

Compact Muon Solenoid
LHC, CERN
| CMS-PAS-SUS-16-044 | ||
| Search for the pair production of Higgsinos in pp collisions at $\sqrt{s} = $ 13 TeV in final states with Higgs bosons and large missing transverse momentum | ||
| CMS Collaboration | ||
| March 2017 | ||
| Abstract: Results are reported from a search for new physics in proton-proton collisions leading to an experimental signature with two Higgs bosons and large missing momentum in the direction transverse to the beam axis. This signature can arise in the context of supersymmetry, where a broad class of models predicts the electroweak production of a pair of Higgsinos, each of which can decay via a cascade process to a final state with a Higgs boson and the lightest supersymmetric particle (LSP). The LSPs remain undetected, producing the large missing transverse momentum characteristic for these events. The search uses a 35.9 fb$^{-1}$ sample of proton-proton collision data at $\sqrt{s} = $ 13 TeV, accumulated by the CMS experiment at the LHC. The observed event yield in the signal region is found to be consistent with the expected standard model background predicted from control regions in the data. Higgsinos with mass in the range 225-770 GeV are excluded at 95% CL using a simplified model framework for the production and decay of approximately degenerate Higgsinos in the context of gauge mediated supersymmetry breaking. | ||
|
Links:
CDS record (PDF) ;
inSPIRE record ;
CADI line (restricted) ;
These preliminary results are superseded in this paper, PRD 97 (2018) 032007. The superseded preliminary plots can be found here. |
||
| Figures & Tables | Summary | Additional Figures & Tables | References | CMS Publications |
|---|
|
Additional information on efficiencies needed for reinterpretation of these results are available here.
Additional technical material for CMS speakers can be found here. |
| Figures | |
png pdf |
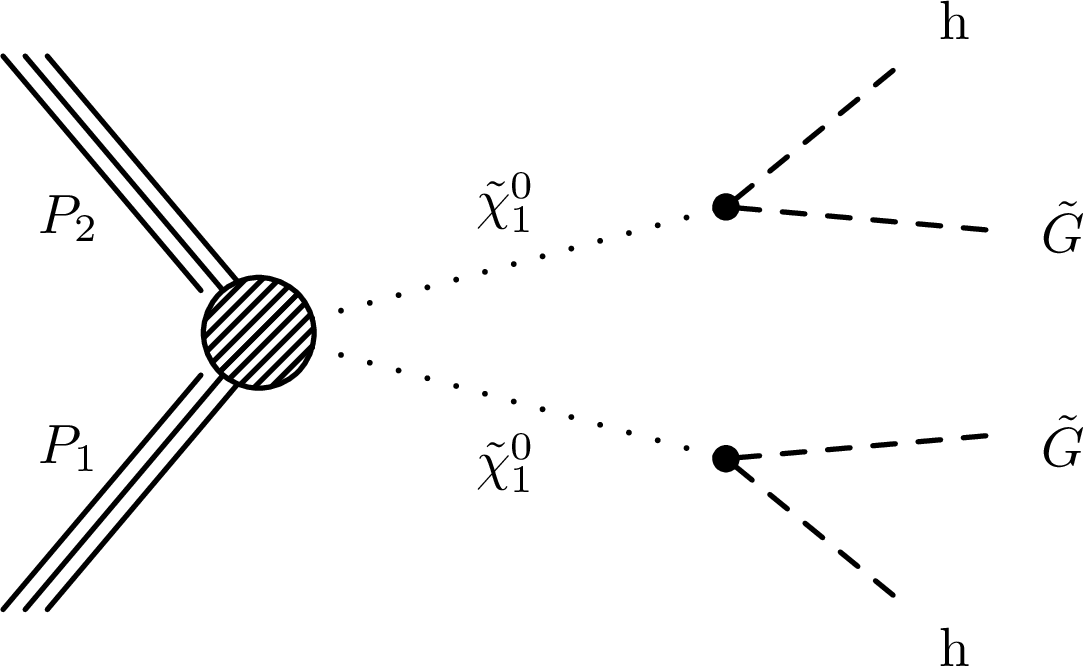
Figure 1:
Diagram for the gauge-mediated-symmetry-breaking signal model, $ {\tilde{\chi }^0_1} {\tilde{\chi }^0_1} \to \mathrm{h} \mathrm{h} \tilde{G}\tilde{G}$ (TChiHH), where $\tilde{G}$ is a Goldstino. The NLSPs $\chi _1^0$ are not directly pair produced, but are instead produced in the cascade decays of several different combinations of neutralinos and charginos, as described in the text. |
png pdf |
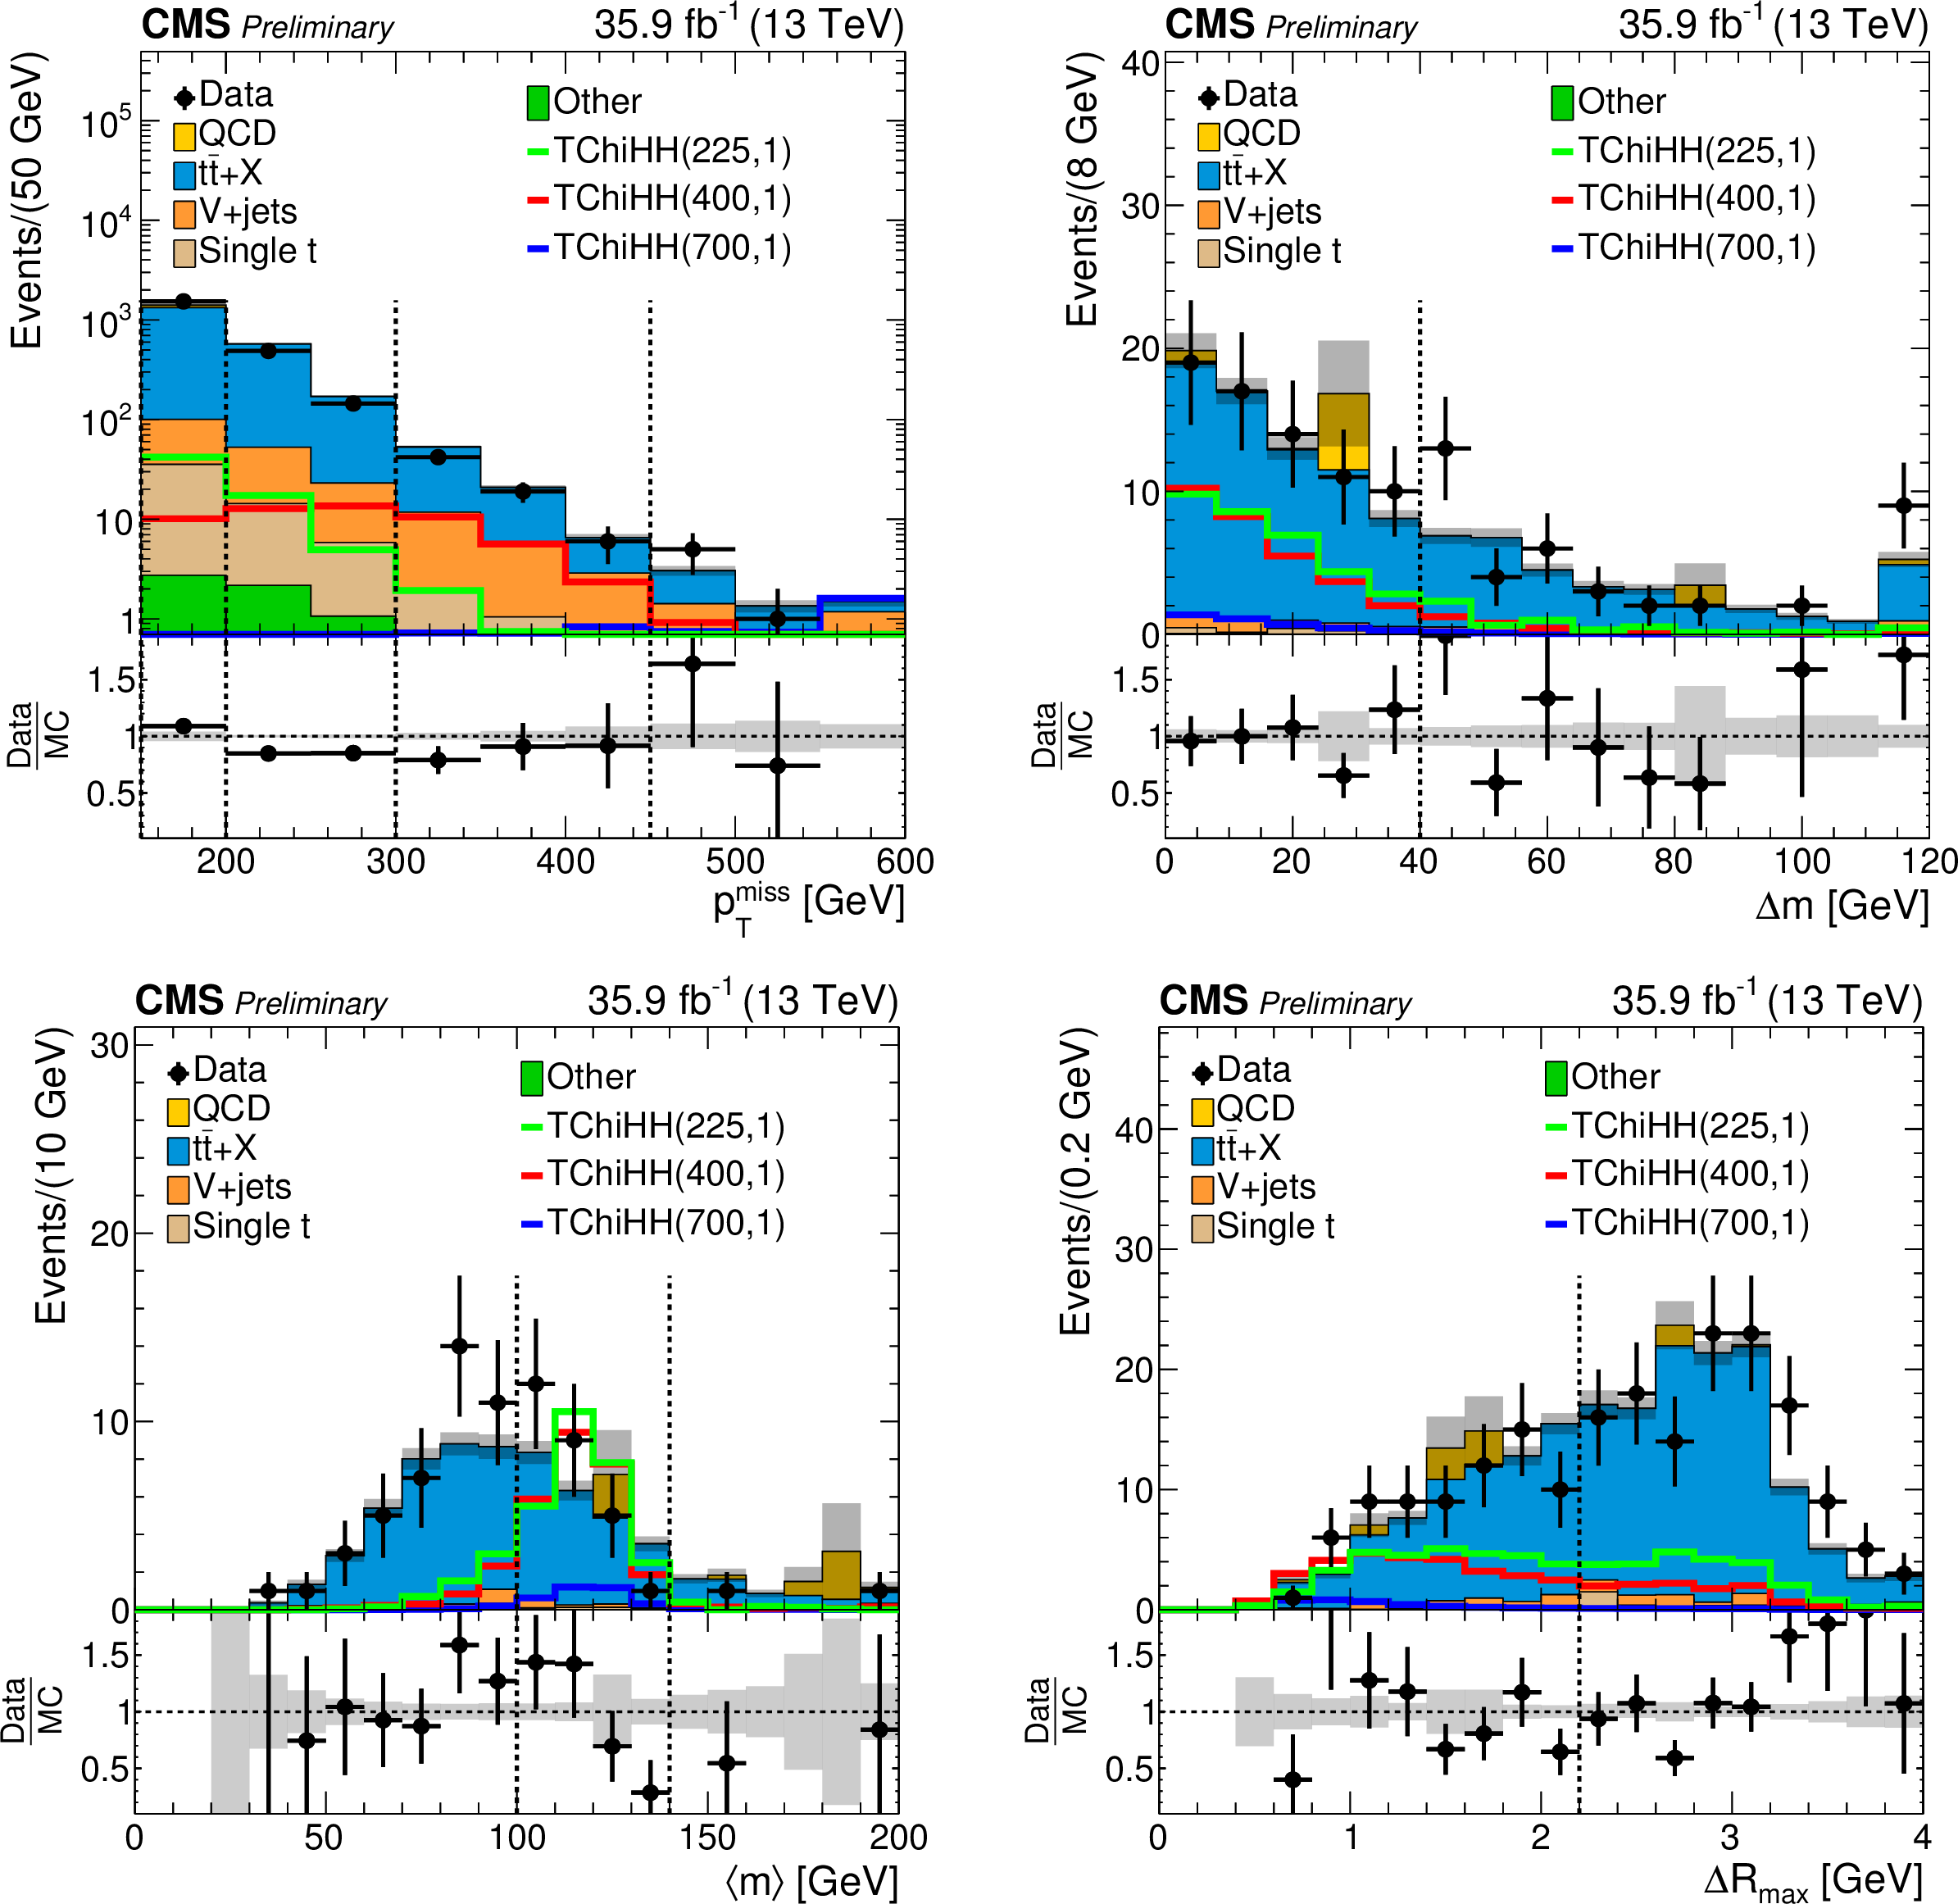
Figure 2:
Distributions of ${ {p_{\mathrm {T}}} ^\text {miss}} $, ${\Delta m} $, <$m$>, and $ {\Delta R_{\rm max}} $ for data and simulated background samples, as well as signal benchmark points for three values of the Higgsino mass. All plots include baseline requirements, and the $ {\Delta m} $, <$m$>, and $ {\Delta R_{\rm max}} $ distributions also include the 4b selection. The simulation is normalized to the data yields. The gray shading indicates the statistical uncertainty on the total simulated background. |
png pdf |
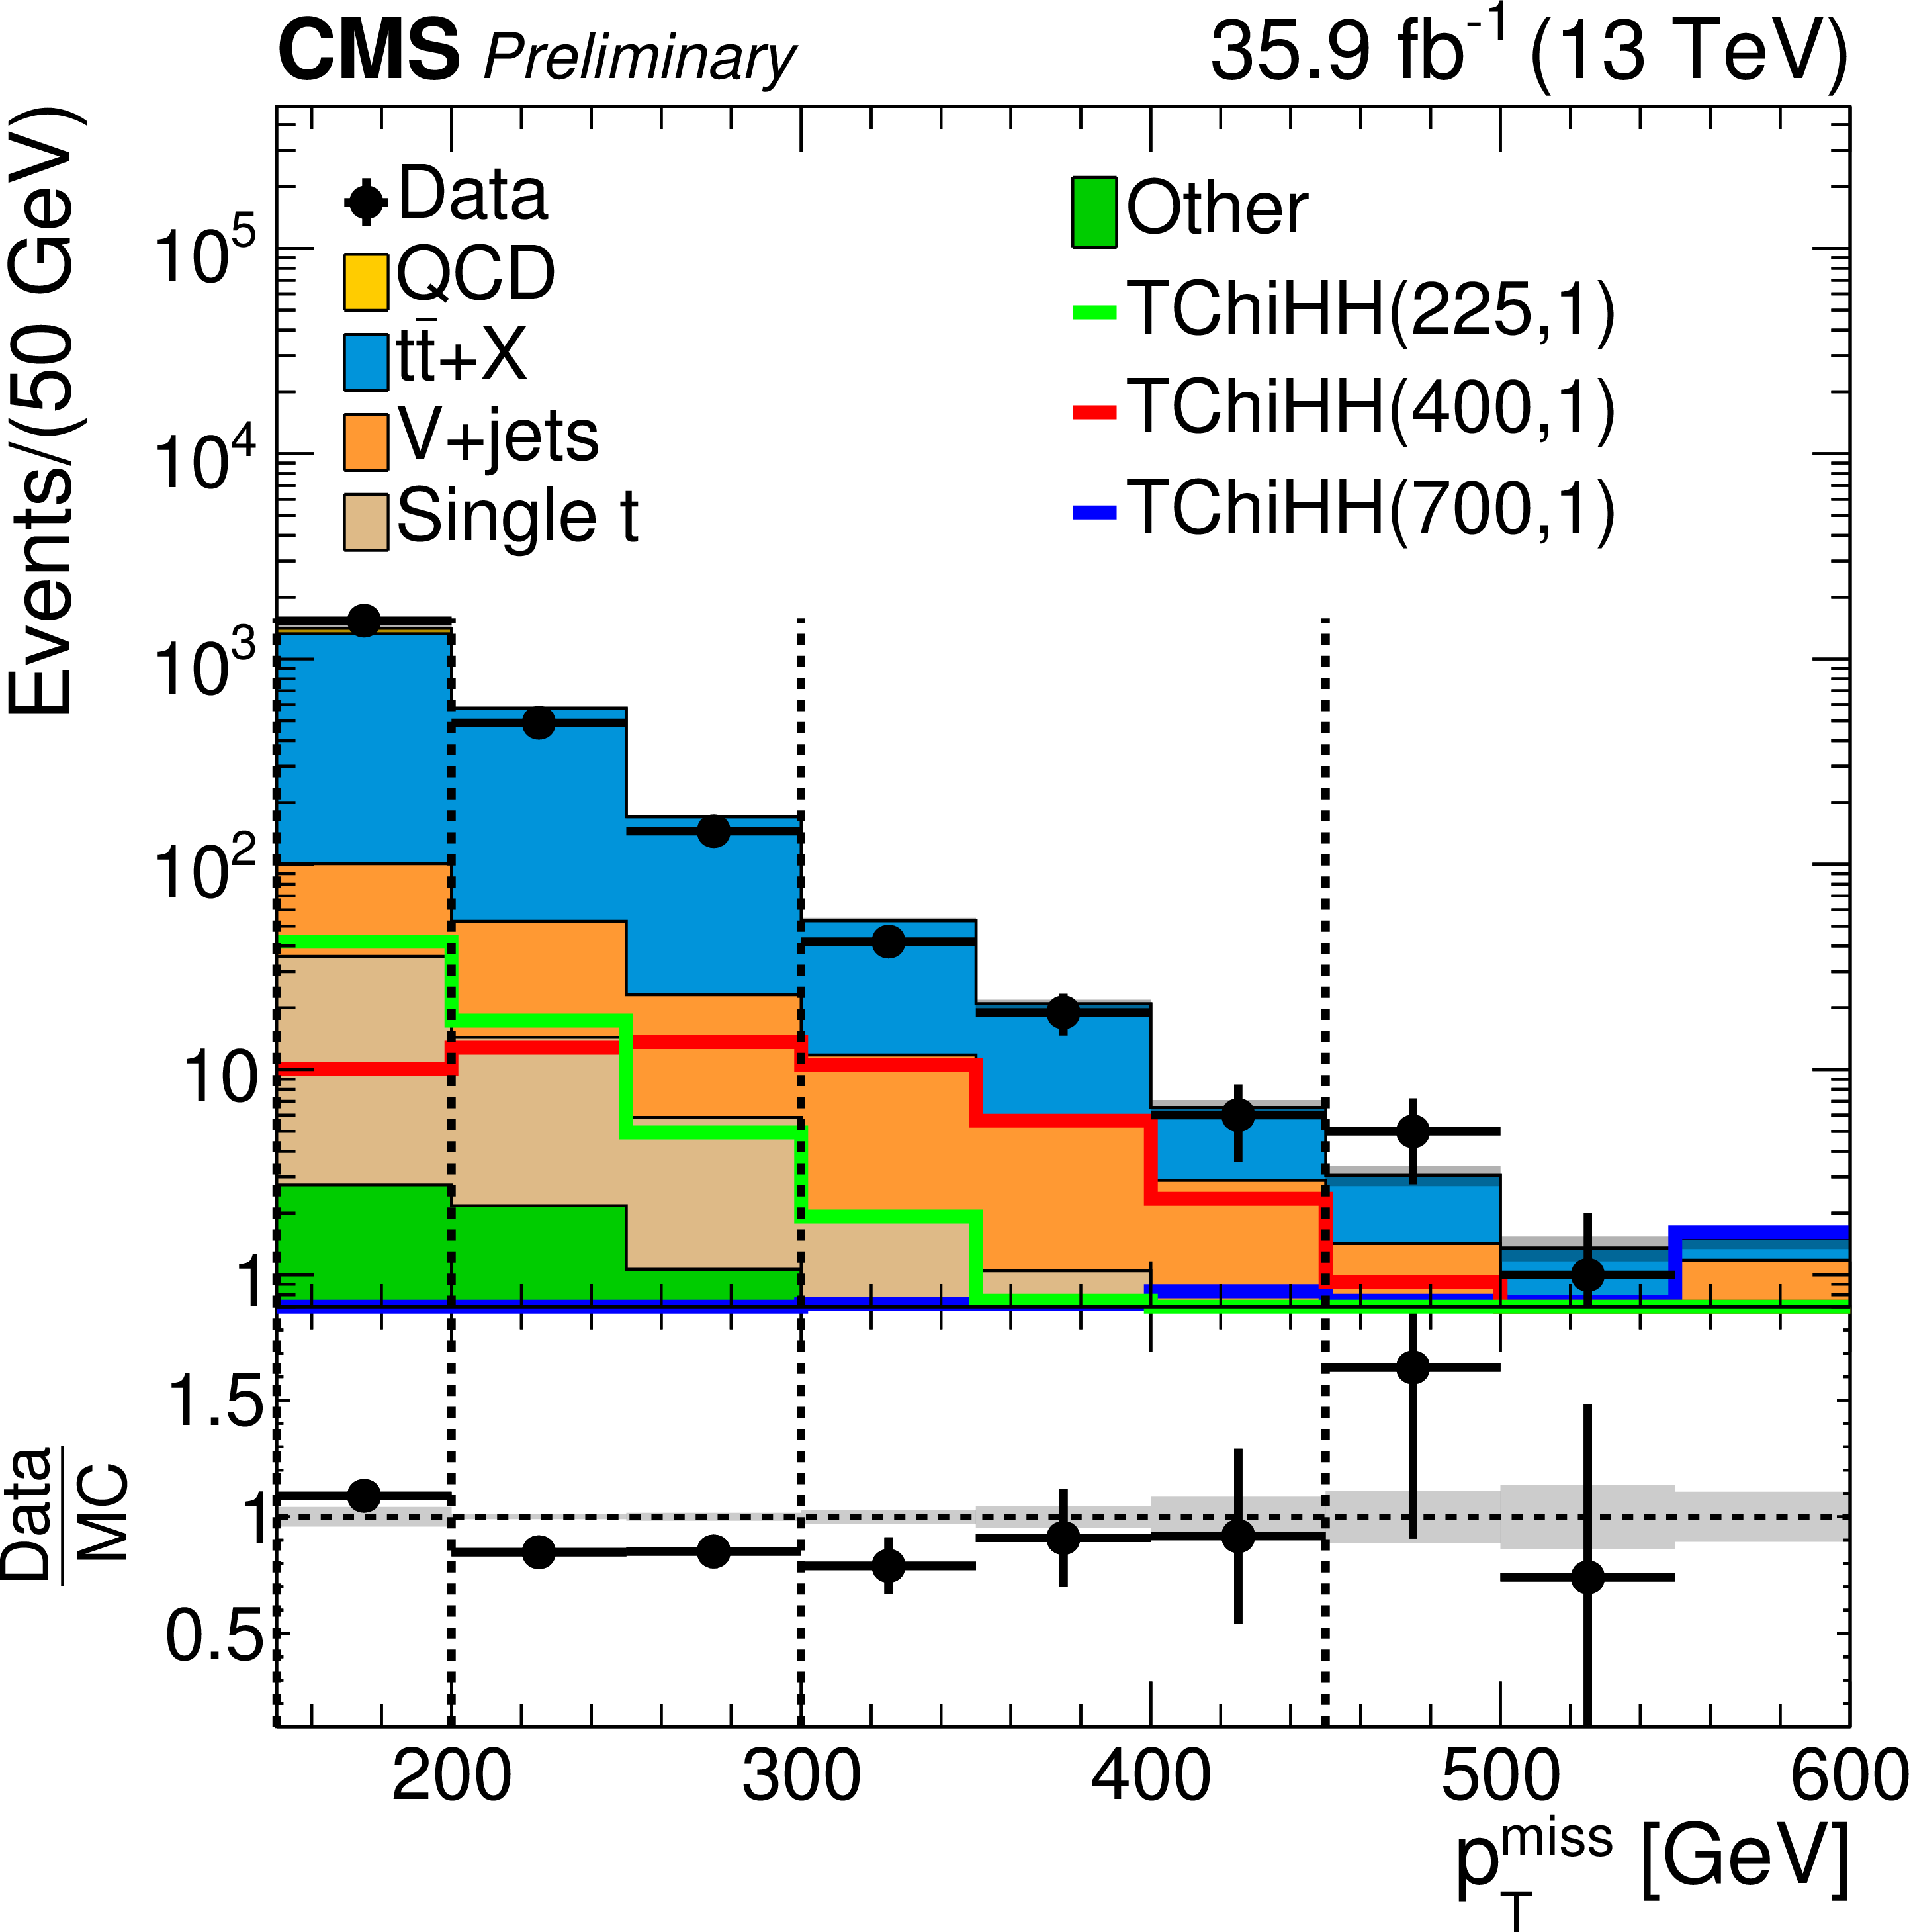
Figure 2-a:
Distribution of ${ {p_{\mathrm {T}}} ^\text {miss}} $ for data and simulated background samples, as well as signal benchmark points for three values of the Higgsino mass. The plot includes baseline requirements. The simulation is normalized to the data yields. The gray shading indicates the statistical uncertainty on the total simulated background. |

png pdf |
Figure 2-b:
Distribution of ${\Delta m} $ for data and simulated background samples, as well as signal benchmark points for three values of the Higgsino mass. The plot includes baseline requirements. The distribution also includes the 4b selection. The simulation is normalized to the data yields. The gray shading indicates the statistical uncertainty on the total simulated background. |
png pdf |
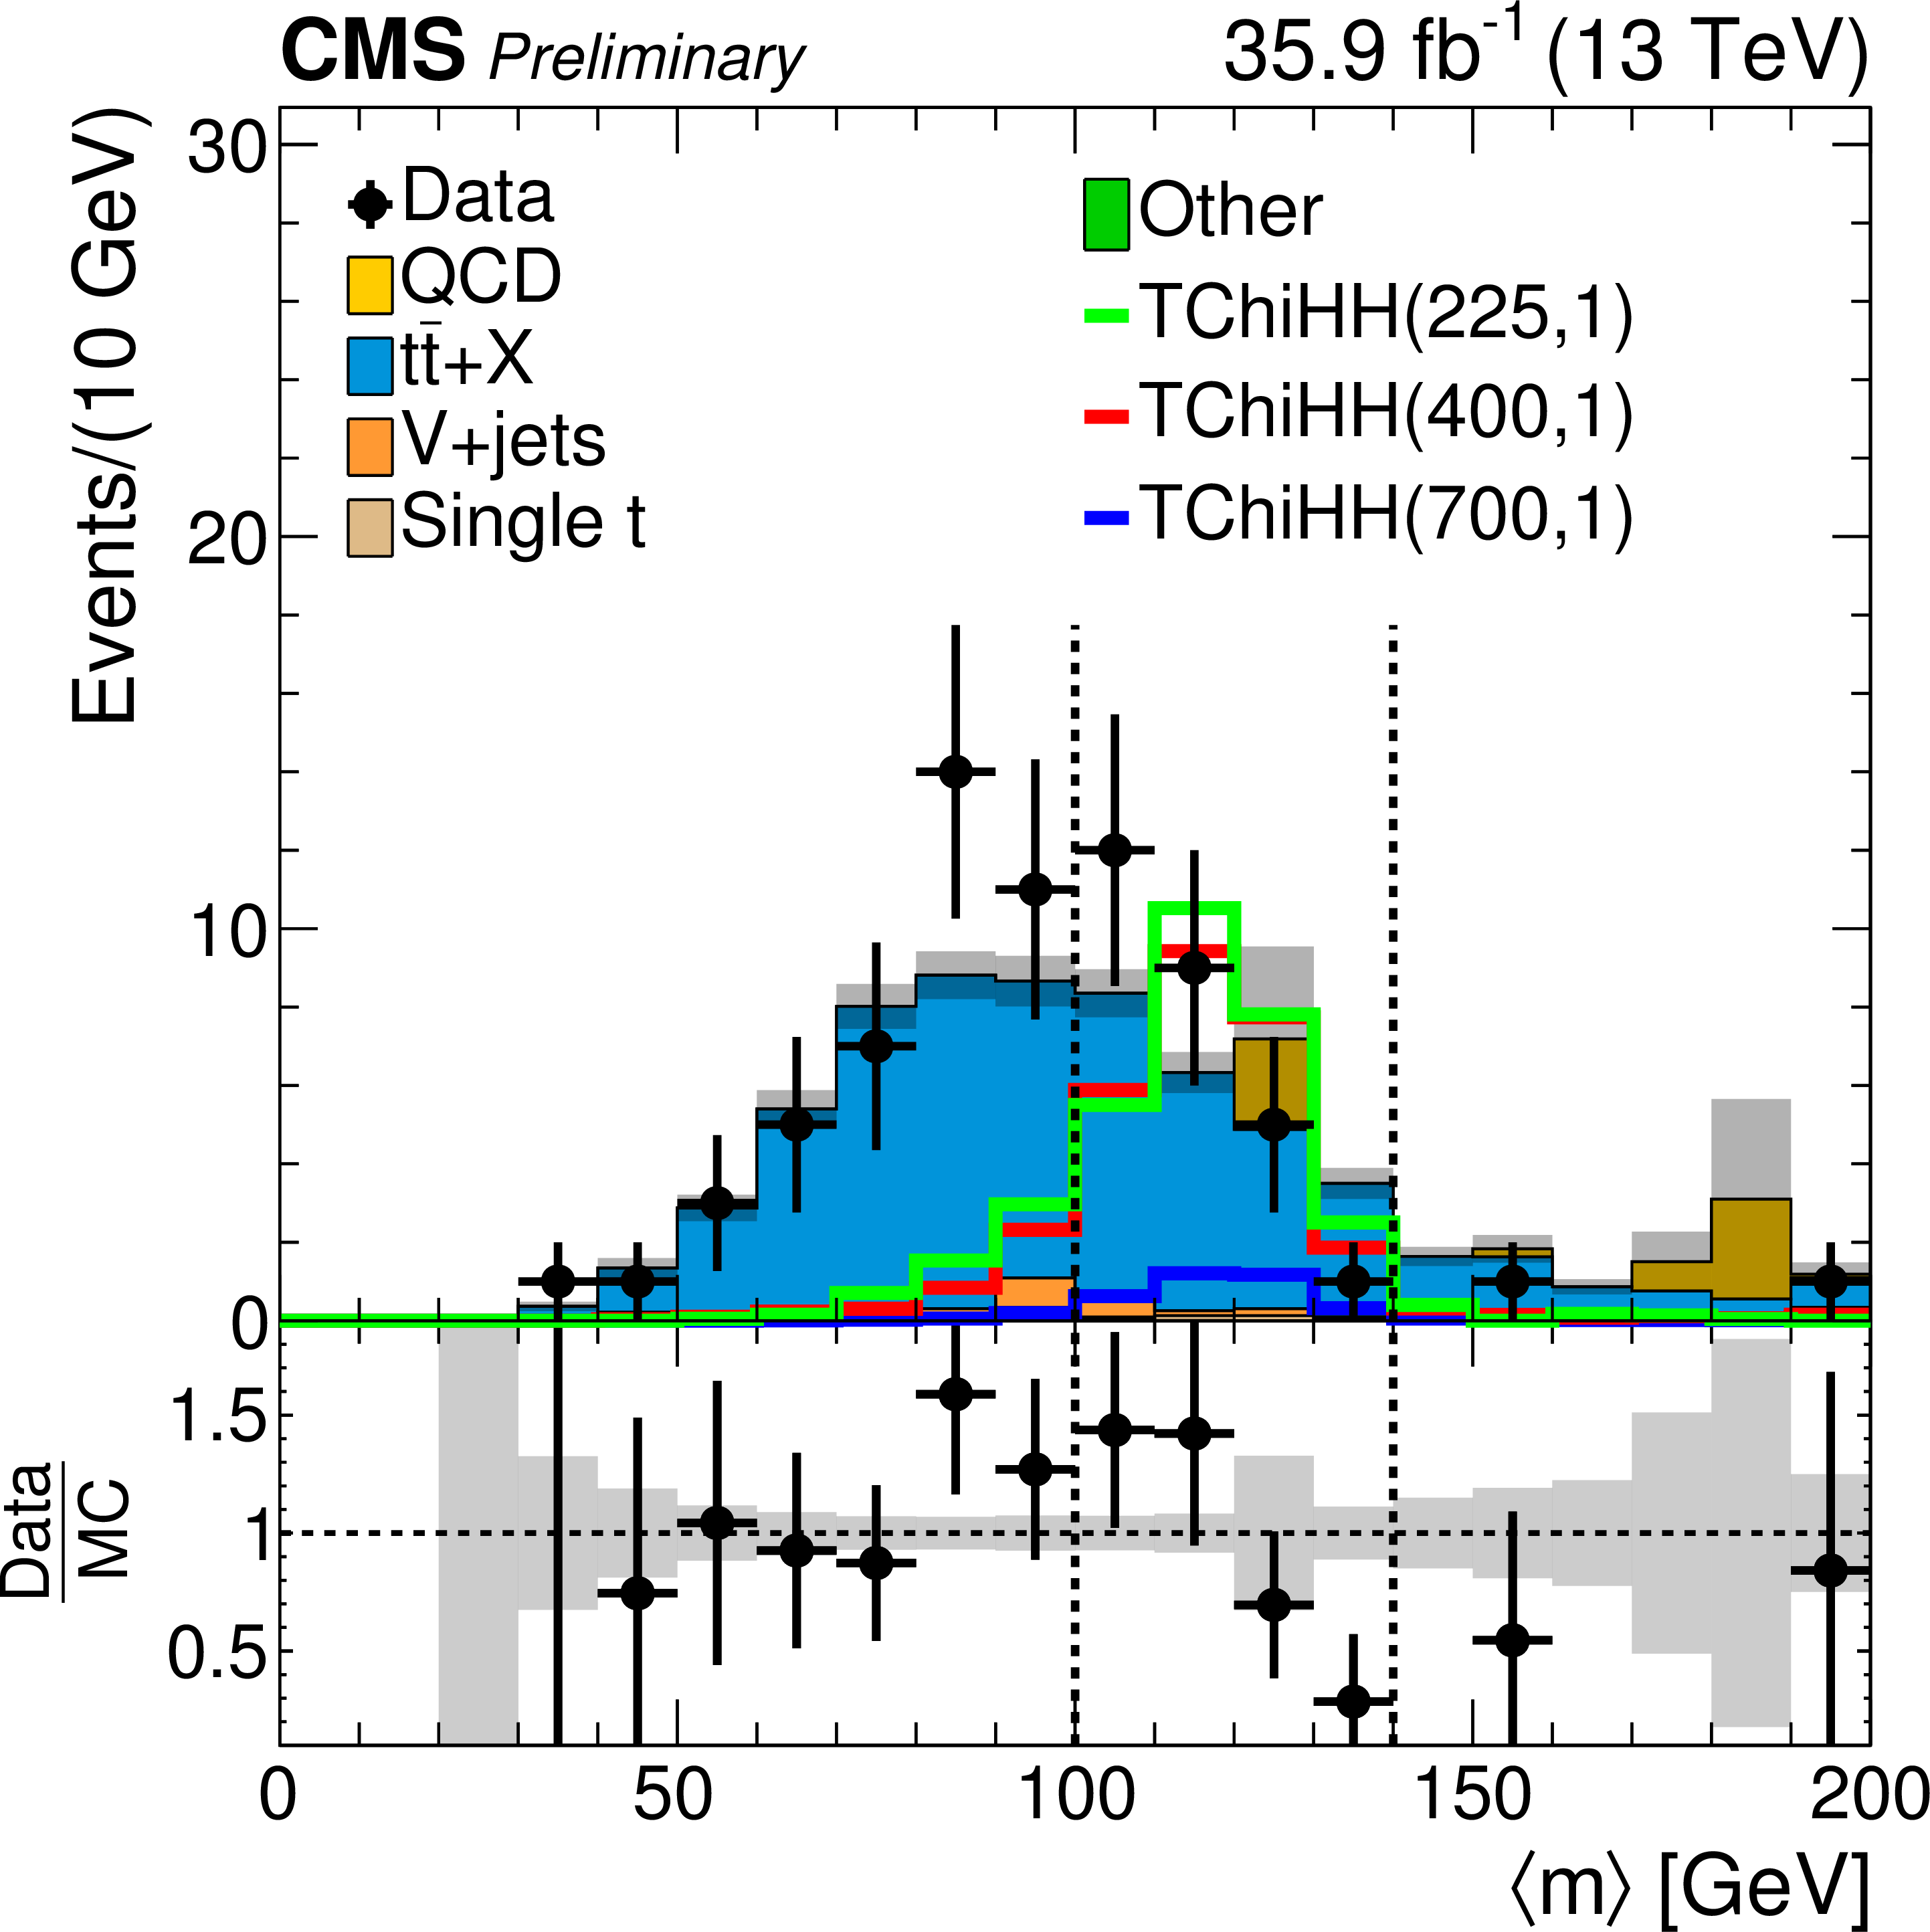
Figure 2-c:
Distribution of <$m$> for data and simulated background samples, as well as signal benchmark points for three values of the Higgsino mass. The plot includes baseline requirements. The distribution also includes the 4b selection. The simulation is normalized to the data yields. The gray shading indicates the statistical uncertainty on the total simulated background. |

png pdf |
Figure 2-d:
Distributions of $ {\Delta R_{\rm max}} $ for data and simulated background samples, as well as signal benchmark points for three values of the Higgsino mass. The plot includes baseline requirements. The distribution also includes the 4b selection. The simulation is normalized to the data yields. The gray shading indicates the statistical uncertainty on the total simulated background. |

png pdf |
Figure 3:
Comparison of the <$m$> shape from simulated background samples among the three b-tag categories after baseline selection. Note that QCD is not included due to the poor statistics of the simulation. |
png pdf |
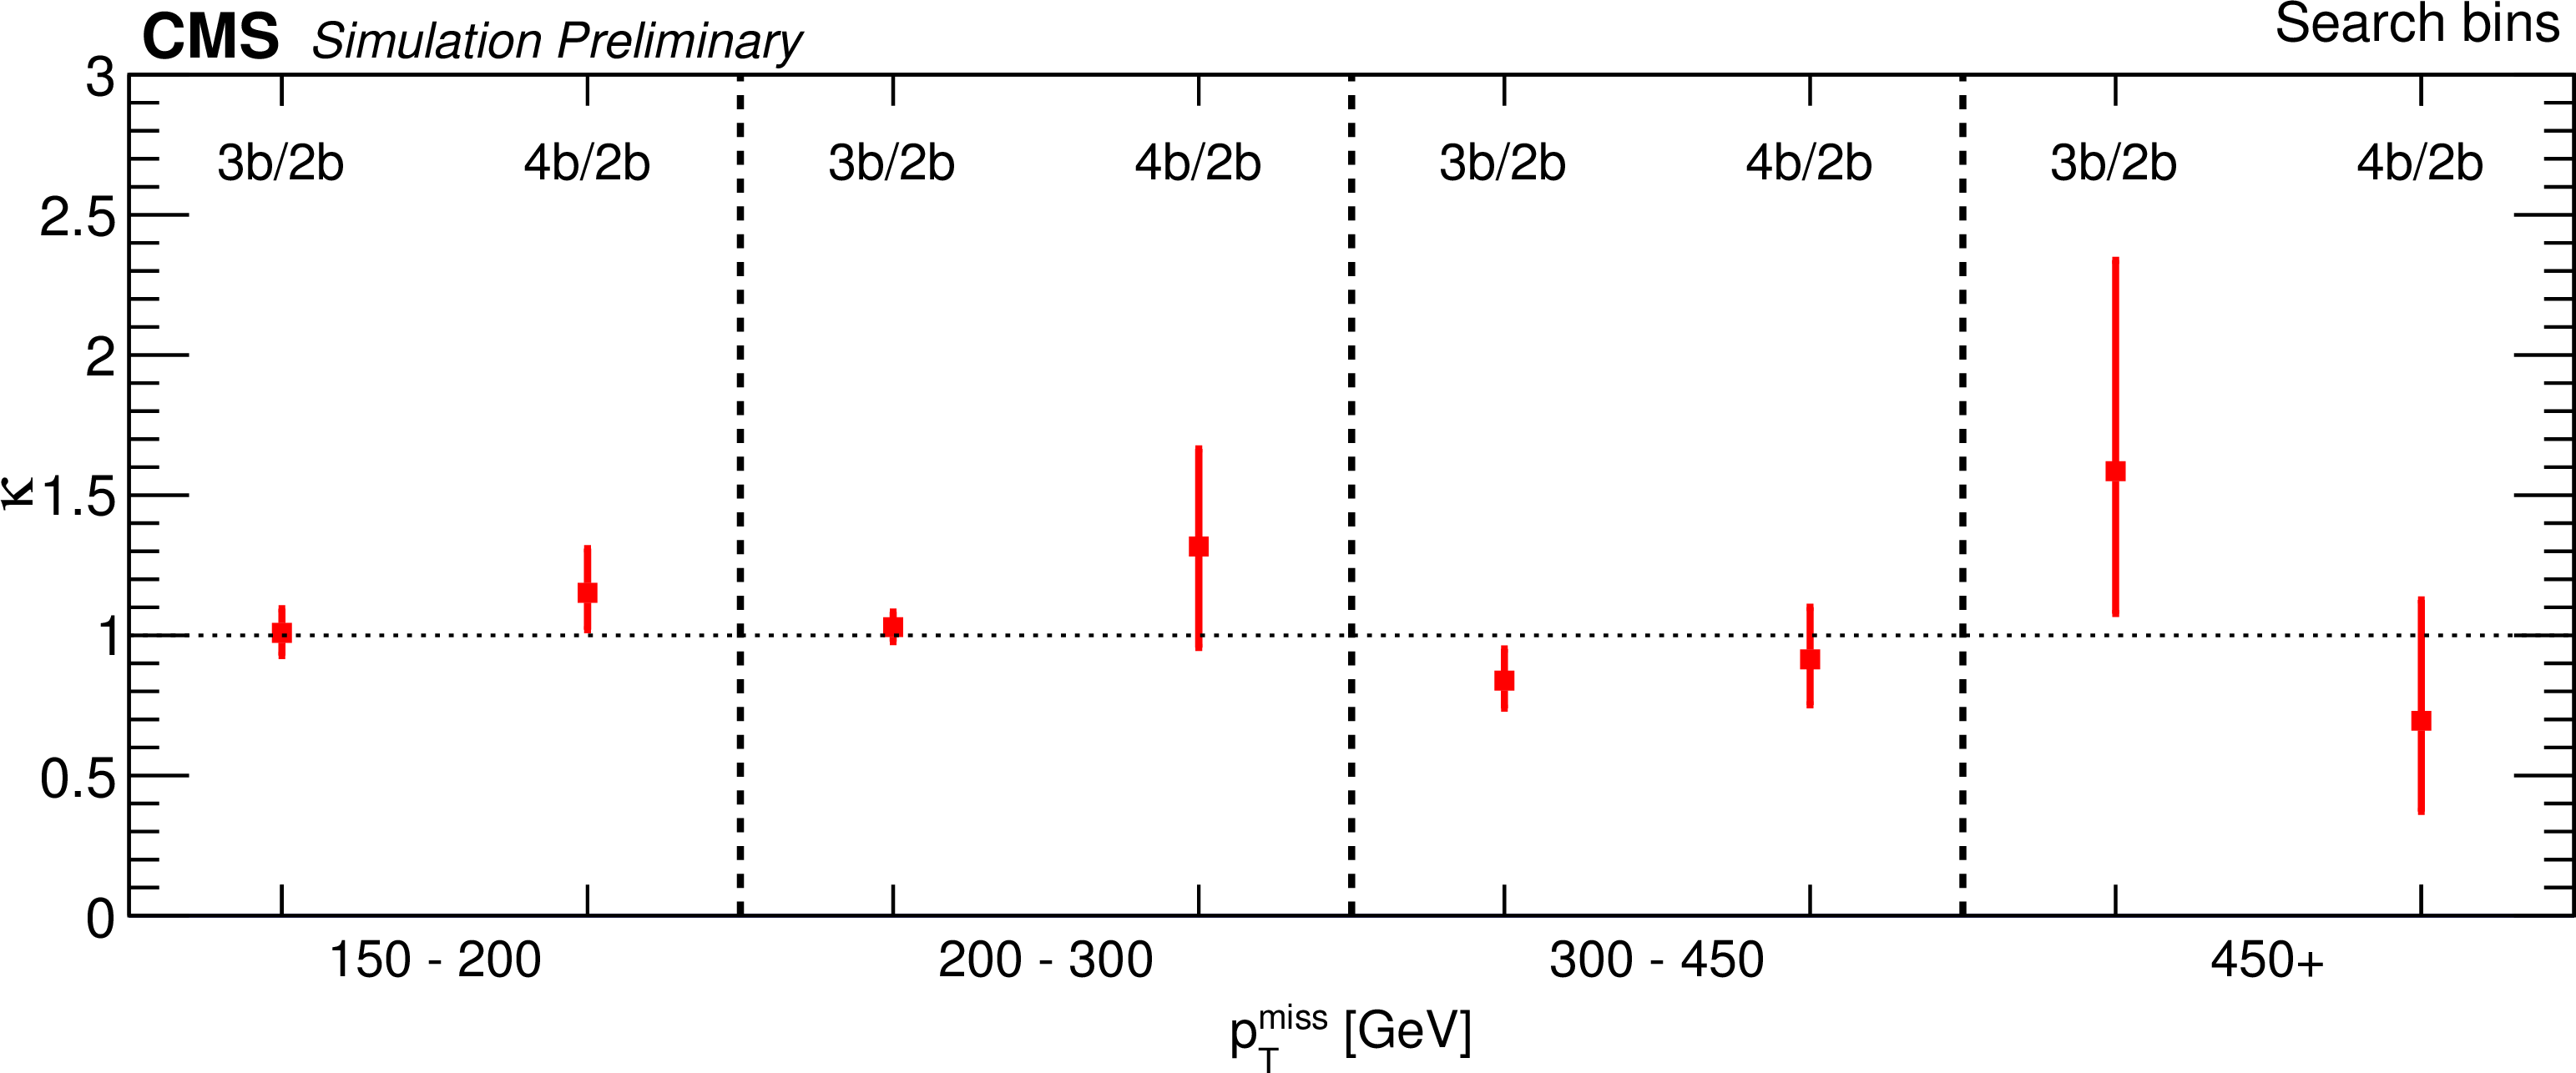
Figure 4:
Values of the double-ratios $\kappa _{3\text {b}}$ and $\kappa _{4\text {b}}$ obtained from the background simulation for each of the ${ {p_{\mathrm {T}}} ^\text {miss}}$ bins. |

png pdf |
Figure 5:
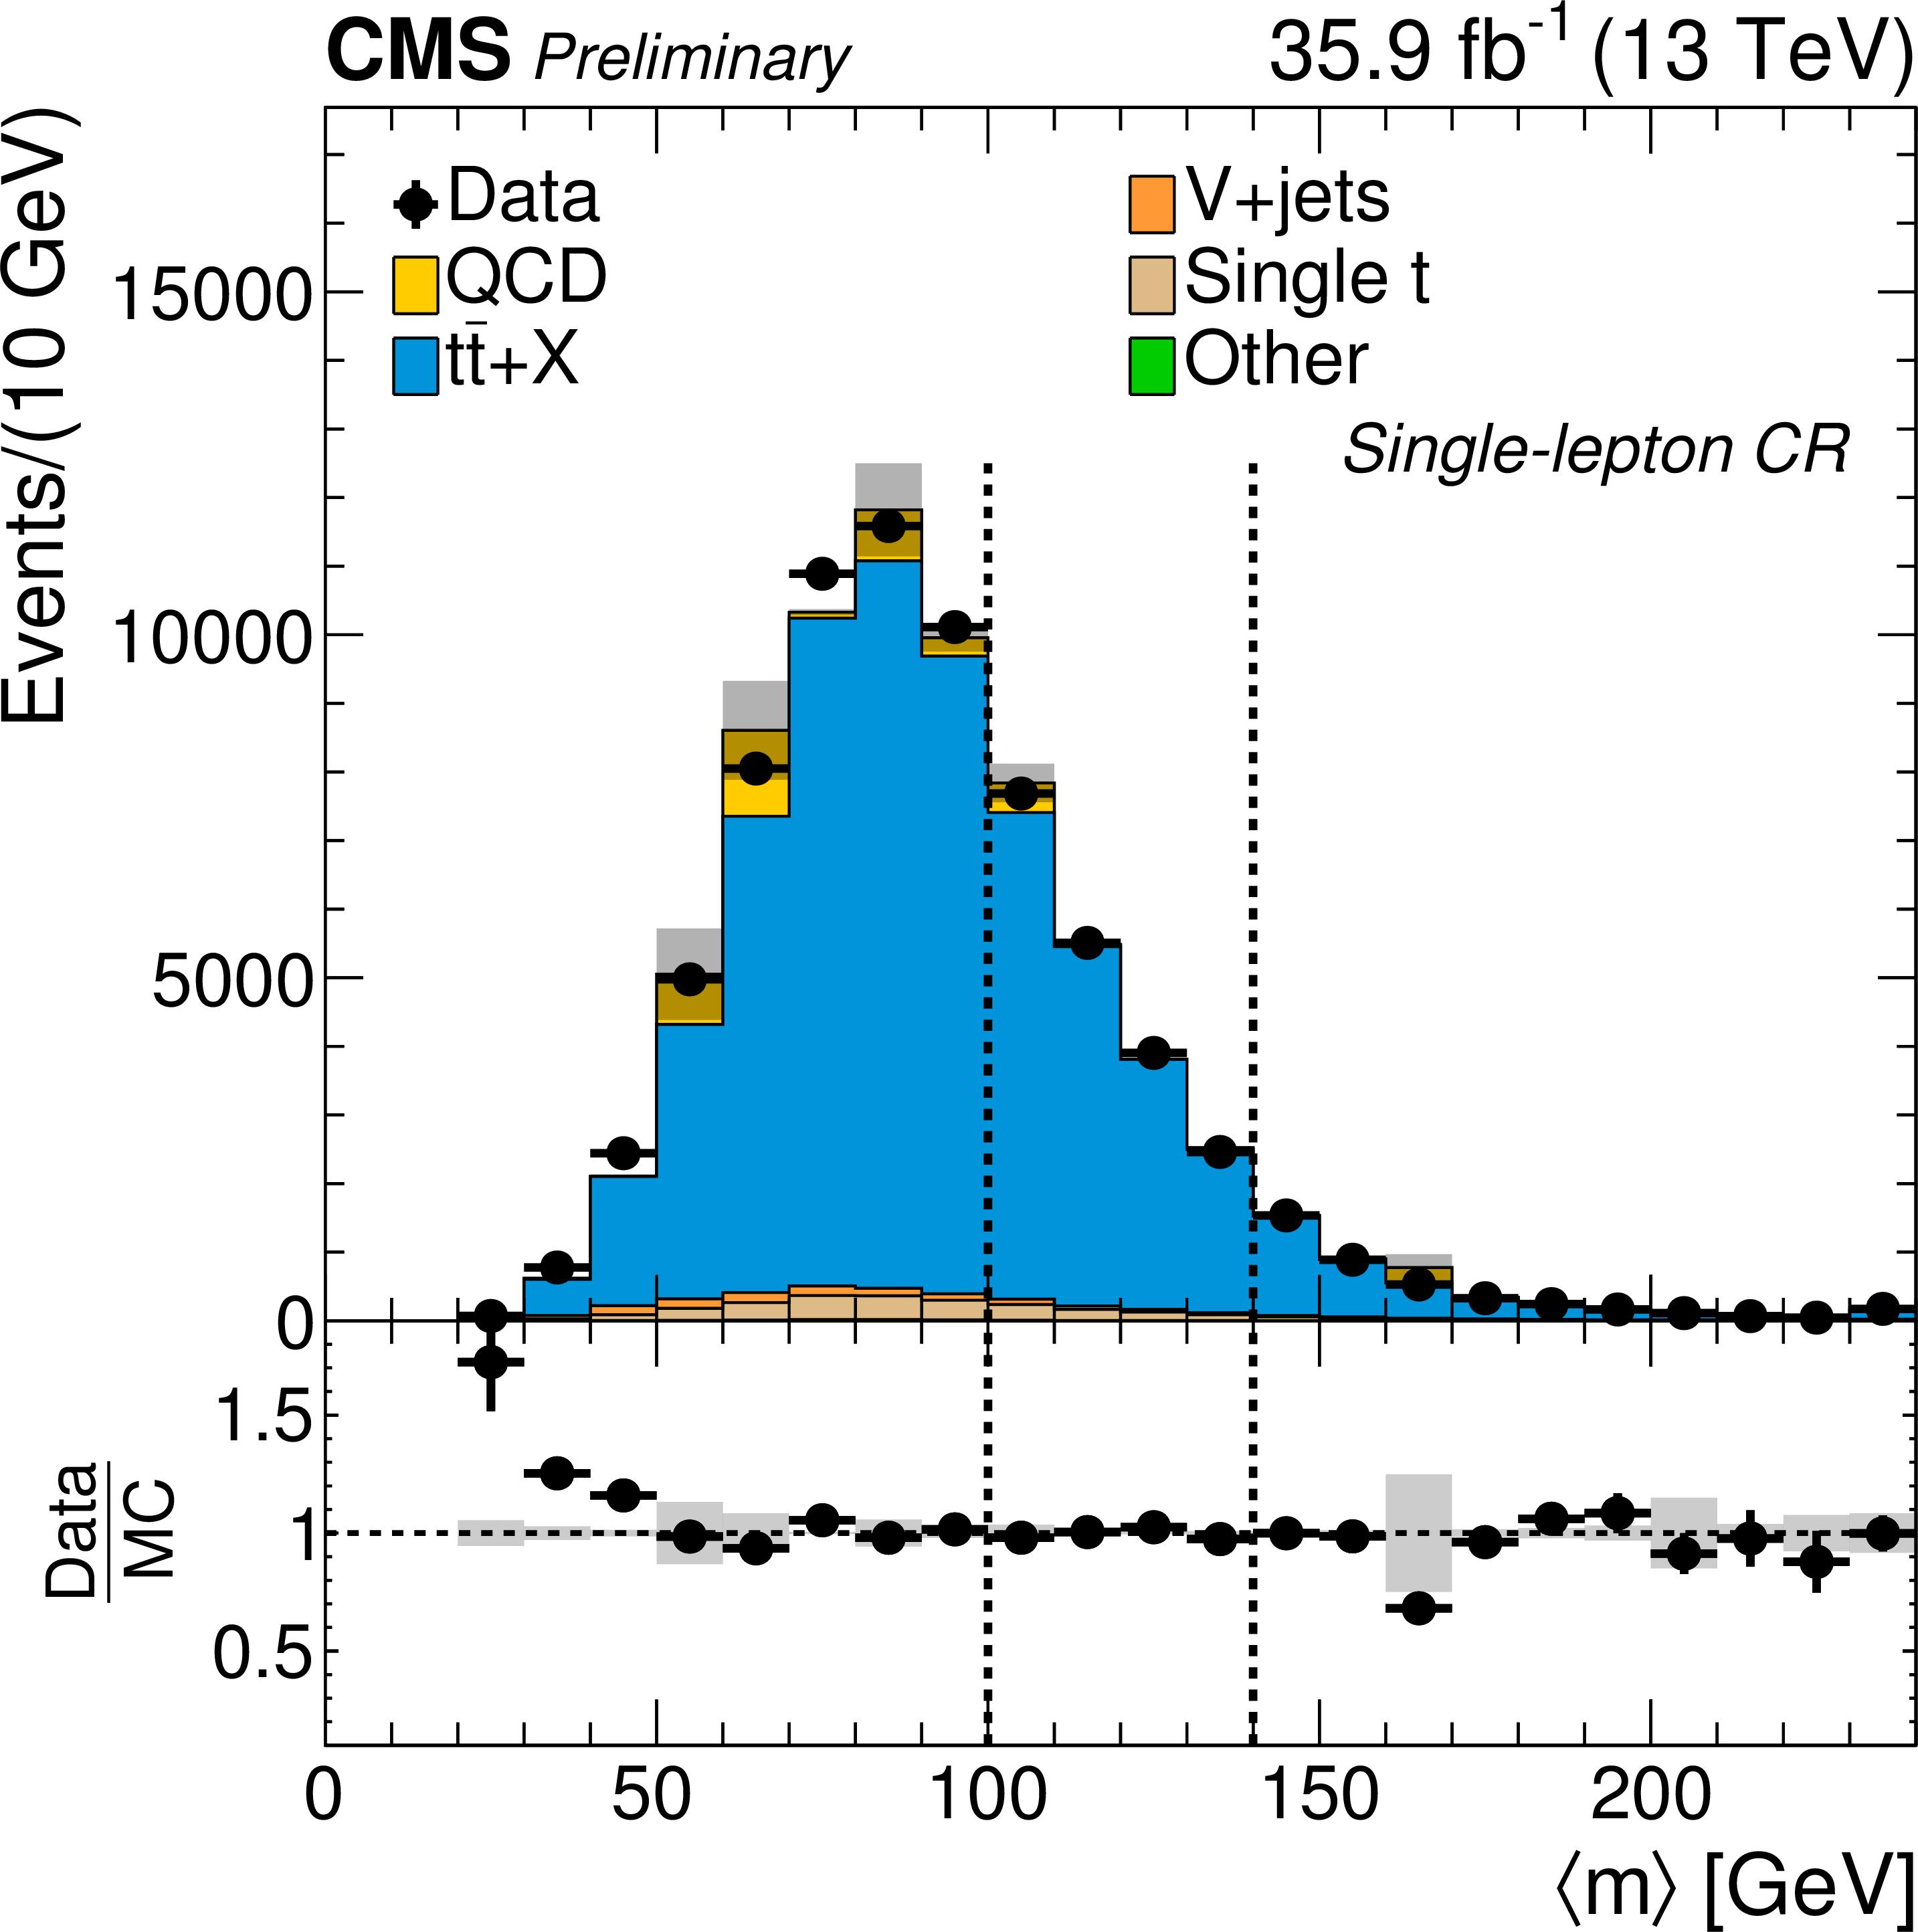
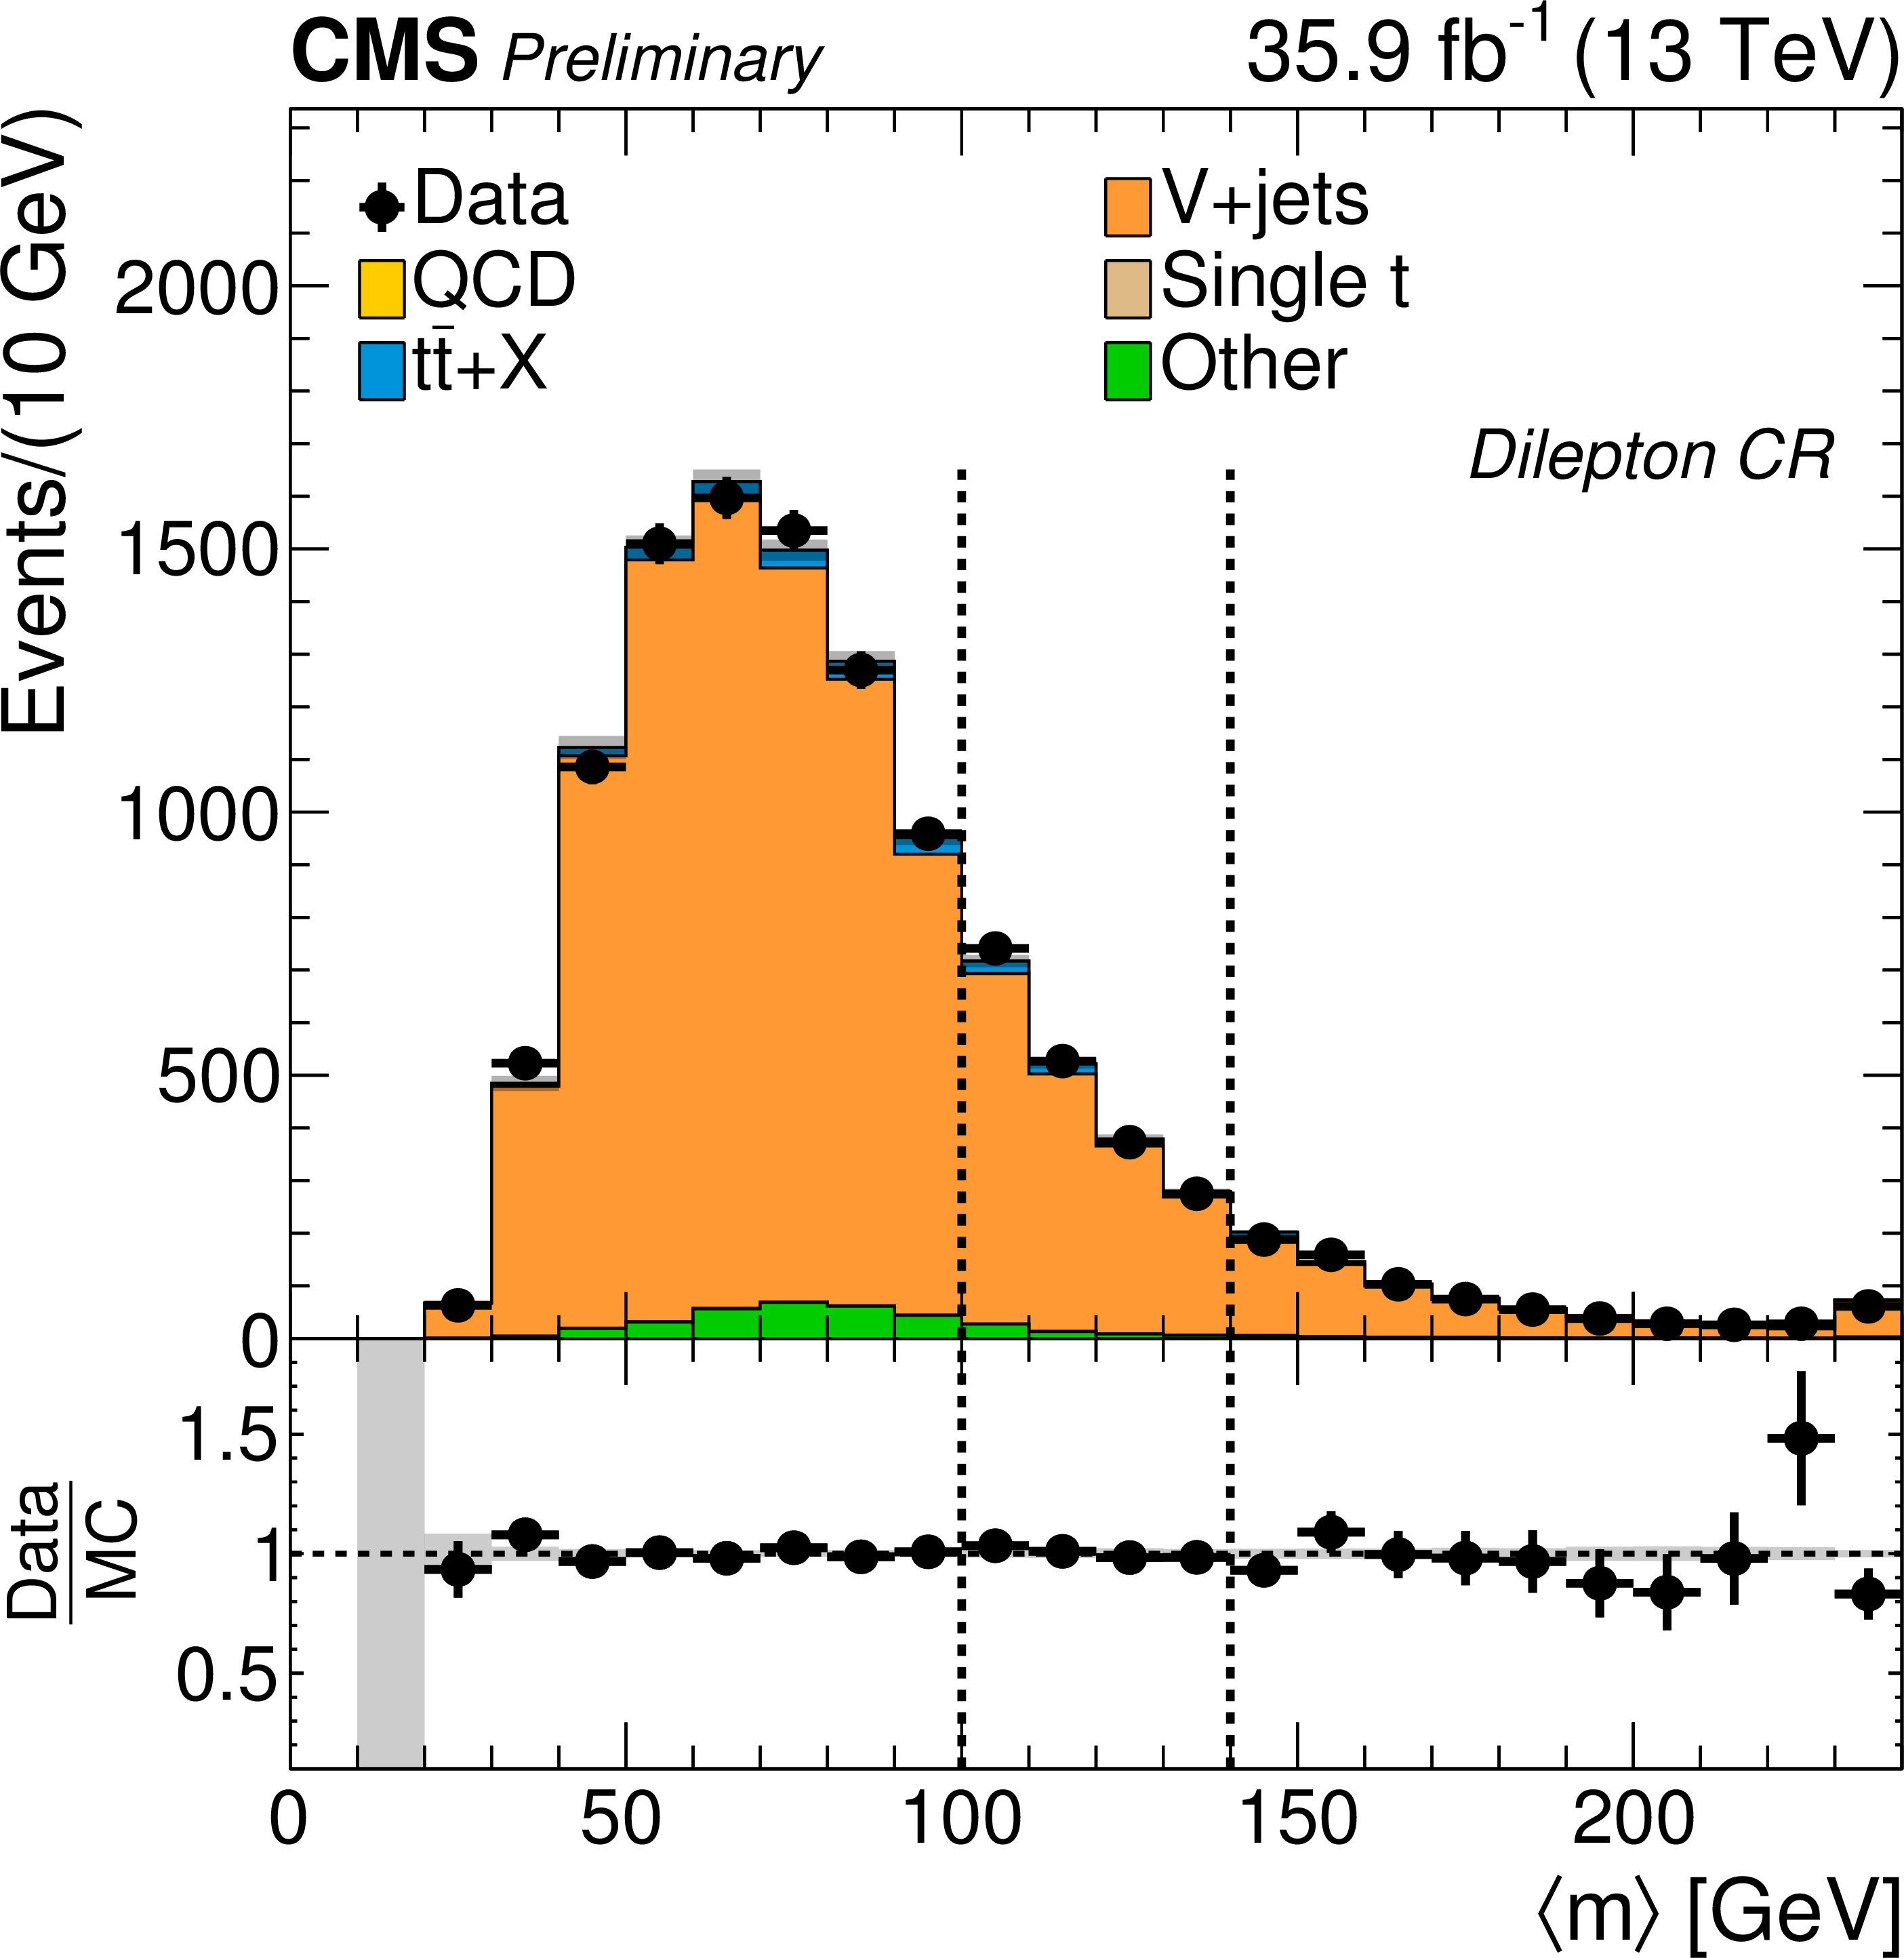
Comparison of the distribution of <$m$> in data and simulation in the single-lepton control sample (left) and the dilepton control sample (right) integrated in ${ {p_{\mathrm {T}}} ^\text {miss}} $. The simulation is normalized to the data yields. The gray shading indicates the statistical uncertainty on the total simulated background. |
png pdf |
Figure 5-a:
Comparison of the distribution of <$m$> in data and simulation in the single-lepton control sample integrated in ${ {p_{\mathrm {T}}} ^\text {miss}} $. The simulation is normalized to the data yields. The gray shading indicates the statistical uncertainty on the total simulated background. |
png pdf |
Figure 5-b:
Comparison of the distribution of <$m$> in data and simulation in the dilepton control sample integrated in ${ {p_{\mathrm {T}}} ^\text {miss}} $. The simulation is normalized to the data yields. The gray shading indicates the statistical uncertainty on the total simulated background. |

png pdf |
Figure 6:
Comparison of the ${\kappa }$ values found in the single-lepton control sample, for data and simulated events, for the 2b-3b and 2b-4b ABCD planes in each ${ {p_{\mathrm {T}}} ^\text {miss}}$ bin. |

png pdf |
Figure 7:
Comparison of the ${\kappa }$ values found in the dilepton control sample, data and simulation, for the 1b/0b ABCD planes in bins of ${p_T(\ell \ell )} $. |

png pdf |
Figure 8:
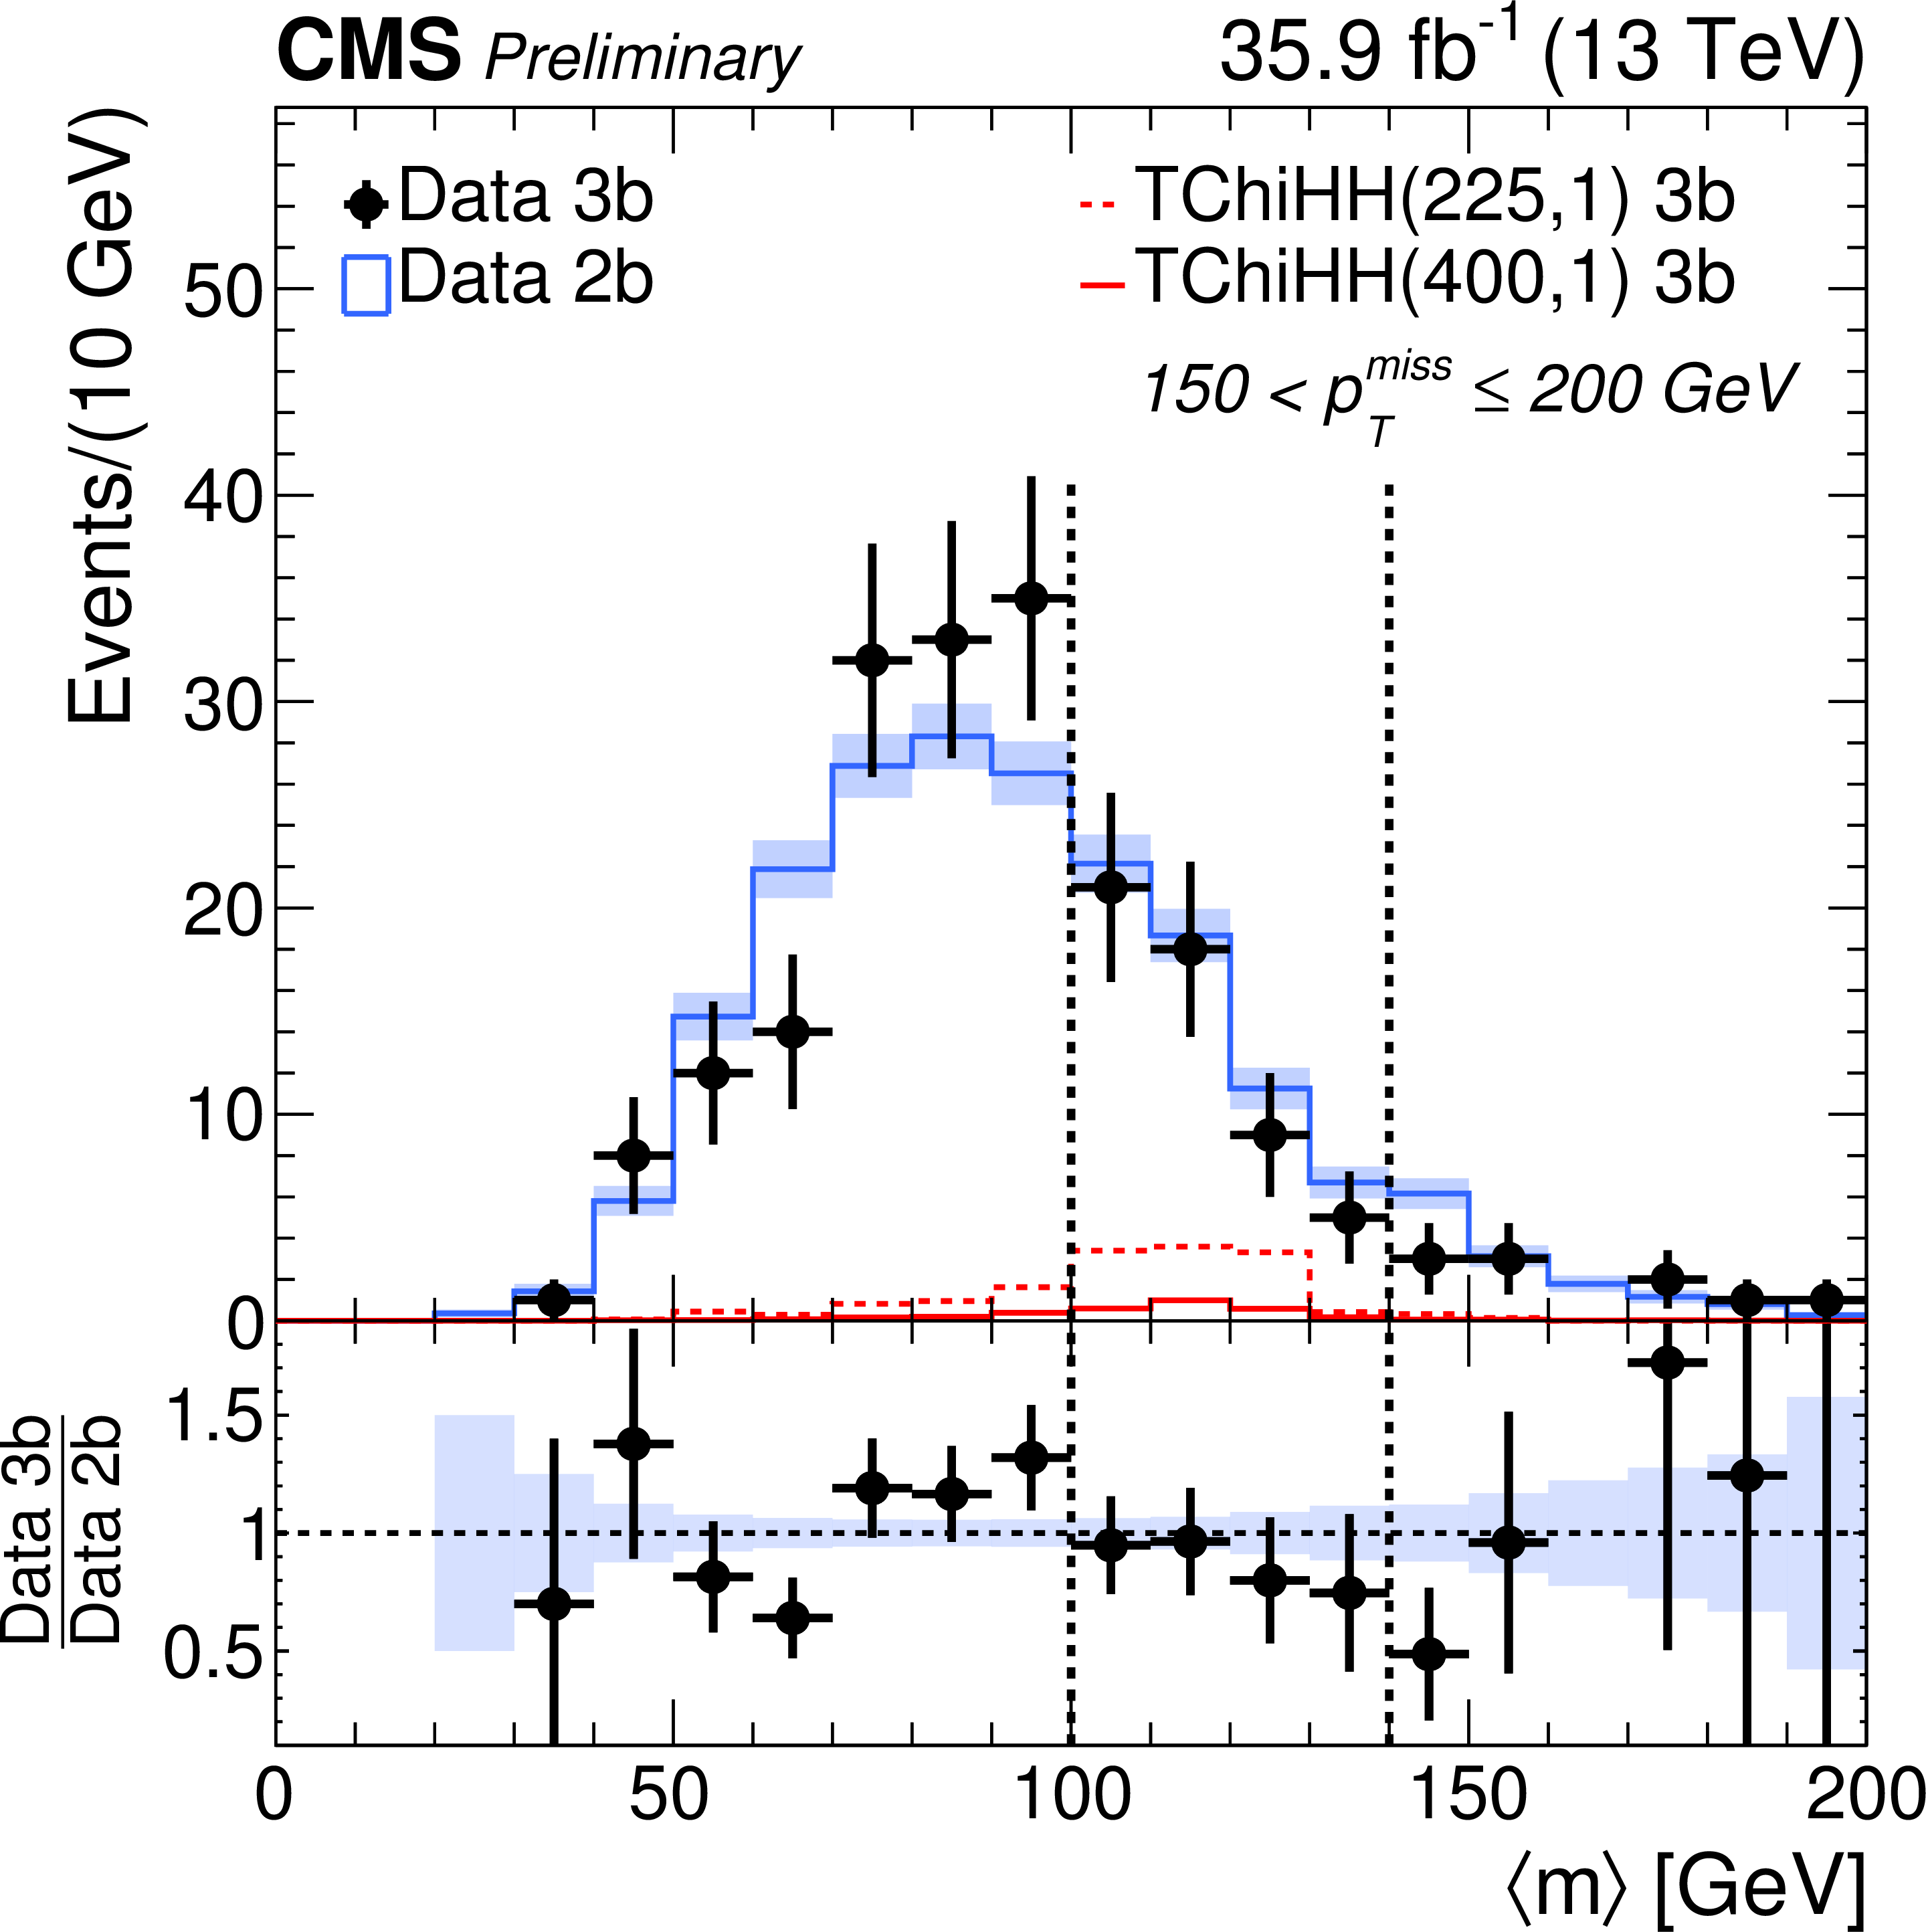
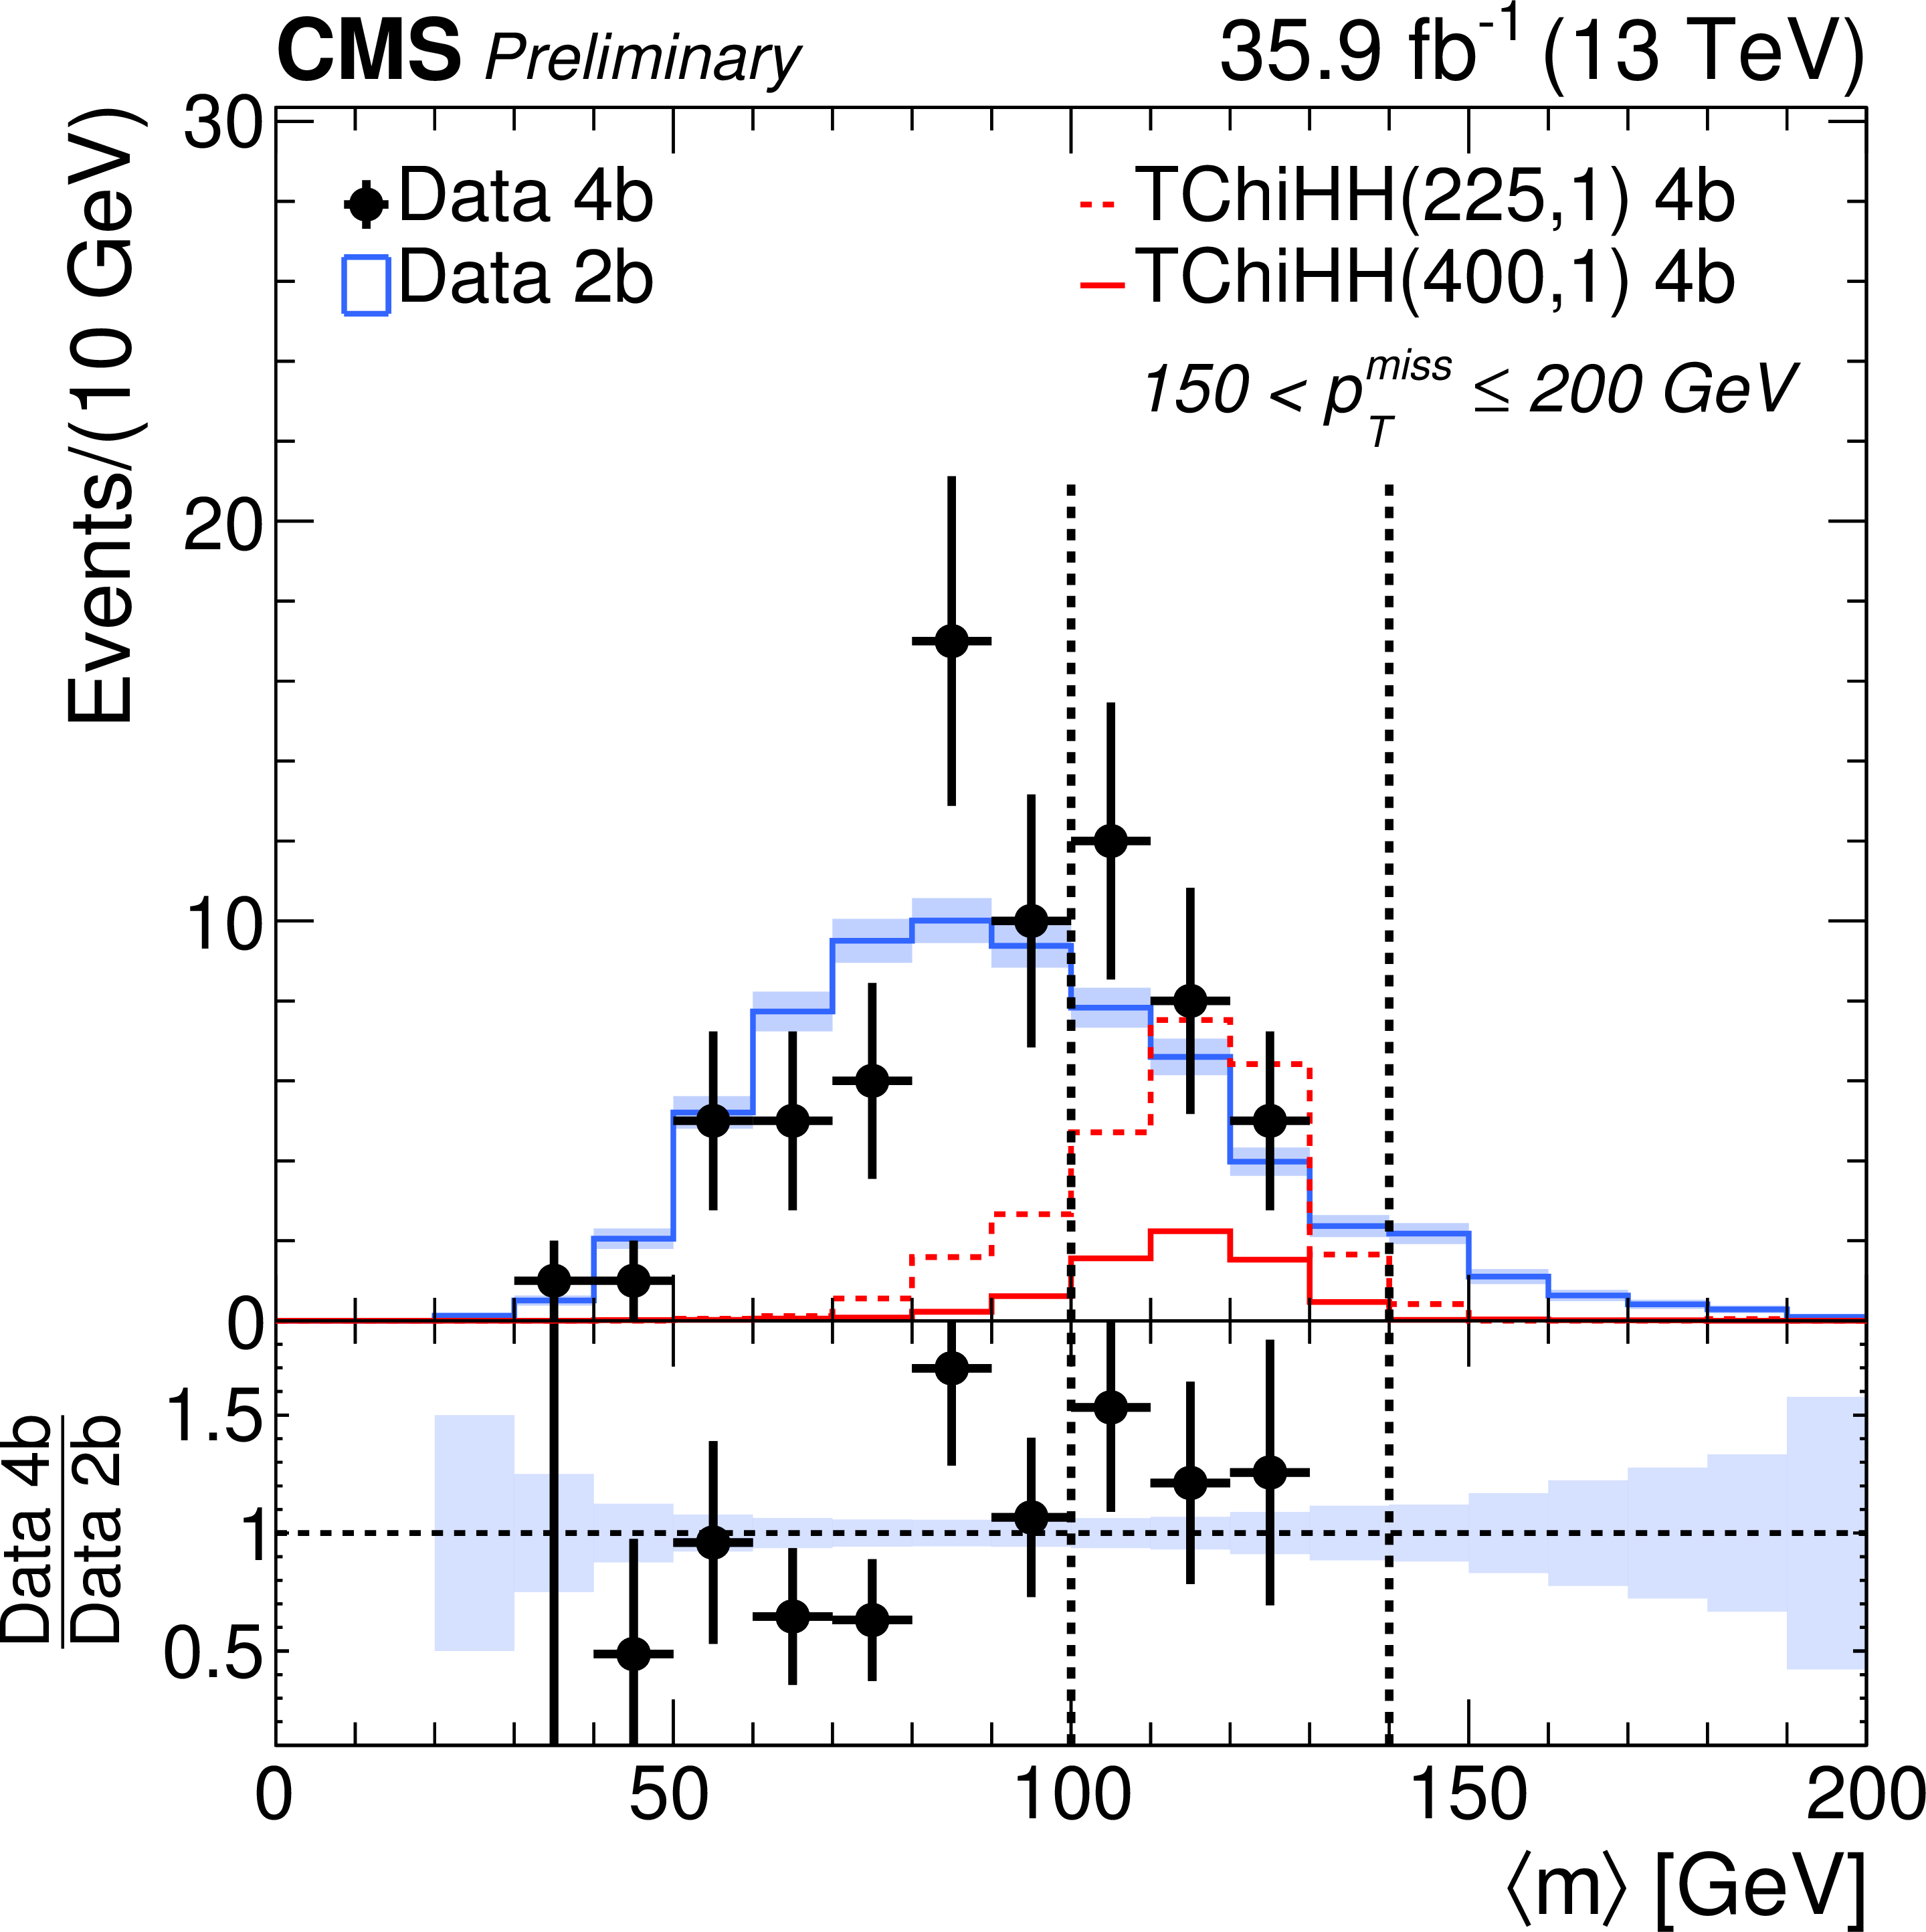
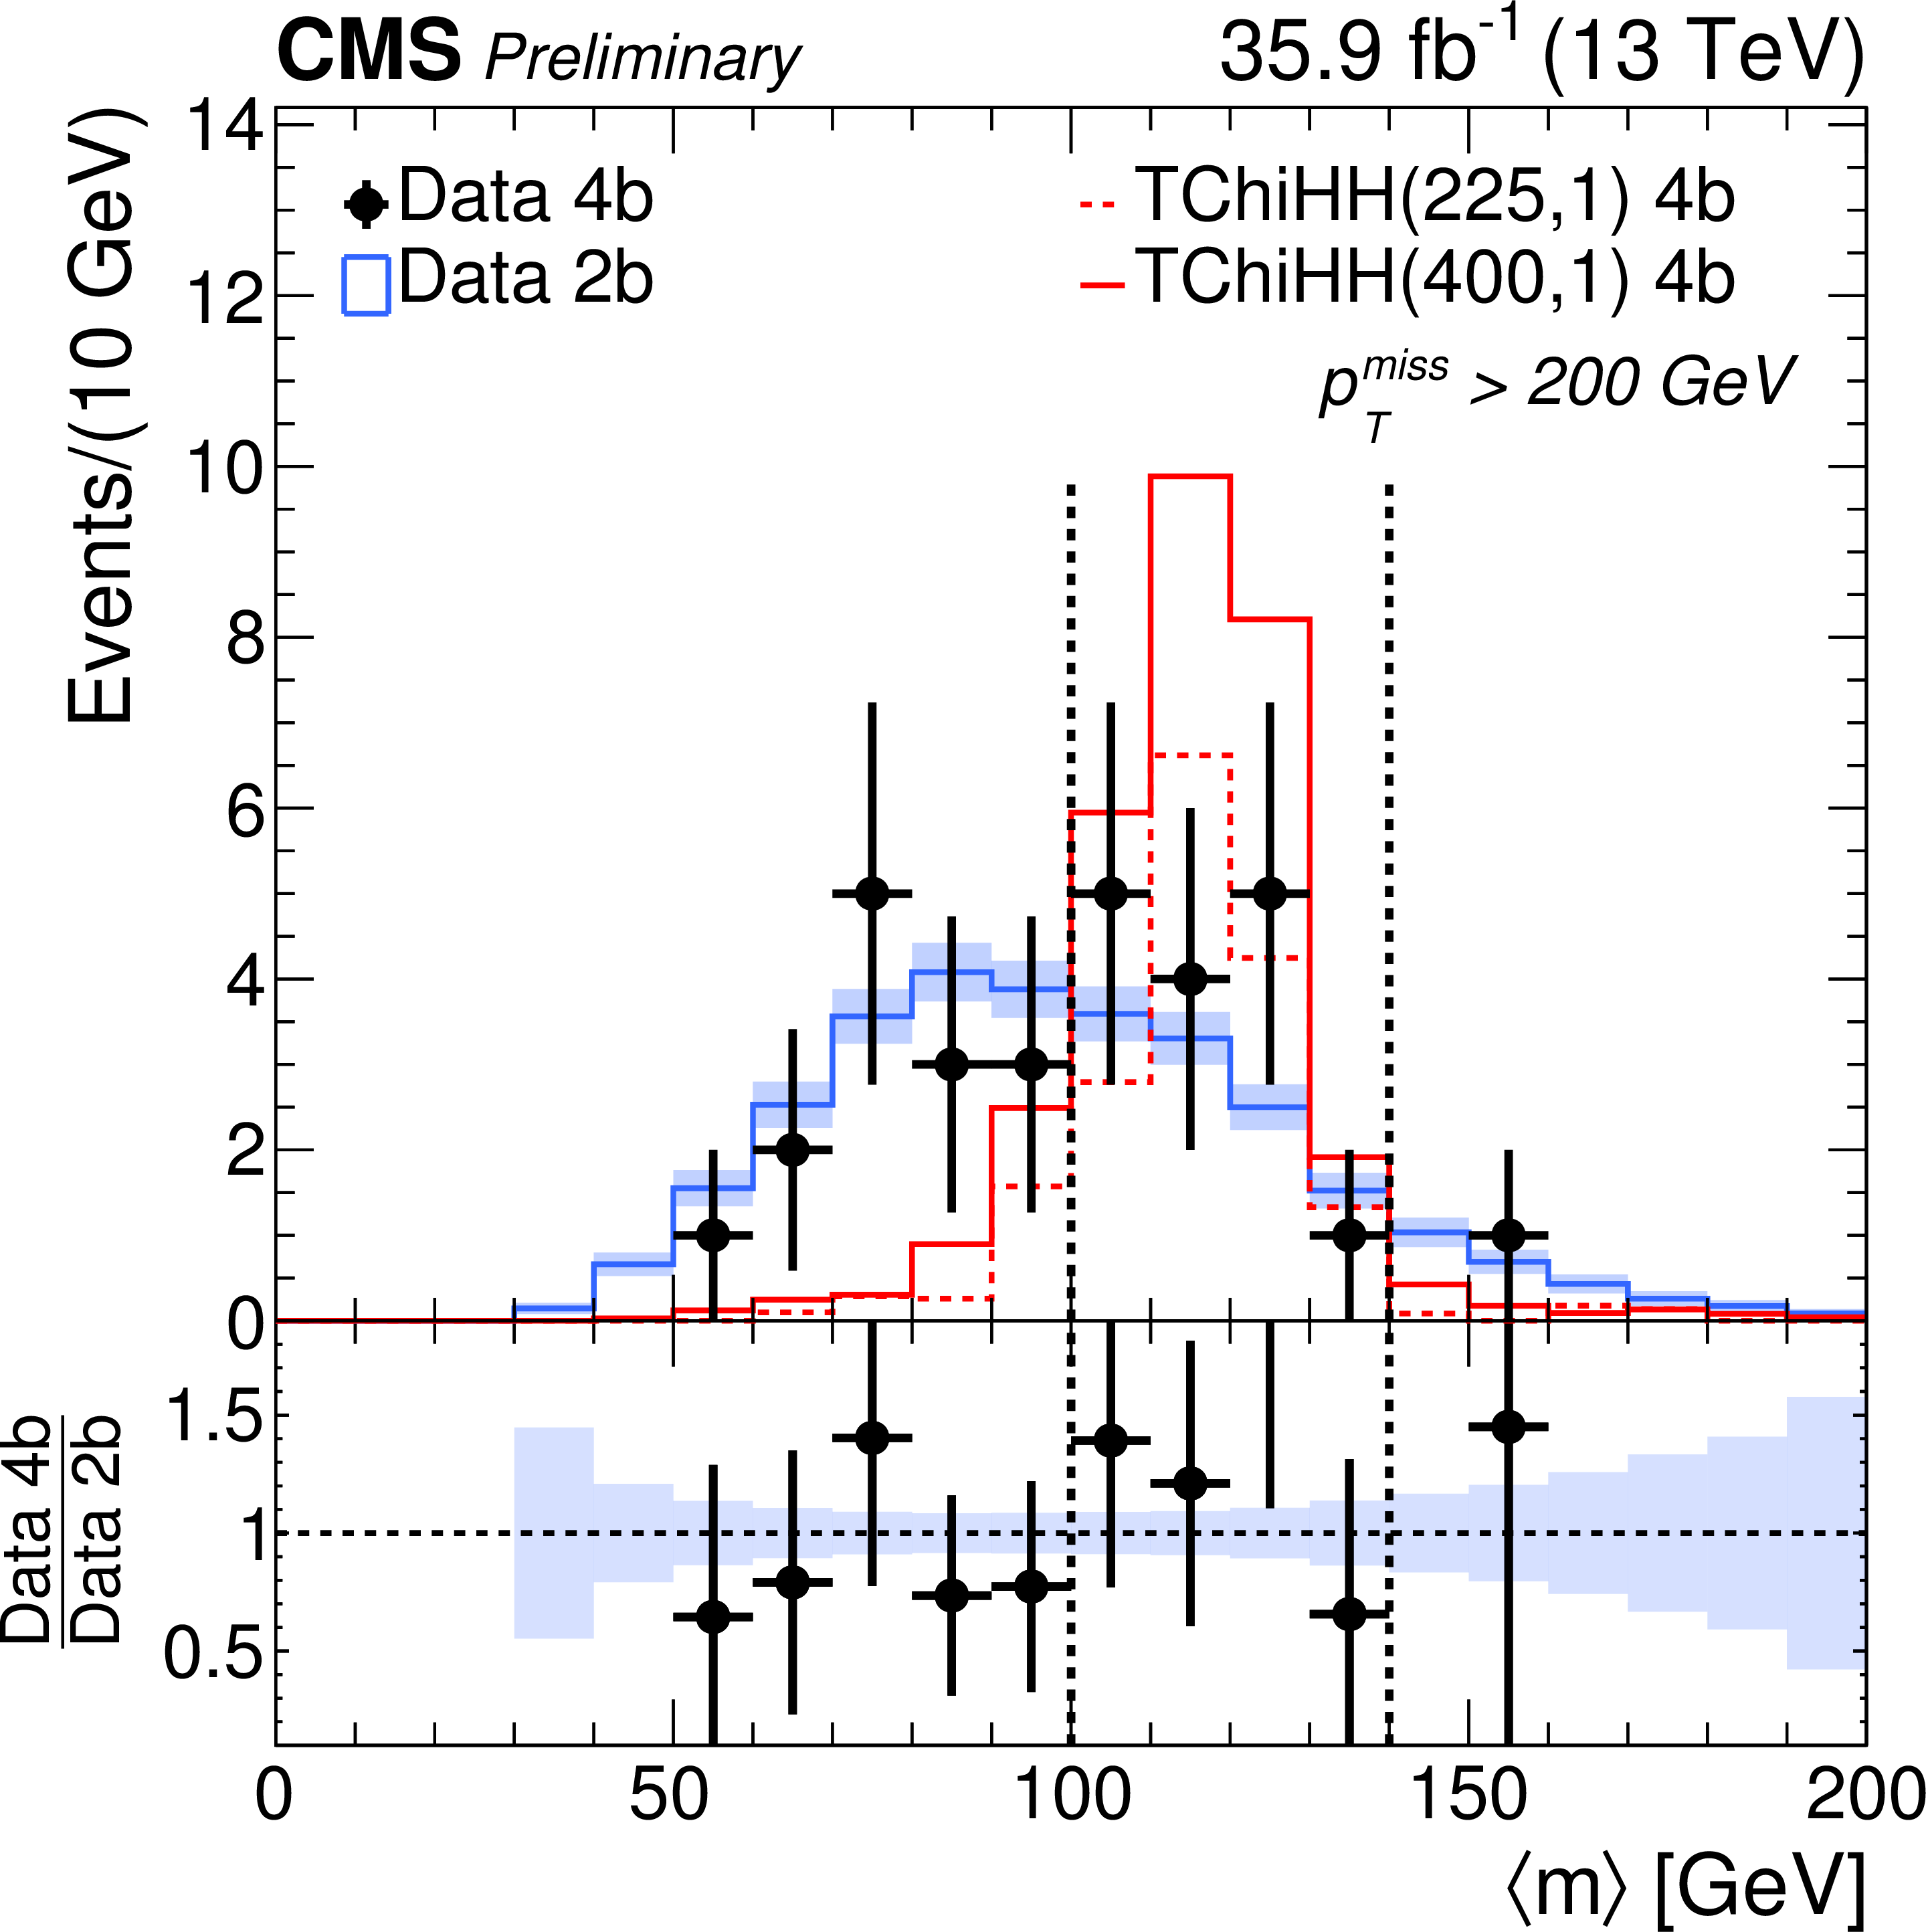
Distributions of <$m$> in data and two signal benchmark models. The points with error bars show the data in the 3b (top) and 4b bins (bottom) for 150 $ < { {p_{\mathrm {T}}} ^\text {miss}} \leq $ 200 GeV (left) and $ { {p_{\mathrm {T}}} ^\text {miss}} > $ 200 GeV (right). The histograms show the shape of the <$m$> distribution observed in the 2b bin with an overall event yield normalized to those observed in the 3b and 4b samples. The shaded areas reflect the statistical uncertainty on the <$m$>distribution in the 2b data. The ratio plots demonstrate that the shapes are in agreement. |
png pdf |
Figure 8-a:
Distributions of <$m$> in data and two signal benchmark models. The points with error bars show the data in the 3b bin for 150 $ < { {p_{\mathrm {T}}} ^\text {miss}} \leq $ 200 GeV. The histogram shows the shape of the <$m$> distribution observed in the 2b bin with an overall event yield normalized to those observed in the 3b sample. The shaded areas reflect the statistical uncertainty on the <$m$> distribution in the 2b data. The ratio plot demonstrates that the shapes are in agreement. |

png pdf |
Figure 8-b:
Distributions of <$m$> in data and two signal benchmark models. The points with error bars show the data in the 3b bin for $ { {p_{\mathrm {T}}} ^\text {miss}} > $ 200 GeV. The histogram shows the shape of the <$m$> distribution observed in the 2b bin with an overall event yield normalized to those observed in the 3b sample. The shaded areas reflect the statistical uncertainty on the <$m$> distribution in the 2b data. The ratio plot demonstrates that the shapes are in agreement. |
png pdf |
Figure 8-c:
Distributions of <$m$> in data and two signal benchmark models. The points with error bars show the data in the 4b bin for 150 $ < { {p_{\mathrm {T}}} ^\text {miss}} \leq $ 200 GeV. The histogram shows the shape of the <$m$> distribution observed in the 2b bin with an overall event yield normalized to those observed in the 4b sample. The shaded areas reflect the statistical uncertainty on the <$m$> distribution in the 2b data. The ratio plot demonstrates that the shapes are in agreement. |
png pdf |
Figure 8-d:
Distributions of <$m$> in data and two signal benchmark models. The points with error bars show the data in the 4b bin for $ { {p_{\mathrm {T}}} ^\text {miss}} > $ 200 GeV. The histogram shows the shape of the <$m$> distribution observed in the 2b bin with an overall event yield normalized to those observed in the 4b sample. The shaded areas reflect the statistical uncertainty on the <$m$> distribution in the 2b data. The ratio plot demonstrates that the shapes are in agreement. |
png pdf |
Figure 9:
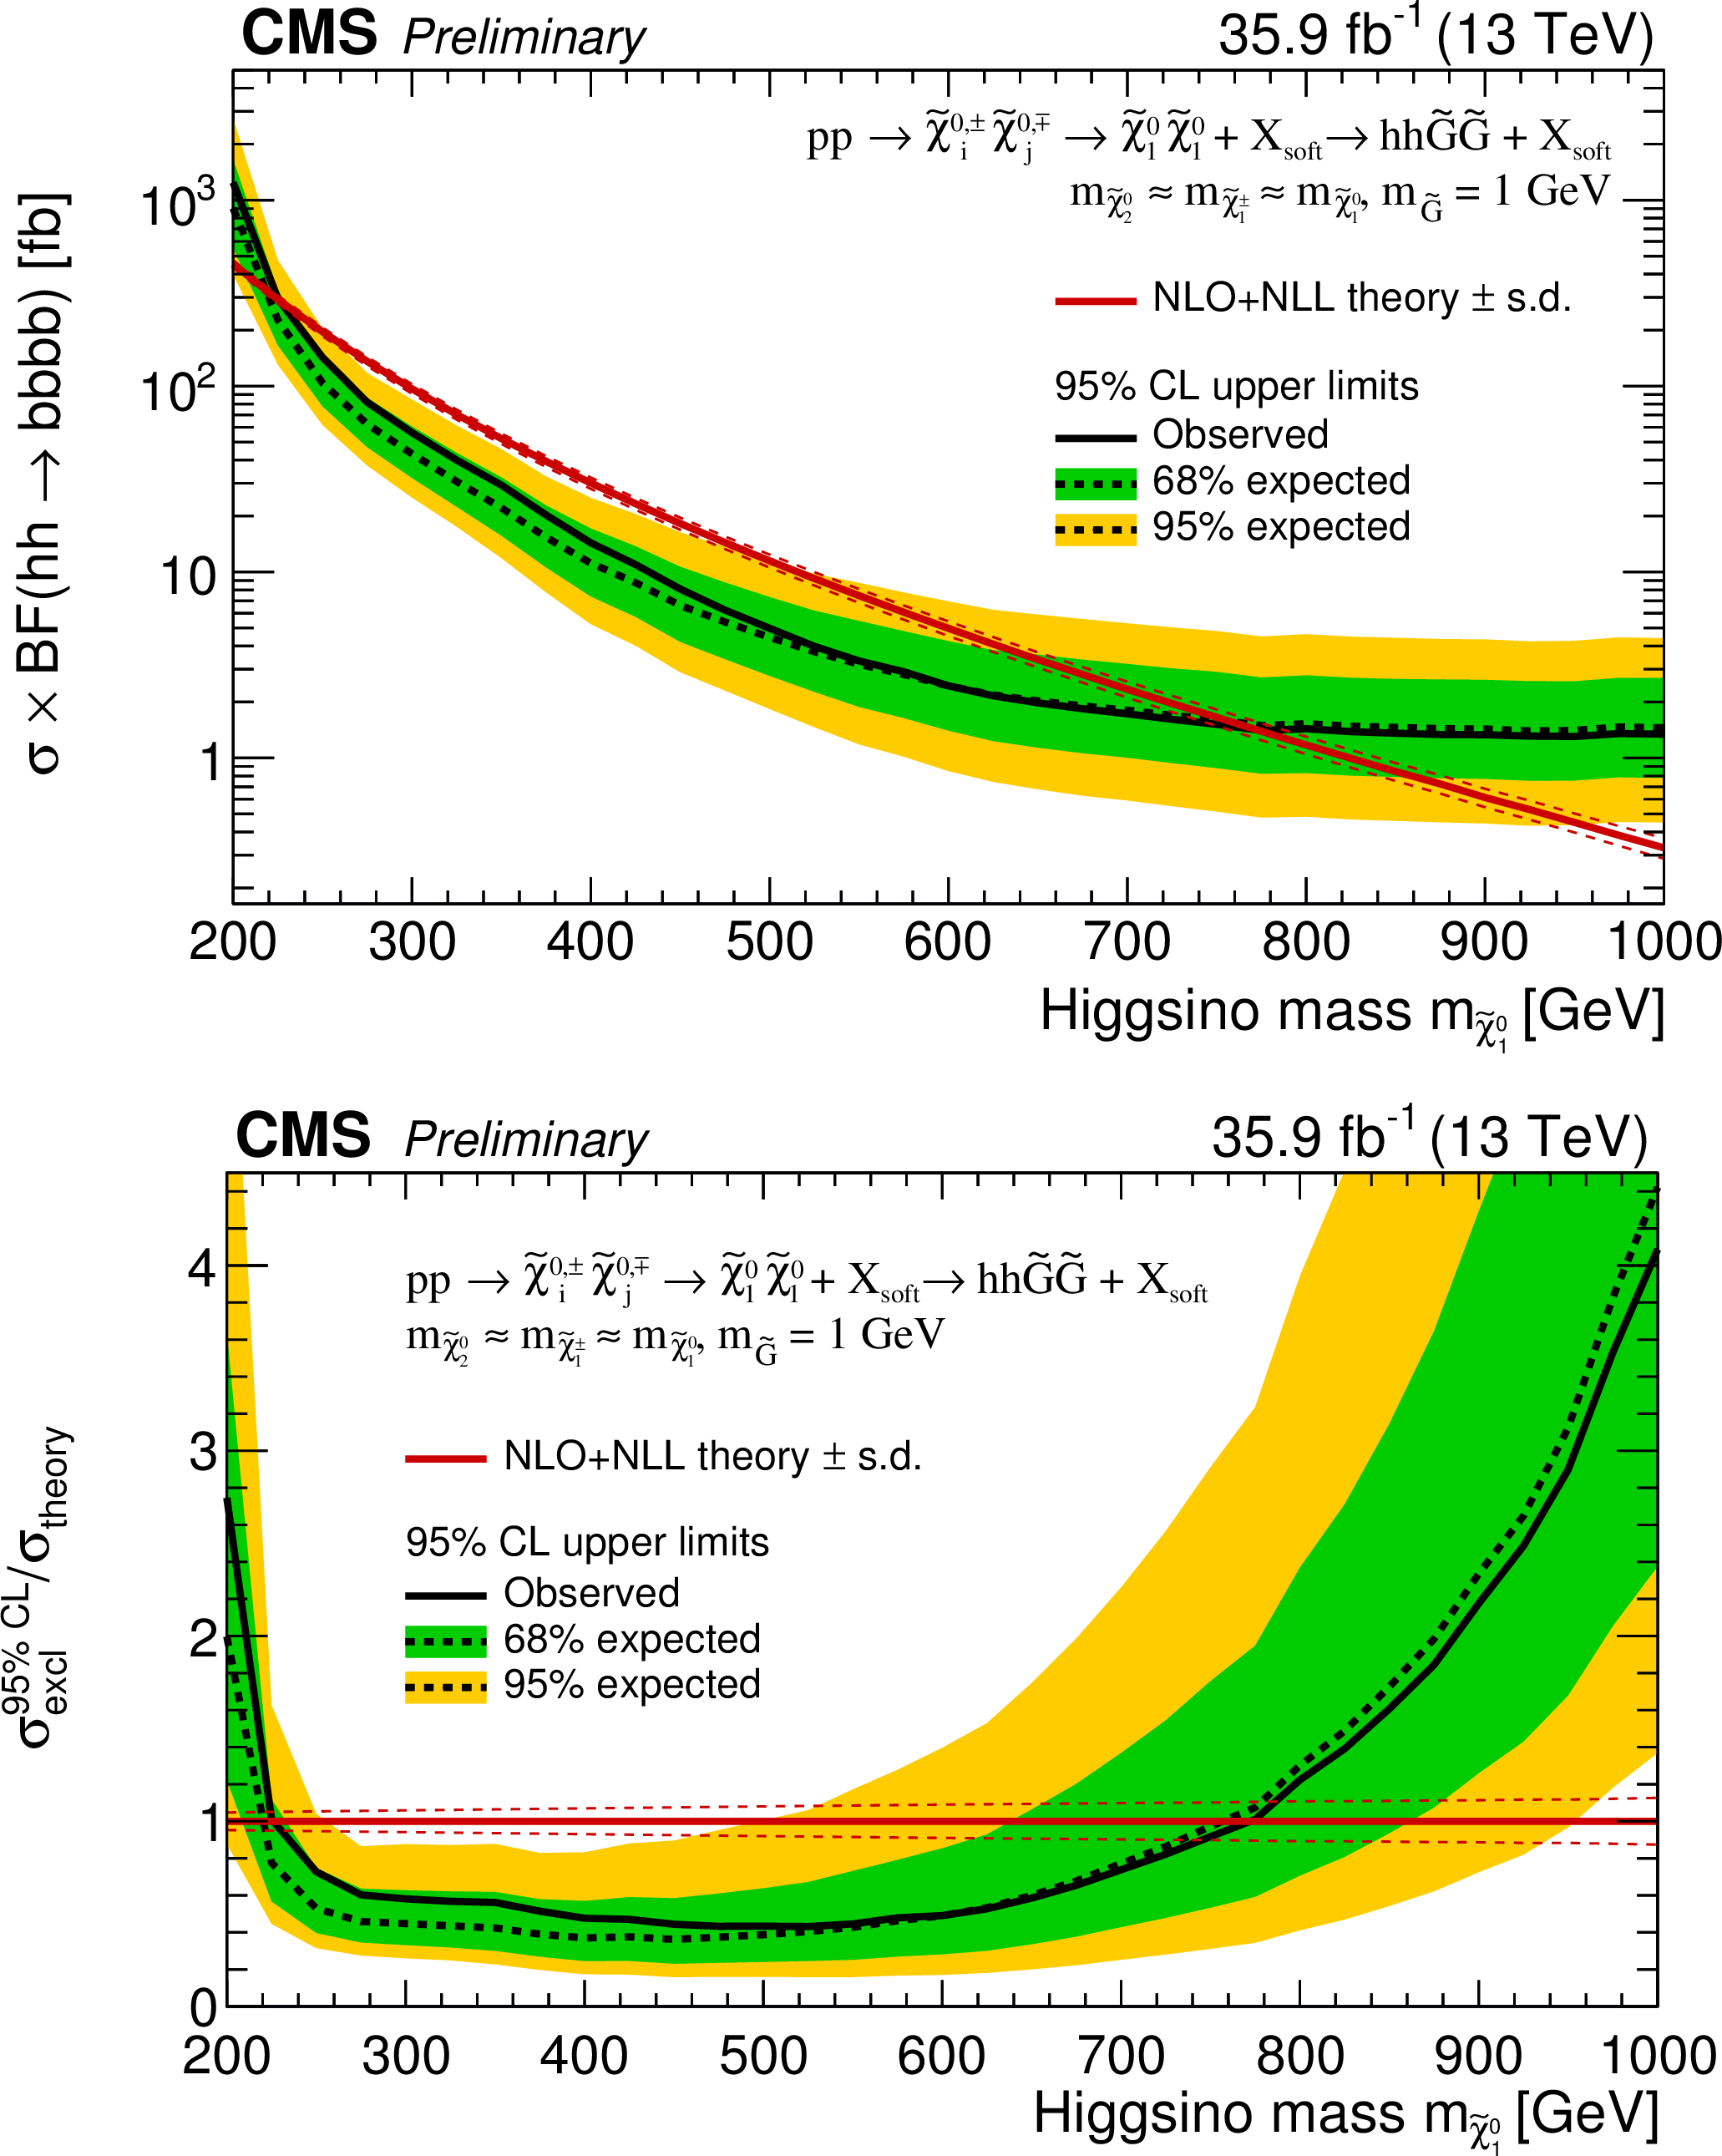
Top: excluded cross section times the $ \mathrm{hh} \rightarrow {\mathrm{ b \bar{b} } } {\mathrm{ b \bar{b} } } $ branching fraction at 95% CL as a function of the Higgsino mass. The theoretical cross section is shown as a dotted line. Bottom: excluded cross section at 95% CL divided by the theoretical cross section as a function of the Higgsino mass. |

png pdf root |
Figure 9-a:
Excluded cross section times the $ \mathrm{hh} \rightarrow {\mathrm{ b \bar{b} } } {\mathrm{ b \bar{b} } } $ branching fraction at 95% CL as a function of the Higgsino mass. The theoretical cross section is shown as a dotted line. |

png pdf root |
Figure 9-b:
Excluded cross section at 95% CL divided by the theoretical cross section as a function of the Higgsino mass. |
| Tables | |
png pdf |
Table 1:
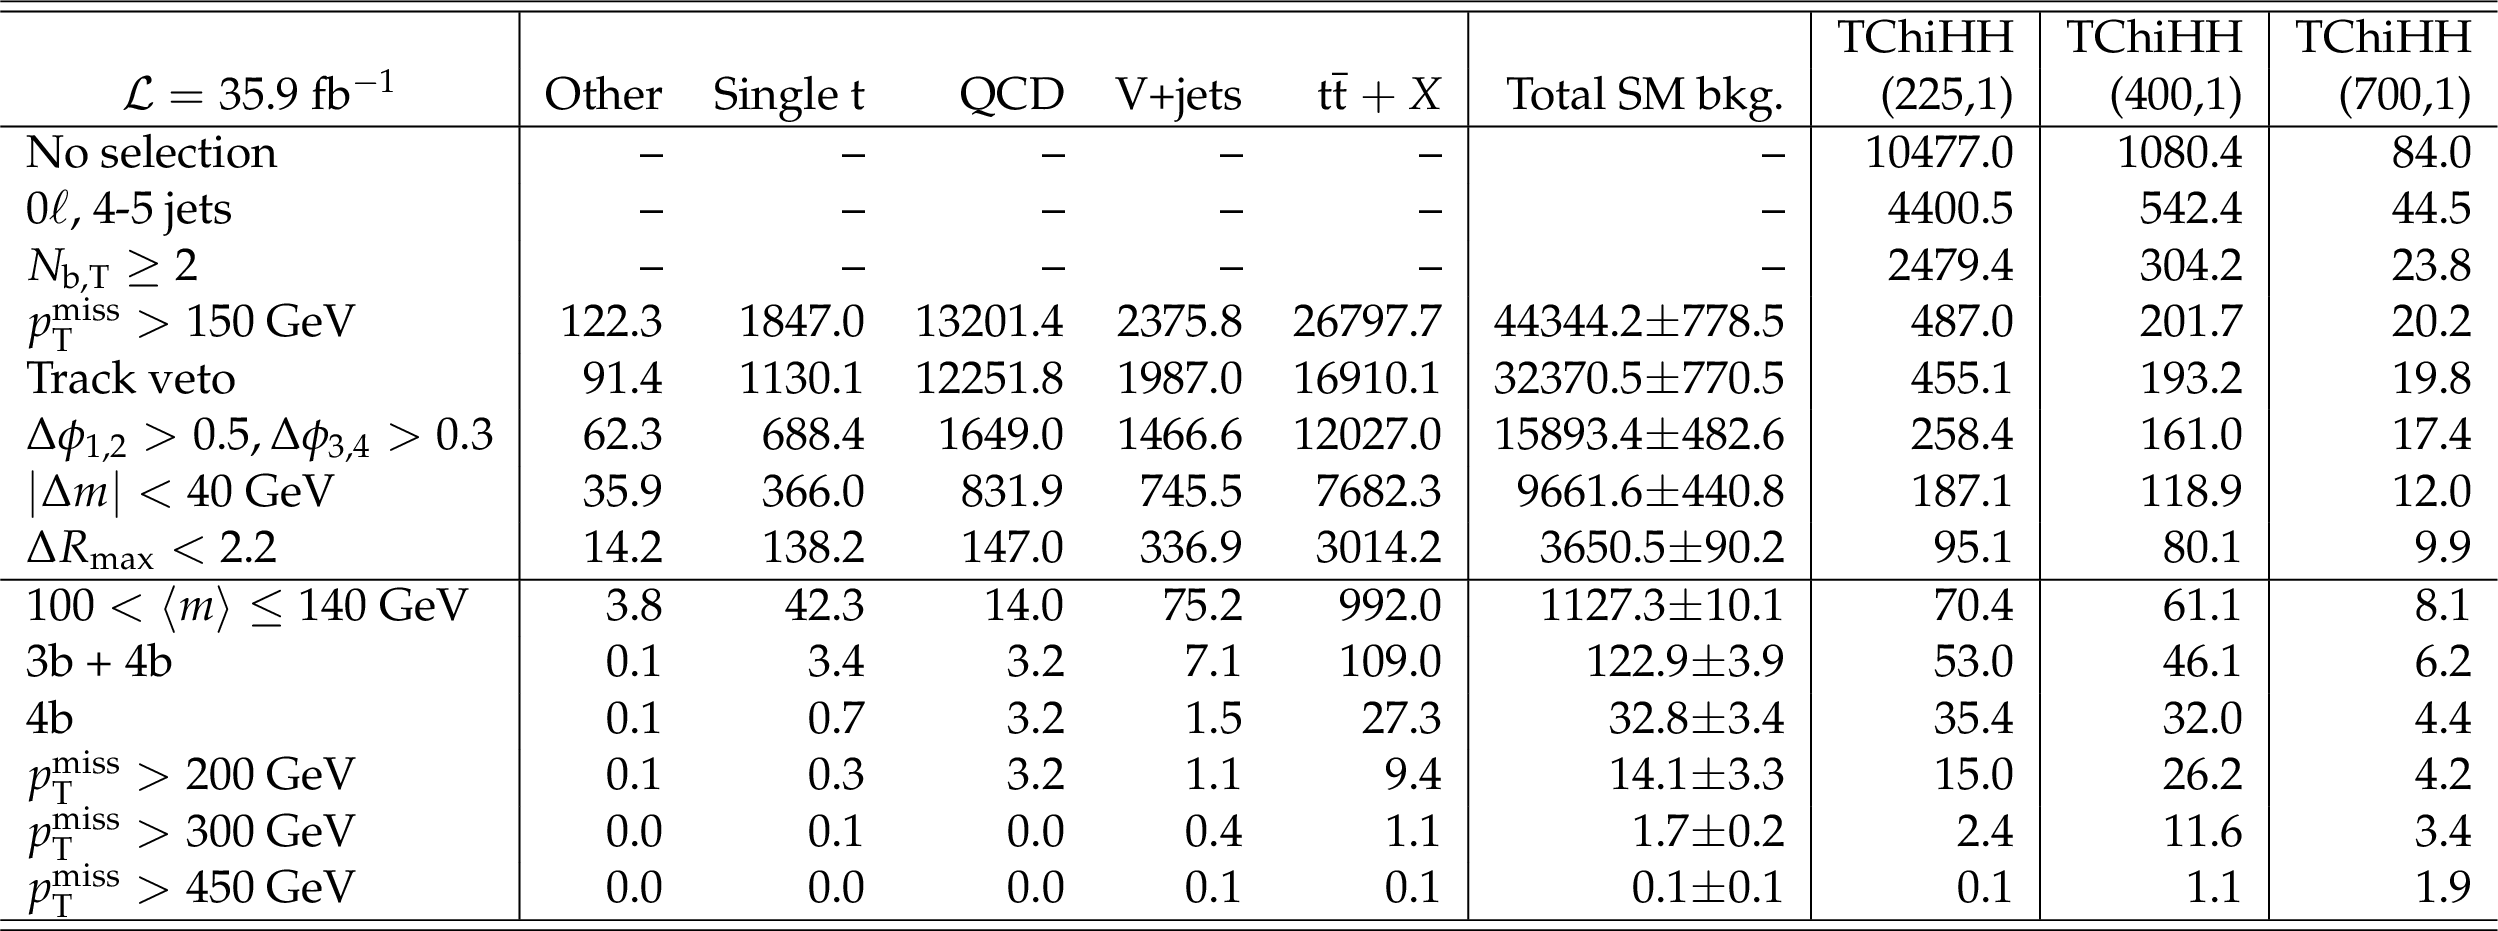
Event yields obtained from simulated event samples scaled to 35.9 fb$^{-1}$, as the event selection criteria are applied. The category "${\mathrm{ t } {}\mathrm{ \bar{t} } } +X$'' is dominated by ${\mathrm{ t } {}\mathrm{ \bar{t} } }$ (98.5%), but also includes small contributions from ${\mathrm{ t } {}\mathrm{ \bar{t} } } {\mathrm{ t } {}\mathrm{ \bar{t} } } $, ${\mathrm{ t } {}\mathrm{ \bar{t} } } \mathrm{ W } $, ${\mathrm{ t } {}\mathrm{ \bar{t} } } \mathrm{ Z } $, ${\mathrm{ t } {}\mathrm{ \bar{t} } } \mathrm{ H } $, and ${\mathrm{ t } {}\mathrm{ \bar{t} } } \gamma $. The category "V+jets'' includes Z+jets and W+jets in all their decays. The category "Other'' includes ZZ, WZ, WW, WH ($\rightarrow {\mathrm{ b \bar{b} } } $), and ZH ($\rightarrow {\mathrm{ b \bar{b} } } $). The event selection requirements listed above the horizontal line in the middle of the table are defined as the baseline selection. The trigger efficiency is applied as an event weight and is first taken into account in the $ { {p_{\mathrm {T}}} ^\text {miss}} > $ 150 GeV row. |

png pdf |
Table 2:
Observed event yields ("Obs.'') for all control and signal regions in each of the four ${ {p_{\mathrm {T}}} ^\text {miss}}$ bins corresponding to 35.9 fb$^{-1}$of data. The predicted SM background rates ("Pred.'') in the (HIG,3b) and (HIG,4b) regions correspond to the values obtained with the predictive fit. The results of the global fit under the background-only hypothesis ($r=$ 0) are also shown. The expected signal yields for three values of the Higgsino mass are shown for reference. |
png pdf |
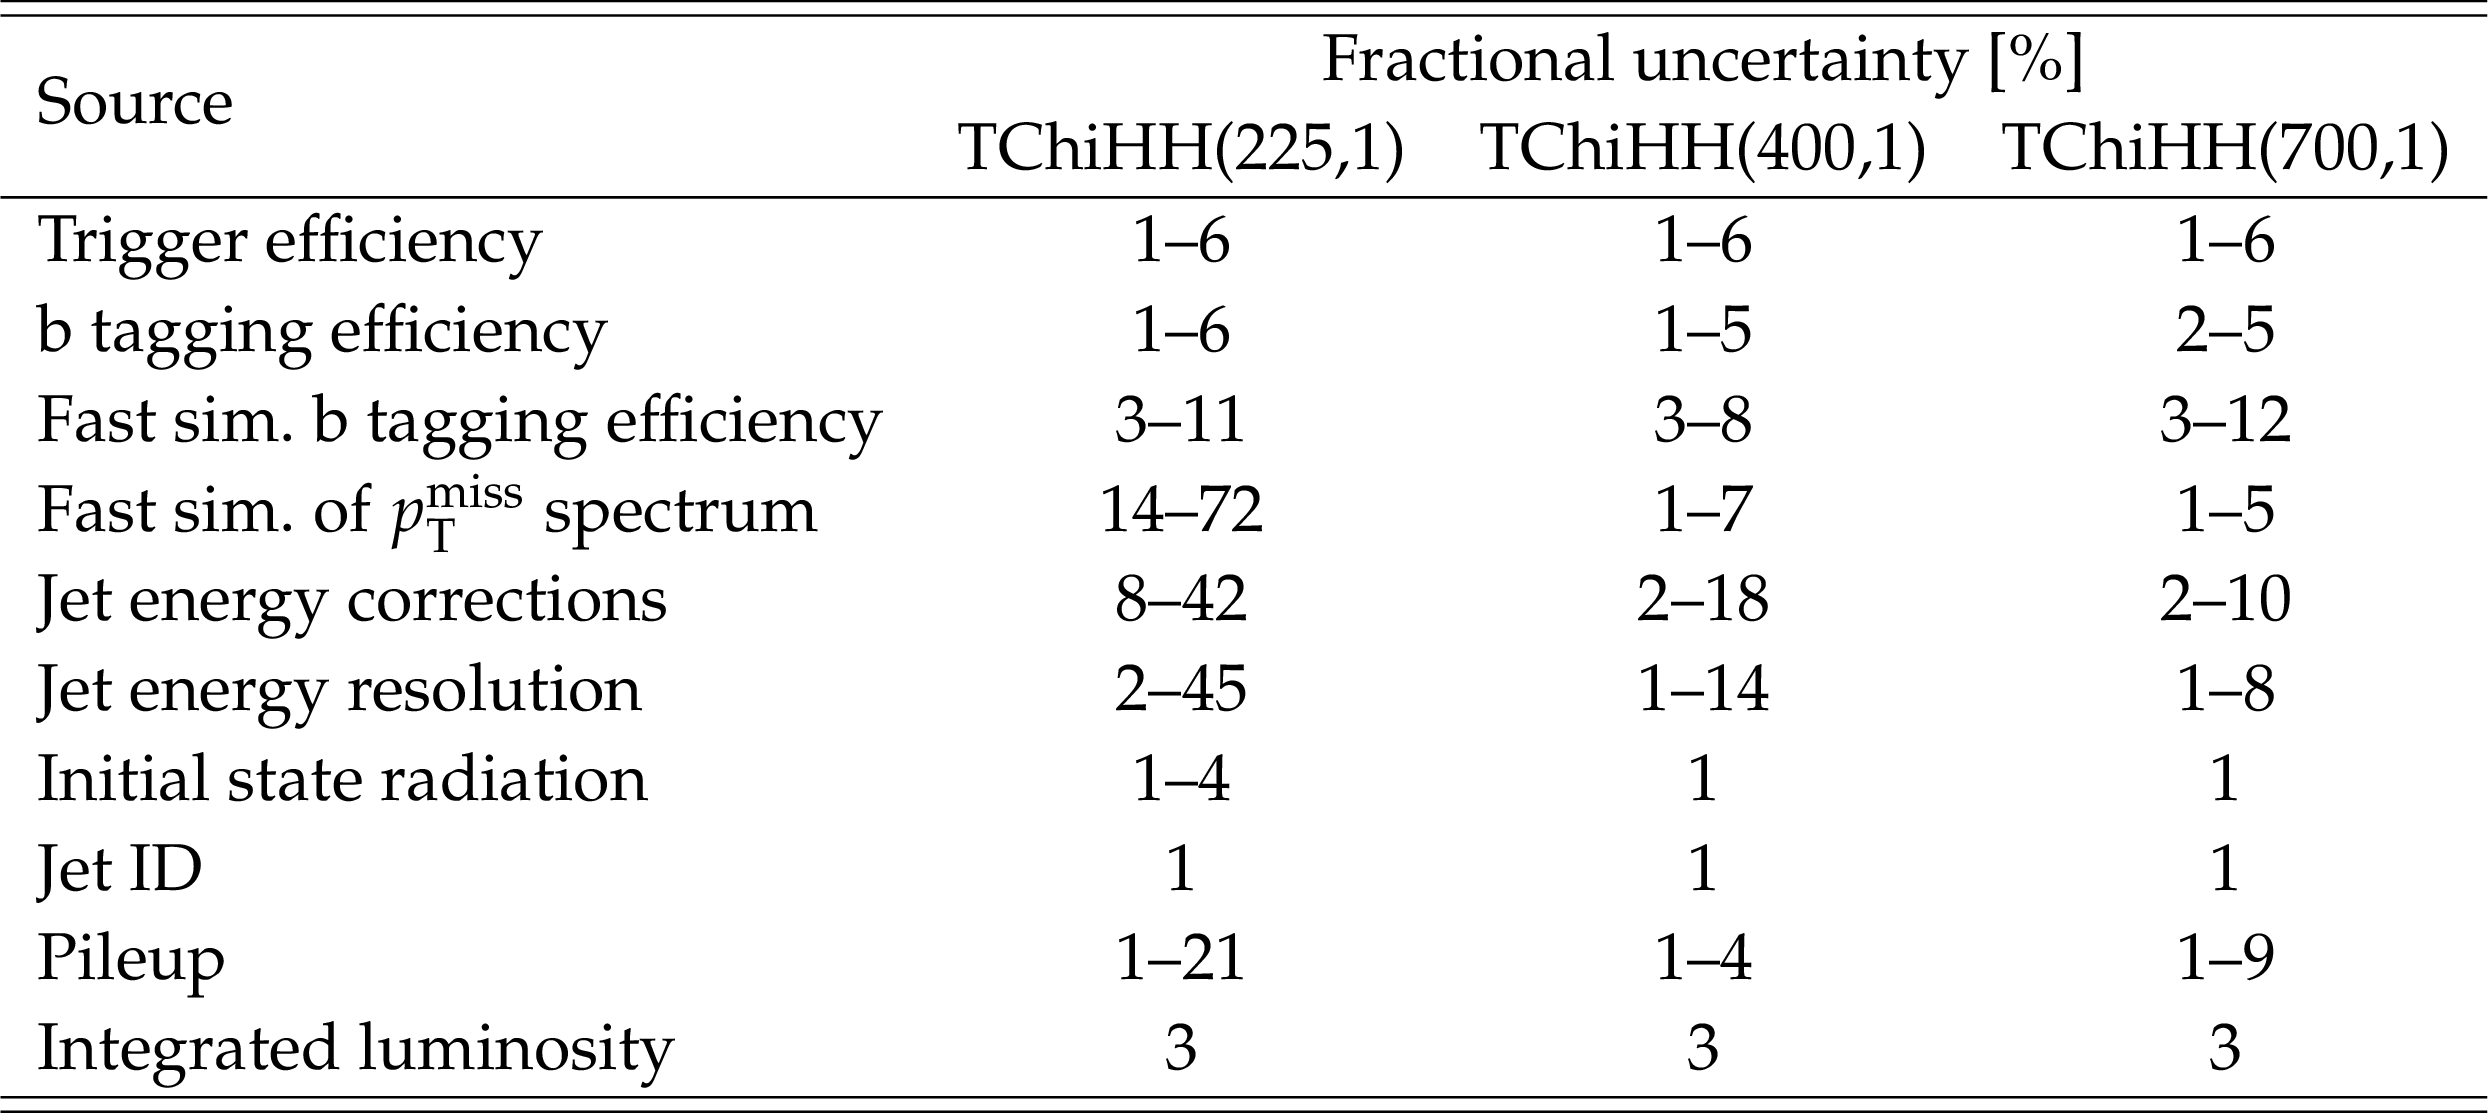
Table 3:
Range of values for the systematic uncertainties on the signal efficiency and acceptance for each analysis bin. Uncertainties due to a particular source are treated as fully correlated between bins, while uncertainties due to different sources are treated as uncorrelated. |
| Summary |
| We have performed a search for an excess of events in proton-proton collisions in the channel with two Higgs bosons and large missing transverse momentum, with each of the Higgs bosons reconstructed in its $\mathrm{h} \to\mathrm{b} \bar{\mathrm{b} } $ decay. The data sample corresponds to an integrated luminosity of 35.9 fb$^{-1}$ at $\sqrt s = $ 13 TeV. Because the signal is rich in b quarks, while the background is dominated by $\mathrm{ t \bar{t} }$ events, the analysis is binned in the number of b-tagged quarks. In each event, the mass difference between the two Higgs-boson candidates is required to be small, and the average mass of the two candidates is used in conjunction with the number of observed b tags to define signal and sideband regions. The observed event yields in these regions are used to obtain estimates for the SM background in the signal regions without input from simulated event samples. The data are also binned in regions of $|\vec{p}_{\mathrm{T}}^{\text miss}|$ to enhance the sensitivity to the signal. The observed event yields in the signal regions are consistent with the background predictions, leading to an excluded range of Higgsino masses extending from 225 GeV to 770 GeV at 95% CL. The model used in the interpretation assumes that each Higgsino decays into a Higgs boson plus a nearly massless lightest supersymmetric particle (LSP), which is weakly interacting. Such a scenario occurs in Gauge Mediated Supersymmetry Breaking (GMSB) models, in which the LSP is a Goldstino. The cross section calculation assumes that the Higgsino sector is mass degenerate and sums over the cross sections for the pair production of all relevant combinations of Higgsinos. |
| Additional Figures | |

png pdf root |
Additional Figure 1:
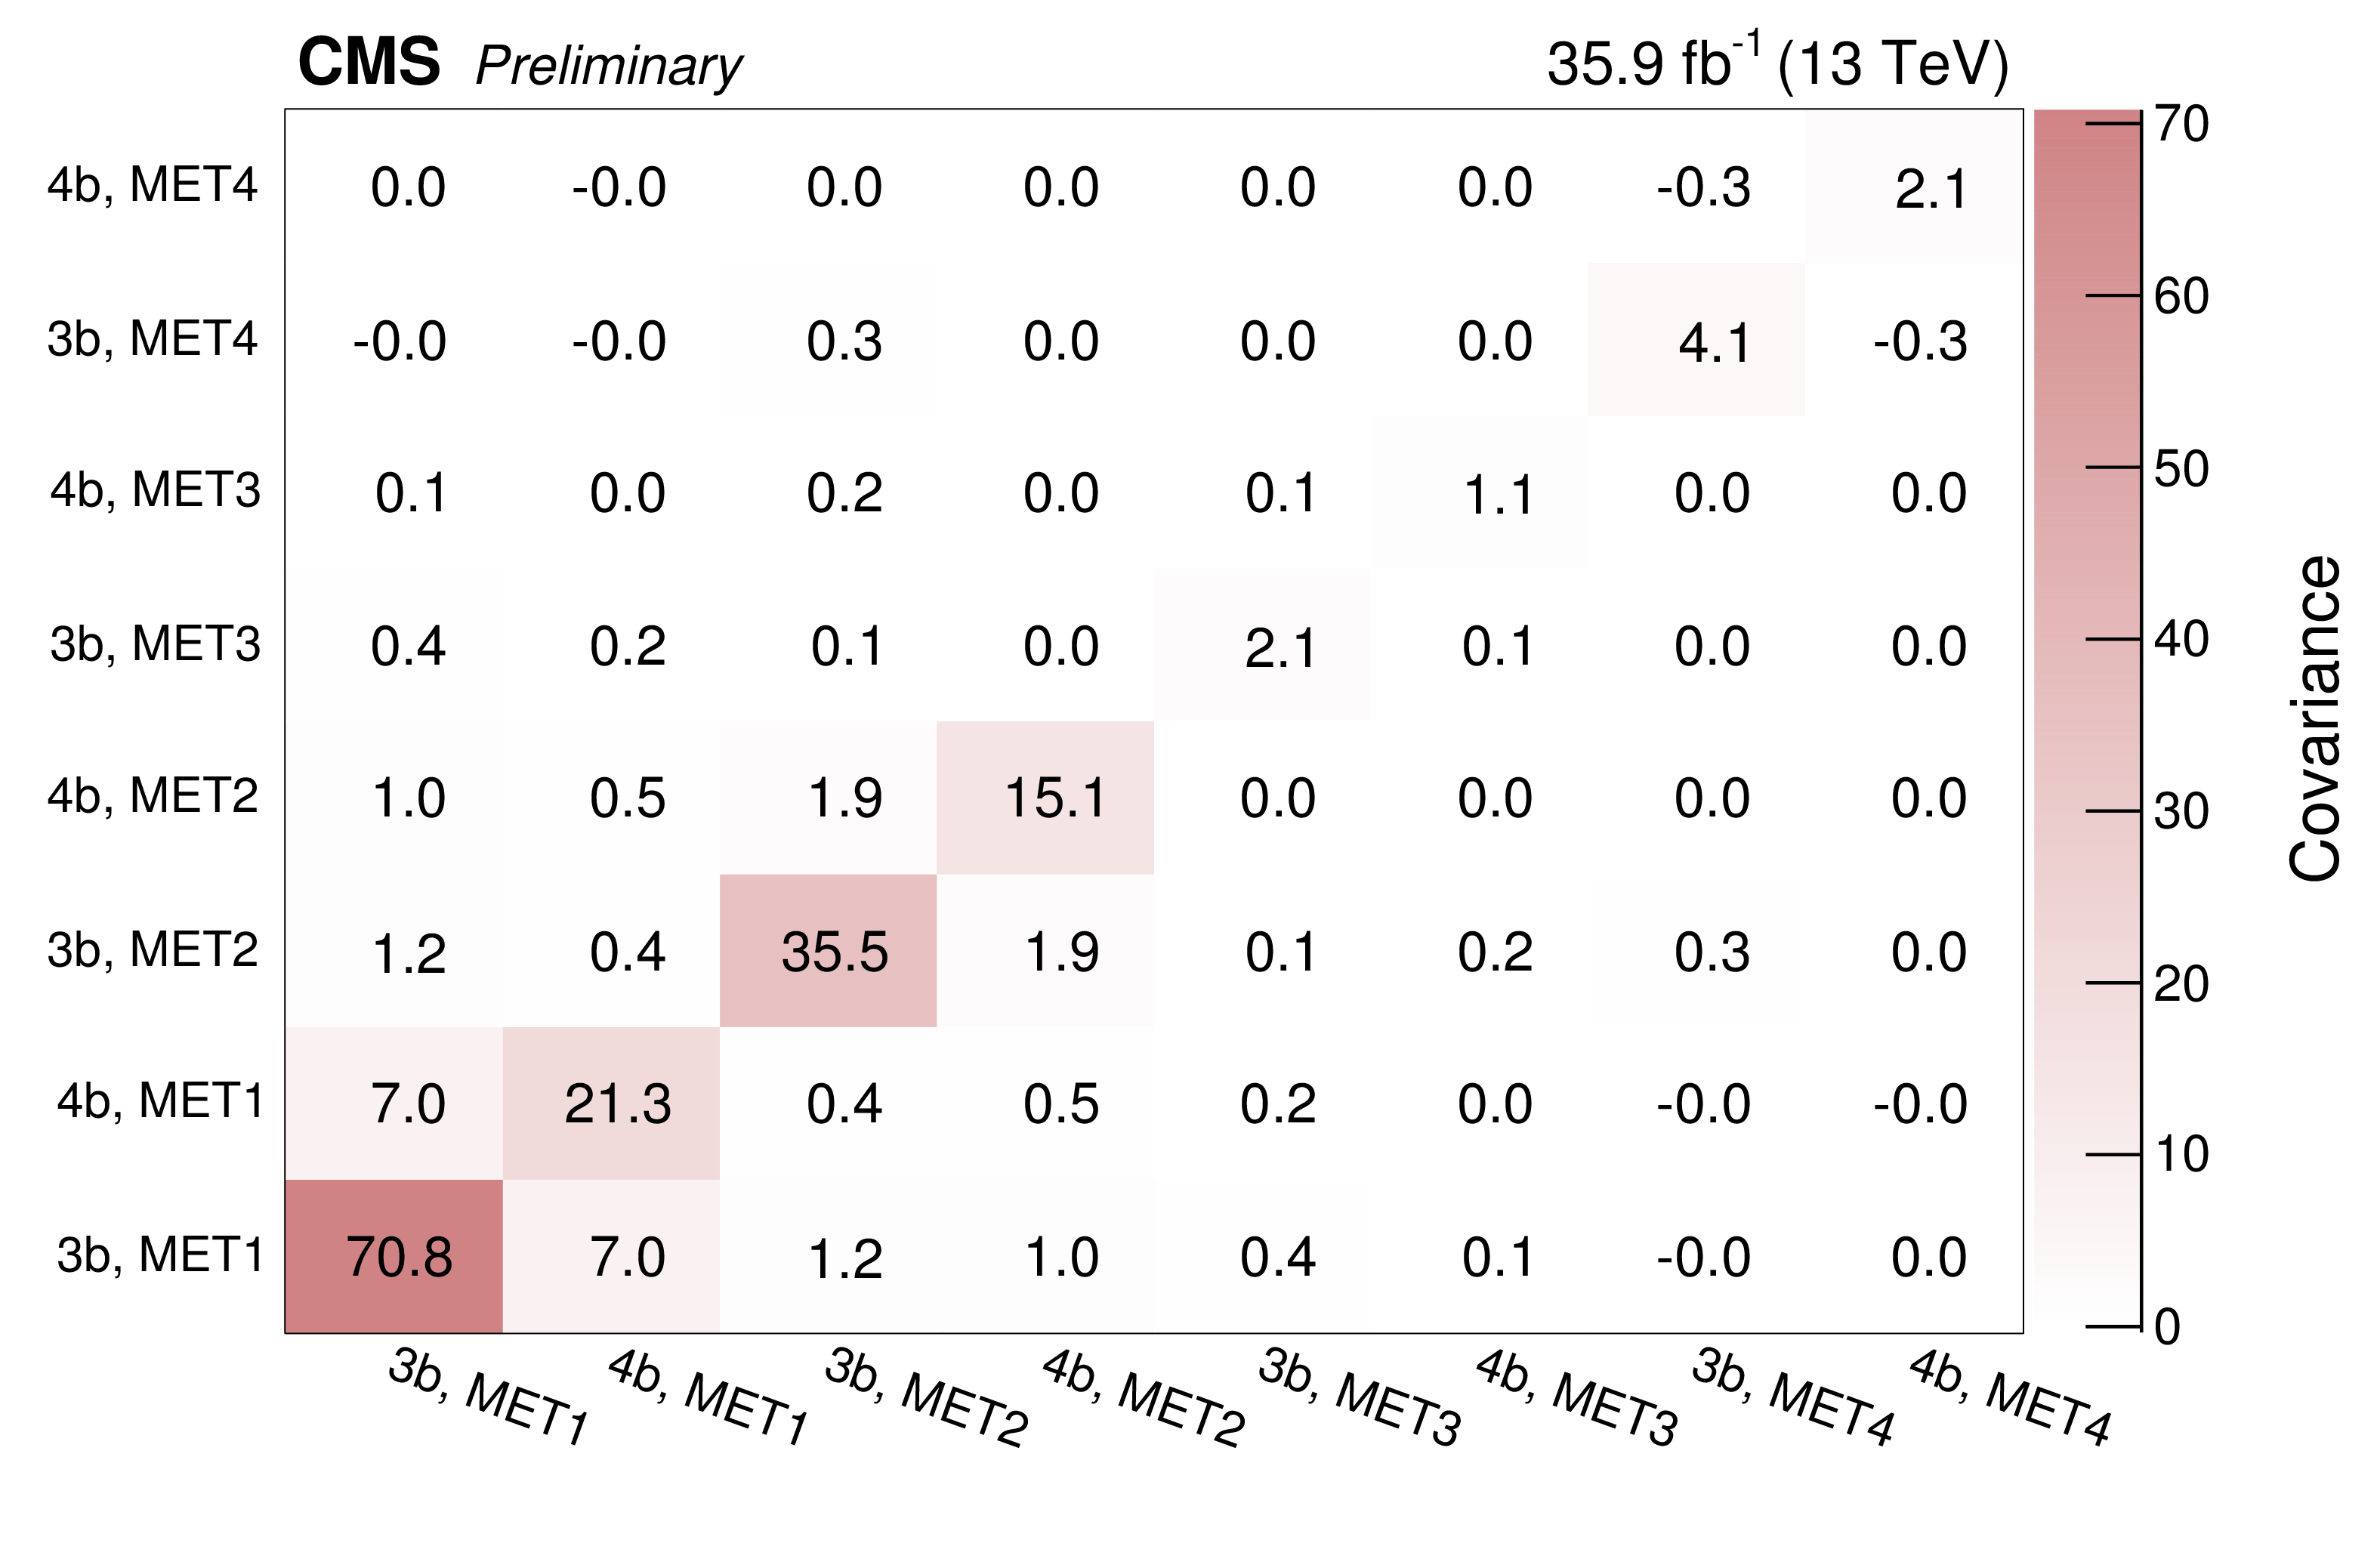
(a) Correlation and (b) covariance matrices for the background rates obtained with the predictive fit in the 8 signal bins. ``MET1'' corresponds to 150 $ < p_{\rm T}^{\rm miss} \leq $ 200 GeV, ``MET2'' to 200 $ < p_{\rm T}^{\rm miss} \leq $ 300 GeV, ``MET3'' to 300 $ < p_{\rm T}^{\rm miss} \leq $ 450 GeV, and ``MET4'' to $p_{\rm T}^{\rm miss} > $ 450 GeV. |

png pdf root |
Additional Figure 1-a:
Correlation matrix for the background rates obtained with the predictive fit in the 8 signal bins. ``MET1'' corresponds to 150 $ < p_{\rm T}^{\rm miss} \leq $ 200 GeV, ``MET2'' to 200 $ < p_{\rm T}^{\rm miss} \leq $ 300 GeV, ``MET3'' to 300 $ < p_{\rm T}^{\rm miss} \leq $ 450 GeV, and ``MET4'' to $p_{\rm T}^{\rm miss} > $ 450 GeV. |
png pdf root |
Additional Figure 1-b:
Covariance matrix for the background rates obtained with the predictive fit in the 8 signal bins. ``MET1'' corresponds to 150 $ < p_{\rm T}^{\rm miss} \leq $ 200 GeV, ``MET2'' to 200 $ < p_{\rm T}^{\rm miss} \leq $ 300 GeV, ``MET3'' to 300 $ < p_{\rm T}^{\rm miss} \leq $ 450 GeV, and ``MET4'' to $p_{\rm T}^{\rm miss} > $ 450 GeV. |

png pdf root |
Additional Figure 2:
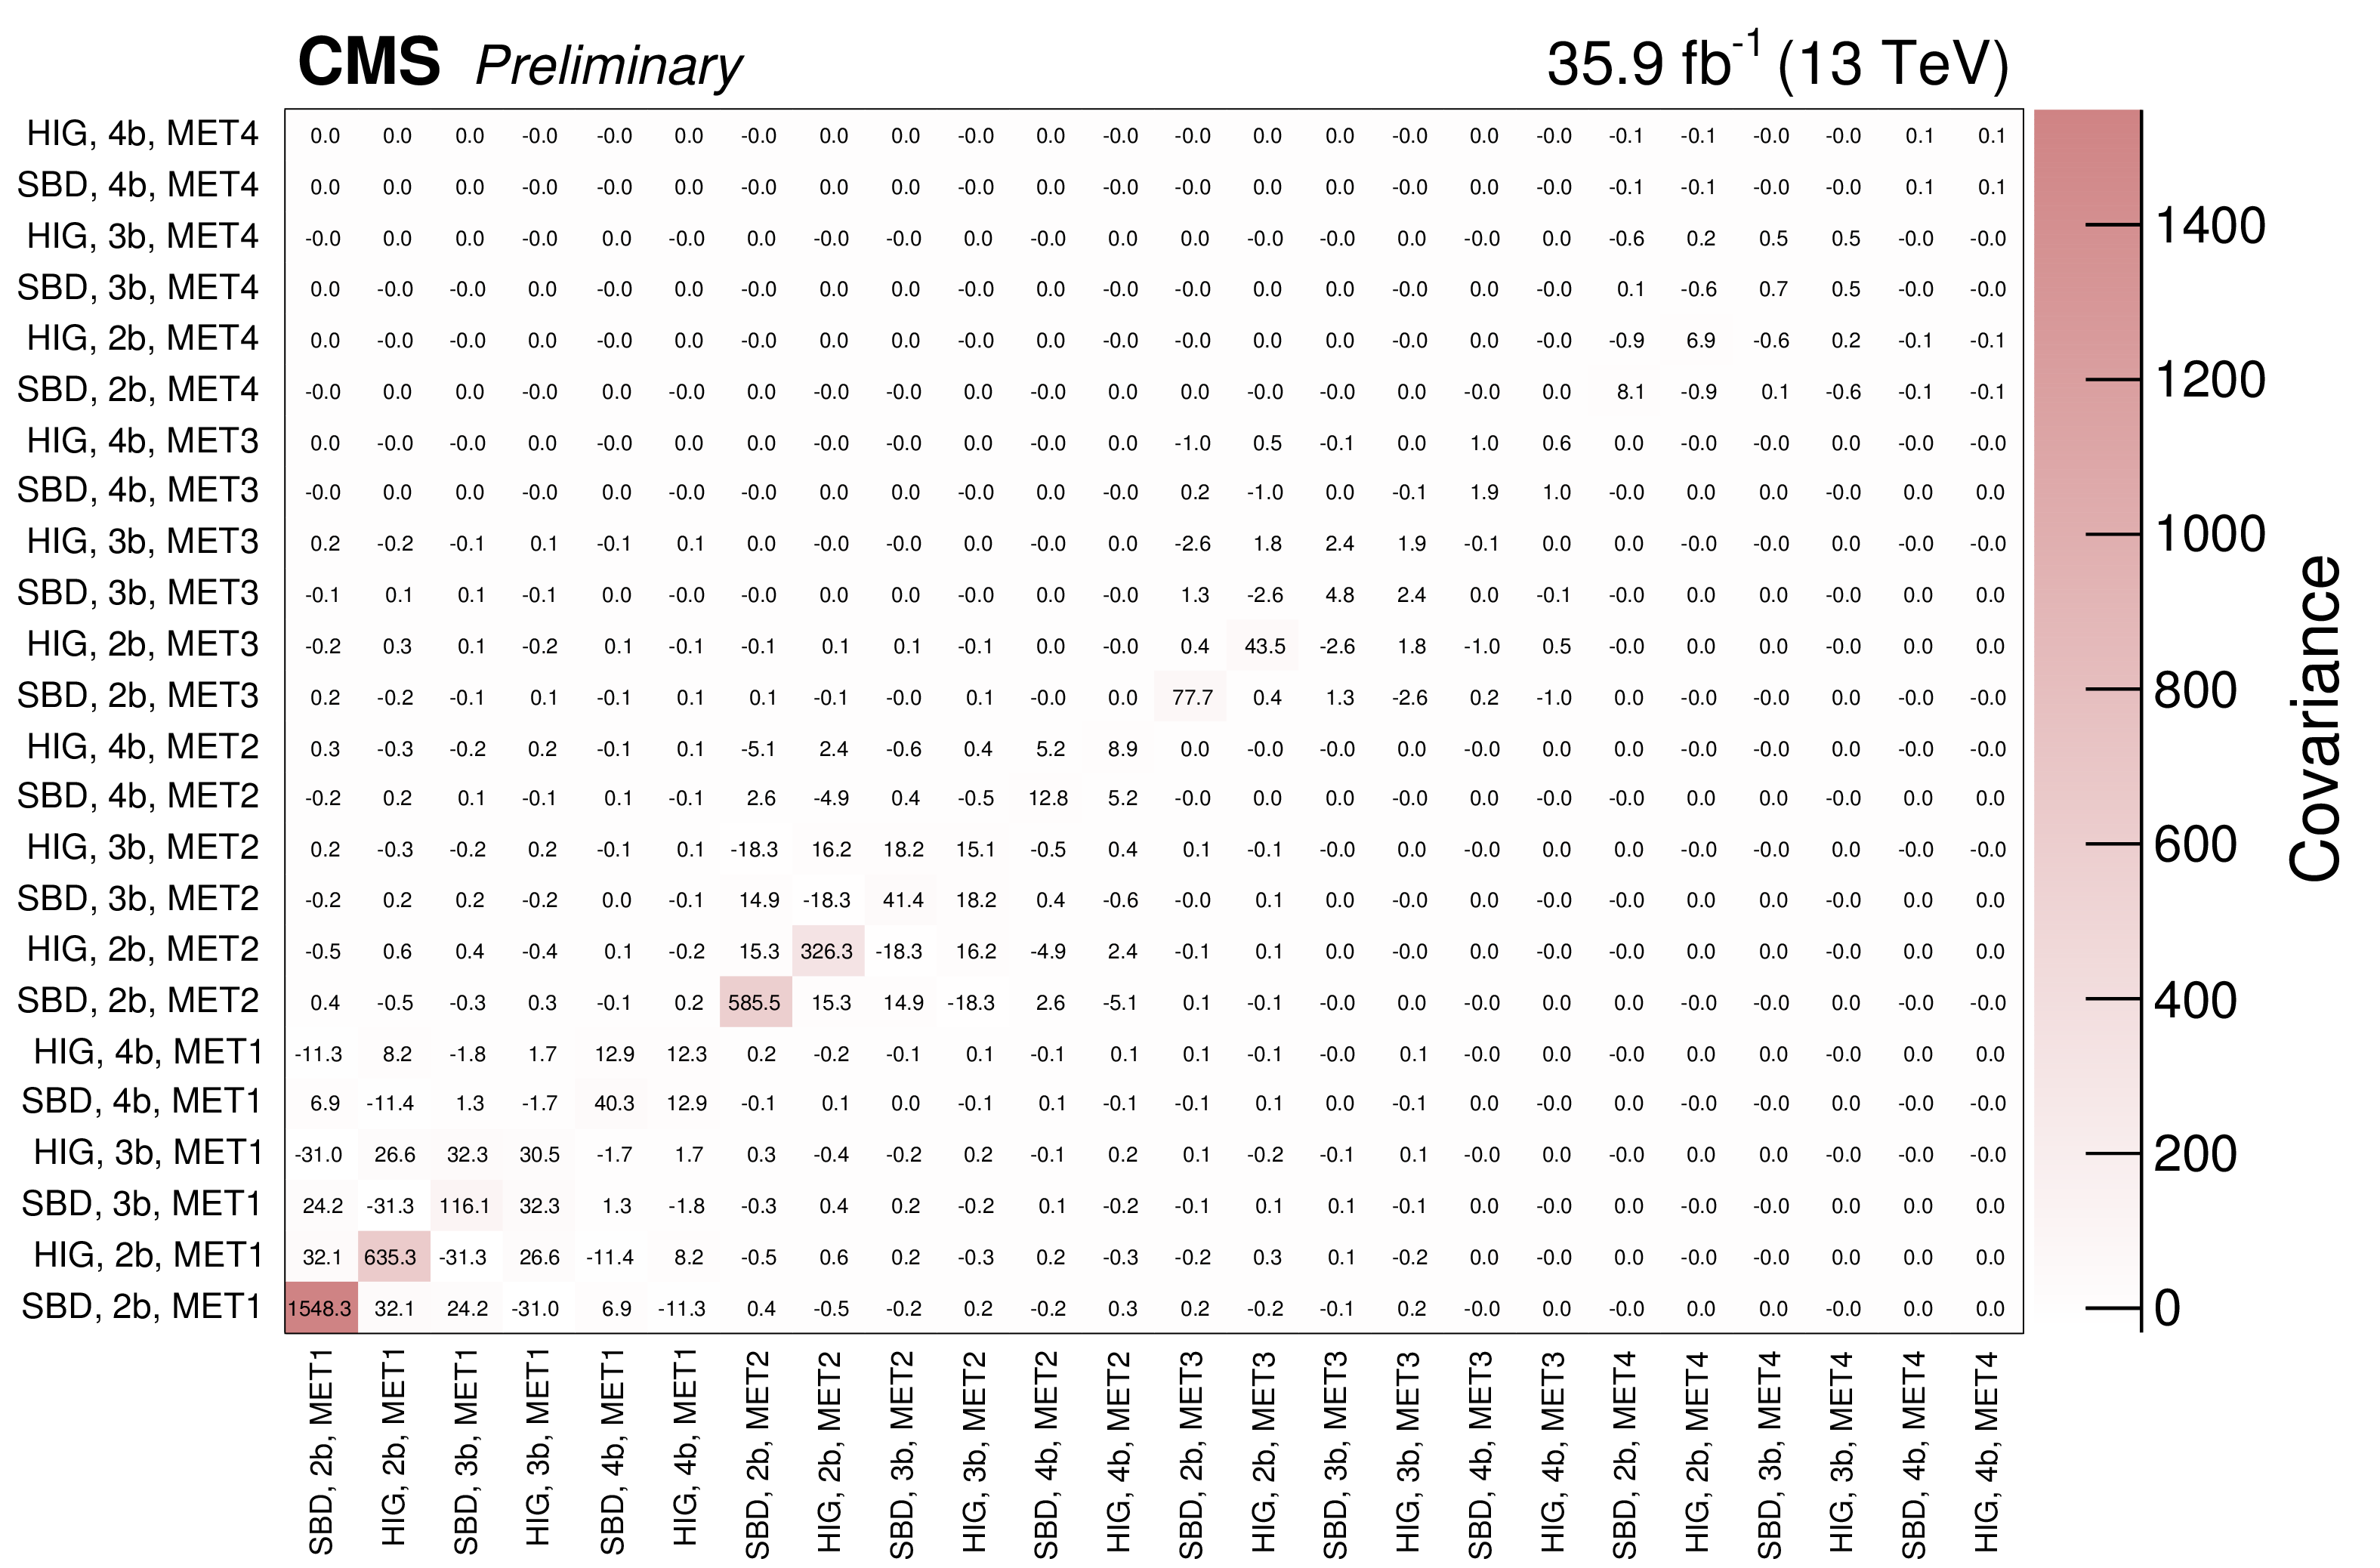
(a) Correlation and (b) covariance matrices for the background rates obtained with the global fit in all 24 analysis bins. ``MET1'' corresponds to 150 $ < p_{\rm T}^{\rm miss} \leq $ 200 GeV, ``MET2'' to 200 $ < p_{\rm T}^{\rm miss} \leq $ 300 GeV, ``MET3'' to 300 $ < p_{\rm T}^{\rm miss} \leq $ 450 GeV, and ``MET4'' to $p_{\rm T}^{\rm miss} > $ 450 GeV. |

png pdf root |
Additional Figure 2-a:
Correlation matrix for the background rates obtained with the global fit in all 24 analysis bins. ``MET1'' corresponds to 150 $ < p_{\rm T}^{\rm miss} \leq $ 200 GeV, ``MET2'' to 200 $ < p_{\rm T}^{\rm miss} \leq $ 300 GeV, ``MET3'' to 300 $ < p_{\rm T}^{\rm miss} \leq $ 450 GeV, and ``MET4'' to $p_{\rm T}^{\rm miss} > $ 450 GeV. |
png pdf root |
Additional Figure 2-b:
Covariance matrix for the background rates obtained with the global fit in all 24 analysis bins. ``MET1'' corresponds to 150 $ < p_{\rm T}^{\rm miss} \leq $ 200 GeV, ``MET2'' to 200 $ < p_{\rm T}^{\rm miss} \leq $ 300 GeV, ``MET3'' to 300 $ < p_{\rm T}^{\rm miss} \leq $ 450 GeV, and ``MET4'' to $p_{\rm T}^{\rm miss} > $ 450 GeV. |
png pdf root |
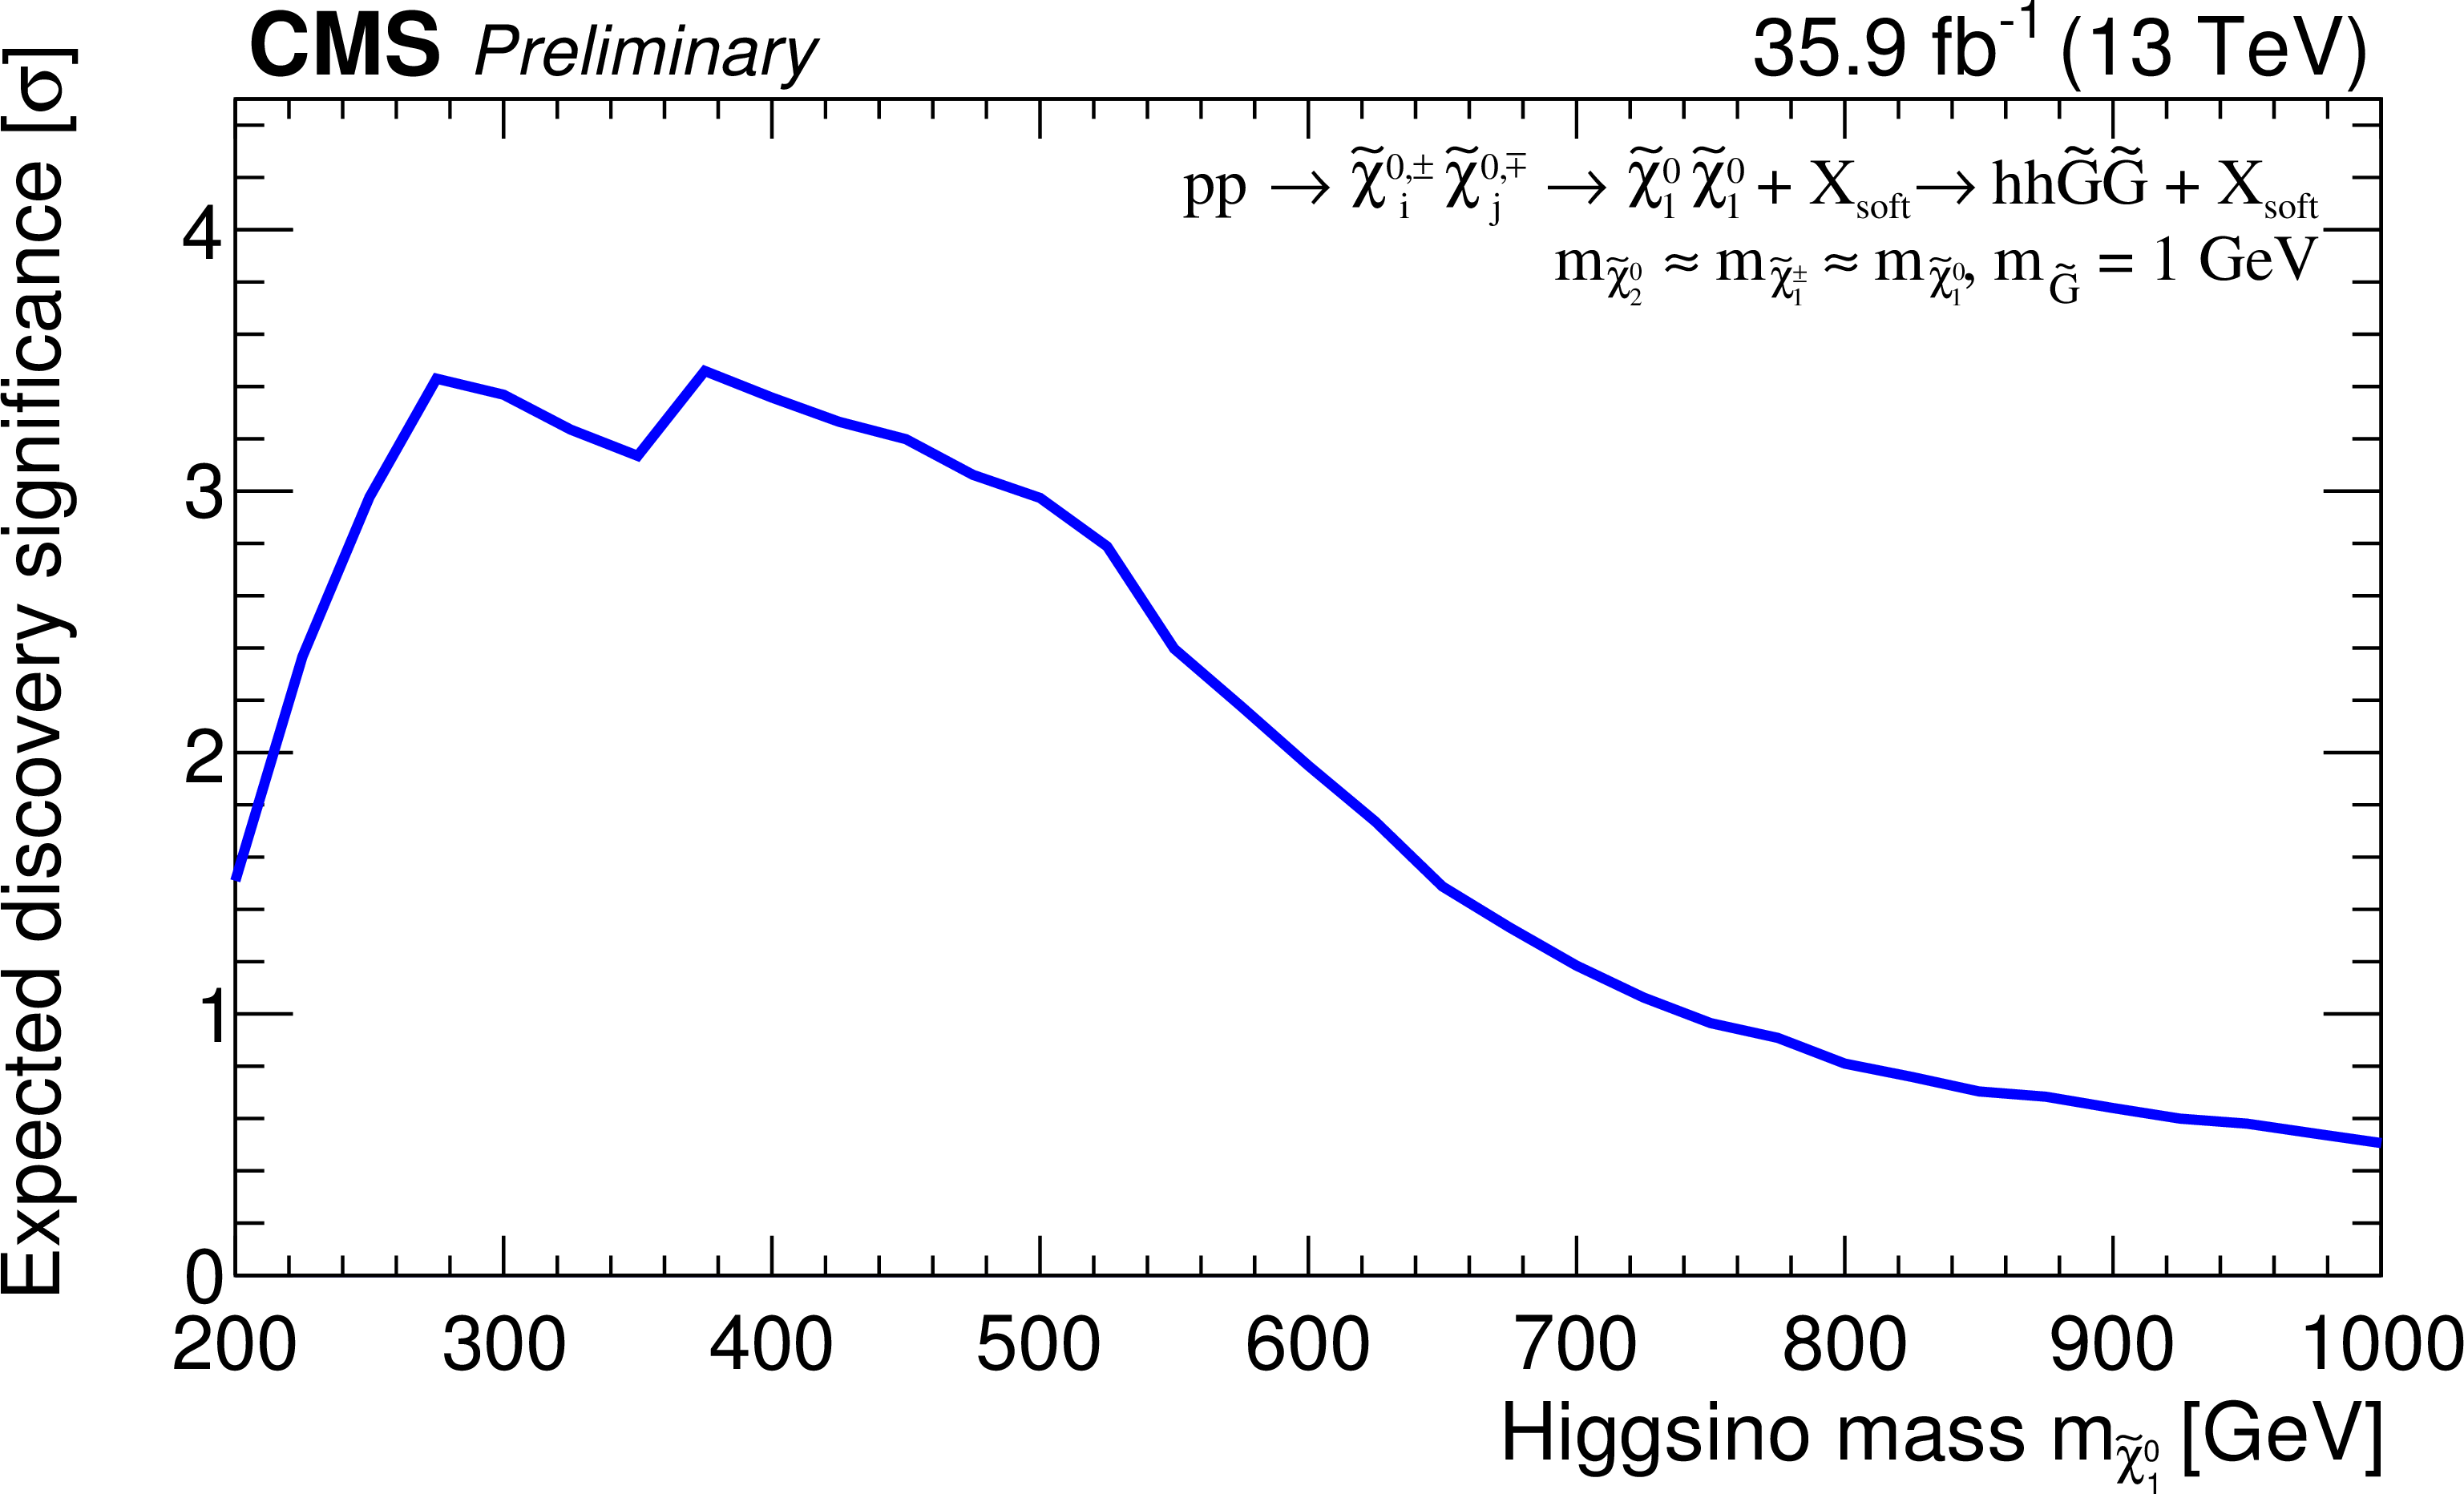
Additional Figure 3:
A posteriori expected discovery significance for the TChiHH model as a function of the Higgsino mass. |

png pdf root |
Additional Figure 4:
Observed signal significance for the TChiHH model as a function of the Higgsino mass. |
png pdf root |
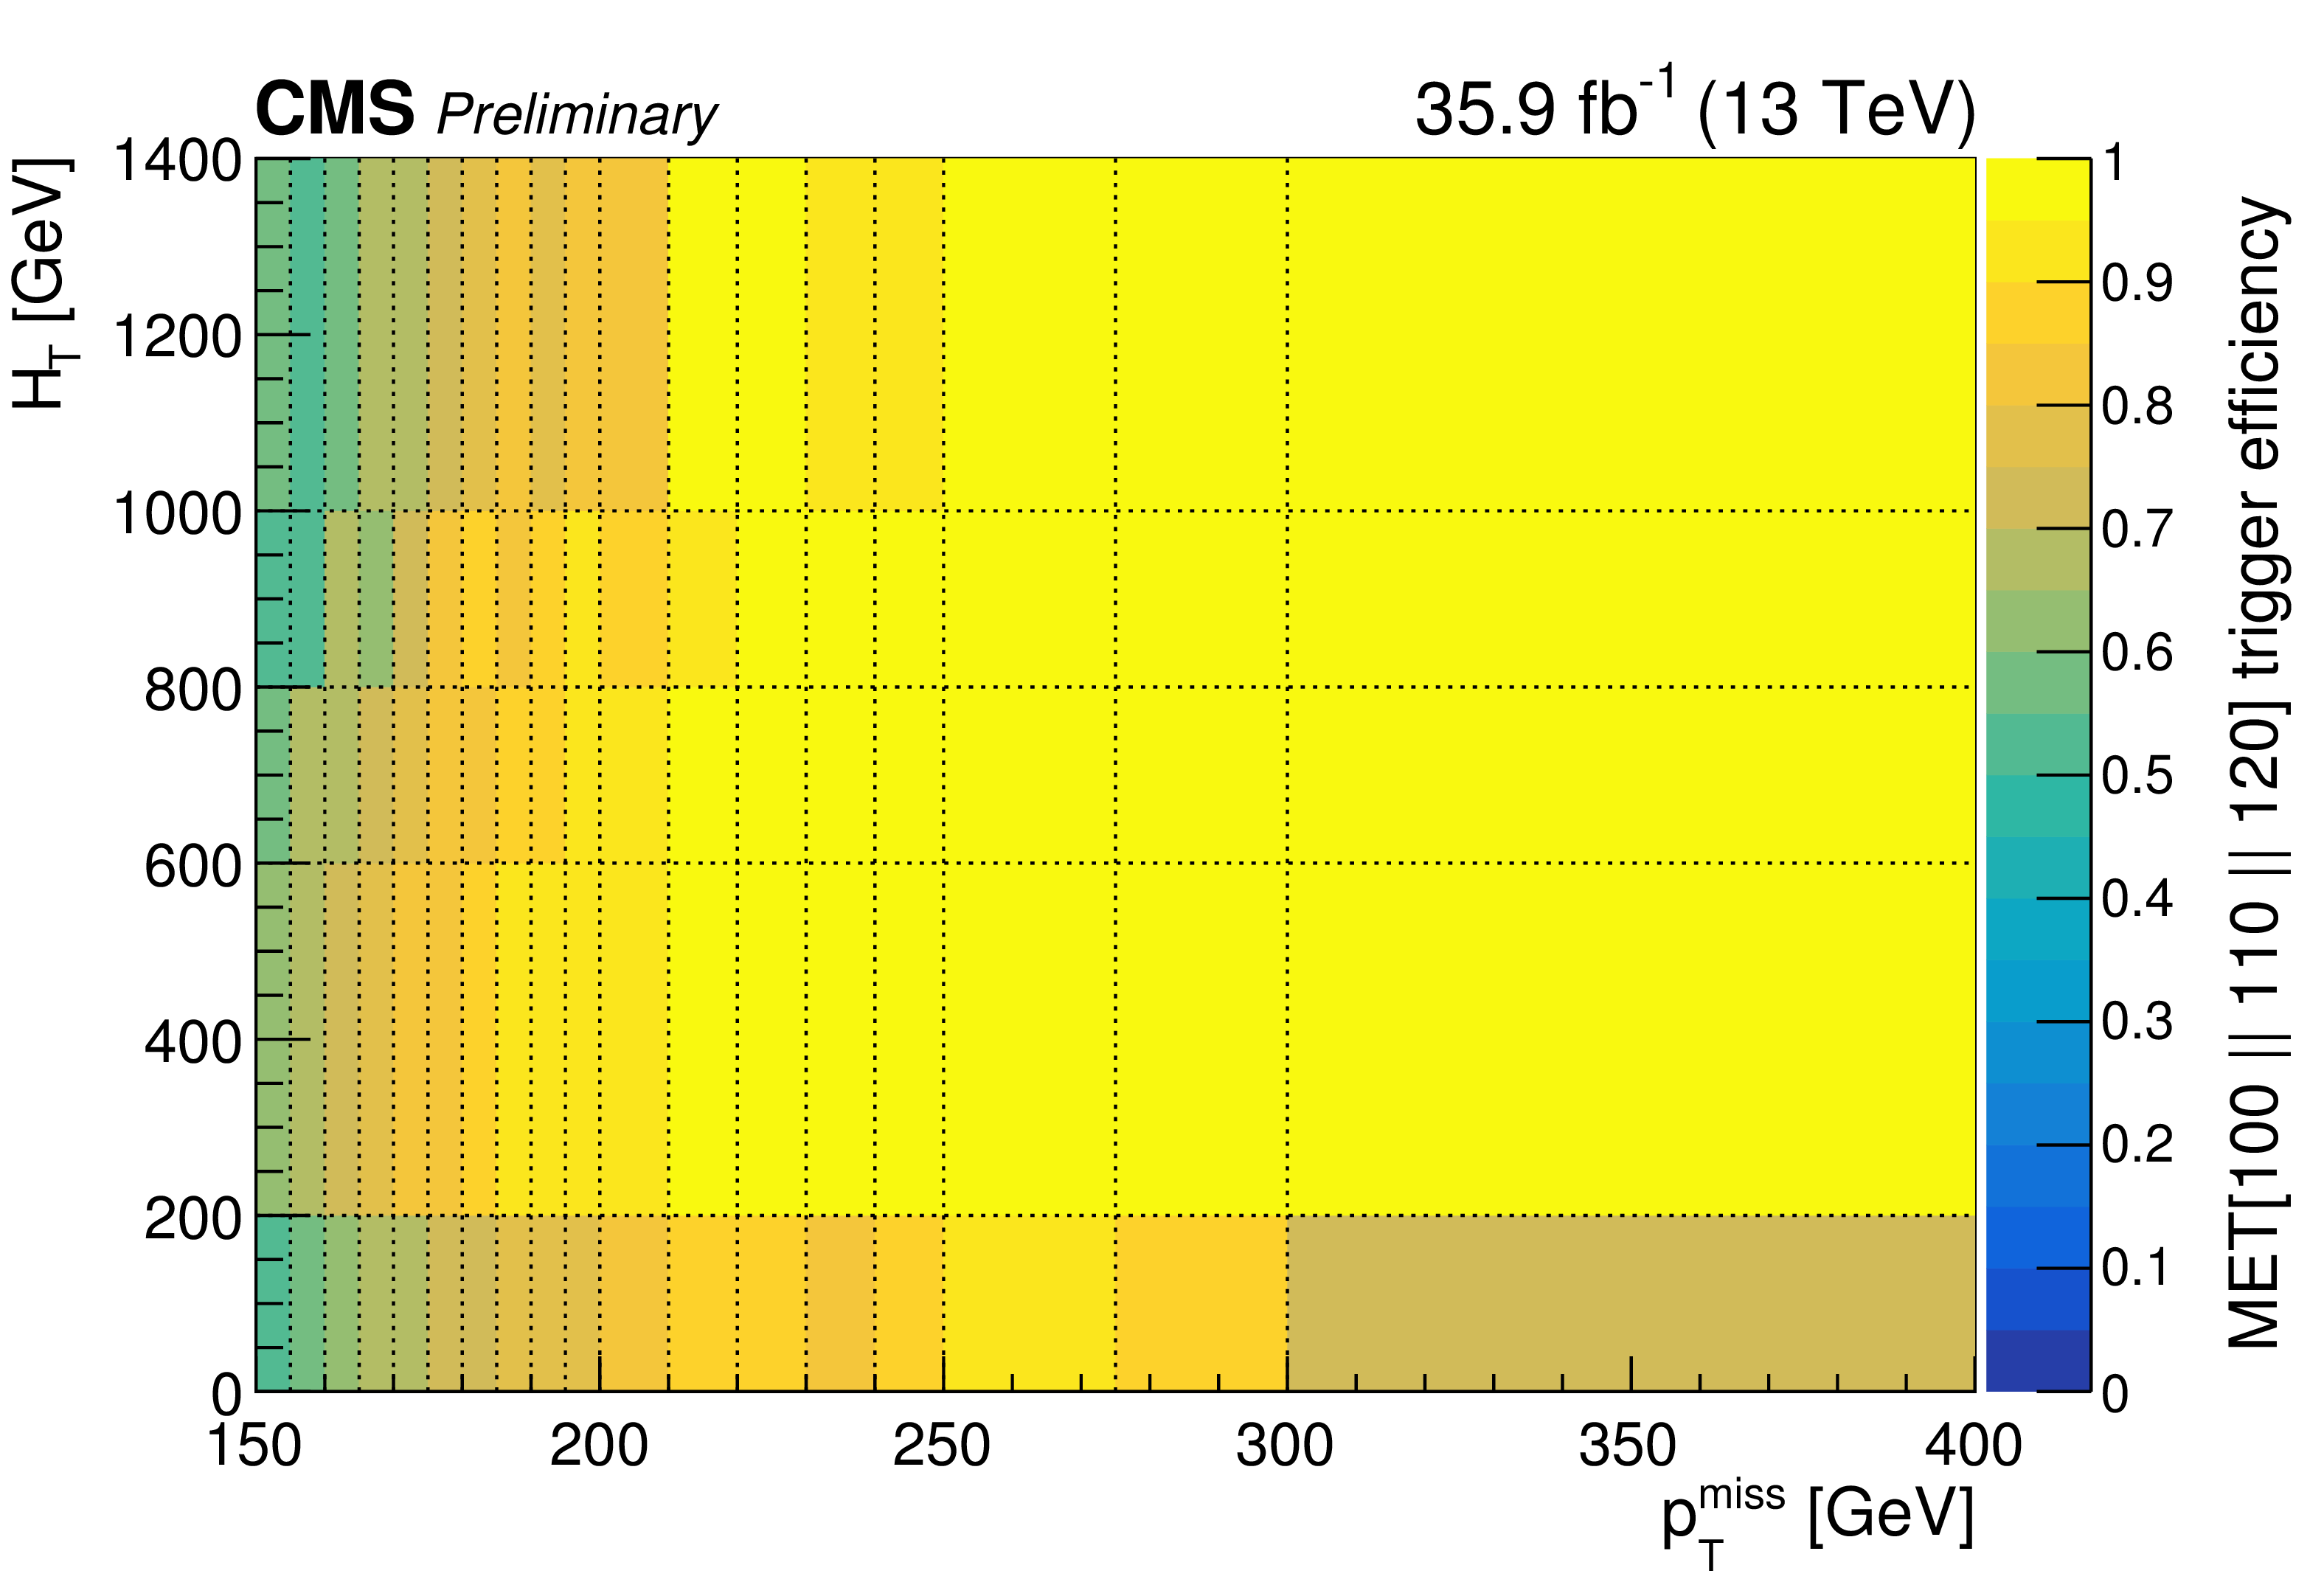
Additional Figure 5:
Efficiency for the logical OR of the various $p_{\rm T}^{\rm miss}$ triggers used in the analysis as a function of $p_{\rm T}^{\rm miss}$ and $H_{\rm T}$. |
png pdf root |
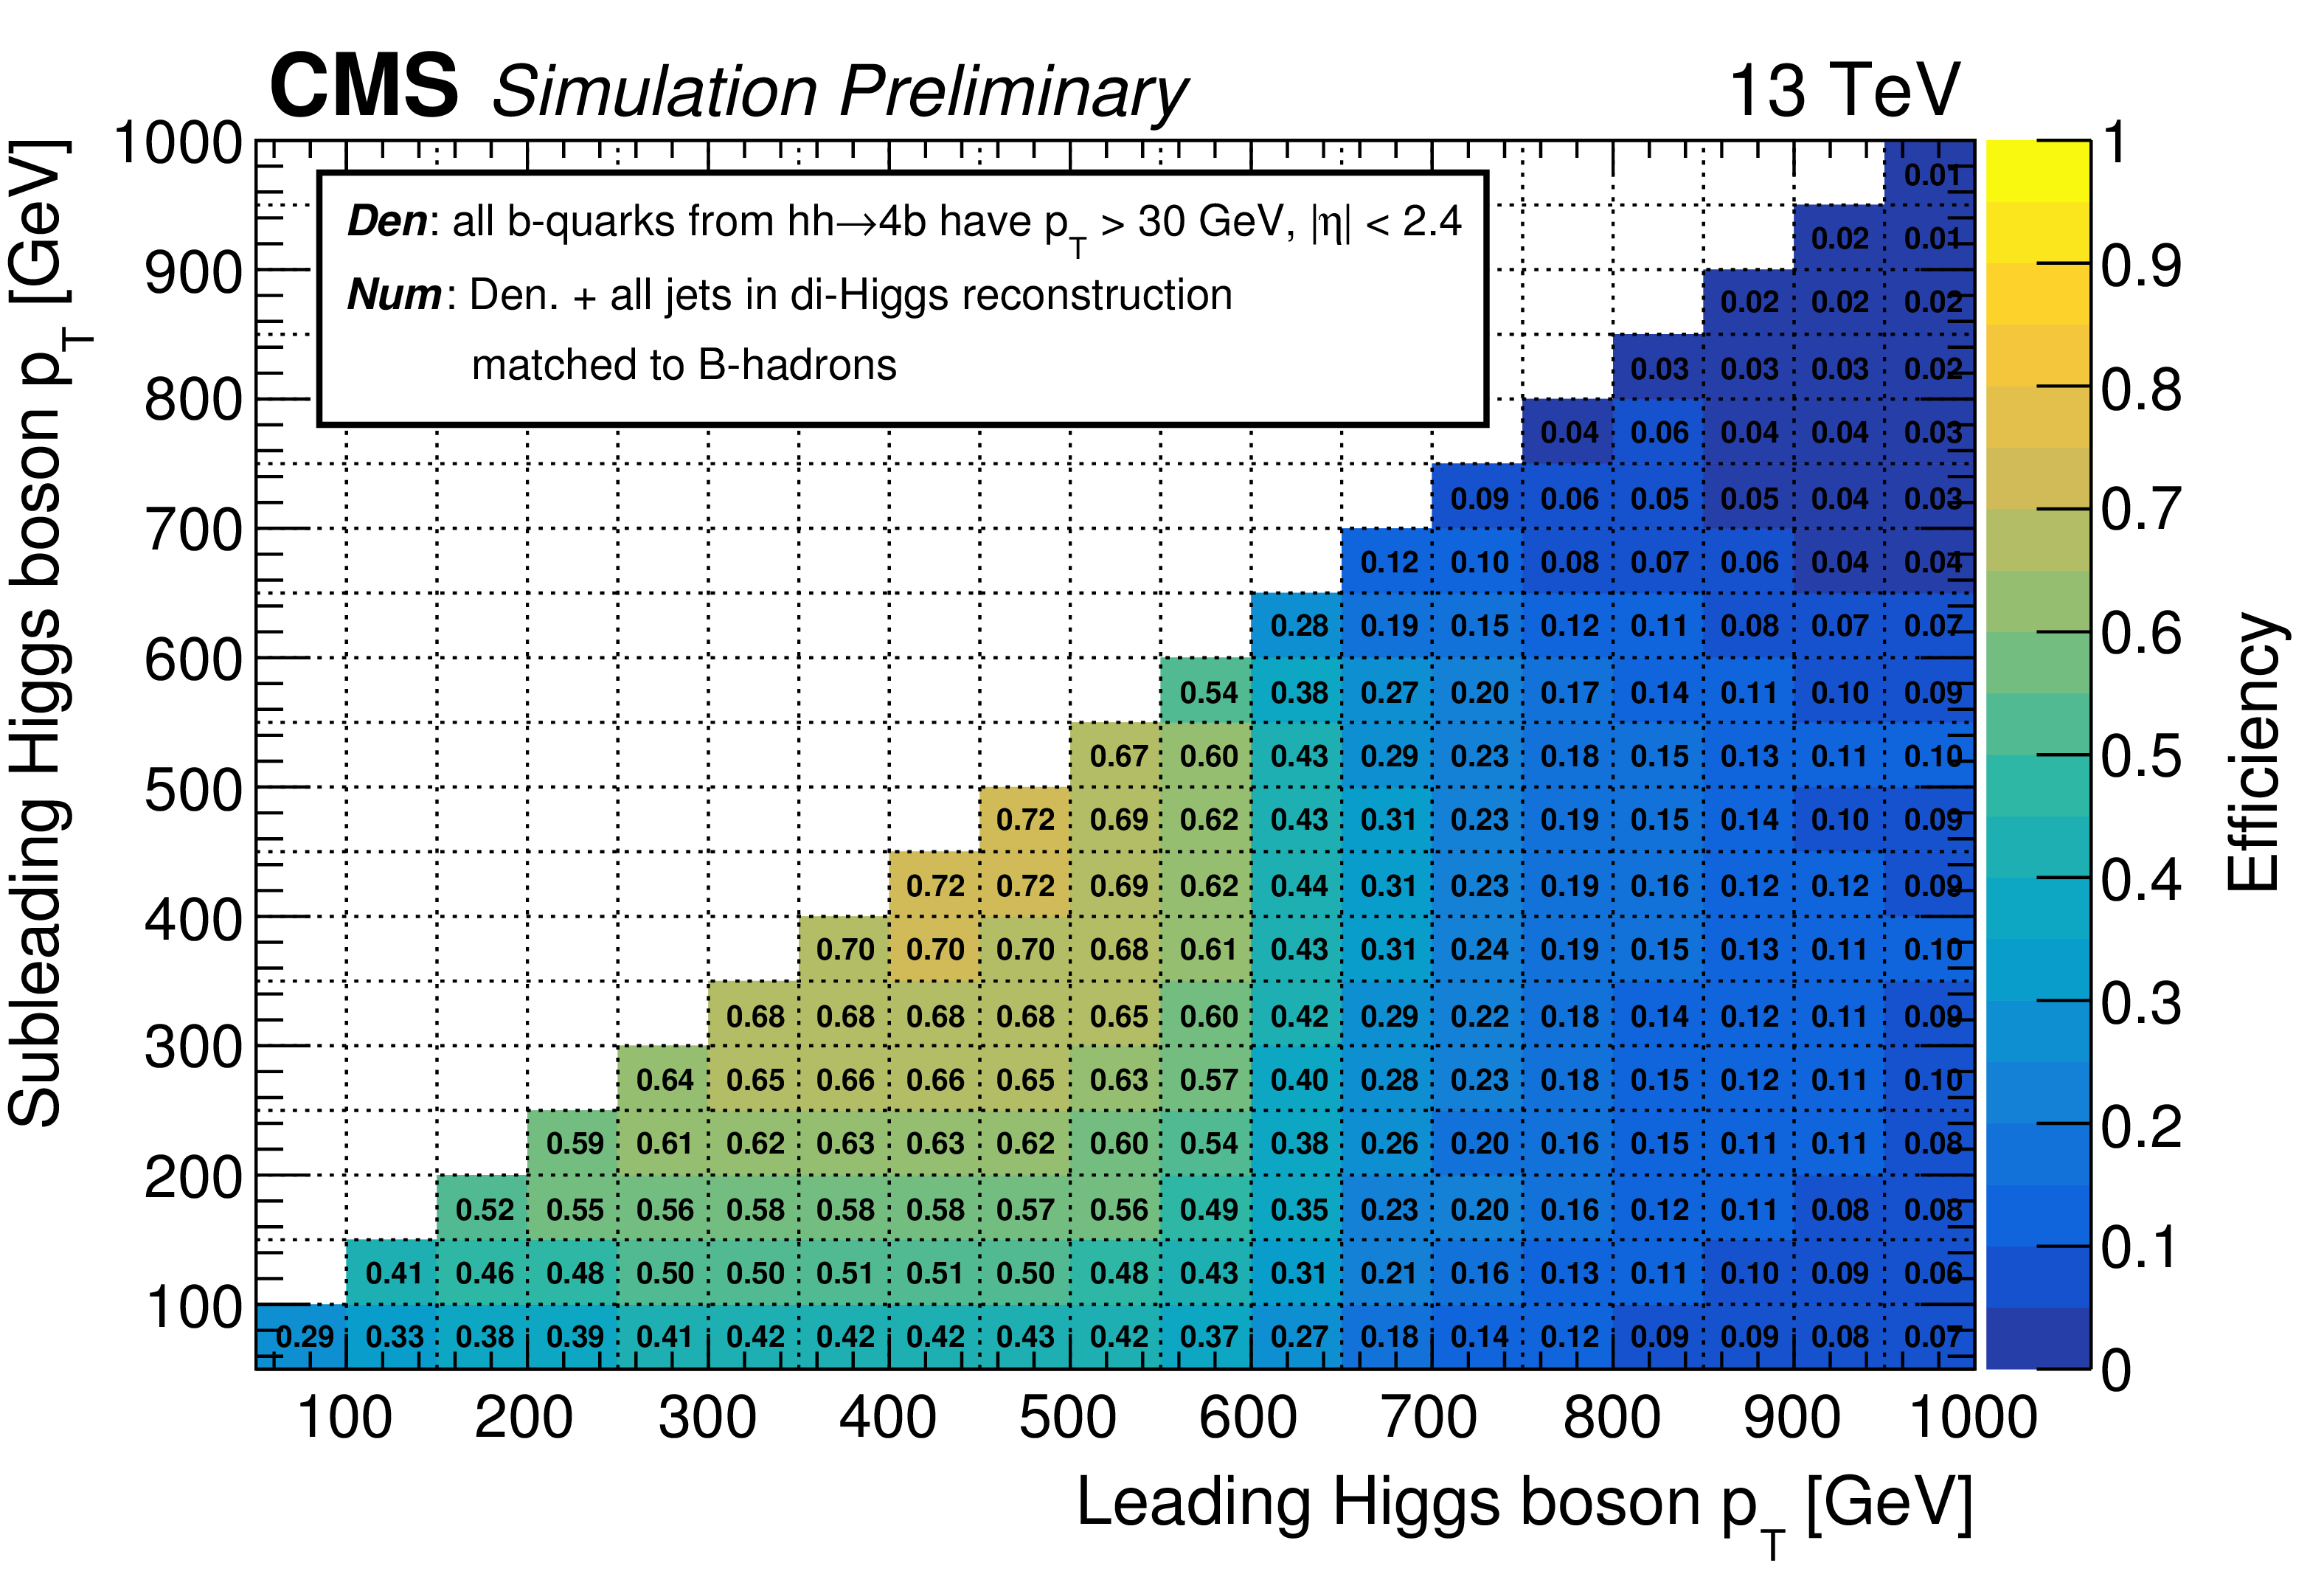
Additional Figure 6:
Efficiency to reconstruct all b-quarks from the two Higgs boson decays as individual jets, given that all four of the b-quarks are within acceptance, $p_T> $ 30 GeV and $|\eta | < $ 2.4. The efficiency is calculated based on the TChiHH model with all Higgsino masses included. |

png pdf root |
Additional Figure 7:
Efficiency to pass the mass cut requirement, 100 $ < $ <$m$> $ < $ 140 GeV, given that all b-quarks from the di-Higgs system are reconstructed as individual jets. The efficiency is calculated based on the TChiHH model with all Higgsino masses included. |
| Additional Tables | |

png pdf |
Additional Table 1:
Total background and signal yields in simulation for selections based on the CSVv2 b-tagging discriminator. To be compared to the equivalent table based on the DeepCSV discriminator used in the analysis. |

png pdf |
Additional Table 2:
Total background and signal yields in simulation for selections based on the DeepCSV b-tagging discriminator. The background is dominated by events with 2 true b quarks, while the signal has 4 b quarks. Compared to CSVv2, the high b-tagging efficiency of the DeepCSV algorithm extends the a-posteriori expected exclusion limit by approximately 150 GeV in the Higgsino mass, corresponding to a cross-section that is 3 times smaller. This gain in mass reach is aided by the increasingly more favorable kinematics of the signal at higher Higgsino masses and the observed yields in the signal regions. |
| References | ||||
| 1 | ATLAS Collaboration | Observation of a new particle in the search for the Standard Model Higgs boson with the ATLAS detector at the LHC | PLB 716 (2012) 1 | 1207.7214 |
| 2 | CMS Collaboration | Observation of a new boson at a mass of 125 GeV with the CMS experiment at the LHC | PLB 716 (2012) 30 | CMS-HIG-12-028 1207.7235 |
| 3 | CMS Collaboration | Observation of a new boson with mass near 125 GeV in pp collisions at $ \sqrt{s} = $ 7 and 8 TeV | JHEP 06 (2013) 081 | CMS-HIG-12-036 1303.4571 |
| 4 | CMS Collaboration | Precise determination of the mass of the Higgs boson and tests of compatibility of its couplings with the standard model predictions using proton collisions at 7 and 8 TeV | EPJC 75 (2015) 212 | CMS-HIG-14-009 1412.8662 |
| 5 | ATLAS Collaboration | Measurement of the Higgs boson mass from the $ \textrm{H}\rightarrow \gamma\gamma $ and $ \textrm{H} \rightarrow \textrm{ZZ}^{*} \rightarrow 4\ell $ channels with the ATLAS detector using 25 fb$ ^{-1} $ of $ \textrm{pp} $ collision data | PRD 90 (2014) 052004 | 1406.3827 |
| 6 | ATLAS and CMS Collaborations | Combined Measurement of the Higgs Boson Mass in pp Collisions at $ \sqrt{s}=$ 7 and 8 TeV with the ATLAS and CMS Experiments | PRL 114 (2015) 191803 | 1503.07589 |
| 7 | P. Ramond | Dual theory for free fermions | PRD 3 (1971) 2415 | |
| 8 | Y. A. Golfand and E. P. Likhtman | Extension of the algebra of Poincar$ \'e $ group generators and violation of P invariance | JEPTL 13 (1971)323 | |
| 9 | A. Neveu and J. H. Schwarz | Factorizable dual model of pions | Nucl. Phys. B 31 (1971) 86 | |
| 10 | D. V. Volkov and V. P. Akulov | Possible universal neutrino interaction | JEPTL 16 (1972)438 | |
| 11 | J. Wess and B. Zumino | A Lagrangian model invariant under supergauge transformations | PLB 49 (1974) 52 | |
| 12 | J. Wess and B. Zumino | Supergauge transformations in four dimensions | Nucl. Phys. B 70 (1974) 39 | |
| 13 | P. Fayet | Supergauge invariant extension of the Higgs mechanism and a model for the electron and its neutrino | Nucl. Phys. B 90 (1975) 104 | |
| 14 | H. P. Nilles | Supersymmetry, supergravity and particle physics | Phys. Rep. 110 (1984) 1 | |
| 15 | CMS Collaboration | Searches for electroweak neutralino and chargino production in channels with Higgs, Z, and W bosons in pp collisions at 8 TeV | PRD90 (2014), no. 9, 092007 | CMS-SUS-14-002 1409.3168 |
| 16 | CMS Collaboration | Search for top-squark pairs decaying into Higgs or Z bosons in pp collisions at $ \sqrt{s} =$ 8 TeV | PLB736 (2014) 371--397 | CMS-SUS-13-024 1405.3886 |
| 17 | CMS Collaboration | Search for top squark and higgsino production using diphoton Higgs boson decays | PRL 112 (2014) 161802 | CMS-SUS-13-014 1312.3310 |
| 18 | ATLAS Collaboration | Search for supersymmetry in events with photons, bottom quarks, and missing transverse momentum in proton-proton collisions at a centre-of-mass energy of 7 TeV with the ATLAS detector | PLB719 (2013) 261--279 | 1211.1167 |
| 19 | ATLAS Collaboration | Search for direct pair production of a chargino and a neutralino decaying to the 125 GeV Higgs boson in $ \sqrt{s} = $ 8 TeV $ {pp} $ collisions with the ATLAS detector | EPJC 75 (2015), no. 5, 208 | 1501.07110 |
| 20 | CMS Collaboration | Searches for electroweak production of charginos, neutralinos, and sleptons decaying to leptons and W, Z, and Higgs bosons in pp collisions at 8 TeV | EPJC74 (2014), no. 9 | CMS-SUS-13-006 1405.7570 |
| 21 | G. 't Hooft | Naturalness, chiral symmetry, and spontaneous chiral symmetry breaking | NATO Sci. Ser. B 59 (1980)135 | |
| 22 | E. Witten | Dynamical Breaking of Supersymmetry | Nucl. Phys. B 188 (1981) 513 | |
| 23 | M. Dine, W. Fischler, and M. Srednicki | Supersymmetric Technicolor | Nucl. Phys. B 189 (1981) 575 | |
| 24 | S. Dimopoulos and S. Raby | Supercolor | Nucl. Phys. B 192 (1981) 353 | |
| 25 | S. Dimopoulos and H. Georgi | Softly Broken Supersymmetry and SU(5) | Nucl. Phys. B 193 (1981) 150 | |
| 26 | R. K. Kaul and P. Majumdar | Cancellation of Quadratically Divergent Mass Corrections in Globally Supersymmetric Spontaneously Broken Gauge Theories | Nucl. Phys. B 199 (1982) 36 | |
| 27 | S. Dimopoulos and G. F. Giudice | Naturalness constraints in supersymmetric theories with nonuniversal soft terms | PLB 357 (1995) 573 | hep-ph/9507282 |
| 28 | R. Barbieri and D. Pappadopulo | S-particles at their naturalness limits | JHEP 10 (2009) 061 | 0906.4546 |
| 29 | M. Papucci, J. T. Ruderman, and A. Weiler | Natural SUSY endures | JHEP 09 (2012) 035 | 1110.6926 |
| 30 | J. L. Feng | Naturalness and the Status of Supersymmetry | Ann. Rev. Nucl. Part. Sci. 63 (2013) 351 | 1302.6587 |
| 31 | G. R. Farrar and P. Fayet | Phenomenology of the Production, Decay, and Detection of New Hadronic States Associated with Supersymmetry | PLB 76 (1978) 575 | |
| 32 | ATLAS Collaboration | Search for new phenomena in final states with an energetic jet and large missing transverse momentum in pp collisions at $ \sqrt{s}= $ 8 TeV with the ATLAS detector | EPJC75 (2015), no. 7, 299 | 1502.01518 |
| 33 | CMS Collaboration | Search for dark matter, extra dimensions, and unparticles in monojet events in proton-proton collisions at $ \sqrt{s} = $ 8 TeV | EPJC 75 (2015), no. 5, 235 | CMS-EXO-12-048 1408.3583 |
| 34 | S. Dimopoulos, M. Dine, S. Raby, and S. D. Thomas | Experimental signatures of low-energy gauge mediated supersymmetry breaking | PRL 76 (1996) 3494--3497 | hep-ph/9601367 |
| 35 | K. T. Matchev and S. D. Thomas | Higgs and $ Z $ boson signatures of supersymmetry | PRD62 (2000) 077702 | hep-ph/9908482 |
| 36 | B. Fuks, M. Klasen, D. R. Lamprea, and M. Rothering | Gaugino production in proton-proton collisions at a center-of-mass energy of 8 TeV | JHEP 10 (2012) 081 | 1207.2159 |
| 37 | B. Fuks, M. Klasen, D. R. Lamprea, and M. Rothering | Precision predictions for electroweak superpartner production at hadron colliders with Resummino | EPJC 73 (2013) 2480 | 1304.0790 |
| 38 | J. Alwall, P. Schuster, and N. Toro | Simplified models for a first characterization of new physics at the LHC | PRD 79 (2009) 075020 | 0810.3921 |
| 39 | J. Alwall, M.-P. Le, M. Lisanti, and J. G. Wacker | Model-independent jets plus missing energy searches | PRD 79 (2009) 015005 | 0809.3264 |
| 40 | D. Alves et al. | Simplified models for LHC new physics searches | JPG 39 (2012) 105005 | 1105.2838 |
| 41 | CMS Collaboration | The CMS experiment at the CERN LHC | JINST 3 (2008) S08004 | CMS-00-001 |
| 42 | J. Alwall et al. | The automated computation of tree-level and next-to-leading order differential cross sections, and their matching to parton shower simulations | JHEP 07 (2014) 079 | 1405.0301 |
| 43 | S. Alioli, P. Nason, C. Oleari, and E. Re | NLO single-top production matched with shower in POWHEG: $ s $- and $ t $-channel contributions | JHEP 09 (2009) 111 | 0907.4076 |
| 44 | E. Re | Single-top Wt-channel production matched with parton showers using the POWHEG method | EPJC 71 (2011) 1547 | 1009.2450 |
| 45 | NNPDF Collaboration | Parton distributions for the LHC Run II | JHEP 04 (2015) 040 | 1410.8849 |
| 46 | T. Sjostrand et al. | An Introduction to PYTHIA 8.2 | CPC 191 (2015) 159 | 1410.3012 |
| 47 | CMS Collaboration | Event generator tunes obtained from underlying event and multiparton scattering measurements | EPJC 76 (2016), no. 3, 155 | CMS-GEN-14-001 1512.00815 |
| 48 | GEANT4 Collaboration | GEANT4 --- a simulation toolkit | NIMA 506 (2003) 250 | |
| 49 | CMS Collaboration | The fast simulation of the CMS detector at LHC | J. Phys. Conf. Ser. 331 (2011) 032049 | |
| 50 | CMS Collaboration | Particle flow event reconstruction in CMS and performance for jets, taus and~$ E_{\mathrm{T}}^{\text{miss}} $ | CDS | |
| 51 | CMS Collaboration | Commissioning of the particle-flow event reconstruction with the first LHC collisions recorded in the CMS detector | CDS | |
| 52 | M. Cacciari, G. P. Salam, and G. Soyez | The anti-$ k_{\rm t} $ jet clustering algorithm | JHEP 04 (2008) 063 | 0802.1189 |
| 53 | M. Cacciari, G. P. Salam, and G. Soyez | FastJet User Manual | EPJC72 (2012) 1896 | 1111.6097 |
| 54 | M. Cacciari and G. P. Salam | Pileup subtraction using jet areas | PLB 659 (2008) 119 | 0707.1378 |
| 55 | CMS Collaboration | Determination of jet energy calibration and transverse momentum resolution in CMS | JINST 6 (2011) P11002 | CMS-JME-10-011 1107.4277 |
| 56 | CMS Collaboration | Heavy flavor identification at CMS with deep neural networks | CDS | |
| 57 | D. Guest et al. | Jet Flavor Classification in High-Energy Physics with Deep Neural Networks | PRD 94 (2016), no. 11, 112002 | 1607.08633 |
| 58 | CMS Collaboration | Identification of $ \mathrm{b }-quark $ jets with the CMS experiment | JINST 8 (2013) P04013 | CMS-BTV-12-001 1211.4462 |
| 59 | CMS Collaboration | Identification of b quark jets at the CMS Experiment in the LHC Run 2 | CMS-PAS-BTV-15-001 | CMS-PAS-BTV-15-001 |
| 60 | CMS Collaboration | Performance of electron reconstruction and selection with the CMS detector in proton-proton collisions at $ \sqrt{s} = $ 8 TeV | JINST 10 (2015) P06005 | CMS-EGM-13-001 1502.02701 |
| 61 | CMS Collaboration | Performance of CMS muon reconstruction in pp collision events at $ \sqrt{s}=$ 7 TeV | JINST 7 (2012) P10002 | CMS-MUO-10-004 1206.4071 |
| 62 | K. Rehermann and B. Tweedie | Efficient Identification of Boosted Semileptonic Top Quarks at the LHC | JHEP 03 (2011) 059 | 1007.2221 |
| 63 | CMS Collaboration | Search for supersymmetry in pp collisions at sqrt(s) = 13 TeV in the single-lepton final state using the sum of masses of large-radius jets | CMS-SUS-15-007 1605.04608 |
|
| 64 | T. Junk | Confidence level computation for combining searches with small statistics | NIMA 434 (1999) 435 | hep-ex/9902006 |
| 65 | A. L. Read | Presentation of search results: The $ \text{CL}_{\text{S}} $ technique | JPG 28 (2002) 2693 | |
| 66 | ATLAS Collaboration, CMS Collaboration, LHC Higgs Combination Group | Procedure for the LHC Higgs boson search combination in Summer 2011 | CMS-NOTE-2011-005 | |
| 67 | G. Cowan, K. Cranmer, E. Gross, and O. Vitells | Asymptotic formulae for likelihood-based tests of new physics | EPJC 71 (2011) 1554 | 1007.1727 |
|
|
Compact Muon Solenoid LHC, CERN |
|

|

|

|

|

|