

Compact Muon Solenoid
LHC, CERN
| CMS-PAS-TOP-19-003 | ||
| Measurement of differential cross sections for single top quark production in association with a W boson at $\sqrt{s}= $ 13 TeV | ||
| CMS Collaboration | ||
| March 2020 | ||
| Abstract: Measurements are presented of normalized differential cross sections for the production of single top quarks in association with a W boson, in proton-proton collisions at a centre-of-mass energy of 13 TeV. Events containing one muon and one electron in the final state are analyzed. A fiducial region is defined according to the detector acceptance, and the requirement of exactly one b-tagged jet. The presence of lower-energy jets is vetoed to reduce the contribution from backgrounds. The resulting distributions are unfolded to particle-level and compared with predictions calculations at next-to-leading order in perturbative QCD. Within current uncertainties, all the predictions agree with the data. | ||
| Links: CDS record (PDF) ; inSPIRE record ; CADI line (restricted) ; | ||
| Figures | |
png pdf |
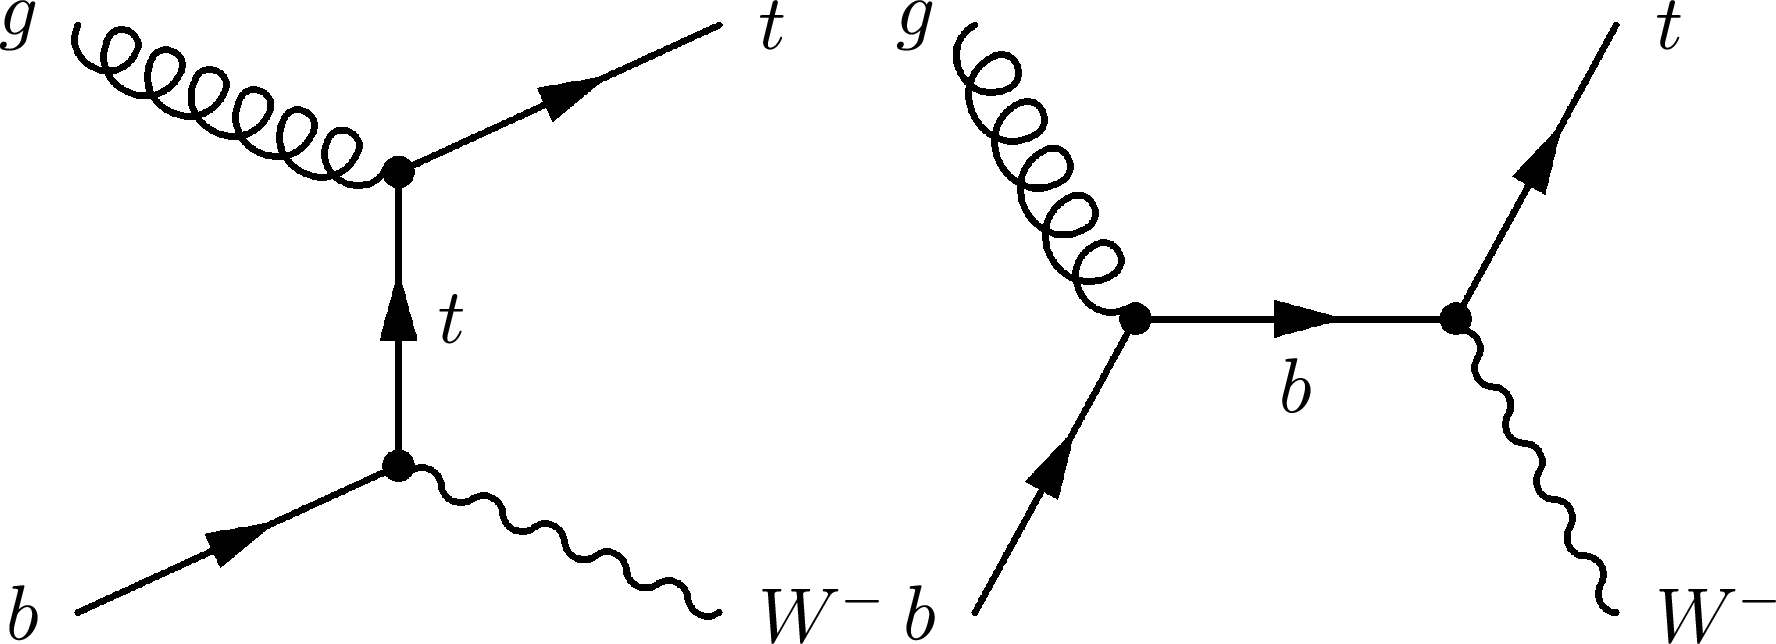
Figure 1:
Leading order Feynman diagrams for single top quark production in the tW mode. The charge-conjugate modes are implicitly included. |

png pdf |
Figure 1-a:
Leading order Feynman diagram for single top quark production in the tW mode. The charge-conjugate mode is implicitly included. |

png pdf |
Figure 1-b:
Leading order Feynman diagram for single top quark production in the tW mode. The charge-conjugate mode is implicitly included. |

png pdf |
Figure 2:
Feynman diagrams for tW single top quark production at NLO that are removed from the signal definition in the DR scheme, the charge-conjugate modes are implicitly included. |

png pdf |
Figure 2-a:
Feynman diagram for tW single top quark production at NLO that is removed from the signal definition in the DR scheme, the charge-conjugate mode is implicitly included. |

png pdf |
Figure 2-b:
Feynman diagram for tW single top quark production at NLO that is removed from the signal definition in the DR scheme, the charge-conjugate mode is implicitly included. |

png pdf |
Figure 2-c:
Feynman diagram for tW single top quark production at NLO that is removed from the signal definition in the DR scheme, the charge-conjugate mode is implicitly included. |
png pdf |
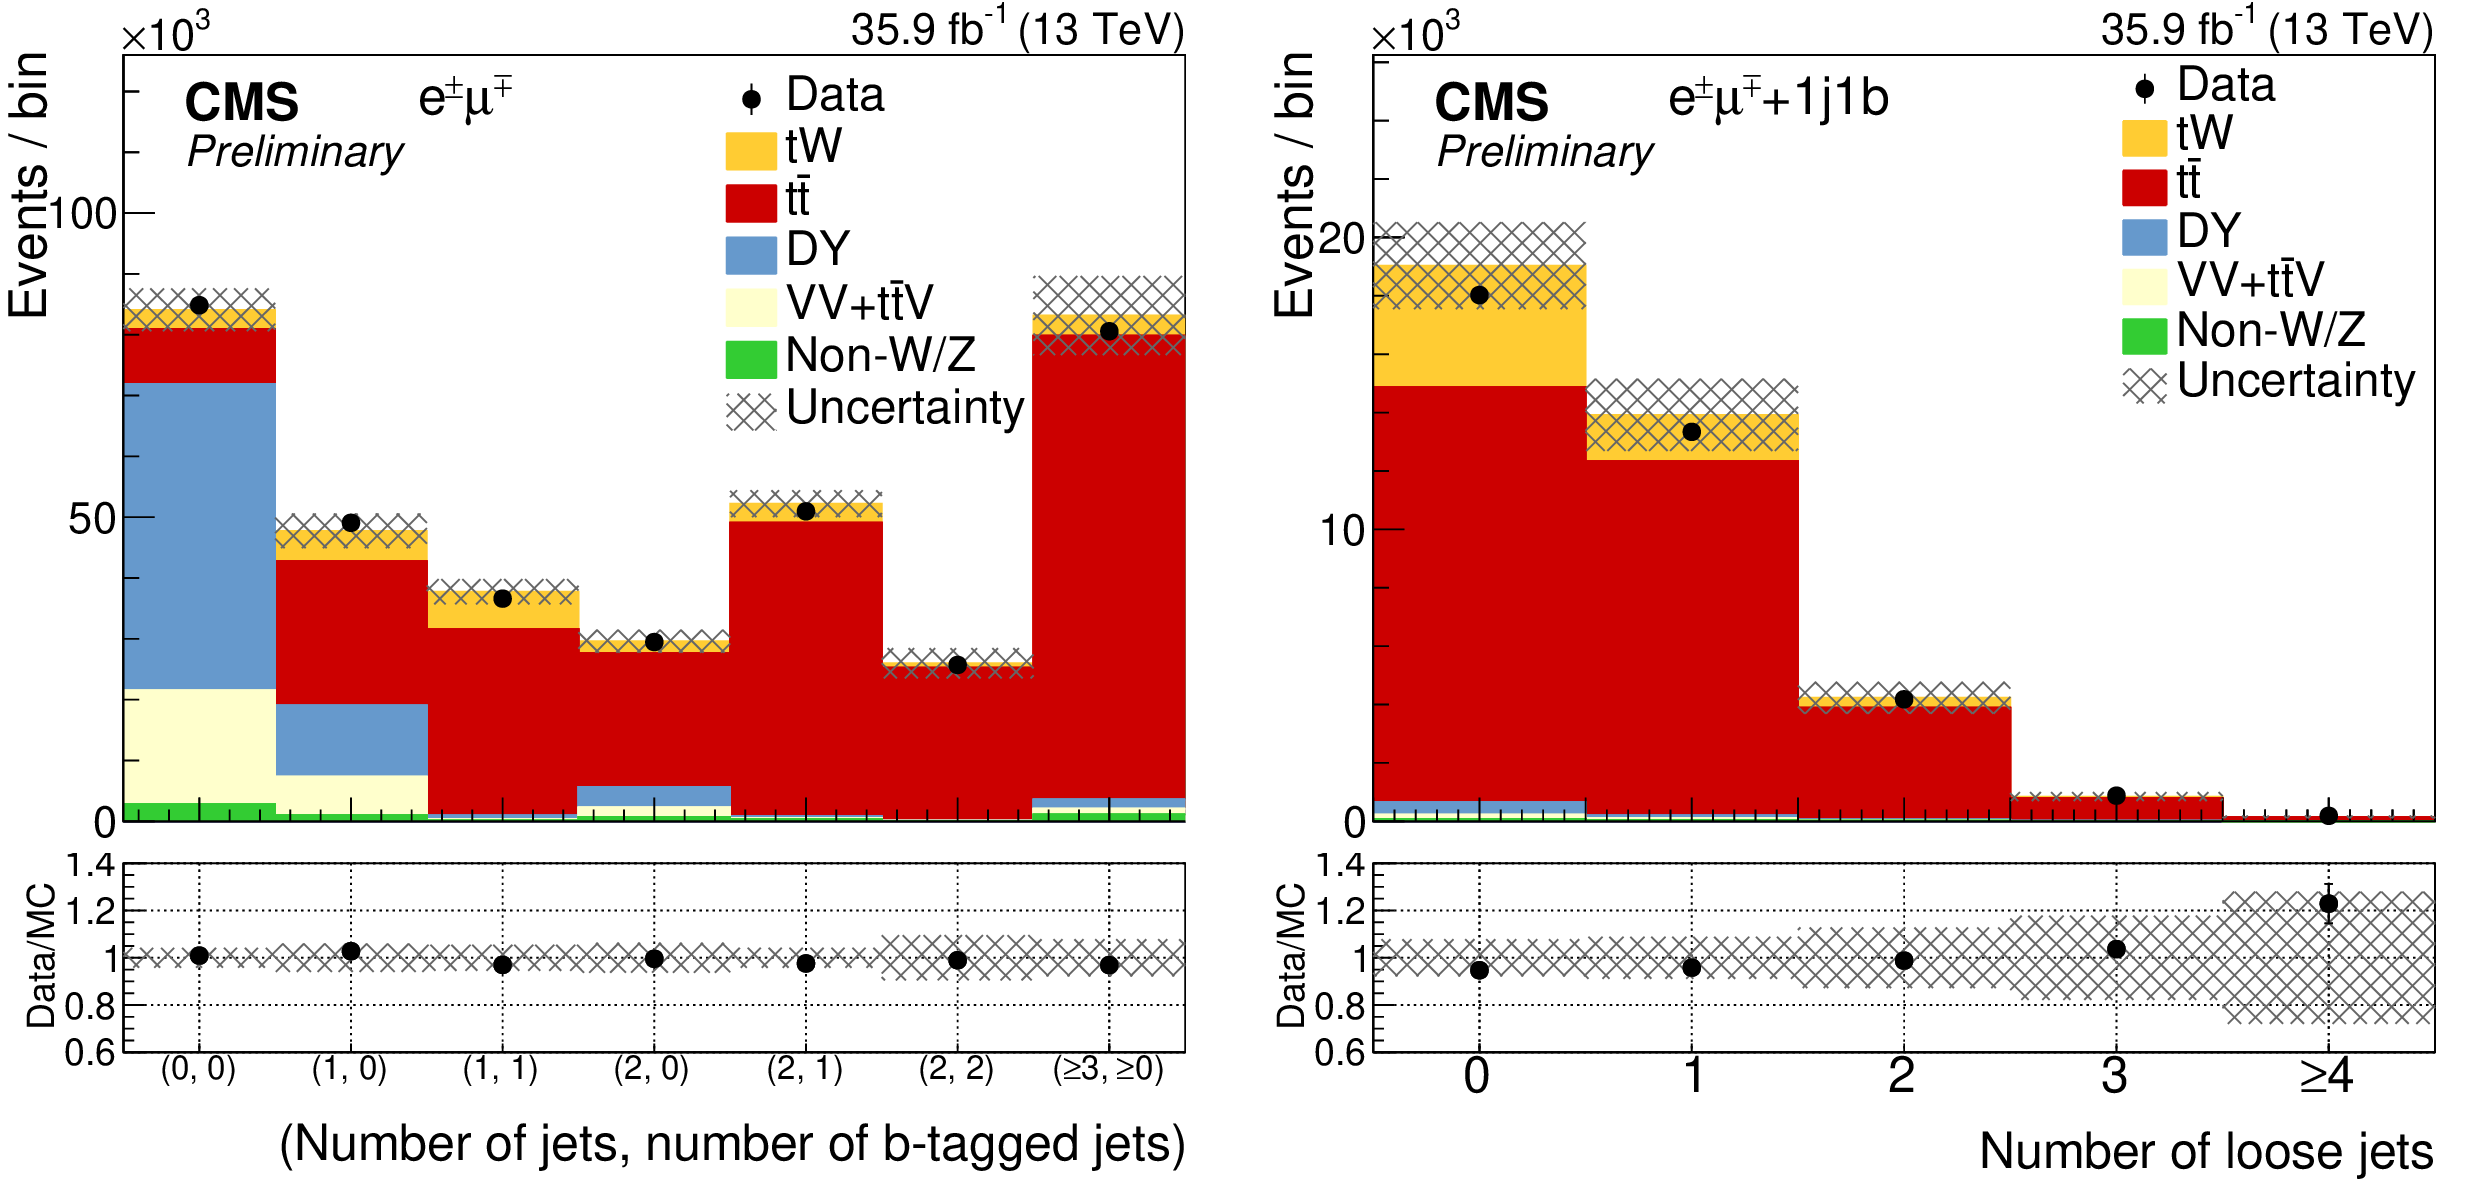
Figure 3:
Left: yields observed in data, compared with those expected from simulation, as a function of the number of jets and number of b-tagged jets for events passing the baseline dilepton selection. The error band includes the statistical and all systematic uncertainties, except those from background normalization. Right: yields observed in data, compared with those expected from simulation, as a function of the number of loose jets for events passing the ${\mathrm{e^{\pm}} {\mu^{\mp}}}$ selection in the 1j1b region. The hatched band includes the statistical and all systematic uncertainties. The bottom of the panel shows the ratio of data to the sum of the expected yields. |
png pdf |
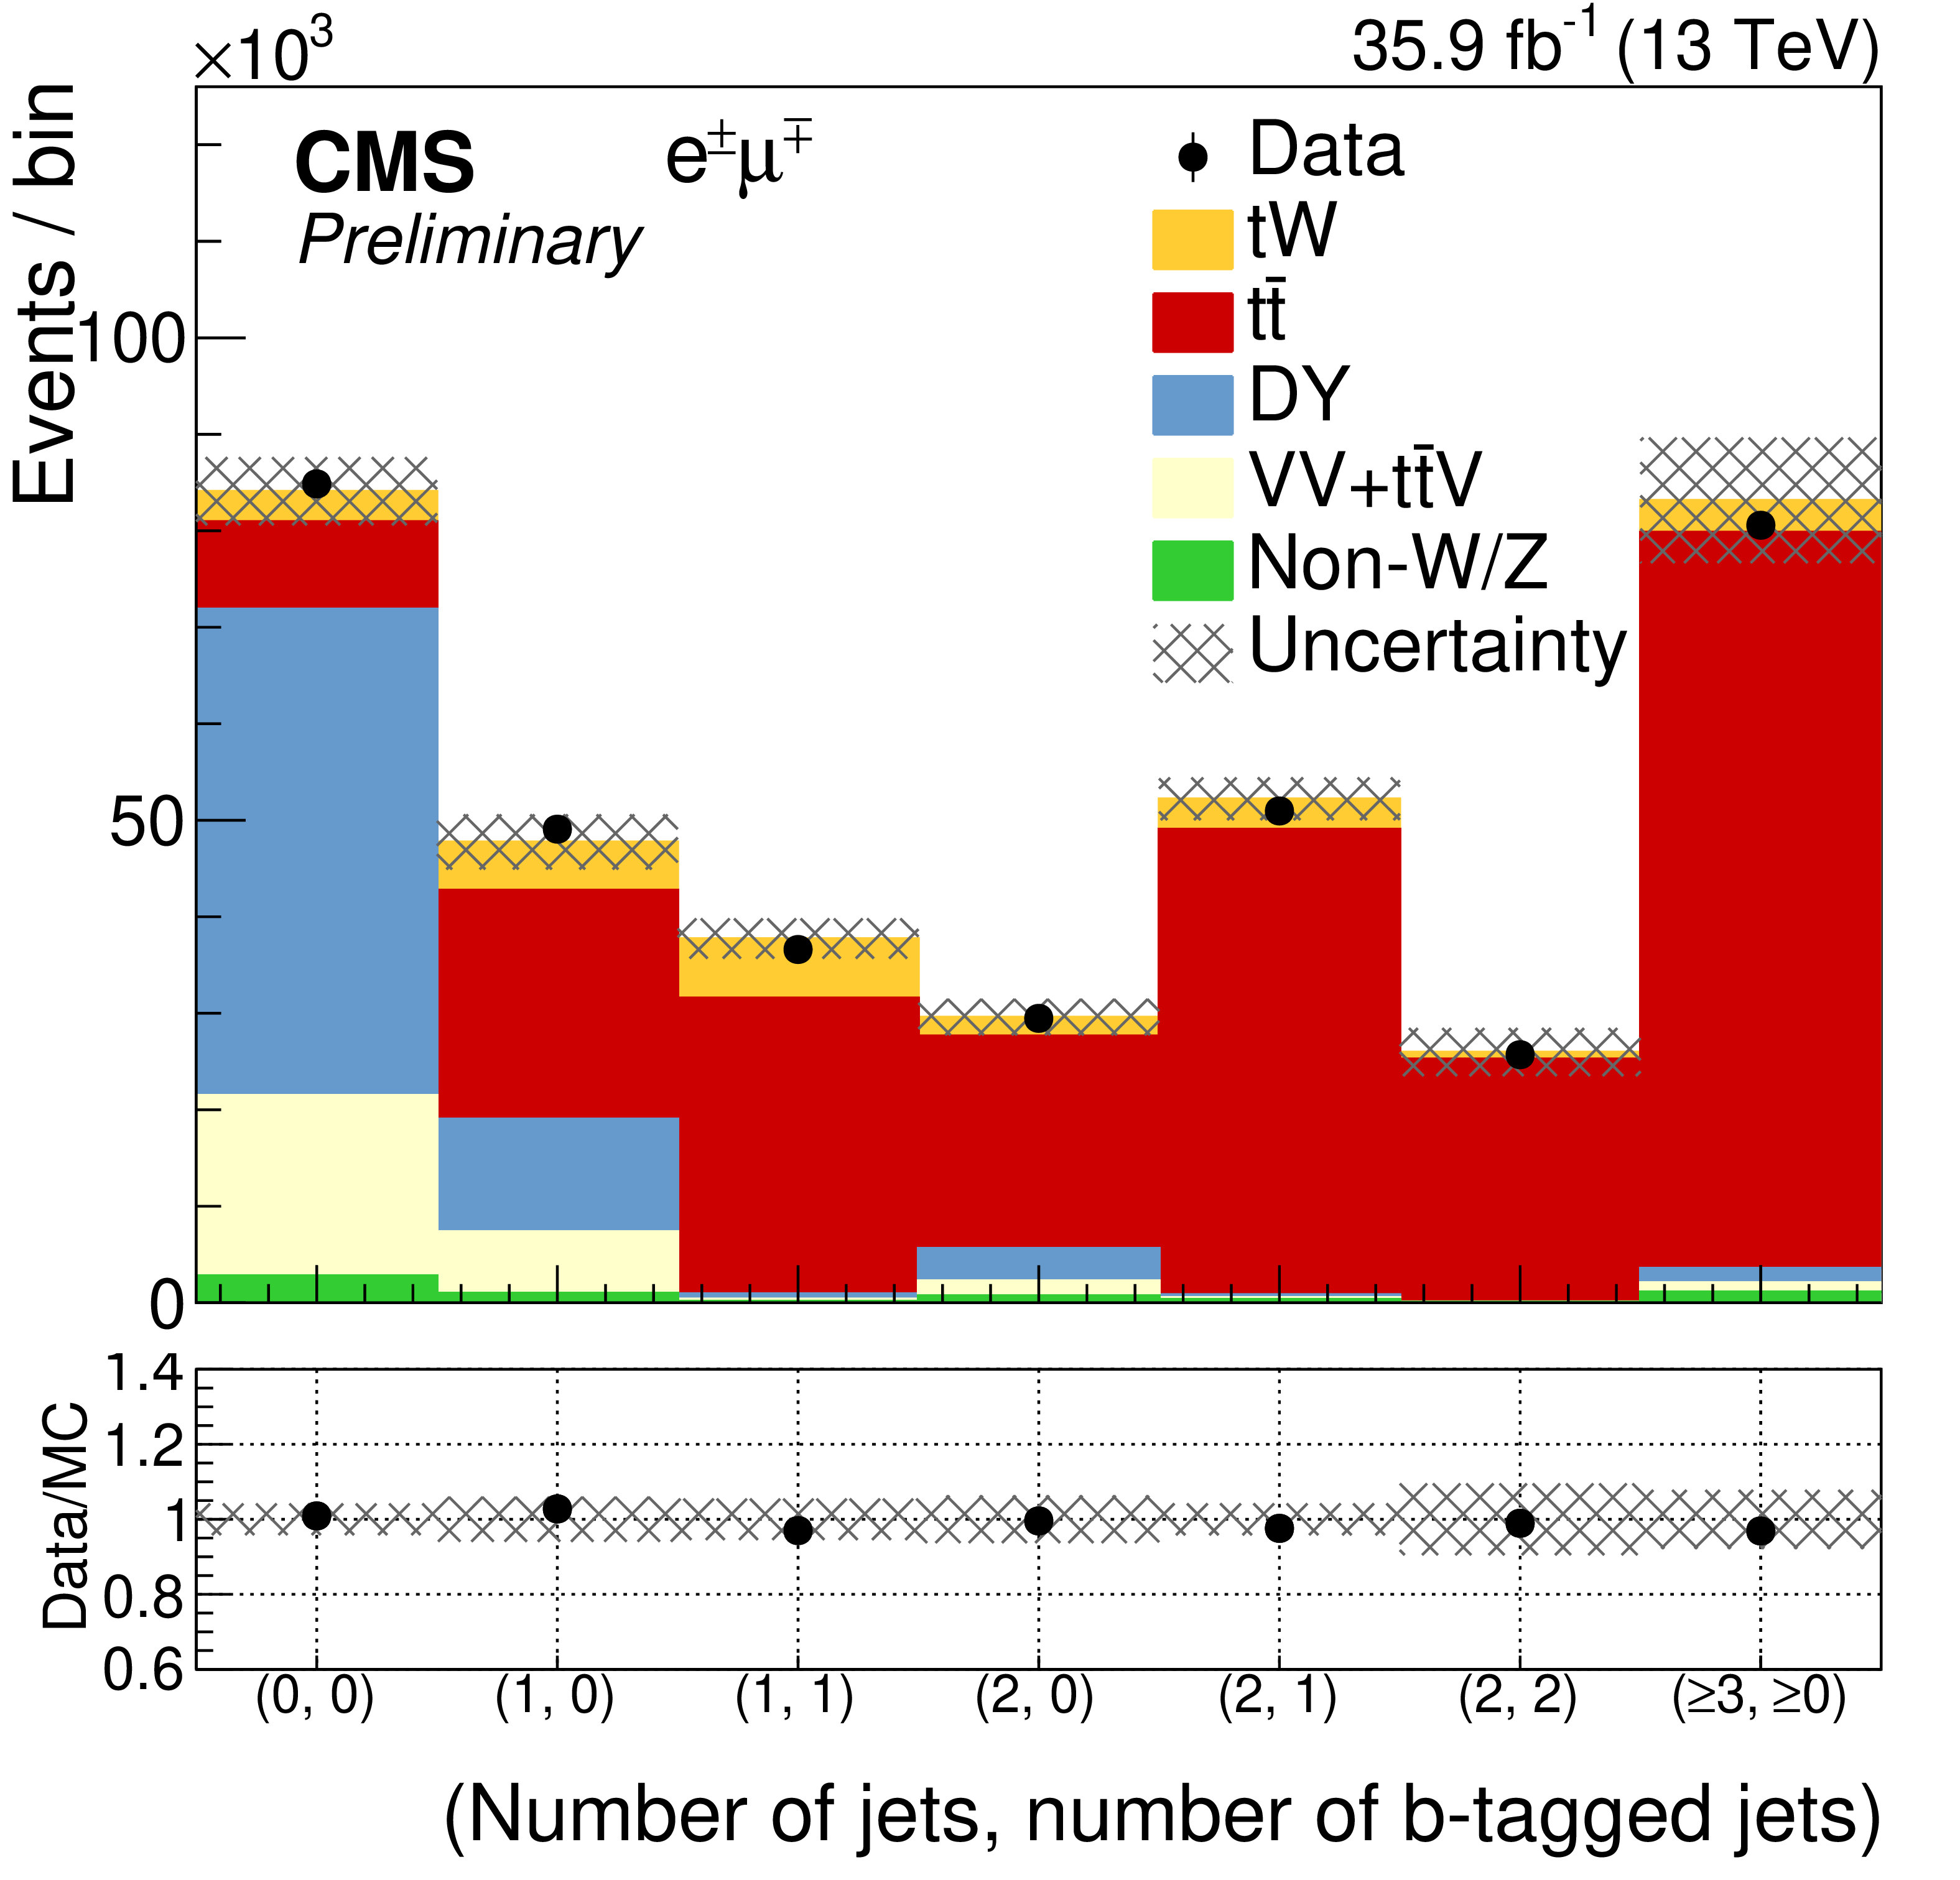
Figure 3-a:
Yields observed in data, compared with those expected from simulation, as a function of the number of jets and number of b-tagged jets for events passing the baseline dilepton selection. The error band includes the statistical and all systematic uncertainties, except those from background normalization. The bottom of the panel shows the ratio of data to the sum of the expected yields. |
png pdf |
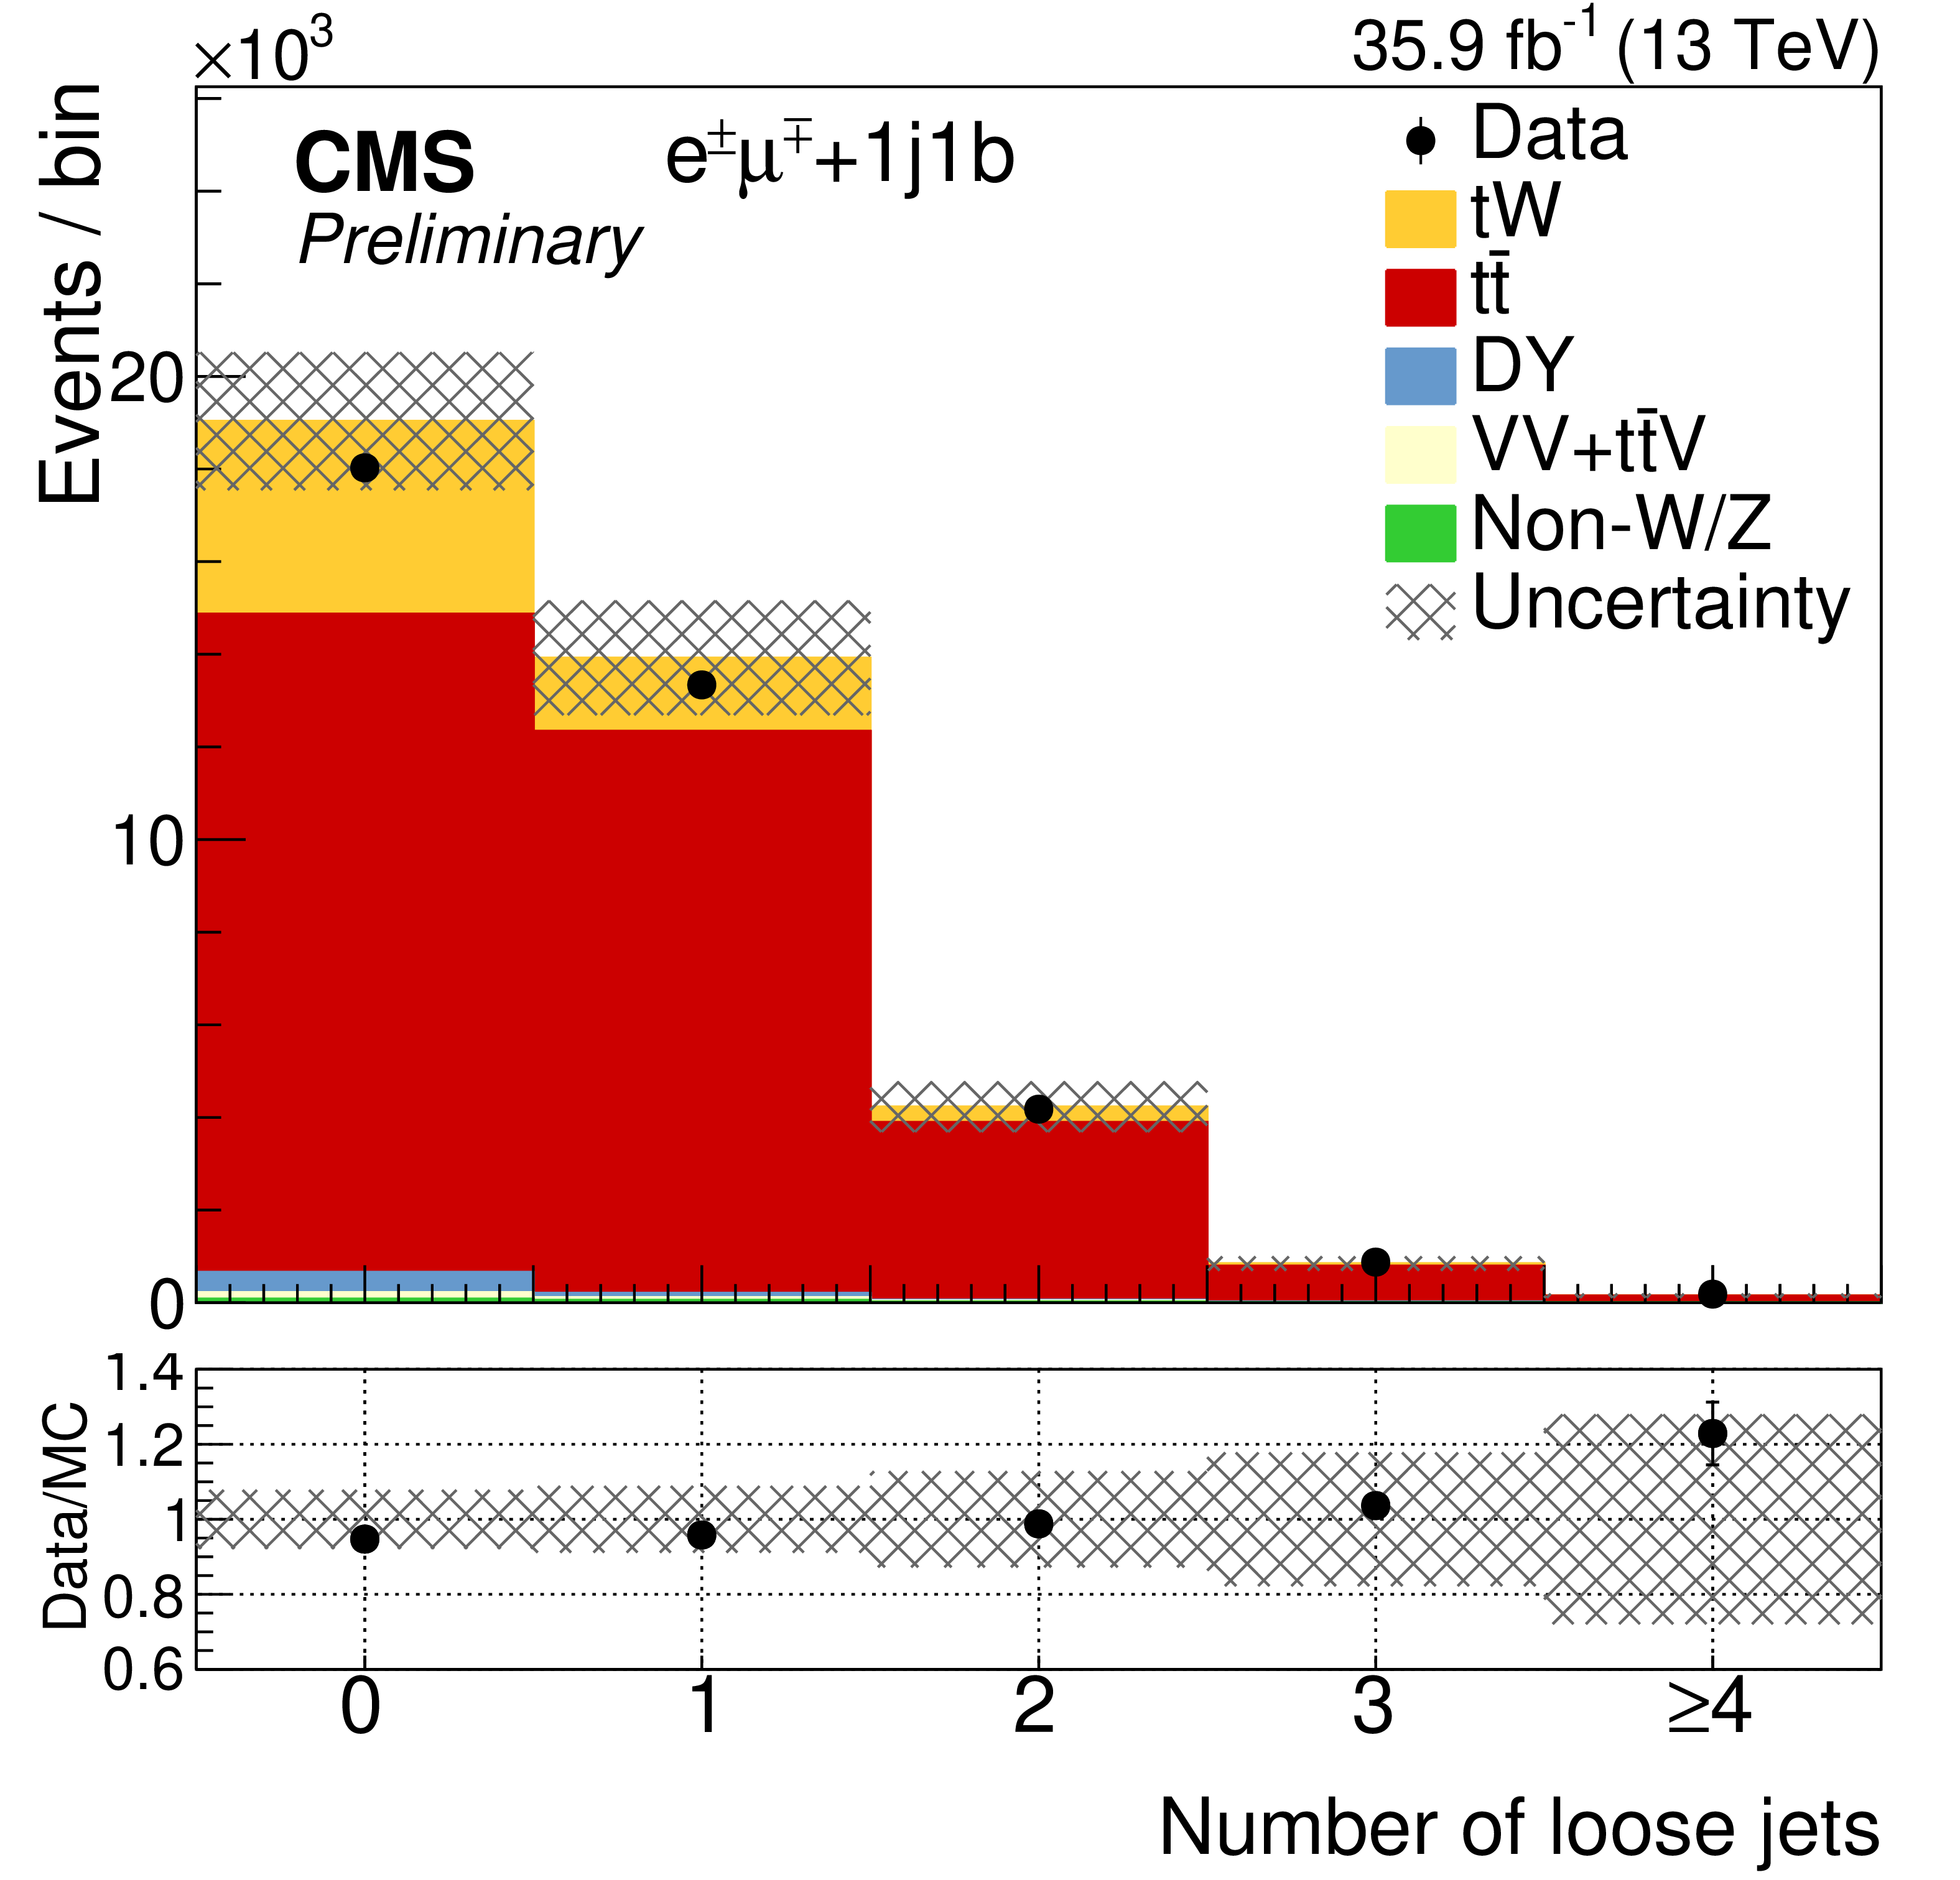
Figure 3-b:
Yields observed in data, compared with those expected from simulation, as a function of the number of loose jets for events passing the ${\mathrm{e^{\pm}} {\mu^{\mp}}}$ selection in the 1j1b region. The hatched band includes the statistical and all systematic uncertainties. The bottom of the panel shows the ratio of data to the sum of the expected yields. |

png pdf |
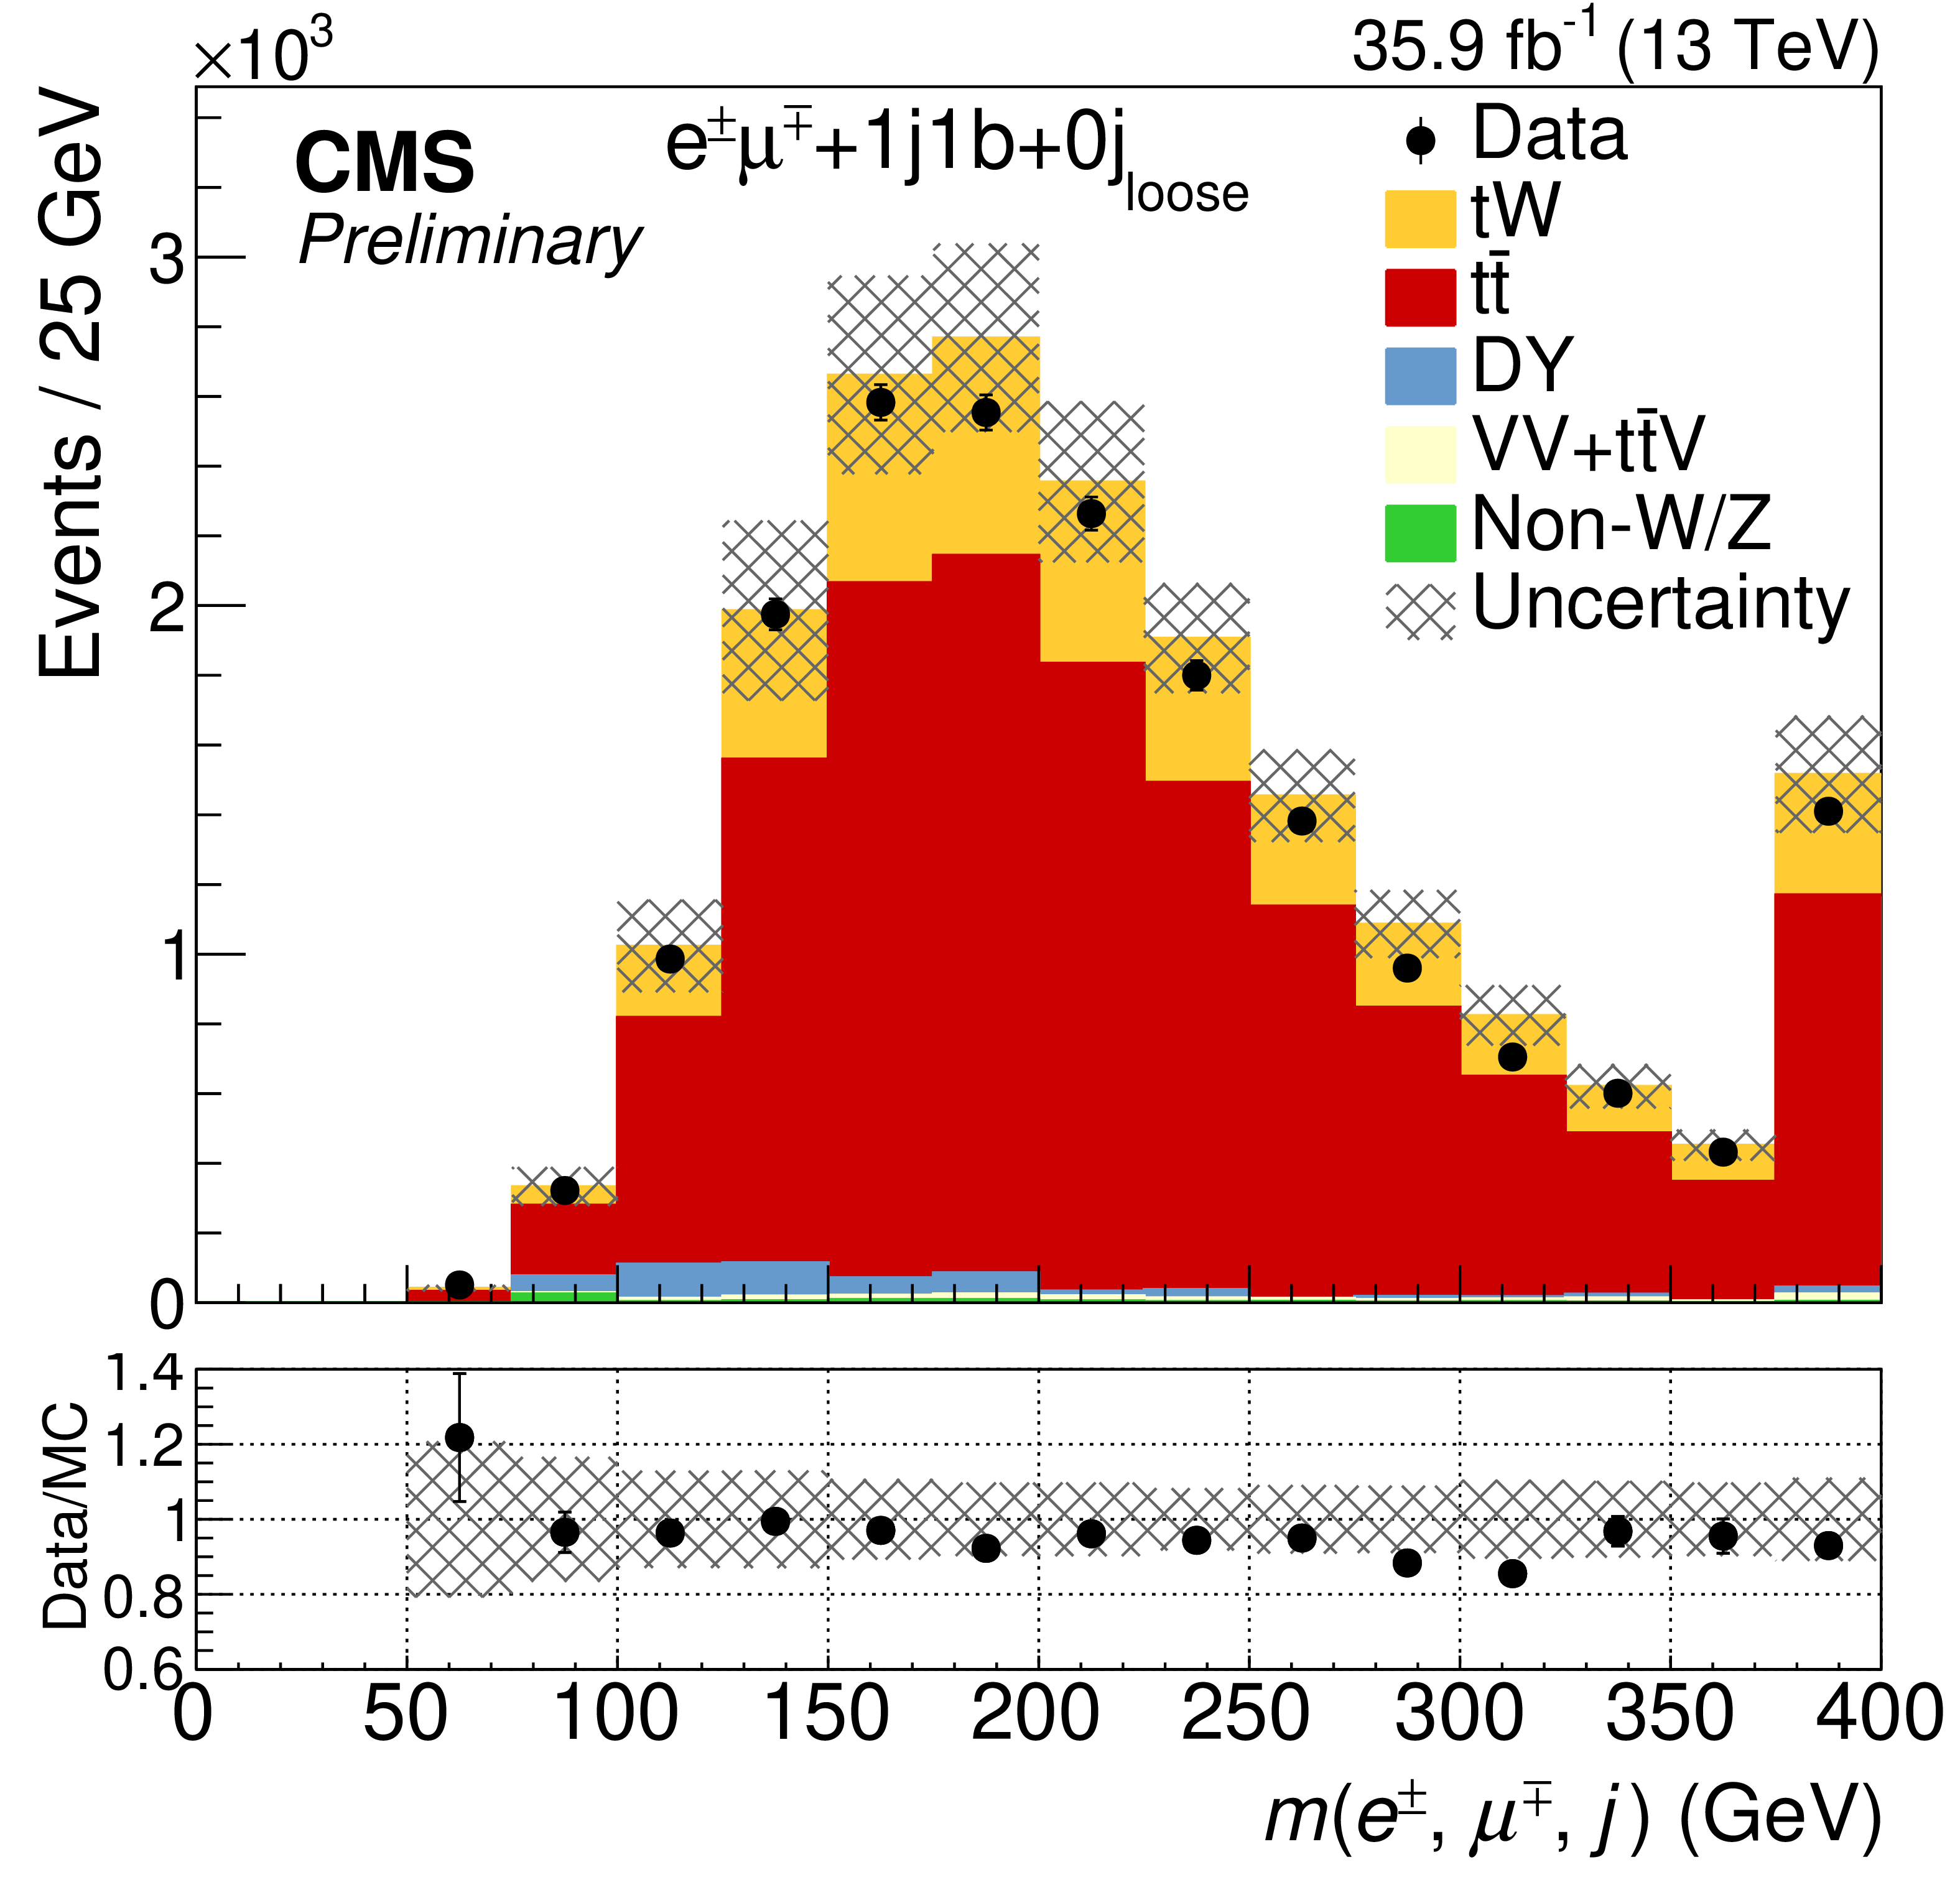
Figure 4:
Yields observed in data, compared with those expected from simulation, as a function of different observables for the selected events. The hatched bands include the statistical and all systematic uncertainties. The last bin of each contribution contains overflow events. The bottom of each panel shows the ratios of data to the sum of the expected yields. |

png pdf |
Figure 4-a:
Yields observed in data, compared with those expected from simulation, as a function of one of the observables for the selected events. The hatched bands include the statistical and all systematic uncertainties. The last bin contains overflow events. The bottom panel shows the ratio of data to the sum of the expected yields. |

png pdf |
Figure 4-b:
Yields observed in data, compared with those expected from simulation, as a function of one of the observables for the selected events. The hatched bands include the statistical and all systematic uncertainties. The last bin contains overflow events. The bottom panel shows the ratio of data to the sum of the expected yields. |

png pdf |
Figure 4-c:
Yields observed in data, compared with those expected from simulation, as a function of one of the observables for the selected events. The hatched bands include the statistical and all systematic uncertainties. The last bin contains overflow events. The bottom panel shows the ratio of data to the sum of the expected yields. |

png pdf |
Figure 4-d:
Yields observed in data, compared with those expected from simulation, as a function of one of the observables for the selected events. The hatched bands include the statistical and all systematic uncertainties. The last bin contains overflow events. The bottom panel shows the ratio of data to the sum of the expected yields. |
png pdf |
Figure 4-e:
Yields observed in data, compared with those expected from simulation, as a function of one of the observables for the selected events. The hatched bands include the statistical and all systematic uncertainties. The last bin contains overflow events. The bottom panel shows the ratio of data to the sum of the expected yields. |

png pdf |
Figure 4-f:
Yields observed in data, compared with those expected from simulation, as a function of one of the observables for the selected events. The hatched bands include the statistical and all systematic uncertainties. The last bin contains overflow events. The bottom panel shows the ratio of data to the sum of the expected yields. |

png pdf |
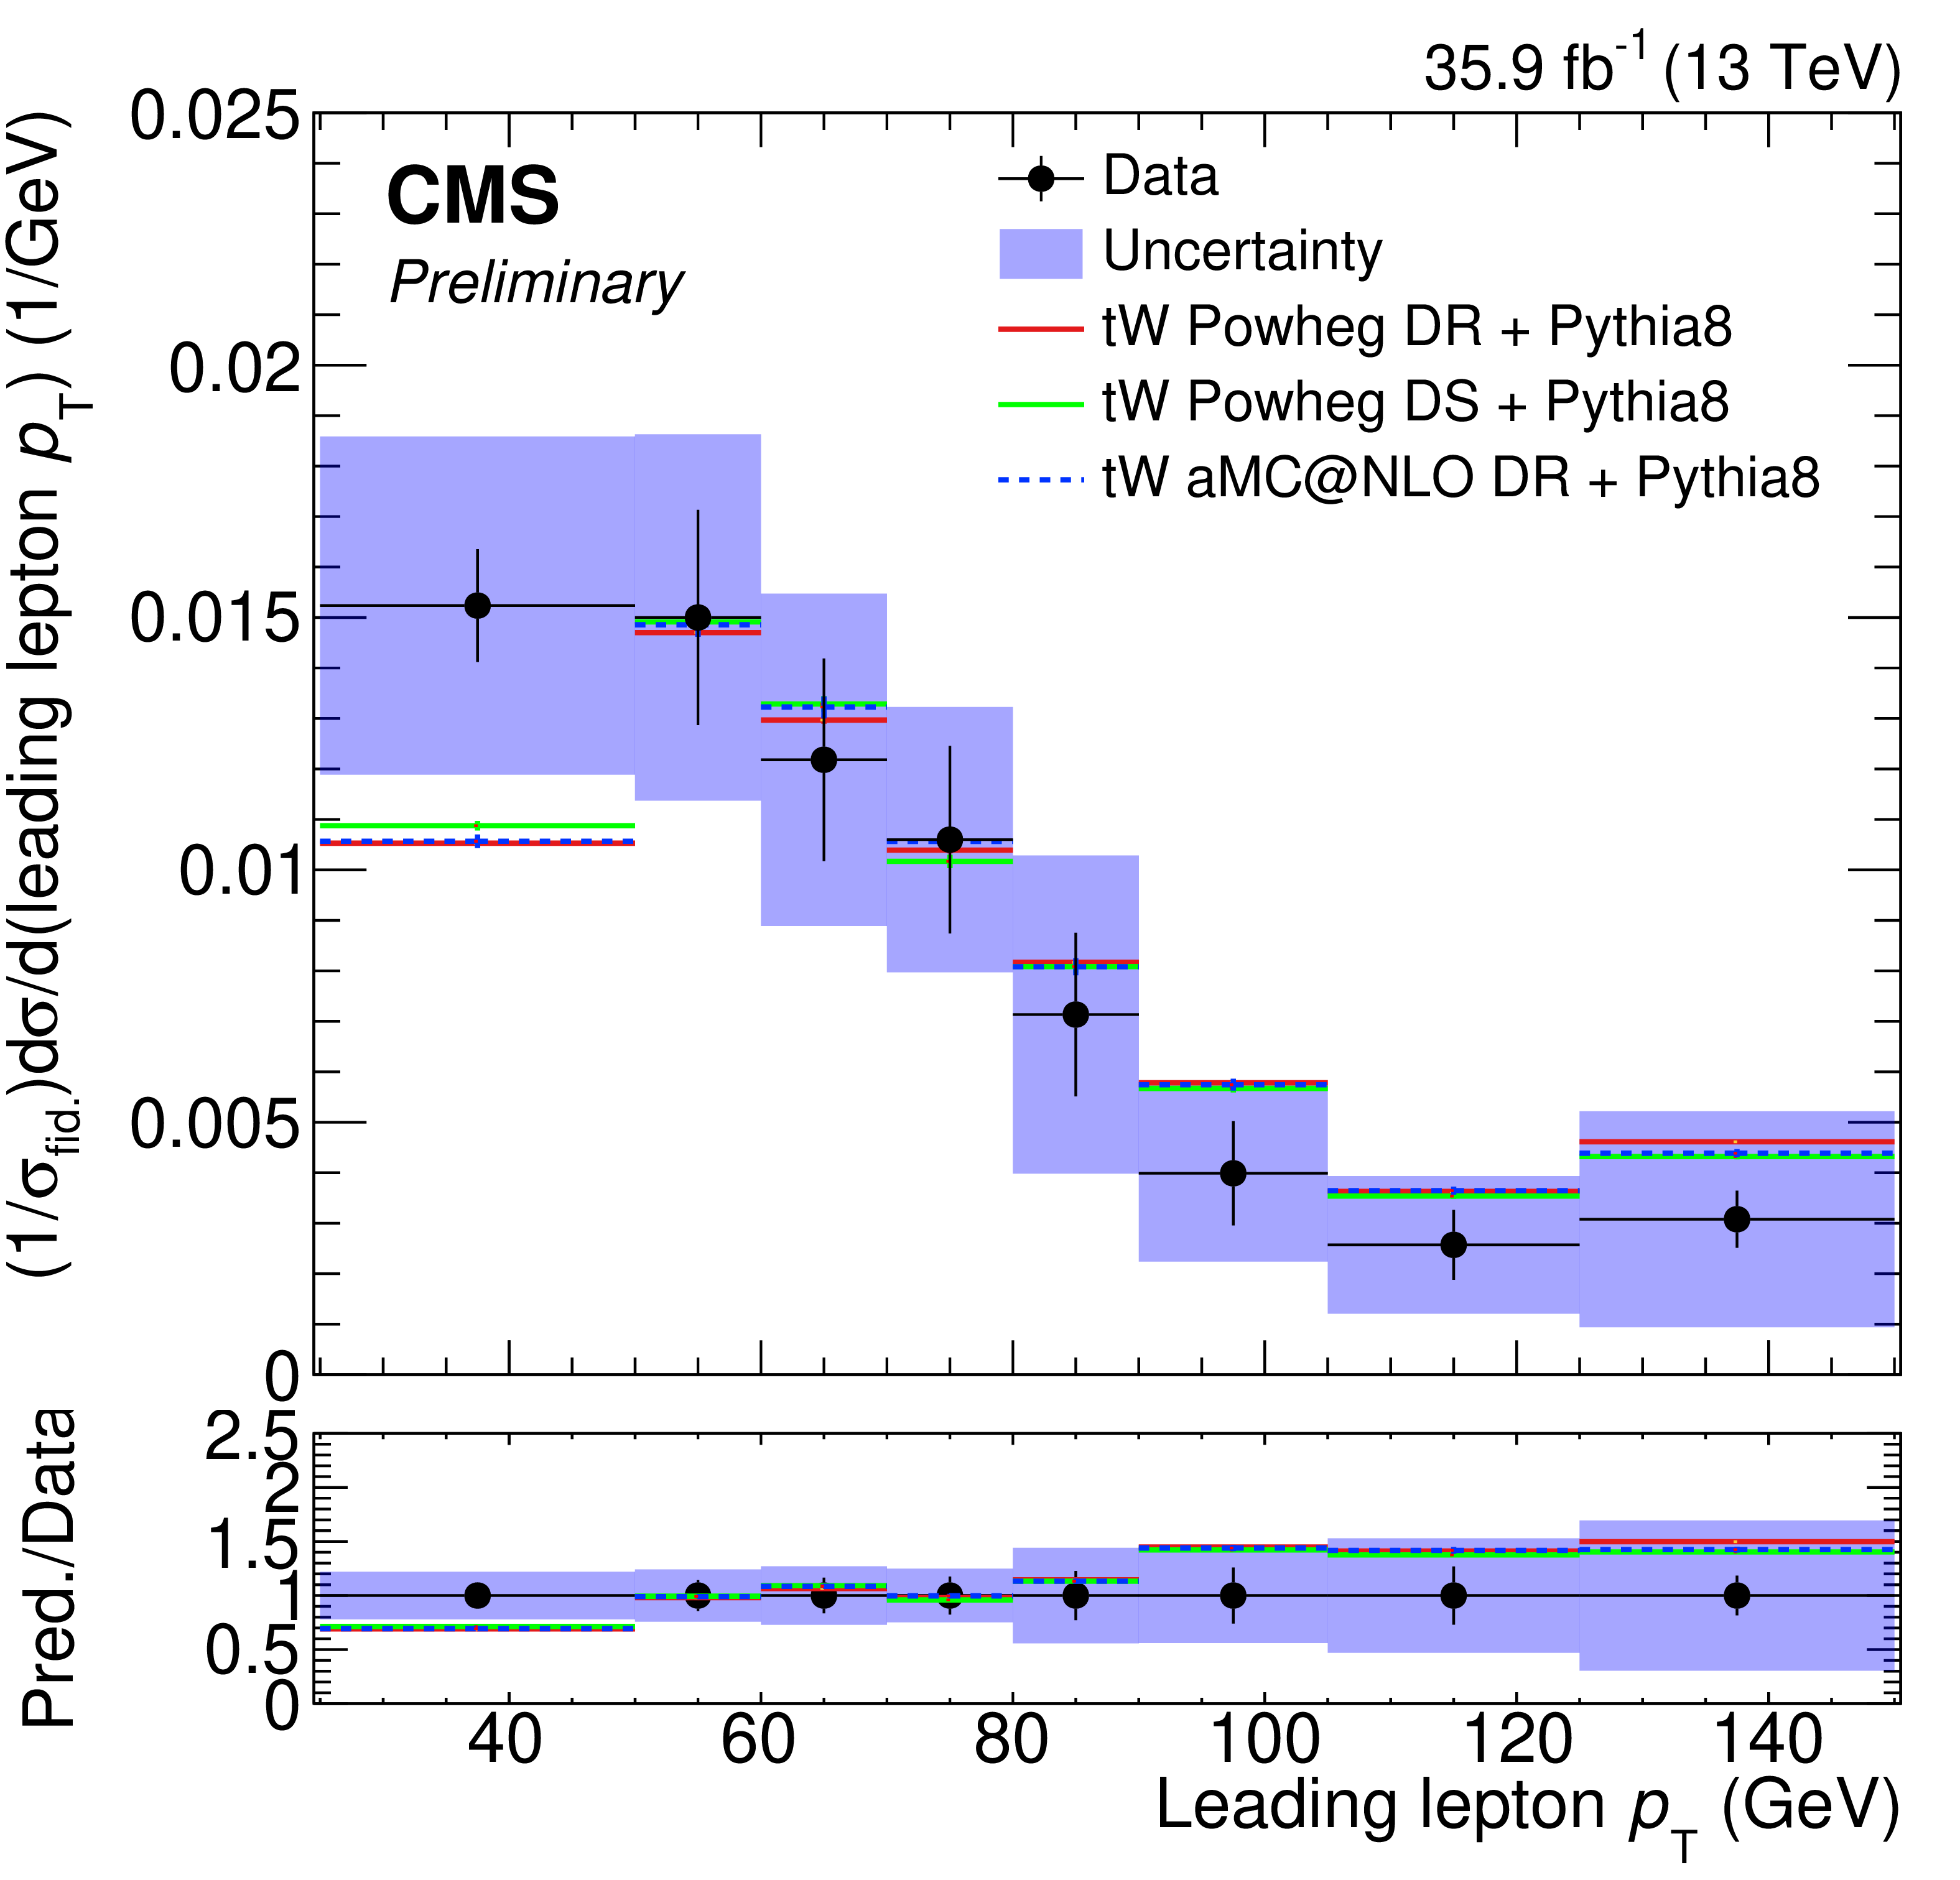
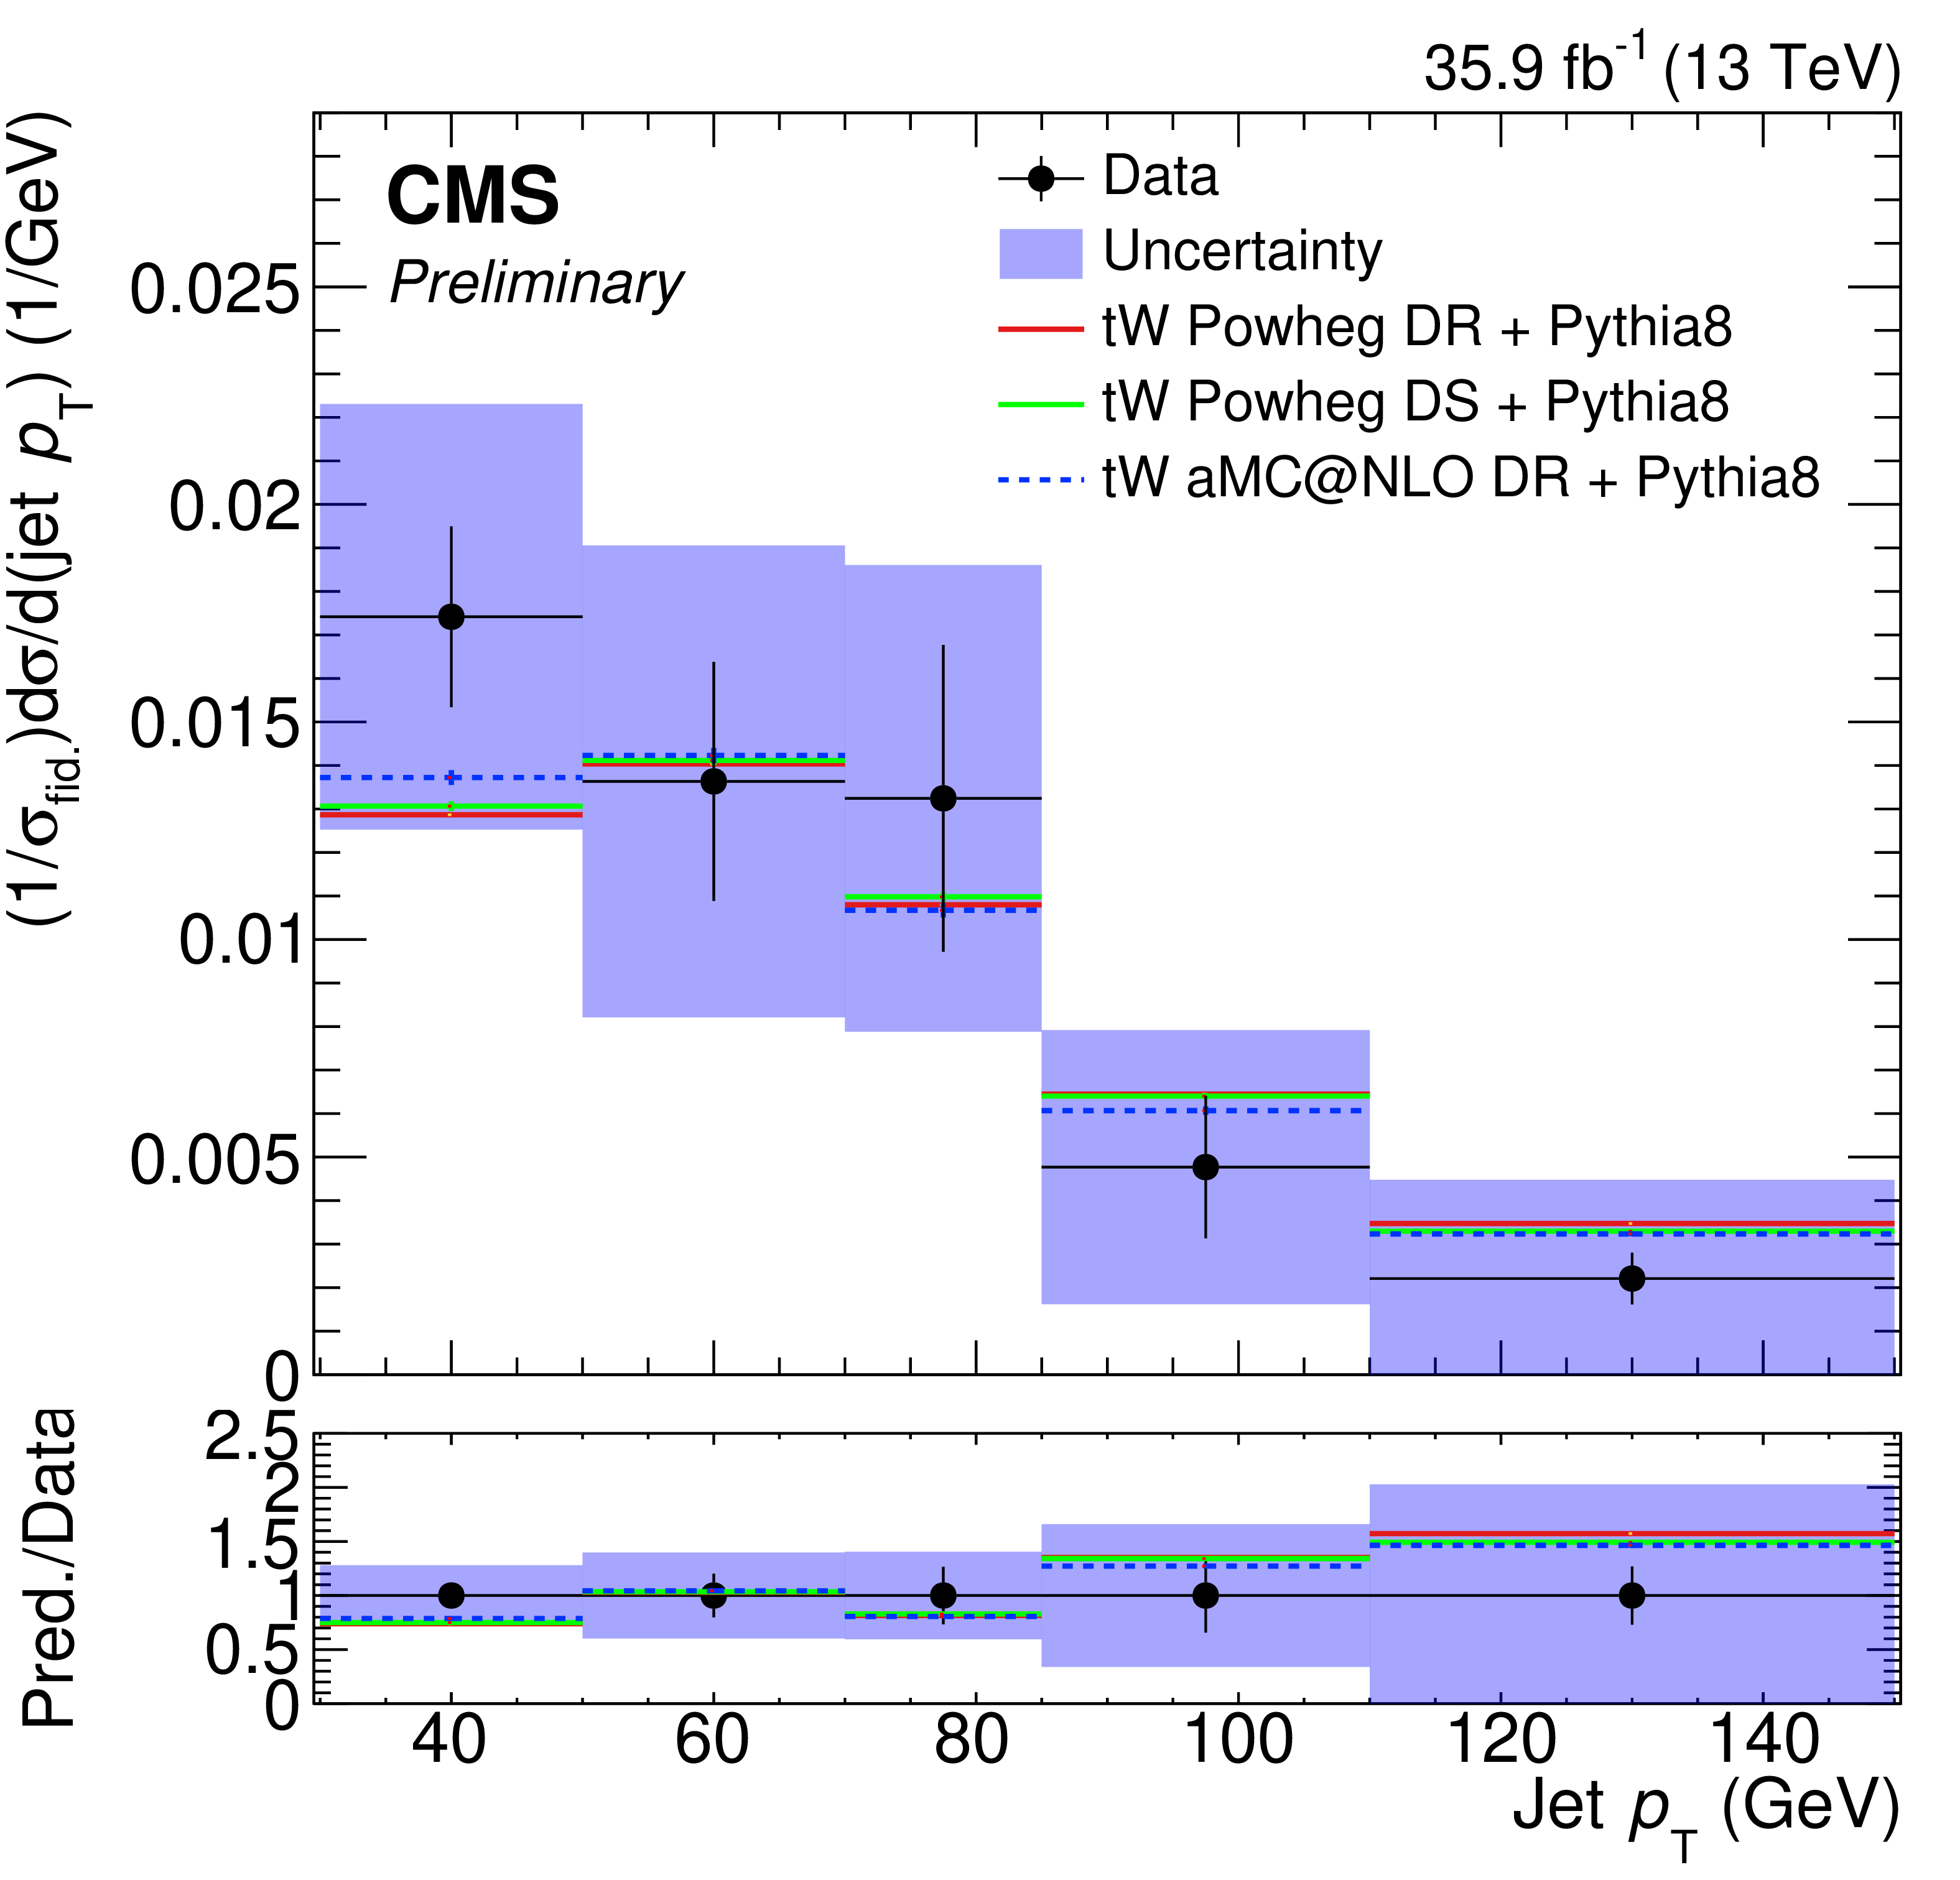
Figure 5:
Left: normalized differential tW production cross section as a function of the ${p_{\mathrm {T}}}$ of the leading lepton (top), ${p_{\mathrm {T}}}$ of the jet (middle) and ${\Delta \varphi (\mathrm{e^{\pm}}, {\mu^{\mp}})}$ (bottom). The solid band represents the total uncertainty. Predictions from POWHEG and MadGraph5_aMC@NLO are also shown. In the bottom panel, the ratio between predictions and data is shown. Right: total, systematic, statistical and individual leading (averaging over all bins) sources of uncertainty as a function of each observable. |
png pdf |
Figure 5-a:
Normalized differential tW production cross section as a function of the ${p_{\mathrm {T}}}$ of the leading lepton. The solid band represents the total uncertainty. Predictions from POWHEG and MadGraph5_aMC@NLO are also shown. In the bottom panel, the ratio between predictions and data is shown. |

png pdf |
Figure 5-b:
Total, systematic, statistical and individual leading (averaging over all bins) sources of uncertainty as a function of the ${p_{\mathrm {T}}}$ of the leading lepton. |
png pdf |
Figure 5-c:
Normalized differential tW production cross section as a function of ${p_{\mathrm {T}}}$ of the jet. The solid band represents the total uncertainty. Predictions from POWHEG and MadGraph5_aMC@NLO are also shown. In the bottom panel, the ratio between predictions and data is shown. |

png pdf |
Figure 5-d:
Total, systematic, statistical and individual leading (averaging over all bins) sources of uncertainty as a function of ${p_{\mathrm {T}}}$ of the jet. |

png pdf |
Figure 5-e:
Normalized differential tW production cross section as a function of ${\Delta \varphi (\mathrm{e^{\pm}}, {\mu^{\mp}})}$. The solid band represents the total uncertainty. Predictions from POWHEG and MadGraph5_aMC@NLO are also shown. In the bottom panel, the ratio between predictions and data is shown. |

png pdf |
Figure 5-f:
Total, systematic, statistical and individual leading (averaging over all bins) sources of uncertainty as a function of ${\Delta \varphi (\mathrm{e^{\pm}}, {\mu^{\mp}})}$. |
png pdf |
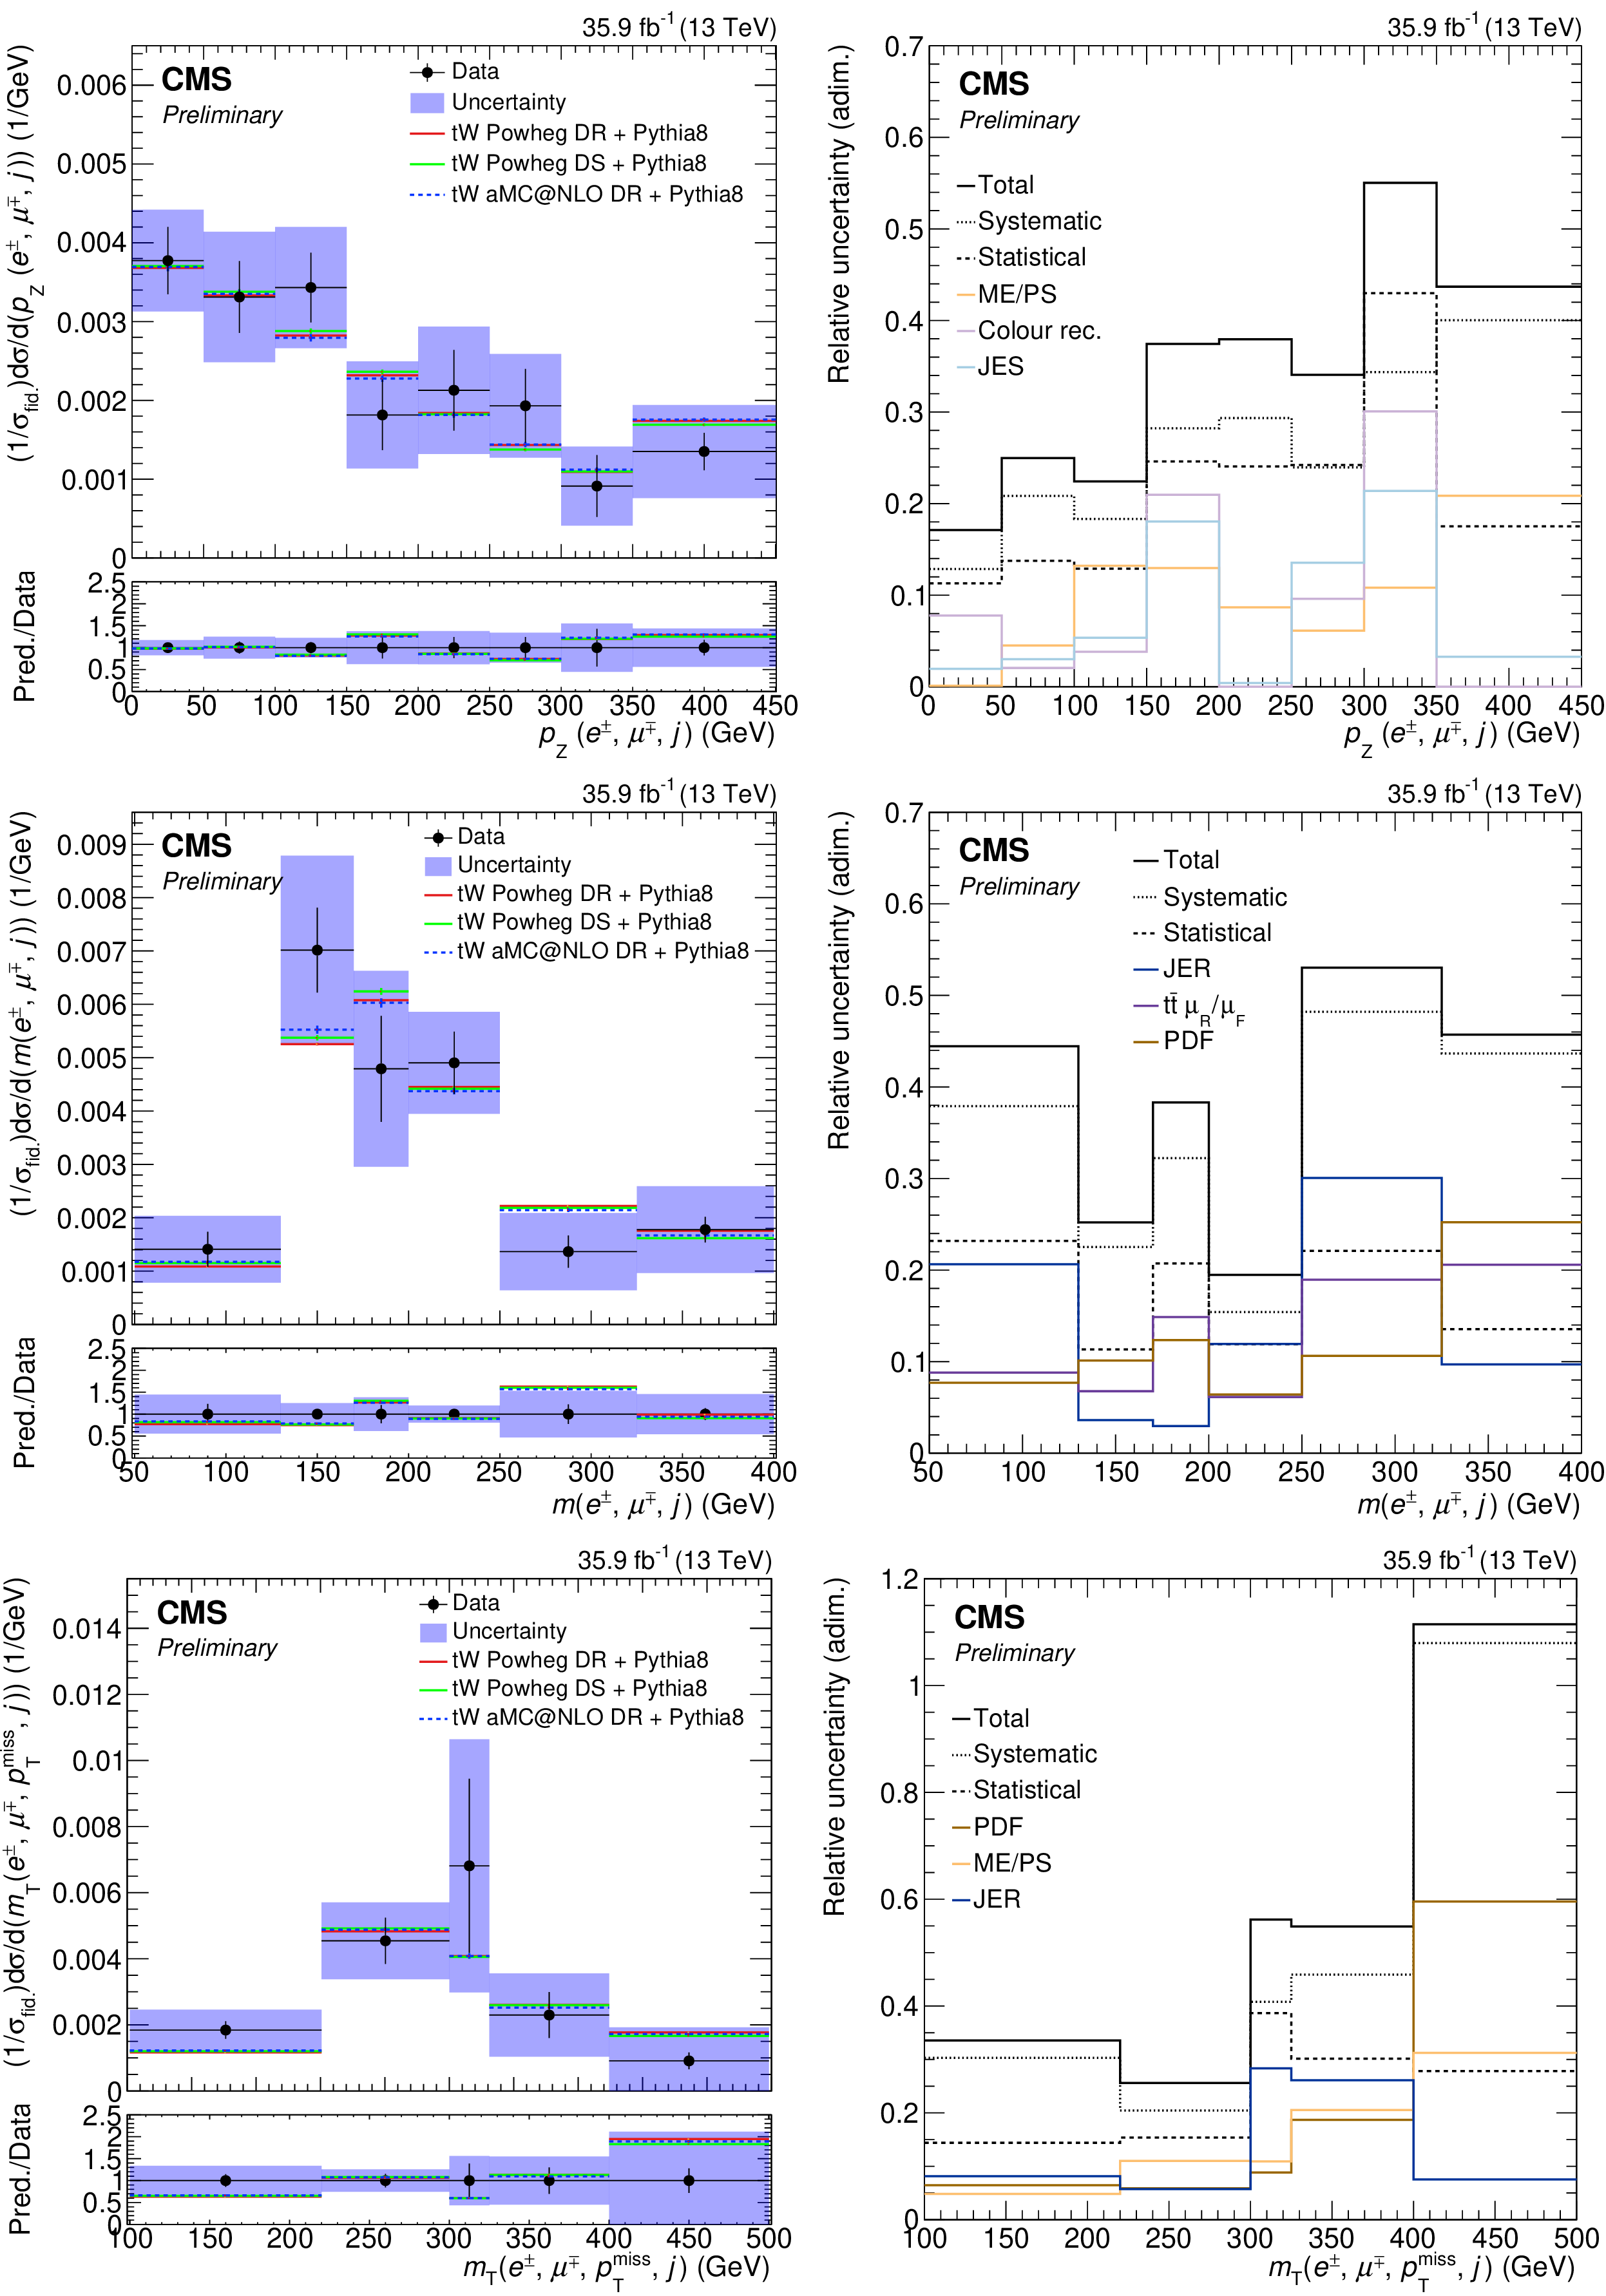
Figure 6:
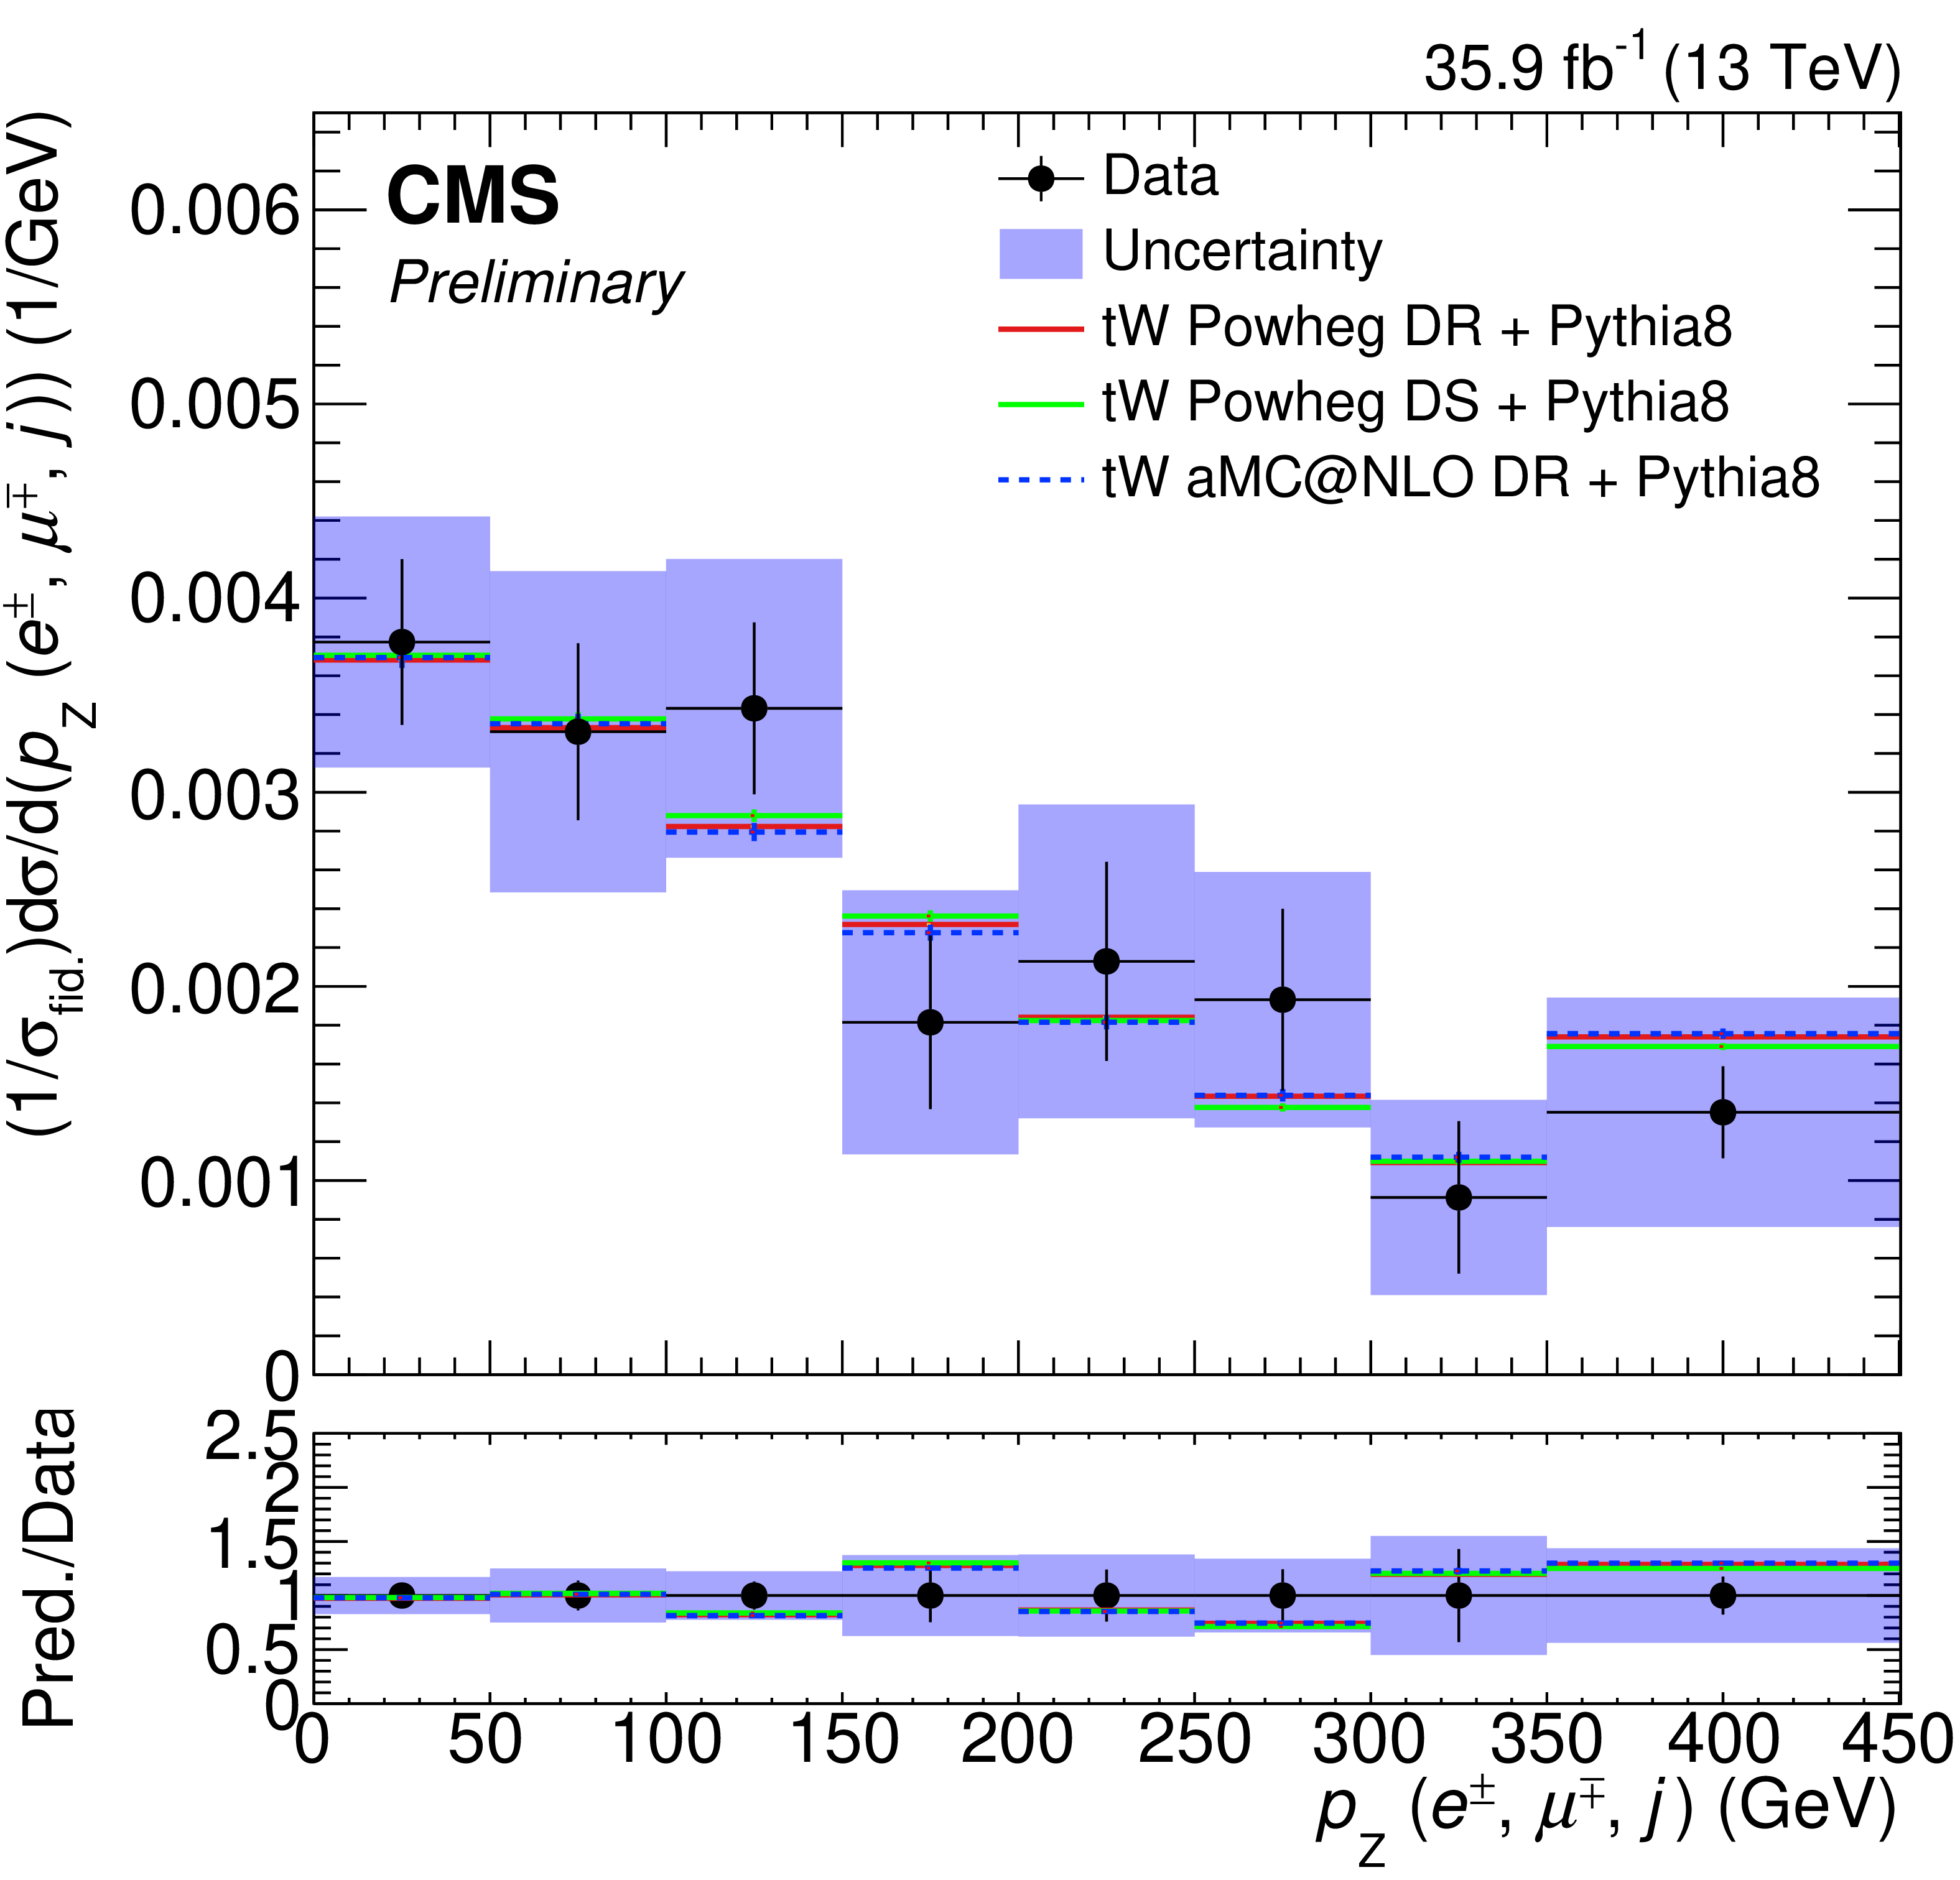
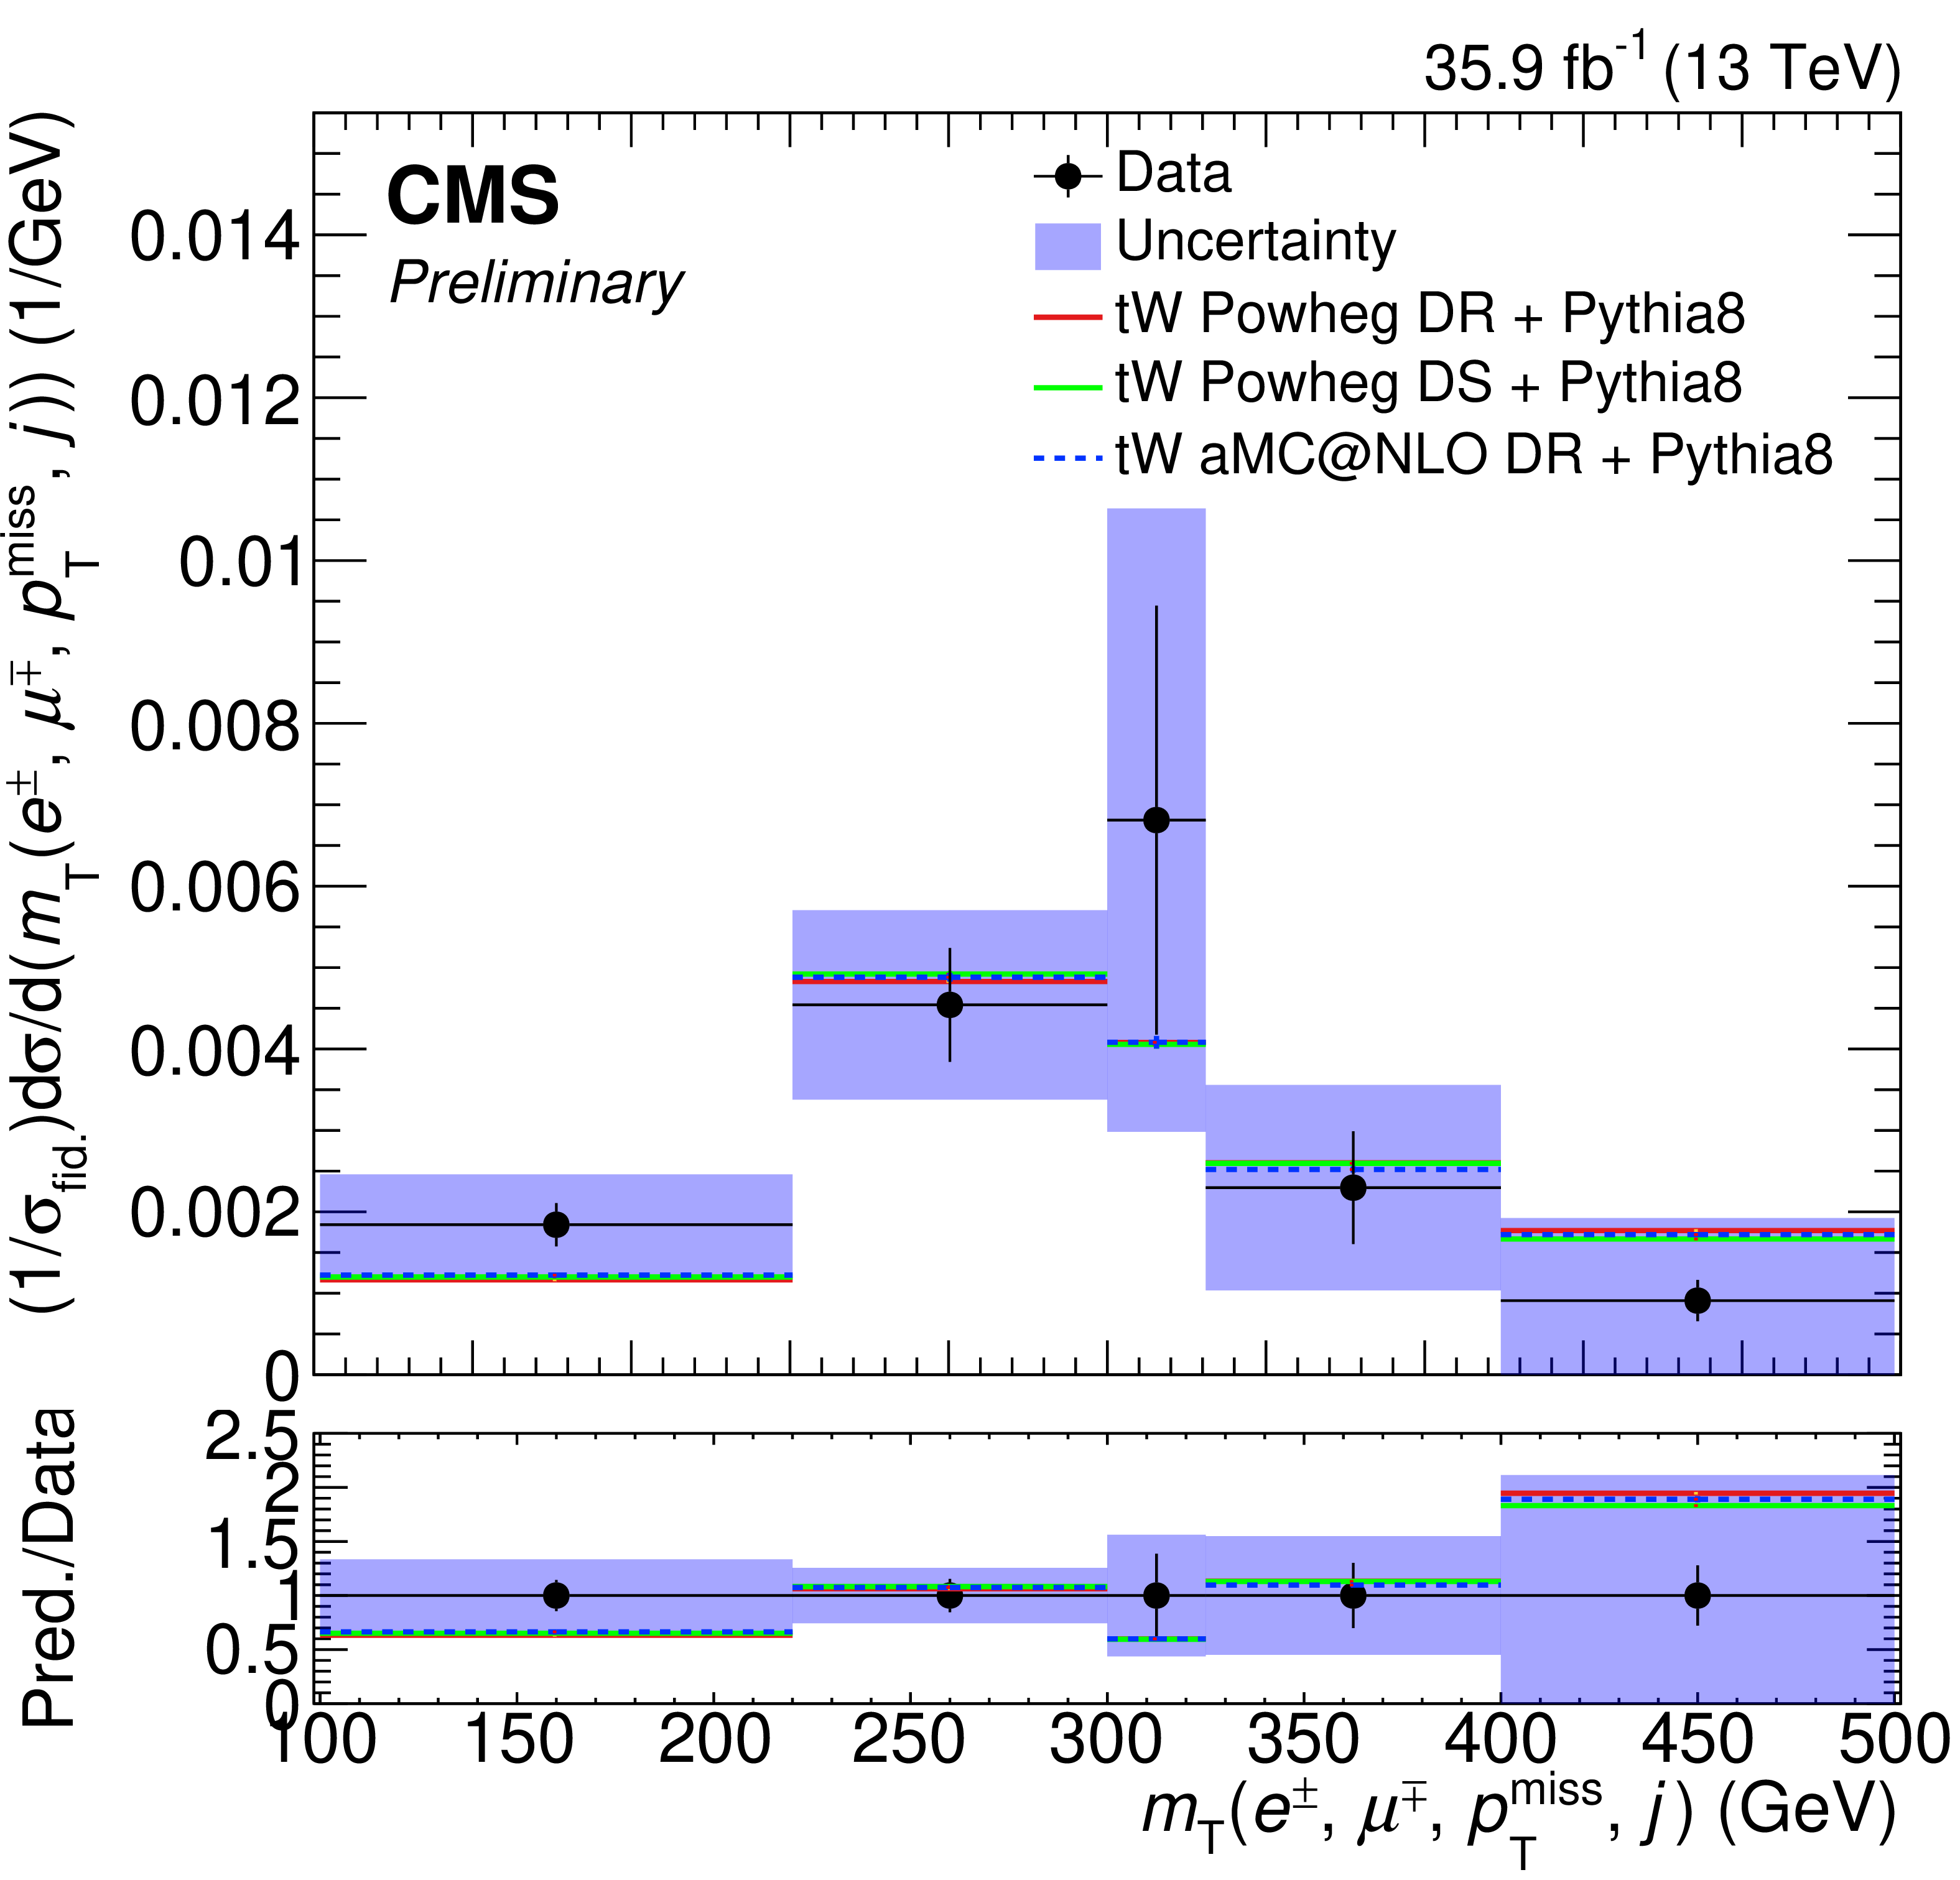
Left: normalized differential tW production cross section as a function of ${p_\text {Z}(\mathrm{e^{\pm}}, {\mu^{\mp}}, j)}$ (top), ${m(\mathrm{e^{\pm}}, {\mu^{\mp}},j)}$ (middle) and ${m_{\text {T}}(\mathrm{e^{\pm}}, {\mu^{\mp}},j, {{p_{\mathrm {T}}} ^\text {miss}})}$ (bottom). The solid band represents the total uncertainty. Predictions from POWHEG and MadGraph5_aMC@NLO are also shown. In the bottom panel, the ratio between predictions and data is shown. Right: total, systematic, statistical and individual leading (averaging over all bins) sources of uncertainty as a function of each observable. |
png pdf |
Figure 6-a:
Normalized differential tW production cross section as a function of ${p_\text {Z}(\mathrm{e^{\pm}}, {\mu^{\mp}}, j)}$. The solid band represents the total uncertainty. Predictions from POWHEG and MadGraph5_aMC@NLO are also shown. In the bottom panel, the ratio between predictions and data is shown. |

png pdf |
Figure 6-b:
Total, systematic, statistical and individual leading (averaging over all bins) sources of uncertainty as a function of ${p_\text {Z}(\mathrm{e^{\pm}}, {\mu^{\mp}}, j)}$. |

png pdf |
Figure 6-c:
Normalized differential tW production cross section as a function of ${m(\mathrm{e^{\pm}}, {\mu^{\mp}},j)}$. The solid band represents the total uncertainty. Predictions from POWHEG and MadGraph5_aMC@NLO are also shown. In the bottom panel, the ratio between predictions and data is shown. |

png pdf |
Figure 6-d:
Total, systematic, statistical and individual leading (averaging over all bins) sources of uncertainty as a function of ${m(\mathrm{e^{\pm}}, {\mu^{\mp}},j)}$. |
png pdf |
Figure 6-e:
Normalized differential tW production cross section as a function of ${m_{\text {T}}(\mathrm{e^{\pm}}, {\mu^{\mp}},j, {{p_{\mathrm {T}}} ^\text {miss}})}$. The solid band represents the total uncertainty. Predictions from POWHEG and MadGraph5_aMC@NLO are also shown. In the bottom panel, the ratio between predictions and data is shown. |

png pdf |
Figure 6-f:
Total, systematic, statistical and individual leading (averaging over all bins) sources of uncertainty as a function of ${m_{\text {T}}(\mathrm{e^{\pm}}, {\mu^{\mp}},j, {{p_{\mathrm {T}}} ^\text {miss}})}$. |
| Tables | |

png pdf |
Table 1:
Definition of the fiducial region. |

png pdf |
Table 2:
Selection requirements of particle-level objects. |
| Summary |
| The measurement of the normalized differential cross section of the production of a top quark in association with a W boson using 35.9 fb$^{-1}$ of data recorded by CMS has been presented for a final state containing an electron and a muon. The measurements are made as a function of various properties of the event: the transverse momentum of the leading lepton, the transverse momentum of the jet; the difference in the $\varphi$ angle of the muon and the electron; the longitudinal momentum of the muon, the electron and the jet; the invariant mass of the muon, electron and the jet; and the transverse mass of the electron, the muon, the jet, and the missing transverse momentum. The main sources of uncertainty, both in the jet reconstruction and the theoretical modeling, are driven by the overwhelming $ \mathrm{t\bar{t}}$ background. The results obtained are, in general, consistent with the expectations from the two models used for the modeling of the tW signal, POWHEG and MadGraph5+MCatNLO. |
| References | ||||
| 1 | D0 Collaboration | Observation of single top quark production | PRL 103 (2009) 092001 | 0903.0850 |
| 2 | CDF Collaboration | First observation of electroweak single top quark production | PRL 103 (2009) 092002 | 0903.0885 |
| 3 | S. Frixione et al. | Single-top hadroproduction in association with a W boson | JHEP 07 (2008) 029 | 0805.3067 |
| 4 | A. S. Belyaev, E. E. Boos, and L. V. Dudko | Single top quark at future hadron colliders: Complete signal and background study | PRD 59 (1999) 075001 | hep-ph/9806332 |
| 5 | C. D. White, S. Frixione, E. Laenen, and F. Maltoni | Isolating Wt production at the LHC | JHEP 11 (2009) 074 | 0908.0631 |
| 6 | T. M. P. Tait and C. P. Yuan | Single top quark production as a window to physics beyond the standard model | PRD 63 (2000) 014018 | hep-ph/0007298 |
| 7 | Q.-H. Cao, J. Wudka, and C. P. Yuan | Search for new physics via single top production at the LHC | PLB 658 (2007) 50 | 0704.2809 |
| 8 | V. Barger, M. McCaskey, and G. Shaughnessy | Single top and Higgs associated production at the LHC | PRD 81 (2010) 034020 | 0911.1556 |
| 9 | N. Kidonakis | Theoretical results for electroweak-boson and single-top production | in Proceedings, 23rd International Workshop on Deep-Inelastic Scattering and Related Subjects (DIS 2015), Dallas, 2015 | 1506.04072 |
| 10 | CMS Collaboration | Evidence for associated production of a single top quark and W boson in pp collisions at $ \sqrt{s} = $ 7 TeV | PRL 110 (2013) 022003 | CMS-TOP-11-022 1209.3489 |
| 11 | ATLAS Collaboration | Evidence for the associated production of a $ W $ boson and a top quark in ATLAS at $ \sqrt{s}= $ 7 TeV | PLB 716 (2012) 142 | 1205.5764 |
| 12 | CMS Collaboration | Observation of the associated production of a single top quark and a $ W $ boson in pp collisions at $ \sqrt s = $ 8 TeV | PRL 112 (2014) 231802 | CMS-TOP-12-040 1401.2942 |
| 13 | ATLAS Collaboration | Measurement of the production cross-section of a single top quark in association with a $ W $ boson at 8 TeV with the ATLAS experiment | JHEP 01 (2016) 064 | 1510.03752 |
| 14 | CMS Collaboration | Measurement of the production cross section for single top quarks in association with W bosons in proton-proton collisions at $ \sqrt{s}= $ 13 TeV | JHEP 10 (2018) 117 | CMS-TOP-17-018 1805.07399 |
| 15 | ATLAS Collaboration | Measurement of the cross-section for producing a W boson in association with a single top quark in pp collisions at $ \sqrt{s}= $ 13 TeV with ATLAS | JHEP 01 (2018) 063 | 1612.07231 |
| 16 | ATLAS Collaboration | Measurement of differential cross-sections of a single top quark produced in association with a $ W $ boson at $ \sqrt{s}= $ 13 TeV with ATLAS | EPJC 78 (2018) 186 | 1712.01602 |
| 17 | E. Re | Single-top Wt-channel production matched with parton showers using the POWHEG method | EPJC 71 (2011) 1547 | 1009.2450 |
| 18 | NNPDF Collaboration | Parton distributions for the LHC Run II | JHEP 04 (2015) 040 | 1410.8849 |
| 19 | T. Sjostrand et al. | An introduction to PYTHIA 8.2 | CPC 191 (2015) 159 | 1410.3012 |
| 20 | T. M. P. Tait | $ t{W}^- $ mode of single top quark production | PRD 61 (1999) 034001 | |
| 21 | J. Alwall et al. | The automated computation of tree-level and next-to-leading order differential cross sections, and their matching to parton shower simulations | JHEP 07 (2014) 079 | 1405.0301 |
| 22 | S. Alioli, P. Nason, C. Oleari, and E. Re | A general framework for implementing NLO calculations in shower Monte Carlo programs: the POWHEG BOX | JHEP 06 (2010) 043 | 1002.2581 |
| 23 | R. Frederix and S. Frixione | Merging meets matching in MC@NLO | JHEP 12 (2012) 061 | 1209.6215 |
| 24 | CMS Collaboration | Event generator tunes obtained from underlying event and multiparton scattering measurements | EPJC 76 (2016) 155 | CMS-GEN-14-001 1512.00815 |
| 25 | P. Skands, S. Carrazza, and J. Rojo | Tuning PYTHIA 8.1: the Monash 2013 Tune | EPJC 74 (2014) 3024 | 1404.5630 |
| 26 | CMS Collaboration | Investigations of the impact of the parton shower tuning in Pythia 8 in the modelling of $ \mathrm{t\overline{t}} $ at $ \sqrt{s}= $ 8 and 13 TeV | CMS-PAS-TOP-16-021 | CMS-PAS-TOP-16-021 |
| 27 | Y. Li and F. Petriello | Combining QCD and electroweak corrections to dilepton production in the framework of the FEWZ simulation code | PRD 86 (2012) 094034 | 1208.5967 |
| 28 | J. M. Campbell, R. K. Ellis, and C. Williams | Vector boson pair production at the LHC | JHEP 07 (2011) 018 | 1105.0020 |
| 29 | M. Czakon, P. Fiedler, and A. Mitov | Total top-quark pair-production cross section at hadron colliders through o($ \alpha_s^4 $) | PRL 110 (2013) 252004 | 1303.6254 |
| 30 | M. Czakon and A. Mitov | Top++: A program for the calculation of the top-pair cross-section at hadron colliders | CPC 185 (2014) 2930 | 1112.5675 |
| 31 | CMS Collaboration | Measurement of normalized differential $ \mathrm{t}\overline{\mathrm{t}} $ cross sections in the dilepton channel from pp collisions at $ \sqrt{s}= $ 13 TeV | JHEP 04 (2018) 060 | CMS-TOP-16-007 1708.07638 |
| 32 | CMS Collaboration | Measurement of differential cross sections for top quark pair production using the lepton+jets final state in proton-proton collisions at 13 TeV | PRD 95 (2017) 092001 | CMS-TOP-16-008 1610.04191 |
| 33 | CMS Collaboration | Measurement of the differential cross section for $ \mathrm{t \bar t} $ production in the dilepton final state at $ \sqrt{s}= $ 13 TeV | CMS-PAS-TOP-16-011 | CMS-PAS-TOP-16-011 |
| 34 | CMS Collaboration | Measurement of the differential cross section for top quark pair production in pp collisions at $ \sqrt{s} = $ 8 TeV | EPJC 75 (2015) 542 | CMS-TOP-12-028 1505.04480 |
| 35 | CMS Collaboration | Measurement of the $ \mathrm{t}\overline{{\mathrm{t}}} $ production cross section in the all-jets final state in pp collisions at $ \sqrt{s}= $ 8 TeV | EPJC 76 (2016) 128 | CMS-TOP-14-018 1509.06076 |
| 36 | CMS Collaboration | Particle-flow reconstruction and global event description with the CMS detector | JINST 12 (2017) P10003 | CMS-PRF-14-001 1706.04965 |
| 37 | CMS Collaboration | Performance of electron reconstruction and selection with the CMS detector in proton-proton collisions at $ \sqrt{s} = $ 8 TeV | JINST 10 (2015) P06005 | CMS-EGM-13-001 1502.02701 |
| 38 | CMS Collaboration | Performance of the CMS muon detector and muon reconstruction with proton-proton collisions at $ \sqrt{s}= $ 13 TeV | JINST 13 (2018) P06015 | CMS-MUO-16-001 1804.04528 |
| 39 | M. Cacciari, G. P. Salam, and G. Soyez | The anti-$ {k_{\mathrm{T}}} $ jet clustering algorithm | JHEP 04 (2008) 063 | 0802.1189 |
| 40 | M. Cacciari, G. P. Salam, and G. Soyez | FastJet user manual | EPJC 72 (2012) 1896 | 1111.6097 |
| 41 | CMS Collaboration | Jet algorithms performance in 13 TeV data | CMS-PAS-JME-16-003 | CMS-PAS-JME-16-003 |
| 42 | CMS Collaboration | Performance of missing energy reconstruction in $ \sqrt{s}= $ 13 TeV pp collision data using the CMS detector | CMS-PAS-JME-16-004 | CMS-PAS-JME-16-004 |
| 43 | CMS Collaboration | Identification of heavy-flavour jets with the CMS detector in pp collisions at 13 TeV | JINST 13 (2018) P05011 | CMS-BTV-16-002 1712.07158 |
| 44 | S. Schmitt | TUnfold: an algorithm for correcting migration effects in high energy physics | JINST 7 (2012) T10003 | 1205.6201 |
| 45 | CMS Collaboration | Object definitions for top quark analyses at the particle level | CDS | |
| 46 | ATLAS Collaboration | Measurement of the inelastic proton-proton cross section at $ \sqrt{s} = $ 13 TeV with the ATLAS detector at the LHC | PRL 117 (2016) 182002 | 1606.02625 |
| 47 | CMS Collaboration | CMS luminosity measurements for the 2016 data taking period | CMS-PAS-LUM-17-001 | CMS-PAS-LUM-17-001 |
| 48 | J. R. Christiansen and P. Z. Skands | String formation beyond leading colour | JHEP 08 (2015) 003 | 1505.01681 |
| 49 | S. Argyropoulos and T. Sjostrand | Effects of color reconnection on $ \rm{t\bar{t}} $ final states at the LHC | JHEP 11 (2014) 043 | 1407.6653 |
| 50 | CMS Collaboration | Measurement of the top quark mass using proton-proton data at $ \sqrt{s} = $ 7 and 8 TeV | PRD 93 (2016) 072004 | CMS-TOP-14-022 1509.04044 |
| 51 | CMS Collaboration | Measurement of the $ \mathrm{t}\overline{\mathrm{t}} $ production cross section, the top quark mass, and the strong coupling constant using dilepton events in pp collisions at $ \sqrt{s} = $ 13 TeV | EPJC 79 (2019) 368 | CMS-TOP-17-001 1812.10505 |
|
|
Compact Muon Solenoid LHC, CERN |
|

|

|

|

|

|