

Compact Muon Solenoid
LHC, CERN
| CMS-B2G-16-024 ; CERN-EP-2017-107 | ||
| Search for pair production of vector-like T and B quarks in single-lepton final states using boosted jet substructure techniques at $\sqrt{s} = $ 13 TeV | ||
| CMS Collaboration | ||
| 12 June 2017 | ||
| JHEP 11 (2017) 085 | ||
| Abstract: A search for pair production of massive vector-like T and B quarks in proton-proton collisions at $\sqrt{s} = $ 13 TeV is presented. The data set was collected in 2015 by the CMS experiment at the LHC and corresponds to an integrated luminosity of up to 2.6 fb$^{-1}$. The T and B quarks are assumed to decay through three possible channels into a heavy boson (either a W, Z or Higgs boson) and a third generation quark. This search is performed in final states with one charged lepton and several jets, exploiting techniques to identify W or Higgs bosons decaying hadronically with large transverse momenta. No excess over the predicted standard model background is observed. Upper limits at 95% confidence level on the T quark pair production cross section are set that exclude T quark masses below 860 GeV in the singlet, and below 830 GeV in the doublet branching fraction scenario. For other branching fraction combinations with $\mathcal{B}(\mathrm{ t }\mathrm{ H }) + \mathcal{B}(\mathrm{ b }\mathrm{ W }) \geq $ 0.4, lower limits on the T quark range from 790 to 940 GeV. Limits are also set on pair production of singlet vector-like B quarks, which can be excluded up to a mass of 730 GeV. These limits are among the most stringent to date for vector-like T quarks. The techniques showcased here for understanding highly-boosted final states are important as the sensitivity to new particles is extended to higher masses. | ||
| Links: e-print arXiv:1706.03408 [hep-ex] (PDF) ; CDS record ; inSPIRE record ; CADI line (restricted) ; | ||
| Figures | |
png pdf |
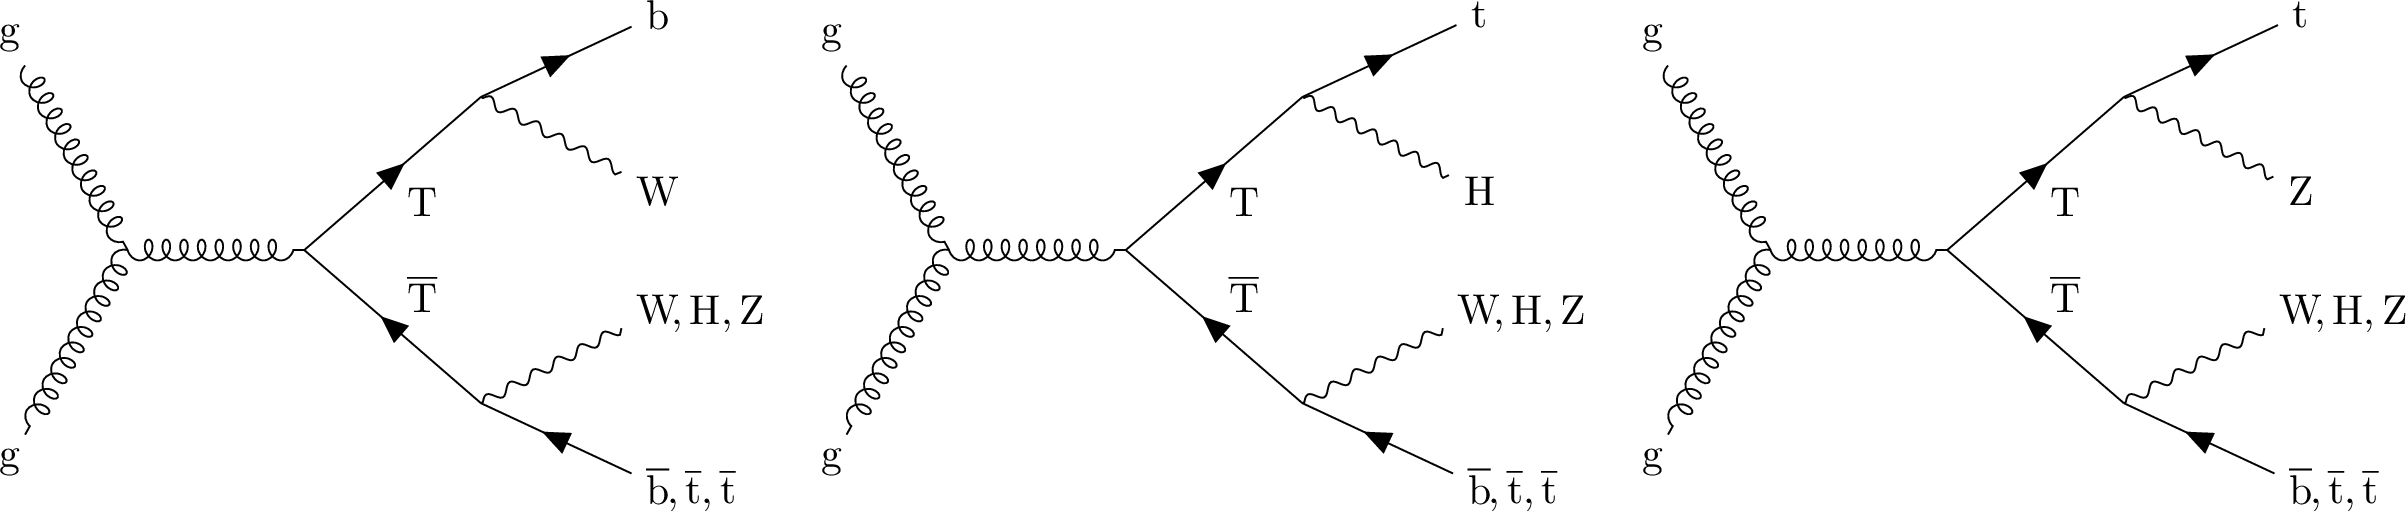
Figure 1:
Examples of leading-order Feynman diagrams showing production of a $ { {\mathrm {T}} {\overline {\mathrm {T}}} } $ pair with the T quark decaying to bW (left), tH (middle), and tZ (right). |
png pdf |
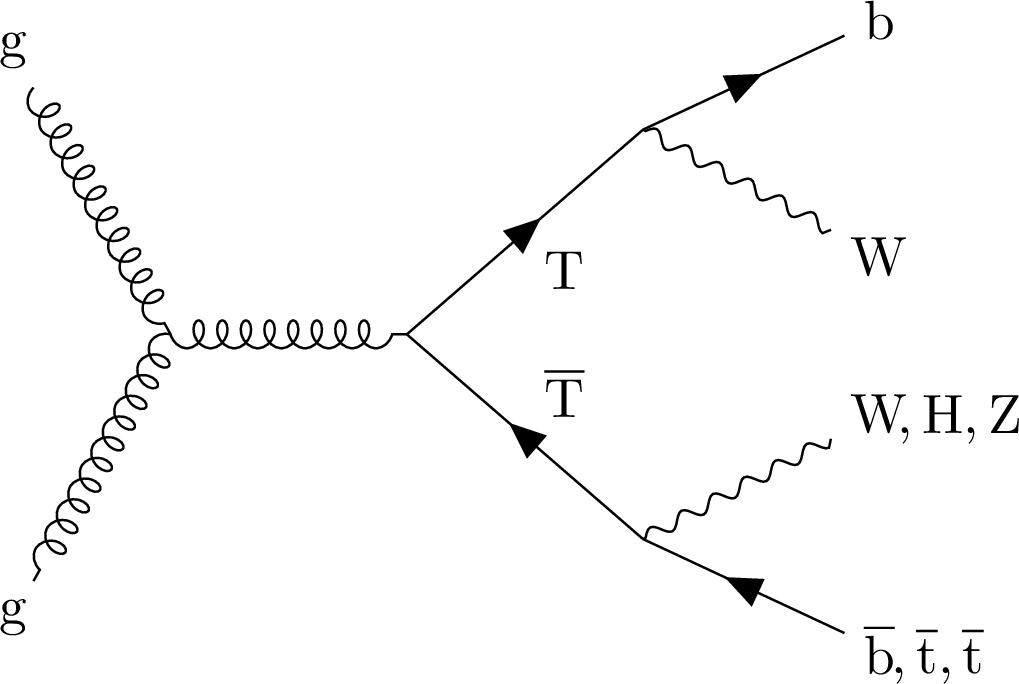
Figure 1-a:
Example of leading-order Feynman diagram showing production of a $ { {\mathrm {T}} {\overline {\mathrm {T}}} } $ pair with the T quark decaying to bW. |
png pdf |
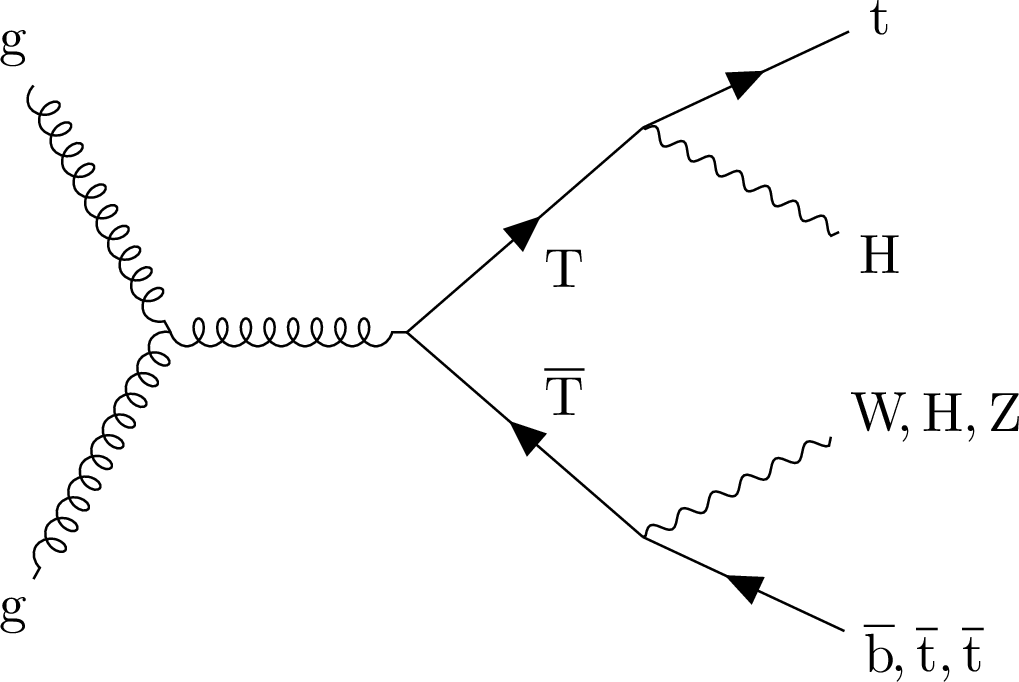
Figure 1-b:
Example of leading-order Feynman diagram showing production of a $ { {\mathrm {T}} {\overline {\mathrm {T}}} } $ pair with the T quark decaying to tH. |
png pdf |
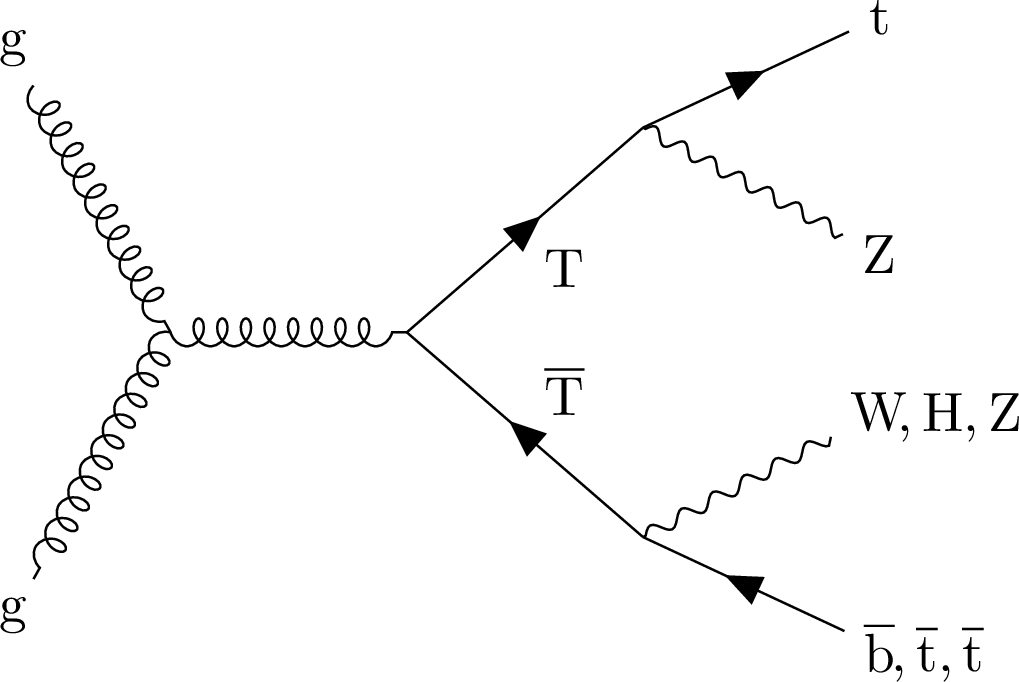
Figure 1-c:
Example of leading-order Feynman diagram showing production of a $ { {\mathrm {T}} {\overline {\mathrm {T}}} } $ pair with the T quark decaying to tZ. |
png pdf |
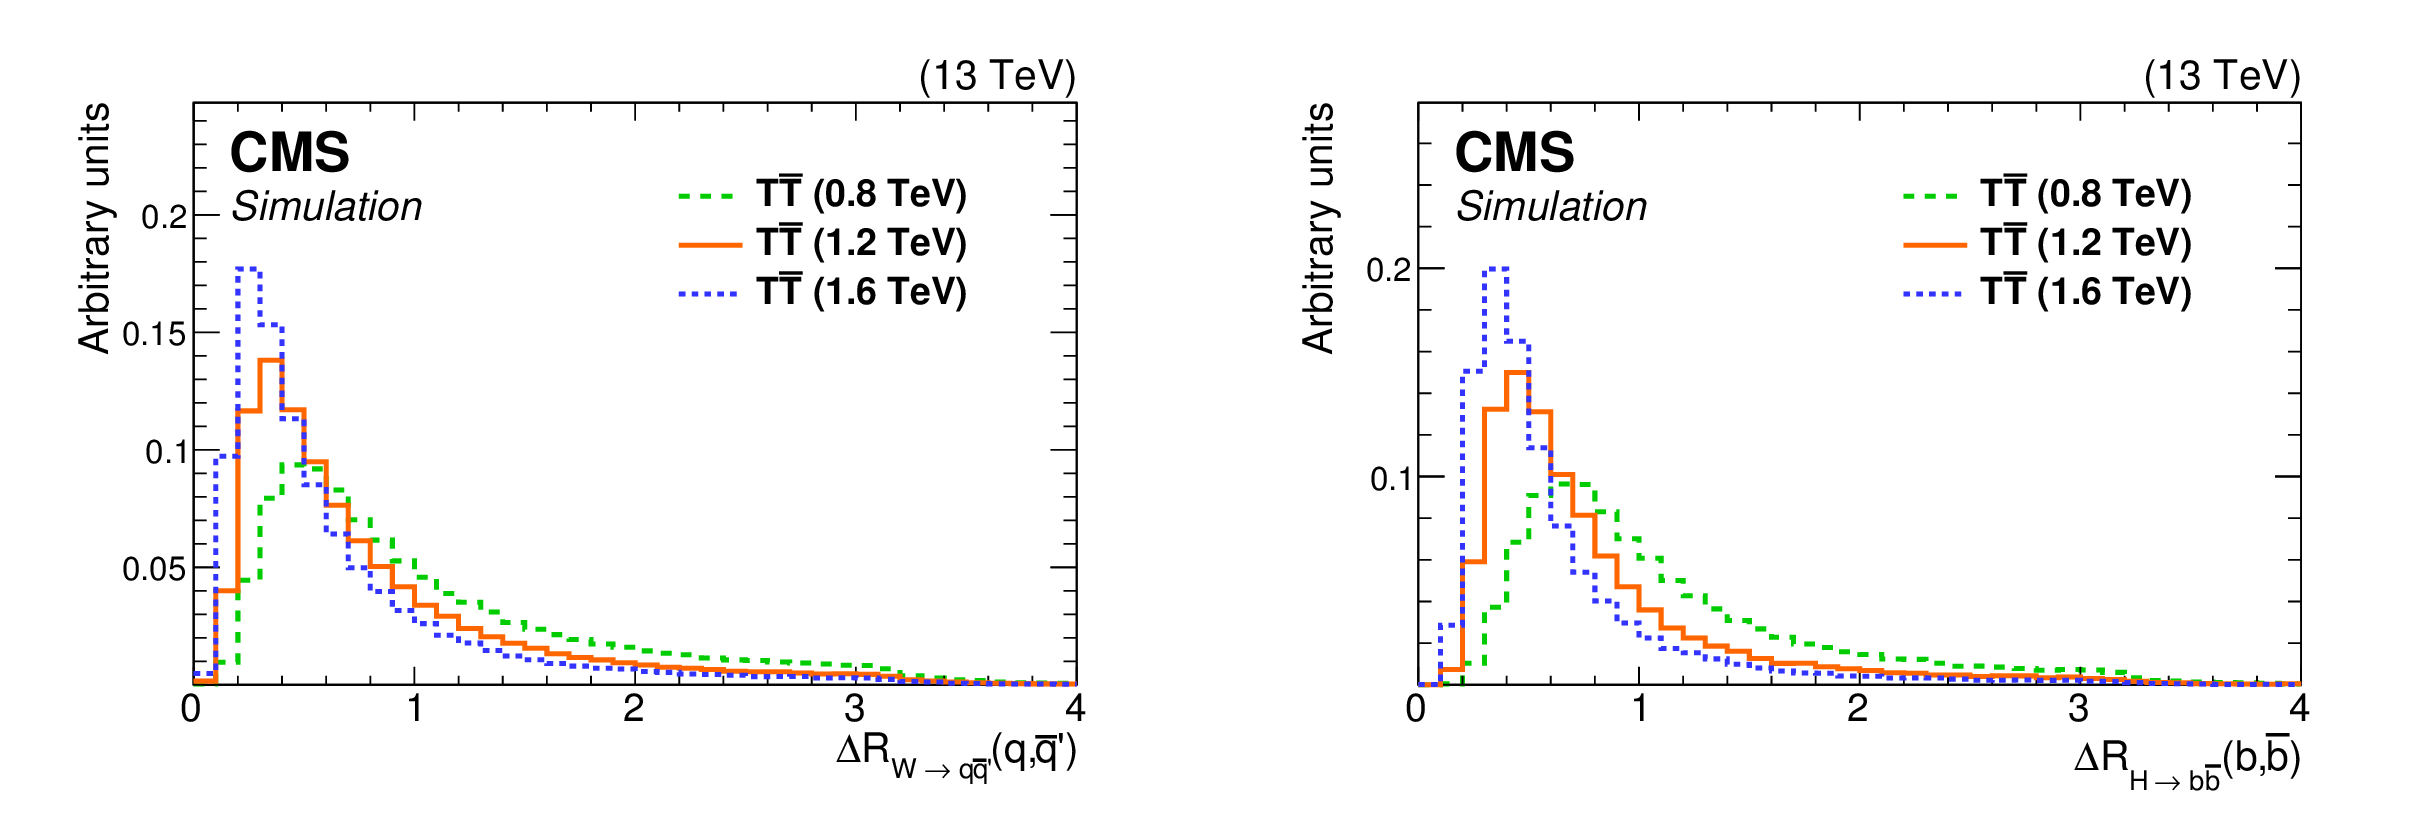
Figure 2:
Angular separations $\Delta {R}$ between the products of simulated $\mathrm{ W } \to \mathrm{ q } \mathrm{ \bar{q} } '$ (left) and $\mathrm{ H } \to {\mathrm{ b \bar{b} } } $ (right) decay processes for three different mass points of the T quark. Even for the lowest mass point shown, the final state particles are very often emitted with a separation of $\Delta {R} < $ 0.8 and are merged into an AK8 jet. |

png pdf |
Figure 2-a:
Angular separations $\Delta {R}$ between the products of the simulated $\mathrm{ W } \to \mathrm{ q } \mathrm{ \bar{q} } '$ decay process for three different mass points of the T quark. Even for the lowest mass point shown, the final state particles are very often emitted with a separation of $\Delta {R} < $ 0.8 and are merged into an AK8 jet. |
png pdf |
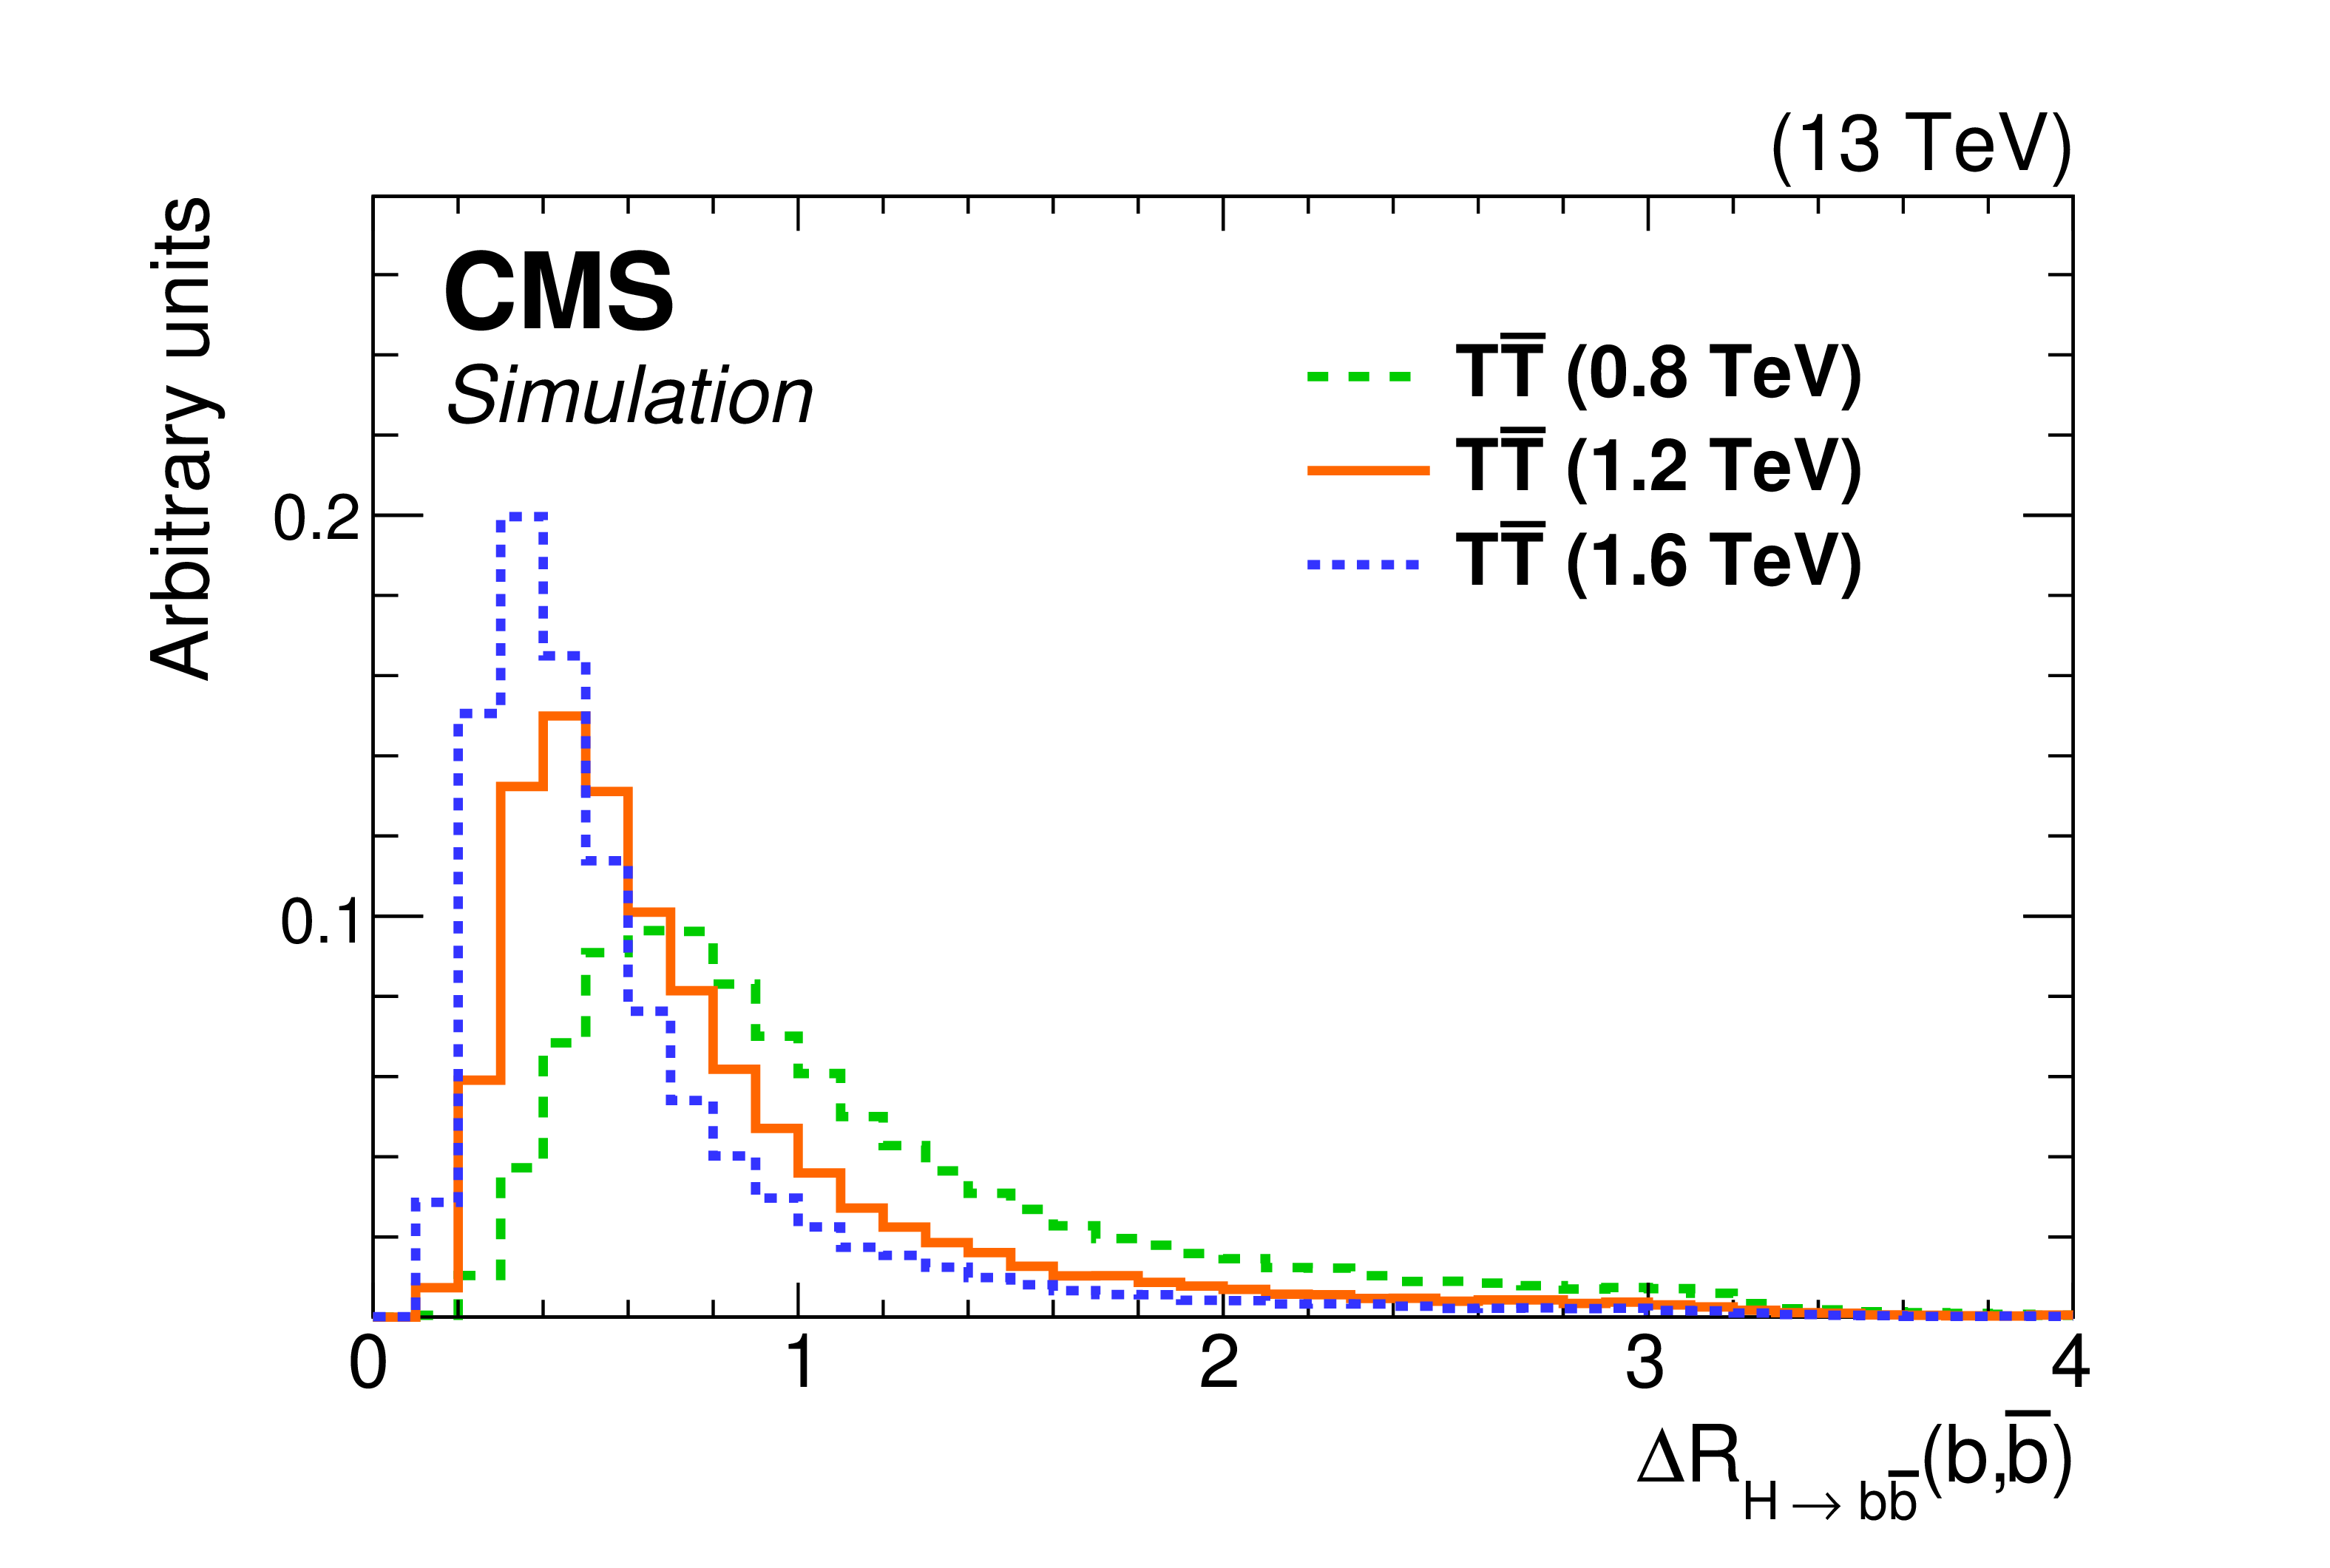
Figure 2-b:
Angular separations $\Delta {R}$ between the products of the simulated $\mathrm{ H } \to {\mathrm{ b \bar{b} } } $ decay process for three different mass points of the T quark. Even for the lowest mass point shown, the final state particles are very often emitted with a separation of $\Delta {R} < $ 0.8 and are merged into an AK8 jet. |
png pdf |
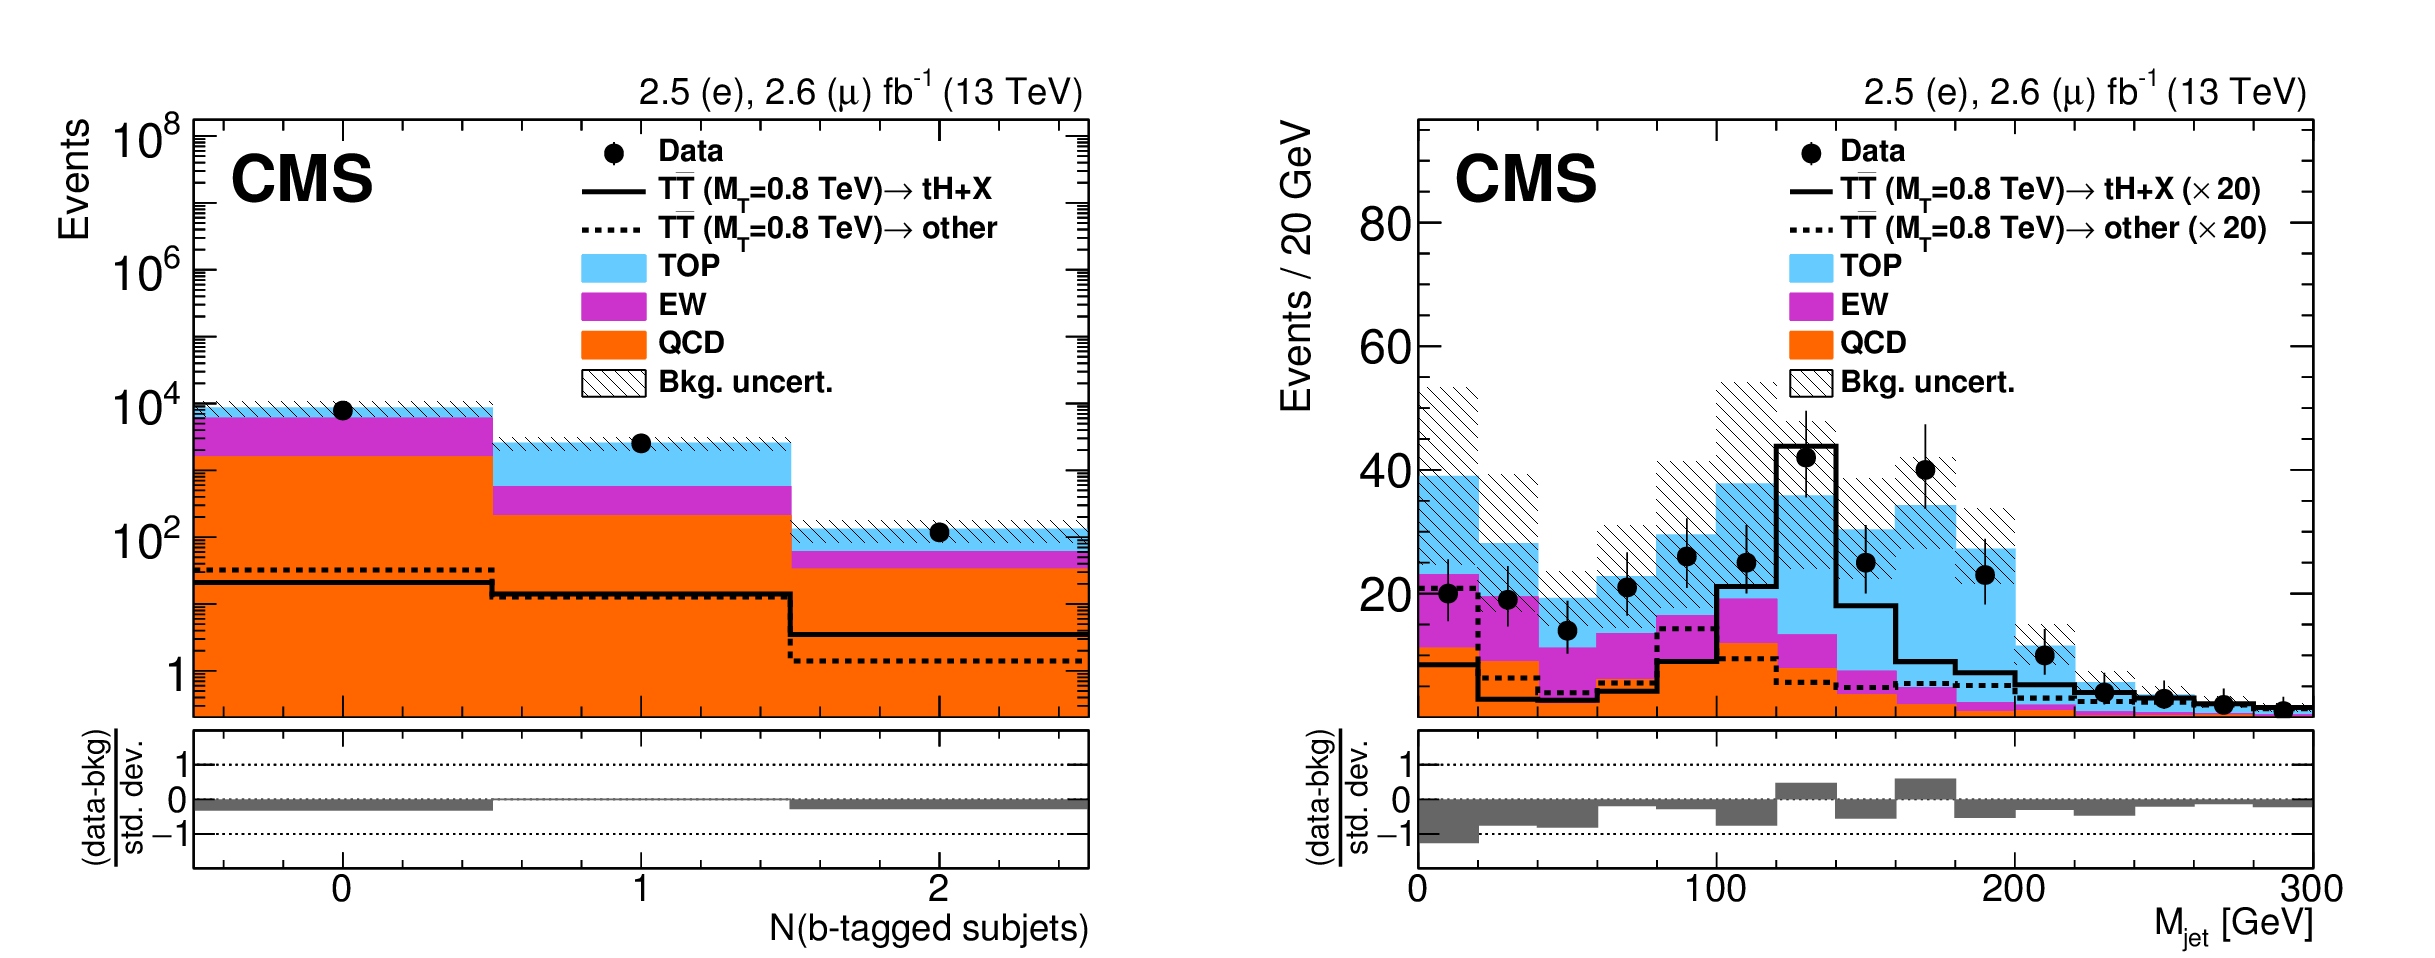
Figure 3:
Distributions of the number of b-tagged subjets of the highest $ {p_{\mathrm {T}}} $ H-tagged jet candidate with $ {p_{\mathrm {T}}} > $ 300 GeV and $M_\text {jet}$ in the range [60, 160] GeV (left), and $M_\text {jet}$ of the highest $ {p_{\mathrm {T}}} $ H-tagged jet candidate with $ {p_{\mathrm {T}}} > $ 300 GeV and two subjet b tags (right). A T quark signal with $ M(\mathrm{T}) = $ 0.8 TeV is shown (right), normalized to the predicted cross section and scaled by a factor of 20, with the singlet benchmark branching fractions assumed. The solid (dashed) curve shows $ { {\mathrm {T}} {\overline {\mathrm {T}}} } $ events with at least one (zero) Higgs boson decay, where contributions from each decay mode are weighted to reflect the singlet branching fraction scenario. The uncertainty in the background includes the statistical and systematic uncertainties described in Section 7. |

png pdf |
Figure 3-a:
Distribution of the number of b-tagged subjets of the highest $ {p_{\mathrm {T}}} $ H-tagged jet candidate with $ {p_{\mathrm {T}}} > $ 300 GeV and $M_\text {jet}$ in the range [60, 160] GeV. The solid (dashed) curve shows $ { {\mathrm {T}} {\overline {\mathrm {T}}} } $ events with at least one (zero) Higgs boson decay, where contributions from each decay mode are weighted to reflect the singlet branching fraction scenario. The uncertainty in the background includes the statistical and systematic uncertainties described in Section 7. |
png pdf |
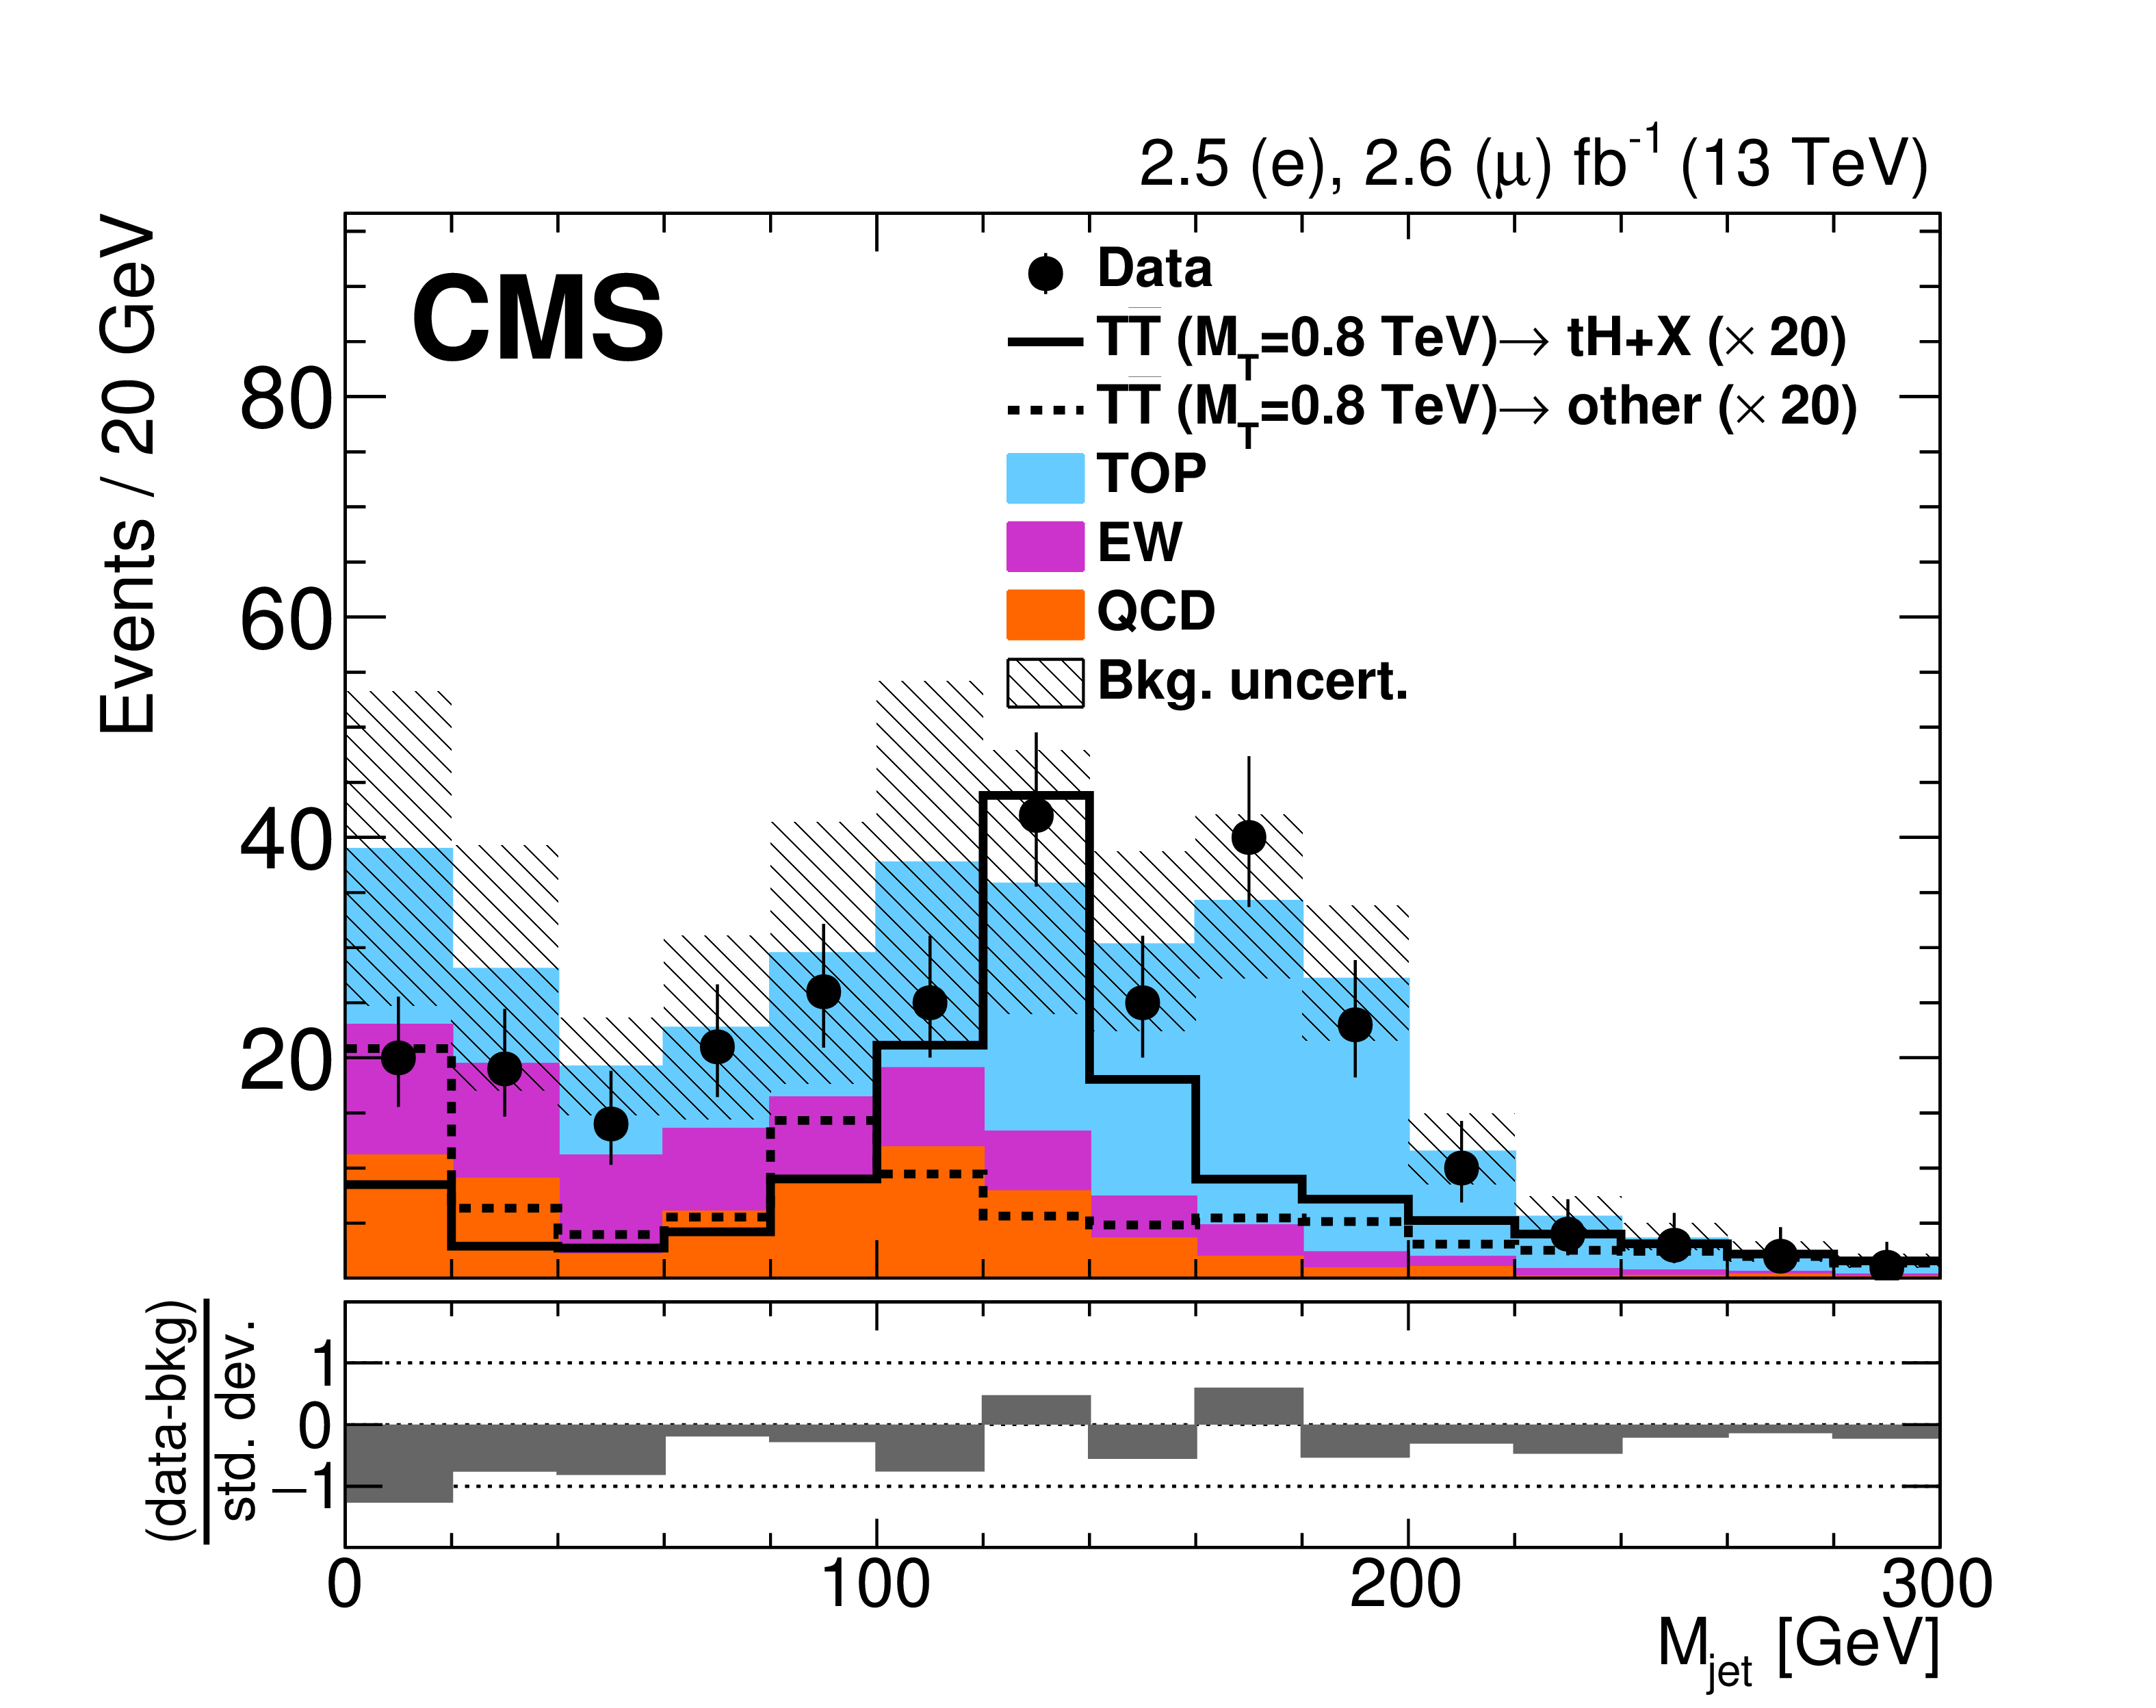
Figure 3-b:
Distribution of $M_\text {jet}$ of the highest $ {p_{\mathrm {T}}} $ H-tagged jet candidate with $ {p_{\mathrm {T}}} > $ 300 GeV and two subjet b tags. A T quark signal with $ M(\mathrm{T}) = $ 0.8 TeV is shown, normalized to the predicted cross section and scaled by a factor of 20, with the singlet benchmark branching fractions assumed. The solid (dashed) curve shows $ { {\mathrm {T}} {\overline {\mathrm {T}}} } $ events with at least one (zero) Higgs boson decay, where contributions from each decay mode are weighted to reflect the singlet branching fraction scenario. The uncertainty in the background includes the statistical and systematic uncertainties described in Section 7. |
png pdf |
Figure 4:
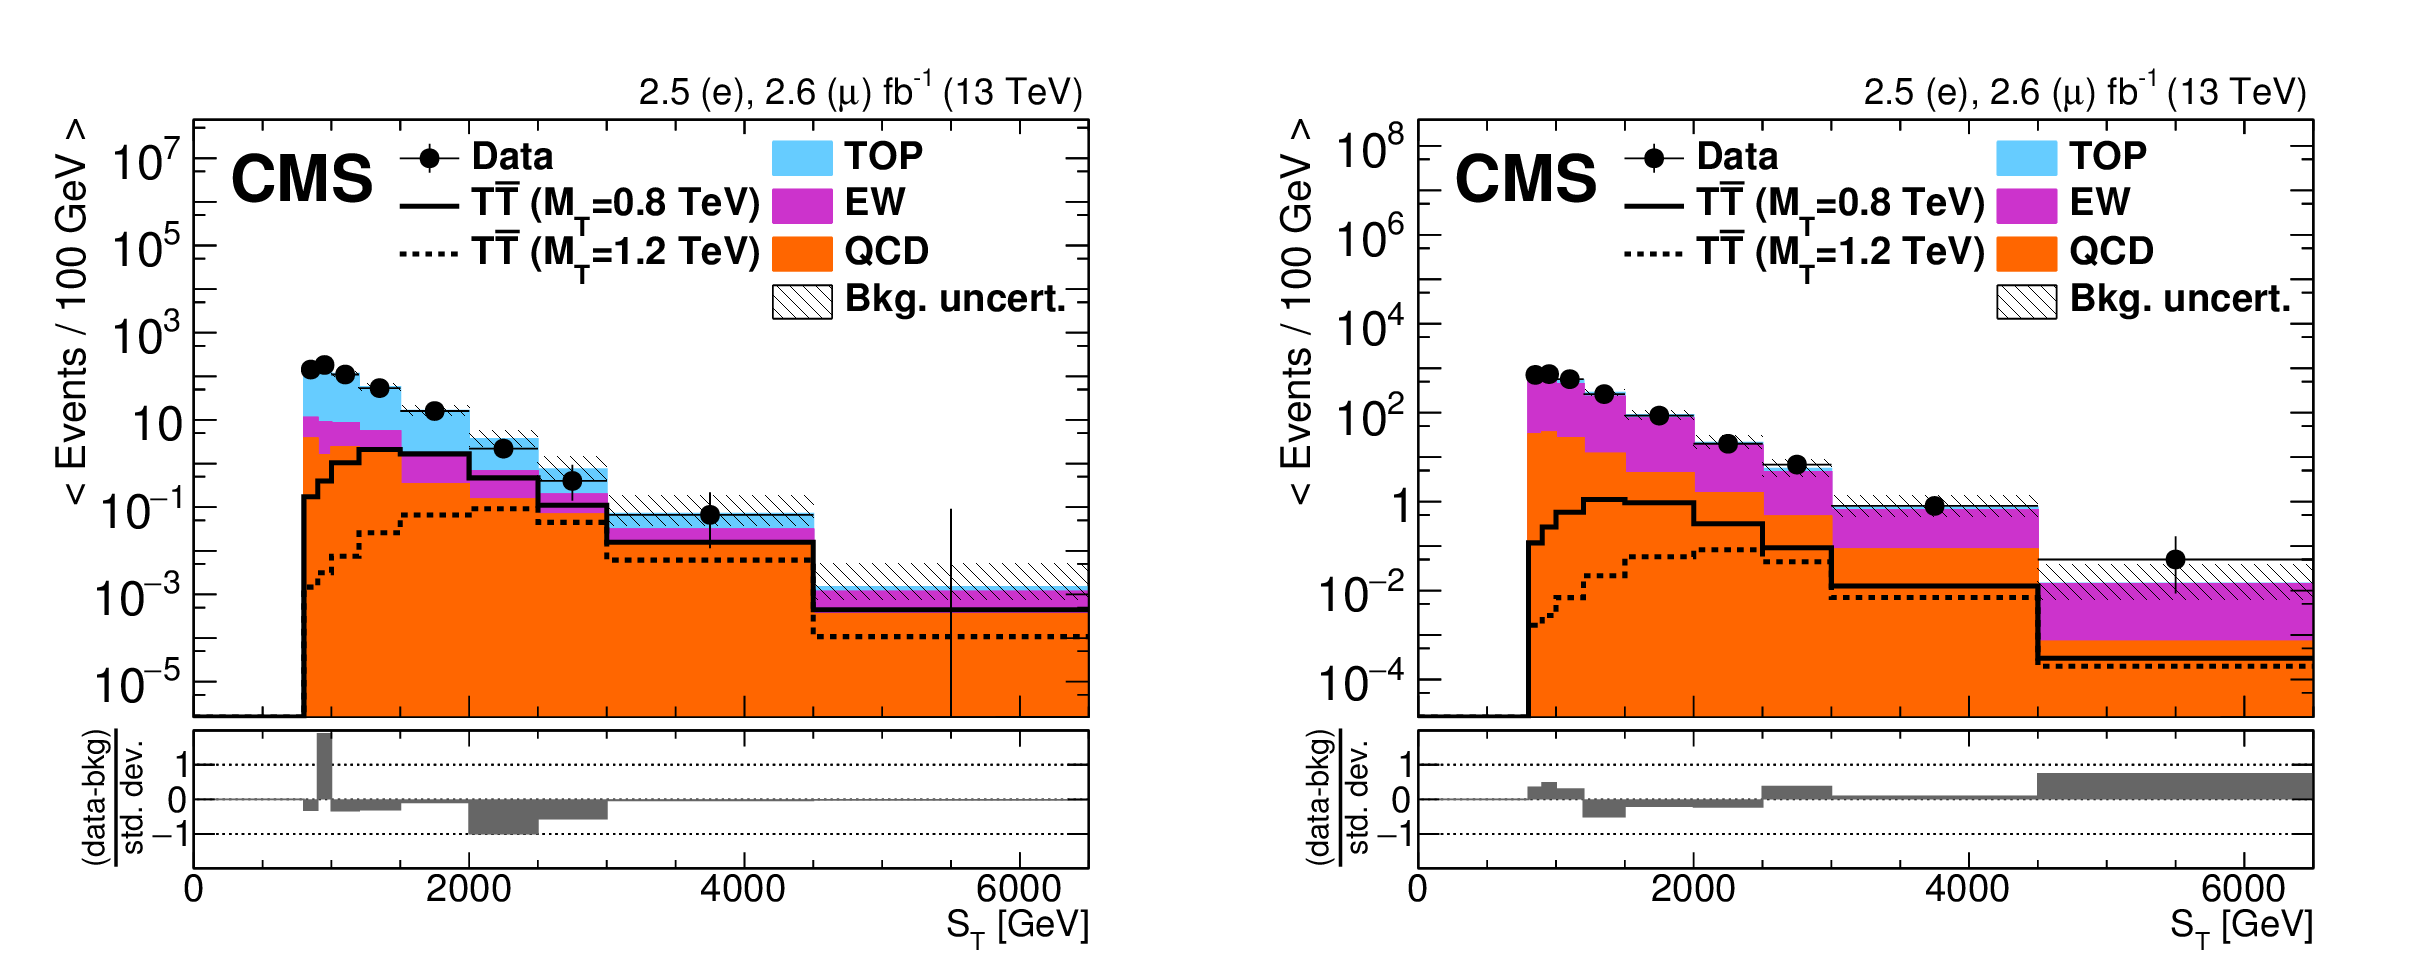
Distributions of $ {S_\mathrm {T}} $ in the $ {\mathrm{ t } {}\mathrm{ \bar{t} } } $ (left) and W + jets (right) control regions of the boosted H channel after applying all corrections to their shape and normalization. The $ { {\mathrm {T}} {\overline {\mathrm {T}}} } $ signal, shown for T quark masses of 0.8 and 1.2 TeV, is normalized to the theoretical cross section and the singlet benchmark branching fractions are assumed. The uncertainty in the background includes statistical and systematic uncertainties described in Section 7. |
png pdf |
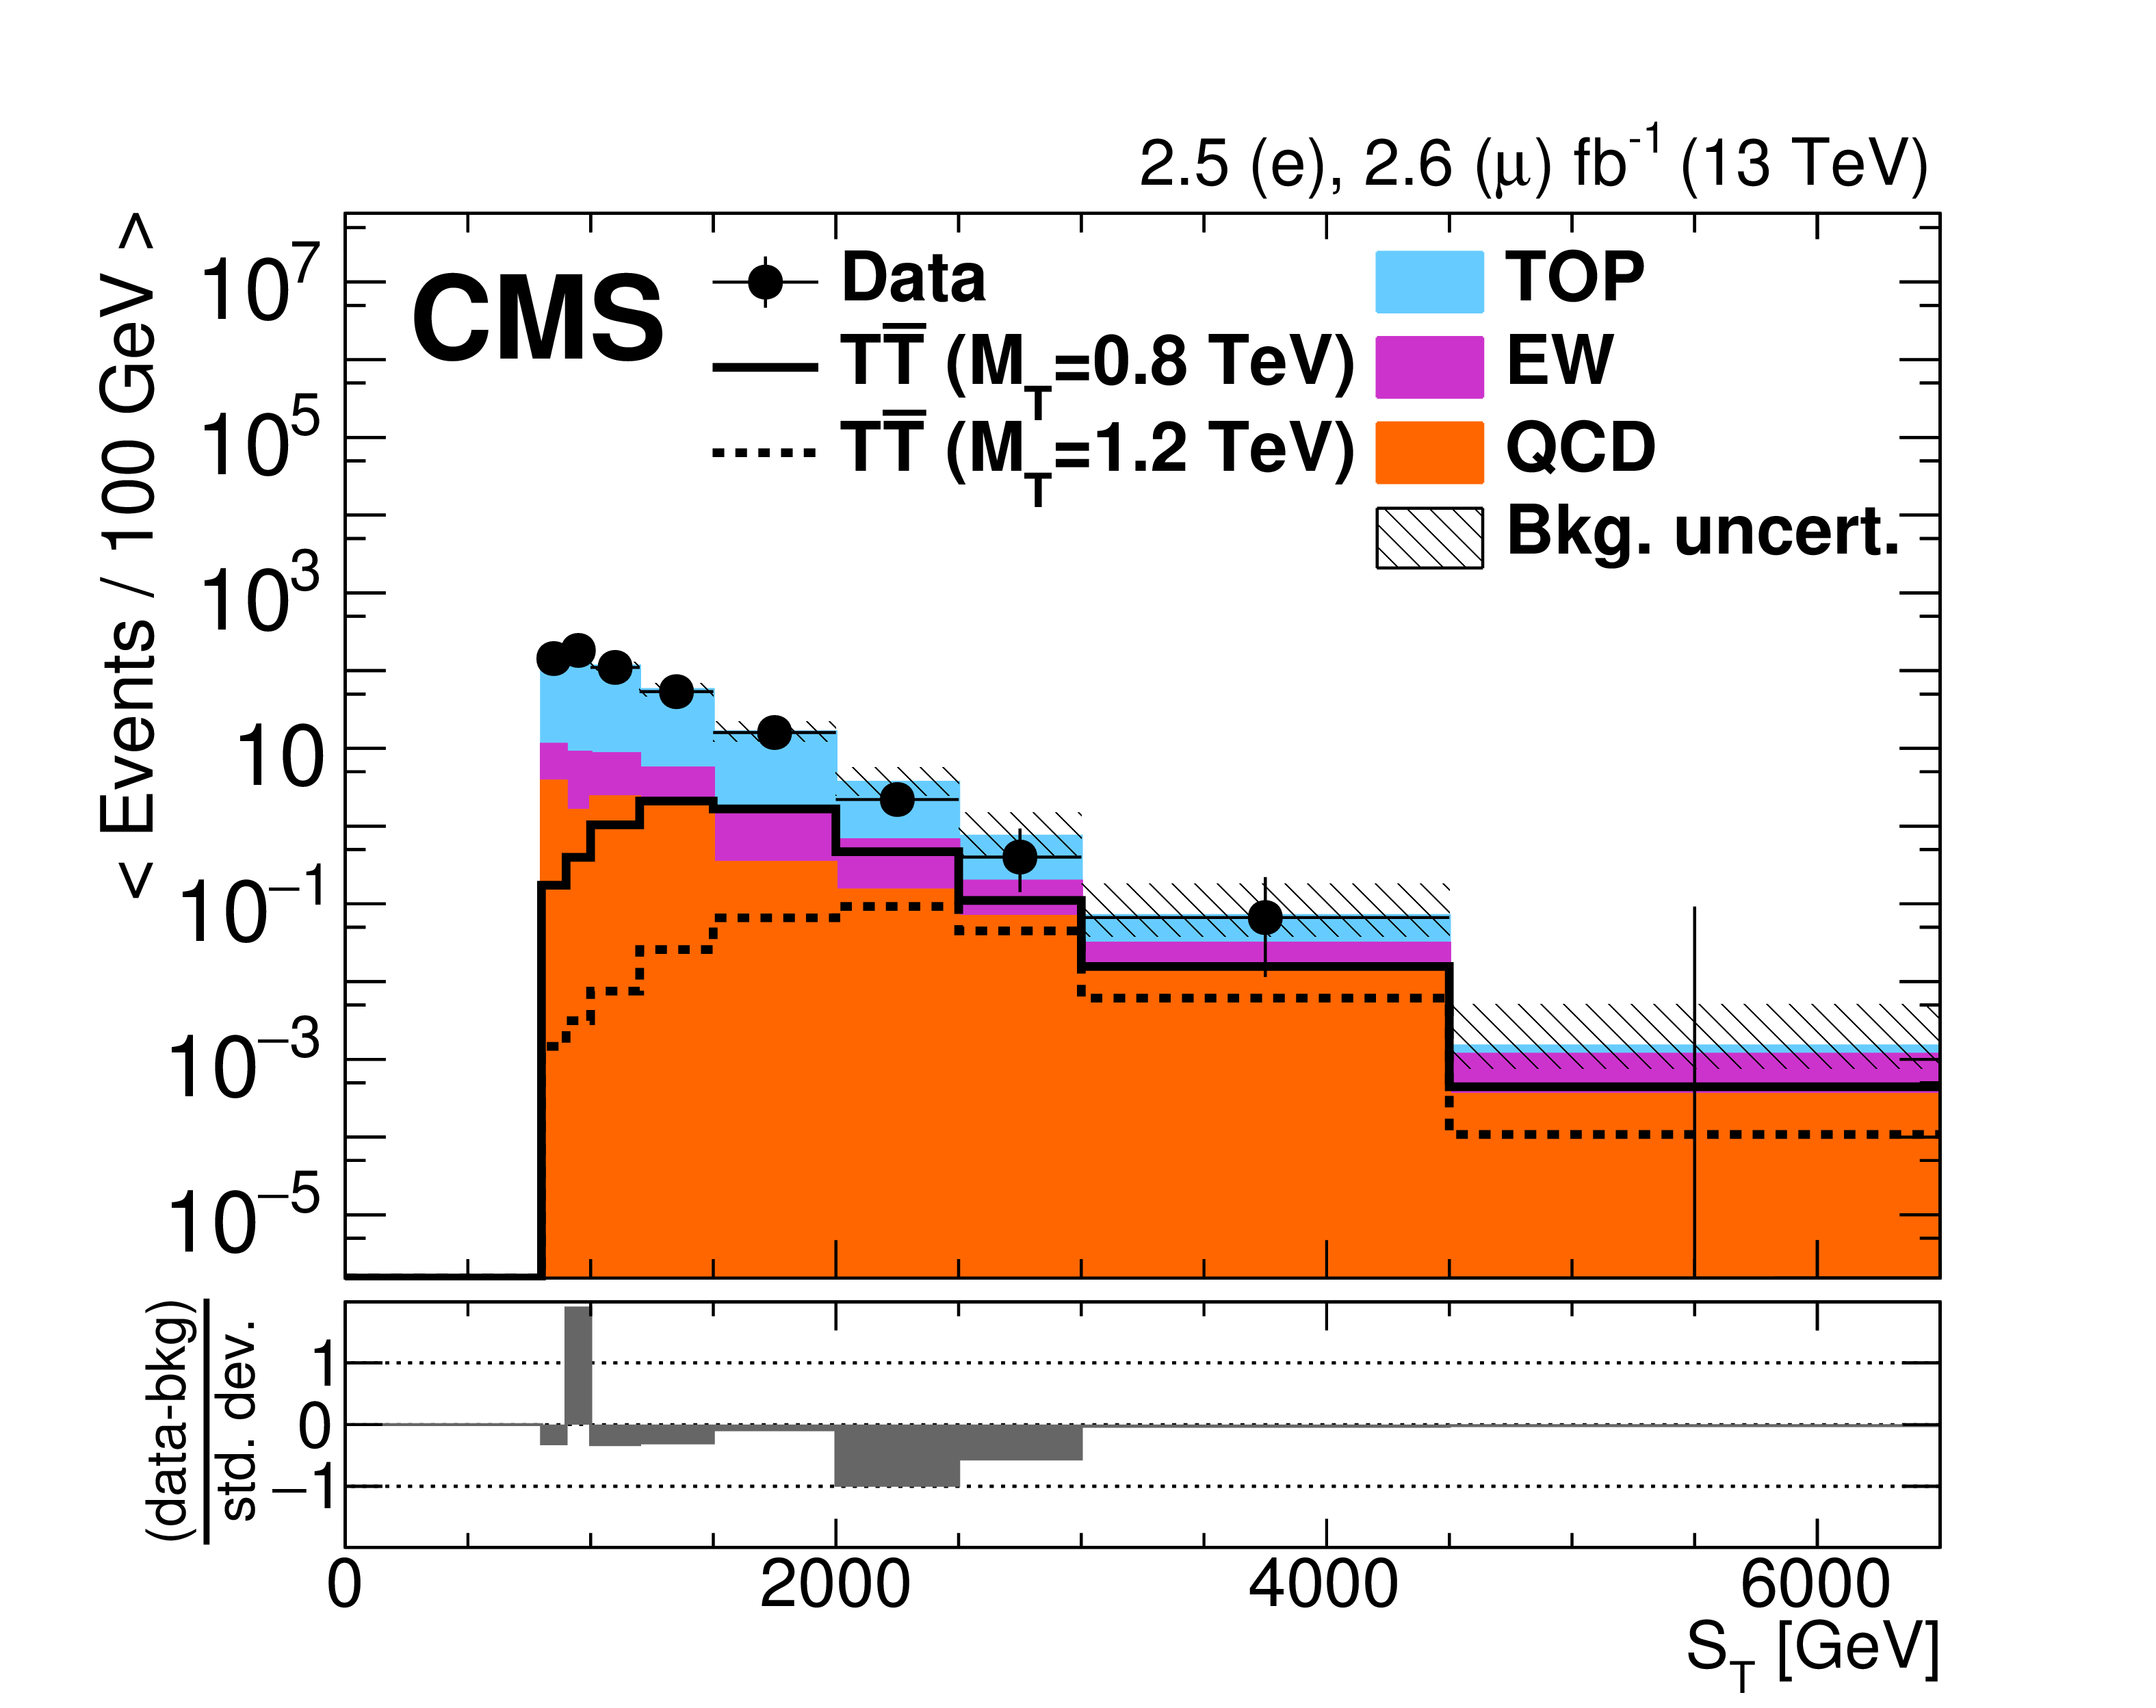
Figure 4-a:
Distribution of $ {S_\mathrm {T}} $ in the $ {\mathrm{ t } {}\mathrm{ \bar{t} } } $ control region of the boosted H channel after applying all corrections to their shape and normalization. The $ { {\mathrm {T}} {\overline {\mathrm {T}}} } $ signal, shown for T quark masses of 0.8 and 1.2 TeV, is normalized to the theoretical cross section and the singlet benchmark branching fractions are assumed. The uncertainty in the background includes statistical and systematic uncertainties described in Section 7. |

png pdf |
Figure 4-b:
Distribution of $ {S_\mathrm {T}} $ in the W + jets control region of the boosted H channel after applying all corrections to their shape and normalization. The $ { {\mathrm {T}} {\overline {\mathrm {T}}} } $ signal, shown for T quark masses of 0.8 and 1.2 TeV, is normalized to the theoretical cross section and the singlet benchmark branching fractions are assumed. The uncertainty in the background includes statistical and systematic uncertainties described in Section 7. |
png pdf |
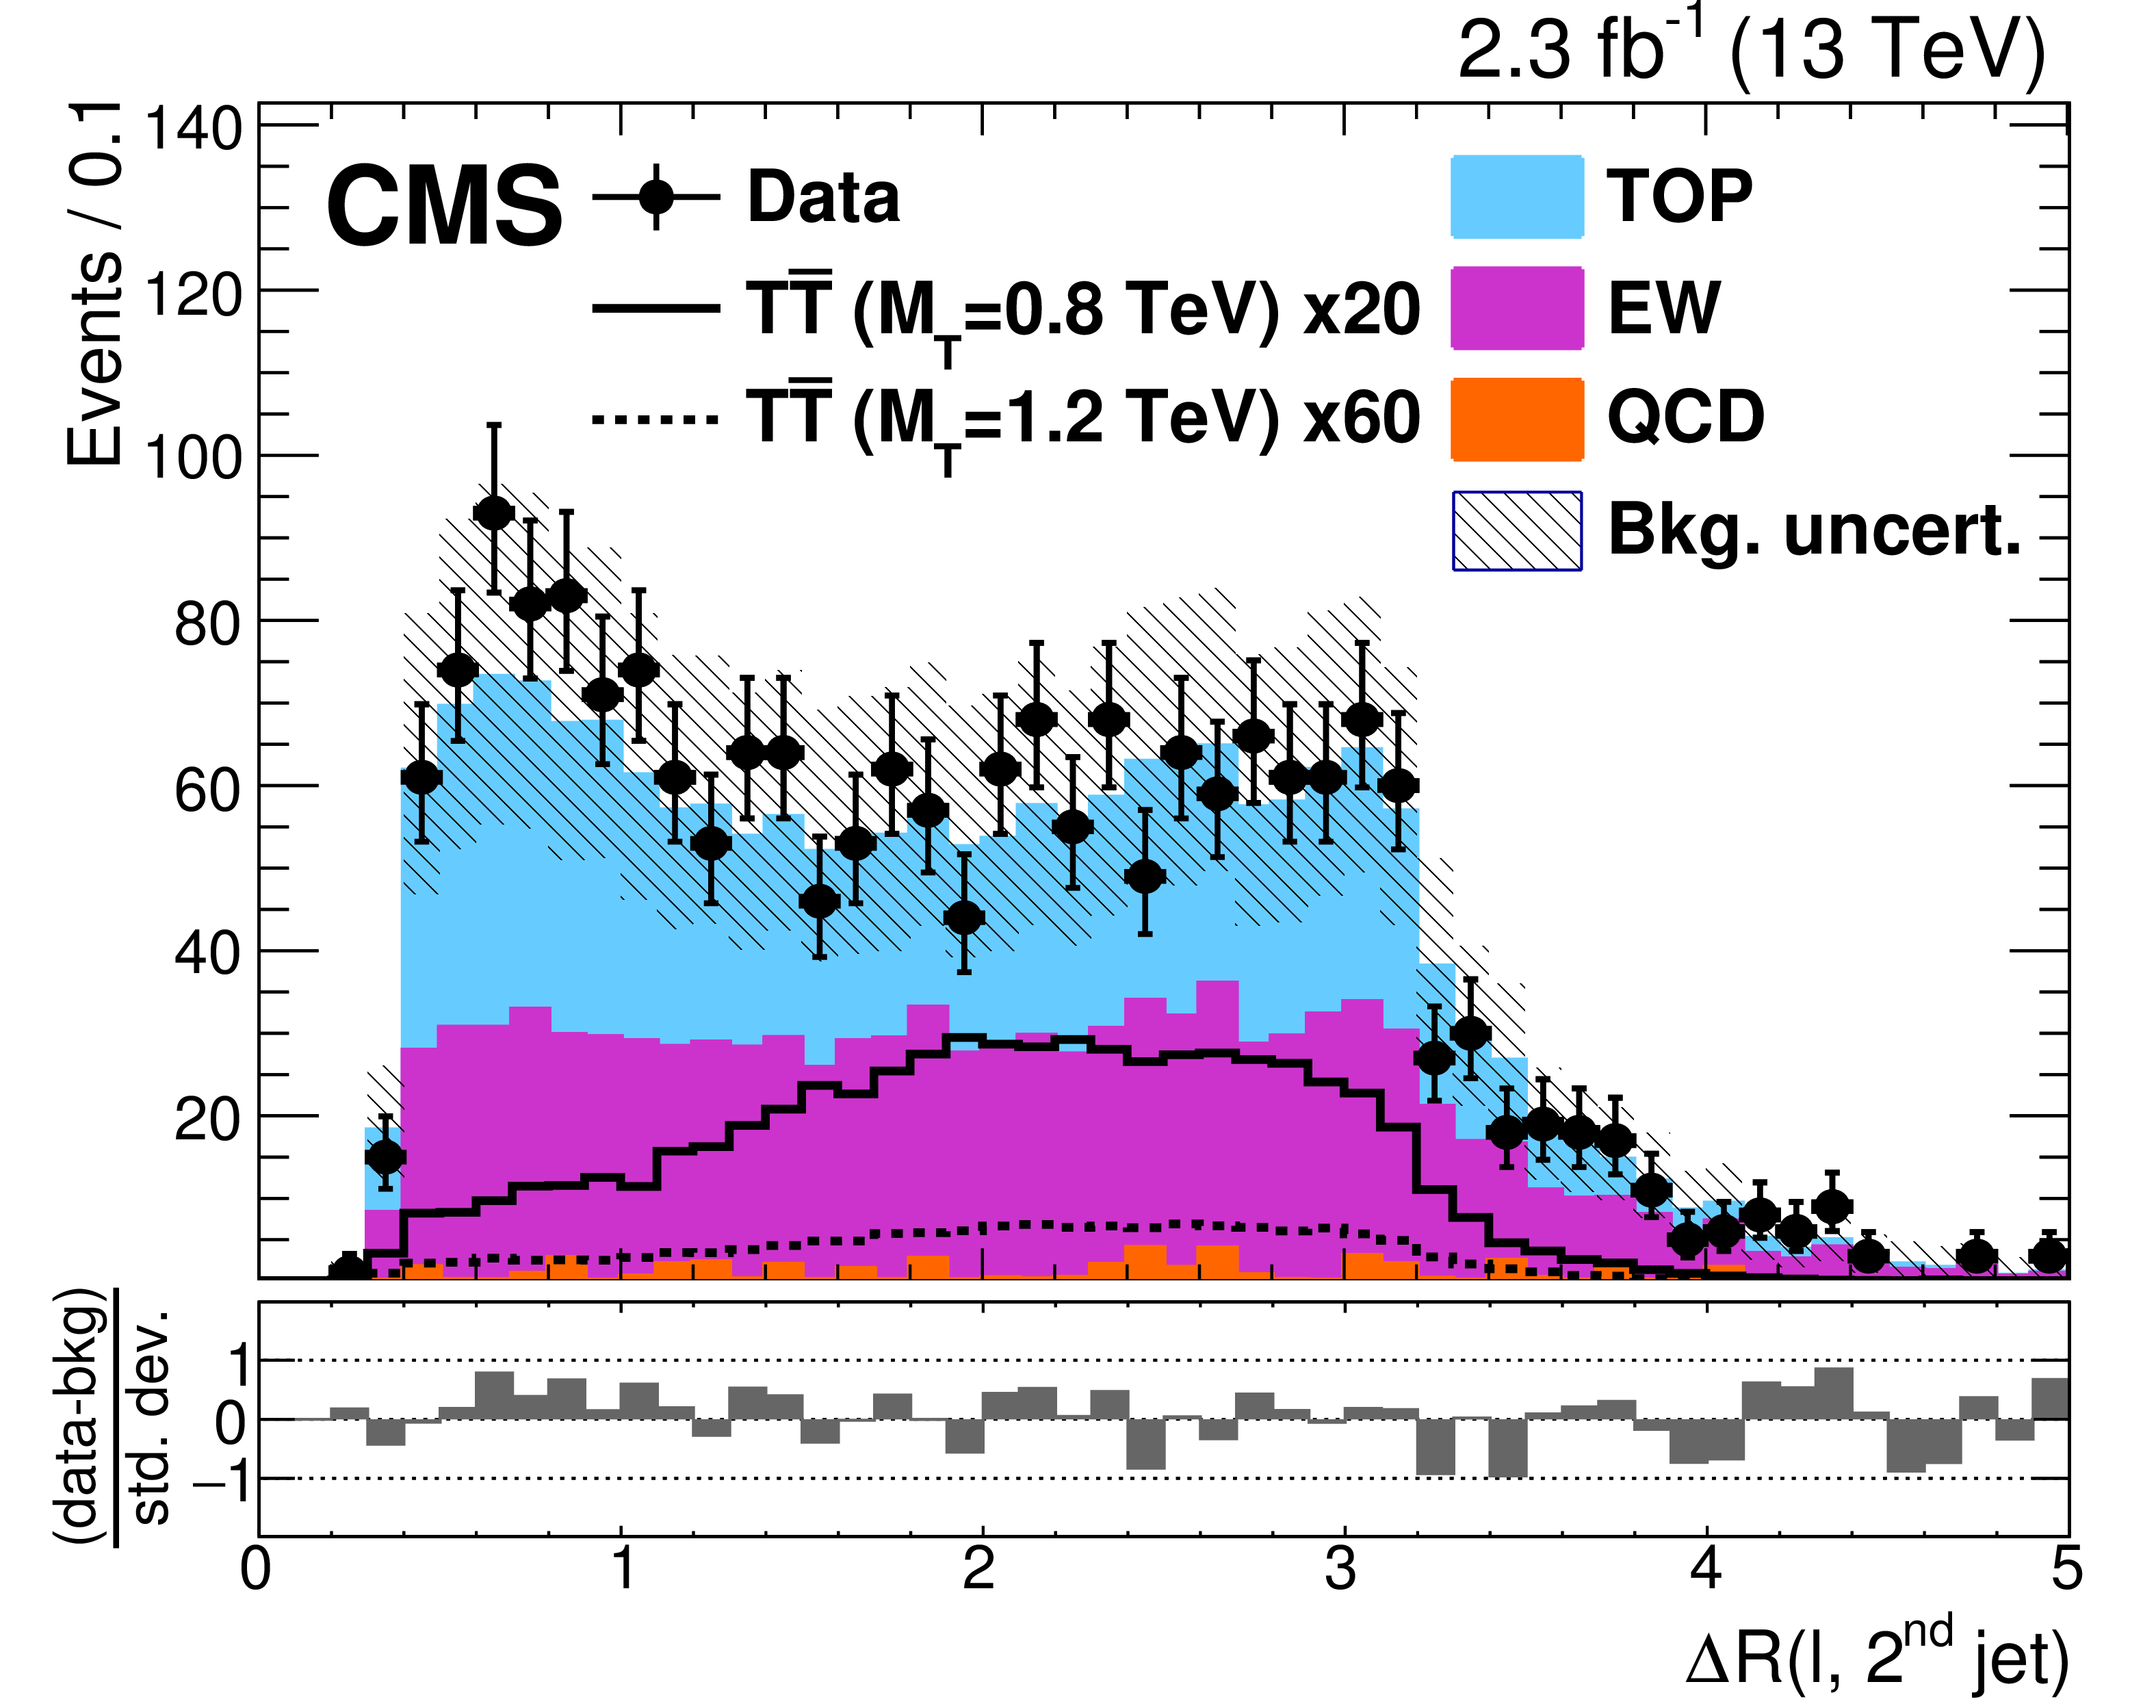
Figure 5:
Distribution of $\Delta R(\ell,j_2)$ in the boosted W channel after all selection requirements except for $\Delta R(\ell,j_2)> $ 1. Also shown are the distributions of $ { {\mathrm {T}} {\overline {\mathrm {T}}} } $ signal events with T quark masses of 0.8 and 1.2 TeV, scaled by factors of 20 and 60, respectively. The uncertainty in the background includes the statistical and systematic uncertainties described in Section 7. |
png pdf |
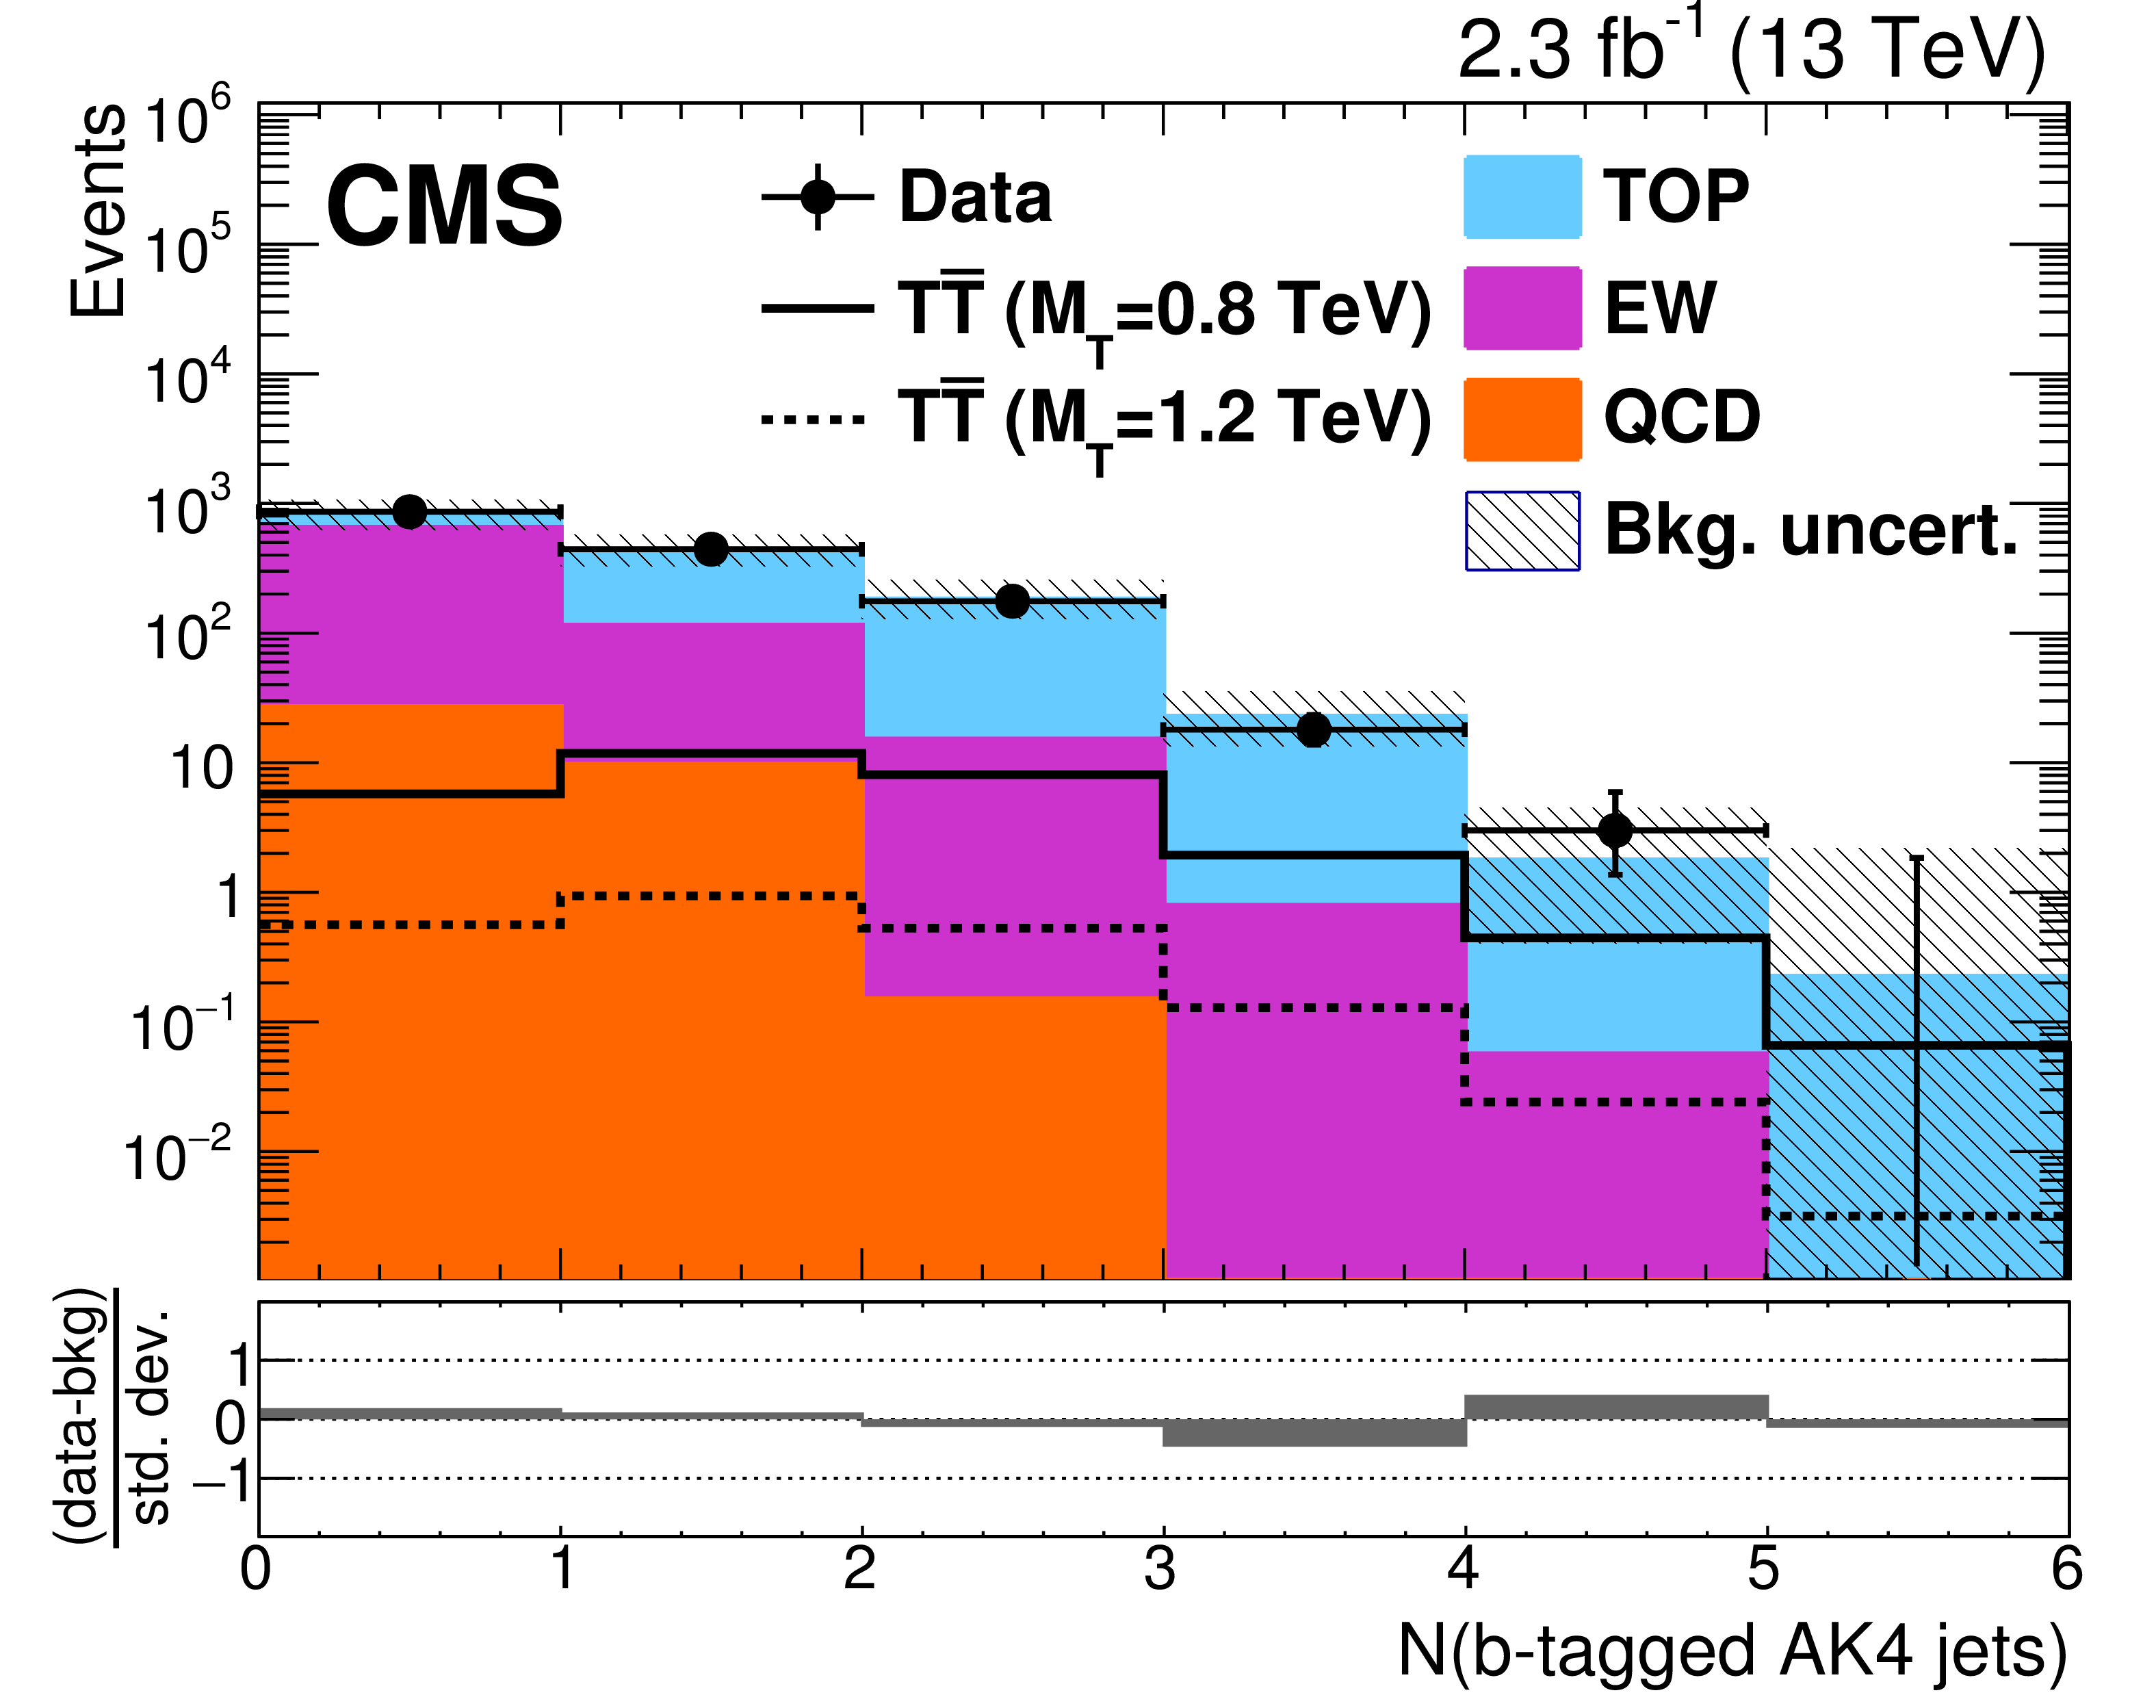
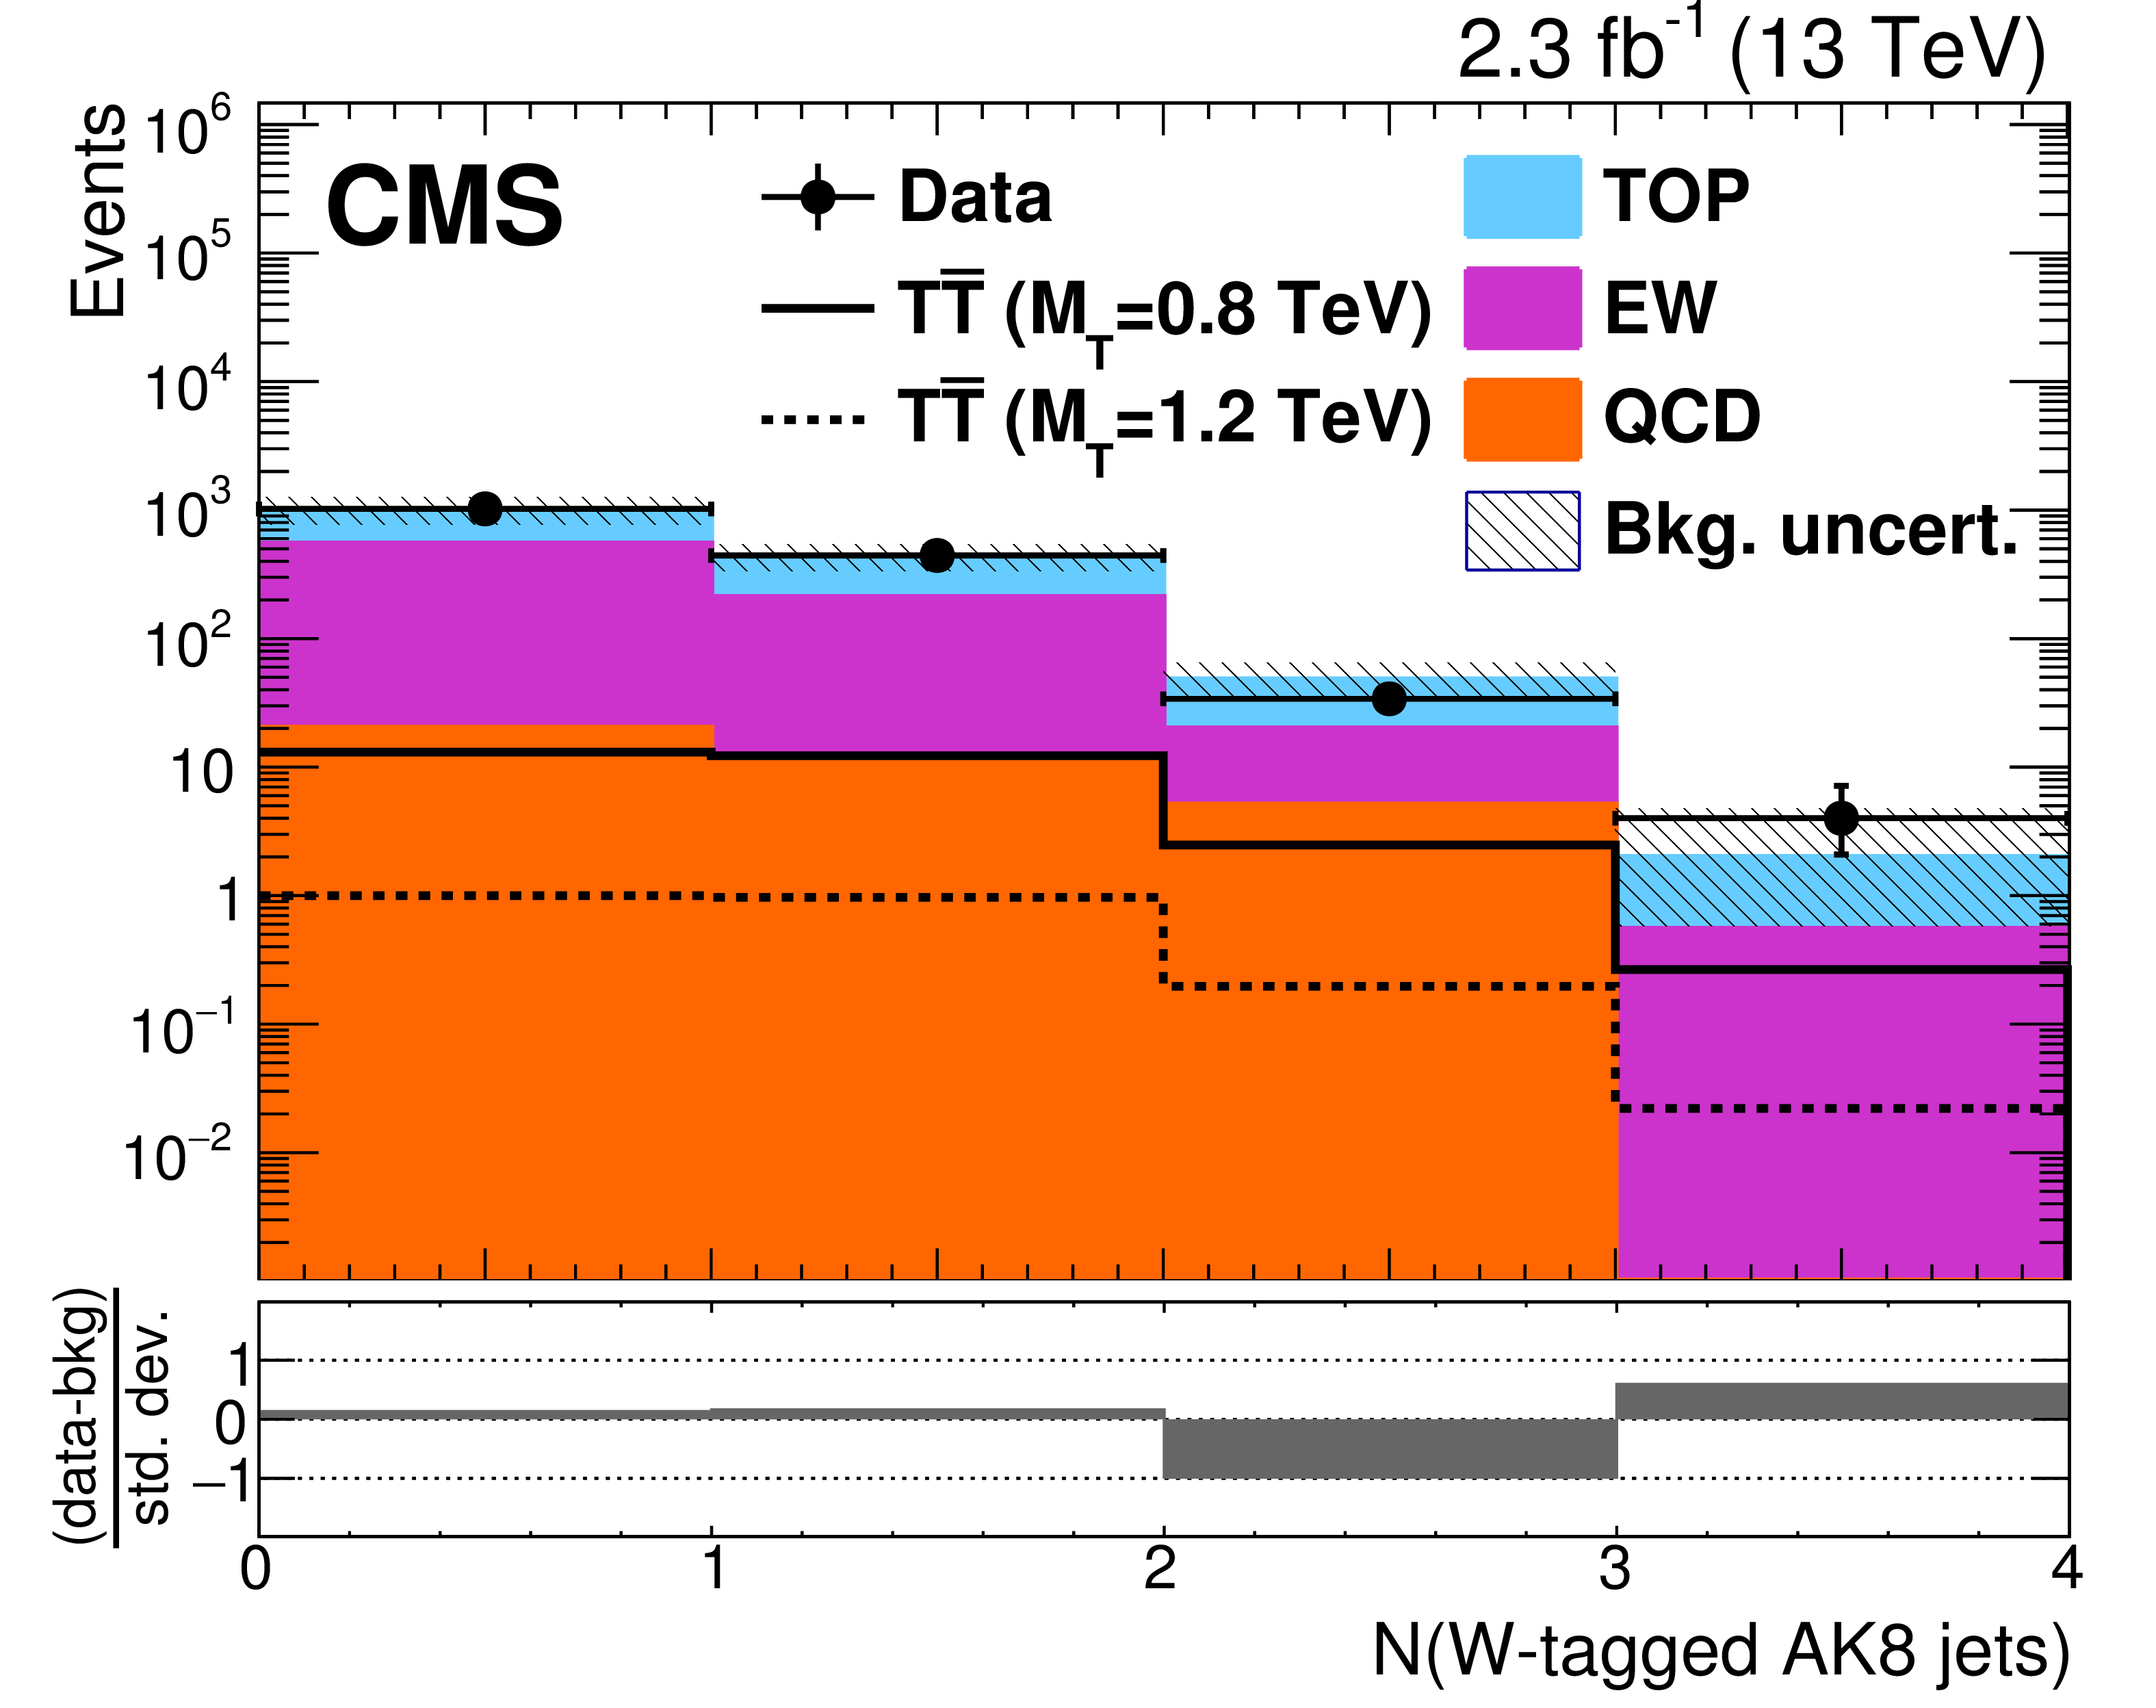
Figure 6:
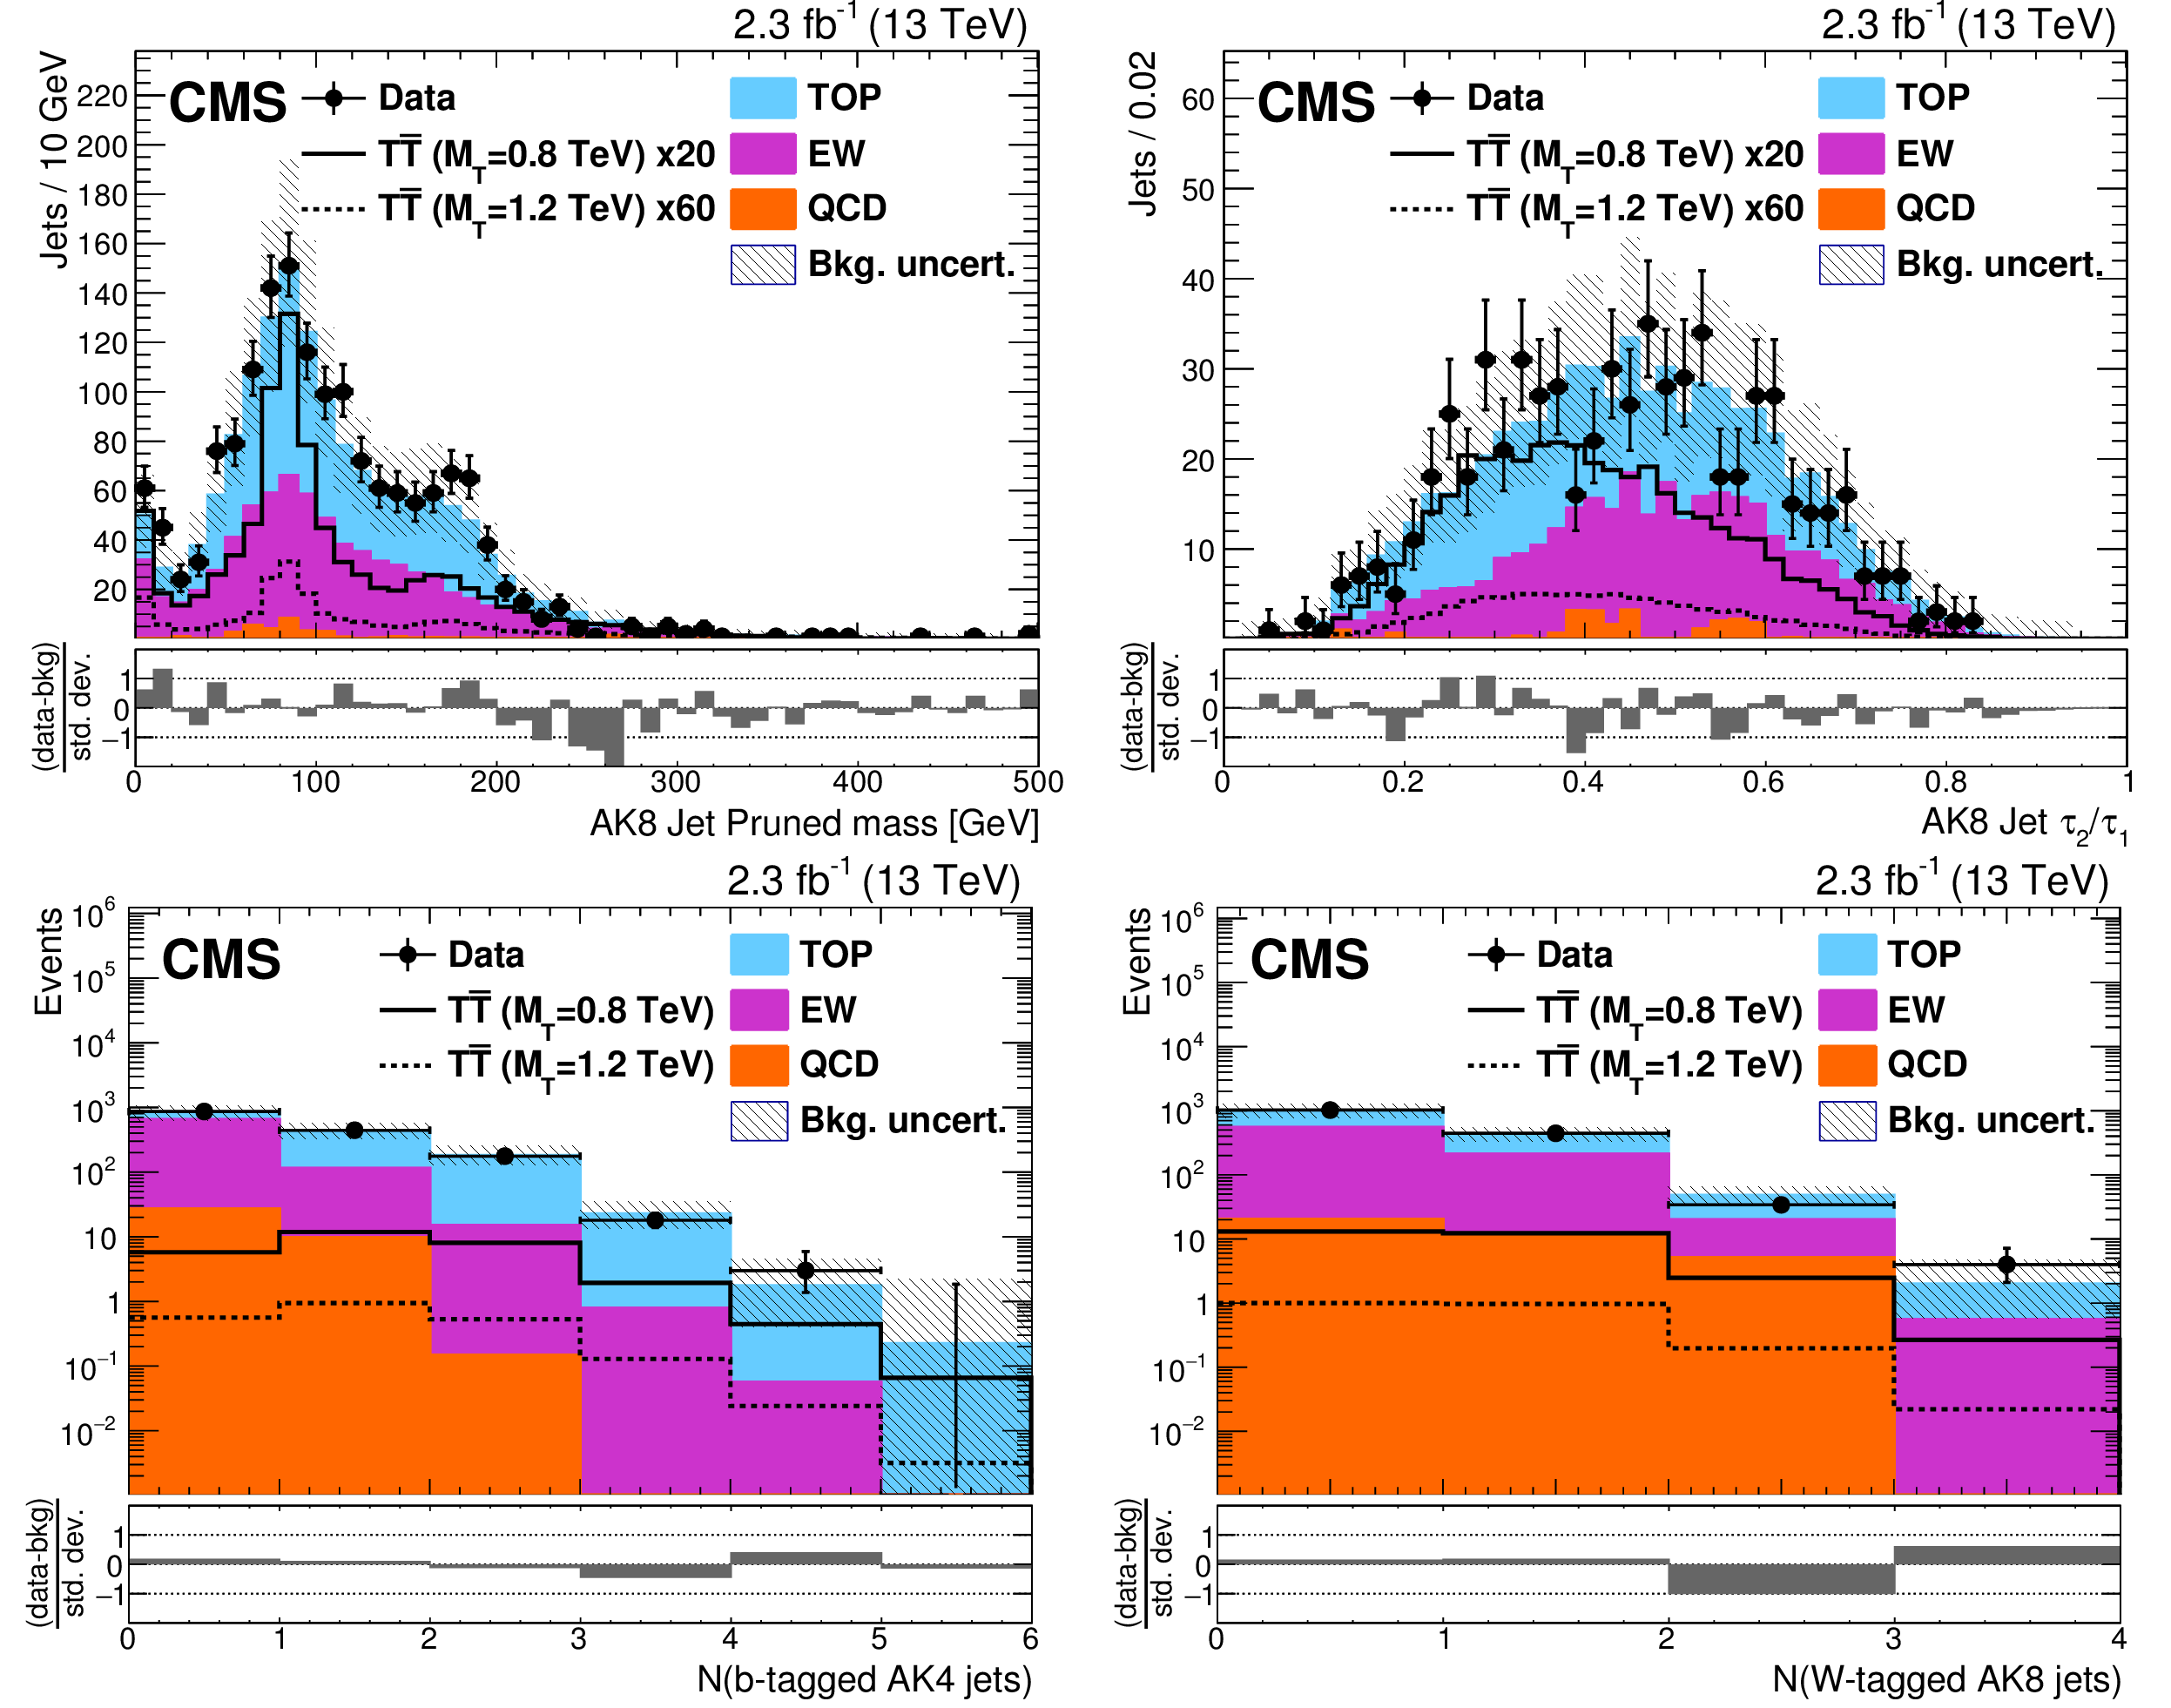
Distributions of (left-to-right, upper-to-lower) pruned jet quark mass for AK8 jets passing $\tau _2/\tau _1 < $ 0.6, $\tau _2/\tau _1$ for AK8 jets with pruned mass within 65-105 GeV, number of b-tagged AK4 jets, and number of W-tagged AK8 jets in the boosted W channel with all categories combined. Also shown are the distributions of $ { {\mathrm {T}} {\overline {\mathrm {T}}} } $ signal events with T quark masses of 0.8 and 1.2 TeV, scaled by factors of 20 and 60, respectively, in the upper figures. The uncertainty in the background includes the statistical and systematic uncertainties described in Section 7. |

png pdf |
Figure 6-a:
Distribution of the pruned jet quark mass for AK8 jets passing $\tau _2/\tau _1 < $ 0.6, in the boosted W channel with all categories combined. Also shown are the distributions of $ { {\mathrm {T}} {\overline {\mathrm {T}}} } $ signal events with T quark masses of 0.8 and 1.2 TeV, scaled by factors of 20 and 60, respectively, in the upper figures. The uncertainty in the background includes the statistical and systematic uncertainties described in Section 7. |

png pdf |
Figure 6-b:
Distribution of $\tau _2/\tau _1$ for AK8 jets with pruned mass within 65-105 GeV, in the boosted W channel with all categories combined. Also shown are the distributions of $ { {\mathrm {T}} {\overline {\mathrm {T}}} } $ signal events with T quark masses of 0.8 and 1.2 TeV, scaled by factors of 20 and 60, respectively, in the upper figures. The uncertainty in the background includes the statistical and systematic uncertainties described in Section 7. |
png pdf |
Figure 6-c:
Distribution of the number of b-tagged AK4 jets, in the boosted W channel with all categories combined. Also shown are the distributions of $ { {\mathrm {T}} {\overline {\mathrm {T}}} } $ signal events with T quark masses of 0.8 and 1.2 TeV, scaled by factors of 20 and 60, respectively, in the upper figures. The uncertainty in the background includes the statistical and systematic uncertainties described in Section 7. |
png pdf |
Figure 6-d:
Distribution of the number of W-tagged AK8 jets, in the boosted W channel with all categories combined. Also shown are the distributions of $ { {\mathrm {T}} {\overline {\mathrm {T}}} } $ signal events with T quark masses of 0.8 and 1.2 TeV, scaled by factors of 20 and 60, respectively, in the upper figures. The uncertainty in the background includes the statistical and systematic uncertainties described in Section 7. |
png pdf |
Figure 7:
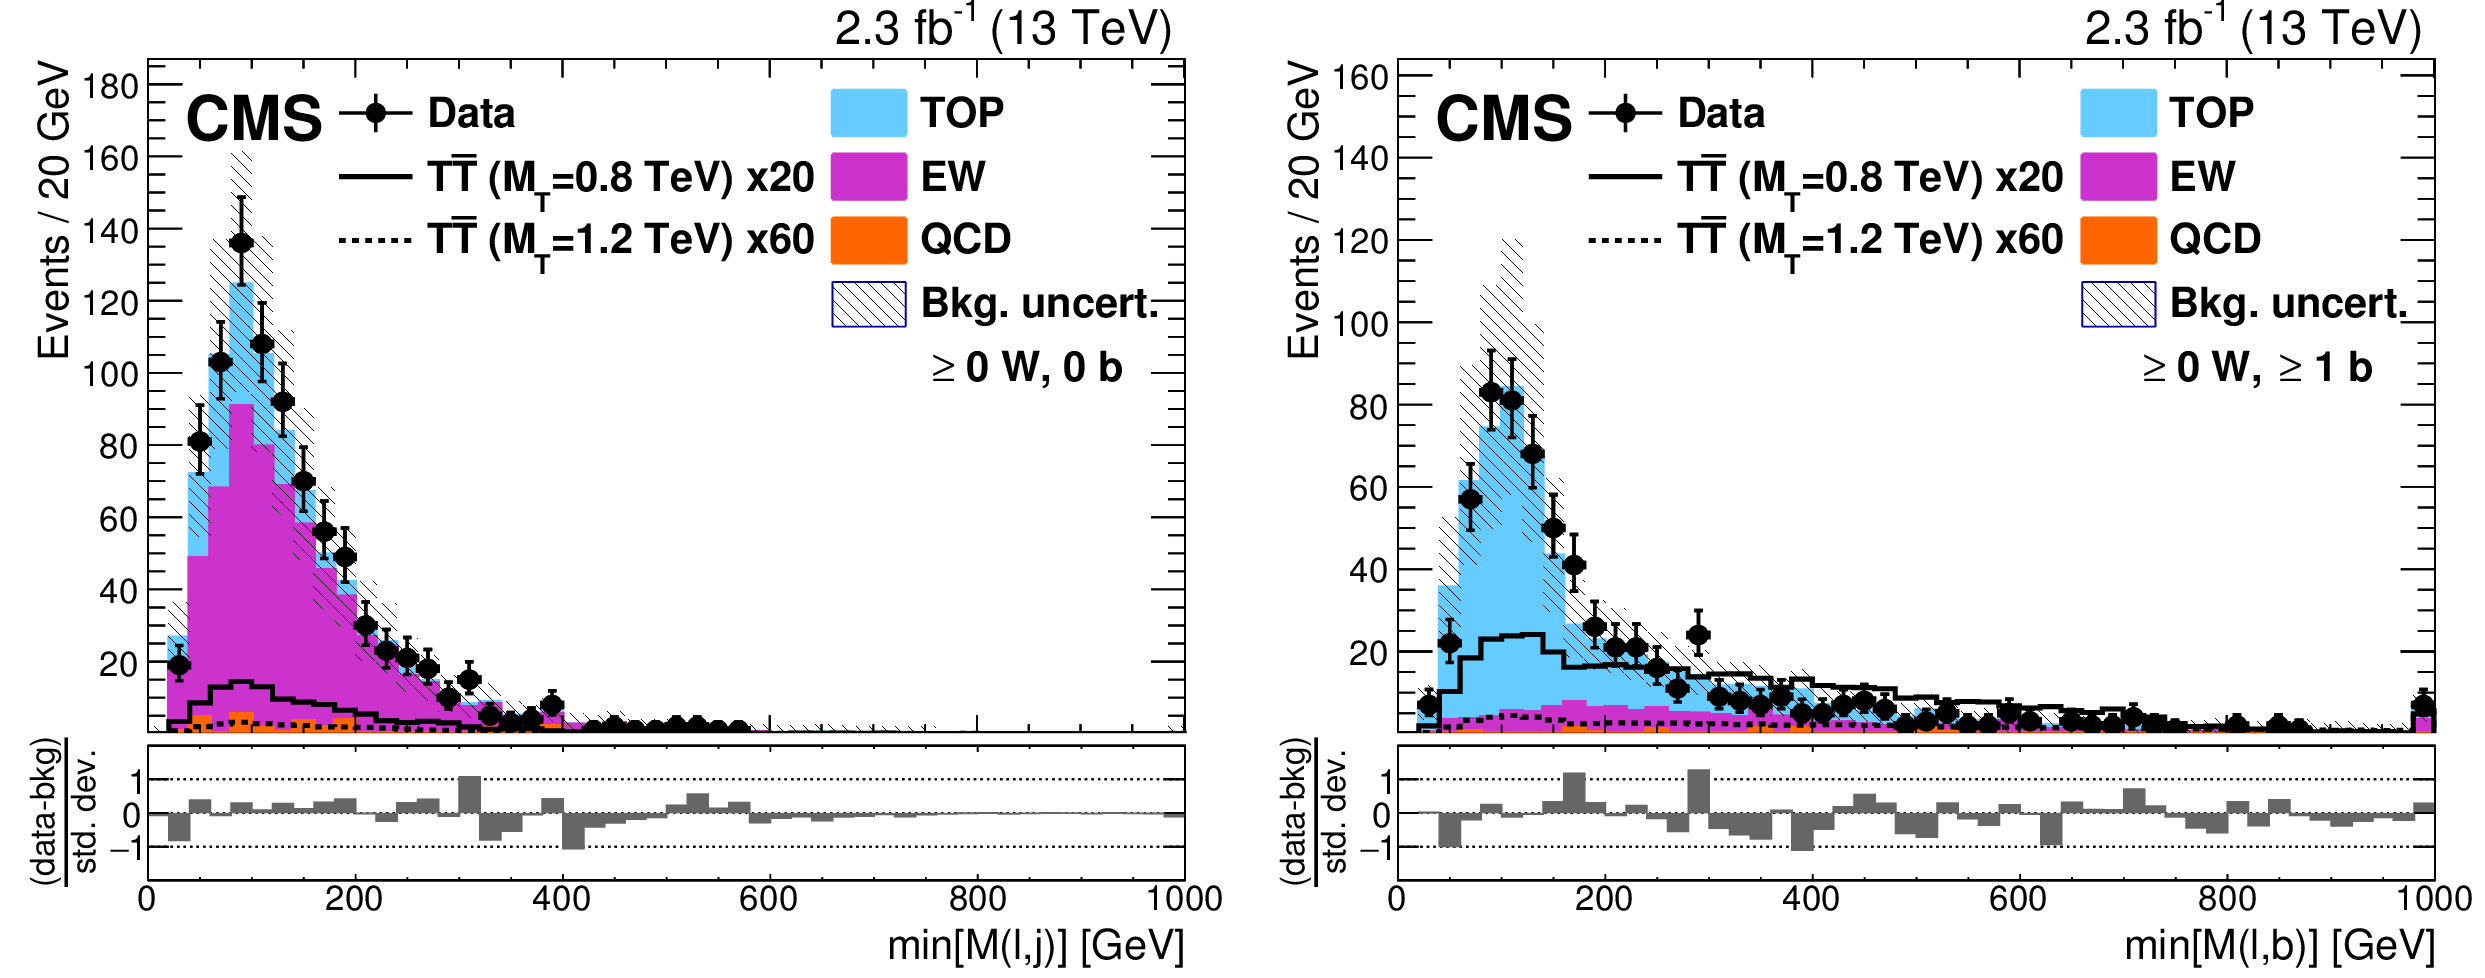
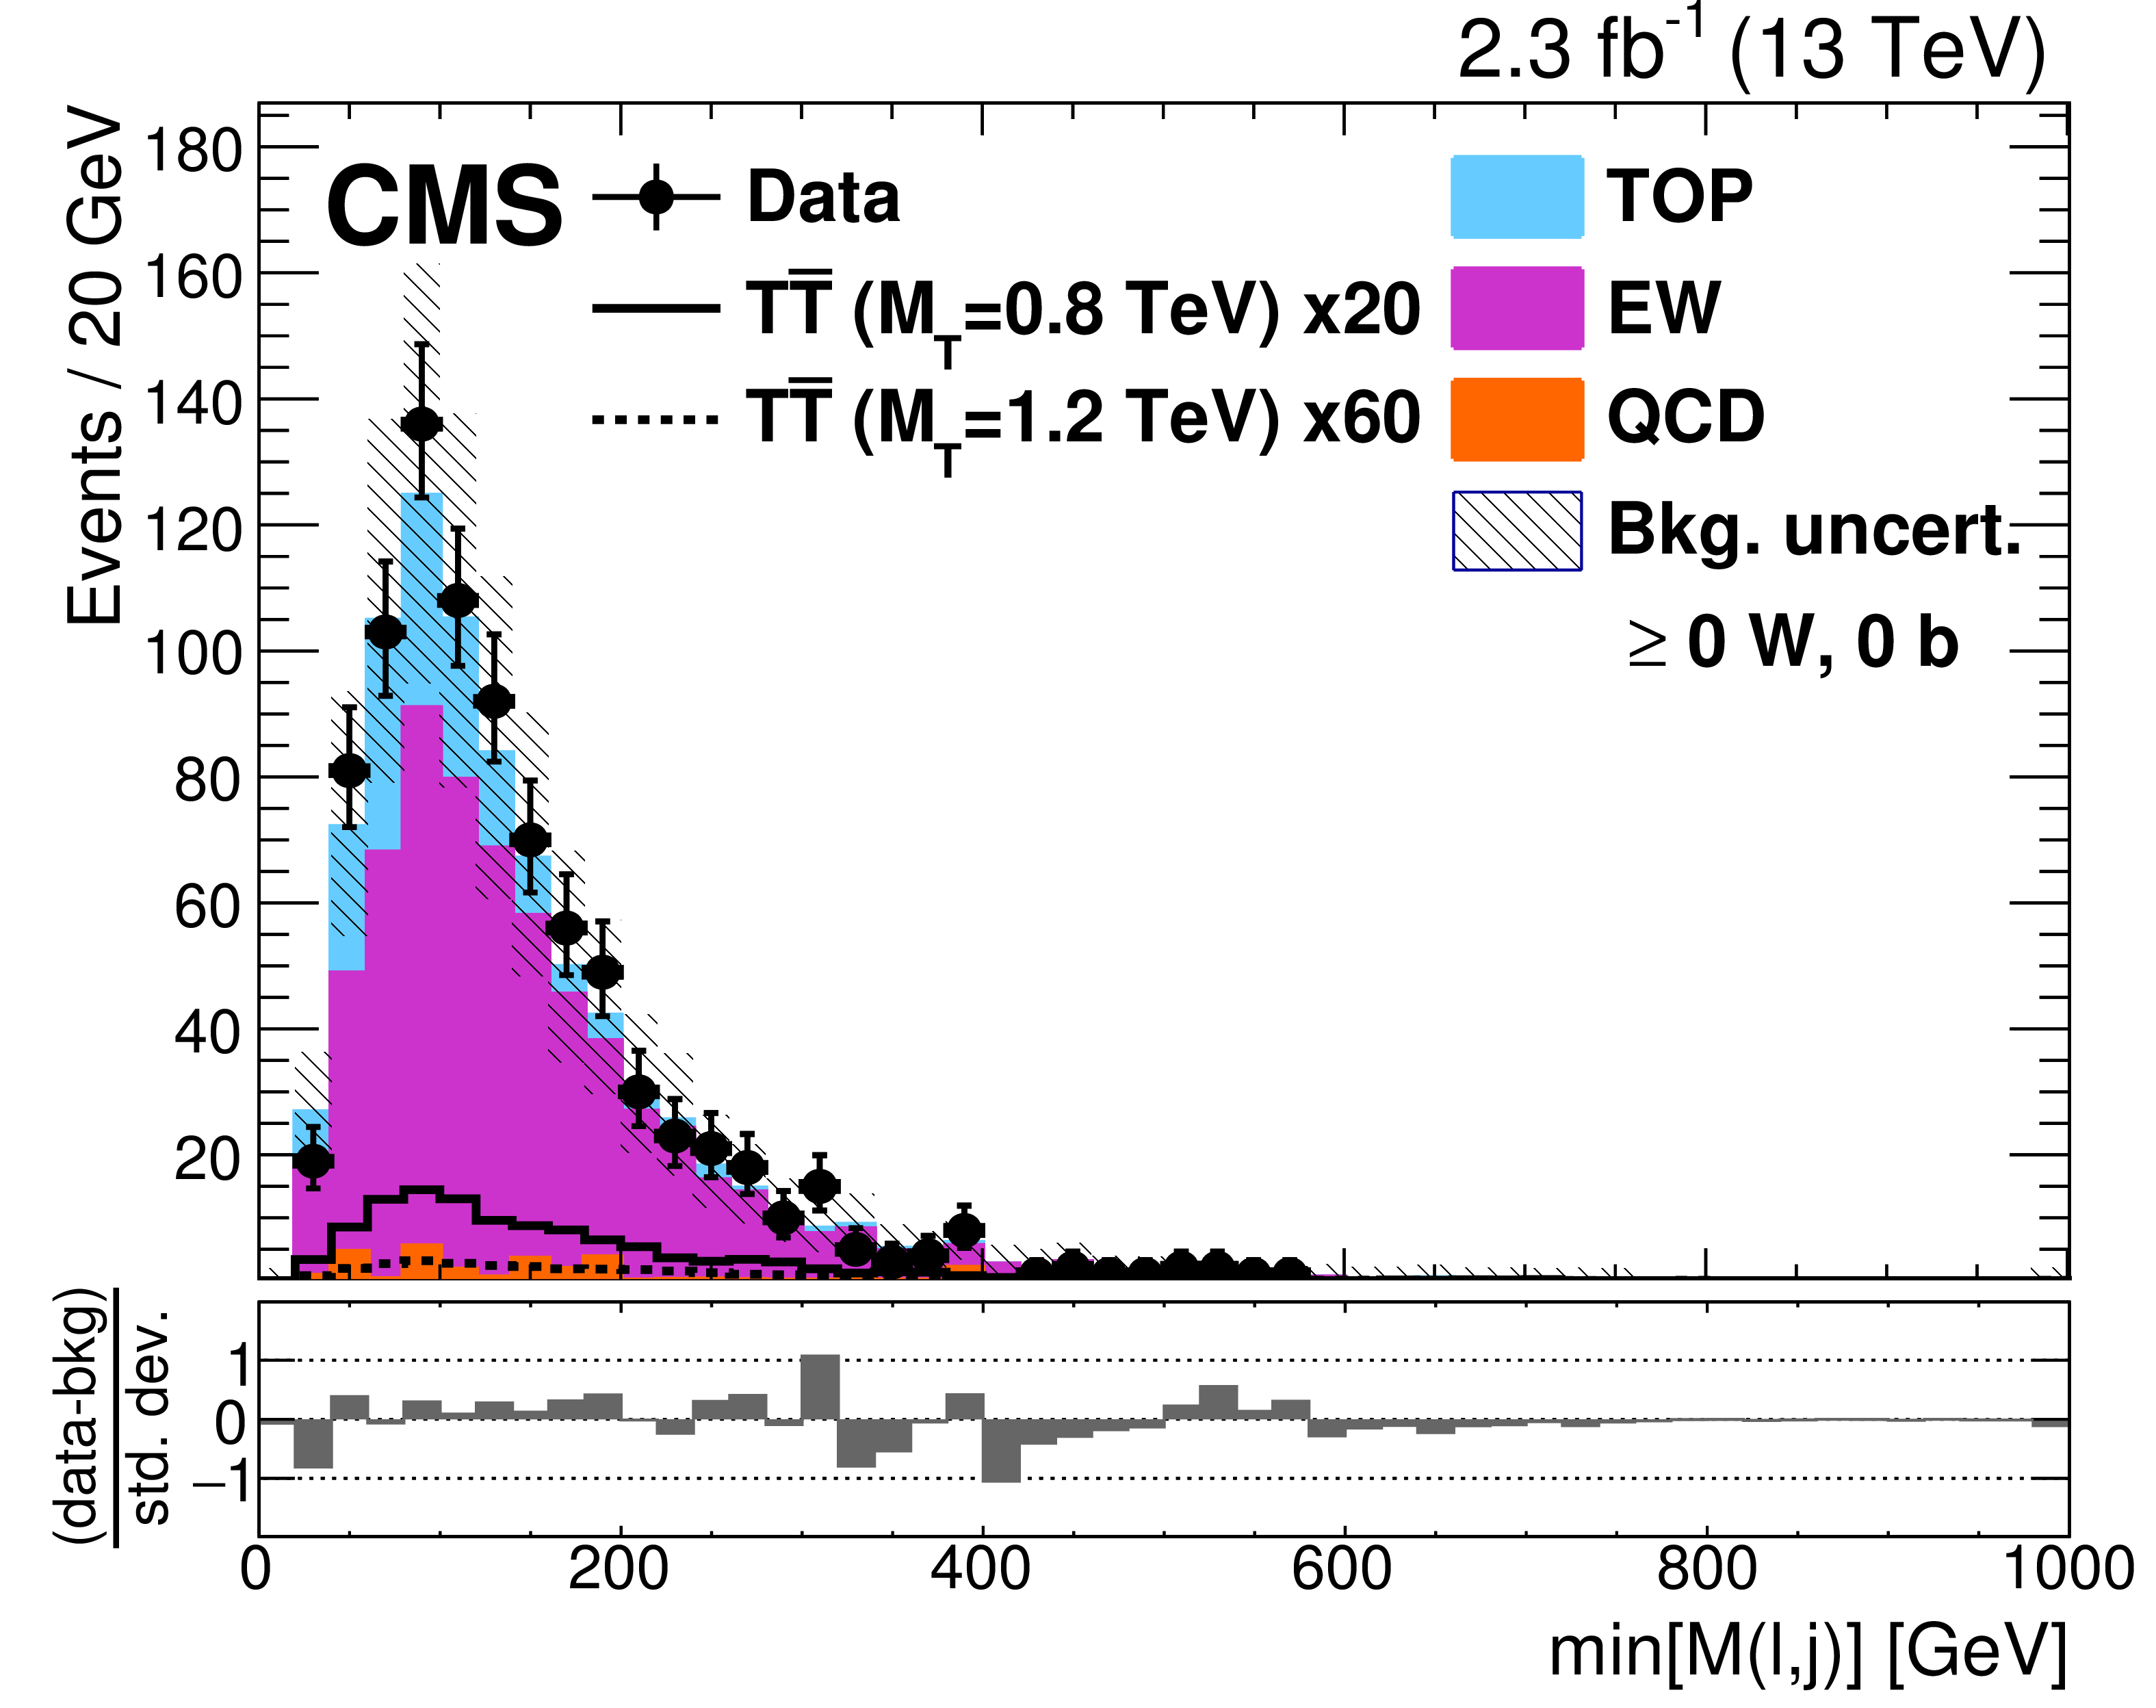
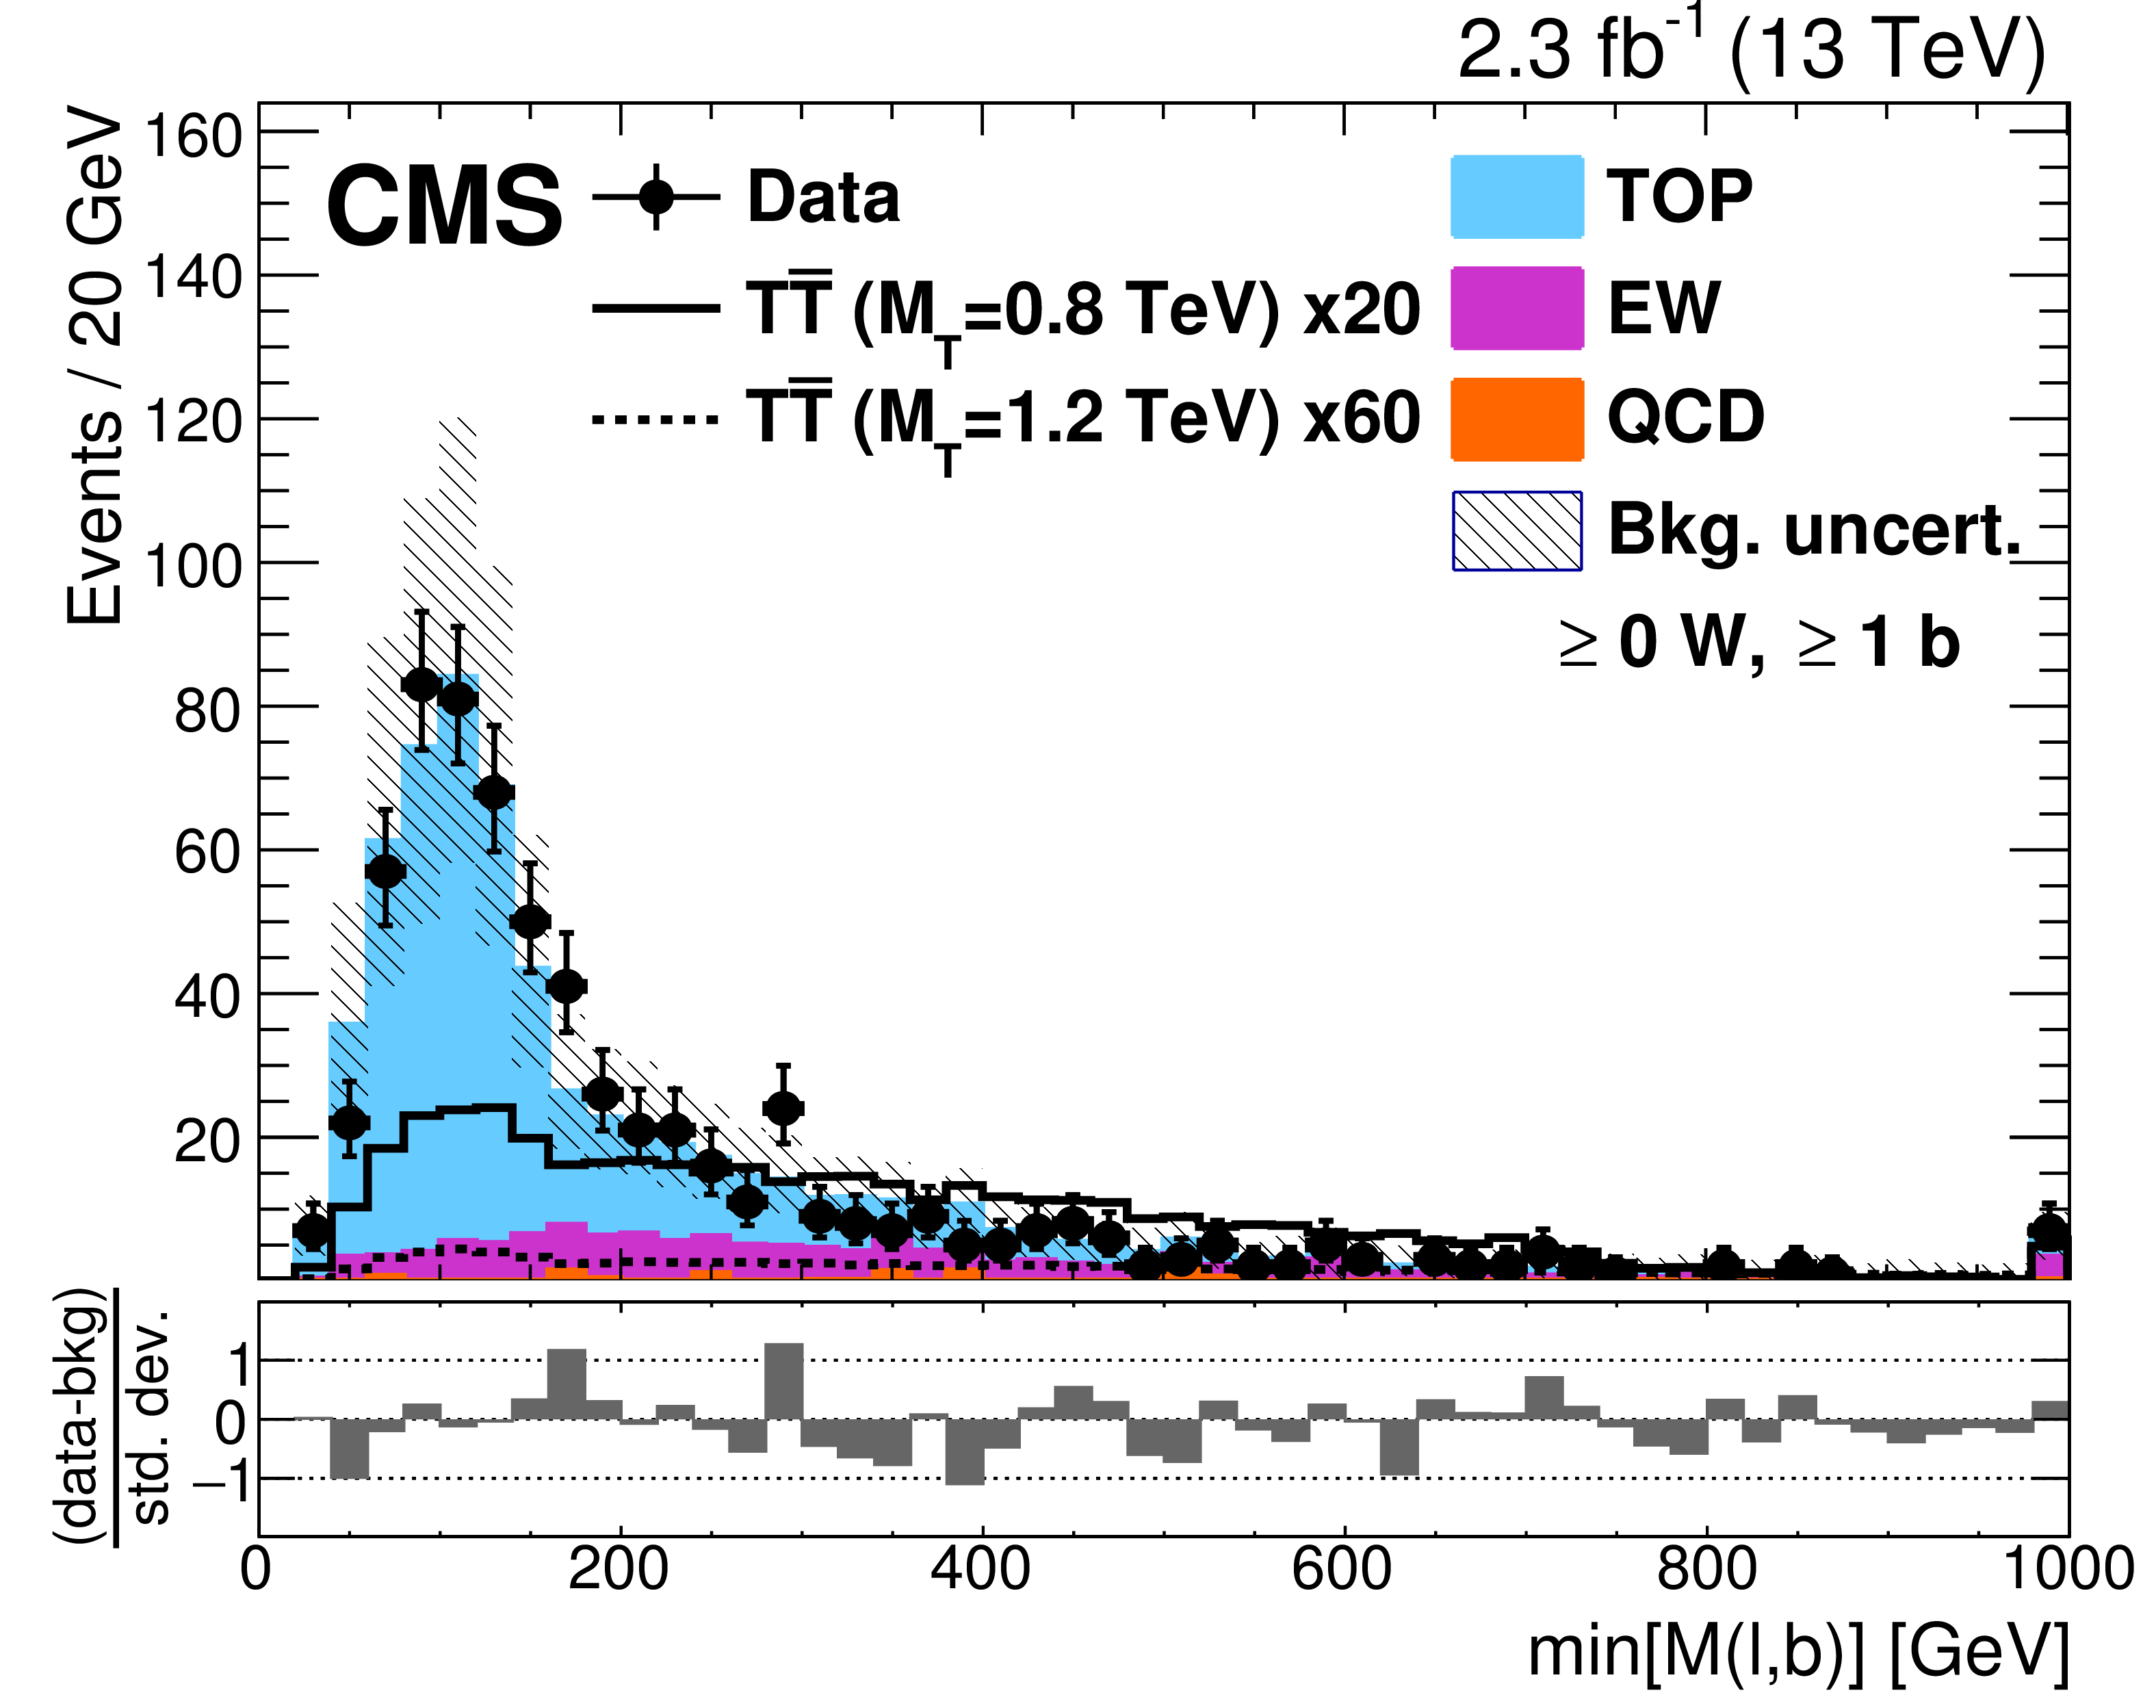
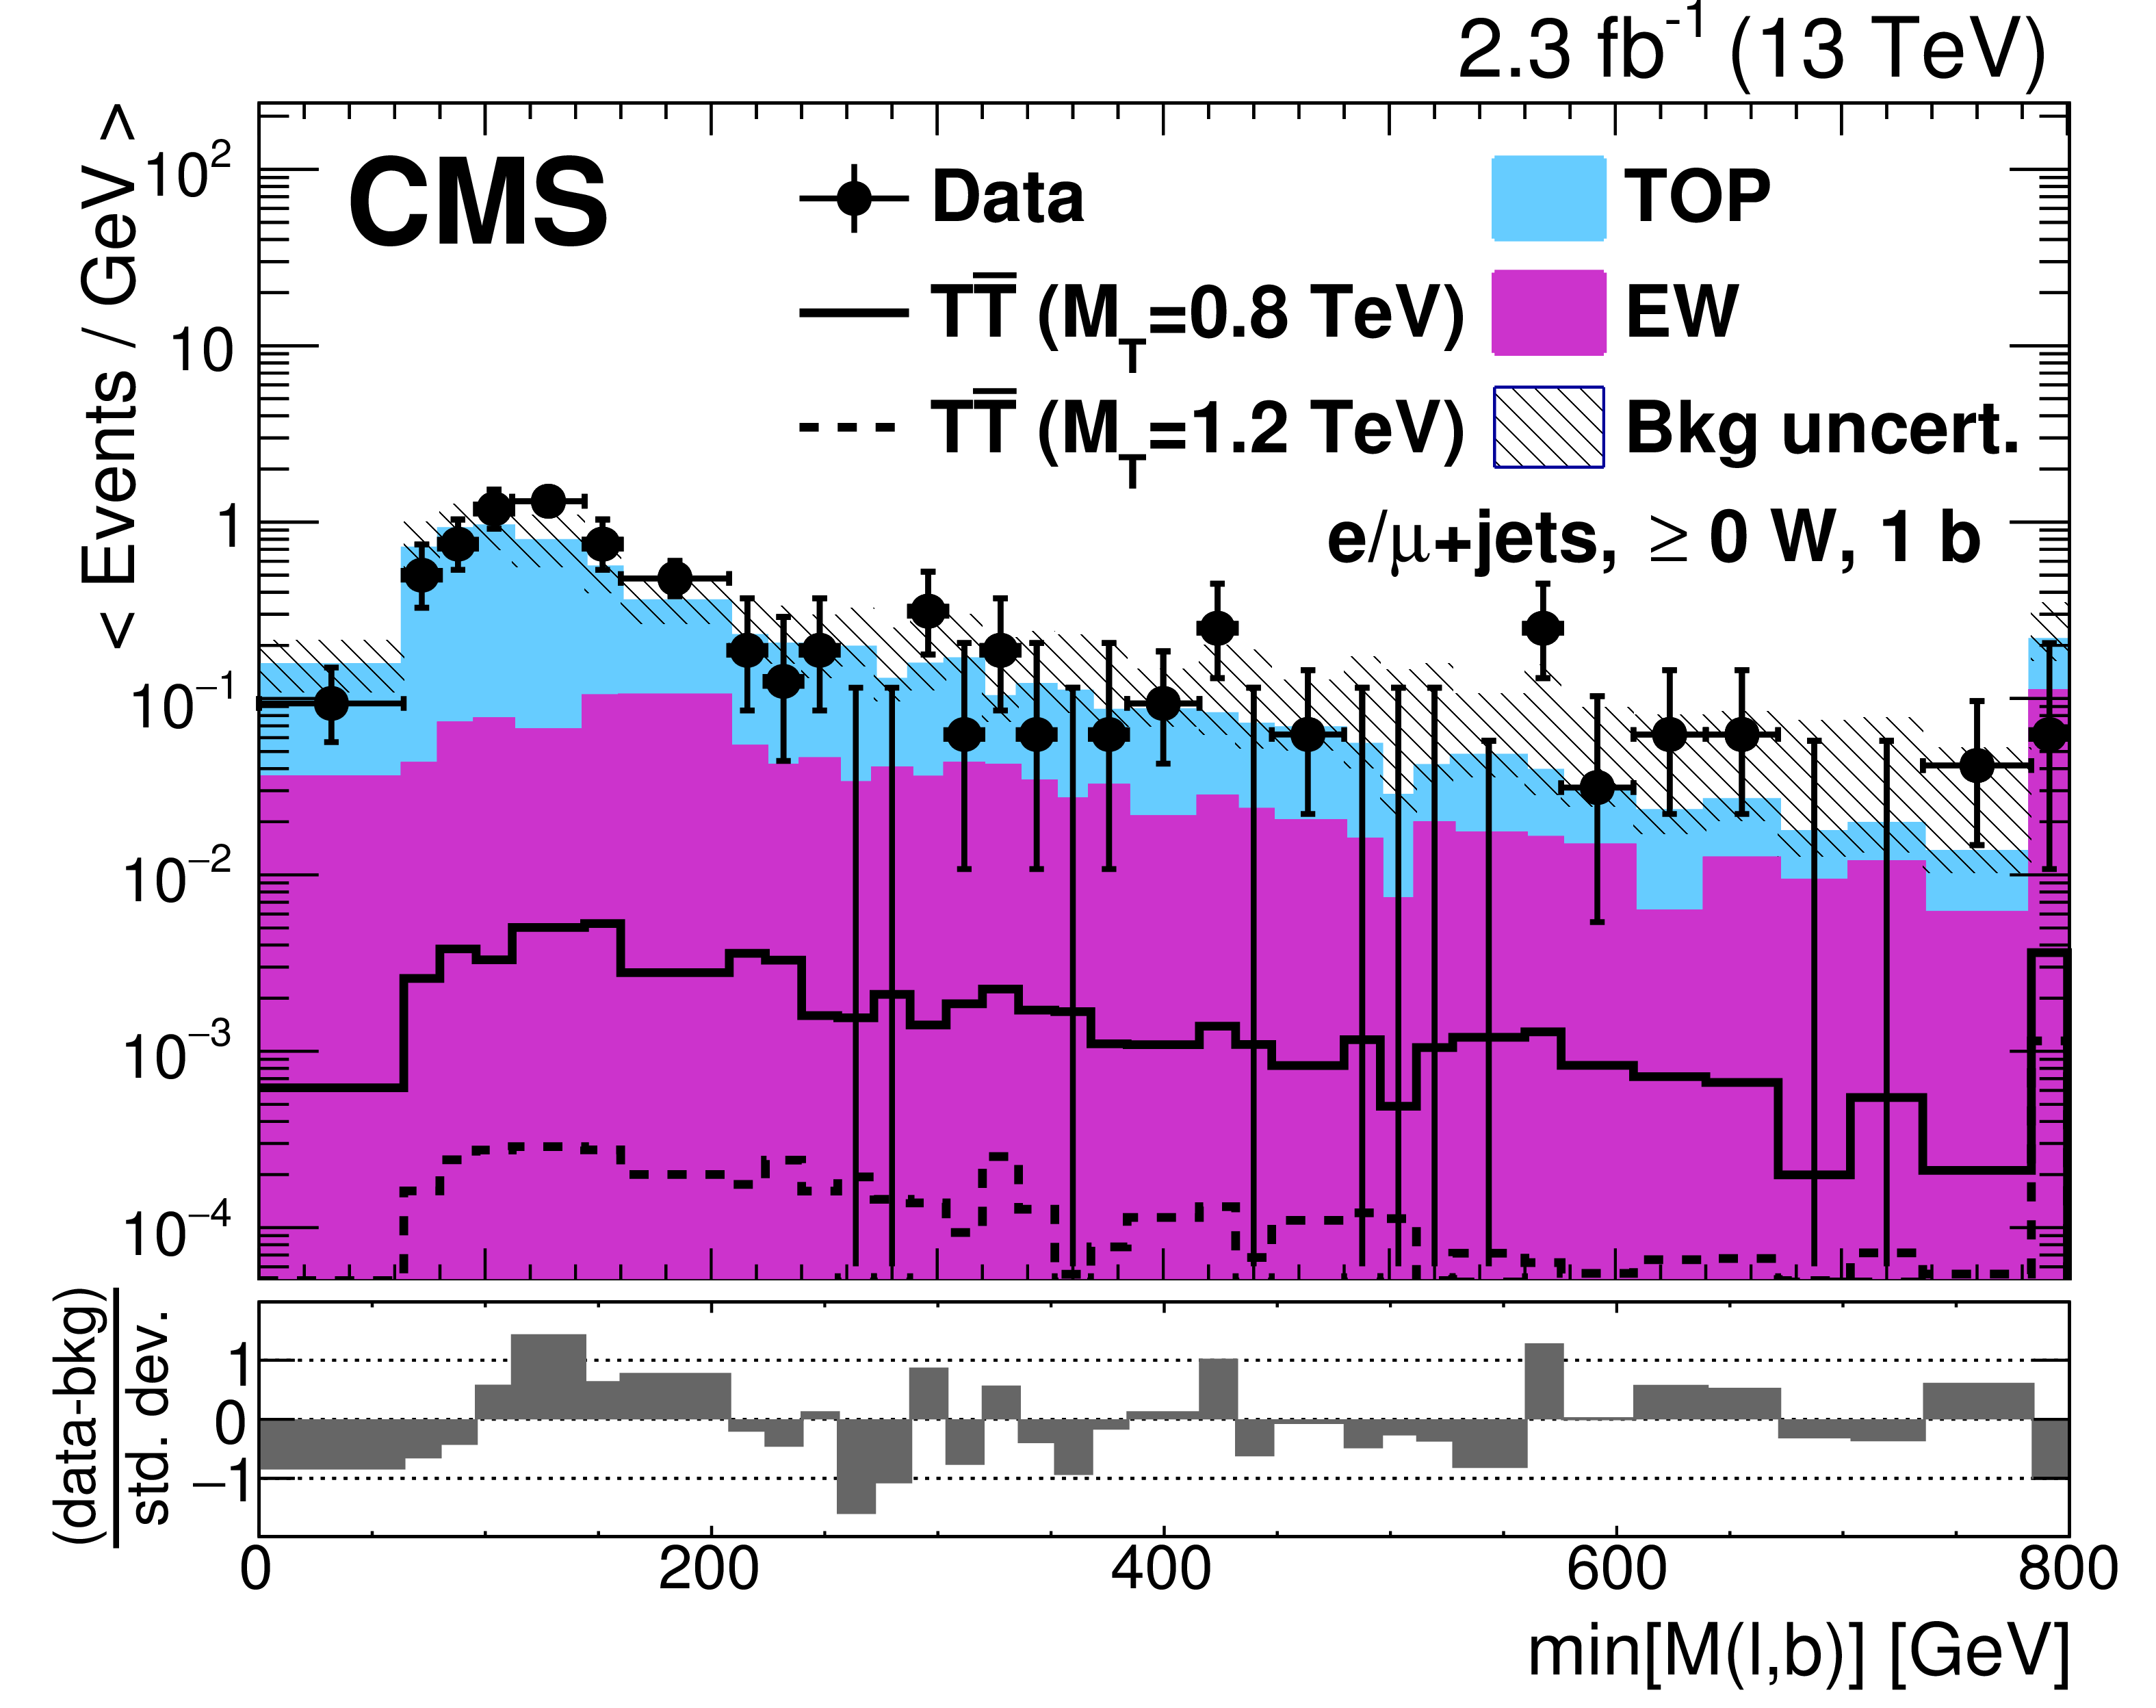
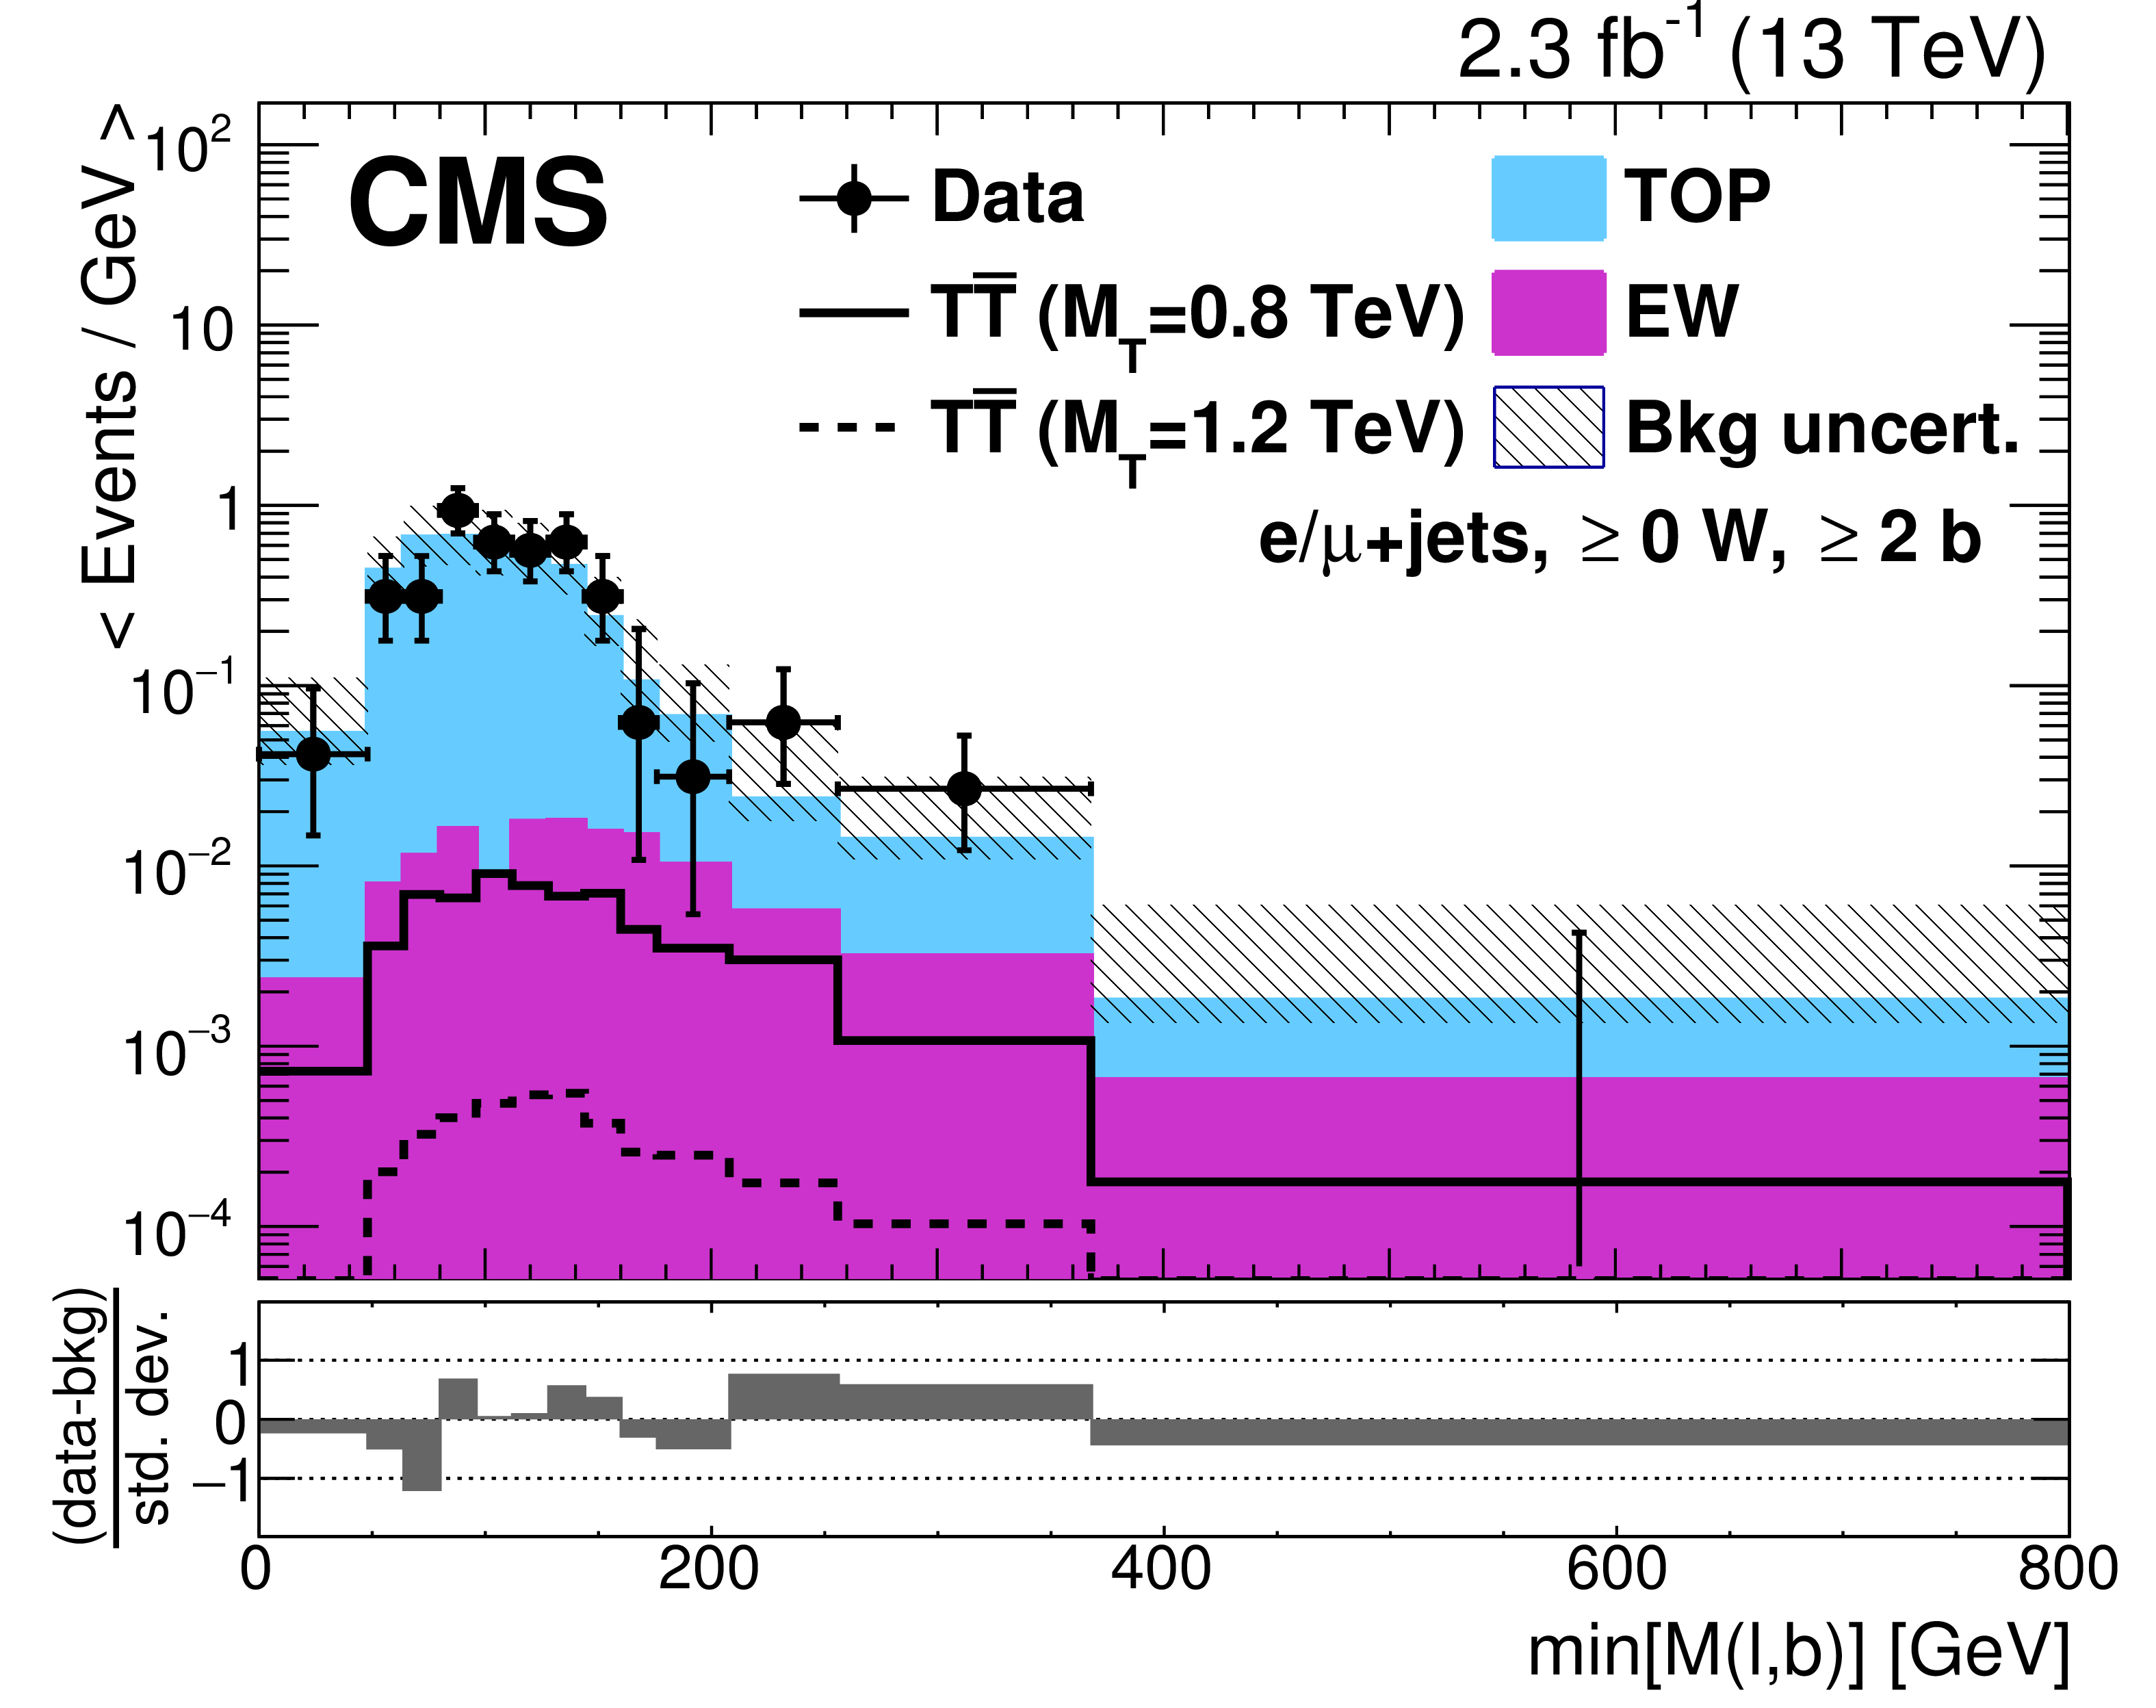
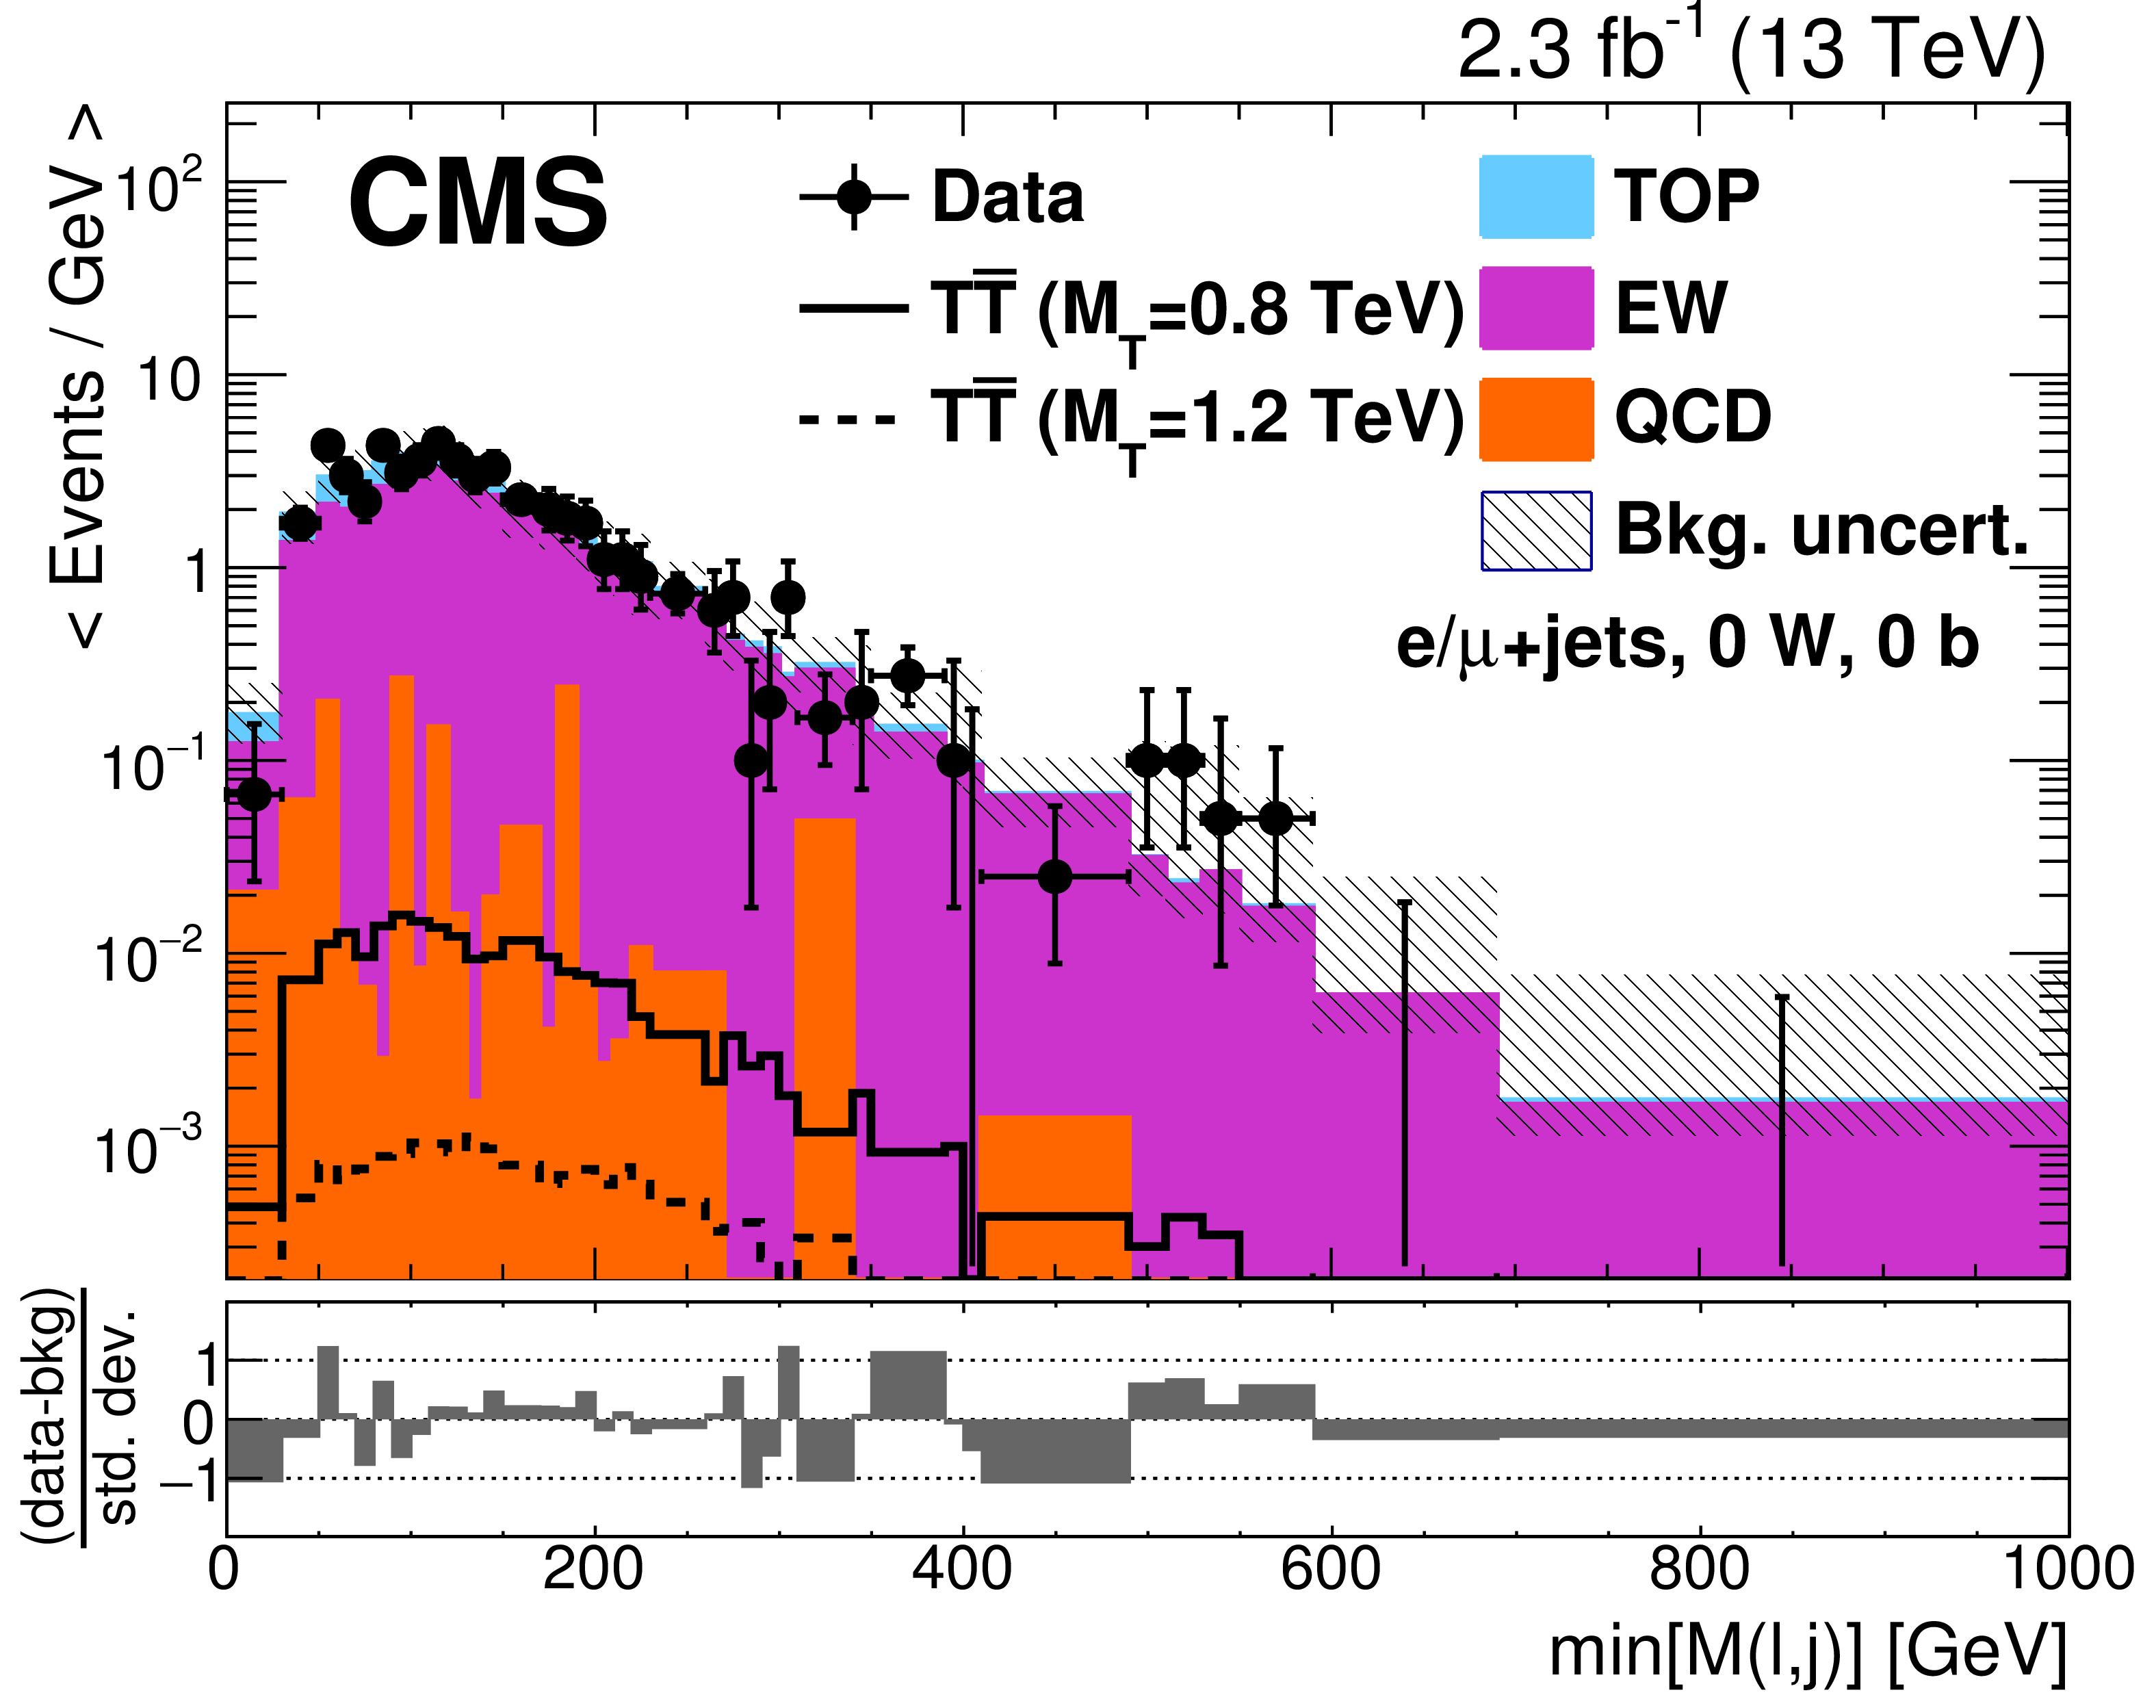
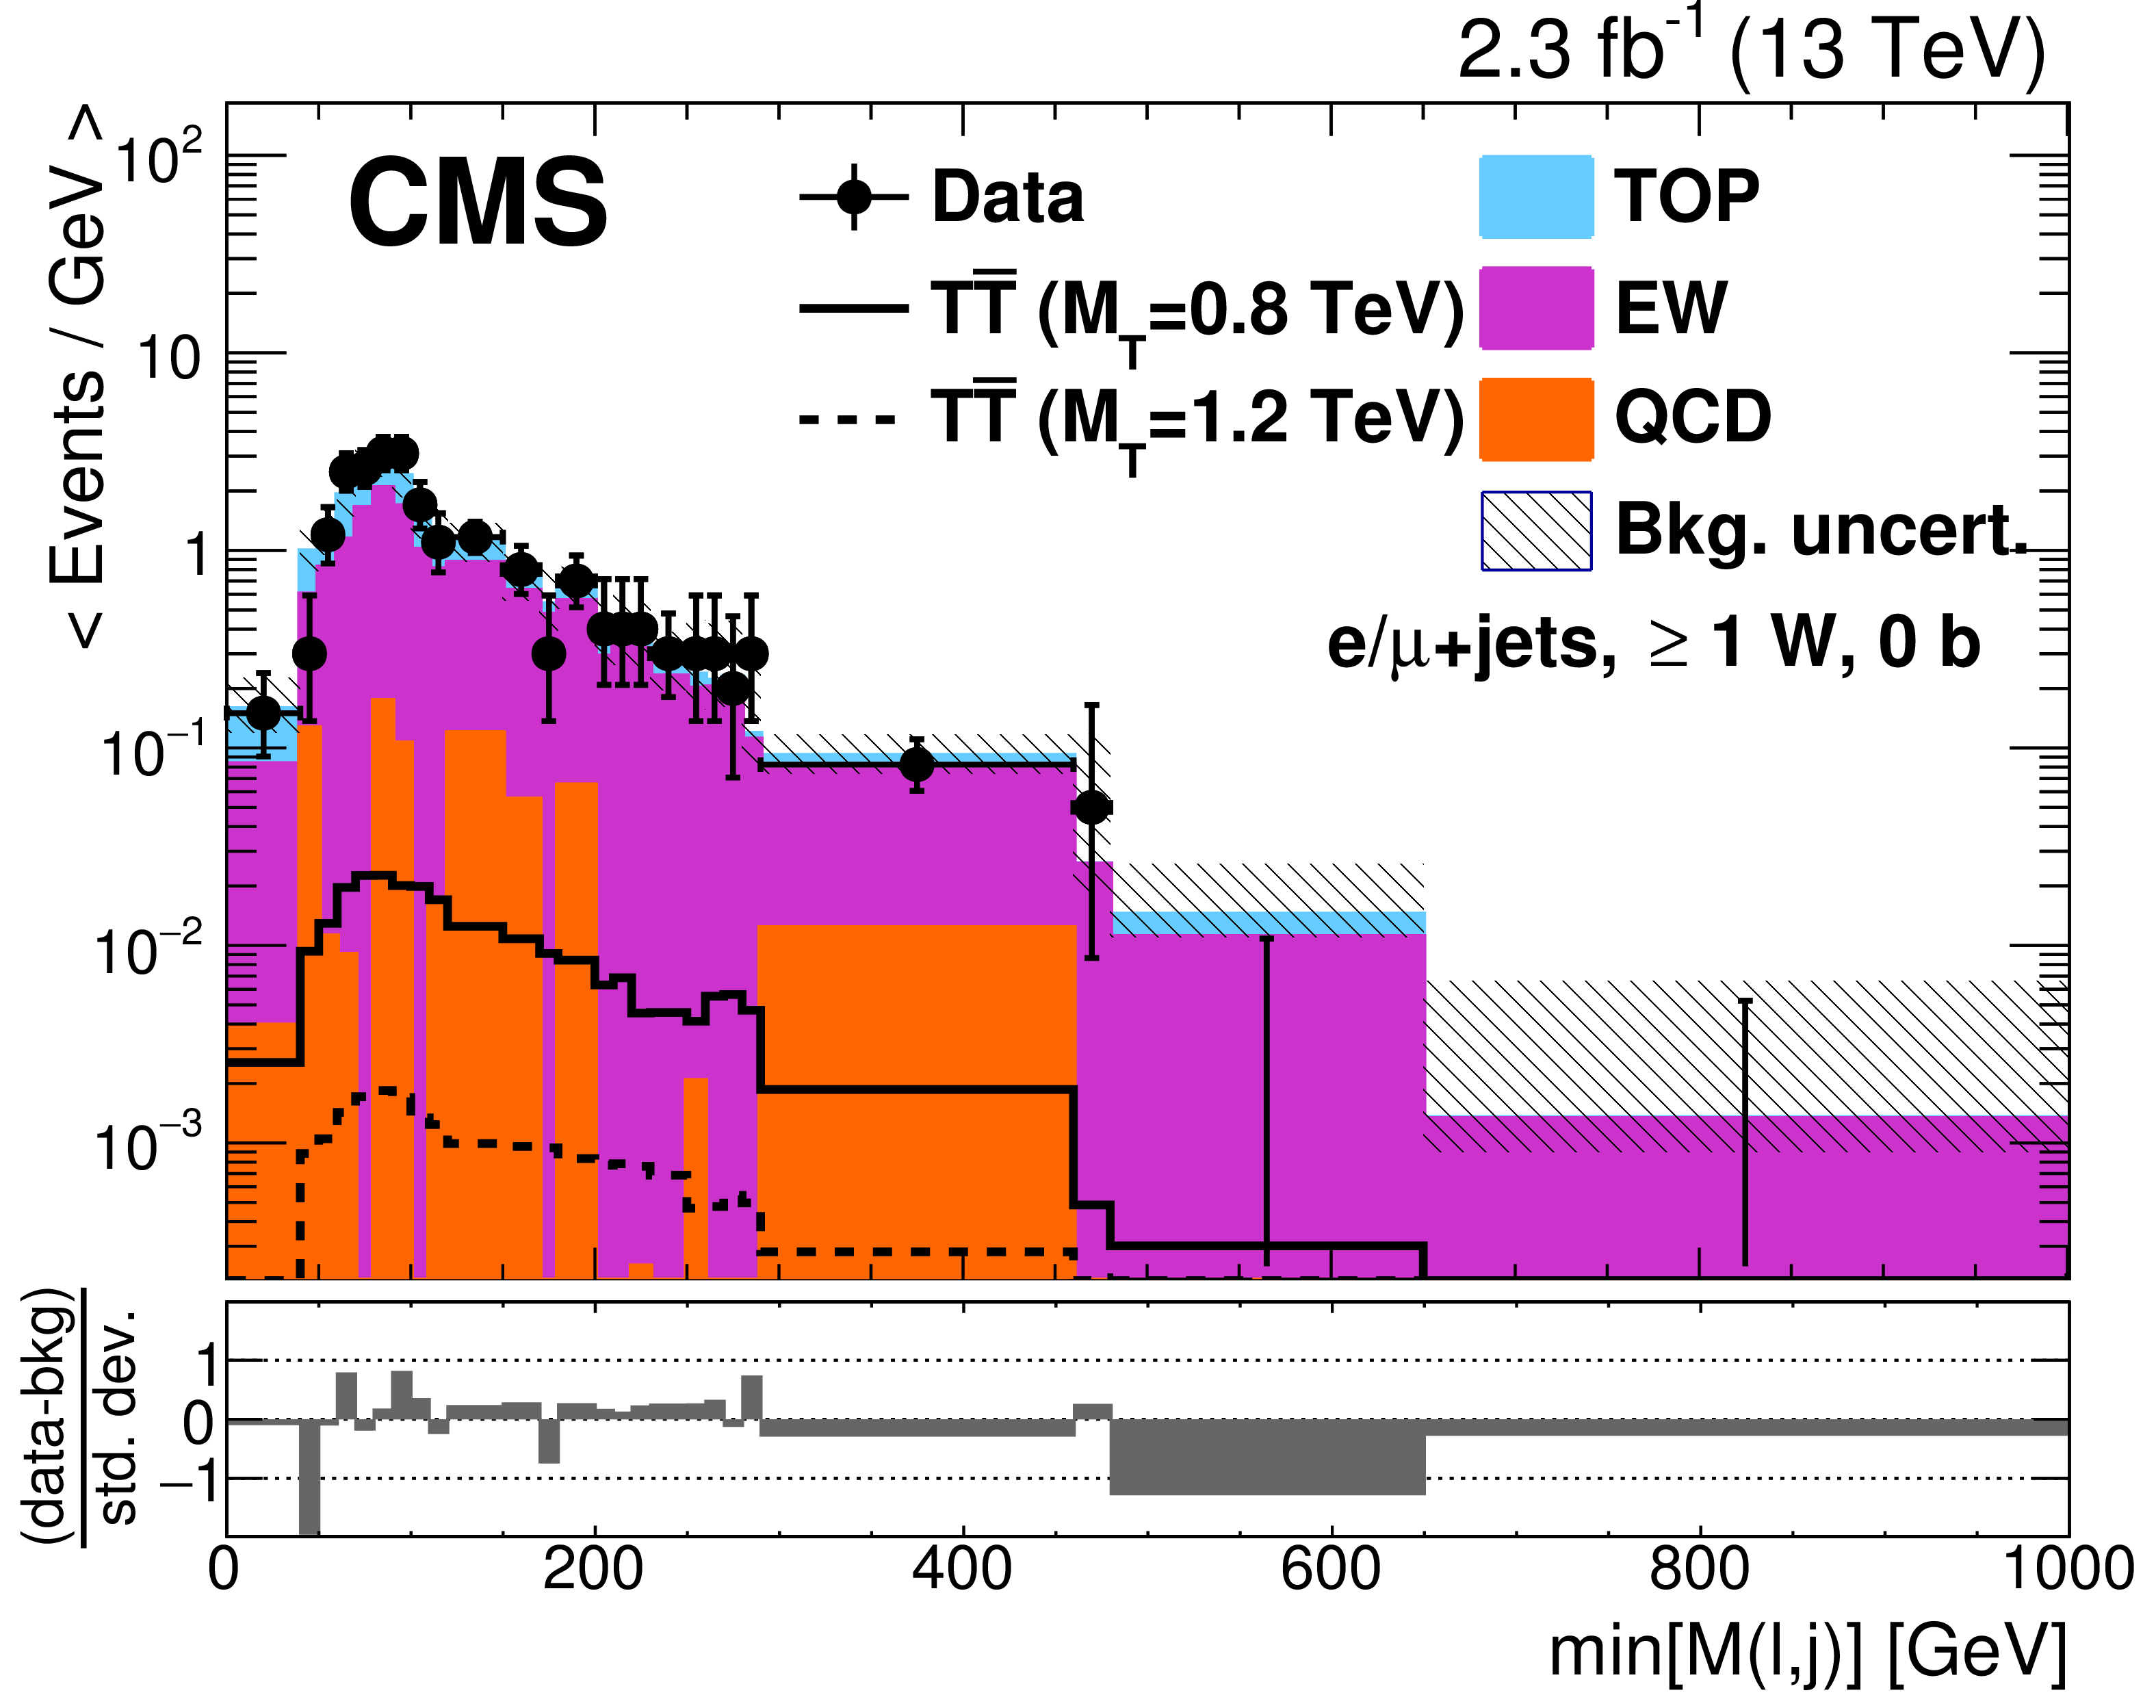
Distributions of $\mathrm{min} [M(\ell, j)]$ in events without b-tagged AK4 jets (left) and $\mathrm{min} [M(\ell, \mathrm{ b })]$ in events with ${\geq }$1 b-tagged AK4 jets (right) in the boosted W channel with all categories combined. Also shown are the distributions of $ { {\mathrm {T}} {\overline {\mathrm {T}}} } $ signal events with T quark masses of 0.8 and 1.2 TeV, scaled by factors of 20 and 60, respectively. The uncertainty in the background includes the statistical and systematic uncertainties described in Section 7. |
png pdf |
Figure 7-a:
Distribution of $\mathrm{min} [M(\ell, j)]$ in events without b-tagged AK4 jets in the boosted W channel with all categories combined. Also shown are the distributions of $ { {\mathrm {T}} {\overline {\mathrm {T}}} } $ signal events with T quark masses of 0.8 and 1.2 TeV, scaled by factors of 20 and 60, respectively. The uncertainty in the background includes the statistical and systematic uncertainties described in Section 7. |
png pdf |
Figure 7-b:
Distribution of $\mathrm{min} [M(\ell, \mathrm{ b })]$ in events with ${\geq }$1 b-tagged AK4 jets in the boosted W channel with all categories combined. Also shown are the distributions of $ { {\mathrm {T}} {\overline {\mathrm {T}}} } $ signal events with T quark masses of 0.8 and 1.2 TeV, scaled by factors of 20 and 60, respectively. The uncertainty in the background includes the statistical and systematic uncertainties described in Section 7. |
png pdf |
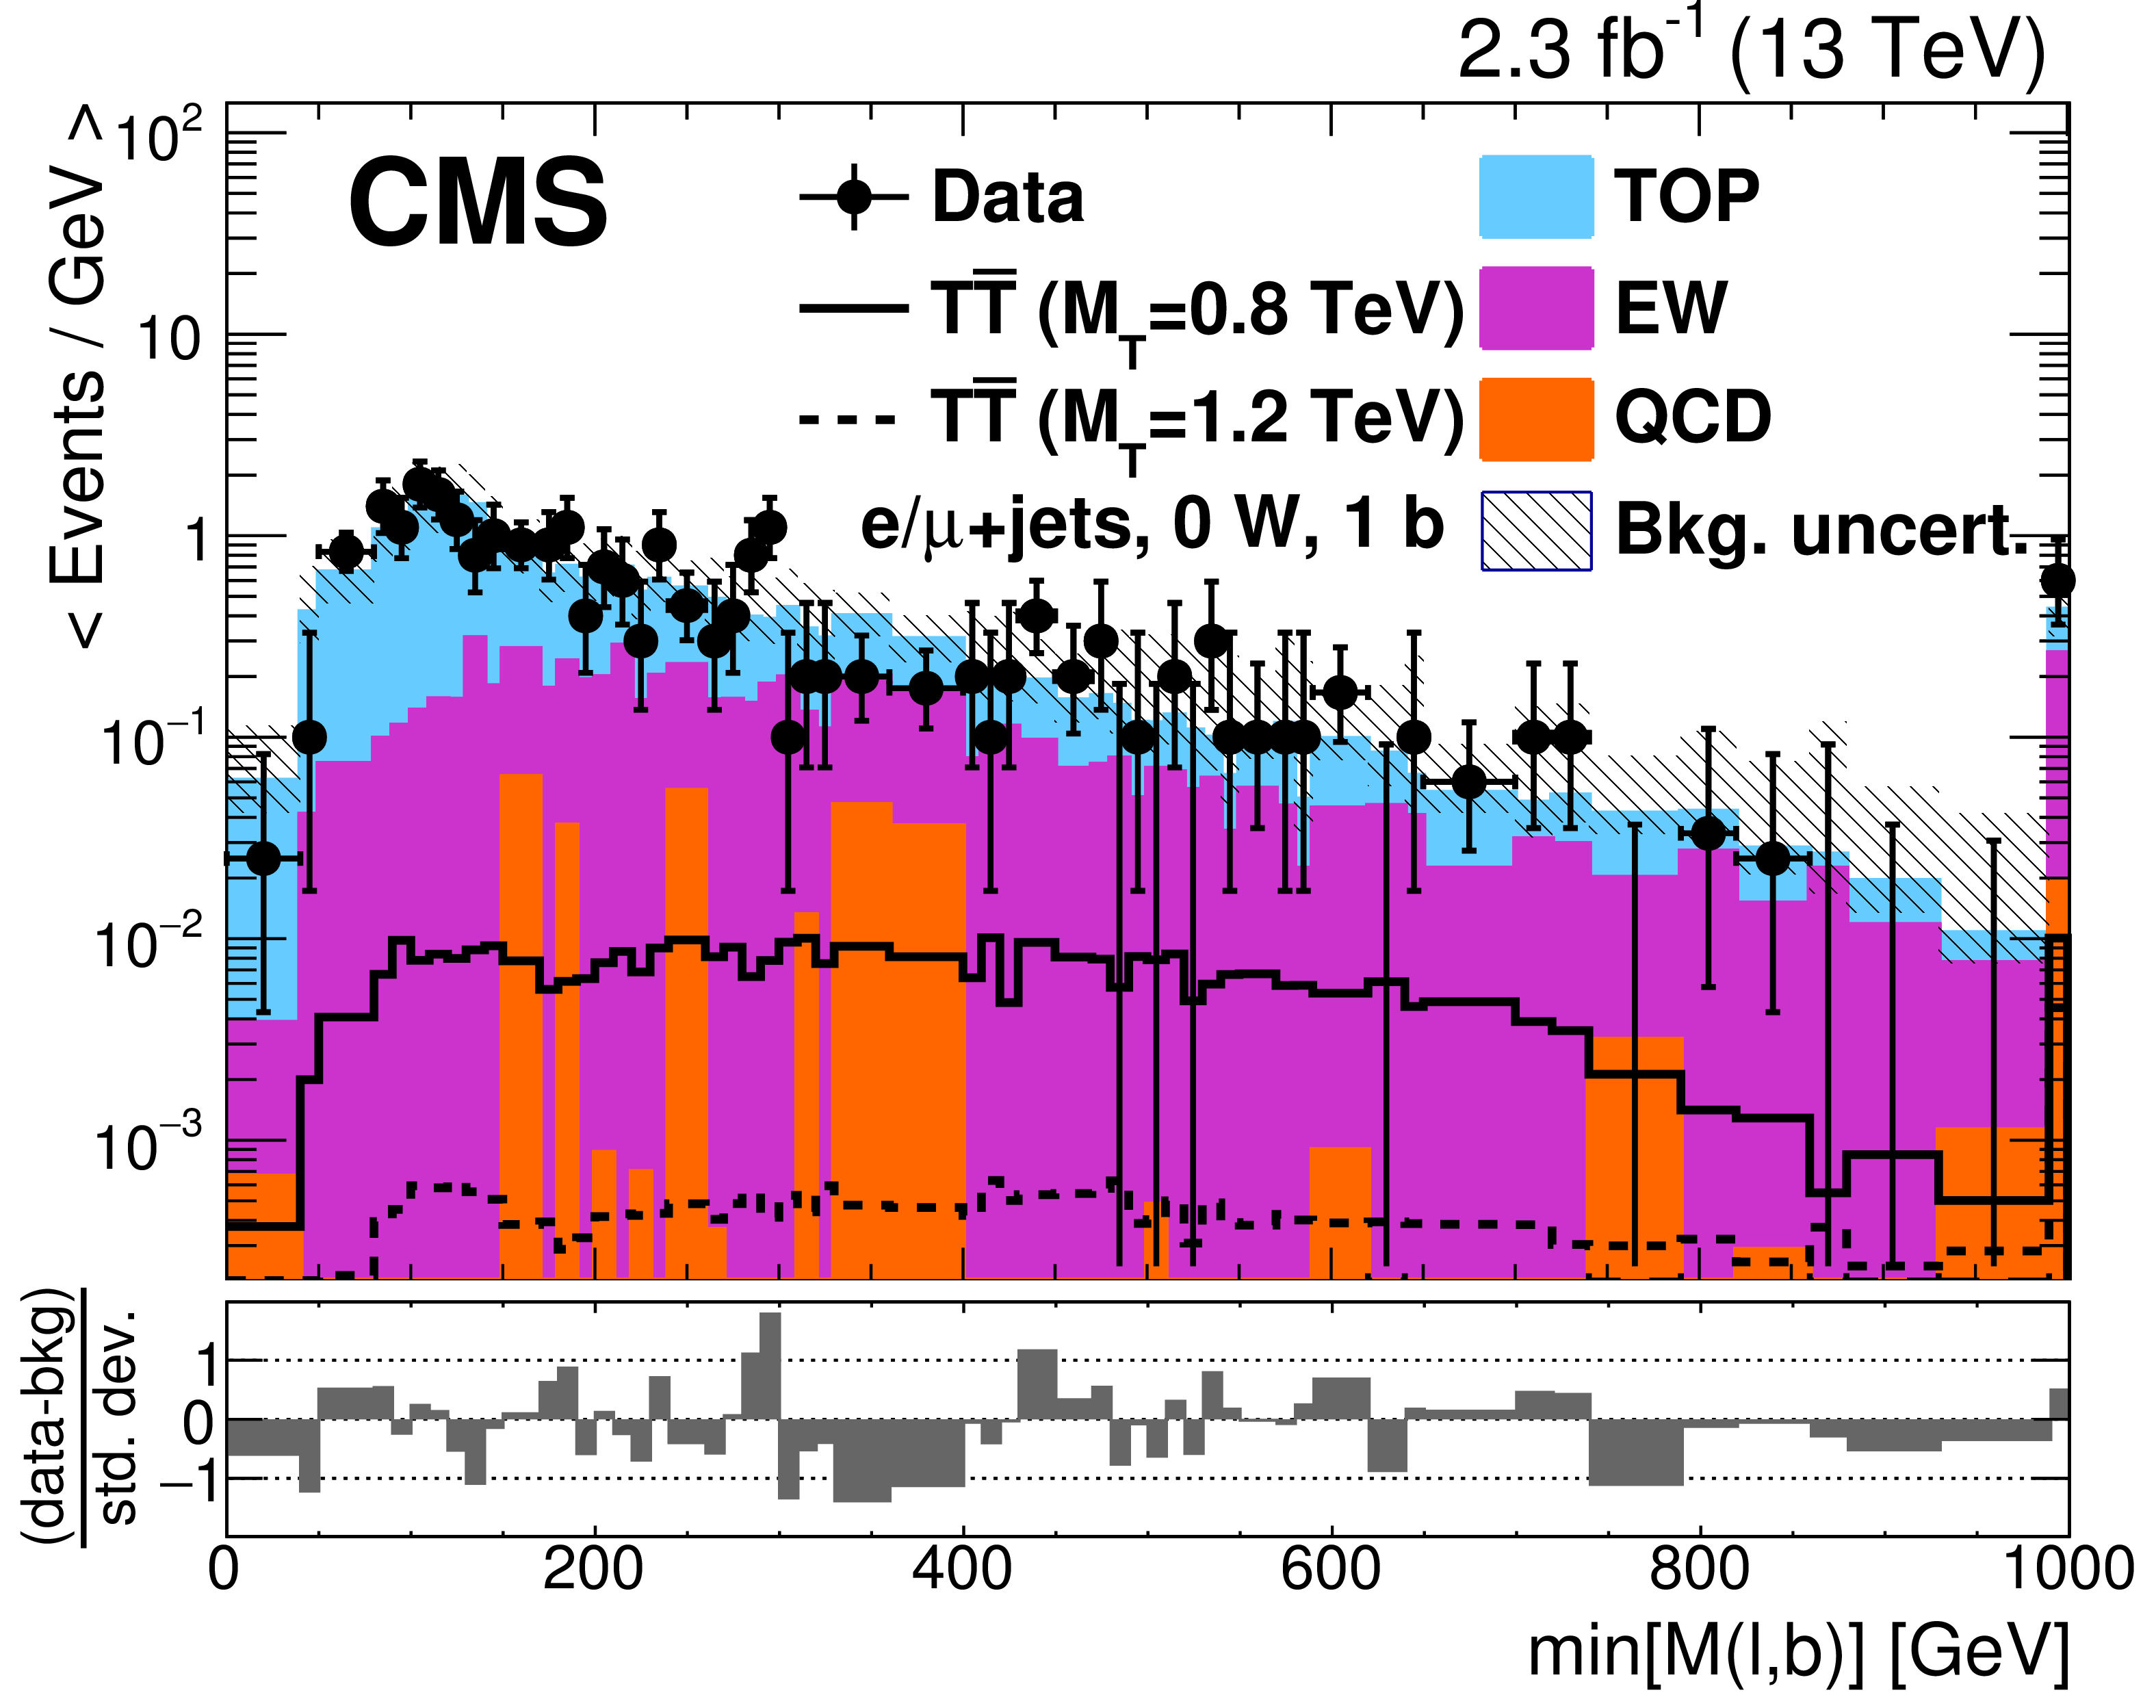
Figure 8:
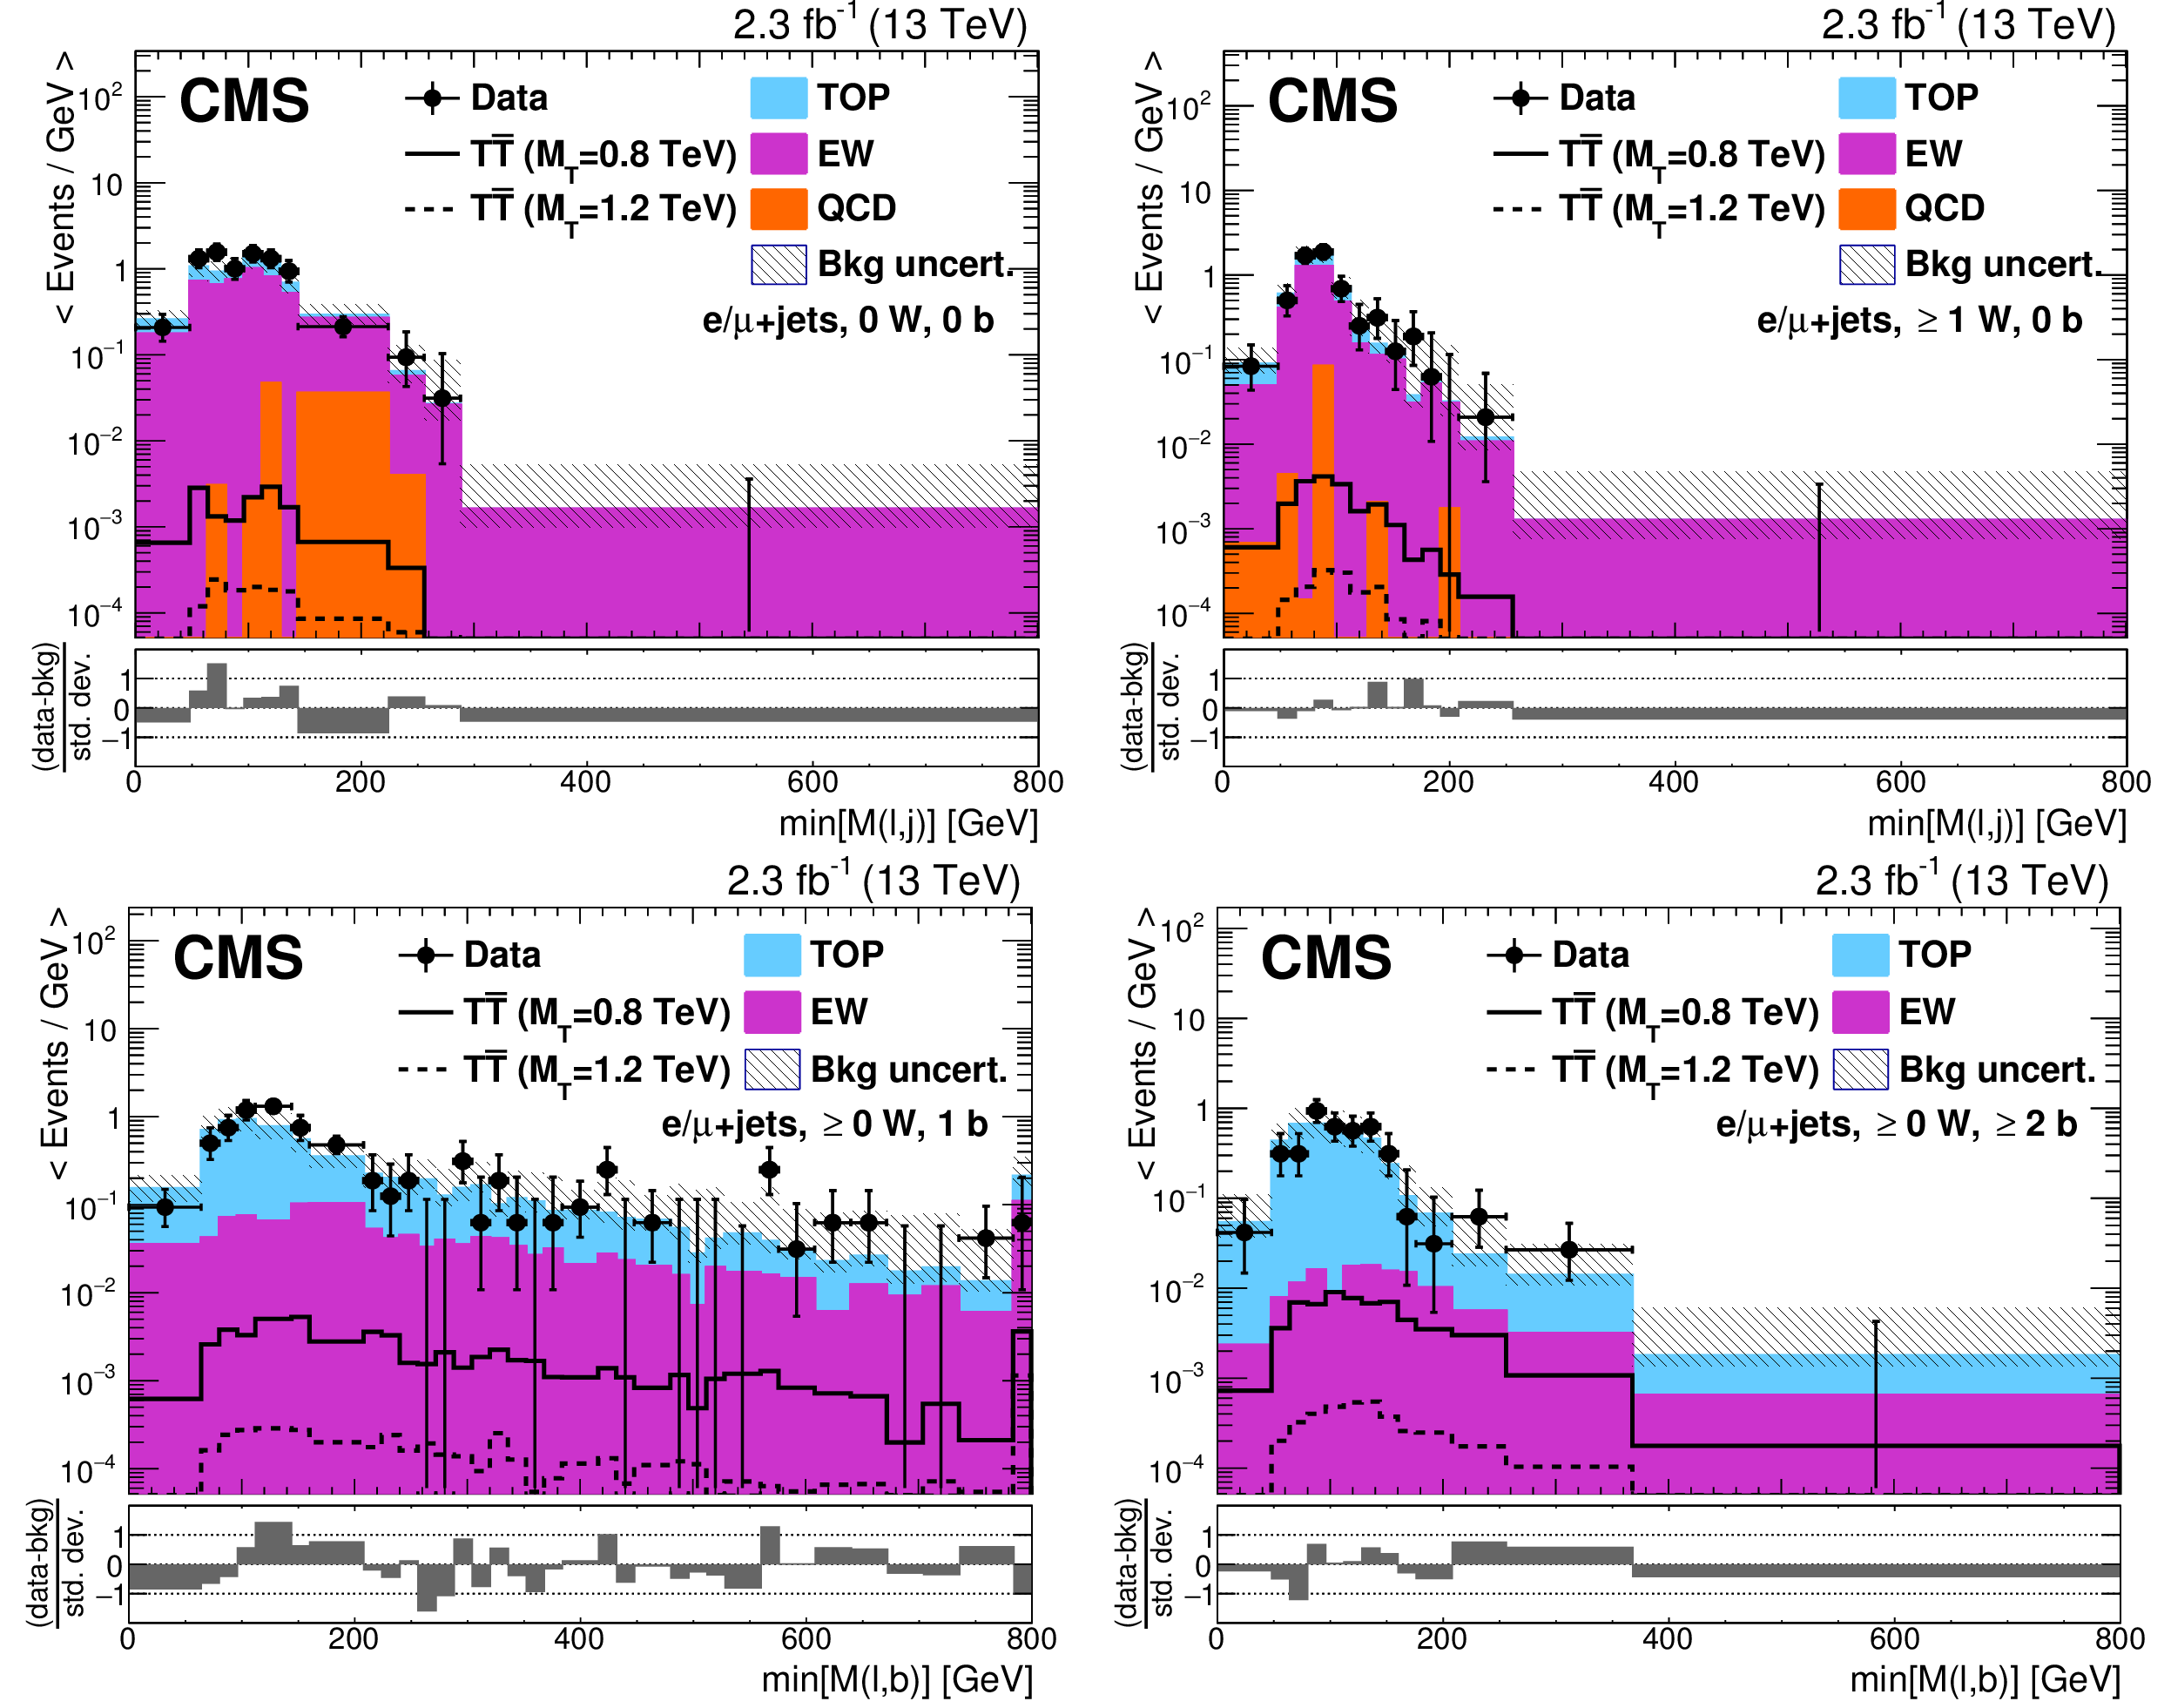
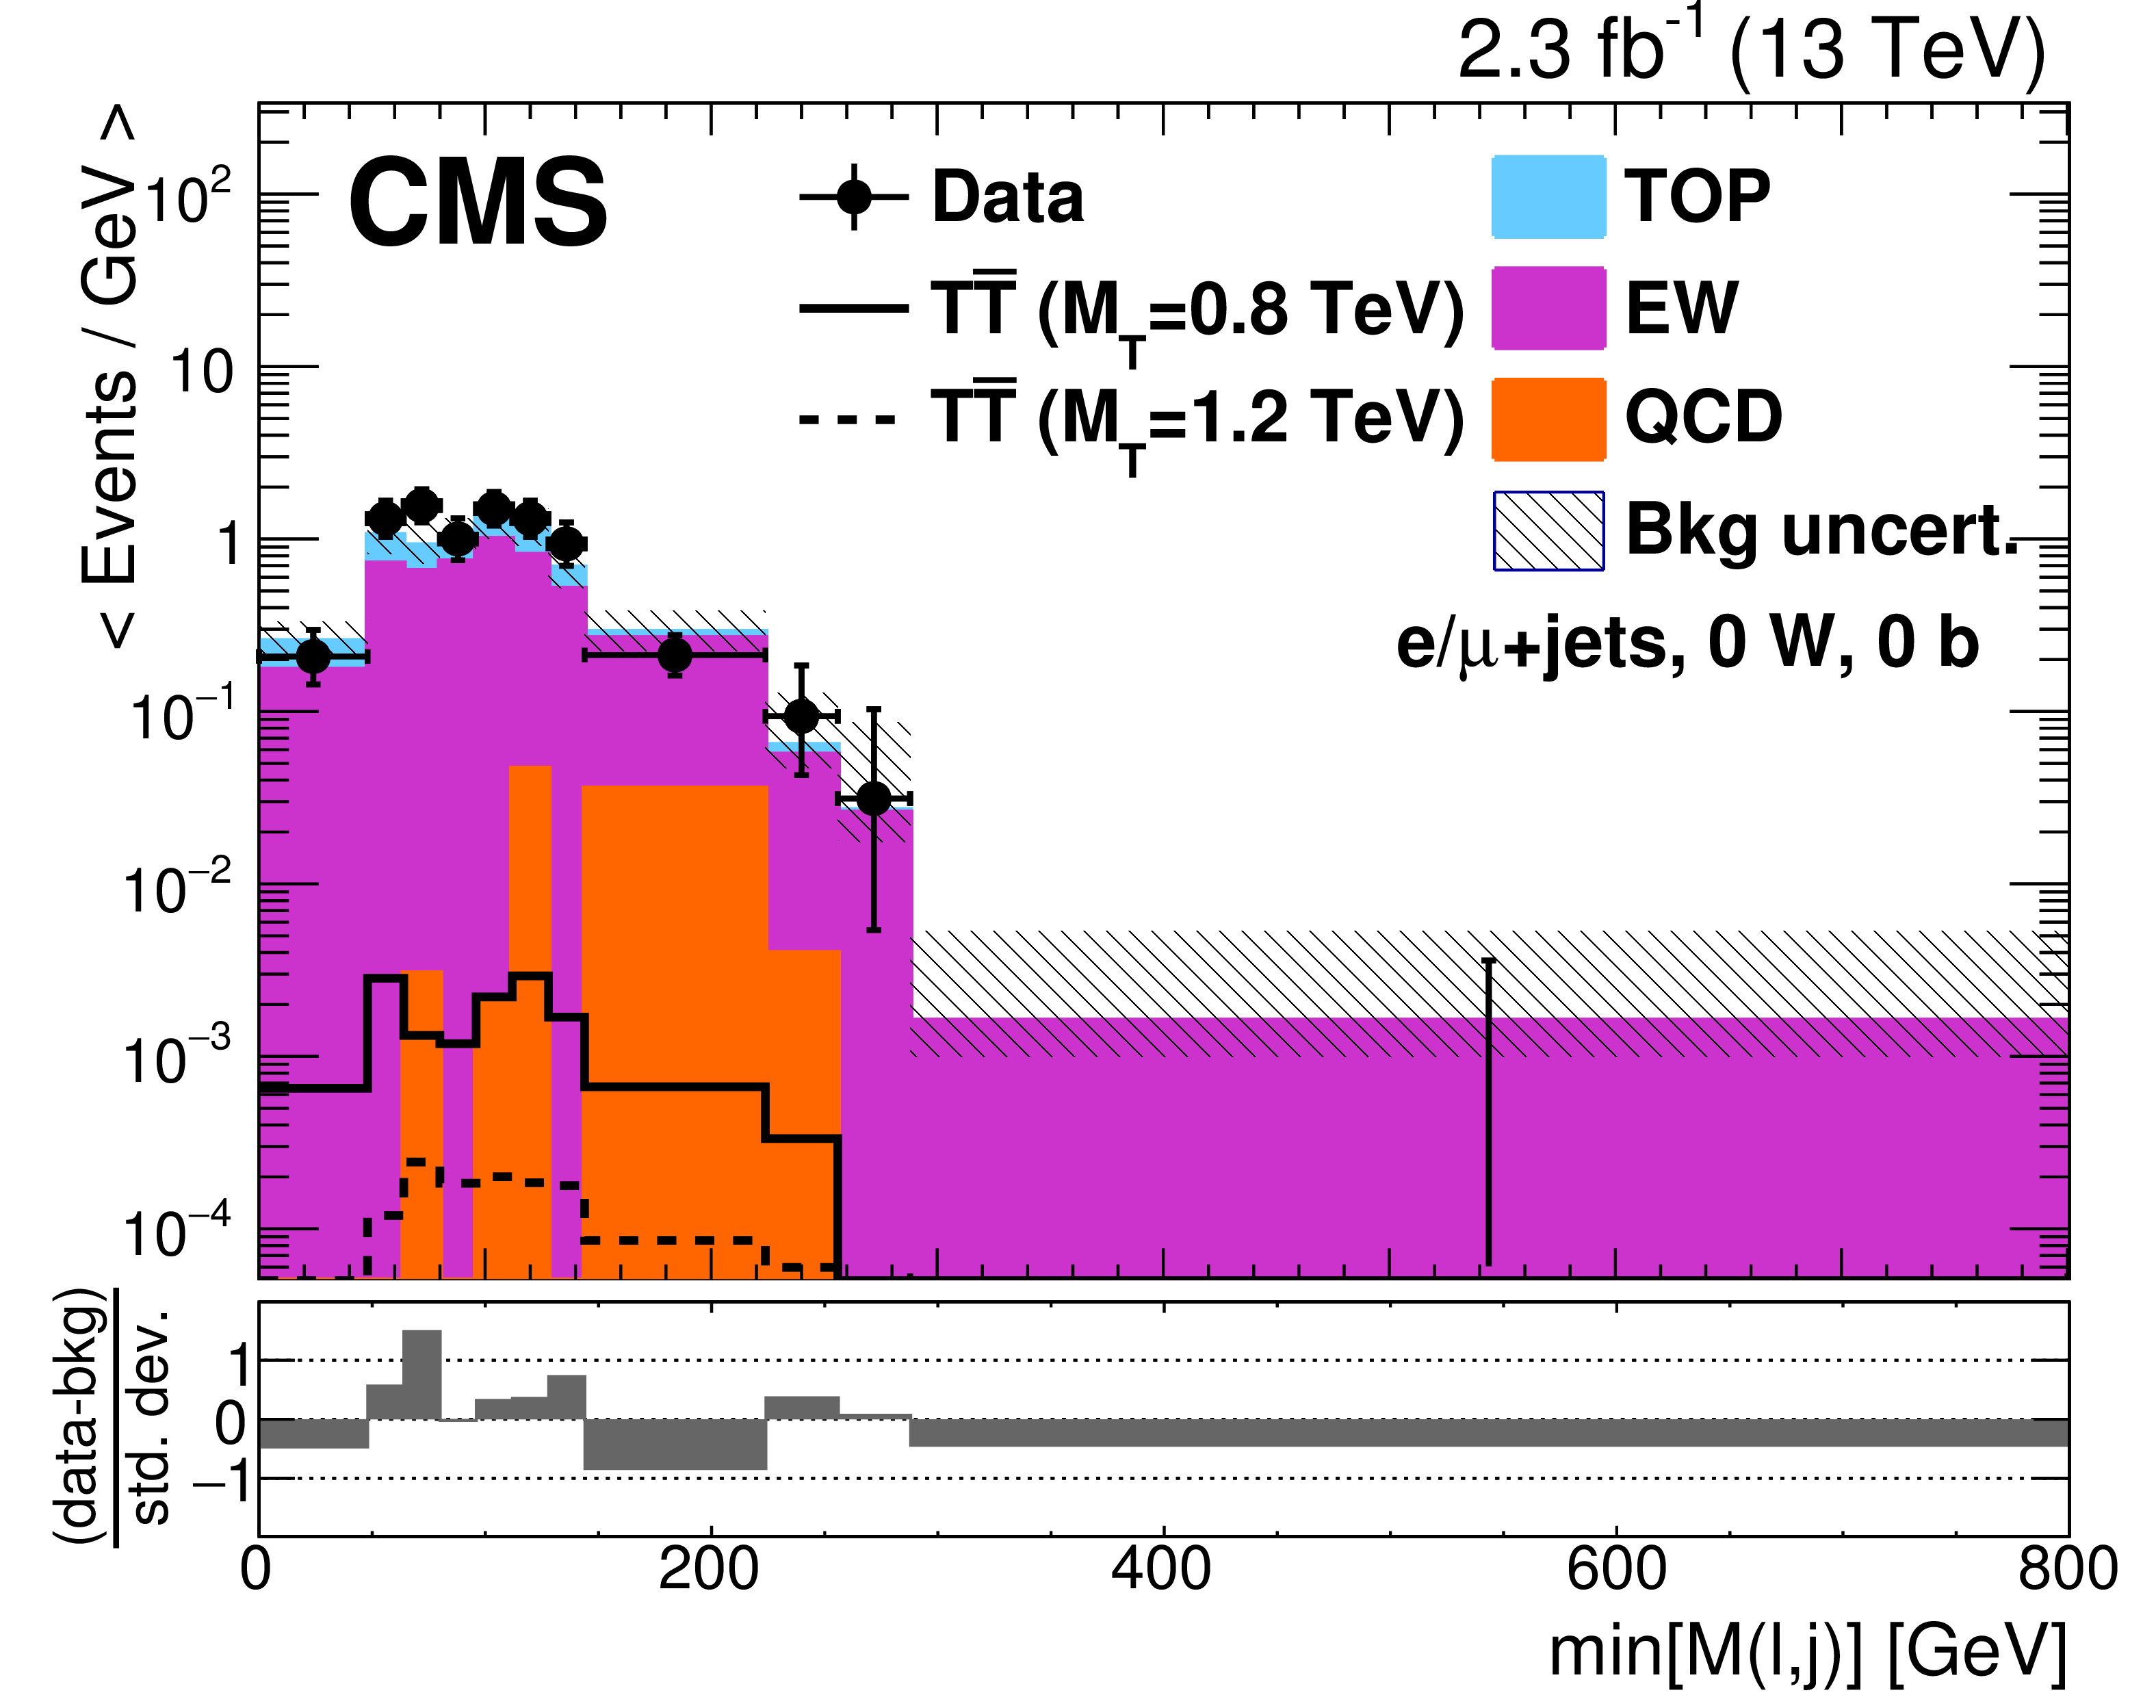
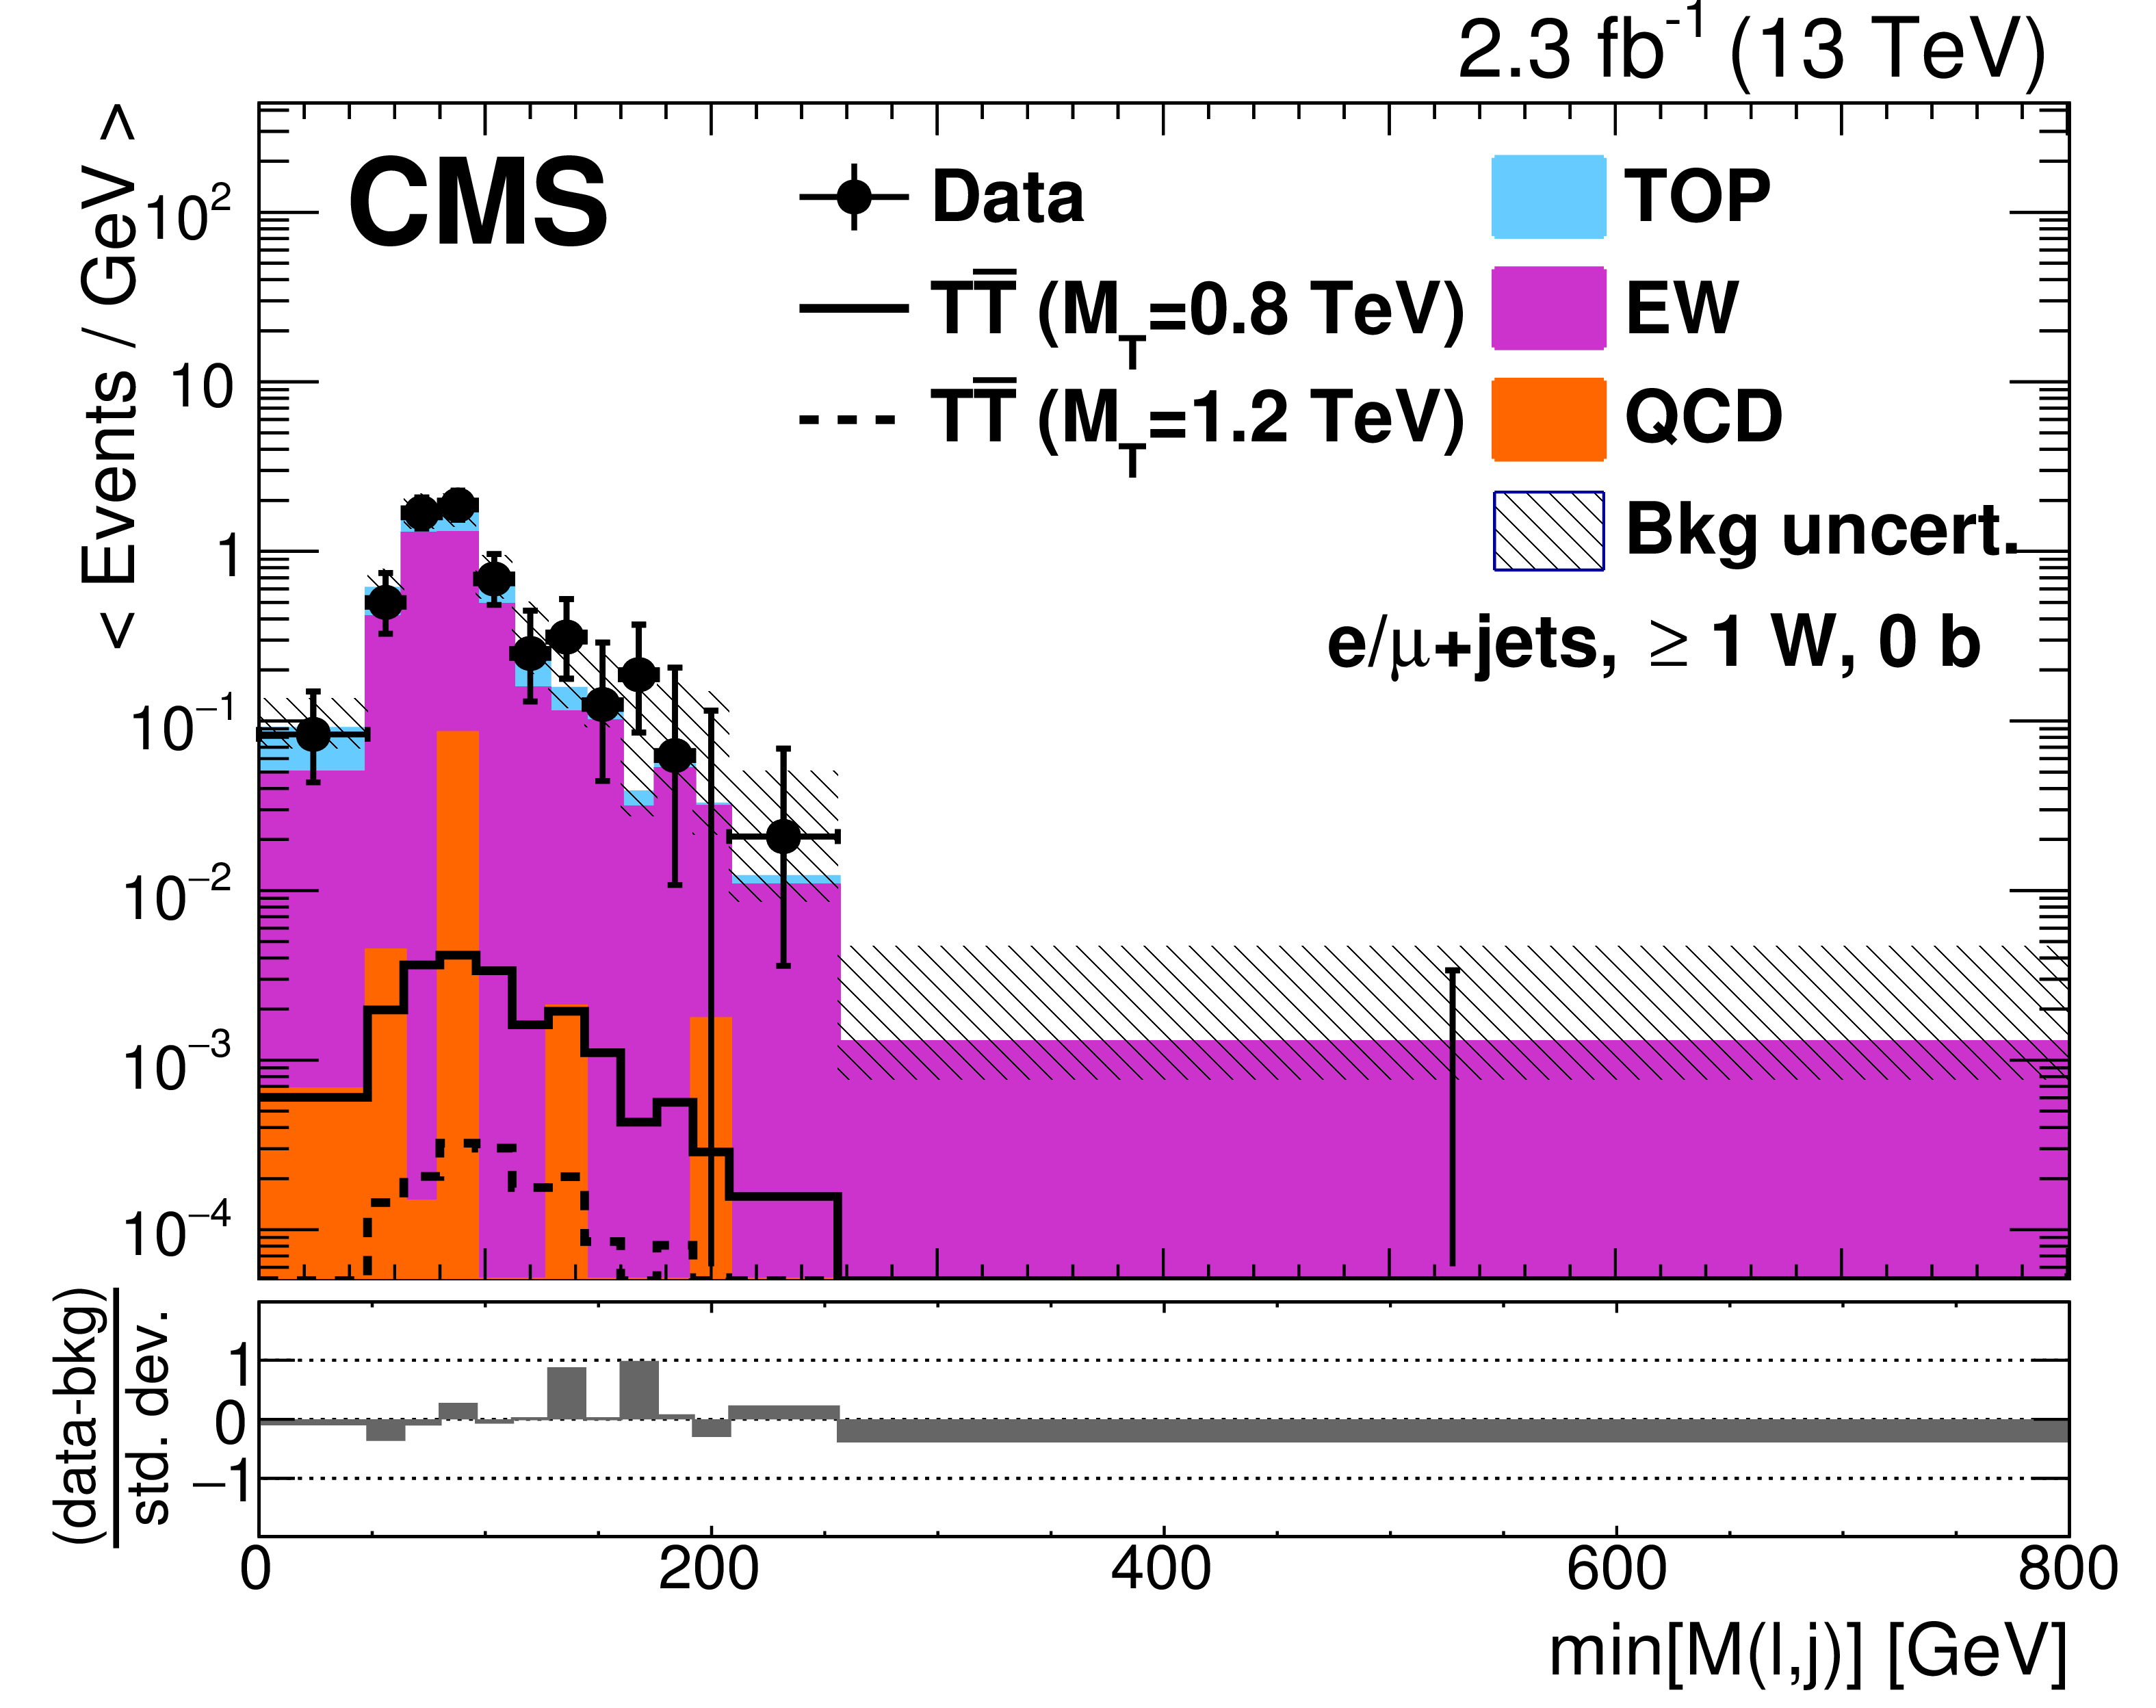
Distributions of $\mathrm{min} [M(\ell, j)]$ in the W + jets control region of the boosted W channel (upper) for 0/${\geq }$1 W tag categories (left/right), and $\mathrm{min} [M(\ell, \mathrm{ b })]$ in the $ {\mathrm{ t } {}\mathrm{ \bar{t} } } $ control region of the boosted W channel (lower) for 1/${\geq }$2 b tag categories (left/right). Also shown are the distributions of $ { {\mathrm {T}} {\overline {\mathrm {T}}} } $ signal events with T quark masses of 0.8 and 1.2 TeV. The uncertainty in the background includes the statistical and systematic uncertainties described in Section 7. |
png pdf |
Figure 8-a:
Distribution of $\mathrm{min} [M(\ell, j)]$ in the W + jets control region of the boosted W channel for the 0 W tag category. Also shown are the distributions of $ { {\mathrm {T}} {\overline {\mathrm {T}}} } $ signal events with T quark masses of 0.8 and 1.2 TeV. The uncertainty in the background includes the statistical and systematic uncertainties described in Section 7. |
png pdf |
Figure 8-b:
Distribution of $\mathrm{min} [M(\ell, j)]$ in the W + jets control region of the boosted W channel for the ${\geq }$1 W tag category. Also shown are the distributions of $ { {\mathrm {T}} {\overline {\mathrm {T}}} } $ signal events with T quark masses of 0.8 and 1.2 TeV. The uncertainty in the background includes the statistical and systematic uncertainties described in Section 7. |
png pdf |
Figure 8-c:
Distribution of $\mathrm{min} [M(\ell, \mathrm{ b })]$ in the $ {\mathrm{ t } {}\mathrm{ \bar{t} } } $ control region of the boosted W channel for the 1 b tag category. Also shown are the distributions of $ { {\mathrm {T}} {\overline {\mathrm {T}}} } $ signal events with T quark masses of 0.8 and 1.2 TeV. The uncertainty in the background includes the statistical and systematic uncertainties described in Section 7. |
png pdf |
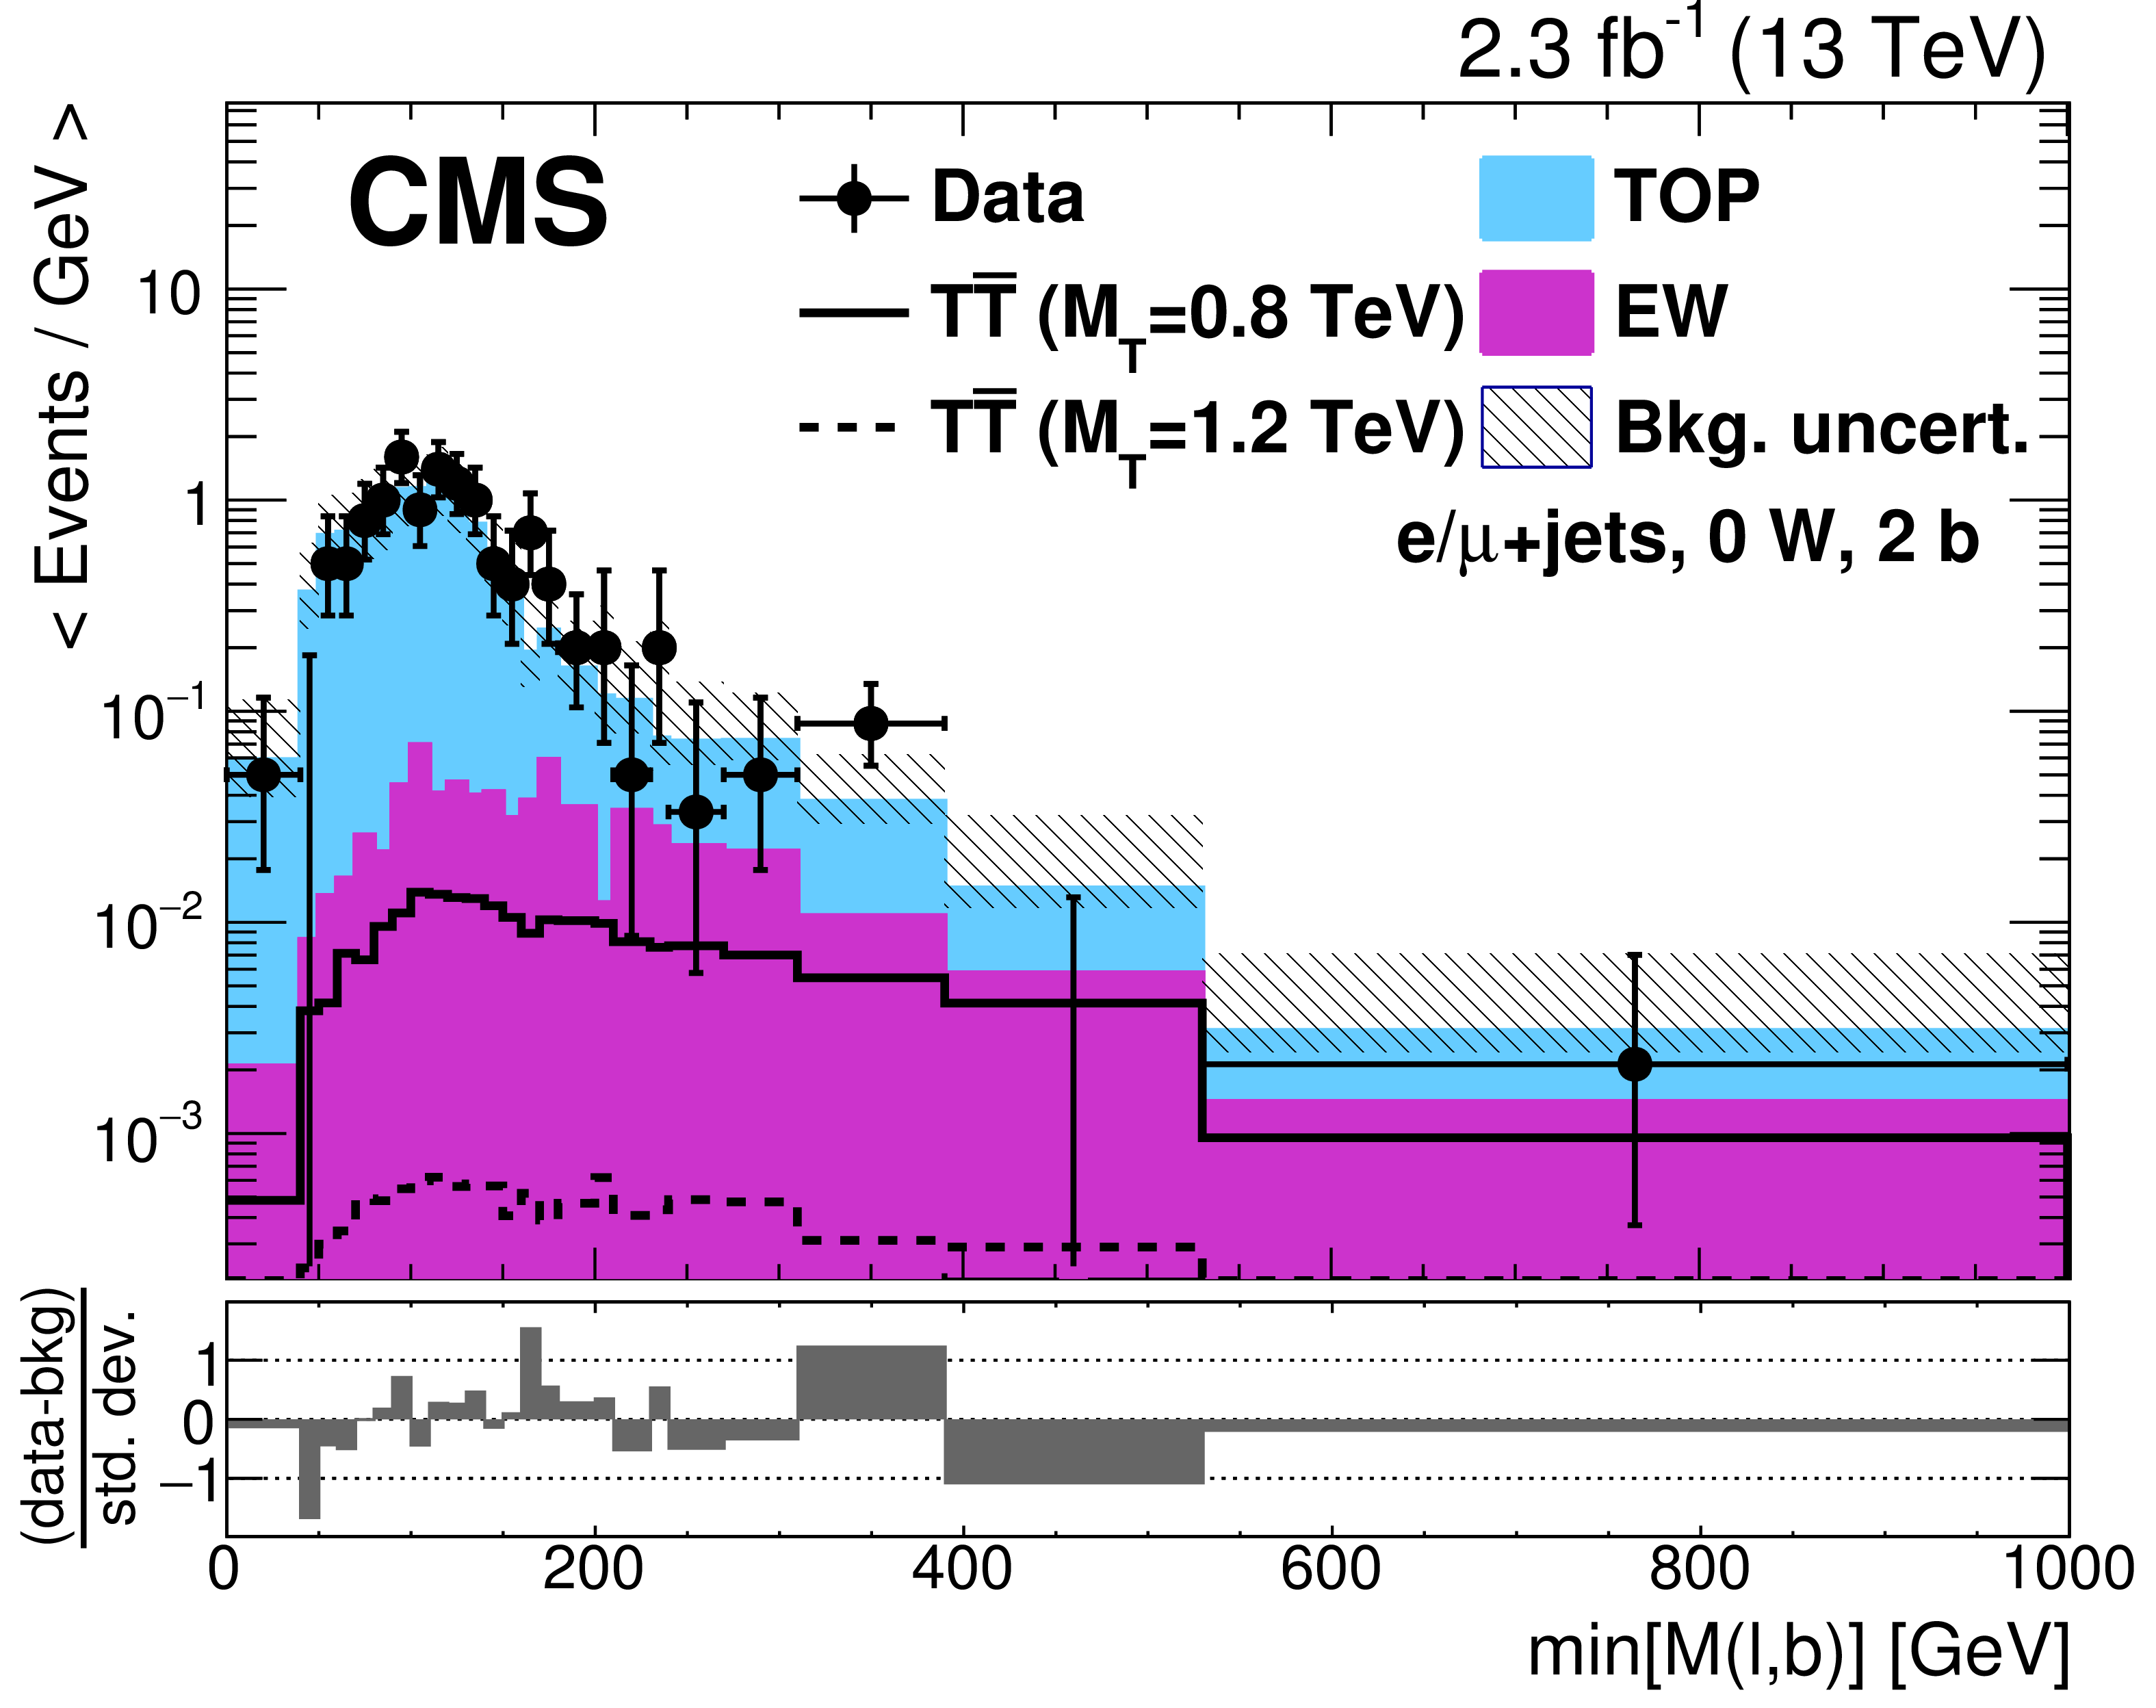
Figure 8-d:
Distribution of $\mathrm{min} [M(\ell, \mathrm{ b })]$ in the $ {\mathrm{ t } {}\mathrm{ \bar{t} } } $ control region of the boosted W channel for the ${\geq }$2 b tag category. Also shown are the distributions of $ { {\mathrm {T}} {\overline {\mathrm {T}}} } $ signal events with T quark masses of 0.8 and 1.2 TeV. The uncertainty in the background includes the statistical and systematic uncertainties described in Section 7. |

png pdf |
Figure 9:
Distributions of $\mathrm{min} [M(\ell, j)]$ or $\mathrm{min} [M(\ell, \mathrm{ b })]$ in the combination of electron and muon channels in the boosted W categories with 0 (left) or ${\geq }$1 (right) W-tagged jets and (upper to lower) 0, 1, 2, or ${\geq }$3 b-tagged jets. Also shown are the distributions of $ { {\mathrm {T}} {\overline {\mathrm {T}}} } $ signal events with T quark masses of 0.8 and 1.2 TeV. The uncertainty in the background includes the statistical and systematic uncertainties described in Section 7. |
png pdf |
Figure 9-a:
Distribution of $\mathrm{min} [M(\ell, j)]$ in the combination of electron and muon channels in the boosted W categories with 0 W-tagged jet and 0 b-tagged jet. Also shown are the distributions of $ { {\mathrm {T}} {\overline {\mathrm {T}}} } $ signal events with T quark masses of 0.8 and 1.2 TeV. The uncertainty in the background includes the statistical and systematic uncertainties described in Section 7. |
png pdf |
Figure 9-b:
Distribution of $\mathrm{min} [M(\ell, j)]$ in the combination of electron and muon channels in the boosted W categories with ${\geq }$1 W-tagged jets and 0 b-tagged jet. Also shown are the distributions of $ { {\mathrm {T}} {\overline {\mathrm {T}}} } $ signal events with T quark masses of 0.8 and 1.2 TeV. The uncertainty in the background includes the statistical and systematic uncertainties described in Section 7. |
png pdf |
Figure 9-c:
Distribution of $\mathrm{min} [M(\ell, \mathrm{ b })]$ in the combination of electron and muon channels in the boosted W categories with 0 W-tagged jet and 1 b-tagged jets. Also shown are the distributions of $ { {\mathrm {T}} {\overline {\mathrm {T}}} } $ signal events with T quark masses of 0.8 and 1.2 TeV. The uncertainty in the background includes the statistical and systematic uncertainties described in Section 7. |

png pdf |
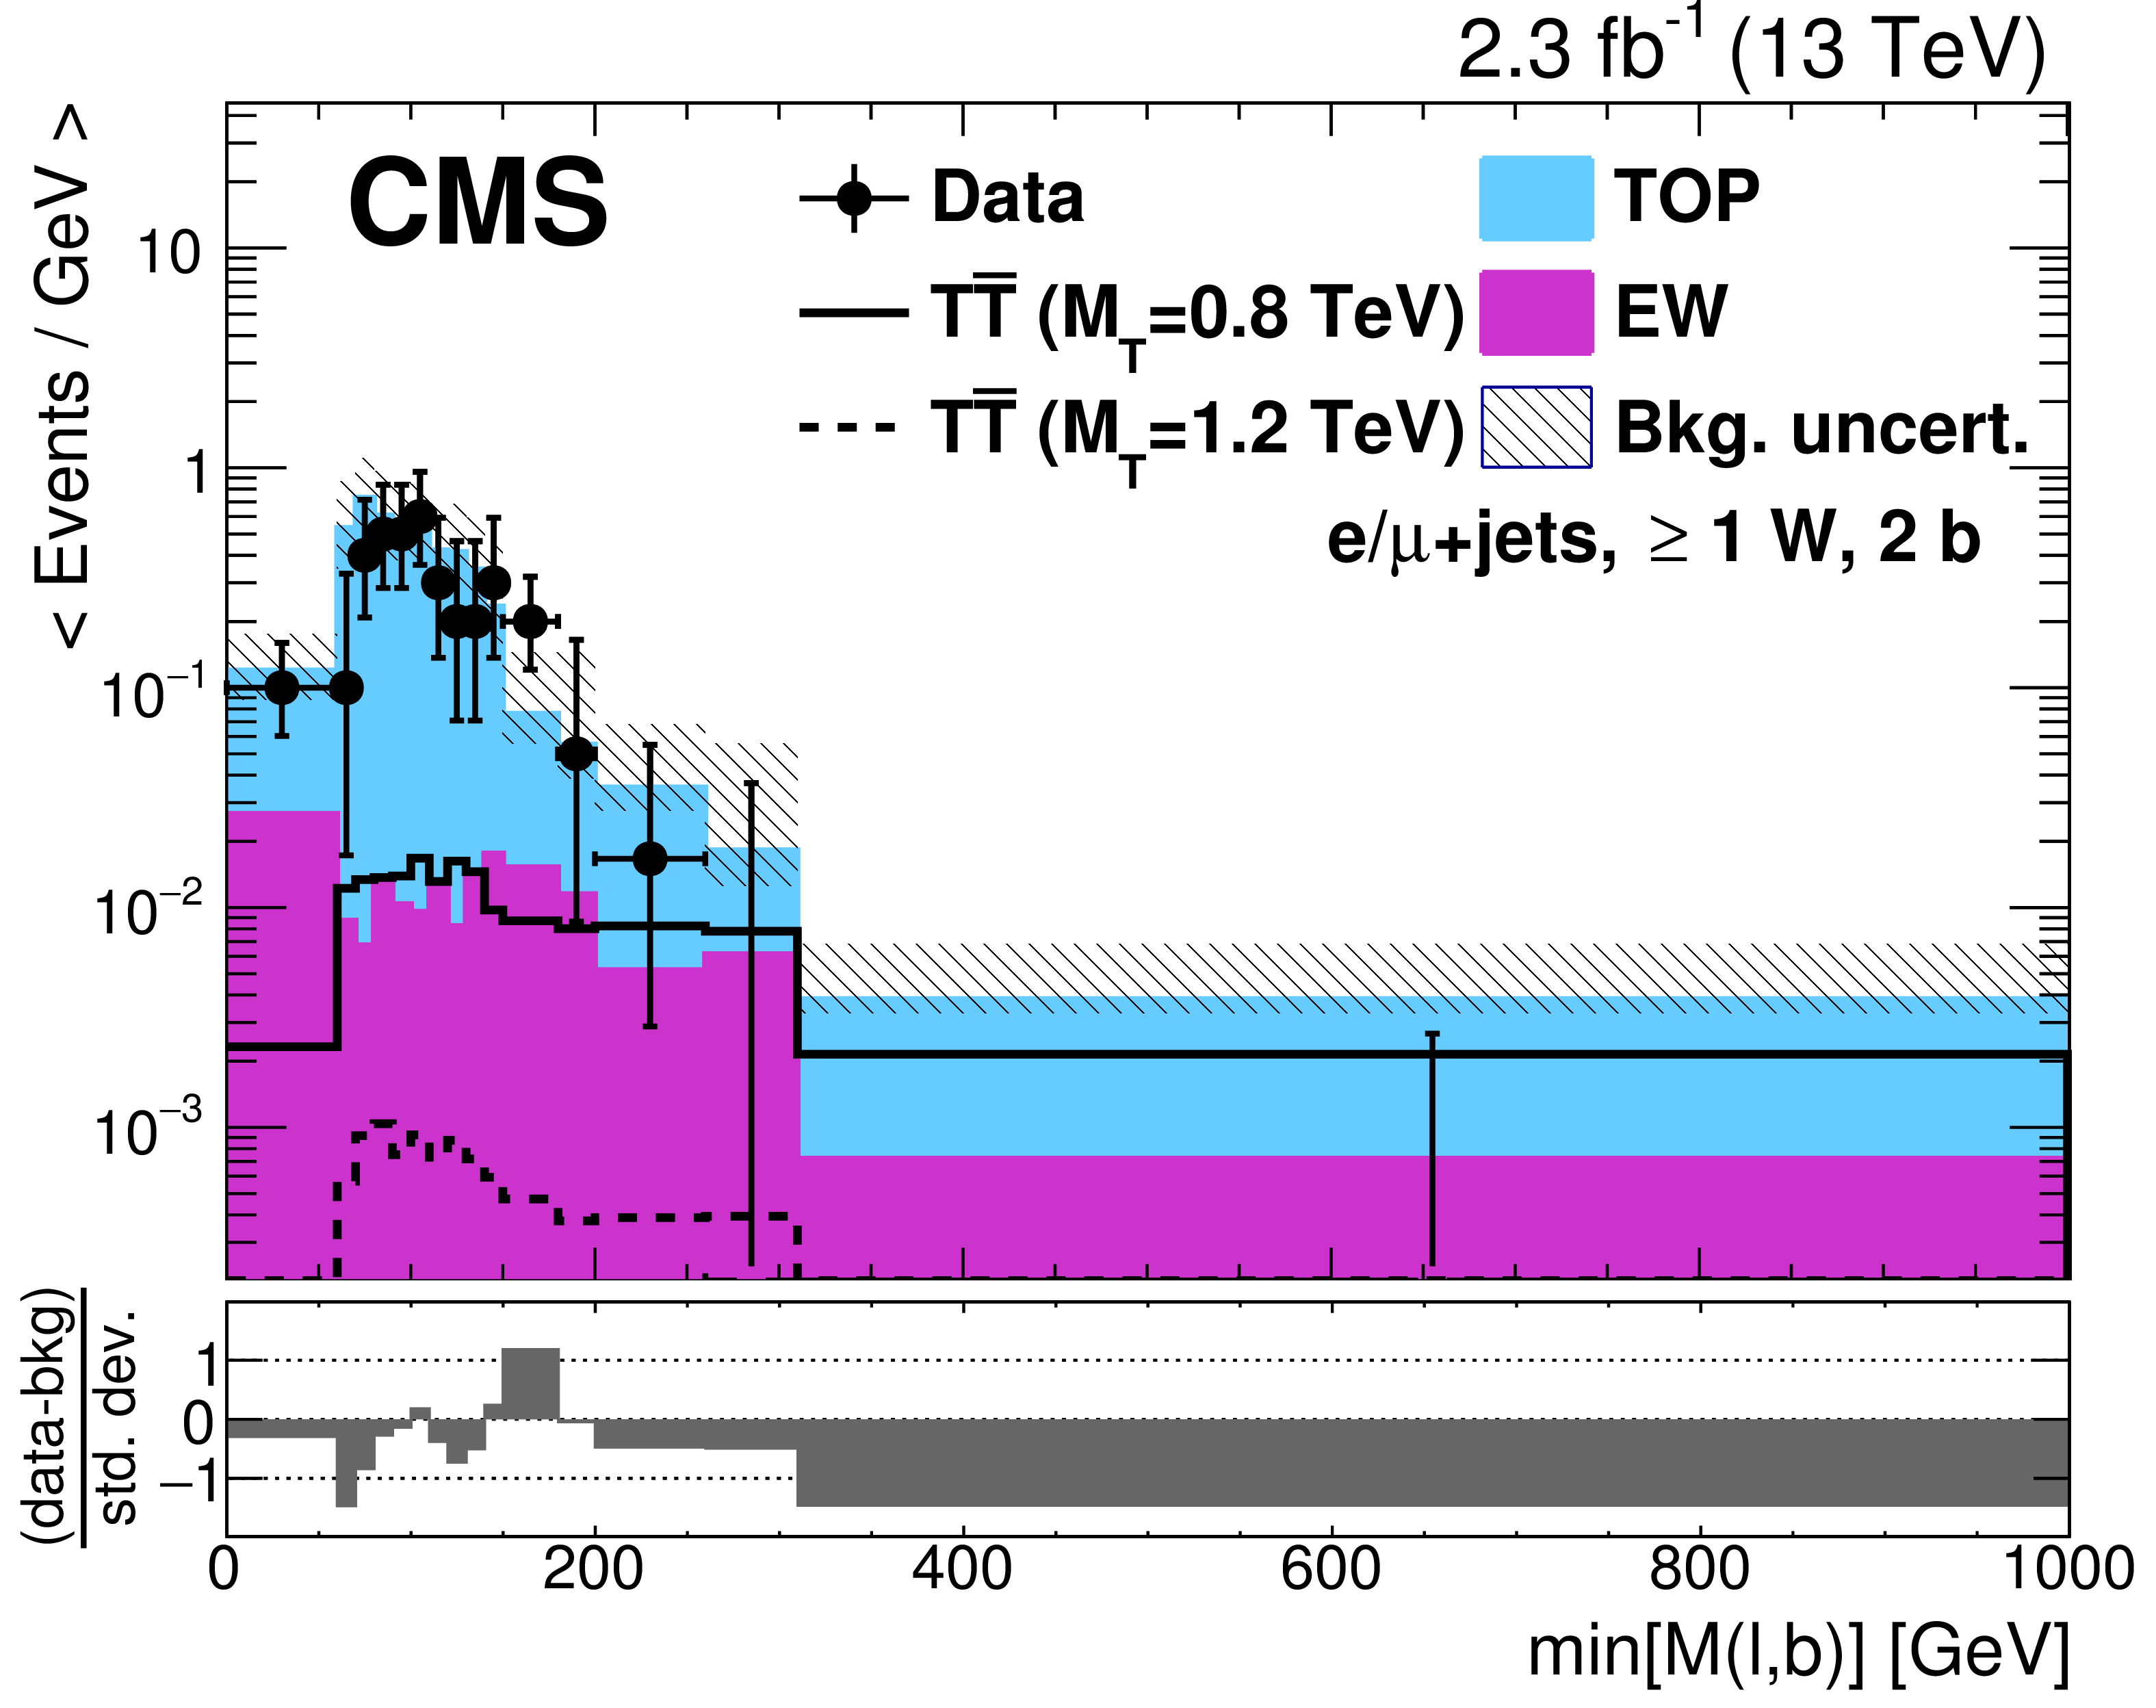
Figure 9-d:
Distribution of $\mathrm{min} [M(\ell, \mathrm{ b })]$ in the combination of electron and muon channels in the boosted W categories with ${\geq }$1 W-tagged jets and 1 b-tagged jets. Also shown are the distributions of $ { {\mathrm {T}} {\overline {\mathrm {T}}} } $ signal events with T quark masses of 0.8 and 1.2 TeV. The uncertainty in the background includes the statistical and systematic uncertainties described in Section 7. |
png pdf |
Figure 9-e:
Distribution of $\mathrm{min} [M(\ell, \mathrm{ b })]$ in the combination of electron and muon channels in the boosted W categories with 0 W-tagged jet and 2 b-tagged jets. Also shown are the distributions of $ { {\mathrm {T}} {\overline {\mathrm {T}}} } $ signal events with T quark masses of 0.8 and 1.2 TeV. The uncertainty in the background includes the statistical and systematic uncertainties described in Section 7. |
png pdf |
Figure 9-f:
Distribution of $\mathrm{min} [M(\ell, \mathrm{ b })]$ in the combination of electron and muon channels in the boosted W categories with ${\geq }$1 W-tagged jets and 2 b-tagged jets. Also shown are the distributions of $ { {\mathrm {T}} {\overline {\mathrm {T}}} } $ signal events with T quark masses of 0.8 and 1.2 TeV. The uncertainty in the background includes the statistical and systematic uncertainties described in Section 7. |

png pdf |
Figure 9-g:
Distribution of $\mathrm{min} [M(\ell, \mathrm{ b })]$ in the combination of electron and muon channels in the boosted W categories with 0 W-tagged jet and ${\geq }$3 b-tagged jets. Also shown are the distributions of $ { {\mathrm {T}} {\overline {\mathrm {T}}} } $ signal events with T quark masses of 0.8 and 1.2 TeV. The uncertainty in the background includes the statistical and systematic uncertainties described in Section 7. |

png pdf |
Figure 9-h:
Distribution of $\mathrm{min} [M(\ell, \mathrm{ b })]$ in the combination of electron and muon channels in the boosted W categories with ${\geq }$1 W-tagged jets and ${\geq }$3 b-tagged jets. Also shown are the distributions of $ { {\mathrm {T}} {\overline {\mathrm {T}}} } $ signal events with T quark masses of 0.8 and 1.2 TeV. The uncertainty in the background includes the statistical and systematic uncertainties described in Section 7. |

png pdf |
Figure 10:
Distributions of $ {S_\mathrm {T}} $ in the H1b (left) and H2b (right) categories in the combination of electron and muon channels. The $ { {\mathrm {T}} {\overline {\mathrm {T}}} } $ signal, shown for T quark masses of 0.8 and 1.2 TeV, is normalized to the theoretical cross section and the singlet benchmark branching fractions are assumed. The uncertainty in the background includes the statistical and systematic uncertainties described in Section 7. |

png pdf |
Figure 10-a:
Distribution of $ {S_\mathrm {T}} $ in the H1b category in the combination of electron and muon channels. The $ { {\mathrm {T}} {\overline {\mathrm {T}}} } $ signal, shown for T quark masses of 0.8 and 1.2 TeV, is normalized to the theoretical cross section and the singlet benchmark branching fractions are assumed. The uncertainty in the background includes the statistical and systematic uncertainties described in Section 7. |
png pdf |
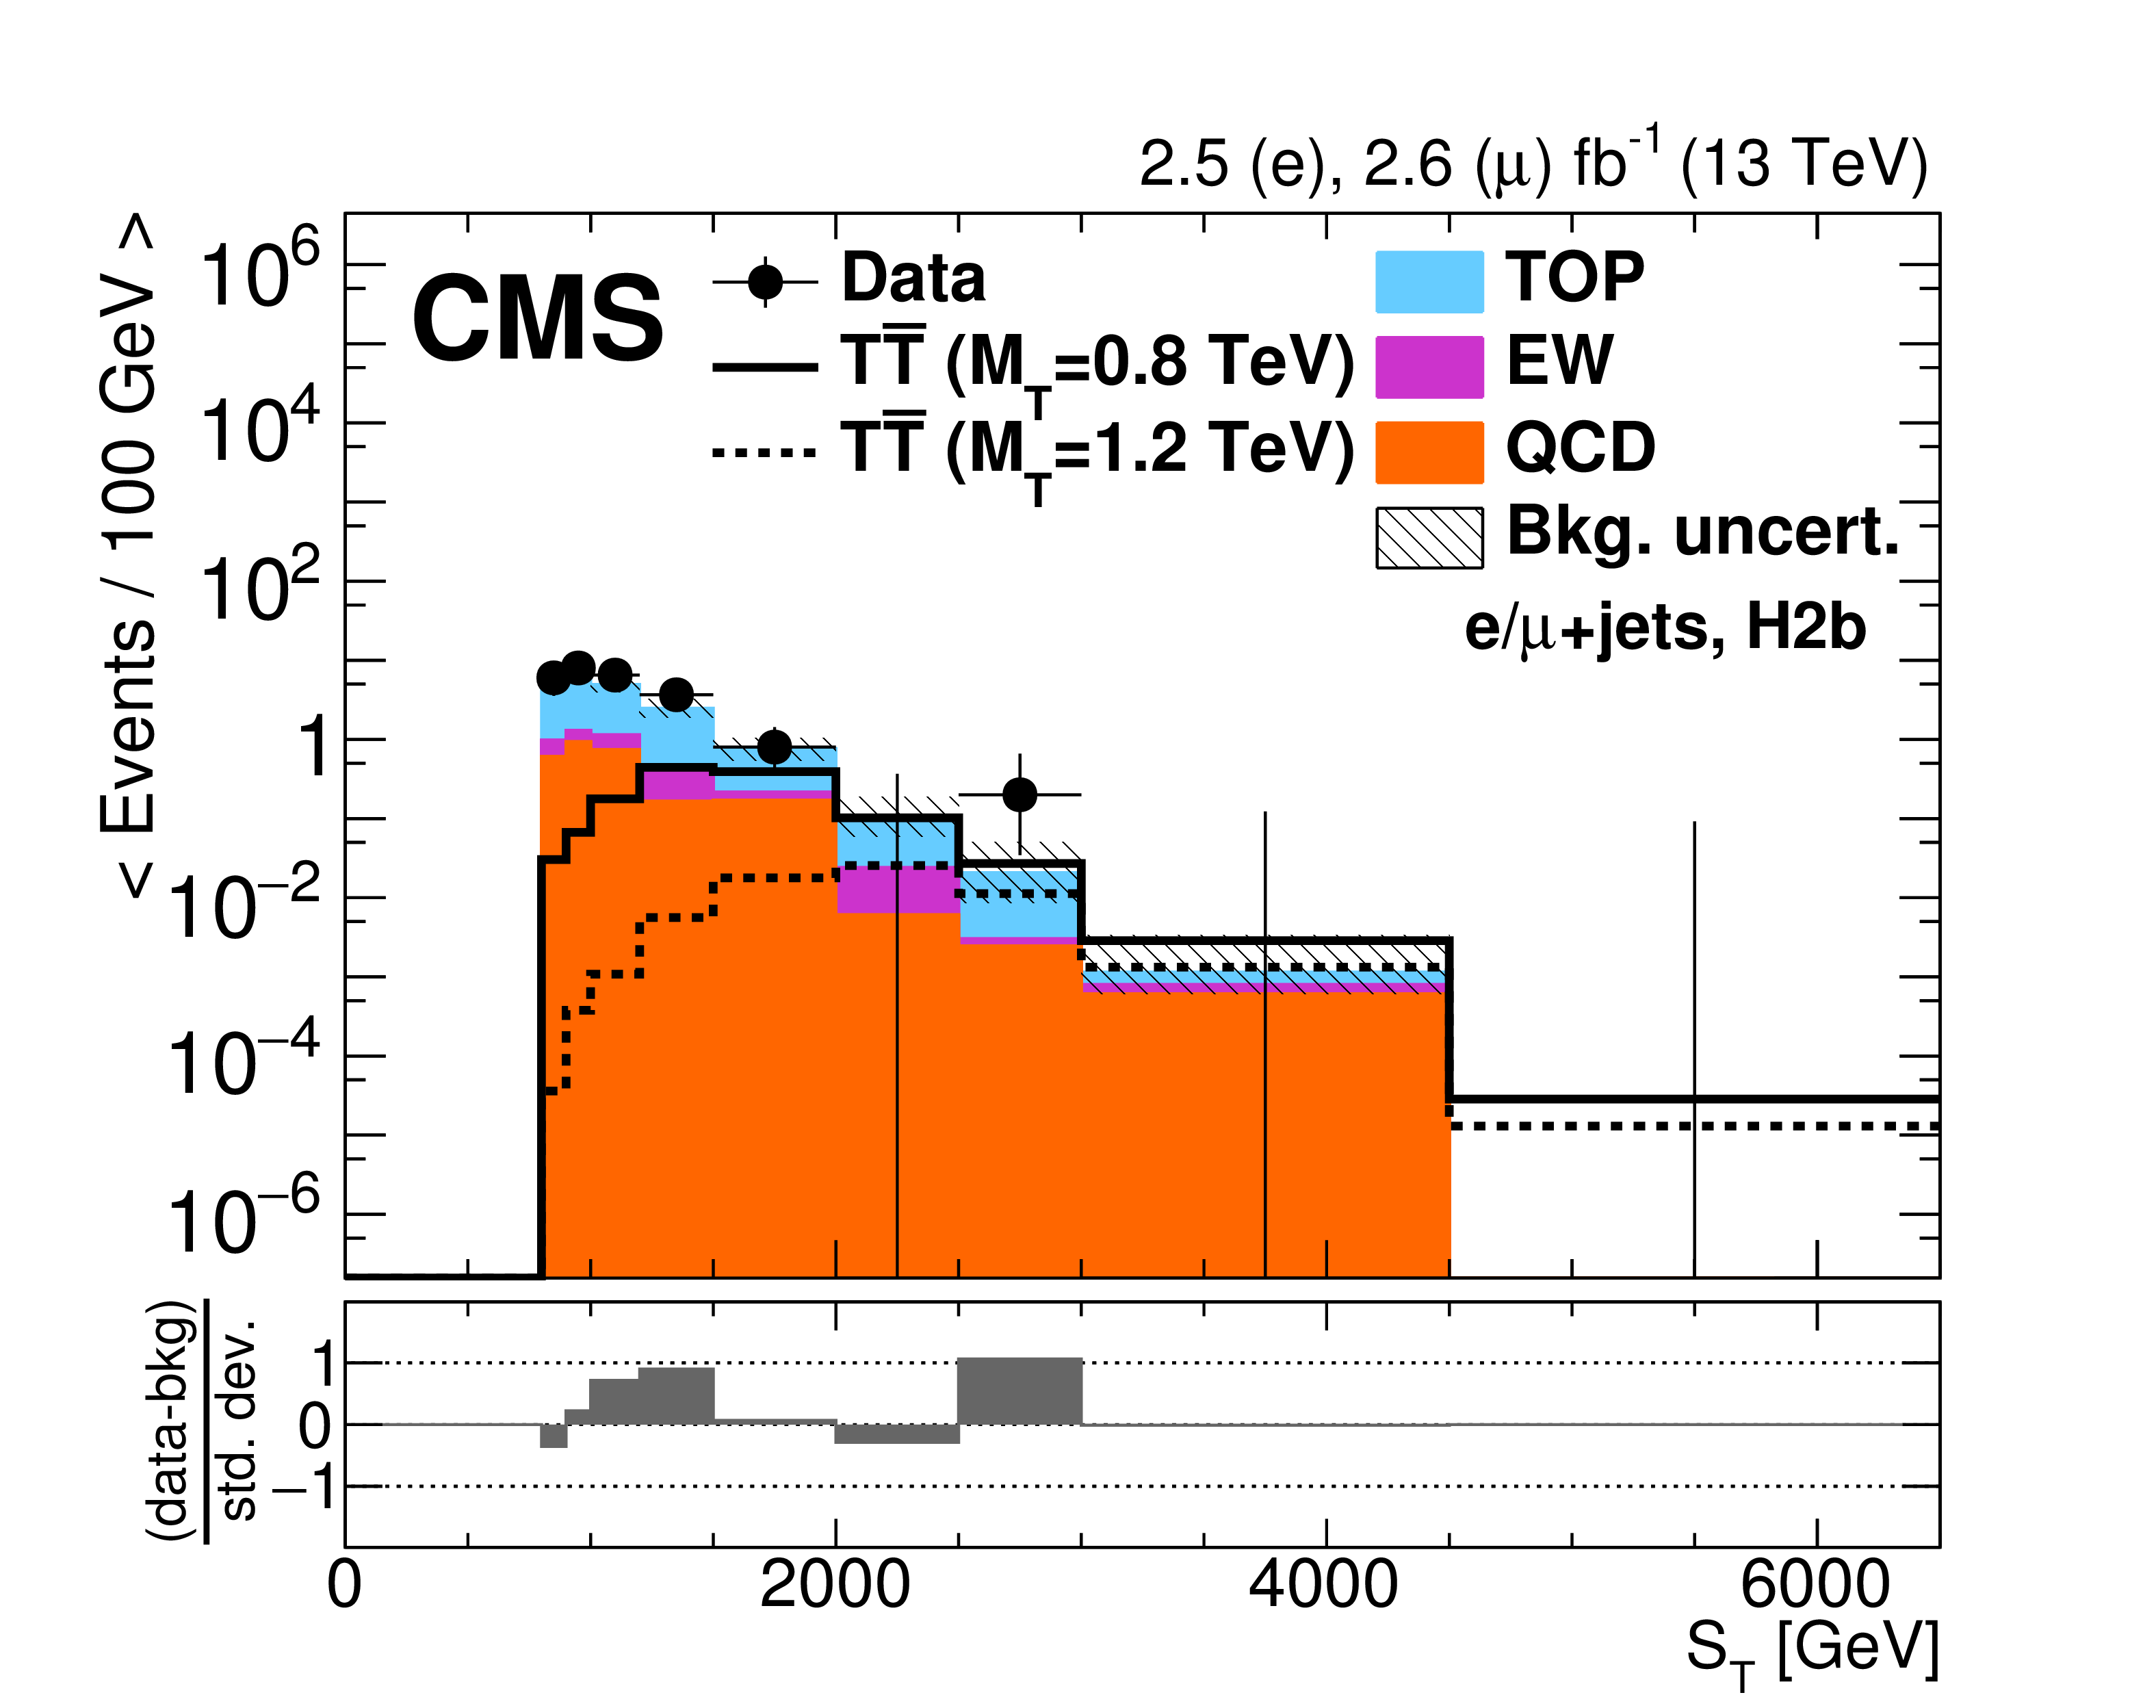
Figure 10-b:
Distribution of $ {S_\mathrm {T}} $ in the H2b category in the combination of electron and muon channels. The $ { {\mathrm {T}} {\overline {\mathrm {T}}} } $ signal, shown for T quark masses of 0.8 and 1.2 TeV, is normalized to the theoretical cross section and the singlet benchmark branching fractions are assumed. The uncertainty in the background includes the statistical and systematic uncertainties described in Section 7. |
png pdf |
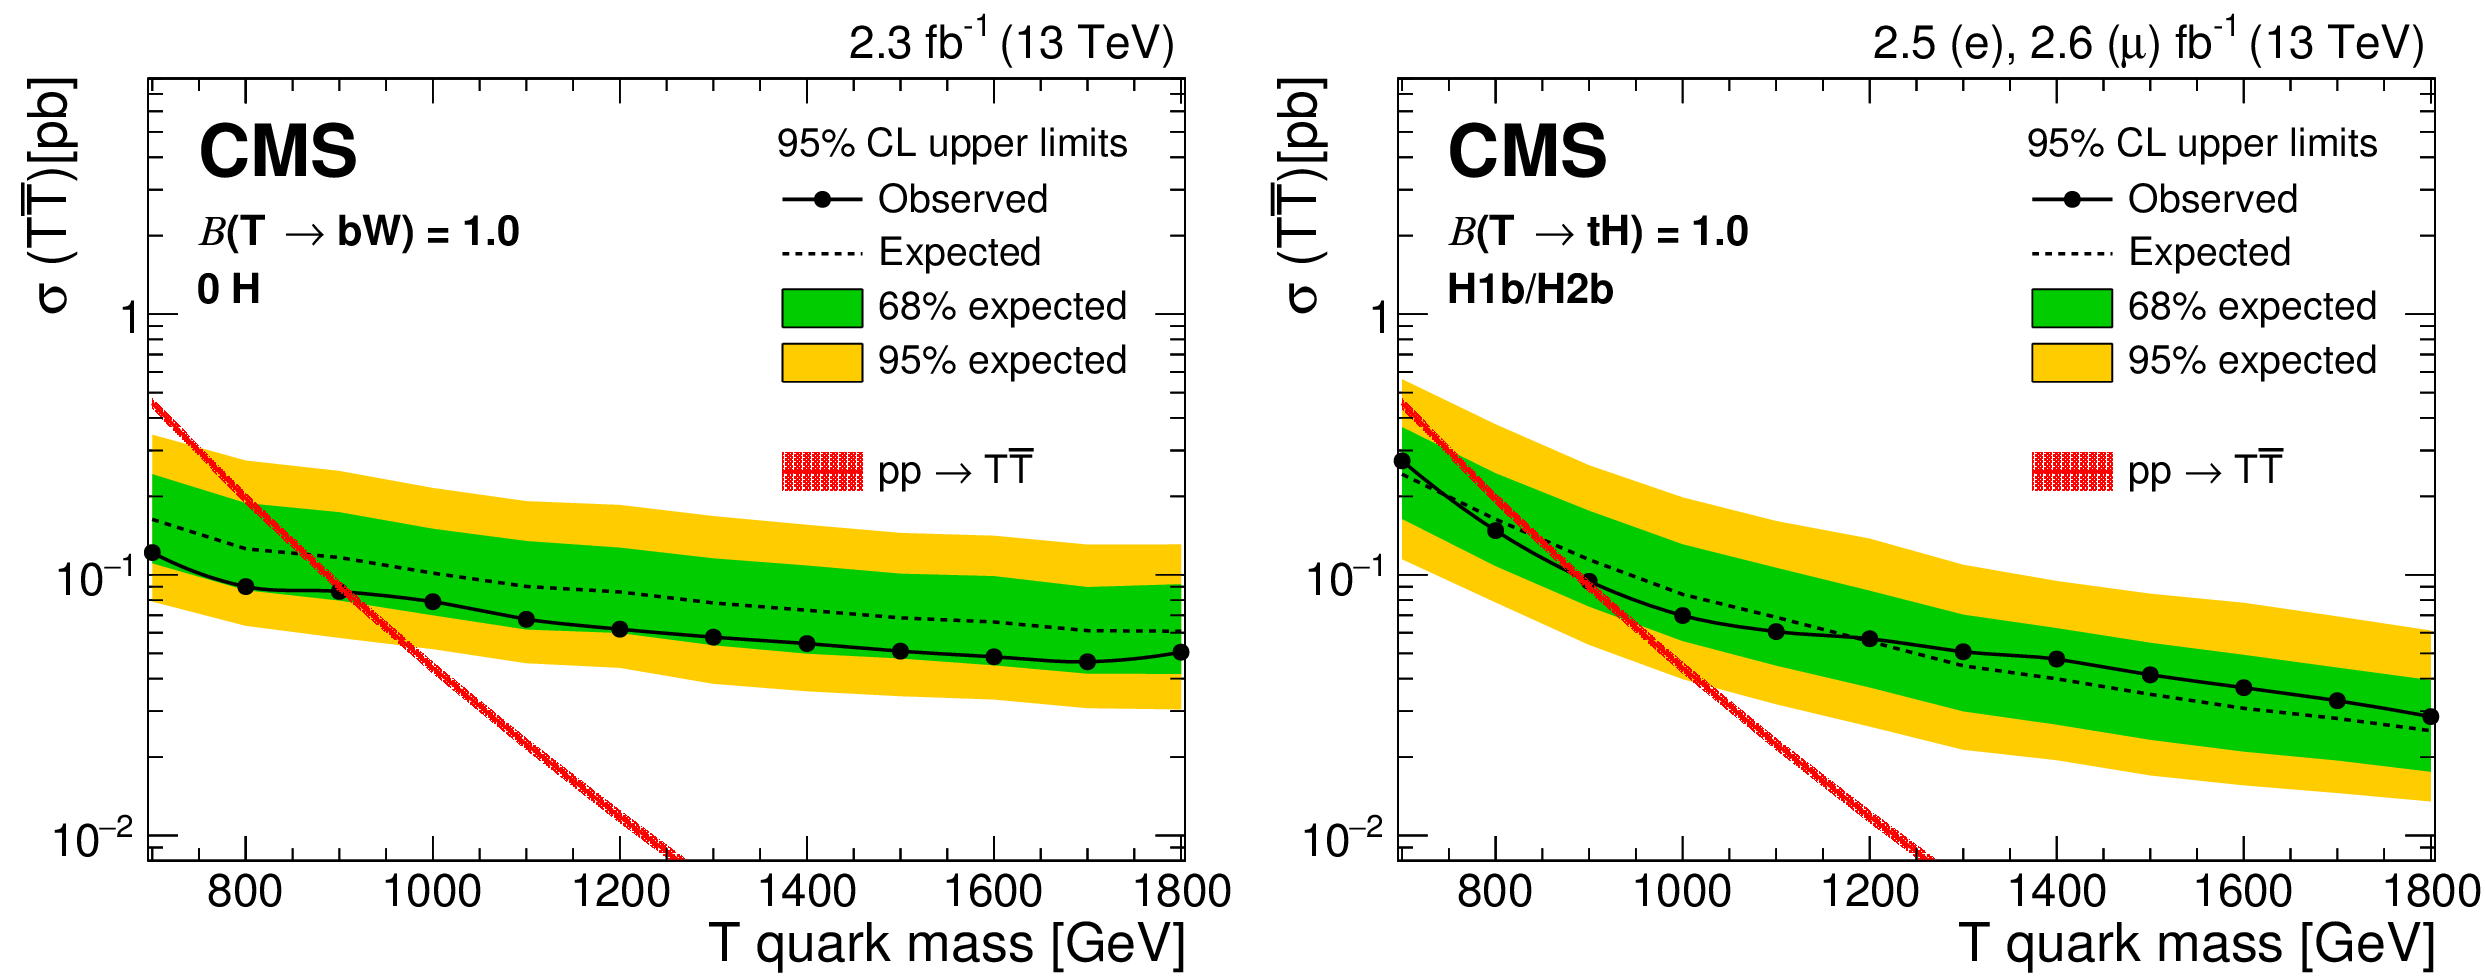
Figure 11:
The expected and observed upper limits (Bayesian) at 95% CL on the cross section of $ { {\mathrm {T}} {\overline {\mathrm {T}}} } $ production for 100% $ {\mathrm {T}} \to \mathrm{ b } \mathrm{ W } $ in the boosted W channel (left), and 100% T $\to $ tH in the boosted H channel (right). The theoretically predicted cross section for $ { {\mathrm {T}} {\overline {\mathrm {T}}} } $ production calculated at NNLO is shown as red line, with the uncertainties in the PDFs and renormalization and factorization scales indicated by the shaded area. |
png pdf |
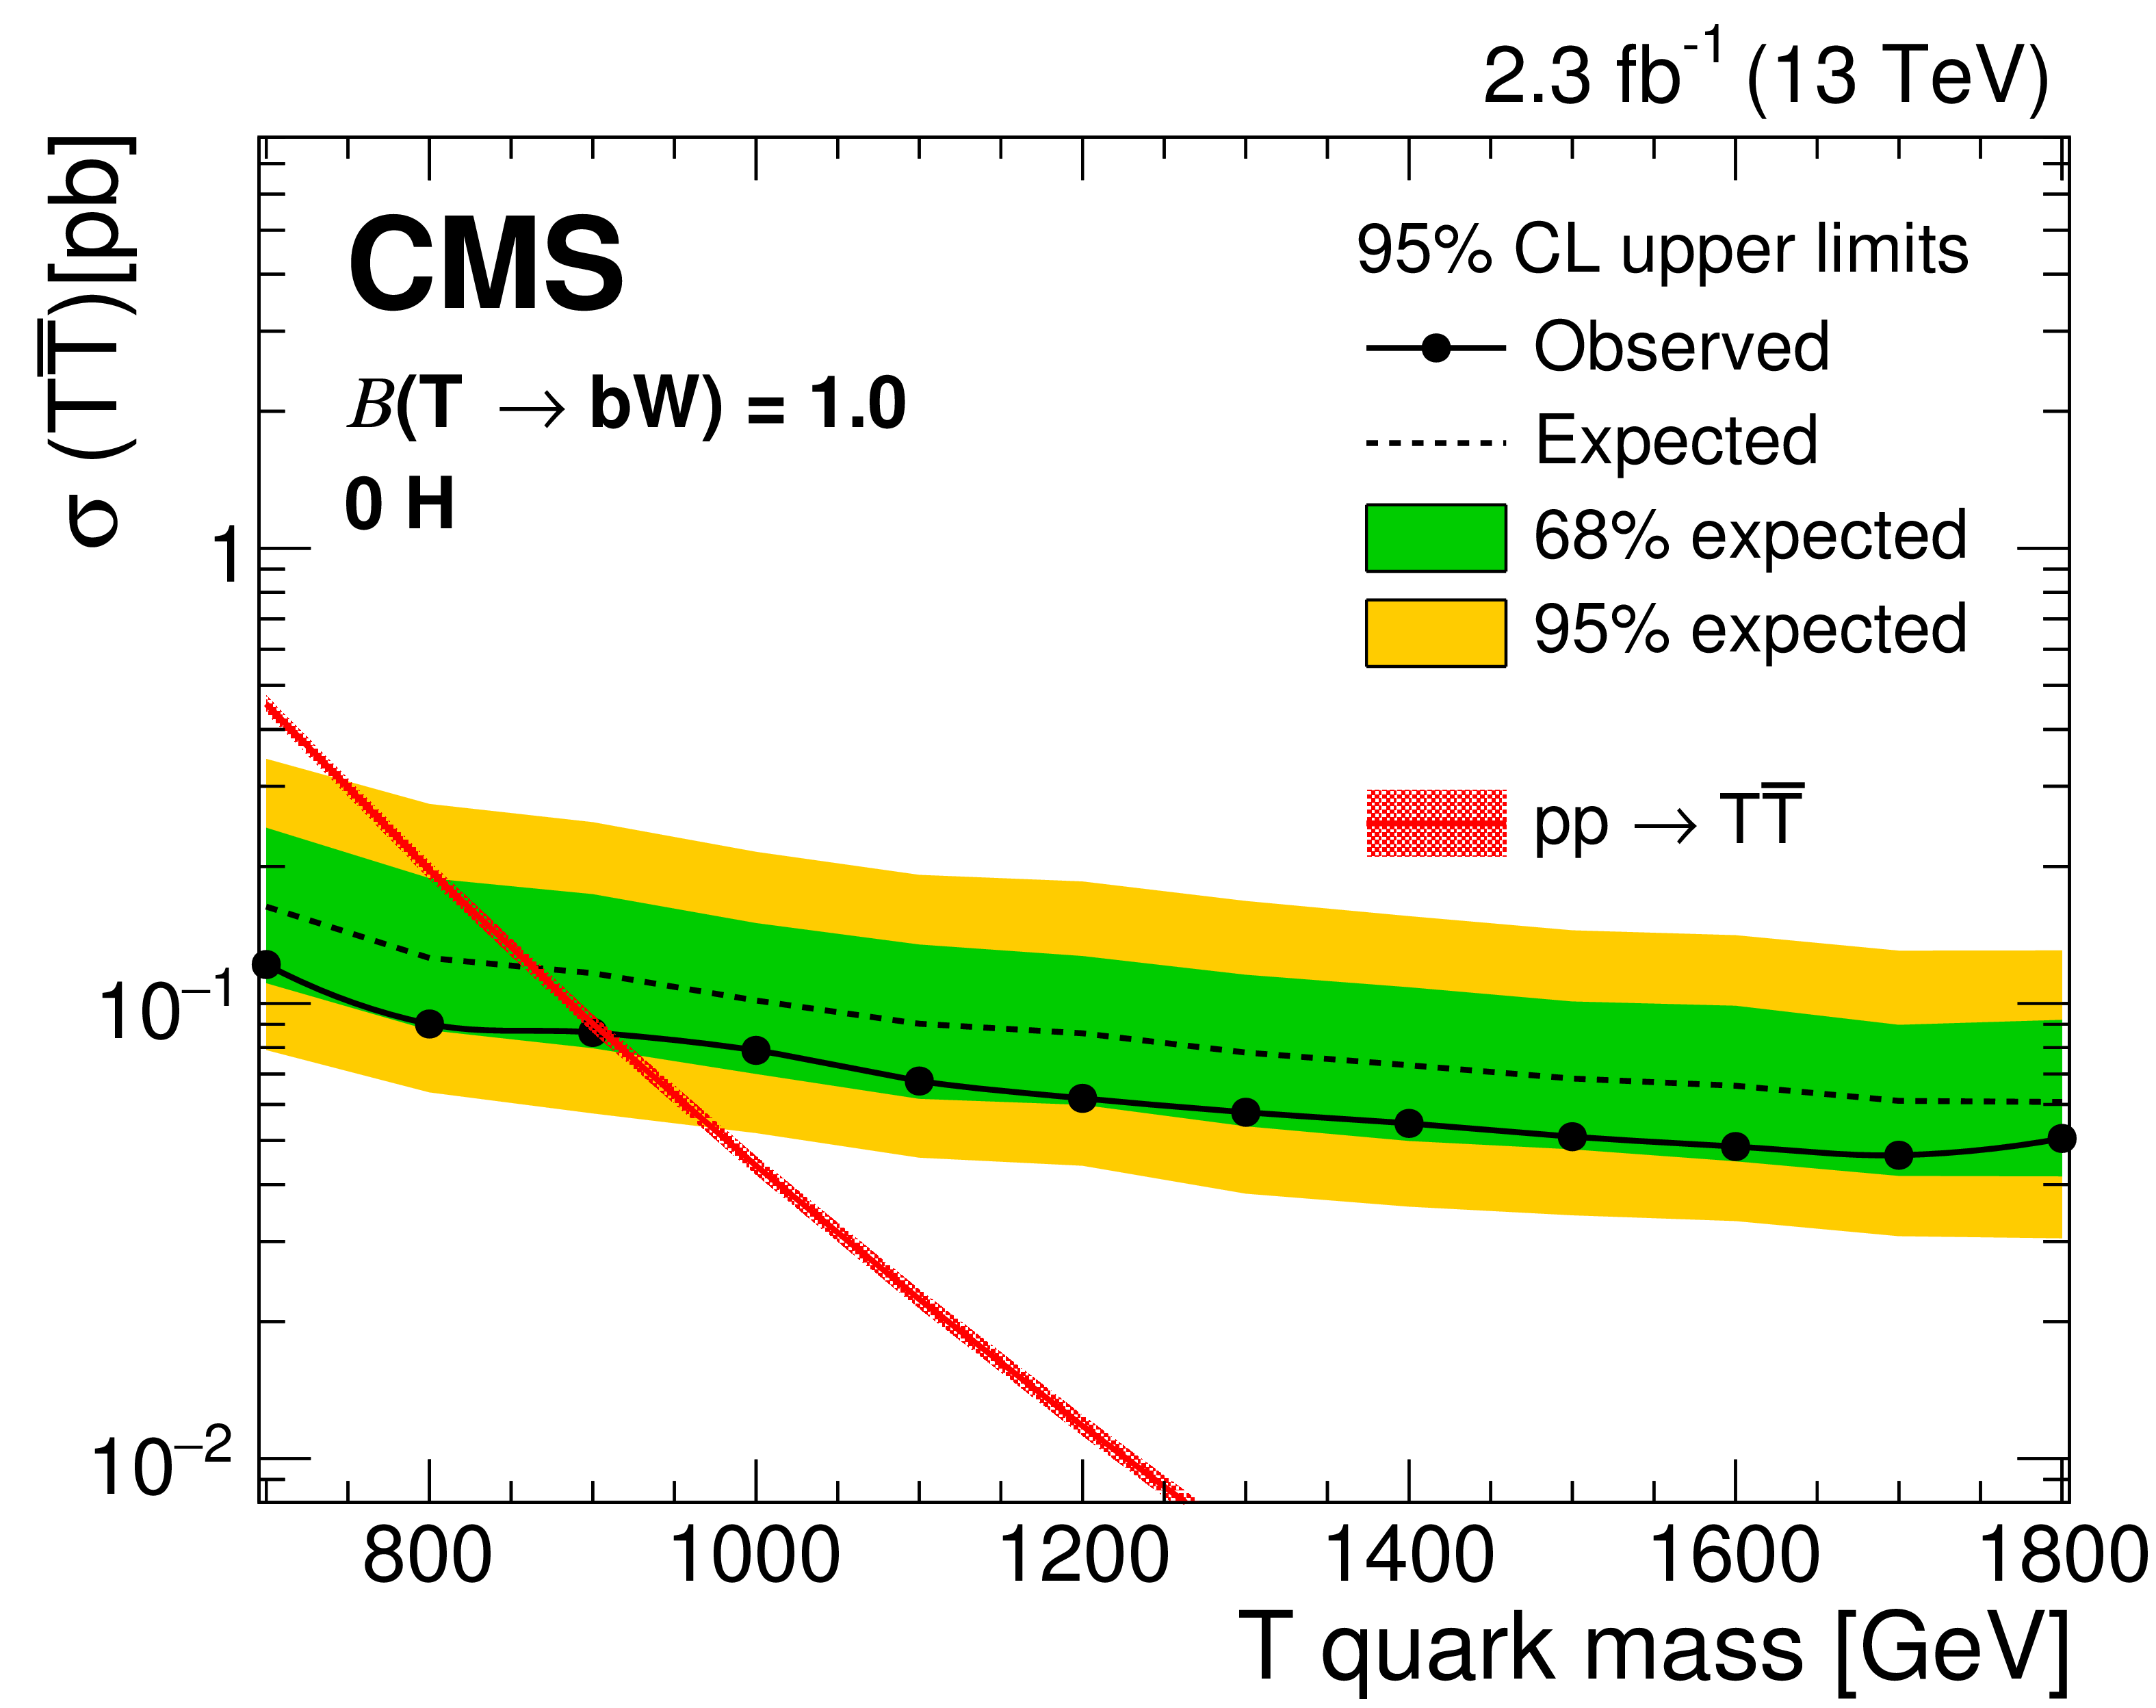
Figure 11-a:
The expected and observed upper limits (Bayesian) at 95% CL on the cross section of $ { {\mathrm {T}} {\overline {\mathrm {T}}} } $ production for 100% $ {\mathrm {T}} \to \mathrm{ b } \mathrm{ W } $ in the boosted W channel. The theoretically predicted cross section for $ { {\mathrm {T}} {\overline {\mathrm {T}}} } $ production calculated at NNLO is shown as red line, with the uncertainties in the PDFs and renormalization and factorization scales indicated by the shaded area. |

png pdf |
Figure 11-b:
The expected and observed upper limits (Bayesian) at 95% CL on the cross section of $ { {\mathrm {T}} {\overline {\mathrm {T}}} } $ production for 100% T $\to $ tH in the boosted H channel. The theoretically predicted cross section for $ { {\mathrm {T}} {\overline {\mathrm {T}}} } $ production calculated at NNLO is shown as red line, with the uncertainties in the PDFs and renormalization and factorization scales indicated by the shaded area. |
png pdf |
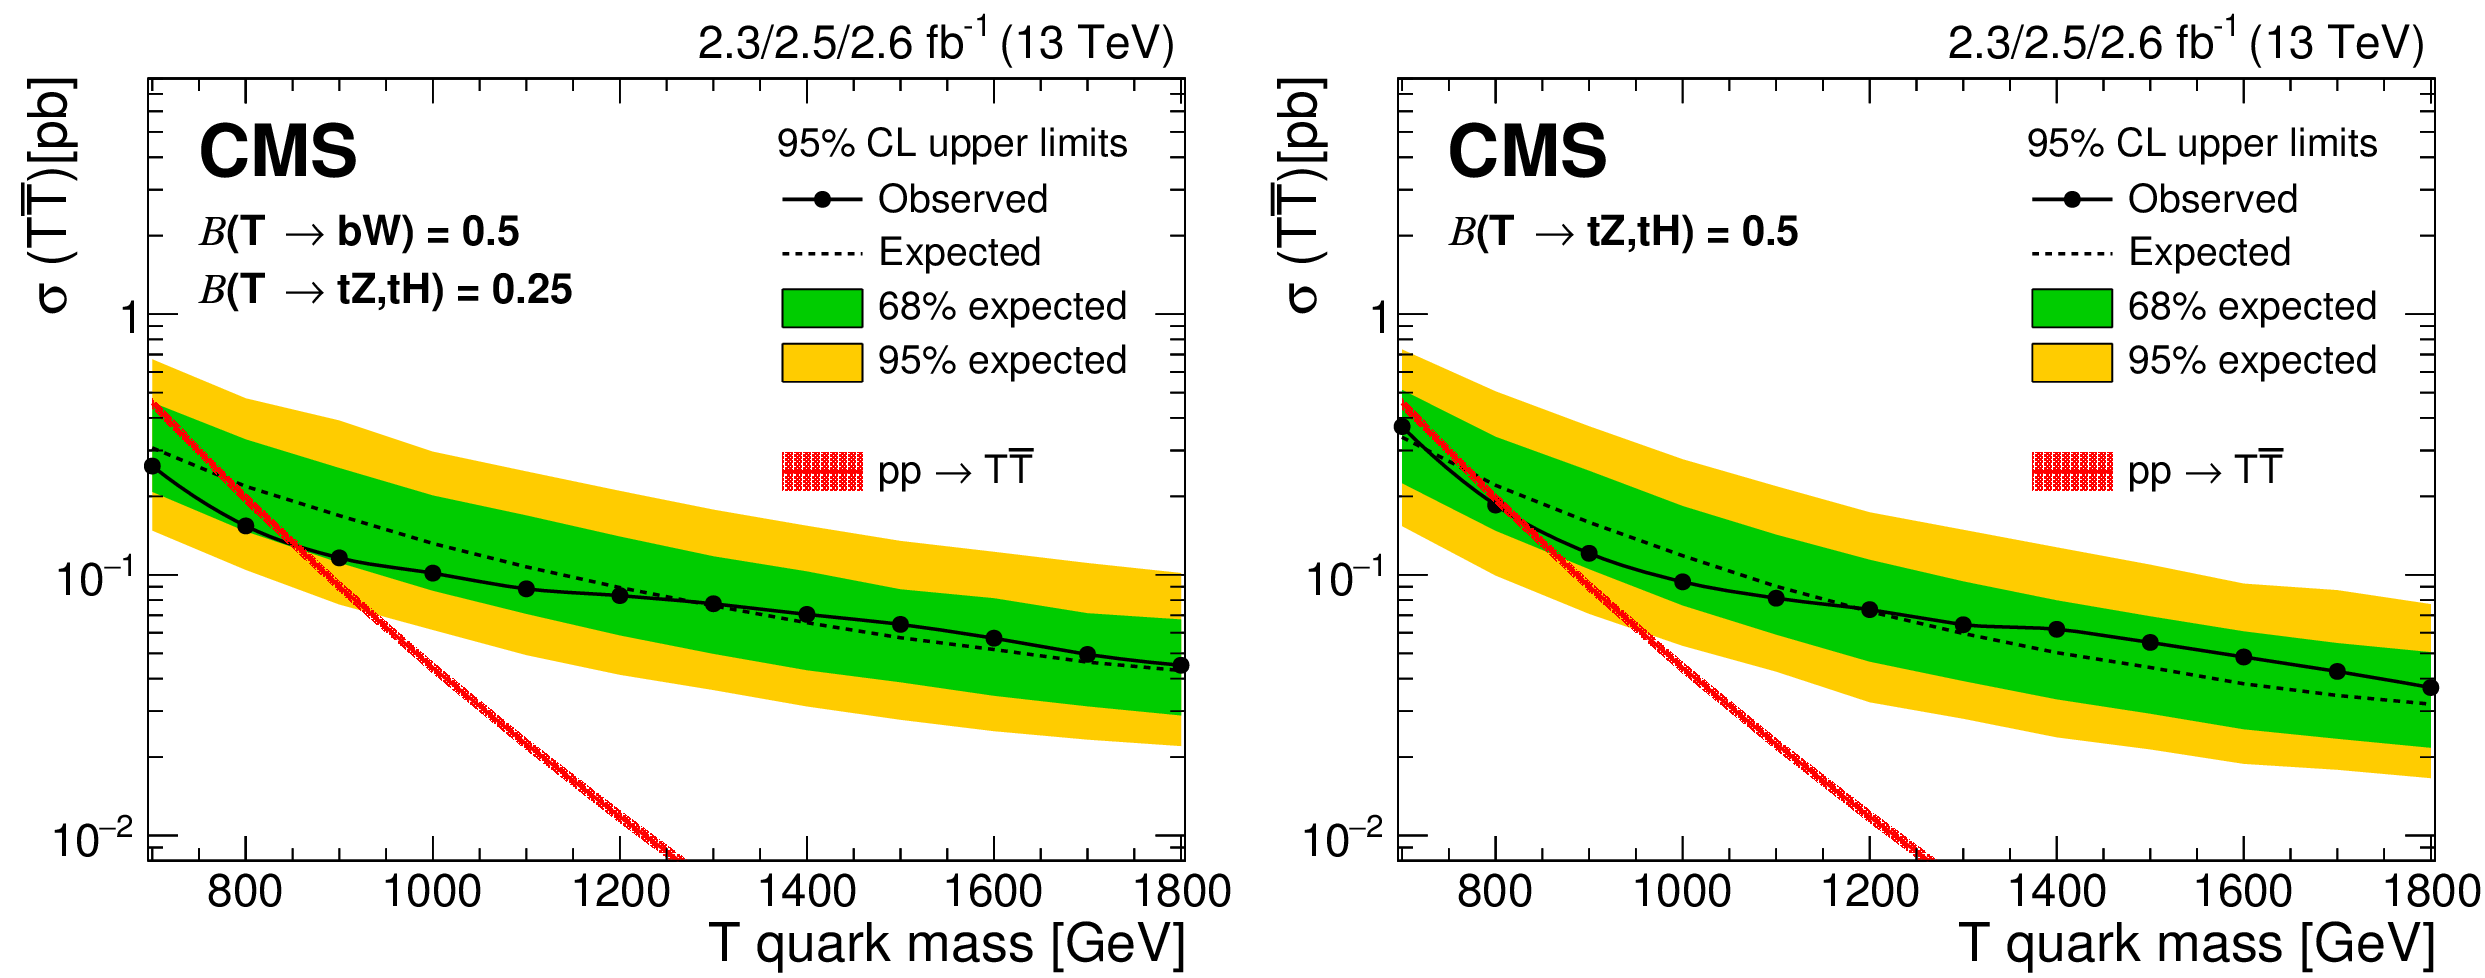
Figure 12:
The expected and observed upper limits (Bayesian) at 95% CL on the cross section of $ { {\mathrm {T}} {\overline {\mathrm {T}}} } $ production for the singlet benchmark (left) and the doublet benchmark (right) after combining the boosted W and boosted H channels. The theoretically predicted cross section for $ { {\mathrm {T}} {\overline {\mathrm {T}}} } $ production calculated at NNLO is shown as red line, with the uncertainties in the PDFs and renormalization and factorization scales indicated by the shaded area. |

png pdf |
Figure 12-a:
The expected and observed upper limits (Bayesian) at 95% CL on the cross section of $ { {\mathrm {T}} {\overline {\mathrm {T}}} } $ production for the singlet benchmark after combining the boosted W and boosted H channels. The theoretically predicted cross section for $ { {\mathrm {T}} {\overline {\mathrm {T}}} } $ production calculated at NNLO is shown as red line, with the uncertainties in the PDFs and renormalization and factorization scales indicated by the shaded area. |
png pdf |
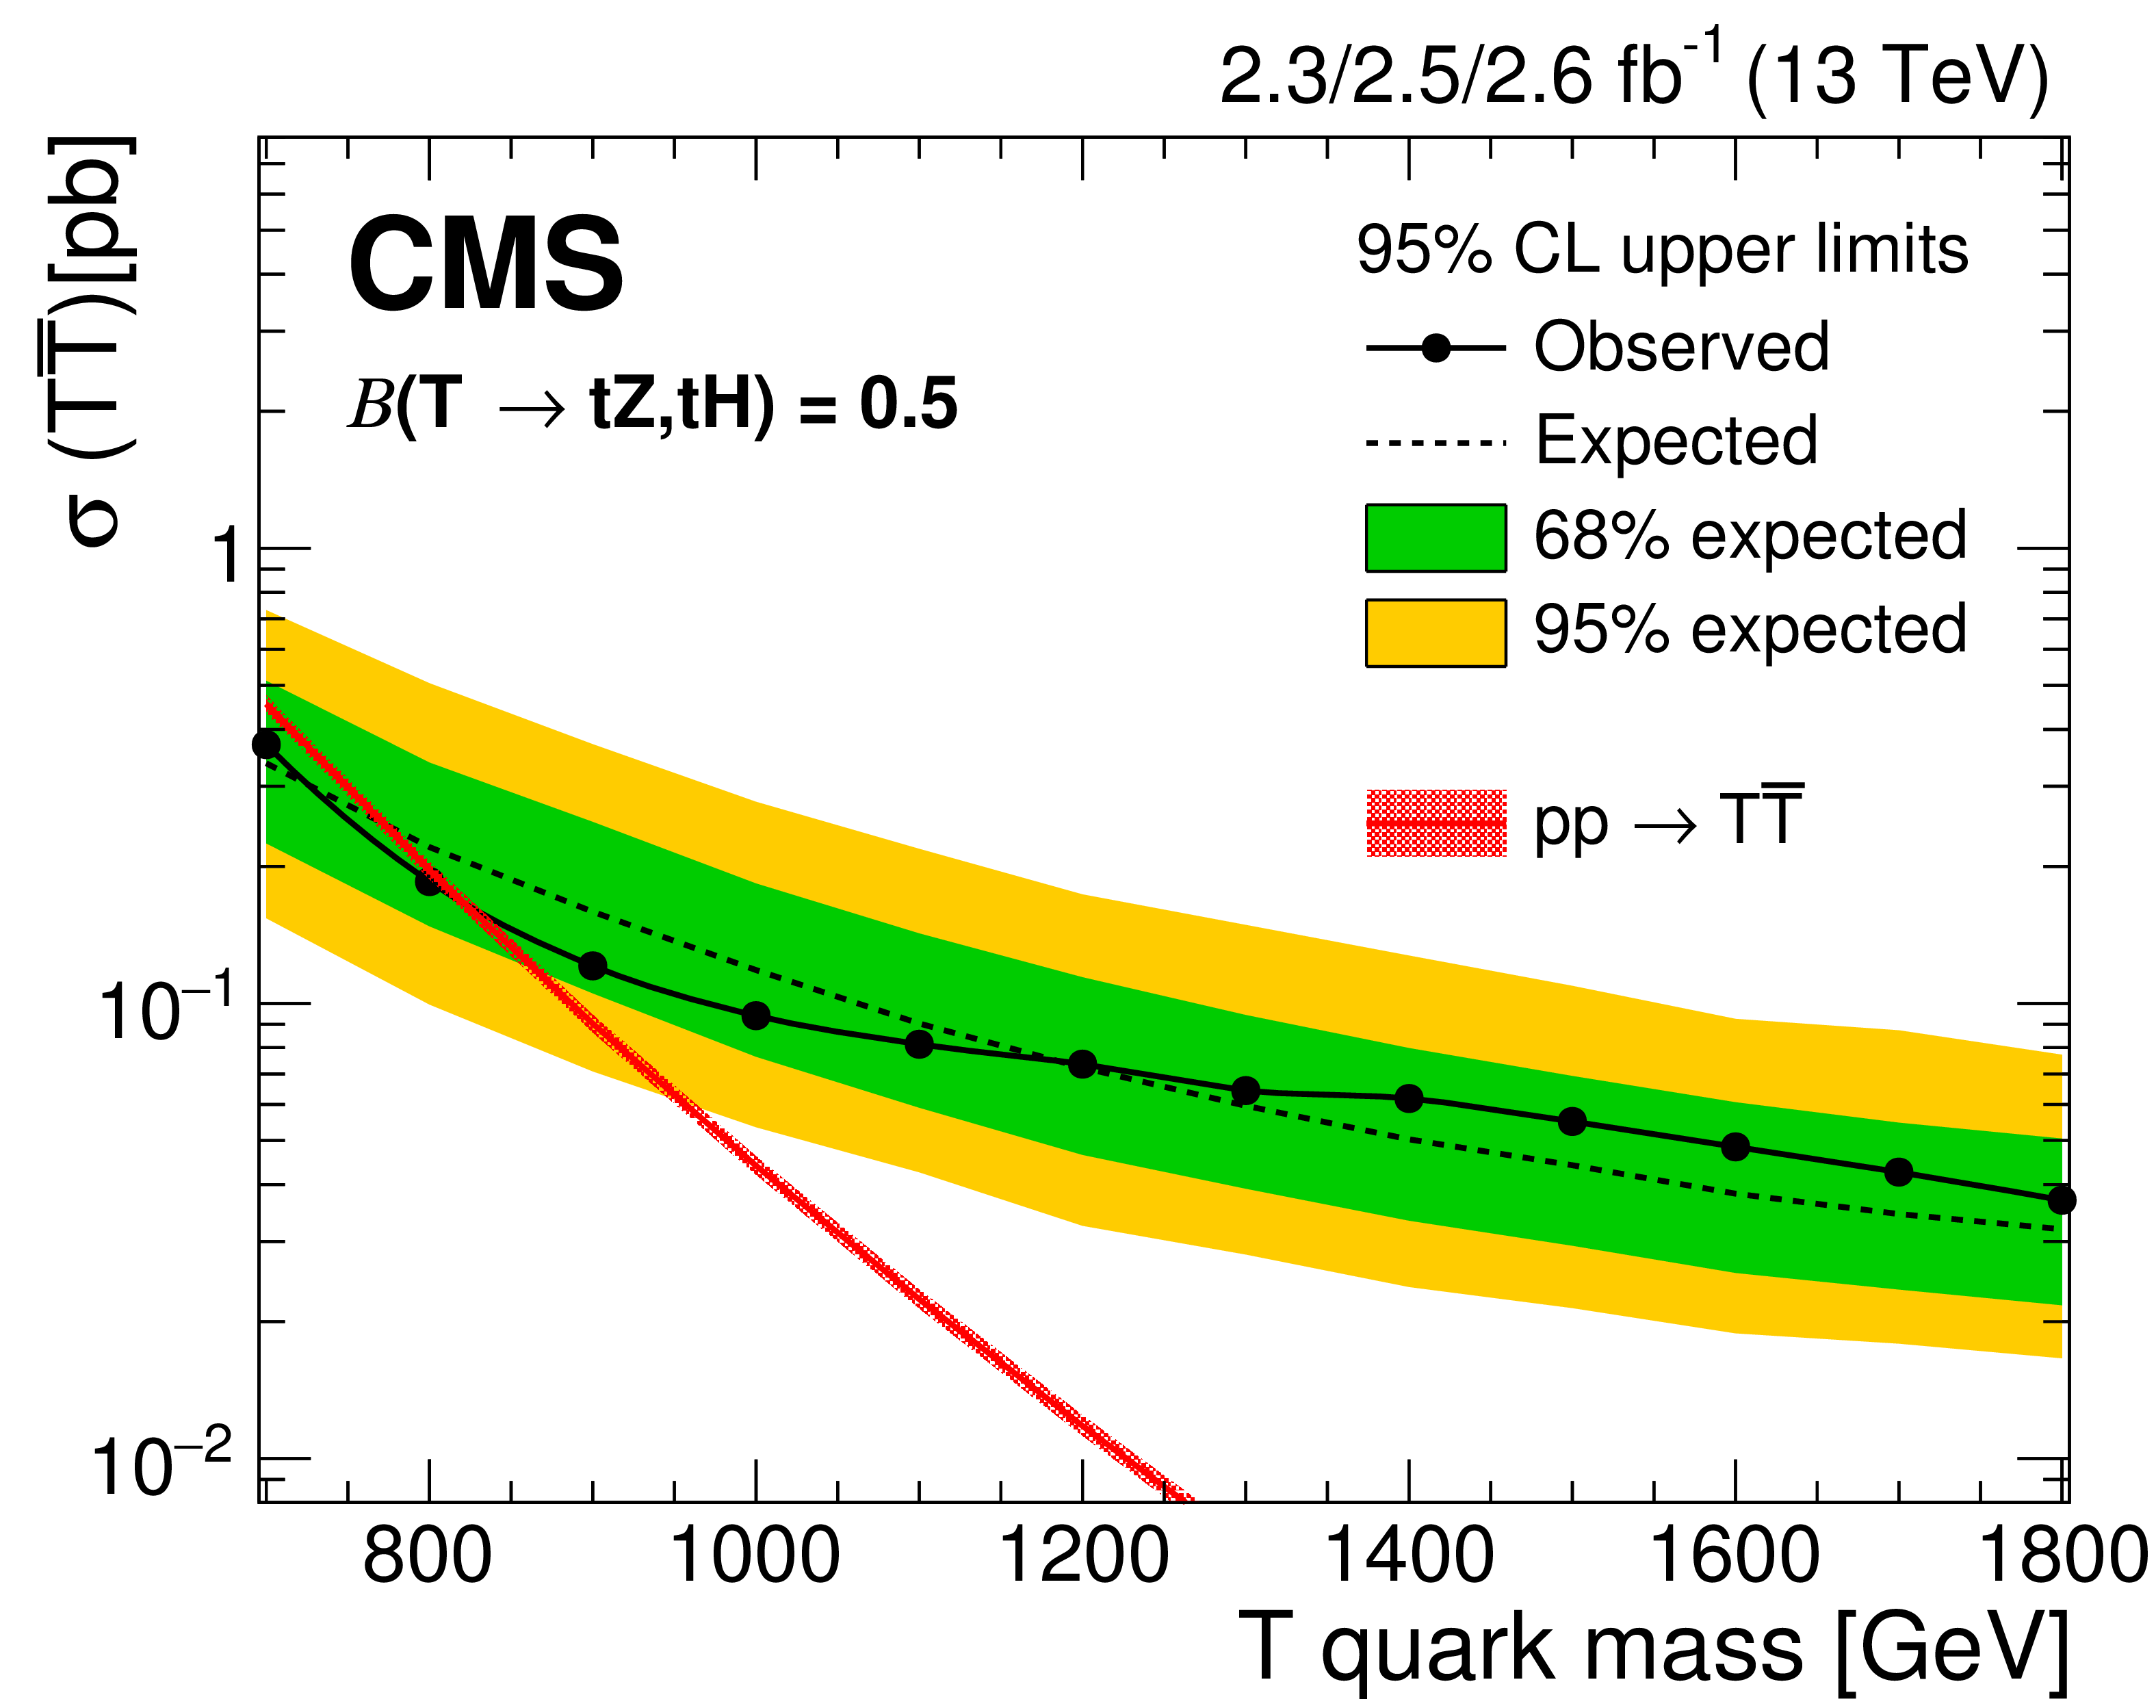
Figure 12-b:
The expected and observed upper limits (Bayesian) at 95% CL on the cross section of $ { {\mathrm {T}} {\overline {\mathrm {T}}} } $ production for the doublet benchmark after combining the boosted W and boosted H channels. The theoretically predicted cross section for $ { {\mathrm {T}} {\overline {\mathrm {T}}} } $ production calculated at NNLO is shown as red line, with the uncertainties in the PDFs and renormalization and factorization scales indicated by the shaded area. |
png pdf |
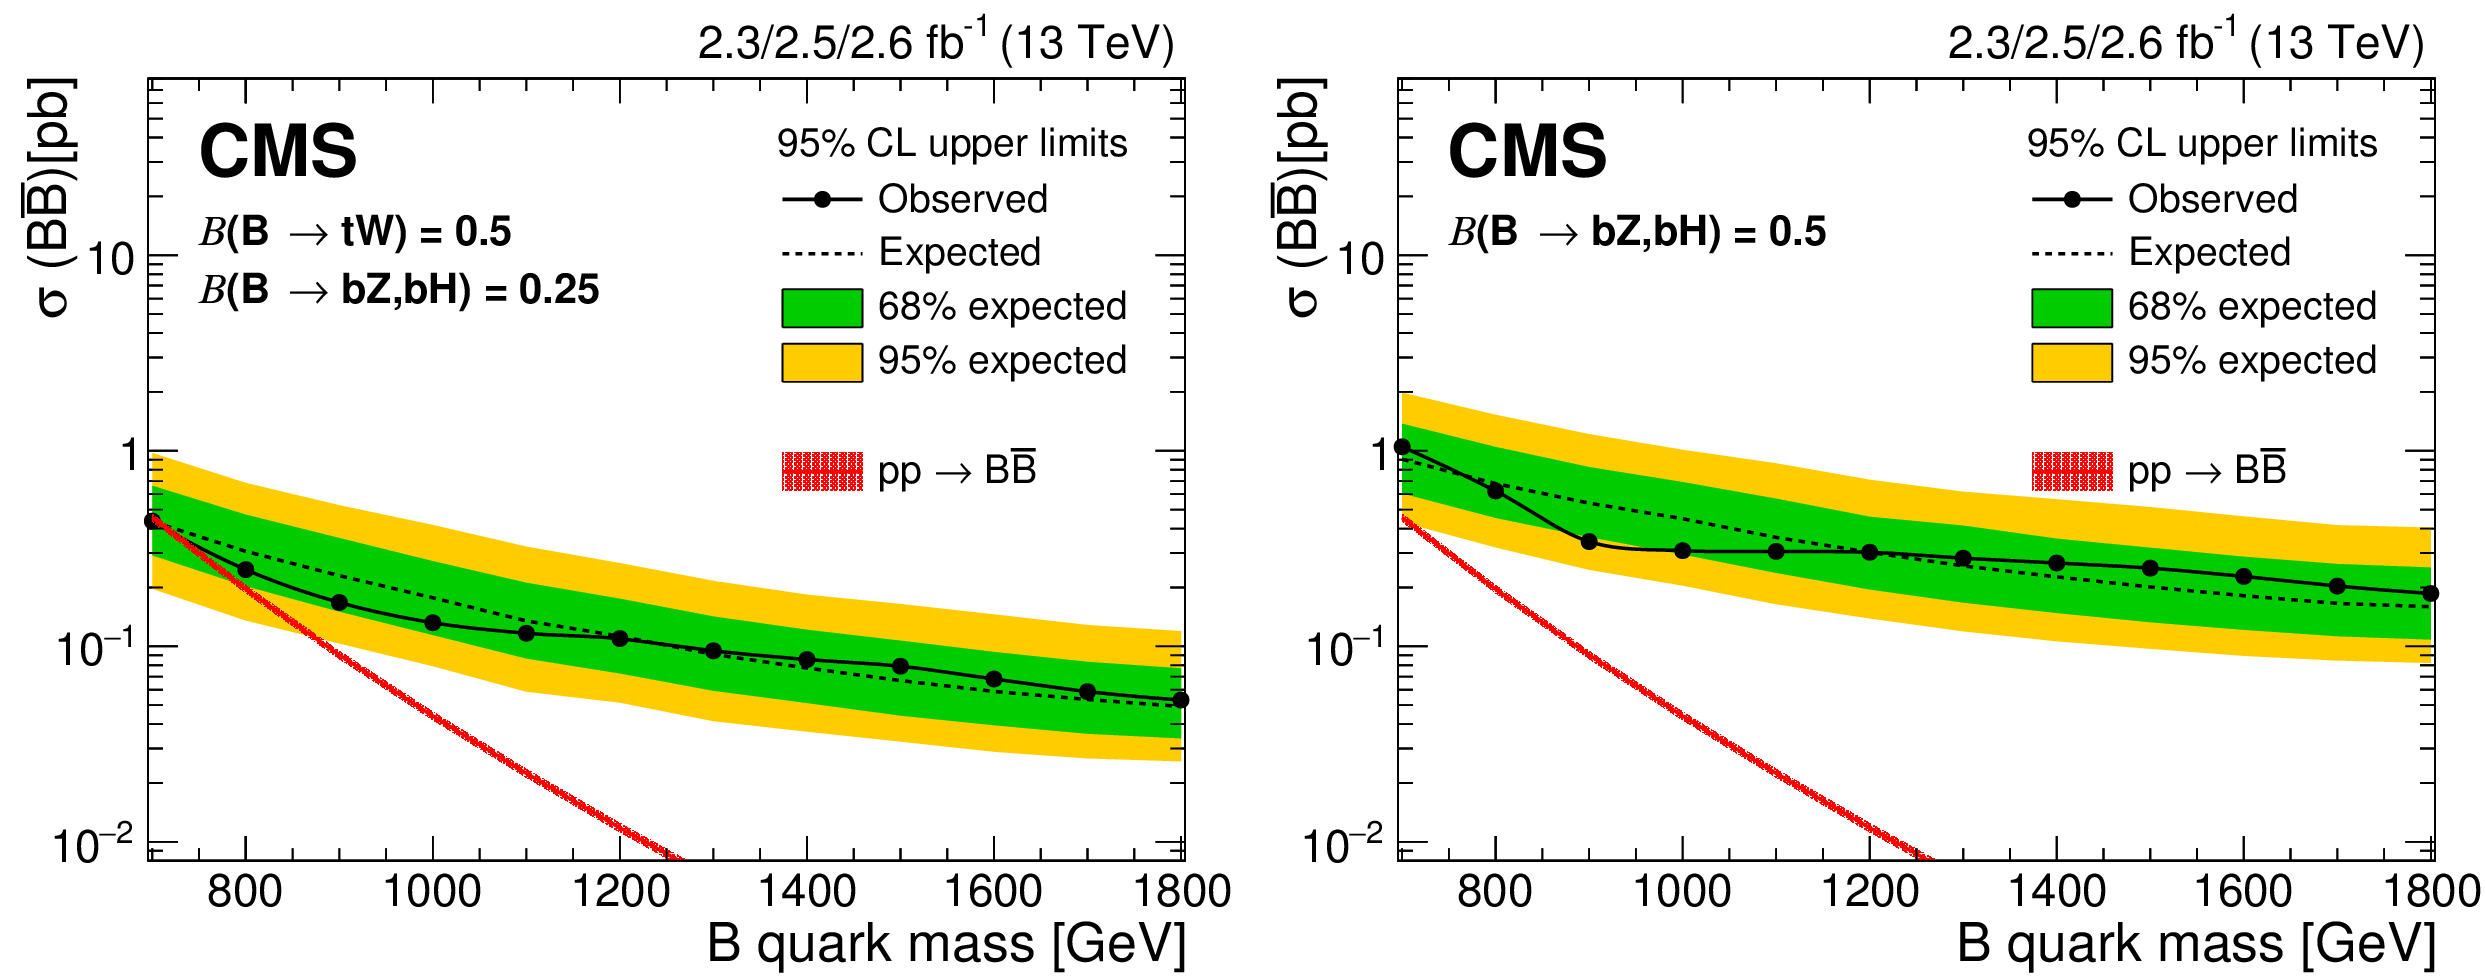
Figure 13:
The expected and observed upper limits (Bayesian) at 95% CL on the cross section of $ { {\mathrm {B}} {\overline {\mathrm {B}}} } $ production for the singlet benchmark (left) and the doublet benchmark (right) after combining the boosted W and boosted H channels. The theoretically predicted cross section for $ { {\mathrm {B}} {\overline {\mathrm {B}}} } $ production calculated at NNLO is shown as red line, with the uncertainties in the PDFs and renormalization and factorization scales indicated by the shaded area. |
png pdf |
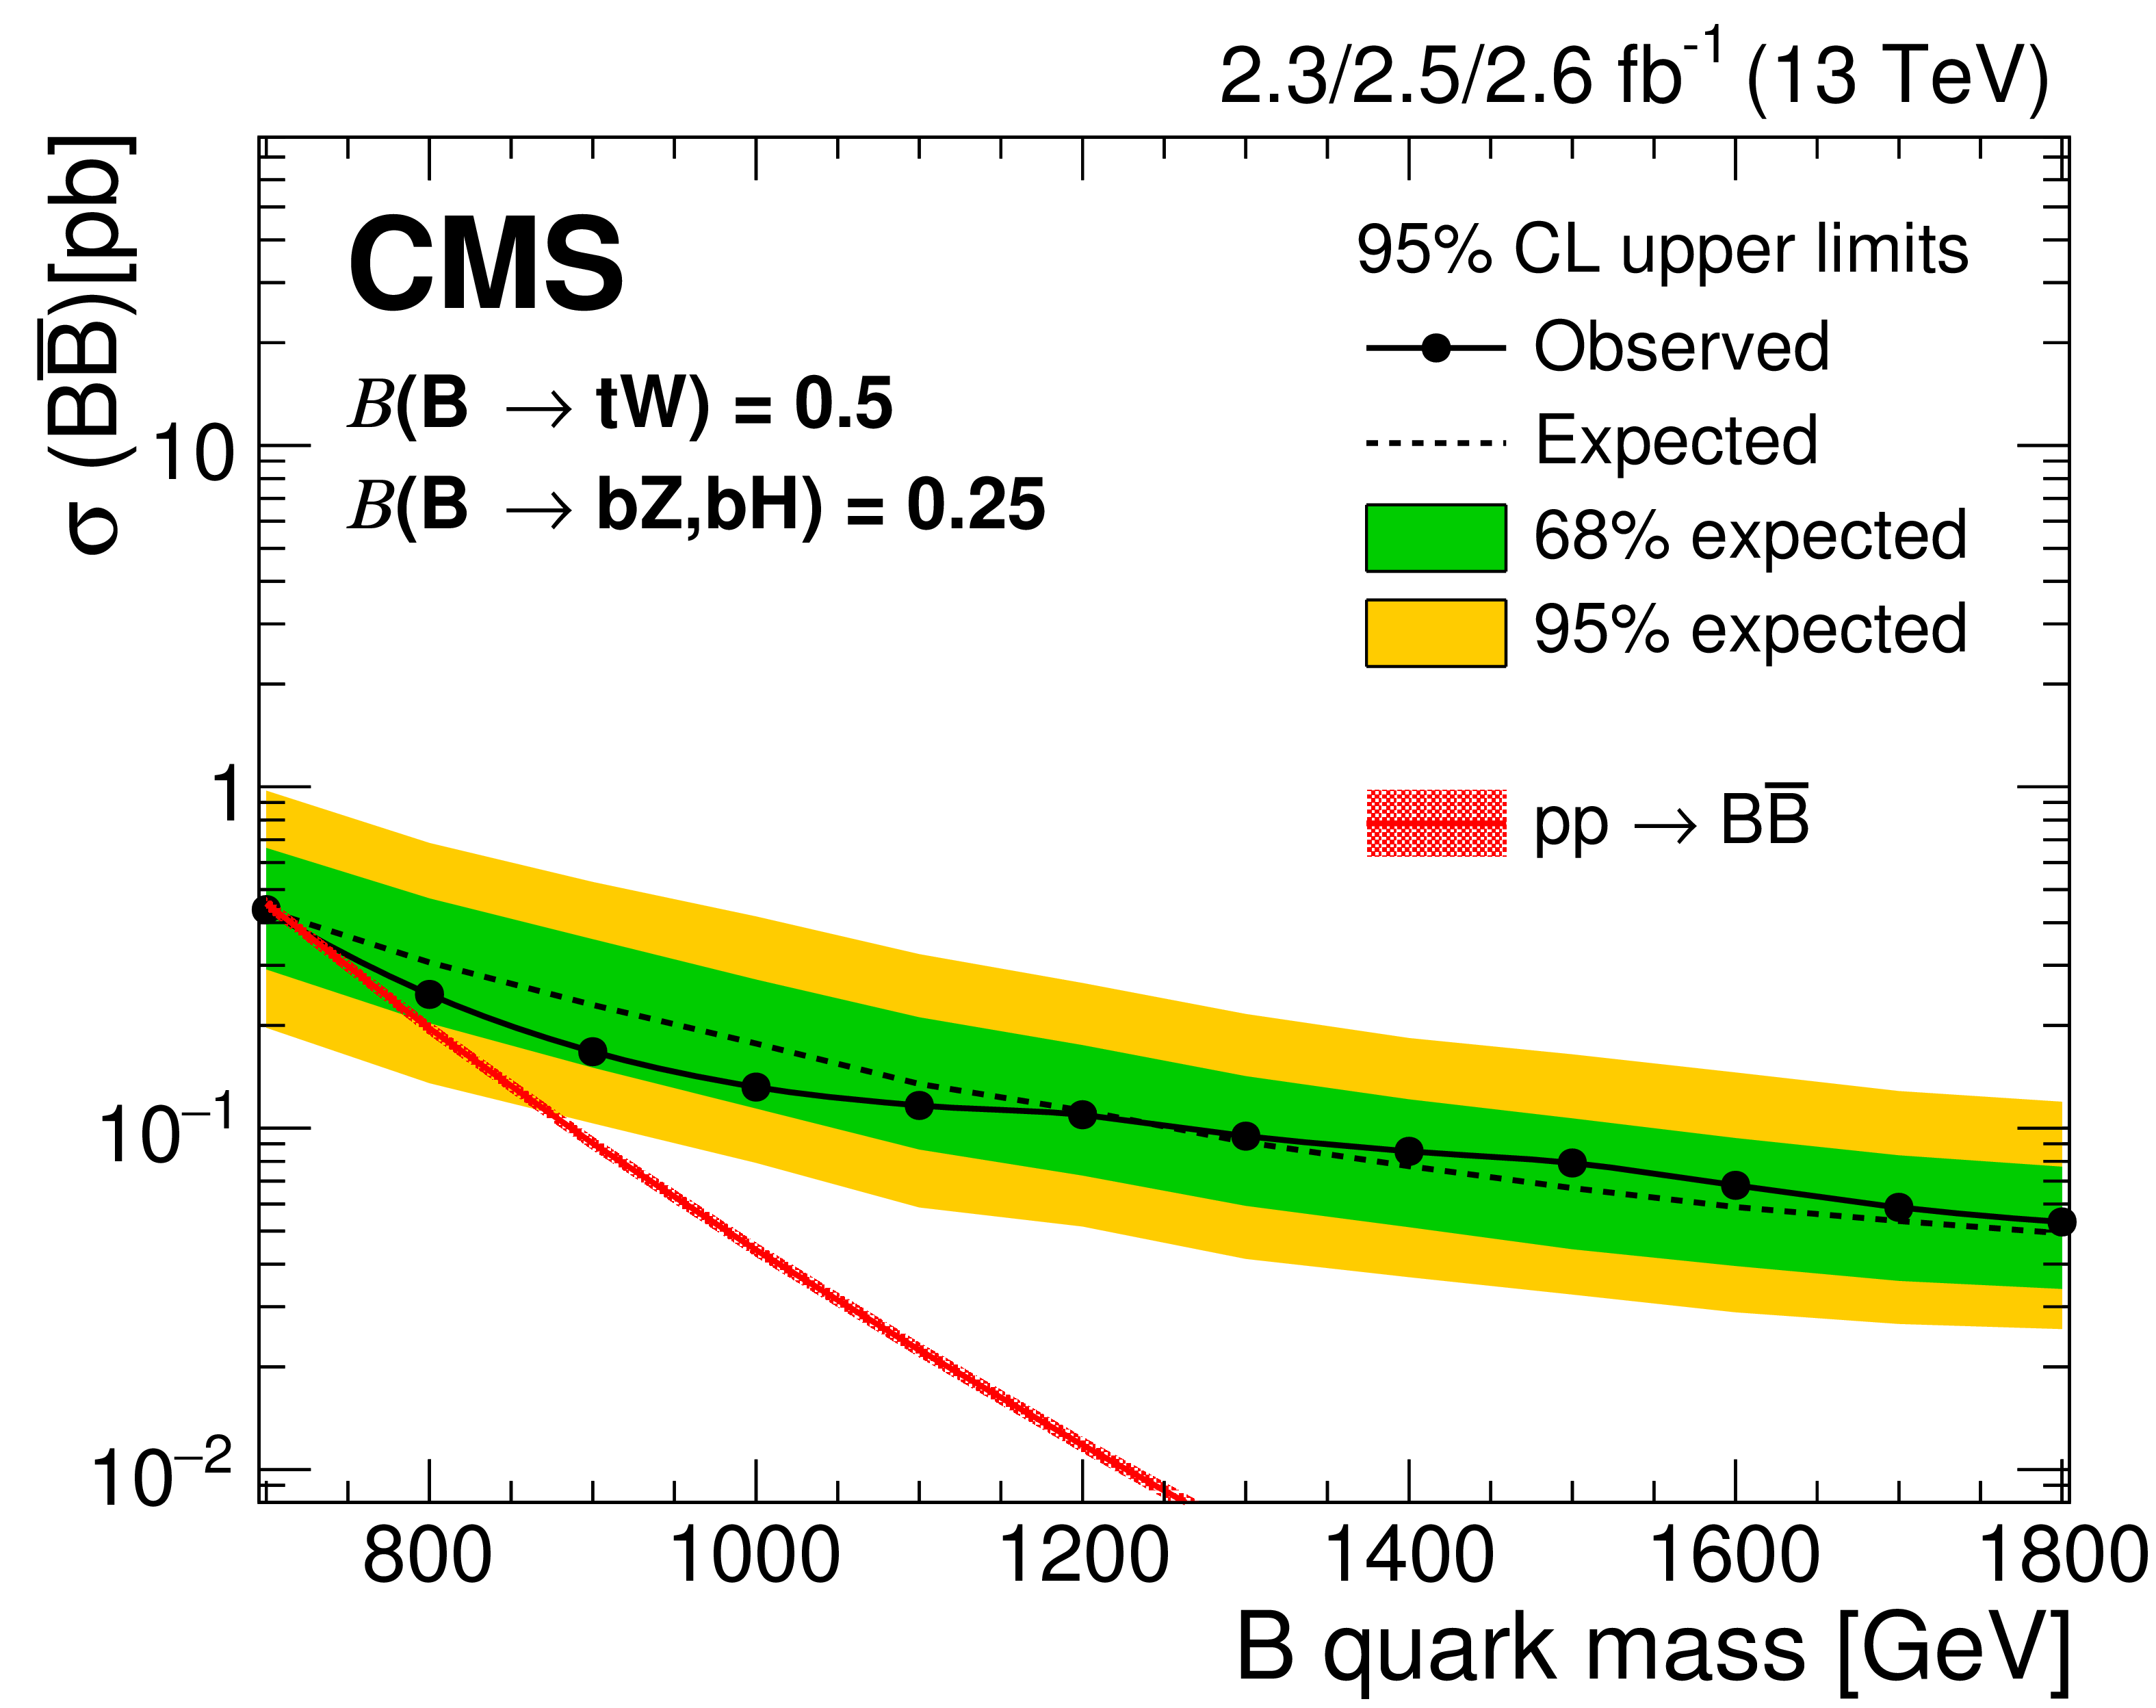
Figure 13-a:
The expected and observed upper limits (Bayesian) at 95% CL on the cross section of $ { {\mathrm {B}} {\overline {\mathrm {B}}} } $ production for the singlet benchmark after combining the boosted W and boosted H channels. The theoretically predicted cross section for $ { {\mathrm {B}} {\overline {\mathrm {B}}} } $ production calculated at NNLO is shown as red line, with the uncertainties in the PDFs and renormalization and factorization scales indicated by the shaded area. |
png pdf |
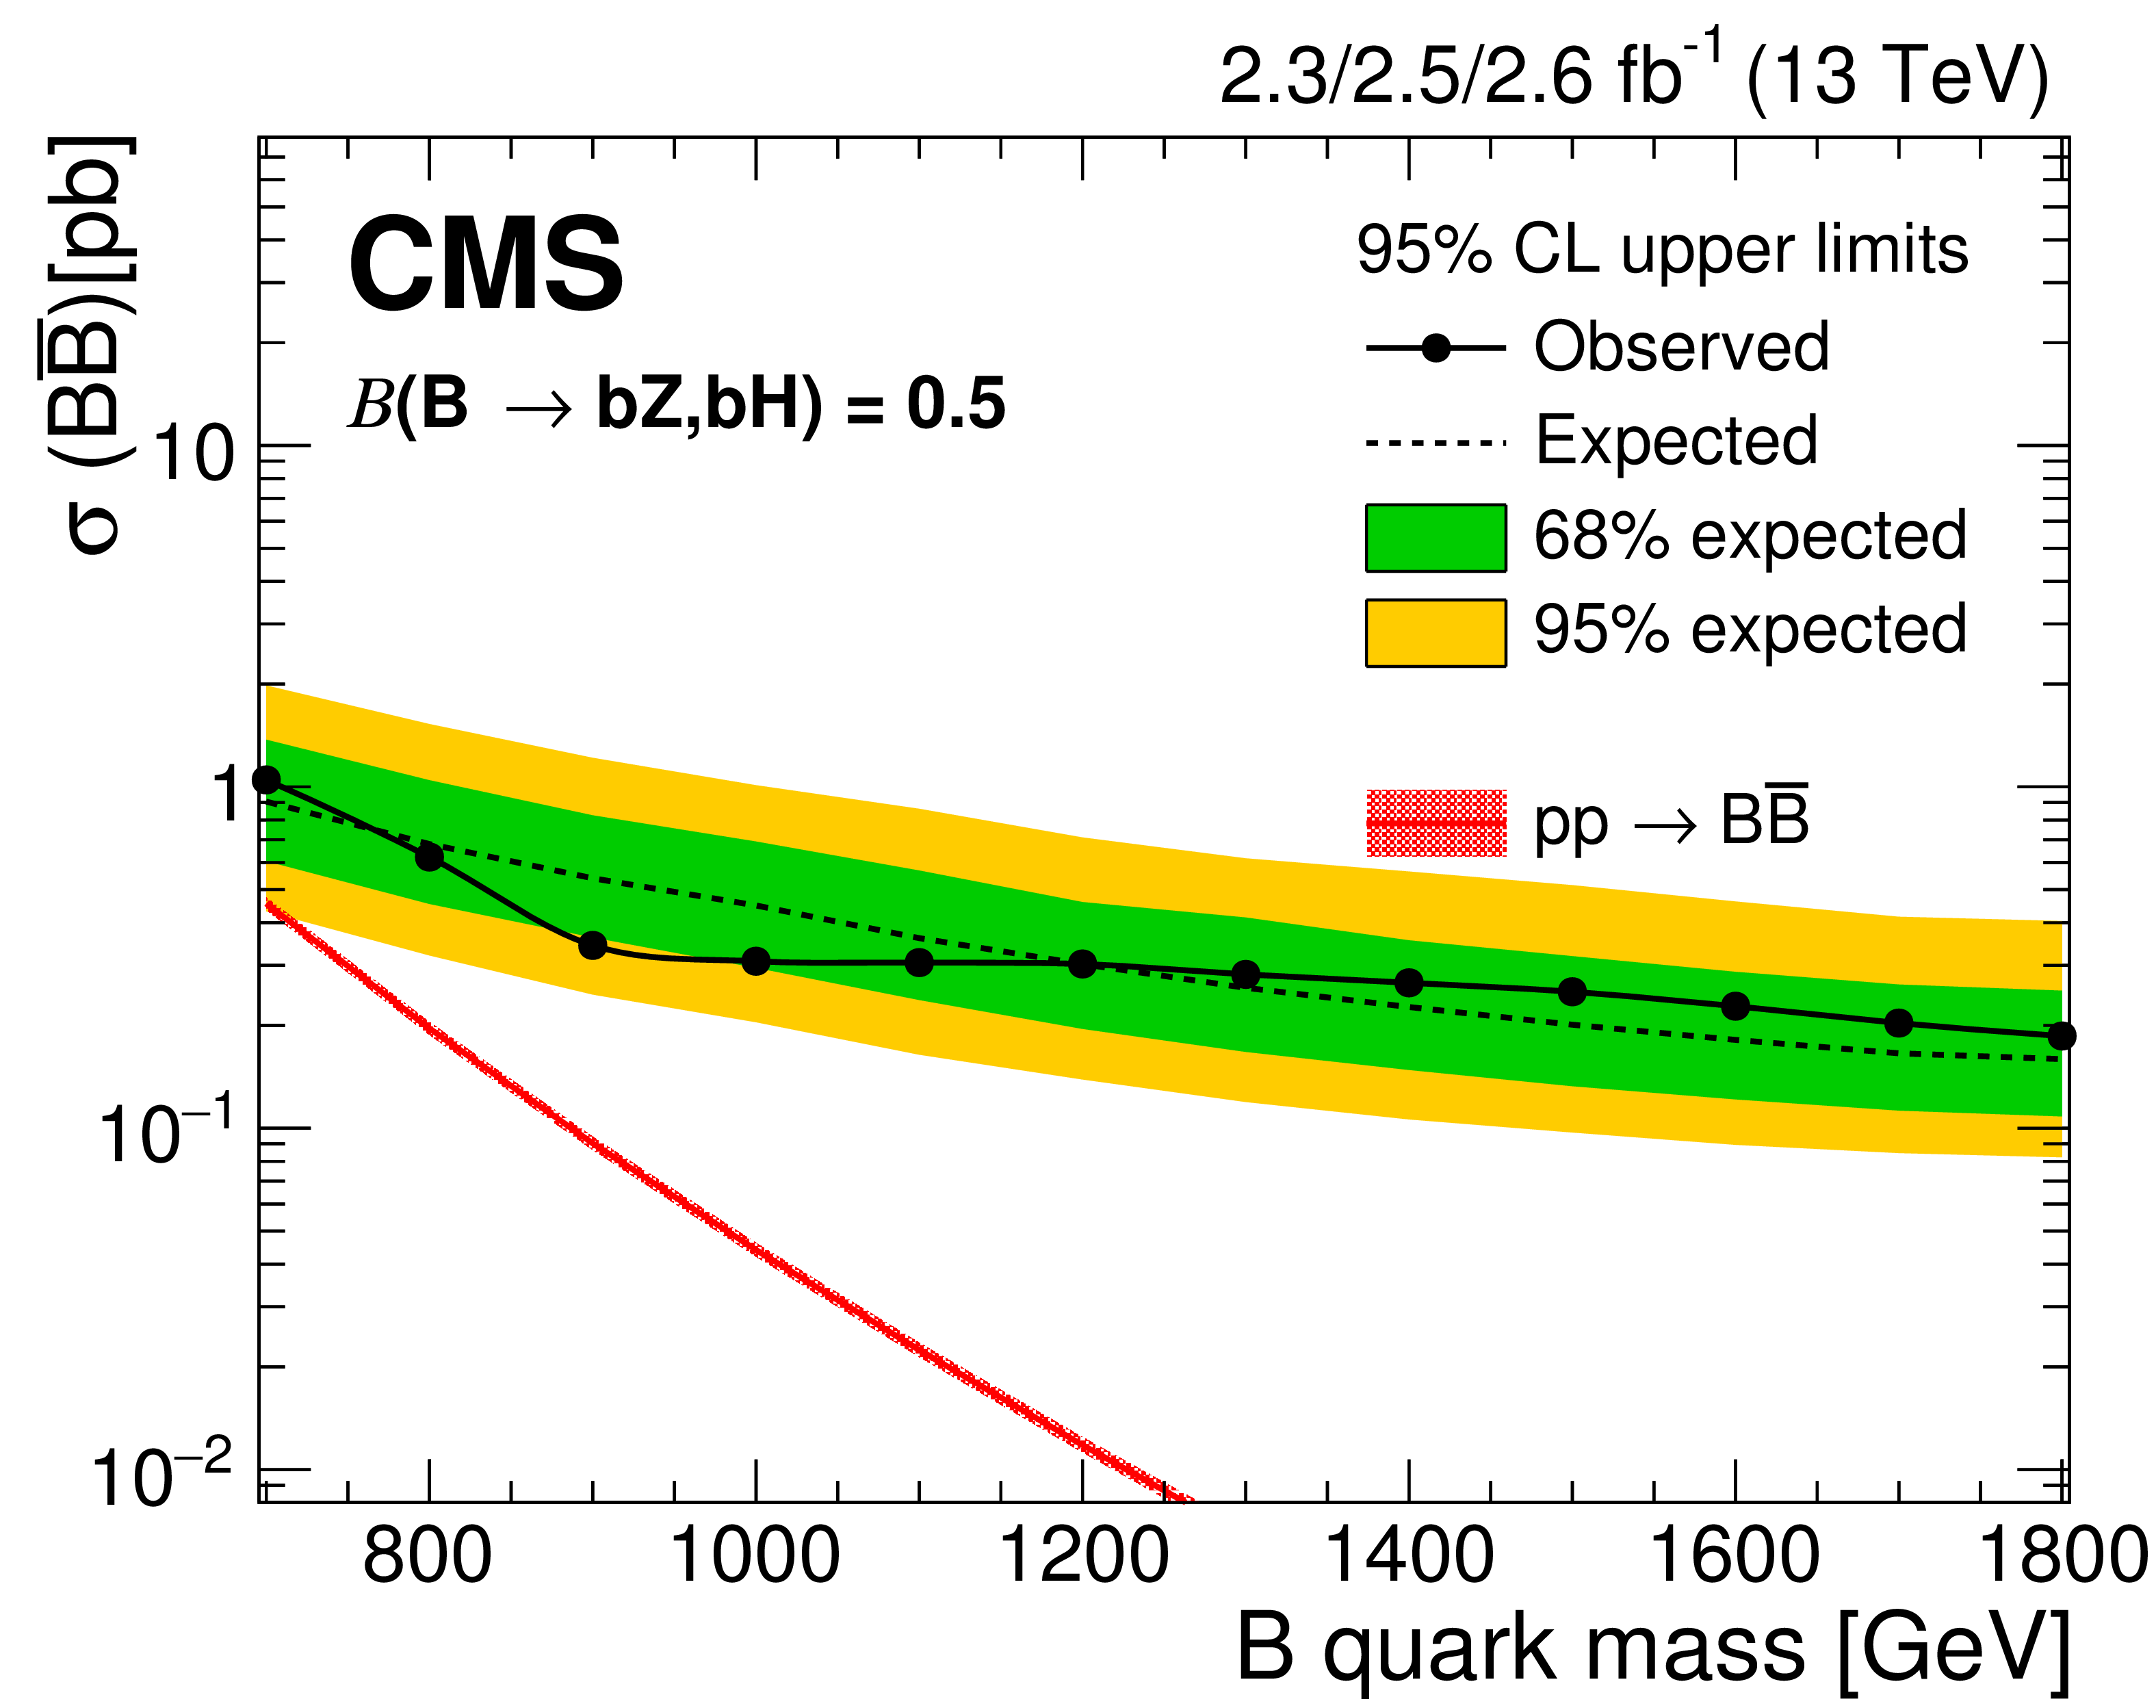
Figure 13-b:
The expected and observed upper limits (Bayesian) at 95% CL on the cross section of $ { {\mathrm {B}} {\overline {\mathrm {B}}} } $ production for the doublet benchmark after combining the boosted W and boosted H channels. The theoretically predicted cross section for $ { {\mathrm {B}} {\overline {\mathrm {B}}} } $ production calculated at NNLO is shown as red line, with the uncertainties in the PDFs and renormalization and factorization scales indicated by the shaded area. |

png pdf |
Figure 14:
The expected (left) and observed (right) at 95% CL lower limits (Bayesian) on the T quark mass for a variety of $ {\mathrm {T}} \to \mathrm{ t } \mathrm{ H } $ and $ {\mathrm {T}} \to \mathrm{ b } \mathrm{ W } $ branching fraction combinations, indicated by the coordinates at the center of each box, after combining the boosted W and boosted H channels. A limit of $<$ 700 GeV indicates that this search is not sensitive to T quark decays with that branching fraction combination. |

png pdf |
Figure 14-a:
The expected at 95% CL lower limit (Bayesian) on the T quark mass for a variety of $ {\mathrm {T}} \to \mathrm{ t } \mathrm{ H } $ and $ {\mathrm {T}} \to \mathrm{ b } \mathrm{ W } $ branching fraction combinations, indicated by the coordinates at the center of each box, after combining the boosted W and boosted H channels. A limit of $<$ 700 GeV indicates that this search is not sensitive to T quark decays with that branching fraction combination. |

png pdf |
Figure 14-b:
The observed at 95% CL lower limit (Bayesian) on the T quark mass for a variety of $ {\mathrm {T}} \to \mathrm{ t } \mathrm{ H } $ and $ {\mathrm {T}} \to \mathrm{ b } \mathrm{ W } $ branching fraction combinations, indicated by the coordinates at the center of each box, after combining the boosted W and boosted H channels. A limit of $<$ 700 GeV indicates that this search is not sensitive to T quark decays with that branching fraction combination. |
| Tables | |
png pdf |
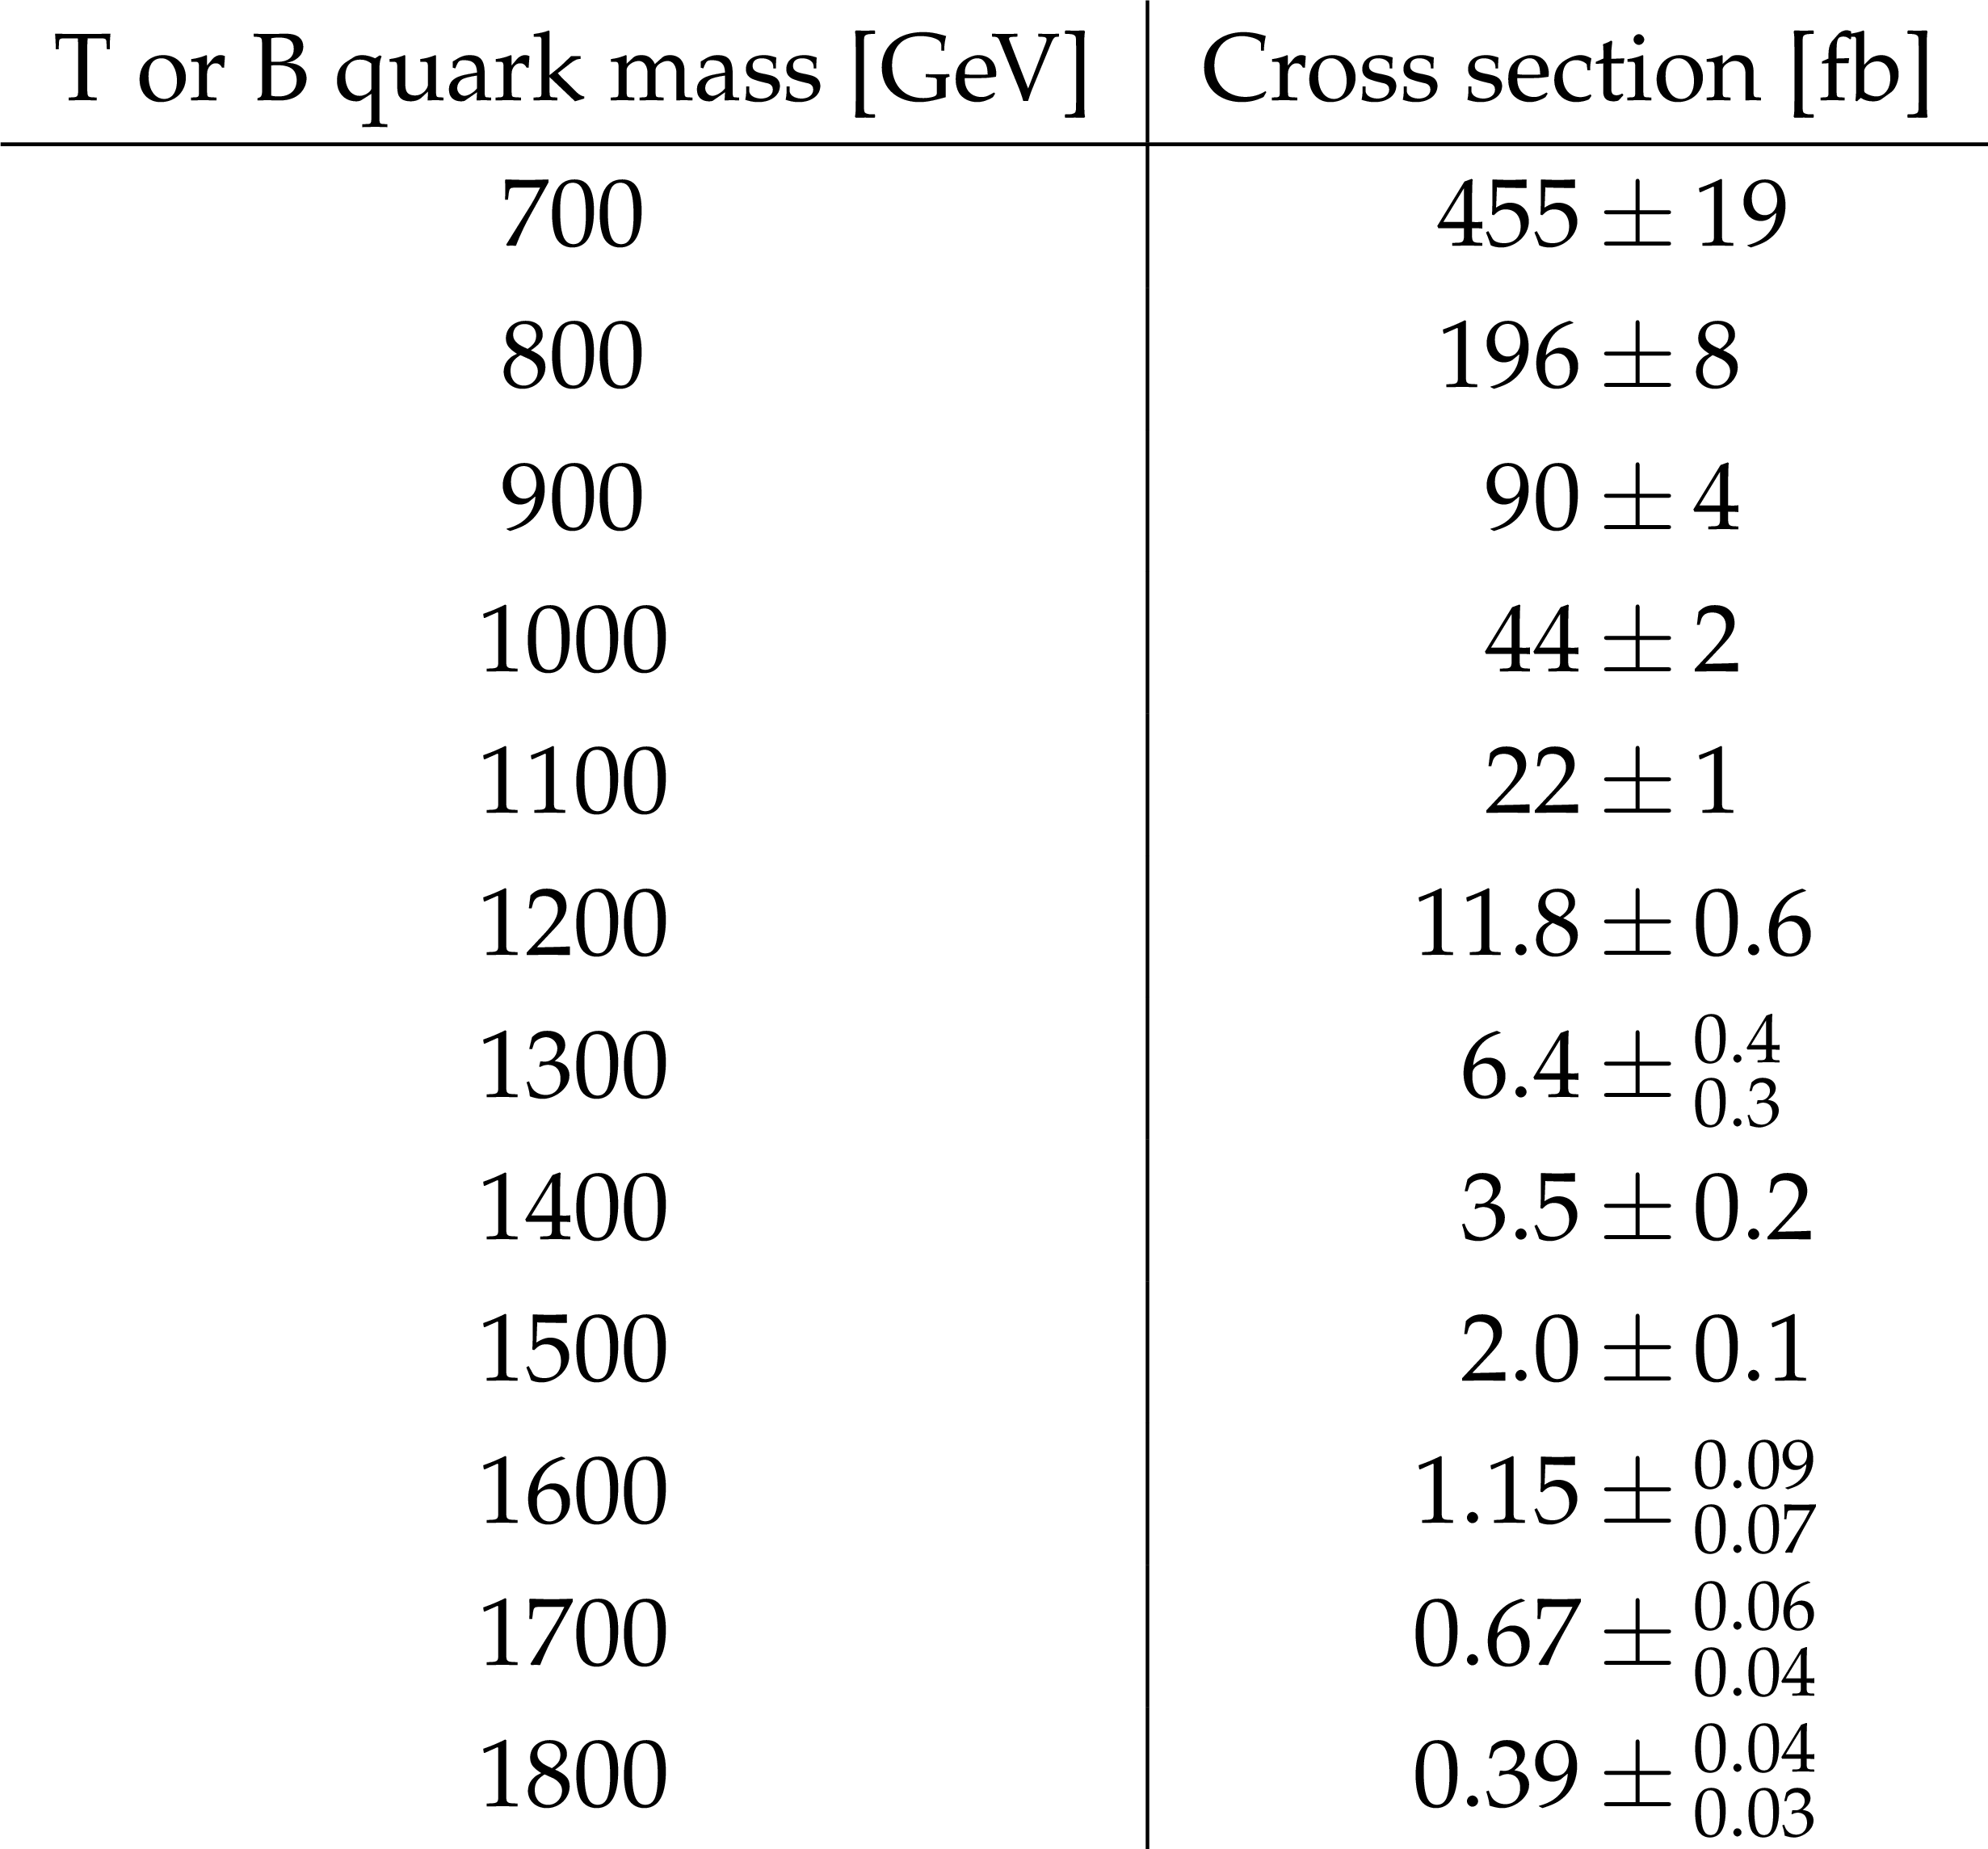
Table 1:
Predicted cross sections for pair production of T or B quarks for various masses. Uncertainties include contributions from energy scale variations and from the PDFs. |
png pdf |
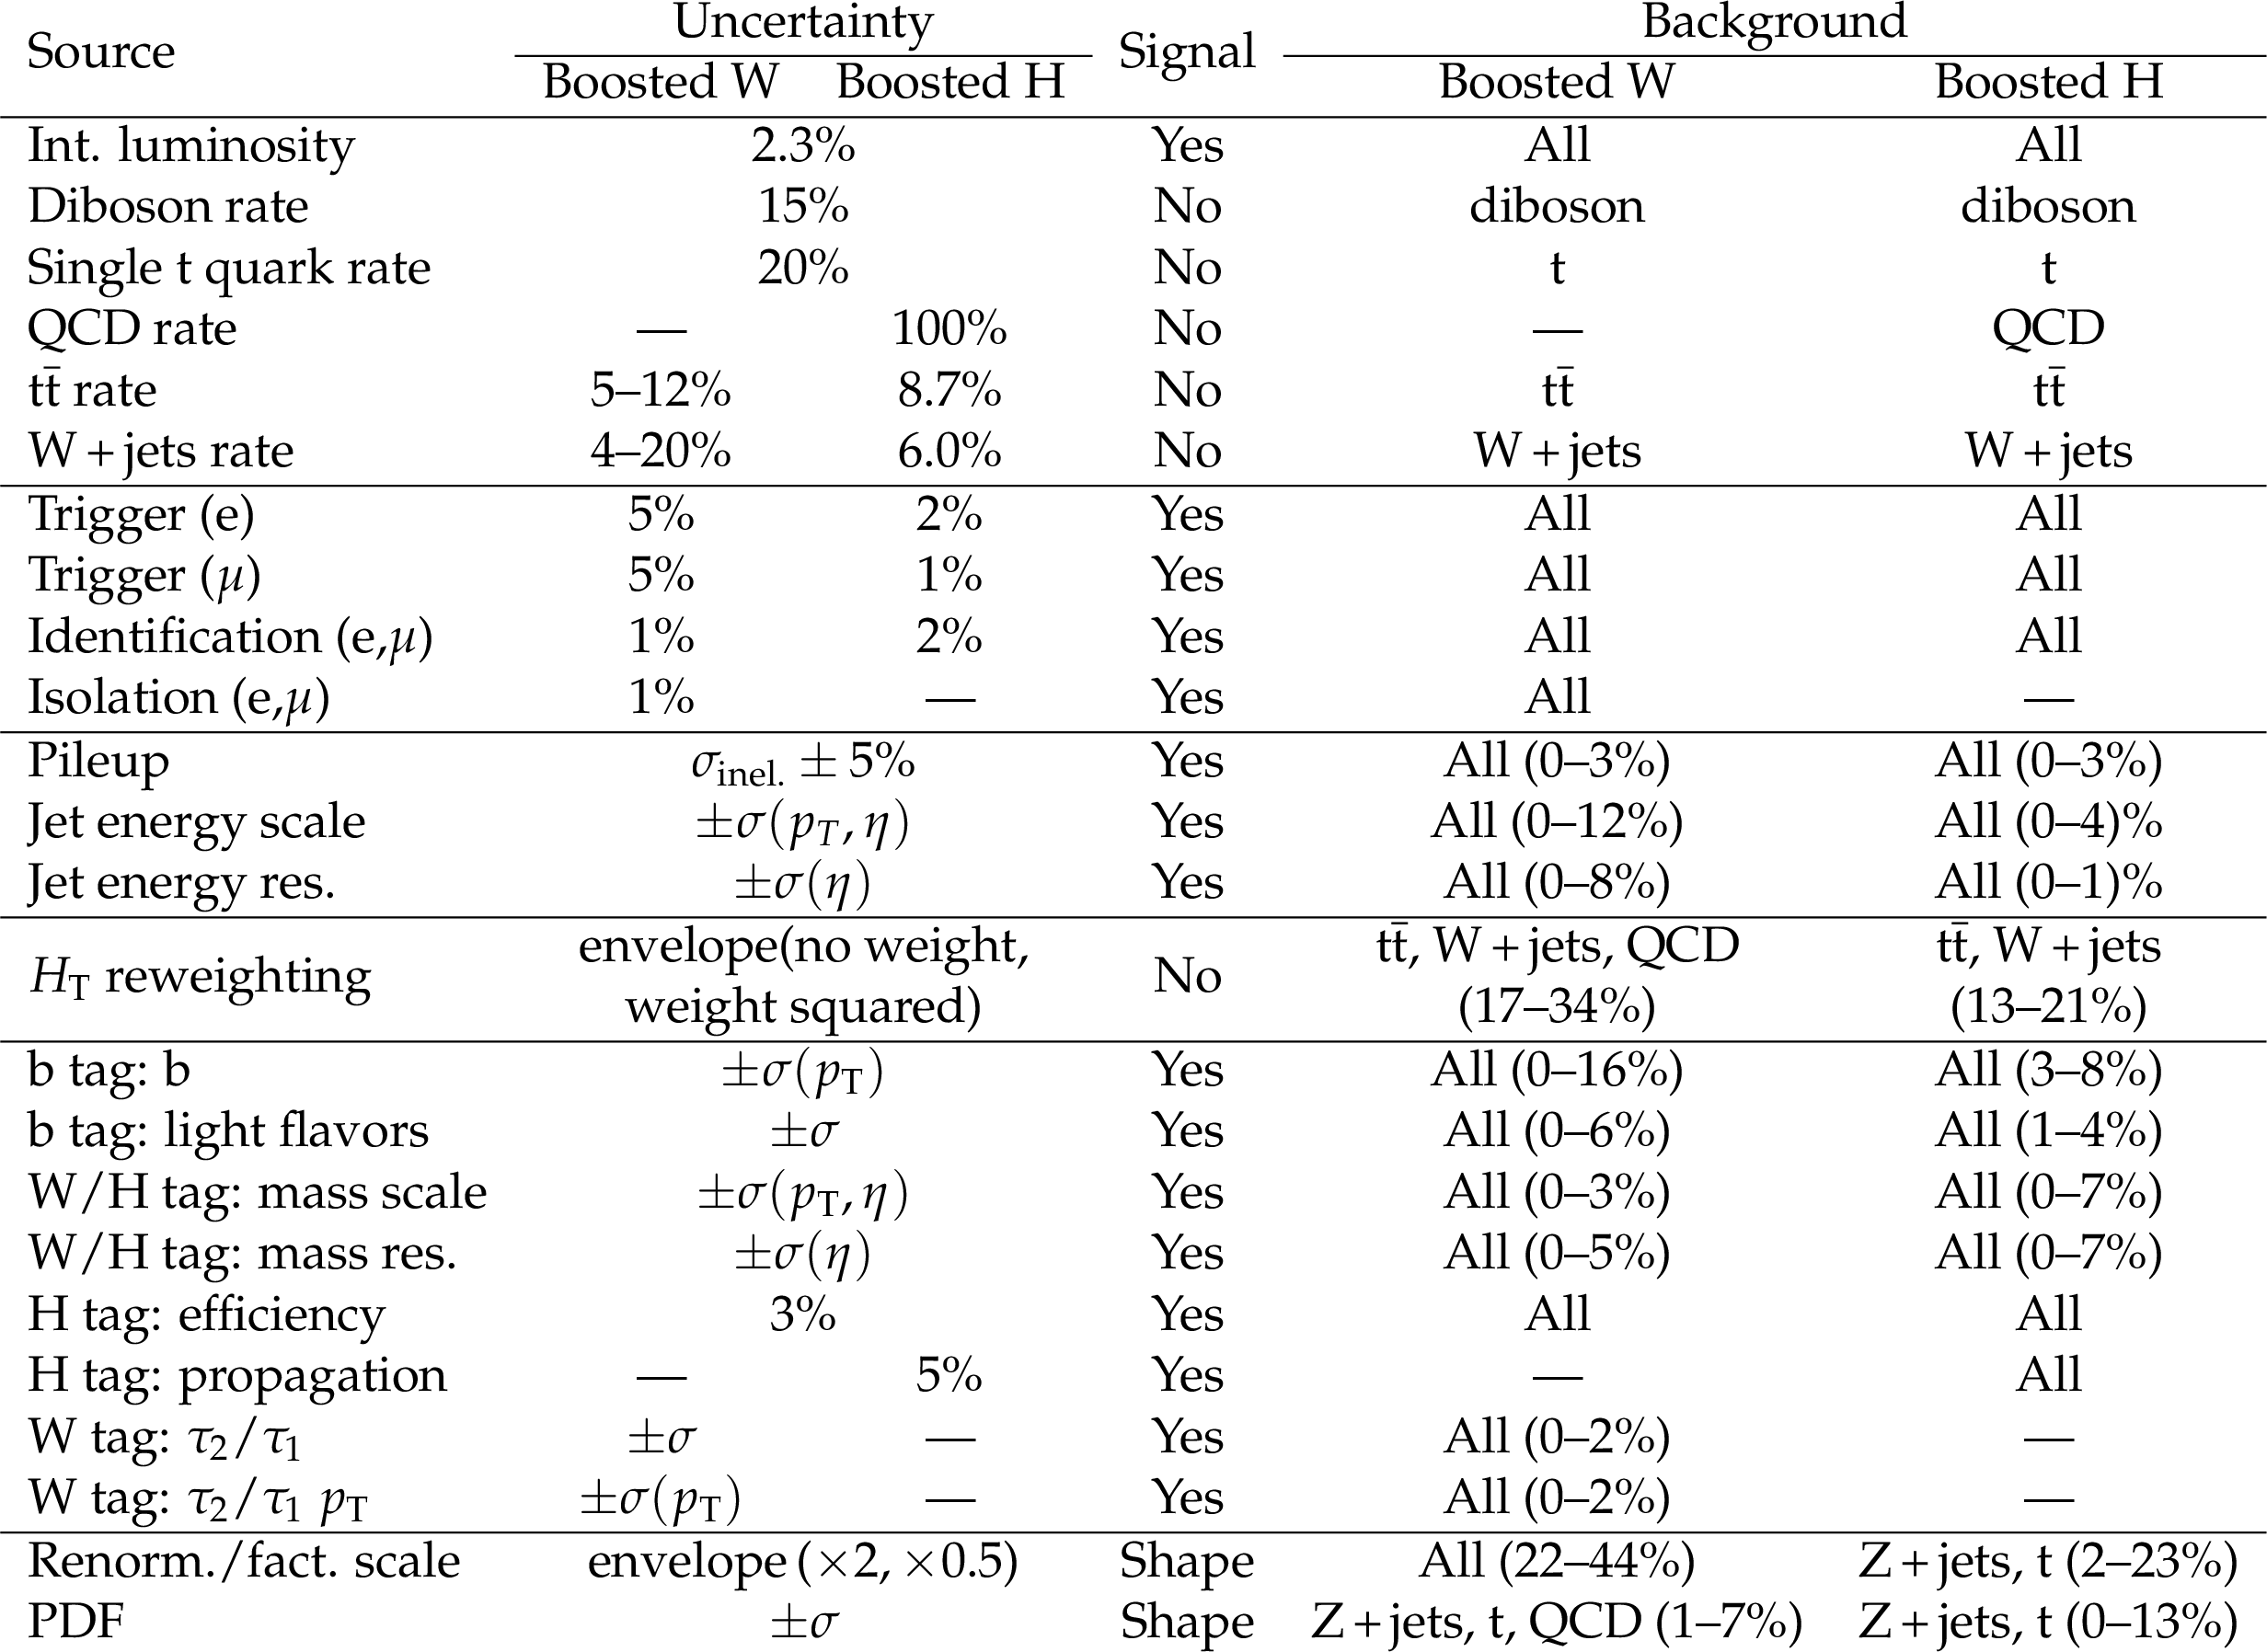
Table 2:
Summary of the systematic uncertainties. The second column gives the magnitude of normalization uncertainties or the procedure used to evaluate shape uncertainties. The symbols (W), (H) indicate values for the boosted W or boosted H channels, and $\sigma $ indicates one standard deviation of the corresponding systematic uncertainty. Renormalization and factorization energy scale uncertainties are treated as shape-only for signal but include normalization uncertainties in background. Values stated for shape uncertainties indicate a representative range over the categories for the dominant backgrounds and/or signal. |
png pdf |
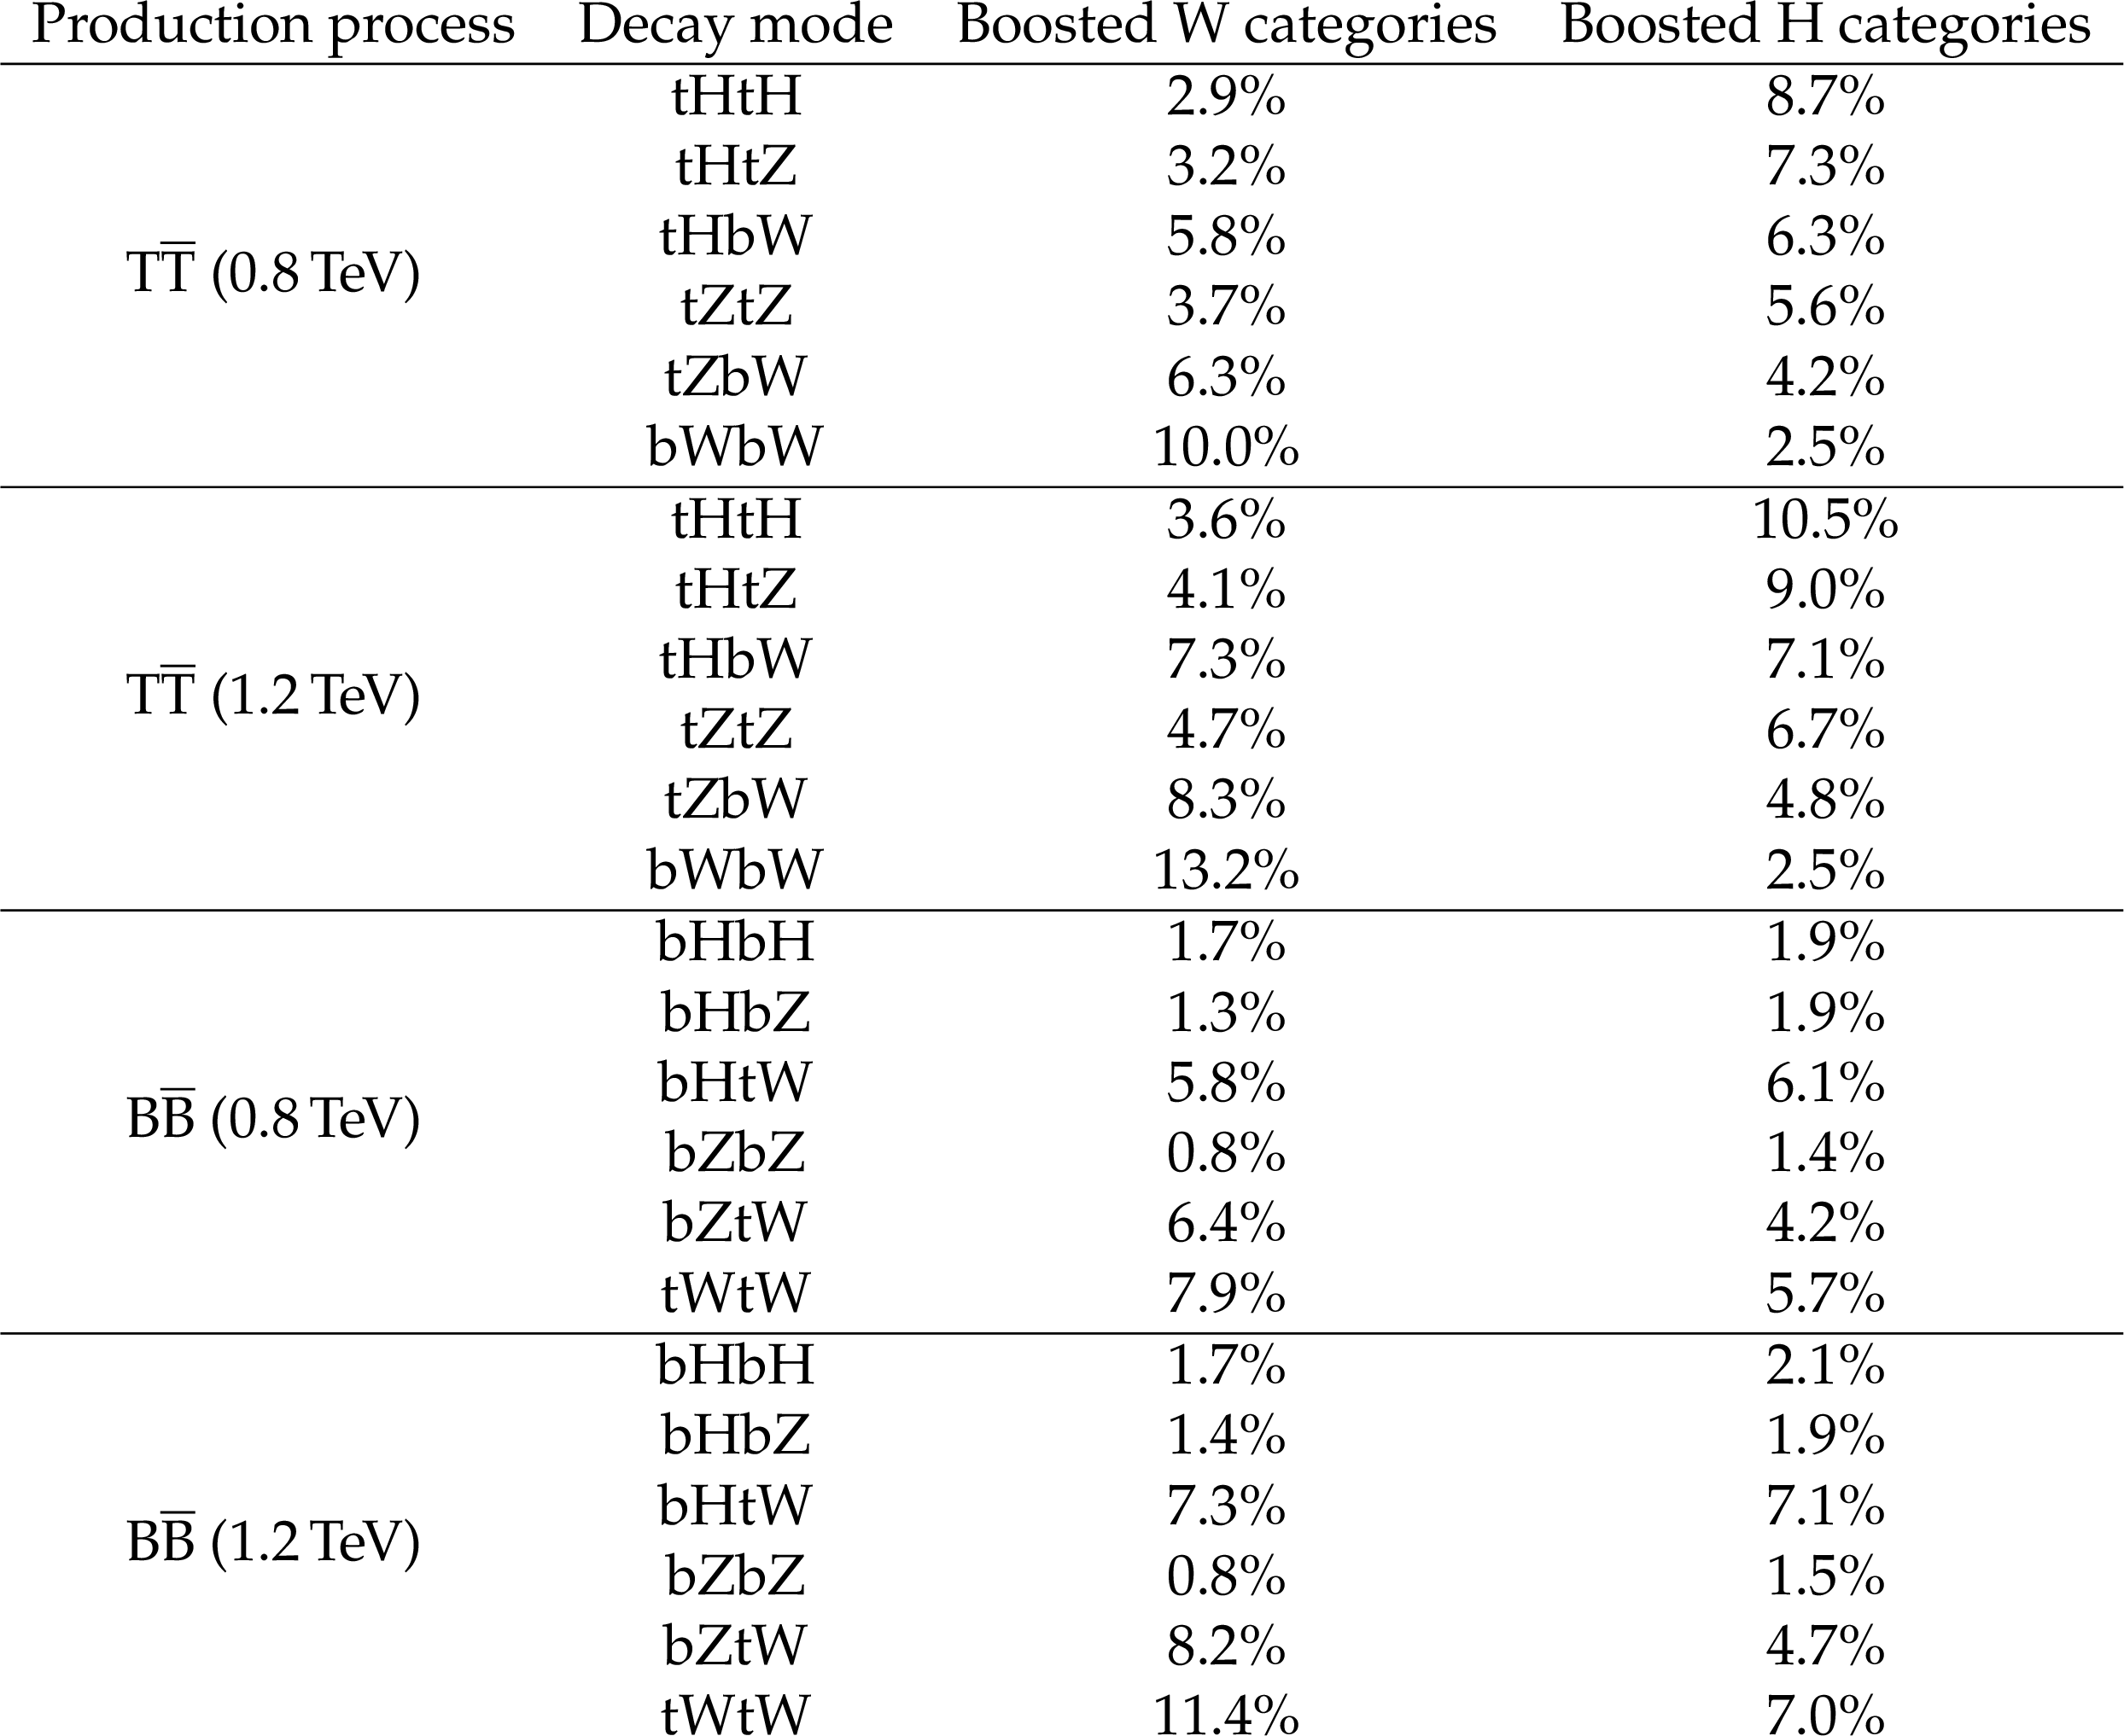
Table 3:
Signal efficiencies in the boosted W and boosted H event categories, split into the six possible final states, of both $ { {\mathrm {T}} {\overline {\mathrm {T}}} } $ and $ { {\mathrm {B}} {\overline {\mathrm {B}}} } $ production for two illustrative mass points. Efficiencies are calculated with respect to the expected number of events in the corresponding final state before any selection. The relative uncertainty in the efficiencies after combining systematic and statistical uncertainties in the MC samples is about 8% in the boosted W categories and about 12% in the boosted H categories. |
png pdf |
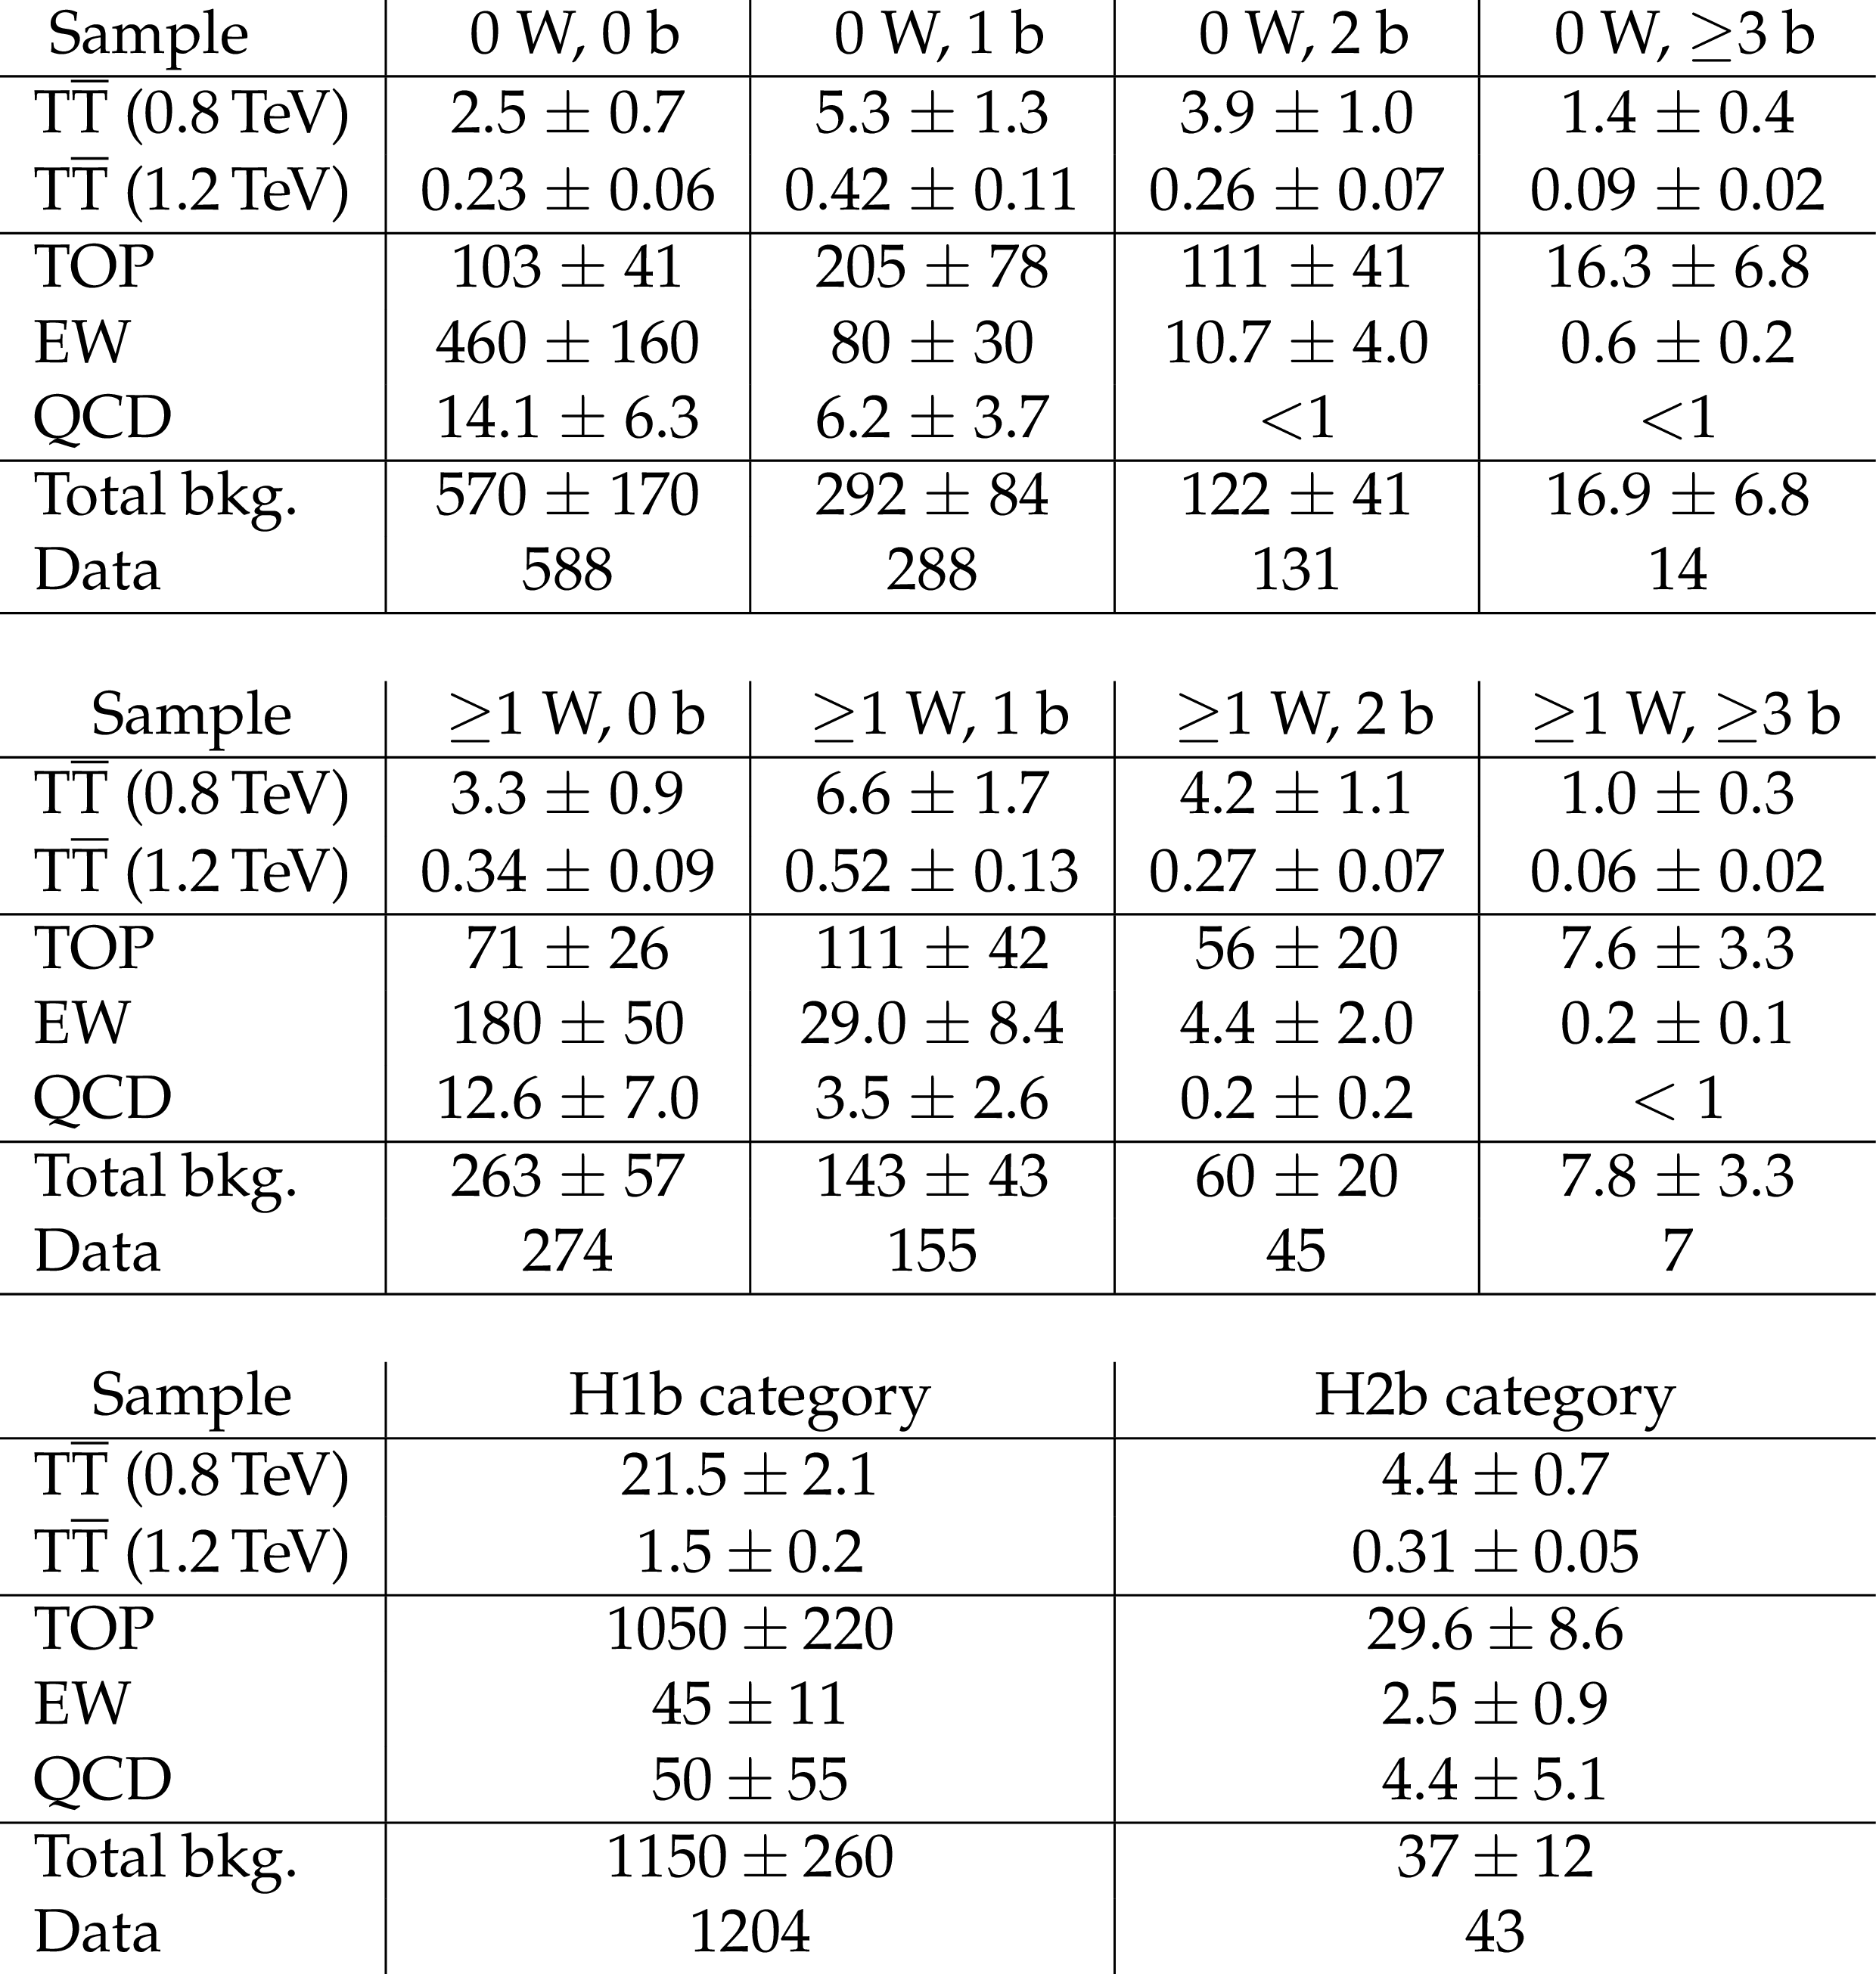
Table 4:
Number of events in each category after combining the electron and muon channels. Uncertainties include statistical and all systematic components (Table 2). Yields of $ { {\mathrm {T}} {\overline {\mathrm {T}}} } $ signal assume the theoretically predicted production cross section within the singlet branching fraction scenario. |
| Summary |
| The first search by CMS for pair-produced vector-like T and B quarks at $\sqrt{s}= $ 13 TeV is presented, using data from proton-proton collisions recorded in 2015 corresponding to integrated luminosities of 2.3-2.6 fb$^{-1}$. The search requires at least one lepton in the final state and is optimized for cases where a T quark decays to a boosted W or Higgs boson. No excess above the standard model background is observed and 95% confidence level upper limits are placed on the cross section of $ \mathrm{ t \bar{t} } $ and $ \mathrm{ b \bar{b} } $ production. For an electroweak singlet T quark, masses below 860 GeV are excluded, and for a doublet T quark, masses below 830 GeV are excluded. Considering other possible branching fraction combinations for T quarks, and assuming that the sum of the branching fractions to bW, tH and tZ is equal to unity, we set lower mass limits that range from 790 to 940 GeV for combinations with $\mathcal{B}(\mathrm{ t }\mathrm{ H }) + \mathcal{B}(\mathrm{ b }\mathrm{ W }) \geq $ 0.4. These results represent the most stringent limits to date for many possible T quark decay scenarios, and showcase the importance of new techniques for understanding highly-boosted final states in extending searches for new particles to higher masses. |
| References | ||||
| 1 | ATLAS Collaboration | Observation of a new particle in the search for the Standard Model Higgs boson with the ATLAS detector at the LHC | PLB 716 (2012) 1 | 1207.7214 |
| 2 | CMS Collaboration | Observation of a new boson at a mass of 125 GeV with the CMS experiment at the LHC | PLB 716 (2012) 30 | CMS-HIG-12-028 1207.7235 |
| 3 | CMS Collaboration | Observation of a new boson with mass near 125 GeV in pp collisions at $ \sqrt{s} = $ 7 and 8 TeV | JHEP 06 (2013) 081 | CMS-HIG-12-036 1303.4571 |
| 4 | L. Evans and P. Bryant | LHC Machine | JINST 3 (2008) S08001 | |
| 5 | M. Perelstein, M. E. Peskin, and A. Pierce | Top quarks and electroweak symmetry breaking in little Higgs models | PRD 69 (2004) 075002 | hep-ph/0310039 |
| 6 | O. Matsedonskyi, G. Panico, and A. Wulzer | Light top partners for a light composite Higgs | JHEP 01 (2013) 164 | 1204.6333 |
| 7 | R. Contino, L. Da Rold, and A. Pomarol | Light custodians in natural composite Higgs models | PRD 75 (2007) 055014 | hep-ph/0612048 |
| 8 | R. Contino, T. Kramer, M. Son, and R. Sundrum | Warped/composite phenomenology simplified | JHEP 05 (2007) 074 | hep-ph/0612180 |
| 9 | D. B. Kaplan | Flavor at SSC energies: A new mechanism for dynamically generated fermion masses | NPB 365 (1991) 259 | |
| 10 | M. J. Dugan, H. Georgi, and D. B. Kaplan | Anatomy of a composite Higgs model | NPB 254 (1985) 299 | |
| 11 | J. A. Aguilar-Saavedra | Mixing with vector-like quarks: constraints and expectations | in LHCP 2013 -- Large Hadron Collider Physics 2013, p. 16012 2013 | 1306.4432 |
| 12 | F. del Aguila, J. A. Aguilar-Saavedra, and R. Miquel | Constraints on top couplings in models with exotic quarks | PRL 82 (1999) 1628 | hep-ph/9808400 |
| 13 | ALEPH, LEP Electroweak, L3, DELPHI, and OPAL Collaborations | Electroweak measurements in electron-positron collisions at W-boson-pair energies at LEP | PR 532 (2013) 119 | 1302.3415 |
| 14 | O. Eberhardt et al. | Impact of a Higgs boson at a mass of 126 GeV on the standard model with three and four fermion generations | PRL 109 (2012) 241802 | 1209.1101 |
| 15 | A. Djouadi and A. Lenz | Sealing the fate of a fourth generation of fermions | PLB 715 (2012) 310 | 1204.1252 |
| 16 | J. A. Aguilar-Saavedra, R. Benbrik, S. Heinemeyer, and M. P\'erez-Victoria | Handbook of vectorlike quarks: Mixing and single production | PRD 88 (2013) 094010 | |
| 17 | J. Ellis | TikZ-Feynman: Feynman diagrams with TikZ | CPC 210 (2017) 103 | 1601.05437 |
| 18 | A. De Simone, O. Matsedonskyi, R. Rattazzi, and A. Wulzer | A first top partner hunter's guide | JHEP 04 (2013) 004 | 1211.5663 |
| 19 | F. del Aguila, L. Ametller, G. L. Kane, and J. Vidal | Vector like fermion and standard Higgs production at hadron colliders | NPB 334 (1990) 1 | |
| 20 | O. Matsedonskyi, G. Panico, and A. Wulzer | On the interpretation of top partners searches | JHEP 12 (2014) 097 | 1409.0100 |
| 21 | CMS Collaboration | Search for vector-like charge 2/3 T quarks in proton-proton collisions at $ \sqrt{s} = $ 8 TeV | PRD 93 (2016) 012003 | CMS-B2G-13-005 1509.04177 |
| 22 | CMS Collaboration | Inclusive search for a vector-like T quark with charge $ \frac{2}{3} $ in pp collisions at $ \sqrt{s} = $ 8 TeV | PLB 729 (2014) 149 | CMS-B2G-12-015 1311.7667 |
| 23 | ATLAS Collaboration | Search for pair production of a new heavy quark that decays into a $ w $ boson and a light quark in pp collisions at $ \sqrt{s}=8\text{}\text{}\mathrm{TeV} $ with the atlas detector | PRD 92 (2015) 112007 | 1509.04261 |
| 24 | ATLAS Collaboration | Search for production of vector-like quark pairs and of four top quarks in the lepton-plus-jets final state in pp collisions at $ \sqrt{s}=8\text{}\text{}\mathrm{TeV} $ with the atlas detector | JHEP 08 (2015) 105 | 1505.04306 |
| 25 | CMS Collaboration | Search for pair-produced vectorlike B quarks in proton-proton collisions at $ \sqrt{s} = $ 8 TeV | PRD 93 (2016) 112009 | CMS-B2G-13-006 1507.07129 |
| 26 | ATLAS Collaboration | Search for vector-like $ B $ quarks in events with one isolated lepton, missing transverse momentum and jets at $ \sqrt{s}= $ 8 TeV with the ATLAS detector | PRD 91 (2015) 112011 | 1503.05425 |
| 27 | ATLAS Collaboration | Search for pair production of vector-like top quarks in events with one lepton, jets, and missing transverse momentum in $ \sqrt{s} = $ 13 TeV pp collisions with the ATLAS detector | Submitted to JHEP | 1705.10751 |
| 28 | ATLAS Collaboration | Search for pair production of heavy vector-like quarks decaying to high-$ p_{\mathrm{T}} W $ bosons and $ b $ quarks in the lepton-plus-jets final state in $ pp $ collisions at $ \sqrt{s} = $ 13 TeV with the ATLAS detector | Submitted to JHEP | 1707.03347 |
| 29 | CMS Collaboration | The CMS experiment at the CERN LHC | JINST 3 (2008) S08004 | CMS-00-001 |
| 30 | CMS Collaboration | Particle-flow reconstruction and global event description with the CMS detector | Submitted to JINST | CMS-PRF-14-001 1706.04965 |
| 31 | CMS Collaboration | Performance of electron reconstruction and selection with the CMS detector in proton-proton collisions at $ \sqrt{s} = $ 8 TeV | JINST 10 (2015) P06005 | CMS-EGM-13-001 1502.02701 |
| 32 | CMS Collaboration | Performance of CMS muon reconstruction in pp collision events at $ \sqrt{s} = $ 7 TeV | JINST 7 (2012) P10002 | CMS-MUO-10-004 1206.4071 |
| 33 | M. Cacciari, G. P. Salam, and G. Soyez | The anti-$ k_\mathrm{t} $ jet clustering algorithm | JHEP 04 (2008) 063 | 0802.1189 |
| 34 | M. Cacciari, G. P. Salam, and G. Soyez | FastJet user manual | EPJC 72 (2012) 1896 | 1111.6097 |
| 35 | M. Cacciari, G. P. Salam, and G. Soyez | The catchment area of jets | JHEP 04 (2008) 005 | 0802.1188 |
| 36 | CMS Collaboration | Jet energy scale and resolution in the CMS experiment in pp collisions at 8 TeV | JINST 12 (2017) P02014 | CMS-JME-13-004 1607.03663 |
| 37 | CMS Collaboration | Determination of jet energy calibration and transverse momentum resolution in CMS | JINST 6 (2011) P11002 | CMS-JME-10-011 1107.4277 |
| 38 | P. Nason | A new method for combining NLO QCD with shower Monte Carlo algorithms | JHEP 11 (2004) 040 | hep-ph/0409146 |
| 39 | S. Frixione, P. Nason, and C. Oleari | Matching NLO QCD computations with parton shower simulations: the POWHEG method | JHEP 11 (2007) 070 | 0709.2092 |
| 40 | S. Alioli, P. Nason, C. Oleari, and E. Re | A general framework for implementing NLO calculations in shower Monte Carlo programs: the POWHEG BOX | JHEP 06 (2010) 043 | 1002.2581 |
| 41 | S. Frixione, P. Nason, and G. Ridolfi | A positive-weight next-to-leading-order Monte Carlo for heavy flavour hadroproduction | JHEP 09 (2007) 126 | 0707.3088 |
| 42 | J. Alwall et al. | The automated computation of tree-level and next-to-leading order differential cross sections, and their matching to parton shower simulations | JHEP 07 (2014) 079 | hep-ph/1405.0301 |
| 43 | R. Frederix and S. Frixione | Merging meets matching in MC@NLO | JHEP 12 (2012) 061 | 1209.6215 |
| 44 | J. Alwall et al. | Comparative study of various algorithms for the merging of parton showers and matrix elements in hadronic collisions | EPJC 53 (2008) 473 | 0706.2569 |
| 45 | T. Sjostrand, S. Mrenna and P. Skands | PYTHIA 6.4 physics and manual | JHEP 05 (2006) 026 | hep-ph/0603175 |
| 46 | T. Sjostrand et al. | An introduction to pythia 8.2 | CPC 191 (2015) 159 | 1410.3012 |
| 47 | M. Czakon and A. Mitov | Top++: A program for the calculation of the top-pair cross-section at hadron colliders | CPC 185 (2014) 2930 | 1112.5675 |
| 48 | M. Czakon, P. Fiedler, and A. Mitov | Total top-quark pair-production cross section at hadron colliders through $ \mathcal{O}({{\alpha}}_{S}^{4}) $ | PRL 110 (2013) 252004 | 1303.6254 |
| 49 | M. Czakon and A. Mitov | NNLO corrections to top pair production at hadron colliders: the quark-gluon reaction | JHEP 01 (2013) 080 | 1210.6832 |
| 50 | M. Czakon and A. Mitov | NNLO corrections to top-pair production at hadron colliders: the all-fermionic scattering channels | JHEP 12 (2012) 054 | 1207.0236 |
| 51 | P. Barnreuther, M. Czakon, and A. Mitov | Percent level precision physics at the Tevatron: First genuine NNLO QCD corrections to $ \mathrm{q \bar{q} \to t \bar{t}} + x $ | PRL 109 (2012) 132001 | 1204.5201 |
| 52 | M. Cacciari et al. | Top-pair production at hadron colliders with next-to-next-to-leading logarithmic soft-gluon resummation | PLB 710 (2012) 612 | 1111.5869 |
| 53 | P. Skands, S. Carrazza, and J. Rojo | Tuning PYTHIA 8.1: the Monash 2013 tune | EPJC 74 (2014) 3024 | 1404.5630 |
| 54 | CMS Collaboration | Event generator tunes obtained from underlying event and multiparton scattering measurements | EPJC 76 (2016) 155 | CMS-GEN-14-001 1512.00815 |
| 55 | NNPDF Collaboration | Parton distributions for the LHC Run II | JHEP 04 (2015) 040 | 1410.8849 |
| 56 | GEANT4 Collaboration | GEANT4: A simulation toolkit | NIMA 506 (2003) 250 | |
| 57 | CMS Collaboration | Description and performance of track and primary-vertex reconstruction with the CMS tracker | JINST 9 (2014) P10009 | CMS-TRK-11-001 1405.6569 |
| 58 | ATLAS Collaboration | Measurement of the inelastic proton-proton cross section at $ \sqrt{s} = $ 13~TeV with the ATLAS detector at the LHC | PRL 117 (2016) 182002 | 1606.02625 |
| 59 | CMS Collaboration | Measurements of inclusive W and Z cross sections in pp collisions at $ \sqrt{s}= $ 7 TeV | JHEP 01 (2011) 080 | CMS-EWK-10-002 1012.2466 |
| 60 | J. Thaler and K. Van Tilburg | Maximizing boosted top identification by minimizing $ N $-subjettiness | JHEP 02 (2012) 093 | 1108.2701 |
| 61 | S. D. Ellis, C. K. Vermilion, and J. R. Walsh | Techniques for improved heavy particle searches with jet substructure | PRD 80 (2009) 051501 | 0903.5081 |
| 62 | A. J. Larkoski, S. Marzani, G. Soyez, and J. Thaler | Soft drop | JHEP 05 (2014) 146 | hep-ph/1402.2657 |
| 63 | CMS Collaboration | Identification of b-quark jets with the CMS experiment | JINST 8 (2013) P04013 | CMS-BTV-12-001 1211.4462 |
| 64 | CMS Collaboration | Jet algorithms performance in 13 TeV data | CMS-PAS-JME-16-003 | CMS-PAS-JME-16-003 |
| 65 | CMS Collaboration | Search for electroweak production of a vector-like quark decaying to a top quark and a Higgs boson using boosted topologies in fully hadronic final states | JHEP 04 (2017) 136 | CMS-B2G-16-005 1612.05336 |
| 66 | CMS Collaboration | Search for single production of vector-like quarks decaying into a b quark and a W boson in proton-proton collisions at $ \sqrt{s} = $ 13 TeV | Submitted to PLB | CMS-B2G-16-006 1701.08328 |
| 67 | G. Cowan | PDG review on statistics (chap. 39) | CPC 40 (2016) 100001 | |
| 68 | T. Muller, J. Ott, and J. Wagner-Kuhr | theta -- a framework for template-based modeling and inference | 2012 \urlhttp://www-ekp.physik.uni-karlsruhe.de/ ott/theta/theta-auto/index.html | |
| 69 | CMS Collaboration | CMS luminosity measurement for the 2015 data-taking period | CMS-PAS-LUM-15-001 | CMS-PAS-LUM-15-001 |
| 70 | CMS Collaboration | Measurement of the ZZ production cross section and Z $ \to \ell^+\ell^-\ell'^+\ell'^- $ branching fraction in pp collisions at $ \sqrt{s} = $ 13 TeV | PLB 763 (2016) 280 | CMS-SMP-16-001 1607.08834 |
| 71 | CMS Collaboration | Measurement of the WZ production cross section in pp collisions at $ \sqrt{s} = $ 13 TeV | PLB 766 (2017) 268 | CMS-SMP-16-002 1607.06943 |
| 72 | M. Bahr et al. | Herwig++ physics and manual | EPJC 58 (2008) 639 | 0803.0883 |
| 73 | R. J. Barlow and C. Beeston | Fitting using finite monte carlo samples | CPC (1993) 219 | |
|
|
Compact Muon Solenoid LHC, CERN |
|

|

|

|

|

|