

Compact Muon Solenoid
LHC, CERN
| CMS-B2G-17-003 ; CERN-EP-2017-224 | ||
| Search for pair production of vector-like quarks in the ${\mathrm{b}\mathrm{W}\mathrm{\bar{b}}\mathrm{W}} $ channel from proton-proton collisions at $\sqrt{s} = $ 13 TeV | ||
| CMS Collaboration | ||
| 2 October 2017 | ||
| Phys. Lett. B 779 (2018) 82 | ||
| Abstract: A search is presented for the production of vector-like quark pairs, ${\mathrm{T}\overline{\mathrm{T}}} $ or ${\mathrm{Y}\overline{\mathrm{Y}}} $, with electric charge of $ 2 / 3 $ (T) or $ - 4 / 3 $ (Y), in proton-proton collisions at $\sqrt{s} = $ 13 TeV. The data were collected by the CMS experiment at the LHC in 2016 and correspond to an integrated luminosity of 35.8 fb$^{-1}$. The T and Y quarks are assumed to decay exclusively to a W boson and a b quark. The search is based on events with a single isolated electron or muon, large missing transverse momentum, and at least four jets with large transverse momenta. In the search, a kinematic reconstruction of the final state observables is performed, which would permit a signal to be detected as a narrow mass peak ($\approx$ 7% resolution). The observed number of events is consistent with the standard model prediction. Assuming strong pair production of the vector-like quarks and a 100% branching fraction to bW, a lower limit of 1295 GeV at 95% confidence level is set on the T and Y quark masses. | ||
| Links: e-print arXiv:1710.01539 [hep-ex] (PDF) ; CDS record ; inSPIRE record ; CADI line (restricted) ; | ||
| Figures & Tables | Summary | Additional Figures | References | CMS Publications |
|---|
| Figures | |
png pdf |
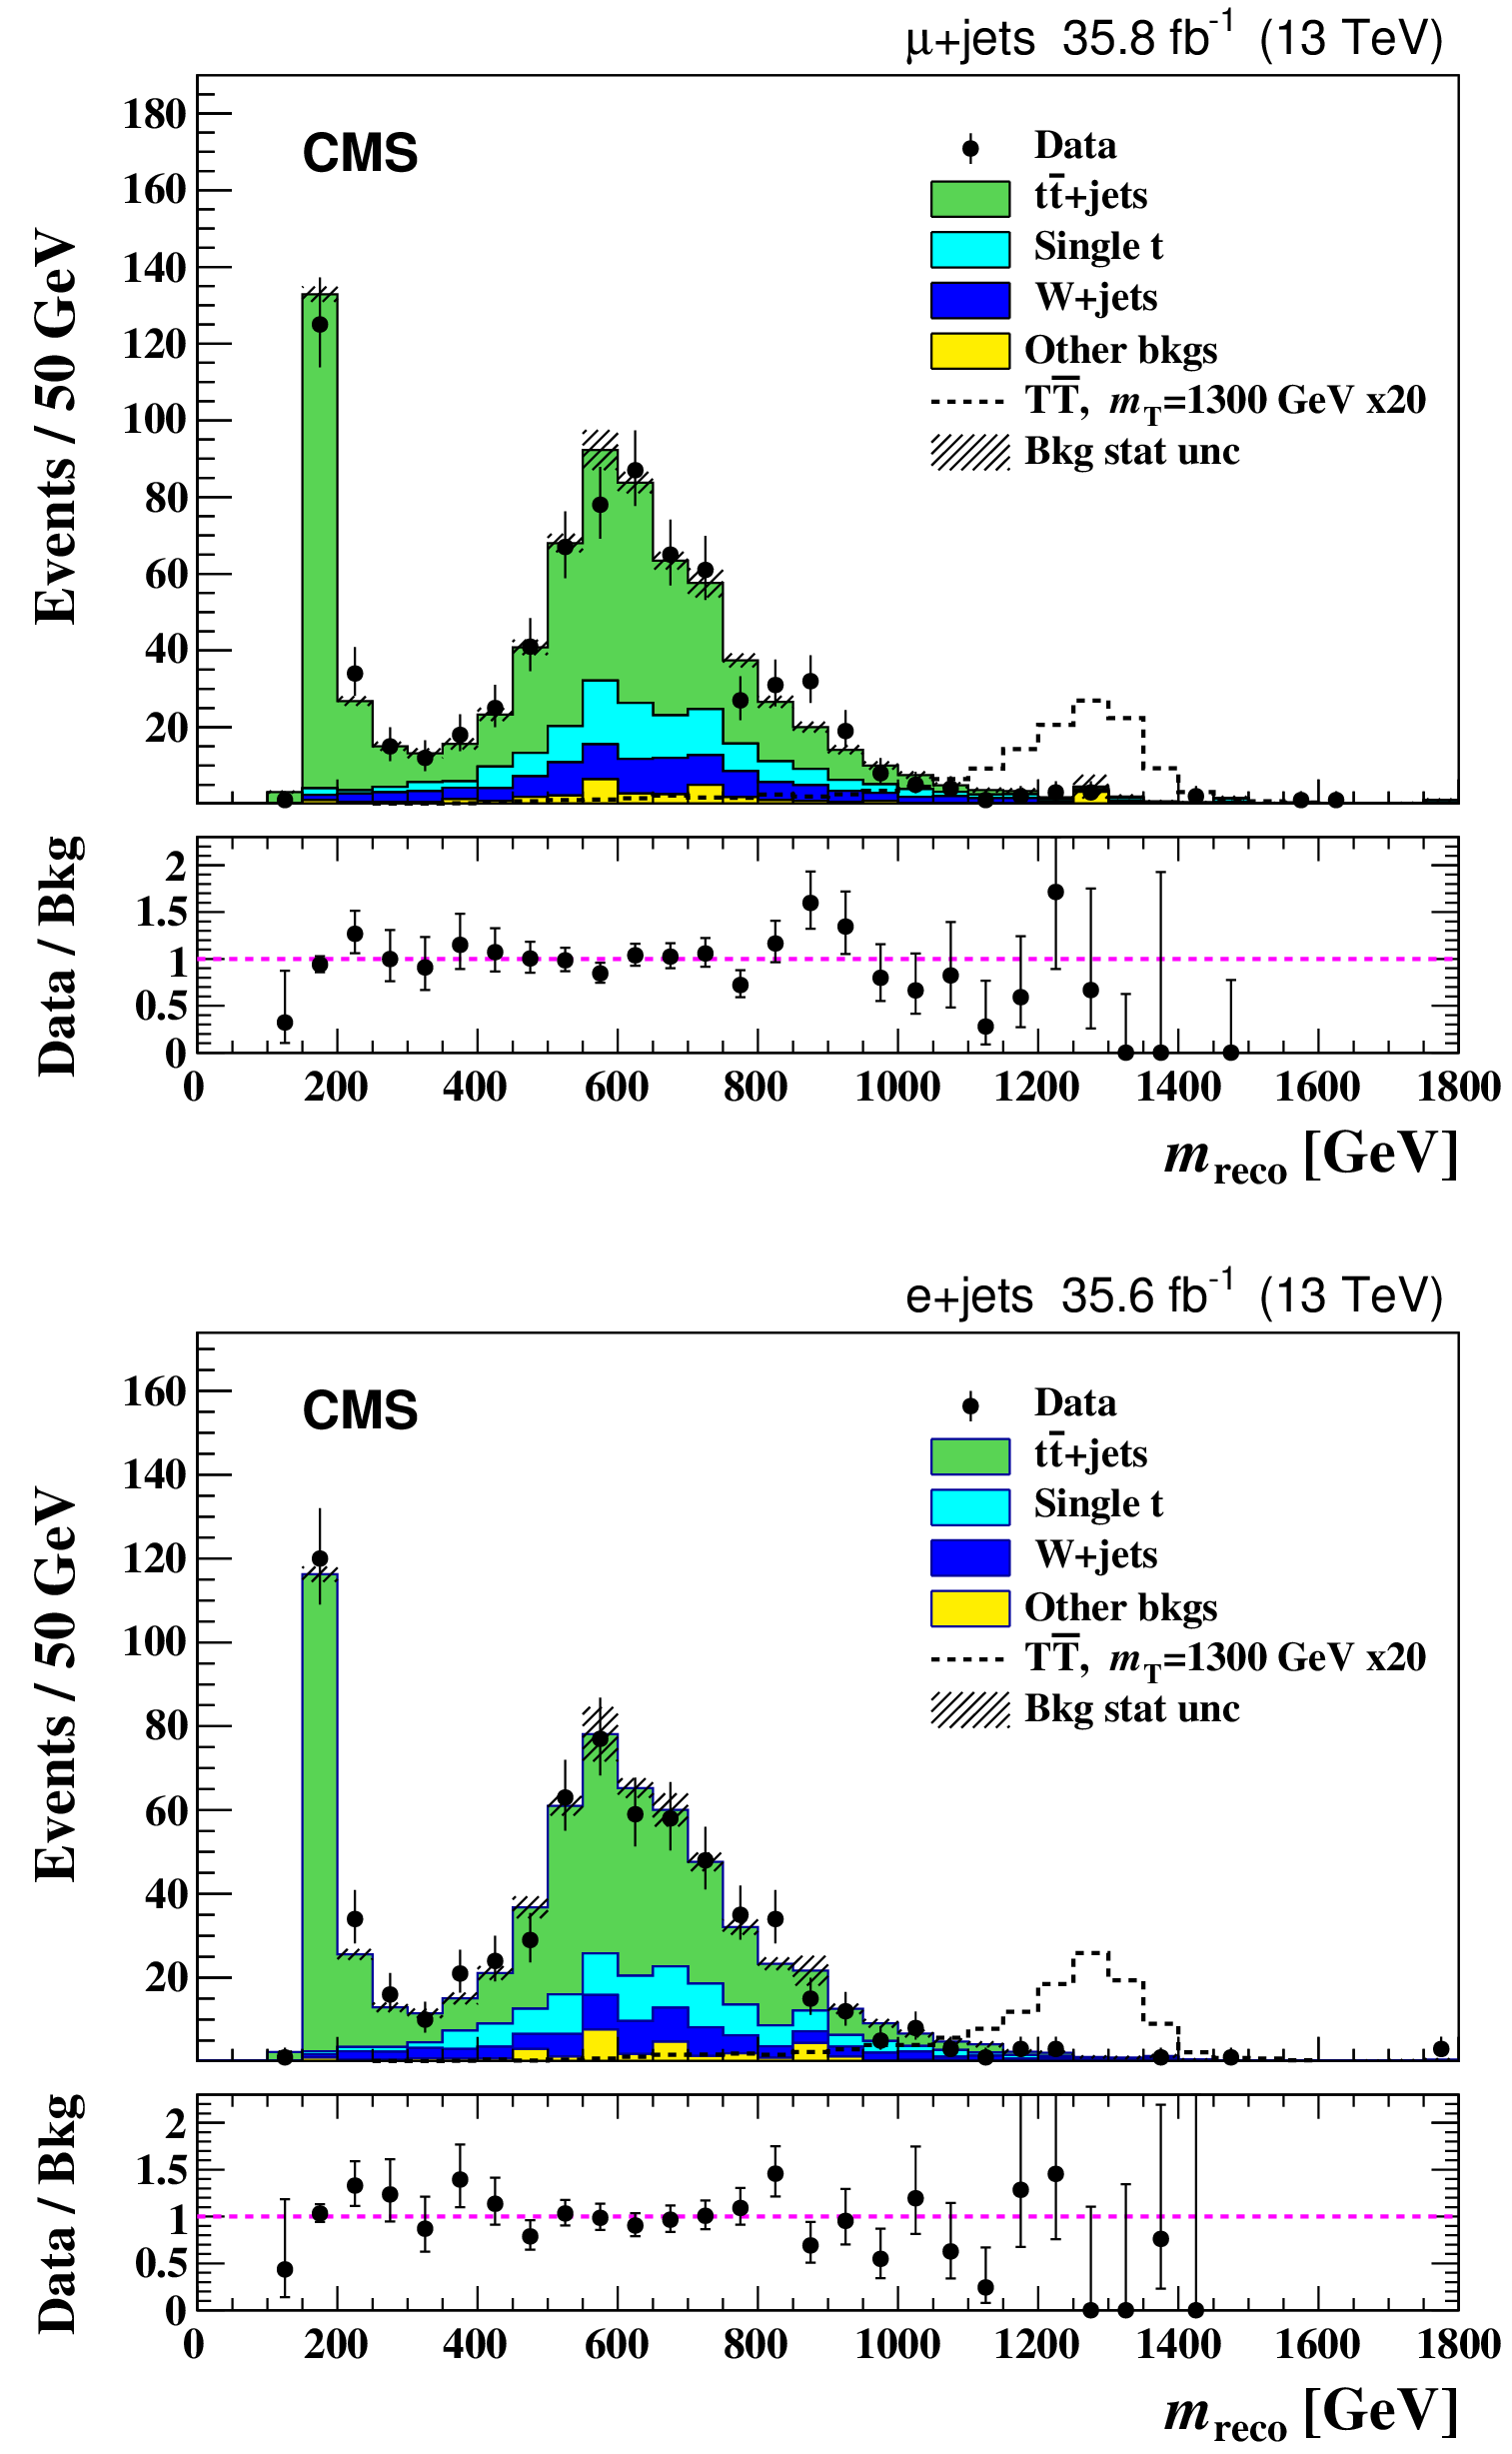
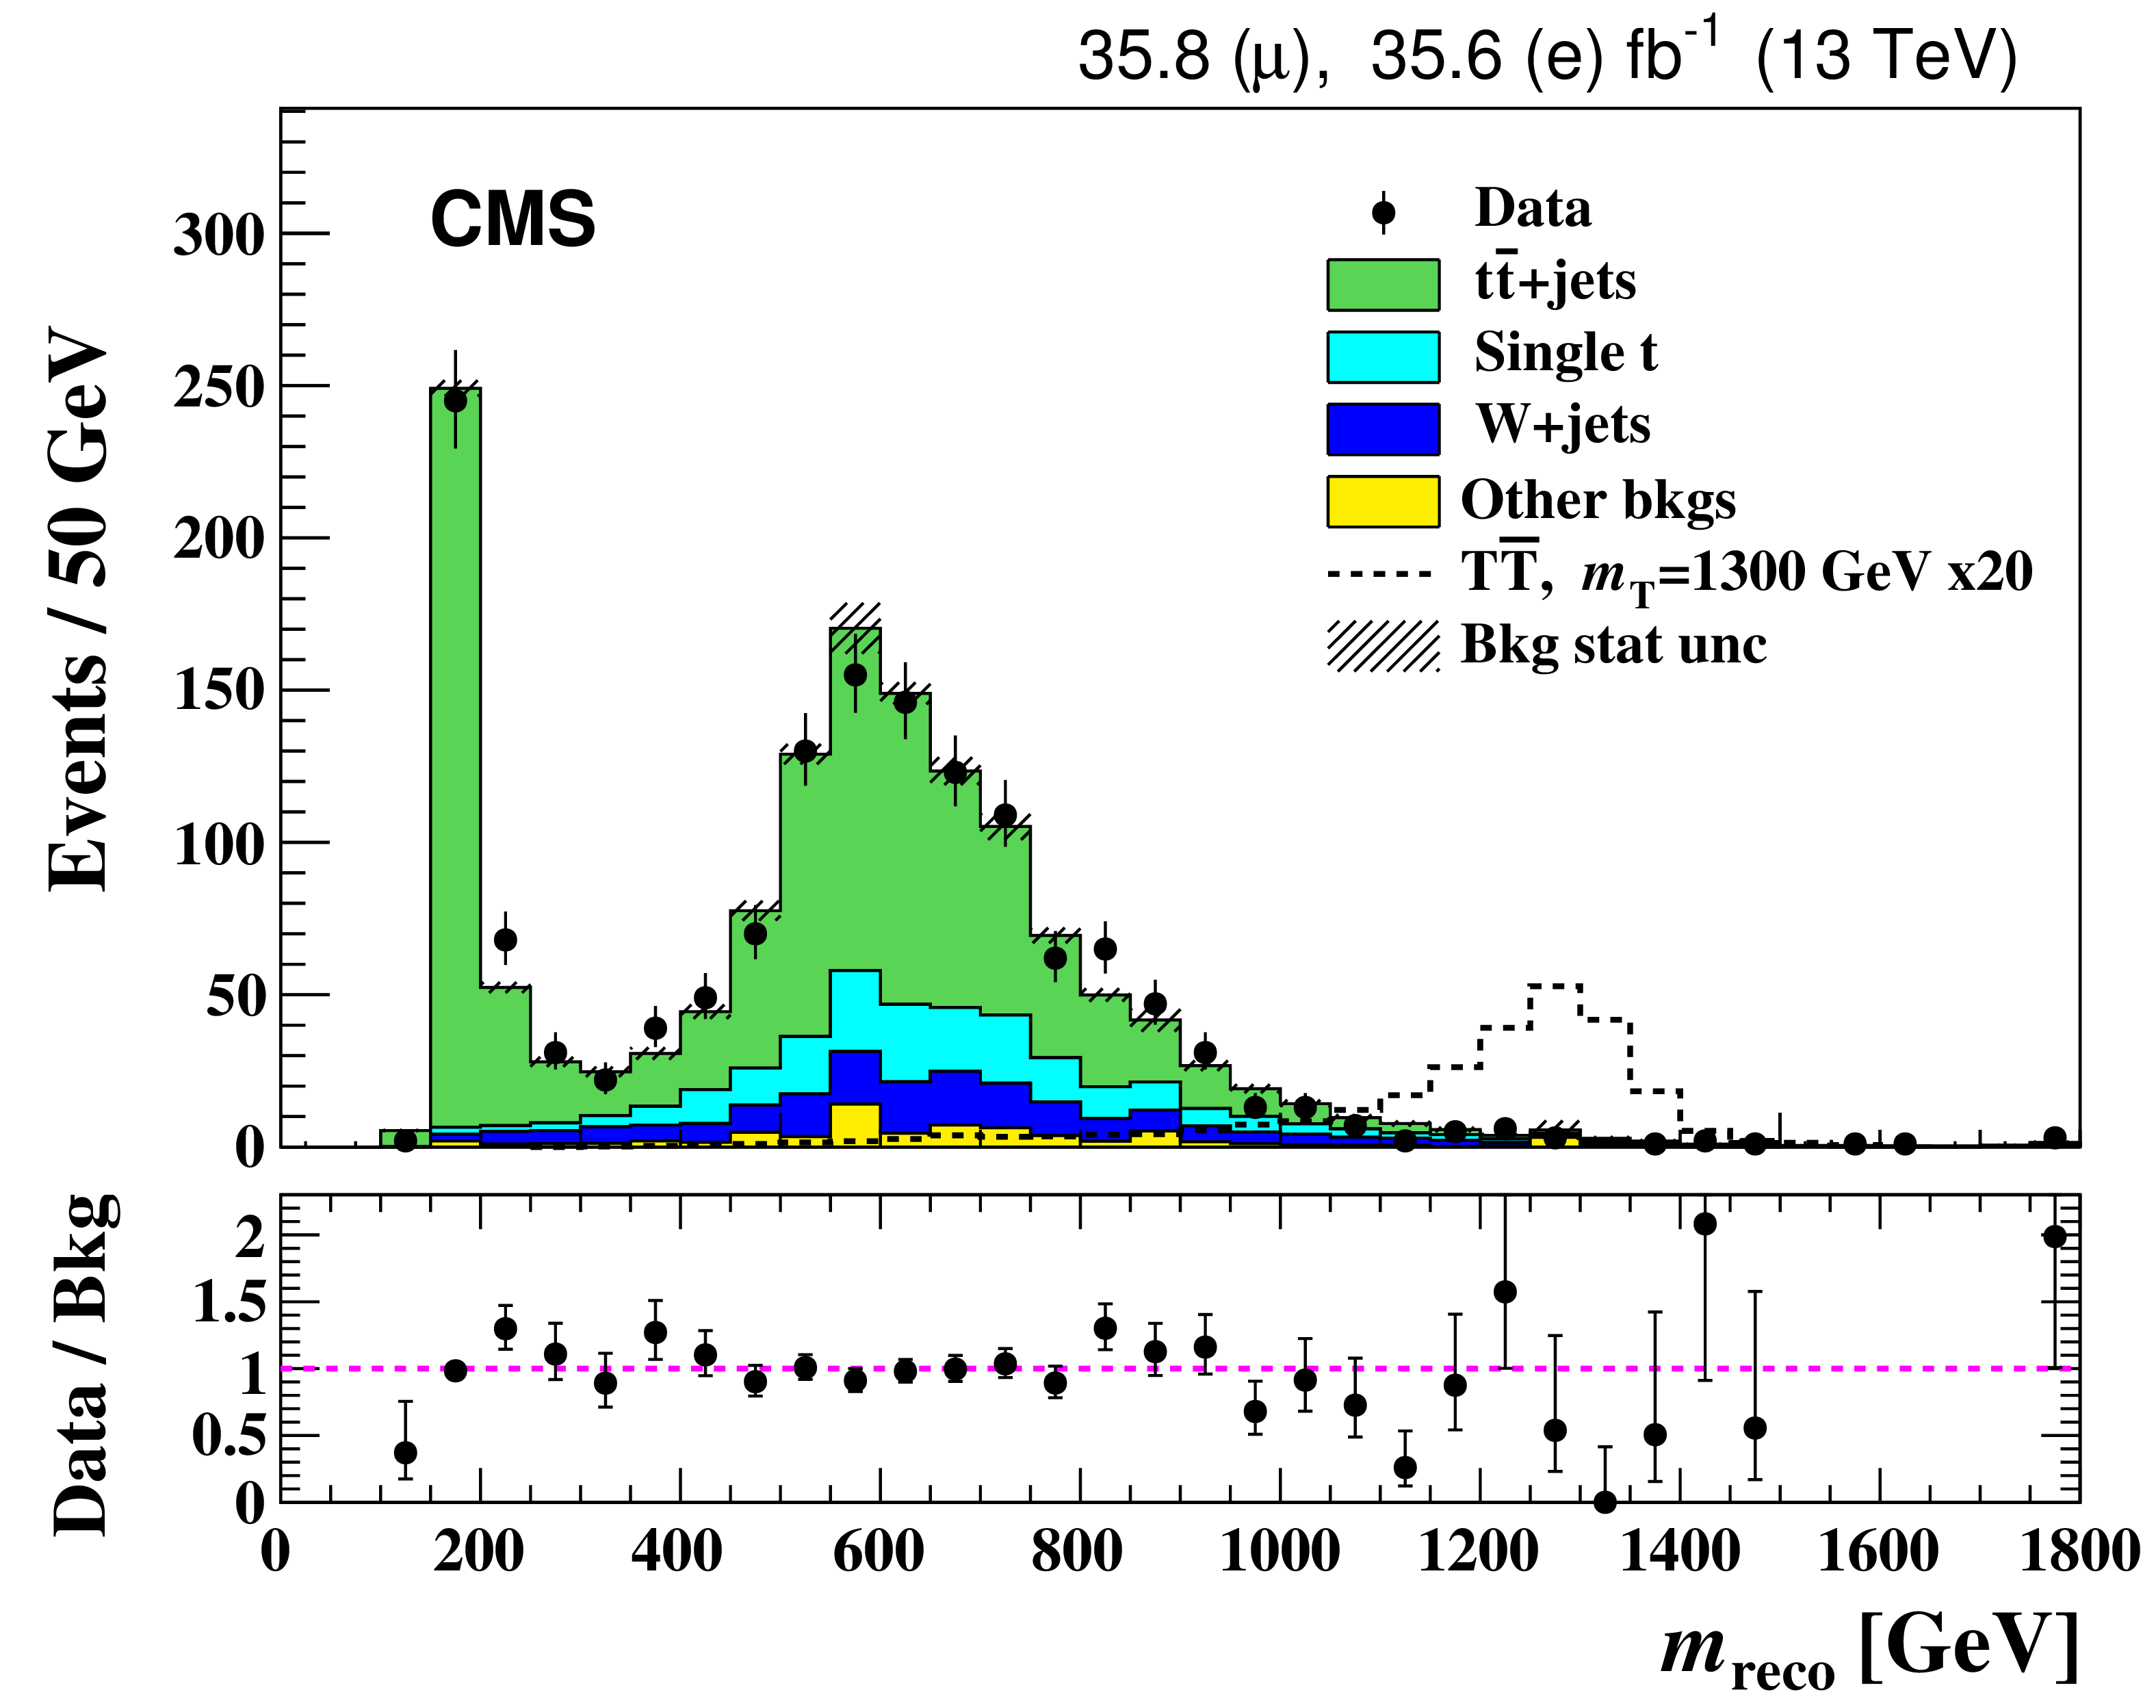
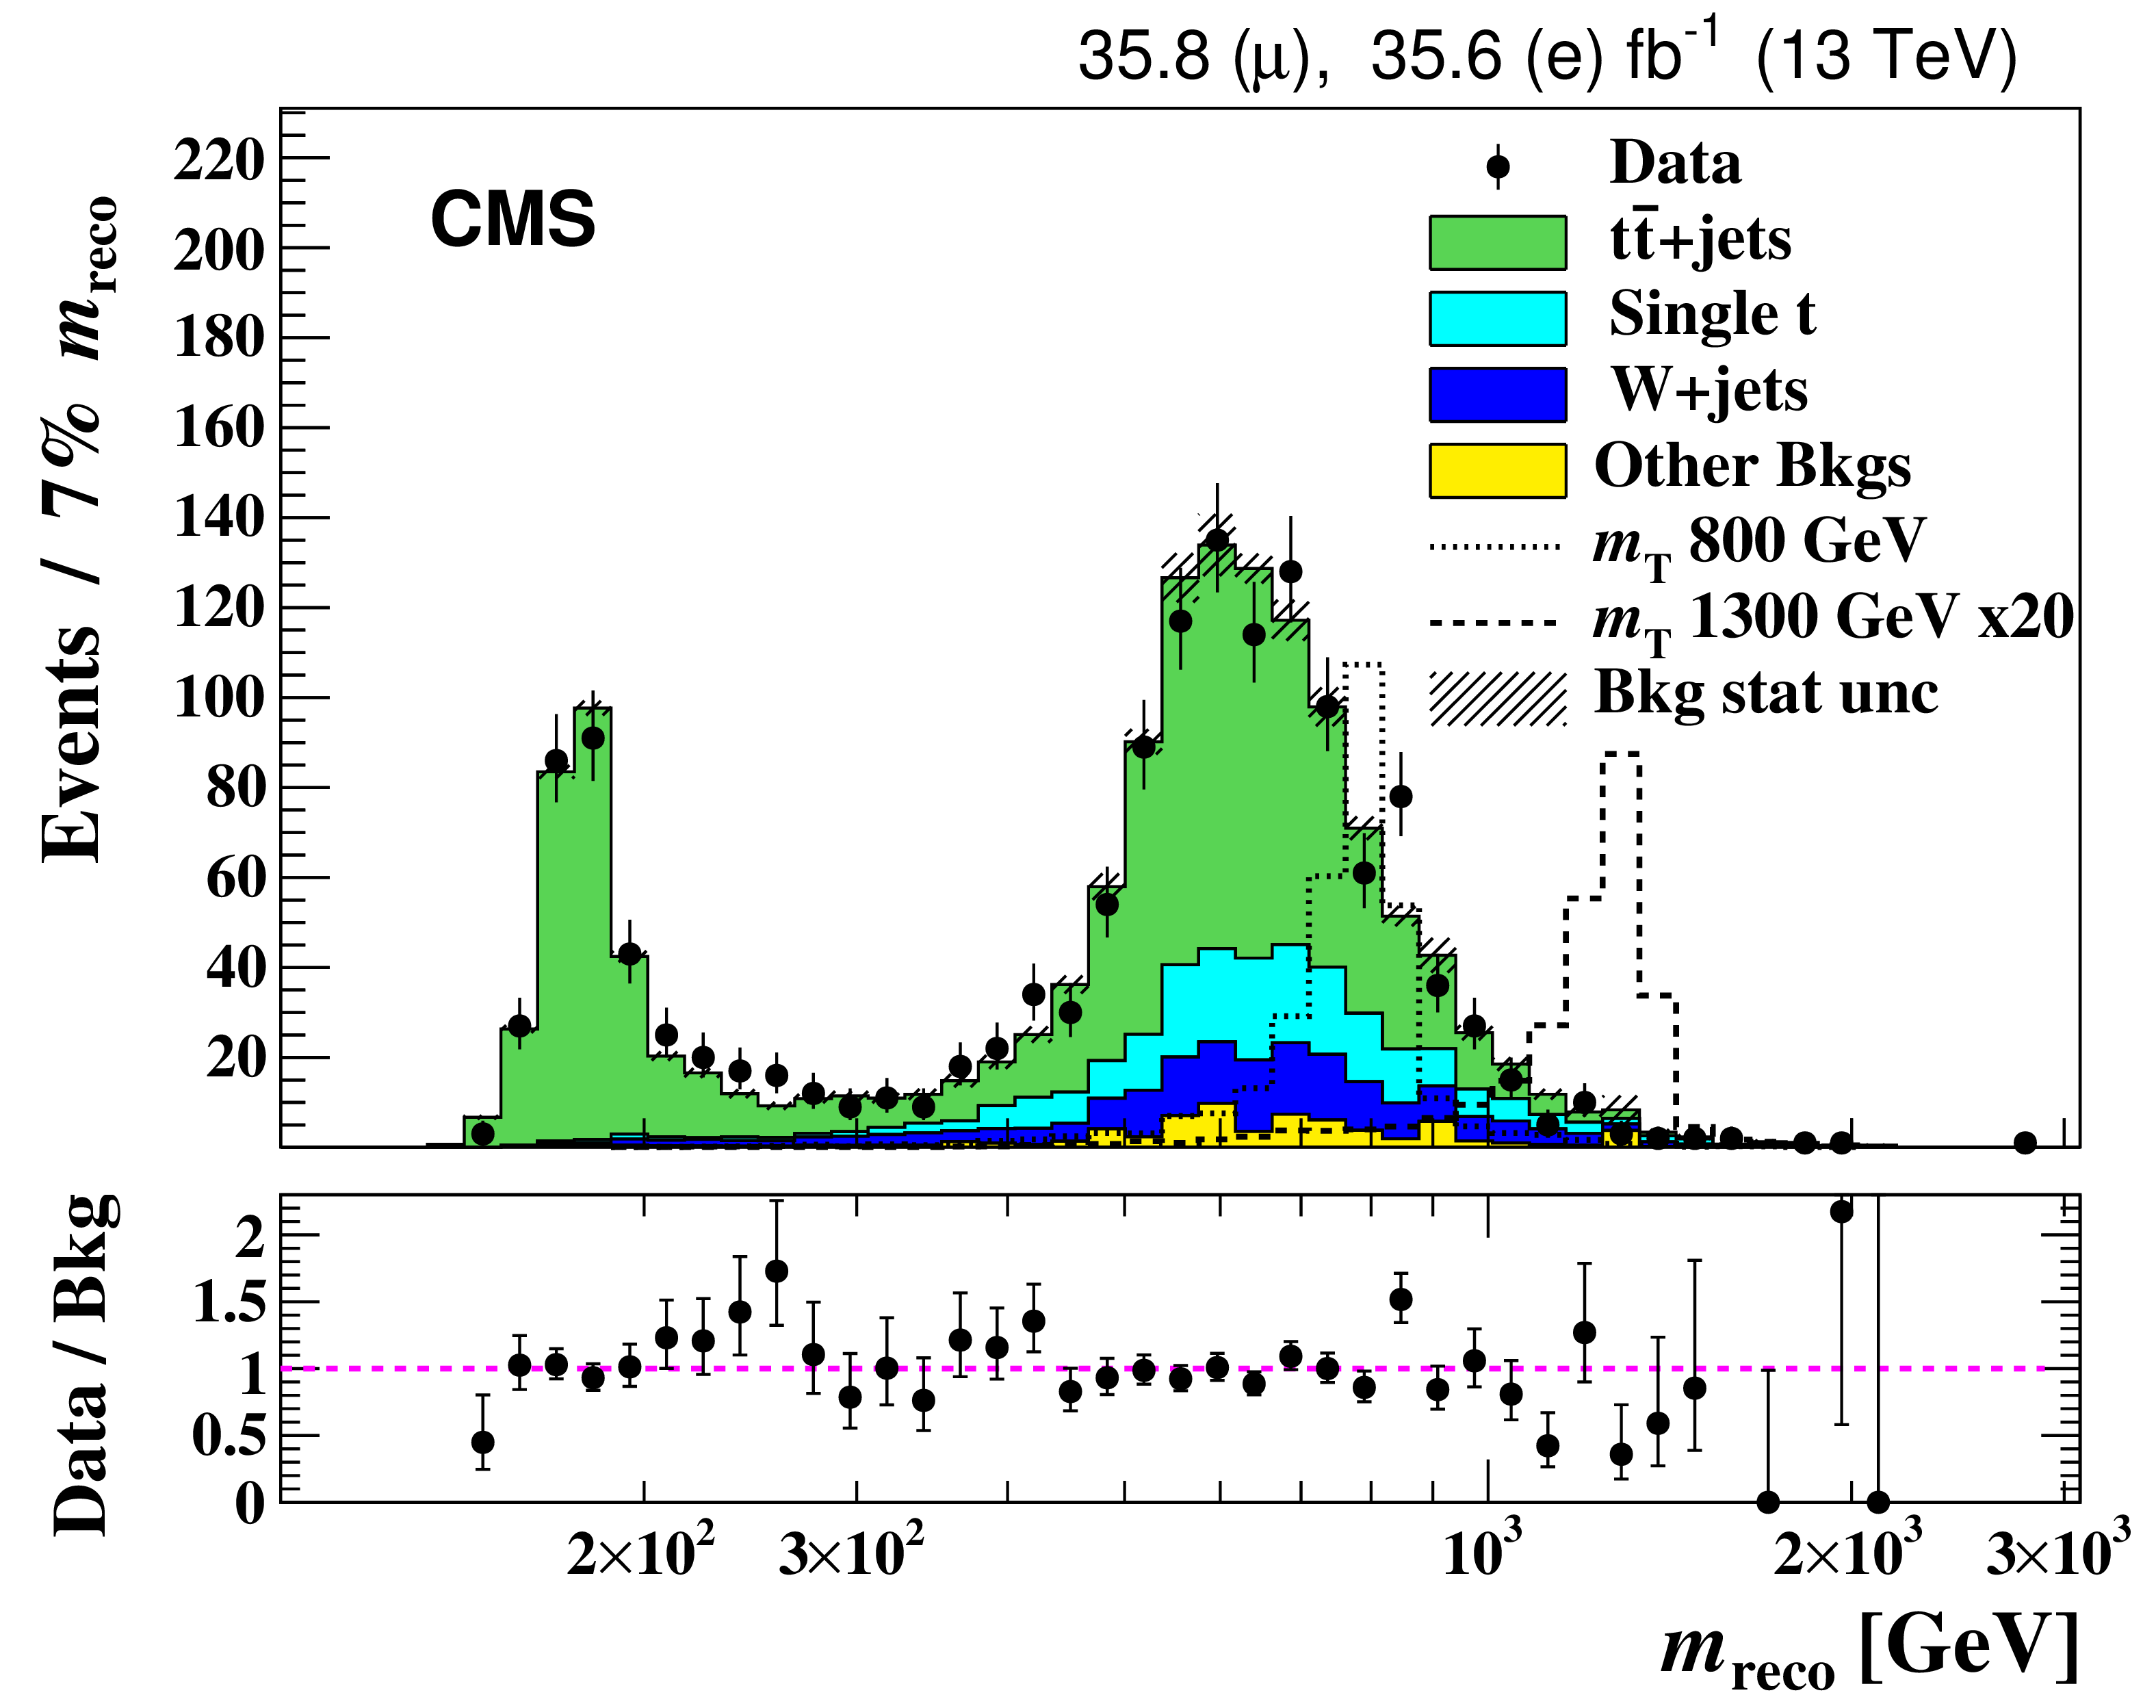
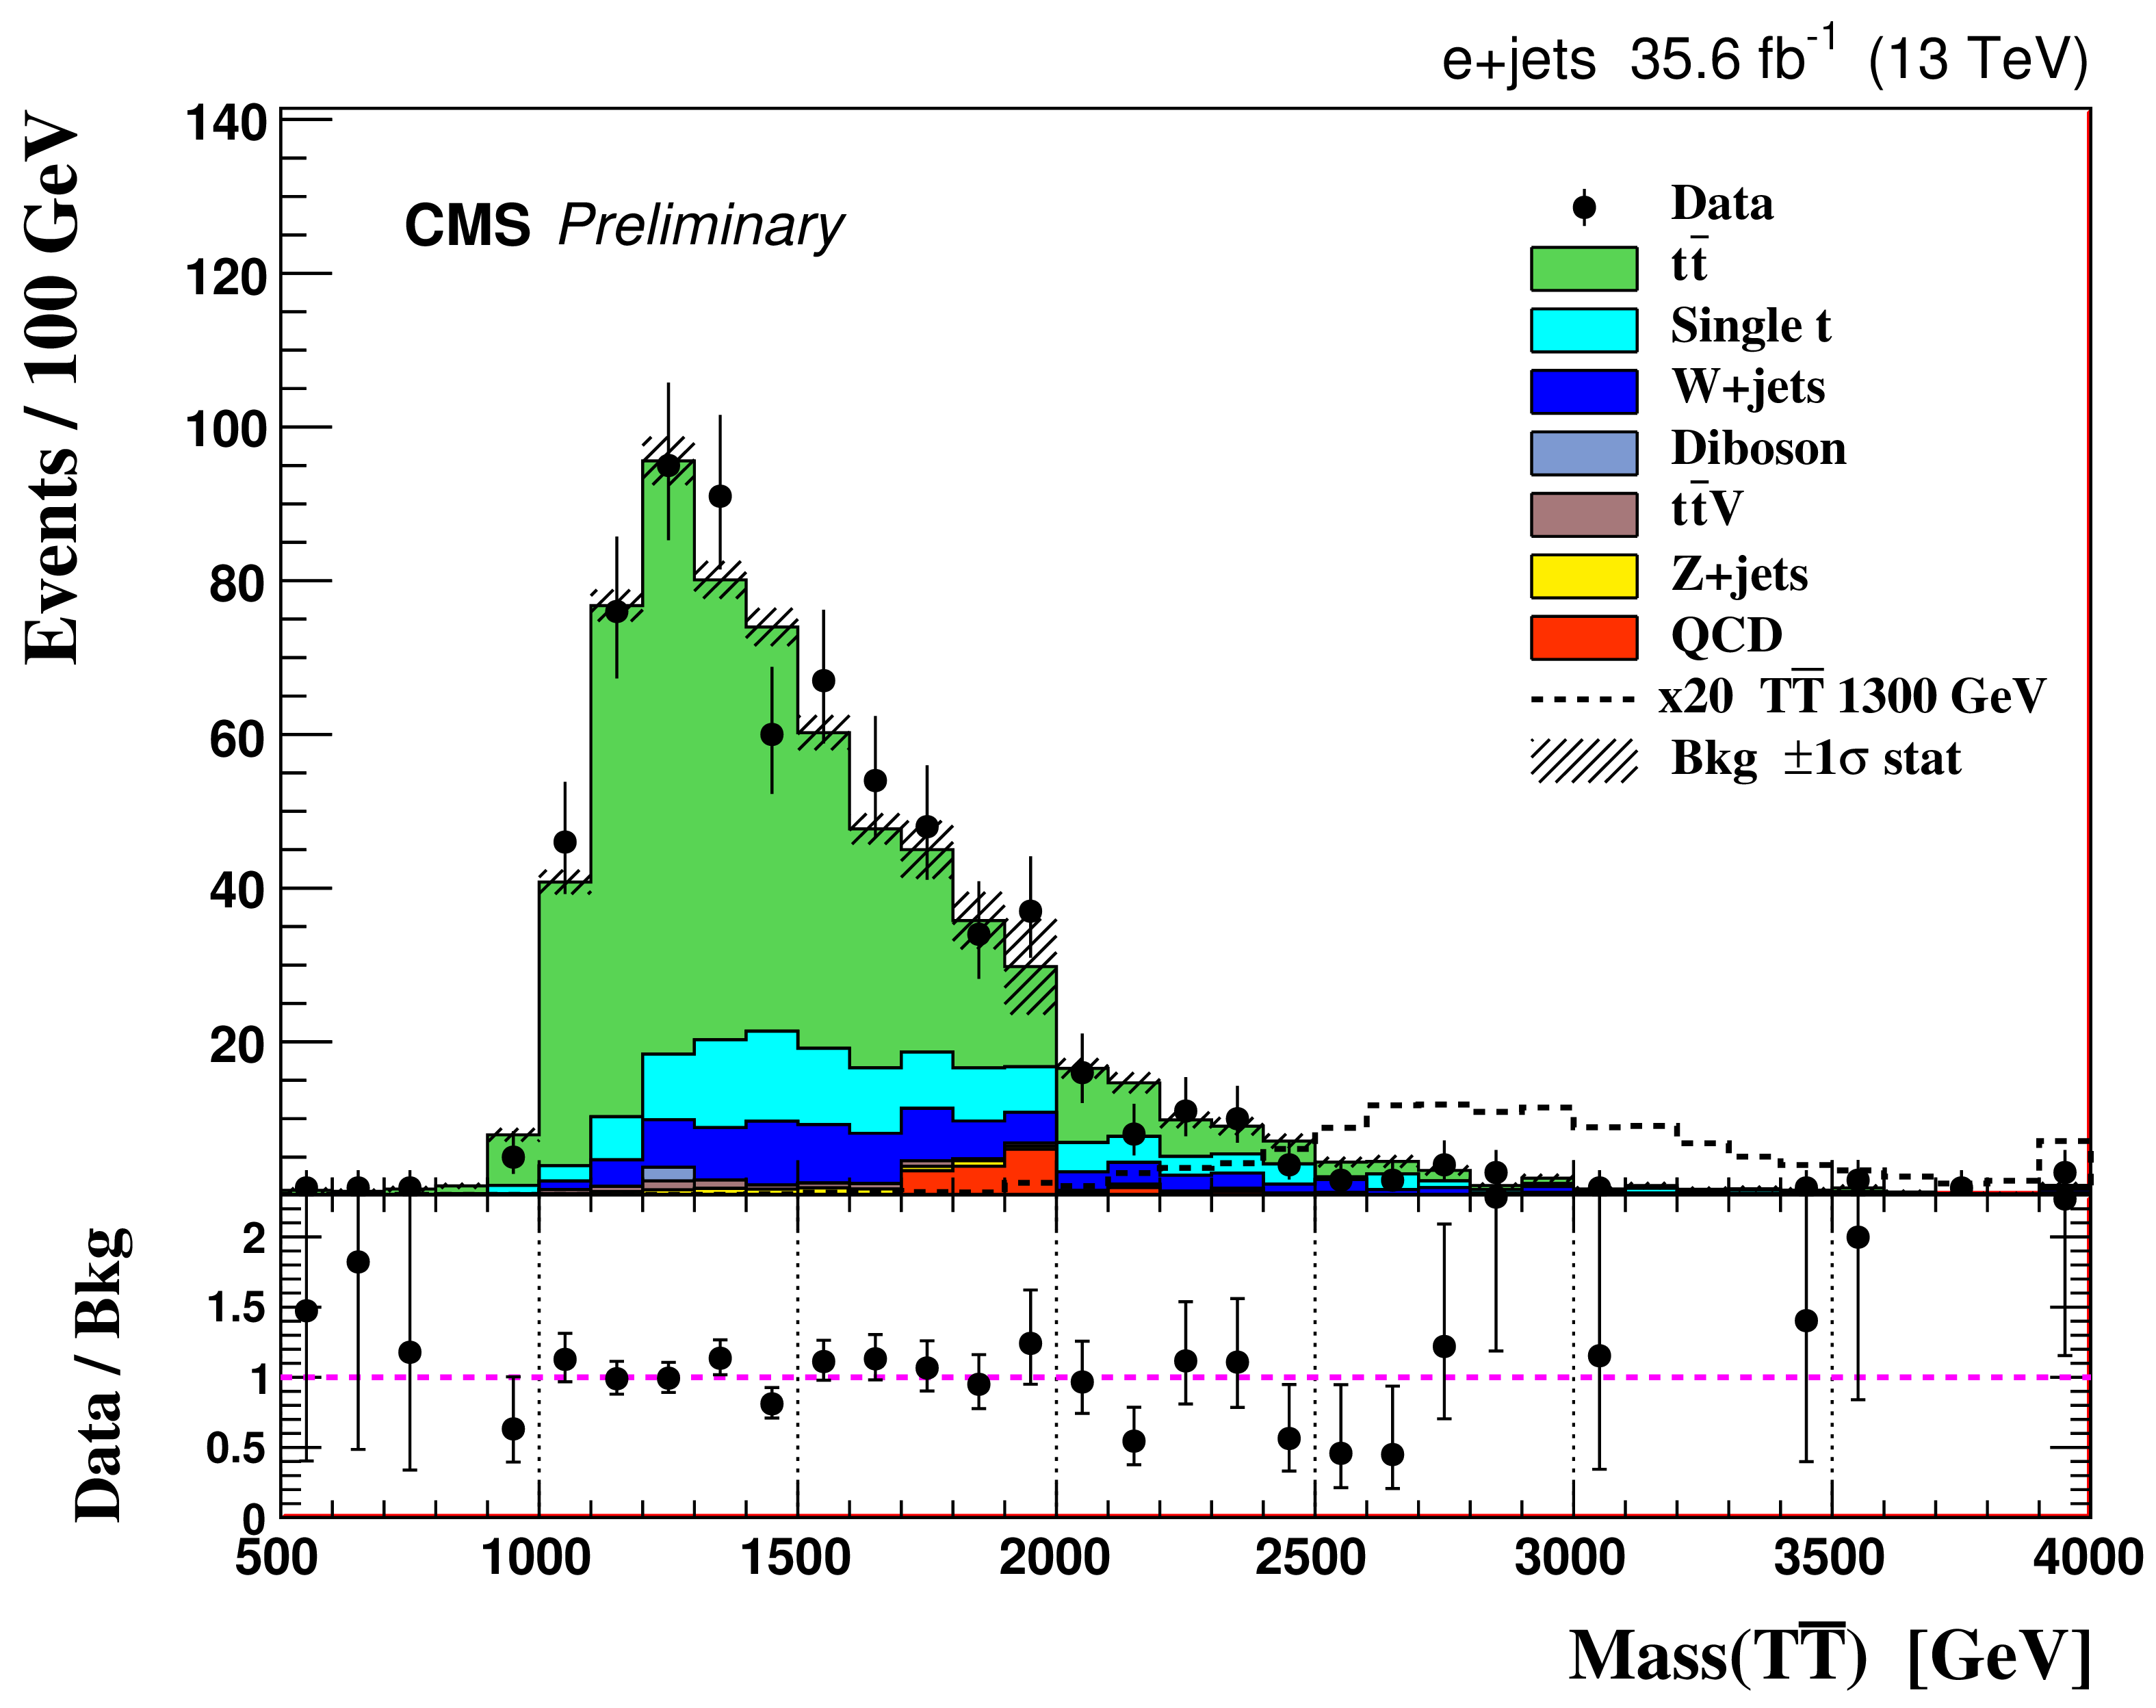
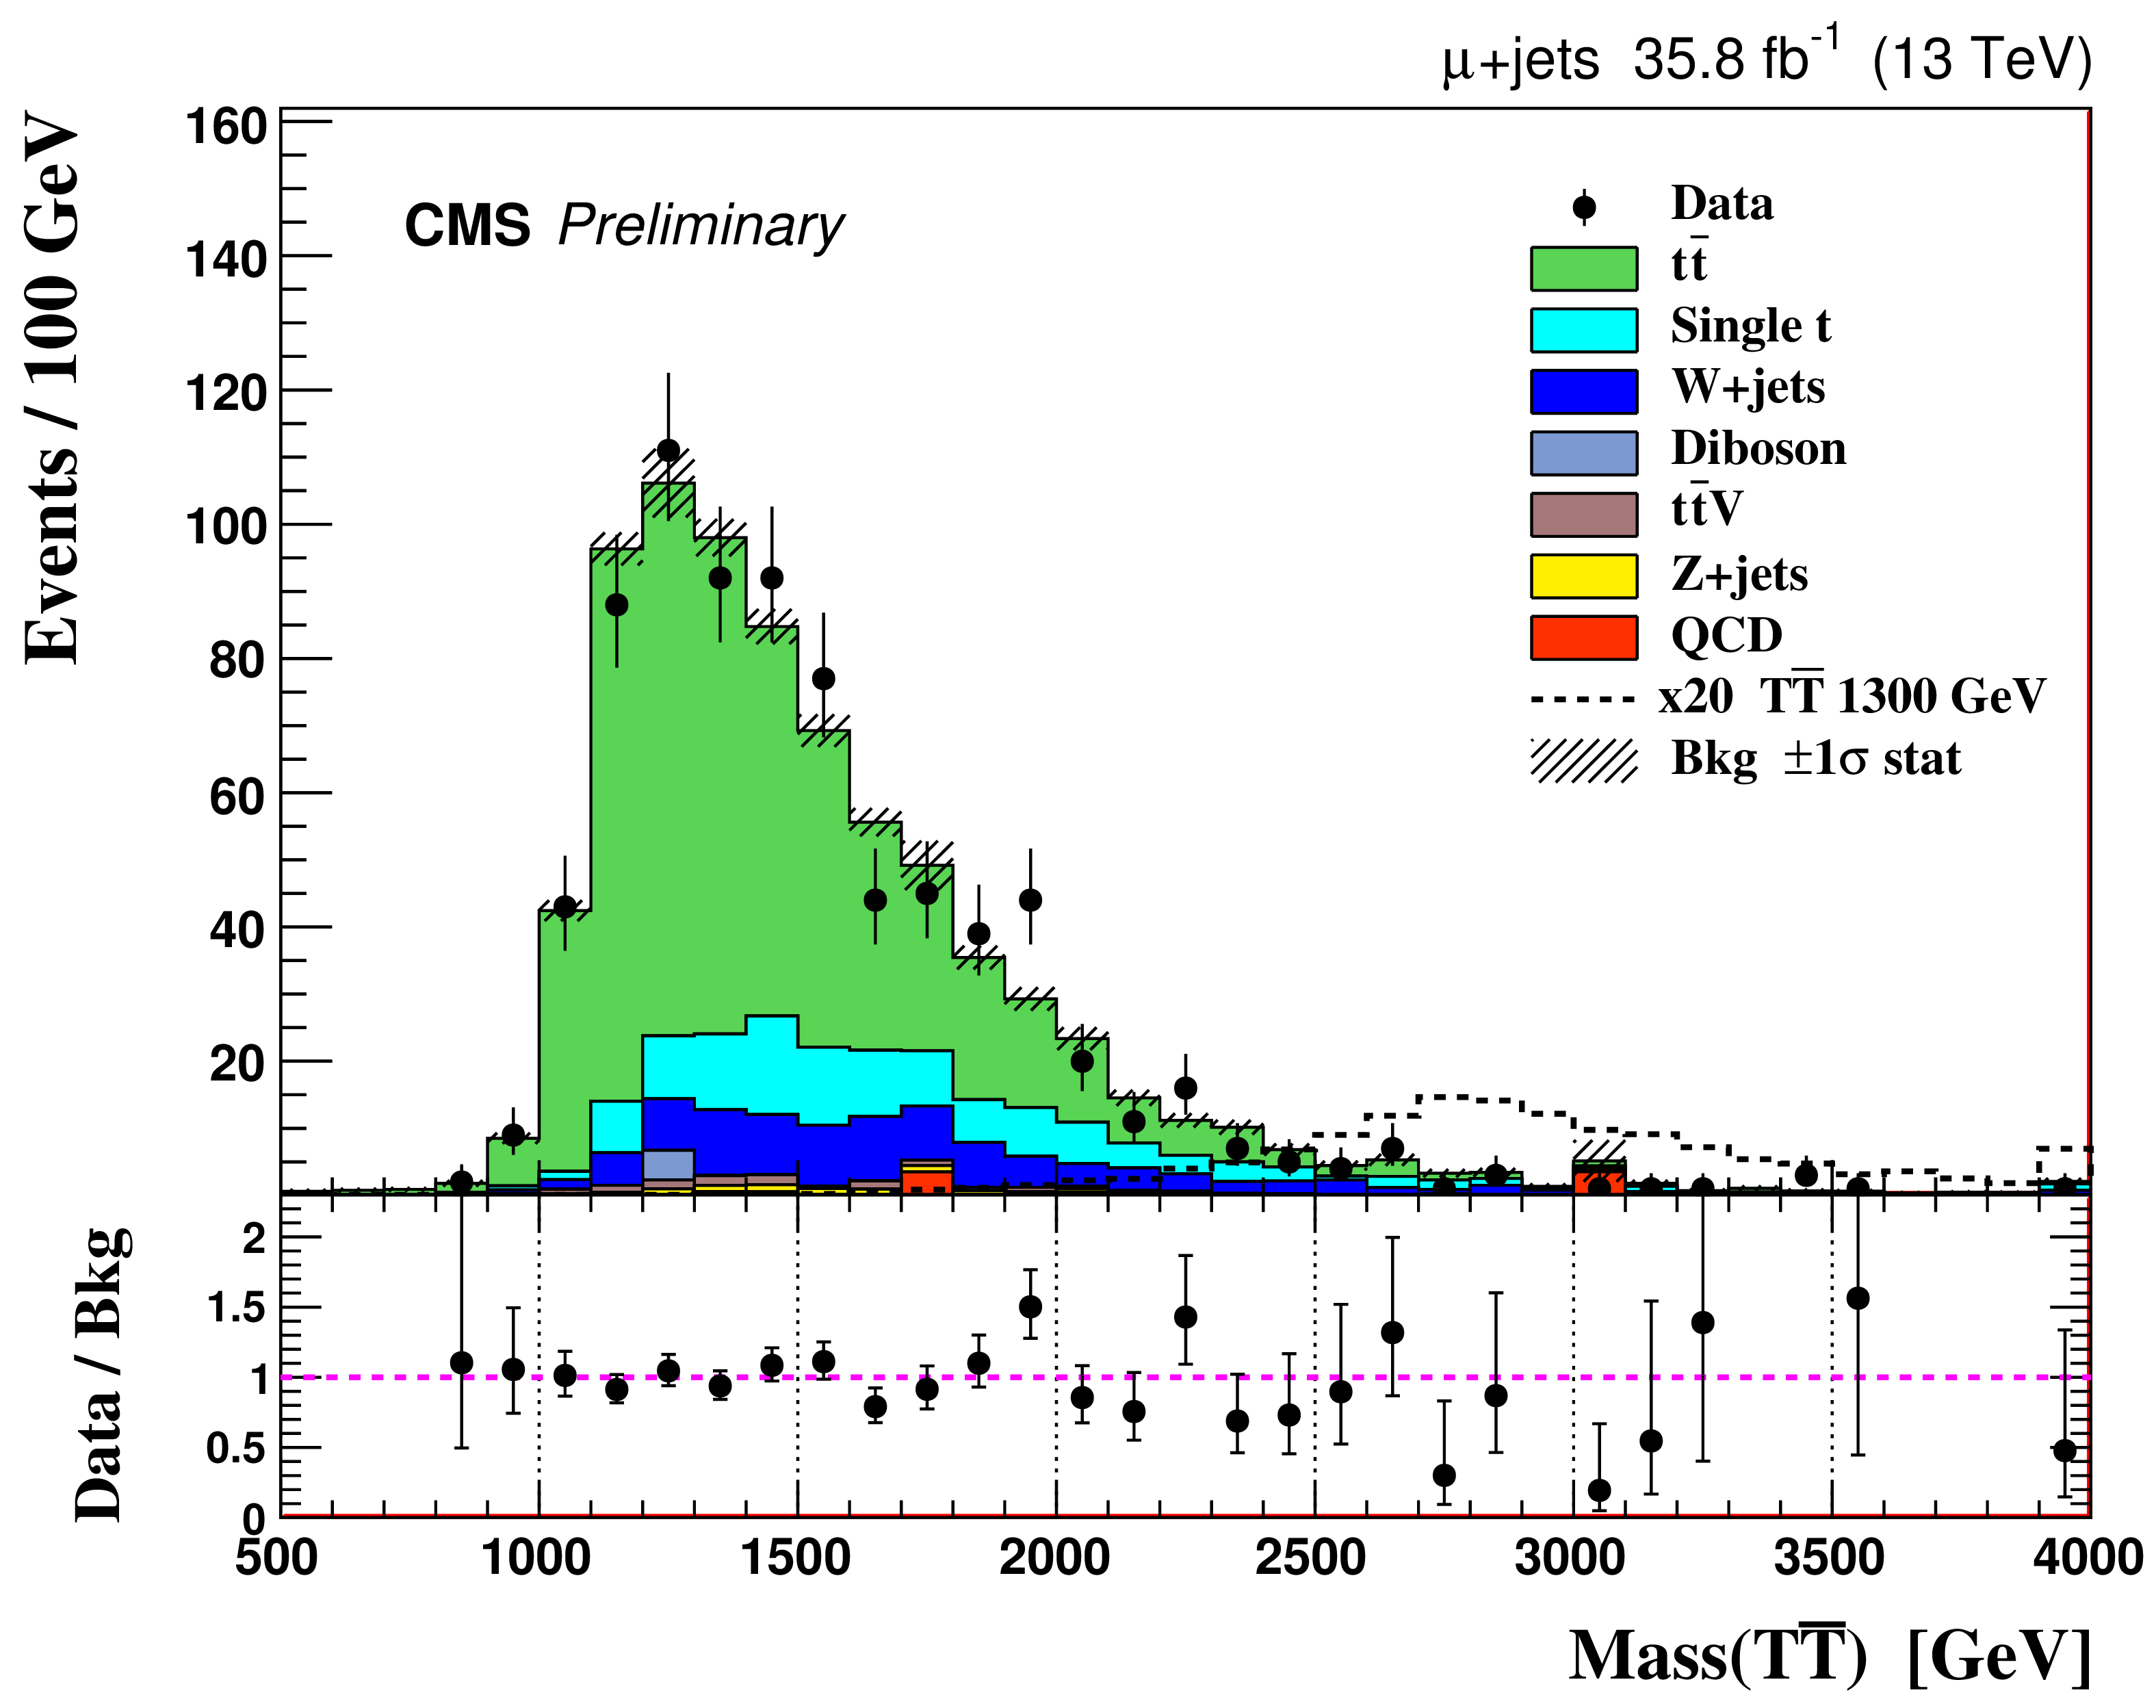
Figure 1:
The T quark reconstructed mass spectra for the $\mu $+jets (upper plot) and e+jets (lower plot) channels from data and from MC simulations of signal and background processes. The MC prediction for pair production of a T quark with a mass of 1300 GeV is shown by a dotted line, enhanced by a factor of 20. The lower panels show the ratio of the data to the background prediction. The uncertainties represented by the vertical bars on the points are statistical only. The shaded regions show the total statistical uncertainties in the background. |
png pdf |
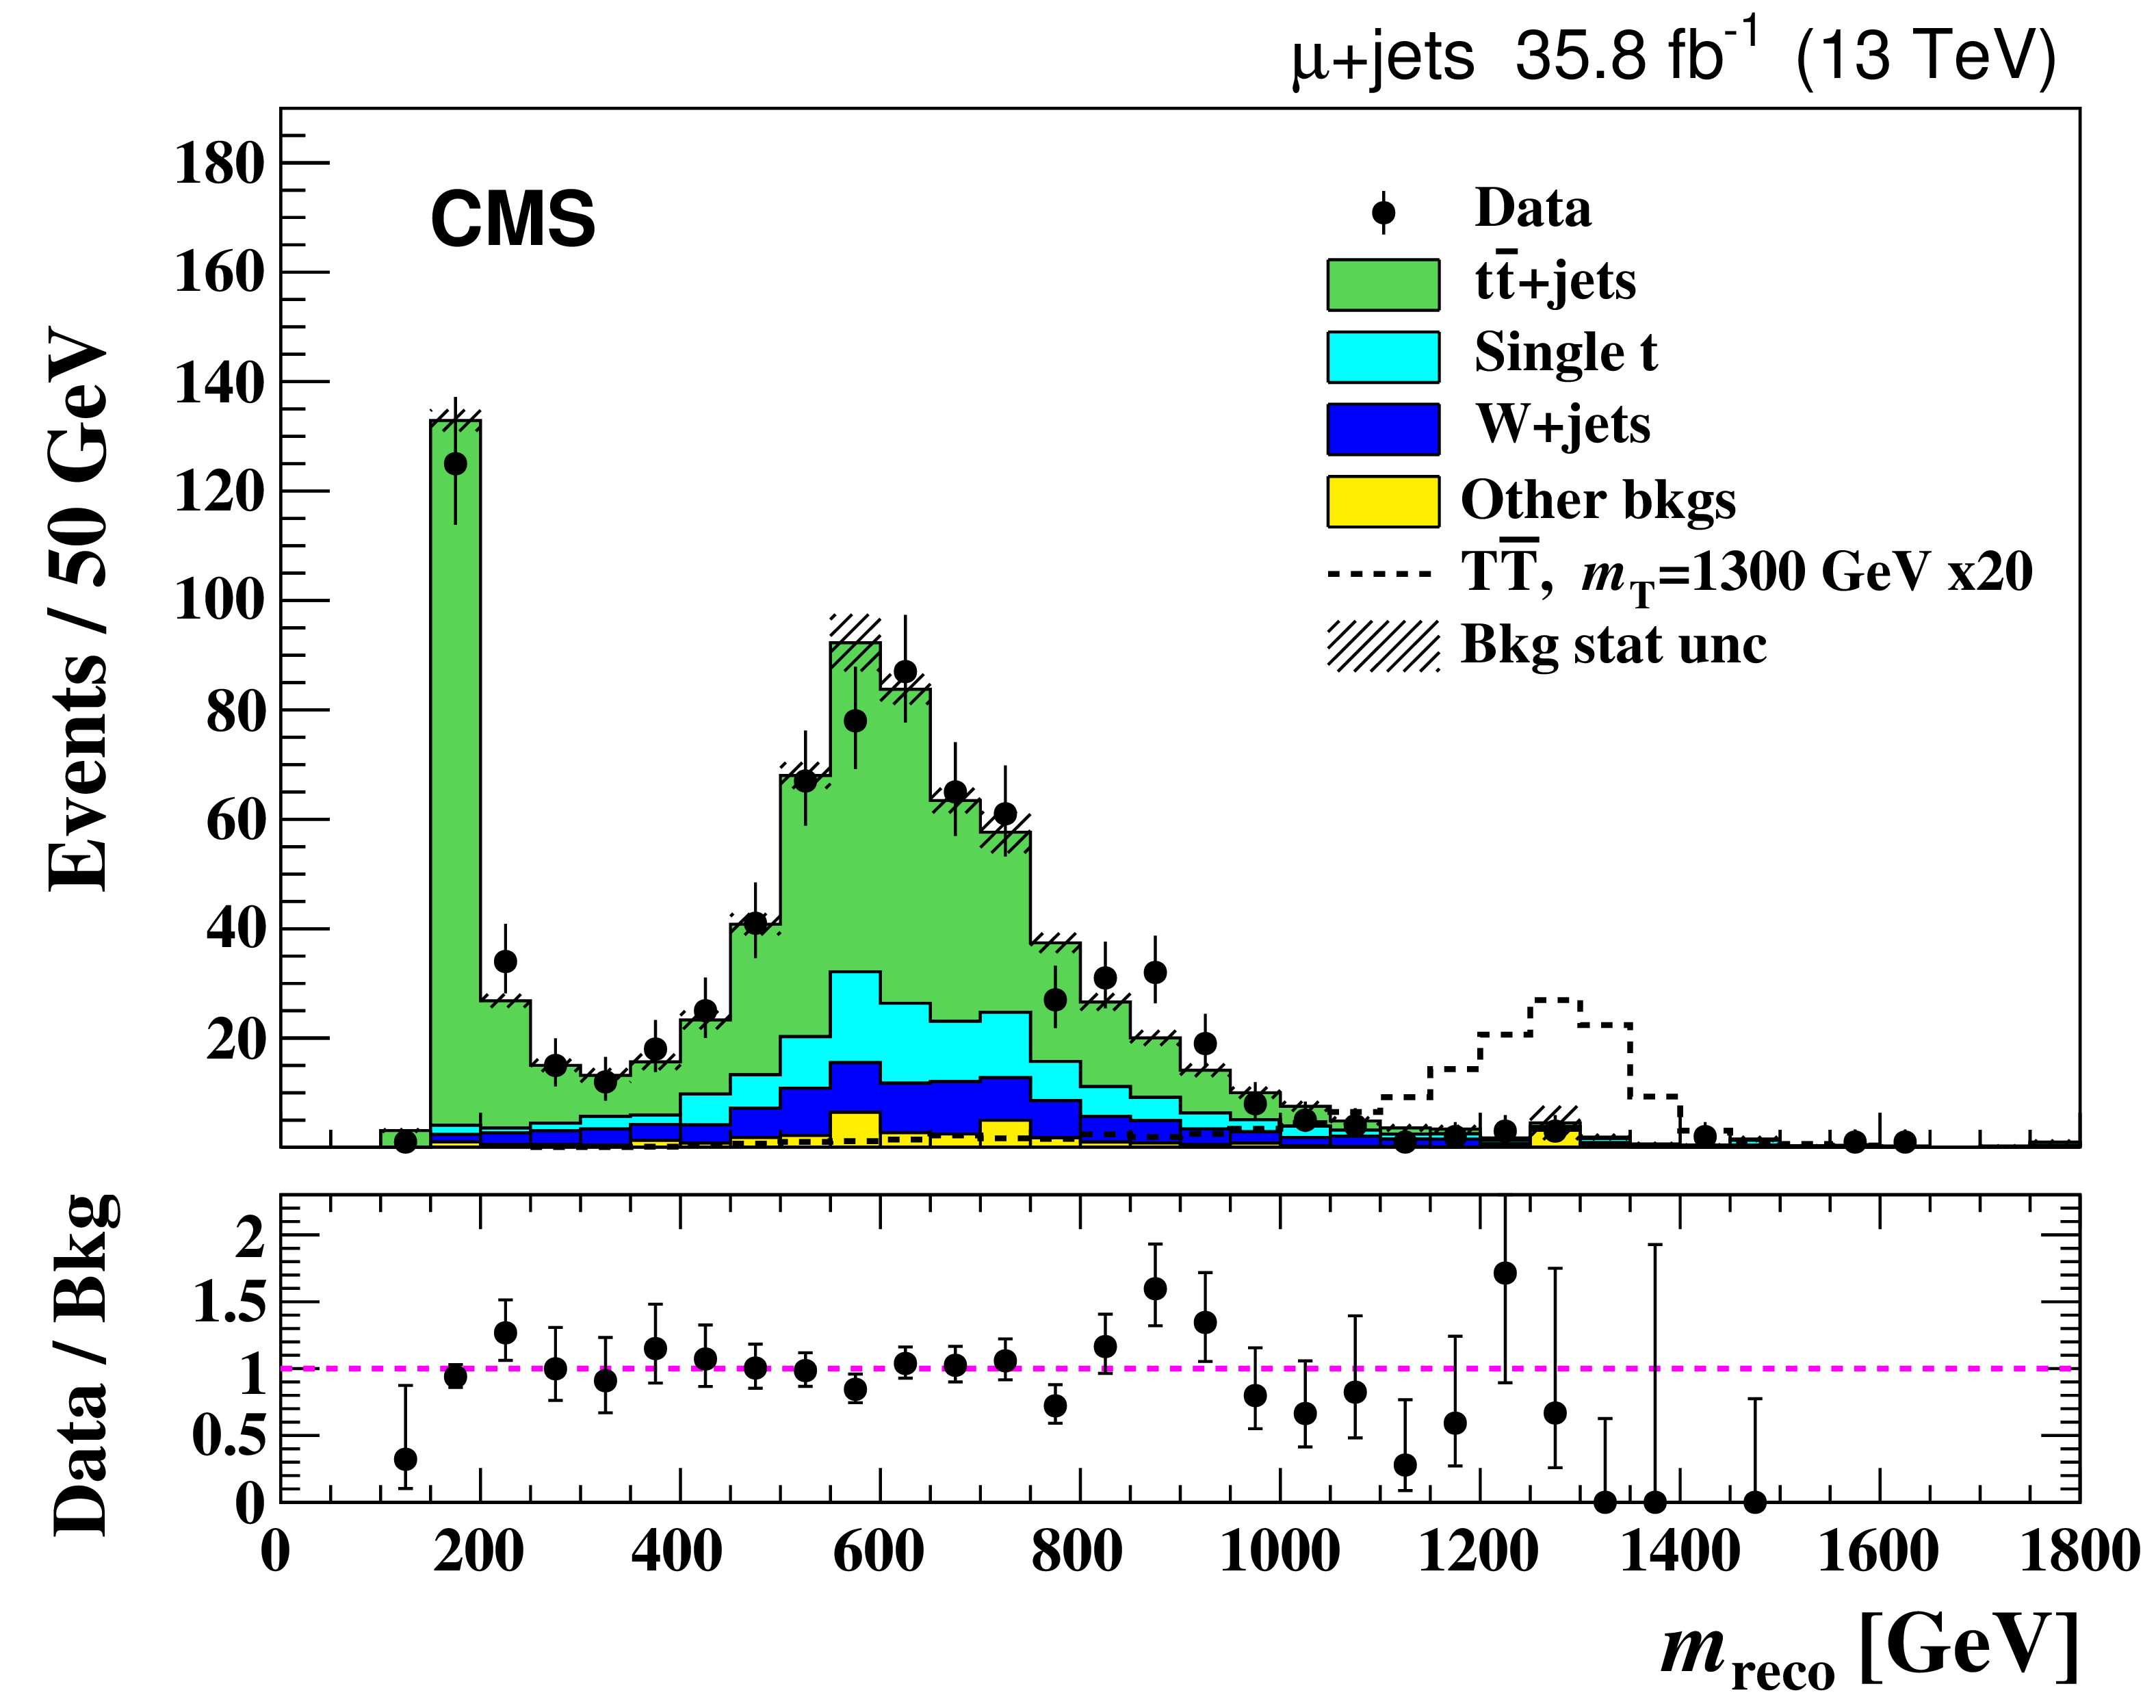
Figure 1-a:
The T quark reconstructed mass spectrum for the $\mu $+jets channel from data and from MC simulations of signal and background processes. The MC prediction for pair production of a T quark with a mass of 1300 GeV is shown by a dotted line, enhanced by a factor of 20. The lower panel shows the ratio of the data to the background prediction. The uncertainties represented by the vertical bars on the points are statistical only. The shaded region shows the total statistical uncertainty in the background. |
png pdf |
Figure 1-b:
The T quark reconstructed mass spectrum for the e+jets channel from data and from MC simulations of signal and background processes. The MC prediction for pair production of a T quark with a mass of 1300 GeV is shown by a dotted line, enhanced by a factor of 20. The lower panel shows the ratio of the data to the background prediction. The uncertainties represented by the vertical bars on the points are statistical only. The shaded region shows the total statistical uncertainty in the background. |
png pdf |
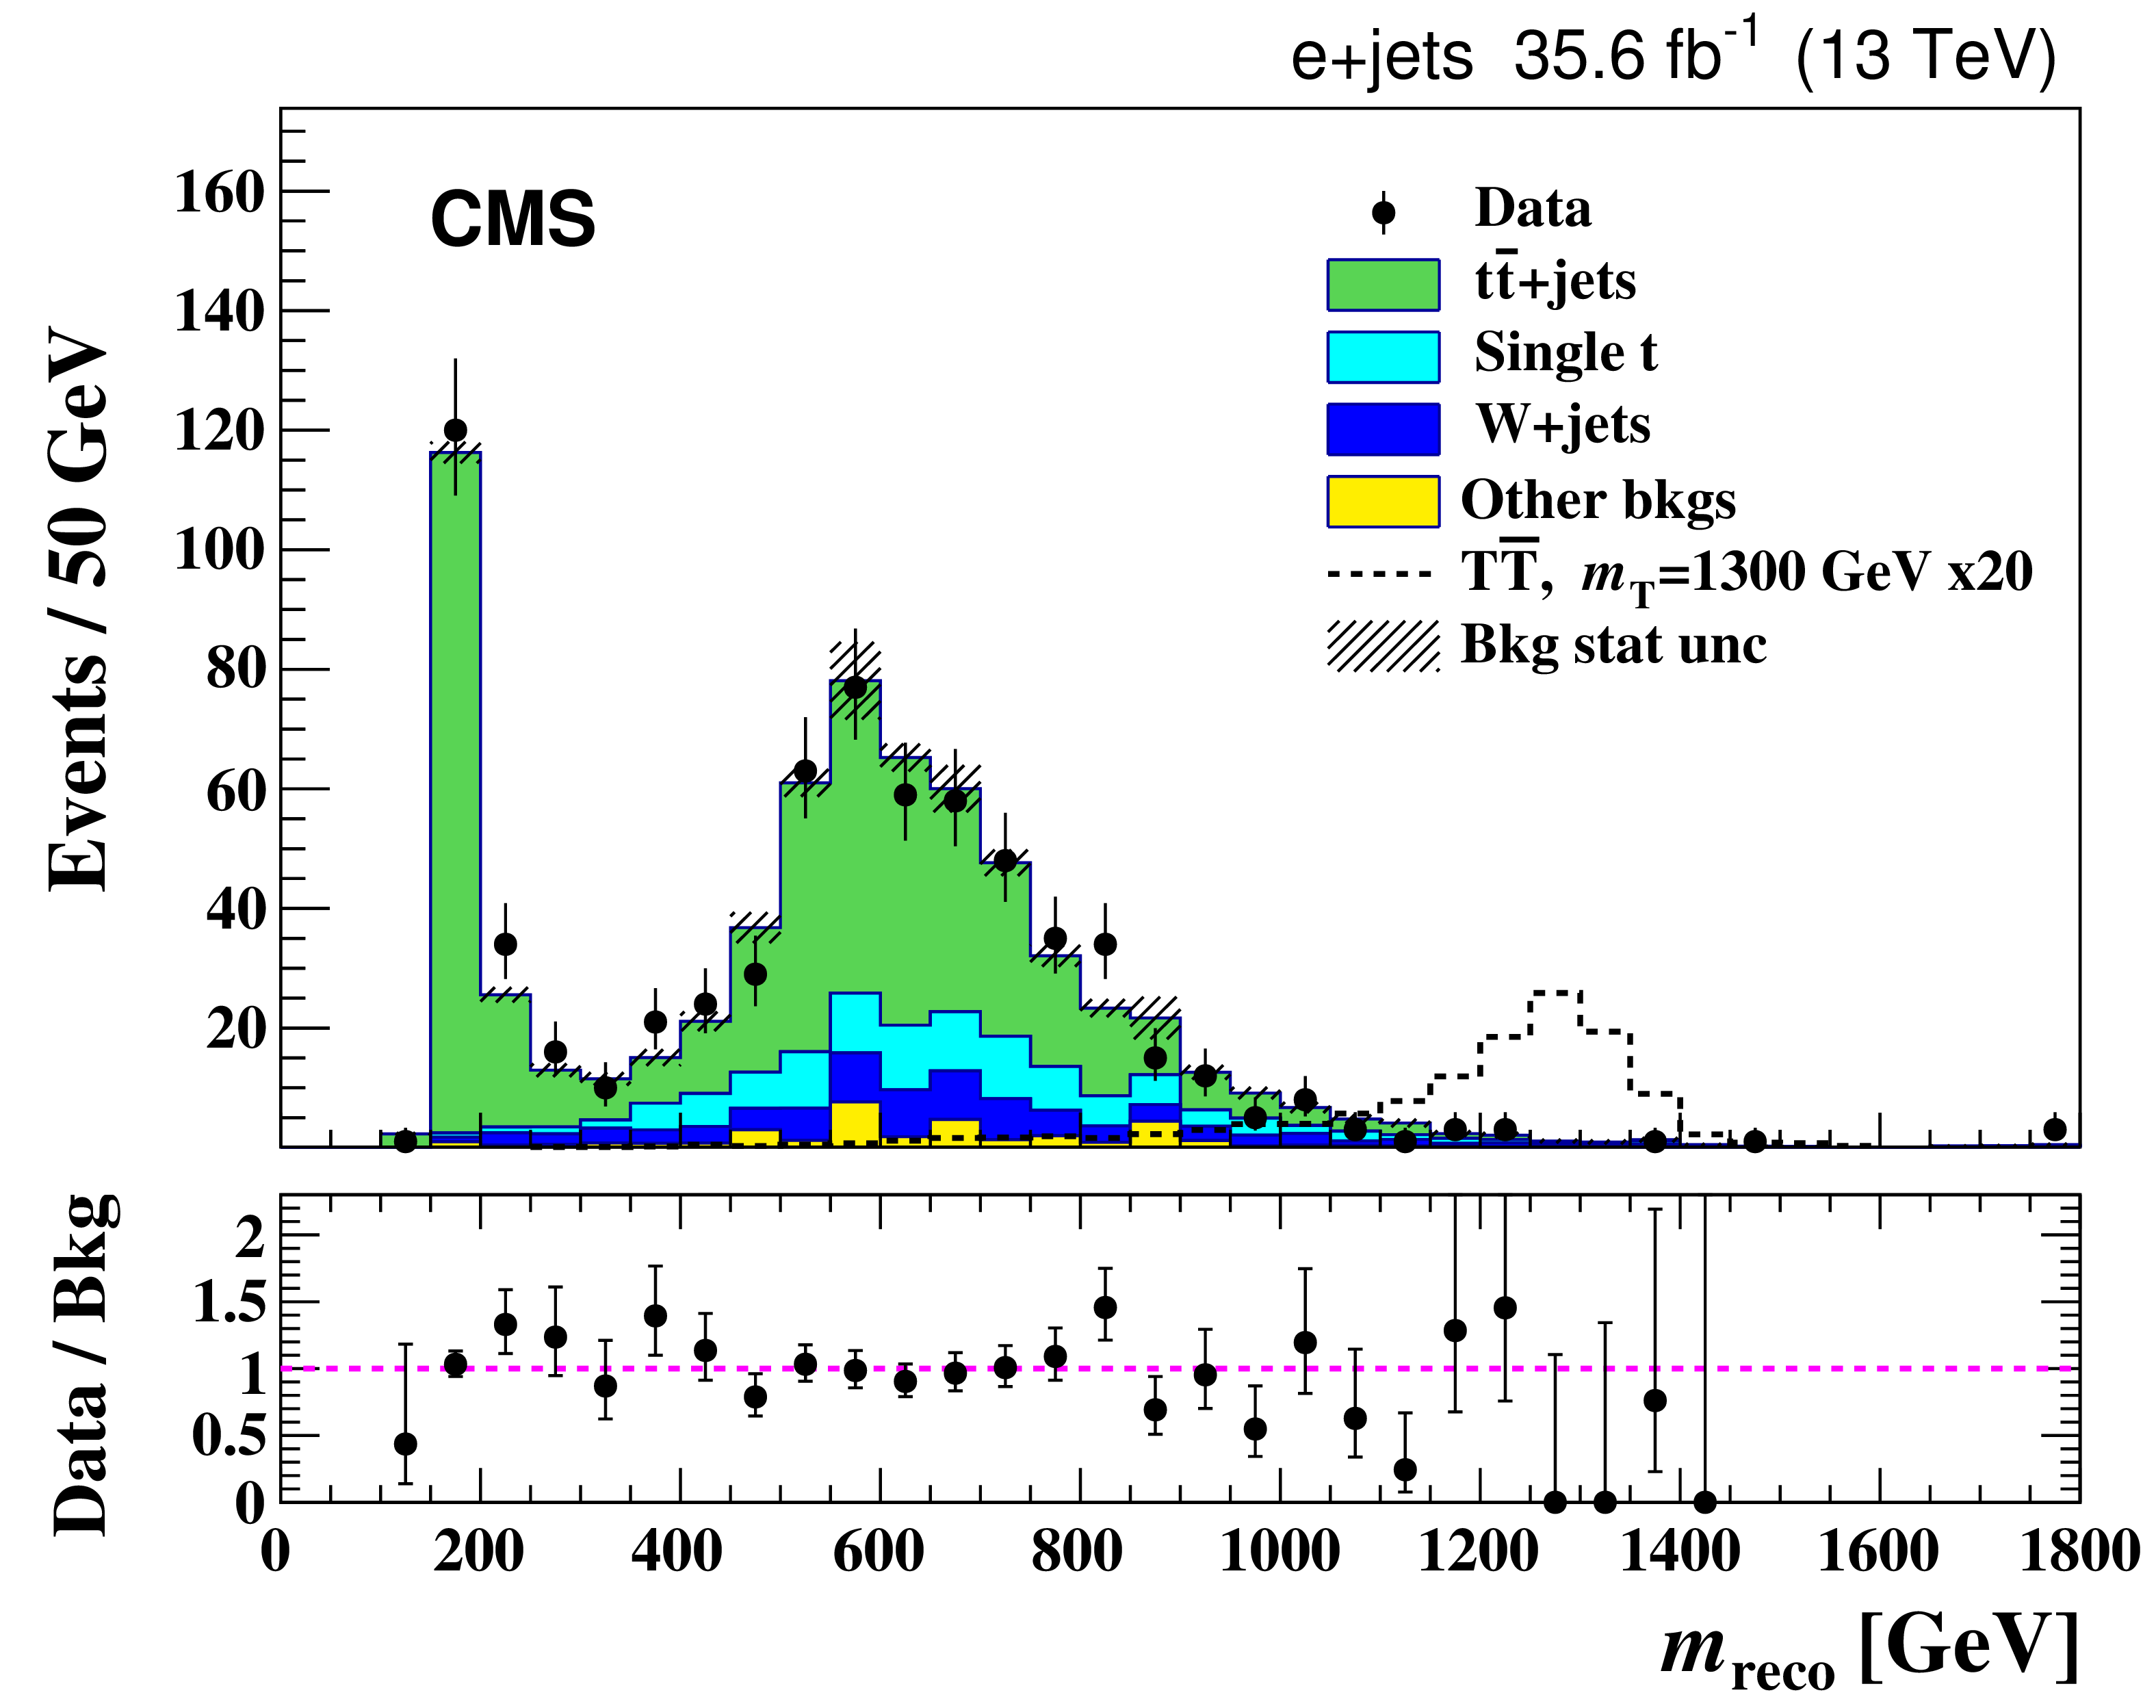
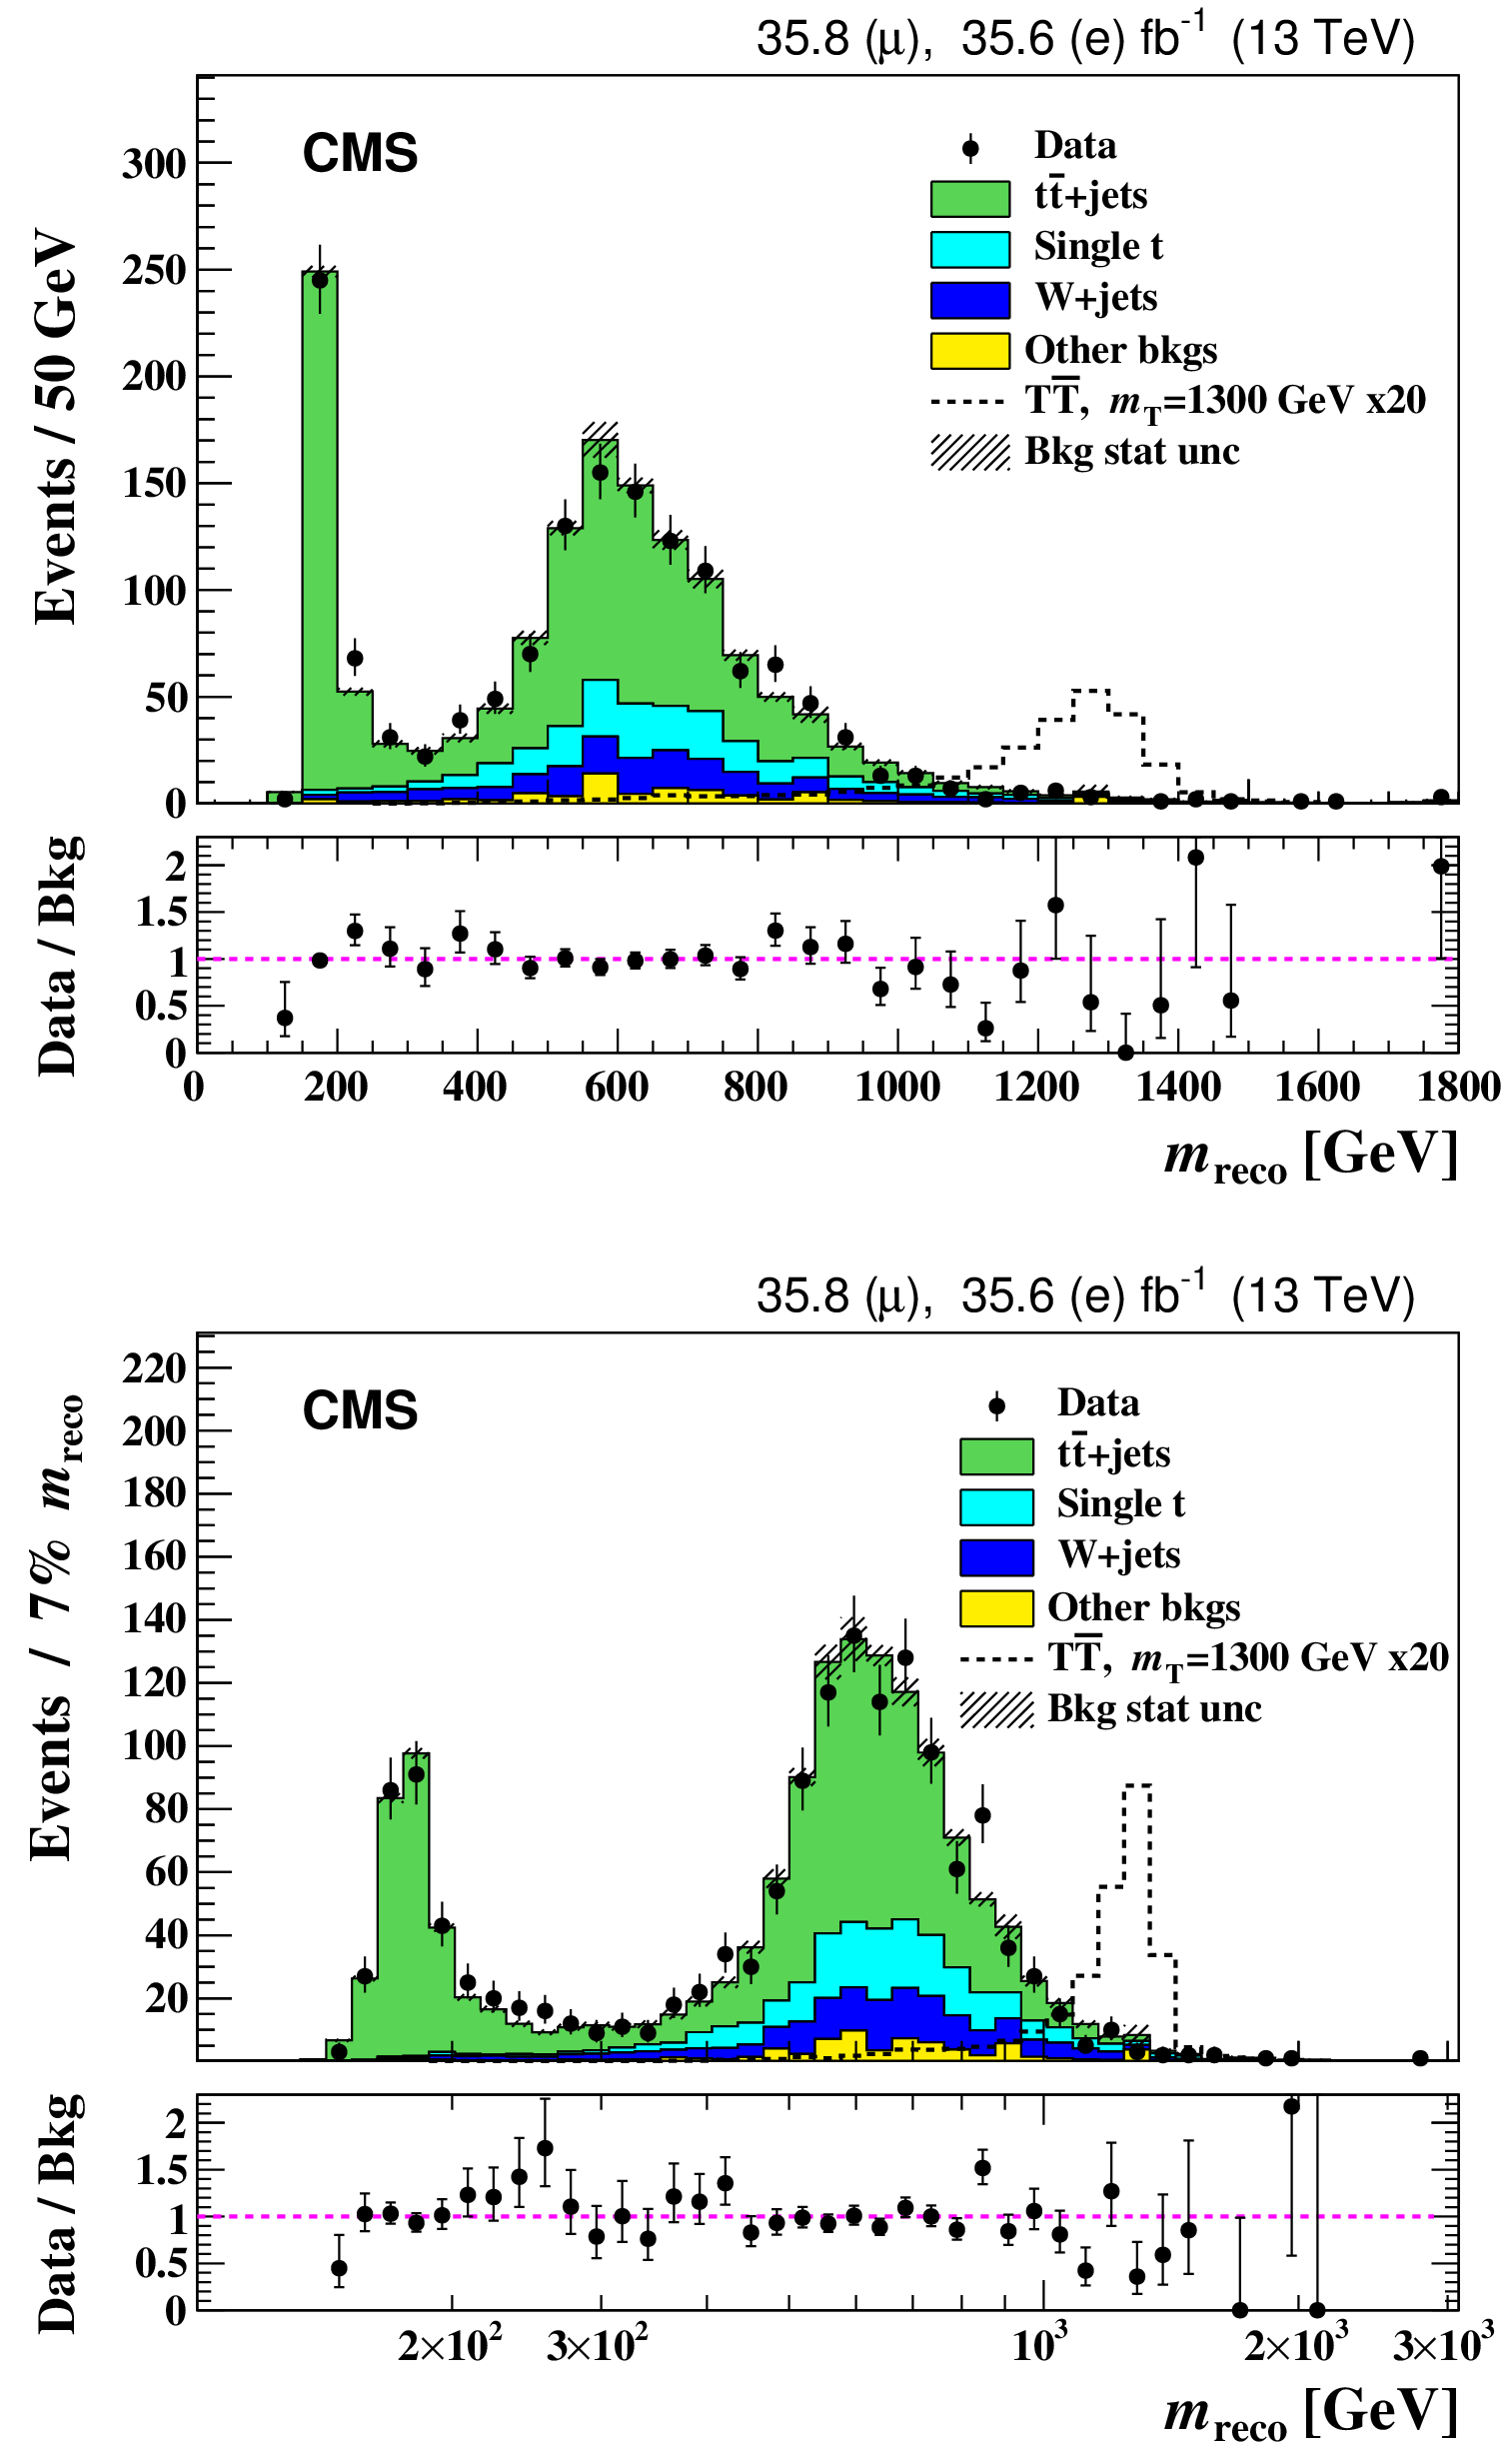
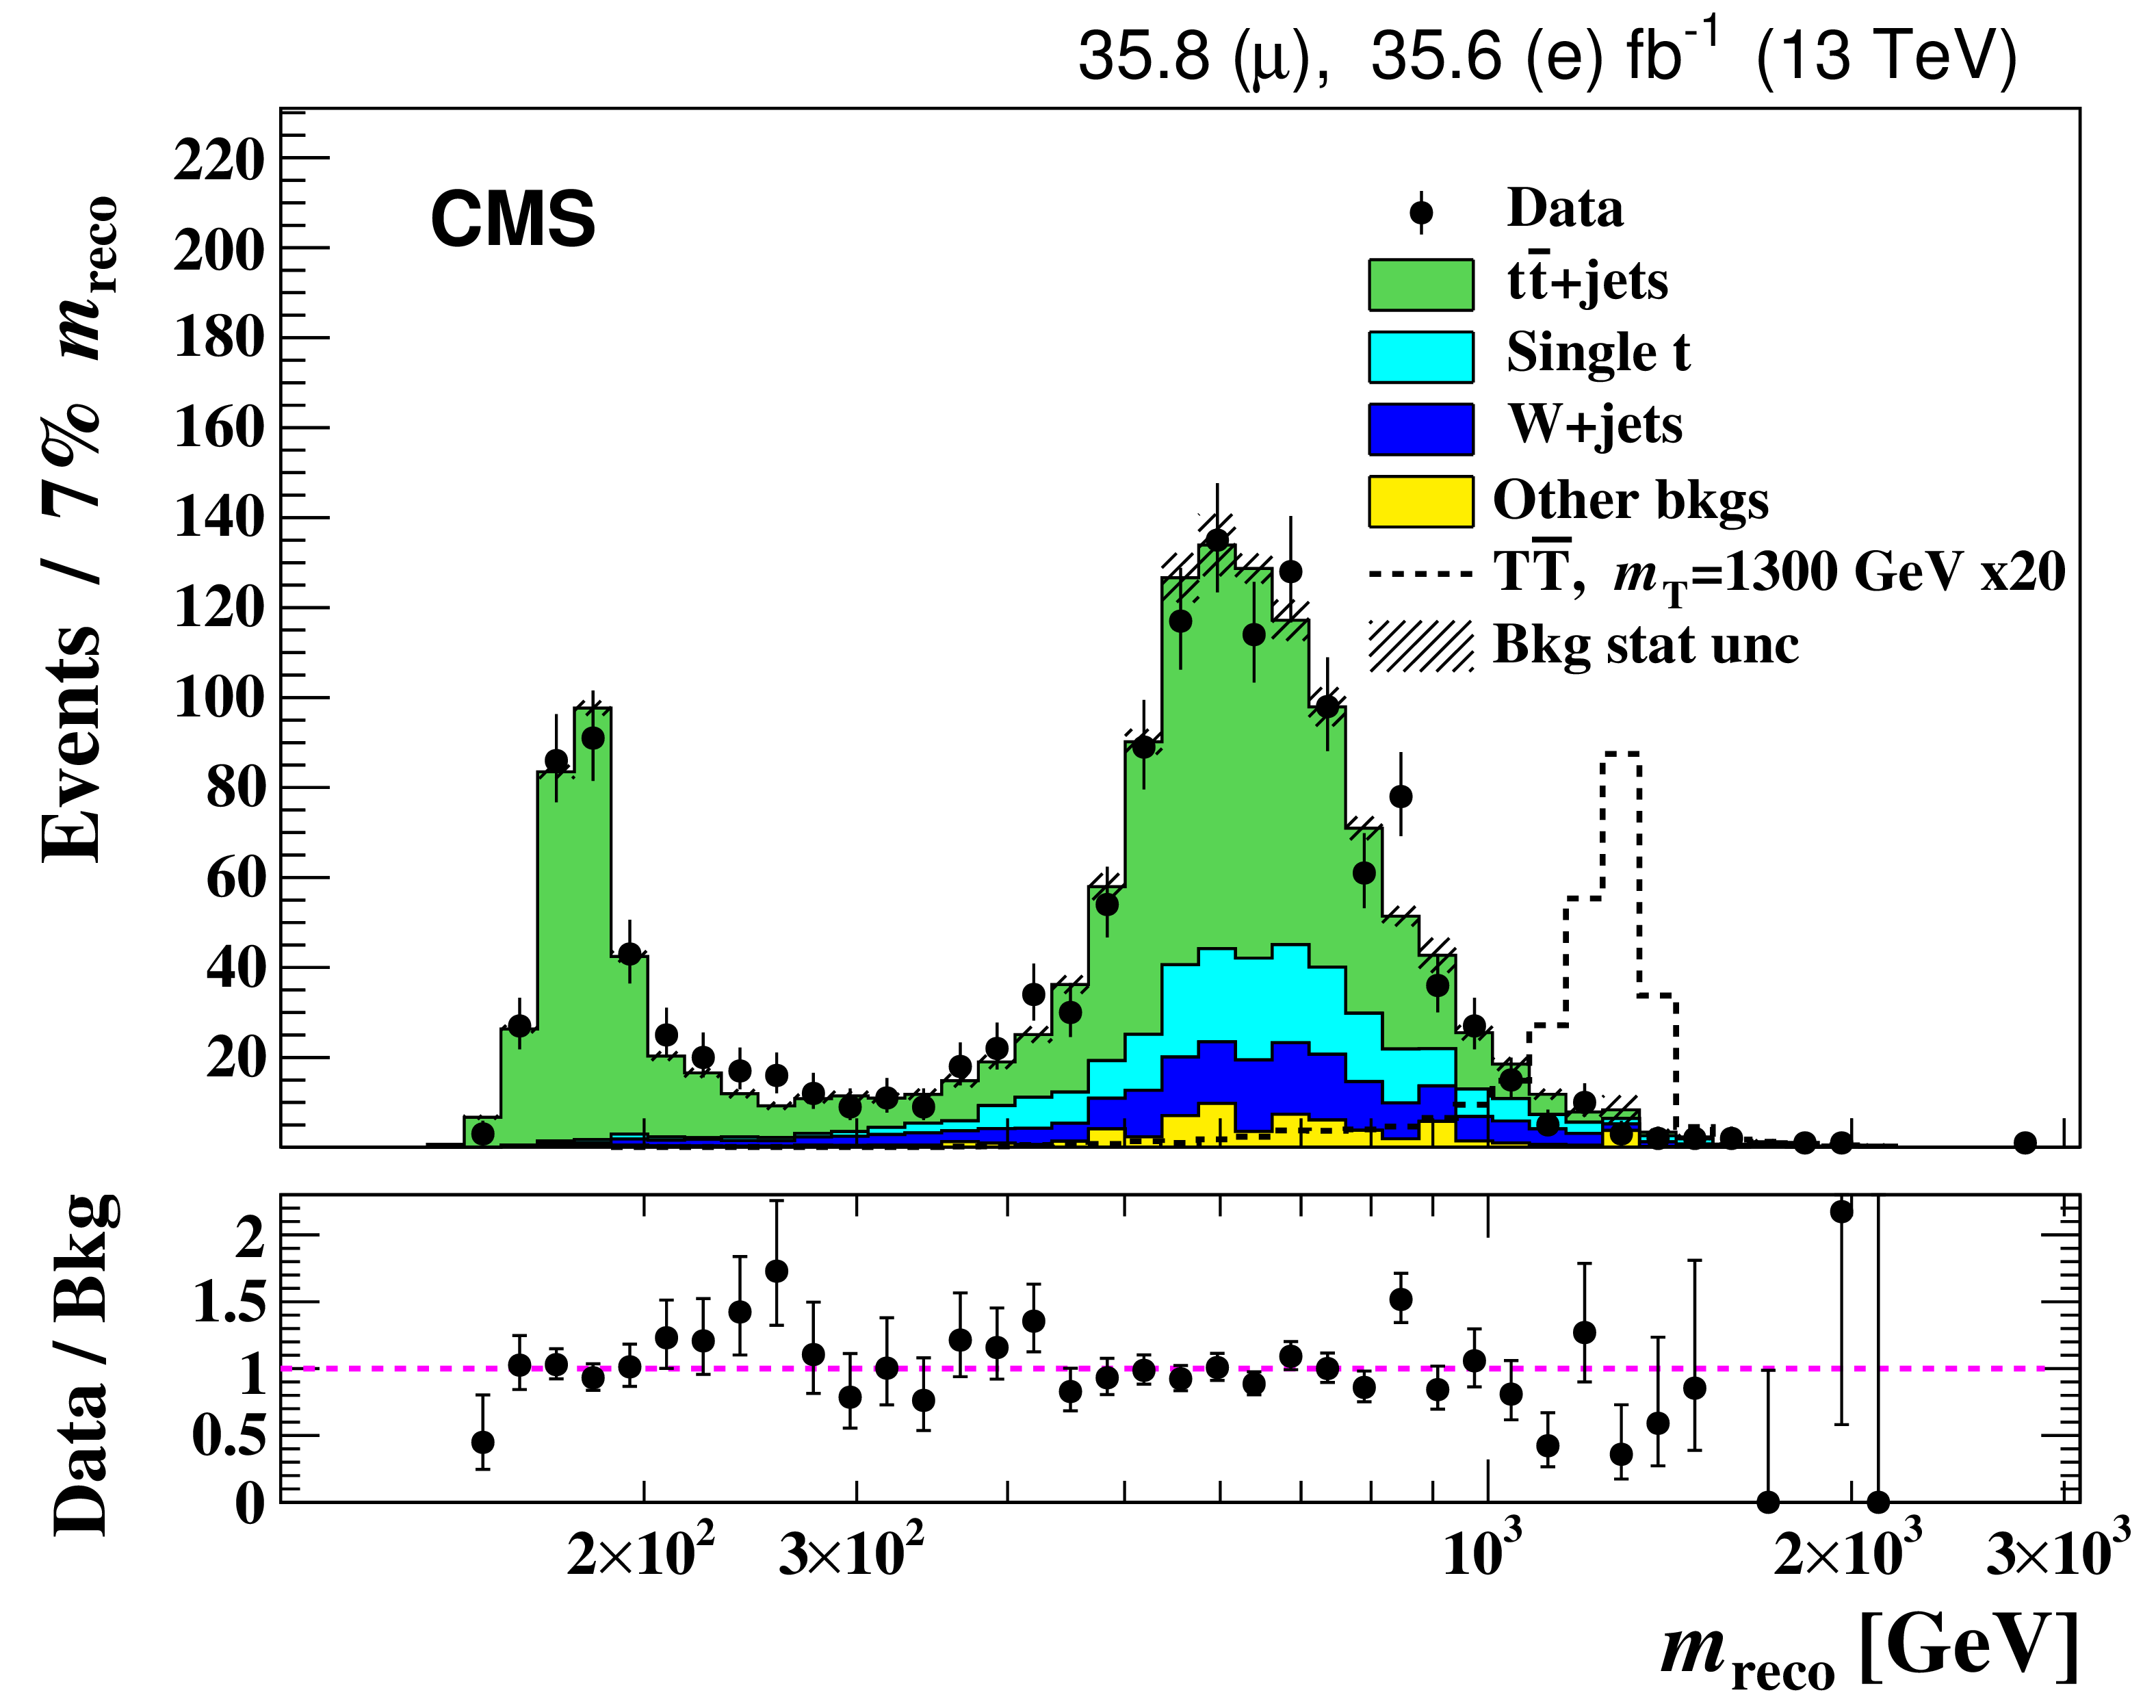
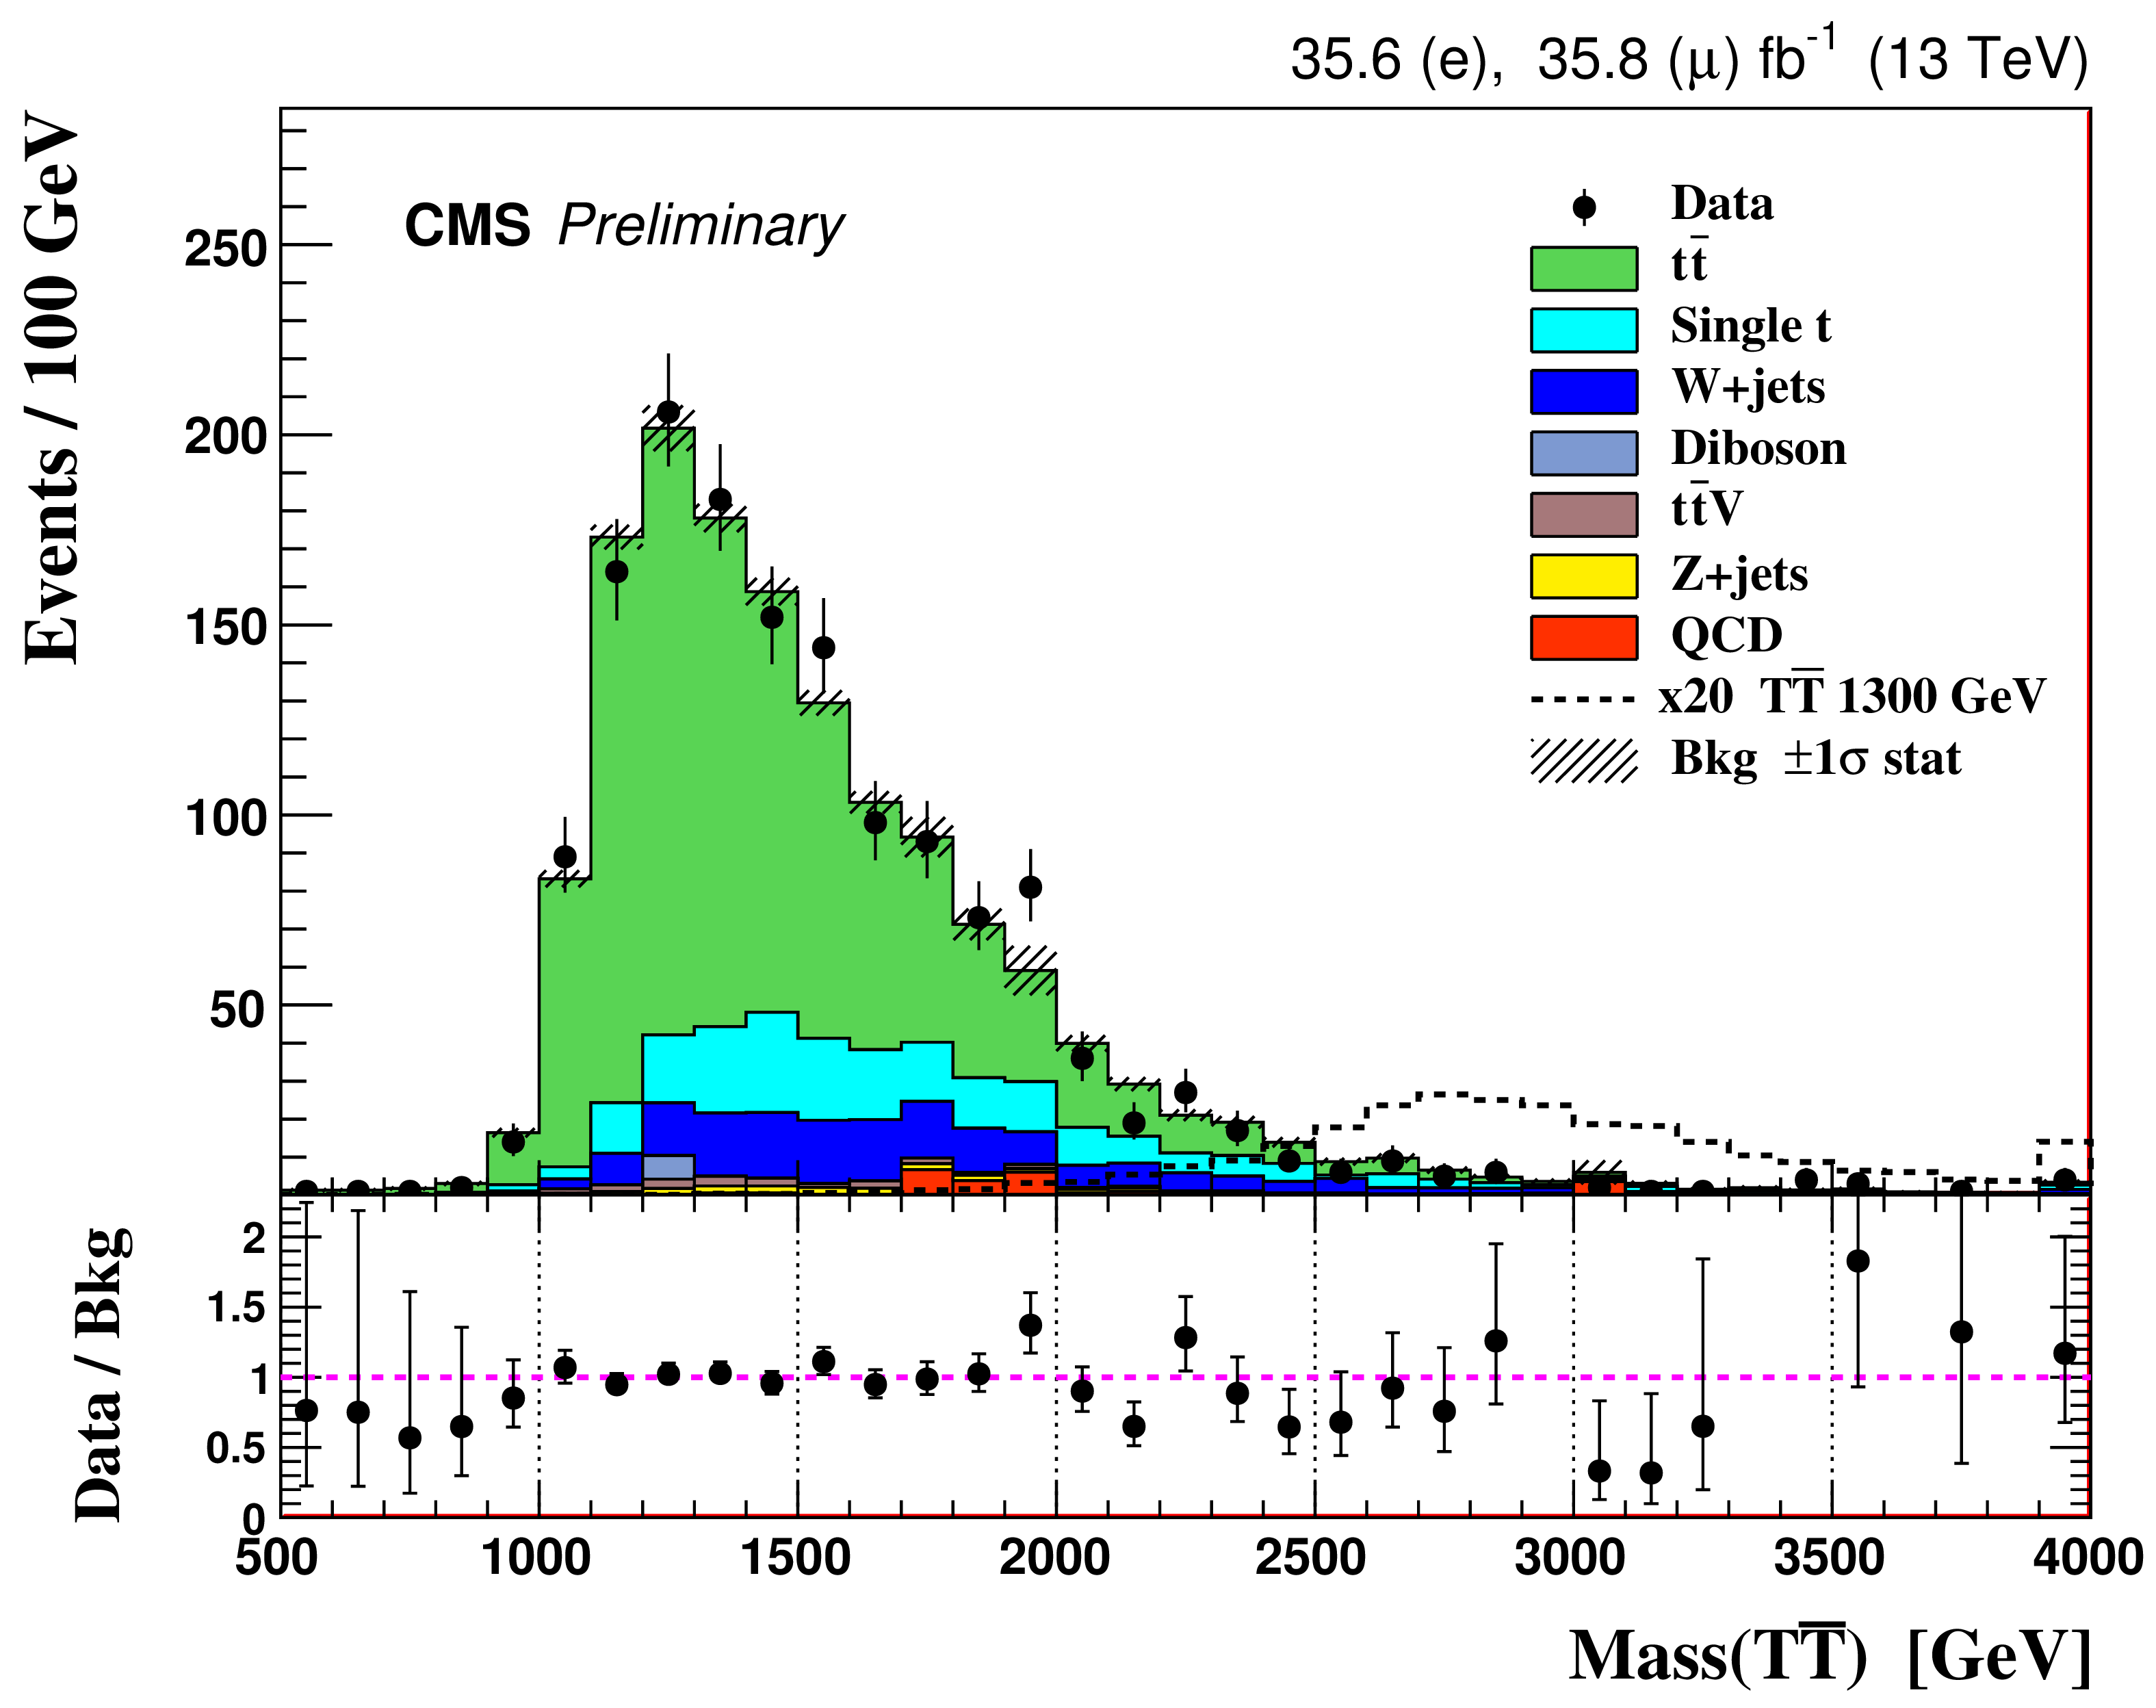
Figure 2:
The T quark reconstructed mass spectra for the sum of $\mu $+jets and e+jets channels from data and from MC simulations of signal and background processes. The lower plot has a logarithmic x-axis scale and the bin size corresponds to 7% of the mass value in the middle of the bin. The MC prediction for pair production of a T quark with a mass of 1300 GeV is shown by a dotted line, enhanced by a factor of 20. The lower panels show the ratio of the data to the background prediction. The uncertainties represented by the vertical bars on the points are statistical only. The shaded regions show the total statistical uncertainties in the background. |
png pdf |
Figure 2-a:
The T quark reconstructed mass spectrum for the sum of $\mu $+jets channel from data and from MC simulations of signal and background processes. The MC prediction for pair production of a T quark with a mass of 1300 GeV is shown by a dotted line, enhanced by a factor of 20. The lower panel shows the ratio of the data to the background prediction. The uncertainties represented by the vertical bars on the points are statistical only. The shaded region shows the total statistical uncertainty in the background. |
png pdf |
Figure 2-b:
The T quark reconstructed mass spectrum for the sum of e+jets channel from data and from MC simulations of signal and background processes. The plot has a logarithmic x-axis scale and the bin size corresponds to 7% of the mass value in the middle of the bin. The MC prediction for pair production of a T quark with a mass of 1300 GeV is shown by a dotted line, enhanced by a factor of 20. The lower panel shows the ratio of the data to the background prediction. The uncertainties represented by the vertical bars on the points are statistical only. The shaded region shows the total statistical uncertainty in the background. |
png pdf |
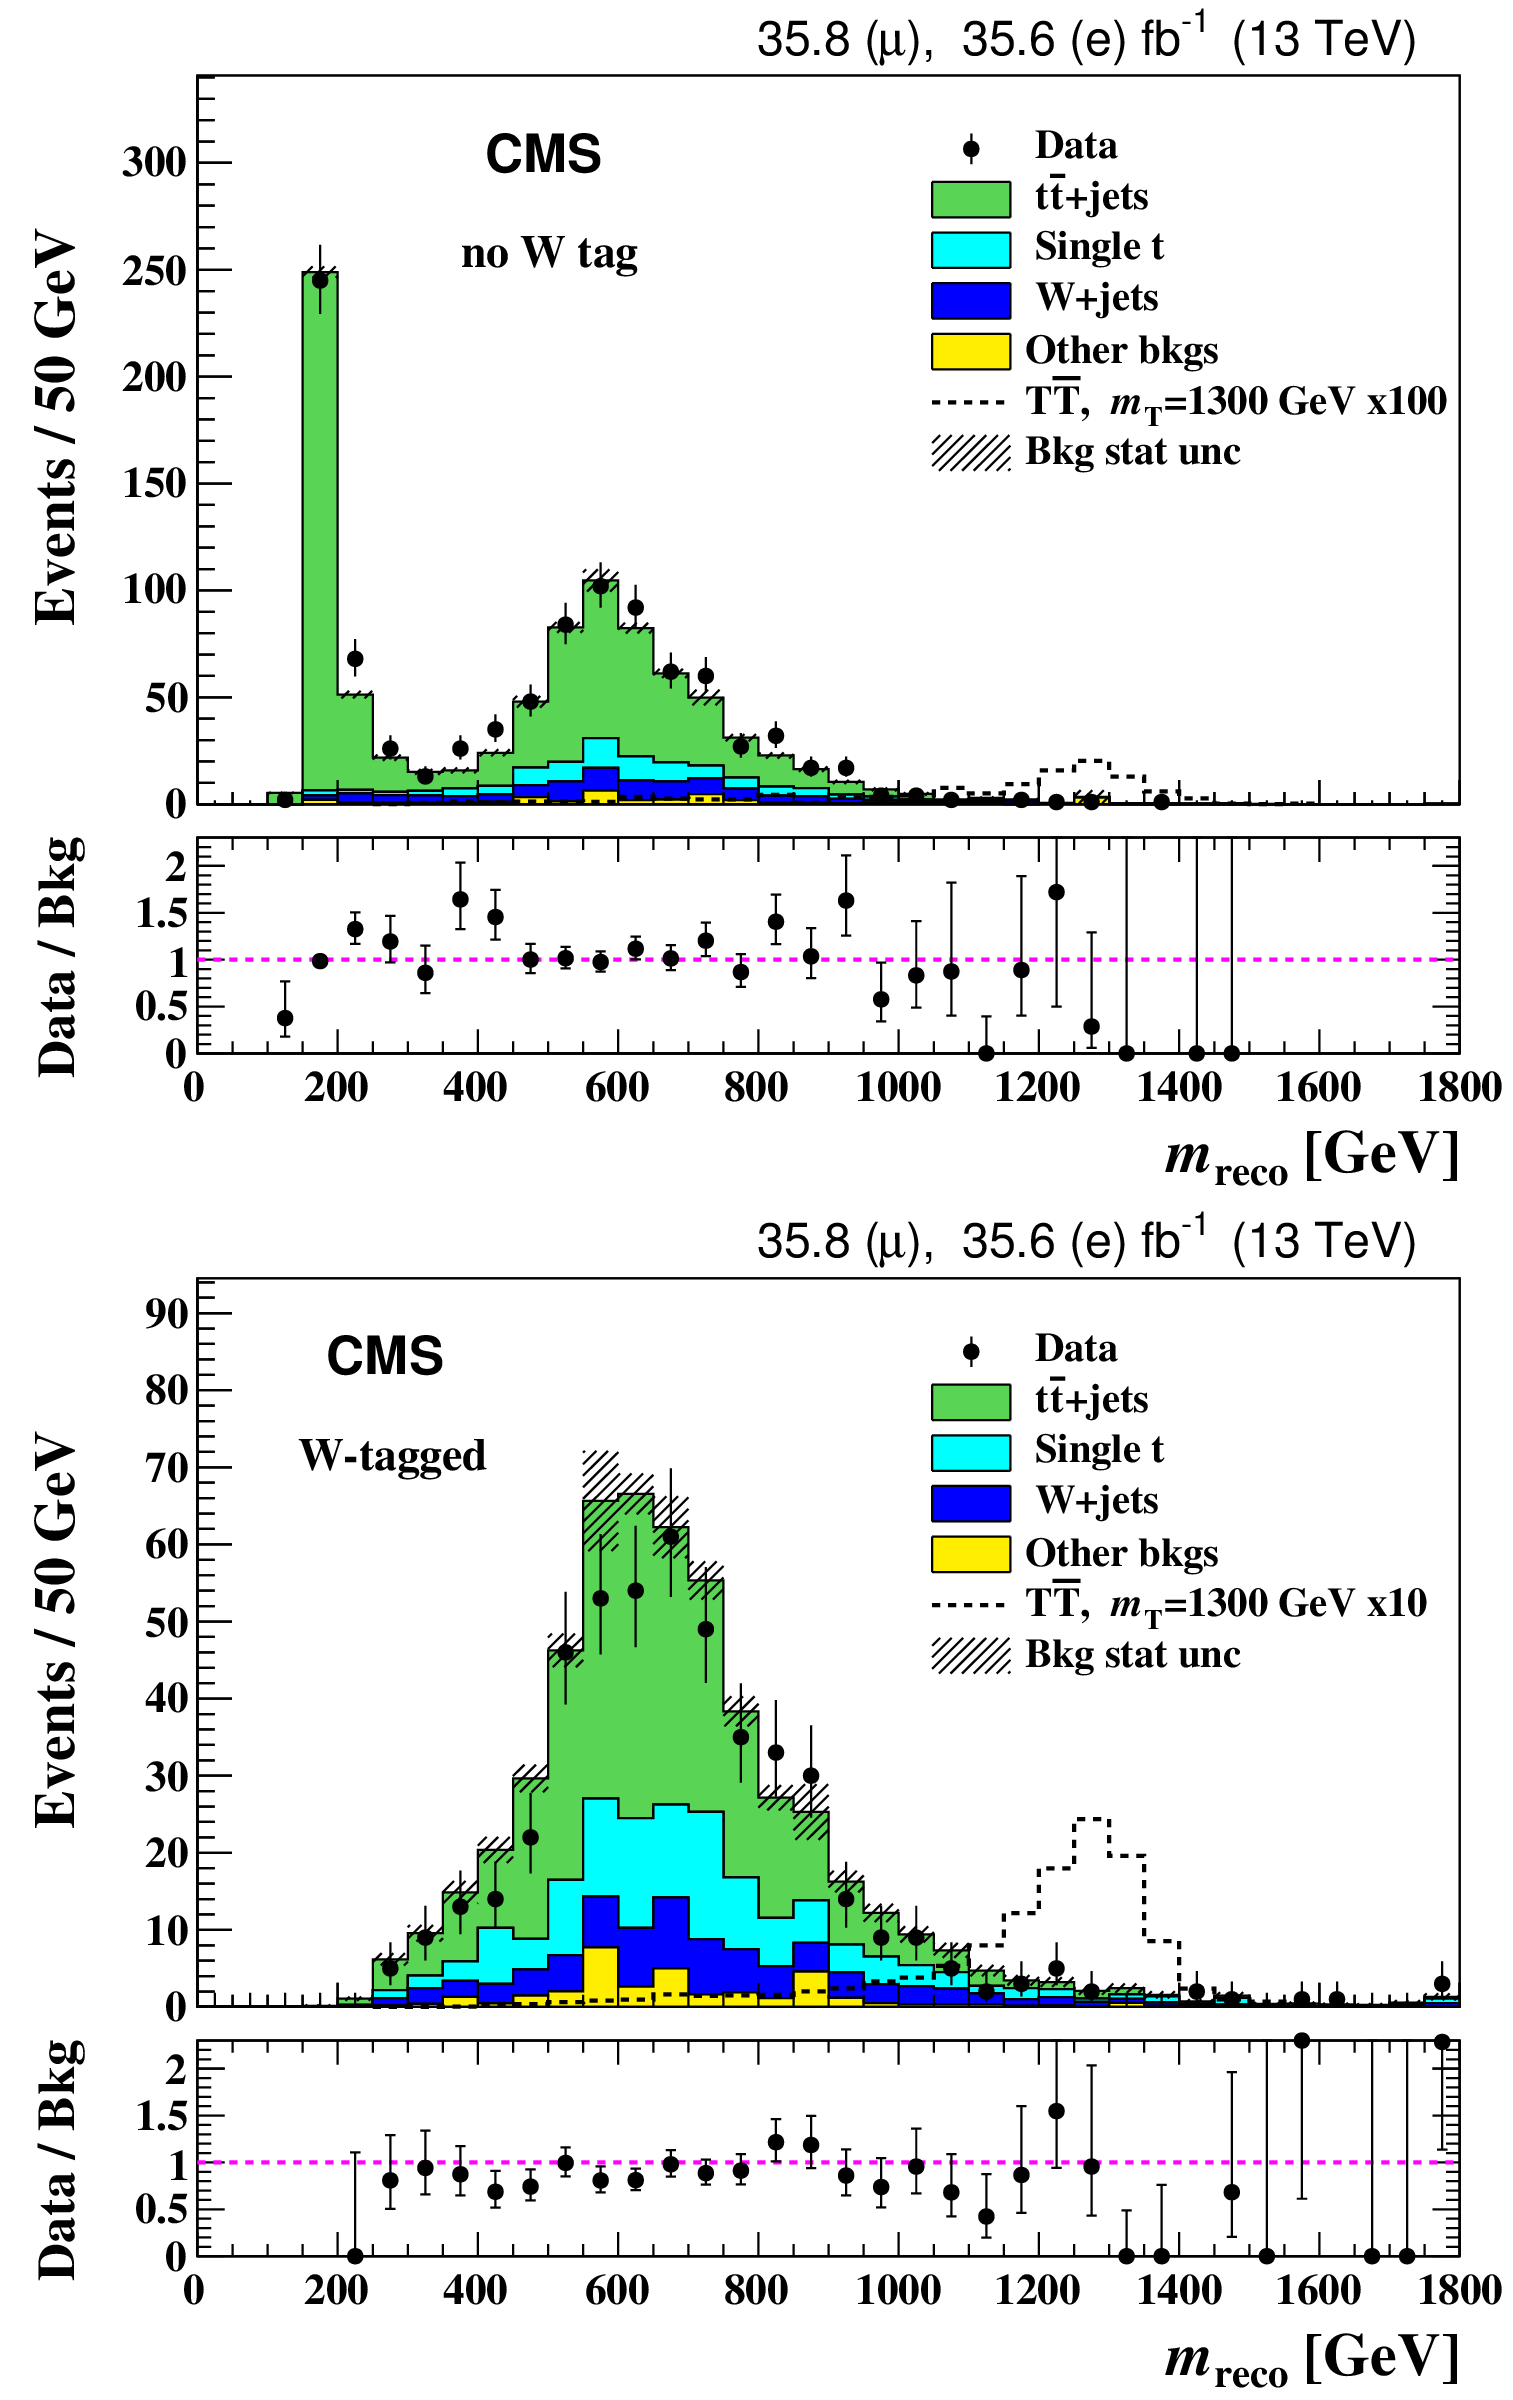
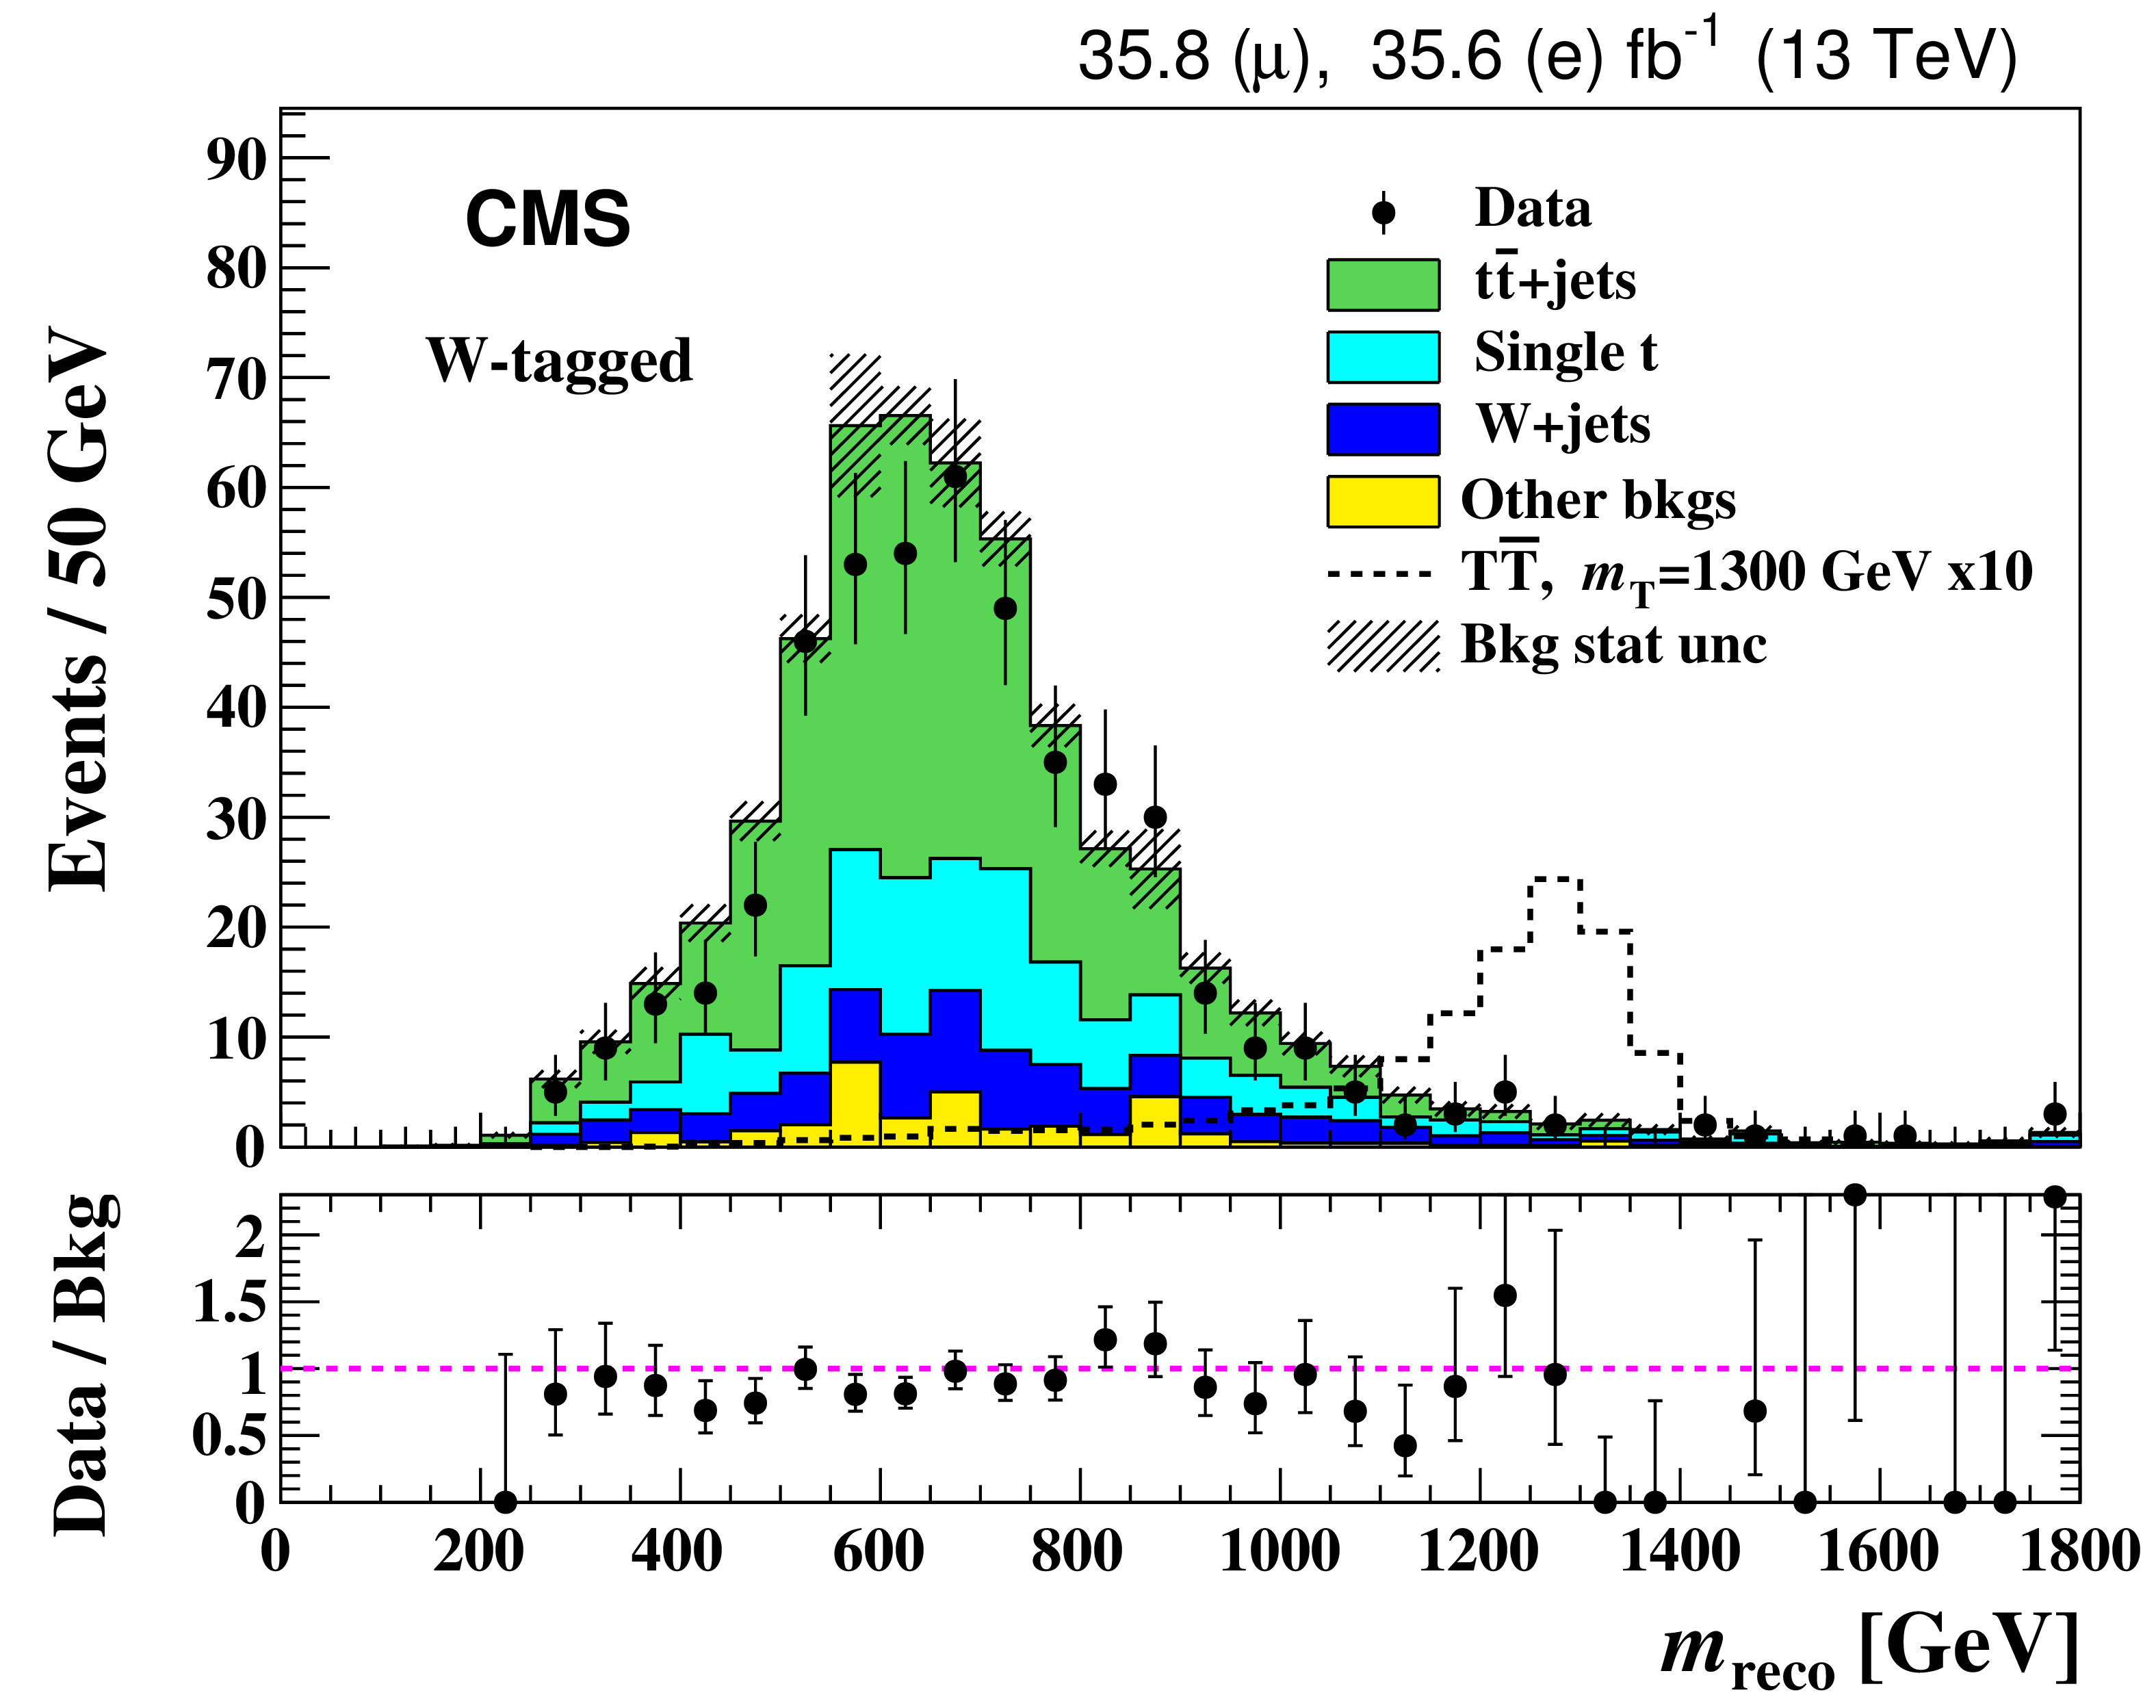
Figure 3:
The T quark reconstructed mass spectra for the sum of the $\mu $+jets and e+jets channels for the "no W tag'' category of events (upper plot), and for the "W-tagged'' category (lower plot) from data and from MC simulations of the background processes. The MC prediction for $ {\mathrm {T}\overline {\mathrm {T}}} $ production of a T quark with a mass of 1300 GeV is shown by a dotted line, enhanced by a factor of 100 (upper) and 10 (lower). The lower panels show the ratio of the data to the background prediction. The uncertainties represented by the vertical bars on the data points are statistical only. |
png pdf |
Figure 3-a:
The T quark reconstructed mass spectra for the sum of the $\mu $+jets and e+jets channels for the "no W tag'' category of events from data and from MC simulations of the background processes. The MC prediction for $ {\mathrm {T}\overline {\mathrm {T}}} $ production of a T quark with a mass of 1300 GeV is shown by a dotted line, enhanced by a factor of 100. The lower panel shows the ratio of the data to the background prediction. The uncertainties represented by the vertical bars on the data points are statistical only. |
png pdf |
Figure 3-b:
The T quark reconstructed mass spectra for the sum of the $\mu $+jets and e+jets channels for the "W-tagged'' category from data and from MC simulations of the background processes. The MC prediction for $ {\mathrm {T}\overline {\mathrm {T}}} $ production of a T quark with a mass of 1300 GeV is shown by a dotted line, enhanced by a factor of 10. The lower panel shows the ratio of the data to the background prediction. The uncertainties represented by the vertical bars on the data points are statistical only. |
png pdf |
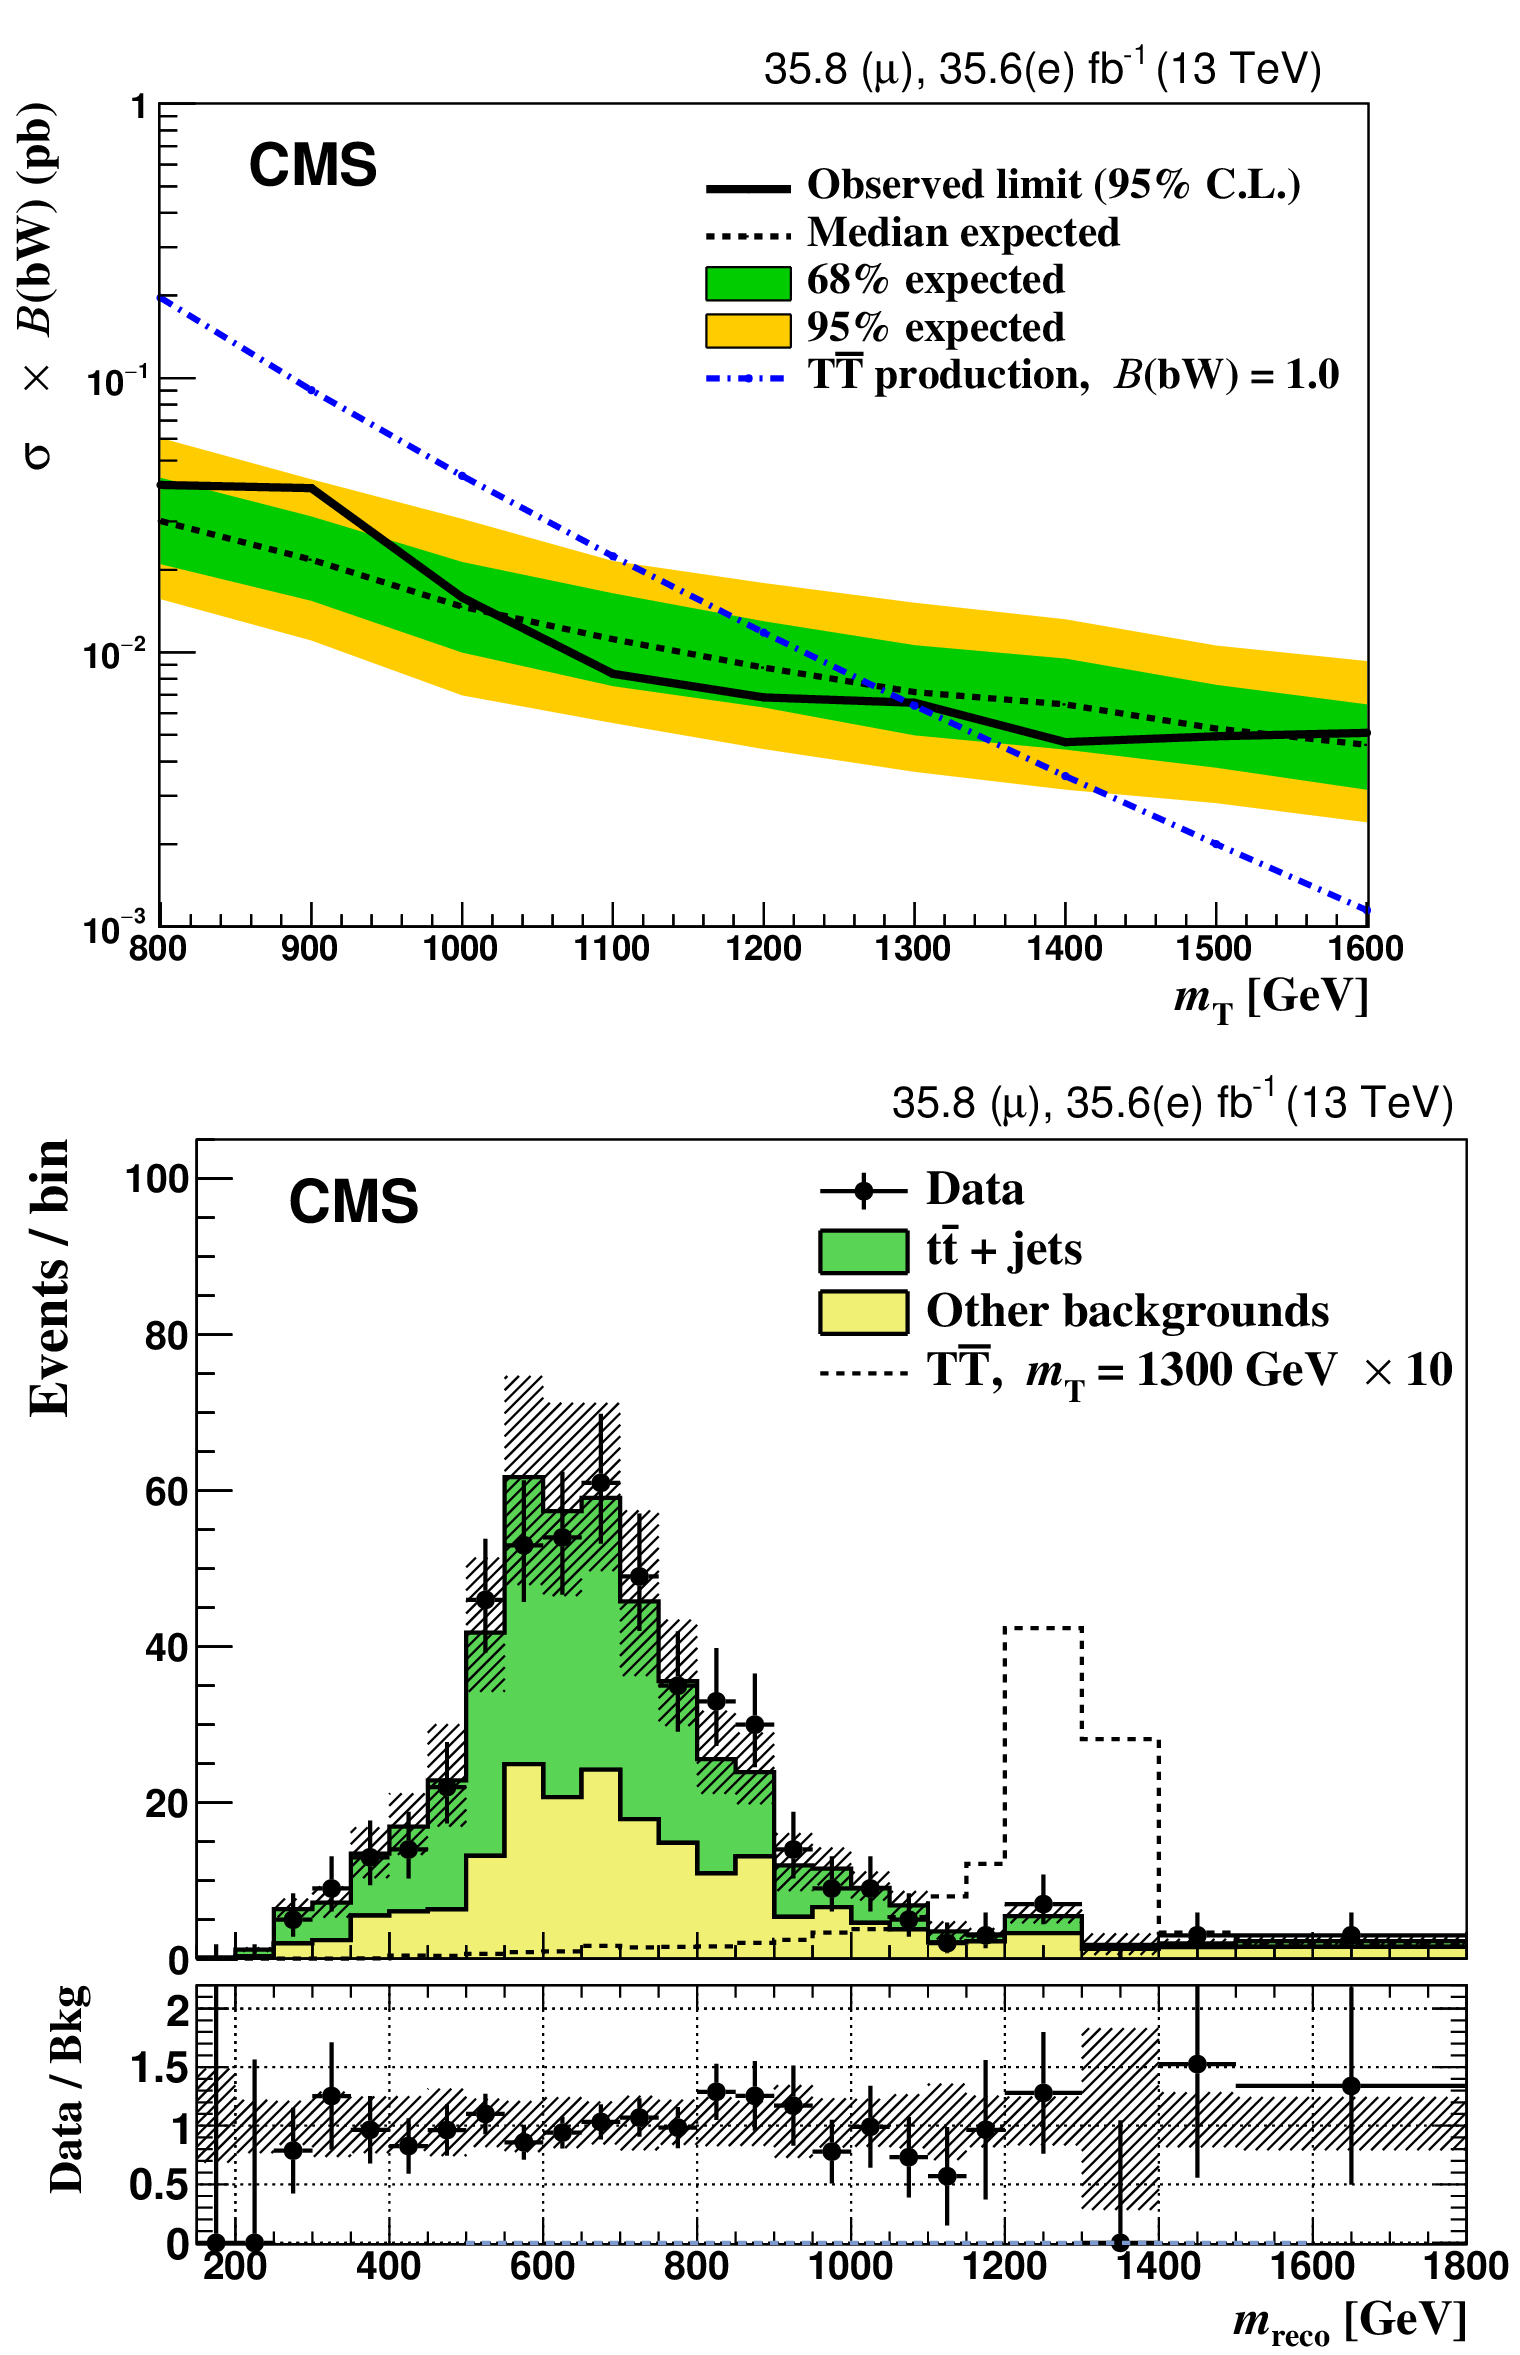
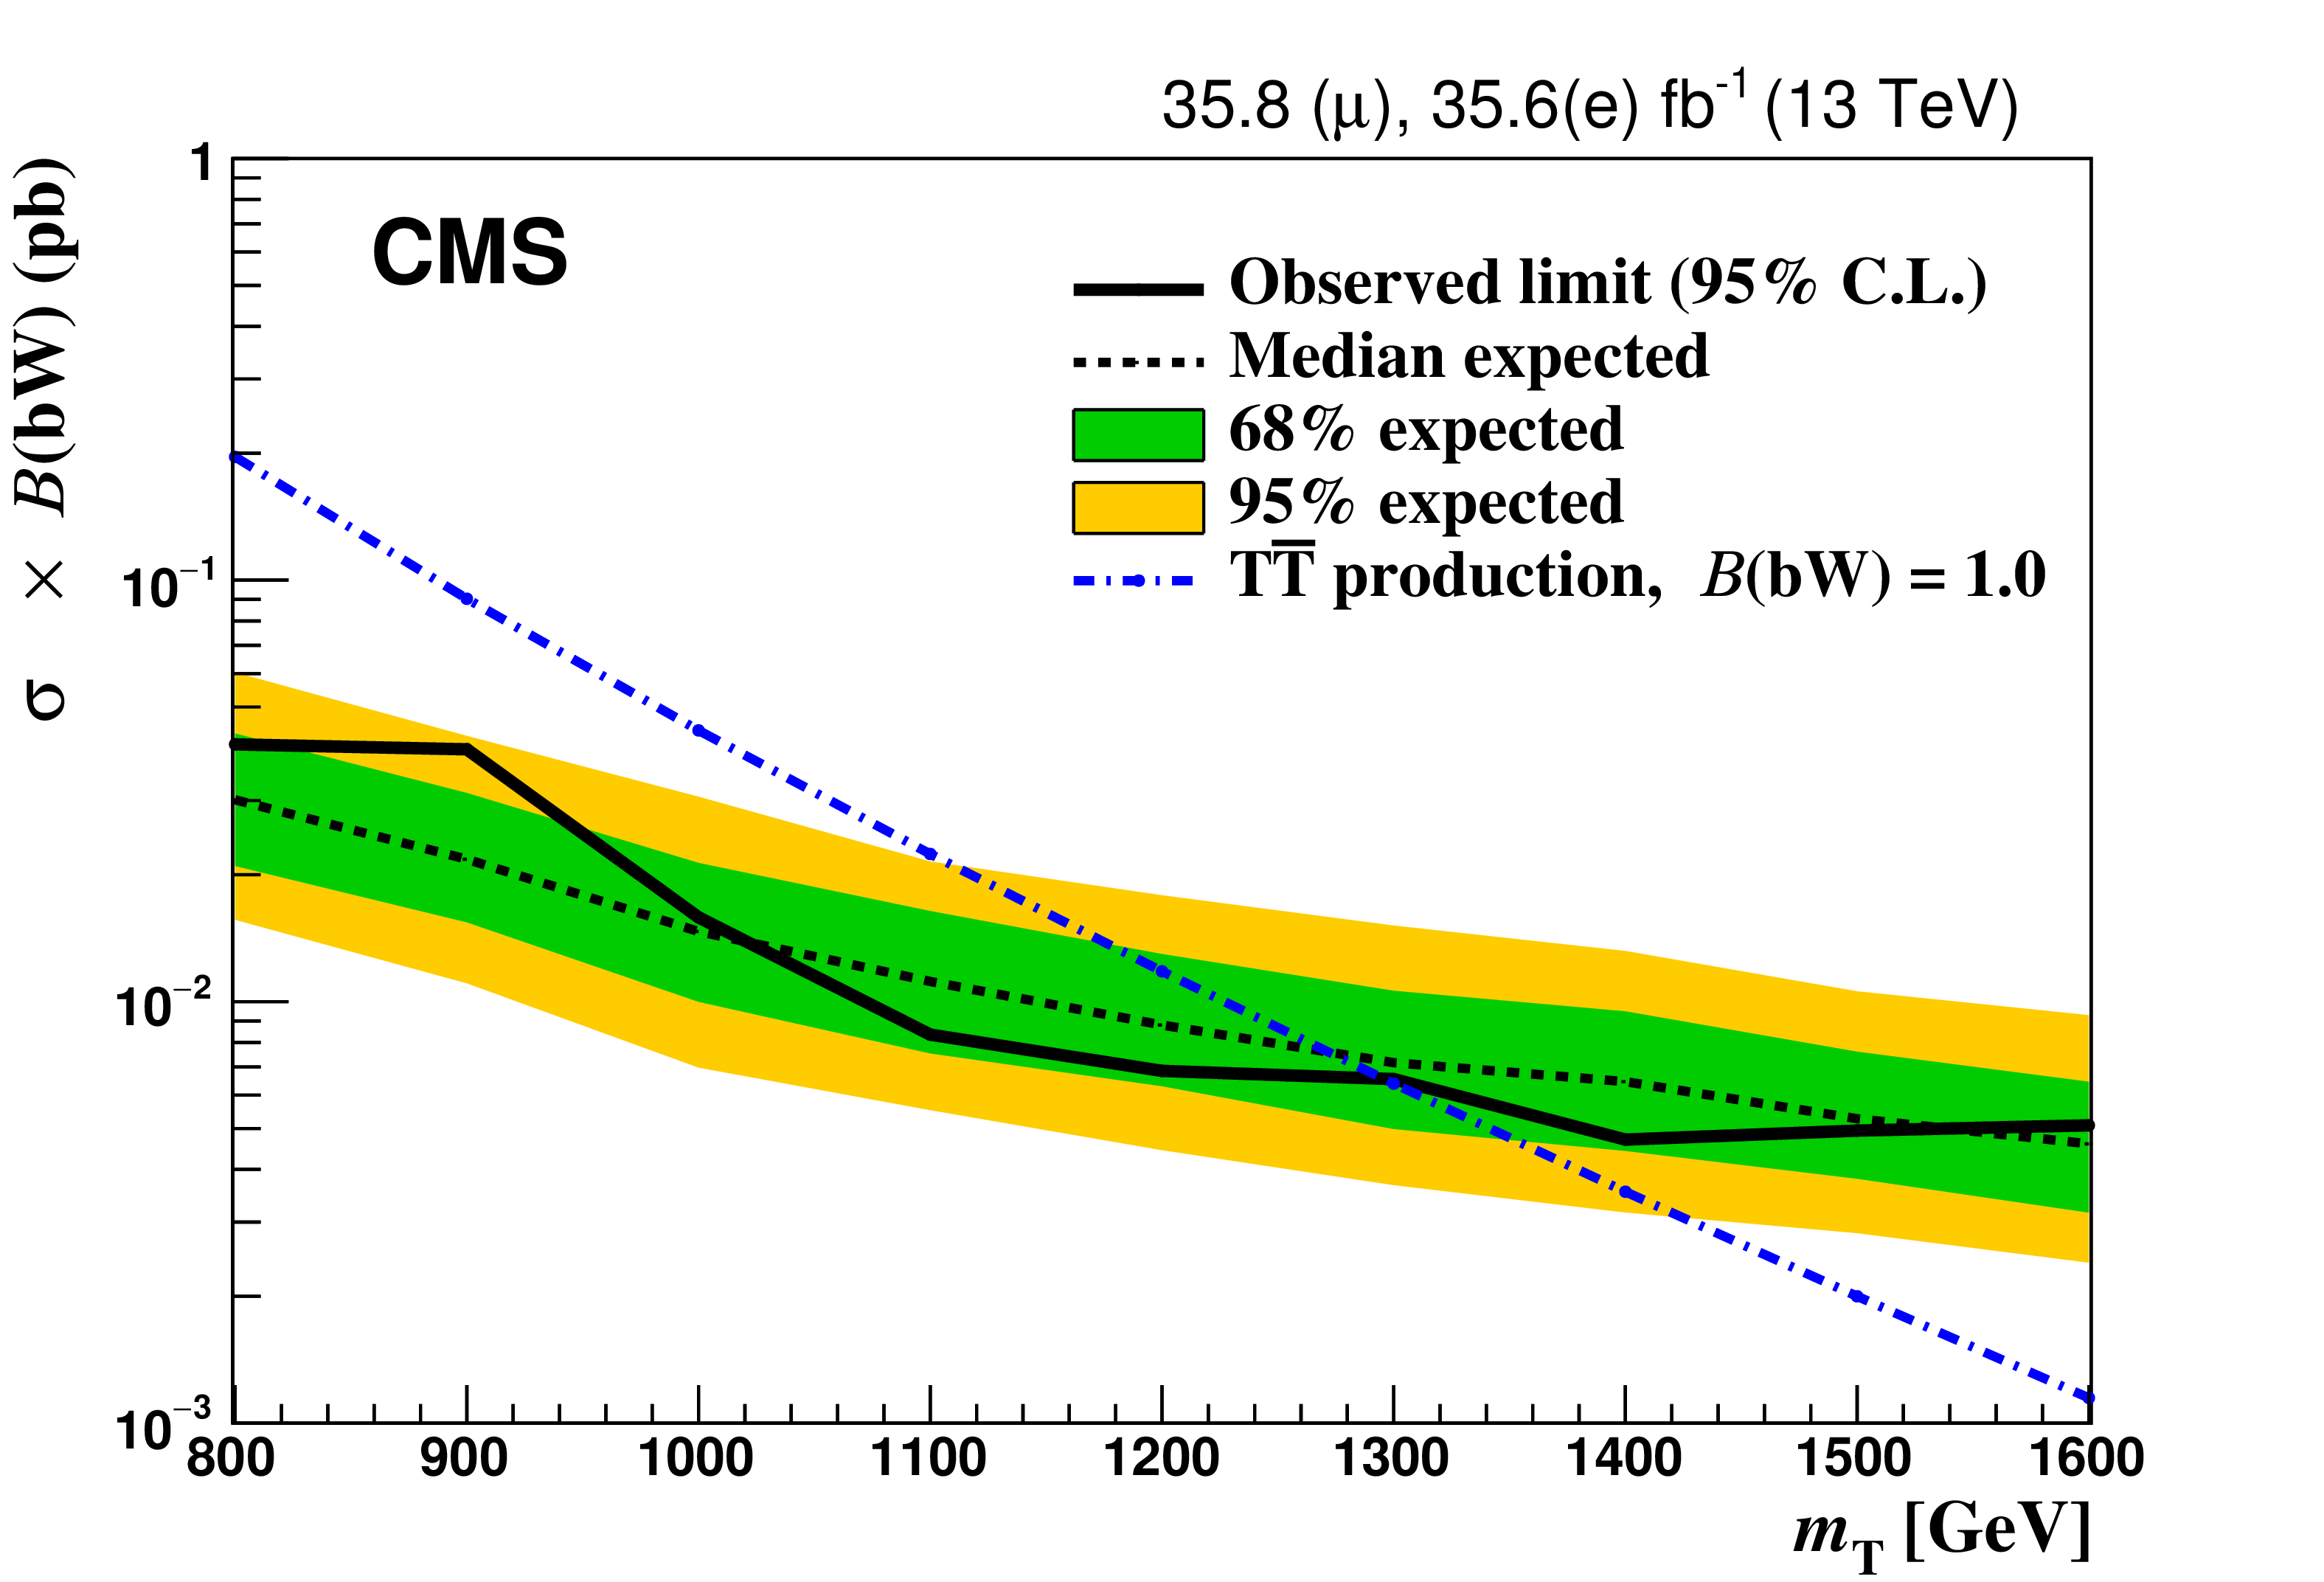
Figure 4:
Upper plot: Observed and expected Bayesian upper limits at 95% CL on the product of the $ {\mathrm {T}\overline {\mathrm {T}}} $ or $ {\mathrm {Y}\overline {\mathrm {Y}}} $ production cross section and the branching fraction to bW using only the W-tagged events. The inner and outer bands show the 1 and 2 standard deviation uncertainty ranges in the expected limits, respectively. The dashed-dotted line shows the prediction of the theory. Lower plot: The post-fit distribution of the reconstructed T quark mass, $ {m_{\text {reco}}}$. Horizontal bars on the data points show bin size. The shaded band on the histogram and on the ratio plot shows the quadrature sum of the statistical and systematic uncertainties. The MC prediction for heavy quark production with a mass of 1300 GeV is shown by a dashed line, enhanced by a factor of 10. |
png pdf |
Figure 4-a:
Observed and expected Bayesian upper limits at 95% CL on the product of the $ {\mathrm {T}\overline {\mathrm {T}}} $ or $ {\mathrm {Y}\overline {\mathrm {Y}}} $ production cross section and the branching fraction to bW using only the W-tagged events. The inner and outer bands show the 1 and 2 standard deviation uncertainty ranges in the expected limits, respectively. The dashed-dotted line shows the prediction of the theory. |

png pdf |
Figure 4-b:
The post-fit distribution of the reconstructed T quark mass, $ {m_{\text {reco}}}$. Horizontal bars on the data points show bin size. The shaded band on the histogram and on the ratio plot shows the quadrature sum of the statistical and systematic uncertainties. The MC prediction for heavy quark production with a mass of 1300 GeV is shown by a dashed line, enhanced by a factor of 10. |
| Tables | |
png pdf |
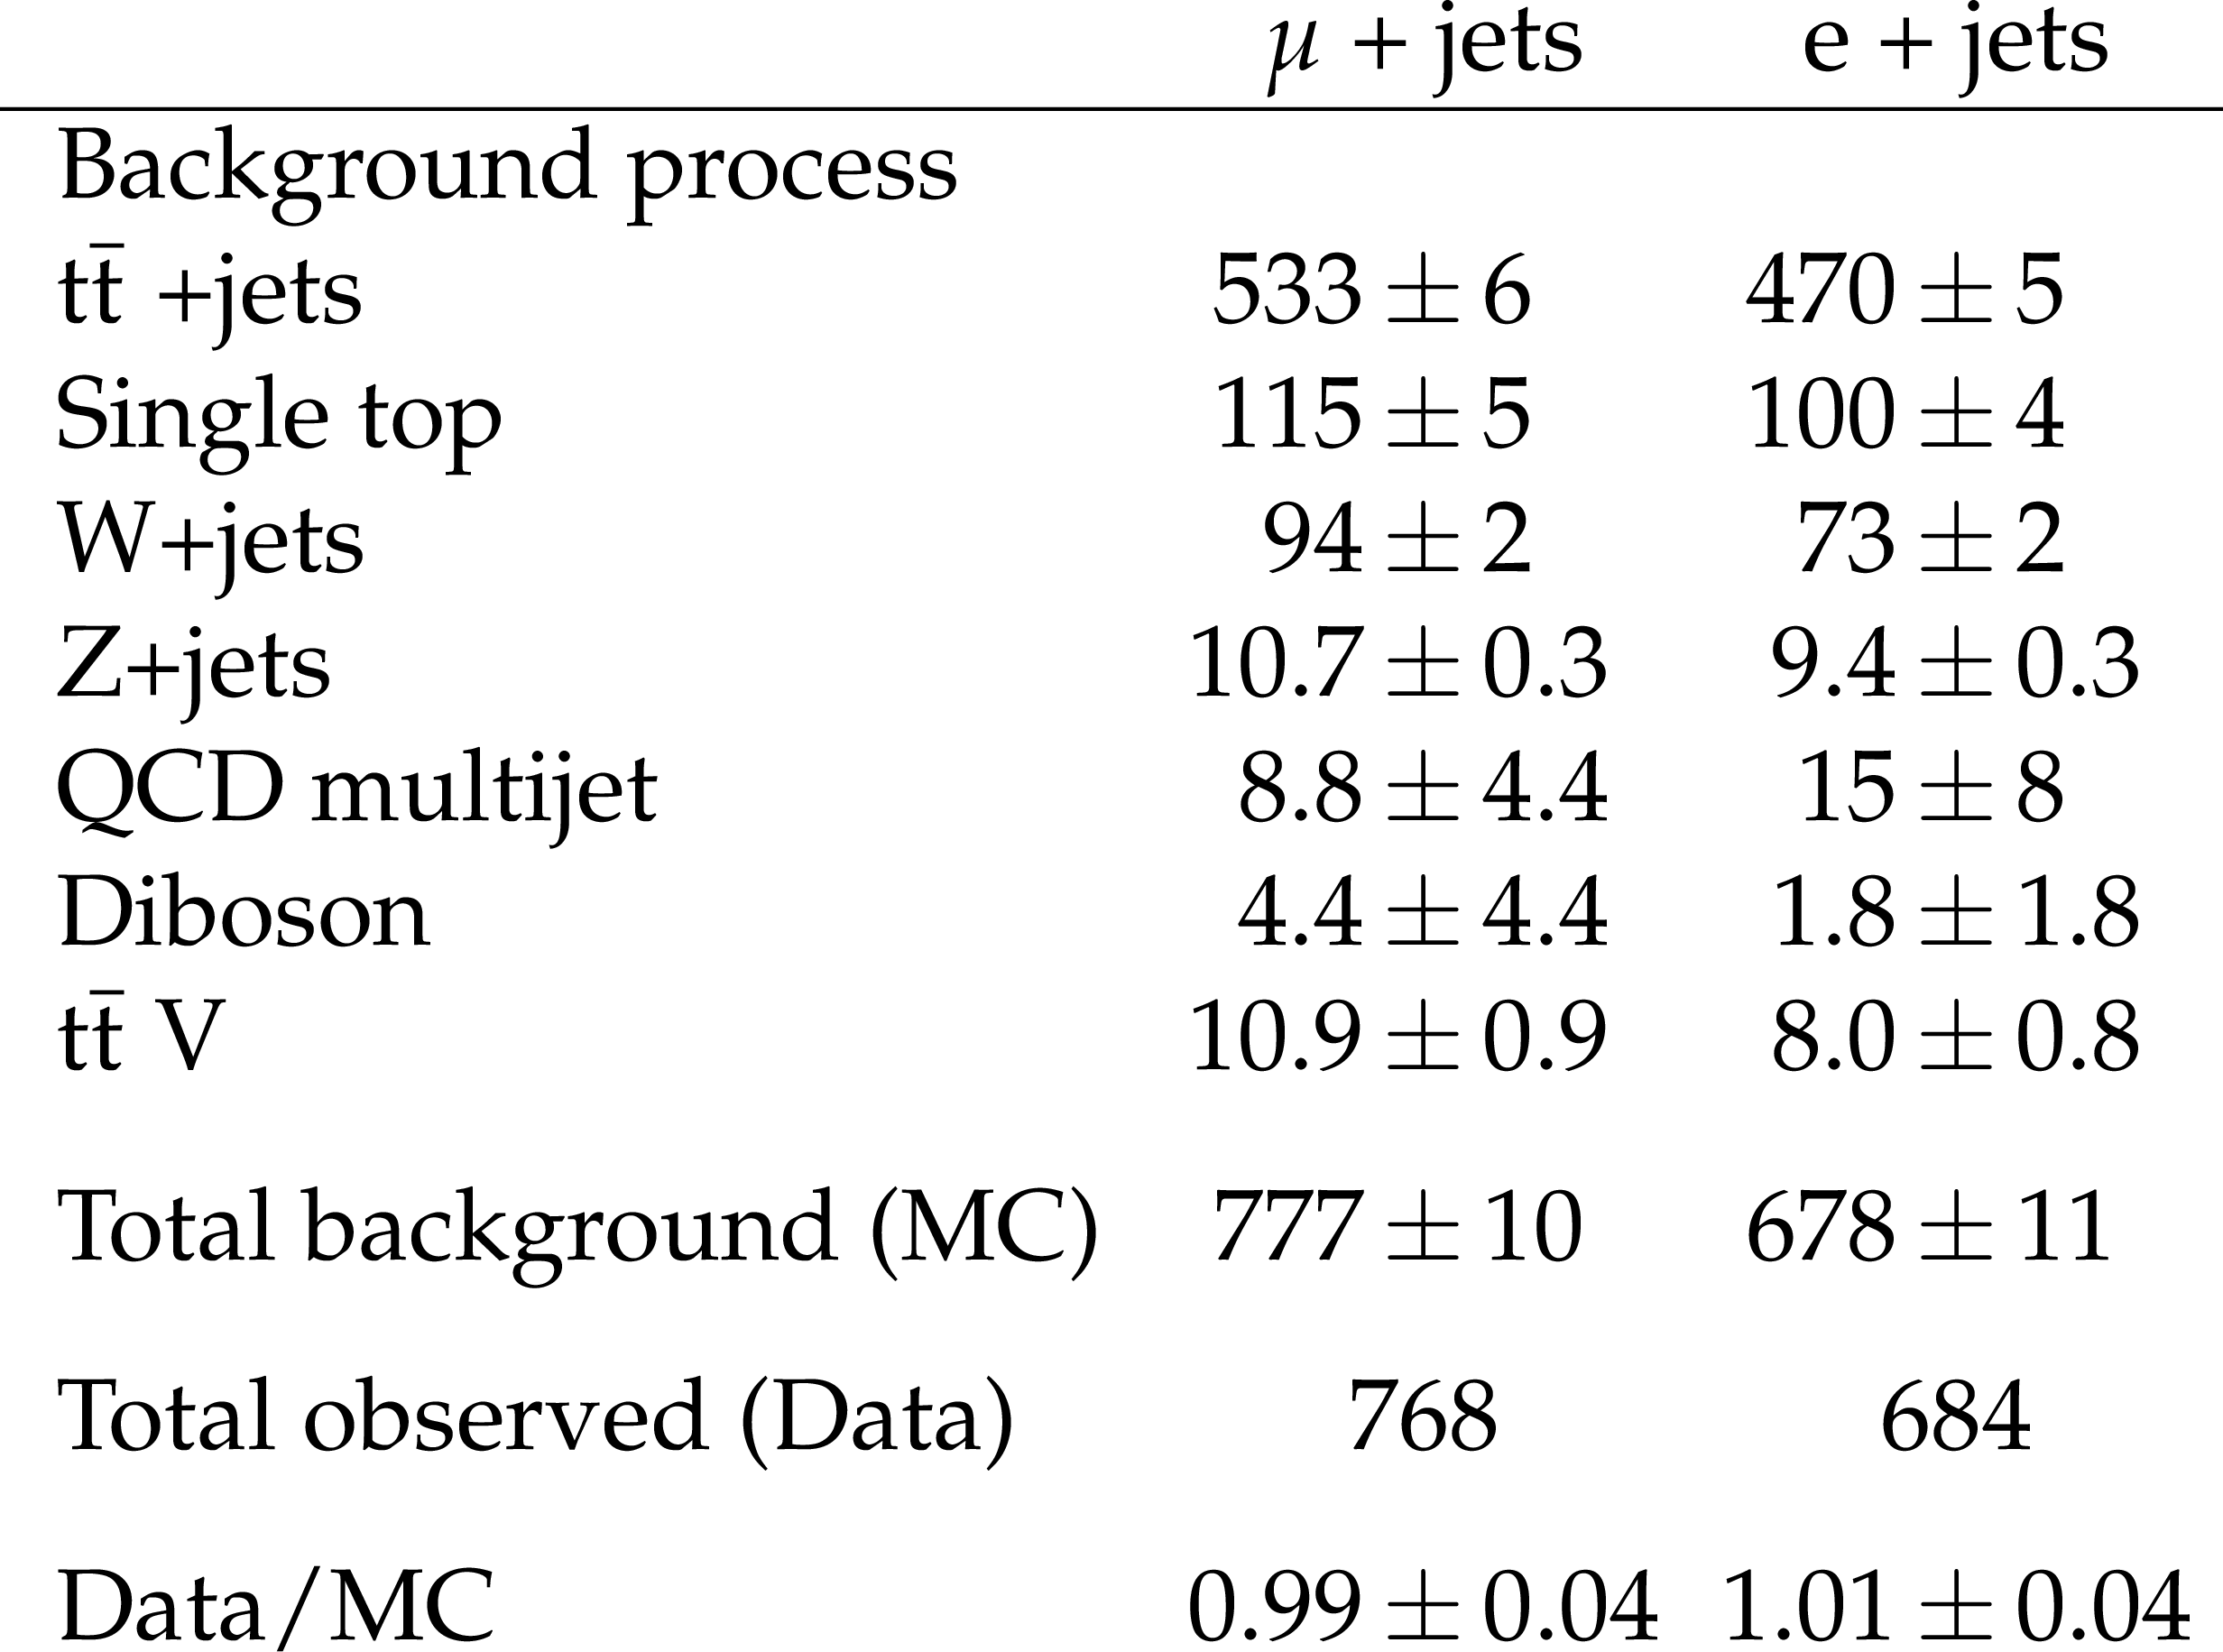
Table 1:
The numbers of expected background events for each process in the $\mu $+jets and e+jets channels, normalized to the integrated luminosity of the data, the number of observed events, and the ratio of the observed to predicted events. The uncertainties in the predicted numbers of background events are statistical only. |
png pdf |
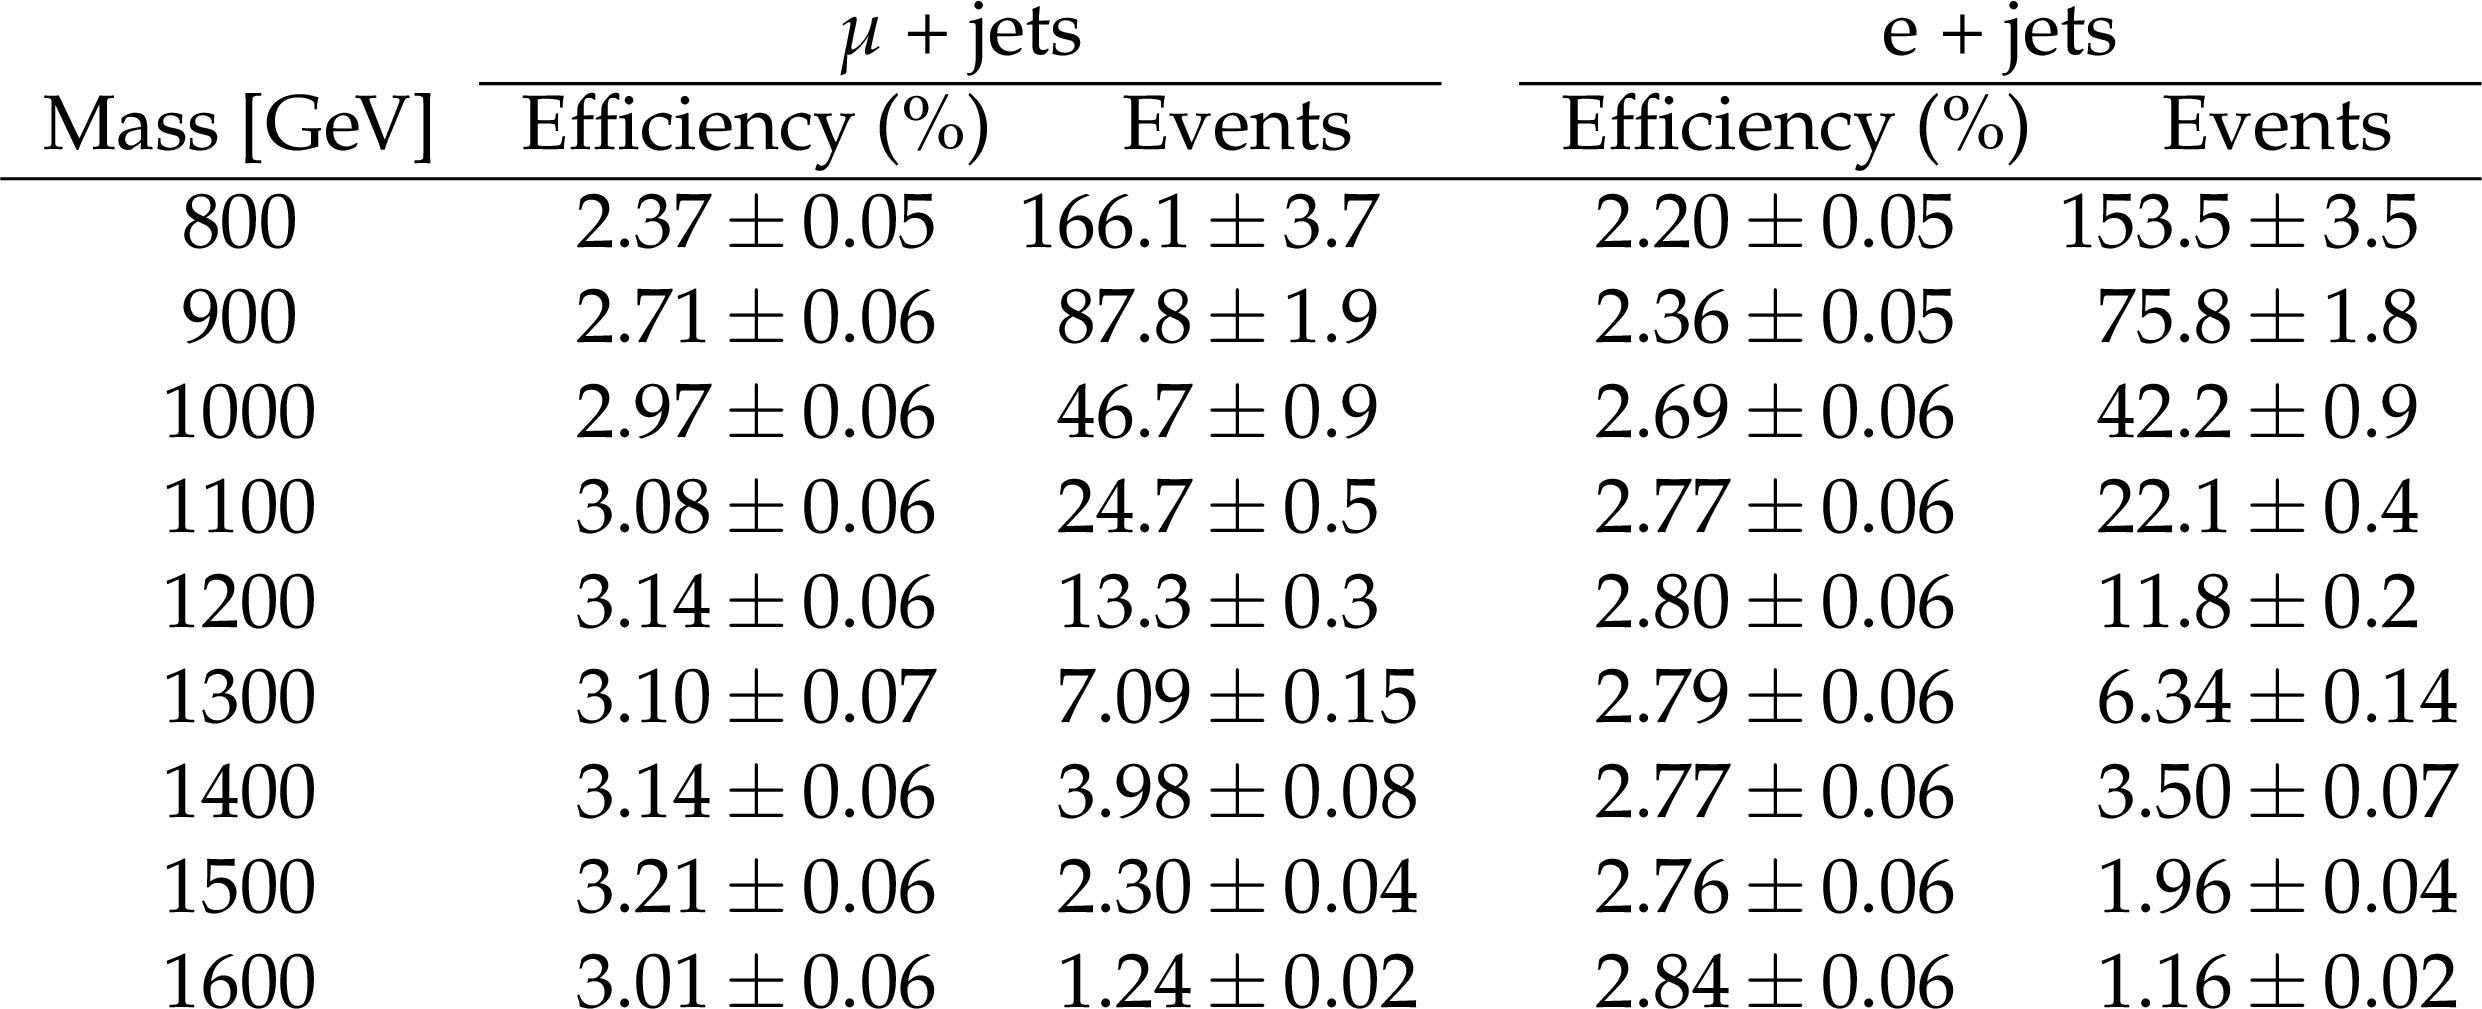
Table 2:
Selection efficiencies from MC simulation for the $ {\mathrm {T}\overline {\mathrm {T}}} $ signal as a function of the T quark mass assuming $\mathcal {B}({\mathrm {T}} \to {\mathrm{b} \mathrm{W}}) = 100%$, and the numbers of expected signal events after the final selection for the integrated luminosity of the data. The uncertainties are statistical only. |
png pdf |
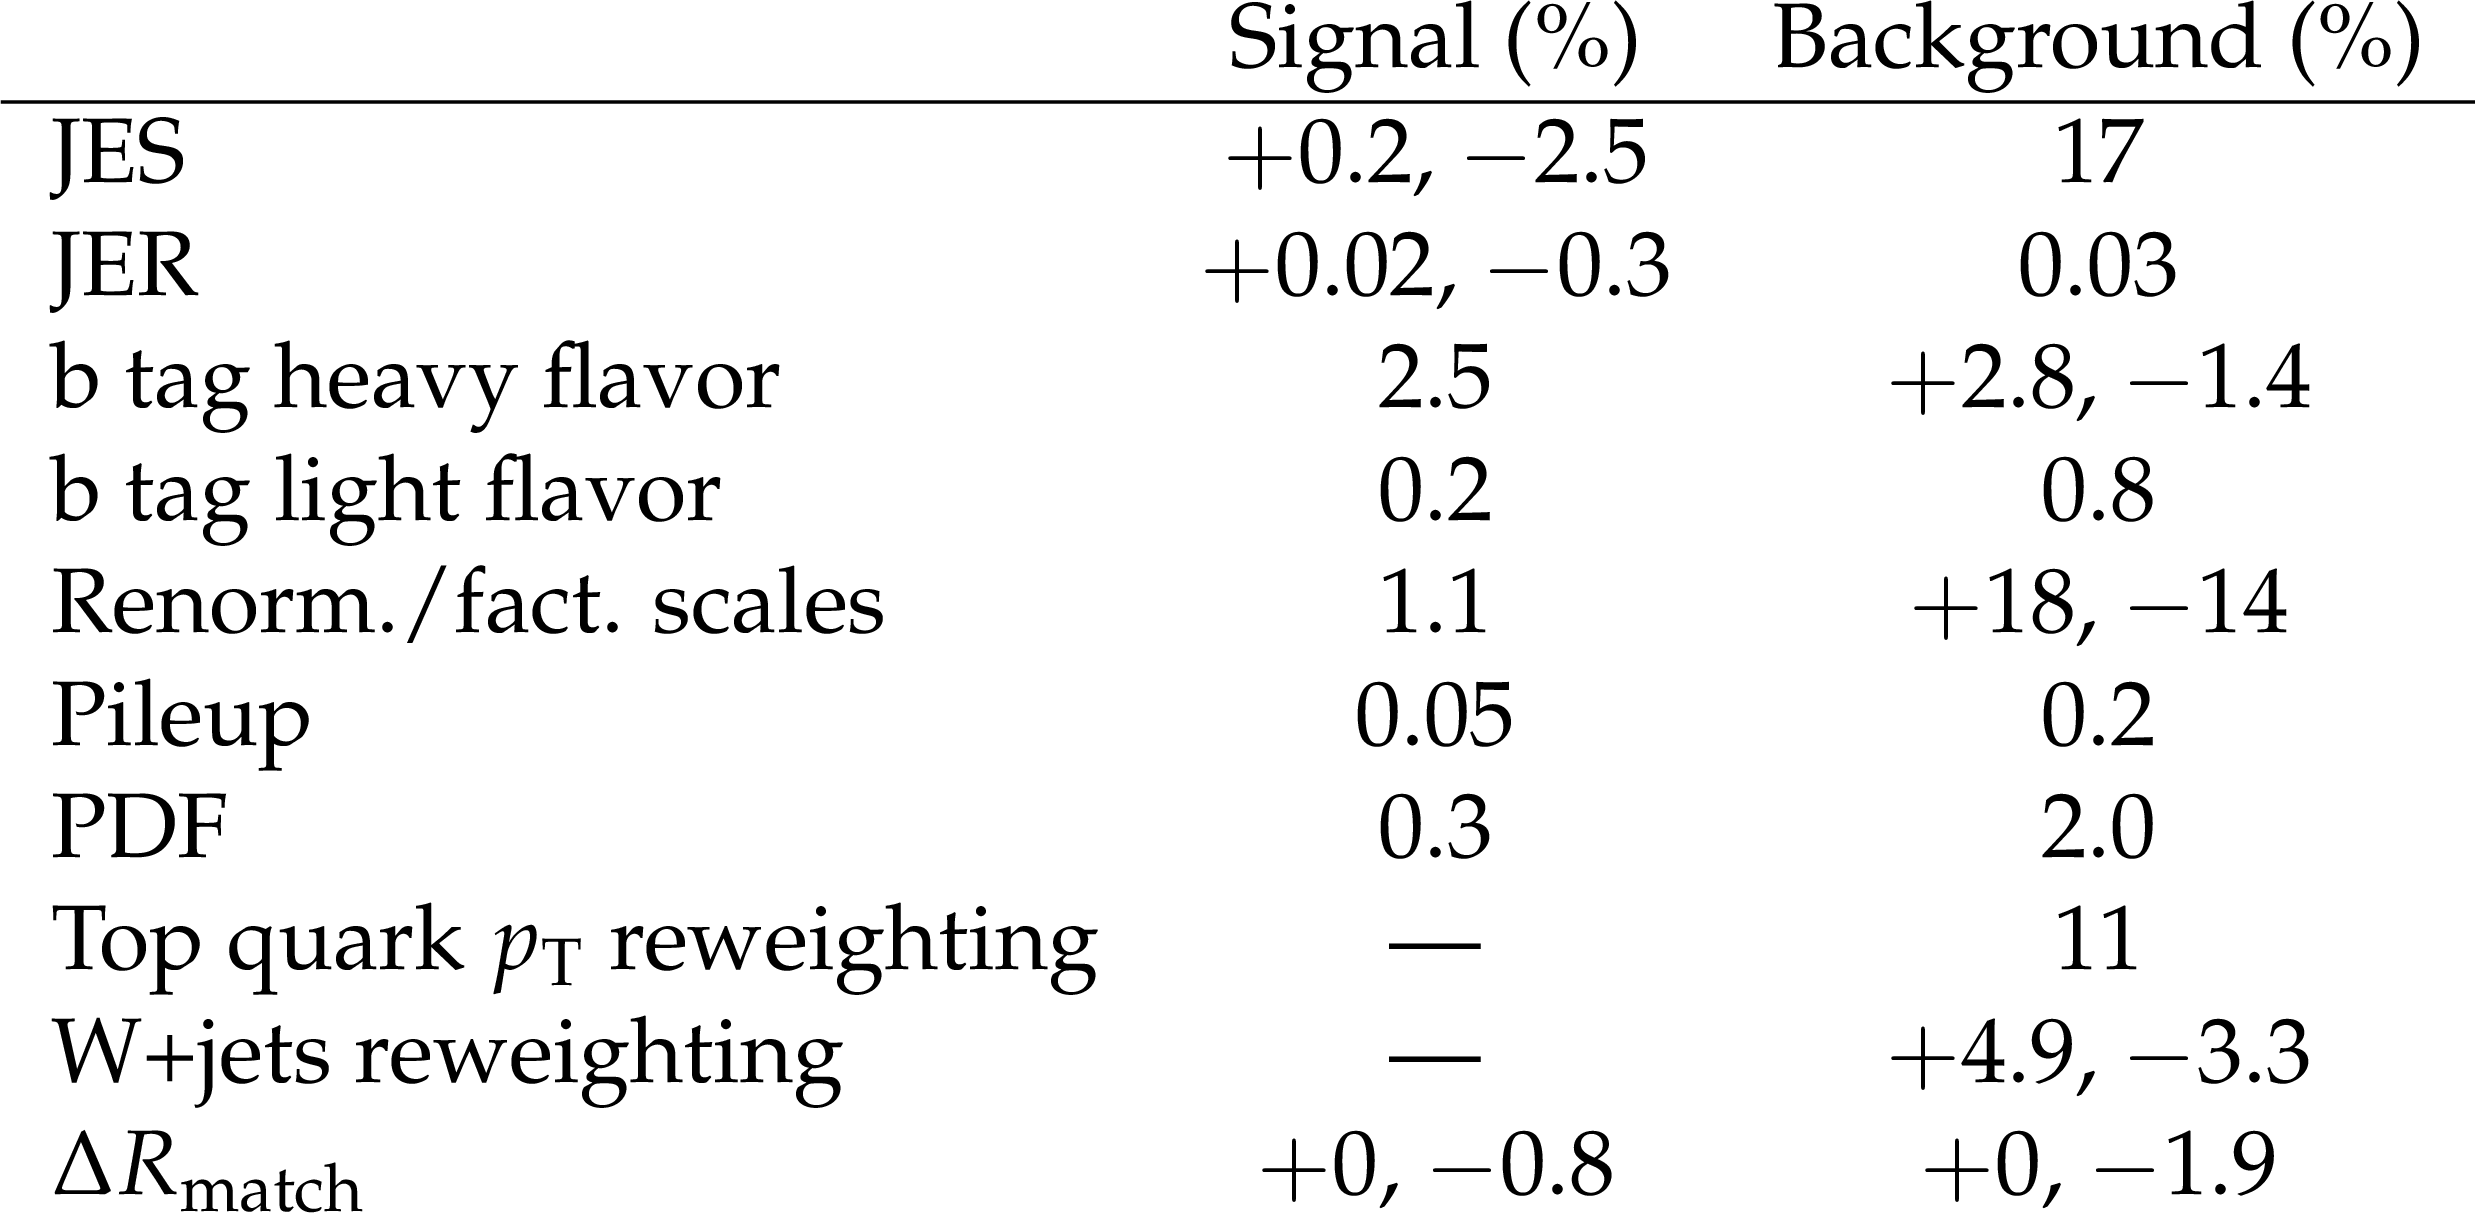
Table 3:
Variations in percent on the yield of the selected MC events due to shape systematic uncertainties for a signal with a T quark mass of 1200 GeV and background. |
| Summary |
| The results of a search for vector-like quarks, either T or Y, with electric charge of $ 2/3 $ and $ -4/3 $, respectively, that are pair produced in pp interactions at $\sqrt{s} = $ 13 TeV and decay exclusively via the bW channel have been presented. Events are selected requiring that one W boson decays to a lepton and neutrino, and the other to a quark-antiquark pair. The selection requires a muon or electron, significant missing transverse momentum, and at least four jets. A kinematic fit assuming ${\mathrm{T}\overline{\mathrm{T}}} $ or ${\mathrm{Y}\overline{\mathrm{Y}}} $ production is performed and for every event a candidate T/Y quark mass ${m_{\text{reco}}}$ is reconstructed. The analysis provides a high-resolution (7%) mass scan of the bW spectrum in the range from the top quark mass up to $\approx$2 TeV, in which the signal from pair production of equal mass objects decaying to bW would show up in a model-independent way as a narrow peak. A binned maximum-likelihood fit to the ${m_{\text{reco}}}$ distribution is made and no significant deviations from the standard model expectations are found. Upper limits are set on the ${\mathrm{T}\overline{\mathrm{T}}} $ and ${\mathrm{Y}\overline{\mathrm{Y}}} $ pair production cross sections as a function of their mass. By comparing these limits with the predicted theoretical cross section of the pair production, the production of T and Y quarks is excluded at 95% confidence level for masses below 1295 GeV (1275 GeV expected). More generally, the results set upper limits on the product of the production cross section and branching fraction to bW for any new heavy quark decaying to this channel. |
| Additional Figures | |
png pdf |
Additional Figure 1:
The $ {\mathrm {T}} $ quark reconstructed mass spectra for the sum of $\mu $+jets and e+jets channels from data and from MC simulations of signal and background processes. The upper plot has a logarithmic x-axis scale and the bin size corresponds to 7% of the mass value in the middle of the bin. The MC prediction for the pair production of a $ {\mathrm {T}} $ quark with a mass of 800 GeV is shown by a dotted line, without an enhancement factor. The MC prediction for pair production of a $ {\mathrm {T}} $ quark with a mass of 1300 GeV is shown by a dashed line, enhanced by a factor of 20. The lower panels show the ratio of the data to the background prediction. The uncertainties represented by the vertical bars on the points are statistical only. The shaded regions show the total statistical uncertainties in the background. |
png pdf |
Additional Figure 2:
The $ {\mathrm {T}\overline {\mathrm {T}}} $ mass distributions for the $e$+jets (upper) and $\mu $+jets (middle) channels and their sum (the lowest). The lower panels on each plot show the ratio of the data to the background prediction. The dashed lines shown the expected signal for a T quark mass of 1300 GeV, multiplied by a factor of 20. The uncertainties shown by the vertical bars are statistical only. |
png pdf |
Additional Figure 2-a:
The $ {\mathrm {T}\overline {\mathrm {T}}} $ mass distributions for the $e$+jets channel. The lower panel shows the ratio of the data to the background prediction. The dashed lines shown the expected signal for a T quark mass of 1300 GeV, multiplied by a factor of 20. The uncertainties shown by the vertical bars are statistical only. |
png pdf |
Additional Figure 2-b:
The $ {\mathrm {T}\overline {\mathrm {T}}} $ mass distributions for the $\mu$+jets channel. The lower panel shows the ratio of the data to the background prediction. The dashed lines shown the expected signal for a T quark mass of 1300 GeV, multiplied by a factor of 20. The uncertainties shown by the vertical bars are statistical only. |
png pdf |
Additional Figure 2-c:
The $ {\mathrm {T}\overline {\mathrm {T}}} $ mass distributions for the sum of $e$+jets and $\mu$+jets channels. The lower panel shows the ratio of the data to the background prediction. The dashed lines shown the expected signal for a T quark mass of 1300 GeV, multiplied by a factor of 20. The uncertainties shown by the vertical bars are statistical only. |
png pdf |
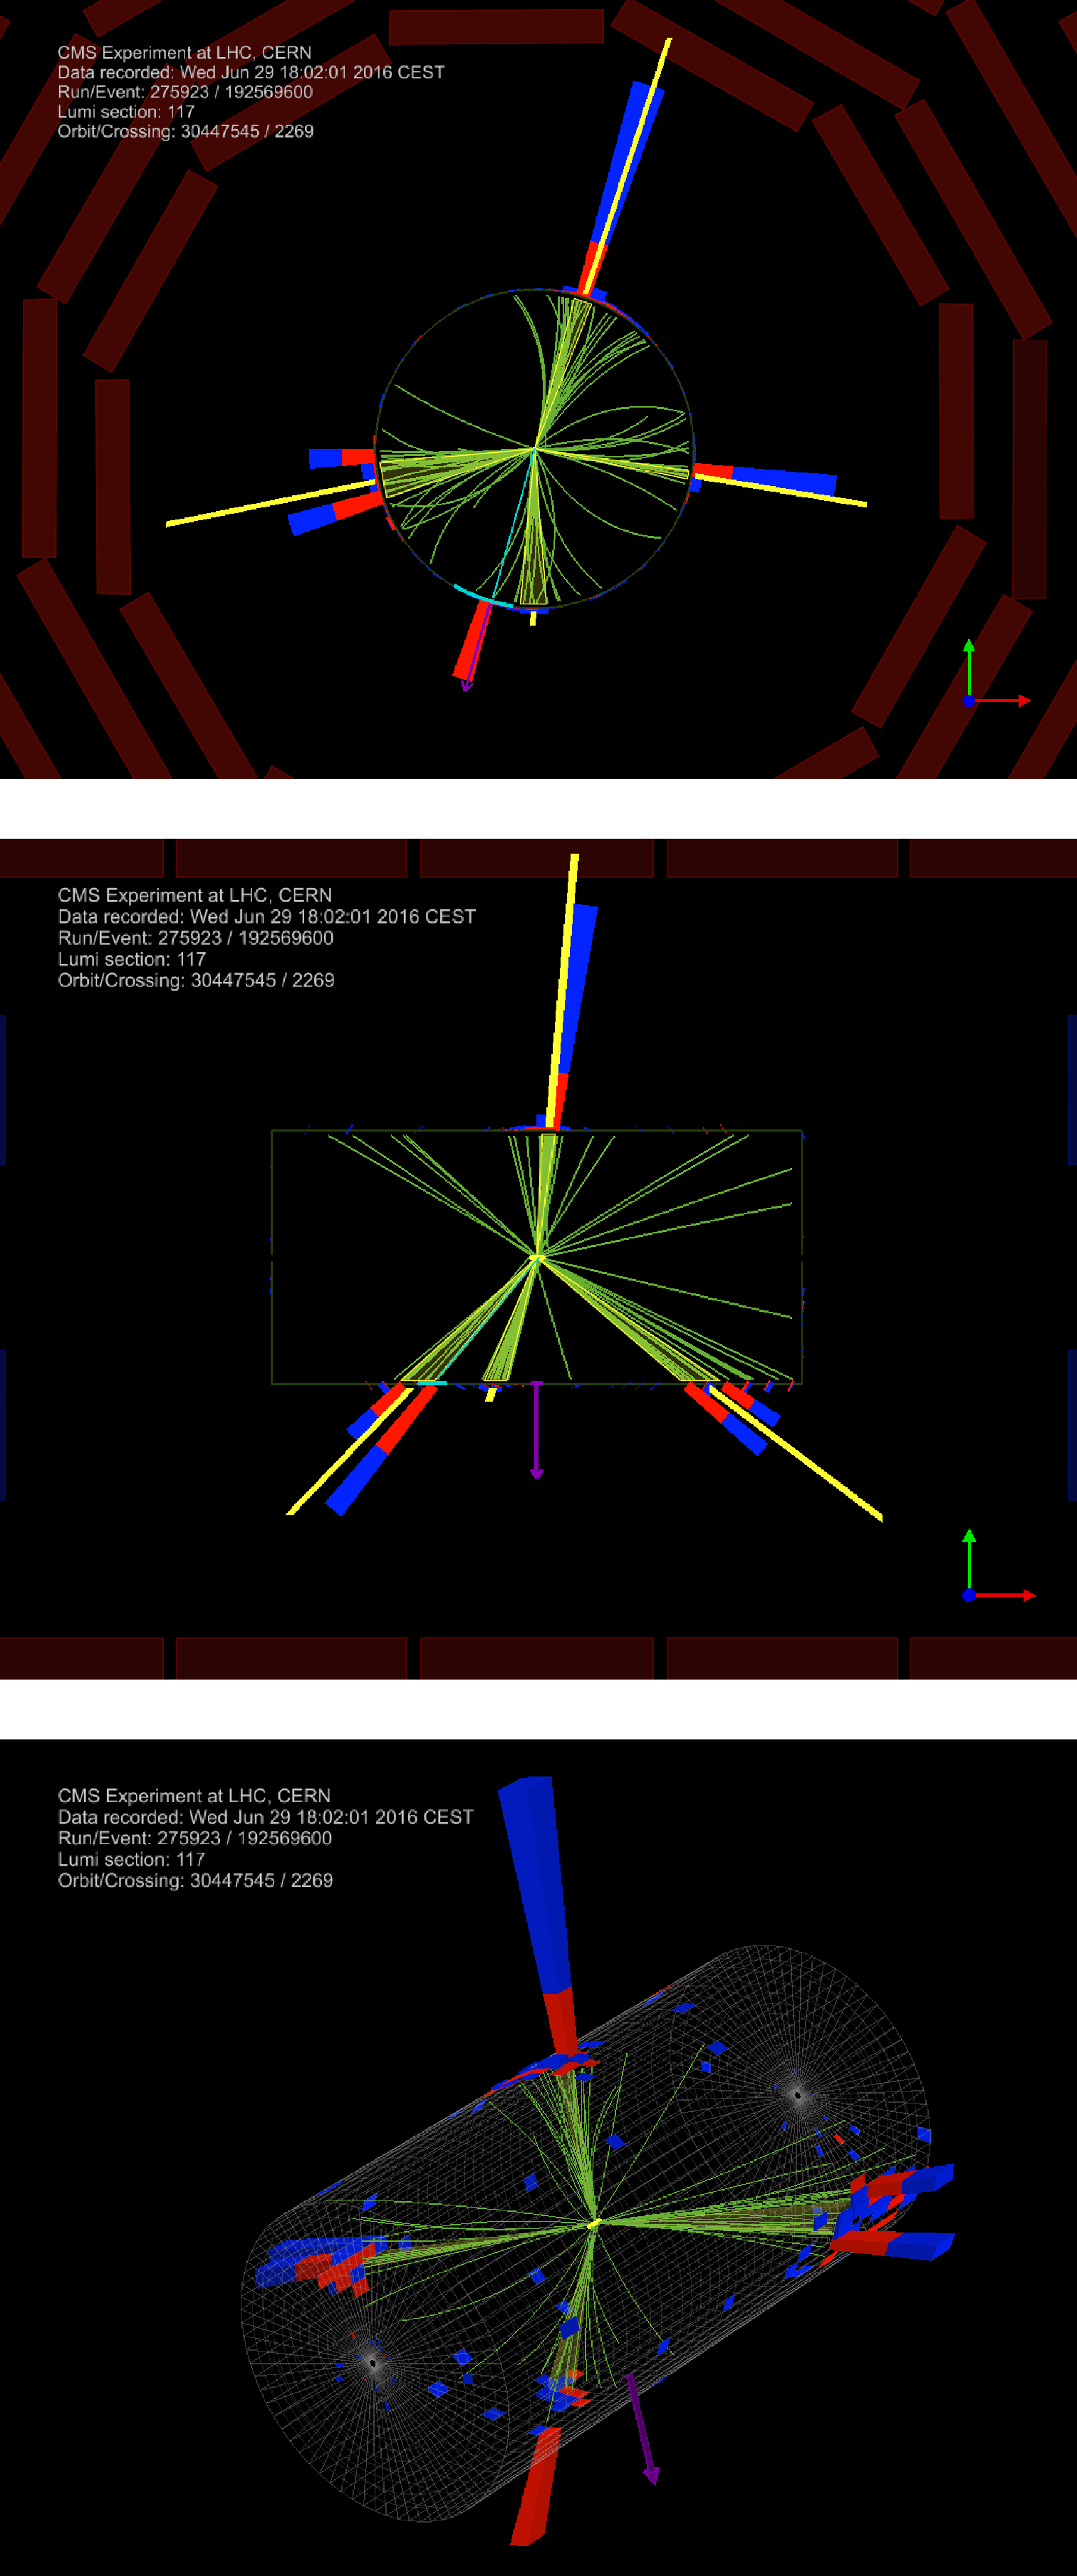
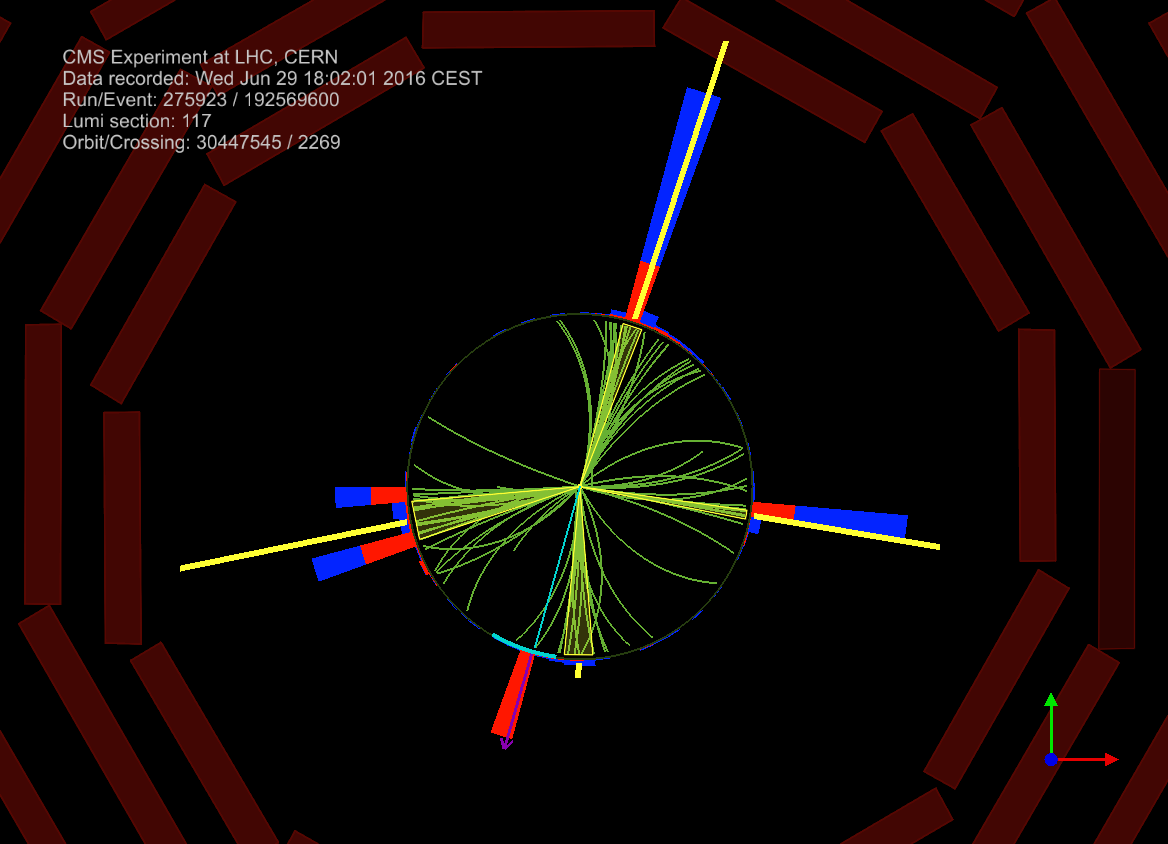
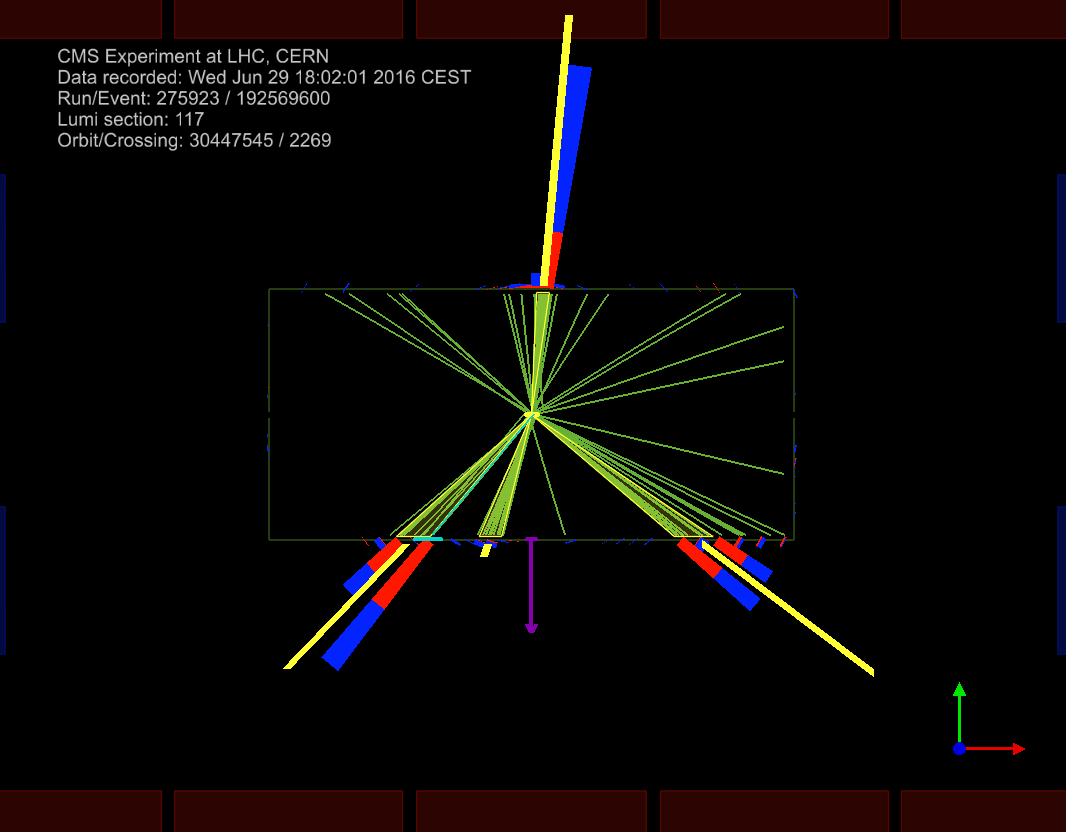
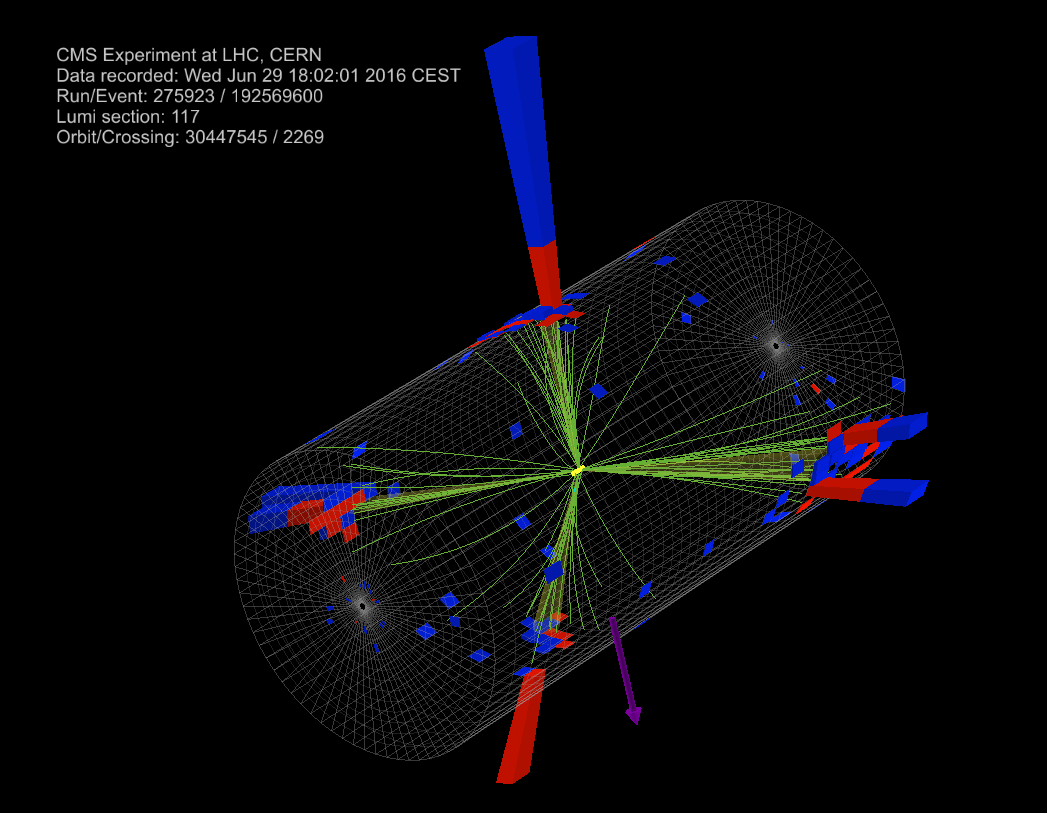
Additional Figure 3:
Display of the data event with the highest reconstructed TT-bar mass of 2775 GeV for the hypothesis $ {\mathrm {T}\overline {\mathrm {T}}} \rightarrow \mathrm {bWbW} \rightarrow \mathrm {e}\nu + 4\mathrm {jets} $ |
png |
Additional Figure 3-a:
Display of the data event with the highest reconstructed TT-bar mass of 2775 GeV for the hypothesis $ {\mathrm {T}\overline {\mathrm {T}}} \rightarrow \mathrm {bWbW} \rightarrow \mathrm {e}\nu + 4\mathrm {jets} $ |
png |
Additional Figure 3-b:
Display of the data event with the highest reconstructed TT-bar mass of 2775 GeV for the hypothesis $ {\mathrm {T}\overline {\mathrm {T}}} \rightarrow \mathrm {bWbW} \rightarrow \mathrm {e}\nu + 4\mathrm {jets} $ |
png |
Additional Figure 3-c:
Display of the data event with the highest reconstructed TT-bar mass of 2775 GeV for the hypothesis $ {\mathrm {T}\overline {\mathrm {T}}} \rightarrow \mathrm {bWbW} \rightarrow \mathrm {e}\nu + 4\mathrm {jets} $ |
Signal reconstruction of a 800 GeV T quark
Additional Fig. 1 displays the reconstructed mass distribution of a vector-like T quark with a mass of 800 GeV. This is near the mass of the previously indicated "ghost state" at $\approx$750 GeV decaying into two photons, though the quantum numbers of the two states are different. This figure is similar to Fig. 2-b in the paper, except it also shows the expected signal (without an enhancement factor) for a T quark with a mass of 800 GeV. The resulting narrow peak with $\approx$300 events shows the high sensitivity of the analysis for this mass region.
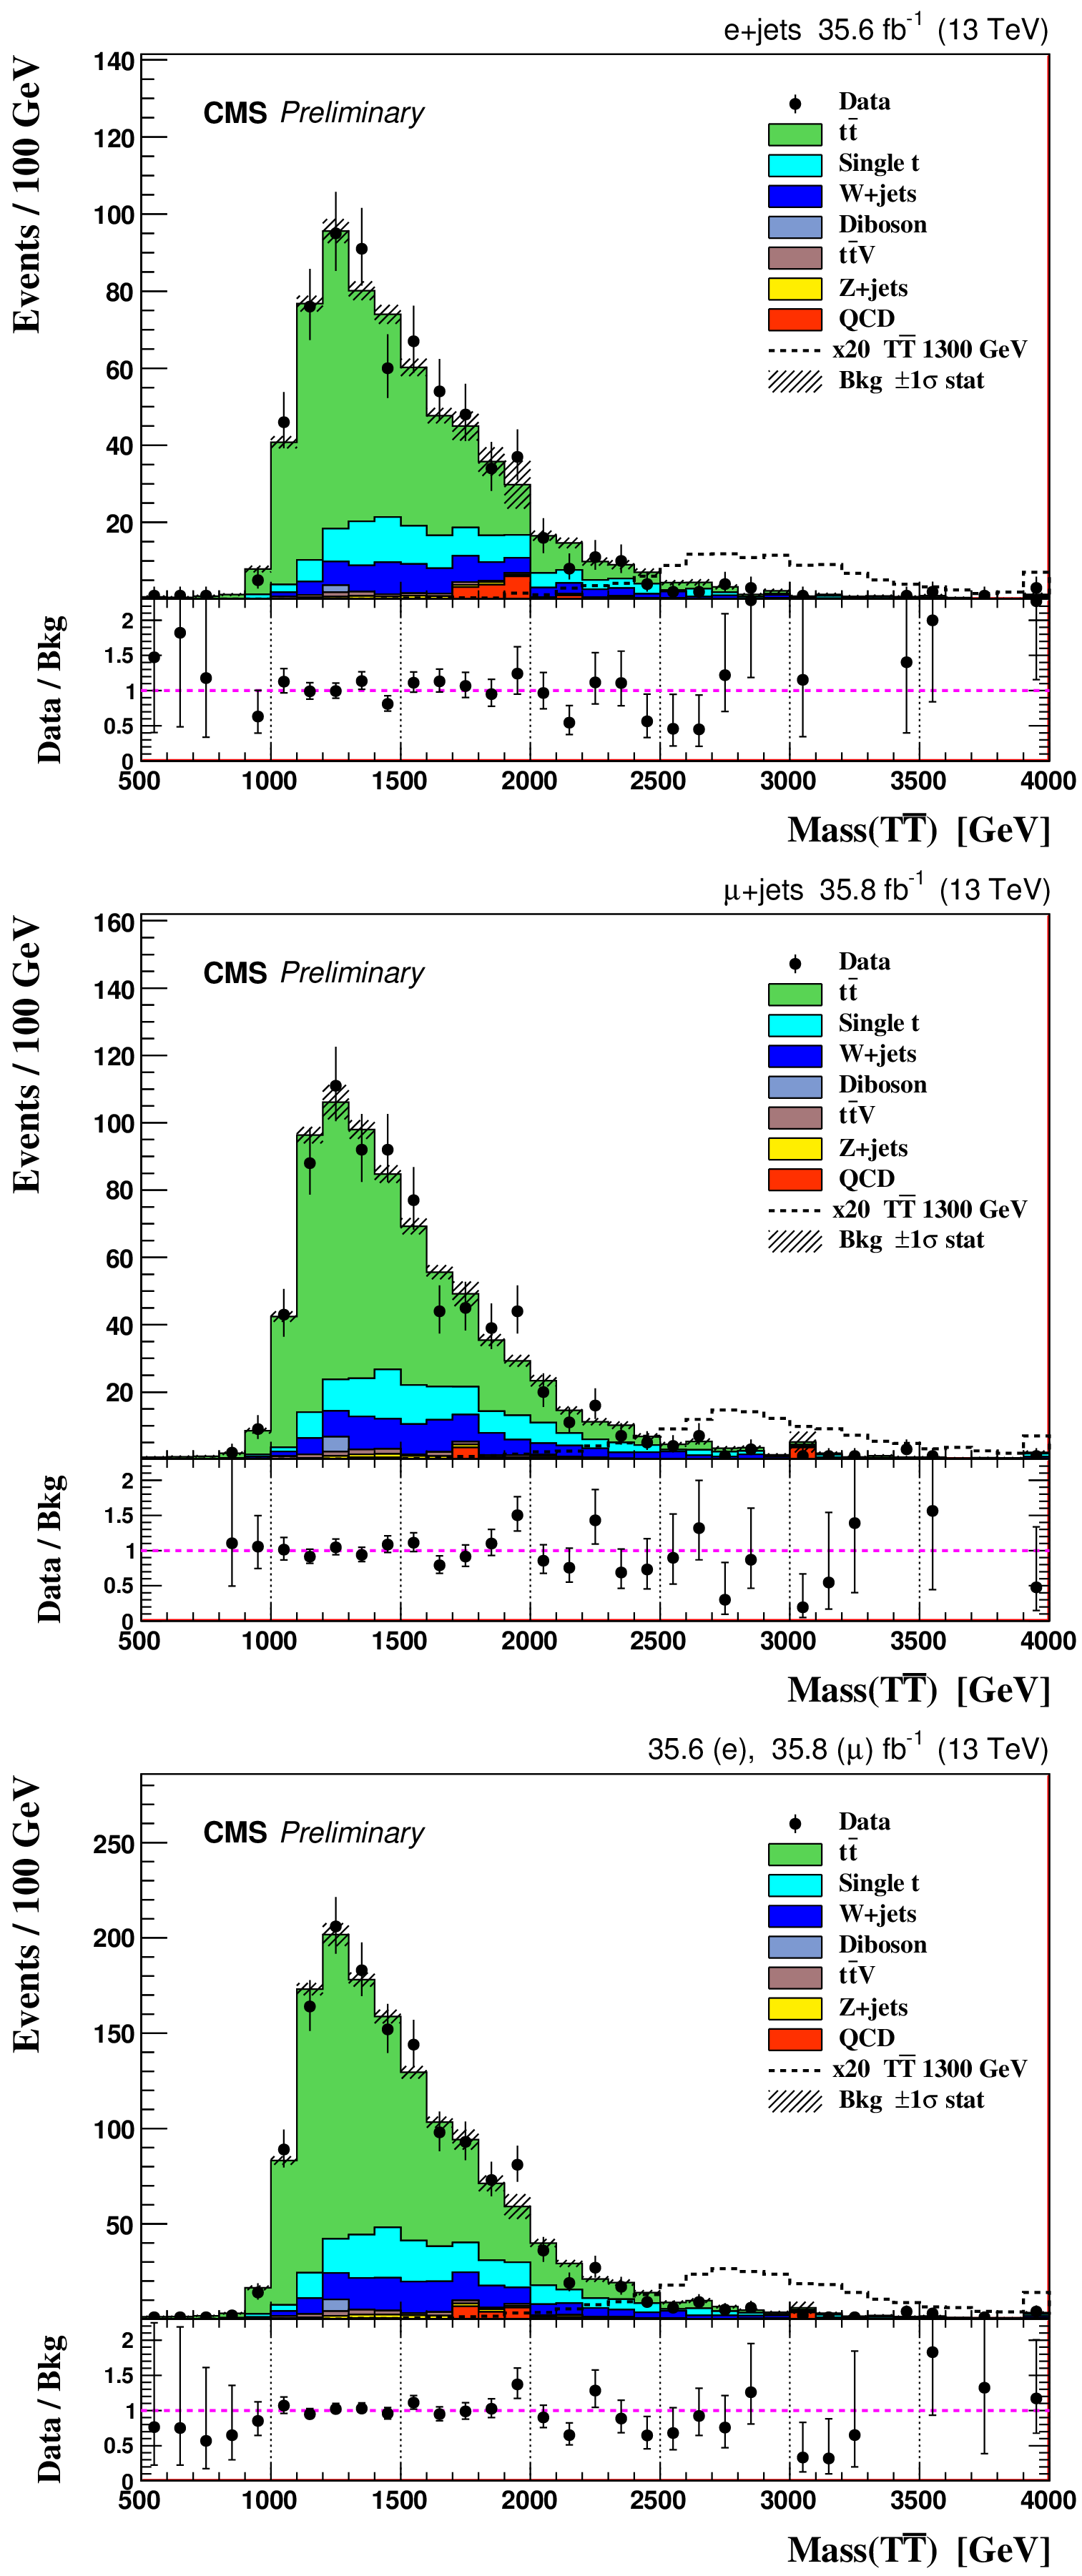
$\mathrm{ T \overline{T} }$ mass distributions
If we assume the existence of a heavy resonance decaying to a pair of
VLQs (like, for example $\mathrm{Z}' \rightarrow \mathrm{ T \overline{T} }$), we can consider the mass
spectrum $ M(\mathrm{ T \overline{T} } )$ as another signal distribution that permits the search
for heavy resonances. This distribution is shown in Additional Fig. 2
for selected events. We do not observe any significant excess of data over
the expected background. Our measured lower limit on the T quark mass of
1295 GeV implies that $ M(\mathrm{ T \overline{T} }) > $ 2590 GeV at the 95%CL.
Properties of the data event with highest reconstructed mass
Additional Fig. 3 displays the event in data that passed all
the selection criteria and had the highest reconstructed TT-bar mass.
Some of the properties of this particular event include:
|
| References | ||||
| 1 | L. Randall and R. Sundrum | A large mass hierarchy from a small extra dimension | PRL 83 (1999) 3370 | hep-ph/9905221 |
| 2 | H.-C. Cheng, B. A. Dobrescu, and C. T. Hill | Electroweak symmetry breaking and extra dimensions | NPB 589 (2000) 249 | hep-ph/9912343 |
| 3 | D. Choudhury, T. M. P. Tait, and C. E. M. Wagner | Beautiful mirrors and precision electroweak data | PRD 65 (2002) 053002 | hep-ph/0109097 |
| 4 | N. Arkani-Hamed, A. G. Cohen, E. Katz, and A. E. Nelson | The littlest Higgs | JHEP 07 (2002) 034 | hep-ph/0206021 |
| 5 | M. Schmaltz | Physics beyond the standard model (theory): Introducing the little Higgs | NPPS 117 (2003) 40 | hep-ph/0210415 |
| 6 | T. Han, H. E. Logan, B. McElrath, and L.-T. Wang | Loop induced decays of the little Higgs: H$ \rightarrow $gg,~$ \gamma\gamma $ | PLB 563 (2003) 191 | hep-ph/0302188 |
| 7 | M. Schmaltz and D. Tucker-Smith | Little Higgs theories | Ann. Rev. Nucl. Part. Sci. 55 (2005) 229 | hep-ph/0502182v1 |
| 8 | H.-C. Cheng, I. Low, and L.-T. Wang | Top partners in little Higgs theories with $ T $ parity | PRD 74 (2006) 055001 | hep-ph/0510225 |
| 9 | D. Marzocca, M. Serone, and J. Shu | General composite Higgs models | JHEP 08 (2012) 013 | 1205.0770 |
| 10 | J. Kang, P. Langacker, and B. D. Nelson | Theory and phenomenology of exotic isosinglet quarks and squarks | PRD 77 (2008) 035003 | 0708.2701 |
| 11 | D. Guadagnoli, R. N. Mohapatra, and I. Sung | Gauged flavor group with left-right symmetry | JHEP 04 (2011) 093 | 1103.4170 |
| 12 | F. del Aguila, L. Ametller, G. L. Kane, and J. Vidal | Vector-like fermion and standard higgs production at hadron colliders | NPB 334 (1990) 1 | |
| 13 | J. A. Aguilar-Saavedra, R. Benbrik, S. Heinemeyer, and M. P\'erez-Victoria | Handbook of vectorlike quarks: Mixing and single production | PRD 88 (2013) 094010 | 1306.0572 |
| 14 | CMS Collaboration | Search for vectorlike charge 2/3 T quarks in proton-proton collisions at $ \sqrt{s} = $ 8 TeV | PRD 93 (2016) 012003 | CMS-B2G-13-005 1509.04177 |
| 15 | ATLAS Collaboration | Search for production of vector-like quark pairs and of four top quarks in the lepton-plus-jets final state in pp collisions at $ \sqrt{s} = $ 8 TeV with the ATLAS detector | JHEP 08 (2015) 105 | 1505.04306 |
| 16 | ATLAS Collaboration | Search for pair production of heavy vector-like quarks decaying to high-$ p_\mathrm{T} $ W bosons and b quarks in the lepton-plus-jets final state in pp collisions at $ \sqrt{s} = $ 13 TeV with the ATLAS detector | JHEP 10 (2017) 141 | 1707.03347 |
| 17 | A. J. Larkoski, S. Marzani, G. Soyez, and J. Thaler | Soft drop | JHEP 05 (2014) 146 | 1402.2657 |
| 18 | CMS Collaboration | The CMS experiment at the CERN LHC | JINST 3 (2008) S08004 | CMS-00-001 |
| 19 | P. Nason | A new method for combining NLO QCD with shower Monte Carlo algorithms | JHEP 11 (2004) 040 | hep-ph/0409146 |
| 20 | S. Frixione, P. Nason, and C. Oleari | Matching NLO QCD computations with parton shower simulations: the POWHEG method | JHEP 11 (2007) 070 | 0709.2092 |
| 21 | S. Alioli, P. Nason, C. Oleari, and E. Re | A general framework for implementing NLO calculations in shower Monte Carlo programs: the POWHEG BOX | JHEP 06 (2010) 043 | 1002.2581 |
| 22 | J. Baglio | Next-to-leading order QCD corrections to associated production of a SM Higgs boson with a pair of weak bosons in the POWHEG-BOX | PRD 93 (2016) 054010 | 1512.05787 |
| 23 | T. Sjostrand et al. | An introduction to PYTHIA 8.2 | CPC 191 (2015) 159 | 1410.3012 |
| 24 | J. Alwall et al. | The automated computation of tree-level and next-to-leading order differential cross sections, and their matching to parton shower simulations | JHEP 07 (2014) 079 | 1405.0301 |
| 25 | M. Czakon, P. Fiedler, and A. Mitov | Total top-quark pair-production cross section at hadron colliders through $ O(\alpha_{S}^4) $ | PRL 110 (2013) 252004 | 1303.6254 |
| 26 | GEANT4 Collaboration | GEANT4 -- a simulation toolkit | NIMA 506 (2003) 250 | |
| 27 | NNPDF Collaboration | Parton distributions for the LHC Run II | JHEP 04 (2015) 040 | 1410.8849 |
| 28 | CMS Collaboration | Particle-flow reconstruction and global event description with the CMS detector | JINST 12 (2017) P10003 | CMS-PRF-14-001 1706.04965 |
| 29 | CMS Collaboration | Performance of CMS muon reconstruction in pp collision events at $ \sqrt{s} = $ 7 TeV | JINST 7 (2012) P10002 | CMS-MUO-10-004 1206.4071 |
| 30 | CMS Collaboration | Performance of electron reconstruction and selection with the CMS detector in proton-proton collisions at $ \sqrt{s} = $ 8 TeV | JINST 10 (2015) P06005 | CMS-EGM-13-001 1502.02701 |
| 31 | M. Cacciari, G. P. Salam, and G. Soyez | The catchment area of jets | JHEP 04 (2008) 005 | 0802.1188 |
| 32 | M. Cacciari and G. P. Salam | Pileup subtraction using jet areas | PLB 659 (2008) 119 | 0707.1378 |
| 33 | M. Cacciari, G. P. Salam, and G. Soyez | The anti-$ k_t $ jet clustering algorithm | JHEP 04 (2008) 063 | 0802.1189 |
| 34 | M. Cacciari, G. P. Salam, and G. Soyez | FastJet user manual | EPJC 72 (2012) 1896 | 1111.6097 |
| 35 | M. Cacciari and G. P. Salam | Dispelling the $ N^{3} $ myth for the $ k_t $ jet-finder | PLB 641 (2006) 57 | hep-ph/0512210 |
| 36 | CMS Collaboration | Determination of jet energy calibration and transverse momentum resolution in CMS | JINST 6 (2011) P11002 | CMS-JME-10-011 1107.4277 |
| 37 | CMS Collaboration | Jet energy scale and resolution in the CMS experiment in pp collisions at 8 TeV | JINST 12 (2017) P02014 | CMS-JME-13-004 1607.03663 |
| 38 | V. Lefebure, S. Banerjee, and I. Gonzalez | CMS simulation software using GEANT4 | CMS -NOTE-1999-072 | |
| 39 | CMS Collaboration | Identification of b quark jets at the CMS experiment in the LHC run 2 | CMS-PAS-BTV-15-001 | CMS-PAS-BTV-15-001 |
| 40 | H. Sumowidagdo | HitFit: A kinematic fitter for complete reconstruction of top quark-antitop quark lepton+jets events | ||
| 41 | S. S. Snyder | Measurement of the top quark mass at D0 | PhD thesis, State University of New York, Stony Brook, 1995 FERMILAB-THESIS-1995-27 | |
| 42 | Particle Data Group, C. Patrignani et al. | Review of particle physics | CPC 40 (2016) 100001 | |
| 43 | CMS Collaboration | Measurement of the $ \mathrm{t\bar{t}} $ production cross section using events in the e$ \mu $ final state in pp collisions at $ \sqrt{s} = $ 13 TeV | EPJC 77 (2017) 172 | CMS-TOP-16-005 1611.04040 |
| 44 | CMS Collaboration | CMS luminosity measurements for the 2016 data-taking period | CDS | |
| 45 | CMS Collaboration | Cross section measurement of $ t $-channel single top quark production in pp collisions at $ \sqrt{s} = $ 13 TeV | PLB 772 (2017) 752 | CMS-TOP-16-003 1610.00678 |
| 46 | J. S. Conway | Incorporating nuisance parameters in likelihoods for multisource spectra | 1103.0354 | |
| 47 | CMS Collaboration | Measurement of the differential cross section for top quark pair production in pp collisions at $ \sqrt{s} = $ 8 TeV | EPJC 75 (2015) 542 | CMS-TOP-12-028 1505.04480 |
| 48 | J. Ott | Theta --- theta-auto testing documentation | link | |
| 49 | A. O'Hagan and J. Forster | Kendall's advanced theory of statistics, Vol. 2B: Bayesian inference | Arnold, London, 2nd edition | |
| 50 | W. T. Eadie et al. | Statistical methods in experimental physics | North Holland, Amsterdam | |
| 51 | F. James | Statistical methods in experimental physics | World Scientific, Singapore, 2nd edition | |
|
|
Compact Muon Solenoid LHC, CERN |
|

|

|

|

|

|