

Compact Muon Solenoid
LHC, CERN
| CMS-BPH-17-004 ; CERN-EP-2020-113 | ||
| Search for the lepton flavor violating decay $ {\tau \!\to\! 3\mu} $ in proton-proton collisions at $ \sqrt{s} = $ 13 TeV | ||
| CMS Collaboration | ||
| 11 July 2020 | ||
| JHEP 01 (2021) 163 | ||
| Abstract: Results are reported from a search for the lepton flavor violating decay $ {\tau \!\to\! 3\mu}$ in proton-proton collisions at $\sqrt{s} = $ 13 TeV. The data sample corresponds to an integrated luminosity of 33.2 fb$^{-1}$ recorded by the CMS experiment at the LHC in 2016. The search exploits $\tau$ leptons produced in both W boson and heavy-flavor hadron decays. No significant excess above the expected background is observed. An upper limit on the branching fraction $\mathcal{B}({\tau \!\to\! 3\mu} )$ of 8.0 $\times$ 10$^{-8}$ at 90% confidence level is obtained, with an expected upper limit of 6.9 $\times$ 10$^{-8}$. | ||
| Links: e-print arXiv:2007.05658 [hep-ex] (PDF) ; CDS record ; inSPIRE record ; CADI line (restricted) ; | ||
| Figures | |
png pdf |
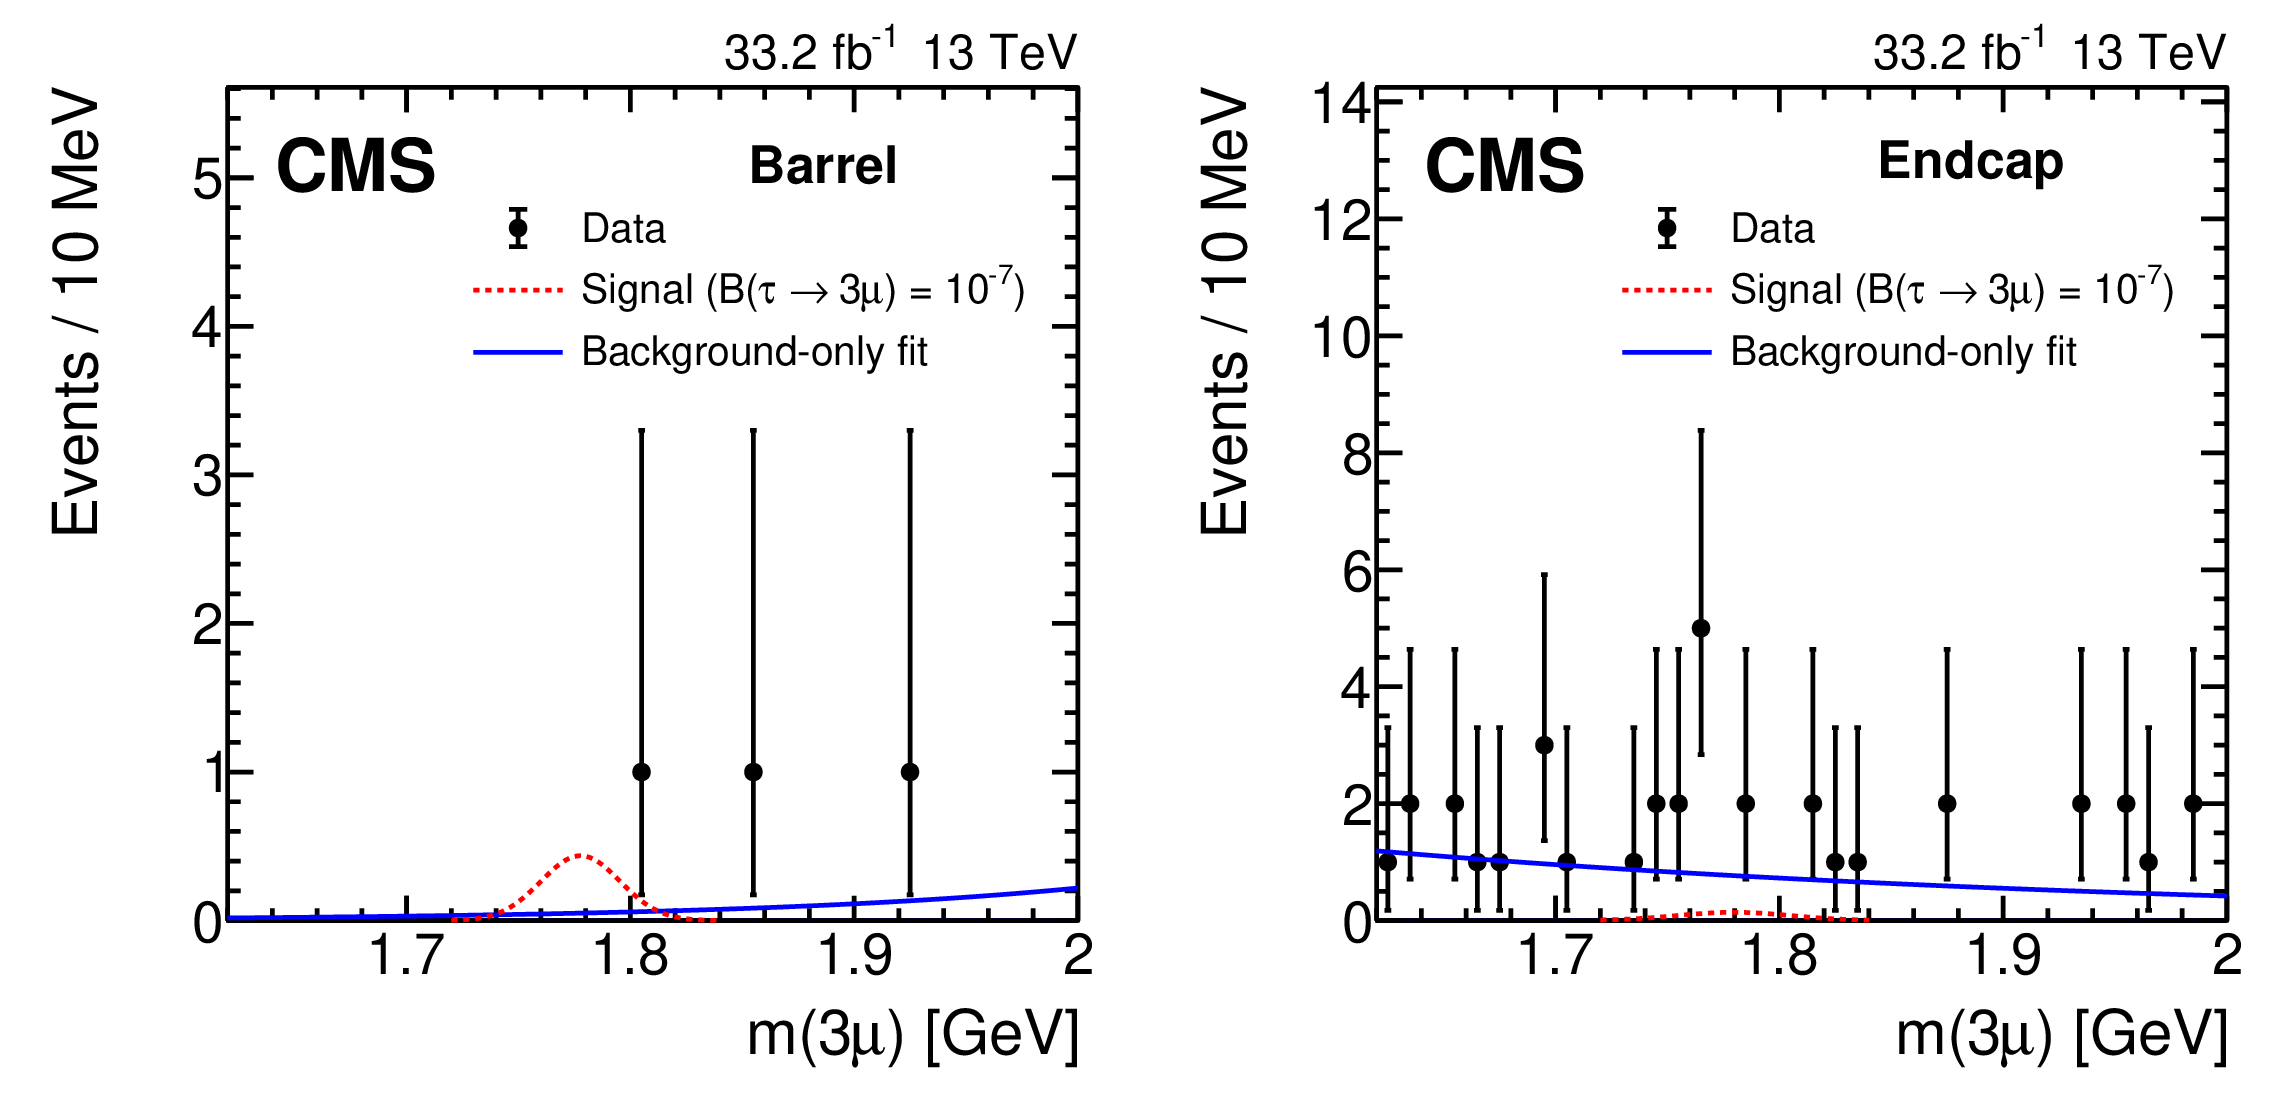
Figure 1:
Trimuon invariant mass distributions for barrel (left) and endcap (right) categories of the W boson analysis. The data are shown with filled circles and vertical bars representing the statistical uncertainty. The background-only fit and the expected signal for $\mathcal {B}({\tau \,\to \, 3\mu}) = $ 10$^{-7}$ are shown with solid and dashed lines, respectively. |
png pdf |
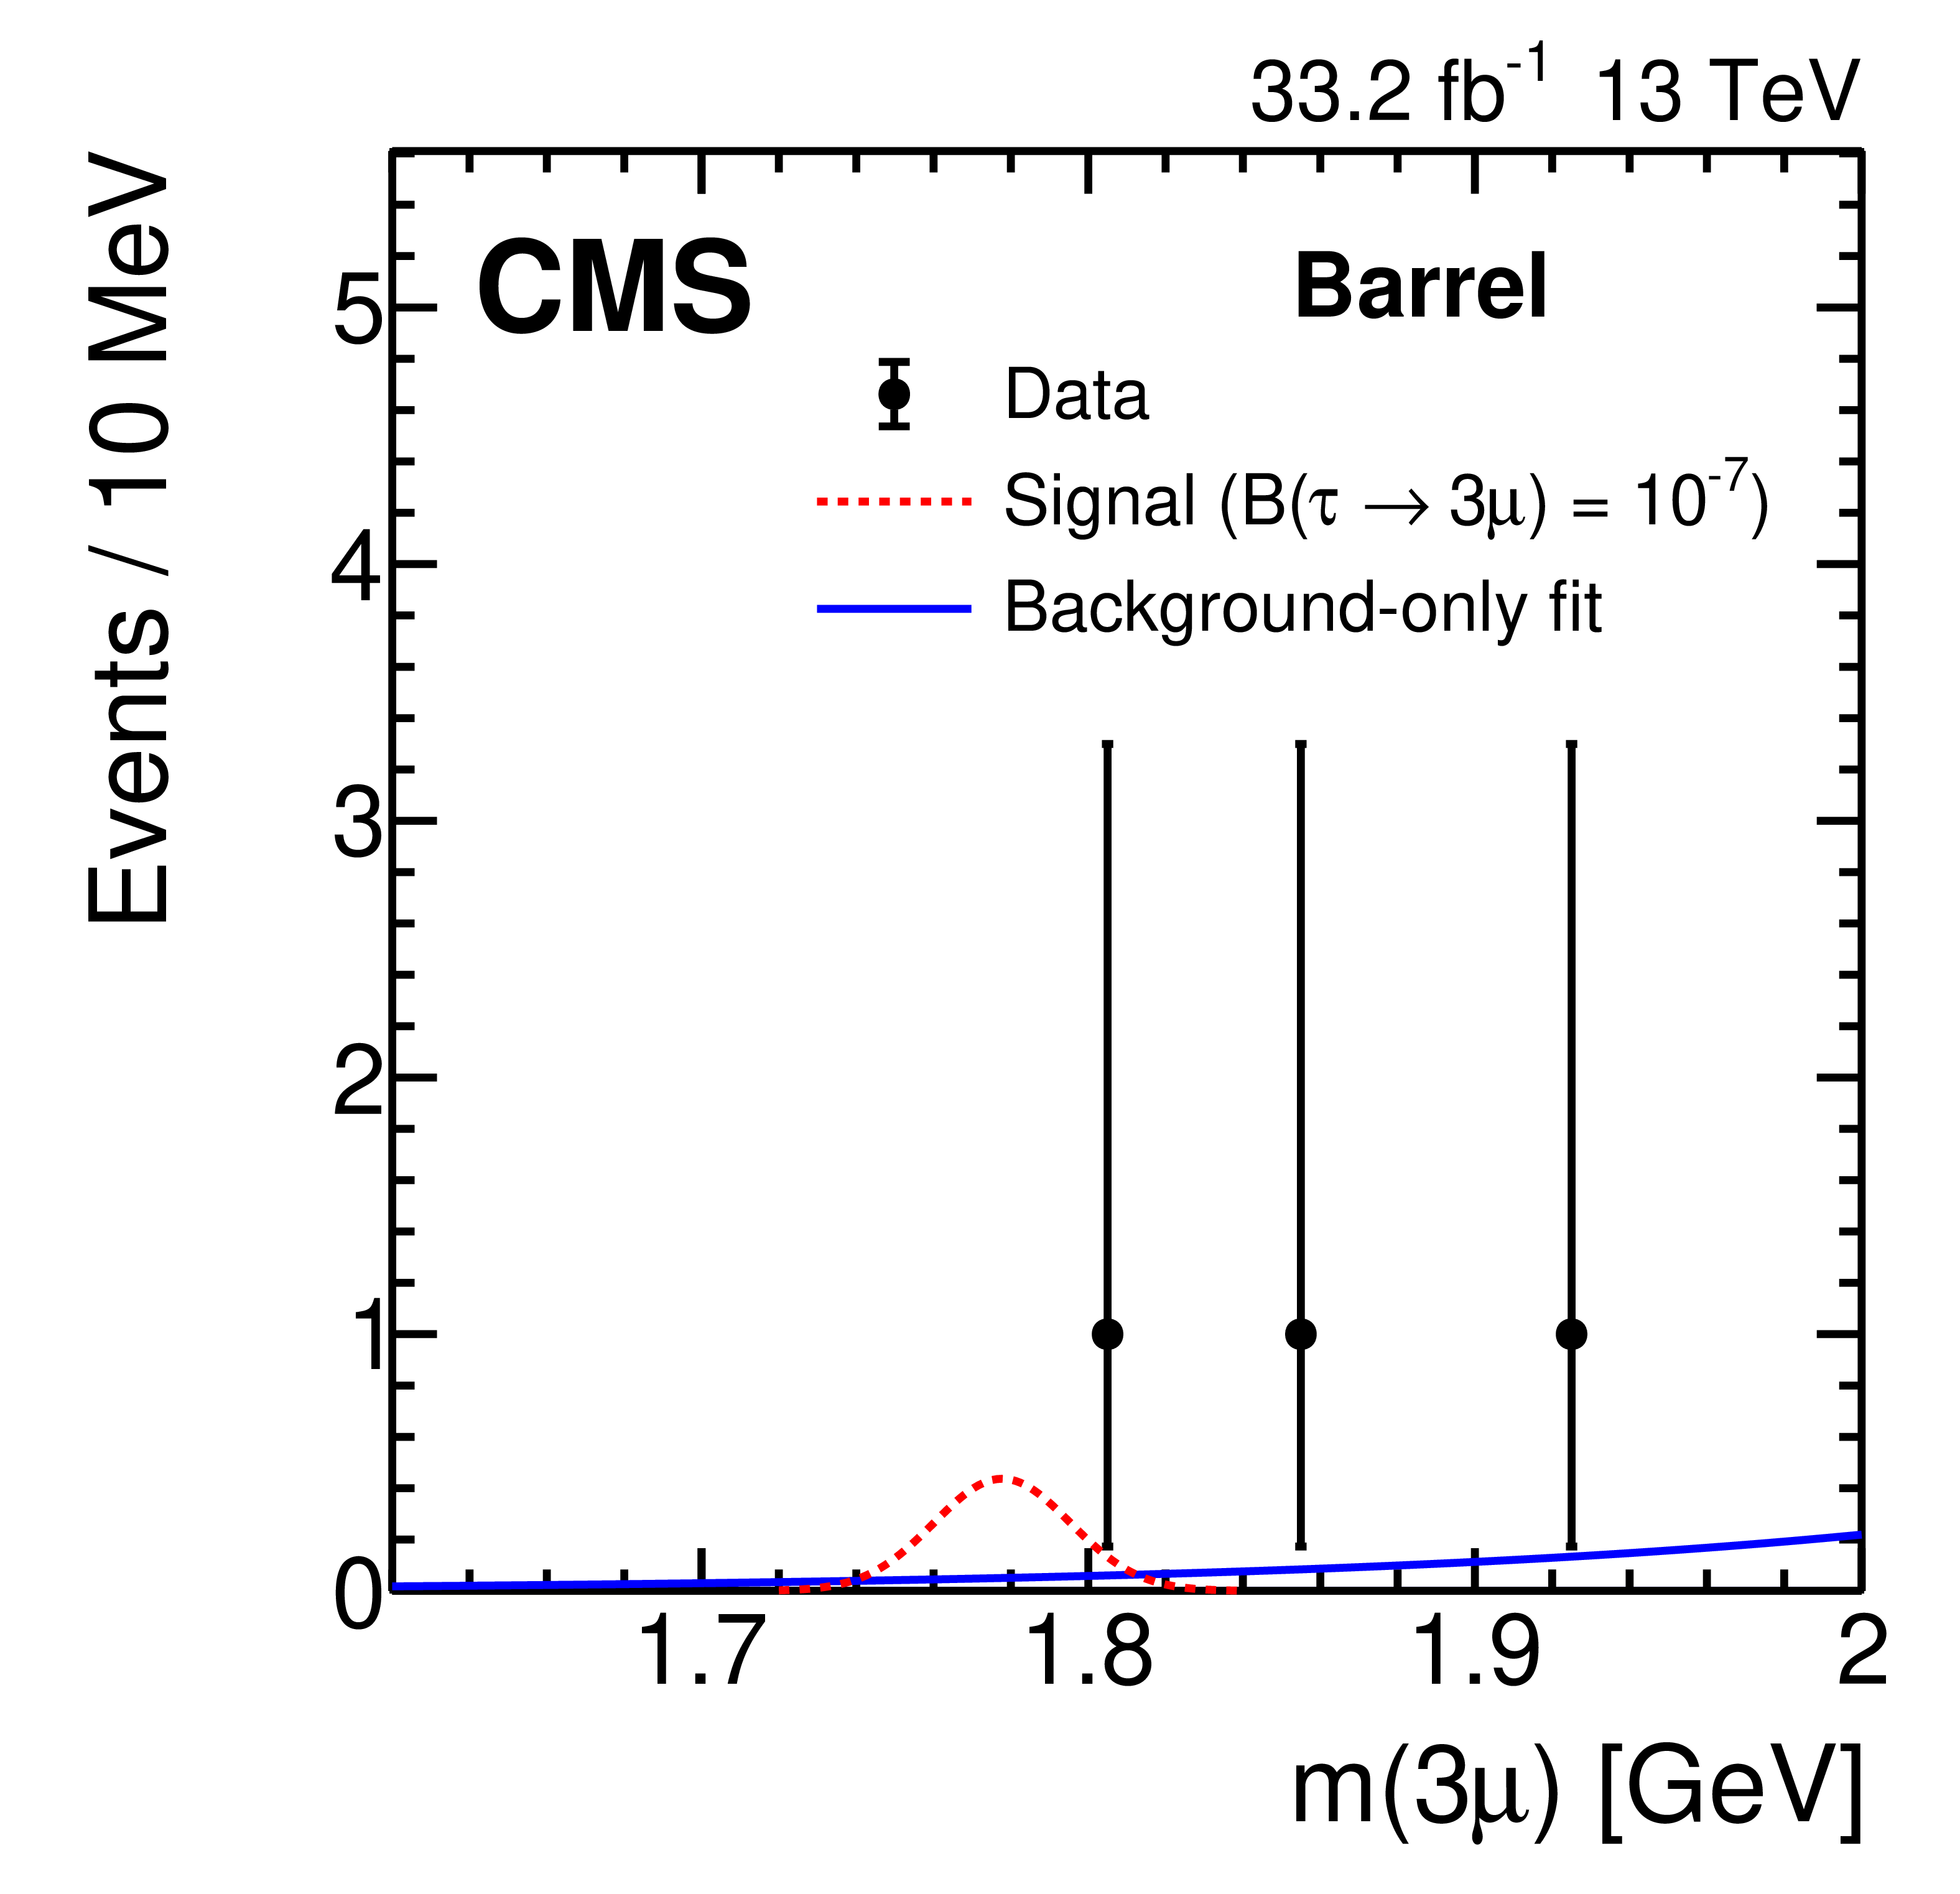
Figure 1-a:
Trimuon invariant mass distributions for the barrel category of the W boson analysis. The data are shown with filled circles and vertical bars representing the statistical uncertainty. The background-only fit and the expected signal for $\mathcal {B}({\tau \,\to \, 3\mu}) = $ 10$^{-7}$ are shown with solid and dashed lines, respectively. |
png pdf |
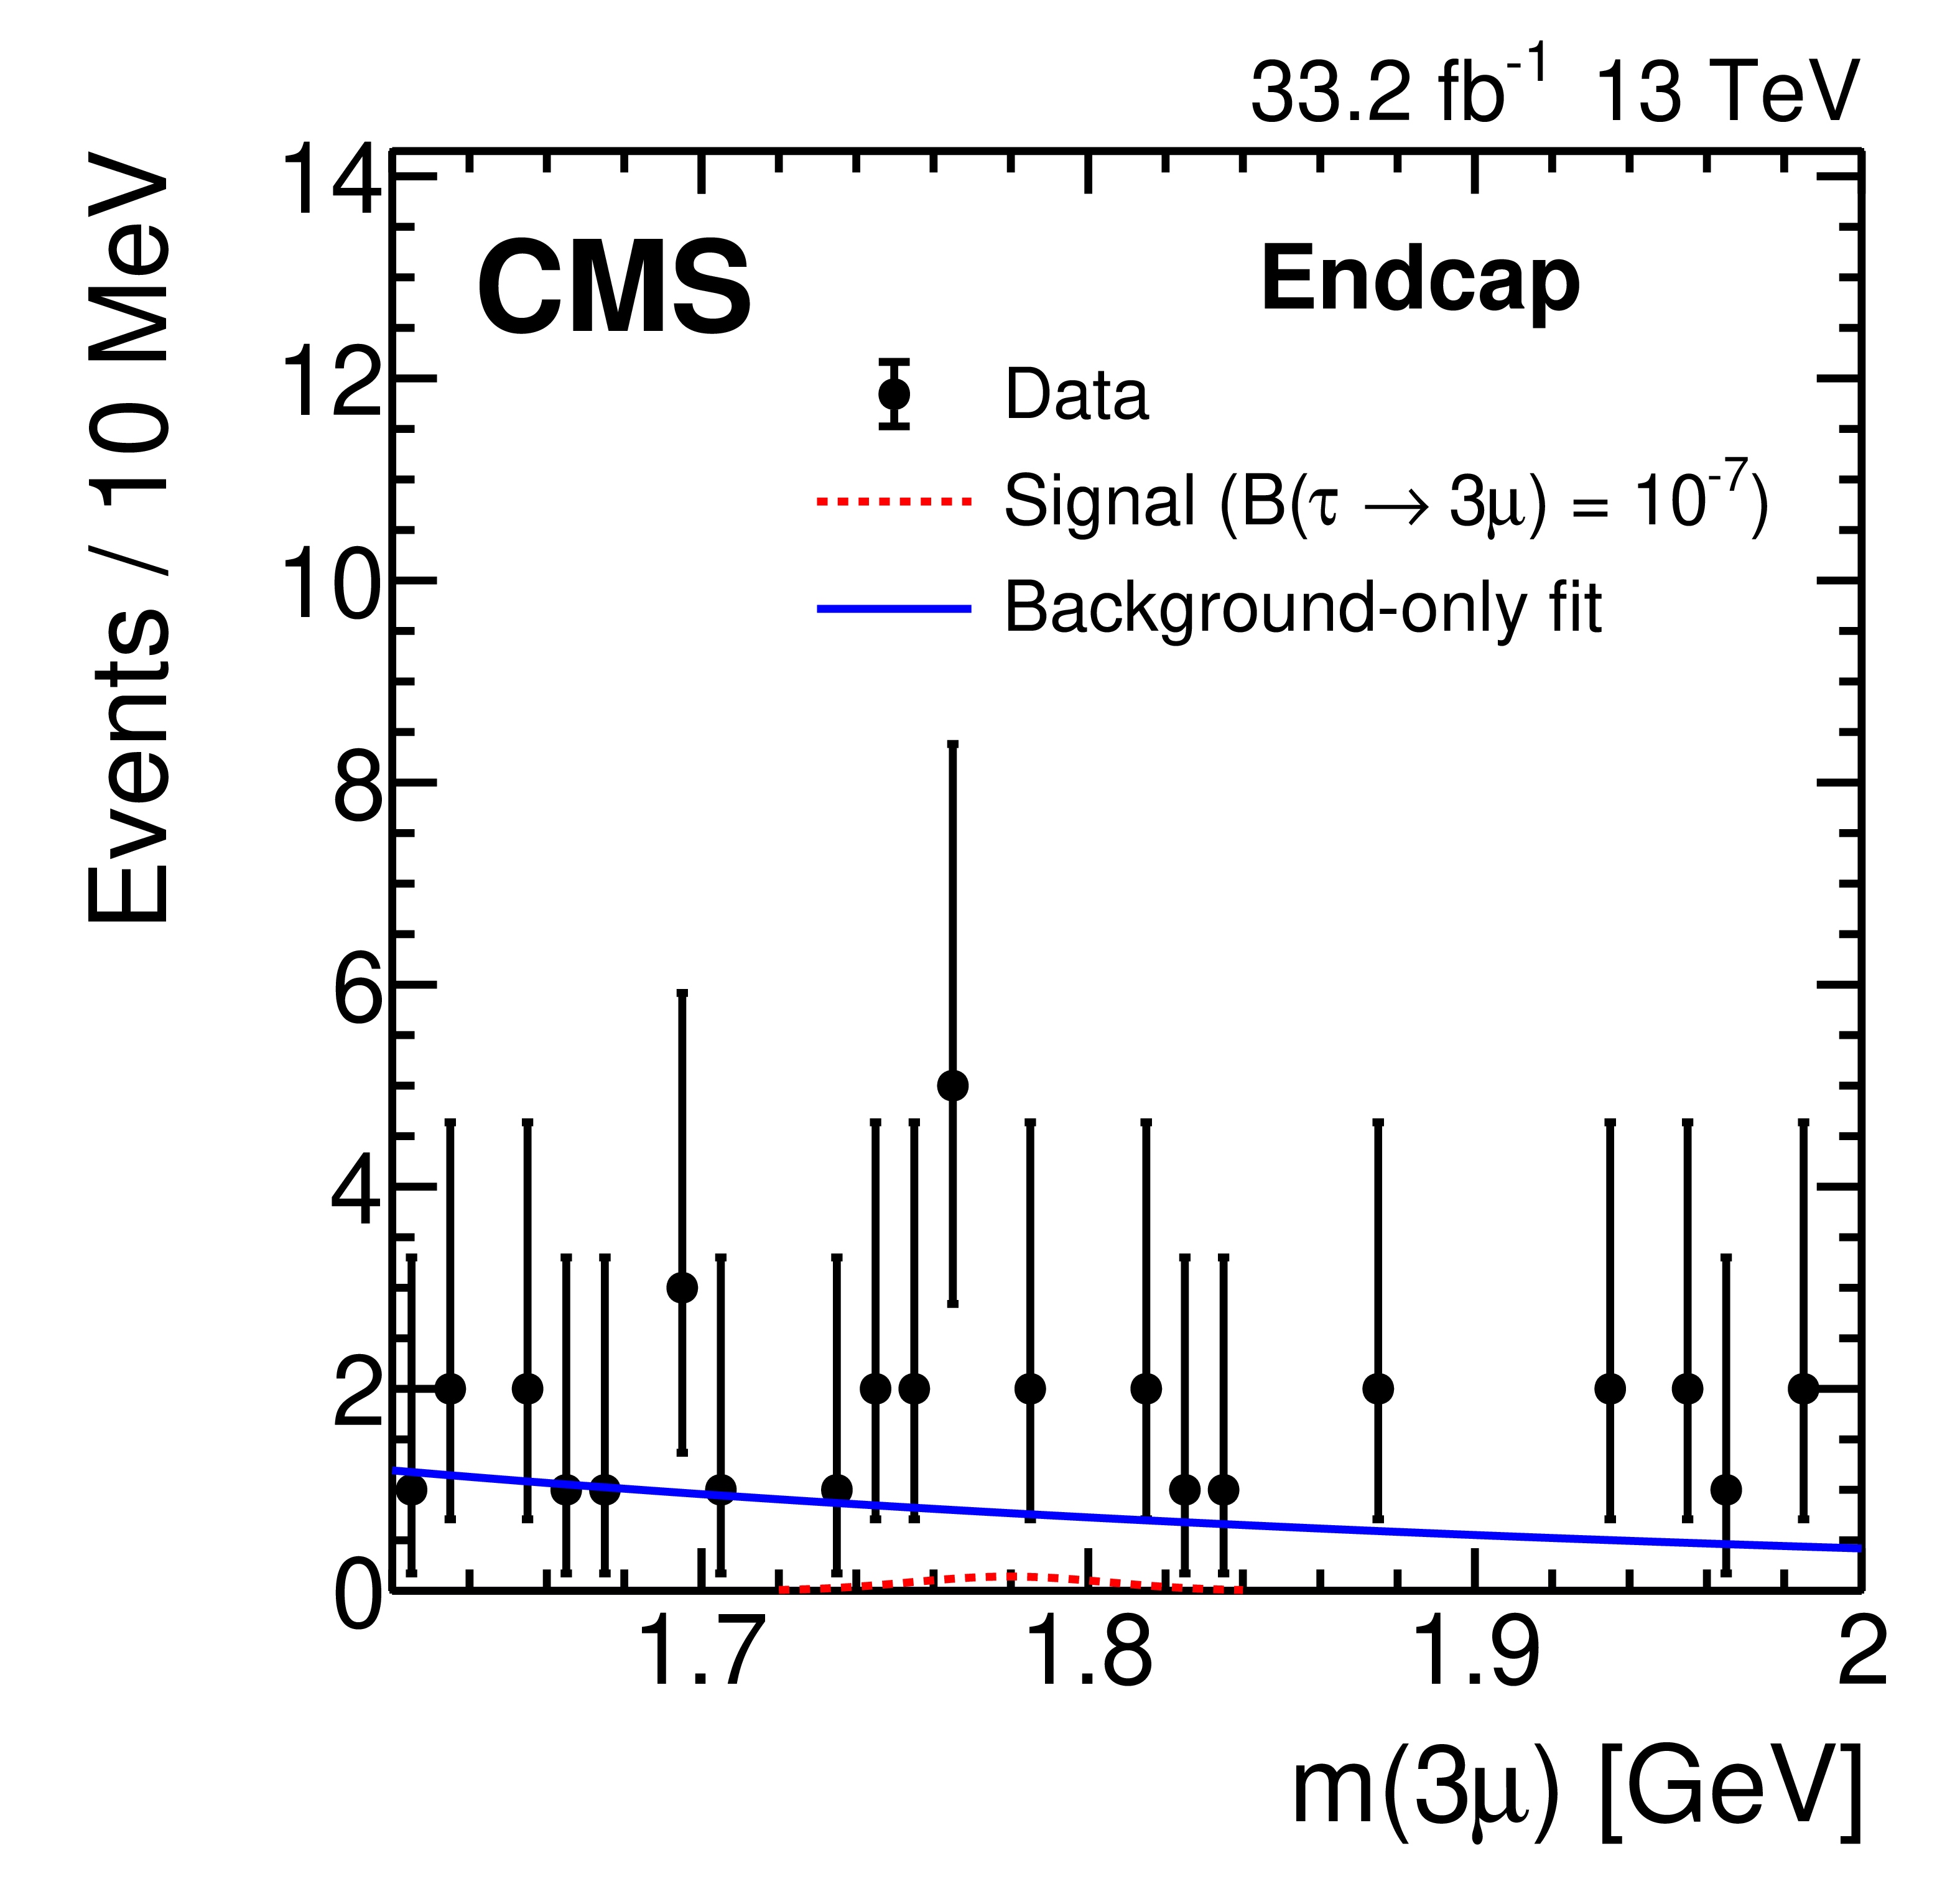
Figure 1-b:
Trimuon invariant mass distributions for the endcap category of the W boson analysis. The data are shown with filled circles and vertical bars representing the statistical uncertainty. The background-only fit and the expected signal for $\mathcal {B}({\tau \,\to \, 3\mu}) = $ 10$^{-7}$ are shown with solid and dashed lines, respectively. |
png pdf |
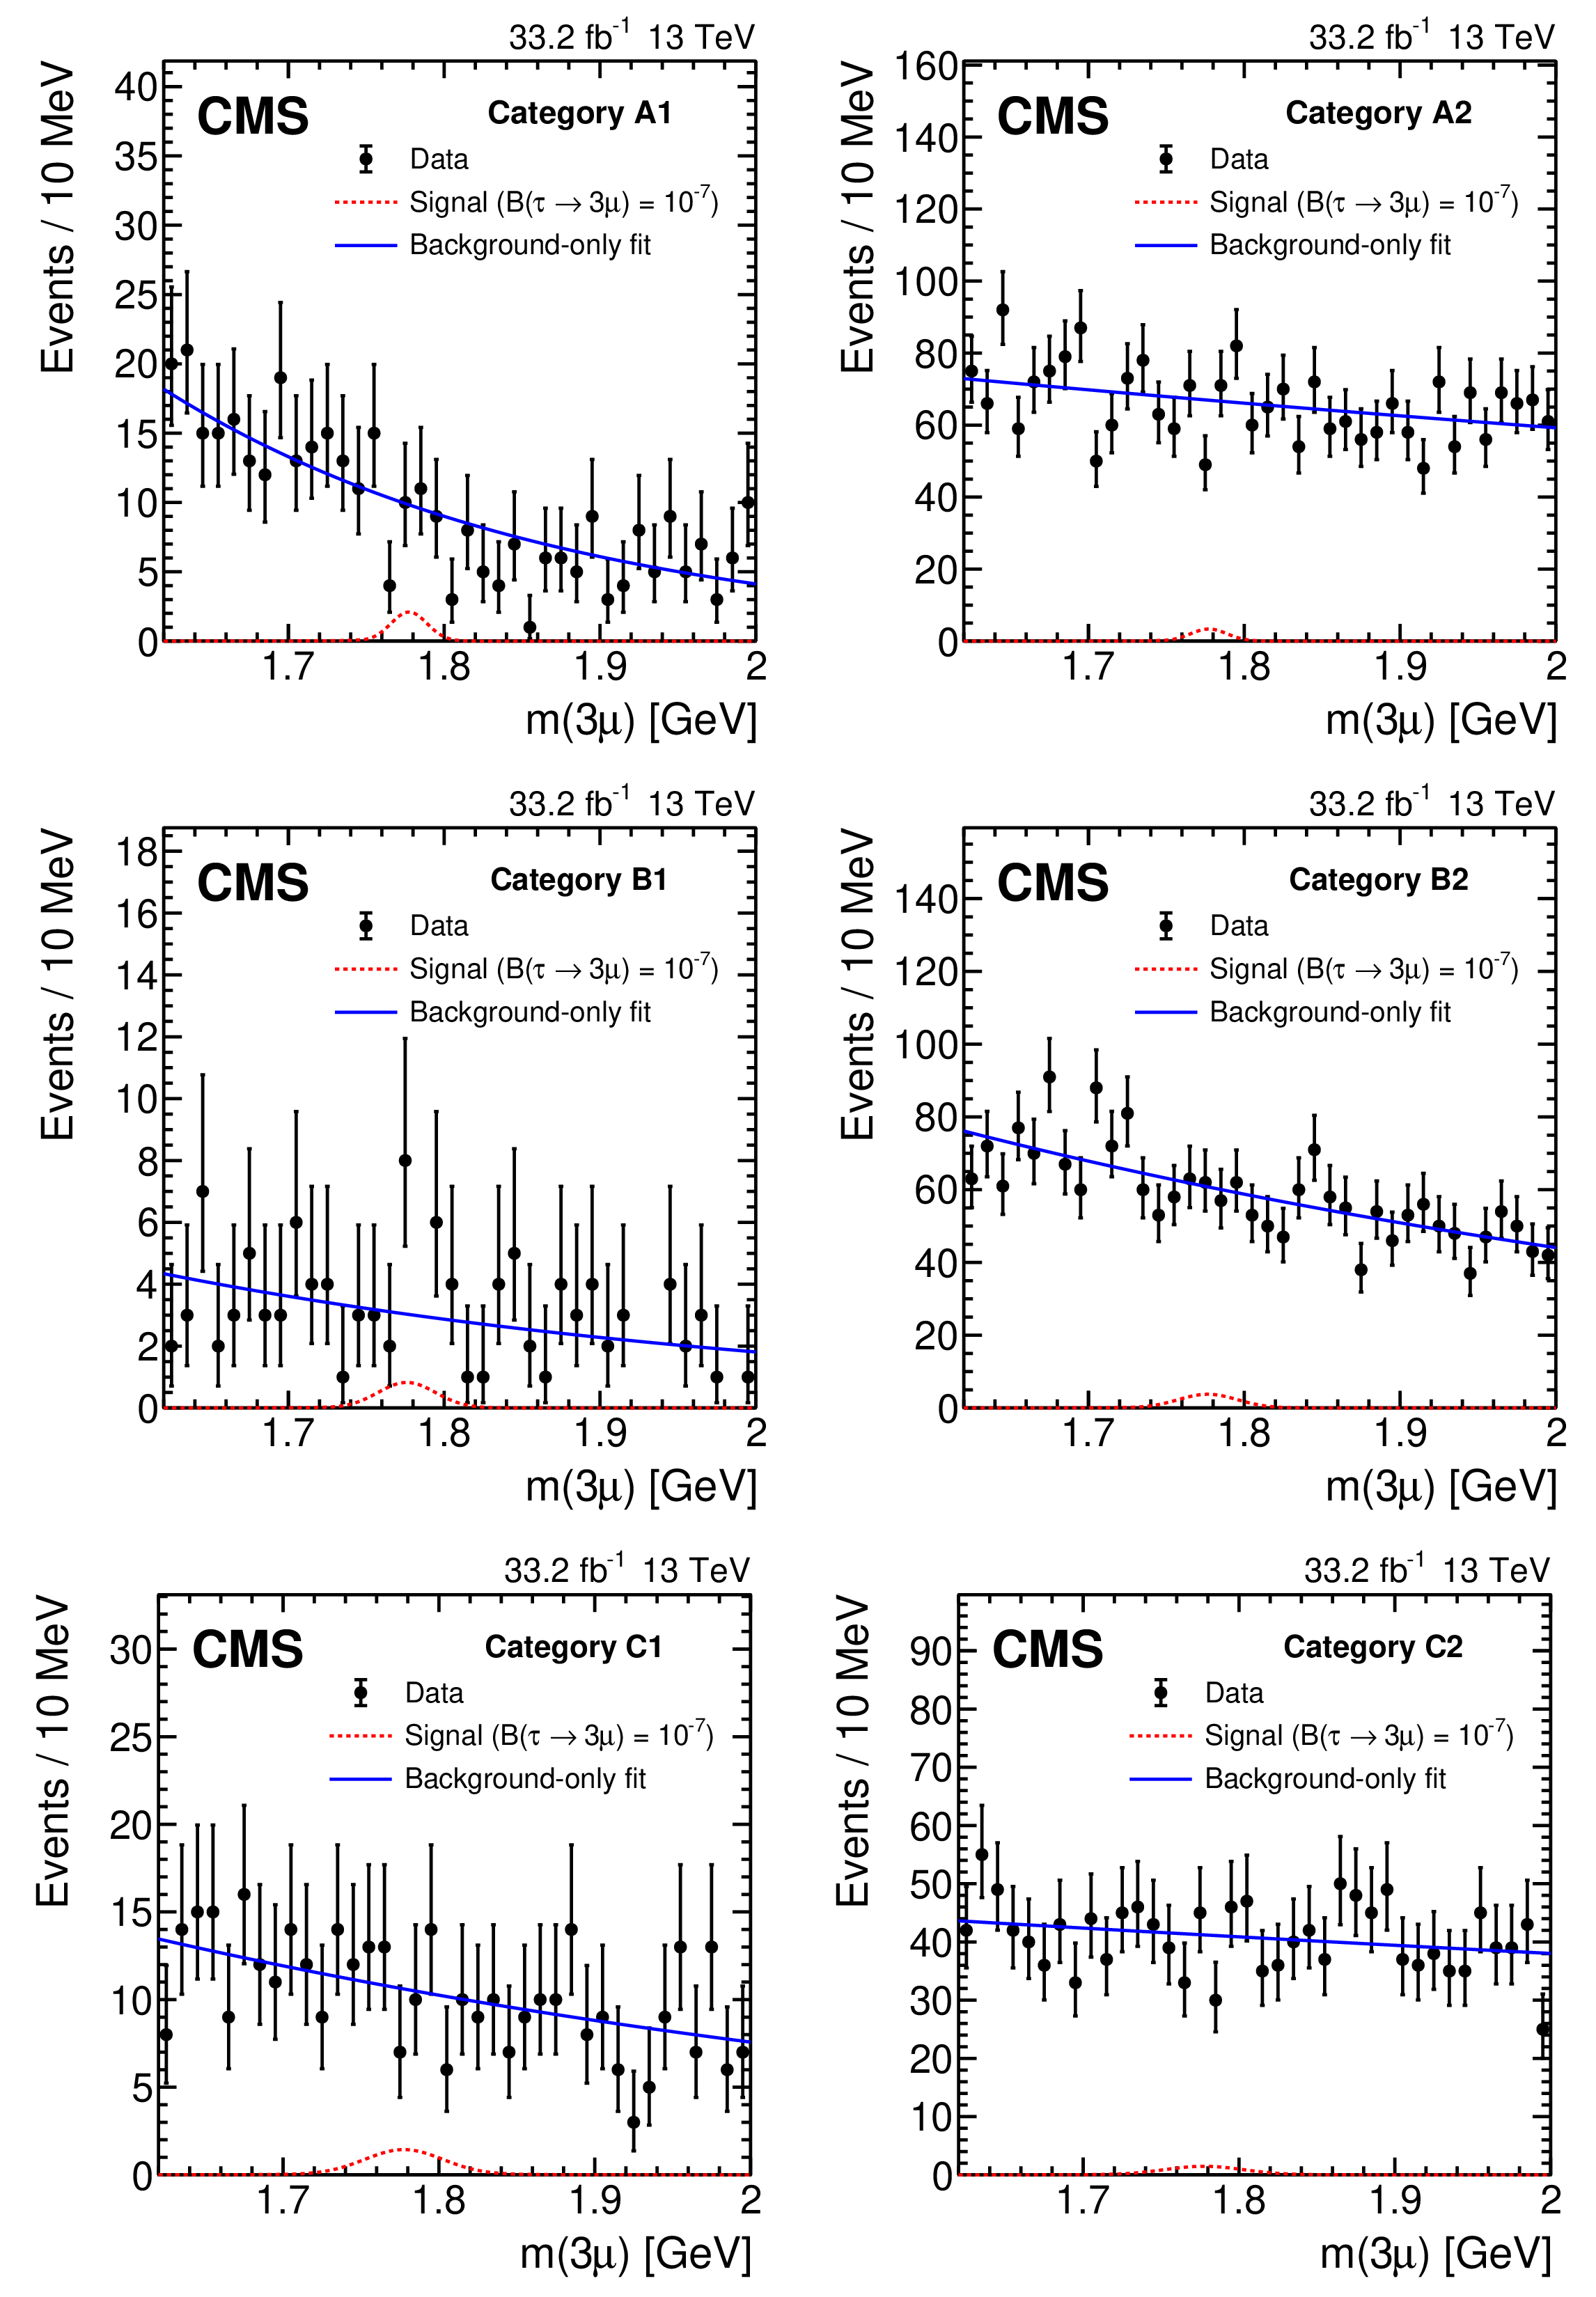
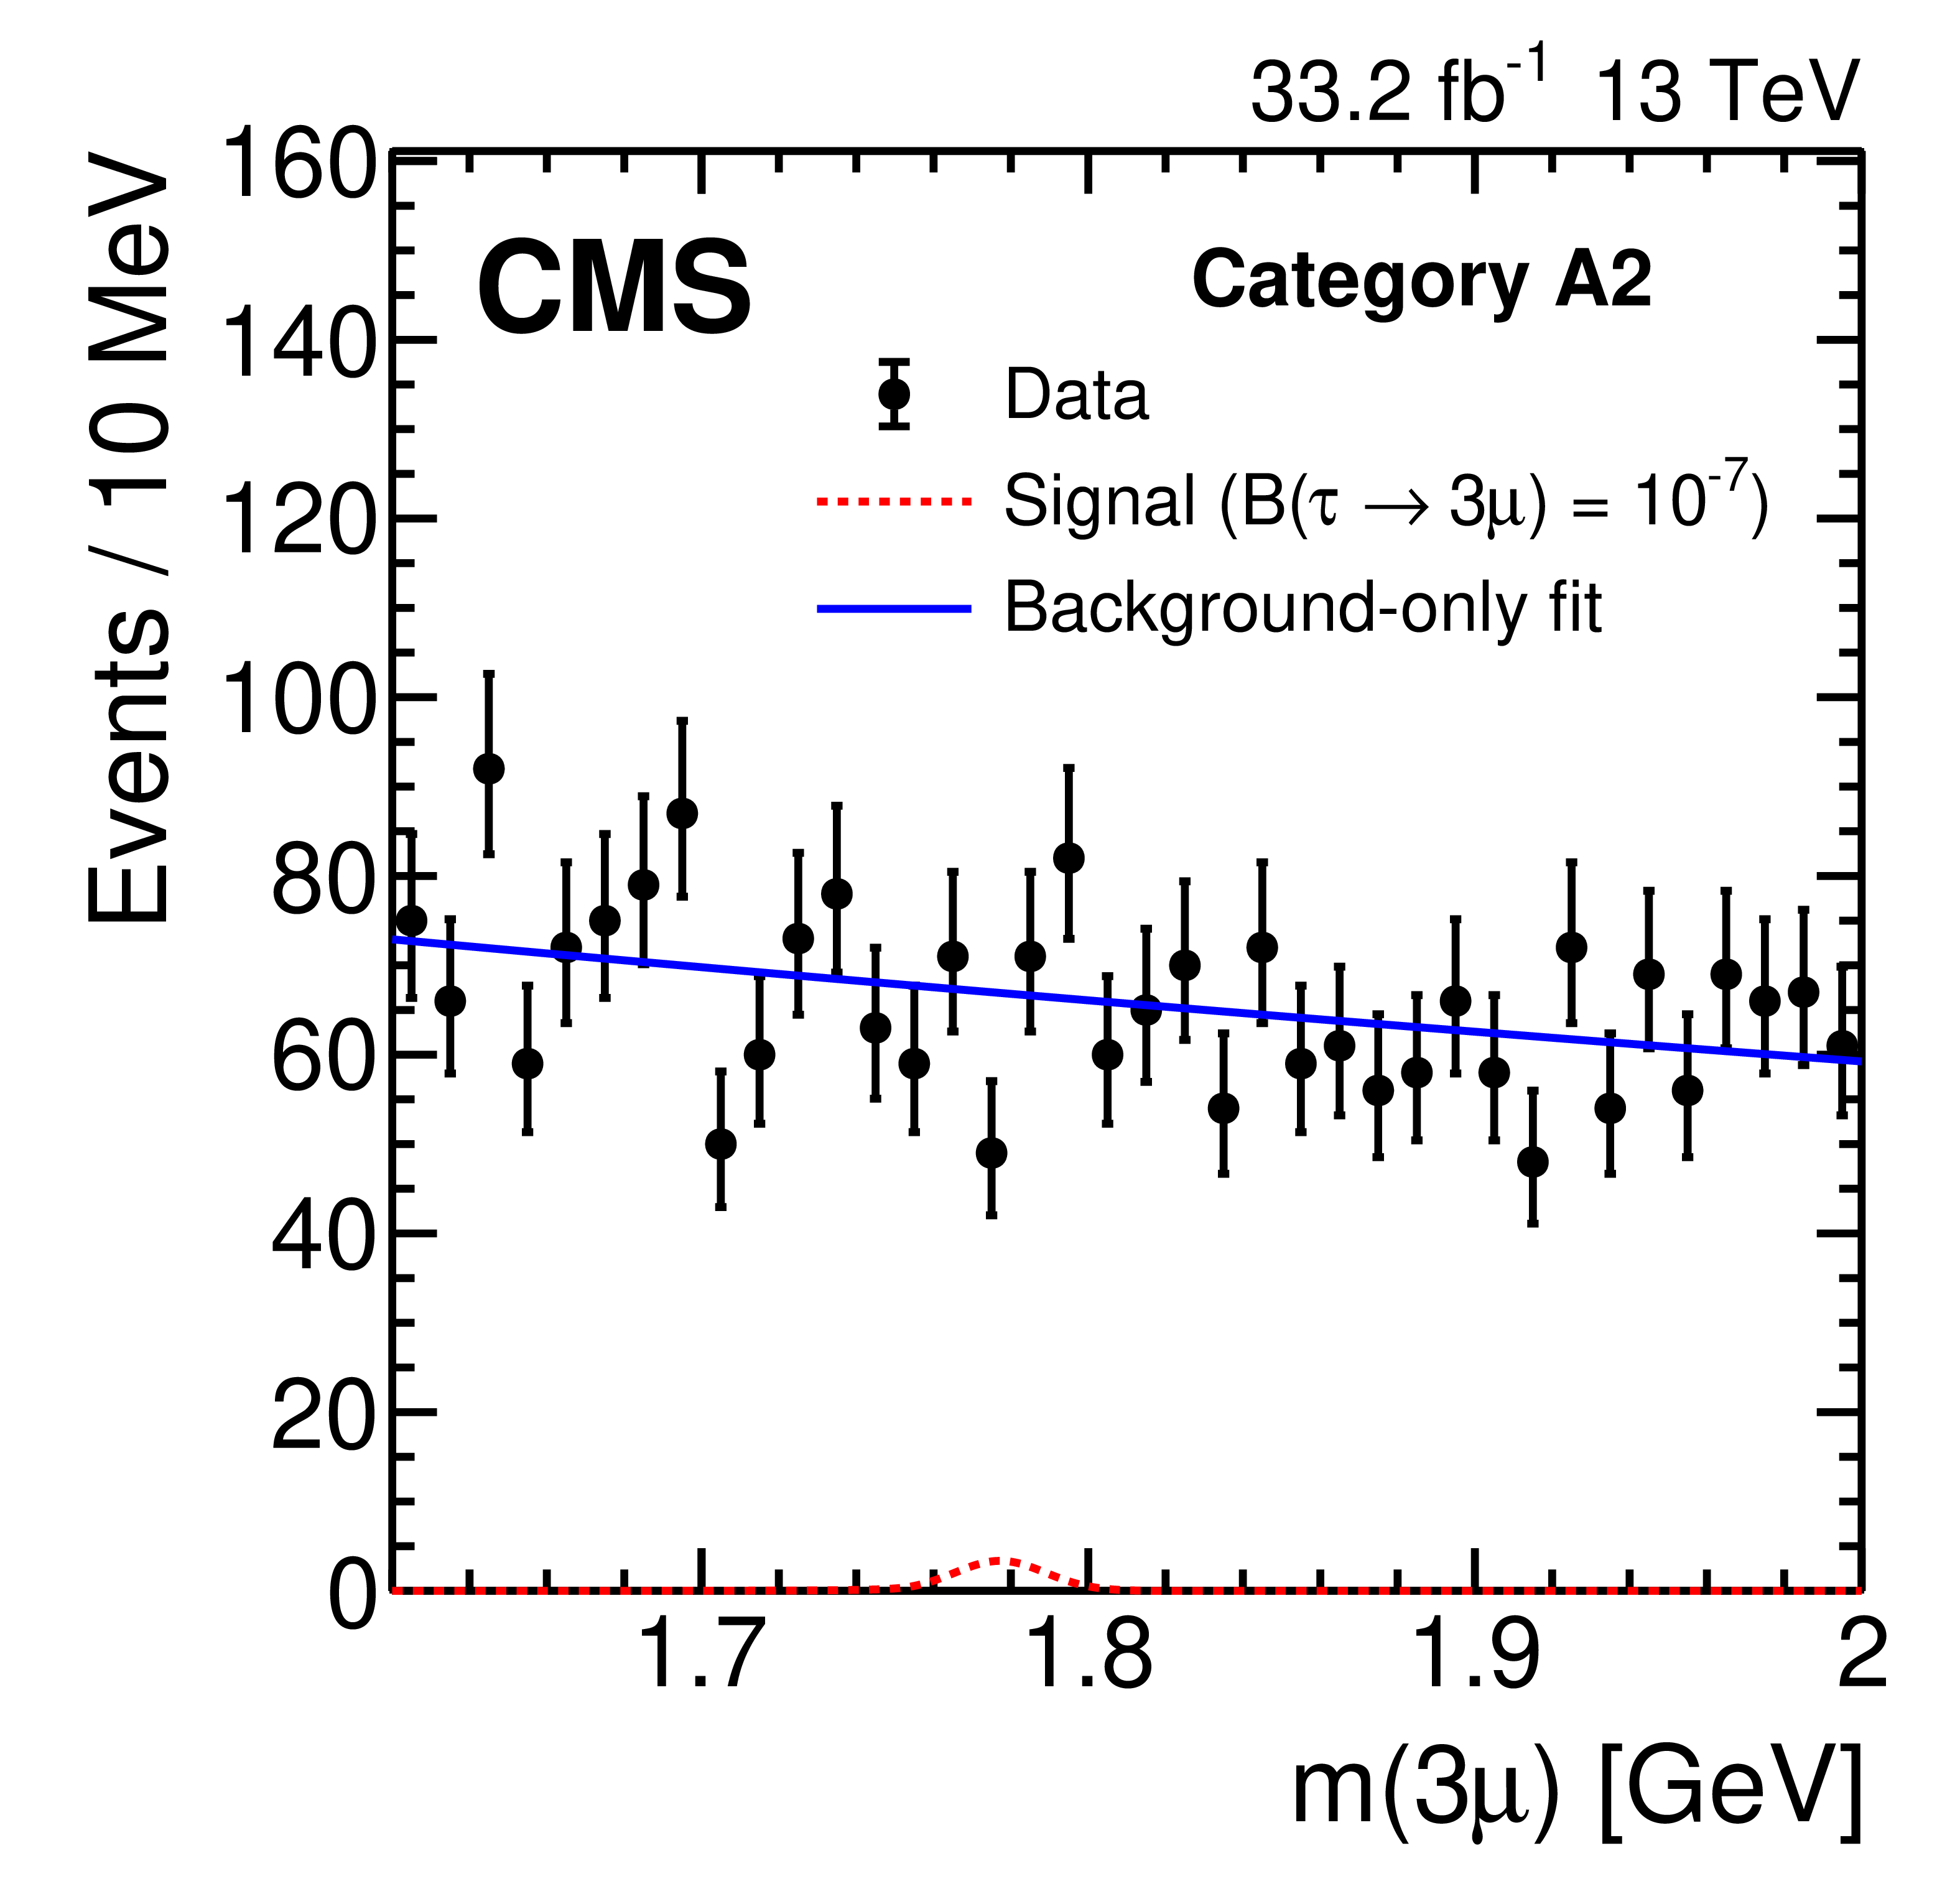
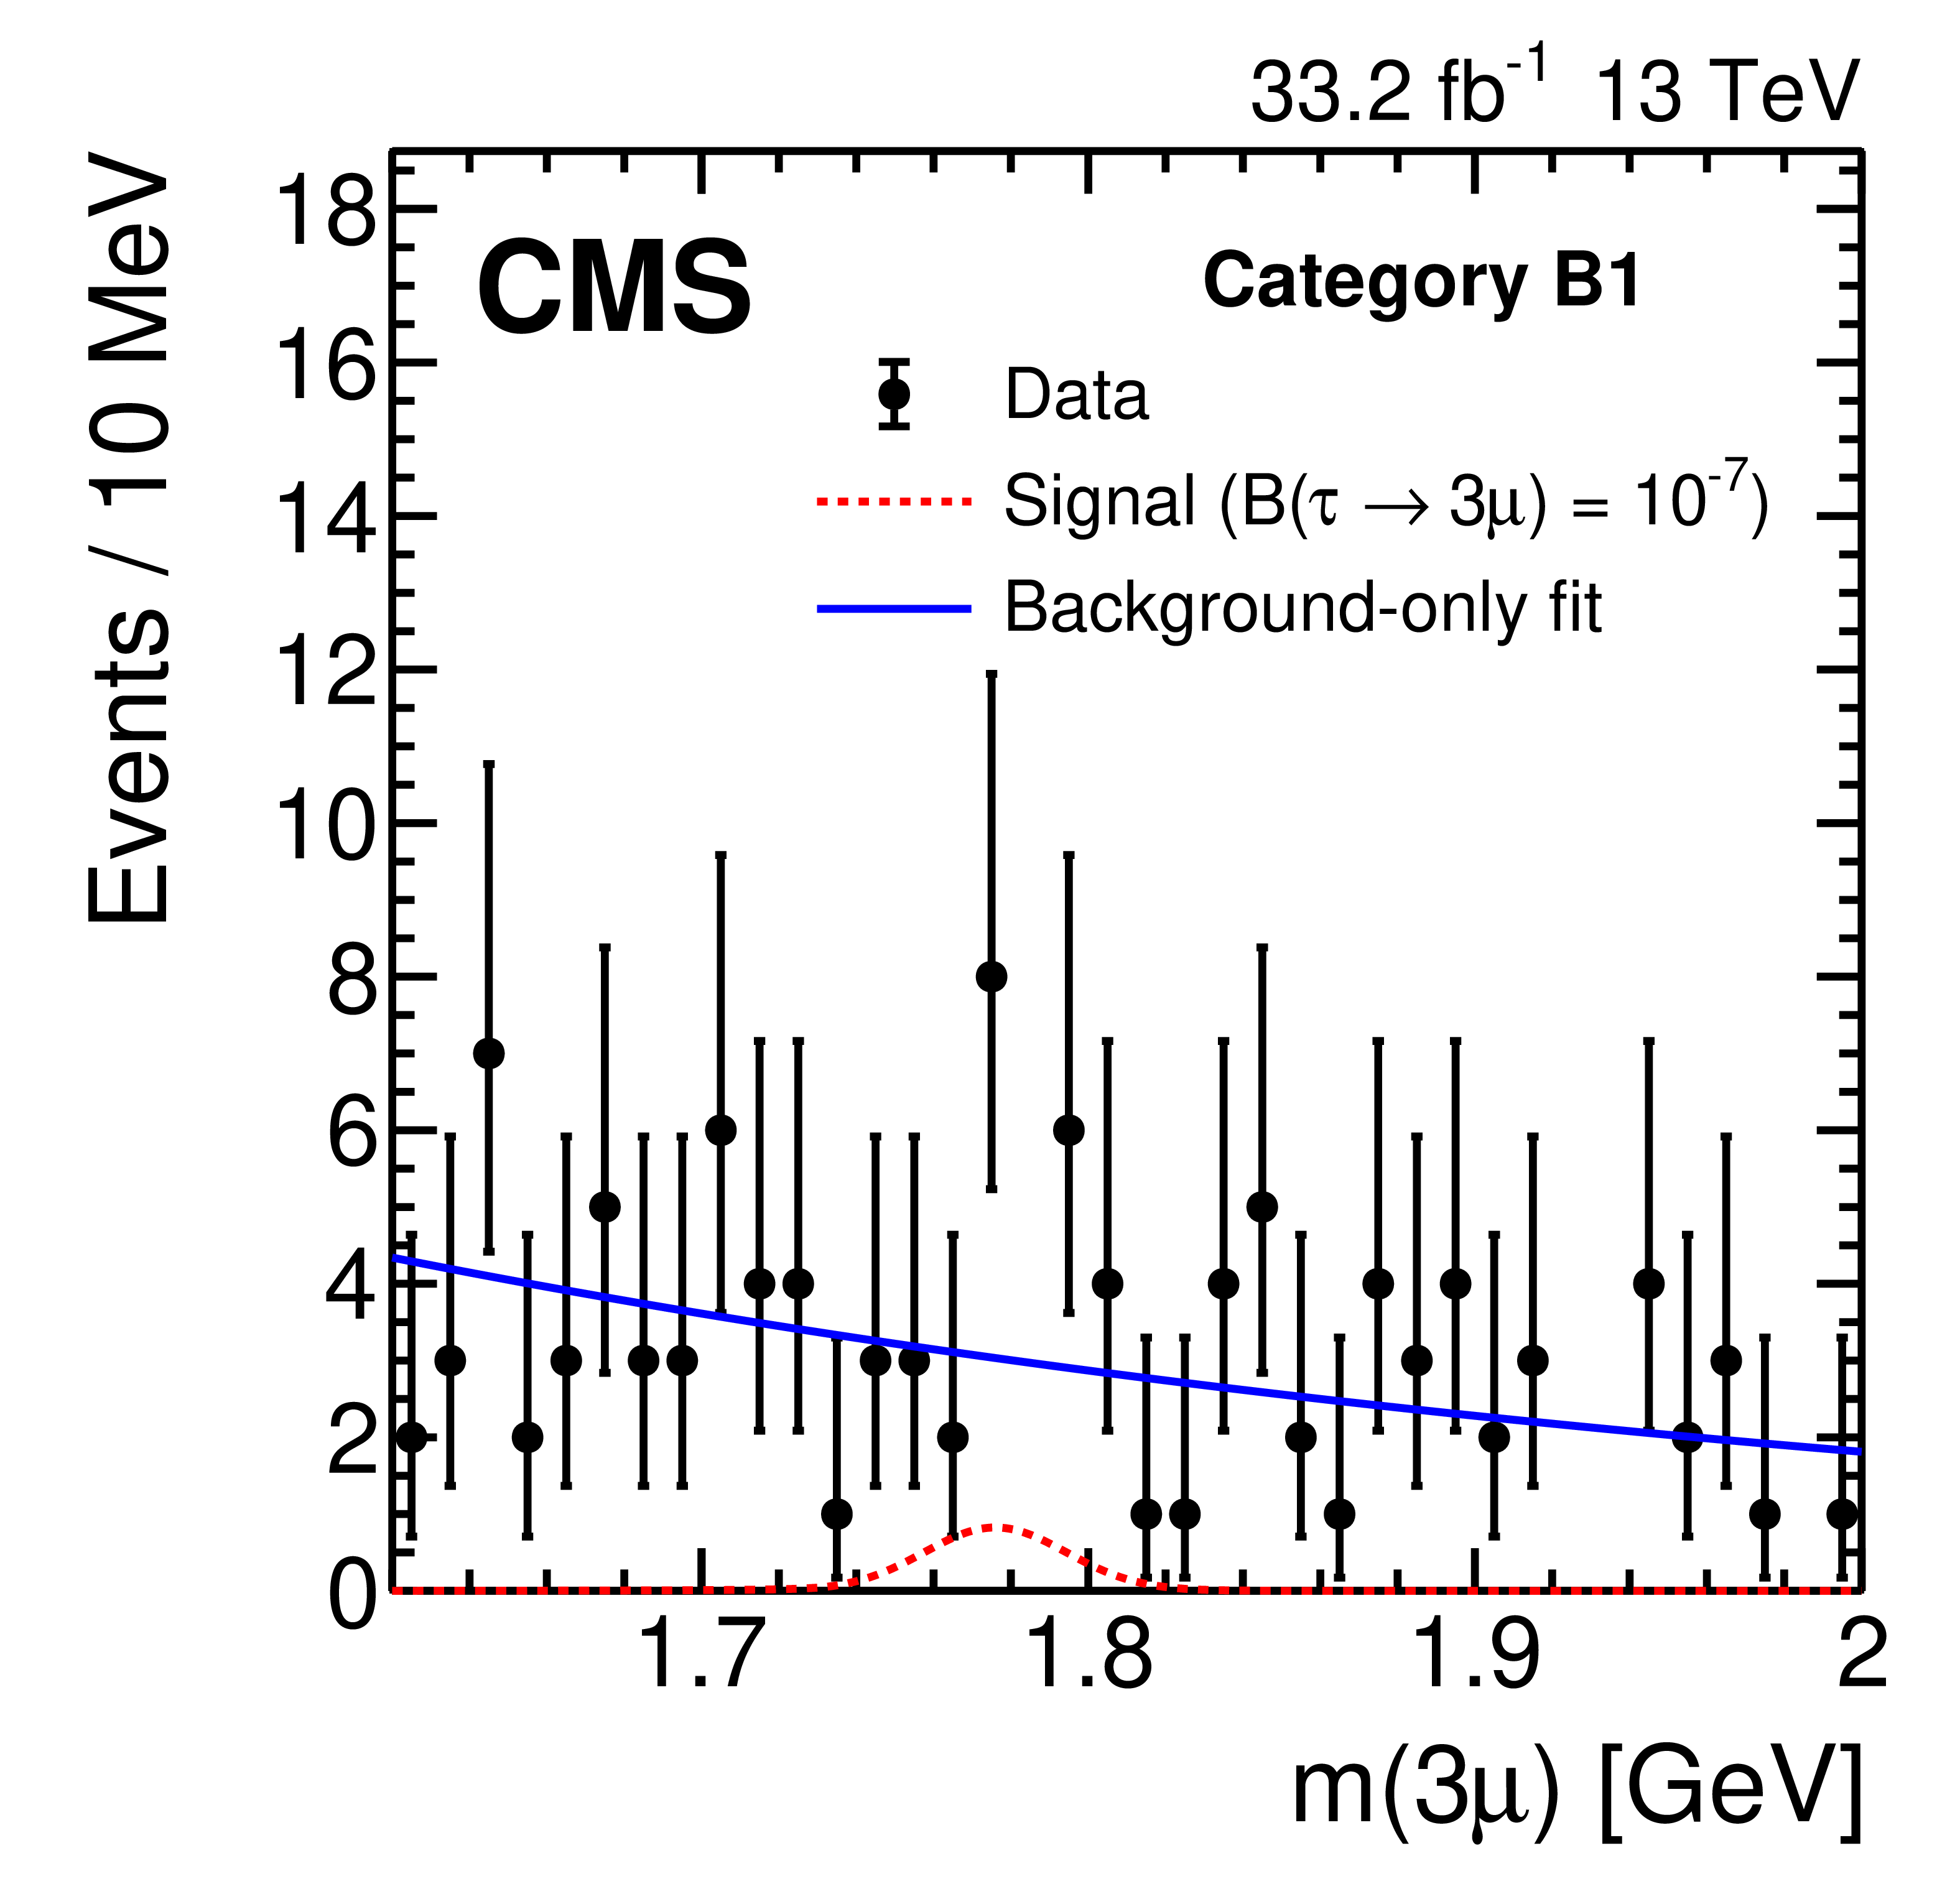
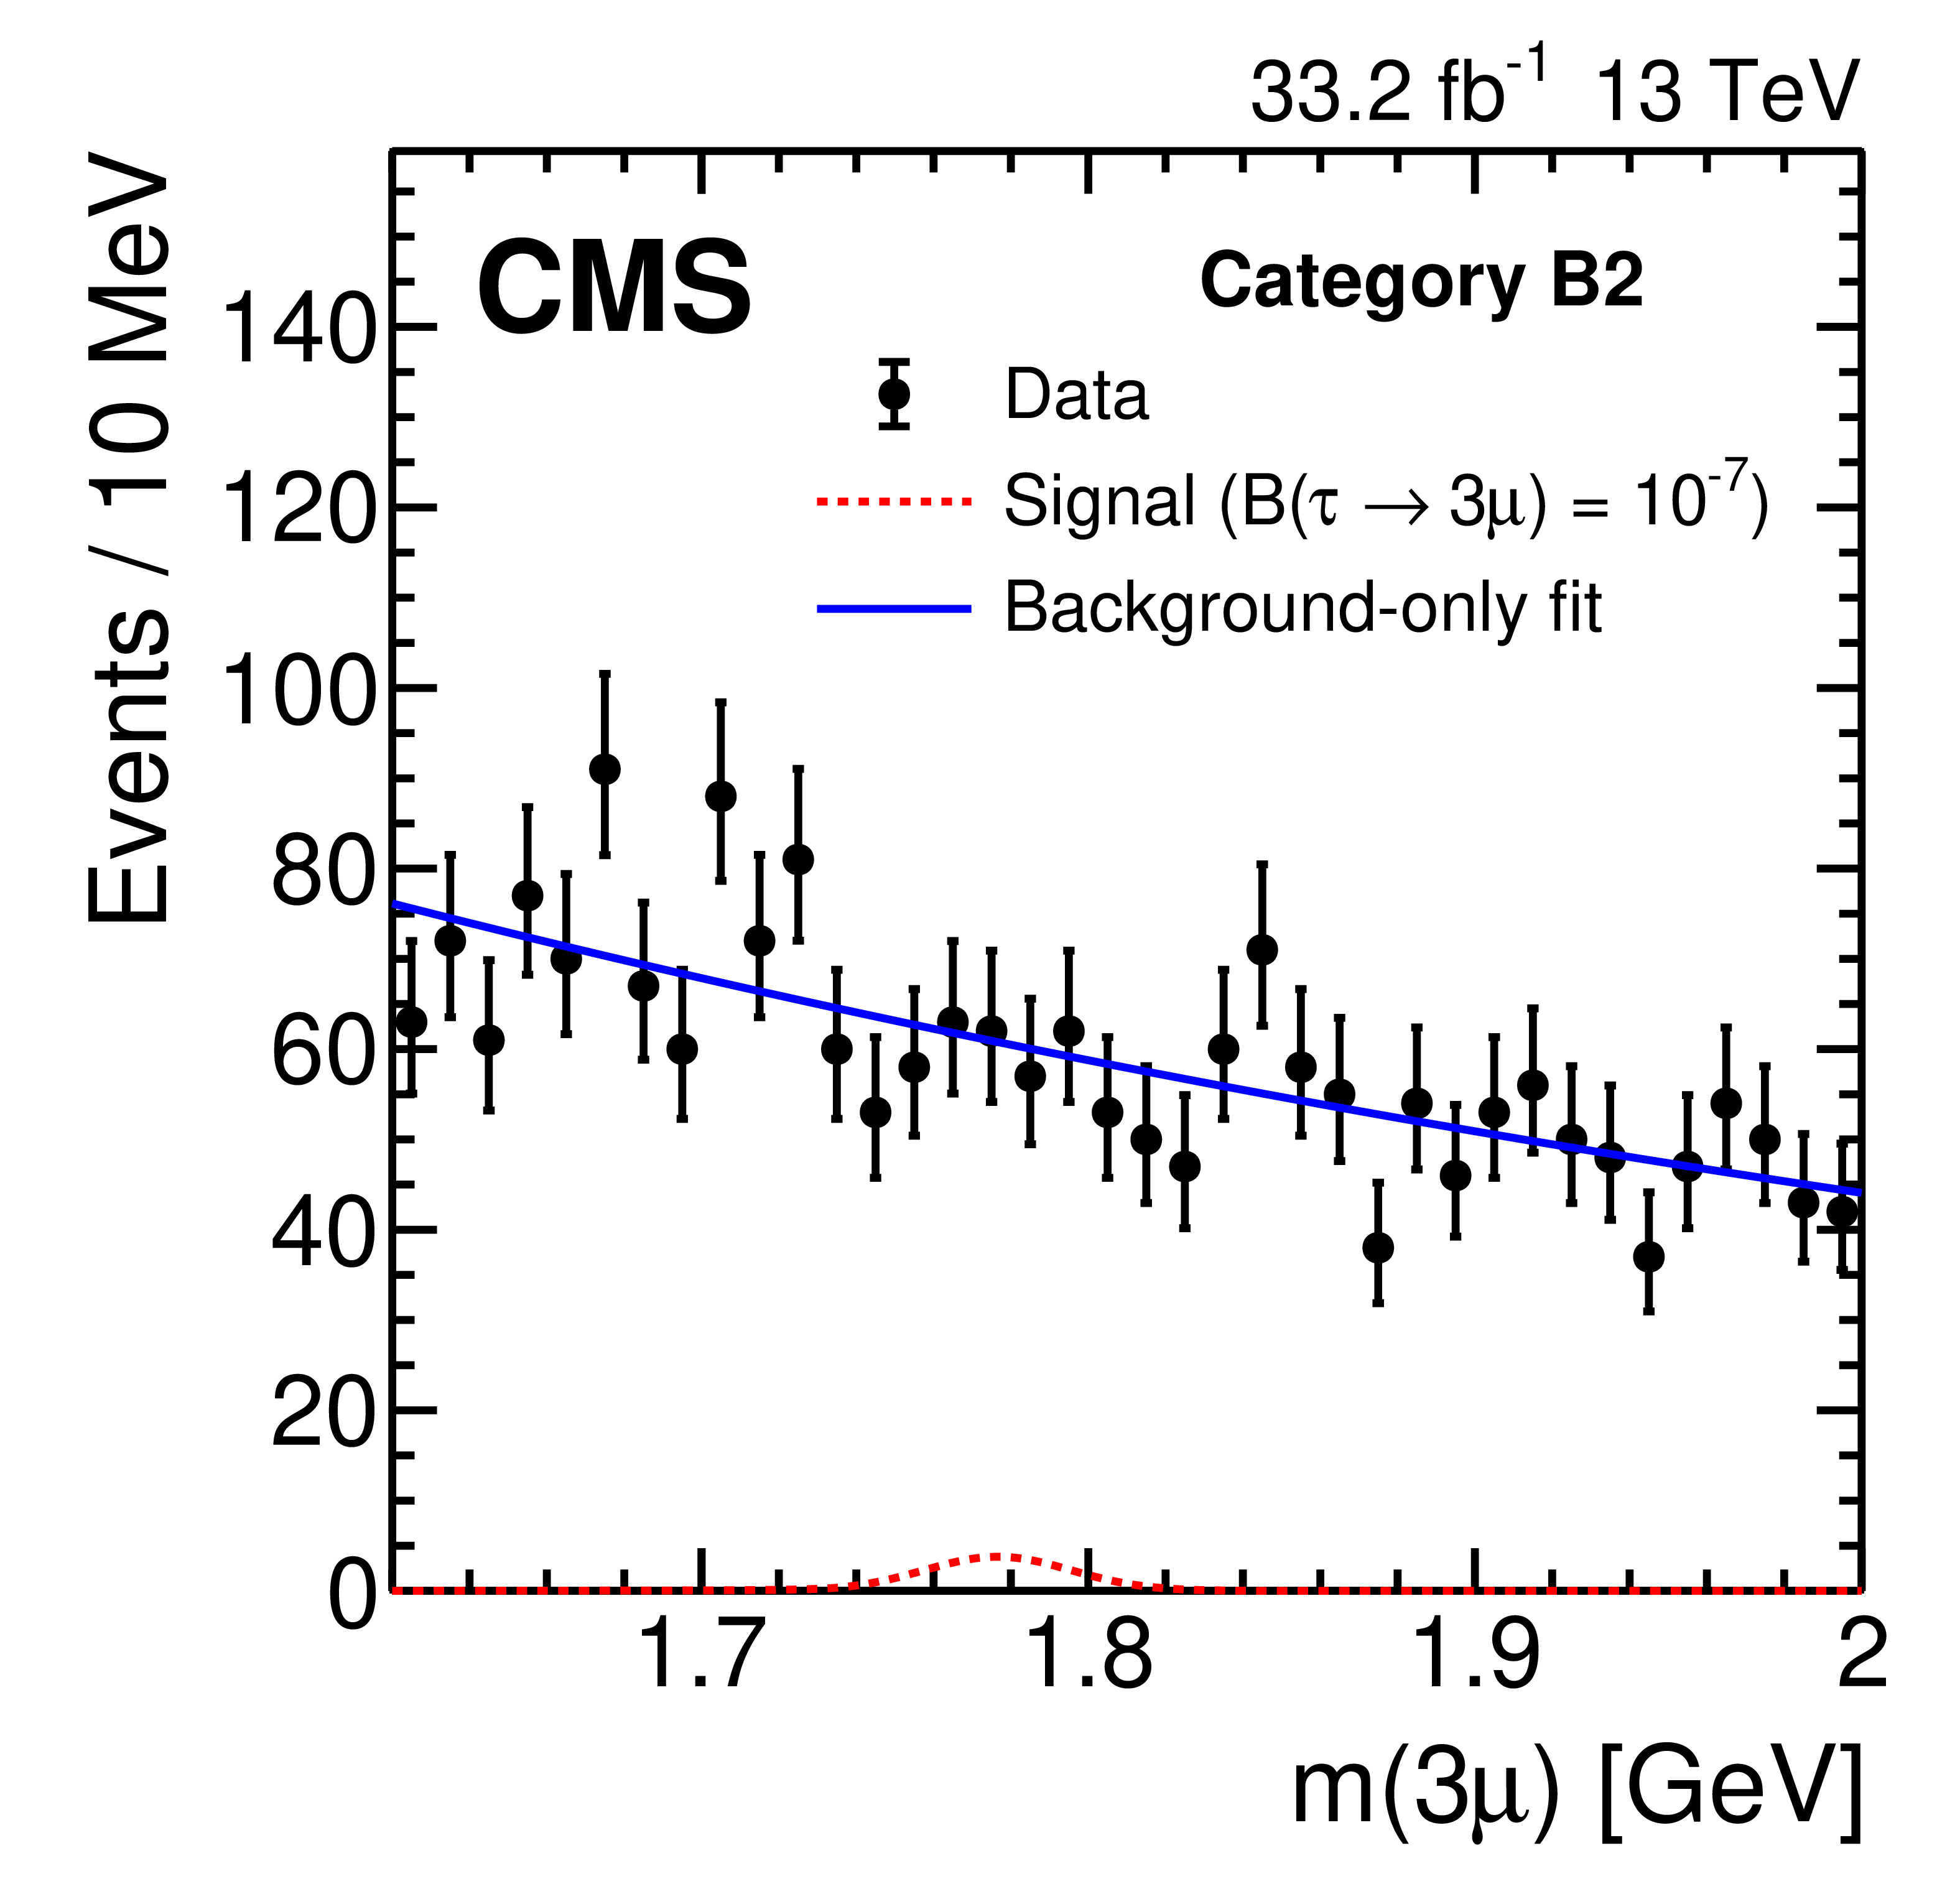
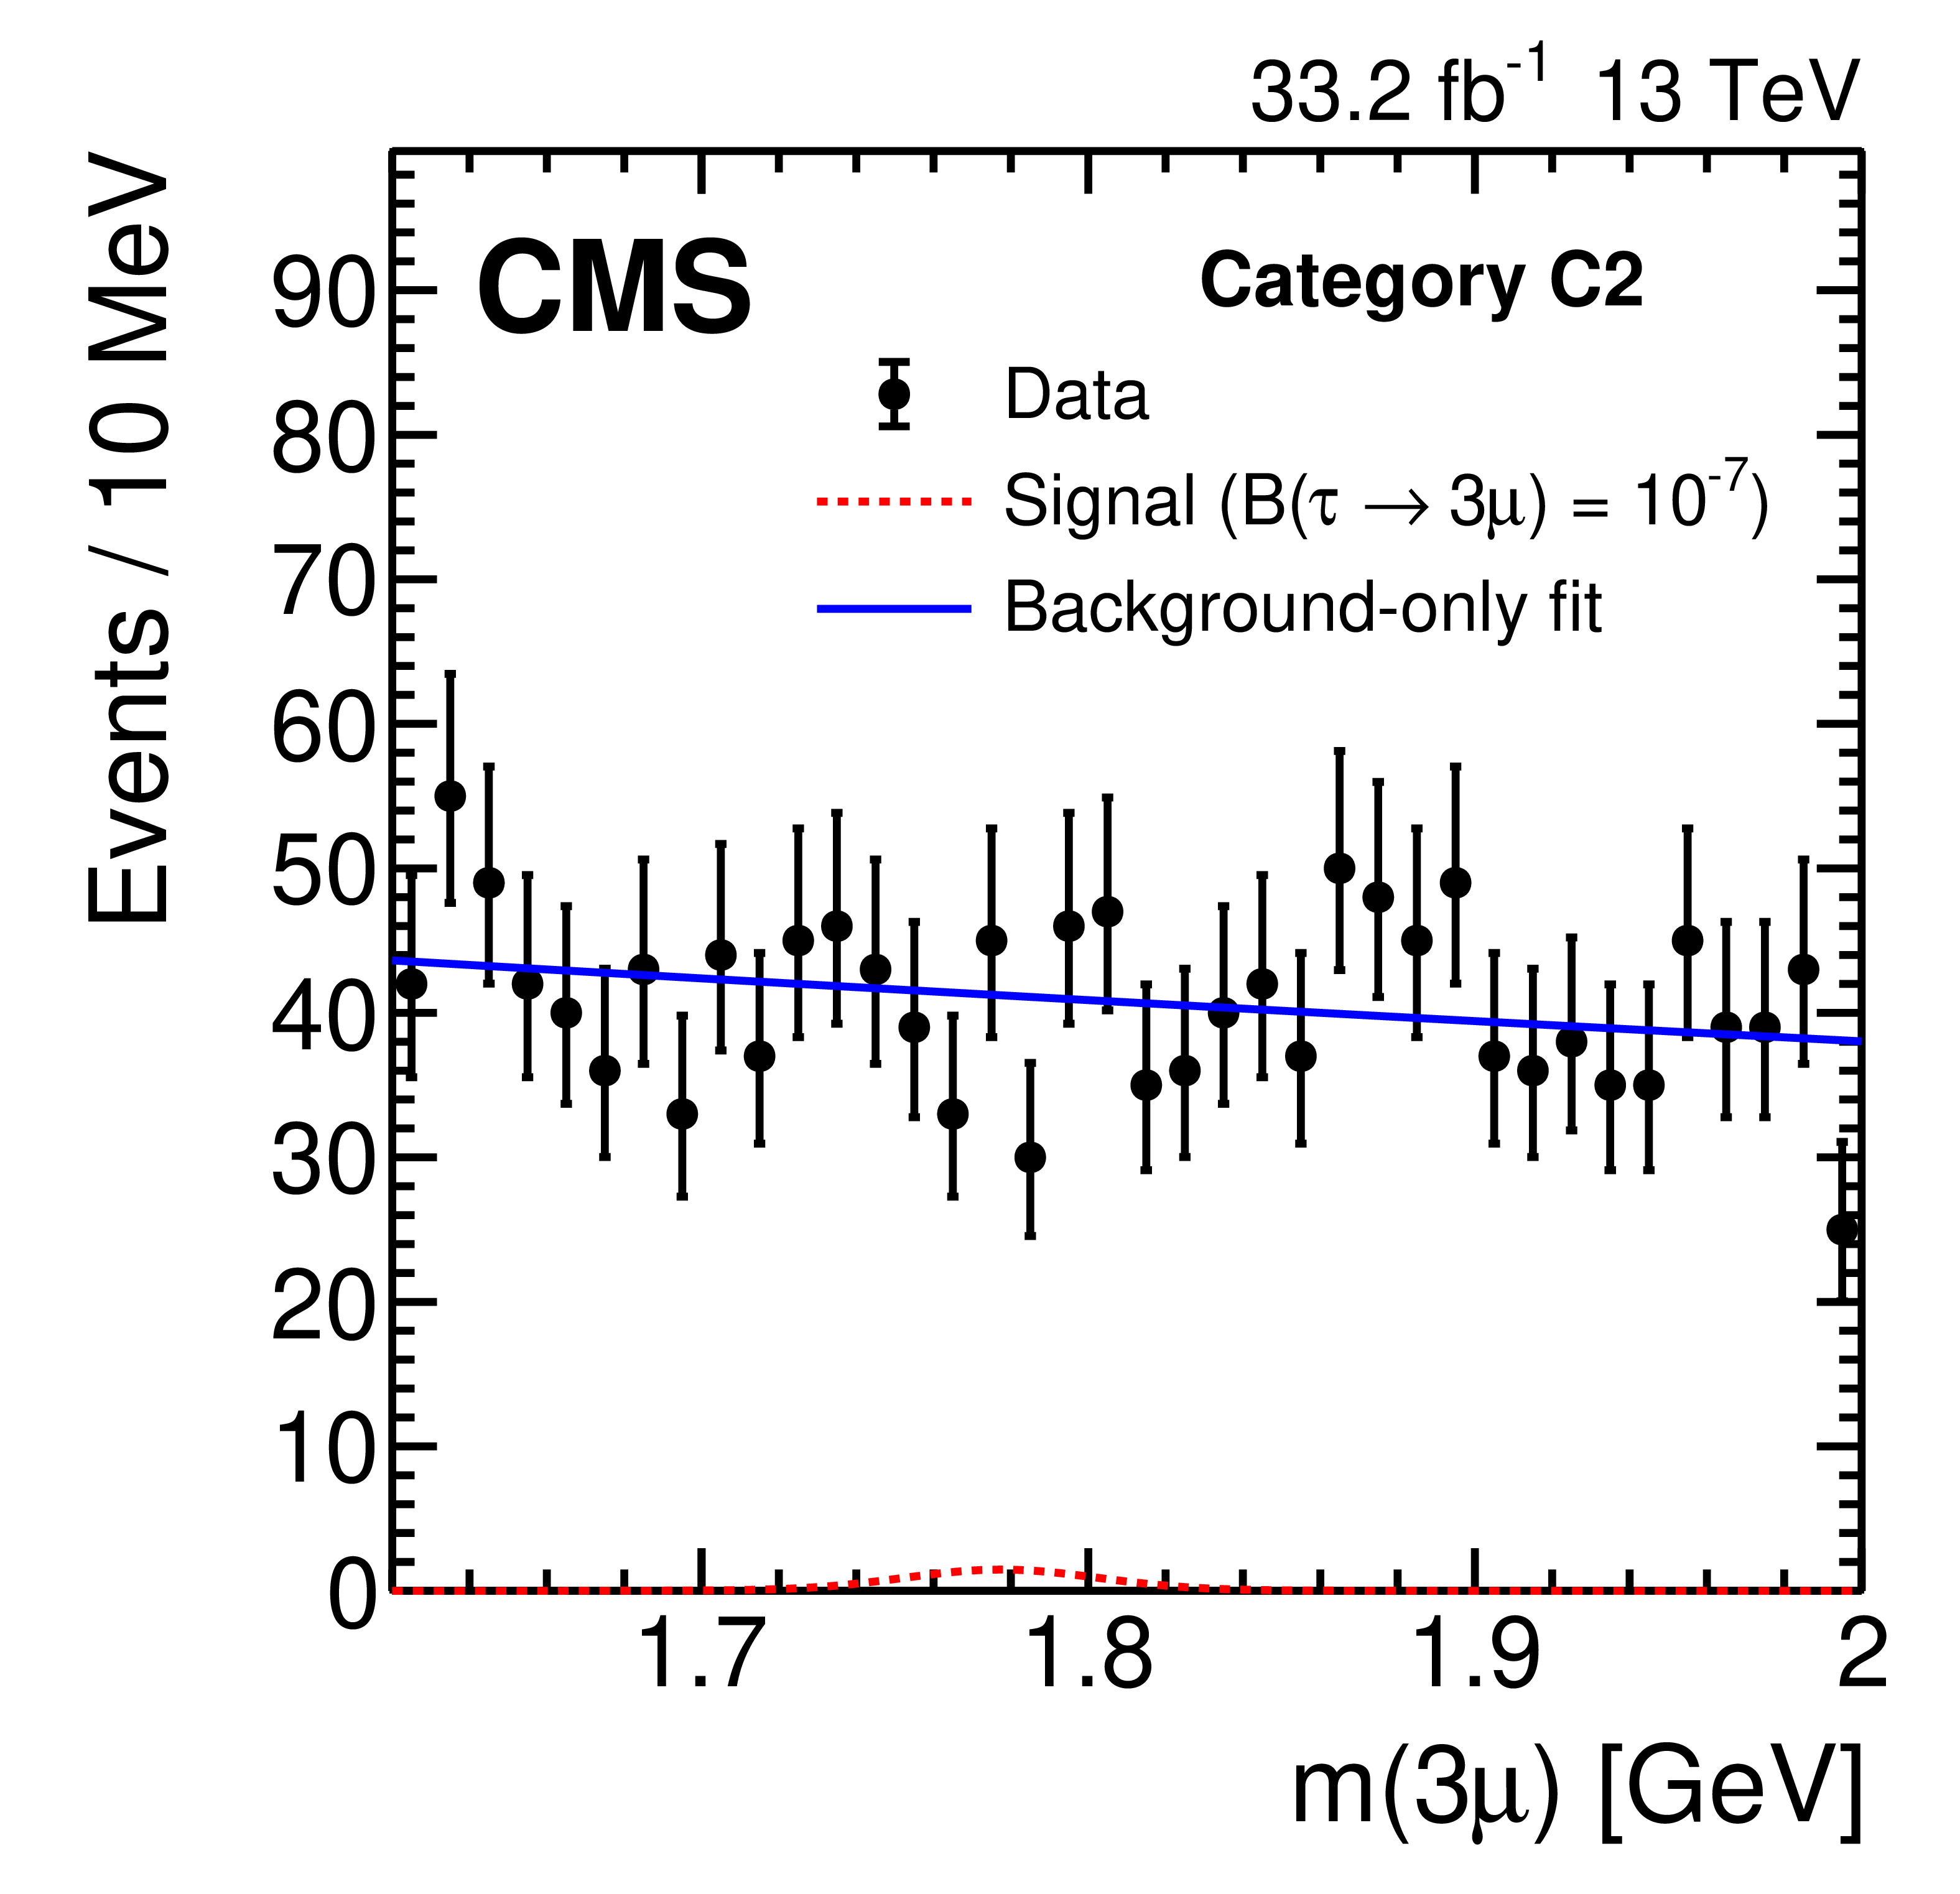
Figure 2:
Trimuon invariant mass distribution in the six independent event categories used in the heavy-flavor analysis and defined in the text: A1, A2, B1, B2, C1, C2. The data are shown with filled circles and vertical bars representing the statistical uncertainty. The background-only fit and the expected signal for $\mathcal {B}({\tau \,\to \, 3\mu}) = $ 10$^{-7}$ are shown with solid and dashed lines, respectively. |

png pdf |
Figure 2-a:
Trimuon invariant mass distribution in the A1 event category. The data are shown with filled circles and vertical bars representing the statistical uncertainty. The background-only fit and the expected signal for $\mathcal {B}({\tau \,\to \, 3\mu}) = $ 10$^{-7}$ are shown with solid and dashed lines, respectively. |
png pdf |
Figure 2-b:
Trimuon invariant mass distribution in the A2 event category. The data are shown with filled circles and vertical bars representing the statistical uncertainty. The background-only fit and the expected signal for $\mathcal {B}({\tau \,\to \, 3\mu}) = $ 10$^{-7}$ are shown with solid and dashed lines, respectively. |
png pdf |
Figure 2-c:
Trimuon invariant mass distribution in the B1 event category. The data are shown with filled circles and vertical bars representing the statistical uncertainty. The background-only fit and the expected signal for $\mathcal {B}({\tau \,\to \, 3\mu}) = $ 10$^{-7}$ are shown with solid and dashed lines, respectively. |
png pdf |
Figure 2-d:
Trimuon invariant mass distribution in the B2 event category. The data are shown with filled circles and vertical bars representing the statistical uncertainty. The background-only fit and the expected signal for $\mathcal {B}({\tau \,\to \, 3\mu}) = $ 10$^{-7}$ are shown with solid and dashed lines, respectively. |

png pdf |
Figure 2-e:
Trimuon invariant mass distribution in the C1 event category. The data are shown with filled circles and vertical bars representing the statistical uncertainty. The background-only fit and the expected signal for $\mathcal {B}({\tau \,\to \, 3\mu}) = $ 10$^{-7}$ are shown with solid and dashed lines, respectively. |
png pdf |
Figure 2-f:
Trimuon invariant mass distribution in the C2 event category. The data are shown with filled circles and vertical bars representing the statistical uncertainty. The background-only fit and the expected signal for $\mathcal {B}({\tau \,\to \, 3\mu}) = $ 10$^{-7}$ are shown with solid and dashed lines, respectively. |
png pdf |
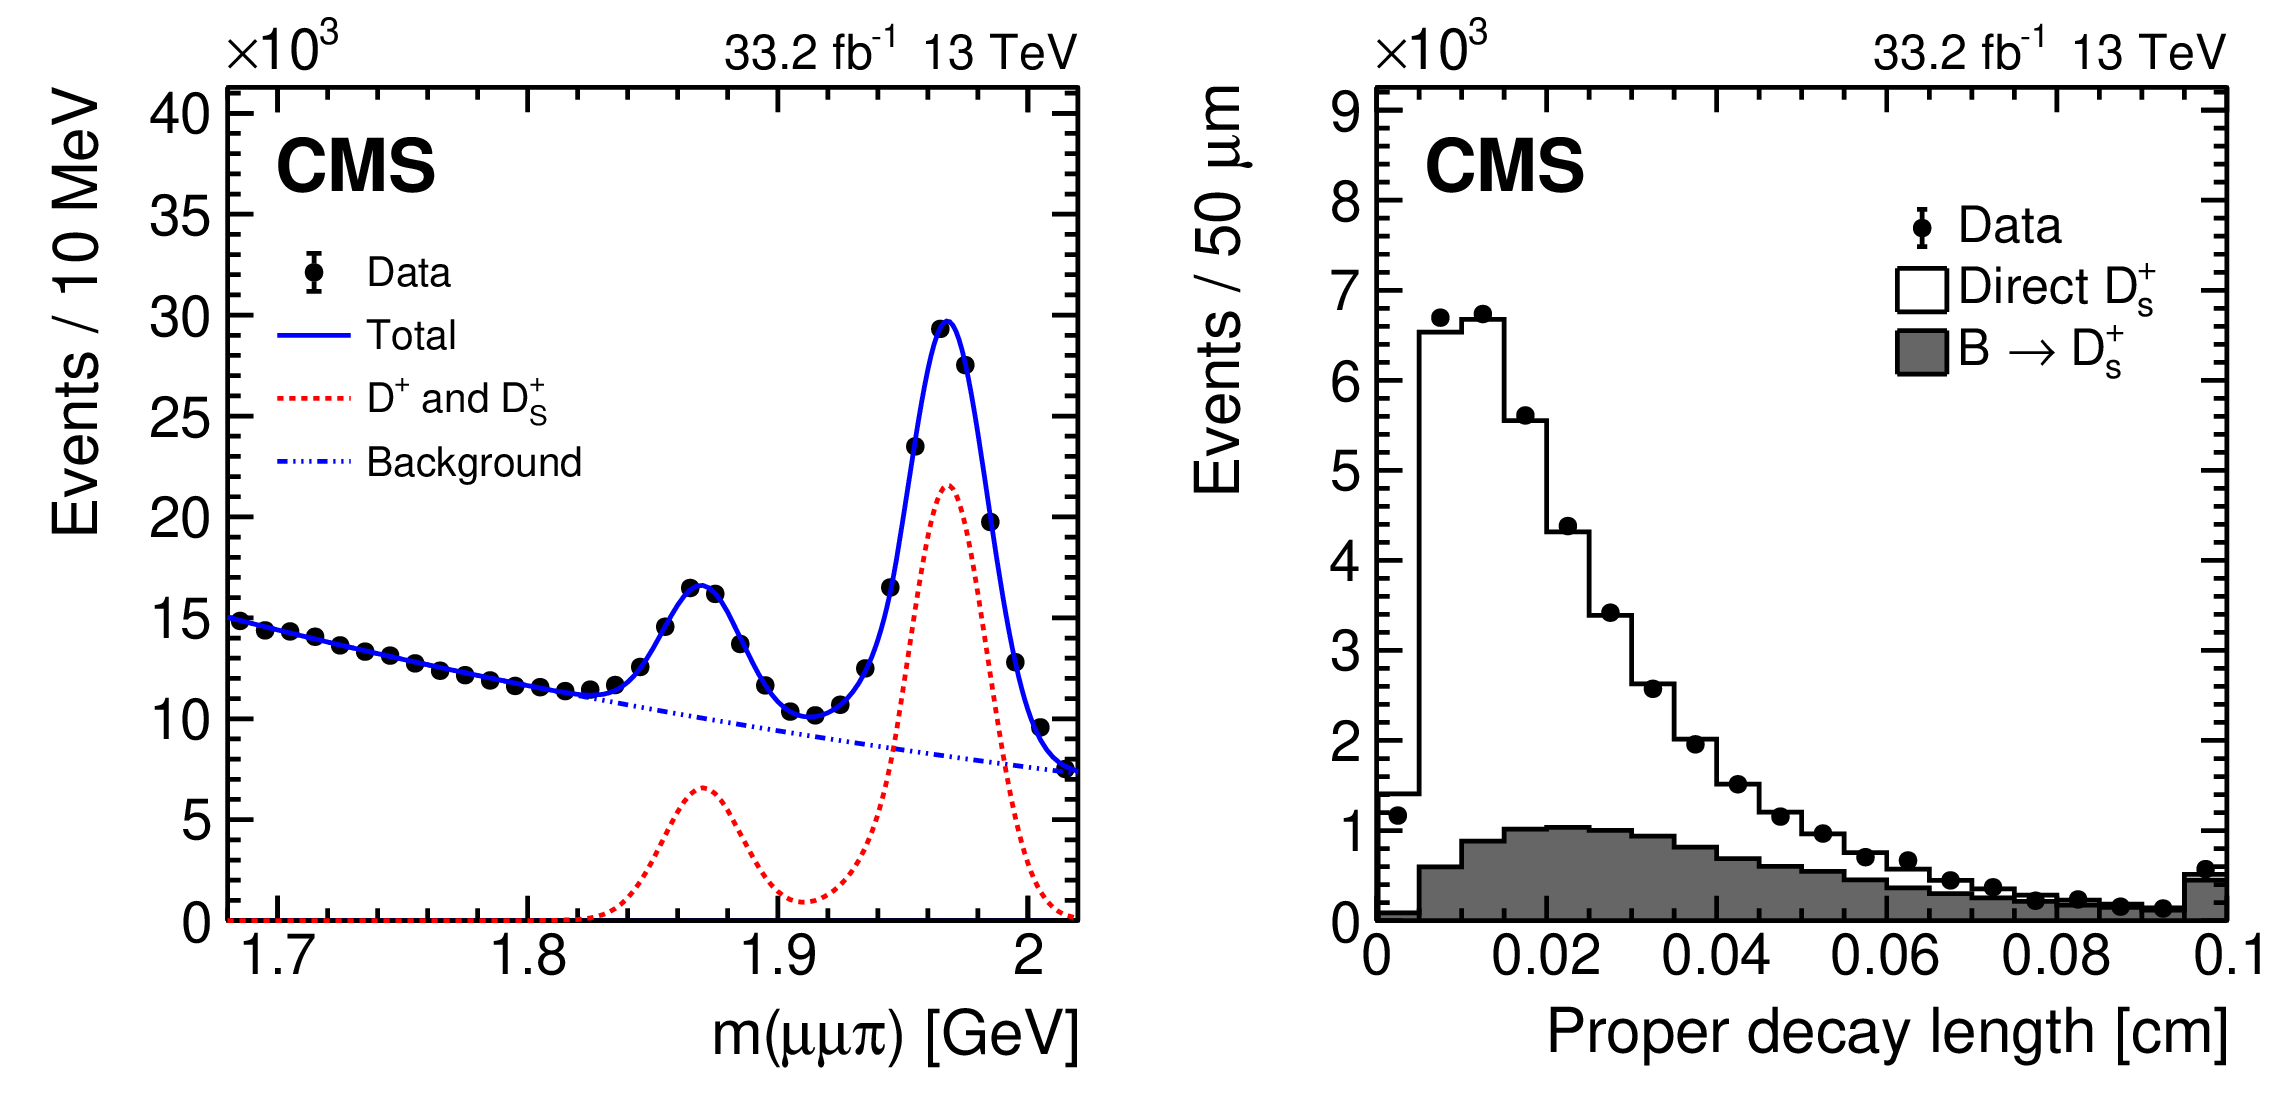
Figure 3:
Left: the $\mu \mu \pi $ invariant mass distribution with fits to the ${\mathrm{D^+}}$ and ${\mathrm{D^+}_{s}}$ peaks and the background. Right: background-subtracted proper decay length distribution for ${{\mathrm{D^+}_{s}} \,\to \, \phi \pi^{+} \,\to \, \mu^{+} \mu^{-} \pi^{+}}$ events (points) and the fitted contributions from ${\mathrm{D^+}_{s}}$ mesons produced directly (open histogram) and from B meson decays (filled histogram). The highest bin also contains the overflow events. The vertical bars in both plots represent the statistical uncertainties in the data. |

png pdf |
Figure 3-a:
The $\mu \mu \pi $ invariant mass distribution with fits to the ${\mathrm{D^+}}$ and ${\mathrm{D^+}_{s}}$ peaks and the background. The vertical bars represent the statistical uncertainties in the data. |
png pdf |
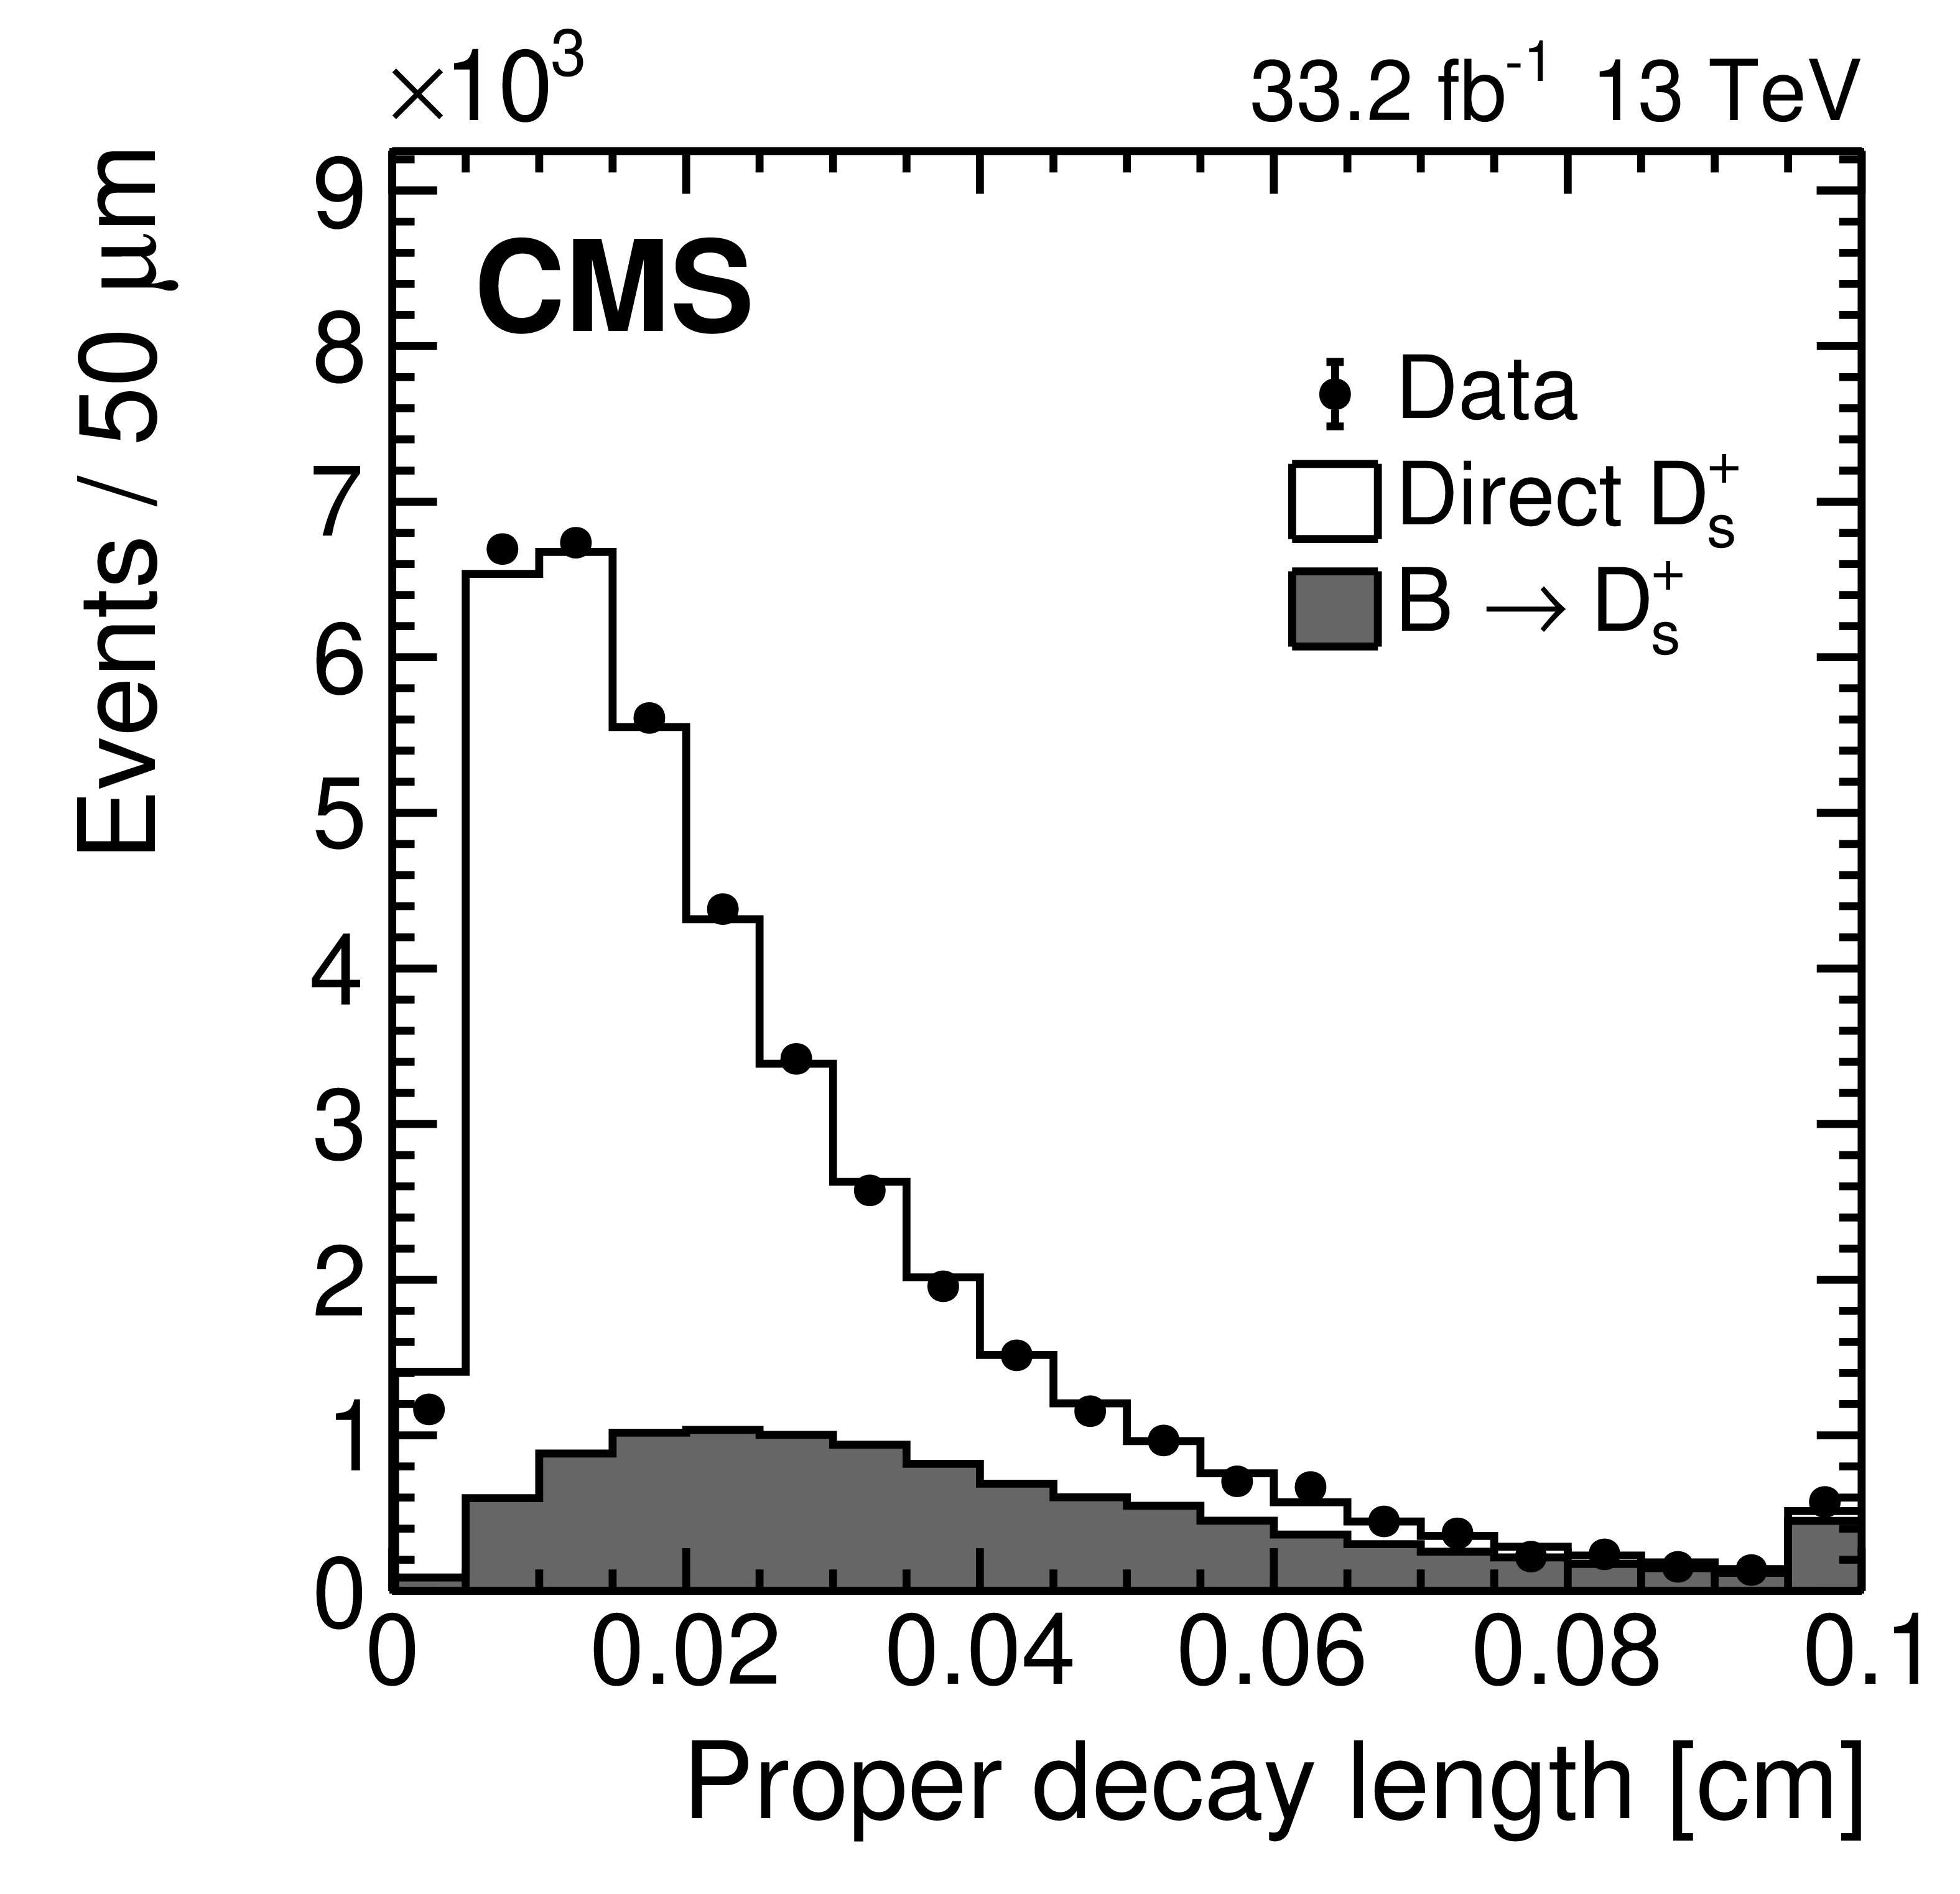
Figure 3-b:
Background-subtracted proper decay length distribution for ${{\mathrm{D^+}_{s}} \,\to \, \phi \pi^{+} \,\to \, \mu^{+} \mu^{-} \pi^{+}}$ events (points) and the fitted contributions from ${\mathrm{D^+}_{s}}$ mesons produced directly (open histogram) and from B meson decays (filled histogram). The highest bin also contains the overflow events. The vertical bars represent the statistical uncertainties in the data. |
| Tables | |
png pdf |
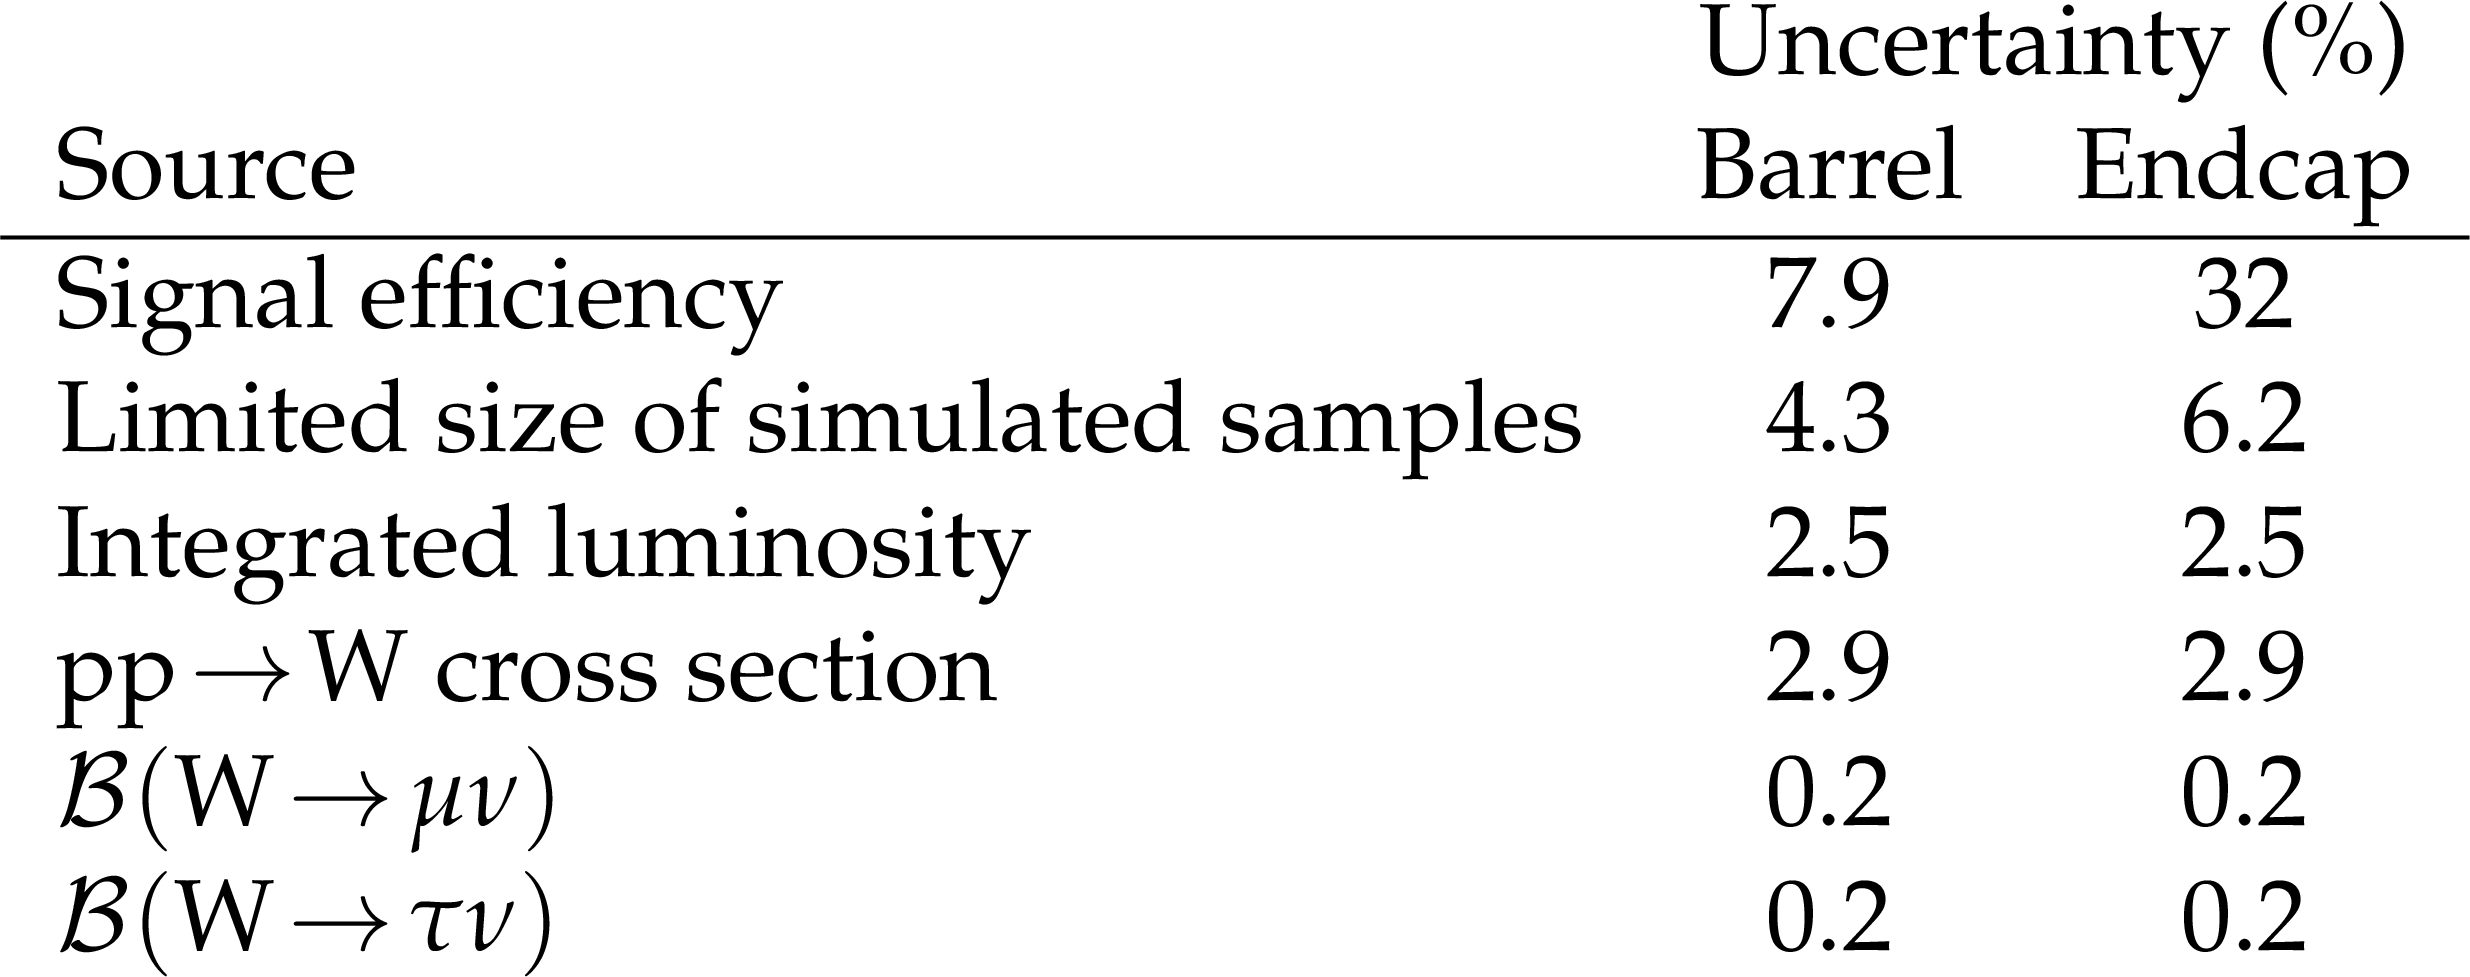
Table 1:
Sources of systematic uncertainties in the W boson analysis and their effect on the signal efficiency and normalization for the barrel and endcap categories. |

png pdf |
Table 2:
The sources of systematic uncertainties in the heavy-flavor analysis affecting signal modeling and their impact on the expected signal event yield. The columns labeled Uncertainty and Yield give the uncertainty associated with the source, and the resulting effect on the yield, respectively. |
| Summary |
| The results of a search for the lepton flavor violating decay ${\tau \!\to\! 3\mu} $, using proton-proton collisions with a center-of-mass energy of 13 TeV at the LHC, are presented. The search uses data collected by CMS in 2016, corresponding to an integrated luminosity of 33.2 fb$^{-1}$, and, for the first time, combines the result of two analyses: one targeting $\tau$ leptons produced in W boson decays and the other using $\tau$ leptons from heavy-flavor hadron decays. No signal is observed, and the branching fraction $\mathcal{B}({\tau \!\to\! 3\mu} )$ is determined to be less than 8.0 $\times$ 10$^{-8}$ at 90% confidence level, with an expected upper limit of 6.9 $\times$ 10$^{-8}$. While the limit obtained in this measurement is still a factor of four away from the current most restrictive one from the Belle experiment [8], we have achieved similar sensitivity to that by BaBar [7] and LHCb [9]. |
| References | ||||
| 1 | X.-Y. Pham | Lepton flavor changing in neutrinoless $ \tau $ decays | EPJC 8 (1999) 513 | hep-ph/9810484 |
| 2 | G. Hern\'andez-Tom\'e, G. L\'opez Castro, and P. Roig | Flavor violating leptonic decays of $ \tau $ and $ \mu $ leptons in the Standard Model with massive neutrinos | EPJC 79 (2019) 84 | 1807.06050 |
| 3 | P. Blackstone, M. Fael, and E. Passemar | $ \tau \to \mu\mu\mu $ at a rate of one out of $ 10^{14} $ tau decays? | EPJC 80 (2020) 506 | 1912.09862 |
| 4 | W. J. Marciano, T. Mori, and J. M. Roney | Charged lepton flavor violation experiments | Ann. Rev. Nucl. Part. Sci. 58 (2008) 315 | |
| 5 | M. Raidal et al. | Flavour physics of leptons and dipole moments | EPJC 57 (2008) 13 | 0801.1826 |
| 6 | E. Arganda and M. J. Herrero | Testing supersymmetry with lepton flavor violating $ \tau $ and $ \mu $ decays | PRD 73 (2006) 055003 | hep-ph/0510405 |
| 7 | BaBar Collaboration | Improved limits on the lepton-flavor violating decays $ \tau^{-} \to \ell^{-} \ell^{+} \ell^{-} $ | PRL 99 (2007) 251803 | 0708.3650 |
| 8 | Belle Collaboration | Search for lepton flavor violating $ \tau $ decays into three leptons with 719 million produced $ \tau^+\tau^- $ pairs | PLB 687 (2010) 139 | 1001.3221 |
| 9 | LHCb Collaboration | Search for the lepton flavour violating decay $ \tau^- \to \mu^-\mu^+\mu^- $ | JHEP 02 (2015) 121 | 1409.8548 |
| 10 | ATLAS Collaboration | Probing lepton flavour violation via neutrinoless $ \tau \to 3\mu $ decays with the ATLAS detector | EPJC 76 (2016) 232 | 1601.03567 |
| 11 | CMS Collaboration | The CMS experiment at the CERN LHC | JINST 3 (2008) S08004 | CMS-00-001 |
| 12 | CMS Collaboration | The CMS trigger system | JINST 12 (2017) P01020 | CMS-TRG-12-001 1609.02366 |
| 13 | CMS Collaboration | Particle-flow reconstruction and global event description with the CMS detector | JINST 12 (2017) P10003 | CMS-PRF-14-001 1706.04965 |
| 14 | CMS Collaboration | Performance of the CMS muon detector and muon reconstruction with proton-proton collisions at $ \sqrt{s} = $ 13 TeV | JINST 13 (2018) P06015 | CMS-MUO-16-001 1804.04528 |
| 15 | S. Frixione and B. R. Webber | Matching NLO QCD computations and parton shower simulations | JHEP 06 (2002) 029 | hep-ph/0204244 |
| 16 | J. Alwall et al. | The automated computation of tree-level and next-to-leading order differential cross sections, and their matching to parton shower simulations | JHEP 07 (2014) 079 | 1405.0301 |
| 17 | T. Sjostrand et al. | An introduction to PYTHIA 8.2 | CPC 191 (2015) 159 | 1410.3012 |
| 18 | CMS Collaboration | Event generator tunes obtained from underlying event and multiparton scattering measurements | EPJC 76 (2016) 155 | CMS-GEN-14-001 1512.00815 |
| 19 | D. J. Lange | The EvtGen particle decay simulation package | NIMA 462 (2001) 152 | |
| 20 | GEANT4 Collaboration | GEANT4--a simulation toolkit | NIMA 506 (2003) 250 | |
| 21 | M. Cacciari, G. P. Salam, and G. Soyez | The anti-$ {k_{\mathrm{T}}} $ jet clustering algorithm | JHEP 04 (2008) 063 | 0802.1189 |
| 22 | M. Cacciari, G. P. Salam, and G. Soyez | FastJet user manual | EPJC 72 (2012) 1896 | 1111.6097 |
| 23 | T. Chen and C. Guestrin | XGBoost: A scalable tree boosting system | in Proceedings of the 22nd ACM SIGKDD International Conference on Knowledge Discovery and Data Mining, KDD '16, New York 2016 | |
| 24 | CMS Collaboration | Performance of reconstruction and identification of $ \tau $ leptons decaying to hadrons and $ \nu_\tau $ in $ {\mathrm{p}}{\mathrm{p}} $ collisions at $ \sqrt{s}= $ 13 TeV | JINST 13 (2018) P10005 | CMS-TAU-16-003 1809.02816 |
| 25 | CMS Collaboration | Multivariate determination of the missing energy in the transverse plane $ (E^\text{miss}_\text{T}) $ at $ \sqrt{s} = $ 13 TeV | CDS | |
| 26 | ATLAS Collaboration | Measurement of $ \mathrm{W}^{\pm} $ and $ \mathrm{Z} $-boson production cross sections in $ {\mathrm{p}}{\mathrm{p}} $ collisions at $ \sqrt{s}= $ 13 TeV with the ATLAS detector | PLB 759 (2016) 601 | 1603.09222 |
| 27 | Particle Data Group, M. Tanabashi et al. | Review of particle physics | PRD 98 (2018) 030001 | |
| 28 | CMS Collaboration | CMS luminosity measurements for the 2016 data taking period | CMS-PAS-LUM-17-001 | CMS-PAS-LUM-17-001 |
| 29 | M. J. Oreglia | A study of the reactions $\psi' \to \gamma\gamma \psi$ | PhD thesis, Stanford University, 1980 SLAC Report SLAC-R-236, see A | |
| 30 | CMS Collaboration | Measurement of the inclusive $ \mathrm{W} $ and $ \mathrm{Z} $ production cross sections in $ {\mathrm{p}}{\mathrm{p}} $ collisions at $ \sqrt{s}= $ 7 TeV | JHEP 10 (2011) 132 | CMS-EWK-10-005 1107.4789 |
| 31 | The ATLAS Collaboration, The CMS Collaboration, The LHC Higgs Combination Group | Procedure for the LHC Higgs boson search combination in Summer 2011 | CMS-NOTE-2011-005 | |
| 32 | T. Junk | Confidence level computation for combining searches with small statistics | NIMA 434 (1999) 435 | hep-ex/9902006 |
| 33 | A. L. Read | Presentation of search results: The CL$ _{\text{s}} $ technique | JPG 28 (2002) 2693 | |
|
|
Compact Muon Solenoid LHC, CERN |
|

|

|

|

|

|