

Compact Muon Solenoid
LHC, CERN
| CMS-TAU-16-003 ; CERN-EP-2018-229 | ||
| Performance of reconstruction and identification of $\tau$ leptons decaying to hadrons and $\nu_{\tau}$ in pp collisions at $ \sqrt{s} = $ 13 TeV | ||
| CMS Collaboration | ||
| 8 September 2018 | ||
| JINST 13 (2018) P10005 | ||
| Abstract: The algorithm developed by the CMS Collaboration to reconstruct and identify $\tau$ leptons produced in proton-proton collisions at $\sqrt{s}= $ 7 and 8 TeV, via their decays to hadrons and a neutrino, has been significantly improved. The changes include a revised reconstruction of $\pi^{0}$ candidates, and improvements in multivariate discriminants to separate $\tau$ leptons from jets and electrons. The algorithm is extended to reconstruct $\tau$ leptons in highly Lorentz-boosted pair production, and in the high-level trigger. The performance of the algorithm is studied using proton-proton collisions recorded during 2016 at $\sqrt{s} = $ 13 TeV, corresponding to an integrated luminosity of 35.9 fb$^{-1}$. The performance is evaluated in terms of the efficiency for a genuine $\tau$ lepton to pass the identification criteria and of the probabilities for jets, electrons, and muons to be misidentified as $\tau$ leptons. The results are found to be very close to those expected from Monte Carlo simulation. | ||
| Links: e-print arXiv:1809.02816 [hep-ex] (PDF) ; CDS record ; inSPIRE record ; CADI line (restricted) ; | ||
| Figures | |
png pdf |
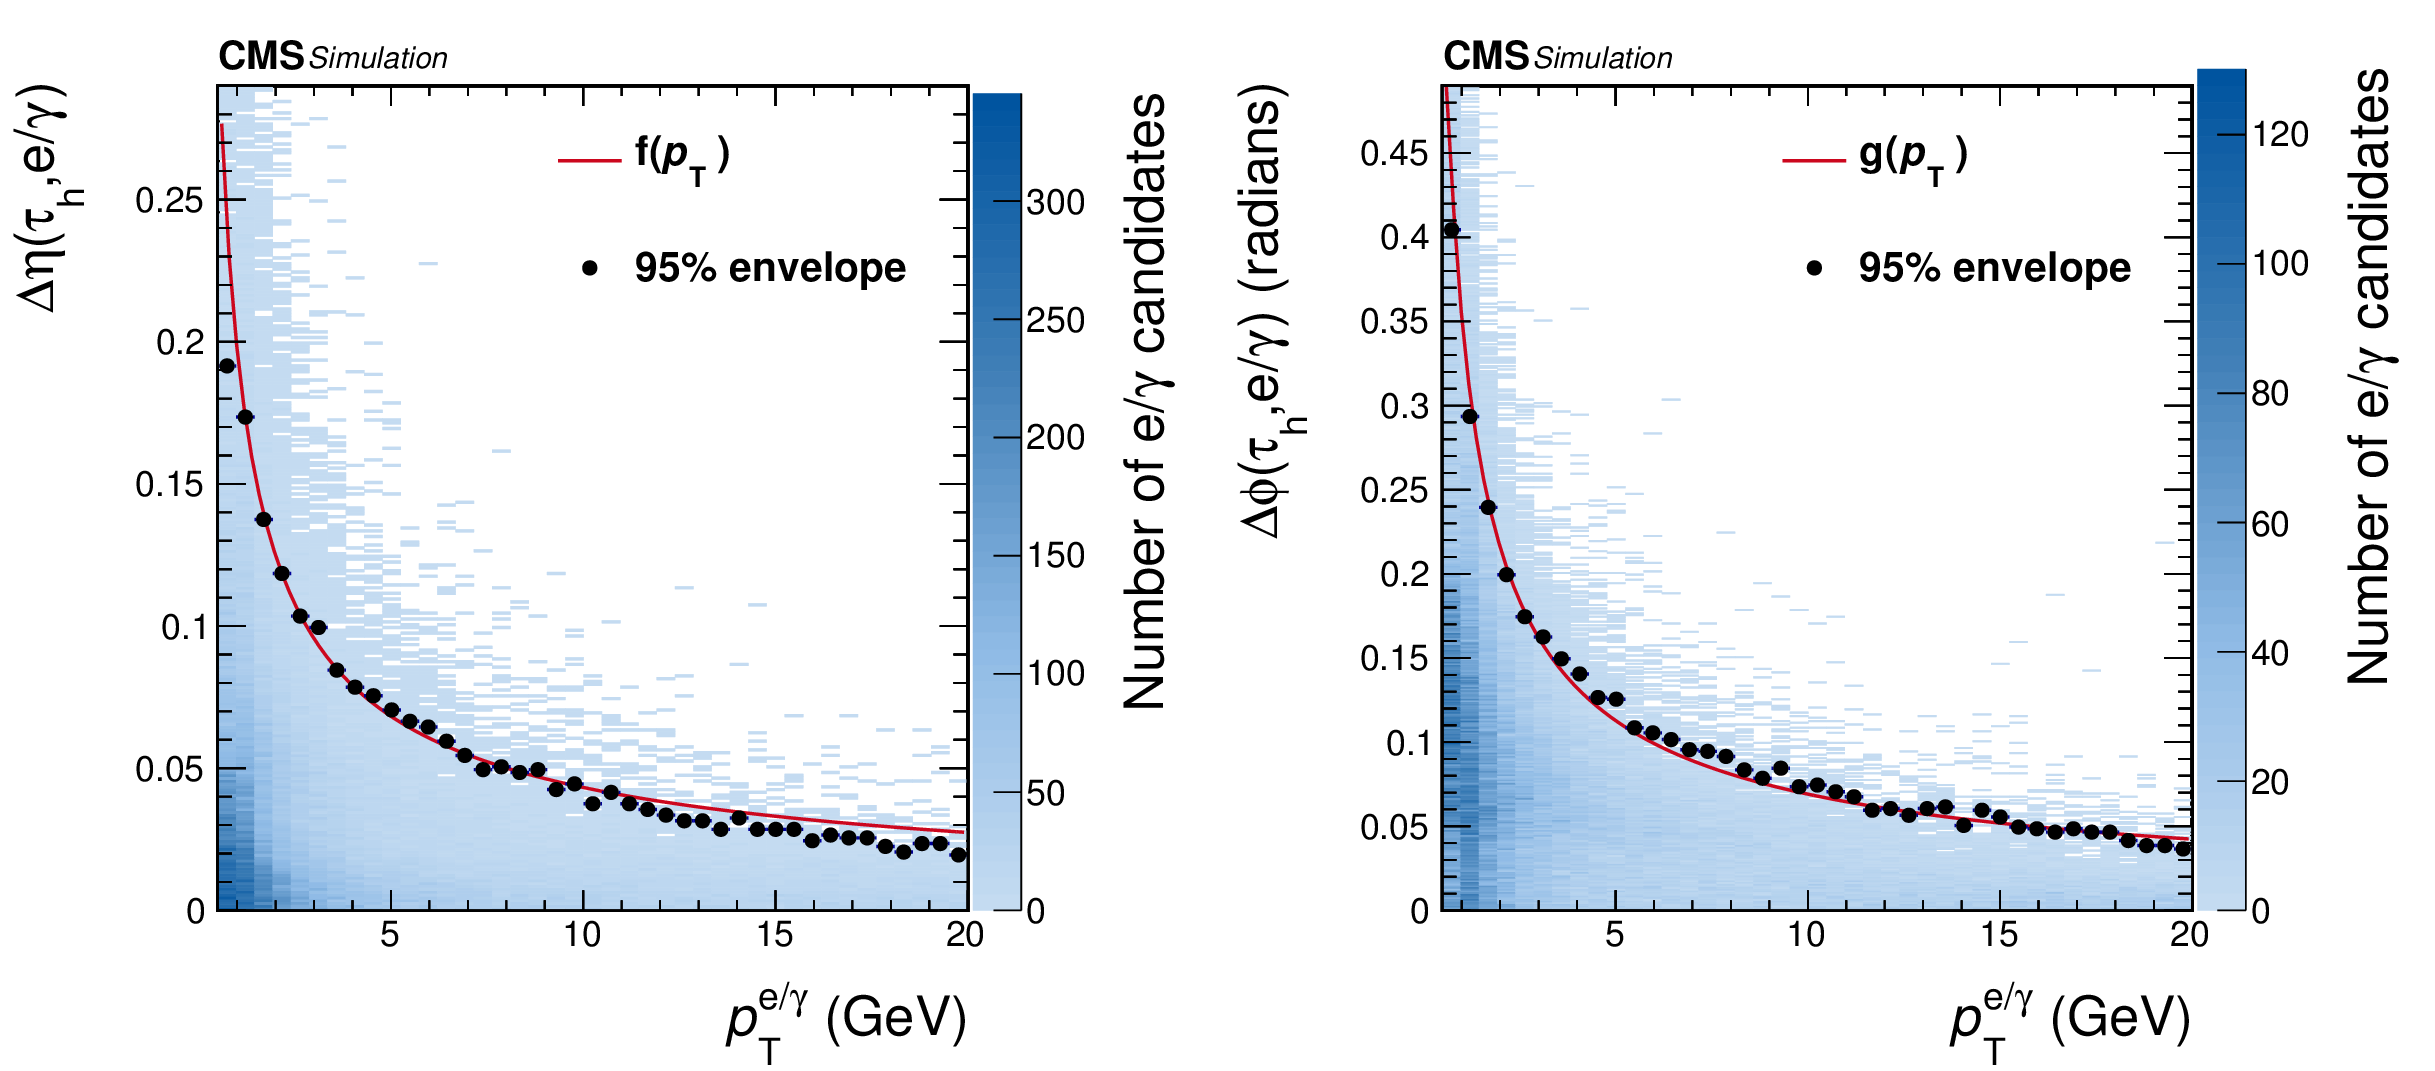
Figure 1:
Distance in $\eta $ (left) and in $\phi $ (right) between the $ {{\tau} _\mathrm {h}} $ and $ {\mathrm {e}}/ {\gamma} $ candidates for $ {{\tau} _\mathrm {h}} $ decay products, as a function of the $ {p_{\mathrm {T}}} $ of the $ {\mathrm {e}}/ {\gamma} $ candidate, in simulated $ {{\tau} _\mathrm {h}} $ decays. The points show the 95% envelope for a given bin, and the solid red lines represent the fitted functions $f$ and $g$ given in Eq. 3. |

png pdf |
Figure 1-a:
Distance in $\eta $ between the $ {{\tau} _\mathrm {h}} $ and $ {\mathrm {e}}/ {\gamma} $ candidates for $ {{\tau} _\mathrm {h}} $ decay products, as a function of the $ {p_{\mathrm {T}}} $ of the $ {\mathrm {e}}/ {\gamma} $ candidate, in simulated $ {{\tau} _\mathrm {h}} $ decays. The points show the 95% envelope for a given bin, and the solid red lines represent the fitted functions $f$ and $g$ given in Eq. 3. |

png pdf |
Figure 1-b:
Distance in $\phi $ between the $ {{\tau} _\mathrm {h}} $ and $ {\mathrm {e}}/ {\gamma} $ candidates for $ {{\tau} _\mathrm {h}} $ decay products, as a function of the $ {p_{\mathrm {T}}} $ of the $ {\mathrm {e}}/ {\gamma} $ candidate, in simulated $ {{\tau} _\mathrm {h}} $ decays. The points show the 95% envelope for a given bin, and the solid red lines represent the fitted functions $f$ and $g$ given in Eq. 3. |
png pdf |
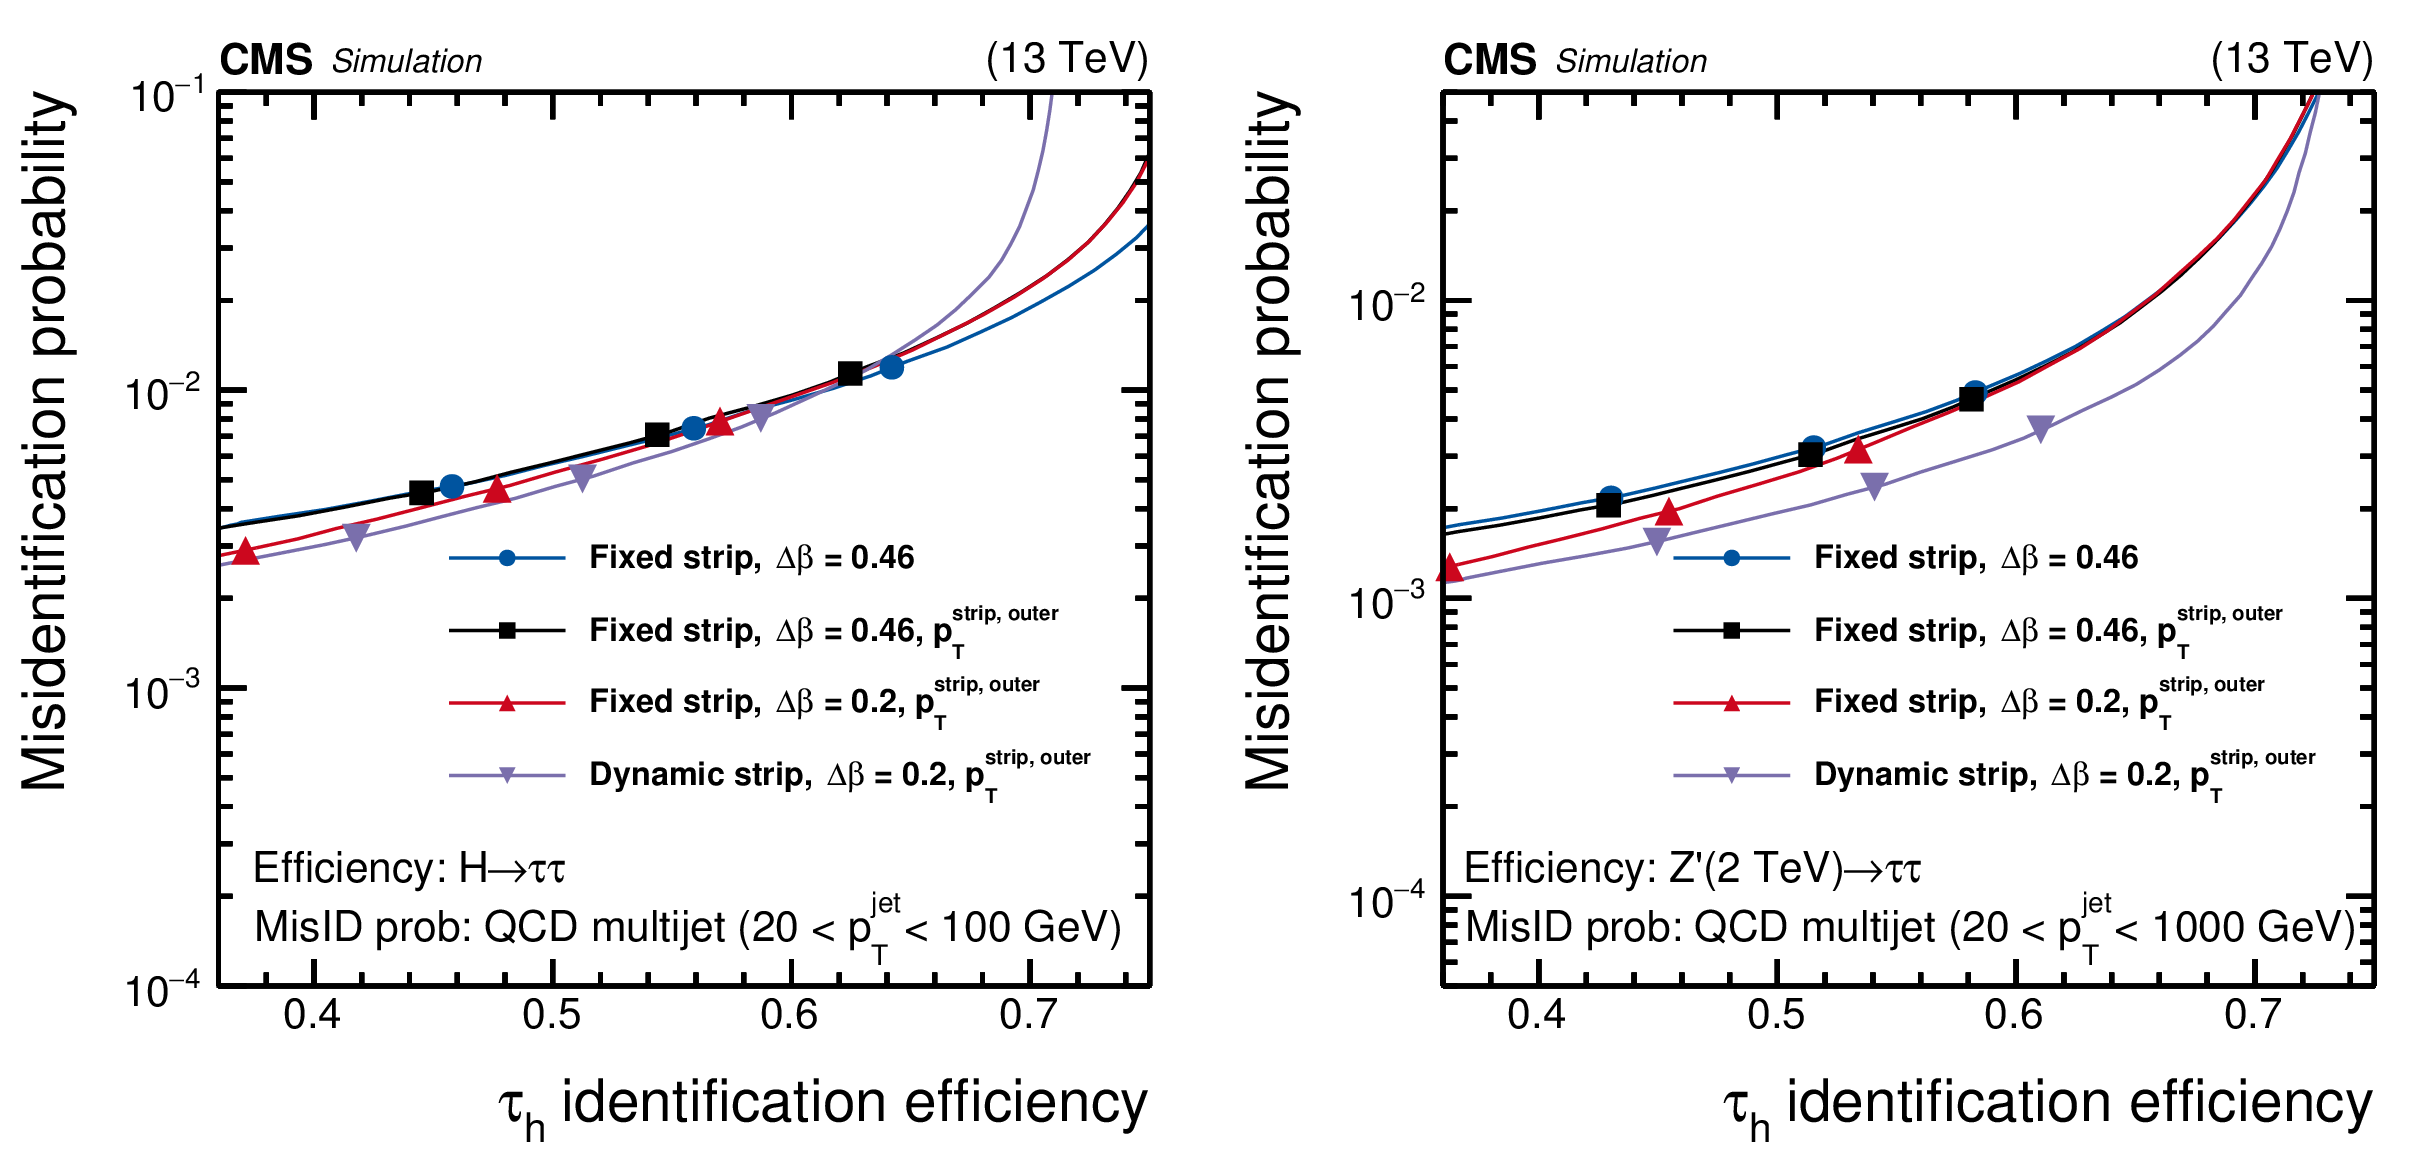
Figure 2:
Misidentification probabilities as a function of the $ {{\tau} _\mathrm {h}} $ identification efficiencies, evaluated for $ {\mathrm {H}} \to {\tau} {\tau}$ (left) and $ {\mathrm {Z}}^{'}(2 TeV) \to {\tau} {\tau}$ (right), and for QCD multijet MC events. Four configurations of the reconstruction and isolation method are compared. The three points on each curve correspond, from left to right, to the tight, medium, and loose WPs. The solid curves are obtained by imposing cutoffs on $I_{{{\tau} _\mathrm {h}}}$ that decrease linearly from small to large efficiency. |
png pdf |
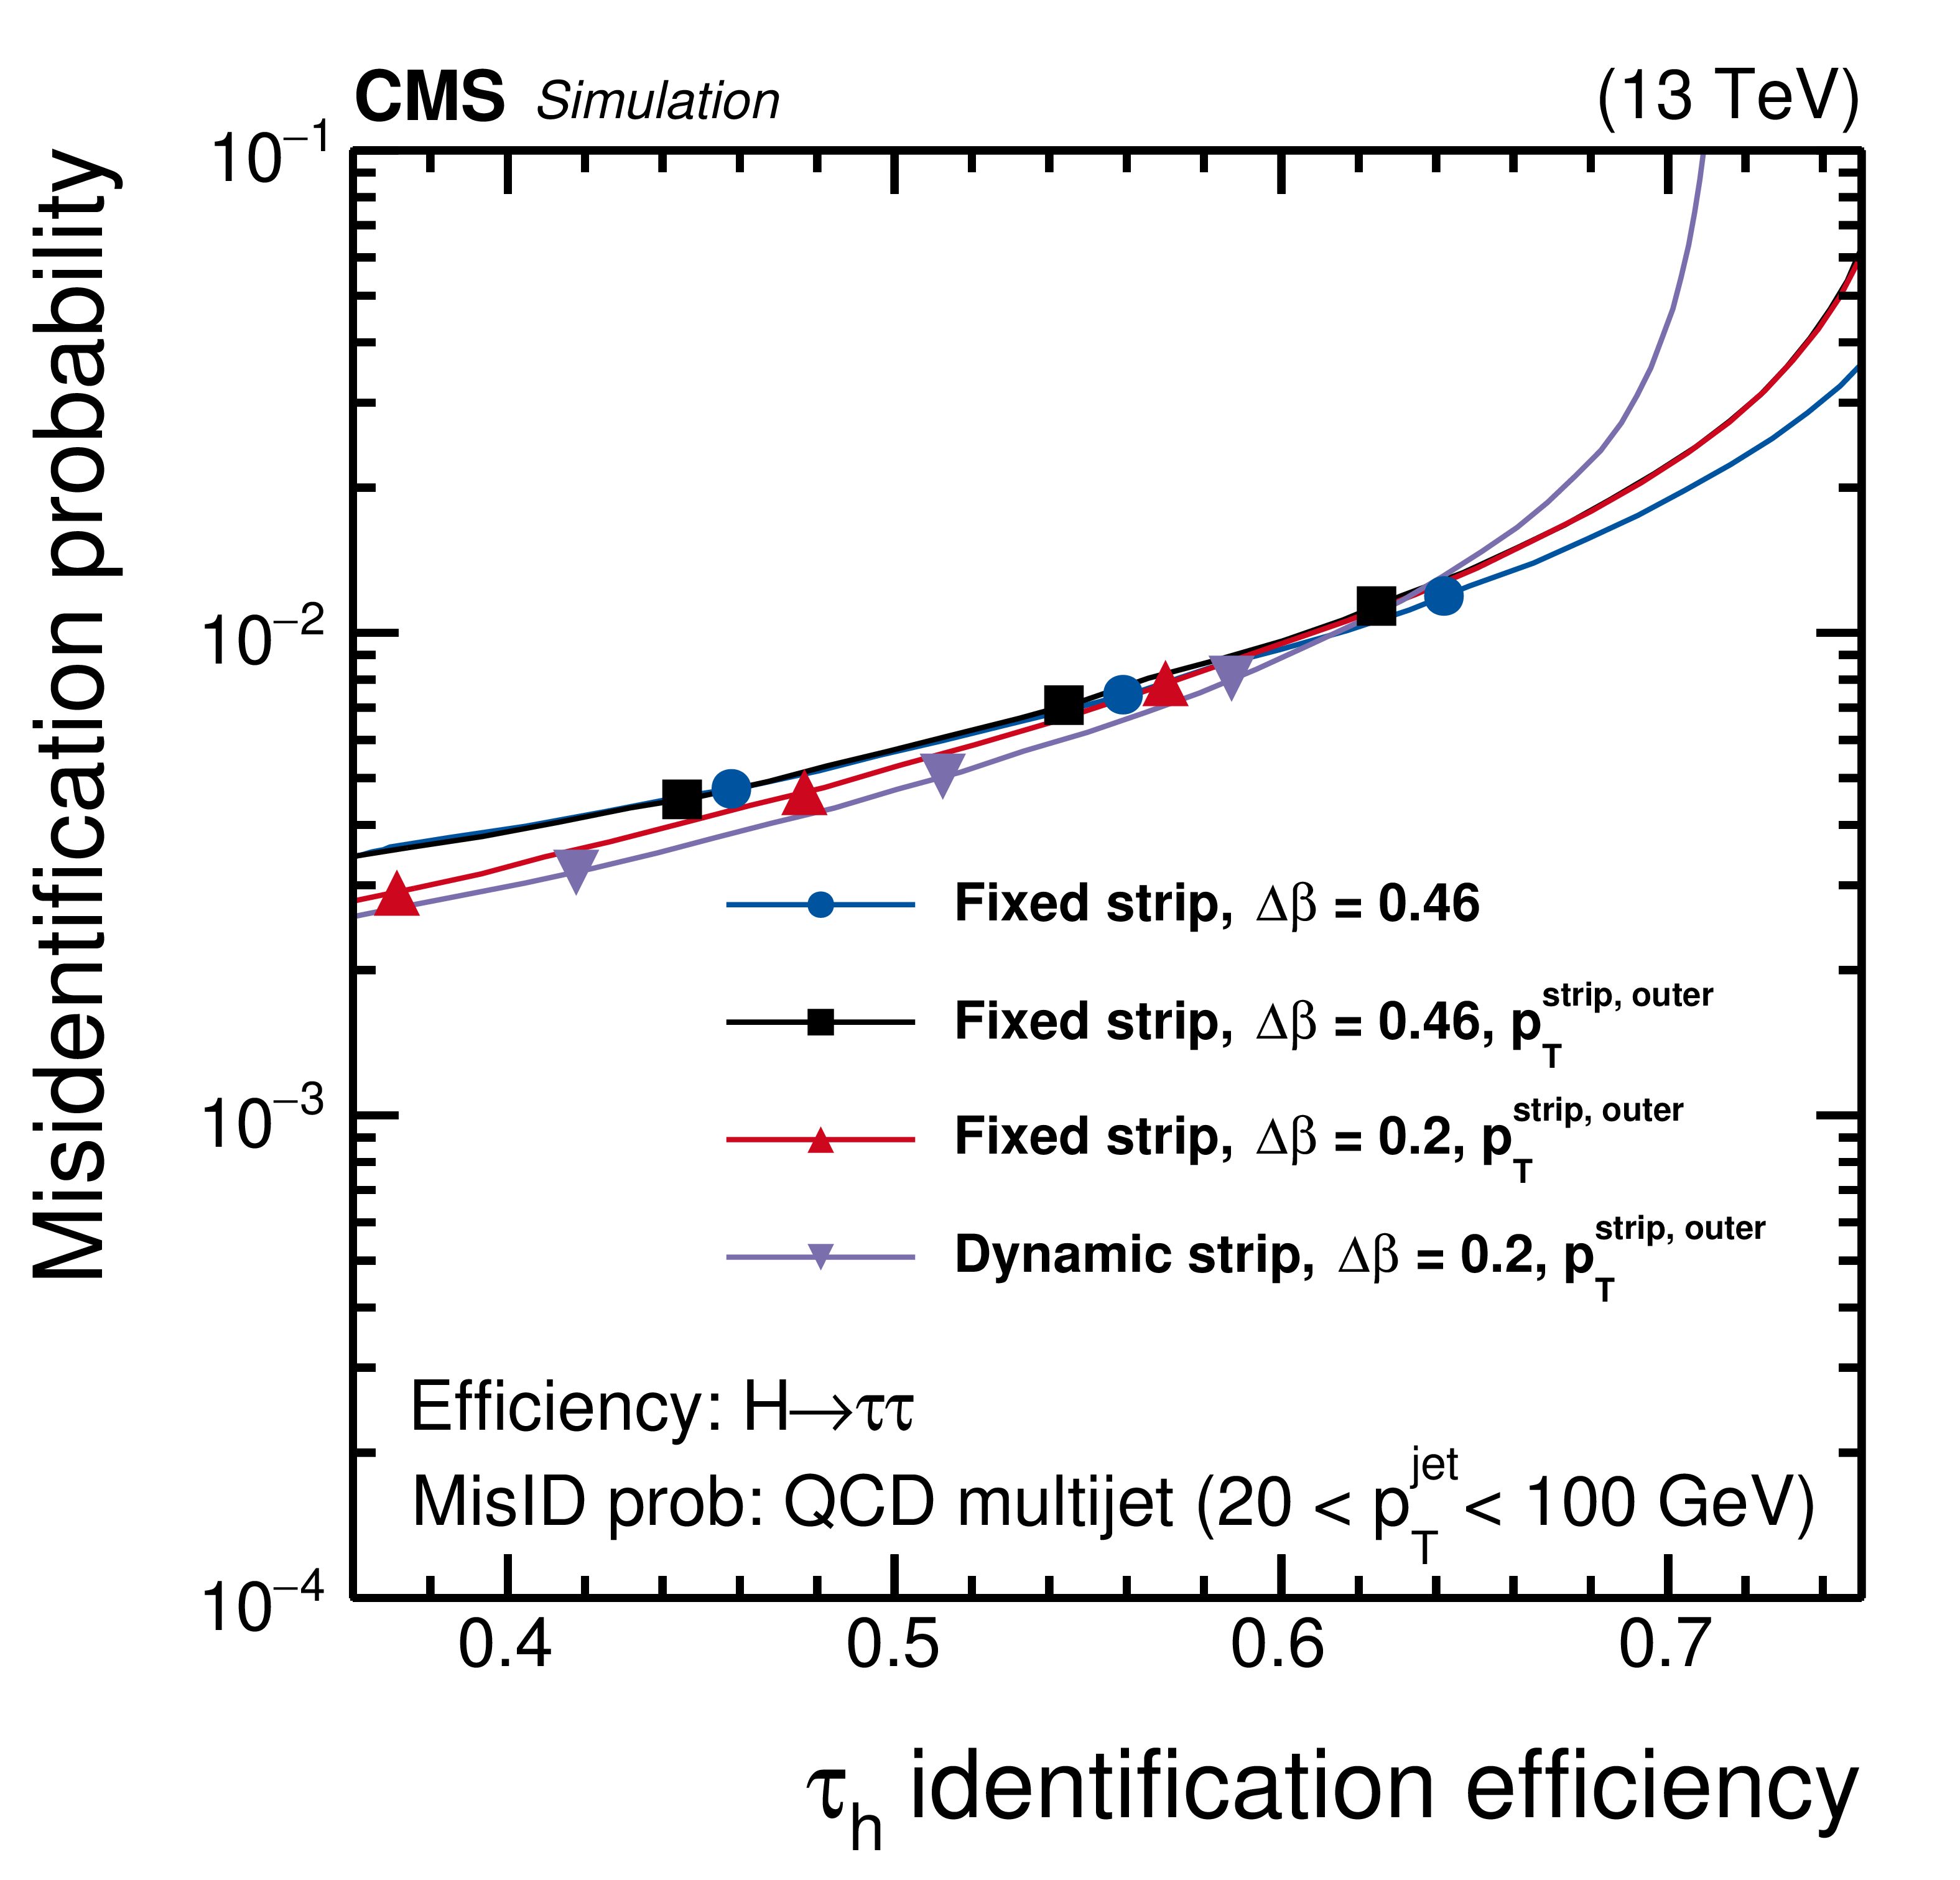
Figure 2-a:
Misidentification probabilities as a function of the $ {{\tau} _\mathrm {h}} $ identification efficiencies, evaluated for $ {\mathrm {H}} \to {\tau} {\tau}$, and for QCD multijet MC events. Four configurations of the reconstruction and isolation method are compared. The three points on each curve correspond, from left to right, to the tight, medium, and loose WPs. The solid curves are obtained by imposing cutoffs on $I_{{{\tau} _\mathrm {h}}}$ that decrease linearly from small to large efficiency. |
png pdf |
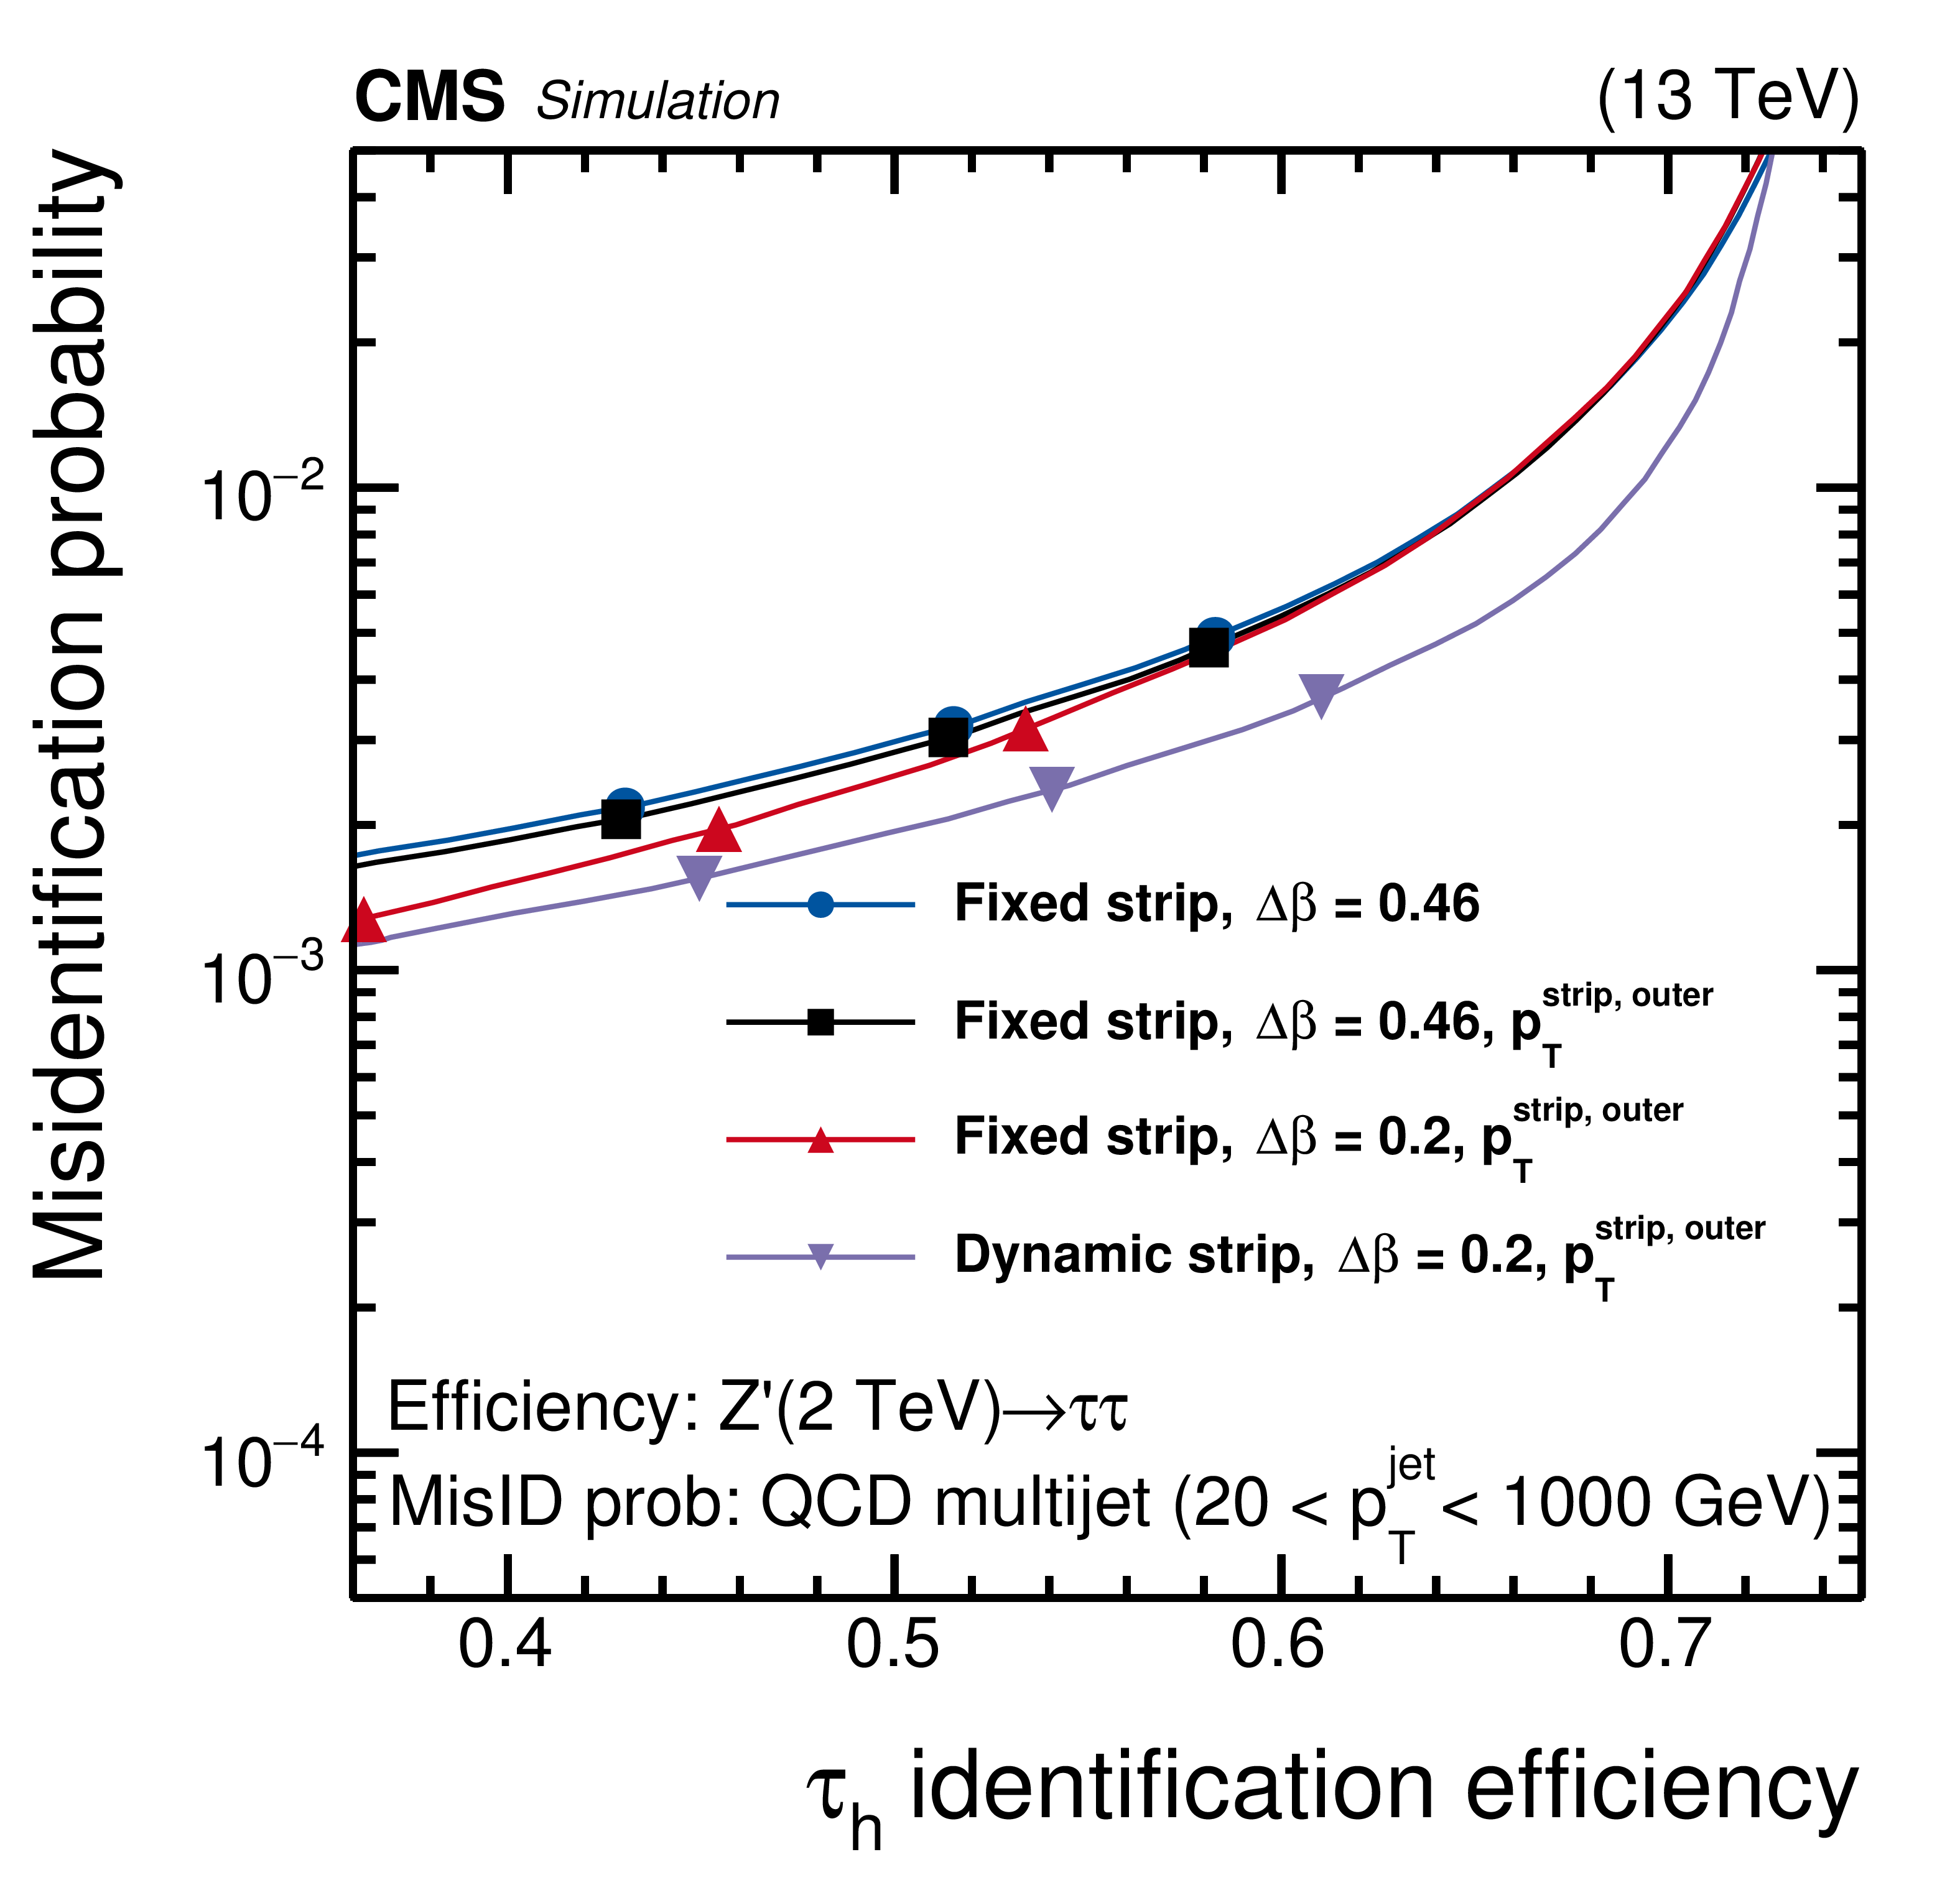
Figure 2-b:
Misidentification probabilities as a function of the $ {{\tau} _\mathrm {h}} $ identification efficiencies, evaluated for $ {\mathrm {Z}}^{'}(2 TeV) \to {\tau} {\tau}$, and for QCD multijet MC events. Four configurations of the reconstruction and isolation method are compared. The three points on each curve correspond, from left to right, to the tight, medium, and loose WPs. The solid curves are obtained by imposing cutoffs on $I_{{{\tau} _\mathrm {h}}}$ that decrease linearly from small to large efficiency. |
png pdf |
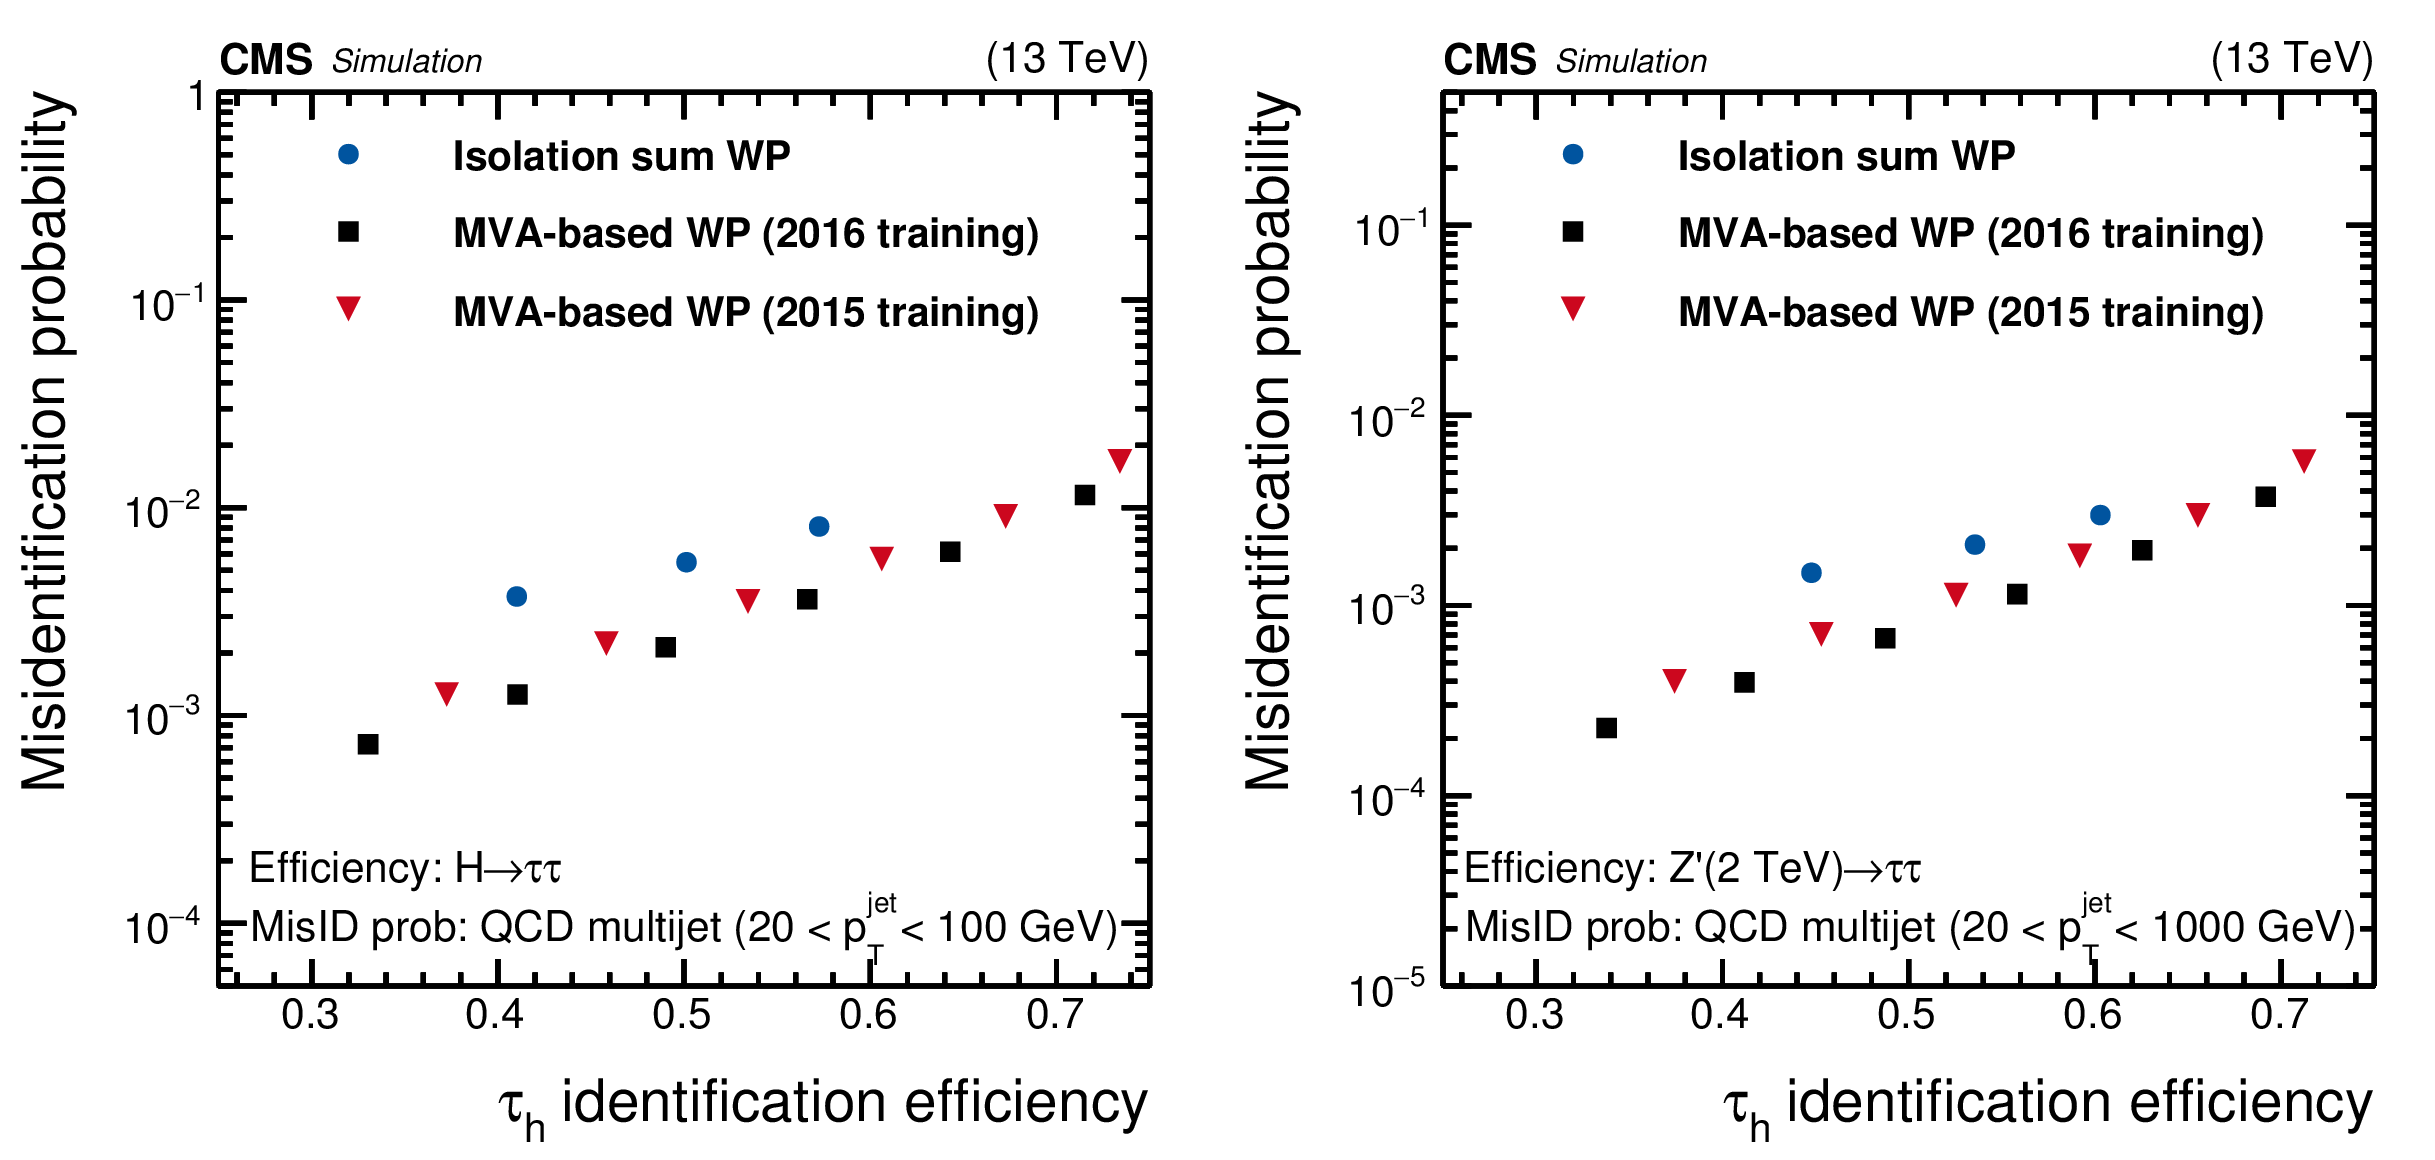
Figure 3:
Misidentification probabilities for $ {{\tau} _\mathrm {h}} $ as a function of their identification efficiency, evaluated using $ {\mathrm {H}} \to {\tau} {\tau}$ (left), $ {\mathrm {Z}}^{'}(2 TeV) \to {\tau} {\tau}$ (right), and QCD multijet MC events. The MVA-based discriminants trained on their corresponding MC events are compared to each other, as well as to the isolation-sum discriminants. The points correspond to different working points of the discriminants. The three points for the isolation-sum discriminants from left to right correspond to the tight, medium, and loose WPs. Similarly, the six points of the MVA-based discriminants define the WP as very-very tight, very tight, tight, medium, loose, and very loose, respectively. |

png pdf |
Figure 3-a:
Misidentification probabilities for $ {{\tau} _\mathrm {h}} $ as a function of their identification efficiency, evaluated using $ {\mathrm {H}} \to {\tau} {\tau}$ and QCD multijet MC events. The MVA-based discriminants trained on their corresponding MC events are compared to each other, as well as to the isolation-sum discriminants. The points correspond to different working points of the discriminants. The three points for the isolation-sum discriminants from left to right correspond to the tight, medium, and loose WPs. Similarly, the six points of the MVA-based discriminants define the WP as very-very tight, very tight, tight, medium, loose, and very loose, respectively. |
png pdf |
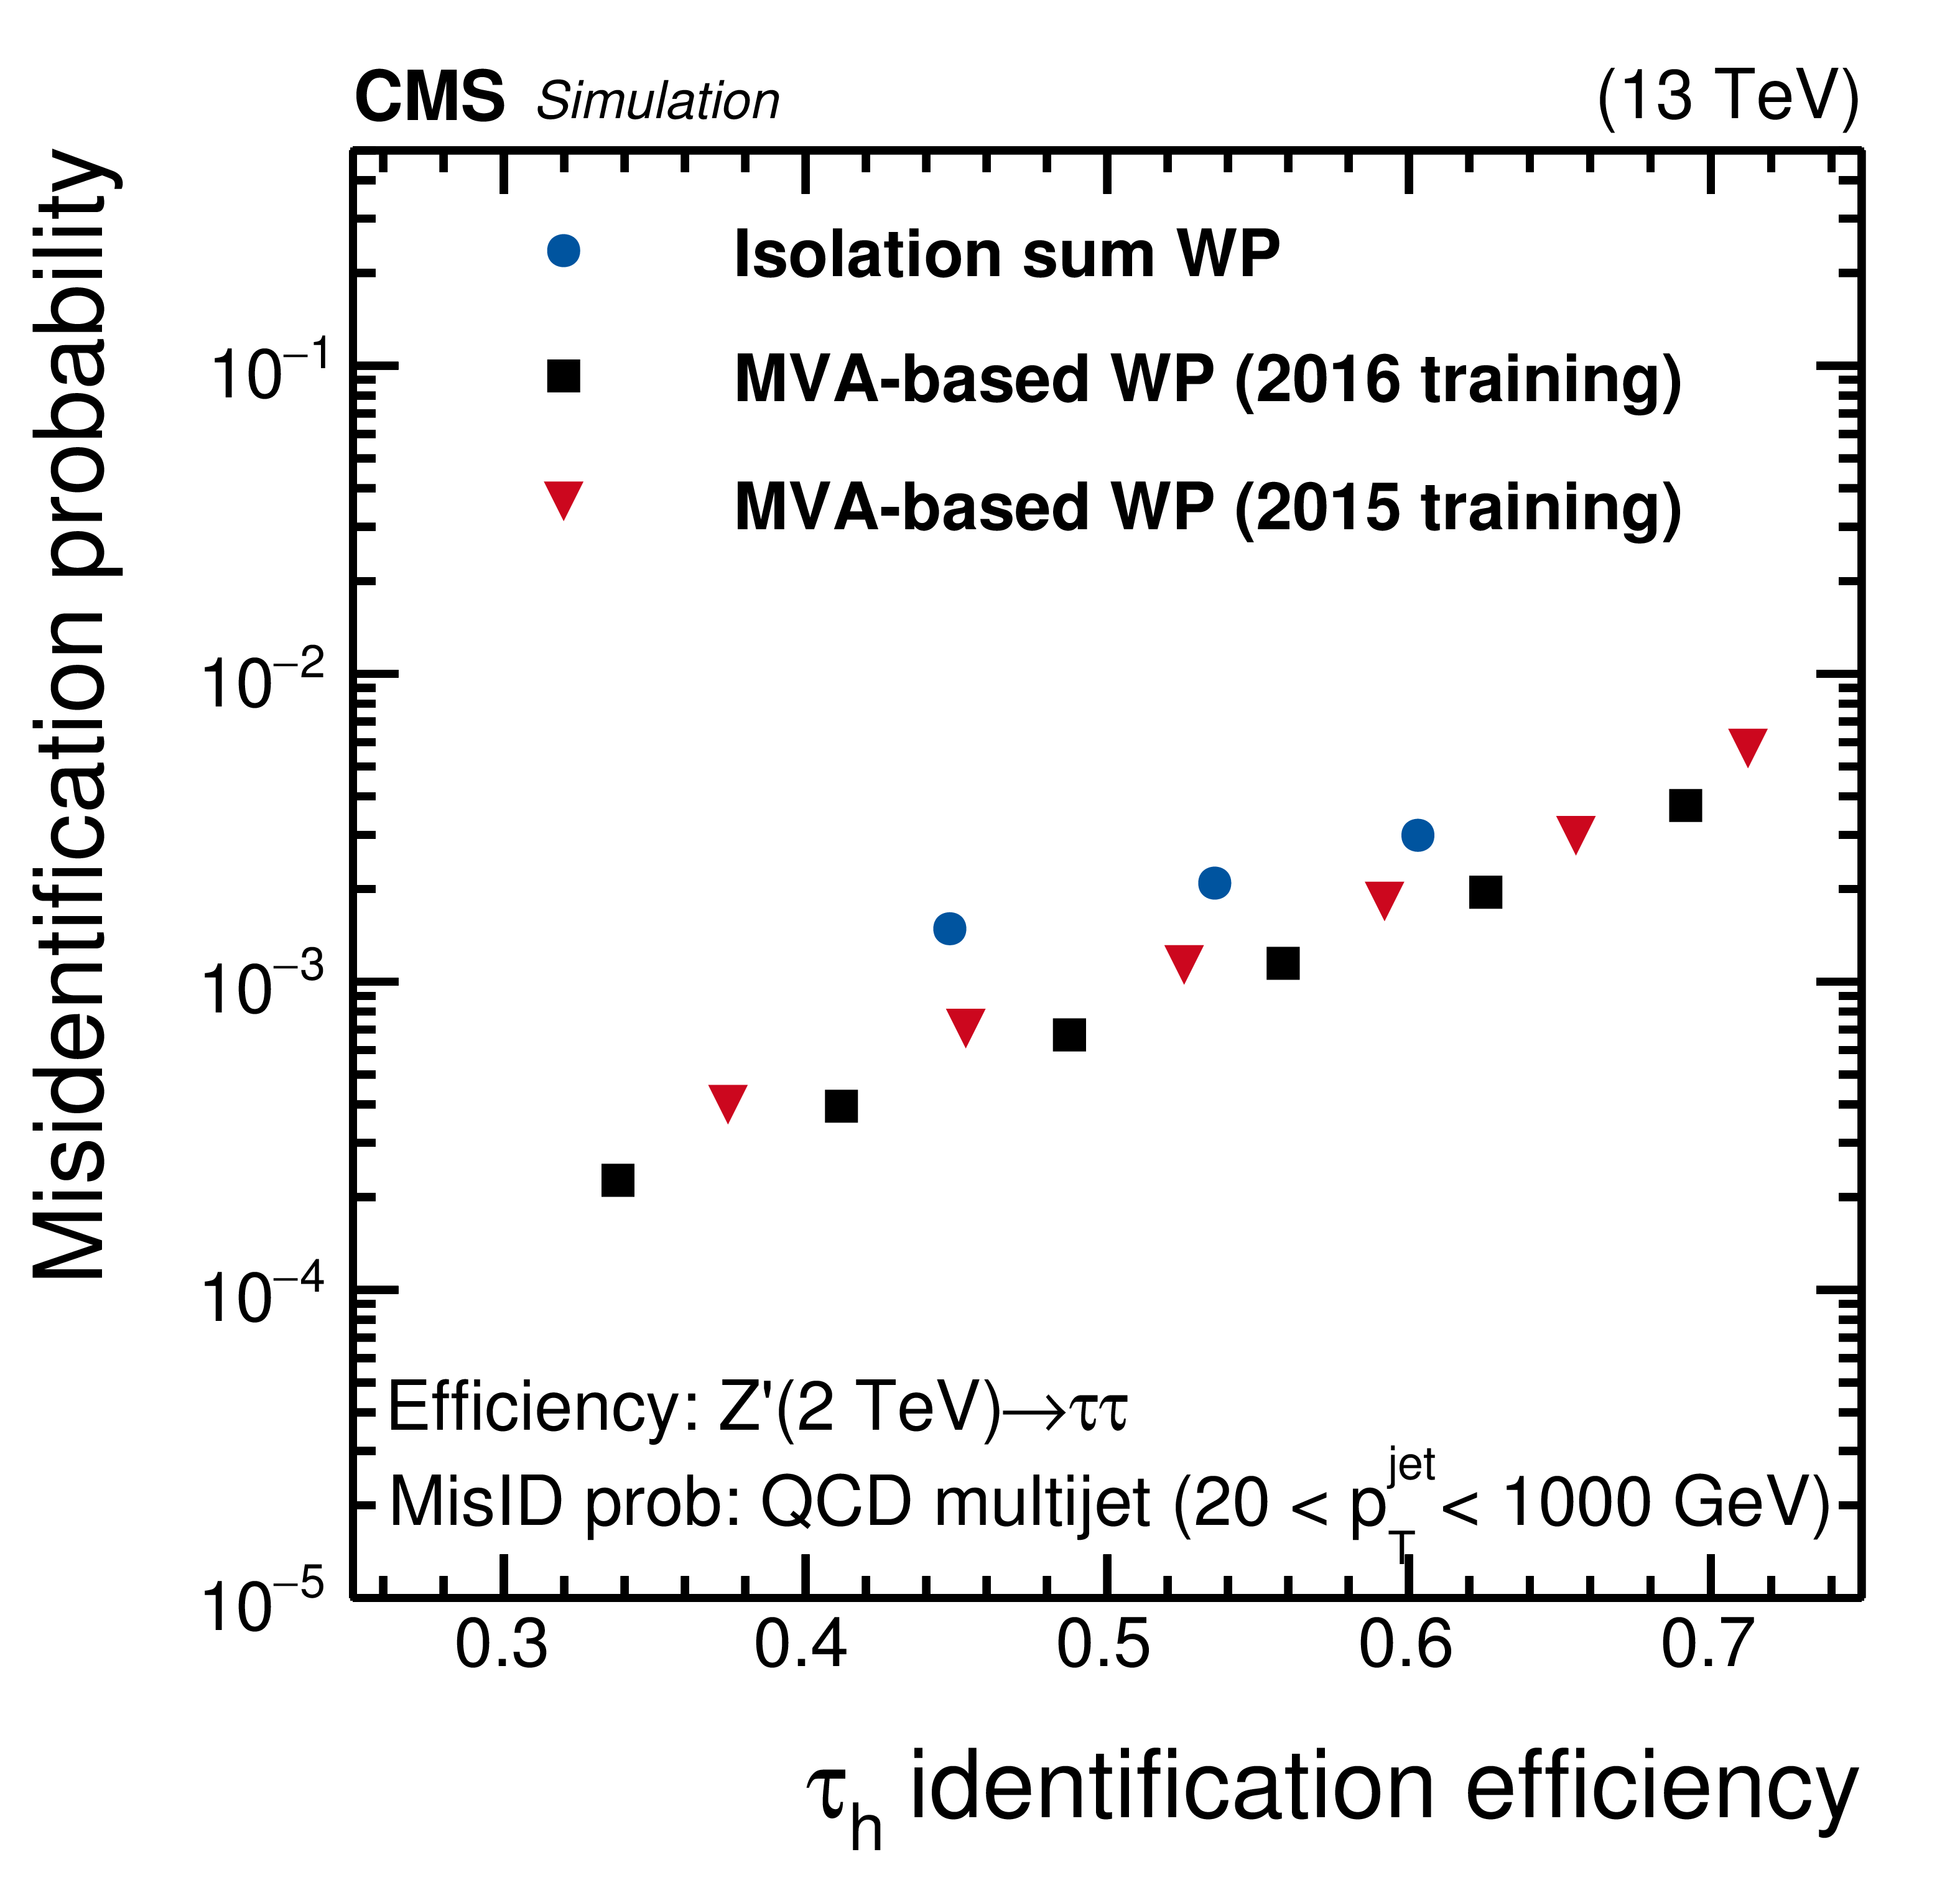
Figure 3-b:
Misidentification probabilities for $ {{\tau} _\mathrm {h}} $ as a function of their identification efficiency, evaluated using $ {\mathrm {Z}}^{'}(2 TeV) \to {\tau} {\tau}$ and QCD multijet MC events. The MVA-based discriminants trained on their corresponding MC events are compared to each other, as well as to the isolation-sum discriminants. The points correspond to different working points of the discriminants. The three points for the isolation-sum discriminants from left to right correspond to the tight, medium, and loose WPs. Similarly, the six points of the MVA-based discriminants define the WP as very-very tight, very tight, tight, medium, loose, and very loose, respectively. |

png pdf |
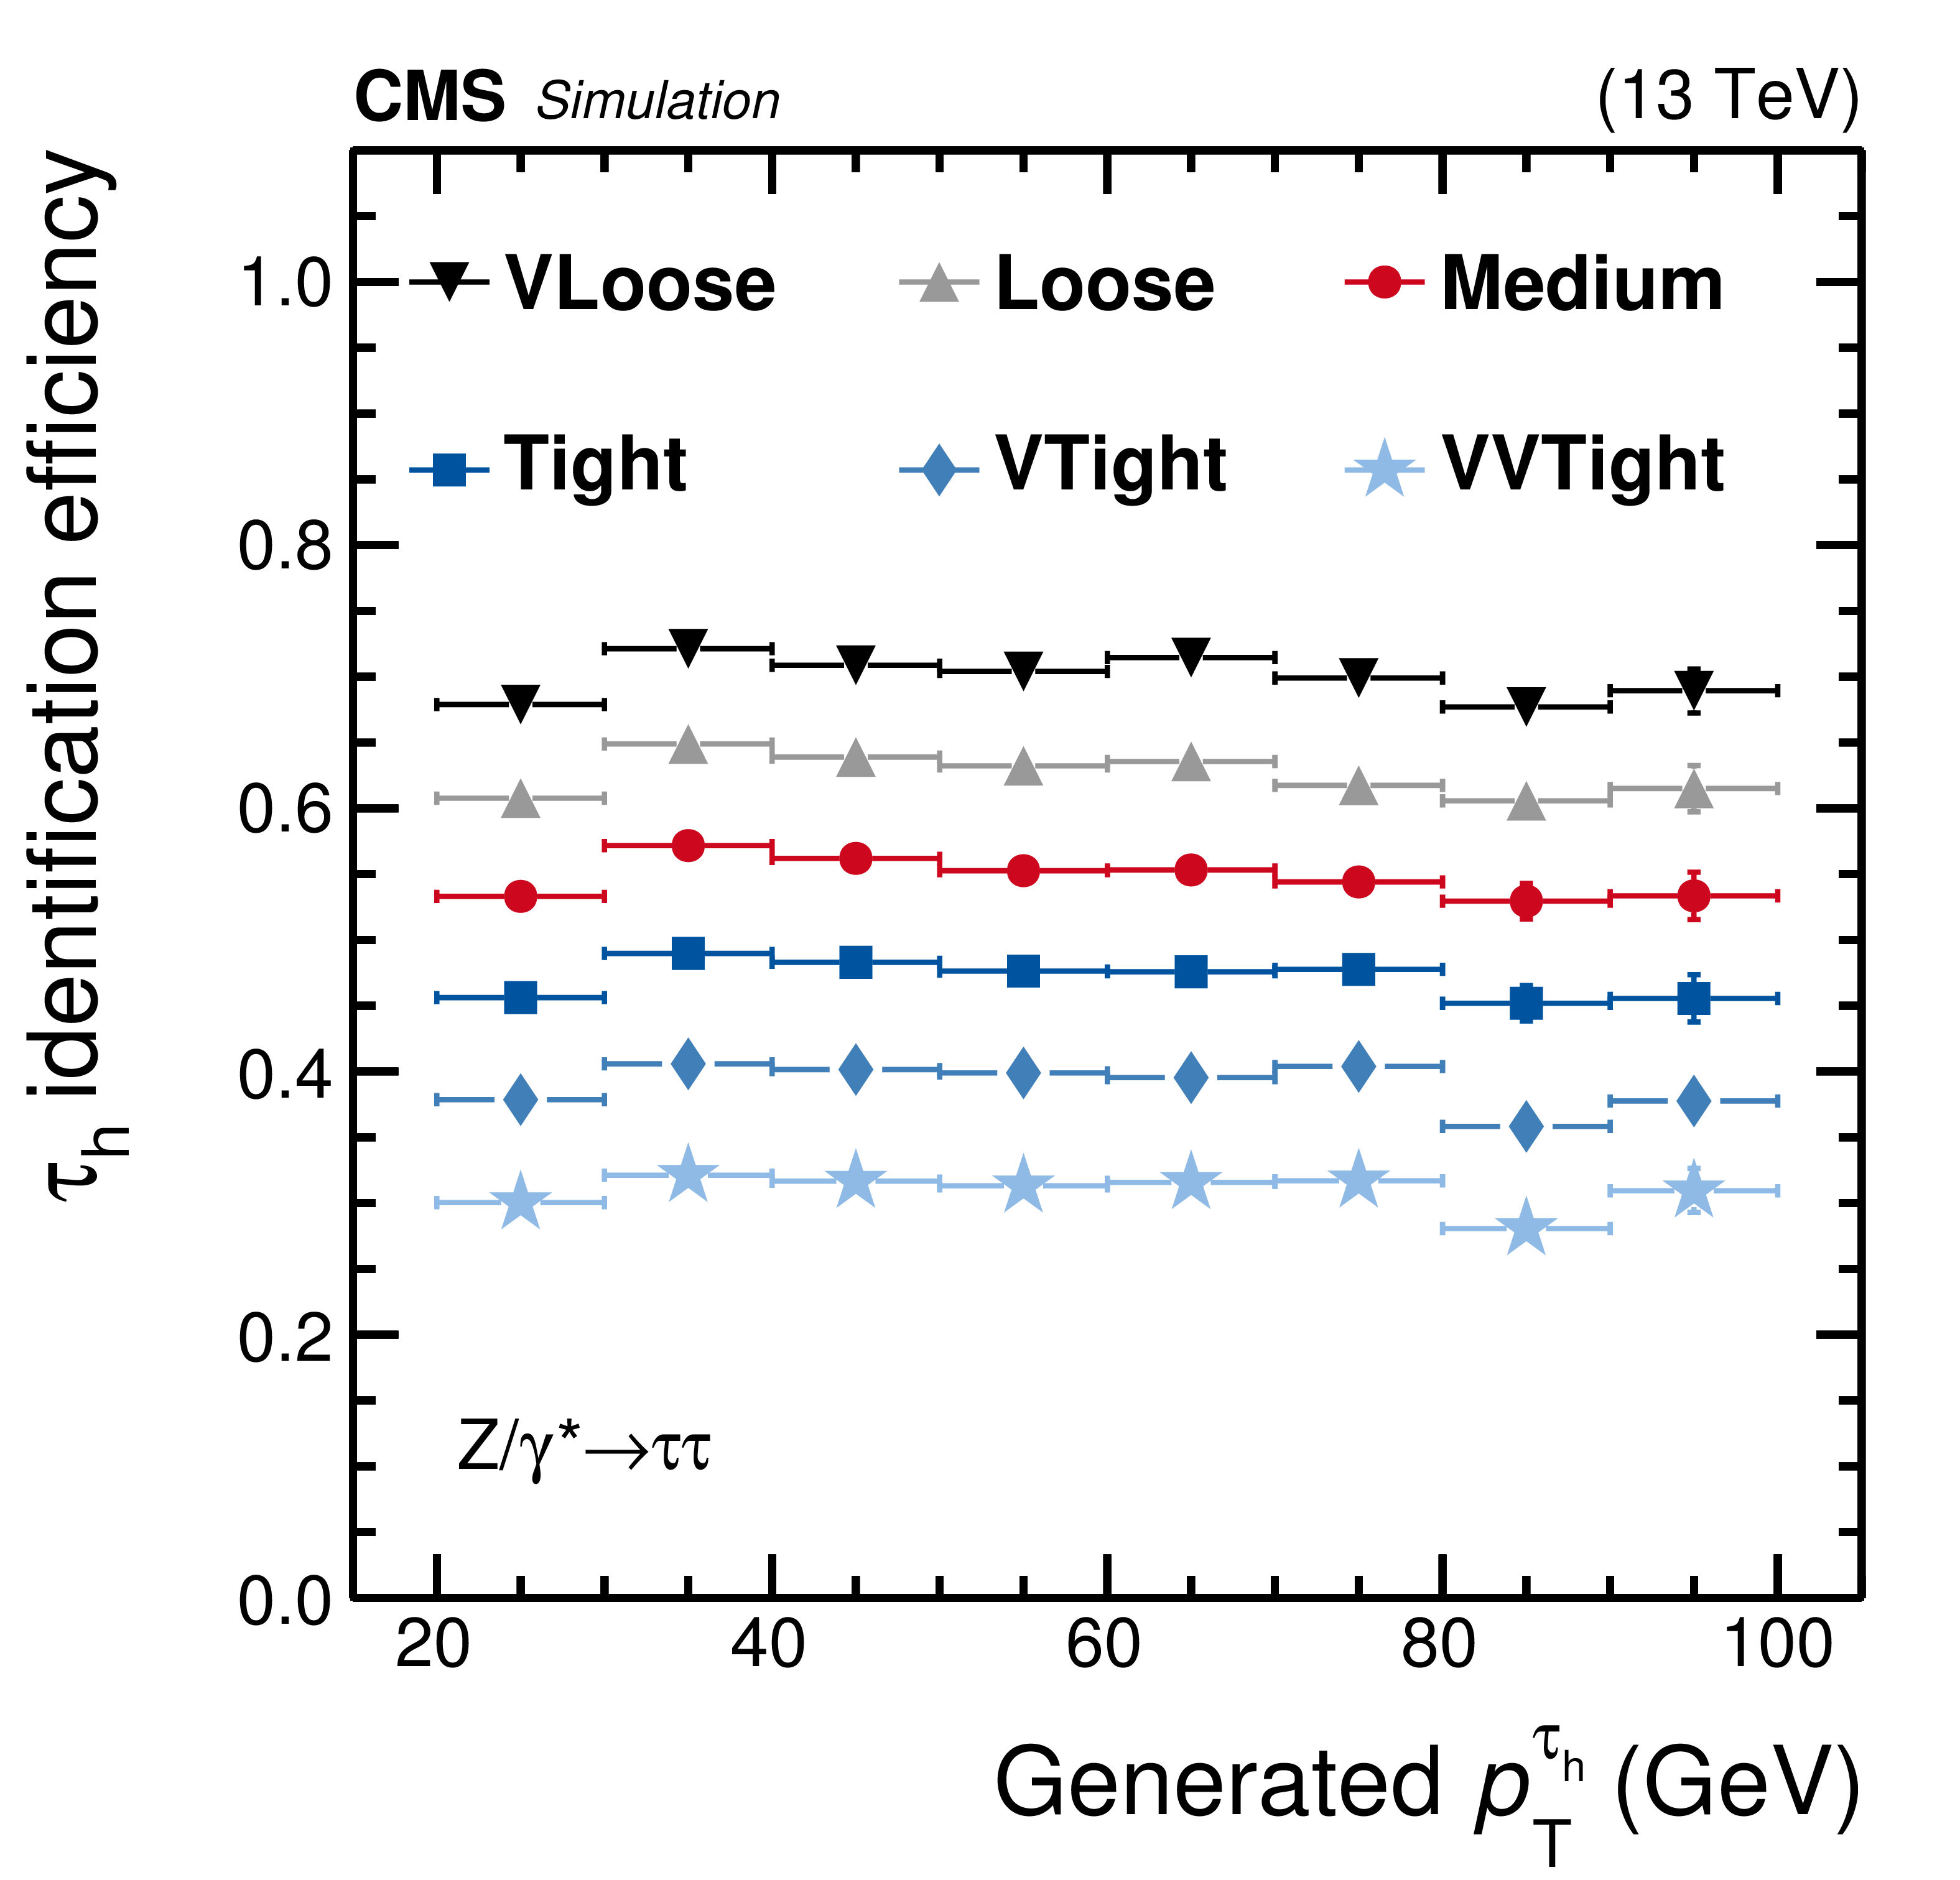
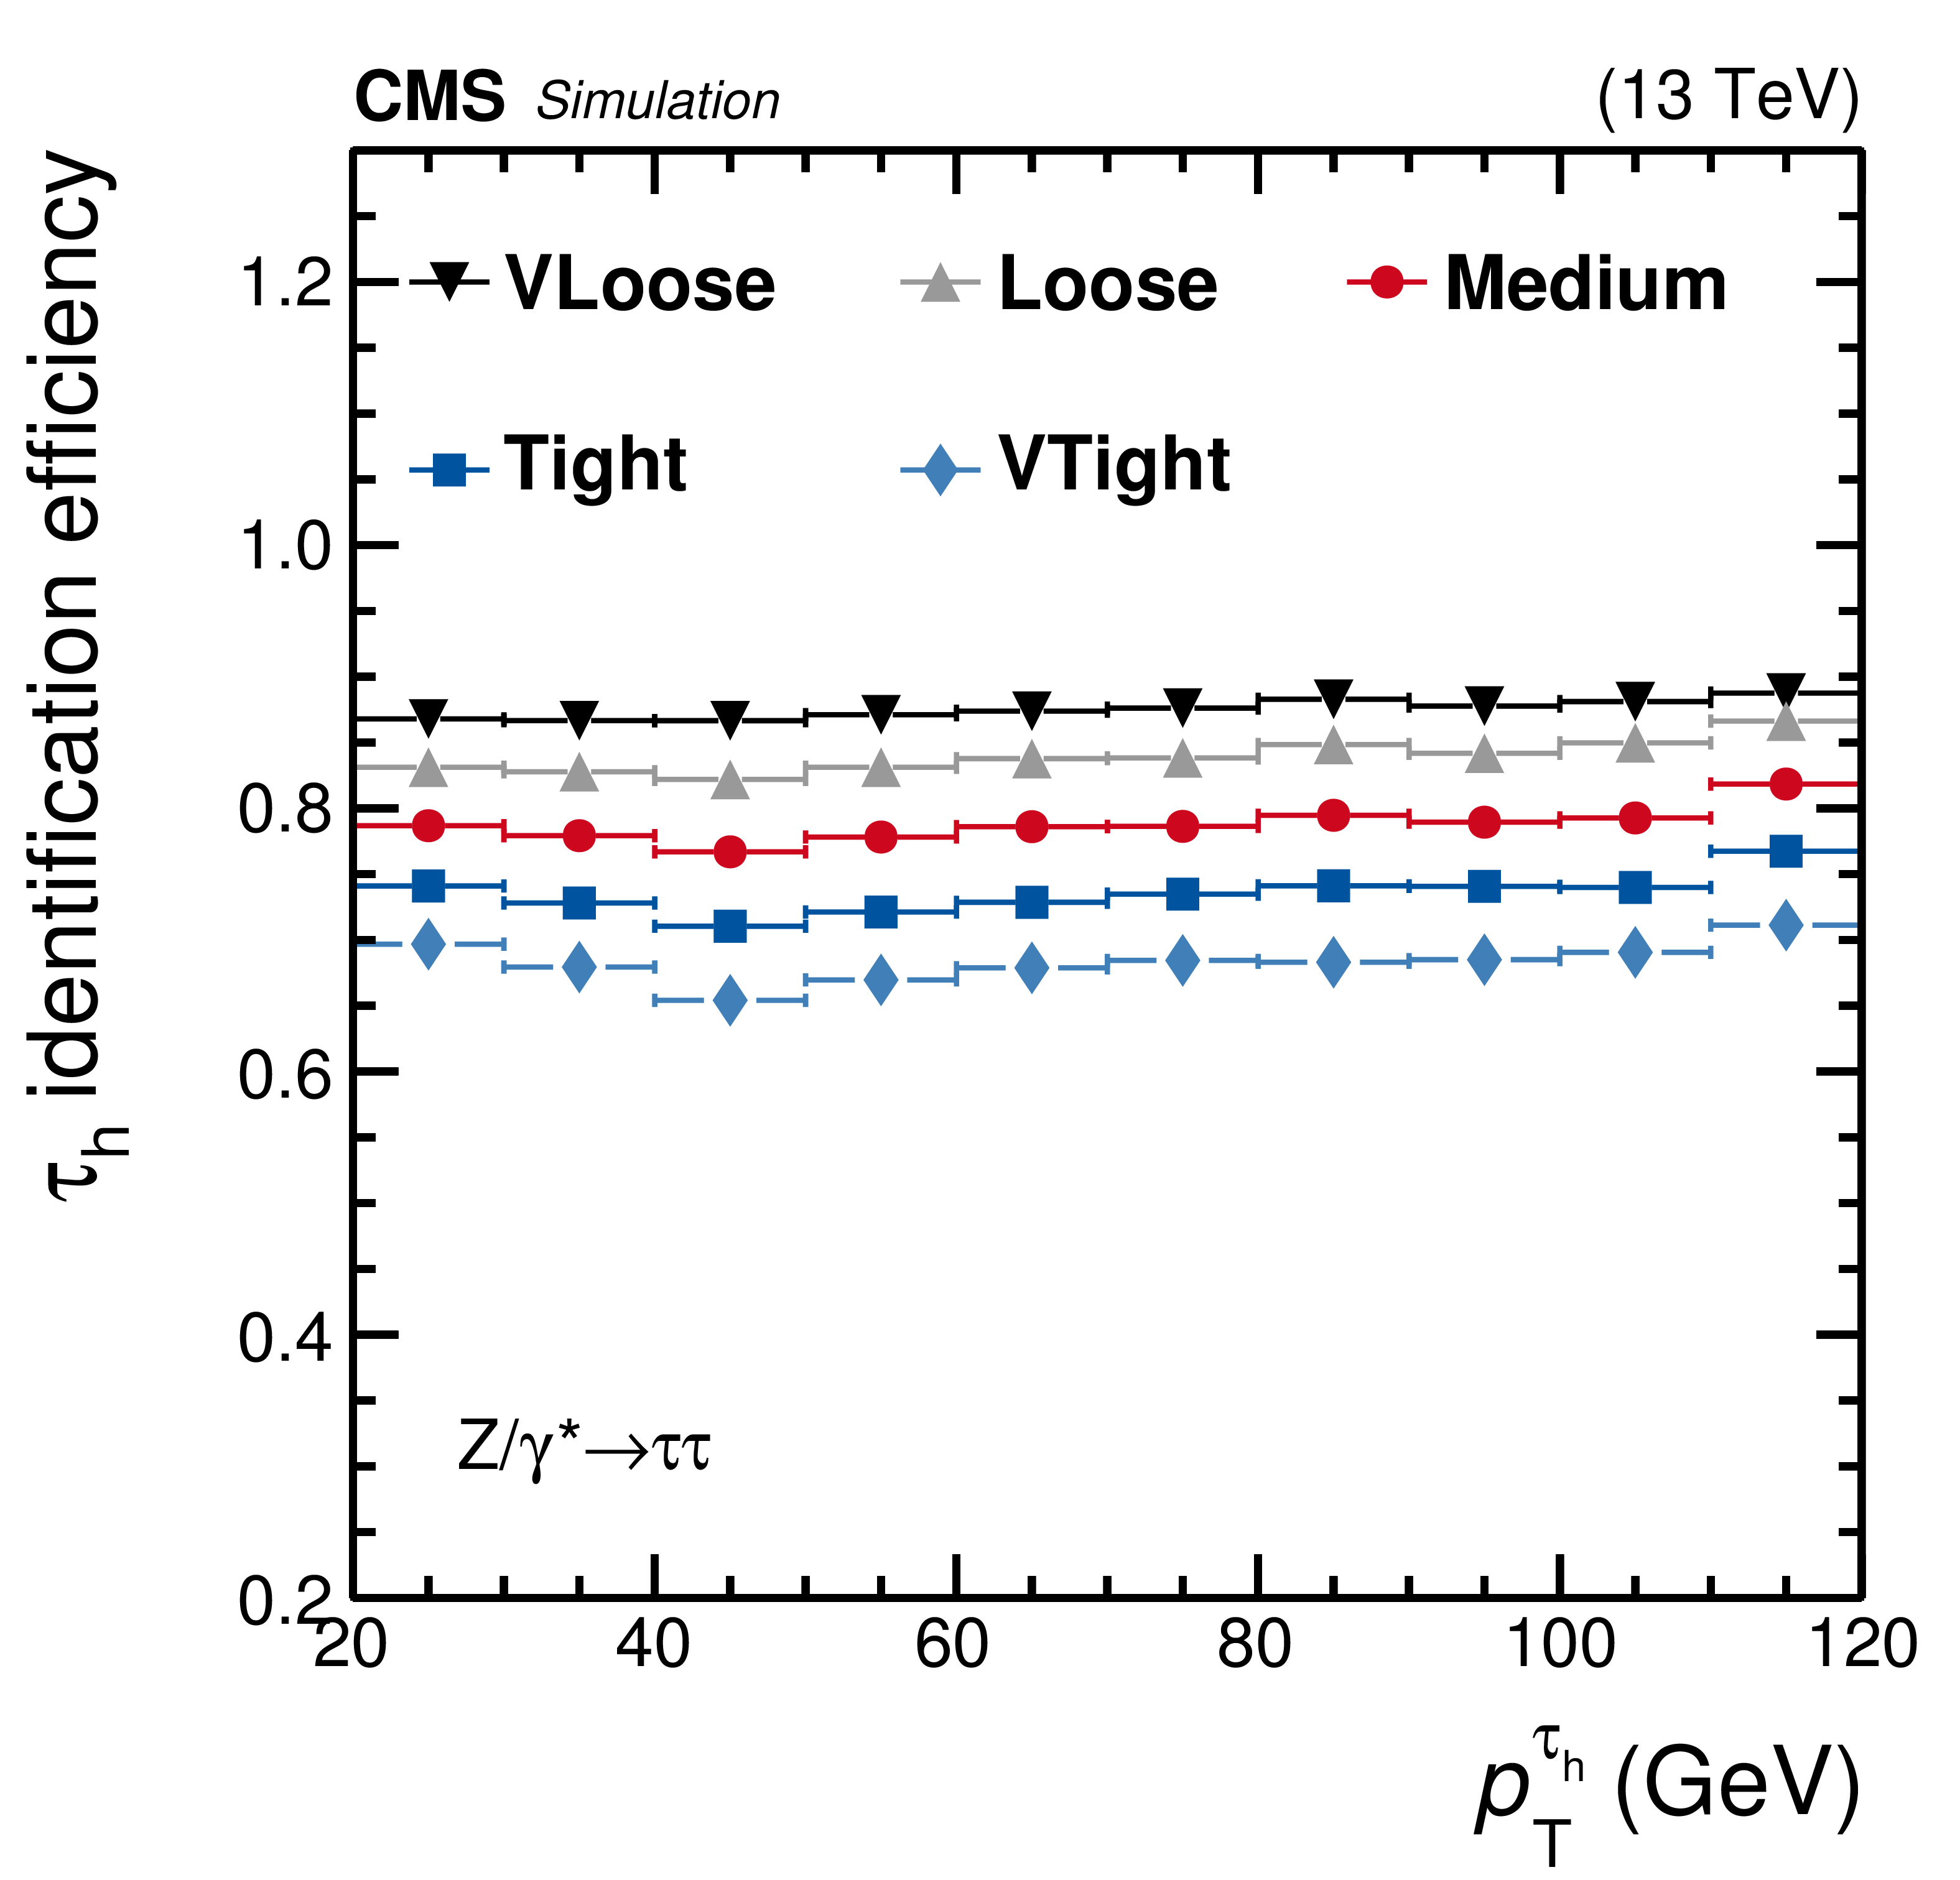
Figure 4:
Efficiency of $ {{\tau} _\mathrm {h}} $ identification, estimated using simulated $ {\mathrm {Z}}/ {\gamma ^{*}} \to {\tau} {\tau}$ events (left), and the misidentification probability estimated using simulated QCD multijet events (right) are given, for the very loose, loose, medium, tight, very tight, and very-very tight WPs of the MVA-based $ {{\tau} _\mathrm {h}} $ isolation algorithm. The efficiency and misidentification probabilities are shown as a function of ${p_{\mathrm {T}}}$ of the generated $ {{\tau} _\mathrm {h}} $ and of the reconstructed jet, respectively. Vertical bars (often smaller than the symbol size) correspond to the statistical uncertainties (the 68% Clopper-Pearson intervals [61]), while horizontal bars indicate the bin widths. |
png pdf |
Figure 4-a:
Efficiency of $ {{\tau} _\mathrm {h}} $ identification, estimated using simulated $ {\mathrm {Z}}/ {\gamma ^{*}} \to {\tau} {\tau}$ events is given, for the very loose, loose, medium, tight, very tight, and very-very tight WPs of the MVA-based $ {{\tau} _\mathrm {h}} $ isolation algorithm. The probability is shown as a function of ${p_{\mathrm {T}}}$ of the generated $ {{\tau} _\mathrm {h}} $ and of the reconstructed jet, respectively. Vertical bars (often smaller than the symbol size) correspond to the statistical uncertainties (the 68% Clopper-Pearson intervals [61]), while horizontal bars indicate the bin widths. |
png pdf |
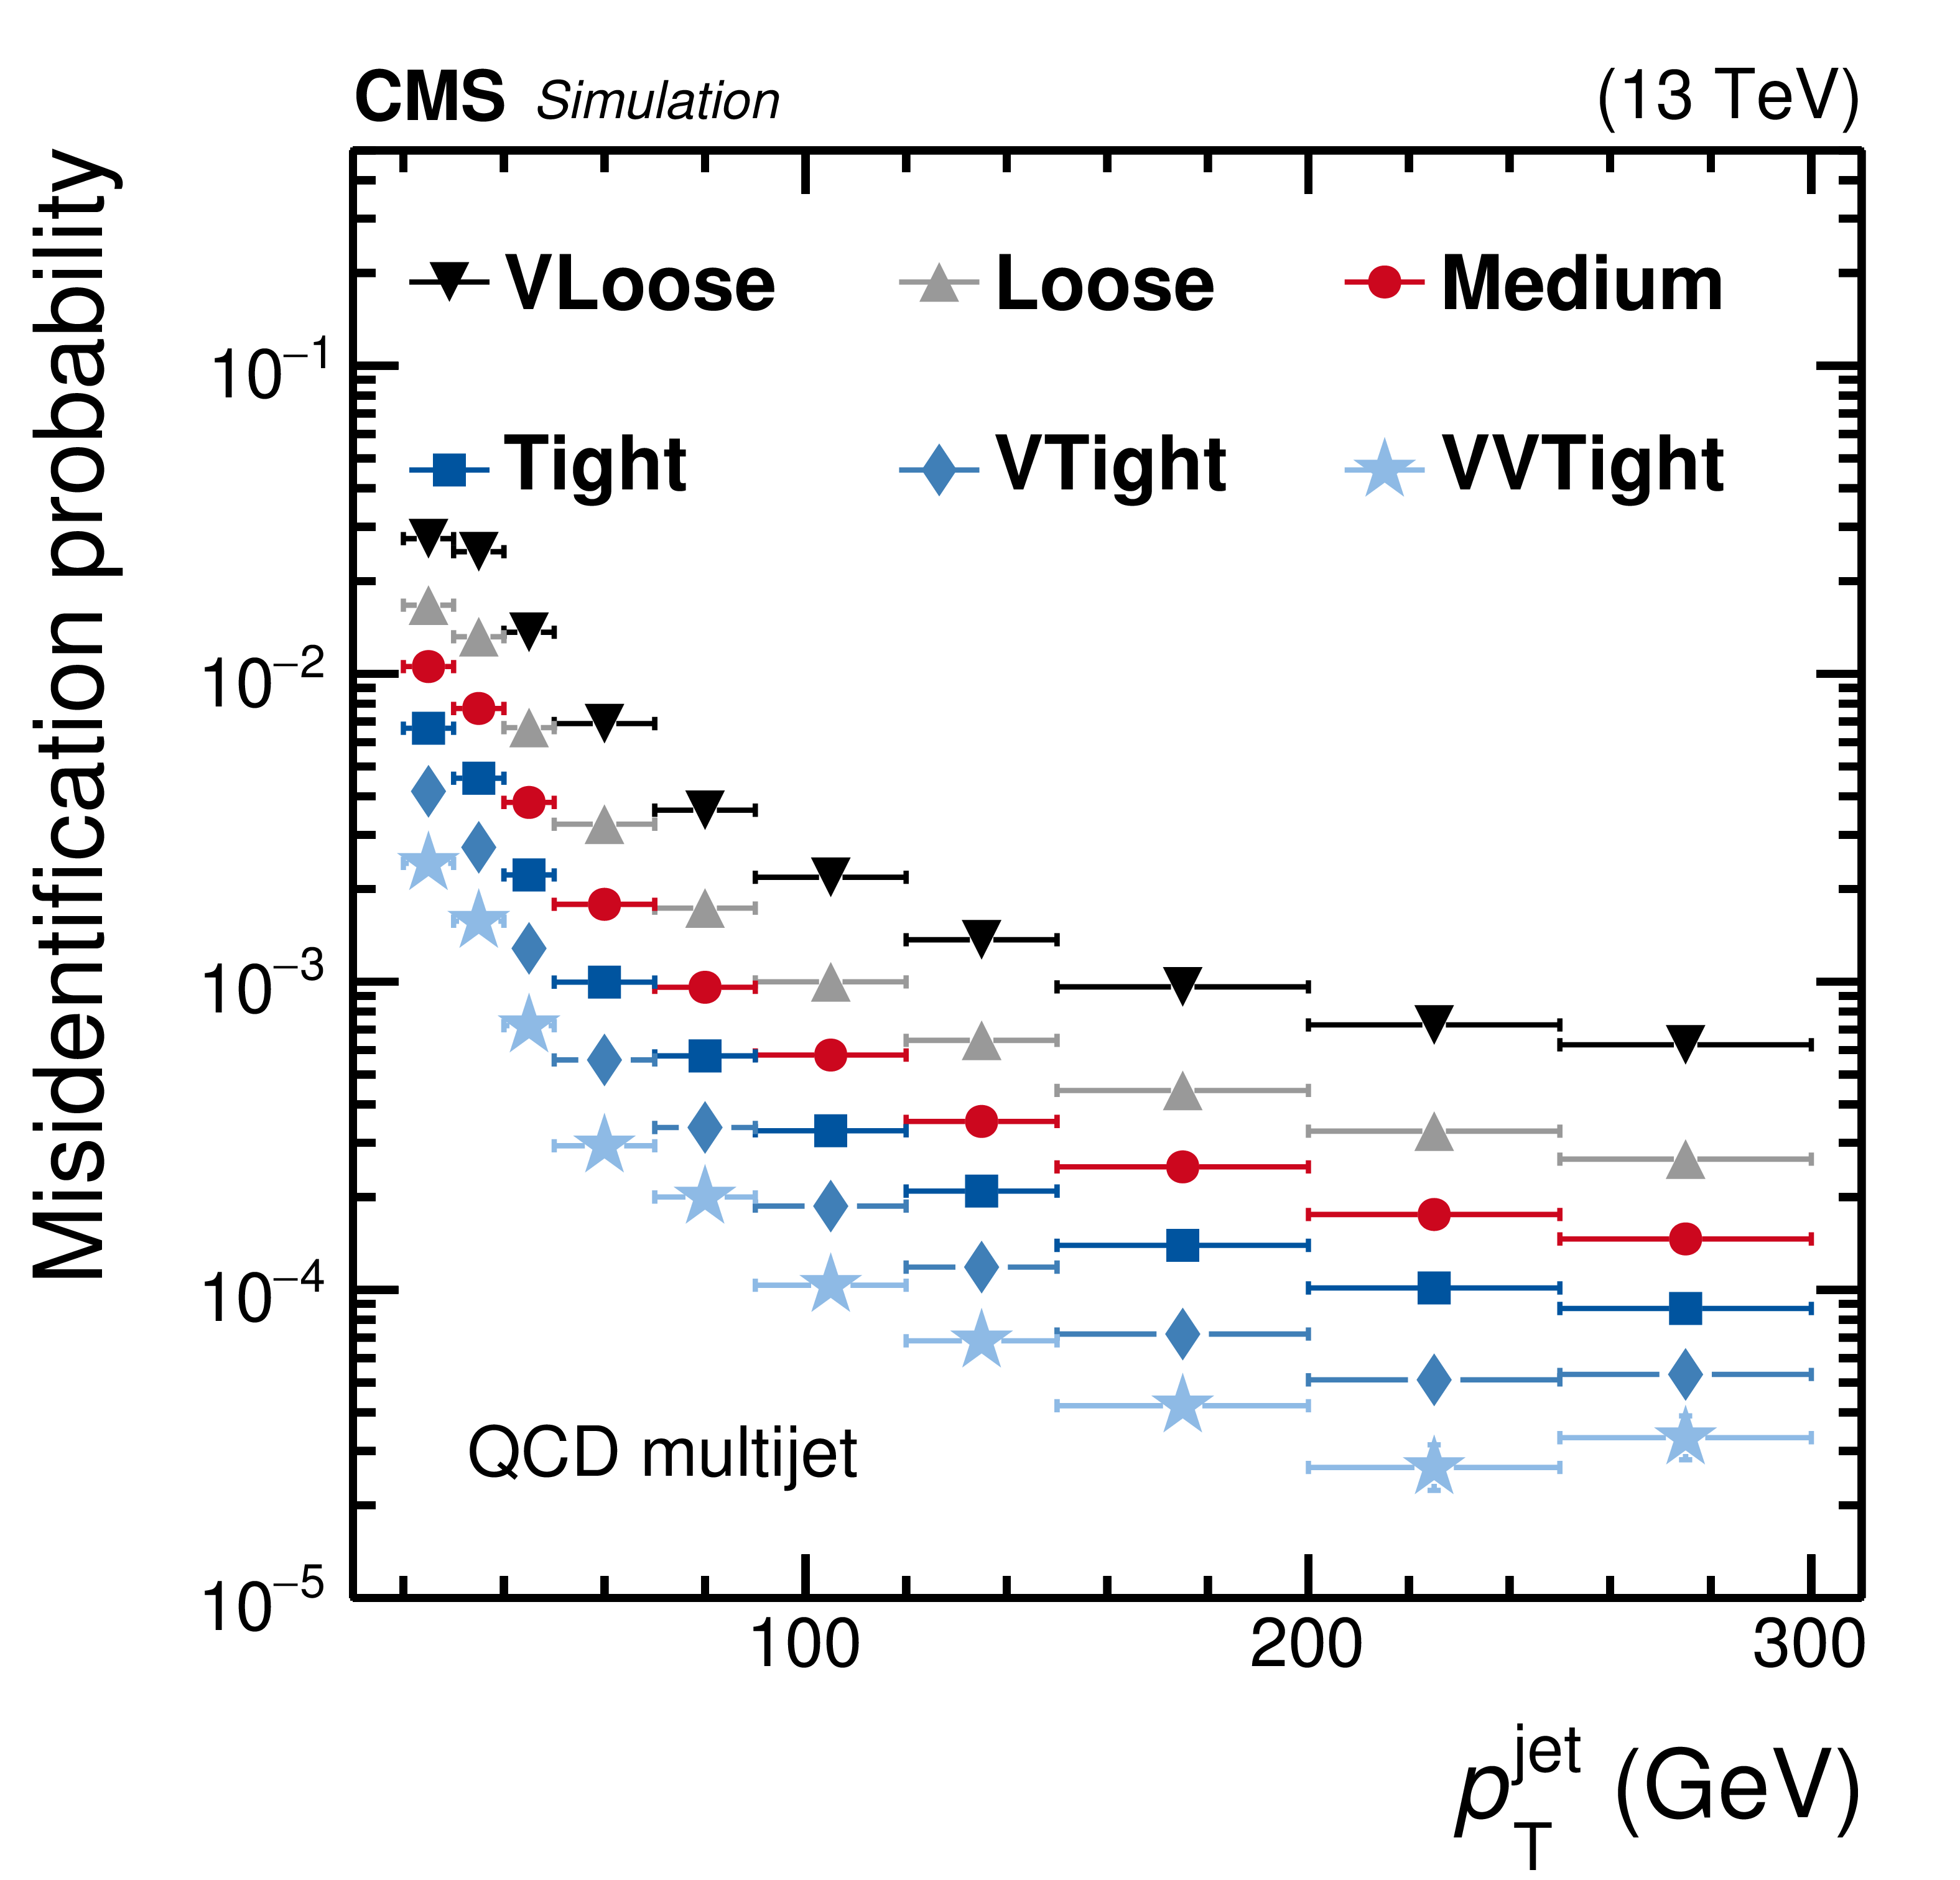
Figure 4-b:
Misidentification probability estimated using simulated QCD multijet events is given, for the very loose, loose, medium, tight, very tight, and very-very tight WPs of the MVA-based $ {{\tau} _\mathrm {h}} $ isolation algorithm. The probability is shown as a function of ${p_{\mathrm {T}}}$ of the generated $ {{\tau} _\mathrm {h}} $ and of the reconstructed jet, respectively. Vertical bars (often smaller than the symbol size) correspond to the statistical uncertainties (the 68% Clopper-Pearson intervals [61]), while horizontal bars indicate the bin widths. |

png pdf |
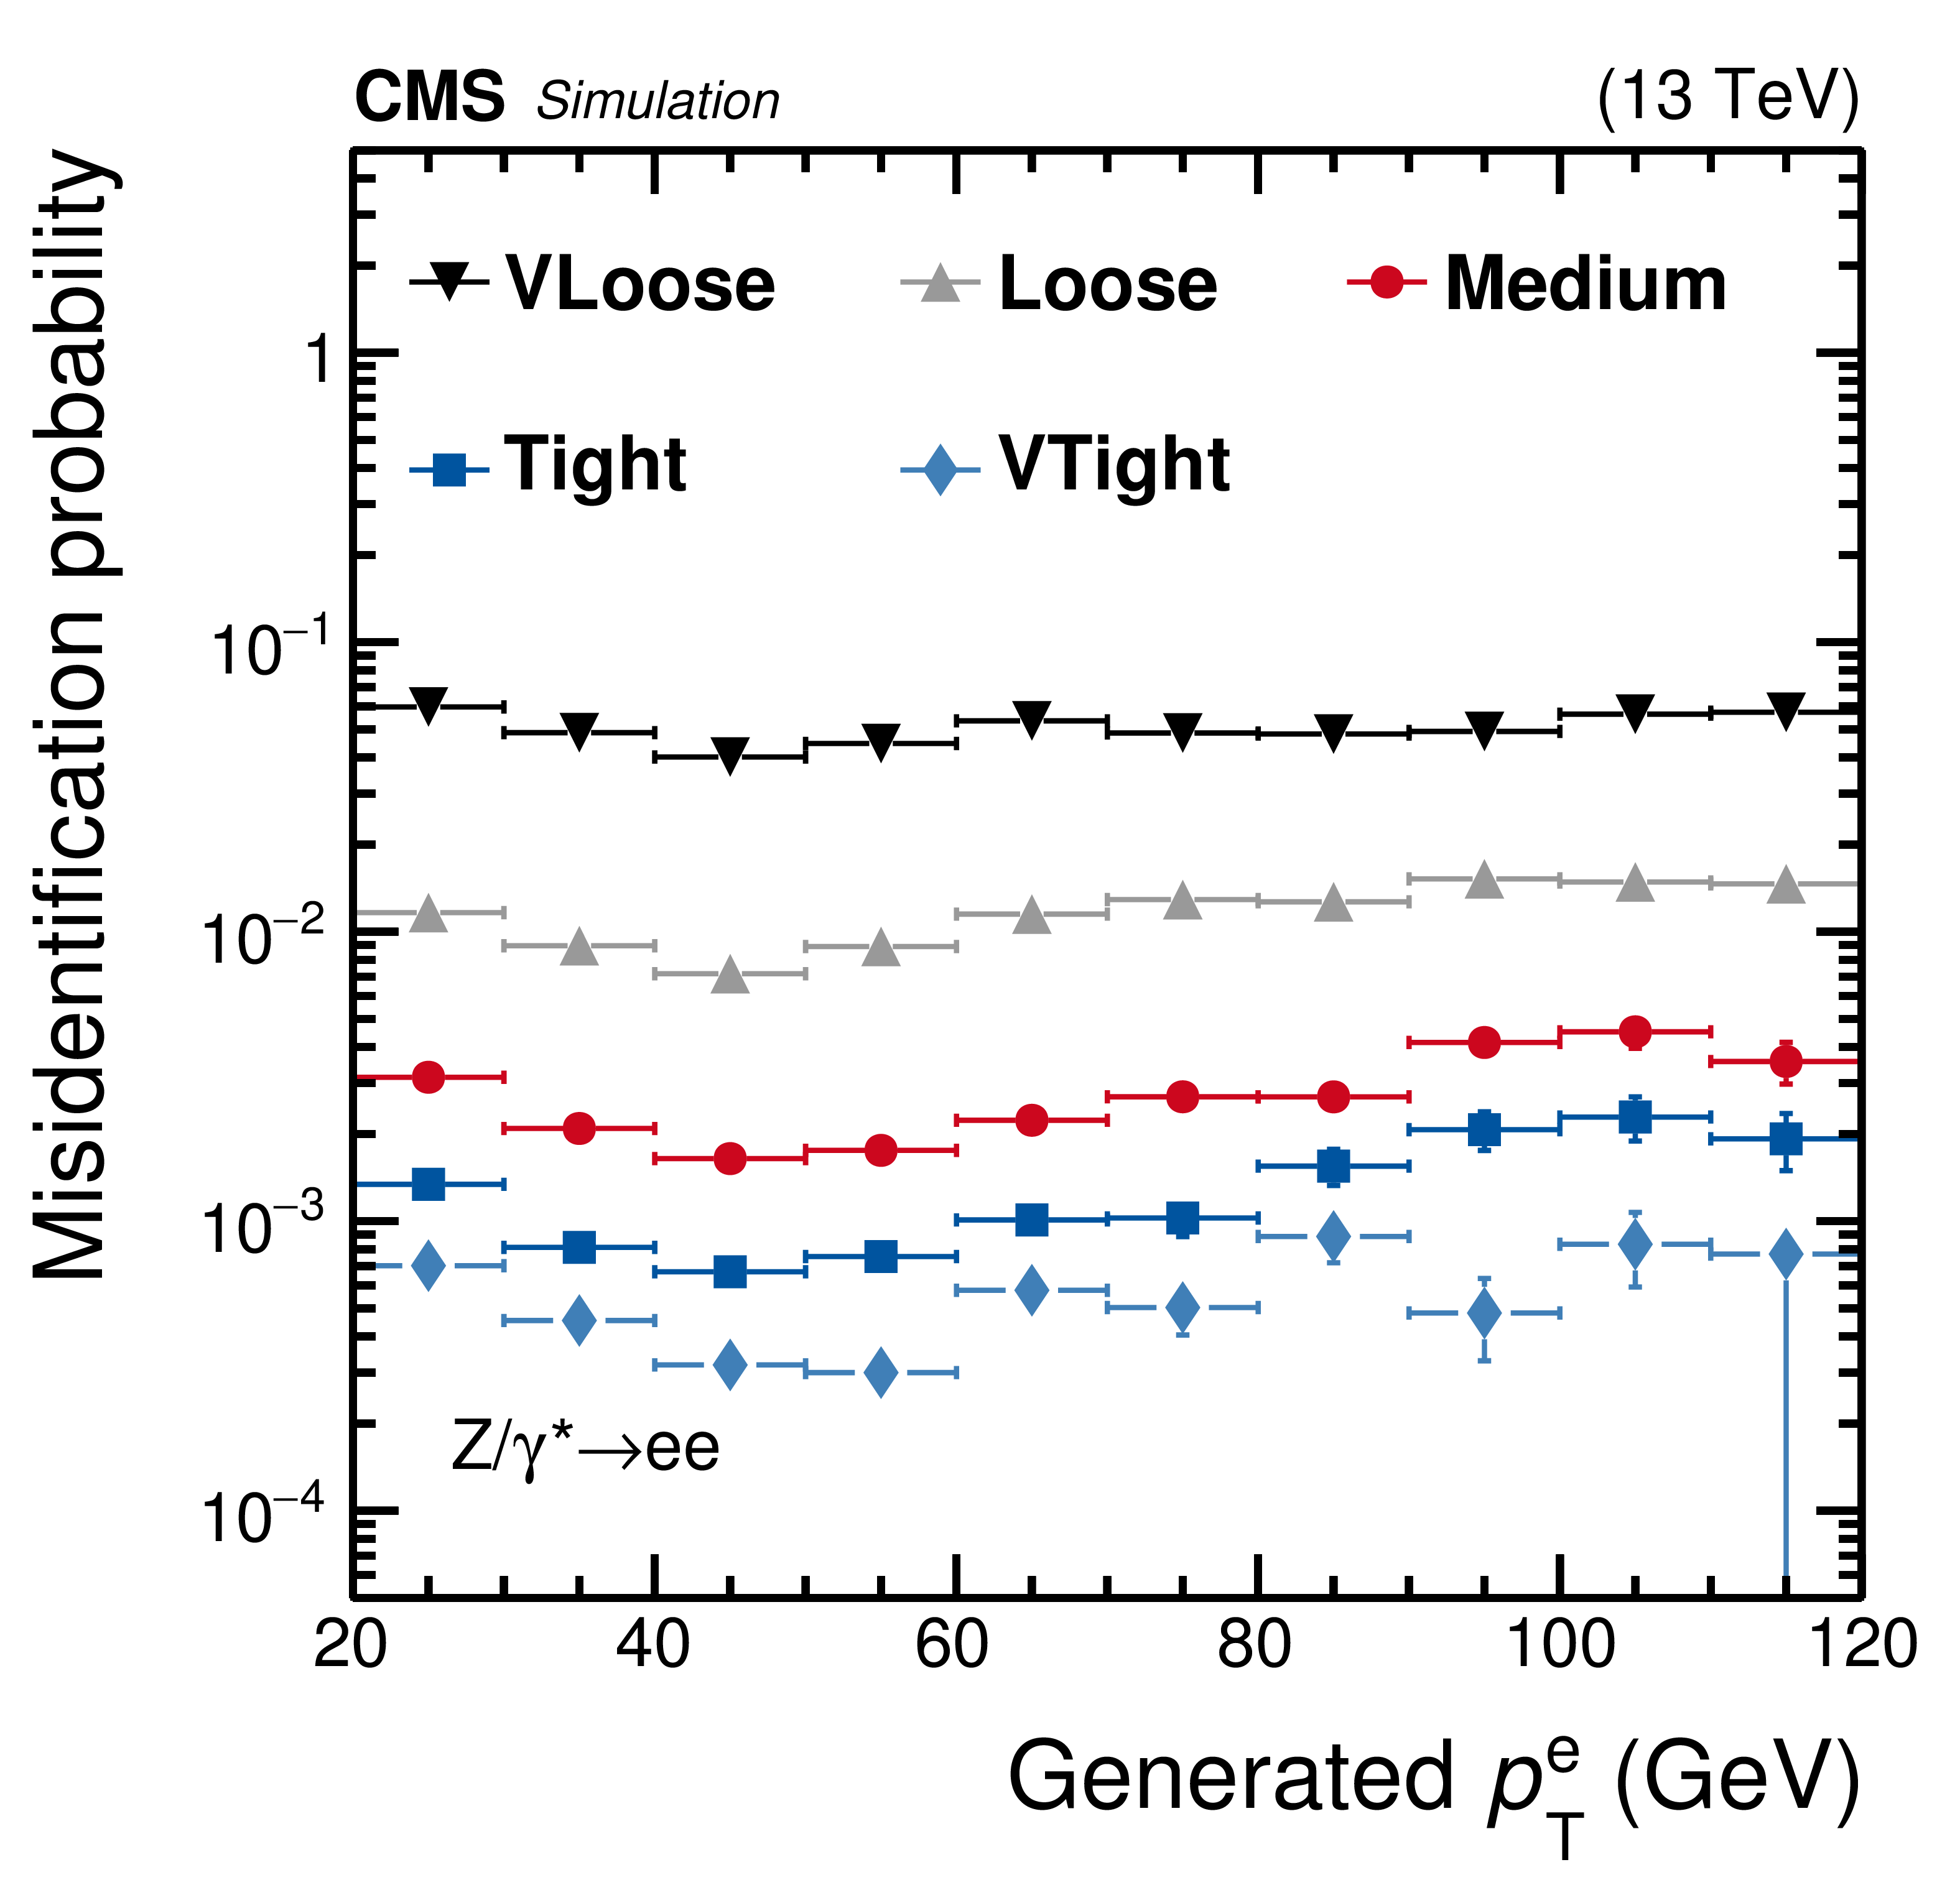
Figure 5:
Efficiencies of $ {{\tau} _\mathrm {h}} $ identification estimated via simulated $ {\mathrm {Z}}/ {\gamma ^{*}} \to {\tau} {\tau}$ events (left), and the $ {\mathrm {e}} \rightarrow {{\tau} _\mathrm {h}} $ misidentification probability estimated using simulated $ {\mathrm {Z}}/ {\gamma ^{*}} \to {\mathrm {e}} {\mathrm {e}}$ events (right) for the very loose, loose, medium, tight, and very tight WPs of the MVA-based electron discrimination algorithm. The efficiency is shown as a function of ${p_{\mathrm {T}}}$ of the reconstructed $ {{\tau} _\mathrm {h}} $ candidate, while the misidentification probability is shown as a function of the generated electron ${p_{\mathrm {T}}}$. The efficiency is calculated for $ {{\tau} _\mathrm {h}} $ candidates with a reconstructed decay mode that pass the loose WP of the isolation-sum discriminant, while the misidentification probability is calculated for generated electrons of $ {p_{\mathrm {T}}} > $ 20 GeV and $ {| \eta |} < 2.3$, excluding the less sensitive detector region of 1.46 $ < {| \eta |} < $ 1.56 between the barrel and endcap ECAL regions. Vertical bars (often smaller than the symbol size) indicate the statistical uncertainties (the 68% Clopper-Pearson intervals), while horizontal bars indicate the bin widths. |
png pdf |
Figure 5-a:
Efficiencies of $ {{\tau} _\mathrm {h}} $ identification estimated via simulated $ {\mathrm {Z}}/ {\gamma ^{*}} \to {\tau} {\tau}$ events for the very loose, loose, medium, tight, and very tight WPs of the MVA-based electron discrimination algorithm. The efficiency is shown as a function of ${p_{\mathrm {T}}}$ of the reconstructed $ {{\tau} _\mathrm {h}} $ candidate. The efficiency is calculated for $ {{\tau} _\mathrm {h}} $ candidates with a reconstructed decay mode that pass the loose WP of the isolation-sum discriminant. Vertical bars (often smaller than the symbol size) indicate the statistical uncertainties (the 68% Clopper-Pearson intervals), while horizontal bars indicate the bin widths. |
png pdf |
Figure 5-b:
The $ {\mathrm {e}} \rightarrow {{\tau} _\mathrm {h}} $ misidentification probability estimated using simulated $ {\mathrm {Z}}/ {\gamma ^{*}} \to {\mathrm {e}} {\mathrm {e}}$ events for the very loose, loose, medium, tight, and very tight WPs of the MVA-based electron discrimination algorithm. The misidentification probability is shown as a function of the generated electron ${p_{\mathrm {T}}}$. The misidentification probability is calculated for generated electrons of $ {p_{\mathrm {T}}} > $ 20 GeV and $ {| \eta |} < $ 2.3, excluding the less sensitive detector region of 1.46 $ < {| \eta |} < $ 1.56 between the barrel and endcap ECAL regions. Vertical bars (often smaller than the symbol size) indicate the statistical uncertainties (the 68% Clopper-Pearson intervals), while horizontal bars indicate the bin widths. |
png pdf |
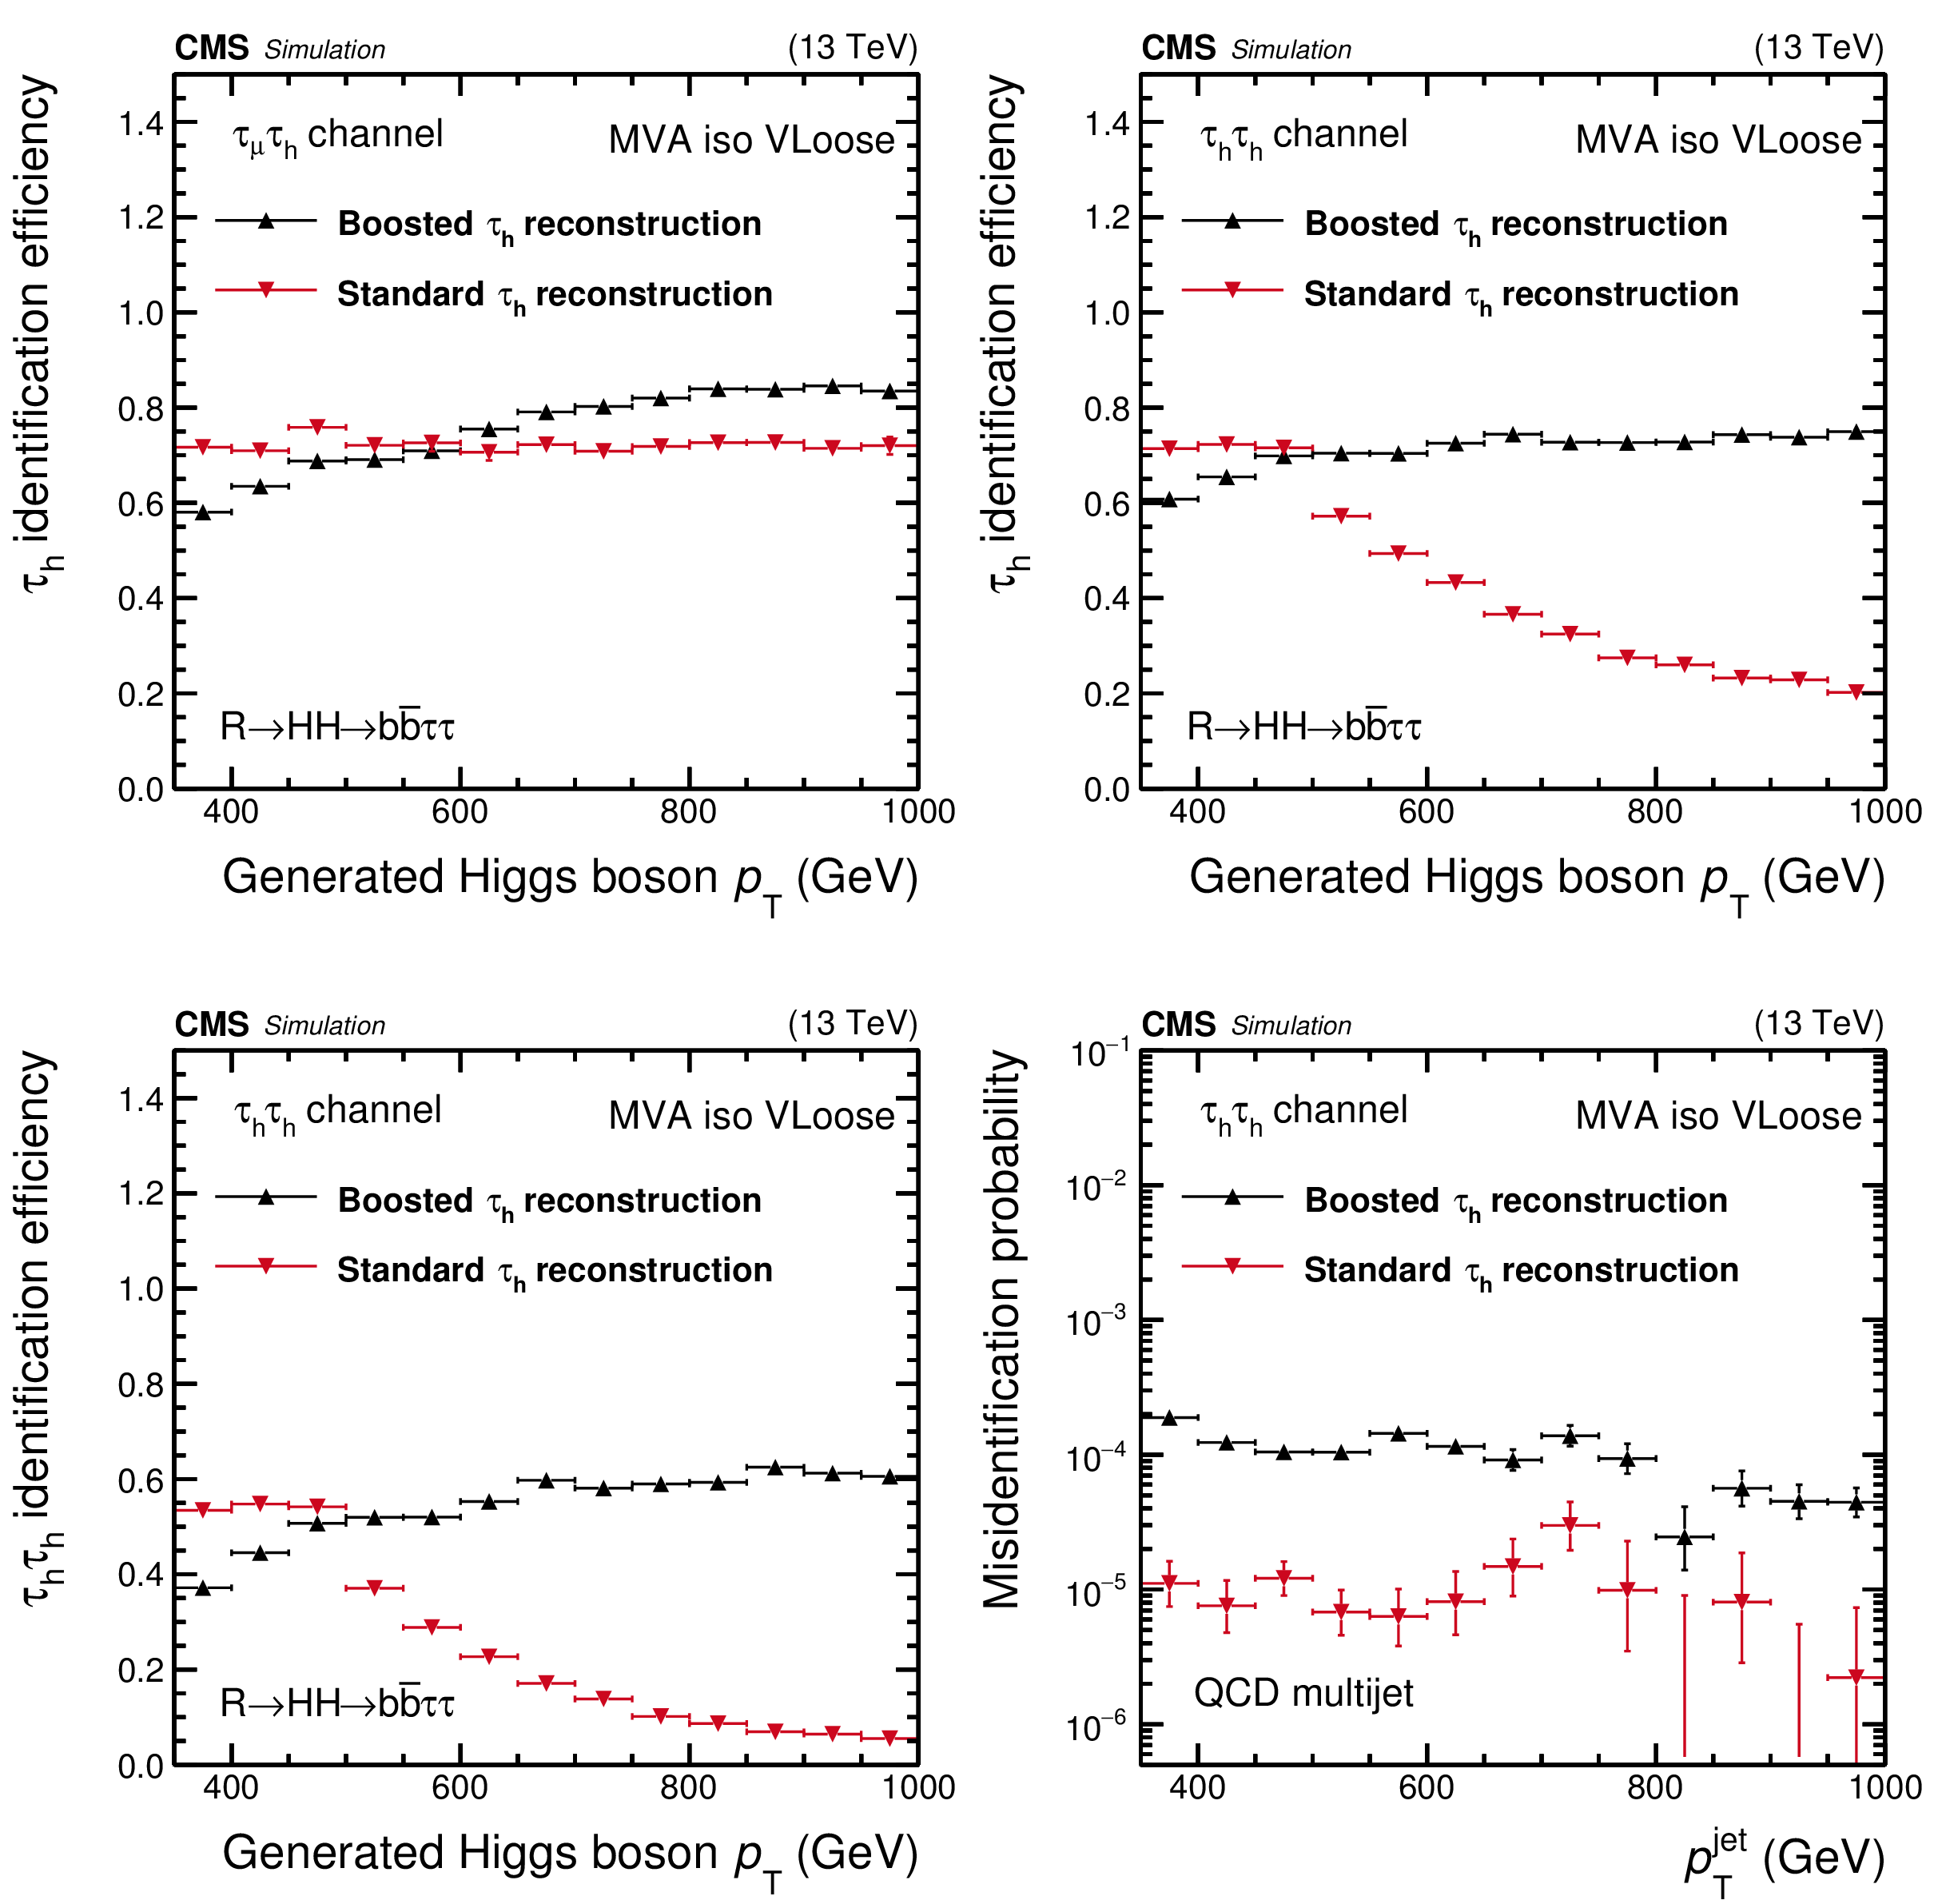
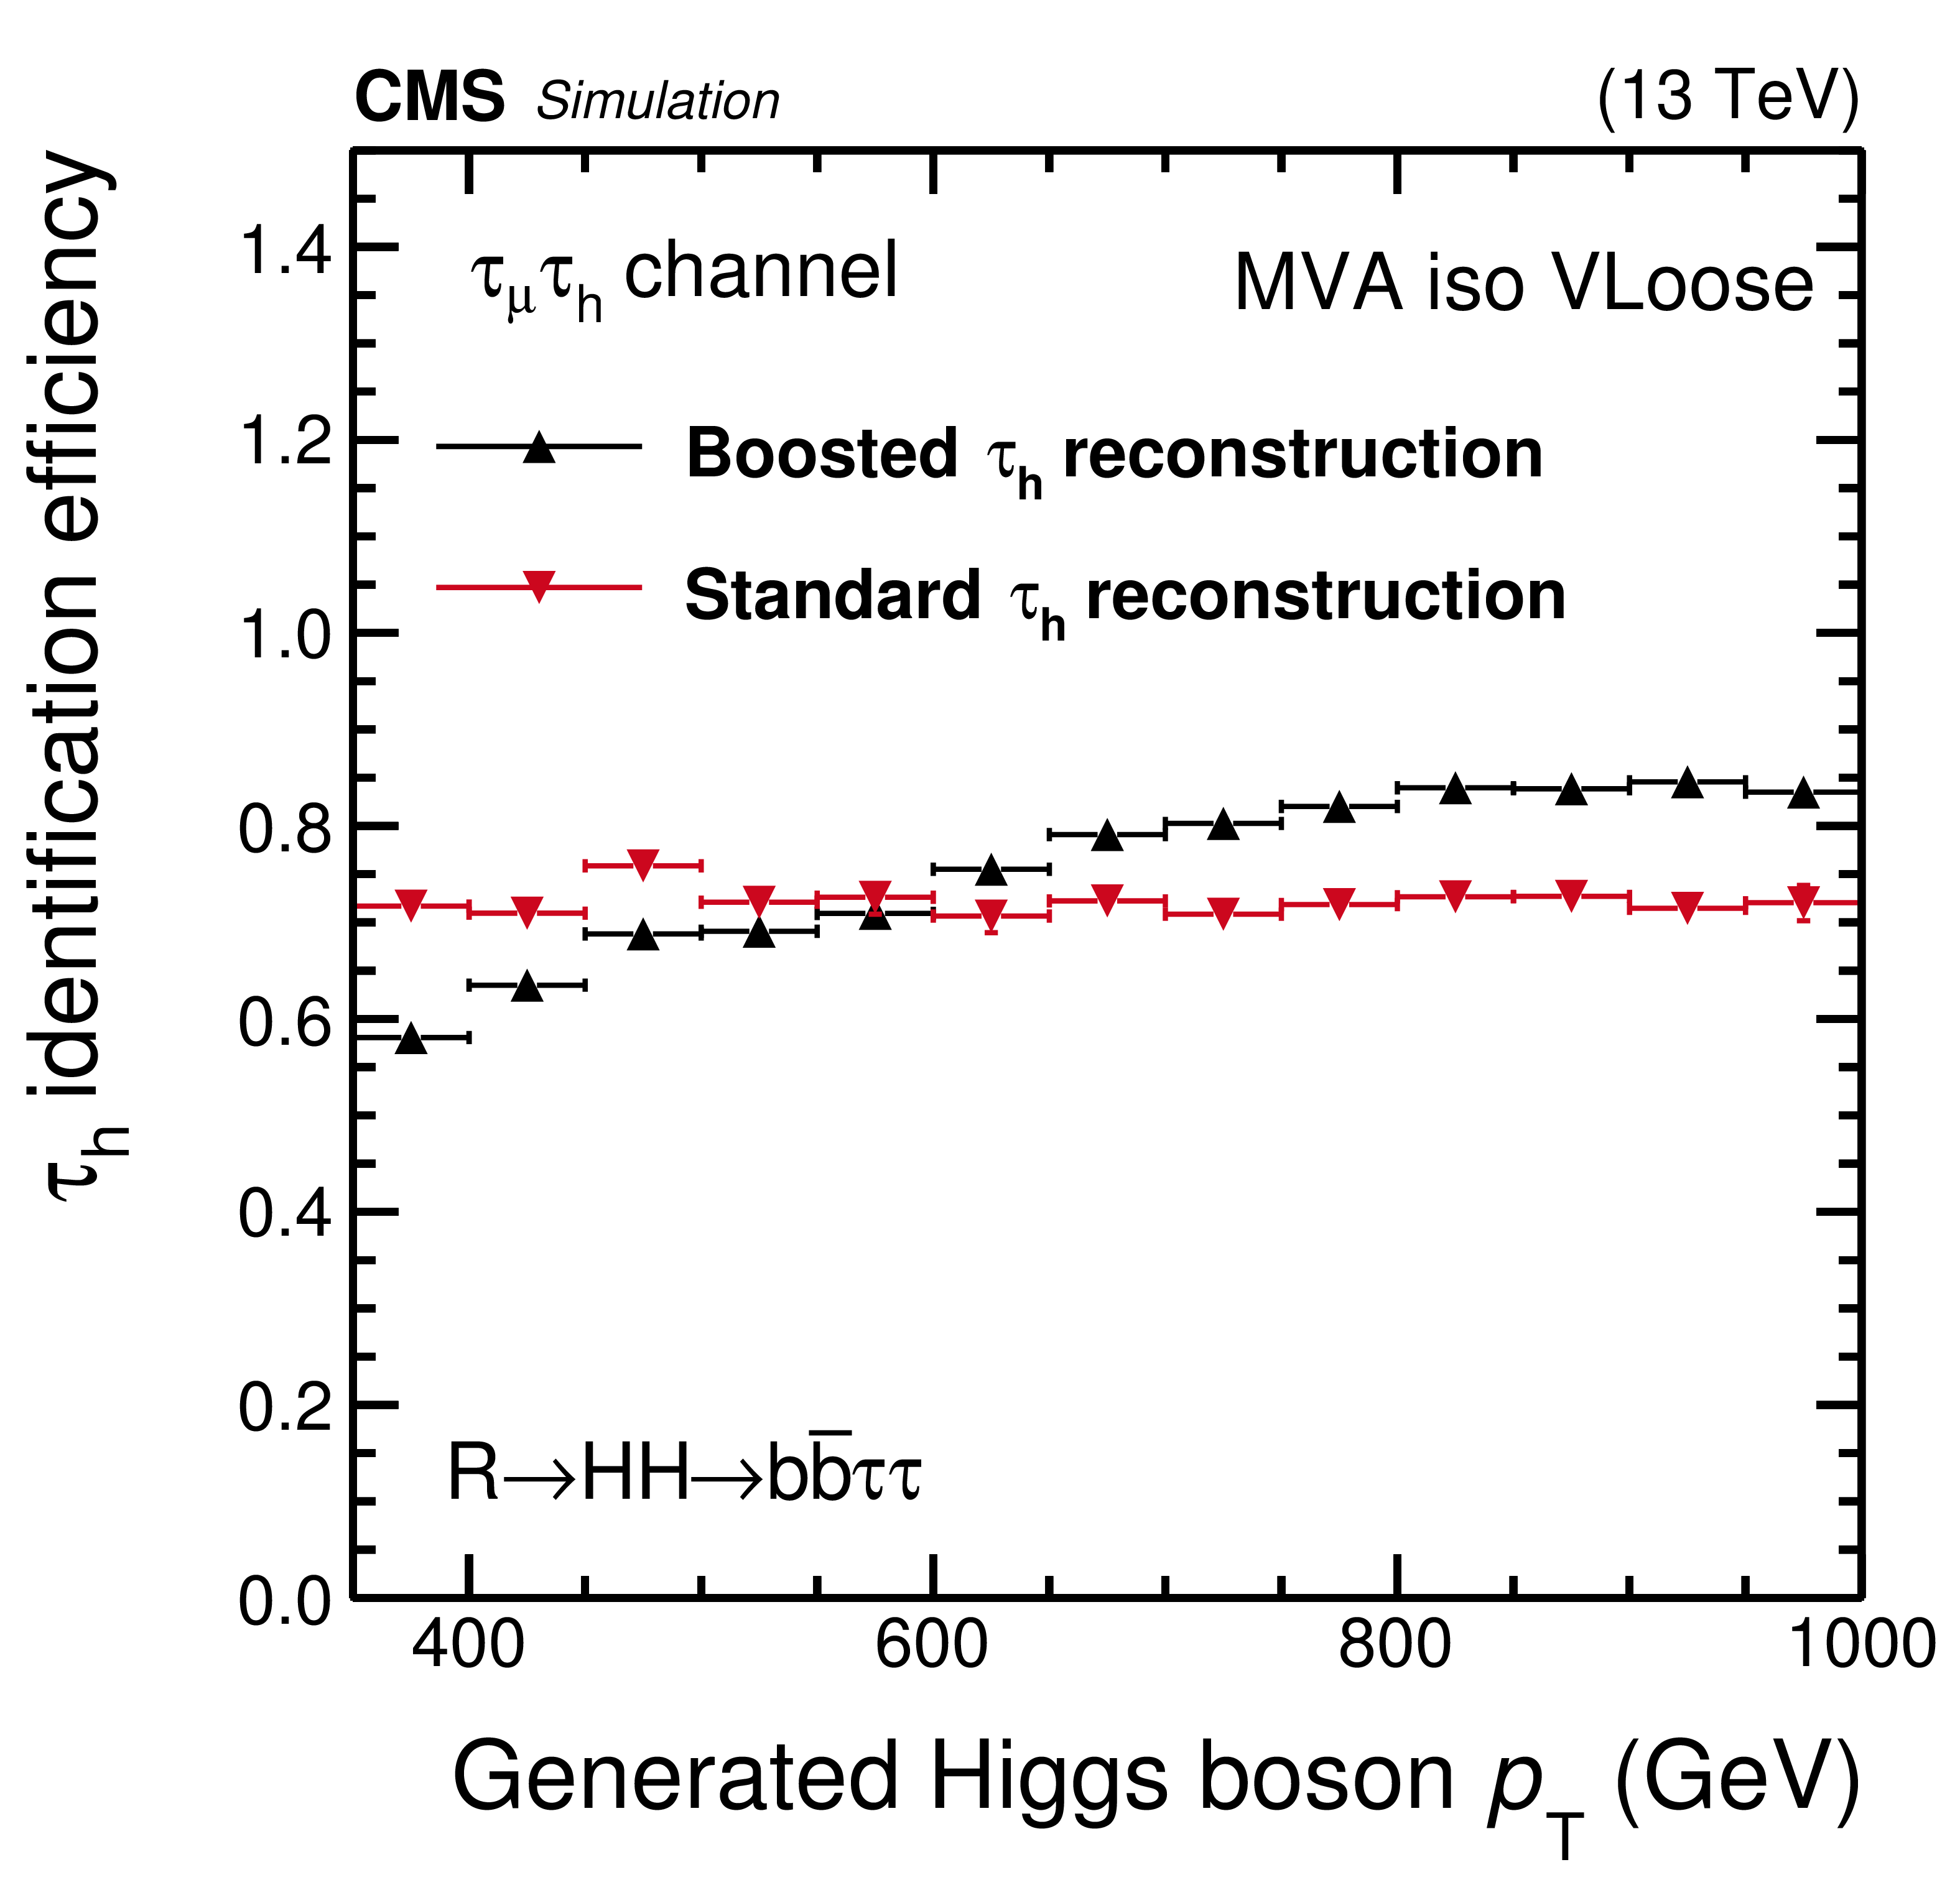
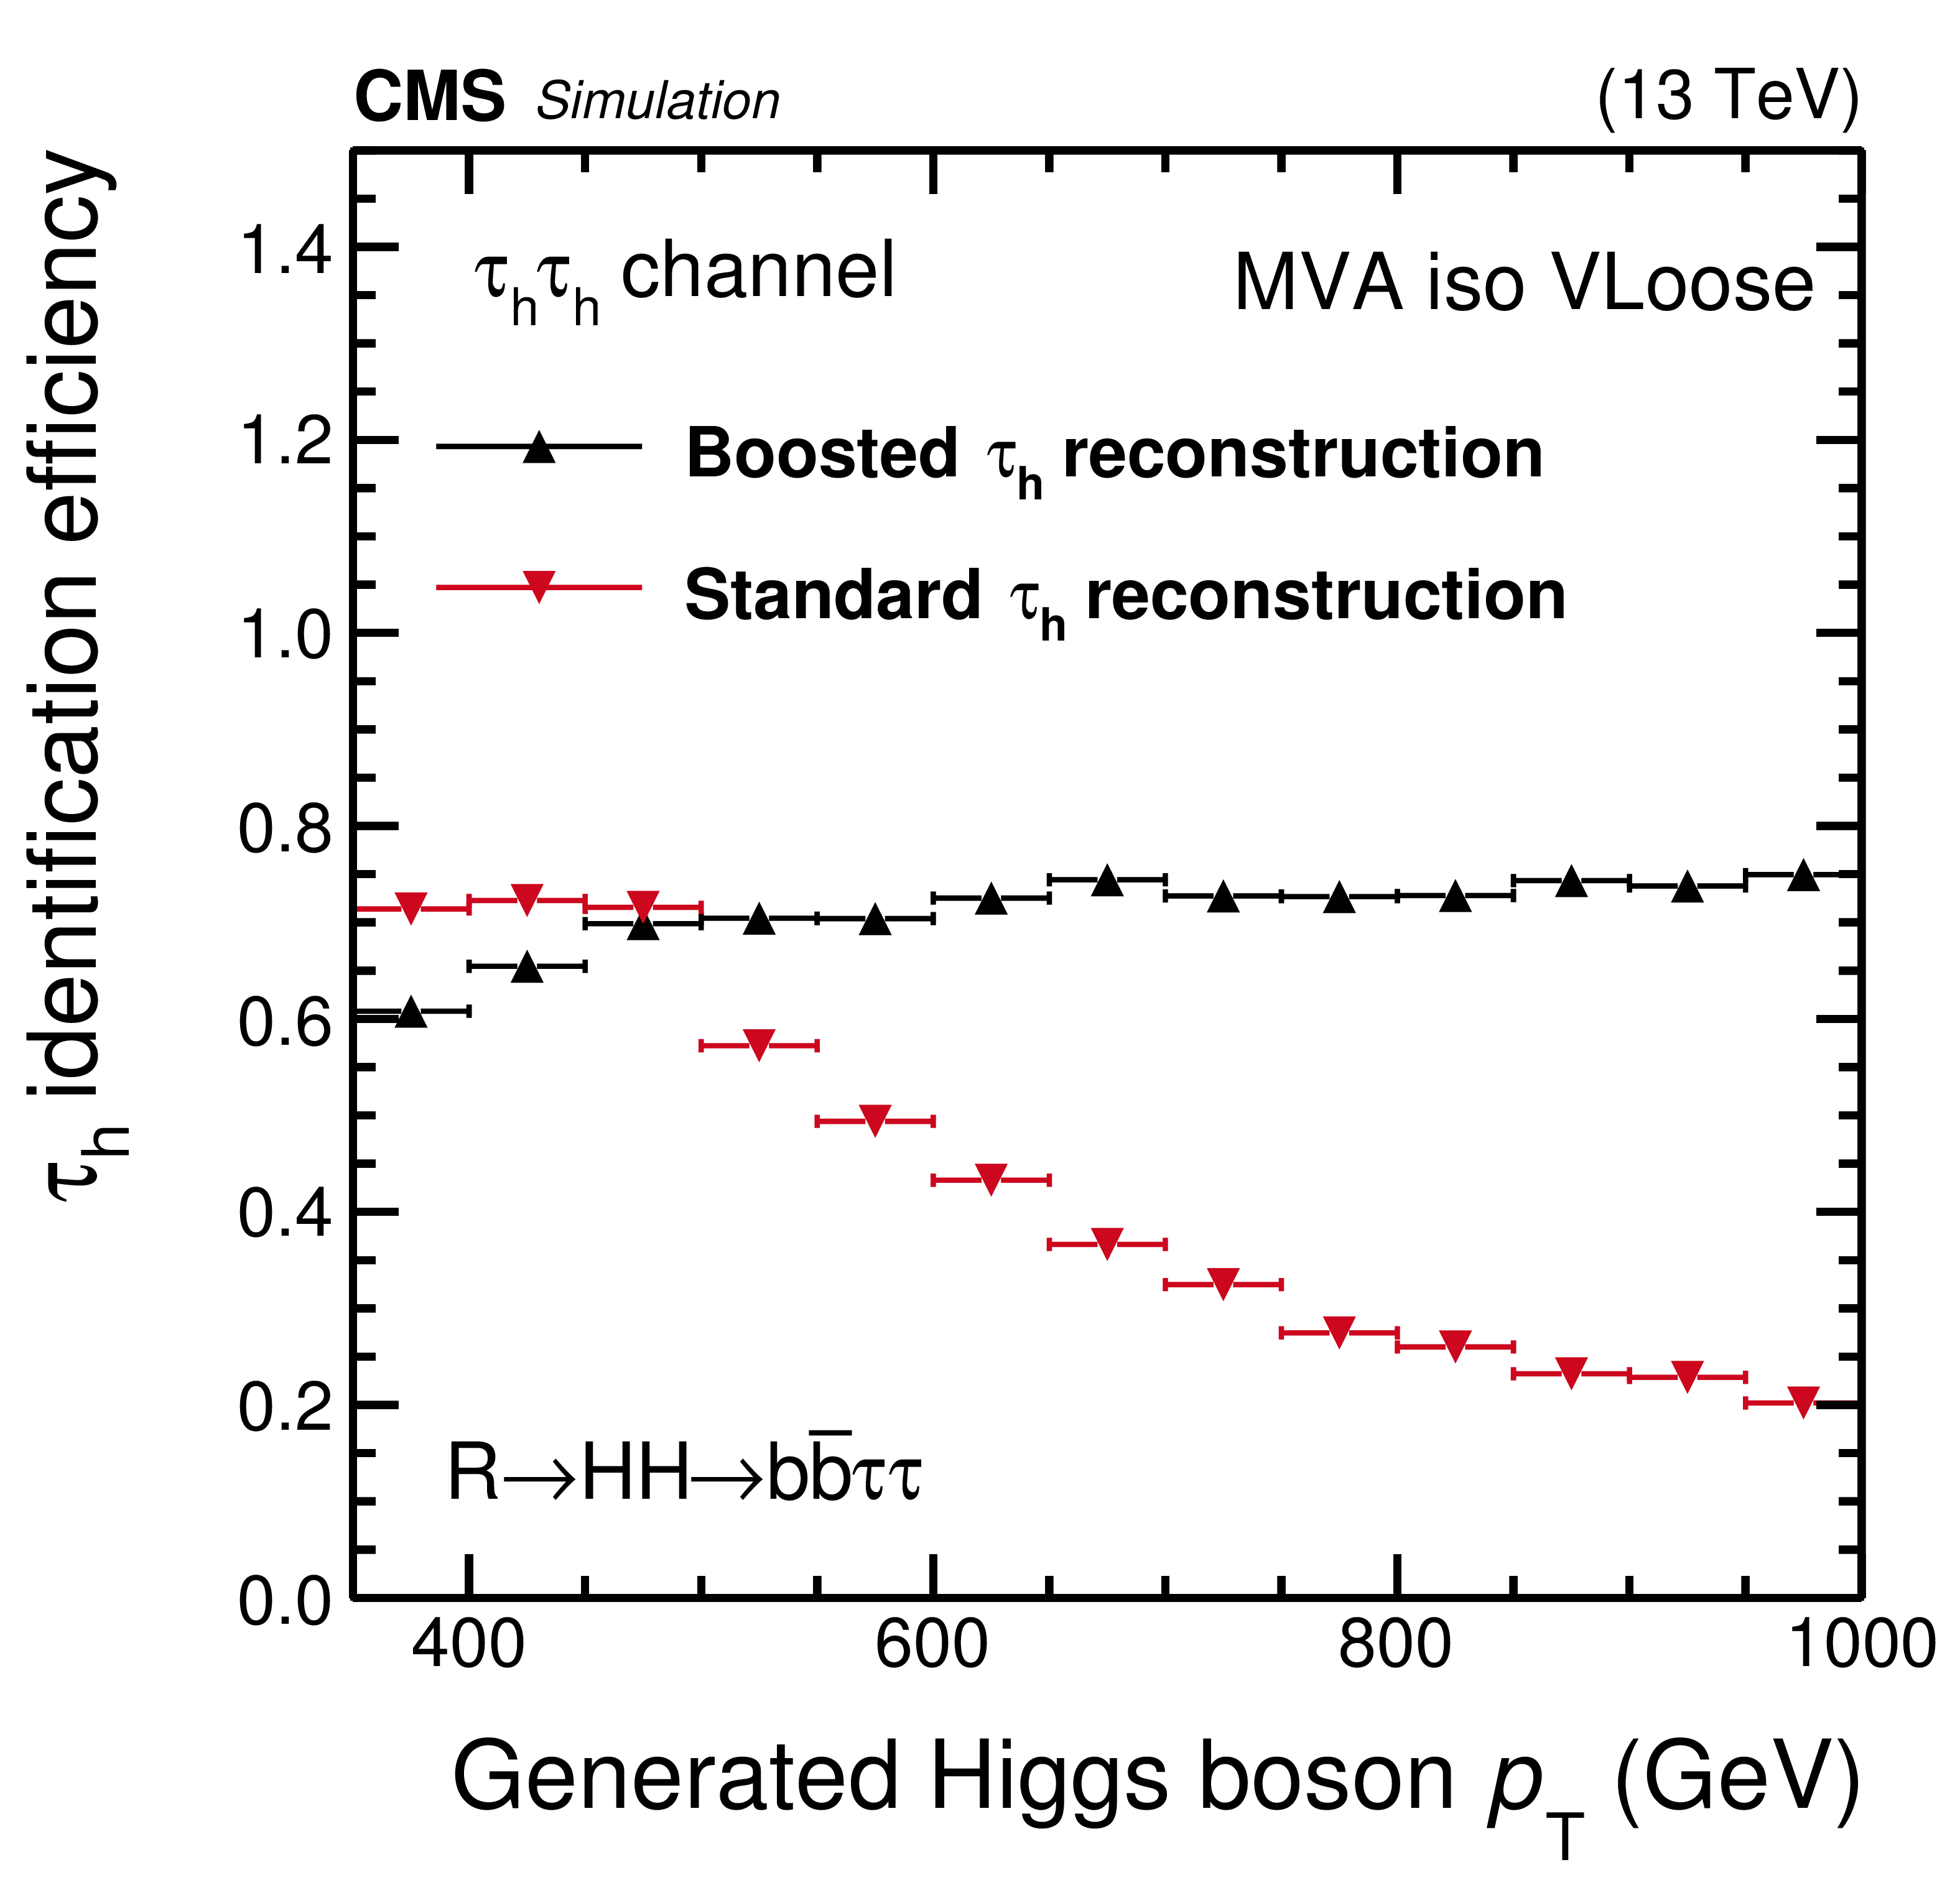
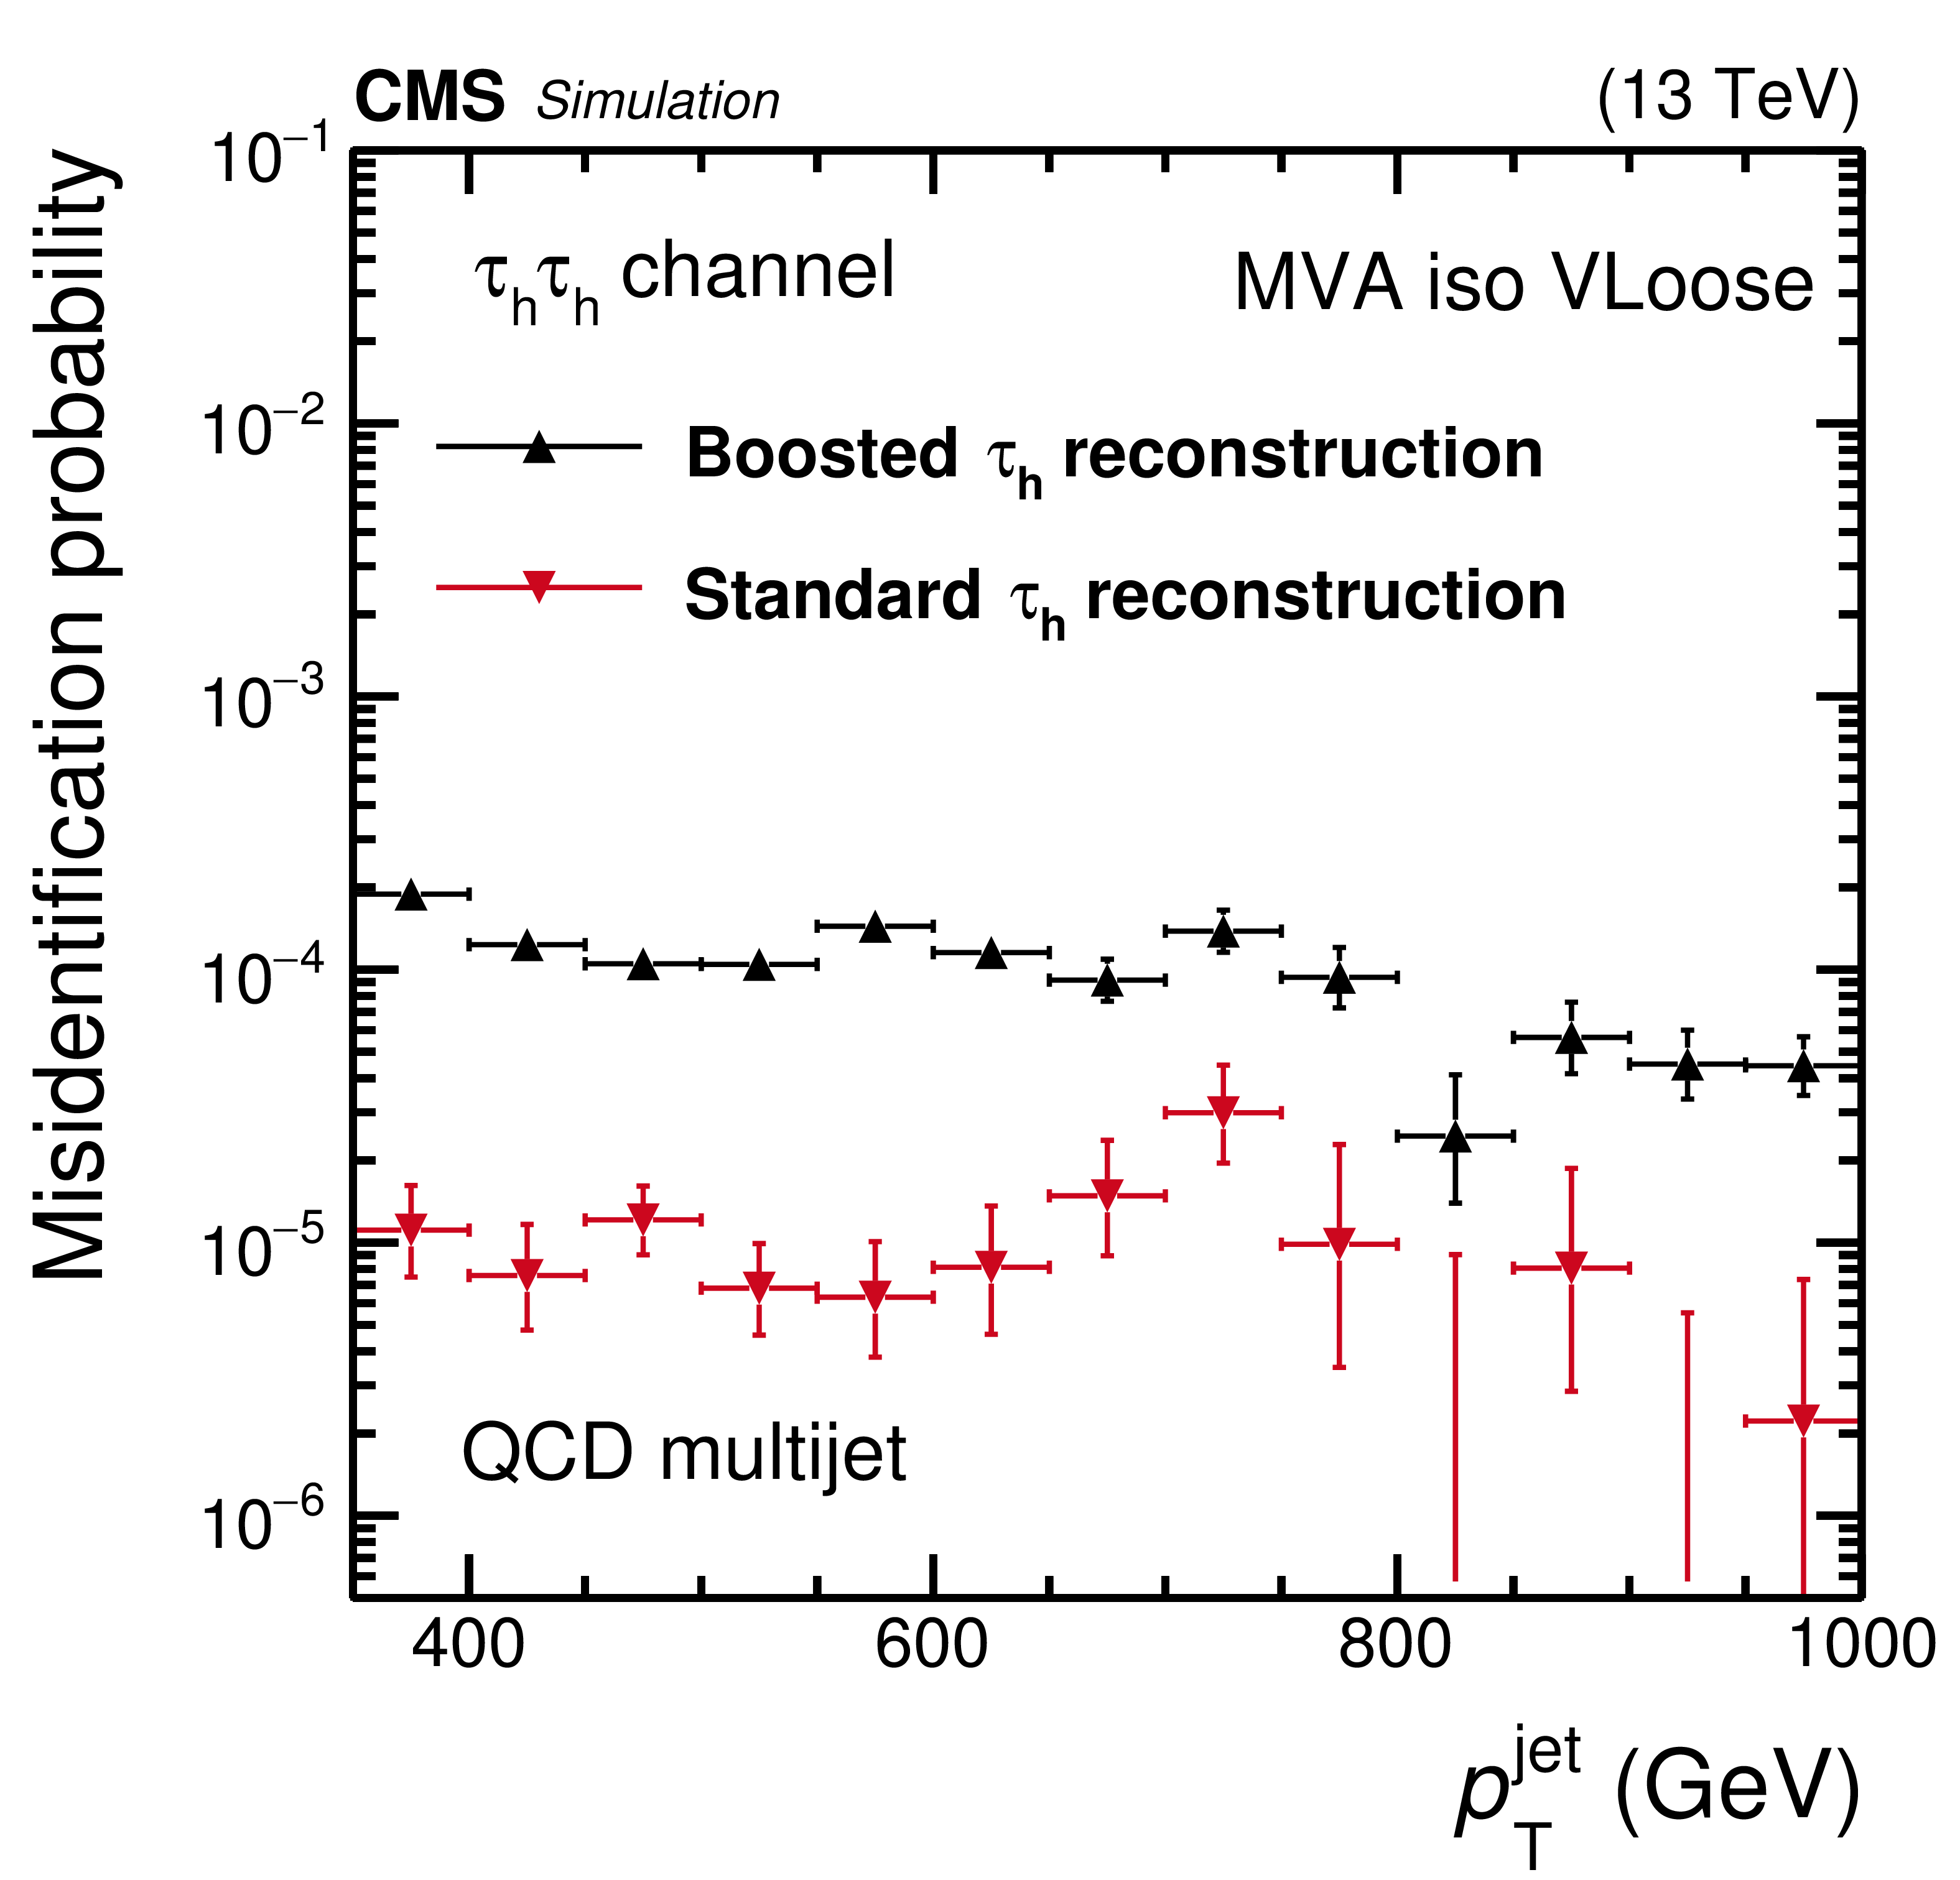
Figure 6:
Reconstruction and identification efficiencies for the $ {{\tau} _\mathrm {h}} $ in the $ {{\mu}} {{\tau} _\mathrm {h}} $ (upper left) and $ {{\tau} _\mathrm {h}} {{\tau} _\mathrm {h}} $ (upper right) final states, and for the $ {{\tau} _\mathrm {h}} {{\tau} _\mathrm {h}} $ pair (lower left), as a function of the generated $ {p_{\mathrm {T}}} $ of the Higgs boson, and the probability for large-radius jets in QCD multijet events to be misidentified as $ {{\tau} _\mathrm {h}} {{\tau} _\mathrm {h}} $ final states (lower right), as a function of the large-radius jet $ {p_{\mathrm {T}}}$. Vertical bars correspond to the statistical uncertainties (the 68% Clopper-Pearson intervals), while horizontal bars indicate the bin widths. |
png pdf |
Figure 6-a:
Reconstruction and identification efficiencies for the $ {{\tau} _\mathrm {h}} $ in the $ {{\mu}} {{\tau} _\mathrm {h}} $ final state, as a function of the generated $ {p_{\mathrm {T}}} $ of the Higgs boson. Vertical bars correspond to the statistical uncertainties (the 68% Clopper-Pearson intervals), while horizontal bars indicate the bin widths. |
png pdf |
Figure 6-b:
Reconstruction and identification efficiencies for the $ {{\tau} _\mathrm {h}} $ in the $ {{\tau} _\mathrm {h}} {{\tau} _\mathrm {h}} $ final state, as a function of the generated $ {p_{\mathrm {T}}} $ of the Higgs boson. Vertical bars correspond to the statistical uncertainties (the 68% Clopper-Pearson intervals), while horizontal bars indicate the bin widths. |

png pdf |
Figure 6-c:
Reconstruction and identification efficiencies for the $ {{\tau} _\mathrm {h}} {{\tau} _\mathrm {h}} $ pair, as a function of the generated $ {p_{\mathrm {T}}} $ of the Higgs boson. Vertical bars correspond to the statistical uncertainties (the 68% Clopper-Pearson intervals), while horizontal bars indicate the bin widths. |
png pdf |
Figure 6-d:
The probability for large-radius jets in QCD multijet events to be misidentified as $ {{\tau} _\mathrm {h}} {{\tau} _\mathrm {h}} $ final states, as a function of the large-radius jet $ {p_{\mathrm {T}}}$. Vertical bars correspond to the statistical uncertainties (the 68% Clopper-Pearson intervals), while horizontal bars indicate the bin widths. |

png pdf |
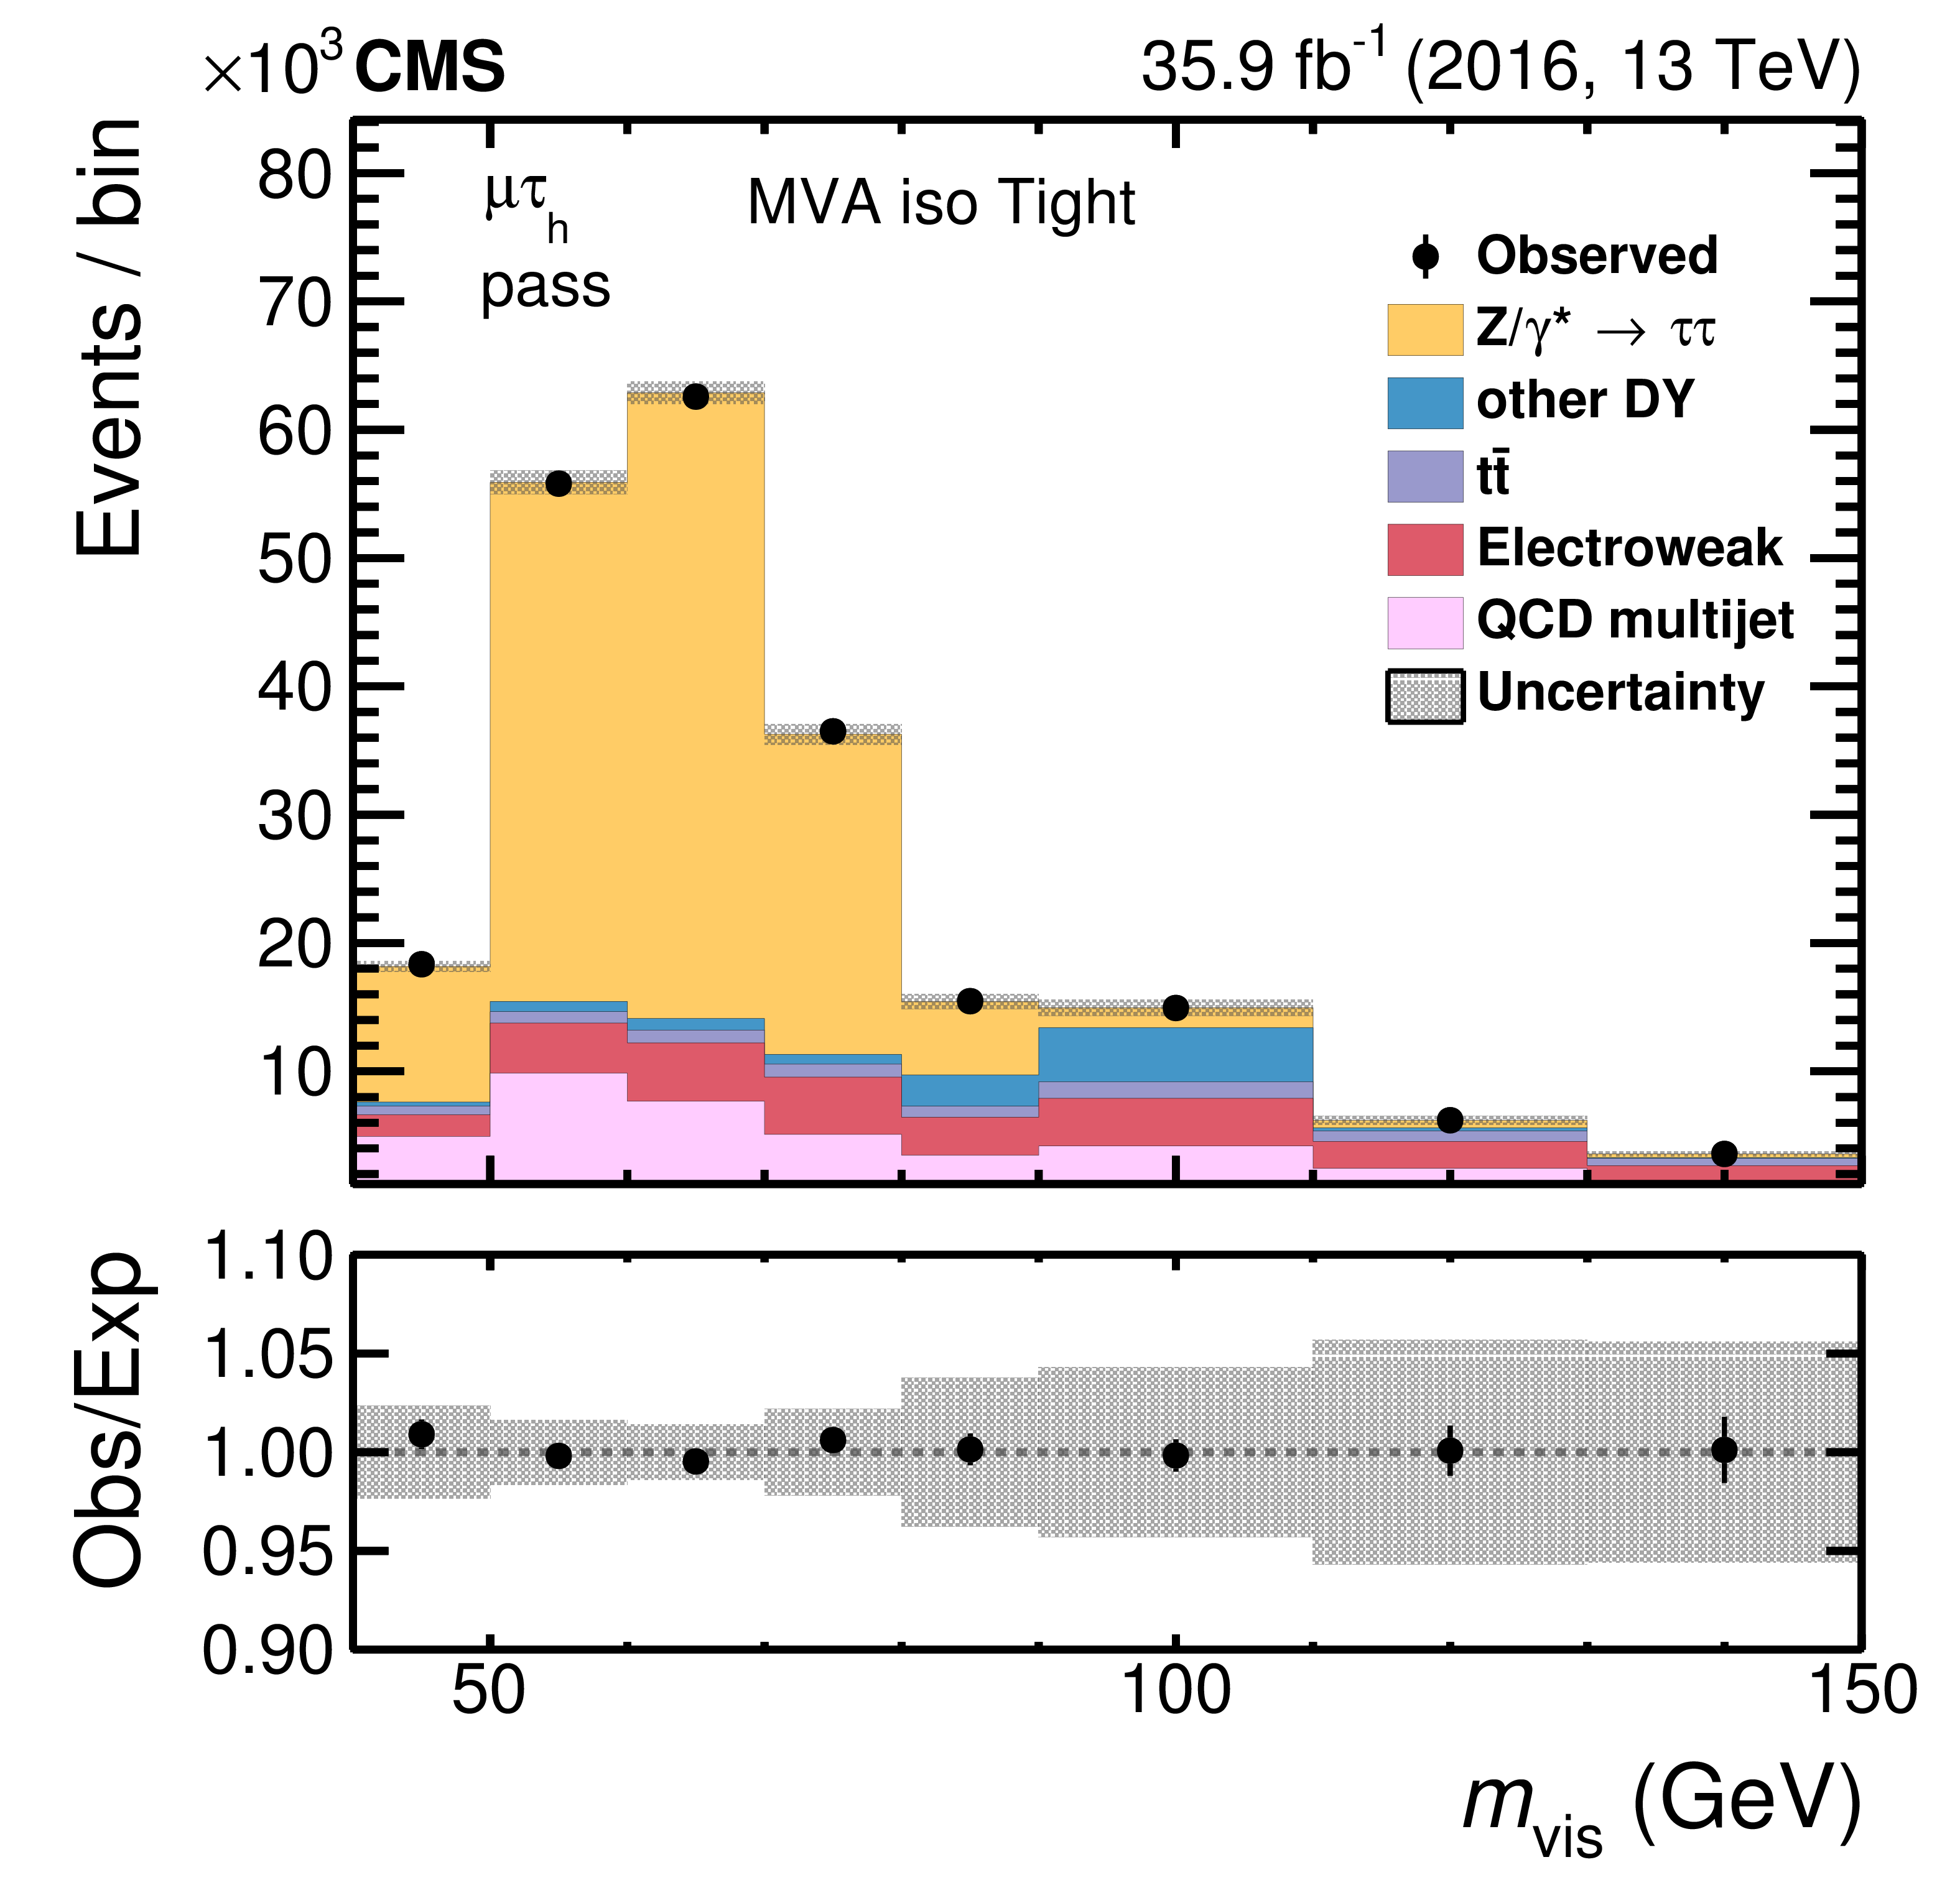
Figure 7:
The fitted distribution in $ {m_\text {vis}}$ in the passing (left) and failing (right) categories for the tight WP of the MVA-based isolation. The electroweak background includes contributions from W+jets (dominating), diboson, and single top quark events. Vertical bars correspond to the statistical uncertainties in the data points (68% frequentist confidence intervals), while shaded bands to the quadratic sum of the fitted statistical and systematic uncertainties. |
png pdf |
Figure 7-a:
The fitted distribution in $ {m_\text {vis}}$ in the passing category for the tight WP of the MVA-based isolation. The electroweak background includes contributions from W+jets (dominating), diboson, and single top quark events. Vertical bars correspond to the statistical uncertainties in the data points (68% frequentist confidence intervals), while shaded bands to the quadratic sum of the fitted statistical and systematic uncertainties. |

png pdf |
Figure 7-b:
The fitted distribution in $ {m_\text {vis}}$ in the failing category for the tight WP of the MVA-based isolation. The electroweak background includes contributions from W+jets (dominating), diboson, and single top quark events. Vertical bars correspond to the statistical uncertainties in the data points (68% frequentist confidence intervals), while shaded bands to the quadratic sum of the fitted statistical and systematic uncertainties. |
png pdf |
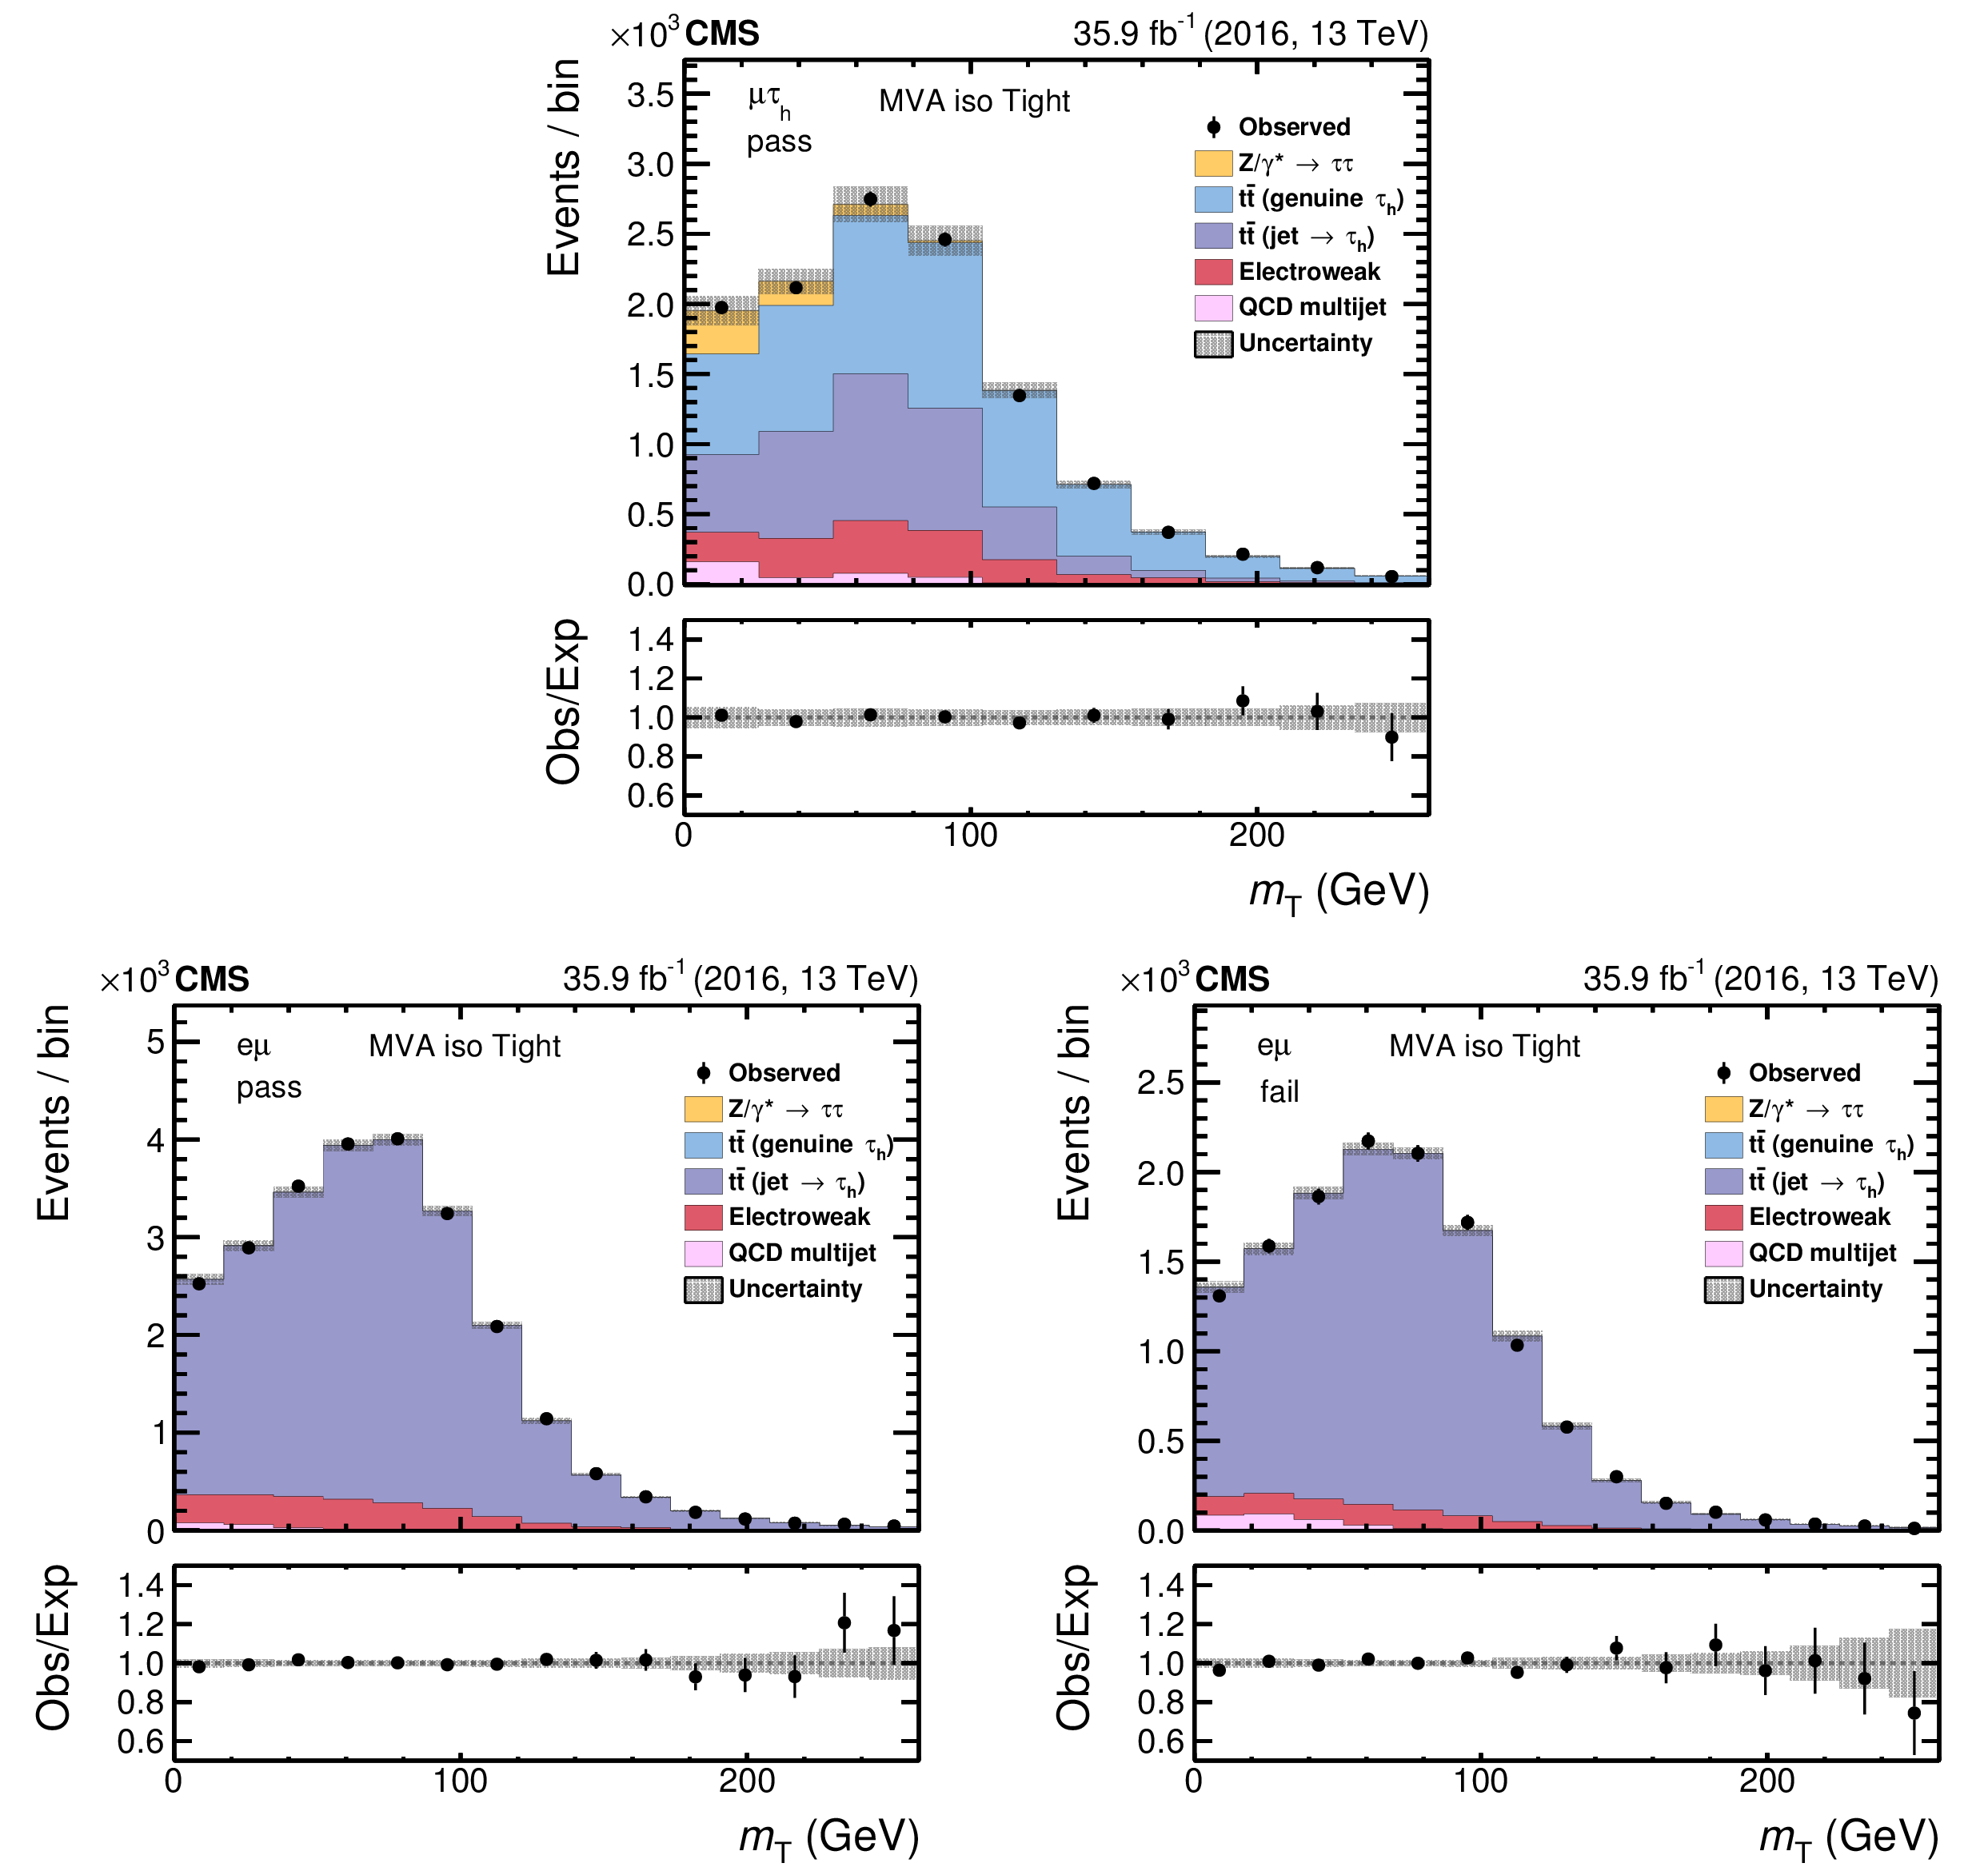
Figure 8:
Fitted distributions for the signal (upper), $ {\mathrm {e}} {{\mu}}$ passing (lower left), and the $ {\mathrm {e}} {{\mu}}$ failing (lower right) categories, using the $ {m_{\mathrm {T}}} $ for the $ {\vec{p}_{\mathrm {T}}} ^{\mu}$ and ${\vec{p}_{\mathrm {T}}^{\,\text {miss}}}$ vectors as observables for the tight WP of the MVA-based isolation with $ {p_{\mathrm {T}}} ^{{{\tau} _\mathrm {h}}}$ between 30 and 40 GeV. The electroweak background includes contributions from W+jets (dominating), diboson, and single top quark events. Vertical bars correspond to the statistical uncertainties in the data points (68% frequentist confidence intervals), while the shaded bands reflect the quadratic sum of the statistical and systematic uncertainties after the fit. |

png pdf |
Figure 8-a:
Fitted distribution for the signal category, using the $ {m_{\mathrm {T}}} $ for the $ {\vec{p}_{\mathrm {T}}} ^{\mu}$ and ${\vec{p}_{\mathrm {T}}^{\,\text {miss}}}$ vectors as observables for the tight WP of the MVA-based isolation with $ {p_{\mathrm {T}}} ^{{{\tau} _\mathrm {h}}}$ between 30 and 40 GeV. The electroweak background includes contributions from W+jets (dominating), diboson, and single top quark events. Vertical bars correspond to the statistical uncertainties in the data points (68% frequentist confidence intervals), while the shaded bands reflect the quadratic sum of the statistical and systematic uncertainties after the fit. |

png pdf |
Figure 8-b:
Fitted distribution for the $ {\mathrm {e}} {{\mu}}$ passing category, using the $ {m_{\mathrm {T}}} $ for the $ {\vec{p}_{\mathrm {T}}} ^{\mu}$ and ${\vec{p}_{\mathrm {T}}^{\,\text {miss}}}$ vectors as observables for the tight WP of the MVA-based isolation with $ {p_{\mathrm {T}}} ^{{{\tau} _\mathrm {h}}}$ between 30 and 40 GeV. The electroweak background includes contributions from W+jets (dominating), diboson, and single top quark events. Vertical bars correspond to the statistical uncertainties in the data points (68% frequentist confidence intervals), while the shaded bands reflect the quadratic sum of the statistical and systematic uncertainties after the fit. |

png pdf |
Figure 8-c:
Fitted distribution for the $ {\mathrm {e}} {{\mu}}$ failing category, using the $ {m_{\mathrm {T}}} $ for the $ {\vec{p}_{\mathrm {T}}} ^{\mu}$ and ${\vec{p}_{\mathrm {T}}^{\,\text {miss}}}$ vectors as observables for the tight WP of the MVA-based isolation with $ {p_{\mathrm {T}}} ^{{{\tau} _\mathrm {h}}}$ between 30 and 40 GeV. The electroweak background includes contributions from W+jets (dominating), diboson, and single top quark events. Vertical bars correspond to the statistical uncertainties in the data points (68% frequentist confidence intervals), while the shaded bands reflect the quadratic sum of the statistical and systematic uncertainties after the fit. |

png pdf |
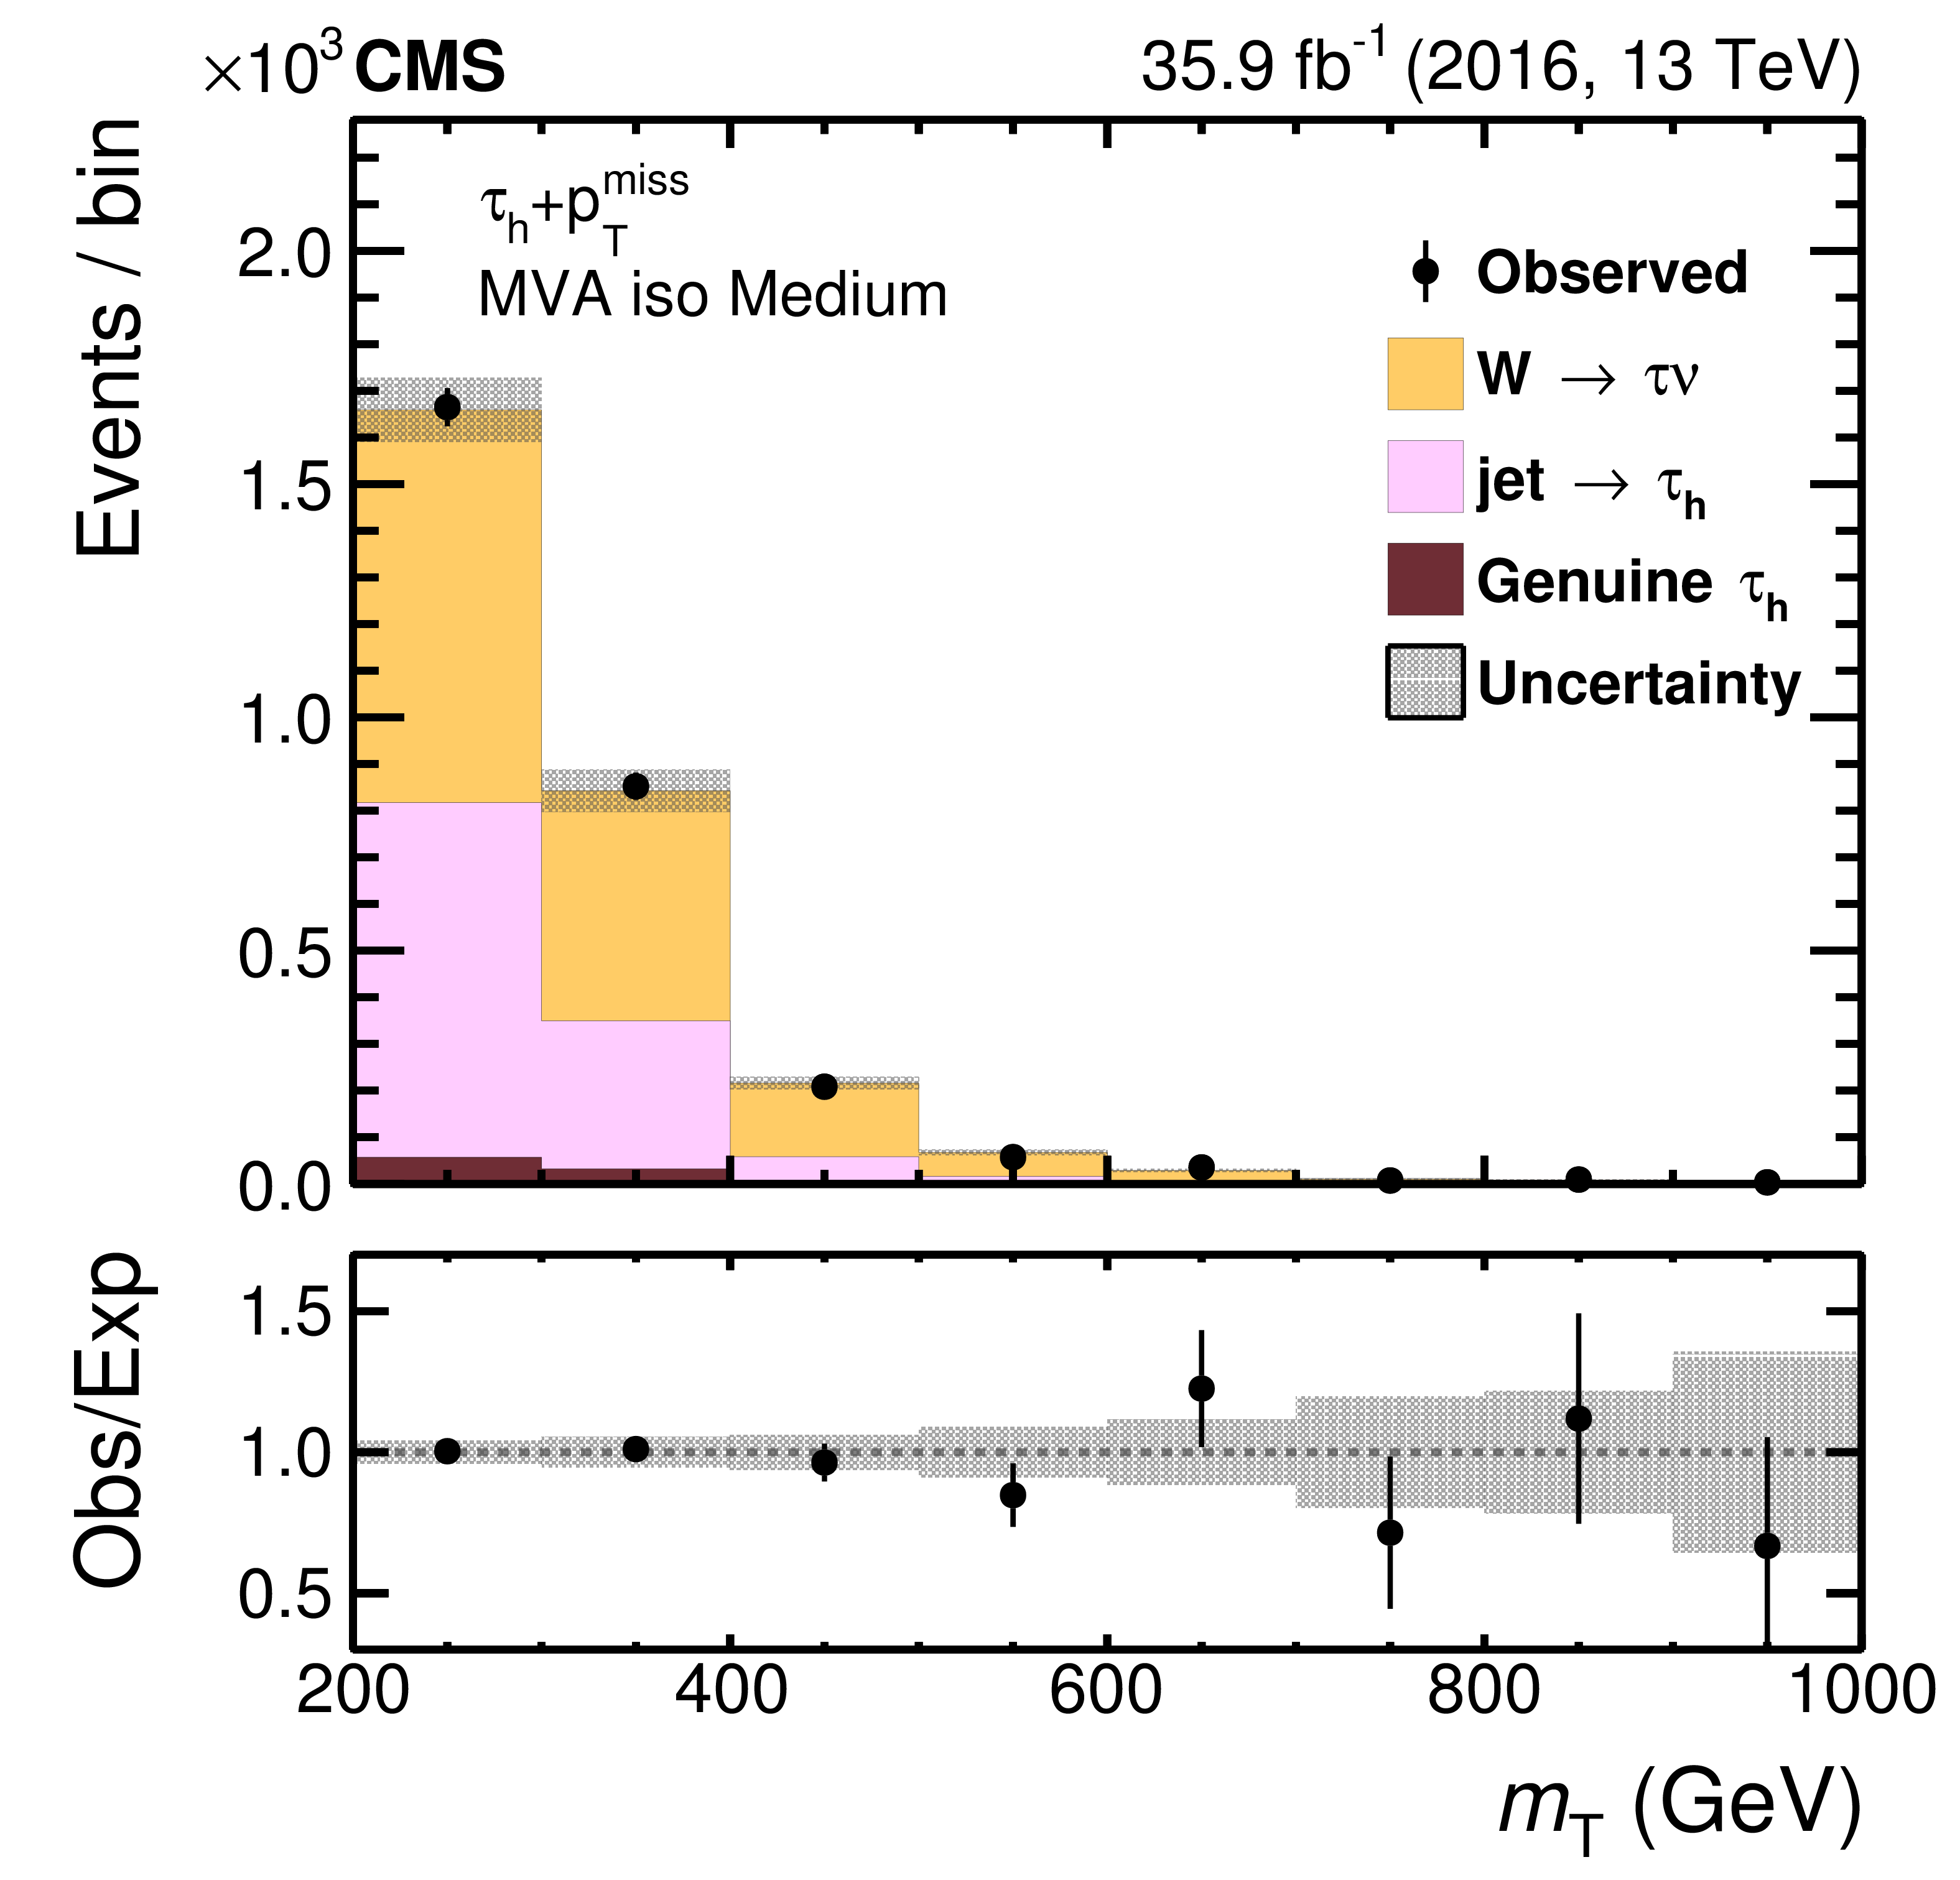
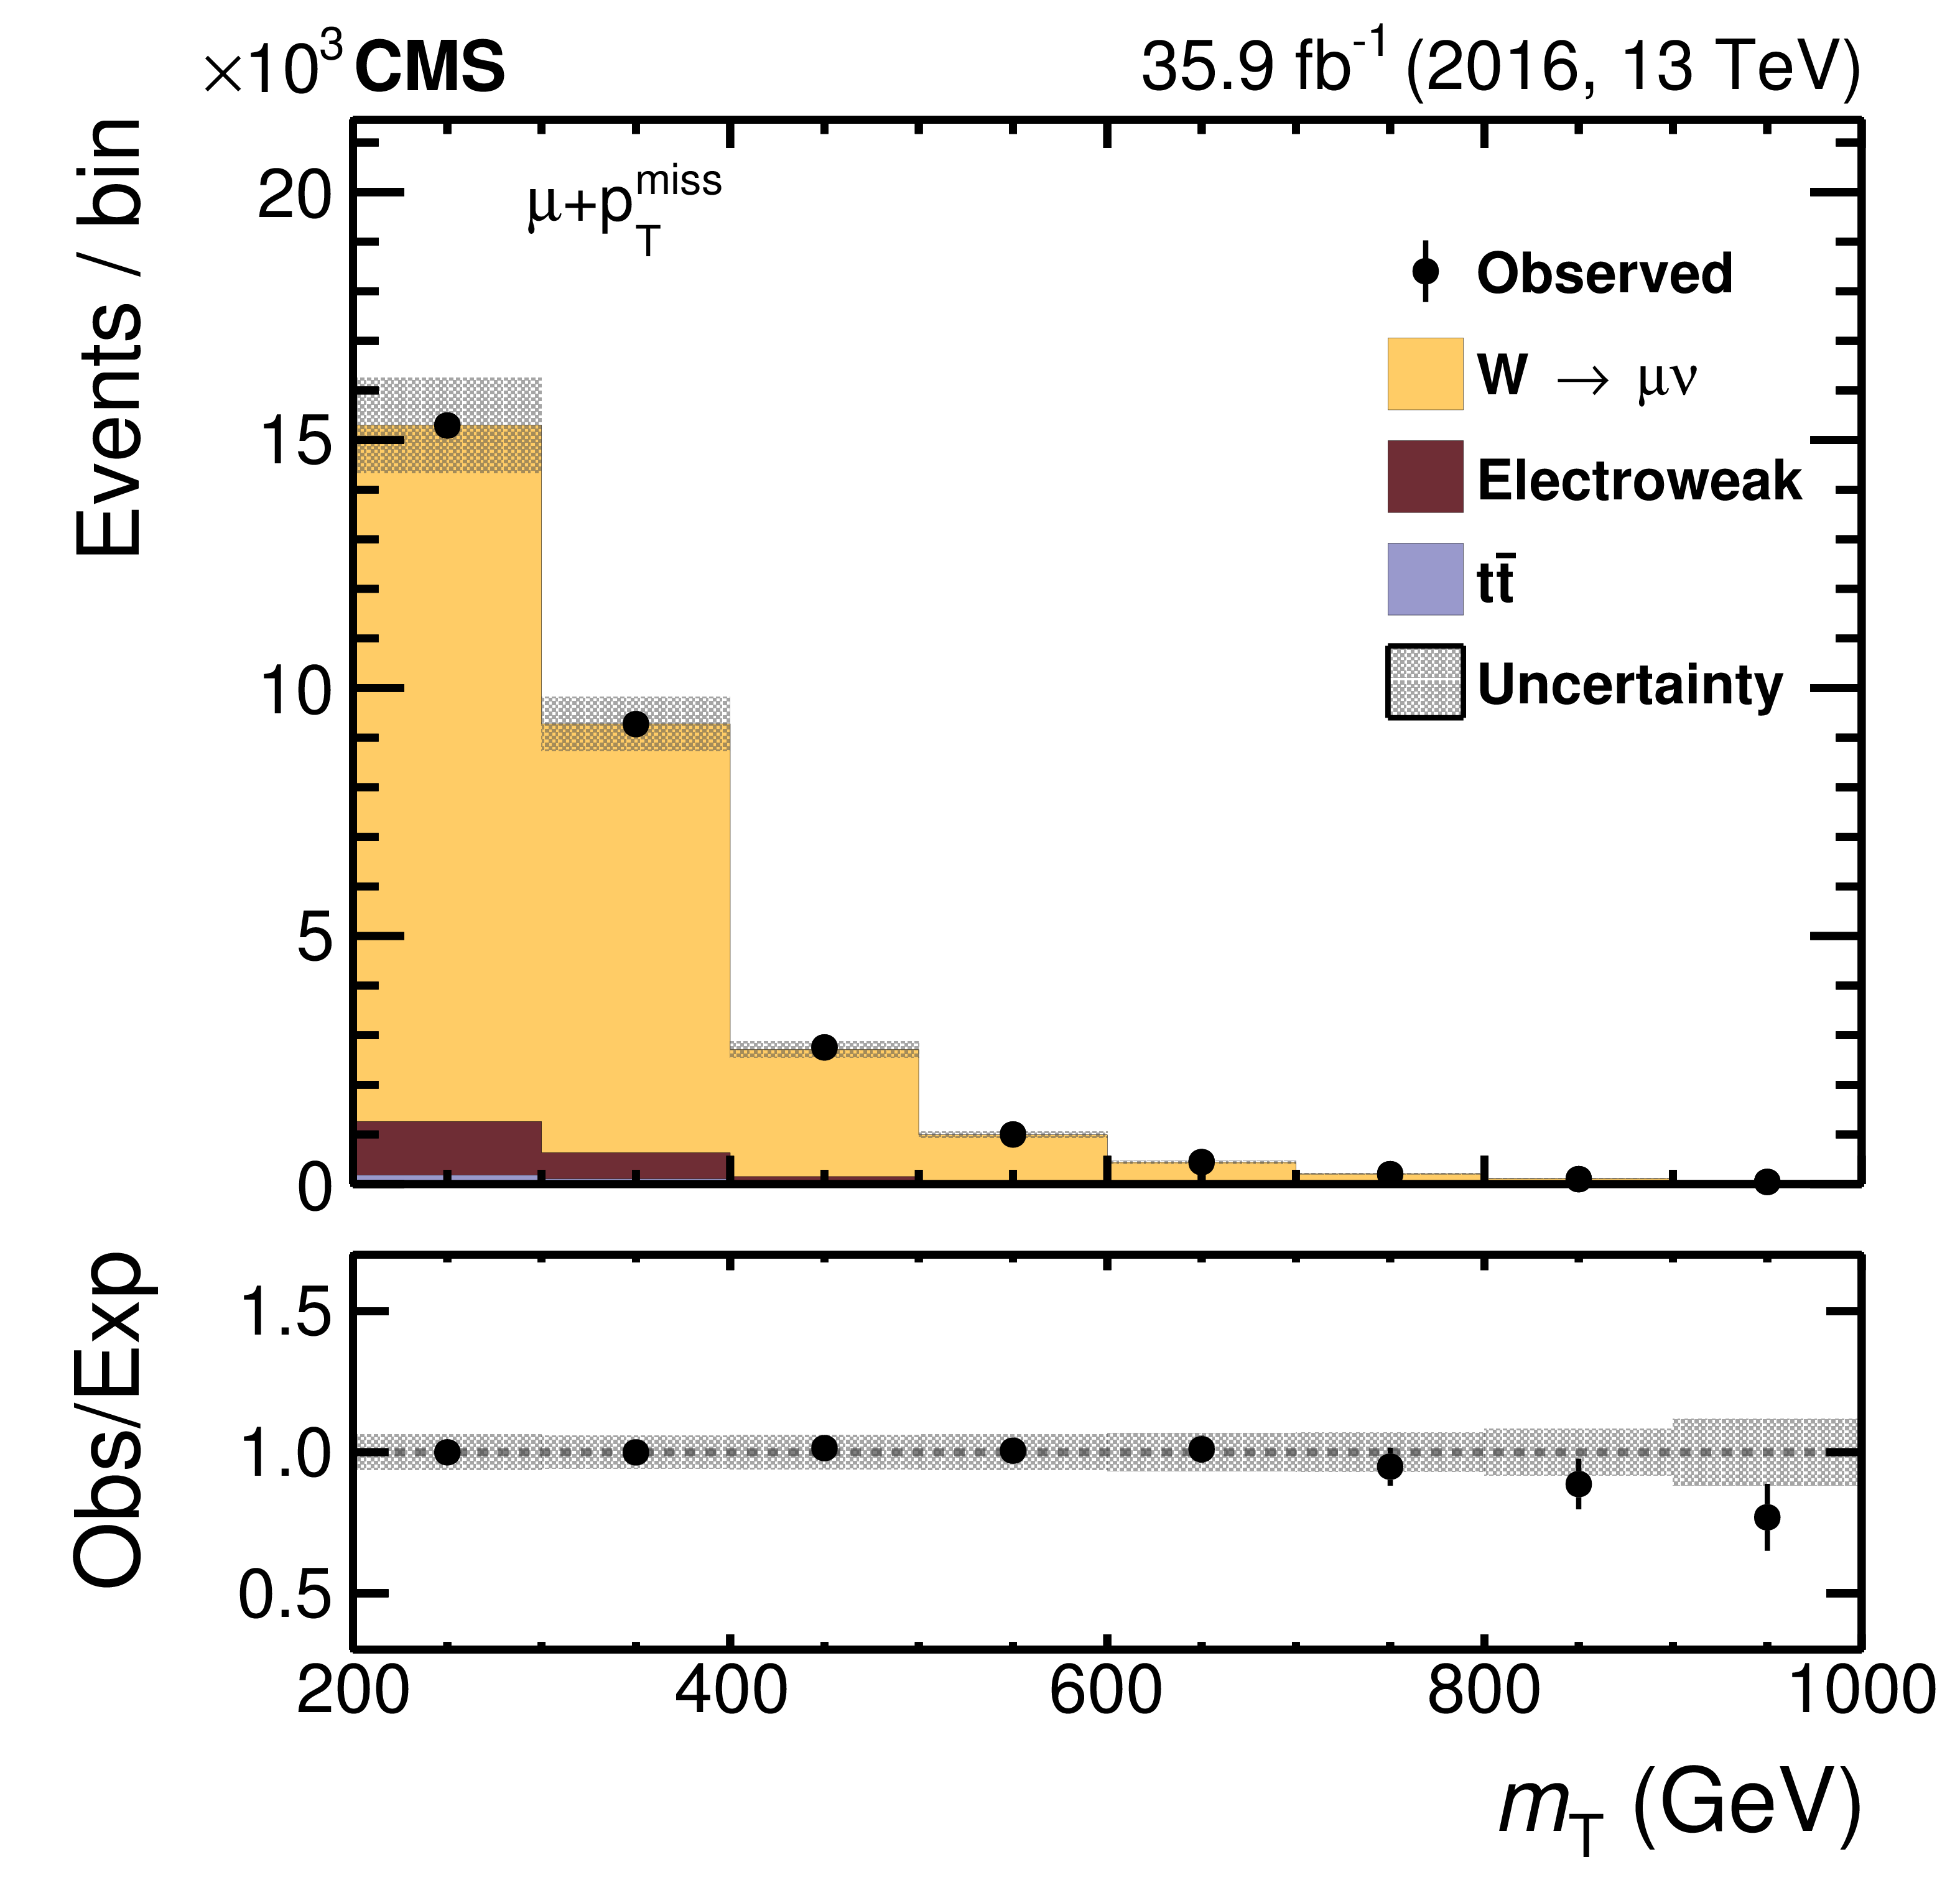
Figure 9:
The $ {m_{\mathrm {T}}} $ distribution for selected $ {\mathrm {W}}\to {\tau} {\nu}$ (left) and $ {\mathrm {W}}\to {{\mu}} {\nu}$ (right) events after the maximum likelihood fit. The medium WP of the MVA-based isolation discriminant is applied to select $ {\mathrm {W}}\to {\tau} {\nu}$ events. The electroweak background contribution includes diboson and single top quark events. Vertical bars correspond to the statistical uncertainties in the data points (68% frequentist confidence intervals), while the shaded bands to the quadratic sum of the statistical and systematic uncertainties after the fit. |
png pdf |
Figure 9-a:
The $ {m_{\mathrm {T}}} $ distribution for selected $ {\mathrm {W}}\to {\tau} {\nu}$ events after the maximum likelihood fit. The medium WP of the MVA-based isolation discriminant is applied to select $ {\mathrm {W}}\to {\tau} {\nu}$ events. The electroweak background contribution includes diboson and single top quark events. Vertical bars correspond to the statistical uncertainties in the data points (68% frequentist confidence intervals), while the shaded bands to the quadratic sum of the statistical and systematic uncertainties after the fit. |
png pdf |
Figure 9-b:
The $ {m_{\mathrm {T}}} $ distribution for selected $ {\mathrm {W}}\to {{\mu}} {\nu}$ events after the maximum likelihood fit. The electroweak background contribution includes diboson and single top quark events. Vertical bars correspond to the statistical uncertainties in the data points (68% frequentist confidence intervals), while the shaded bands to the quadratic sum of the statistical and systematic uncertainties after the fit. |

png pdf |
Figure 10:
Fit of the measured scale factors to a constant value in the $ {{\tau} _\mathrm {h}} $ identification efficiency, for the tight WP of the MVA-based isolation discriminant in $ {\mathrm {Z}}/ {\gamma ^{*}} $, $ {{\mathrm {t}\overline {\mathrm {t}}}} $, and W events, as a function of $ {p_{\mathrm {T}}} ^{{{\tau} _\mathrm {h}}}$. The shaded band represents the uncertainties in the fit, where the result is combined with the difference obtained using a first-order polynomial instead of a constant for the downward deviations, which also contain an additional contribution from the uncertainty in track-reconstruction efficiency. |
png pdf |
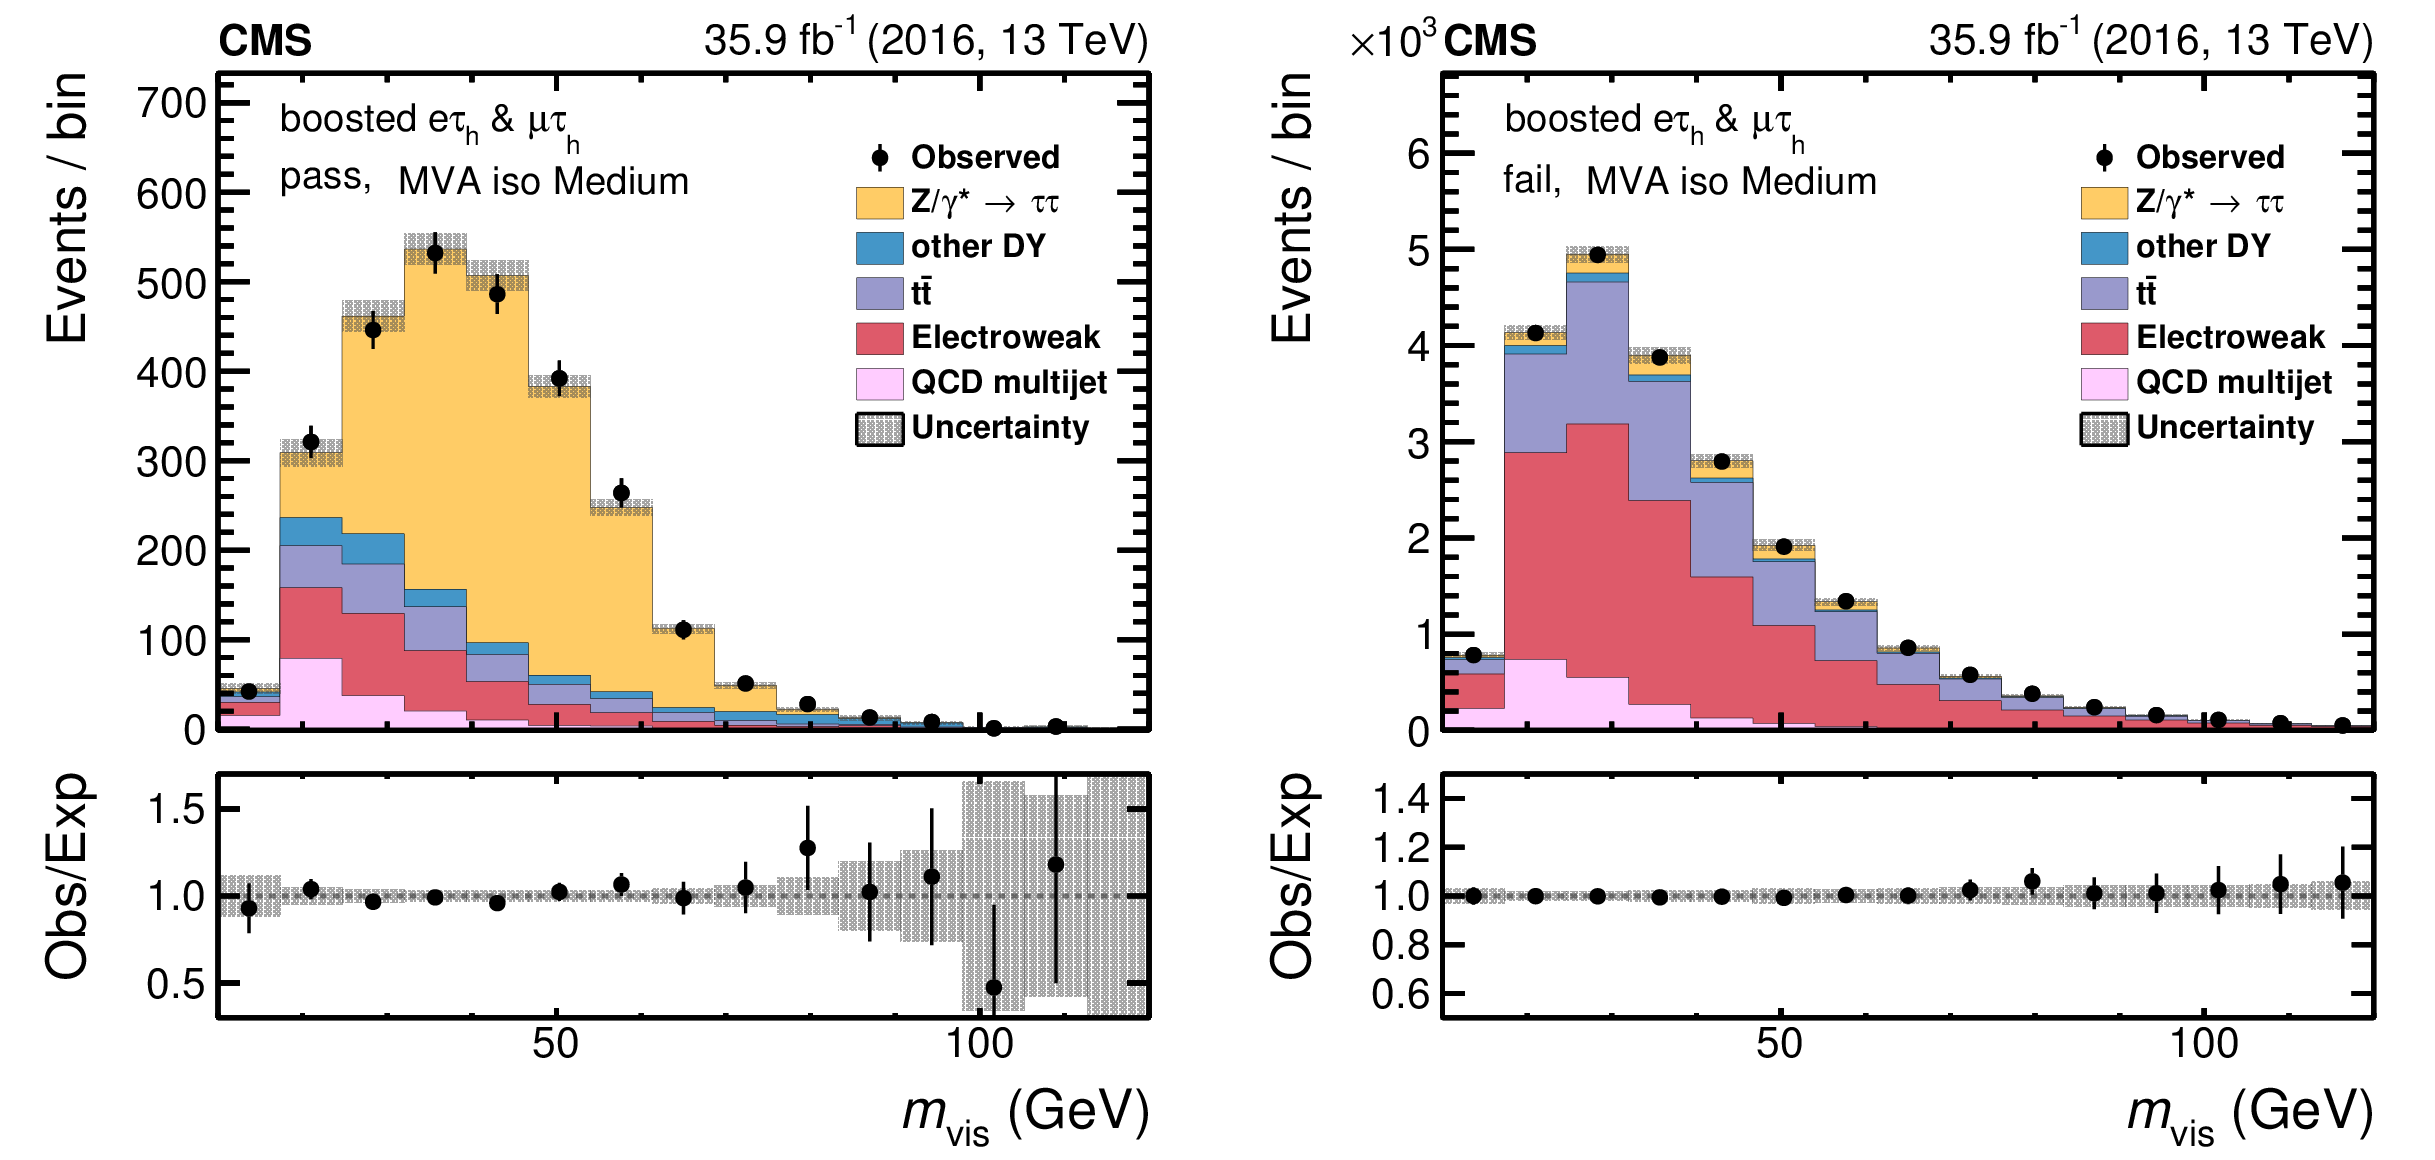
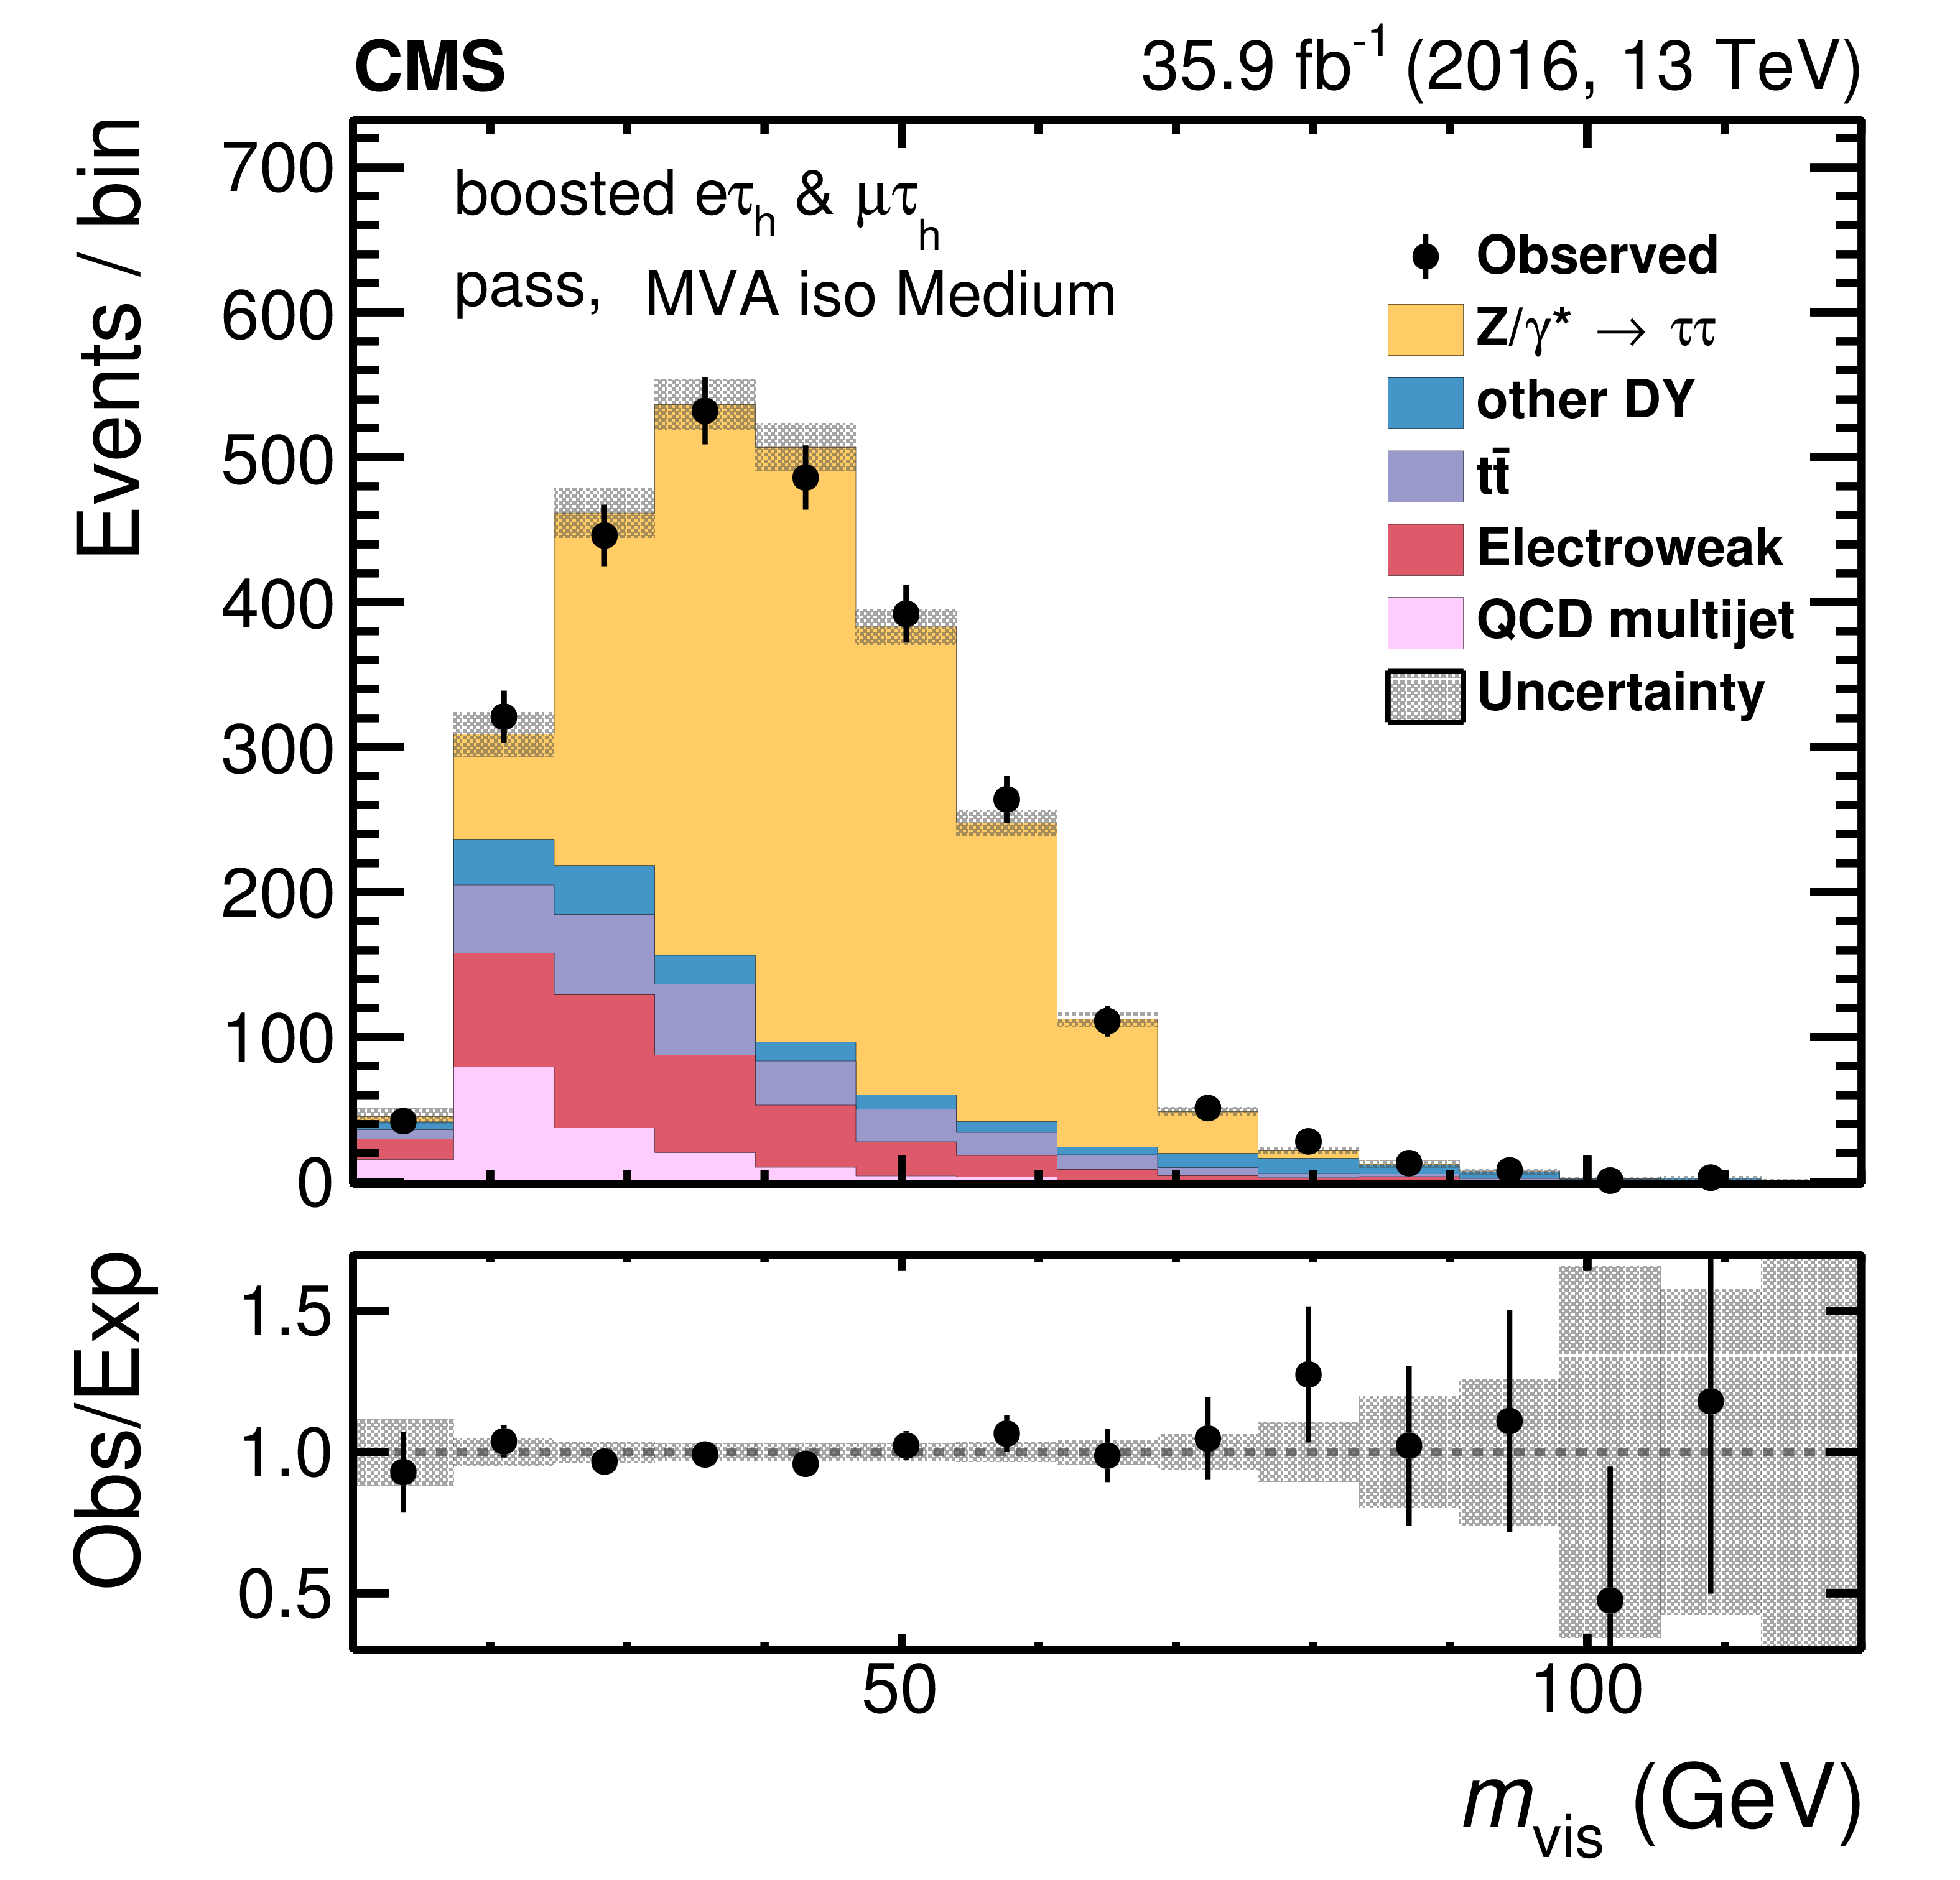
Figure 11:
Fitted distributions to the passing (left) and failing (right) events for $ {{\tau} _\mathrm {h}} $ from highly boosted $ {\tau}$ lepton pairs that pass the medium WP of the MVA-based isolation discriminant. The electroweak background includes contributions from W+jets (dominating), diboson, and single top quark events. Vertical bars correspond to the statistical uncertainties in the data points (68% frequentist confidence intervals), while the shaded bands provide the quadratic sum of the statistical and systematic uncertainties after the fit. |
png pdf |
Figure 11-a:
Fitted distributions to the passing events for $ {{\tau} _\mathrm {h}} $ from highly boosted $ {\tau}$ lepton pairs that pass the medium WP of the MVA-based isolation discriminant. The electroweak background includes contributions from W+jets (dominating), diboson, and single top quark events. Vertical bars correspond to the statistical uncertainties in the data points (68% frequentist confidence intervals), while the shaded bands provide the quadratic sum of the statistical and systematic uncertainties after the fit. |

png pdf |
Figure 11-b:
Fitted distributions to the failing events for $ {{\tau} _\mathrm {h}} $ from highly boosted $ {\tau}$ lepton pairs that pass the medium WP of the MVA-based isolation discriminant. The electroweak background includes contributions from W+jets (dominating), diboson, and single top quark events. Vertical bars correspond to the statistical uncertainties in the data points (68% frequentist confidence intervals), while the shaded bands provide the quadratic sum of the statistical and systematic uncertainties after the fit. |
png pdf |
Figure 12:
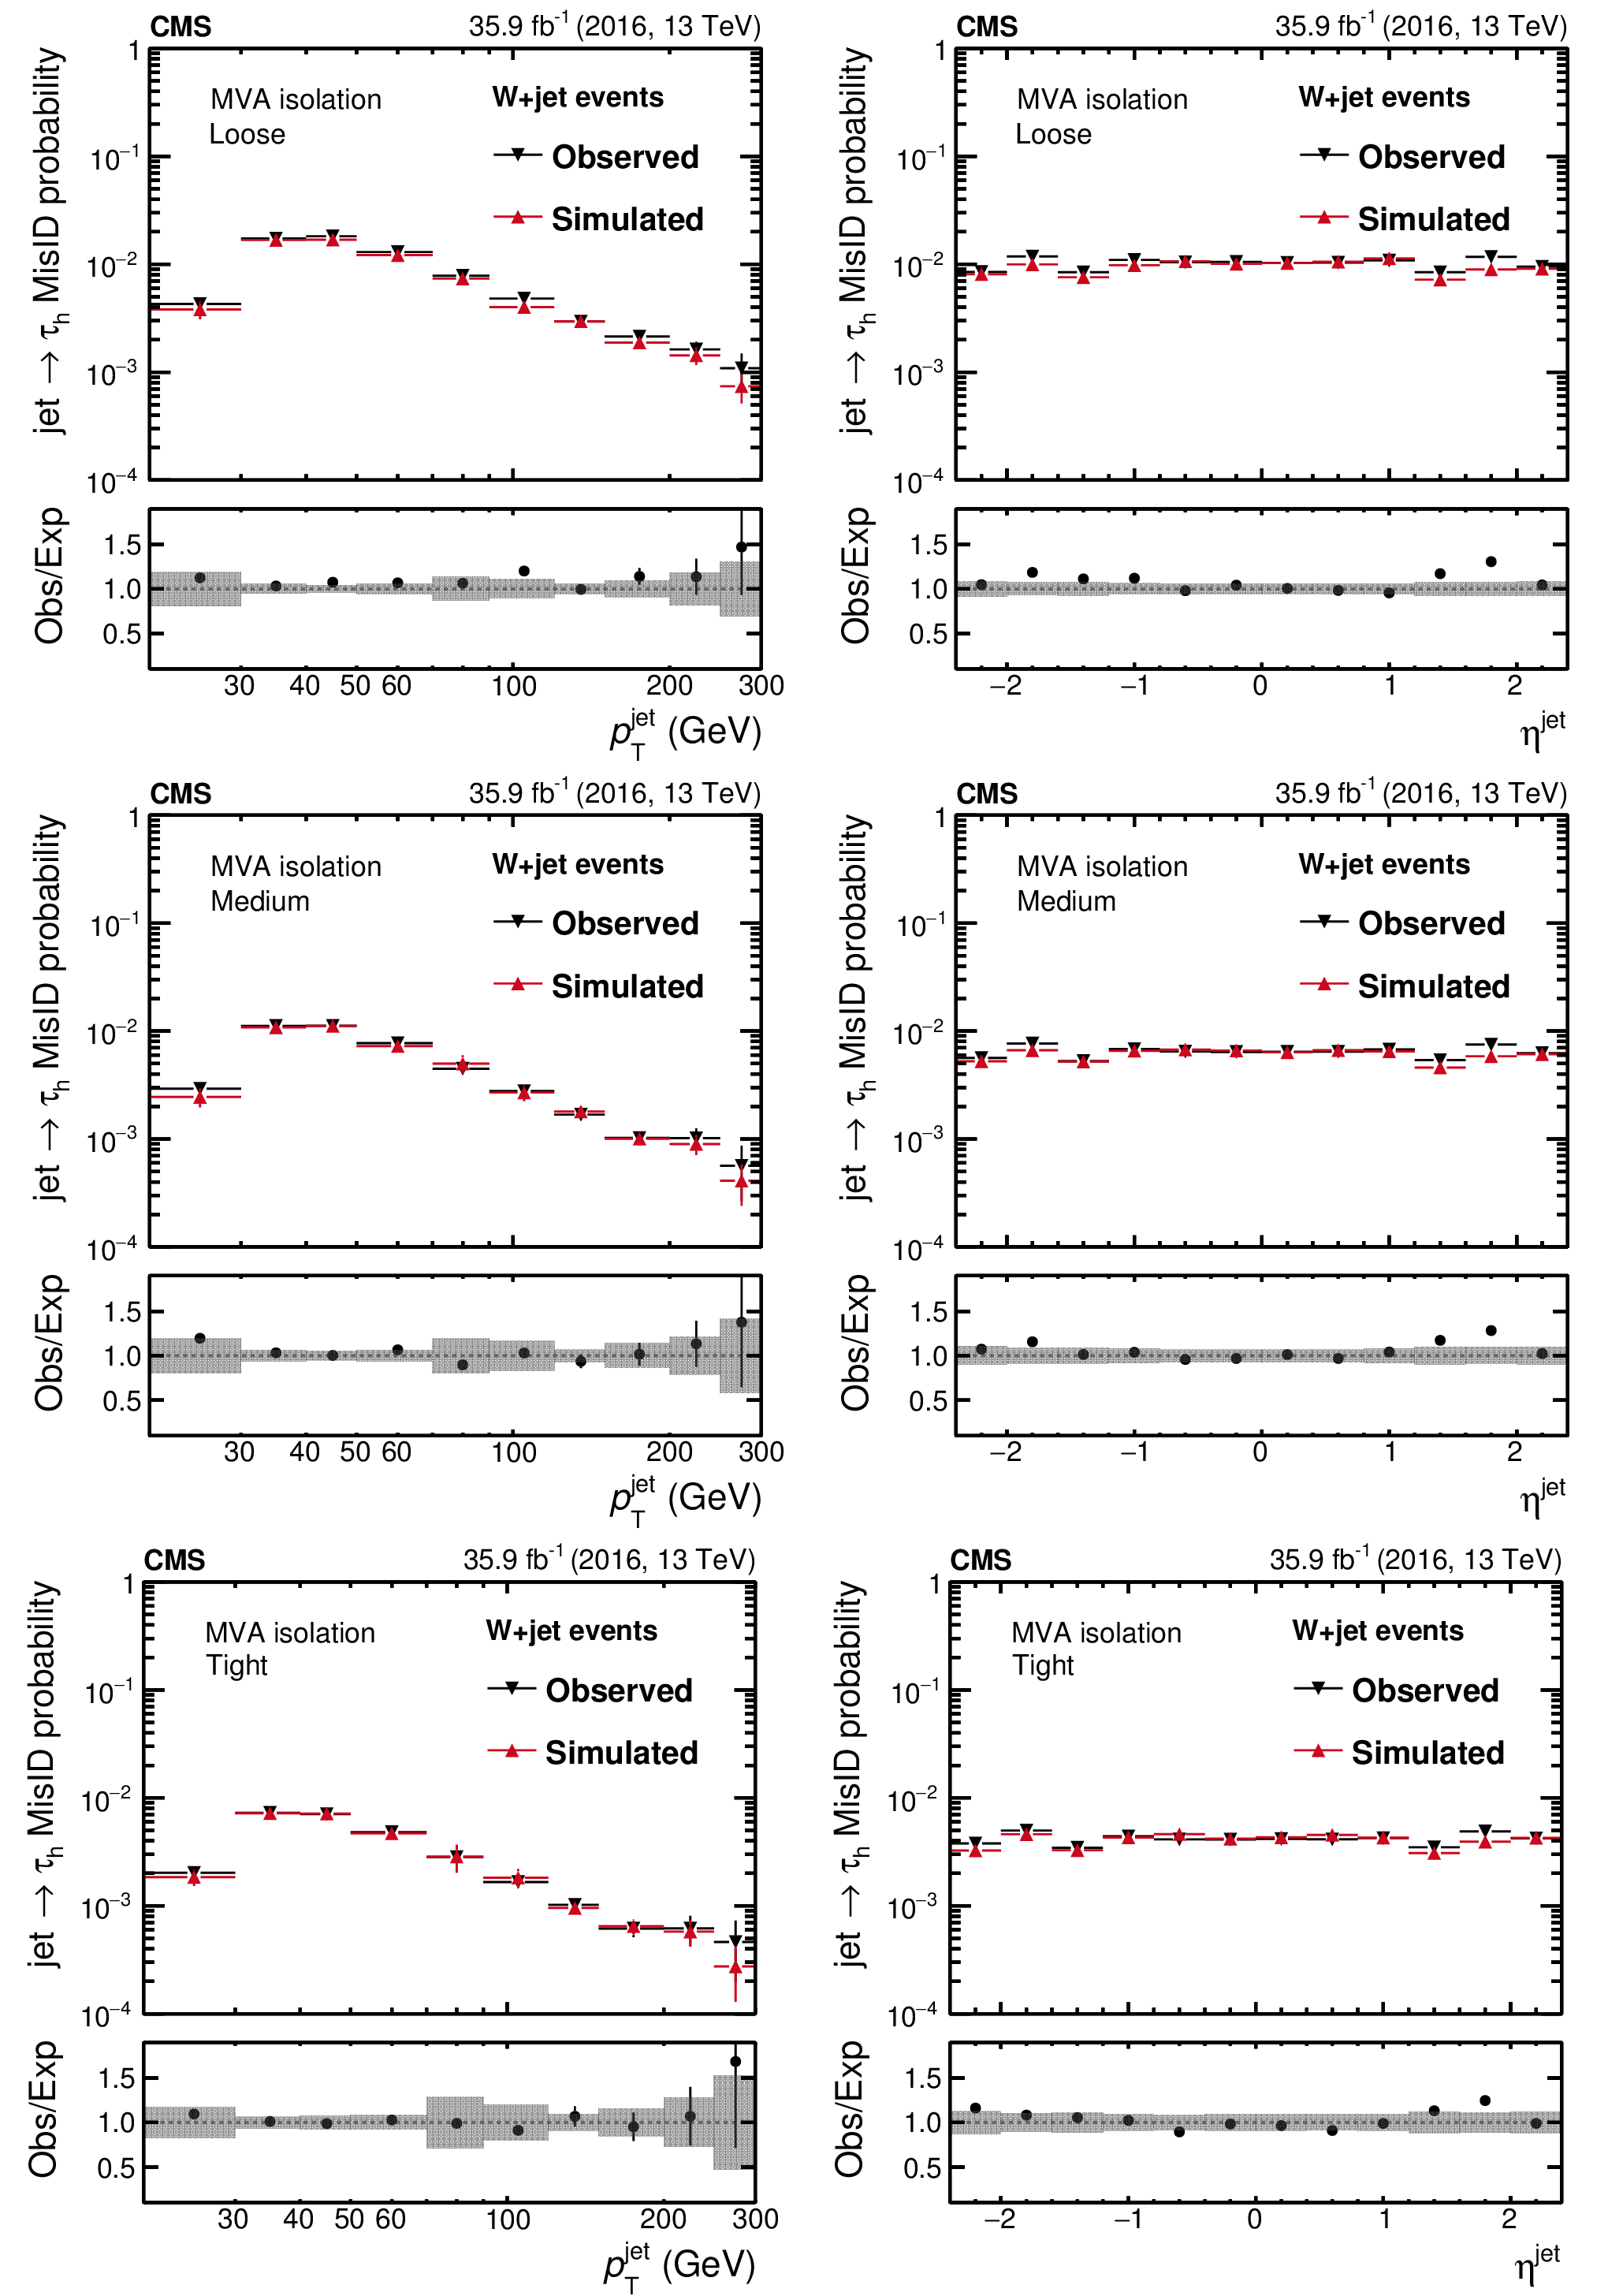
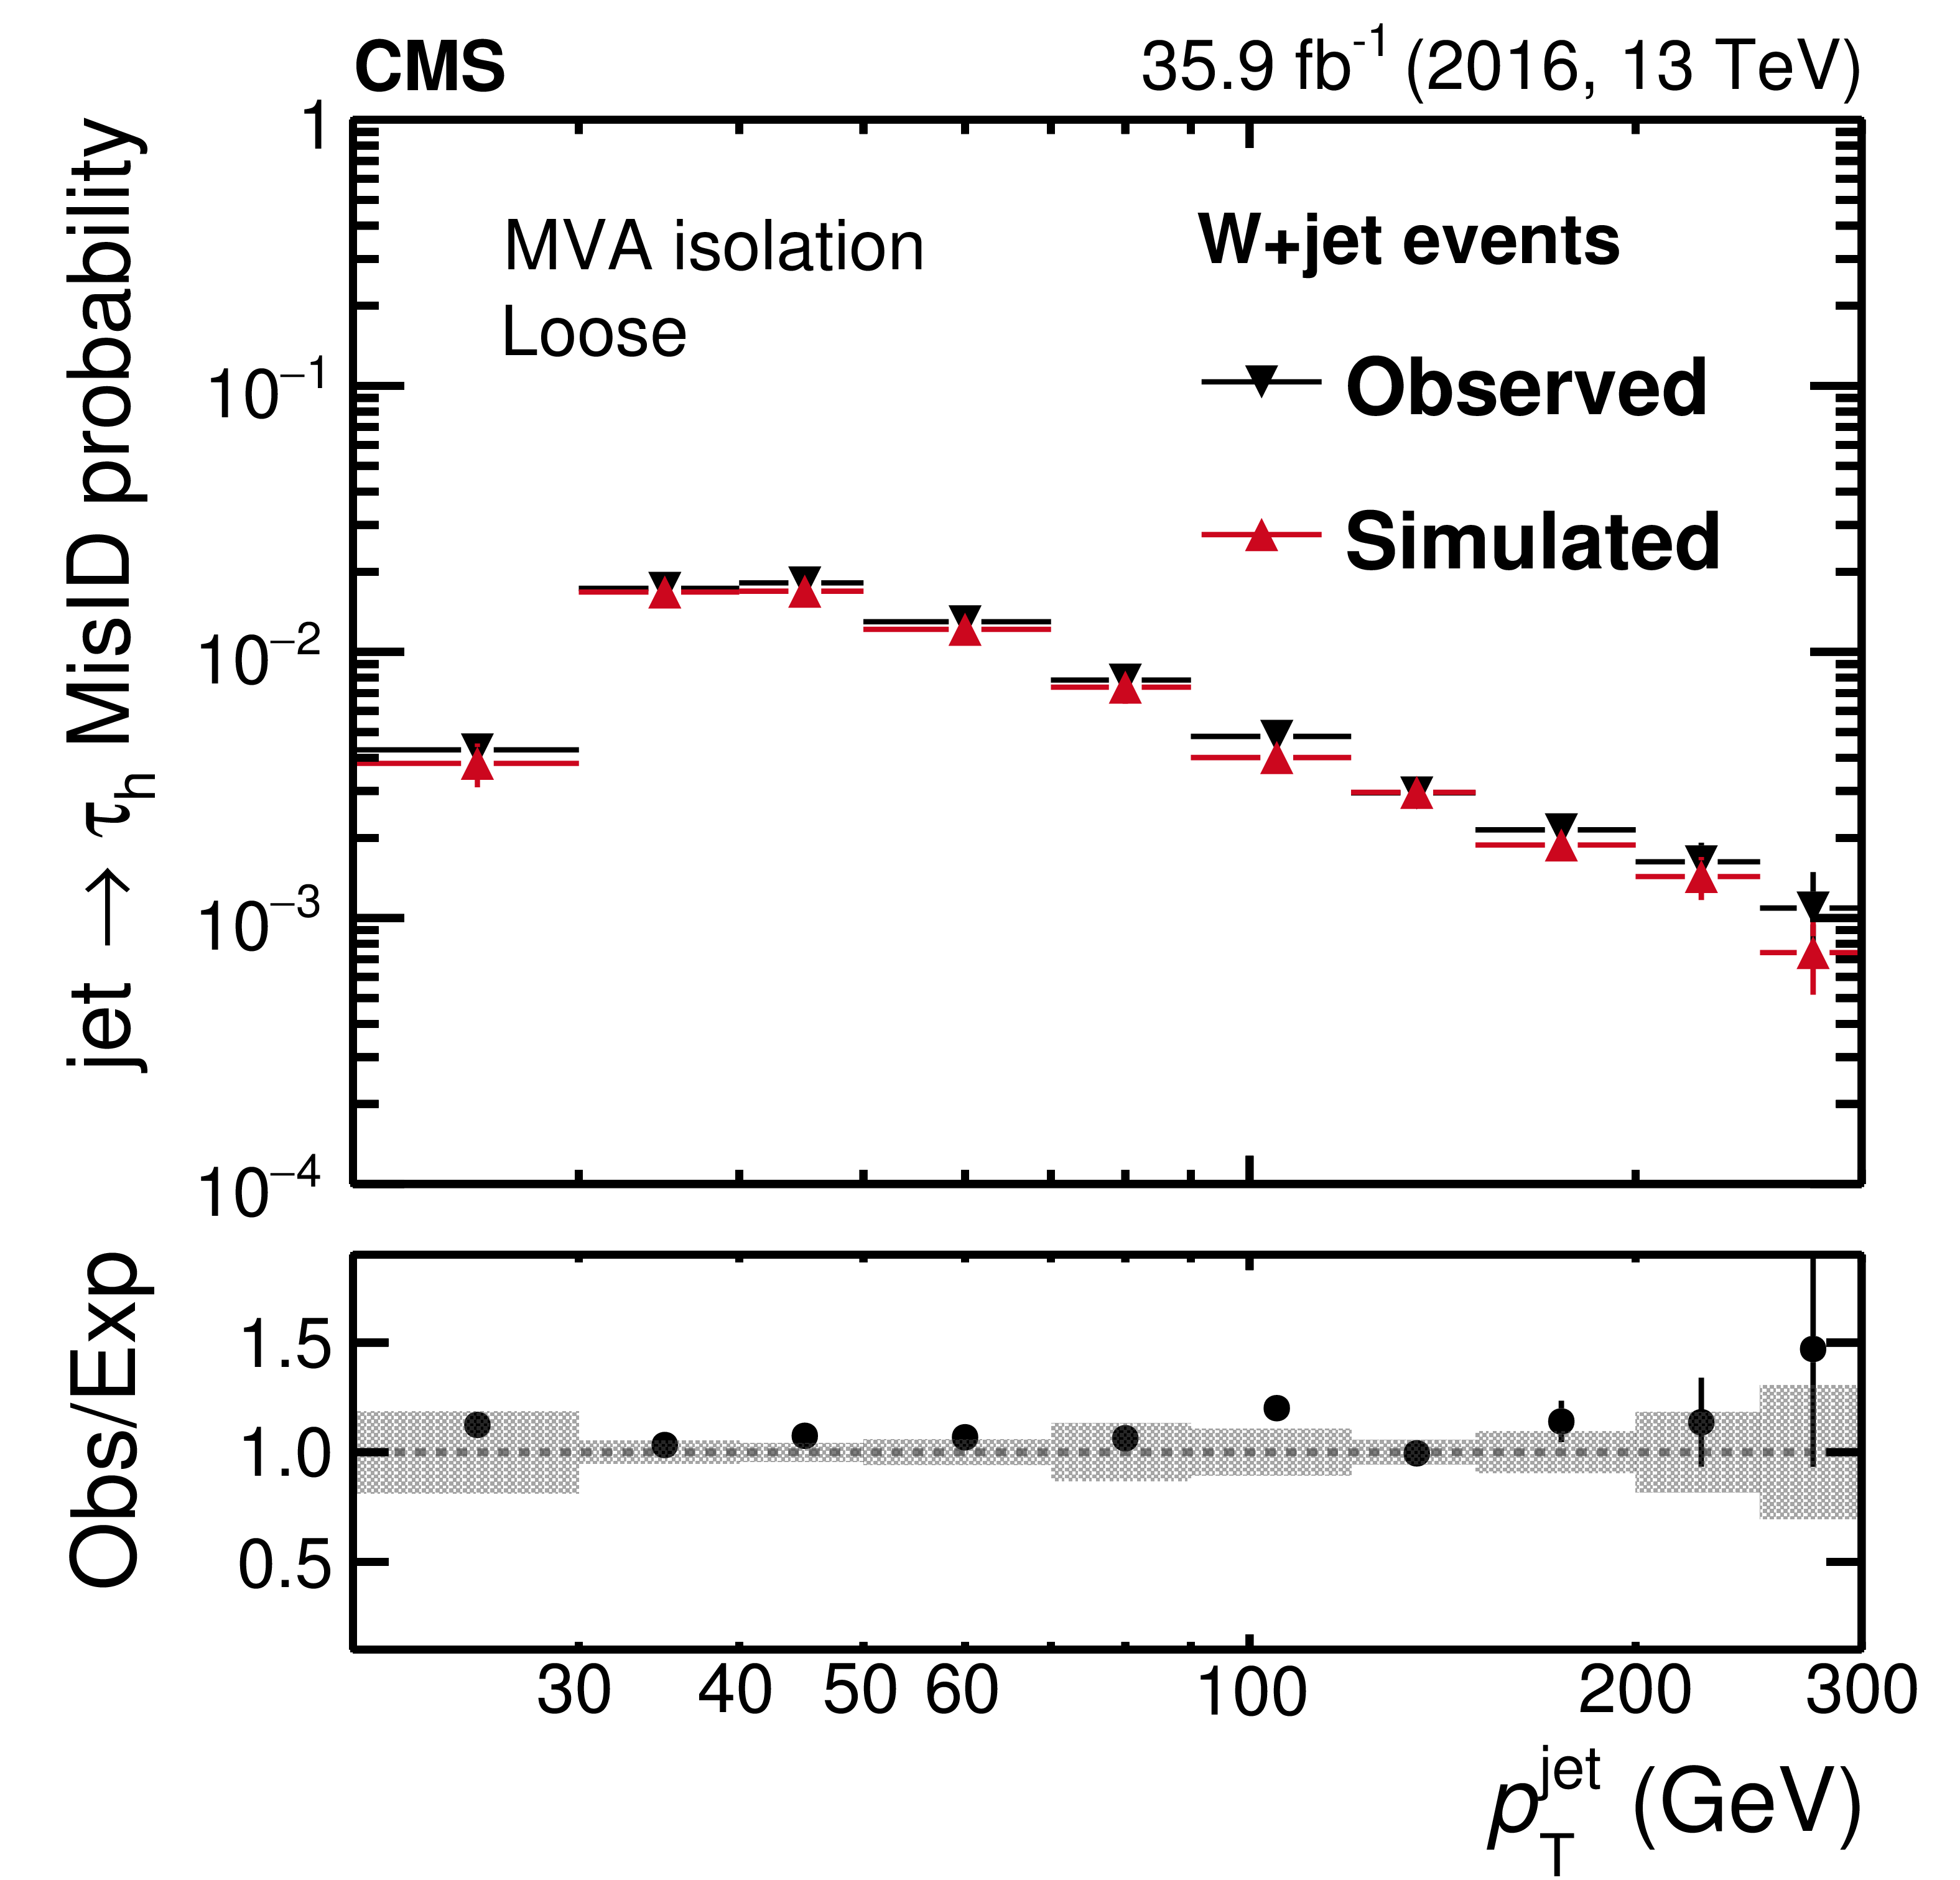
Probabilities for quark and gluon jets in W+jet events to pass the loose (uppermost), medium (middle), and tight (lowest) WPs of the MVA-based isolation discriminant as a function of $ {p_{\mathrm {T}}} ^\text {jet}$ (left) and $\eta ^\text {jet}$ (right). The misidentification probabilities in data are compared to expectations from simulation. The vertical bars in the simulated and observed misidentification probabilities include statistical uncertainties from the limited event count in both data and simulated samples, including the background subtraction. The shaded bands contain the systematic uncertainties related to background subtraction and the jet energy scale. |
png pdf |
Figure 12-a:
Probability for quark and gluon jets in W+jet events to pass the loose WP of the MVA-based isolation discriminant as a function of $ {p_{\mathrm {T}}} ^\text {jet}$. The misidentification probabilities in data are compared to expectations from simulation. The vertical bars in the simulated and observed misidentification probabilities include statistical uncertainties from the limited event count in both data and simulated samples, including the background subtraction. The shaded bands contain the systematic uncertainties related to background subtraction and the jet energy scale. |

png pdf |
Figure 12-b:
Probability for quark and gluon jets in W+jet events to pass the loose WP of the MVA-based isolation discriminant as a function of $\eta ^\text {jet}$. The misidentification probabilities in data are compared to expectations from simulation. The vertical bars in the simulated and observed misidentification probabilities include statistical uncertainties from the limited event count in both data and simulated samples, including the background subtraction. The shaded bands contain the systematic uncertainties related to background subtraction and the jet energy scale. |
png pdf |
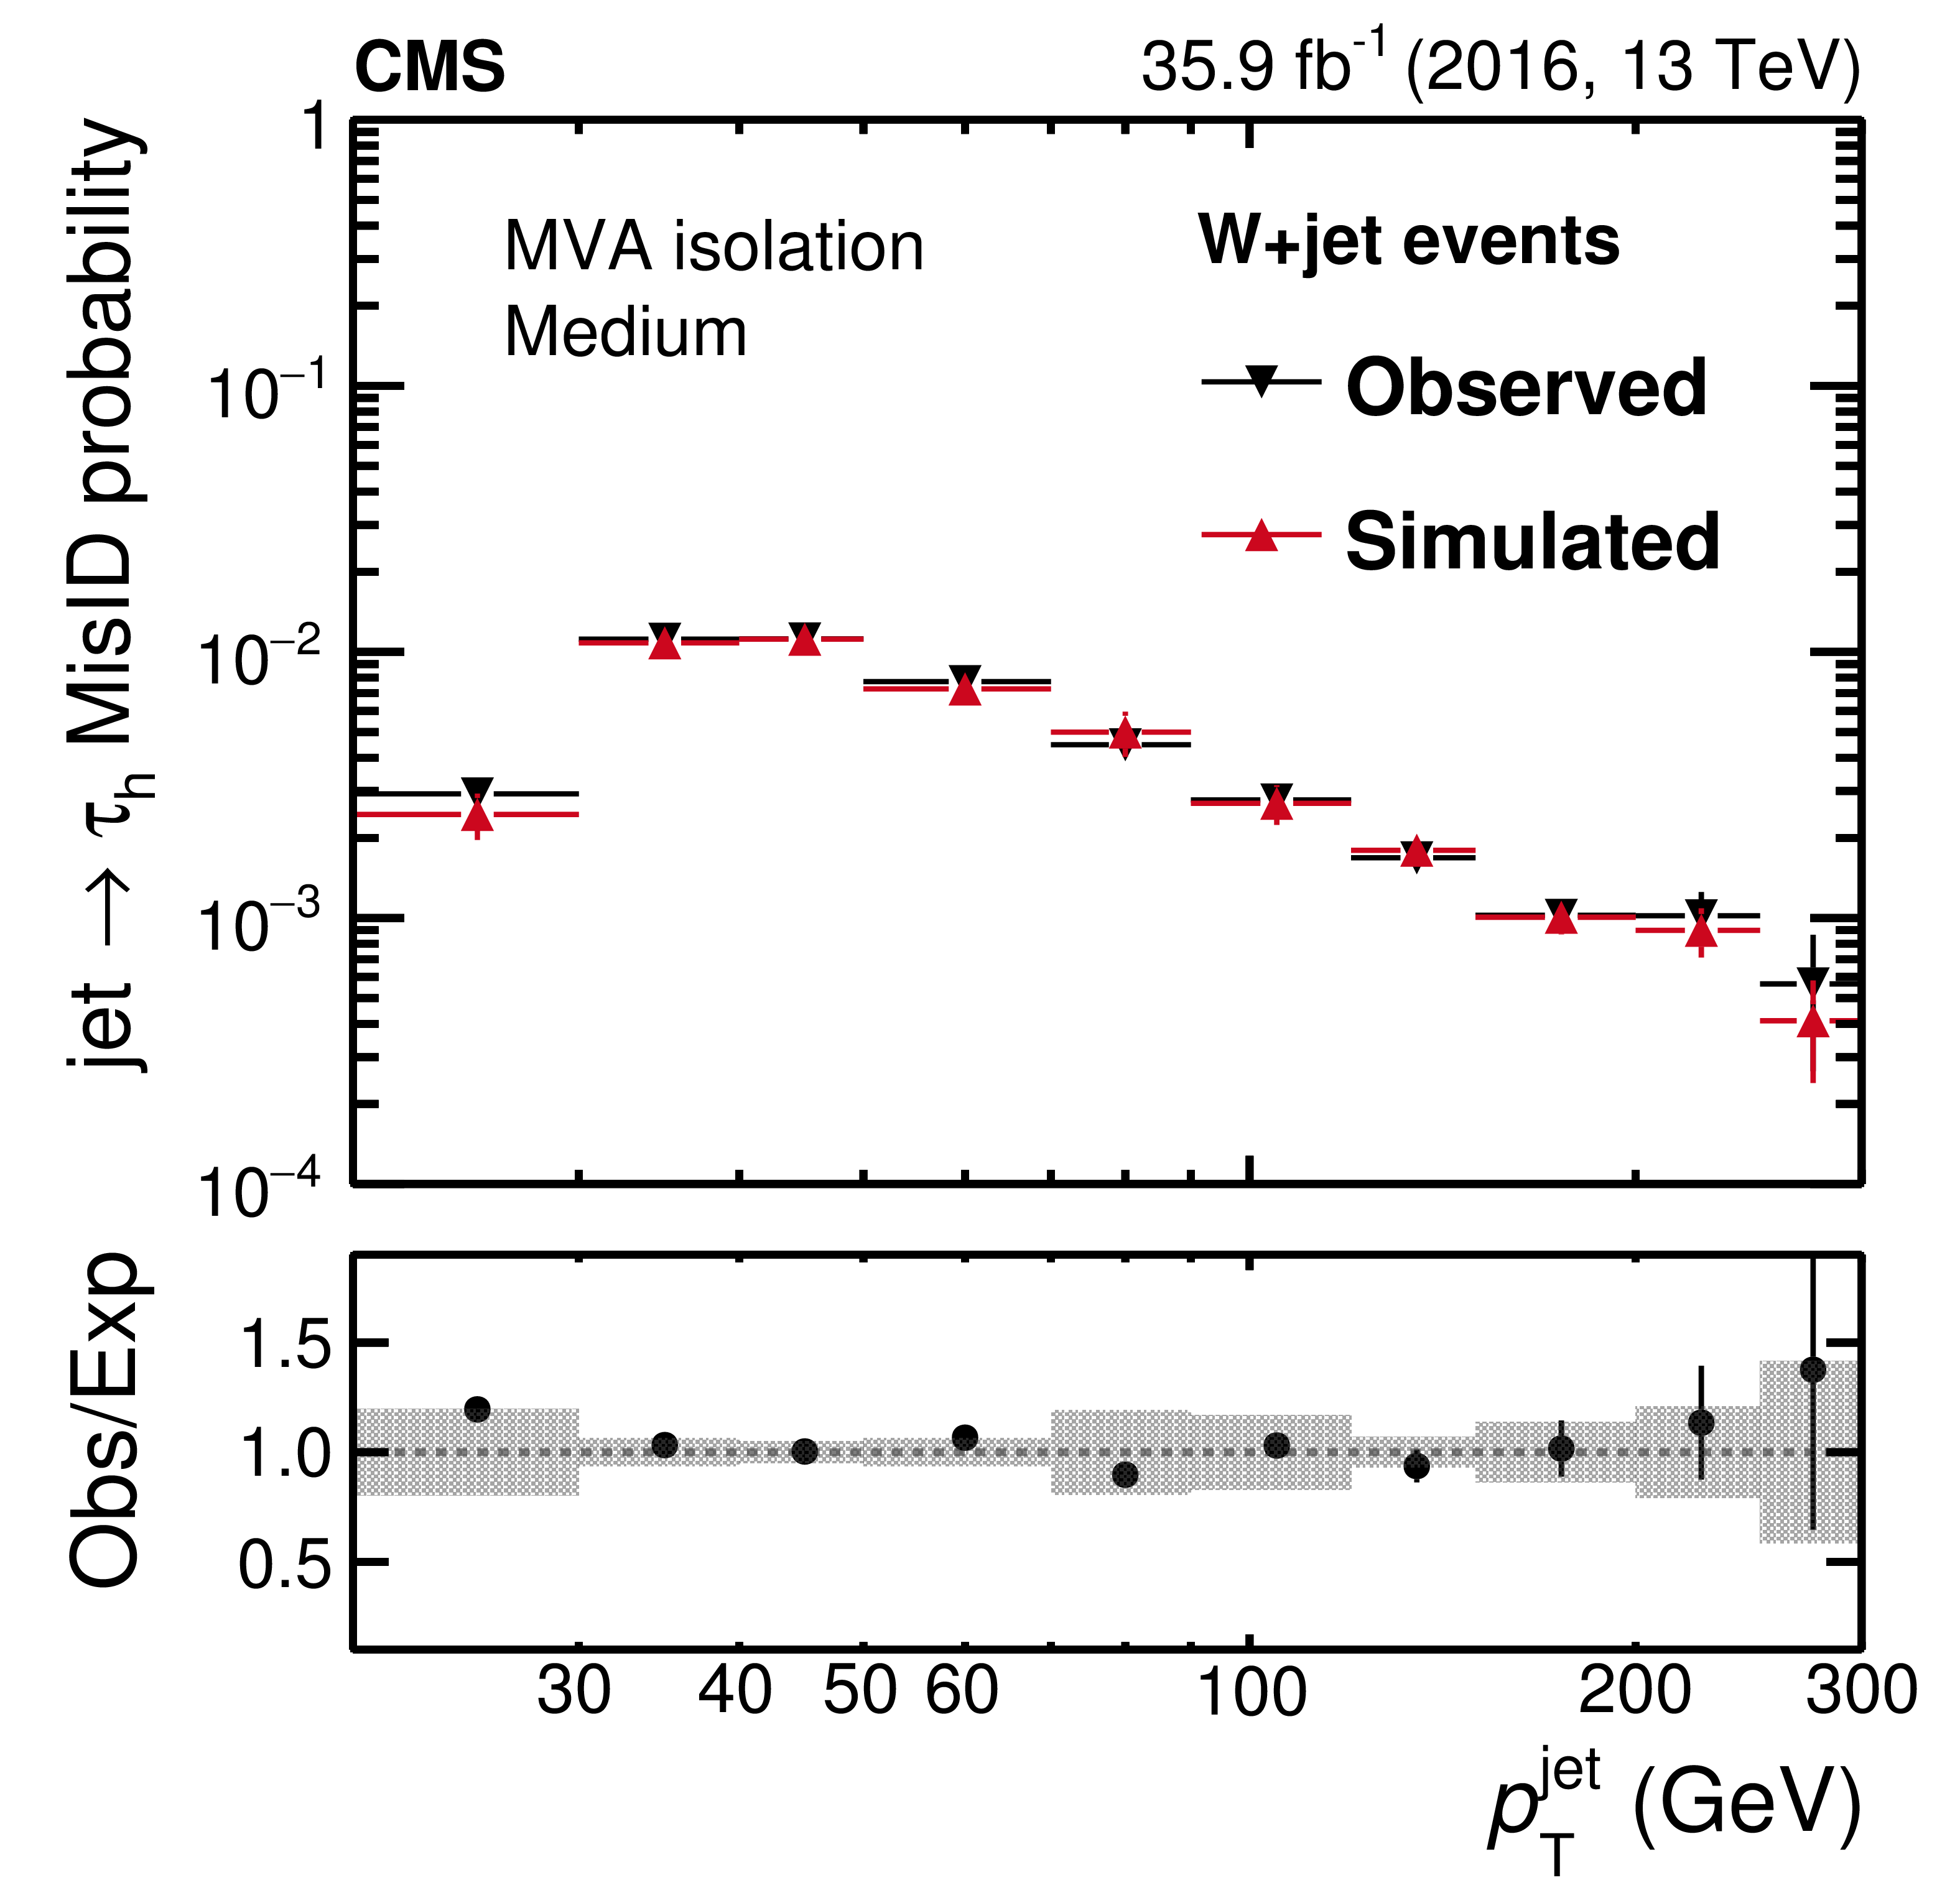
Figure 12-c:
Probability for quark and gluon jets in W+jet events to pass the medium WP of the MVA-based isolation discriminant as a function of $ {p_{\mathrm {T}}} ^\text {jet}$. The misidentification probabilities in data are compared to expectations from simulation. The vertical bars in the simulated and observed misidentification probabilities include statistical uncertainties from the limited event count in both data and simulated samples, including the background subtraction. The shaded bands contain the systematic uncertainties related to background subtraction and the jet energy scale. |

png pdf |
Figure 12-d:
Probability for quark and gluon jets in W+jet events to pass the medium WP of the MVA-based isolation discriminant as a function of $\eta ^\text {jet}$. The misidentification probabilities in data are compared to expectations from simulation. The vertical bars in the simulated and observed misidentification probabilities include statistical uncertainties from the limited event count in both data and simulated samples, including the background subtraction. The shaded bands contain the systematic uncertainties related to background subtraction and the jet energy scale. |
png pdf |
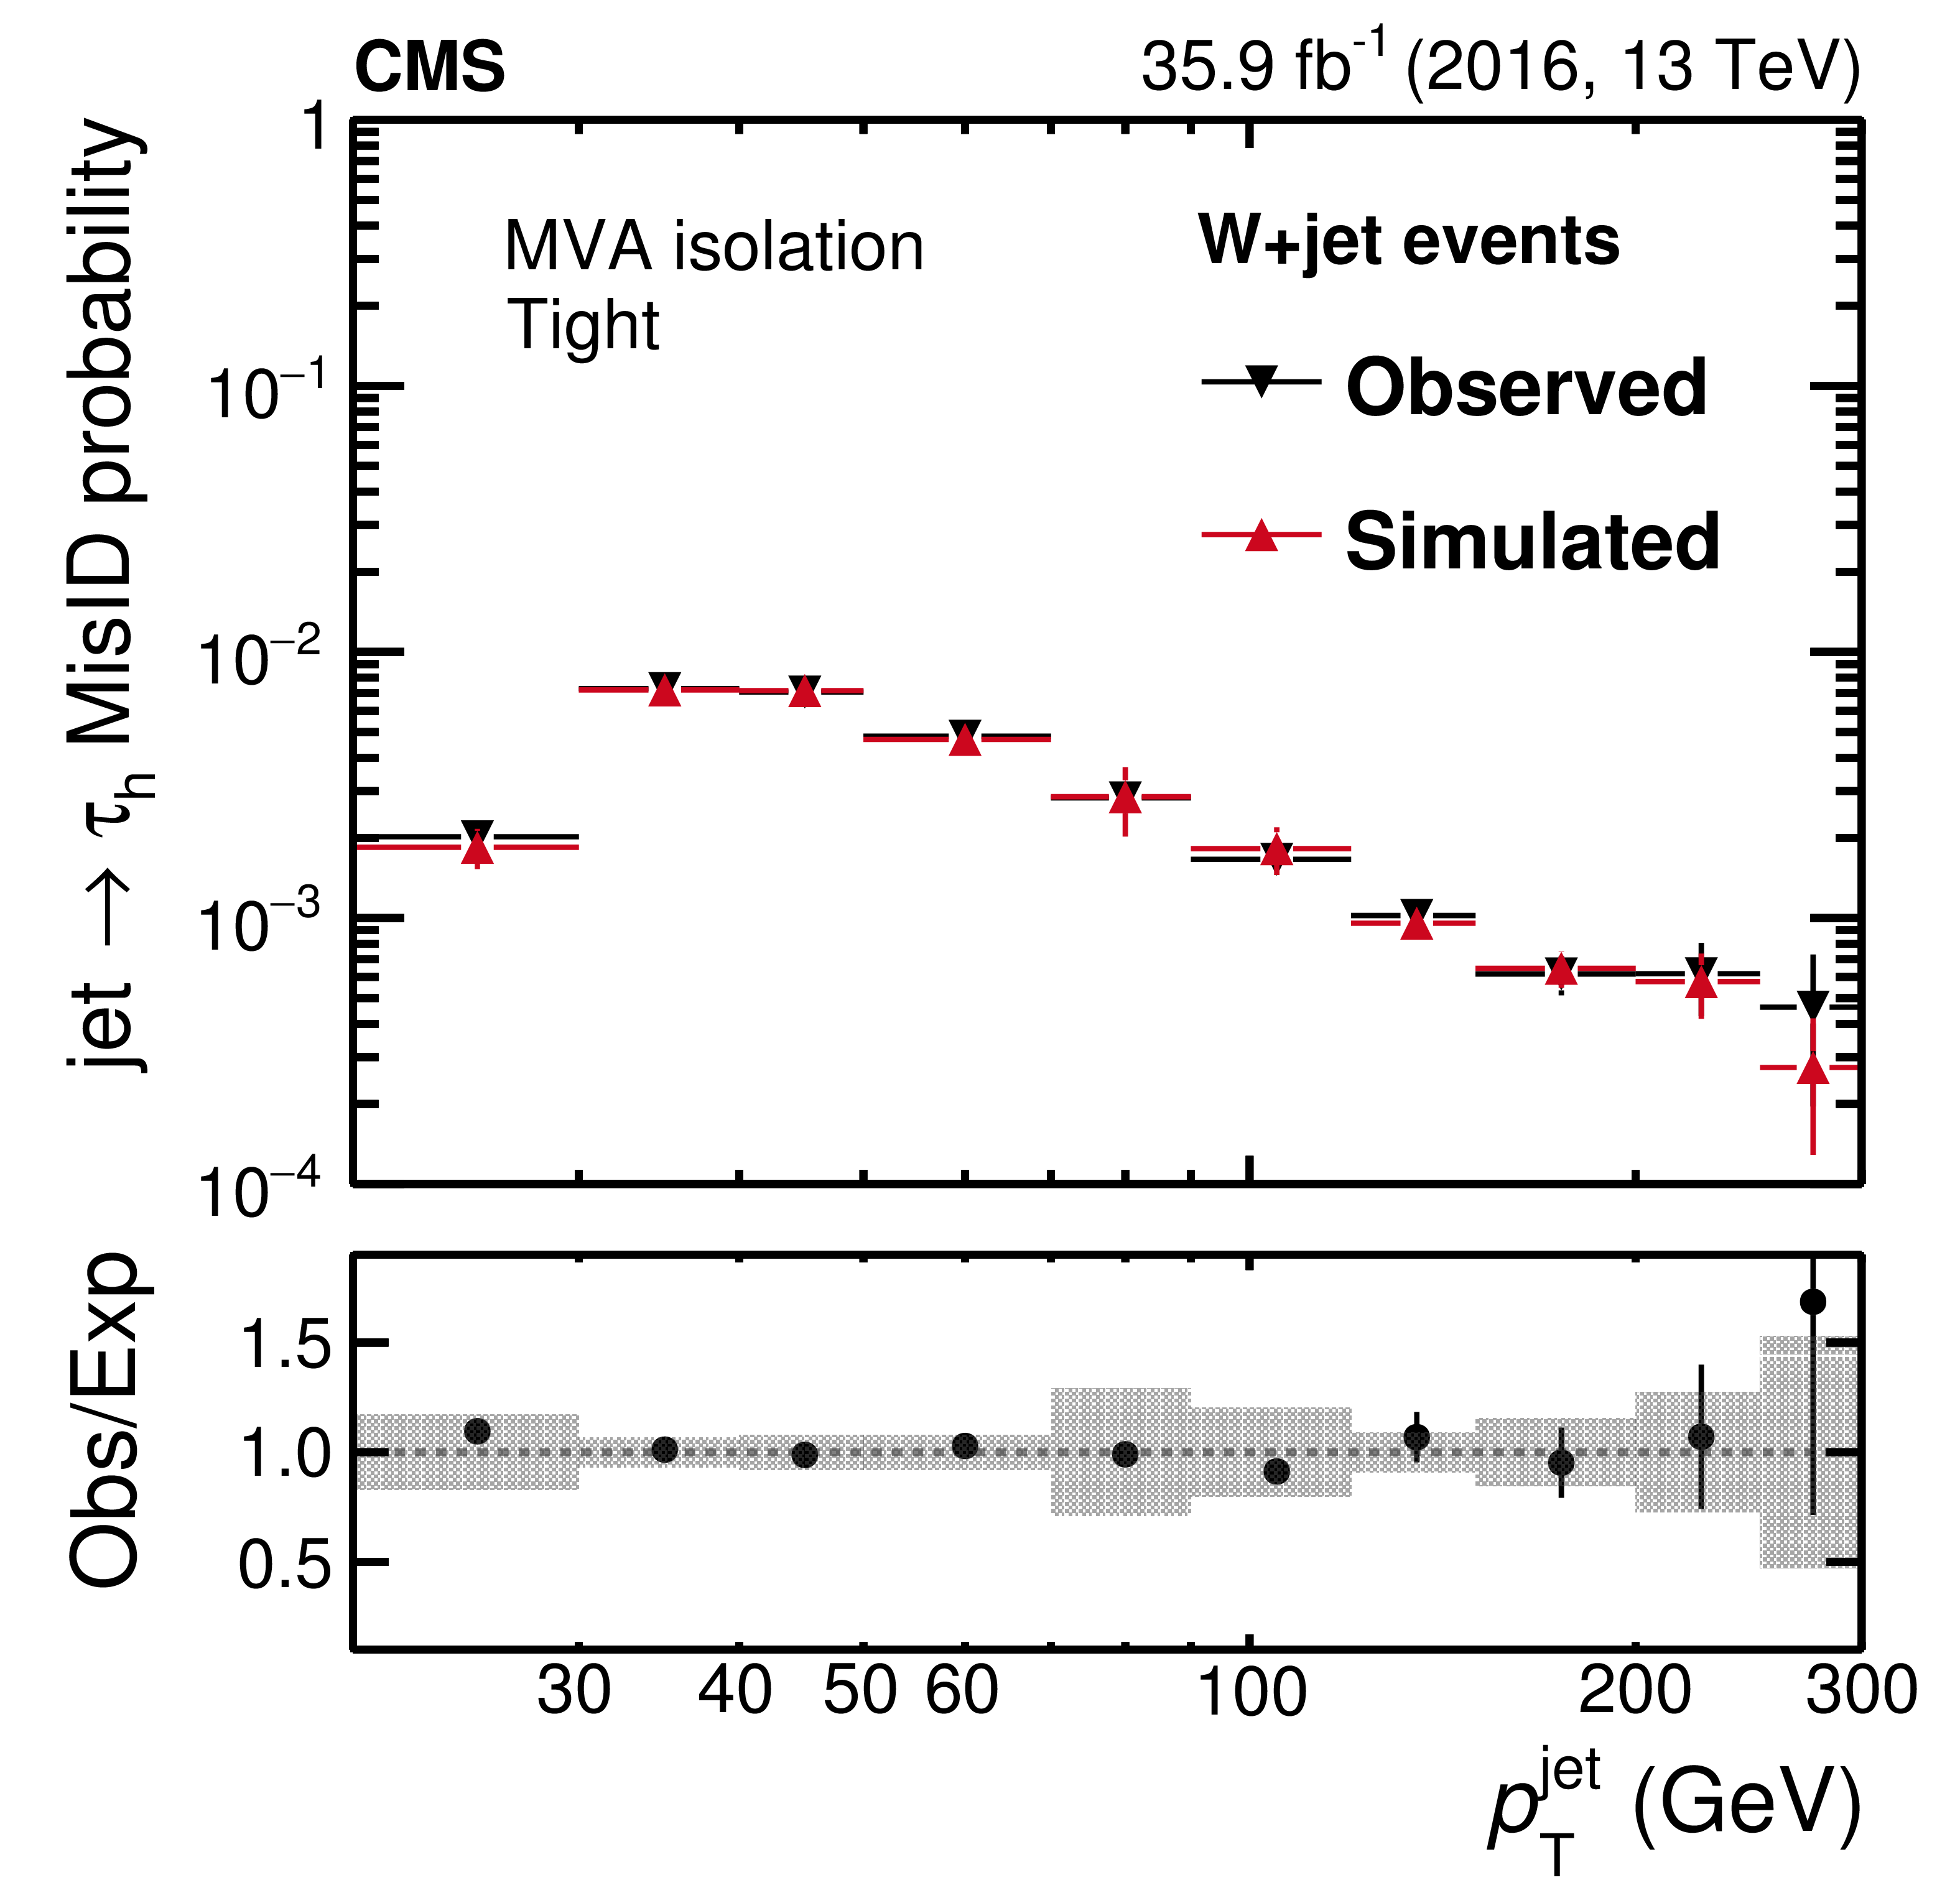
Figure 12-e:
Probability for quark and gluon jets in W+jet events to pass the tight WP of the MVA-based isolation discriminant as a function of $ {p_{\mathrm {T}}} ^\text {jet}$. The misidentification probabilities in data are compared to expectations from simulation. The vertical bars in the simulated and observed misidentification probabilities include statistical uncertainties from the limited event count in both data and simulated samples, including the background subtraction. The shaded bands contain the systematic uncertainties related to background subtraction and the jet energy scale. |

png pdf |
Figure 12-f:
Probability for quark and gluon jets in W+jet events to pass the ltight WP of the MVA-based isolation discriminant as a function of $\eta ^\text {jet}$. The misidentification probabilities in data are compared to expectations from simulation. The vertical bars in the simulated and observed misidentification probabilities include statistical uncertainties from the limited event count in both data and simulated samples, including the background subtraction. The shaded bands contain the systematic uncertainties related to background subtraction and the jet energy scale. |
png pdf |
Figure 13:
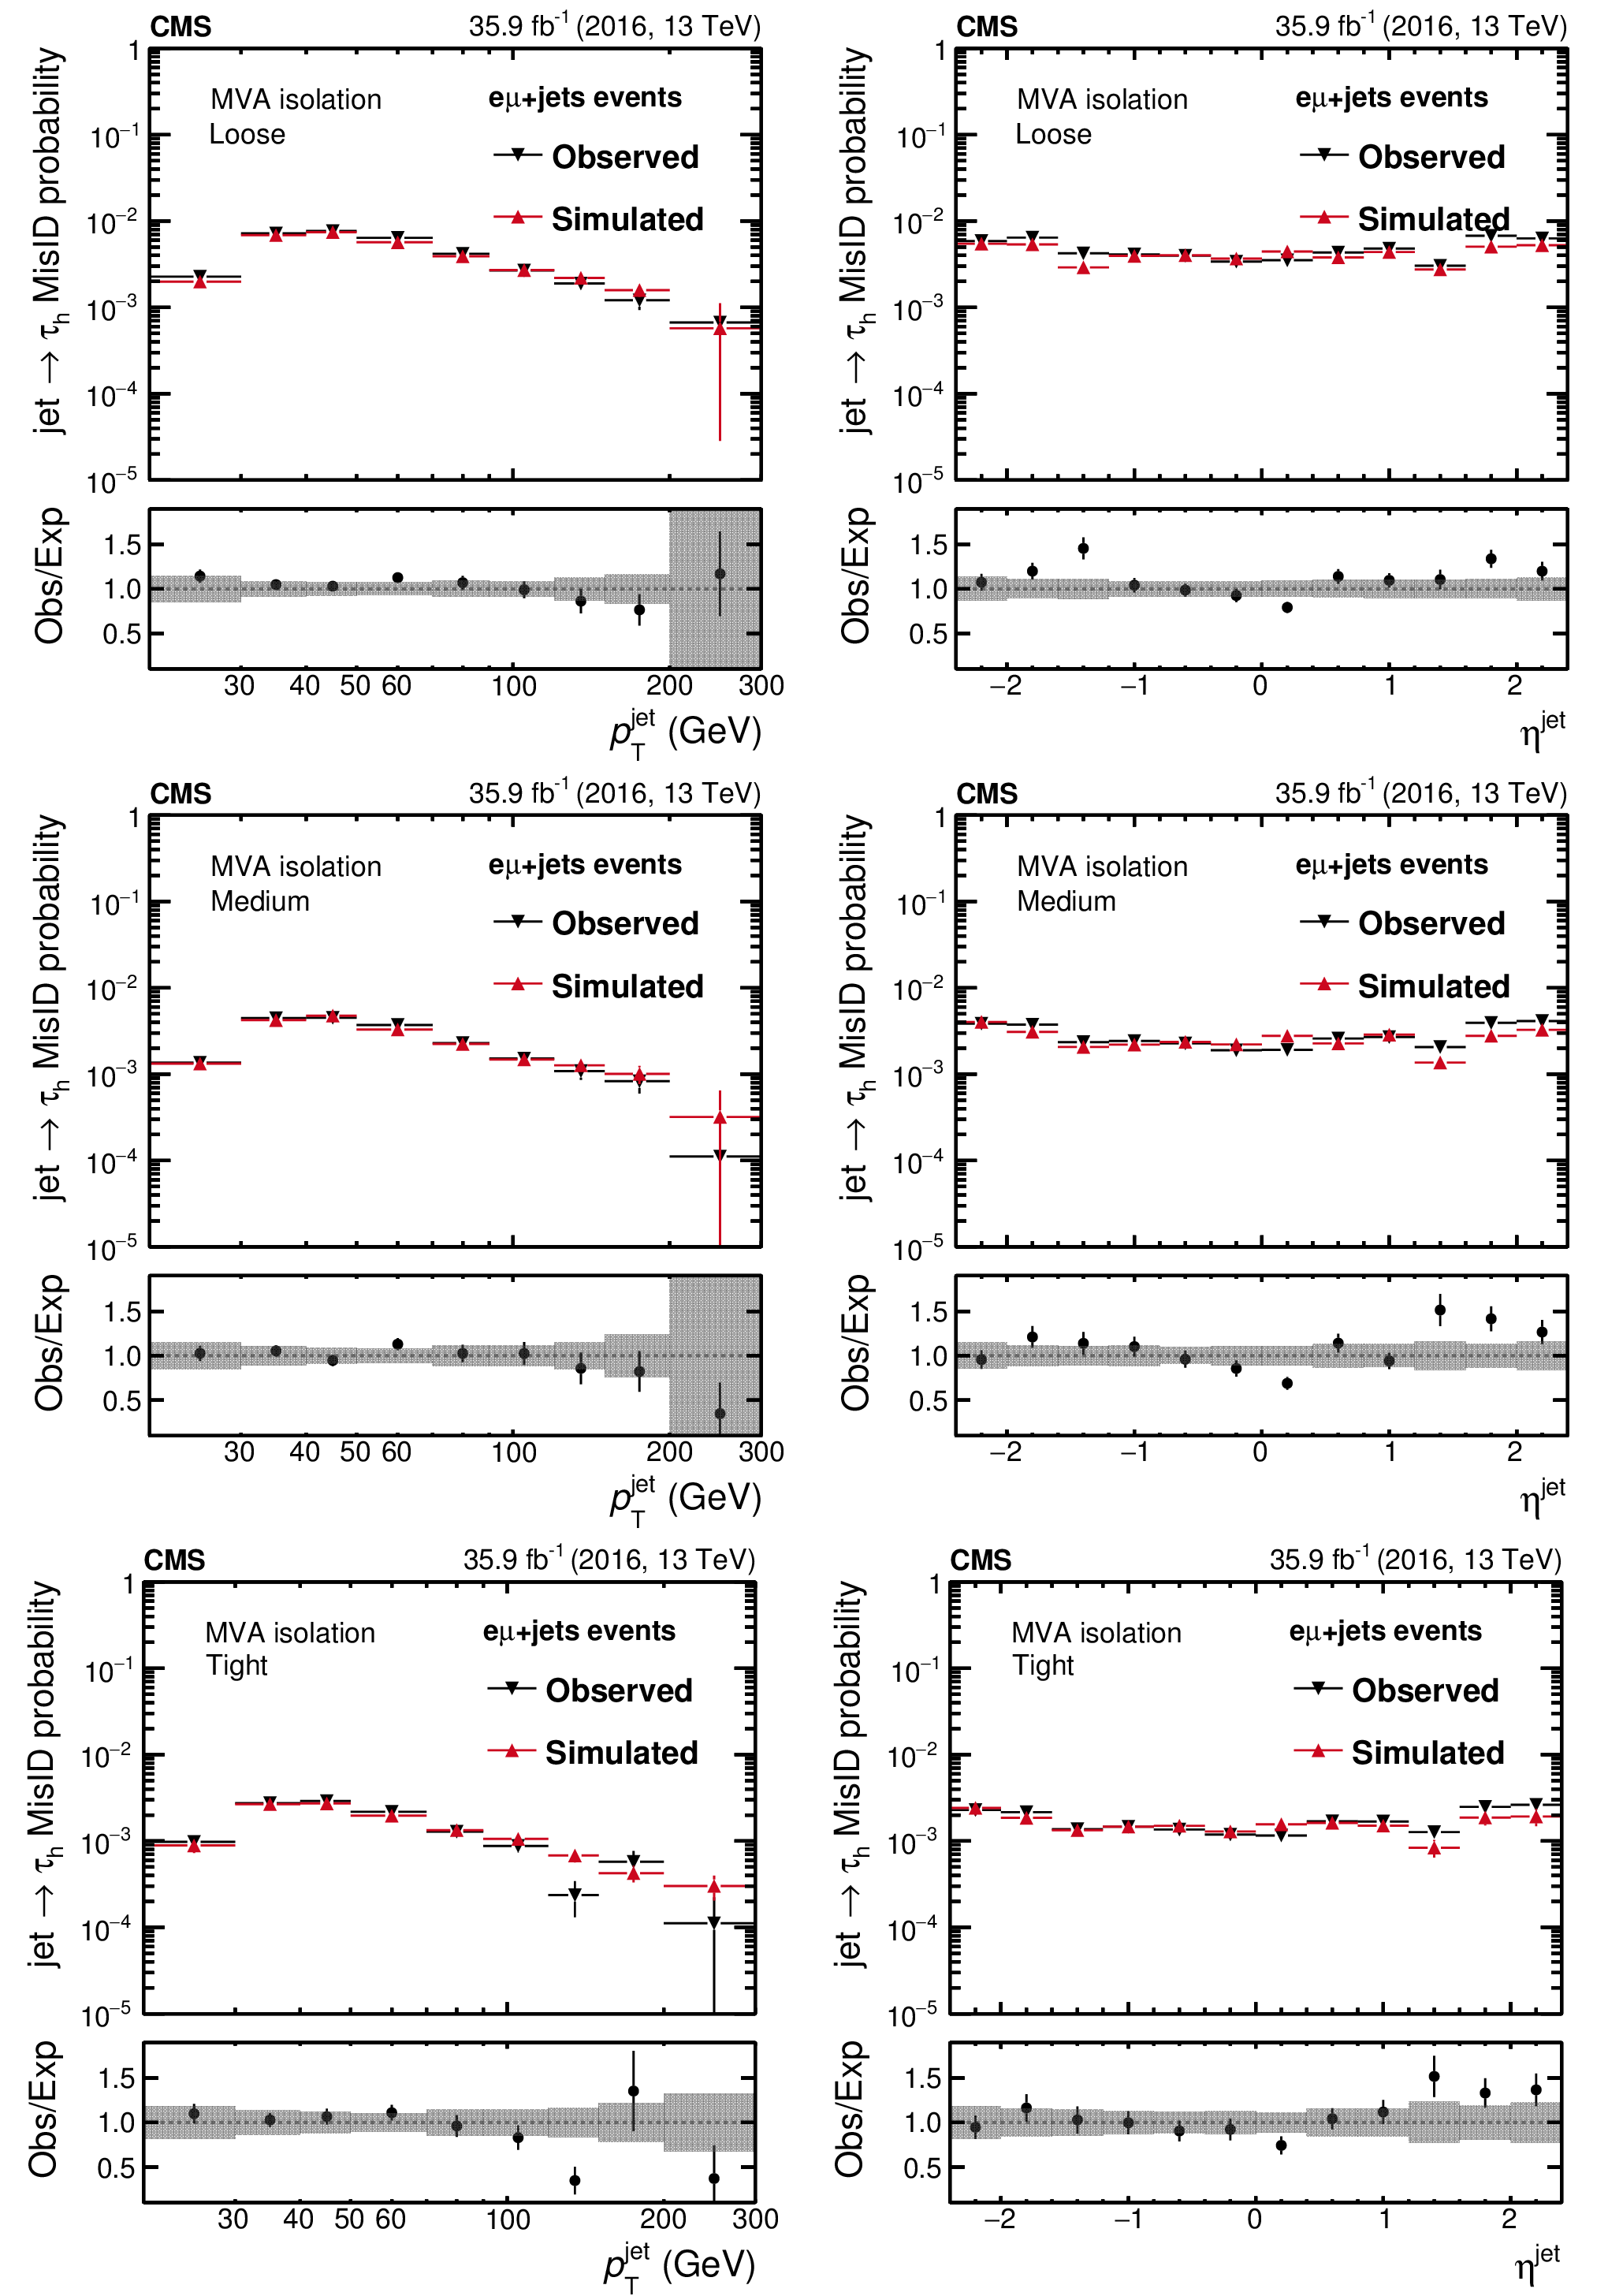
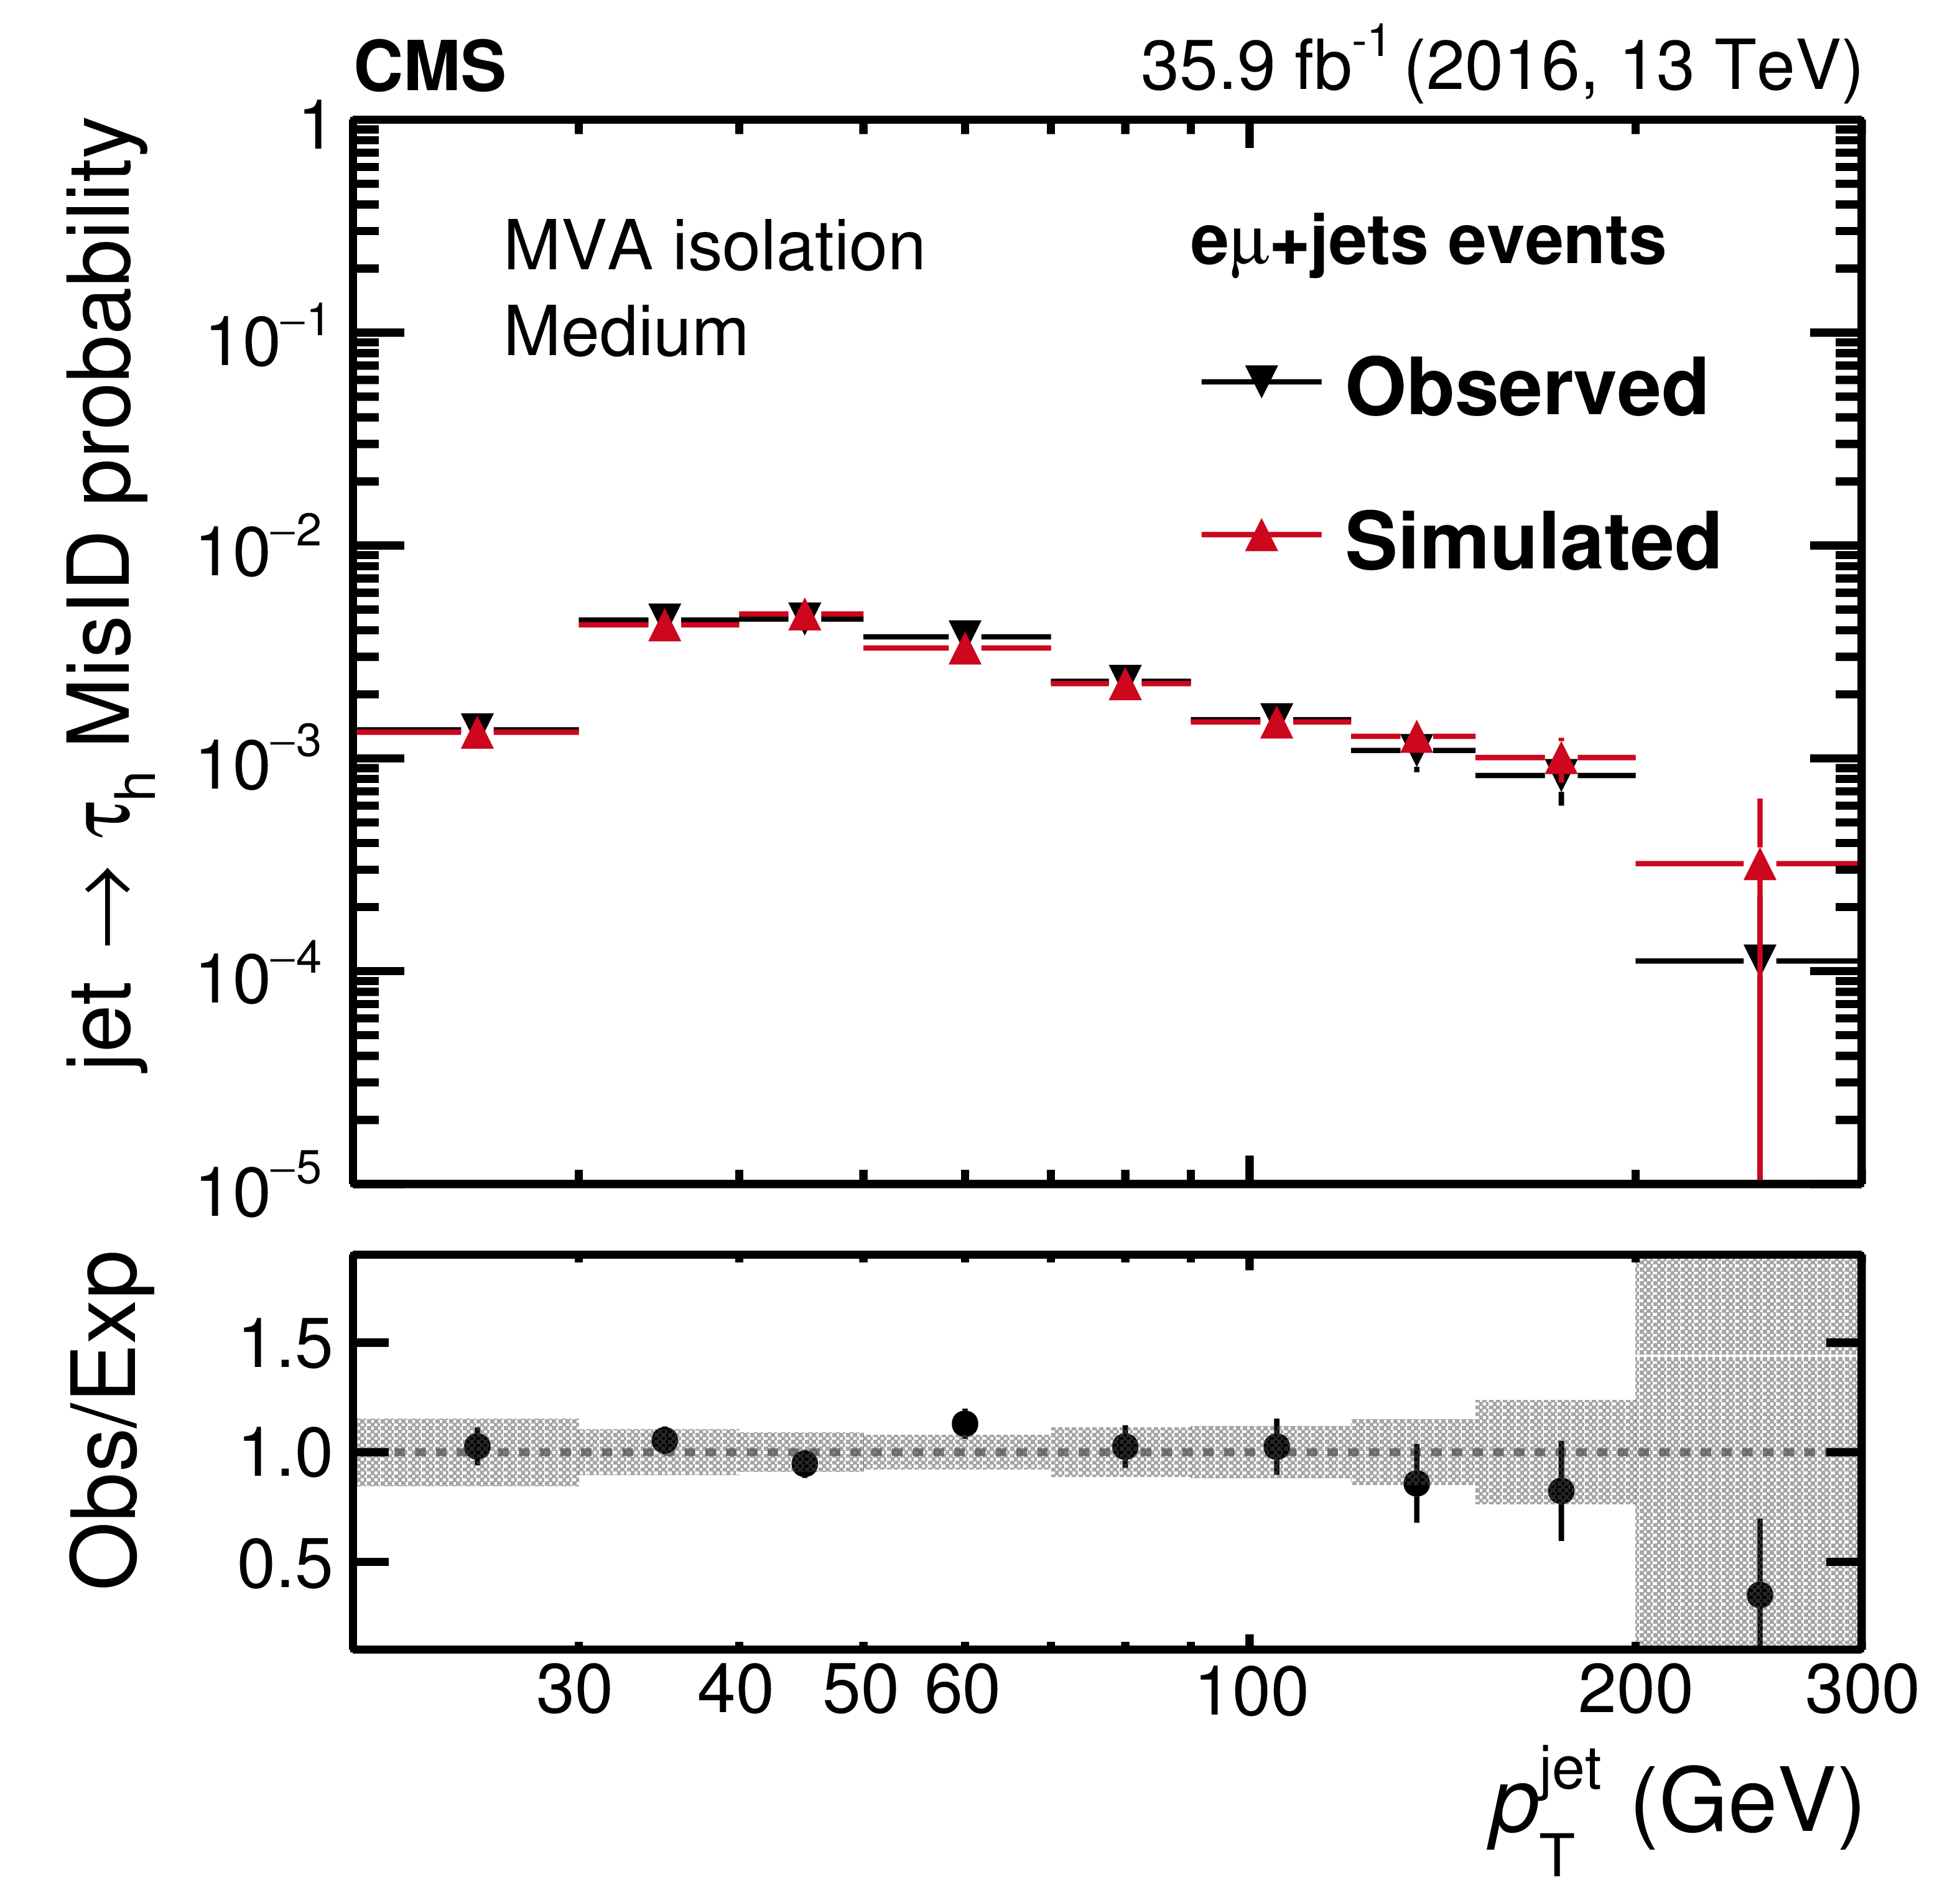
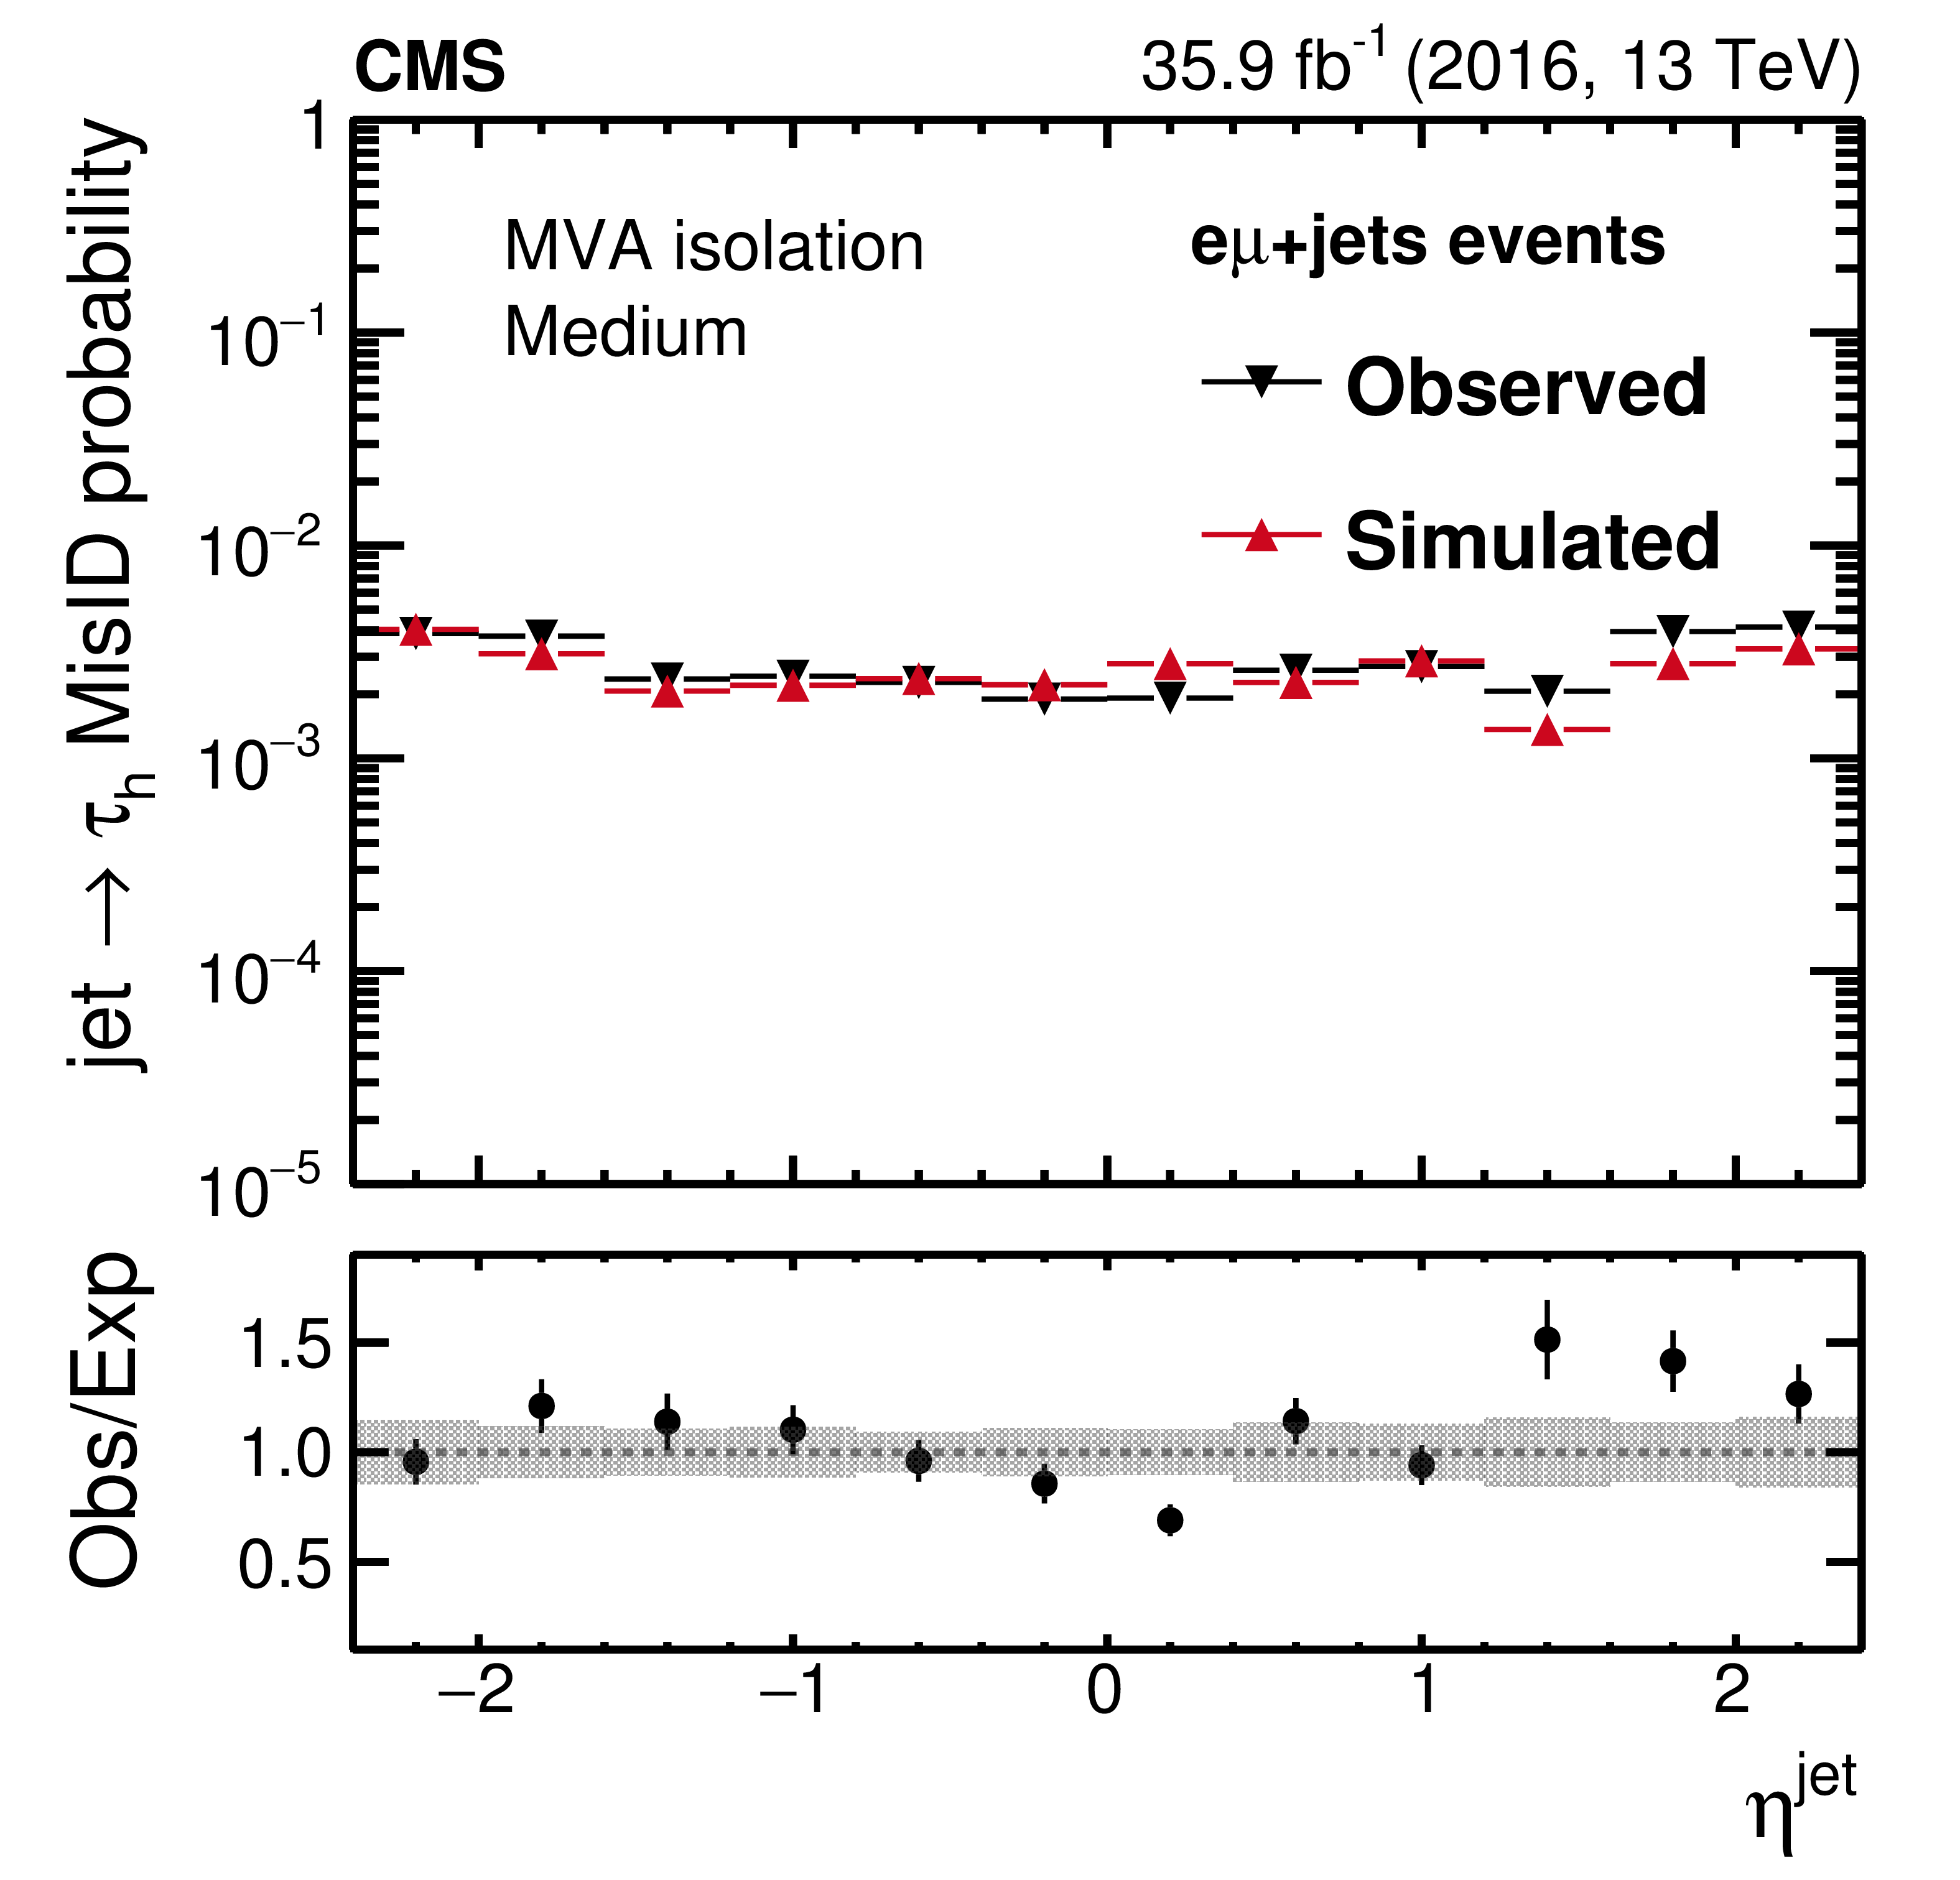
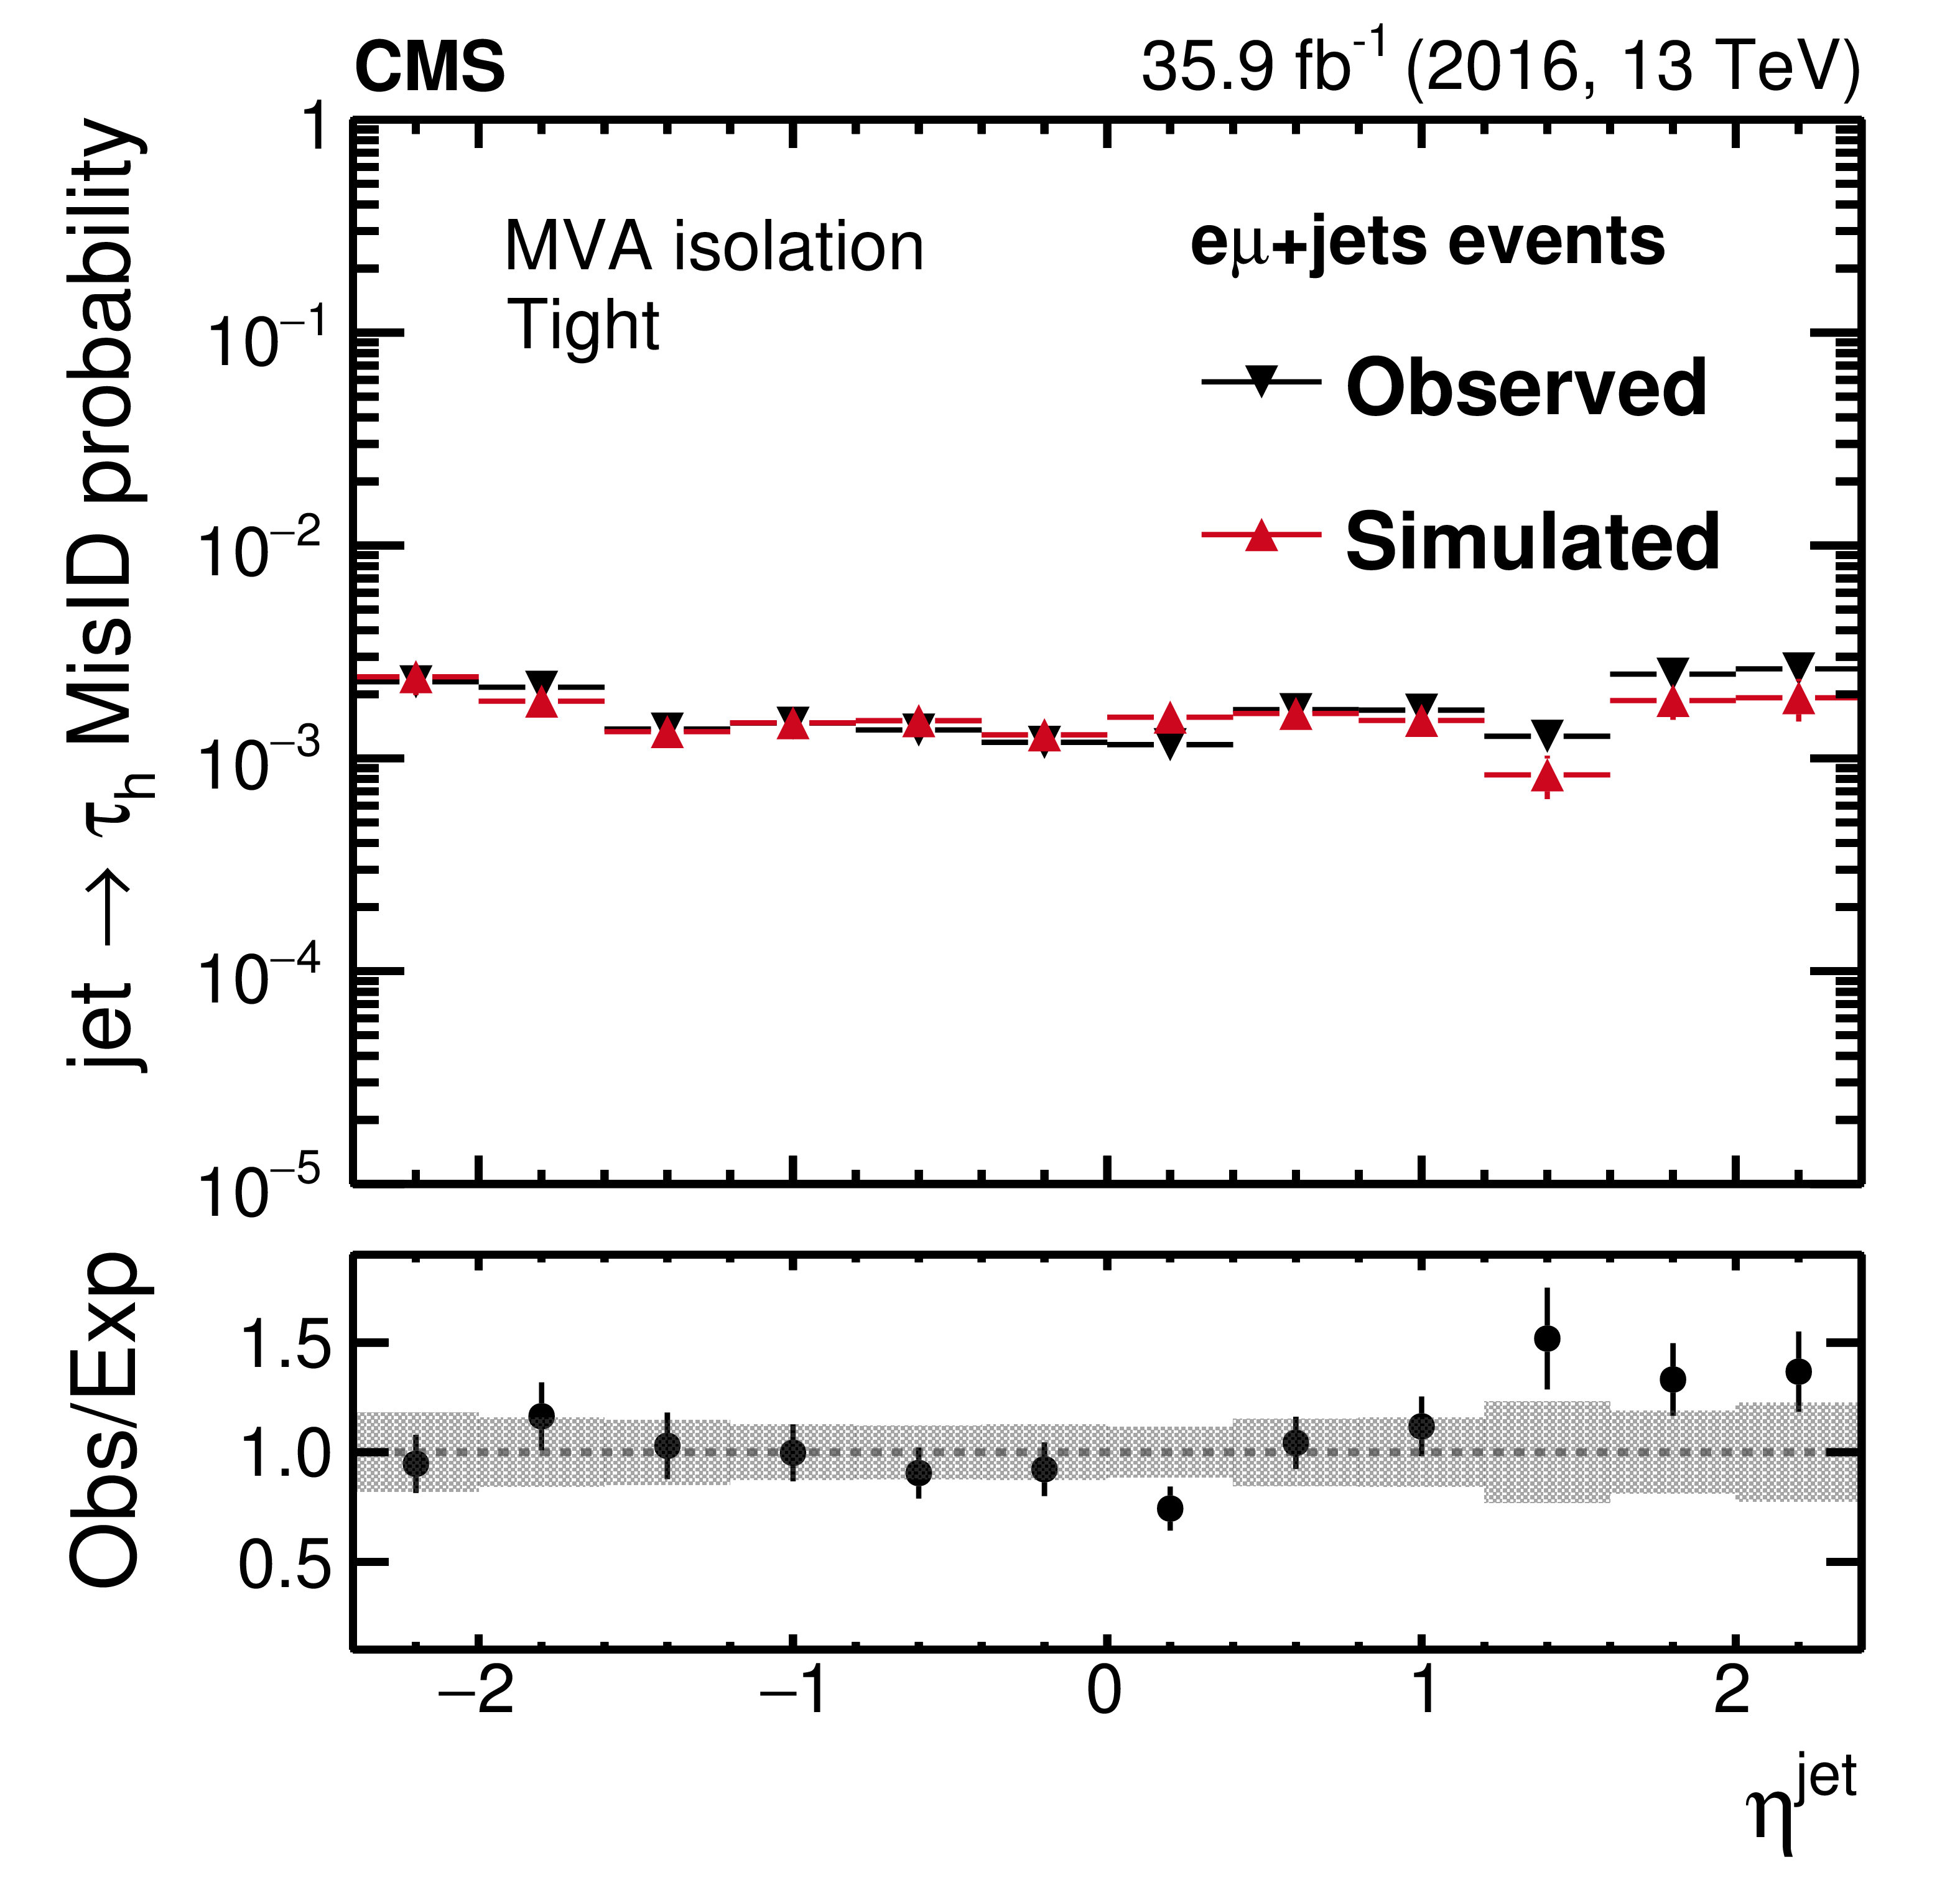
Probabilities for quark and gluon jets in $ {\mathrm {e}} {{\mu}}$+jets events to pass the loose (uppermost), medium (middle), and tight (lowest) WPs of the MVA-based isolation discriminant as a function of $ {p_{\mathrm {T}}} ^\text {jet}$ (left) and $\eta ^\text {jet}$ (right). The misidentification probabilities in data are compared to expectations from simulation. The vertical bars in the simulated and observed misidentification probabilities include statistical uncertainties from the limited event count in both data and simulated samples, including the background subtraction. The shaded bands contain the systematic uncertainties related to background subtraction and the jet energy scale. |

png pdf |
Figure 13-a:
Probability for quark and gluon jets in $ {\mathrm {e}} {{\mu}}$+jets events to pass the loose WP of the MVA-based isolation discriminant as a function of $ {p_{\mathrm {T}}} ^\text {jet}$. The misidentification probabilities in data are compared to expectations from simulation. The vertical bars in the simulated and observed misidentification probabilities include statistical uncertainties from the limited event count in both data and simulated samples, including the background subtraction. The shaded bands contain the systematic uncertainties related to background subtraction and the jet energy scale. |

png pdf |
Figure 13-b:
Probability for quark and gluon jets in $ {\mathrm {e}} {{\mu}}$+jets events to pass the loose WP of the MVA-based isolation discriminant as a function of $\eta ^\text {jet}$. The misidentification probabilities in data are compared to expectations from simulation. The vertical bars in the simulated and observed misidentification probabilities include statistical uncertainties from the limited event count in both data and simulated samples, including the background subtraction. The shaded bands contain the systematic uncertainties related to background subtraction and the jet energy scale. |
png pdf |
Figure 13-c:
Probability for quark and gluon jets in $ {\mathrm {e}} {{\mu}}$+jets events to pass the medium WP of the MVA-based isolation discriminant as a function of $ {p_{\mathrm {T}}} ^\text {jet}$. The misidentification probabilities in data are compared to expectations from simulation. The vertical bars in the simulated and observed misidentification probabilities include statistical uncertainties from the limited event count in both data and simulated samples, including the background subtraction. The shaded bands contain the systematic uncertainties related to background subtraction and the jet energy scale. |
png pdf |
Figure 13-d:
Probability for quark and gluon jets in $ {\mathrm {e}} {{\mu}}$+jets events to pass the medium WP of the MVA-based isolation discriminant as a function of $\eta ^\text {jet}$. The misidentification probabilities in data are compared to expectations from simulation. The vertical bars in the simulated and observed misidentification probabilities include statistical uncertainties from the limited event count in both data and simulated samples, including the background subtraction. The shaded bands contain the systematic uncertainties related to background subtraction and the jet energy scale. |

png pdf |
Figure 13-e:
Probability for quark and gluon jets in $ {\mathrm {e}} {{\mu}}$+jets events to pass the tight WP of the MVA-based isolation discriminant as a function of $ {p_{\mathrm {T}}} ^\text {jet}$. The misidentification probabilities in data are compared to expectations from simulation. The vertical bars in the simulated and observed misidentification probabilities include statistical uncertainties from the limited event count in both data and simulated samples, including the background subtraction. The shaded bands contain the systematic uncertainties related to background subtraction and the jet energy scale. |
png pdf |
Figure 13-f:
Probability for quark and gluon jets in $ {\mathrm {e}} {{\mu}}$+jets events to pass the tight WP of the MVA-based isolation discriminant as a function of $\eta ^\text {jet}$. The misidentification probabilities in data are compared to expectations from simulation. The vertical bars in the simulated and observed misidentification probabilities include statistical uncertainties from the limited event count in both data and simulated samples, including the background subtraction. The shaded bands contain the systematic uncertainties related to background subtraction and the jet energy scale. |
png pdf |
Figure 14:
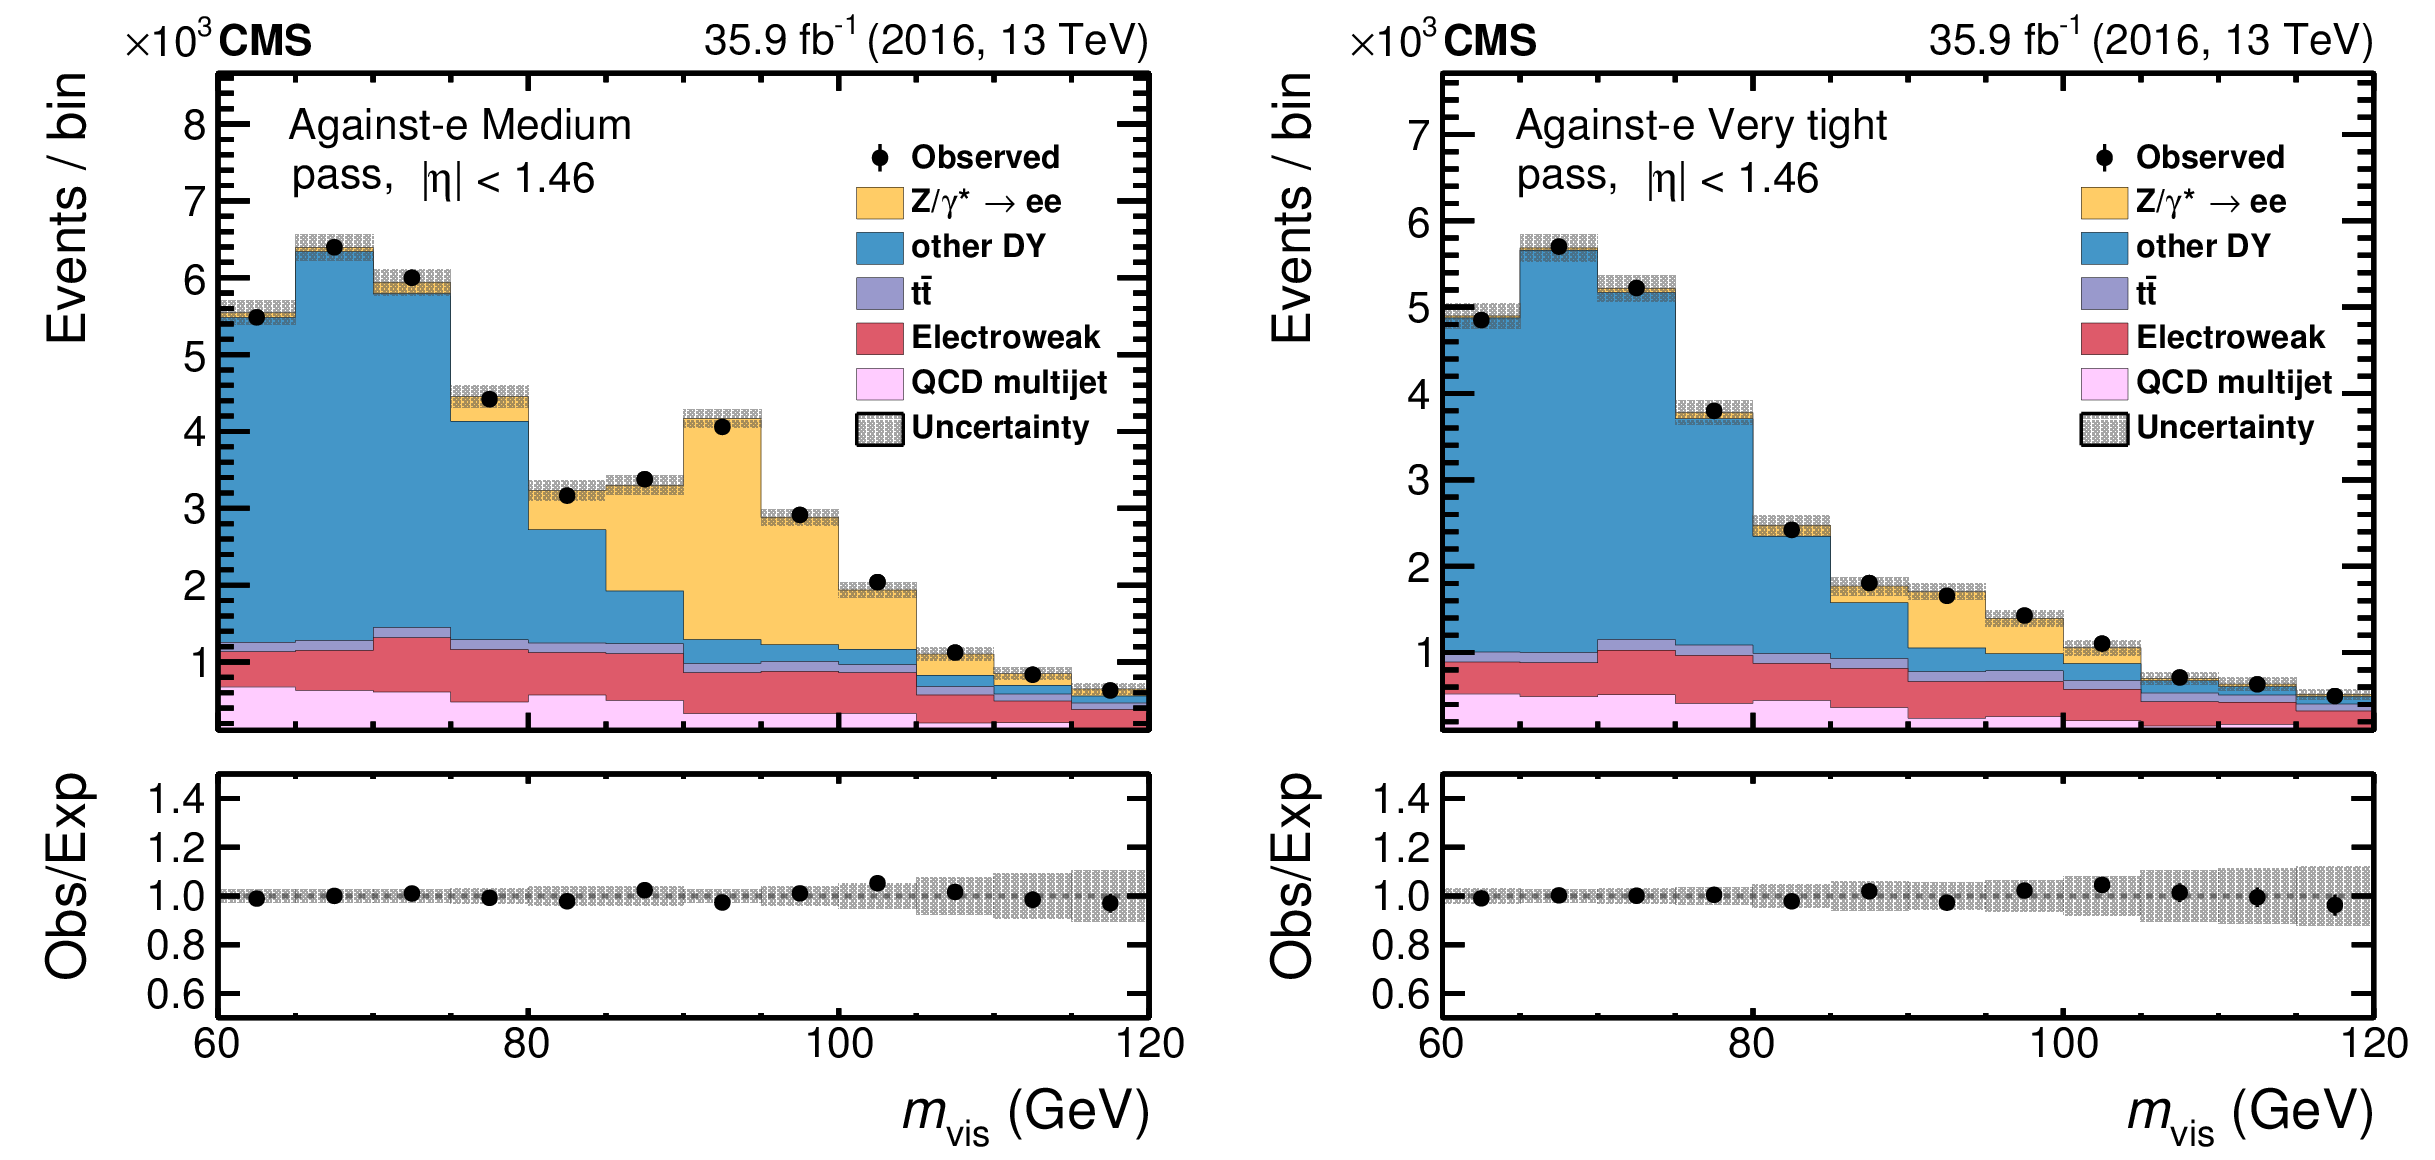
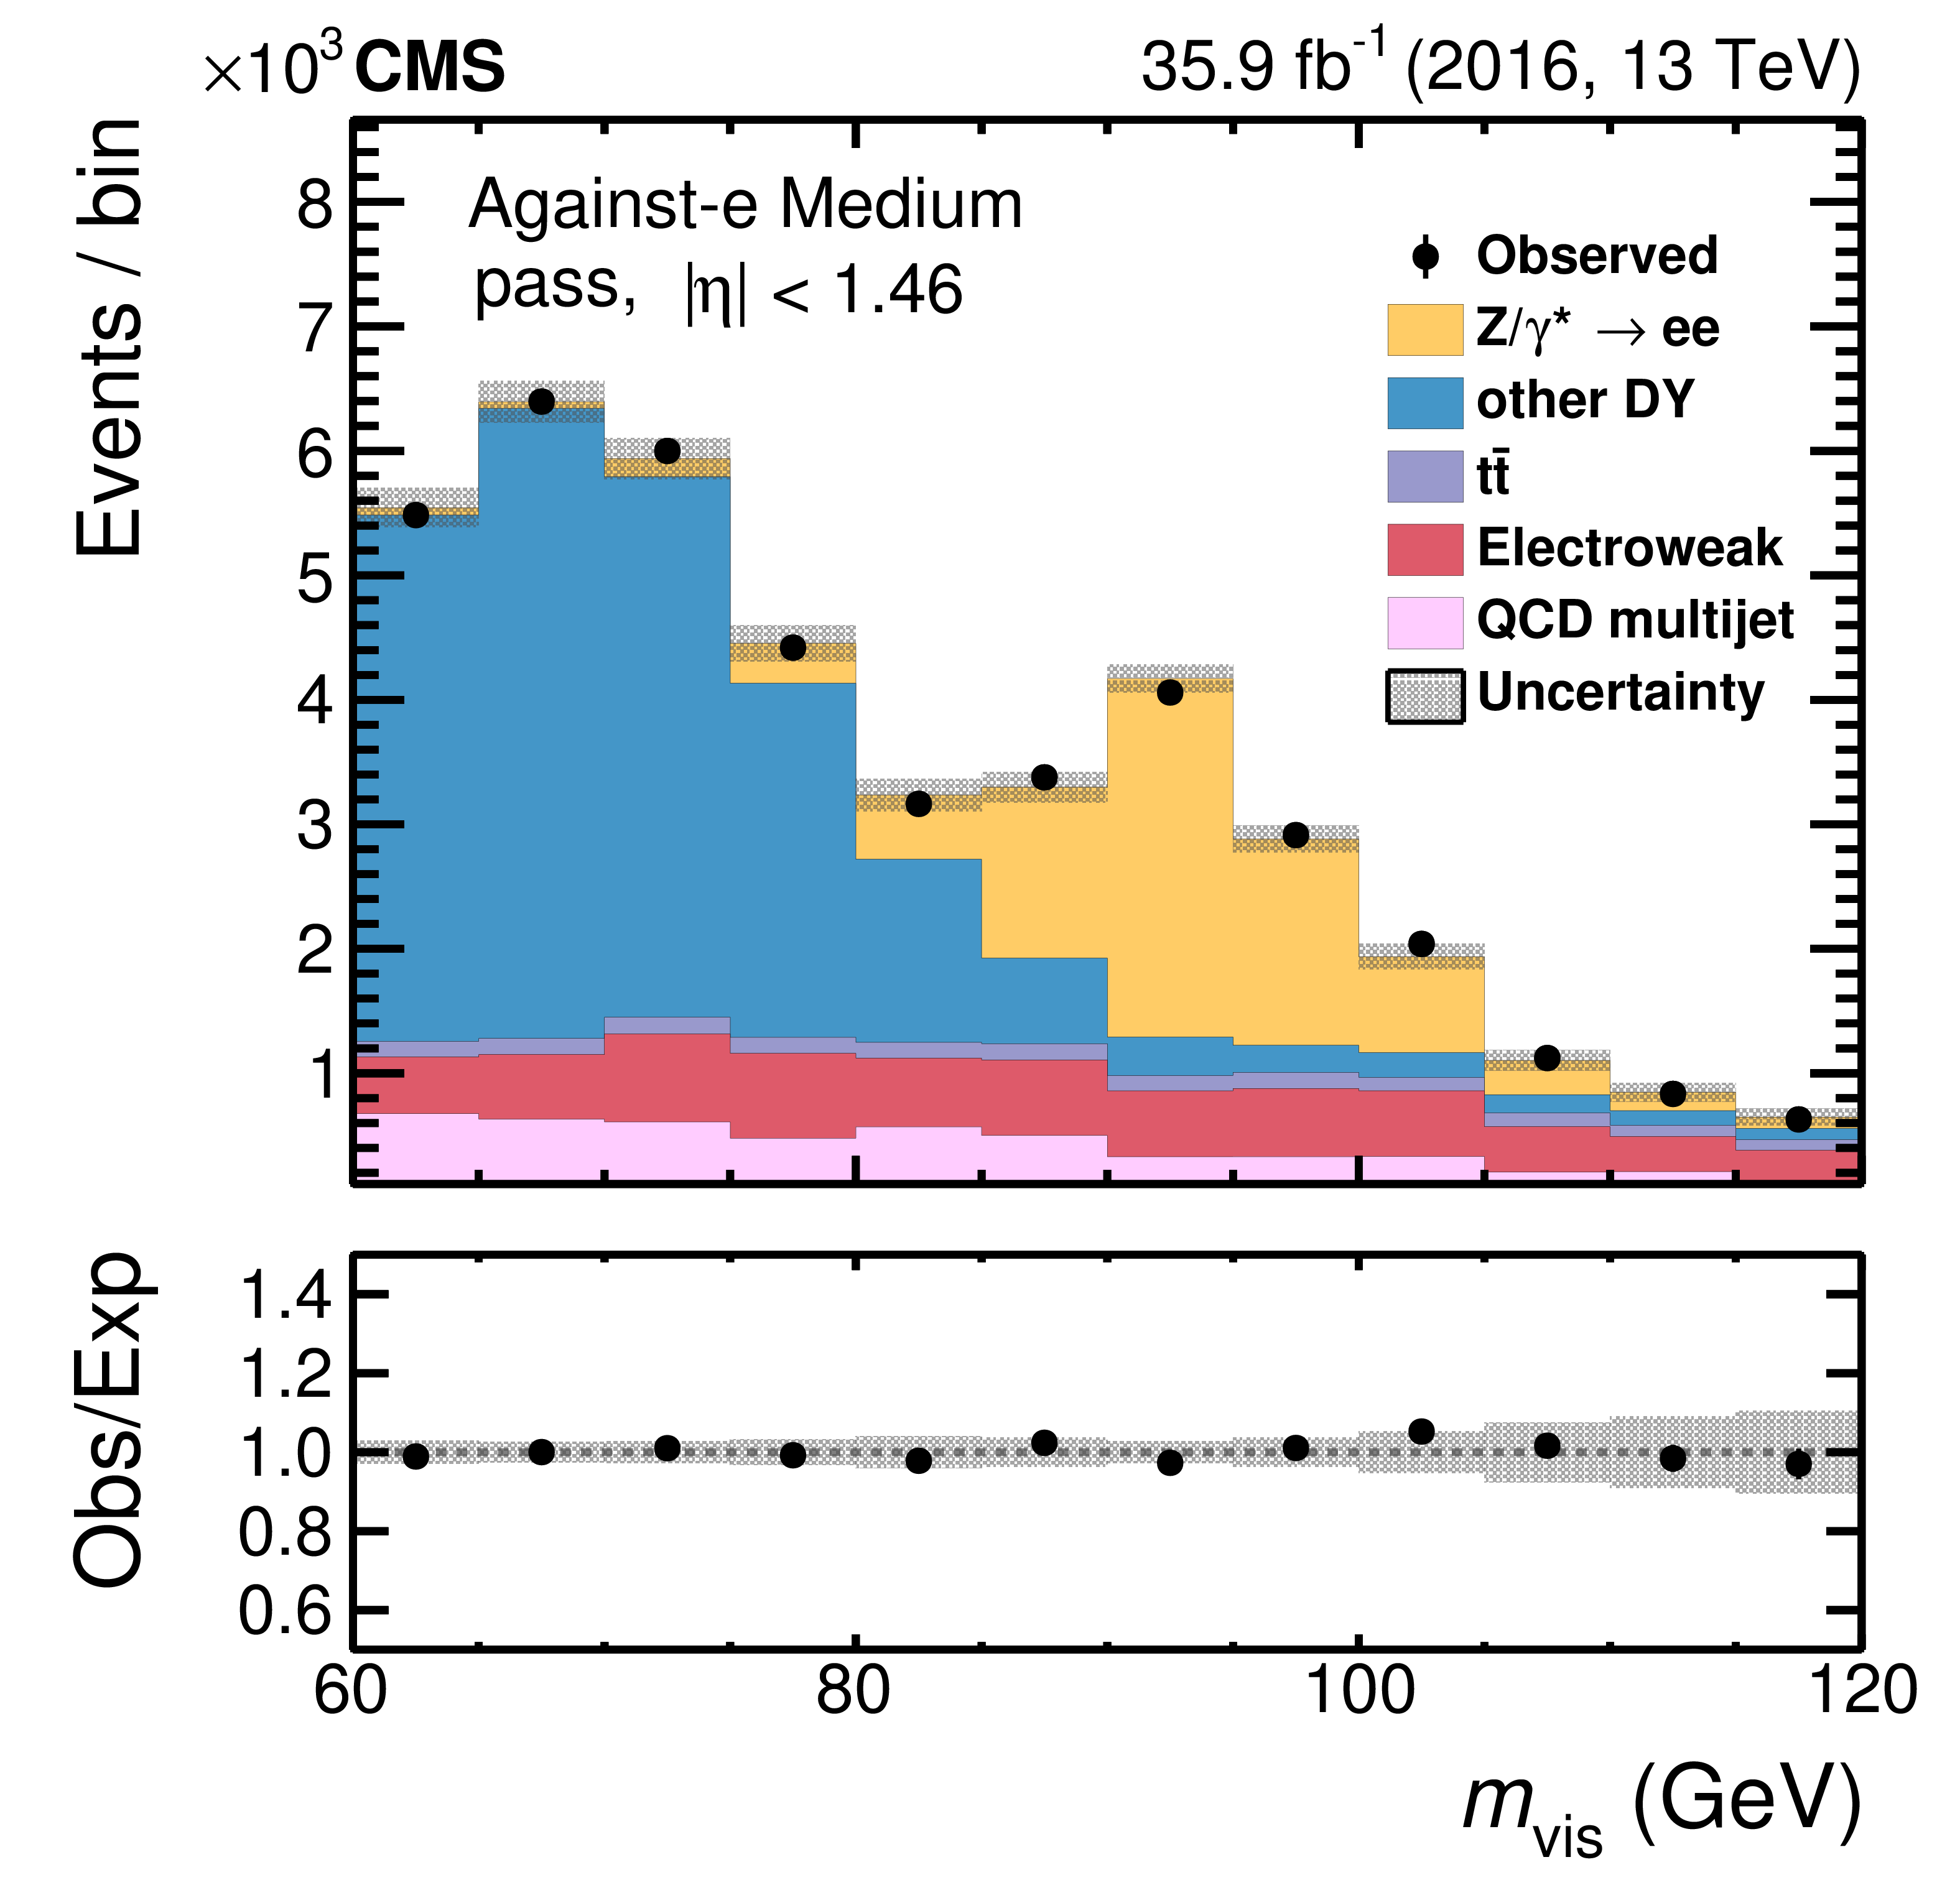
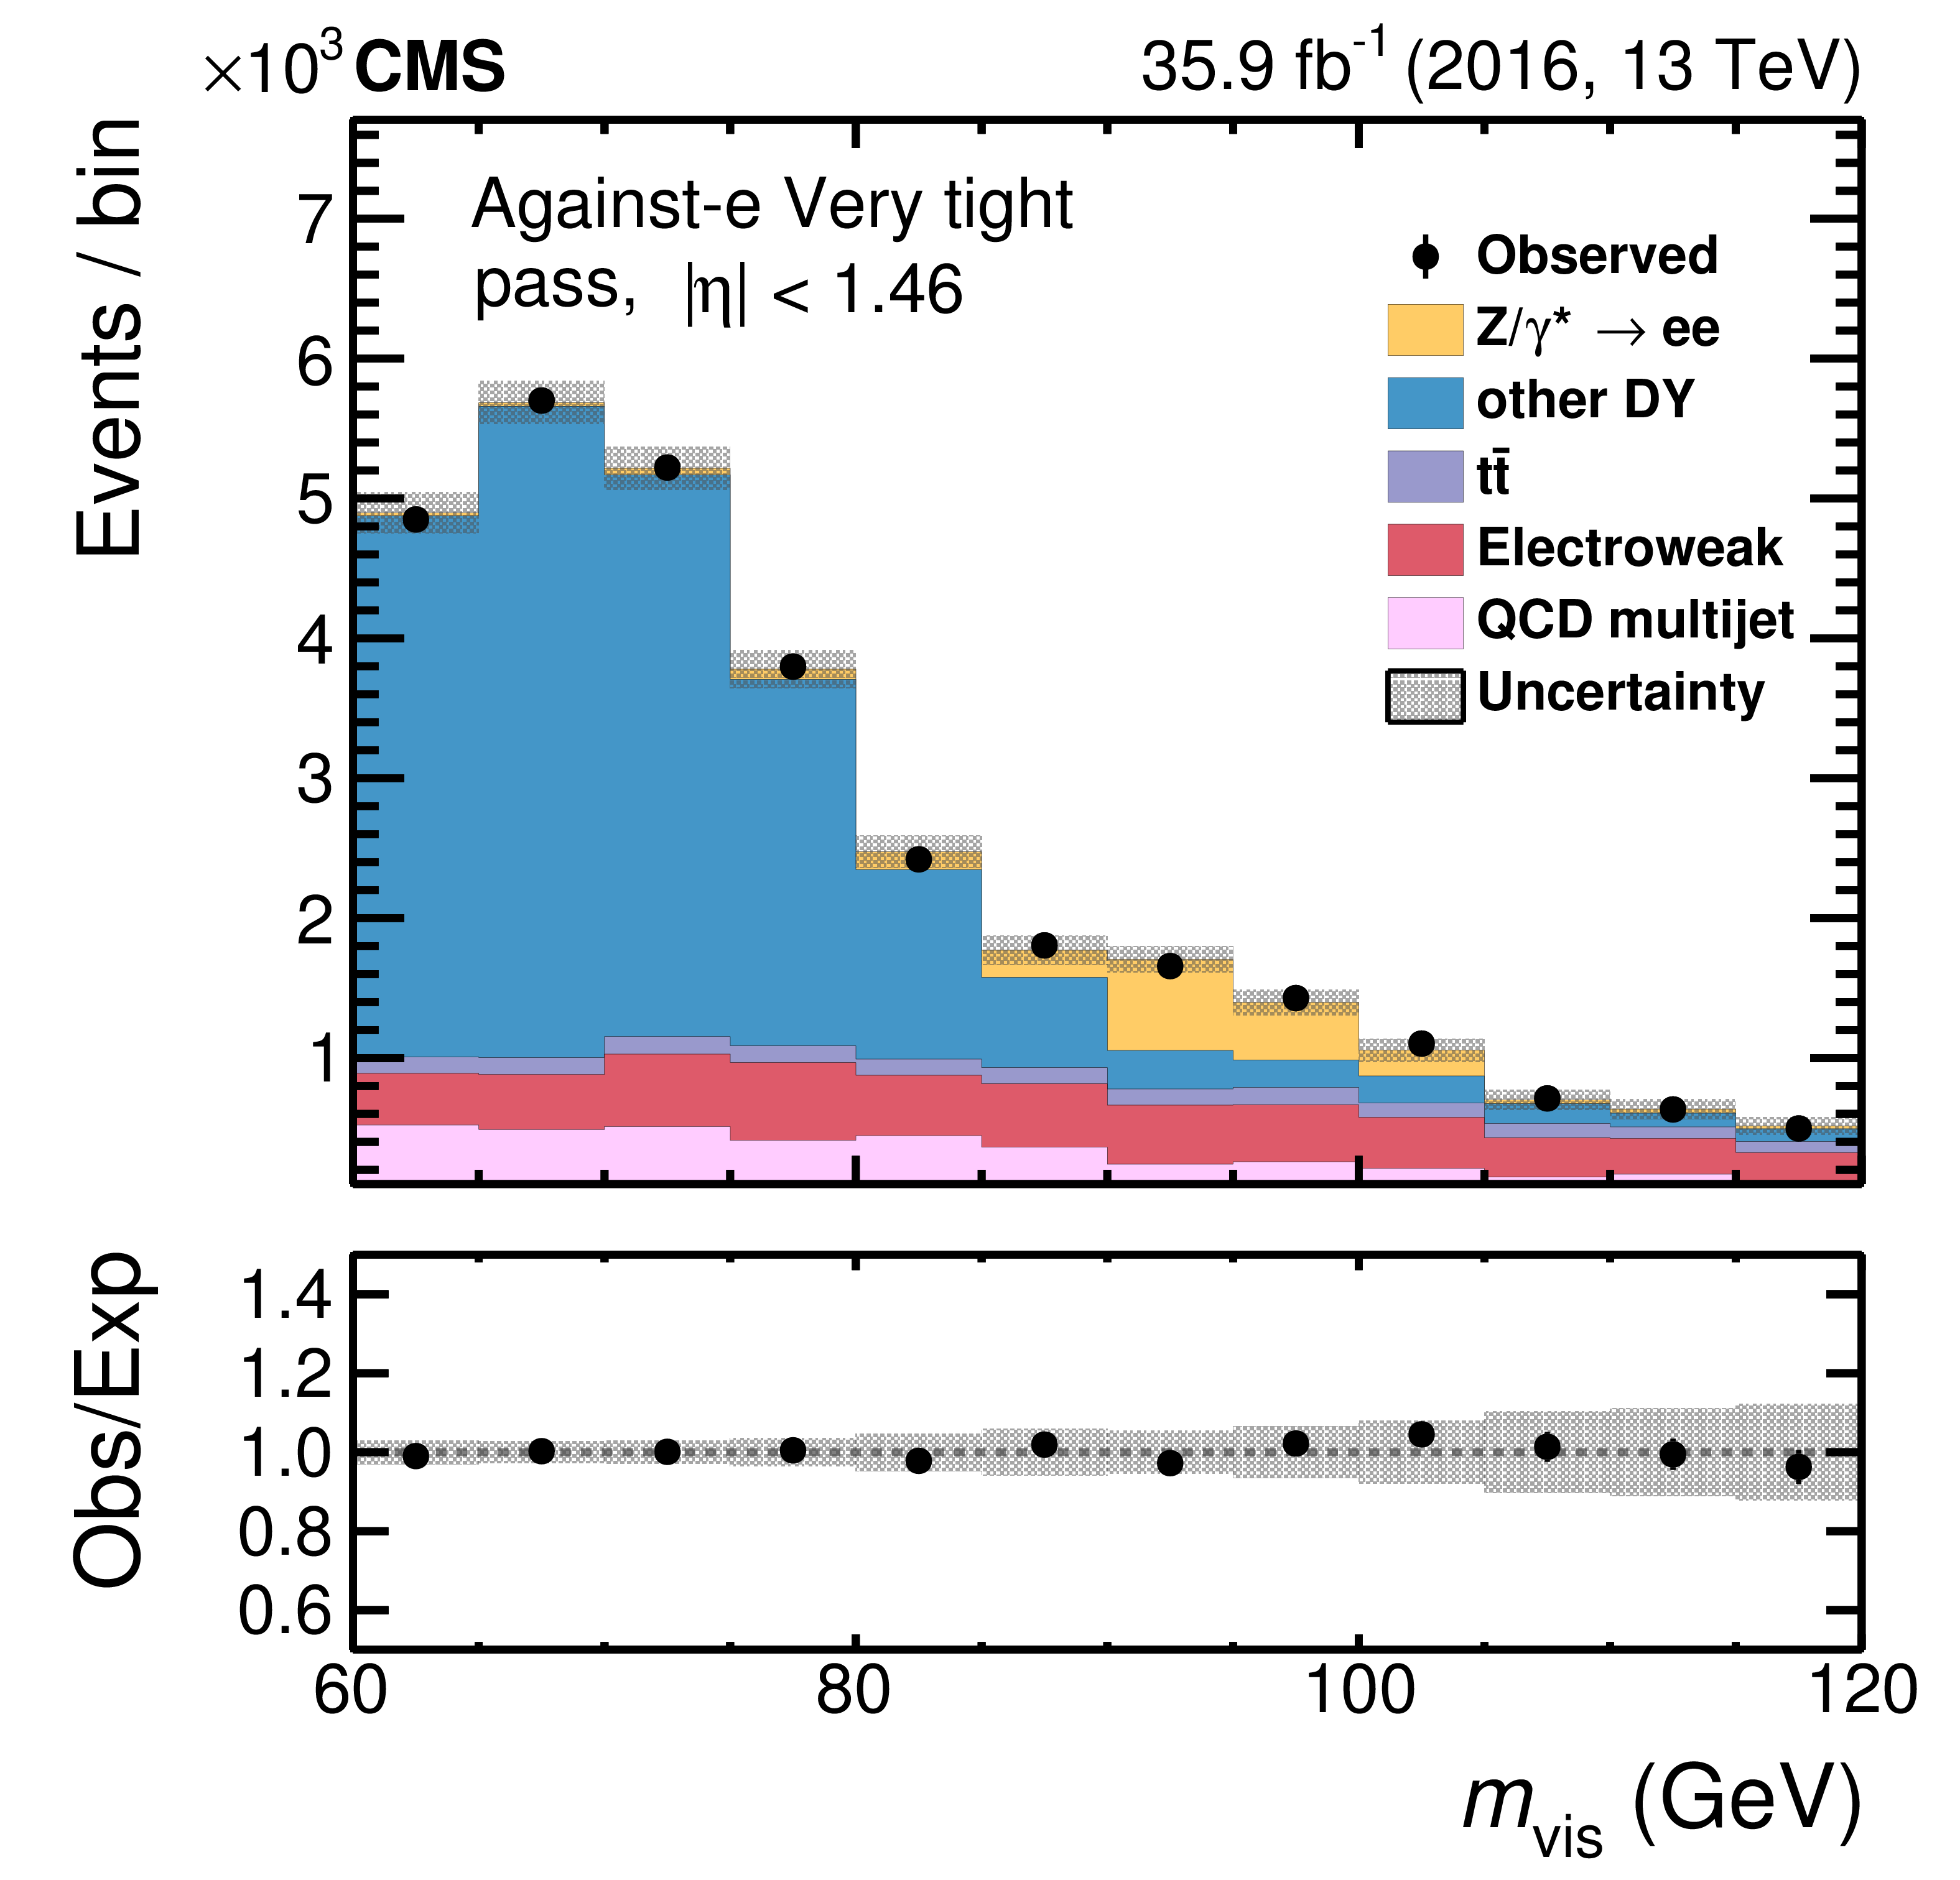
Fitted distributions in $ {m_\text {vis}}$ in the passing category for the medium (left) and very tight (right) WPs of the against-$ {\mathrm {e}}$ discriminant in the barrel region. The electroweak background includes contributions from W+jets (dominating), diboson, and single top quark events. Vertical bars correspond to the small (not visible) statistical uncertainties in the data points (68% frequentist confidence intervals), while the shaded bands provide the quadratic sum of the statistical and systematic uncertainties after the fit. |
png pdf |
Figure 14-a:
Fitted distribution in $ {m_\text {vis}}$ in the passing category for the medium WP of the against-$ {\mathrm {e}}$ discriminant in the barrel region. The electroweak background includes contributions from W+jets (dominating), diboson, and single top quark events. Vertical bars correspond to the small (not visible) statistical uncertainties in the data points (68% frequentist confidence intervals), while the shaded bands provide the quadratic sum of the statistical and systematic uncertainties after the fit. |
png pdf |
Figure 14-b:
Fitted distribution in $ {m_\text {vis}}$ in the passing category for the very tight WP of the against-$ {\mathrm {e}}$ discriminant in the barrel region. The electroweak background includes contributions from W+jets (dominating), diboson, and single top quark events. Vertical bars correspond to the small (not visible) statistical uncertainties in the data points (68% frequentist confidence intervals), while the shaded bands provide the quadratic sum of the statistical and systematic uncertainties after the fit. |
png pdf |
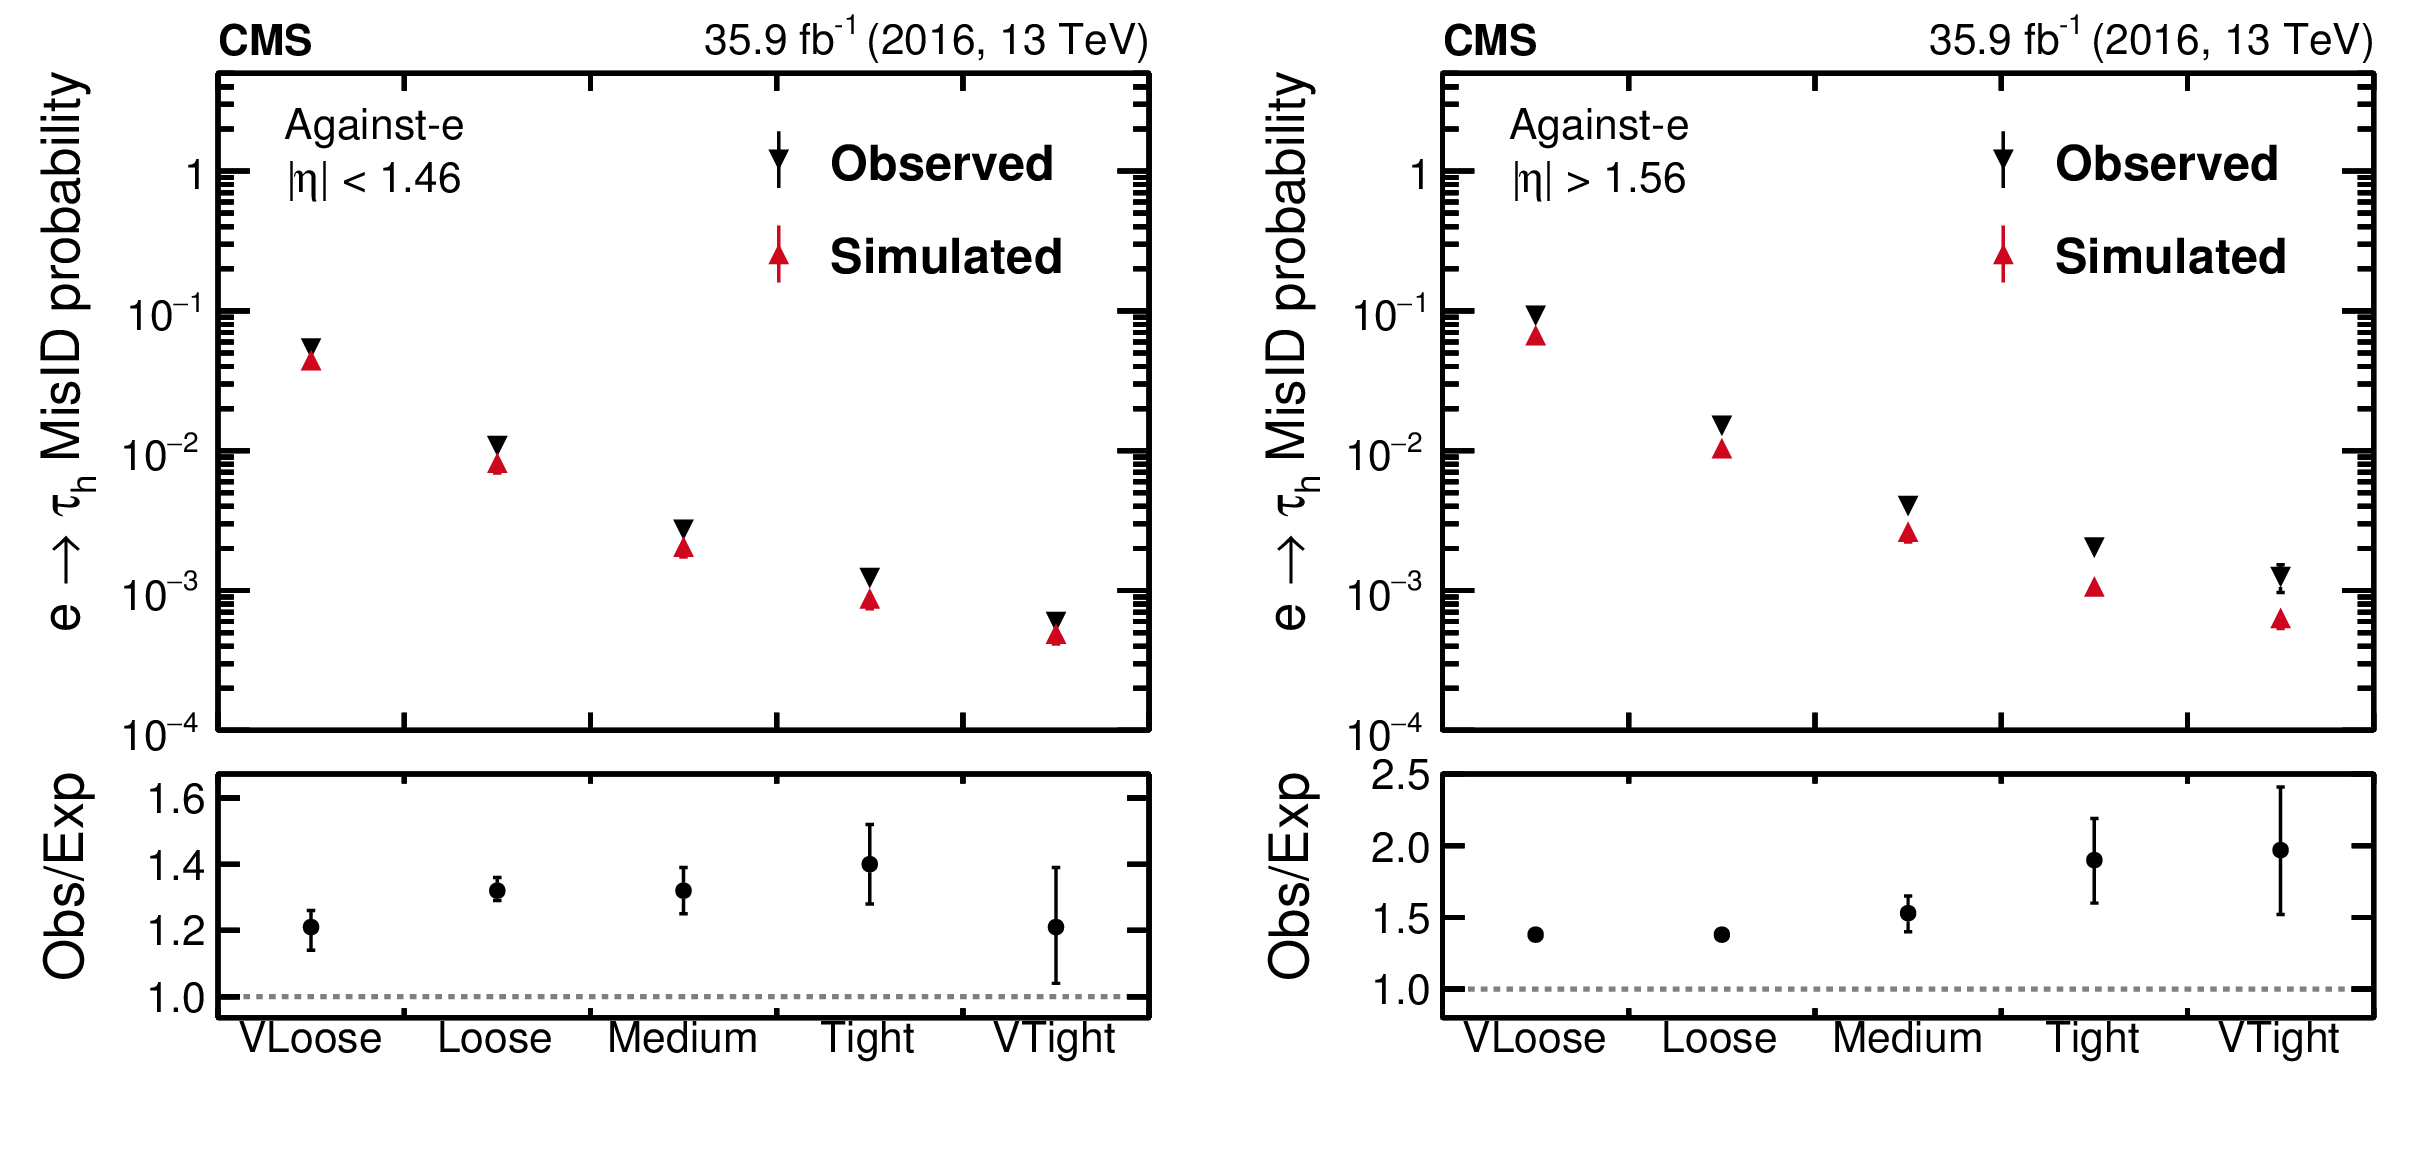
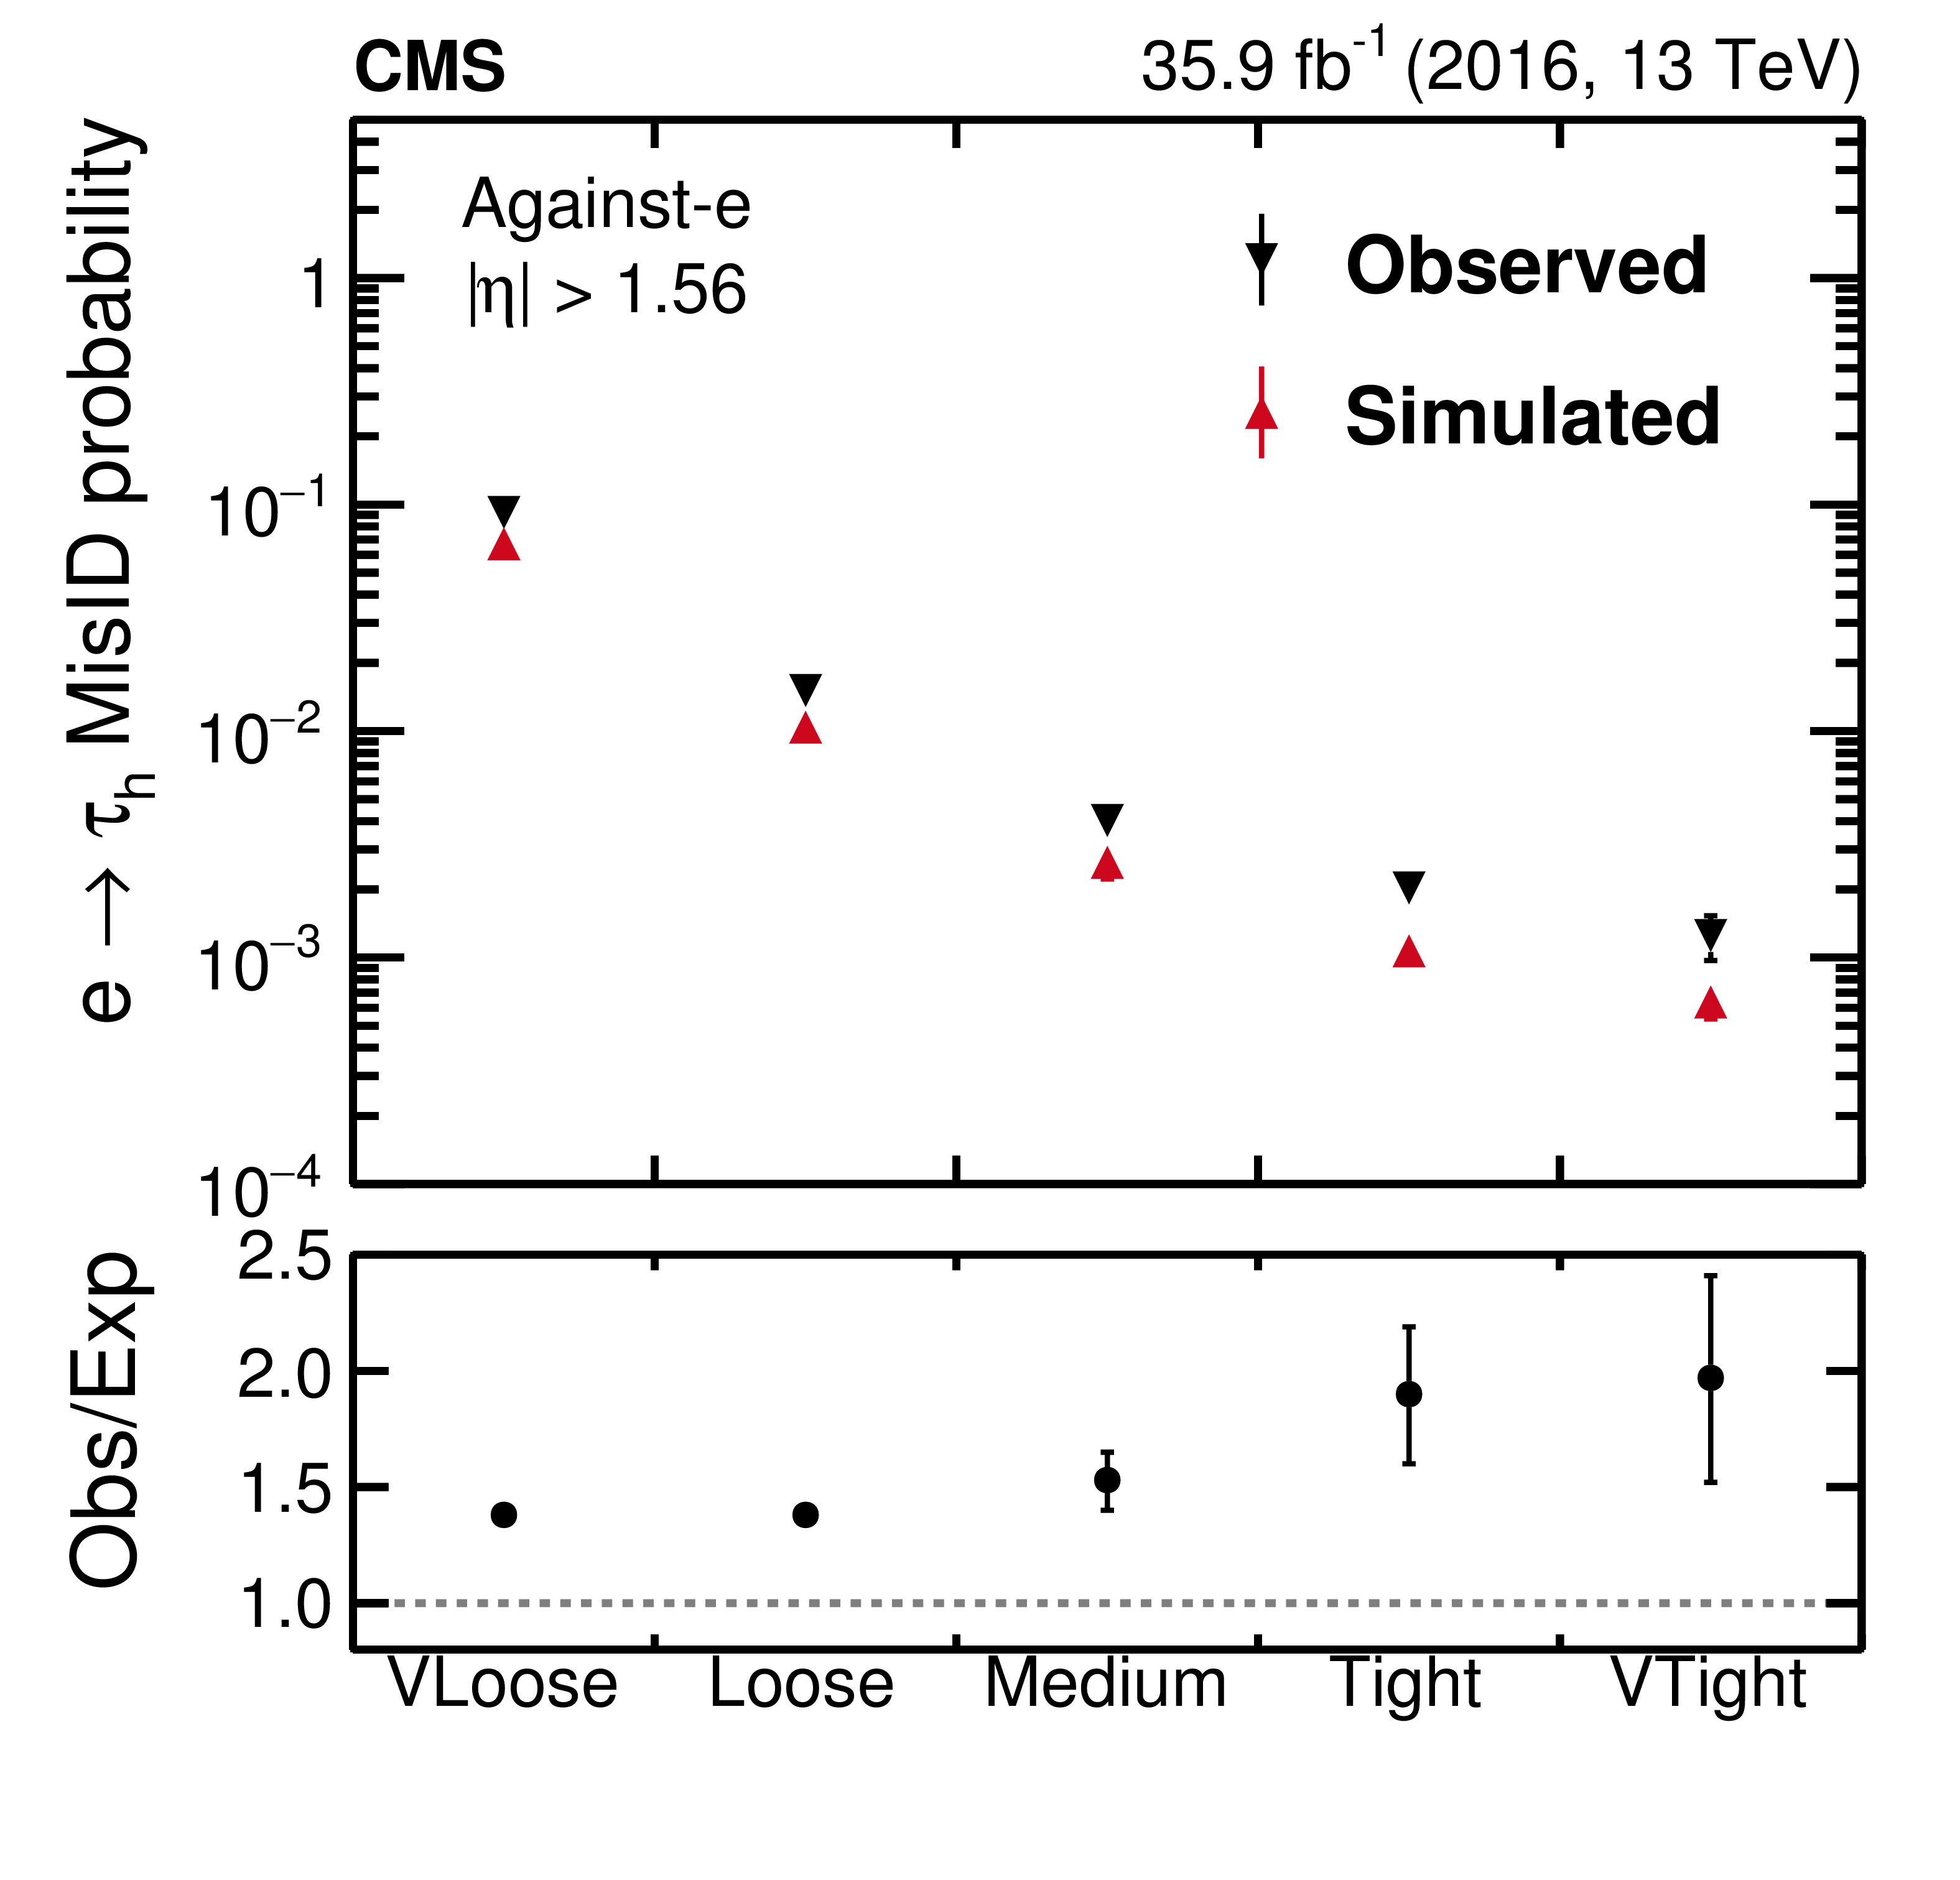
Figure 15:
Probability for electrons to pass different working points of the against-$ {\mathrm {e}}$ discriminant, split into the barrel (left) and endcap (right) regions. For each working point, the $ {\mathrm {e}} \rightarrow {{\tau} _\mathrm {h}} $ misidentification probability is defined as the fraction of probes passing that working point relative to the total number of probes. Vertical bars correspond to the statistical and the quadratic sum of the statistical and systematic uncertainties, respectively, for simulated and observed data. |

png pdf |
Figure 15-a:
Probability for electrons to pass different working points of the against-$ {\mathrm {e}}$ discriminant, in the barrel region. For each working point, the $ {\mathrm {e}} \rightarrow {{\tau} _\mathrm {h}} $ misidentification probability is defined as the fraction of probes passing that working point relative to the total number of probes. Vertical bars correspond to the statistical and the quadratic sum of the statistical and systematic uncertainties, respectively, for simulated and observed data. |
png pdf |
Figure 15-b:
Probability for electrons to pass different working points of the against-$ {\mathrm {e}}$ discriminant, in the endcap region. For each working point, the $ {\mathrm {e}} \rightarrow {{\tau} _\mathrm {h}} $ misidentification probability is defined as the fraction of probes passing that working point relative to the total number of probes. Vertical bars correspond to the statistical and the quadratic sum of the statistical and systematic uncertainties, respectively, for simulated and observed data. |

png pdf |
Figure 16:
Fitted distribution in $ {m_\text {vis}}$ in the passing category for the loose (left) and tight (right) WPs of the against-$ {{\mu}}$ discriminant in the region of $ {| \eta |} < $ 0.4. The electroweak background includes contributions from W+jets (dominating), diboson, and single top quark events. Vertical bars correspond to the small (not visible) statistical uncertainties in the data points (68% frequentist confidence intervals), while the shaded bands provide the quadratic sum of the statistical and systematic uncertainties after the fit. |

png pdf |
Figure 16-a:
Fitted distribution in $ {m_\text {vis}}$ in the passing category for the loose WP of the against-$ {{\mu}}$ discriminant in the region of $ {| \eta |} < $ 0.4. The electroweak background includes contributions from W+jets (dominating), diboson, and single top quark events. Vertical bars correspond to the small (not visible) statistical uncertainties in the data points (68% frequentist confidence intervals), while the shaded bands provide the quadratic sum of the statistical and systematic uncertainties after the fit. |

png pdf |
Figure 16-b:
Fitted distribution in $ {m_\text {vis}}$ in the passing category for the tight WP of the against-$ {{\mu}}$ discriminant in the region of $ {| \eta |} < $ 0.4. The electroweak background includes contributions from W+jets (dominating), diboson, and single top quark events. Vertical bars correspond to the small (not visible) statistical uncertainties in the data points (68% frequentist confidence intervals), while the shaded bands provide the quadratic sum of the statistical and systematic uncertainties after the fit. |

png pdf |
Figure 17:
Probability for muons to pass the loose (left) and tight (right) WPs of the against-$ {{\mu}}$ discriminant, as a function of the $ {| \eta |}$ of the probe. For each working point, the $ {{\mu}} \rightarrow {{\tau} _\mathrm {h}} $ misidentification probability is defined as the fraction of probes passing that working point relative to the total number of probes. Vertical bars correspond to the statistical and the quadratic sum of the statistical and systematic uncertainties, respectively, for simulated and observed data. |

png pdf |
Figure 17-a:
Probability for muons to pass the loose WP of the against-$ {{\mu}}$ discriminant, as a function of the $ {| \eta |}$ of the probe. The $ {{\mu}} \rightarrow {{\tau} _\mathrm {h}} $ misidentification probability is defined as the fraction of probes passing that working point relative to the total number of probes. Vertical bars correspond to the statistical and the quadratic sum of the statistical and systematic uncertainties, respectively, for simulated and observed data. |

png pdf |
Figure 17-b:
Probability for muons to pass the tight WP of the against-$ {{\mu}}$ discriminant, as a function of the $ {| \eta |}$ of the probe. The $ {{\mu}} \rightarrow {{\tau} _\mathrm {h}} $ misidentification probability is defined as the fraction of probes passing that working point relative to the total number of probes. Vertical bars correspond to the statistical and the quadratic sum of the statistical and systematic uncertainties, respectively, for simulated and observed data. |
png pdf |
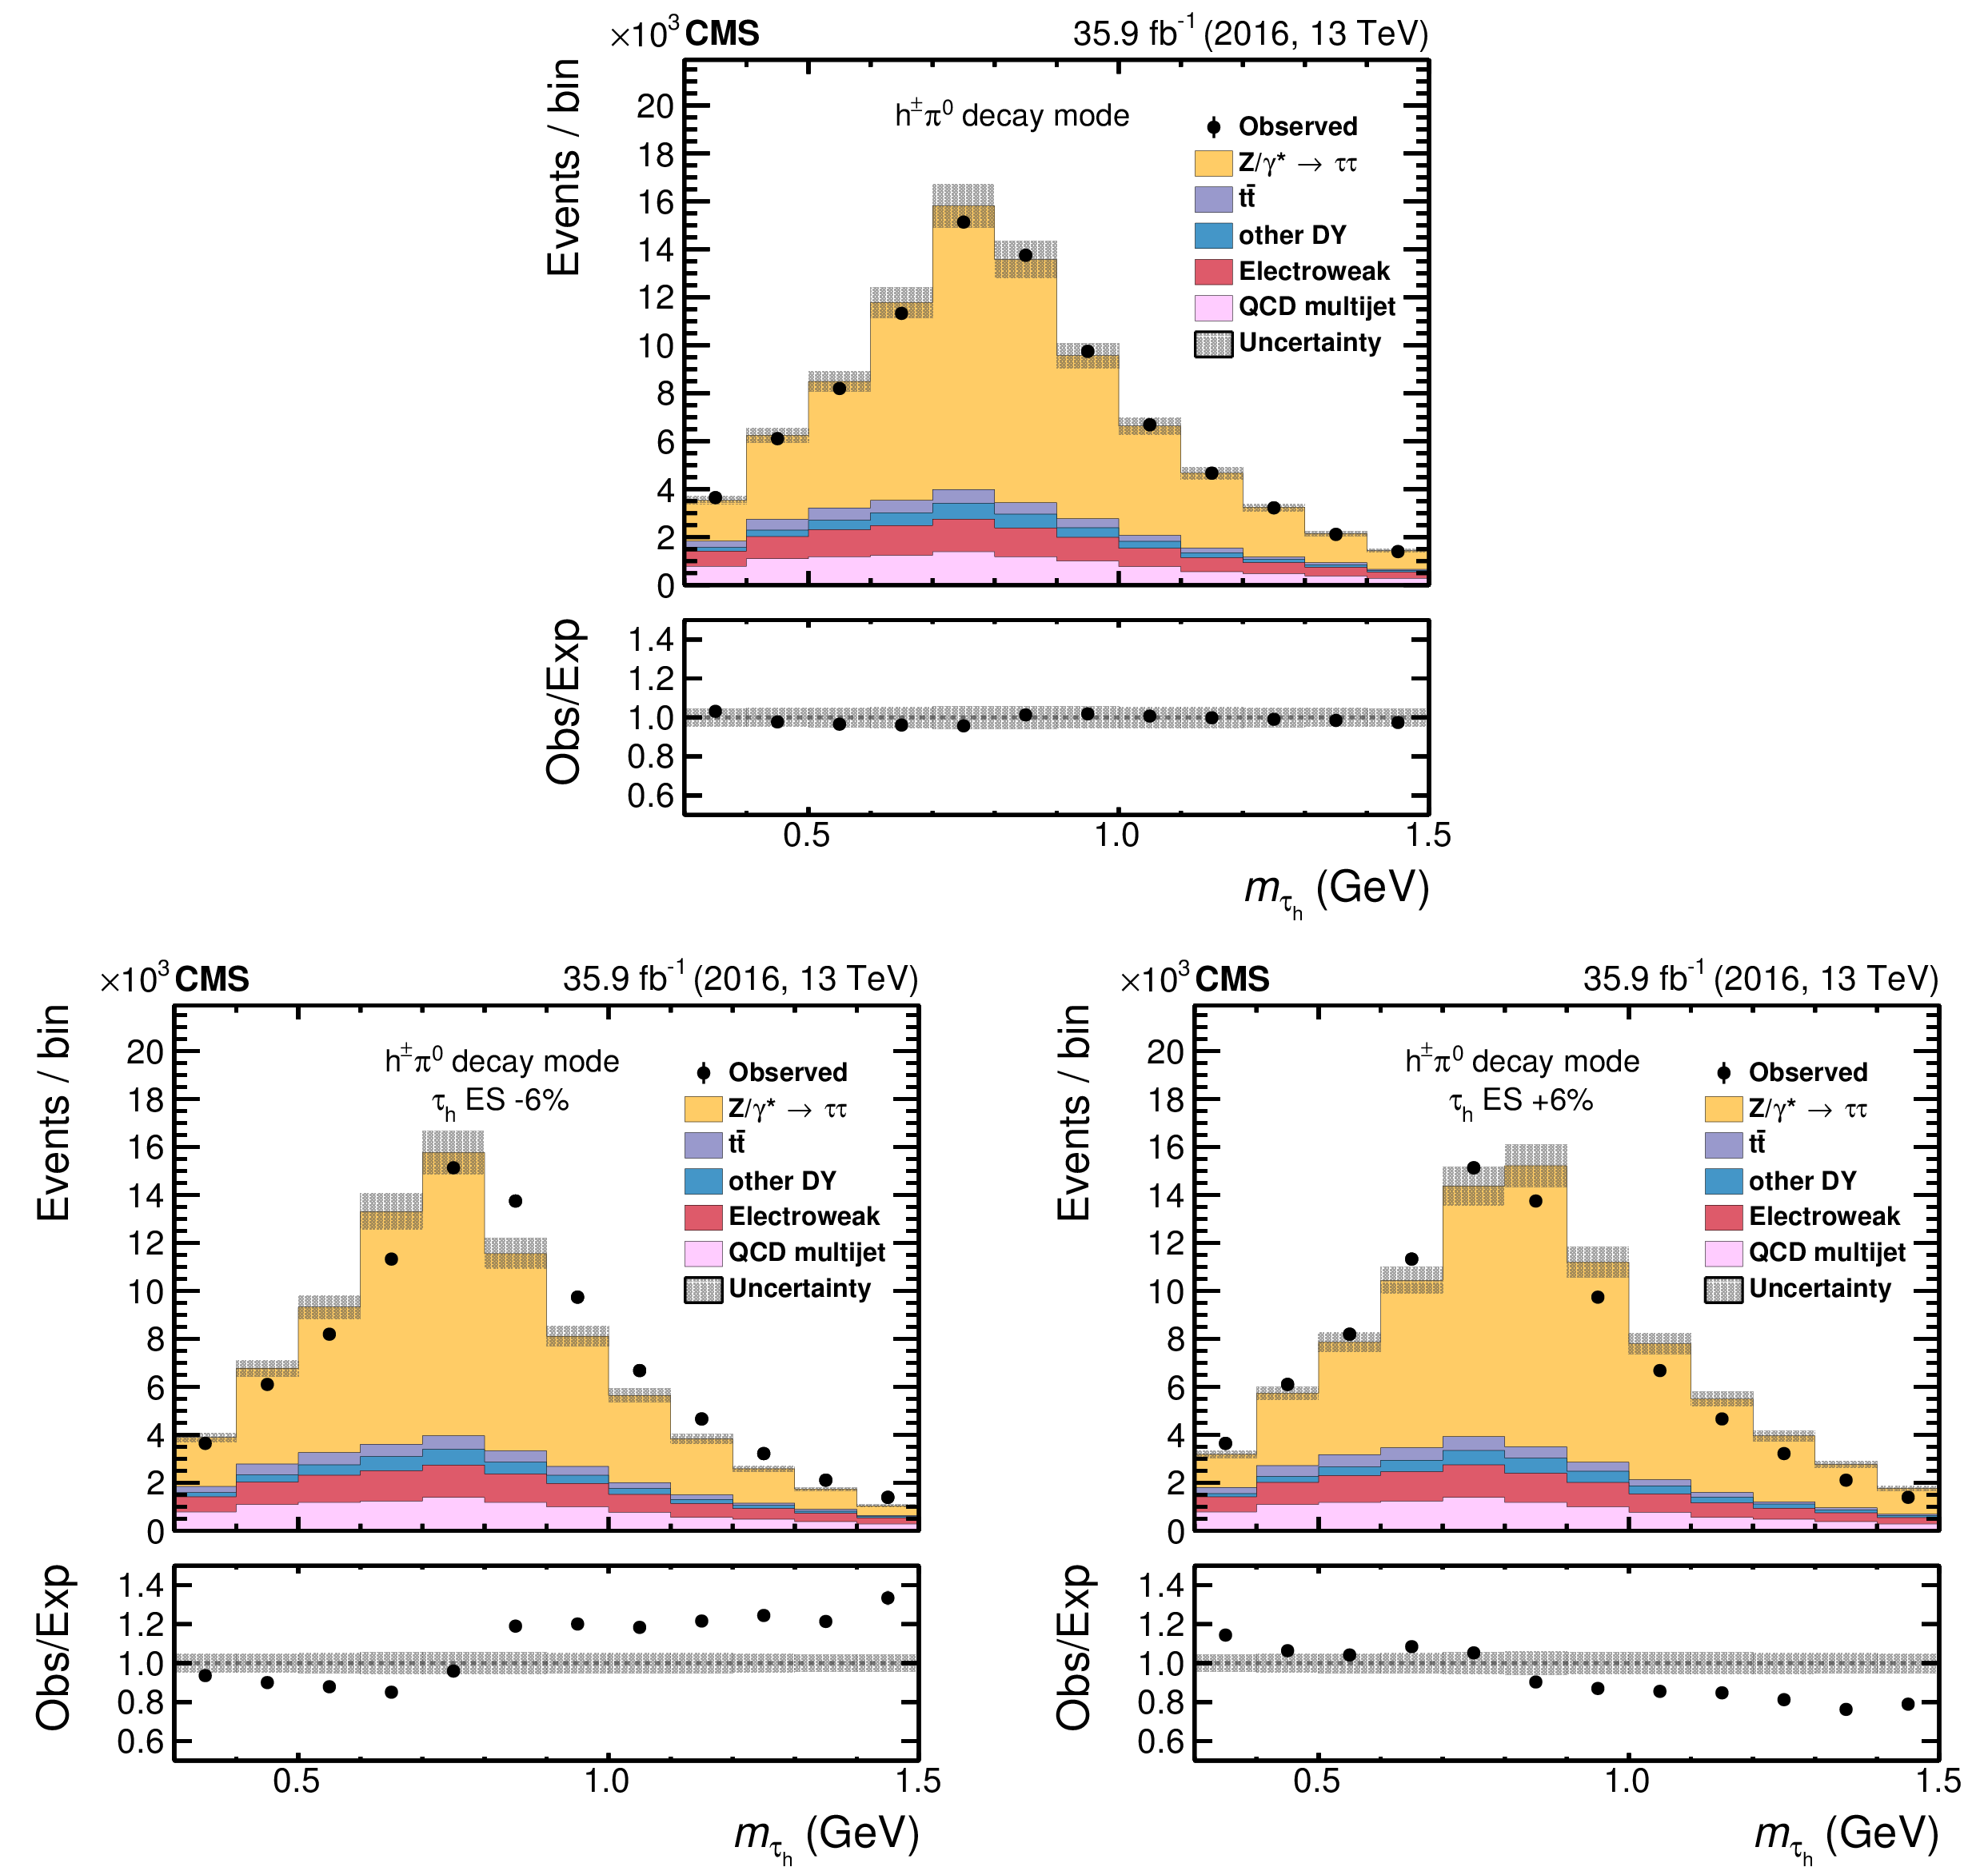
Figure 18:
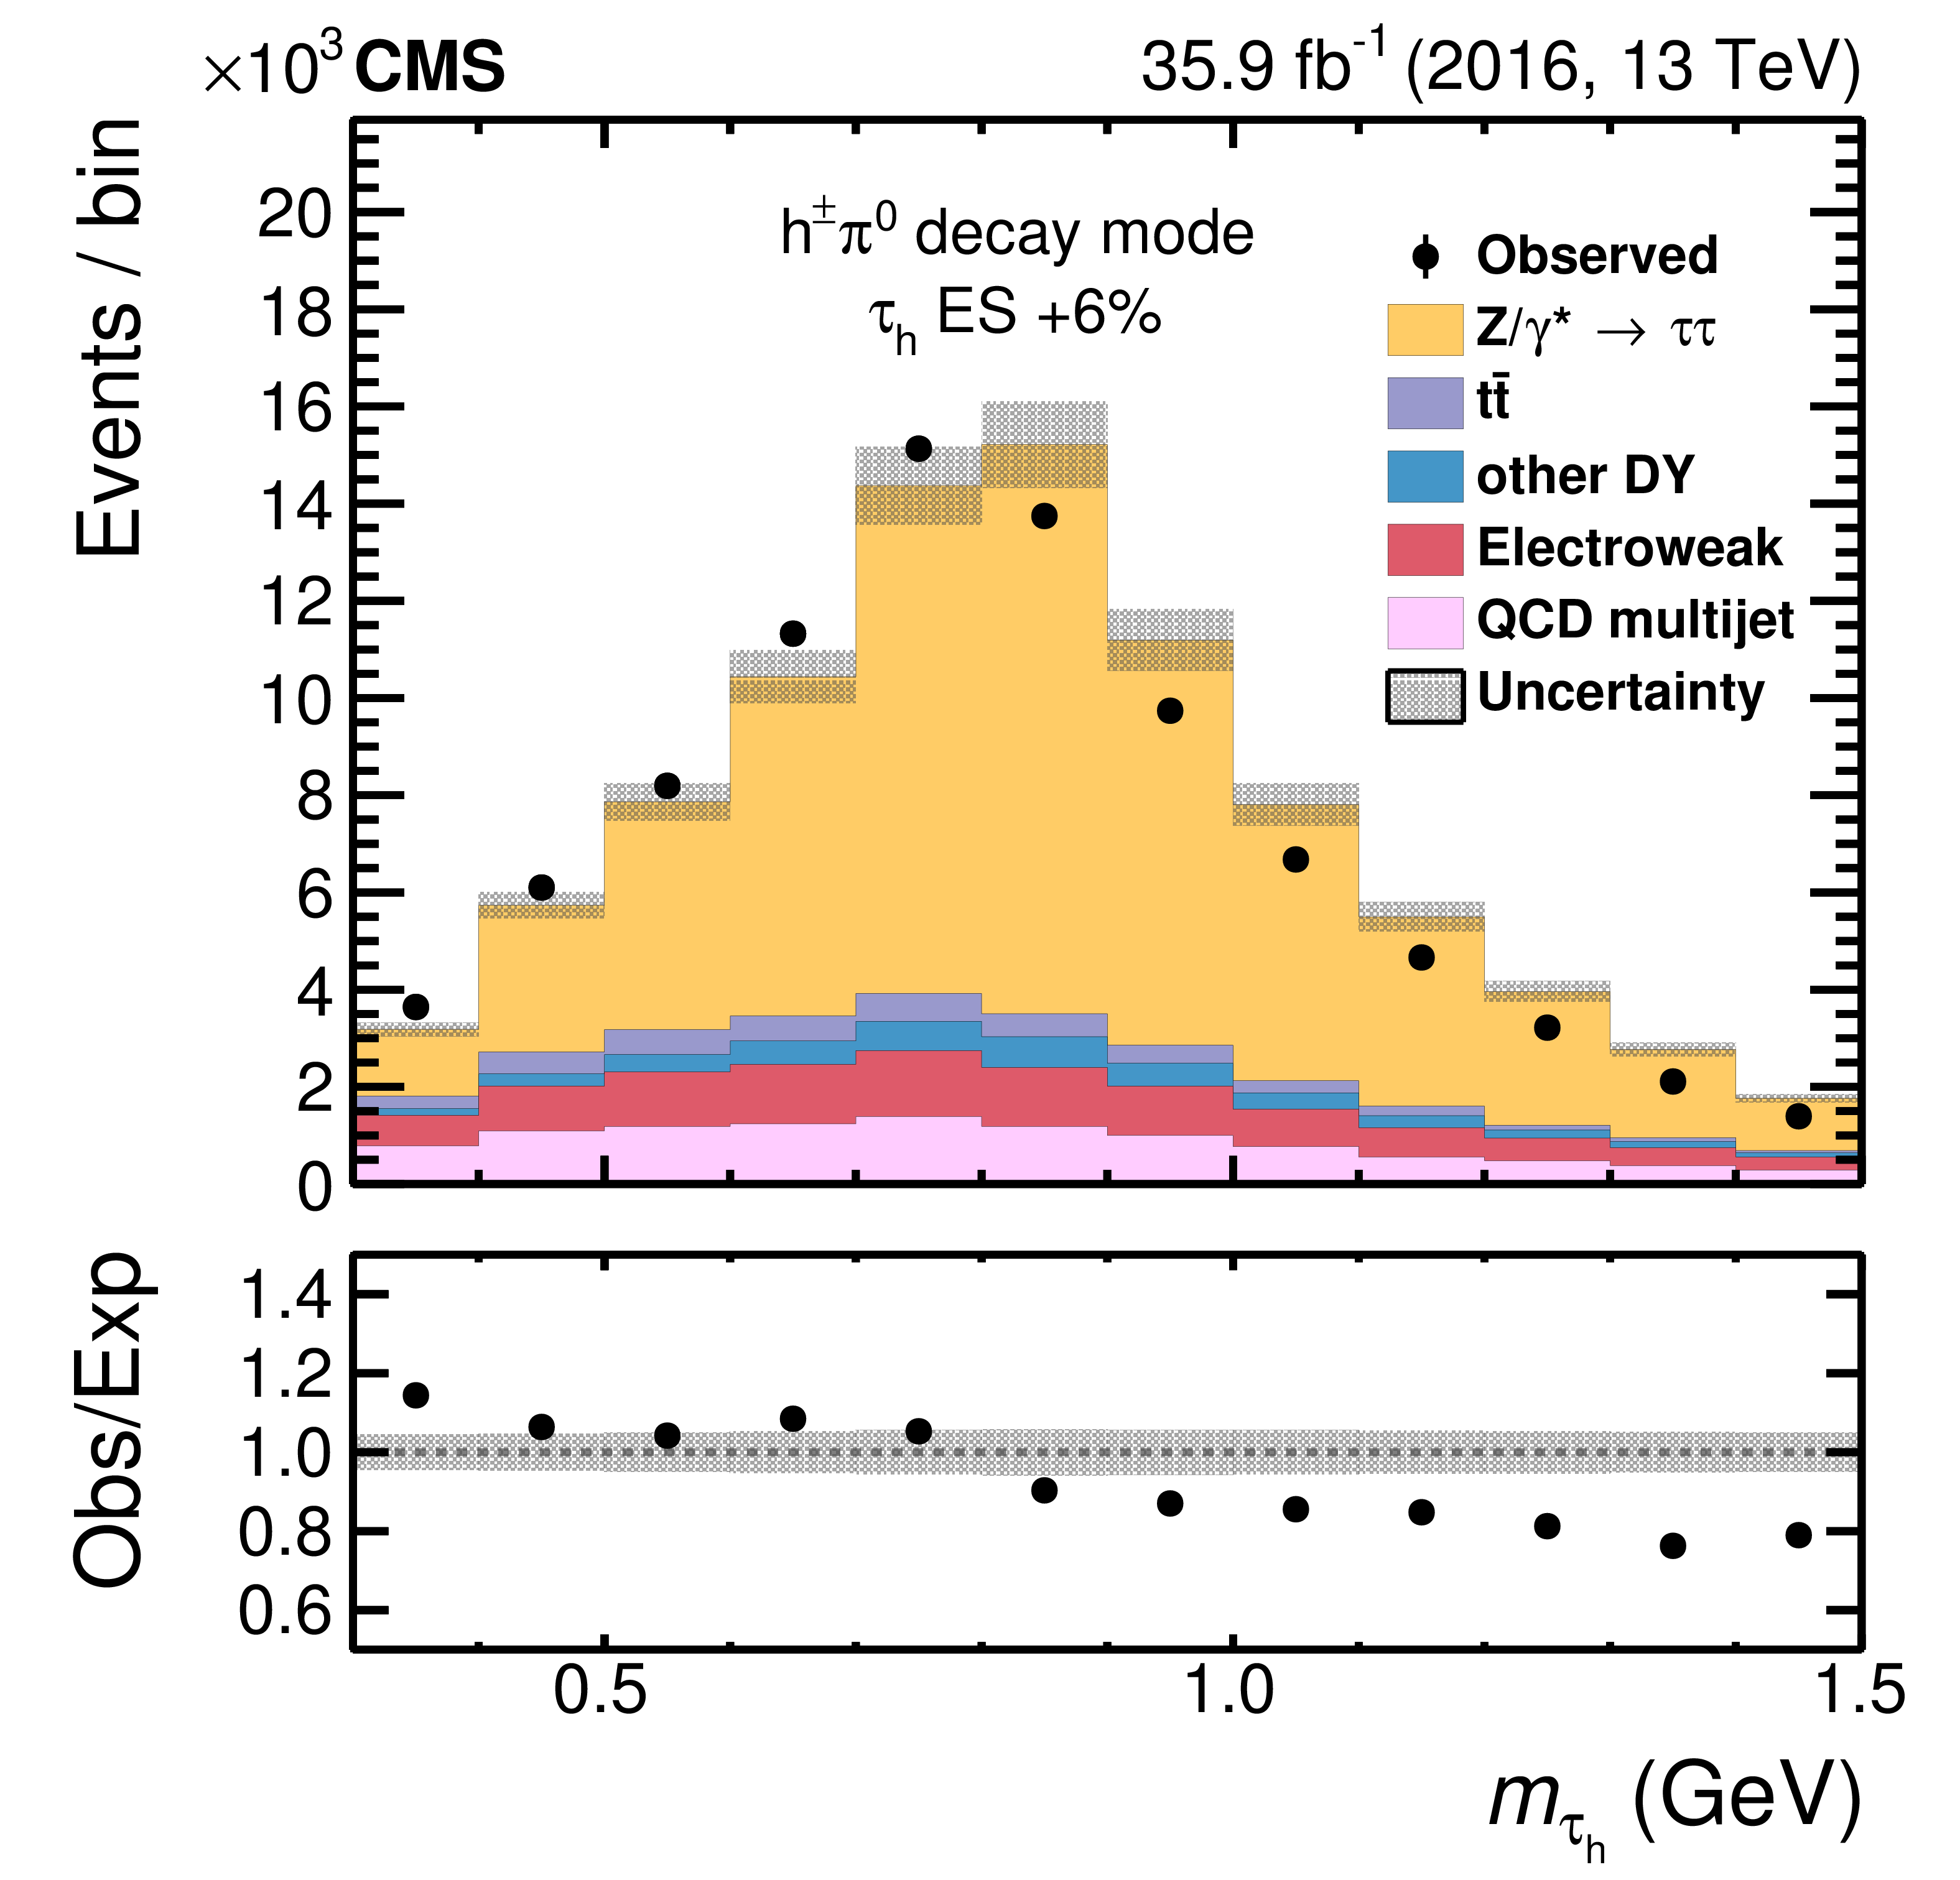
The distributions in $m_{{{\tau} _\mathrm {h}}}$ for $ {{\mu}} {{\tau} _\mathrm {h}} $ events in the $ {\mathrm {h}^{\pm} {\pi ^0}} $ decay channel. The data are compared to predictions with different shifts applied to the $ {{\tau} _\mathrm {h}} $ energy scale: 0% (upper), $-$6% (lower left), and $+$6% (lower right). The electroweak background includes contributions from W+jets (dominating), diboson, and single top quark events. Vertical bars (smaller than the symbol size) correspond to the statistical uncertainty in the data points (68% frequentist confidence intervals), while the shaded bands provide the expected systematic uncertainties. |
png pdf |
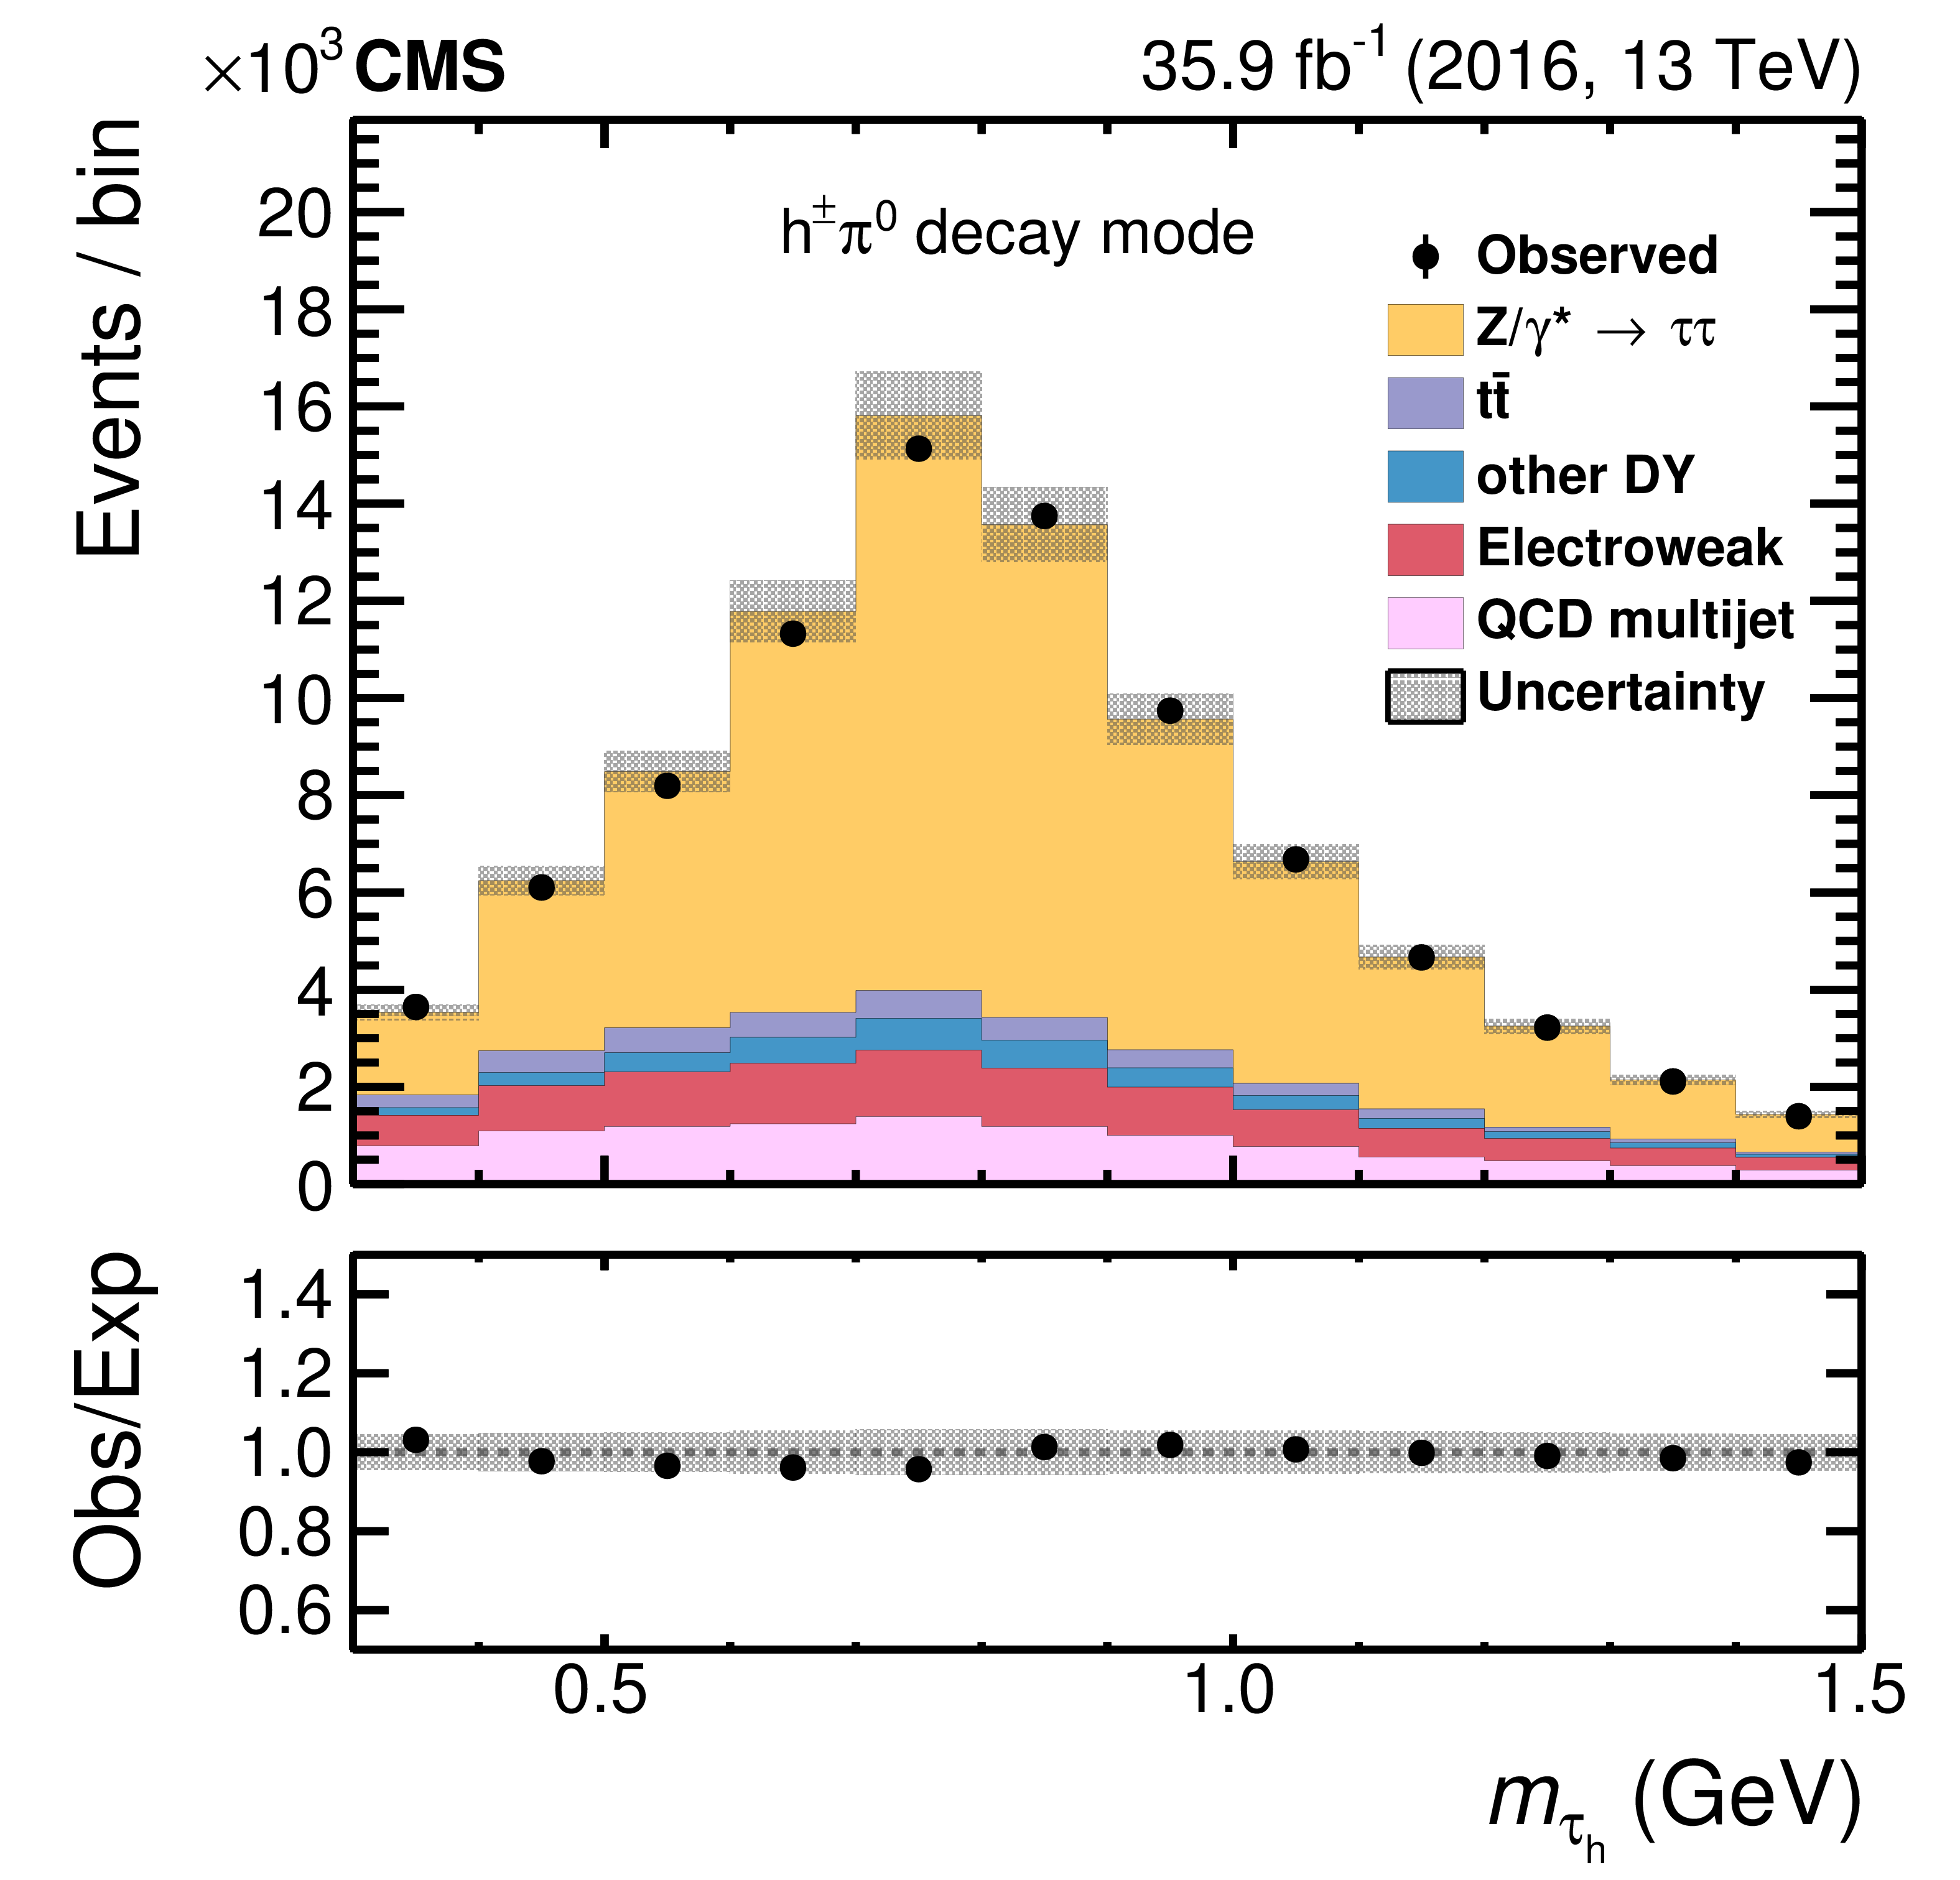
Figure 18-a:
The distributions in $m_{{{\tau} _\mathrm {h}}}$ for $ {{\mu}} {{\tau} _\mathrm {h}} $ events in the $ {\mathrm {h}^{\pm} {\pi ^0}} $ decay channel. The data are compared to predictions with 0% shift applied to the $ {{\tau} _\mathrm {h}} $ energy scale. The electroweak background includes contributions from W+jets (dominating), diboson, and single top quark events. Vertical bars (smaller than the symbol size) correspond to the statistical uncertainty in the data points (68% frequentist confidence intervals), while the shaded bands provide the expected systematic uncertainties. |
png pdf |
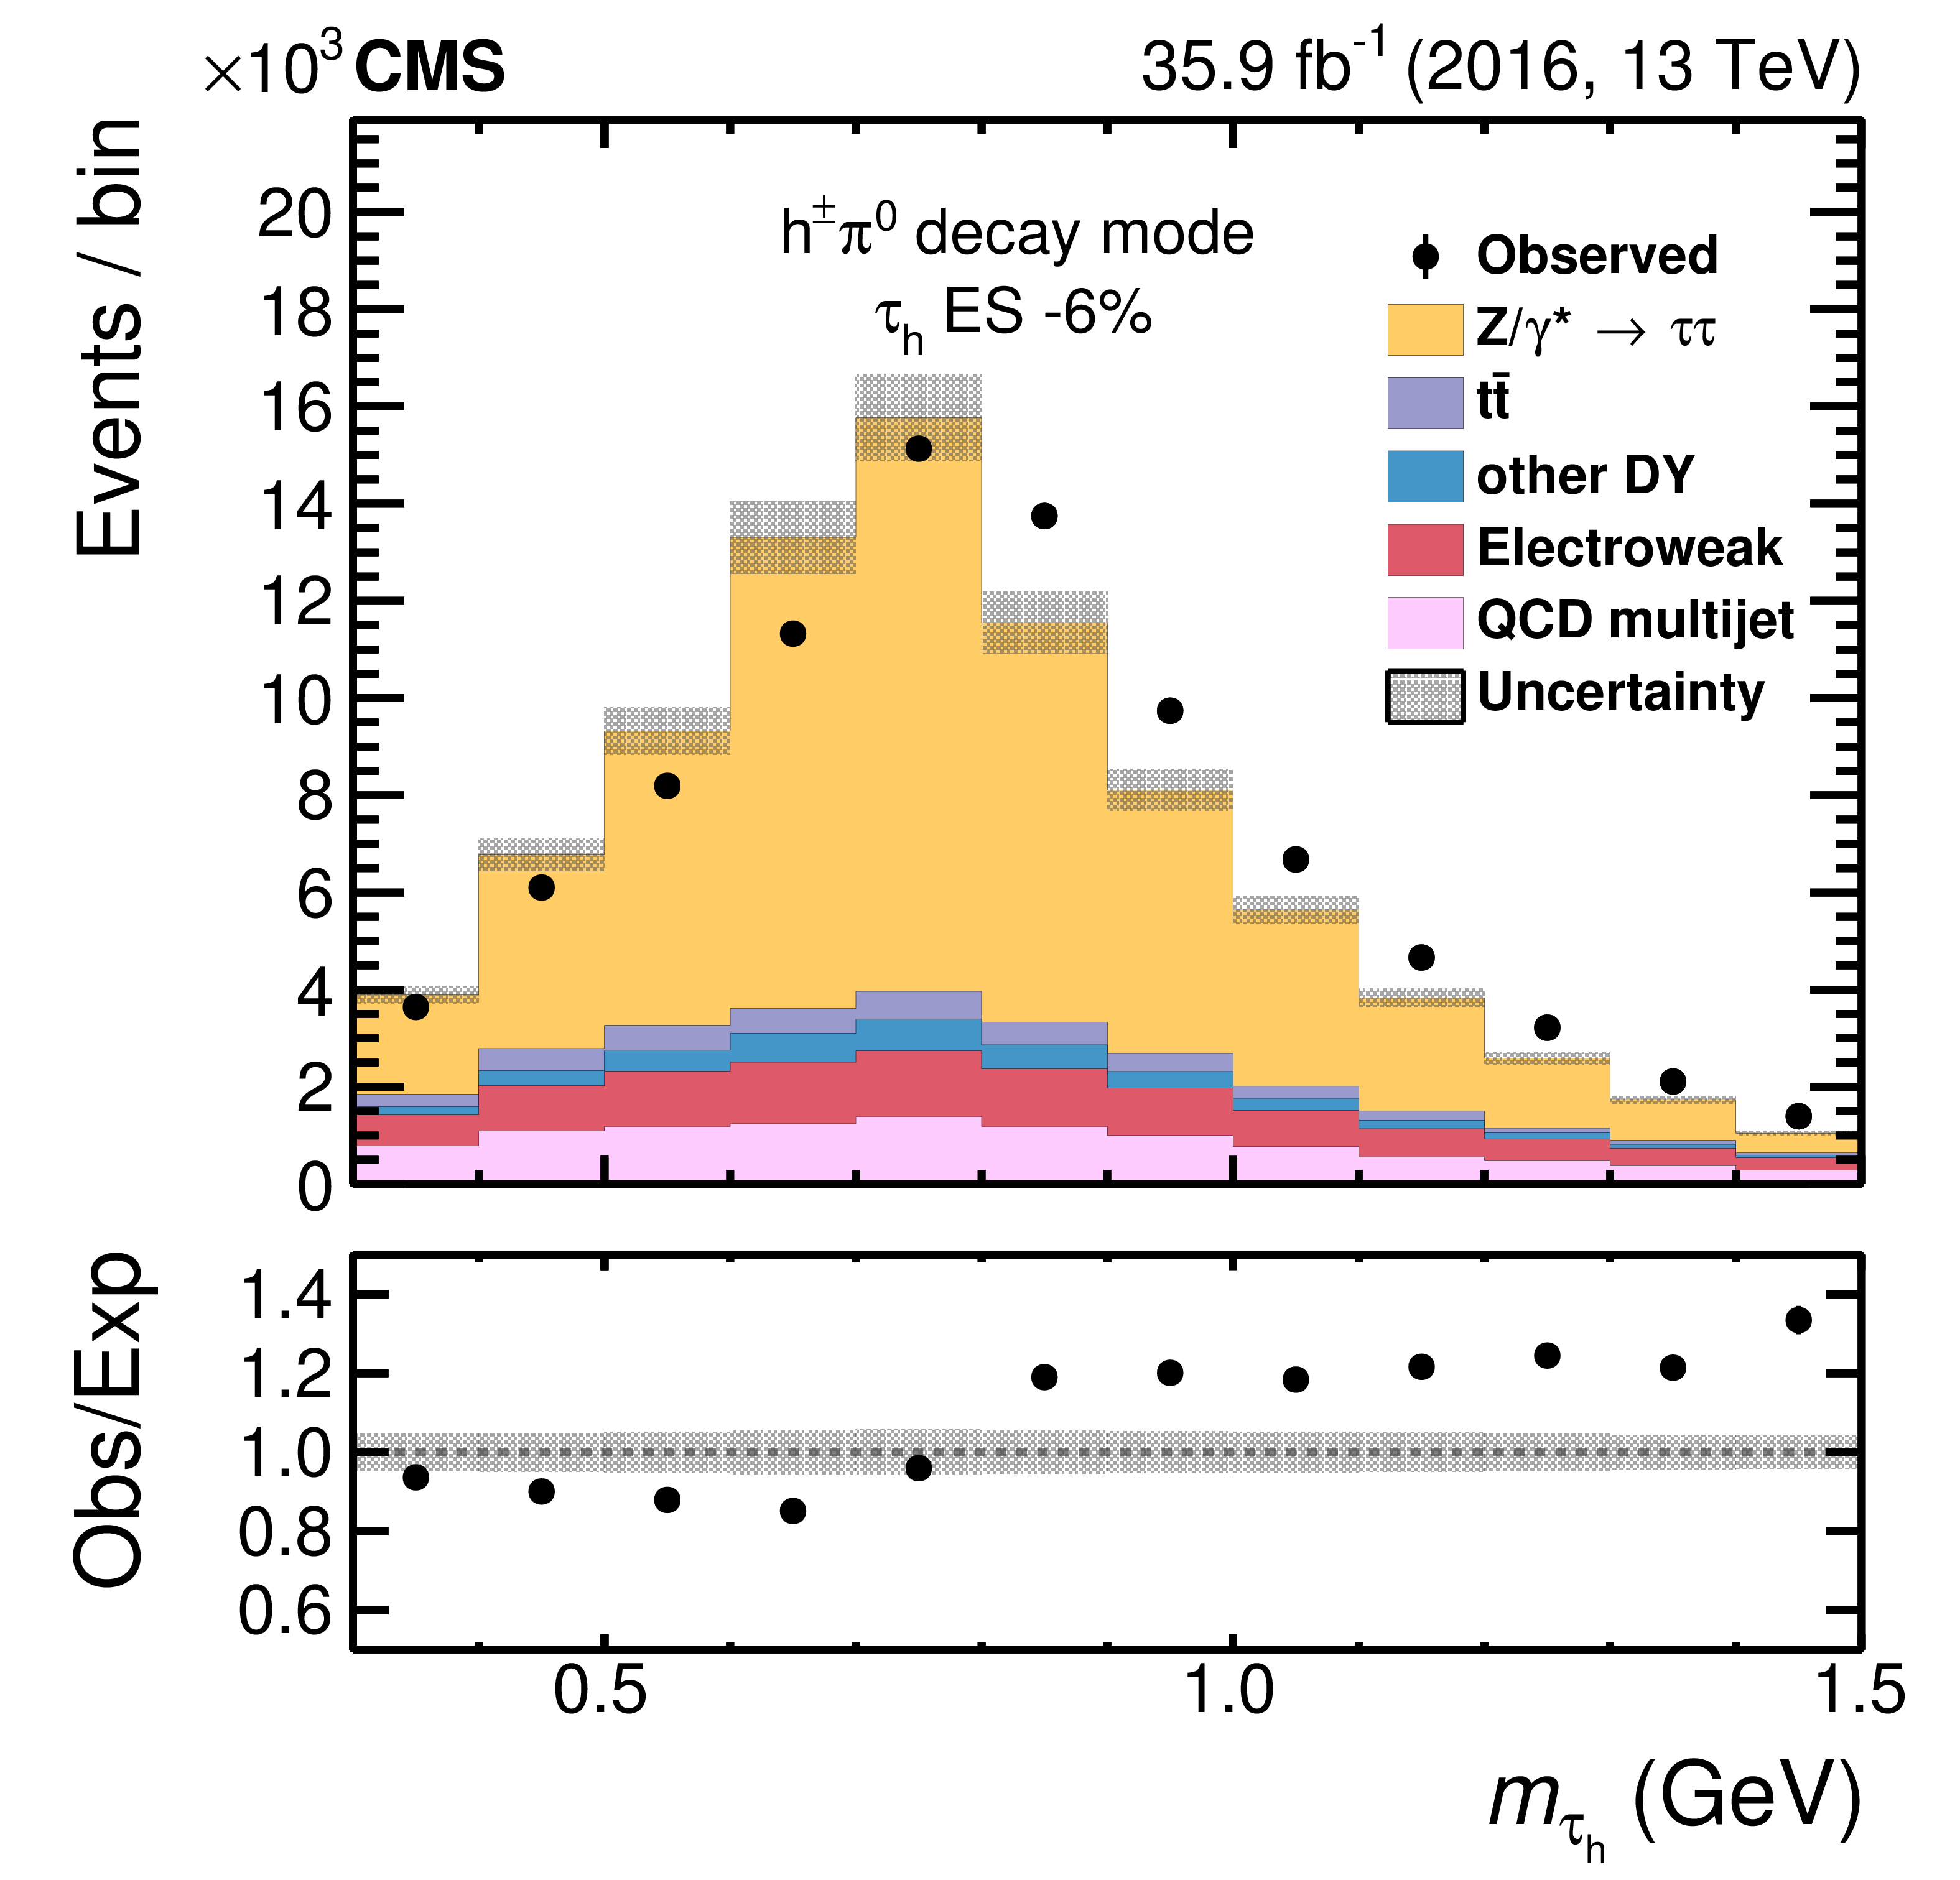
Figure 18-b:
The distributions in $m_{{{\tau} _\mathrm {h}}}$ for $ {{\mu}} {{\tau} _\mathrm {h}} $ events in the $ {\mathrm {h}^{\pm} {\pi ^0}} $ decay channel. The data are compared to predictions with $-$6% shift applied to the $ {{\tau} _\mathrm {h}} $ energy scale. The electroweak background includes contributions from W+jets (dominating), diboson, and single top quark events. Vertical bars (smaller than the symbol size) correspond to the statistical uncertainty in the data points (68% frequentist confidence intervals), while the shaded bands provide the expected systematic uncertainties. |
png pdf |
Figure 18-c:
The distributions in $m_{{{\tau} _\mathrm {h}}}$ for $ {{\mu}} {{\tau} _\mathrm {h}} $ events in the $ {\mathrm {h}^{\pm} {\pi ^0}} $ decay channel. The data are compared to predictions with $+$6% shift applied to the $ {{\tau} _\mathrm {h}} $ energy scale. The electroweak background includes contributions from W+jets (dominating), diboson, and single top quark events. Vertical bars (smaller than the symbol size) correspond to the statistical uncertainty in the data points (68% frequentist confidence intervals), while the shaded bands provide the expected systematic uncertainties. |
png pdf |
Figure 19:
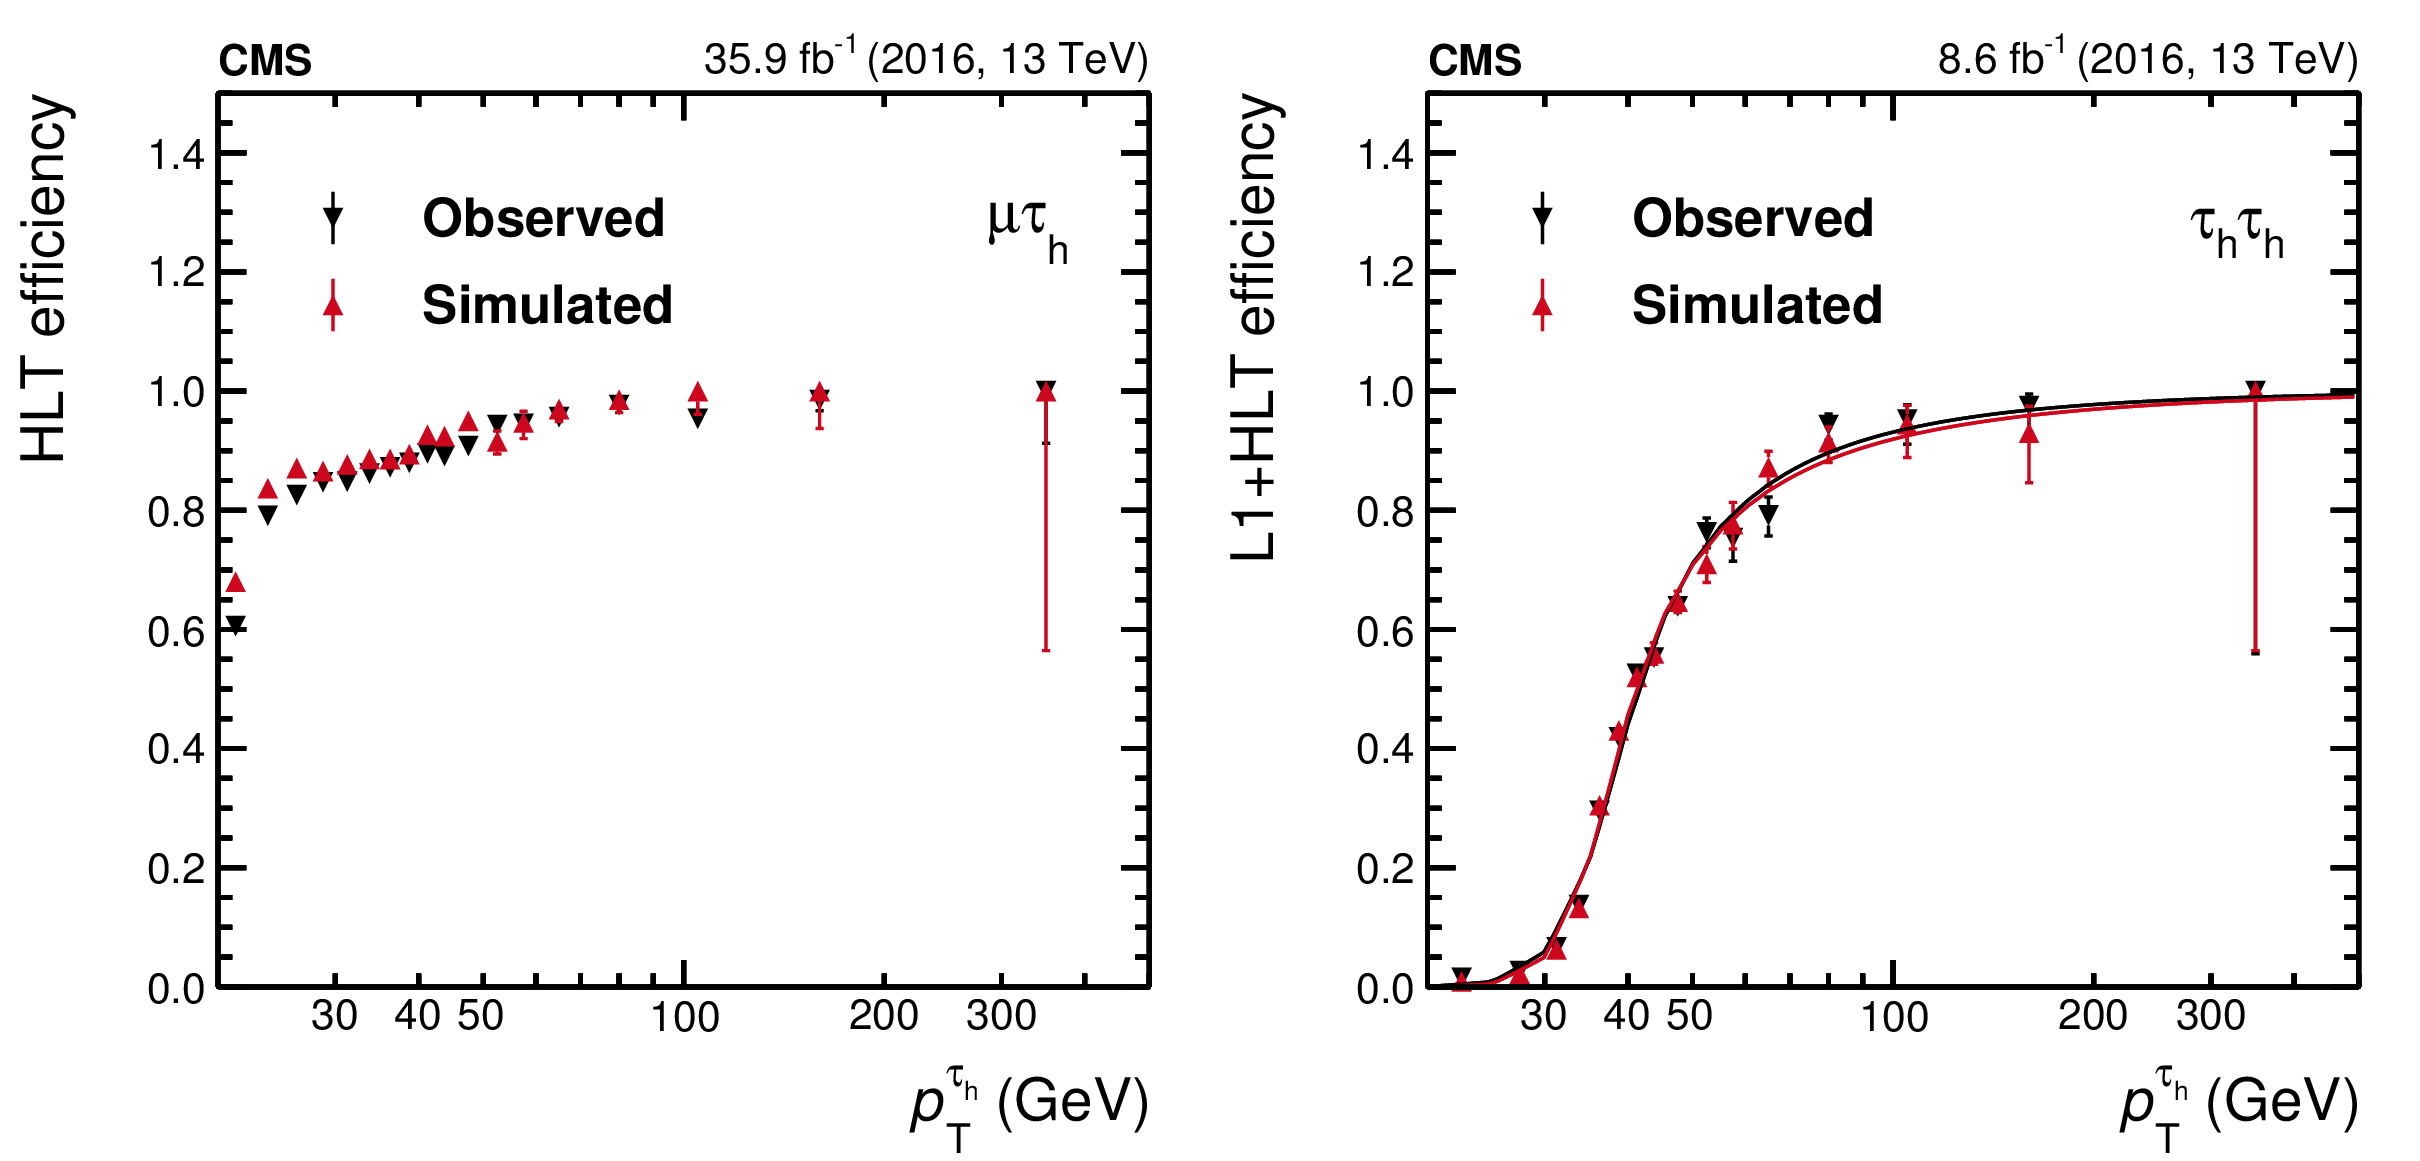
Single-$ {{\tau} _\mathrm {h}} $ efficiency of the $ {{\mu}} {{\tau} _\mathrm {h}} $ (left) and $ {{\tau} _\mathrm {h}} {{\tau} _\mathrm {h}} $ (right) triggers. The efficiency is computed per single $ {{\tau} _\mathrm {h}} $, using the tag-and-probe method as a function of the offline-reconstructed $ {p_{\mathrm {T}}} ^{{{\tau} _\mathrm {h}}}$. Observed data are compared to simulated $ {\mathrm {Z}}/ {\gamma ^{*}} \to {\tau} {\tau}$ events selected through the same procedure. Vertical bars correspond to the statistical uncertainties. The plot on the right has data points fitted using a cumulative (integral) distribution of the Crystal Ball function [76]. |

png pdf |
Figure 19-a:
Single-$ {{\tau} _\mathrm {h}} $ efficiency of the $ {{\mu}} {{\tau} _\mathrm {h}} $ trigger. The efficiency is computed per single $ {{\tau} _\mathrm {h}} $, using the tag-and-probe method as a function of the offline-reconstructed $ {p_{\mathrm {T}}} ^{{{\tau} _\mathrm {h}}}$. Observed data are compared to simulated $ {\mathrm {Z}}/ {\gamma ^{*}} \to {\tau} {\tau}$ events selected through the same procedure. Vertical bars correspond to the statistical uncertainties. |

png pdf |
Figure 19-b:
Single-$ {{\tau} _\mathrm {h}} $ efficiency of the $ {{\tau} _\mathrm {h}} {{\tau} _\mathrm {h}} $ trigger. The efficiency is computed per single $ {{\tau} _\mathrm {h}} $, using the tag-and-probe method as a function of the offline-reconstructed $ {p_{\mathrm {T}}} ^{{{\tau} _\mathrm {h}}}$. Observed data are compared to simulated $ {\mathrm {Z}}/ {\gamma ^{*}} \to {\tau} {\tau}$ events selected through the same procedure. Vertical bars correspond to the statistical uncertainties. Data points are fitted using a cumulative (integral) distribution of the Crystal Ball function [76]. |
| Tables | |
png pdf |
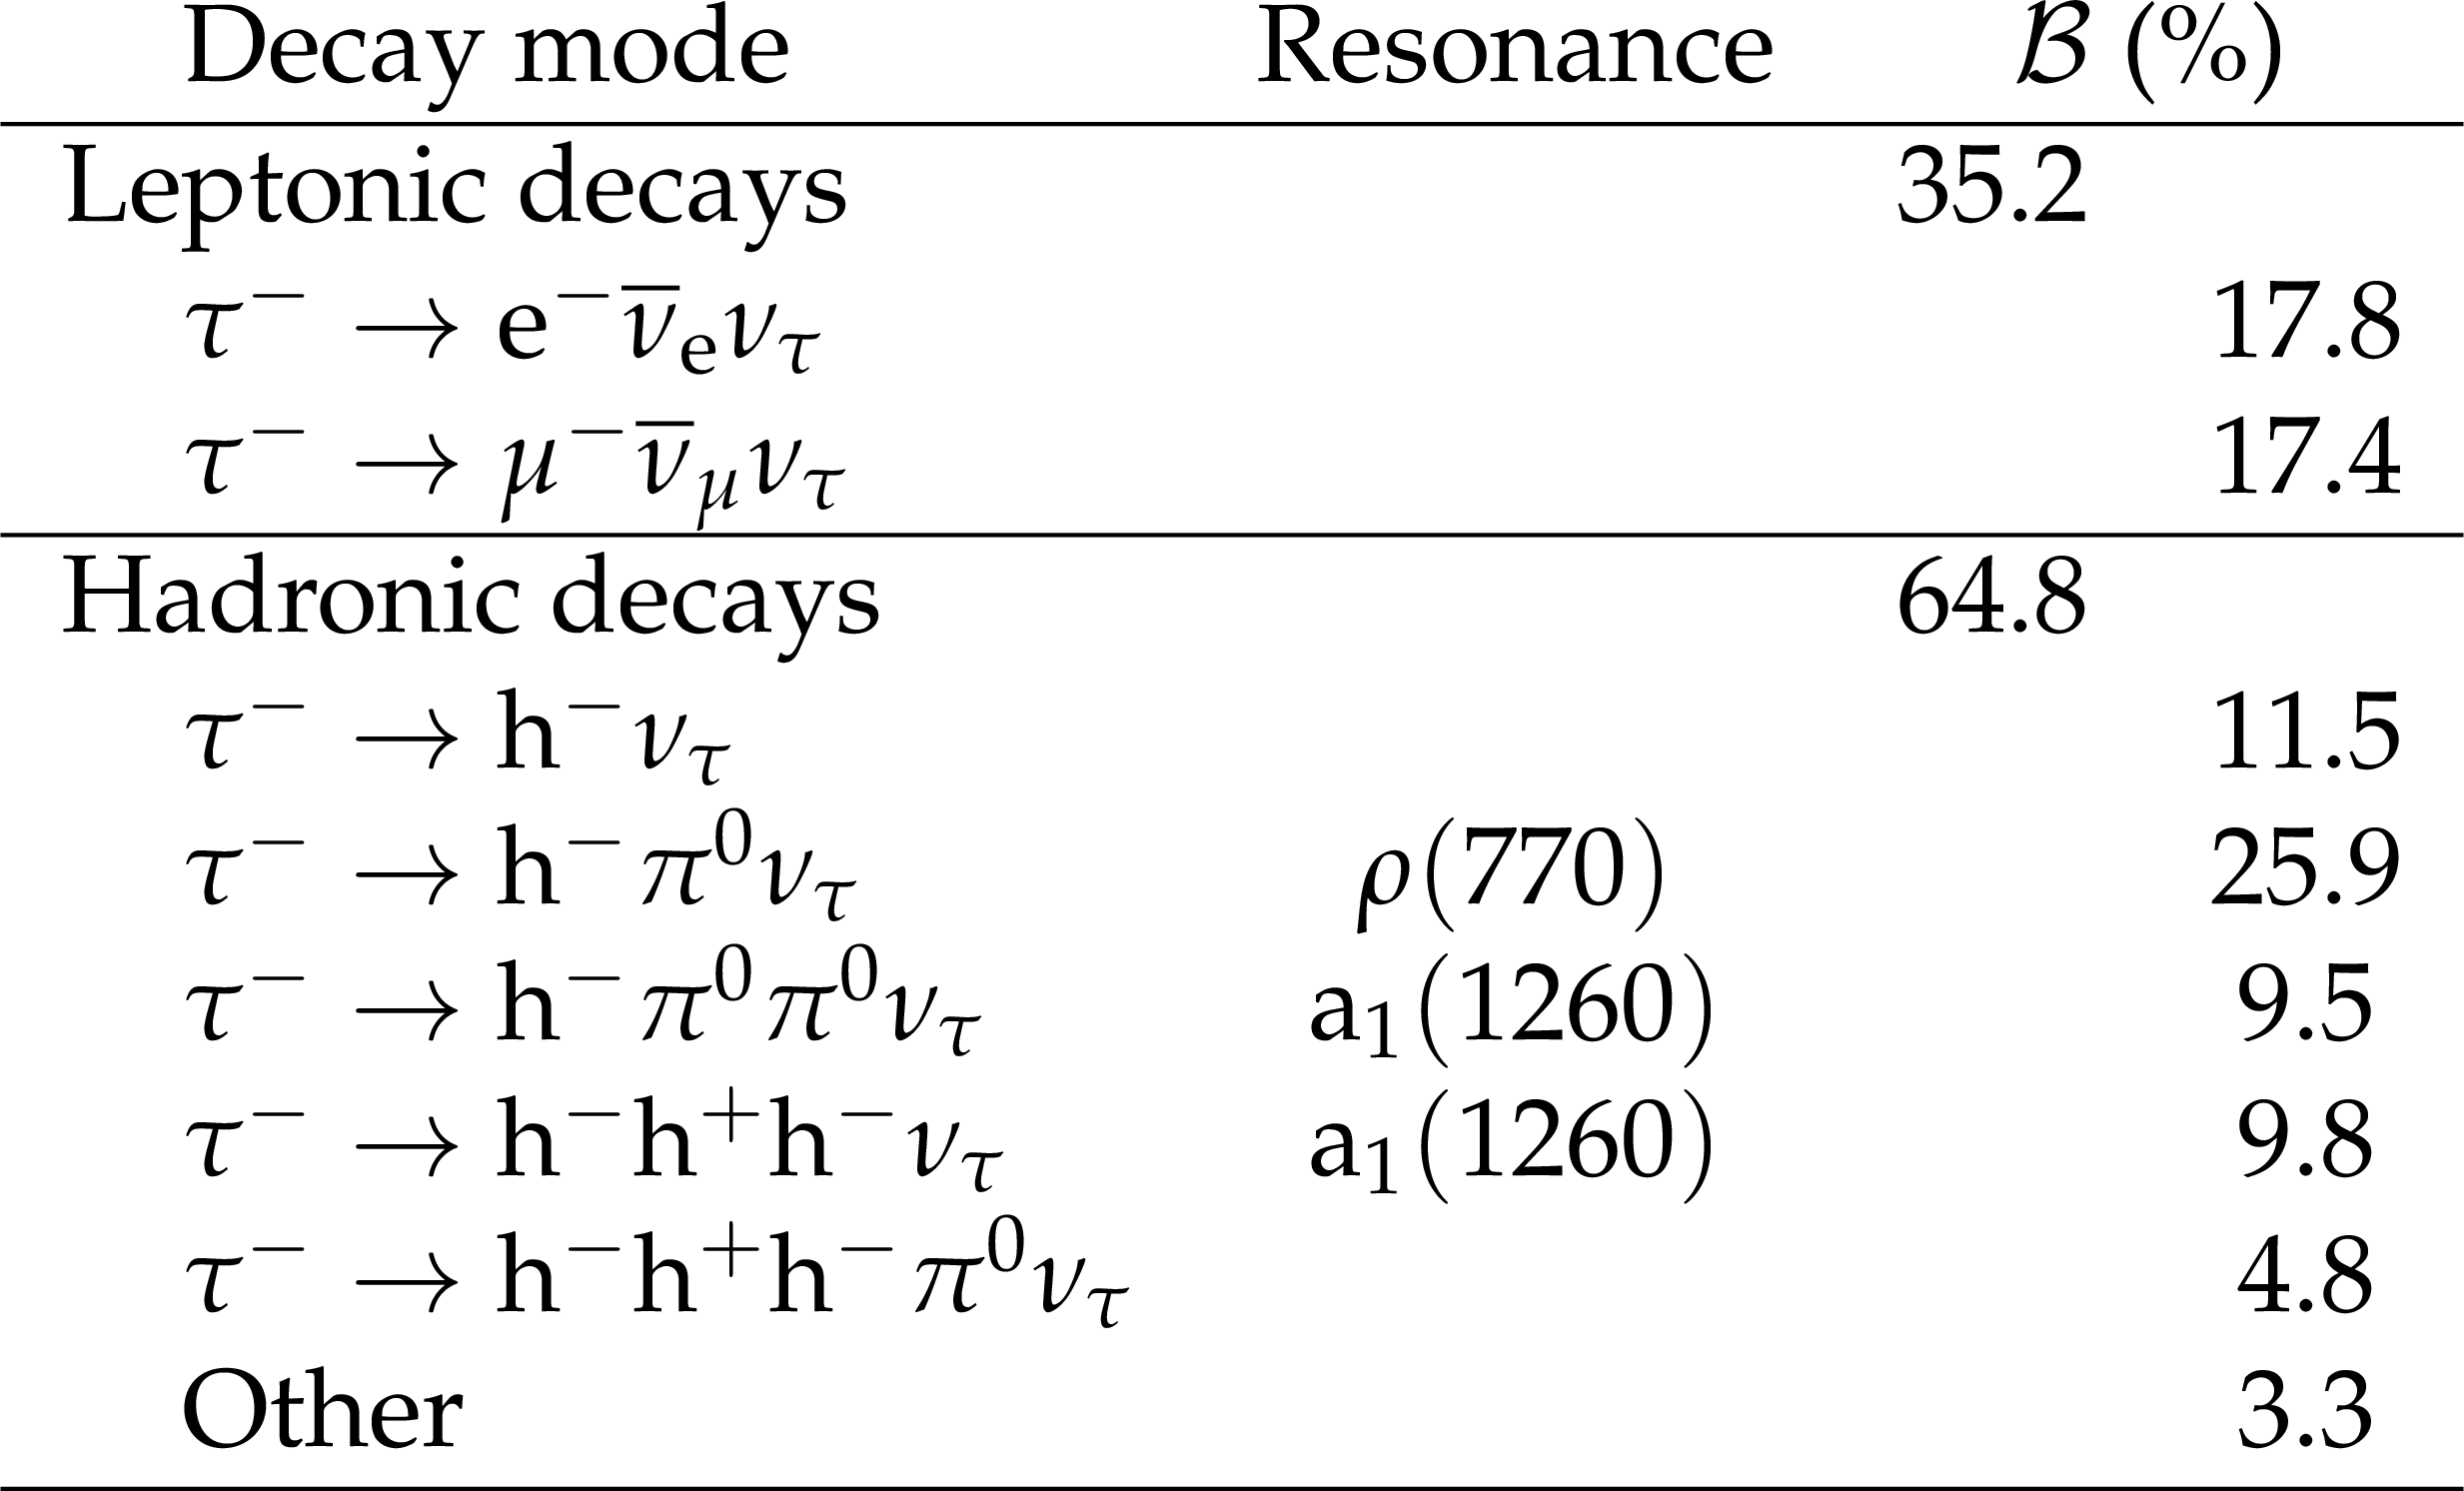
Table 1:
Tau lepton decays and their branching fractions. |

png pdf |
Table 2:
Systematic uncertainties affecting the measurements described in Sections 9-12. Given are the source of the uncertainty and whether the distribution in question is affected. |

png pdf |
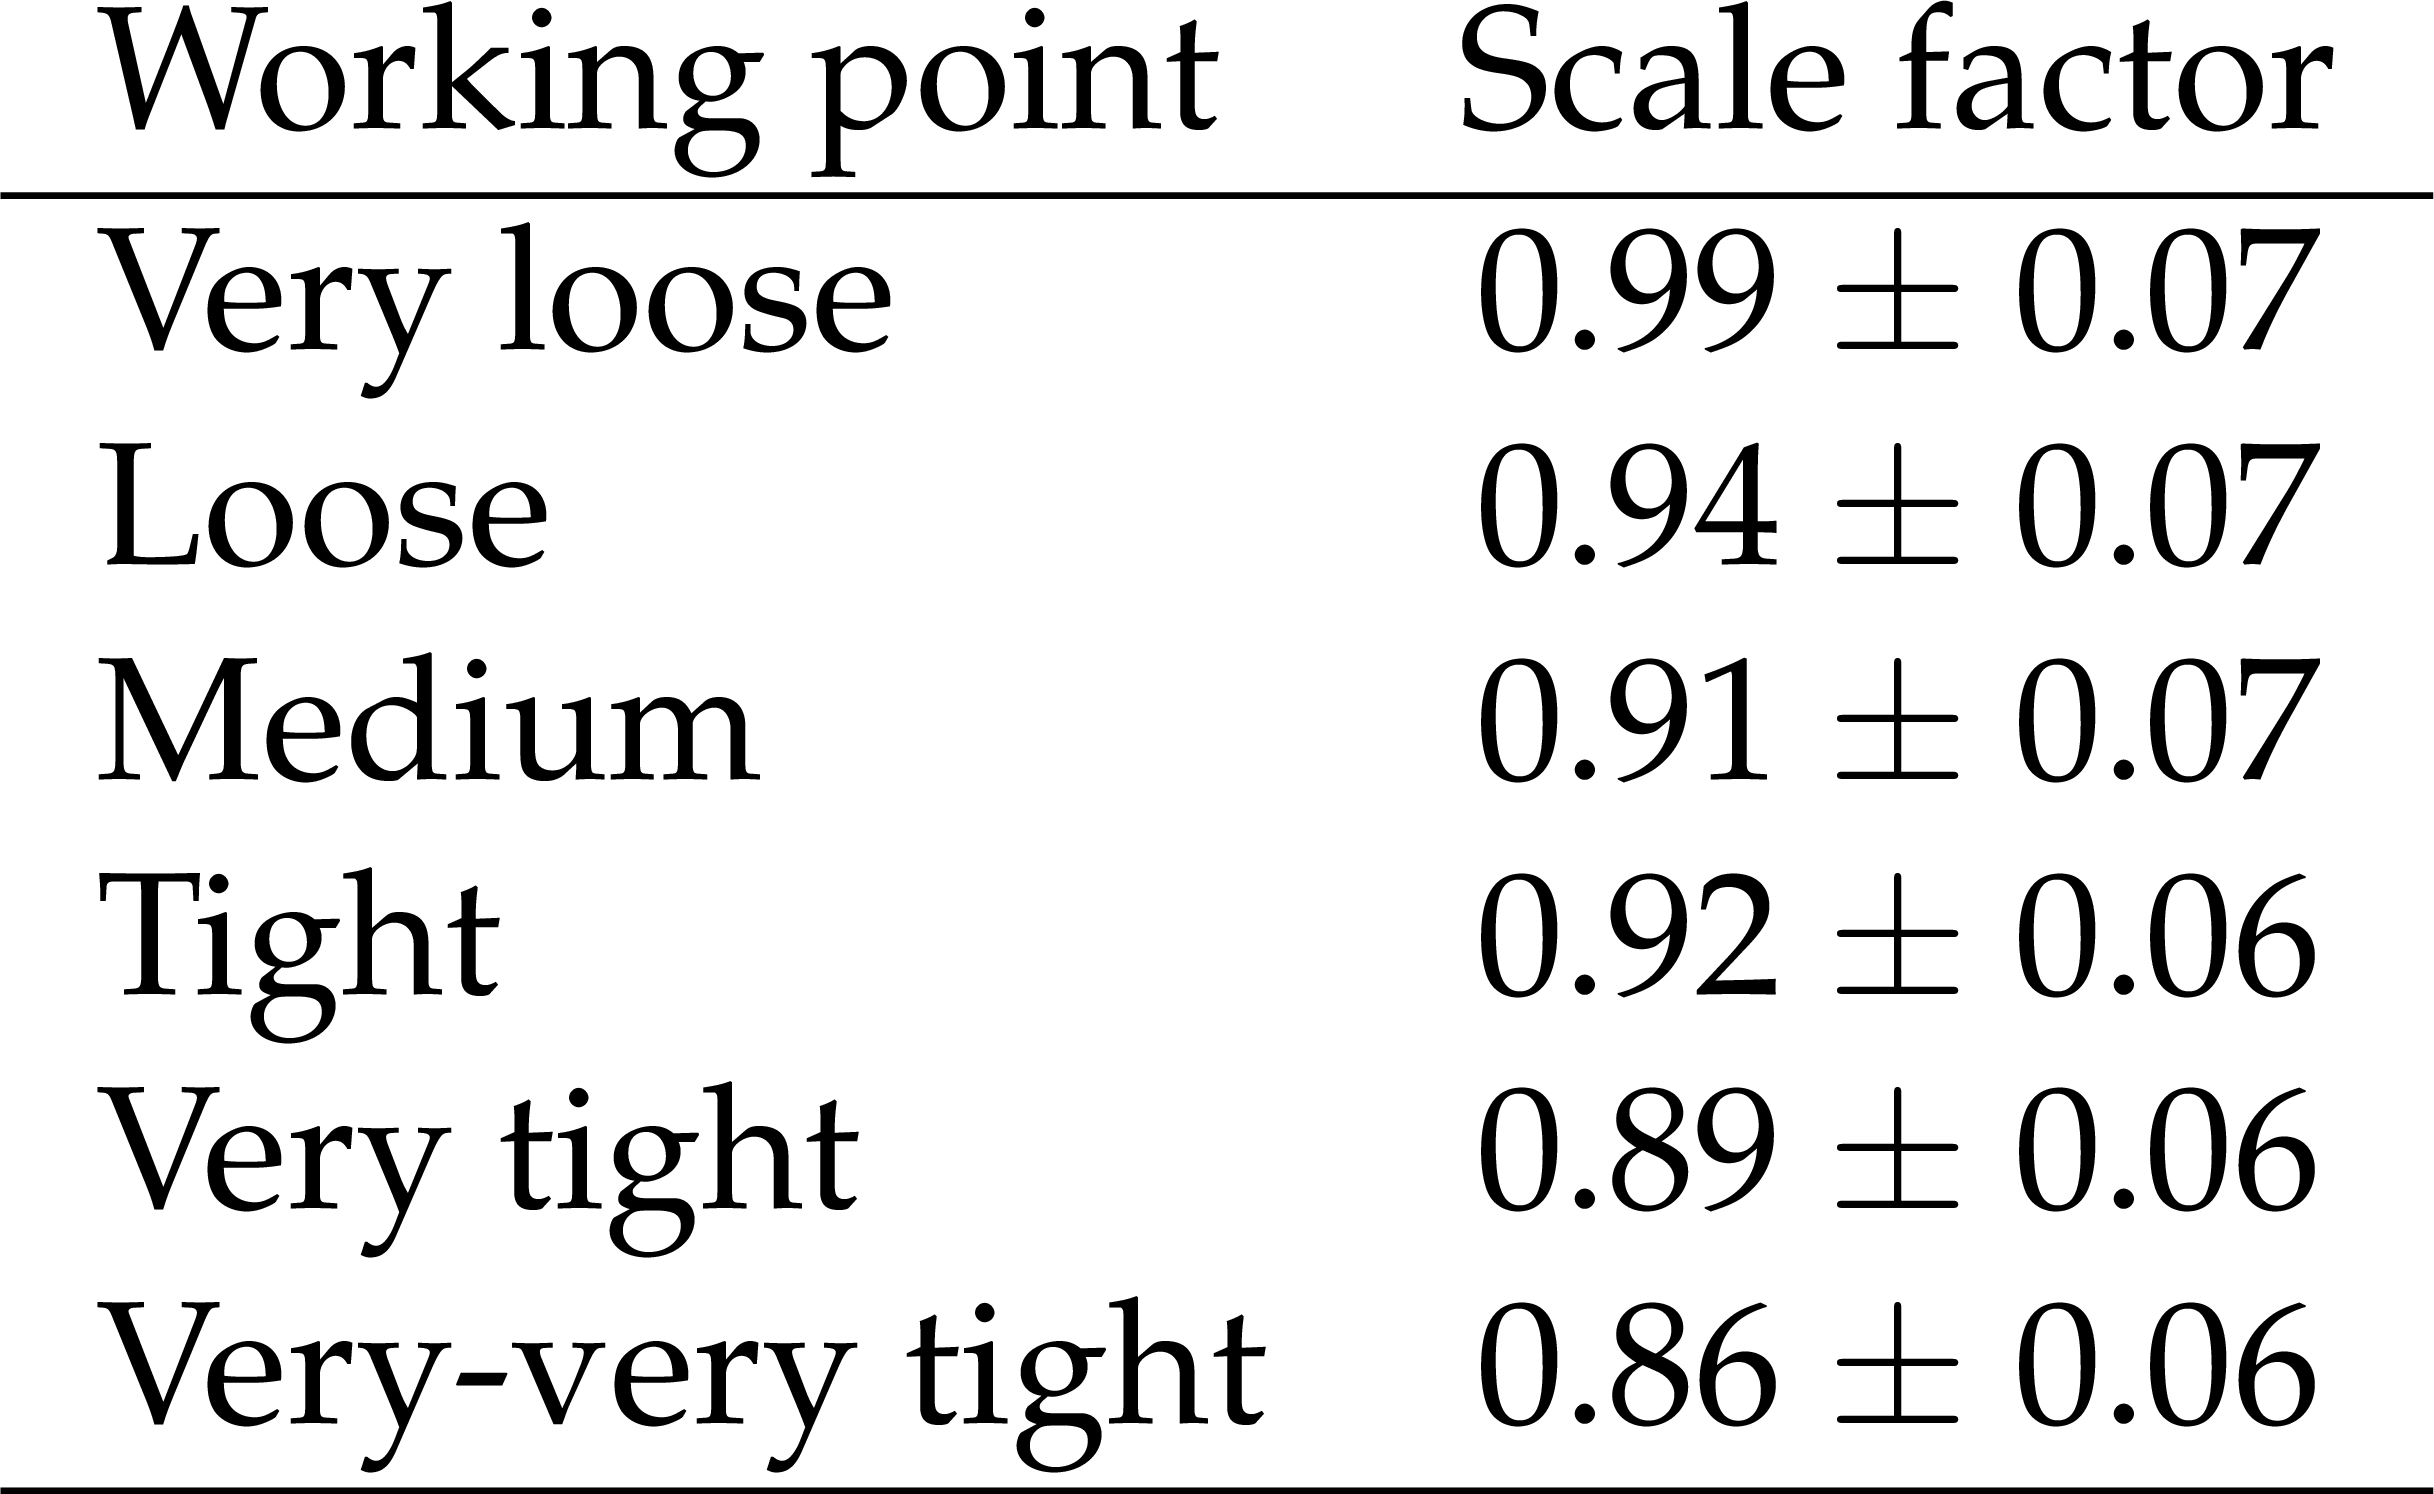
Table 3:
Data-to-simulation scale factors for different MVA-based isolation working points with $\Delta R=$ 0.5, measured using $ {\mathrm {Z}}/ {\gamma ^{*}} $ events. An uncertainty of 3.9% is added in quadrature to the uncertainty returned by the fit to account for the uncertainty in track reconstruction efficiency. |
png pdf |
Table 4:
Data-to-simulation scale factors for different MVA-based isolation working points obtained from $ {{\mathrm {t}\overline {\mathrm {t}}}} $ events. |
png pdf |
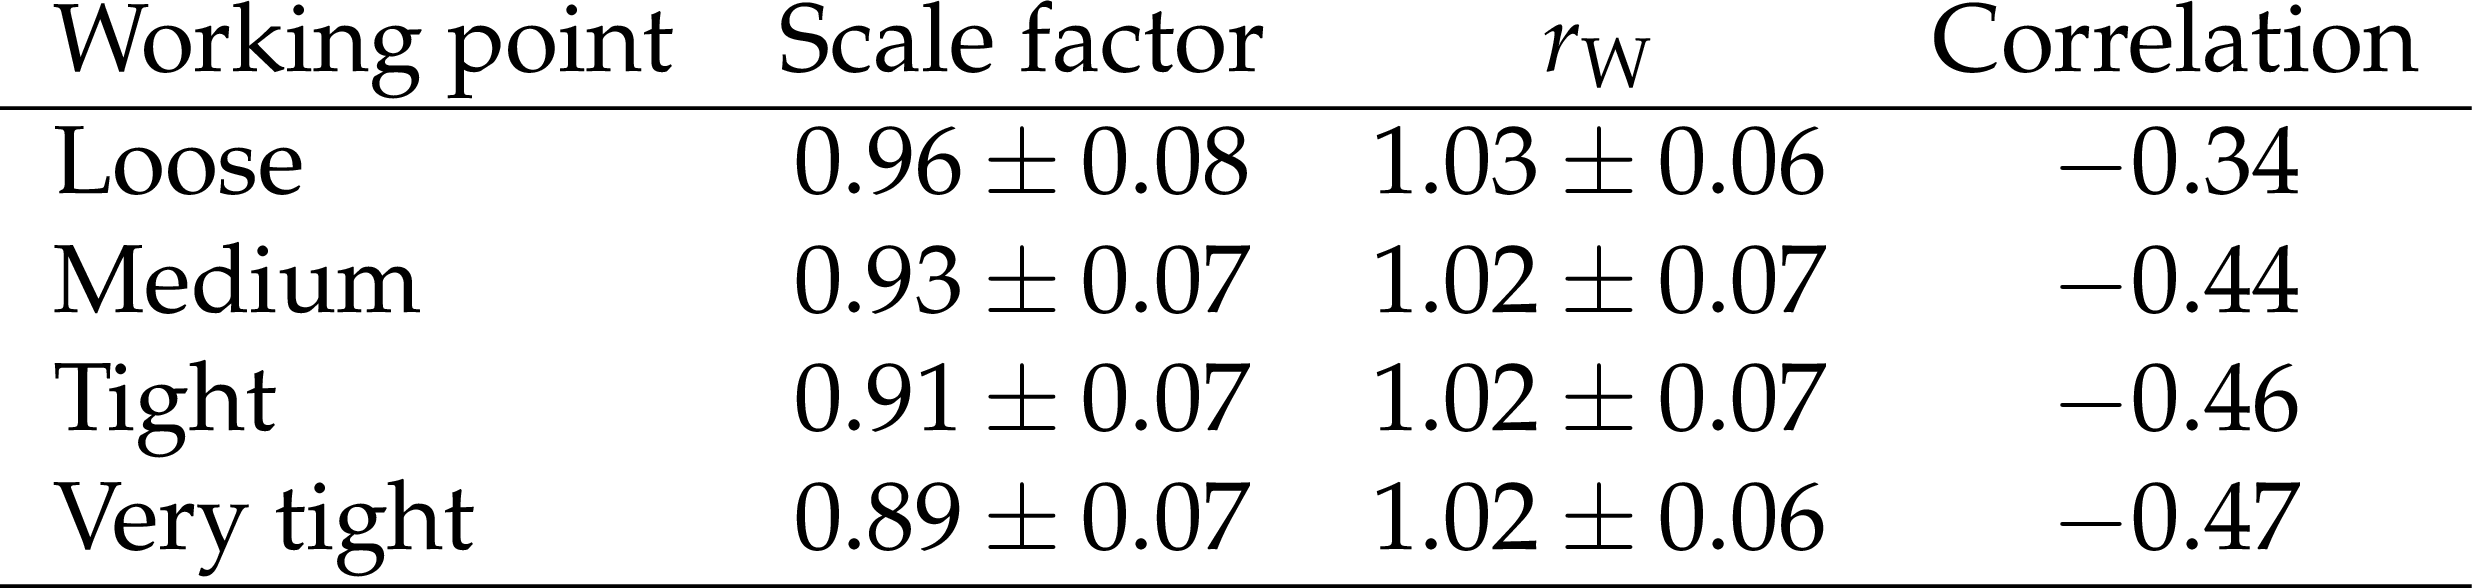
Table 5:
The scale factor in the $ {{\tau} _\mathrm {h}} $ identification efficiency, the normalization of W boson production with $m_{{\mathrm {W}}} > $ 200 GeV, $r_{{\mathrm {W}}}$, and the correlation coefficient between the two quantities obtained from the fit, measured for MVA-based discriminants using $\Delta R =$ 0.5 in $ {\mathrm {W}}\to {\tau} {\nu}$ events. |

png pdf |
Table 6:
Data-to-simulation scale factors for different working points of the MVA-based isolation discriminant, using highly boosted $ {\mathrm {Z}}/ {\gamma ^{*}} $ events decaying to $ {\tau}$ lepton pairs. |
png pdf |
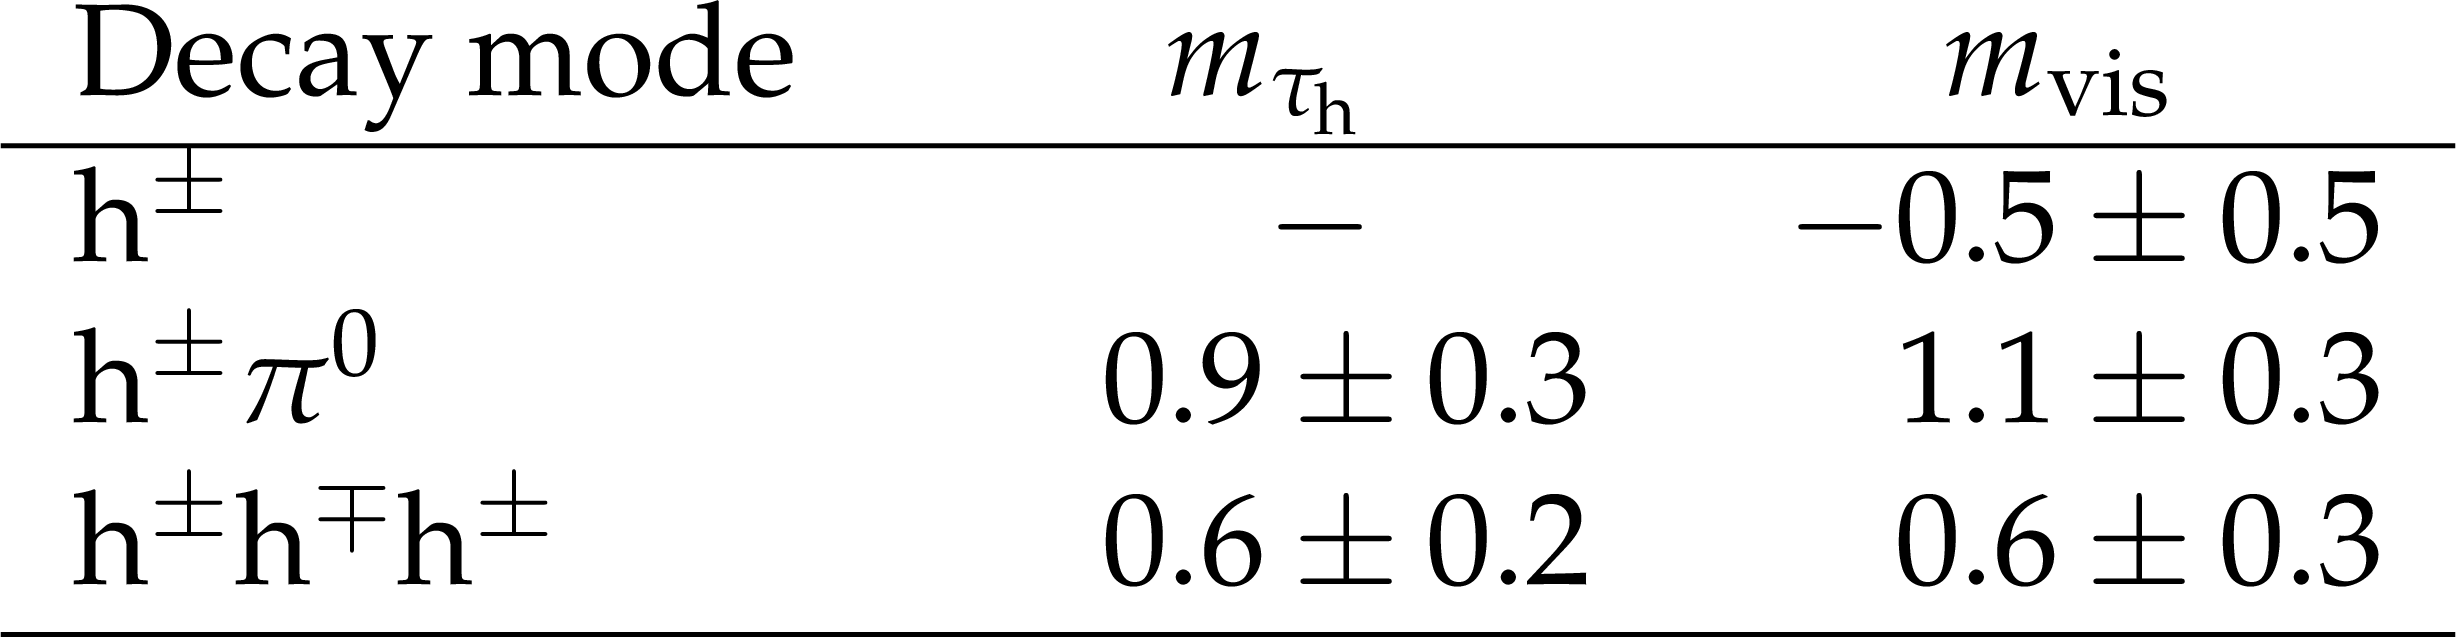
Table 7:
Numerical results of the tau energy scale measurements. |
png pdf |
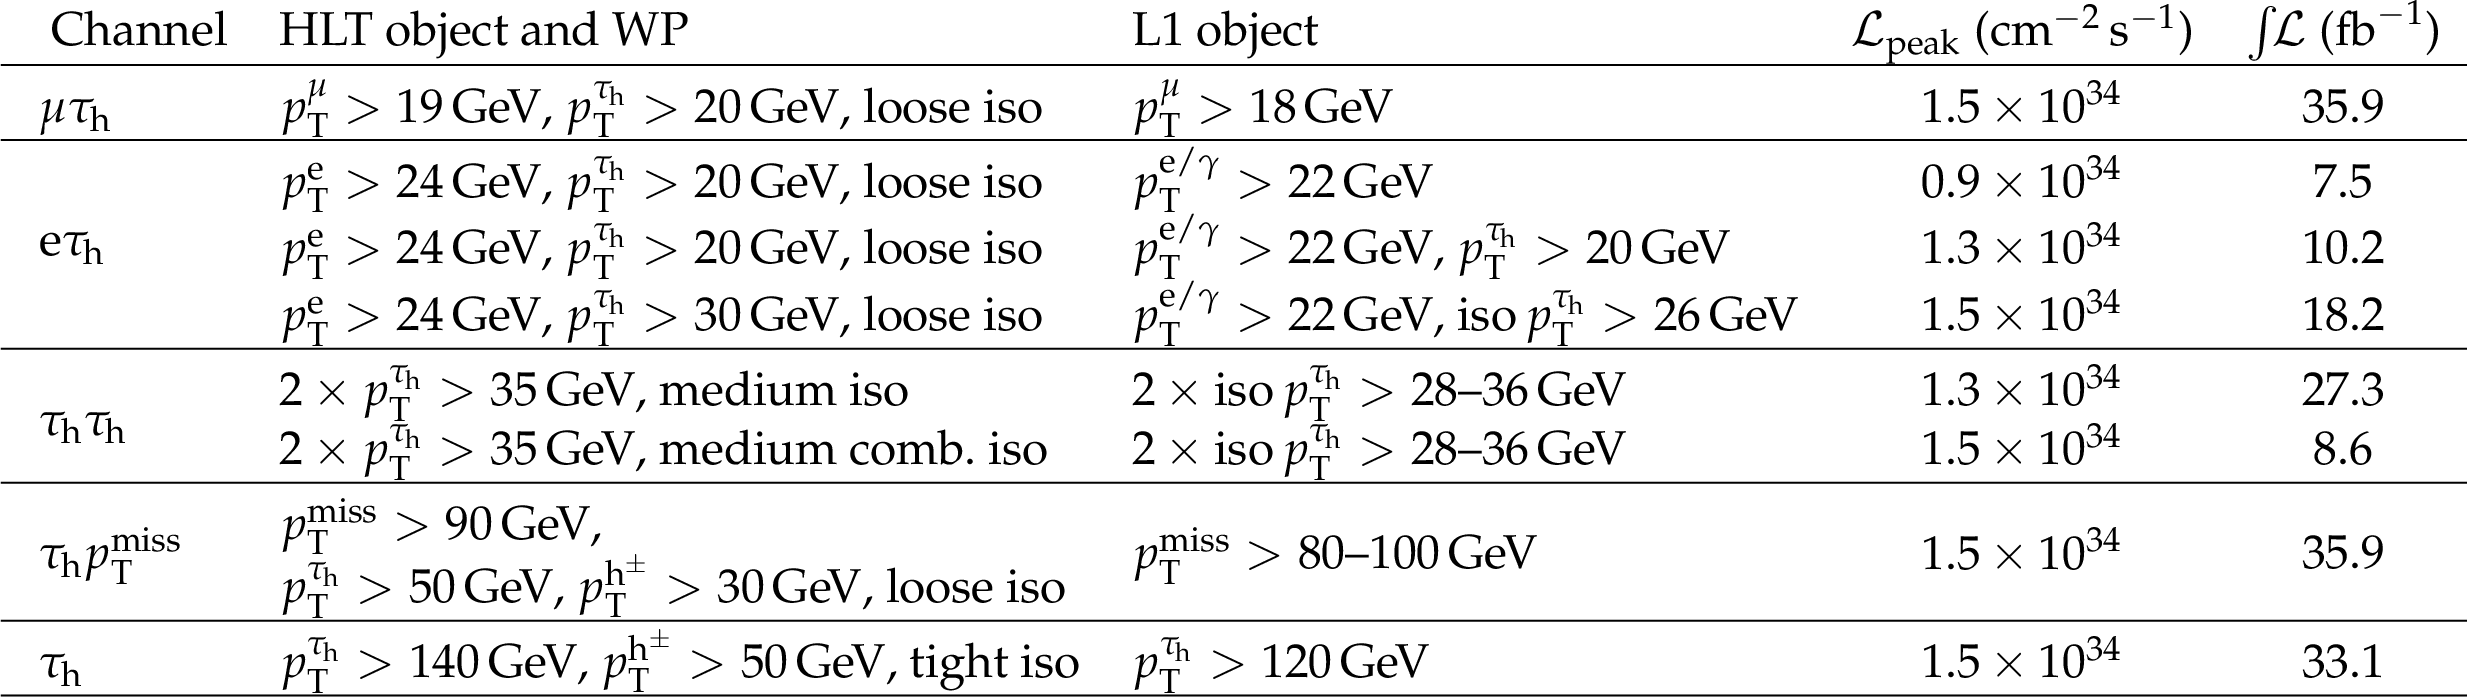
Table 8:
Triggers with $ {{\tau} _\mathrm {h}} $ candidates used to record pp collisions in 2016: the final state (Channel), HLT $ {p_{\mathrm {T}}} $ thresholds and $ {{\tau} _\mathrm {h}} $ isolation working point, L1 $ {p_{\mathrm {T}}} $ thresholds, peak instantaneous luminosity ($ {\mathcal {L}} _\text {peak}$) in the period of operation as main trigger, and integrated luminosity (${\mathcal {L}} $) collected with the trigger. The $ {{\tau} _\mathrm {h}} {{\tau} _\mathrm {h}} $ and $ {{\tau} _\mathrm {h}} {{p_{\mathrm {T}}} ^\text {miss}} $ triggers are seeded by sets of L1 triggers with thresholds dynamically adjusted as a function of the instantaneous luminosity to maintain a constant L1 rate, given by the ranges in $ {p_{\mathrm {T}}}$. The trigger $ {p_{\mathrm {T}}} $ thresholds and isolation criteria were successively tightened over the data-taking period to keep the rate of events passing HLT approximately constant with increasing instantaneous luminosity. |
| Summary |
|
The "hadron-plus-strips'' algorithm developed at the CMS experiment to reconstruct and identify $\tau\to\text{hadrons}+\nu_{\tau}$ decays in proton-proton collisions at $\sqrt{s}=$ 7 and 8 TeV, as presented in Ref. [24], has been improved. The changes include a dynamic strip reconstruction, the reconstruction of highly boosted $\tau$ lepton pairs, and the introduction of additional variables in the multivariate-analysis discriminants used to reject jets and electrons. The isolation discriminants have also been optimized to cope with the large pileup of events in $\sqrt{s} = $ 13 TeV proton-proton runs. The performance of the improved algorithm has been measured using 35.9 fb$^{-1}$ of data recorded during 2016 at $\sqrt{s} = $ 13 TeV. The ${\tau_\mathrm{h}}$ identification efficiency in data at low, intermediate, and high transverse momenta, as well as for highly Lorentz-boosted $\tau$ lepton pairs, is similar to that expected from Monte Carlo simulation, while differences of 10-20% are found between data and simulation for the $\text{jet} \mapsto {\tau_\mathrm{h}}$ misidentification probability. The $\mathrm{e} \mapsto {\tau_\mathrm{h}}$ and $\mu \mapsto {\tau_\mathrm{h}}$ misidentification probabilities are smaller than those of the previous version of the algorithm under the same running conditions, while maintaining a high efficiency for the selection of genuine ${\tau_\mathrm{h}}$ candidates. The corresponding data-to-simulation scale factors have also been determined. The energy scale of ${\tau_\mathrm{h}}$ candidates is measured, and its response relative to Monte Carlo simulation is found to be close to unity. Finally, a specialized ${\tau_\mathrm{h}}$ reconstruction and identification algorithm has been used in the high-level trigger, and its performance has been presented. |
| References | ||||
| 1 | ATLAS, CMS Collaboration | Measurements of the Higgs boson production and decay rates and constraints on its couplings from a combined ATLAS and CMS analysis of the LHC pp collision data at $ \sqrt{s}= $ 7 and 8 TeV | JHEP 08 (2016) 045 | 1606.02266 |
| 2 | CMS Collaboration | Observation of the Higgs boson decay to a pair of tau leptons | PLB 779 (2018) 283 | CMS-HIG-16-043 1708.00373 |
| 3 | P. Fayet | Supergauge Invariant Extension of the Higgs Mechanism and a Model for the Electron and its Neutrino | NPB 90 (1975) 104 | |
| 4 | P. Fayet | Spontaneously Broken Supersymmetric Theories of Weak, Electromagnetic and Strong Interactions | PLB 69 (1977) 489 | |
| 5 | CMS Collaboration | Search for neutral MSSM Higgs bosons decaying to a pair of tau leptons in pp collisions | JHEP 10 (2014) 160 | CMS-HIG-13-021 1408.3316 |
| 6 | CMS Collaboration | Search for a charged Higgs boson in pp collisions at $ \sqrt{s}= $ 8 TeV | JHEP 11 (2015) 018 | CMS-HIG-14-023 1508.07774 |
| 7 | ATLAS Collaboration | Search for the neutral Higgs bosons of the Minimal Supersymmetric Standard Model in pp collisions at $ \sqrt{s}= $ 7 ~TeV with the ATLAS detector | JHEP 02 (2013) 095 | 1211.6956 |
| 8 | CMS Collaboration | Searches for a heavy scalar boson $ \mathrm{H} $ decaying to a pair of 125 GeV Higgs bosons $ \mathrm{hh} $ or for a heavy pseudoscalar boson $ \mathrm{A} $ decaying to $ \mathrm{Zh} $, in the final states with $ \mathrm{h} \to \tau \tau $ | PLB 755 (2016) 217 | CMS-HIG-14-034 1510.01181 |
| 9 | CMS Collaboration | Search for lepton flavour violating decays of the Higgs boson to $ \mathrm{e}\tau $ and $ \mathrm{e}\mu $ in proton-proton collisions at $ \sqrt{s}= $ 8 TeV | PLB 763 (2016) 472 | CMS-HIG-14-040 1607.03561 |
| 10 | CMS Collaboration | Search for Lepton-Flavour-Violating Decays of the Higgs Boson | PLB 749 (2015) 337 | CMS-HIG-14-005 1502.07400 |
| 11 | ATLAS Collaboration | Search for additional heavy neutral Higgs and gauge bosons in the ditau final state produced in 36 fb$ ^{-1} $ of pp collisions at $ \sqrt{s}= $ 13 ~TeV with the ATLAS detector | JHEP 01 (2018) 055 | 1709.07242 |
| 12 | CMS Collaboration | Search for Third-Generation Scalar Leptoquarks in the t$ \tau $ Channel in Proton-Proton Collisions at $ \sqrt{s} = $ 8 TeV | JHEP 07 (2015) 042 | CMS-EXO-14-008 1503.09049 |
| 13 | CMS Collaboration | Search for electroweak production of charginos in final states with two $ \tau $ leptons in pp collisions at $ \sqrt{s}= $ 8 TeV | JHEP 04 (2017) 018 | CMS-SUS-14-022 1610.04870 |
| 14 | CMS Collaboration | Search for physics beyond the standard model in events with $ \tau $ leptons, jets, and large transverse momentum imbalance in pp collisions at $ \sqrt{s} = $ 7 TeV | EPJC 73 (2013) 2493 | CMS-SUS-12-004 1301.3792 |
| 15 | ATLAS Collaboration | Search for the direct production of charginos and neutralinos in final states with tau leptons in $ \sqrt{s} = $ 13 TeV pp collisions with the ATLAS detector | EPJC 78 (2018) 154 | 1708.07875 |
| 16 | ATLAS Collaboration | Search for top squarks decaying to tau sleptons in pp collisions at $ \sqrt{s} = $ 13 ~TeV with the ATLAS detector | PRD 98 (2018) 032008 | 1803.10178 |
| 17 | CMS Collaboration | Search for high mass resonances decaying into $ \tau^- $ lepton pairs in pp collisions at $ \sqrt{s}= $ 7 TeV | PLB 716 (2012) 82 | CMS-EXO-11-031 1206.1725 |
| 18 | CMS Collaboration | Search for W' decaying to tau lepton and neutrino in proton-proton collisions at $ \sqrt{s} = $ 8 TeV | PLB 755 (2016) 196 | CMS-EXO-12-011 1508.04308 |
| 19 | ATLAS Collaboration | Search for High-Mass Resonances Decaying to $ \tau\nu $ in pp Collisions at $ \sqrt{s}= $ 13 ~TeV with the ATLAS Detector | PRL 120 (2018) 161802 | 1801.06992 |
| 20 | Particle Data Group | Review of Particle Physics | CPC 40 (2016) 100001 | |
| 21 | CMS Collaboration | Performance of electron reconstruction and selection with the CMS detector in proton-proton collisions at $ \sqrt{s}= $ 8 TeV | JINST 10 (2015) P06005 | CMS-EGM-13-001 1502.02701 |
| 22 | CMS Collaboration | Performance of the CMS muon detector and muon reconstruction with proton-proton collisions at $ \sqrt{s}= $ 13 TeV | JINST 13 (2018) P06015 | CMS-MUO-16-001 1804.04528 |
| 23 | CMS Collaboration | Performance of tau-lepton reconstruction and identification in CMS | JINST 7 (2012) P01001 | CMS-TAU-11-001 1109.6034 |
| 24 | CMS Collaboration | Reconstruction and identification of $ \tau $ lepton decays to hadrons and $ \nu_\tau $ at CMS | JINST 11 (2016) P01019 | CMS-TAU-14-001 1510.07488 |
| 25 | CMS Collaboration | CMS Tracking Performance Results from early LHC Operation | EPJC 70 (2010) 1165 | CMS-TRK-10-001 1007.1988 |
| 26 | CMS Collaboration | Description and performance of track and primary-vertex reconstruction with the CMS tracker | JINST 9 (2014) P10009 | CMS-TRK-11-001 1405.6569 |
| 27 | CMS Collaboration | The CMS trigger system | JINST 12 (2017) P01020 | CMS-TRG-12-001 1609.02366 |
| 28 | CMS Collaboration | The CMS experiment at the CERN LHC | JINST 3 (2008) S08004 | CMS-00-001 |
| 29 | P. Nason | A new method for combining NLO QCD with shower Monte Carlo algorithms | JHEP 11 (2004) 040 | hep-ph/0409146 |
| 30 | S. Frixione, P. Nason, and C. Oleari | Matching NLO QCD computations with Parton Shower simulations: the POWHEG method | JHEP 11 (2007) 070 | 0709.2092 |
| 31 | S. Alioli, P. Nason, C. Oleari, and E. Re | A general framework for implementing NLO calculations in shower Monte Carlo programs: the POWHEG BOX | JHEP 06 (2010) 043 | 1002.2581 |
| 32 | S. Alioli, P. Nason, C. Oleari, and E. Re | NLO Higgs boson production via gluon fusion matched with shower in POWHEG | JHEP 04 (2009) 002 | 0812.0578 |
| 33 | P. Nason and C. Oleari | NLO Higgs boson production via vector-boson fusion matched with shower in POWHEG | JHEP 02 (2010) 037 | 0911.5299 |
| 34 | T. Sjostrand, S. Mrenna, and P. Z. Skands | A Brief Introduction to PYTHIA 8.1 | CPC 178 (2008) 852 | 0710.3820 |
| 35 | J. Alwall et al. | The automated computation of tree-level and next-to-leading order differential cross sections, and their matching to parton shower simulations | JHEP 07 (2014) 079 | 1405.0301 |
| 36 | J. Alwall et al. | Comparative study of various algorithms for the merging of parton showers and matrix elements in hadronic collisions | EPJC 53 (2008) 473 | 0706.2569 |
| 37 | S. Alioli, P. Nason, C. Oleari, and E. Re | NLO single-top production matched with shower in POWHEG: $ s $- and $ t $-channel contributions | JHEP 09 (2009) 111 | 0907.4076 |
| 38 | E. Re | Single-top Wt-channel production matched with parton showers using the POWHEG method | EPJC 71 (2011) 1547 | 1009.2450 |
| 39 | J. M. Campbell, R. K. Ellis, P. Nason, and E. Re | Top-Pair Production and Decay at NLO Matched with Parton Showers | JHEP 04 (2015) 114 | 1412.1828 |
| 40 | R. Frederix and S. Frixione | Merging meets matching in MC@NLO | JHEP 12 (2012) 061 | 1209.6215 |
| 41 | P. Nason and G. Zanderighi | $ W^+ W^- $, $ W Z $ and $ Z Z $ production in the POWHEG-BOX-V2 | EPJC 74 (2014) 2702 | 1311.1365 |
| 42 | CMS Collaboration | Event generator tunes obtained from underlying event and multiparton scattering measurements | EPJC 76 (2016) 155 | CMS-GEN-14-001 1512.00815 |
| 43 | K. Melnikov and F. Petriello | Electroweak gauge boson production at hadron colliders through $ \mathcal{O}(\alpha_{S}^{2}) $ | PRD 74 (2006) 114017 | hep-ph/0609070 |
| 44 | K. Melnikov and F. Petriello | $ W $ Boson Production Cross Section at the Large Hadron Collider with $ \mathcal{O}(\alpha^2_s) $ Corrections | PRL 96 (2006) 231803 | hep-ph/0603182 |
| 45 | R. Gavin, Y. Li, F. Petriello, and S. Quackenbush | FEWZ 2.0: A code for hadronic Z production at next-to-next-to-leading order | CPC 182 (2011) 2388 | 1011.3540 |
| 46 | R. Gavin, Y. Li, F. Petriello, and S. Quackenbush | W Physics at the LHC with FEWZ 2.1 | CPC 184 (2013) 208 | 1201.5896 |
| 47 | Y. Li and F. Petriello | Combining QCD and electroweak corrections to dilepton production in the framework of the FEWZ simulation code | PRD 86 (2012) 094034 | 1208.5967 |
| 48 | M. Czakon and A. Mitov | Top++: A Program for the Calculation of the Top-Pair Cross-Section at Hadron Colliders | CPC 185 (2014) 2930 | 1112.5675 |
| 49 | M. Czakon, P. Fiedler, and A. Mitov | Total Top-Quark Pair-Production Cross Section at Hadron Colliders Through $ \mathcal{O}(\alpha_{S}^{4}) $ | PRL 110 (2013) 252004 | 1303.6254 |
| 50 | J. M. Campbell, R. K. Ellis, and C. Williams | Vector boson pair production at the LHC | JHEP 07 (2011) 018 | 1105.0020 |
| 51 | S. G. Bondarenko and A. A. Sapronov | NLO EW and QCD proton-proton cross section calculations with mcsanc-v1.01 | CPC 184 (2013) 2343 | 1301.3687 |
| 52 | J. R. Andersen et al. | Les Houches 2013: Physics at TeV Colliders: Standard Model Working Group Report | 1405.1067 | |
| 53 | NNPDF Collaboration | Parton distributions for the LHC Run II | JHEP 04 (2015) 040 | 1410.8849 |
| 54 | GEANT4 Collaboration | $ GEANT4--a $ simulation toolkit | NIMA 506 (2003) 250 | |
| 55 | CMS Collaboration | Particle-flow reconstruction and global event description with the CMS detector | JINST 12 (2017) P10003 | CMS-PRF-14-001 1706.04965 |
| 56 | M. Cacciari and G. P. Salam | Pileup subtraction using jet areas | PLB 659 (2008) 119 | 0707.1378 |
| 57 | M. Cacciari, G. P. Salam, and G. Soyez | The anti-$ {k_{\mathrm{T}}} $ jet clustering algorithm | JHEP 04 (2008) 063 | 0802.1189 |
| 58 | M. Cacciari, G. P. Salam, and G. Soyez | FastJet User Manual | EPJC 72 (2012) 1896 | 1111.6097 |
| 59 | CMS Collaboration | Jet energy scale and resolution in the CMS experiment in pp collisions at 8 TeV | JINST 12 (2017) P02014 | CMS-JME-13-004 1607.03663 |
| 60 | CMS Collaboration | Identification of heavy-flavour jets with the CMS detector in pp collisions at 13 TeV | JINST 13 (2018) P05011 | CMS-BTV-16-002 1712.07158 |
| 61 | C. J. Clopper and E. S. Pearson | The use of confidence or fiducial limits illustrated in the case of the binomial | Biometrika 26 (1934) 404 | |
| 62 | G. F. Giudice, R. Rattazzi, and J. D. Wells | Graviscalars from higher dimensional metrics and curvature Higgs mixing | NPB 595 (2001) 250 | hep-ph/0002178 |
| 63 | A. Oliveira | Gravity particles from Warped Extra Dimensions, predictions for LHC | 1404.0102 | |
| 64 | M. Wobisch and T. Wengler | Hadronization corrections to jet cross-sections in deep inelastic scattering | in Monte Carlo generators for HERA physics. Proceedings, Workshop, Hamburg, Germany, 1998-1999, p. 270 1998 | hep-ph/9907280 |
| 65 | CMS Collaboration | CMS Technical Design Report for the Level-1 Trigger Upgrade | CDS | |
| 66 | CMS Collaboration | Level 1 Tau trigger performance in 2016 data and VBF seeds at Level 1 trigger | CDS | |
| 67 | CMS Collaboration | Electron and photon performance in CMS with first 12.9/fb of 2016 data | CDS | |
| 68 | CDF Collaboration | Search for neutral MSSM Higgs bosons decaying to tau pairs in $ p\bar{p} $ collisions at $ \sqrt{s} = $ 1.96 TeV | PRL 96 (2006) 011802 | hep-ex/0508051 |
| 69 | CMS Collaboration | Measurements of Inclusive $ W $ and $ Z $ Cross Sections in pp Collisions at $ \sqrt{s}= $ 7 TeV | JHEP 01 (2011) 080 | CMS-EWK-10-002 1012.2466 |
| 70 | CMS Collaboration | CMS luminosity measurements for the 2016 data taking period | CMS-PAS-LUM-17-001 | CMS-PAS-LUM-17-001 |
| 71 | J. M. Campbell and R. K. Ellis | Update on vector boson pair production at hadron colliders | PRD 60 (1999) 113006 | hep-ph/9905386 |
| 72 | J. M. Campbell, R. K. Ellis, and W. T. Giele | A multi-threaded version of MCFM | EPJC 75 (2015) 246 | 1503.06182 |
| 73 | R. Barlow and C. Beeston | Fitting using finite Monte Carlo samples | CPC 77 (1993) 219 | |
| 74 | J. S. Conway | Incorporating nuisance parameters in likelihoods for multisource spectra | in Proceedings, PHYSTAT 2011 Workshop on Statistical Issues Related to Discovery Claims in Search Experiments and Unfolding, p. 115 CERN, Geneva, Switzerland, January | 1103.0354 |
| 75 | CMS Collaboration | Measurement of the properties of a Higgs boson in the four-lepton final state | PRD 89 (2014) 092007 | CMS-HIG-13-002 1312.5353 |
| 76 | M. J. Oreglia | A study of the reactions $\psi' \to \gamma\gamma \psi$ | PhD thesis, Stanford University, 1980 SLAC Report SLAC-R-236, see Appendix D | |
|
|
Compact Muon Solenoid LHC, CERN |
|

|

|

|

|

|