

Compact Muon Solenoid
LHC, CERN
| CMS-BPH-18-002 ; CERN-EP-2020-003 | ||
| Measurement of the $\Upsilon(\mathrm{1S}) $ pair production cross section and search for resonances decaying to $\Upsilon(\mathrm{1S}) \mu^{+}\mu^{-}$ in proton-proton collisions at $\sqrt{s} = $ 13 TeV | ||
| CMS Collaboration | ||
| 15 February 2020 | ||
| Phys. Lett. B 808 (2020) 135578 | ||
| Abstract: The fiducial cross section for $\Upsilon(\mathrm{1S}) $ pair production in proton-proton collisions at a center-of-mass energy of 13 TeV in the region where both $\Upsilon(\mathrm{1S}) $ mesons have an absolute rapidity below 2.0 is measured to be 79 $\pm$ 11 (stat) $\pm$ 6 (syst) $\pm$ 3 ($\mathcal{B}$) pb assuming the mesons are produced unpolarized. The last uncertainty corresponds to the uncertainty in the $\Upsilon(\mathrm{1S}) $ meson dimuon branching fraction. The measurement is performed in the final state with four muons using proton-proton collision data collected in 2016 by the CMS experiment at the LHC, corresponding to an integrated luminosity of 35.9 fb$^{-1}$. This process serves as a standard model reference in a search for narrow resonances decaying to $\Upsilon(\mathrm{1S}) \mu^{+}\mu^{-}$ in the same final state. Such a resonance could indicate the existence of a tetraquark that is a bound state of two $\mathrm{b}$ quarks and two $\bar{\mathrm{b}}$ antiquarks. The tetraquark search is performed for masses in the vicinity of four times the bottom quark mass, between 17.5 and 19.5 GeV, while a generic search for other resonances is performed for masses between 16.5 and 27 GeV. No significant excess of events compatible with a narrow resonance is observed in the data. Limits on the production cross section times branching fraction to four muons via an intermediate $\Upsilon(\mathrm{1S}) $ resonance are set as a function of the resonance mass. | ||
| Links: e-print arXiv:2002.06393 [hep-ex] (PDF) ; CDS record ; inSPIRE record ; HepData record ; CADI line (restricted) ; | ||
| Figures | |
png pdf |
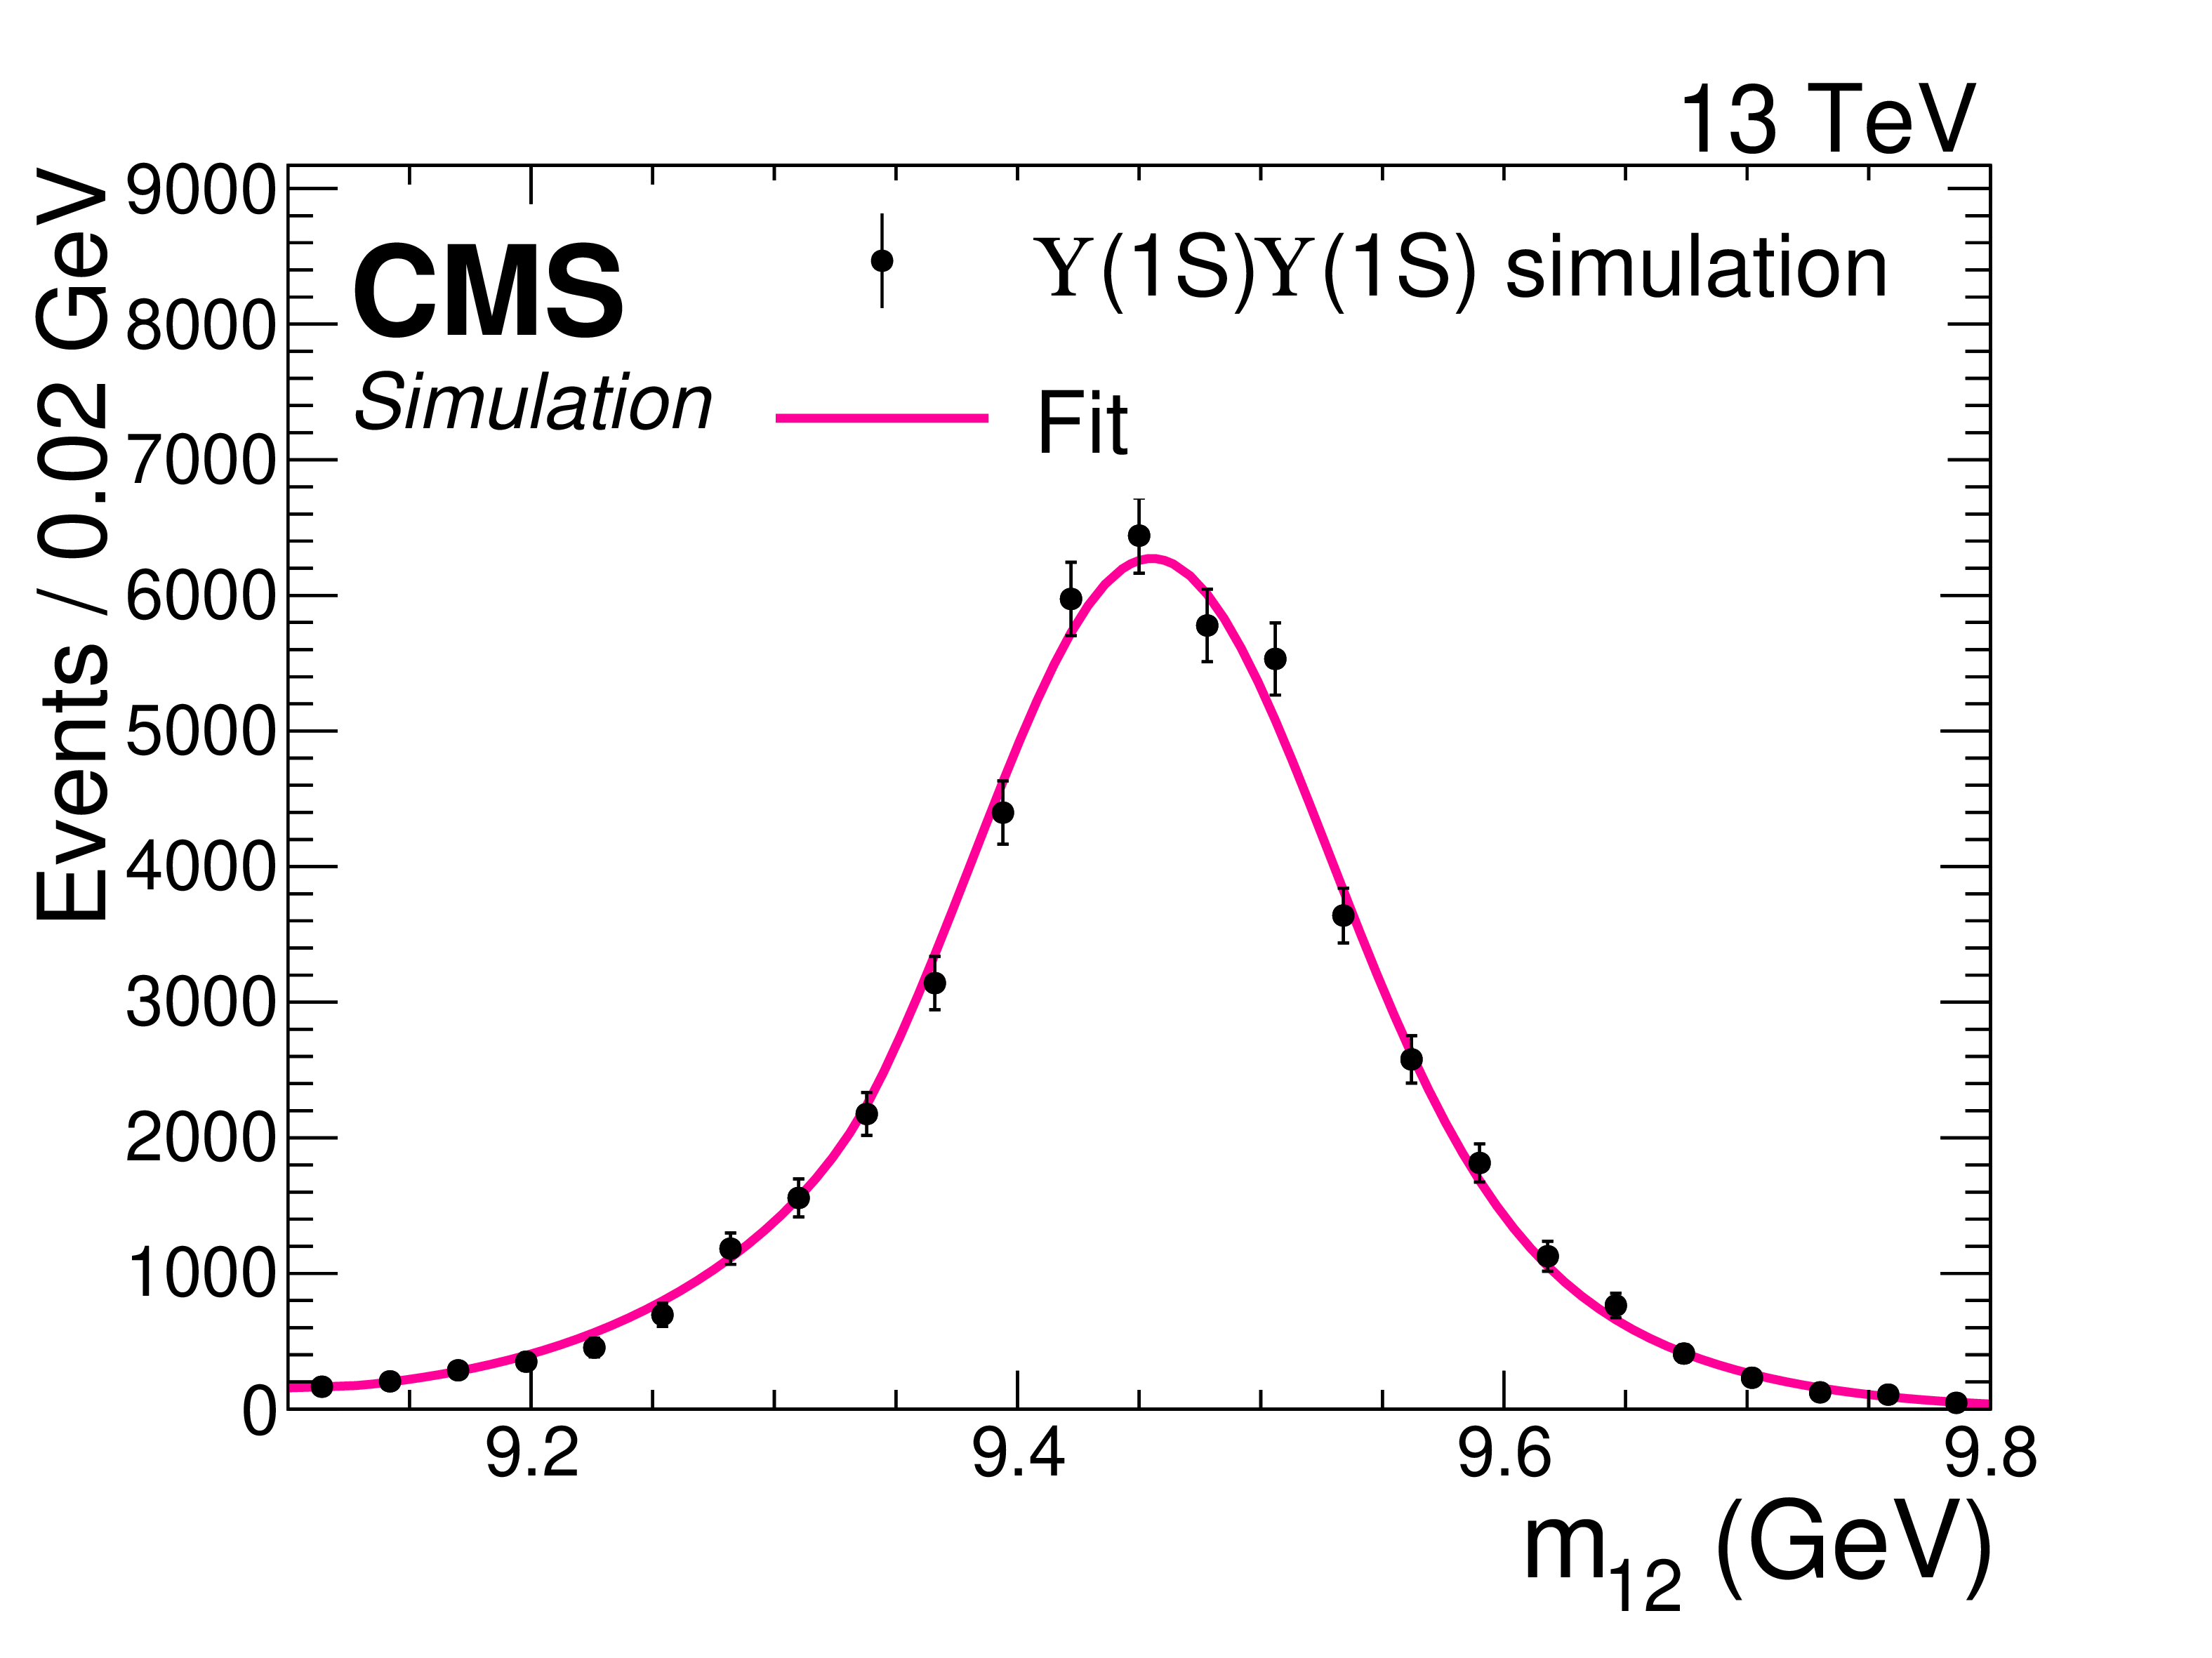
Figure 1:
Projection of the 2D fit (line) to the ${m_\mathrm {12}}$ invariant mass distribution (points) for the SPS $\Upsilon(\mathrm{1S}) \Upsilon(\mathrm{1S}) $ simulation. The vertical bars on the points show the statistical uncertainty only. The mass distribution is modeled with the sum of two Crystal Ball functions with the same mean. |
png pdf |
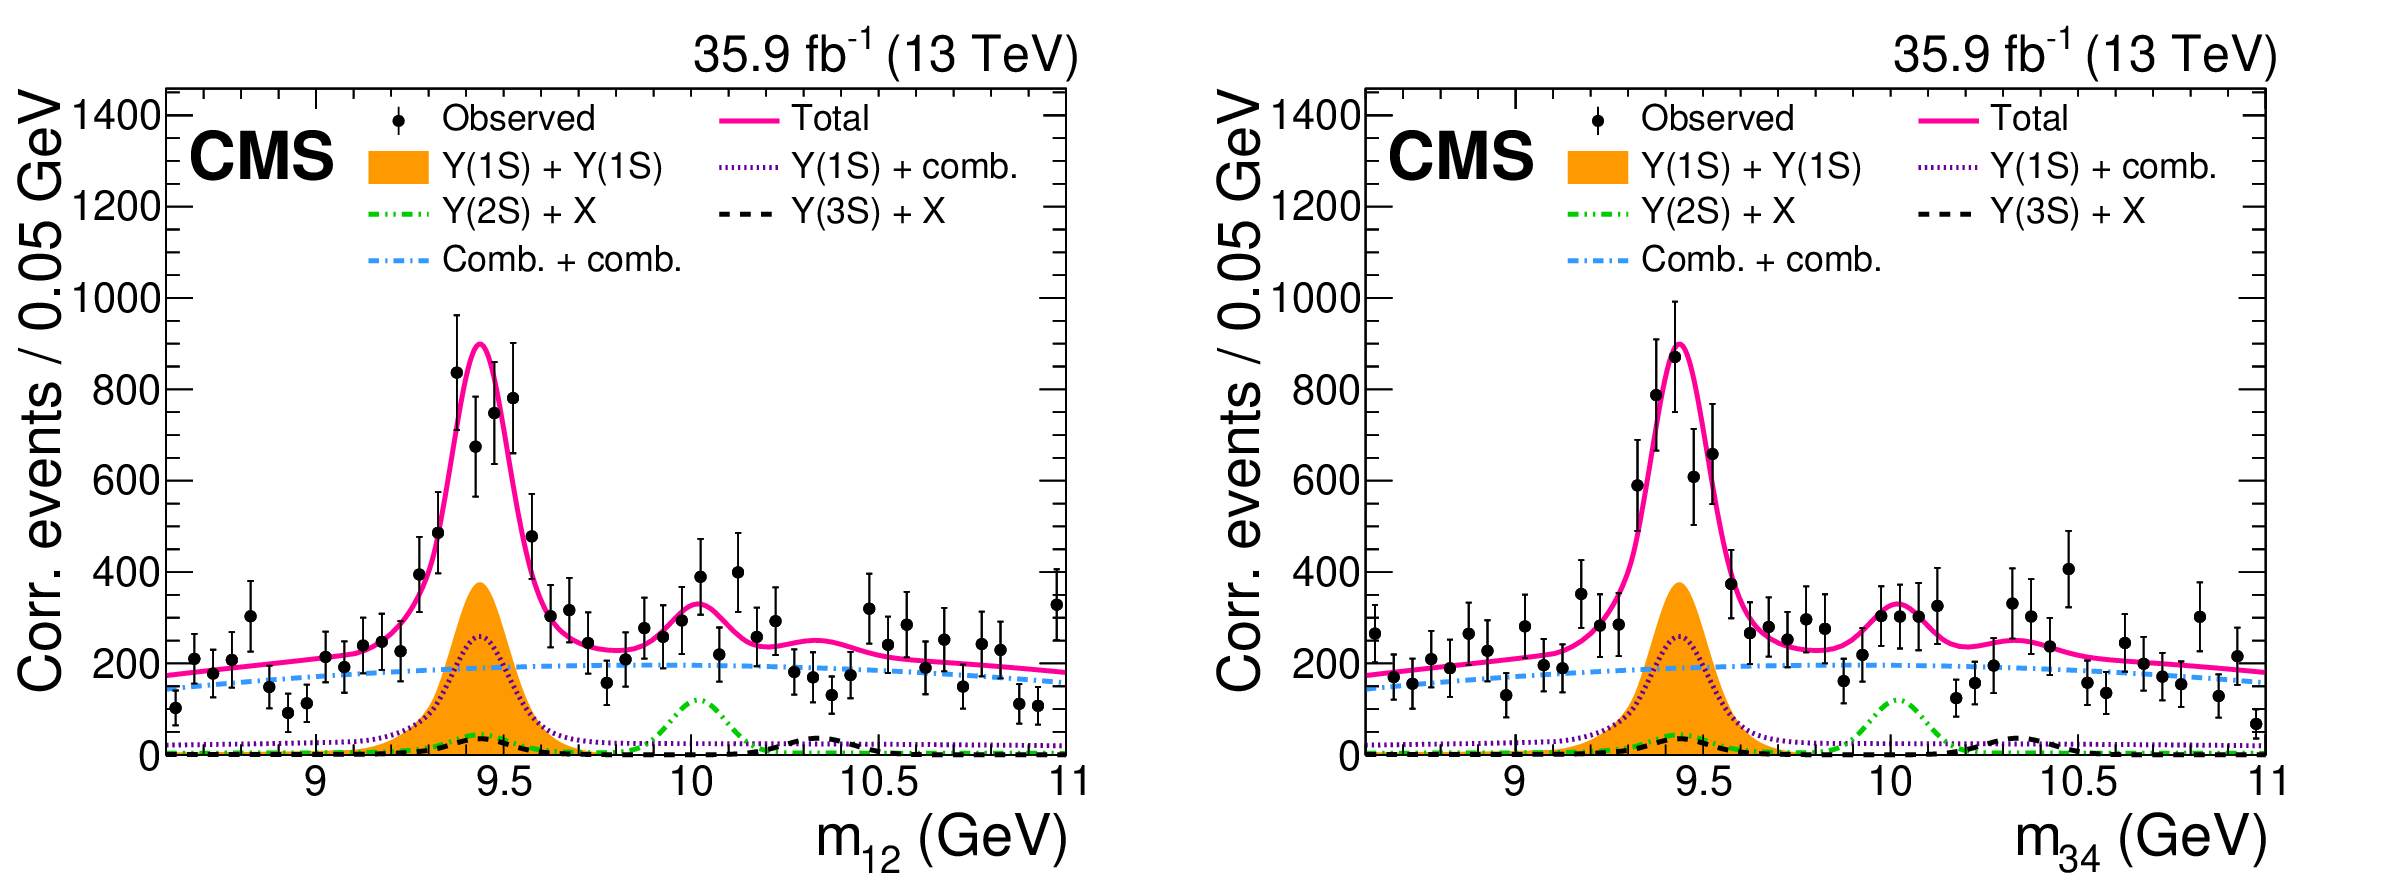
Figure 2:
The two projections and the result of the 2D fit to the muon pair invariant masses. Each event is corrected for acceptance and efficiency. The $\Upsilon(\mathrm{1S})$ pair production signal is shown as a filled area. The contributions from the combinatorial background, and from events with a $\Upsilon(\mathrm{1S})$ meson and a pair of combinatorial muons, with a $\Upsilon(\mathrm{2S})$ meson and two reconstructed muons from any origin, and with a $\Upsilon(\mathrm{3S})$ meson and two reconstructed muons from any origin, are overlaid. |
png pdf |
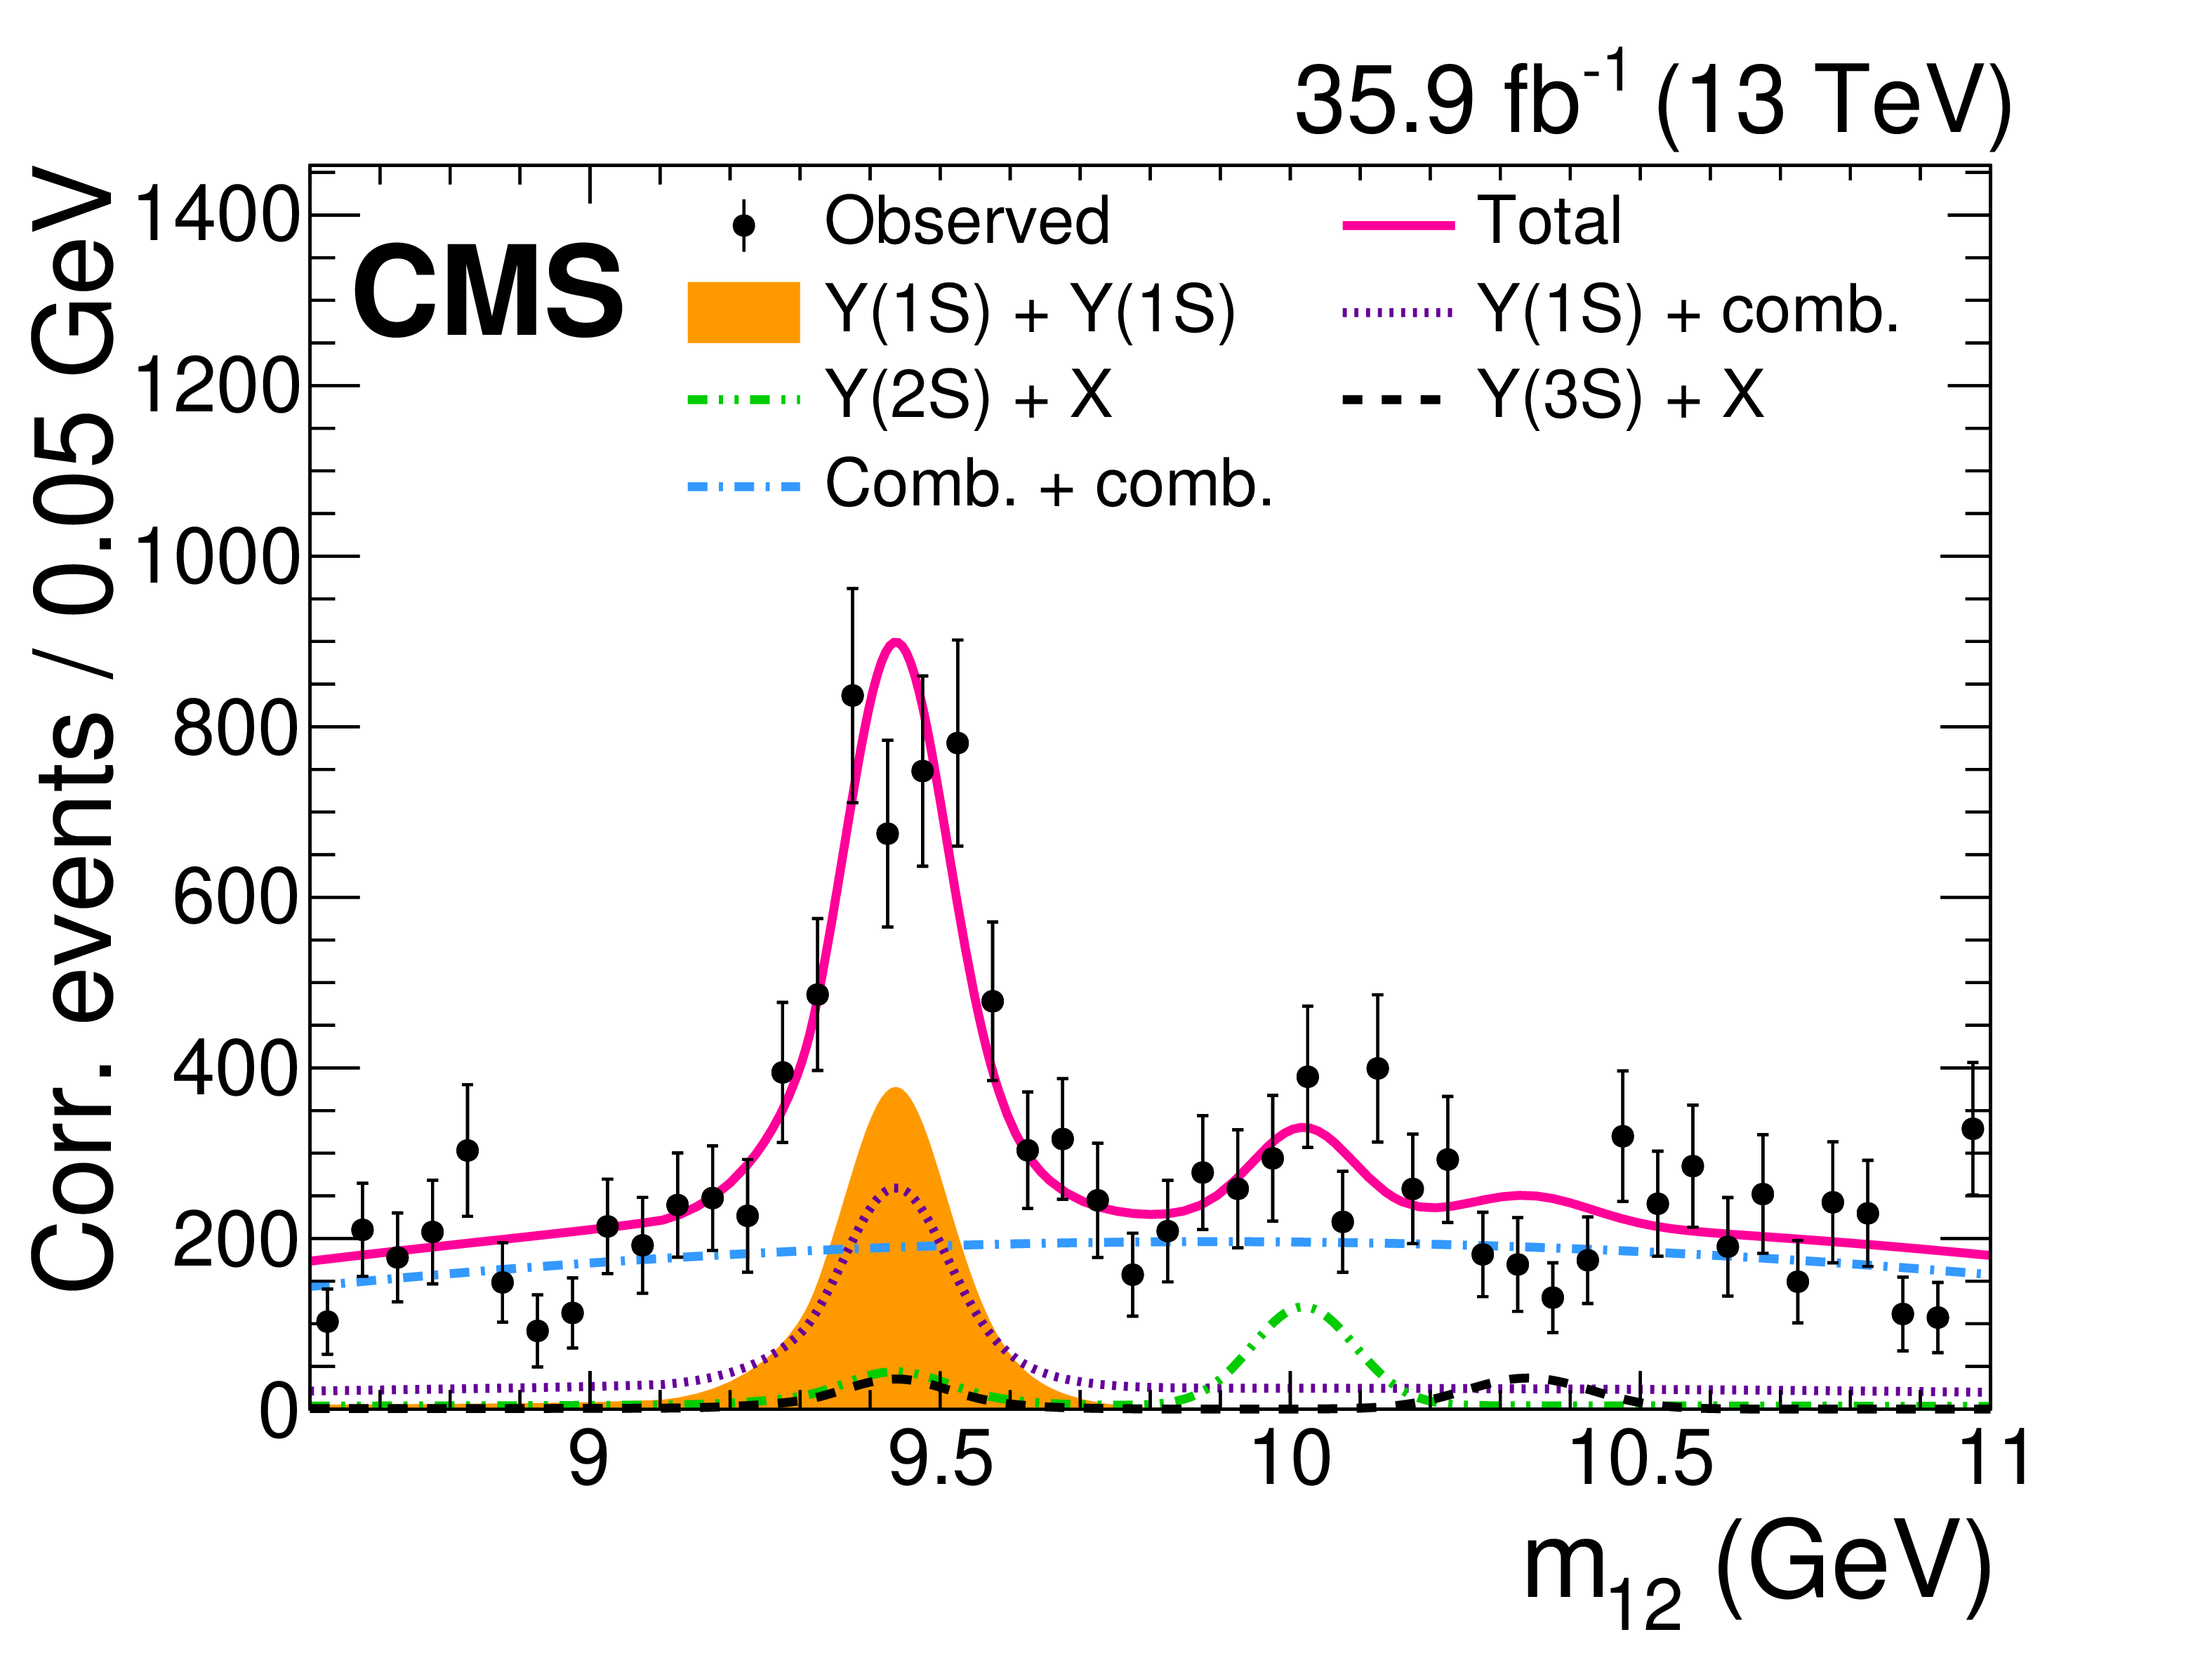
Figure 2-a:
The ${m_\mathrm {12}}$ projection and the result of the 2D fit to the muon pair invariant masses. Each event is corrected for acceptance and efficiency. The $\Upsilon(\mathrm{1S})$ pair production signal is shown as a filled area. The contributions from the combinatorial background, and from events with a $\Upsilon(\mathrm{1S})$ meson and a pair of combinatorial muons, with a $\Upsilon(\mathrm{2S})$ meson and two reconstructed muons from any origin, and with a $\Upsilon(\mathrm{3S})$ meson and two reconstructed muons from any origin, are overlaid. |
png pdf |
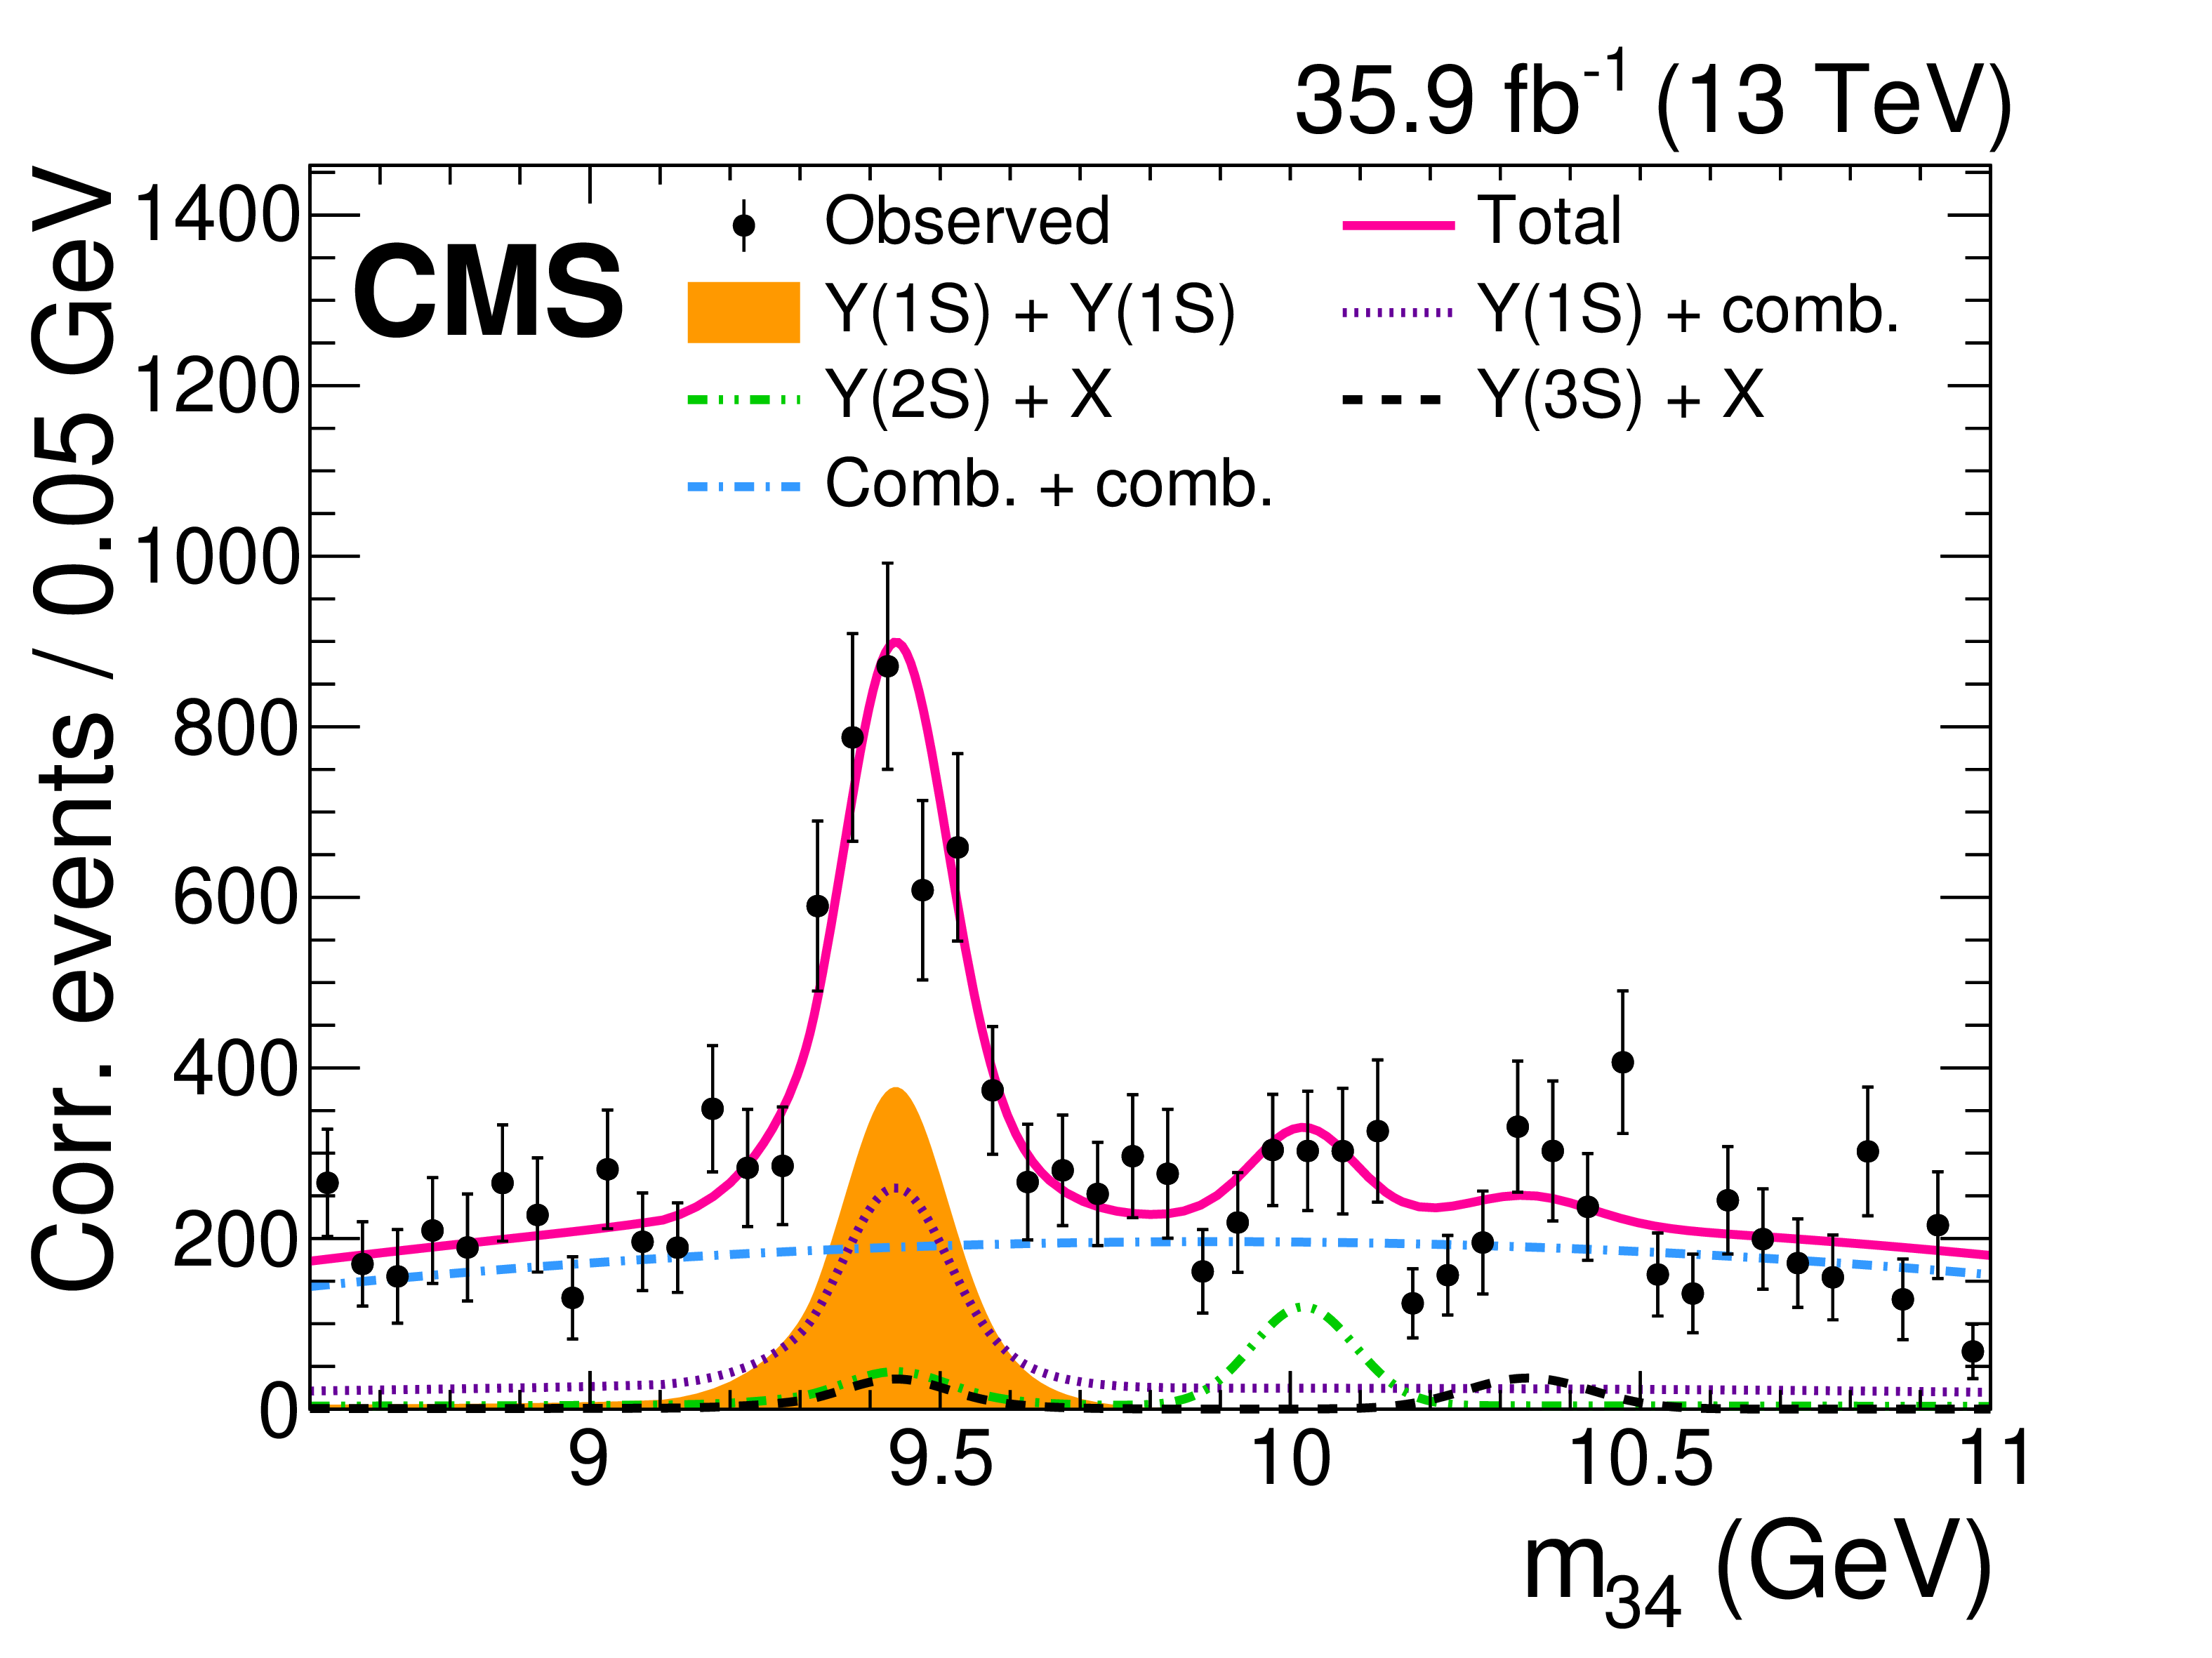
Figure 2-b:
The ${m_\mathrm {34}}$ projection and the result of the 2D fit to the muon pair invariant masses. Each event is corrected for acceptance and efficiency. The $\Upsilon(\mathrm{1S})$ pair production signal is shown as a filled area. The contributions from the combinatorial background, and from events with a $\Upsilon(\mathrm{1S})$ meson and a pair of combinatorial muons, with a $\Upsilon(\mathrm{2S})$ meson and two reconstructed muons from any origin, and with a $\Upsilon(\mathrm{3S})$ meson and two reconstructed muons from any origin, are overlaid. |
png pdf |
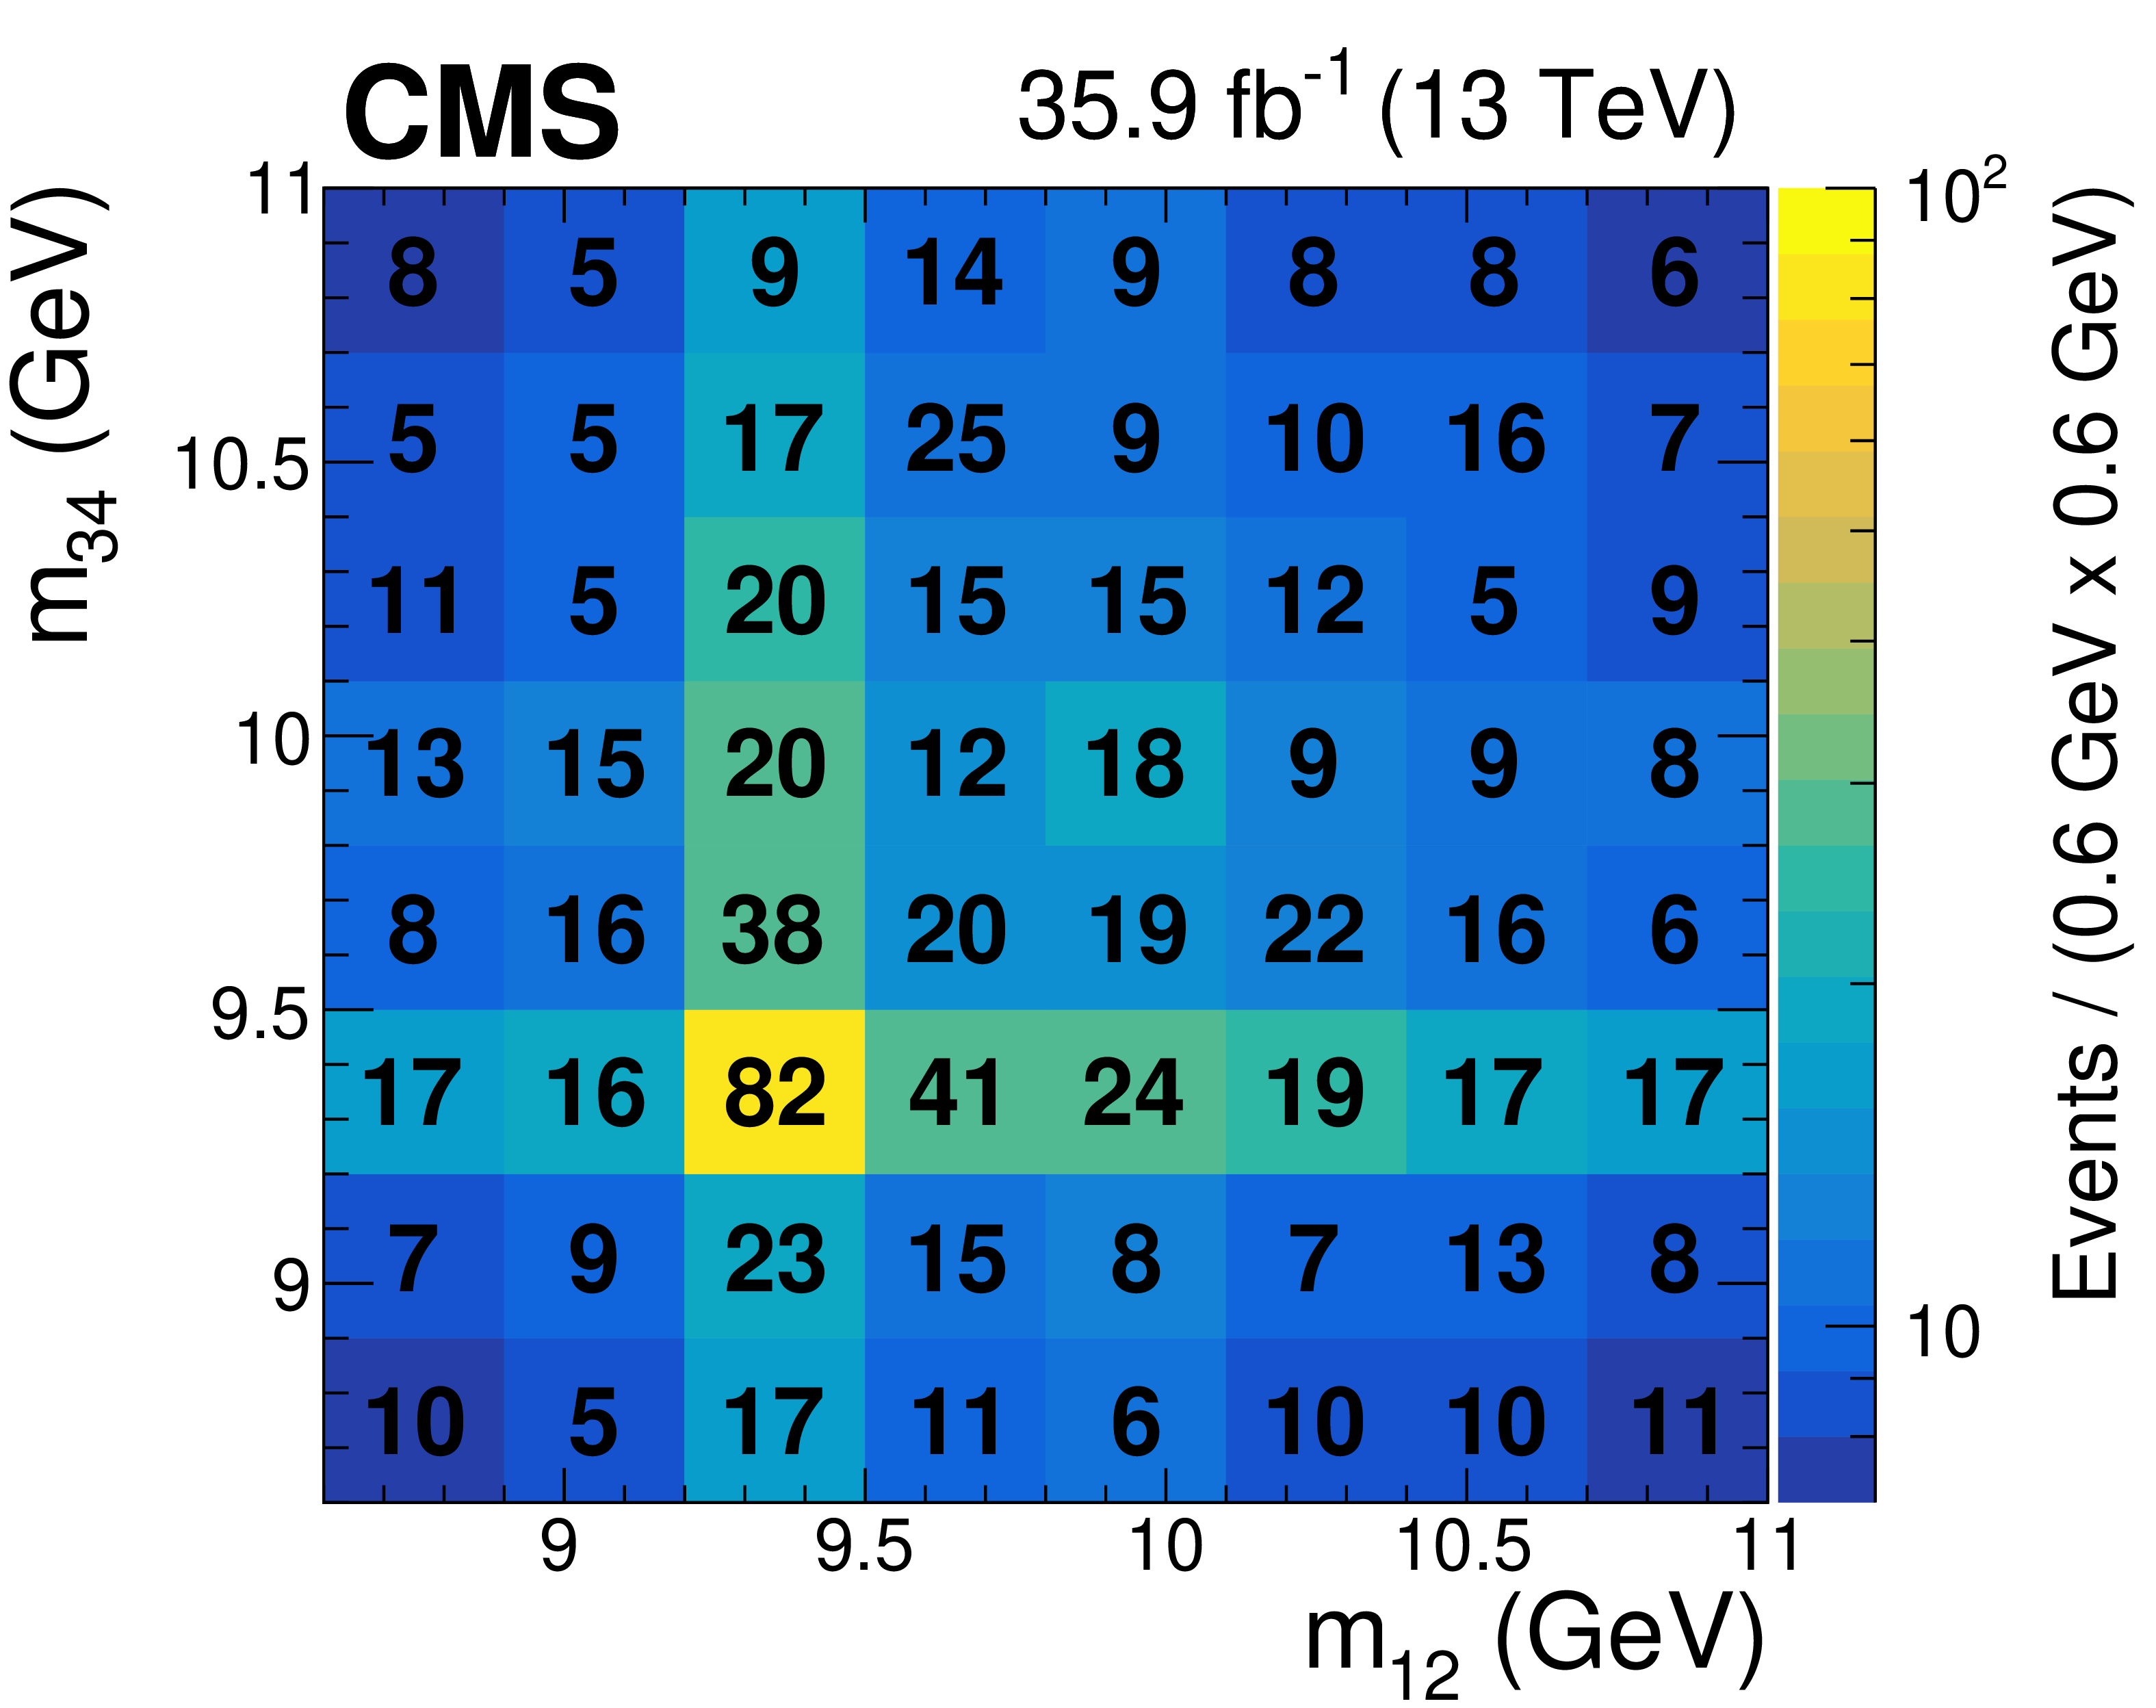
Figure 3:
The number of data events in each 0.6 GeV $\times$ 0.6 GeV bin of the ${m_\mathrm {12}}$ vs. ${m_\mathrm {34}}$ distribution is shown. The results of the maximum-likelihood fit to the signal+background model are given by the colors, using the color scale to the right of the plot. |

png pdf |
Figure 4:
Measured fiducial cross section (black dots) in bins of ${{| \Delta y(\Upsilon(\mathrm{1S}) ,\Upsilon(\mathrm{1S}) ) |}}$ (left) or ${m_{\Upsilon(\mathrm{1S}) \Upsilon(\mathrm{1S}) }}$ (right). The last bin includes the overflow. The SPS and DPS distributions predicted from simulation are overlaid using the ${f_\mathrm {DPS}}$ value extracted from the fit to the ${{| \Delta y(\Upsilon(\mathrm{1S}) ,\Upsilon(\mathrm{1S}) ) |}}$ distribution. The shaded areas around the SPS and DPS predictions indicate the theoretical uncertainties, which are often smaller than the thickness of the dashed lines. The shaded area around the total distribution corresponds to the uncertainty in the measurement of ${f_\mathrm {DPS}}$. The solid line shows the sum of the SPS and DPS contributions with the best-fit ${f_\mathrm {DPS}}$. |
png pdf |
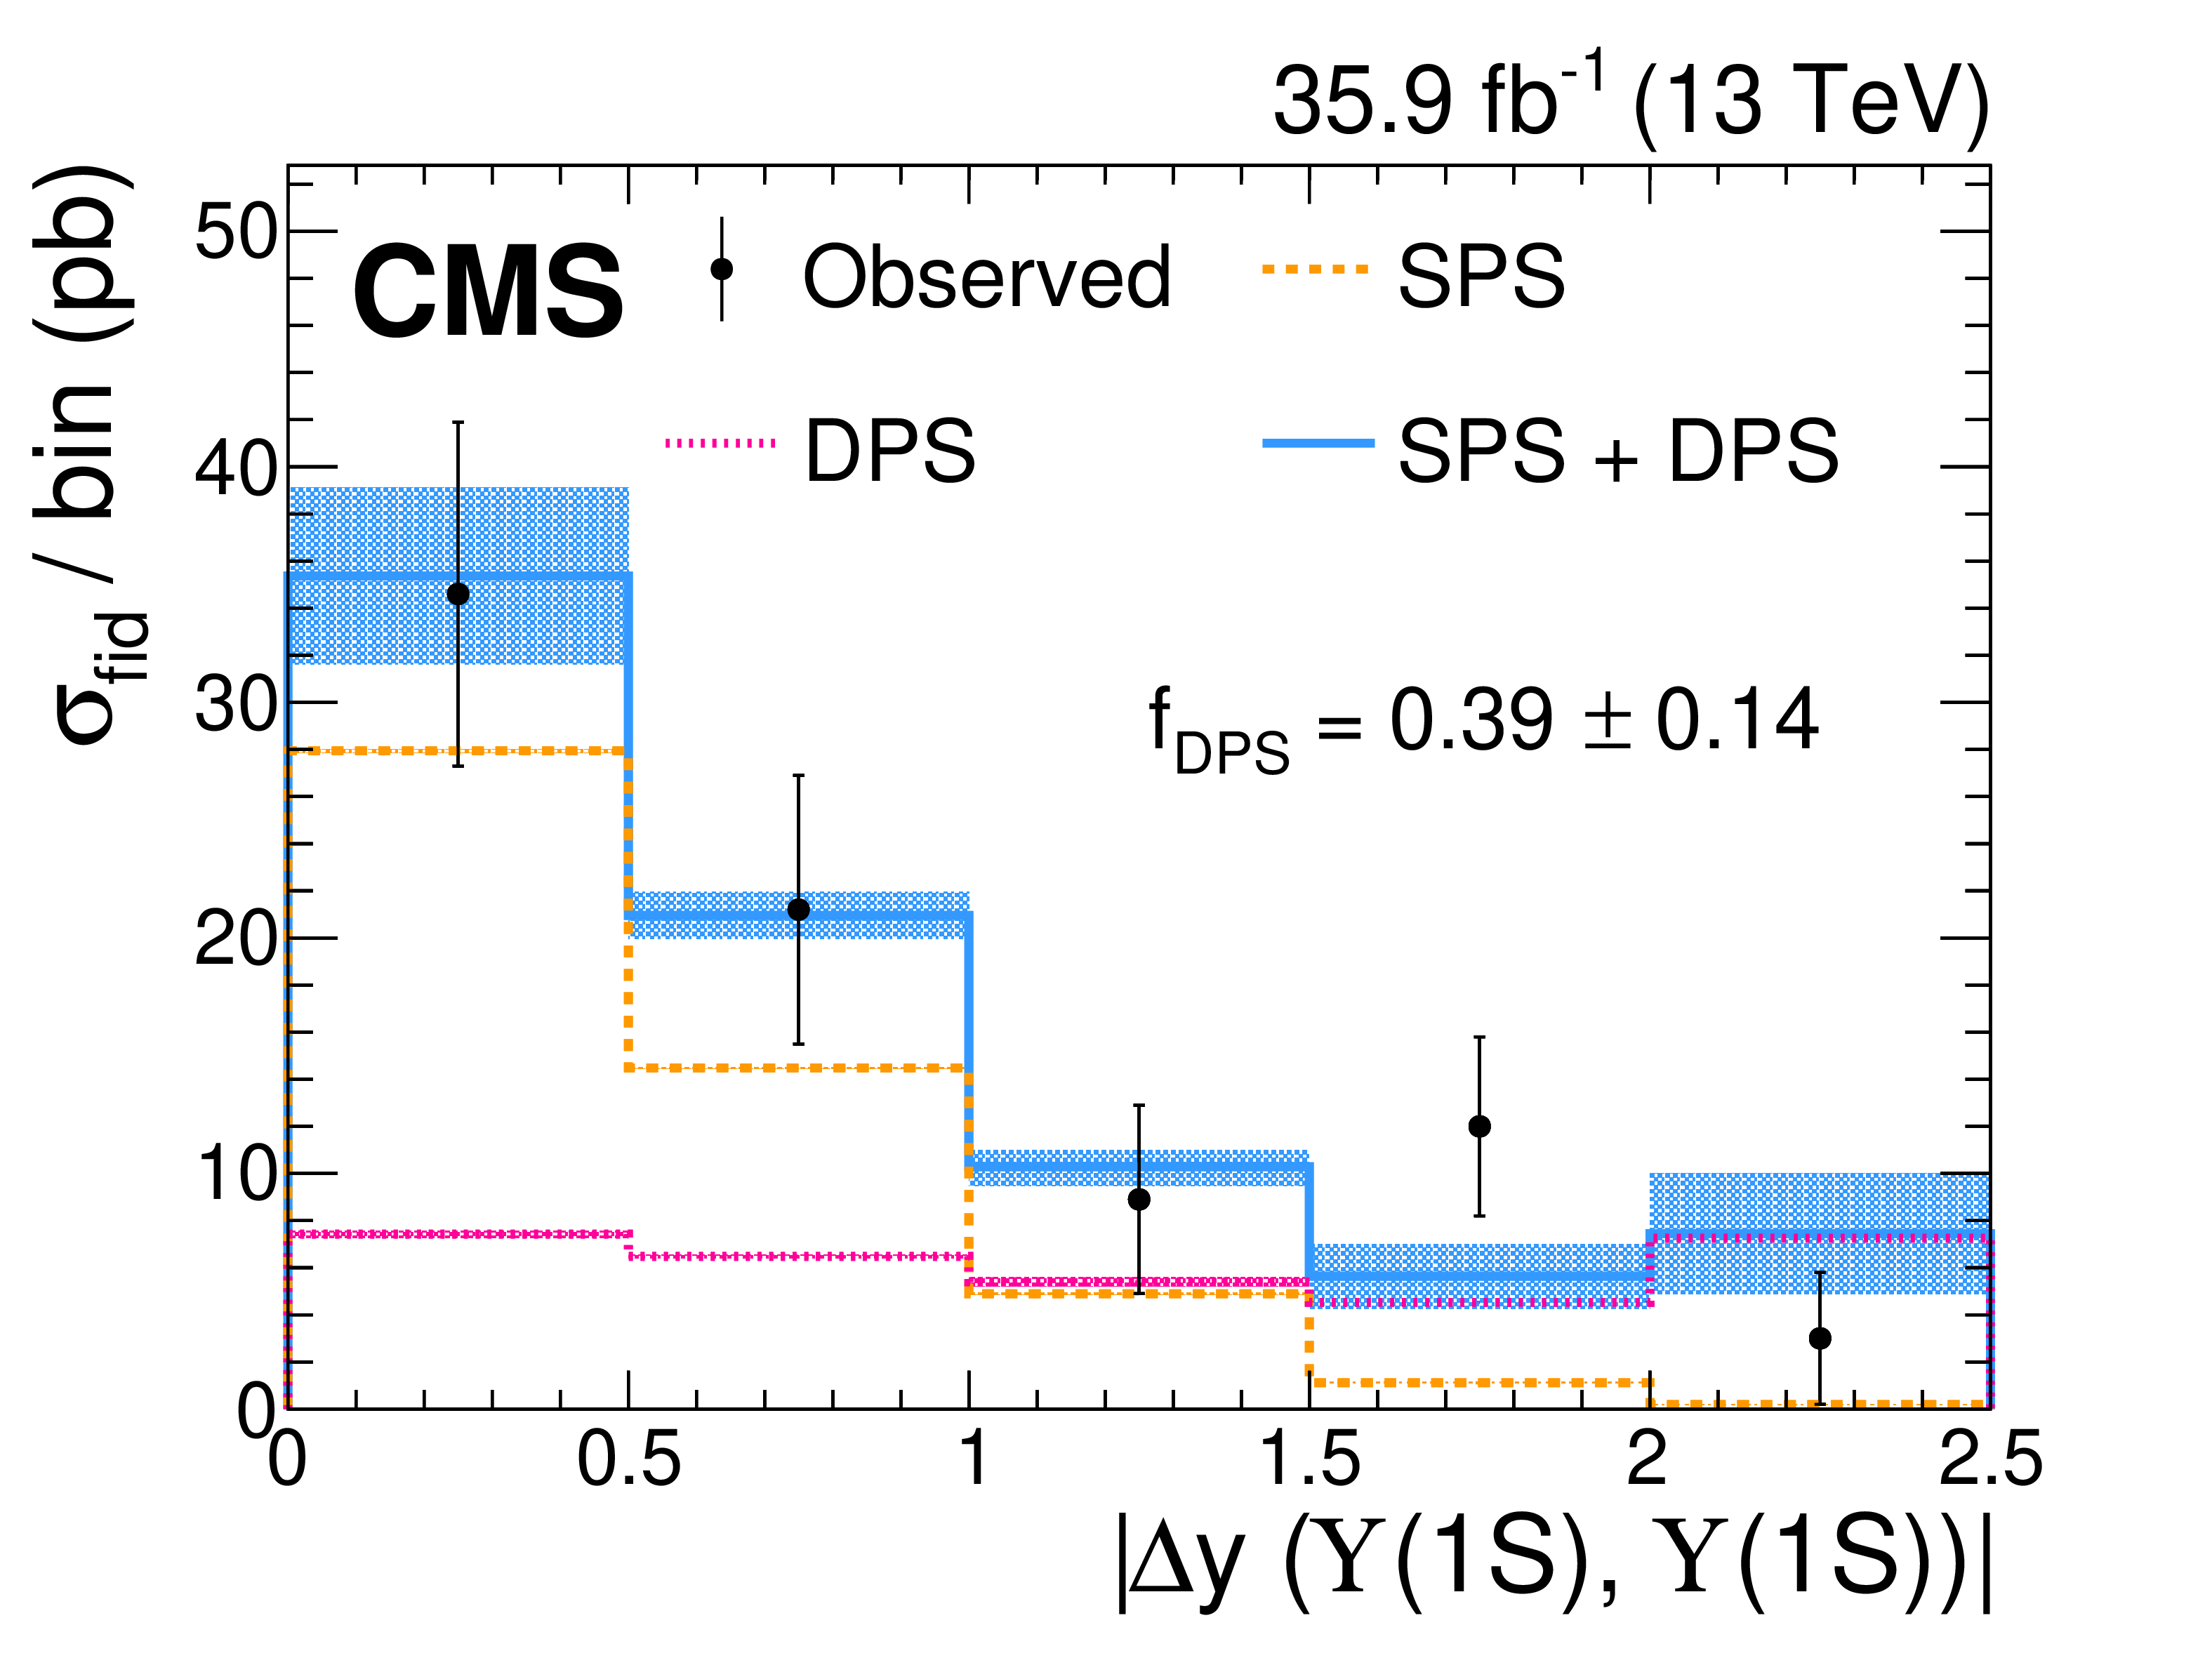
Figure 4-a:
Measured fiducial cross section (black dots) in bins of ${{| \Delta y(\Upsilon(\mathrm{1S}) ,\Upsilon(\mathrm{1S}) ) |}}$. The last bin includes the overflow. The SPS and DPS distributions predicted from simulation are overlaid using the ${f_\mathrm {DPS}}$ value extracted from the fit to the distribution. The shaded areas around the SPS and DPS predictions indicate the theoretical uncertainties, which are often smaller than the thickness of the dashed lines. The shaded area around the total distribution corresponds to the uncertainty in the measurement of ${f_\mathrm {DPS}}$. The solid line shows the sum of the SPS and DPS contributions with the best-fit ${f_\mathrm {DPS}}$. |

png pdf |
Figure 4-b:
Measured fiducial cross section (black dots) in bins of ${m_{\Upsilon(\mathrm{1S}) \Upsilon(\mathrm{1S}) }}$. The last bin includes the overflow. The SPS and DPS distributions predicted from simulation are overlaid using the ${f_\mathrm {DPS}}$ value extracted from the fit to the ${{| \Delta y(\Upsilon(\mathrm{1S}) ,\Upsilon(\mathrm{1S}) ) |}}$ distribution. The shaded areas around the SPS and DPS predictions indicate the theoretical uncertainties, which are often smaller than the thickness of the dashed lines. The shaded area around the total distribution corresponds to the uncertainty in the measurement of ${f_\mathrm {DPS}}$. The solid line shows the sum of the SPS and DPS contributions with the best-fit ${f_\mathrm {DPS}}$. |

png pdf |
Figure 5:
Distributions of $ {\tilde{m}_{\mathrm {4}\mu}} $ for simulated $\Upsilon(\mathrm{1S}) \Upsilon(\mathrm{1S}) $ events. The dashed lines are the best-fit models for the SPS and DPS simulations. The solid line is the average of the SPS and DPS models, which is taken as the nominal model for the $\Upsilon(\mathrm{1S}) \Upsilon(\mathrm{1S}) $ background in the resonance search. |

png pdf |
Figure 6:
Distributions of ${\tilde{m}_{\mathrm {4}\mu}}$ for the combinatorial background in a control region with the vertex fit $\chi ^2$ probability of the four muons in the range 10$^{-10}$-10$^{-3}$. The parameters obtained in this fit are not used as an input for the fit in the signal region. The functional forms for the combinatorial background shown by the lines are all considered as possible shapes for the background model in the likelihood fit. The order of the polynomials is indicated in parentheses in the legend. |

png pdf |
Figure 7:
The ${\tilde{m}_{\mathrm {4}\mu}}$ distribution from data and the results of the fit in the resonance search. An example signal is shown for the tetraquark model with a mass of 19 GeV, which has a significance of about one standard deviation. |
png pdf |
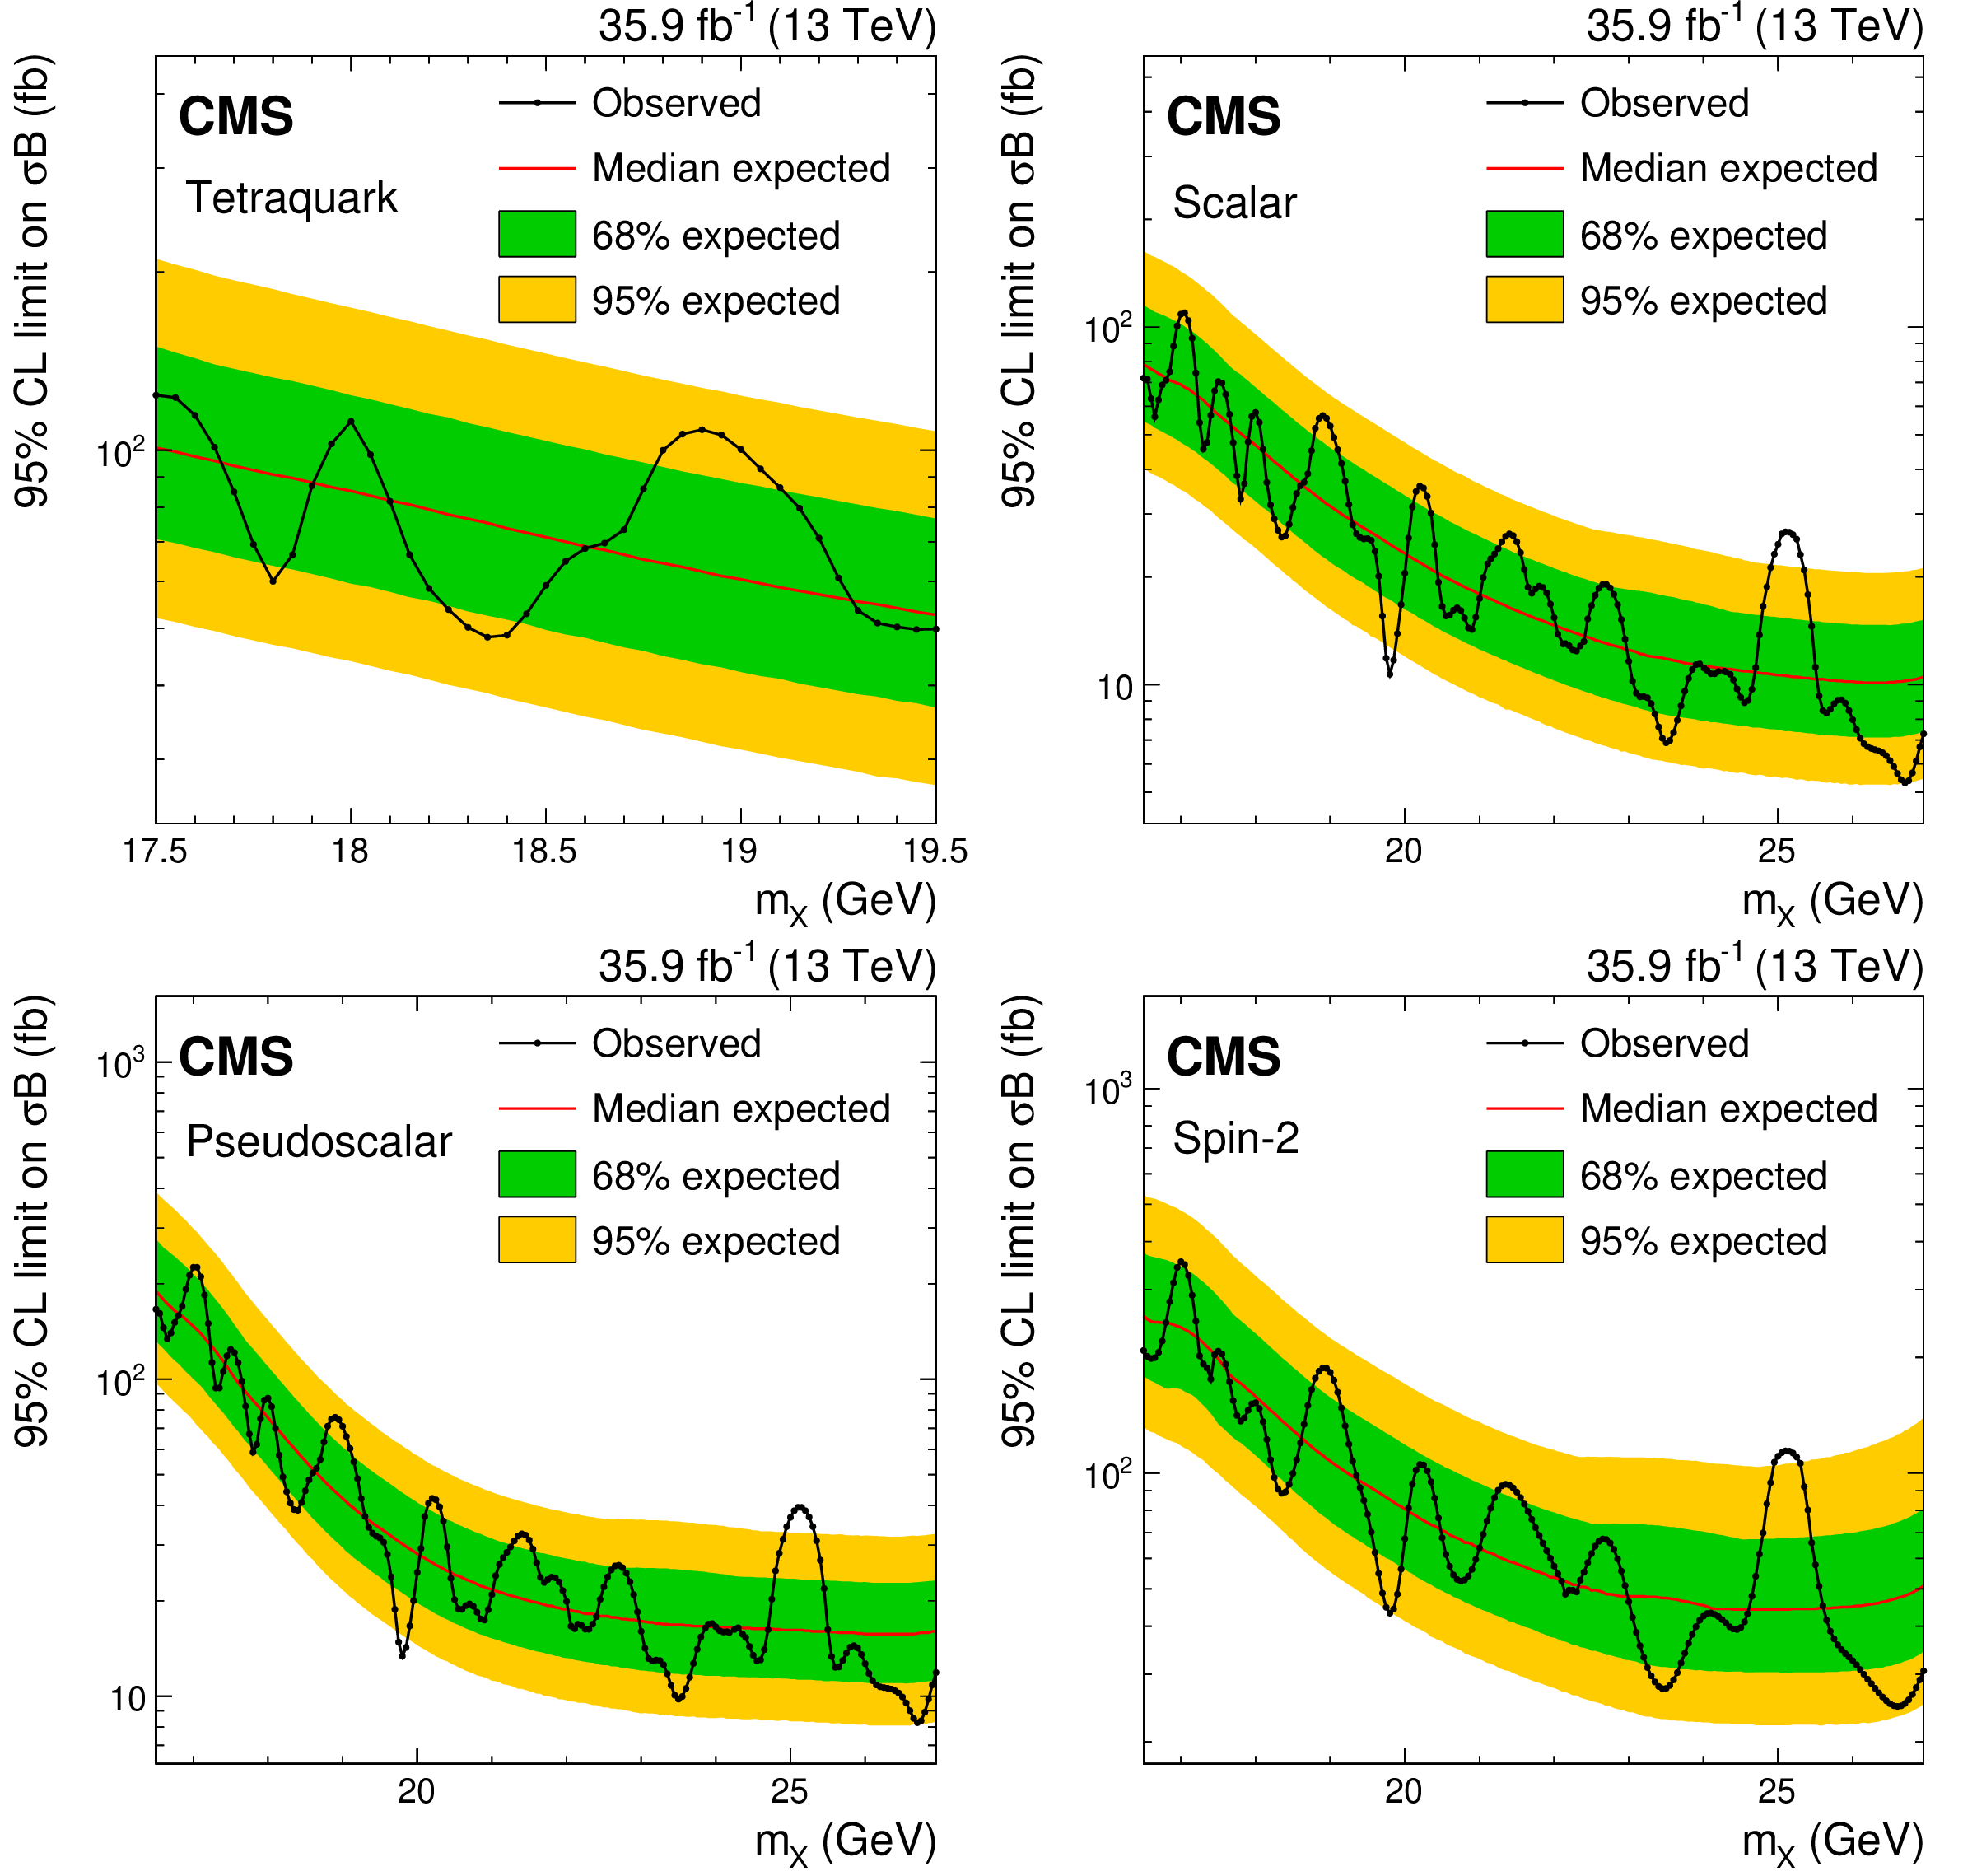
Figure 8:
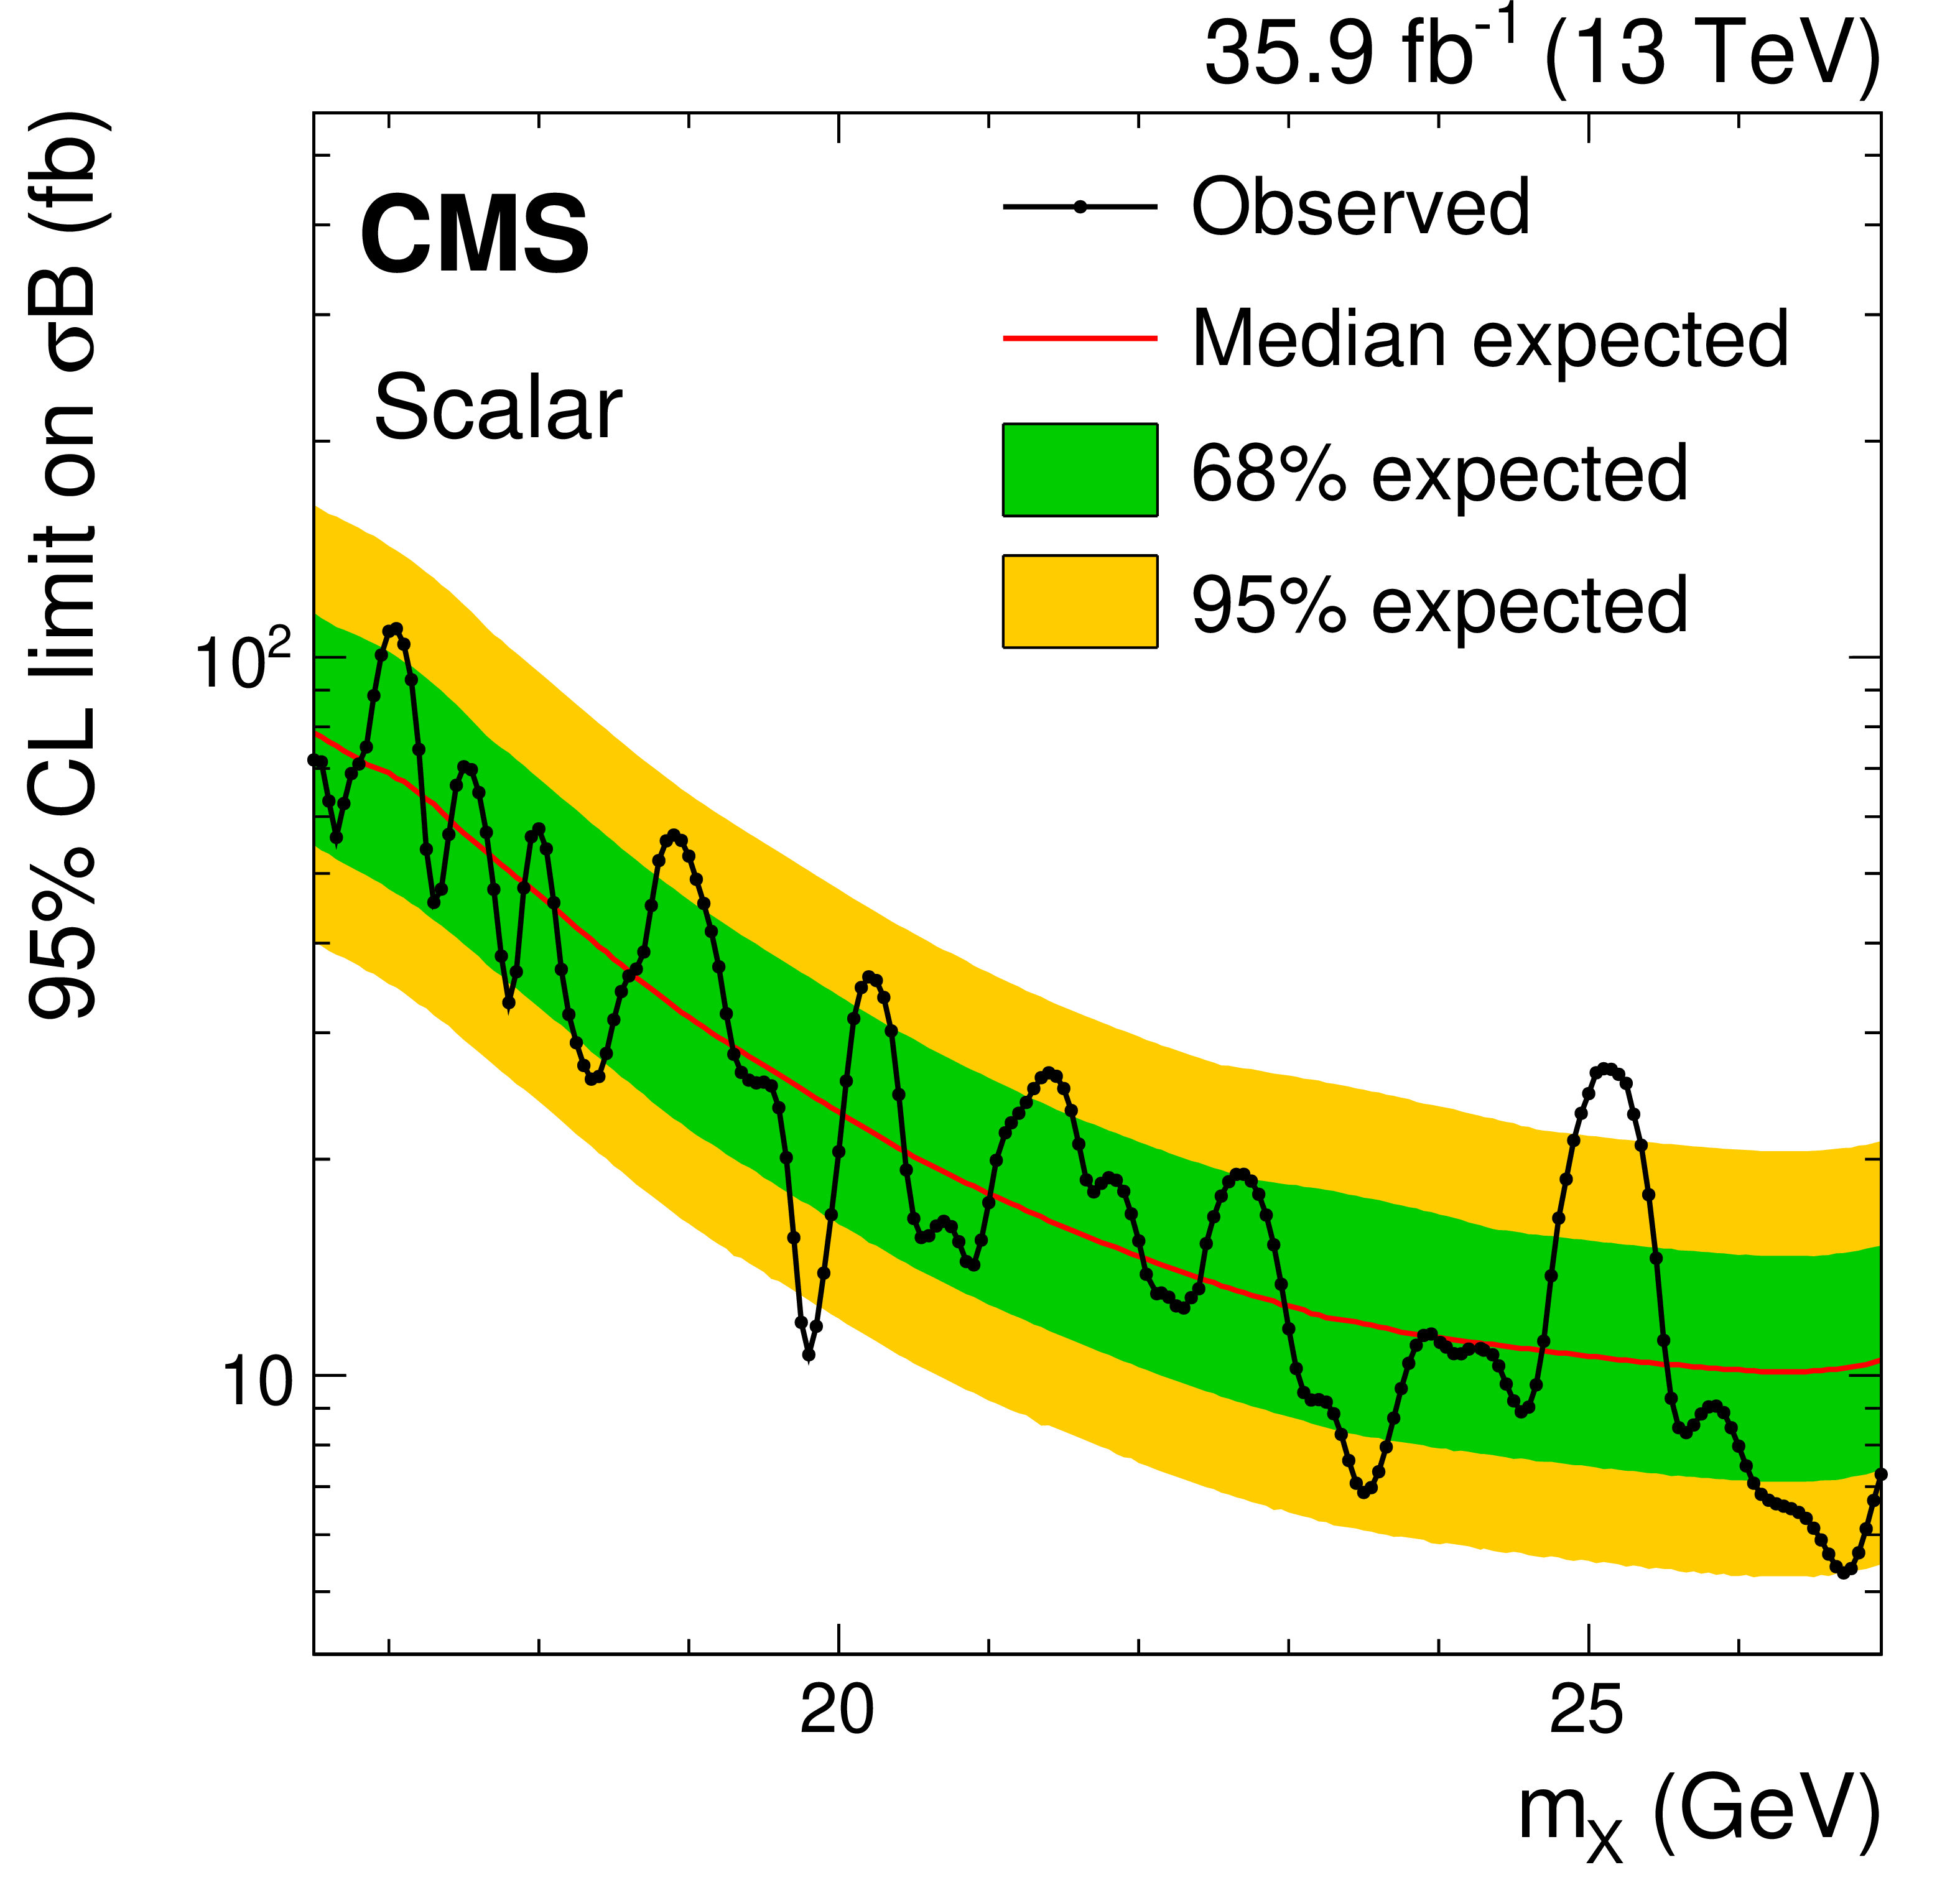
Upper limits at 95% CL on the product of the cross section and branching fraction for a tetraquark (upper left), scalar (upper right), pseudoscalar (lower left), and spin-2 (lower right) states. The symbol $\sigma $ denotes the production cross section of the resonance, and the symbol $\mathcal {B}$ denotes the product of the branching fraction for the decay of the resonance to a $\Upsilon(\mathrm{1S}) $ meson and two muons, and the $\Upsilon(\mathrm{1S}) $ meson dimuon branching fraction. The line with the points on it shows the observed upper limits and the thin red line is the median of the expected upper limits. The inner (green) band and the outer (yellow) band indicate the regions containing 68 and 95%, respectively, of the distribution of limits expected under the background-only hypothesis. |
png pdf |
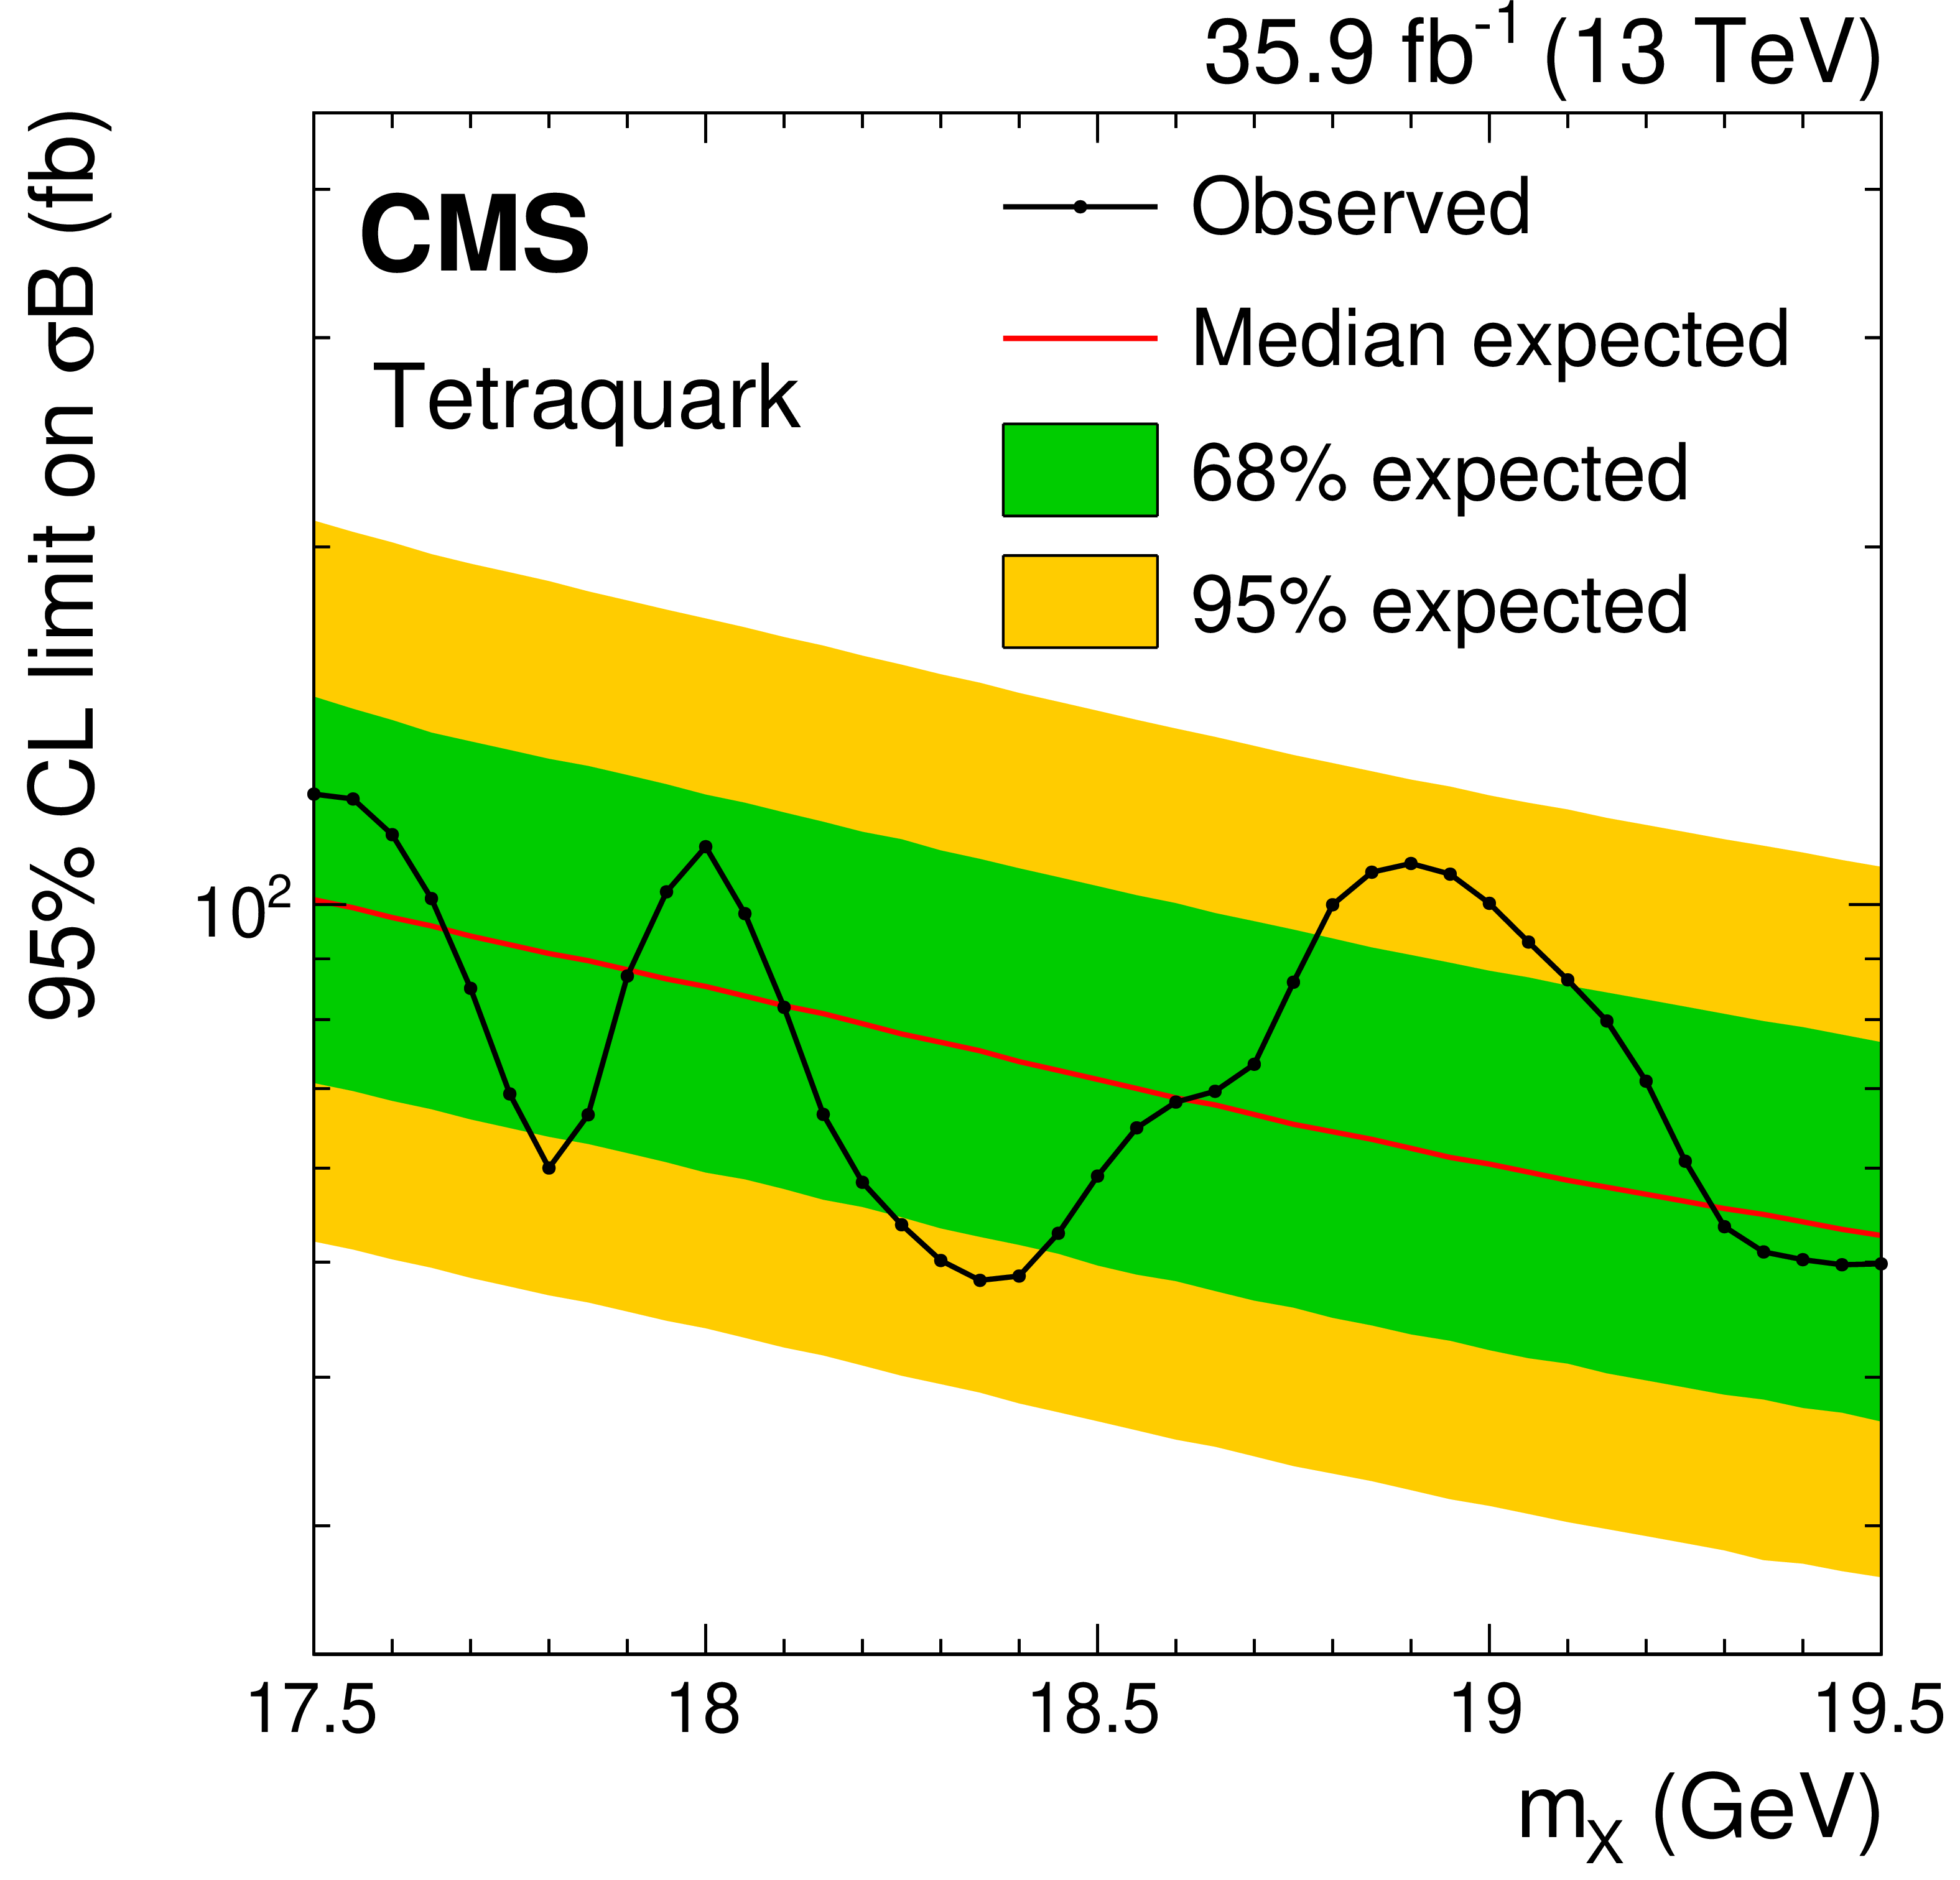
Figure 8-a:
Upper limits at 95% CL on the product of the cross section and branching fraction for a tetraquark state. The symbol $\sigma $ denotes the production cross section of the resonance, and the symbol $\mathcal {B}$ denotes the product of the branching fraction for the decay of the resonance to a $\Upsilon(\mathrm{1S}) $ meson and two muons, and the $\Upsilon(\mathrm{1S}) $ meson dimuon branching fraction. The line with the points on it shows the observed upper limits and the thin red line is the median of the expected upper limits. The inner (green) band and the outer (yellow) band indicate the regions containing 68 and 95%, respectively, of the distribution of limits expected under the background-only hypothesis. |
png pdf |
Figure 8-b:
Upper limits at 95% CL on the product of the cross section and branching fraction for a scalar state. The symbol $\sigma $ denotes the production cross section of the resonance, and the symbol $\mathcal {B}$ denotes the product of the branching fraction for the decay of the resonance to a $\Upsilon(\mathrm{1S}) $ meson and two muons, and the $\Upsilon(\mathrm{1S}) $ meson dimuon branching fraction. The line with the points on it shows the observed upper limits and the thin red line is the median of the expected upper limits. The inner (green) band and the outer (yellow) band indicate the regions containing 68 and 95%, respectively, of the distribution of limits expected under the background-only hypothesis. |
png pdf |
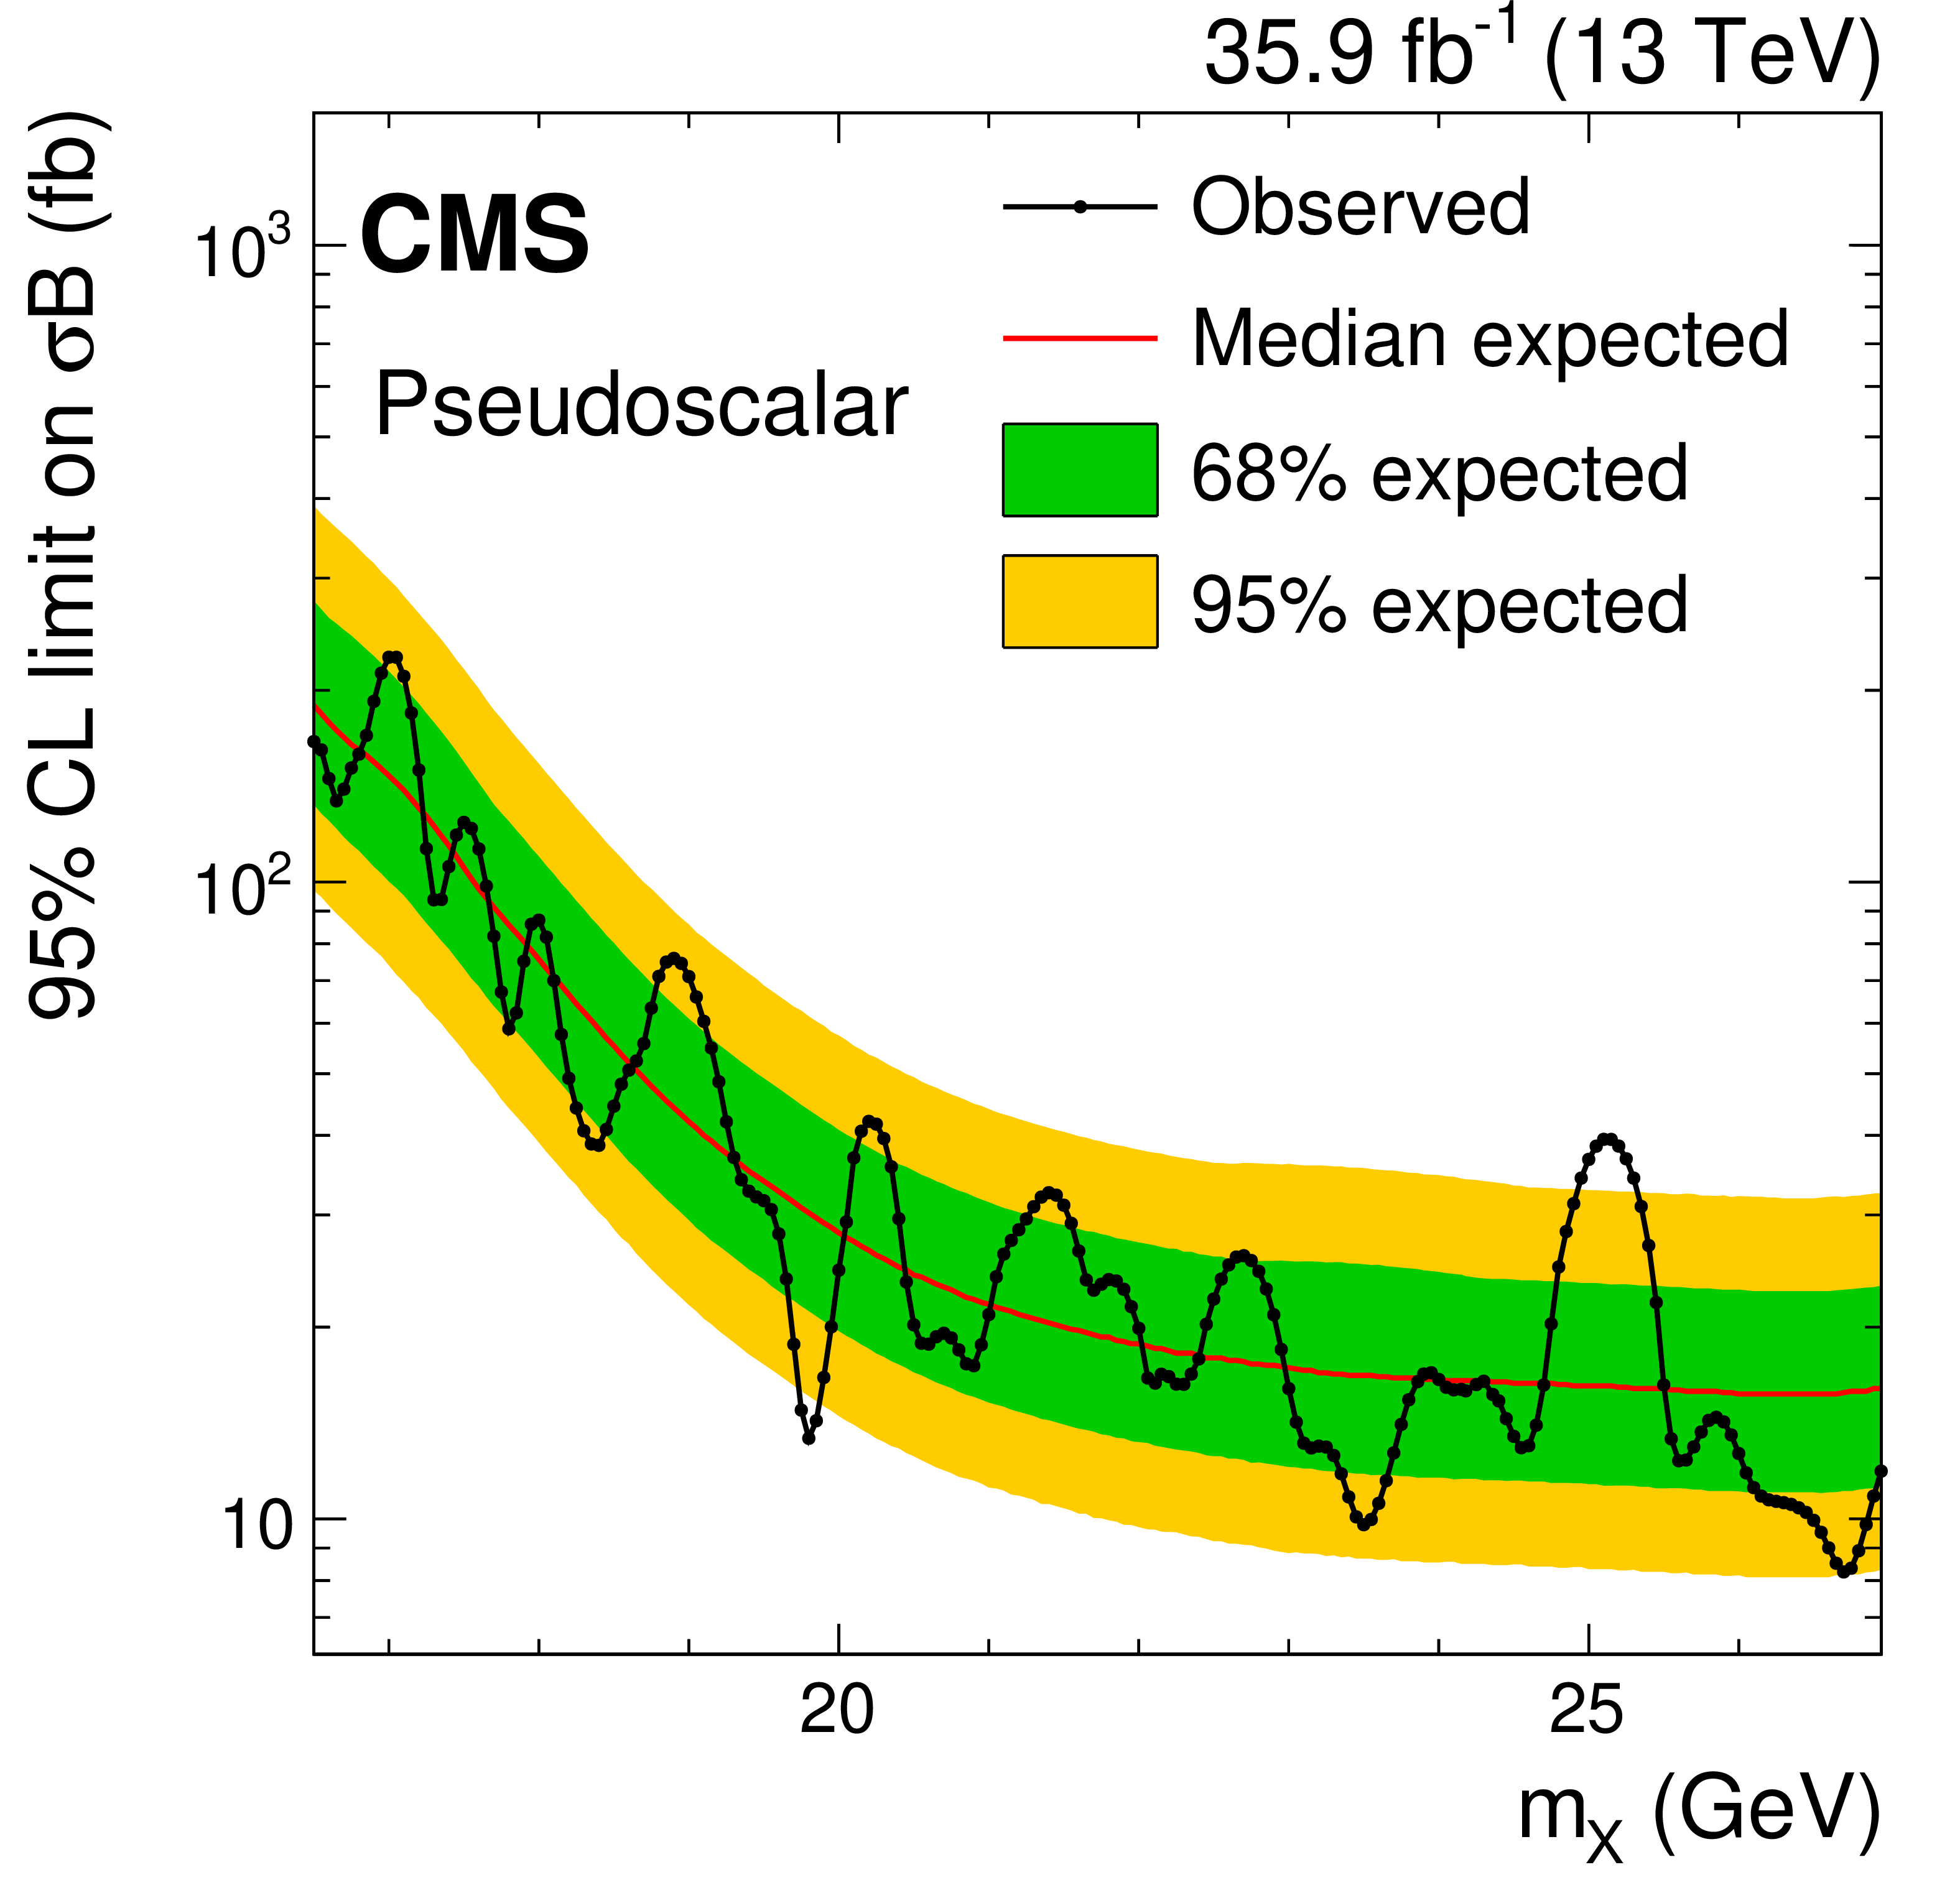
Figure 8-c:
Upper limits at 95% CL on the product of the cross section and branching fraction for a pseudoscalar state. The symbol $\sigma $ denotes the production cross section of the resonance, and the symbol $\mathcal {B}$ denotes the product of the branching fraction for the decay of the resonance to a $\Upsilon(\mathrm{1S}) $ meson and two muons, and the $\Upsilon(\mathrm{1S}) $ meson dimuon branching fraction. The line with the points on it shows the observed upper limits and the thin red line is the median of the expected upper limits. The inner (green) band and the outer (yellow) band indicate the regions containing 68 and 95%, respectively, of the distribution of limits expected under the background-only hypothesis. |
png pdf |
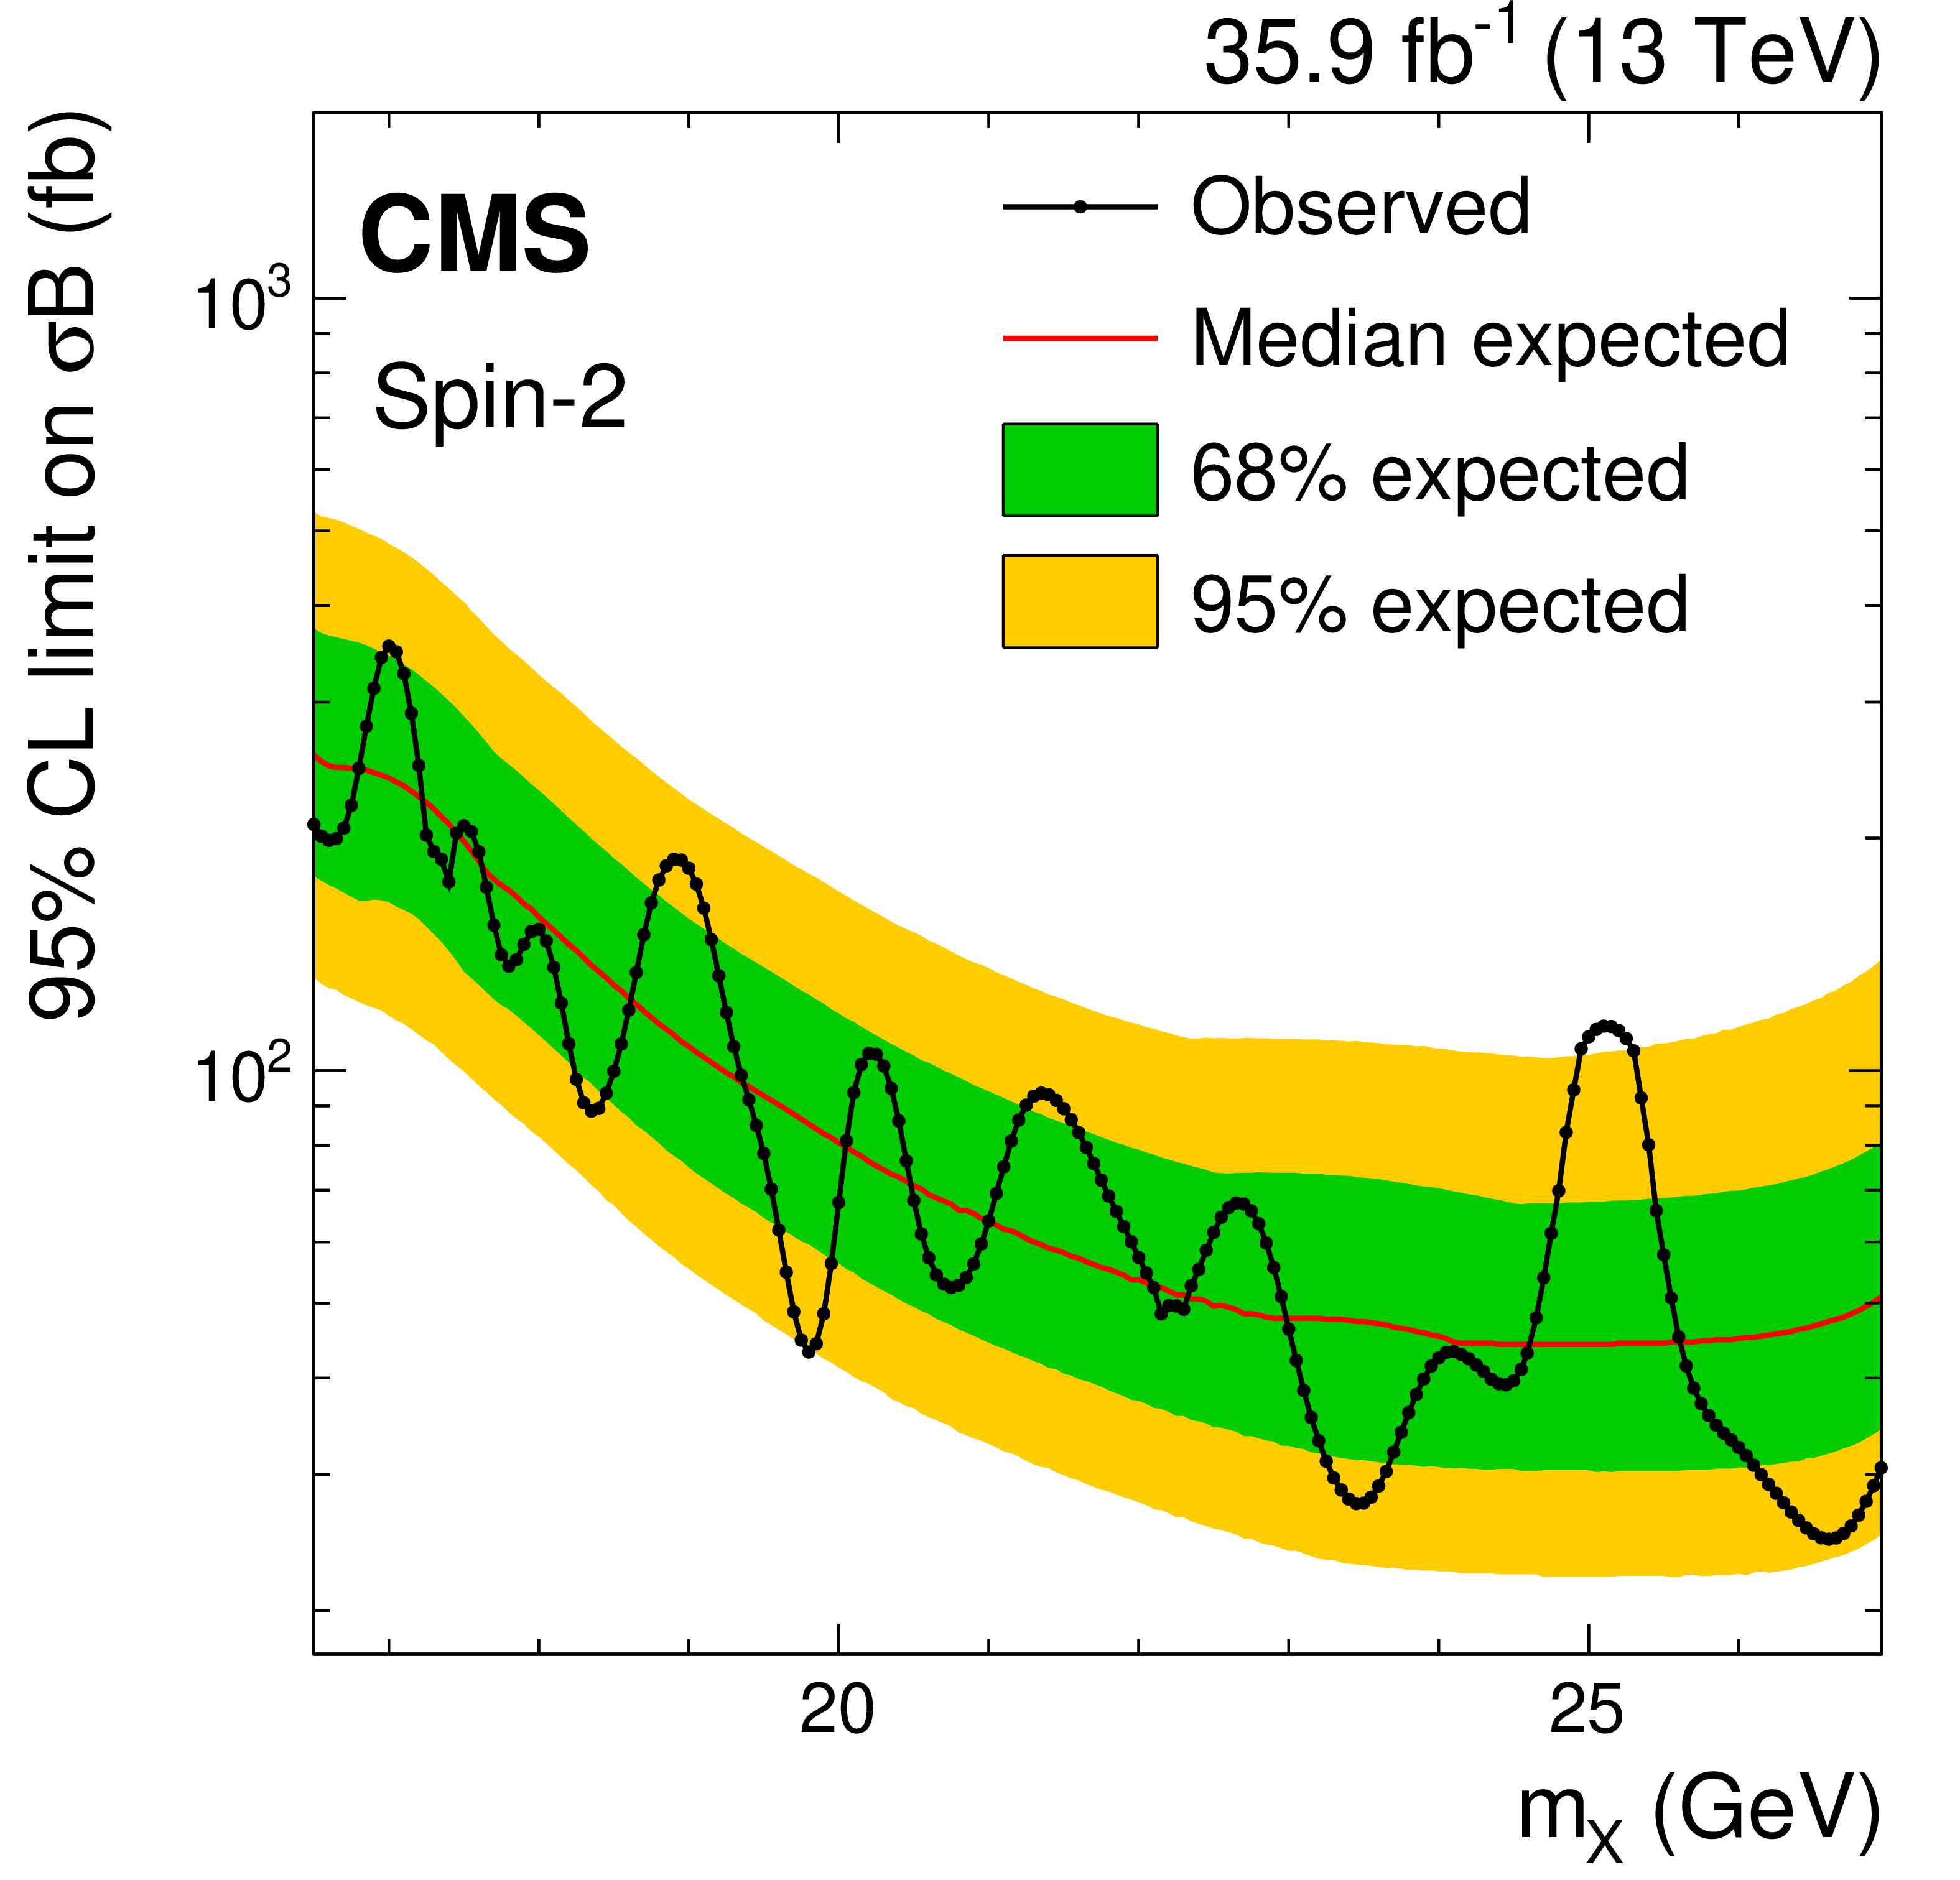
Figure 8-d:
Upper limits at 95% CL on the product of the cross section and branching fraction for a spin-2 state. The symbol $\sigma $ denotes the production cross section of the resonance, and the symbol $\mathcal {B}$ denotes the product of the branching fraction for the decay of the resonance to a $\Upsilon(\mathrm{1S}) $ meson and two muons, and the $\Upsilon(\mathrm{1S}) $ meson dimuon branching fraction. The line with the points on it shows the observed upper limits and the thin red line is the median of the expected upper limits. The inner (green) band and the outer (yellow) band indicate the regions containing 68 and 95%, respectively, of the distribution of limits expected under the background-only hypothesis. |
| Tables | |
png pdf |
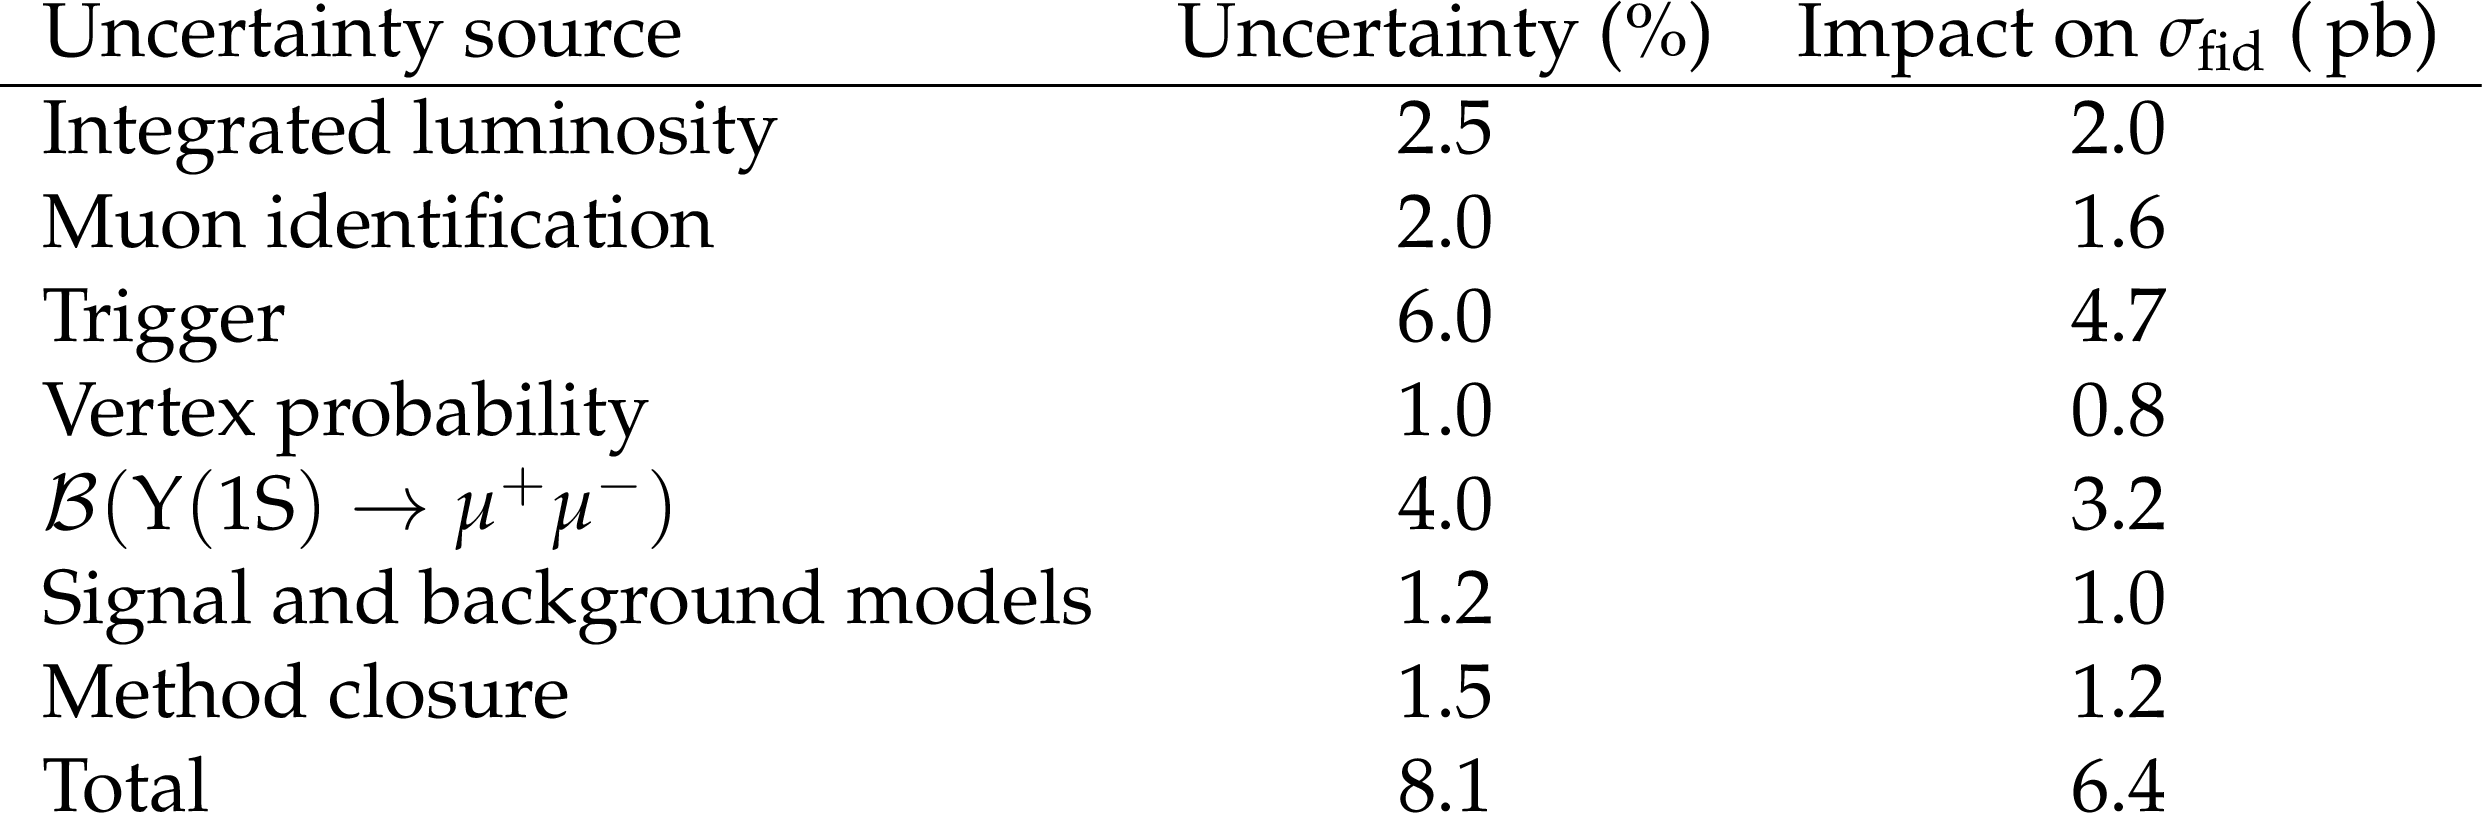
Table 1:
Systematic uncertainties considered in the $\Upsilon(\mathrm{1S})$ pair production cross section measurement. The last column gives the associated absolute uncertainty in the measurement of ${\sigma _\mathrm {fid}}$. |
png pdf |
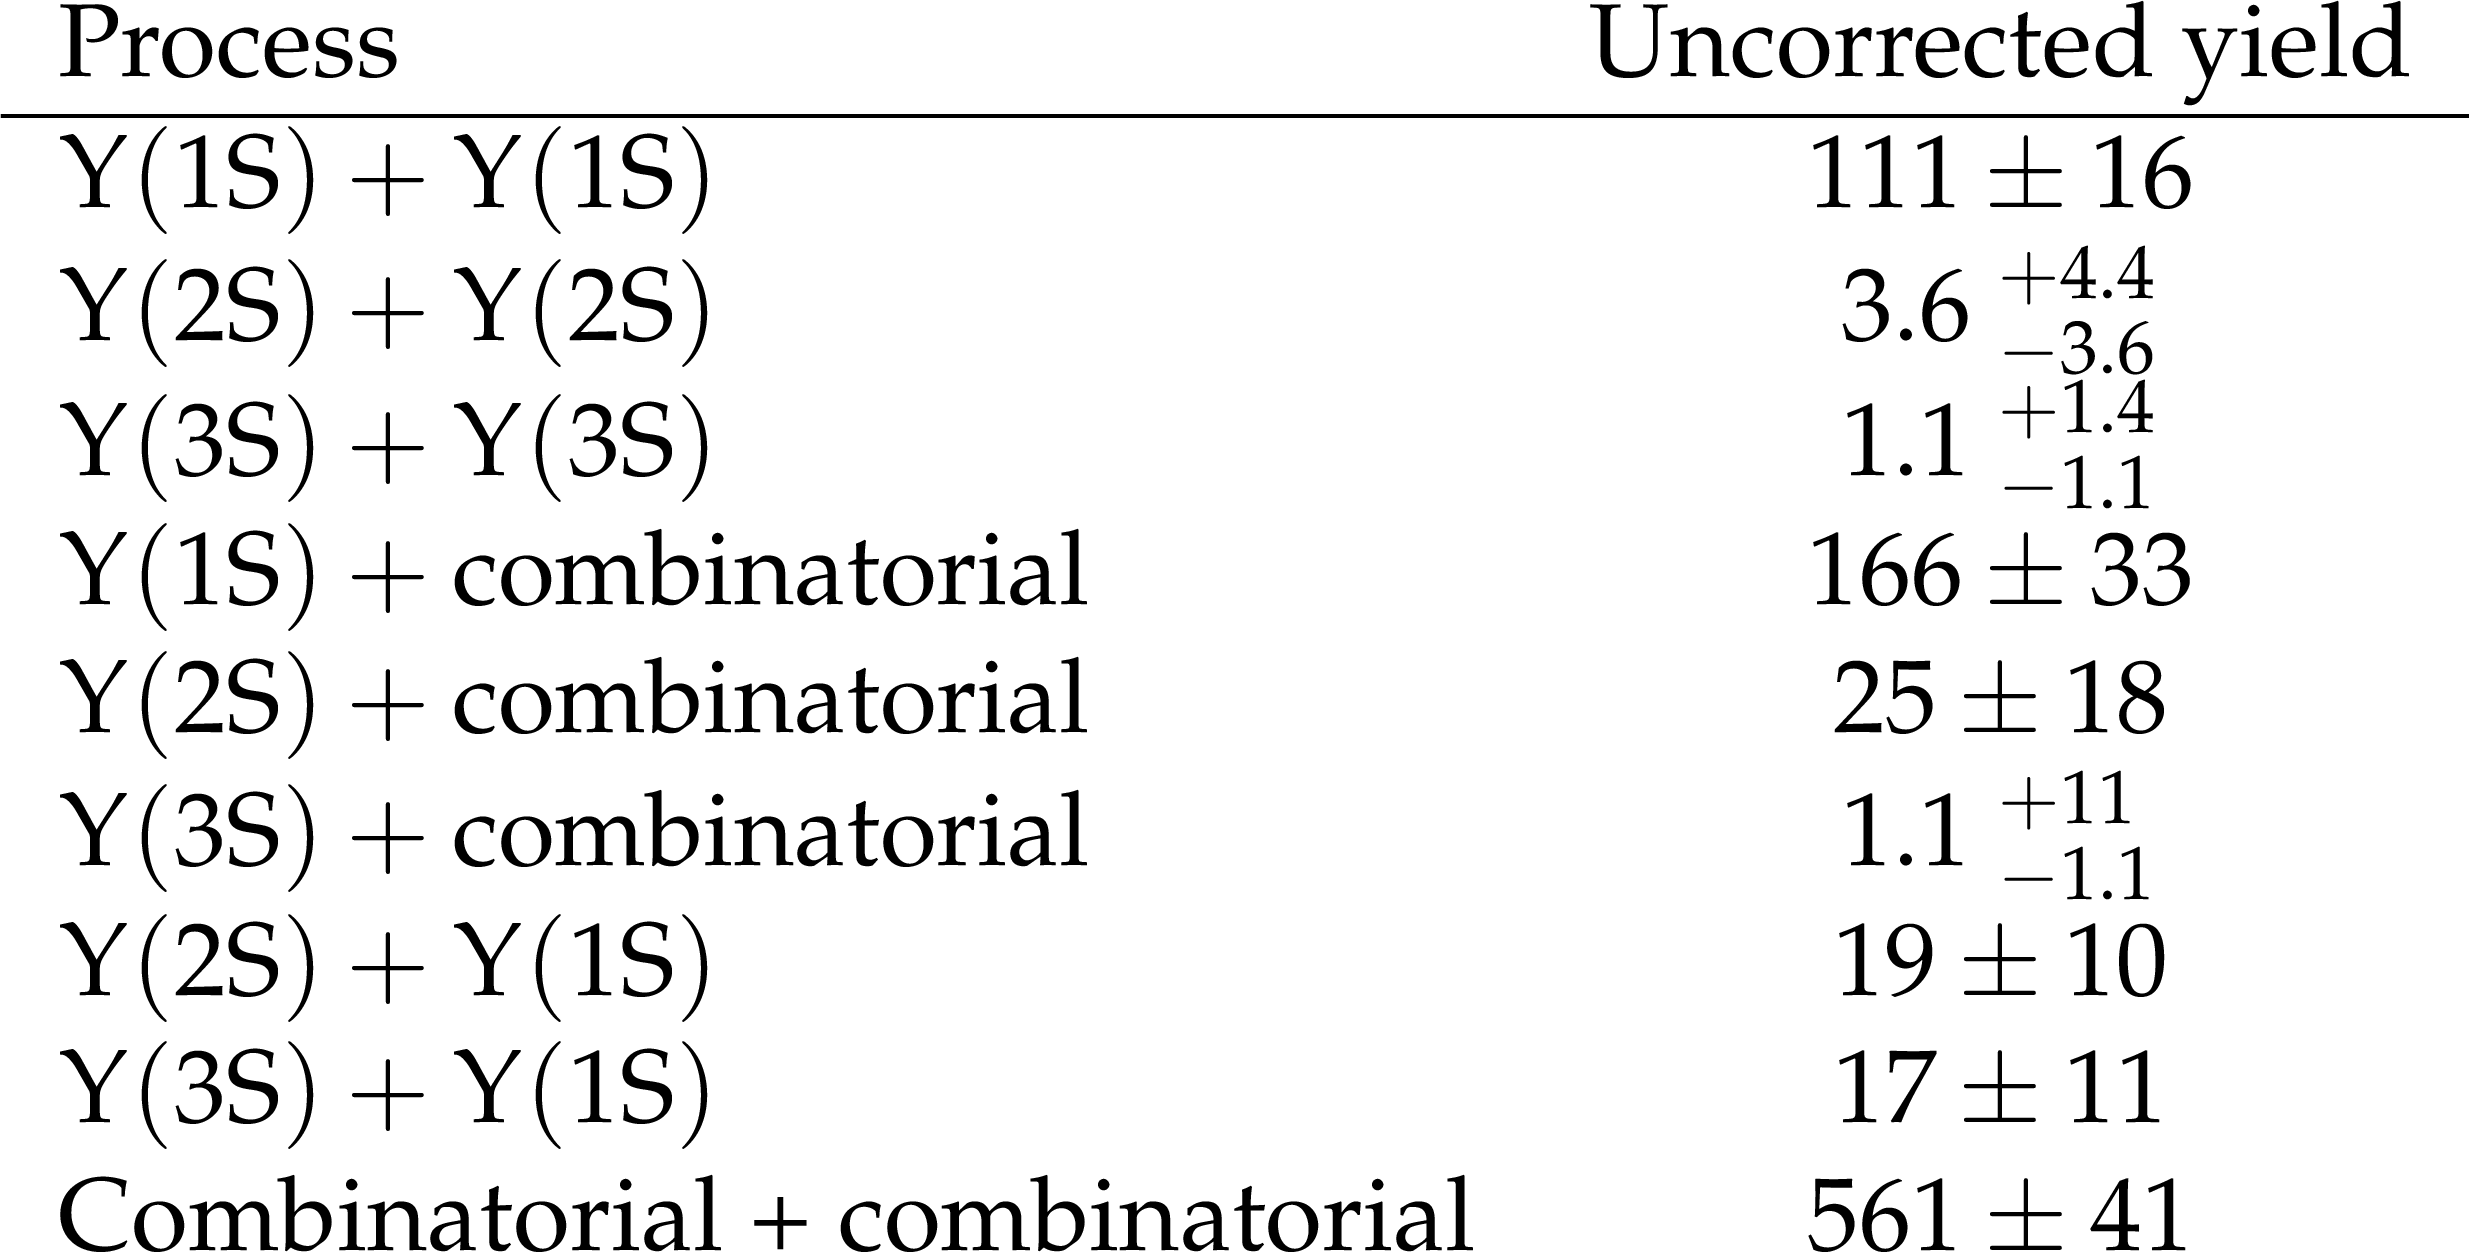
Table 2:
The unweighted number of events for each of the processes from the fit to the ${m_\mathrm {12}}$ and ${m_\mathrm {34}}$ distributions without acceptance nor efficiency corrections. |

png pdf |
Table 3:
Variation of the measured fiducial $\Upsilon(\mathrm{1S})$ pair production cross section for several $\lambda _\theta $ coefficient values. |
| Summary |
|
The cross section for $\Upsilon(\mathrm{1S}) $ pair production is measured in the fiducial region where both $\Upsilon(\mathrm{1S}) $ mesons have an absolute rapidity below 2.0. The measurement is performed using proton-proton collision data collected at a center-of-mass energy of 13 TeV by the CMS detector in 2016 and corresponding to an integrated luminosity of 35.9 fb$^{-1}$. Assuming that the $\Upsilon(\mathrm{1S}) $ mesons are produced unpolarized, the fiducial $\Upsilon(\mathrm{1S}) $ pair production cross section is determined to be 79 $\pm$ 11 (stat) $\pm$ 6 (syst) $\pm$ 3 ($\mathcal{B}$) pb, where the last uncertainty comes from the uncertainty in the $\Upsilon(\mathrm{1S}) $ dimuon branching fraction. The result can change if the $\Upsilon(\mathrm{1S}) $ mesons are produced with a nonzero polarization. Changing the polarization coefficient $\lambda_\theta$ from $-$1 to $+$1, the resulting $\Upsilon(\mathrm{1S}) $ pair production cross section measurement varies by $-$60 to $+$25%. The contribution of double-parton scattering to the total inclusive $\Upsilon(\mathrm{1S}) $ pair production cross section is determined for the first time. It is measured to be (39 $\pm$ 14)% in the same fiducial region as described above, where the uncertainty includes both statistical and systematic components, with the statistical uncertainty dominating. The results of a search are also presented for a light narrow resonance, such as a tetraquark or a bound state beyond-the-standard model, decaying to a $\Upsilon(\mathrm{1S}) $ and a pair of opposite-sign muons. No excess of events compatible with a signal is observed in the four-muon invariant mass spectrum. Upper limits at 95% confidence level on the product of the signal cross section and branching fraction to four muons via an intermediate $\Upsilon(\mathrm{1S}) $ resonance are set for different signal models, expanding the kinematic and mass coverage of previous searches. |
| References | ||||
| 1 | N. Brambilla et al. | Heavy quarkonium: Progress, puzzles, and opportunities | EPJC 71 (2011) 1534 | 1010.5827 |
| 2 | CMS Collaboration | Observation of $ \Upsilon\text{1S} $ pair production in proton-proton collisions at $ \sqrt{s}= $ 8 TeV | JHEP 05 (2017) 013 | CMS-BPH-14-008 1610.07095 |
| 3 | Y. Chen and S. Wu | Production of four-quark states with double heavy quarks at LHC | PLB 705 (2011) 93 | 1101.4568 |
| 4 | A. V. Berezhnoy, A. V. Luchinsky, and A. A. Novoselov | Tetraquarks composed of 4 heavy quarks | PRD 86 (2012) 034004 | 1111.1867 |
| 5 | B. A. Dobrescu and C. Frugiuele | Hidden GeV-scale interactions of quarks | PRL 113 (2014) 061801 | 1404.3947 |
| 6 | M. Karliner, S. Nussinov, and J. L. Rosner | $ Q Q \bar Q \bar Q $ states: masses, production, and decays | PRD 95 (2017) 034011 | 1611.00348 |
| 7 | W. Chen et al. | Hunting for exotic doubly hidden-charm/bottom tetraquark states | PLB 773 (2017) 247 | 1605.01647 |
| 8 | Z.-G. Wang | Analysis of the $ QQ\bar{Q}\bar{Q} $ tetraquark states with QCD sum rules | EPJC 77 (2017) 432 | 1701.04285 |
| 9 | J. Wu et al. | Heavy-flavored tetraquark states with the $ QQ\bar{Q}\bar{Q} $ configuration | PRD 97 (2018) 094015 | 1605.01134 |
| 10 | M. N. Anwar et al. | Spectroscopy and decays of the fully-heavy tetraquarks | EPJC 78 (2018) 647 | 1710.02540 |
| 11 | C. Hughes, E. Eichten, and C. T. H. Davies | Searching for beauty-fully bound tetraquarks using lattice nonrelativistic QCD | PRD 97 (2018) 054505 | 1710.03236 |
| 12 | A. Esposito and A. D. Polosa | A $ bb\bar b\bar b $ di-bottomonium at the LHC? | EPJC 78 (2018) 782 | 1807.06040 |
| 13 | Y. Bai, S. Lu, and J. Osborne | Beauty-full tetraquarks | PLB 798 (2019) 134930 | 1612.00012 |
| 14 | LHCb Collaboration | Search for beautiful tetraquarks in the $ \Upsilon\text{1S}\mu^+\mu^- $ invariant-mass spectrum | JHEP 10 (2018) 086 | 1806.09707 |
| 15 | CMS Collaboration | The CMS trigger system | JINST 12 (2017) P01020 | CMS-TRG-12-001 1609.02366 |
| 16 | CMS Collaboration | The CMS experiment at the CERN LHC | JINST 3 (2008) S08004 | CMS-00-001 |
| 17 | CMS Collaboration | Performance of the CMS muon detector and muon reconstruction with proton-proton collisions at $ \sqrt{s}= $ 13 TeV | JINST 13 (2018) P06015 | CMS-MUO-16-001 1804.04528 |
| 18 | T. Sjostrand et al. | An introduction to PYTHIA 8.2 | CPC 191 (2015) 159 | 1410.3012 |
| 19 | R. Baier and R. Ruckl | Hadronic production of $ \mathrm{J}/\psi $ and $ \Upsilon $: Transverse momentum distributions | PLB 102 (1981) 364 | |
| 20 | J.-P. Lansberg and H.-S. Shao | Production of $ J/\psi + \eta_{c} $ versus $ J/\psi + J/\psi $ at the LHC: Importance of real $ \alpha^{5}_{s} $ corrections | PRL 111 (2013) 122001 | 1308.0474 |
| 21 | J.-P. Lansberg and H.-S. Shao | $ J/\psi $ -pair production at large momenta: Indications for double parton scatterings and large $ \alpha_s^5 $ contributions | PLB 751 (2015) 479 | 1410.8822 |
| 22 | H.-S. Shao | HELAC-Onia: An automatic matrix element generator for heavy quarkonium physics | CPC 184 (2013) 2562 | 1212.5293 |
| 23 | H.-S. Shao | HELAC-Onia 2.0: an upgraded matrix-element and event generator for heavy quarkonium physics | CPC 198 (2016) 238 | 1507.03435 |
| 24 | Y. Gao et al. | Spin determination of single-produced resonances at hadron colliders | PRD 81 (2010) 075022 | 1001.3396 |
| 25 | S. Bolognesi et al. | On the spin and parity of a single-produced resonance at the LHC | PRD 86 (2012) 095031 | 1208.4018 |
| 26 | I. Anderson et al. | Constraining anomalous HVV interactions at proton and lepton colliders | PRD 89 (2014) 035007 | 1309.4819 |
| 27 | A. V. Gritsan, R. Rontsch, M. Schulze, and M. Xiao | Constraining anomalous Higgs boson couplings to the heavy flavor fermions using matrix element techniques | PRD 94 (2016) 055023 | 1606.03107 |
| 28 | CMS Collaboration | Event generator tunes obtained from underlying event and multiparton scattering measurements | EPJC 76 (2016) 155 | CMS-GEN-14-001 1512.00815 |
| 29 | GEANT4 Collaboration | GEANT4 --- a simulation toolkit | NIMA 506 (2003) 250 | |
| 30 | CMS Collaboration | Particle-flow reconstruction and global event description with the CMS detector | JINST 12 (2017) P10003 | CMS-PRF-14-001 1706.04965 |
| 31 | Particle Data Group, M. Tanabashi et al. | Review of particle physics | PRD 98 (2018) 030001 | |
| 32 | R. A. Fisher | On the interpretation of $ \chi^2 $ from contingency tables, and the calculation of p | J. Roy. Stat. Soc. 85 (1922) 87 | |
| 33 | CMS Collaboration | CMS luminosity measurements for the 2016 data taking period | CMS-PAS-LUM-17-001 | CMS-PAS-LUM-17-001 |
| 34 | P. Faccioli, C. Lourenco, J. Seixas, and H. K. Wohri | Towards the experimental clarification of quarkonium polarization | EPJC 69 (2010) 657 | 1006.2738 |
| 35 | LHCb Collaboration | Measurement of the $ \Upsilon $ polarizations in $ pp $ collisions at $ \sqrt{s}= $ 7 and 8 TeV | JHEP 12 (2017) 110 | 1709.01301 |
| 36 | CMS Collaboration | Measurement of the $ \Upsilon\text{1S} $, $ \Upsilon\text{2S} $ and $ \Upsilon\text{3S} $ polarizations in $ pp $ collisions at $ \sqrt{s}= $ 7 TeV | PRL 110 (2013) 081802 | CMS-BPH-11-023 1209.2922 |
| 37 | A. D. Cook | Double $ J/\psi $ production at LHCb | 2015 PhD thesis. \url https://cds.cern.ch/record/2140033 | |
| 38 | CMS Collaboration | Search for Higgs boson pair production in the $ \gamma\gamma\mathrm{b\overline{b}} $ final state in $ {\mathrm{p}}{\mathrm{p}} $ collisions at $ \sqrt{s}= $ 13 TeV | PLB 788 (2019) 7 | CMS-HIG-17-008 1806.00408 |
| 39 | P. D. Dauncey, M. Kenzie, N. Wardle, and G. J. Davies | Handling uncertainties in background shapes | JINST 10 (2015) P04015 | 1408.6865 |
| 40 | The ATLAS Collaboration, The CMS Collaboration, The LHC Higgs Combination Group | Procedure for the LHC Higgs boson search combination in Summer 2011 | CMS-NOTE-2011-005 | |
| 41 | CMS Collaboration | Combined results of searches for the standard model Higgs boson in pp collisions at $ \sqrt{s}= $ 7 TeV | PLB 710 (2012) 26 | CMS-HIG-11-032 1202.1488 |
| 42 | T. Junk | Confidence level computation for combining searches with small statistics | NIMA 434 (1999) 435 | hep-ex/9902006 |
| 43 | A. L. Read | Presentation of search results: the $ CL_s $ technique | JPG 28 (2002) 2693 | |
| 44 | G. Cowan, K. Cranmer, E. Gross, and O. Vitells | Asymptotic formulae for likelihood-based tests of new physics | EPJC 71 (2011) 1554 | 1007.1727 |
|
|
Compact Muon Solenoid LHC, CERN |
|

|

|

|

|

|