

Compact Muon Solenoid
LHC, CERN
| CMS-HIG-17-008 ; CERN-EP-2017-343 | ||
| Search for Higgs boson pair production in the $\gamma\gamma\mathrm{b\bar{b}}$ final state in pp collisions at $\sqrt{s} = $ 13 TeV | ||
| CMS Collaboration | ||
| 1 June 2018 | ||
| Phys. Lett. B 788 (2018) 7 | ||
| Abstract: A search is presented for the production of a pair of Higgs bosons, where one decays into two photons and the other one into a bottom quark-antiquark pair. The analysis is performed using proton-proton collision data at $\sqrt{s} = $ 13 TeV recorded in 2016 by the CMS detector at the LHC, corresponding to an integrated luminosity of 35.9 fb$^{-1}$. The results are in agreement with standard model (SM) predictions. In a search for resonant production, upper limits are set on the cross section for new spin-0 or spin-2 particles. For the SM-like nonresonant production hypothesis, the data exclude a product of cross section and branching fraction larger than 2.0 fb at 95% confidence level (CL), corresponding to about 24 times the SM prediction. Values of the effective Higgs boson self-coupling $\kappa_\lambda$ are constrained to be within the range $-11 < \kappa_\lambda < 17$ at 95% CL, assuming all other Higgs boson couplings are at their SM value. These constraints are the most restrictive to date. | ||
| Links: e-print arXiv:1806.00408 [hep-ex] (PDF) ; CDS record ; inSPIRE record ; CADI line (restricted) ; | ||
| Figures | |
png pdf |
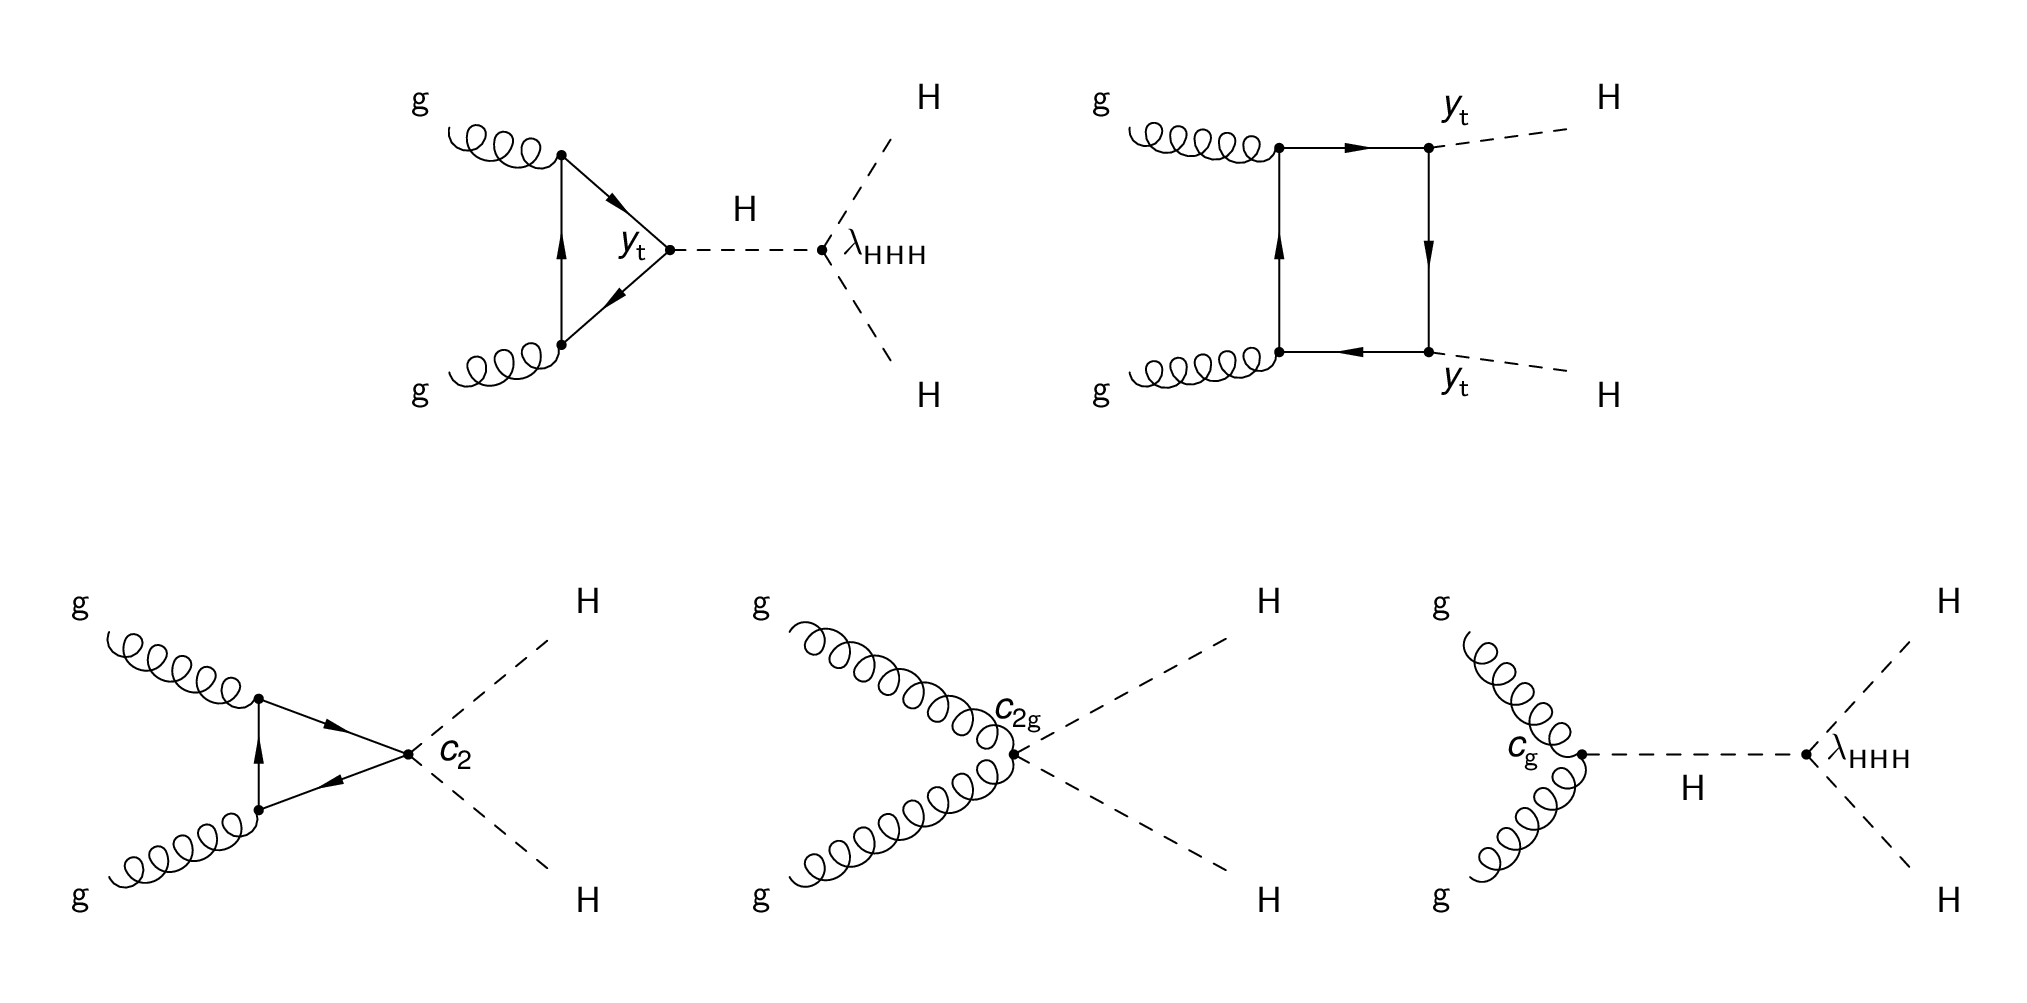
Figure 1:
Feynman diagrams that contribute to ggHH at LO. Top diagrams correspond to SM-like processes, referred to as box and triangle diagrams, respectively, while bottom diagrams correspond to pure BSM effects: the first exploits the contact interaction of two Higgs bosons with two top quarks and the last two describe contact interactions between the H boson and gluons. |

png pdf |
Figure 1-a:
Feynman diagram that contributes to ggHH at LO. It corresponds to a SM-like process referred to as triangle diagram. |
png pdf |
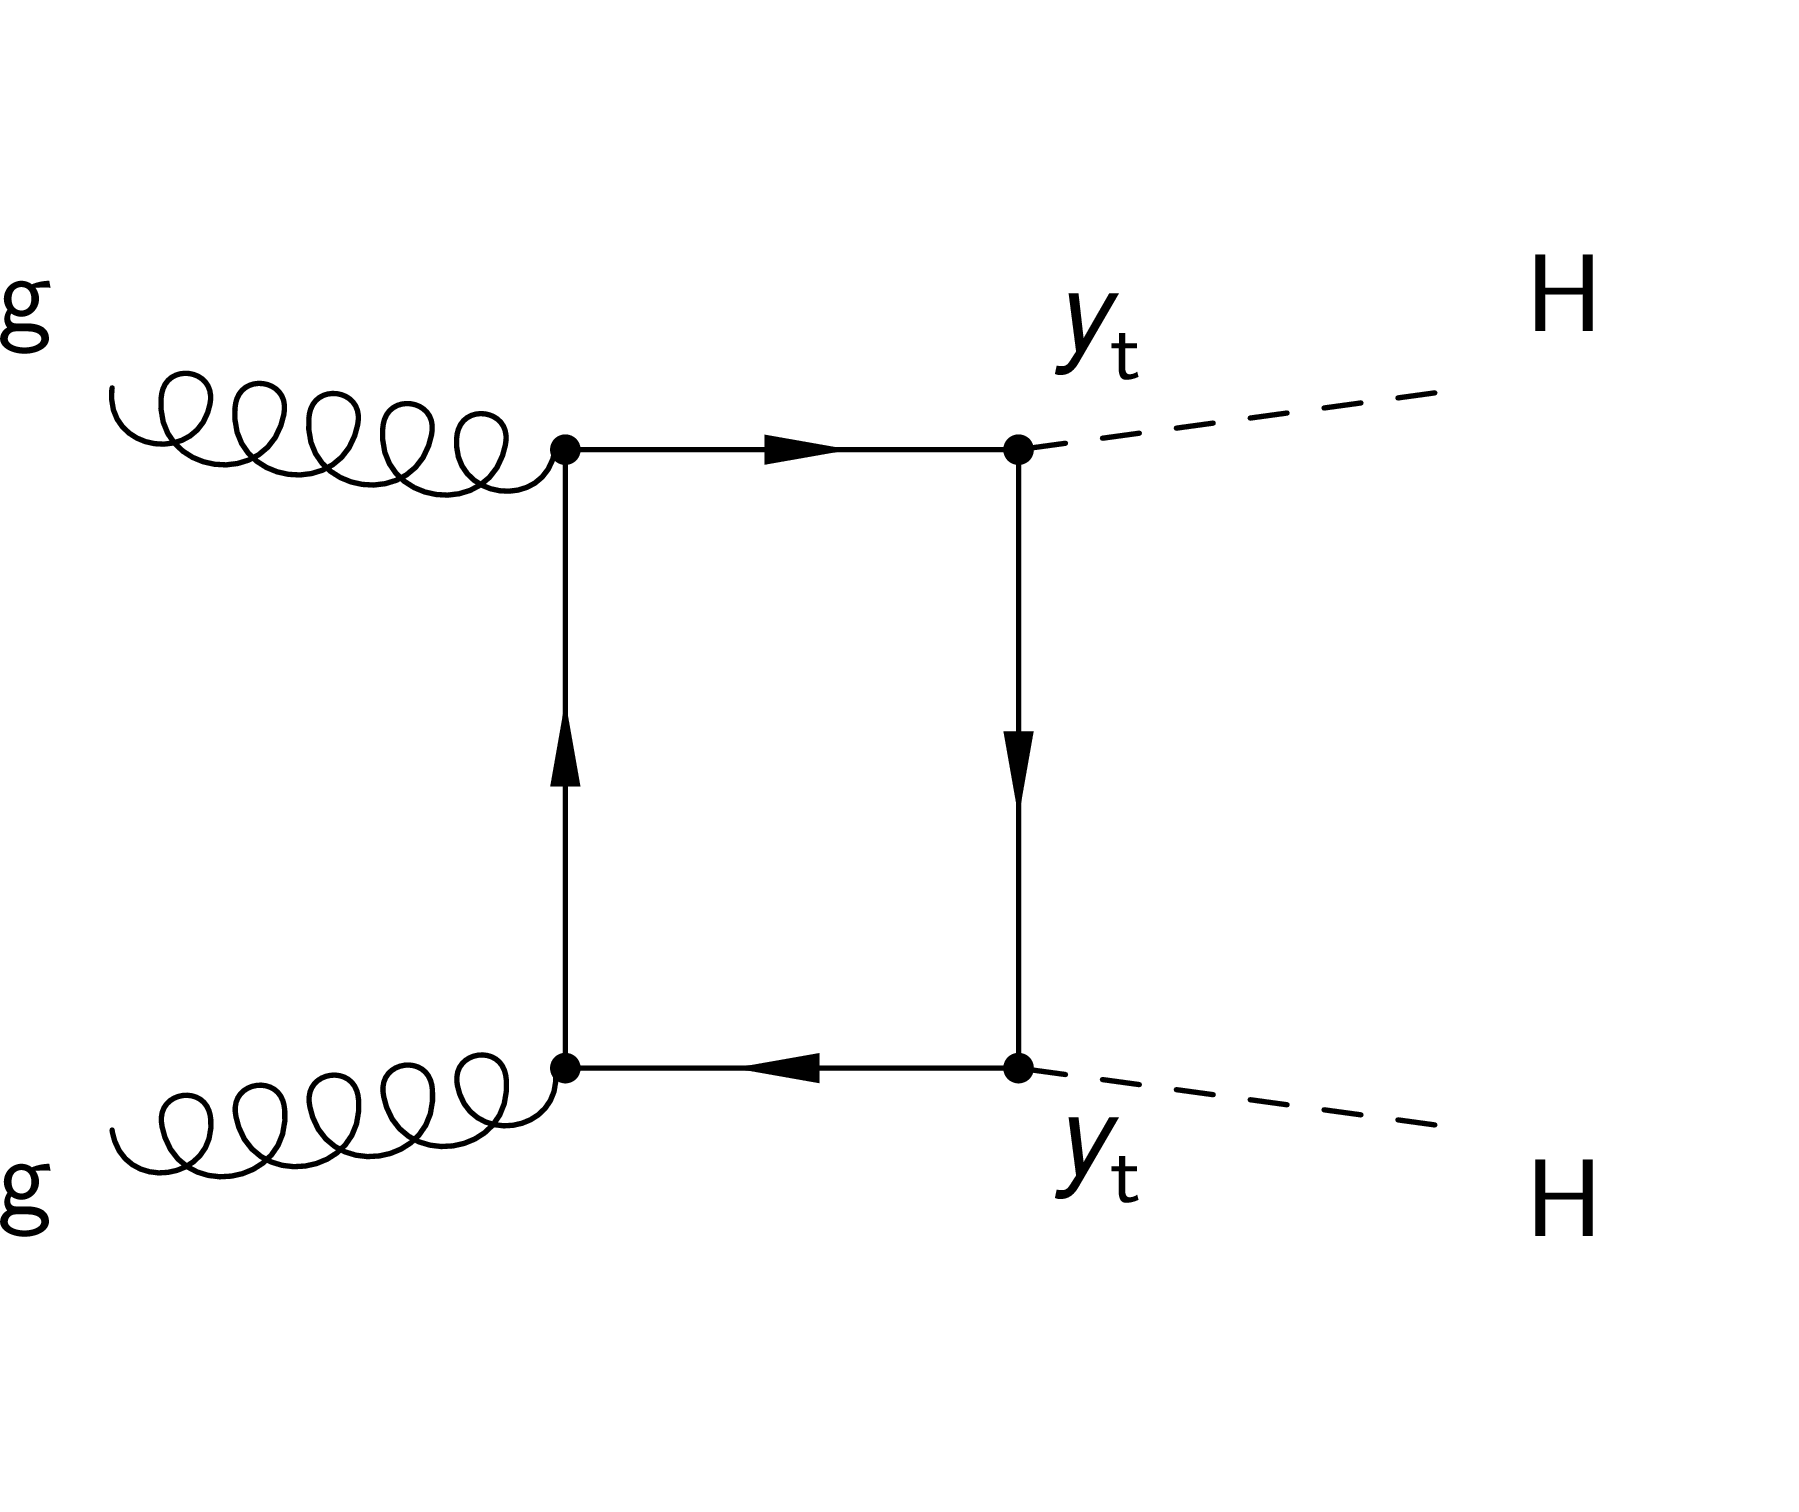
Figure 1-b:
Feynman diagram that contributes to ggHH at LO. It corresponds to a SM-like process,referred to as box diagram. |
png pdf |
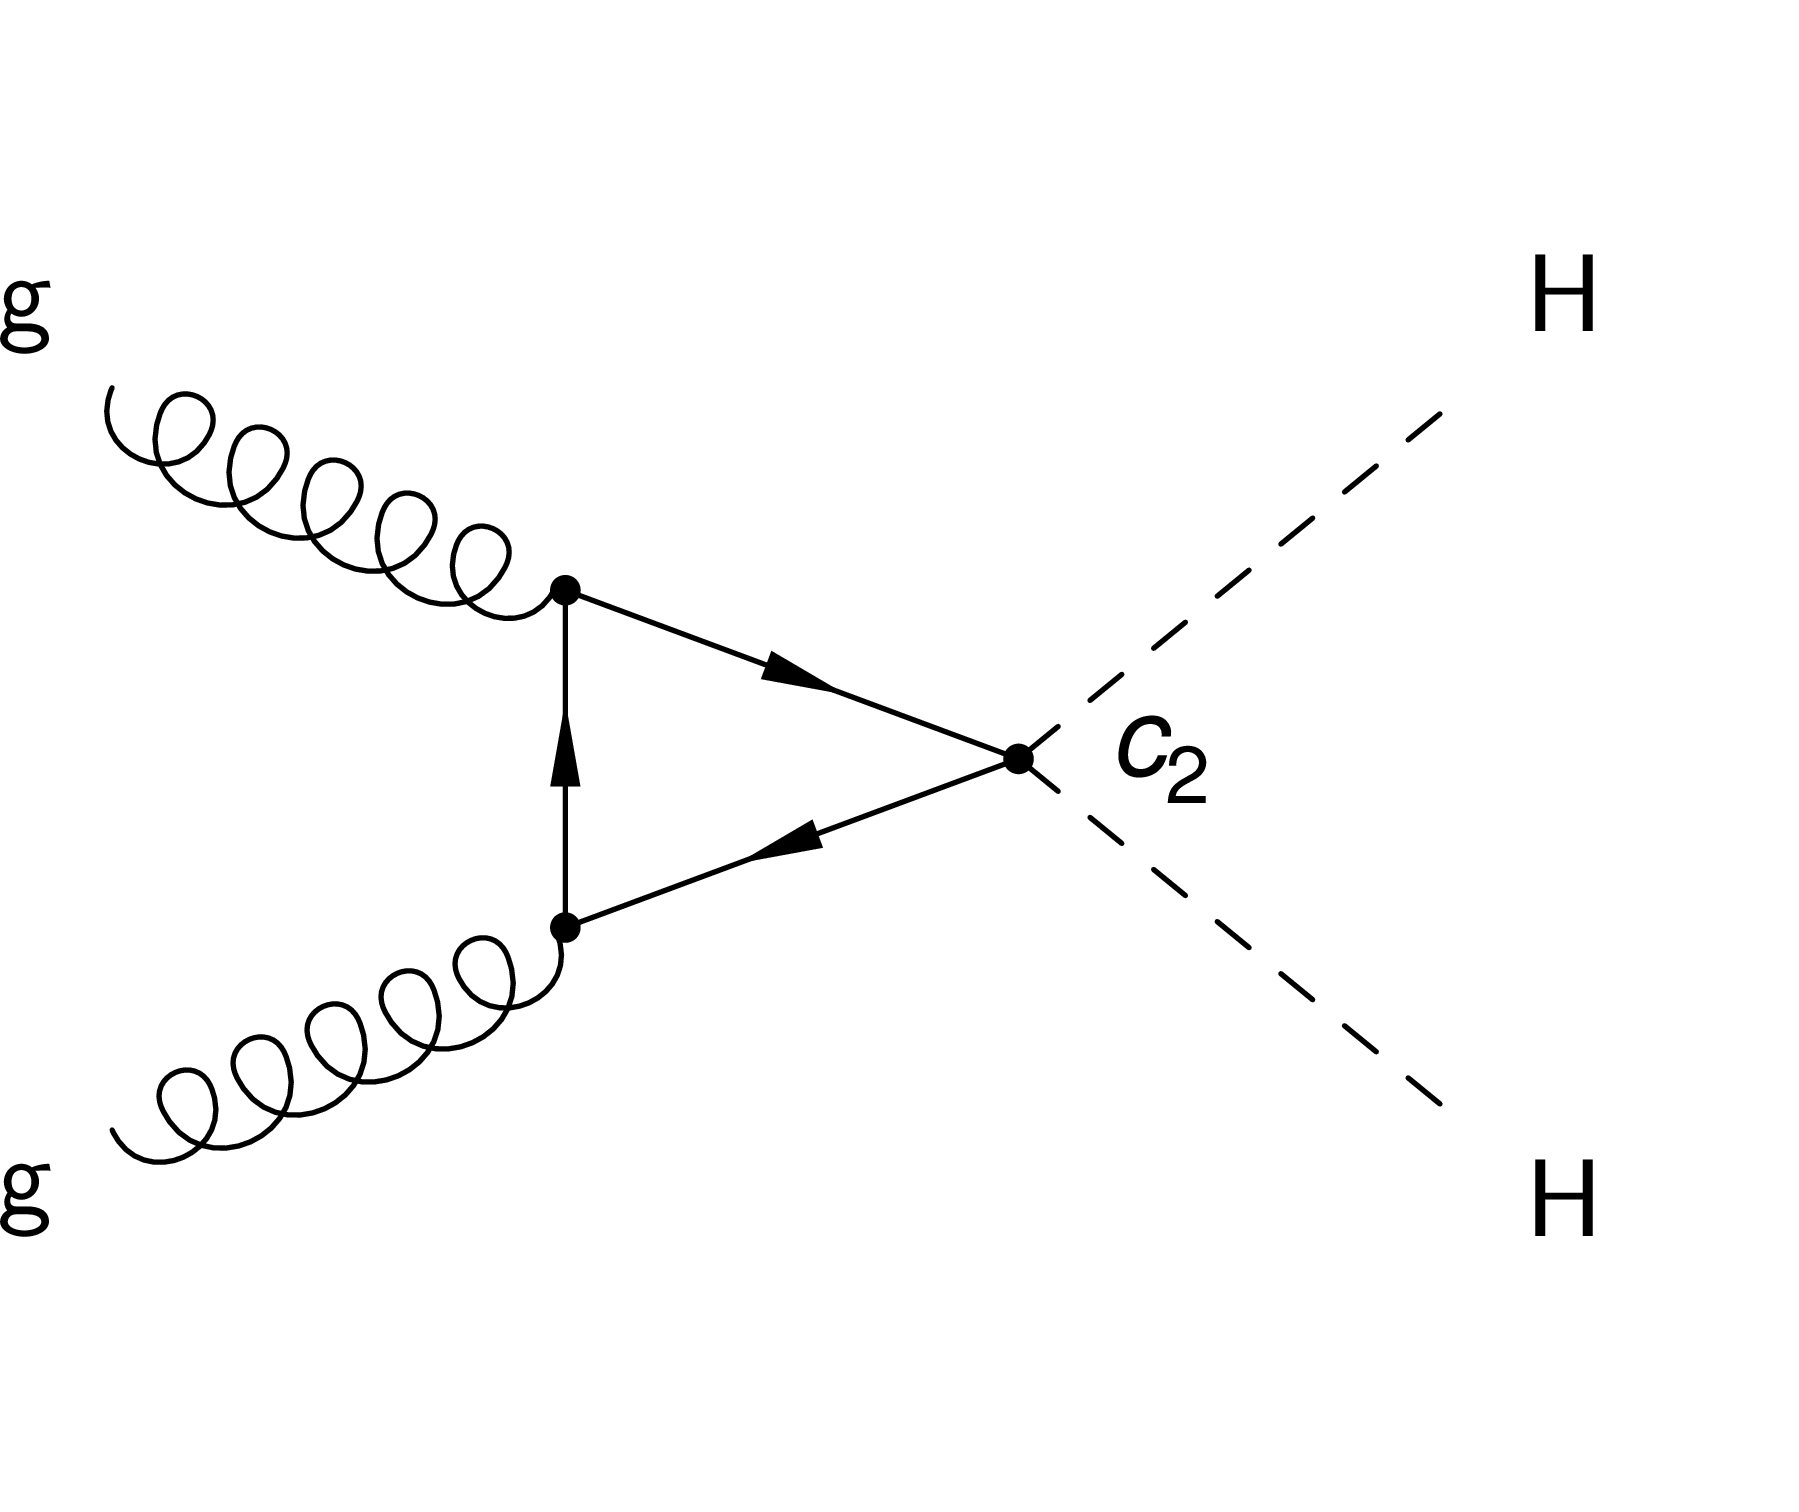
Figure 1-c:
Feynman diagram that contributes to ggHH at LO. It corresponds to a pure BSM effect involving the contact interaction of two Higgs bosons with two top quarks. |
png pdf |
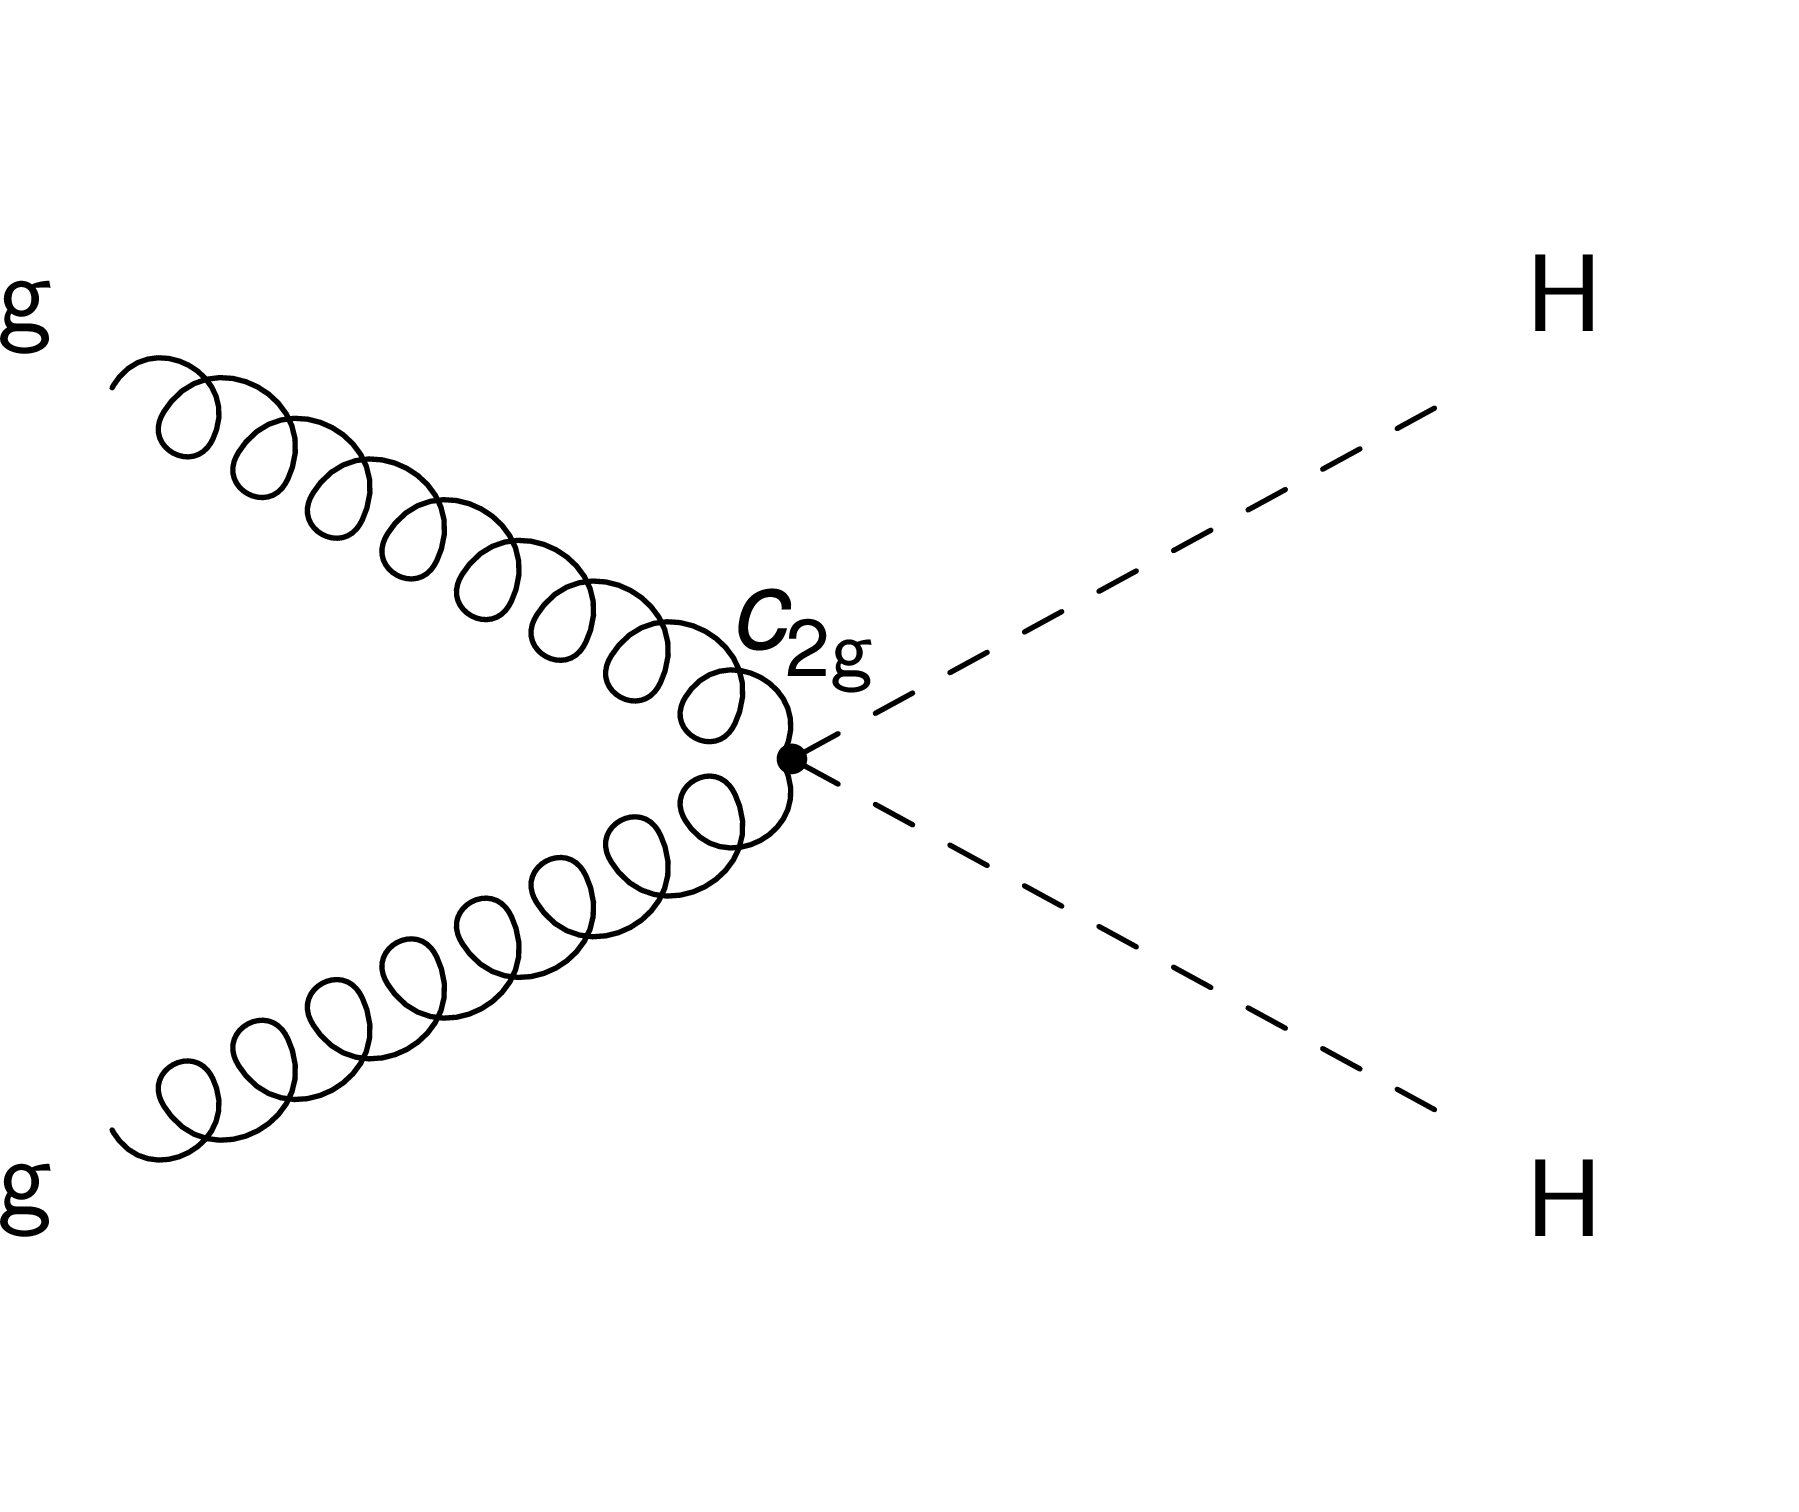
Figure 1-d:
Feynman diagram that contributes to ggHH at LO. It corresponds to a pure BSM effect involving the contact interaction of two Higgs bosons with two gluons. |

png pdf |
Figure 1-e:
Feynman diagram that contributes to ggHH at LO. It corresponds to a pure BSM effect involving the contact interaction of two Higgs bosons with one gluon. |

png pdf |
Figure 2:
Comparison of $ {\tilde{M}_{\mathrm {X}}} $ (red line) with $ {m_{\gamma \gamma \text {jj}}}$ (purple dotted line) for different spin-2 resonance masses. All distributions are obtained after the full baseline selection (Table 2), and are normalized to unit area. |
png pdf |
Figure 3:
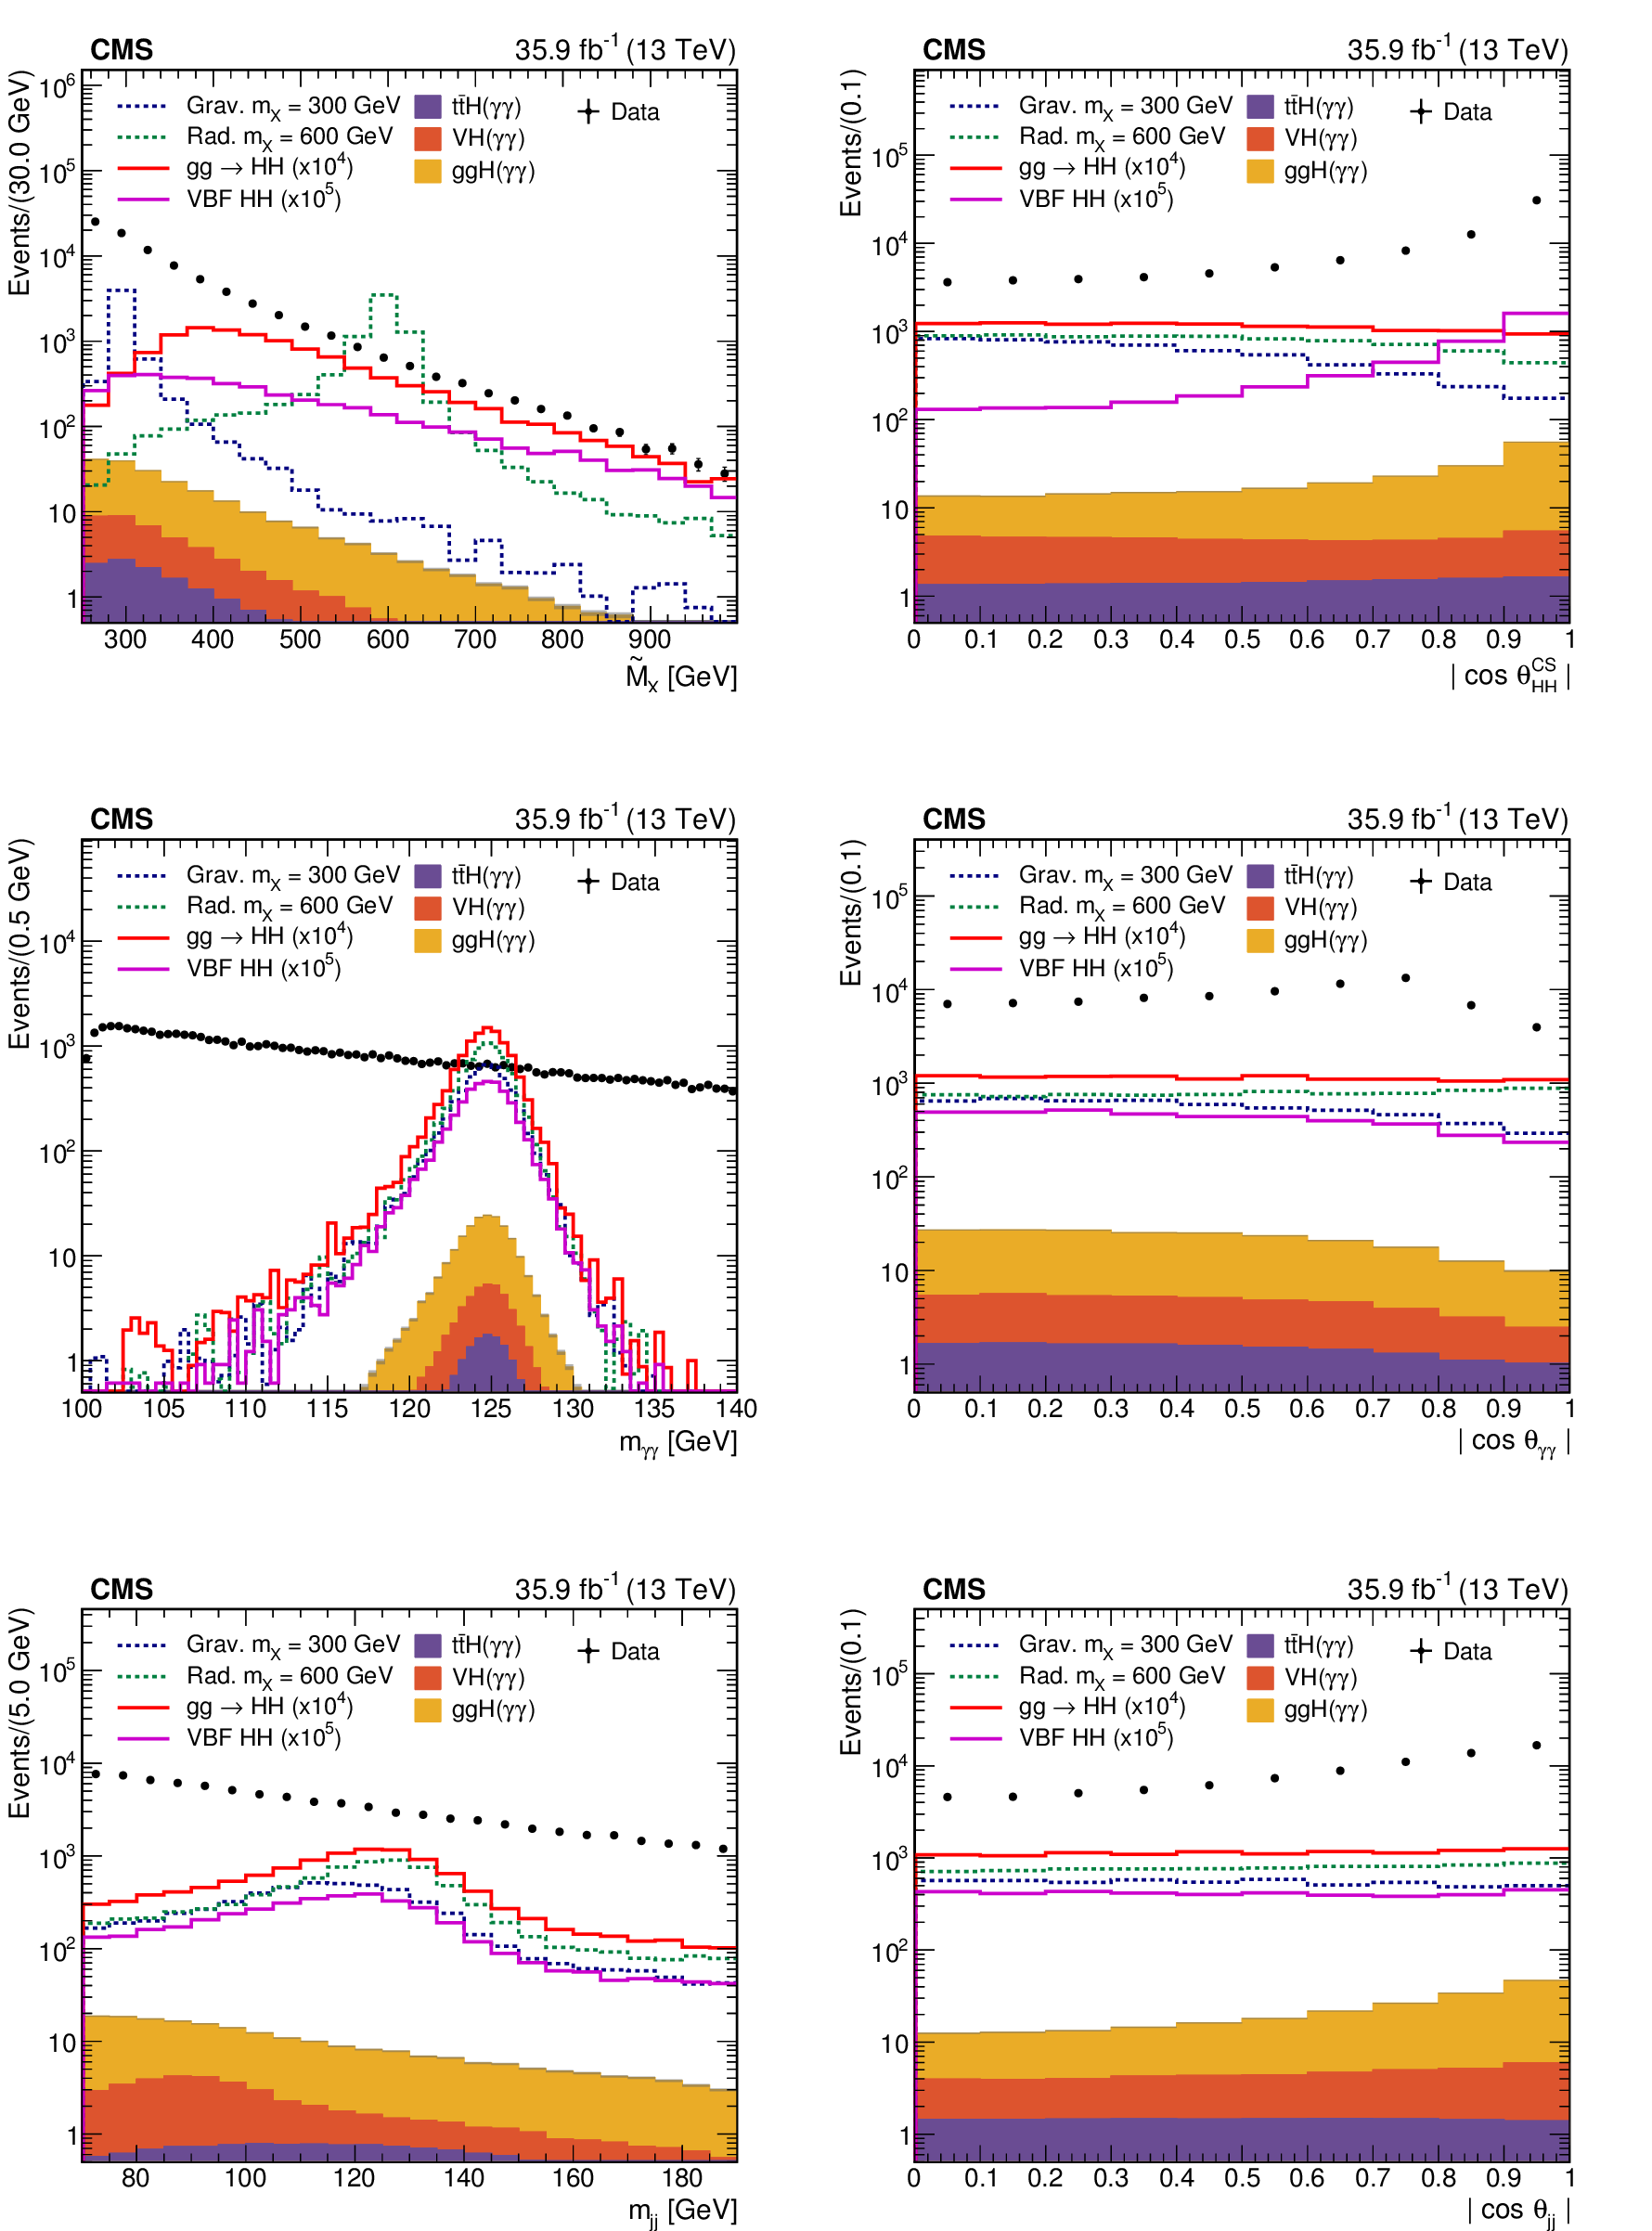
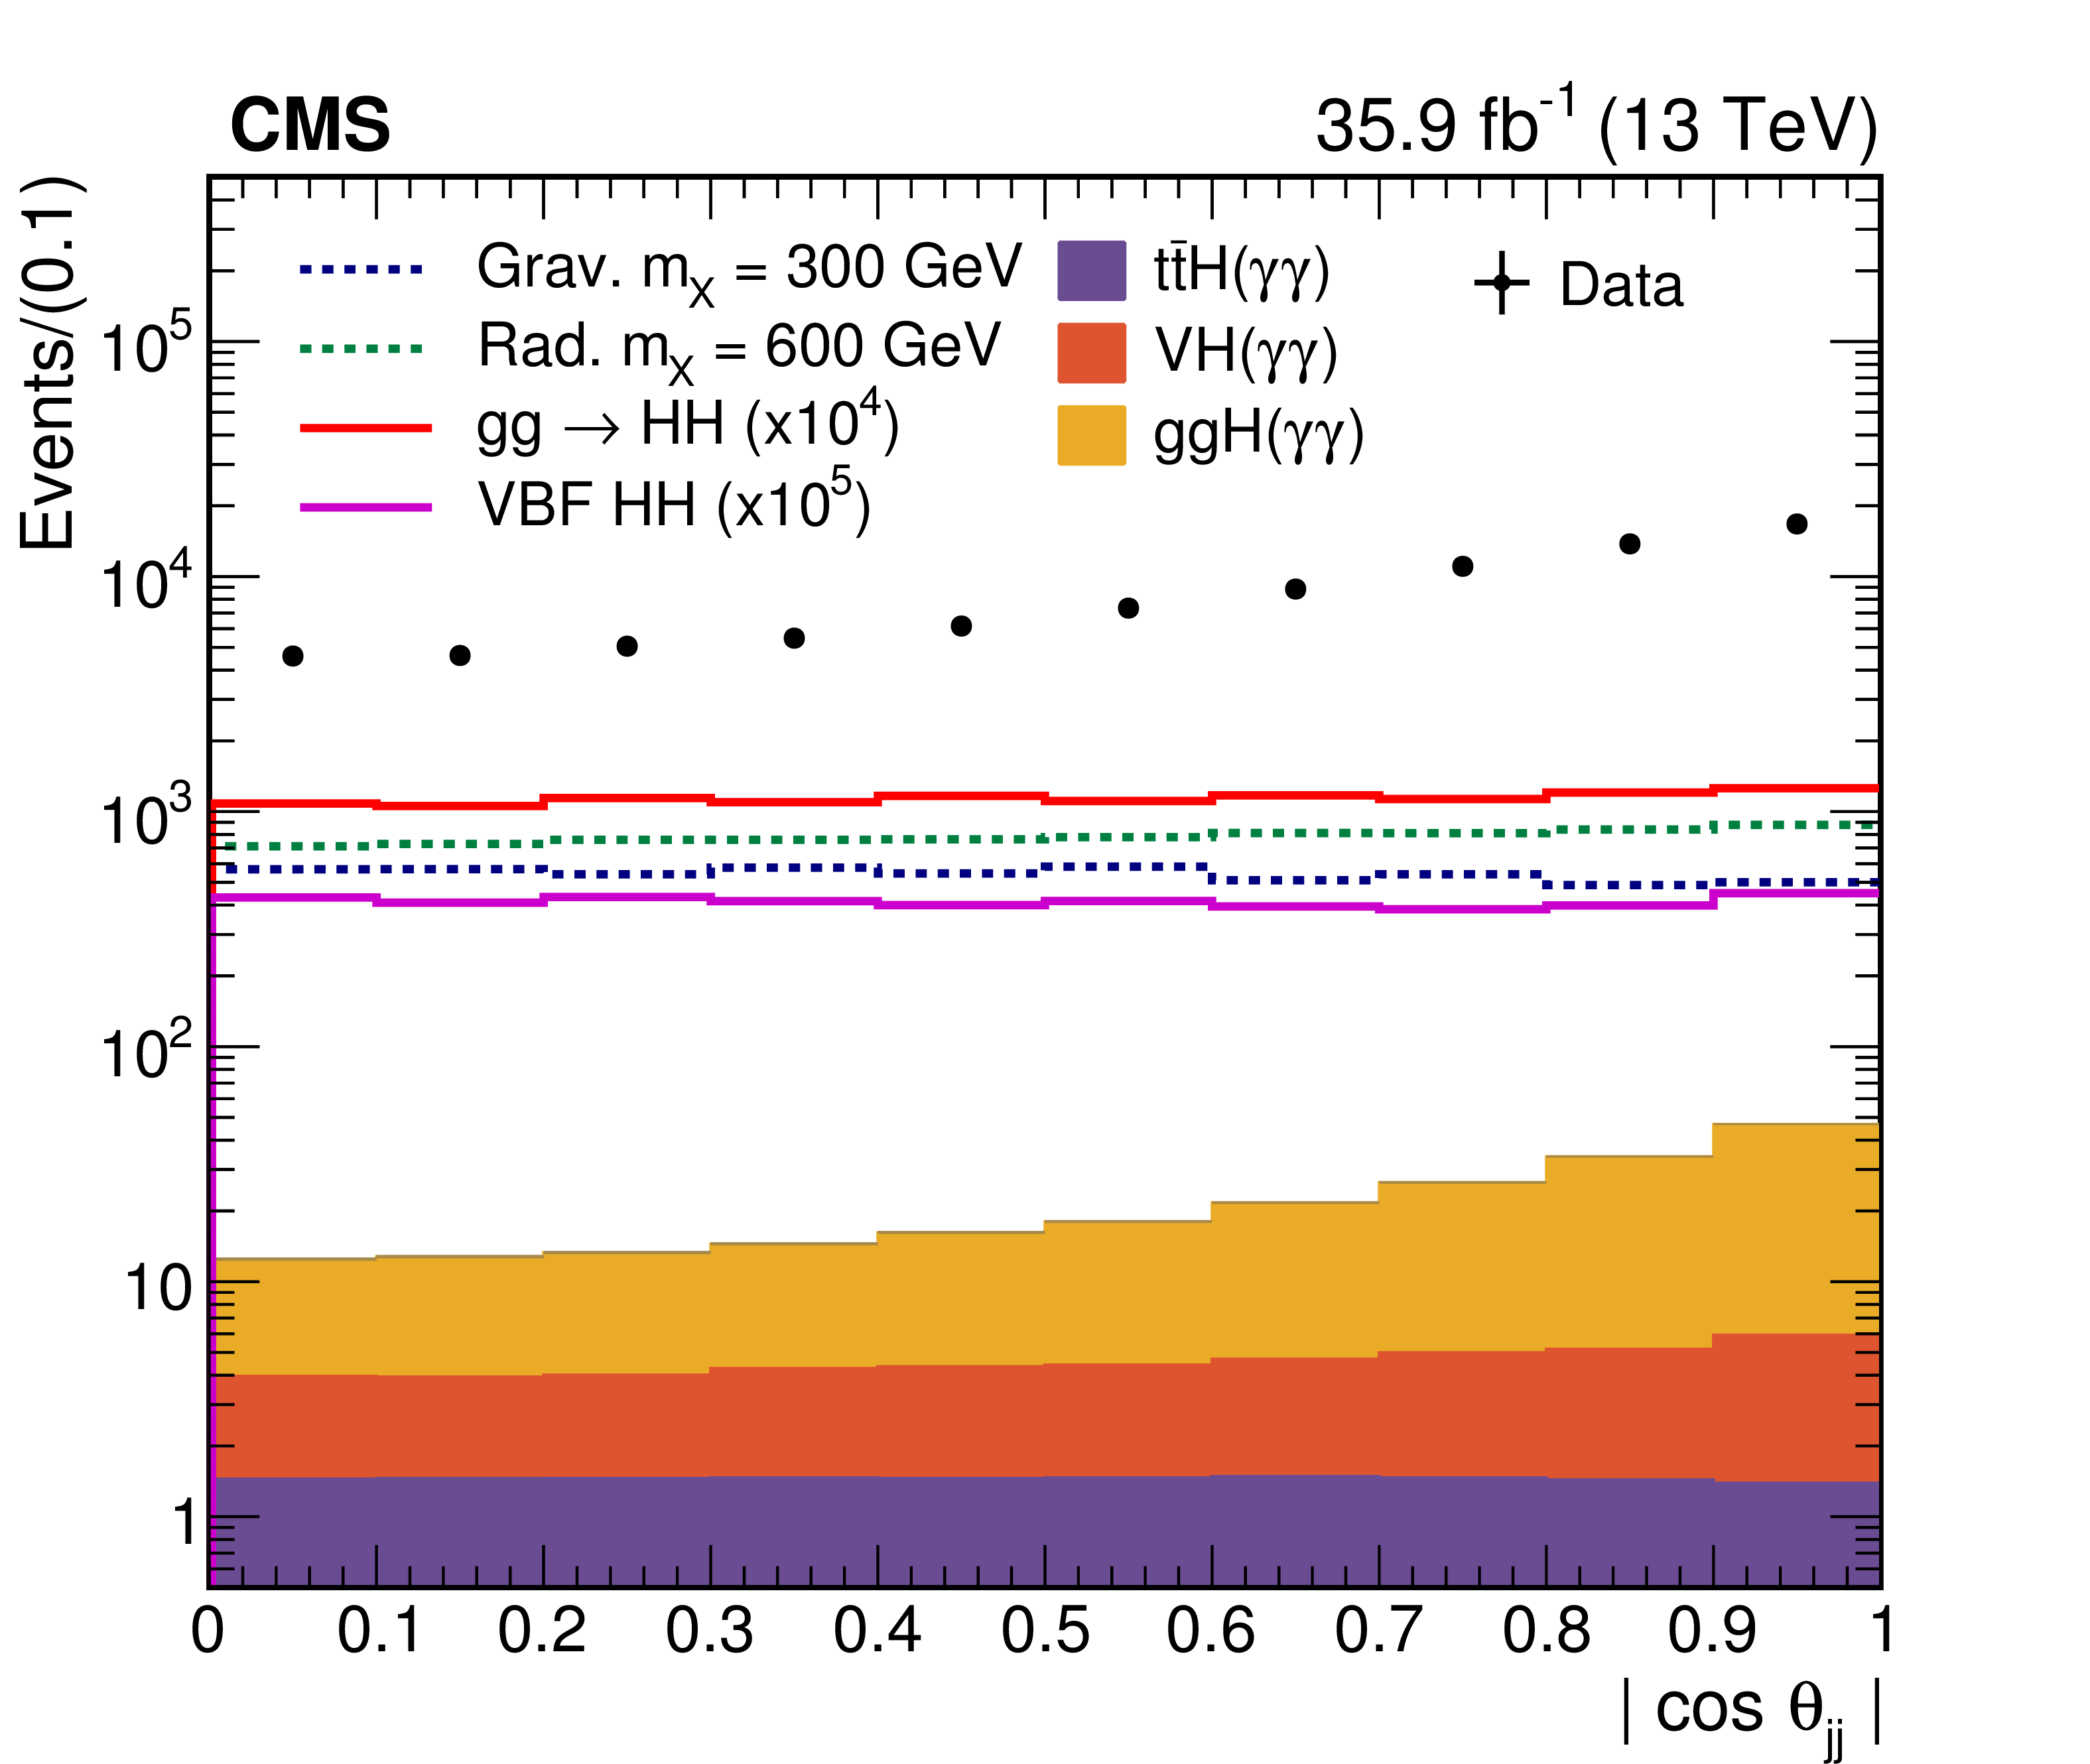
Data (dots), dominated by n$\gamma$+jets background, compared to different signal hypotheses and three single-Higgs boson samples (ttH, VH, and ggH) after the selections on photons and jets summarized in Table 2 for the kinematic distributions described in Sections 1 and 4.3: $ {\tilde{M}_{\mathrm {X}}} $ (top left) and $ | \cos{\theta ^\text {CS}_{{{{\mathrm {H}} {\mathrm {H}}}}}} |$ (top right); $ {m_{\gamma \gamma}} $ (middle left) and $ | \cos{\theta _{\gamma \gamma}} |$ (middle right); $ {m_\text {jj}}$ (bottom left) and $ | \cos{\theta _\text {jj}} | $ (bottom right). The statistical uncertainties on data are barely visible beyond the markers. The resonant signal cross section is normalized to 500 fb. |
png pdf |
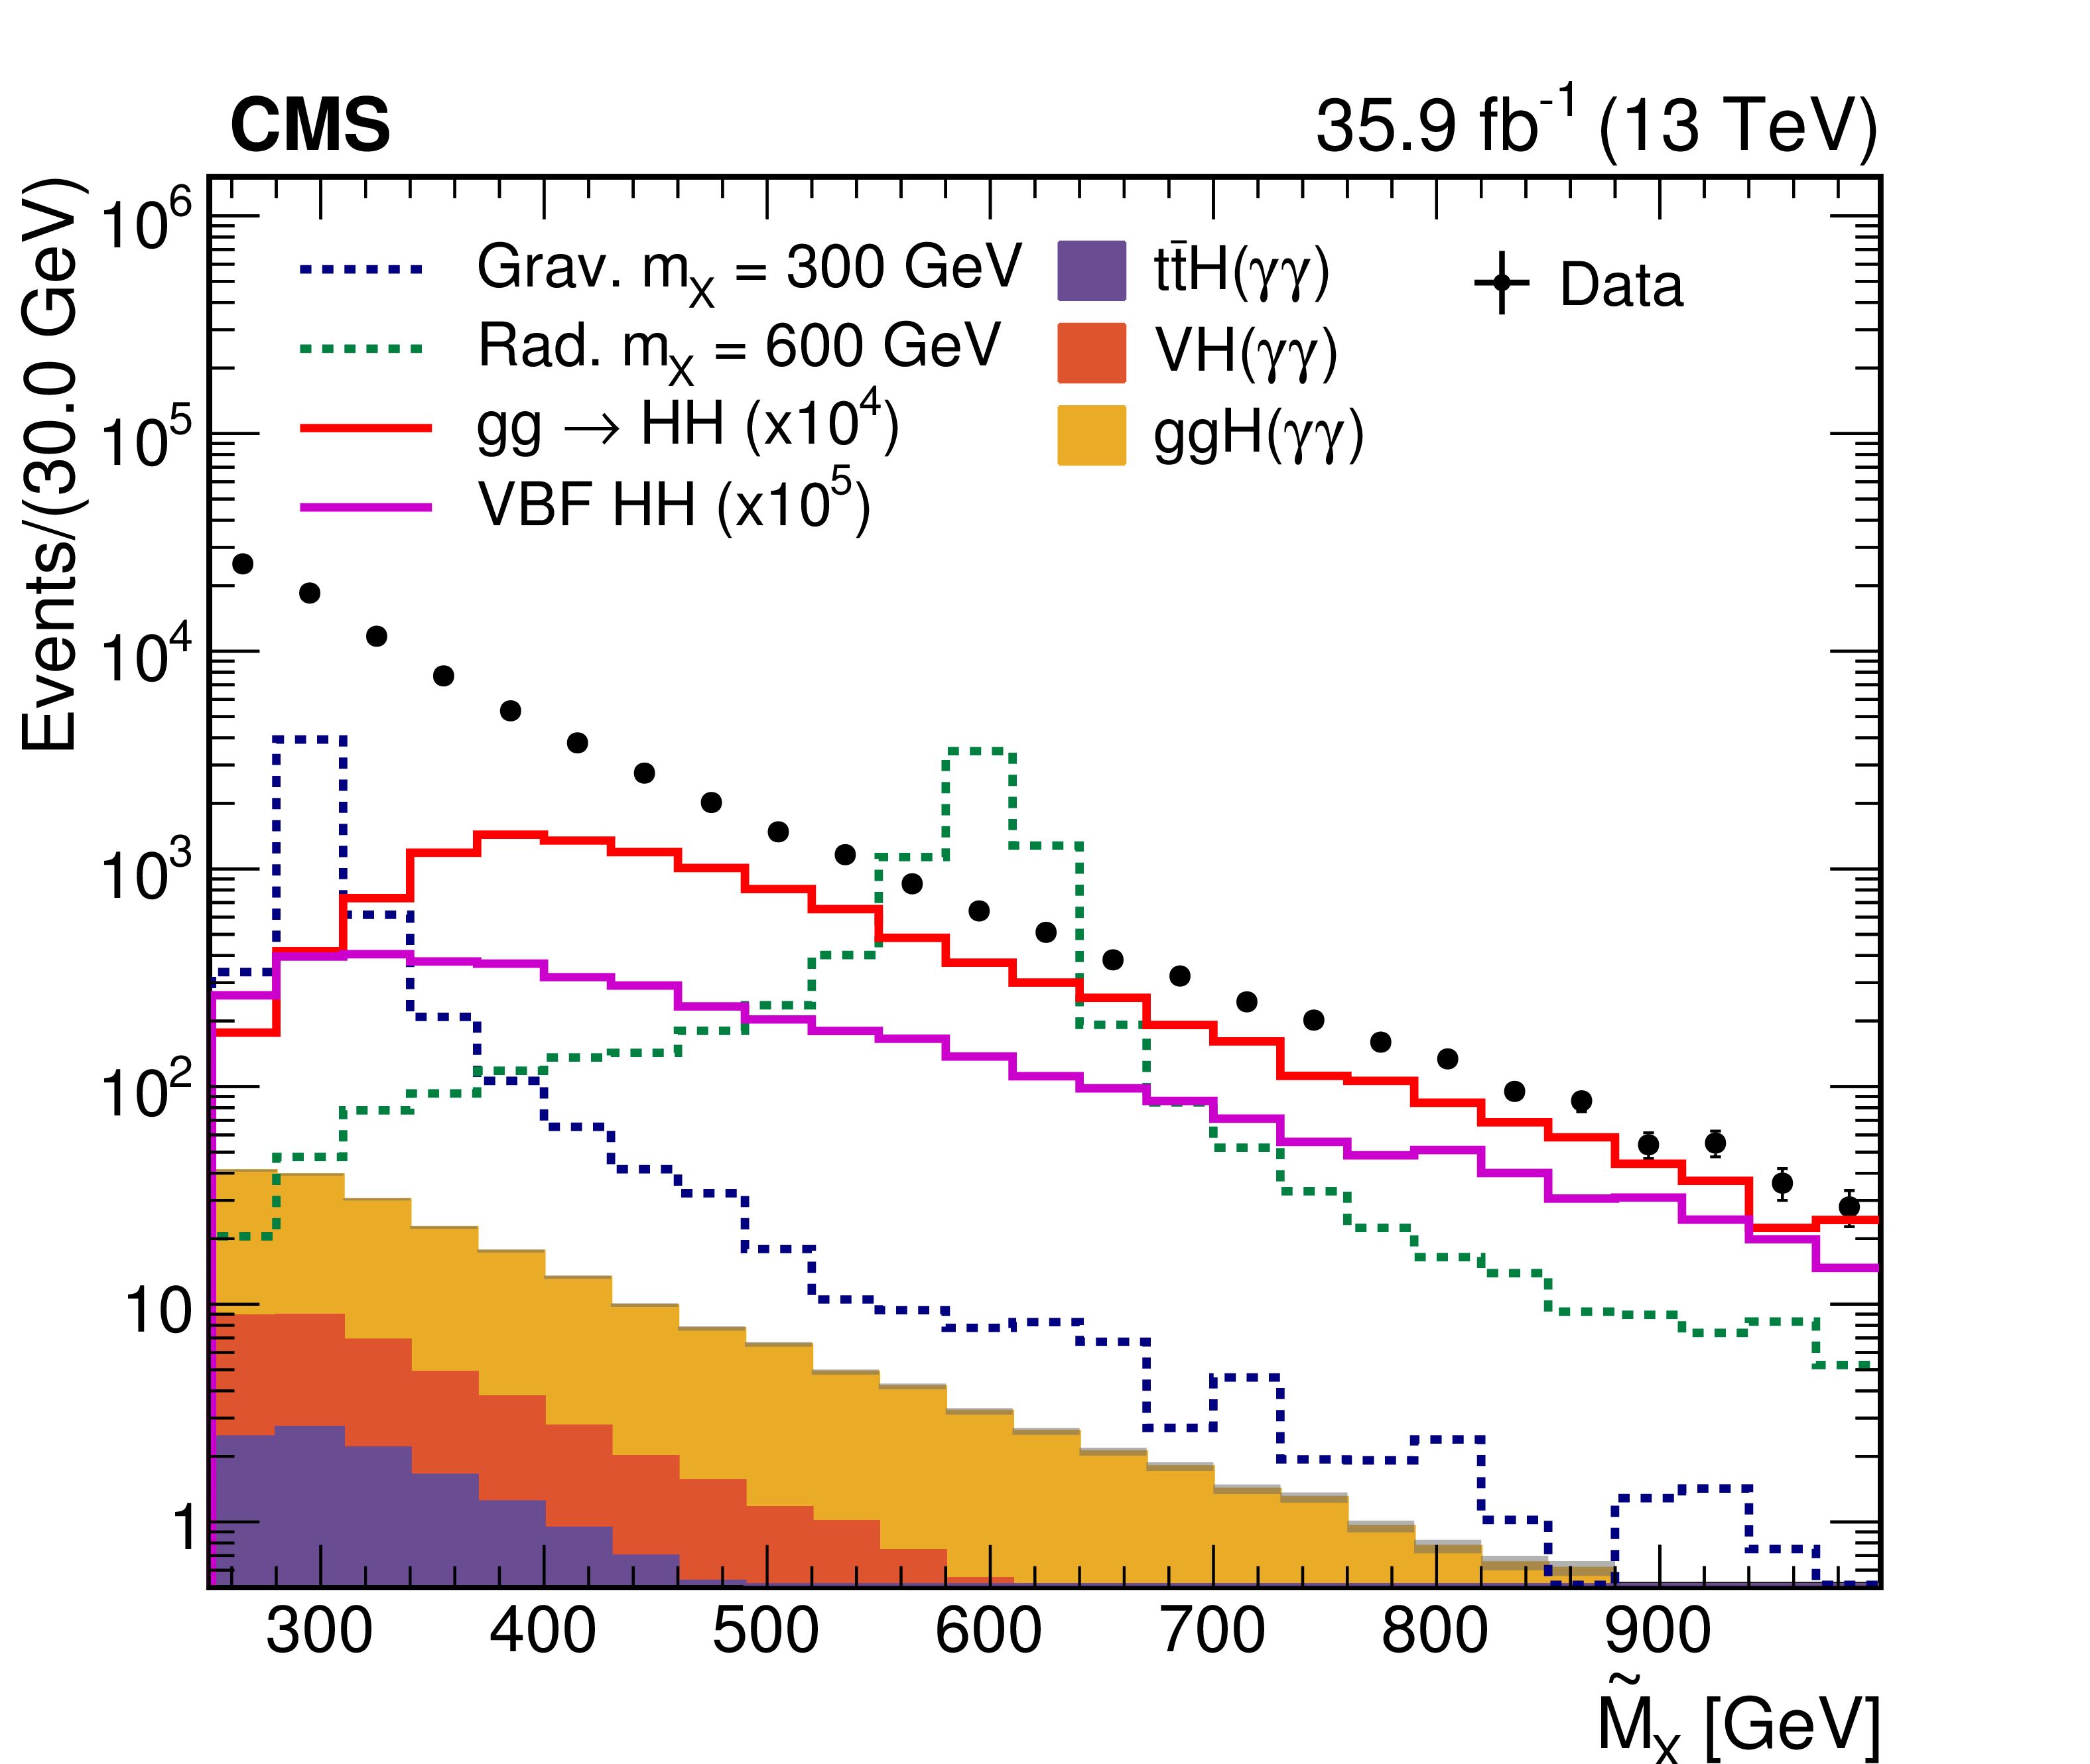
Figure 3-a:
Data (dots), dominated by n$\gamma$+jets background, compared to different signal hypotheses and three single-Higgs boson samples (ttH, VH, and ggH) after the selections on photons and jets summarized in Table 2 for the kinematic distributions described in Sections 1 and 4.3: $ {\tilde{M}_{\mathrm {X}}} $. The statistical uncertainties on data are barely visible beyond the markers. The resonant signal cross section is normalized to 500 fb. |
png pdf |
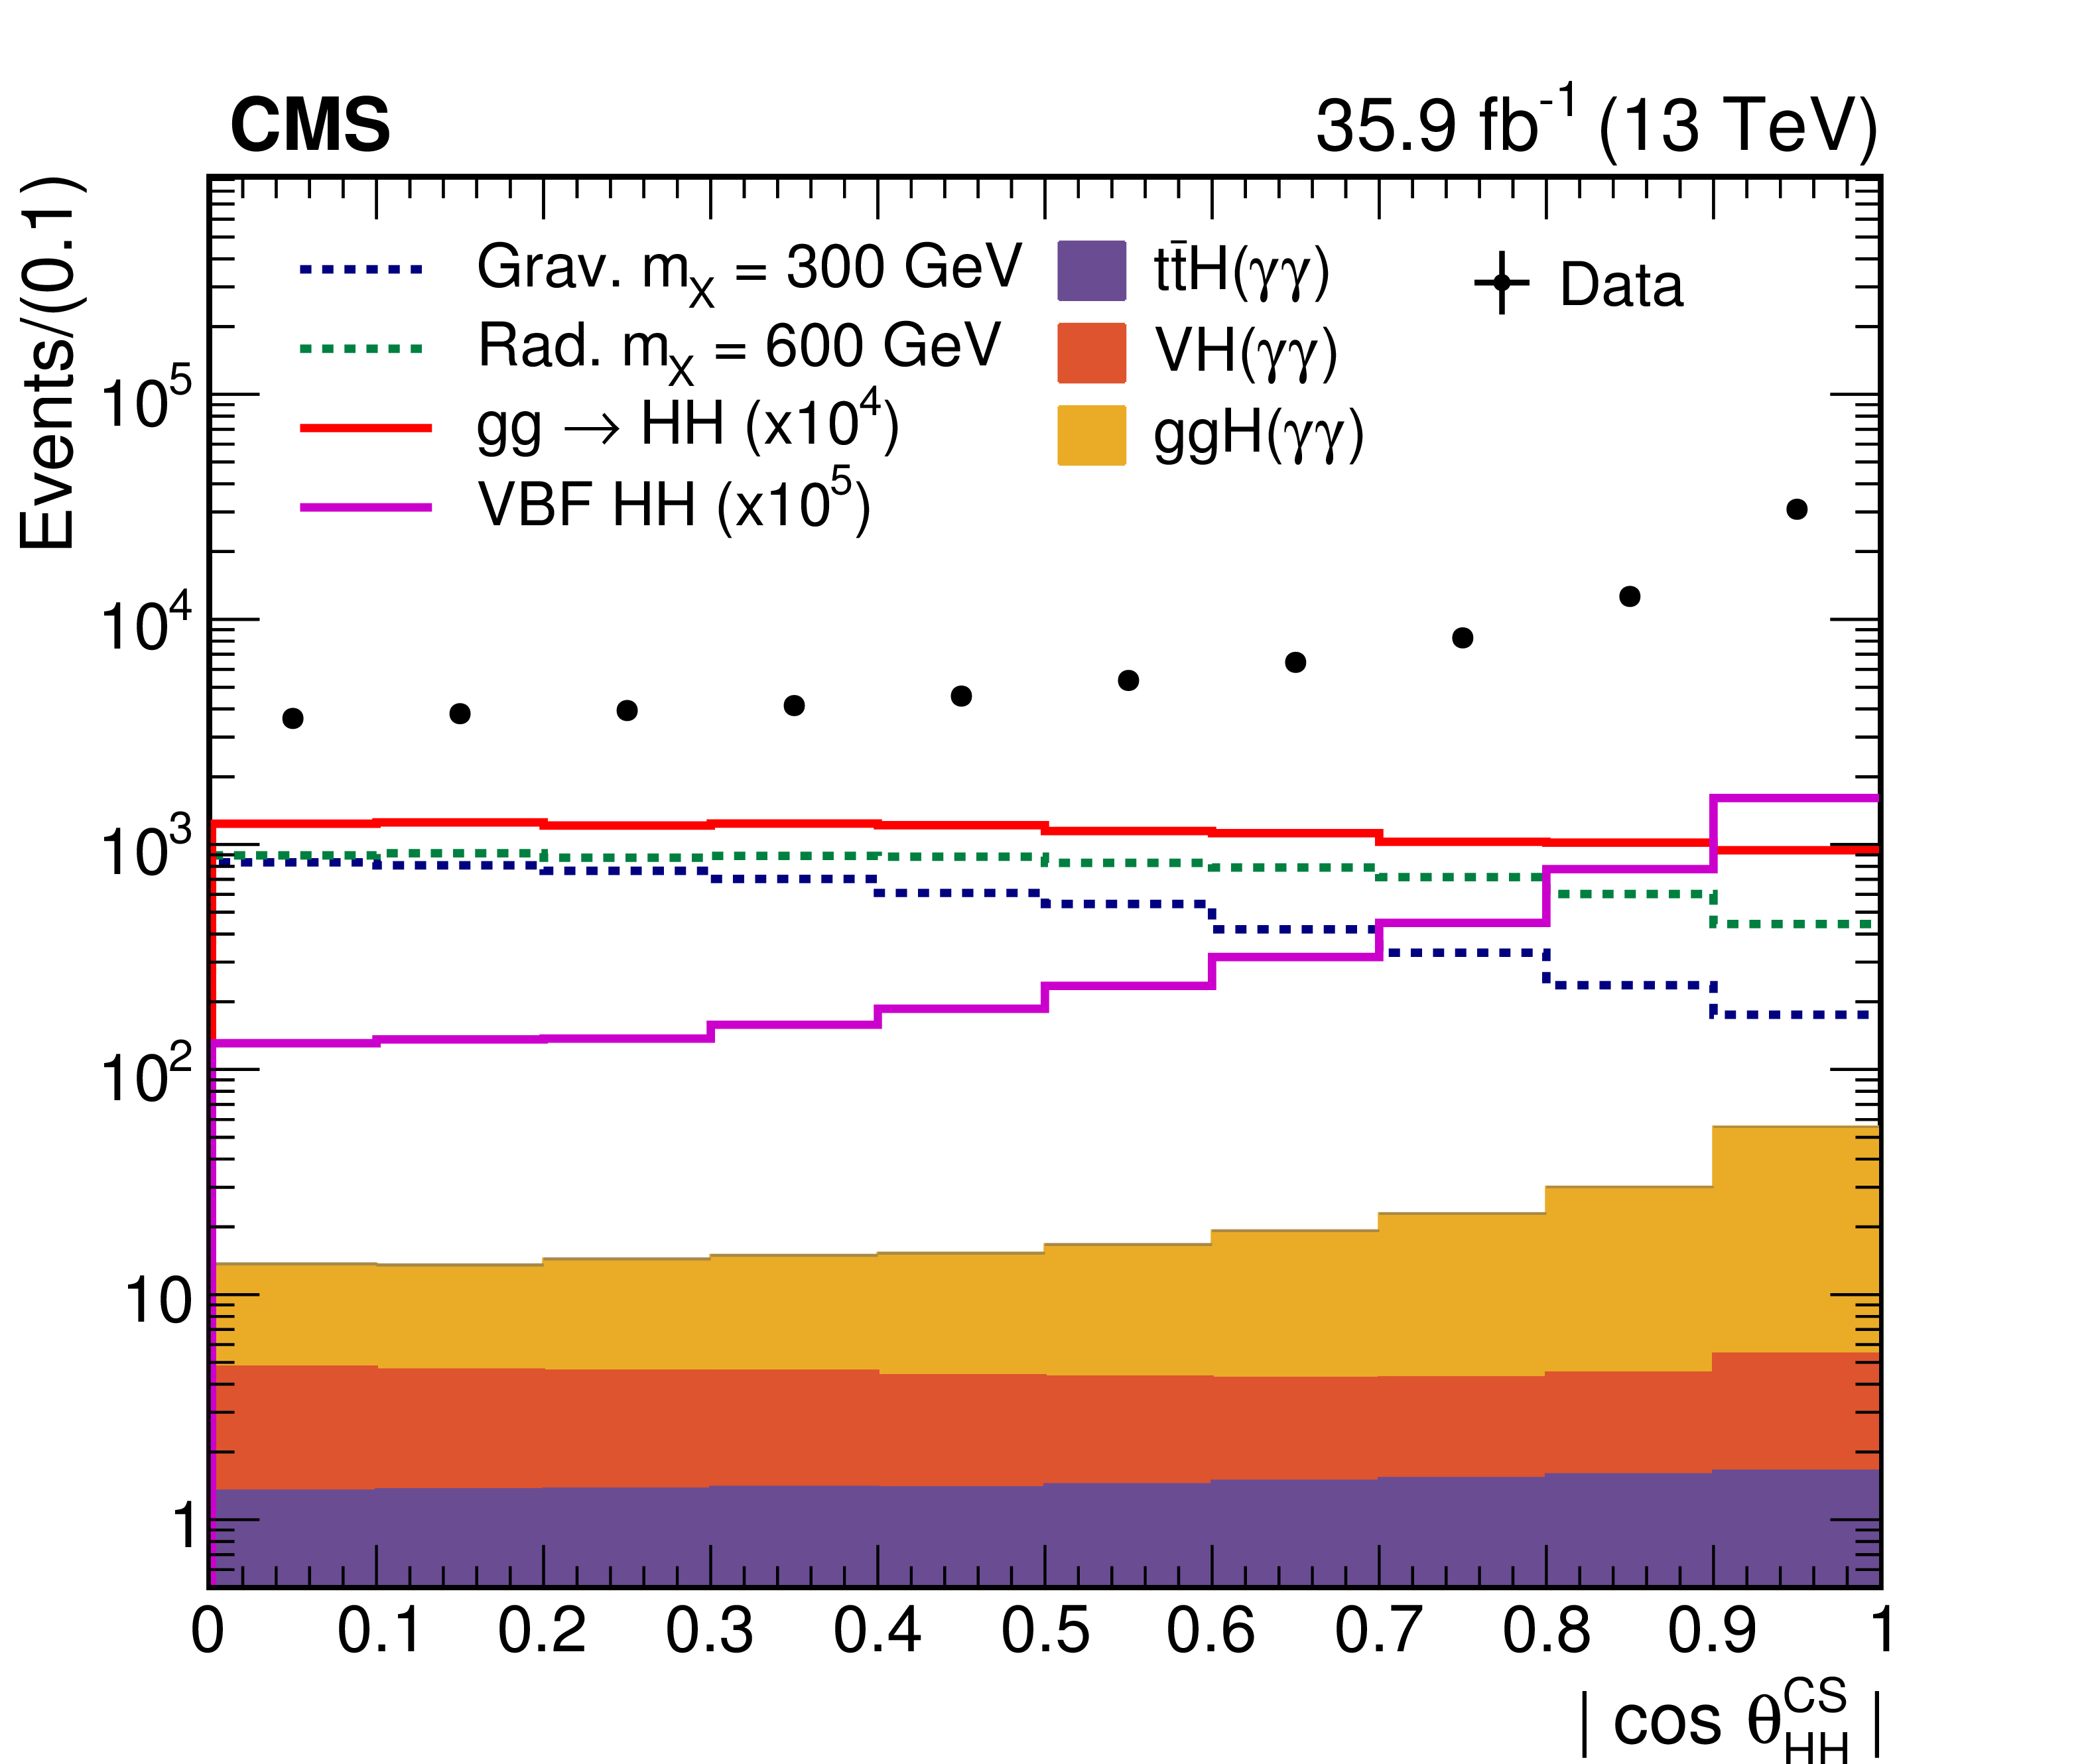
Figure 3-b:
Data (dots), dominated by n$\gamma$+jets background, compared to different signal hypotheses and three single-Higgs boson samples (ttH, VH, and ggH) after the selections on photons and jets summarized in Table 2 for the kinematic distributions described in Sections 1 and 4.3: $ | \cos{\theta ^\text {CS}_{{{{\mathrm {H}} {\mathrm {H}}}}}} |$. The statistical uncertainties on data are barely visible beyond the markers. The resonant signal cross section is normalized to 500 fb. |

png pdf |
Figure 3-c:
Data (dots), dominated by n$\gamma$+jets background, compared to different signal hypotheses and three single-Higgs boson samples (ttH, VH, and ggH) after the selections on photons and jets summarized in Table 2 for the kinematic distributions described in Sections 1 and 4.3: $ {m_{\gamma \gamma}} $. The statistical uncertainties on data are barely visible beyond the markers. The resonant signal cross section is normalized to 500 fb. |

png pdf |
Figure 3-d:
Data (dots), dominated by n$\gamma$+jets background, compared to different signal hypotheses and three single-Higgs boson samples (ttH, VH, and ggH) after the selections on photons and jets summarized in Table 2 for the kinematic distributions described in Sections 1 and 4.3: $ | \cos{\theta _{\gamma \gamma}} |$. The statistical uncertainties on data are barely visible beyond the markers. The resonant signal cross section is normalized to 500 fb. |
png pdf |
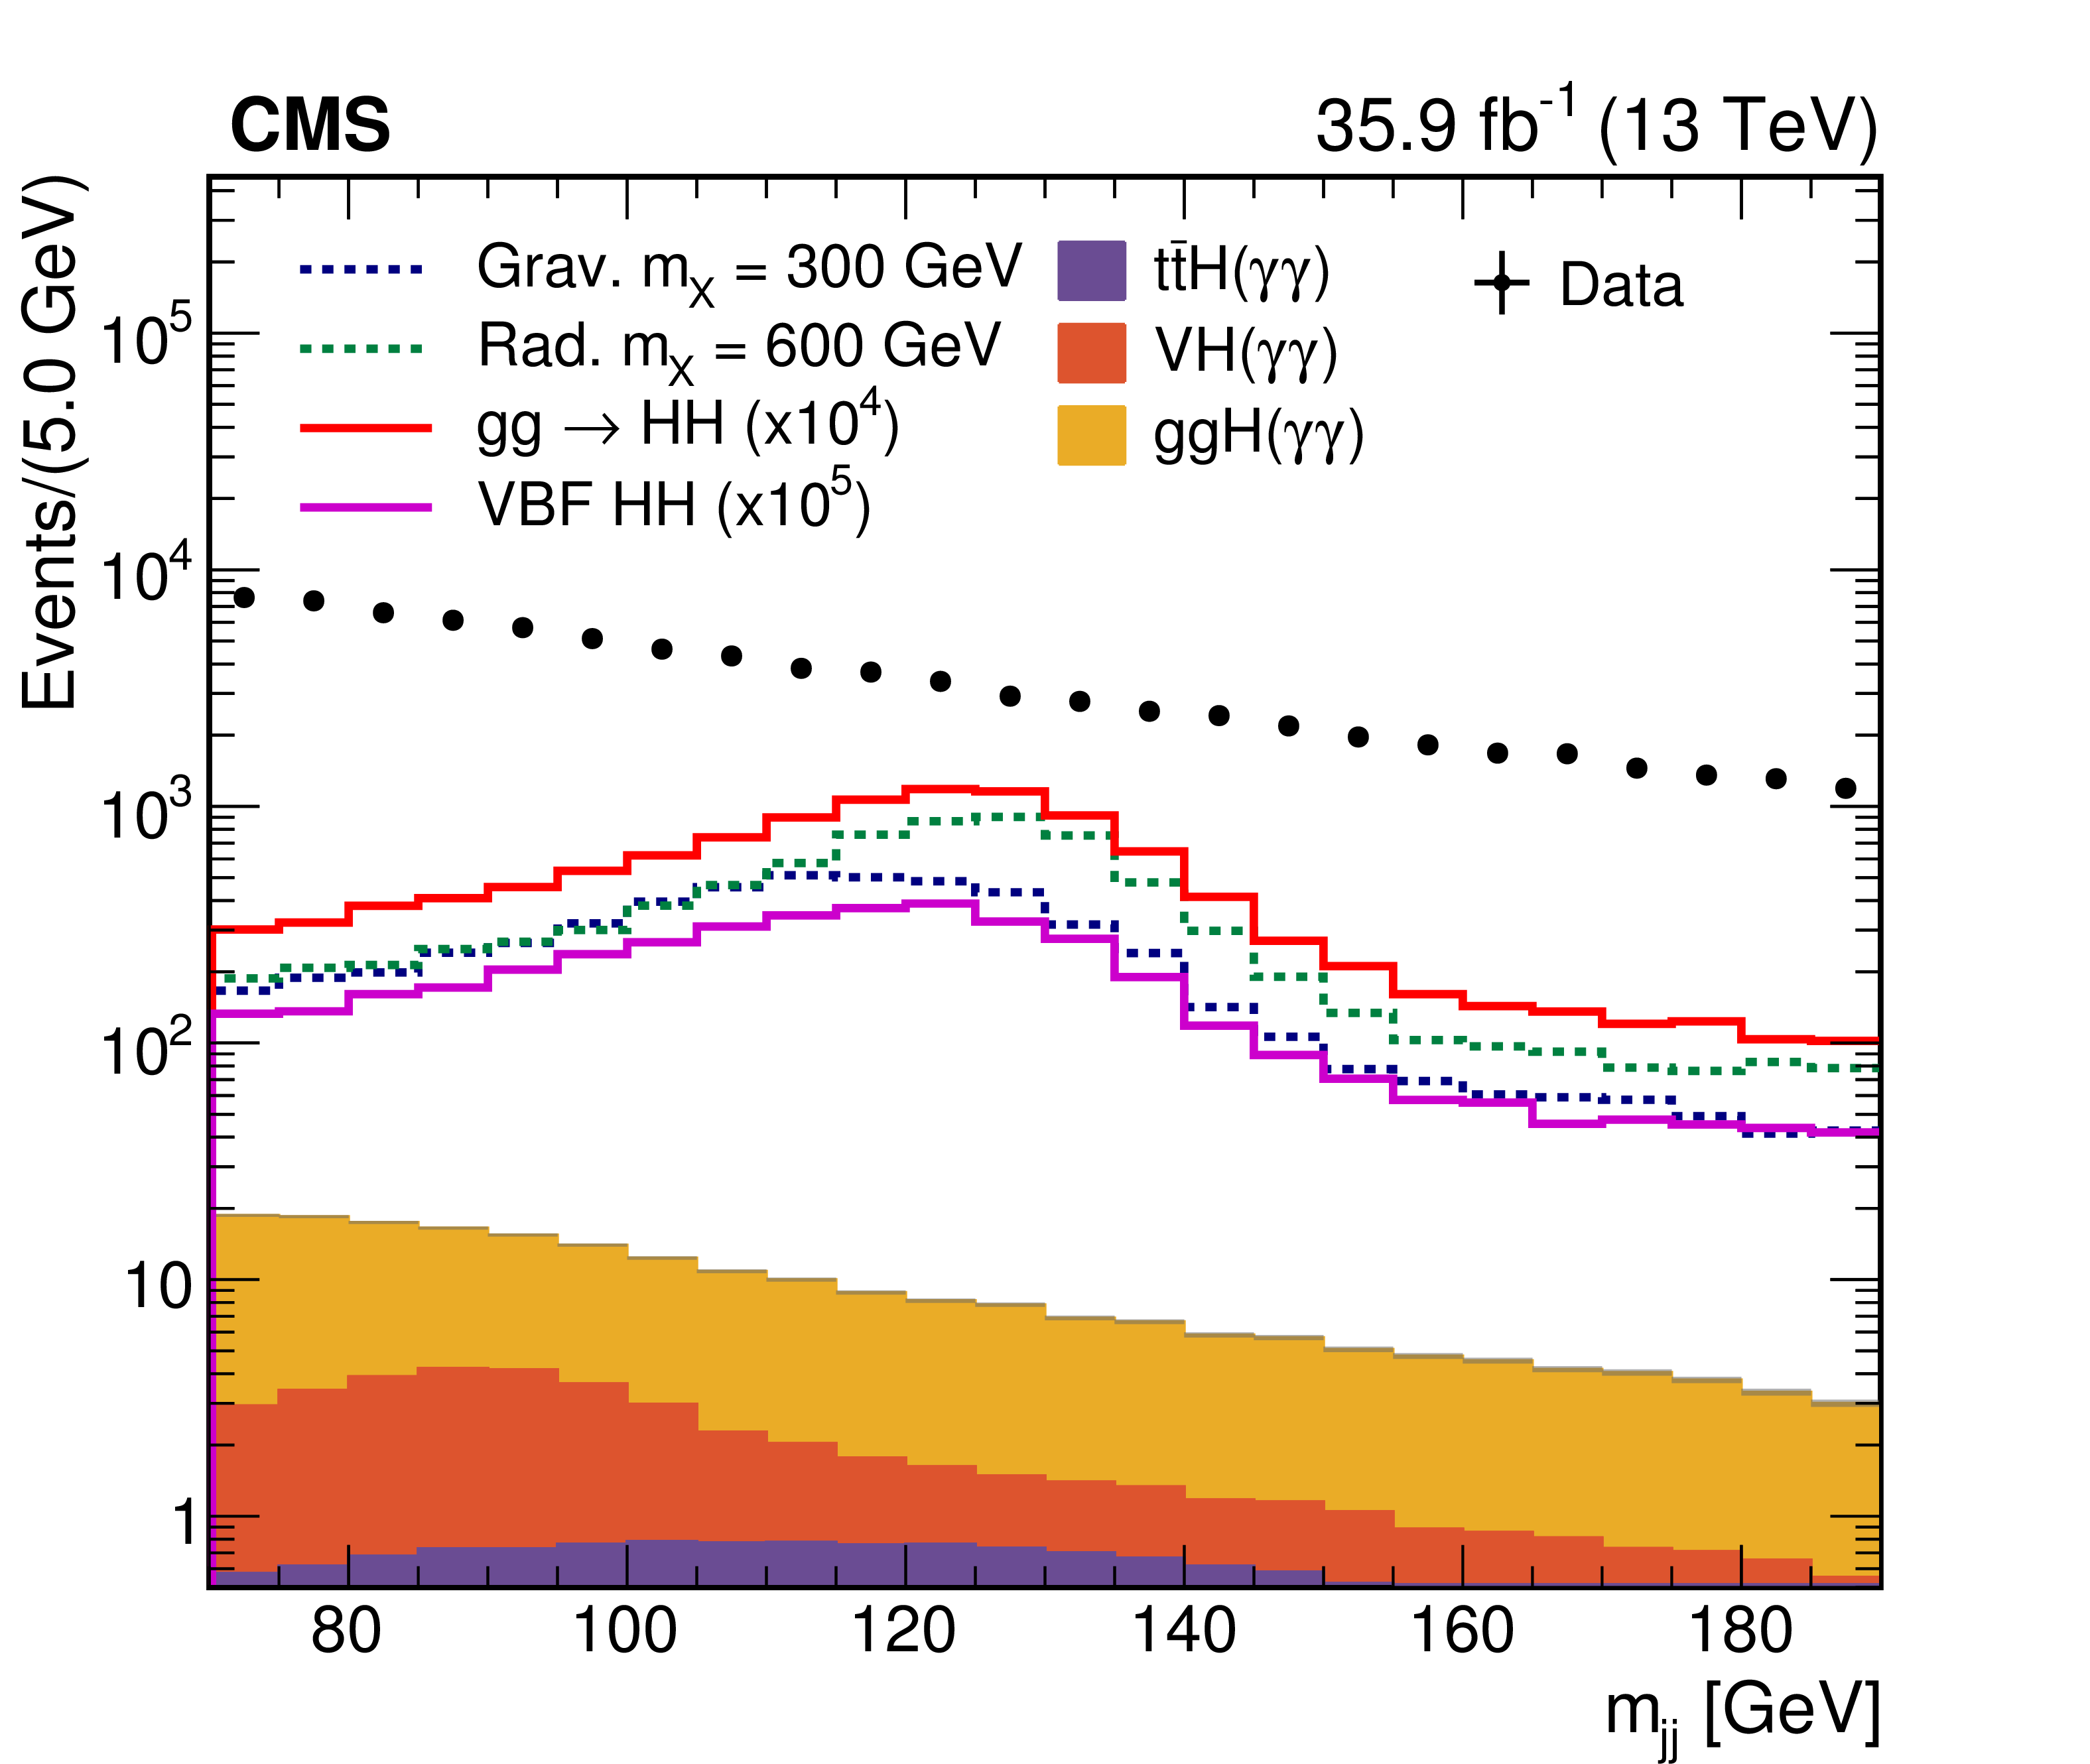
Figure 3-e:
Data (dots), dominated by n$\gamma$+jets background, compared to different signal hypotheses and three single-Higgs boson samples (ttH, VH, and ggH) after the selections on photons and jets summarized in Table 2 for the kinematic distributions described in Sections 1 and 4.3: $ {m_\text {jj}}$. The statistical uncertainties on data are barely visible beyond the markers. The resonant signal cross section is normalized to 500 fb. |
png pdf |
Figure 3-f:
Data (dots), dominated by n$\gamma$+jets background, compared to different signal hypotheses and three single-Higgs boson samples (ttH, VH, and ggH) after the selections on photons and jets summarized in Table 2 for the kinematic distributions described in Sections 1 and 4.3: $ | \cos{\theta _\text {jj}} | $. The statistical uncertainties on data are barely visible beyond the markers. The resonant signal cross section is normalized to 500 fb. |
png pdf |
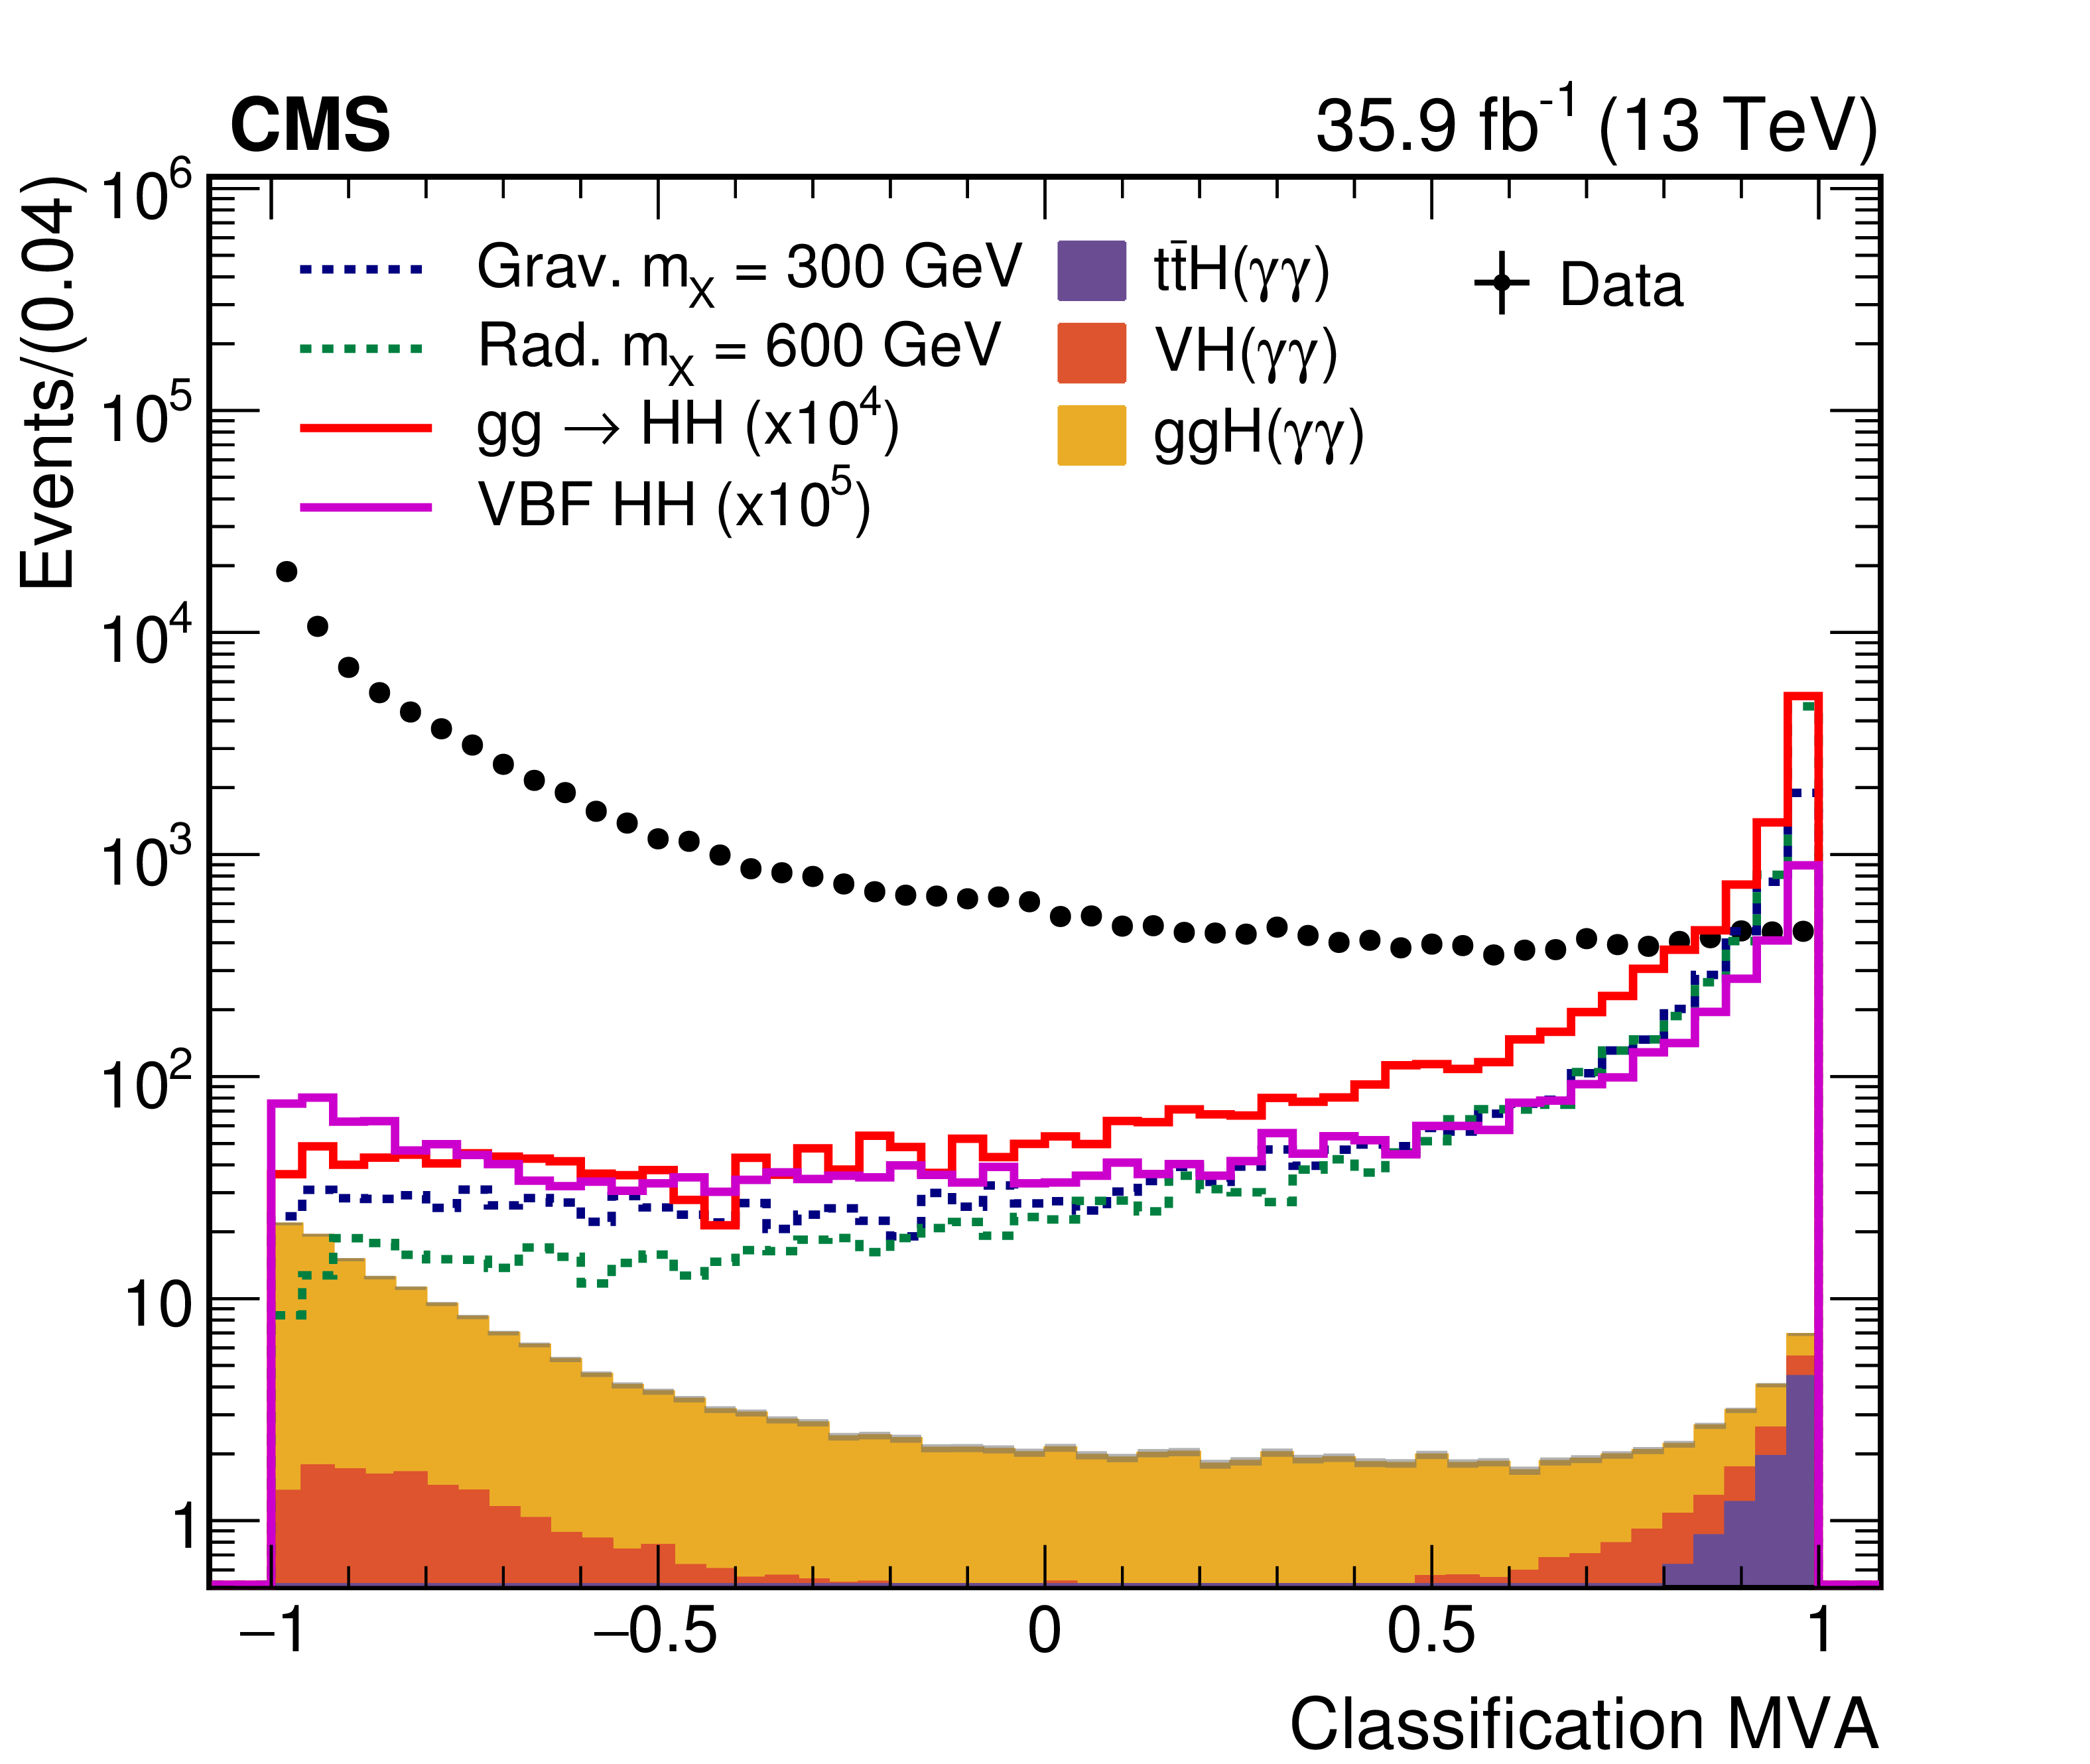
Figure 4:
Distributions of the BDT output (classification MVA) obtained for the high-mass nonresonant training. Data, dominated by n$\gamma$+jets background, are compared to different signal hypotheses and three single-Higgs boson samples (ttH, VH, and ggH) after the selections on photons and jets summarized in Table 2.The resonant signal cross section is normalised to 500 fb. |

png pdf |
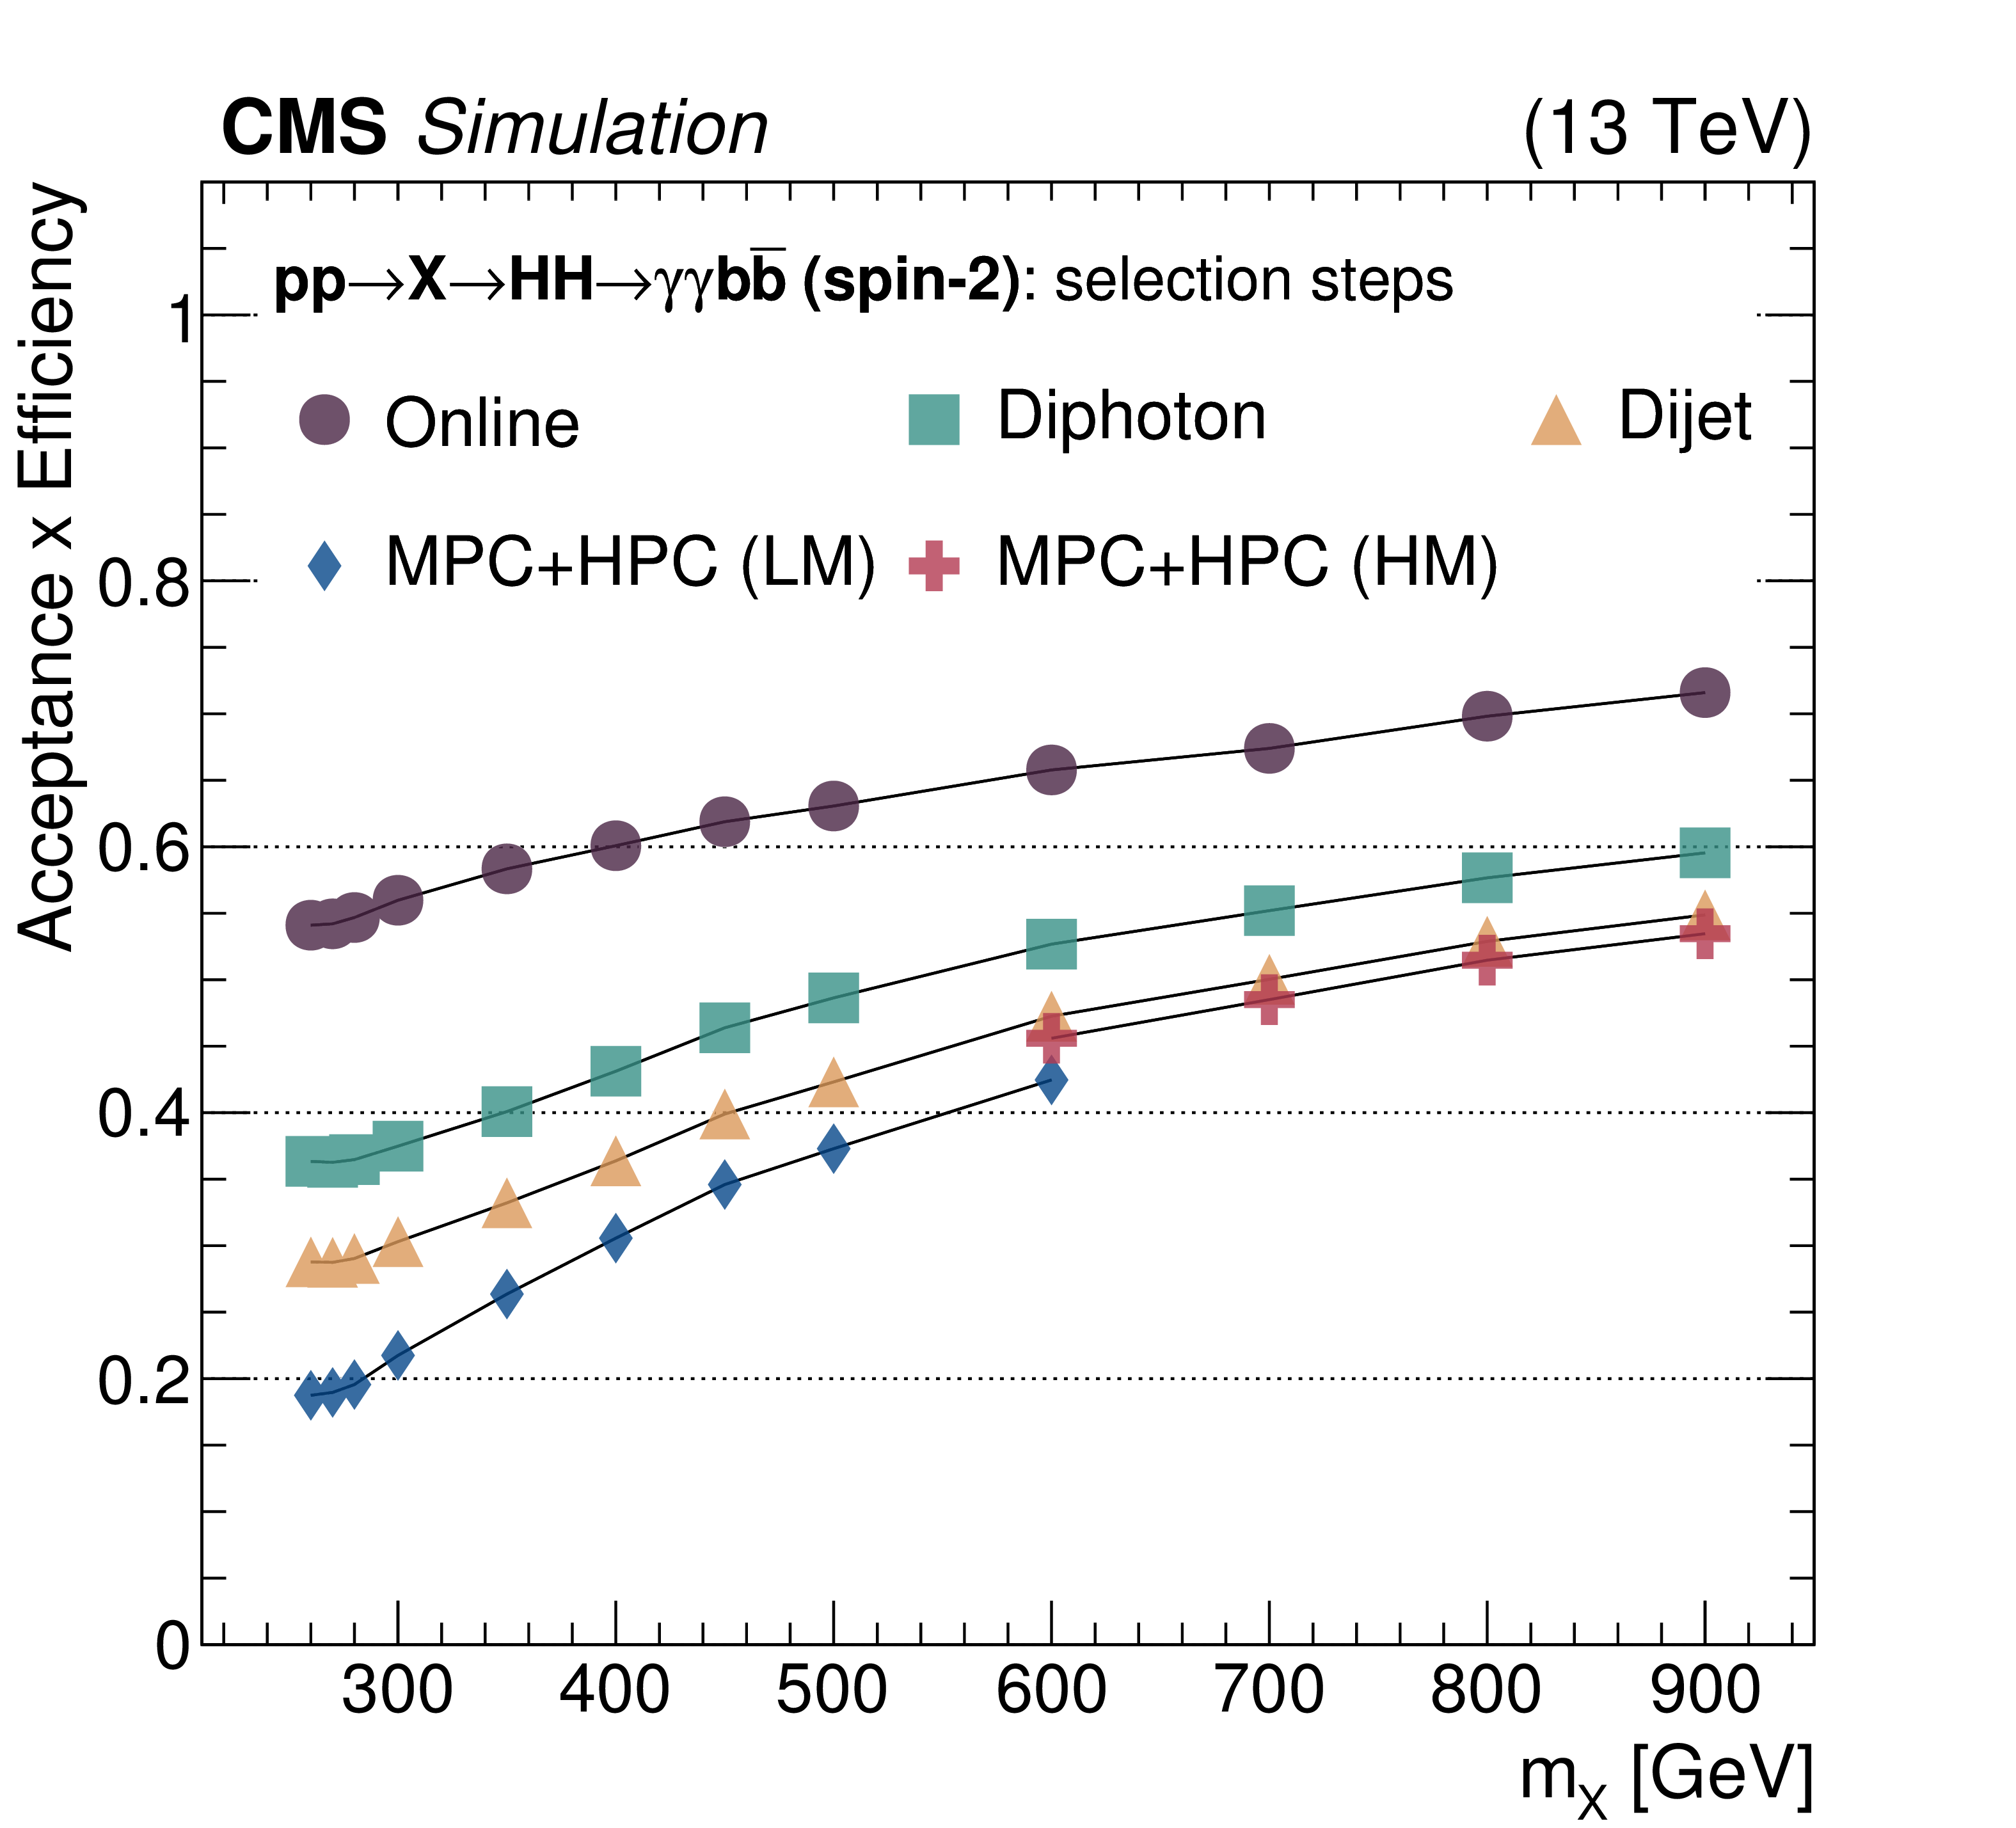
Figure 5:
Consecutive selection efficiencies for different analysis steps for two resonance hypotheses: spin-0 (left) and spin-2 (right). Online selection includes the photon online preselection conditions described at the beginning of Section 4. Diphoton selections include photon identification and kinematics selections from Table 2. Dijet selections are those described in Table 2. |

png pdf |
Figure 5-a:
Consecutive selection efficiencies for different analysis steps for two resonance hypotheses: spin-0. Online selection includes the photon online preselection conditions described at the beginning of Section 4. Diphoton selections include photon identification and kinematics selections from Table 2. Dijet selections are those described in Table 2. |
png pdf |
Figure 5-b:
Consecutive selection efficiencies for different analysis steps for two resonance hypotheses: spin-2. Online selection includes the photon online preselection conditions described at the beginning of Section 4. Diphoton selections include photon identification and kinematics selections from Table 2. Dijet selections are those described in Table 2. |
png pdf |
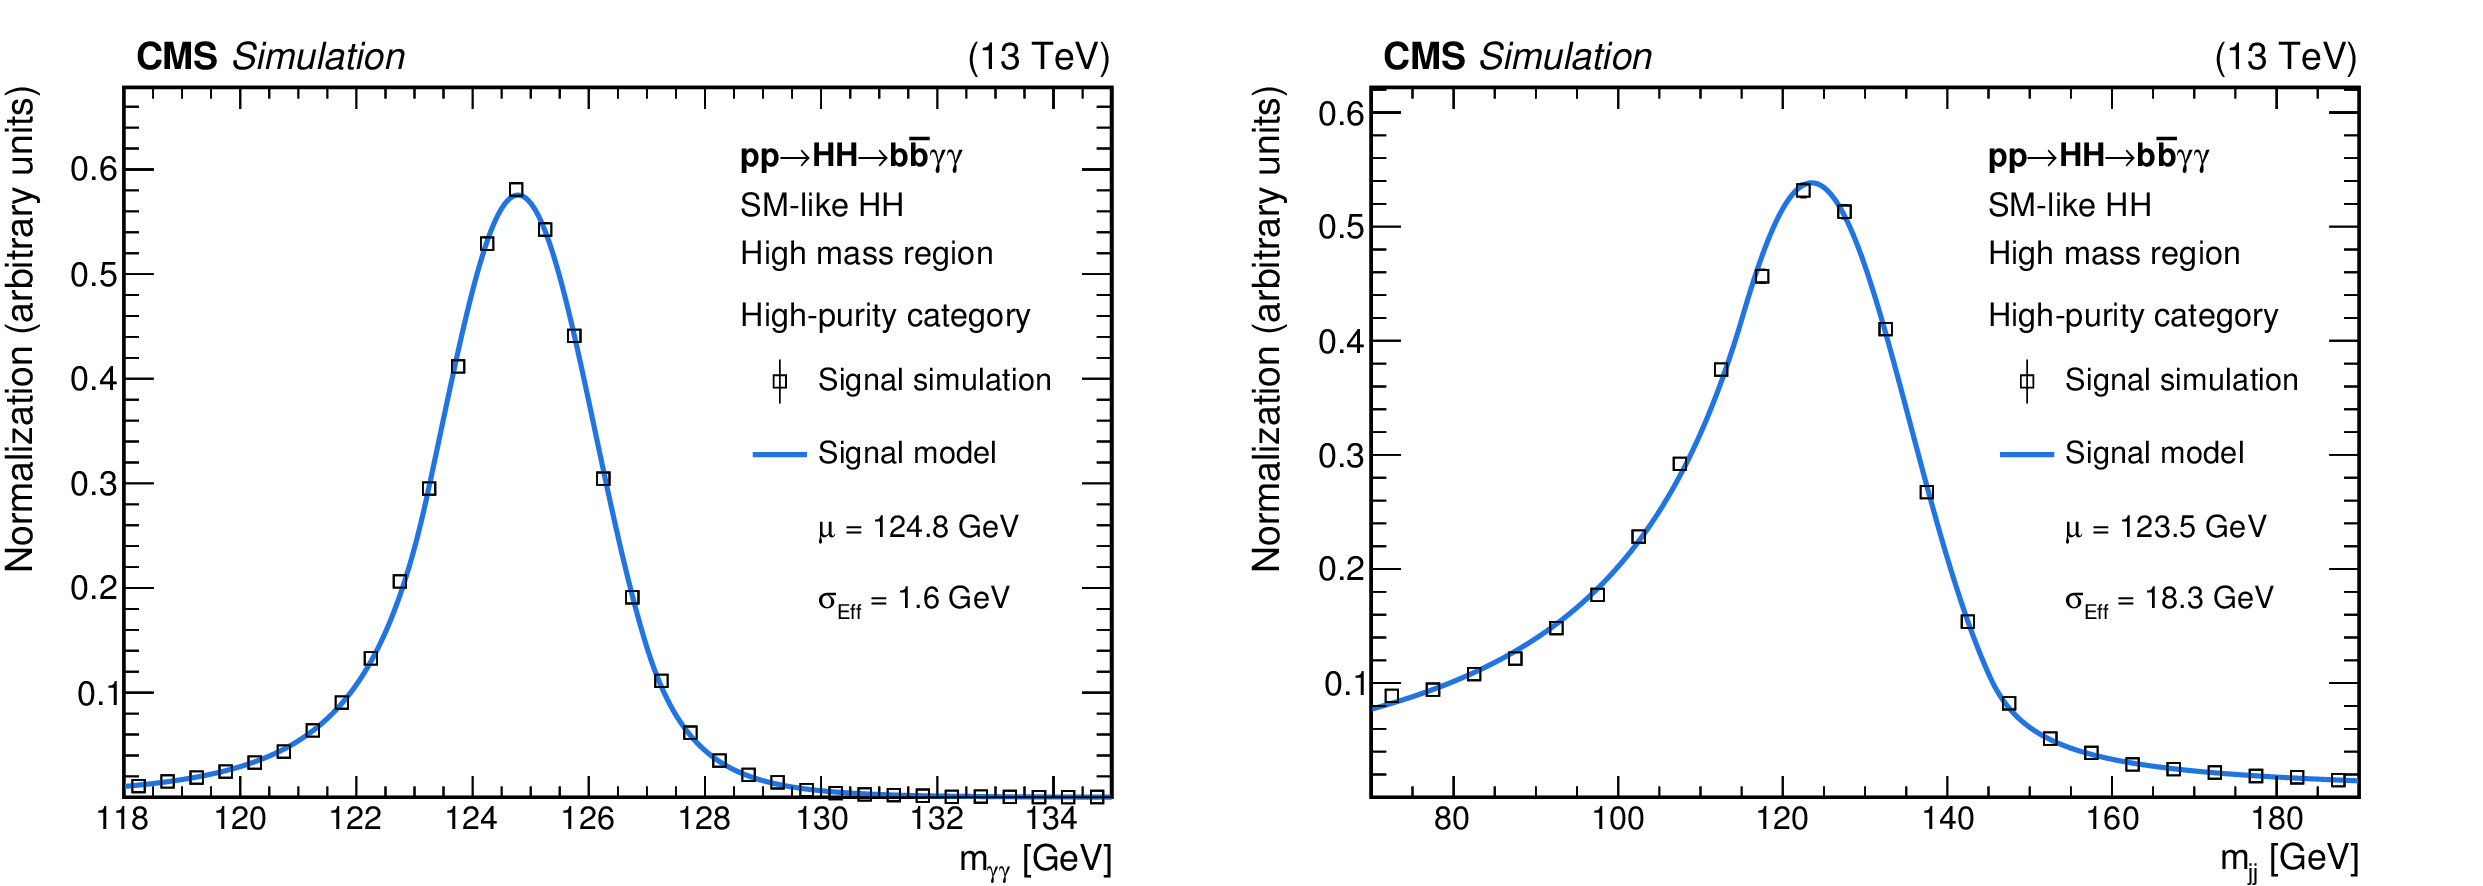
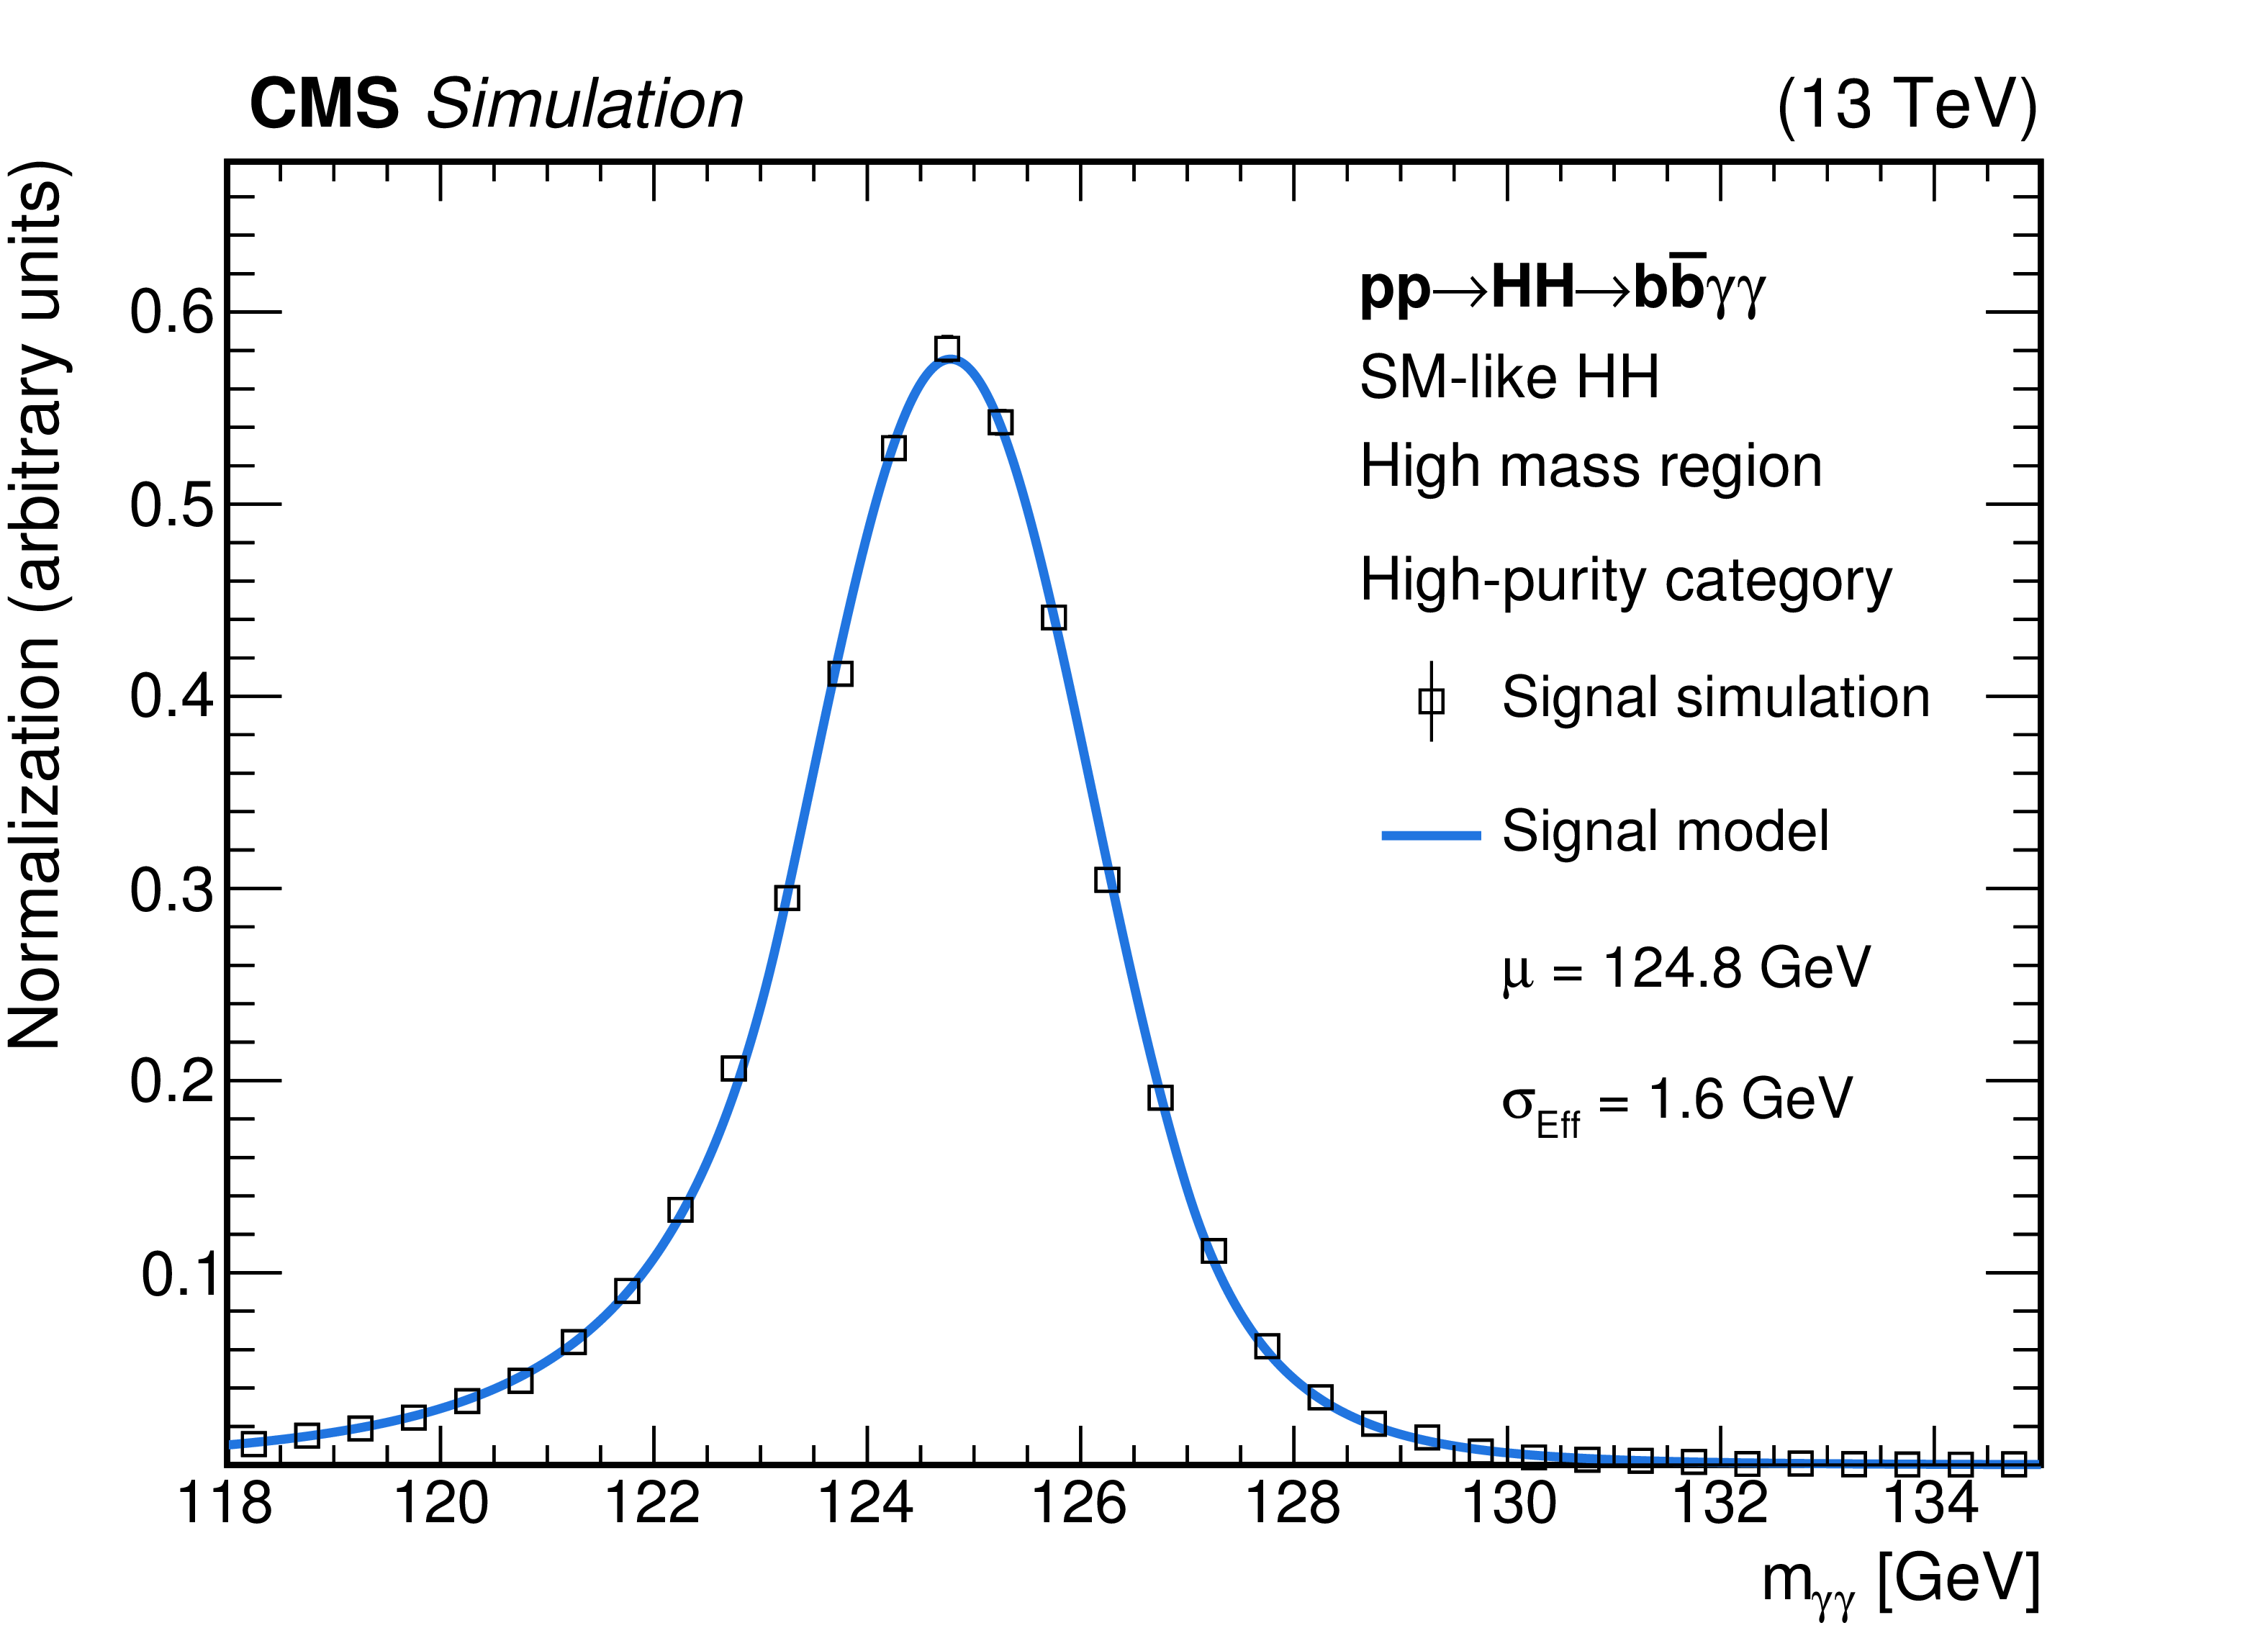
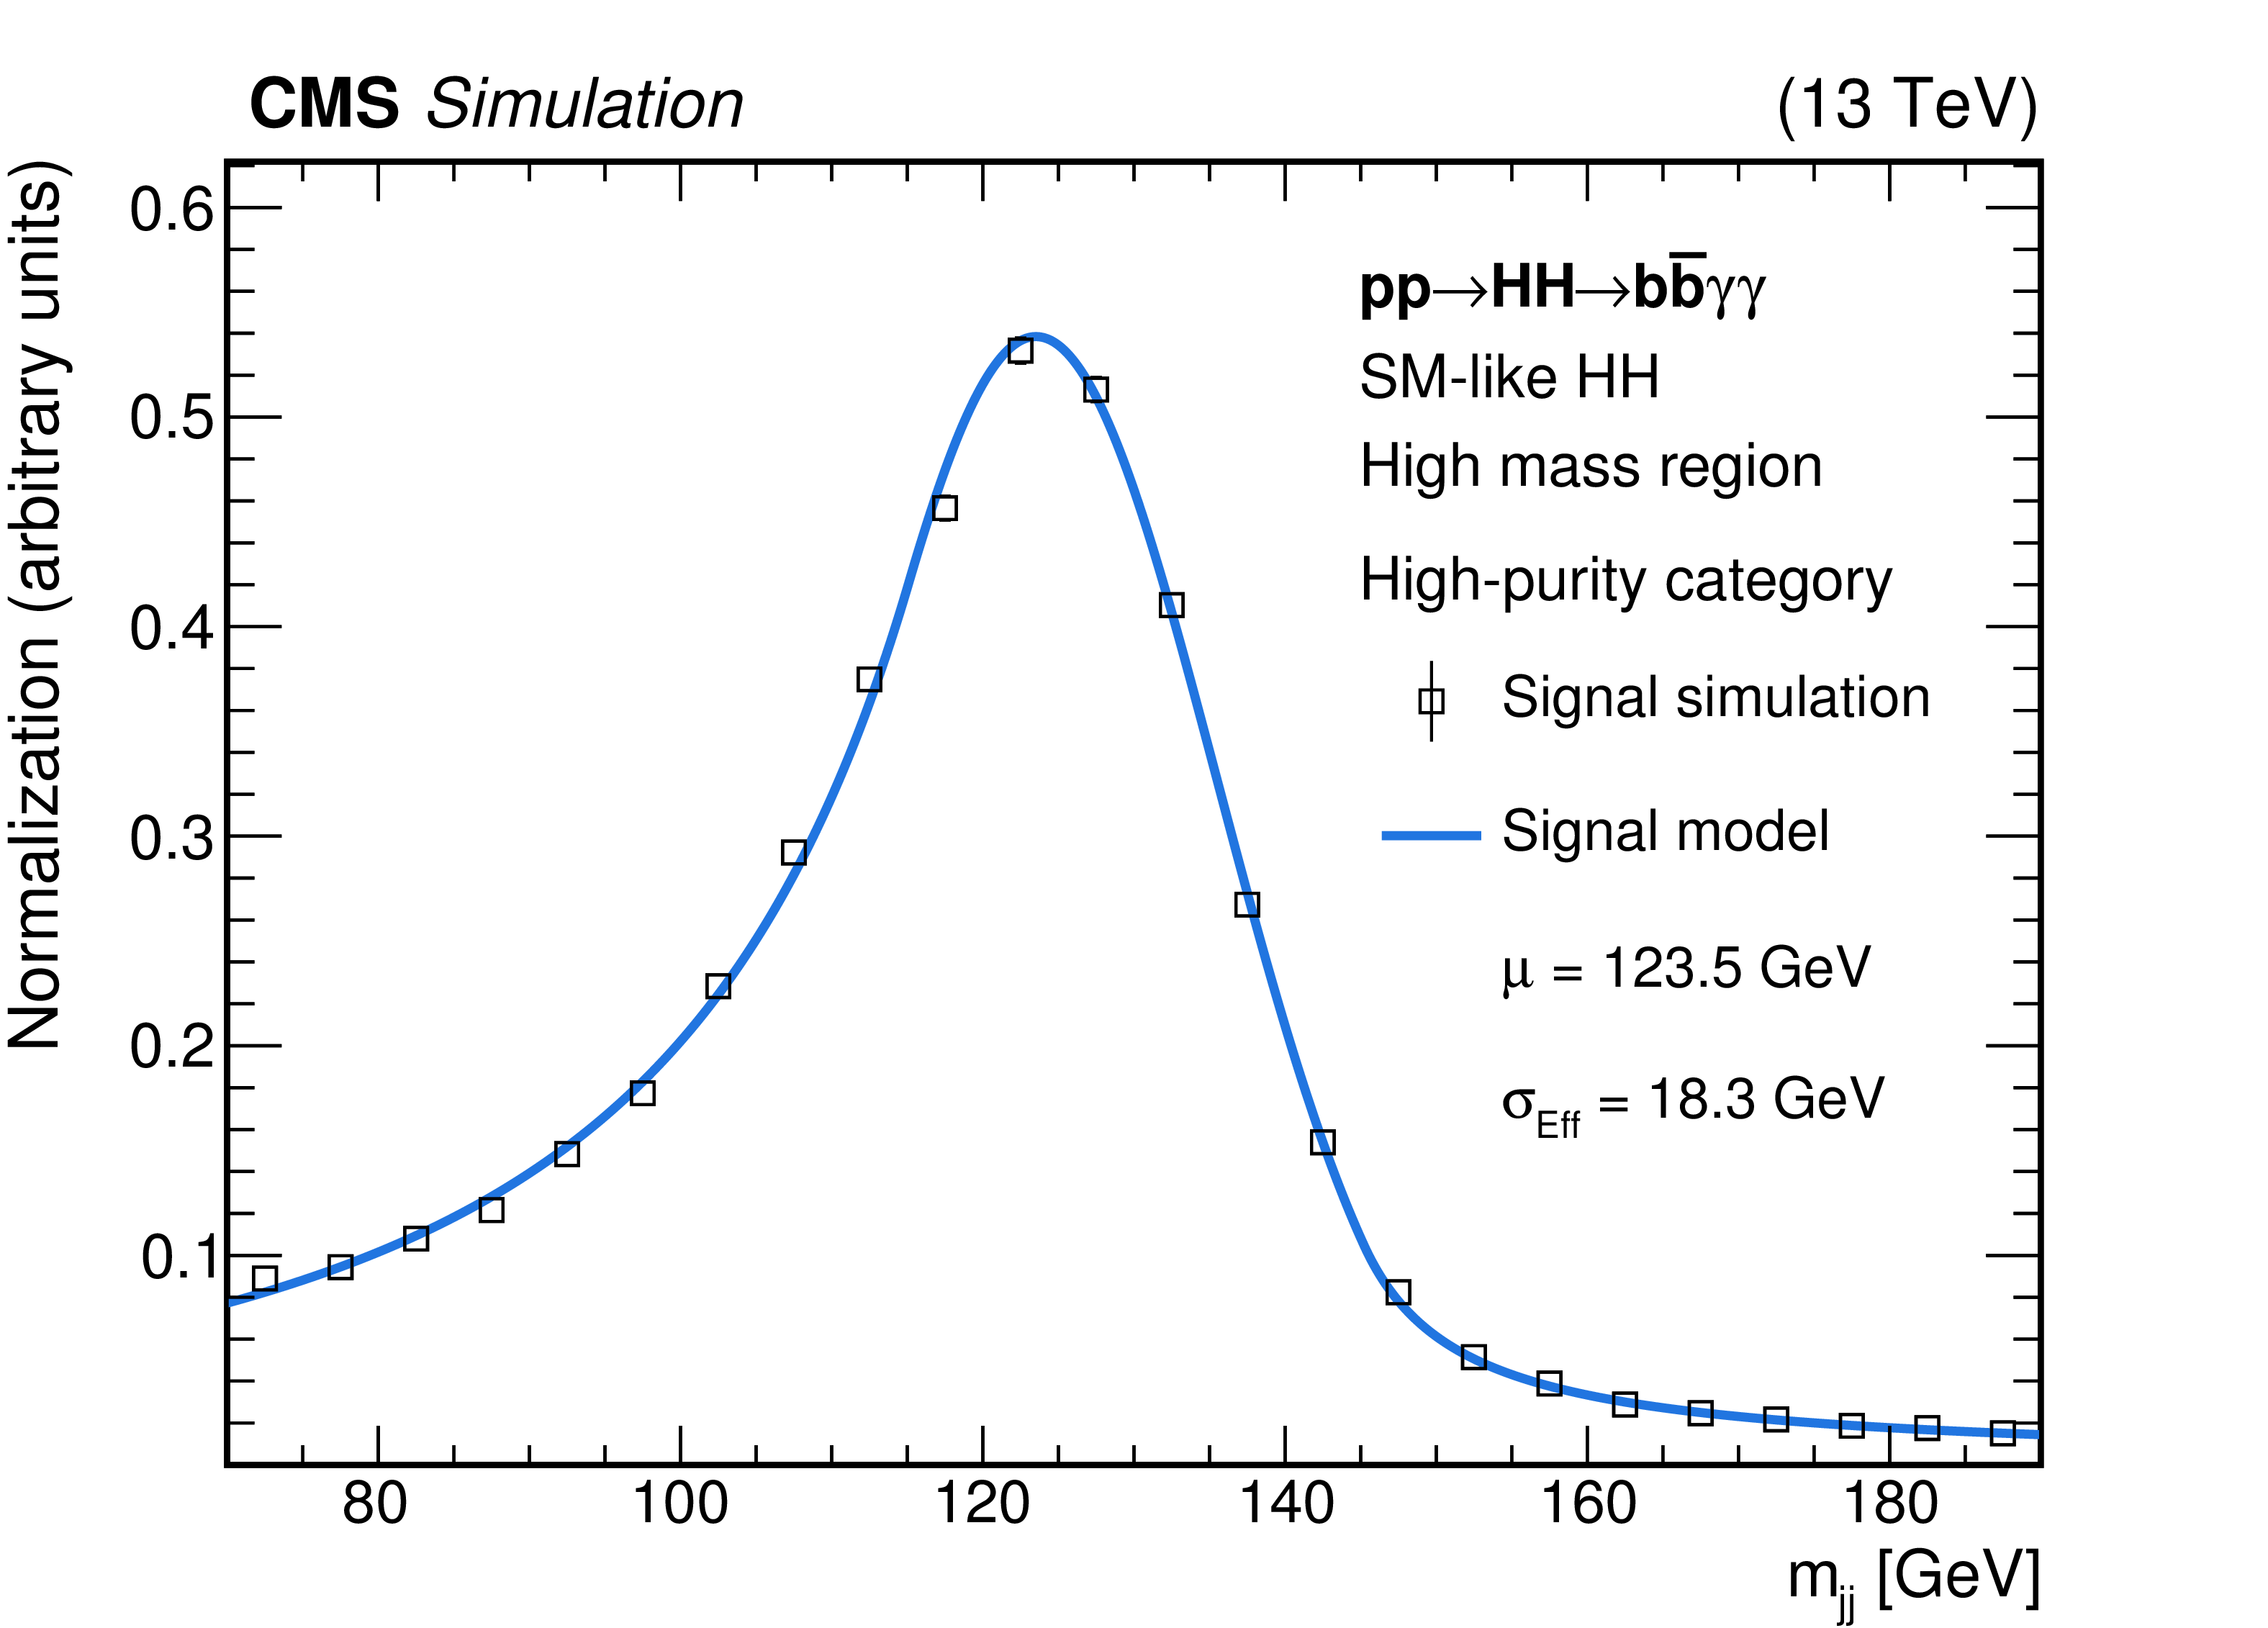
Figure 6:
Signal shapes for $ {m_{\gamma \gamma}} $ (left) and $ {m_\text {jj}}$ (right) in the SM HH nonresonant sample after full analysis selection in the high-mass and HPC region. The solid line shows a fit to the simulated data points with a double-sided CB function. The normalization of the shapes is arbitrary. |
png pdf |
Figure 6-a:
Signal shape for $ {m_{\gamma \gamma}} $ in the SM HH nonresonant sample after full analysis selection in the high-mass and HPC region. The solid line shows a fit to the simulated data points with a double-sided CB function. The normalization of the shapes is arbitrary. |
png pdf |
Figure 6-b:
Signal shape for $ {m_\text {jj}}$ in the SM HH nonresonant sample after full analysis selection in the high-mass and HPC region. The solid line shows a fit to the simulated data points with a double-sided CB function. The normalization of the shapes is arbitrary. |
png pdf |
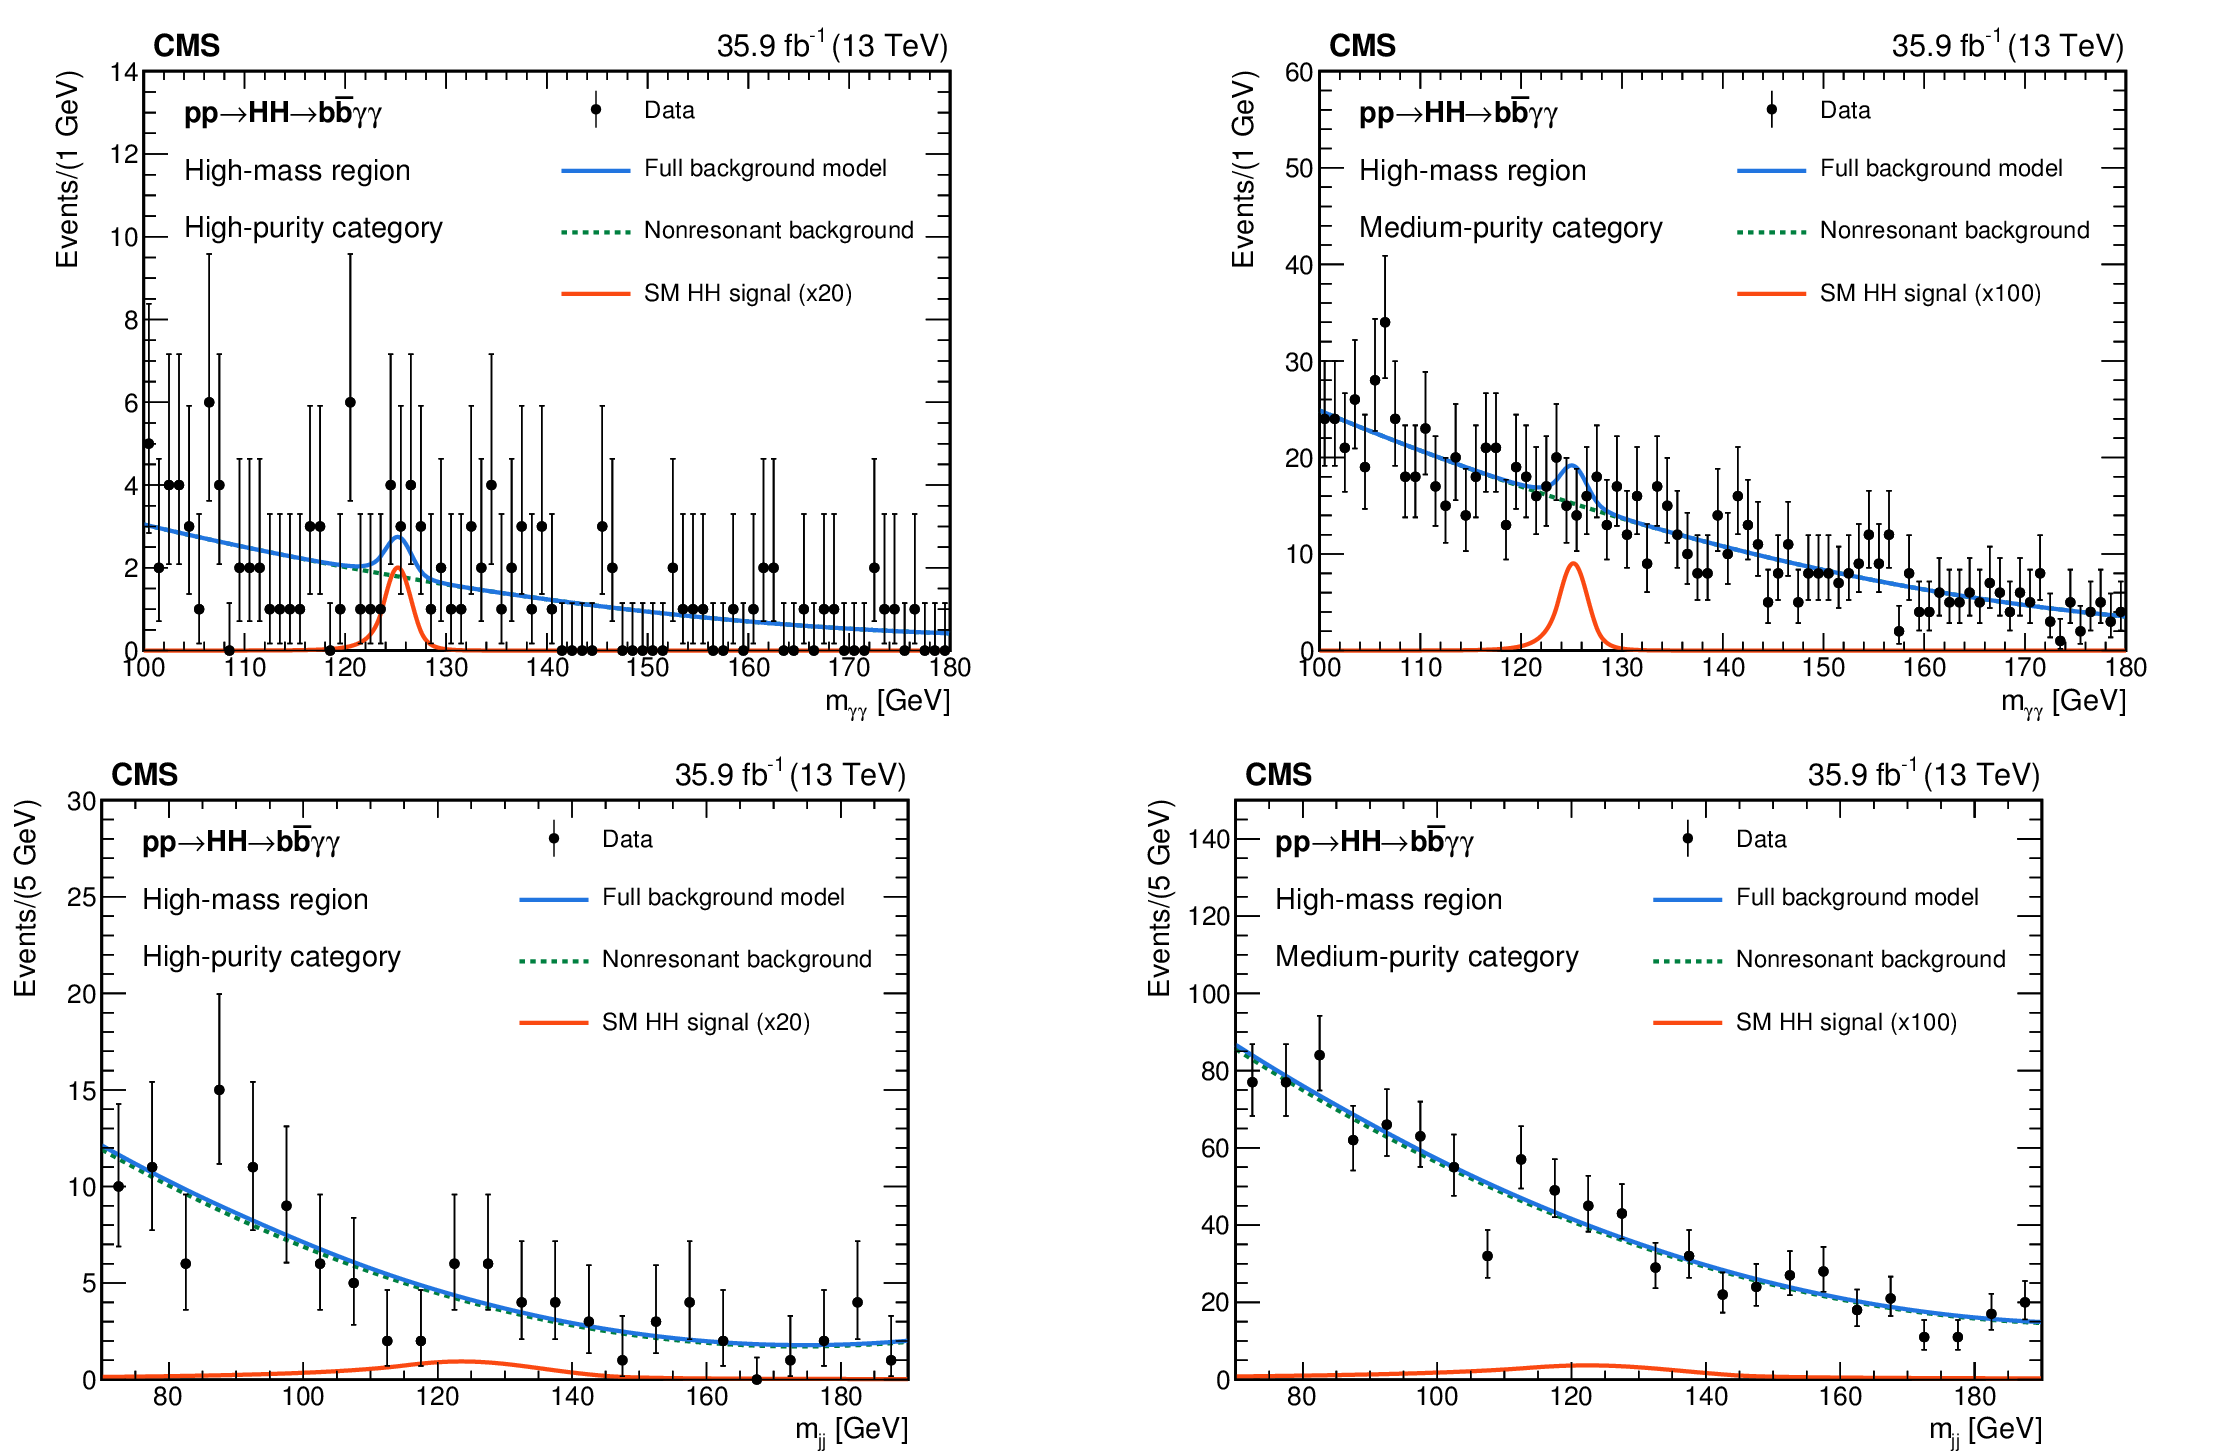
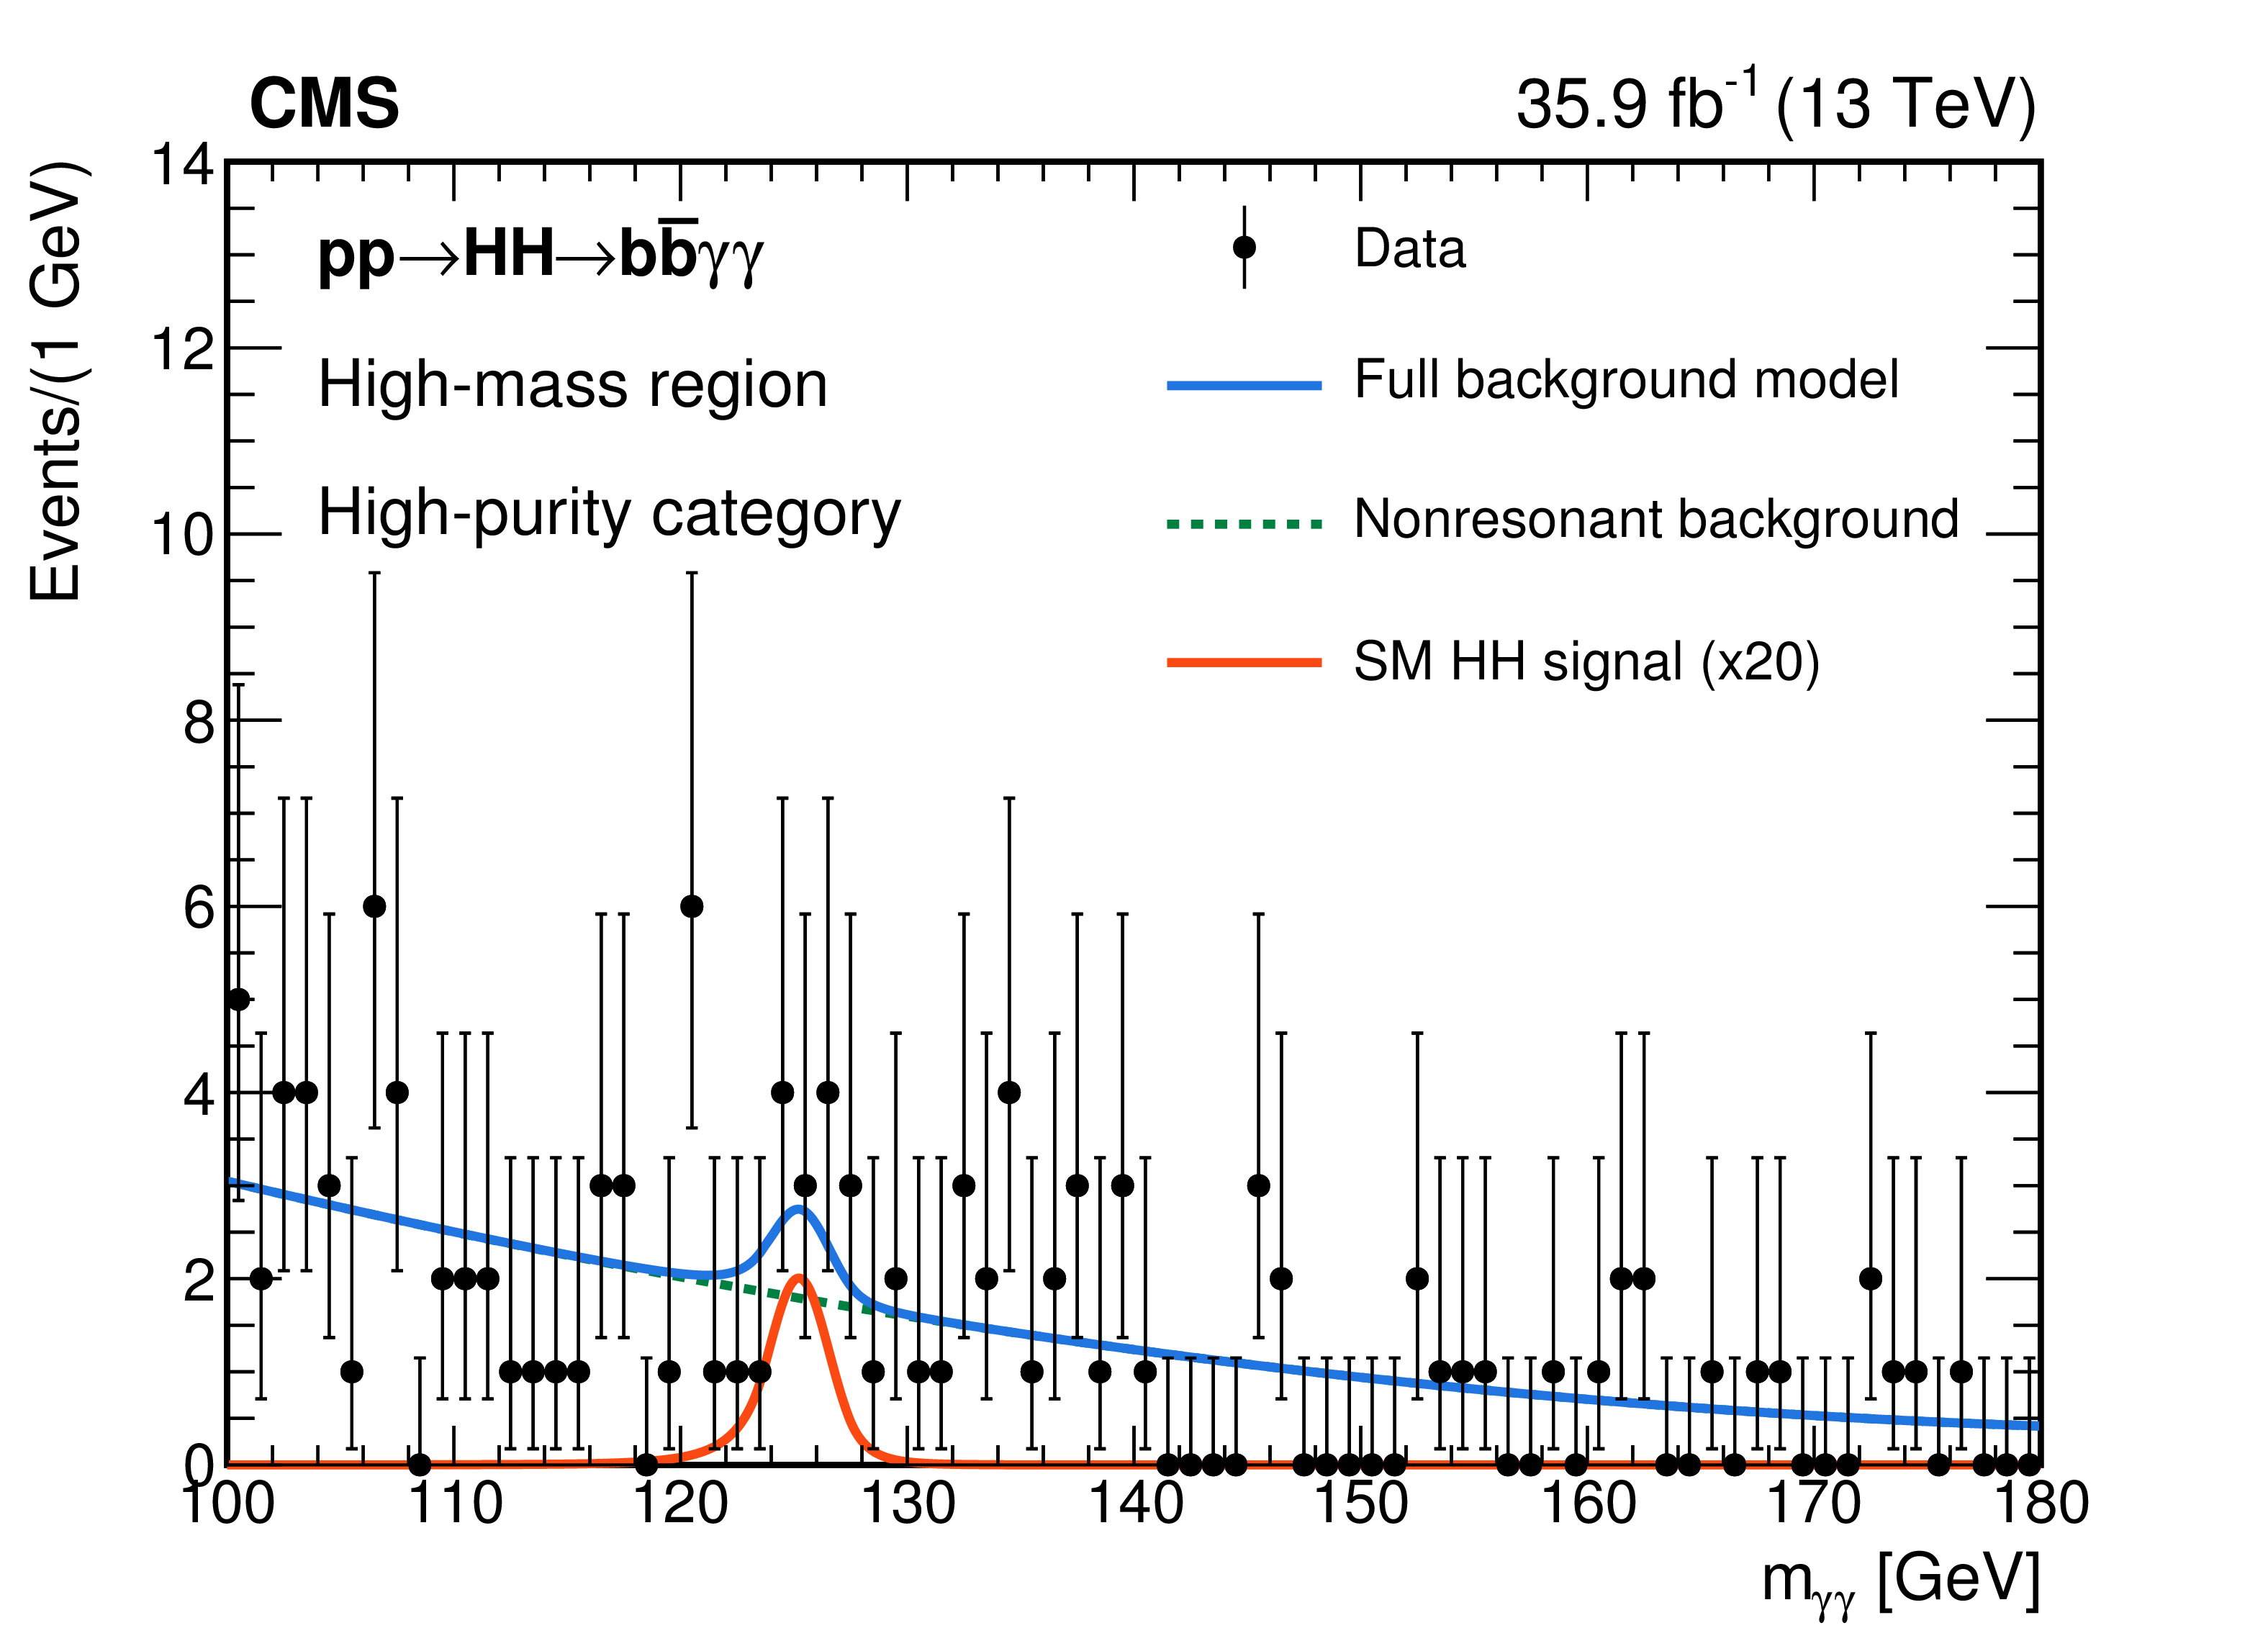
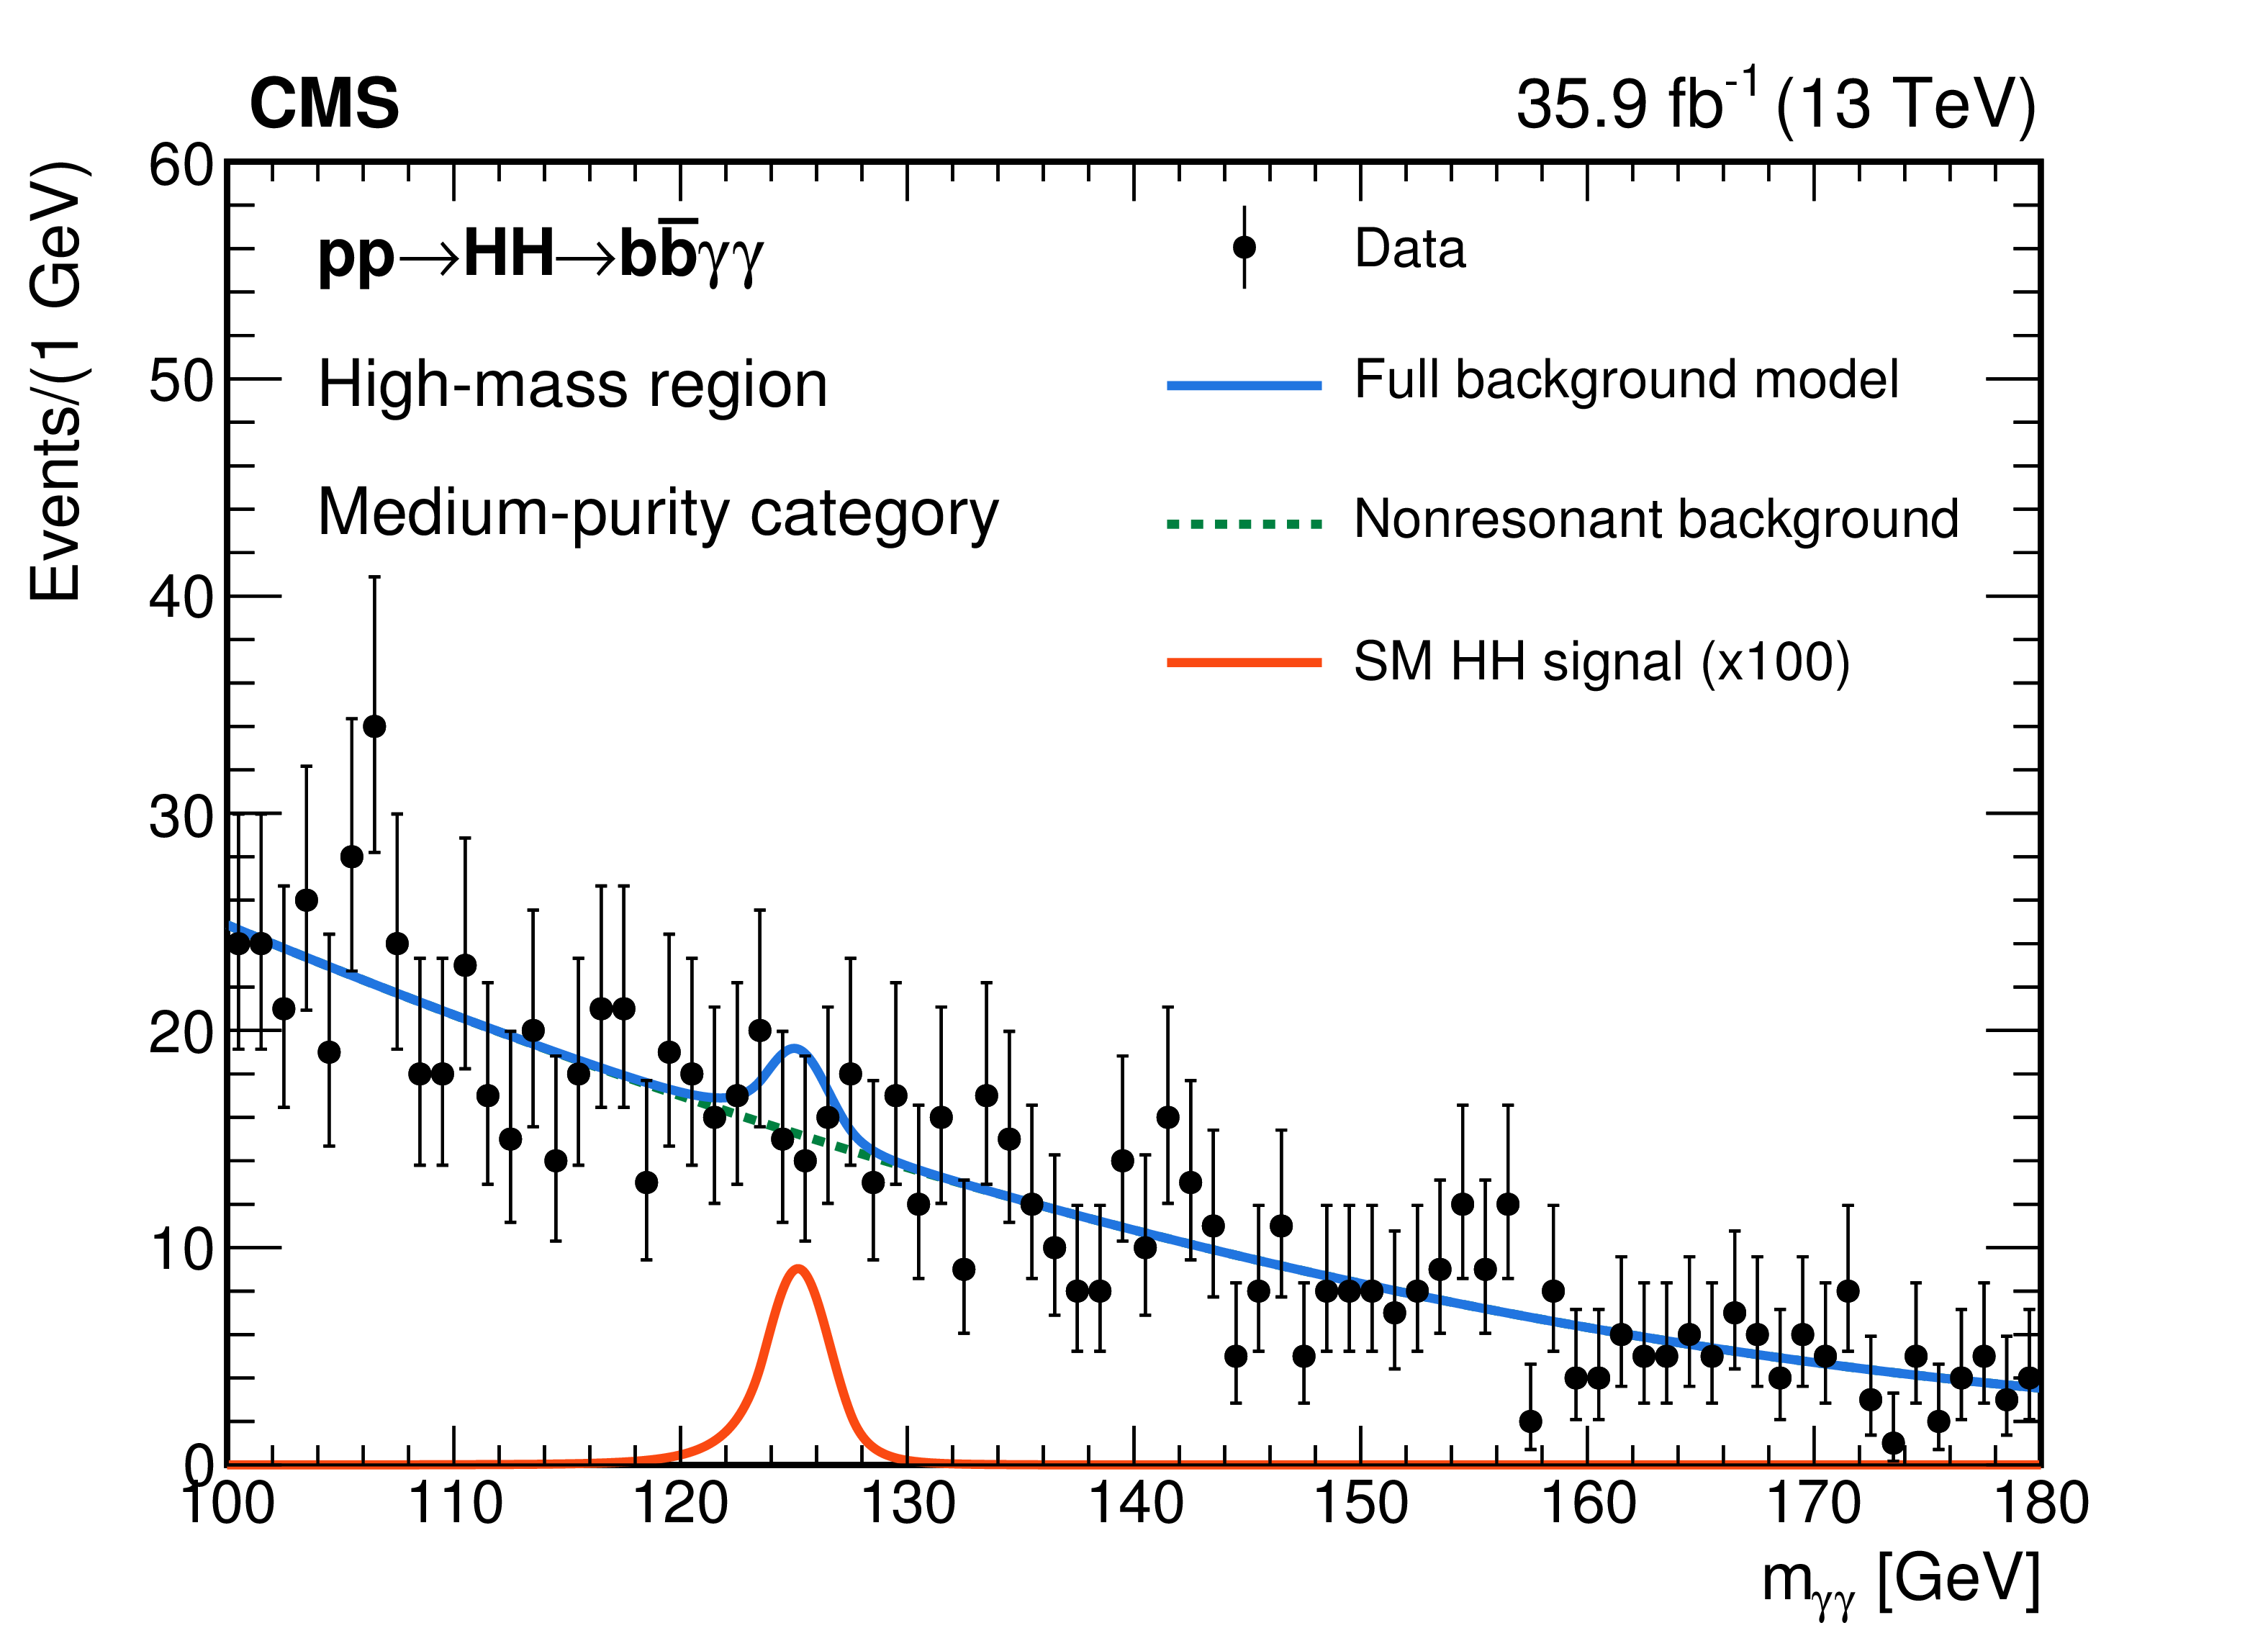
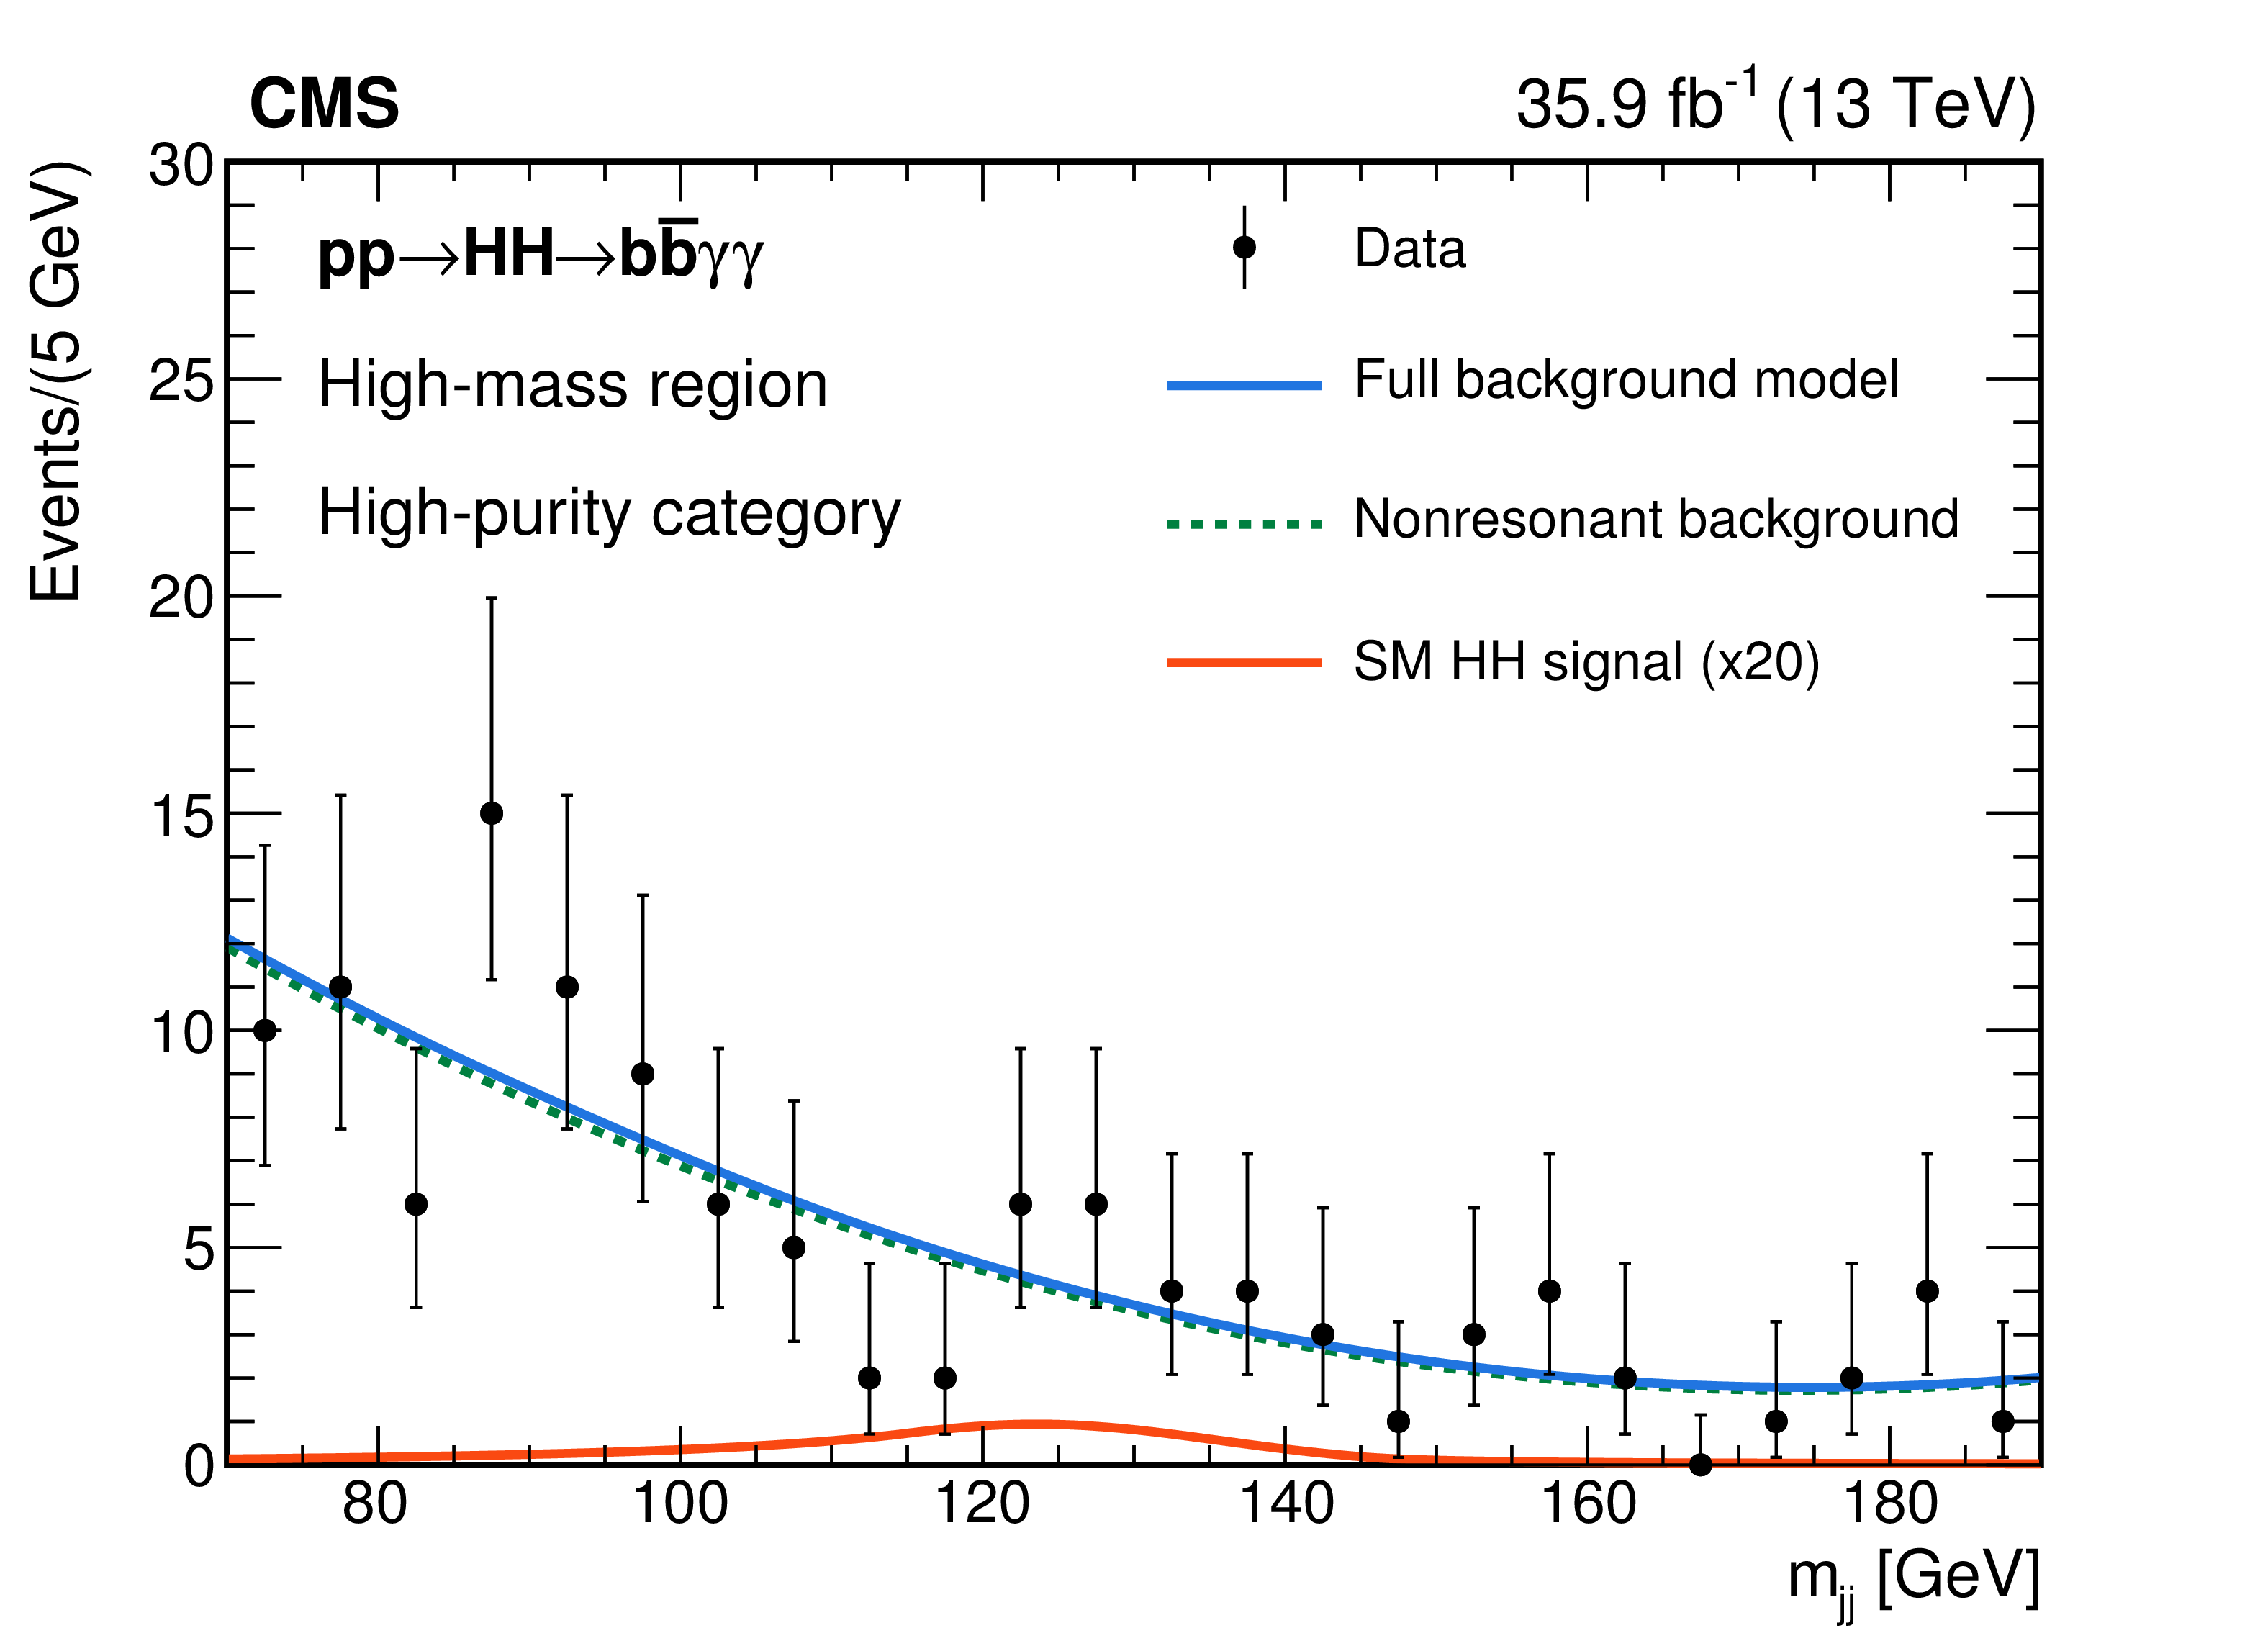
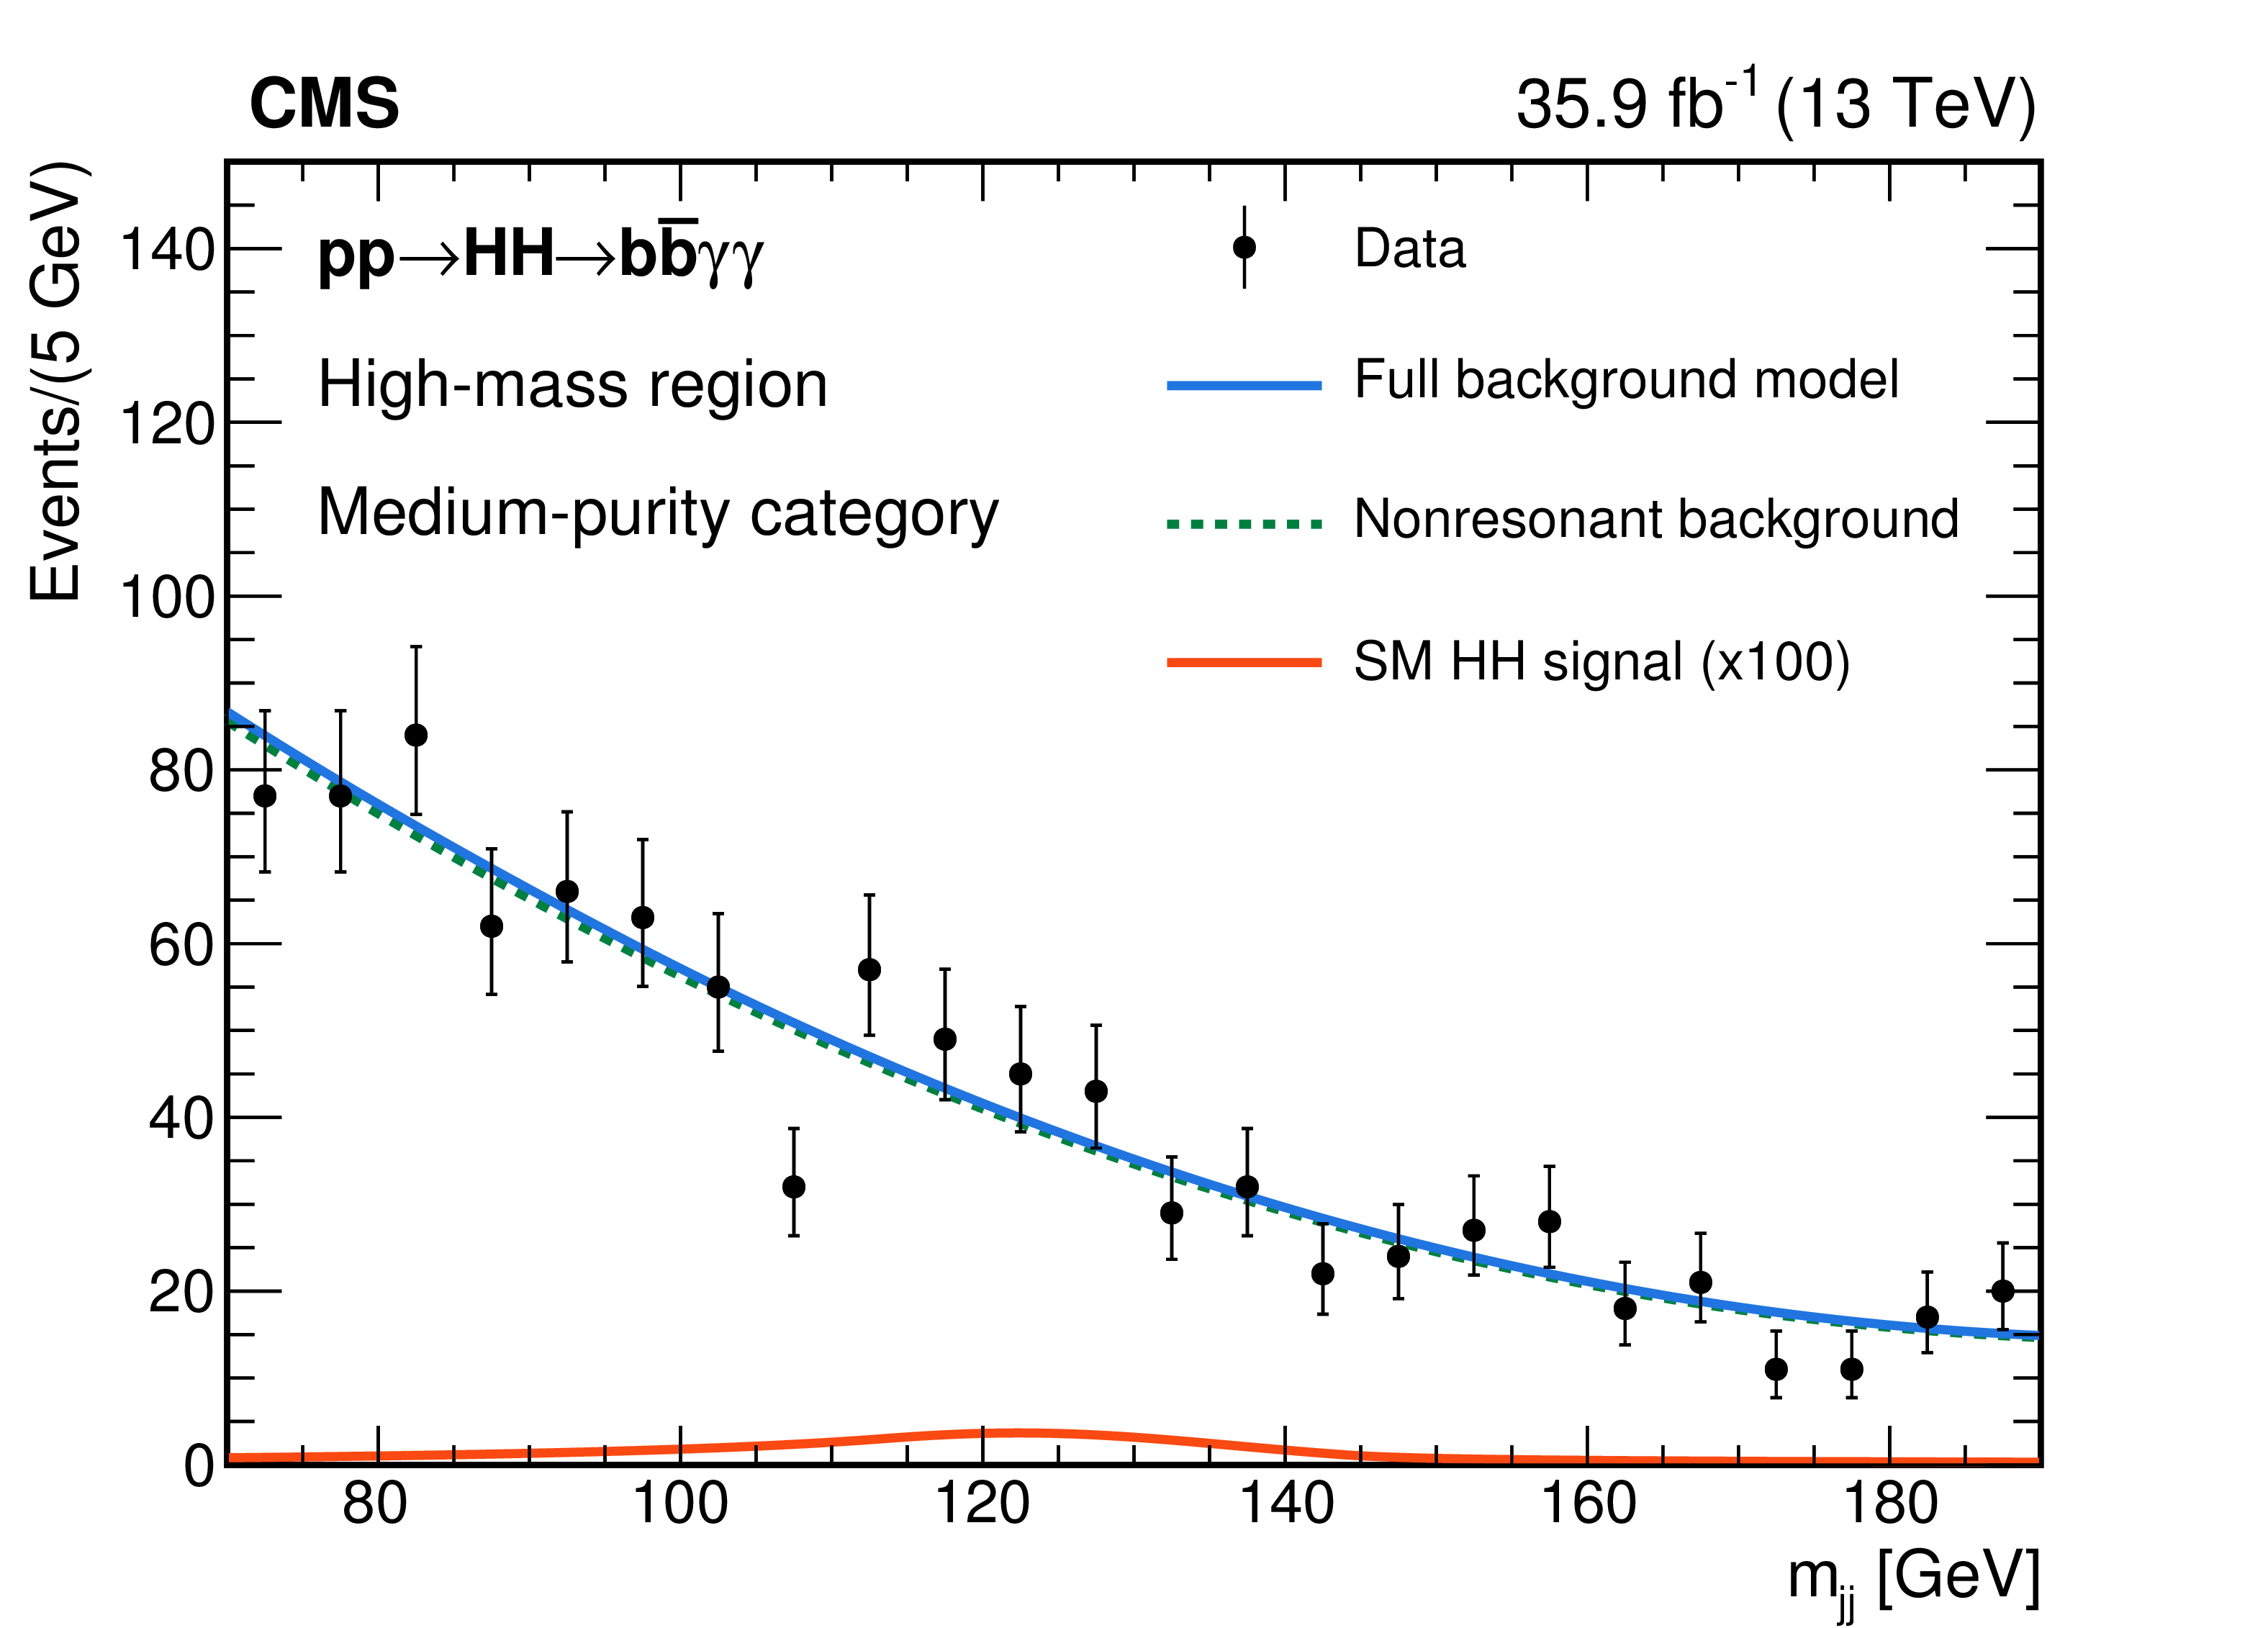
Figure 7:
Background fits for the SM HH nonresonant analysis selection in the HM region. The plots on the left (right) show the distributions in the HPC (MPC) region. Top plots show the $ {m_{\gamma \gamma}} $ spectra and bottom ones the $ {m_\text {jj}}$. |
png pdf |
Figure 7-a:
Background fit for the SM HH nonresonant analysis selection in the HM region. The plot shows the $ {m_{\gamma \gamma}} $ spectrum in the HPC region. |
png pdf |
Figure 7-b:
Background fit for the SM HH nonresonant analysis selection in the HM region. The plot shows the $ {m_{\gamma \gamma}} $ spectrum in the MPC region. |
png pdf |
Figure 7-c:
Background fit for the SM HH nonresonant analysis selection in the HM region. The plot shows the $ {m_\text {jj}}$ spectrum in the HPC region. |
png pdf |
Figure 7-d:
Background fit for the SM HH nonresonant analysis selection in the HM region. The plot shows the $ {m_\text {jj}}$ spectrum in the MPC region. |
png pdf |
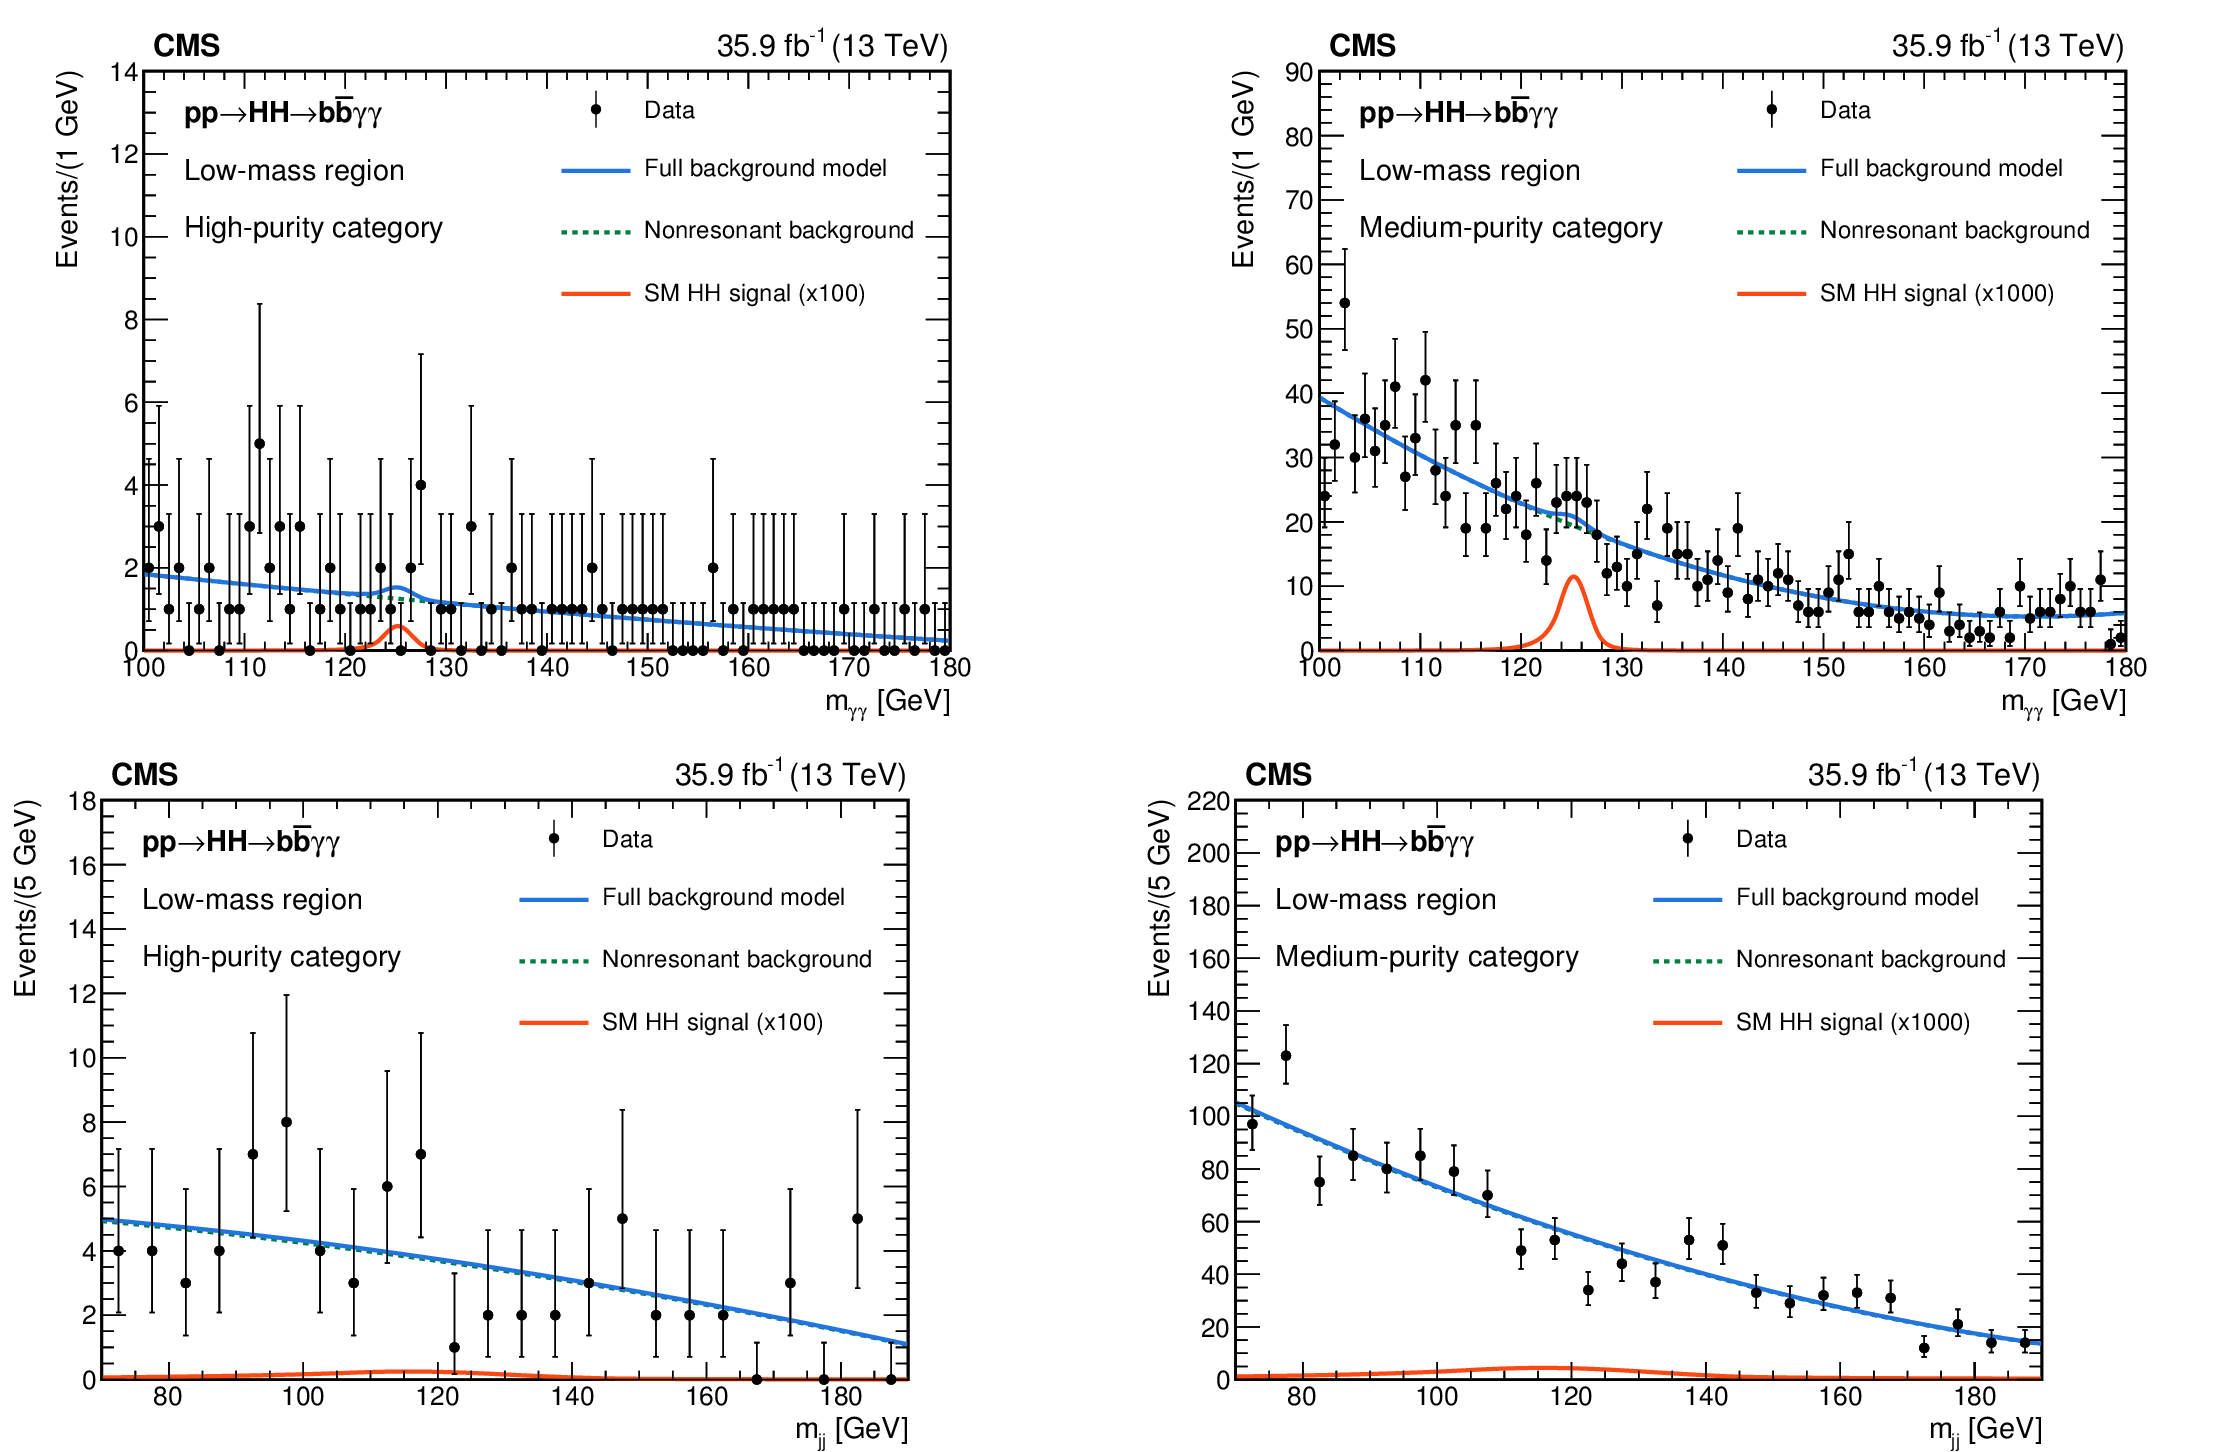
Figure 8:
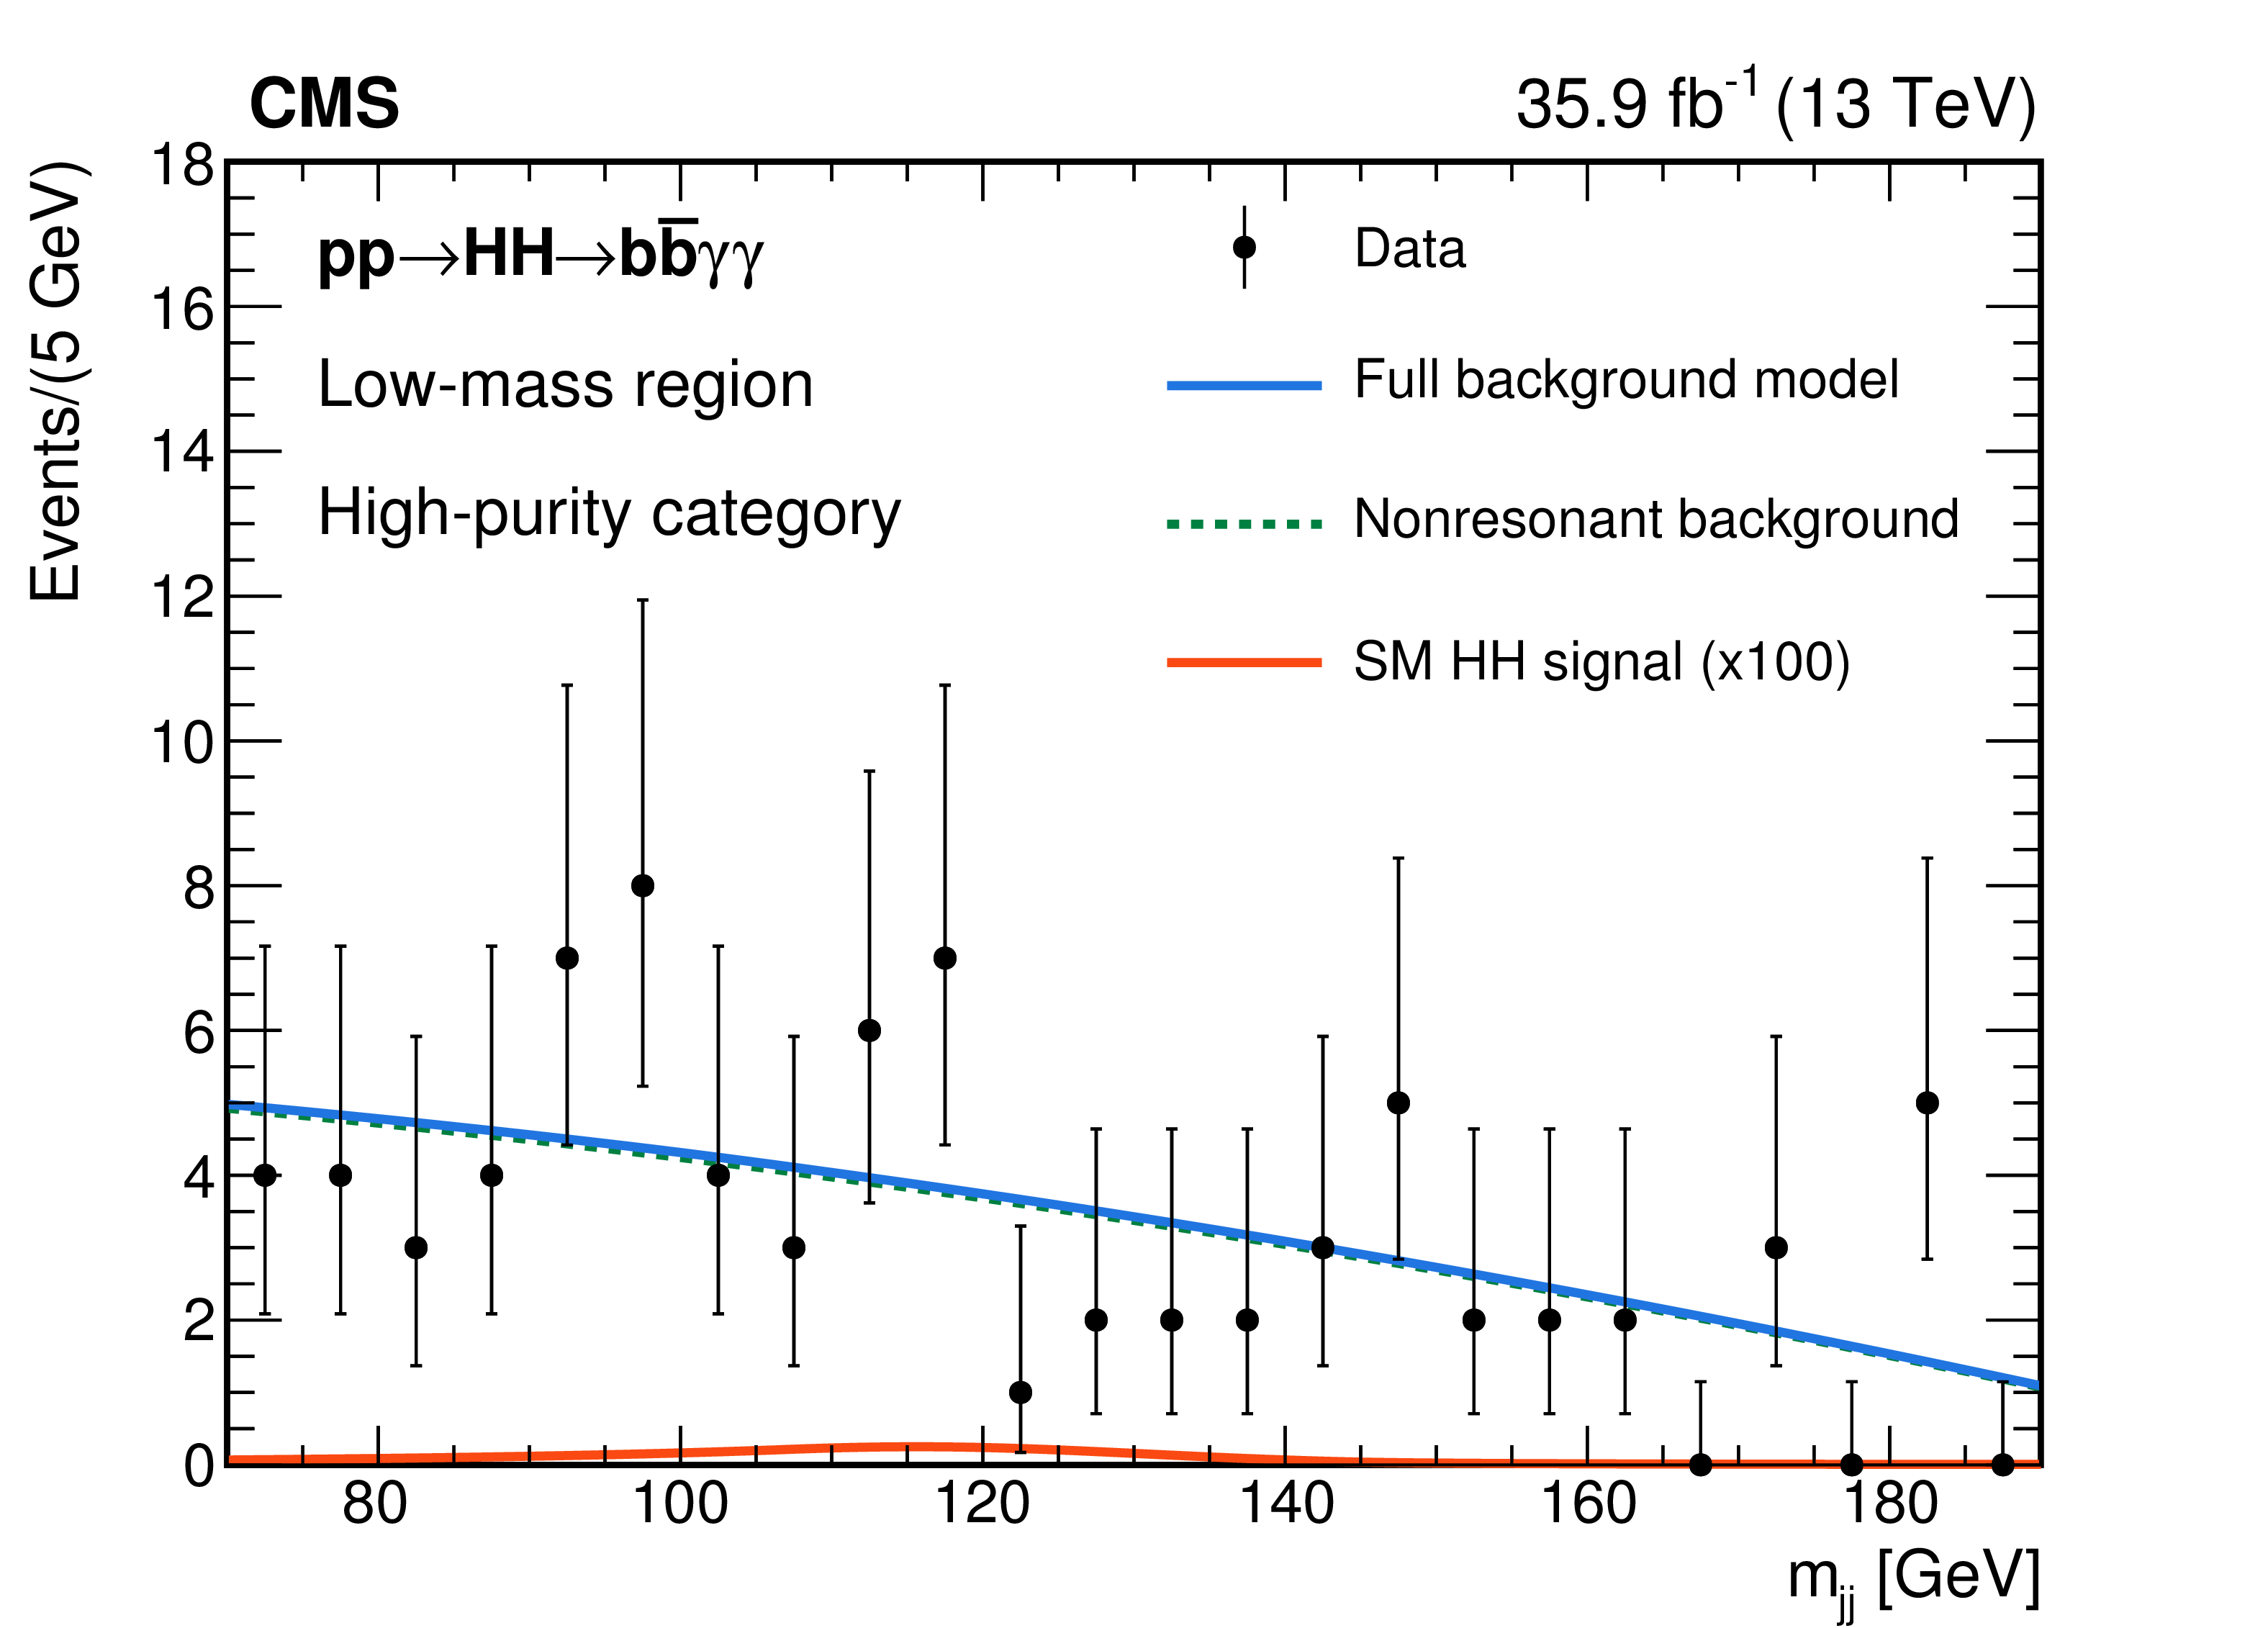
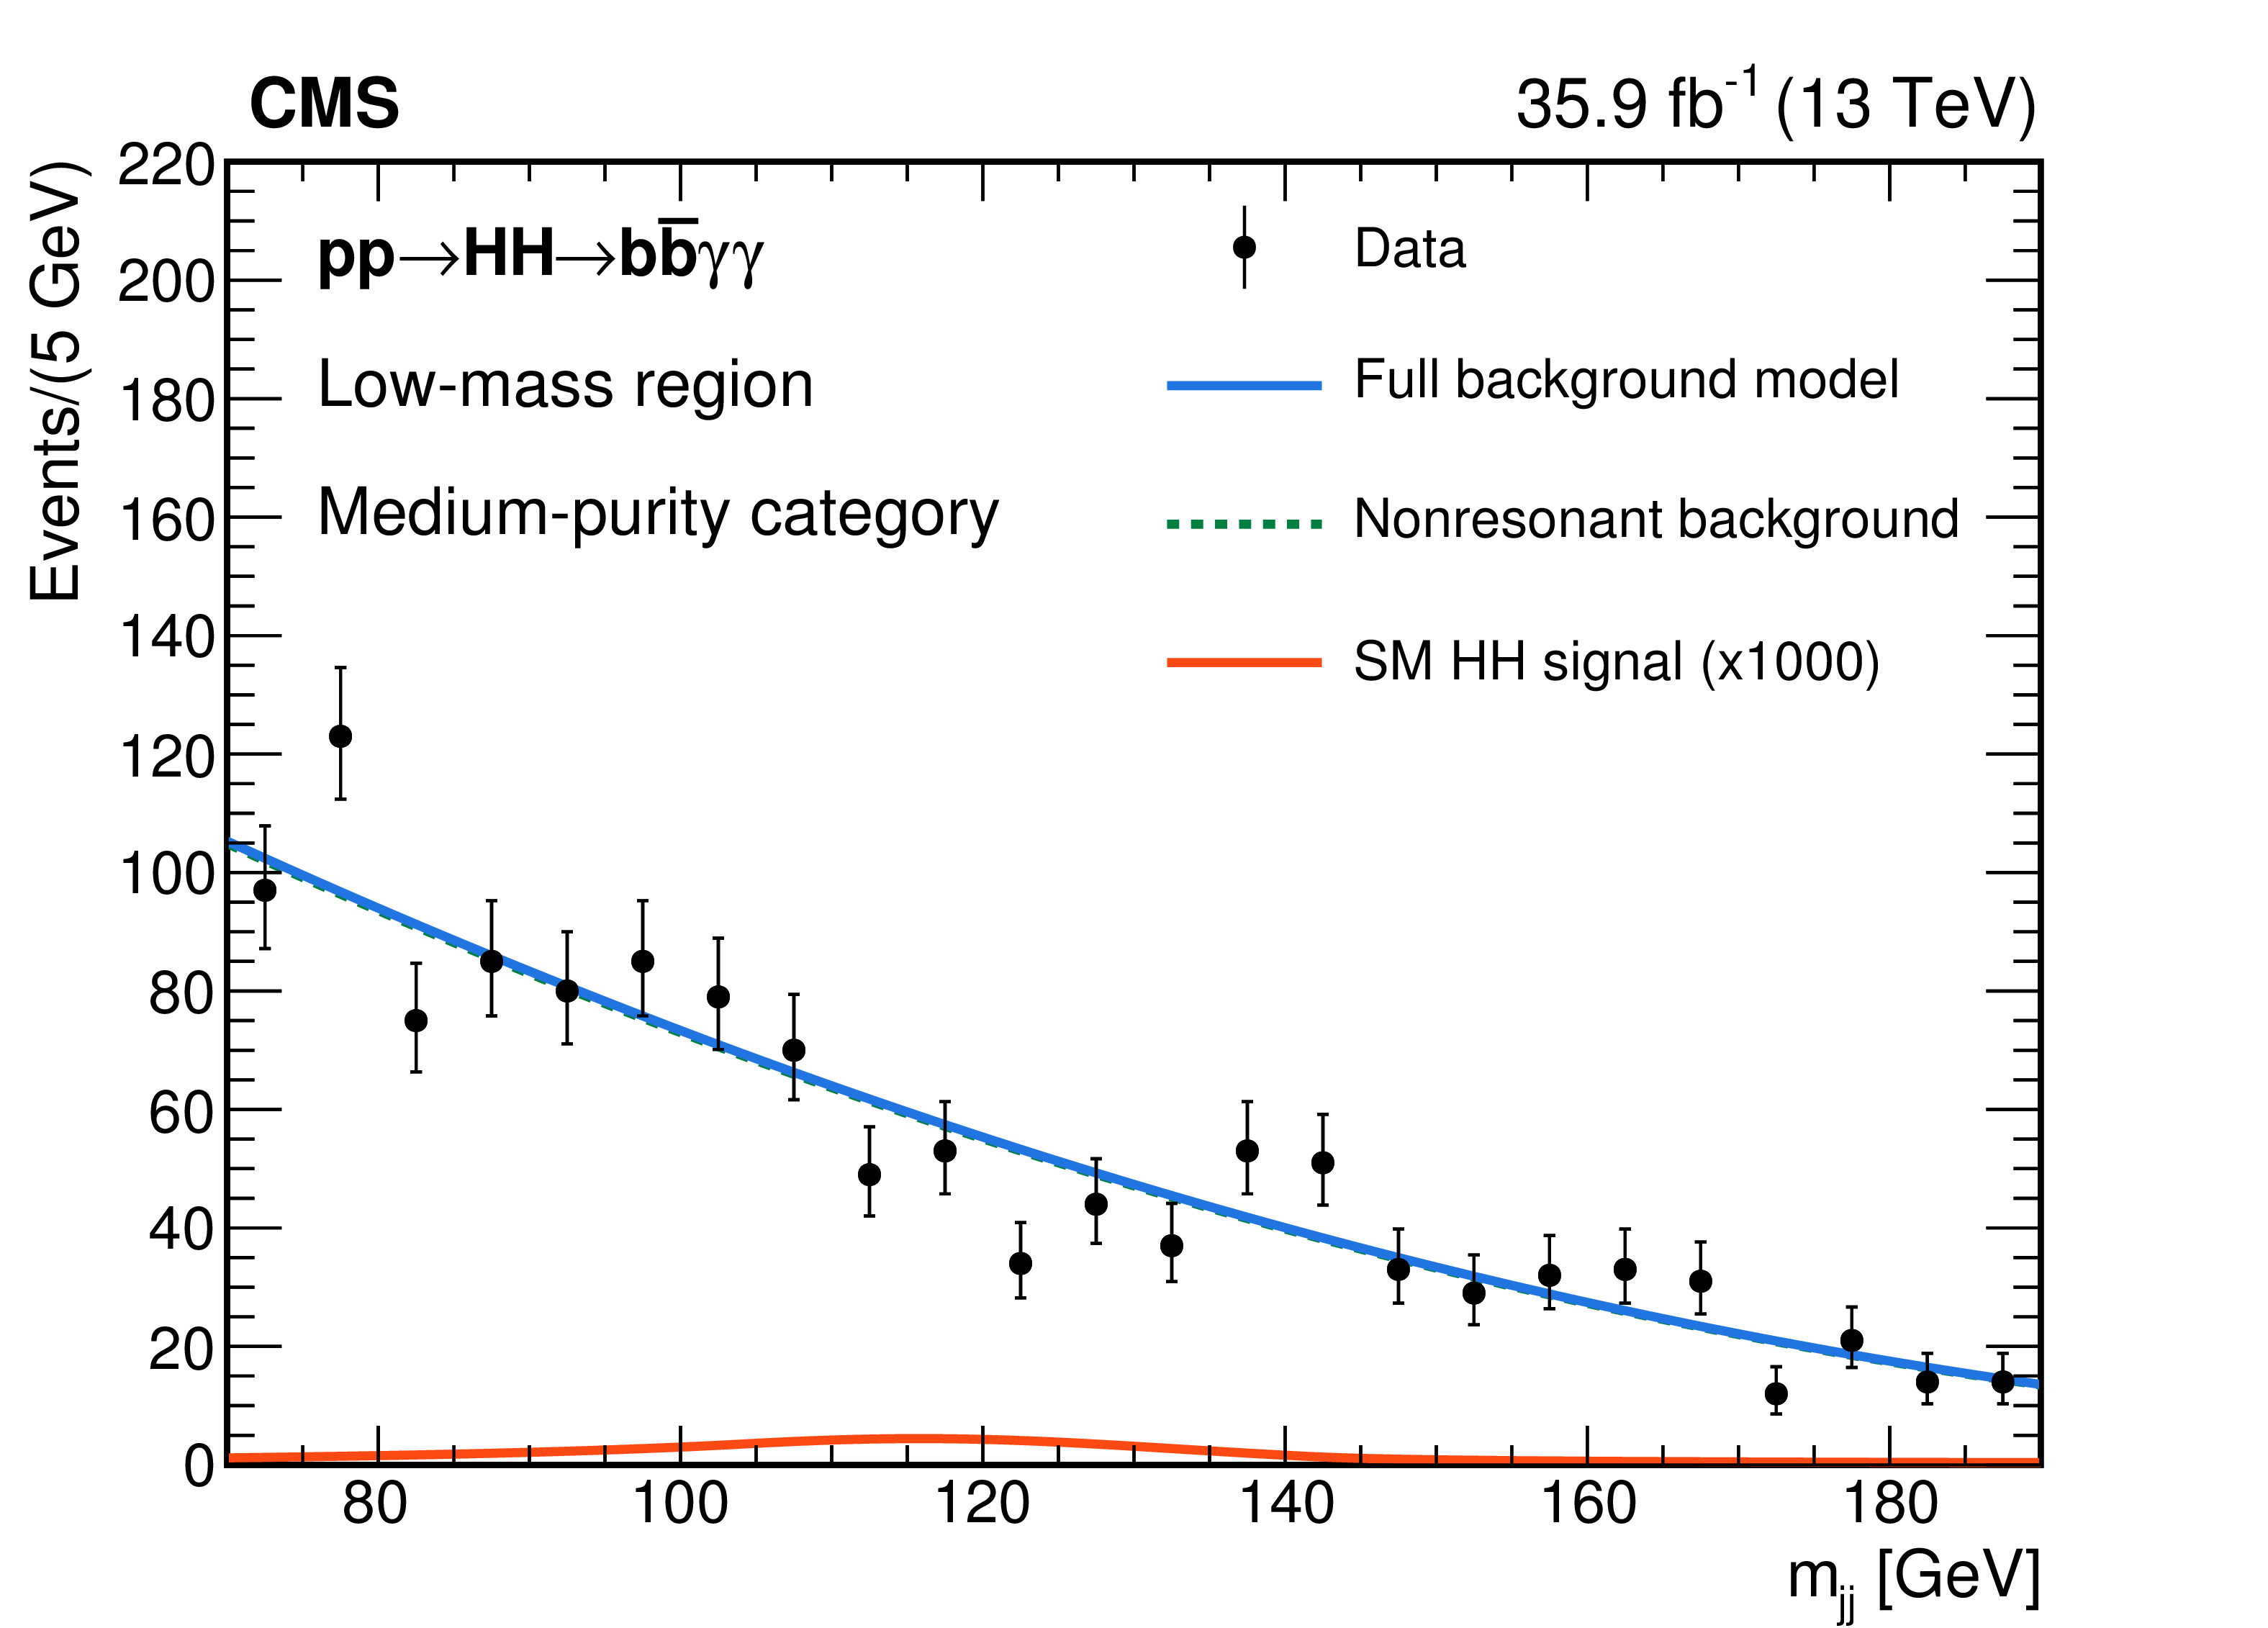
Background fits for the SM HH nonresonant analysis selection in the LM region. The plots on the left (right) show the distributions in the HPC (MPC) region. Top plots show the $ {m_{\gamma \gamma}} $ spectra and bottom ones the $ {m_\text {jj}}$. |

png pdf |
Figure 8-a:
Background fit for the SM HH nonresonant analysis selection in the LM region. The plot shows the $ {m_{\gamma \gamma}} $ spectrum in the HPC region. |
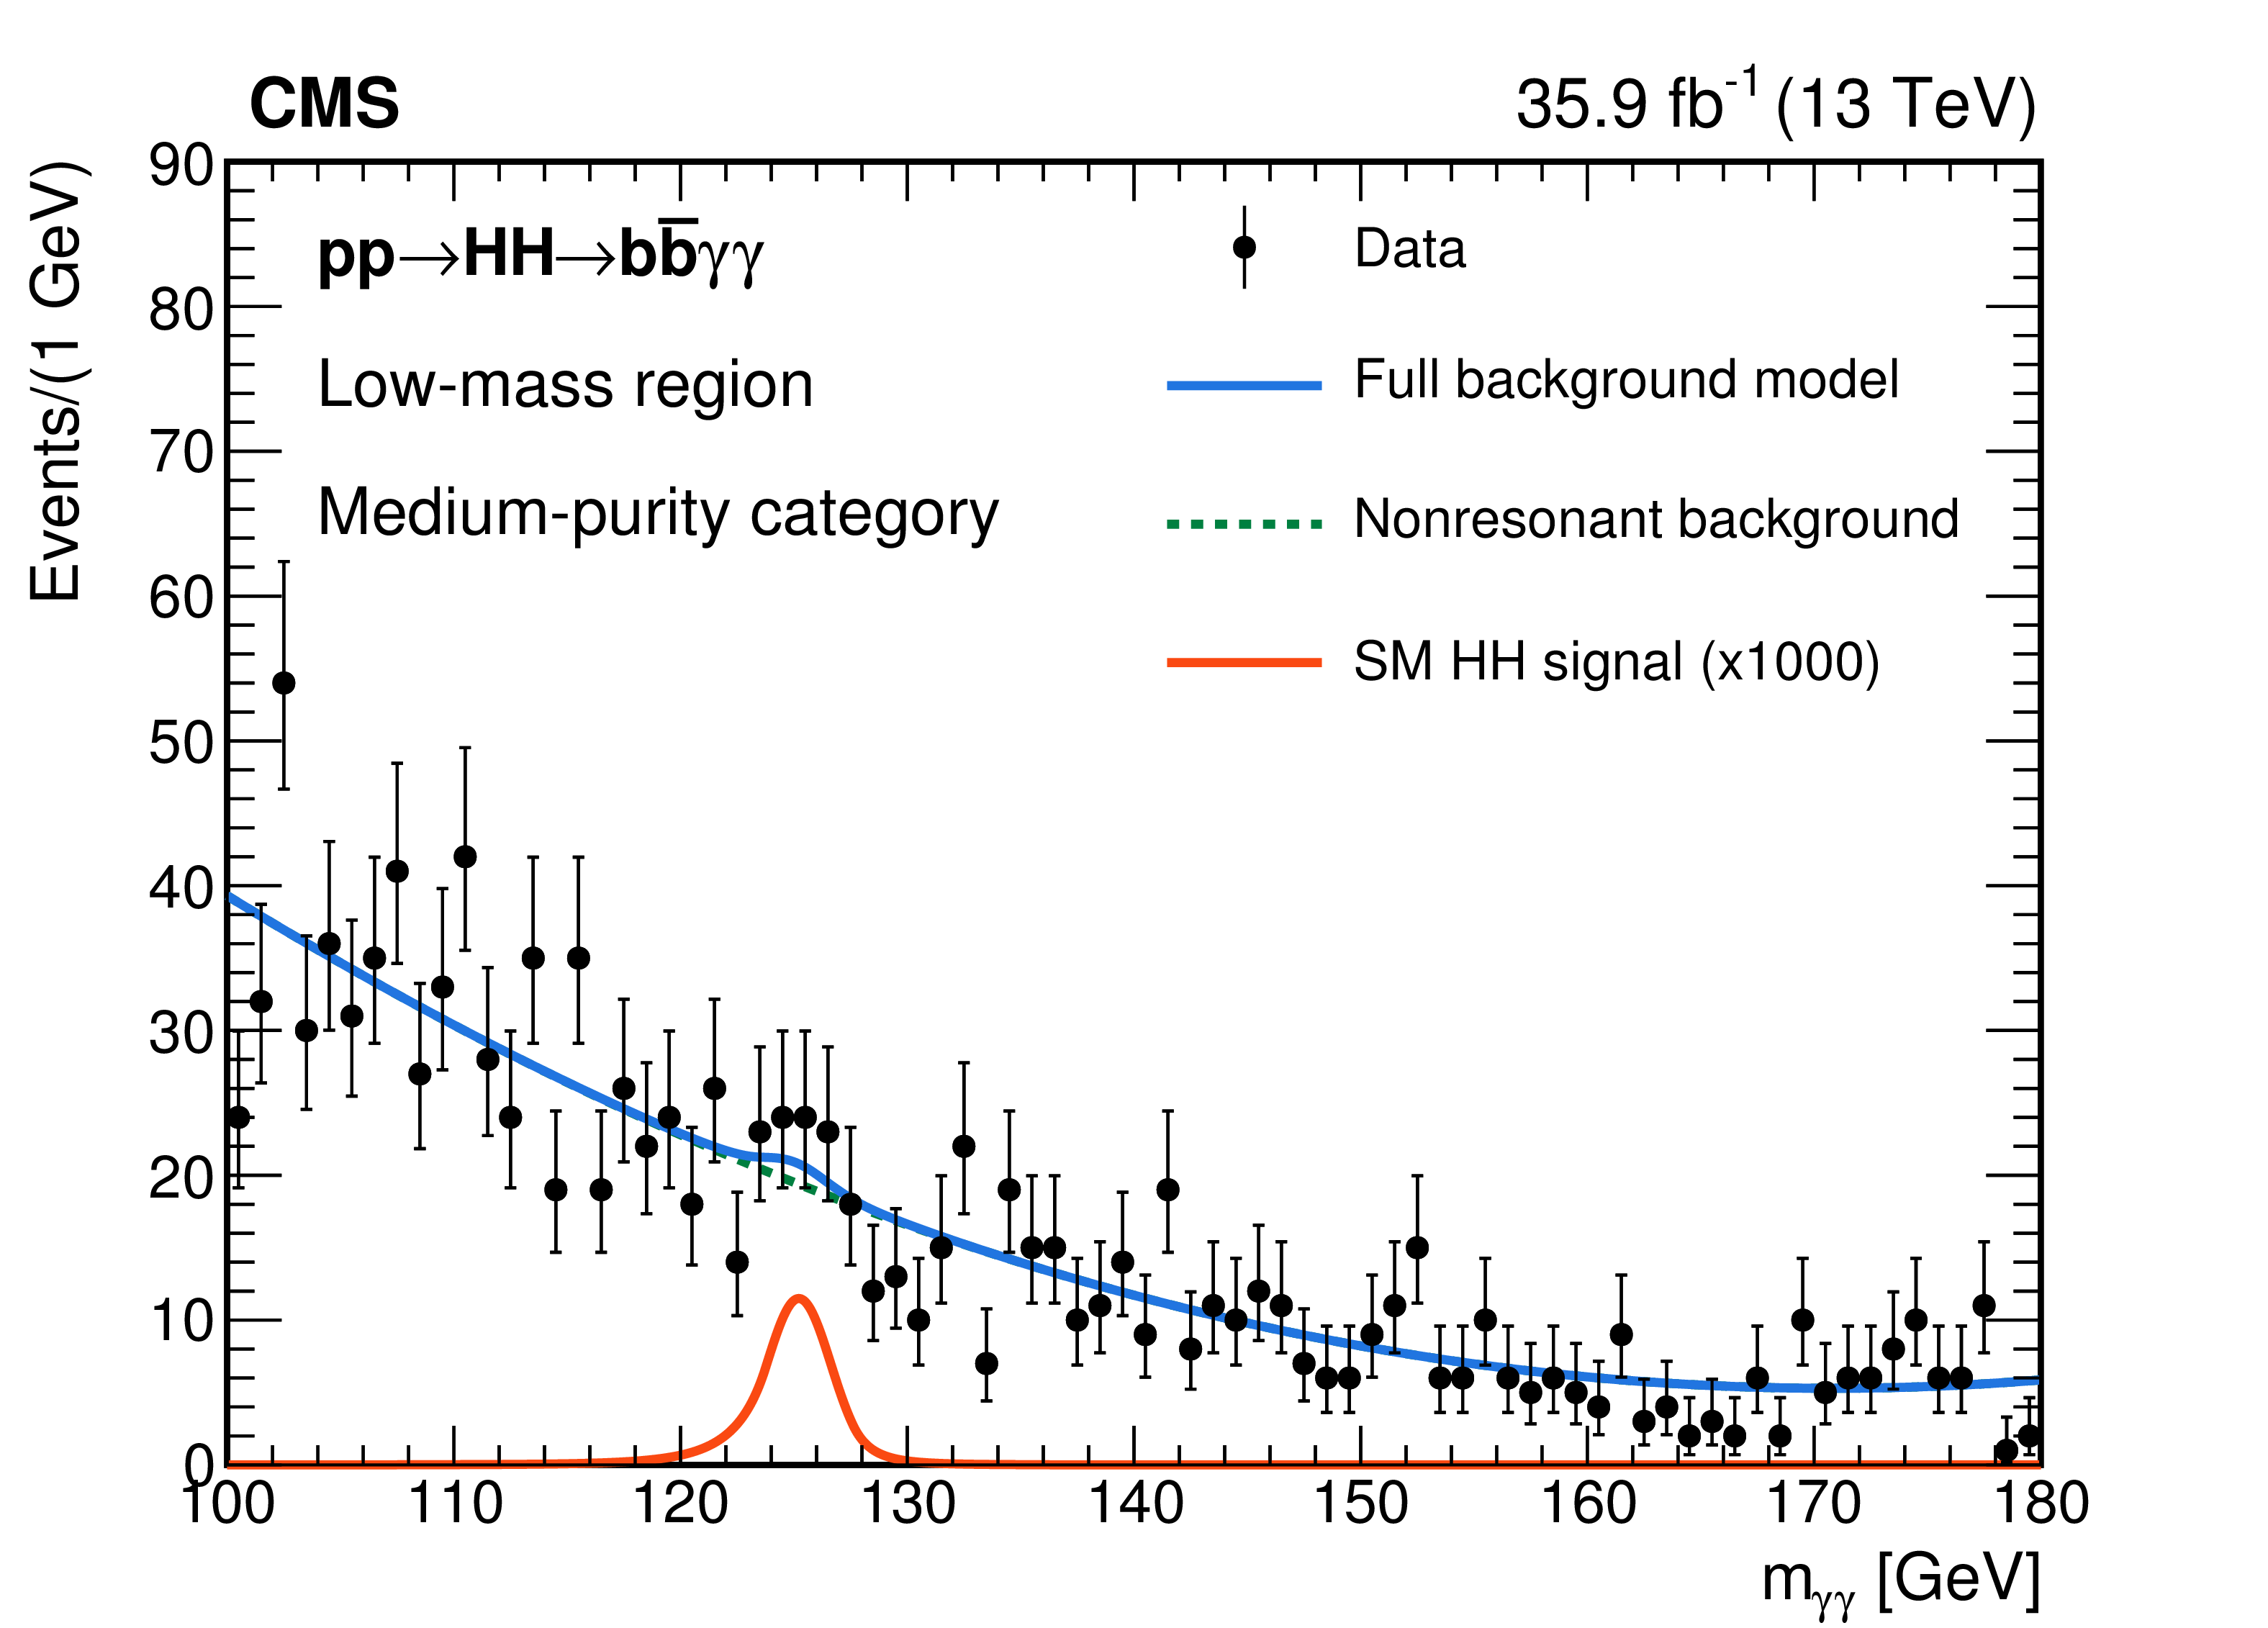
png pdf |
Figure 8-b:
Background fit for the SM HH nonresonant analysis selection in the LM region. The plot shows the $ {m_{\gamma \gamma}} $ spectrum in the MPC region. |
png pdf |
Figure 8-c:
Background fit for the SM HH nonresonant analysis selection in the LM region. The plot shows the $ {m_\text {jj}}$ spectrum in the HPC region. |
png pdf |
Figure 8-d:
Background fit for the SM HH nonresonant analysis selection in the LM region. The plot shows the $ {m_\text {jj}}$ spectrum in the MPC region. |
png pdf |
Figure 9:
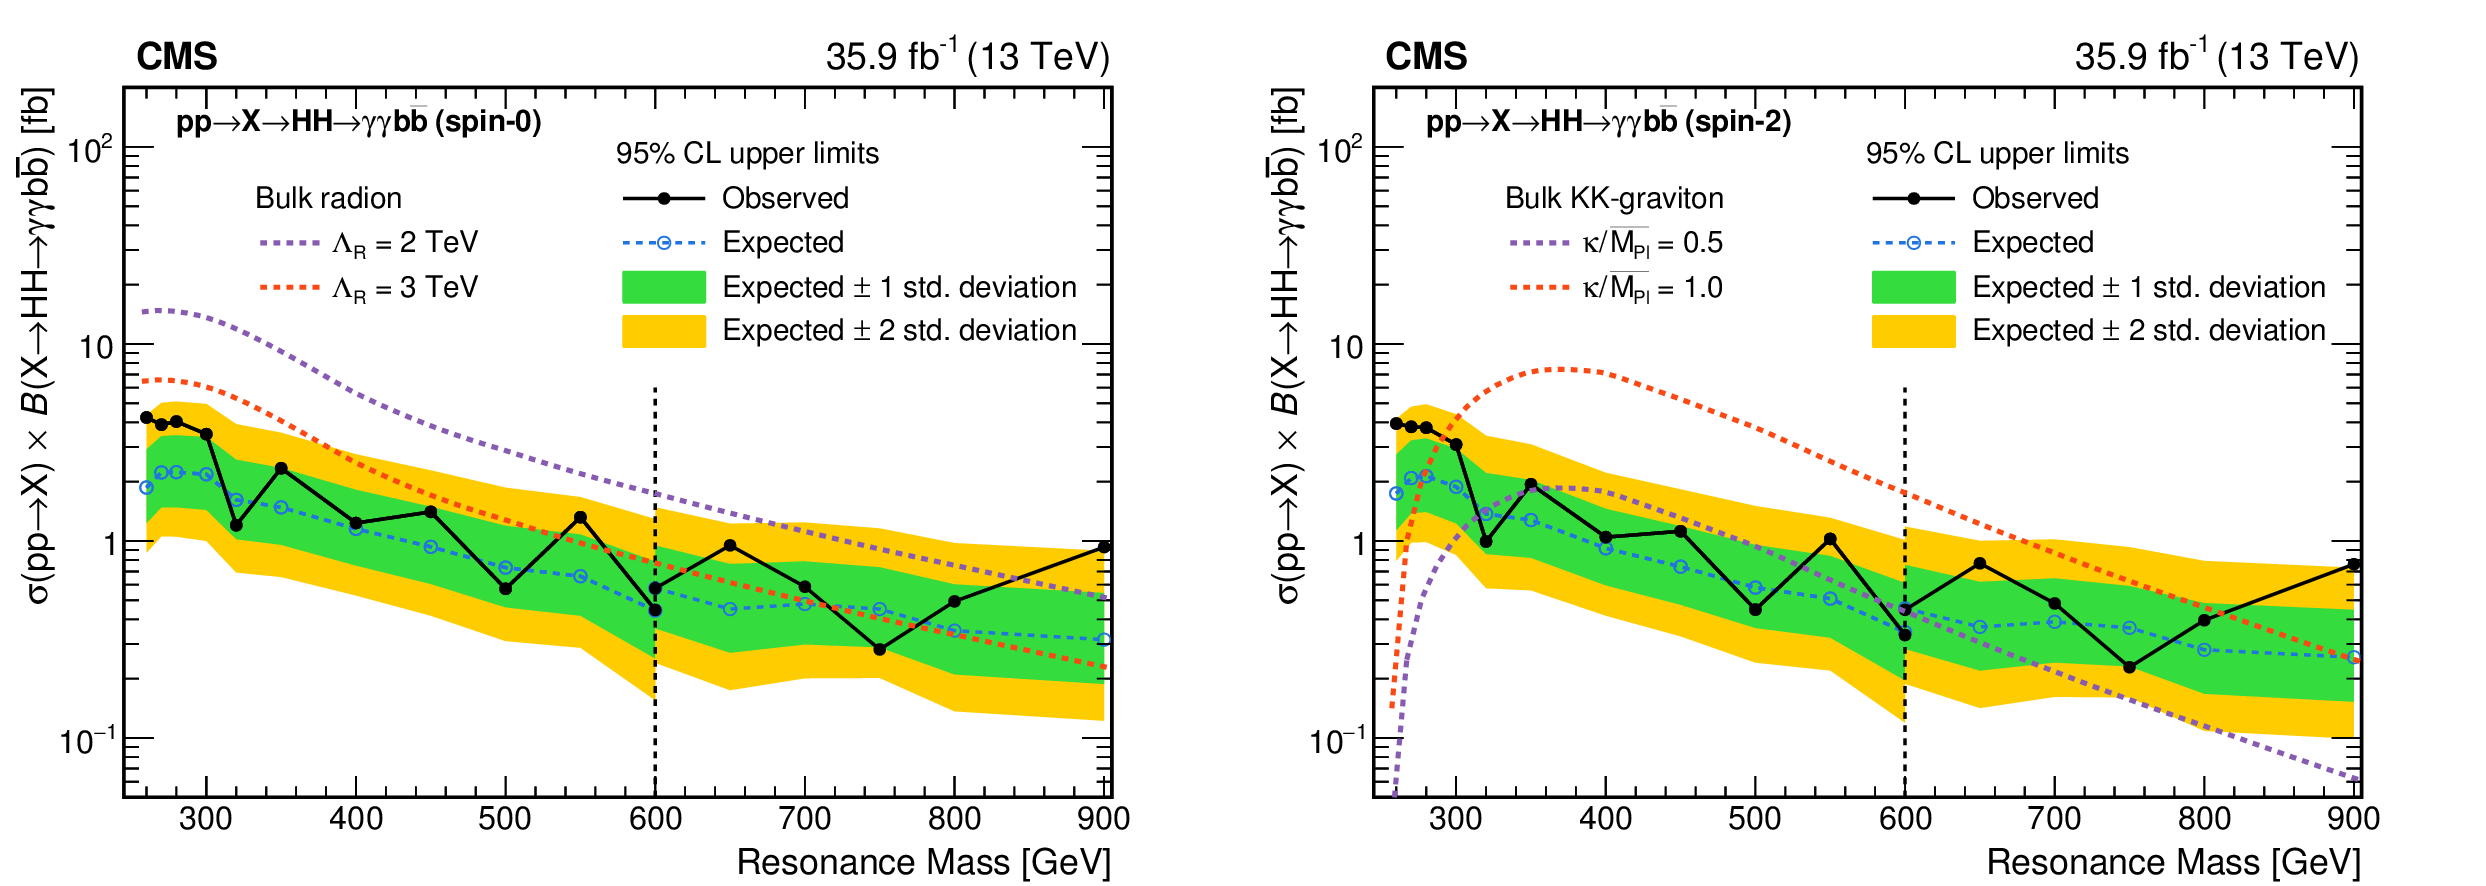
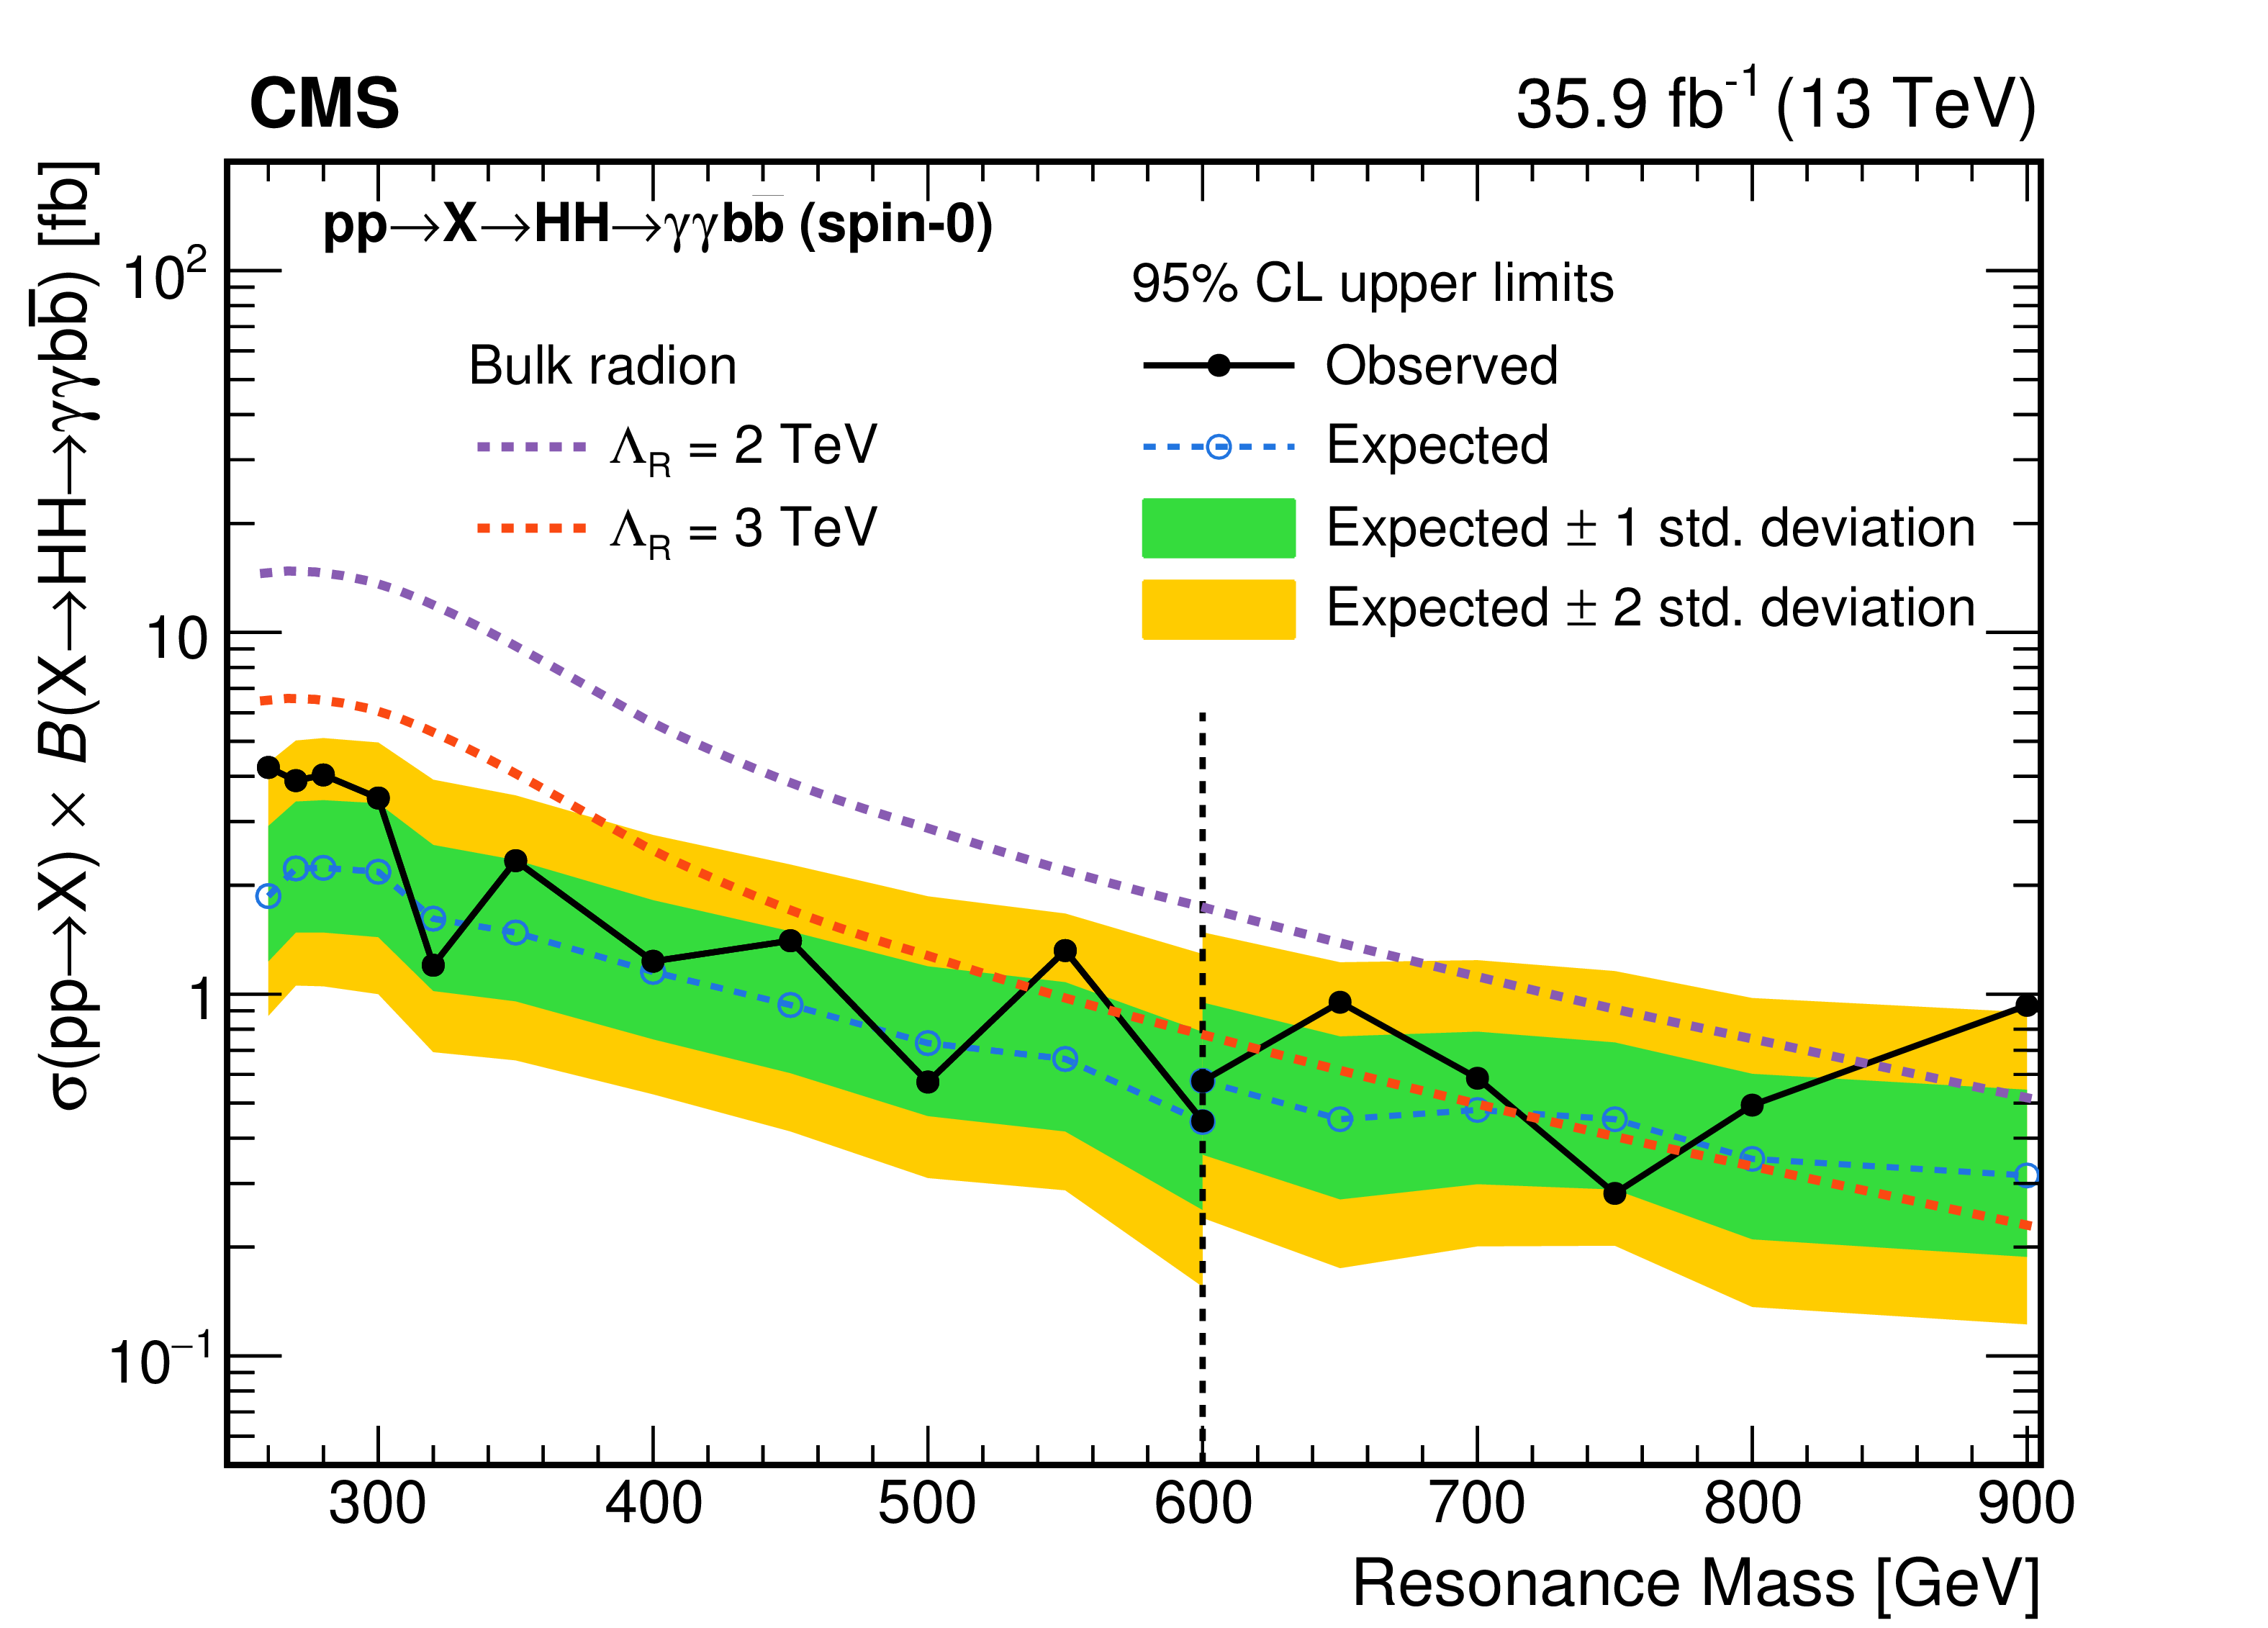
Observed and expected 95% CL upper limits on the product of cross section and branching fraction $\sigma ({\mathrm {p}} {\mathrm {p}}\to \text {X}) \mathcal {B}(\text {X} \to {{{\mathrm {H}} {\mathrm {H}}}} \to \gamma \gamma {{\mathrm {b}} {\overline {\mathrm {b}}}})$ obtained through a combination of the two analysis categories (HPC and MPC) for spin-0 (left) and spin-2 (right) hypotheses. The green and yellow bands represent, respectively, the one and two standard deviation extensions beyond the expected limit. Also shown are theoretical predictions corresponding to WED models for bulk radions (top) and bulk KK gravitons (bottom). The vertical dashed lines show the boundary between the low- and high-mass regions. The limits for $ {m_\text {X}} = $ 600 GeV are shown for both methods. |
png pdf |
Figure 9-a:
Observed and expected 95% CL upper limits on the product of cross section and branching fraction $\sigma ({\mathrm {p}} {\mathrm {p}}\to \text {X}) \mathcal {B}(\text {X} \to {{{\mathrm {H}} {\mathrm {H}}}} \to \gamma \gamma {{\mathrm {b}} {\overline {\mathrm {b}}}})$ obtained through a combination of the two analysis categories (HPC and MPC) for the spin-0 hypothesis. The green and yellow bands represent, respectively, the one and two standard deviation extensions beyond the expected limit. Also shown are theoretical predictions corresponding to WED models for bulk radions. The vertical dashed lines show the boundary between the low- and high-mass regions. The limits for $ {m_\text {X}} = $ 600 GeV are shown for both methods. |
png pdf |
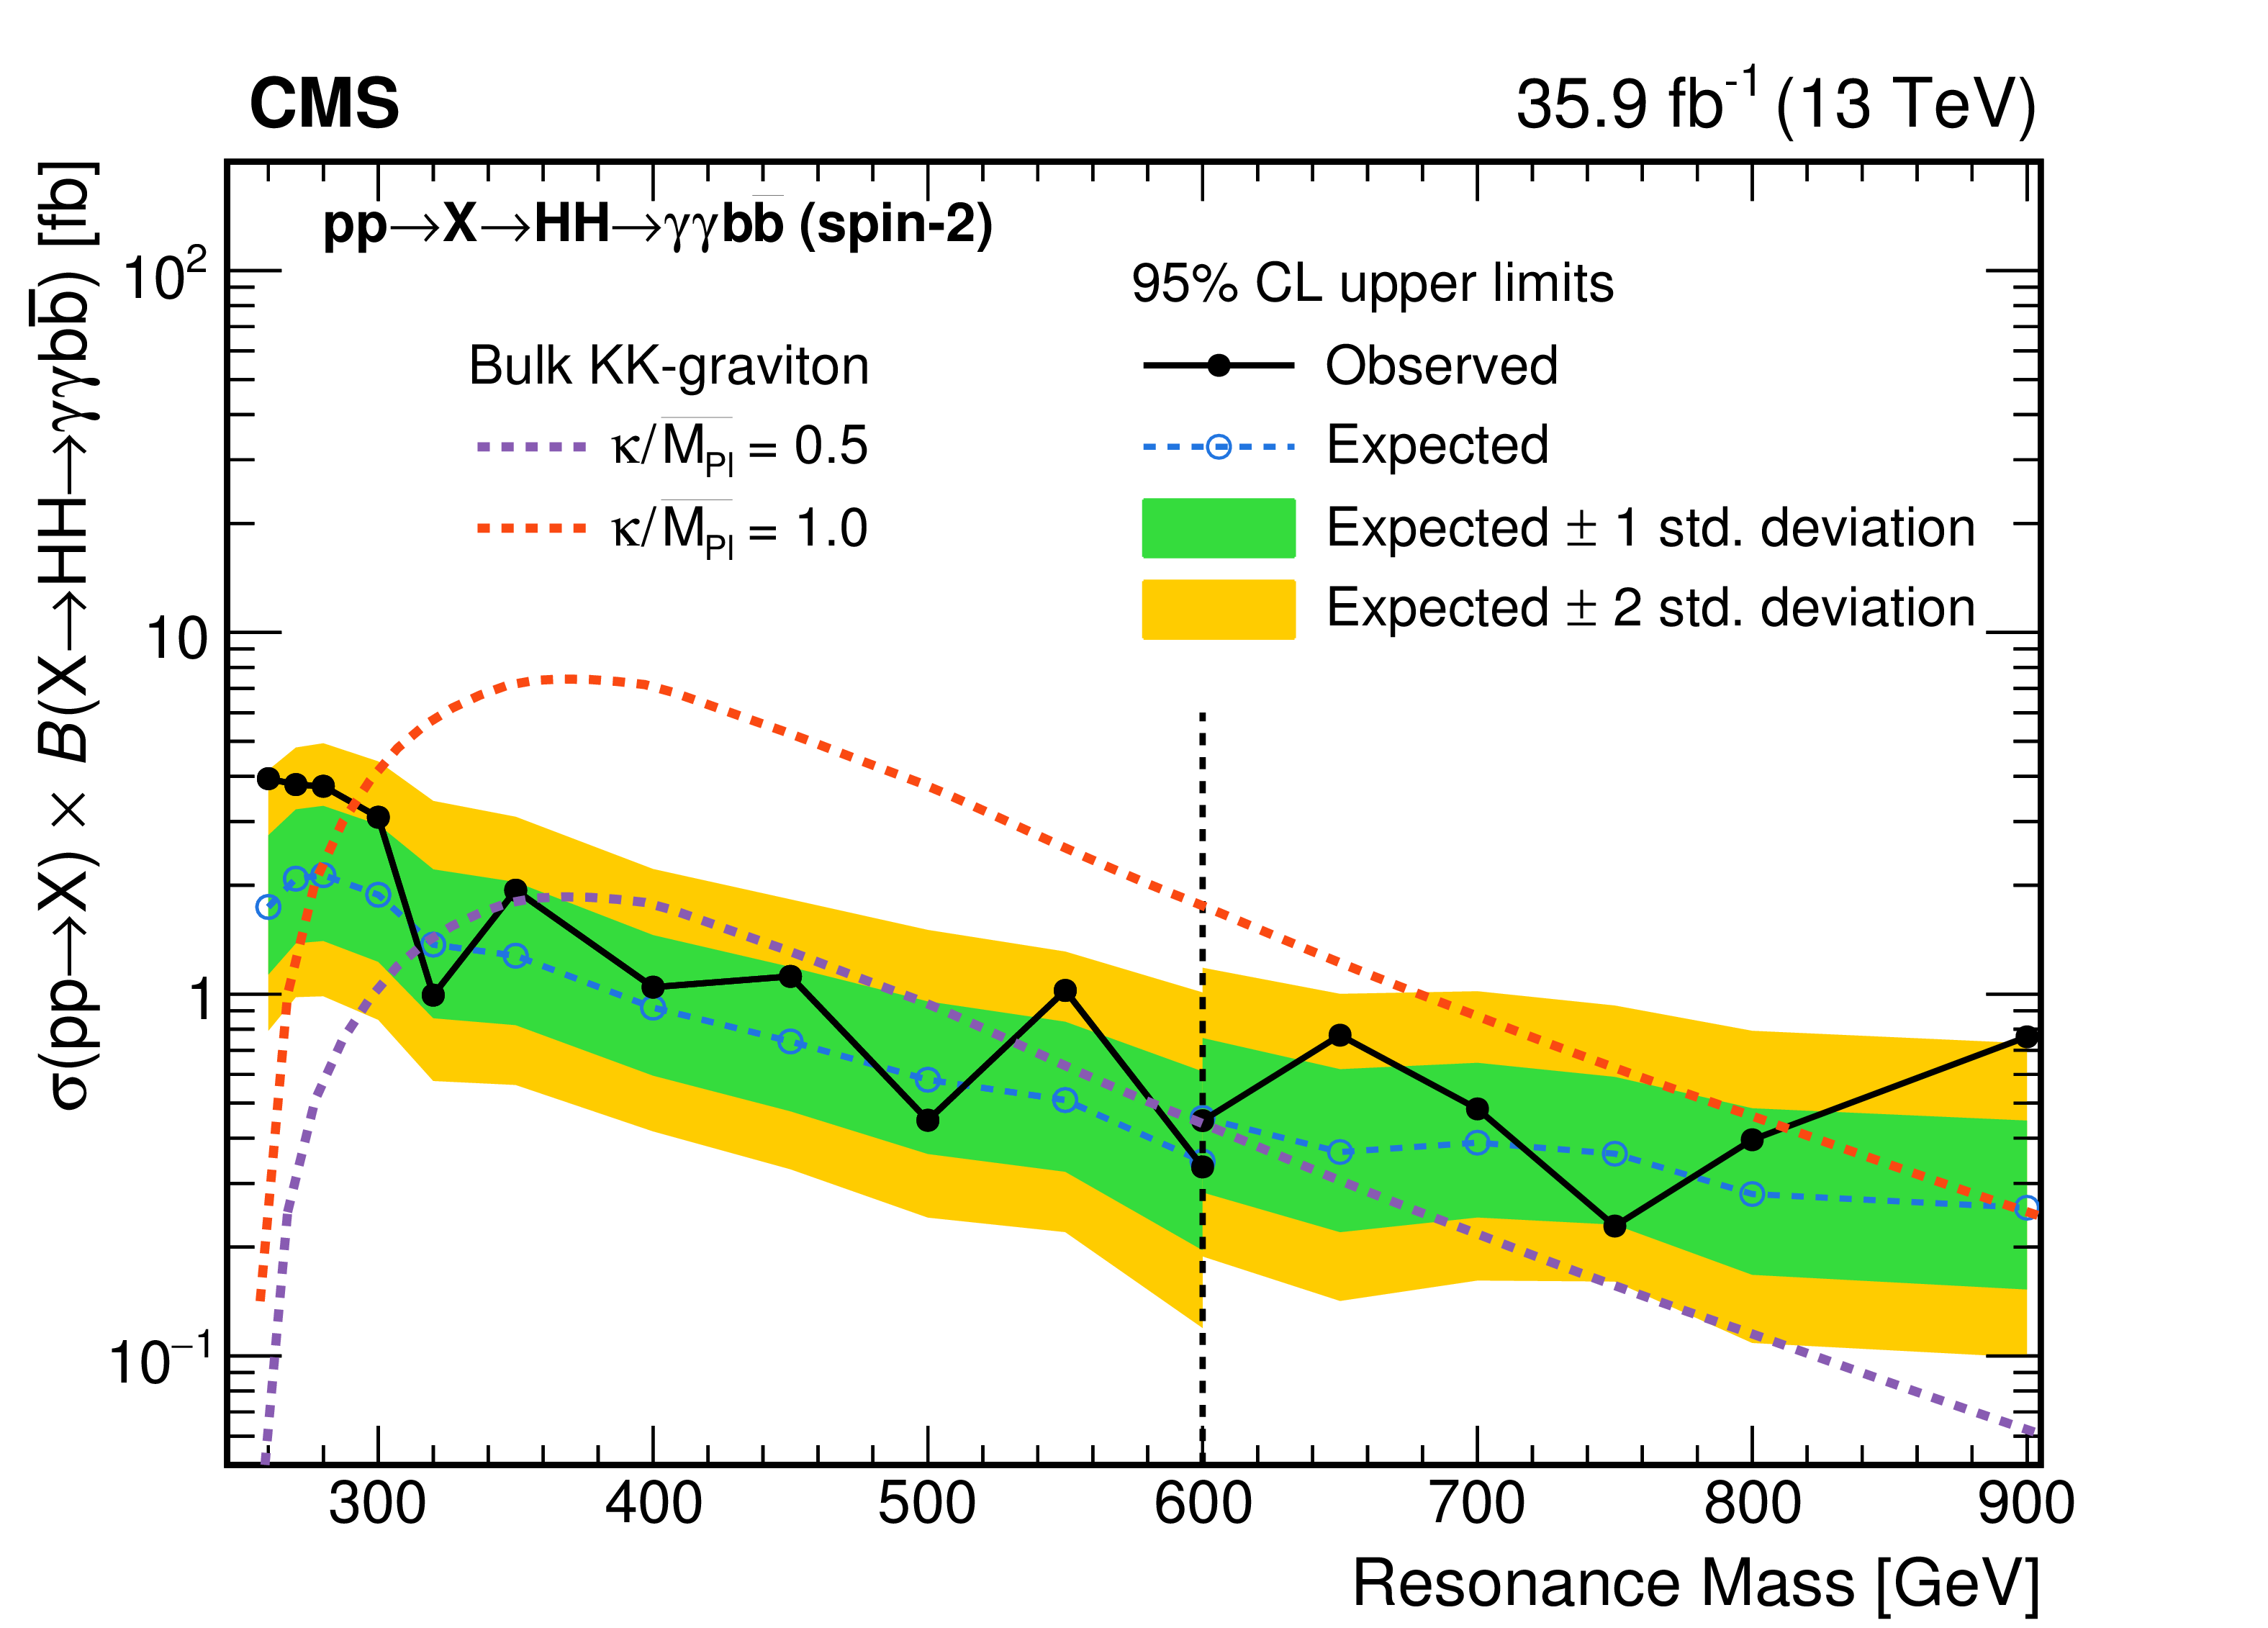
Figure 9-b:
Observed and expected 95% CL upper limits on the product of cross section and branching fraction $\sigma ({\mathrm {p}} {\mathrm {p}}\to \text {X}) \mathcal {B}(\text {X} \to {{{\mathrm {H}} {\mathrm {H}}}} \to \gamma \gamma {{\mathrm {b}} {\overline {\mathrm {b}}}})$ obtained through a combination of the two analysis categories (HPC and MPC) for the spin-2 hypothesis. The green and yellow bands represent, respectively, the one and two standard deviation extensions beyond the expected limit. Also shown are theoretical predictions corresponding to WED models for KK gravitons. The vertical dashed lines show the boundary between the low- and high-mass regions. The limits for $ {m_\text {X}} = $ 600 GeV are shown for both methods. |
png pdf |
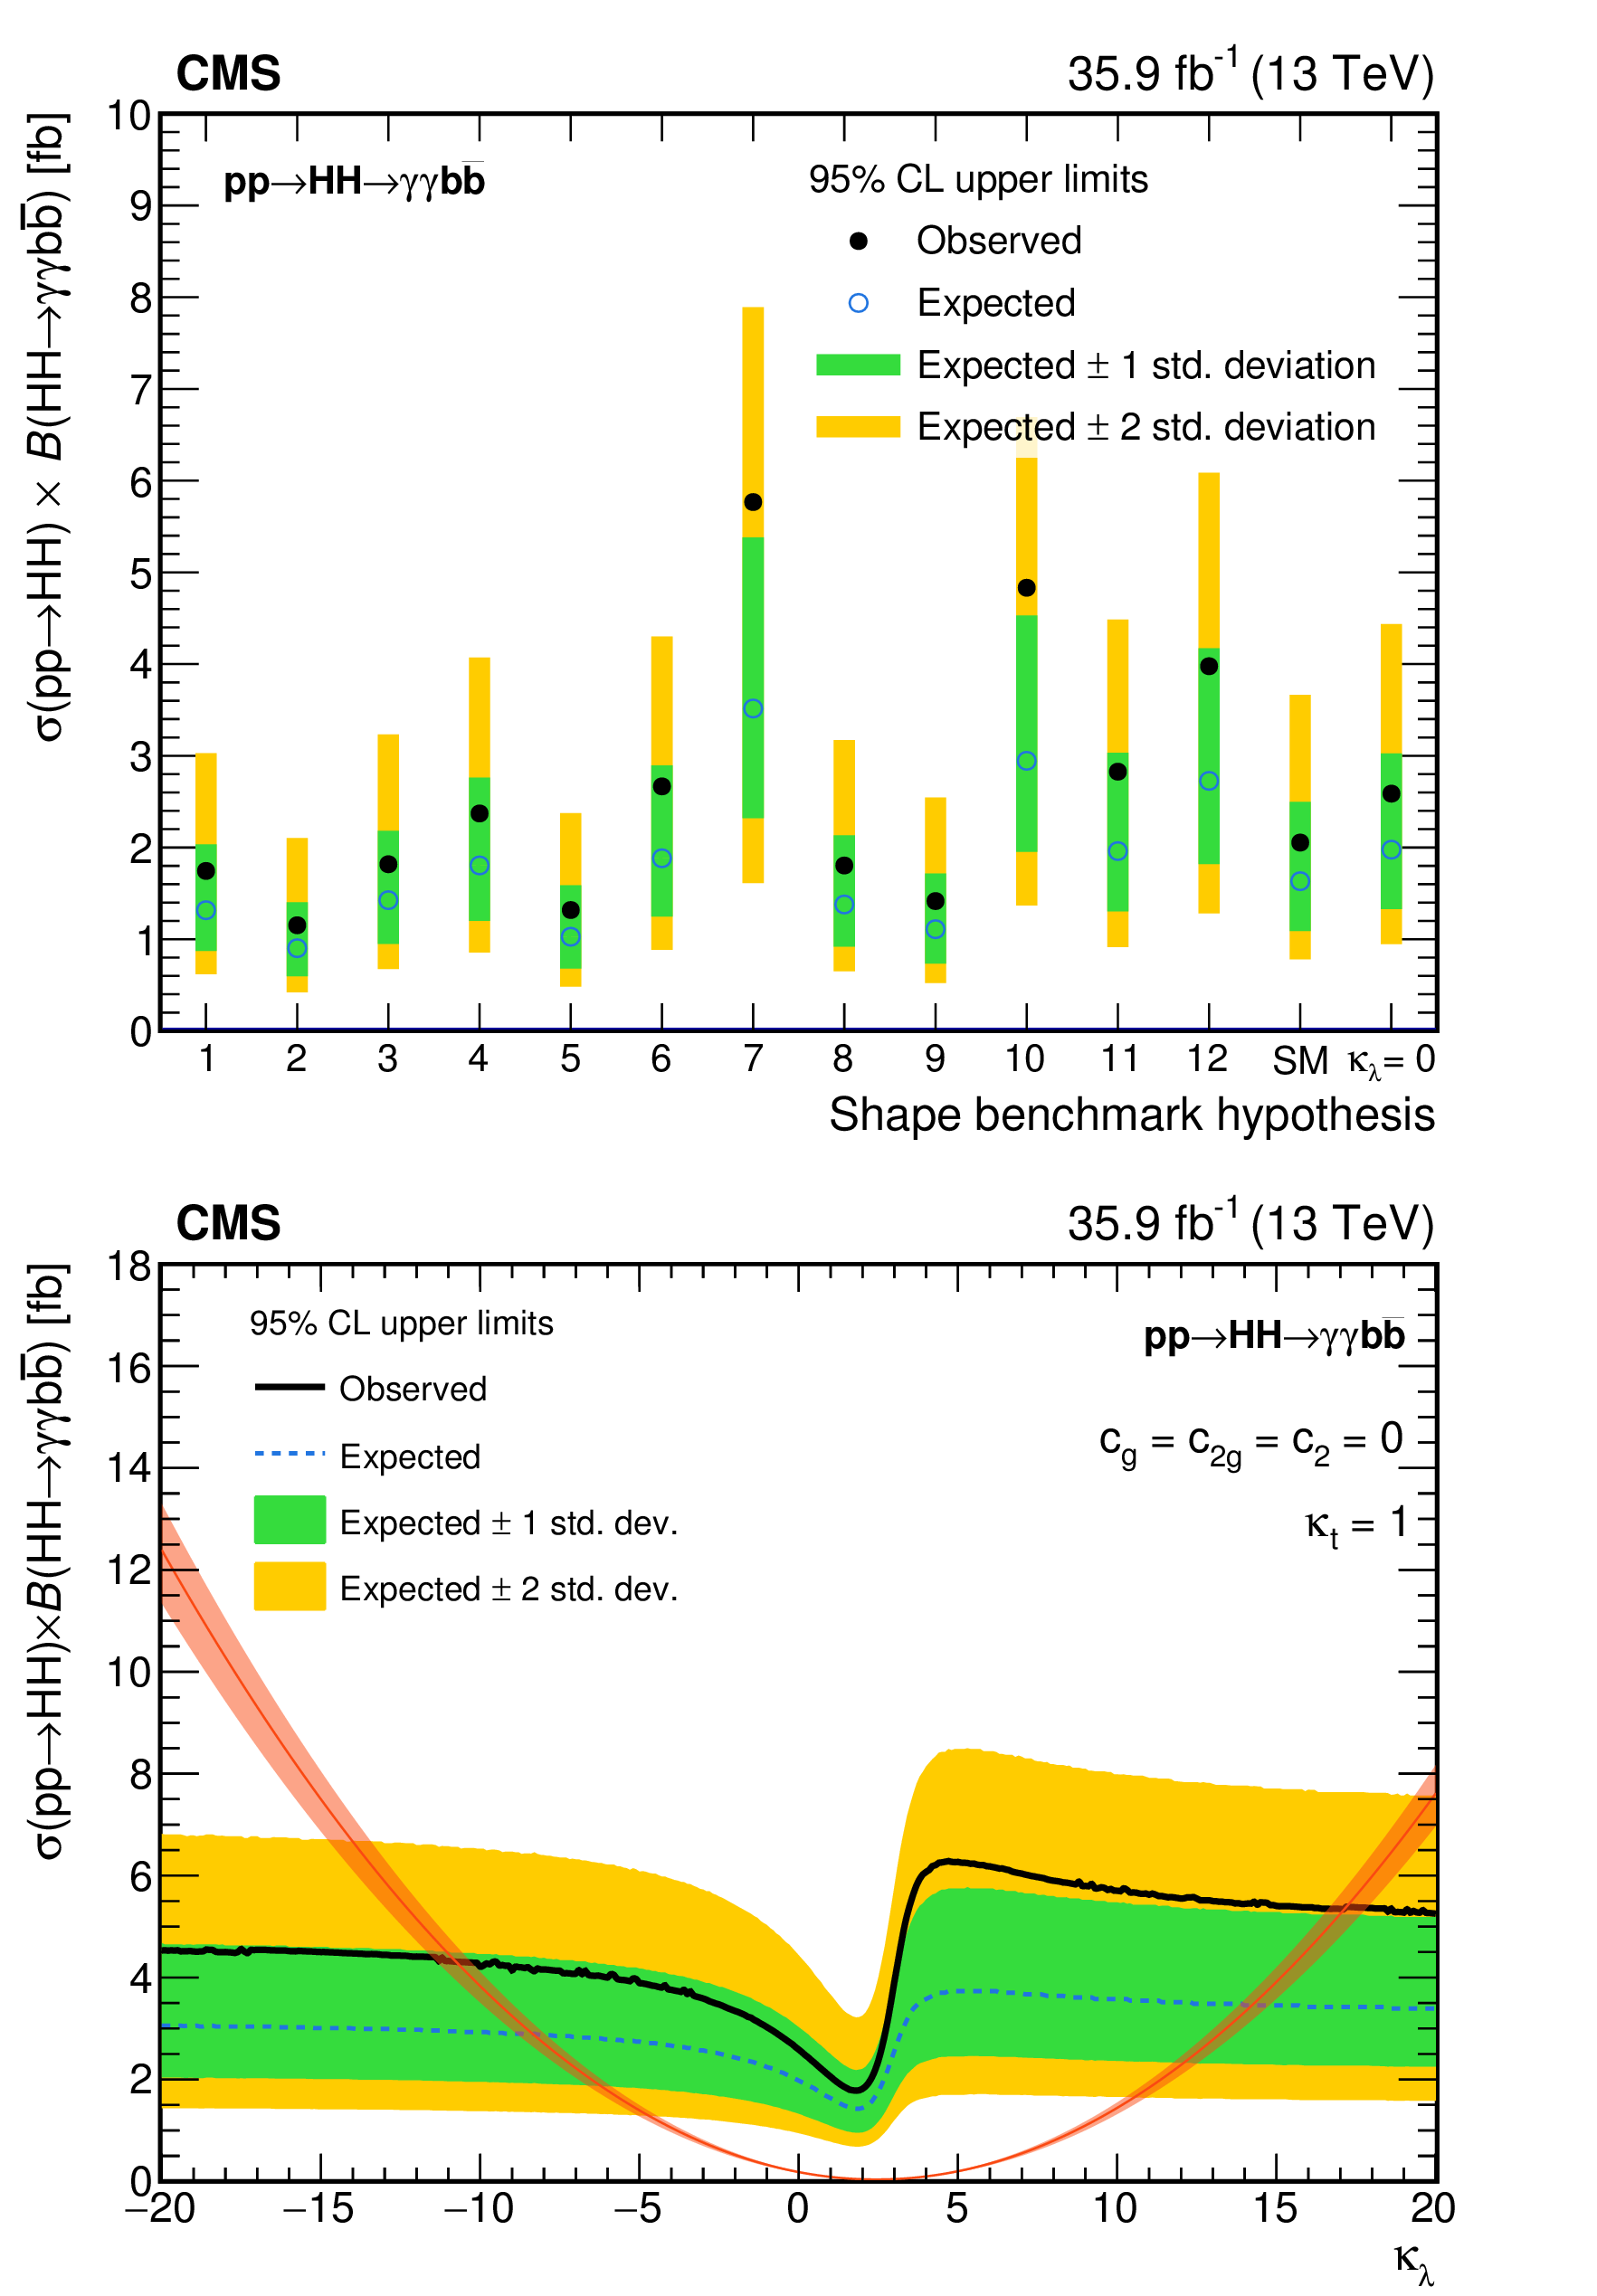
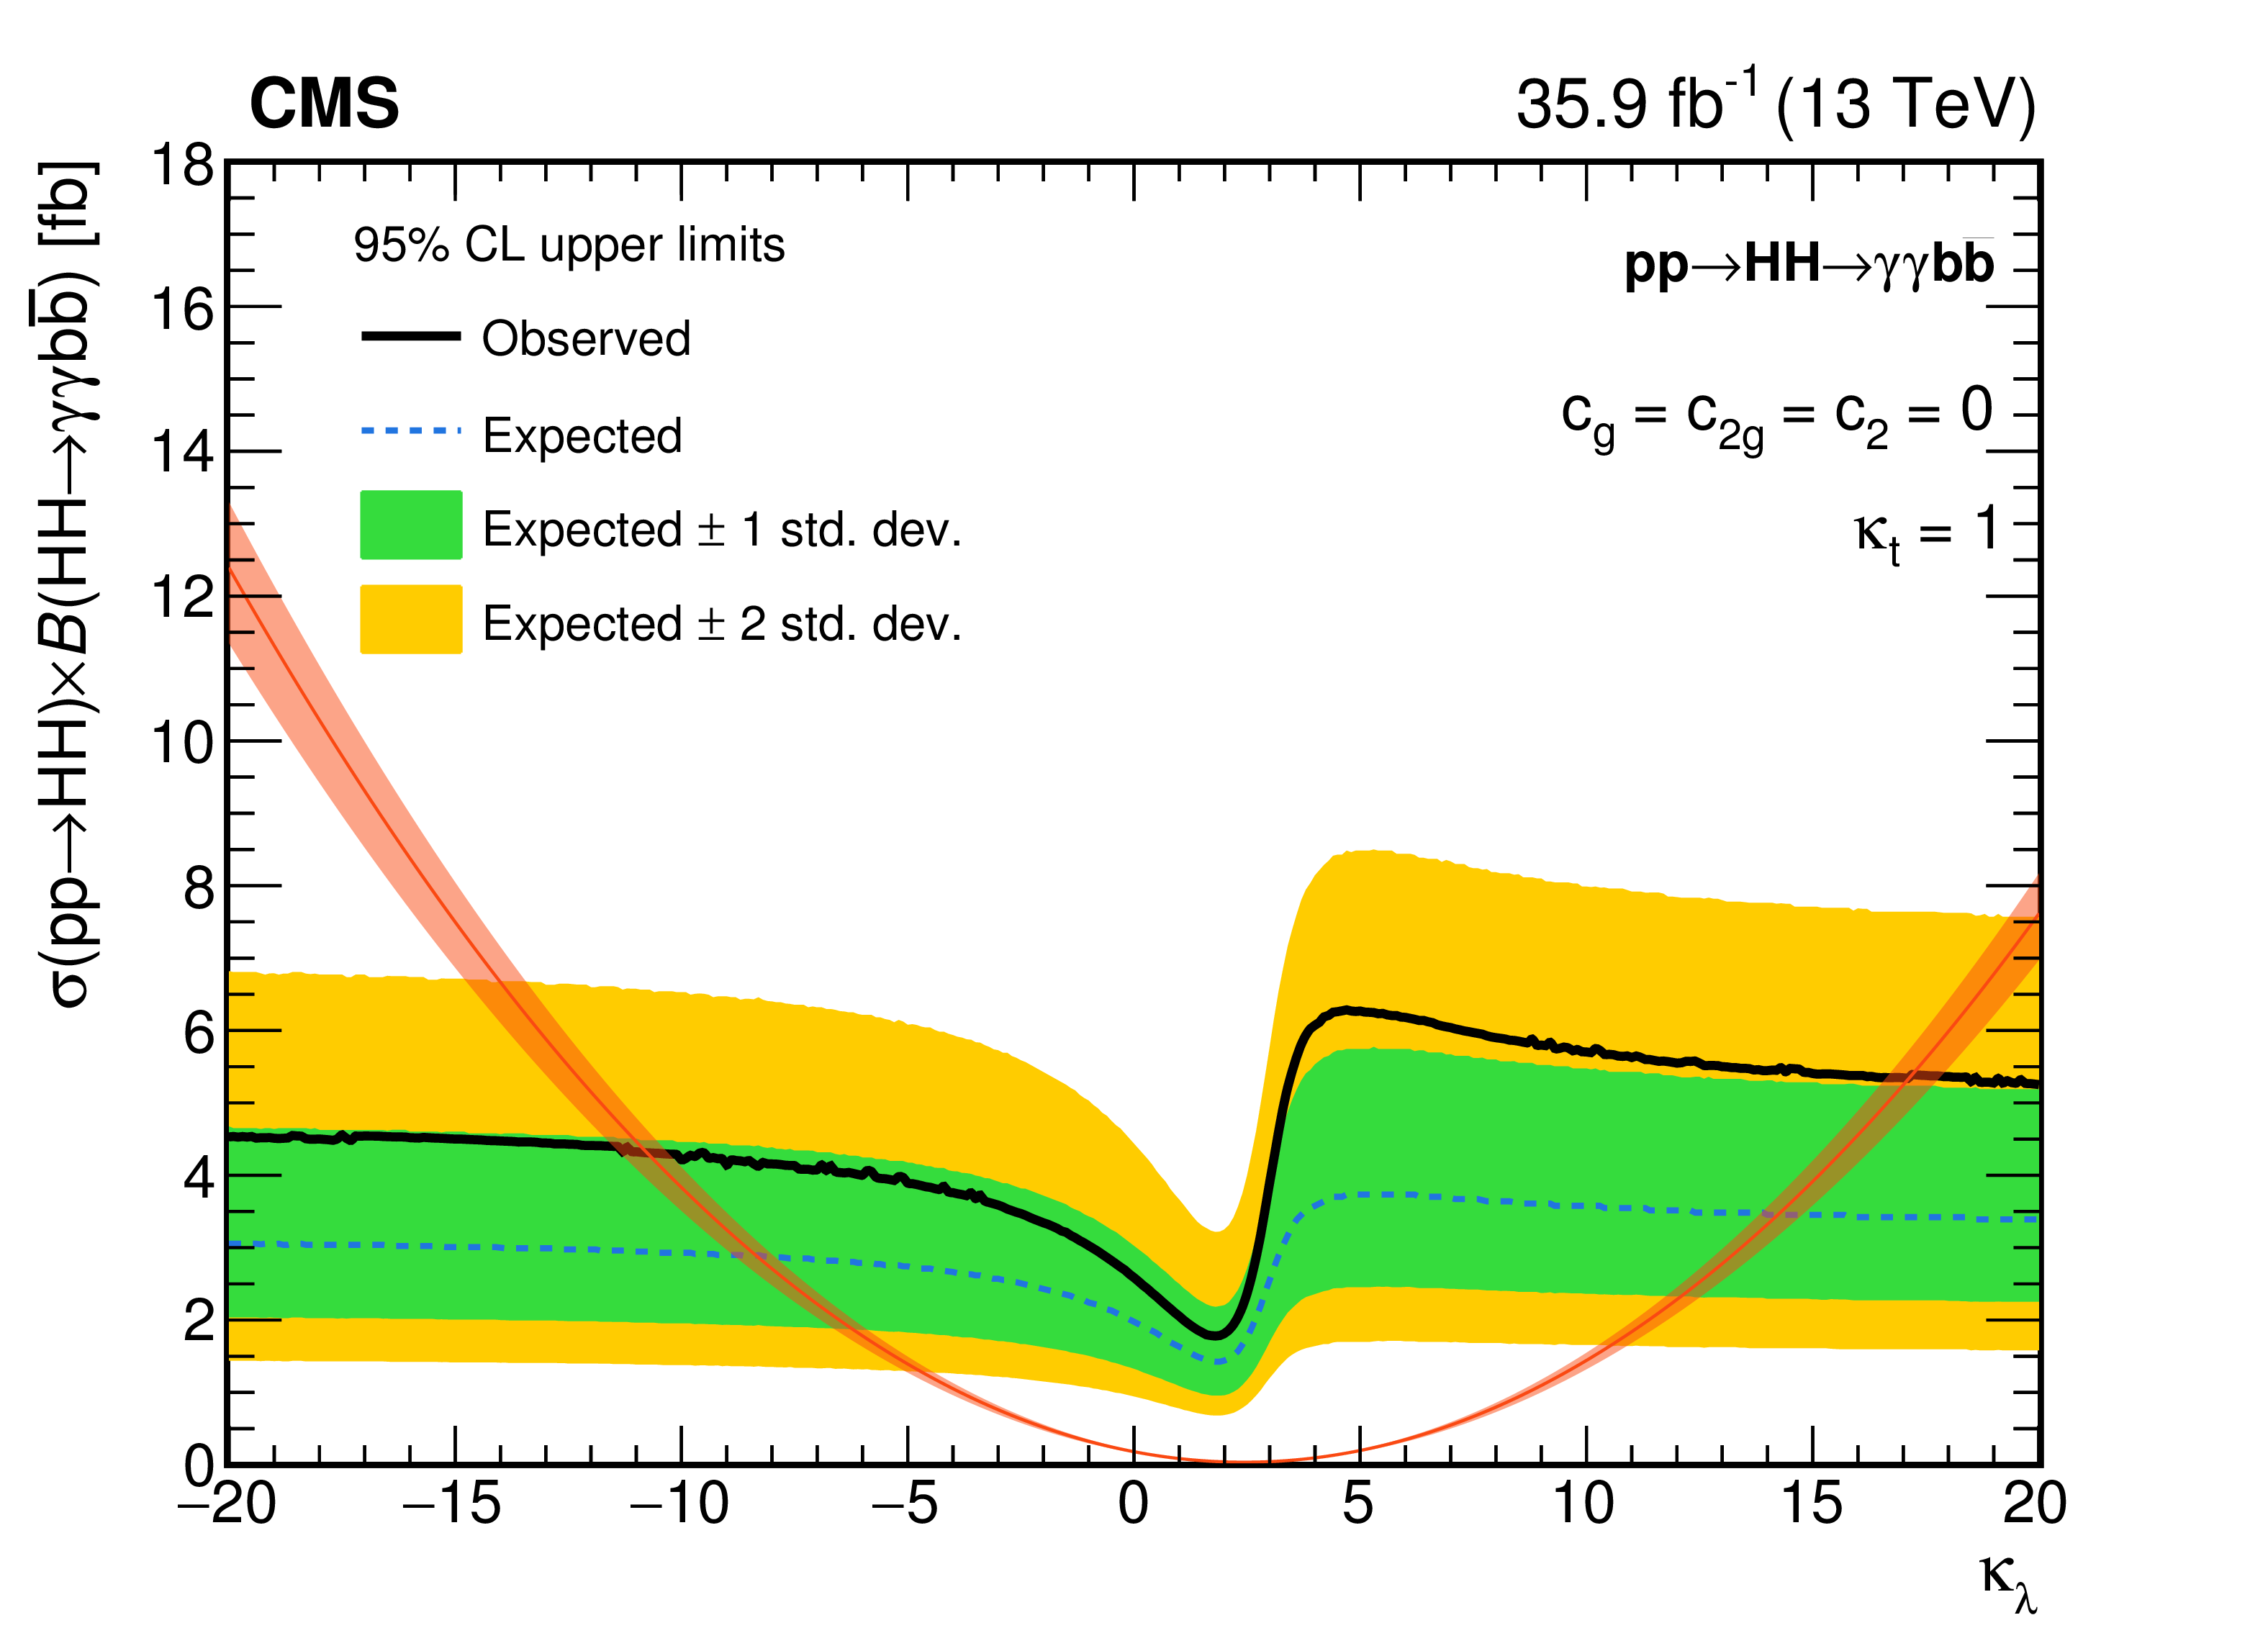
Figure 10:
Expected and observed 95% CL upper limits on the SM-like HH production cross section times $\mathcal {B}({{{\mathrm {H}} {\mathrm {H}}}} \to {\gamma \gamma {{\mathrm {b}} {\overline {\mathrm {b}}}}})$ obtained for different nonresonant benchmark models (defined in Table 1) (top); for different values of the $ {\kappa _{\lambda}} $ (bottom). The red line in the bottom plot shows the prediction of theory with the associated uncertainties shown as the orange band. |
png pdf |
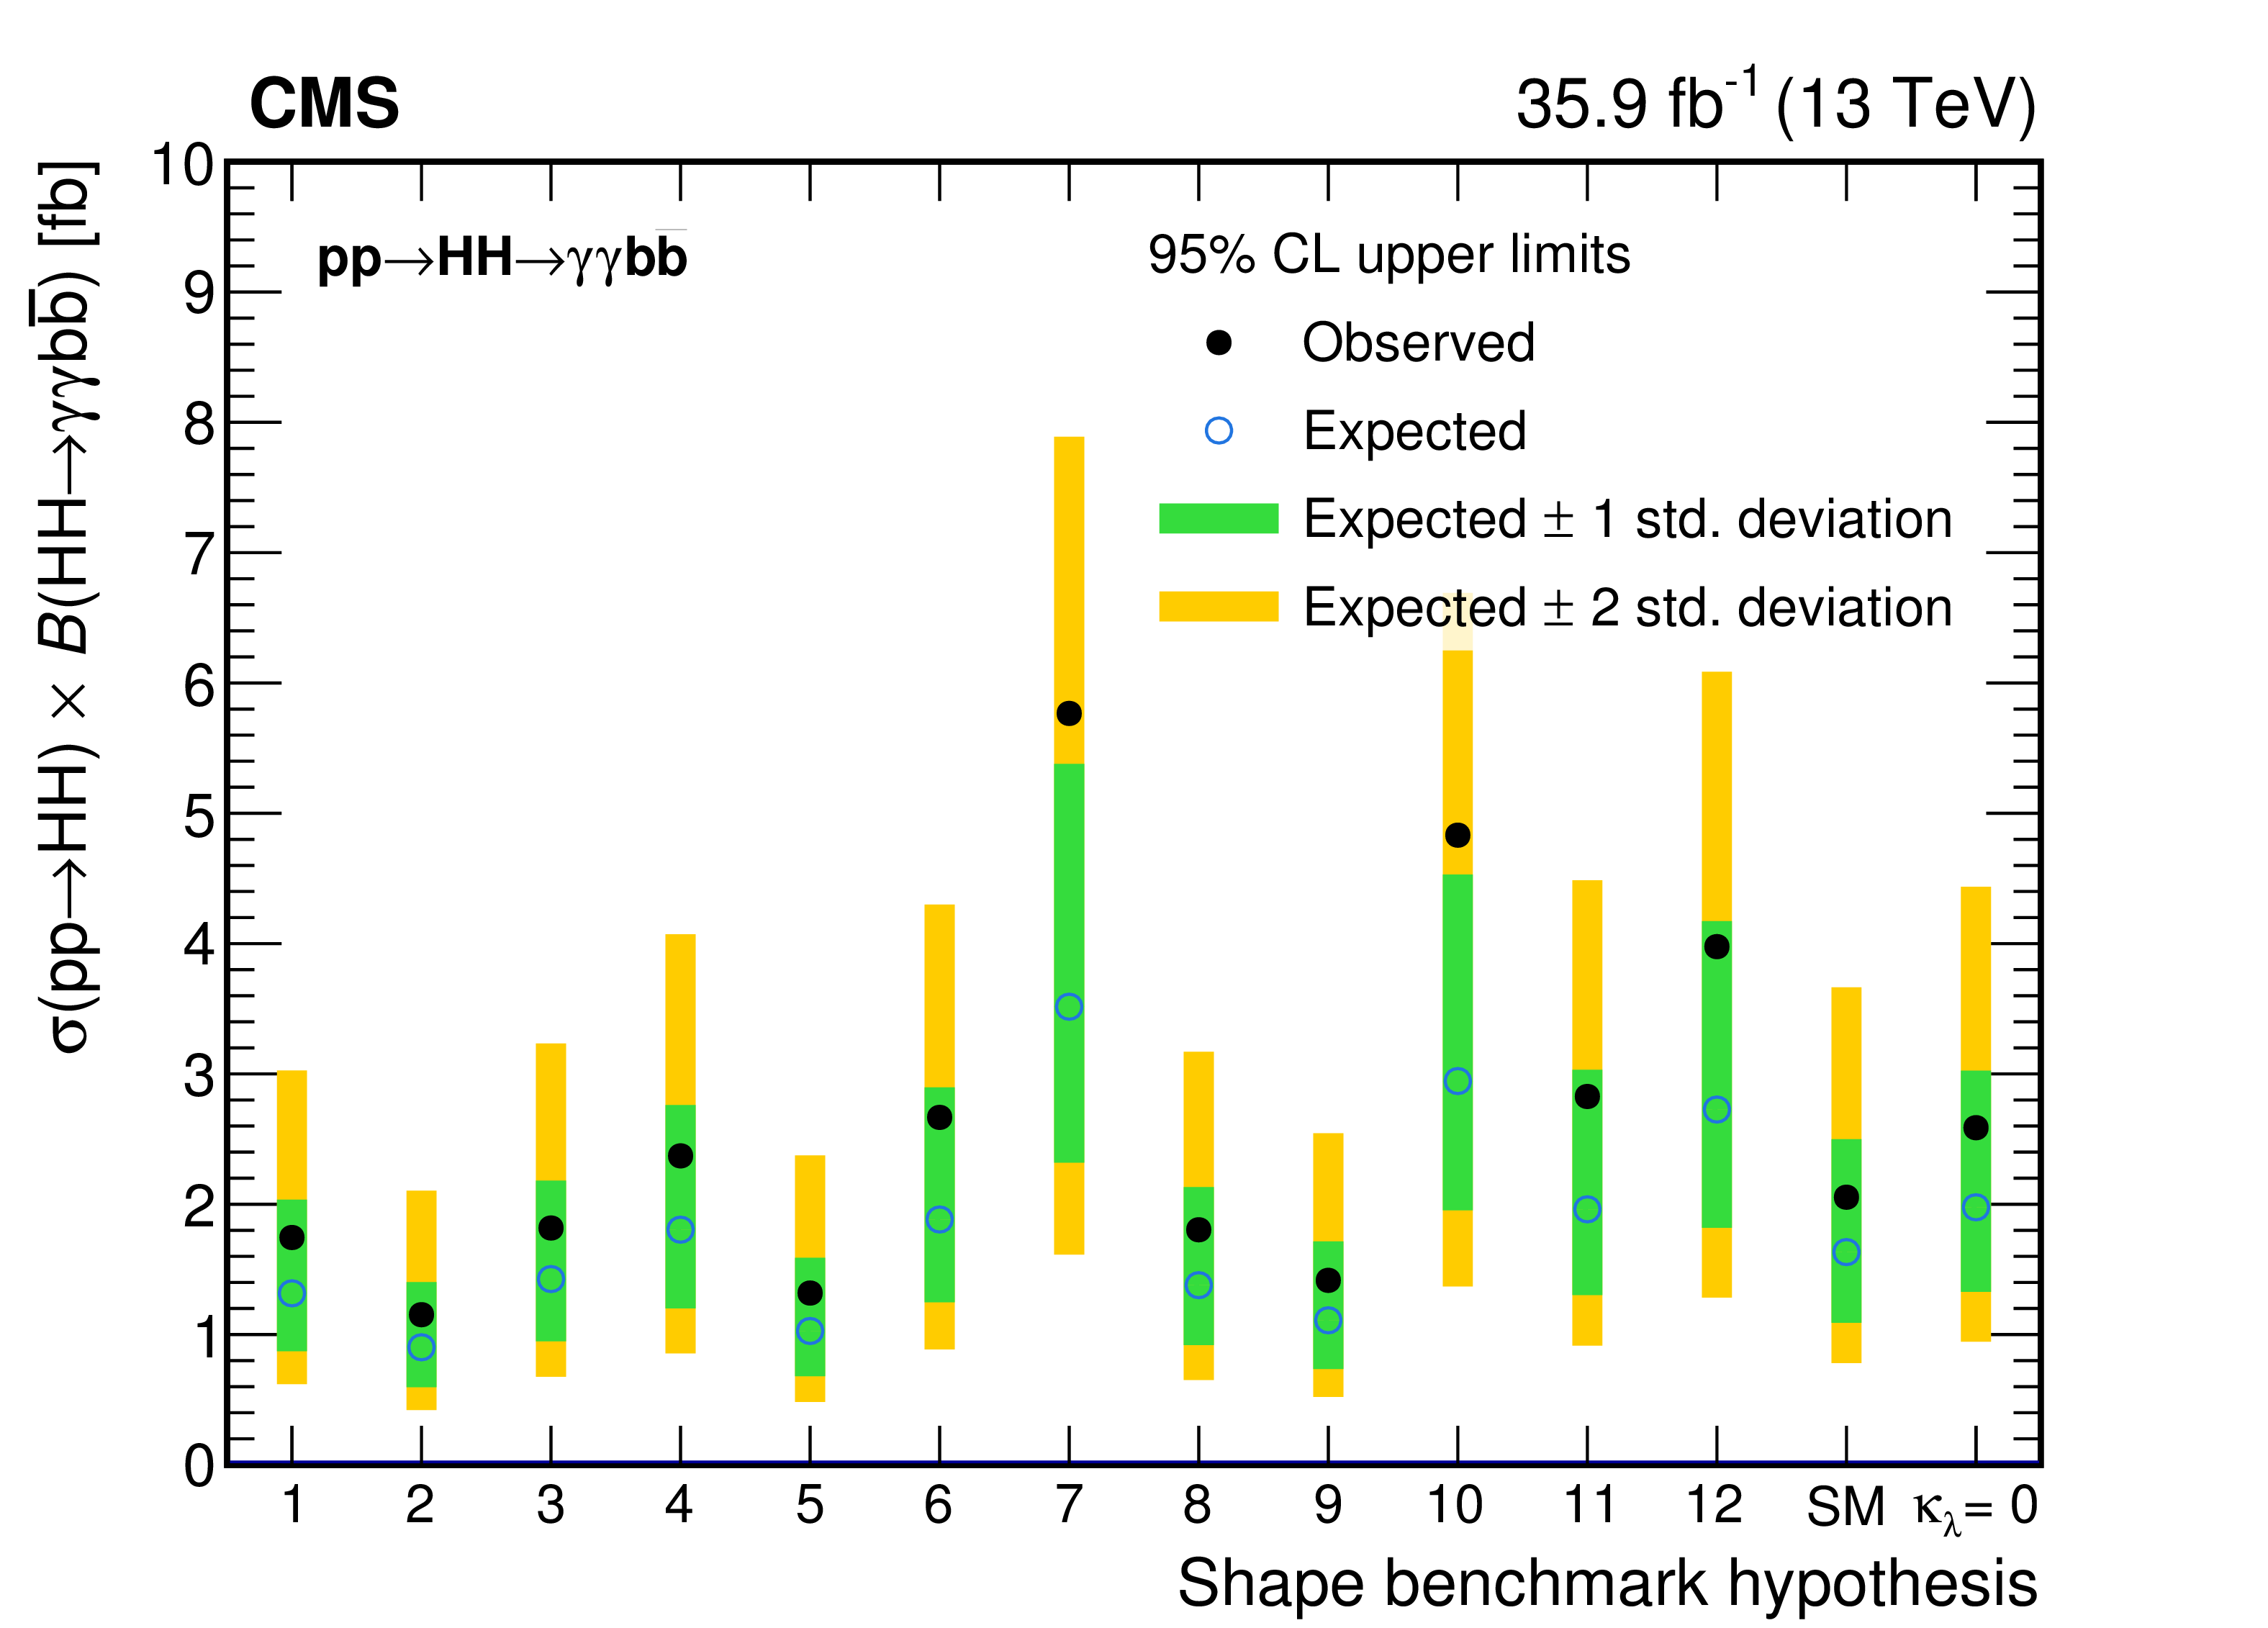
Figure 10-a:
Expected and observed 95% CL upper limits on the SM-like HH production cross section times $\mathcal {B}({{{\mathrm {H}} {\mathrm {H}}}} \to {\gamma \gamma {{\mathrm {b}} {\overline {\mathrm {b}}}}})$ obtained for different nonresonant benchmark models (defined in Table 1). |
png pdf |
Figure 10-b:
Expected and observed 95% CL upper limits on the SM-like HH production cross section times $\mathcal {B}({{{\mathrm {H}} {\mathrm {H}}}} \to {\gamma \gamma {{\mathrm {b}} {\overline {\mathrm {b}}}}})$ obtained for different values of the $ {\kappa _{\lambda}} $ (bottom). The red line shows the prediction of theory with the associated uncertainties shown as the orange band. |
| Tables | |
png pdf |
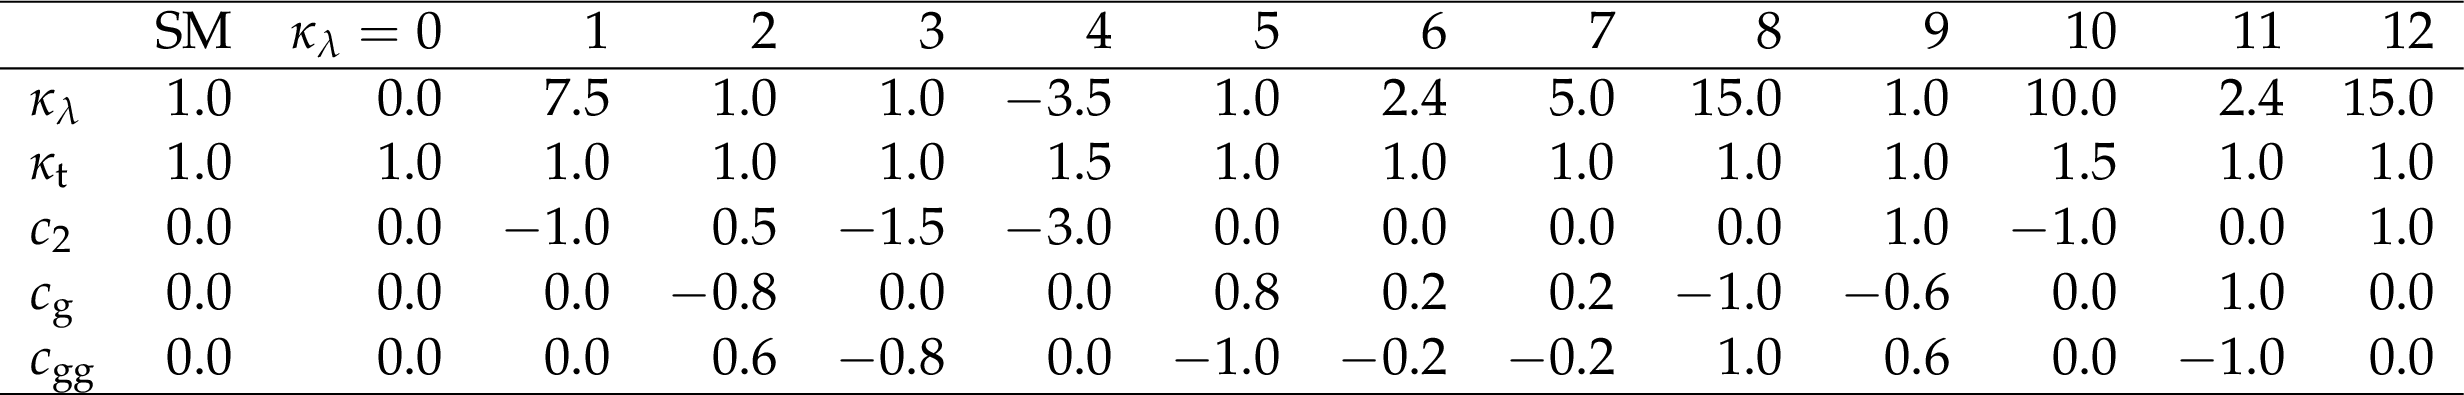
Table 1:
Parameter values of nonresonant BSM benchmark hypotheses. The first two columns correspond to the SM and $ {\kappa _{\lambda}} = $ 0 samples, while the next 12 correspond to the benchmark hypotheses identified using the method from Ref. [43]. |
png pdf |
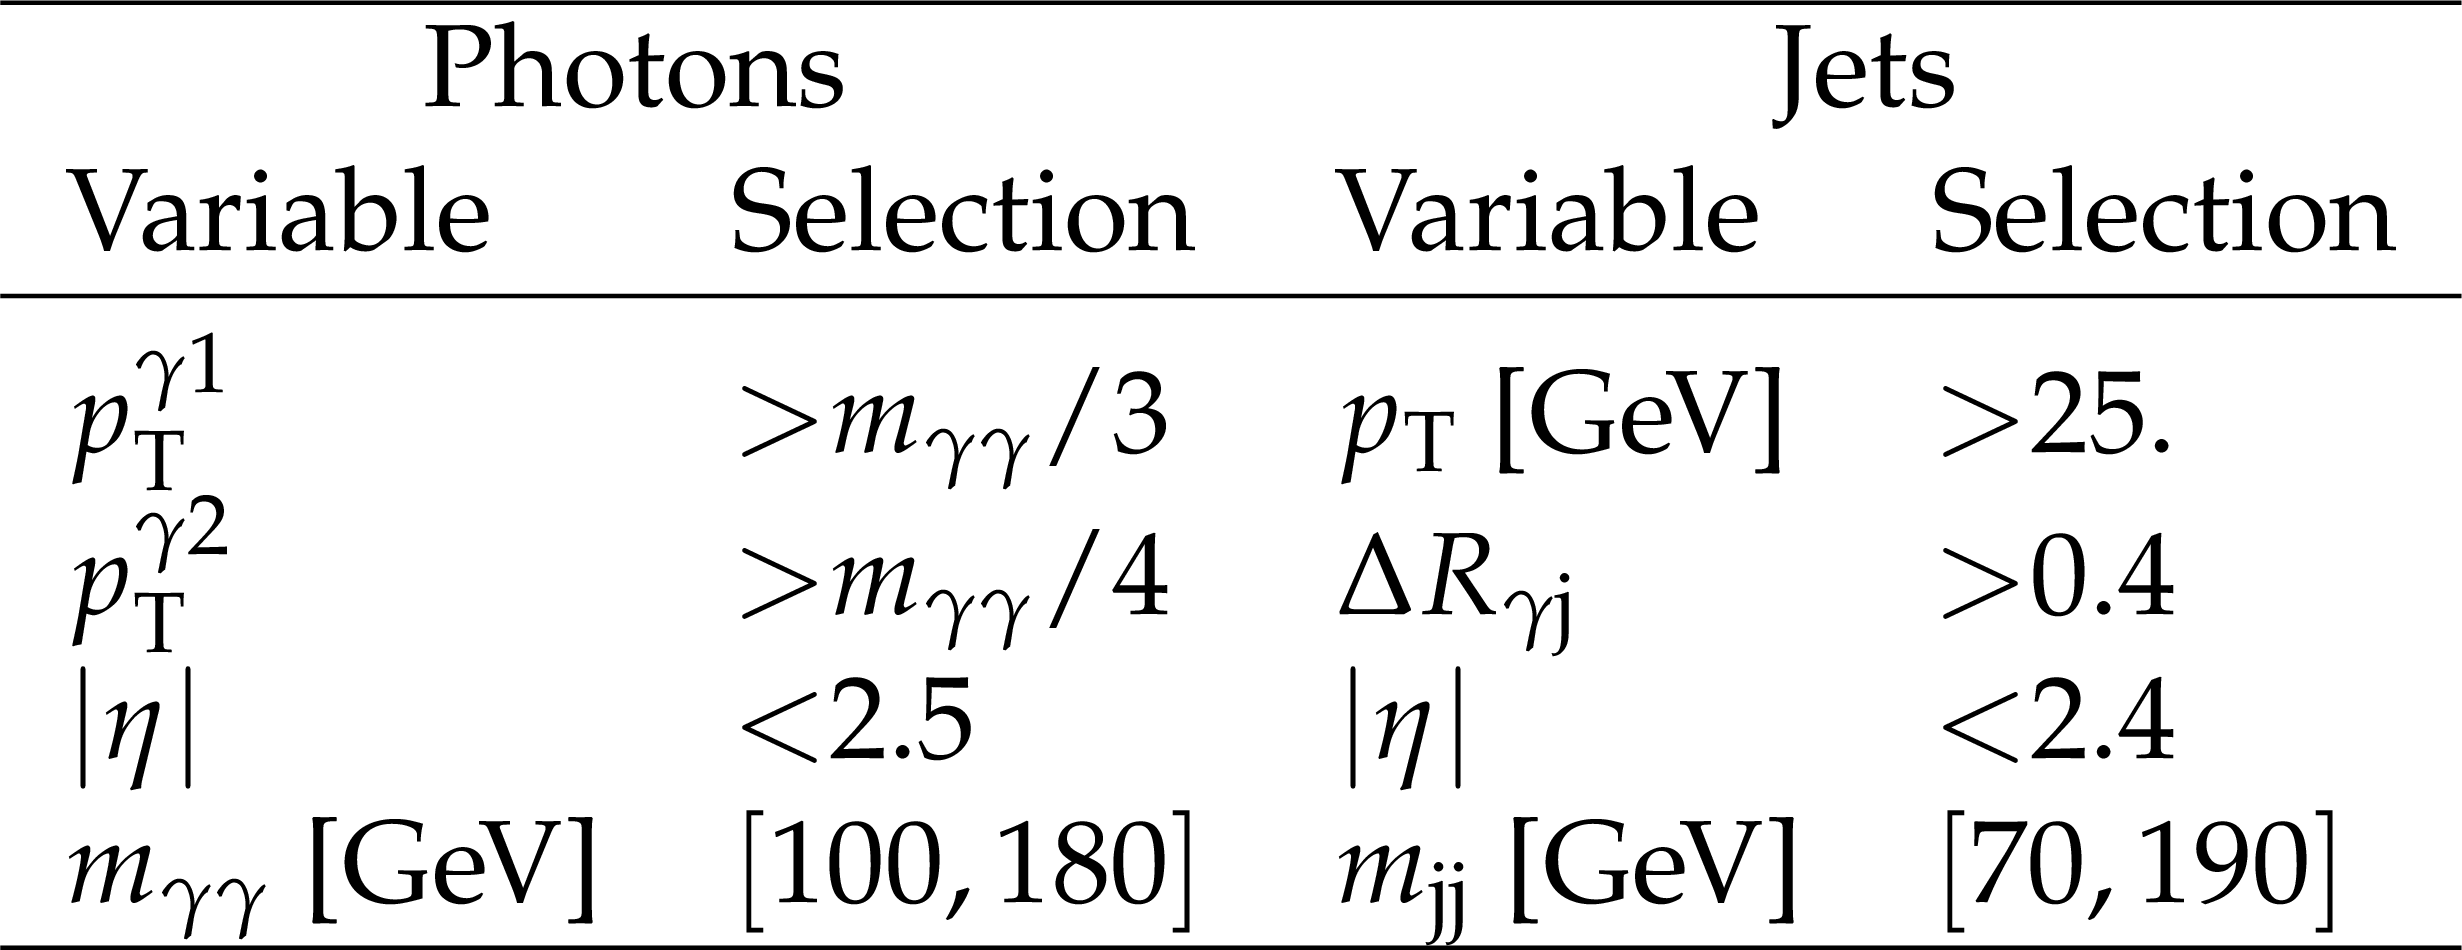
Table 2:
Summary of the baseline selection criteria. |
png pdf |
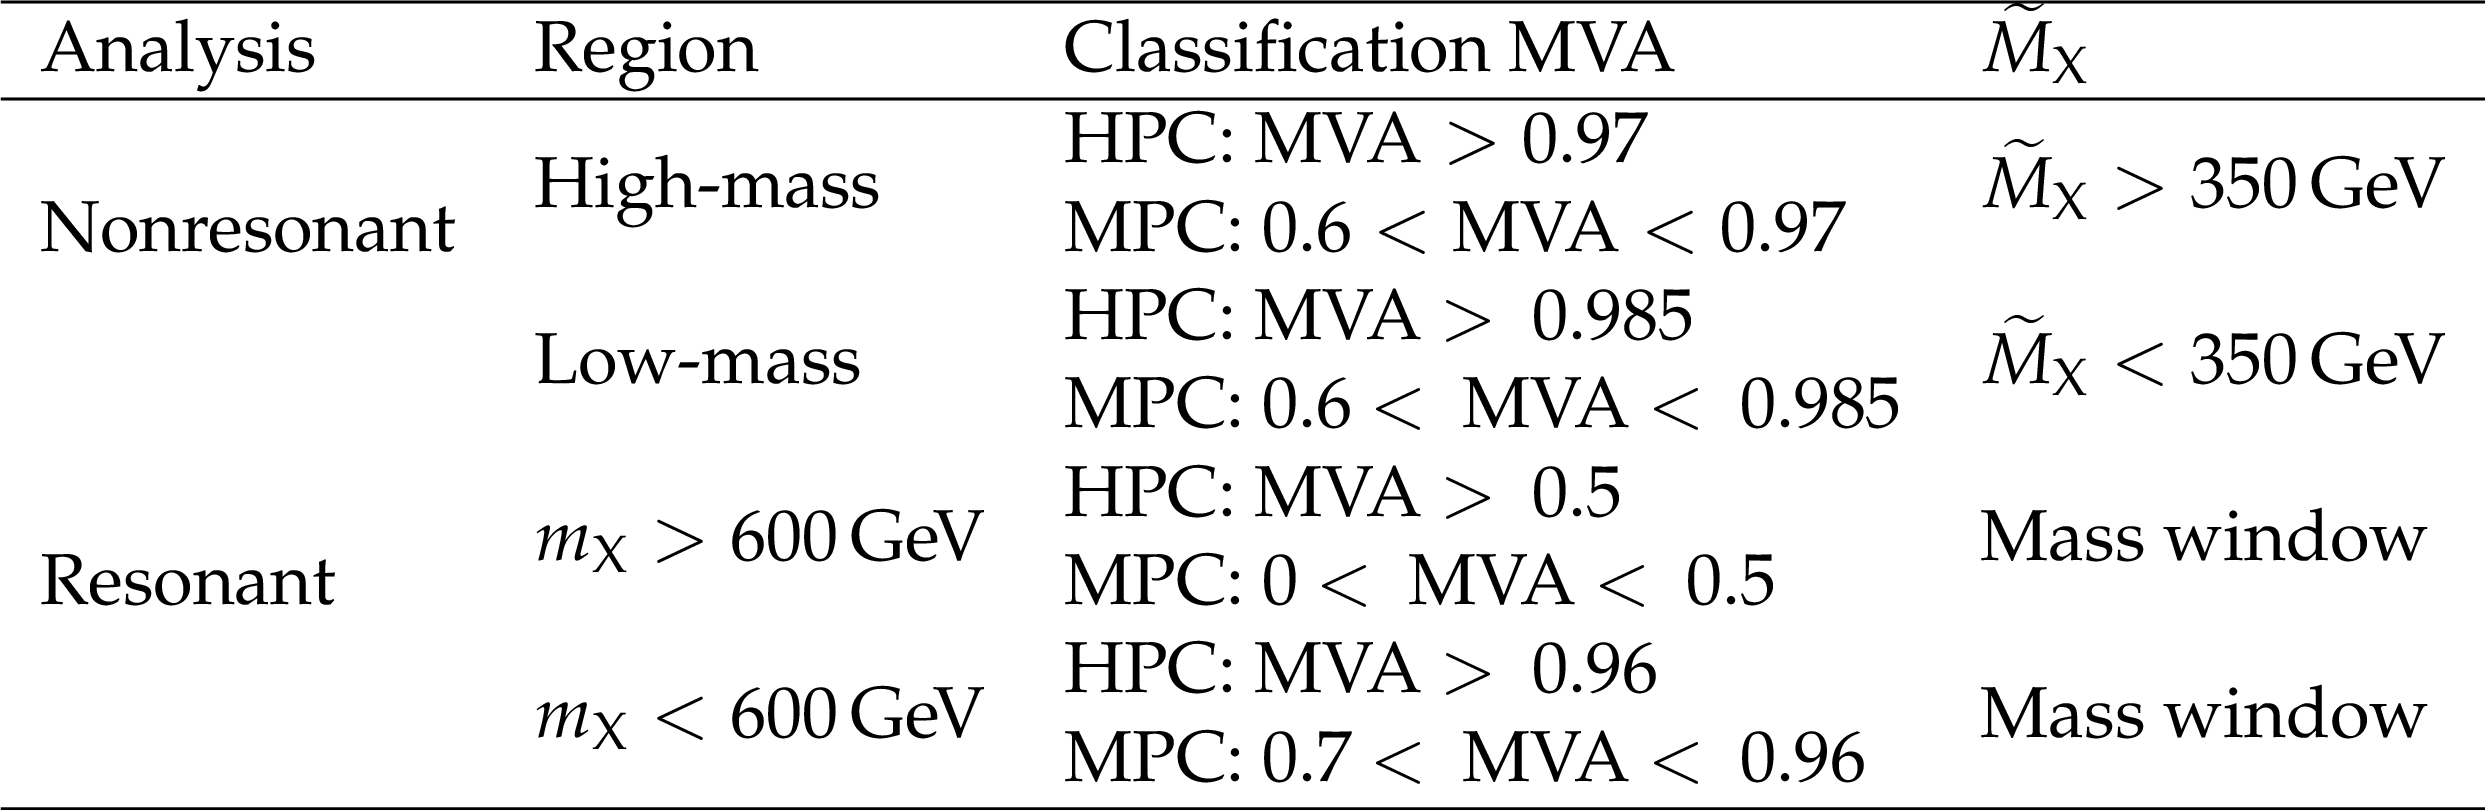
Table 3:
Definition of high-purity category (HPC) and medium-purity category (MPC) for the resonant and nonresonant analyses. |
png pdf |
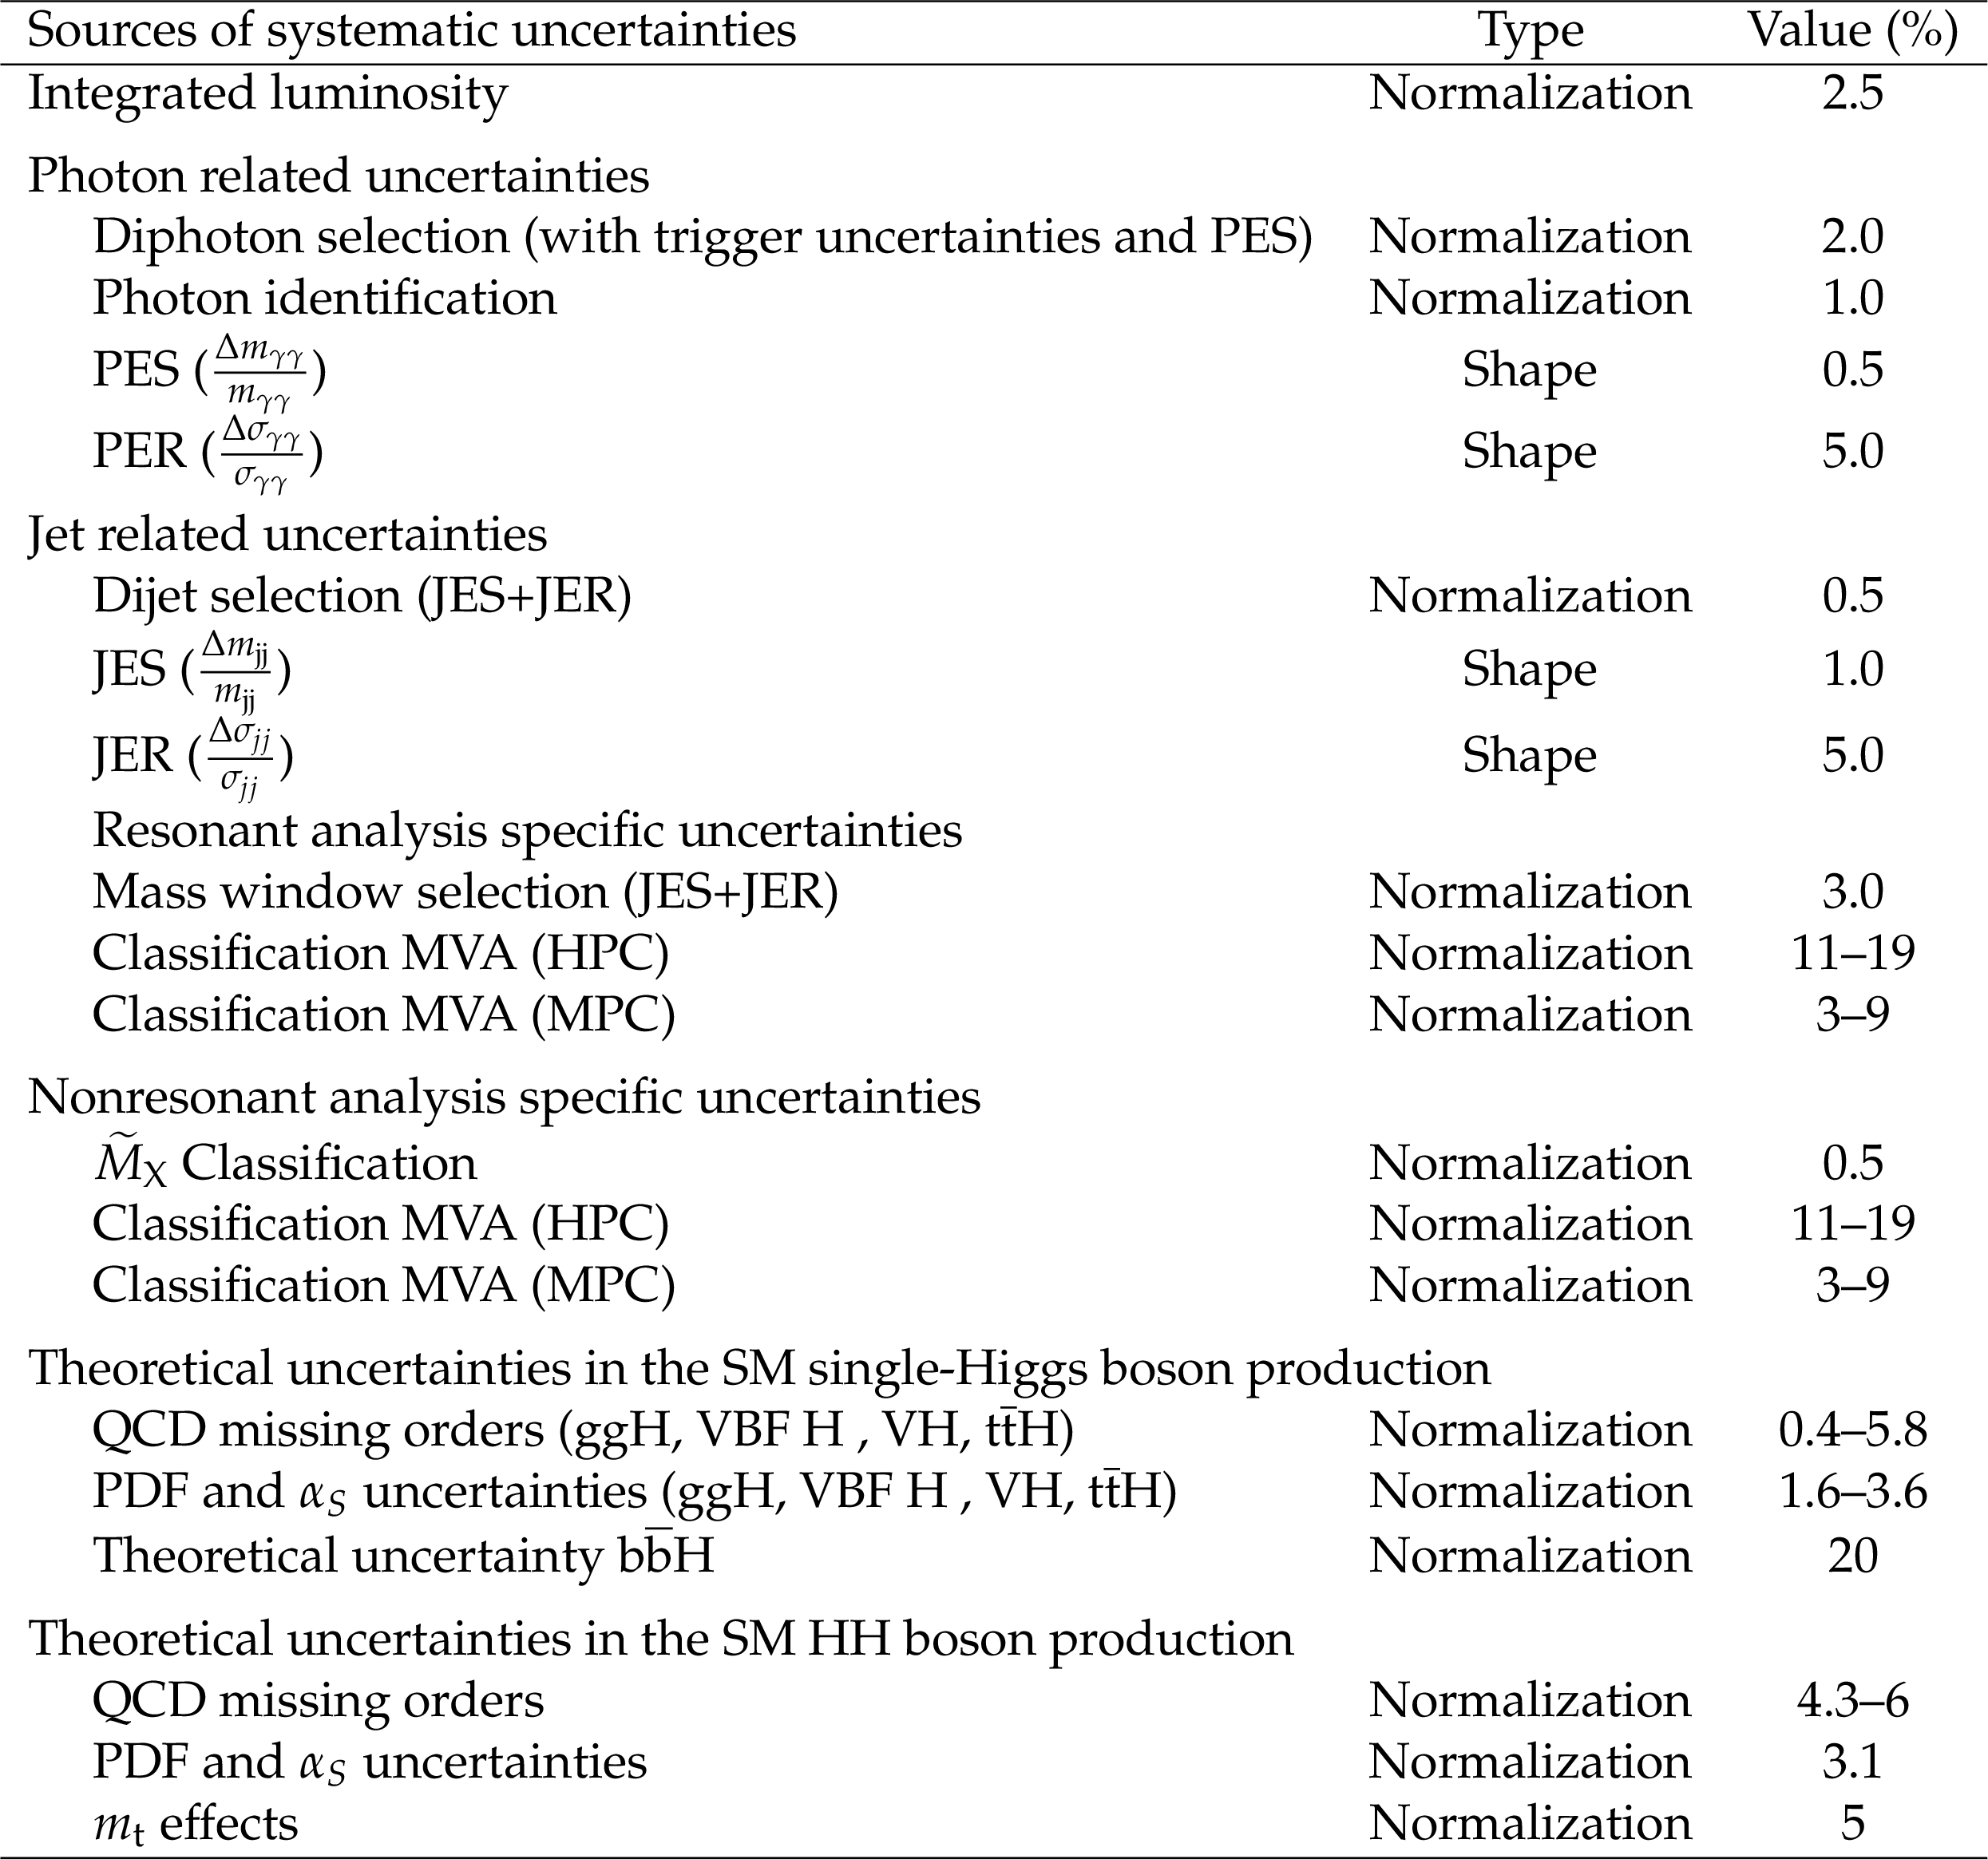
Table 4:
Summary of systematic uncertainties. |
| Summary |
| A search is performed by the CMS Collaboration for the resonant and nonresonant production of a pair of Higgs bosons in the decay channel ${{\mathrm{H}\mathrm{H}}} \to {\gamma\gamma\mathrm{b\bar{b}}} $, based on an integrated luminosity of 35.9 fb$^{-1}$ of pp collisions collected at $\sqrt{s} = $ 13 TeV in 2016. No statistically significant deviations from the standard model (SM) predictions are found. Upper limits at a 95% CL are set on the cross sections for the production of new particles decaying to two Higgs bosons in the mass range between 250 and 900 GeV, under the spin-0 and spin-2 hypotheses. In the case of beyond SM predictions, based on the assumption of the existence of a warped extra dimension, we exclude the radion (spin-0) signal hypothesis, assuming the scale parameter ${\Lambda}_{\mathrm{R}} = $ 3 TeV, for all masses below ${m_\text{X}} = $ 540 GeV, and the KK graviton (spin-2) hypothesis for the mass range 290 $ < {m_\text{X}} < $ 810 GeV, assuming ${\kappa/\overline{{{M_\mathrm{Pl}}}}} = $ 1.0 ($\overline{{{M_\mathrm{Pl}}}}$ being the reduced Planck mass and $\kappa$ the warp factor of the metric). For nonresonant production with SM-like kinematics, a 95% CL upper limit of 2.0 fb is set on $\sigma({\mathrm{p}}{\mathrm{p}\to{{\mathrm{H}\mathrm{H}}} \to{\gamma\gamma\mathrm{b\bar{b}}}} )$, corresponding to about 24 times the SM prediction. Anomalous couplings of the Higgs boson are also investigated, as well as the vector boson fusion ${{\mathrm{H}\mathrm{H}}} $ production process. Values of the effective Higgs boson self-coupling ${\kappa_{\lambda}} $ are constrained to be within the range $-11 < {\kappa_{\lambda}} < 17$ at 95% CL, assuming all other Higgs boson couplings to be at their SM values. The direct constraints reported on SM-like production and ${\kappa_{\lambda}} $ are the most restrictive to date. |
| References | ||||
| 1 | ATLAS Collaboration | Observation of a new particle in the search for the standard model Higgs boson with the ATLAS detector at the LHC | PLB 716 (2012) 1 | 1207.7214 |
| 2 | CMS Collaboration | Observation of a new boson at a mass of 125 GeV with the CMS experiment at the LHC | PLB 716 (2012) 30 | CMS-HIG-12-028 1207.7235 |
| 3 | CMS Collaboration | Observation of a new boson with mass near 125 GeV in pp collisions at $ \sqrt{s} = $ 7 and 8 TeV | JHEP 06 (2013) 081 | CMS-HIG-12-036 1303.4571 |
| 4 | F. Englert and R. Brout | Broken symmetries and the masses of gauge bosons | PRL 13 (1964) 321 | |
| 5 | P. W. Higgs | Broken symmetries and the masses of gauge bosons | PRL 13 (1964) 508 | |
| 6 | D. de Florian et al. | Handbook of LHC Higgs cross sections: 4. Deciphering the nature of the Higgs sector | CERN-2017-002-M | 1610.07922 |
| 7 | D. de Florian and J. Mazzitelli | Higgs boson pair production at next-to-next-to-leading order in QCD | PRL 111 (2013) 201801 | 1309.6594 |
| 8 | J. Baglio et al. | The measurement of the Higgs self-coupling at the LHC: theoretical status | JHEP 04 (2013) 151 | 1212.5581 |
| 9 | L. Randall and R. Sundrum | Large mass hierarchy from a small extra dimension | PRL 83 (1999) 3370 | hep-ph/9905221 |
| 10 | W. D. Goldberger and M. B. Wise | Modulus stabilization with bulk fields | PRL 83 (1999) 4922 | hep-ph/9907447 |
| 11 | H. Davoudiasl, J. L. Hewett, and T. G. Rizzo | Phenomenology of the Randall--Sundrum gauge hierarchy model | PRL 84 (2000) 2080 | hep-ph/9909255 |
| 12 | A. L. Fitzpatrick, J. Kaplan, L. Randall, and L.-T. Wang | Searching for the Kaluza--Klein graviton in bulk RS models | JHEP 09 (2007) 013 | hep-ph/0701150 |
| 13 | D. O'Connell, M. J. Ramsey-Musolf, and M. B. Wise | Minimal extension of the standard model scalar sector | PRD 75 (2007) 037701 | hep-ph/0611014 |
| 14 | G. C. Branco et al. | Theory and phenomenology of two-Higgs-doublet models | PR 516 (2012) 1 | 1106.0034 |
| 15 | A. Djouadi | The anatomy of electroweak symmetry breaking. Tome II: the Higgs bosons in the Minimal Supersymmetric model | PR 459 (2008) 1 | hep-ph/0503173 |
| 16 | H. Georgi and M. Machacek | Doubly charged Higgs bosons | NPB 262 (1985) 463 | |
| 17 | S. Dawson, A. Ismail, and I. Low | What's in the loop? The anatomy of double Higgs production | PRD 91 (2015) 115008 | 1504.05596 |
| 18 | R. Grober and M. Muhlleitner | Composite Higgs boson pair production at the LHC | JHEP 06 (2011) 020 | 1012.1562 |
| 19 | ATLAS Collaboration | Search for Higgs boson pair production in the $ \gamma\gamma \mathrm{b\bar{b}} $ final state using pp collision data at $ \sqrt{s}= $ 8 TeV from the ATLAS detector | PRL 114 (2015) 081802 | 1406.5053 |
| 20 | ATLAS Collaboration | Search for Higgs boson pair production in the $ \mathrm{b\bar{b}}\mathrm{b\bar{b}} $ final state from pp collisions at $ \sqrt{s} = $ 8 TeV with the ATLAS detector | EPJC 75 (2015) 412 | 1506.00285 |
| 21 | ATLAS Collaboration | Searches for Higgs boson pair production in the $ \text{HH}\to \mathrm{b\bar{b}}\tau\tau, \gamma\gamma \text{WW}^*, \gamma\gamma \mathrm{b\bar{b}}, \mathrm{b\bar{b}}\mathrm{b\bar{b}} $ channels with the ATLAS detector | PRD 92 (2015) 092004 | 1509.04670 |
| 22 | ATLAS Collaboration | Search for pair production of Higgs bosons in the $ \mathrm{b\bar{b}}\mathrm{b\bar{b}} $ final state using proton--proton collisions at $ \sqrt{s} = $ 13 TeV with the ATLAS detector | PRD 94 (2016) 052002 | 1606.04782 |
| 23 | CMS Collaboration | Search for two Higgs bosons in final states containing two photons and two bottom quarks in proton-proton collisions at 8 TeV | PRD 94 (2016) 052012 | CMS-HIG-13-032 1603.06896 |
| 24 | CMS Collaboration | Search for resonant pair production of Higgs bosons decaying to two bottom quark-antiquark pairs in proton-proton collisions at 8 TeV | PLB 749 (2015) 560 | CMS-HIG-14-013 1503.04114 |
| 25 | CMS Collaboration | Search for a massive resonance decaying to a pair of Higgs bosons in the four b quark final state in proton-proton collisions at $ \sqrt{s}= $ 13 TeV | PLB 781 (2018) 244 | 1710.04960 |
| 26 | CMS Collaboration | Search for Higgs boson pair production in the $ \mathrm{b\bar{b}}\tau\tau $ final state in proton-proton collisions at $ \sqrt{s}= $ 8 TeV | PRD 96 (2017) 072004 | CMS-HIG-15-013 1707.00350 |
| 27 | CMS Collaboration | Search for Higgs boson pair production in events with two bottom quarks and two tau leptons in proton-proton collisions at $ \sqrt{s} = $ 13 TeV | PLB 778 (2018) 101 | CMS-HIG-17-002 1707.02909 |
| 28 | CMS Collaboration | Search for resonant and nonresonant Higgs boson pair production in the $ \mathrm{b\bar{b}}\ell\nu\ell\nu $ final state in proton-proton collisions at $ \sqrt{s}= $ 13 TeV | JHEP 01 (2018) 054 | CMS-HIG-17-006 1708.04188 |
| 29 | CMS Collaboration | The CMS experiment at the CERN LHC | JINST 3 (2008) S08004 | CMS-00-001 |
| 30 | CMS Collaboration | The CMS trigger system | JINST 12 (2017) P01020 | CMS-TRG-12-001 1609.02366 |
| 31 | J. Alwall et al. | The automated computation of tree-level and next-to-leading order differential cross sections, and their matching to parton shower simulations | JHEP 07 (2014) 079 | 1405.0301 |
| 32 | B. Hespel, D. Lopez-Val, and E. Vryonidou | Higgs pair production via gluon fusion in the two-Higgs-doublet model | JHEP 09 (2014) 124 | 1407.0281 |
| 33 | A. Buckley et al. | LHAPDF6: parton density access in the LHC precision era | EPJC 75 (2015) 132 | 1412.7420 |
| 34 | S. Carrazza, J. I. Latorre, J. Rojo, and G. Watt | A compression algorithm for the combination of PDF sets | EPJC 75 (2015) 474 | 1504.06469 |
| 35 | J. Butterworth et al. | PDF4LHC recommendations for LHC Run II | JPG 43 (2016) 023001 | 1510.03865 |
| 36 | S. Dulat et al. | New parton distribution functions from a global analysis of quantum chromodynamics | PRD 93 (2016) 033006 | 1506.07443 |
| 37 | L. A. Harland-Lang, A. D. Martin, P. Motylinski, and R. S. Thorne | Parton distributions in the LHC era: MMHT 2014 PDFs | EPJC 75 (2015) 204 | 1412.3989 |
| 38 | NNPDF Collaboration | Parton distributions for the LHC Run II | JHEP 04 (2015) 040 | 1410.8849 |
| 39 | ATLAS and CMS Collaboration | Combined measurement of the Higgs boson mass in pp collisions at $ \sqrt{s}= $ 7 and 8 TeV with the ATLAS and CMS experiments | PRL 114 (2015) 191803 | 1503.07589 |
| 40 | A. Carvalho et al. | Analytical parametrization and shape classification of anomalous HH production in the EFT approach | 1608.06578 | |
| 41 | G. F. Giudice, C. Grojean, A. Pomarol, and R. Rattazzi | The strongly-interacting light Higgs | JHEP 06 (2007) 045 | hep-ph/0703164 |
| 42 | J. Grigo, K. Melnikov, and M. Steinhauser | Virtual corrections to Higgs boson pair production in the large top quark mass limit | NPB 888 (2014) 17 | 1408.2422 |
| 43 | A. Carvalho et al. | Higgs pair production: choosing benchmarks with cluster analysis | JHEP 04 (2016) 126 | 1507.02245 |
| 44 | A. Carvalho et al. | On the reinterpretation of non-resonant searches for Higgs boson pairs | 1710.08261 | |
| 45 | D. Fah and N. Greiner | Diphoton production in association with two bottom jets | EPJC 77 (2017) 750 | 1706.08309 |
| 46 | P. Nason | A new method for combining NLO QCD with shower Monte Carlo algorithms | JHEP 11 (2004) 040 | hep-ph/0409146 |
| 47 | S. Frixione, P. Nason, and C. Oleari | Matching NLO QCD computations with parton shower simulations: the POWHEG method | JHEP 11 (2007) 070 | 0709.2092 |
| 48 | S. Alioli, P. Nason, C. Oleari, and E. Re | A general framework for implementing NLO calculations in shower Monte Carlo programs: the POWHEG BOX | JHEP 06 (2010) 043 | 1002.2581 |
| 49 | E. Bagnaschi, G. Degrassi, P. Slavich, and A. Vicini | Higgs production via gluon fusion in the POWHEG approach in the SM and in the MSSM | JHEP 02 (2012) 088 | 1111.2854 |
| 50 | T. Sjostrand et al. | An introduction to PYTHIA 8.2 | CPC 191 (2015) 159 | 1410.3012 |
| 51 | CMS Collaboration | Event generator tunes obtained from underlying event and multiparton scattering measurements | EPJC 76 (2016) 155 | CMS-GEN-14-001 1512.00815 |
| 52 | GEANT4 Collaboration | $ GEANT4--a $ simulation toolkit | NIMA 506 (2003) 250 | |
| 53 | CMS Collaboration | Observation of the diphoton decay of the Higgs boson and measurement of its properties | EPJC 74 (2014) 3076 | CMS-HIG-13-001 1407.0558 |
| 54 | CMS Collaboration | Performance of photon reconstruction and identification with the CMS detector in proton-proton collisions at $ \sqrt{s} = $ 8 TeV | JINST 10 (2015) P08010 | CMS-EGM-14-001 1502.02702 |
| 55 | CMS Collaboration | Particle-flow reconstruction and global event description with the CMS detector | JINST 12 (2017) P10003 | CMS-PRF-14-001 1706.04965 |
| 56 | M. Cacciari, G. P. Salam, and G. Soyez | The anti-$ {k_{\mathrm{T}}} $ jet clustering algorithm | JHEP 04 (2008) 063 | 0802.1189 |
| 57 | M. Cacciari, G. P. Salam, and G. Soyez | FastJet user manual | EPJC 72 (2012) 1896 | 1111.6097 |
| 58 | CMS Collaboration | Identification of heavy-flavour jets with the CMS detector in pp collisions at 13 TeV | JINST 13 (2017) P05011 | CMS-BTV-16-002 1712.07158 |
| 59 | CMS Collaboration | Determination of jet energy calibration and transverse momentum resolution in CMS | JINST 6 (2011) P11002 | CMS-JME-10-011 1107.4277 |
| 60 | CMS Collaboration | Evidence for the Higgs boson decay to a bottom quark-antiquark pair | PLB 780 (2018) 501 | CMS-HIG-16-044 1709.07497 |
| 61 | N. Kumar and S. P. Martin | LHC search for di-Higgs decays of stoponium and other scalars in events with two photons and two bottom jets | PRD 90 (2014) 055007 | 1404.0996 |
| 62 | S. Bolognesi et al. | Spin and parity of a single-produced resonance at the LHC | PRD 86 (2012) 095031 | 1208.4018 |
| 63 | M. V. Chizhov, V. A. Bednyakov, and J. A. Budagov | On resonance search in dijet events at the LHC | 1106.4161 | |
| 64 | A. Azatov, R. Contino, G. Panico, and M. Son | Effective field theory analysis of double Higgs boson production via gluon fusion | PRD 92 (2015) 035001 | 1502.00539 |
| 65 | M. Gouzevitch et al. | Scale-invariant resonance tagging in multijet events and new physics in Higgs pair production | JHEP 07 (2013) 148 | 1303.6636 |
| 66 | H. Voss, A. Hocker, J. Stelzer, and F. Tegenfeldt | TMVA, the toolkit for multivariate data analysis with ROOT | in XIth International Workshop on Advanced Computing and Analysis Techniques in Physics Research (ACAT), p. 40 2007 | physics/0703039 |
| 67 | M. J. Oreglia | A study of the reactions $\psi' \to \gamma\gamma \psi$ | PhD thesis, Stanford University, 1980 SLAC Report SLAC-R-236, see Appendix D | |
| 68 | CMS Collaboration | CMS luminosity measurements for the 2016 data taking period | CMS-PAS-LUM-17-001 | CMS-PAS-LUM-17-001 |
| 69 | A. L. Read | Presentation of search results: the CL$ _s $ technique | JPG 28 (2002) 2693 | |
| 70 | T. Junk | Confidence level computation for combining searches with small statistics | NIMA 434 (1999) 435 | hep-ex/9902006 |
| 71 | G. Cowan, K. Cranmer, E. Gross, and O. Vitells | Asymptotic formulae for likelihood-based tests of new physics | EPJC 71 (2011) 1554 | 1007.1727 |
| 72 | ATLAS and CMS Collaborations | Procedure for the LHC Higgs boson search combination in summer 2011 | CMS-NOTE-2011-005 | |
| 73 | U. Mahanta and A. Datta | Search prospects of light stabilized radions at Tevatron and LHC | PLB 483 (2000) 196 | hep-ph/0002183 |
| 74 | G. F. Giudice, R. Rattazzi, and J. D. Wells | Graviscalars from higher-dimensional metrics and curvature-Higgs mixing | NPB 595 (2001) 250 | hep-ph/0002178 |
| 75 | A. Carvalho | Gravity particles from warped extra dimensions, predictions for LHC | 1404.0102 | |
|
|
Compact Muon Solenoid LHC, CERN |
|

|

|

|

|

|