

Compact Muon Solenoid
LHC, CERN
| CMS-EXO-19-012 ; CERN-EP-2019-222 | ||
| Search for high mass dijet resonances with a new background prediction method in proton-proton collisions at $\sqrt{s} = $ 13 TeV | ||
| CMS Collaboration | ||
| 10 November 2019 | ||
| JHEP 05 (2020) 033 | ||
| Abstract: A search for narrow and broad resonances with masses greater than 1.8 TeV decaying to a pair of jets is presented. The search uses proton-proton collision data at $\sqrt{s} = $ 13 TeV collected at the LHC, corresponding to an integrated luminosity of 137 fb$^{-1}$. The background arising from standard model processes is predicted with the fit method used in previous publications and with a new method. The dijet invariant mass spectrum is well described by both data-driven methods, and no significant evidence for the production of new particles is observed. Model independent upper limits are reported on the production cross sections of narrow resonances, and broad resonances with widths up to 55% of the resonance mass. Limits are presented on the masses of narrow resonances from various models: string resonances, scalar diquarks, axigluons, colorons, excited quarks, color-octet scalars, W' and Z' bosons, Randall-Sundrum gravitons, and dark matter mediators. The limits on narrow resonances are improved by 200 to 800 GeV relative to those reported in previous CMS dijet resonance searches. The limits on dark matter mediators are presented as a function of the resonance mass and width, and on the associated coupling strength as a function of the mediator mass. These limits exclude at 95% confidence level a dark matter mediator with a mass of 1.8 TeV and width 1% of its mass or higher, up to one with a mass of 4.8 TeV and a width 45% of its mass or higher. | ||
| Links: e-print arXiv:1911.03947 [hep-ex] (PDF) ; CDS record ; inSPIRE record ; HepData record ; CADI line (restricted) ; | ||
| Figures & Tables | Summary | Additional Figures | References | CMS Publications |
|---|
| Figures | |
png pdf |
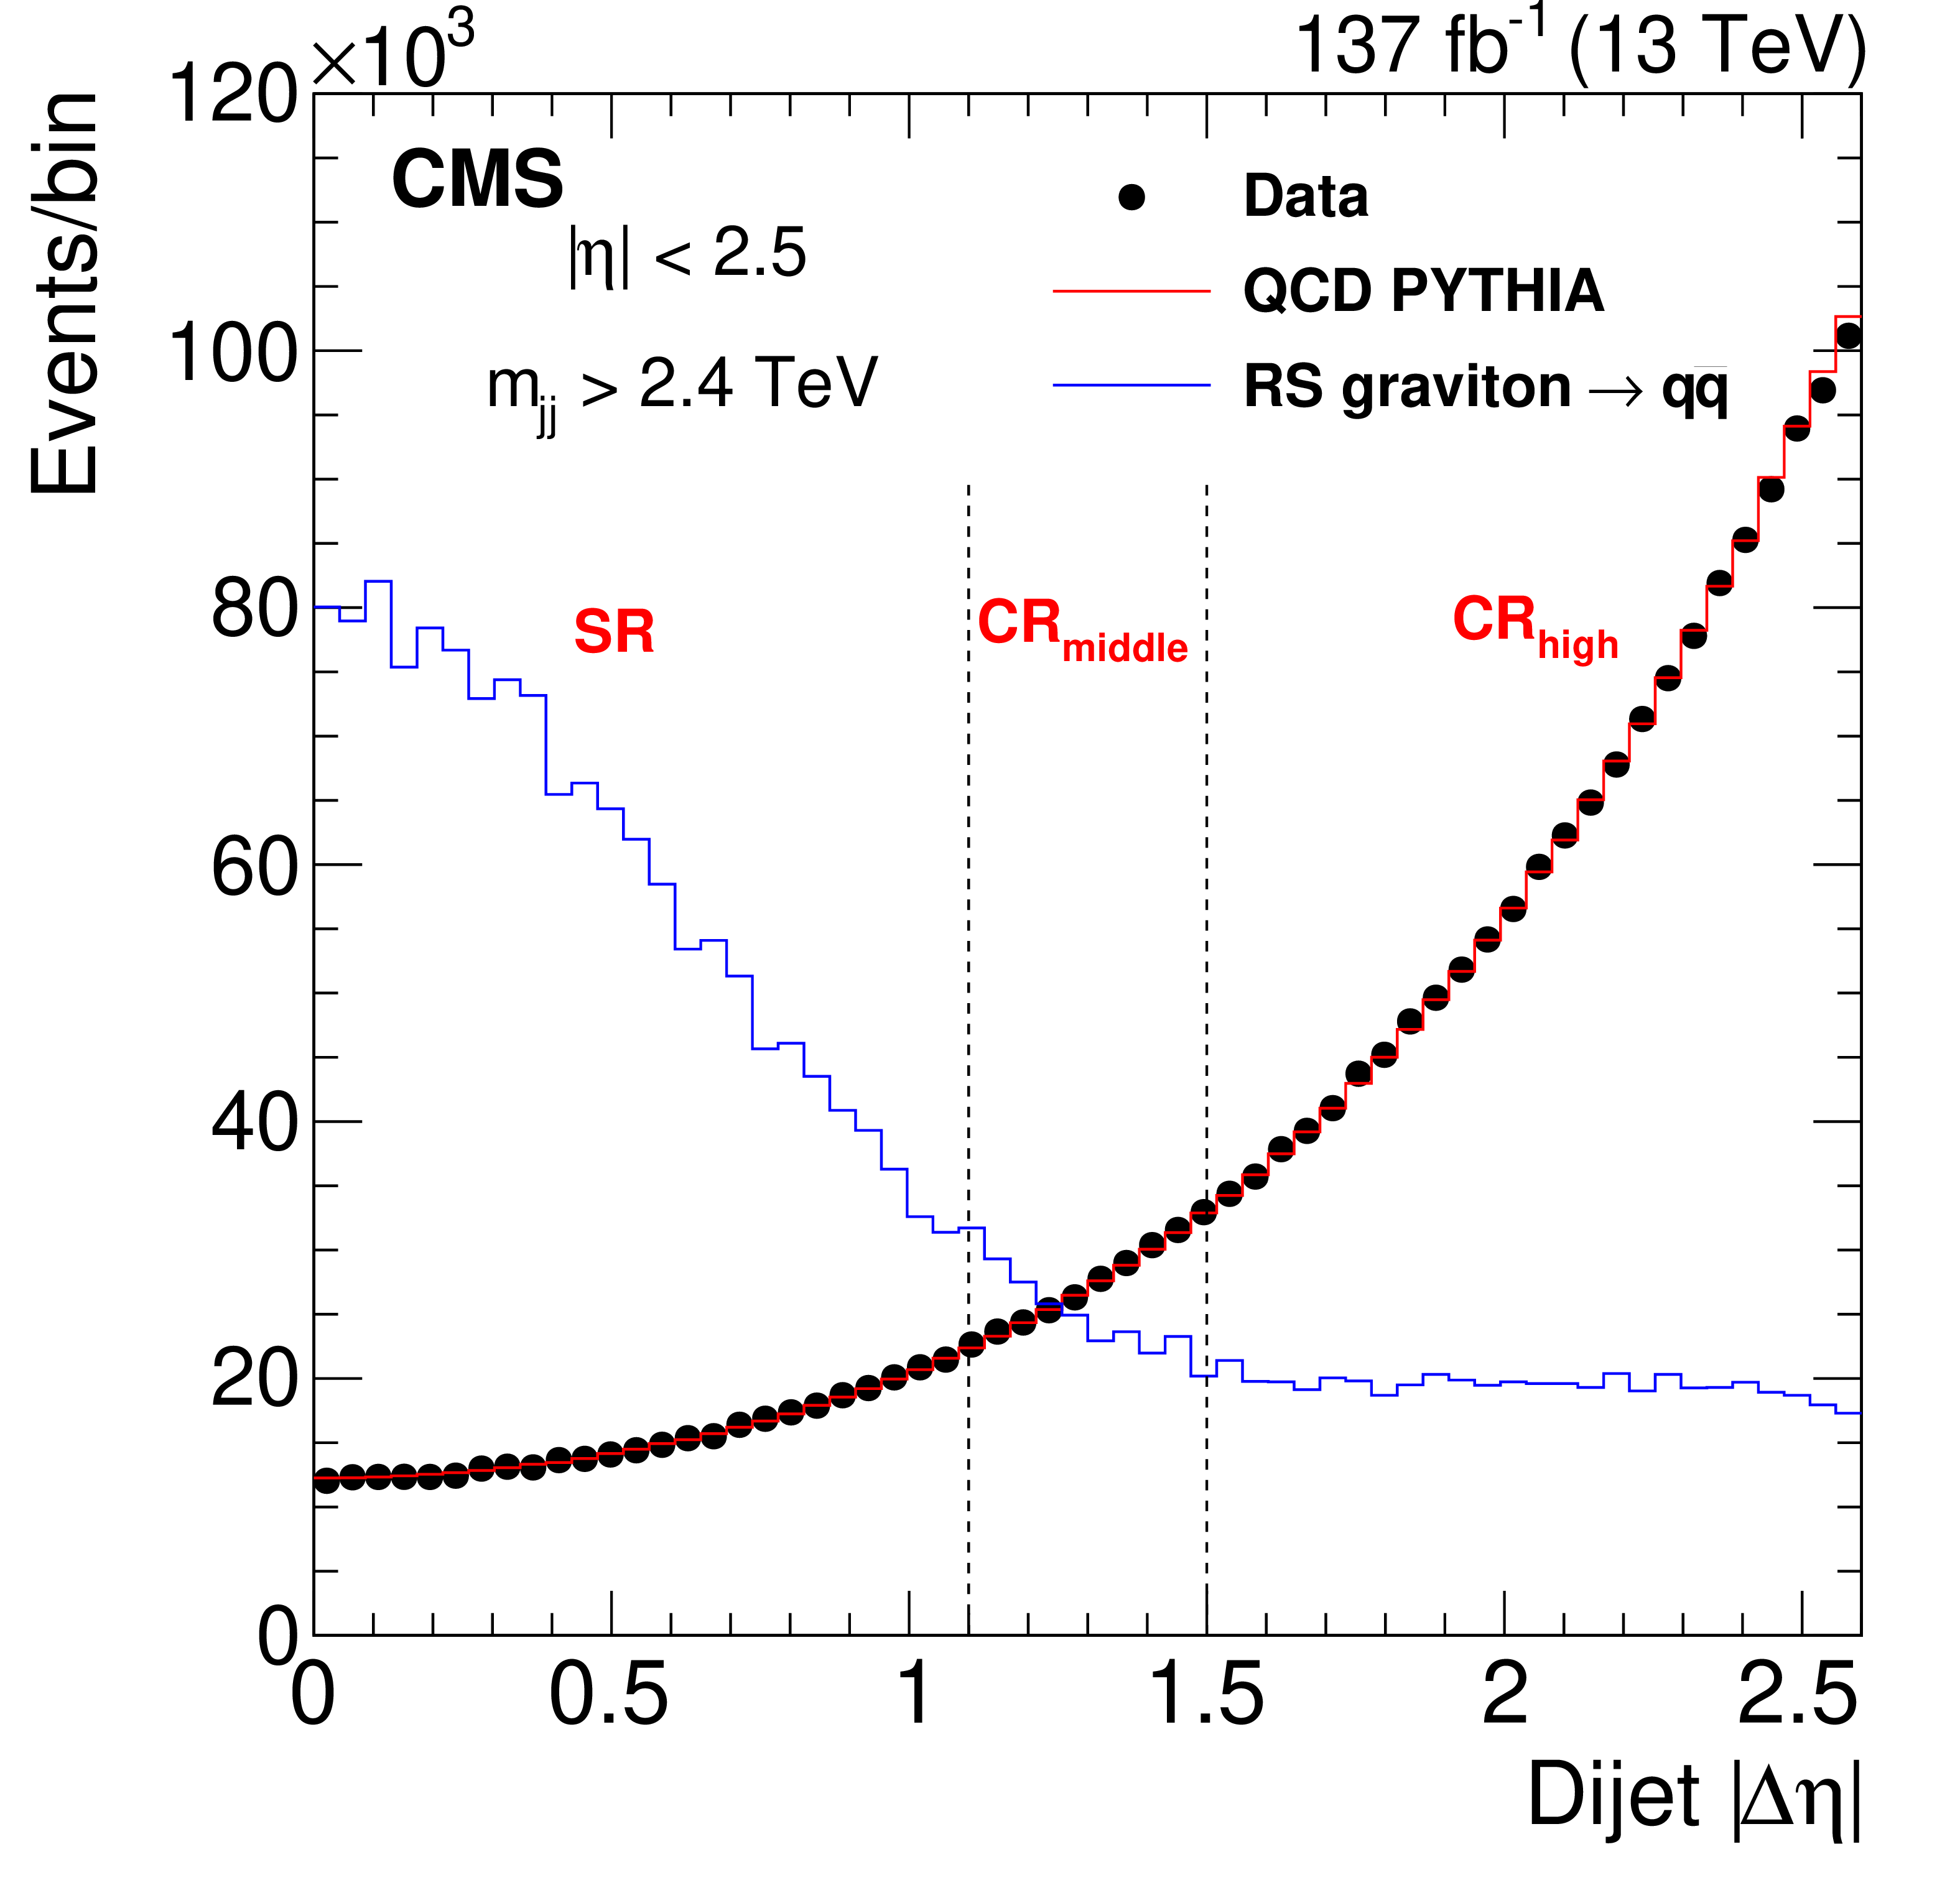
Figure 1:
The pseudorapidity separation between the two wide jets for the signal and control regions. Data (black points) are compared to QCD predictions from the PYTHIA MC with detector simulation (red histogram) normalized to data. A signal from an RS graviton decaying into a $\mathrm{q} \mathrm{\bar{q}}$ pair is also shown (blue histogram) normalized to data. |
png pdf |
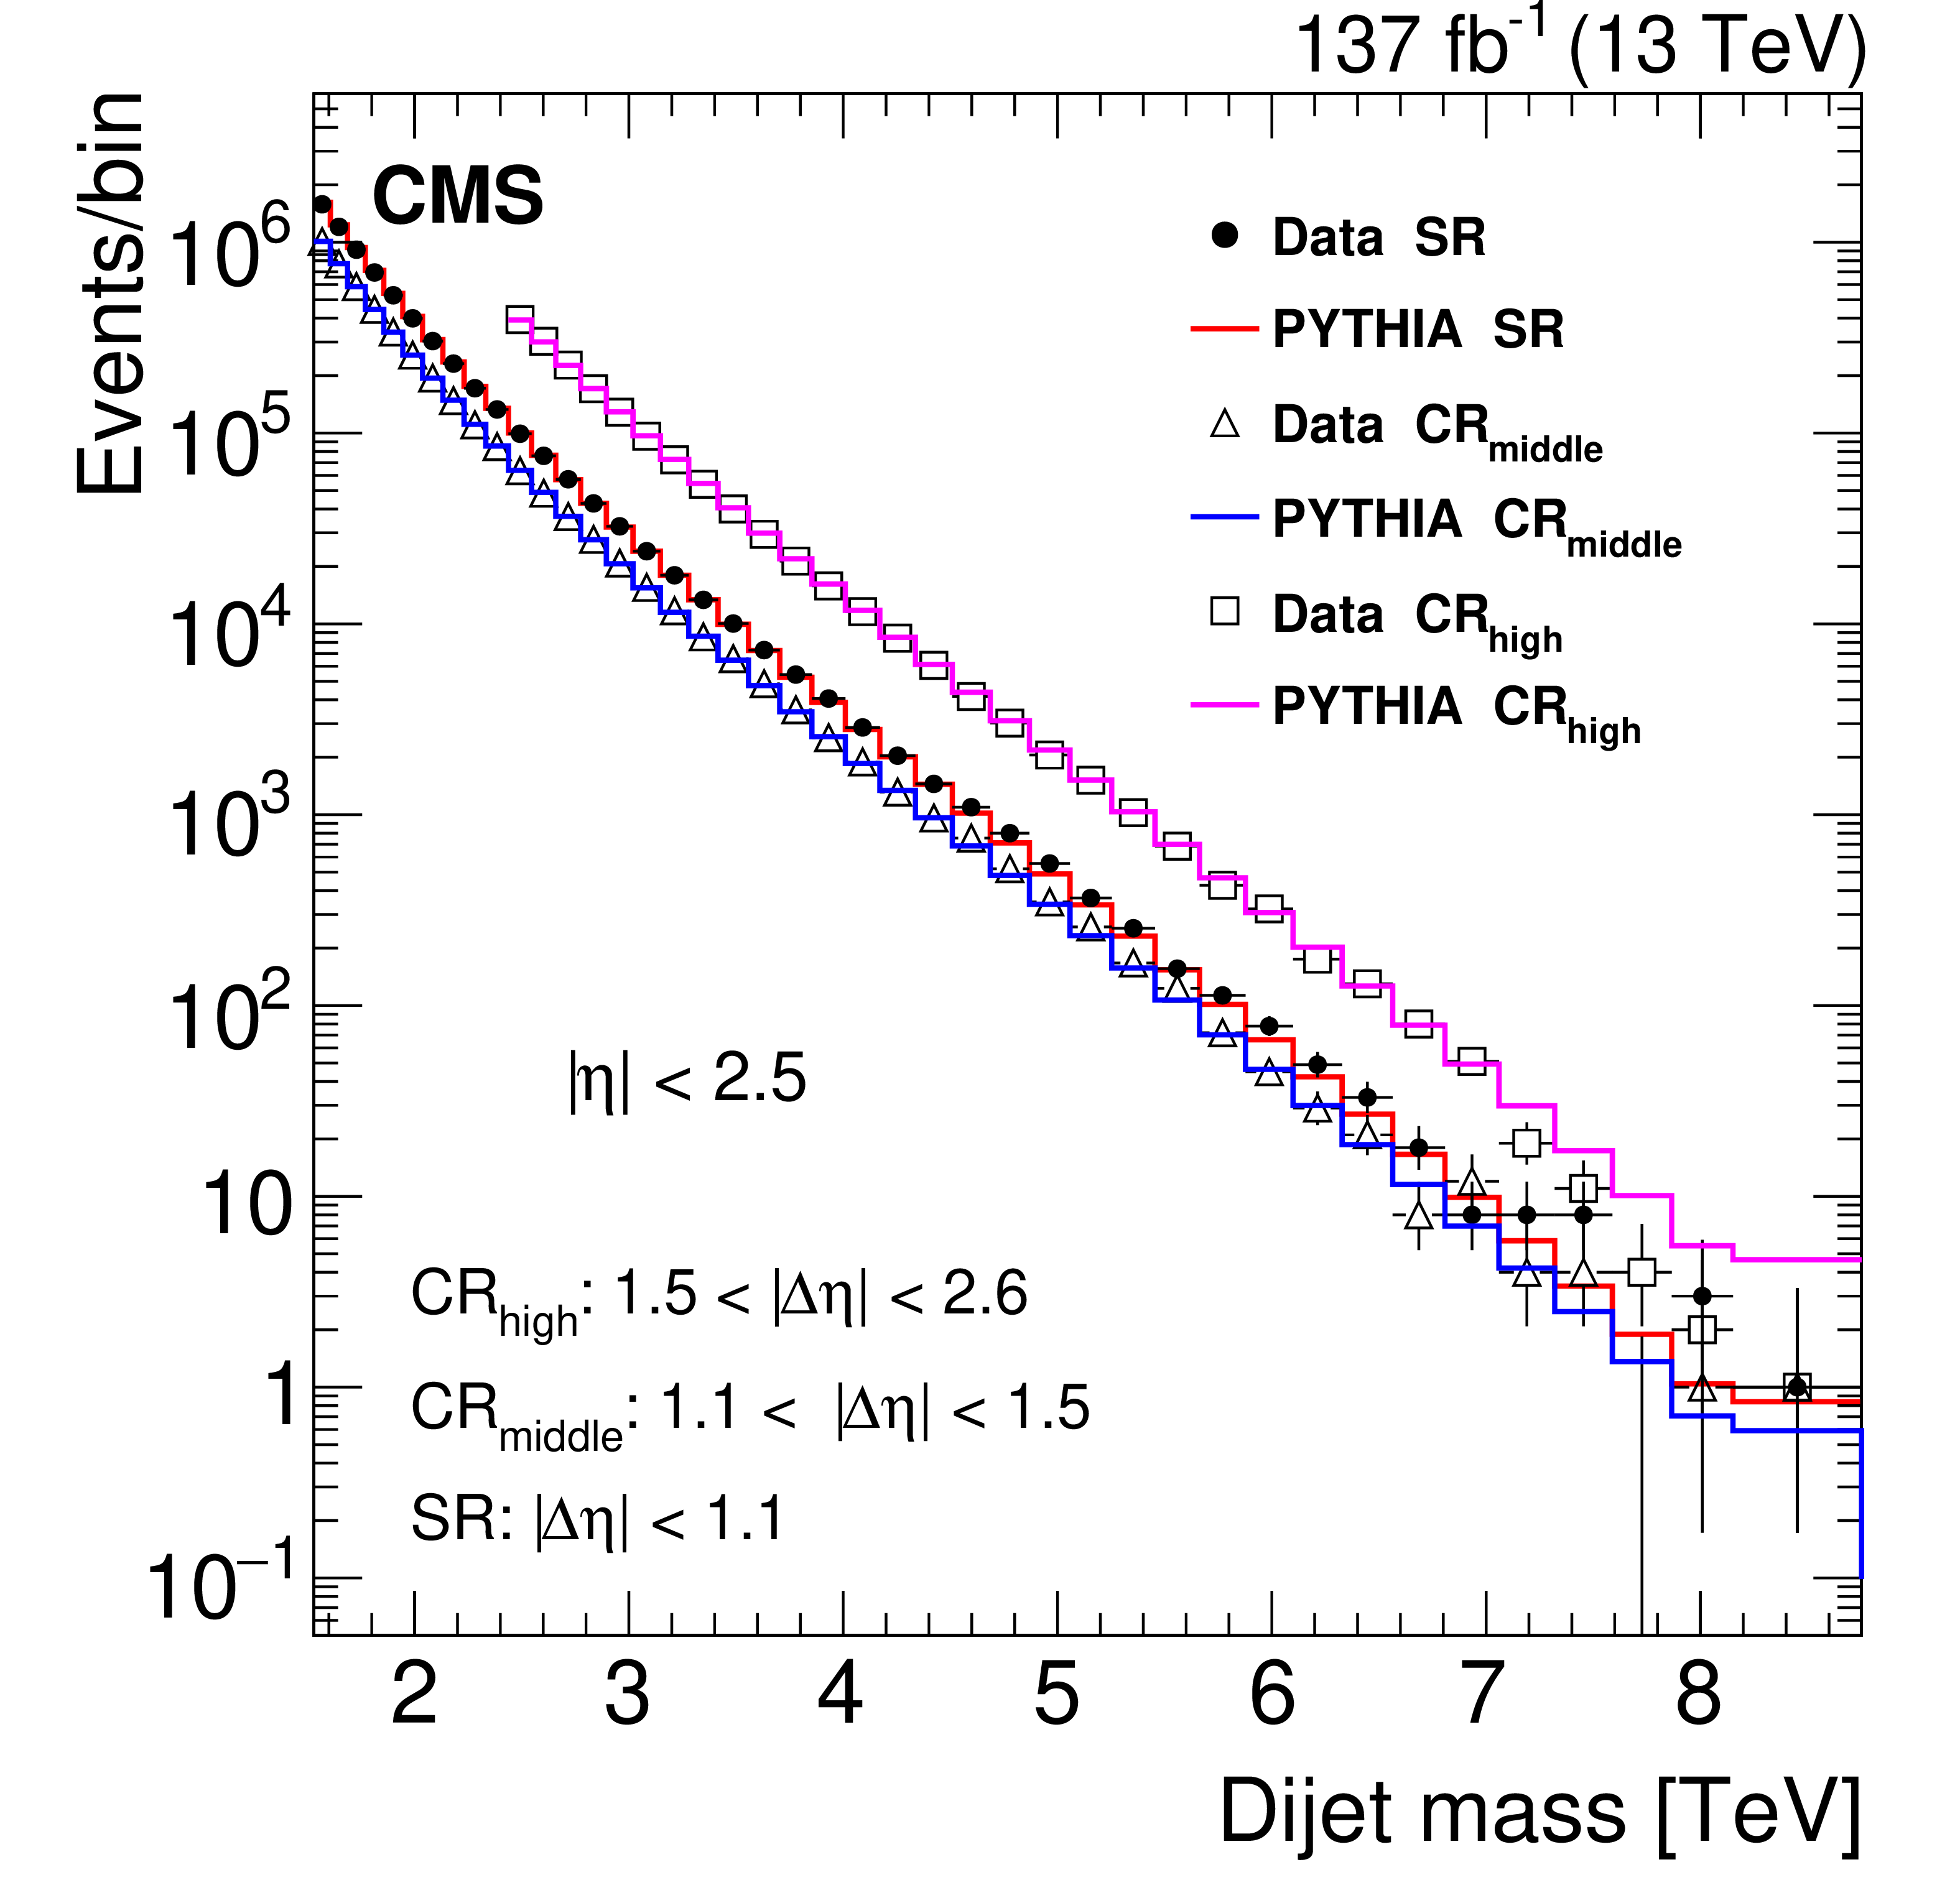
Figure 2:
The dijet mass spectra of the data and PYTHIA simulation in the signal region at low $ {| \Delta \eta |}$ (black points and red histogram), control region at middle $ {| \Delta \eta |}$ (triangles and blue histogram), and control region at high $ {| \Delta \eta |}$ (squares and magenta histogram). The simulation is normalized to data. |
png pdf |
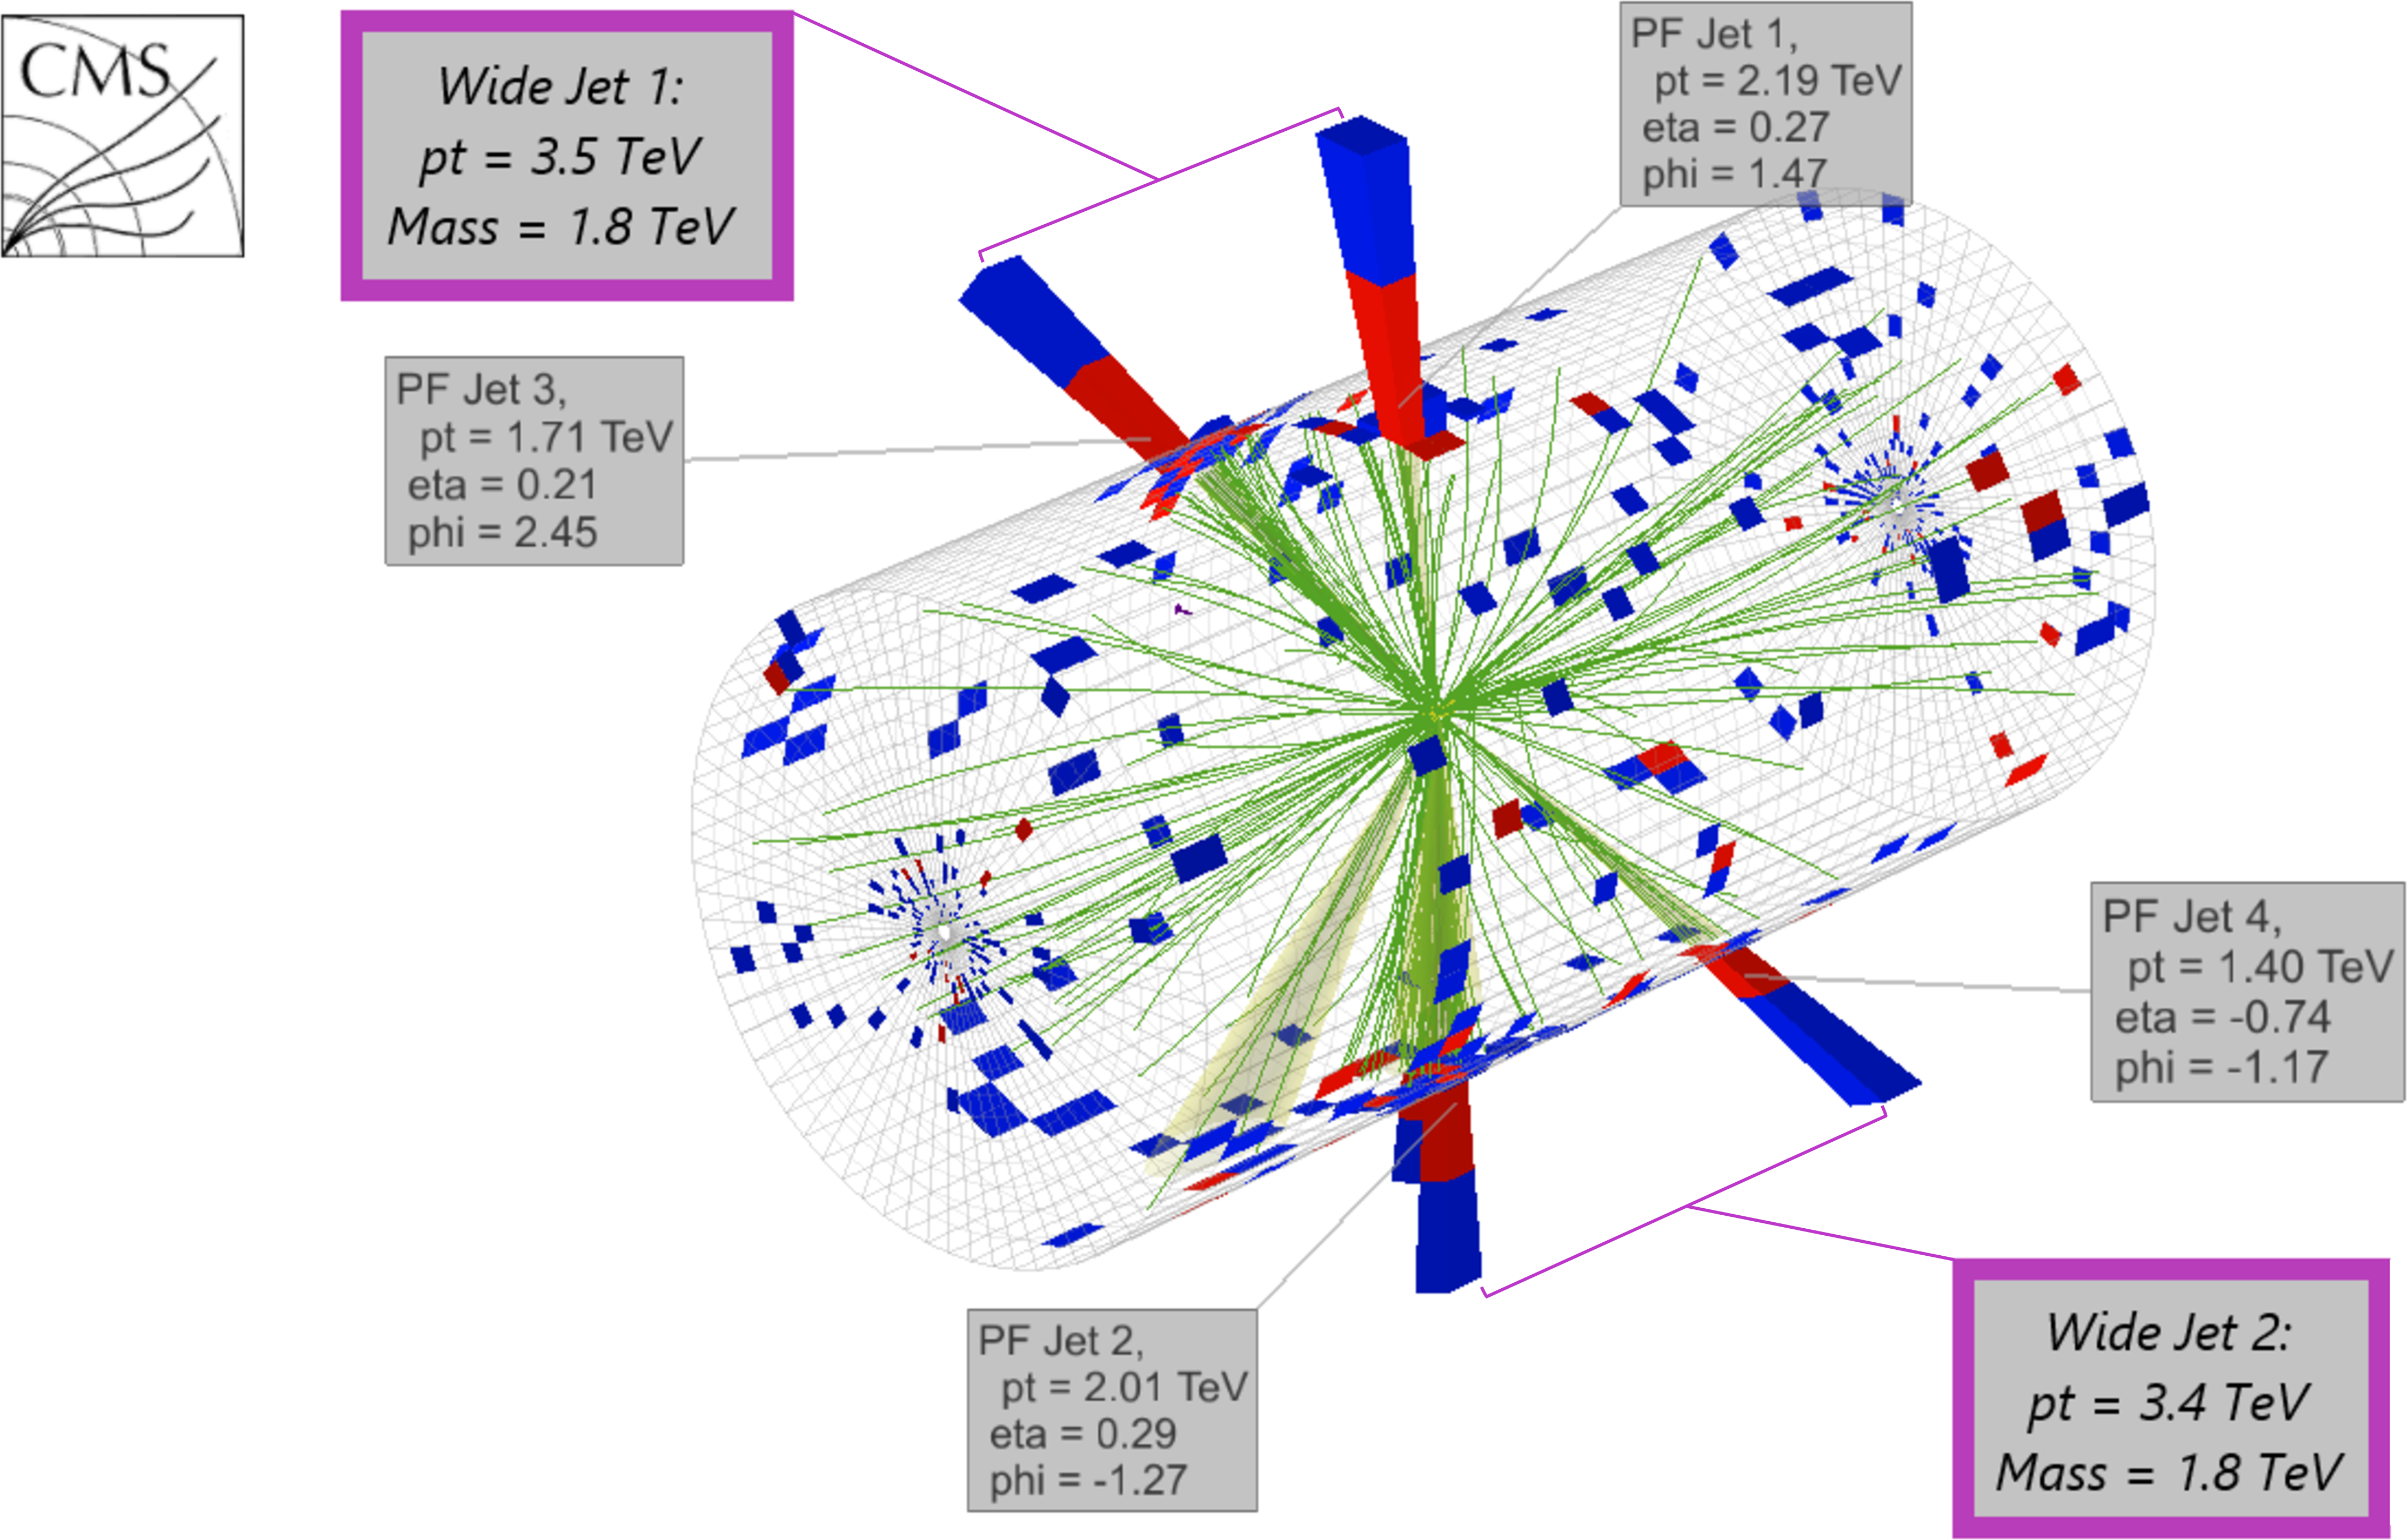
Figure 3:
Three-dimensional display of the event with the second-highest dijet invariant mass of 8 TeV. The display shows the energy deposited in the electromagnetic (red) and hadronic (blue) calorimeters and the reconstructed tracks of charged particles (green). The grouping of four observed jets into two wide jets (purple) is discussed in the text. |
png pdf |
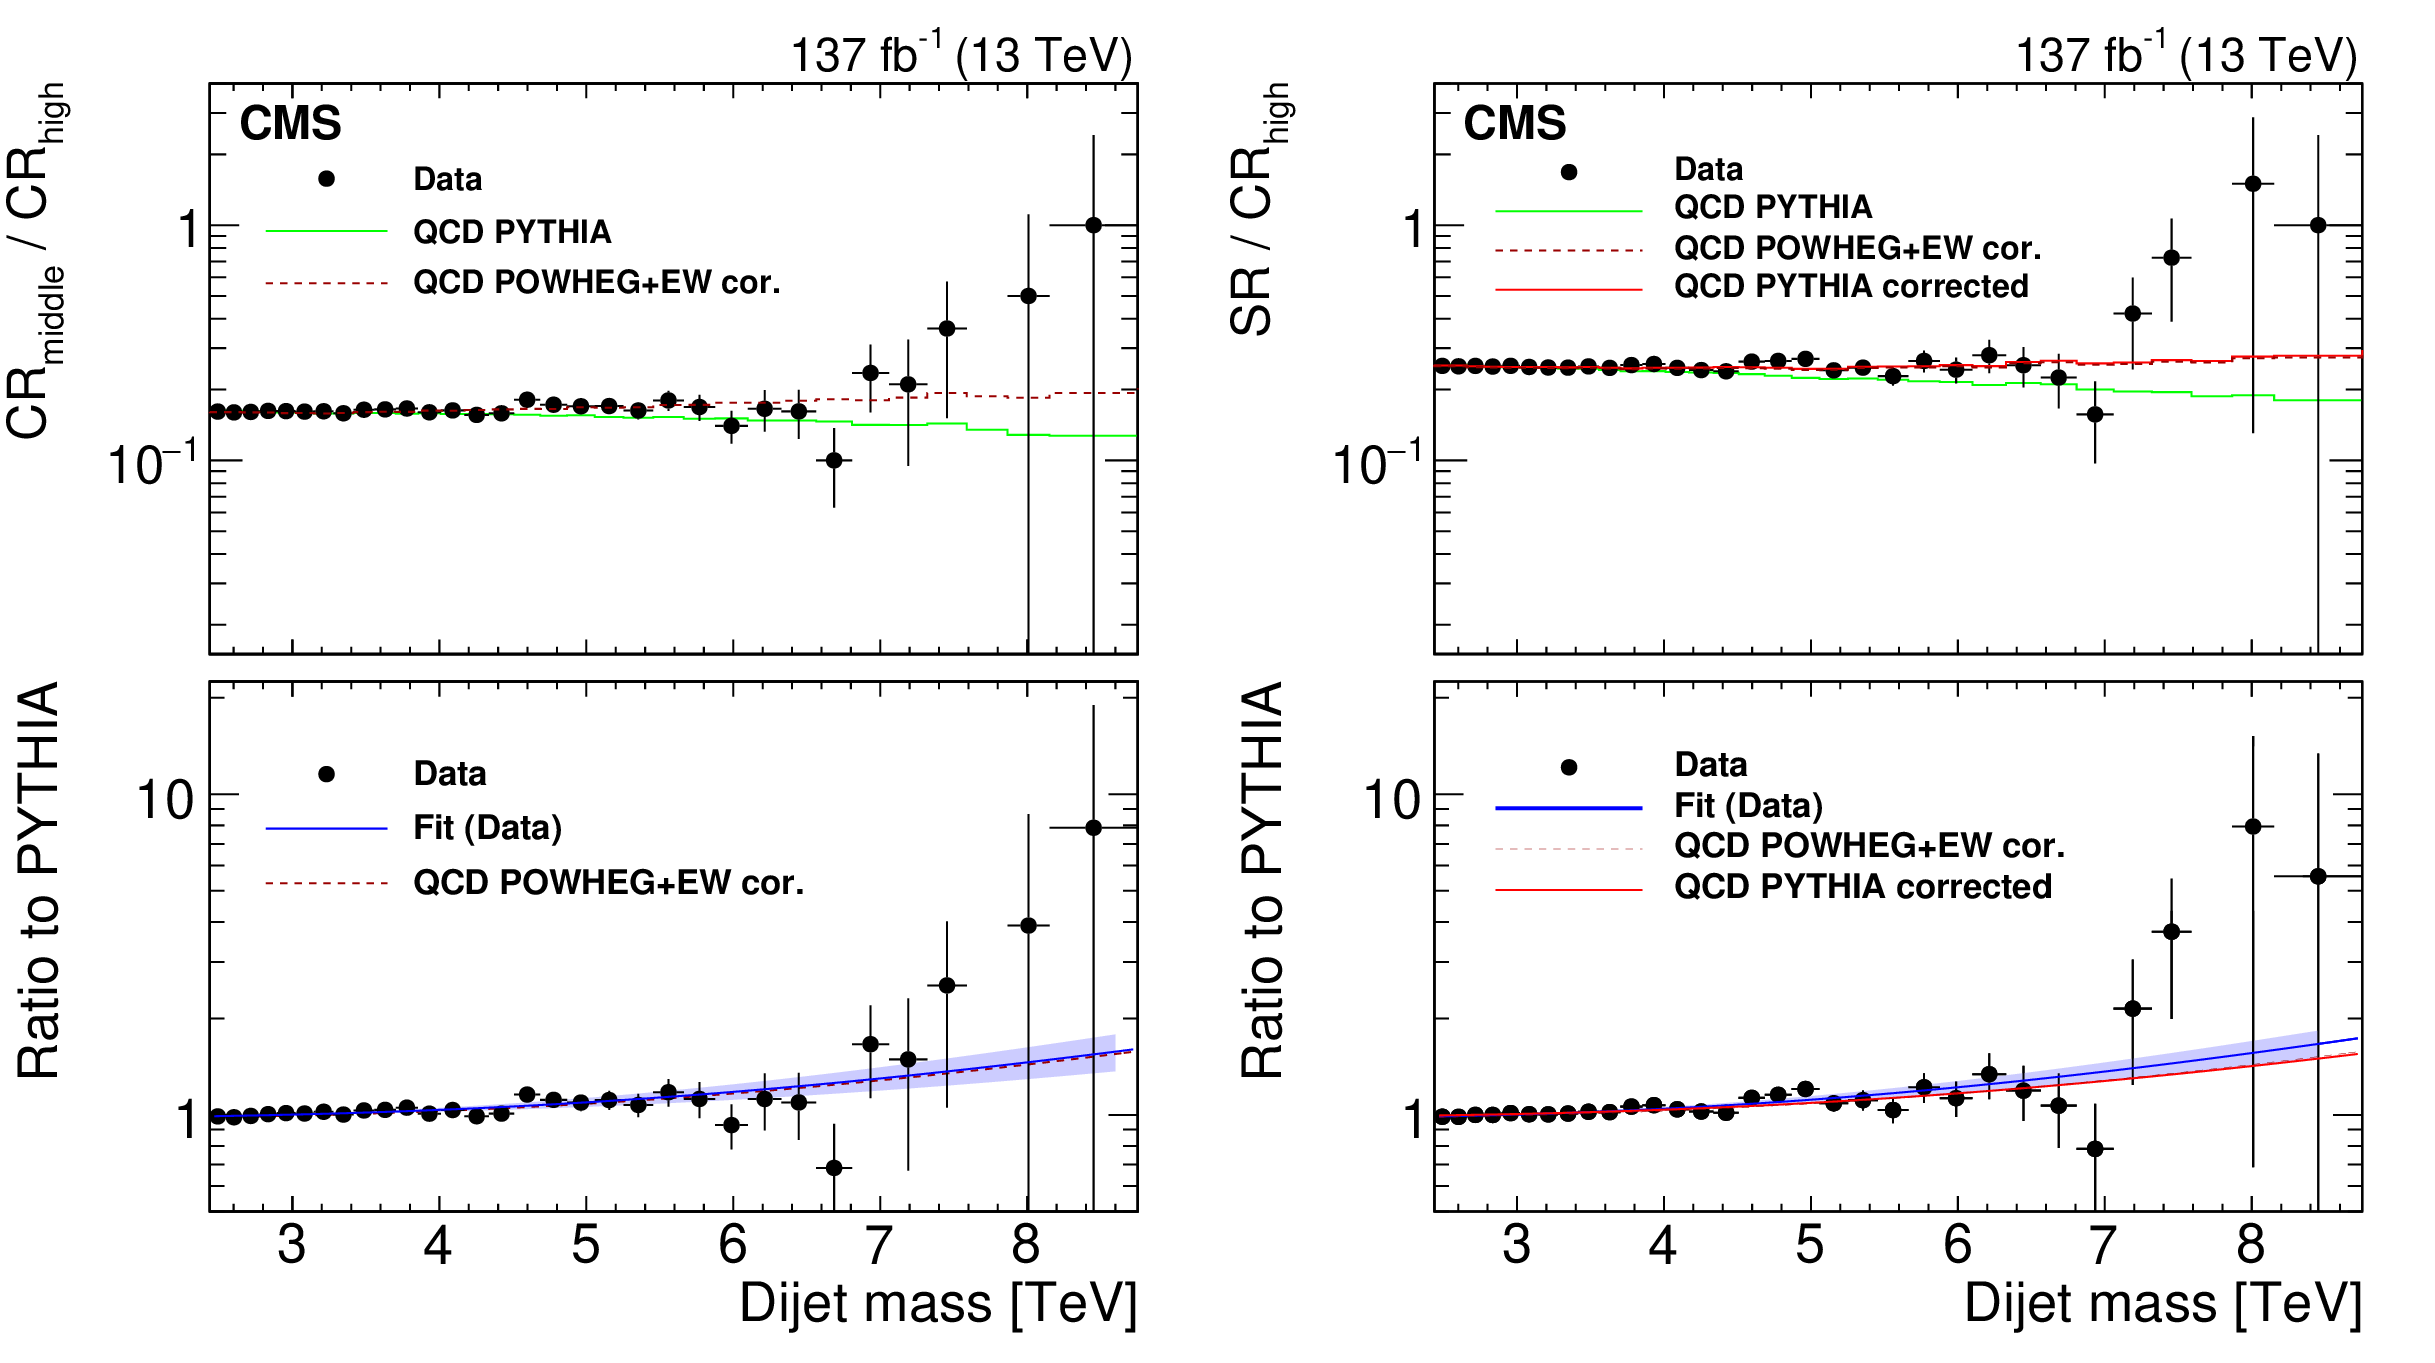
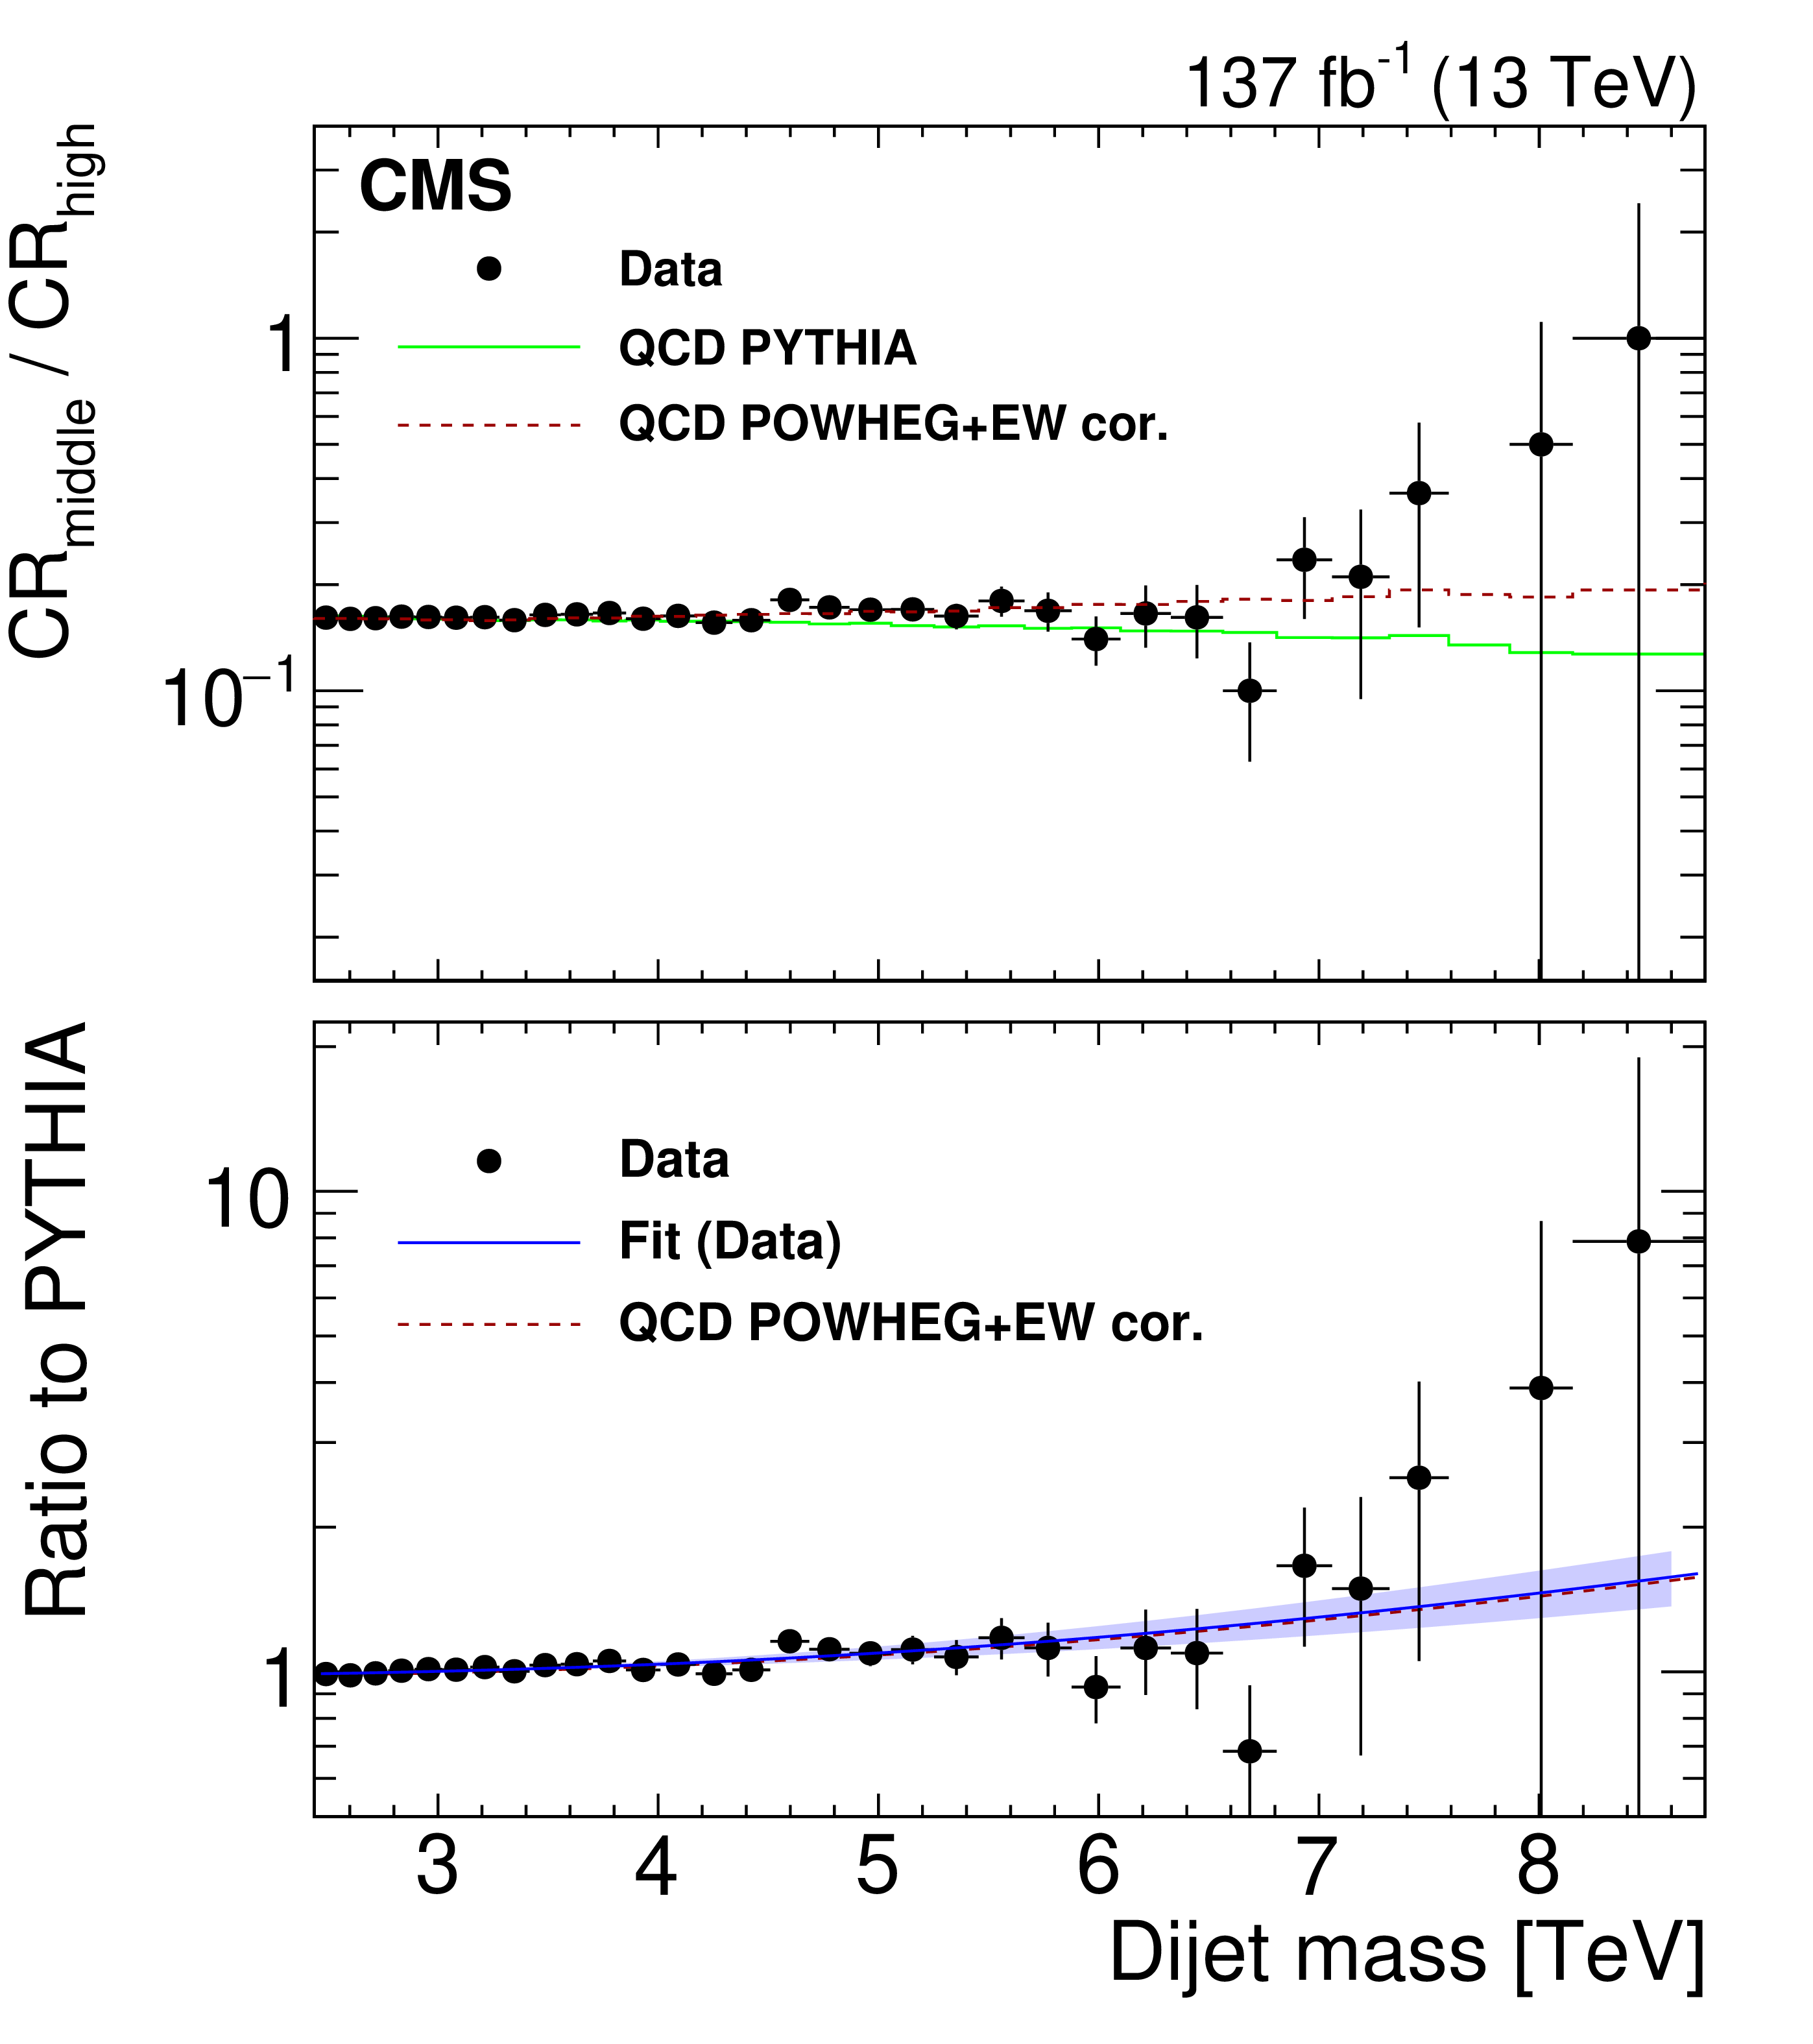
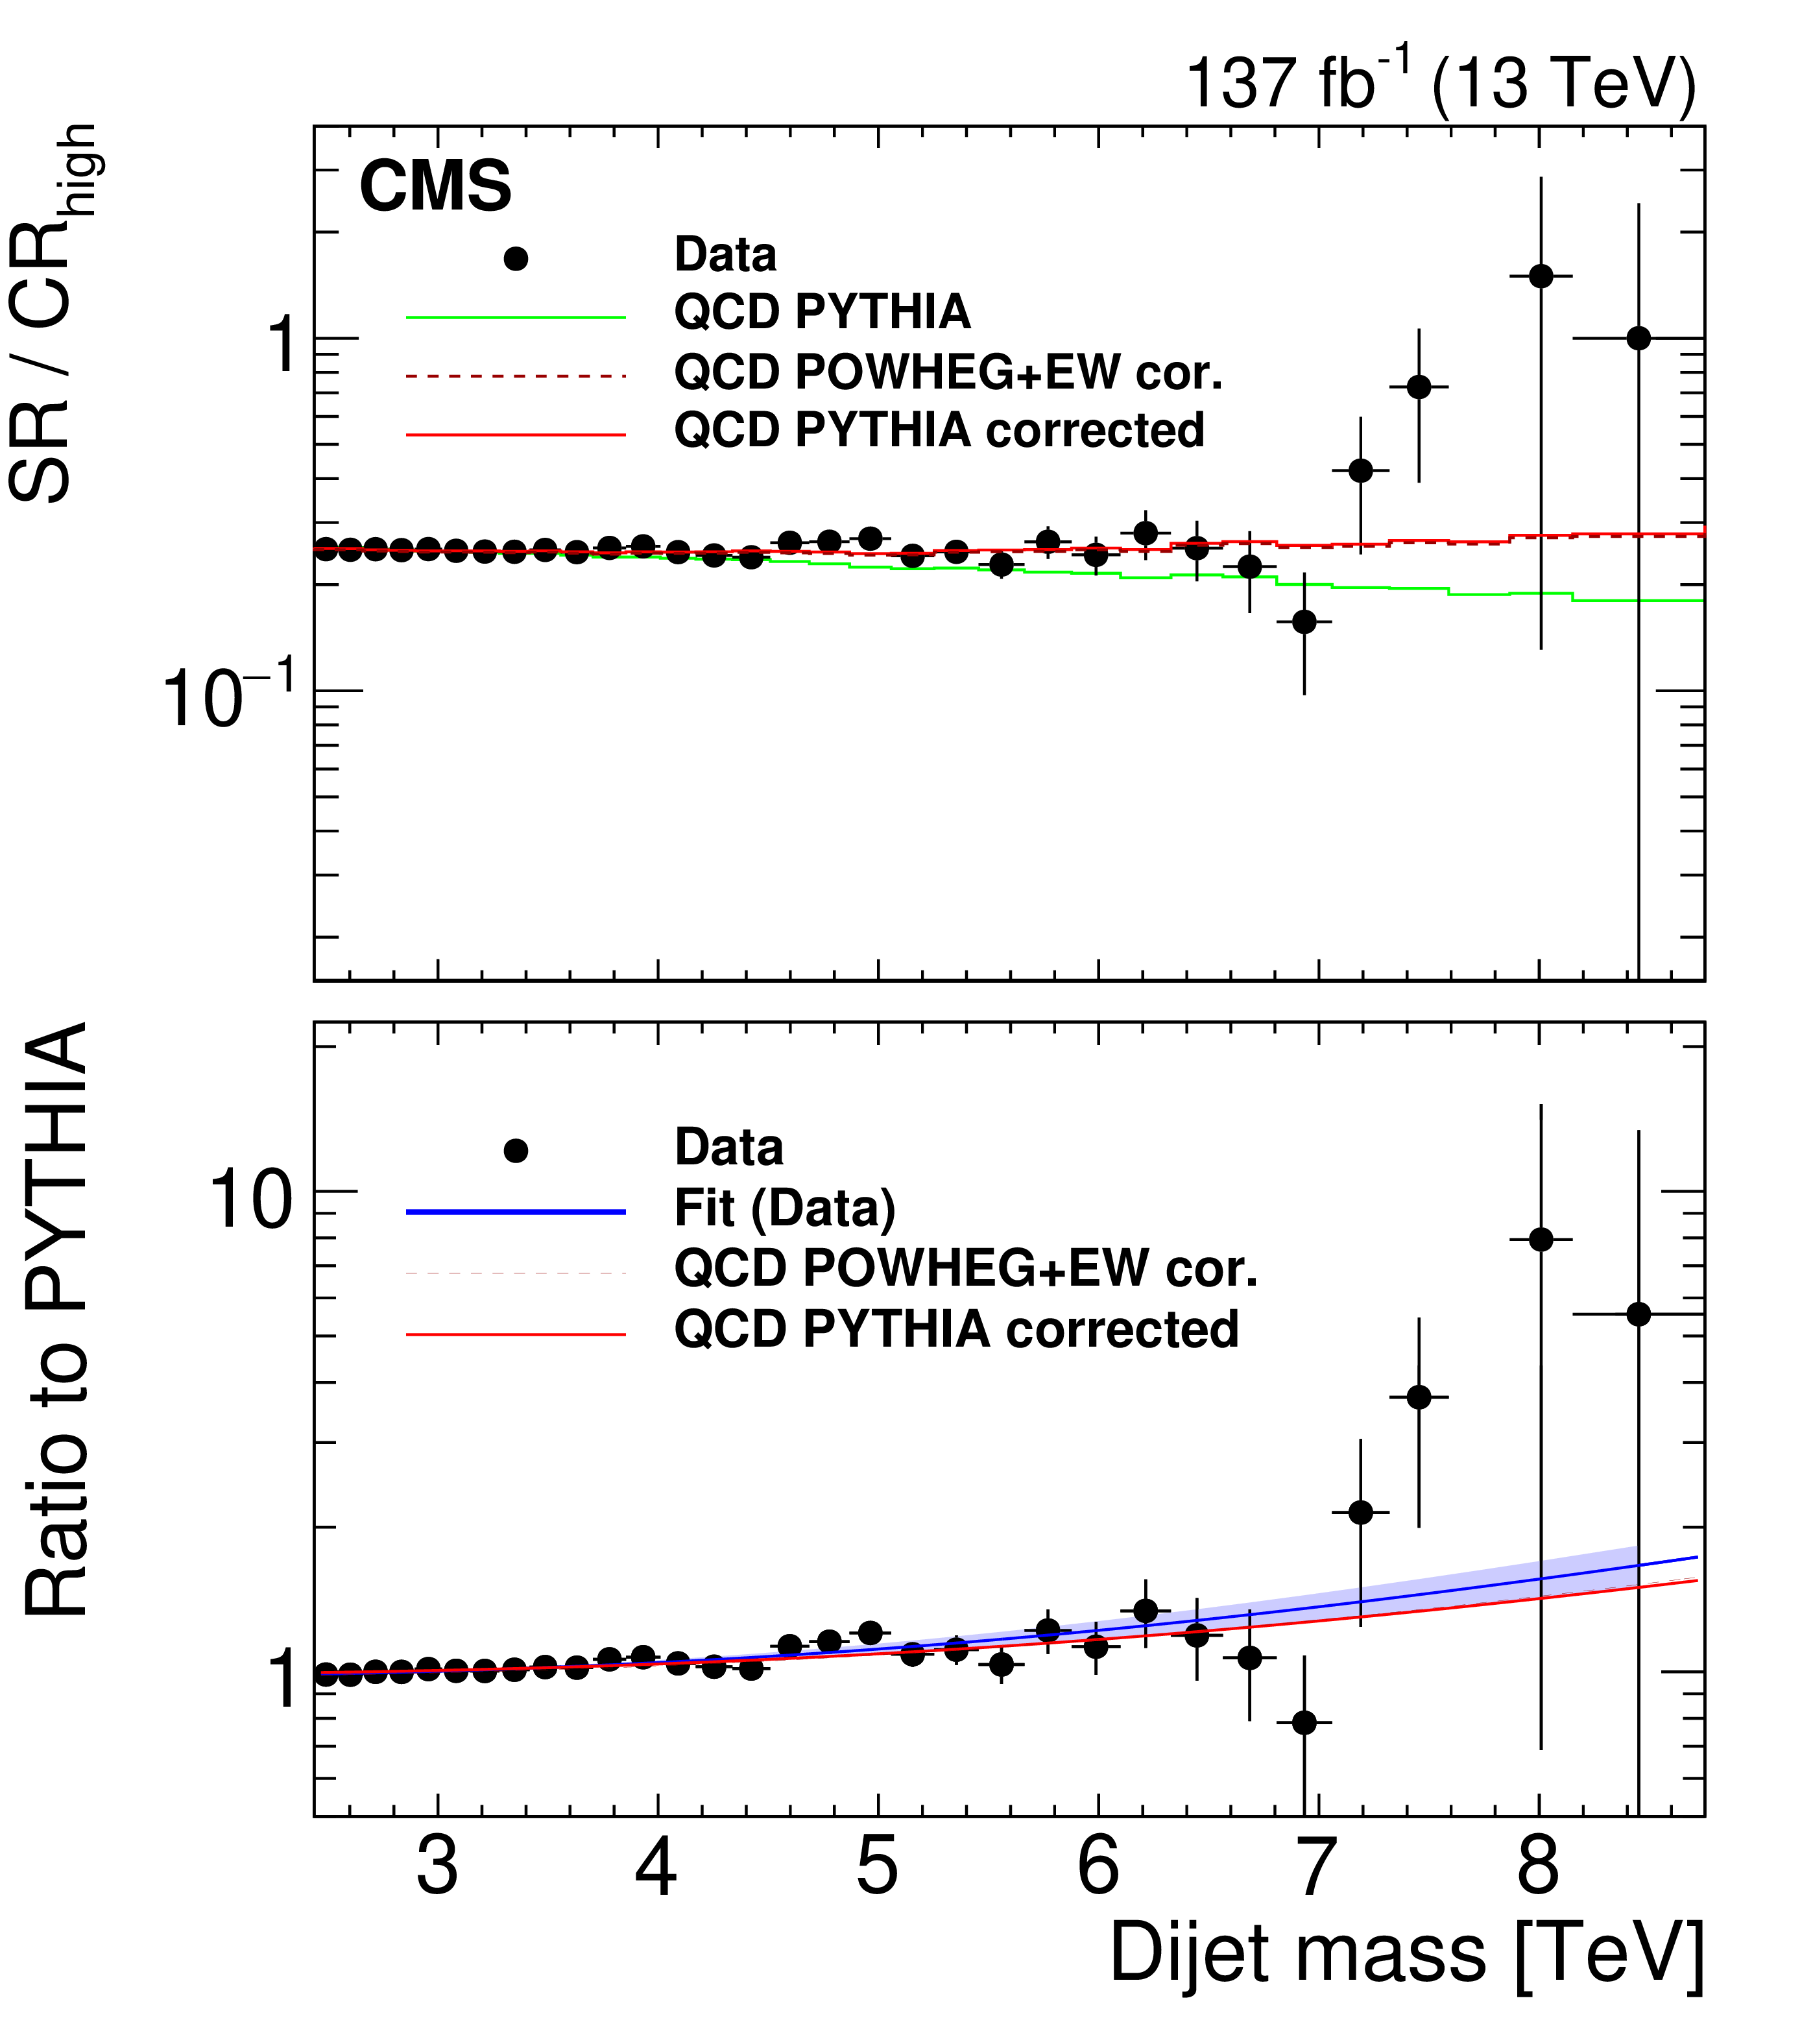
Figure 4:
The ratio $ {R_{\text {aux}}} $, the auxiliary transfer factor, calculated for data, PYTHIA, and POWHEG with electroweak corrections (left, upper panel). The double ratio of the same quantities in the upper left panel to $ {R_{\text {aux}}} $ from PYTHIA, along with the fit of the double ratio for data with the correction function (left, lower panel). The ratio $ {R} $, the transfer factor, calculated for data, PYTHIA, POWHEG with electroweak corrections, and corrected PYTHIA (right, upper panel). The double ratio of the same quantities in the upper right panel to $ {R} $ from PYTHIA, along with the fit of the double ratio for data with a correction function, and corrected PYTHIA using $ {\mathrm {CR}_{\text {middle}}} $ (right, lower panel). The fits in the two lower panels agree with each other within their uncertainty at 95% CL (shaded bands). |
png pdf |
Figure 4-a:
The ratio $ {R_{\text {aux}}} $, the auxiliary transfer factor, calculated for data, PYTHIA, and POWHEG with electroweak corrections (upper panel). The double ratio of the same quantities in the upper panel to $ {R_{\text {aux}}} $ from PYTHIA, along with the fit of the double ratio for data with the correction function (lower panel). |
png pdf |
Figure 4-b:
The ratio $ {R} $, the transfer factor, calculated for data, PYTHIA, POWHEG with electroweak corrections, and corrected PYTHIA (upper panel). The double ratio of the same quantities in the upper panel to $ {R} $ from PYTHIA, along with the fit of the double ratio for data with a correction function, and corrected PYTHIA using $ {\mathrm {CR}_{\text {middle}}} $ (lower panel). |

png pdf |
Figure 5:
Dijet mass spectrum in the signal region (points) compared to a fitted parameterization of the background (solid line) and the one obtained from the control region (green squares). The lower panel shows the difference between the data and the fitted parametrization (red, solid), and the data and the prediction obtained from the control region (green, hatched), divided by the statistical uncertainty in the data, which for the ratio method includes the statistical uncertainty in the data in the control region. Examples of predicted signals from narrow gluon-gluon, quark-gluon, and quark-quark resonances are shown (dashed coloured lines) with cross sections equal to the observed upper limits at 95% CL. |
png pdf |
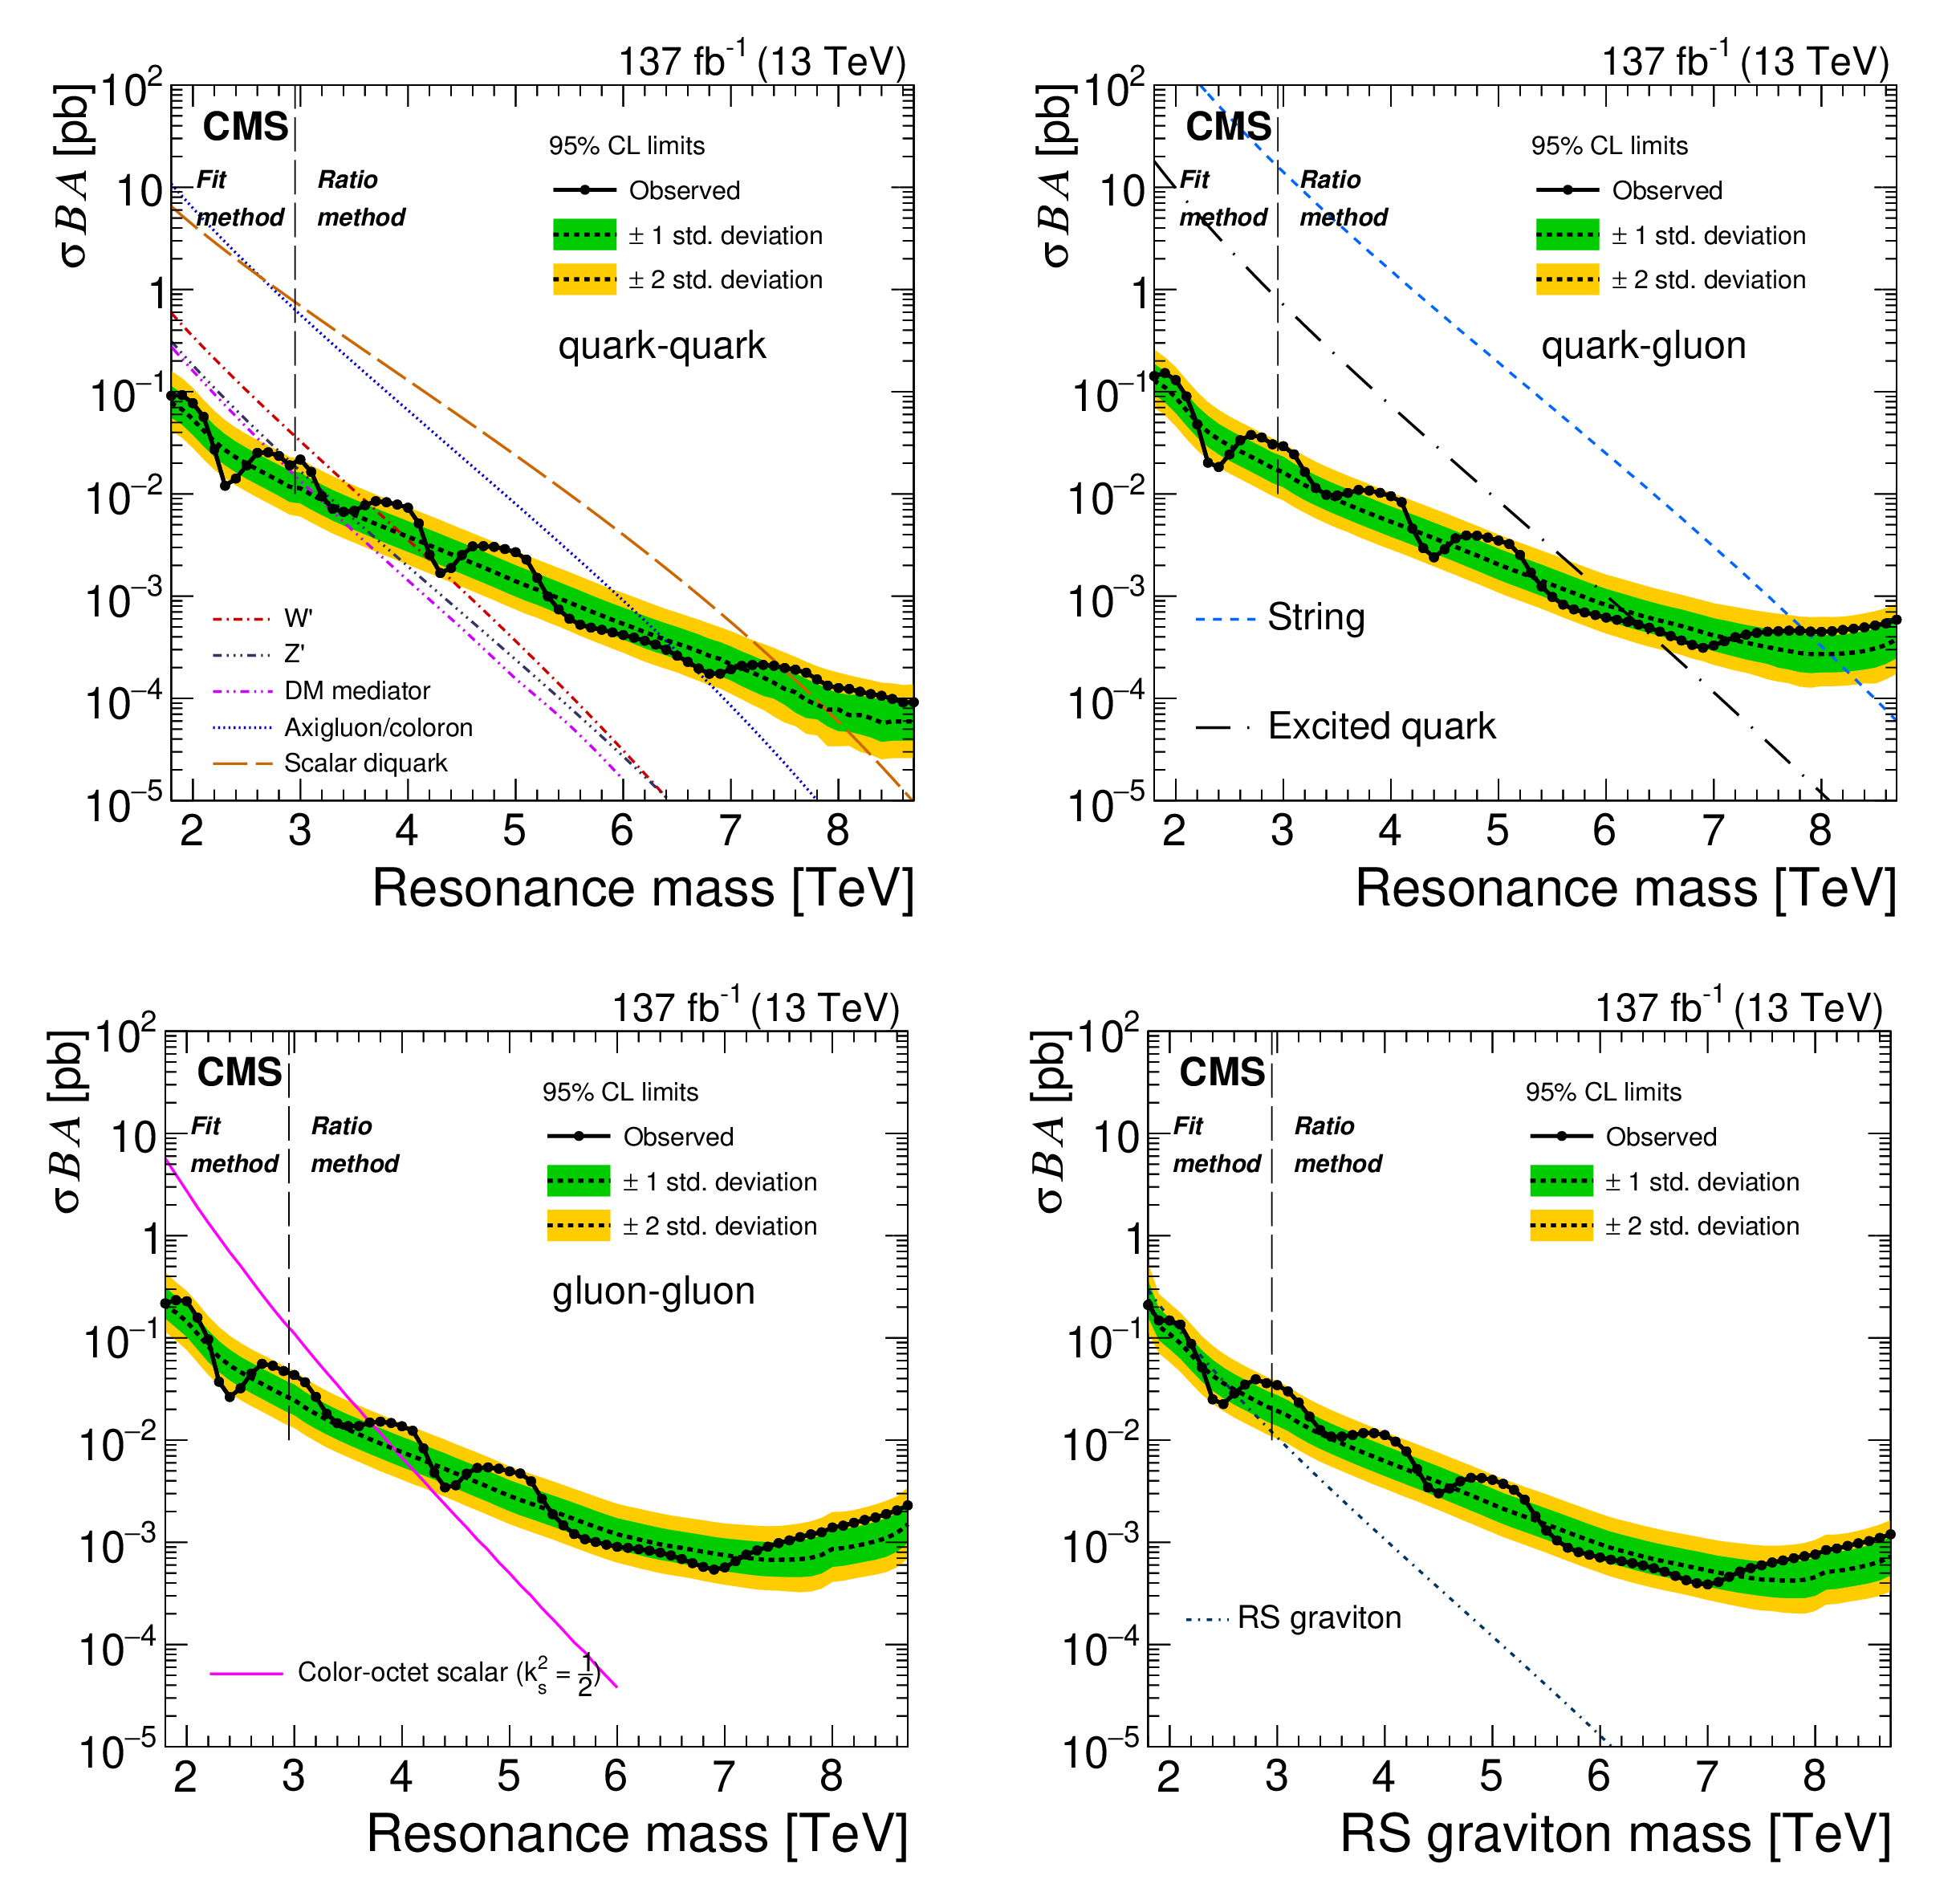
Figure 6:
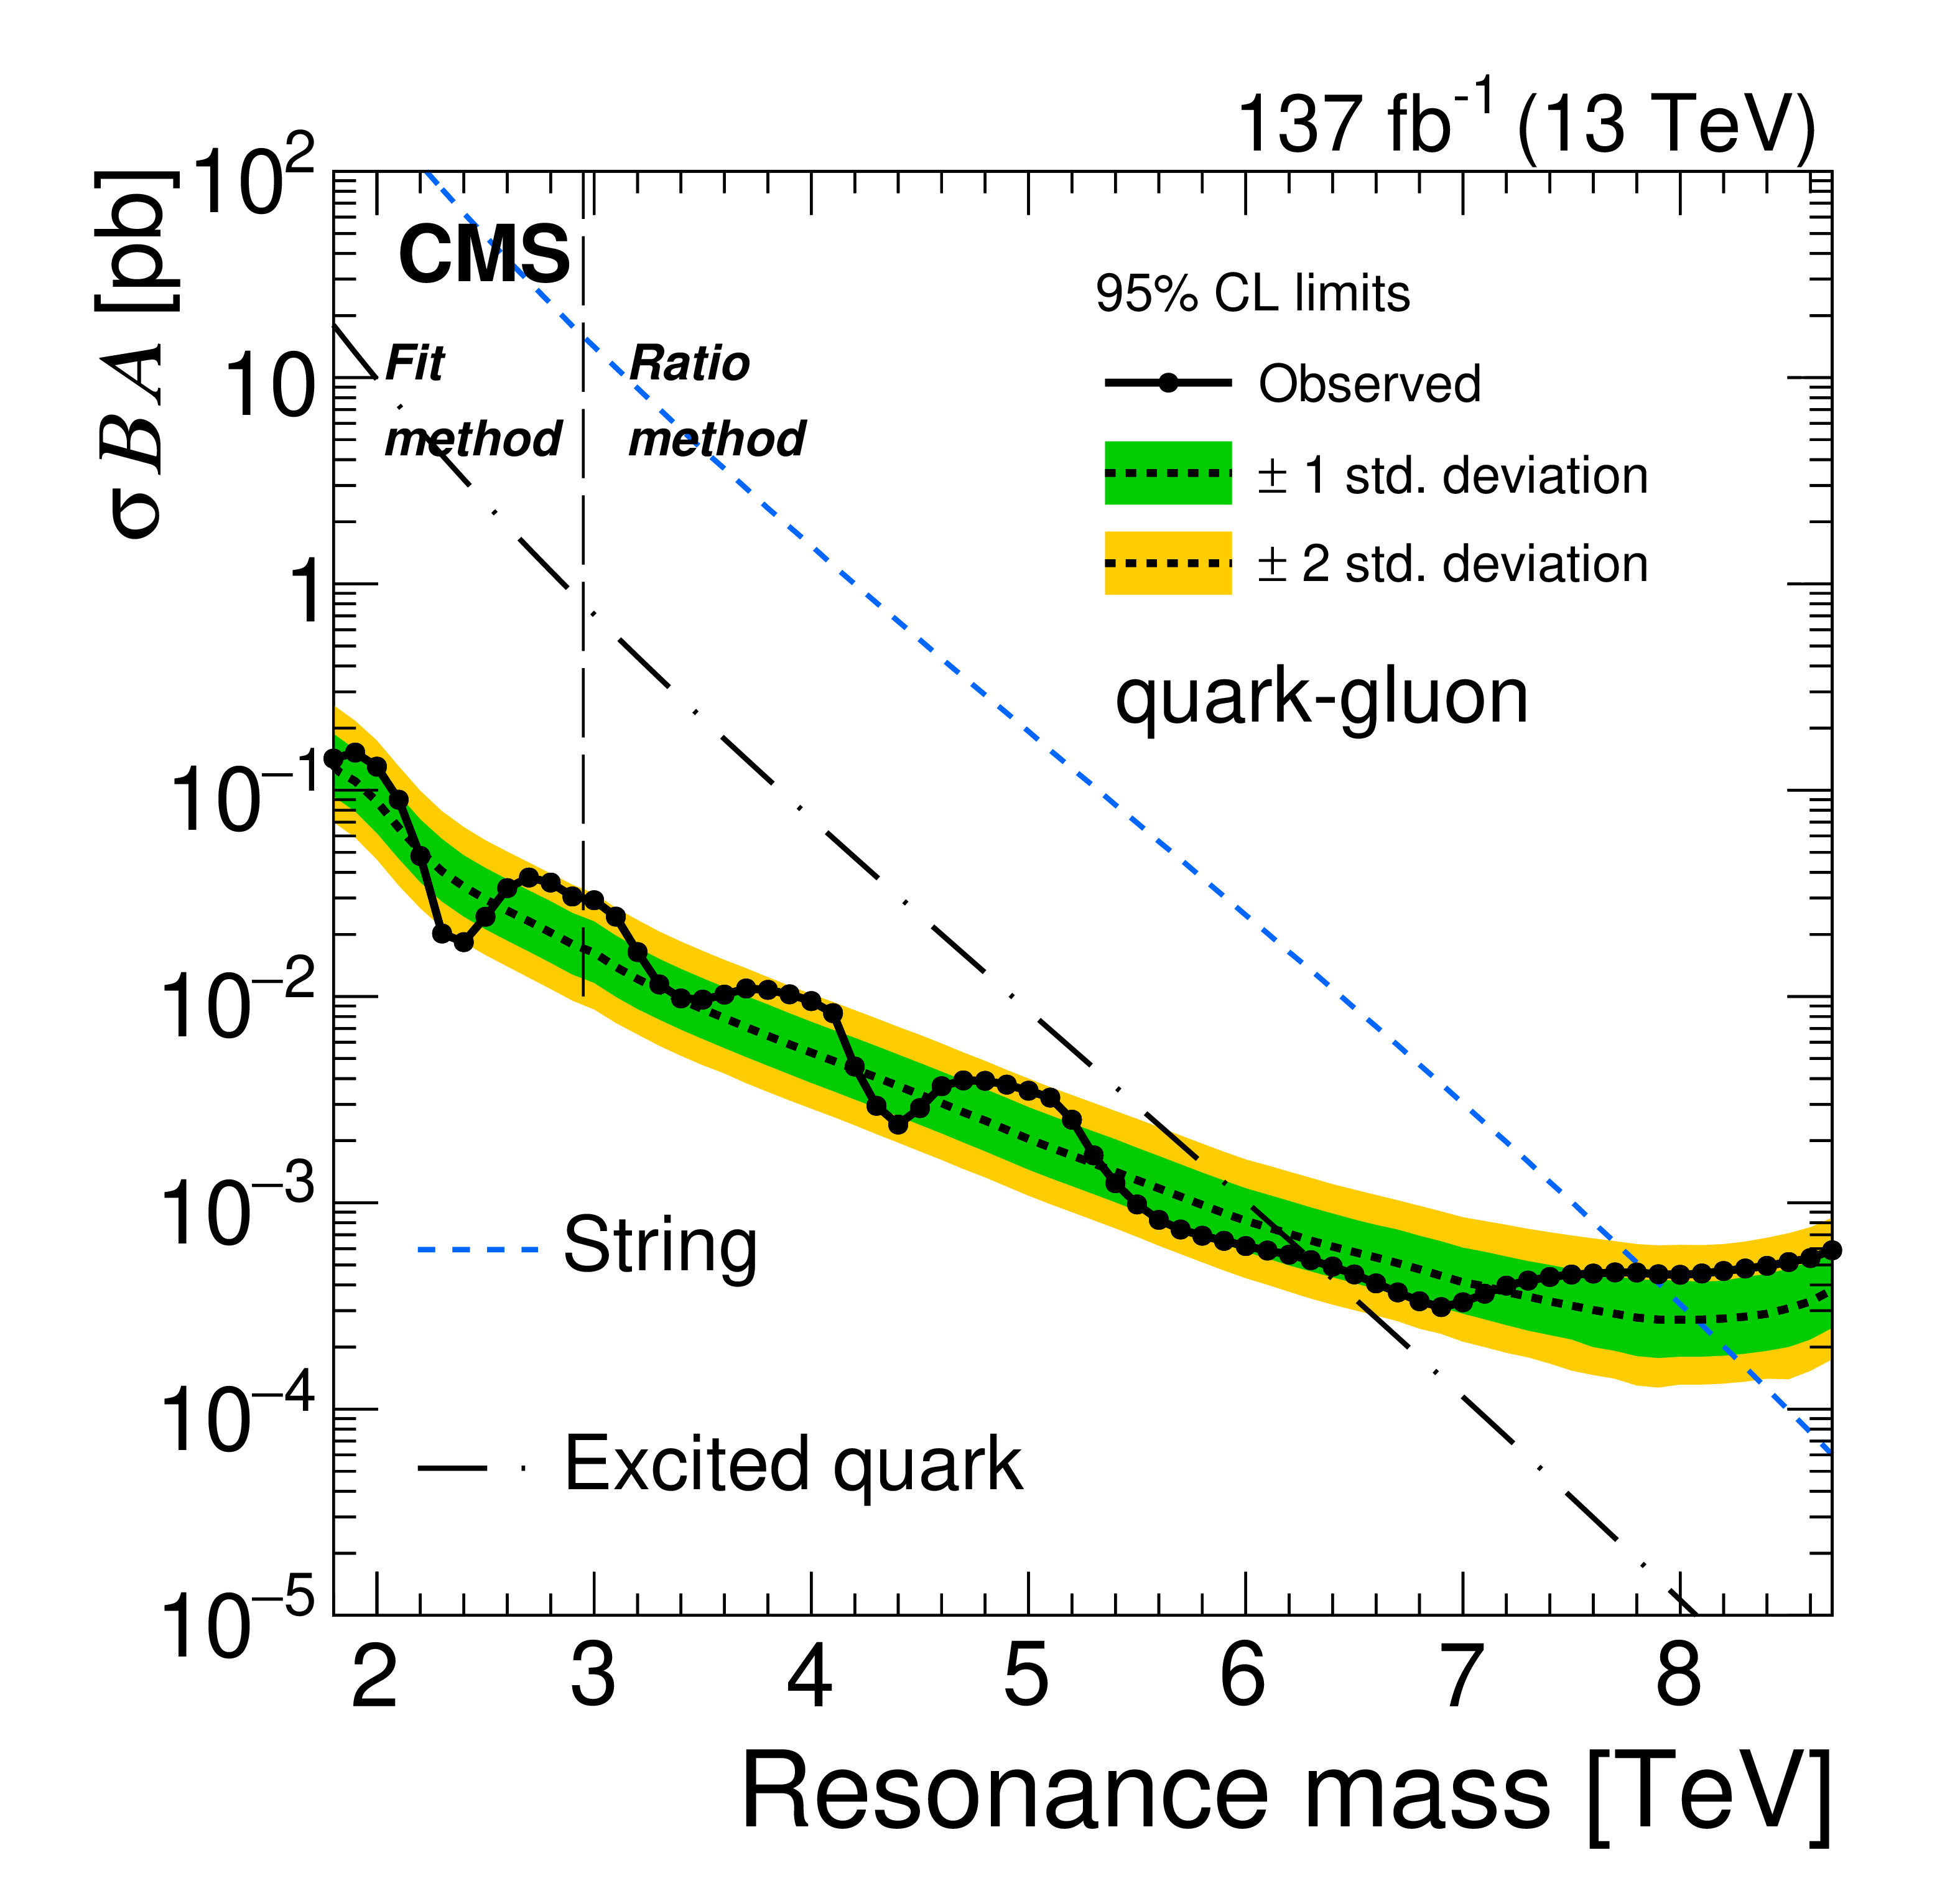
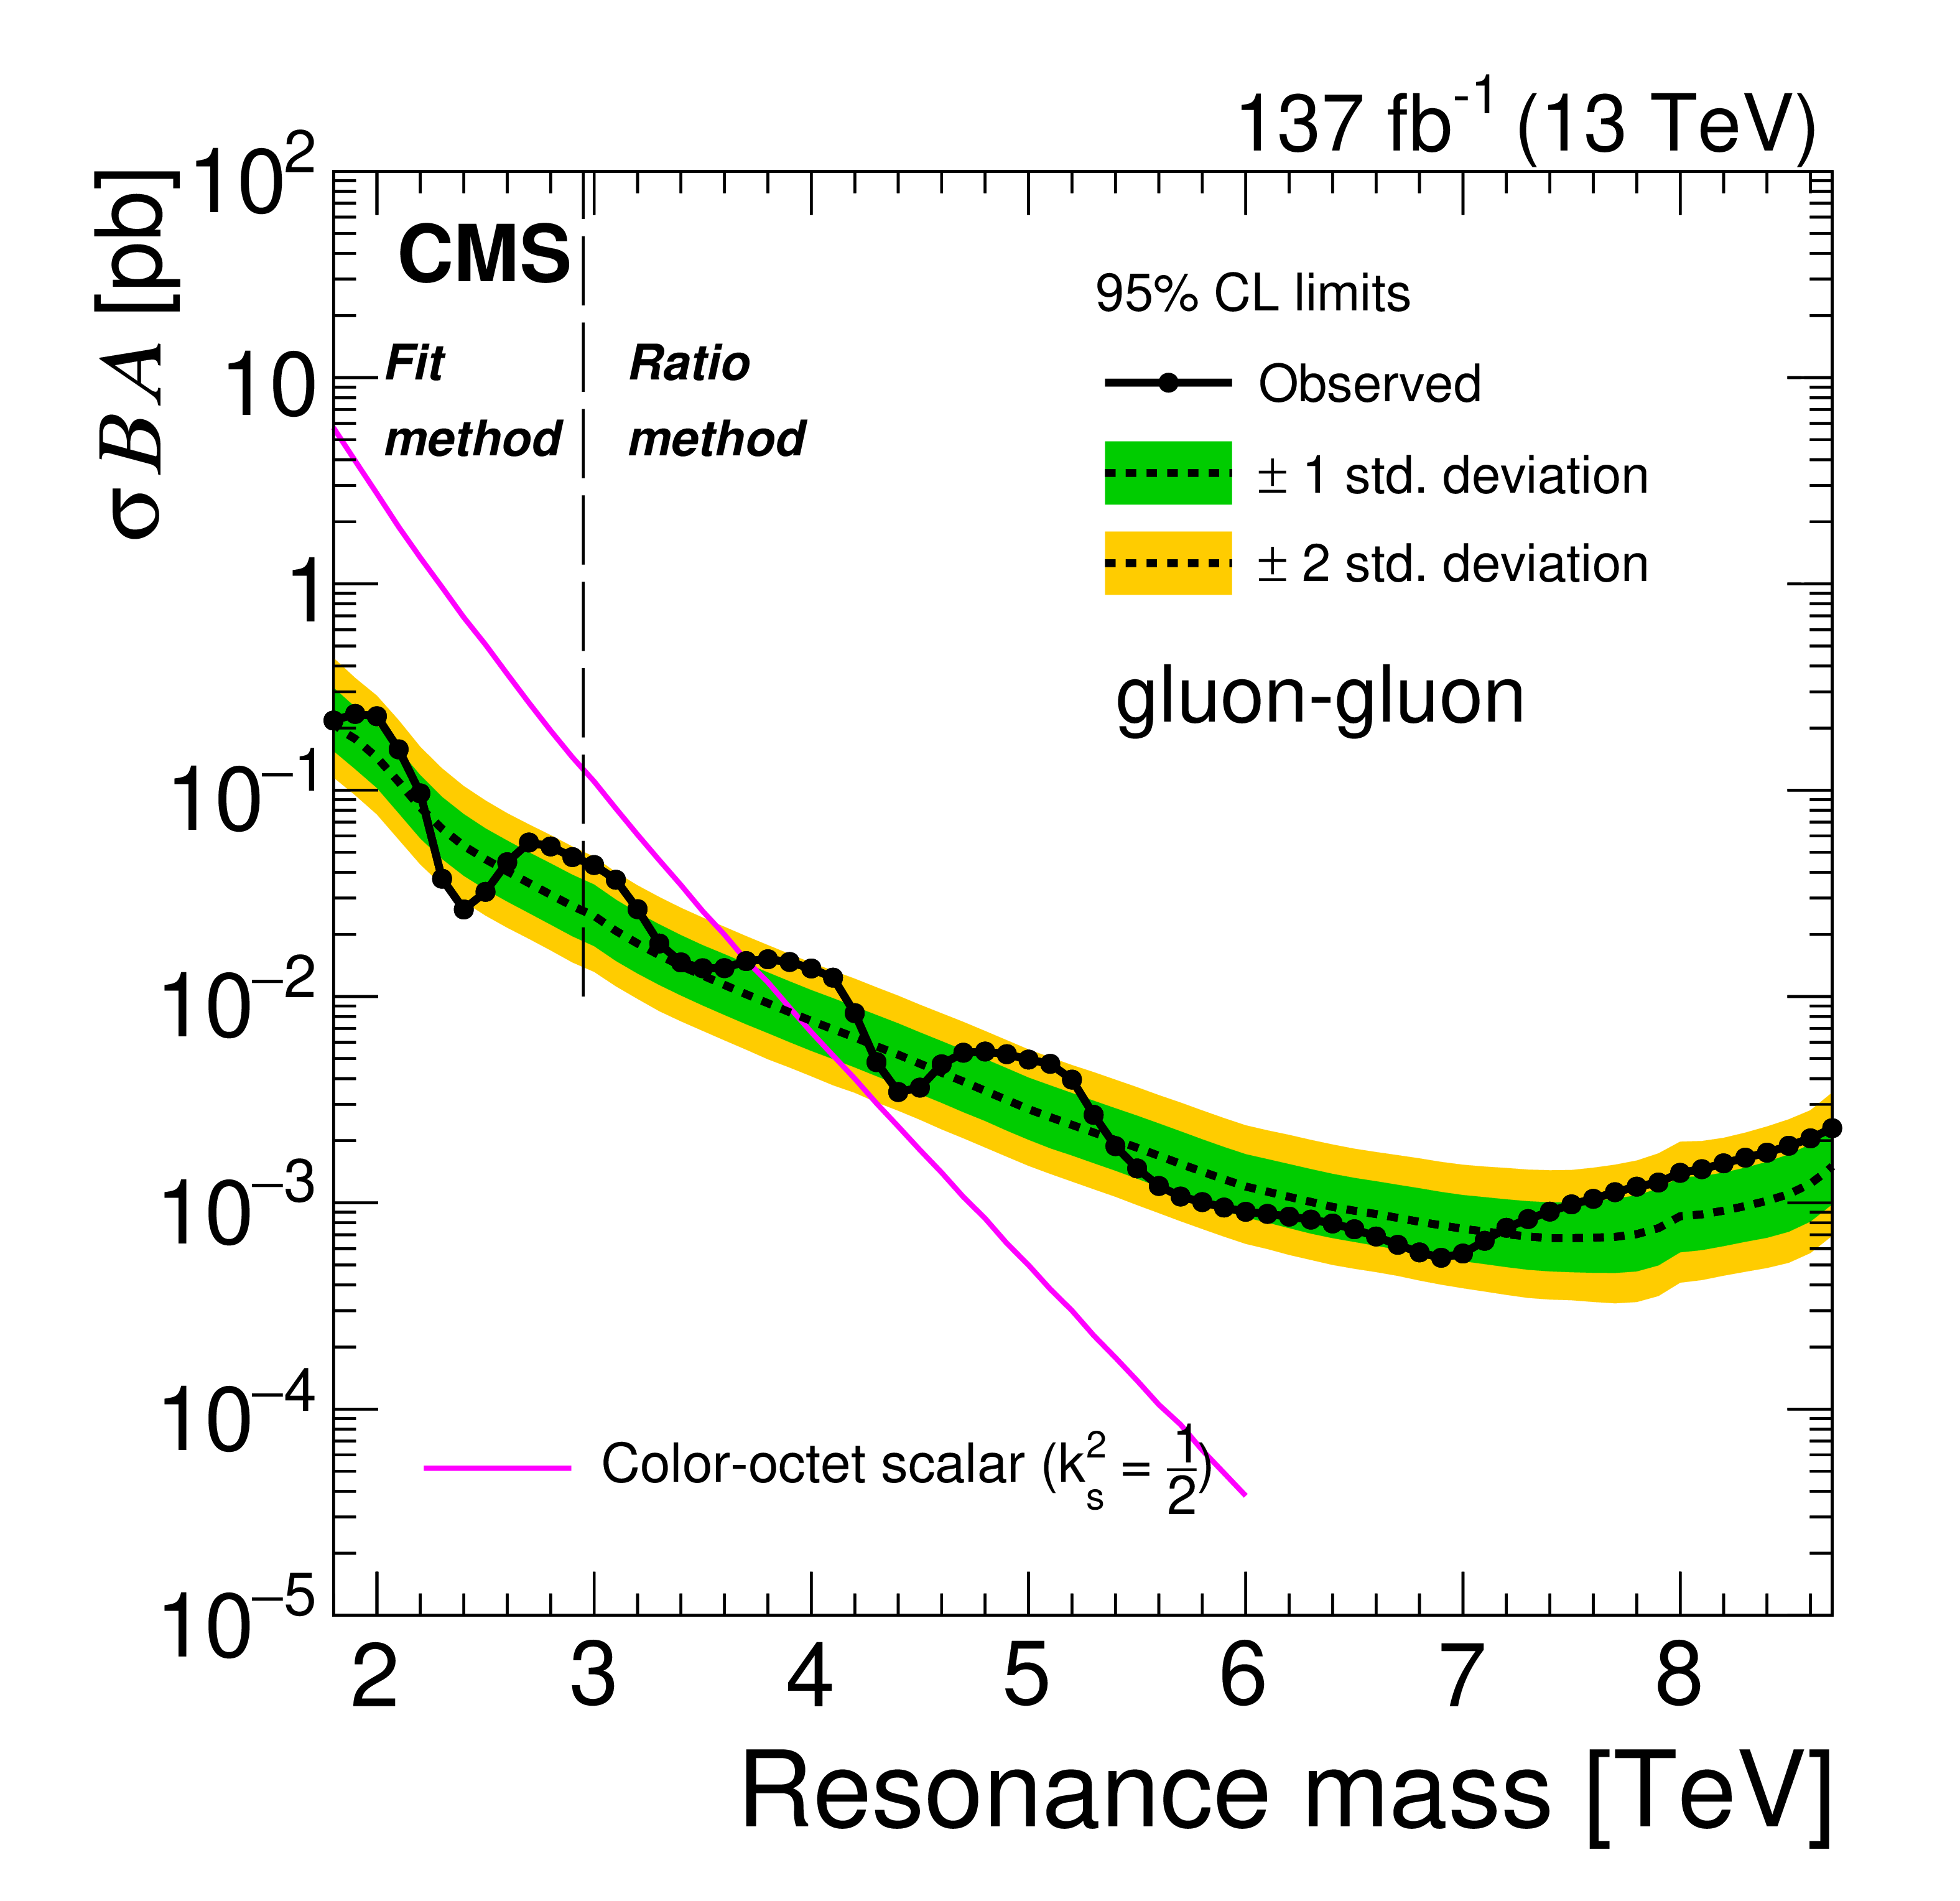
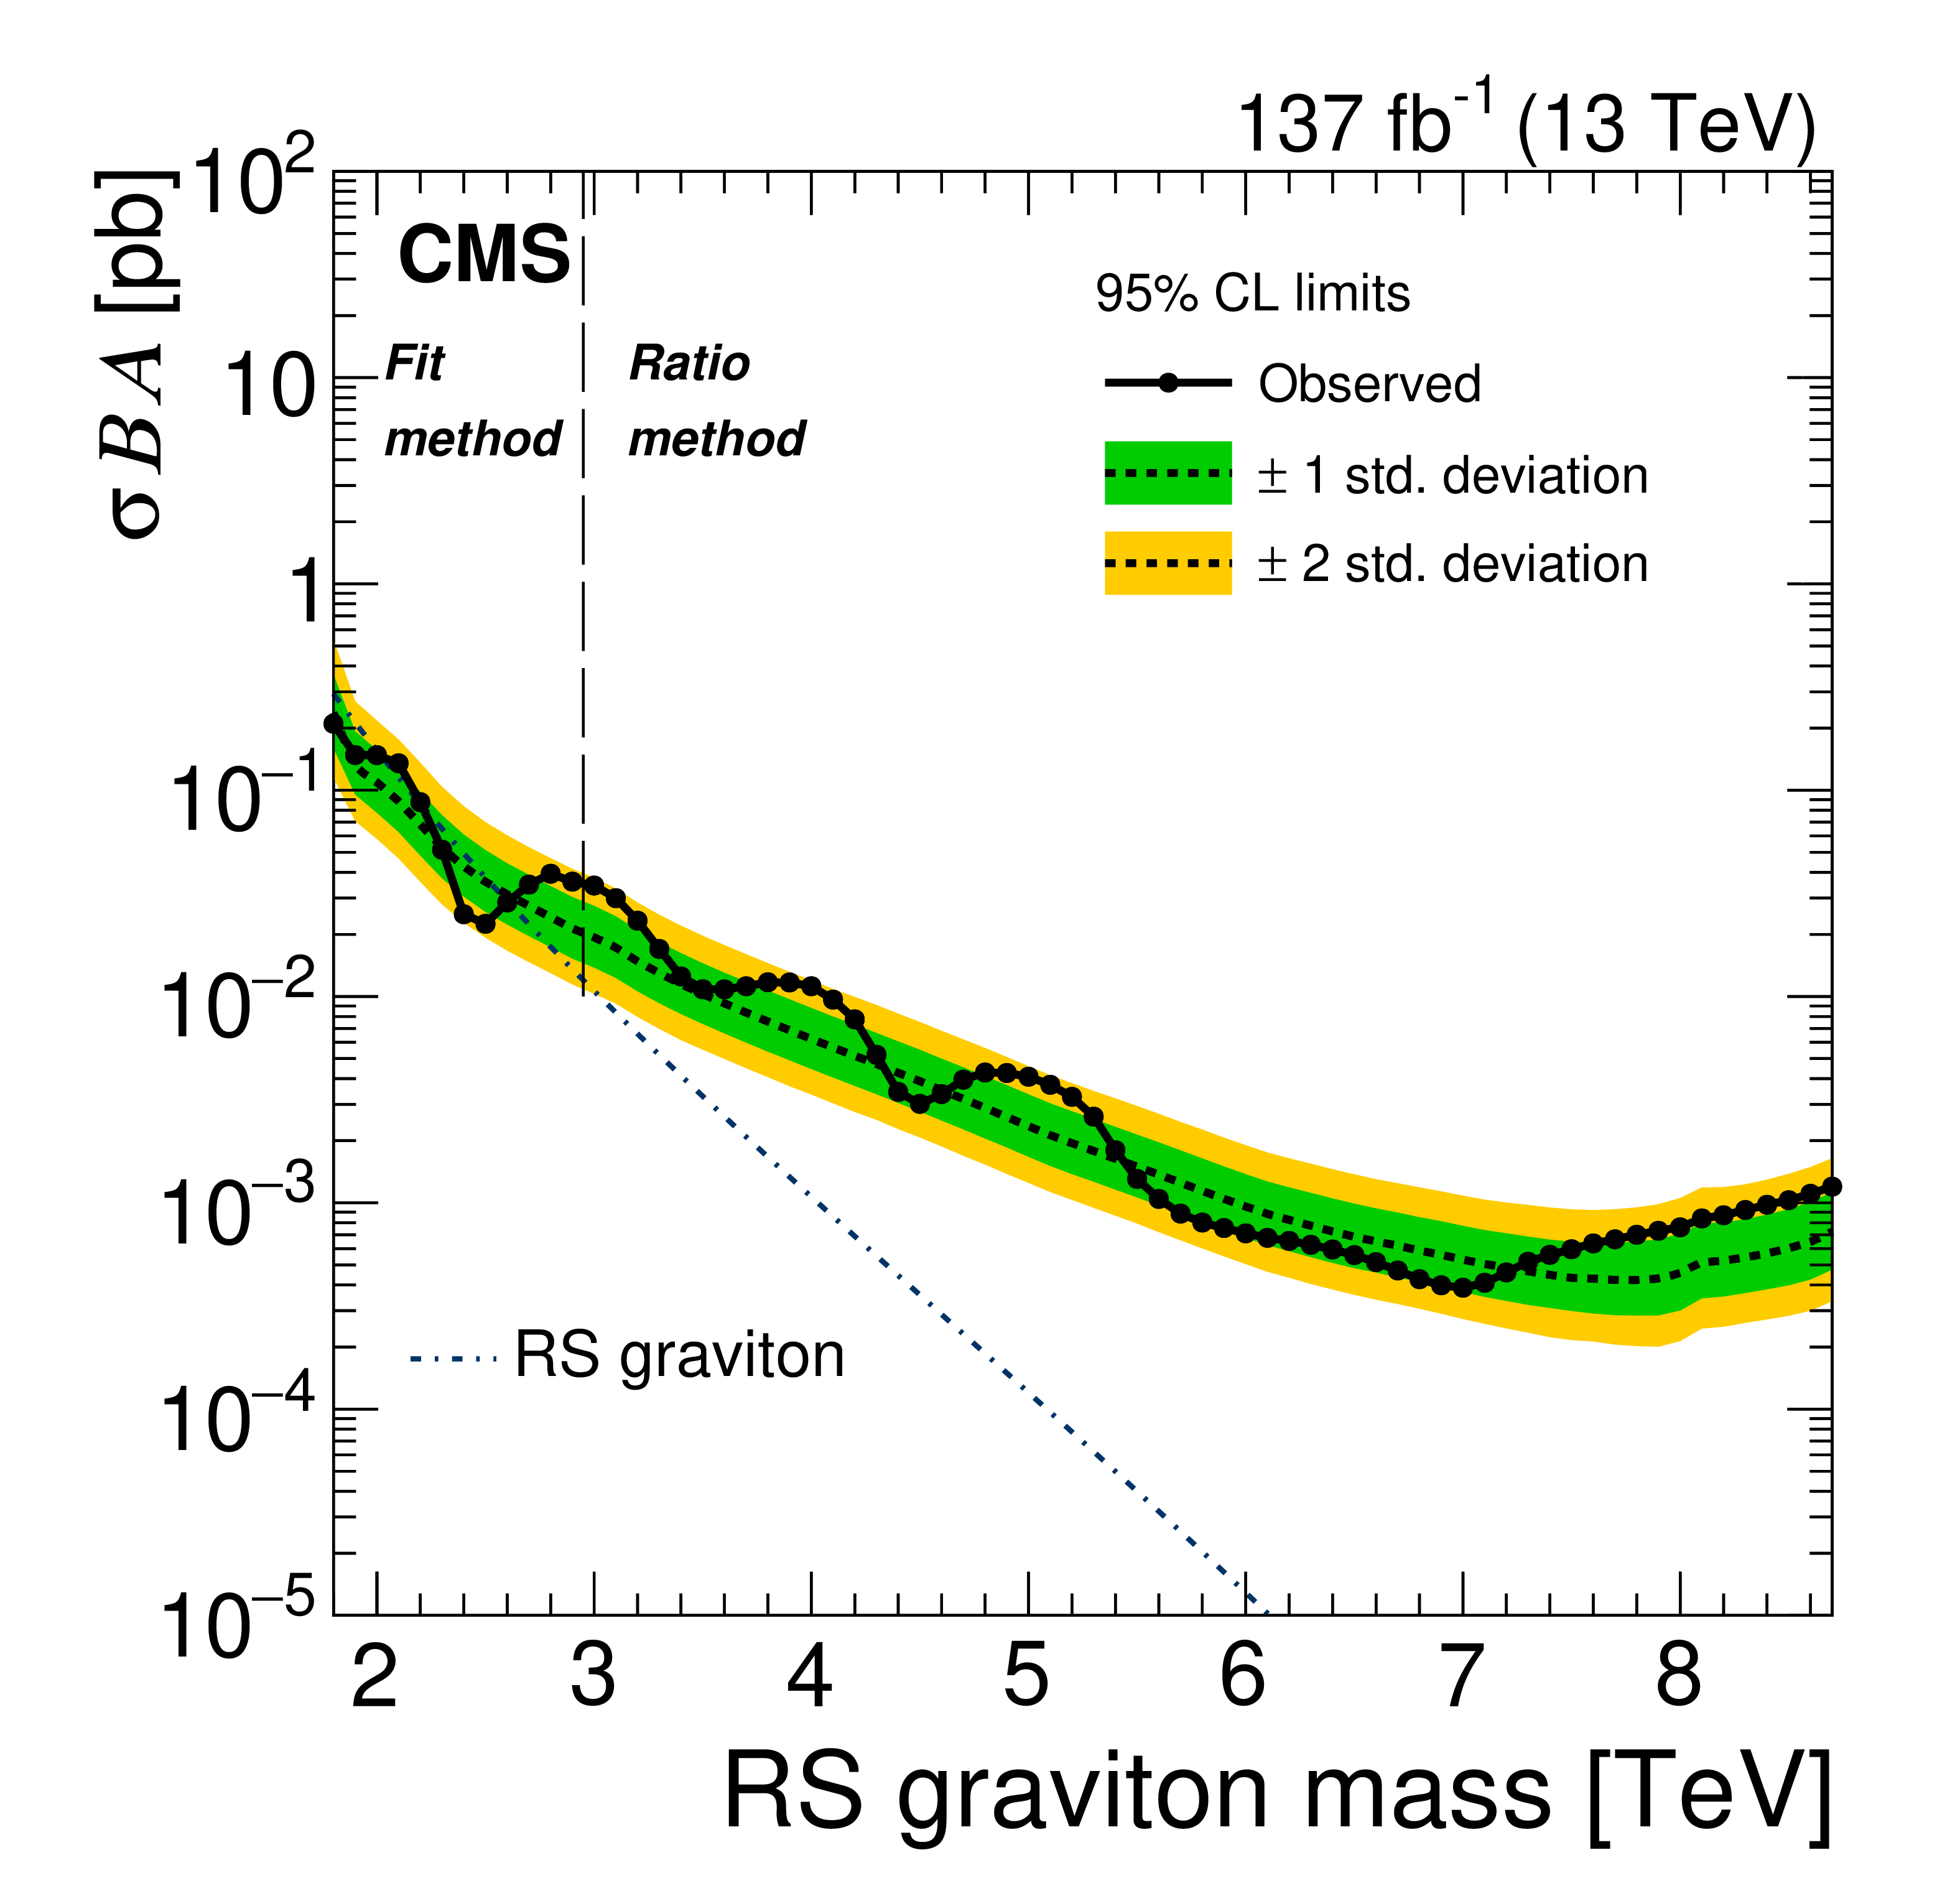
The observed 95% CL upper limits on the product of the cross section, branching fraction, and acceptance for dijet resonances decaying to quark-quark (upper left), quark-gluon (upper right), gluon-gluon (lower left), and for RS gravitons (lower right). The corresponding expected limits (dashed lines) and their variations at the one and two standard deviation levels (shaded bands) are also shown. Limits are compared to predicted cross sections for string resonances [1,2], excited quarks [4,5], axigluons [6], colorons [8], scalar diquarks [3], color-octet scalars [9], new gauge bosons W' and Z' with SM-like couplings [10], DM mediators for $ {m_{\text {DM}}} =$ 1 GeV [15,14], and RS gravitons [11]. The vertical dashed line indicates indicates the boundary between the regions where the fit method and the ratio method are used to estimate the background. |
png pdf |
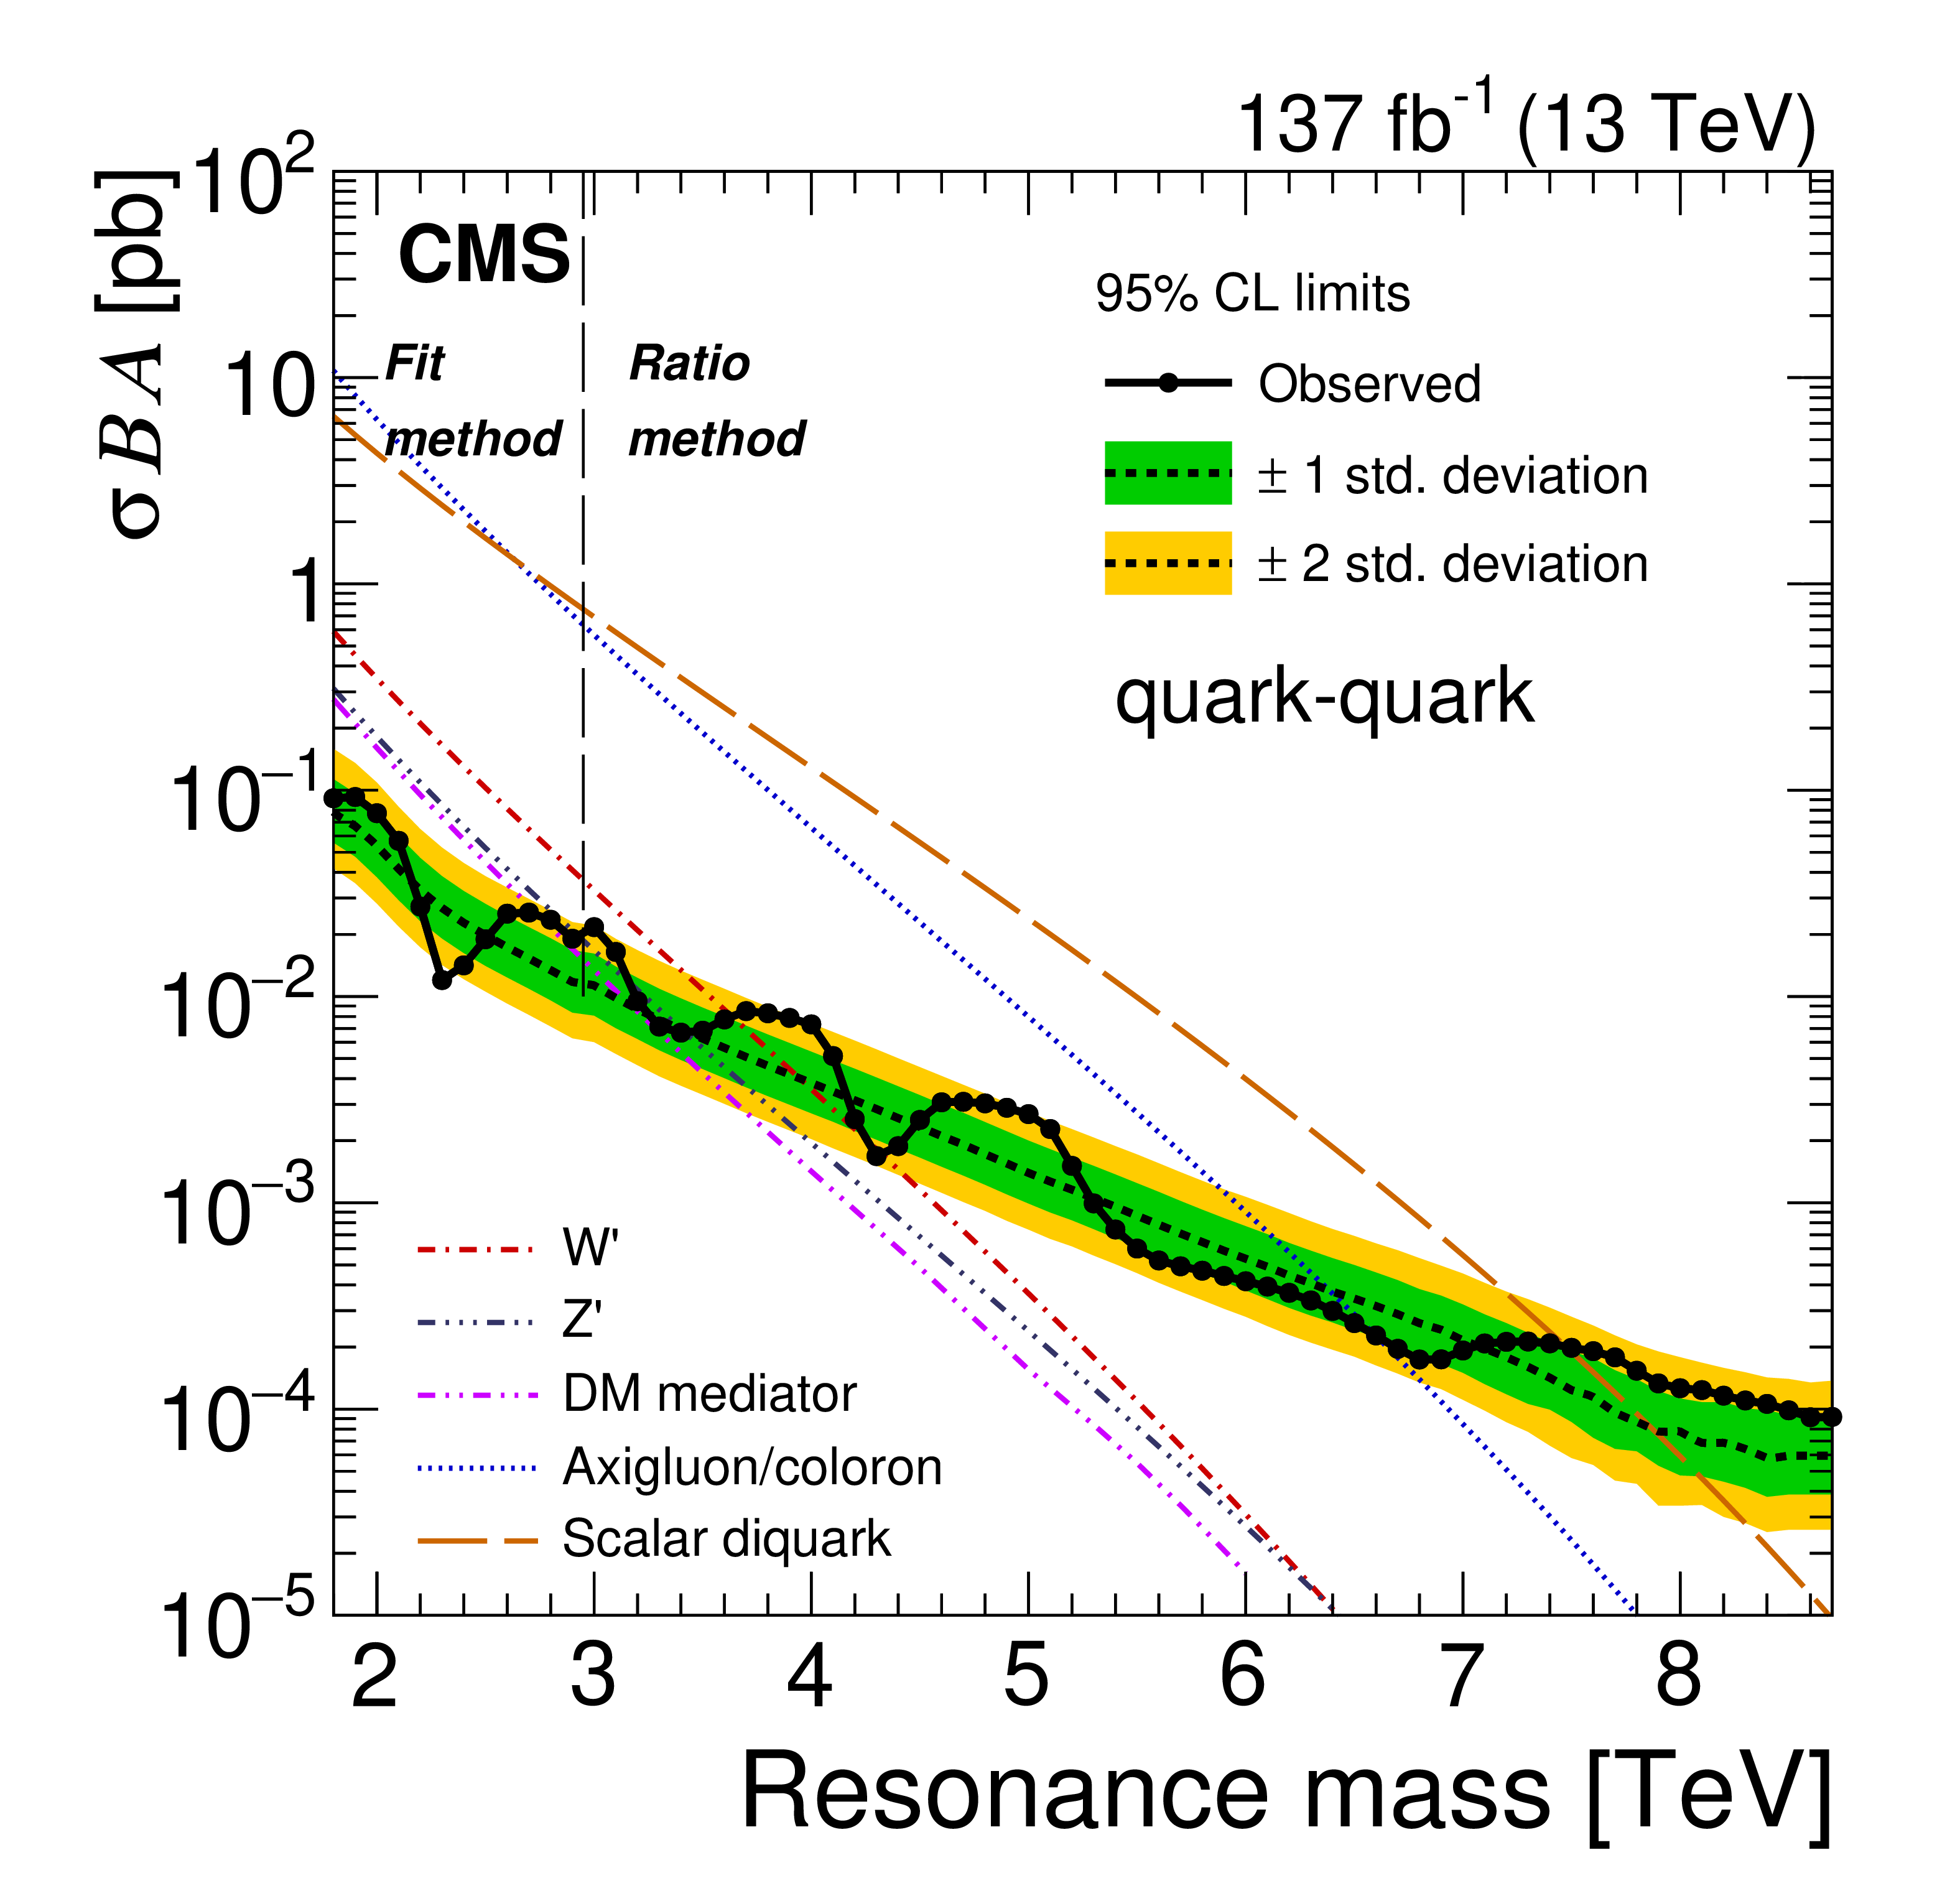
Figure 6-a:
The observed 95% CL upper limits on the product of the cross section, branching fraction, and acceptance for dijet resonances decaying to quark-quark. The corresponding expected limits (dashed lines) and their variations at the one and two standard deviation levels (shaded bands) are also shown. Limits are compared to predicted cross sections for axigluons [6], colorons [8], scalar diquarks [3], new gauge bosons W' and Z' with SM-like couplings [10]. The vertical dashed line indicates indicates the boundary between the regions where the fit method and the ratio method are used to estimate the background. |
png pdf |
Figure 6-b:
The observed 95% CL upper limits on the product of the cross section, branching fraction, and acceptance for dijet resonances decaying to quark-gluon. The corresponding expected limits (dashed lines) and their variations at the one and two standard deviation levels (shaded bands) are also shown. Limits are compared to predicted cross sections for string resonances [1,2], excited quarks [4,5]. The vertical dashed line indicates indicates the boundary between the regions where the fit method and the ratio method are used to estimate the background. |
png pdf |
Figure 6-c:
The observed 95% CL upper limits on the product of the cross section, branching fraction, and acceptance for dijet resonances decaying to gluon-gluon. The corresponding expected limits (dashed lines) and their variations at the one and two standard deviation levels (shaded bands) are also shown. Limits are compared to predicted cross sections for color-octet scalars [9]. The vertical dashed line indicates indicates the boundary between the regions where the fit method and the ratio method are used to estimate the background. |
png pdf |
Figure 6-d:
The observed 95% CL upper limits on the product of the cross section, branching fraction, and acceptance for RS gravitons. The corresponding expected limits (dashed lines) and their variations at the one and two standard deviation levels (shaded bands) are also shown. Limits are compared to predicted cross sections for RS gravitons [11]. The vertical dashed line indicates indicates the boundary between the regions where the fit method and the ratio method are used to estimate the background. |
png pdf |
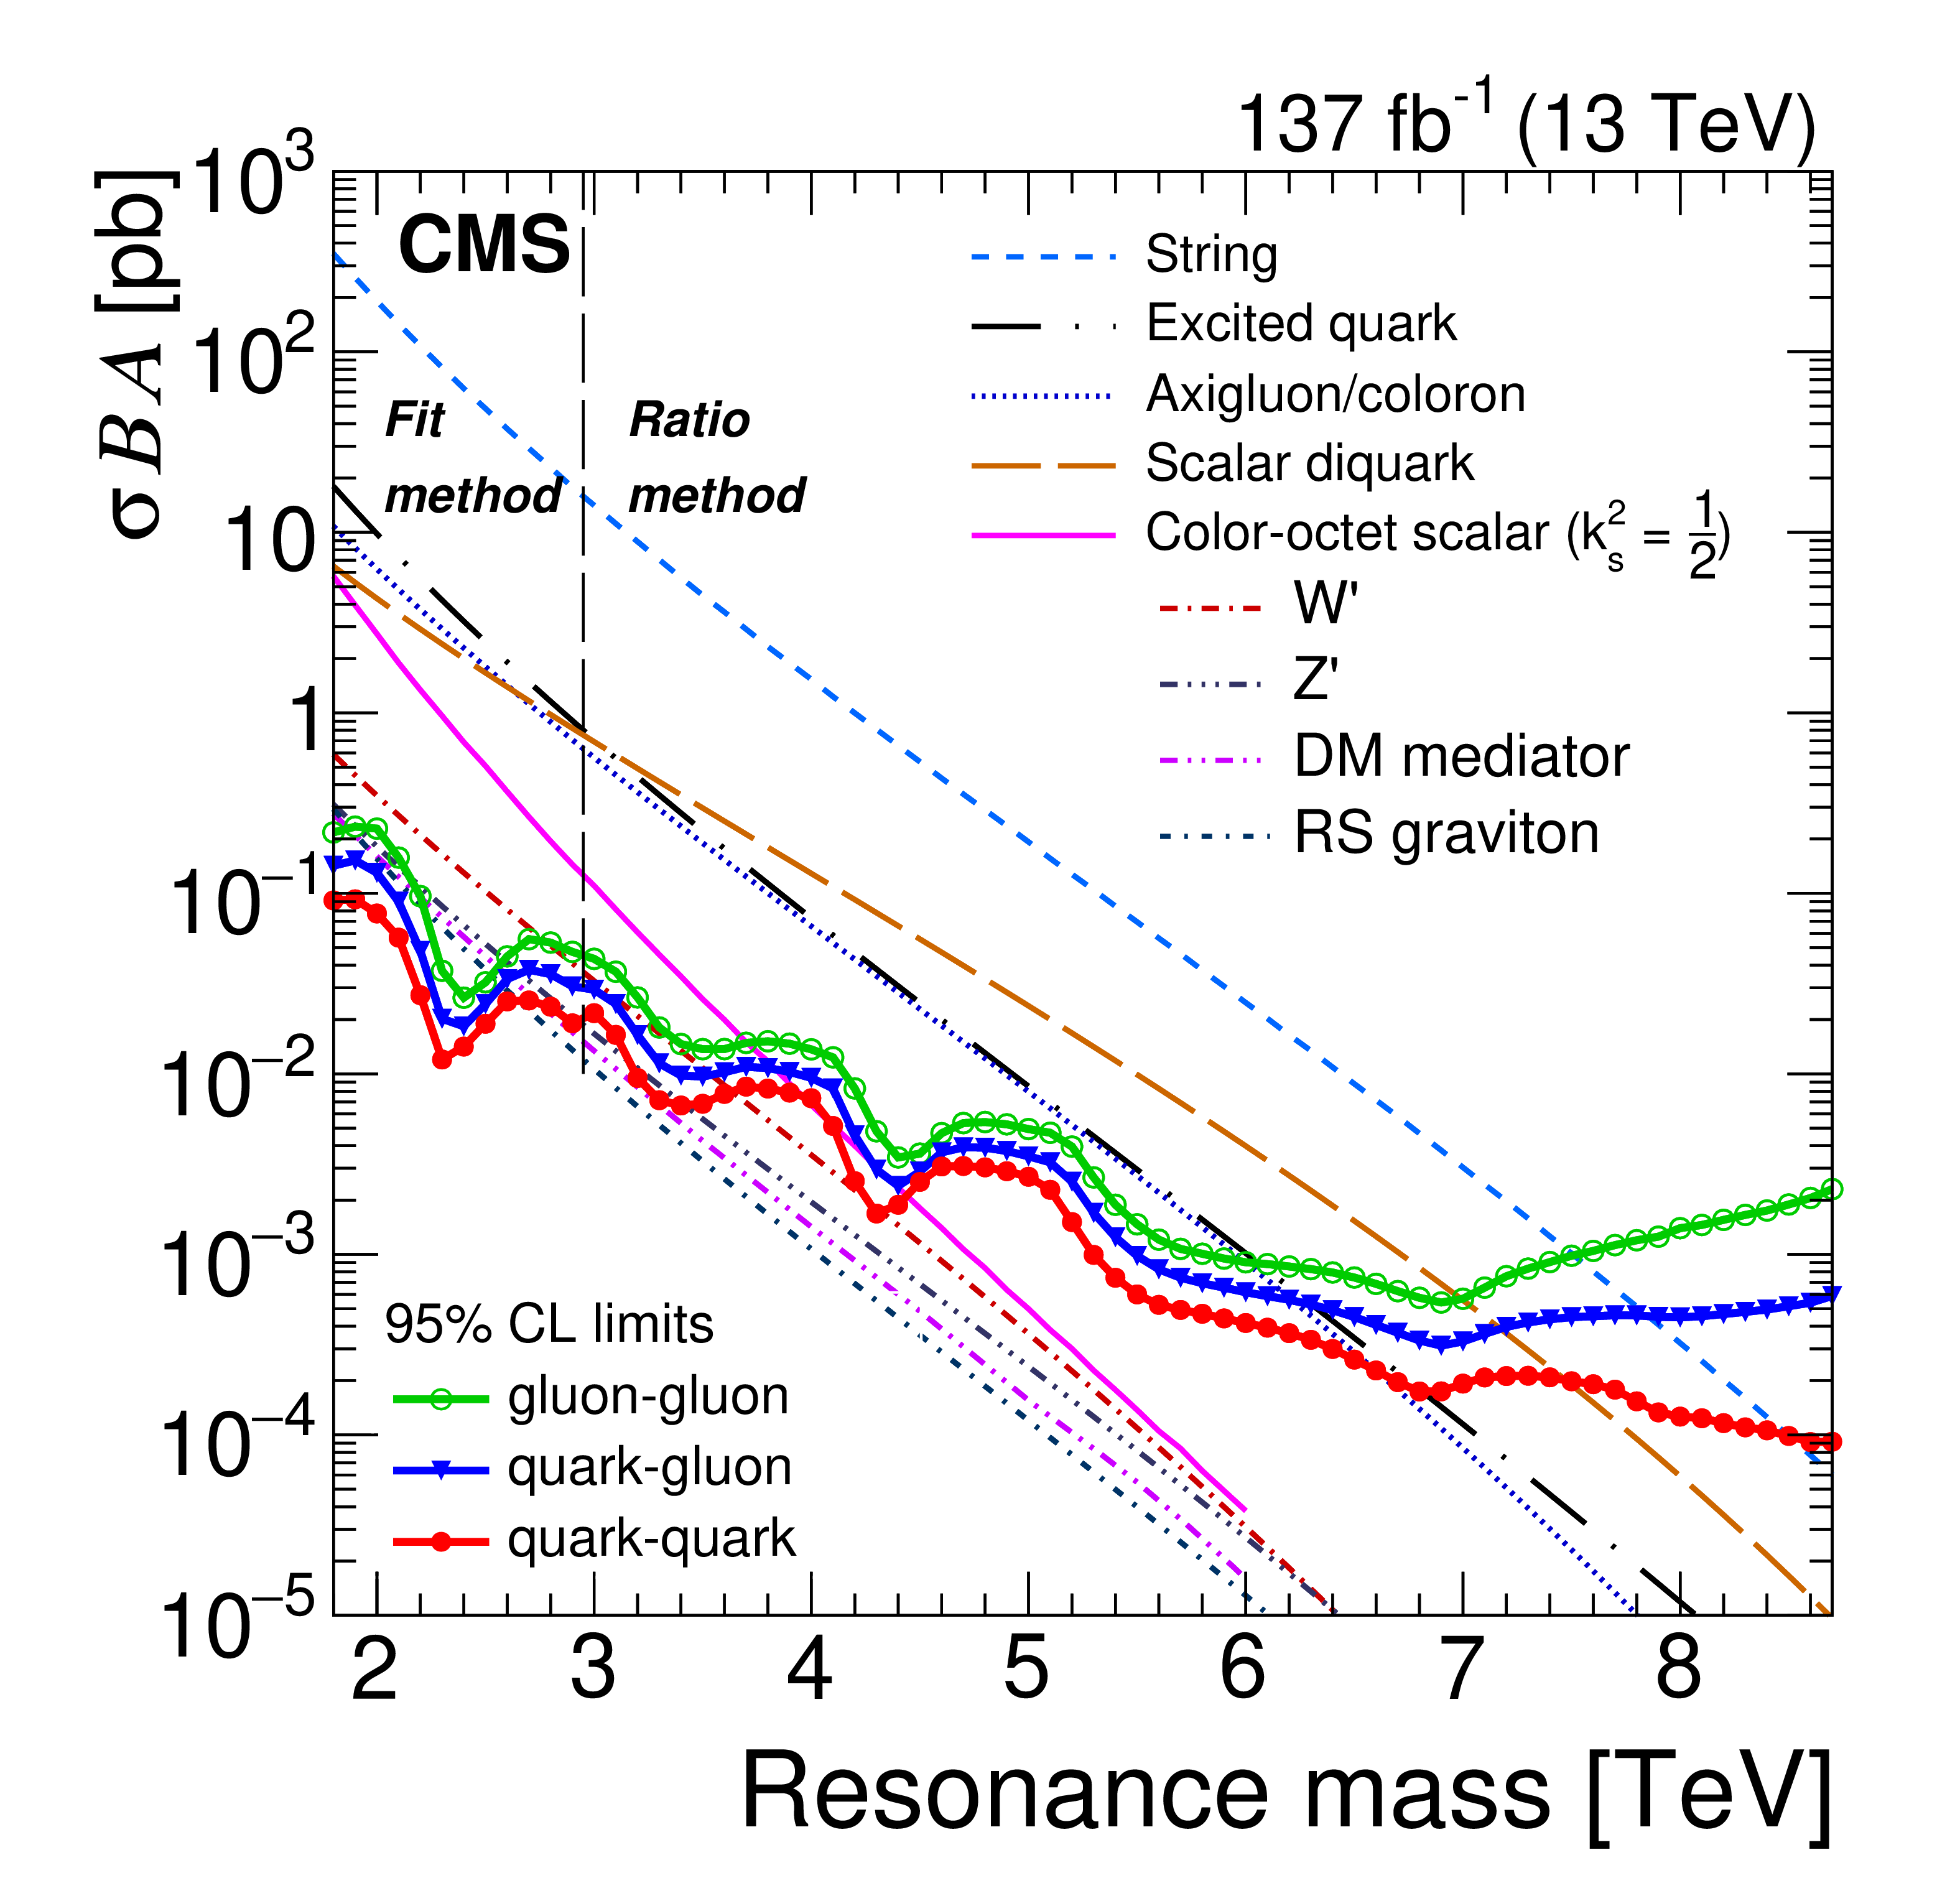
Figure 7:
The observed 95% CL upper limits on the product of the cross section, branching fraction, and acceptance for quark-quark, quark-gluon, and gluon-gluon type dijet resonances. Limits are compared to predicted cross sections for string resonances [1,2], excited quarks [4,5], axigluons [6], colorons [8], scalar diquarks [3], color-octet scalars [9], new gauge bosons W' and Z' with SM-like couplings [10], DM mediators for $ {m_{\text {DM}}} =$ 1 GeV [15,14], and RS gravitons [11]. The vertical dashed line indicates indicates the boundary between the regions where the fit method and the ratio method are used to estimate the background. |
png pdf |
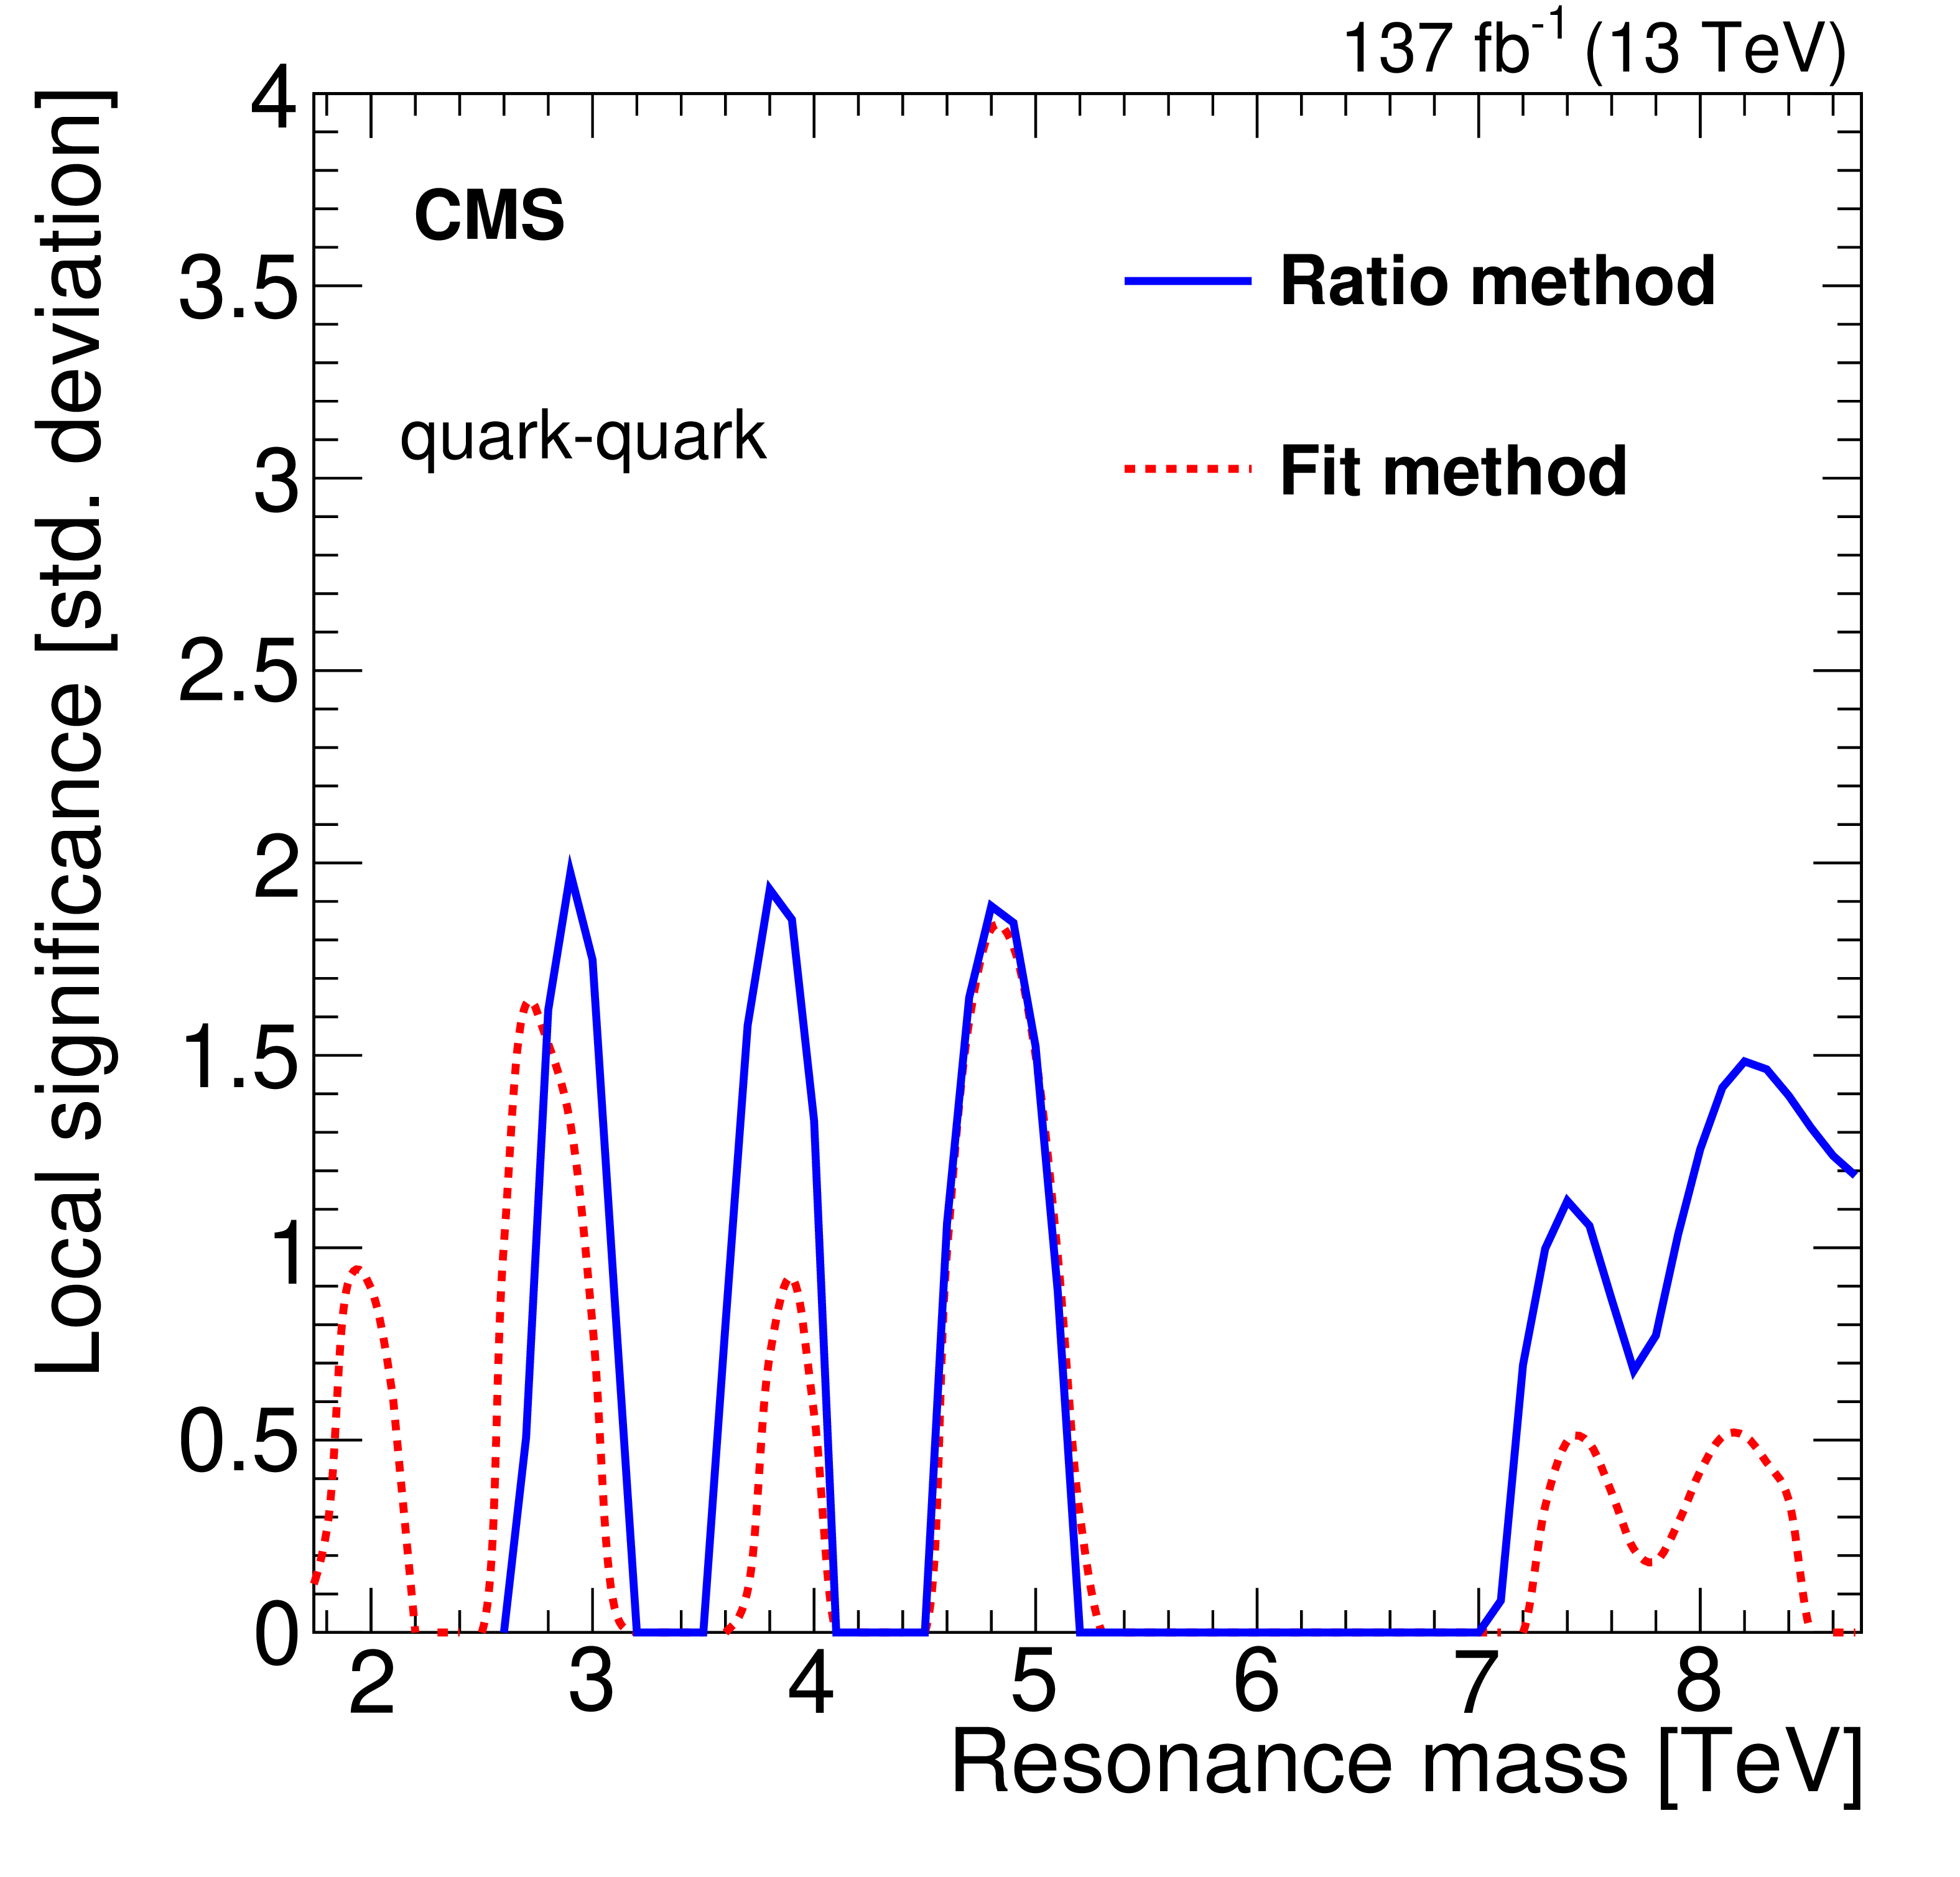
Figure 8:
Local significance for a $\mathrm{q} \mathrm{q} $ resonance with the ratio method (blue line) and the fit method (red dashed line). |
png pdf |
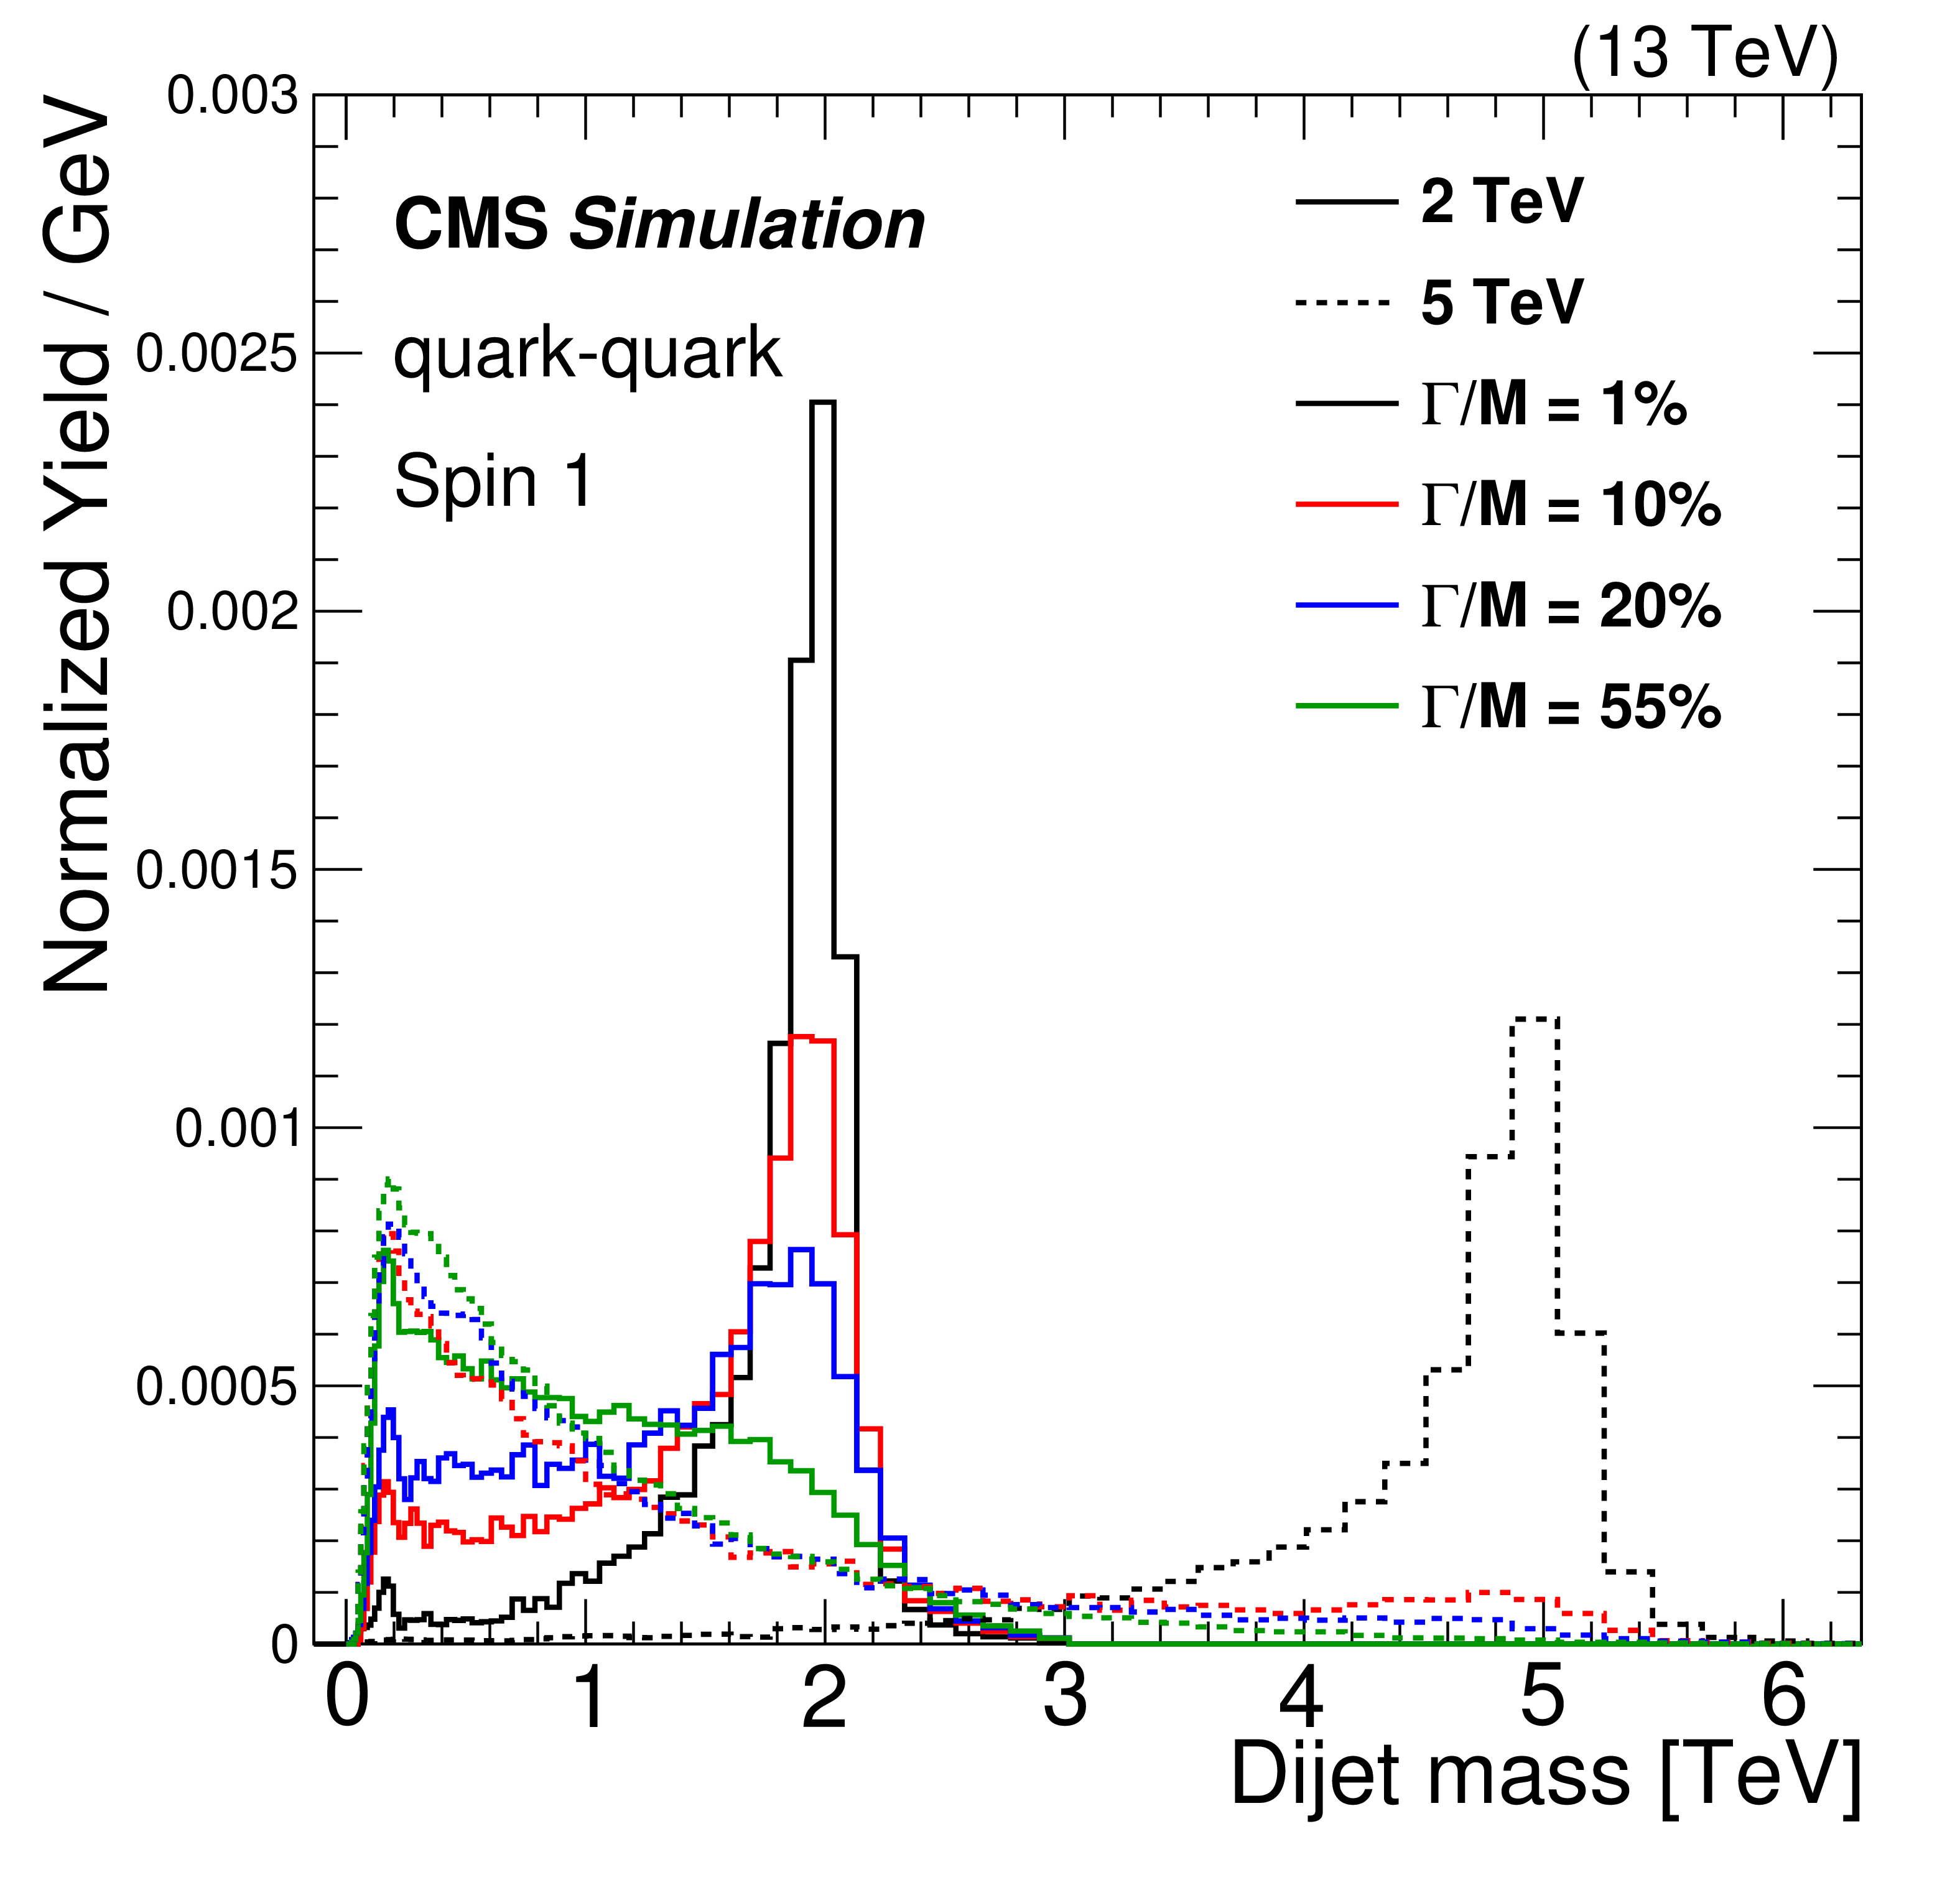
Figure 9:
The reconstructed dijet mass spectra for a vector particle decaying to pairs of quarks are shown for a resonance mass of 2 TeV (solid histogram) and 5 TeV (dashed histogram) for various values of intrinsic width, estimated from the MadGraph {5} and PYTHIA event generators followed by the simulation of the CMS detector response. |
png pdf |
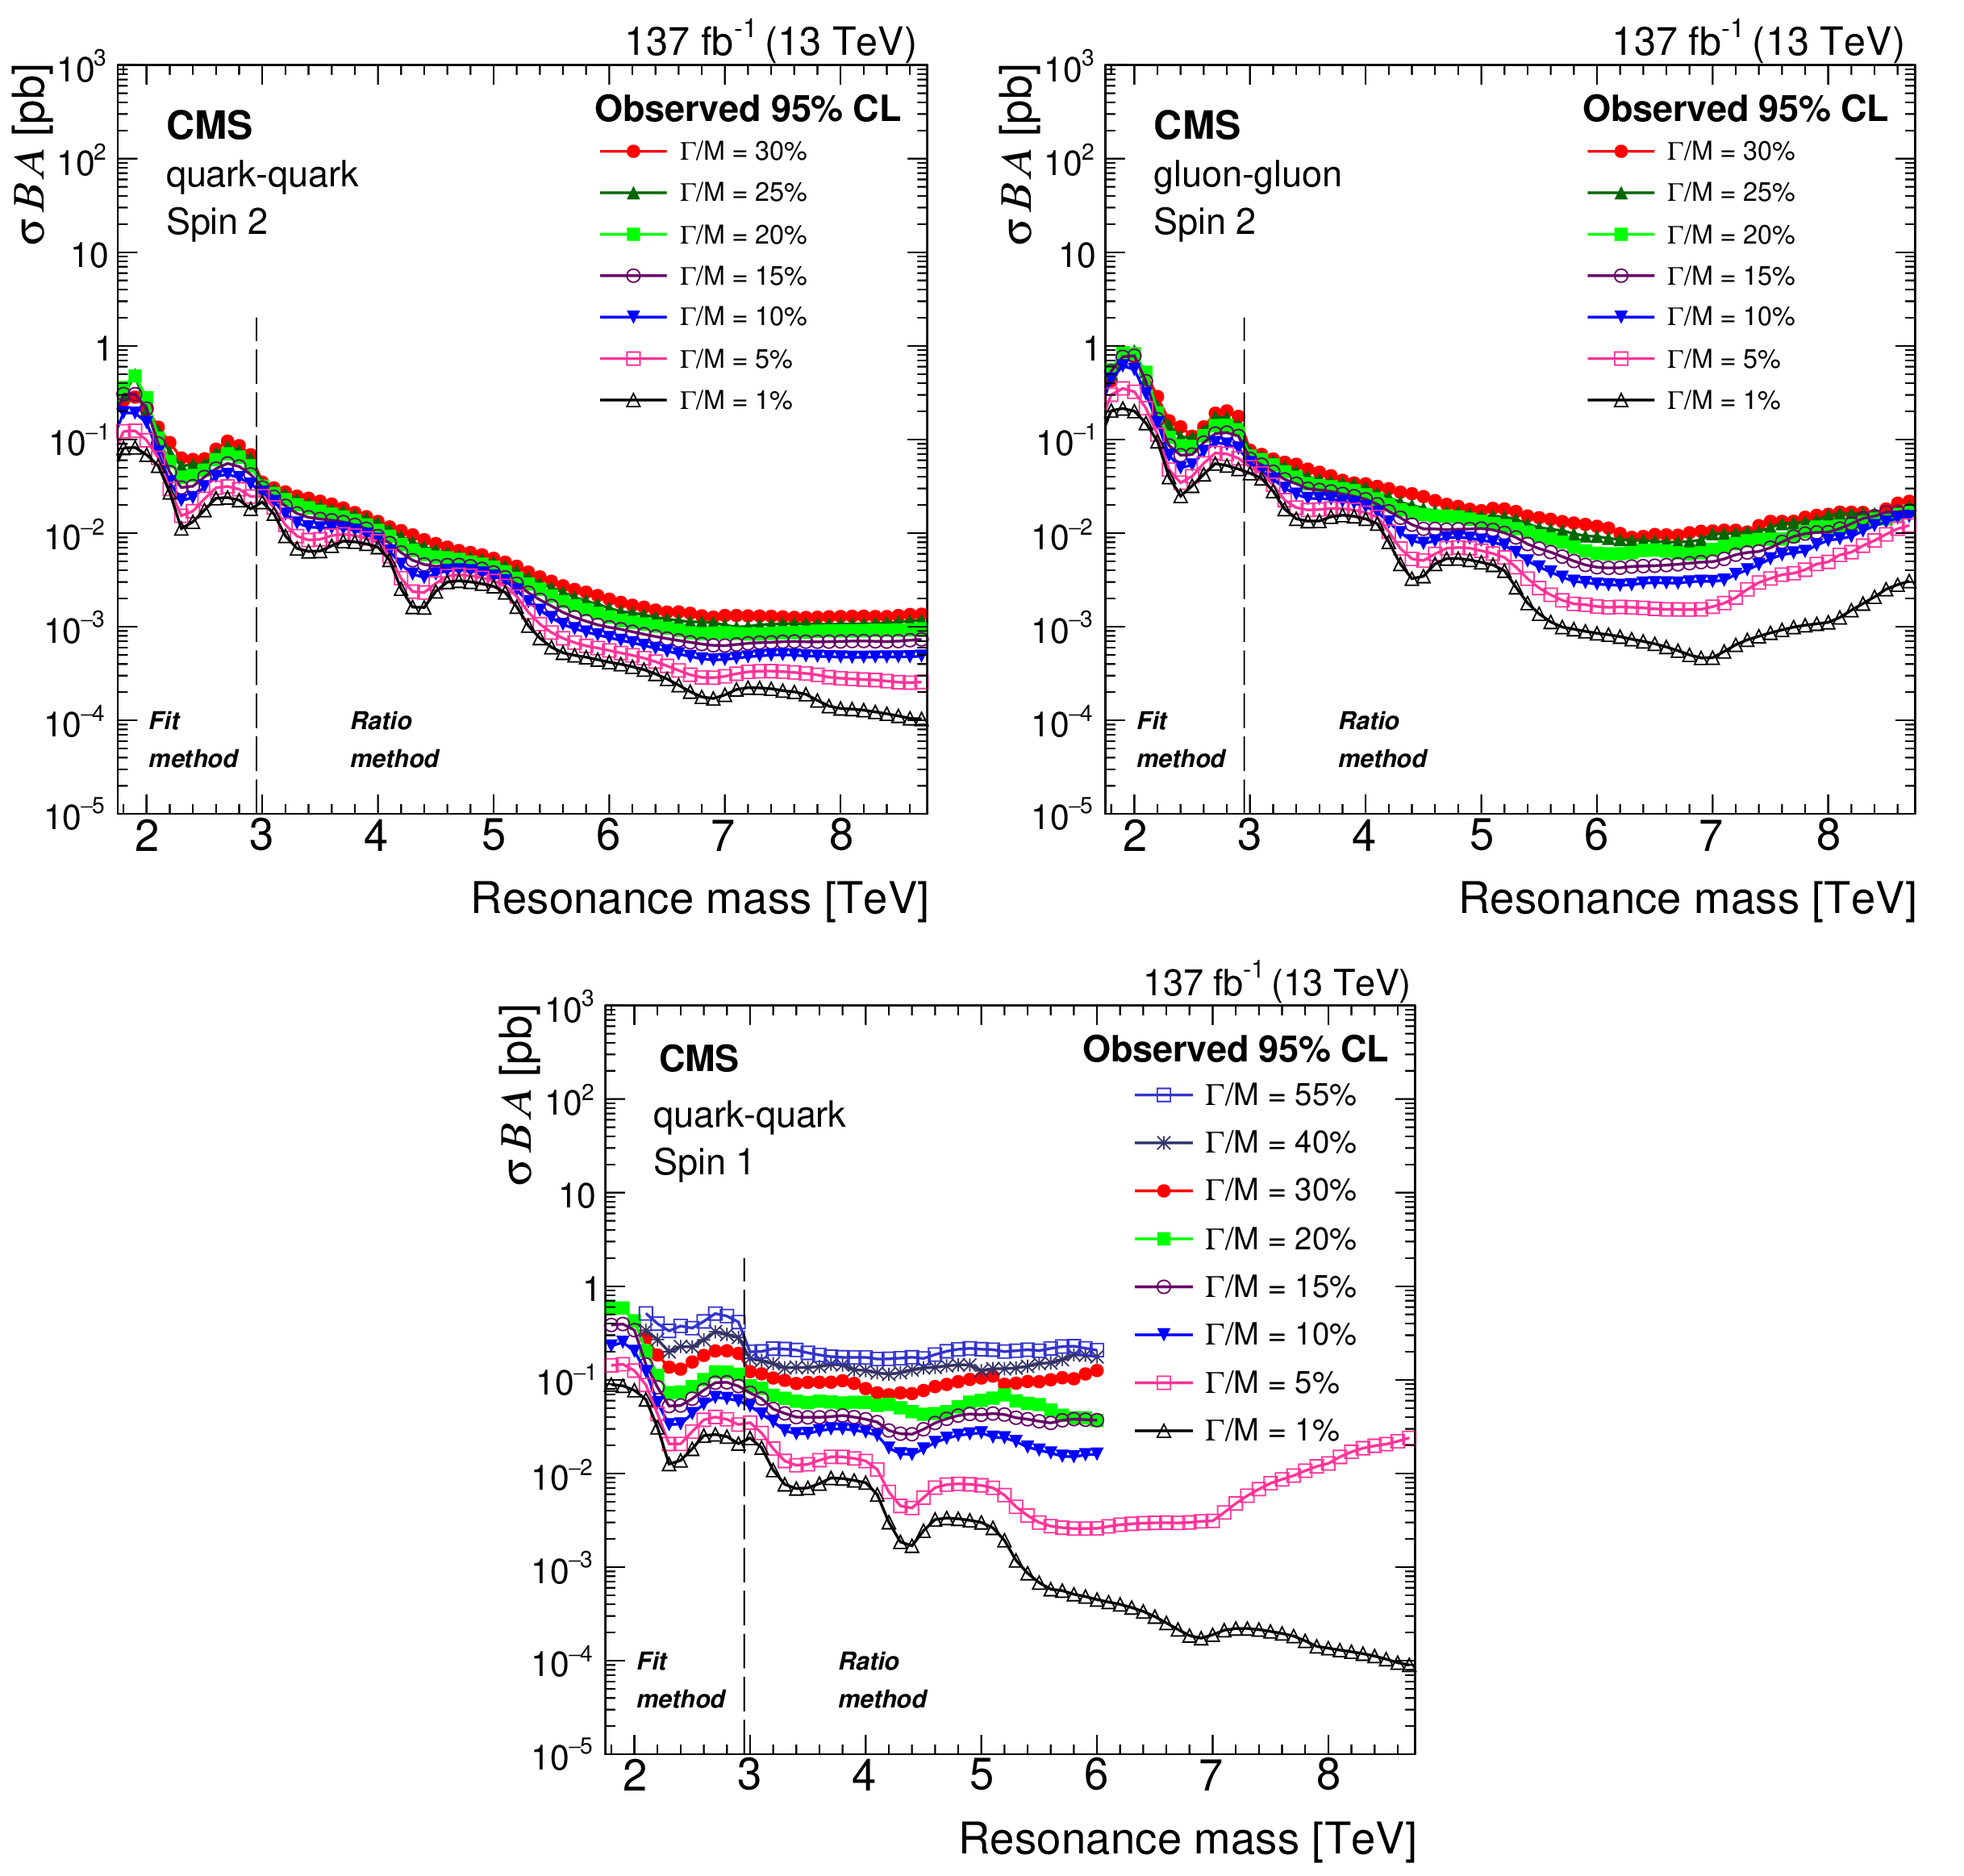
Figure 10:
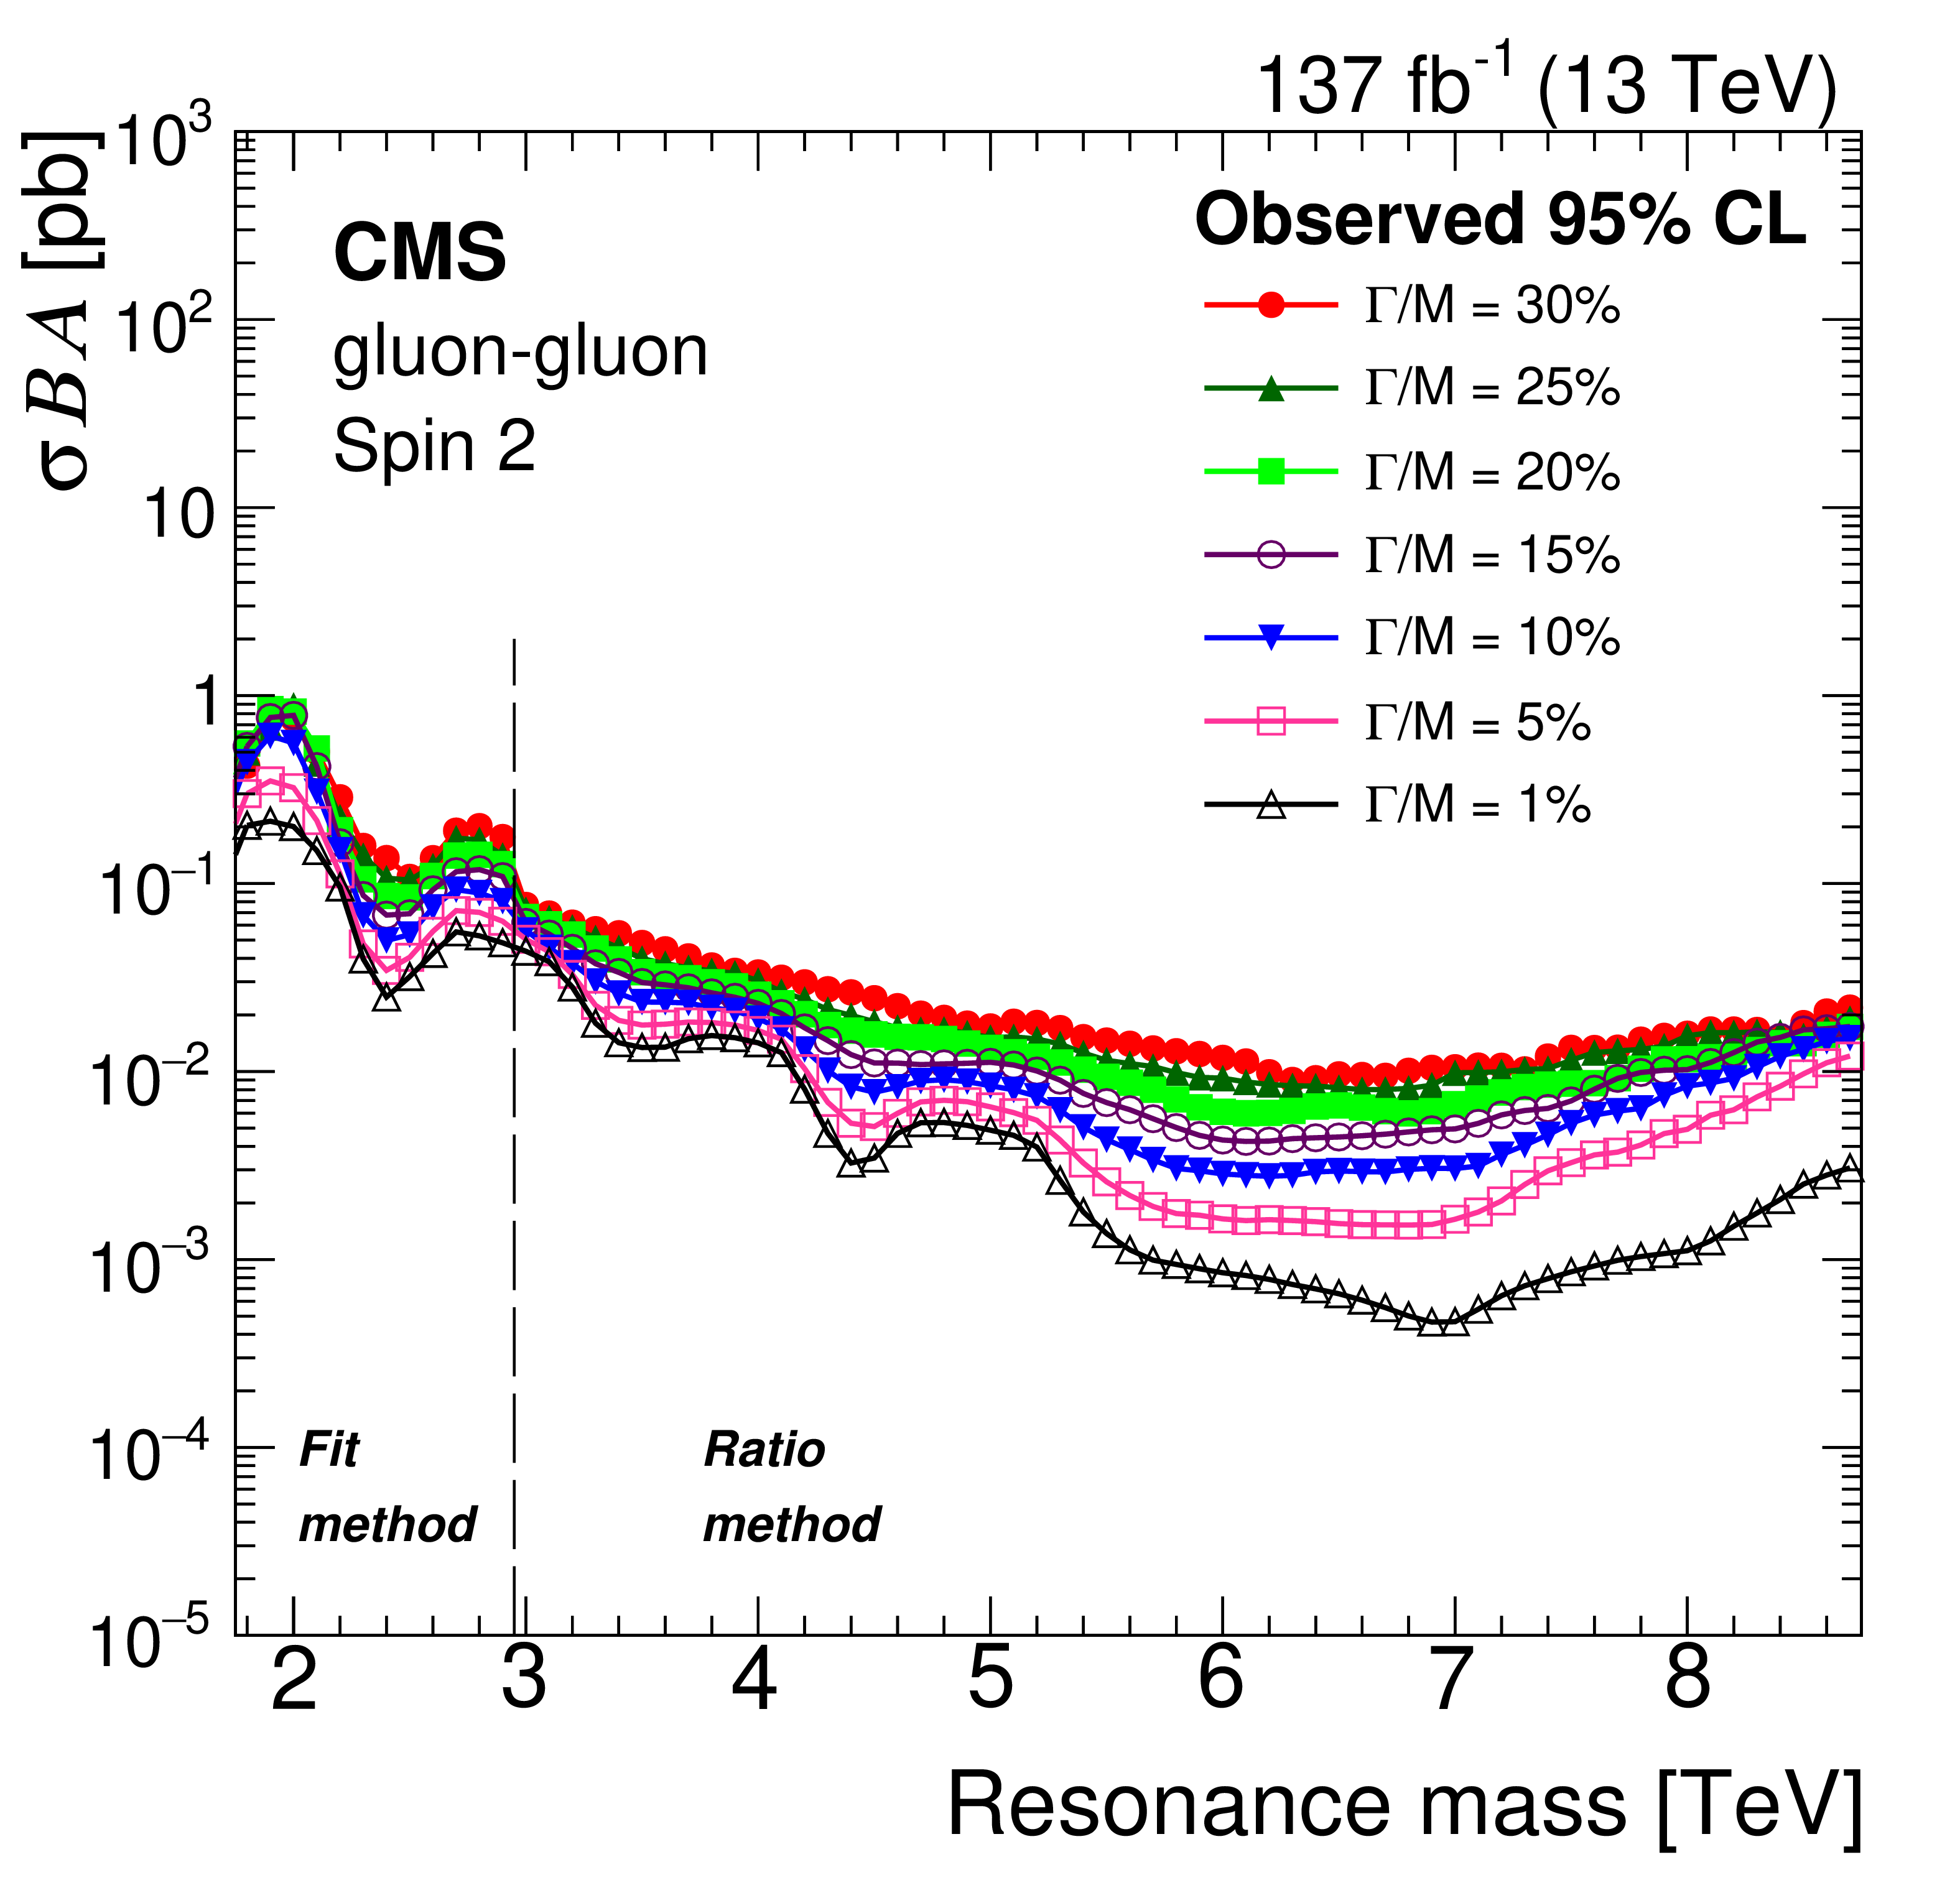
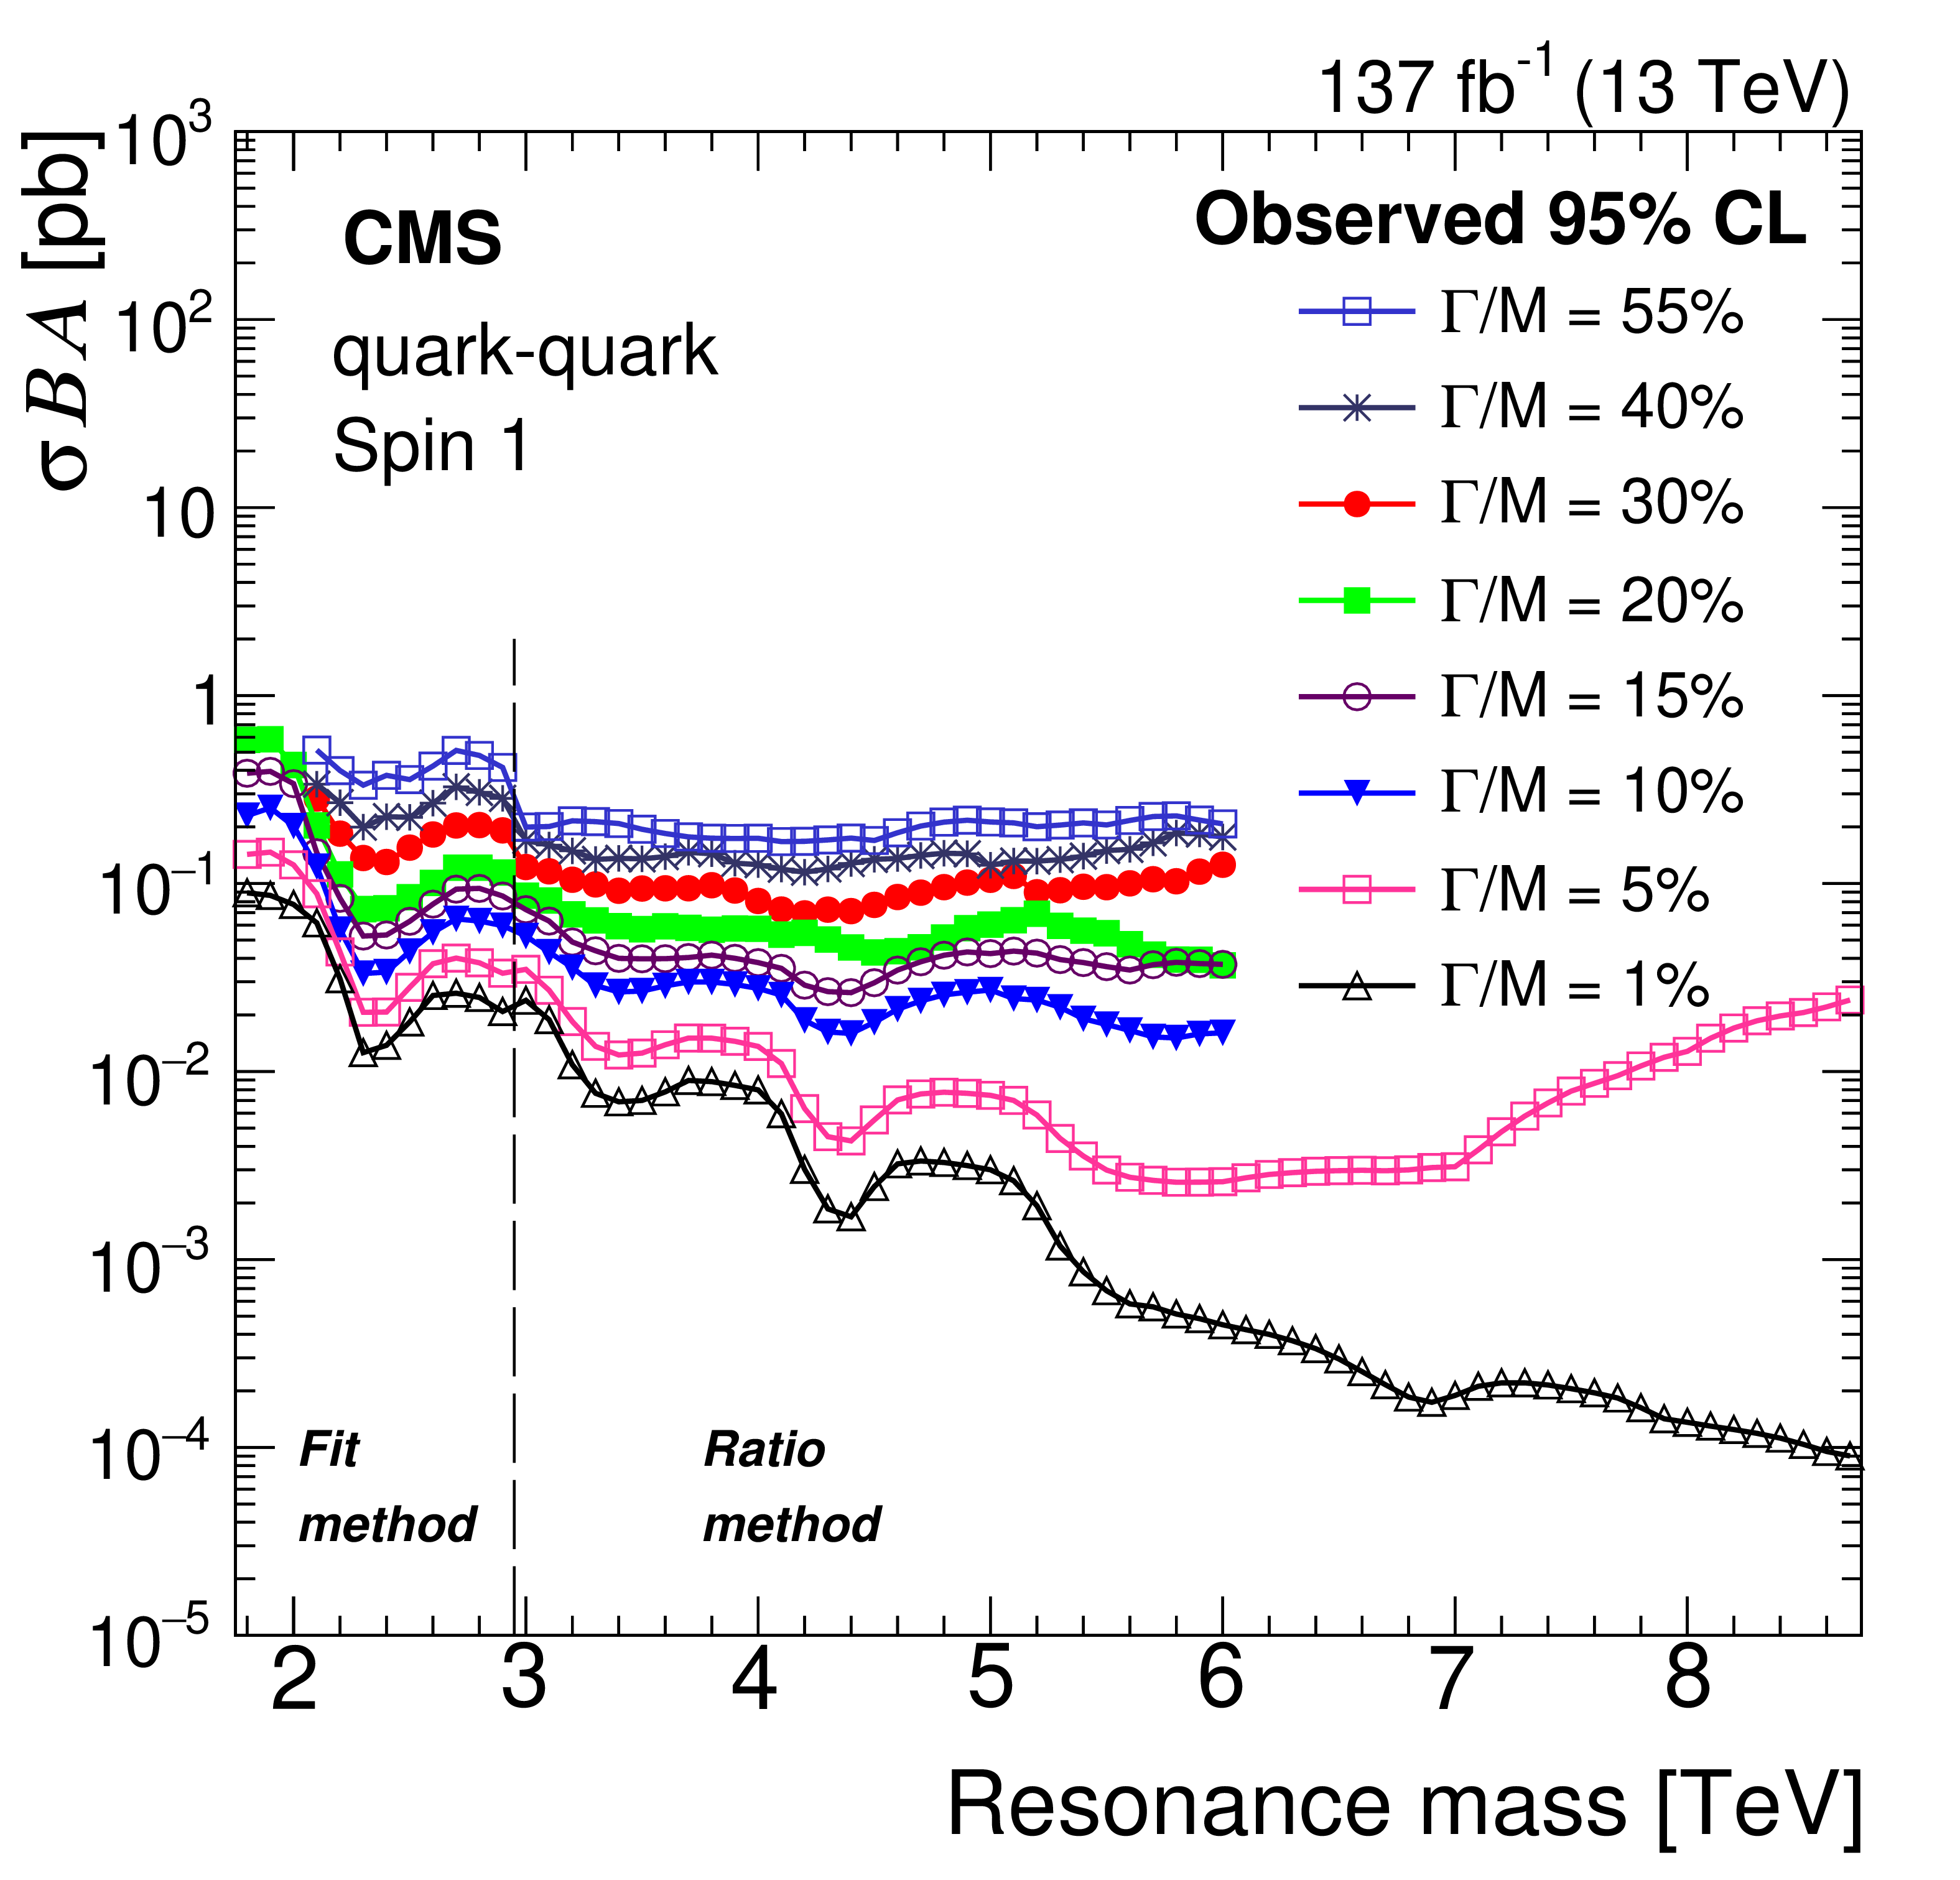
The observed 95% CL upper limits on the product of the cross section, branching fraction, and acceptance for spin-2 resonances produced and decaying in the quark-quark (upper left) and gluon-gluon (upper right) channels, as well as for spin-1 resonances decaying in the quark-quark channel (lower), shown for various values of intrinsic width as a function of resonance mass. The vertical dashed line indicates indicates the boundary between the regions where the fit method and the ratio method are used to estimate the background. |
png pdf |
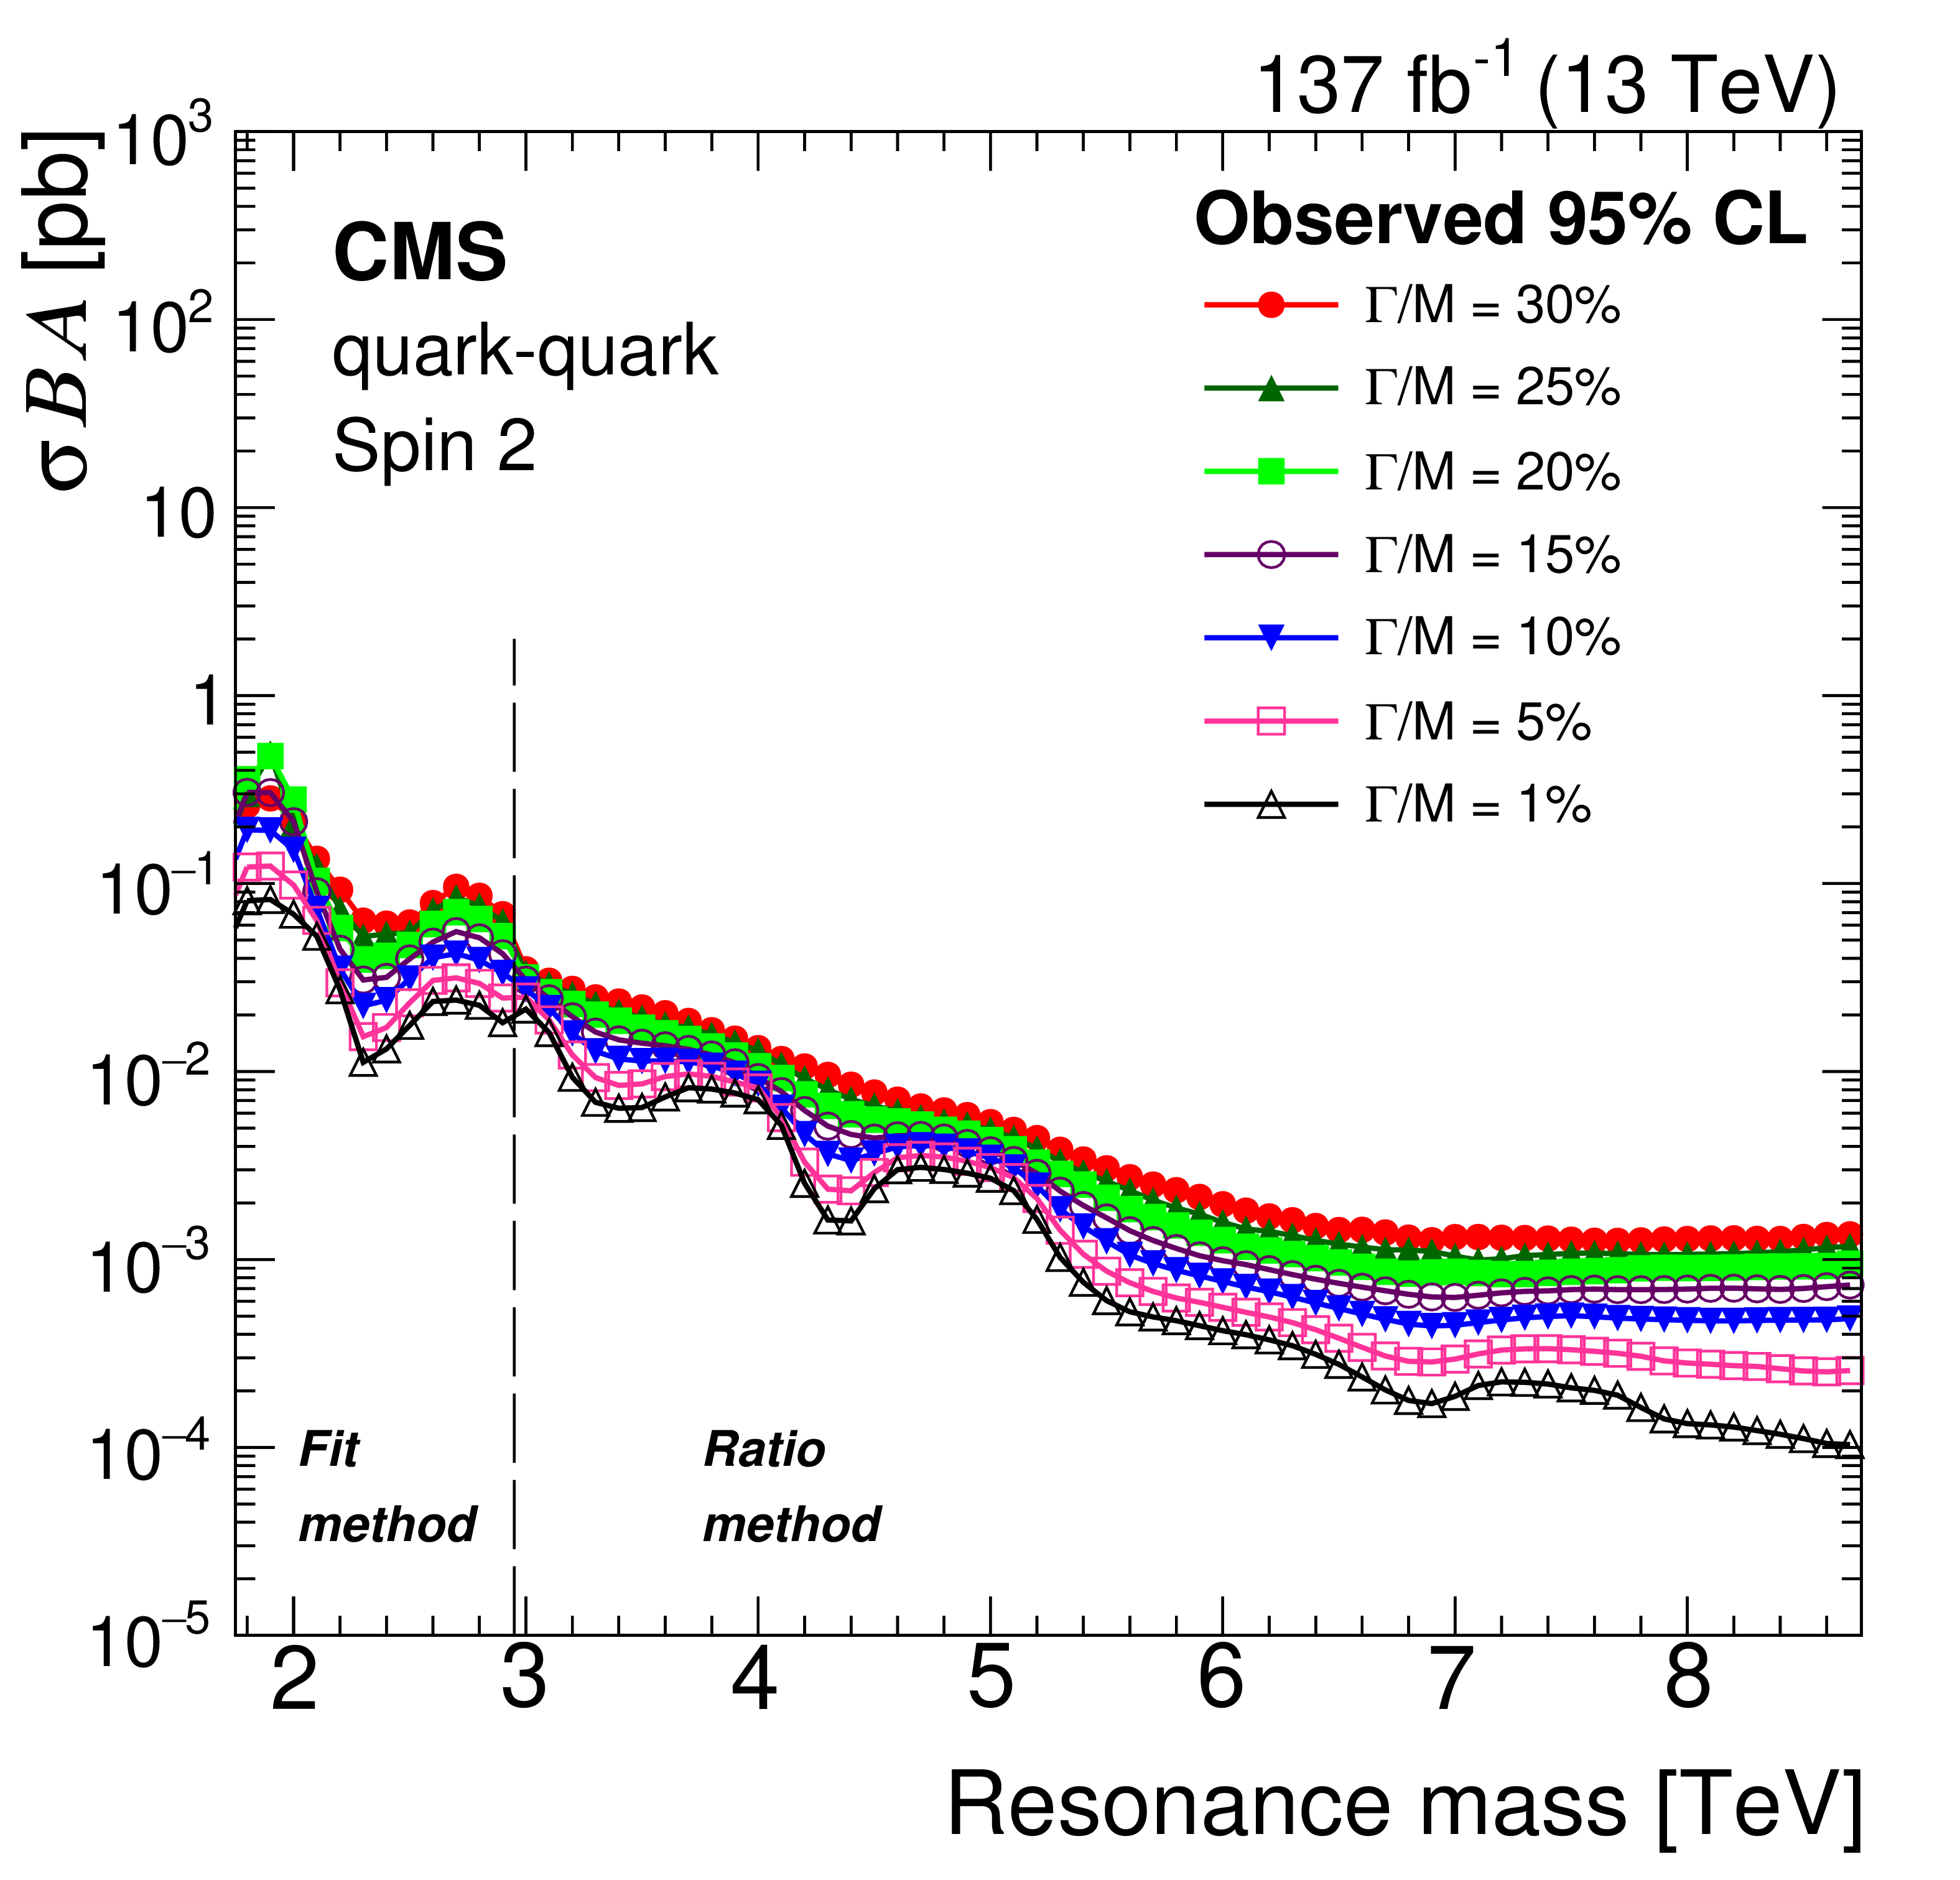
Figure 10-a:
The observed 95% CL upper limits on the product of the cross section, branching fraction, and acceptance for spin-2 resonances produced and decaying in the quark-quark channels, shown for various values of intrinsic width as a function of resonance mass. The vertical dashed line indicates indicates the boundary between the regions where the fit method and the ratio method are used to estimate the background. |
png pdf |
Figure 10-b:
The observed 95% CL upper limits on the product of the cross section, branching fraction, and acceptance for spin-2 resonances produced and decaying in the gluon-gluon channels, shown for various values of intrinsic width as a function of resonance mass. The vertical dashed line indicates indicates the boundary between the regions where the fit method and the ratio method are used to estimate the background. |
png pdf |
Figure 10-c:
The observed 95% CL upper limits on the product of the cross section, branching fraction, and acceptance for spin-1 resonances decaying in the quark-quark channel, shown for various values of intrinsic width as a function of resonance mass. The vertical dashed line indicates indicates the boundary between the regions where the fit method and the ratio method are used to estimate the background. |
png pdf |
Figure 11:
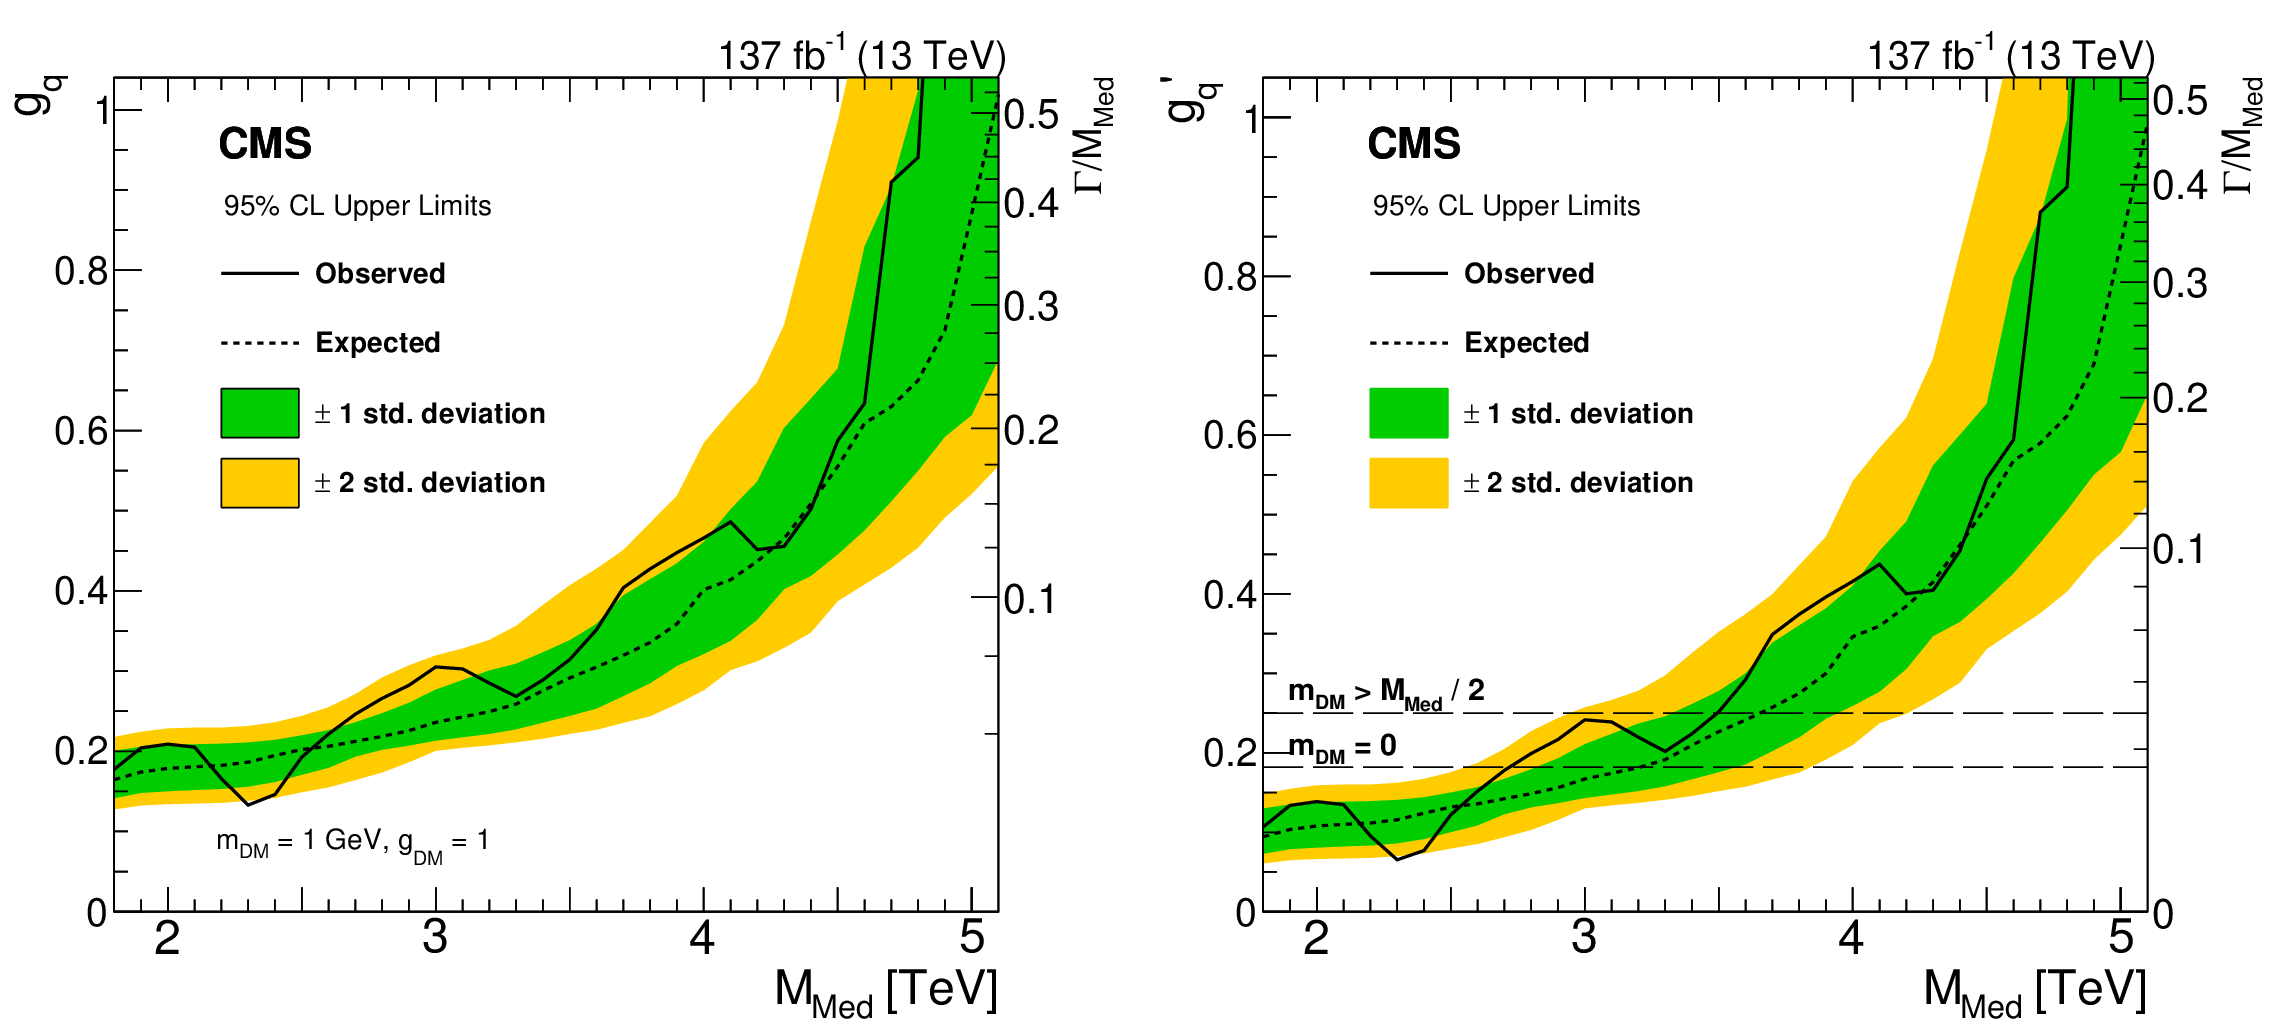
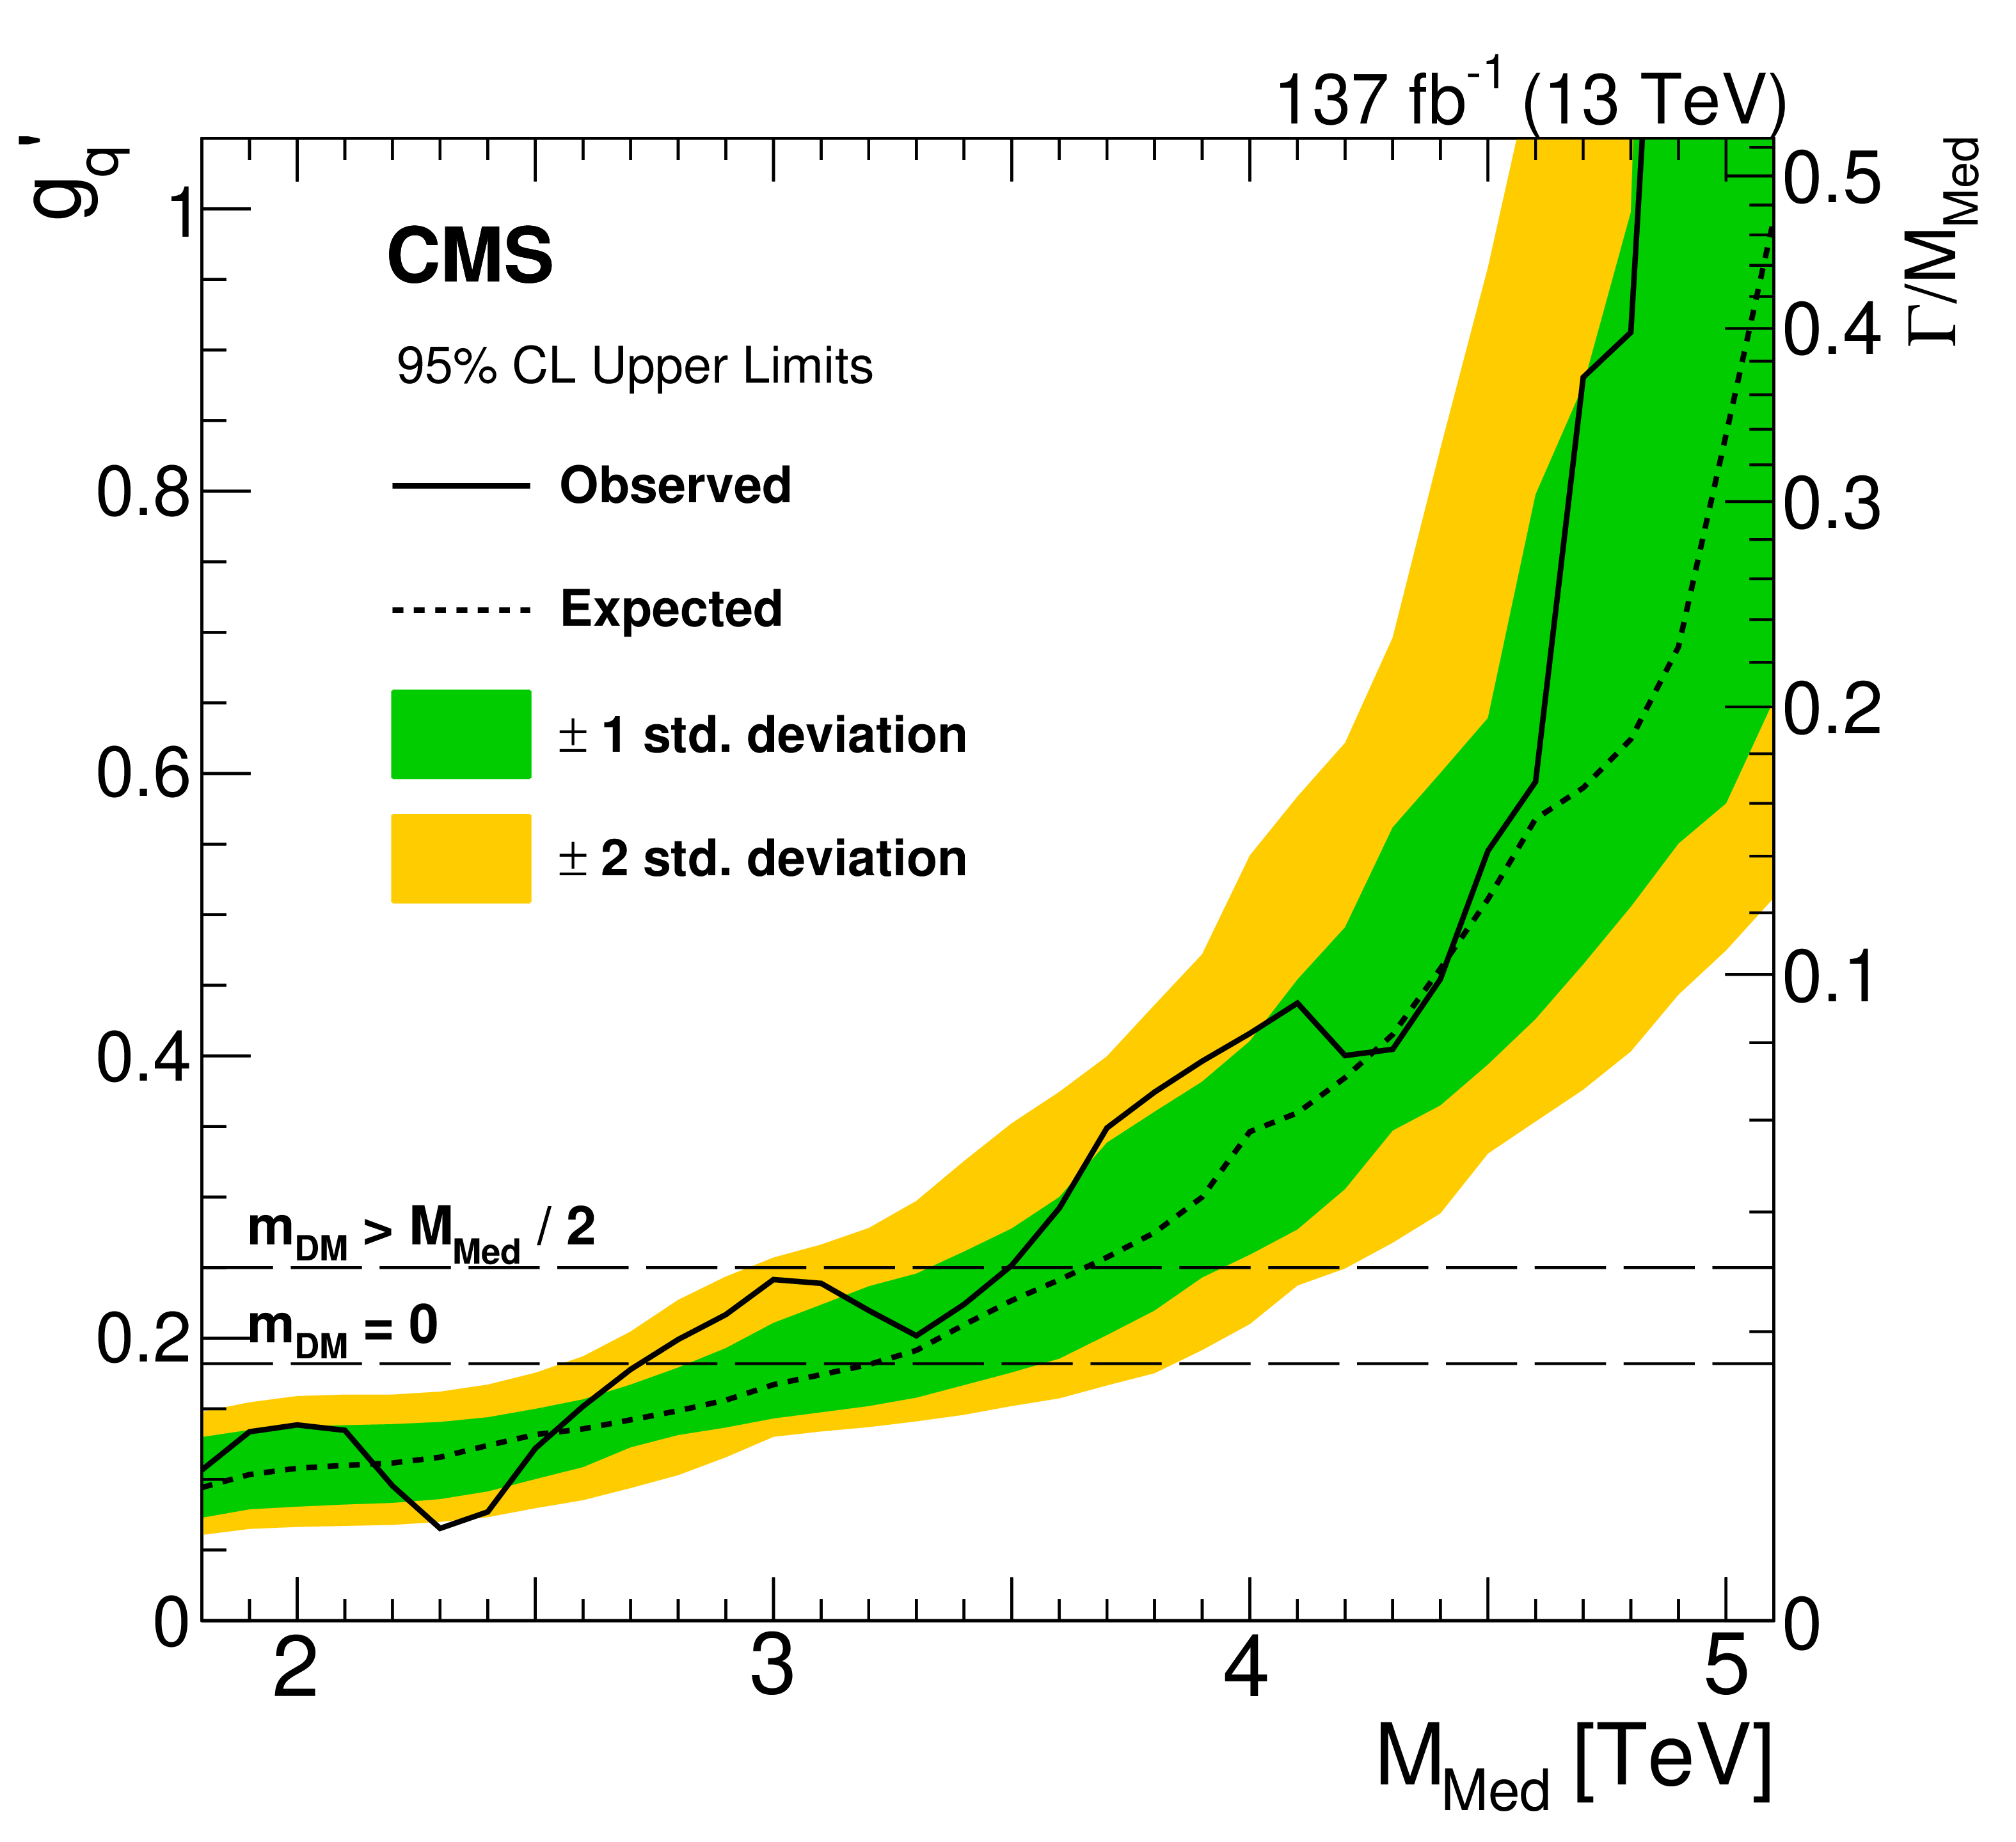
The 95% CL upper limits on the universal quark coupling $ {g_\mathrm{q}} $ as a function of resonance mass for a vector mediator of interactions between quarks and DM particles (left), and between quarks only (right). The dashed horizontal lines on the right plot show the coupling strength for which the cross section for dijet production in this leptophobic Z' model is the same as for a DM mediator for $ {g_\mathrm{q}} =$ 0.25. The right vertical axis shows the natural width of the mediator divided by its mass. The expected limits (dashed lines) and their variation at the one and two standard deviation levels (shaded bands) are also shown. |
png pdf |
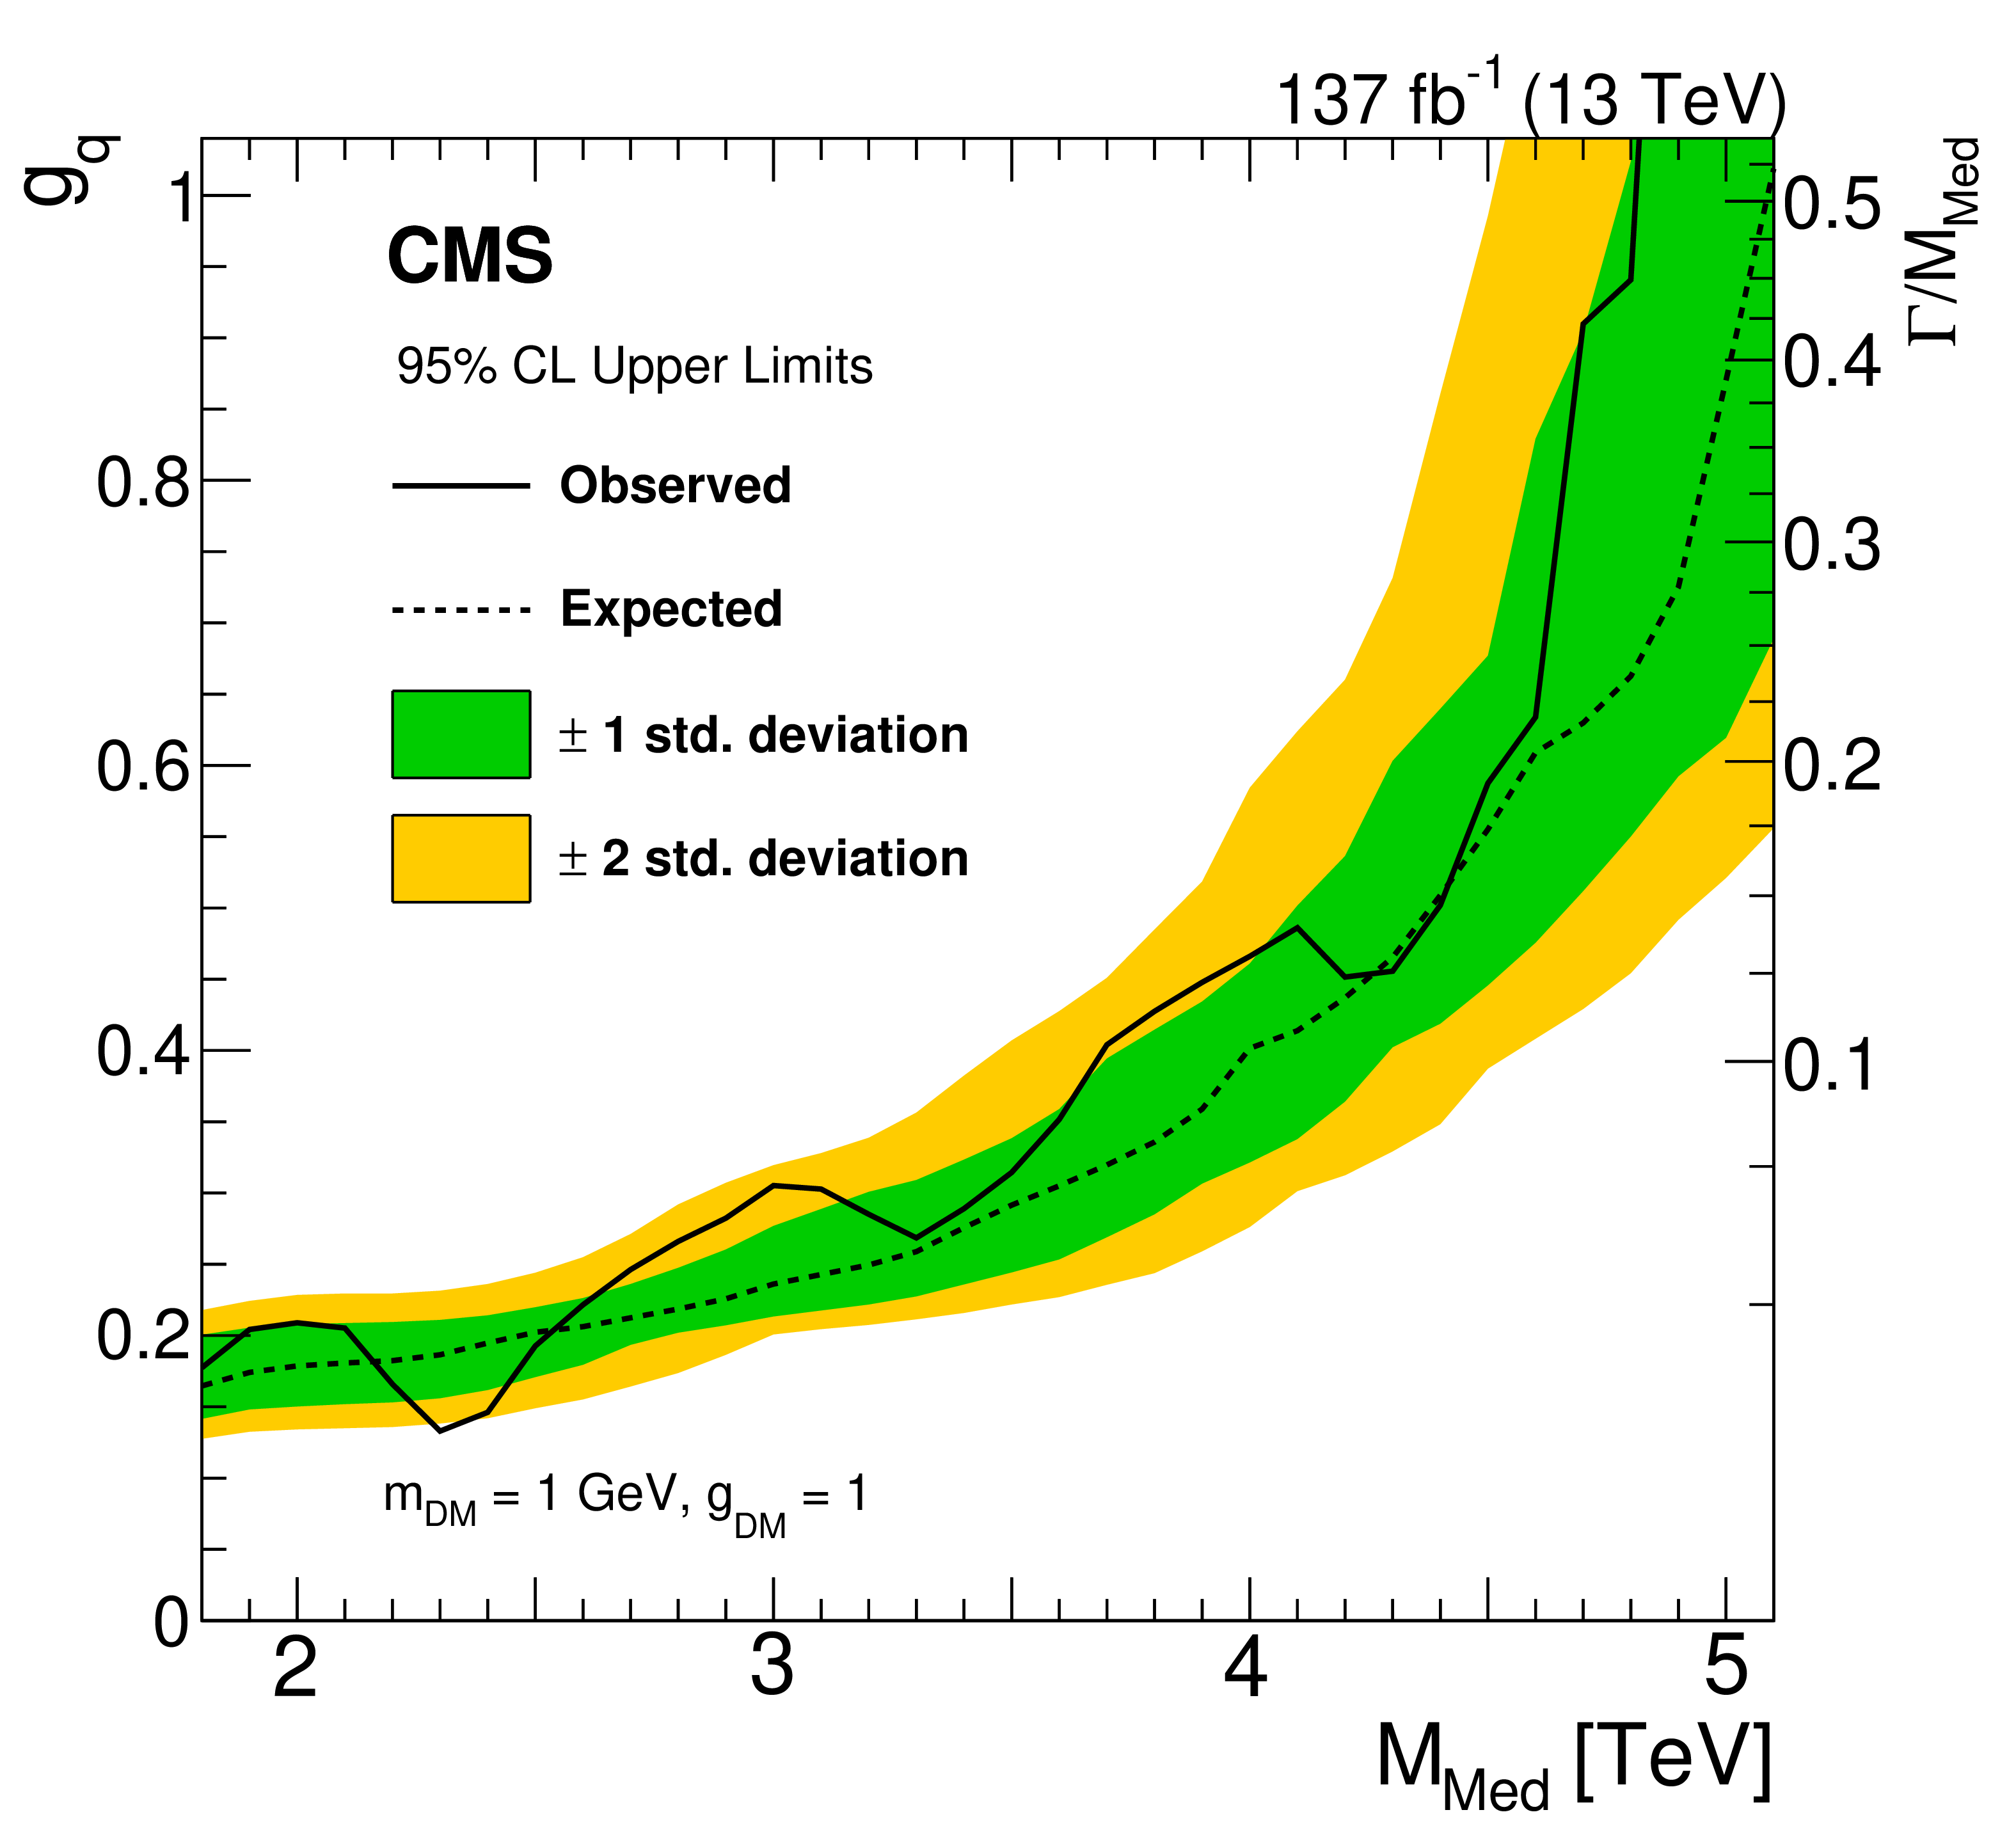
Figure 11-a:
The 95% CL upper limits on the universal quark coupling $ {g_\mathrm{q}} $ as a function of resonance mass for a vector mediator of interactions between quarks and DM particles. The right vertical axis shows the natural width of the mediator divided by its mass. The expected limits (dashed lines) and their variation at the one and two standard deviation levels (shaded bands) are also shown. |
png pdf |
Figure 11-b:
The 95% CL upper limits on the universal quark coupling $ {g_\mathrm{q}} $ as a function of resonance mass for a vector mediator of interactions between quarks. The dashed horizontal lines show the coupling strength for which the cross section for dijet production in this leptophobic Z' model is the same as for a DM mediator for $ {g_\mathrm{q}} =$ 0.25. The right vertical axis shows the natural width of the mediator divided by its mass. The expected limits (dashed lines) and their variation at the one and two standard deviation levels (shaded bands) are also shown. |
| Tables | |
png pdf |
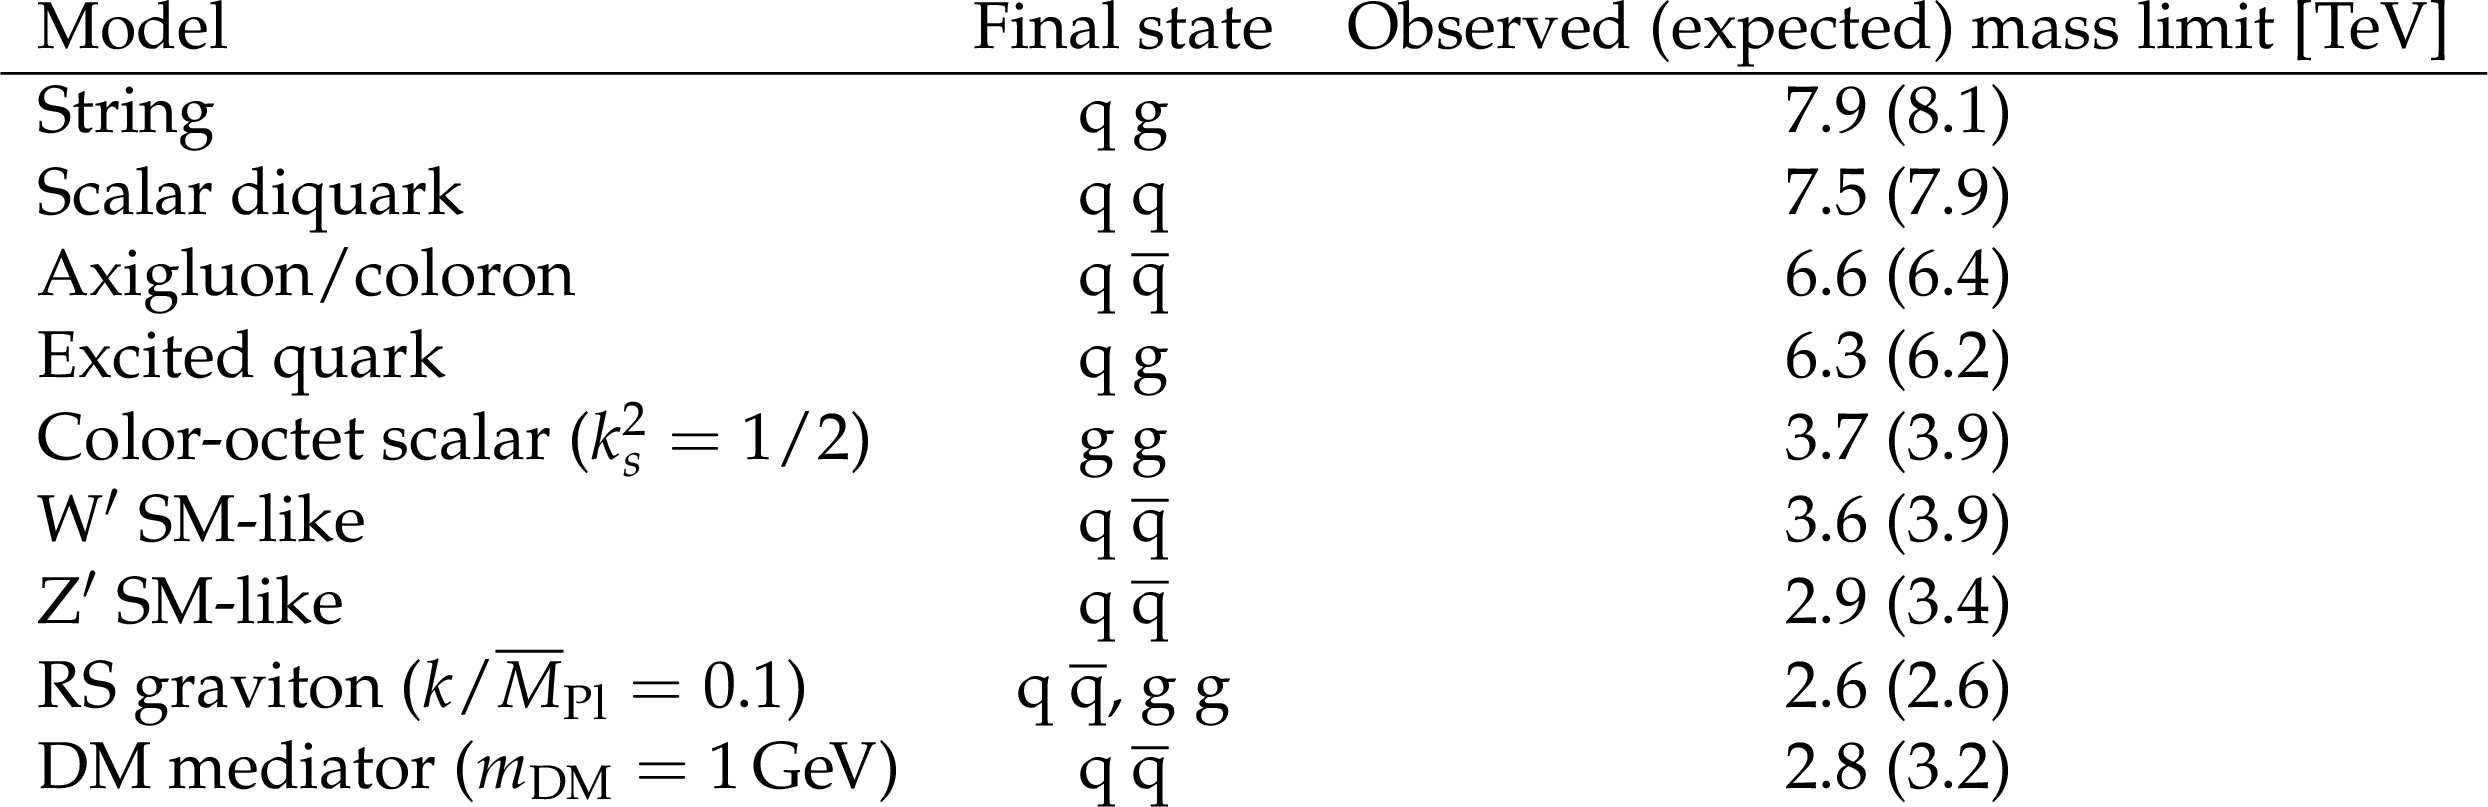
Table 1:
Observed and expected mass limits at 95% CL from this analysis. The listed models are excluded between 1.8 TeV and the indicated mass limit by this analysis. The SM-like Z' resonance is also excluded within the mass interval between 3.1 and 3.3 TeV. |
| Summary |
| A search for resonances decaying into a pair of jets has been performed using proton-proton collision data at $\sqrt{s}=13$ TeV corresponding to an integrated luminosity of 137 fb$^{-1}$. The dijet mass spectra are observed to be smoothly falling distributions of events with typically two-jet topology, although one unusual event with a four-jet topology was found at high mass. The background is predicted using two methods. The fit method uses an empirical functional form to fit the background in the signal region, defined by requiring the pseudorapidity separation of two jets in dijet $|{\Delta\eta}| < $1.1, while the ratio method uses two control regions at higher values of $|{\Delta\eta}|$ to predict the background in the signal region. The ratio method is a new background prediction method, which is independent of and complementary to the fit method. No evidence for resonant particle production is observed. Generic upper limits are presented on the product of the cross section, the branching fraction, and the acceptance for narrow and broad quark-quark, quark-gluon, and gluon-gluon resonances. The limits are applied to various models of new resonances and yield the following 95% confidence level lower limits on the resonance masses: 7.9 TeV for string resonances, 7.5 TeV for scalar diquarks, 6.6 TeV for axigluons and colorons, 6.3 TeV for excited quarks, 3.7 TeV for color-octet scalars, 3.6 TeV for W' bosons with SM-like couplings, 2.9 TeV and between 3.1 and 3.3 TeV for Z' bosons with SM-like couplings, 2.6 TeV for Randall-Sundrum gravitons, and 2.8 TeV for dark matter (DM) mediators. With this search, limits on narrow resonances are improved by 200 to 800 GeV relative to those reported in previous CMS dijet resonance searches. Limits are also presented for spin-2 resonances with intrinsic widths as large as 30% of the resonance mass, and spin-1 resonances with intrinsic widths as large as 55% of the resonance mass. These limits are used to improve and extend the exclusions of a DM mediator to larger values of the resonance mass and coupling to quarks. In the search for broad resonances, the ratio method provides significantly enhanced sensitivity compared to the fit method, resulting in the exclusion at 95% confidence level of a DM mediator with mass less than 4.8 TeV for a width equal to 45% of the mass, which corresponds to a coupling to quarks ${g_\mathrm{q}} =$ 0.9. |
| Additional Figures | |
png pdf |
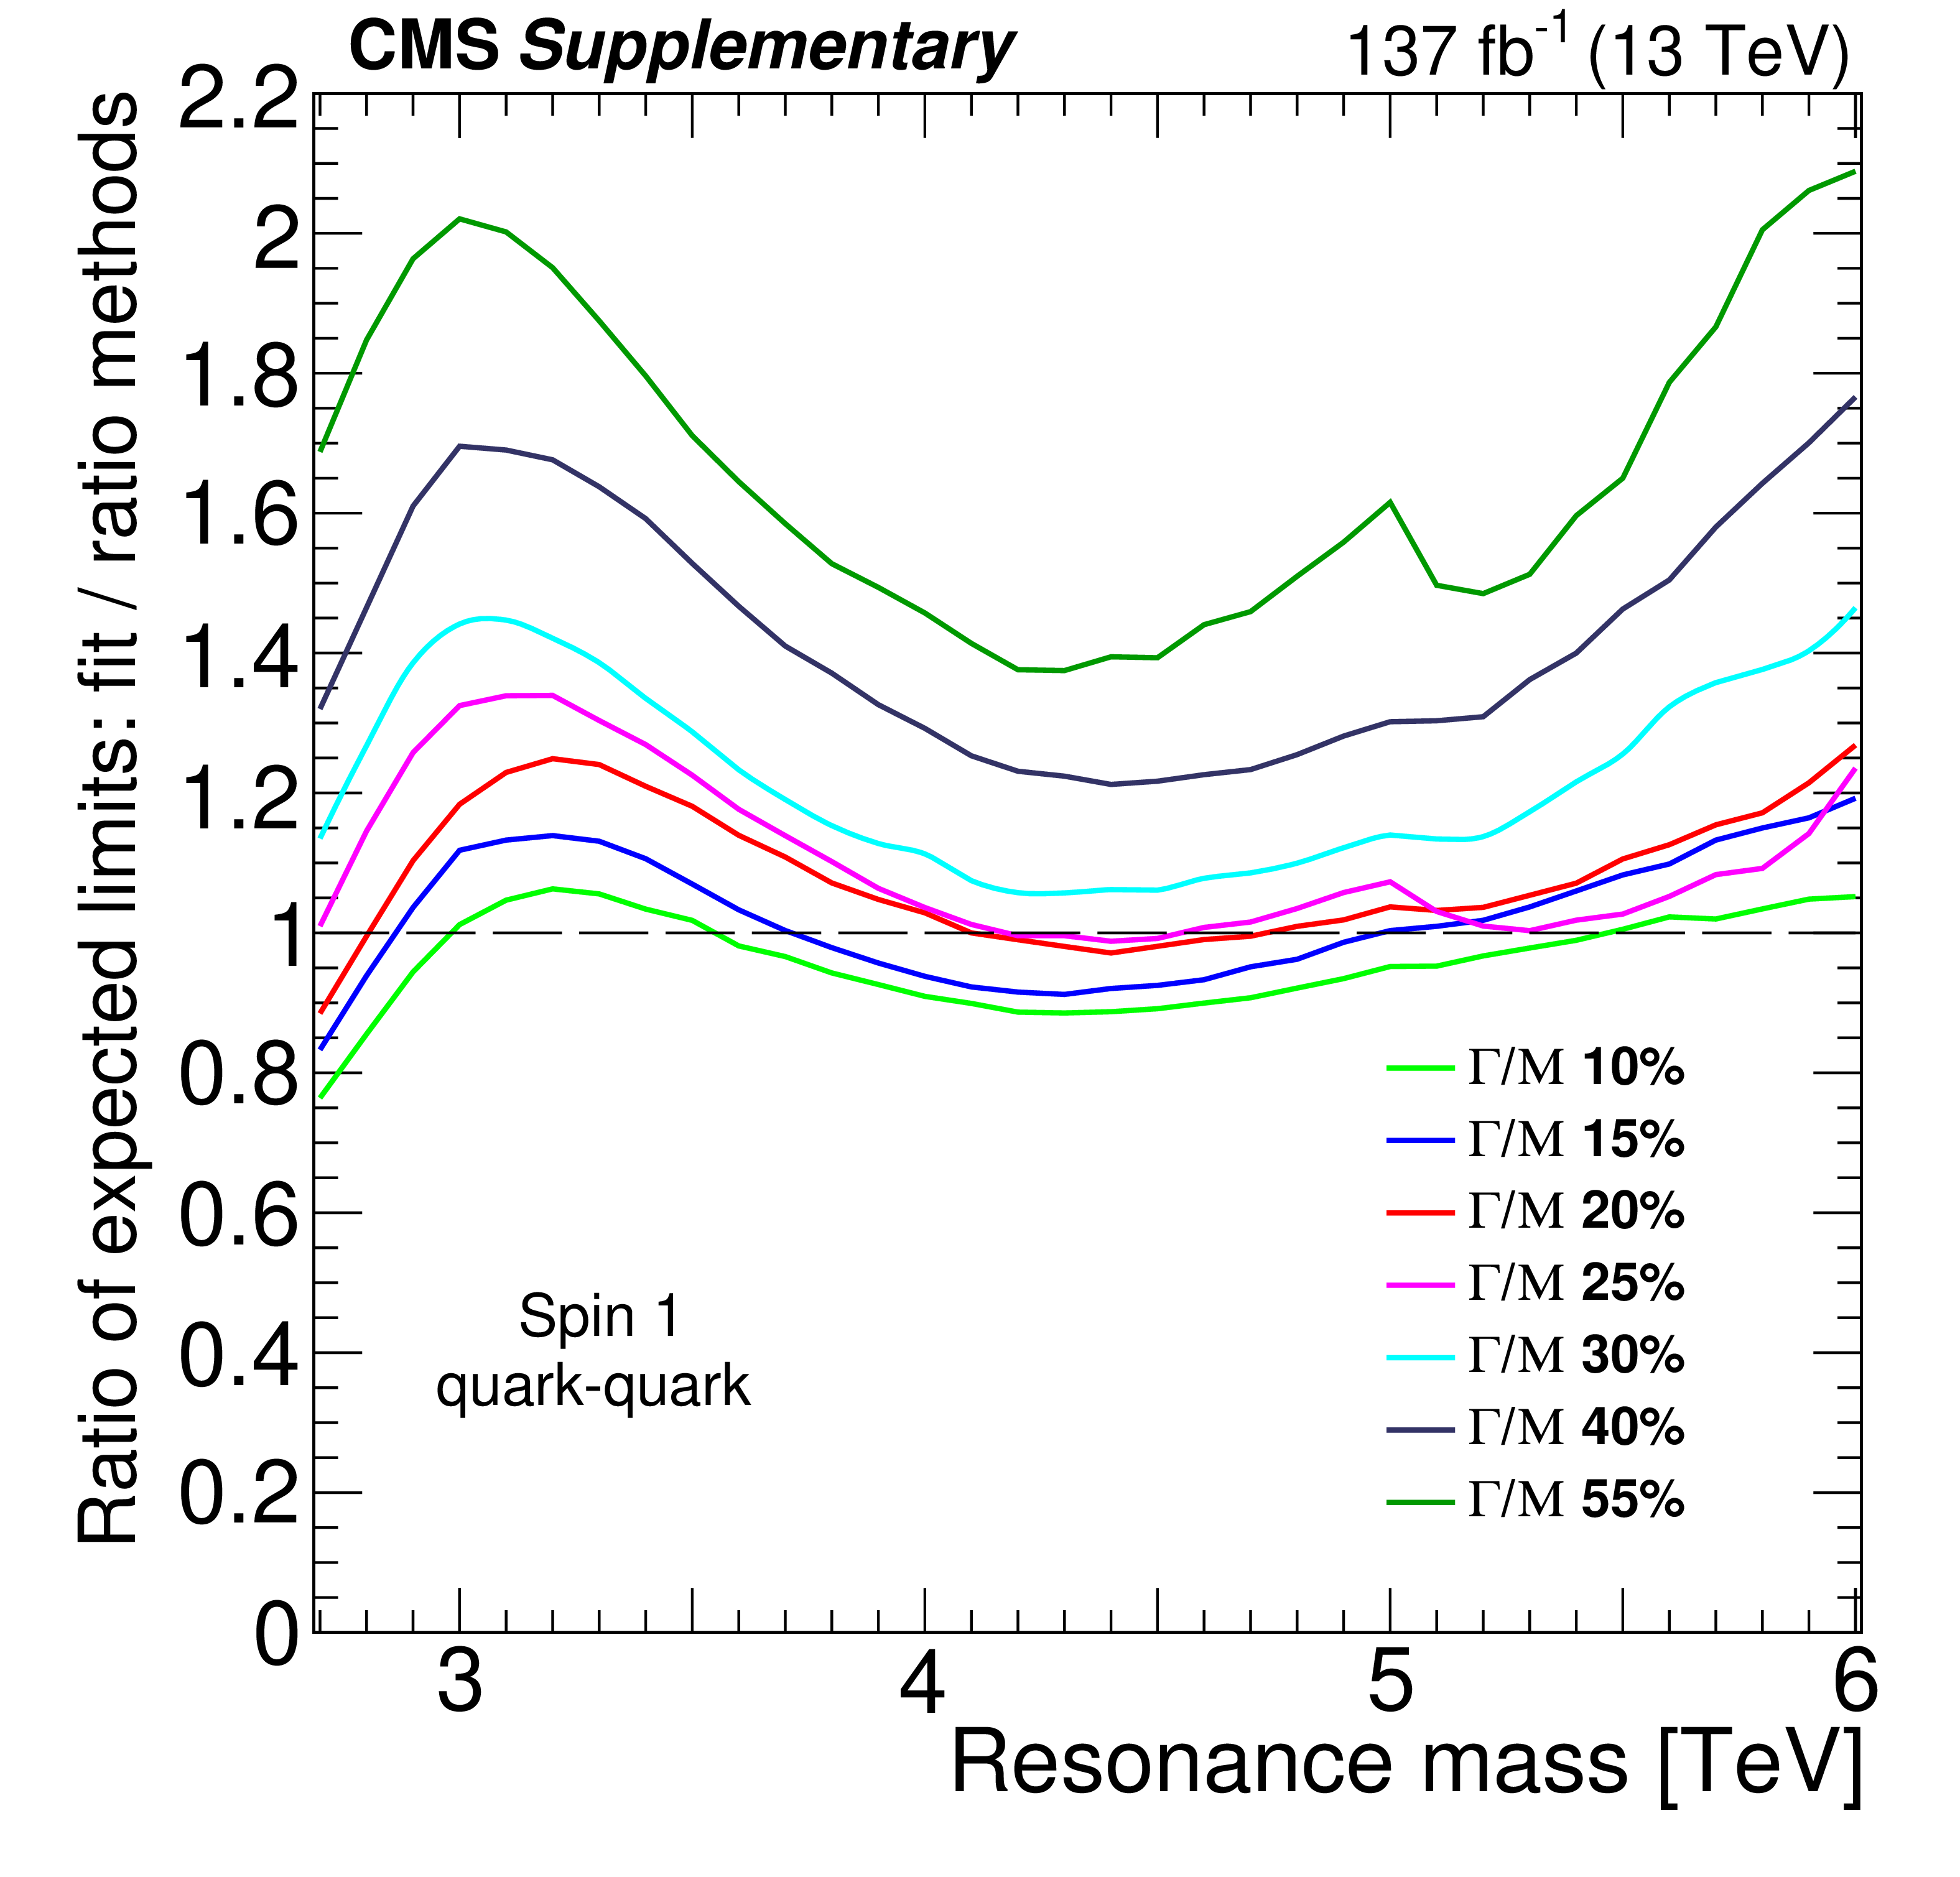
Additional Figure 1:
Ratio of expected limits between the fit method and the ratio method as a function of resonance mass for broad spin-1 resonances decaying to a pair of quarks, and for different resonance widths. |
png pdf |
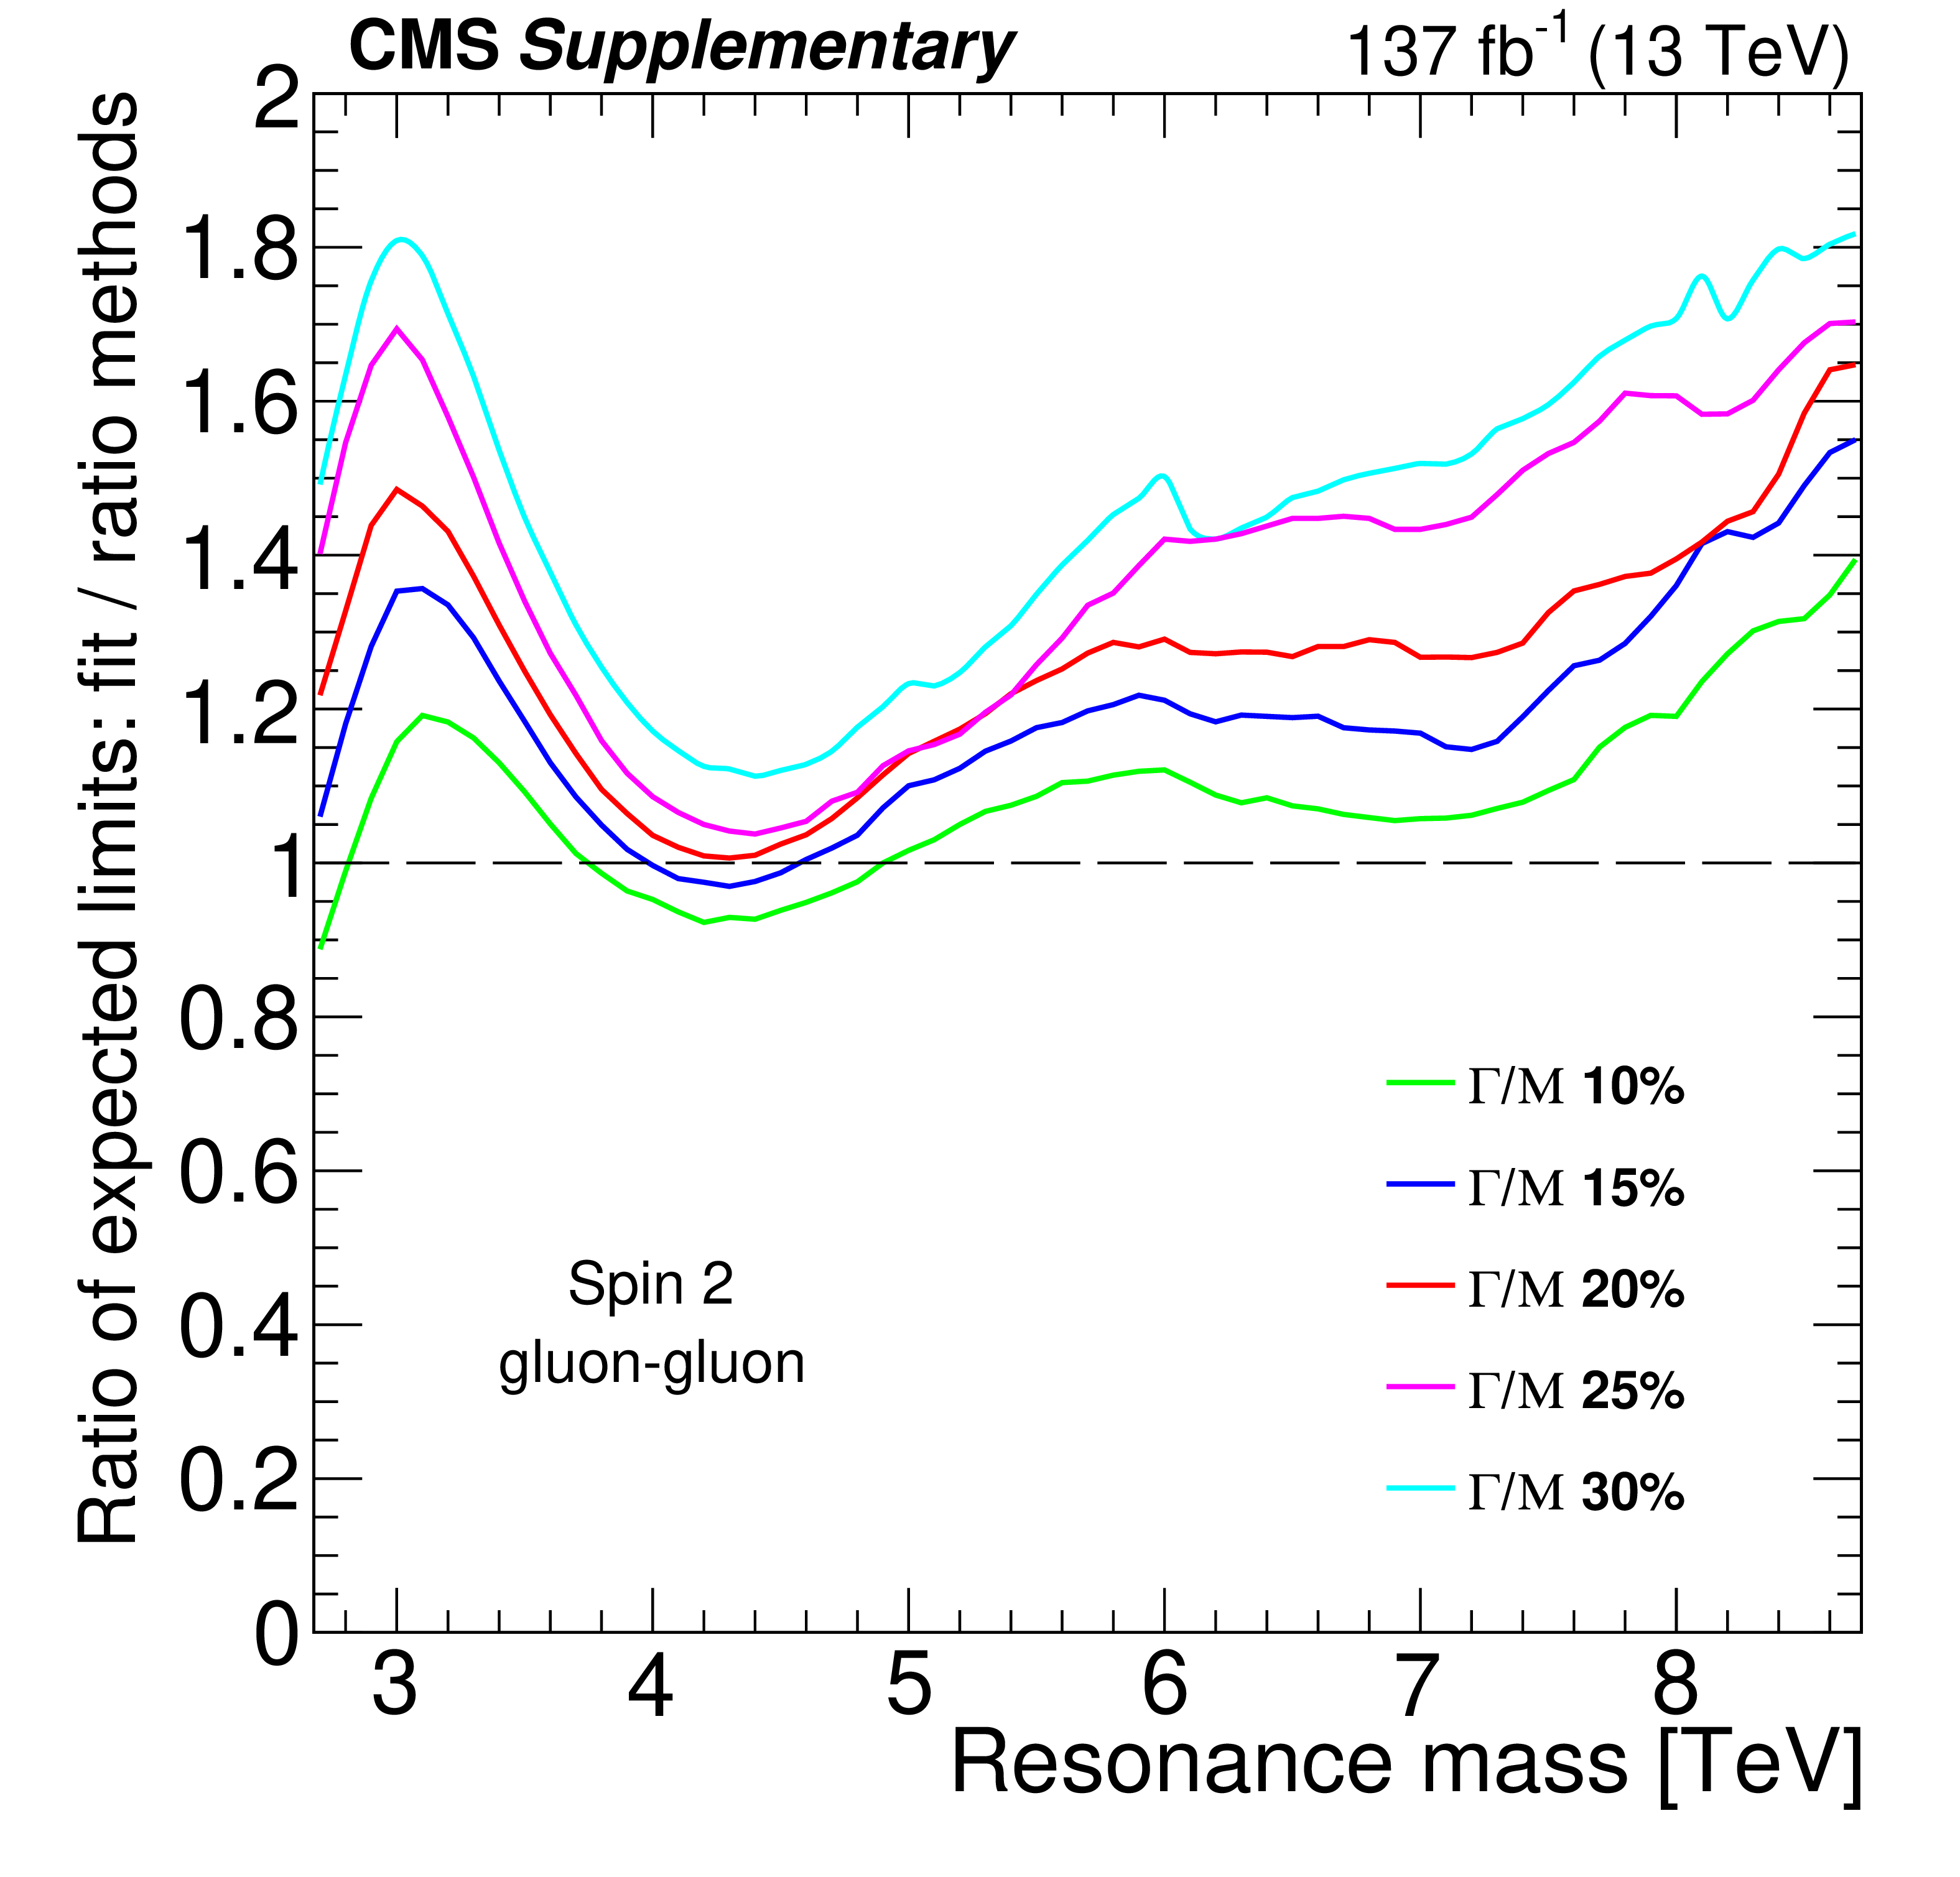
Additional Figure 2:
Ratio of expected limits between the fit method and the ratio method as a function of resonance mass for broad spin-2 resonances decaying to a pair of gluons, and for different resonance widths. |
png pdf |
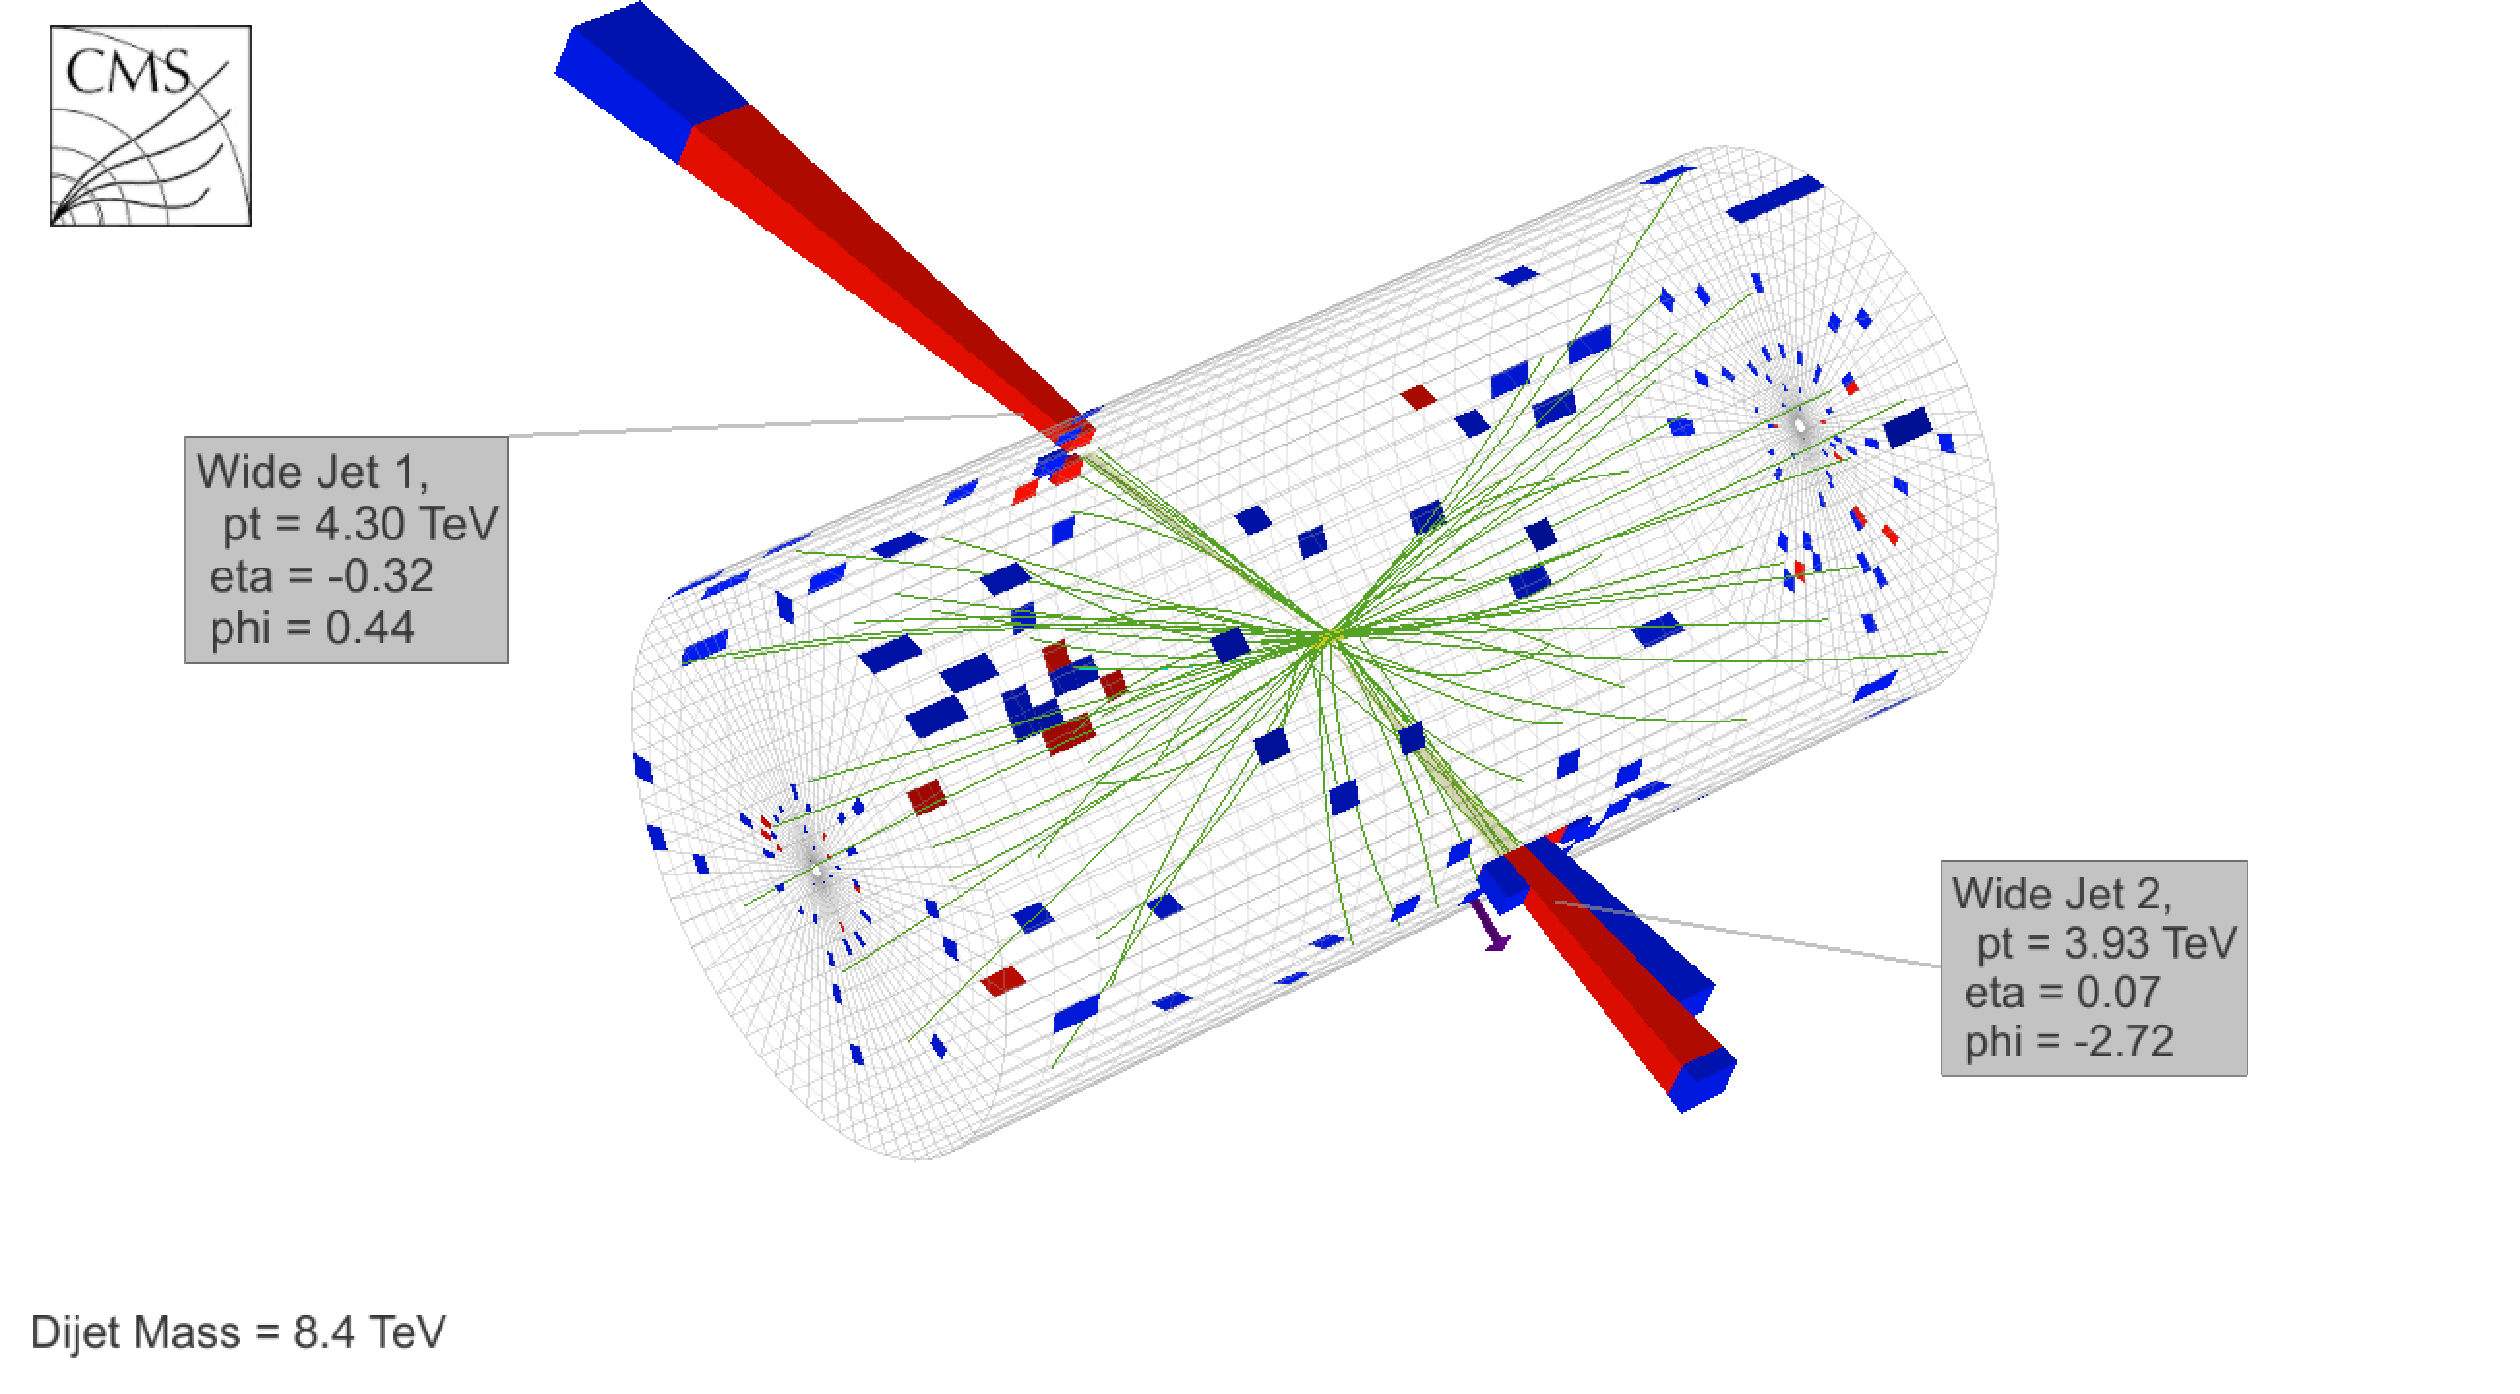
Additional Figure 3:
Three dimensional display of the event with the highest dijet mass at 8.4 TeV. The display shows the energy deposited in the electromagnetic (red) and hadronic (blue) calorimeters and the reconstructed tracks of charged particles (green). |
| References | ||||
| 1 | L. A. Anchordoqui et al. | Dijet signals for low mass strings at the LHC | PRL 101 (2008) 241803 | 0808.0497 |
| 2 | S. Cullen, M. Perelstein, and M. E. Peskin | TeV strings and collider probes of large extra dimensions | PRD 62 (2000) 055012 | hep-ph/0001166 |
| 3 | J. L. Hewett and T. G. Rizzo | Low-energy phenomenology of superstring-inspired E(6) models | PR 183 (1989) 193 | |
| 4 | U. Baur, I. Hinchliffe, and D. Zeppenfeld | Excited quark production at hadron colliders | Int. J. Mod. Phys. A 02 (1987) 1285 | |
| 5 | U. Baur, M. Spira, and P. M. Zerwas | Excited quark and lepton production at hadron colliders | PRD 42 (1990) 815 | |
| 6 | P. H. Frampton and S. L. Glashow | Chiral color: An alternative to the standard model | PLB 190 (1987) 157 | |
| 7 | R. S. Chivukula, E. H. Simmons, A. Farzinnia, and J. Ren | Hadron collider production of massive color-octet vector bosons at next-to-leading order | PRD 87 (2013) 094011 | 1303.1120 |
| 8 | E. H. Simmons | Coloron phenomenology | PRD 55 (1997) 1678 | hep-ph/9608269 |
| 9 | T. Han, I. Lewis, and Z. Liu | Colored resonant signals at the LHC: largest rate and simplest topology | JHEP 12 (2010) 085 | 1010.4309 |
| 10 | E. Eichten, I. Hinchliffe, K. D. Lane, and C. Quigg | Supercollider physics | Rev. Mod. Phys. 56 (1984) 579 | |
| 11 | L. Randall and R. Sundrum | An alternative to compactification | PRL 83 (1999) 4690 | hep-th/9906064 |
| 12 | M. Chala et al. | Constraining dark sectors with monojets and dijets | JHEP 07 (2015) 089 | 1503.05916 |
| 13 | D. Abercrombie et al. | Dark matter benchmark models for early LHC run-2 searches: Report of the ATLAS/CMS dark matter forum | Phys. Dark Univ. 26 (2019) 100371 | 1507.00966 |
| 14 | J. Abdallah et al. | Simplified models for dark matter searches at the LHC | Phys. Dark Univ. 9-10 (2015) 8 | 1506.03116 |
| 15 | G. Busoni et al. | Recommendations on presenting LHC searches for missing transverse energy signals using simplified $ s $-channel models of dark matter | 1603.04156 | |
| 16 | ATLAS Collaboration | Search for new resonances in mass distributions of jet pairs using 139 fb$ ^{-1} $ of $ pp $ collisions at $ \sqrt{s}= $ 13 TeV with the ATLAS detector | Submitted to JHEP | 1910.08447 |
| 17 | CMS Collaboration | Search for narrow and broad dijet resonances in proton-proton collisions at $ \sqrt{s}= $ 13 TeV and constraints on dark matter mediators and other new particles | JHEP 08 (2018) 130 | CMS-EXO-16-056 1806.00843 |
| 18 | ATLAS Collaboration | Search for new phenomena in dijet events using 37 fb$ ^{-1} $ of $ pp $ collision data collected at $ \sqrt{s}= $ 13 TeV with the ATLAS detector | PRD 96 (2017) 052004 | 1703.09127 |
| 19 | CMS Collaboration | Search for dijet resonances in proton-proton collisions at $ \sqrt{s} = $ 13 TeV and constraints on dark matter and other models | PLB 769 (2017) 520 | CMS-EXO-16-032 1611.03568 |
| 20 | CMS Collaboration | Search for narrow resonances decaying to dijets in proton-proton collisions at $ \sqrt{s} = $ 13 TeV | PRL 116 (2016) 071801 | CMS-EXO-15-001 1512.01224 |
| 21 | ATLAS Collaboration | Search for new phenomena in dijet mass and angular distributions from pp collisions at $ \sqrt{s}= $ 13 TeV with the ATLAS detector | PLB 754 (2016) 302 | 1512.01530 |
| 22 | CMS Collaboration | Search for narrow resonances in dijet final states at $ \sqrt{s}= $ 8 TeV with the novel CMS technique of data scouting | PRL 117 (2016) 031802 | CMS-EXO-14-005 1604.08907 |
| 23 | CMS Collaboration | Search for resonances and quantum black holes using dijet mass spectra in proton-proton collisions at $ \sqrt{s} = $ 8 TeV | PRD 91 (2015) 052009 | CMS-EXO-12-059 1501.04198 |
| 24 | ATLAS Collaboration | Search for new phenomena in the dijet mass distribution using pp collision data at $ \sqrt{s}= $ 8 TeV with the ATLAS detector | PRD 91 (2015) 052007 | 1407.1376 |
| 25 | CMS Collaboration | Search for narrow resonances using the dijet mass spectrum in pp collisions at $ \sqrt{s} = $ 8 TeV | PRD 87 (2013) 114015 | CMS-EXO-12-016 1302.4794 |
| 26 | CMS Collaboration | Search for narrow resonances and quantum black holes in inclusive and b-tagged dijet mass spectra from pp collisions at $ \sqrt{s}= $ 7 TeV | JHEP 01 (2013) 013 | CMS-EXO-11-094 1210.2387 |
| 27 | ATLAS Collaboration | Search for new physics in the dijet mass distribution using 1 fb$ ^{-1} $ of $ pp $ collision data at $ \sqrt{s} = $ 7 TeV collected by the ATLAS detector | PLB 708 (2012) 37 | 1108.6311 |
| 28 | ATLAS Collaboration | ATLAS search for new phenomena in dijet mass and angular distributions using pp collisions at $ \sqrt{s}= $ 7 TeV | JHEP 01 (2013) 029 | 1210.1718 |
| 29 | CMS Collaboration | Search for resonances in the dijet mass spectrum from 7 TeV pp collisions at CMS | PLB 704 (2011) 123 | CMS-EXO-11-015 1107.4771 |
| 30 | ATLAS Collaboration | Search for new physics in dijet mass and angular distributions in $ pp $ collisions at $ \sqrt{s} = $ 7 TeV measured with the ATLAS detector | New J. Phys. 13 (2011) 053044 | 1103.3864 |
| 31 | CMS Collaboration | Search for dijet resonances in 7 TeV pp collisions at CMS | PRL 105 (2010) 211801 | CMS-EXO-10-010 1010.0203 |
| 32 | ATLAS Collaboration | Search for new particles in two-jet final states in 7 TeV proton-proton collisions with the ATLAS detector at the LHC | PRL 105 (2010) 161801 | 1008.2461 |
| 33 | R. M. Harris and K. Kousouris | Searches for dijet resonances at hadron colliders | Int. J. Mod. Phys. A 26 (2011) 5005 | 1110.5302 |
| 34 | R. S. Chivukula, E. H. Simmons, and N. Vignaroli | Distinguishing dijet resonances at the LHC | PRD 91 (2015) 055019 | 1412.3094 |
| 35 | CMS Collaboration | The CMS experiment at the CERN LHC | JINST 3 (2008) S08004 | CMS-00-001 |
| 36 | CMS Collaboration | Particle-flow reconstruction and global event description with the CMS detector | JINST 12 (2017) P10003 | CMS-PRF-14-001 1706.04965 |
| 37 | M. Cacciari and G. P. Salam | Dispelling the $ N^{3} $ myth for the $ k_\mathrm{t} $ jet-finder | PLB 641 (2006) 57 | hep-ph/0512210 |
| 38 | M. Cacciari, G. P. Salam, and G. Soyez | The anti-$ {k_{\mathrm{T}}} $ jet clustering algorithm | JHEP 04 (2008) 063 | 0802.1189 |
| 39 | M. Cacciari, G. P. Salam, and G. Soyez | FastJet user manual | EPJC 72 (2012) 1896 | 1111.6097 |
| 40 | M. Cacciari and G. P. Salam | Pileup subtraction using jet areas | PLB 659 (2008) 119 | 0707.1378 |
| 41 | CMS Collaboration | Jet energy scale and resolution in the CMS experiment in pp collisions at 8 TeV | JINST 12 (2017) P02014 | CMS-JME-13-004 1607.03663 |
| 42 | CMS Collaboration | The CMS trigger system | JINST 12 (2017) P01020 | CMS-TRG-12-001 1609.02366 |
| 43 | CMS Collaboration | Jet algorithms performance in 13 TeV data | CMS-PAS-JME-16-003 | CMS-PAS-JME-16-003 |
| 44 | T. Sjostrand et al. | An introduction to PYTHIA 8.2 | CPC 191 (2015) 159 | 1410.3012 |
| 45 | CMS Collaboration | Event generator tunes obtained from underlying event and multiparton scattering measurements | EPJC 76 (2016) 155 | CMS-GEN-14-001 1512.00815 |
| 46 | P. Skands, S. Carrazza, and J. Rojo | Tuning PYTHIA 8.1: the Monash 2013 tune | EPJC 74 (2014) 3024 | 1404.5630 |
| 47 | NNPDF Collaboration | Parton distributions with LHC data | NPB 867 (2013) 244 | 1207.1303 |
| 48 | GEANT4 Collaboration | GEANT4 --- a simulation toolkit | NIMA 506 (2003) 250 | |
| 49 | B. A. Dobrescu, R. M. Harris, and J. Isaacson | Ultraheavy resonances at the LHC: beyond the QCD background | 1810.09429 | |
| 50 | CDF Collaboration | Search for new particles decaying into dijets in proton-antiproton collisions at $ \sqrt{s} = $ 1.96 ~TeV | PRD 79 (2009) 112002 | 0812.4036 |
| 51 | P. Nason | A New method for combining NLO QCD with shower Monte Carlo algorithms | JHEP 11 (2004) 040 | hep-ph/0409146 |
| 52 | S. Frixione, P. Nason, and C. Oleari | Matching NLO QCD computations with parton shower simulations: the POWHEG method | JHEP 11 (2007) 070 | 0709.2092 |
| 53 | S. Alioli, P. Nason, C. Oleari, and E. Re | A general framework for implementing NLO calculations in shower Monte Carlo programs: the POWHEG BOX | JHEP 06 (2010) 043 | 1002.2581 |
| 54 | S. Dittmaier, A. Huss, and C. Speckner | Weak radiative corrections to dijet production at hadron colliders | JHEP 11 (2012) 095 | 1210.0438 |
| 55 | CMS Collaboration | CMS luminosity measurements for the 2016 data taking period | CMS-PAS-LUM-17-001 | CMS-PAS-LUM-17-001 |
| 56 | CMS Collaboration | CMS luminosity measurements for the 2018 data taking period | CMS-PAS-LUM-18-002 | CMS-PAS-LUM-18-002 |
| 57 | CMS Collaboration | CMS luminosity measurements for the 2017 data taking period | CMS-PAS-LUM-17-004 | CMS-PAS-LUM-17-004 |
| 58 | T. Junk | Confidence level computation for combining searches with small statistics | Nucl. Instr. Meth. A 434 (1999) 435 | hep-ex/9902006 |
| 59 | A. L. Read | Presentation of search results: the $ CL_s $ technique | JPG 28 (2002) 2693 | |
| 60 | LHC Higgs Combination Group | Procedure for the LHC Higgs boson search combination in Summer 2011 | CMS-NOTE-2011-005 | |
| 61 | G. Cowan, K. Cranmer, E. Gross, and O. Vitells | Asymptotic formulae for likelihood-based tests of new physics | EPJC 71 (2011) 1554 | 1007.1727 |
| 62 | J. Pumplin et al. | New generation of parton distributions with uncertainties from global QCD analysis | JHEP 07 (2002) 012 | hep-ph/0201195 |
| 63 | V. D. Barger and R. J. N. Phillips | Collider physics | Frontiers in Physics, volume 71, Westview Press, Boulder, Colorado | |
| 64 | J. Alwall et al. | The automated computation of tree-level and next-to-leading order differential cross sections, and their matching to parton shower simulations | JHEP 07 (2014) 079 | 1405.0301 |
| 65 | B. A. Dobrescu and F. Yu | Coupling-mass mapping of dijet peak searches | PRD 88 (2013) 035021 | 1306.2629 |
|
|
Compact Muon Solenoid LHC, CERN |
|

|

|

|

|

|