

Compact Muon Solenoid
LHC, CERN
| CMS-FSQ-13-008 ; CERN-EP-2016-073 | ||
| Evidence for exclusive $\gamma\gamma \to \mathrm{ W^{+} } \mathrm{ W^{-} }$ production and constraints on anomalous quartic gauge couplings in pp collisions at $\sqrt{s}= $ 7 and 8 TeV | ||
| CMS Collaboration | ||
| 15 April 2016 | ||
| JHEP 08 (2016) 119 | ||
| Abstract: A search for exclusive or quasi-exclusive $\gamma\gamma\to\mathrm{ W^{+} }\mathrm{ W^{-} }$ production, via $\mathrm{ p }\mathrm{ p } \to \mathrm{ p }^{(*)}\mathrm{ W^{+} }\mathrm{ W^{-} }\mathrm{ p }^{(*)}\to \mathrm{ p }^{(*)}\mu^{\pm}\mathrm{ e }^{\mp}\mathrm{ p }^{(*)}$ at $\sqrt{s}= $ 8 TeV, is reported using data corresponding to an integrated luminosity of 19.7 fb$^{-1}$. Events are selected by requiring the presence of an electron-muon pair with large transverse momentum $p_{\mathrm{T}}(\mu^{\pm}\mathrm{ e }^{\mp})> $ 30 GeV, and no associated charged particles detected from the same vertex. The 8 TeV results are combined with the previous 7 TeV results (obtained for 5.05 fb$^{-1}$ of data). In the signal region, 13 (2) events are observed over an expected background of 3.9 $\pm$ 0.6 (0.84 $\pm$ 0.15) events for 8 (7) TeV, resulting in a combined excess of 3.4$ \sigma$ over the background-only hypothesis. The observed yields and kinematic distributions are compatible with the standard model prediction for exclusive and quasi-exclusive $\gamma\gamma \to \mathrm{ W^{+} }\mathrm{ W^{-} }$ production. Upper limits on the anomalous quartic gauge coupling operators $a^{\mathrm{ W }}_{0,C}$ (dimension-6) and $f_{M0,1,2,3}$ (dimension-8), the most stringent to date, are derived from the measured dilepton transverse momentum spectrum. | ||
| Links: e-print arXiv:1604.04464 [hep-ex] (PDF) ; CDS record ; inSPIRE record ; HepData record ; CADI line (restricted) ; | ||
| Figures | |

png pdf |
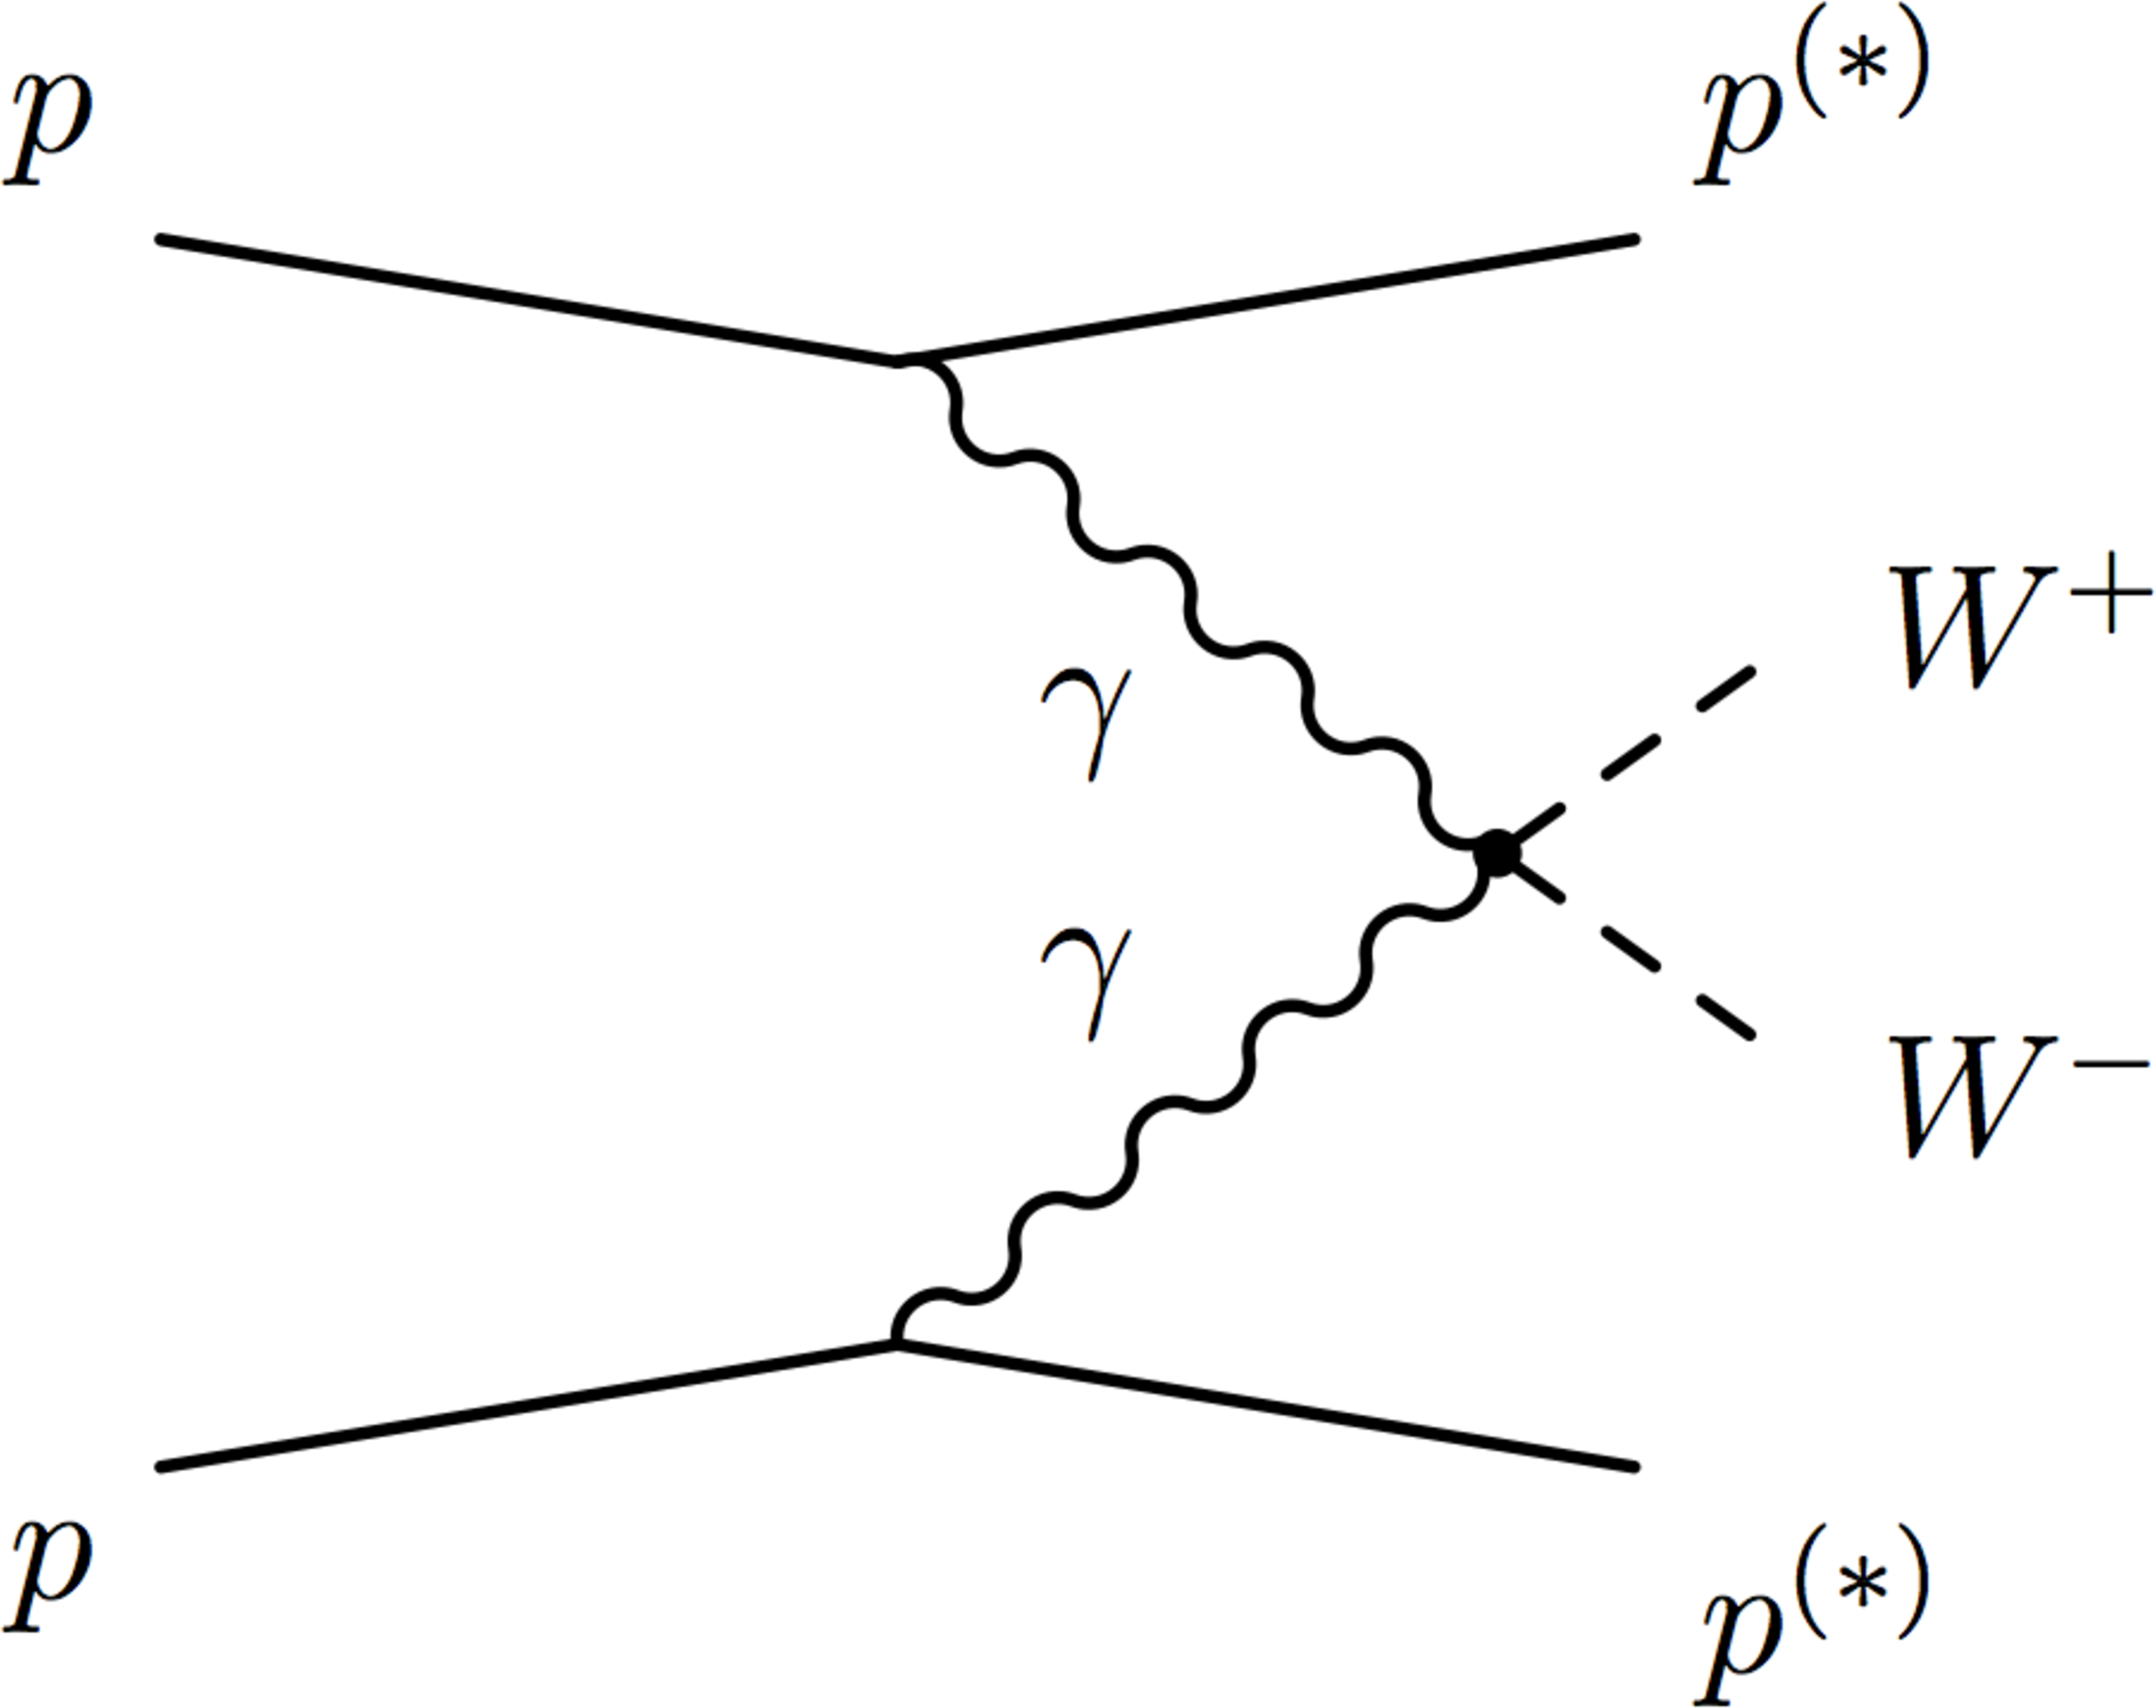
Figure 1:
Quartic (left), $t$-channel (center), and $u$-channel (right) diagrams contributing to the $\gamma \gamma \to \mathrm{ W^{+} } \mathrm{ W^{-} } $ process at leading order in the SM. The $\mathrm{ p } ^{(*)}$ indicates that the final state proton(s) remain intact (``exclusive'' or ``elastic'' production), or dissociate (``quasi-exclusive'' production). |
png pdf |
Figure 1-a:
Quartic diagram contributing to the $\gamma \gamma \to \mathrm{ W^{+} } \mathrm{ W^{-} } $ process at leading order in the SM. The $\mathrm{ p } ^{(*)}$ indicates that the final state proton(s) remain intact (``exclusive'' or ``elastic'' production), or dissociate (``quasi-exclusive'' production). |
png pdf |
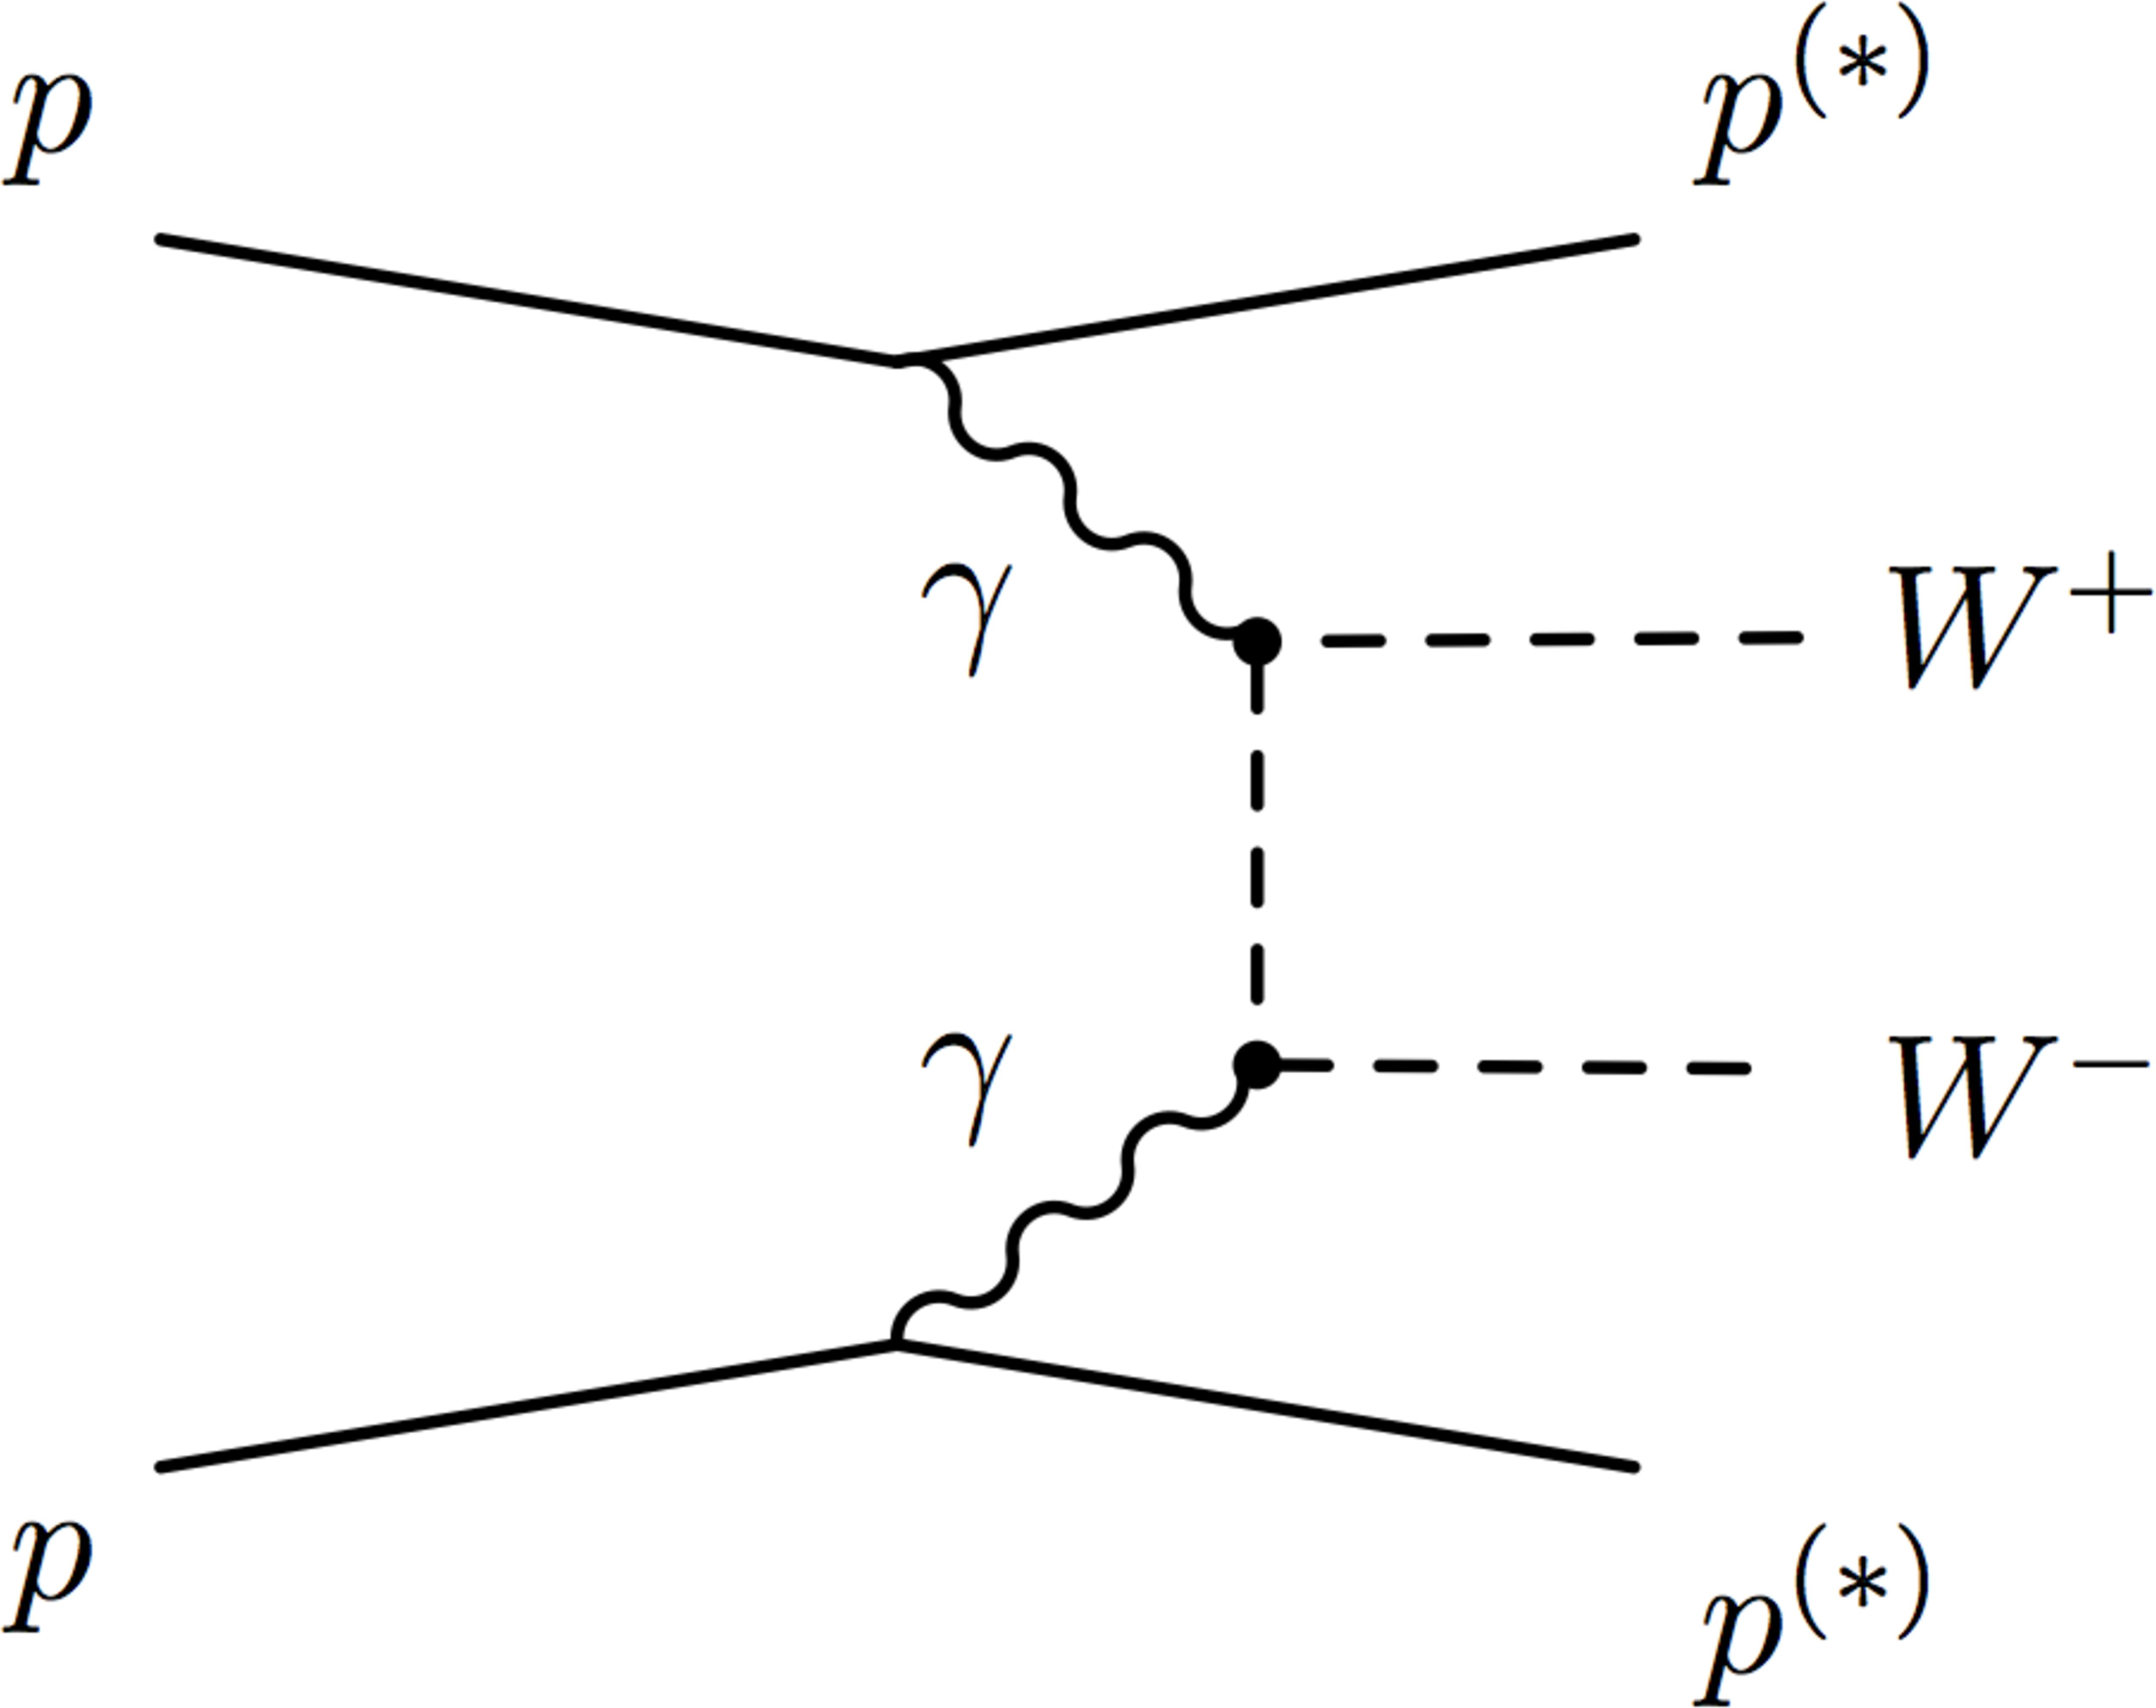
Figure 1-b:
$t$-channel diagram contributing to the $\gamma \gamma \to \mathrm{ W^{+} } \mathrm{ W^{-} } $ process at leading order in the SM. The $\mathrm{ p } ^{(*)}$ indicates that the final state proton(s) remain intact (``exclusive'' or ``elastic'' production), or dissociate (``quasi-exclusive'' production). |

png pdf |
Figure 1-c:
$u$-channel diagram contributing to the $\gamma \gamma \to \mathrm{ W^{+} } \mathrm{ W^{-} } $ process at leading order in the SM. The $\mathrm{ p } ^{(*)}$ indicates that the final state proton(s) remain intact (``exclusive'' or ``elastic'' production), or dissociate (``quasi-exclusive'' production). |
png pdf |
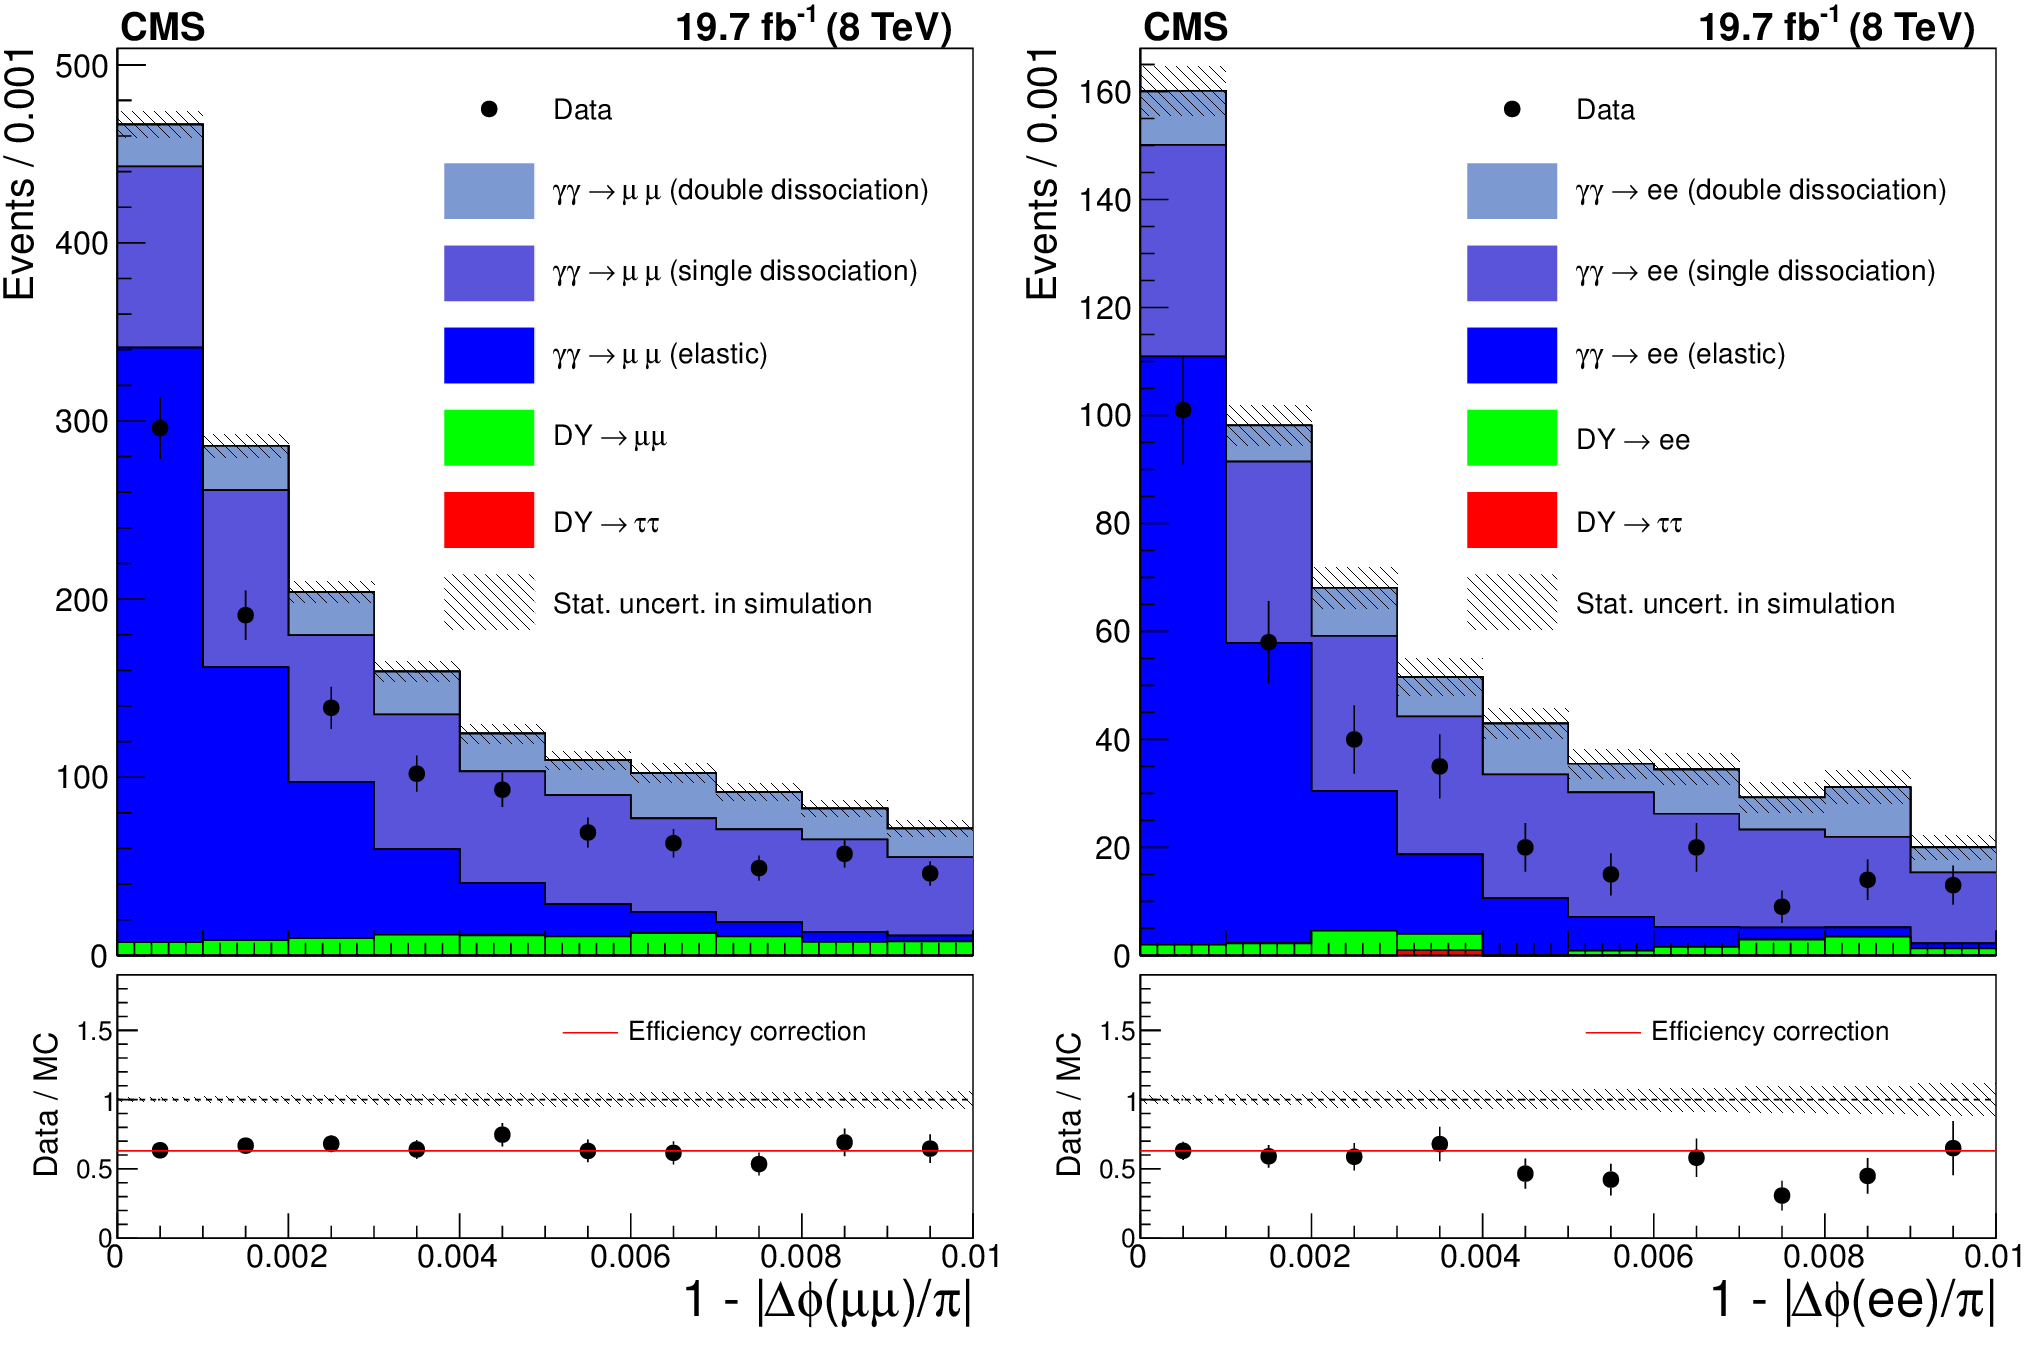
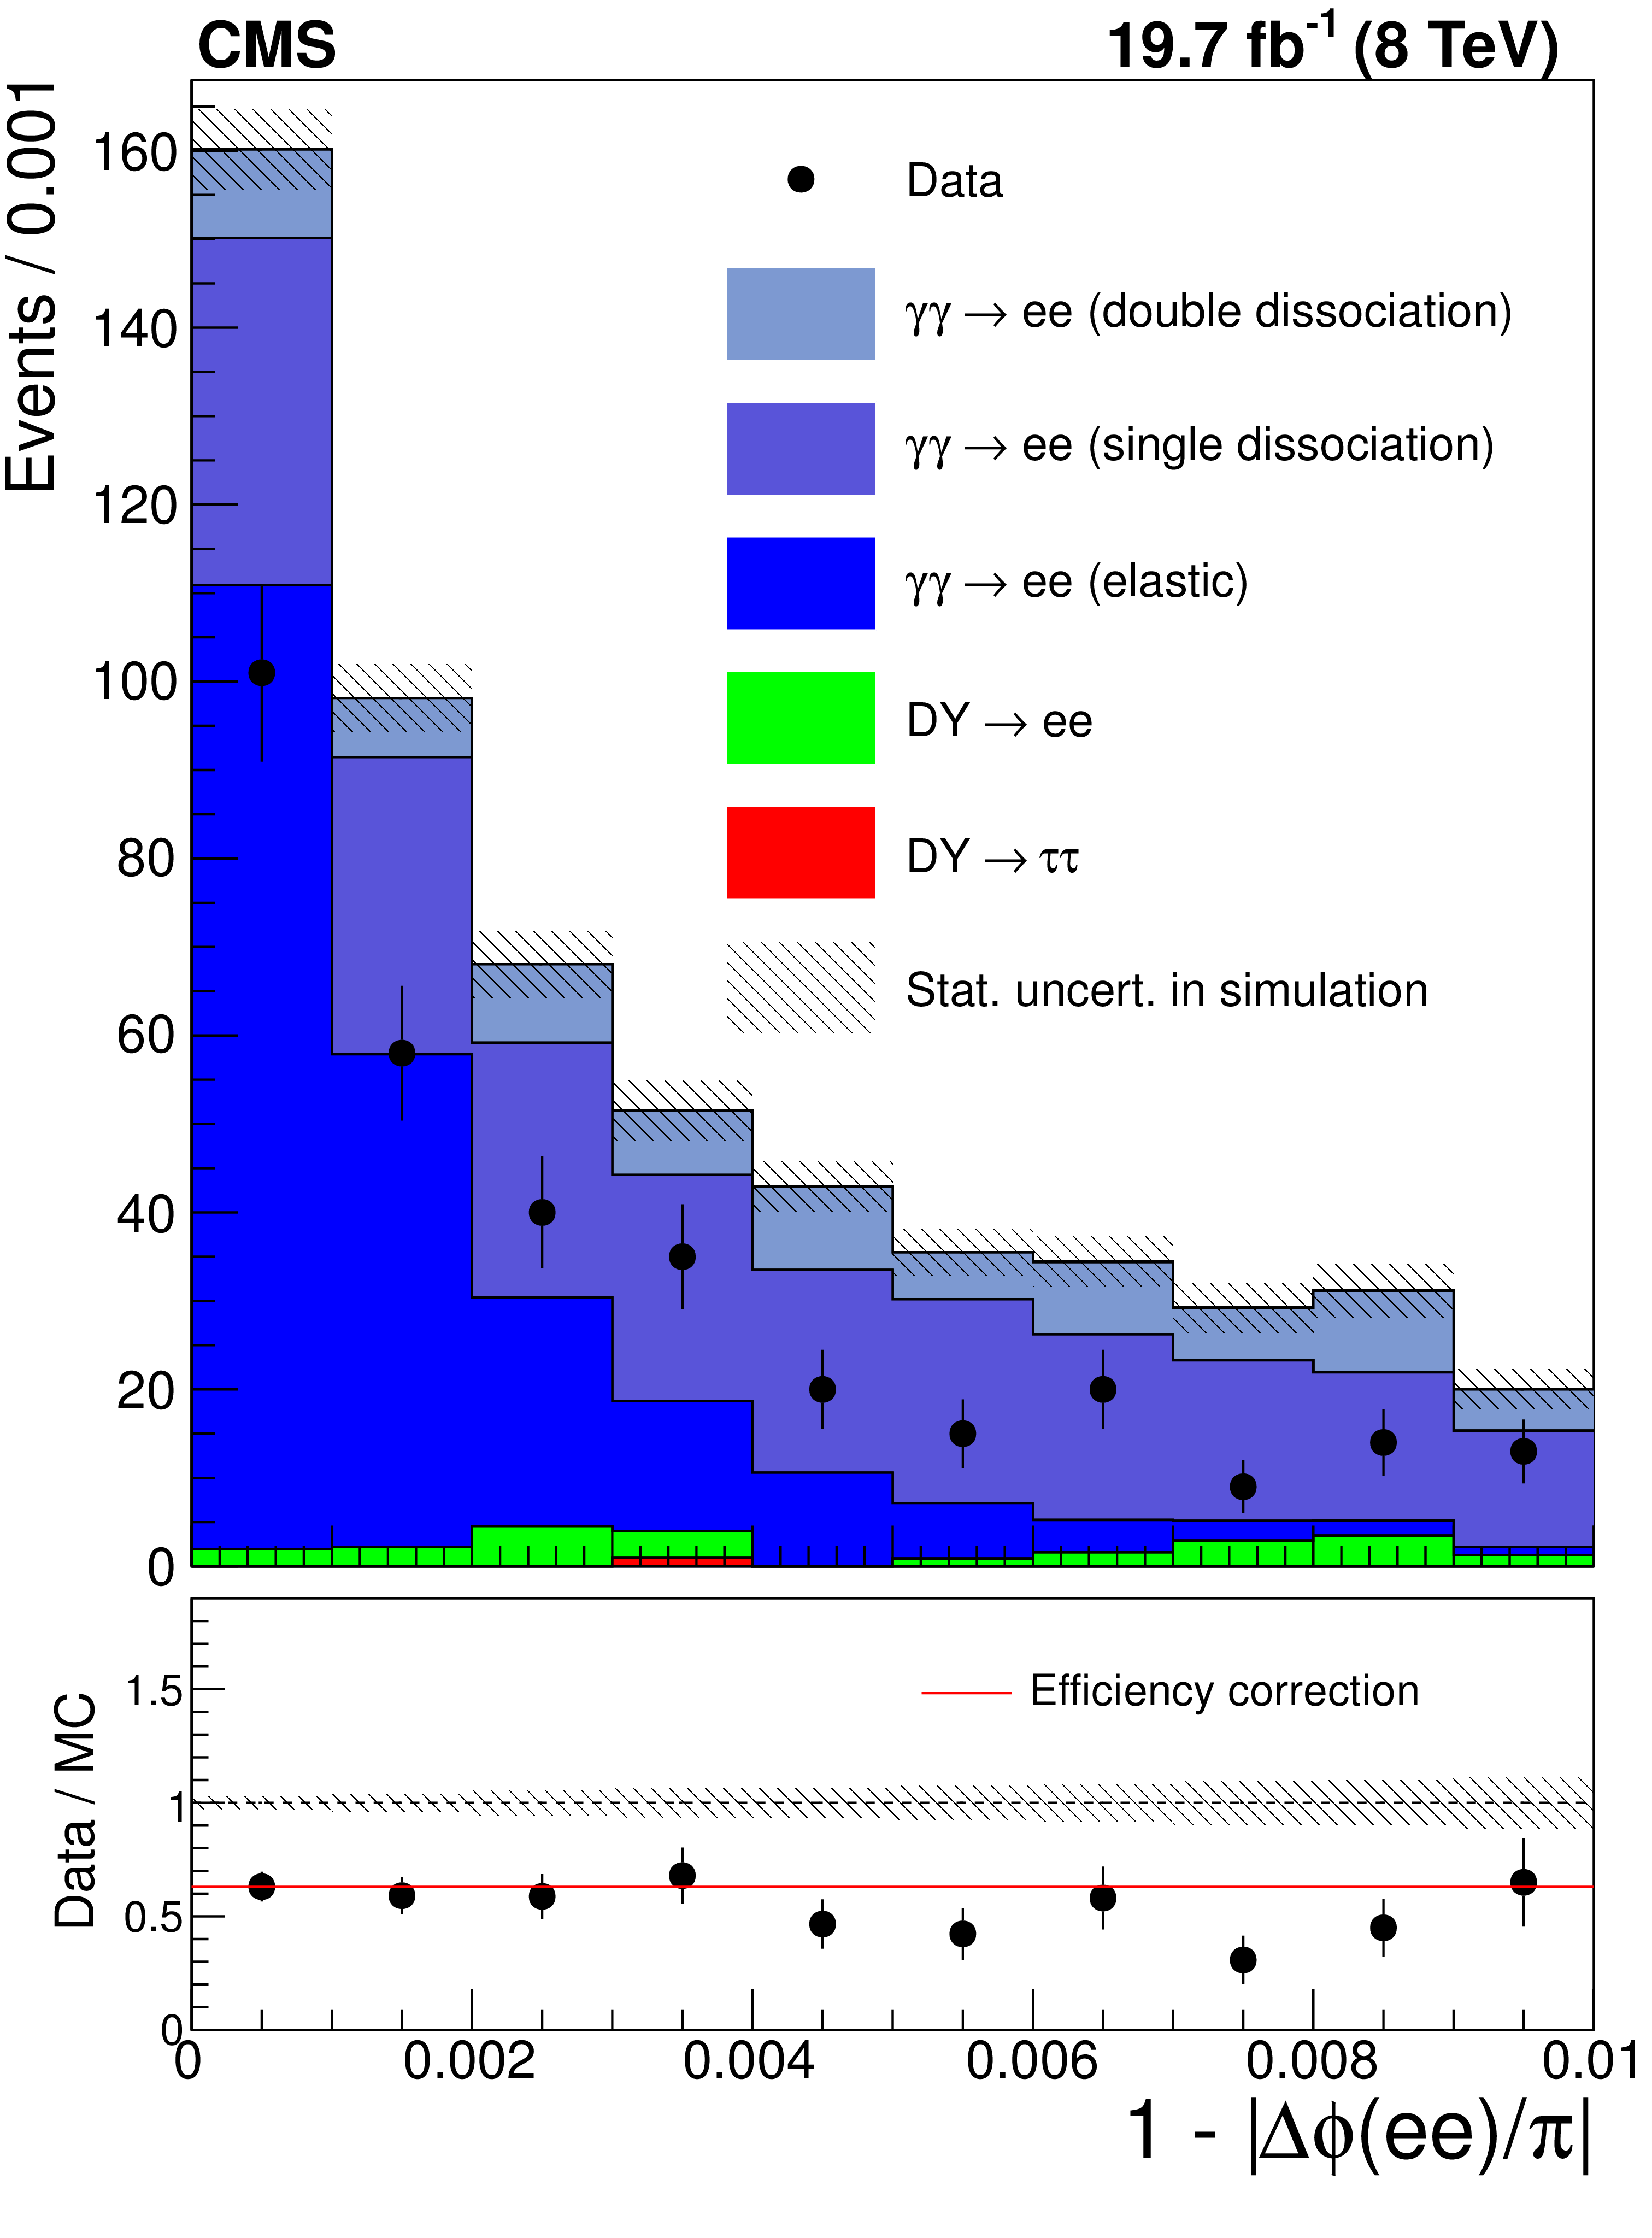
Figure 2:
Acoplanarity for the $ \mu^+ \mu^- $ (left) and $\mathrm{ e }^+ \mathrm{ e }^- $ (right) final states in the elastic $\gamma \gamma \to \ell^+ \ell^- $ control region ($ {| 1-\Delta \phi (\ell^+ \ell^- )/\pi | }<$ 0.01 and $m(\ell^+ \ell^- ) <$ 70 GeV or $m(\ell^+ \ell^- ) >$ 106 GeV ) and 0 additional tracks associated to the dilepton vertex. The data (points with error bars) are compared to the simulated samples (histograms) in the top panels. The data/MC ratios are shown in the bottom panels (the red line shows the extracted correction for the zero extra tracks efficiency). |

png pdf |
Figure 2-a:
Acoplanarity for the $ \mu^+ \mu^- $ final state in the elastic $\gamma \gamma \to \ell^+ \ell^- $ control region ($ {| 1-\Delta \phi (\ell^+ \ell^- )/\pi | }<$ 0.01 and $m(\ell^+ \ell^- ) <$ 70 GeV or $m(\ell^+ \ell^- ) >$ 106 GeV ) and 0 additional tracks associated to the dilepton vertex. The data (points with error bars) are compared to the simulated samples (histograms) in the top panels. The data/MC ratios are shown in the bottom panels (the red line shows the extracted correction for the zero extra tracks efficiency). |
png pdf |
Figure 2-b:
Acoplanarity for the $\mathrm{ e }^+ \mathrm{ e }^- $ final state in the elastic $\gamma \gamma \to \ell^+ \ell^- $ control region ($ {| 1-\Delta \phi (\ell^+ \ell^- )/\pi | }<$ 0.01 and $m(\ell^+ \ell^- ) <$ 70 GeV or $m(\ell^+ \ell^- ) >$ 106 GeV ) and 0 additional tracks associated to the dilepton vertex. The data (points with error bars) are compared to the simulated samples (histograms) in the top panels. The data/MC ratios are shown in the bottom panels (the red line shows the extracted correction for the zero extra tracks efficiency). |
png pdf |
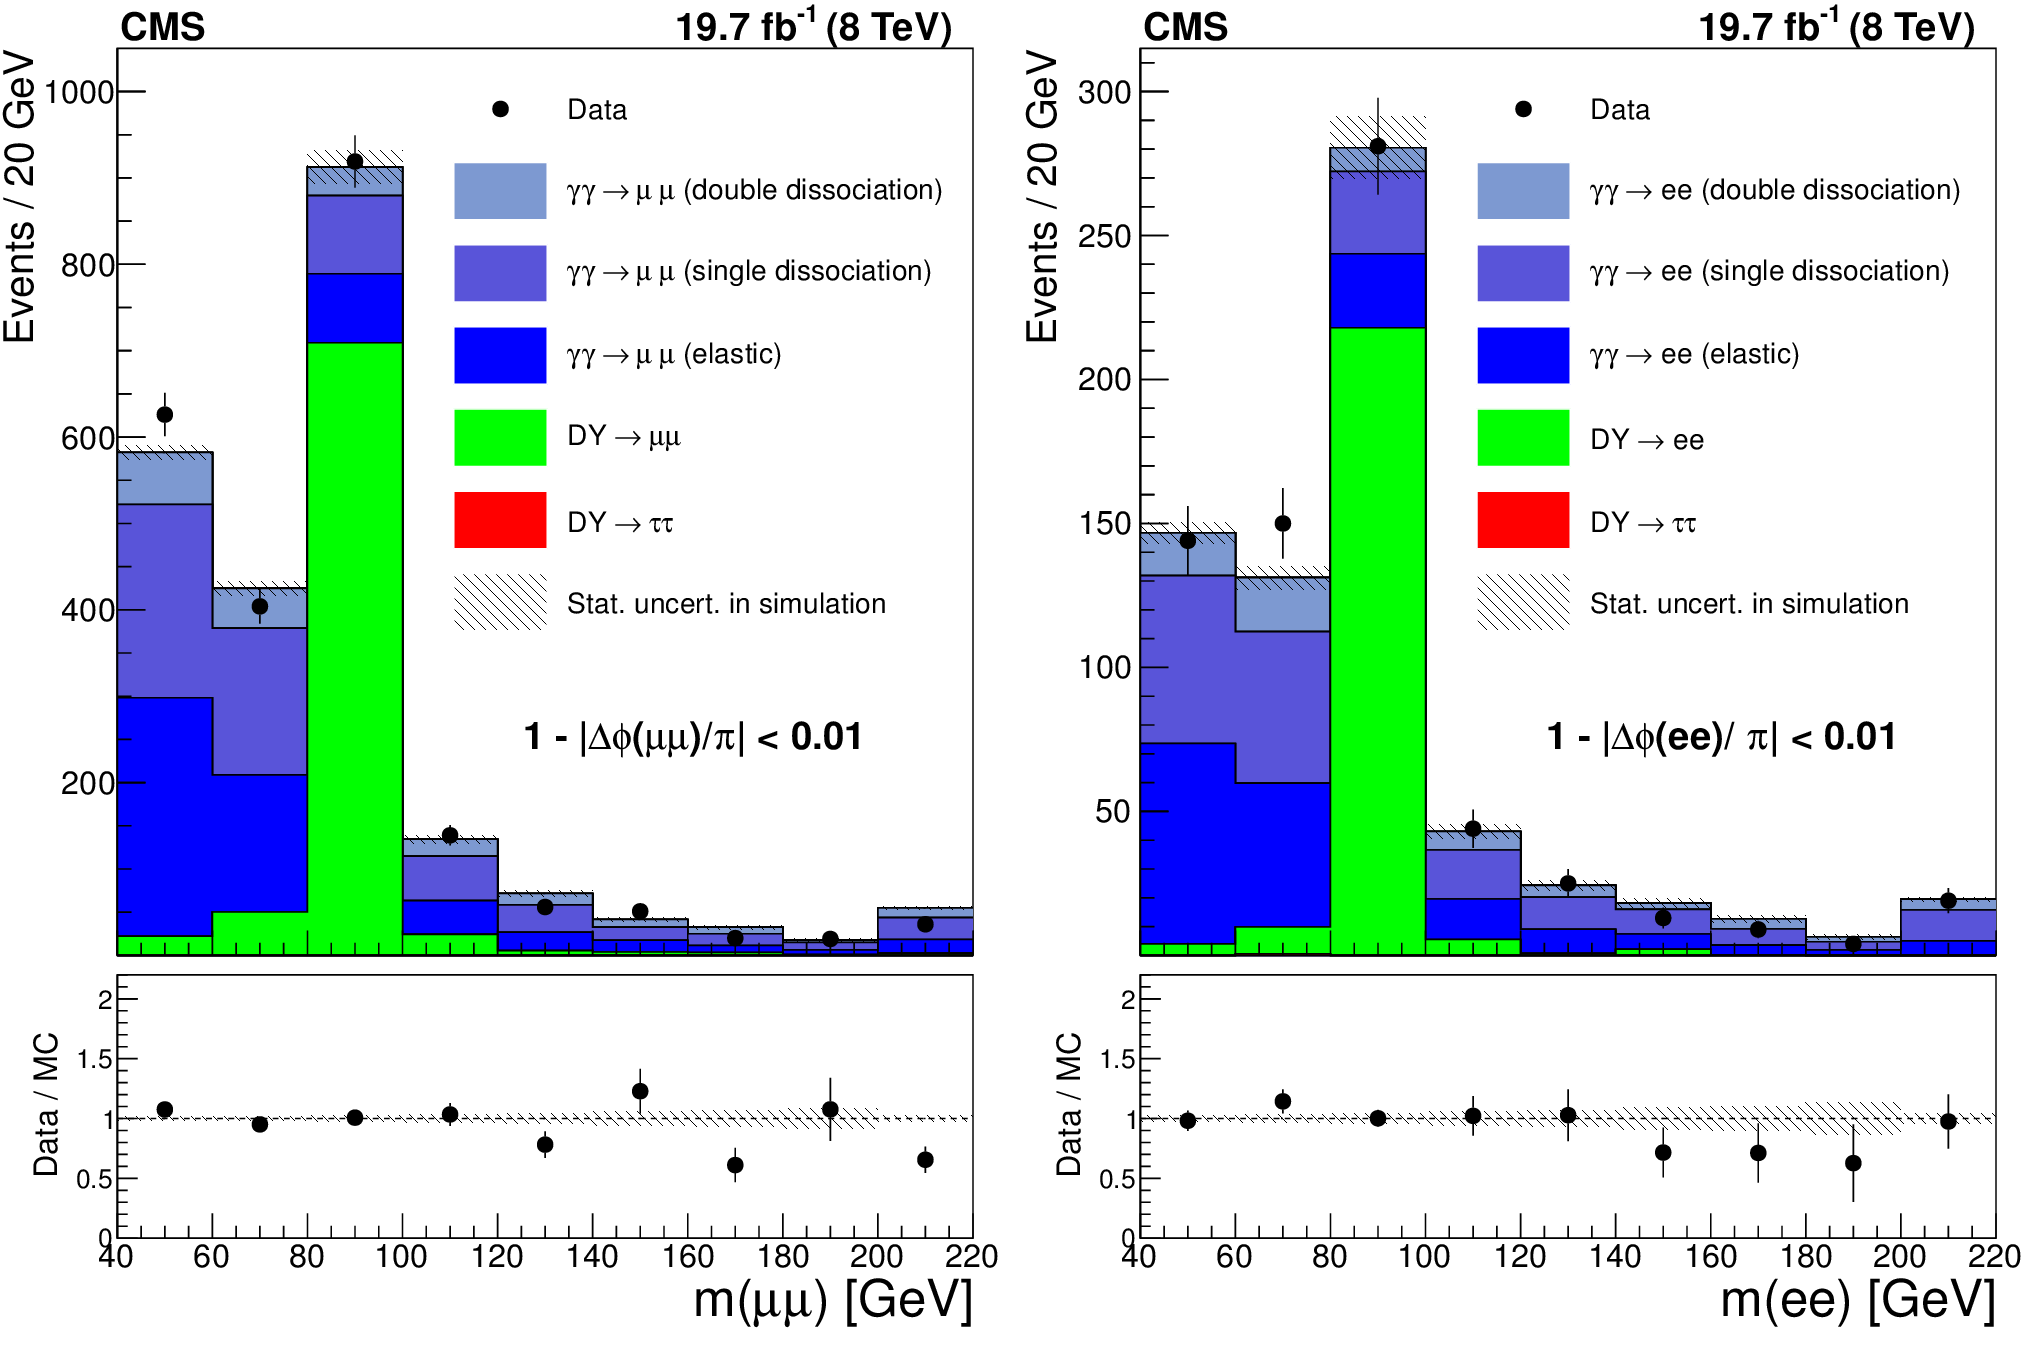
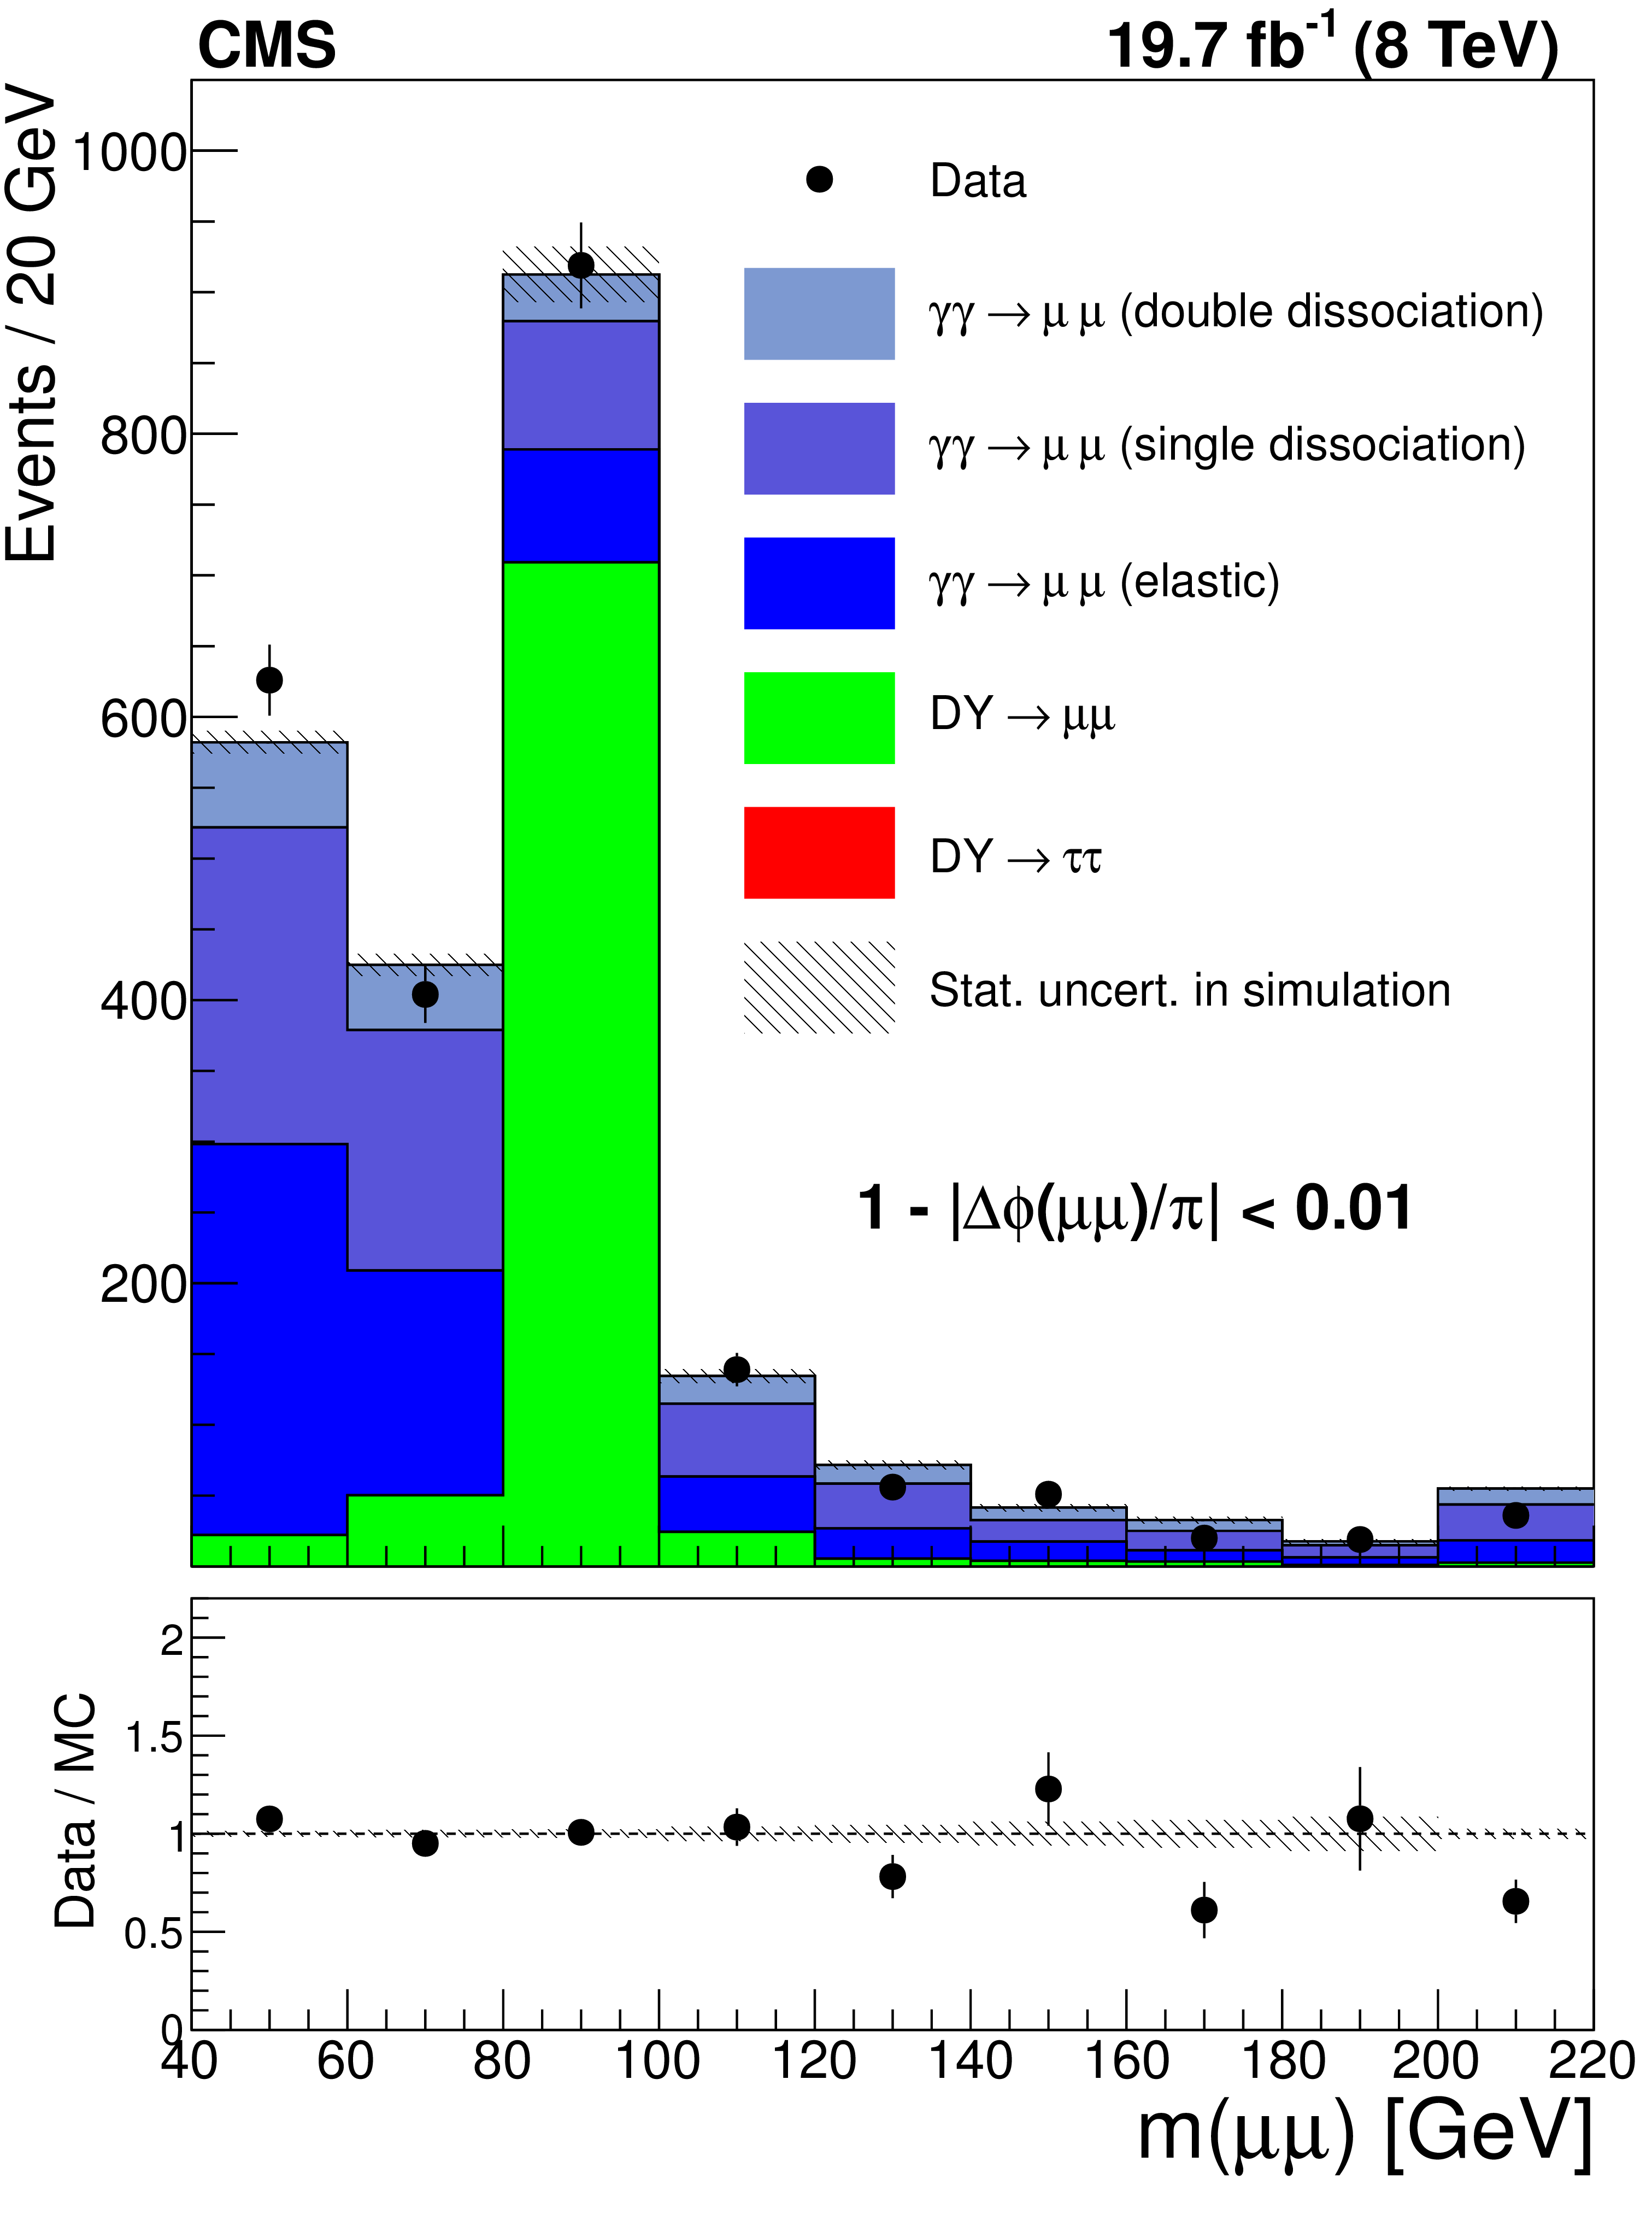
Figure 3:
Dilepton invariant mass for the $ \mu^+ \mu^- $ (left) and $\mathrm{ e }^+ \mathrm{ e }^- $ (right) final states with an acoplanarity requirement, $ {| 1-\Delta \phi (\ell^+ \ell^- )/\pi | }<$ 0.01, and zero additional tracks associated to the dilepton vertex. The data (points with error bars) are compared to the simulated samples (histograms) in the top panels, and the data/MC ratios are shown in the bottom panels. The exclusive-production simulated samples are scaled to the number of events in data for $m(\ell^+ \ell^- ) < $ 70 GeV or $m(\ell^+ \ell^- ) >$ 106 GeV. The Drell-Yan simulation is scaled to the number of events in data for 70 $< m(\ell^+ \ell^- ) <$ 106 GeV. The last bin in both plots is an overflow bin and includes all events with invariant mass greater than 200 GeV. |
png pdf |
Figure 3-a:
Dilepton invariant mass for the $ \mu^+ \mu^- $ final state with an acoplanarity requirement, $ {| 1-\Delta \phi (\ell^+ \ell^- )/\pi | }<$ 0.01, and zero additional tracks associated to the dilepton vertex. The data (points with error bars) are compared to the simulated samples (histograms) in the top panels, and the data/MC ratios are shown in the bottom panels. The exclusive-production simulated samples are scaled to the number of events in data for $m(\ell^+ \ell^- ) < $ 70 GeV or $m(\ell^+ \ell^- ) >$ 106 GeV. The Drell-Yan simulation is scaled to the number of events in data for 70 $< m(\ell^+ \ell^- ) <$ 106 GeV. The last bin in both plots is an overflow bin and includes all events with invariant mass greater than 200 GeV. |
png pdf |
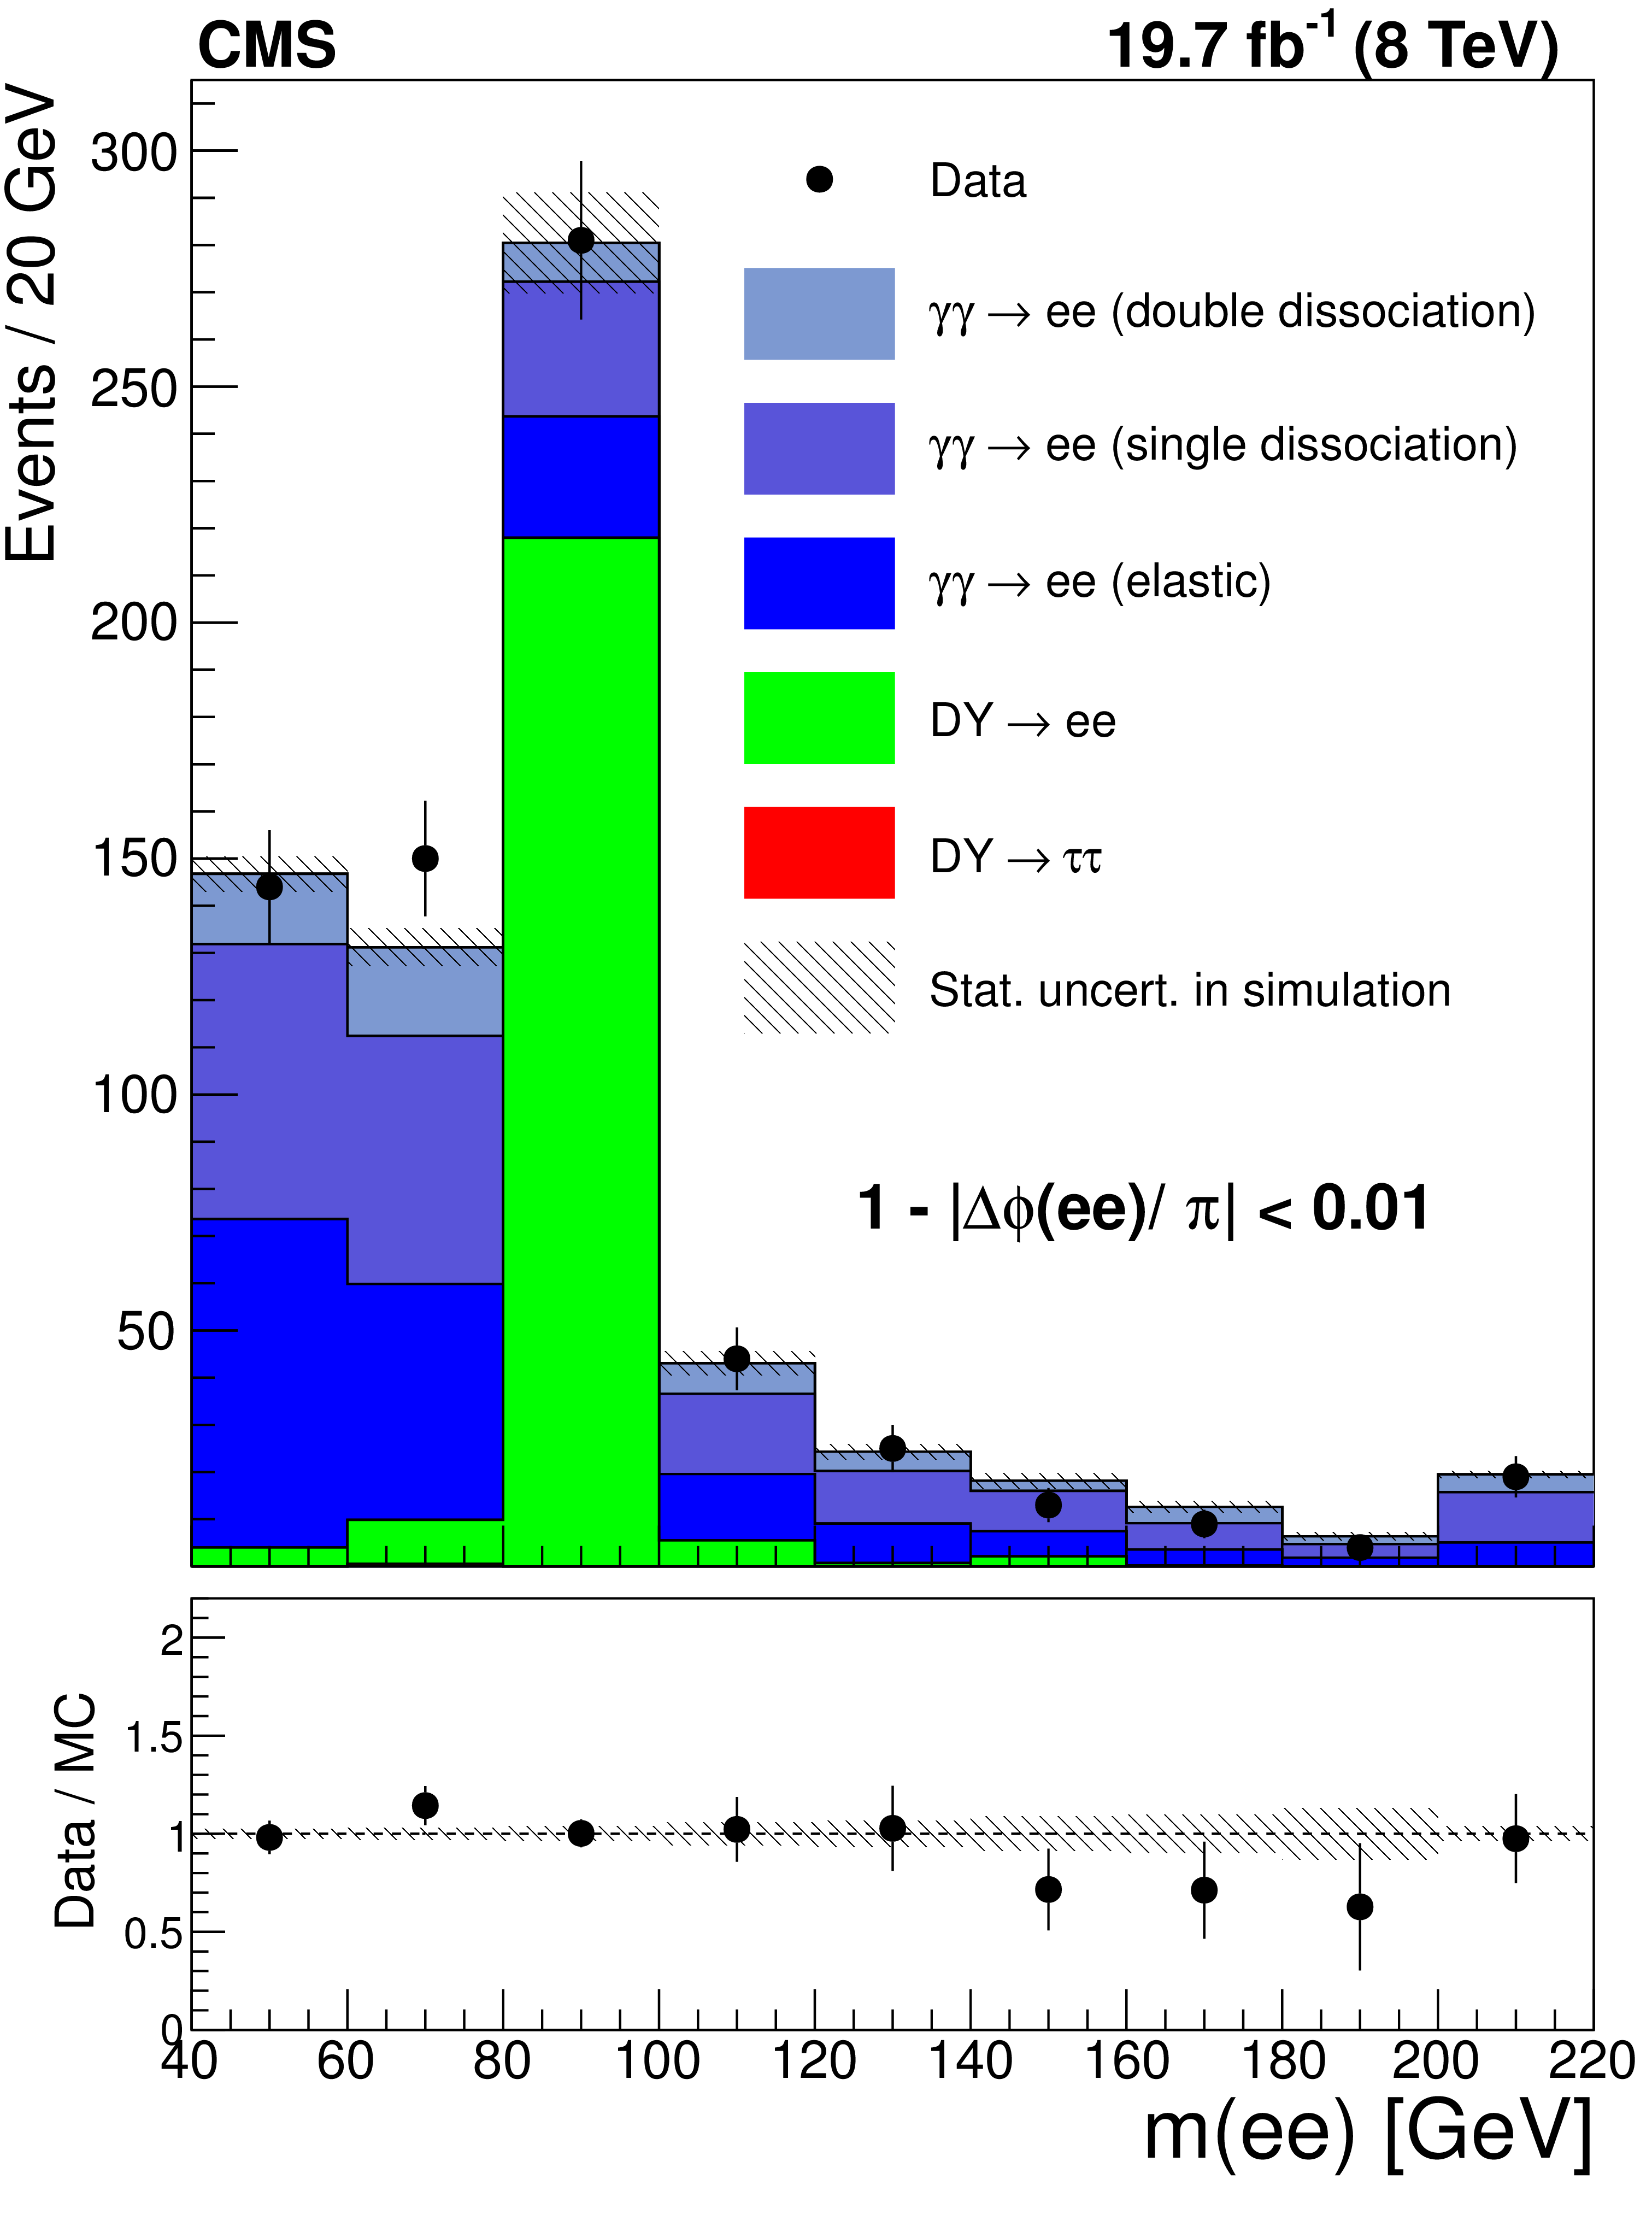
Figure 3-b:
Dilepton invariant mass for the $\mathrm{ e }^+ \mathrm{ e }^- $ (b) final state with an acoplanarity requirement, $ {| 1-\Delta \phi (\ell^+ \ell^- )/\pi | }<$ 0.01, and zero additional tracks associated to the dilepton vertex. The data (points with error bars) are compared to the simulated samples (histograms) in the top panels, and the data/MC ratios are shown in the bottom panels. The exclusive-production simulated samples are scaled to the number of events in data for $m(\ell^+ \ell^- ) < $ 70 GeV or $m(\ell^+ \ell^- ) >$ 106 GeV. The Drell-Yan simulation is scaled to the number of events in data for 70 $< m(\ell^+ \ell^- ) <$ 106 GeV. The last bin in both plots is an overflow bin and includes all events with invariant mass greater than 200 GeV. |
png pdf |
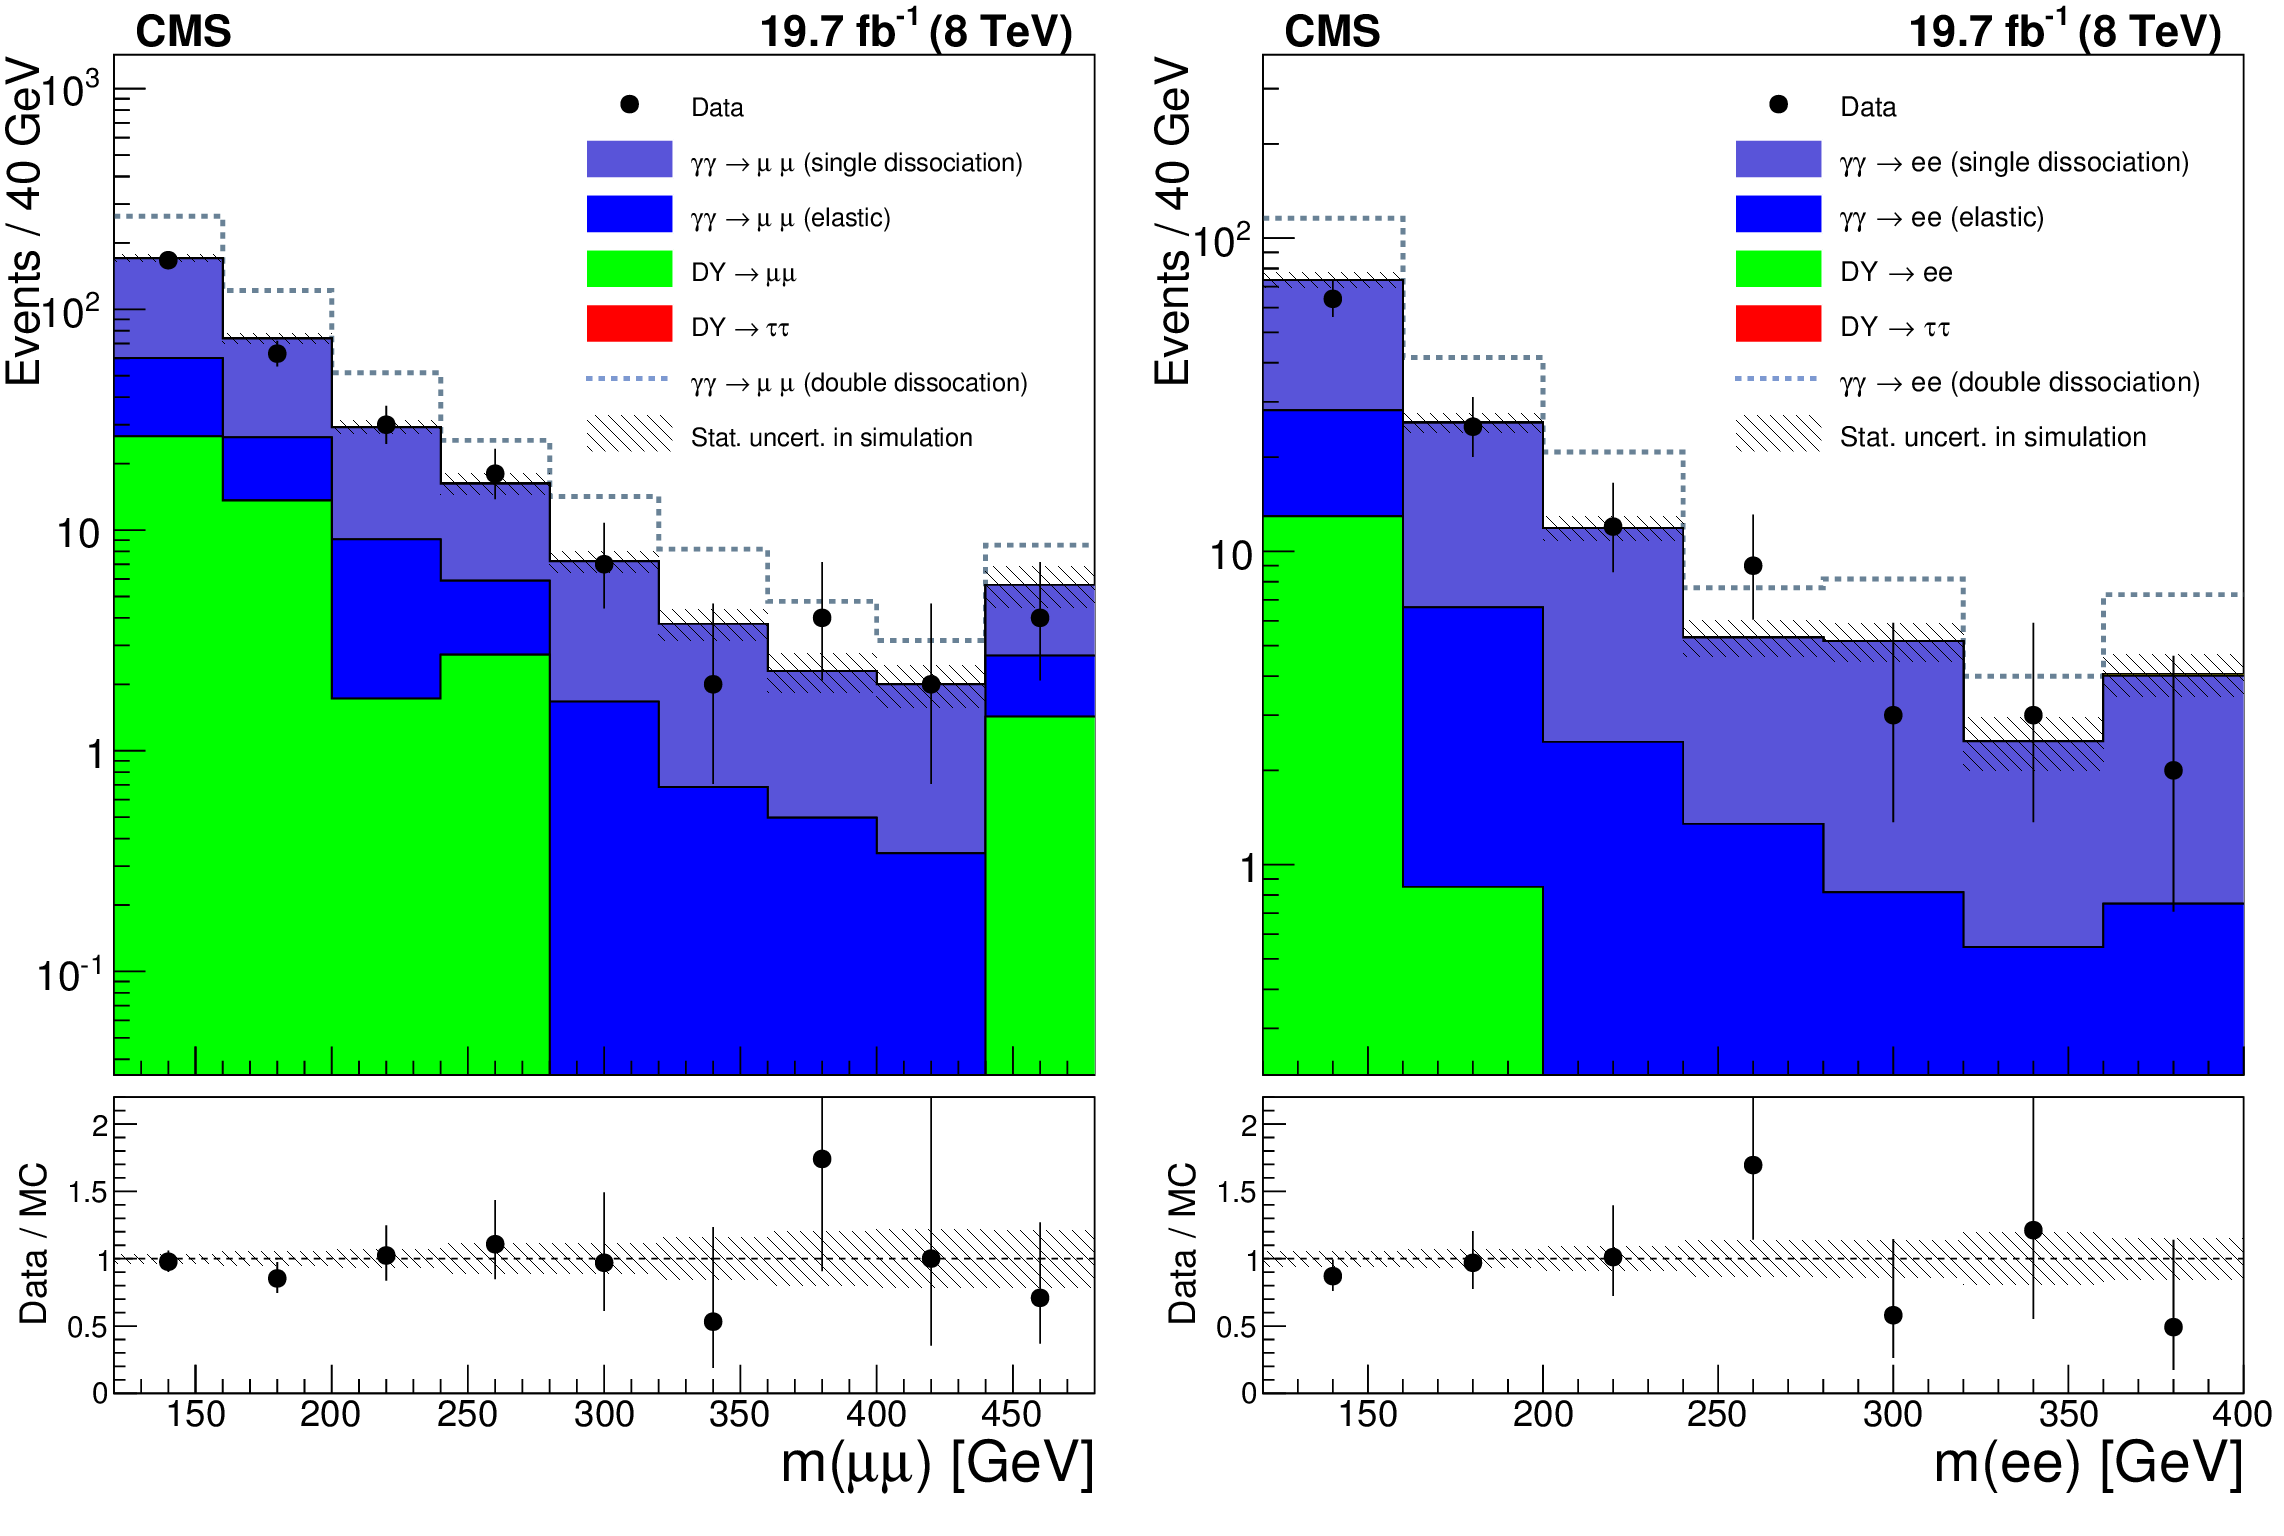
Figure 4:
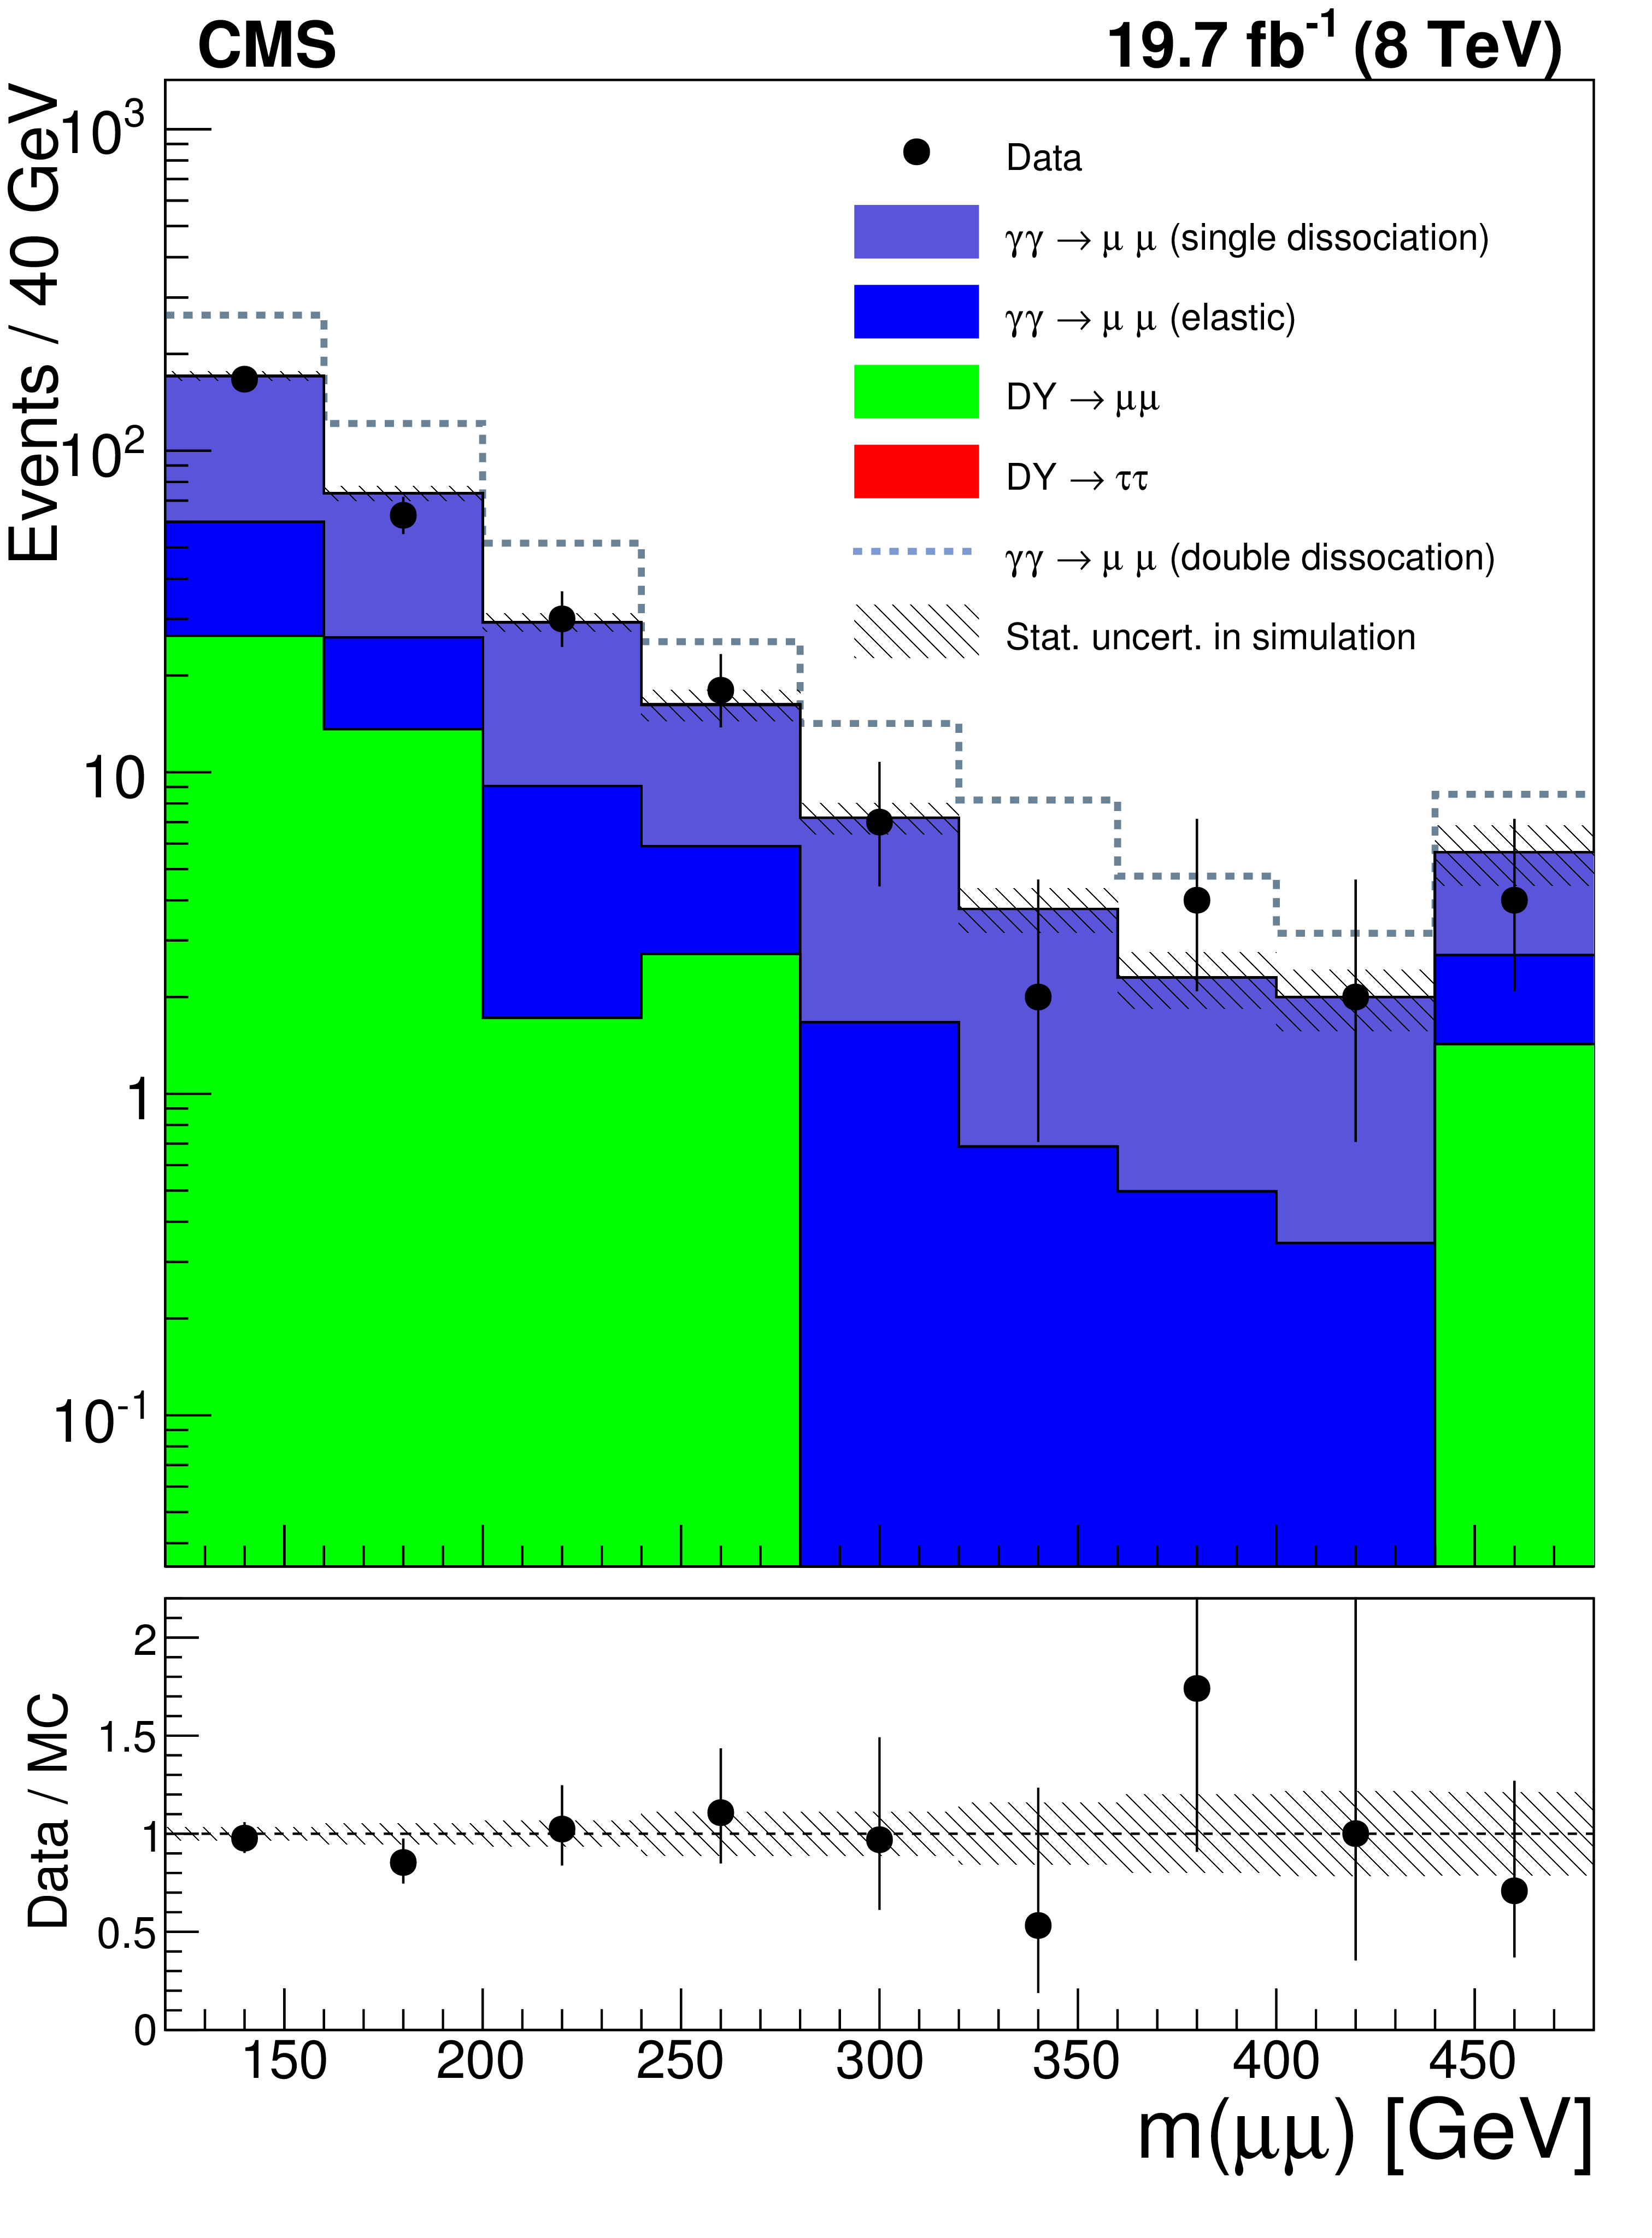
Dilepton invariant mass for the $ \mu^+ \mu^- $ final state in the $\gamma \gamma \to \ell^+ \ell^- $ proton dissociation control region with no additional tracks associated to the dilepton vertex, for data (points with error bars) and simulated samples (histograms, with the efficiency correction applied to the exclusive samples). The last bin is both plots is an overflow bin and includes all events above the maximum value in the plot. The bottom panels show the data/MC ratio where the denominator includes the sum of all simulated samples except the double-dissociation contribution (shown as the blue dotted line in the top plots). |
png pdf |
Figure 4-a:
Dilepton invariant mass for the $ \mu^+ \mu^- $ final state in the $\gamma \gamma \to \ell^+ \ell^- $ proton dissociation control region with no additional tracks associated to the dilepton vertex, for data (points with error bars) and simulated samples (histograms, with the efficiency correction applied to the exclusive samples). The last bin is both plots is an overflow bin and includes all events above the maximum value in the plot. The bottom panels show the data/MC ratio where the denominator includes the sum of all simulated samples except the double-dissociation contribution (shown as the blue dotted line in the top plots). |

png pdf |
Figure 4-b:
Dilepton invariant mass for the $\mathrm{ e }^+ \mathrm{ e }^- $ final states in the $\gamma \gamma \to \ell^+ \ell^- $ proton dissociation control region with no additional tracks associated to the dilepton vertex, for data (points with error bars) and simulated samples (histograms, with the efficiency correction applied to the exclusive samples). The last bin is both plots is an overflow bin and includes all events above the maximum value in the plot. The bottom panels show the data/MC ratio where the denominator includes the sum of all simulated samples except the double-dissociation contribution (shown as the blue dotted line in the top plots). |
png pdf |
Figure 5:
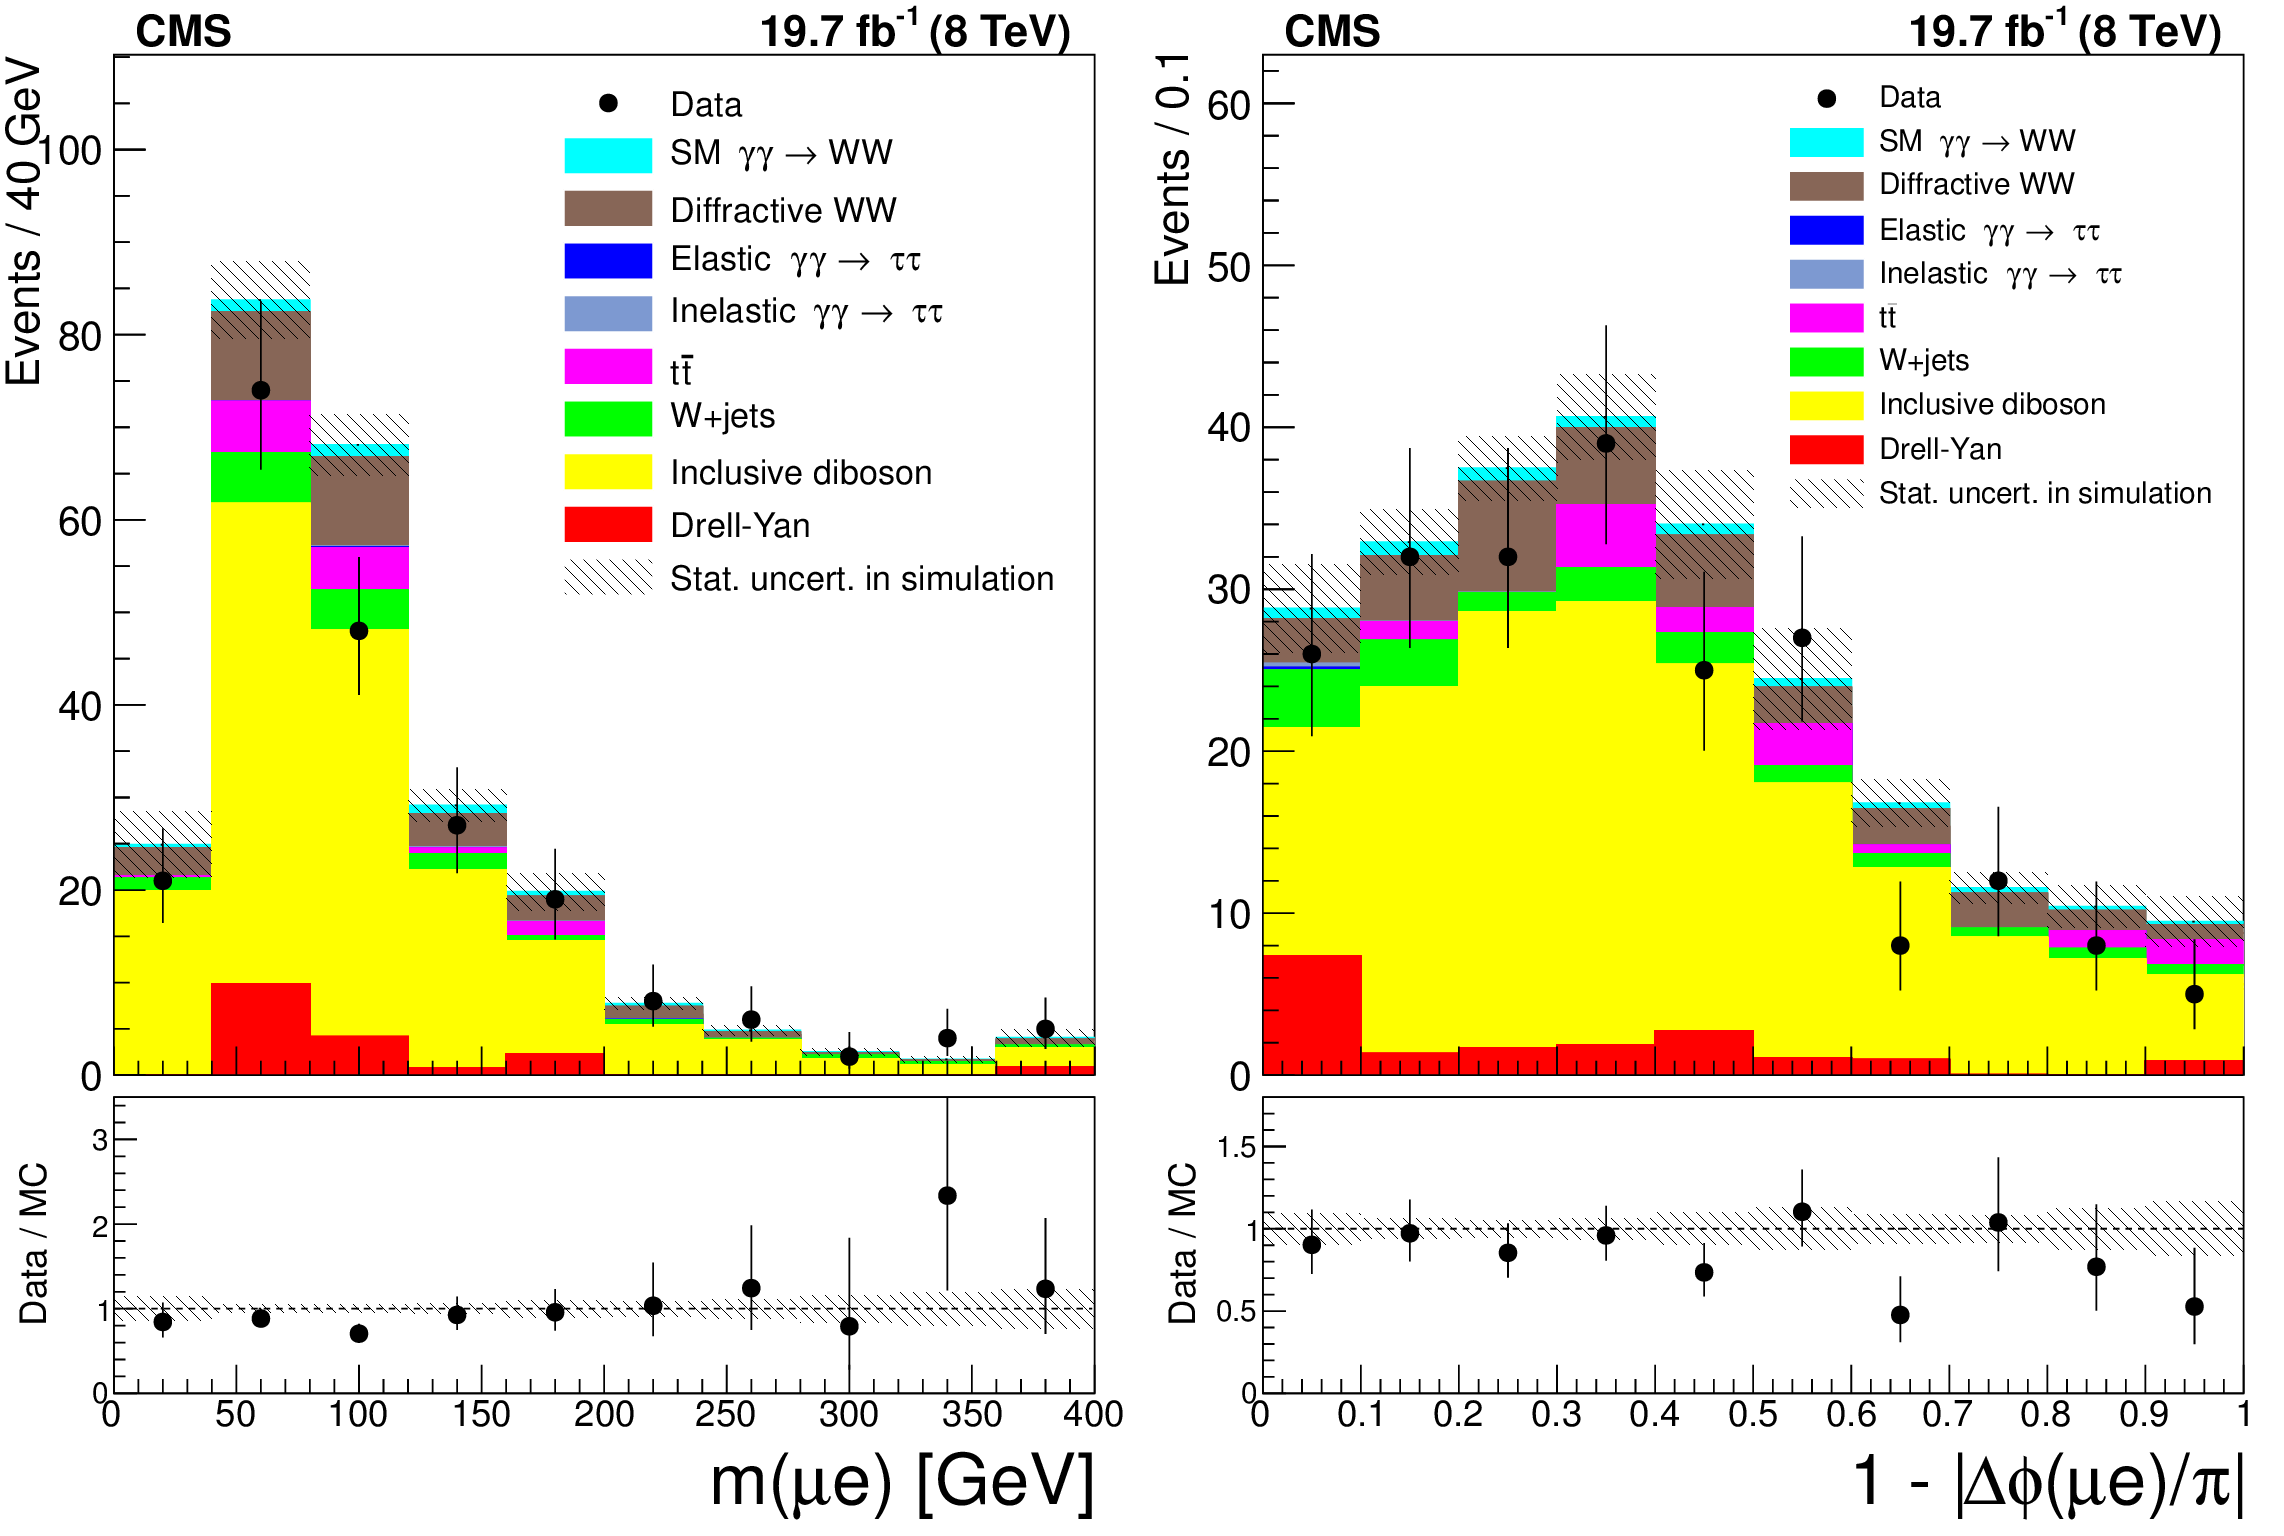
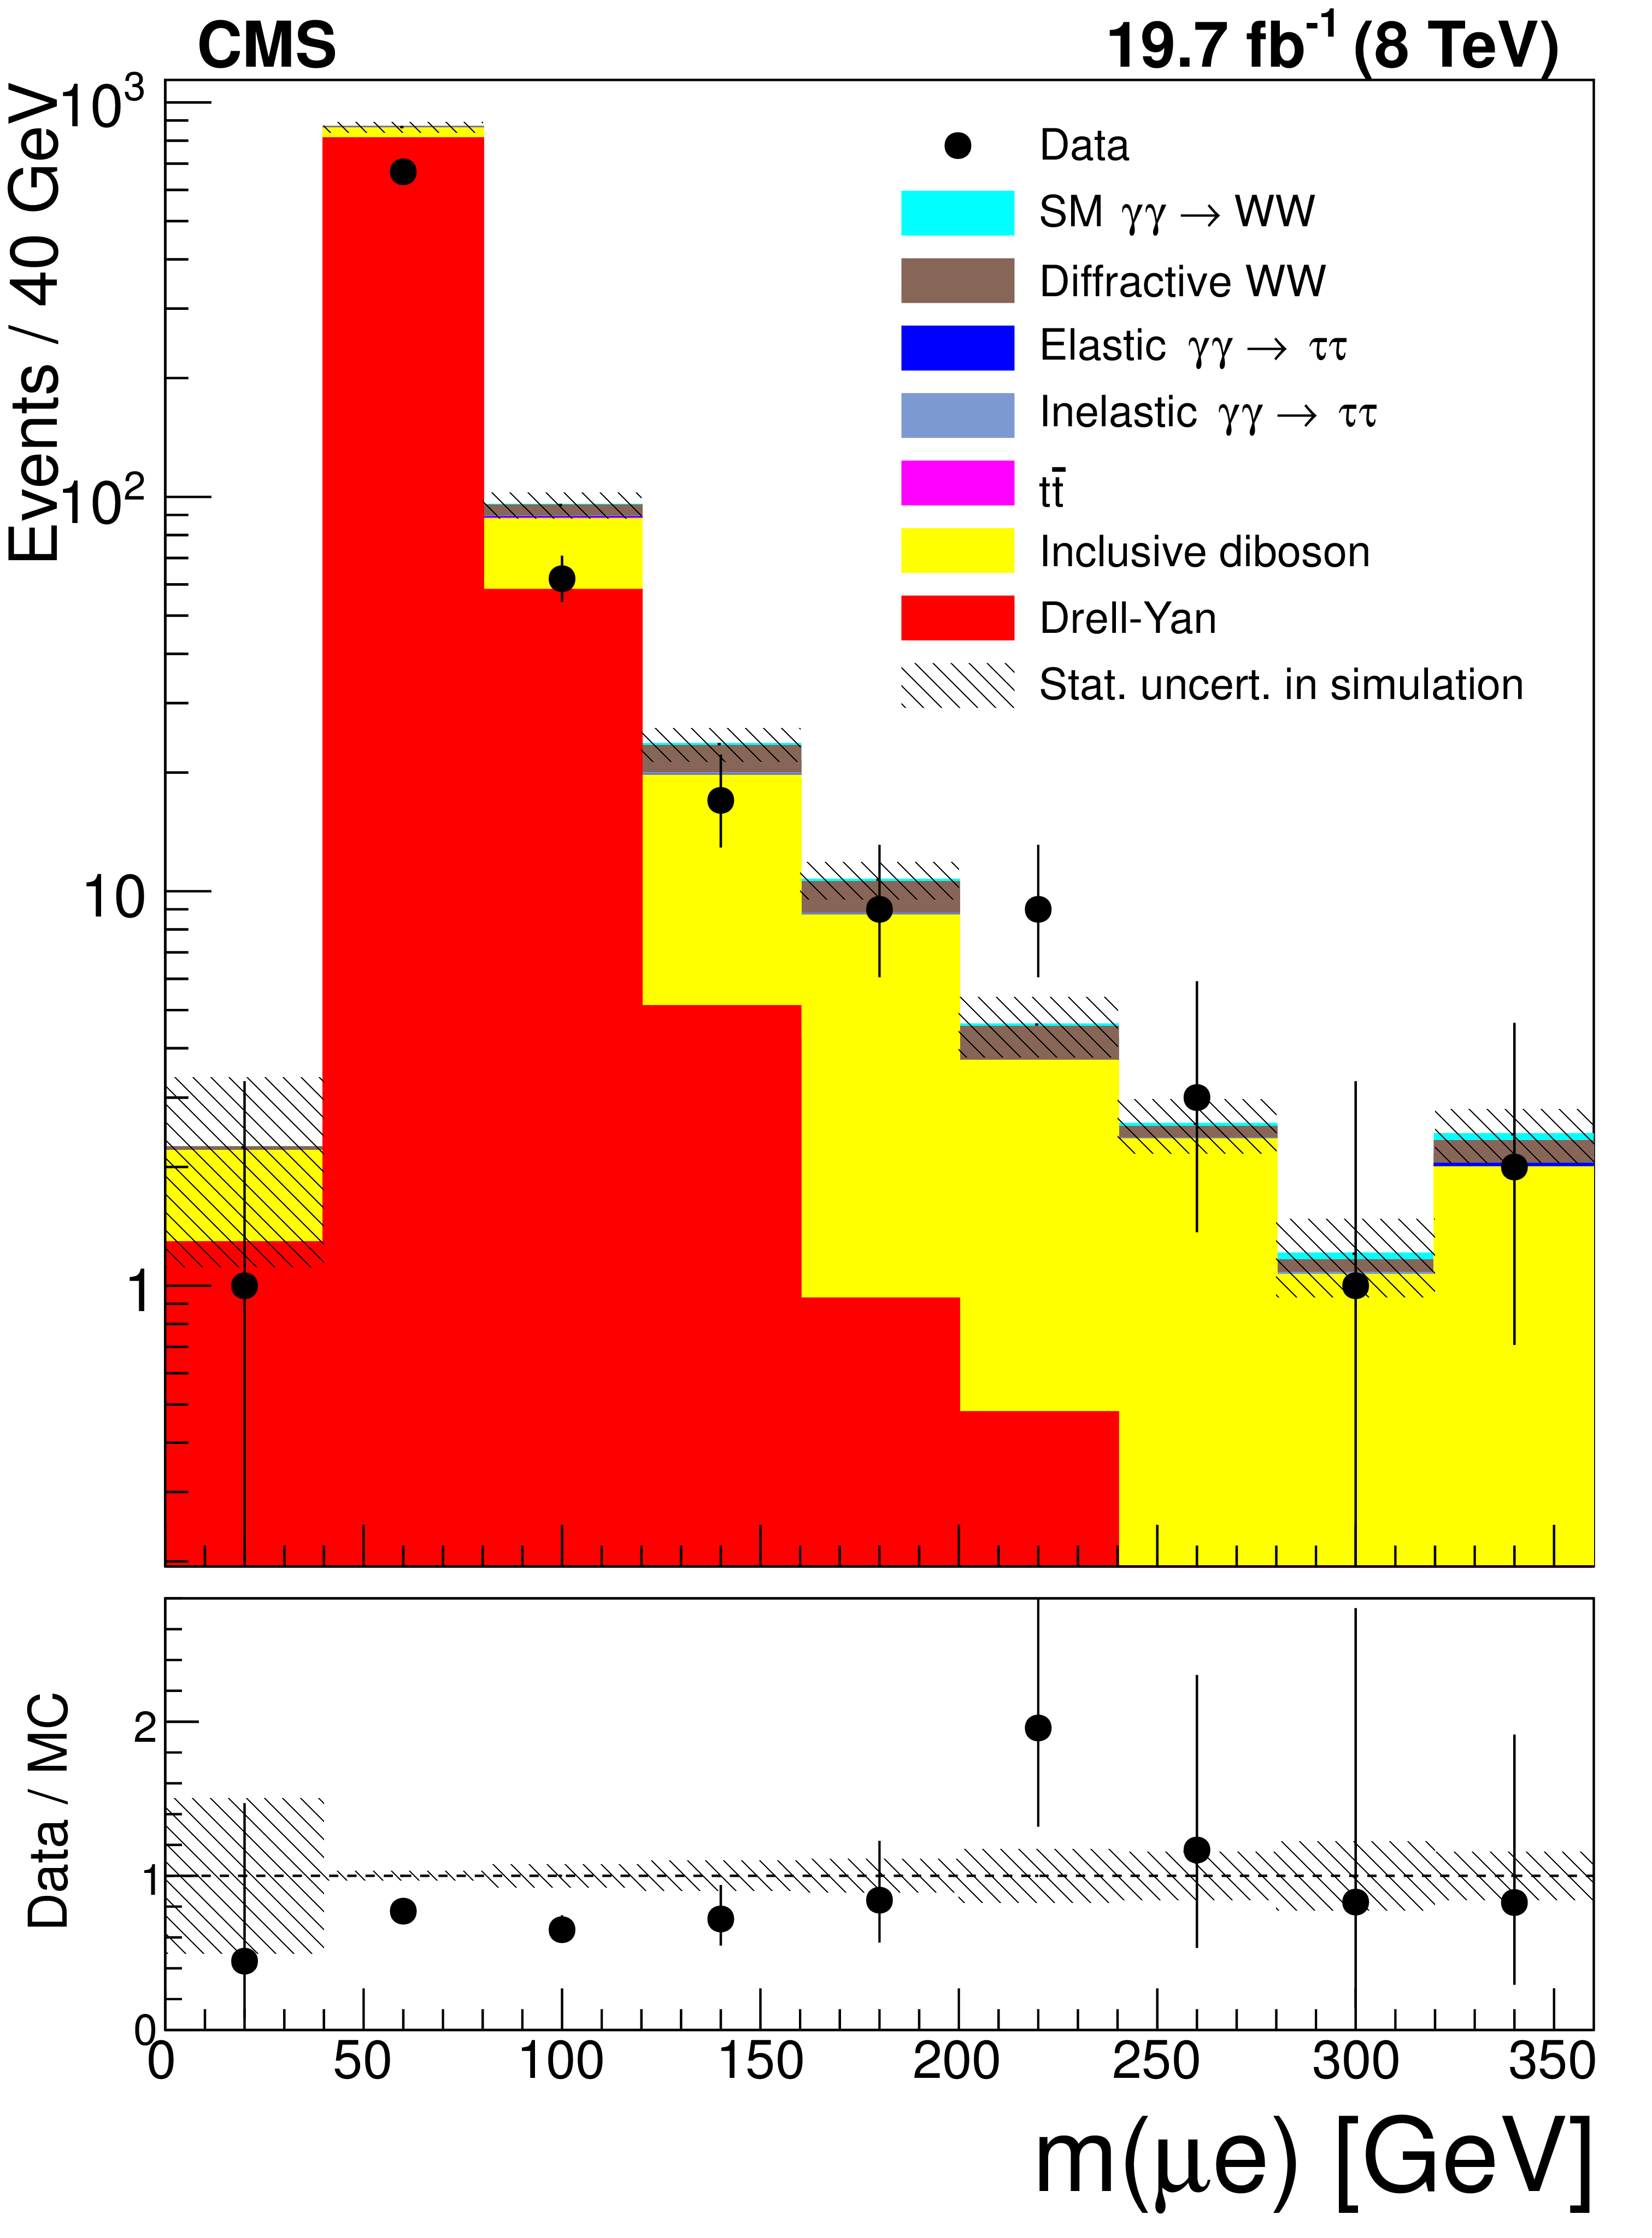
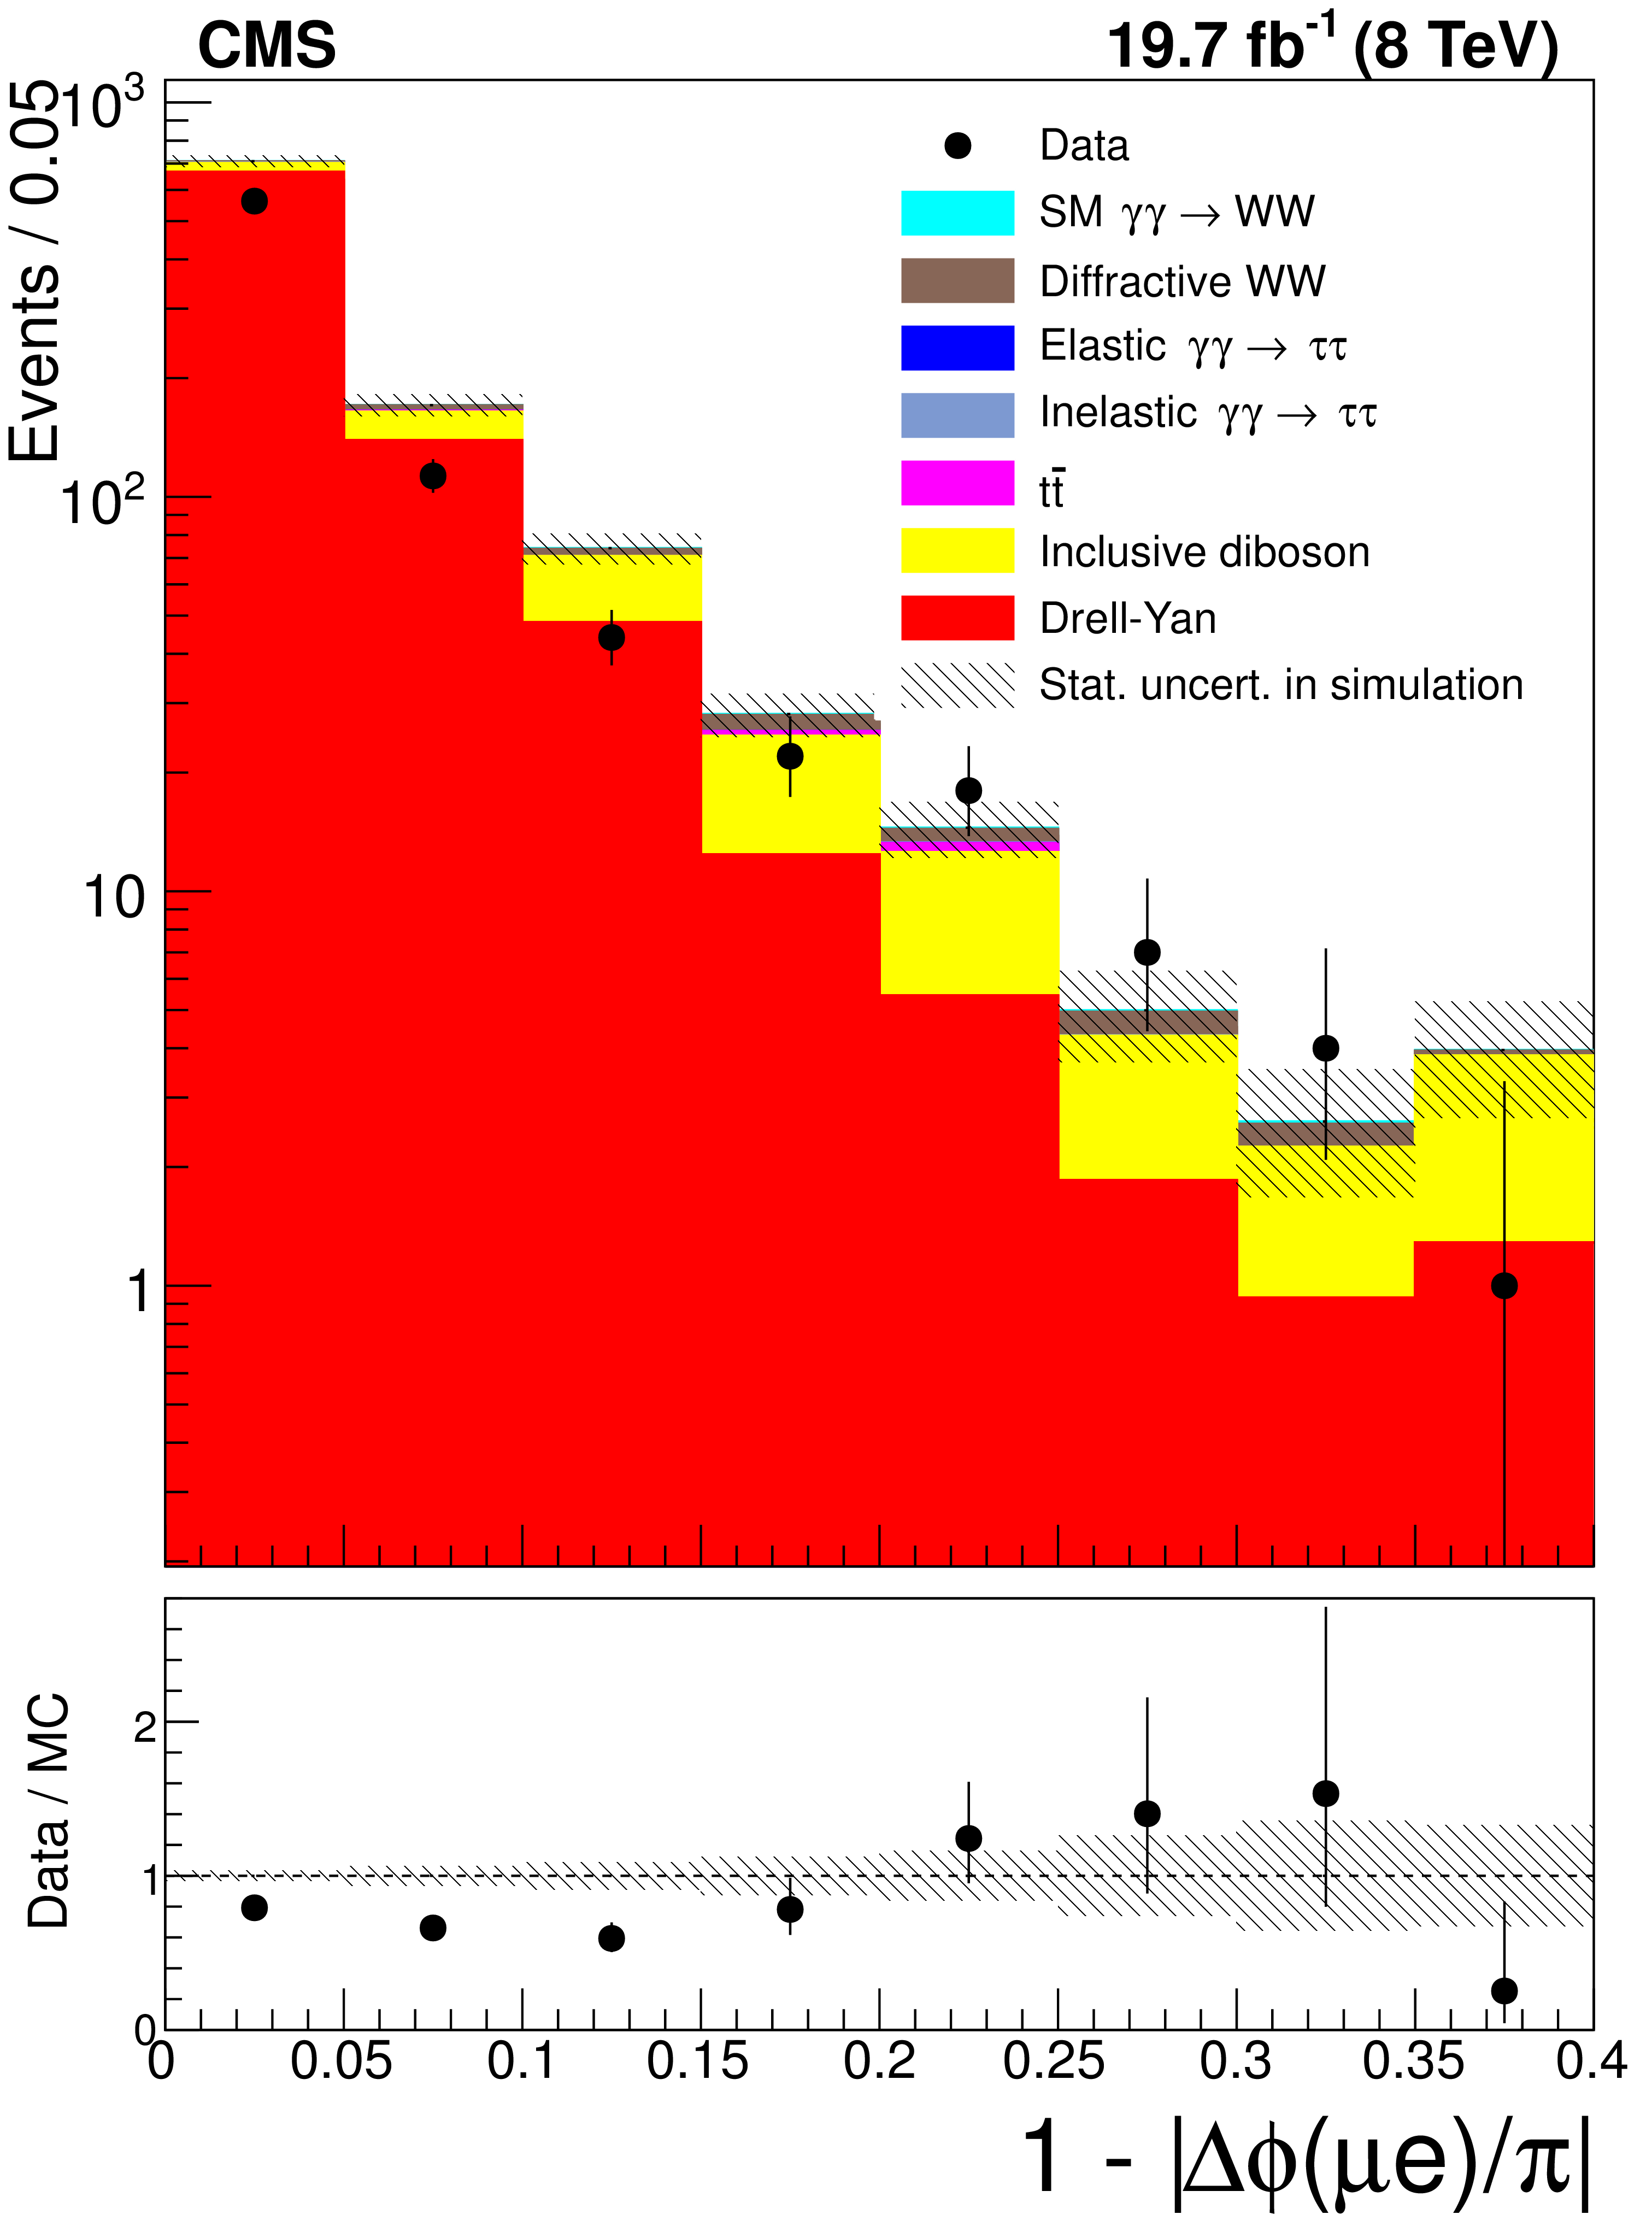
Distributions of $\mu ^{\pm }\mathrm{ e } ^{\mp }$ invariant mass (left) and acoplanarity (right) for data (points with error bars) and expected backgrounds (histograms) for $ {p_{\mathrm {T}}} (\mu ^{\pm }\mathrm{ e } ^{\mp }) > $ 30 GeV and 1-6 extra tracks (inclusive $\mathrm{ W }^+ \mathrm{ W }^- $ control region). The last bin in the invariant mass plot is an overflow bin and includes all events with $m(\mu \mathrm{ e } )> $ 360 GeV. The bottom panels show the data/MC ratio. |
png pdf |
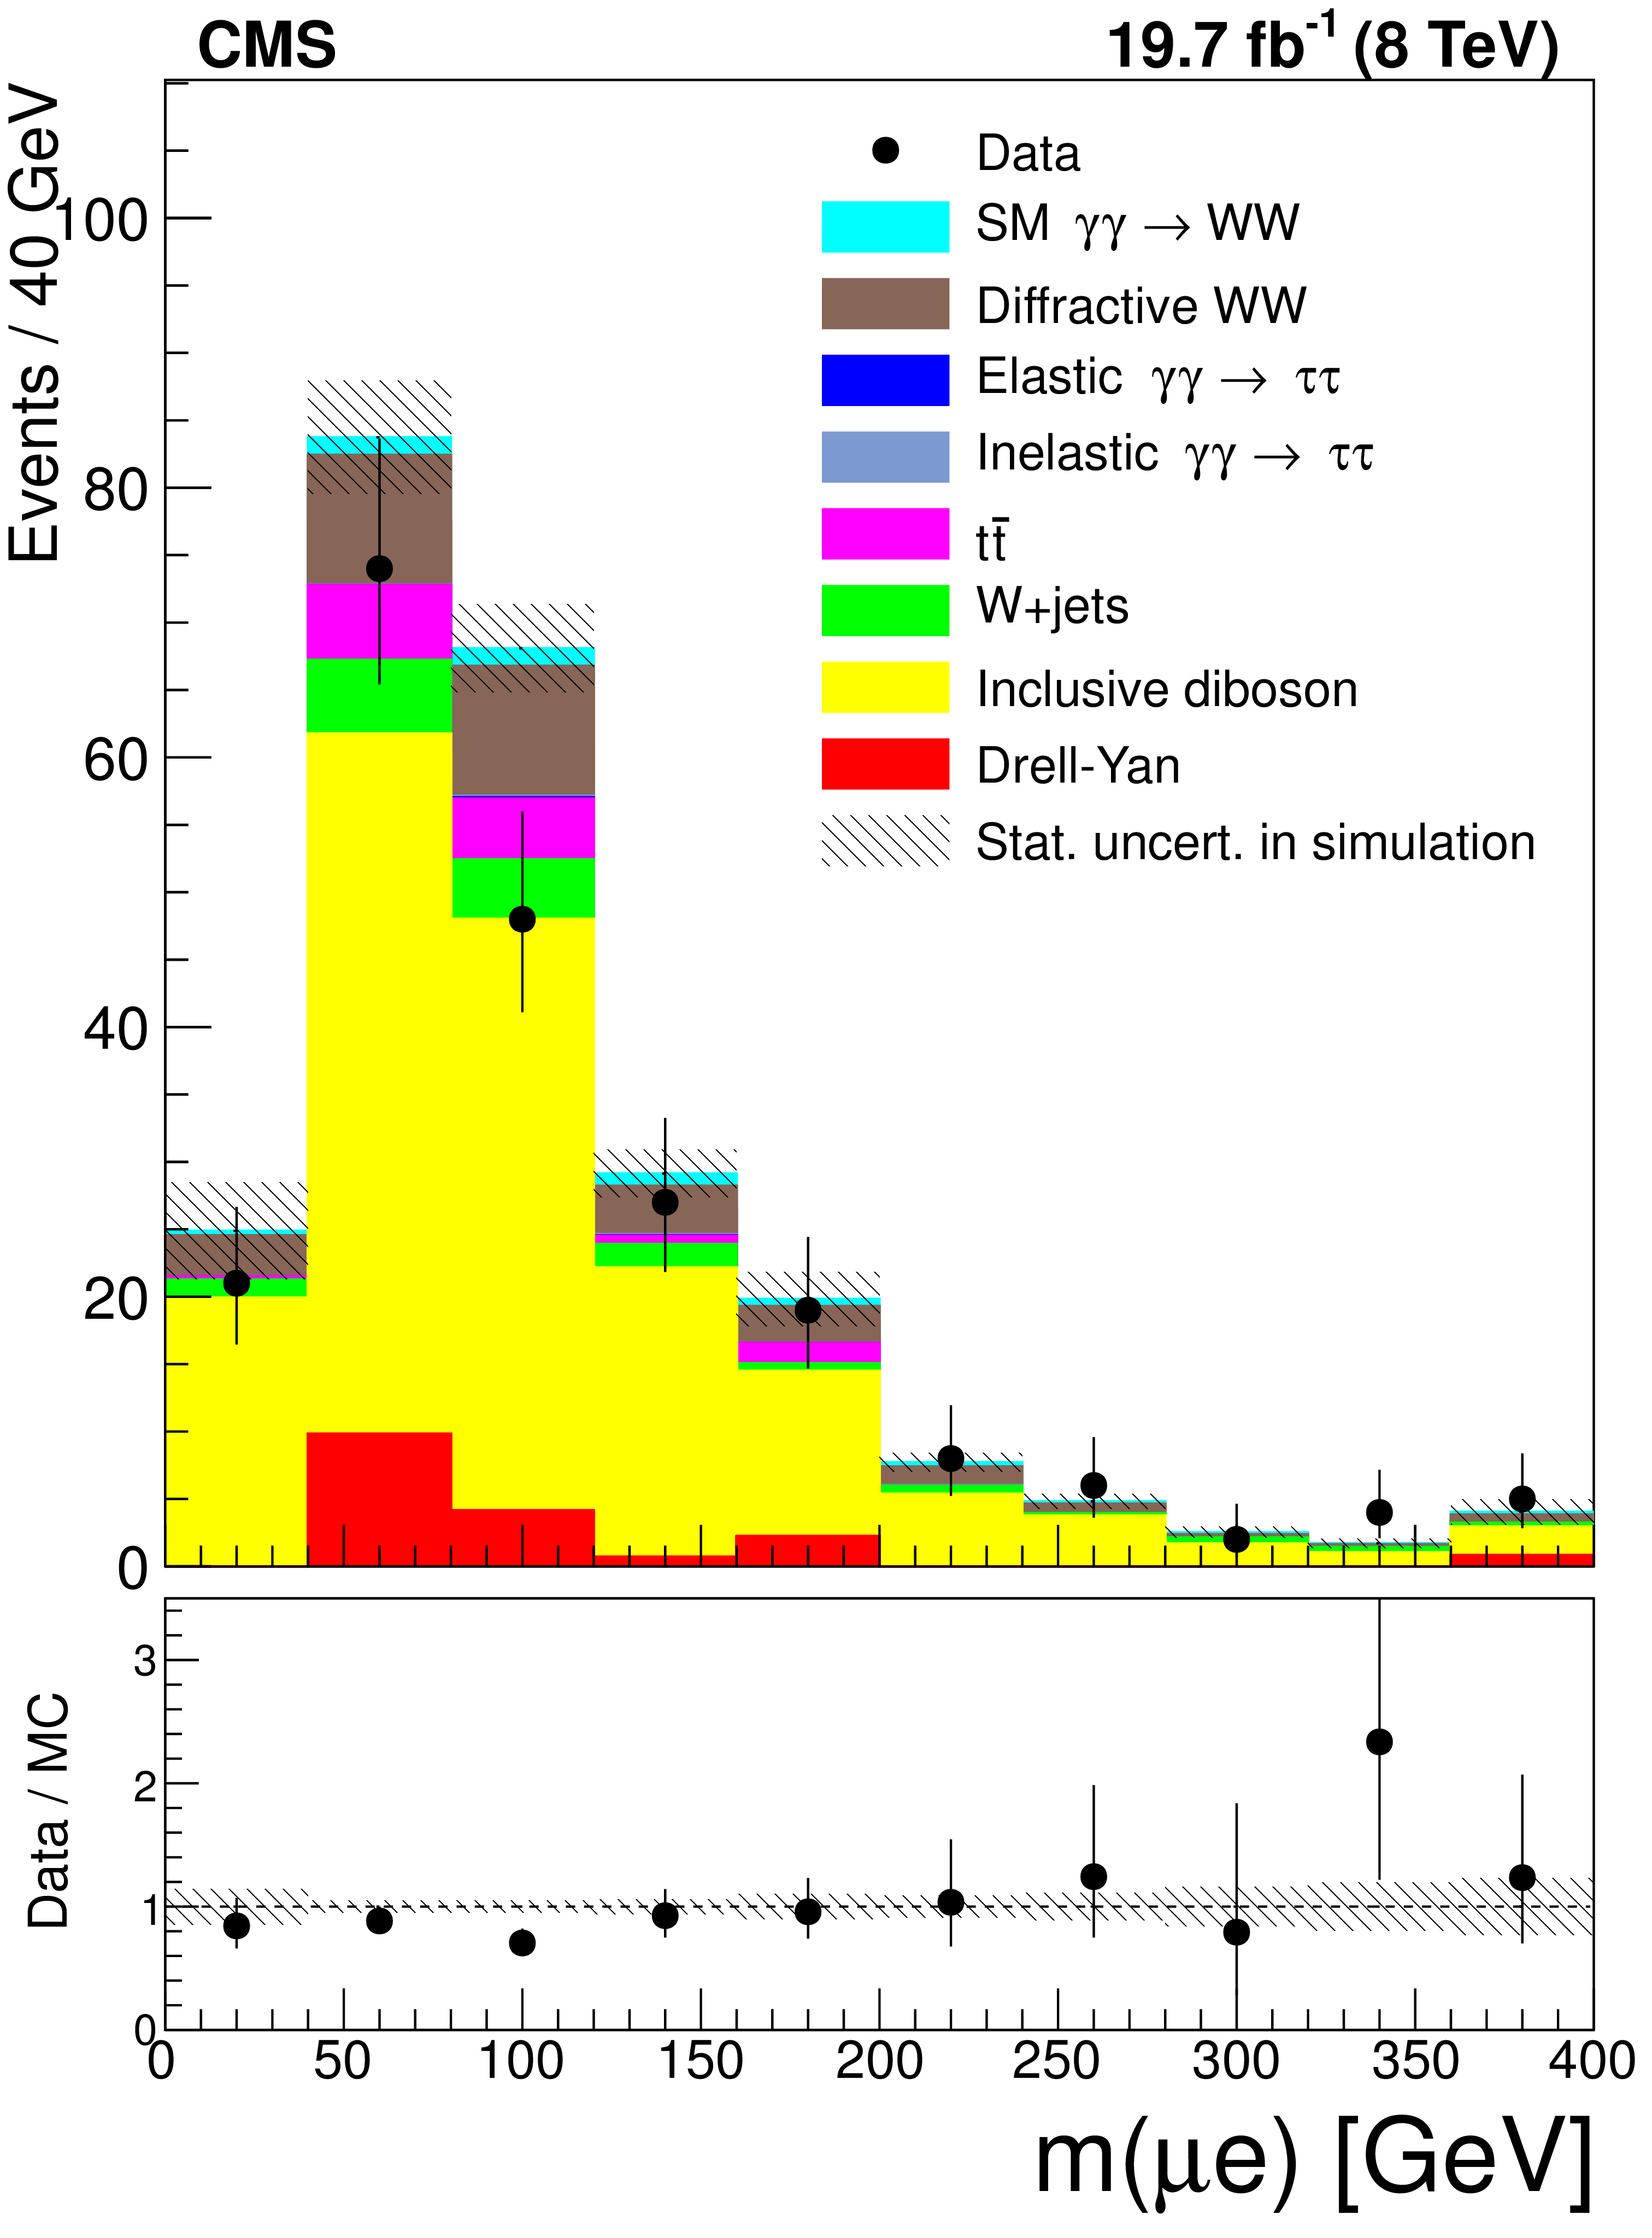
Figure 5-a:
Distribution of $\mu ^{\pm }\mathrm{ e } ^{\mp }$ invariant mass for data (points with error bars) and expected backgrounds (histograms) for $ {p_{\mathrm {T}}} (\mu ^{\pm }\mathrm{ e } ^{\mp }) > $ 30 GeV and 1-6 extra tracks (inclusive $\mathrm{ W }^+ \mathrm{ W }^- $ control region). The last bin in the invariant mass plot is an overflow bin and includes all events with $m(\mu \mathrm{ e } )> $ 360 GeV. The bottom panels show the data/MC ratio. |
png pdf |
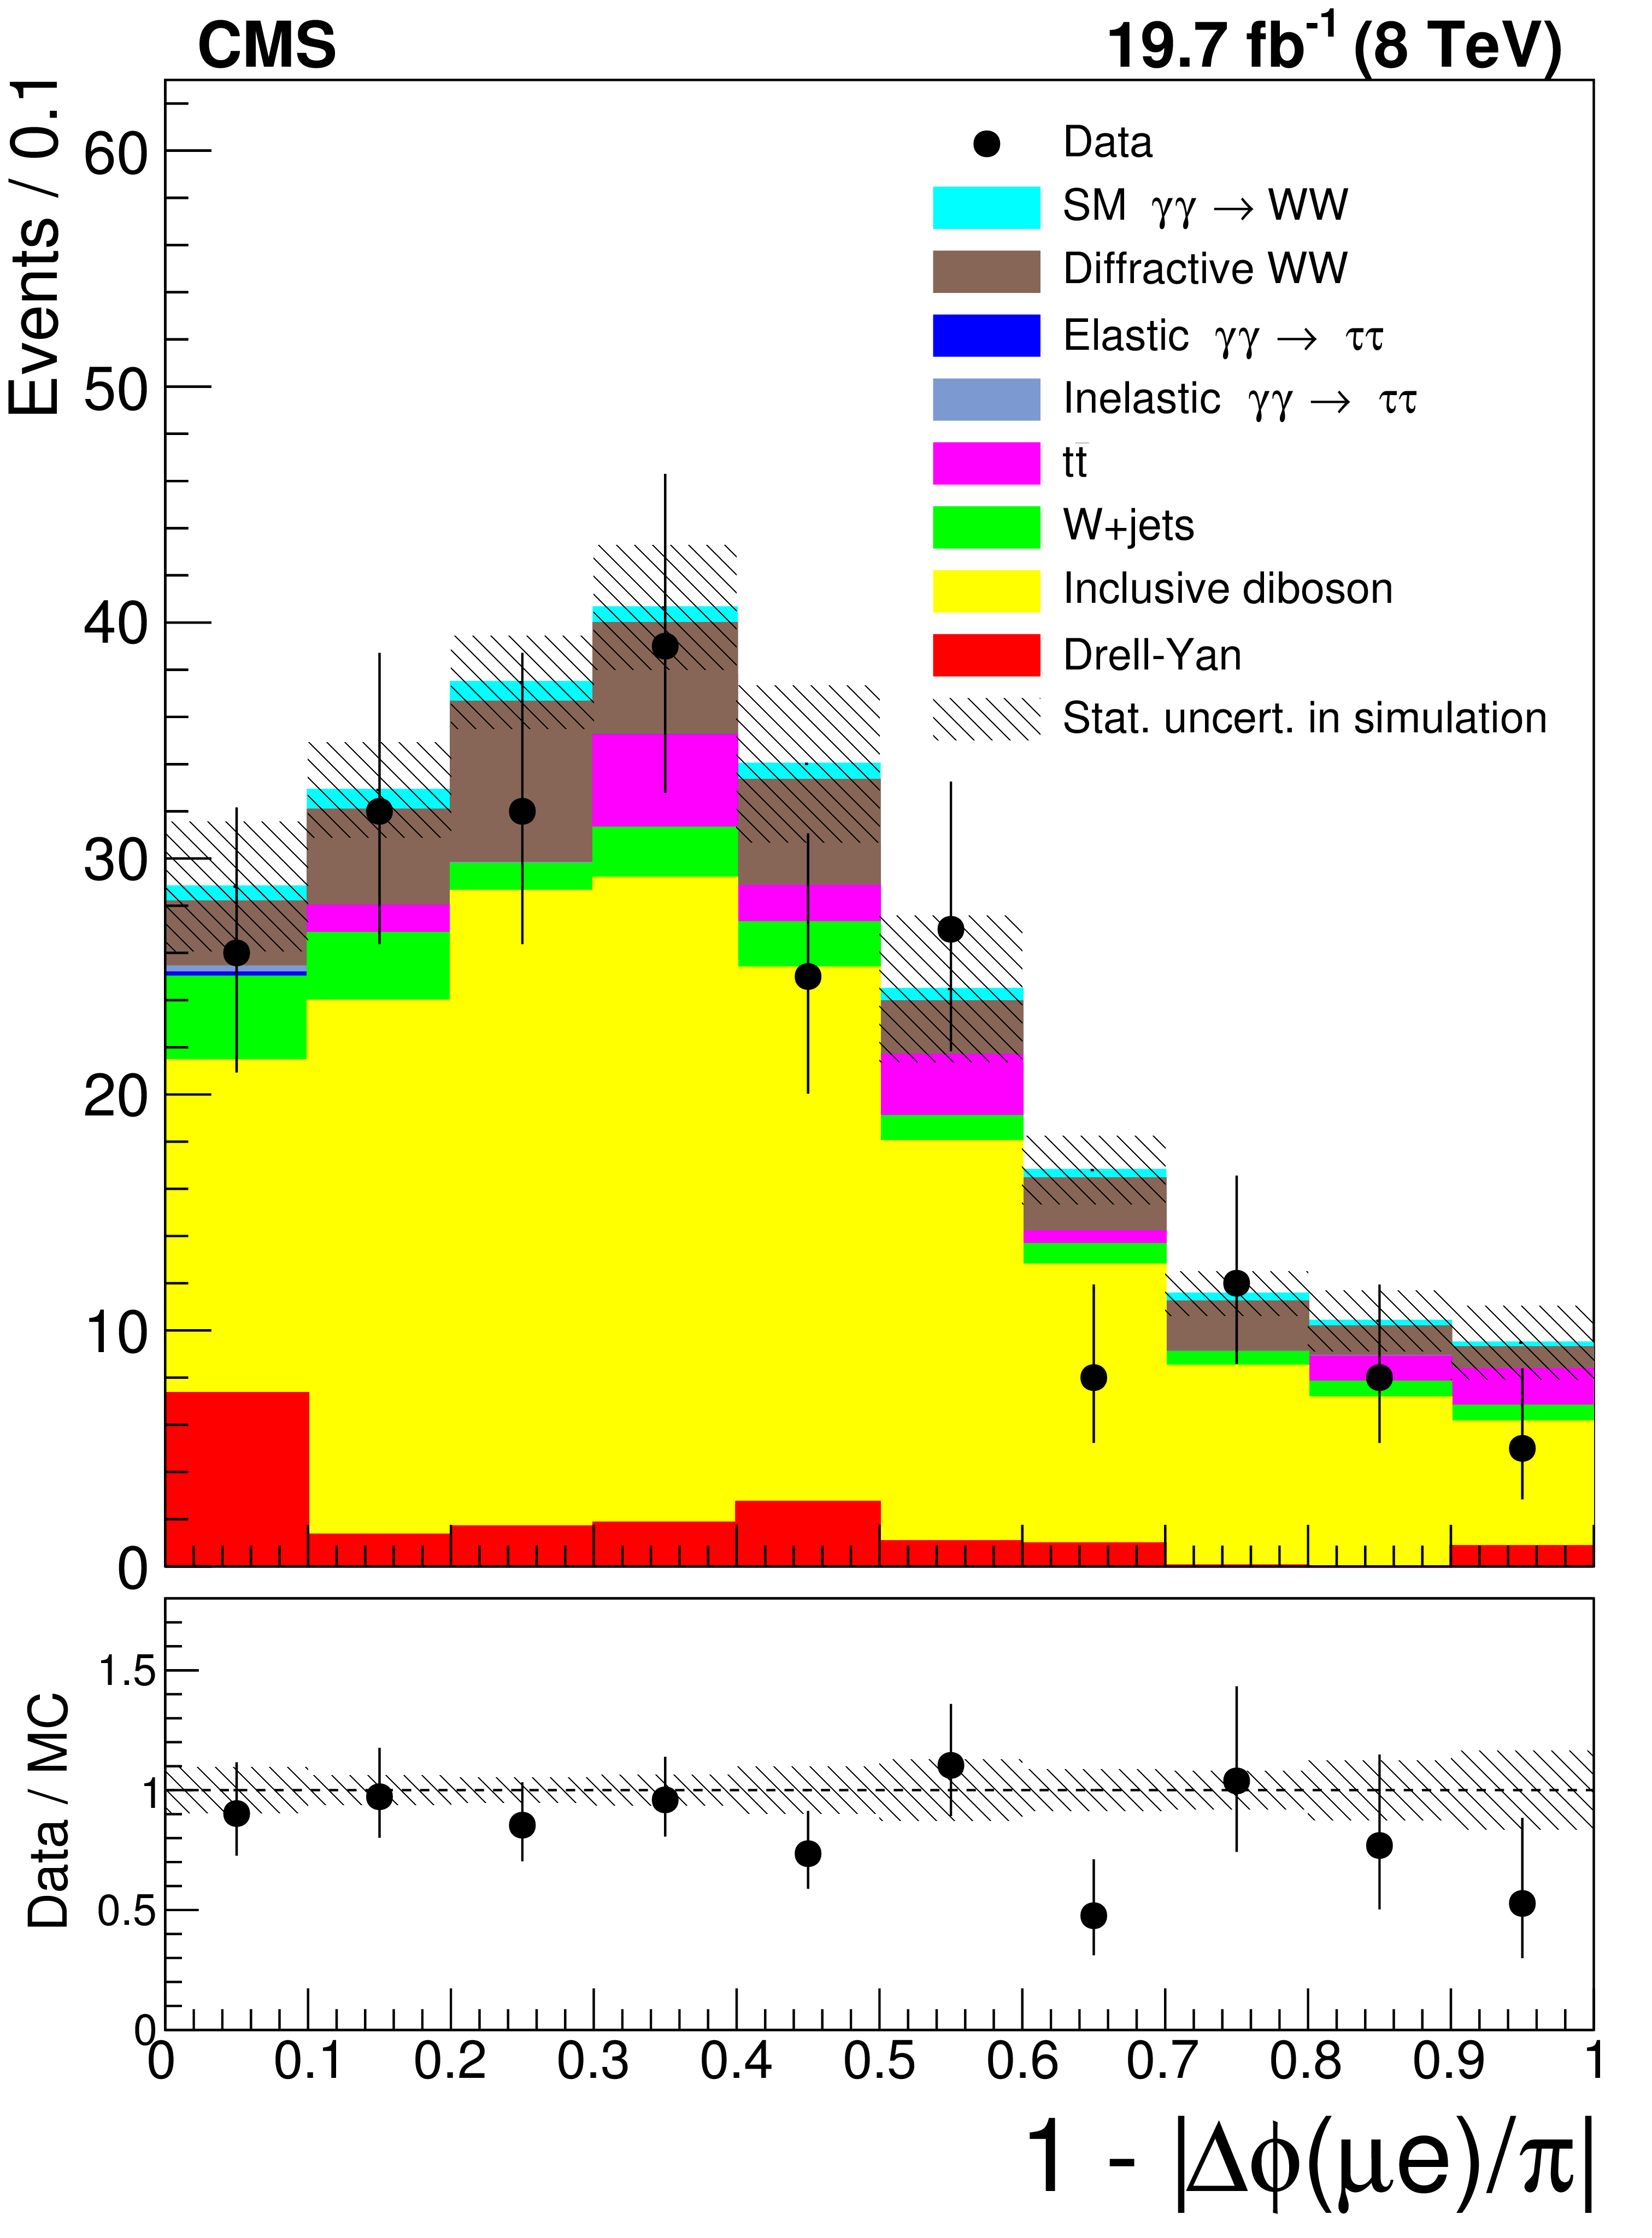
Figure 5-b:
Distributions of $\mu ^{\pm }\mathrm{ e } ^{\mp }$ acoplanarity for data (points with error bars) and expected backgrounds (histograms) for $ {p_{\mathrm {T}}} (\mu ^{\pm }\mathrm{ e } ^{\mp }) > $ 30 GeV and 1-6 extra tracks (inclusive $\mathrm{ W }^+ \mathrm{ W }^- $ control region). The last bin in the invariant mass plot is an overflow bin and includes all events with $m(\mu \mathrm{ e } )> $ 360 GeV. The bottom panels show the data/MC ratio. |

png pdf |
Figure 6:
Distributions of $\mu ^{\pm }\mathrm{ e } ^{\mp }$ invariant mass (left) and acoplanarity (right) for data (points with error bars) and expected backgrounds (histograms) for $ {p_{\mathrm {T}}} (\mu ^{\pm }\mathrm{ e } ^{\mp }) <$ 30 GeV and 1-6 extra tracks (Drell-Yan $\tau ^{+}\tau ^{-}$ control region). The last bin in both plots is an overflow bin and includes all events above the maximum value in the plot. The bottom panels show the data/MC ratio. |
png pdf |
Figure 6-a:
Distributions of $\mu ^{\pm }\mathrm{ e } ^{\mp }$ invariant mass for data (points with error bars) and expected backgrounds (histograms) for $ {p_{\mathrm {T}}} (\mu ^{\pm }\mathrm{ e } ^{\mp }) <$ 30 GeV and 1-6 extra tracks (Drell-Yan $\tau ^{+}\tau ^{-}$ control region). The last bin in both plots is an overflow bin and includes all events above the maximum value in the plot. The bottom panels show the data/MC ratio. |
png pdf |
Figure 6-b:
Distributions of $\mu ^{\pm }\mathrm{ e } ^{\mp }$ acoplanarity for data (points with error bars) and expected backgrounds (histograms) for $ {p_{\mathrm {T}}} (\mu ^{\pm }\mathrm{ e } ^{\mp }) <$ 30 GeV and 1-6 extra tracks (Drell-Yan $\tau ^{+}\tau ^{-}$ control region). The last bin in both plots is an overflow bin and includes all events above the maximum value in the plot. The bottom panels show the data/MC ratio. |
png pdf |
Figure 7:
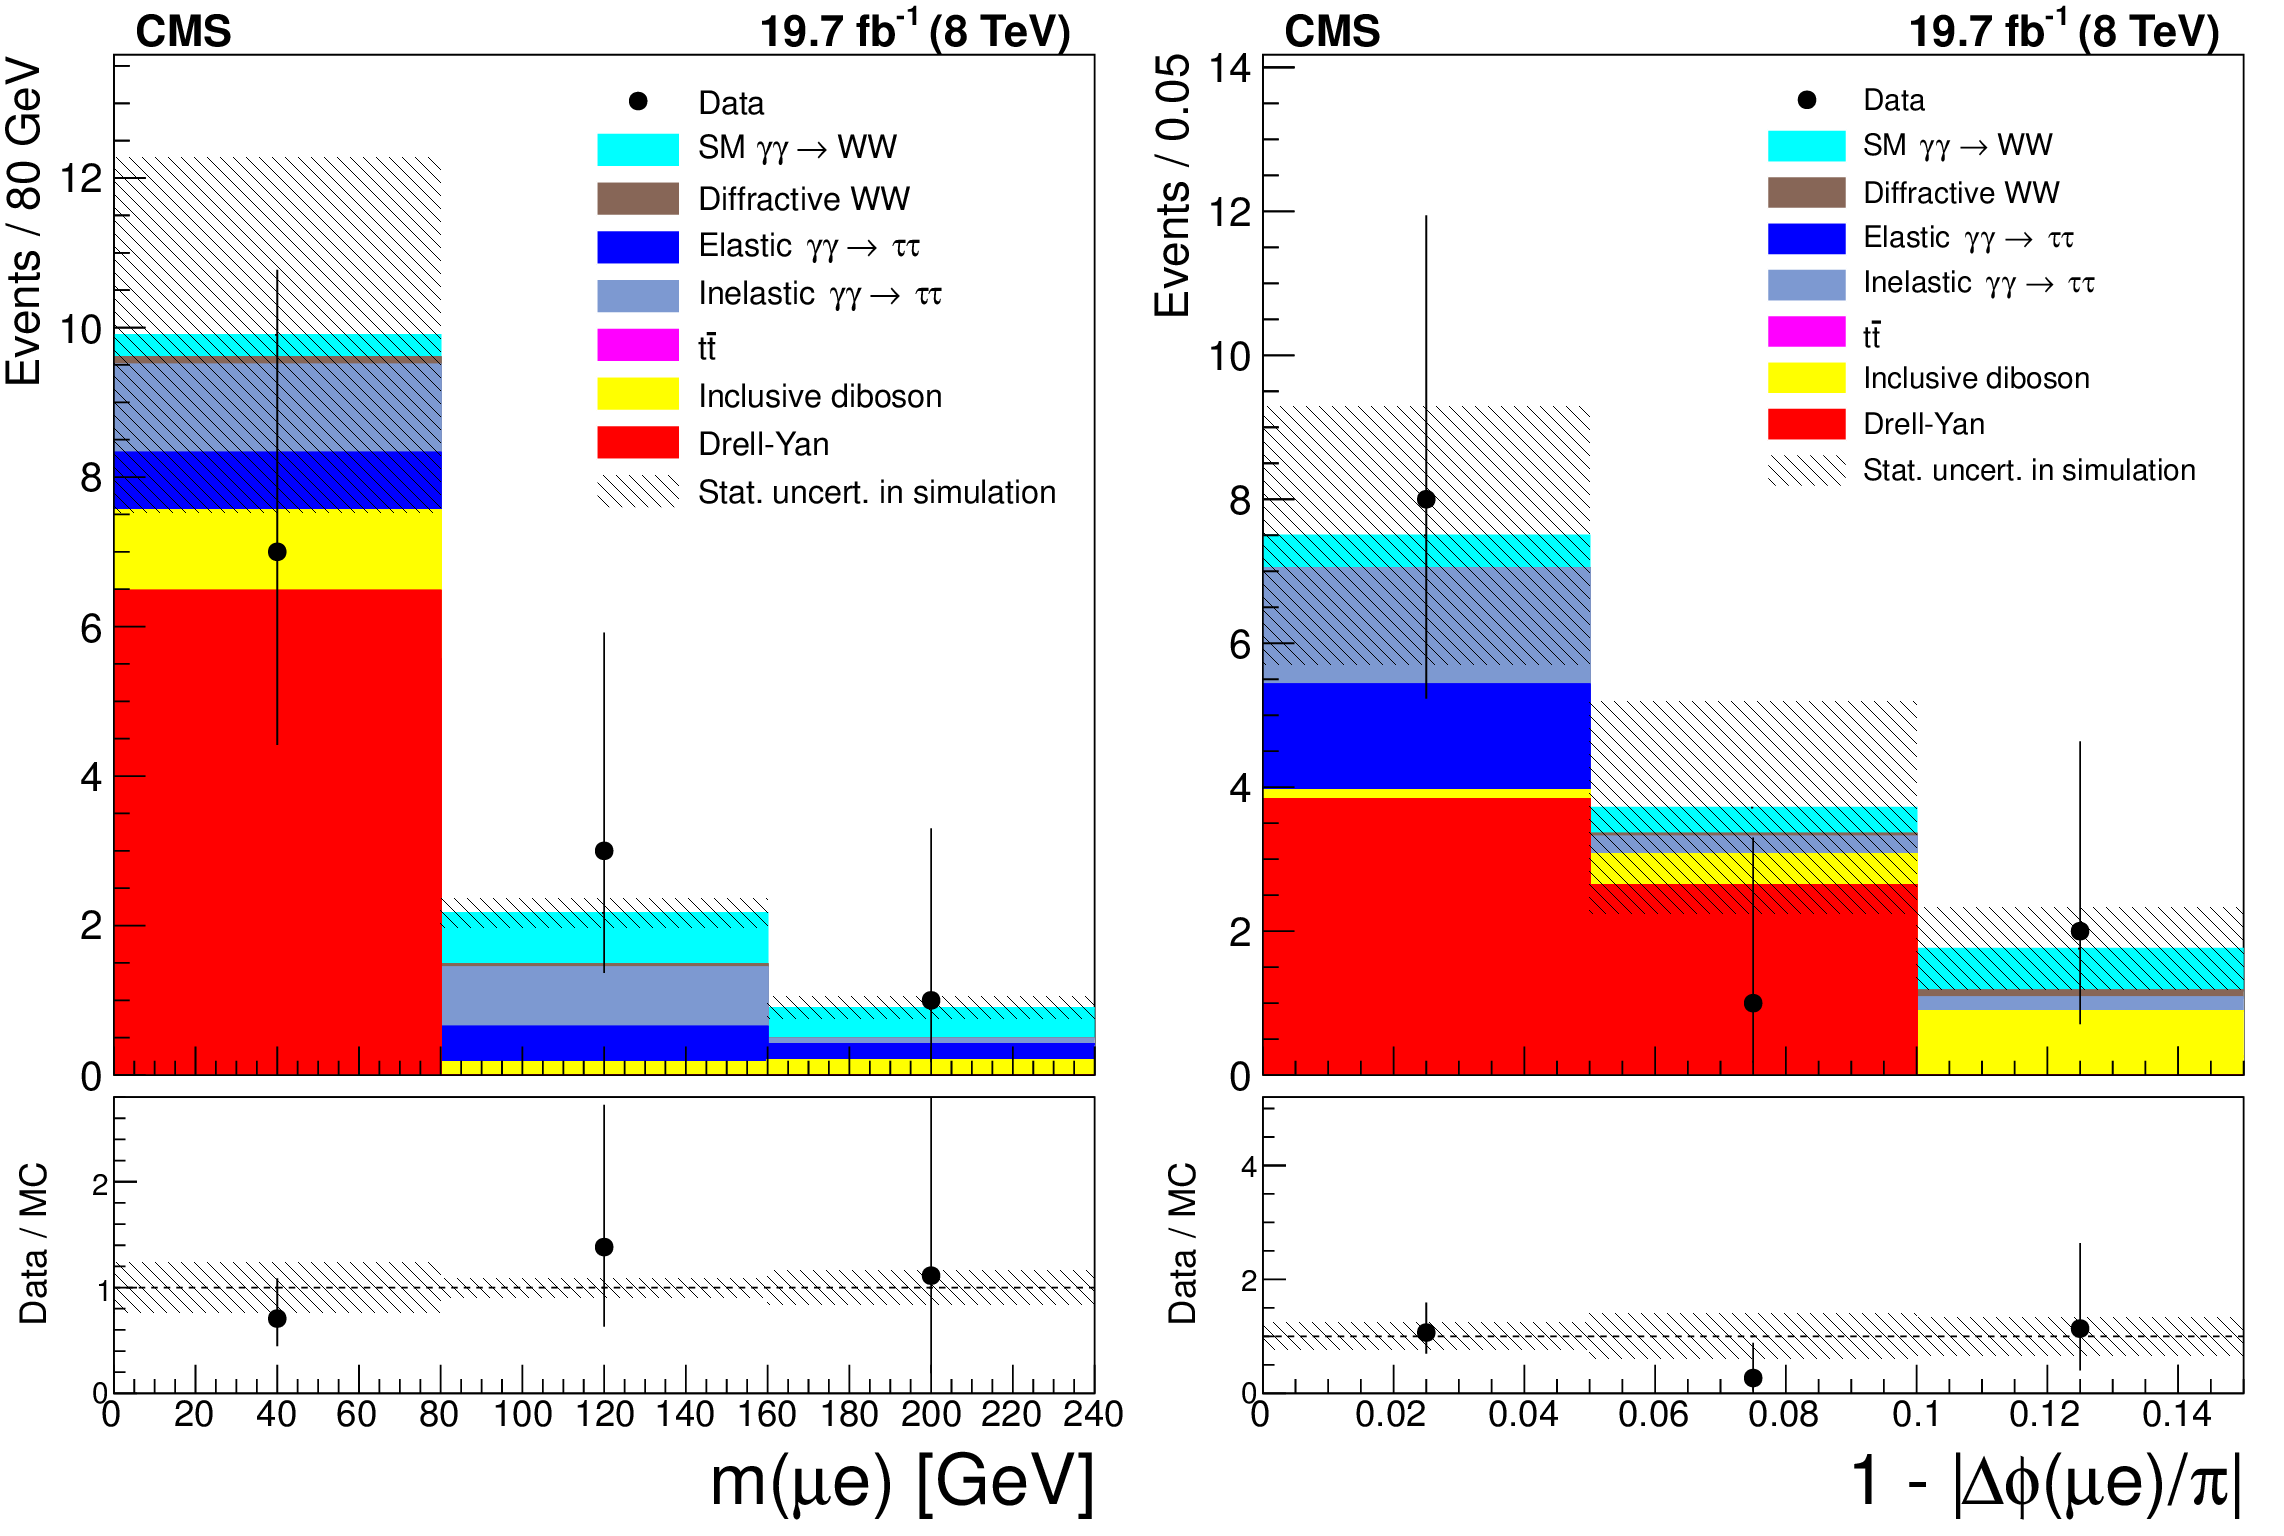
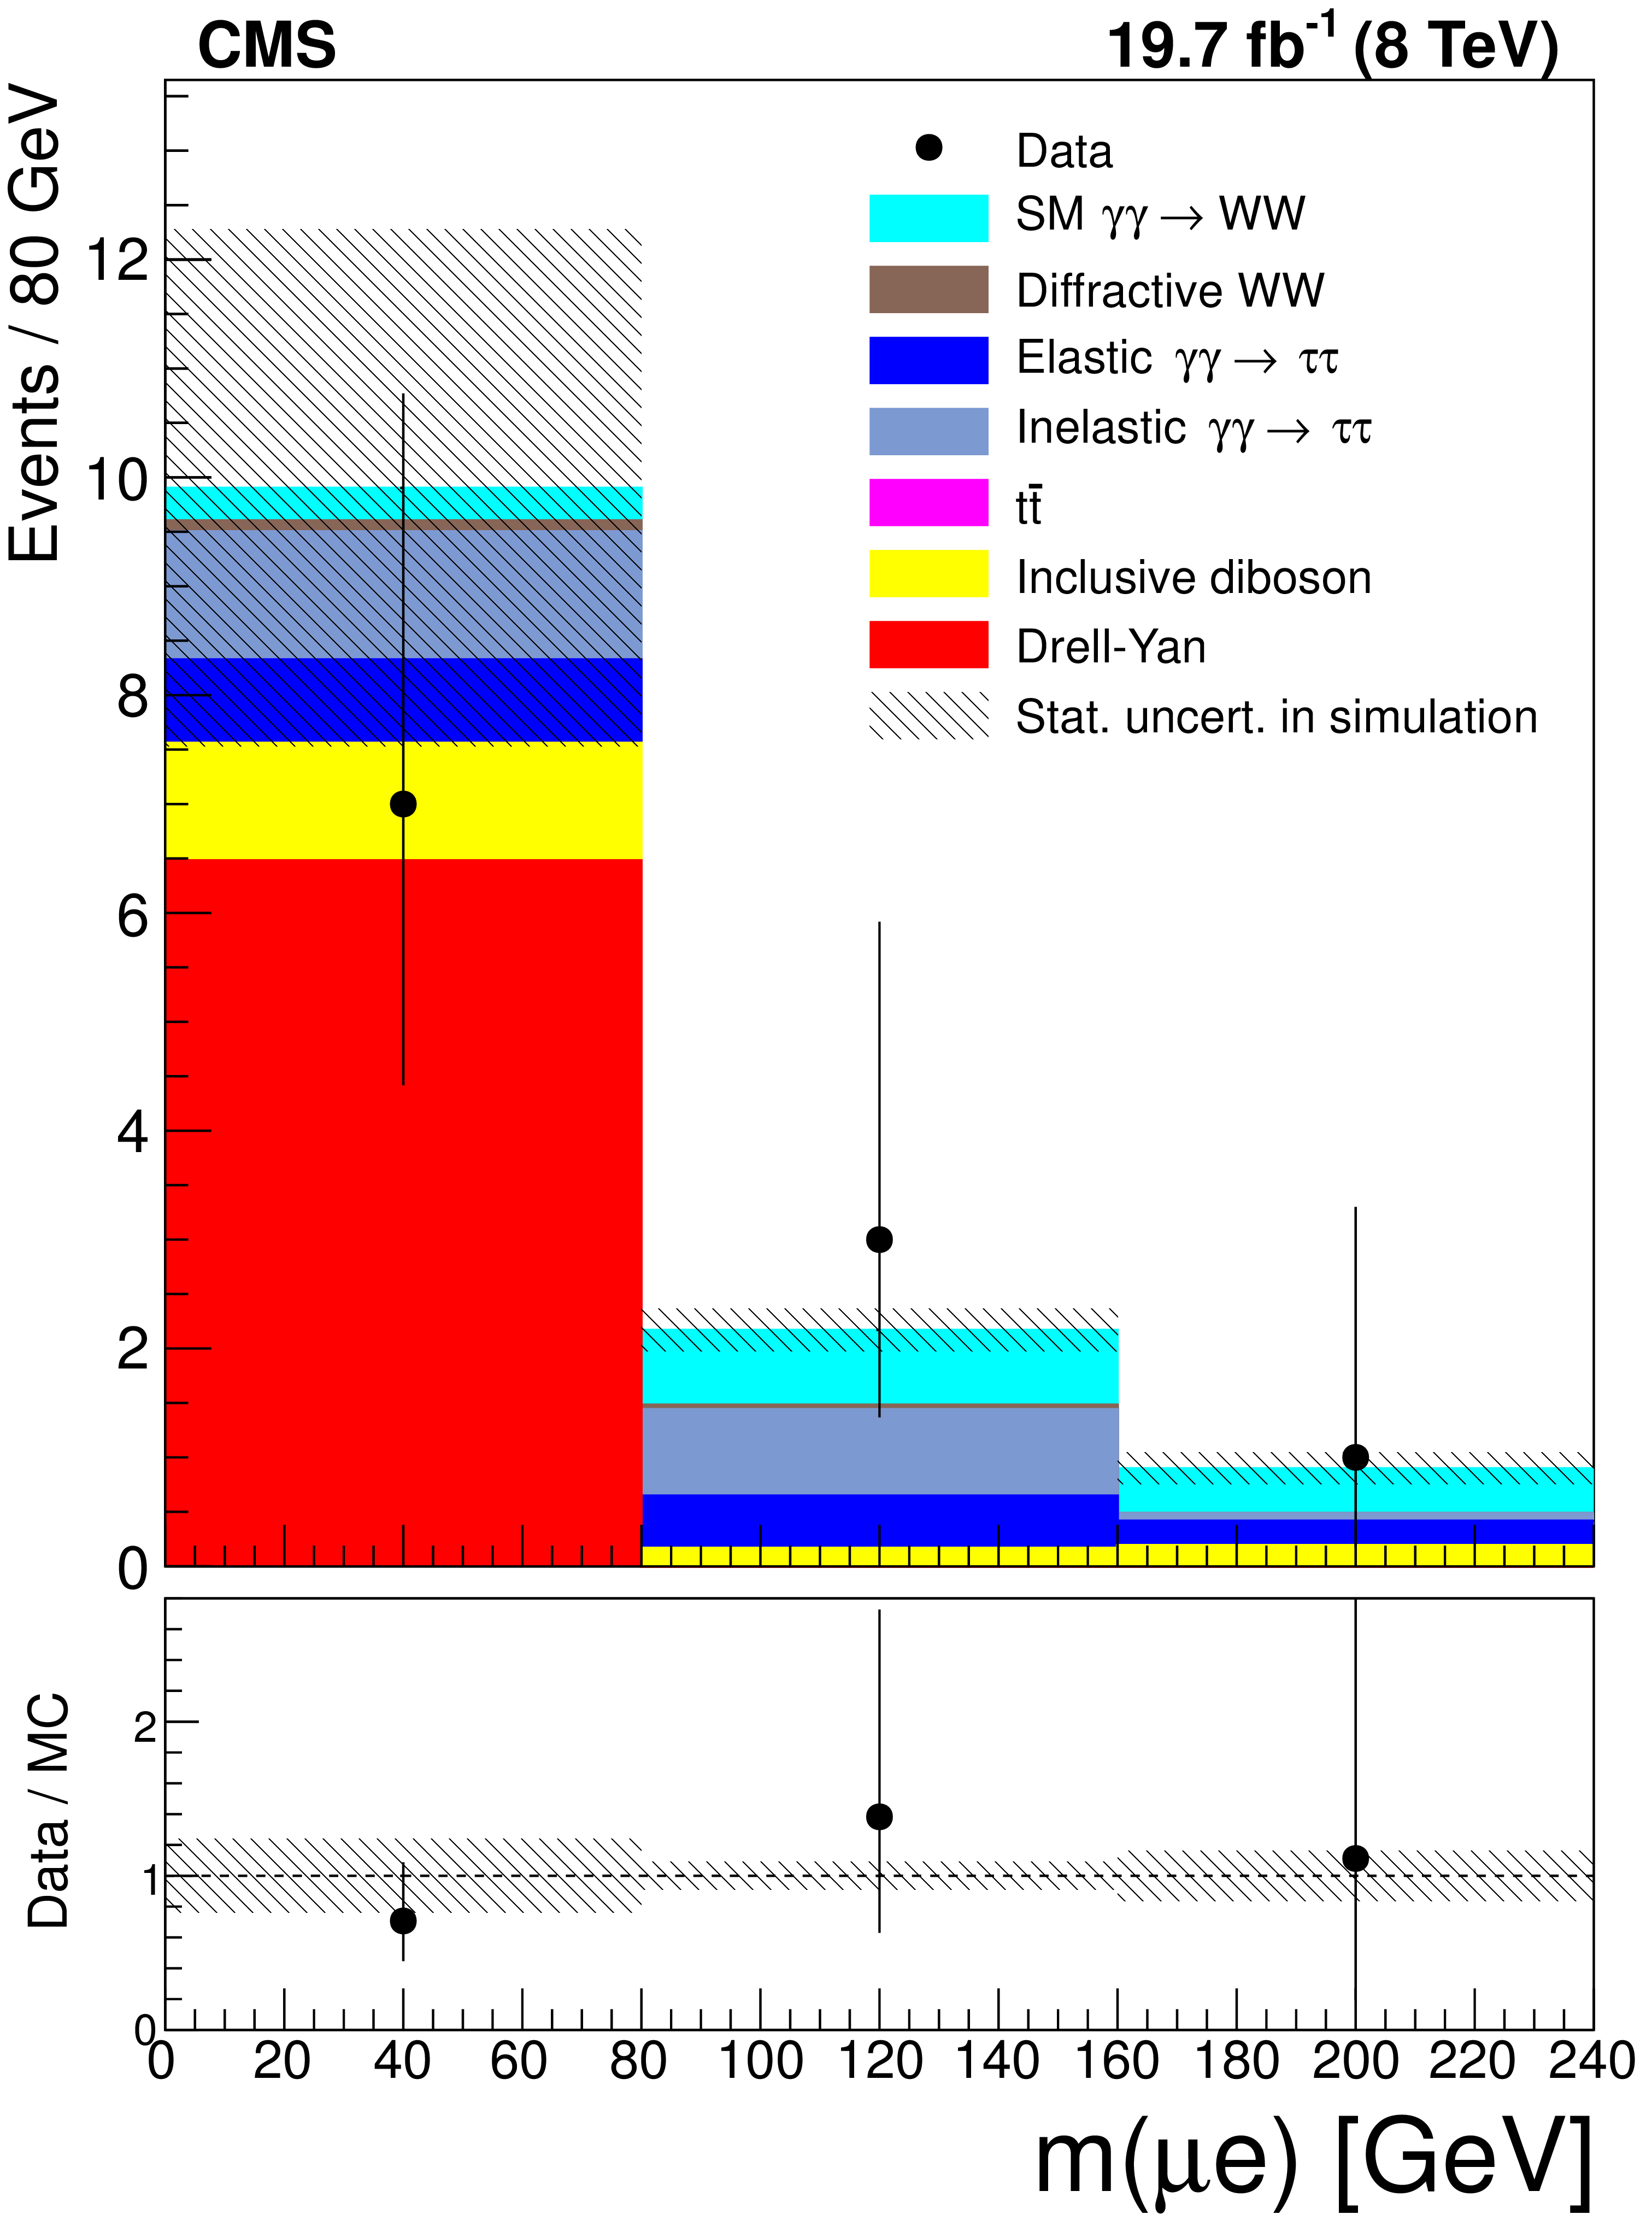
Distributions of $\mu ^{\pm }\mathrm{ e } ^{\mp }$ invariant mass (left) and acoplanarity (right) for data (points with error bars) and expected backgrounds (histograms) for $ {p_{\mathrm {T}}} (\mu ^{\pm }\mathrm{ e } ^{\mp }) <$ 30 GeV and no additional tracks ($\gamma \gamma \to \tau ^{+}\tau ^{-}$ control region). The last bin in both plots is an overflow bin and includes all events above the maximum value in the plot. The bottom panels show the data/MC ratio. |
png pdf |
Figure 7-a:
Distributions of $\mu ^{\pm }\mathrm{ e } ^{\mp }$ invariant mass for data (points with error bars) and expected backgrounds (histograms) for $ {p_{\mathrm {T}}} (\mu ^{\pm }\mathrm{ e } ^{\mp }) <$ 30 GeV and no additional tracks ($\gamma \gamma \to \tau ^{+}\tau ^{-}$ control region). The last bin in both plots is an overflow bin and includes all events above the maximum value in the plot. The bottom panels show the data/MC ratio. |
png pdf |
Figure 7-b:
Distributions of $\mu ^{\pm }\mathrm{ e } ^{\mp }$ acoplanarity for data (points with error bars) and expected backgrounds (histograms) for $ {p_{\mathrm {T}}} (\mu ^{\pm }\mathrm{ e } ^{\mp }) <$ 30 GeV and no additional tracks ($\gamma \gamma \to \tau ^{+}\tau ^{-}$ control region). The last bin in both plots is an overflow bin and includes all events above the maximum value in the plot. The bottom panels show the data/MC ratio. |
png pdf |
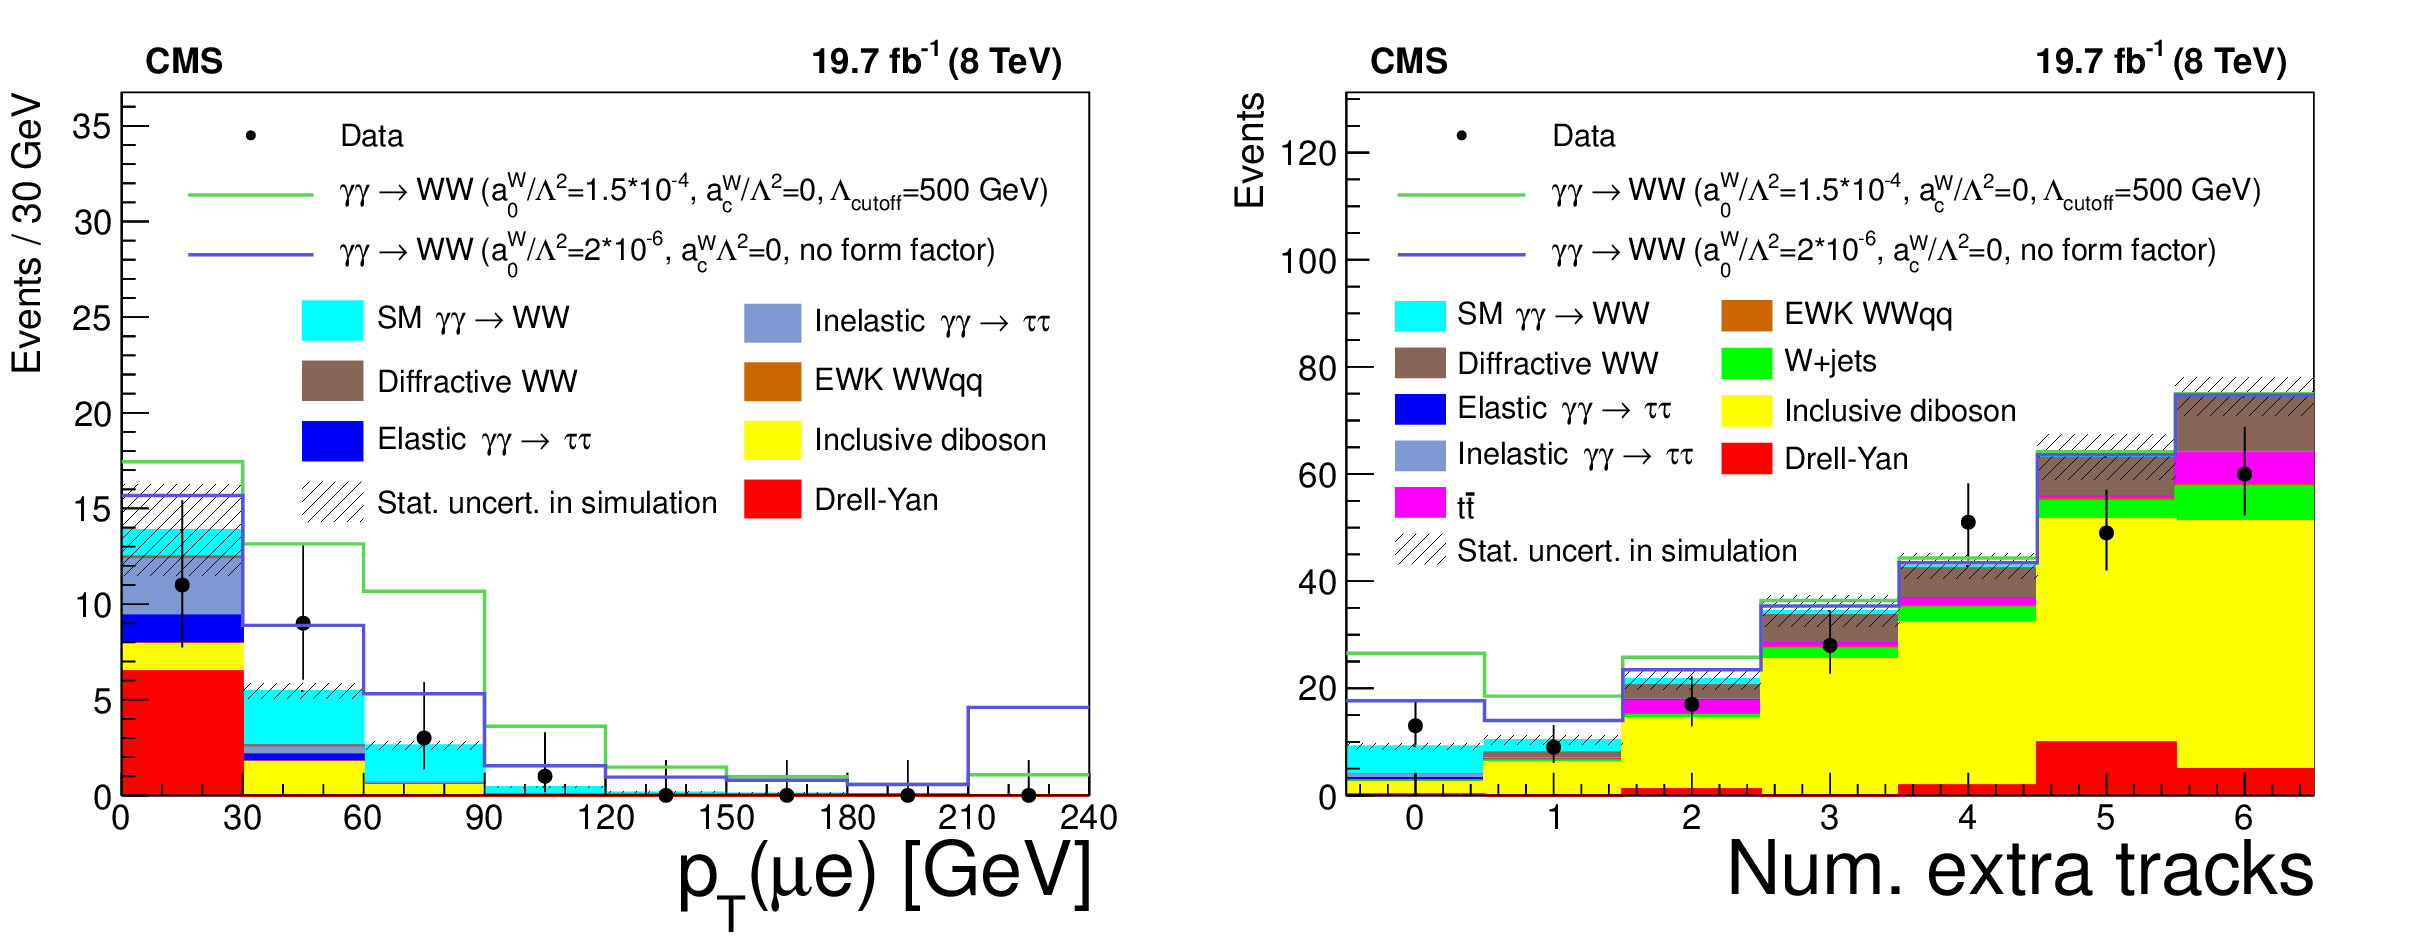
Figure 8:
Distributions of muon-electron transverse momentum for events with zero associated tracks (left), and extra-tracks multiplicity for events with $ {p_{\mathrm {T}}} (\mu ^{\pm }\mathrm{ e } ^{\mp }) >$ 30 GeV (right). The data are shown by the points with error bars; the histograms indicate the expected SM signal and backgrounds. Two representative values for anomalous couplings are shown stacked on top of the backgrounds. The last bin in the $ {p_{\mathrm {T}}} (\mu ^{\pm }\mathrm{ e } ^{\mp })$ distribution is an overflow bin and includes all events with $ {p_{\mathrm {T}}} (\mu ^{\pm }\mathrm{ e } ^{\mp }) >$ 210 GeV. |
png pdf |
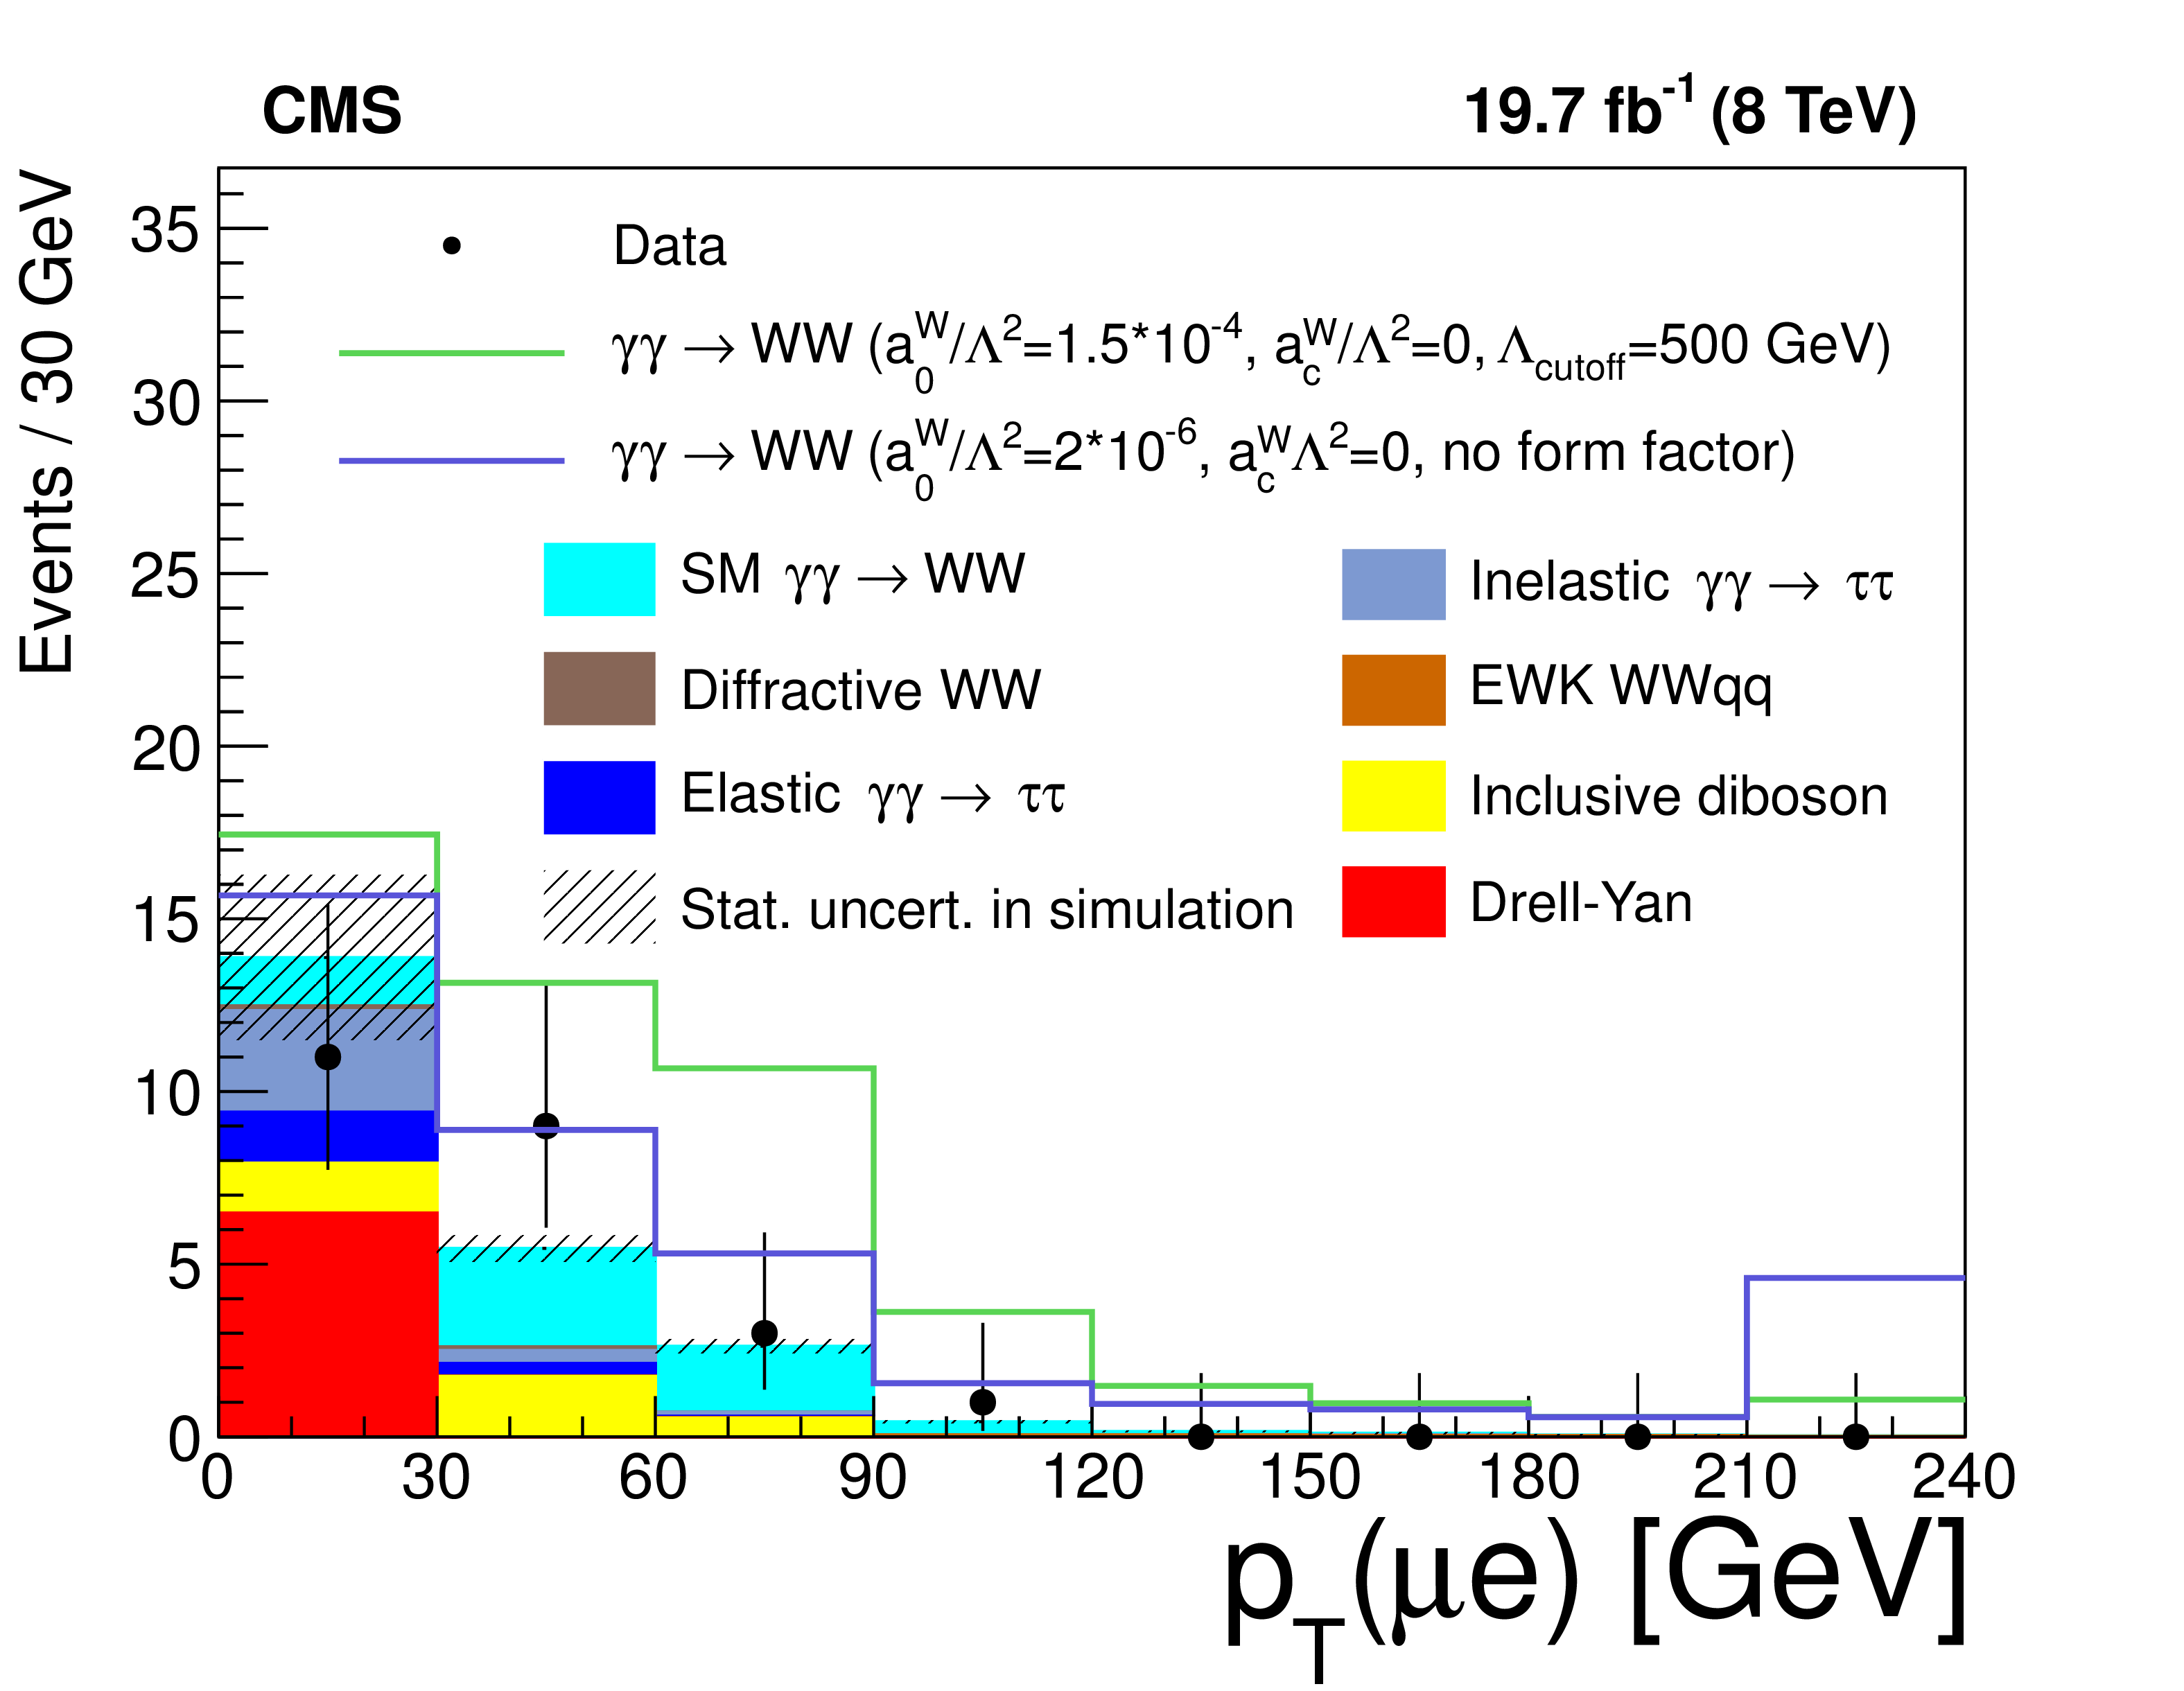
Figure 8-a:
Distribution of muon-electron transverse momentum for events with zero associated tracks. The data are shown by the points with error bars; the histograms indicate the expected SM signal and backgrounds. Two representative values for anomalous couplings are shown stacked on top of the backgrounds. The last bin in the $ {p_{\mathrm {T}}} (\mu ^{\pm }\mathrm{ e } ^{\mp })$ distribution is an overflow bin and includes all events with $ {p_{\mathrm {T}}} (\mu ^{\pm }\mathrm{ e } ^{\mp }) >$ 210 GeV. |

png pdf |
Figure 8-b:
Distribution of extra-tracks multiplicity for events with $ {p_{\mathrm {T}}} (\mu ^{\pm }\mathrm{ e } ^{\mp }) >$ 30 GeV (b). The data are shown by the points with error bars; the histograms indicate the expected SM signal and backgrounds. Two representative values for anomalous couplings are shown stacked on top of the backgrounds. The last bin in the $ {p_{\mathrm {T}}} (\mu ^{\pm }\mathrm{ e } ^{\mp })$ distribution is an overflow bin and includes all events with $ {p_{\mathrm {T}}} (\mu ^{\pm }\mathrm{ e } ^{\mp }) >$ 210 GeV. |
png pdf |
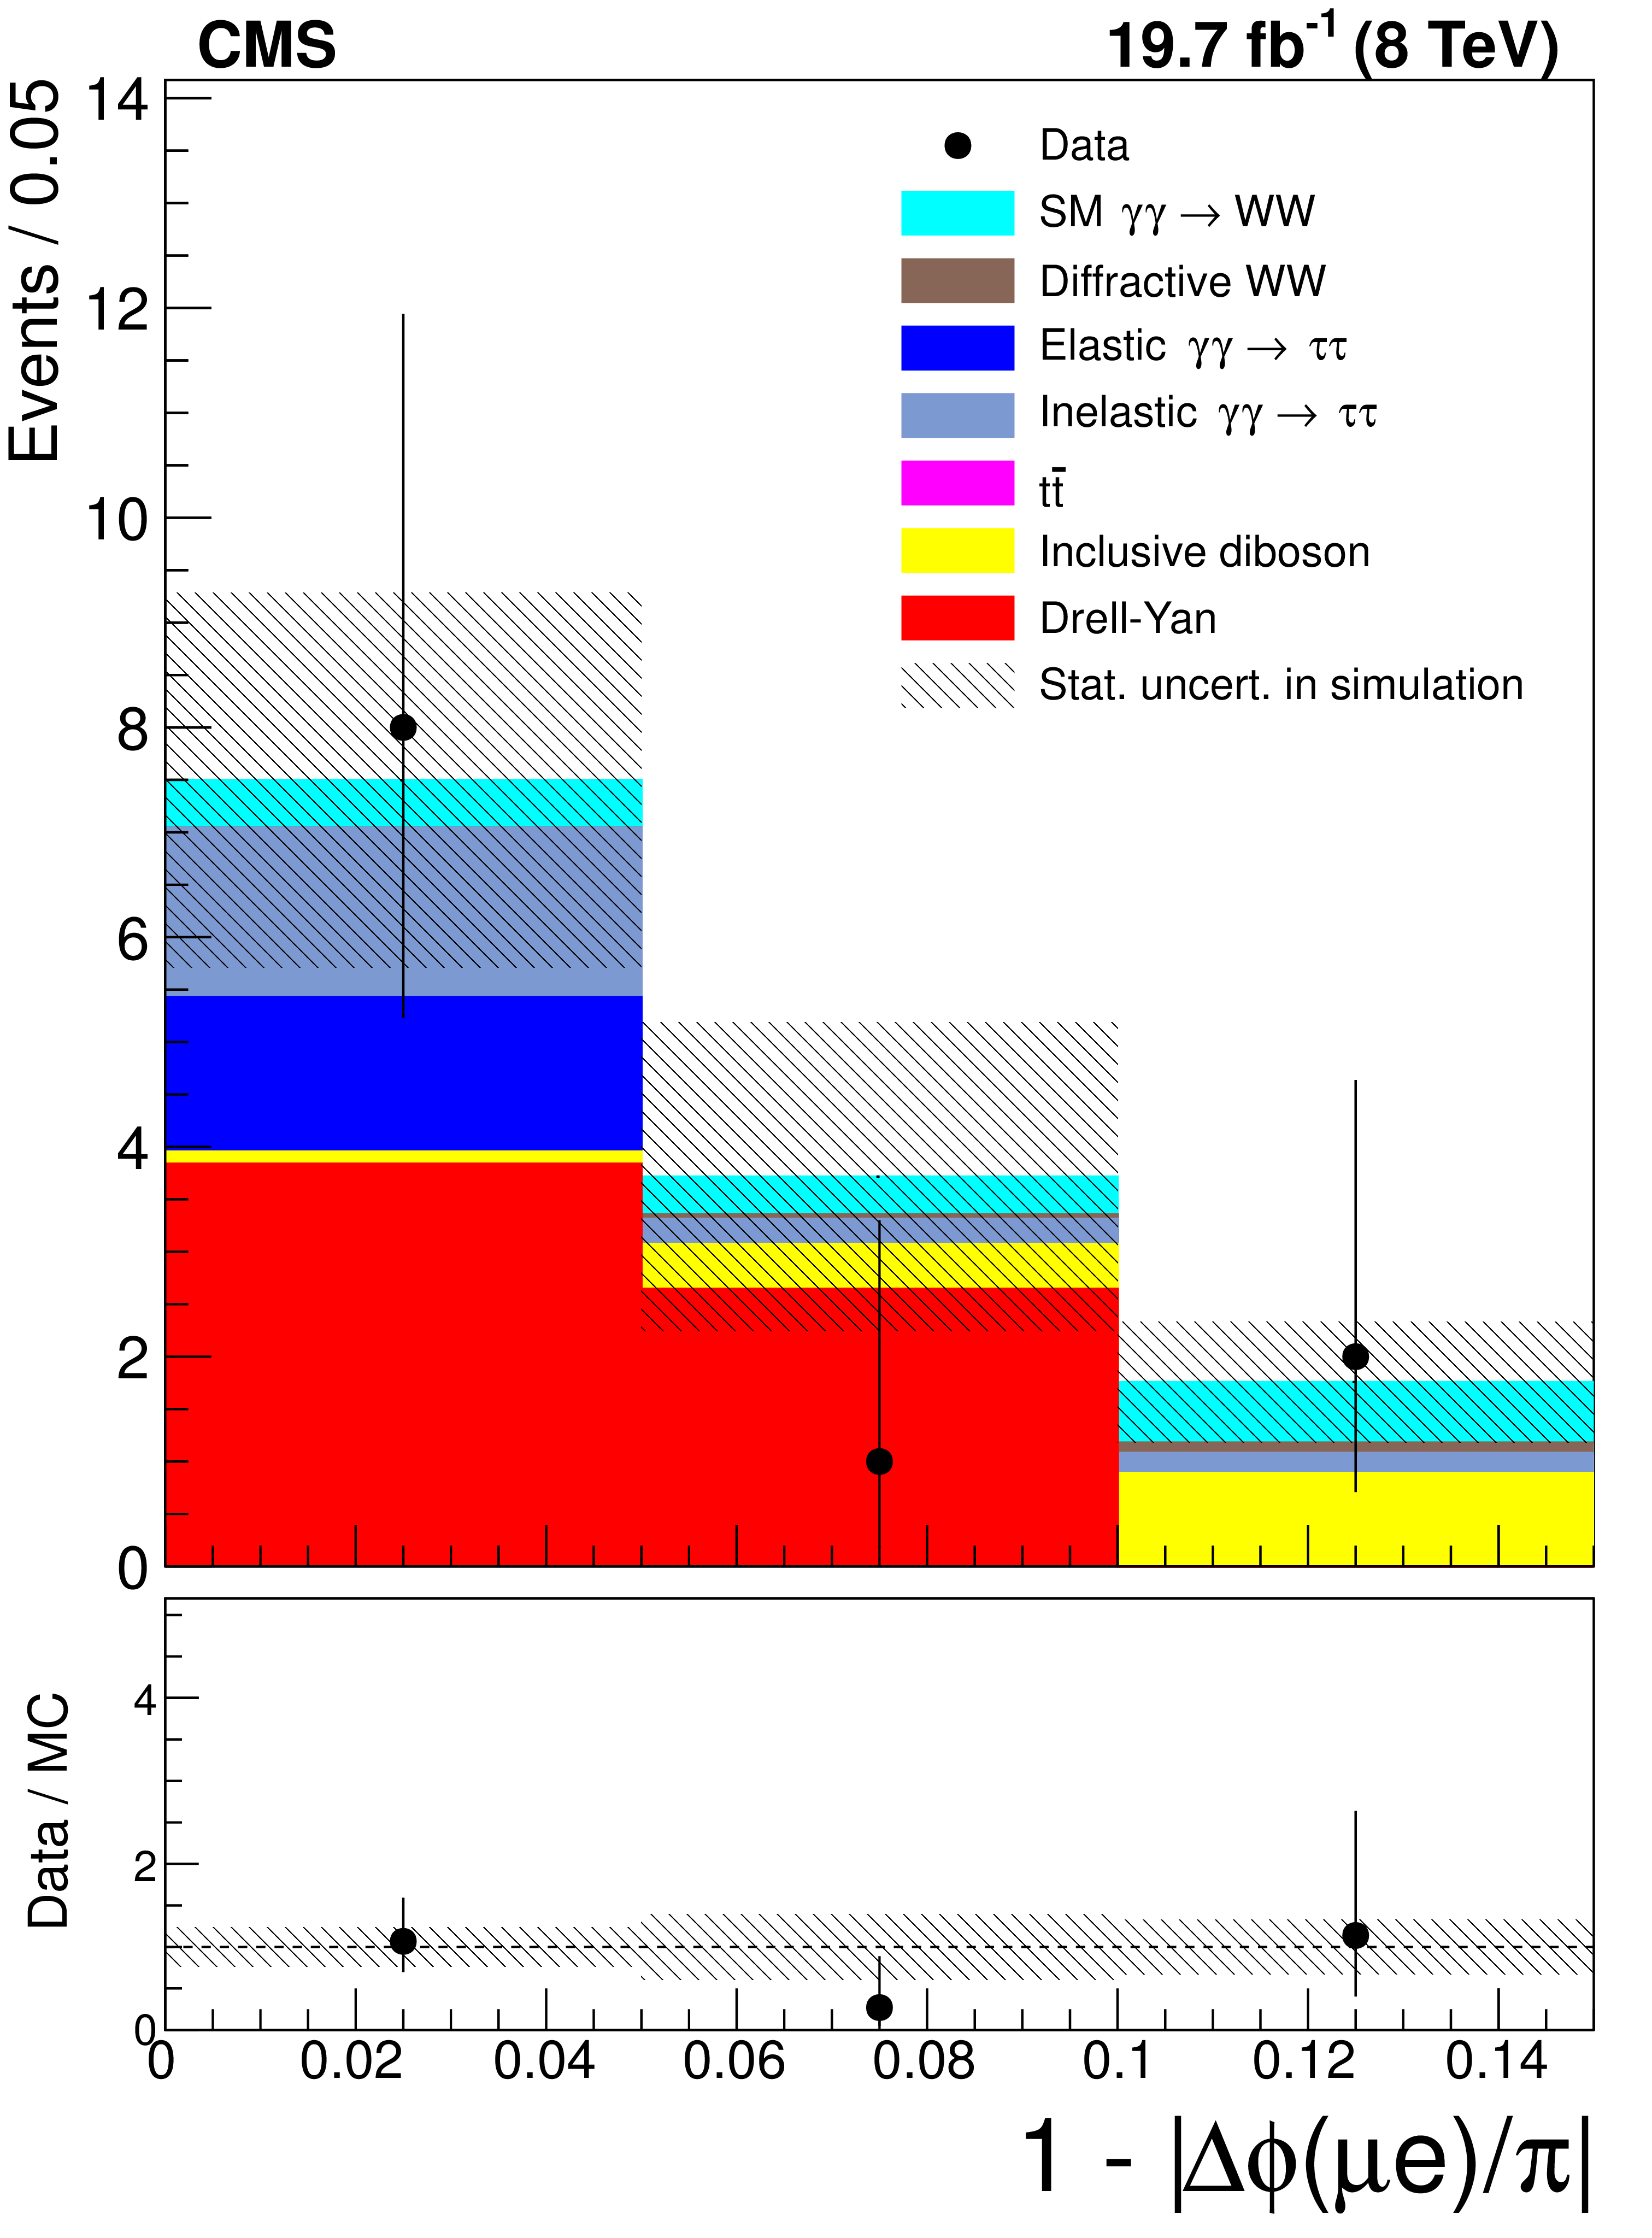
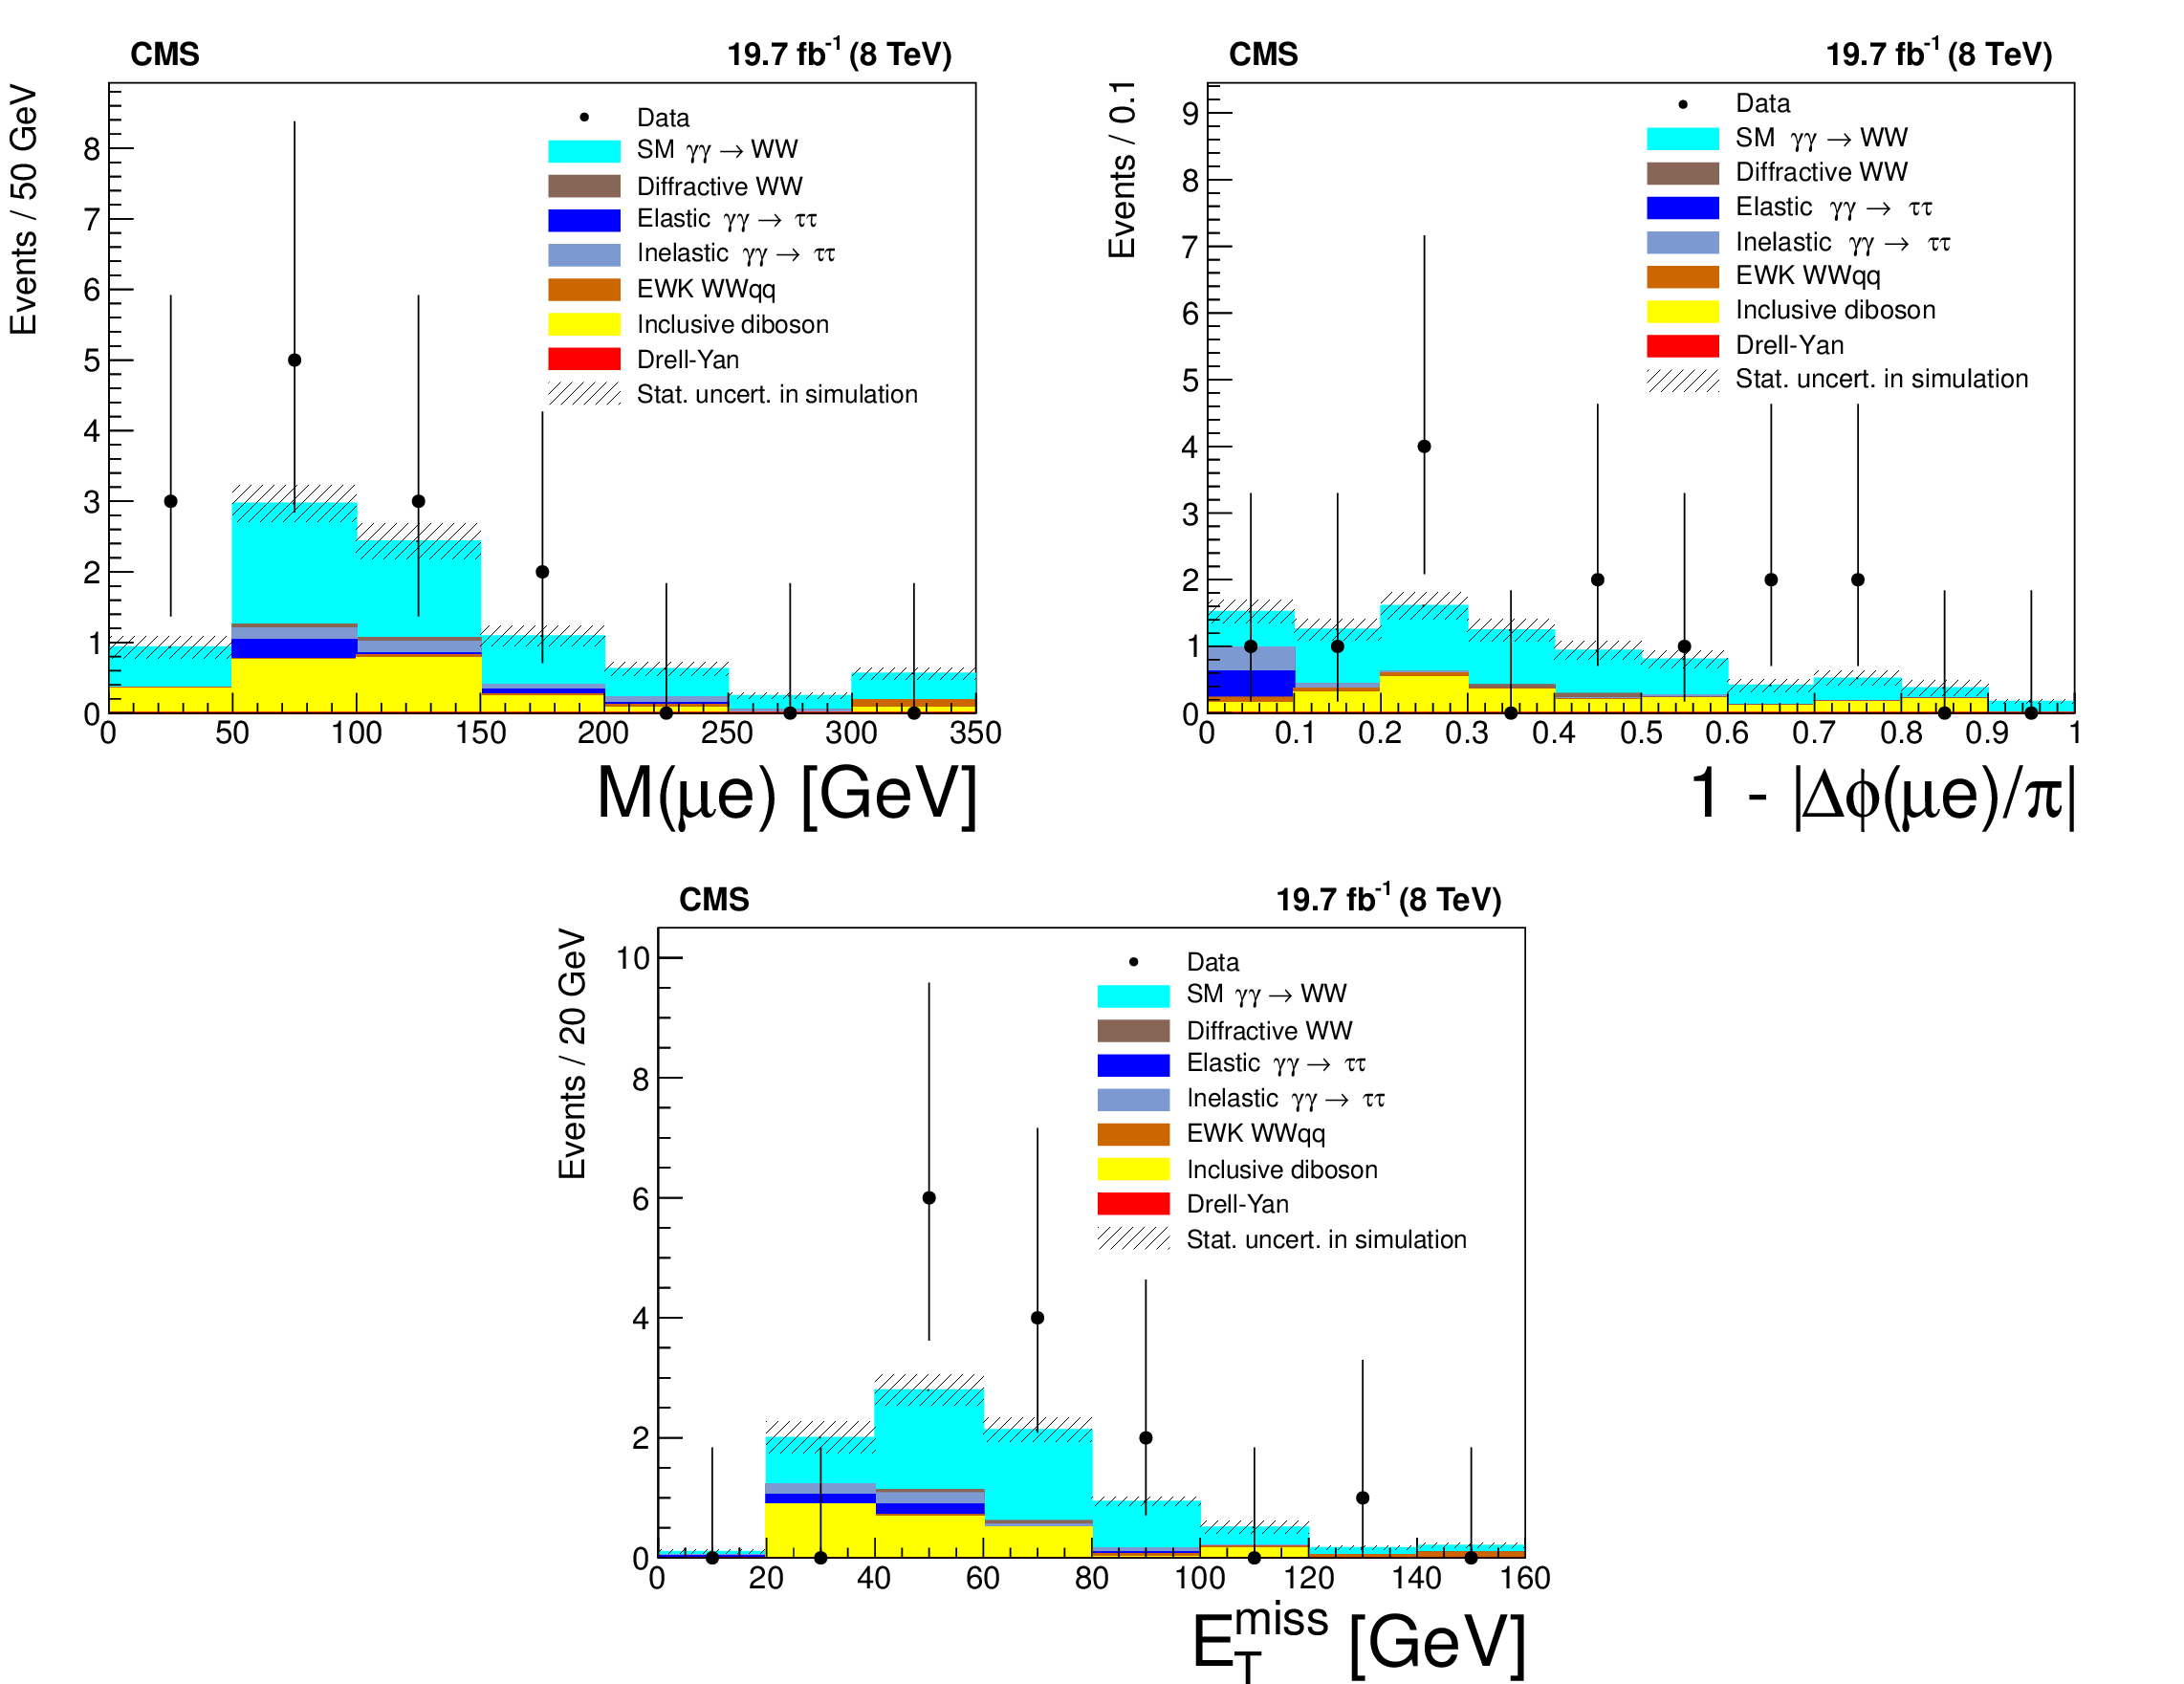
Figure 9:
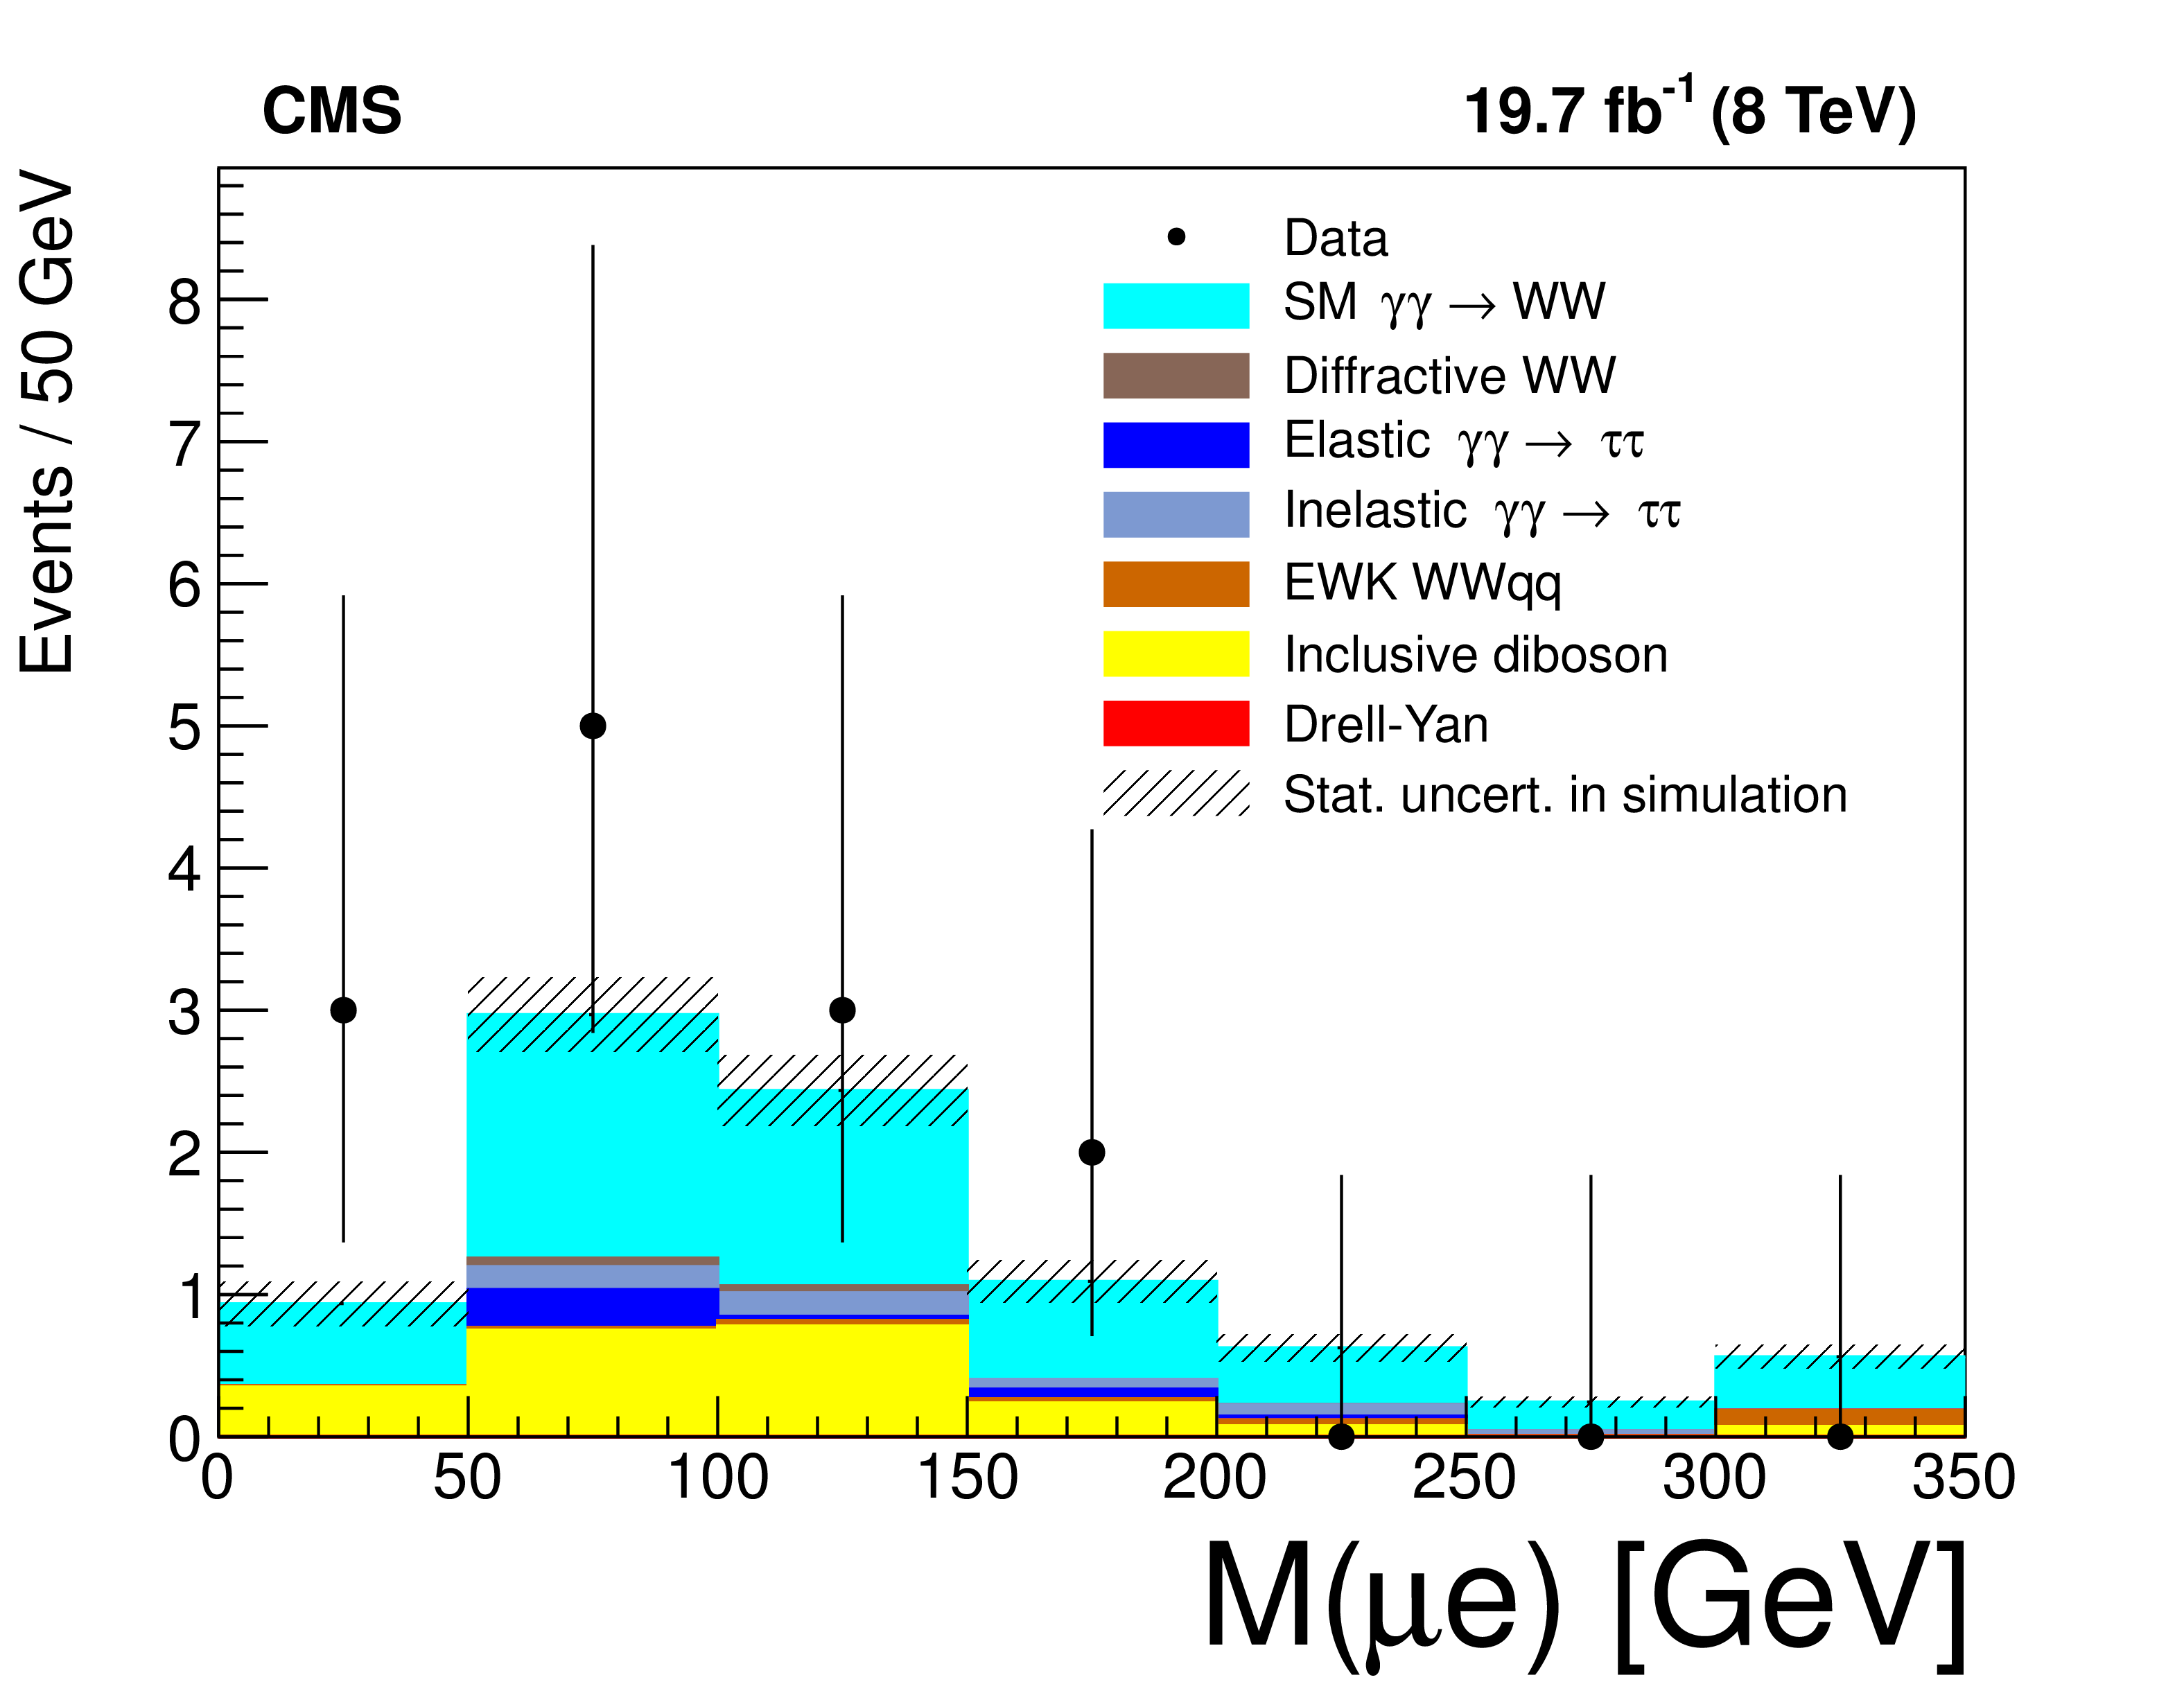
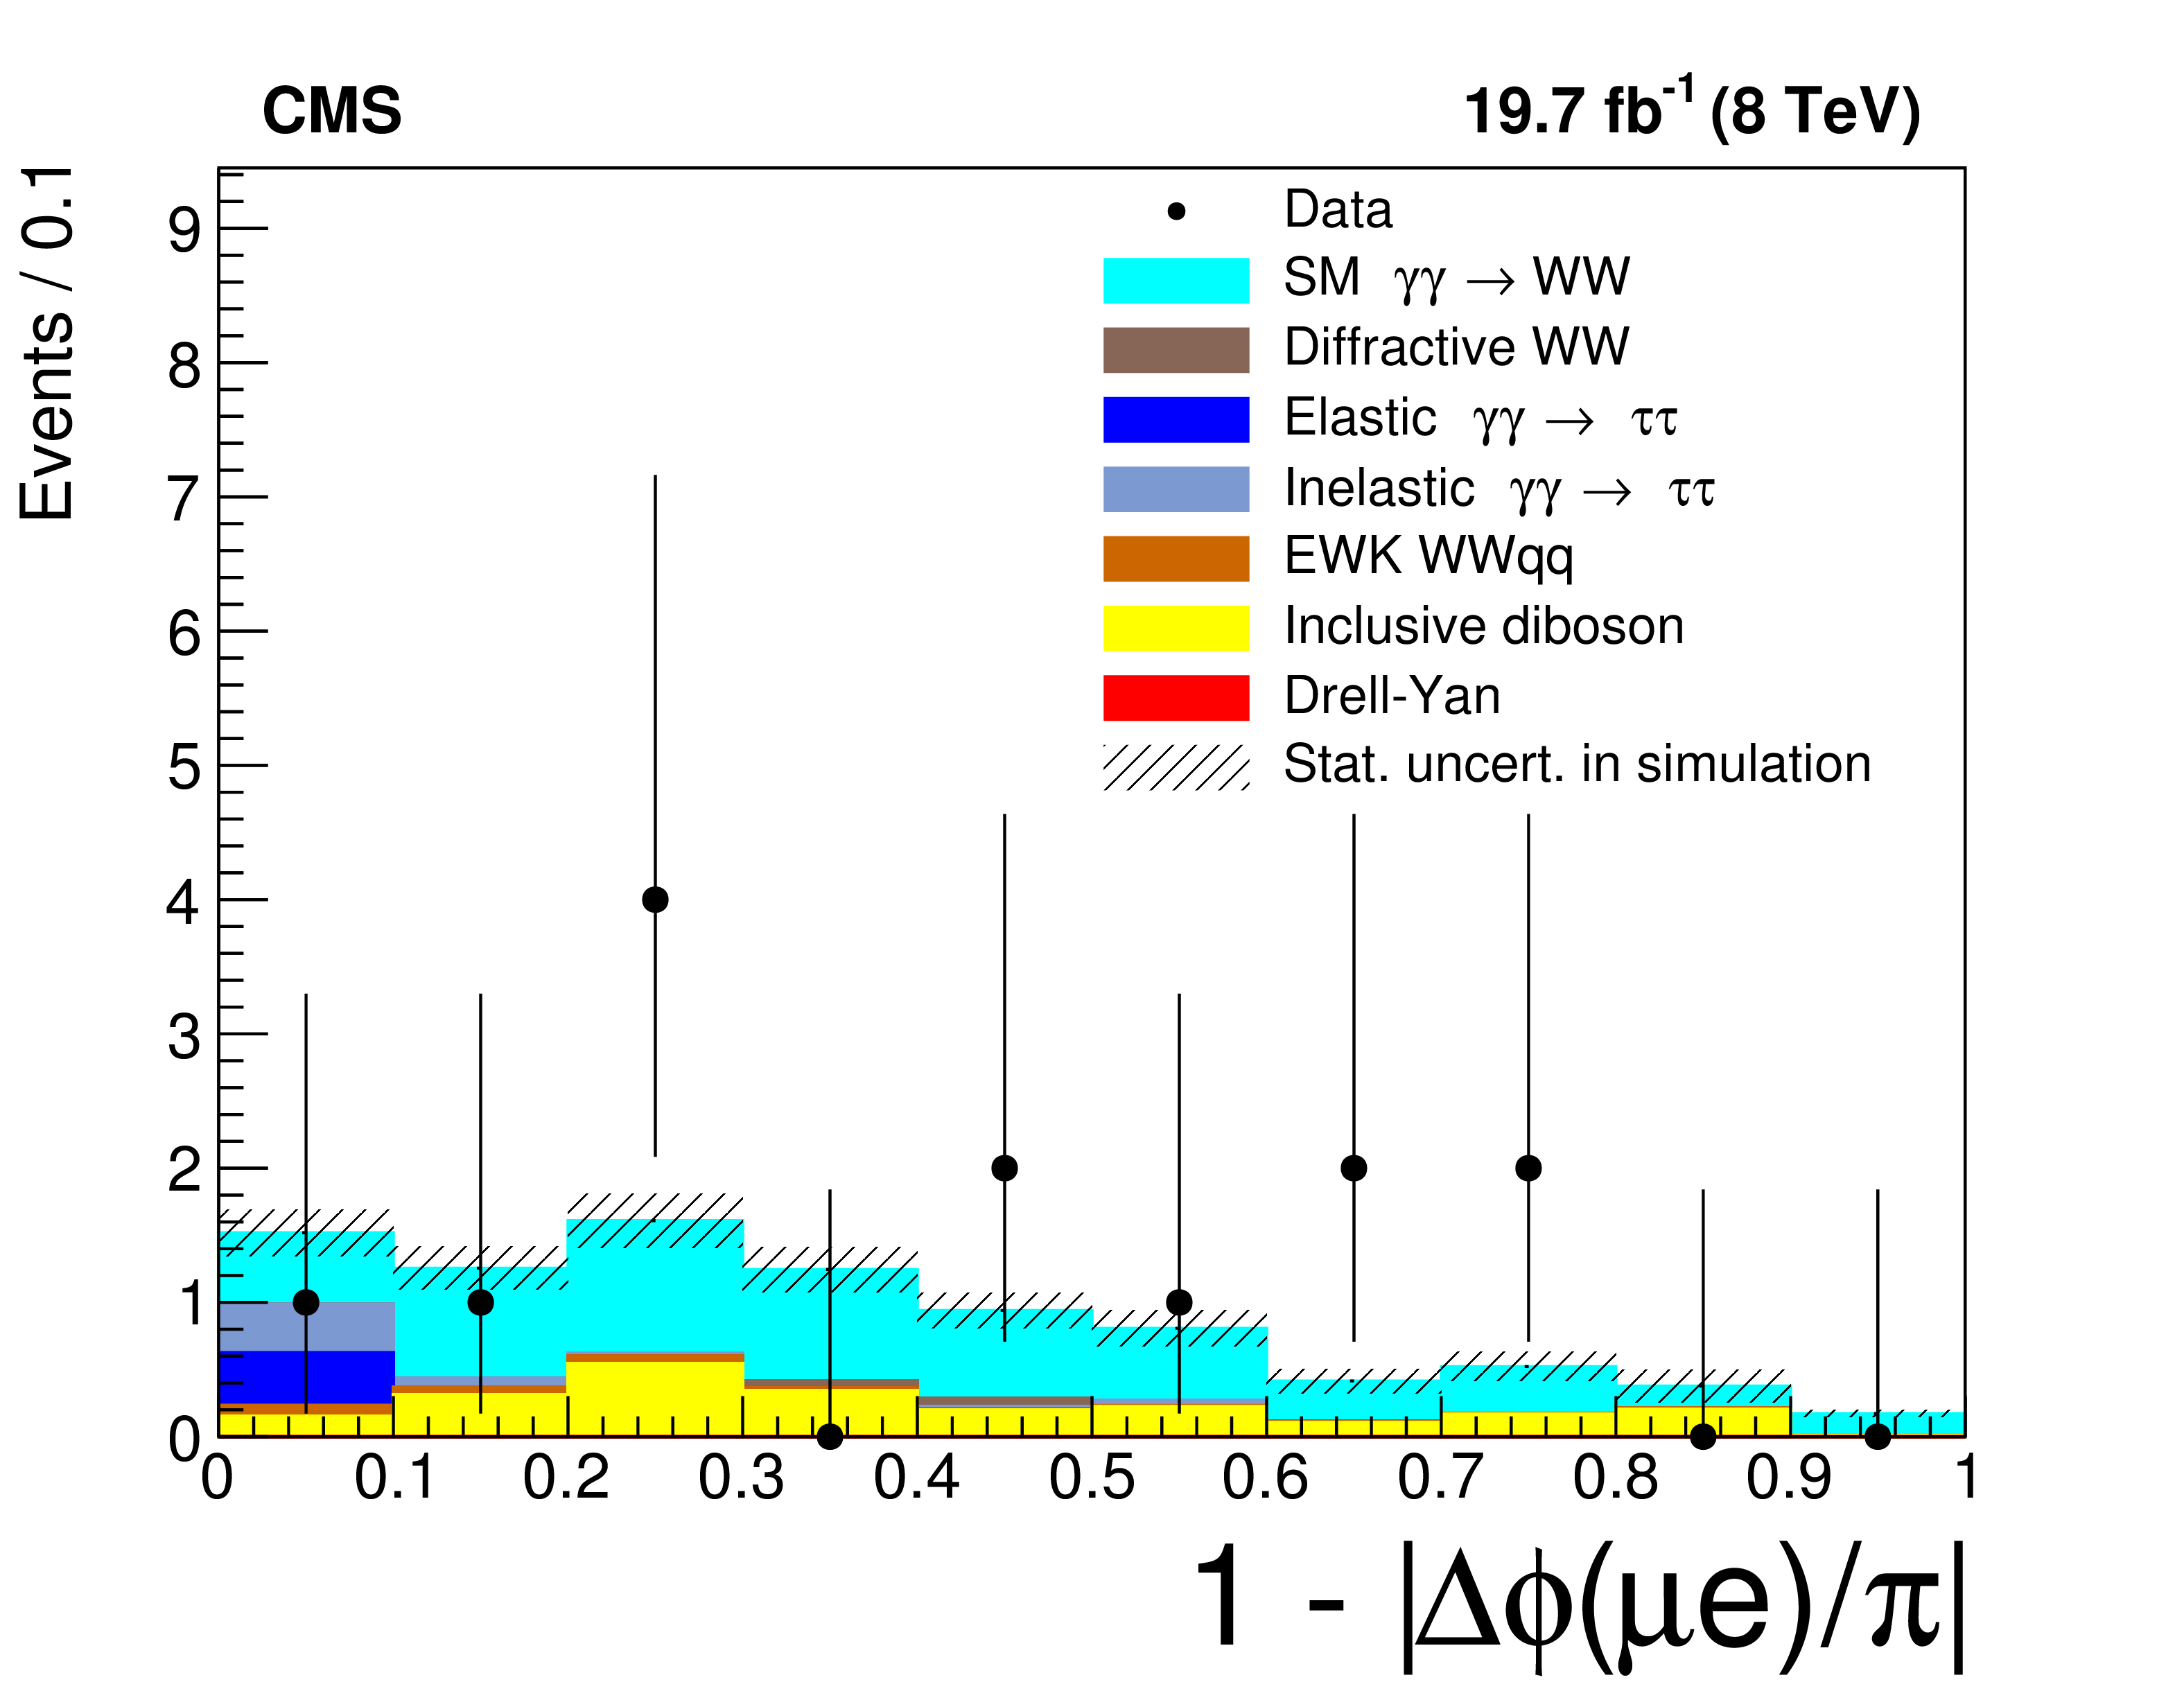
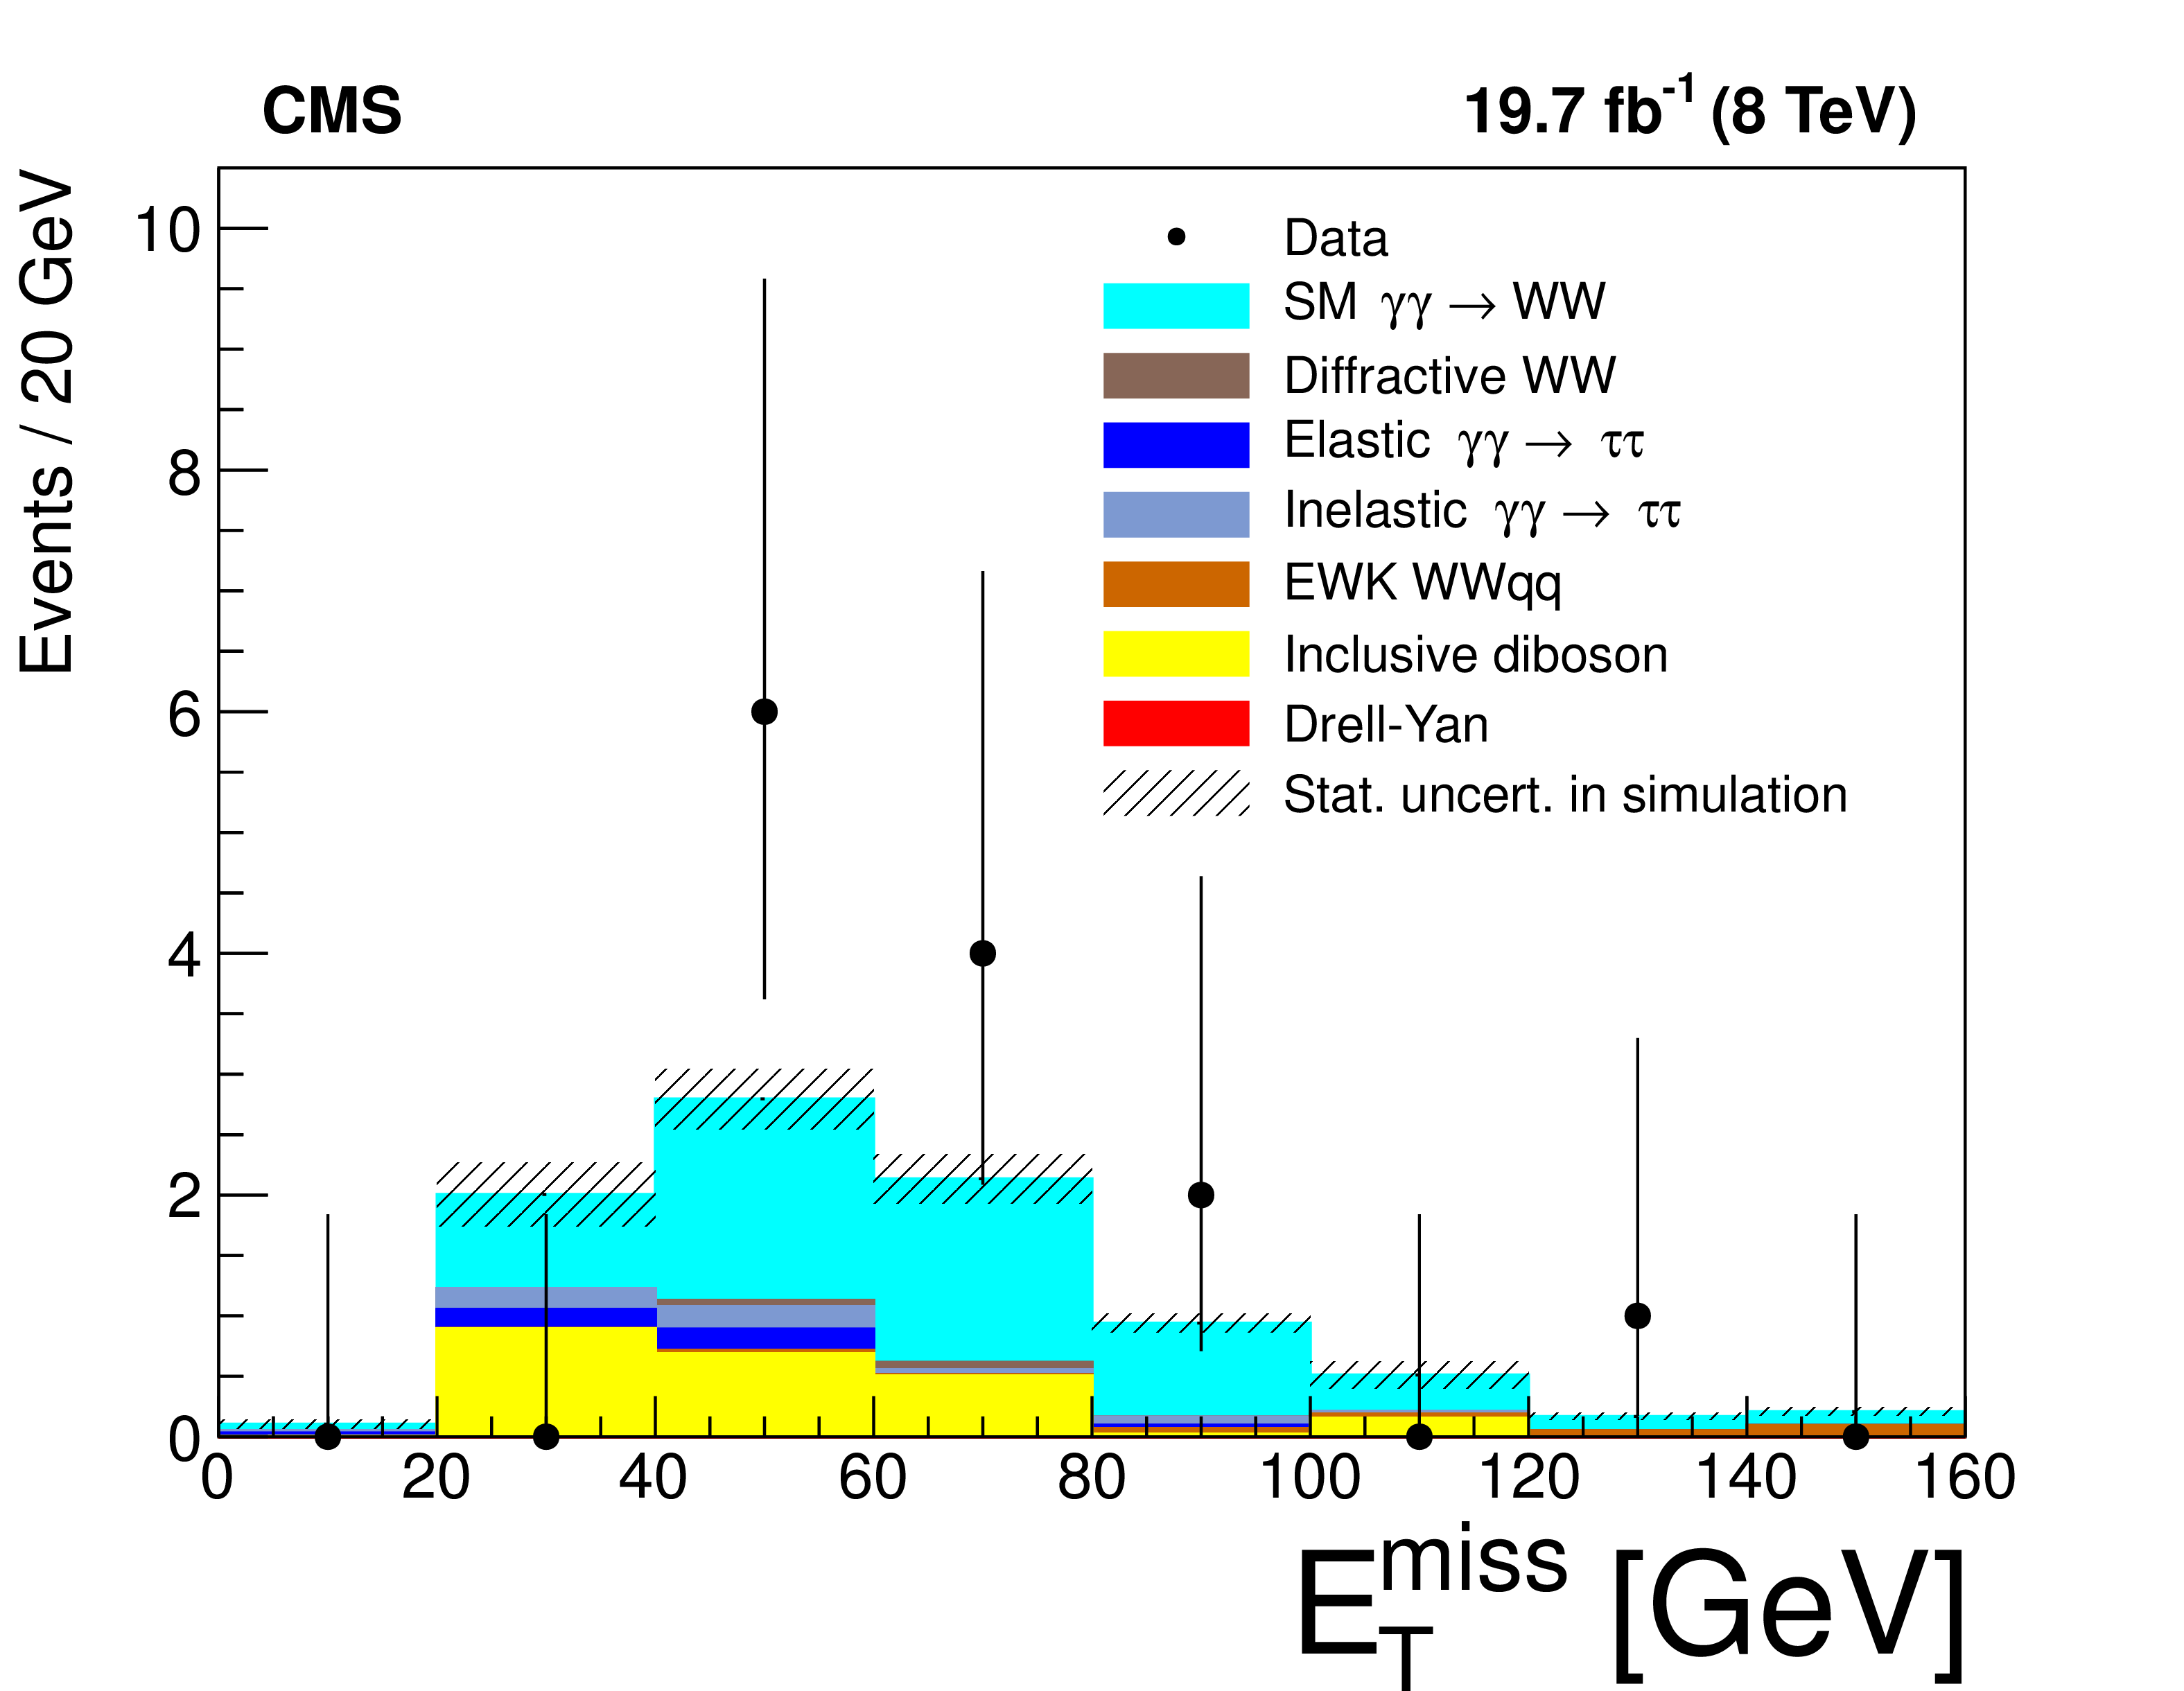
Muon-electron invariant mass (top left), acoplanarity (top right), and missing transverse energy (bottom) in the $\gamma \gamma \to \mathrm{ W }^+ \mathrm{ W }^- $ signal region. The data are shown by the points with error bars; the histograms indicate the expected SM signal and backgrounds. The last bin in the invariant mass and missing transverse energy plots is an overflow bin and includes also all events above the maximum value in the plot. |
png pdf |
Figure 9-a:
Muon-electron invariant mass in the $\gamma \gamma \to \mathrm{ W }^+ \mathrm{ W }^- $ signal region. The data are shown by the points with error bars; the histograms indicate the expected SM signal and backgrounds. The last bin is an overflow bin and includes also all events above the maximum value in the plot. |
png pdf |
Figure 9-b:
Muon-electron acoplanarity in the $\gamma \gamma \to \mathrm{ W }^+ \mathrm{ W }^- $ signal region. The data are shown by the points with error bars; the histograms indicate the expected SM signal and backgrounds. |
png pdf |
Figure 9-c:
Muon-electron missing transverse energy in the $\gamma \gamma \to \mathrm{ W }^+ \mathrm{ W }^- $ signal region. The data are shown by the points with error bars; the histograms indicate the expected SM signal and backgrounds. The last bin is an overflow bin and includes also all events above the maximum value in the plot. |
png pdf |
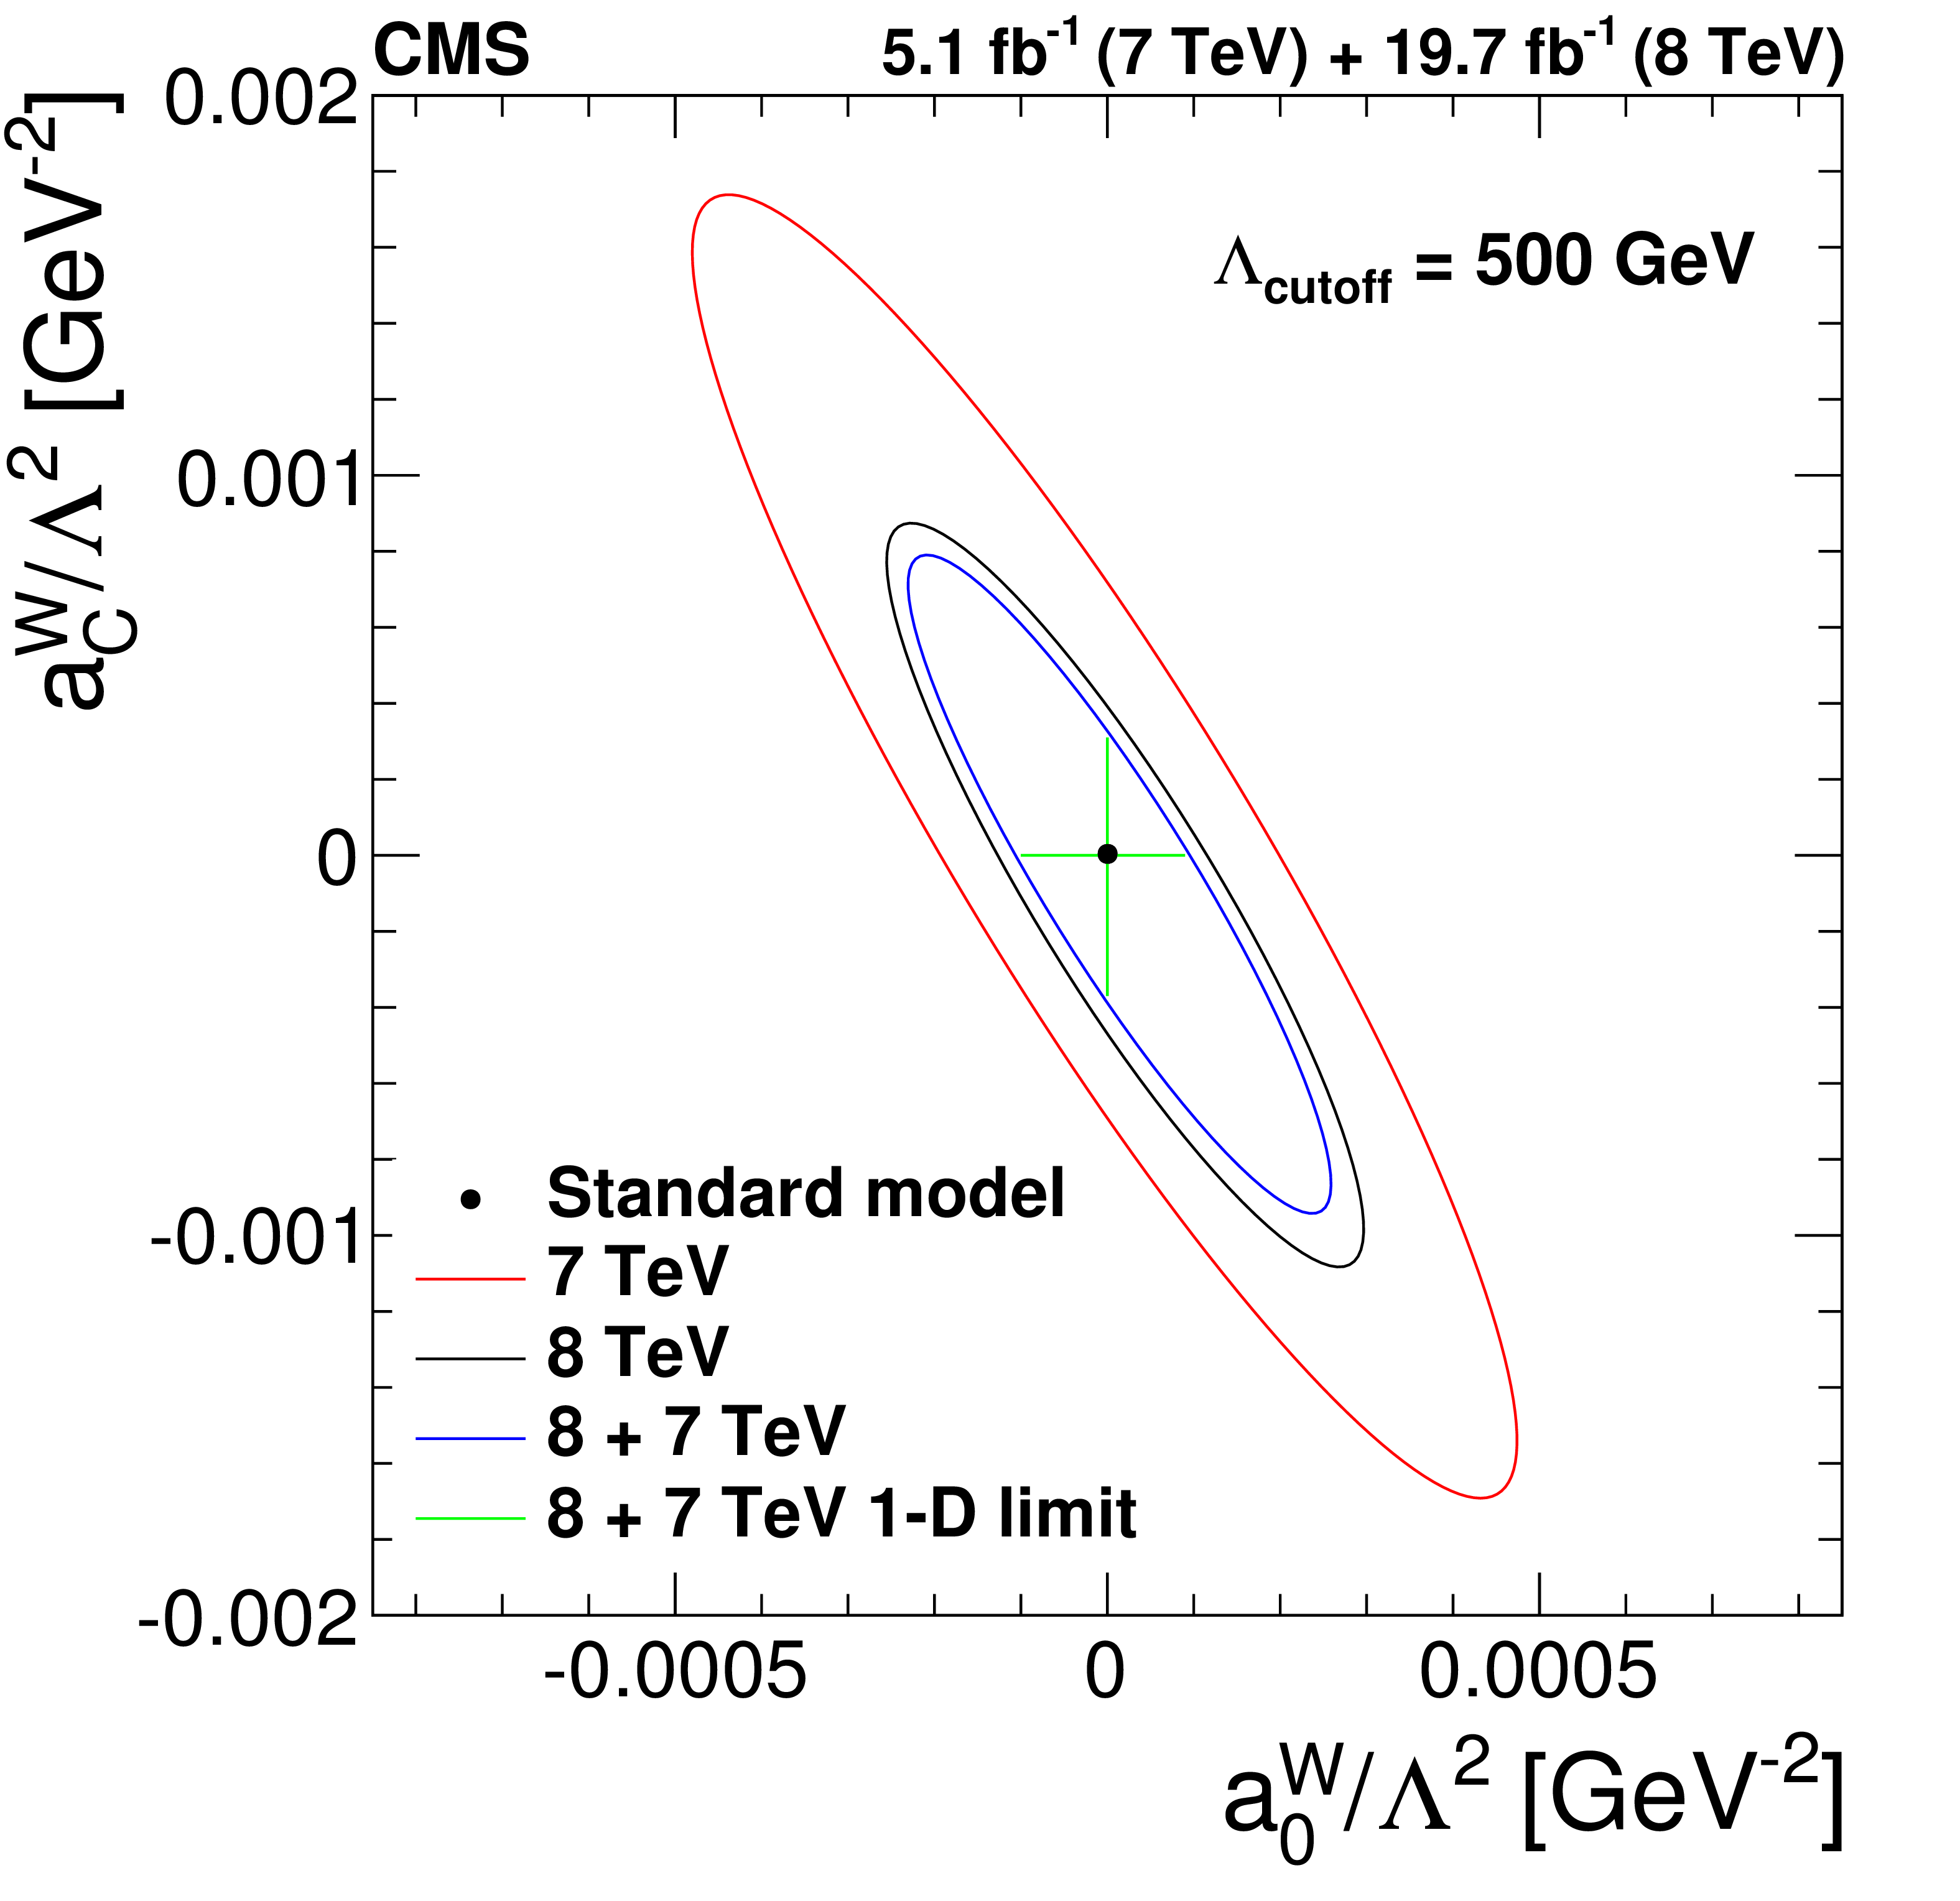
Figure 10:
Excluded values of the anomalous coupling parameters $a^{\mathrm{ W } }_{0}/\Lambda ^{2}$ and $a^{\mathrm{ W } }_{C}/\Lambda ^{2}$ with $\Lambda _{\text {cutoff}}=$ 500 GeV. The exclusion regions are shown for the CMS measurements of $\gamma \gamma \to \mathrm{ W }^+ \mathrm{ W }^- $ at 7 TeV (outer contour), 8 TeV (middle contour), and the 7+8 TeV combination (innermost contour). The areas outside the solid contours are excluded by each measurement at 95% CL. The cross indicates the one-dimensional limits obtained for each parameter from the 7 and 8 TeV combination, with the other parameter fixed to zero. |
| Tables | |
png pdf |
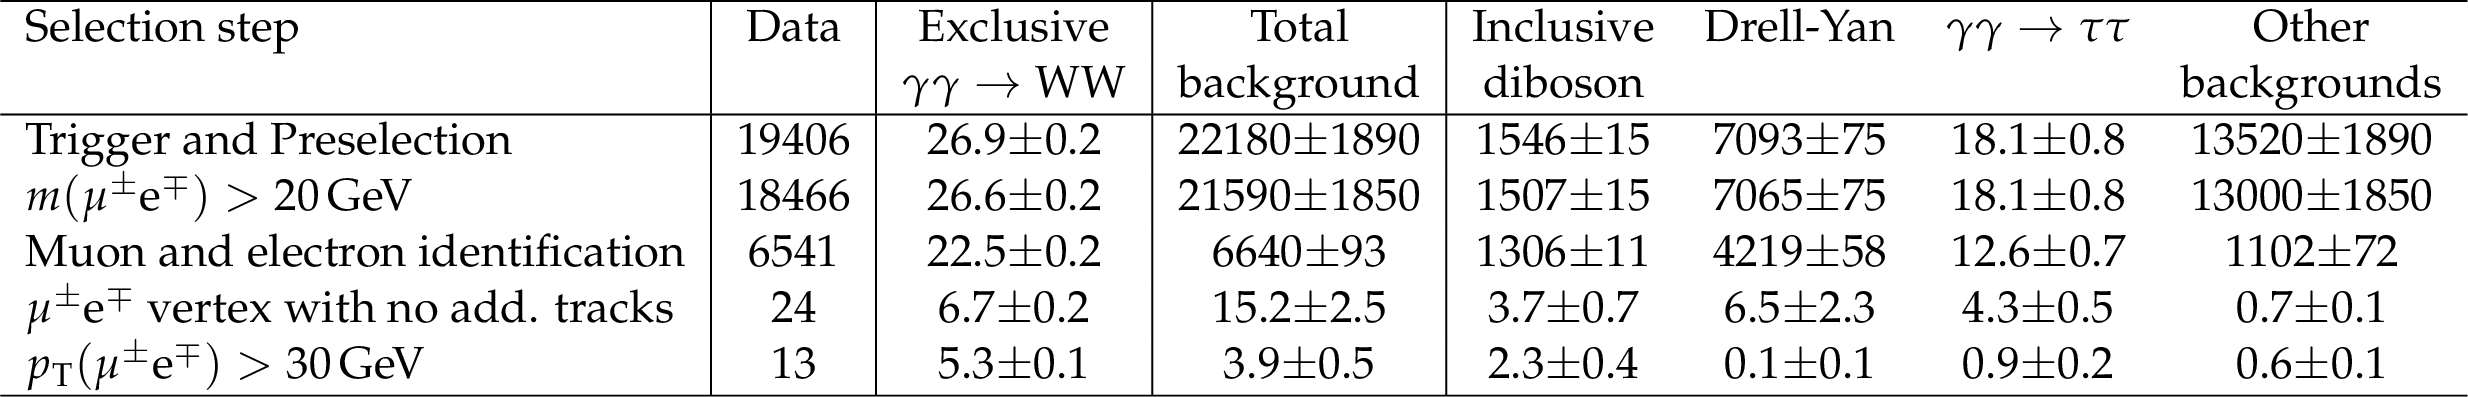
Table 1:
Number of expected signal and background events in simulation passing each selection step, normalized to an integrated luminosity of 19.7 fb$^{-1}$. The preselection includes events with an opposite-charge muon and electron associated with the same vertex, each with $ {p_{\mathrm {T}}} >$ 20 GeV and $ {| \eta | }<$ 2.4, and $<$16 additional tracks at the vertex. Uncertainties are statistical only. |
png pdf |
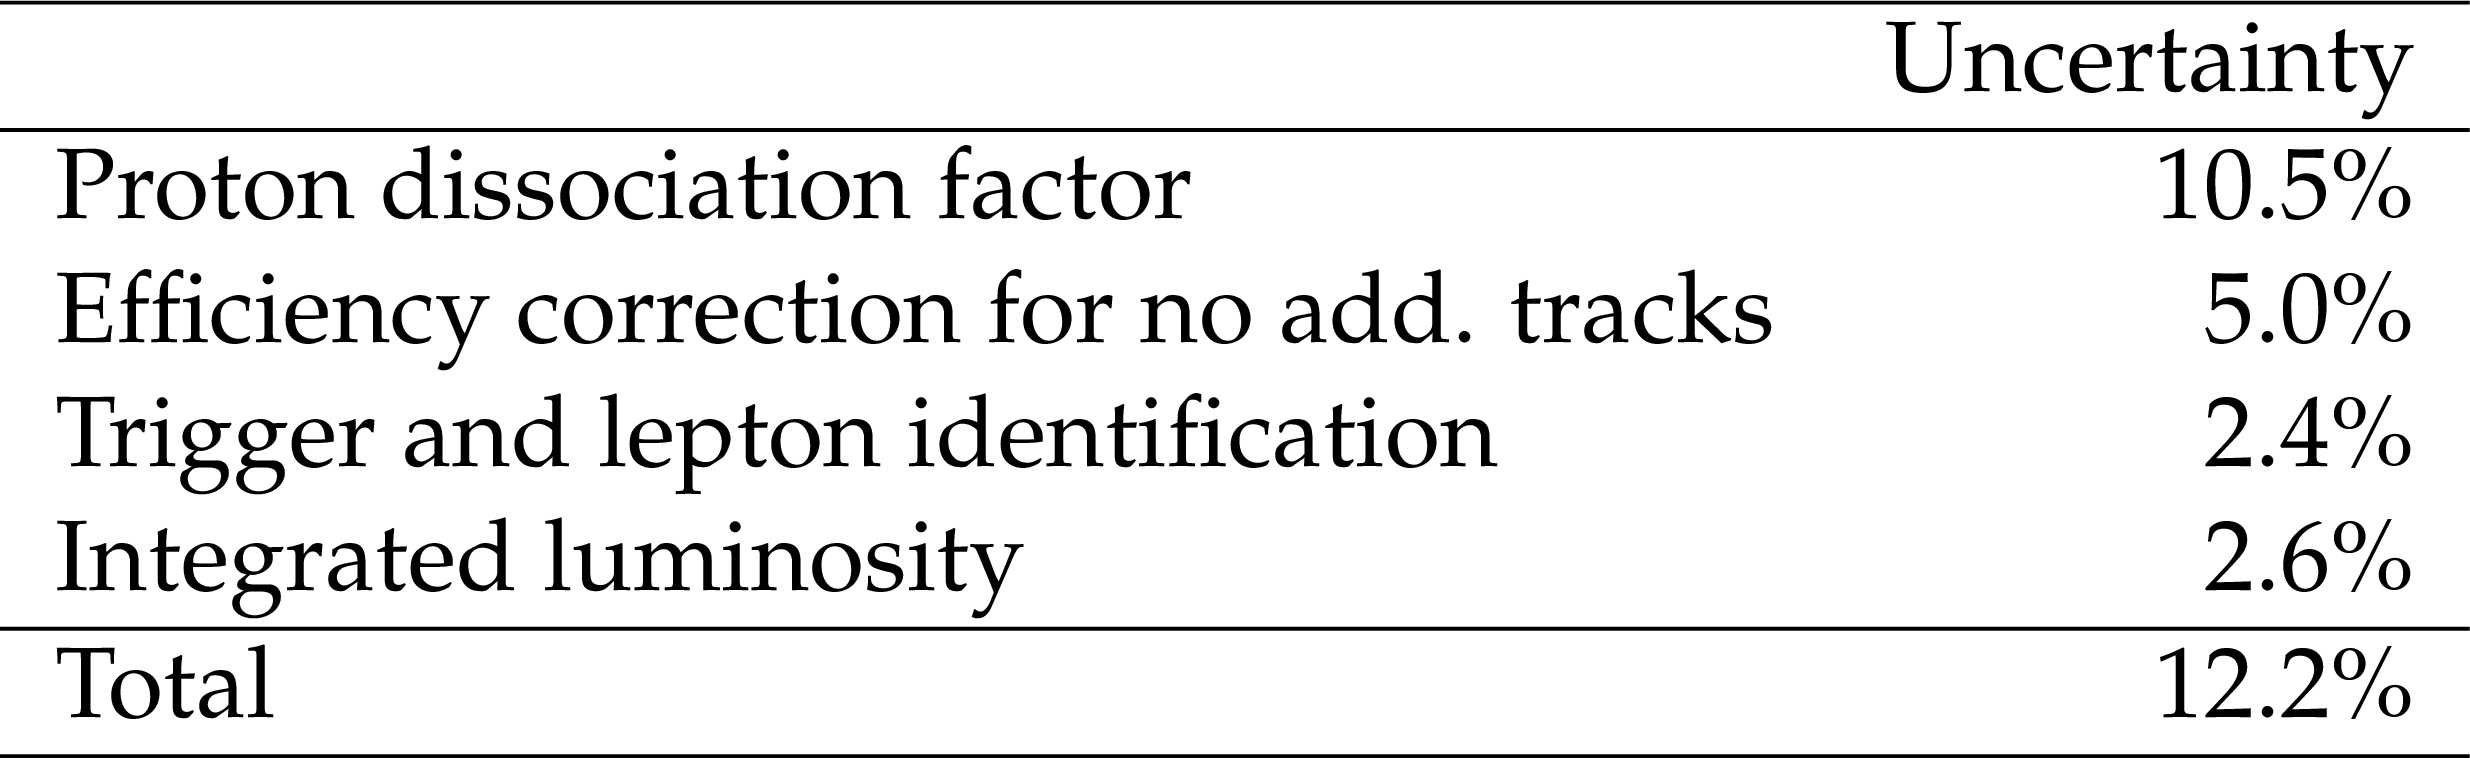
Table 2:
Summary of systematic uncertainties affecting the signal. |
png pdf |
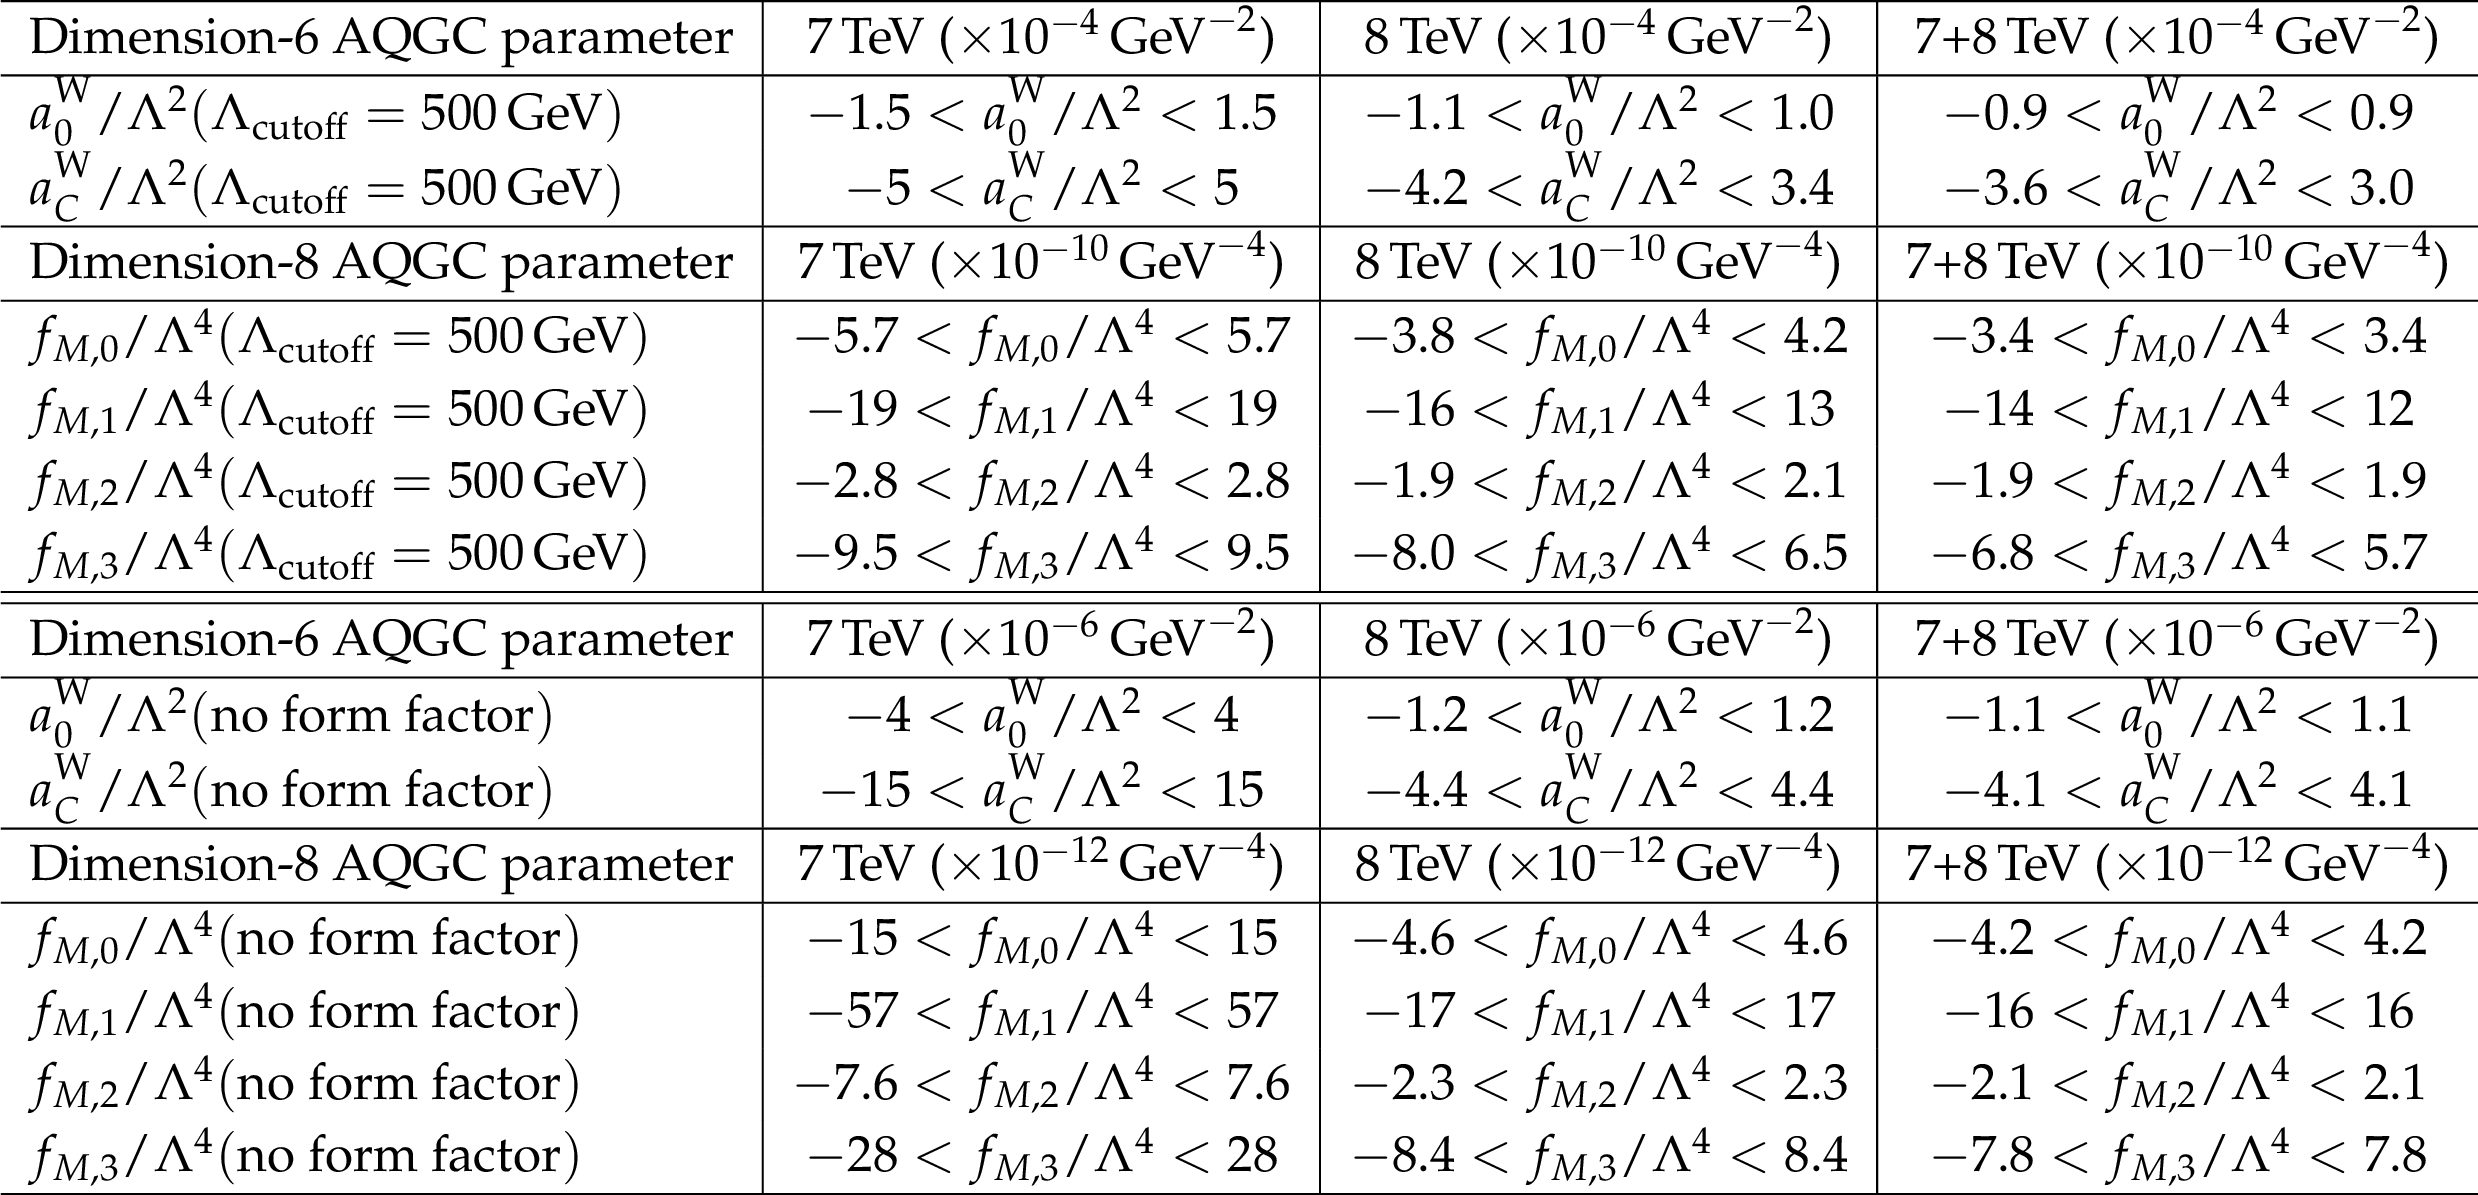
Table 3:
Summary of all 95% CL AQGC limits derived from the measured $ {p_{\mathrm {T}}} (\mu \mathrm{ e } )$ distributions in the $\gamma \gamma \to \mathrm{ W^{+} } \mathrm{ W^{-} } $ signal region production in CMS at 7 and 8 TeV. The second column lists the 7 TeV limits on dimension-6 operators taken from Ref. [5], as well as their conversion to dimension-8 operators at 7 TeV. The third column contains the 8 TeV results described in this paper. The final column shows the combined 7 and 8 TeV limits. |
| Summary |
| Results are presented for exclusive and quasi-exclusive $\gamma\gamma \to \mathrm{ W^{+} }\mathrm{ W^{-} }$ production in the $\mu^{\pm}\mathrm{ e }^{\mp}$ final state in pp collisions at $\sqrt{s} = $ 8 (7) TeV, using data samples corresponding to integrated luminosities of 19.7 (5.05) fb$^{-1}$. In the signal region with $p_{\mathrm{T}}(\mu^{\pm}\mathrm{ e }^{\mp}) > $ 30 GeV and no additional charged particles associated with the $\mu^{\pm}\mathrm{ e }^{\mp}$ vertex, we observe 13 (2) events with an expected background of 3.9 $\pm$ 0.6 (0.84 $\pm$ 0.15) events in the 8 (7) TeV data. The observed yields and kinematic distributions are consistent with the SM prediction, with a combined significance over the background-only hypothesis of 3.4$\sigma$. No significant deviations from the SM are observed in the $p_{\mathrm{T}}(\mu^{\pm}\mathrm{ e }^{\mp})$ distribution, and the combined 7+8 TeV limits are interpreted in terms of improved constraints on dimension-6 and dimension-8 anomalous quartic gauge operator couplings. |
| References | ||||
| 1 | J. de Favereau de Jeneret et al. | High energy photon interactions at the LHC | 0908.2020 | |
| 2 | CMS Collaboration | Exclusive photon-photon production of muon pairs in proton-proton collisions at $ \sqrt{s}=$ 7 TeV | JHEP 01 (2012) 052 | CMS-FWD-10-005 1111.5536 |
| 3 | ATLAS Collaboration | Measurement of exclusive $ \gamma\gamma\rightarrow \ell^+\ell^- $ production in proton-proton collisions at $ \sqrt{s} =$ 7 TeV with the ATLAS detector | PLB 749 (2015) 242 | 1506.07098 |
| 4 | CMS Collaboration | Search for exclusive or semi-exclusive photon pair production and observation of exclusive and semi-exclusive electron pair production in $ \mathrm{pp} $ collisions at $ \sqrt{s}=$ 7 TeV | JHEP 11 (2012) 080 | CMS-FWD-11-004 1209.1666 |
| 5 | CMS Collaboration | Study of exclusive two-photon production of $ W^+W^- $ in $ \mathrm{pp} $ collisions at $ \sqrt{s} =$ 7 TeV and constraints on anomalous quartic gauge couplings | JHEP 07 (2013) 116 | CMS-FSQ-12-010 1305.5596 |
| 6 | T. Pierzchala and K. Piotrzkowski | Sensitivity to anomalous quartic gauge couplings in photon-photon interactions at the LHC | NPPS 179 (2008) 257 | 0807.1121 |
| 7 | E. Chapon, C. Royon, and O. Kepka | Anomalous quartic $ W W \gamma \gamma $, $ Z Z \gamma \gamma $, and trilinear $ WW \gamma $ couplings in two-photon processes at high luminosity at the LHC | PRD 81 (2010) 074003 | 0912.5161 |
| 8 | M. Maniatis, A. von Manteuffel, and O. Nachtmann | Anomalous couplings in $ \gamma \gamma \to W^{+} W^{-} $ at LHC and ILC | NPPS 179 (2008) 104 | |
| 9 | R. L. Delgado, A. Dobado, M. J. Herrero, and J. J. Sanz-Cillero | One-loop $ \gamma\gamma \to W_{L}^{+} W_{L}^{-} $ and $ \gamma\gamma \to Z_{L} Z_{L} $ from the electroweak chiral lagrangian with a light Higgs-like scalar | JHEP 07 (2014) 149 | 1404.2866 |
| 10 | S. Fichet and G. von Gersdorff | Anomalous gauge couplings from composite Higgs and warped extra dimensions | JHEP 03 (2014) 102 | 1311.6815 |
| 11 | D. Espriu and F. Mescia | Unitarity and causality constraints in composite Higgs models | PRD 90 (2014) 015035 | 1403.7386 |
| 12 | ALEPH Collaboration | Constraints on anomalous QGC's in e$ ^{+} $e$ ^{-} $ interactions from 183 GeV to 209 GeV | PLB 602 (2004) 31 | |
| 13 | OPAL Collaboration | Constraints on anomalous quartic gauge boson couplings from $ \nu\bar\nu\gamma\gamma $ and $ q\bar q\gamma\gamma $ events at LEP-2 | PRD 70 (2004) 032005 | hep-ex/0402021 |
| 14 | OPAL Collaboration | A study of $ W^{+}W^{-}\gamma $ events at LEP | PLB 580 (2004) 17 | hep-ex/0309013 |
| 15 | OPAL Collaboration | Measurement of the $ W^{+}W^{-}\gamma $ cross-section and first direct limits on anomalous electroweak quartic gauge couplings | PLB 471 (1999) 293 | hep-ex/9910069 |
| 16 | DELPHI Collaboration | Measurement of the e$ ^{+} $e$ ^{-}\to W^{+}W^{-}\gamma $ cross-section and limits on anomalous quartic gauge couplings with DELPHI | EPJC 31 (2003) 139 | hep-ex/0311004 |
| 17 | L3 Collaboration | The e$ ^{+} $e$ ^{-}\to Z\gamma\gamma\to q\bar{q}\gamma \gamma $ reaction at LEP and constraints on anomalous quartic gauge boson couplings | PLB 540 (2002) 43 | hep-ex/0206050 |
| 18 | L3 Collaboration | Study of the $ W^{+}W^{-}\gamma $ process and limits on anomalous quartic gauge boson couplings at LEP | PLB 527 (2002) 29 | hep-ex/0111029 |
| 19 | D0 Collaboration | Search for anomalous quartic $ WW\gamma\gamma $ couplings in dielectron and missing energy final states in p$ \bar{\mathrm{p}} $ collisions at $ \sqrt{s} $ = 1.96 TeV | PRD 88 (2013) 012005 | 1305.1258 |
| 20 | CMS Collaboration | A search for WW gamma and WZ gamma production and constraints on anomalous quartic gauge couplings in $ \mathrm{pp} $ collisions at $\sqrt{s} = $ 8 TeV | PRD 90 (2014) 032008 | CMS-SMP-13-009 1404.4619 |
| 21 | ATLAS Collaboration | Evidence of $ W\gamma \gamma $ production in $ \mathrm{pp} $ collisions at $ \sqrt{s}= $ 8 TeV and limits on anomalous quartic gauge couplings with the ATLAS Detector | PRL 115 (2015) 031802 | 1503.03243 |
| 22 | ATLAS Collaboration | Evidence for electroweak production of $ W^{\pm}W^{\pm} $jj in pp collisions at $ \sqrt{s}=8 $ TeV with the ATLAS detector | PRL 113 (2014) 141803 | 1405.6241 |
| 23 | CMS Collaboration | Study of vector boson scattering and search for new physics in events with two same-sign leptons and two jets | PRL 114 (2015) 051801 | CMS-SMP-13-015 1410.6315 |
| 24 | V. A. Khoze, A. D. Martin, R. Orava, and M. G. Ryskin | Luminosity monitors at the LHC | EPJC 19 (2001) 313 | hep-ph/0010163 |
| 25 | L. A. Harland-Lang, V. A. Khoze, M. G. Ryskin, and W. J. Stirling | The phenomenology of central exclusive production at hadron colliders | EPJC 72 (2012) 2110 | 1204.4803 |
| 26 | G. Belanger and F. Boudjema | Probing quartic couplings of weak bosons through three vectors production at a 500 GeV NLC | PLB 288 (1992) 201 | |
| 27 | ATLAS Collaboration | Observation of a new particle in the search for the Standard Model Higgs boson with the ATLAS detector at the LHC | PLB 716 (2012) 1 | 1207.7214 |
| 28 | CMS Collaboration | Observation of a new boson at a mass of 125 GeV with the CMS experiment at the LHC | PLB 716 (2012) 30 | CMS-HIG-12-028 1207.7235 |
| 29 | CMS Collaboration | Observation of a new boson with mass near 125 GeV in pp collisions at $ \sqrt{s} $ = 7 and 8 TeV | JHEP 06 (2013) 081 | CMS-HIG-12-036 1303.4571 |
| 30 | G. Belanger et al. | Bosonic quartic couplings at LEP-2 | EPJC 13 (2000) 283 | hep-ph/9908254 |
| 31 | O. J. P. Eboli, M. C. Gonzalez-Garcia, and J. K. Mizukoshi | $ p p \rightarrow $jje$ ^{\pm} \mu^{\pm} \nu \nu $ and jje$ ^{\pm} \mu^{\mp} \nu \nu $ at O($ \alpha_{em}^{6} $) and O($ \alpha_{em}^{4} \alpha_{s}^{2} $) for the study of the quartic electroweak gauge boson vertex at CERN LHC | PRD 74 (2006) 073005 | hep-ph/0606118 |
| 32 | M. Baak et al. | Working group report: precision study of electroweak interactions | 1310.6708 | |
| 33 | O. J. P. Eboli, M. C. Gonzalez-Garcia, S. M. Lietti, and S. F. Novaes | Anomalous quartic gauge boson couplings at hadron colliders | PRD 63 (2001) 075008 | hep-ph/0009262 |
| 34 | R. S. Gupta | Probing quartic neutral gauge boson couplings using diffractive photon fusion at the LHC | PRD 85 (2012) 014006 | 1111.3354 |
| 35 | A. Alboteanu, W. Kilian, and J. Reuter | Resonances and unitarity in weak boson scattering at the LHC | JHEP 11 (2008) 010 | 0806.4145 |
| 36 | CMS Collaboration | The CMS experiment at the CERN LHC | JINST 3 (2008) S08004 | CMS-00-001 |
| 37 | CMS Collaboration | Performance of electron reconstruction and selection with the CMS detector in proton-proton collisions at $ \sqrt{s}= $ 8 TeV | JINST 10 (2015) P06005 | CMS-EGM-13-001 1502.02701 |
| 38 | CMS Collaboration | Description and performance of track and primary-vertex reconstruction with the CMS tracker | JINST 9 (2014) P10009 | CMS-TRK-11-001 1405.6569 |
| 39 | J. Alwall et al. | MadGraph 5: going beyond | JHEP 06 (2011) 128 | 1106.0522 |
| 40 | J. Alwall et al. | The automated computation of tree-level and next-to-leading order differential cross sections, and their matching to parton shower simulations | JHEP 07 (2014) 079 | 1405.0301 |
| 41 | V. M. Budnev, I. F. Ginzburg, G. V. Meledin, and V. G. Serbo | The two-photon particle production mechanism. Physical problems. Applications. Equivalent photon approximation | PR 15 (1975) 181 | |
| 42 | A. Belyaev, N. D. Christensen, and A. Pukhov | CalcHEP 3.4 for collider physics within and beyond the Standard Model | CPC 184 (2013) 1729 | 1207.6082 |
| 43 | J. A. M. Vermaseren | Two-photon processes at very high energies | Nucl. Phys. B 229 (1983) 347 | |
| 44 | S. P. Baranov, O. Duenger, H. Shooshtari, and J. A. M. Vermaseren | LPAIR: A generator for lepton pair production | in Proceedings of Physics at HERA, volume 3, p. 14781991 | |
| 45 | M. Czakon and A. Mitov | Top++: a program for the calculation of the top-pair cross-section at hadron colliders | CPC 185 (2014) 2930 | 1112.5675 |
| 46 | J. M. Campbell and R. K. Ellis | MCFM for the Tevatron and the LHC | NPPS 205 (2010) 10 | 1007.3492 |
| 47 | P. Nason | A new method for combining NLO QCD with shower Monte Carlo algorithms | JHEP 11 (2004) 040 | hep-ph/0409146 |
| 48 | S. Frixione, P. Nason, and C. Oleari | Matching NLO QCD computations with parton shower simulations: the POWHEG method | JHEP 11 (2007) 070 | 0709.2092 |
| 49 | S. Alioli, P. Nason, C. Oleari, and E. Re | A general framework for implementing NLO calculations in shower Monte Carlo programs: the POWHEG BOX | JHEP 06 (2010) 043 | 1002.2581 |
| 50 | T. Sj\"ostrand, S. Mrenna, and P. Z. Skands | PYTHIA 6.4 Physics and Manual | JHEP 05 (2006) 026 | hep-ph/0603175 |
| 51 | CMS Collaboration | Study of the underlying event at forward rapidity in pp collisions at $ \sqrt{s} $ = 0.9, 2.76, and 7 TeV | JHEP 04 (2013) 072 | CMS-FWD-11-003 1302.2394 |
| 52 | R. Field | Min-bias and the underlying event at the LHC | Acta Phys. Polon. B 42 (2011) 2631 | 1110.5530 |
| 53 | P. Bruni and G. Ingelman | Diffractive hard scattering at $ \mathrm{ep} $ and $\mathrm{p} \bar{\mathrm{p}} $ colliders | in Proceedings of the Int. Europhysics Conf. on High Energy Physics, J. Carr and M. Perrottet eds., Marseille, France | |
| 54 | H1 Collaboration | Measurement and QCD analysis of the diffractive deep-inelastic scattering cross-section at HERA | EPJC 48 (2006) 715 | hep-ex/0606004 |
| 55 | CMS Collaboration | Observation of a diffractive contribution to dijet production in proton-proton collisions at $ \sqrt{s}=$ 7 TeV | PRD 87 (2013) 012006 | CMS-FWD-10-004 1209.1805 |
| 56 | P. Lebiedowicz, R. Pasechnik, and A. Szczurek | QCD diffractive mechanism of exclusive $ W^+W^- $ pair production at high energies | Nucl. Phys. B 867 (2013) 61 | 1203.1832 |
| 57 | CMS Collaboration | Measurement of electroweak production of two jets in association with a Z boson in proton-proton collisions at $ \sqrt{s}=8\,\text {TeV} $ | EPJC 75 (2015) 66 | CMS-FSQ-12-035 1410.3153 |
| 58 | A. Ballestrero et al. | PHANTOM: A Monte Carlo event generator for six parton final states at high energy colliders | CPC 180 (2009) 401 | 0801.3359 |
| 59 | GEANT4 Collaboration | GEANT4---a simulation toolkit | NIMA 506 (2003) 250 | |
| 60 | CMS Collaboration | Performance of CMS muon reconstruction in pp collision events at $ \sqrt{s}=7 $ TeV | JINST 7 (2012) P10002 | CMS-MUO-10-004 1206.4071 |
| 61 | CMS Collaboration | Particle--Flow Event Reconstruction in CMS and Performance for Jets, Taus, and $ E_{\mathrm{T}}^{\text{miss}} $ | CDS | |
| 62 | CMS Collaboration | Commissioning of the Particle-flow Event Reconstruction with the first LHC collisions recorded in the CMS detector | CDS | |
| 63 | G. G. da Silveira et al. | Central $ \mu^{+} $ $ \mu^{-} $ production via photon-photon fusion in proton-proton collisions with proton dissociation | JHEP 02 (2015) 159 | 1409.1541 |
| 64 | L. A. Harland-Lang, V. A. Khoze, and M. G. Ryskin | The photon PDF in events with rapidity gaps | EPJC76 (2016), no. 5, 255 | 1601.03772 |
| 65 | CMS Collaboration | CMS Luminosity Based on Pixel Cluster Counting - Summer 2013 Update | CMS-PAS-LUM-13-001 | CMS-PAS-LUM-13-001 |
| 66 | G. J. Feldman and R. D. Cousins | A unified approach to the classical statistical analysis of small signals | PRD 57 (1998) 3873 | physics/9711021 |
| 67 | R. D. Cousins and V. L. Highland | Incorporating systematic uncertainties into an upper limit | NIMA 320 (1992) 331 | |
|
|
Compact Muon Solenoid LHC, CERN |
|

|

|

|

|

|