

Compact Muon Solenoid
LHC, CERN
| CMS-FSQ-14-002 ; CERN-EP-2017-327 | ||
| Study of Bose-Einstein correlations in pp, pPb, and PbPb collisions at the LHC | ||
| CMS Collaboration | ||
| 20 December 2017 | ||
| Phys. Rev. C 97 (2018) 064912 | ||
| Abstract: Quantum statistical (Bose-Einstein) two-particle correlations are measured in pp collisions at $\sqrt{s}= $ 0.9, 2.76, and 7 TeV, as well as in pPb and peripheral PbPb collisions at nucleon-nucleon center-of-mass energies of 5.02 and 2.76 TeV, respectively, using the CMS detector at the LHC. Separate analyses are performed for same-sign unidentified charged particles as well as for same-sign pions and kaons identified via their energy loss in the silicon tracker. The characteristics of the one-, two-, and three-dimensional correlation functions are studied as functions of the pair average transverse momentum (${k_{\mathrm{T}}}$) and the charged-particle multiplicity in the event. For all systems, the extracted correlation radii steadily increase with the event multiplicity, and decrease with increasing ${k_{\mathrm{T}}}$. The radii are in the range 1-5 fm, the largest values corresponding to very high multiplicity pPb interactions and to peripheral PbPb collisions with multiplicities similar to those seen in pPb data. It is also observed that the dependencies of the radii on multiplicity and ${k_{\mathrm{T}}}$ largely factorize. At the same multiplicity, the radii are relatively independent of the colliding system and center-of-mass energy. | ||
| Links: e-print arXiv:1712.07198 [hep-ex] (PDF) ; CDS record ; inSPIRE record ; CADI line (restricted) ; | ||
| Figures | |
png pdf |
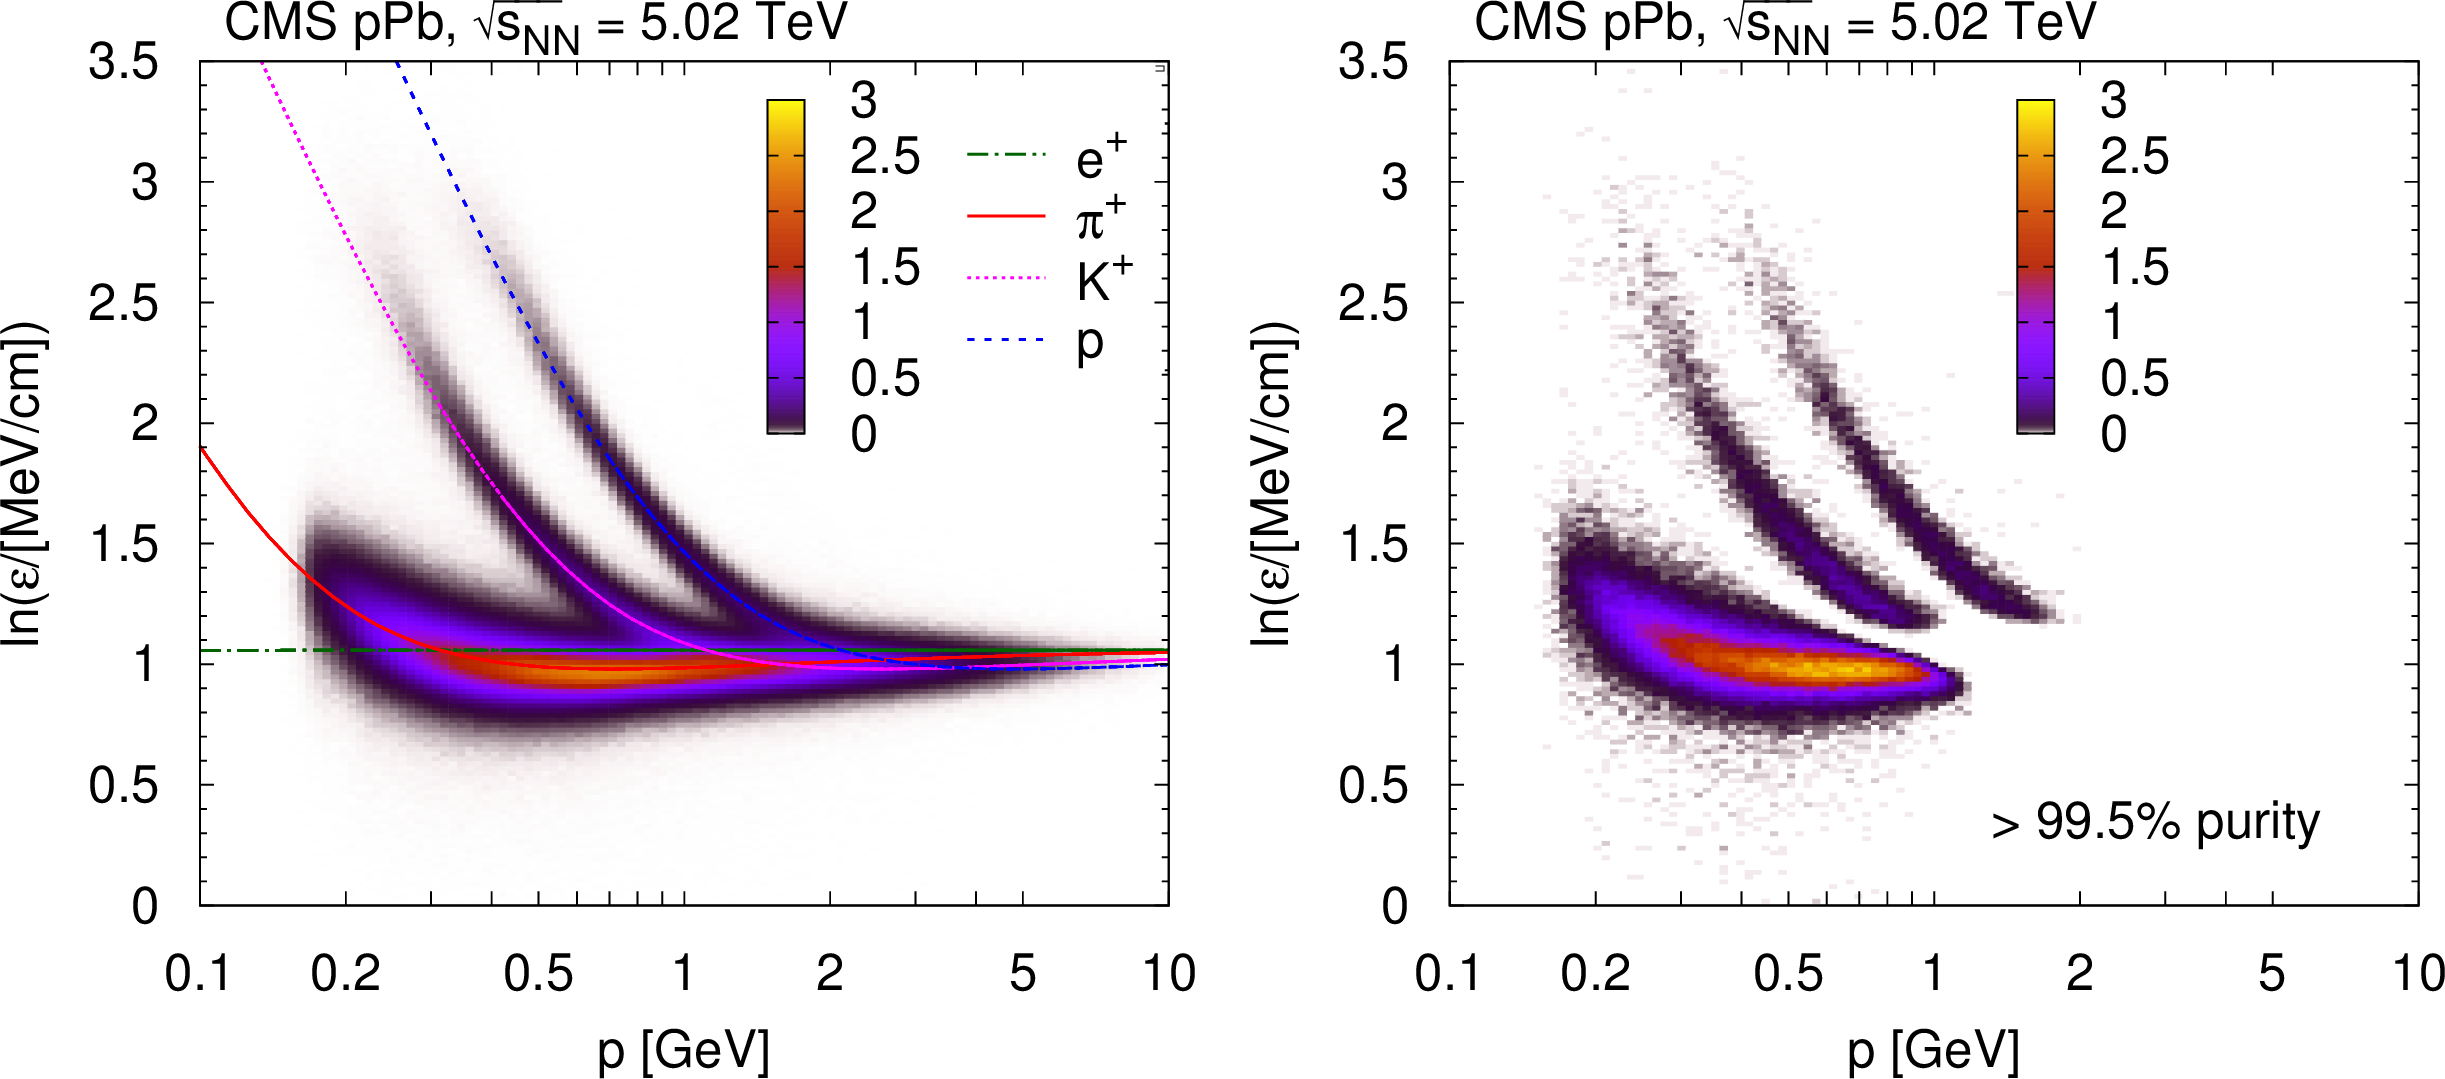
Figure 1:
Most probable logarithm of the energy loss rate $\varepsilon $ normalized at a reference path length $l_0 = $ 450 $\mu $m in pPb collisions at $ {\sqrt {\smash [b]{s_{_\text {NN}}}}} = $ 5.02 TeV. The distribution of $ \ln \varepsilon $ is shown as a function of total momentum $p$ for positively charged particles (left), as well as for identified charged particles (both charges) with high purity selection ($ > $99.5%, right). The linear $z$ axis scale is shown in arbitrary units. The curves show the expected $ \ln \varepsilon $ for electrons, pions, kaons, and protons (full theoretical calculation, Eq. (33.11) in Ref. [23]). |
png pdf |
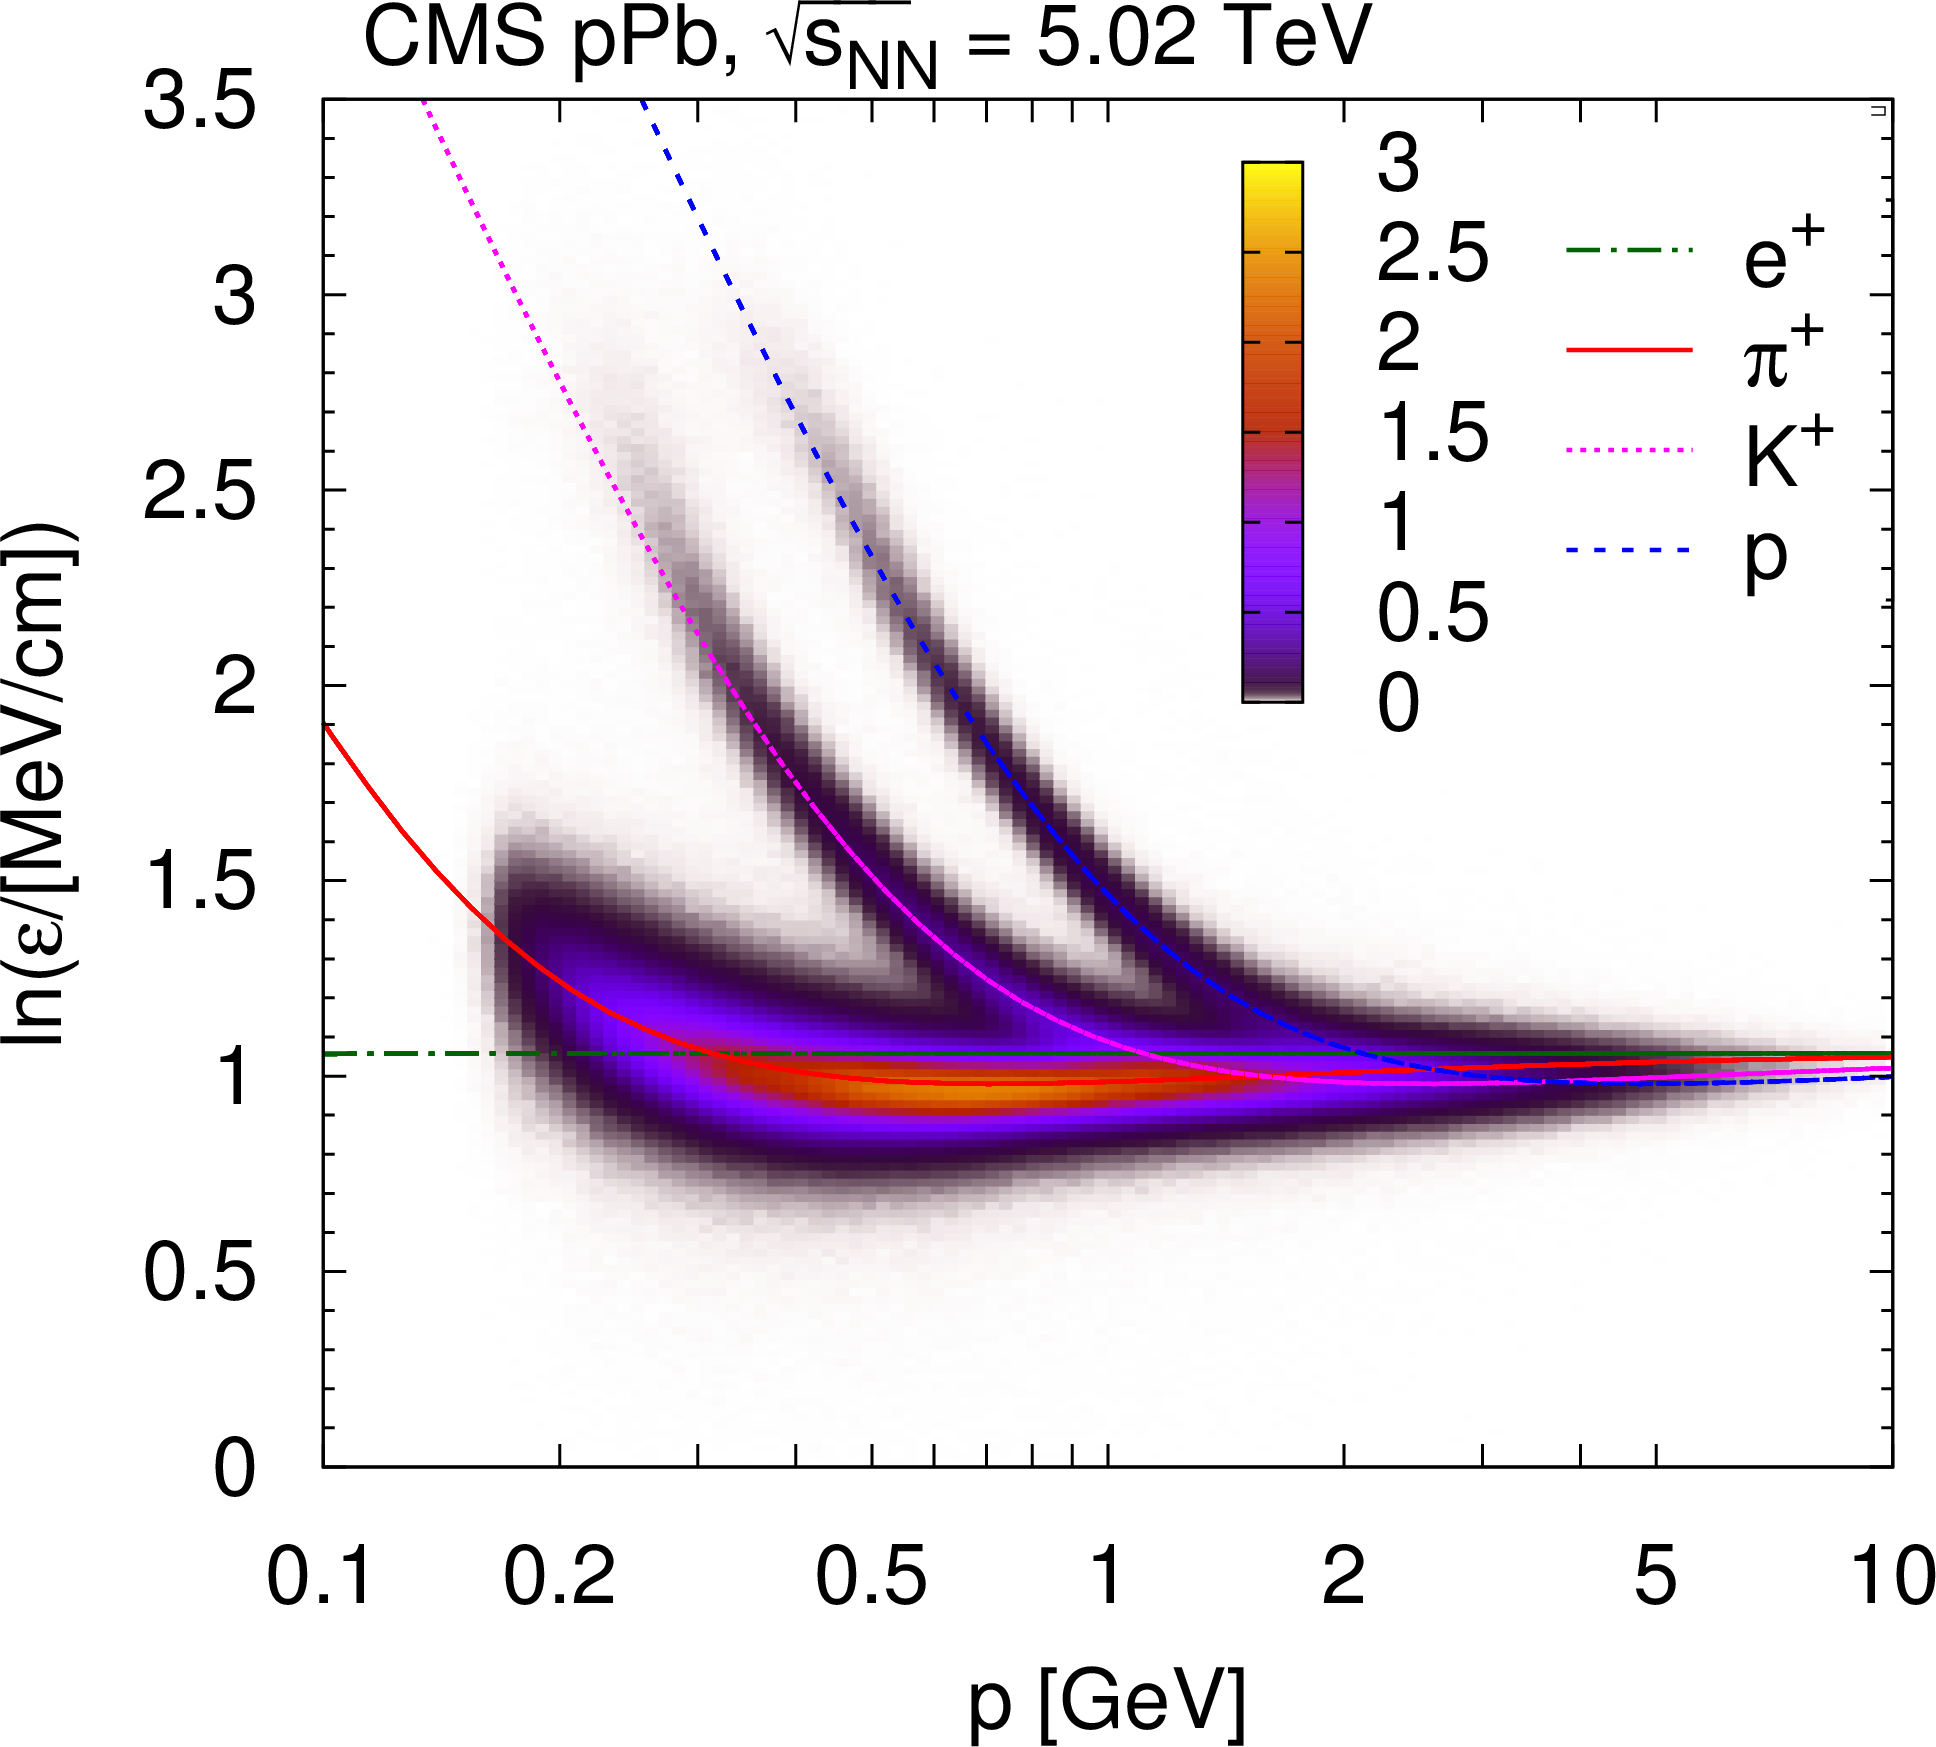
Figure 1-a:
Most probable logarithm of the energy loss rate $\varepsilon $ normalized at a reference path length $l_0 = $ 450 $\mu $m in pPb collisions at $ {\sqrt {\smash [b]{s_{_\text {NN}}}}} = $ 5.02 TeV. The distribution of $ \ln \varepsilon $ is shown as a function of total momentum $p$ for positively charged particles. The linear $z$ axis scale is shown in arbitrary units. The curves show the expected $ \ln \varepsilon $ for electrons, pions, kaons, and protons (full theoretical calculation, Eq. (33.11) in Ref. [23]). |
png pdf |
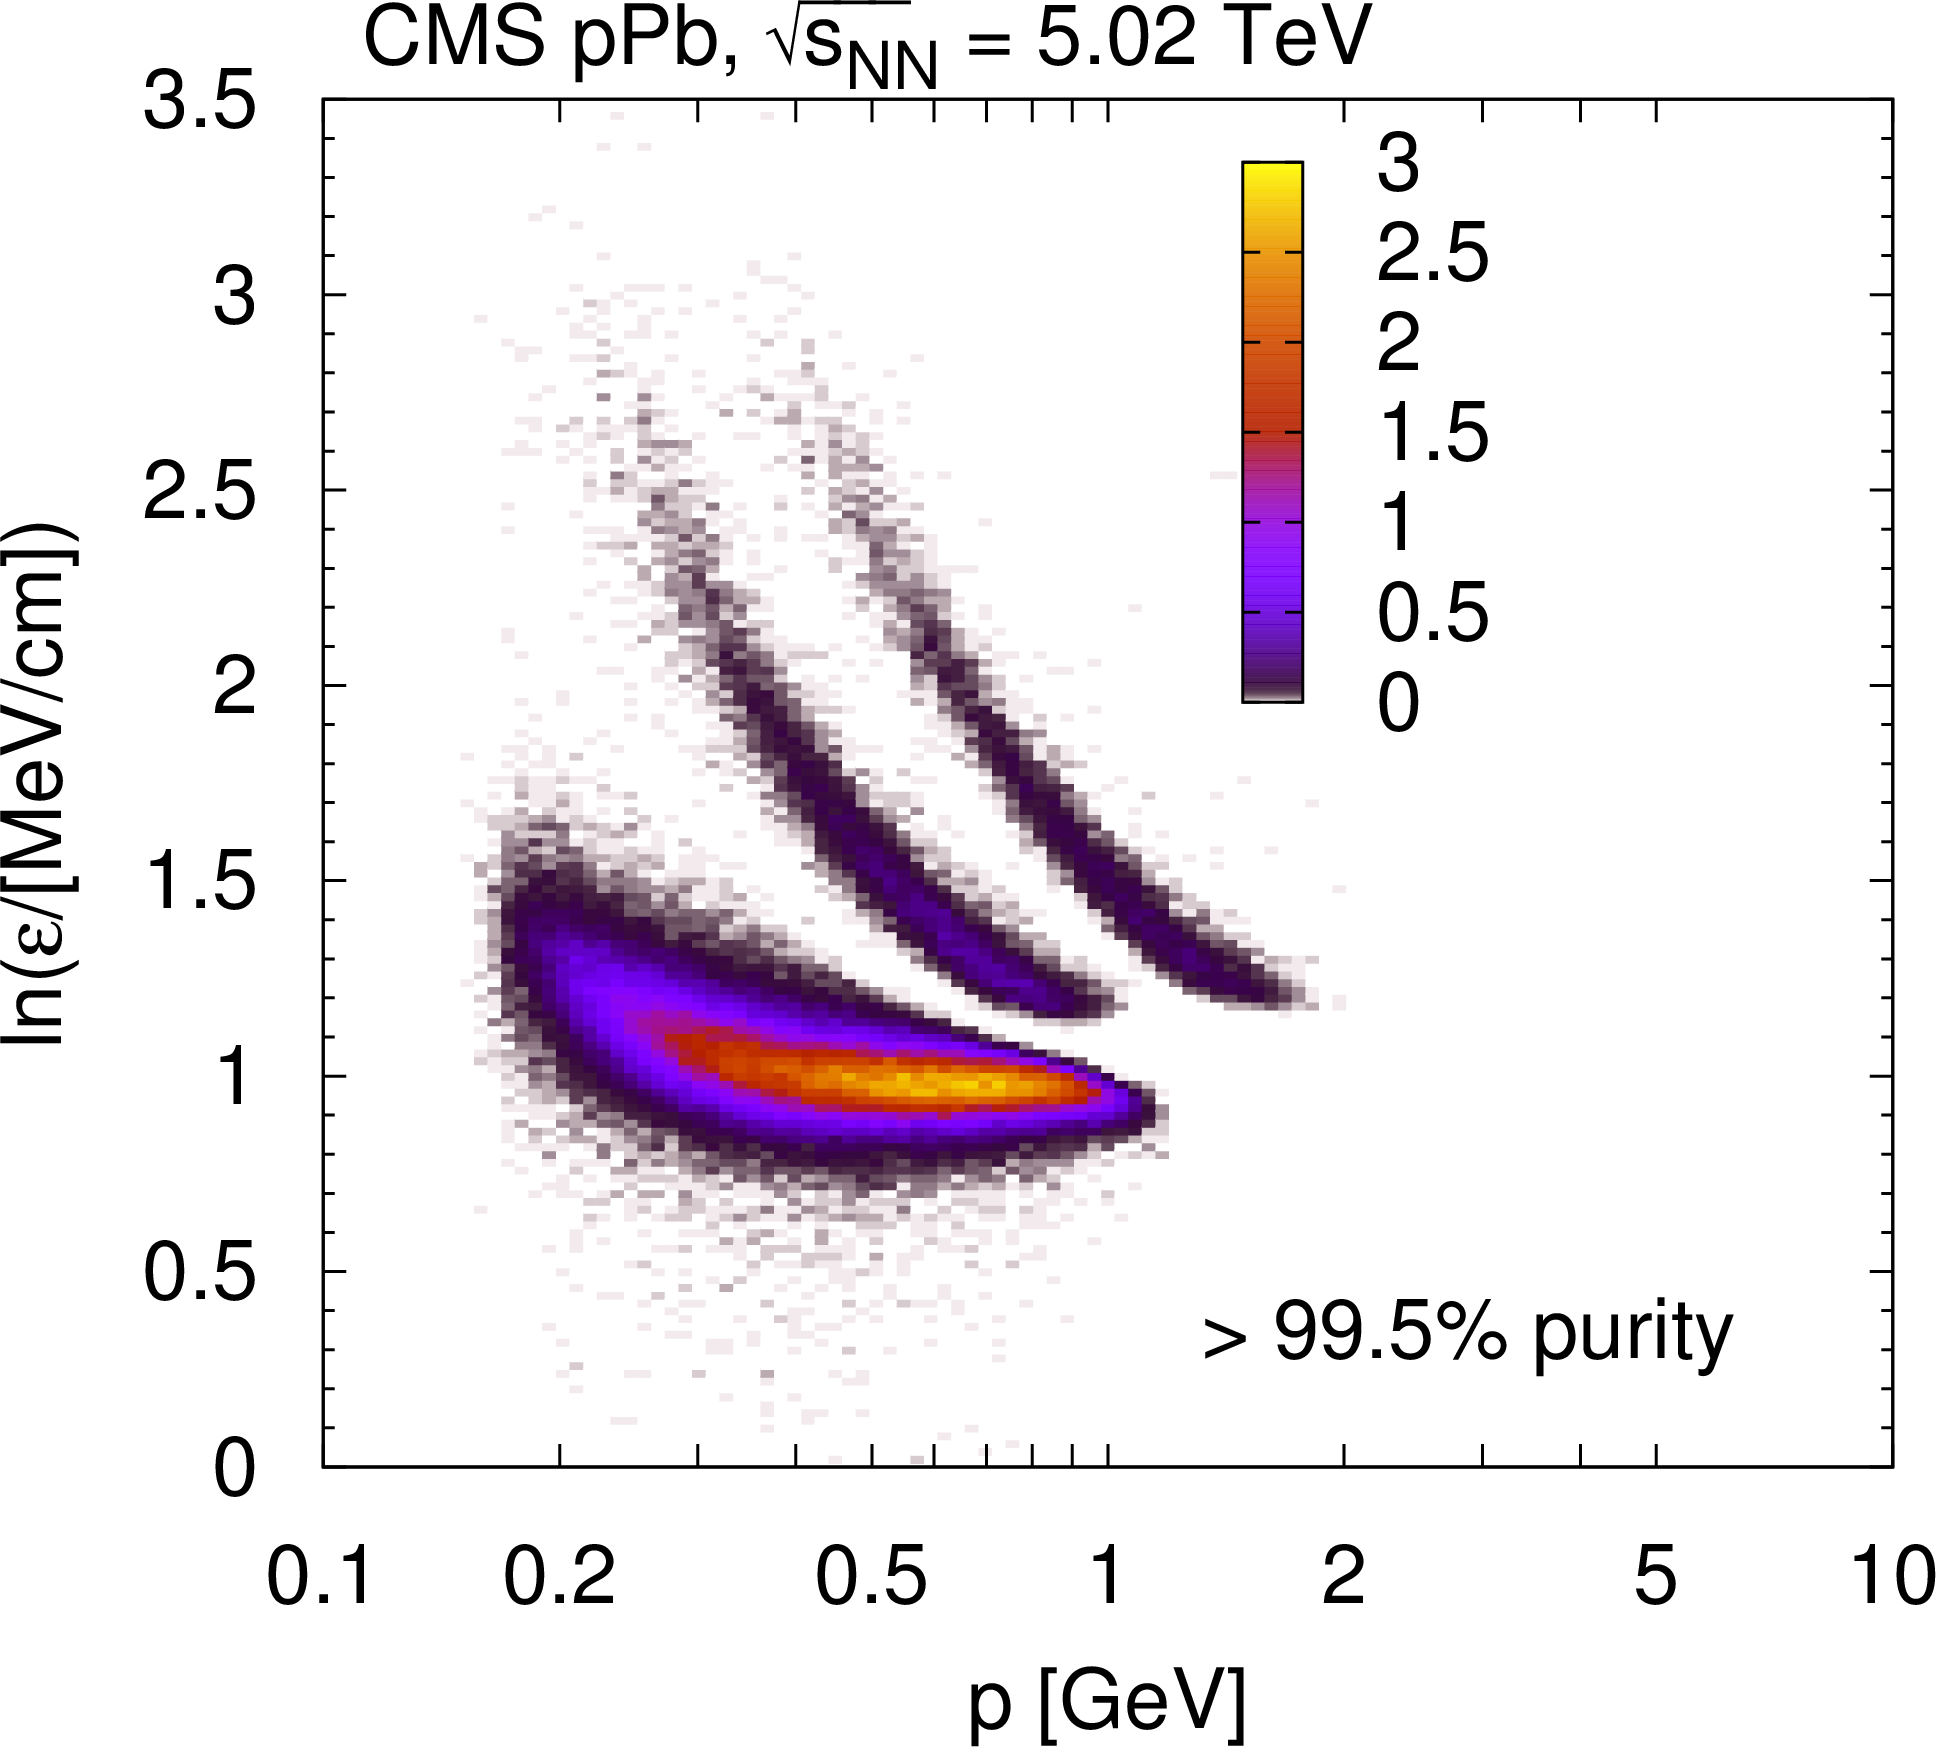
Figure 1-b:
Most probable logarithm of the energy loss rate $\varepsilon $ normalized at a reference path length $l_0 = $ 450 $\mu $m in pPb collisions at $ {\sqrt {\smash [b]{s_{_\text {NN}}}}} = $ 5.02 TeV. The distribution of $ \ln \varepsilon $ is shown as a function of total momentum $p$ for identified charged particles (both charges) with high purity selection ($ > $99.5%). The linear $z$ axis scale is shown in arbitrary units. The curves show the expected $ \ln \varepsilon $ for electrons, pions, kaons, and protons (full theoretical calculation, Eq. (33.11) in Ref. [23]). |
png pdf |
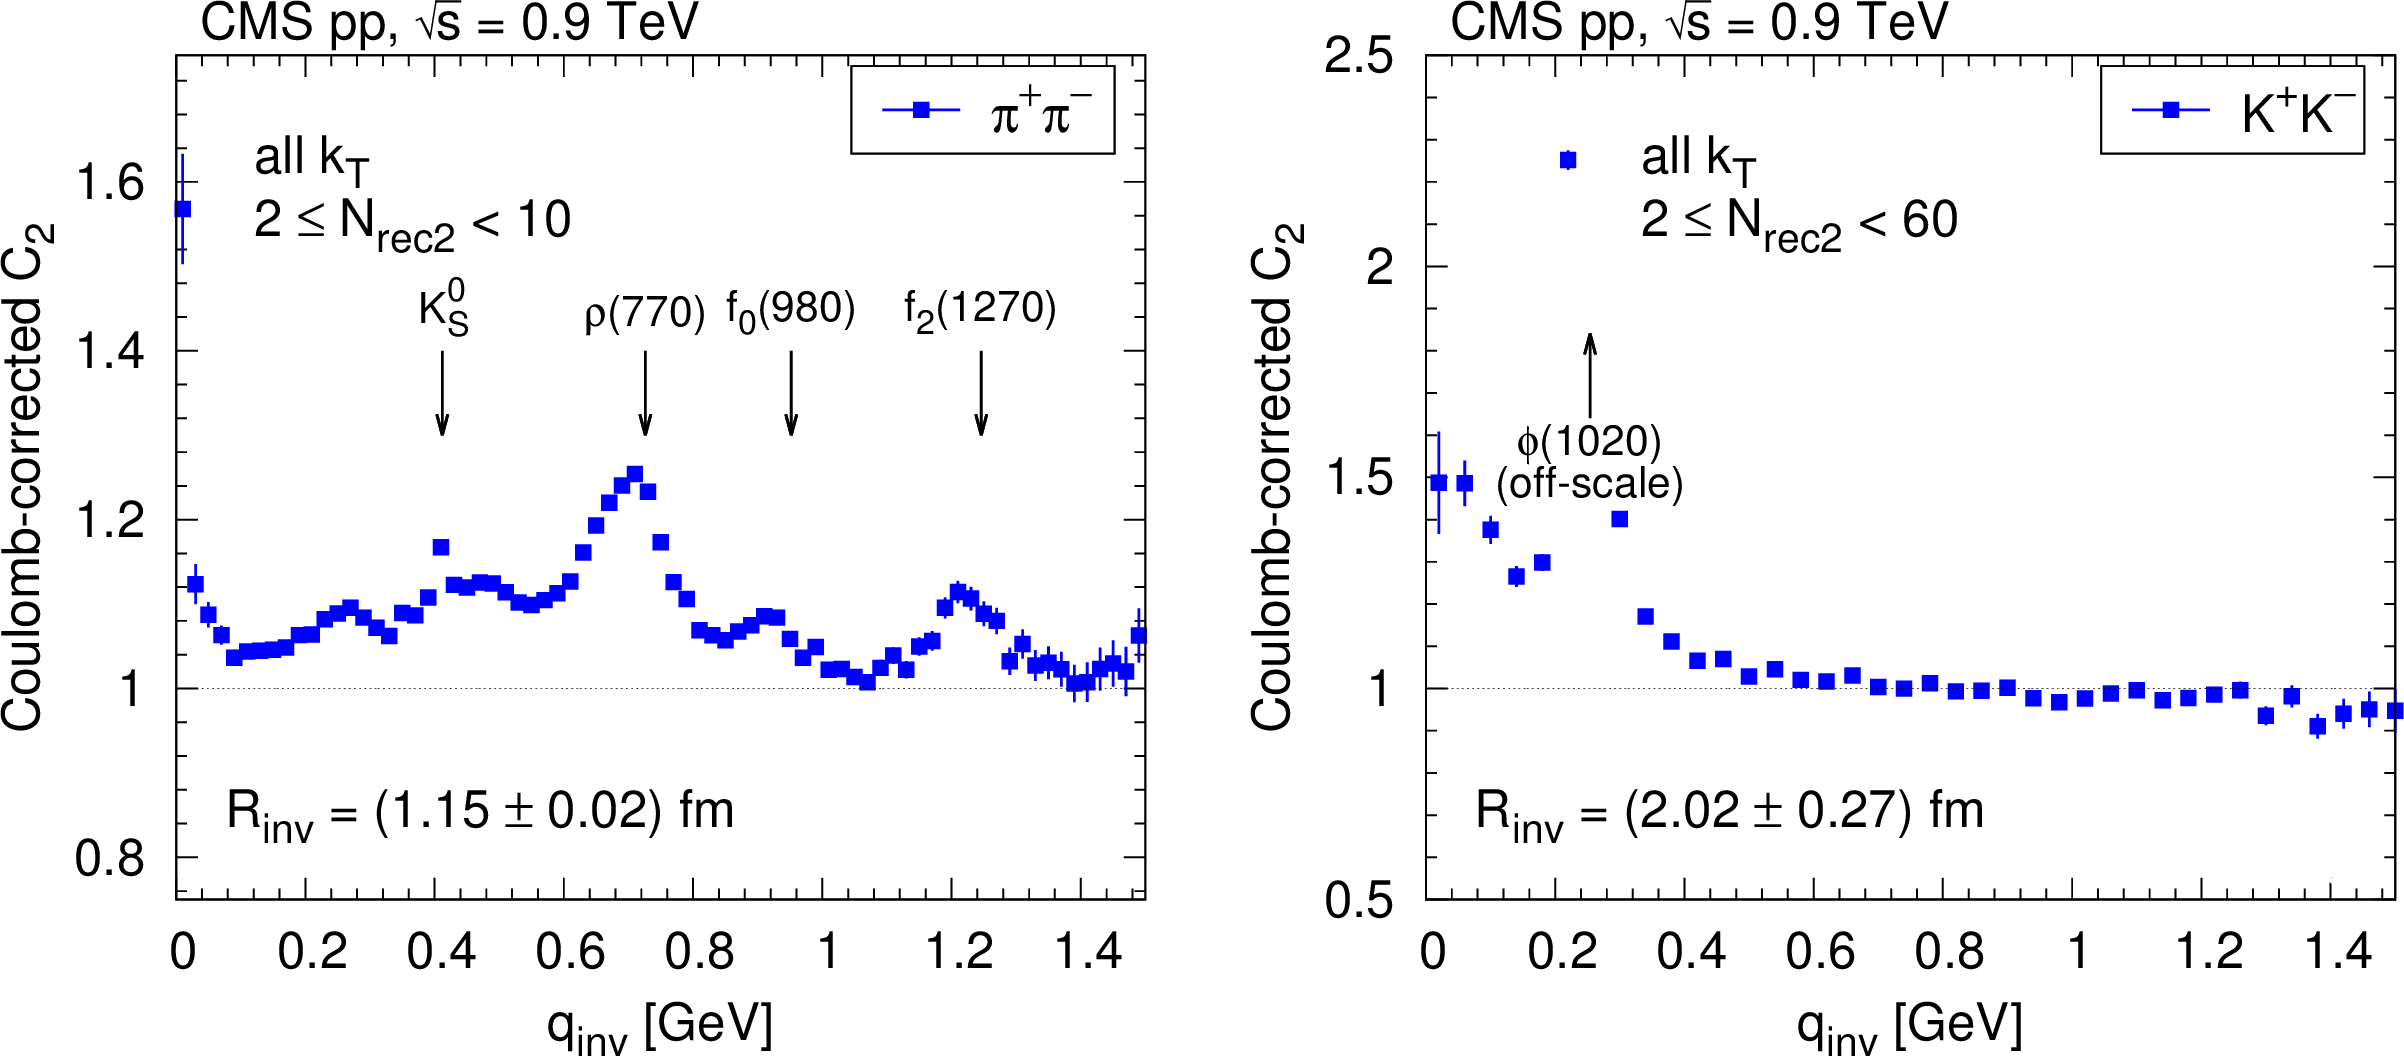
Figure 2:
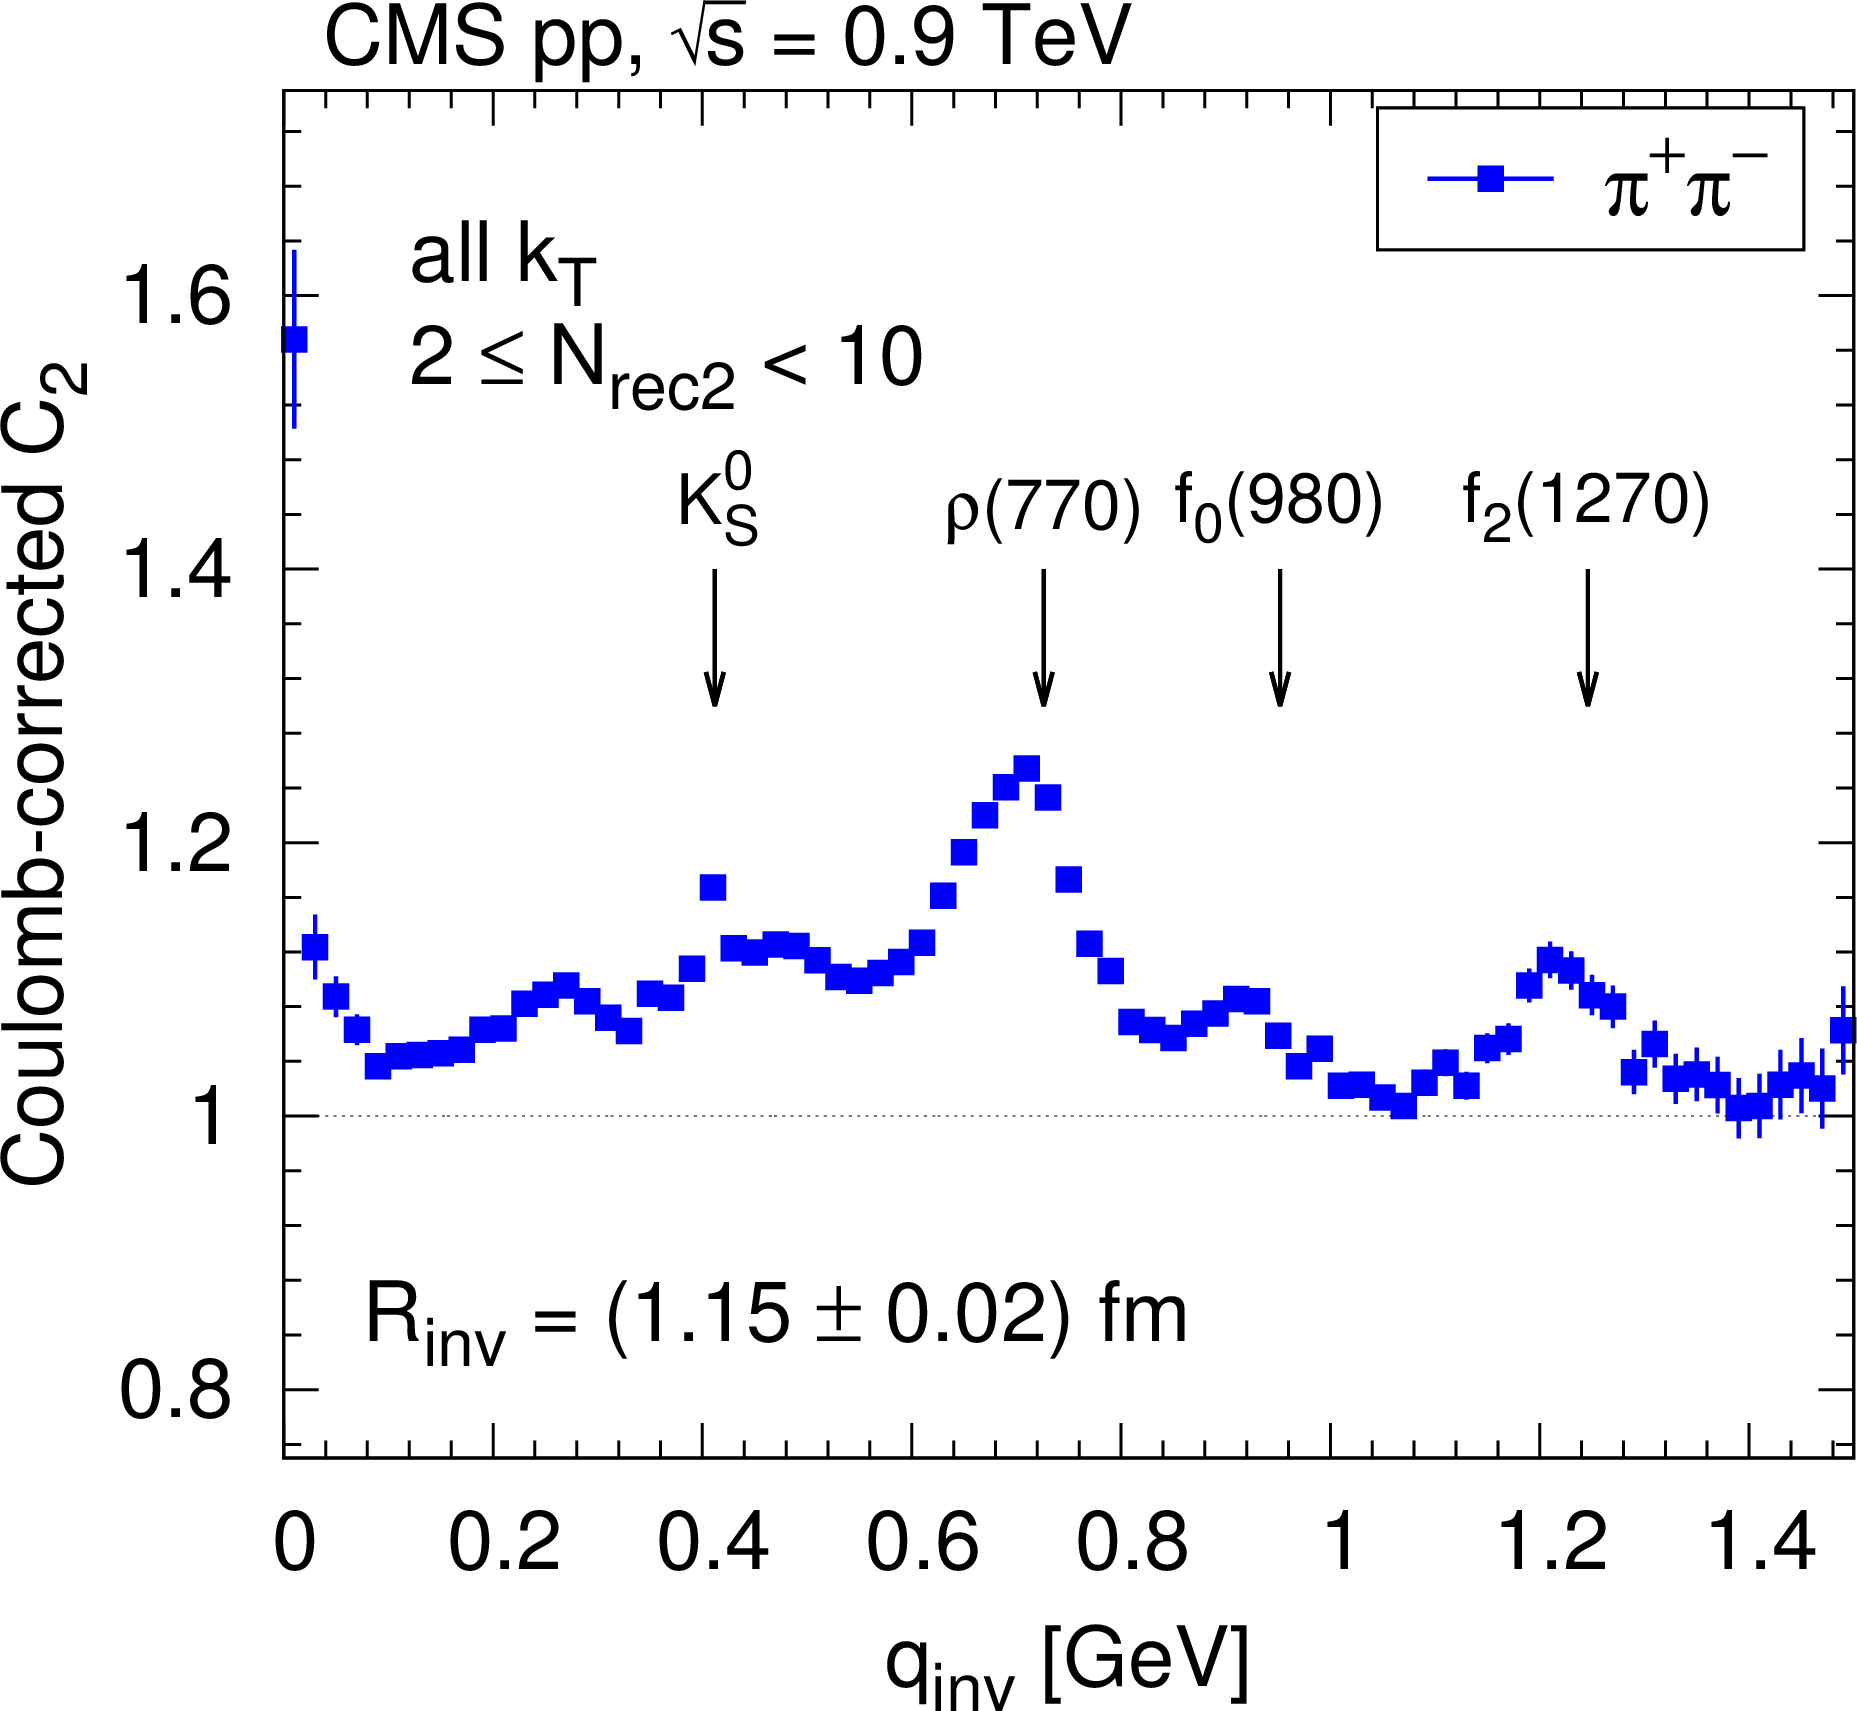
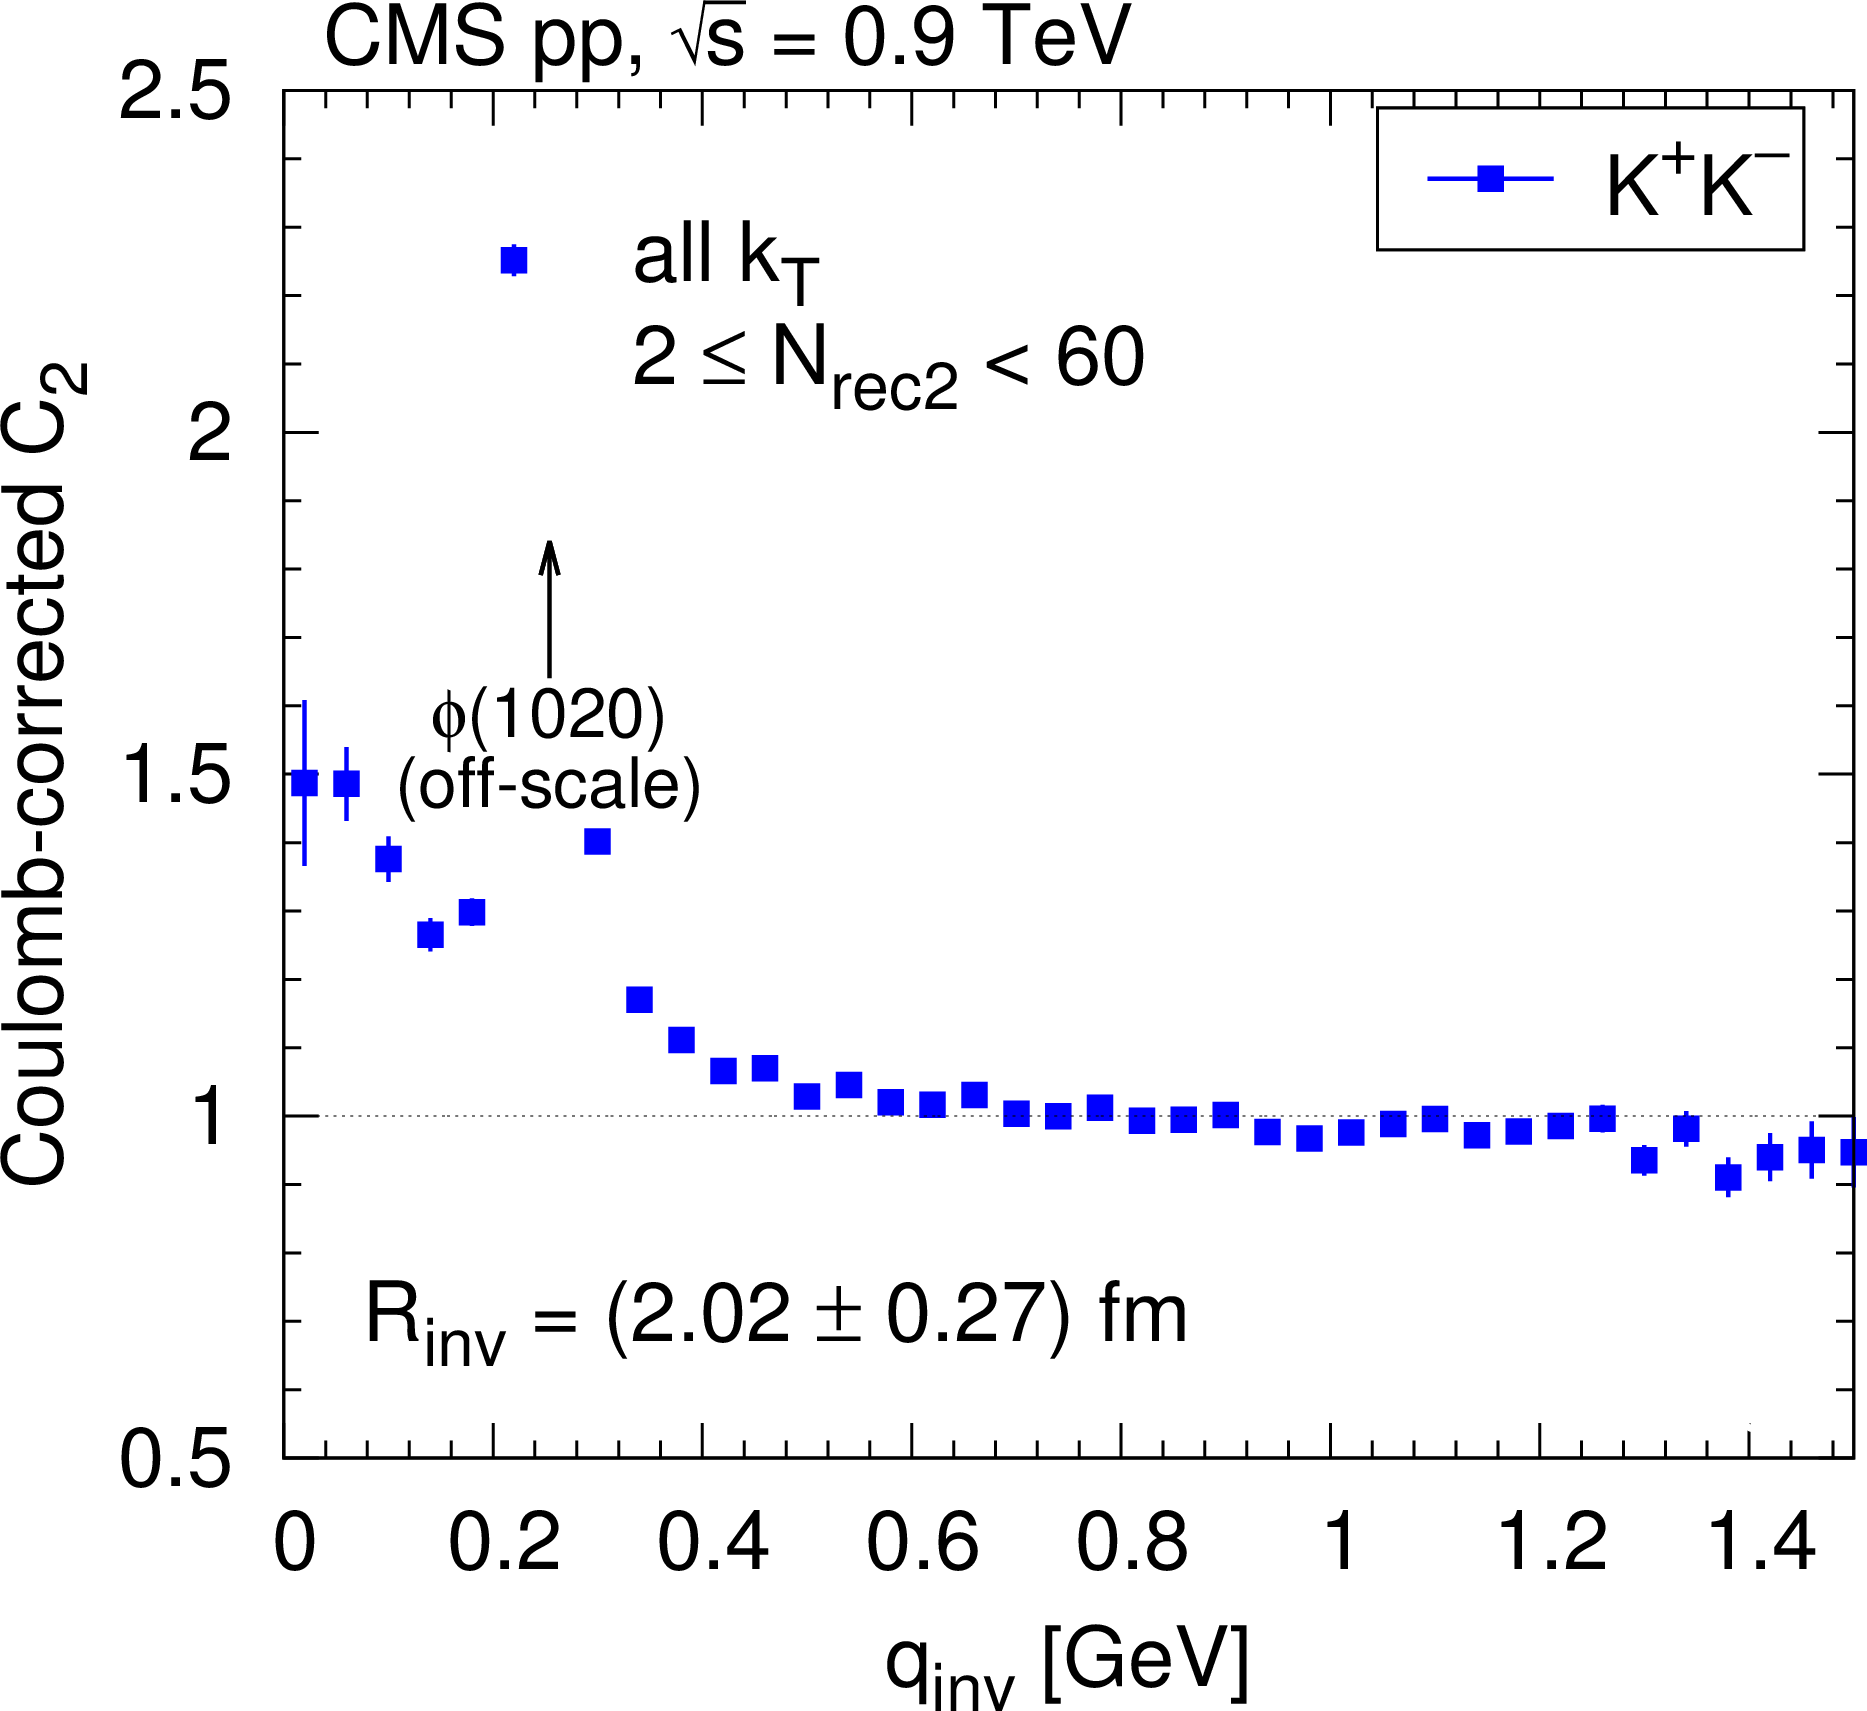
Contribution of resonance decays to the measured Coulomb-corrected correlation function of $ {\pi ^+} {\pi ^-} $ (for 2 $ \le {N_\text {rec2}} < $ 10, left, blue squares) and $ {\mathrm {K^+}} {\mathrm {K^-}} $ (for 2 $ \le {N_\text {rec2}} < $ 60, right, blue squares). The $ {\phi \mathrm {(1020)}}$ peak (right panel) is off-scale. |
png pdf |
Figure 2-a:
Contribution of resonance decays to the measured Coulomb-corrected correlation function of $ {\pi ^+} {\pi ^-} $ (for 2 $ \le {N_\text {rec2}} < $ 10, blue squares). |
png pdf |
Figure 2-b:
Contribution of resonance decays to the measured Coulomb-corrected correlation function of $ {\mathrm {K^+}} {\mathrm {K^-}} $ (for 2 $ \le {N_\text {rec2}} < $ 60, blue squares). The $ {\phi \mathrm {(1020)}}$ peak is off-scale. |
png pdf |
Figure 3:
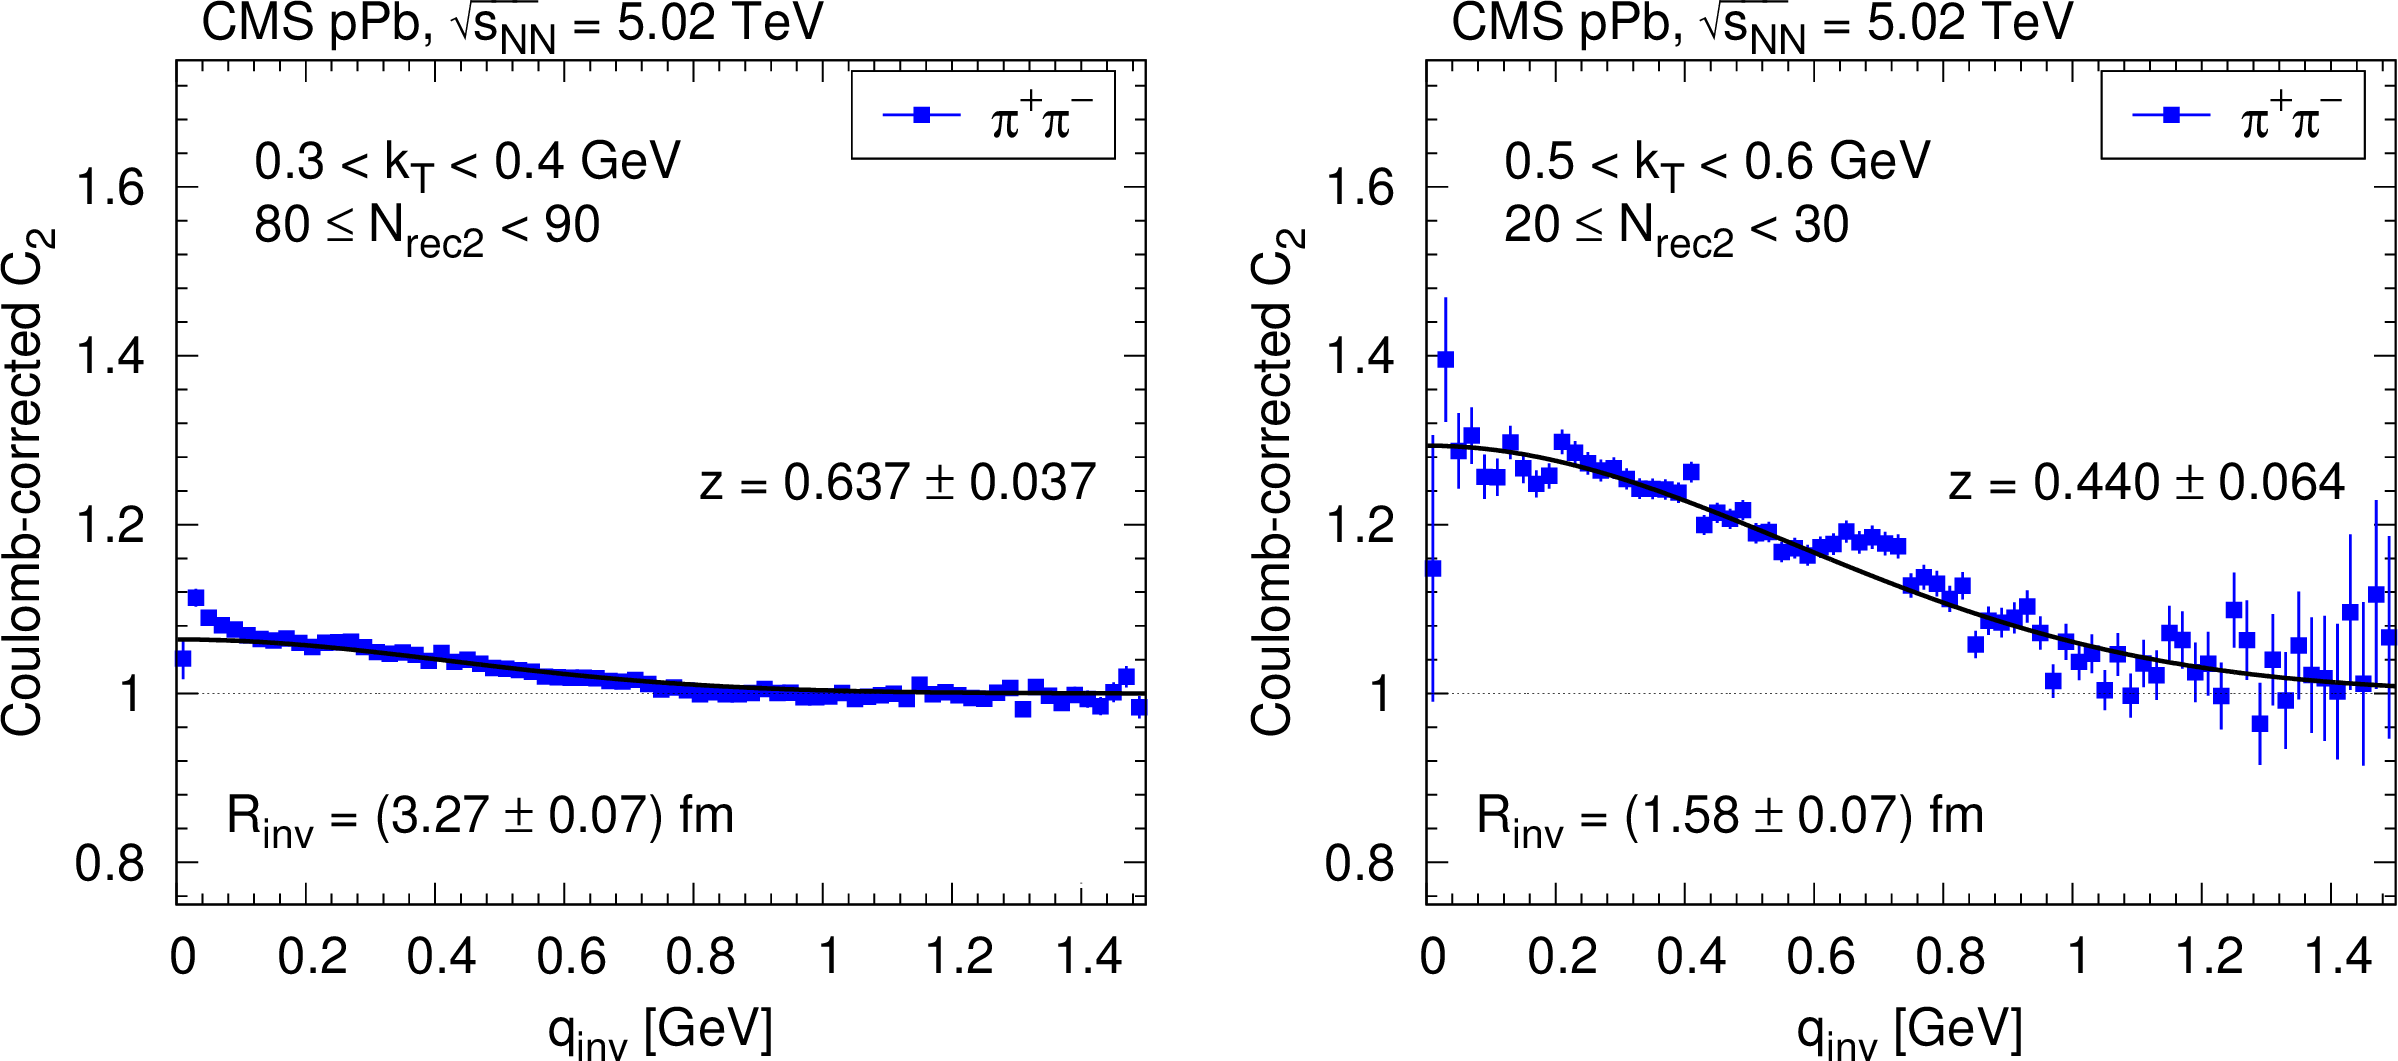
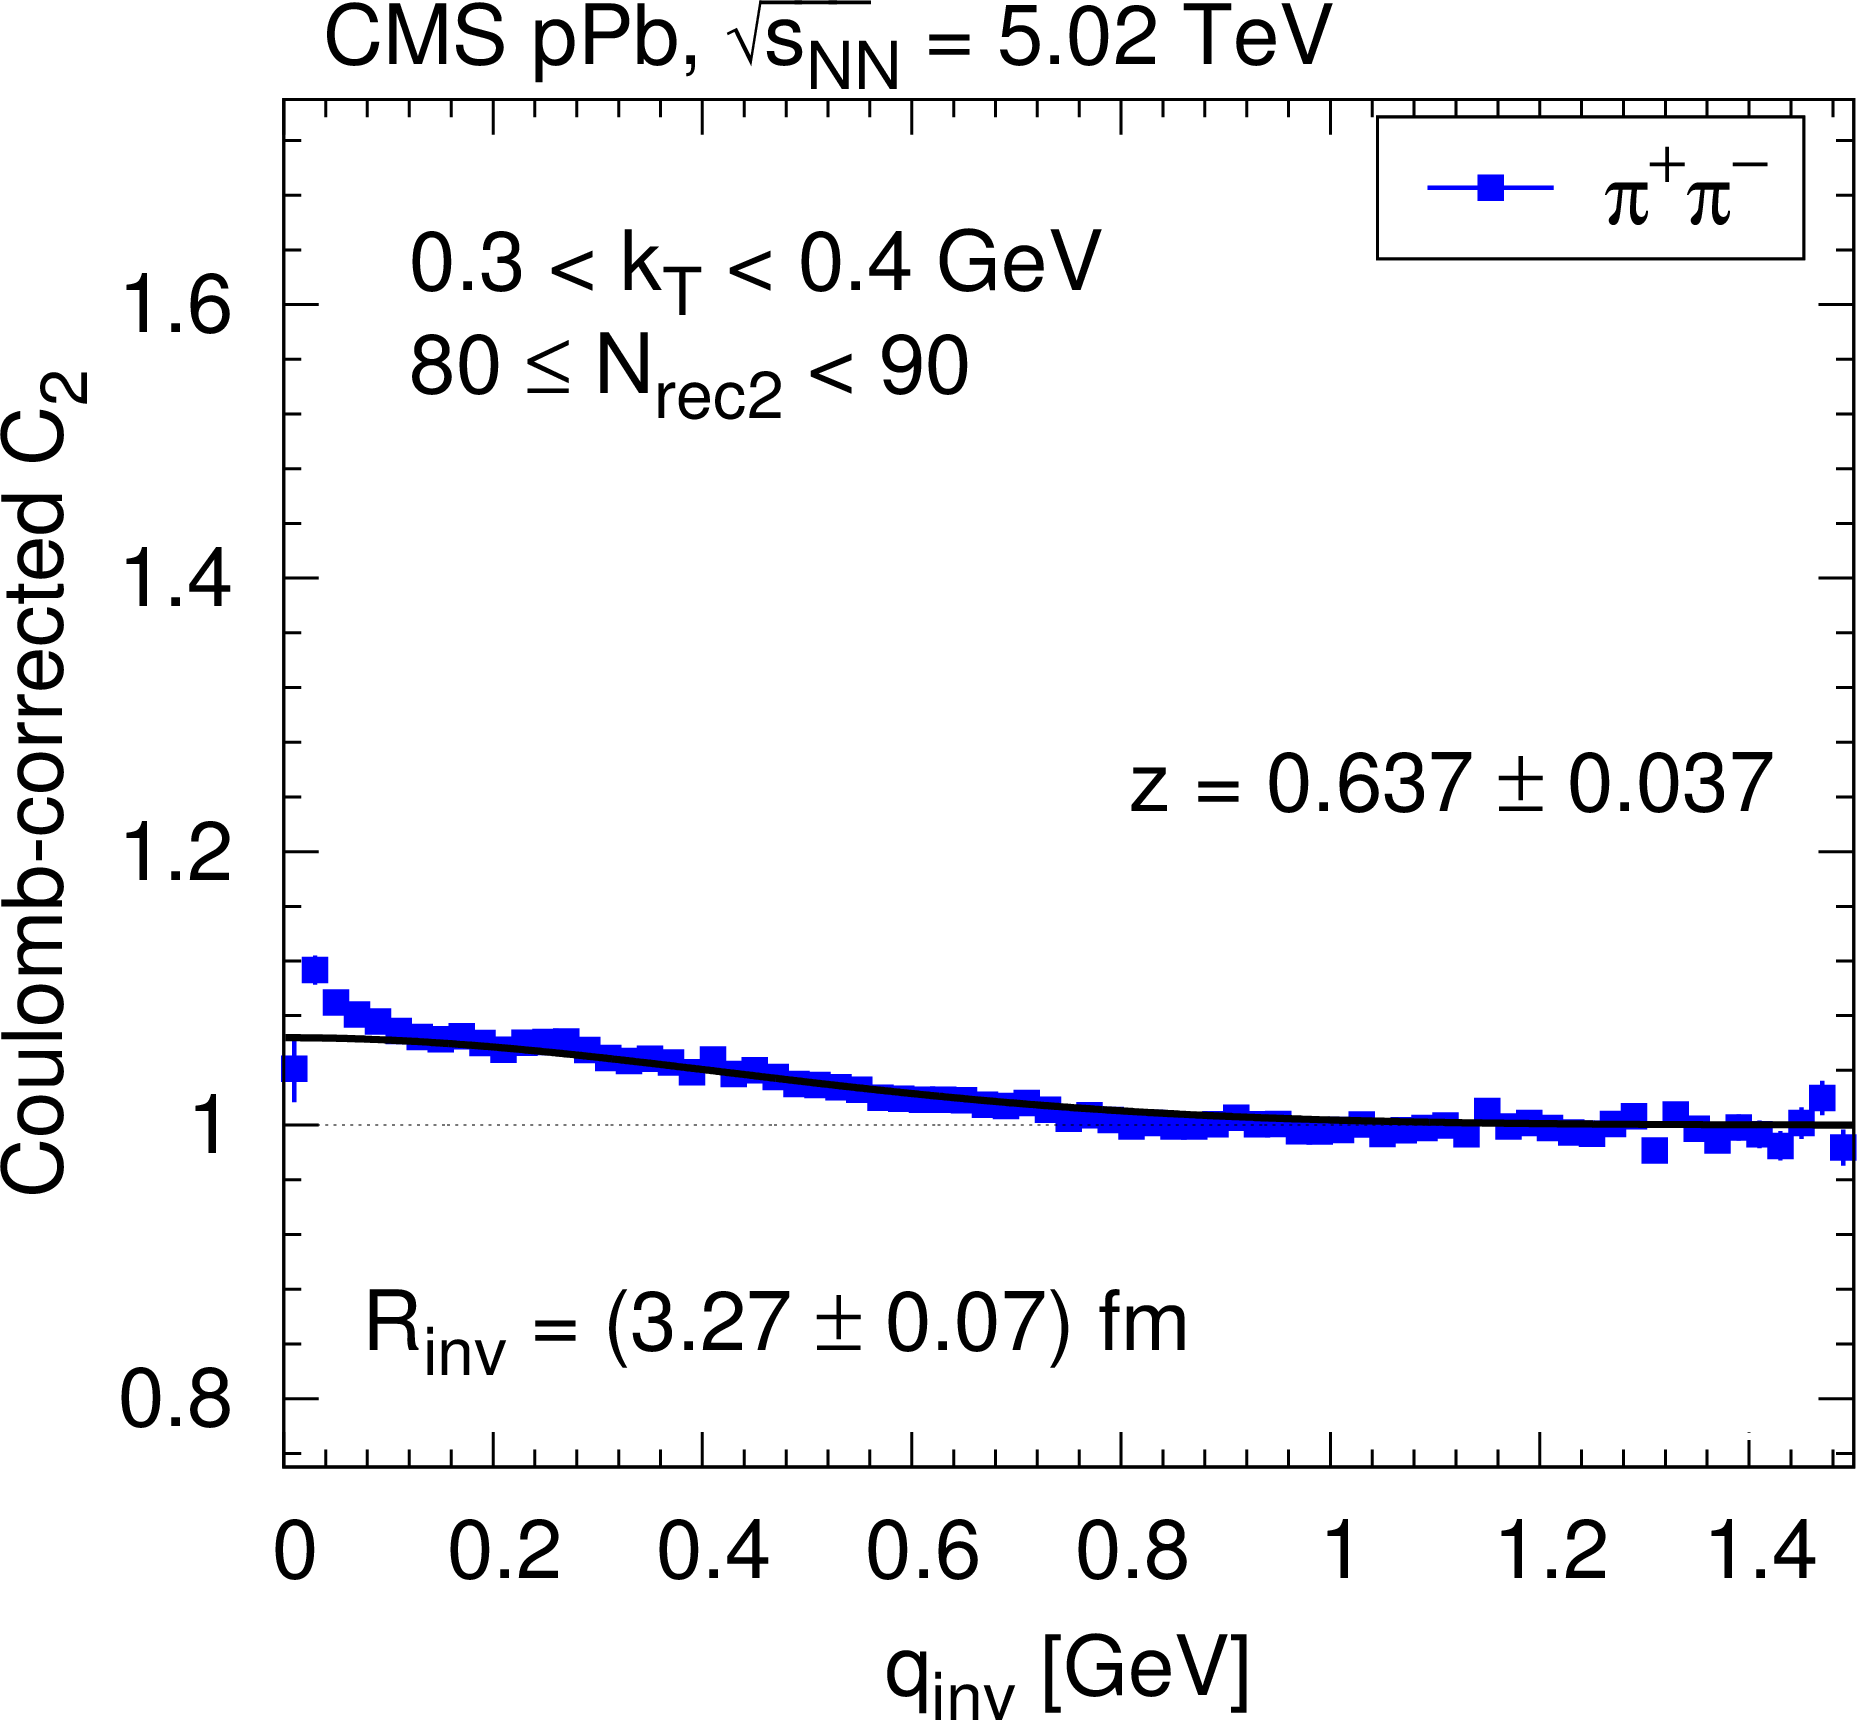
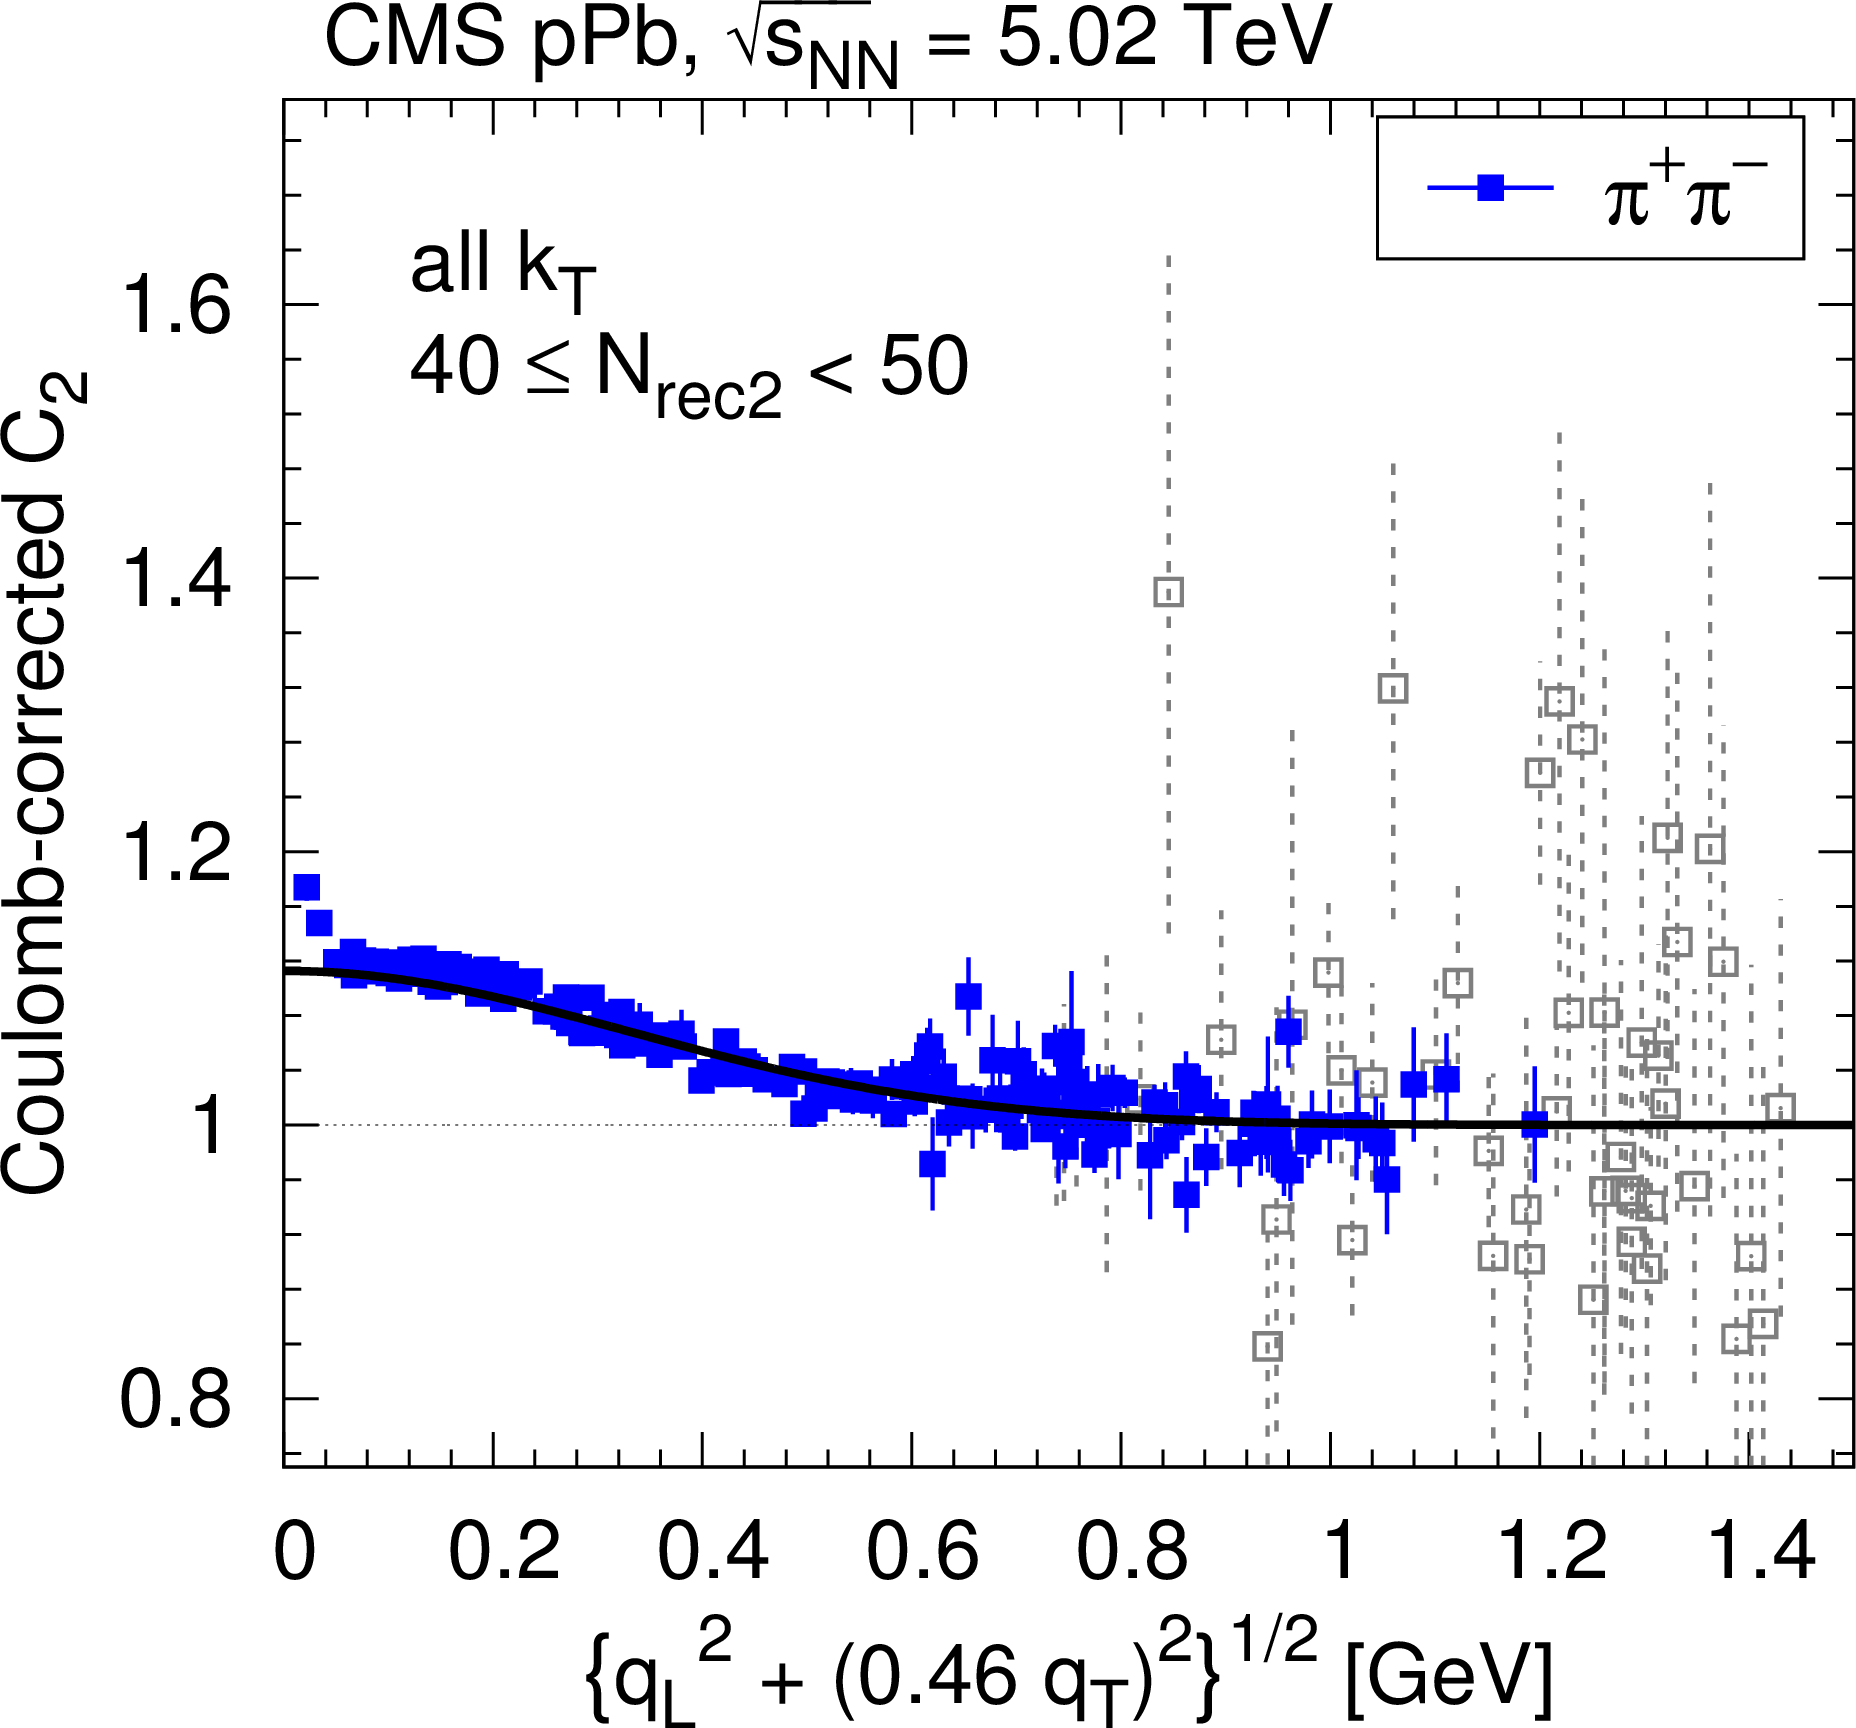
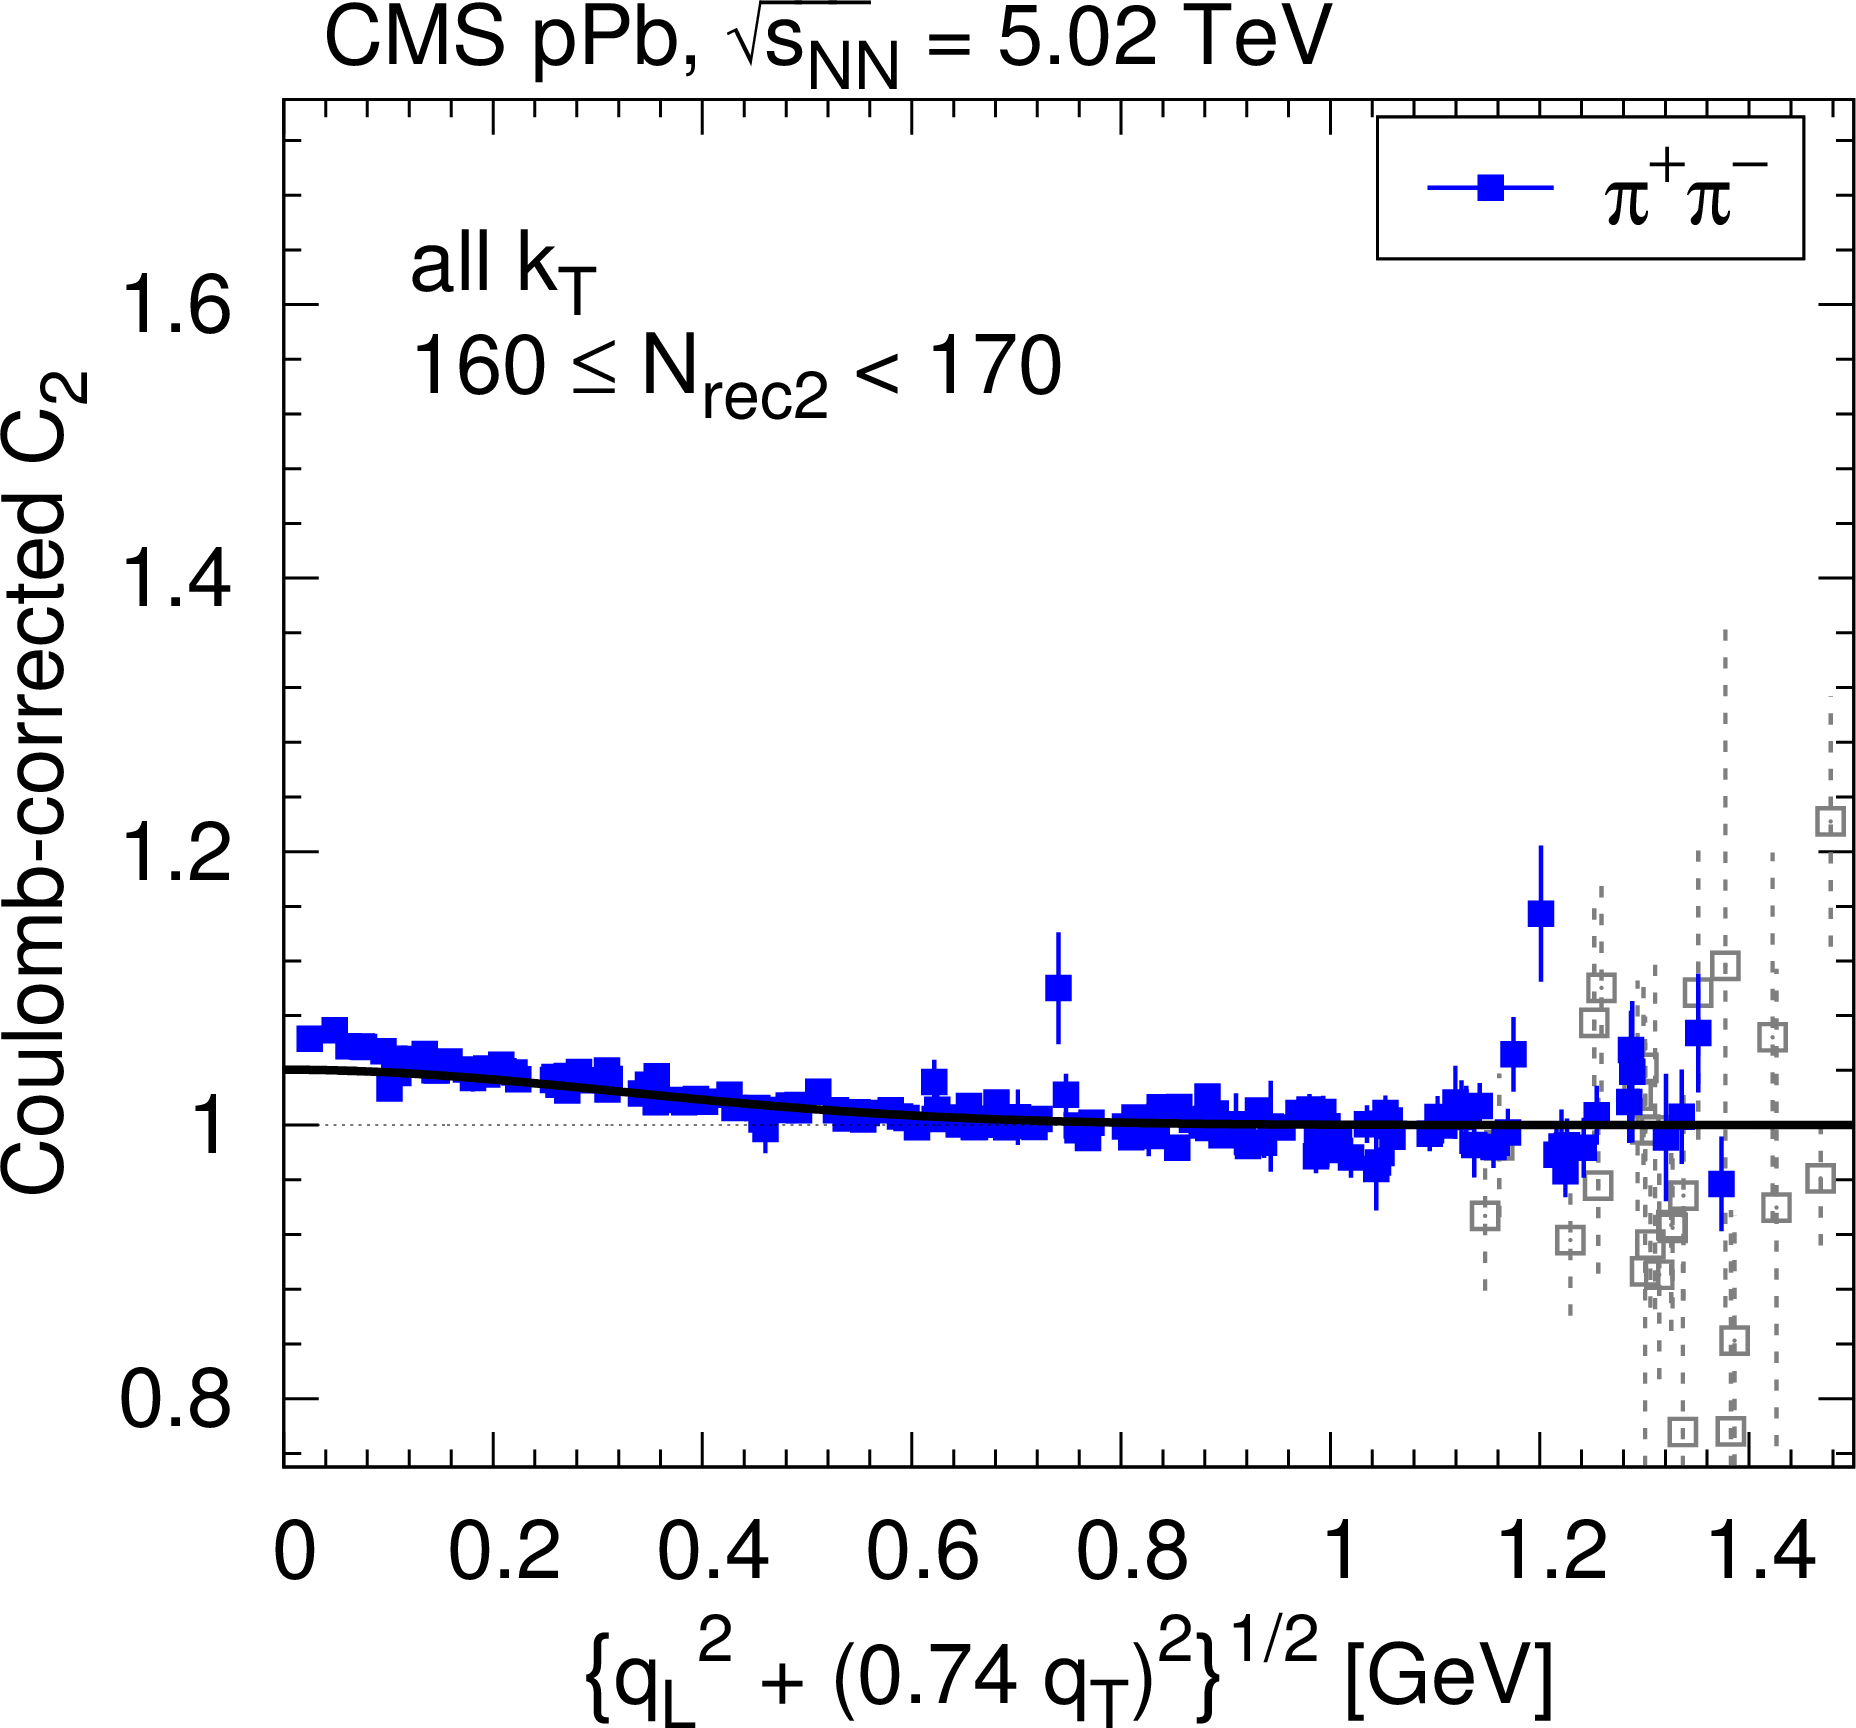
Contribution of clusters (mini-jets and multi-body decays of resonances) to the measured Coulomb-corrected correlation function of ${\pi ^+} {\pi ^-}$ for pPb interactions at $ {\sqrt {\smash [b]{s_{_\text {NN}}}}} = $ 5.02 TeV in two bins of event multiplicity and $ {k_{\mathrm {T}}} $. The solid curves show fits according to Eq. 6. |
png pdf |
Figure 3-a:
Contribution of clusters (mini-jets and multi-body decays of resonances) to the measured Coulomb-corrected correlation function of ${\pi ^+} {\pi ^-}$ for pPb interactions at $ {\sqrt {\smash [b]{s_{_\text {NN}}}}} = $ 5.02 TeV in a bin of event multiplicity and $ {k_{\mathrm {T}}} $. The solid curves show fits according to Eq. 6. |

png pdf |
Figure 3-b:
Contribution of clusters (mini-jets and multi-body decays of resonances) to the measured Coulomb-corrected correlation function of ${\pi ^+} {\pi ^-}$ for pPb interactions at $ {\sqrt {\smash [b]{s_{_\text {NN}}}}} = $ 5.02 TeV in a bin of event multiplicity and $ {k_{\mathrm {T}}} $. The solid curves show fits according to Eq. 6. |

png pdf |
Figure 4:
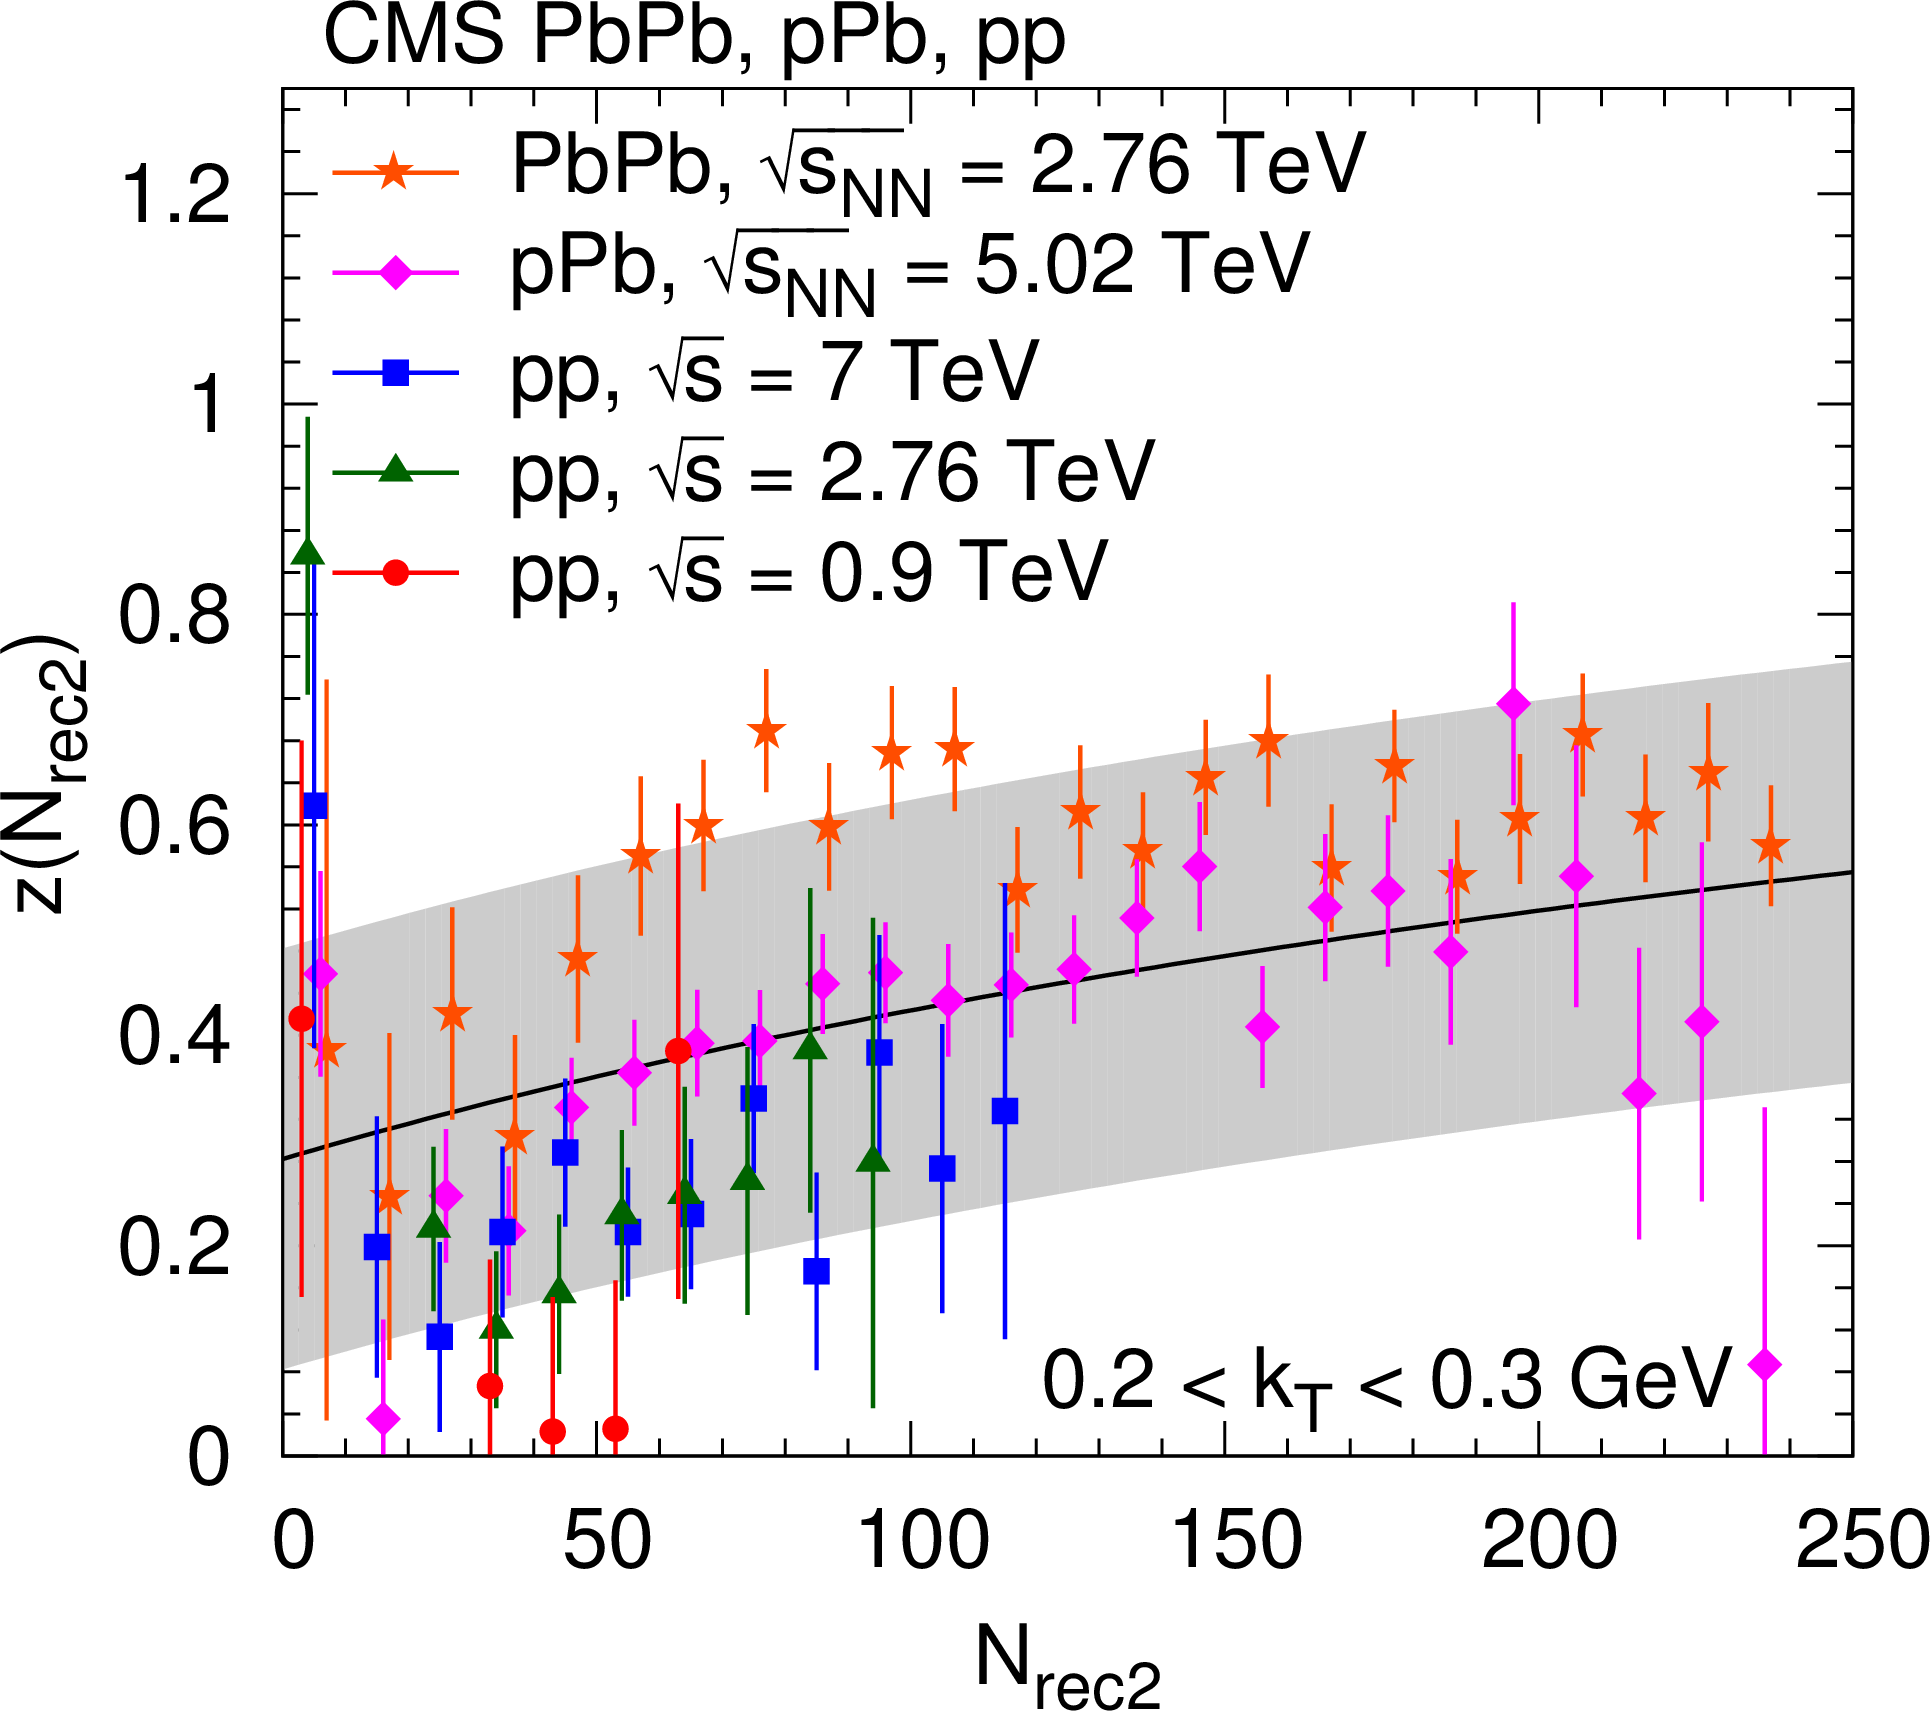
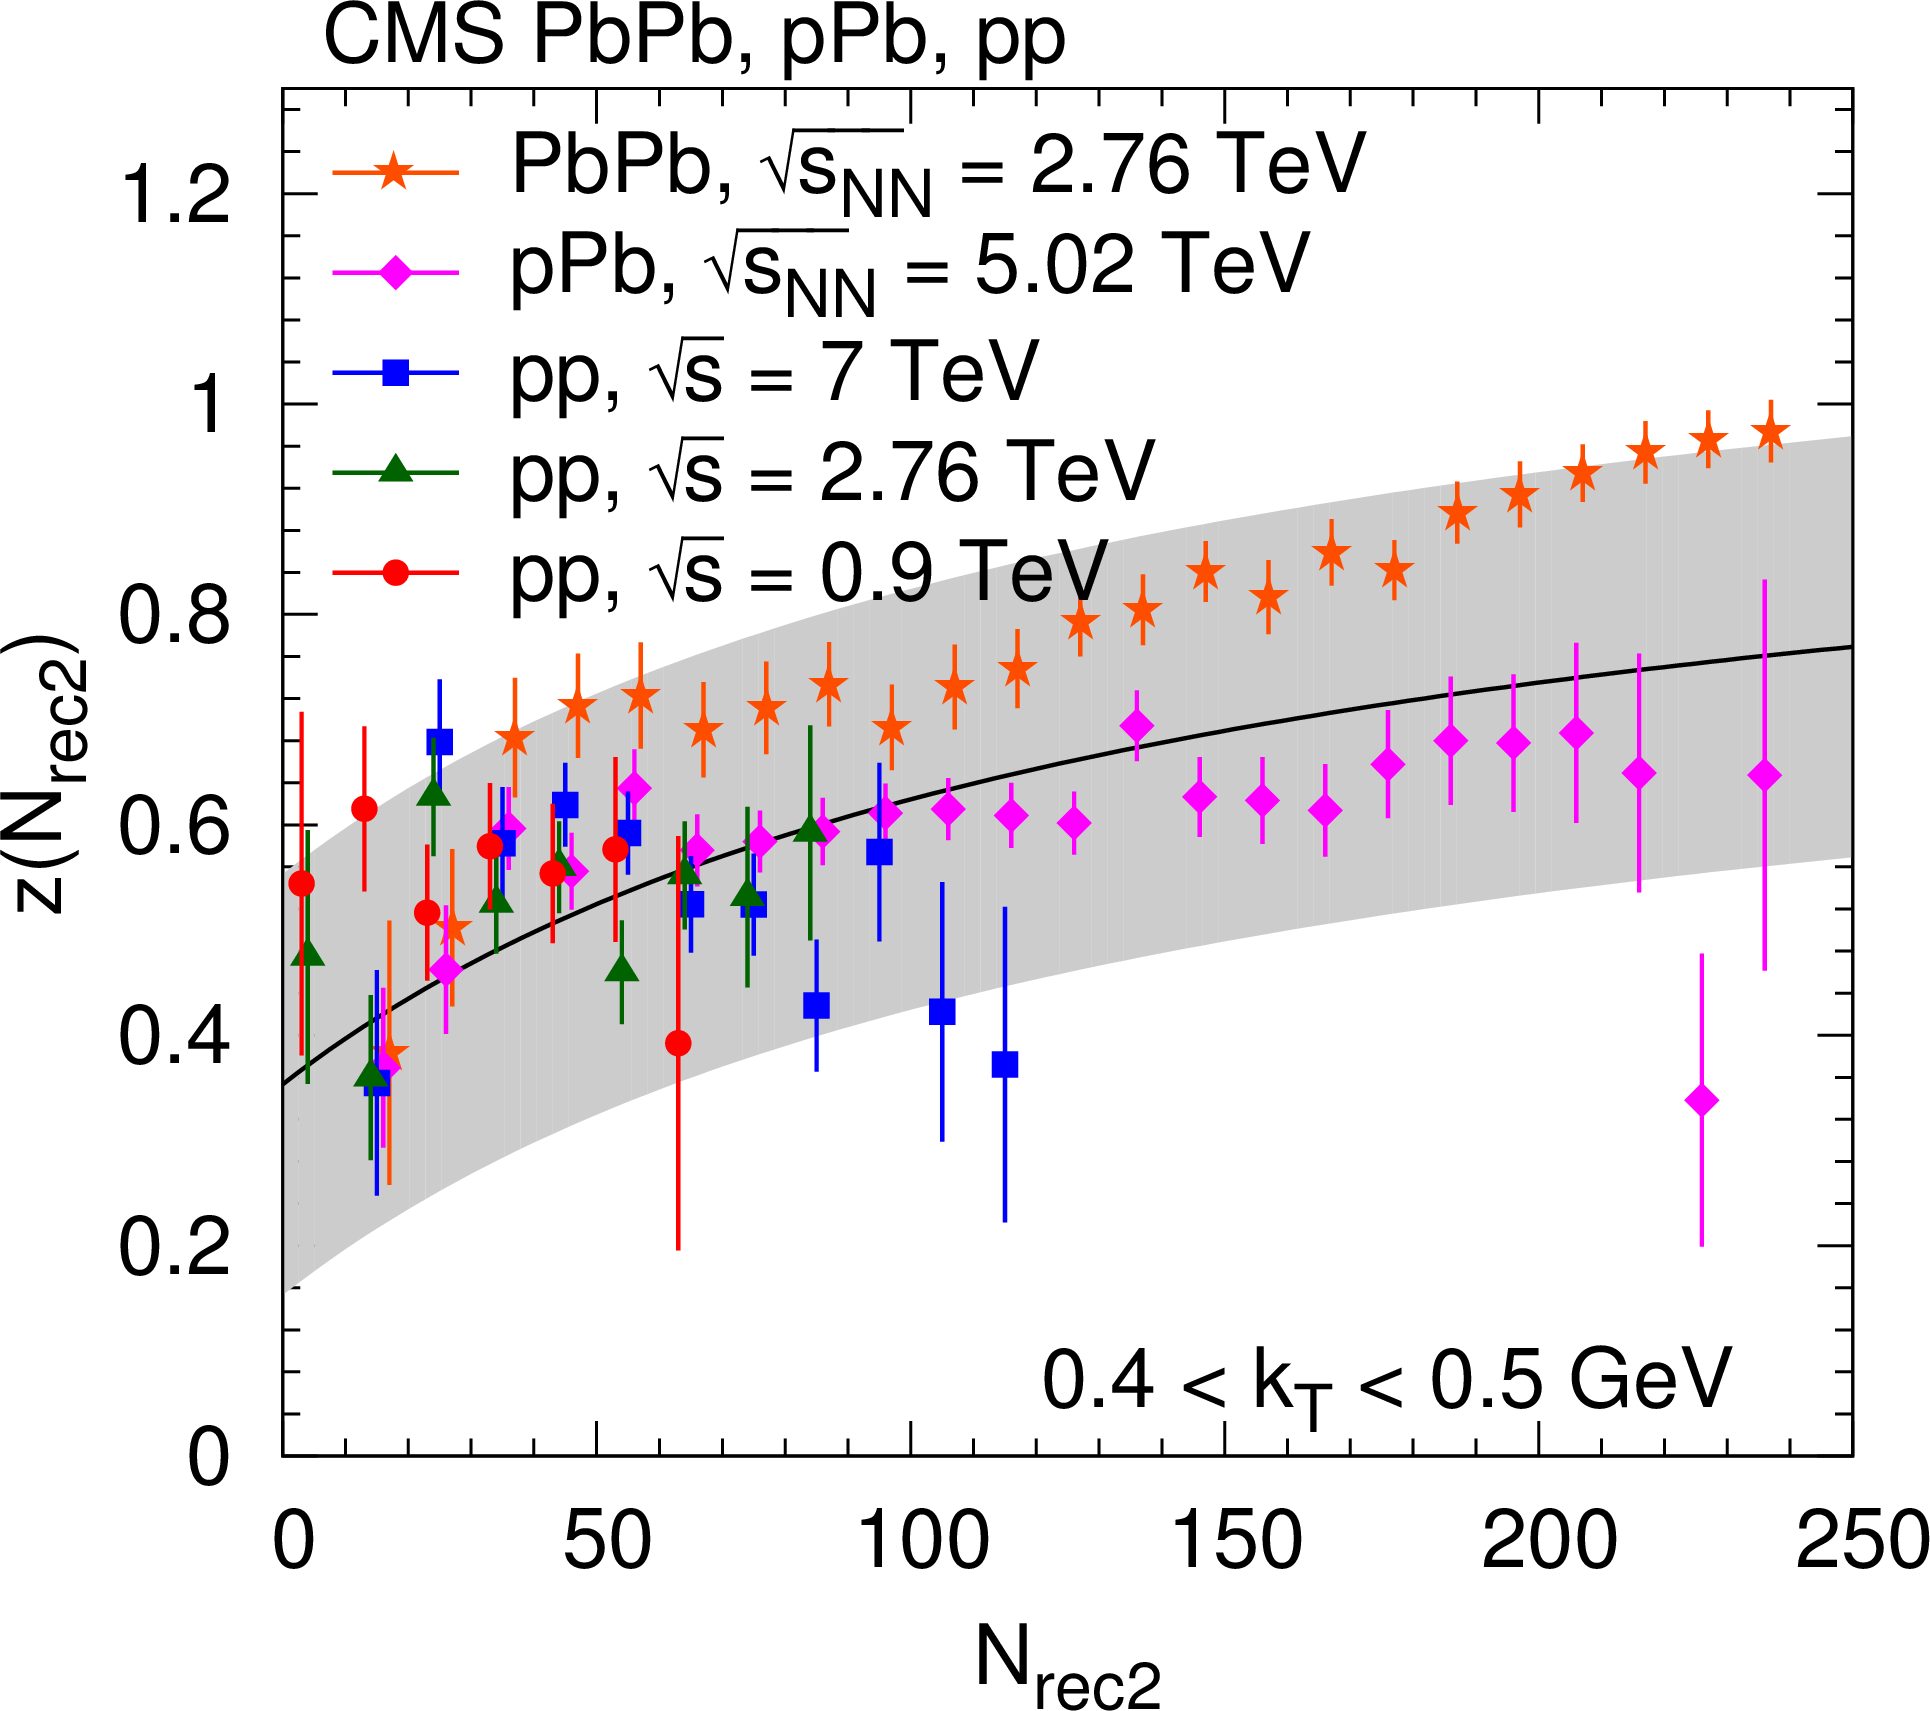
Dependence of the relative amplitude $z({N_\text {rec2}})$ of the cluster contribution (between SS and OS pairs), as a function of $ {N_\text {rec2}} $ for two $ {k_{\mathrm {T}}} $ bins. Fit results (points with error bars) from all collision types are plotted together with combinatorics-motivated fits (solid curves) and their estimated systematic uncertainties ($\pm $0.2 bands). |
png pdf |
Figure 4-a:
Dependence of the relative amplitude $z({N_\text {rec2}})$ of the cluster contribution (between SS and OS pairs), as a function of $ {N_\text {rec2}} $ for a $ {k_{\mathrm {T}}} $ bin. Fit results (points with error bars) from all collision types are plotted together with combinatorics-motivated fits (solid curves) and their estimated systematic uncertainties ($\pm $0.2 bands). |
png pdf |
Figure 4-b:
Dependence of the relative amplitude $z({N_\text {rec2}})$ of the cluster contribution (between SS and OS pairs), as a function of $ {N_\text {rec2}} $ for a $ {k_{\mathrm {T}}} $ bin. Fit results (points with error bars) from all collision types are plotted together with combinatorics-motivated fits (solid curves) and their estimated systematic uncertainties ($\pm $0.2 bands). |

png pdf |
Figure 5:
Coulomb-corrected OS correlation function of pions (blue squares) as a function of a combination of $ {q_\text {L}} $ and $ {q_\text {T}} $, in two selected $ {N_\text {rec2}} $ bins for all $ {k_{\mathrm {T}}} $ values (left : 40 $ \le {N_\text {rec2}} < $ 50, right : 160 $ \le {N_\text {rec2}} < $ 170). For better visibility, only a randomly selected small fraction of the points is plotted. In addition, those with statistical uncertainty higher than 10% are plotted with light grey color. The solid curves indicate the prediction of the parametrized cluster contribution. |
png pdf |
Figure 5-a:
Coulomb-corrected OS correlation function of pions (blue squares) as a function of a combination of $ {q_\text {L}} $ and $ {q_\text {T}} $, in a selected $ {N_\text {rec2}} $ bin for all $ {k_{\mathrm {T}}} $ values (40 $ \le {N_\text {rec2}} < $ 50). For better visibility, only a randomly selected small fraction of the points is plotted. In addition, those with statistical uncertainty higher than 10% are plotted with light grey color. The solid curves indicate the prediction of the parametrized cluster contribution. |
png pdf |
Figure 5-b:
Coulomb-corrected OS correlation function of pions (blue squares) as a function of a combination of $ {q_\text {L}} $ and $ {q_\text {T}} $, in a selected $ {N_\text {rec2}} $ bin for all $ {k_{\mathrm {T}}} $ values (160 $ \le {N_\text {rec2}} < $ 170). For better visibility, only a randomly selected small fraction of the points is plotted. In addition, those with statistical uncertainty higher than 10% are plotted with light grey color. The solid curves indicate the prediction of the parametrized cluster contribution. |

png pdf |
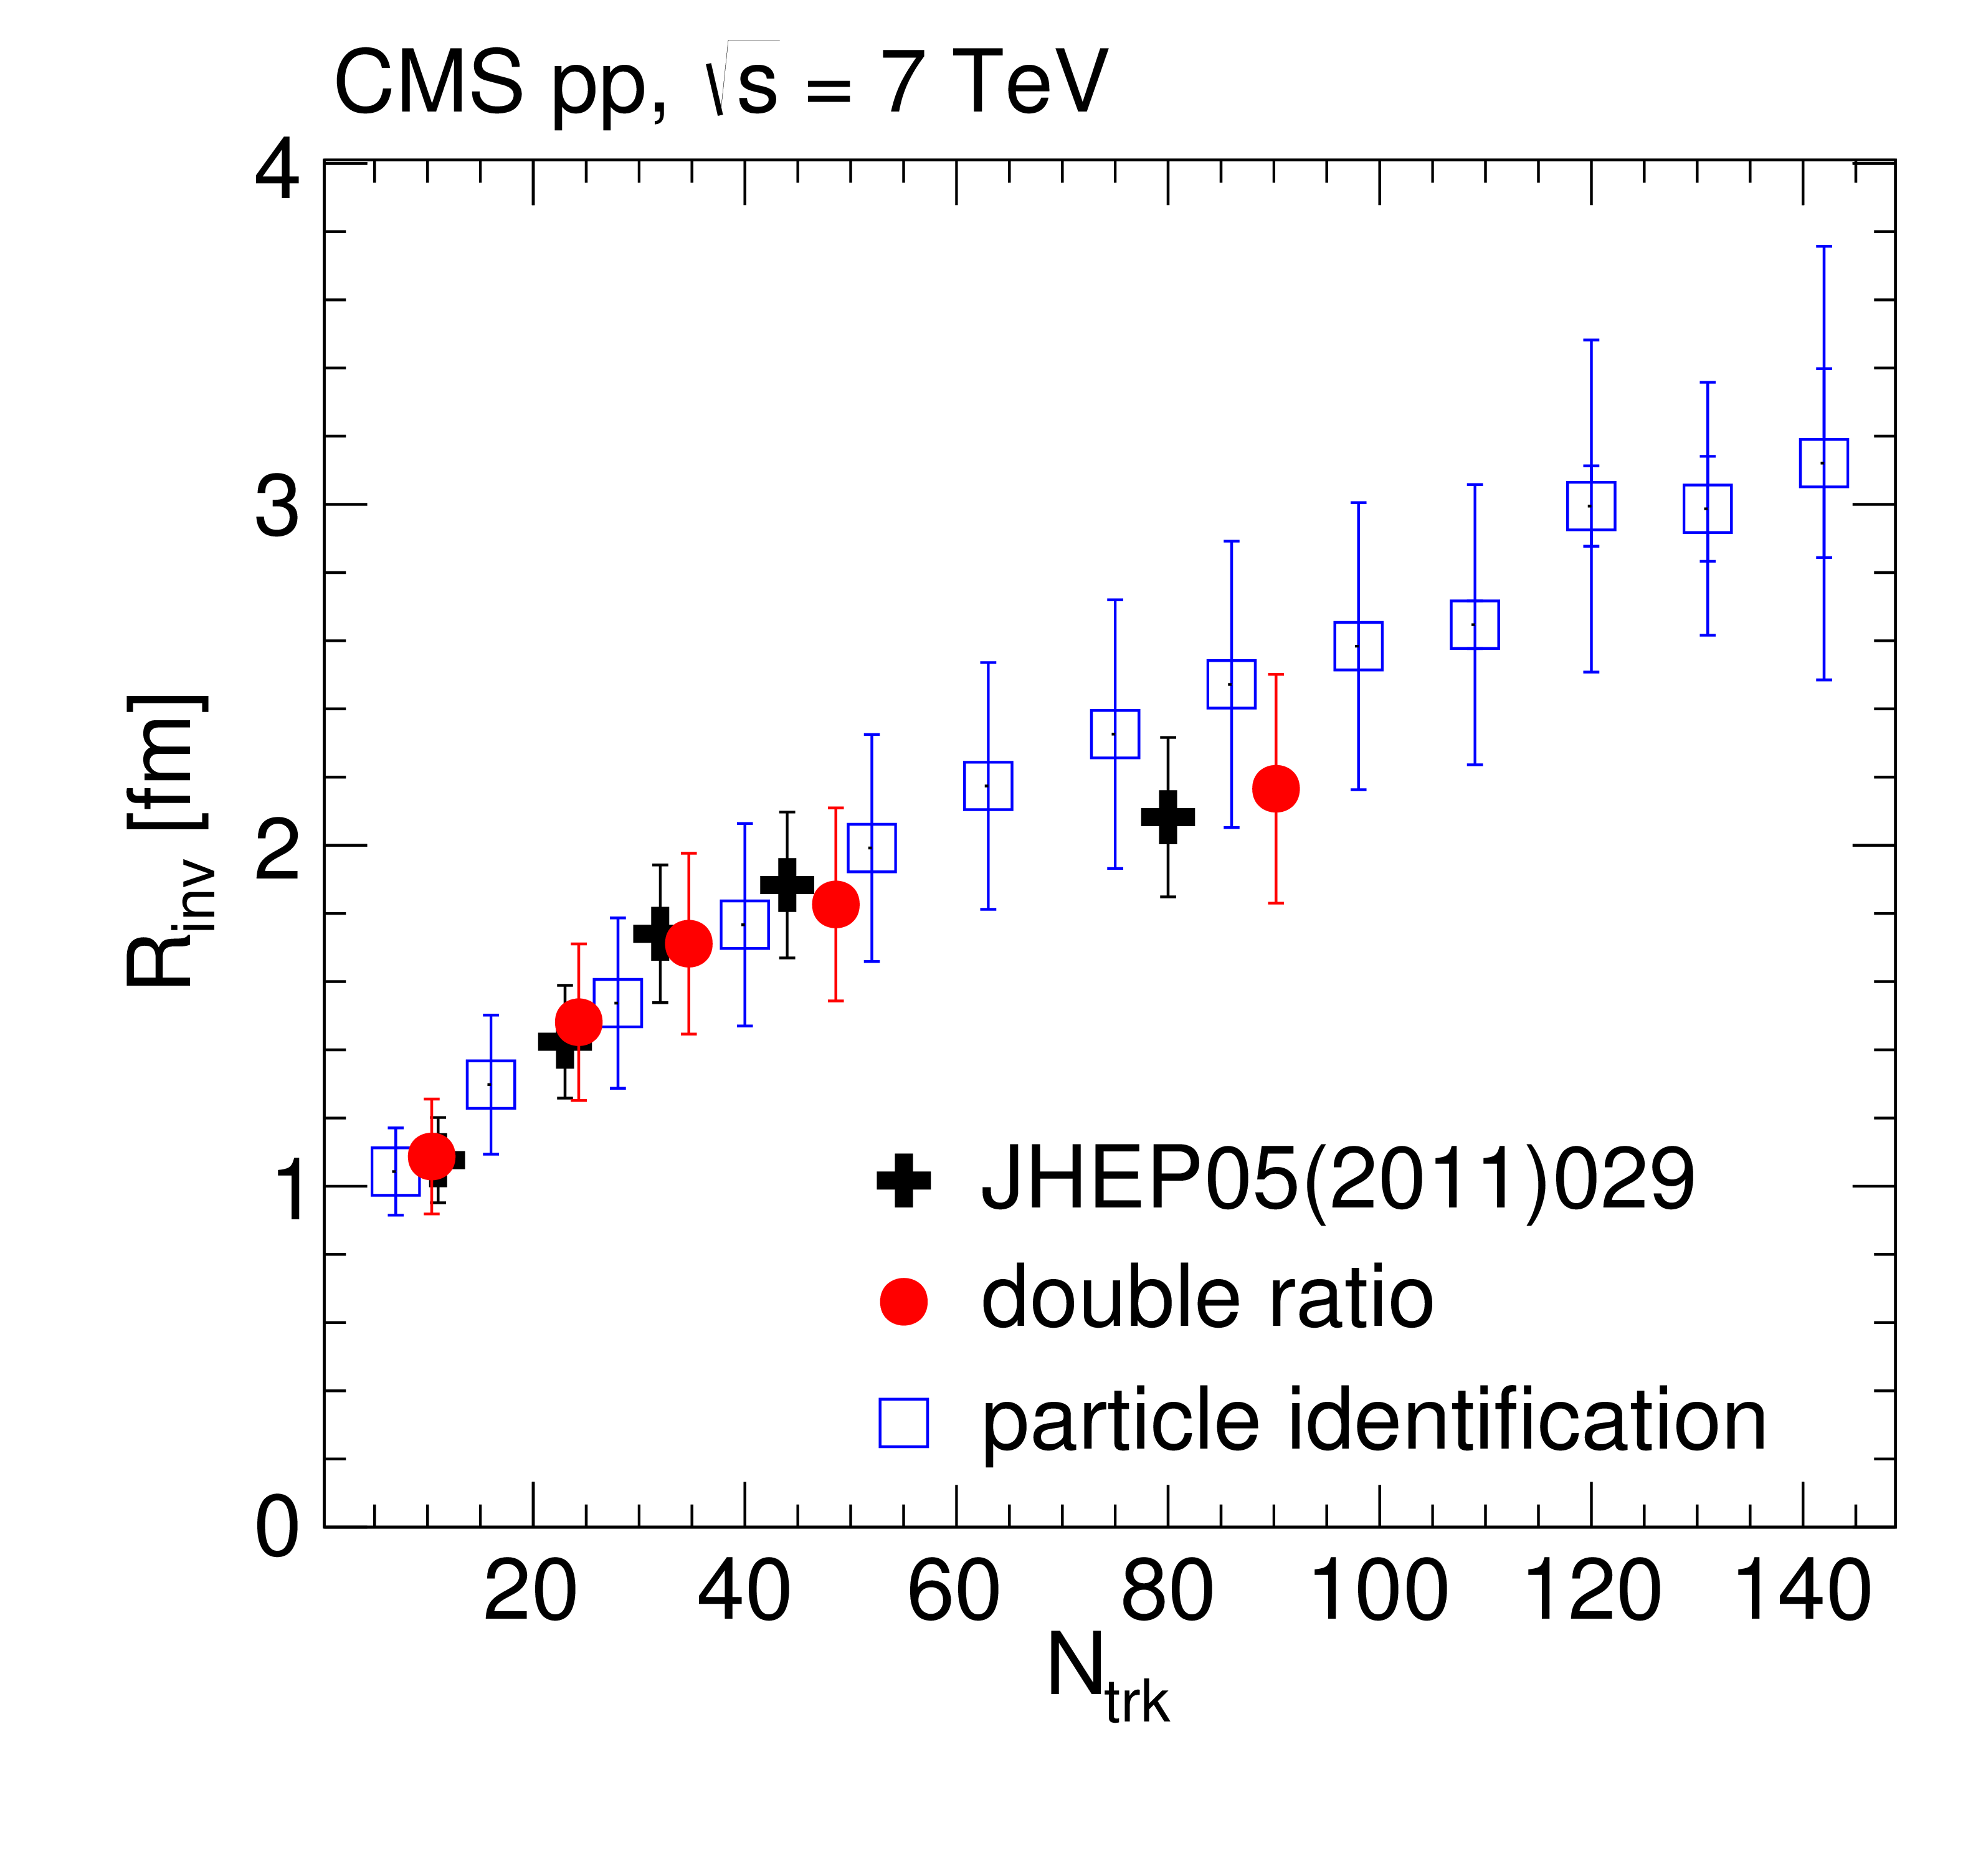
Figure 6:
Dependence on track multiplicity of the radius (left) and intercept parameter (right), from the exponential fits to the 1D correlation functions via Eq. I, obtained in the double ratio (filled markers) and the particle identification (for pions, empty squares) methods in pp collisions at 7 TeV, together with the results from Ref. [6]. The inner (outer) error bars correspond to statistical (systematic) uncertainties. |
png pdf |
Figure 6-a:
Dependence on track multiplicity of the radius, from the exponential fits to the 1D correlation functions via Eq. I, obtained in the double ratio (filled markers) and the particle identification (for pions, empty squares) methods in pp collisions at 7 TeV, together with the results from Ref. [6]. The inner (outer) error bars correspond to statistical (systematic) uncertainties. |

png pdf |
Figure 6-b:
Dependence on track multiplicity of the intercept parameter, from the exponential fits to the 1D correlation functions via Eq. I, obtained in the double ratio (filled markers) and the particle identification (for pions, empty squares) methods in pp collisions at 7 TeV, together with the results from Ref. [6]. The inner (outer) error bars correspond to statistical (systematic) uncertainties. |

png pdf |
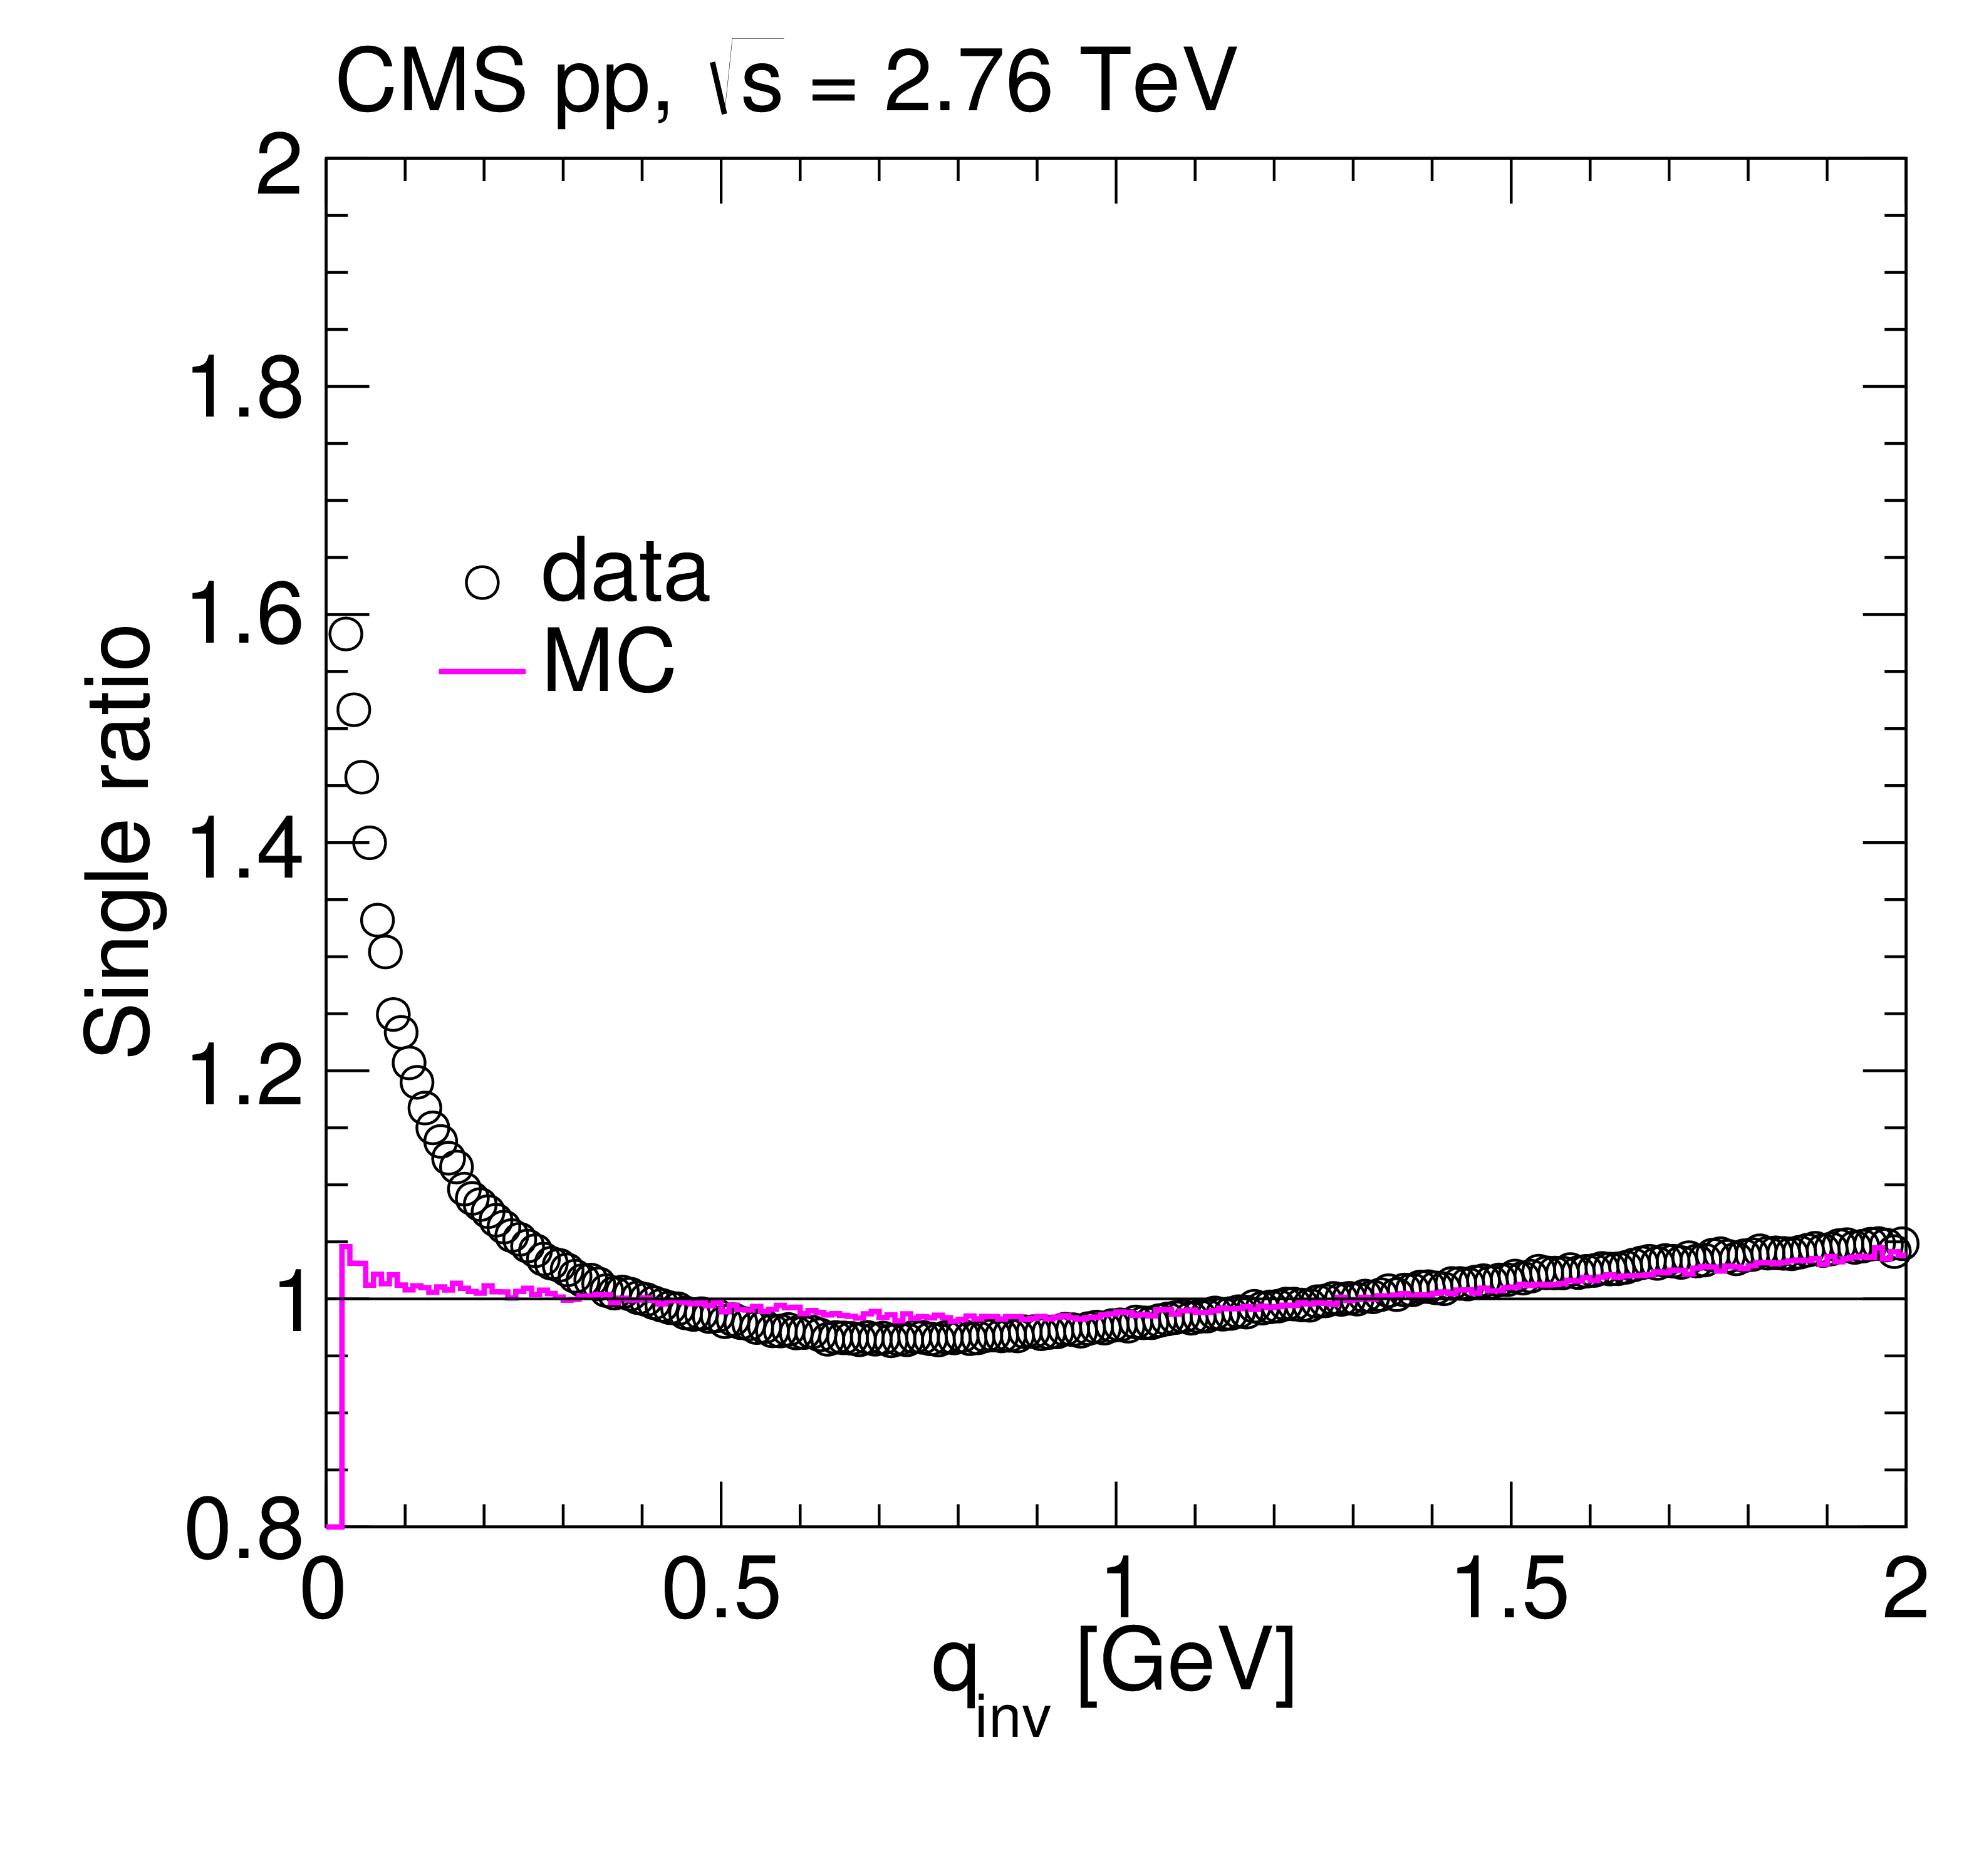
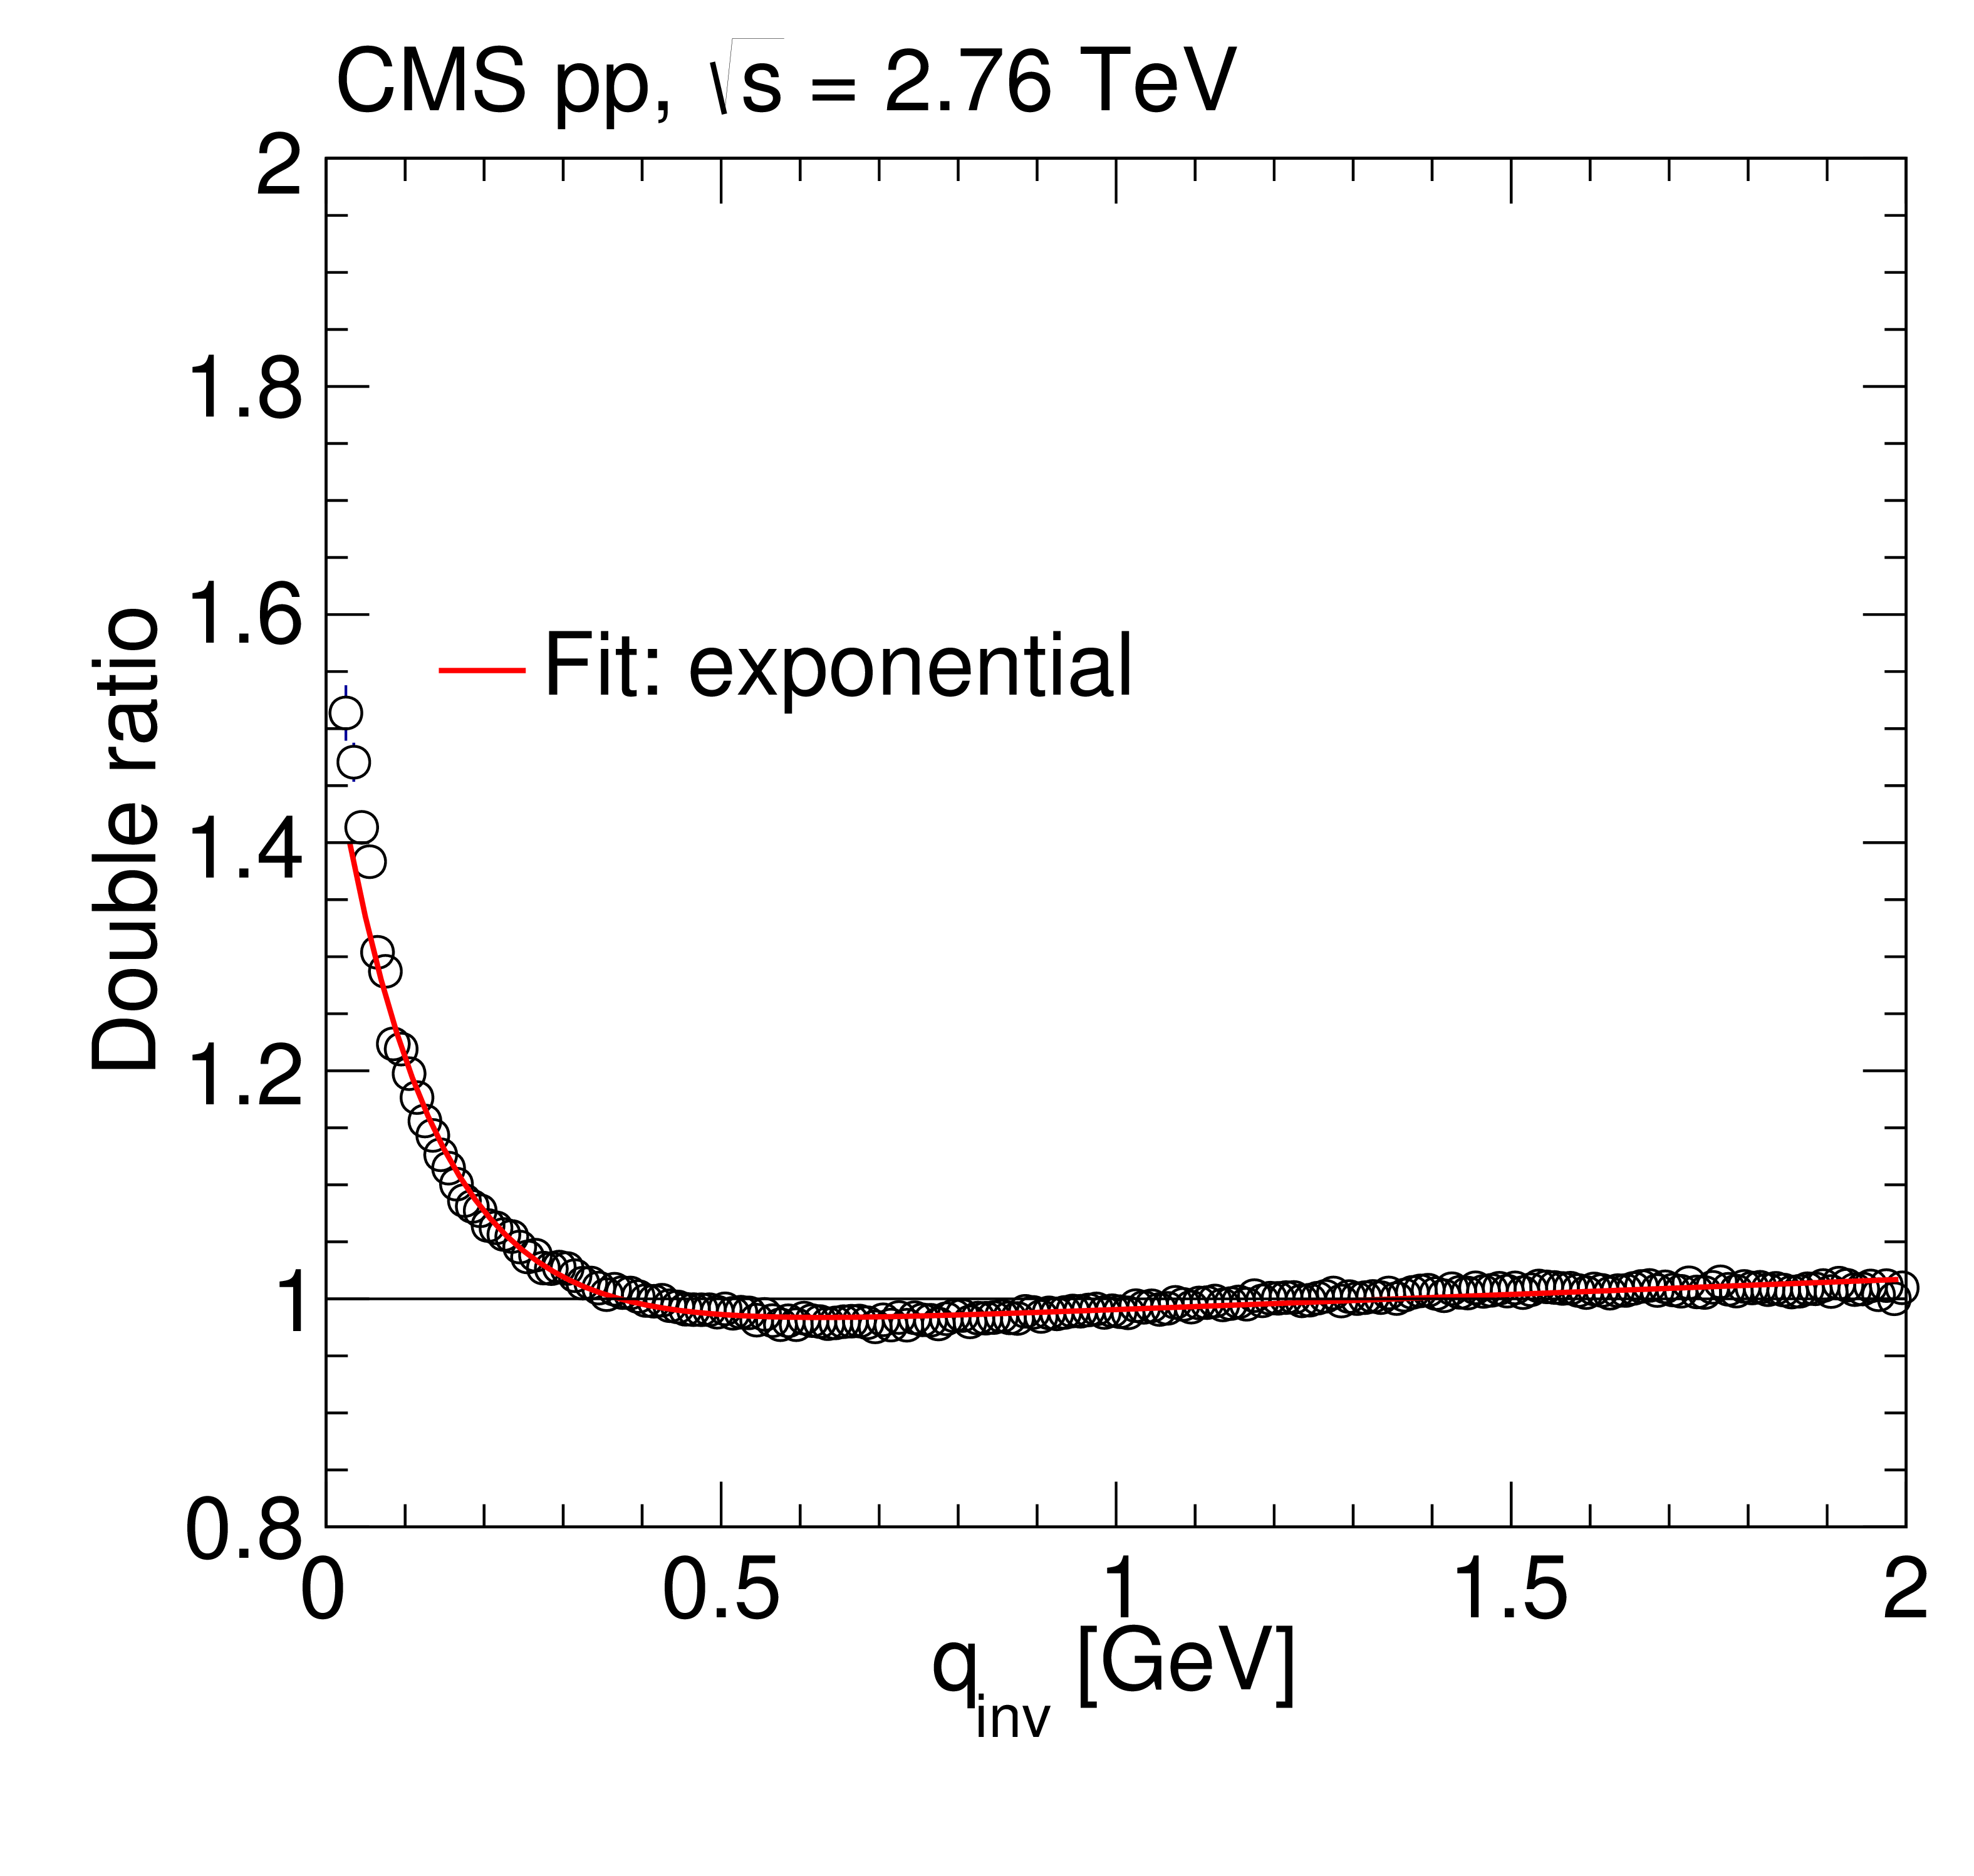
Figure 7:
Left : 1D single ratios as a function of $ {q_\text {inv}} $ for data and simulation (PYTHIA6 Z2 tune) in pp collisions at $\sqrt {s} = $ 2.76 TeV. Right : Corresponding 1D double ratio versus $ {q_\text {inv}} $ fitted to the superimposed exponential fit function. Only statistical uncertainties are included, commonly of the order or smaller than the marker size. |
png pdf |
Figure 7-a:
1D single ratios as a function of $ {q_\text {inv}} $ for data and simulation (PYTHIA6 Z2 tune) in pp collisions at $\sqrt {s} = $ 2.76 TeV. Only statistical uncertainties are included, commonly of the order or smaller than the marker size. |
png pdf |
Figure 7-b:
Corresponding 1D double ratio versus $ {q_\text {inv}} $ fitted to the superimposed exponential fit function. Only statistical uncertainties are included, commonly of the order or smaller than the marker size. |
png pdf |
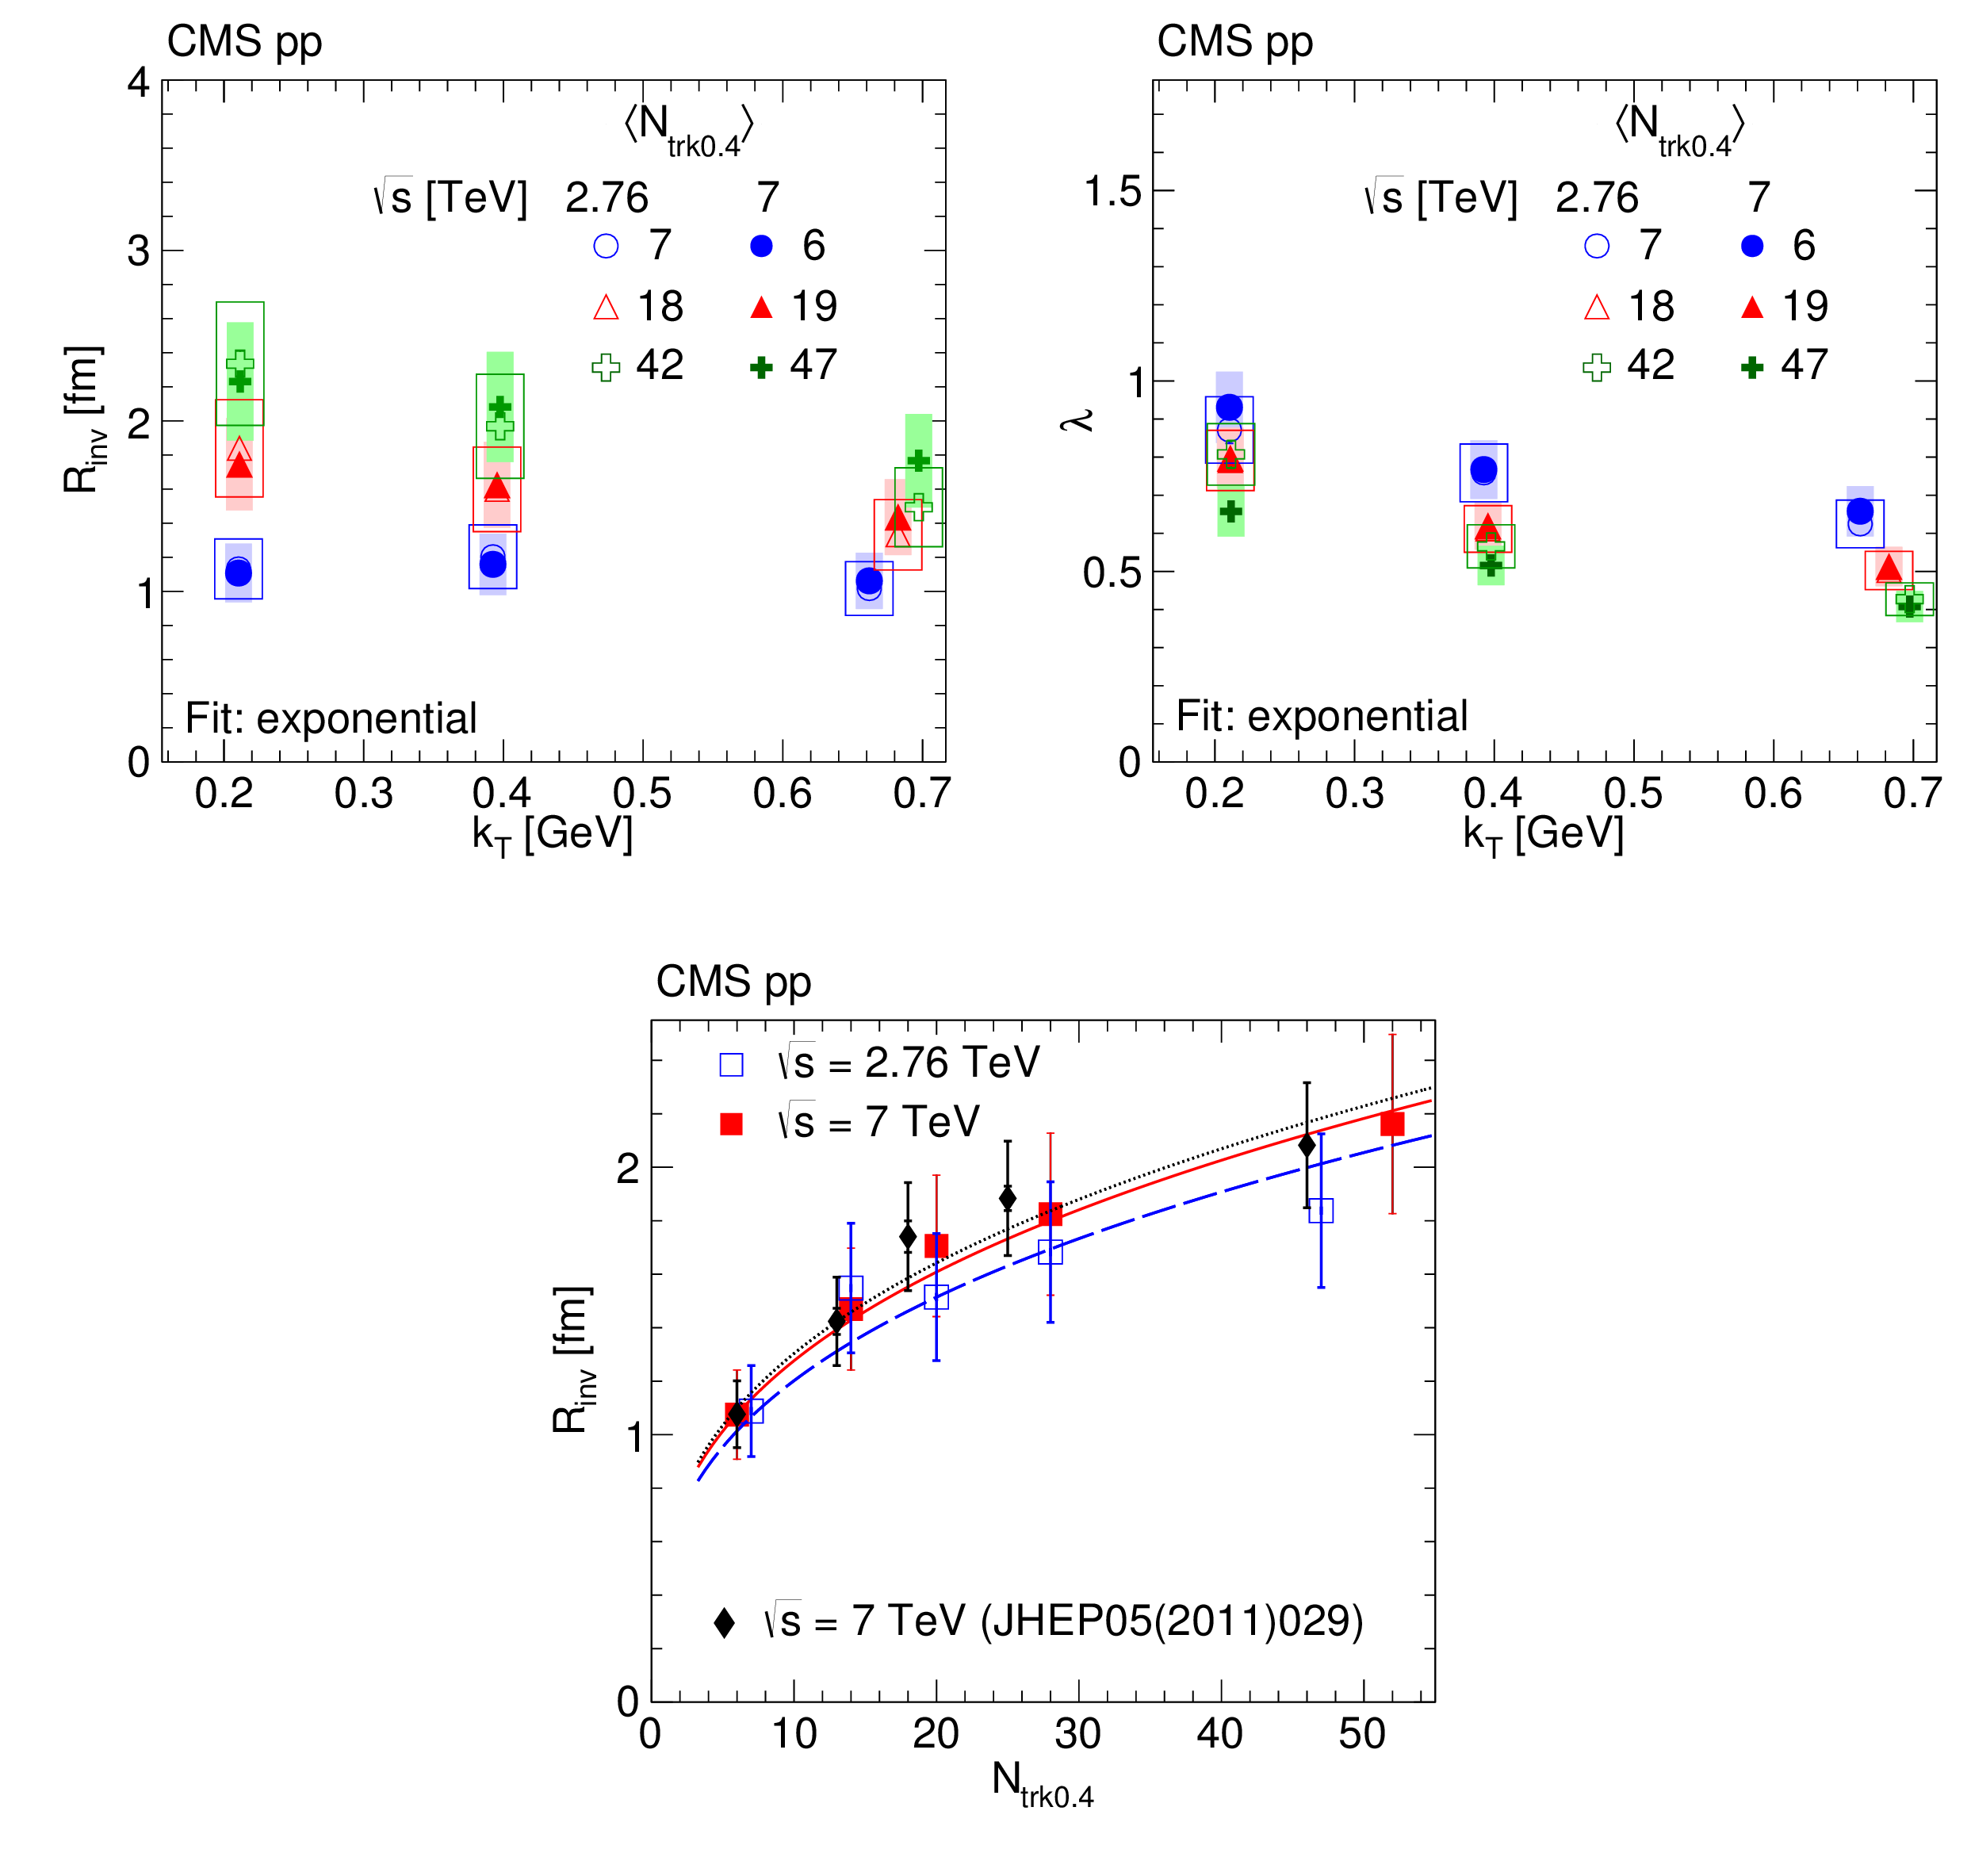
Figure 8:
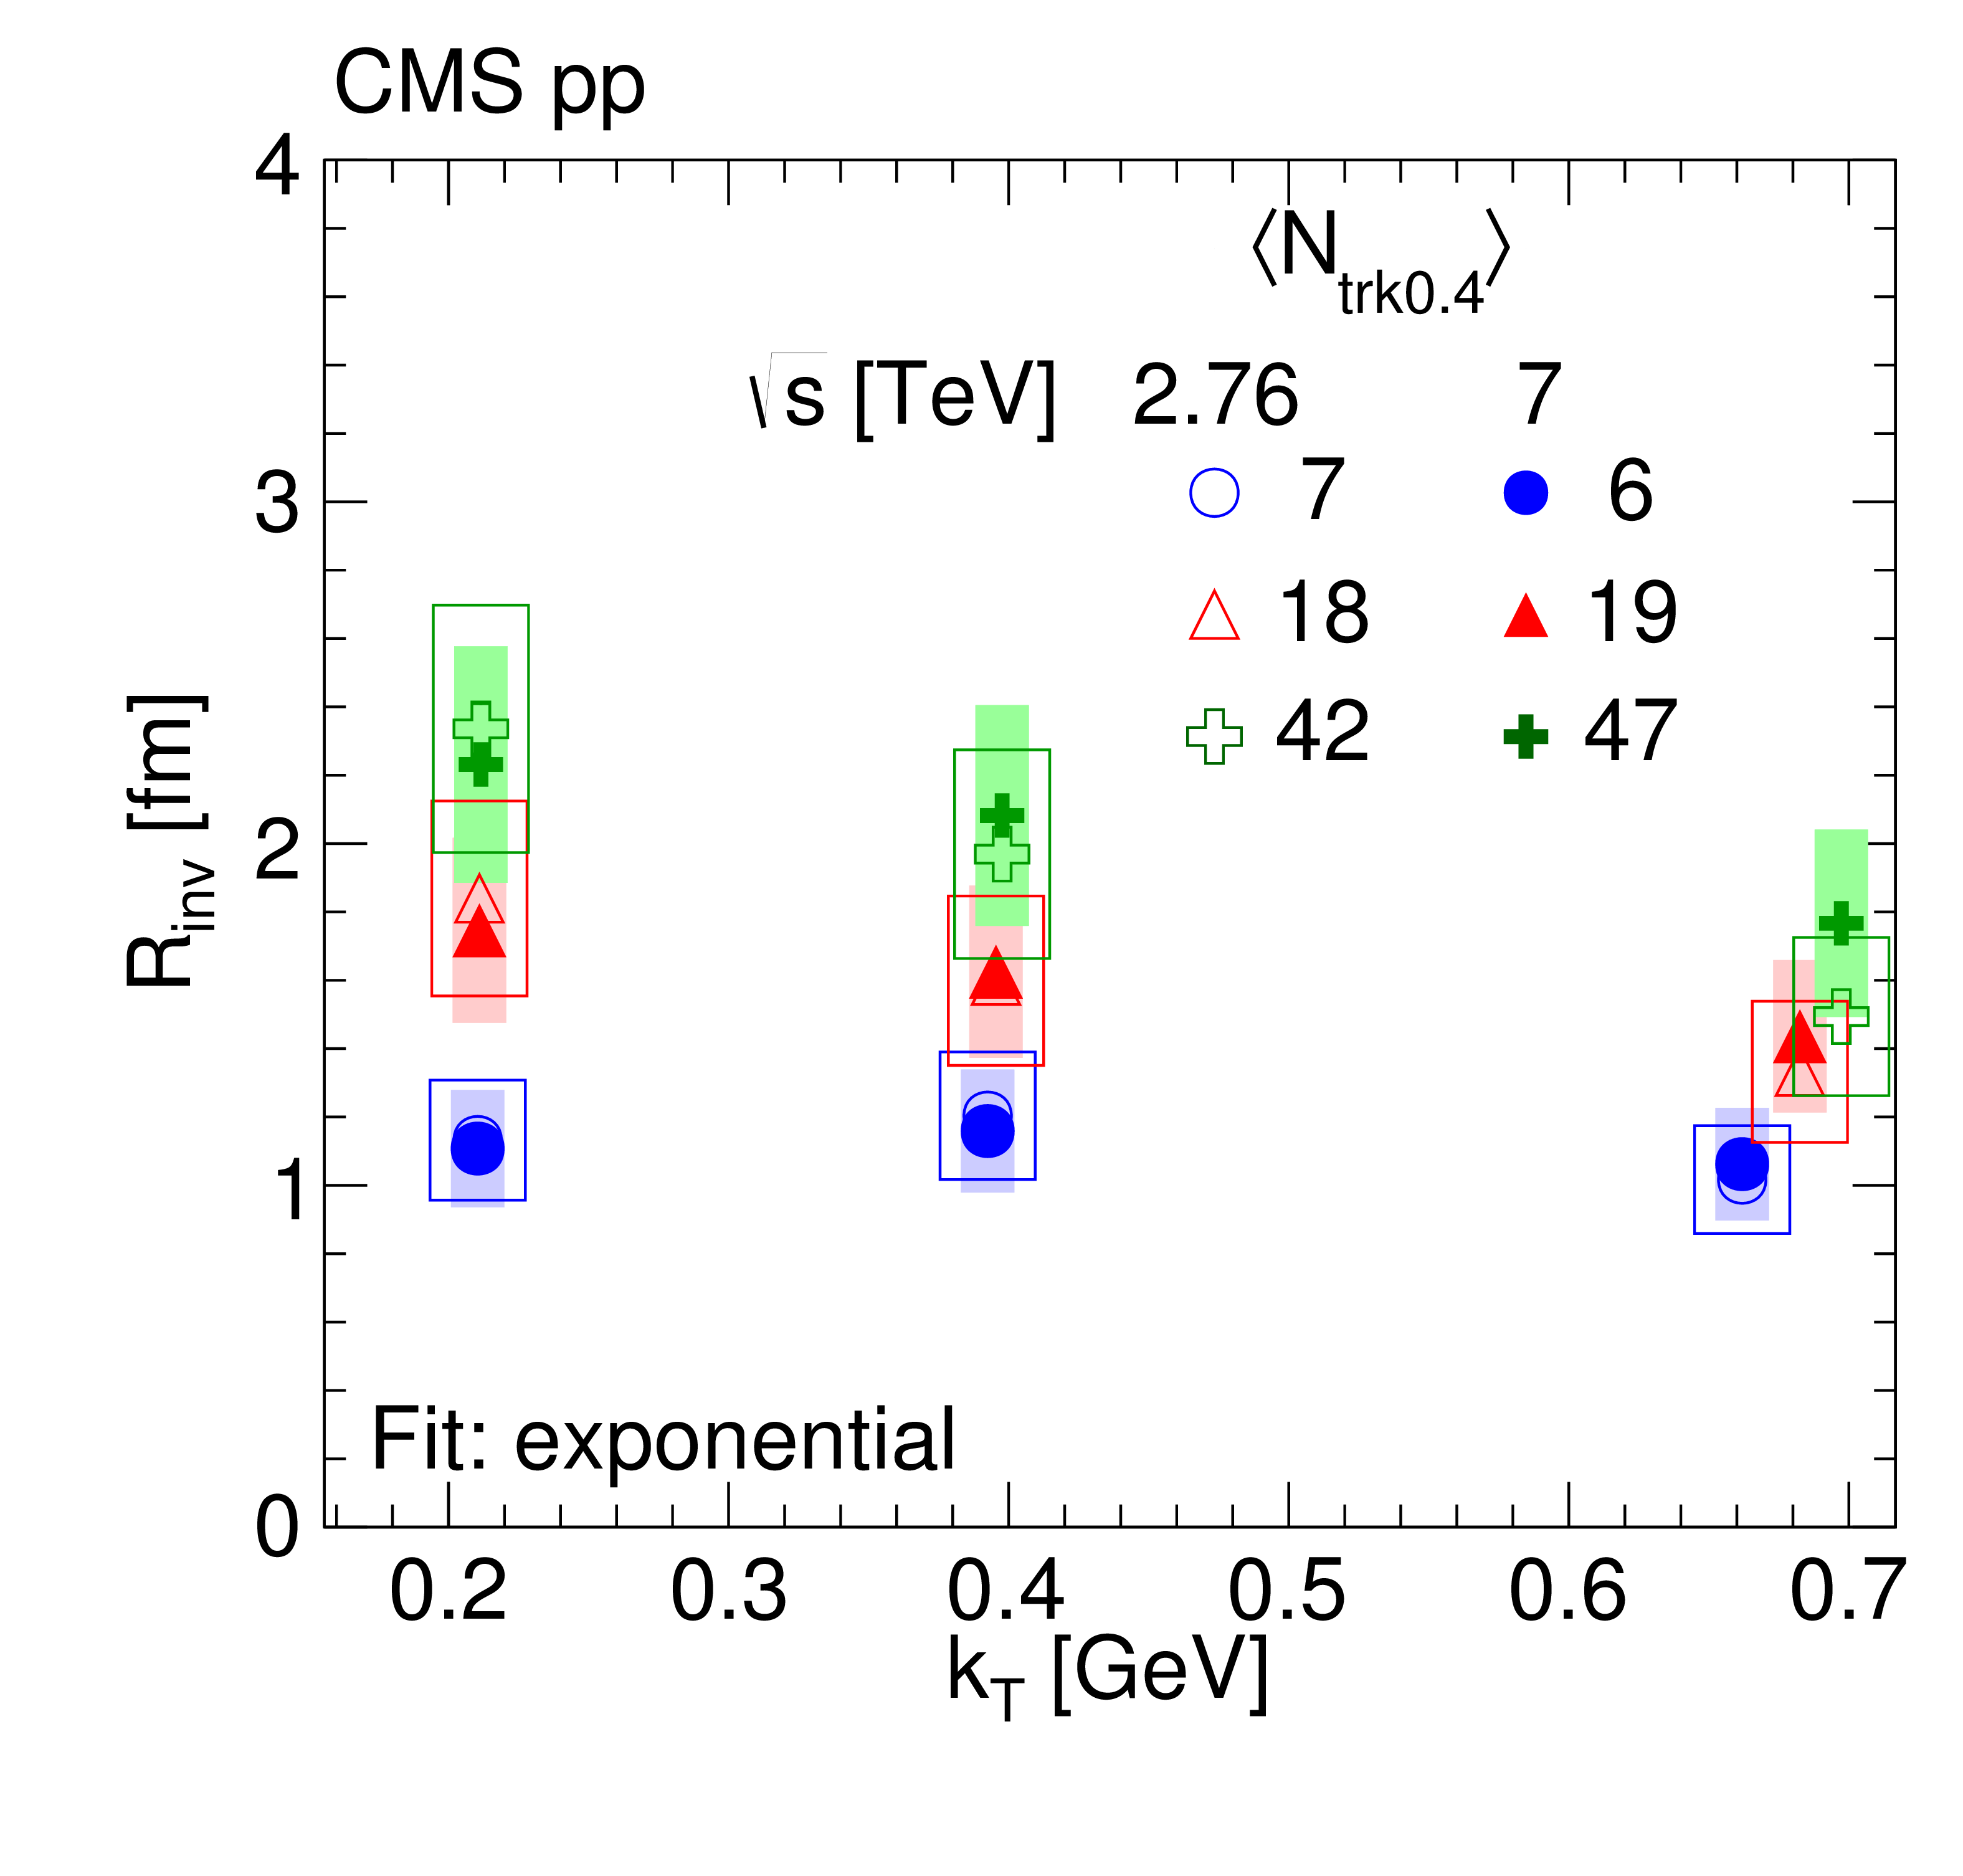
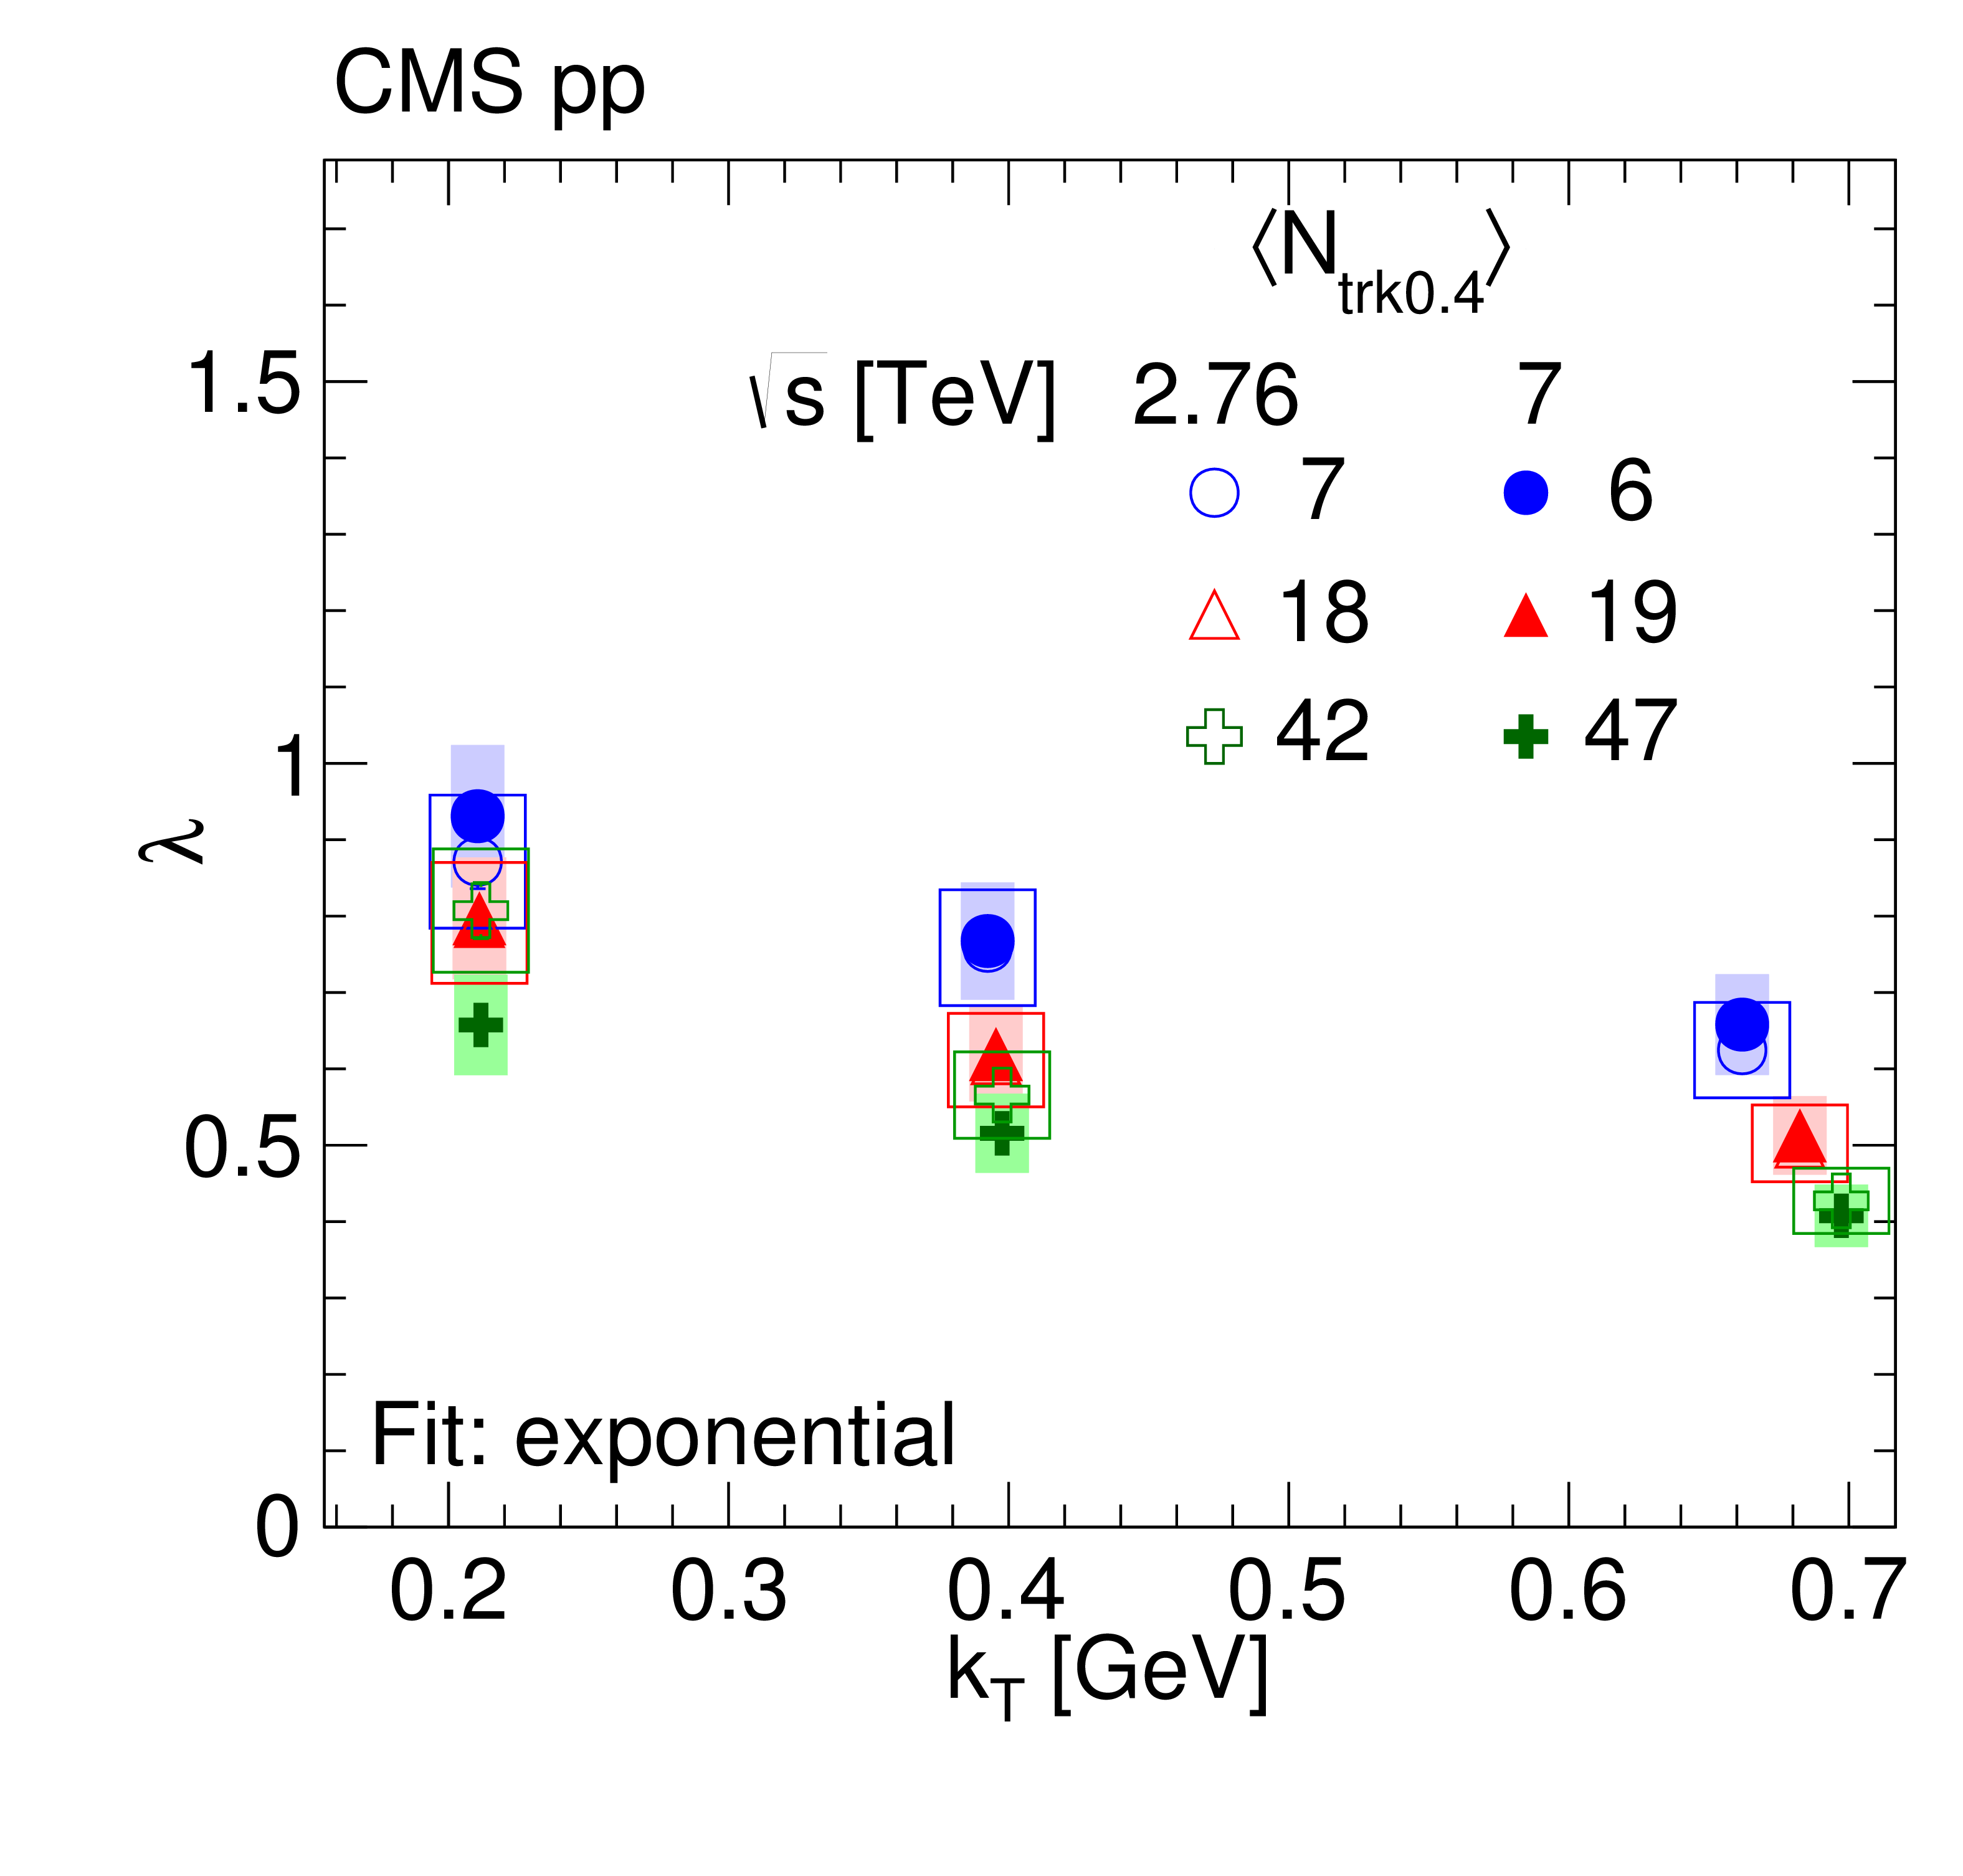
Top: $ {R_\text {inv}} $ (left) and $\lambda $ (right) as a function of $ {k_{\mathrm {T}}} $ obtained from an exponential fit to BEC data in three multiplicity bins in pp collisions at 2.76 TeV (open symbols) and 7 TeV (filled symbols). The boxes indicate the systematic uncertainties. Bottom: Radius parameter $ {R_\text {inv}} $ as a function of $ {N_\text {trk0.4}} $ with statistical (inner error bars) and statistical plus systematic uncertainties added in quadrature (outer error bars) in pp collisions at 2.76 TeV (open squares) and 7 TeV (filled squares), together with previous results at 7 TeV (filled diamonds) [6]. The curves indicate the respective fits to a $ {N_\text {trk0.4}} ^{1/3}$ functional form. |
png pdf |
Figure 8-a:
$ {R_\text {inv}} $ as a function of $ {k_{\mathrm {T}}} $ obtained from an exponential fit to BEC data in three multiplicity bins in pp collisions at 2.76 TeV (open symbols) and 7 TeV (filled symbols). The boxes indicate the systematic uncertainties. |
png pdf |
Figure 8-b:
$\lambda $ as a function of $ {k_{\mathrm {T}}} $ obtained from an exponential fit to BEC data in three multiplicity bins in pp collisions at 2.76 TeV (open symbols) and 7 TeV (filled symbols). The boxes indicate the systematic uncertainties. |

png pdf |
Figure 8-c:
Radius parameter $ {R_\text {inv}} $ as a function of $ {N_\text {trk0.4}} $ with statistical (inner error bars) and statistical plus systematic uncertainties added in quadrature (outer error bars) in pp collisions at 2.76 TeV (open squares) and 7 TeV (filled squares), together with previous results at 7 TeV (filled diamonds) [6]. The curves indicate the respective fits to a $ {N_\text {trk0.4}} ^{1/3}$ functional form. |
png pdf |
Figure 9:
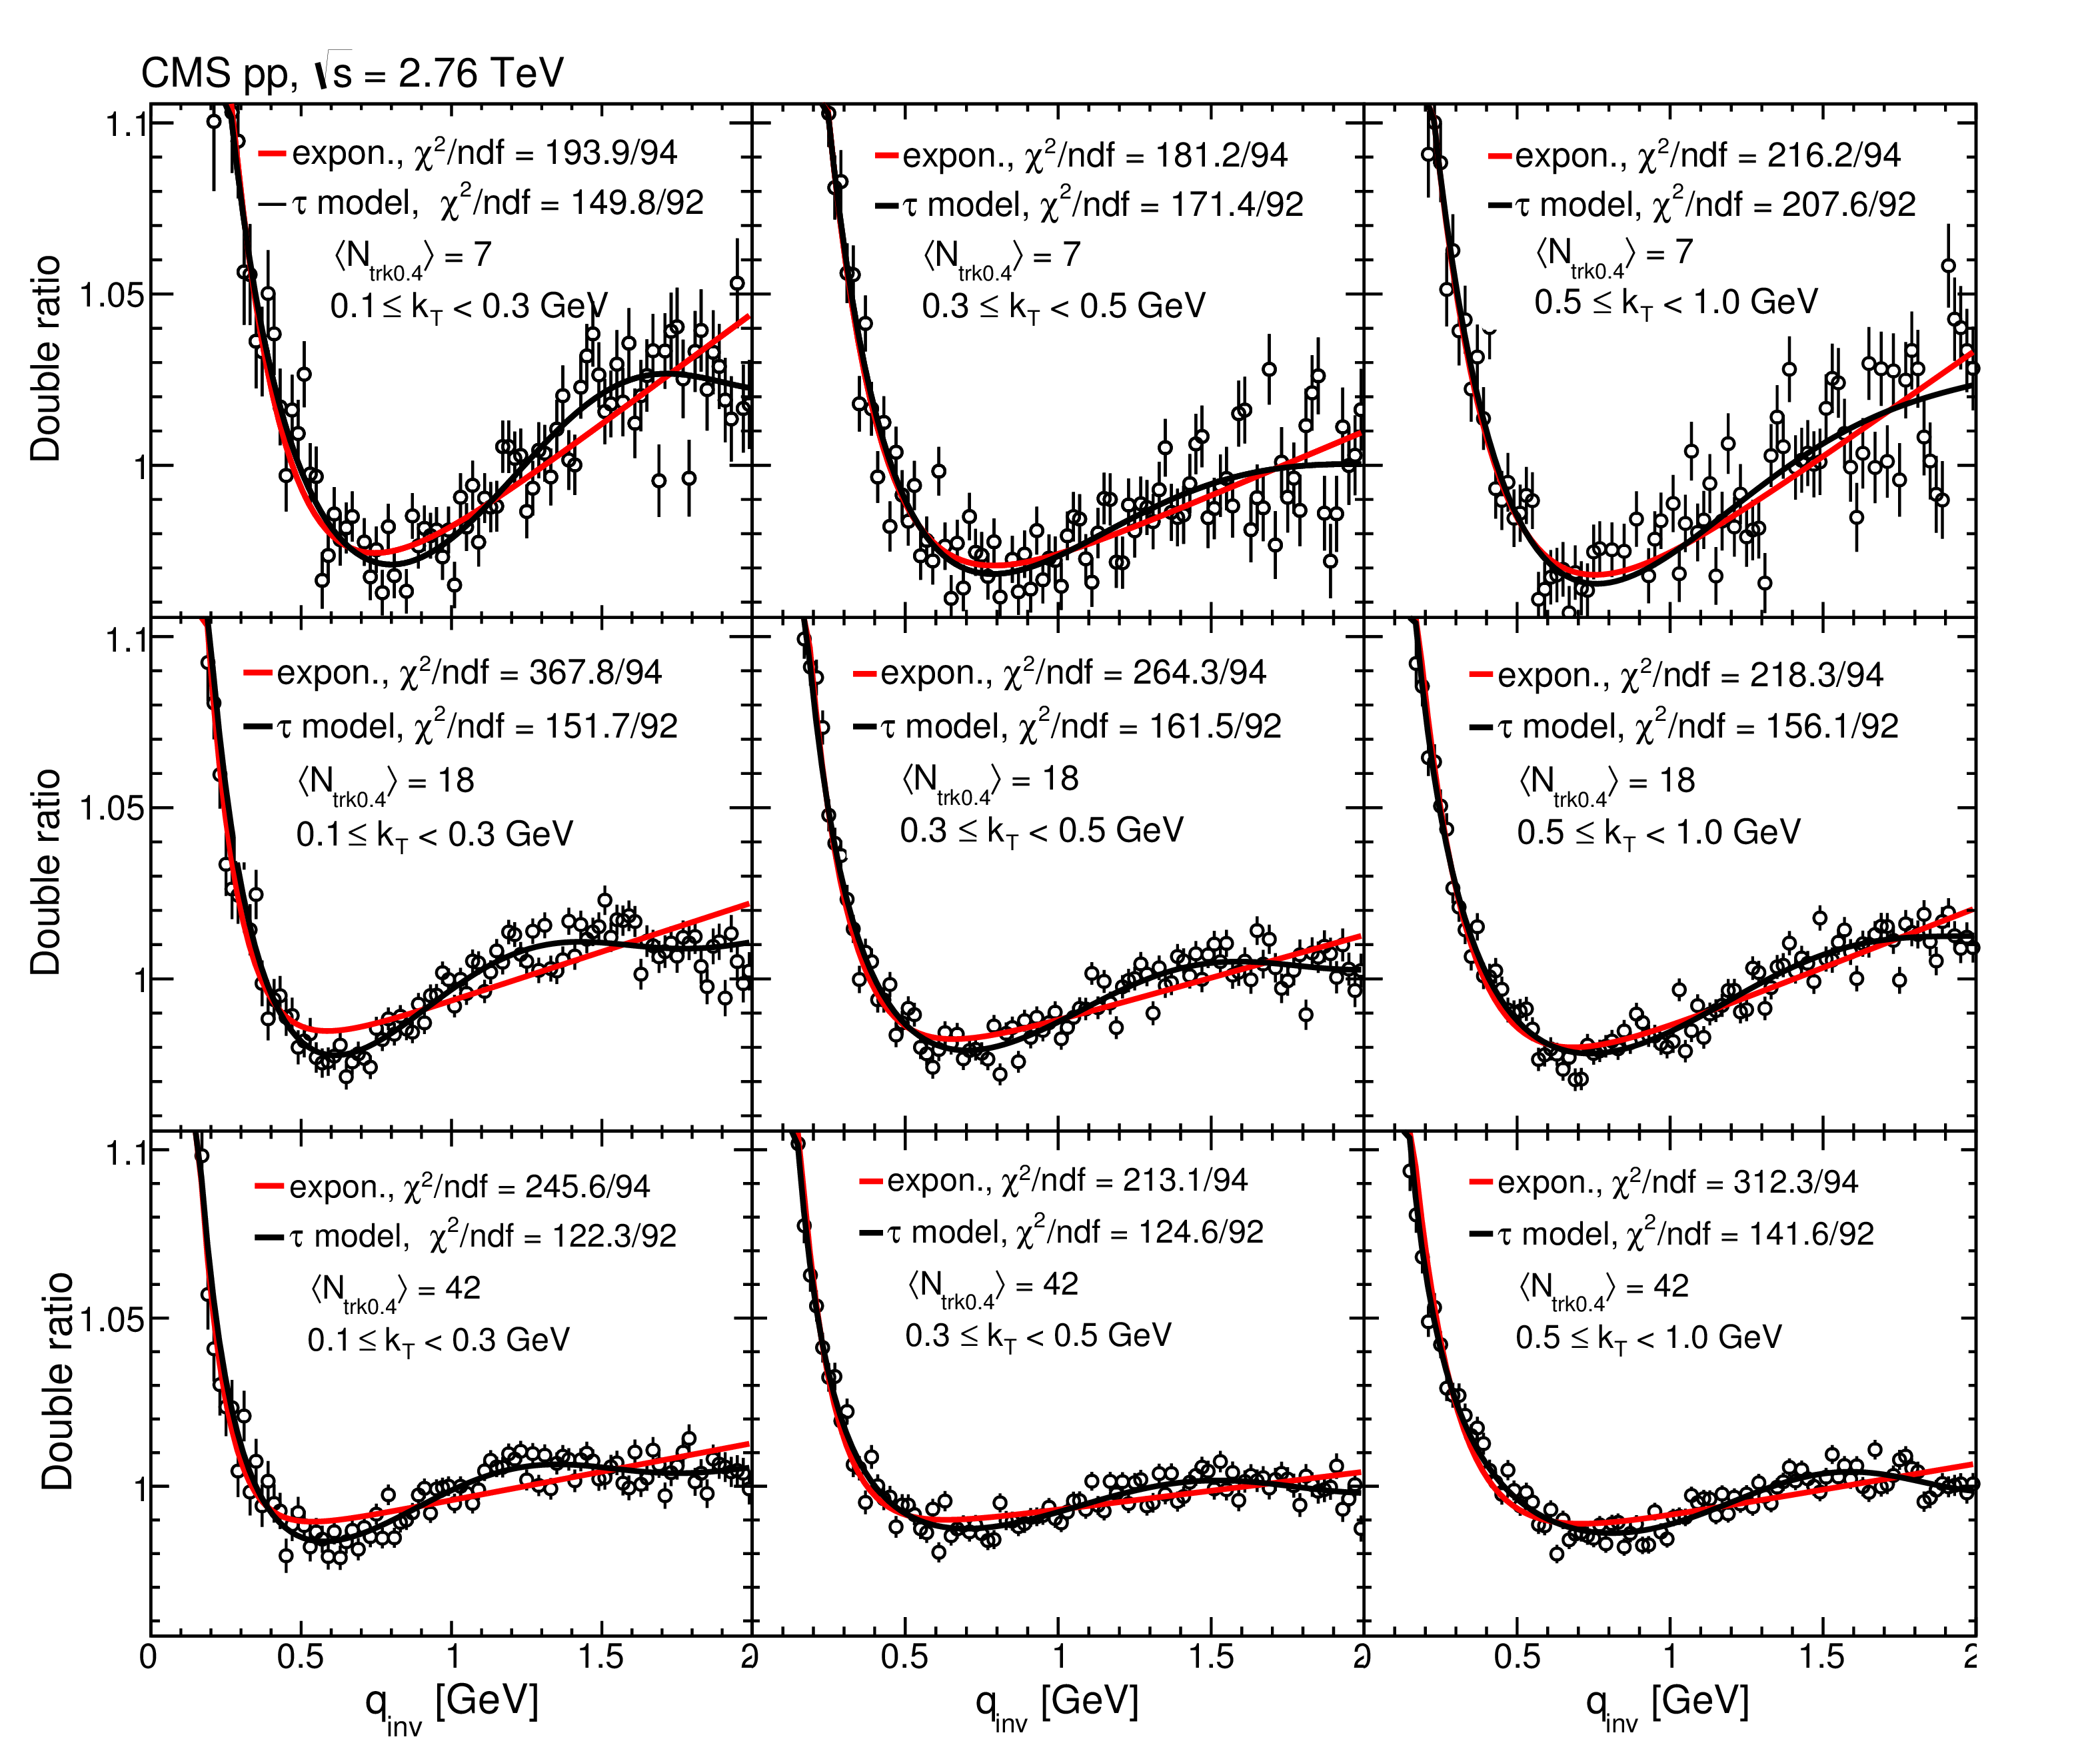
1D correlation functions (with the $y$-axis cut off at $\sim $1.1) versus $ {q_\text {inv}} $ obtained with the double ratio method in pp at 2.76 TeV for increasing ranges of $ {k_{\mathrm {T}}} $ (left to right) and of $ {N_\text {trk0.4}} $ (top to bottom). Data are fitted to the exponential (red curve) and the $\tau $ model (black curve) functions. The error bars show the statistical uncertainties. |
png pdf |
Figure 10:
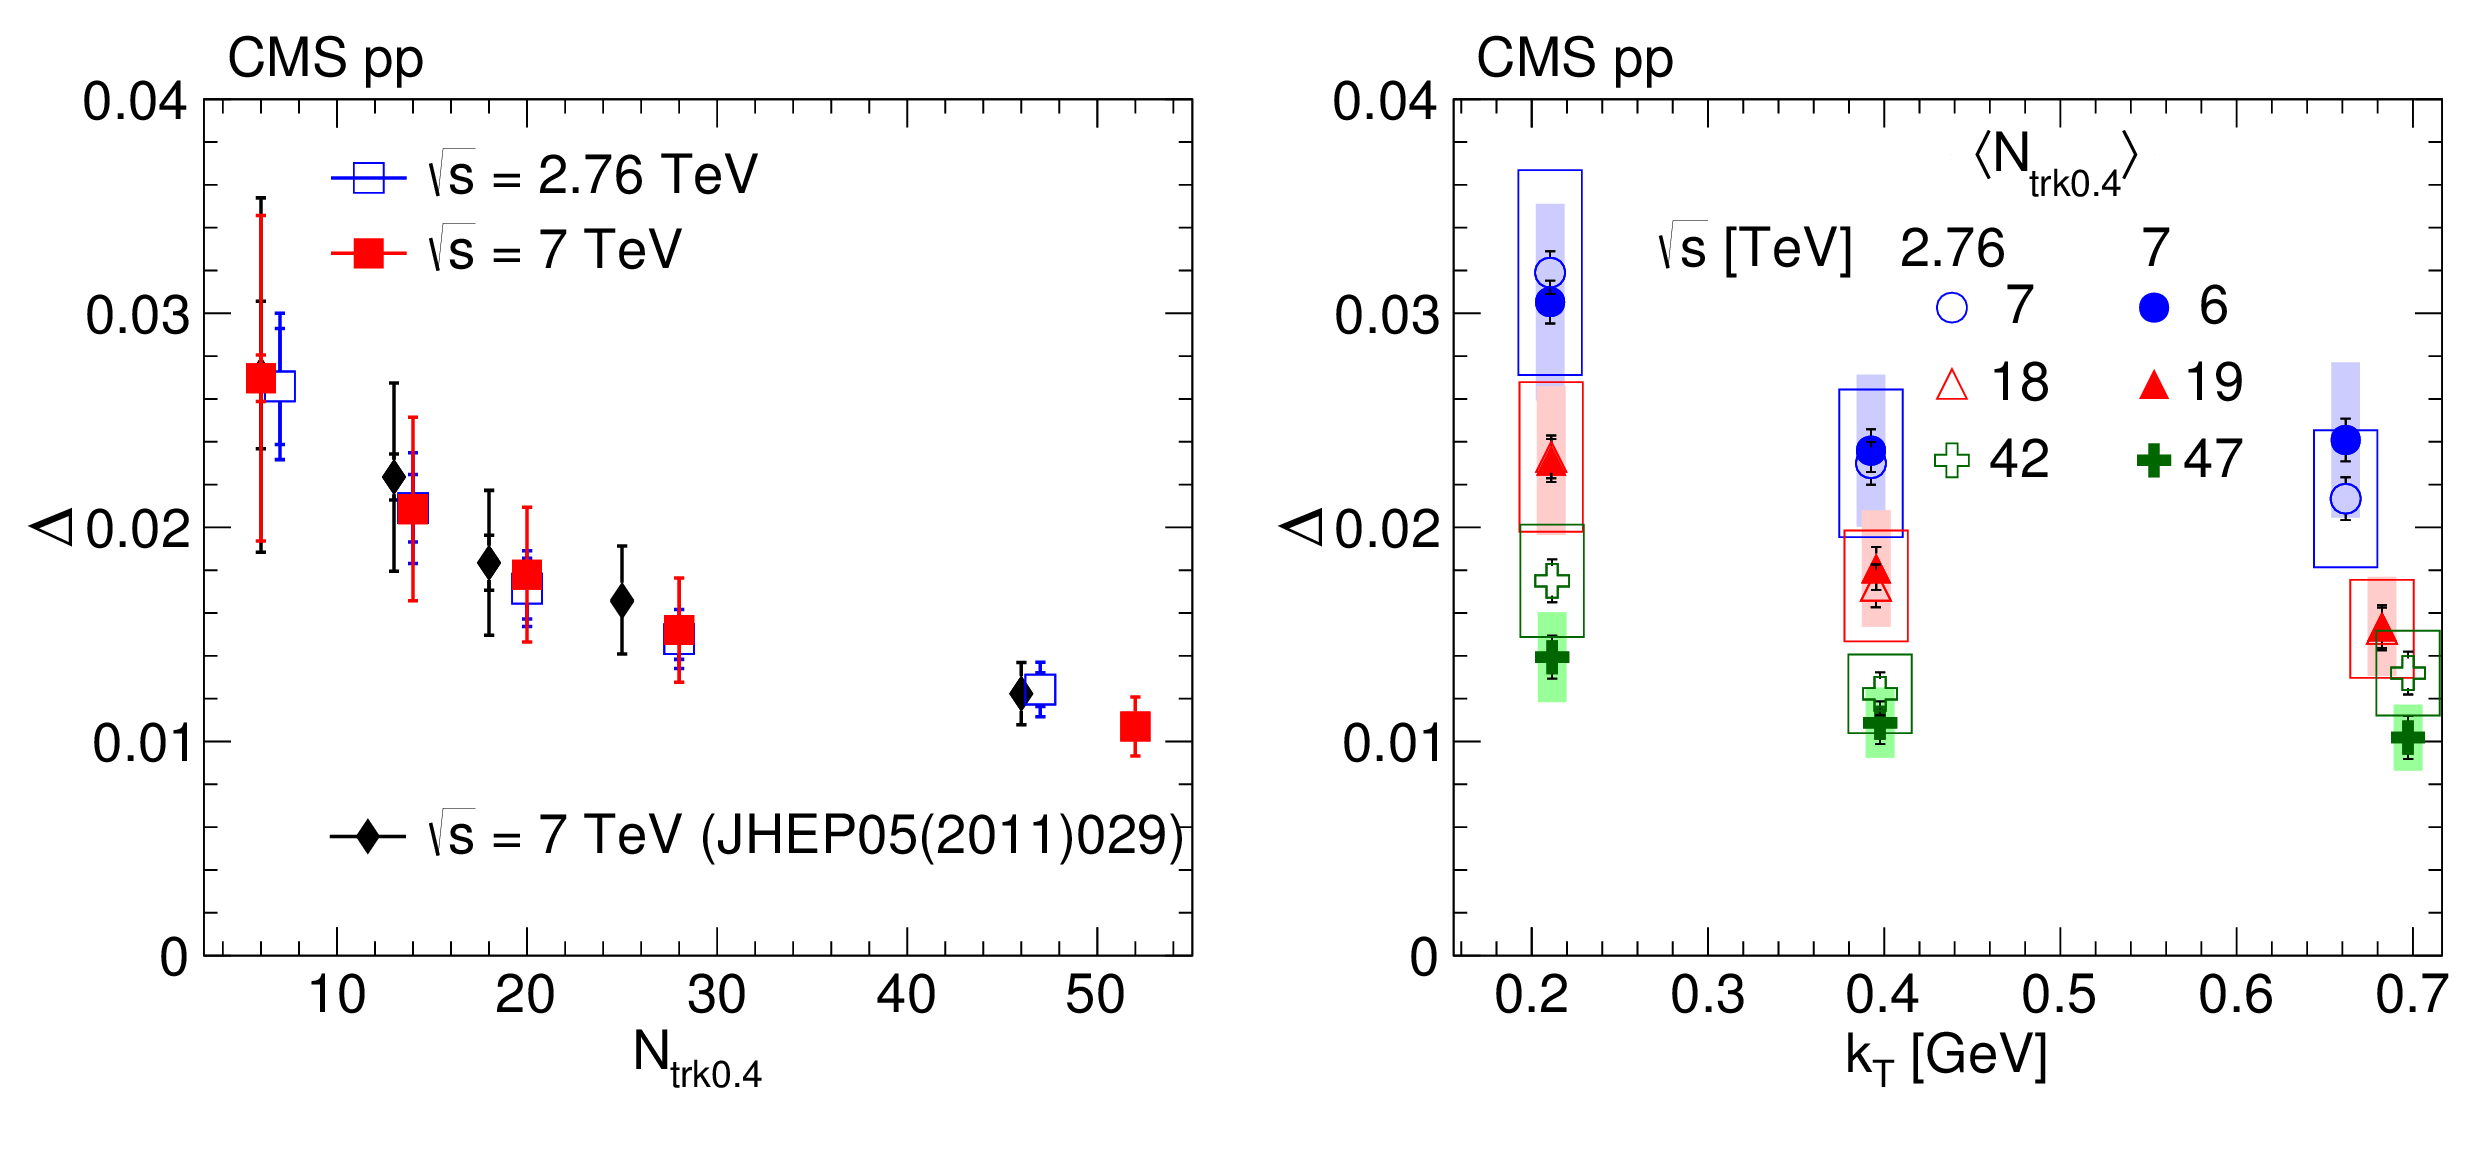
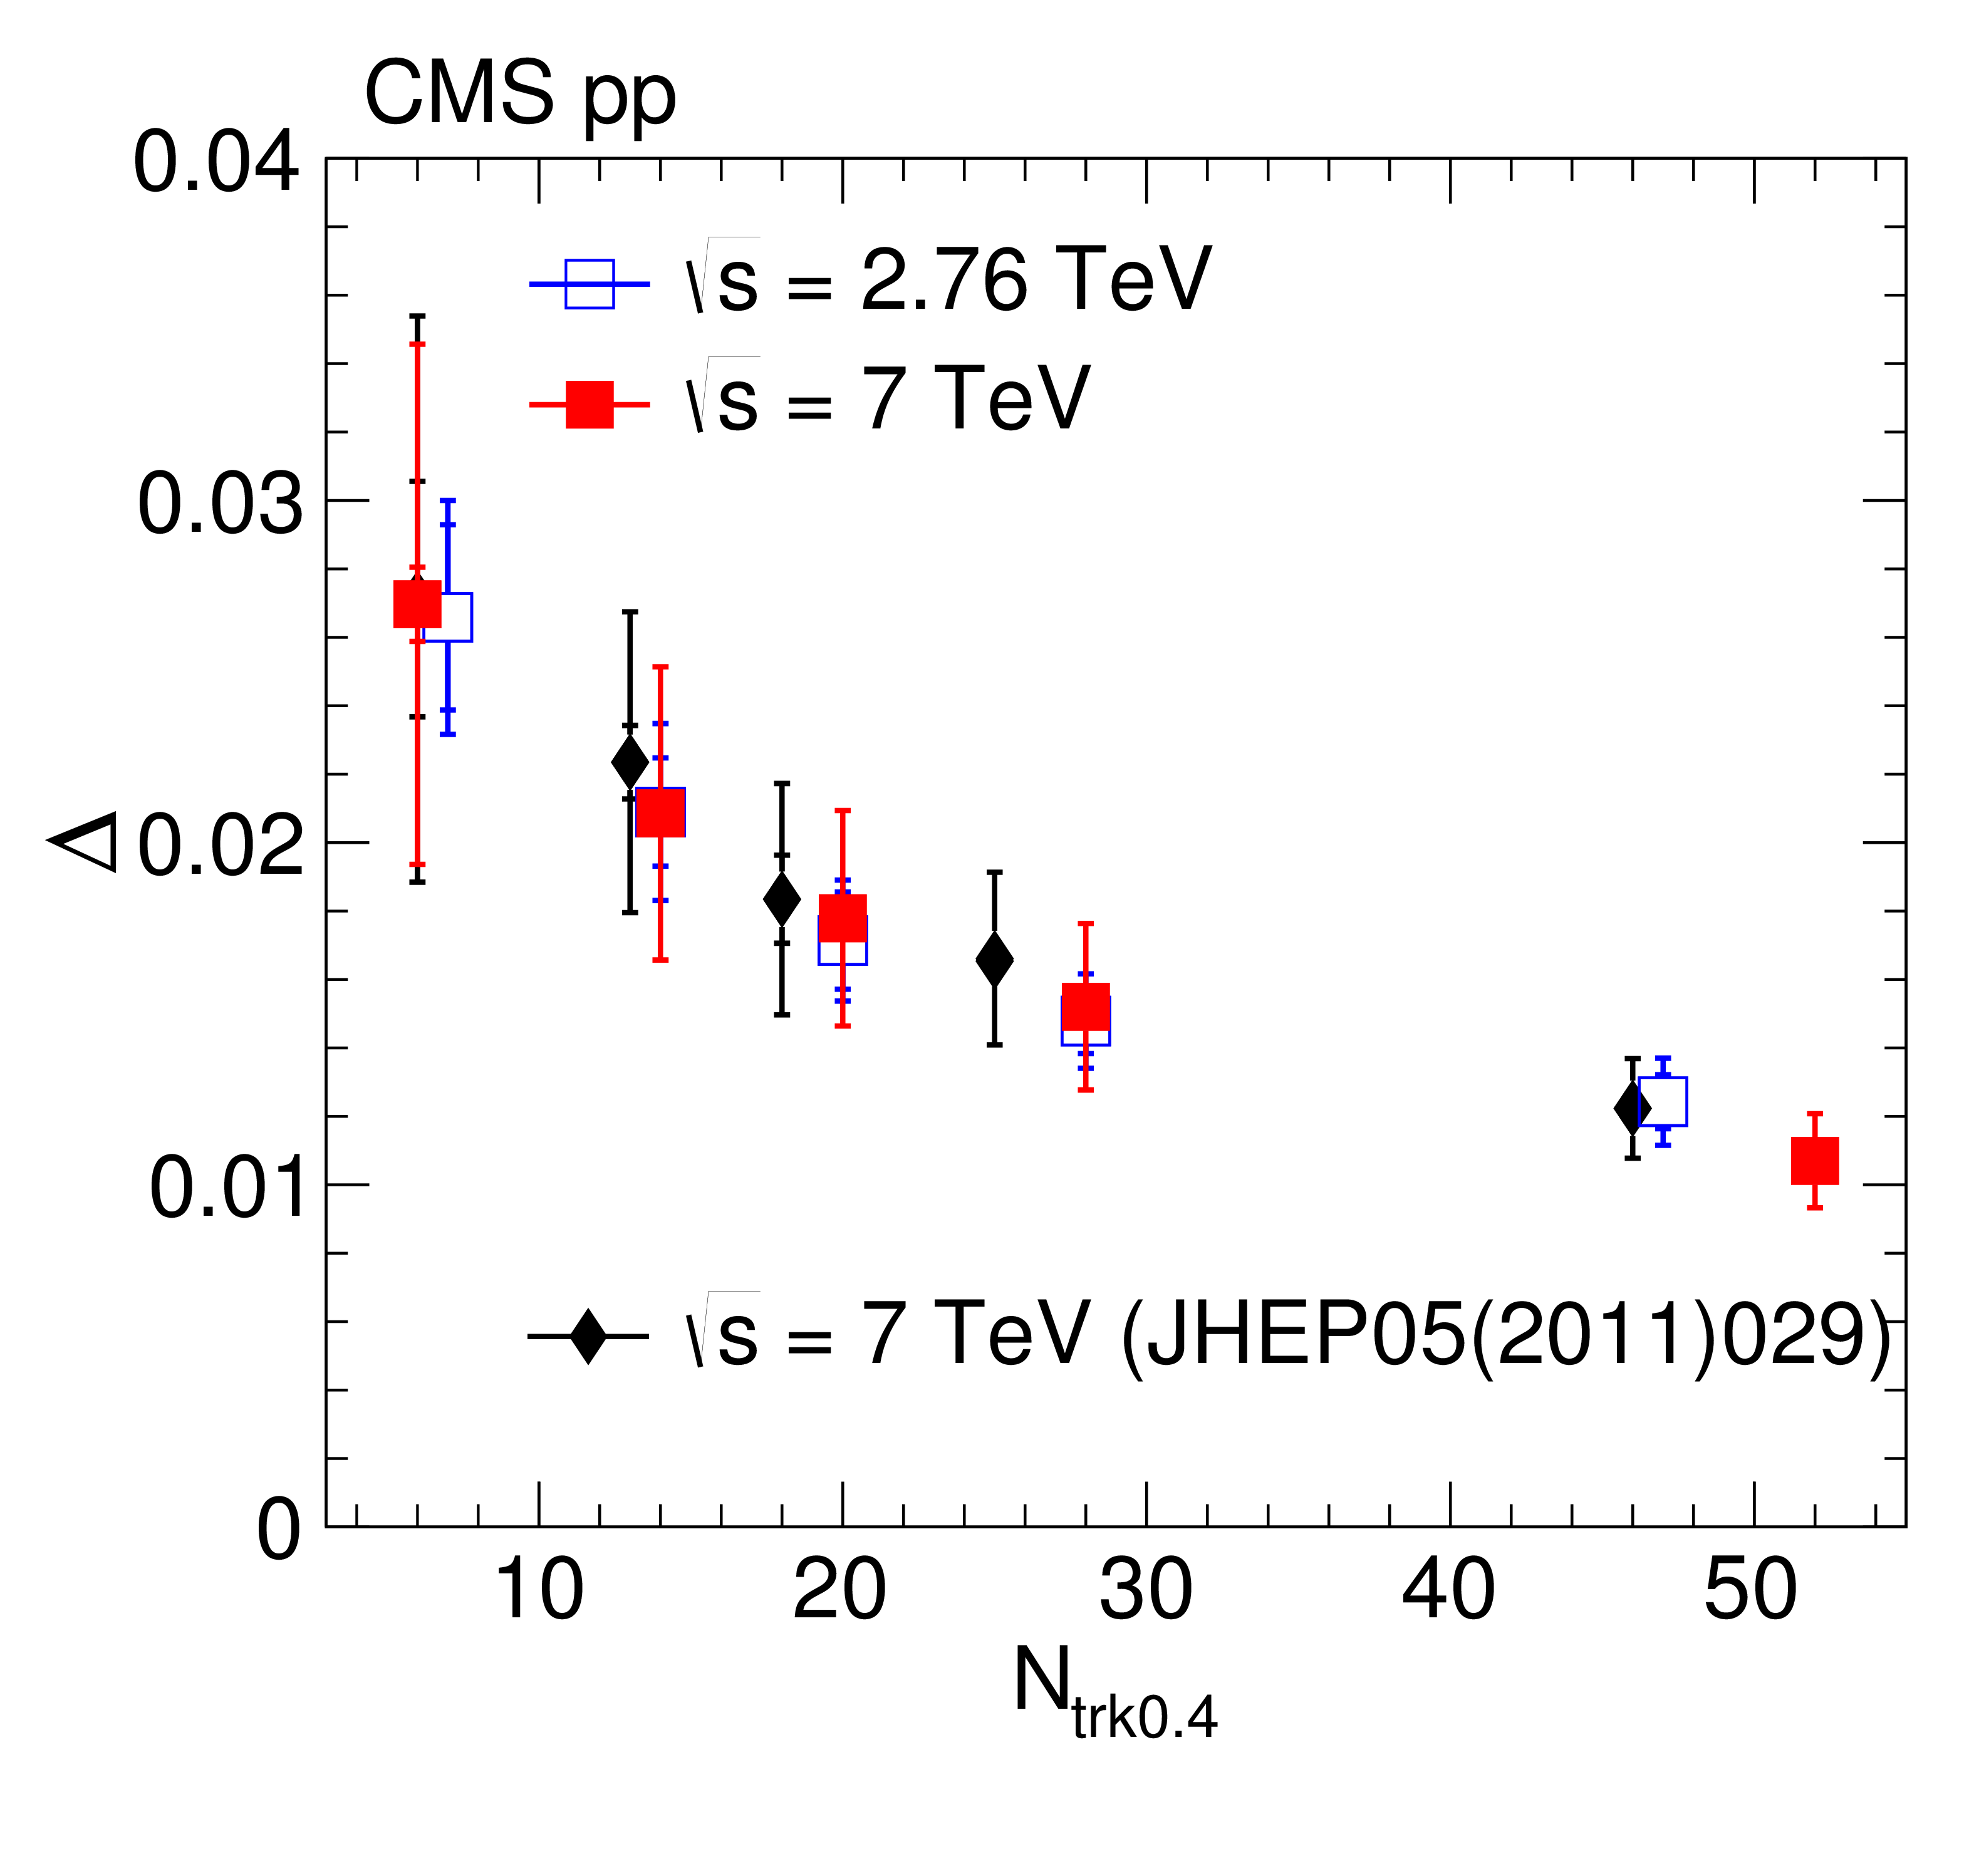
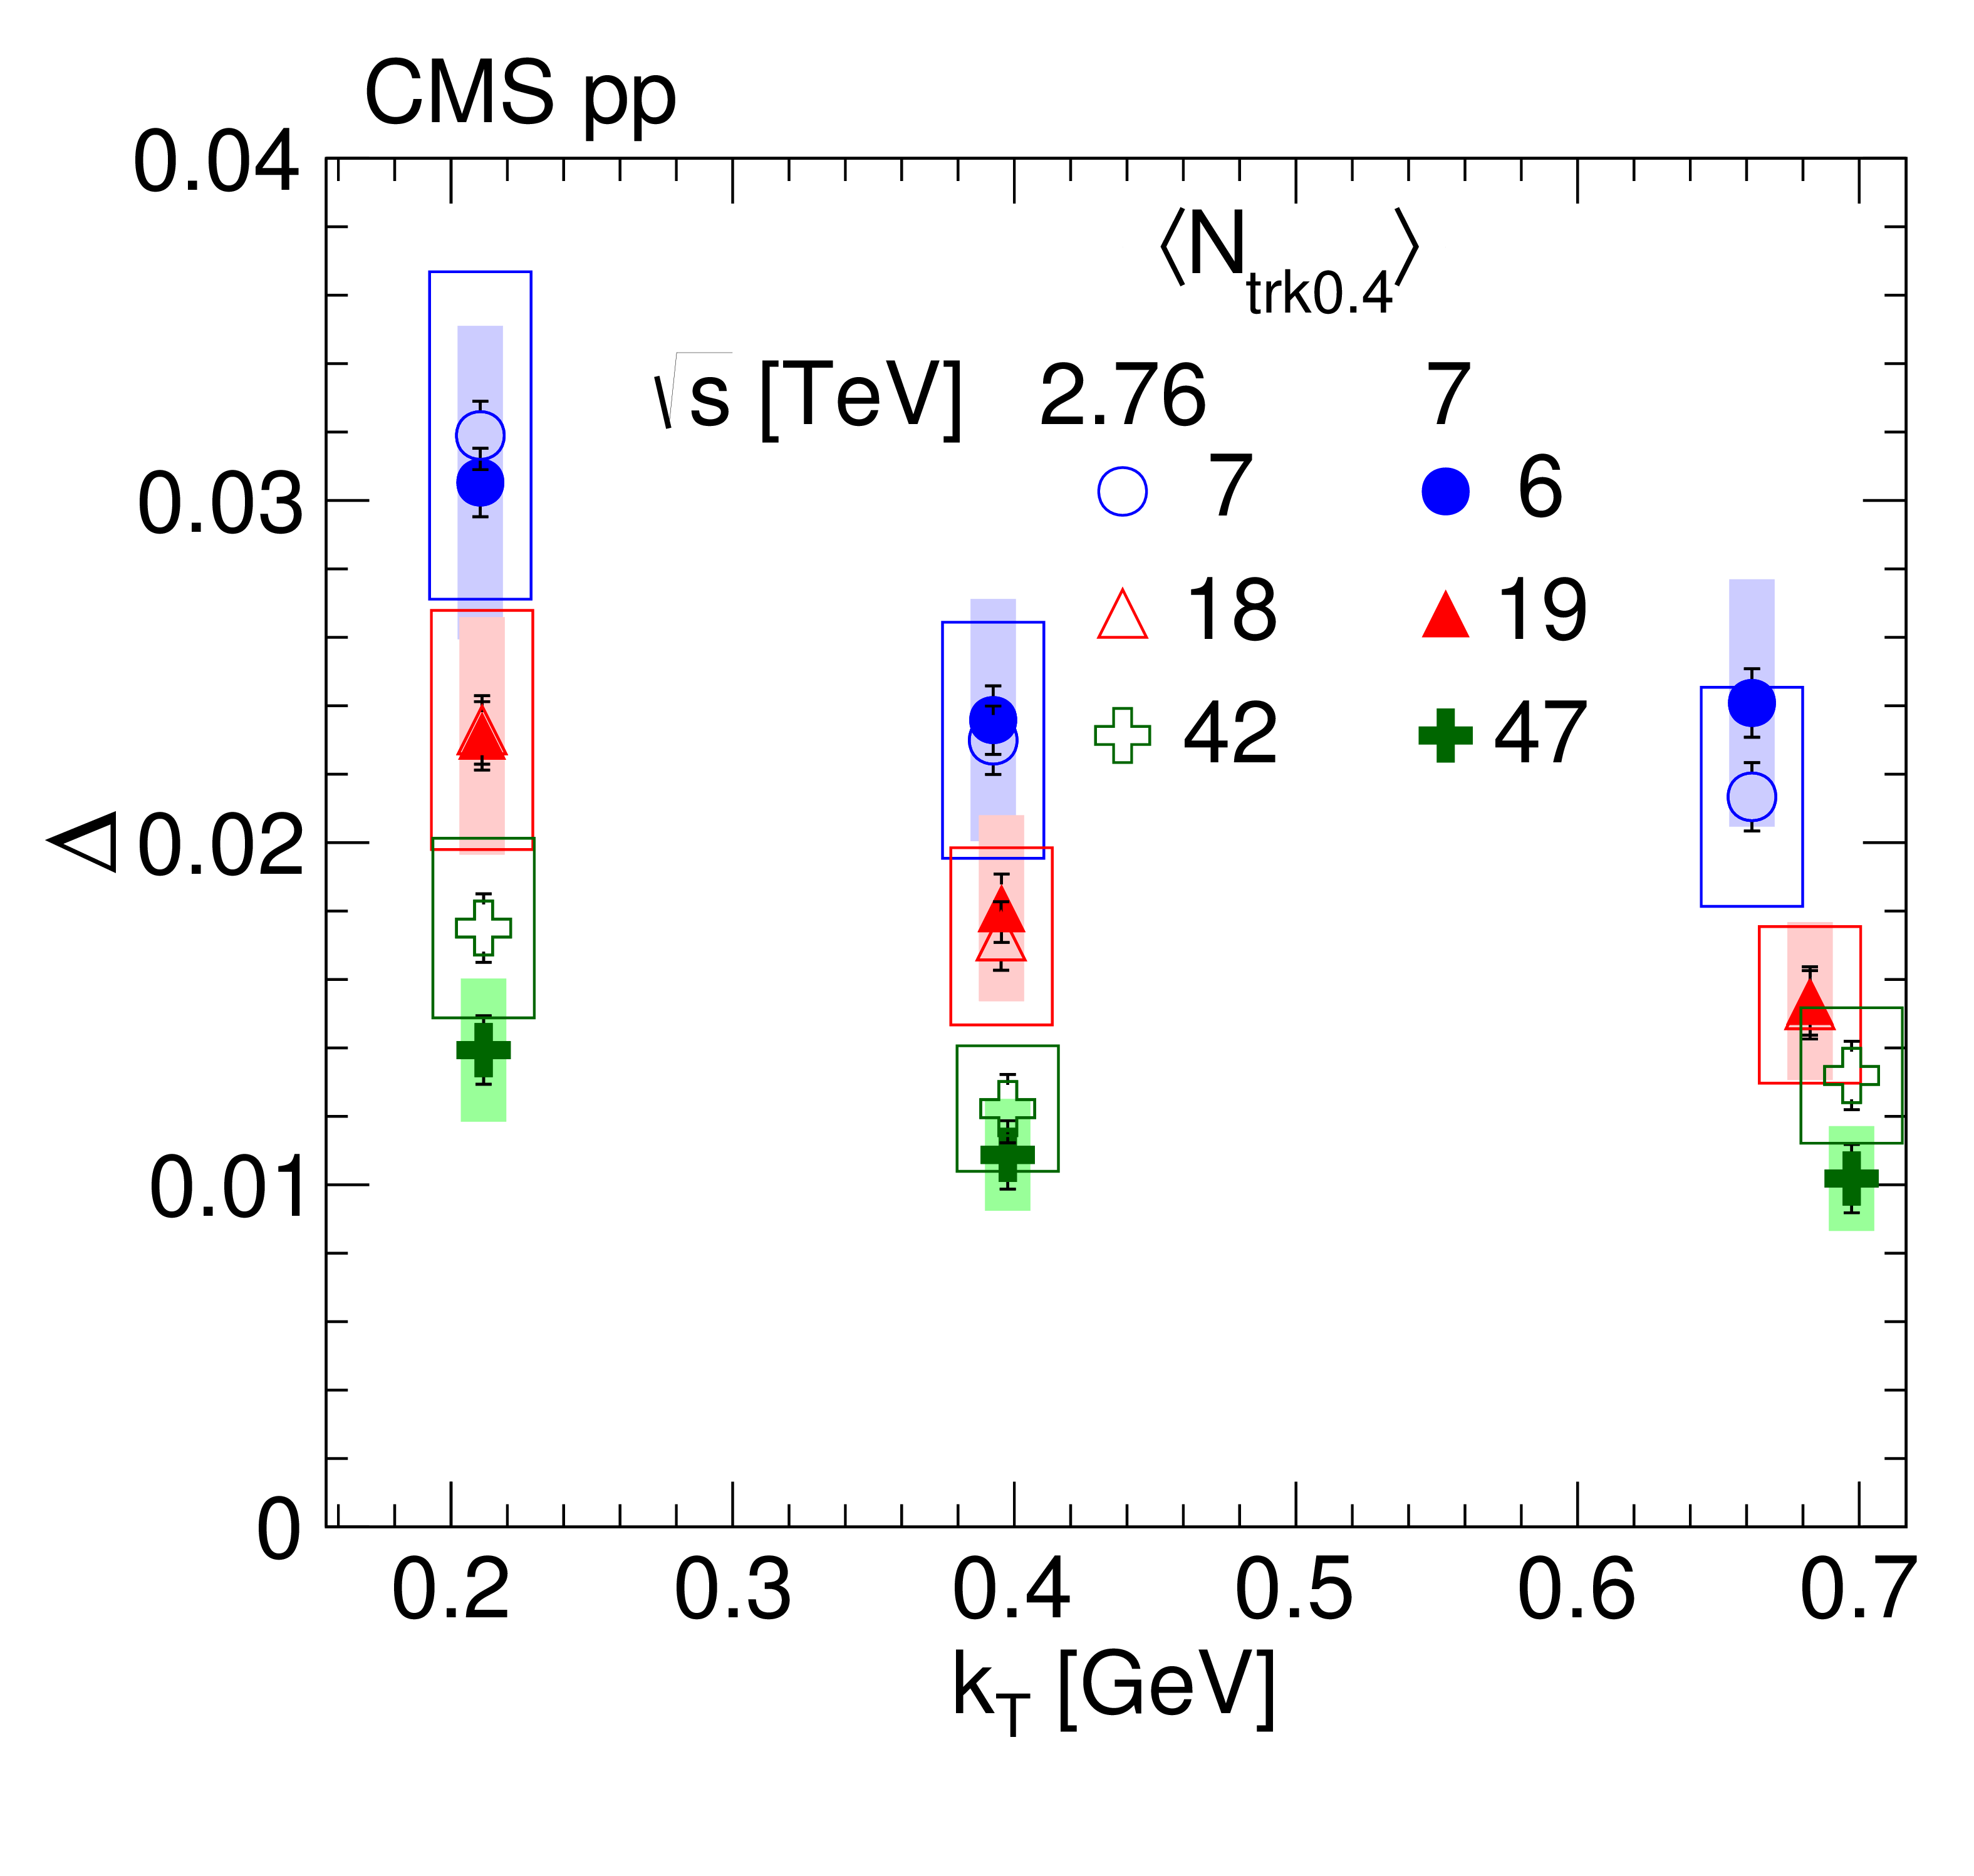
Left : Anticorrelation depth $\Delta $ as a function of $ {N_\text {trk0.4}} $ integrated over all $ {k_{\mathrm {T}}} $, in pp collisions at 2.76 TeV (open squares) and 7 TeV (filled squares), together with previous results at 7 TeV (filled diamonds) [6]. Inner (outer) error bars represent the statistical (plus systematic, added in quadrature) uncertainties. Right : Corresponding anticorrelation depth as a function of $ {k_{\mathrm {T}}} $ for various $ {N_\text {trk0.4}} $ ranges, in pp at 2.76 TeV (open symbols) and 7 TeV (filled symbols). The boxes indicate the systematic uncertainties. |
png pdf |
Figure 10-a:
Anticorrelation depth $\Delta $ as a function of $ {N_\text {trk0.4}} $ integrated over all $ {k_{\mathrm {T}}} $, in pp collisions at 2.76 TeV (open squares) and 7 TeV (filled squares), together with previous results at 7 TeV (filled diamonds) [6]. Inner (outer) error bars represent the statistical (plus systematic, added in quadrature) uncertainties. |
png pdf |
Figure 10-b:
Corresponding anticorrelation depth as a function of $ {k_{\mathrm {T}}} $ for various $ {N_\text {trk0.4}} $ ranges, in pp at 2.76 TeV (open symbols) and 7 TeV (filled symbols). The boxes indicate the systematic uncertainties. |
png pdf |
Figure 11:
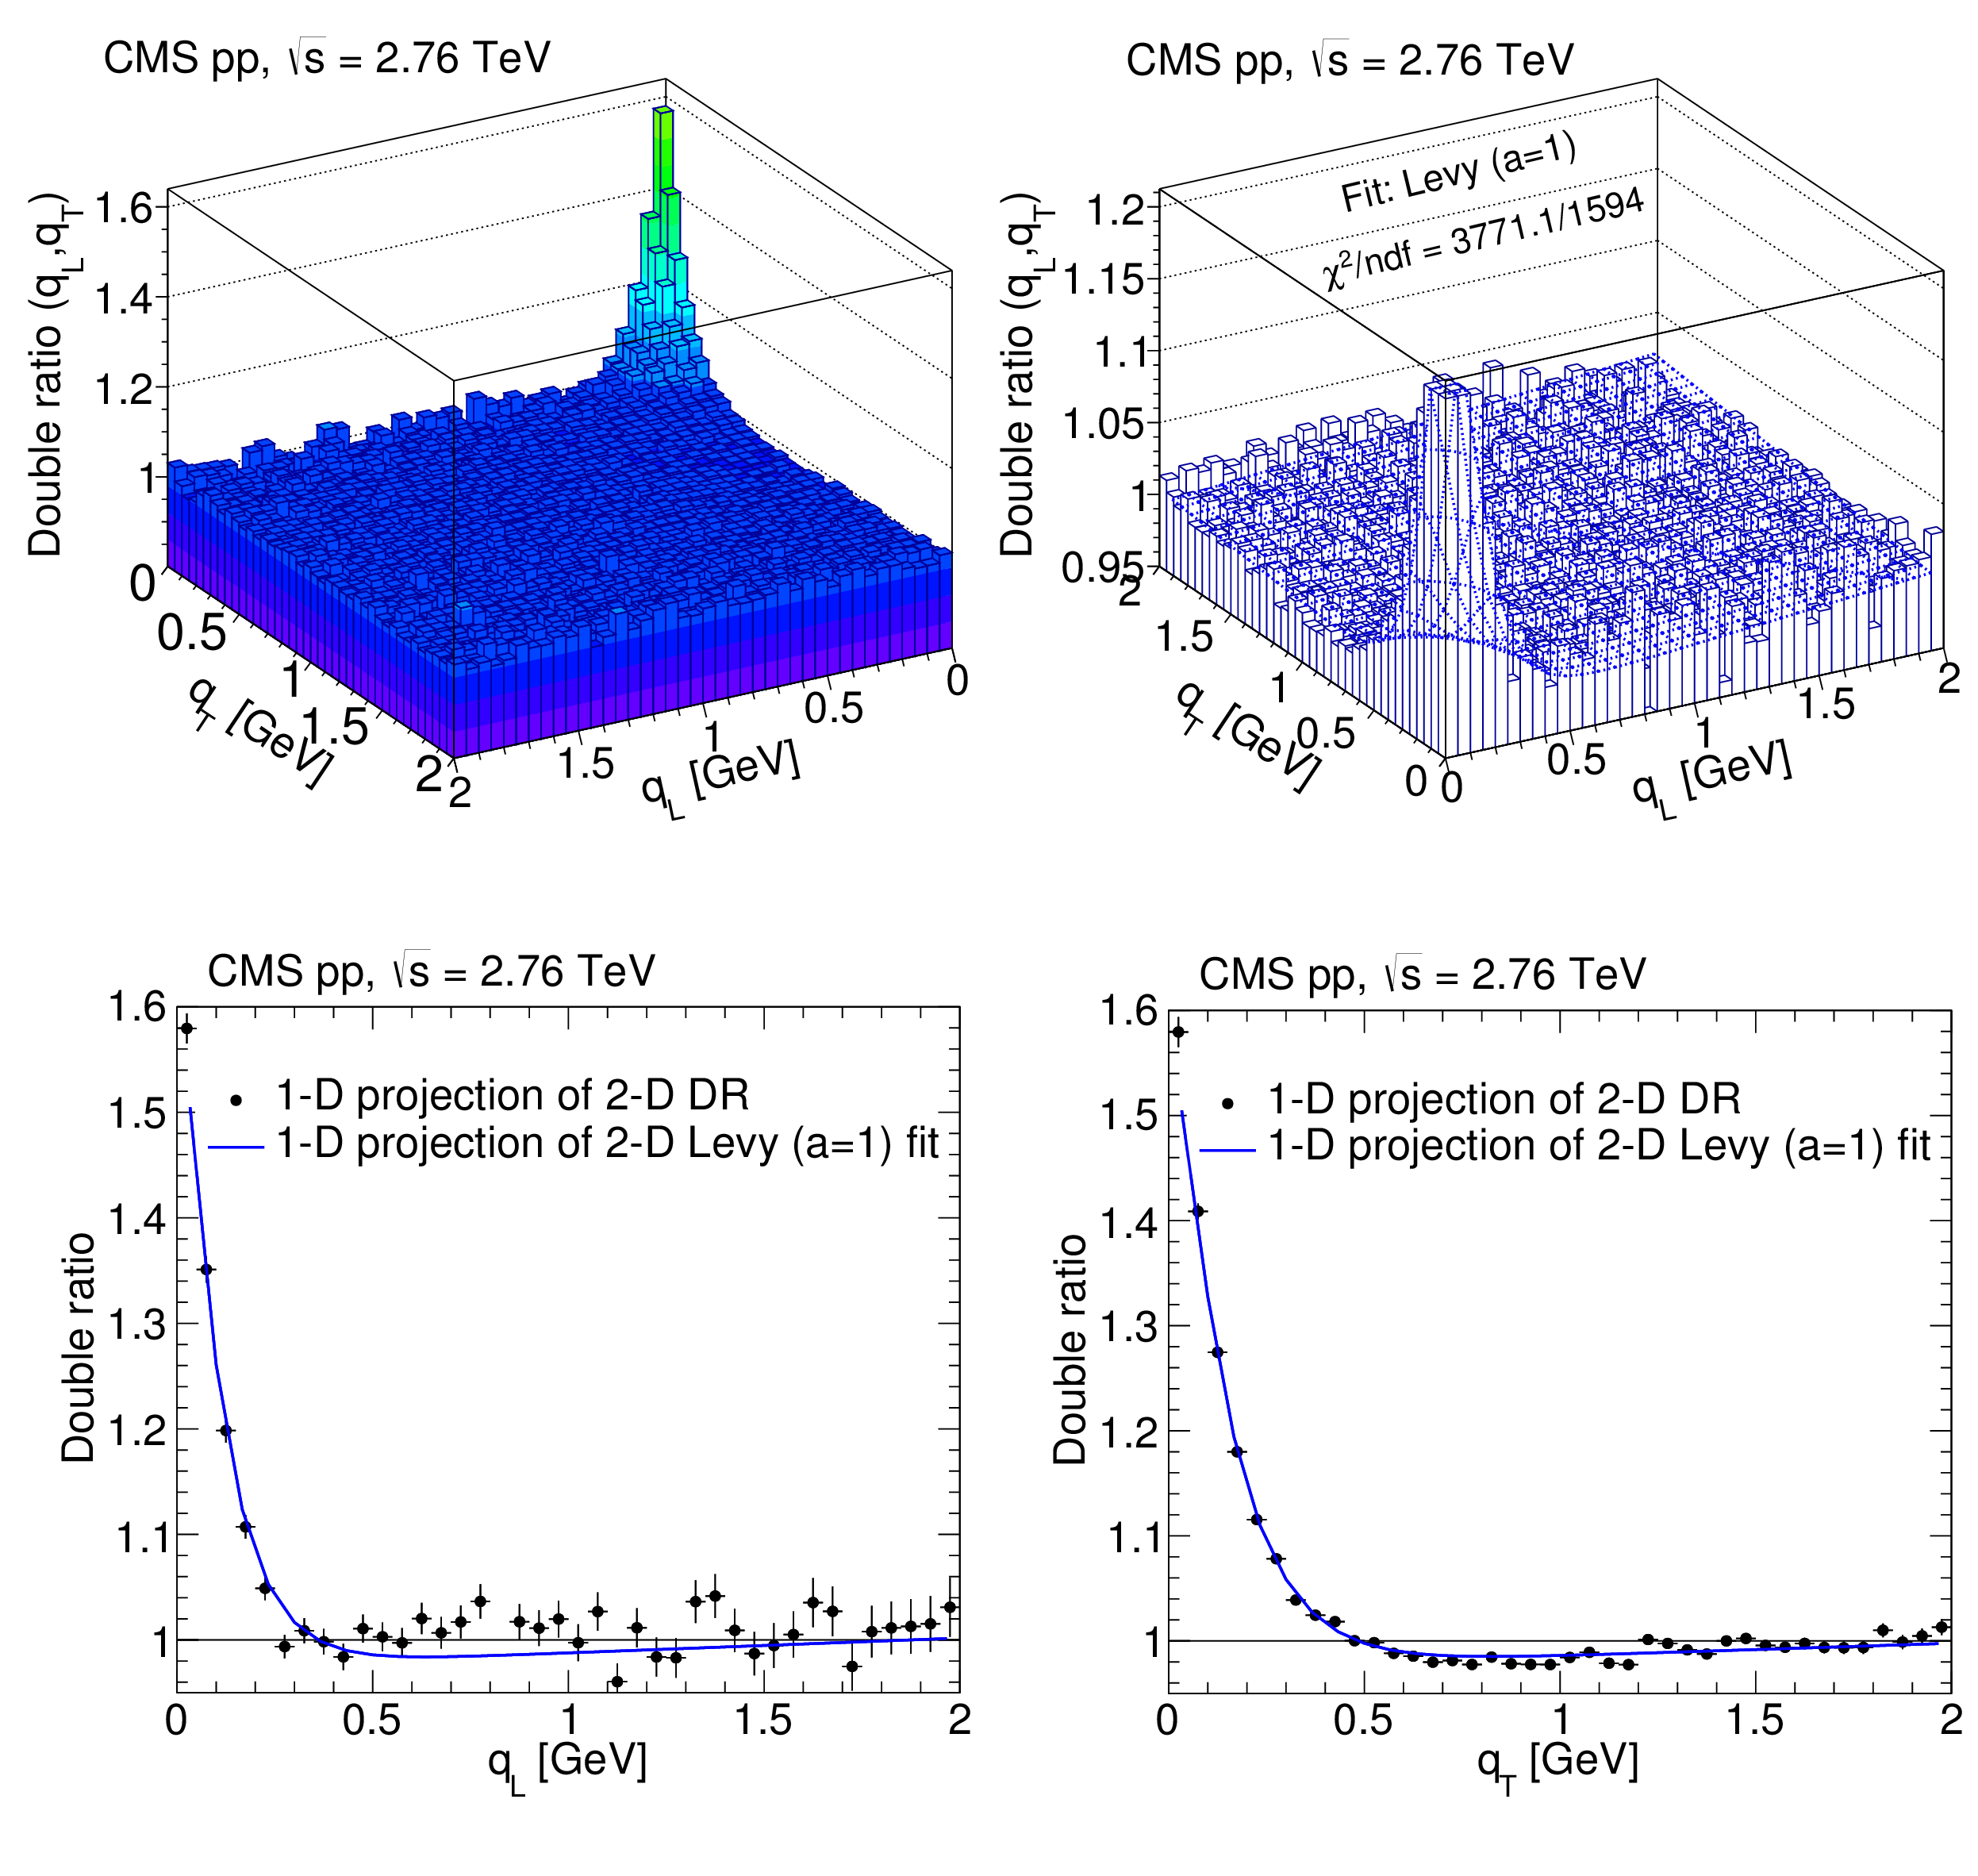
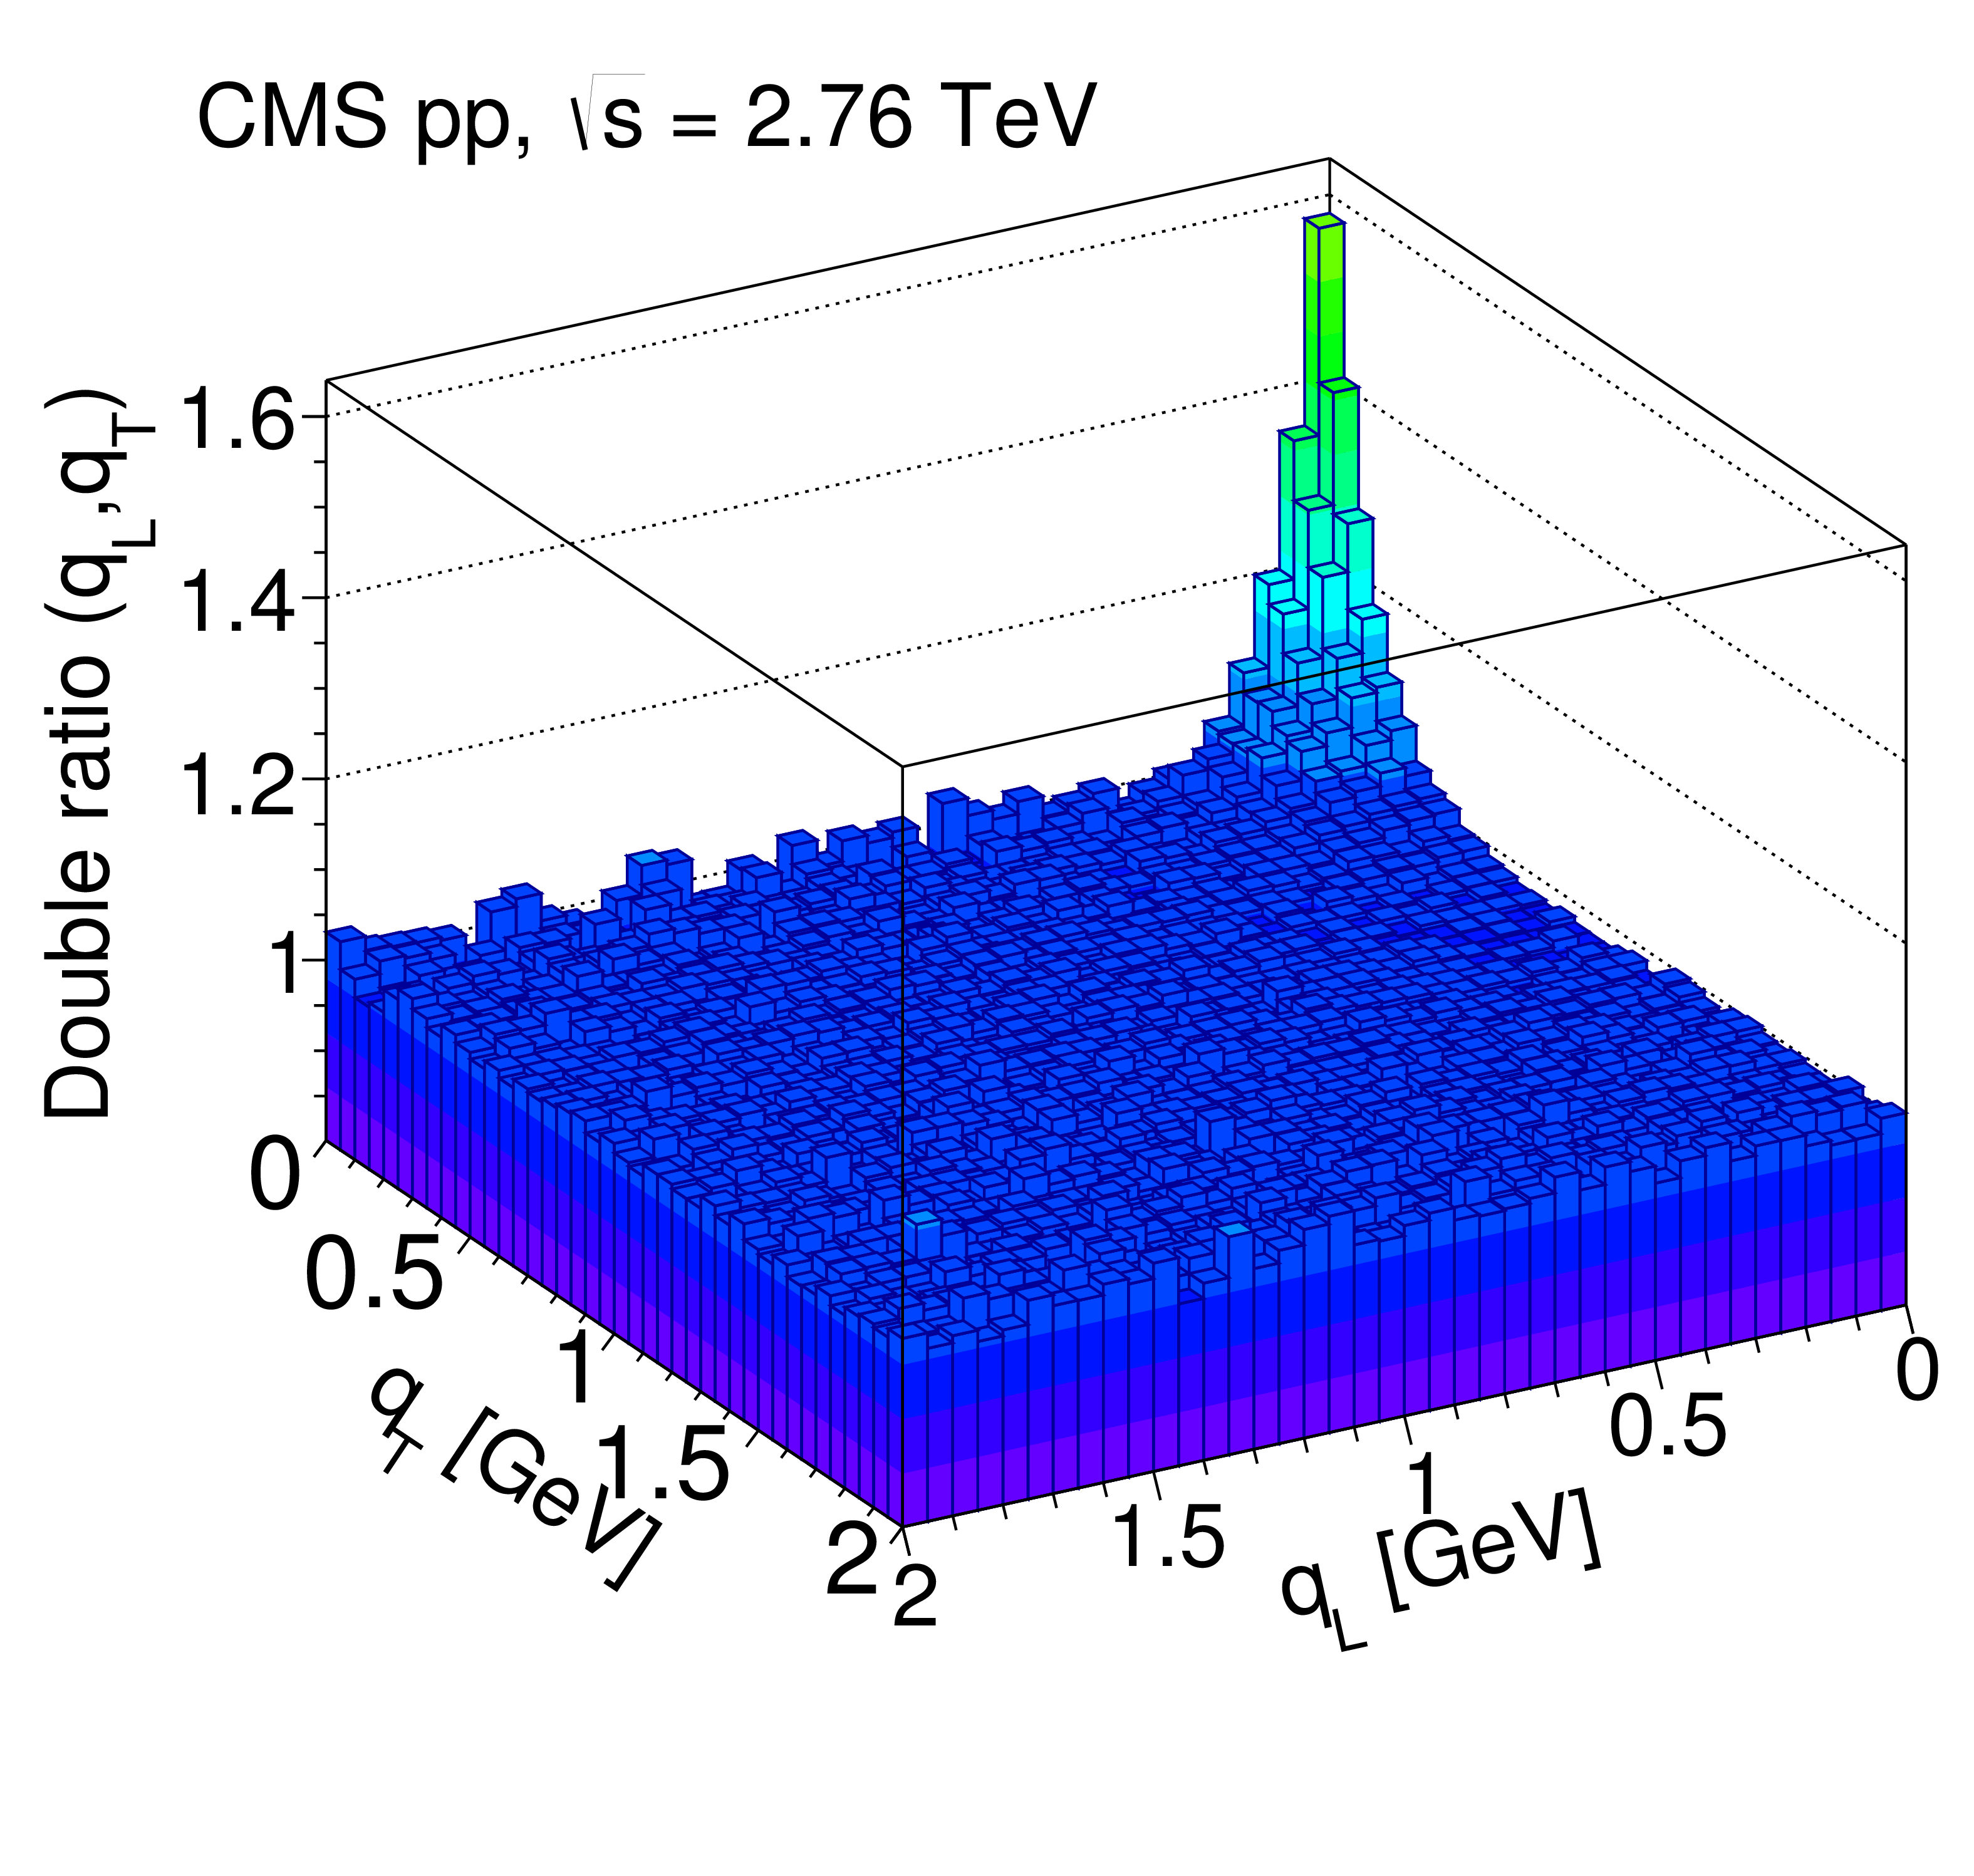
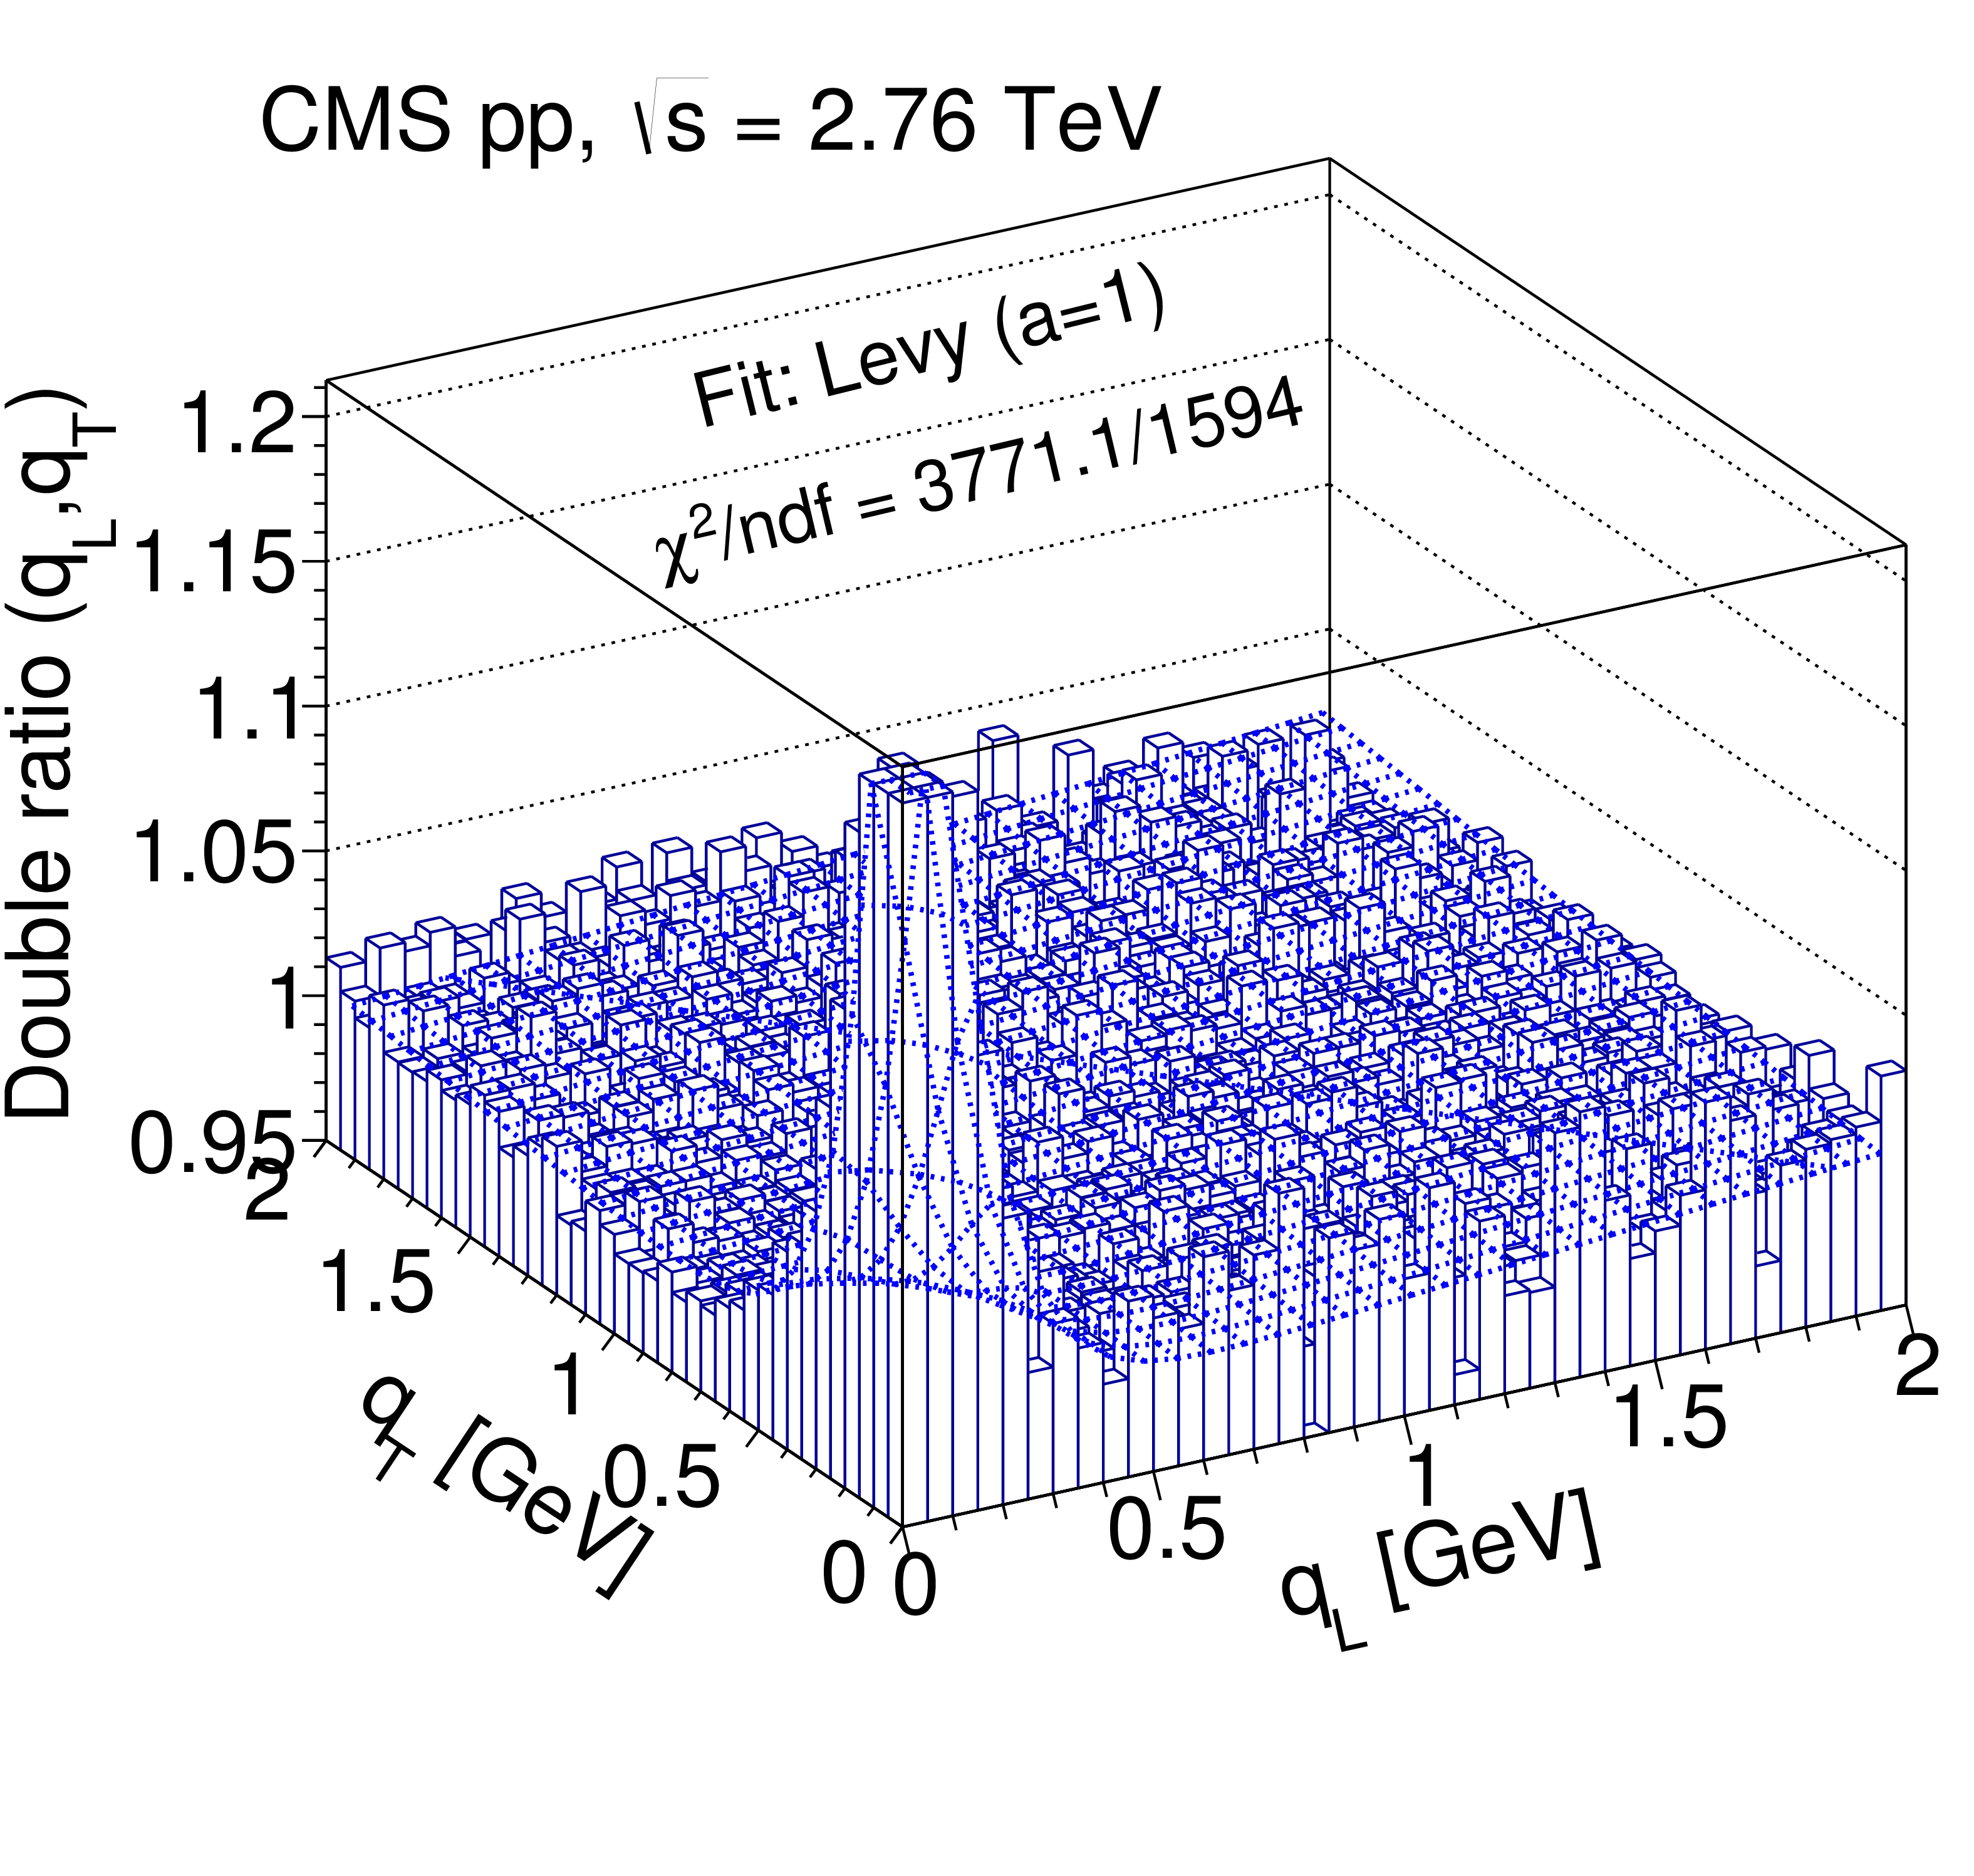
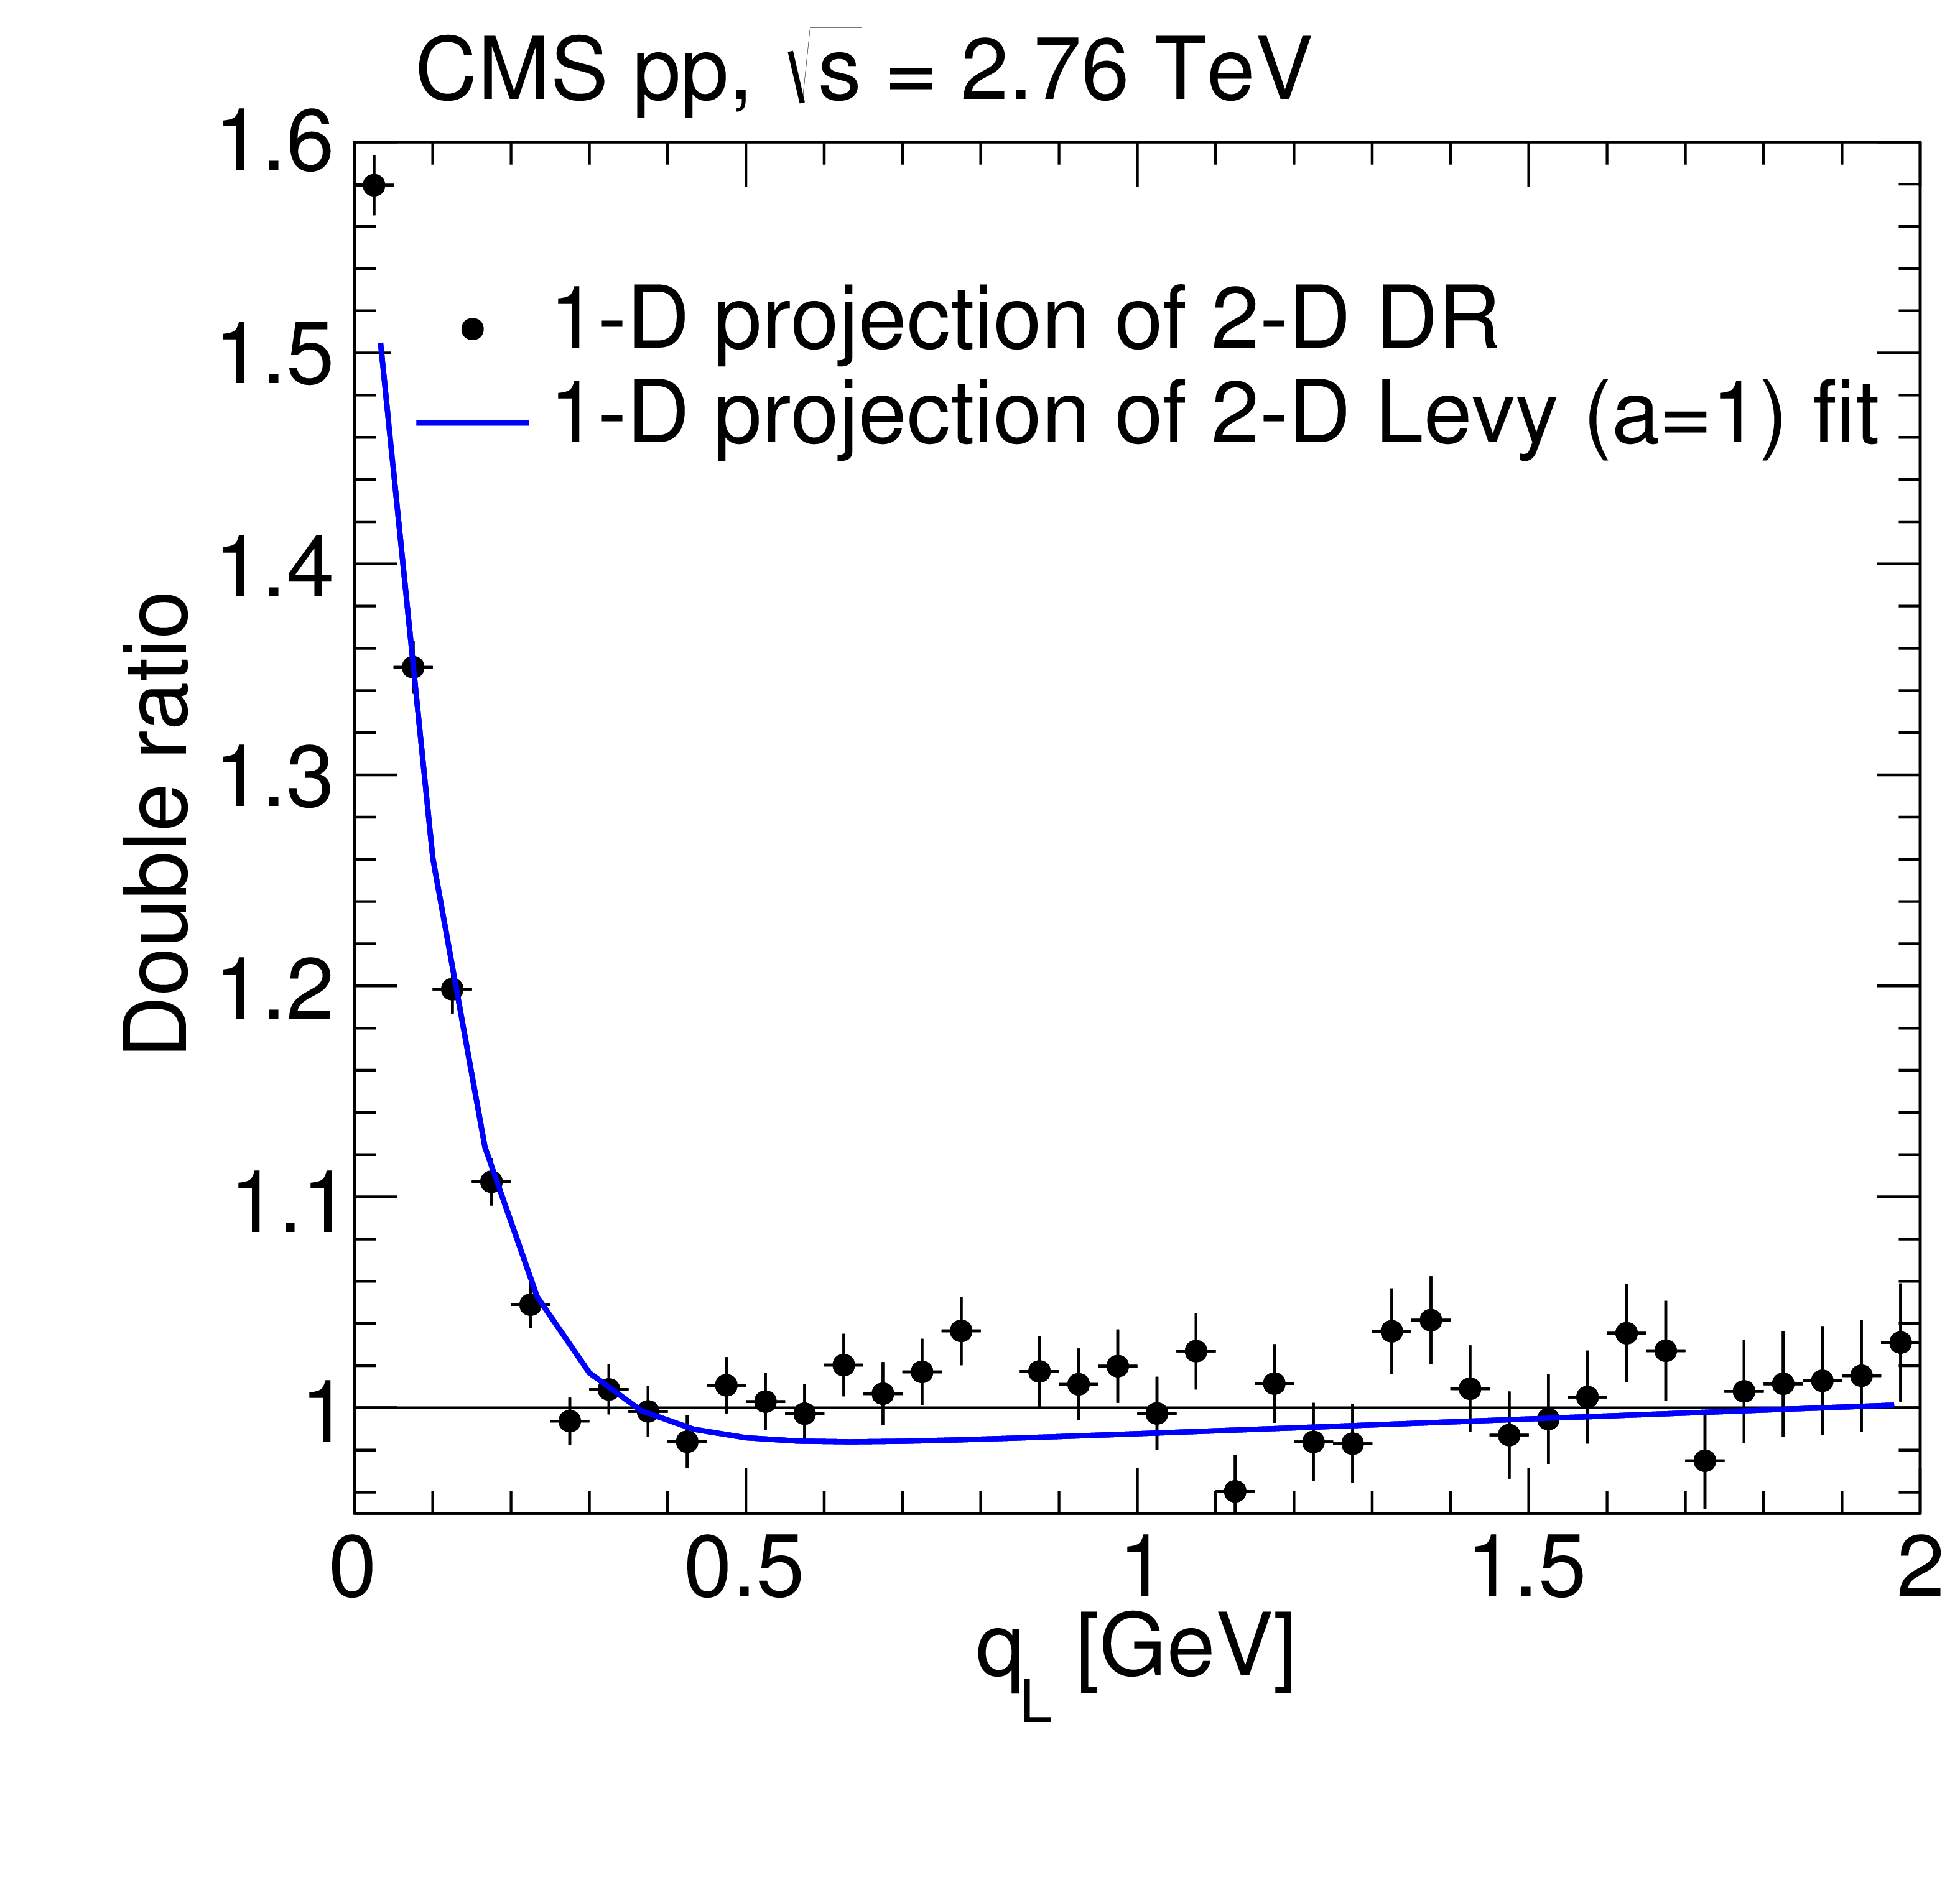
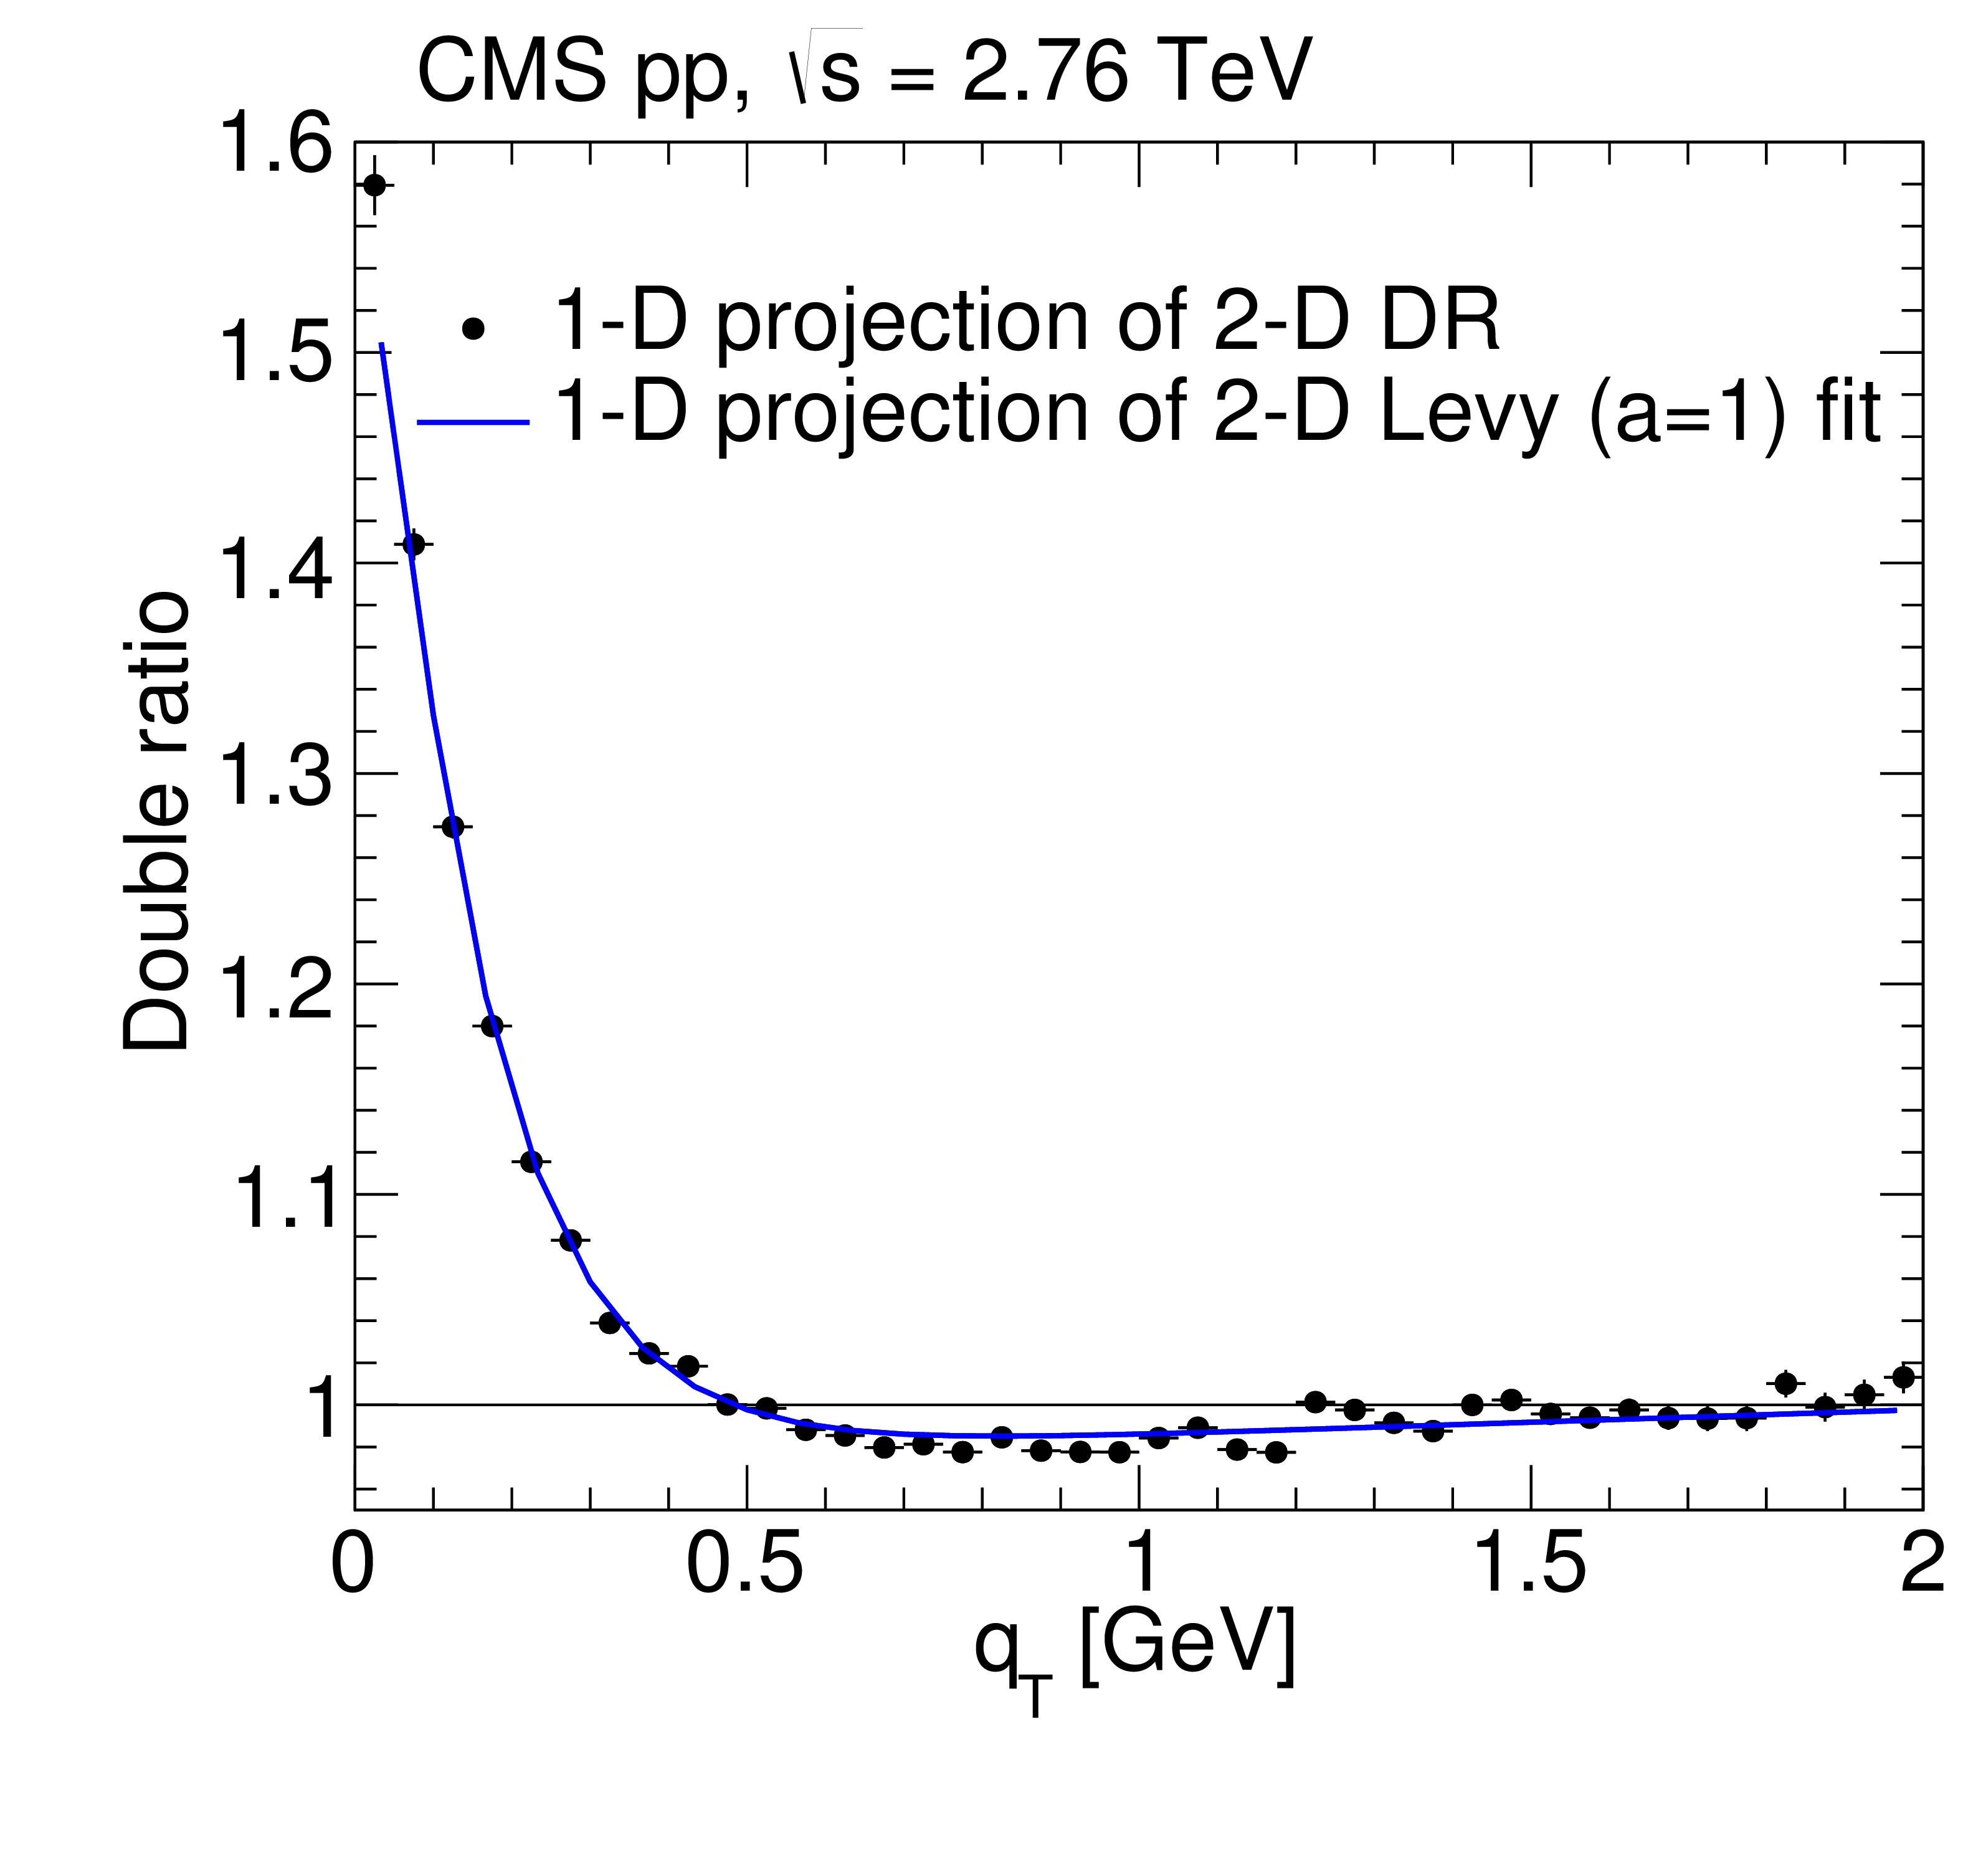
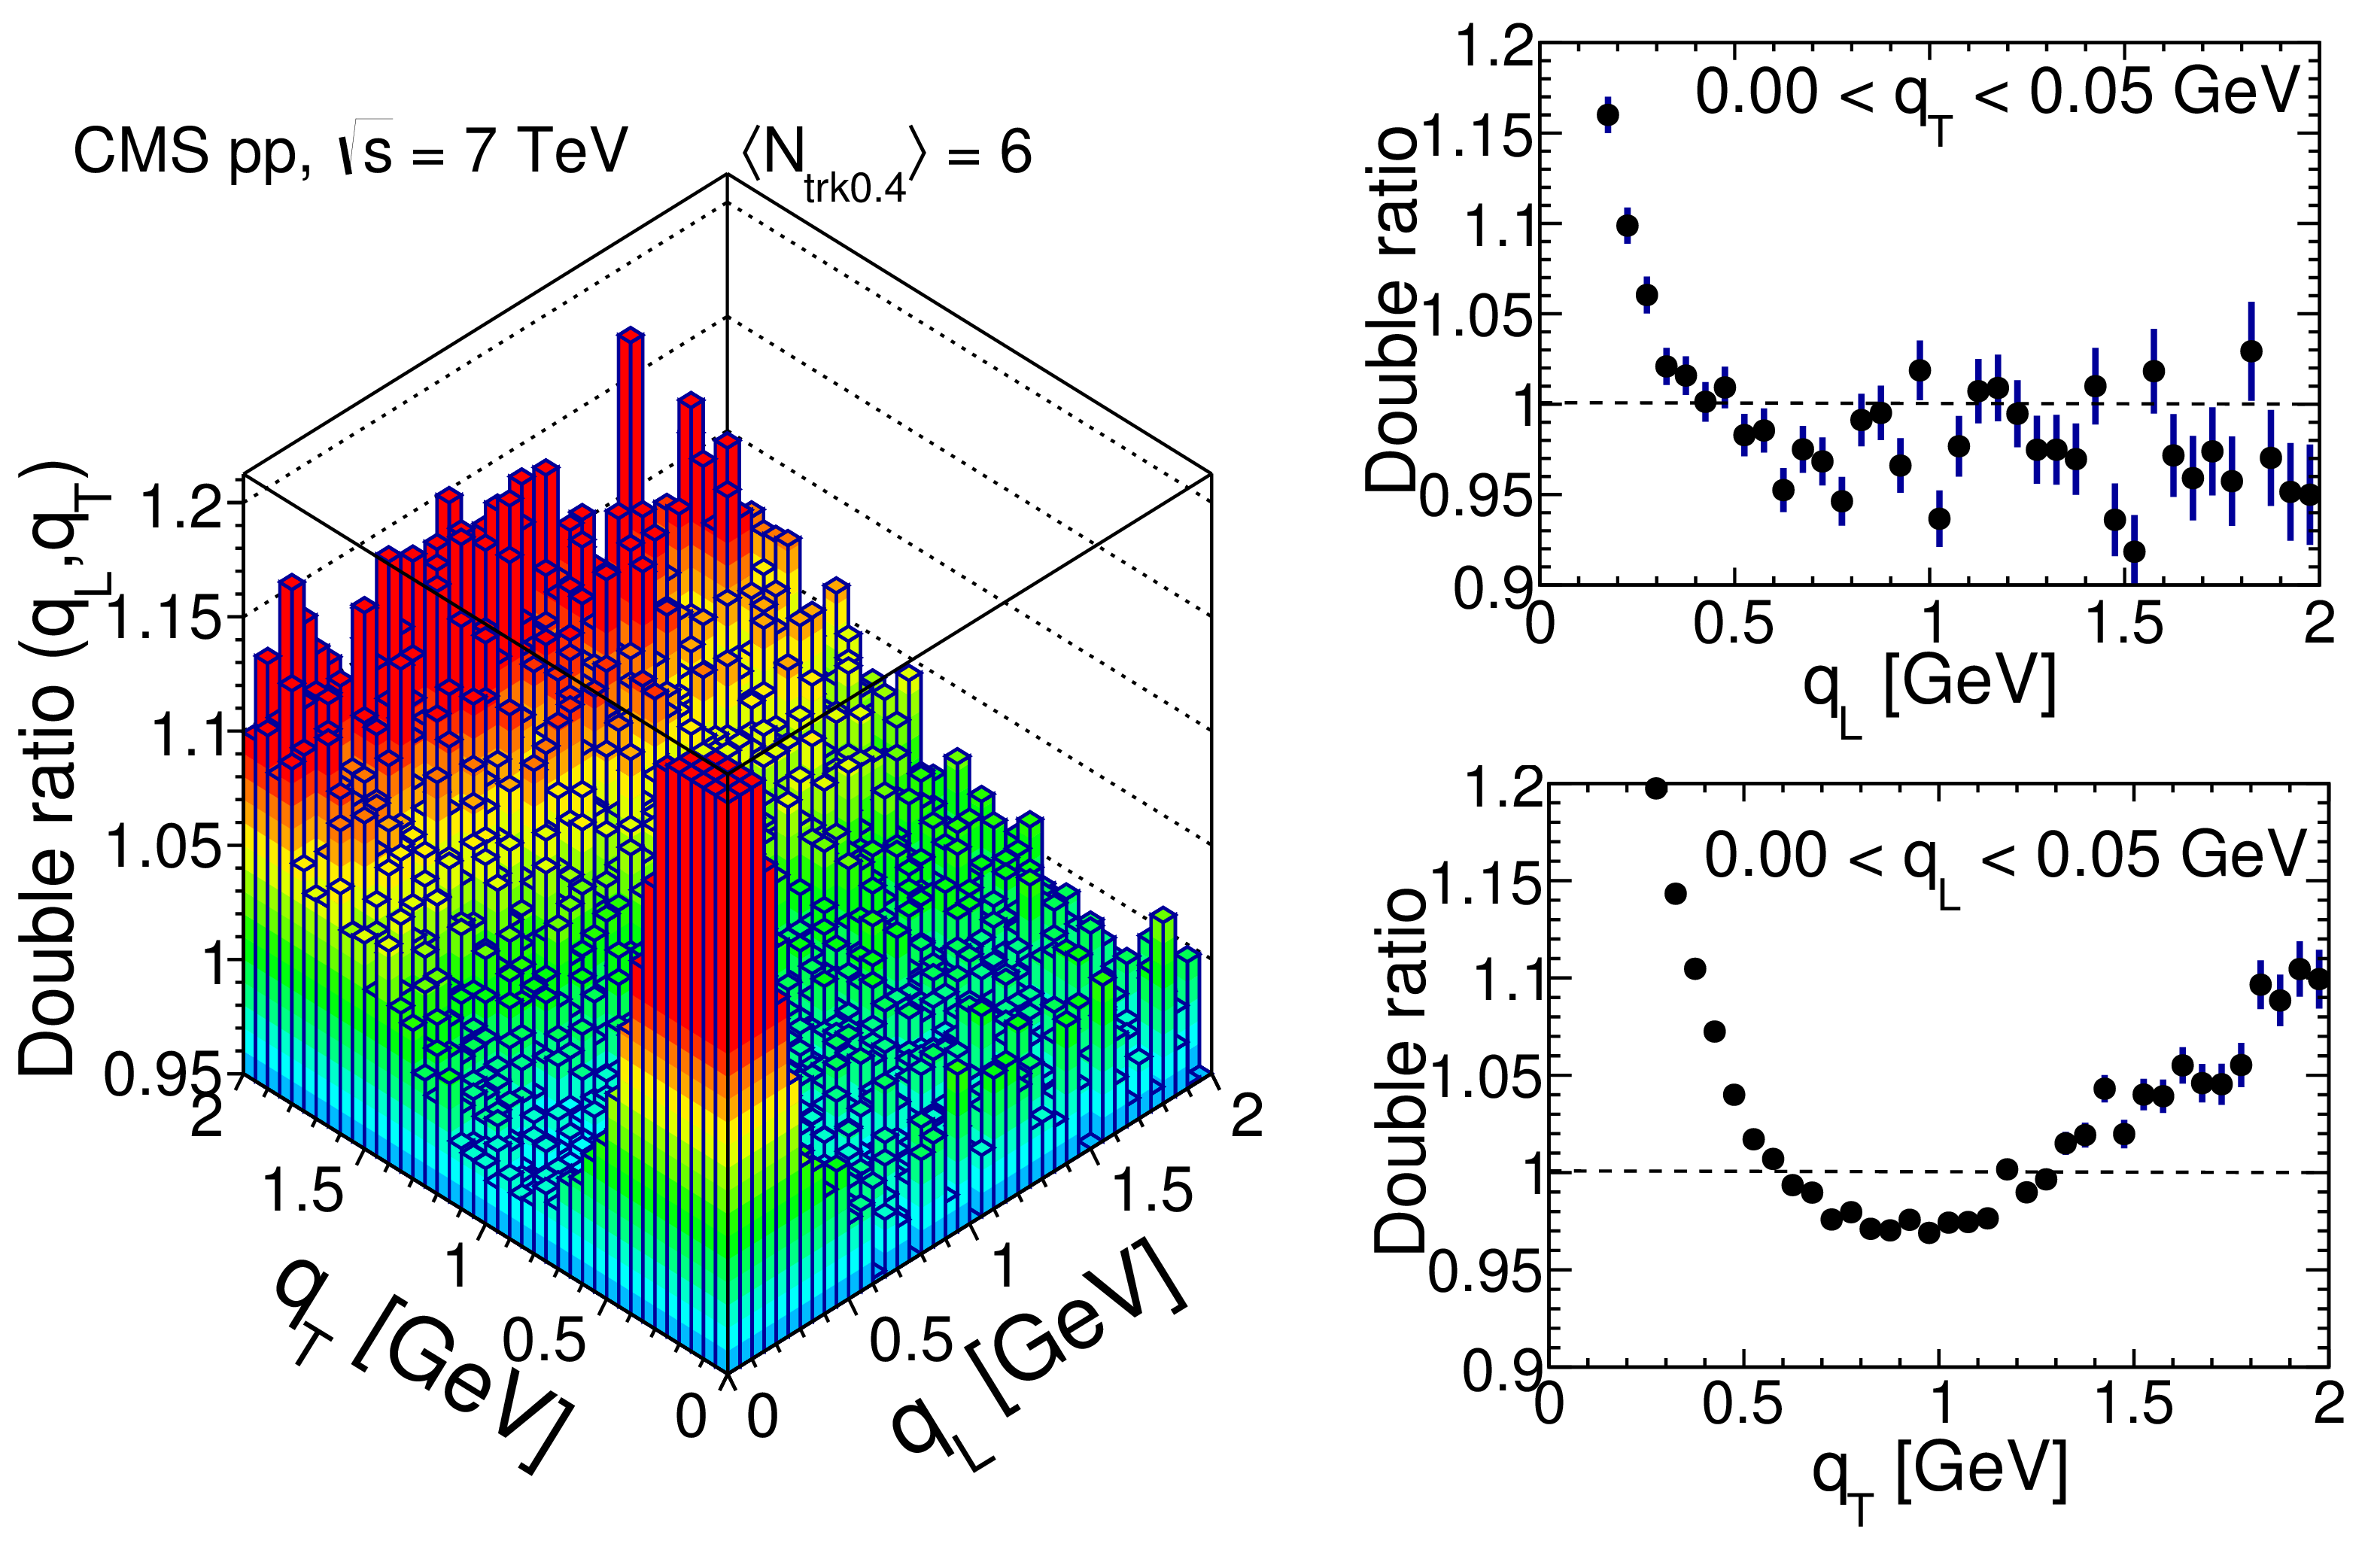
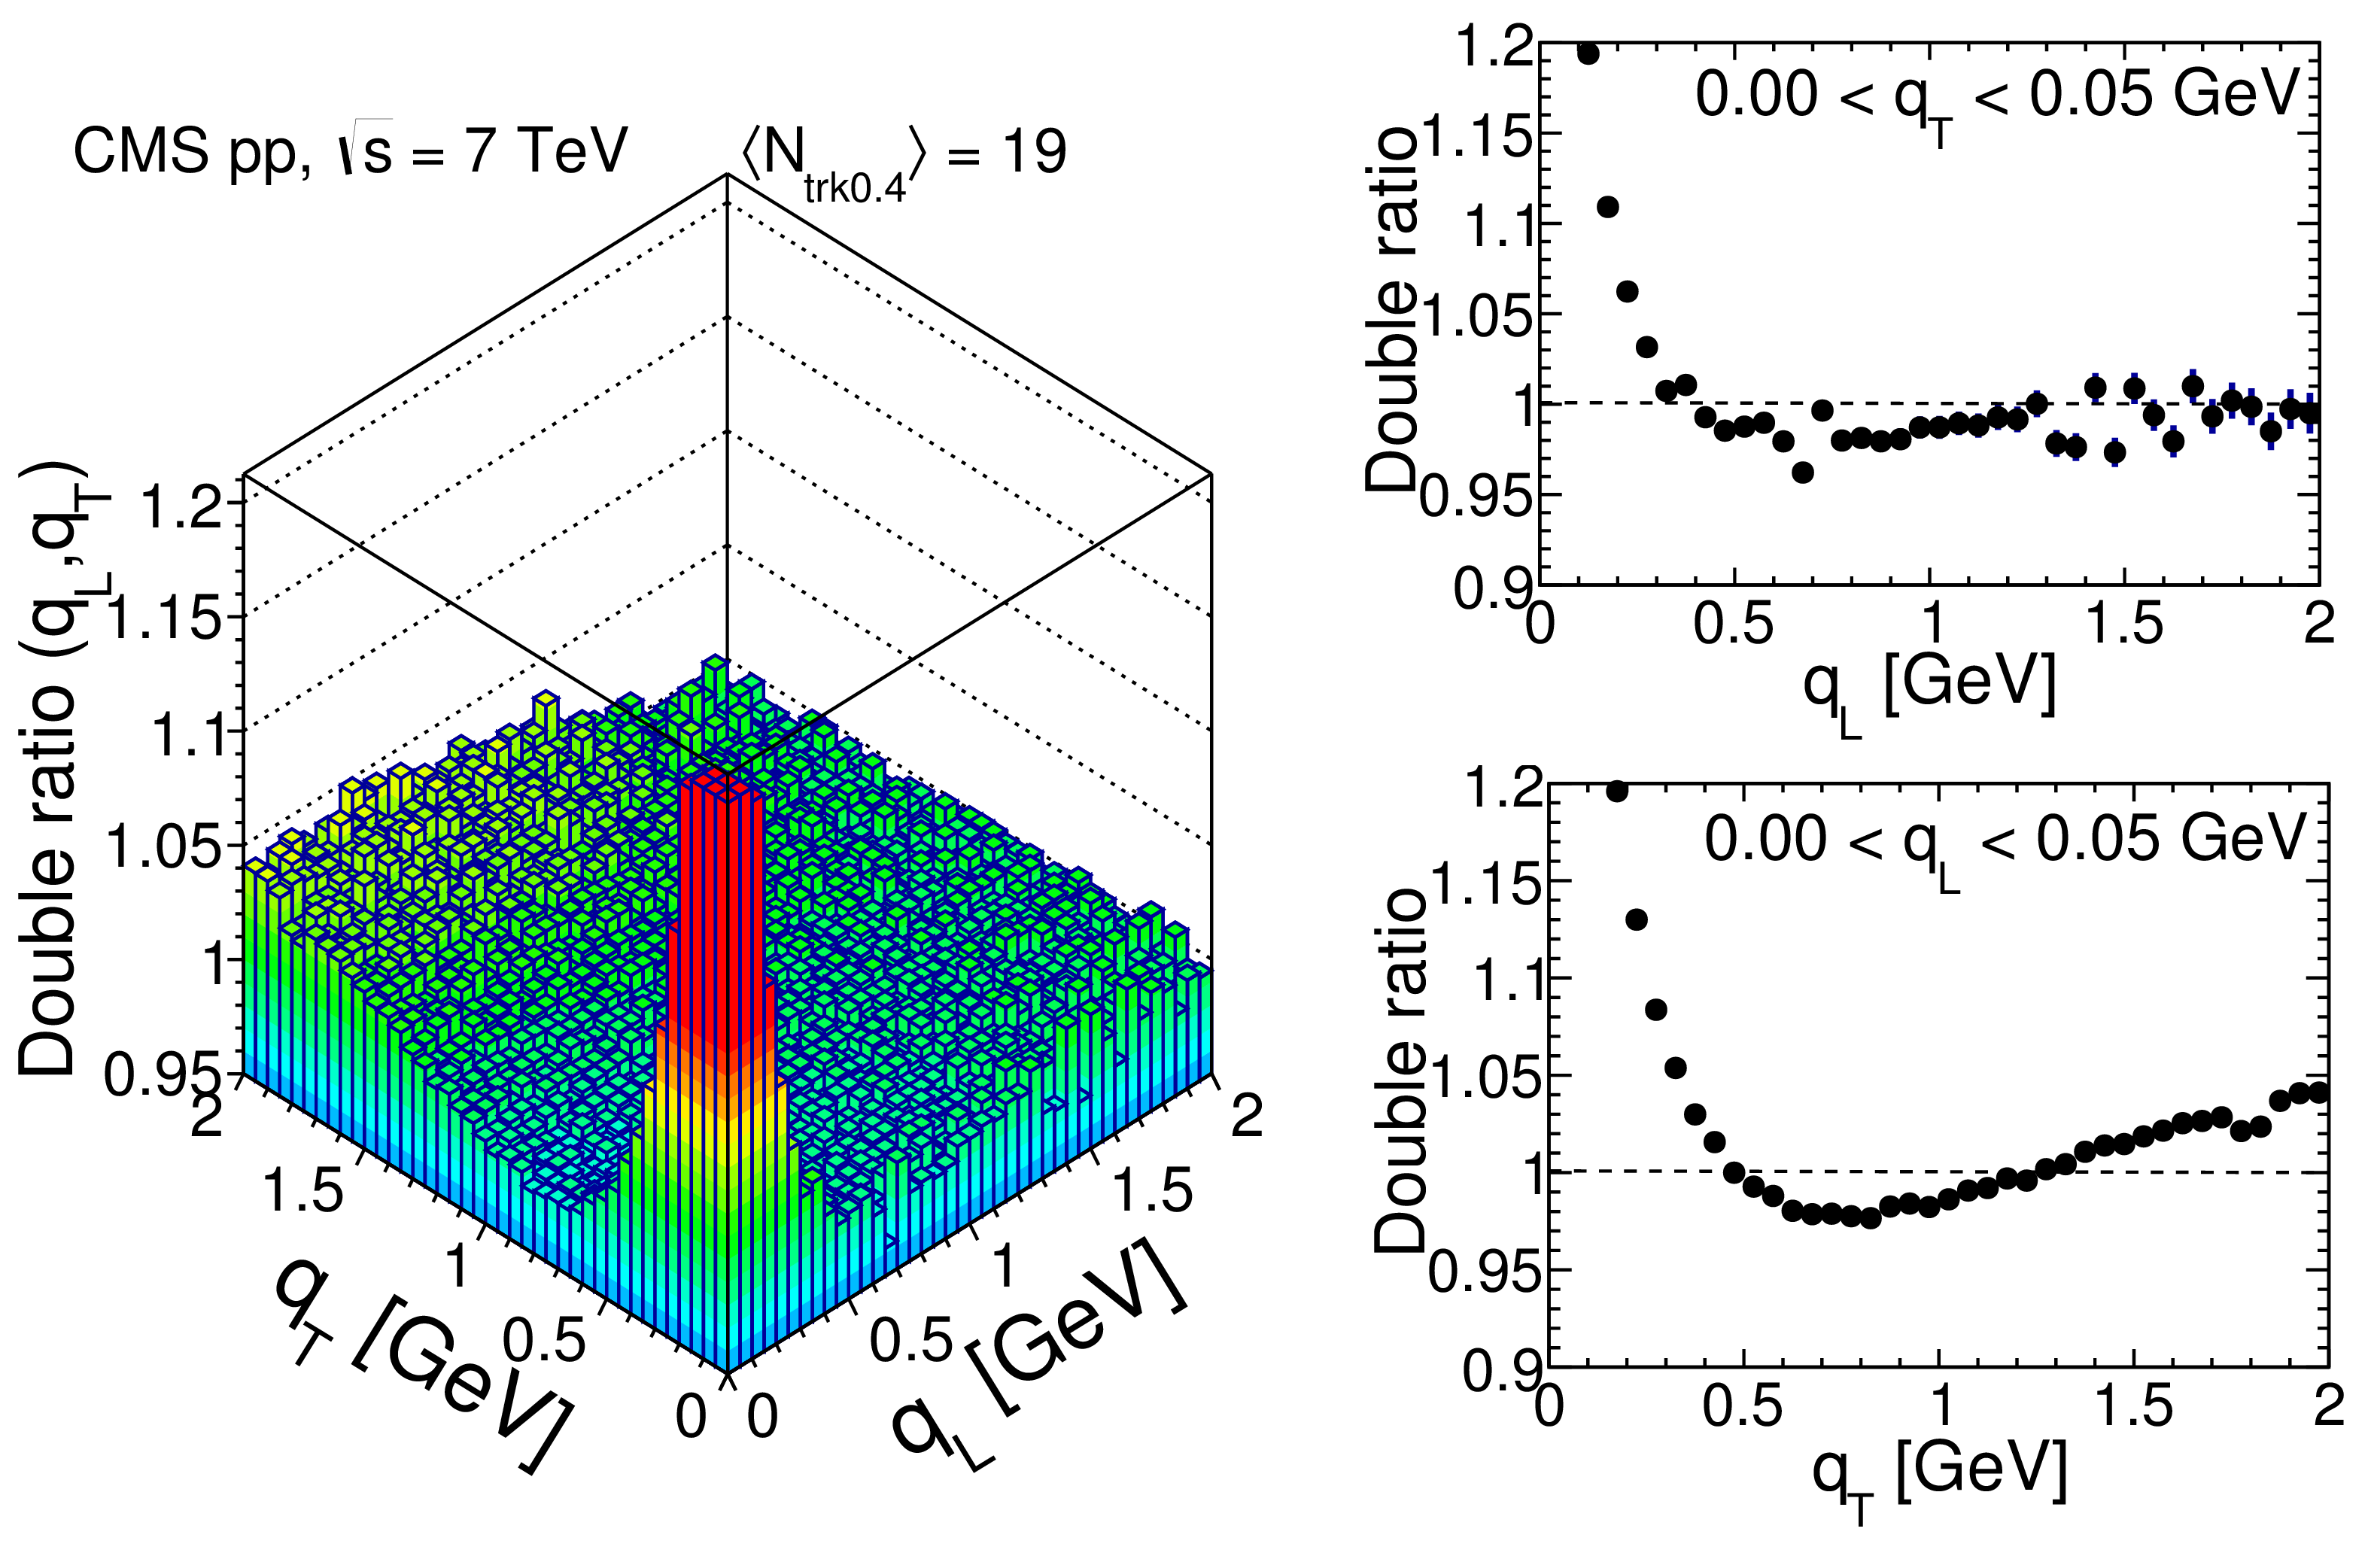
Double ratio results measured in the LCMS, integrated over all $ {N_\text {trk0.4}} $ and $ {k_{\mathrm {T}}} $ bins, in pp collisions at $\sqrt {s} = $ 2.76 TeV. Top: 2D correlation functions as a function of $({q_\text {T}}, {q_\text {L}})$ without (left) and with (right) the 2D L\'evy (with $a = 1$) fit function superimposed. Bottom: Corresponding 1D projections in terms of $ {q_\text {L}} $ (for $| {q_\text {T}} | < $ 0.05 GeV, left) and $ {q_\text {T}} $ (for $| {q_\text {L}} | < $ 0.05 GeV, right). The error bars indicate statistical uncertainties. |
png pdf |
Figure 11-a:
Double ratio results measured in the LCMS, integrated over all $ {N_\text {trk0.4}} $ and $ {k_{\mathrm {T}}} $ bins, in pp collisions at $\sqrt {s} = $ 2.76 TeV. Top: 2D correlation functions as a function of $({q_\text {T}}, {q_\text {L}})$ without (left) and with (right) the 2D L\'evy (with $a = 1$) fit function superimposed. Bottom: Corresponding 1D projections in terms of $ {q_\text {L}} $ (for $| {q_\text {T}} | < $ 0.05 GeV, left) and $ {q_\text {T}} $ (for $| {q_\text {L}} | < $ 0.05 GeV, right). The error bars indicate statistical uncertainties. |
png pdf |
Figure 11-b:
Double ratio results measured in the LCMS, integrated over all $ {N_\text {trk0.4}} $ and $ {k_{\mathrm {T}}} $ bins, in pp collisions at $\sqrt {s} = $ 2.76 TeV. Top: 2D correlation functions as a function of $({q_\text {T}}, {q_\text {L}})$ without (left) and with (right) the 2D L\'evy (with $a = 1$) fit function superimposed. Bottom: Corresponding 1D projections in terms of $ {q_\text {L}} $ (for $| {q_\text {T}} | < $ 0.05 GeV, left) and $ {q_\text {T}} $ (for $| {q_\text {L}} | < $ 0.05 GeV, right). The error bars indicate statistical uncertainties. |
png pdf |
Figure 11-c:
Double ratio results measured in the LCMS, integrated over all $ {N_\text {trk0.4}} $ and $ {k_{\mathrm {T}}} $ bins, in pp collisions at $\sqrt {s} = $ 2.76 TeV. Top: 2D correlation functions as a function of $({q_\text {T}}, {q_\text {L}})$ without (left) and with (right) the 2D L\'evy (with $a = 1$) fit function superimposed. Bottom: Corresponding 1D projections in terms of $ {q_\text {L}} $ (for $| {q_\text {T}} | < $ 0.05 GeV, left) and $ {q_\text {T}} $ (for $| {q_\text {L}} | < $ 0.05 GeV, right). The error bars indicate statistical uncertainties. |
png pdf |
Figure 11-d:
Double ratio results measured in the LCMS, integrated over all $ {N_\text {trk0.4}} $ and $ {k_{\mathrm {T}}} $ bins, in pp collisions at $\sqrt {s} = $ 2.76 TeV. Top: 2D correlation functions as a function of $({q_\text {T}}, {q_\text {L}})$ without (left) and with (right) the 2D L\'evy (with $a = 1$) fit function superimposed. Bottom: Corresponding 1D projections in terms of $ {q_\text {L}} $ (for $| {q_\text {T}} | < $ 0.05 GeV, left) and $ {q_\text {T}} $ (for $| {q_\text {L}} | < $ 0.05 GeV, right). The error bars indicate statistical uncertainties. |
png pdf |
Figure 12:
Radius parameters as a function of $ {k_{\mathrm {T}}} $, for different $ {N_\text {trk0.4}} $ bins, obtained from data fitted to the stretched exponential function in pp collisions at $\sqrt {s} = $ 2.76 TeV (open symbols) and 7 TeV (filled symbols) in the CM frame (top) and in the LCMS (bottom). The boxes indicate the systematic uncertainties. |
png pdf |
Figure 12-a:
Radius parameters as a function of $ {k_{\mathrm {T}}} $, for different $ {N_\text {trk0.4}} $ bins, obtained from data fitted to the stretched exponential function in pp collisions at $\sqrt {s} = $ 2.76 TeV (open symbols) and 7 TeV (filled symbols) in the CM frame (top) and in the LCMS (bottom). The boxes indicate the systematic uncertainties. |
png pdf |
Figure 12-b:
Radius parameters as a function of $ {k_{\mathrm {T}}} $, for different $ {N_\text {trk0.4}} $ bins, obtained from data fitted to the stretched exponential function in pp collisions at $\sqrt {s} = $ 2.76 TeV (open symbols) and 7 TeV (filled symbols) in the CM frame (top) and in the LCMS (bottom). The boxes indicate the systematic uncertainties. |
png pdf |
Figure 12-c:
Radius parameters as a function of $ {k_{\mathrm {T}}} $, for different $ {N_\text {trk0.4}} $ bins, obtained from data fitted to the stretched exponential function in pp collisions at $\sqrt {s} = $ 2.76 TeV (open symbols) and 7 TeV (filled symbols) in the CM frame (top) and in the LCMS (bottom). The boxes indicate the systematic uncertainties. |
png pdf |
Figure 12-d:
Radius parameters as a function of $ {k_{\mathrm {T}}} $, for different $ {N_\text {trk0.4}} $ bins, obtained from data fitted to the stretched exponential function in pp collisions at $\sqrt {s} = $ 2.76 TeV (open symbols) and 7 TeV (filled symbols) in the CM frame (top) and in the LCMS (bottom). The boxes indicate the systematic uncertainties. |
png pdf |
Figure 13:
Intercept parameter $\lambda $ as a function of $ {k_{\mathrm {T}}} $, for different $ {N_\text {trk0.4}} $ bins, obtained from data fitted to the stretched exponential function in pp collisions at $\sqrt {s} = $ 2.76 TeV (open symbols) and 7 TeV (filled symbols) in the CM frame (left) and in the LCMS (right). The boxes indicate the systematic uncertainties. |
png pdf |
Figure 13-a:
Intercept parameter $\lambda $ as a function of $ {k_{\mathrm {T}}} $, for different $ {N_\text {trk0.4}} $ bins, obtained from data fitted to the stretched exponential function in pp collisions at $\sqrt {s} = $ 2.76 TeV (open symbols) and 7 TeV (filled symbols) in the CM frame (left) and in the LCMS (right). The boxes indicate the systematic uncertainties. |
png pdf |
Figure 13-b:
Intercept parameter $\lambda $ as a function of $ {k_{\mathrm {T}}} $, for different $ {N_\text {trk0.4}} $ bins, obtained from data fitted to the stretched exponential function in pp collisions at $\sqrt {s} = $ 2.76 TeV (open symbols) and 7 TeV (filled symbols) in the CM frame (left) and in the LCMS (right). The boxes indicate the systematic uncertainties. |

png pdf |
Figure 14:
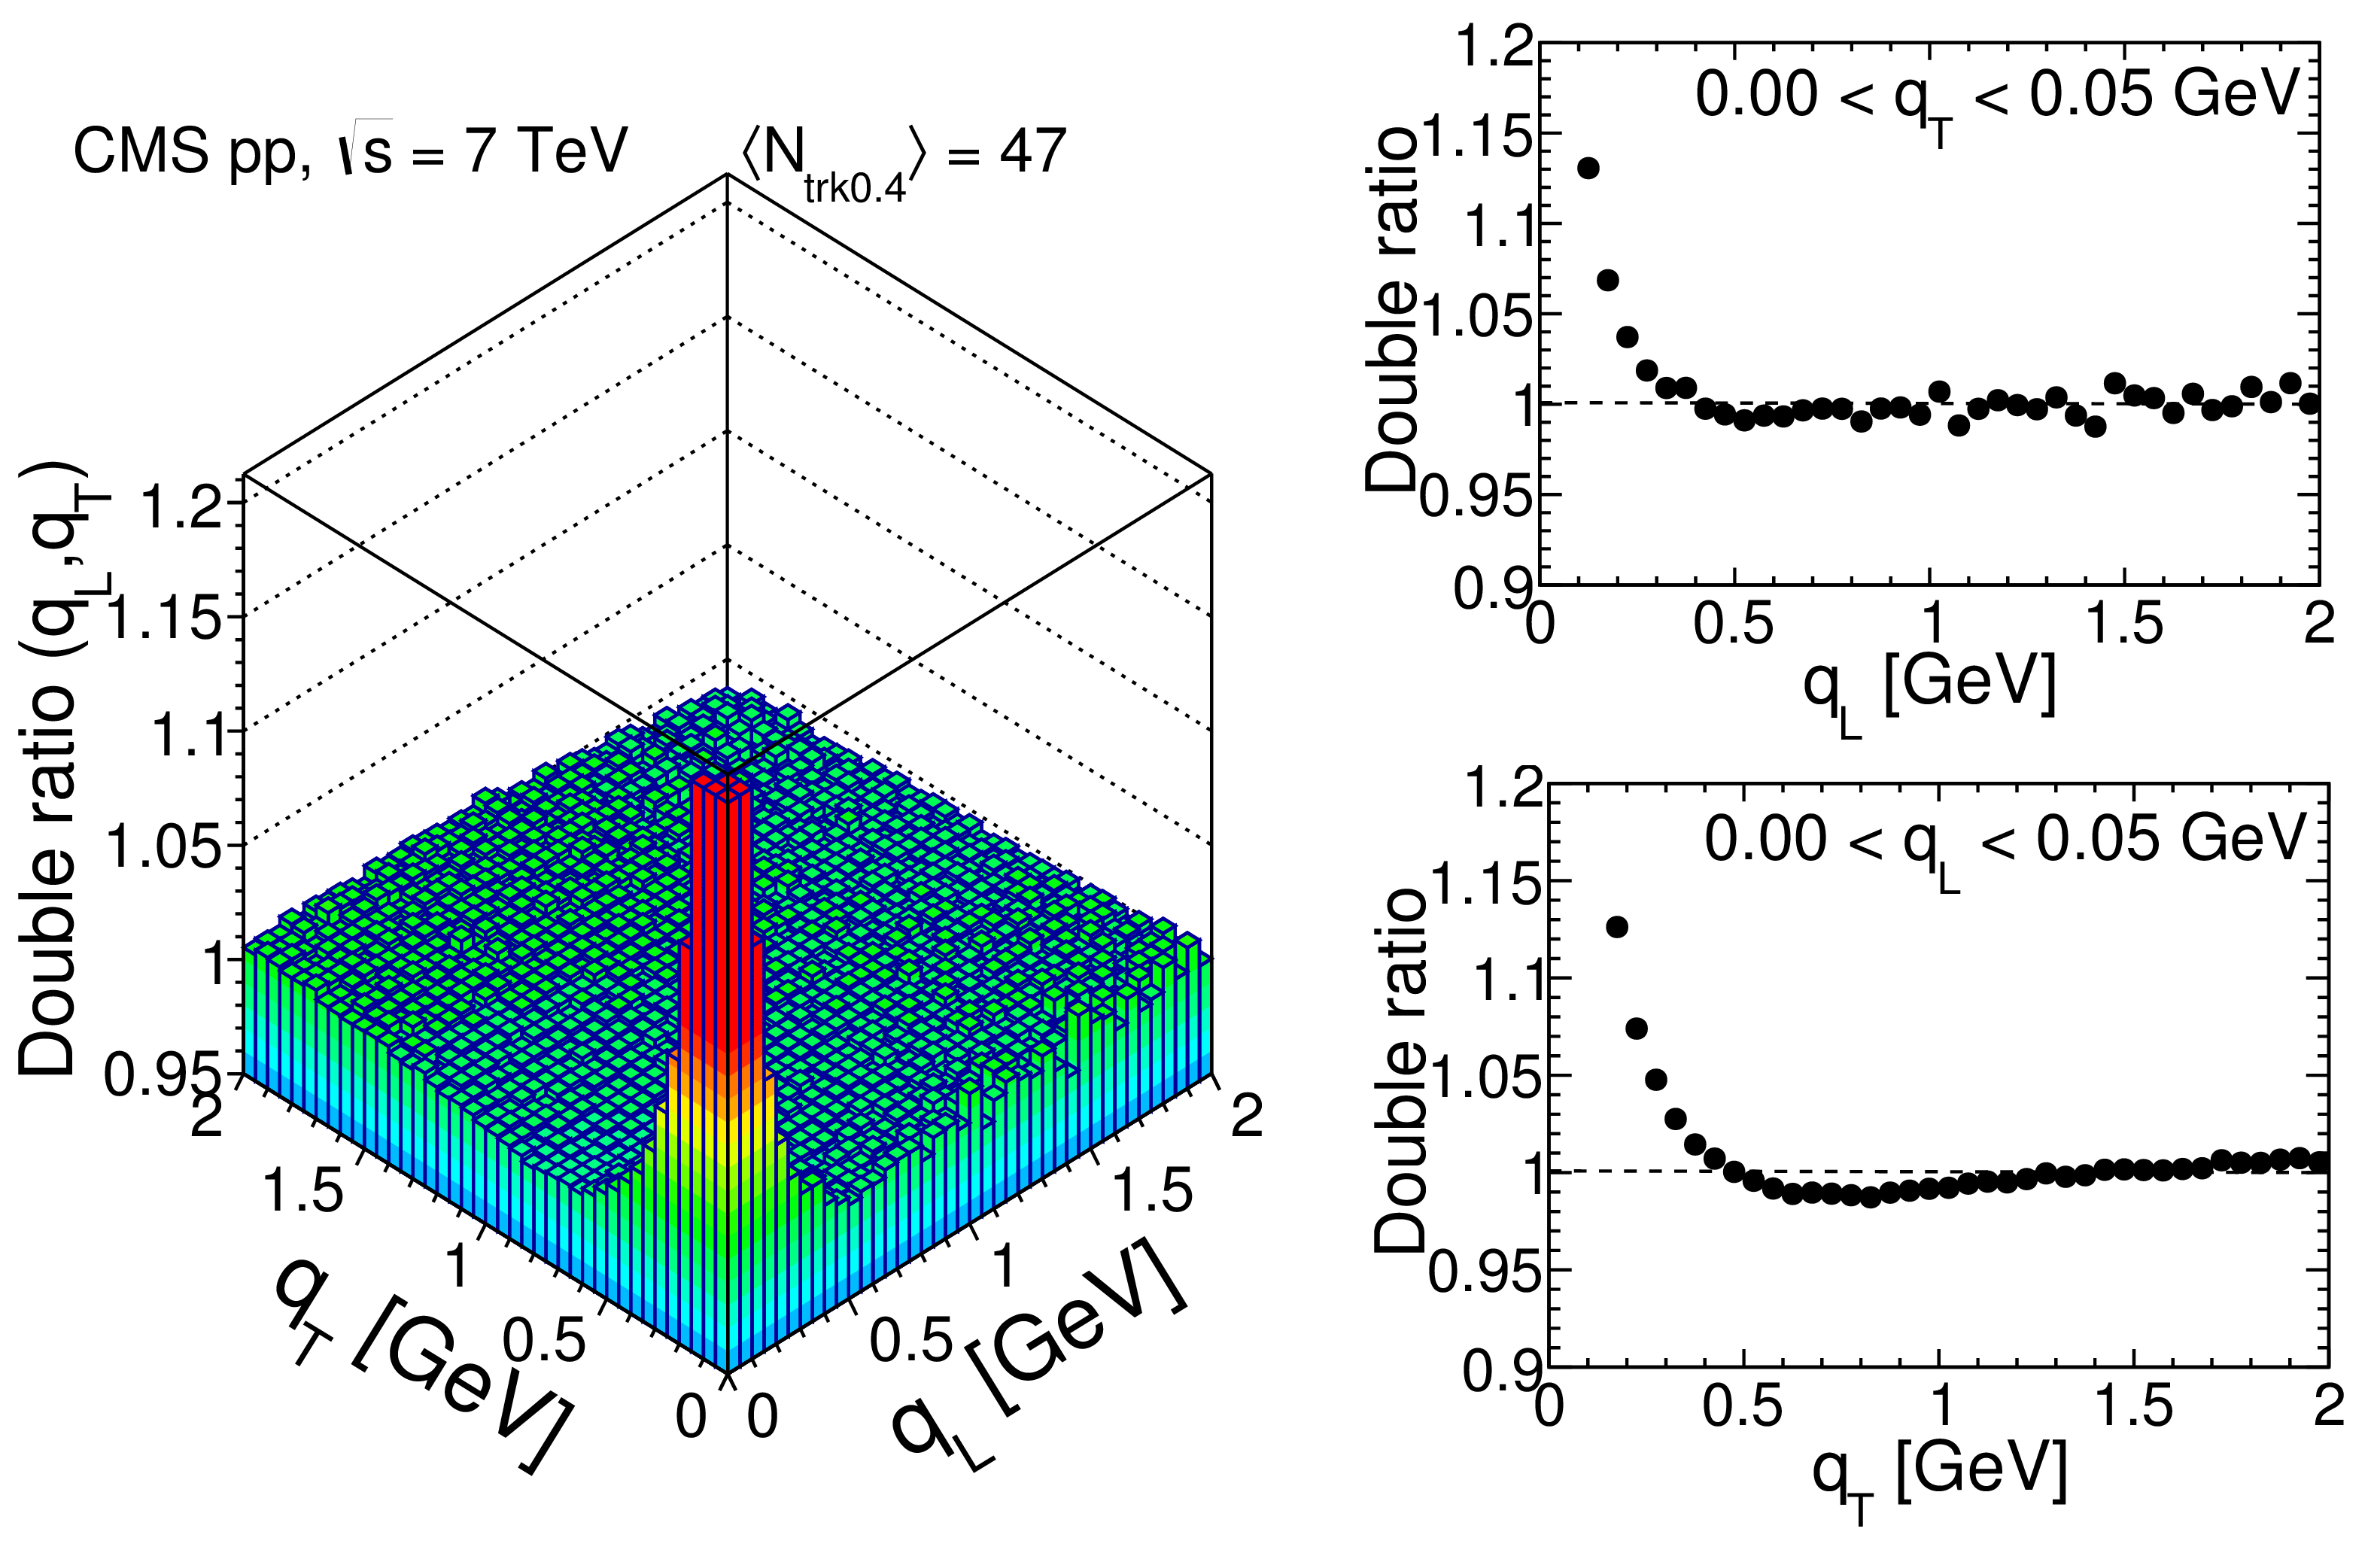
Results obtained in the LCMS for the 2D double ratios in the $({q_\text {L}}, {q_\text {T}})$ plane, zoomed along the correlation function axis, for four charged multiplicity bins, $ {N_\text {trk0.4}} $ (integrated over all $ {k_{\mathrm {T}}} $), increasing from upper left to lower right. The BEC peak is cut off at $\sim $1.2 for a better visualization of the directional behavior. The 1D projections in $ {q_\text {L}} $ (for $ {| {q_\text {T}} |} < $ 0.05 GeV) and $ {q_\text {T}} $ (for $ {| {q_\text {L}} |} < $ 0.05 GeV) are shown to the right of the bidimensional plots, with error bars corresponding to statistical uncertainties. |
png pdf |
Figure 14-a:
Results obtained in the LCMS for the 2D double ratios in the $({q_\text {L}}, {q_\text {T}})$ plane, zoomed along the correlation function axis, for four charged multiplicity bins, $ {N_\text {trk0.4}} $ (integrated over all $ {k_{\mathrm {T}}} $), increasing from upper left to lower right. The BEC peak is cut off at $\sim $1.2 for a better visualization of the directional behavior. The 1D projections in $ {q_\text {L}} $ (for $ {| {q_\text {T}} |} < $ 0.05 GeV) and $ {q_\text {T}} $ (for $ {| {q_\text {L}} |} < $ 0.05 GeV) are shown to the right of the bidimensional plots, with error bars corresponding to statistical uncertainties. |
png pdf |
Figure 14-b:
Results obtained in the LCMS for the 2D double ratios in the $({q_\text {L}}, {q_\text {T}})$ plane, zoomed along the correlation function axis, for four charged multiplicity bins, $ {N_\text {trk0.4}} $ (integrated over all $ {k_{\mathrm {T}}} $), increasing from upper left to lower right. The BEC peak is cut off at $\sim $1.2 for a better visualization of the directional behavior. The 1D projections in $ {q_\text {L}} $ (for $ {| {q_\text {T}} |} < $ 0.05 GeV) and $ {q_\text {T}} $ (for $ {| {q_\text {L}} |} < $ 0.05 GeV) are shown to the right of the bidimensional plots, with error bars corresponding to statistical uncertainties. |
png pdf |
Figure 14-c:
Results obtained in the LCMS for the 2D double ratios in the $({q_\text {L}}, {q_\text {T}})$ plane, zoomed along the correlation function axis, for four charged multiplicity bins, $ {N_\text {trk0.4}} $ (integrated over all $ {k_{\mathrm {T}}} $), increasing from upper left to lower right. The BEC peak is cut off at $\sim $1.2 for a better visualization of the directional behavior. The 1D projections in $ {q_\text {L}} $ (for $ {| {q_\text {T}} |} < $ 0.05 GeV) and $ {q_\text {T}} $ (for $ {| {q_\text {L}} |} < $ 0.05 GeV) are shown to the right of the bidimensional plots, with error bars corresponding to statistical uncertainties. |

png pdf |
Figure 14-d:
Results obtained in the LCMS for the 2D double ratios in the $({q_\text {L}}, {q_\text {T}})$ plane, zoomed along the correlation function axis, for four charged multiplicity bins, $ {N_\text {trk0.4}} $ (integrated over all $ {k_{\mathrm {T}}} $), increasing from upper left to lower right. The BEC peak is cut off at $\sim $1.2 for a better visualization of the directional behavior. The 1D projections in $ {q_\text {L}} $ (for $ {| {q_\text {T}} |} < $ 0.05 GeV) and $ {q_\text {T}} $ (for $ {| {q_\text {L}} |} < $ 0.05 GeV) are shown to the right of the bidimensional plots, with error bars corresponding to statistical uncertainties. |
png pdf |
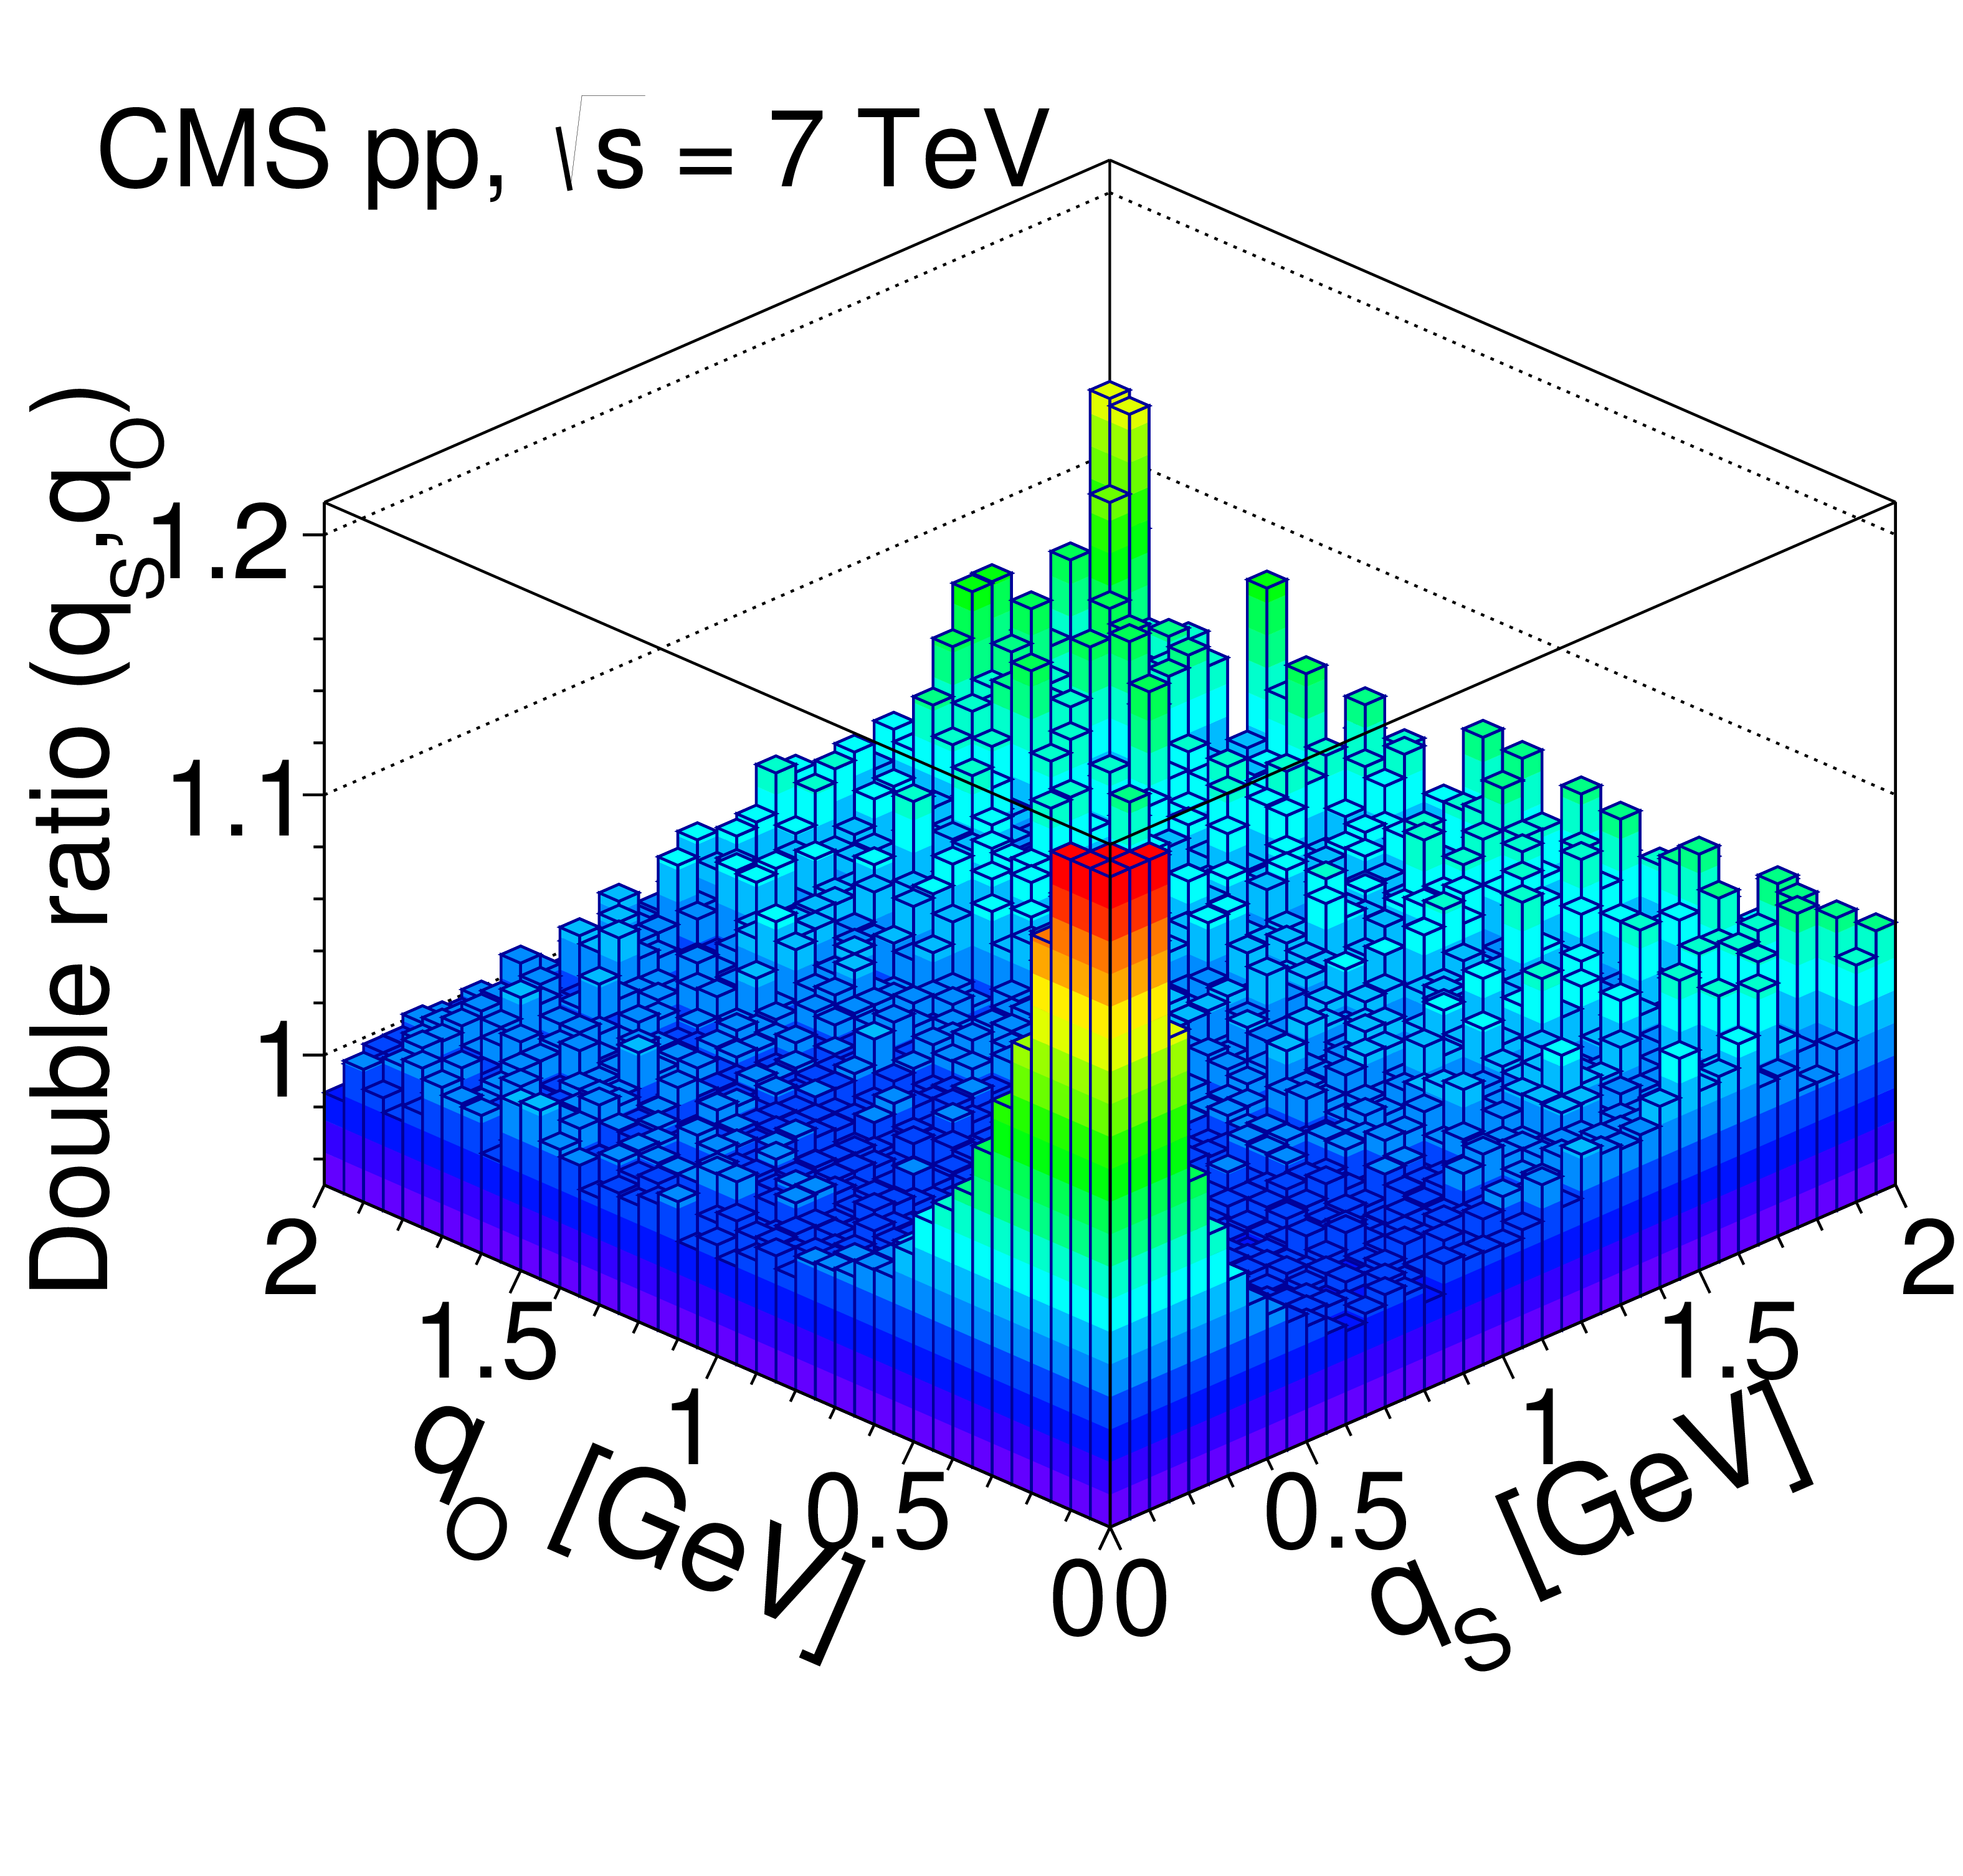
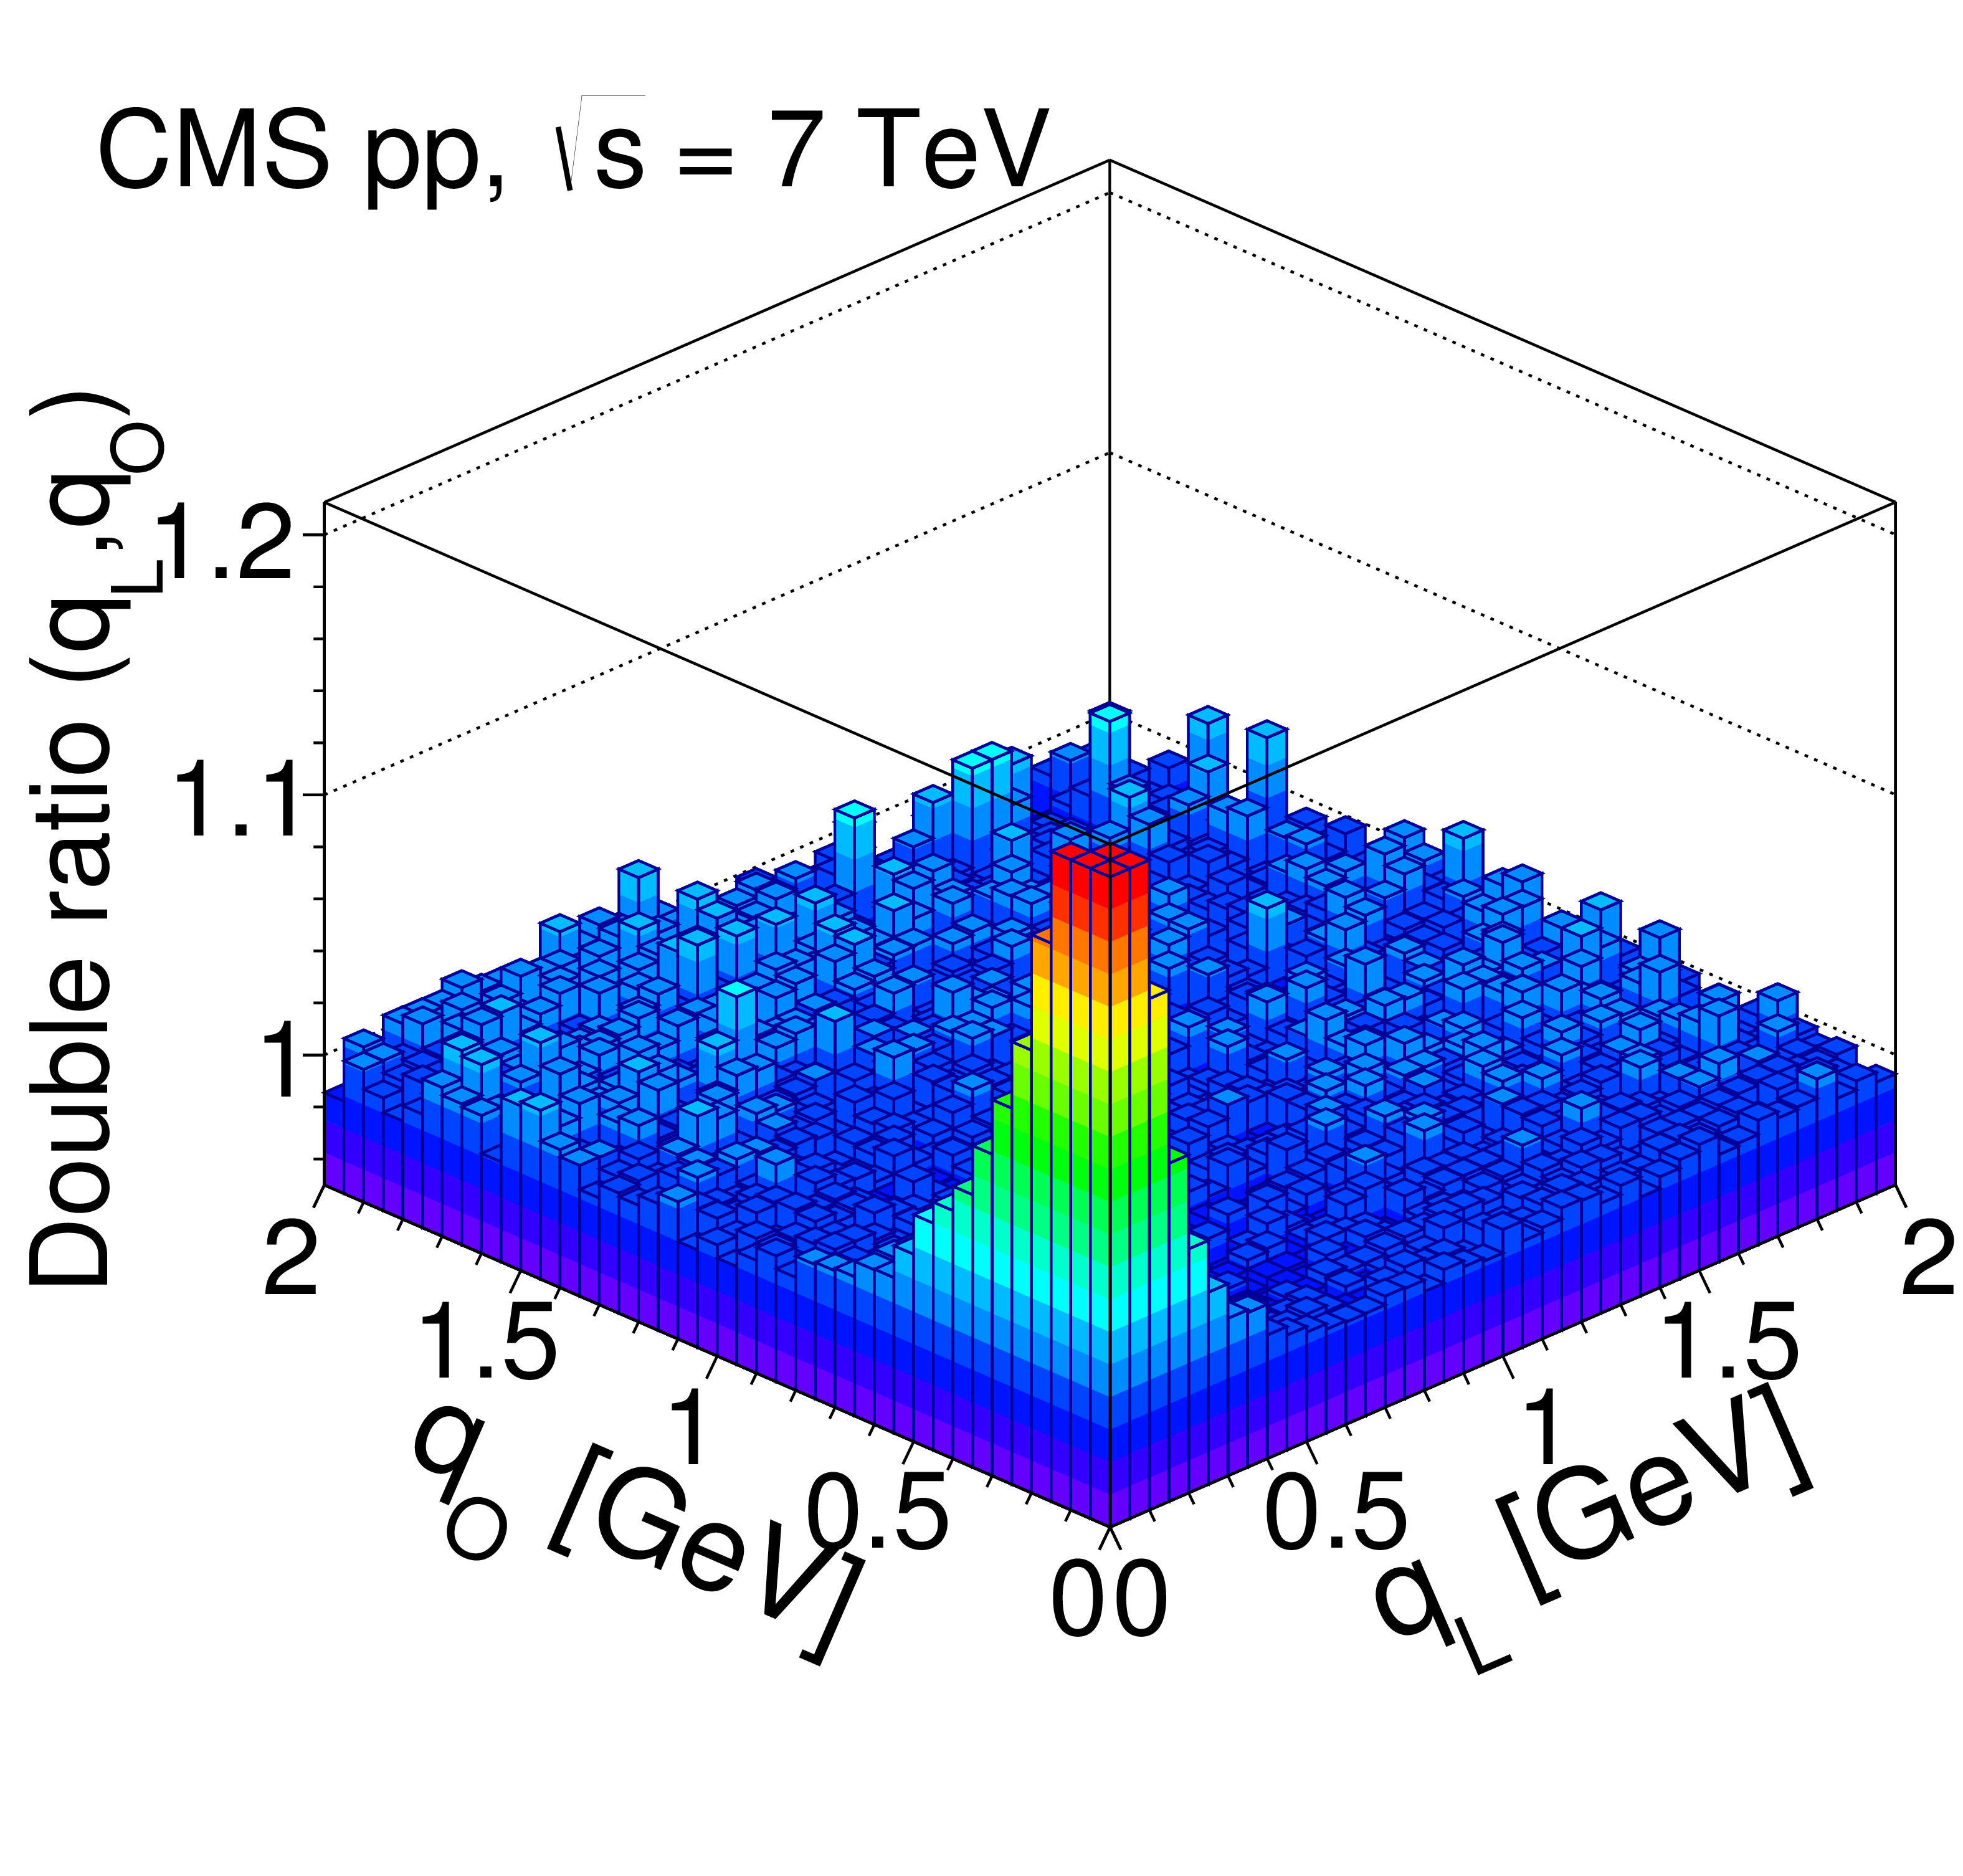
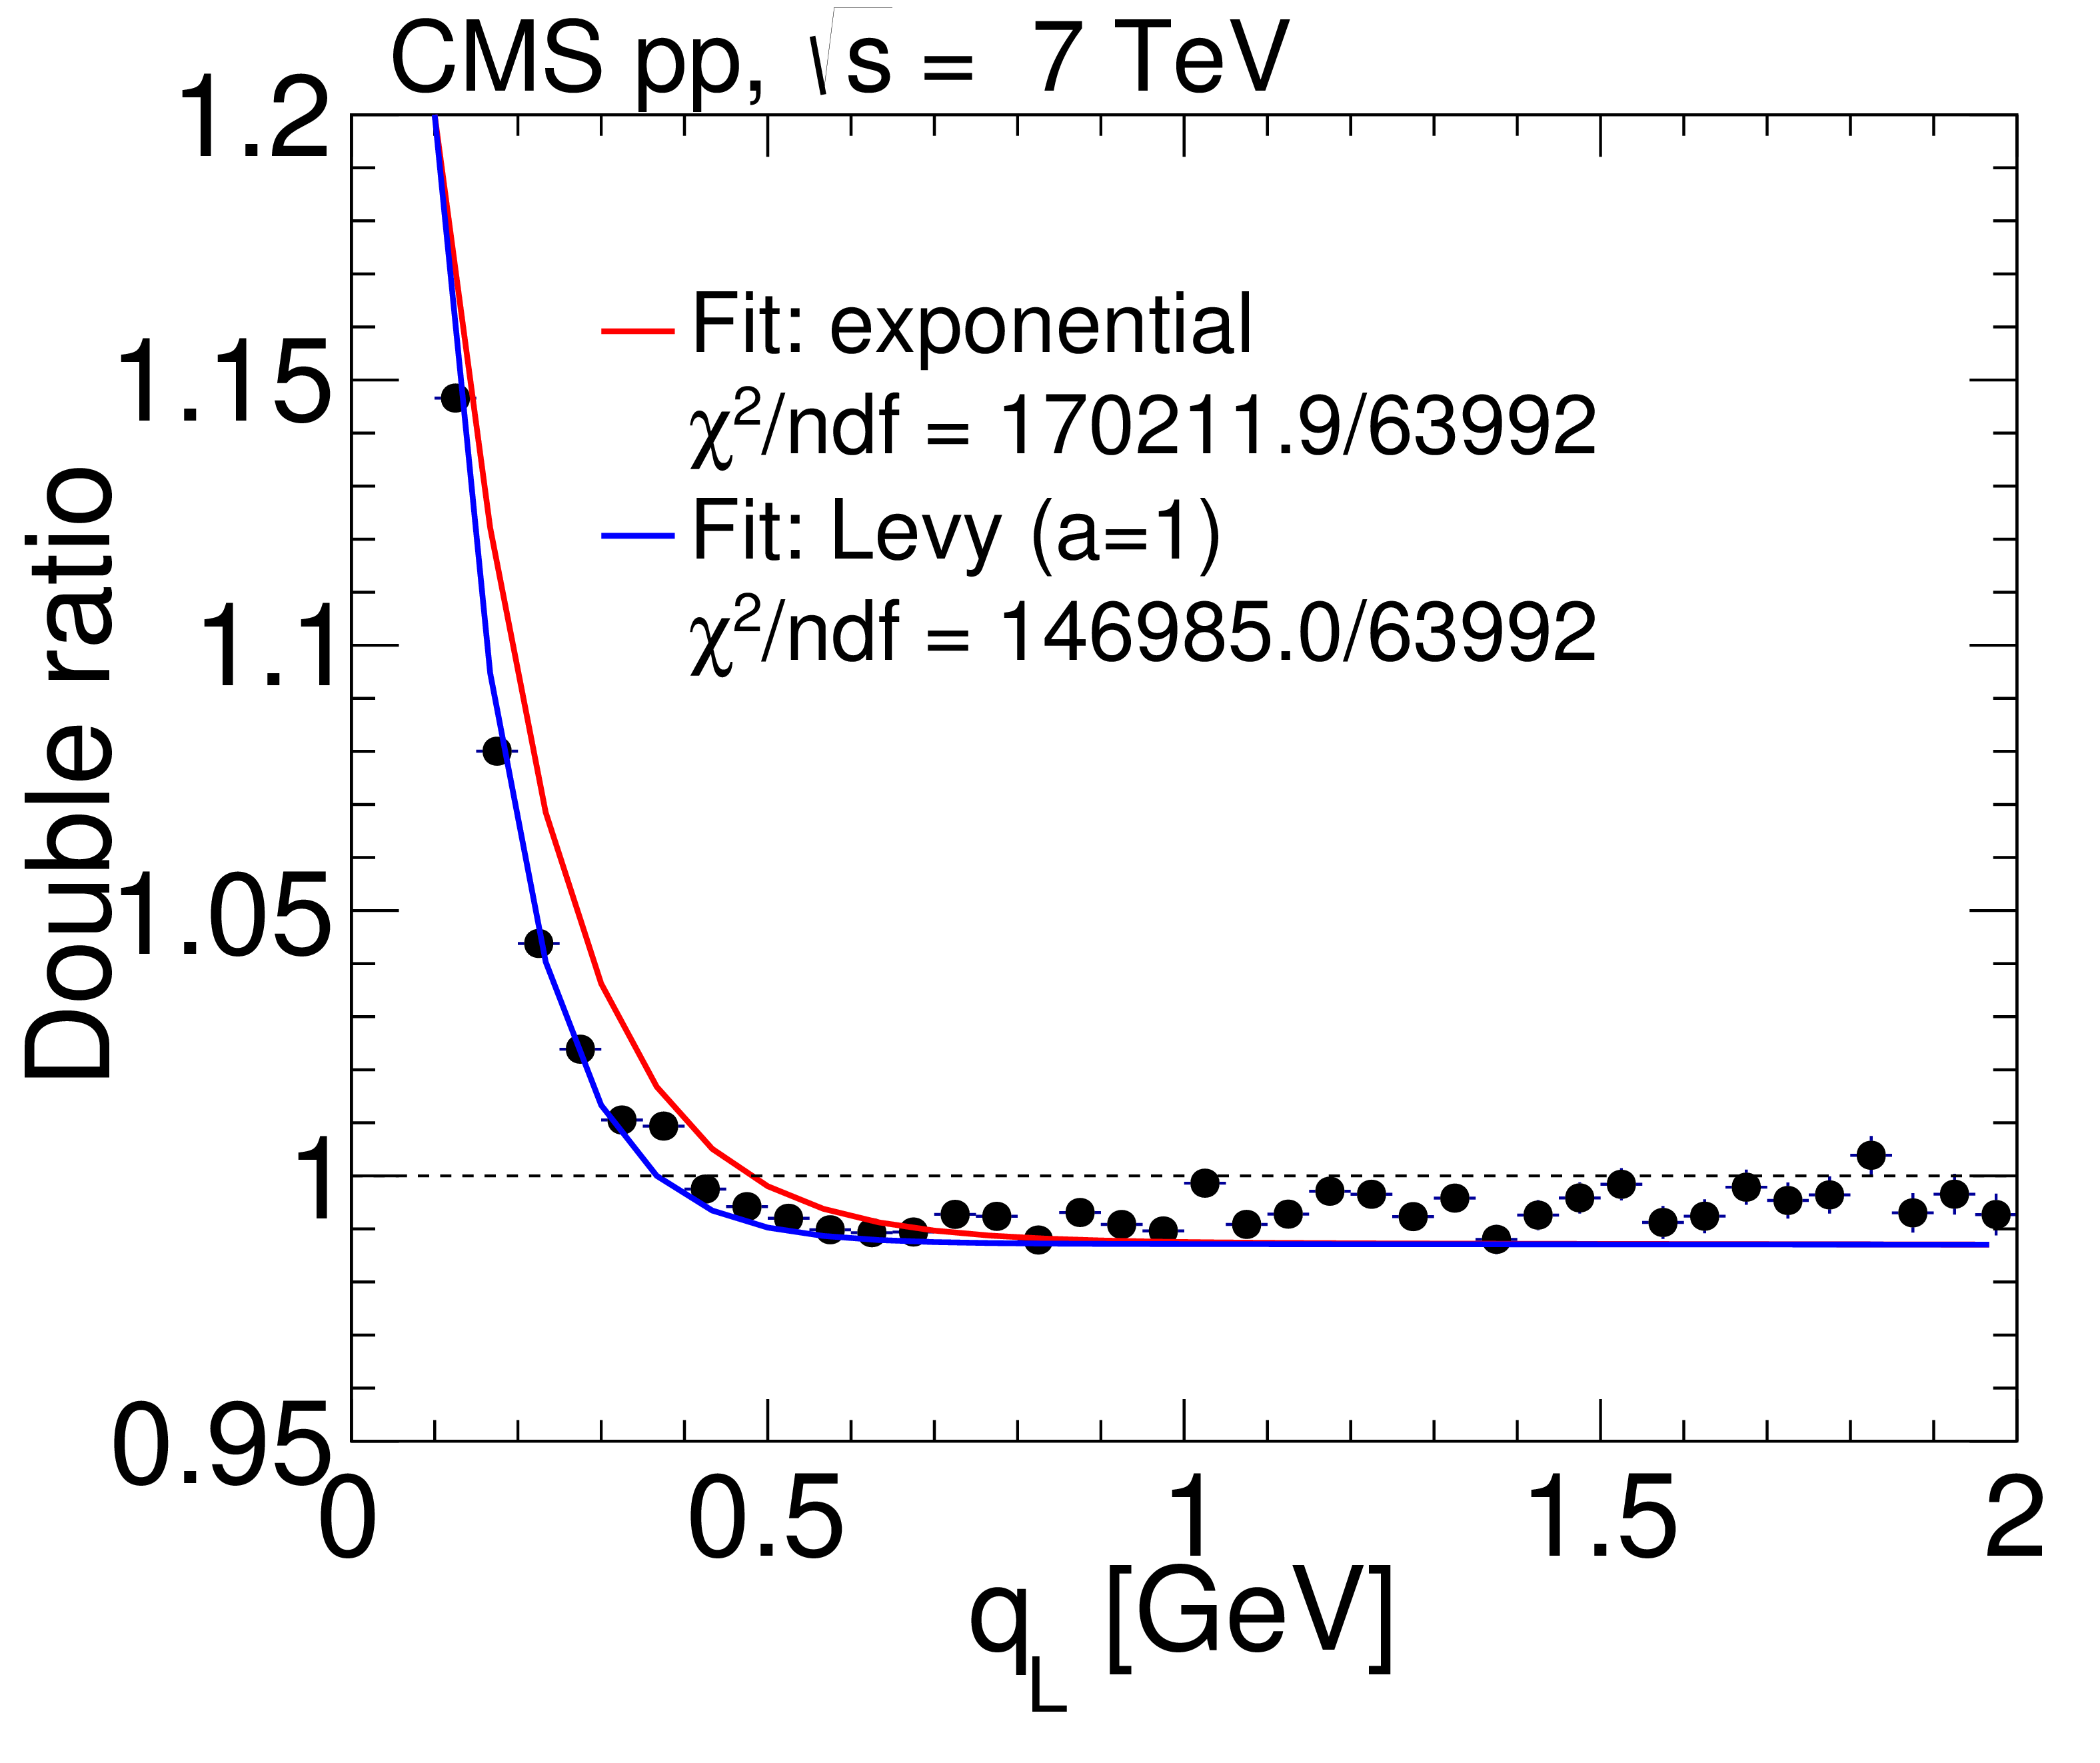
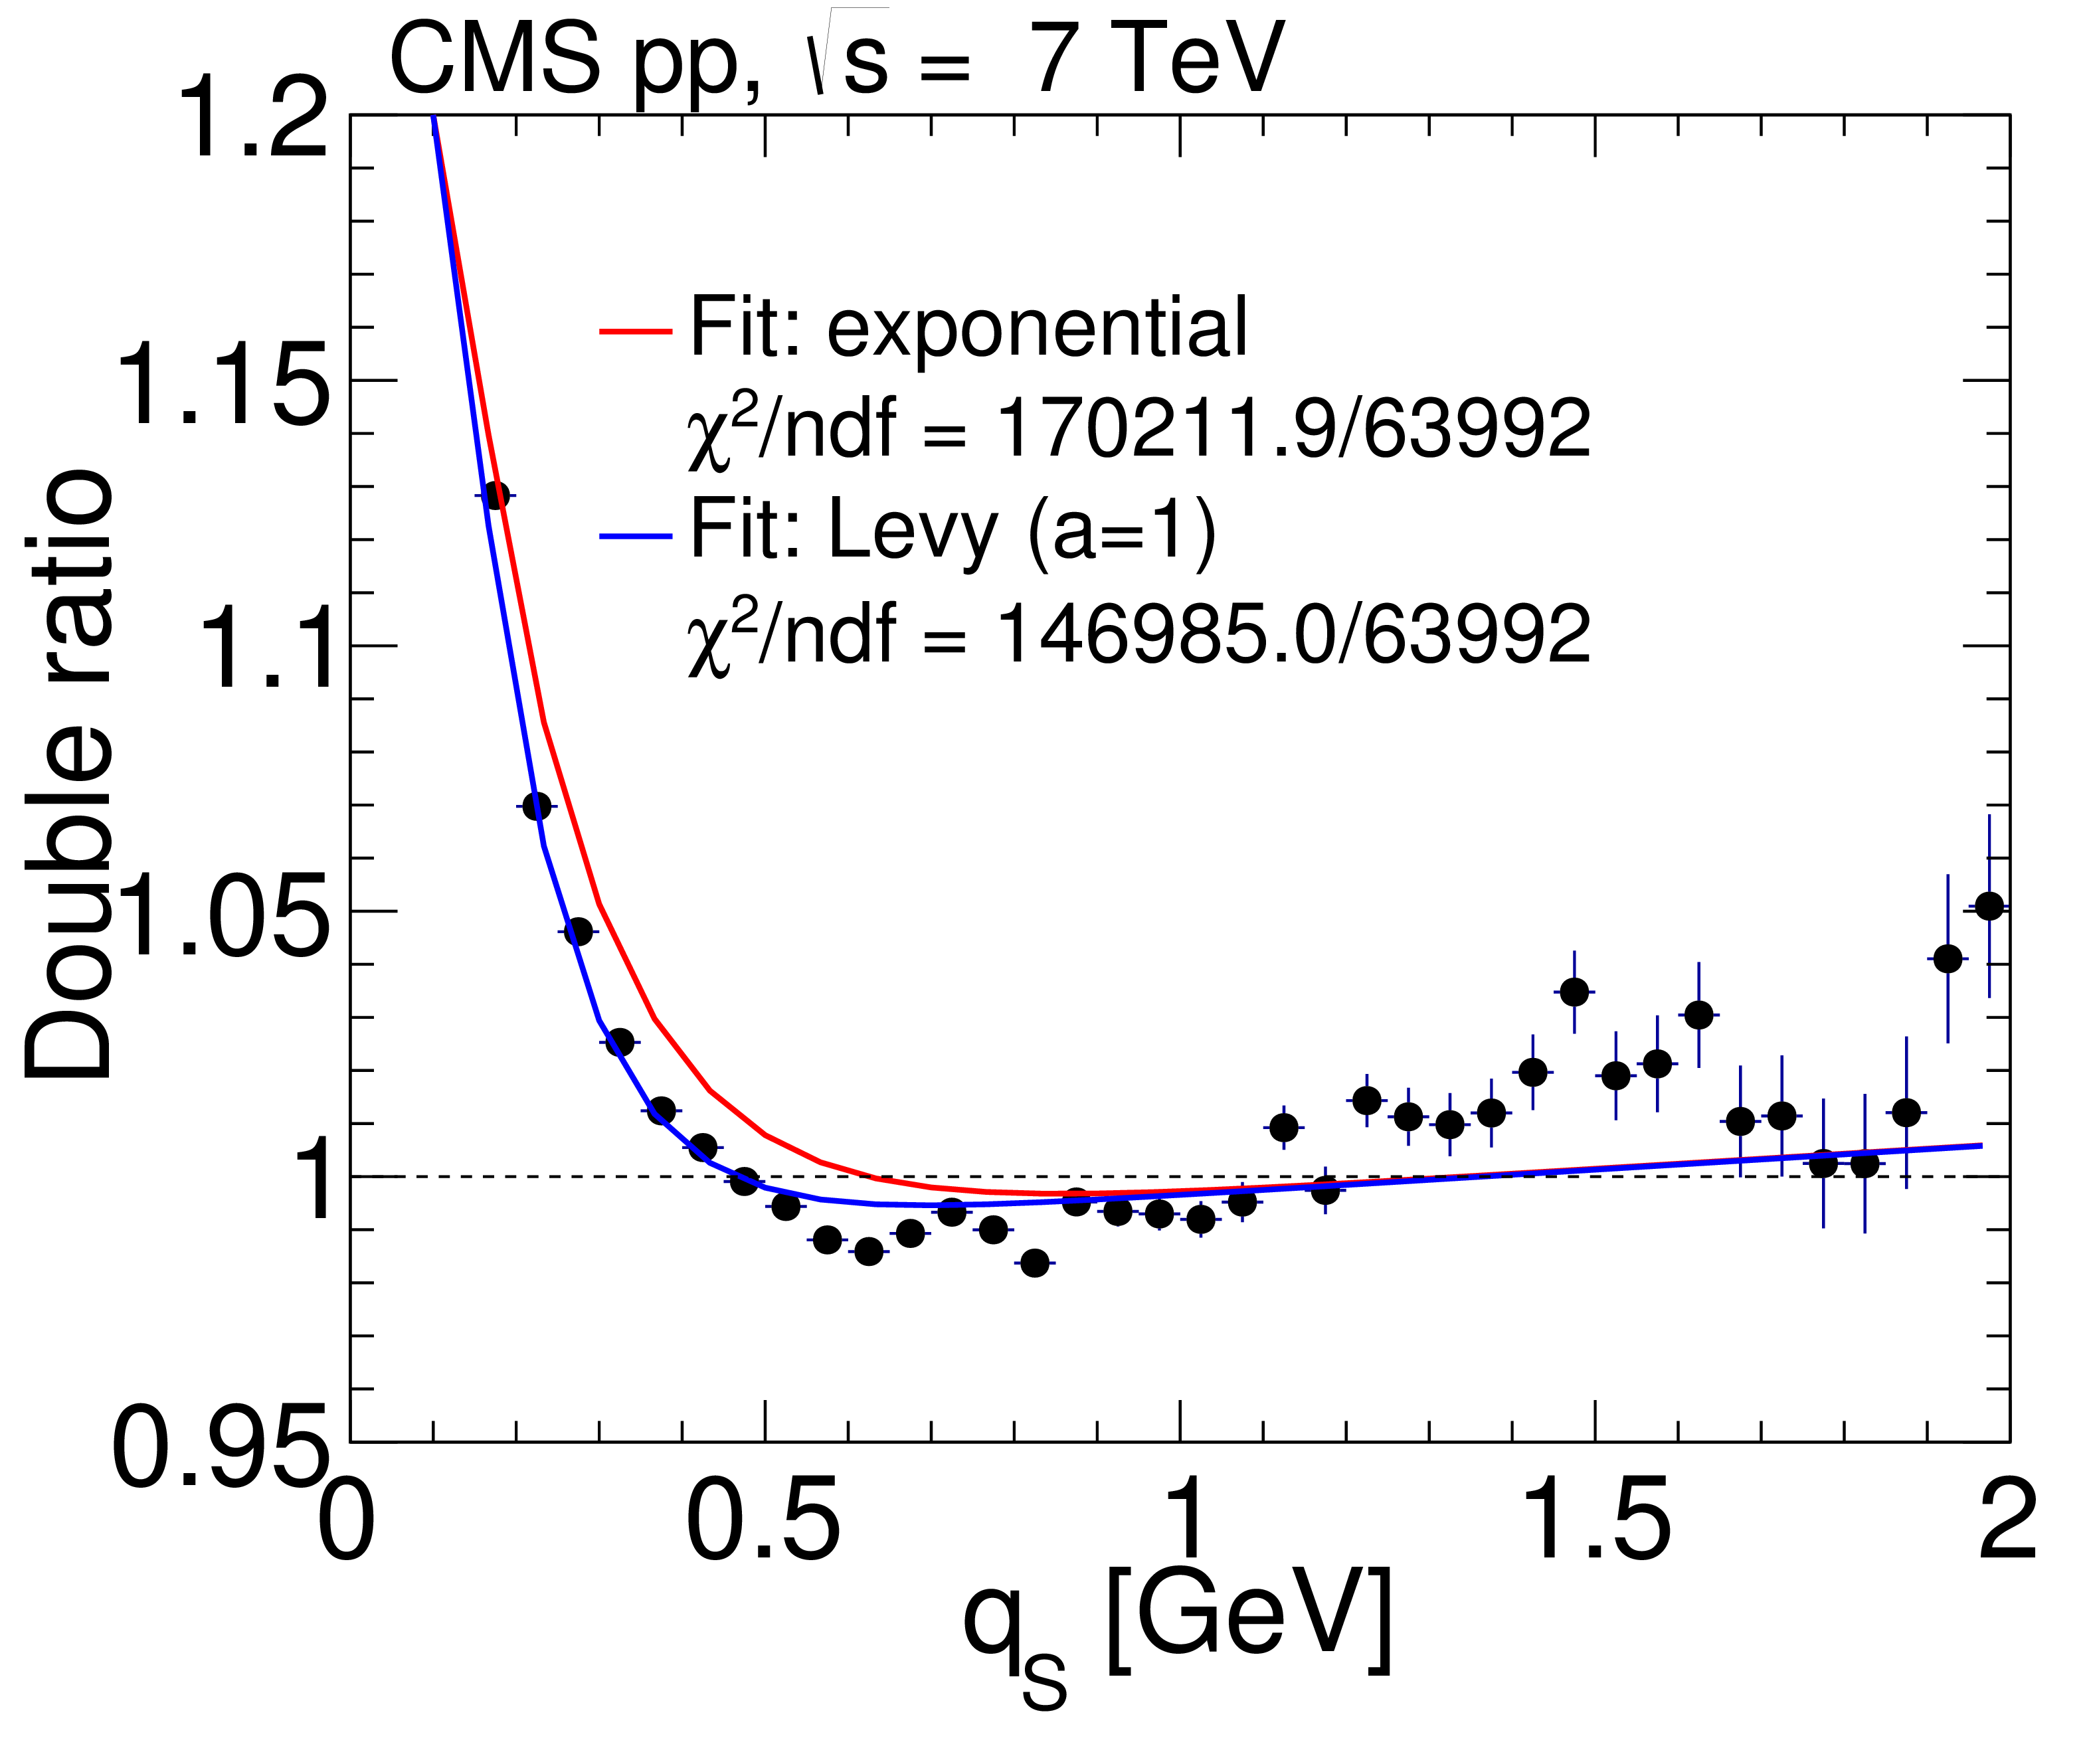
Figure 15:
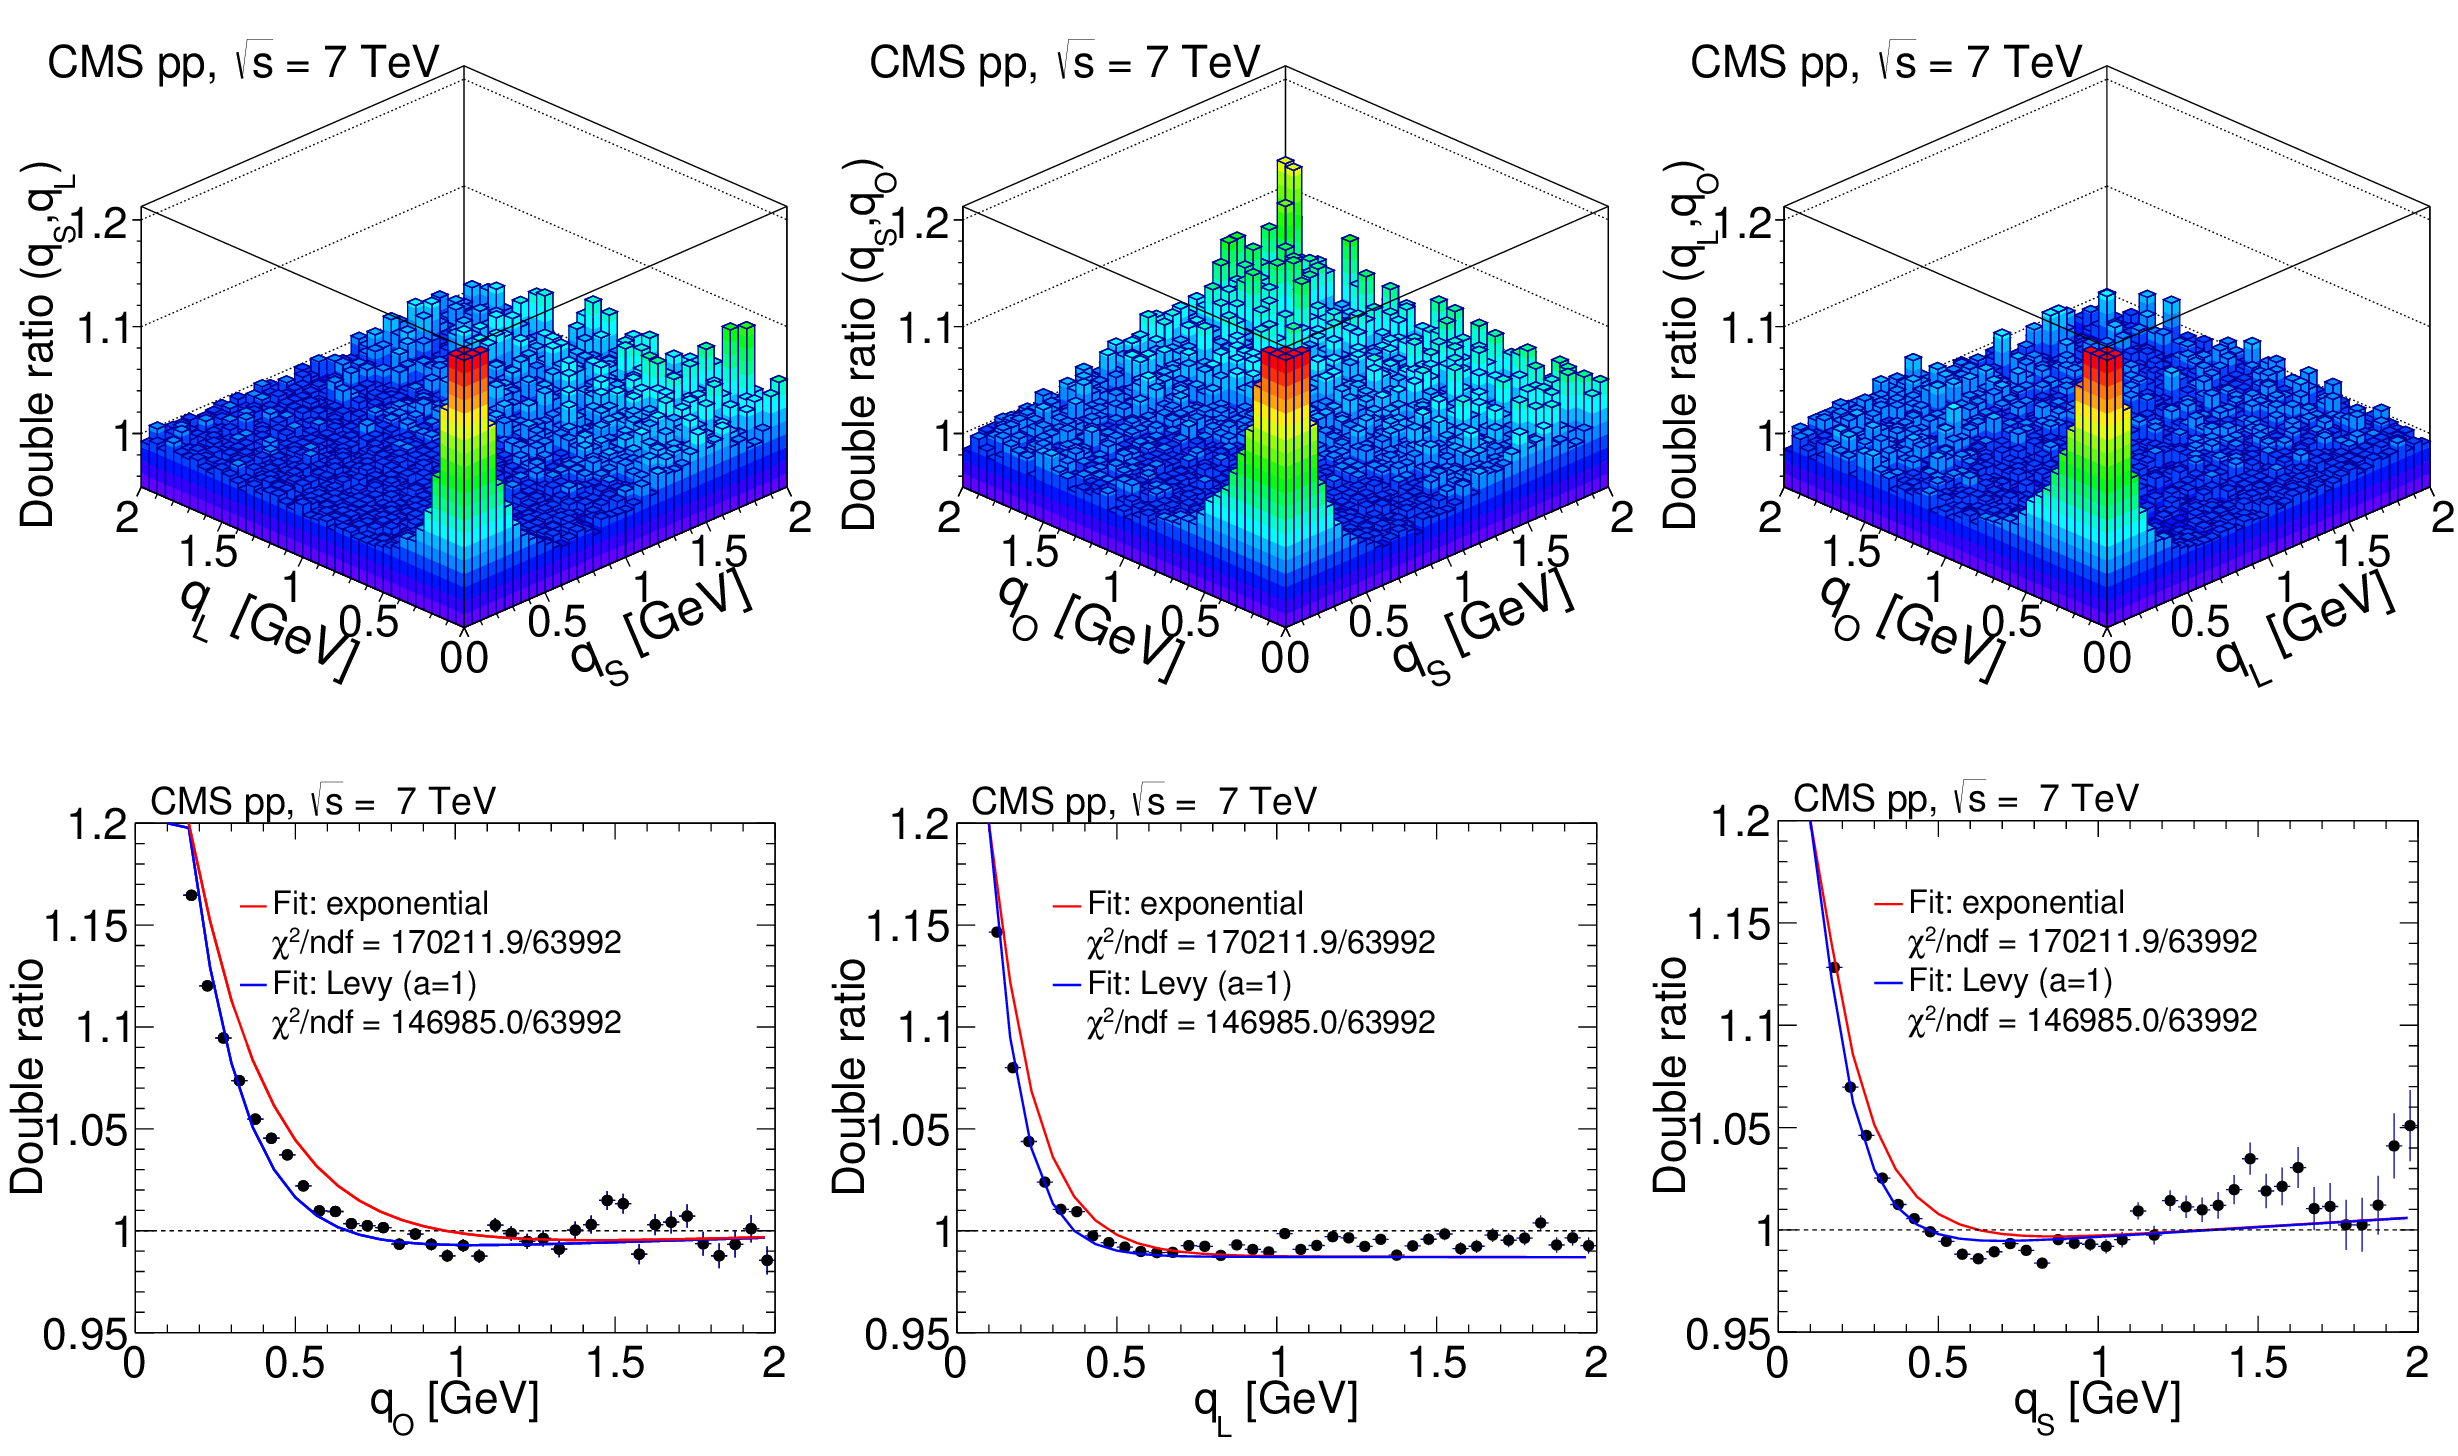
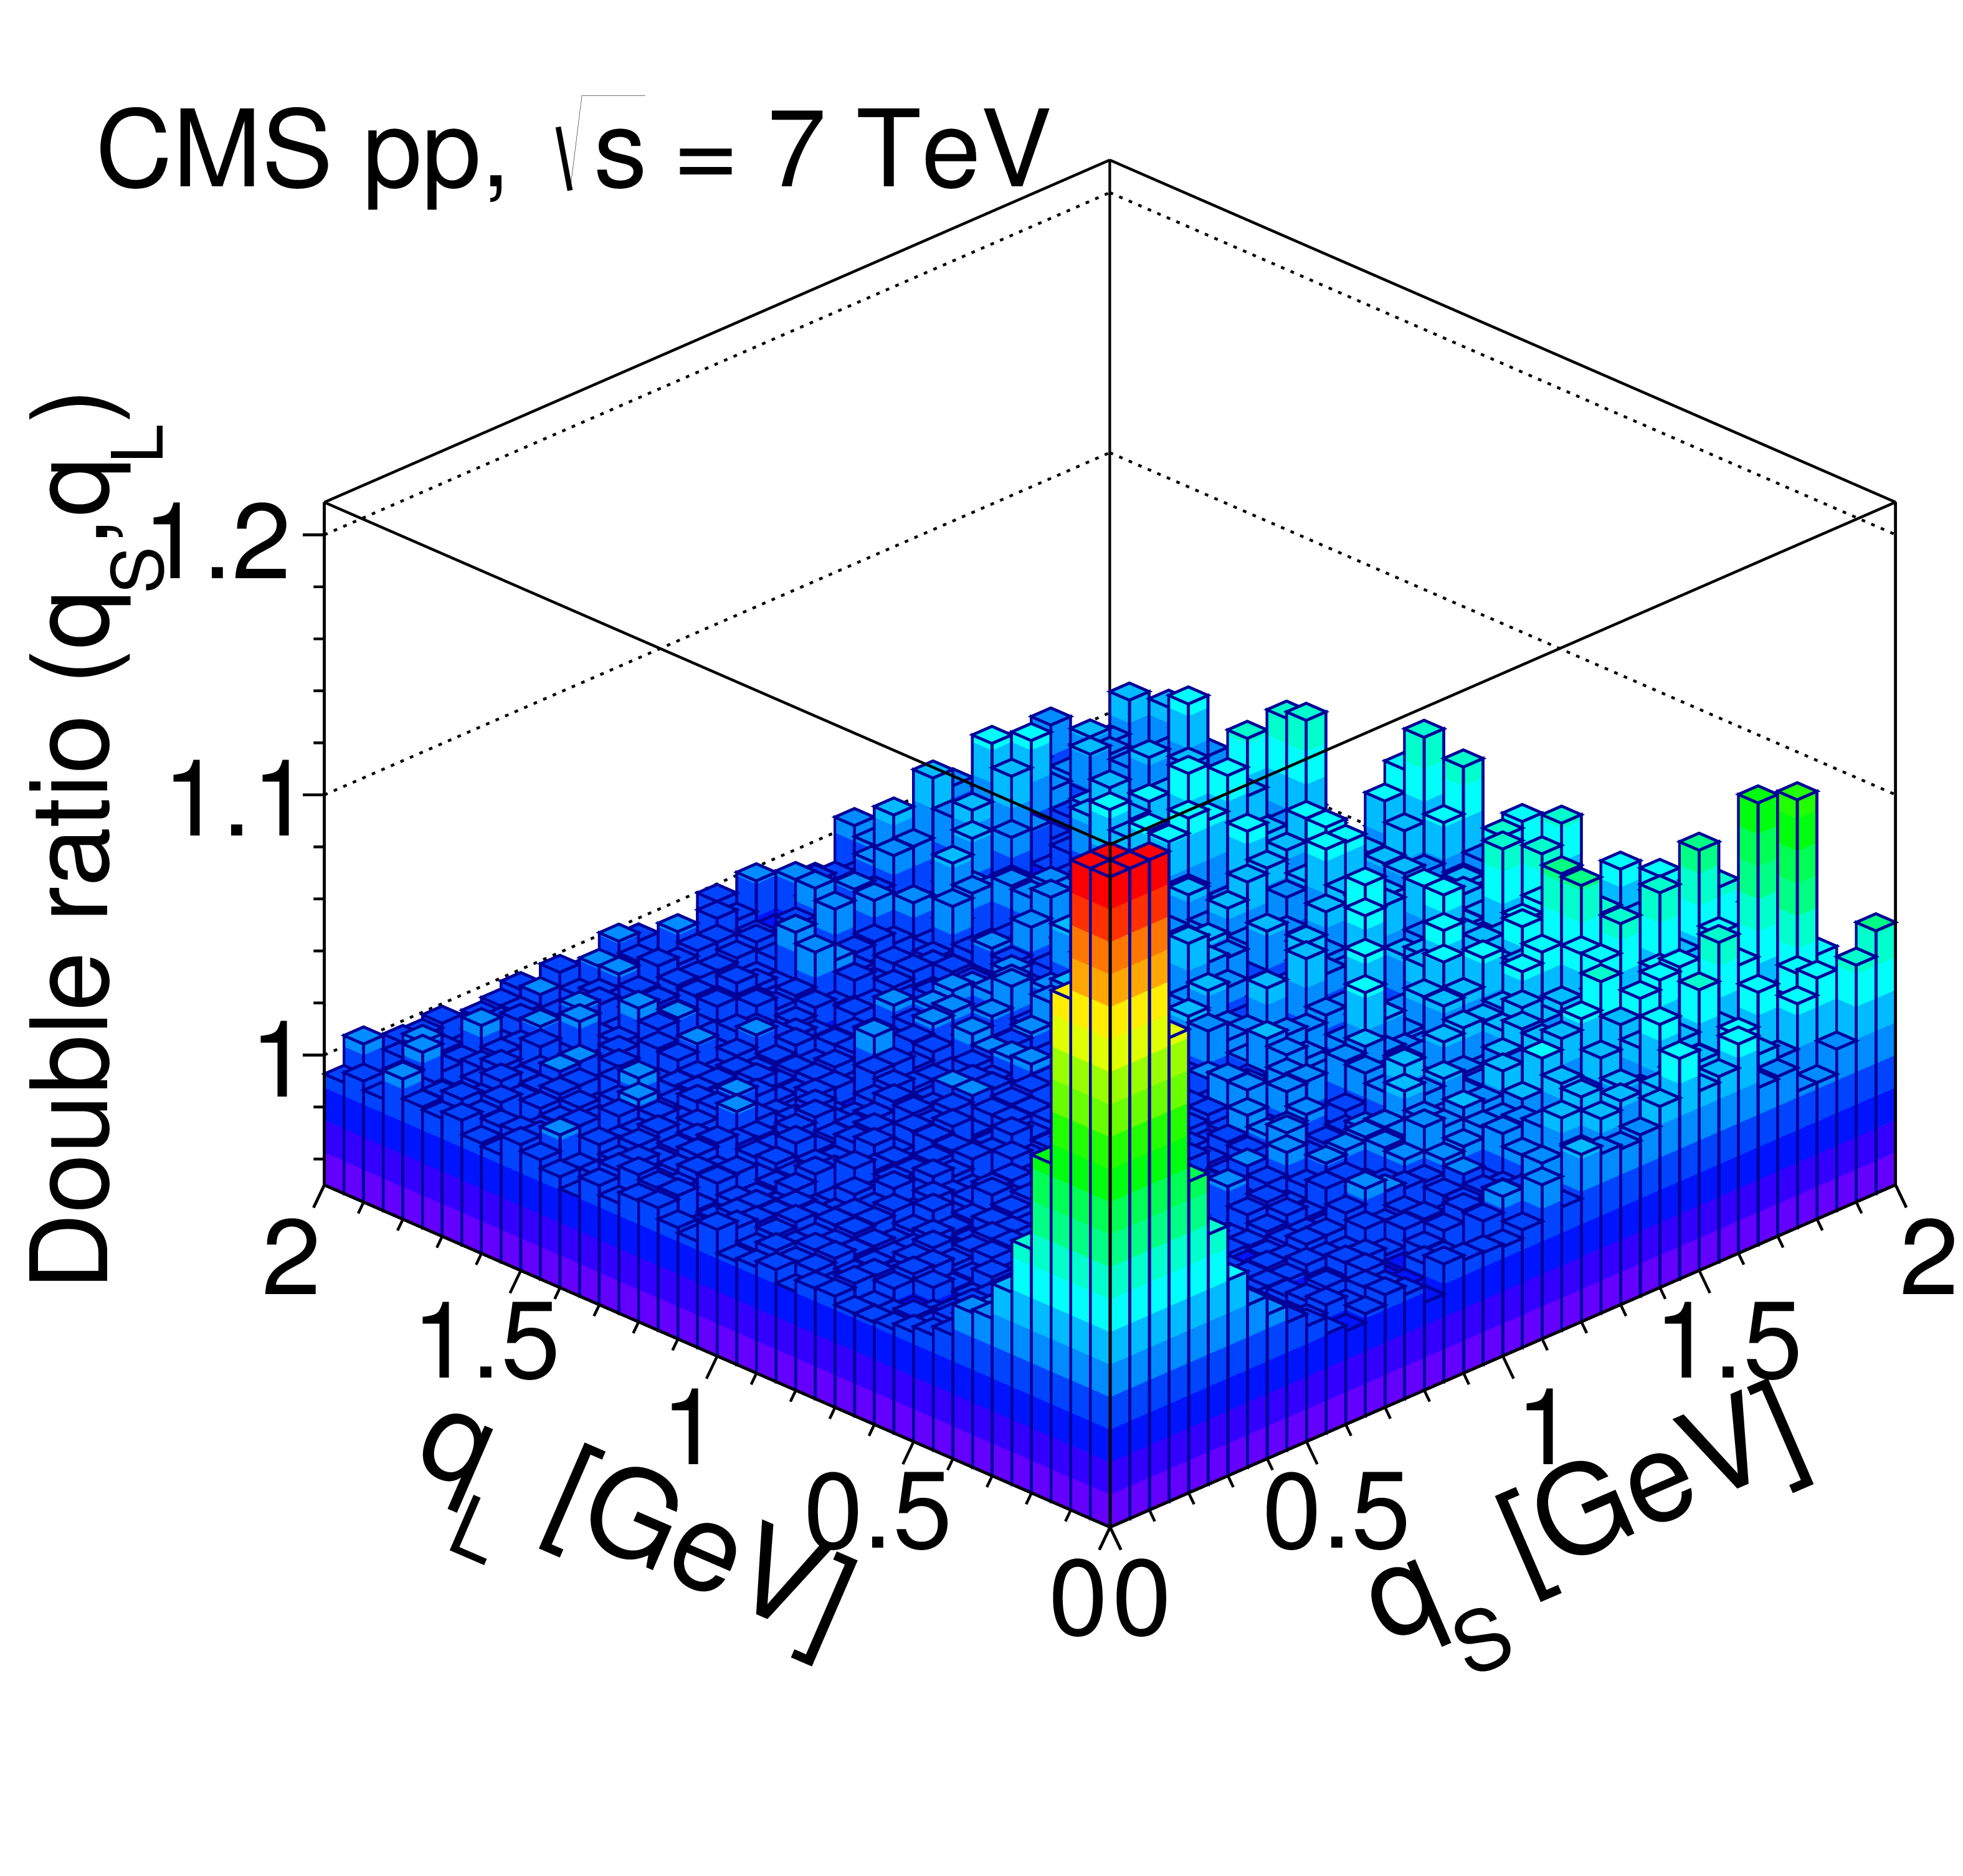
Results obtained in the LCMS for the 3D double ratios in pp collisions at 7 TeV, integrated over $ {N_\text {trk0.4}} $ and $ {k_{\mathrm {T}}} $. Top: 2D projections over the $({q_\text {L}}, {q_\text {S}})$, $({q_\text {O}}, {q_\text {S}})$, and $({q_\text {O}}, {q_\text {L}})$ planes, for $| {q_\text {O}} | < $ 0.05 GeV (left), $| {q_\text {L}} | < $ 0.05 GeV (middle), and $| {q_\text {S}} | < $ 0.05 GeV (right). Bottom: 1D projections of the same data, with the complementary two variables constrained to be within the first bin ($|q_{i,j}| < $ 0.05 GeV). The error bars show the corresponding statistical uncertainties. All plots are zoomed along the correlation function axis with the BEC peak cut off above 1.2. |
png pdf |
Figure 15-a:
Results obtained in the LCMS for the 3D double ratios in pp collisions at 7 TeV, integrated over $ {N_\text {trk0.4}} $ and $ {k_{\mathrm {T}}} $. Top: 2D projections over the $({q_\text {L}}, {q_\text {S}})$, $({q_\text {O}}, {q_\text {S}})$, and $({q_\text {O}}, {q_\text {L}})$ planes, for $| {q_\text {O}} | < $ 0.05 GeV (left), $| {q_\text {L}} | < $ 0.05 GeV (middle), and $| {q_\text {S}} | < $ 0.05 GeV (right). Bottom: 1D projections of the same data, with the complementary two variables constrained to be within the first bin ($|q_{i,j}| < $ 0.05 GeV). The error bars show the corresponding statistical uncertainties. All plots are zoomed along the correlation function axis with the BEC peak cut off above 1.2. |
png pdf |
Figure 15-b:
Results obtained in the LCMS for the 3D double ratios in pp collisions at 7 TeV, integrated over $ {N_\text {trk0.4}} $ and $ {k_{\mathrm {T}}} $. Top: 2D projections over the $({q_\text {L}}, {q_\text {S}})$, $({q_\text {O}}, {q_\text {S}})$, and $({q_\text {O}}, {q_\text {L}})$ planes, for $| {q_\text {O}} | < $ 0.05 GeV (left), $| {q_\text {L}} | < $ 0.05 GeV (middle), and $| {q_\text {S}} | < $ 0.05 GeV (right). Bottom: 1D projections of the same data, with the complementary two variables constrained to be within the first bin ($|q_{i,j}| < $ 0.05 GeV). The error bars show the corresponding statistical uncertainties. All plots are zoomed along the correlation function axis with the BEC peak cut off above 1.2. |
png pdf |
Figure 15-c:
Results obtained in the LCMS for the 3D double ratios in pp collisions at 7 TeV, integrated over $ {N_\text {trk0.4}} $ and $ {k_{\mathrm {T}}} $. Top: 2D projections over the $({q_\text {L}}, {q_\text {S}})$, $({q_\text {O}}, {q_\text {S}})$, and $({q_\text {O}}, {q_\text {L}})$ planes, for $| {q_\text {O}} | < $ 0.05 GeV (left), $| {q_\text {L}} | < $ 0.05 GeV (middle), and $| {q_\text {S}} | < $ 0.05 GeV (right). Bottom: 1D projections of the same data, with the complementary two variables constrained to be within the first bin ($|q_{i,j}| < $ 0.05 GeV). The error bars show the corresponding statistical uncertainties. All plots are zoomed along the correlation function axis with the BEC peak cut off above 1.2. |

png pdf |
Figure 15-d:
Results obtained in the LCMS for the 3D double ratios in pp collisions at 7 TeV, integrated over $ {N_\text {trk0.4}} $ and $ {k_{\mathrm {T}}} $. Top: 2D projections over the $({q_\text {L}}, {q_\text {S}})$, $({q_\text {O}}, {q_\text {S}})$, and $({q_\text {O}}, {q_\text {L}})$ planes, for $| {q_\text {O}} | < $ 0.05 GeV (left), $| {q_\text {L}} | < $ 0.05 GeV (middle), and $| {q_\text {S}} | < $ 0.05 GeV (right). Bottom: 1D projections of the same data, with the complementary two variables constrained to be within the first bin ($|q_{i,j}| < $ 0.05 GeV). The error bars show the corresponding statistical uncertainties. All plots are zoomed along the correlation function axis with the BEC peak cut off above 1.2. |
png pdf |
Figure 15-e:
Results obtained in the LCMS for the 3D double ratios in pp collisions at 7 TeV, integrated over $ {N_\text {trk0.4}} $ and $ {k_{\mathrm {T}}} $. Top: 2D projections over the $({q_\text {L}}, {q_\text {S}})$, $({q_\text {O}}, {q_\text {S}})$, and $({q_\text {O}}, {q_\text {L}})$ planes, for $| {q_\text {O}} | < $ 0.05 GeV (left), $| {q_\text {L}} | < $ 0.05 GeV (middle), and $| {q_\text {S}} | < $ 0.05 GeV (right). Bottom: 1D projections of the same data, with the complementary two variables constrained to be within the first bin ($|q_{i,j}| < $ 0.05 GeV). The error bars show the corresponding statistical uncertainties. All plots are zoomed along the correlation function axis with the BEC peak cut off above 1.2. |
png pdf |
Figure 15-f:
Results obtained in the LCMS for the 3D double ratios in pp collisions at 7 TeV, integrated over $ {N_\text {trk0.4}} $ and $ {k_{\mathrm {T}}} $. Top: 2D projections over the $({q_\text {L}}, {q_\text {S}})$, $({q_\text {O}}, {q_\text {S}})$, and $({q_\text {O}}, {q_\text {L}})$ planes, for $| {q_\text {O}} | < $ 0.05 GeV (left), $| {q_\text {L}} | < $ 0.05 GeV (middle), and $| {q_\text {S}} | < $ 0.05 GeV (right). Bottom: 1D projections of the same data, with the complementary two variables constrained to be within the first bin ($|q_{i,j}| < $ 0.05 GeV). The error bars show the corresponding statistical uncertainties. All plots are zoomed along the correlation function axis with the BEC peak cut off above 1.2. |
png pdf |
Figure 16:
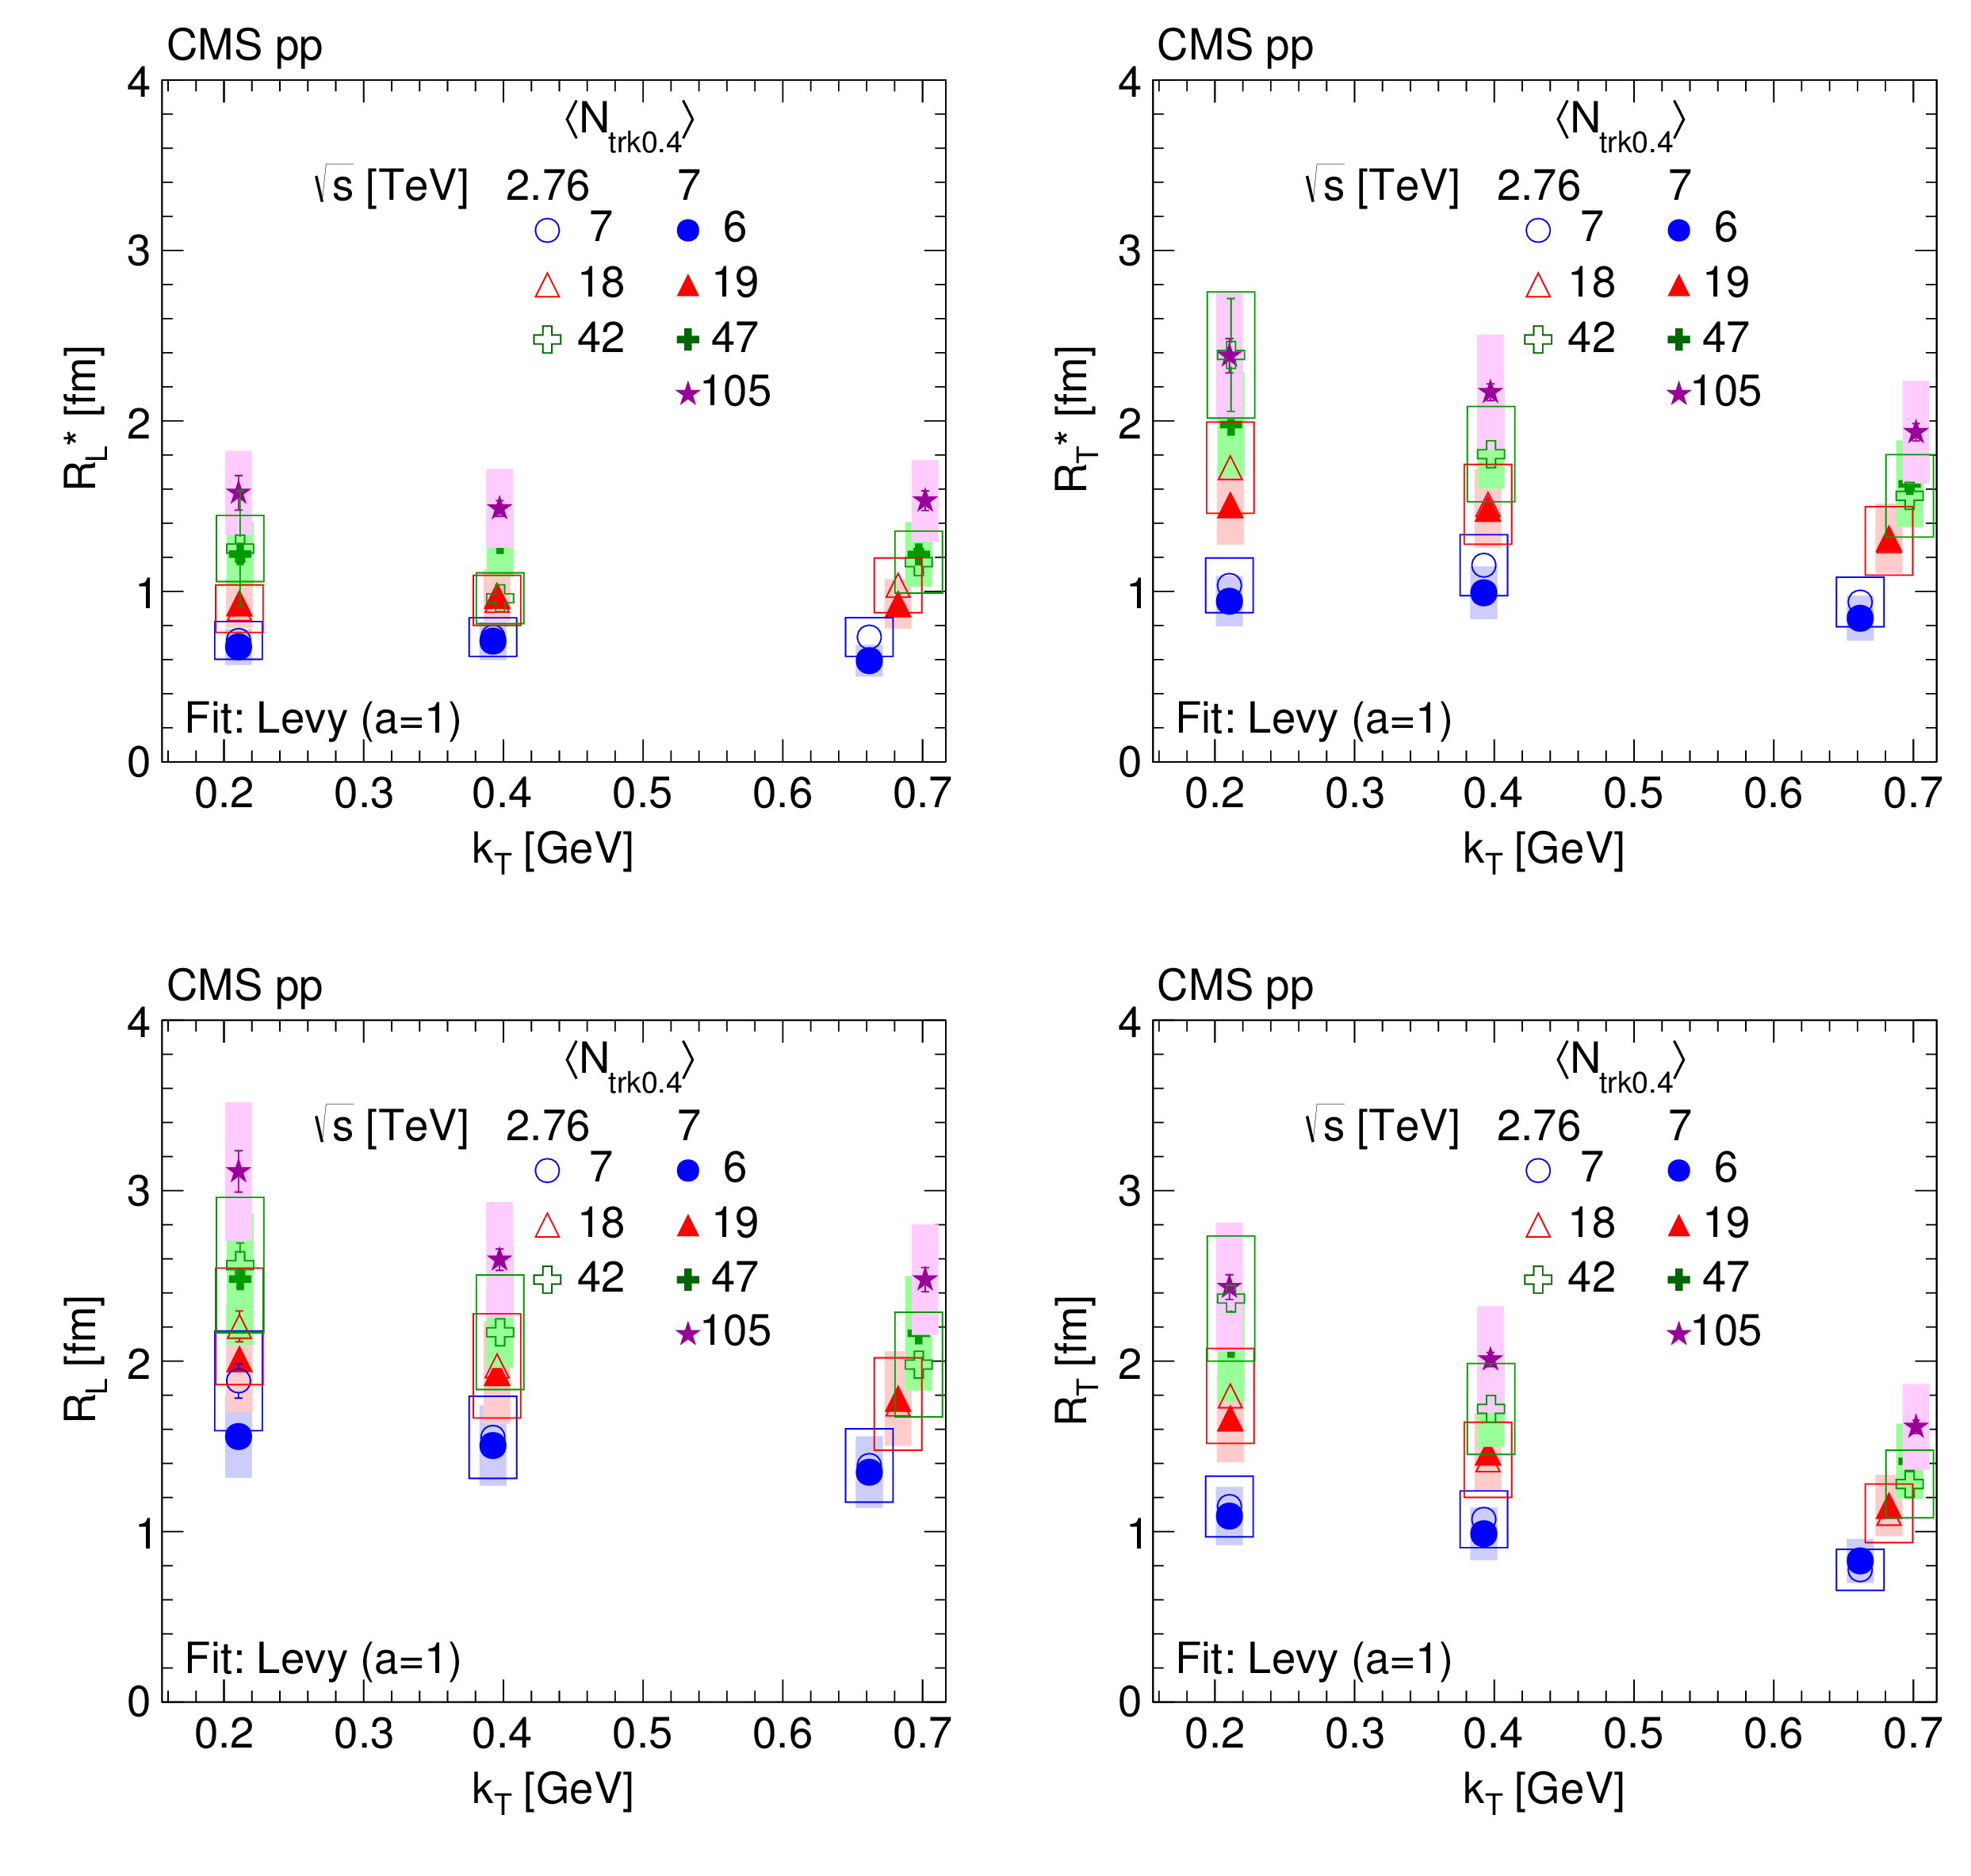
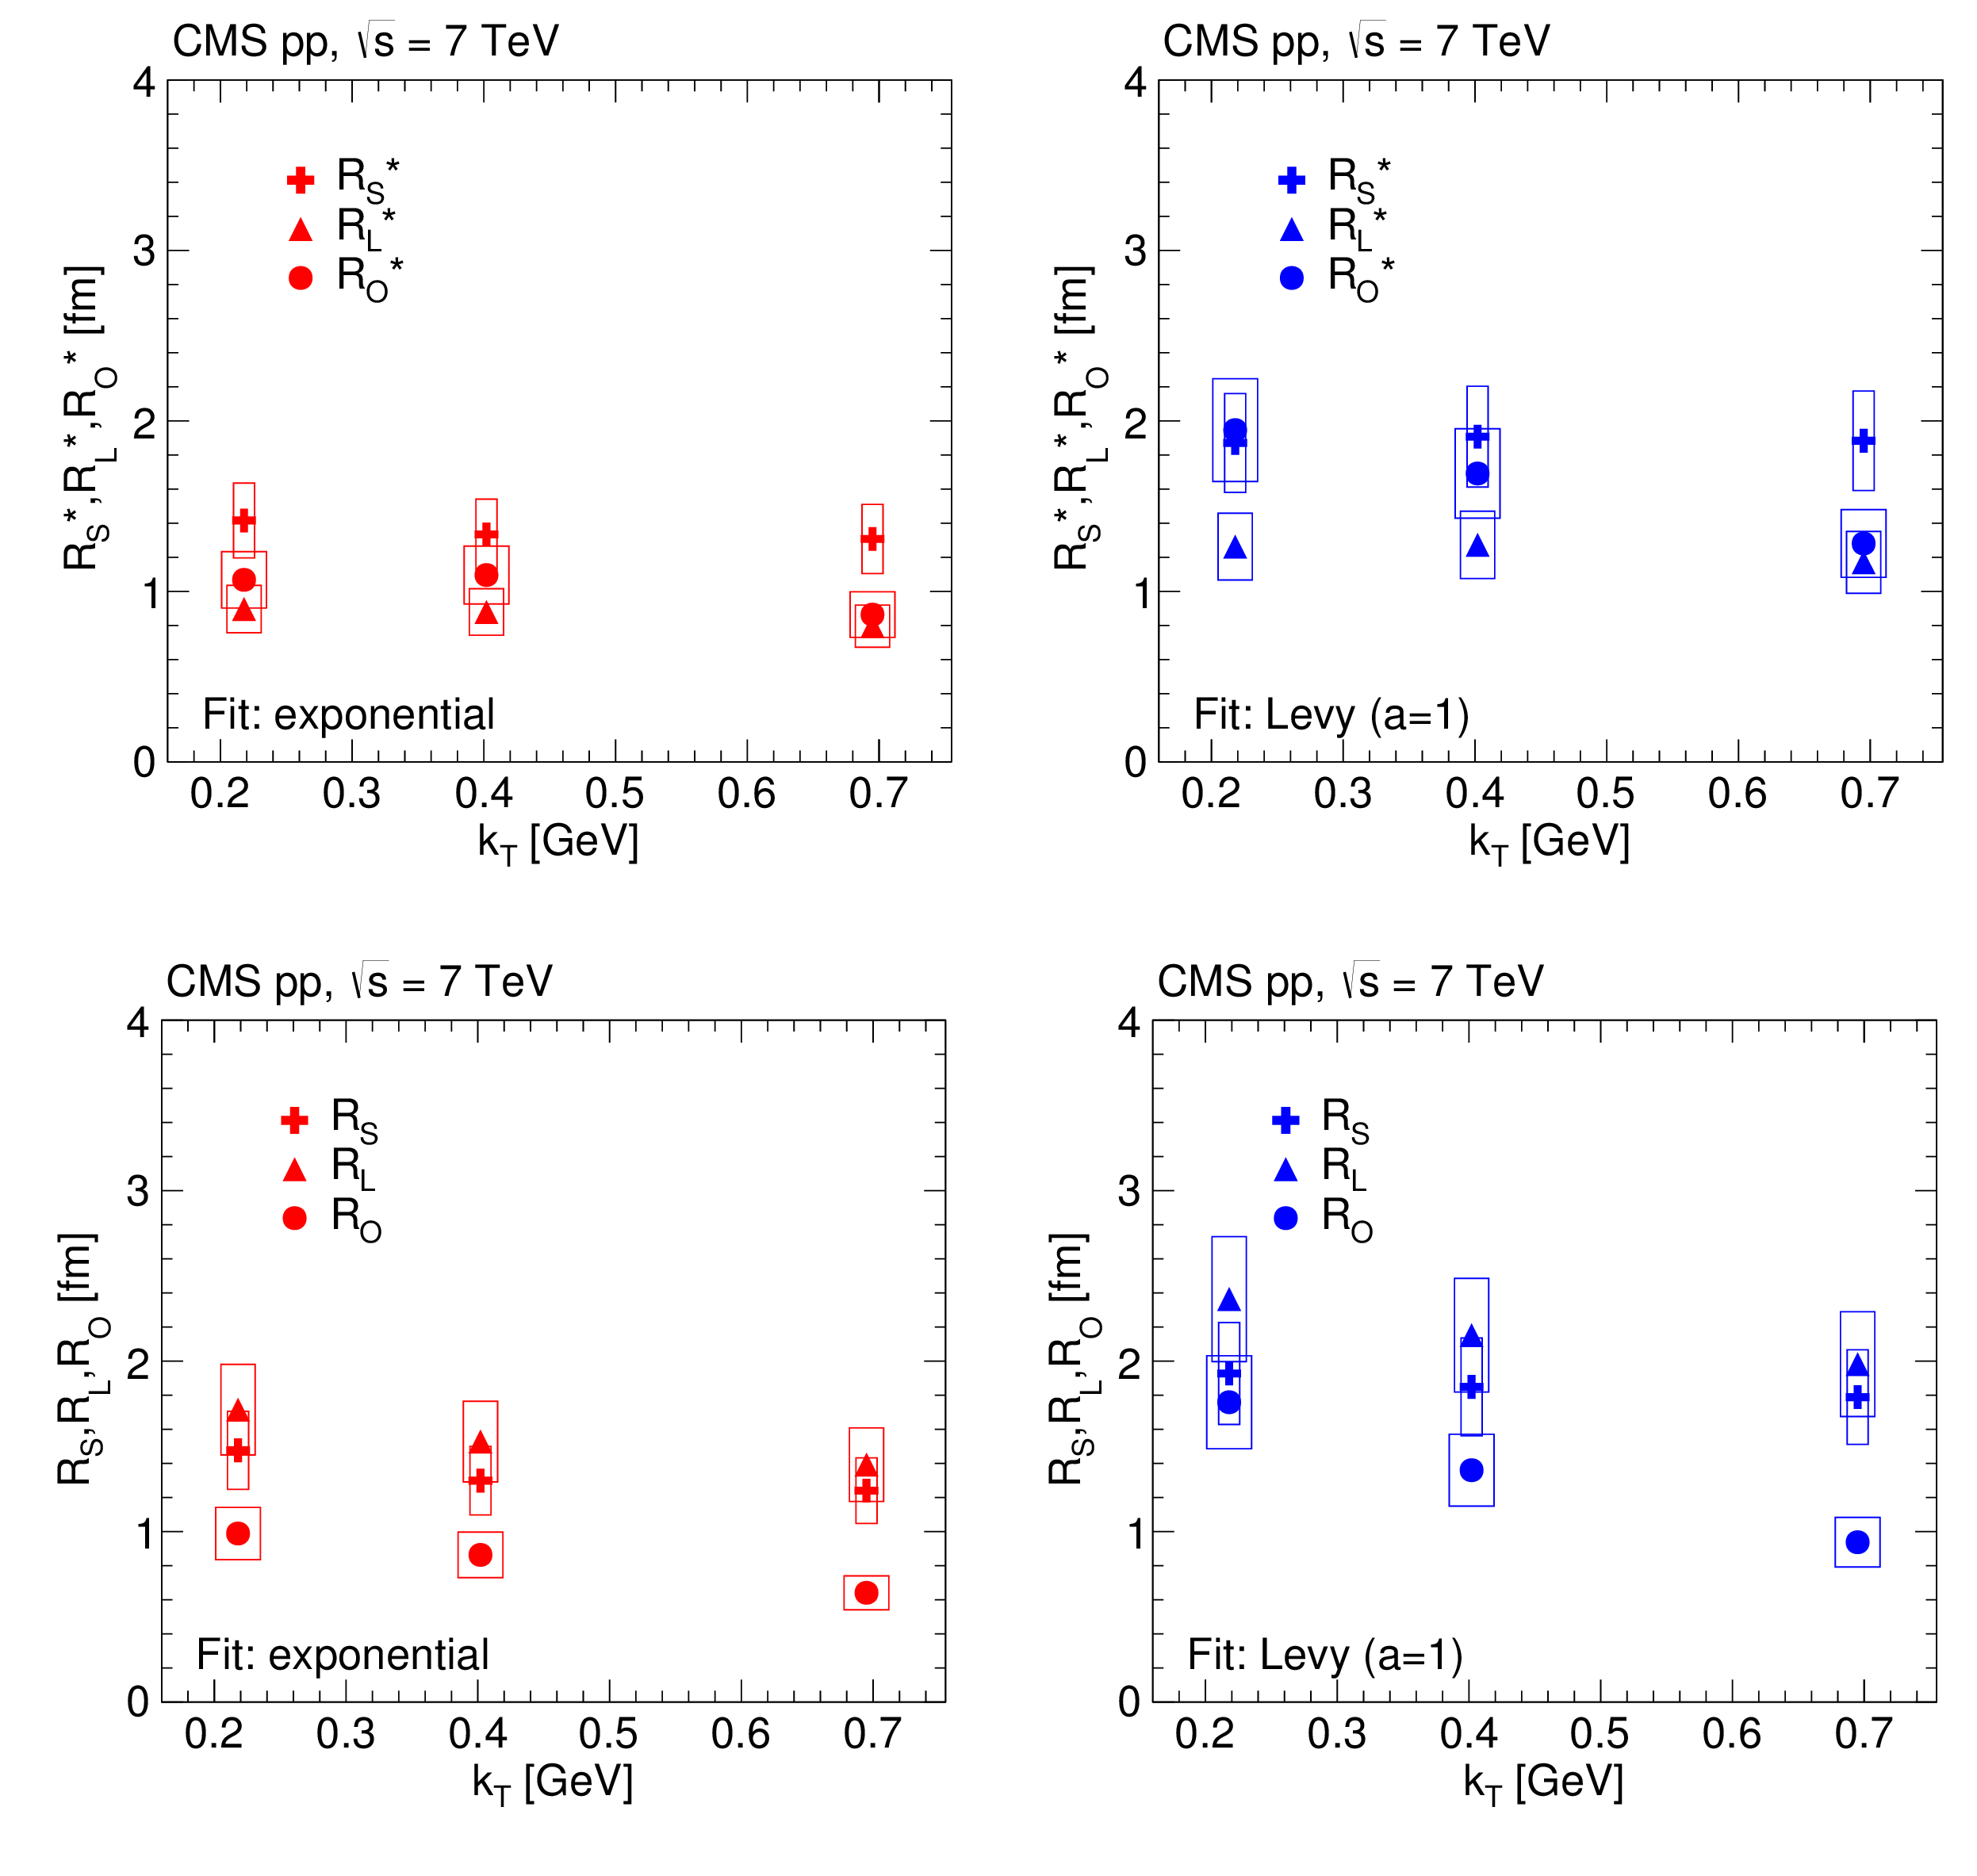
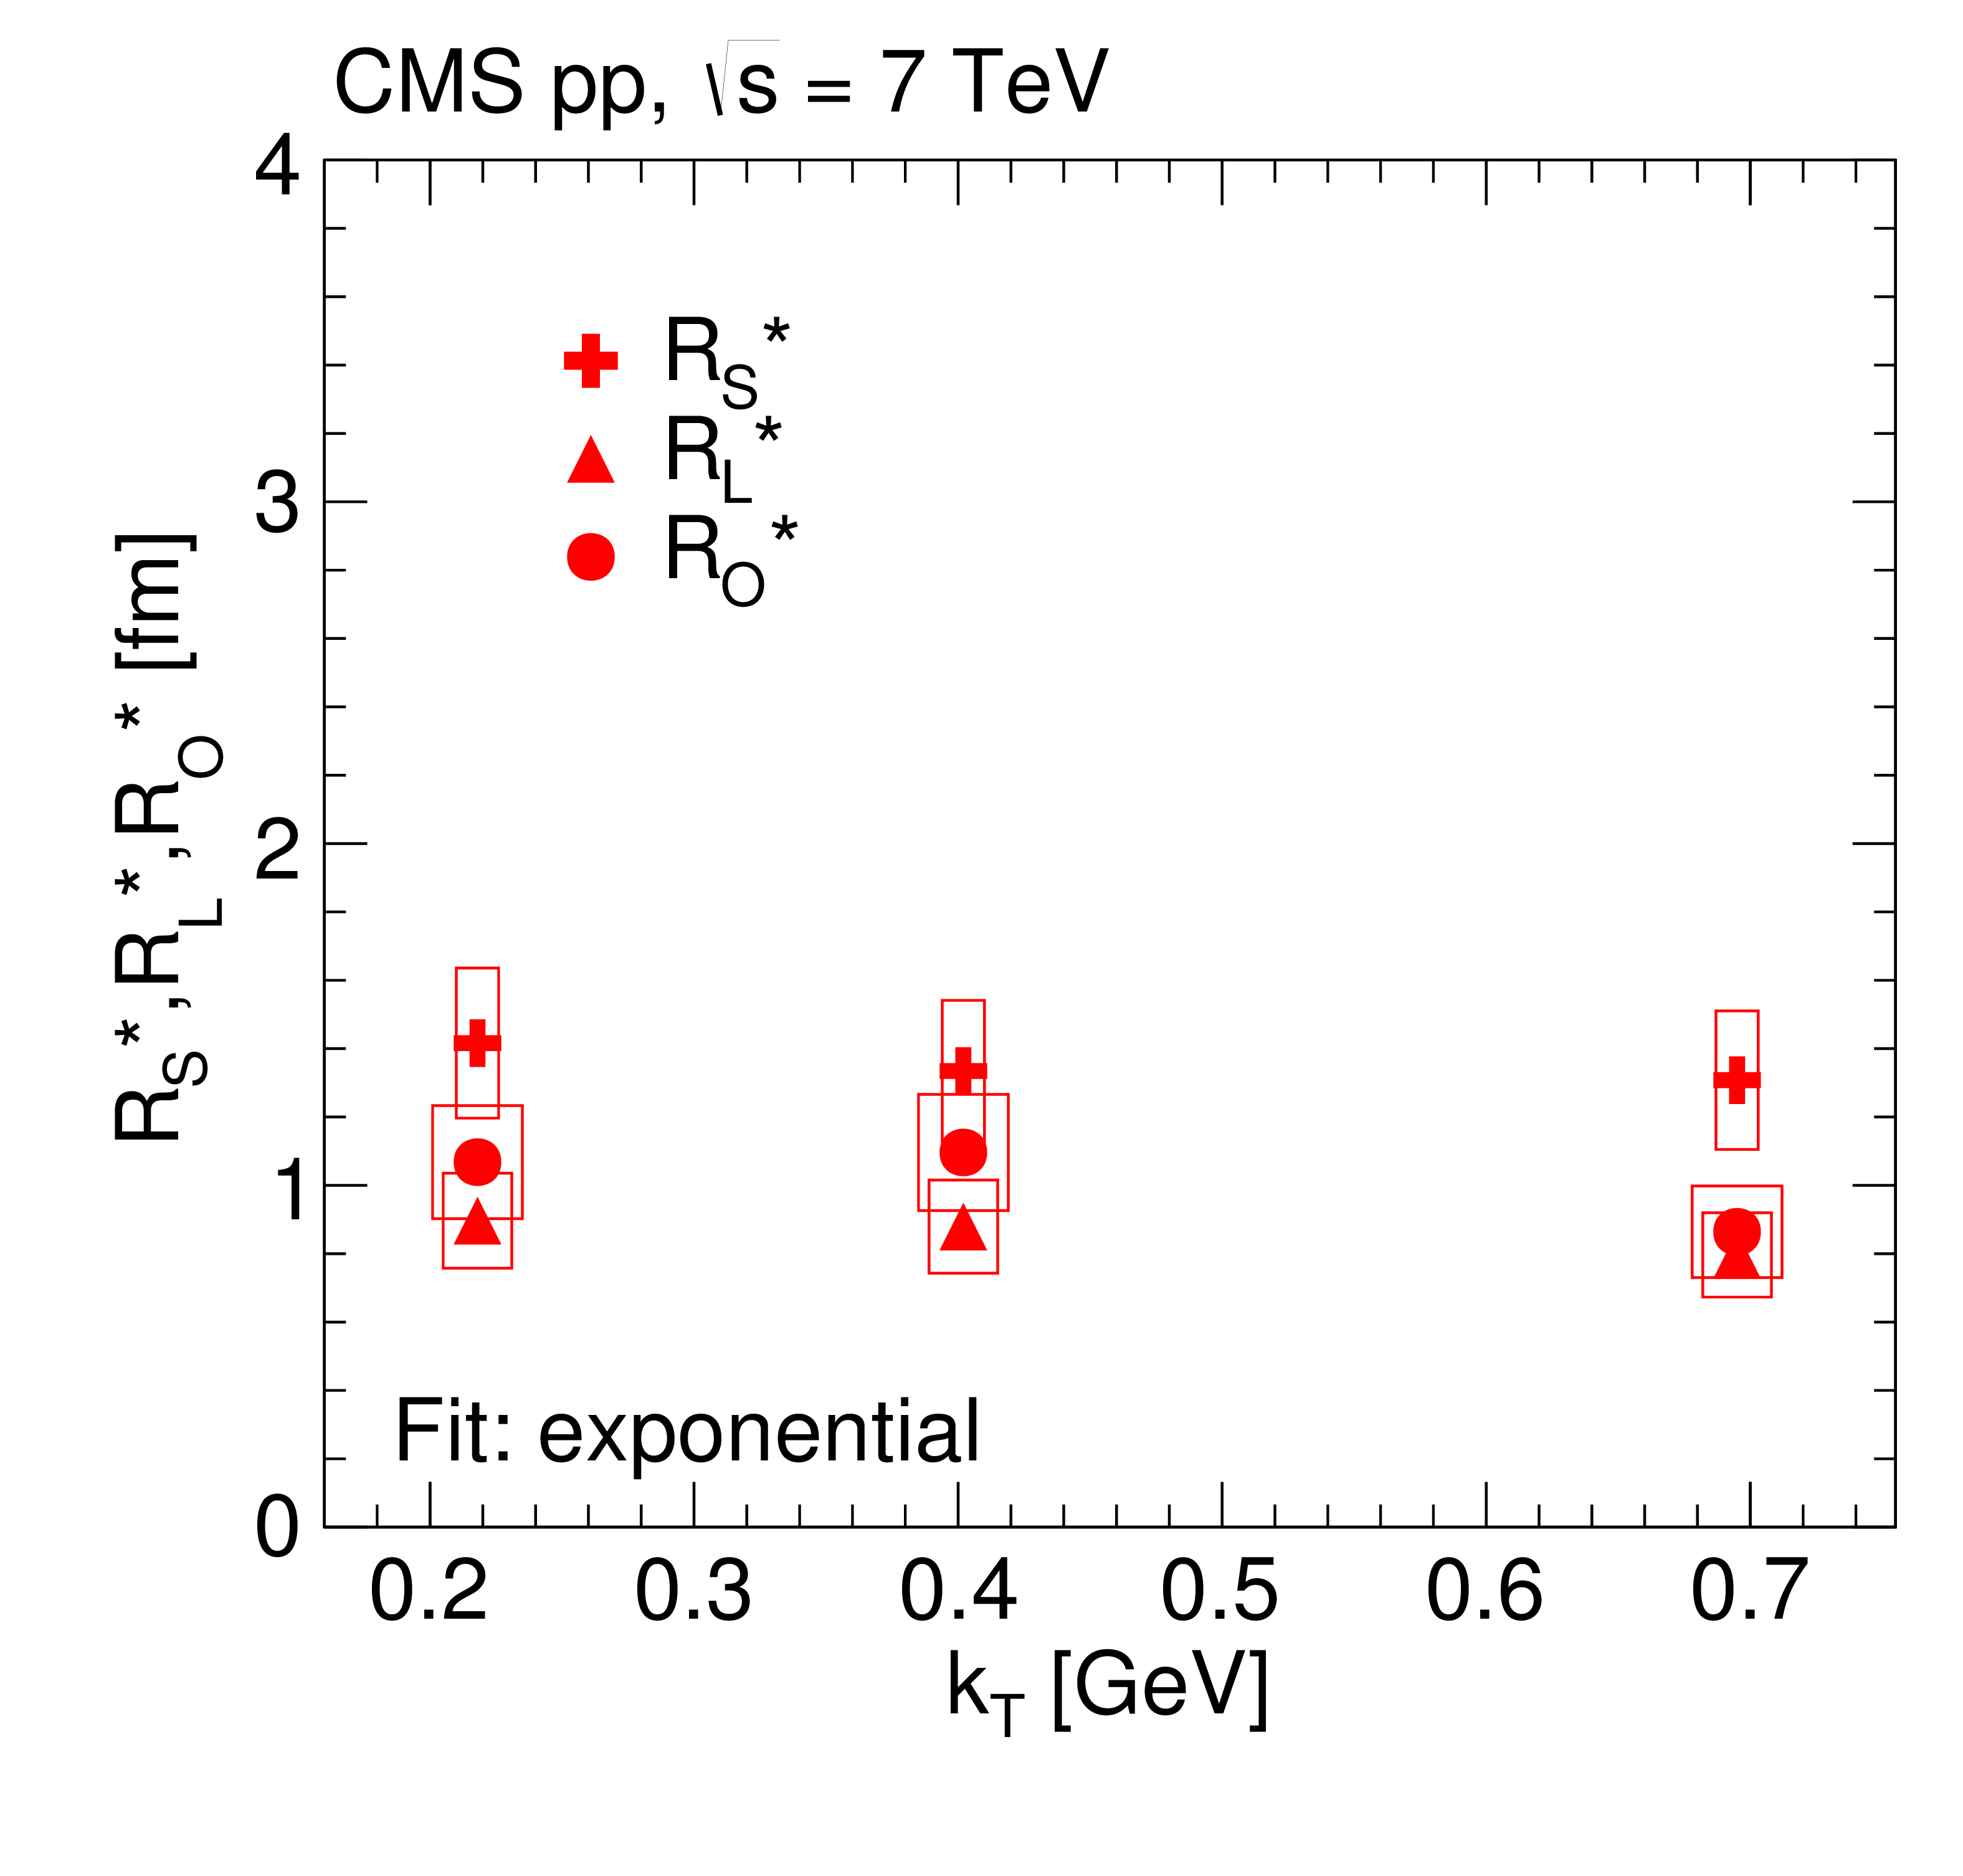
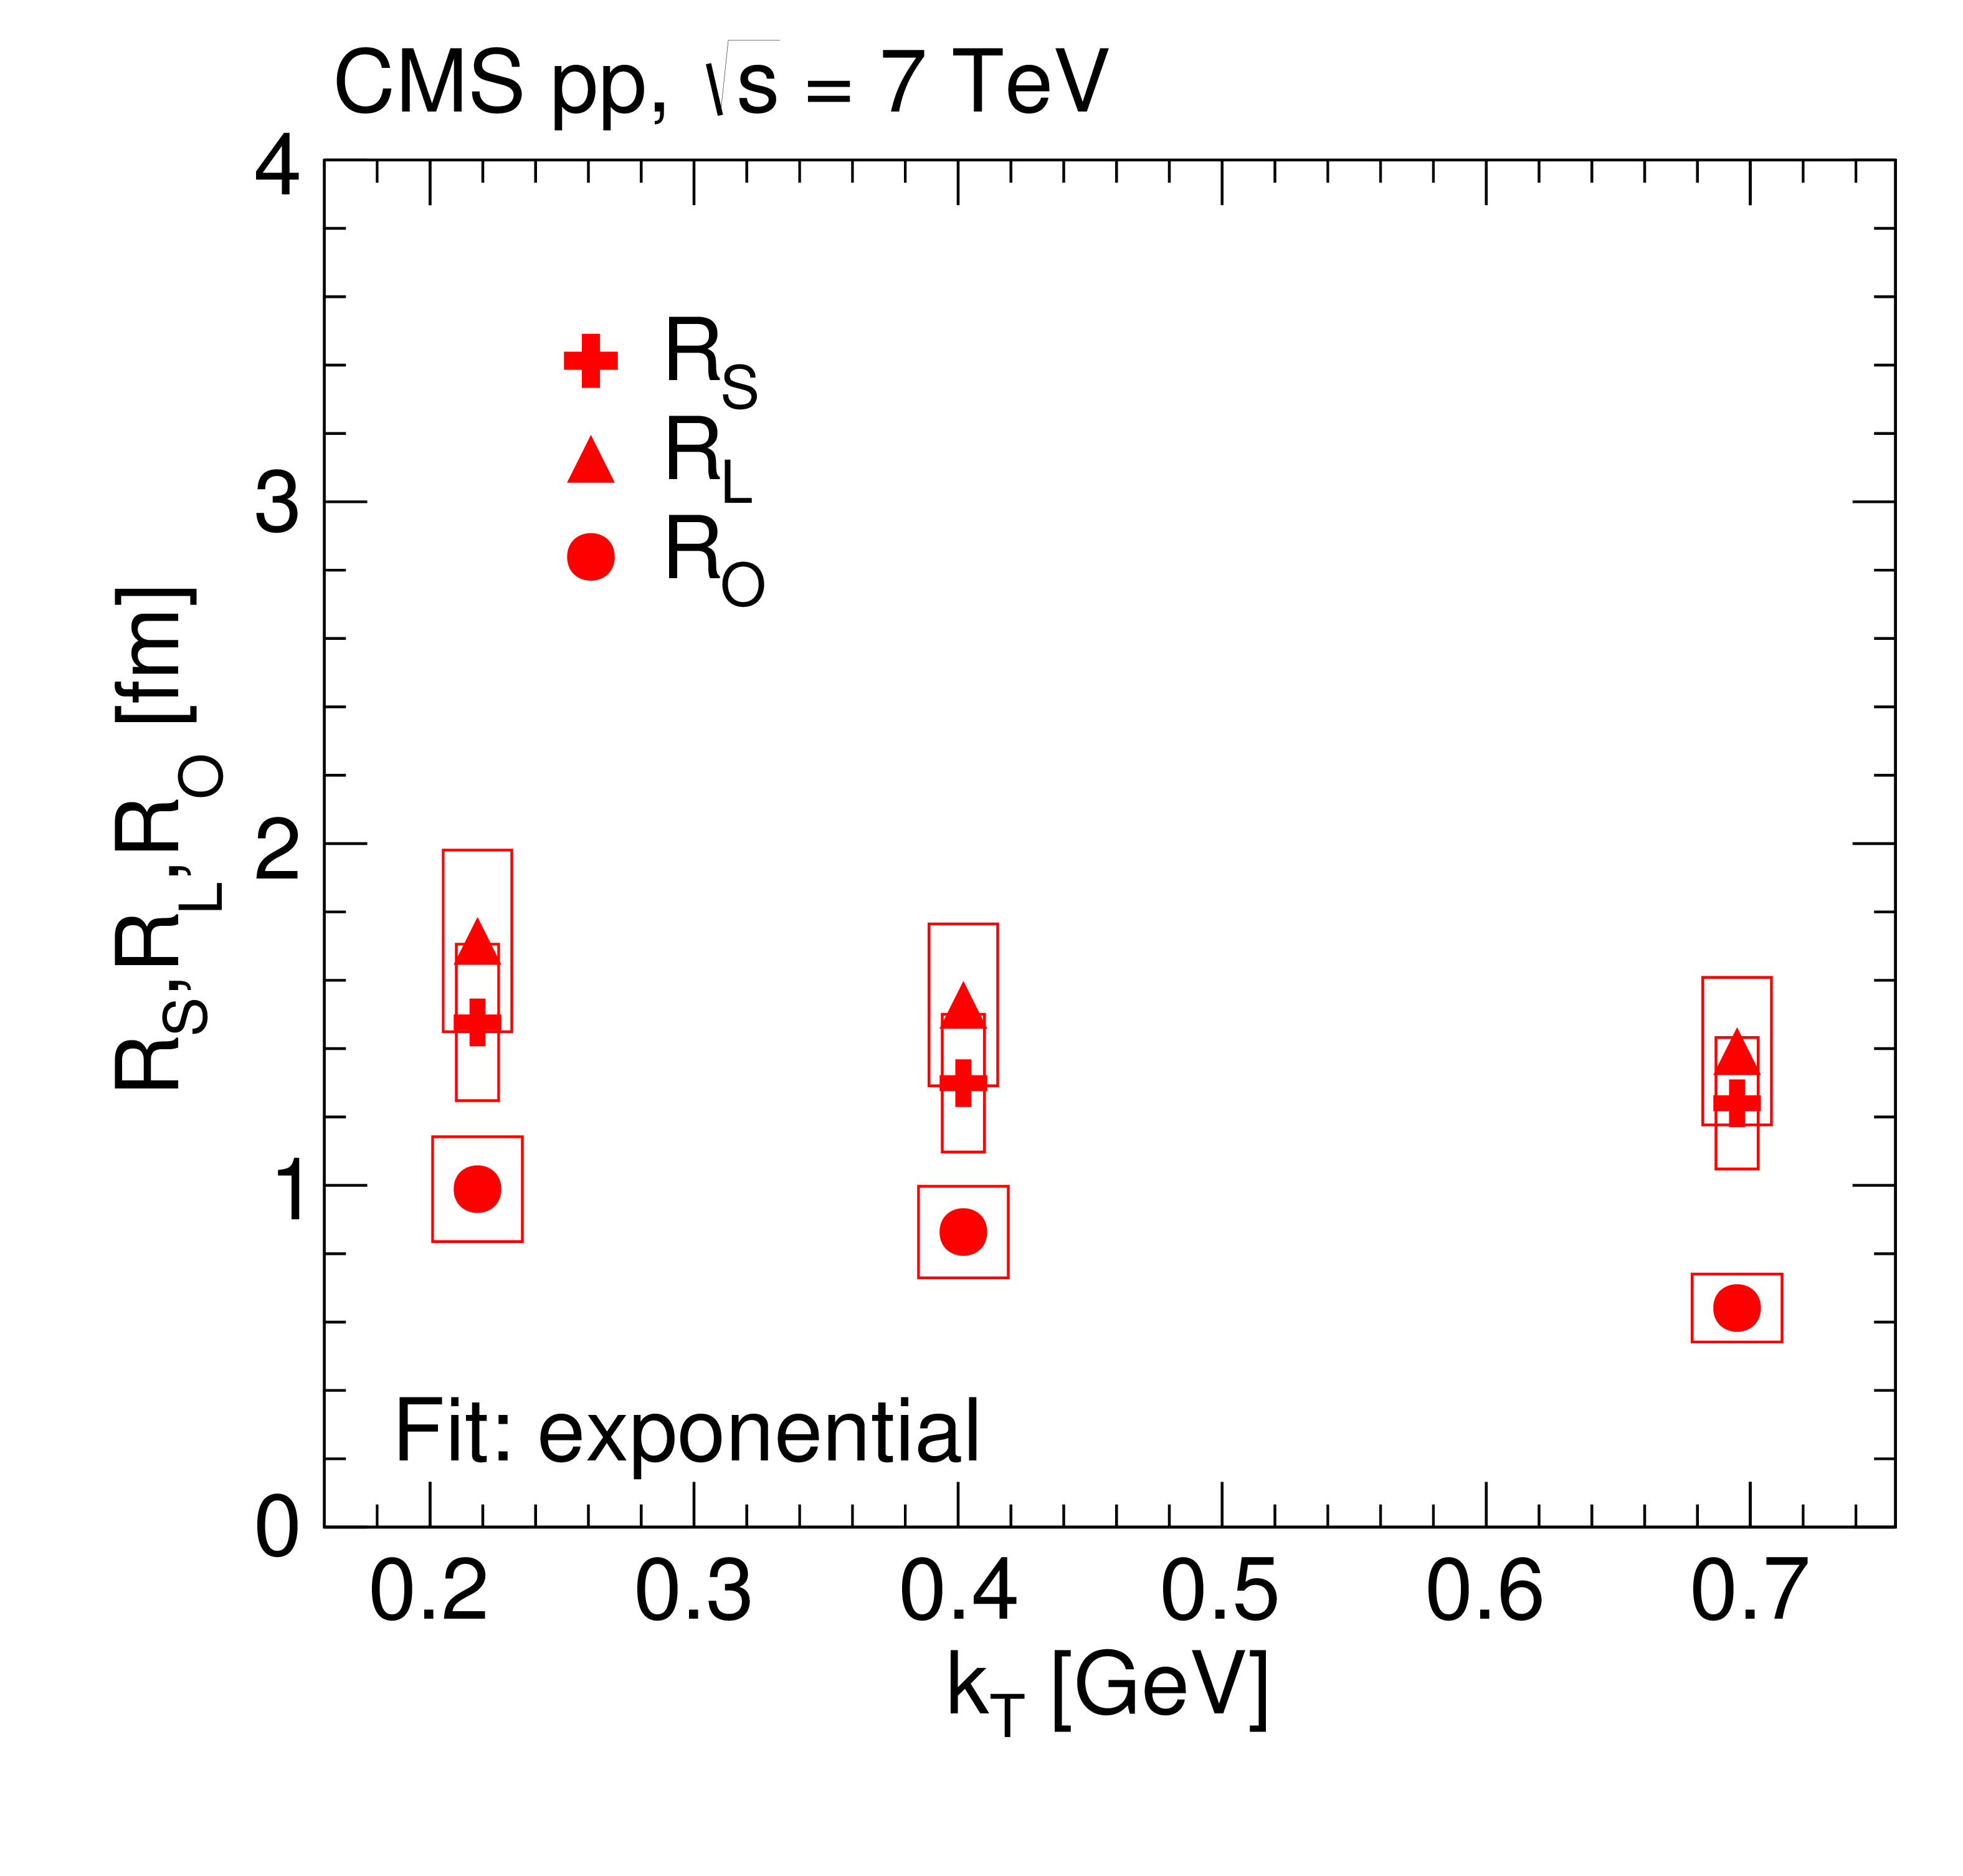
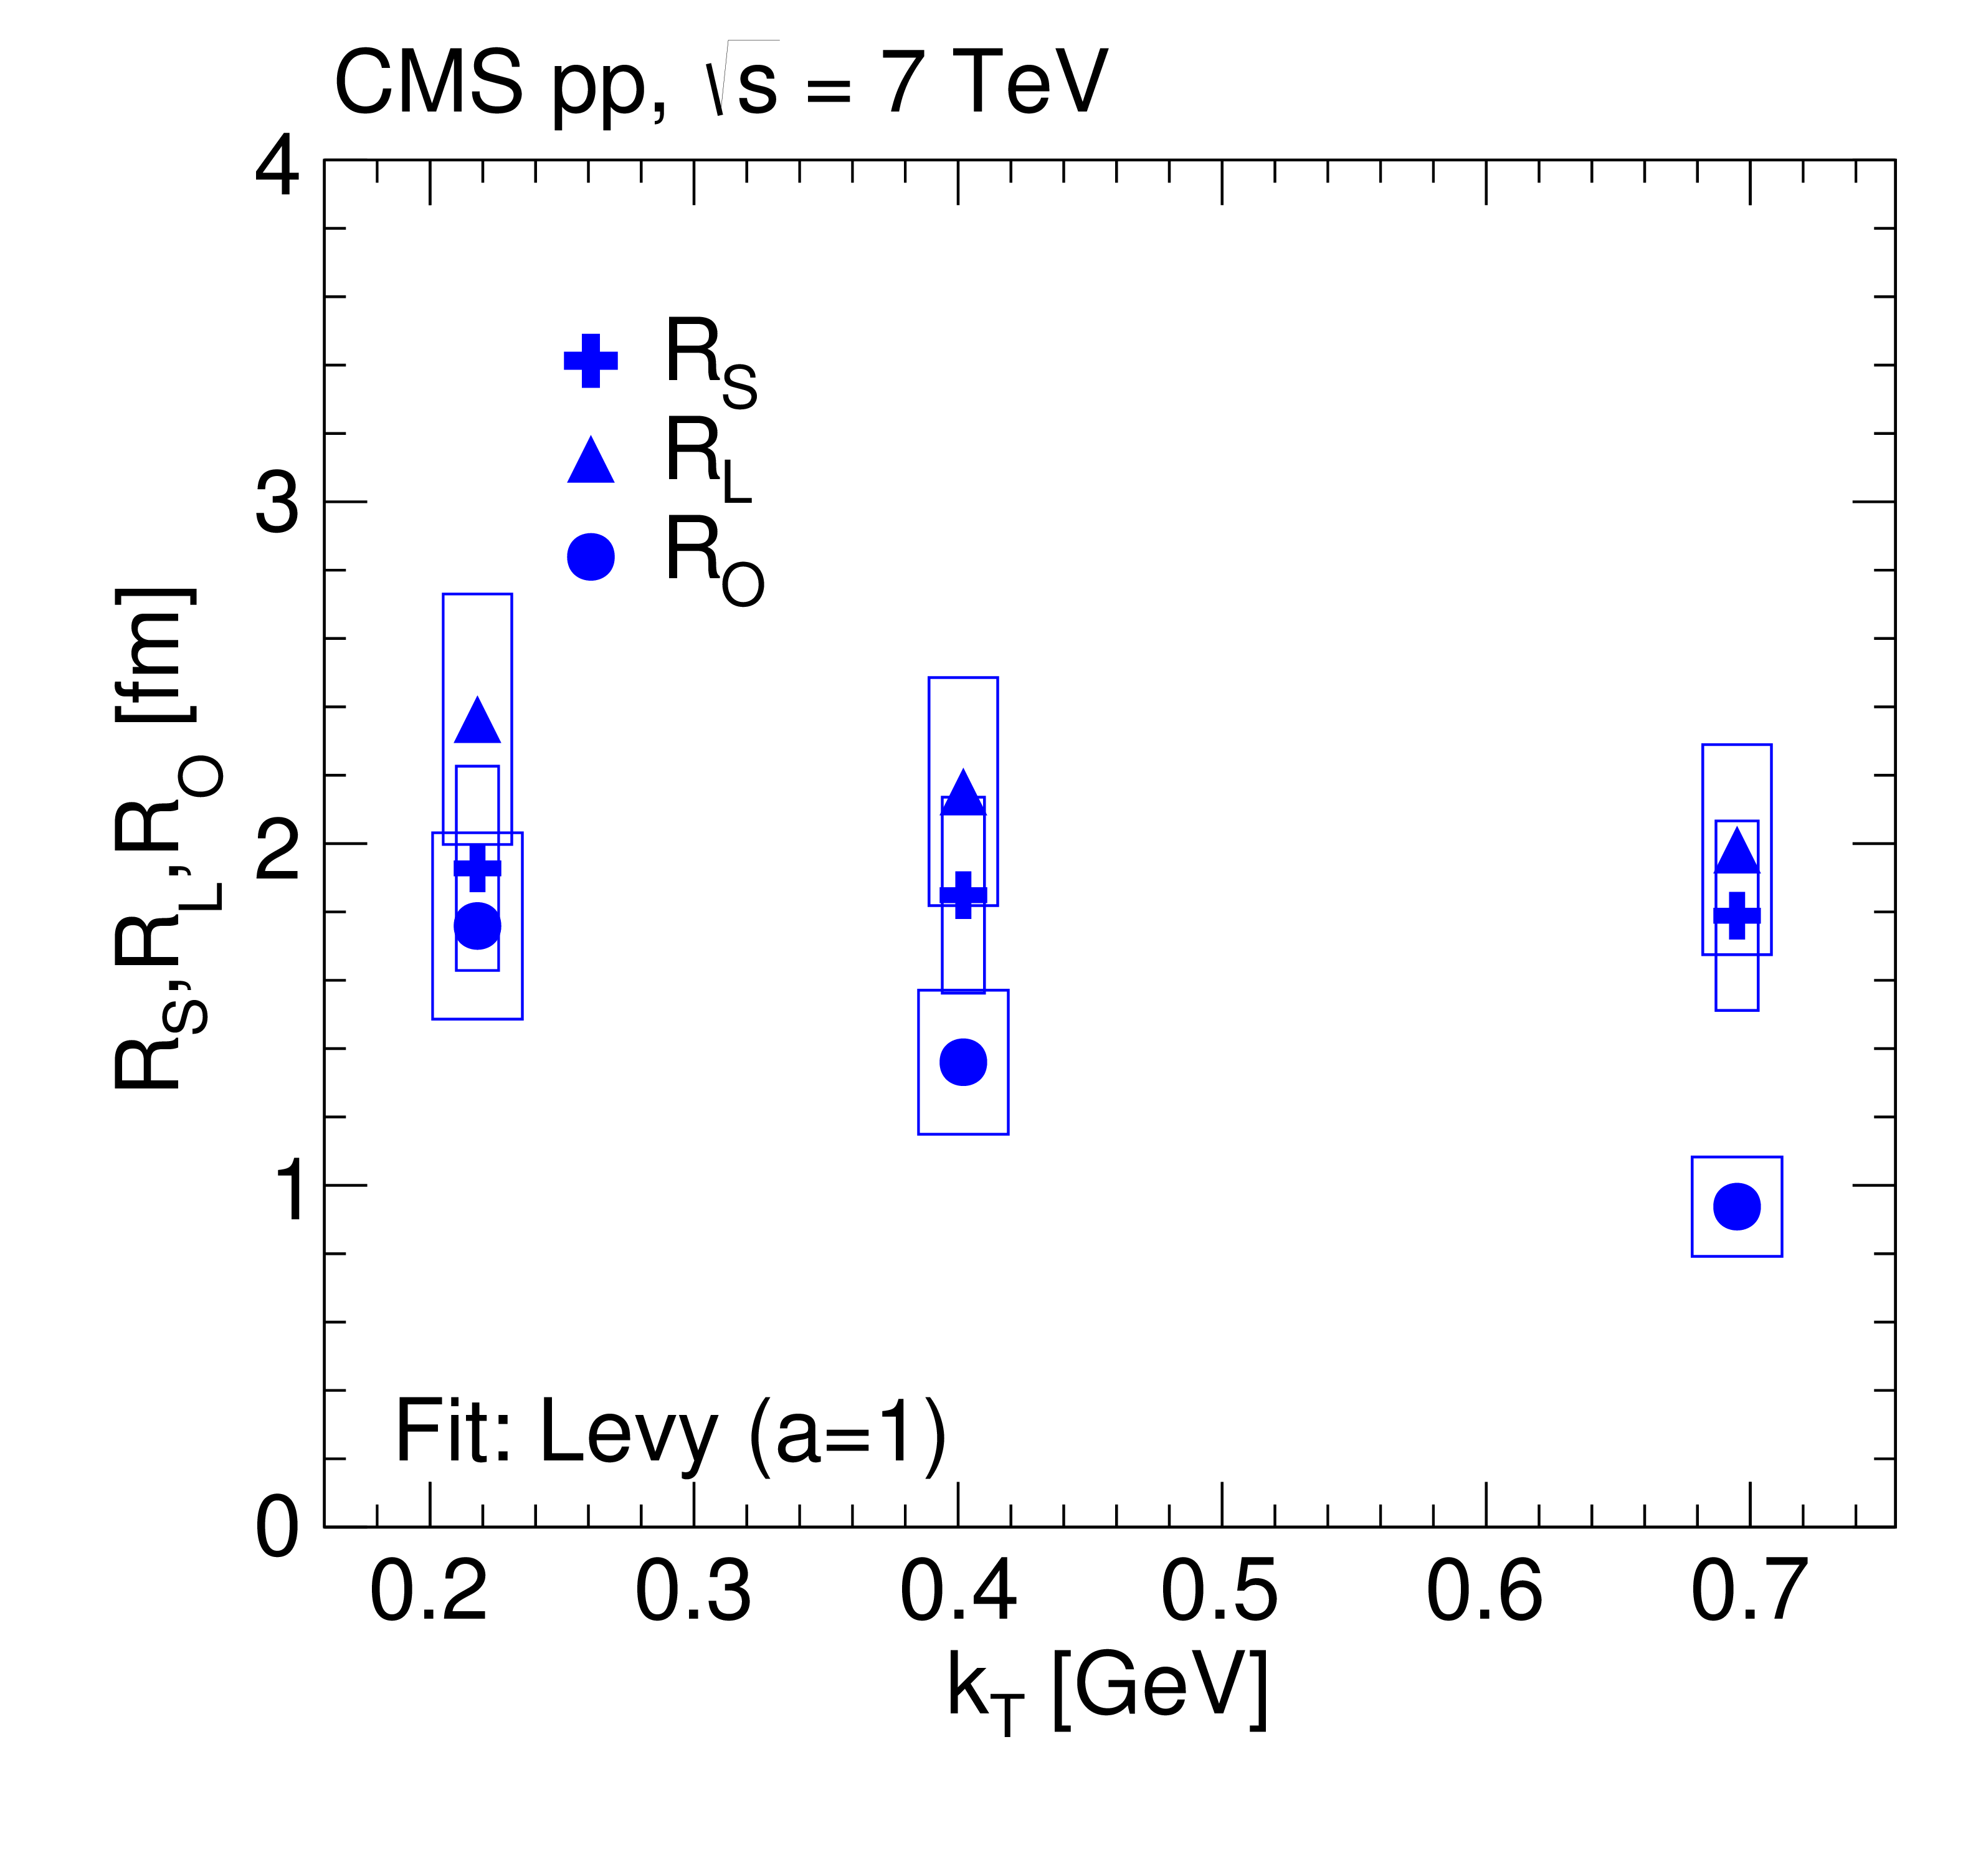
3D radii parameters as a function of $ {k_{\mathrm {T}}} $ (integrated over all $ {N_\text {trk0.4}} $), obtained from double ratios fitted to the exponential (left) and L\'evy (with $a = 1$, right) functions for pp collisions at $\sqrt {s} = $ 7 TeV in the CM frame (top) and in the LCMS (bottom). The boxes indicate the systematic uncertainties. |
png pdf |
Figure 16-a:
3D radii parameters as a function of $ {k_{\mathrm {T}}} $ (integrated over all $ {N_\text {trk0.4}} $), obtained from double ratios fitted to the exponential (left) and L\'evy (with $a = 1$, right) functions for pp collisions at $\sqrt {s} = $ 7 TeV in the CM frame (top) and in the LCMS (bottom). The boxes indicate the systematic uncertainties. |

png pdf |
Figure 16-b:
3D radii parameters as a function of $ {k_{\mathrm {T}}} $ (integrated over all $ {N_\text {trk0.4}} $), obtained from double ratios fitted to the exponential (left) and L\'evy (with $a = 1$, right) functions for pp collisions at $\sqrt {s} = $ 7 TeV in the CM frame (top) and in the LCMS (bottom). The boxes indicate the systematic uncertainties. |
png pdf |
Figure 16-c:
3D radii parameters as a function of $ {k_{\mathrm {T}}} $ (integrated over all $ {N_\text {trk0.4}} $), obtained from double ratios fitted to the exponential (left) and L\'evy (with $a = 1$, right) functions for pp collisions at $\sqrt {s} = $ 7 TeV in the CM frame (top) and in the LCMS (bottom). The boxes indicate the systematic uncertainties. |
png pdf |
Figure 16-d:
3D radii parameters as a function of $ {k_{\mathrm {T}}} $ (integrated over all $ {N_\text {trk0.4}} $), obtained from double ratios fitted to the exponential (left) and L\'evy (with $a = 1$, right) functions for pp collisions at $\sqrt {s} = $ 7 TeV in the CM frame (top) and in the LCMS (bottom). The boxes indicate the systematic uncertainties. |
png pdf |
Figure 17:
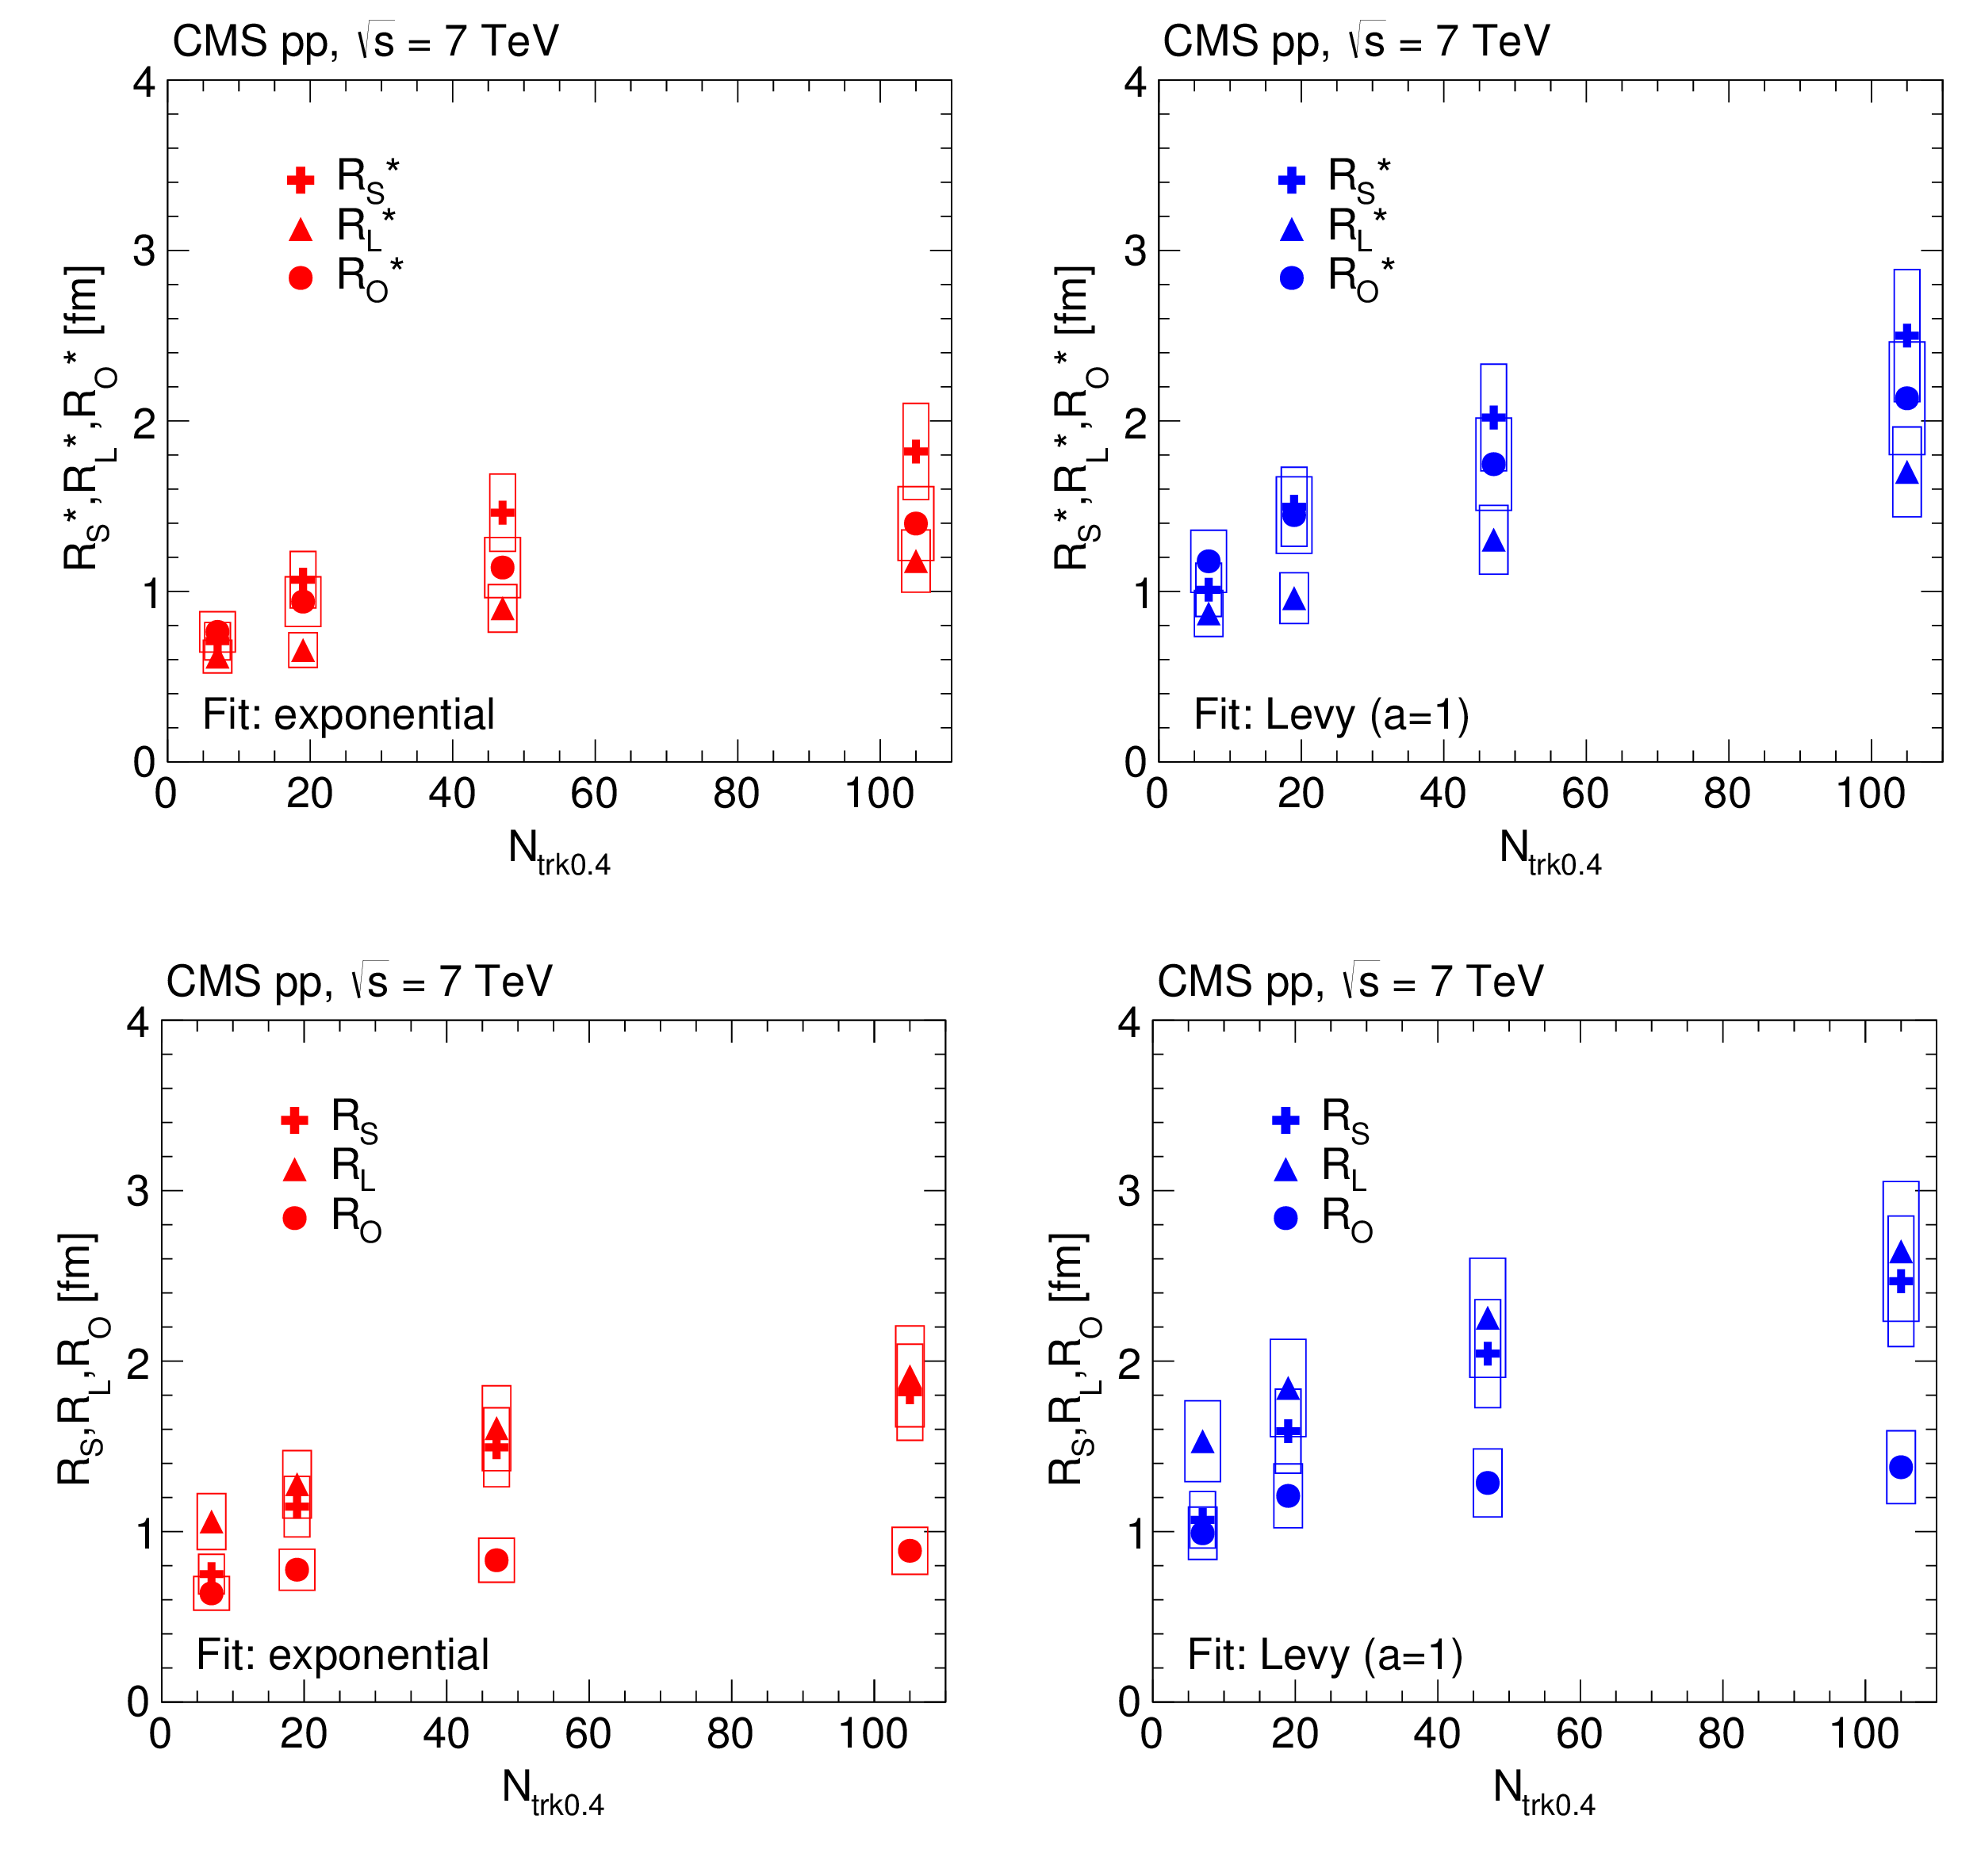
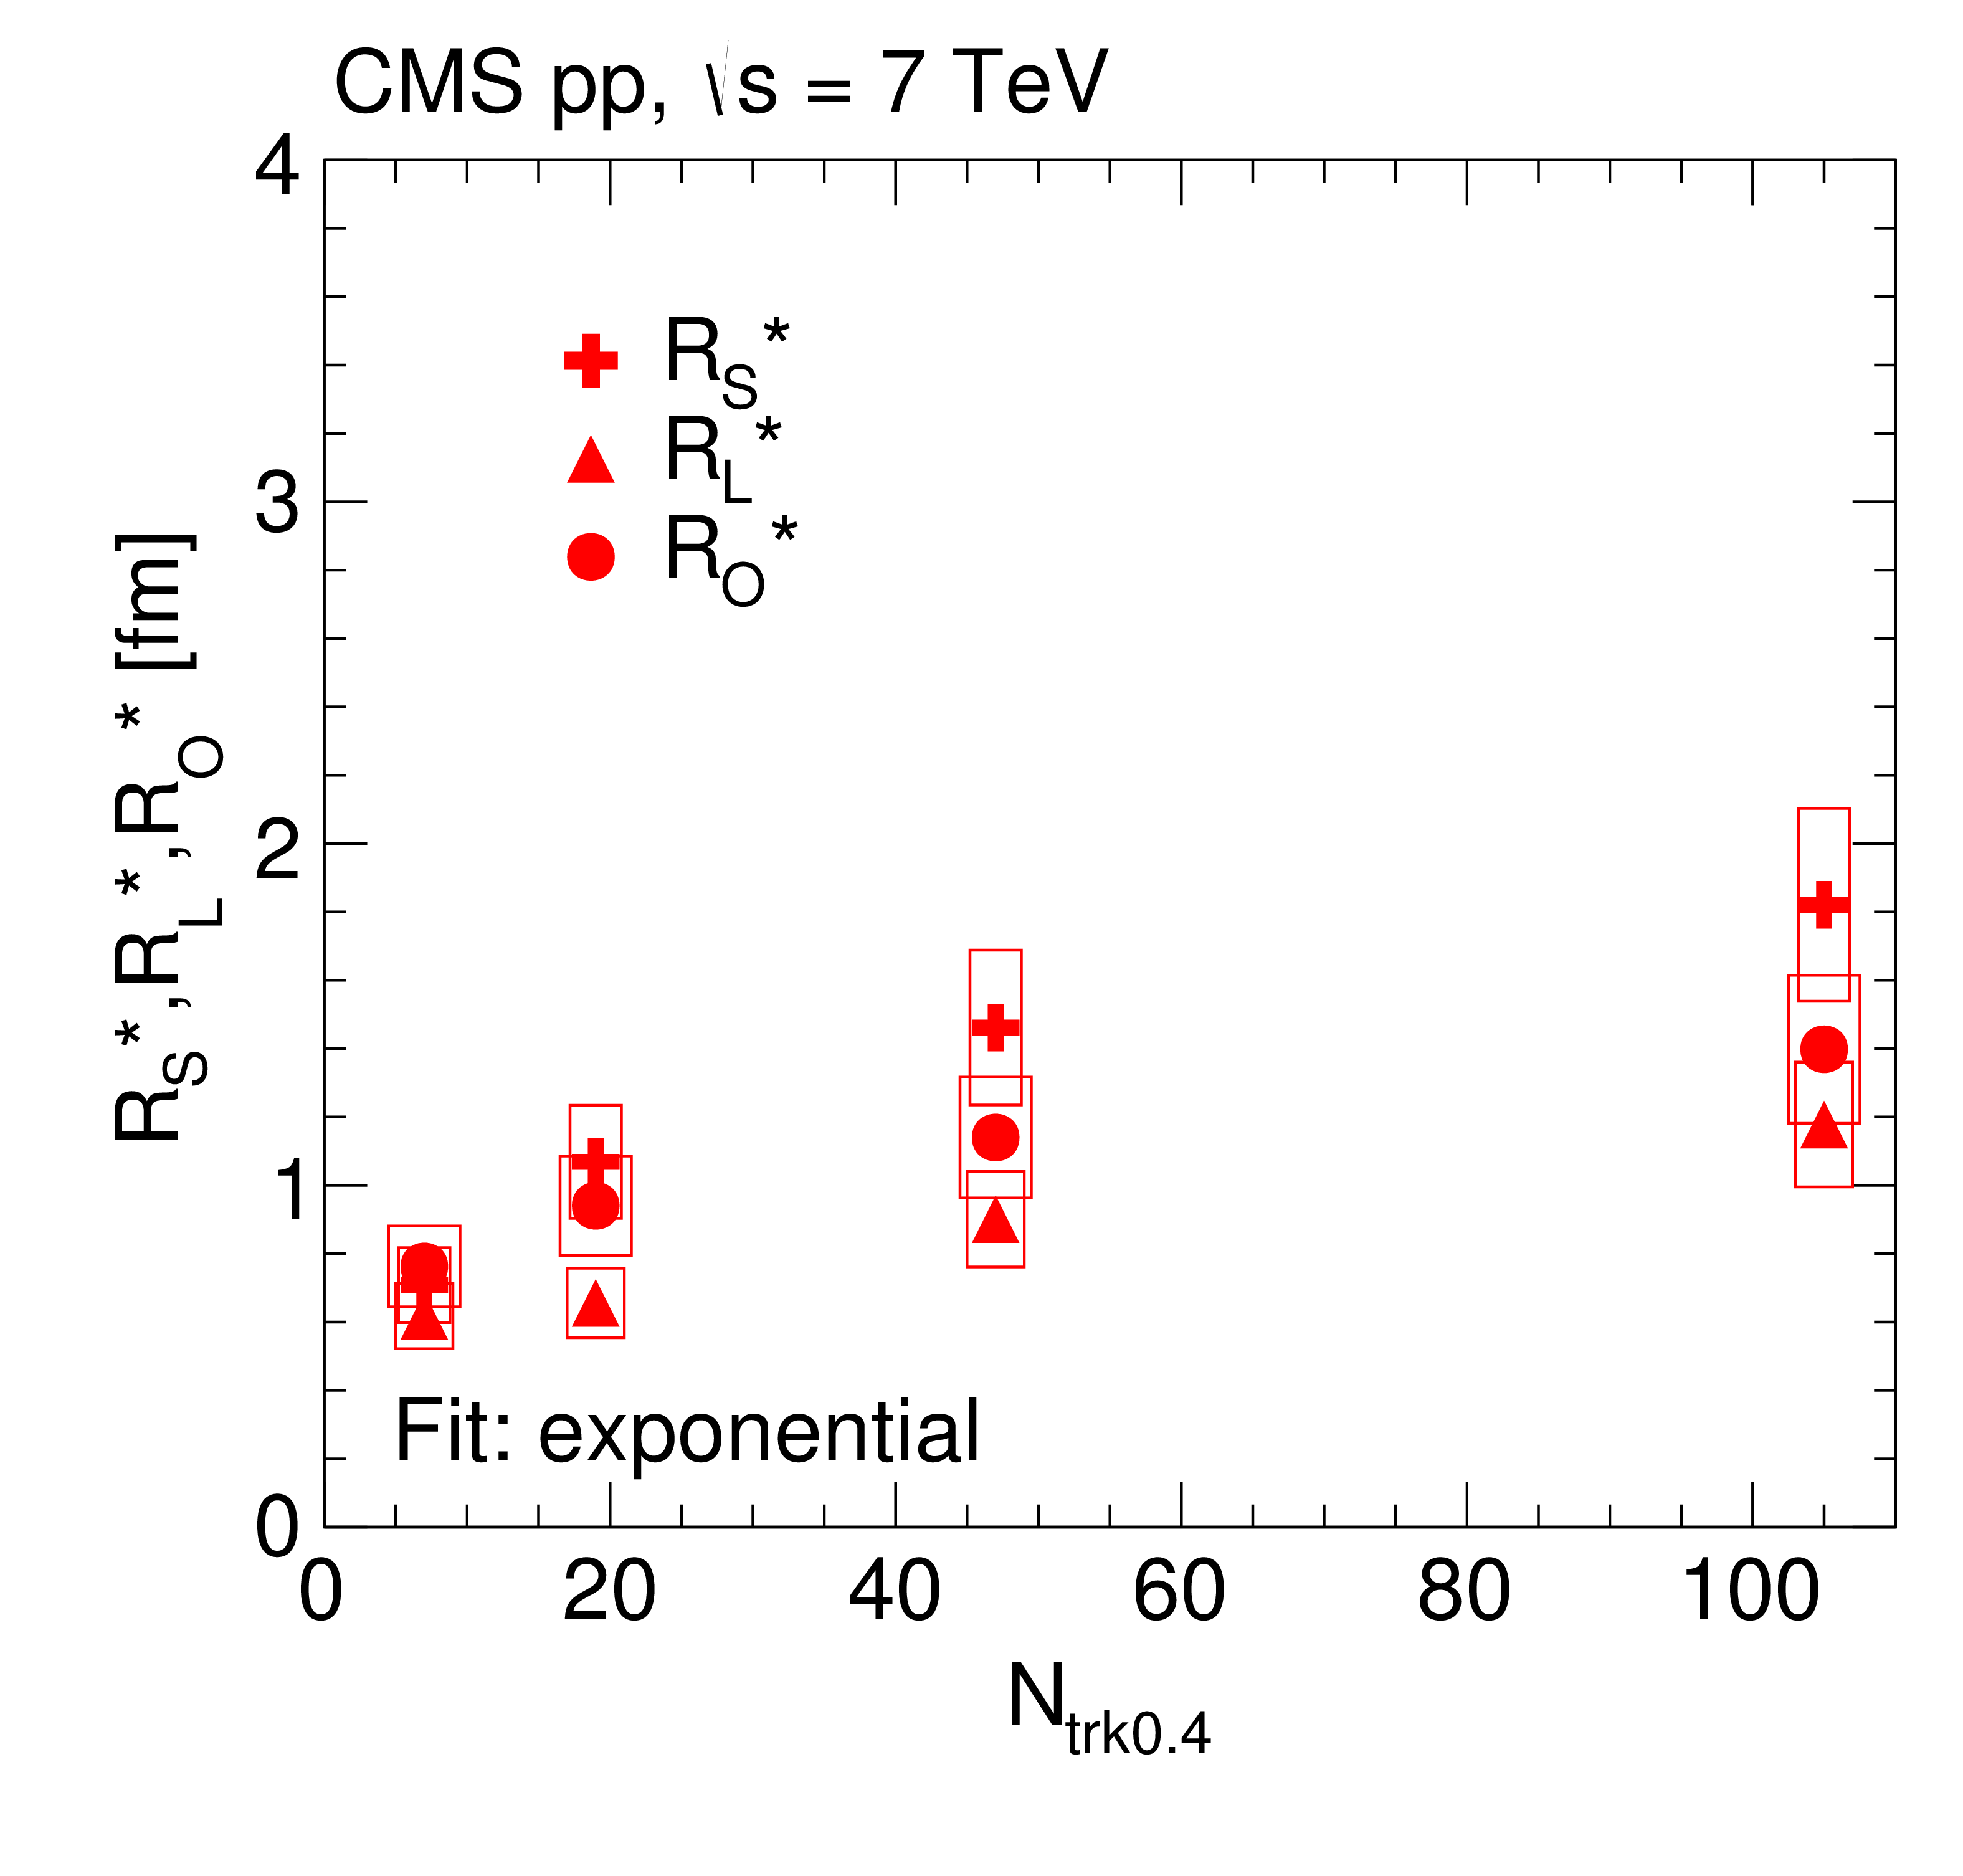
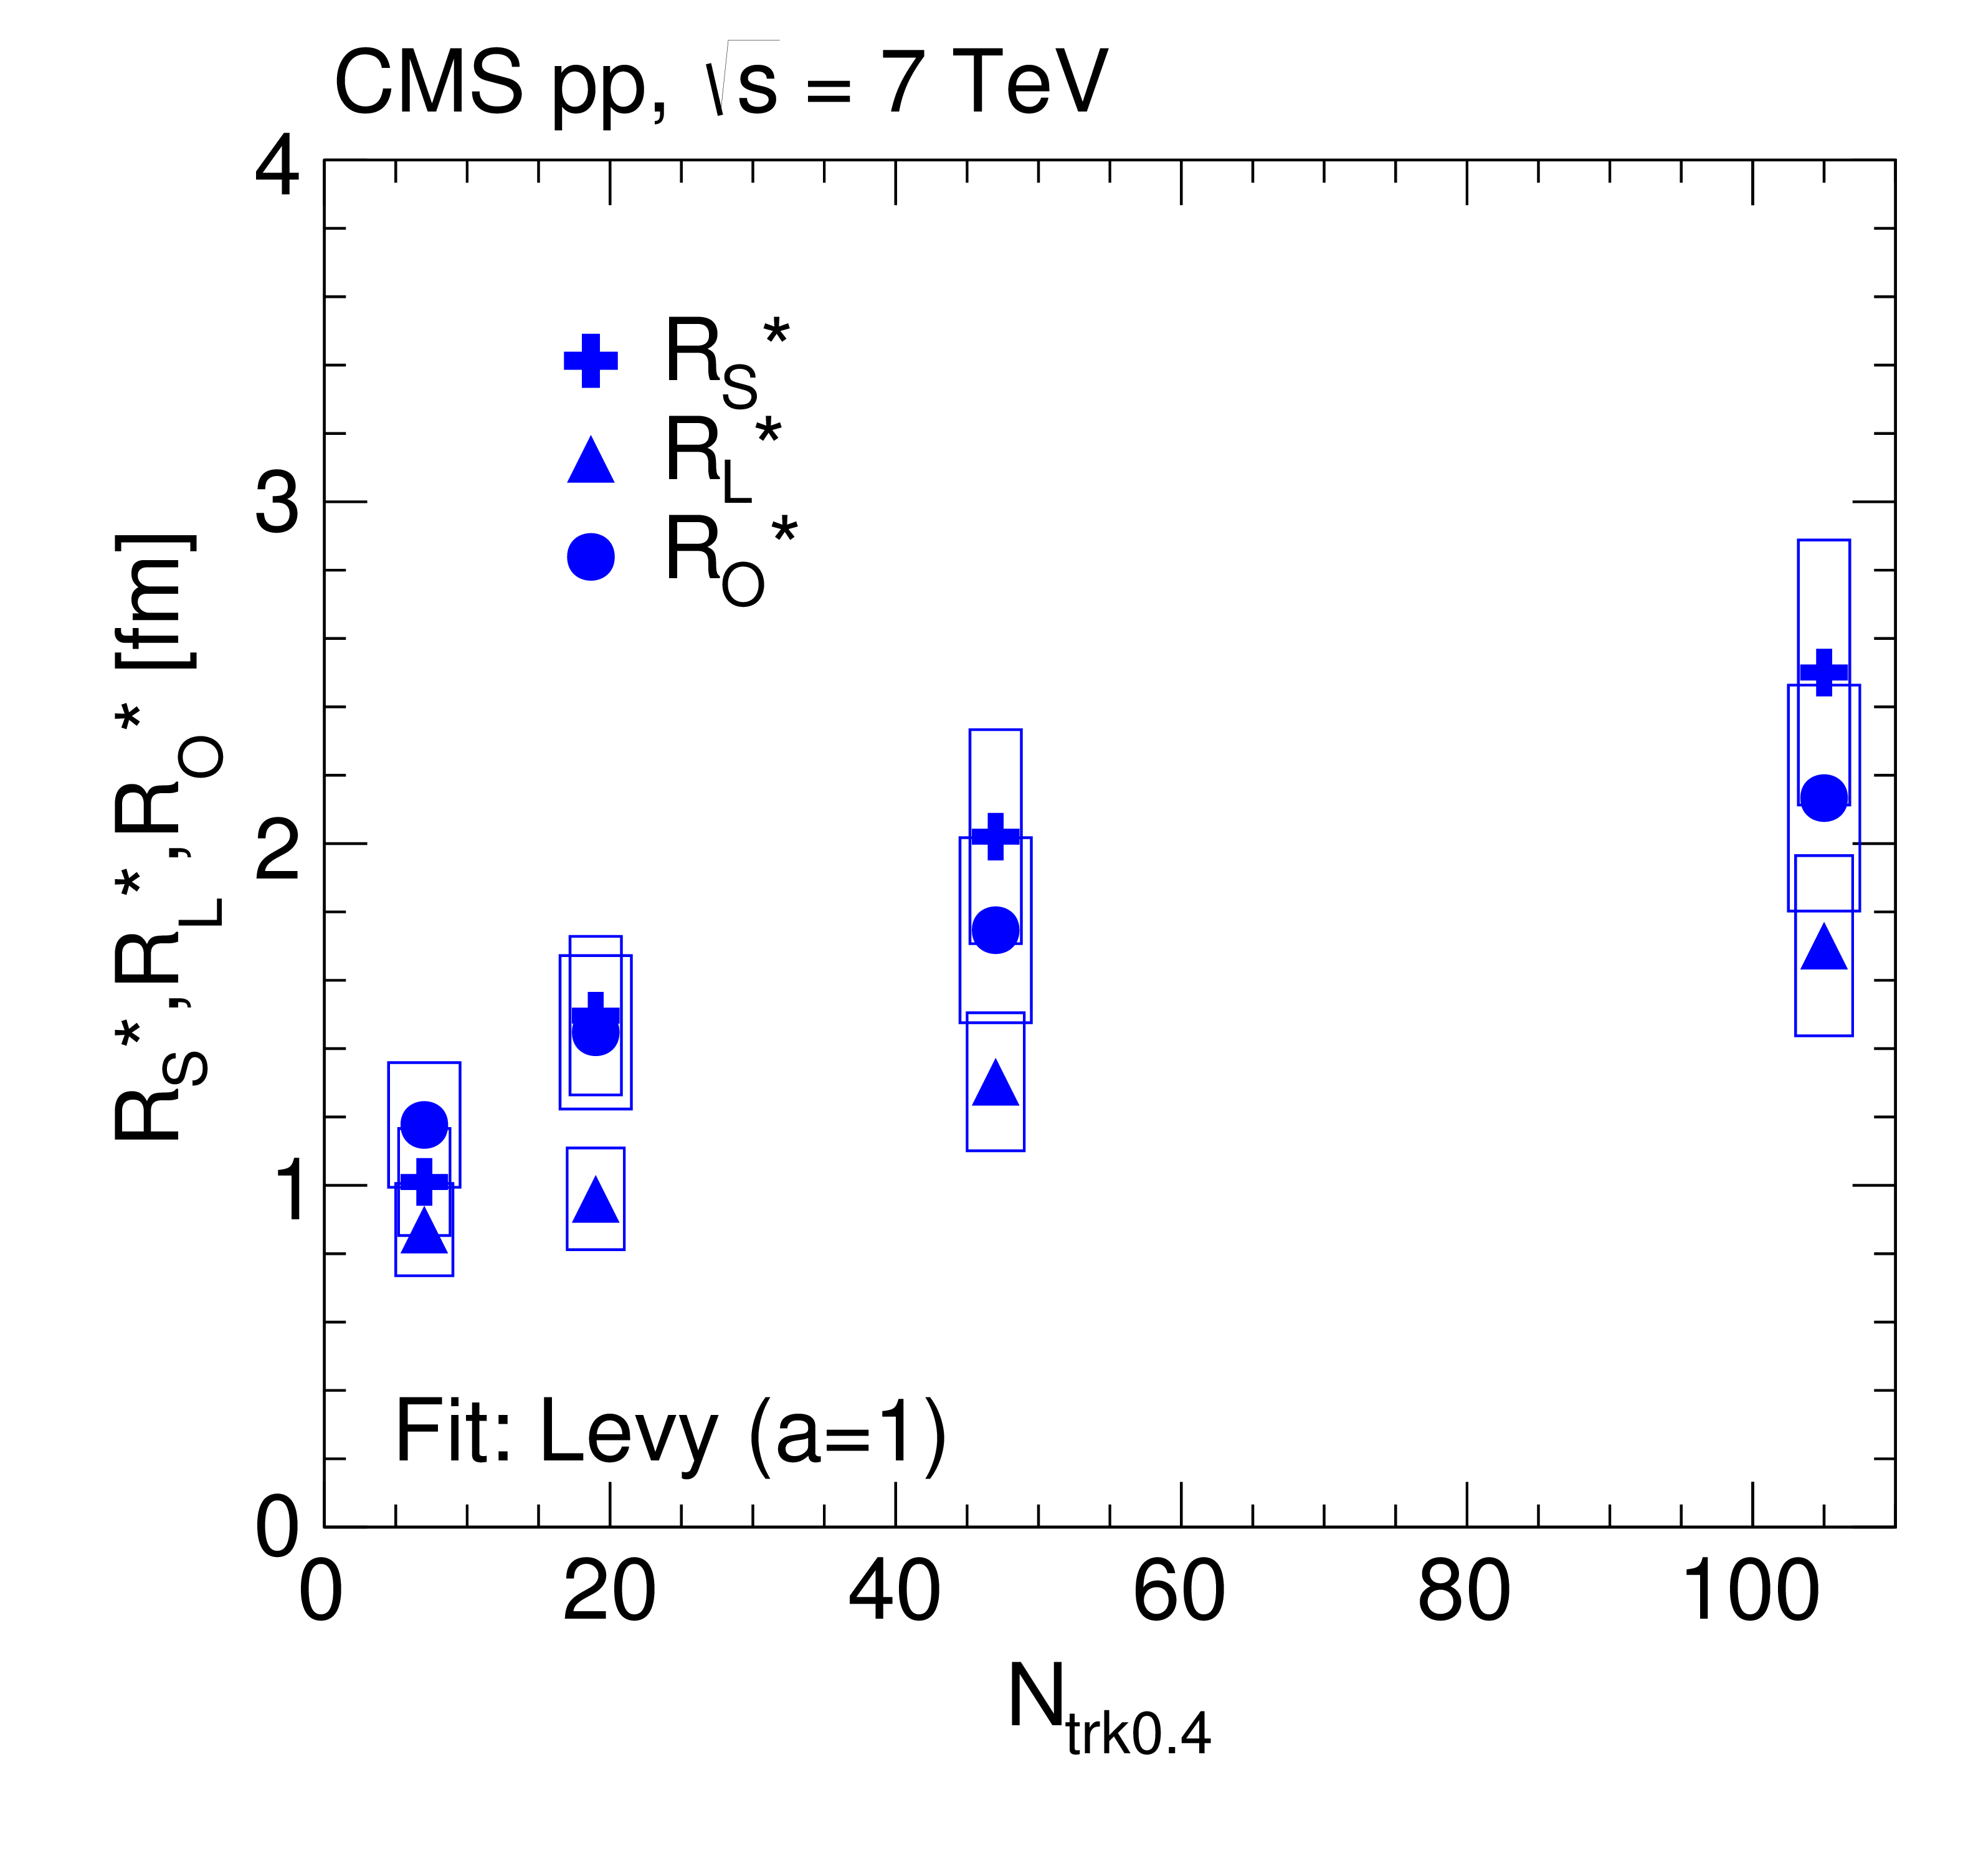
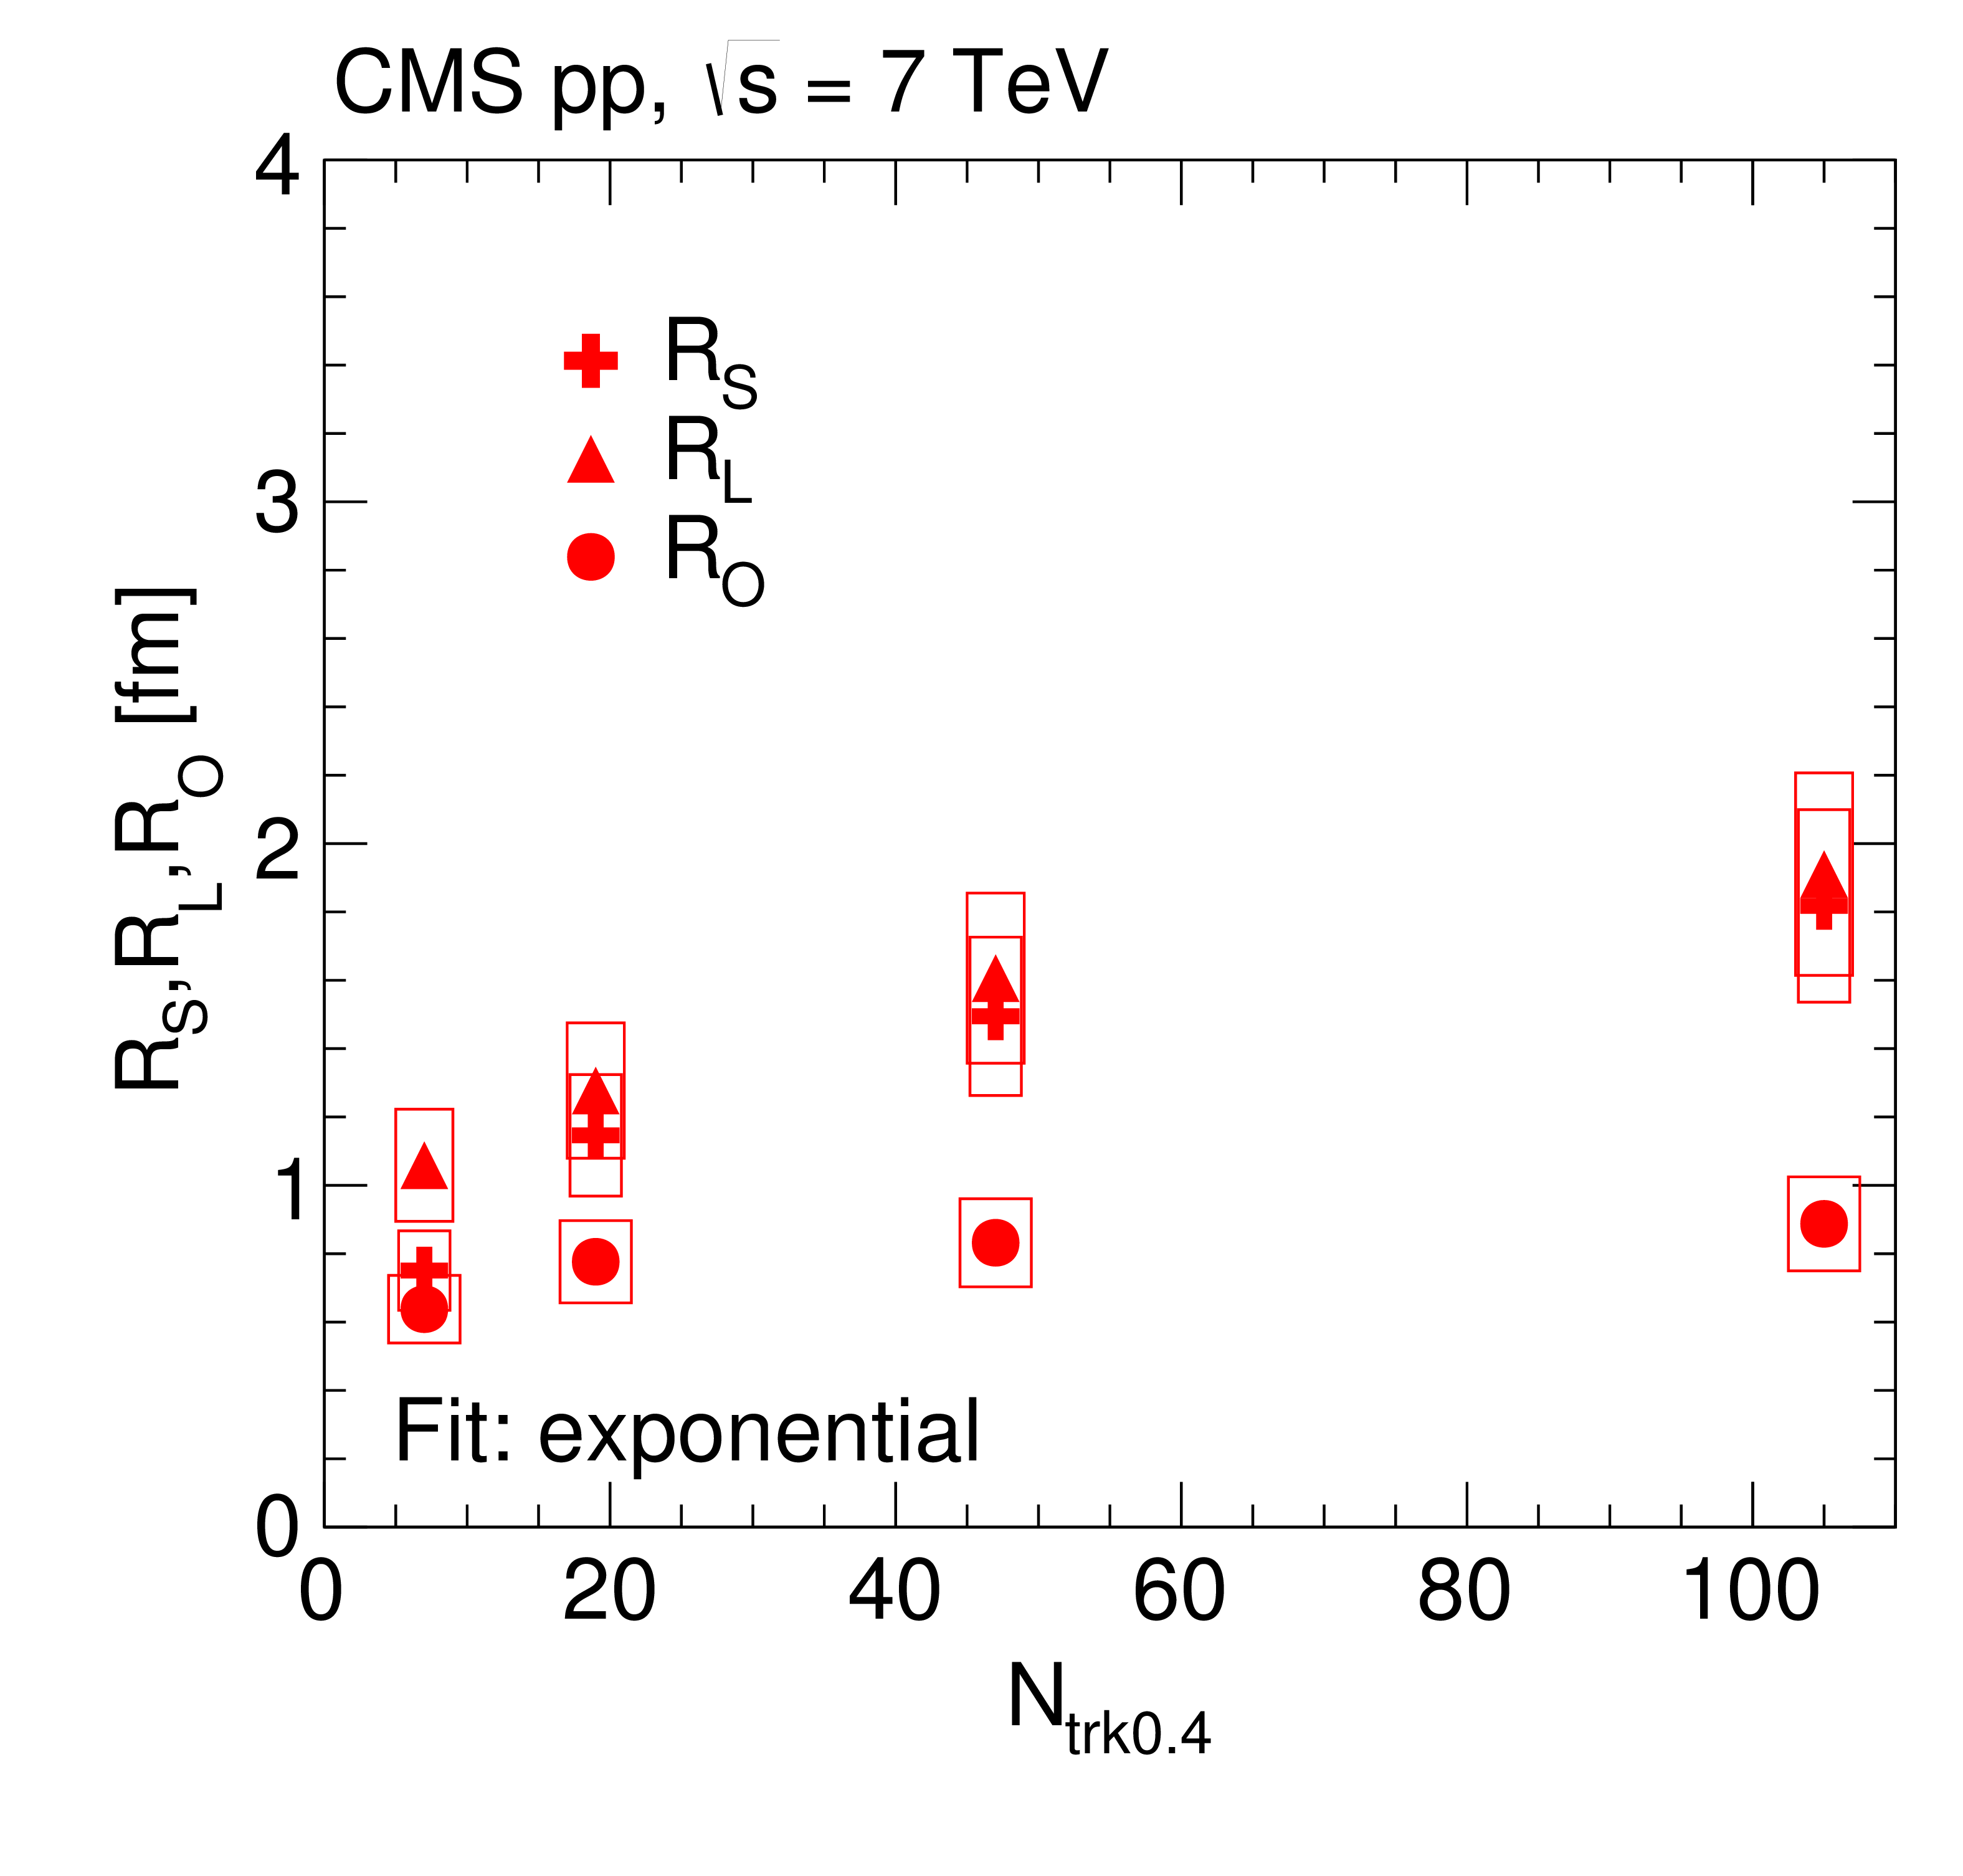
3D radii parameters as a function of $ {N_\text {trk0.4}} $ (integrated over all $ {k_{\mathrm {T}}} $), obtained from double ratios fitted to the exponential (left) and Levy (with $a = $ 1, right) functions for pp collisions at $\sqrt {s} = $ 7 TeV in the CM frame (top) and in the LCMS (bottom). The boxes indicate the systematic uncertainties. |
png pdf |
Figure 17-a:
3D radii parameters as a function of $ {N_\text {trk0.4}} $ (integrated over all $ {k_{\mathrm {T}}} $), obtained from double ratios fitted to the exponential (left) and Levy (with $a = $ 1, right) functions for pp collisions at $\sqrt {s} = $ 7 TeV in the CM frame (top) and in the LCMS (bottom). The boxes indicate the systematic uncertainties. |
png pdf |
Figure 17-b:
3D radii parameters as a function of $ {N_\text {trk0.4}} $ (integrated over all $ {k_{\mathrm {T}}} $), obtained from double ratios fitted to the exponential (left) and Levy (with $a = $ 1, right) functions for pp collisions at $\sqrt {s} = $ 7 TeV in the CM frame (top) and in the LCMS (bottom). The boxes indicate the systematic uncertainties. |
png pdf |
Figure 17-c:
3D radii parameters as a function of $ {N_\text {trk0.4}} $ (integrated over all $ {k_{\mathrm {T}}} $), obtained from double ratios fitted to the exponential (left) and Levy (with $a = $ 1, right) functions for pp collisions at $\sqrt {s} = $ 7 TeV in the CM frame (top) and in the LCMS (bottom). The boxes indicate the systematic uncertainties. |
png pdf |
Figure 17-d:
3D radii parameters as a function of $ {N_\text {trk0.4}} $ (integrated over all $ {k_{\mathrm {T}}} $), obtained from double ratios fitted to the exponential (left) and Levy (with $a = $ 1, right) functions for pp collisions at $\sqrt {s} = $ 7 TeV in the CM frame (top) and in the LCMS (bottom). The boxes indicate the systematic uncertainties. |
png pdf |
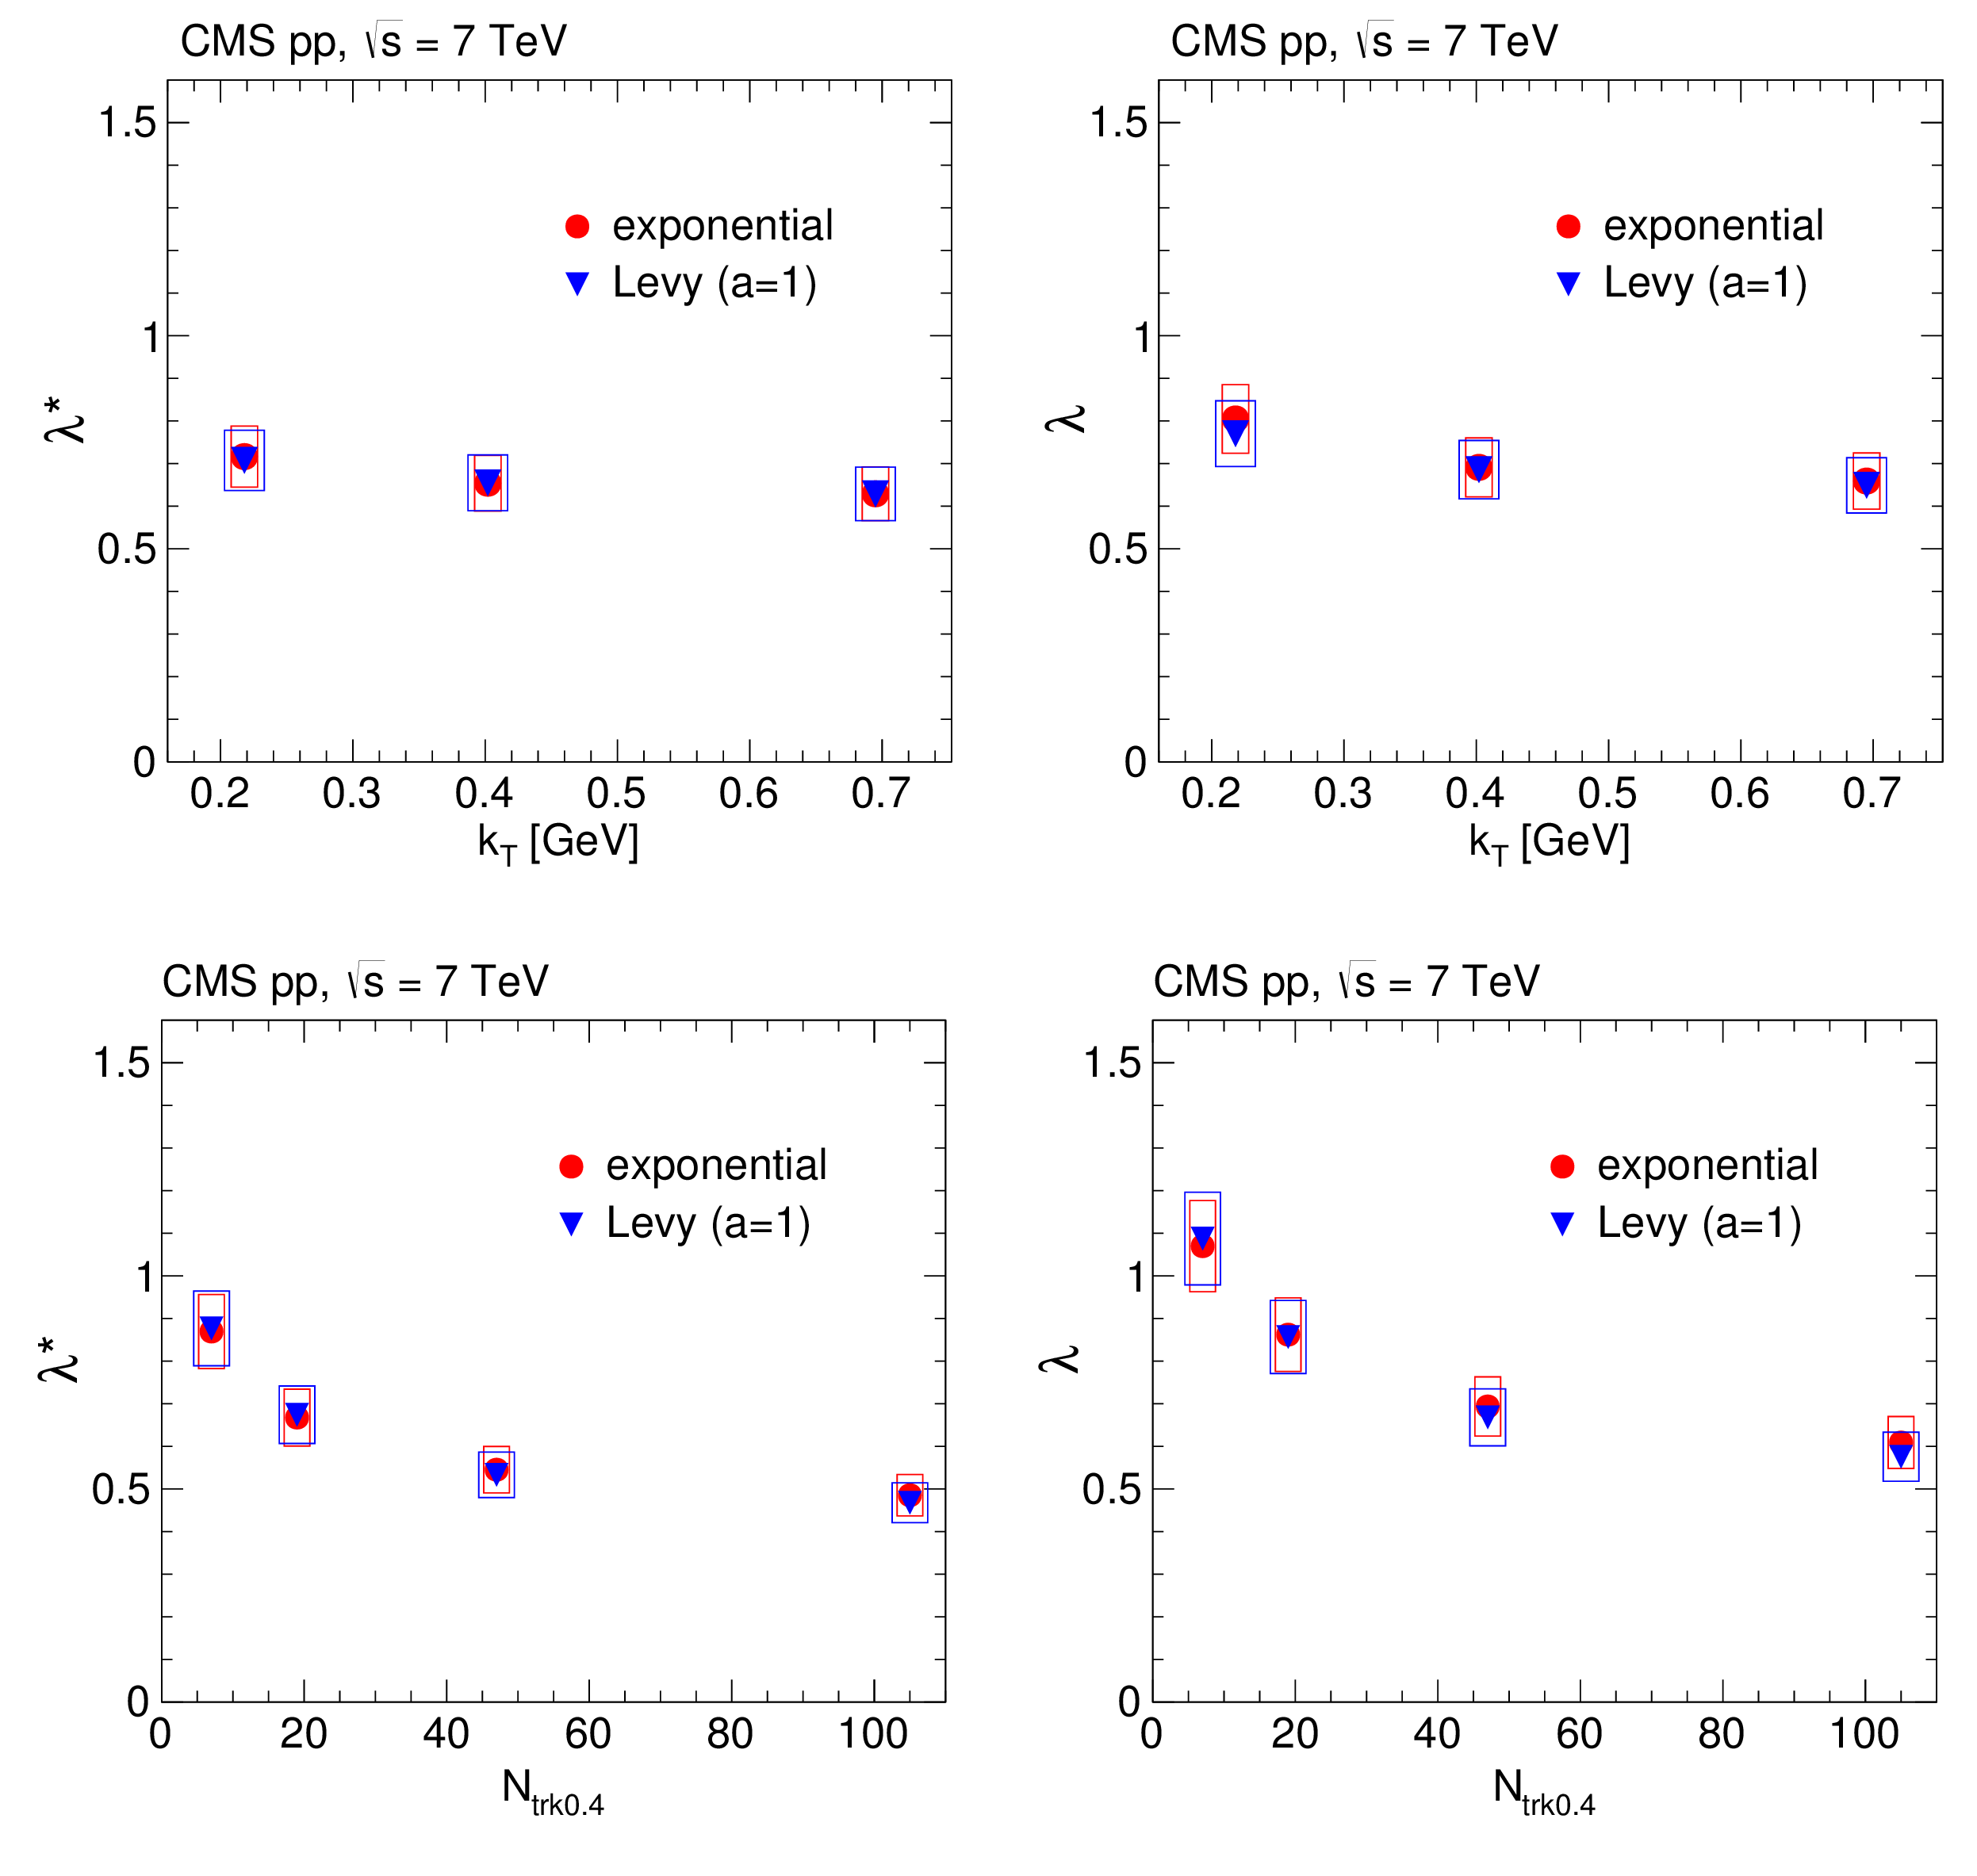
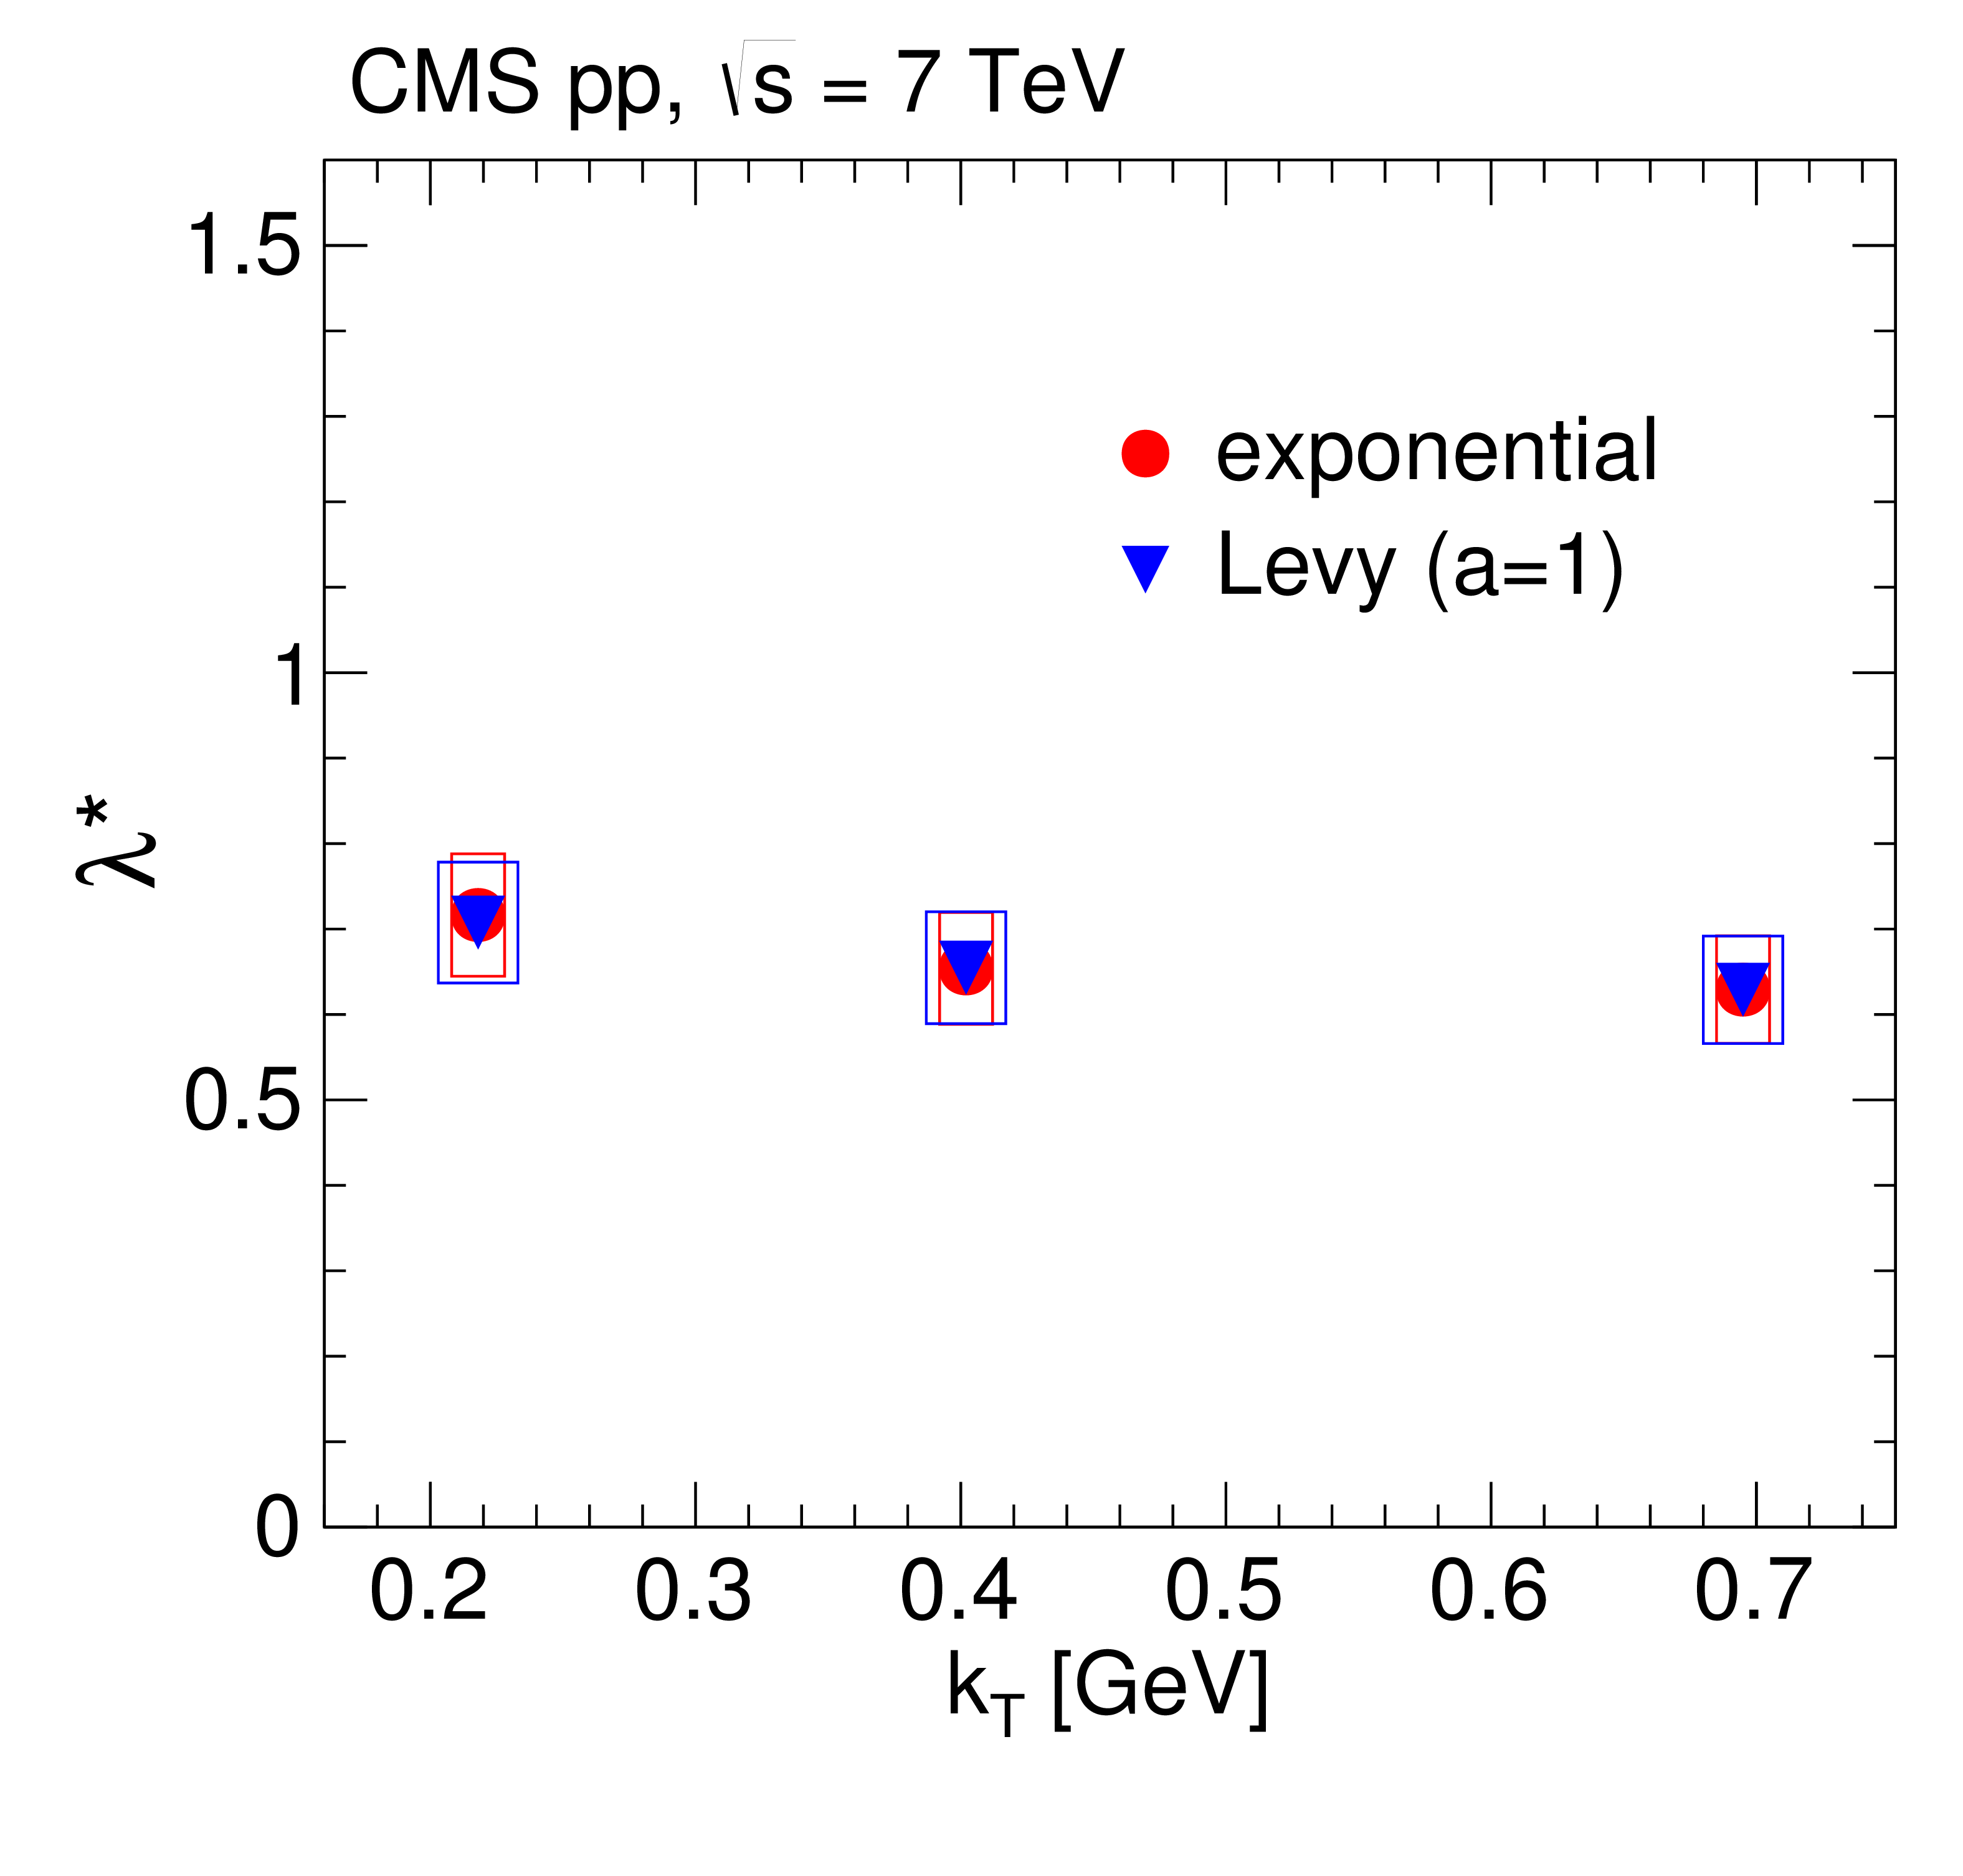
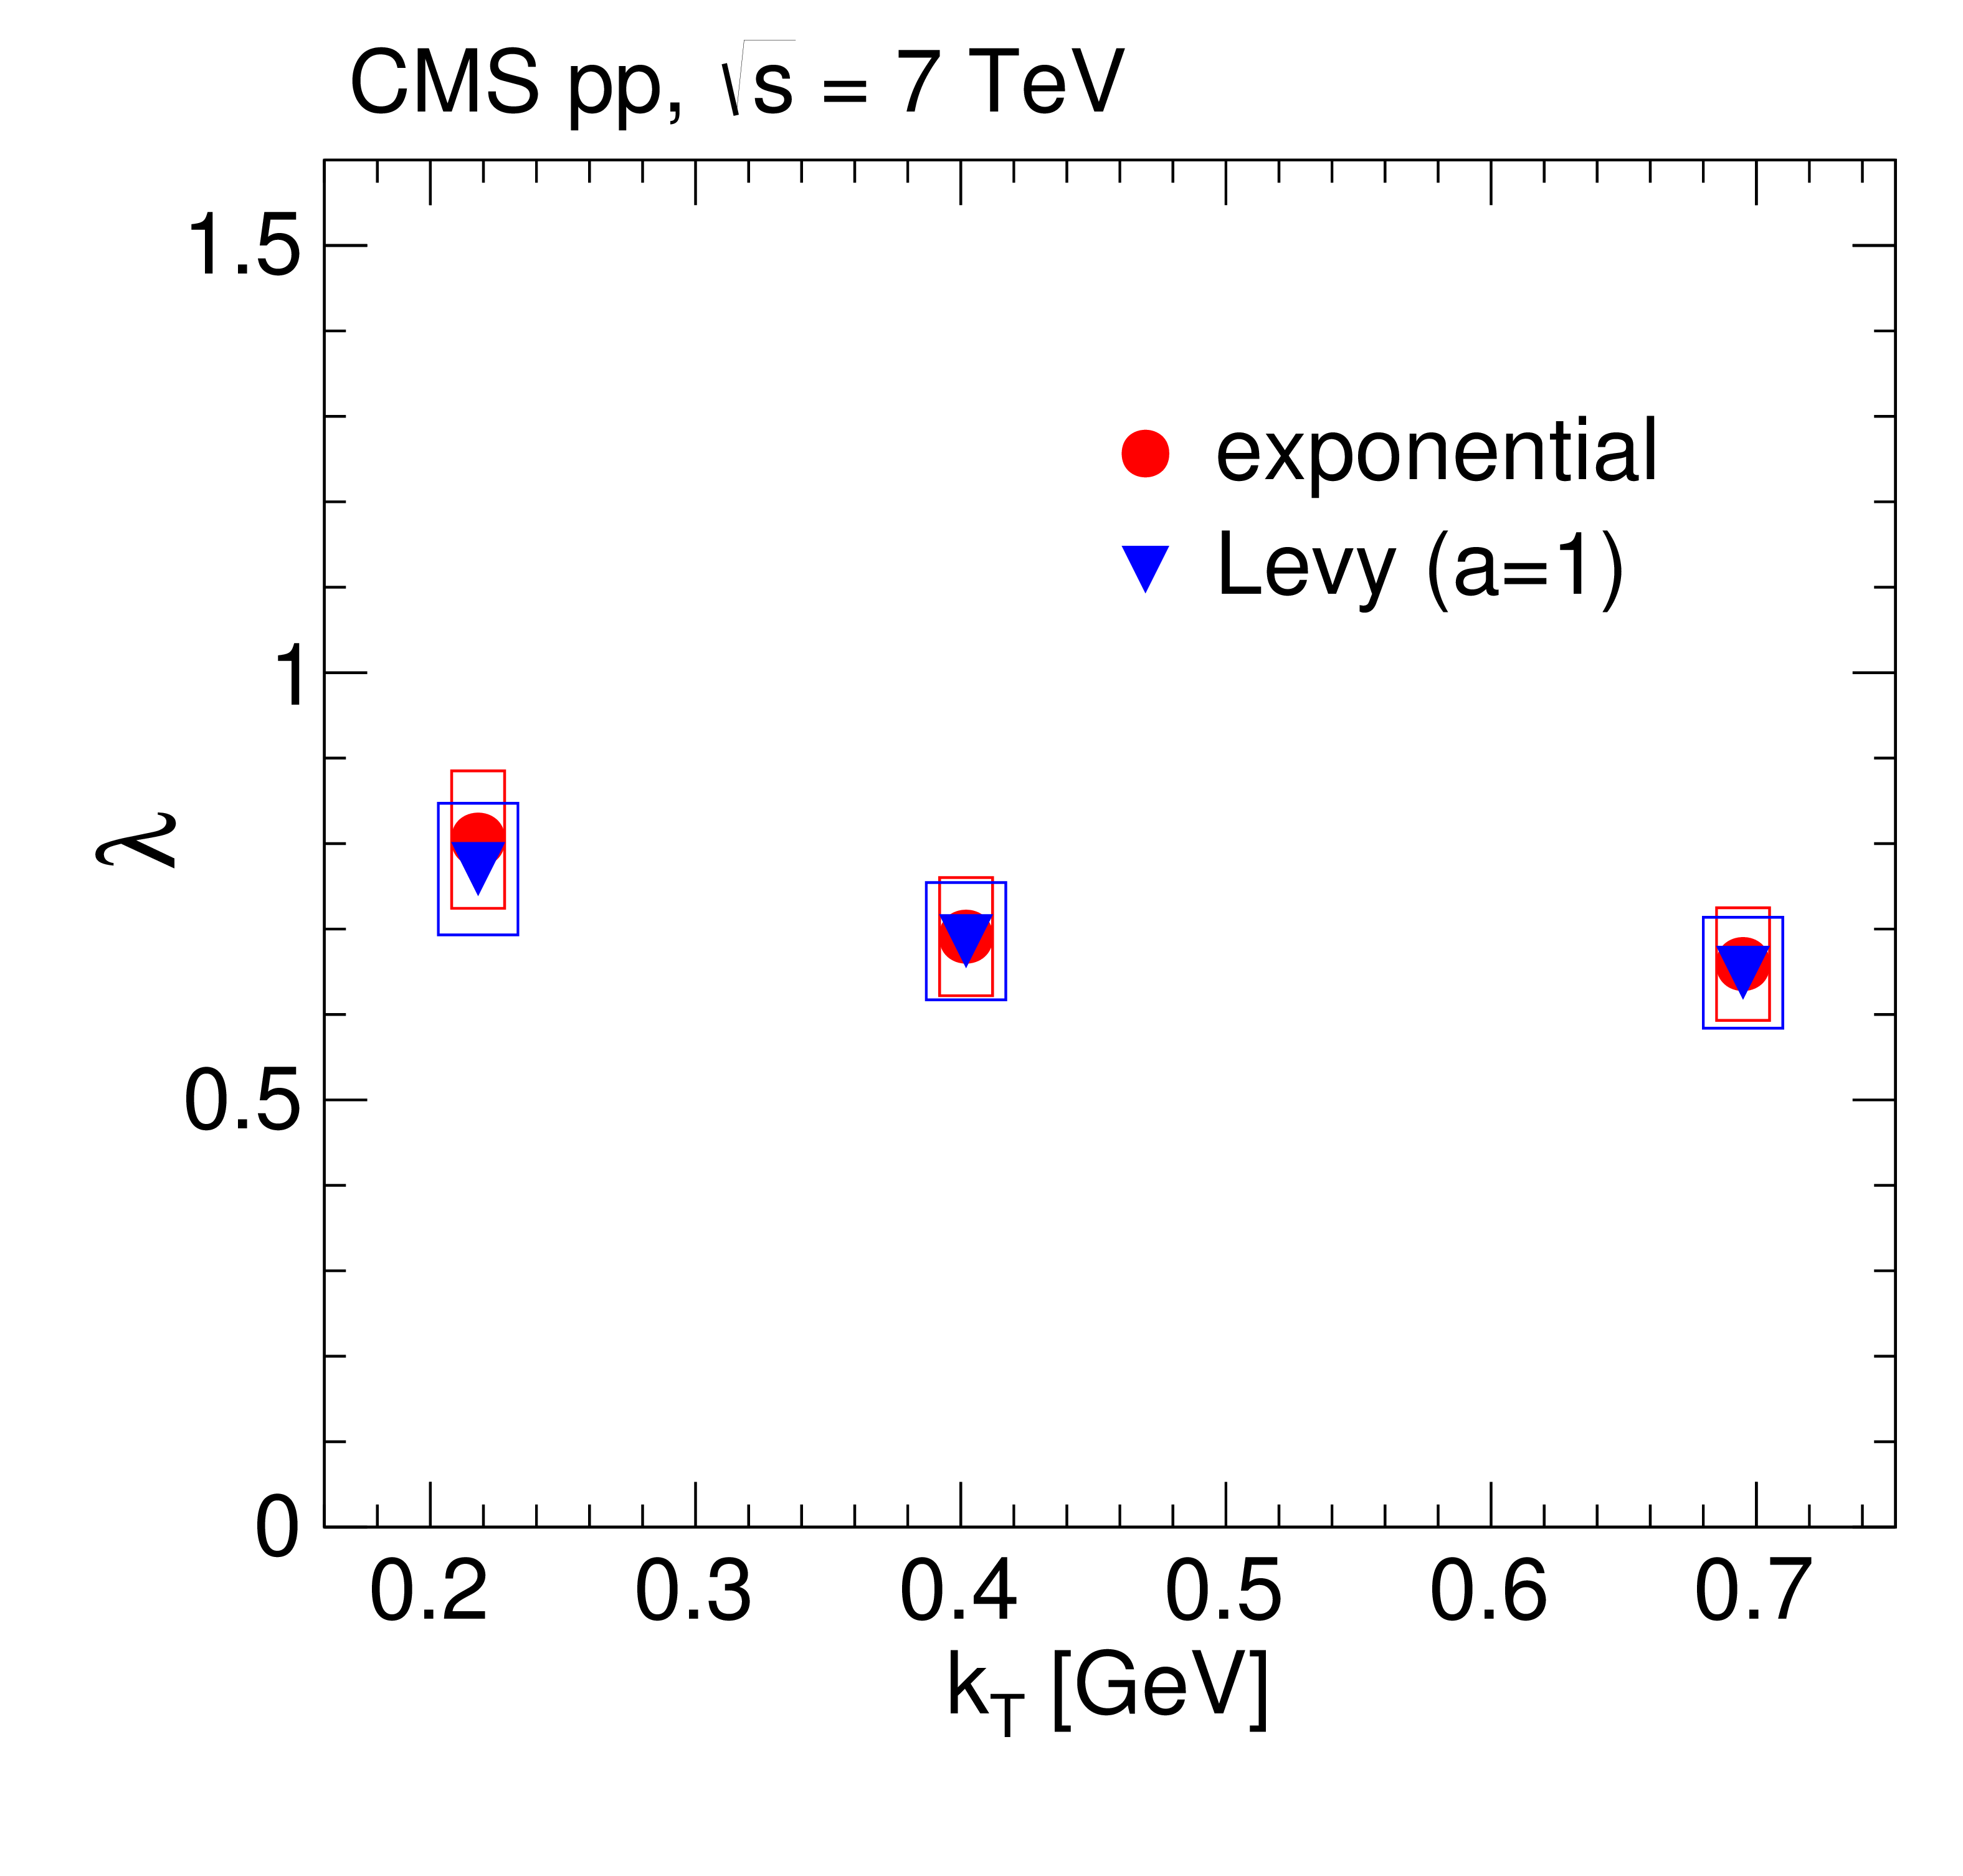
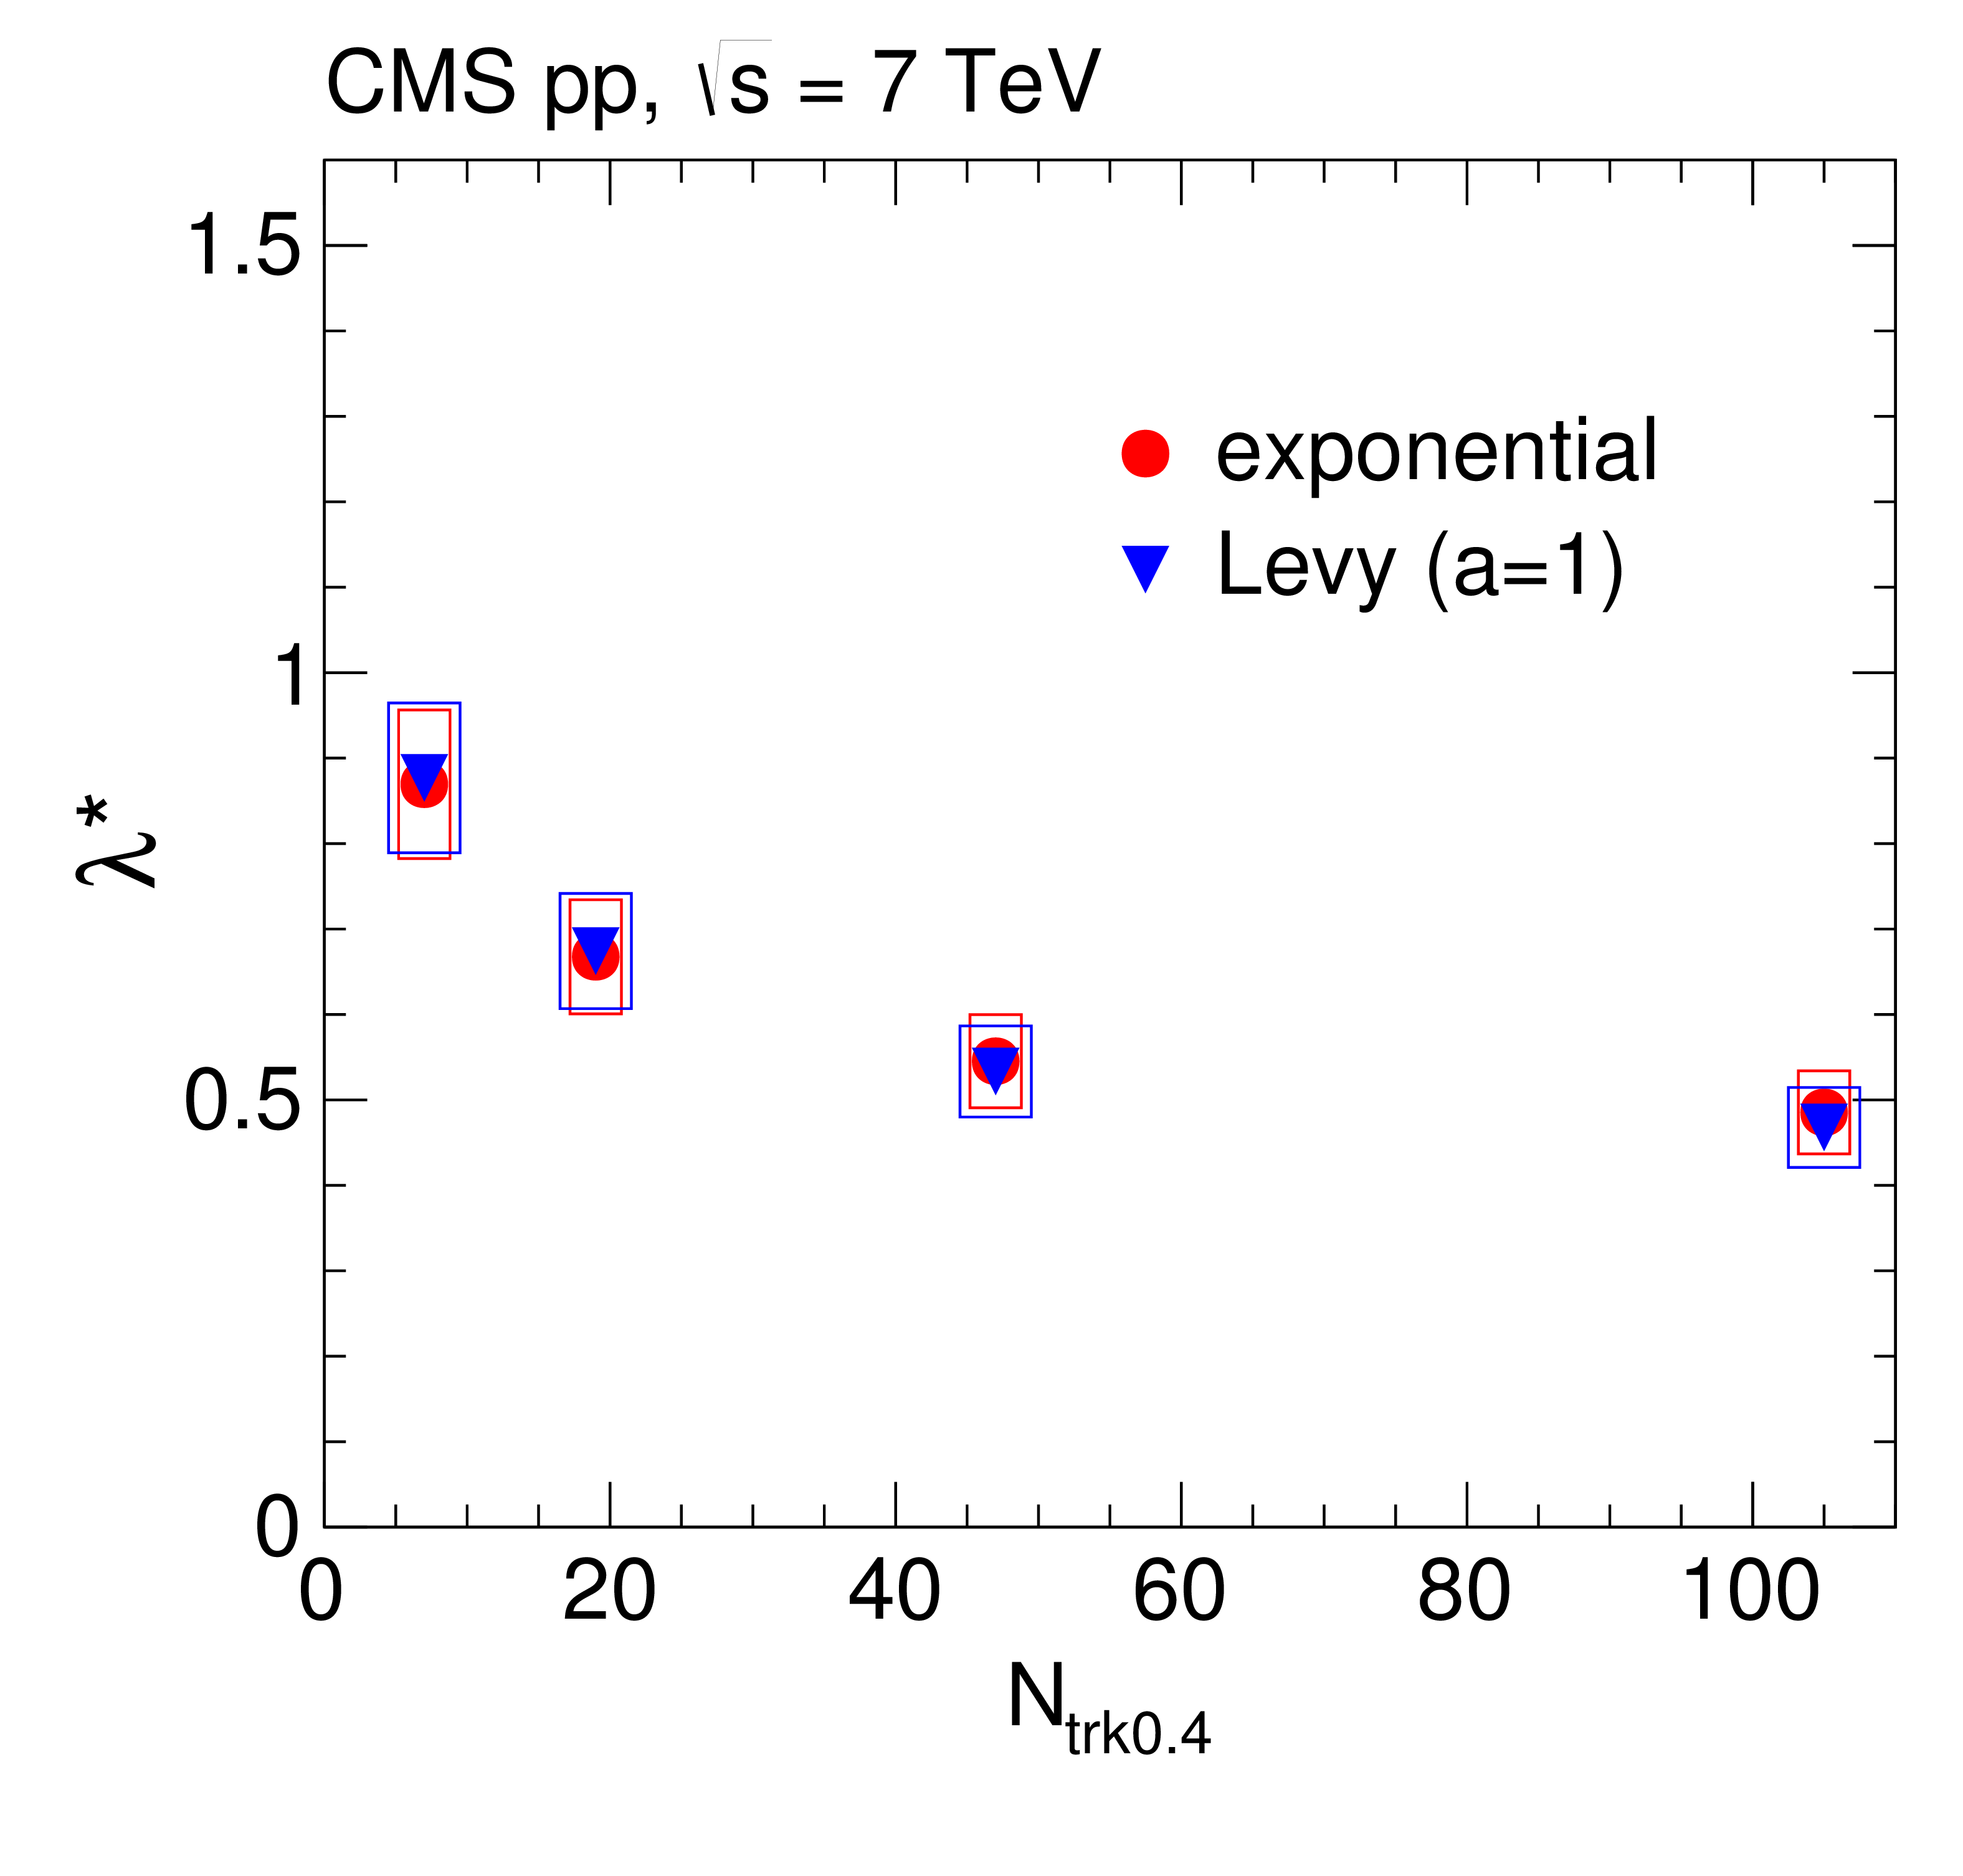
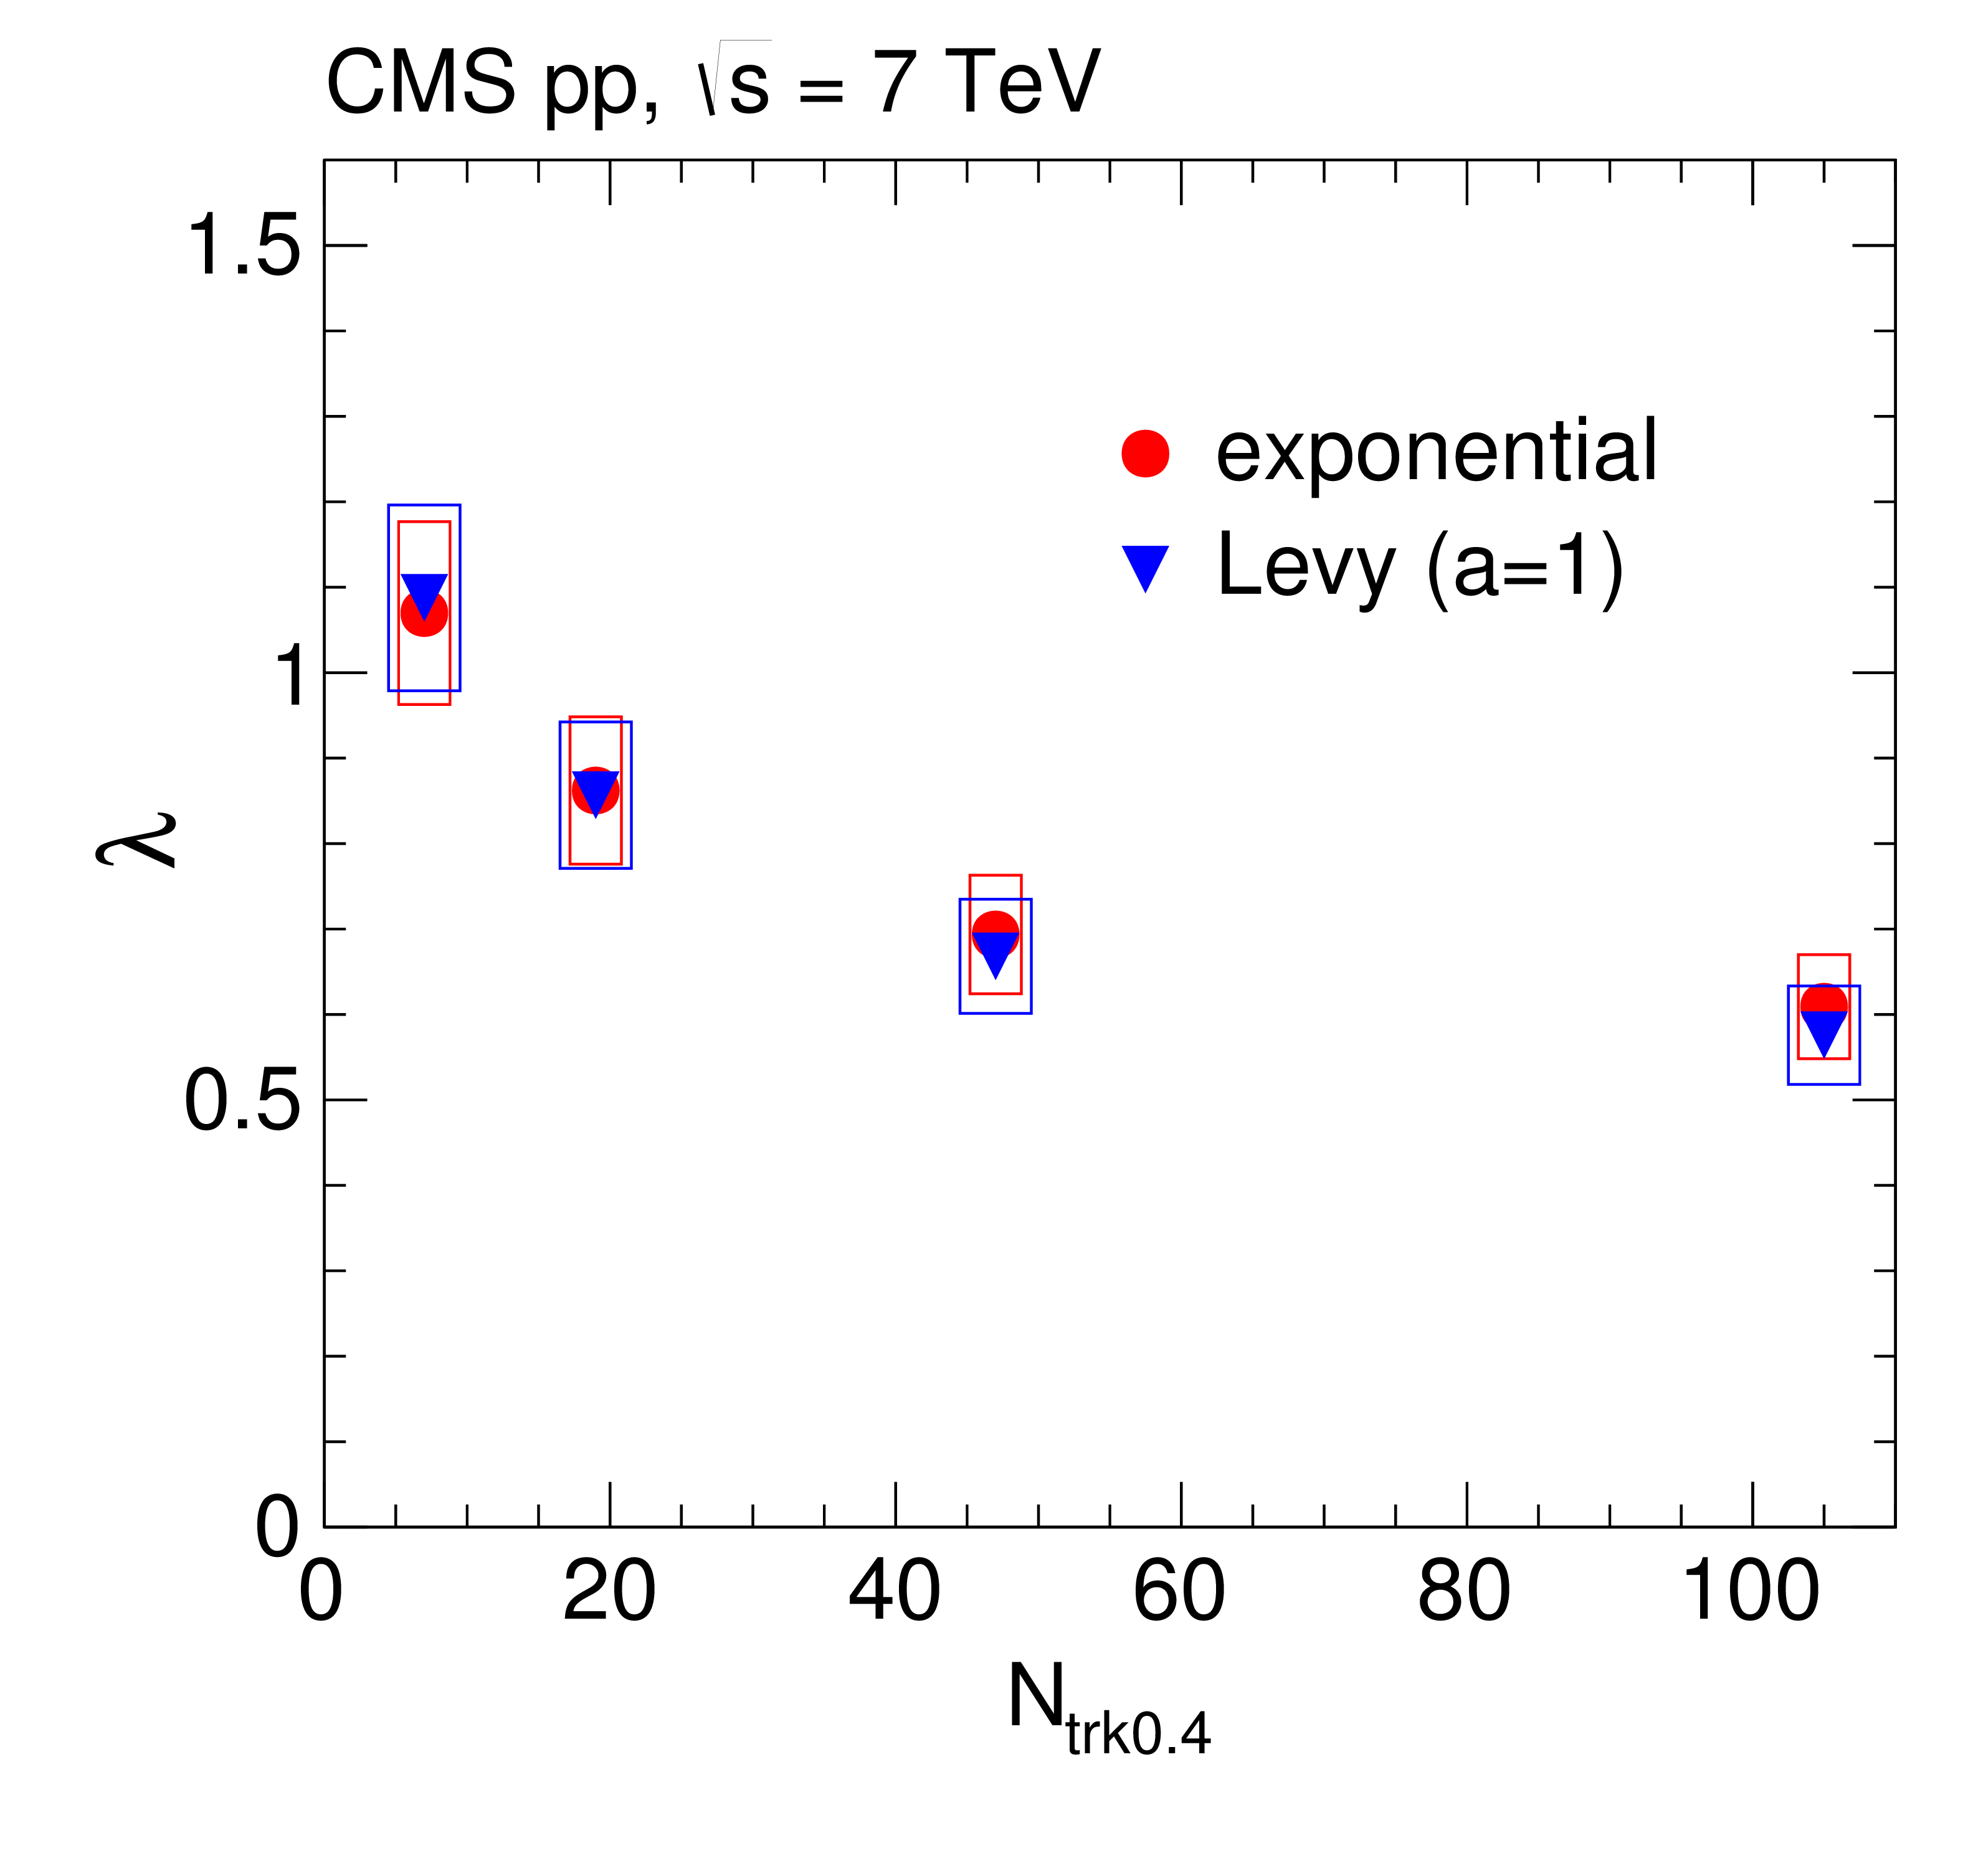
Figure 18:
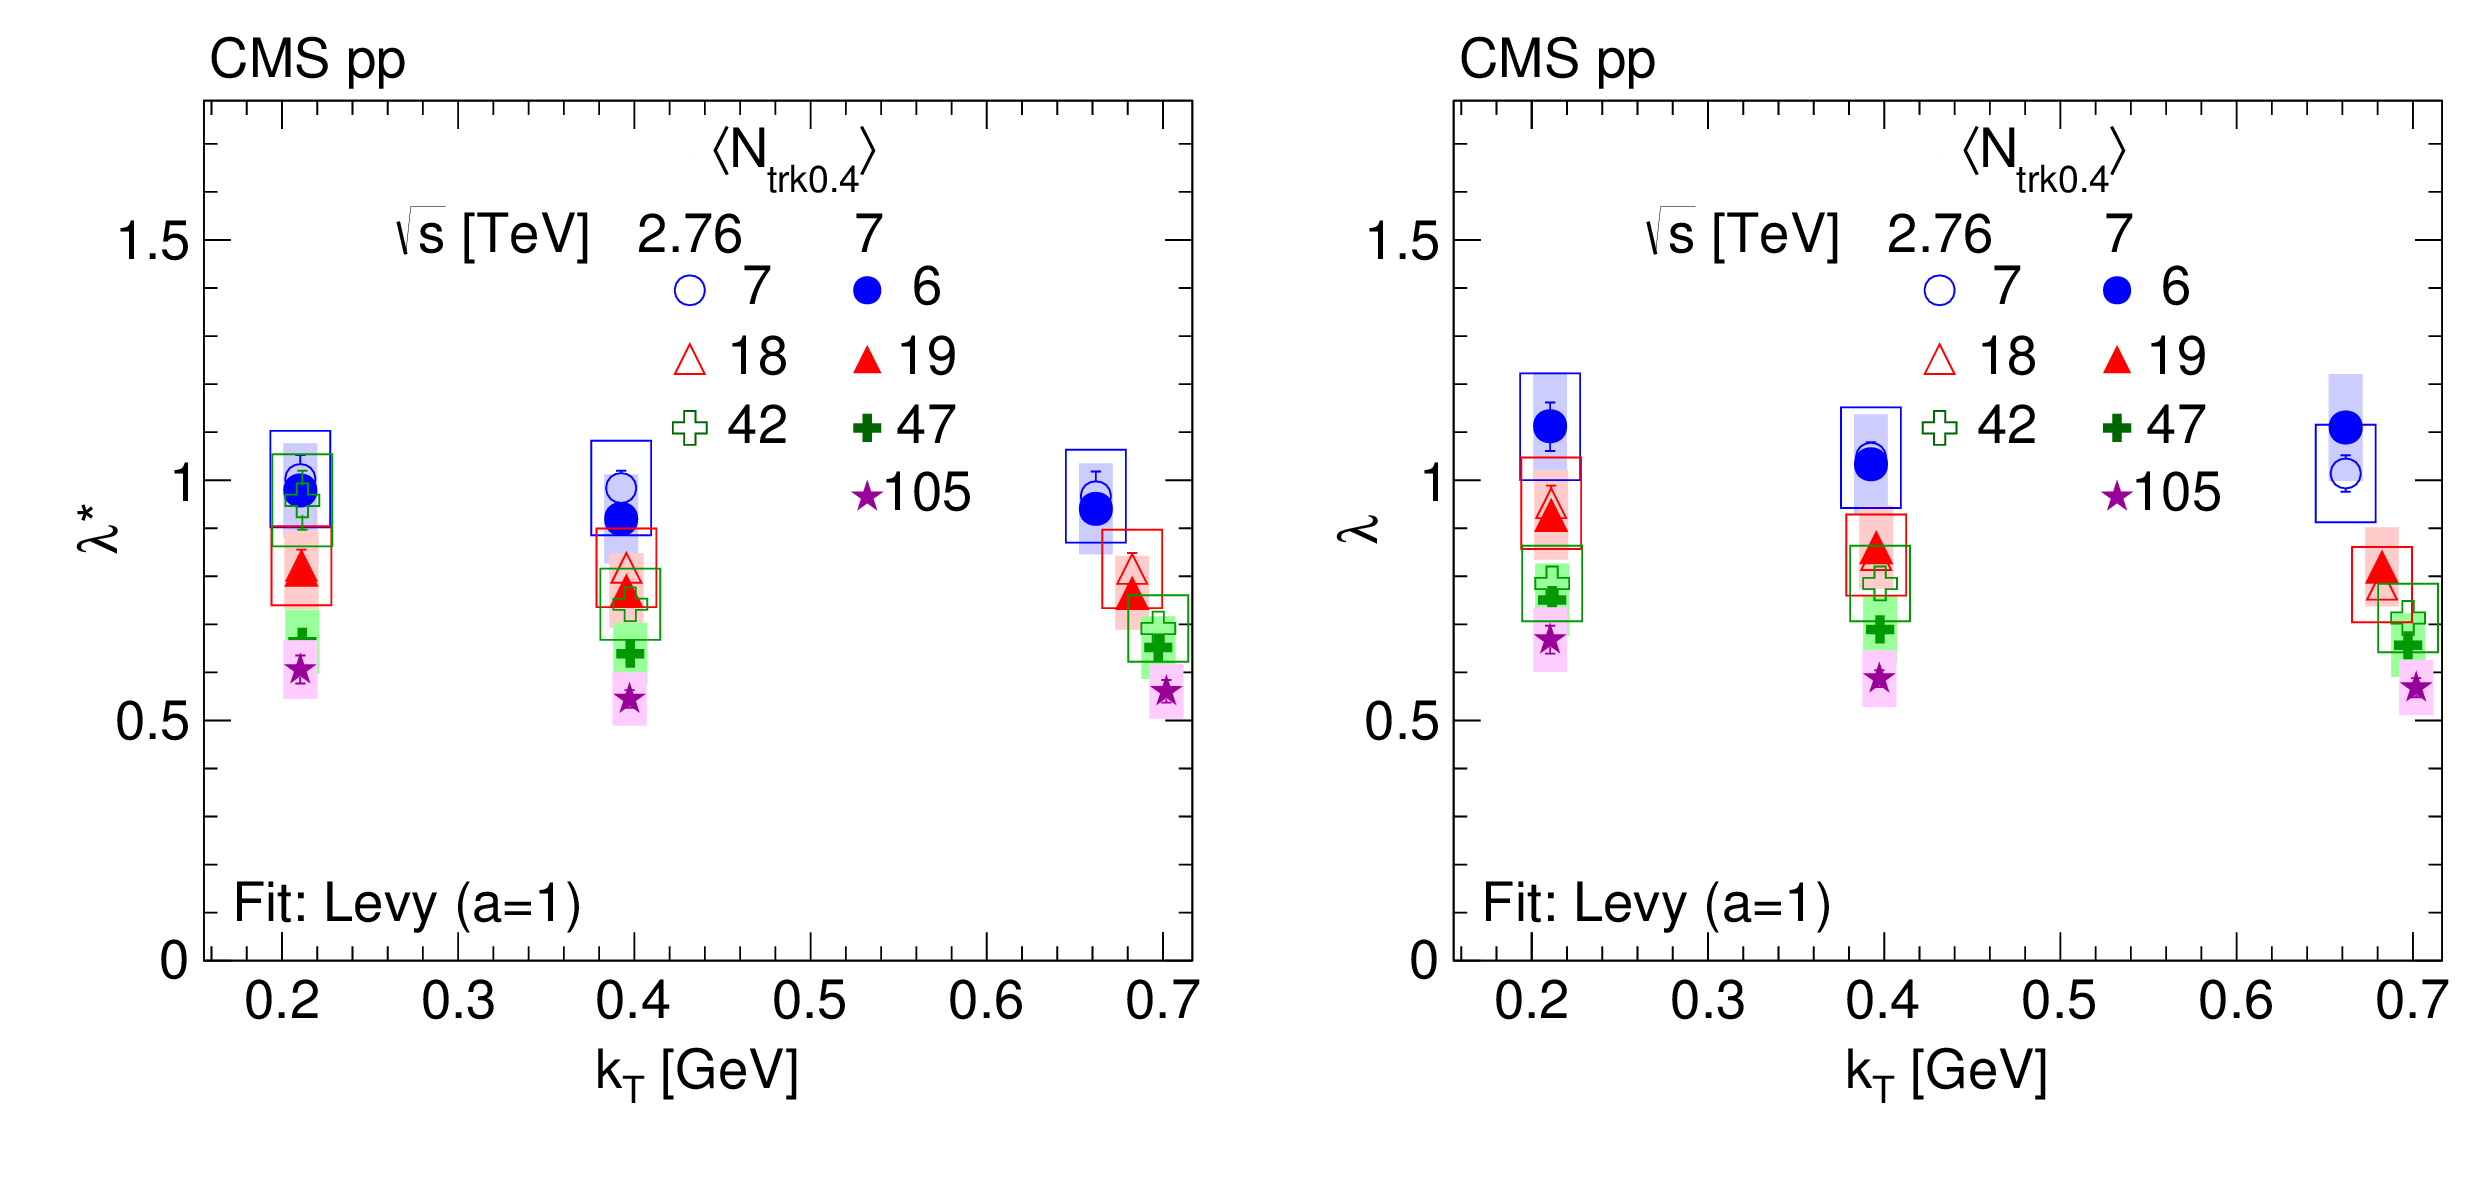
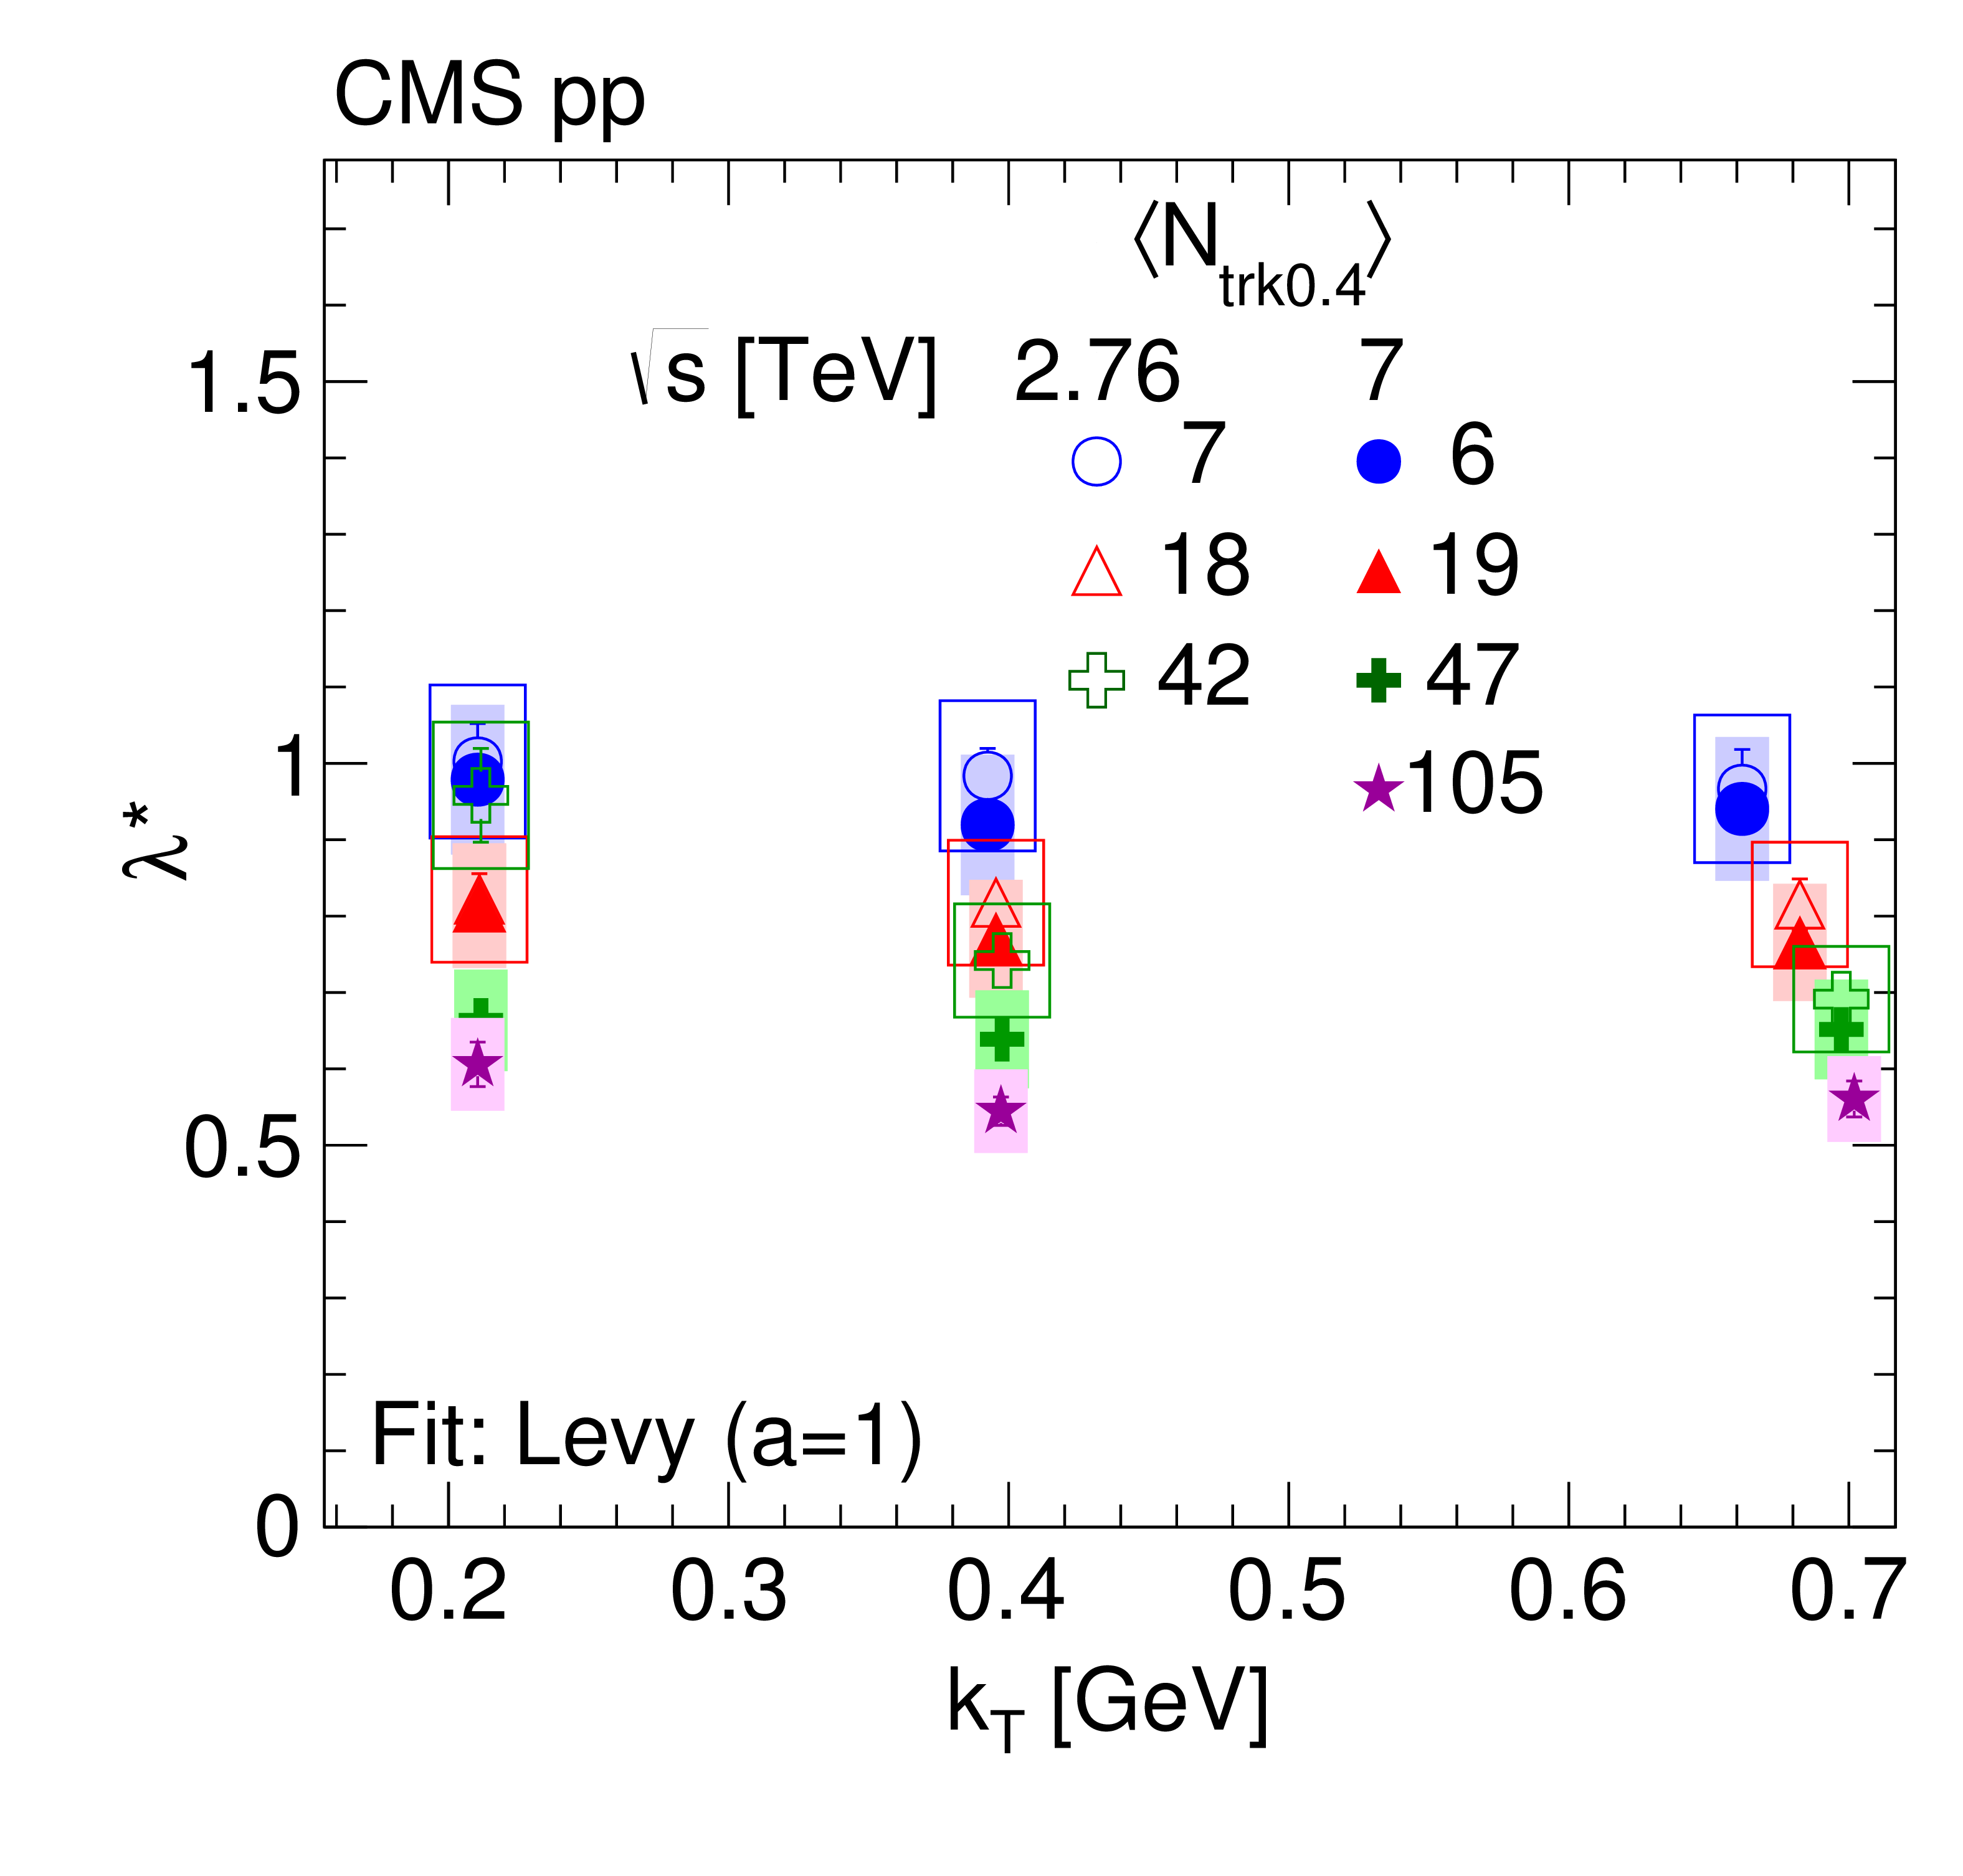
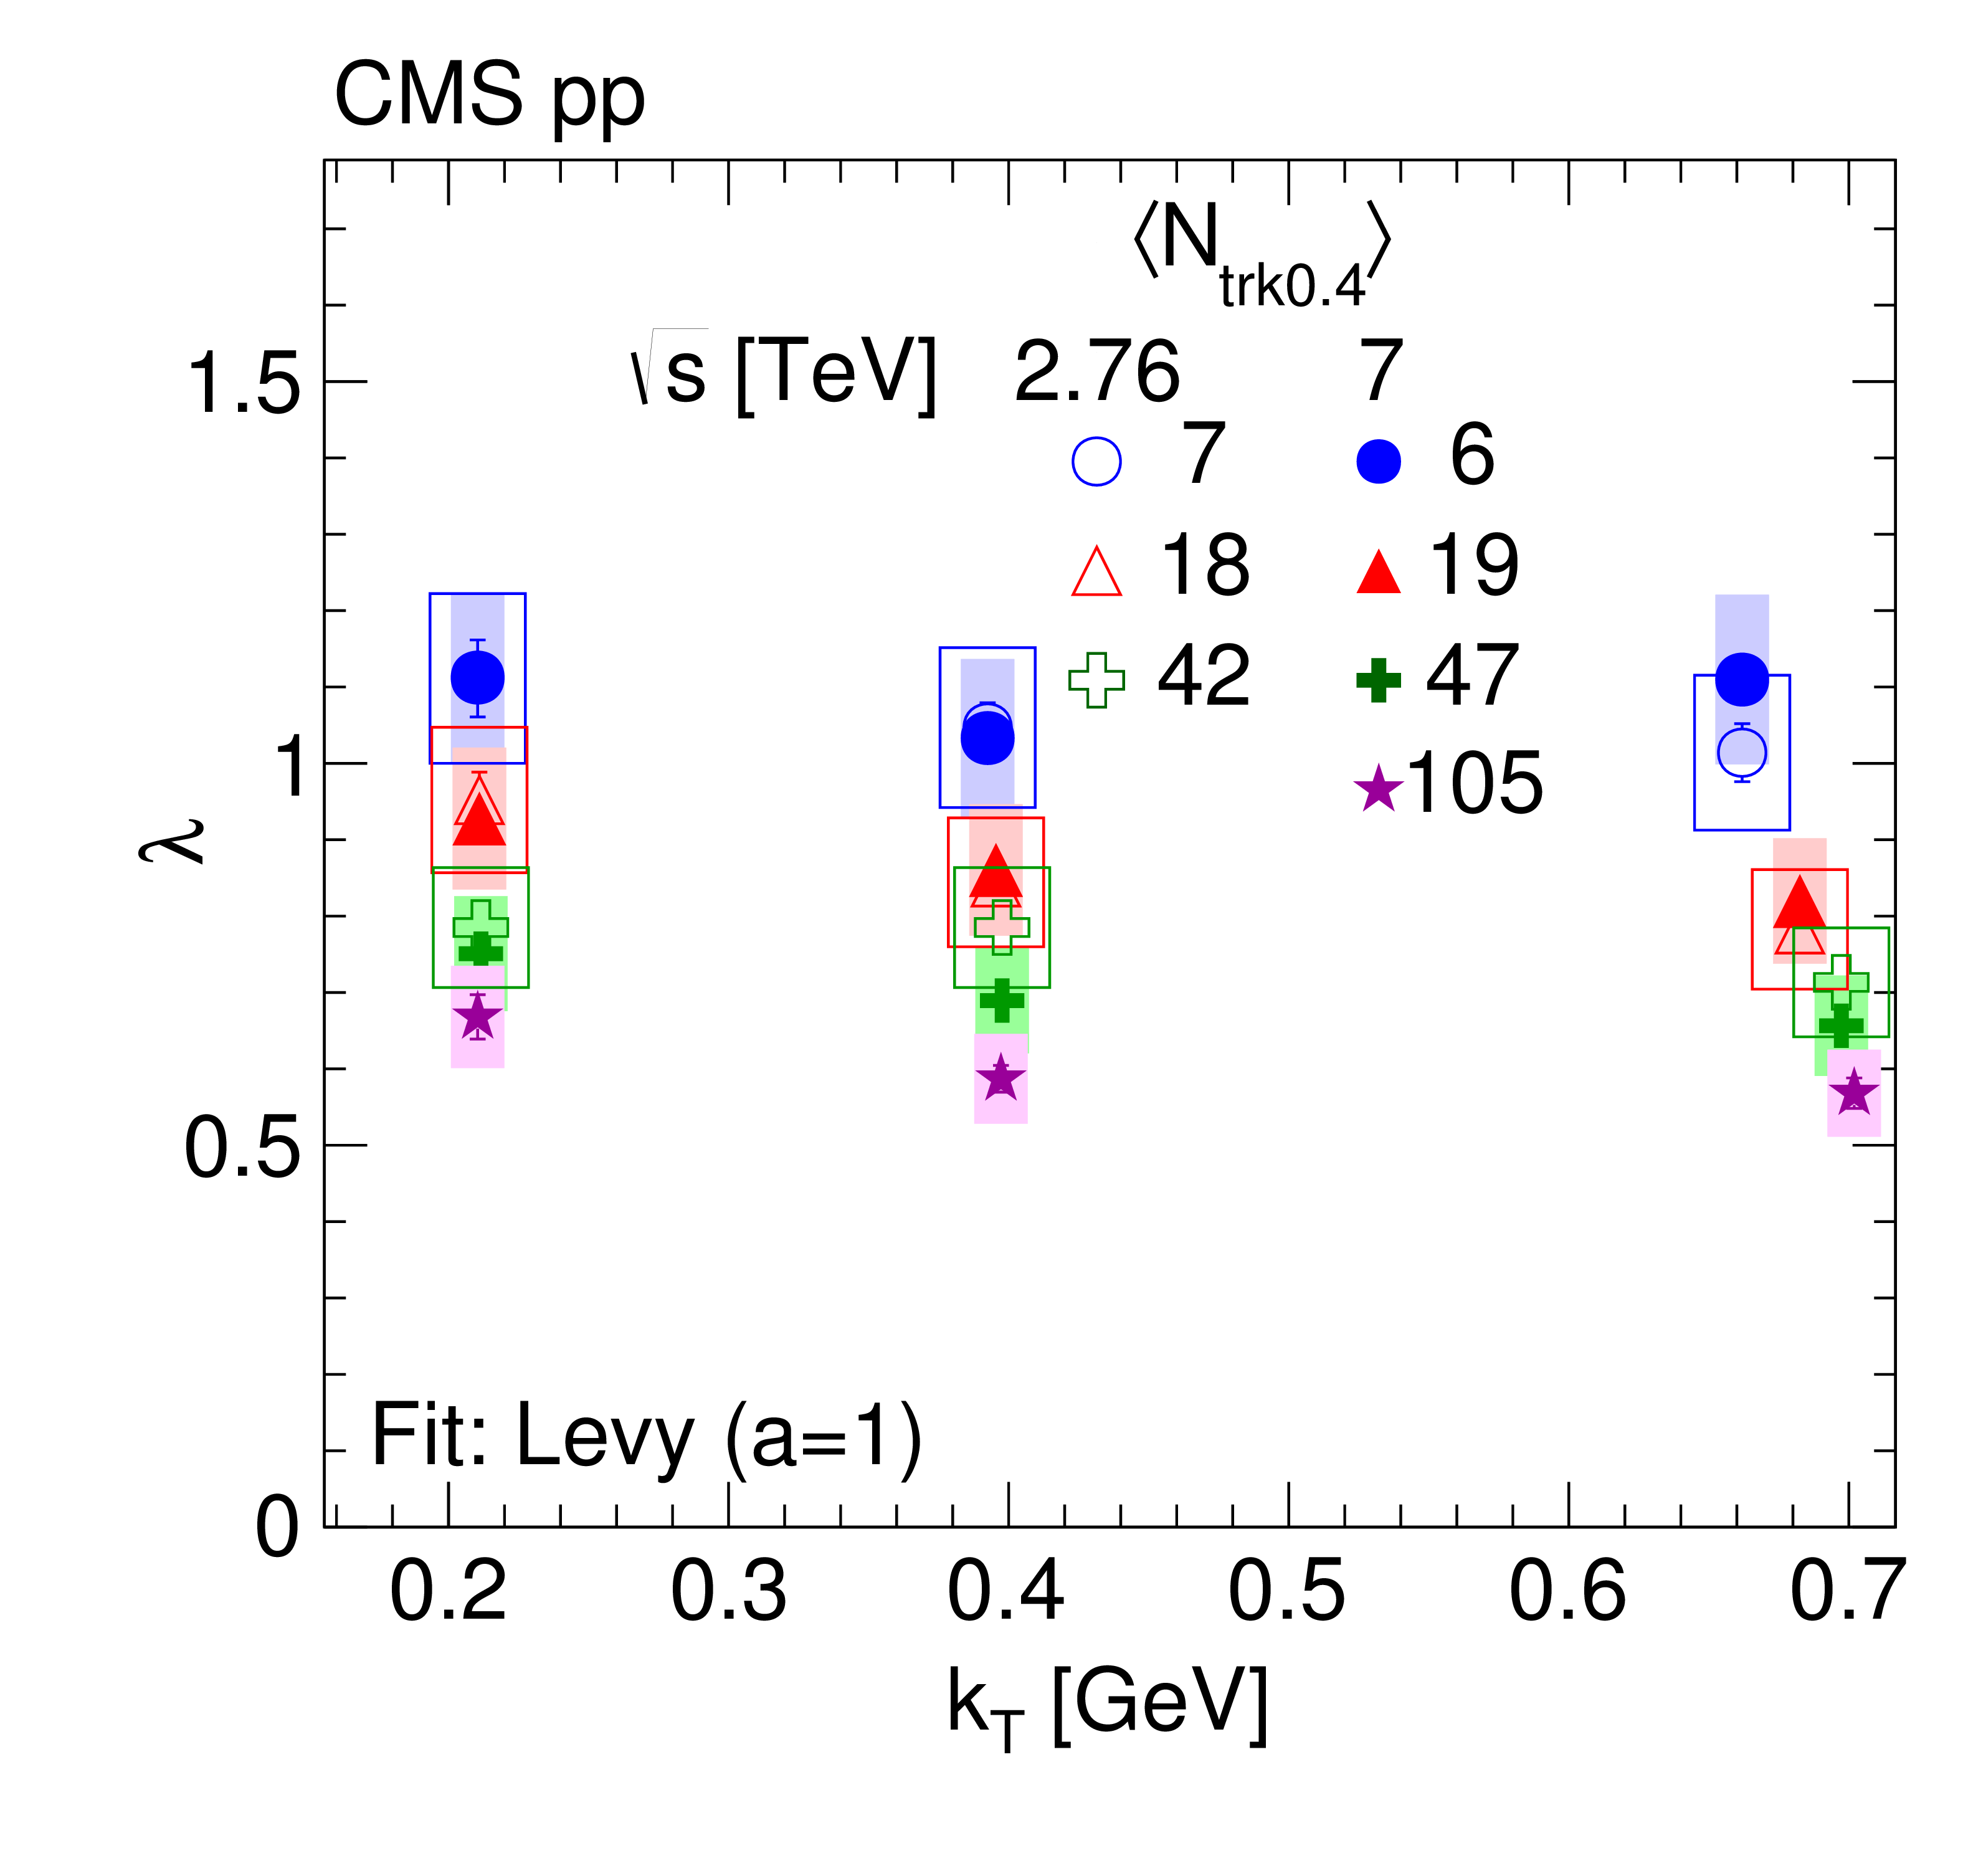
Intercept parameter $\lambda ^{(*)}$ in the CM frame (left) and in the LCMS (right) as functions of $ {k_{\mathrm {T}}} $ (integrated over $ {N_\text {trk0.4}} $, top) and of $ {N_\text {trk0.4}} $ (integrated over $ {k_{\mathrm {T}}} $, bottom), obtained from fits to the double ratios with the exponential and the Levy (with $a = $ 1) functions in pp collisions at 7 TeV. The boxes indicate the systematic uncertainties. |
png pdf |
Figure 18-a:
Intercept parameter $\lambda ^{(*)}$ in the CM frame (left) and in the LCMS (right) as functions of $ {k_{\mathrm {T}}} $ (integrated over $ {N_\text {trk0.4}} $, top) and of $ {N_\text {trk0.4}} $ (integrated over $ {k_{\mathrm {T}}} $, bottom), obtained from fits to the double ratios with the exponential and the Levy (with $a = $ 1) functions in pp collisions at 7 TeV. The boxes indicate the systematic uncertainties. |
png pdf |
Figure 18-b:
Intercept parameter $\lambda ^{(*)}$ in the CM frame (left) and in the LCMS (right) as functions of $ {k_{\mathrm {T}}} $ (integrated over $ {N_\text {trk0.4}} $, top) and of $ {N_\text {trk0.4}} $ (integrated over $ {k_{\mathrm {T}}} $, bottom), obtained from fits to the double ratios with the exponential and the Levy (with $a = $ 1) functions in pp collisions at 7 TeV. The boxes indicate the systematic uncertainties. |
png pdf |
Figure 18-c:
Intercept parameter $\lambda ^{(*)}$ in the CM frame (left) and in the LCMS (right) as functions of $ {k_{\mathrm {T}}} $ (integrated over $ {N_\text {trk0.4}} $, top) and of $ {N_\text {trk0.4}} $ (integrated over $ {k_{\mathrm {T}}} $, bottom), obtained from fits to the double ratios with the exponential and the Levy (with $a = $ 1) functions in pp collisions at 7 TeV. The boxes indicate the systematic uncertainties. |
png pdf |
Figure 18-d:
Intercept parameter $\lambda ^{(*)}$ in the CM frame (left) and in the LCMS (right) as functions of $ {k_{\mathrm {T}}} $ (integrated over $ {N_\text {trk0.4}} $, top) and of $ {N_\text {trk0.4}} $ (integrated over $ {k_{\mathrm {T}}} $, bottom), obtained from fits to the double ratios with the exponential and the Levy (with $a = $ 1) functions in pp collisions at 7 TeV. The boxes indicate the systematic uncertainties. |
png pdf |
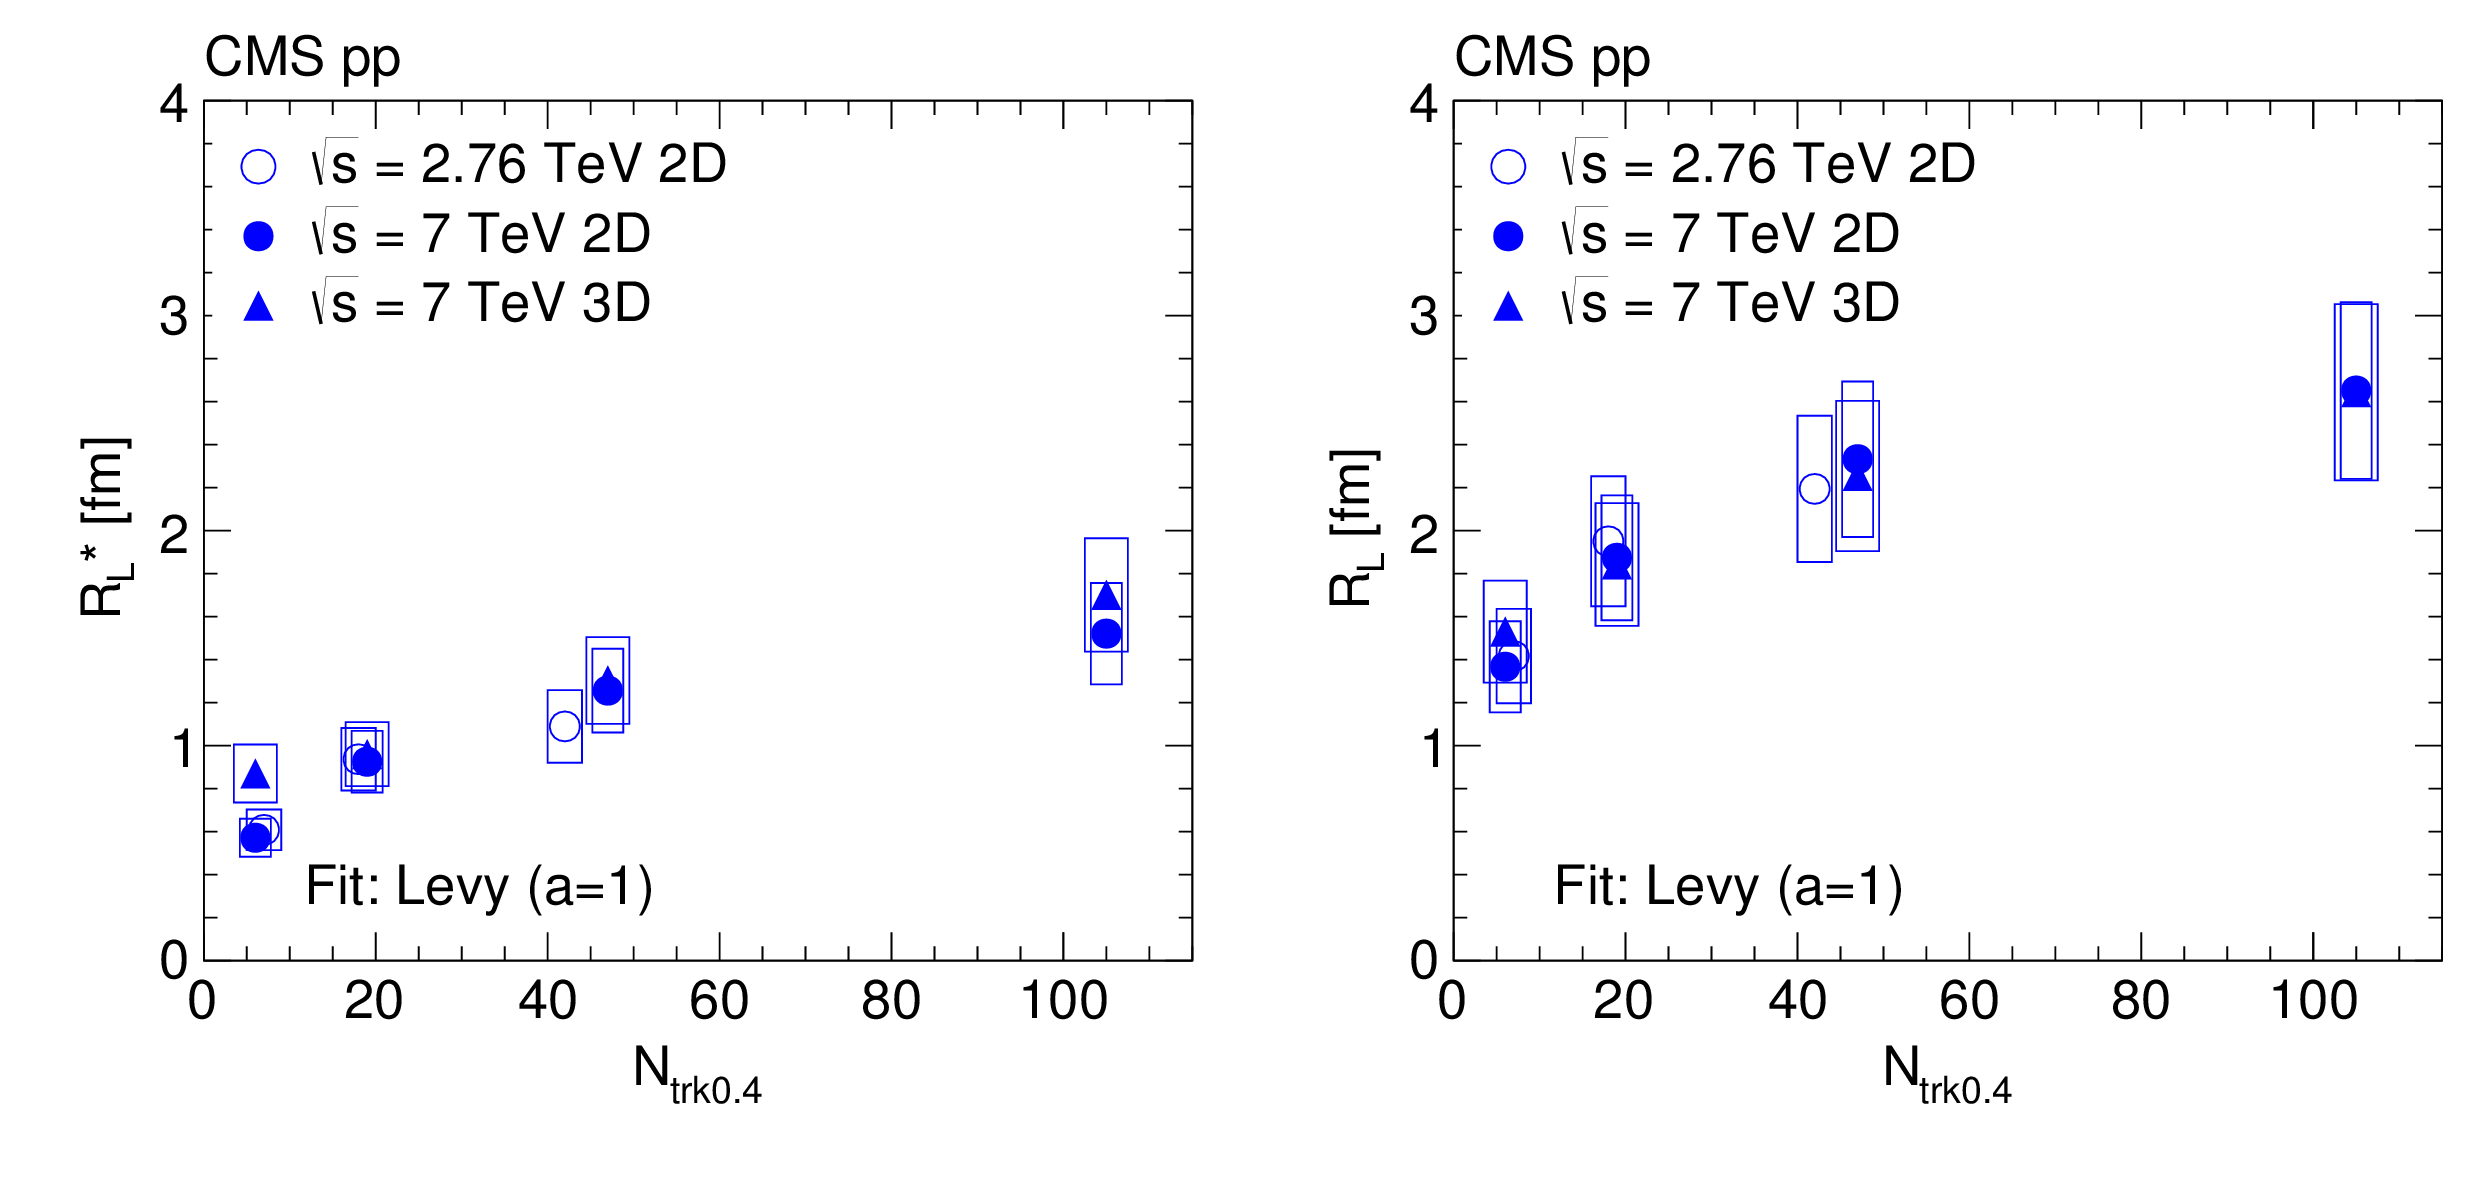
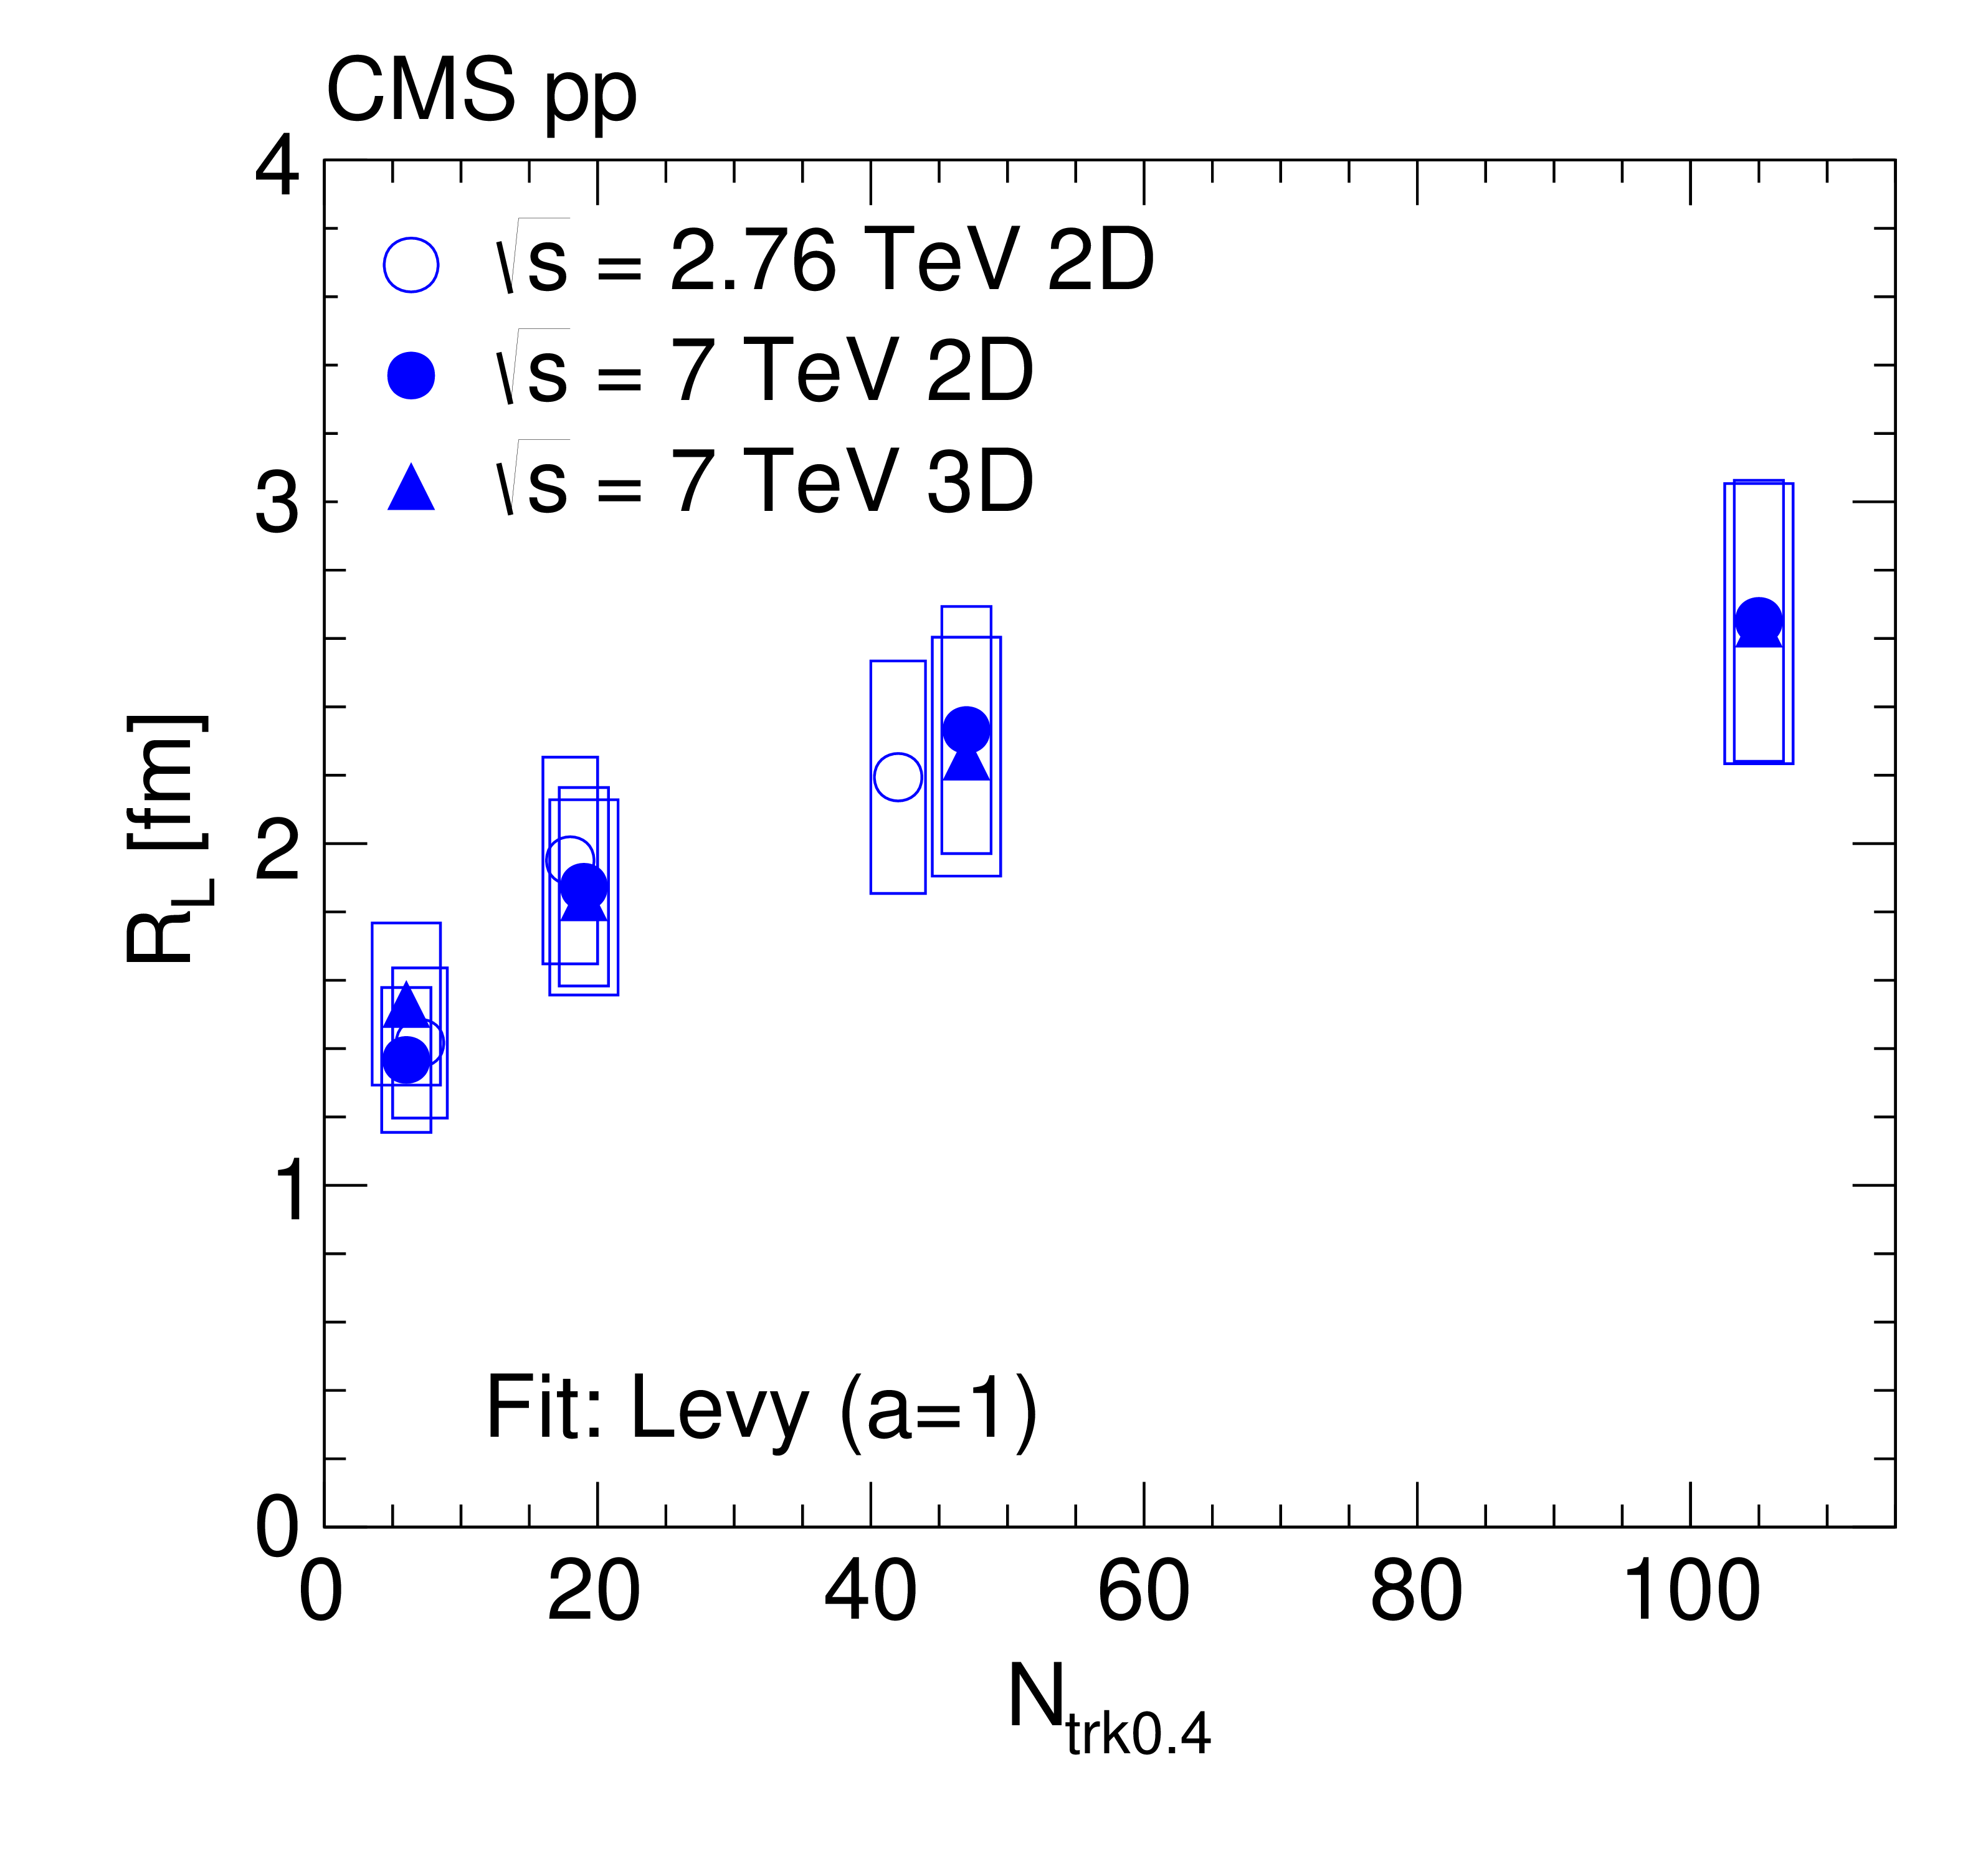
Figure 19:
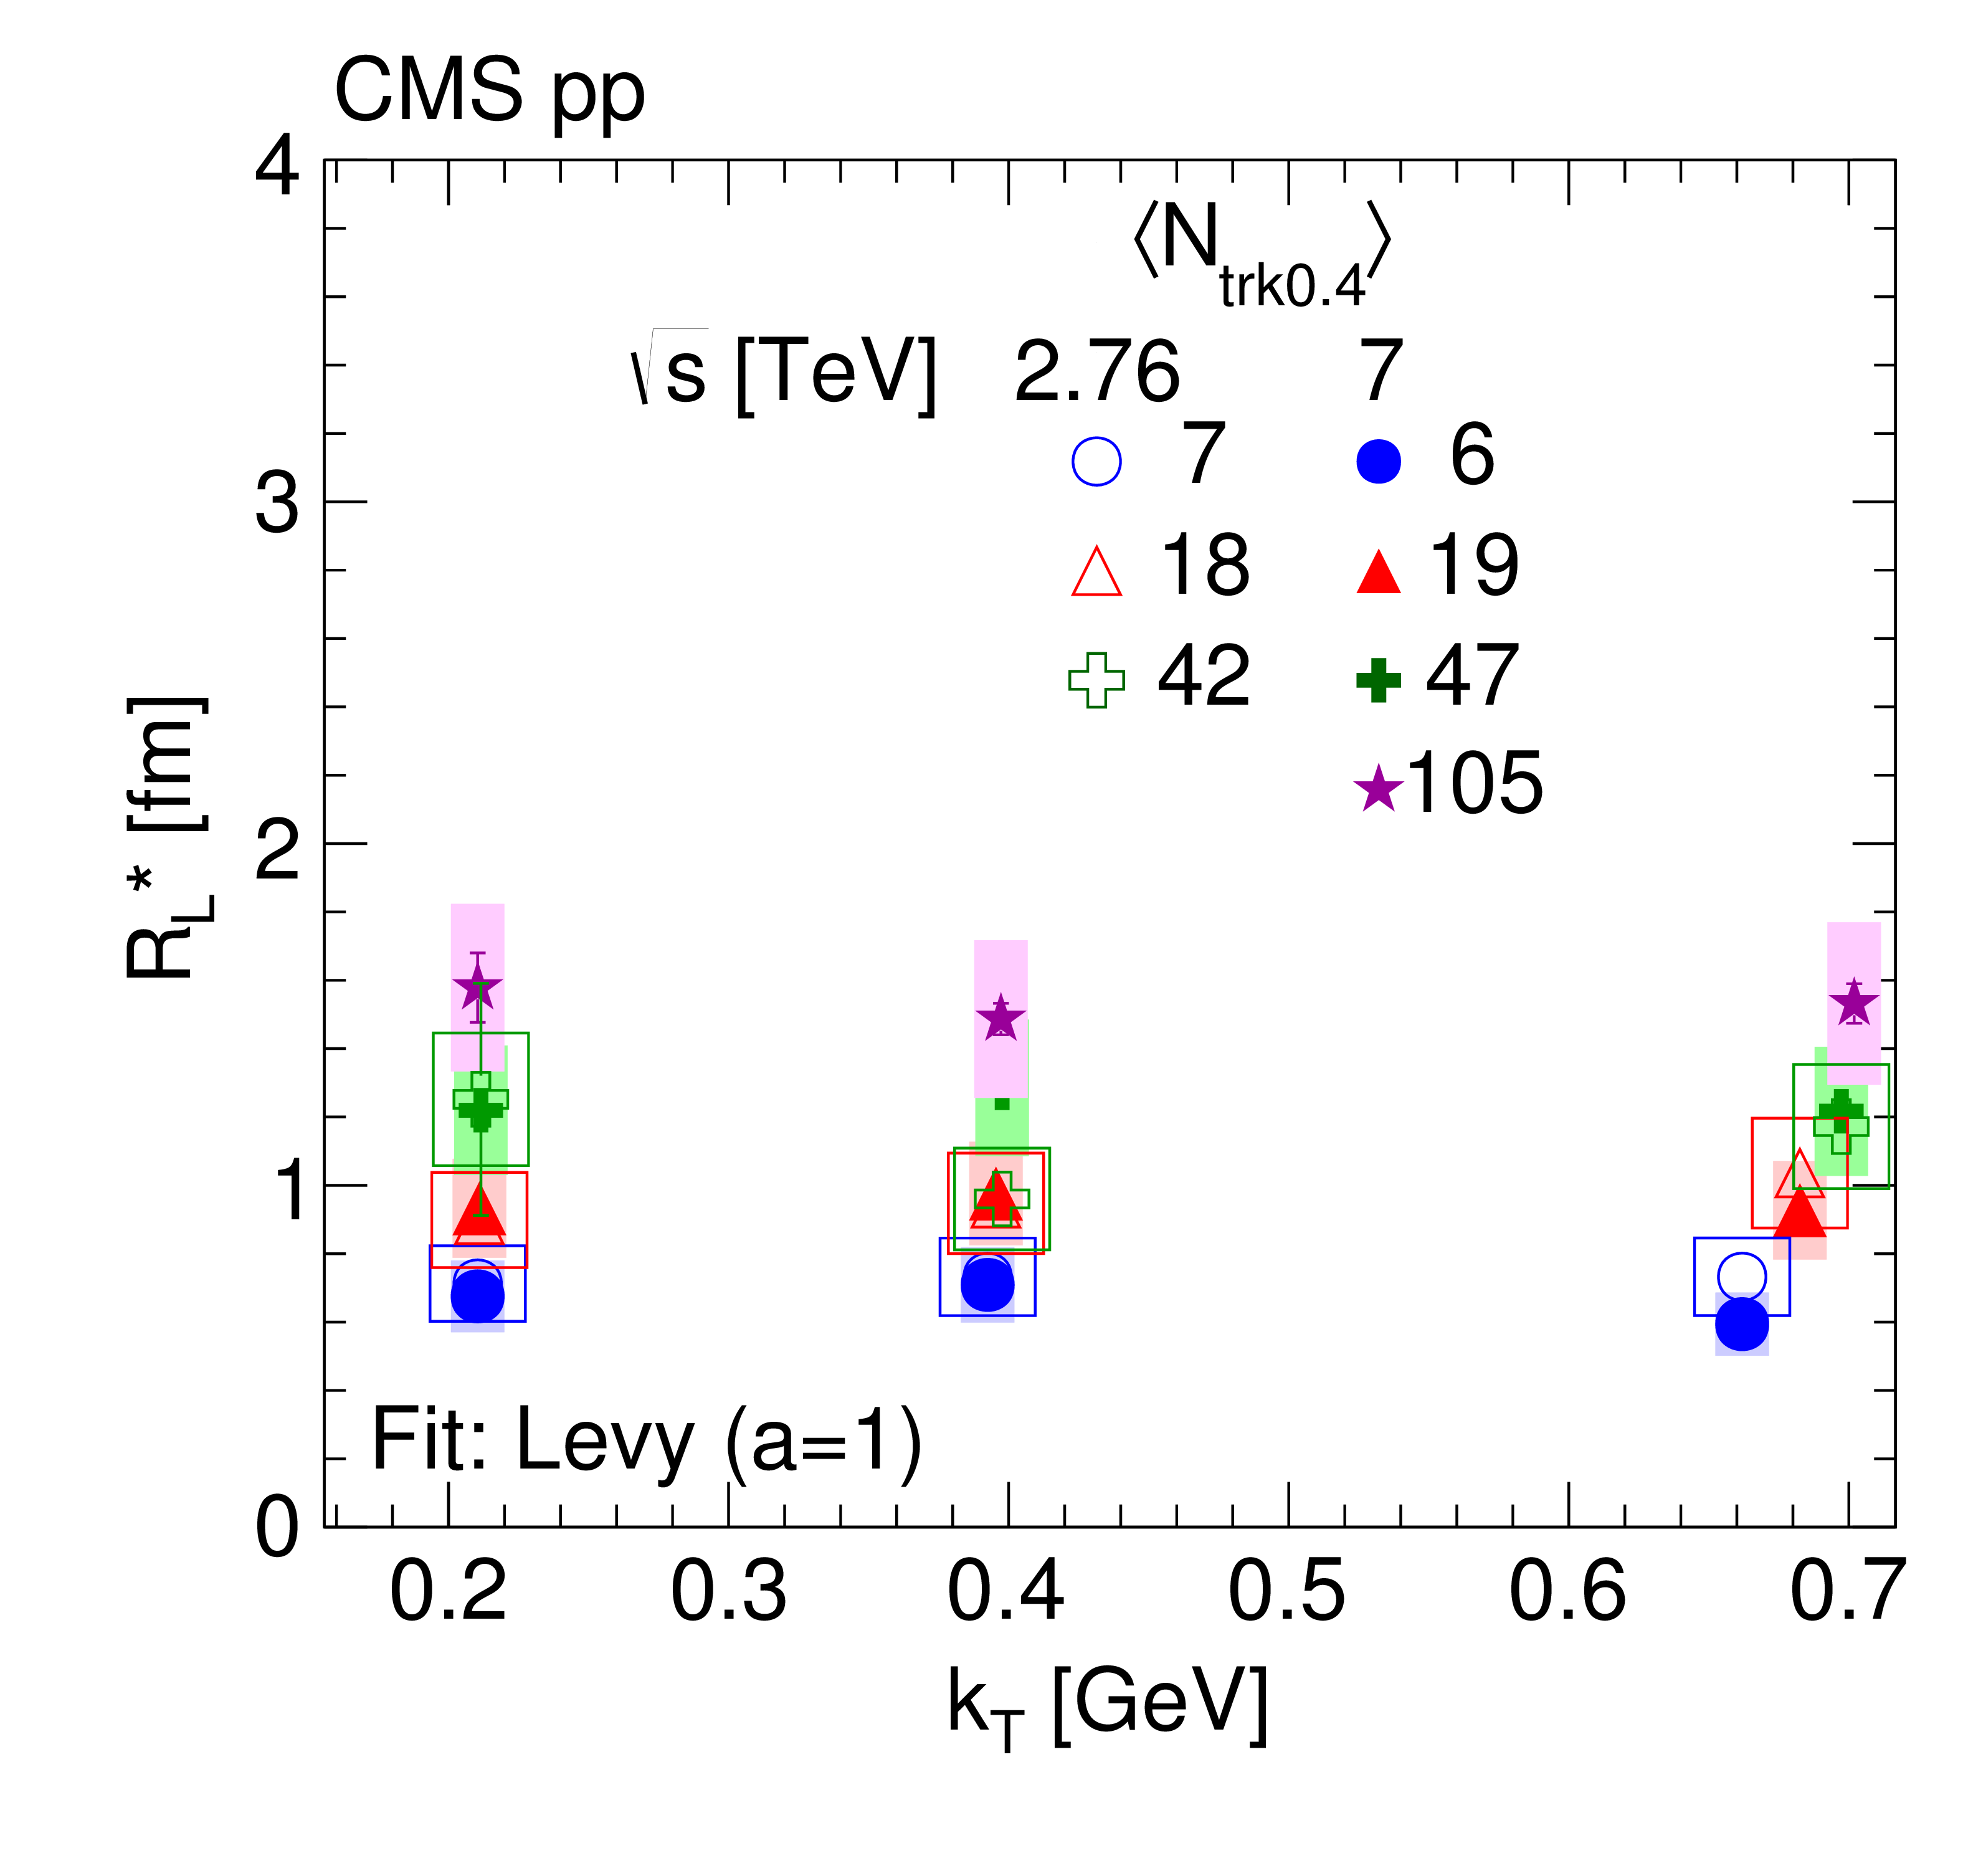
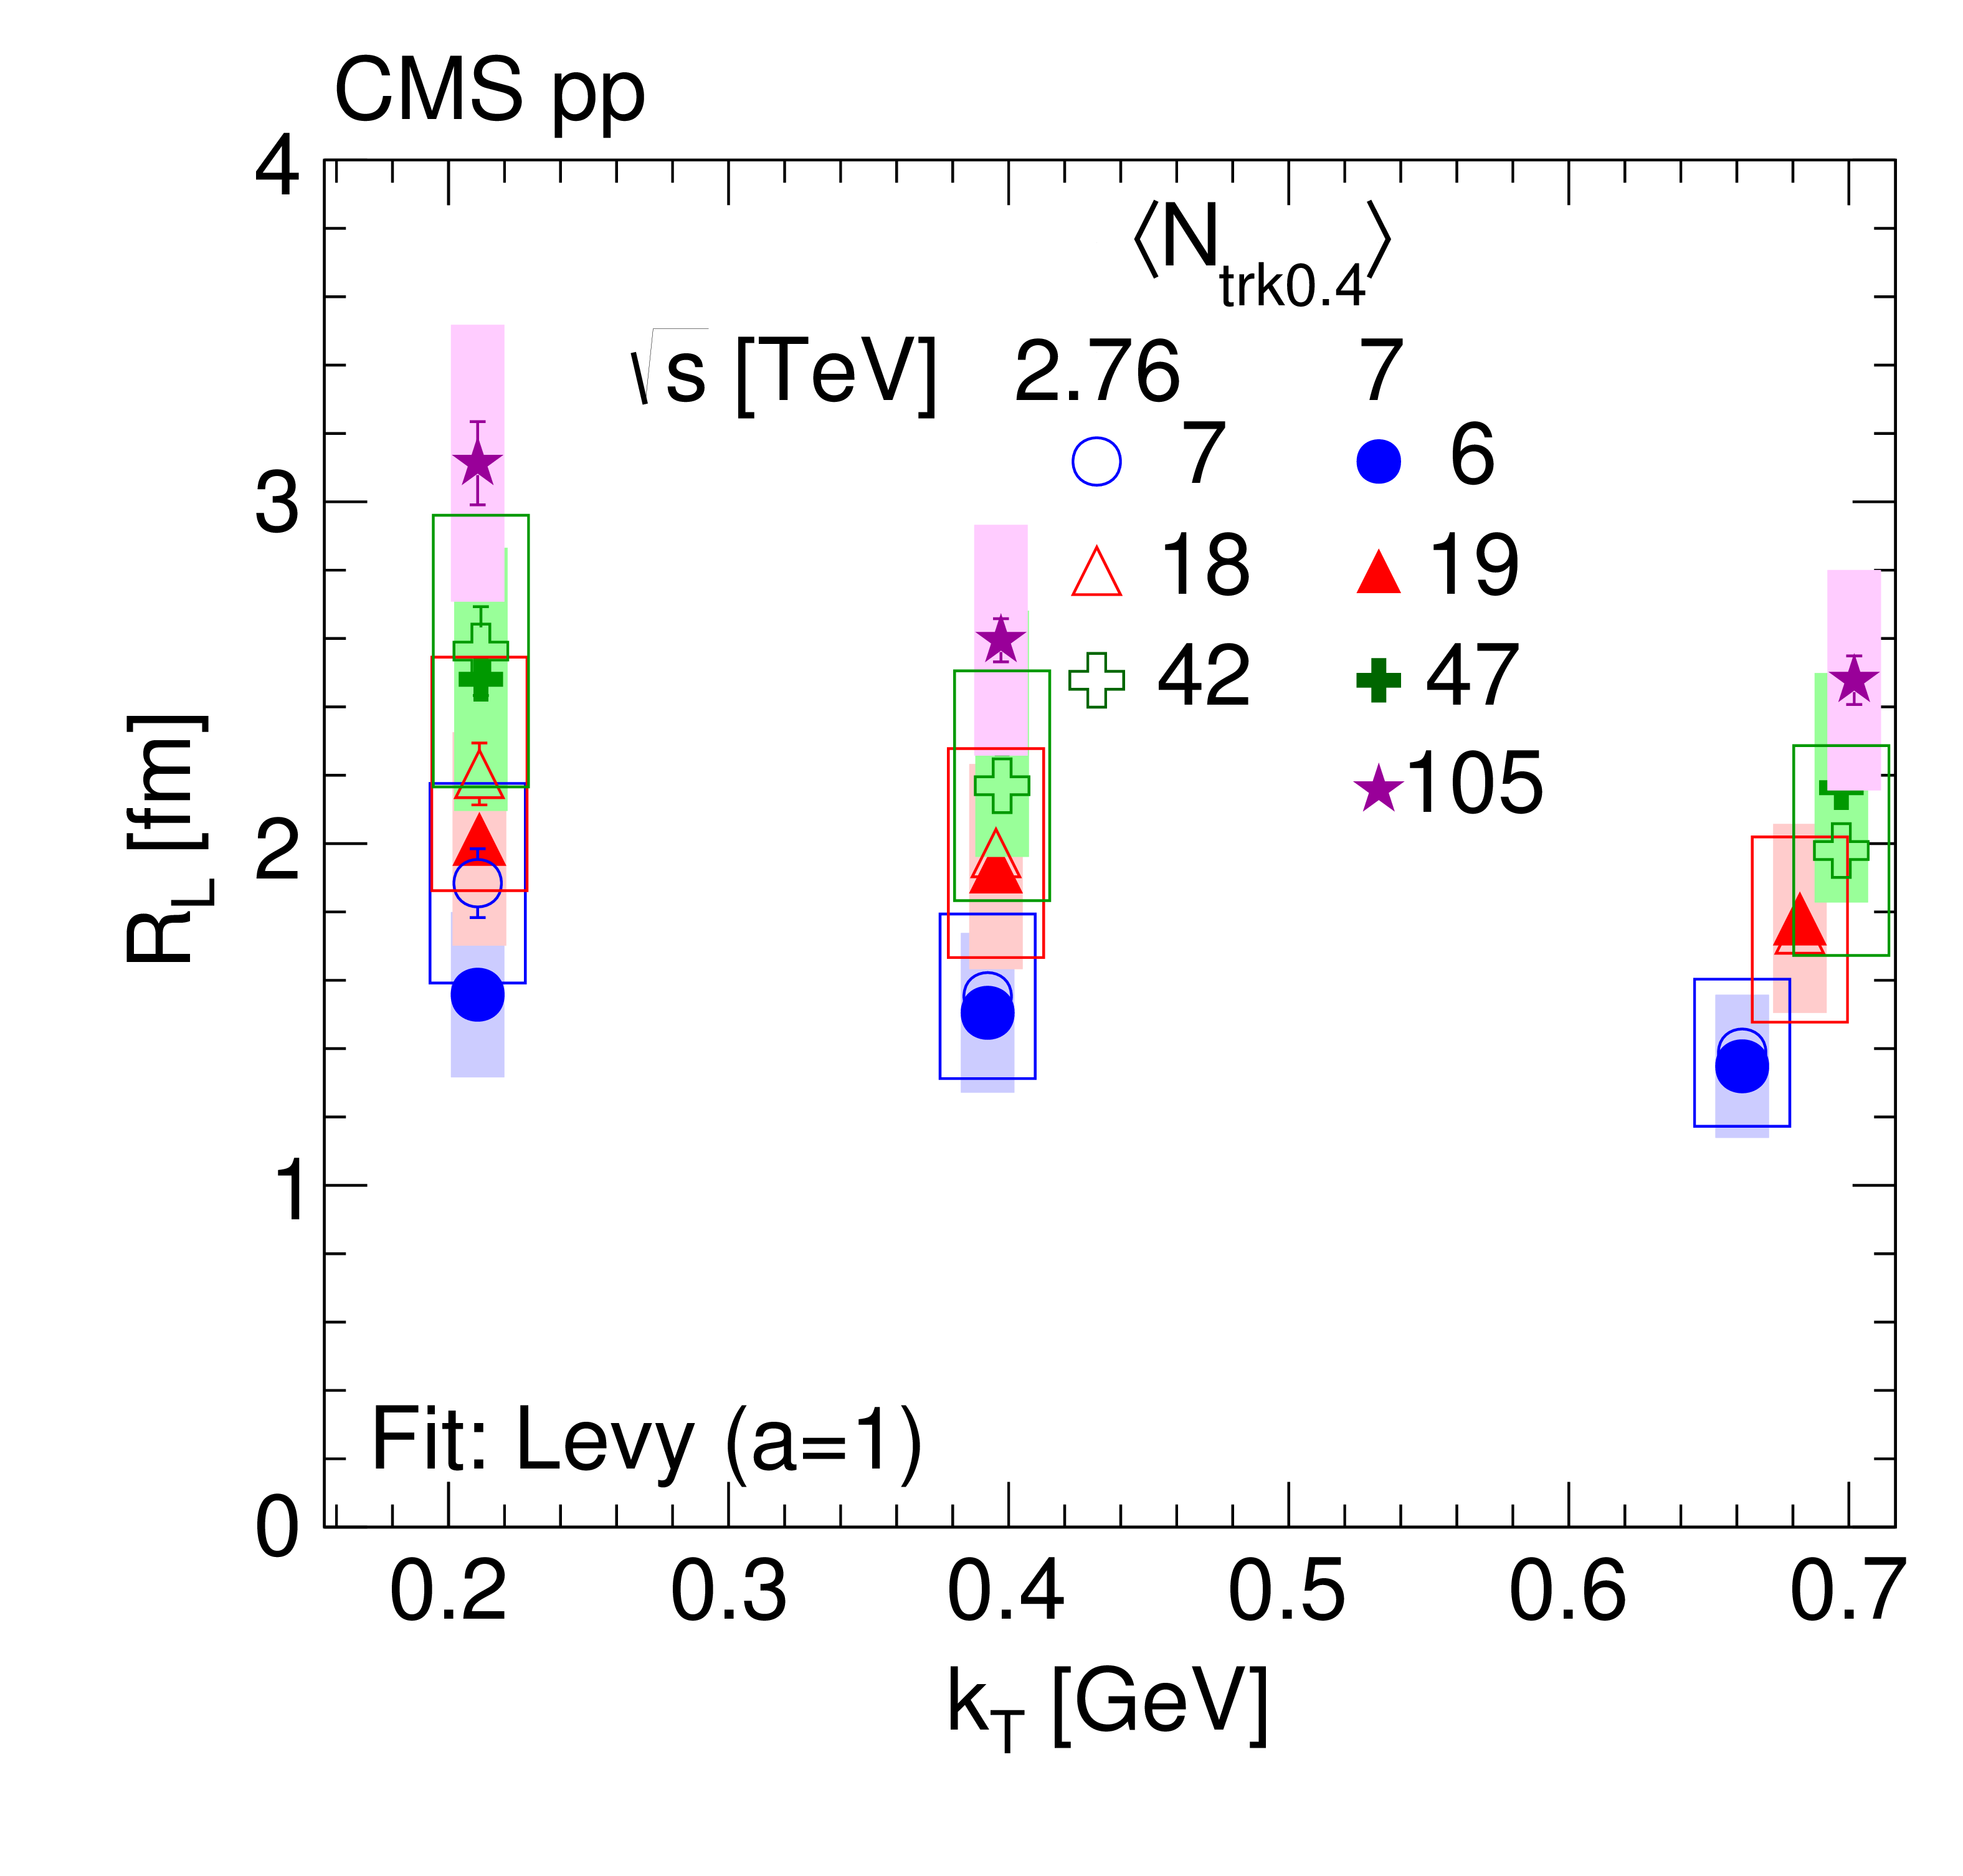
Longitudinal radius parameter as a function of $ {N_\text {trk0.4}} $ (integrated over all $ {k_{\mathrm {T}}} $) in the CM frame ($ {R_\text {L}} ^*$, left) and in the LCMS ($ {R_\text {L}} $, right), obtained from 2D correlation functions fitted as functions of $ {q_\text {T}} $ and $ {q_\text {L}} $, compared to the values obtained in the 3D case (fits as a function of $ {q_\text {S}} $, $ {q_\text {L}} $, and $ {q_\text {S}} $), in pp collisions at $\sqrt {s} = $ 2.76 TeV (open symbols) and 7 TeV (closed symbols). The boxes indicate the systematic uncertainties. |

png pdf |
Figure 19-a:
Longitudinal radius parameter as a function of $ {N_\text {trk0.4}} $ (integrated over all $ {k_{\mathrm {T}}} $) in the CM frame ($ {R_\text {L}} ^*$, left) and in the LCMS ($ {R_\text {L}} $, right), obtained from 2D correlation functions fitted as functions of $ {q_\text {T}} $ and $ {q_\text {L}} $, compared to the values obtained in the 3D case (fits as a function of $ {q_\text {S}} $, $ {q_\text {L}} $, and $ {q_\text {S}} $), in pp collisions at $\sqrt {s} = $ 2.76 TeV (open symbols) and 7 TeV (closed symbols). The boxes indicate the systematic uncertainties. |
png pdf |
Figure 19-b:
Longitudinal radius parameter as a function of $ {N_\text {trk0.4}} $ (integrated over all $ {k_{\mathrm {T}}} $) in the CM frame ($ {R_\text {L}} ^*$, left) and in the LCMS ($ {R_\text {L}} $, right), obtained from 2D correlation functions fitted as functions of $ {q_\text {T}} $ and $ {q_\text {L}} $, compared to the values obtained in the 3D case (fits as a function of $ {q_\text {S}} $, $ {q_\text {L}} $, and $ {q_\text {S}} $), in pp collisions at $\sqrt {s} = $ 2.76 TeV (open symbols) and 7 TeV (closed symbols). The boxes indicate the systematic uncertainties. |
png pdf |
Figure 20:
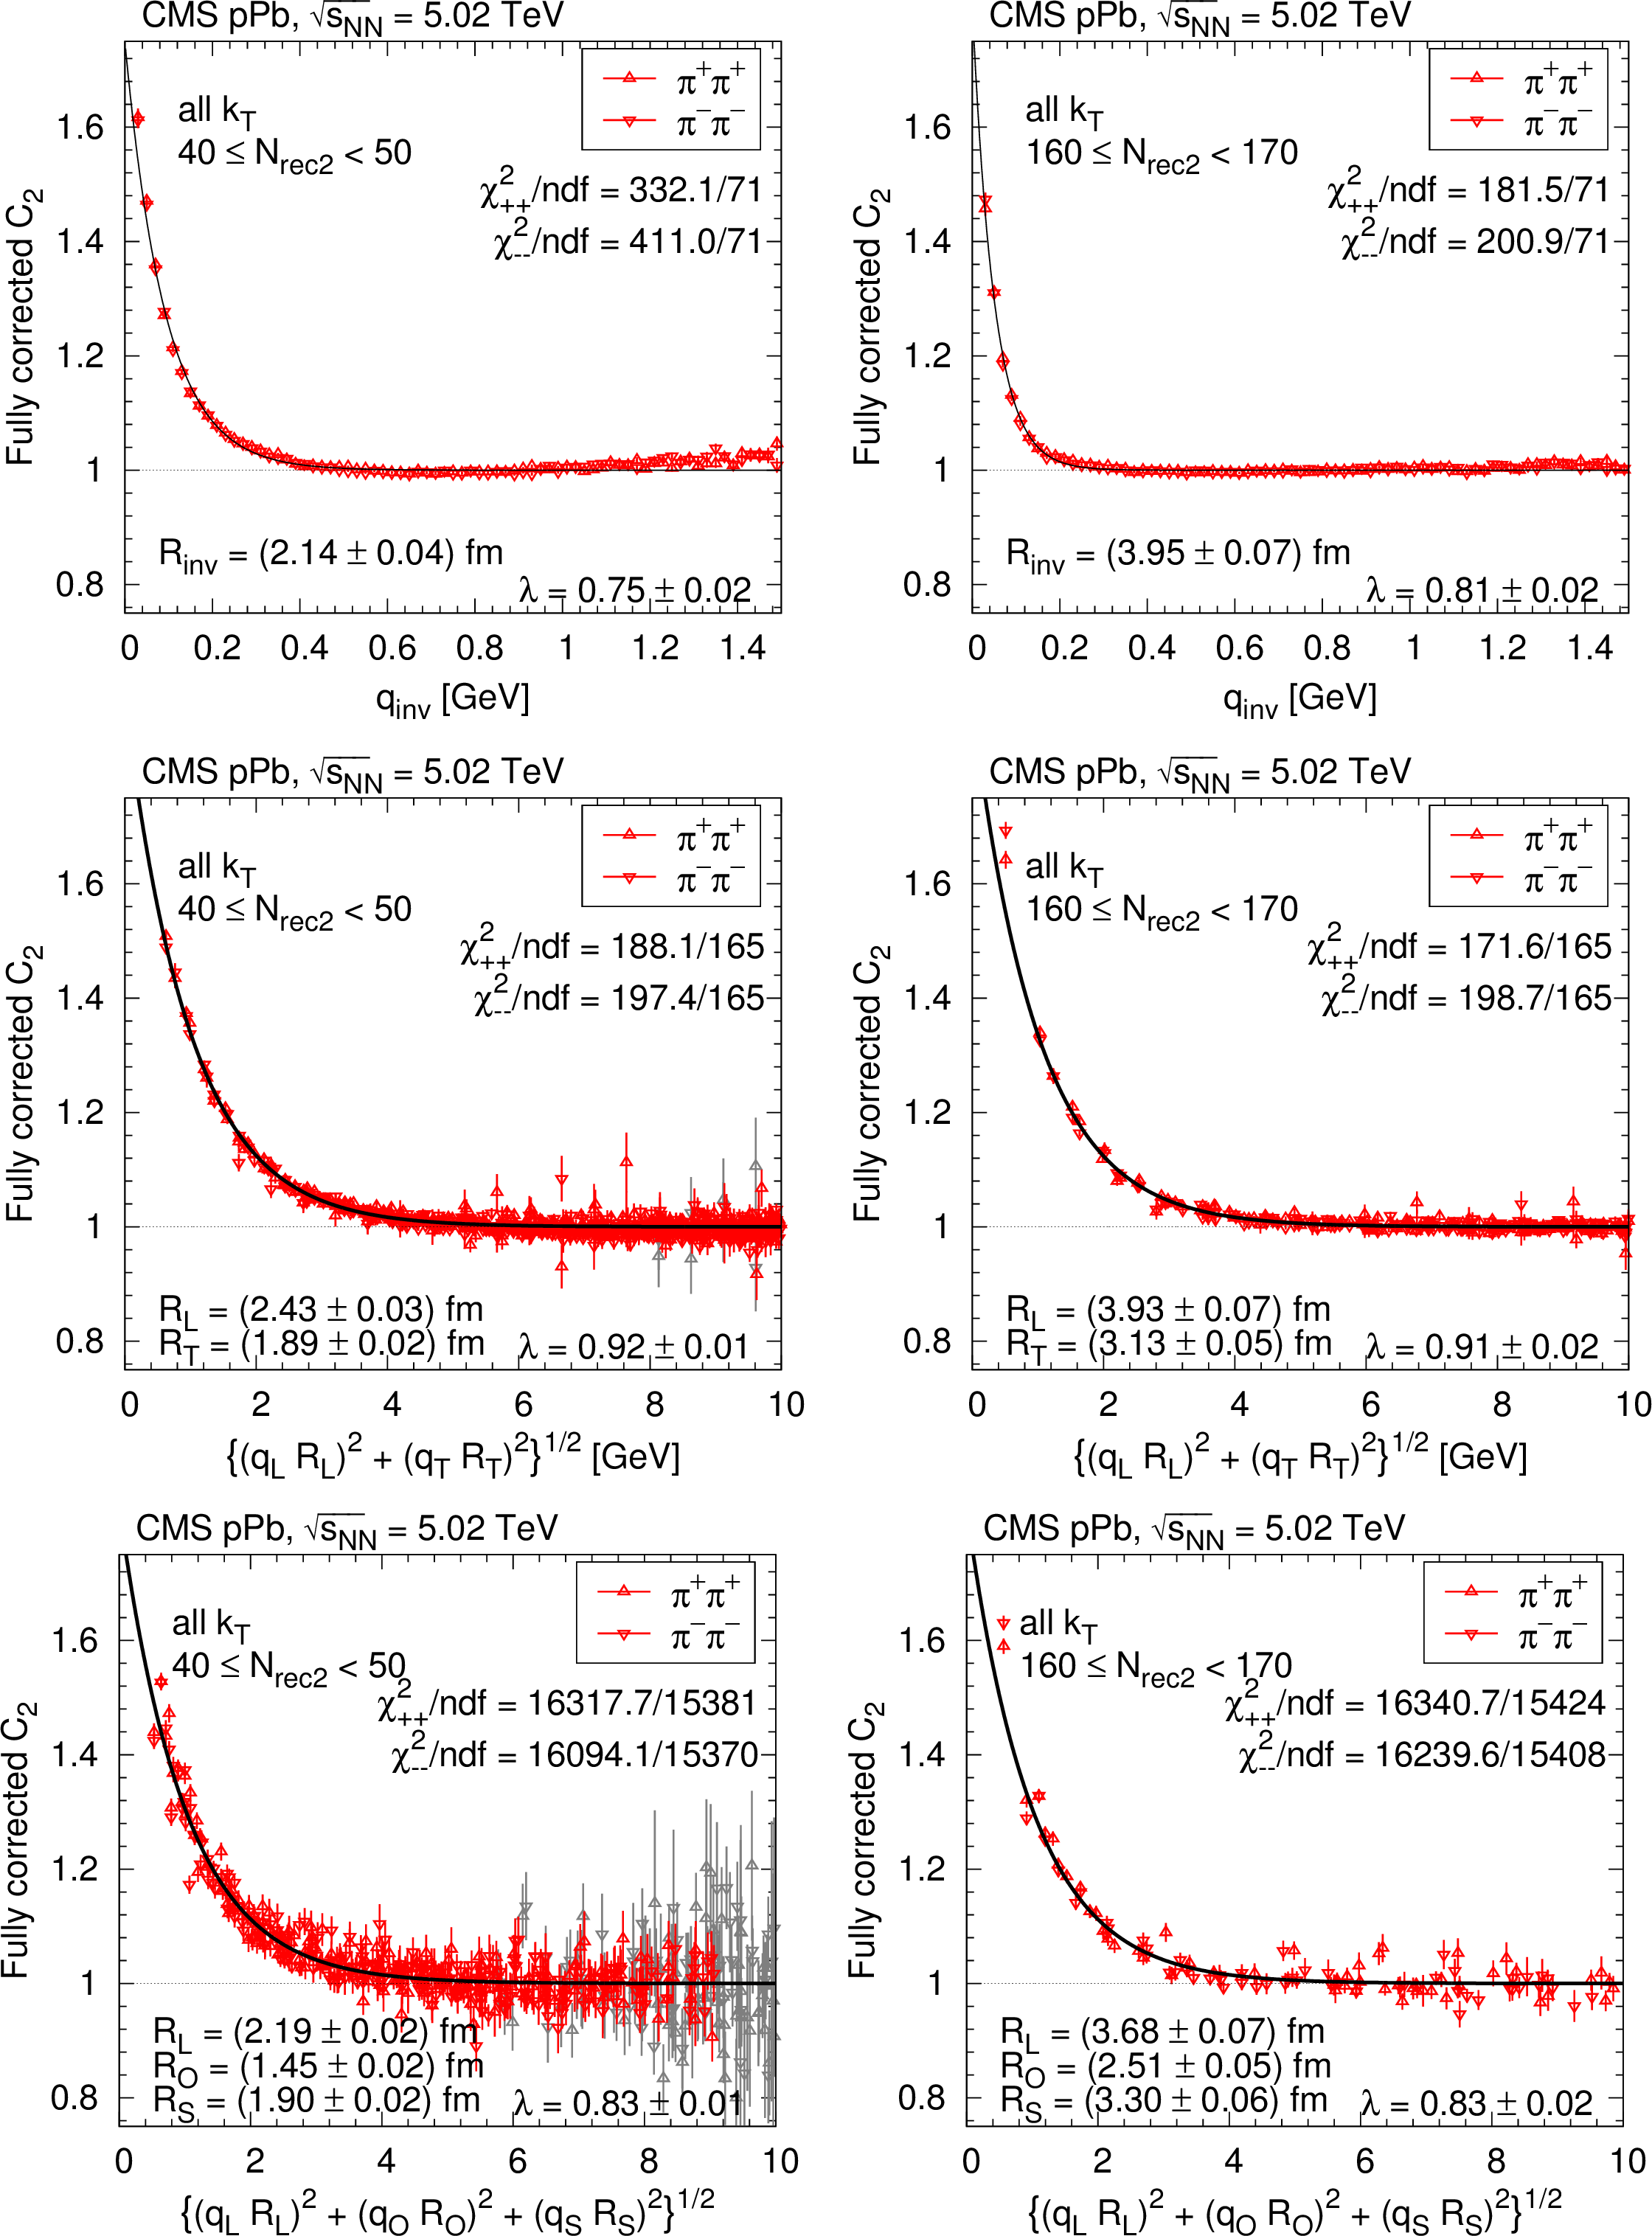
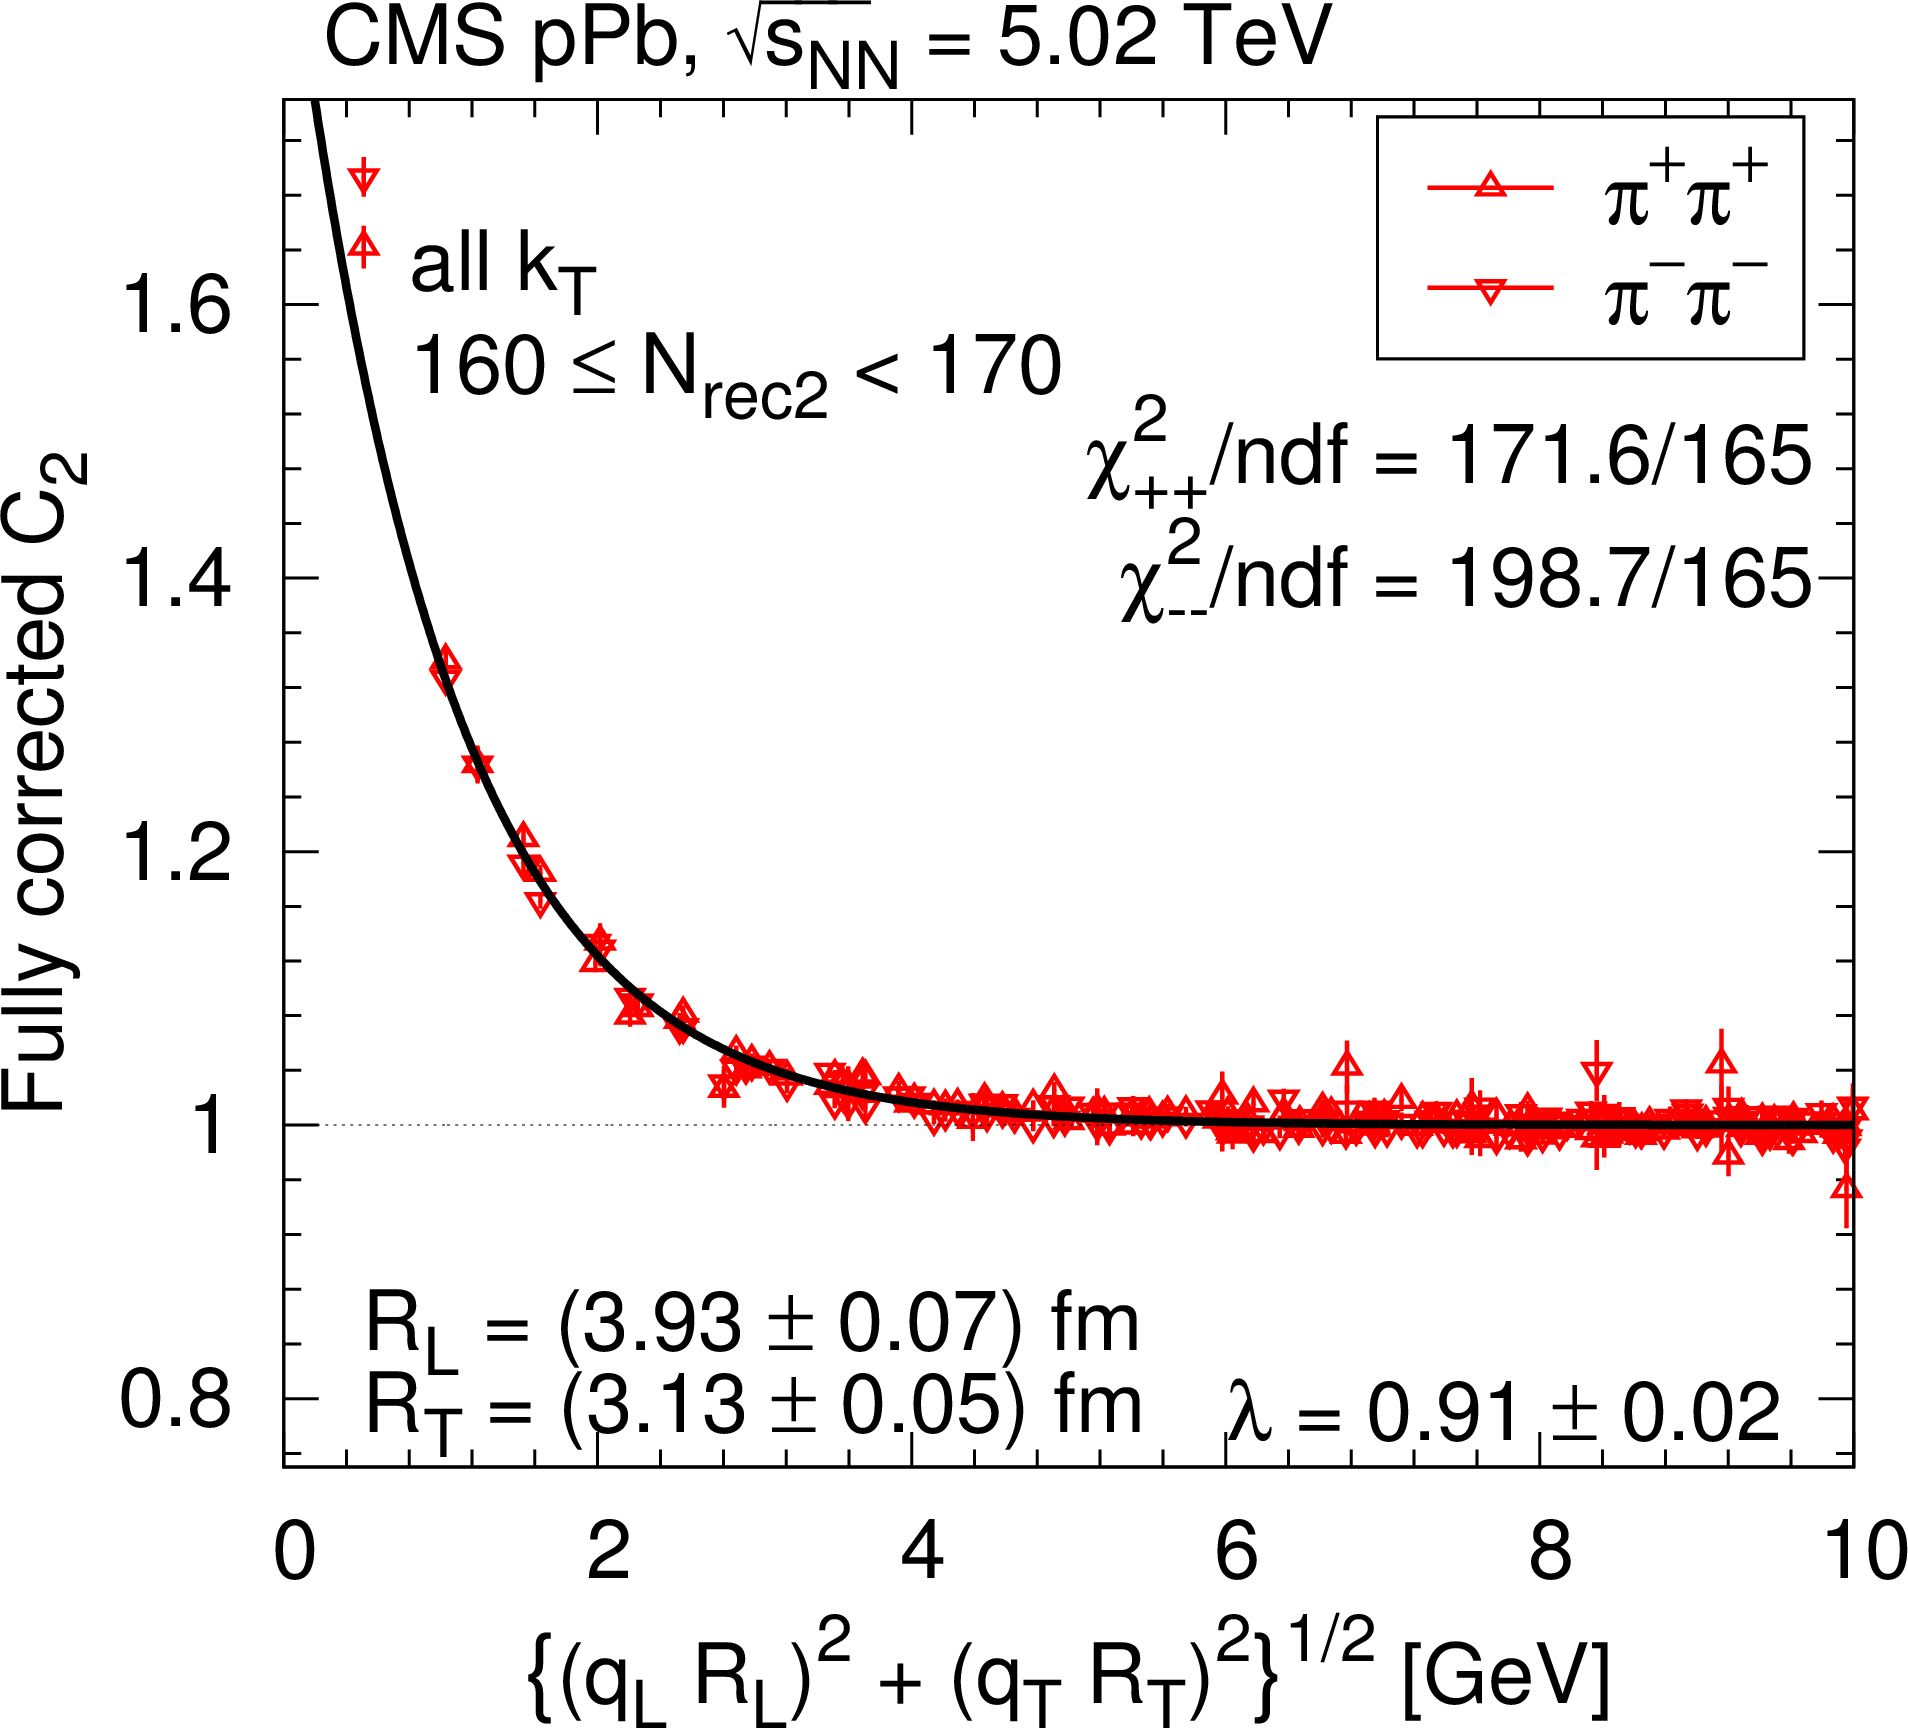
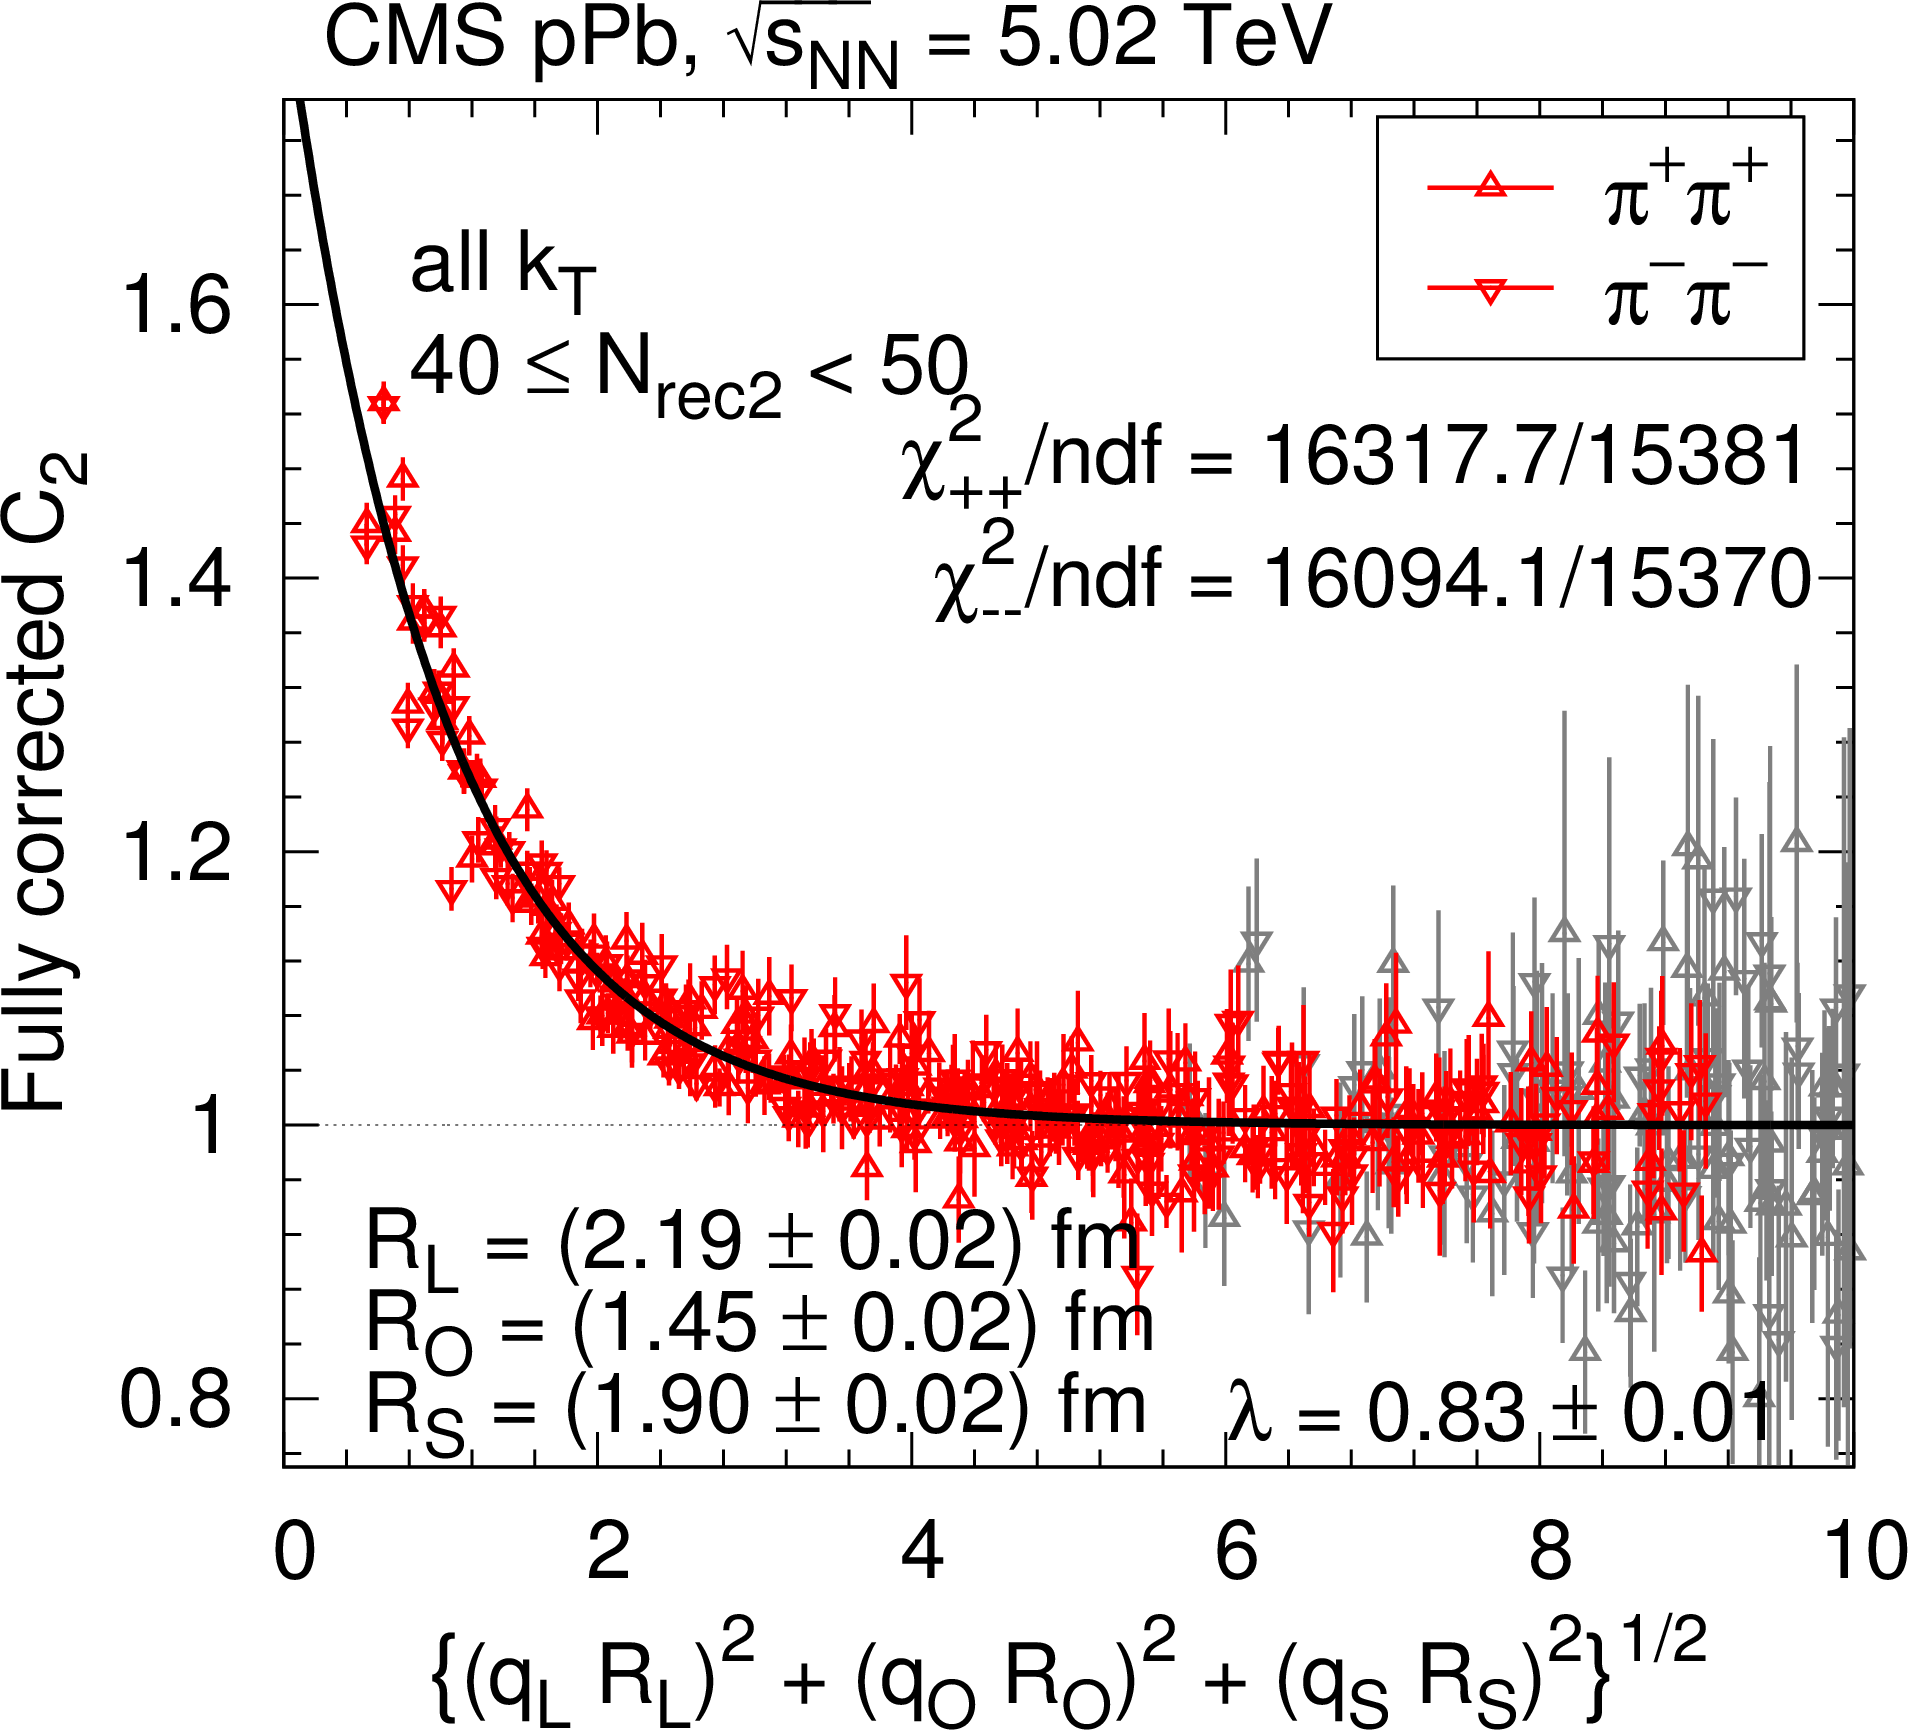
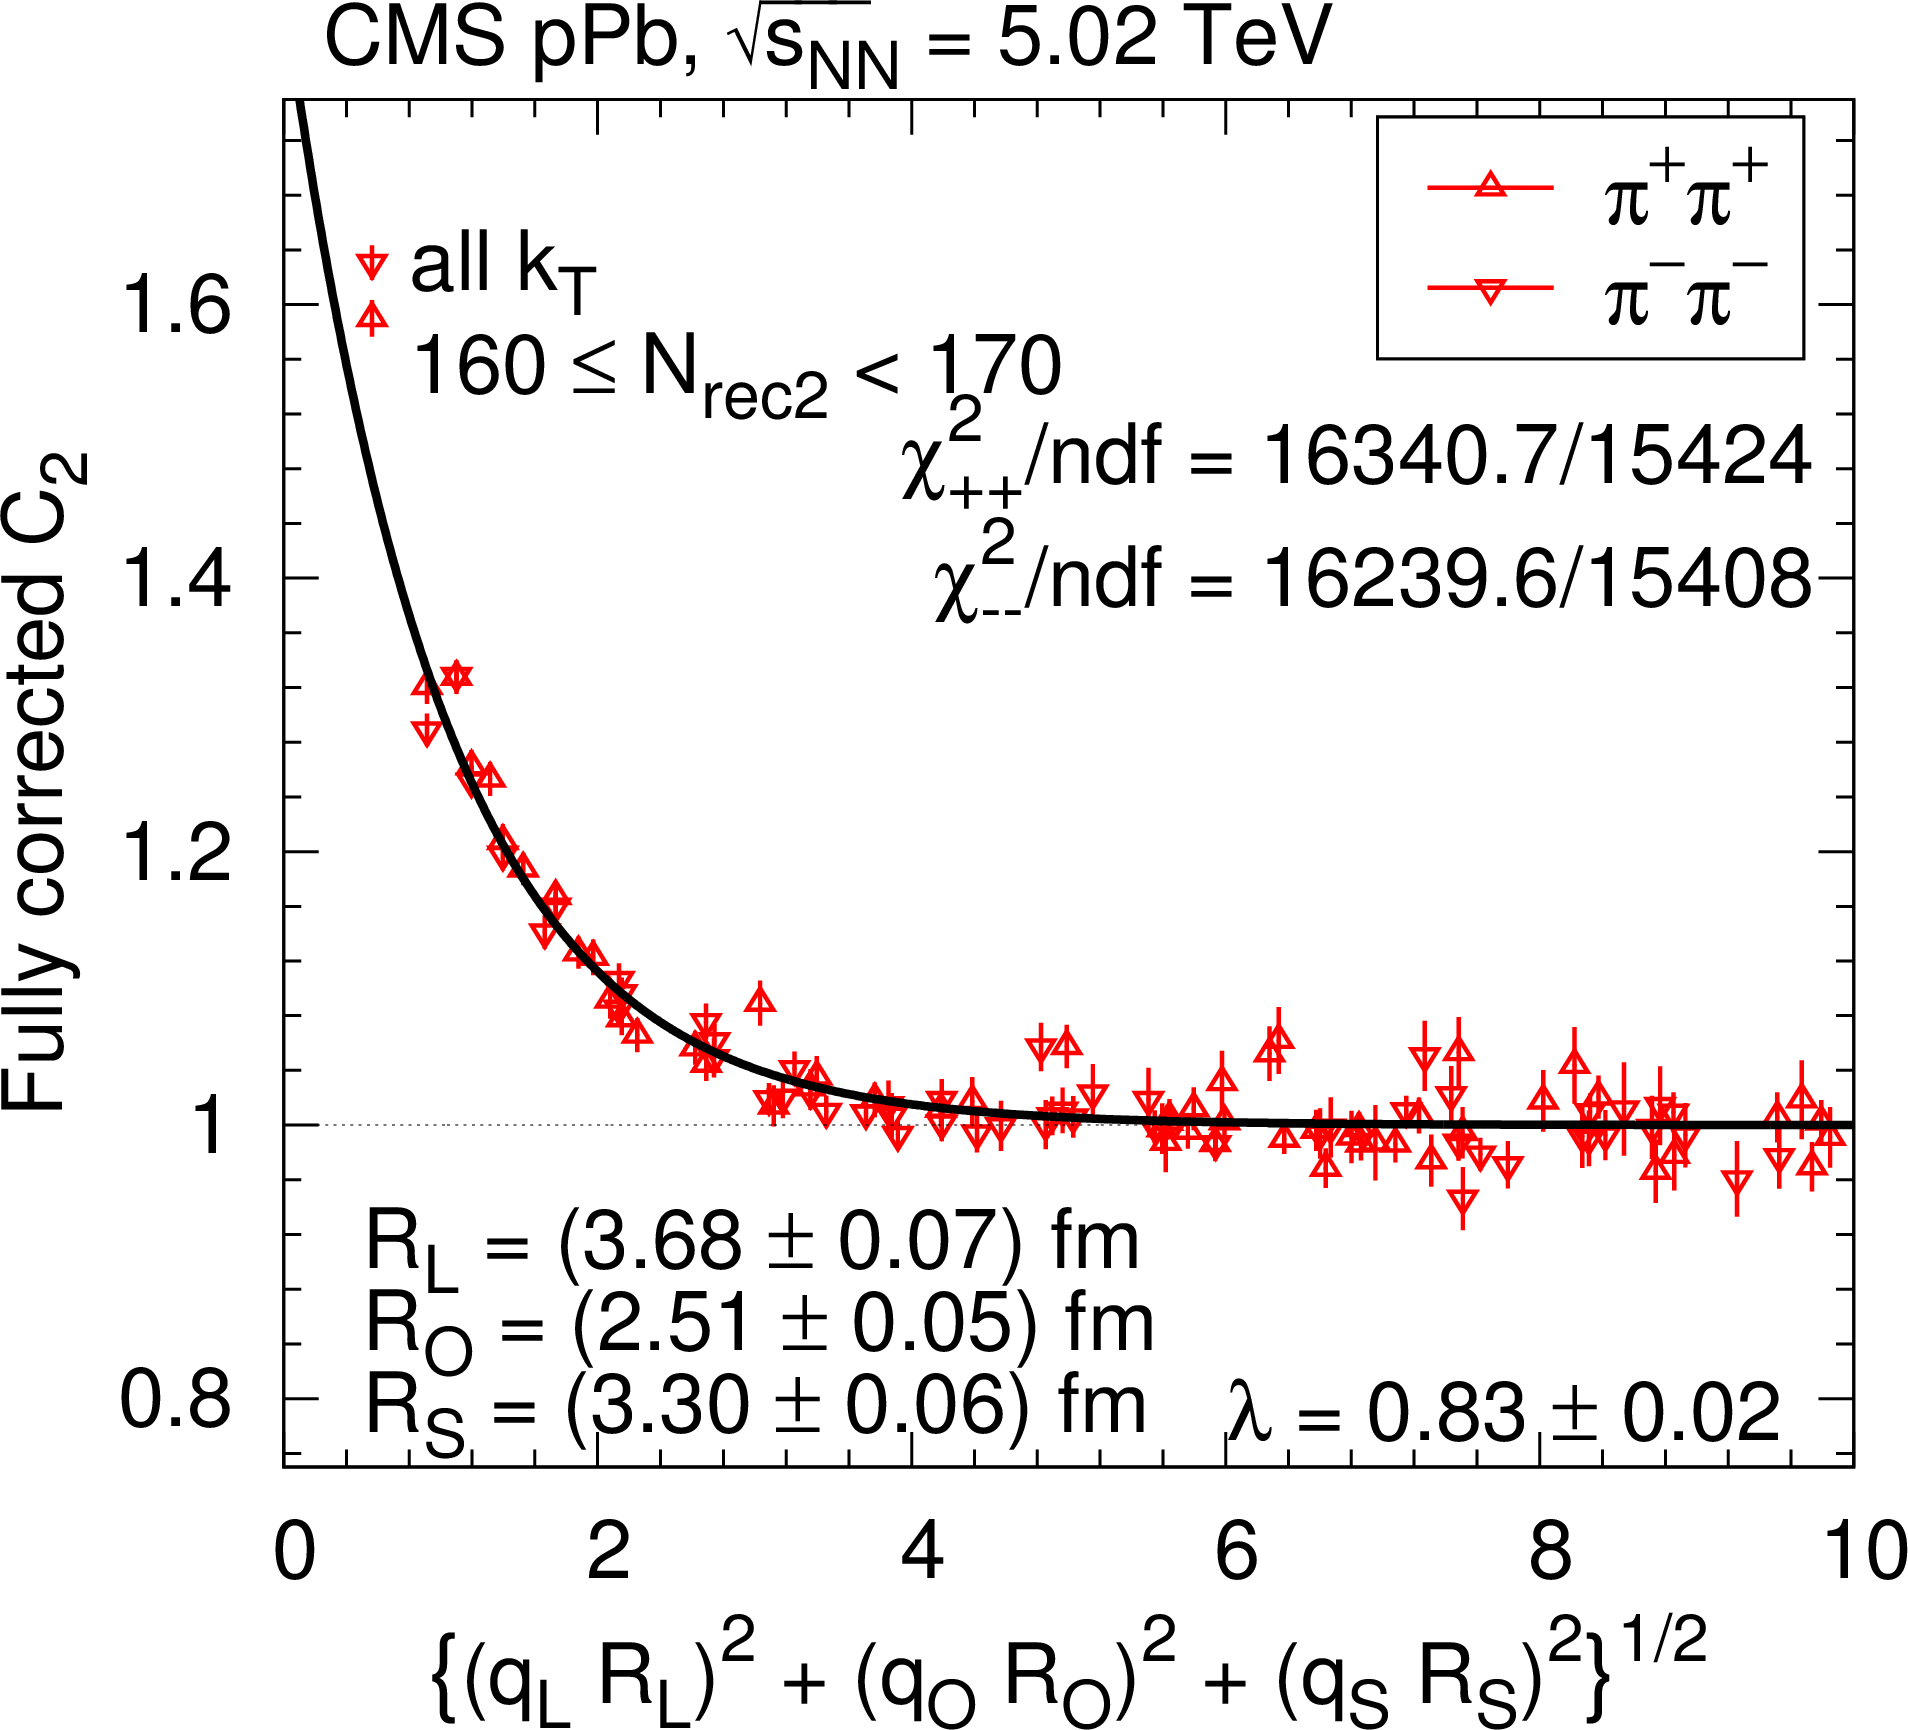
SS correlation function (integrated over all $ {k_{\mathrm {T}}} $) measured in pPb collisions at 5.02 TeV as a function of $ {q_\text {inv}} $ or of the combined momentum, in two selected $ {N_\text {rec2}} $ bins (left and right), for pion pairs (red triangles) in one (top), two (middle), and three (bottom) dimensions, corrected for Coulomb interaction and cluster contributions (mini-jets and multi-body resonance decays). For better visibility, only a fraction of the points is plotted, and those with statistical uncertainty higher than 10% are in light-grey color. The solid curves indicate fits with the stretched exponential parametrization. |
png pdf |
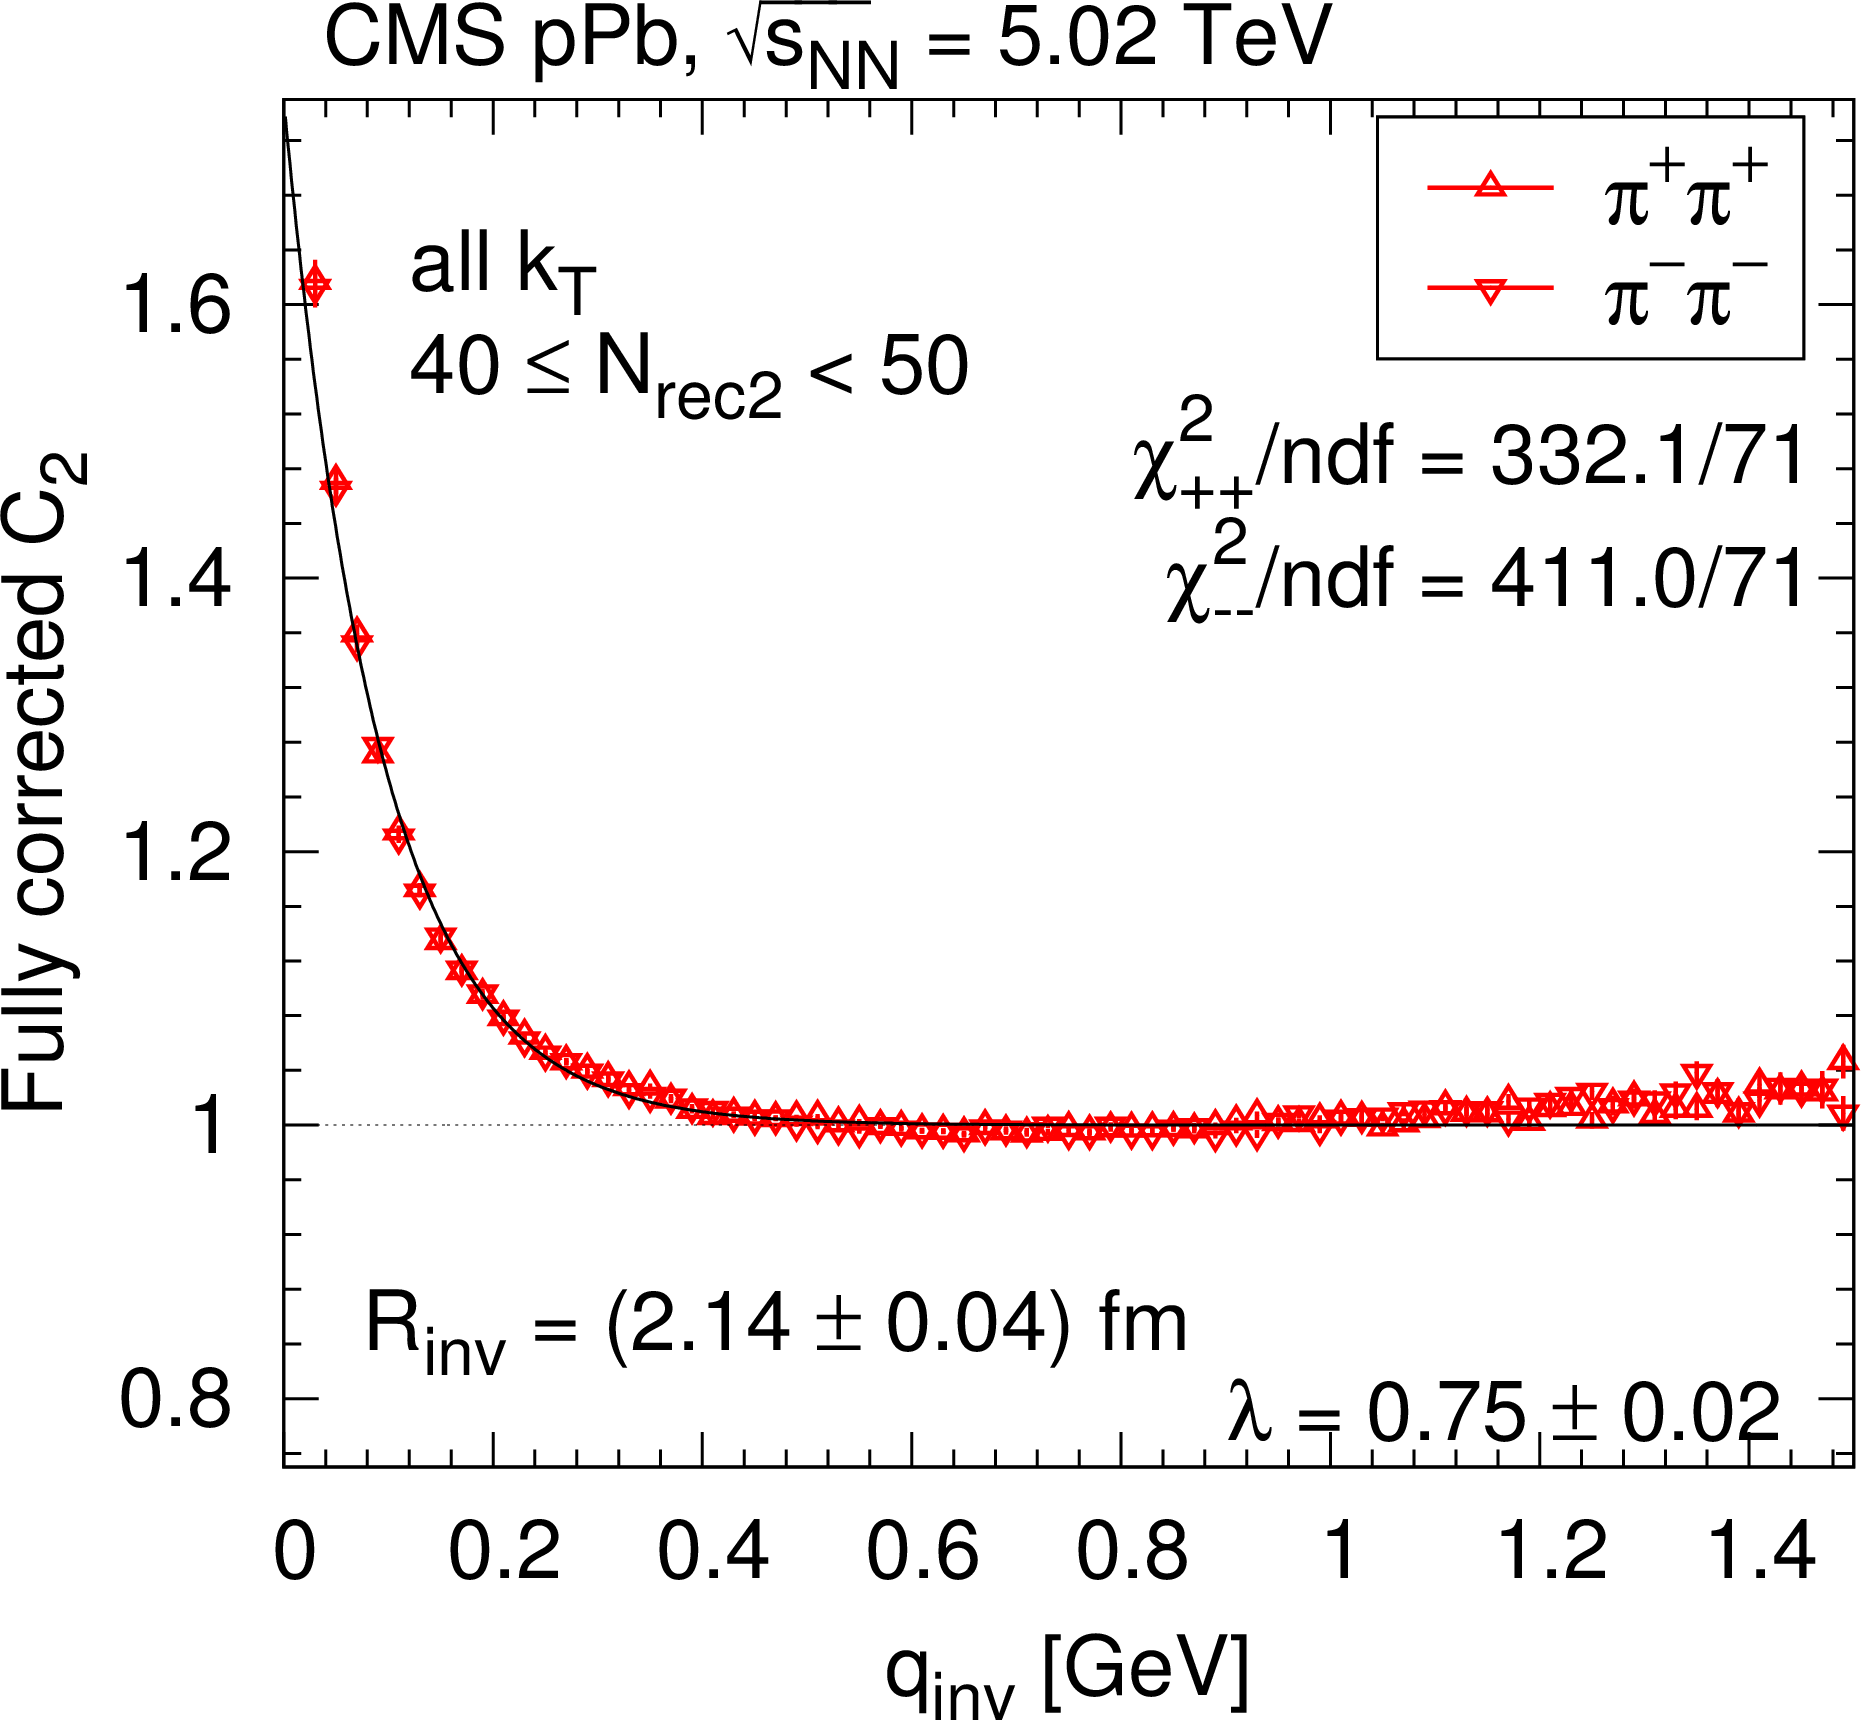
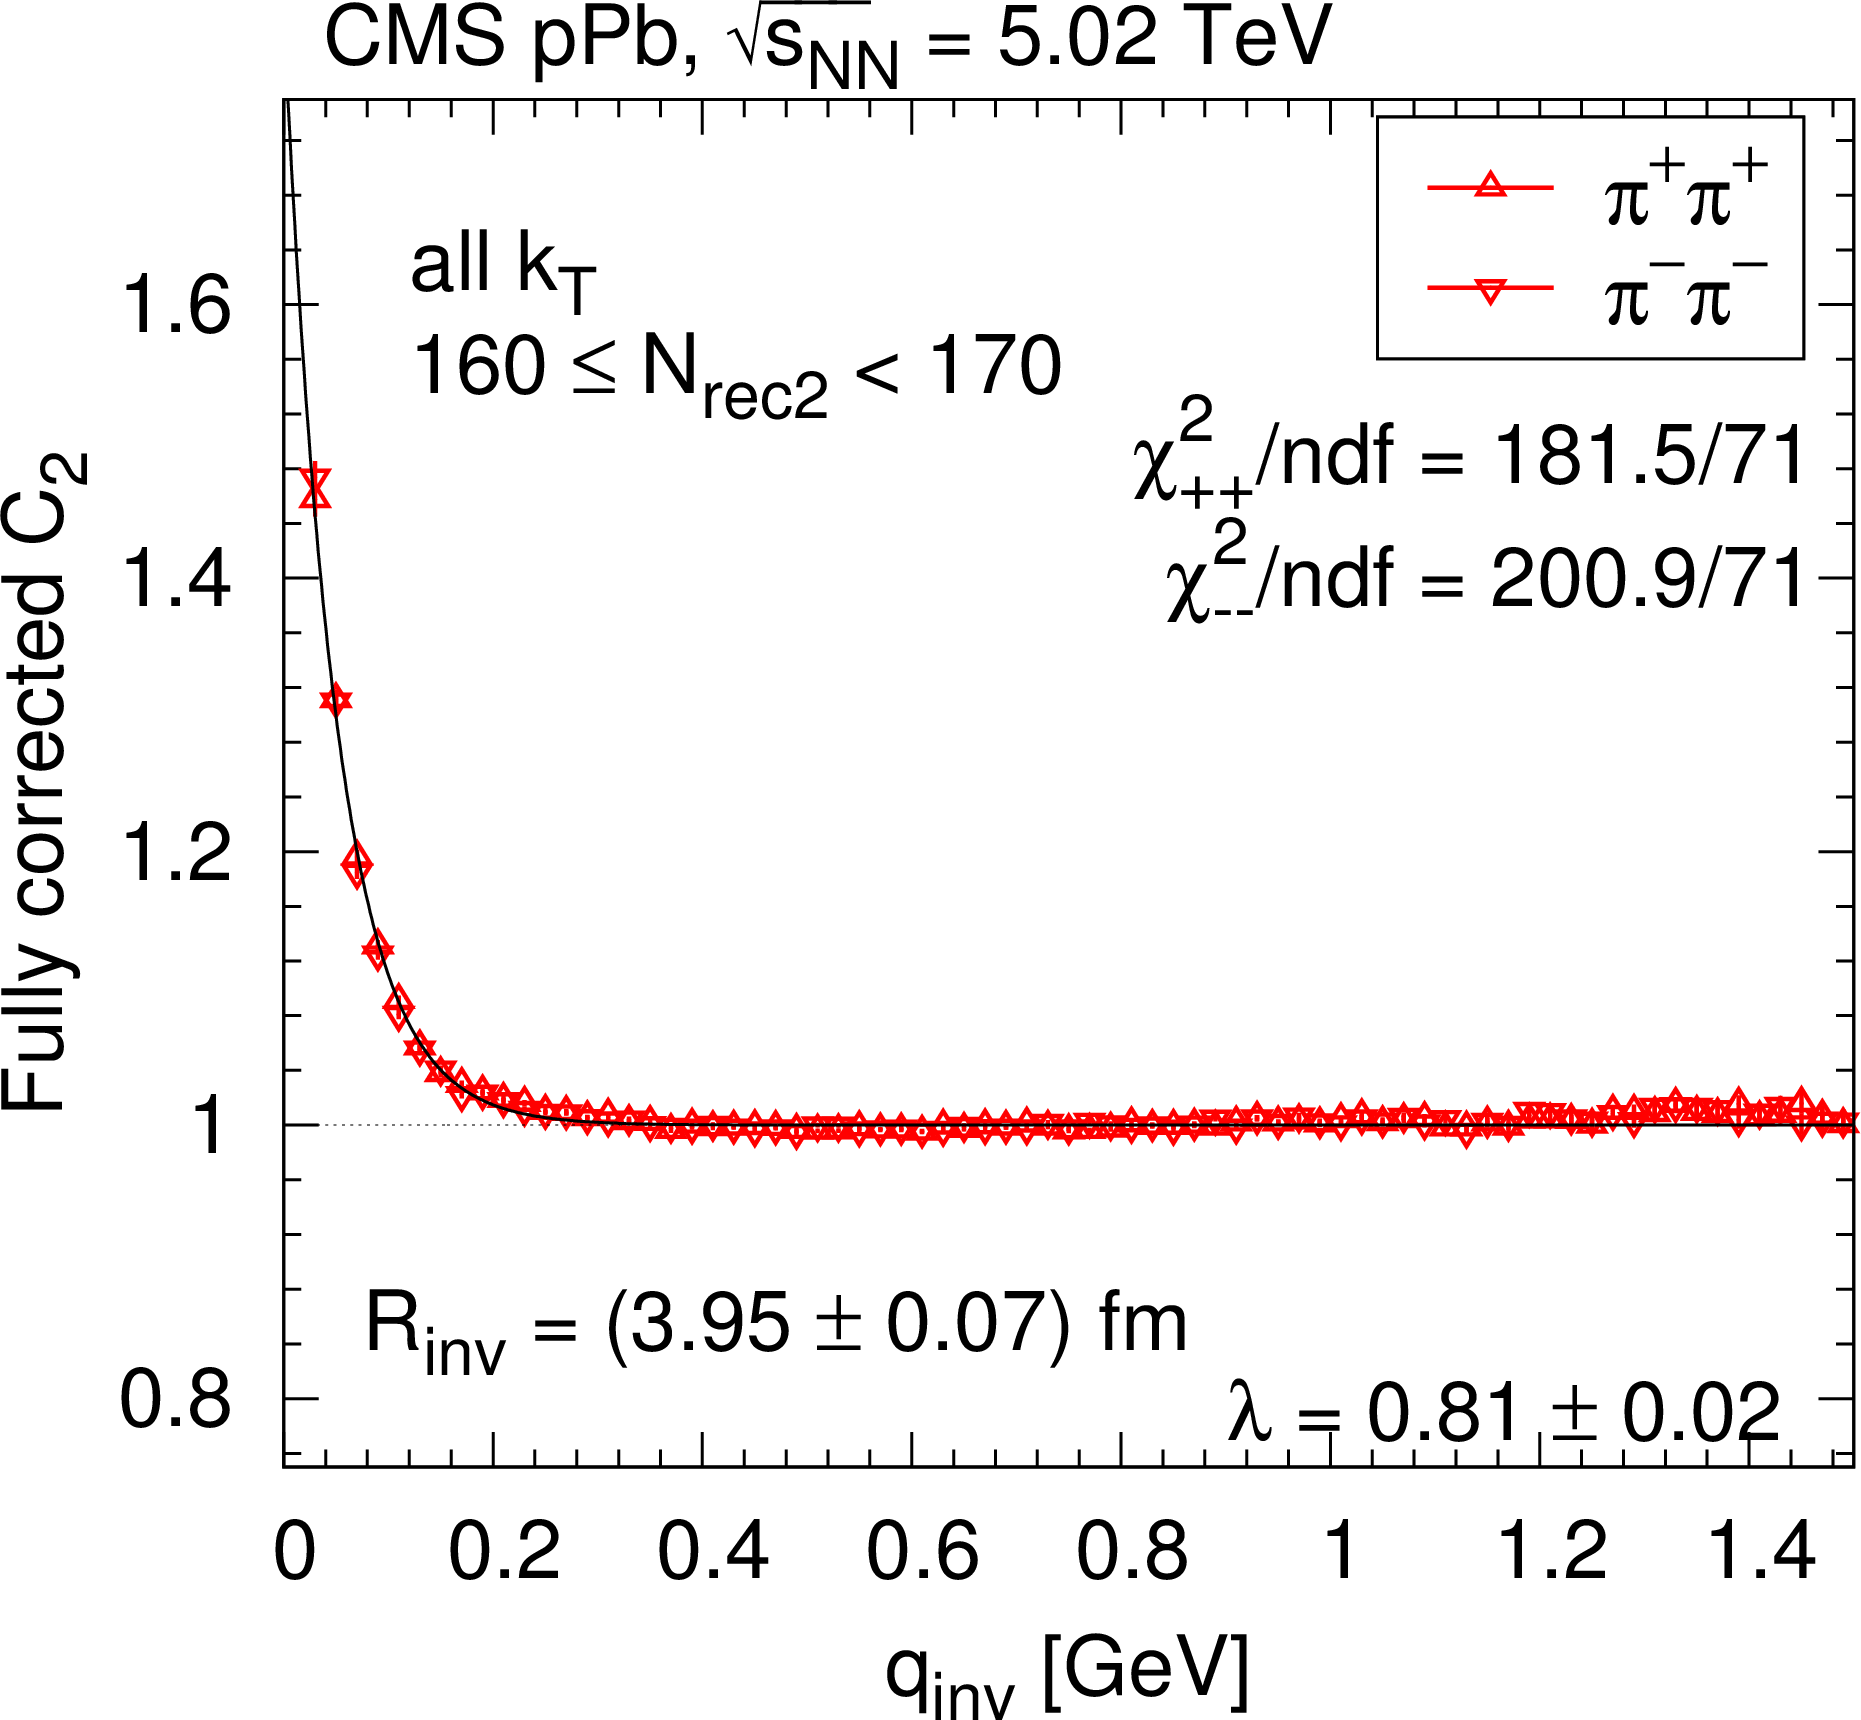
Figure 20-a:
SS correlation function (integrated over all $ {k_{\mathrm {T}}} $) measured in pPb collisions at 5.02 TeV as a function of $ {q_\text {inv}} $ or of the combined momentum, in two selected $ {N_\text {rec2}} $ bins (left and right), for pion pairs (red triangles) in one (top), two (middle), and three (bottom) dimensions, corrected for Coulomb interaction and cluster contributions (mini-jets and multi-body resonance decays). For better visibility, only a fraction of the points is plotted, and those with statistical uncertainty higher than 10% are in light-grey color. The solid curves indicate fits with the stretched exponential parametrization. |
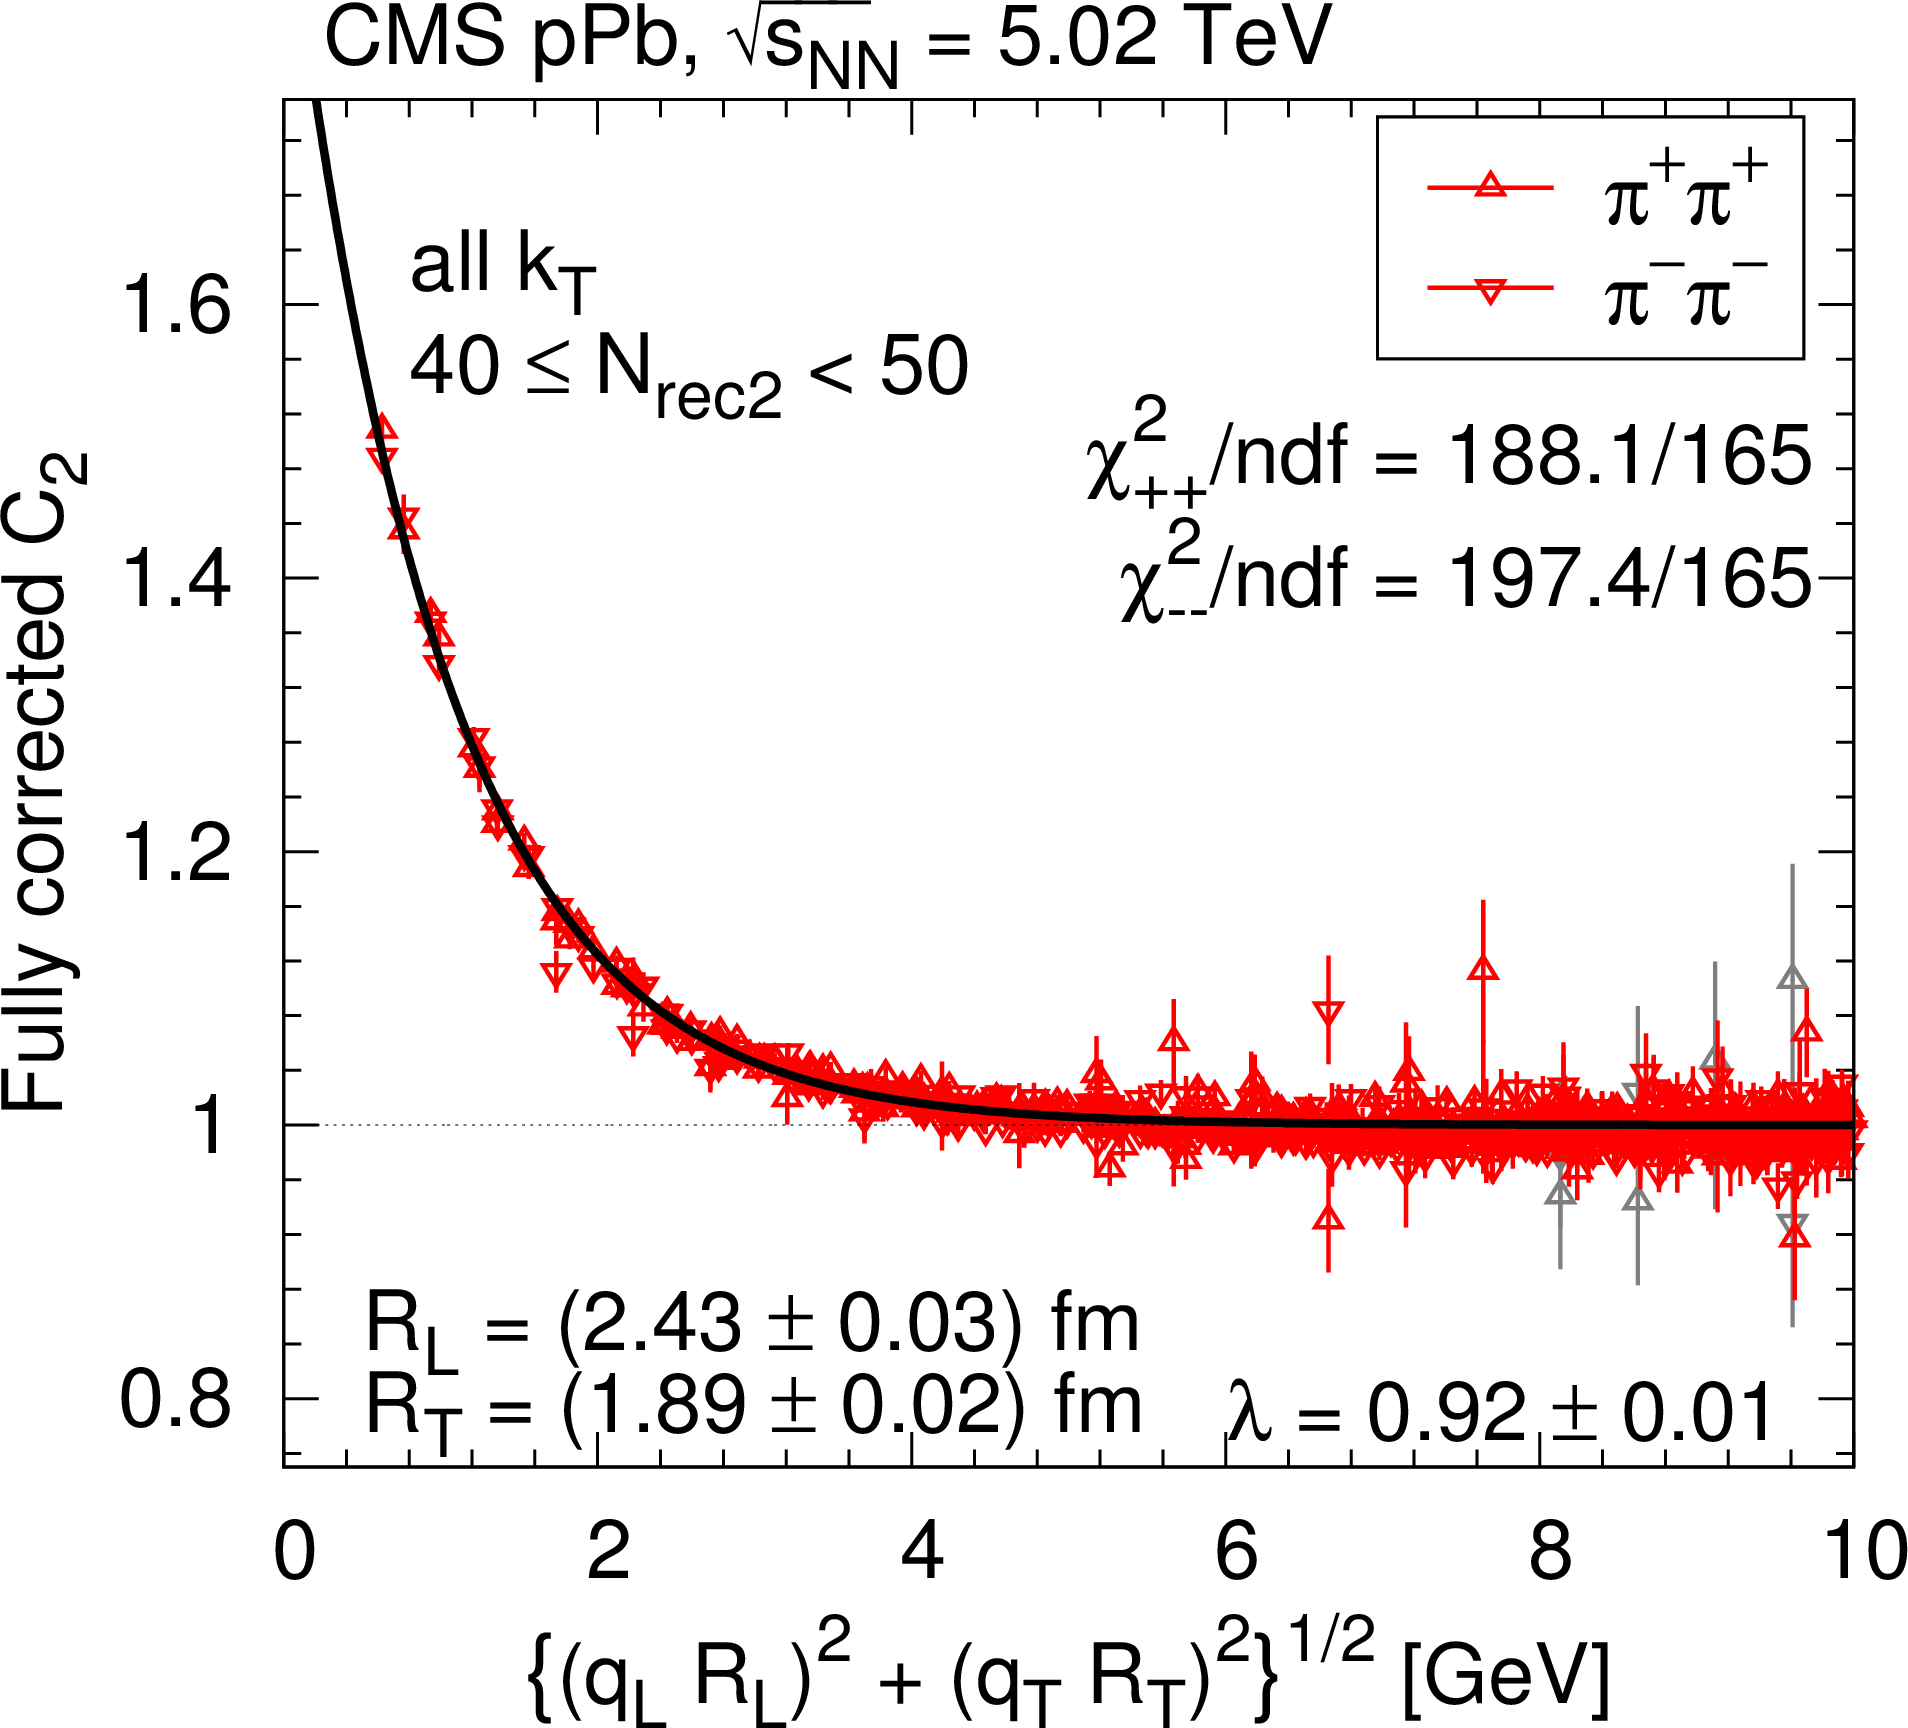
png pdf |
Figure 20-b:
SS correlation function (integrated over all $ {k_{\mathrm {T}}} $) measured in pPb collisions at 5.02 TeV as a function of $ {q_\text {inv}} $ or of the combined momentum, in two selected $ {N_\text {rec2}} $ bins (left and right), for pion pairs (red triangles) in one (top), two (middle), and three (bottom) dimensions, corrected for Coulomb interaction and cluster contributions (mini-jets and multi-body resonance decays). For better visibility, only a fraction of the points is plotted, and those with statistical uncertainty higher than 10% are in light-grey color. The solid curves indicate fits with the stretched exponential parametrization. |
png pdf |
Figure 20-c:
SS correlation function (integrated over all $ {k_{\mathrm {T}}} $) measured in pPb collisions at 5.02 TeV as a function of $ {q_\text {inv}} $ or of the combined momentum, in two selected $ {N_\text {rec2}} $ bins (left and right), for pion pairs (red triangles) in one (top), two (middle), and three (bottom) dimensions, corrected for Coulomb interaction and cluster contributions (mini-jets and multi-body resonance decays). For better visibility, only a fraction of the points is plotted, and those with statistical uncertainty higher than 10% are in light-grey color. The solid curves indicate fits with the stretched exponential parametrization. |
png pdf |
Figure 20-d:
SS correlation function (integrated over all $ {k_{\mathrm {T}}} $) measured in pPb collisions at 5.02 TeV as a function of $ {q_\text {inv}} $ or of the combined momentum, in two selected $ {N_\text {rec2}} $ bins (left and right), for pion pairs (red triangles) in one (top), two (middle), and three (bottom) dimensions, corrected for Coulomb interaction and cluster contributions (mini-jets and multi-body resonance decays). For better visibility, only a fraction of the points is plotted, and those with statistical uncertainty higher than 10% are in light-grey color. The solid curves indicate fits with the stretched exponential parametrization. |
png pdf |
Figure 20-e:
SS correlation function (integrated over all $ {k_{\mathrm {T}}} $) measured in pPb collisions at 5.02 TeV as a function of $ {q_\text {inv}} $ or of the combined momentum, in two selected $ {N_\text {rec2}} $ bins (left and right), for pion pairs (red triangles) in one (top), two (middle), and three (bottom) dimensions, corrected for Coulomb interaction and cluster contributions (mini-jets and multi-body resonance decays). For better visibility, only a fraction of the points is plotted, and those with statistical uncertainty higher than 10% are in light-grey color. The solid curves indicate fits with the stretched exponential parametrization. |
png pdf |
Figure 20-f:
SS correlation function (integrated over all $ {k_{\mathrm {T}}} $) measured in pPb collisions at 5.02 TeV as a function of $ {q_\text {inv}} $ or of the combined momentum, in two selected $ {N_\text {rec2}} $ bins (left and right), for pion pairs (red triangles) in one (top), two (middle), and three (bottom) dimensions, corrected for Coulomb interaction and cluster contributions (mini-jets and multi-body resonance decays). For better visibility, only a fraction of the points is plotted, and those with statistical uncertainty higher than 10% are in light-grey color. The solid curves indicate fits with the stretched exponential parametrization. |
png pdf |
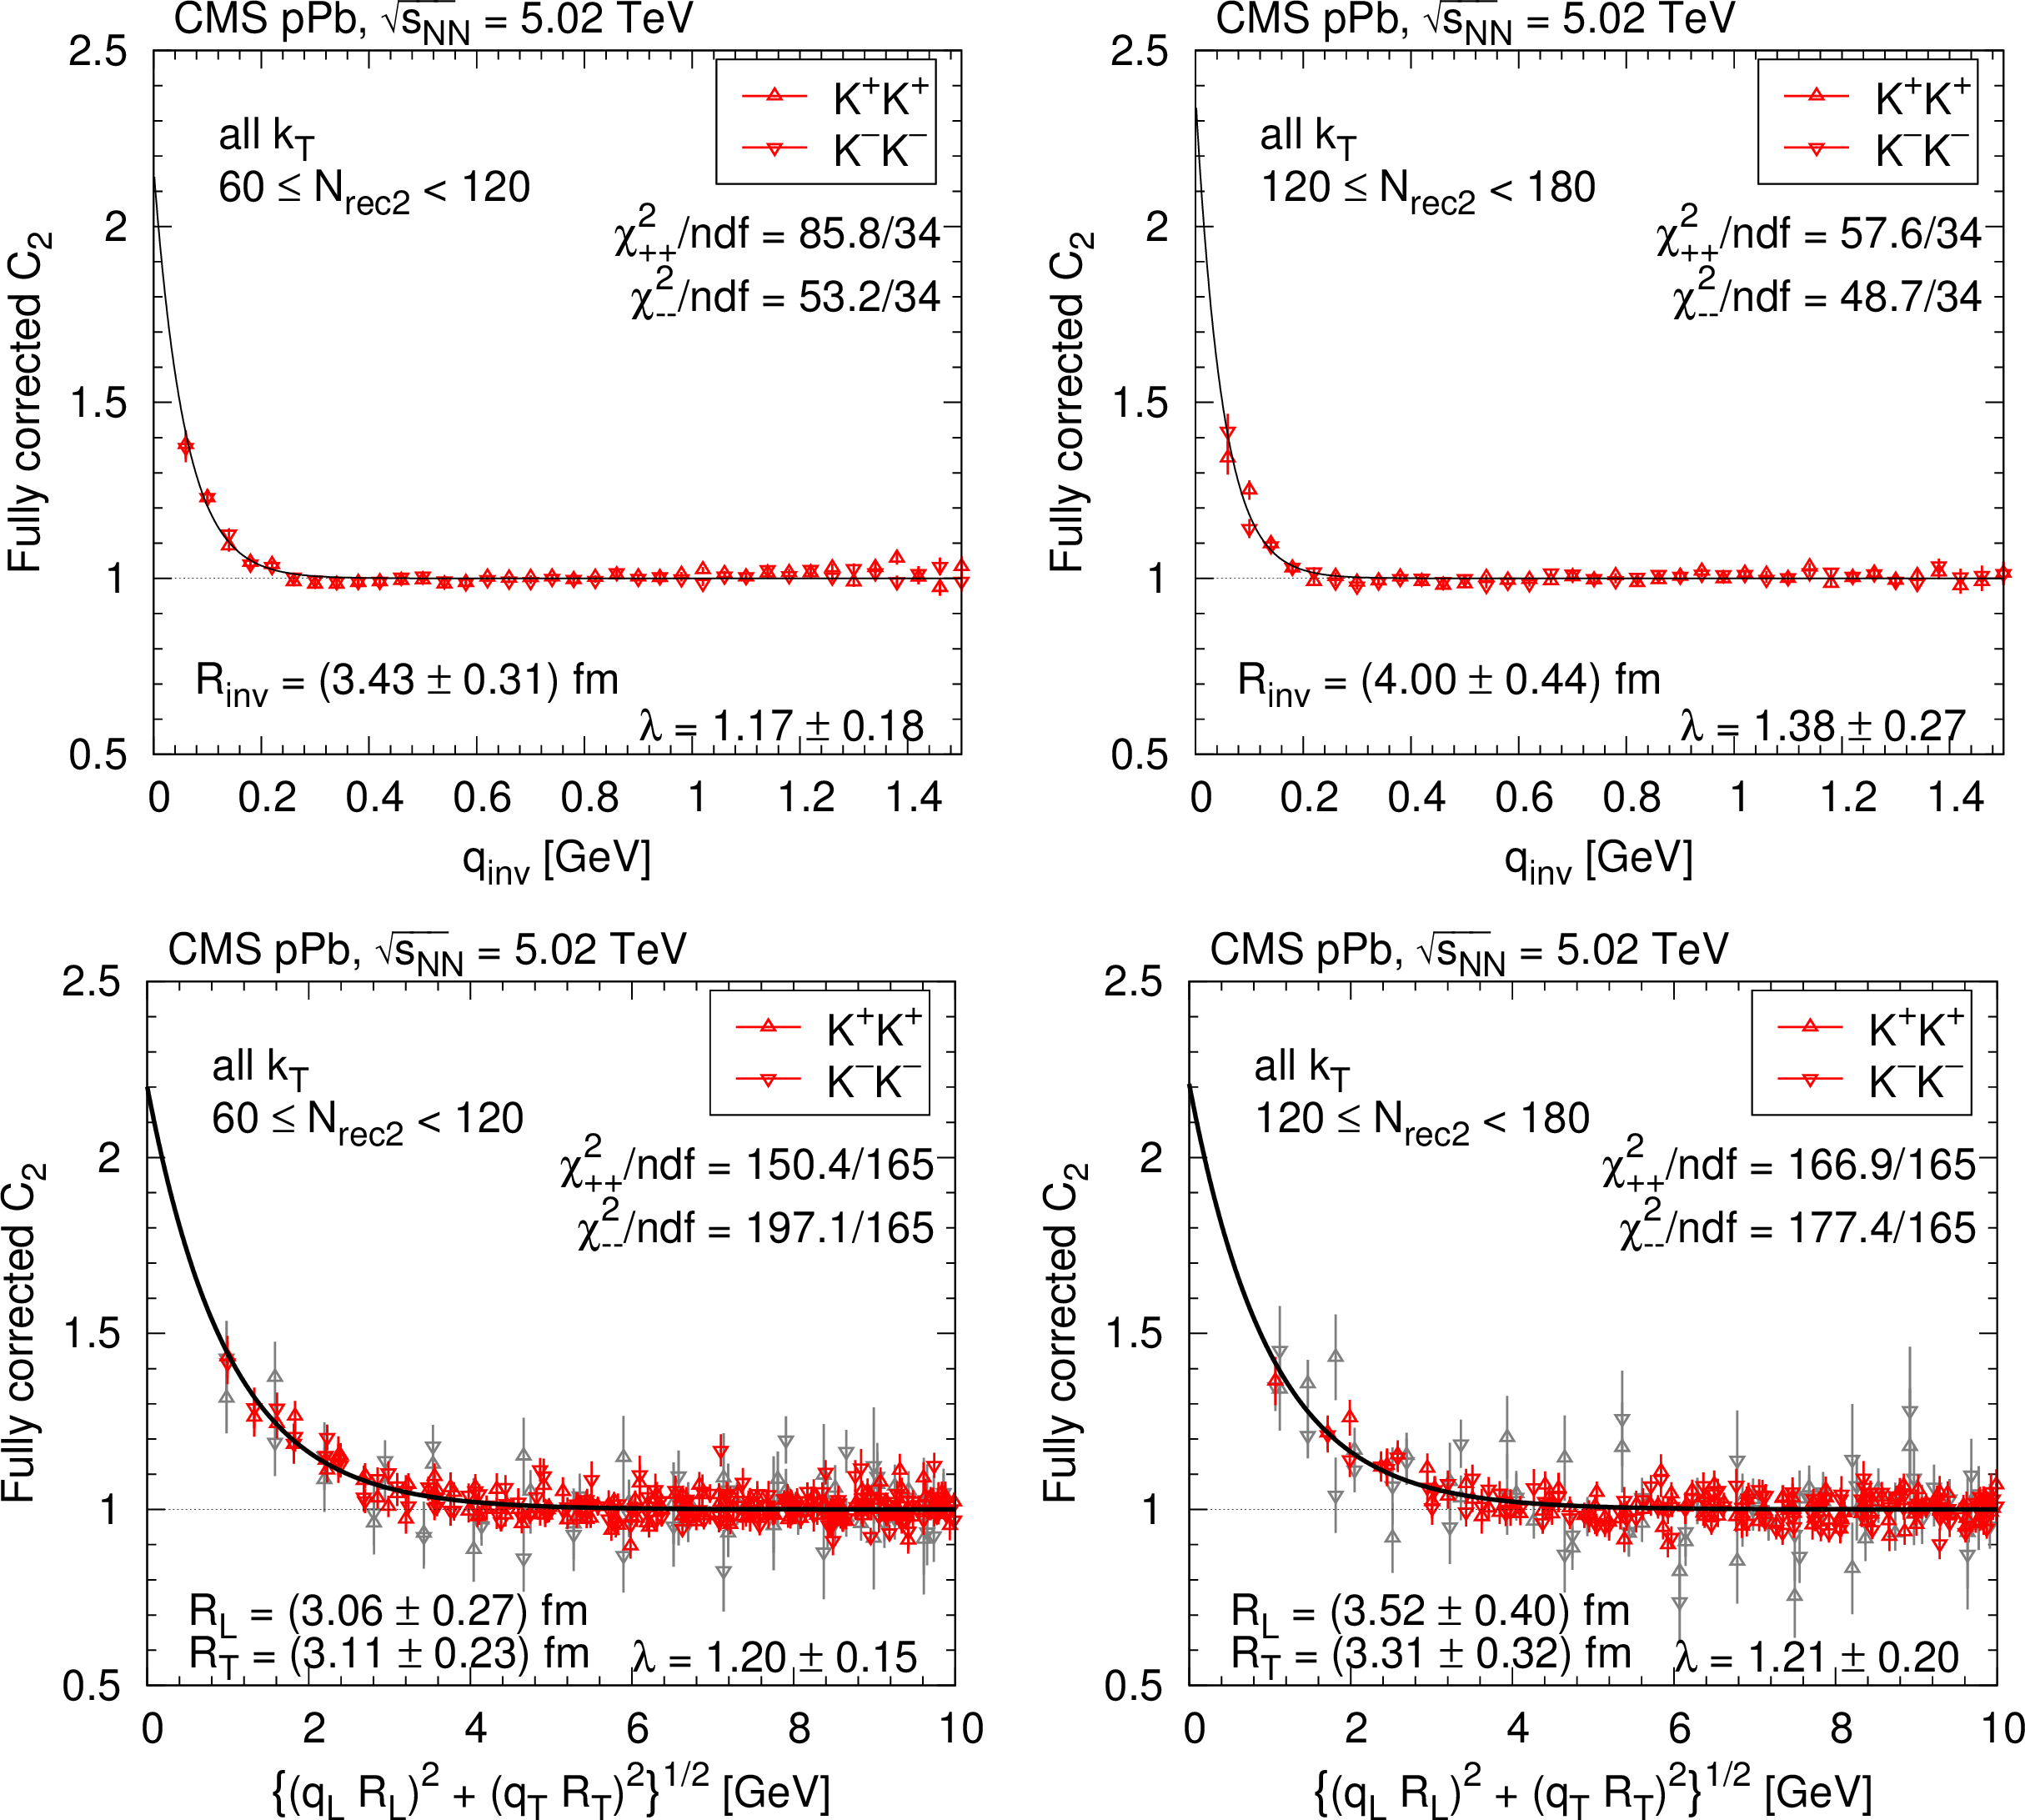
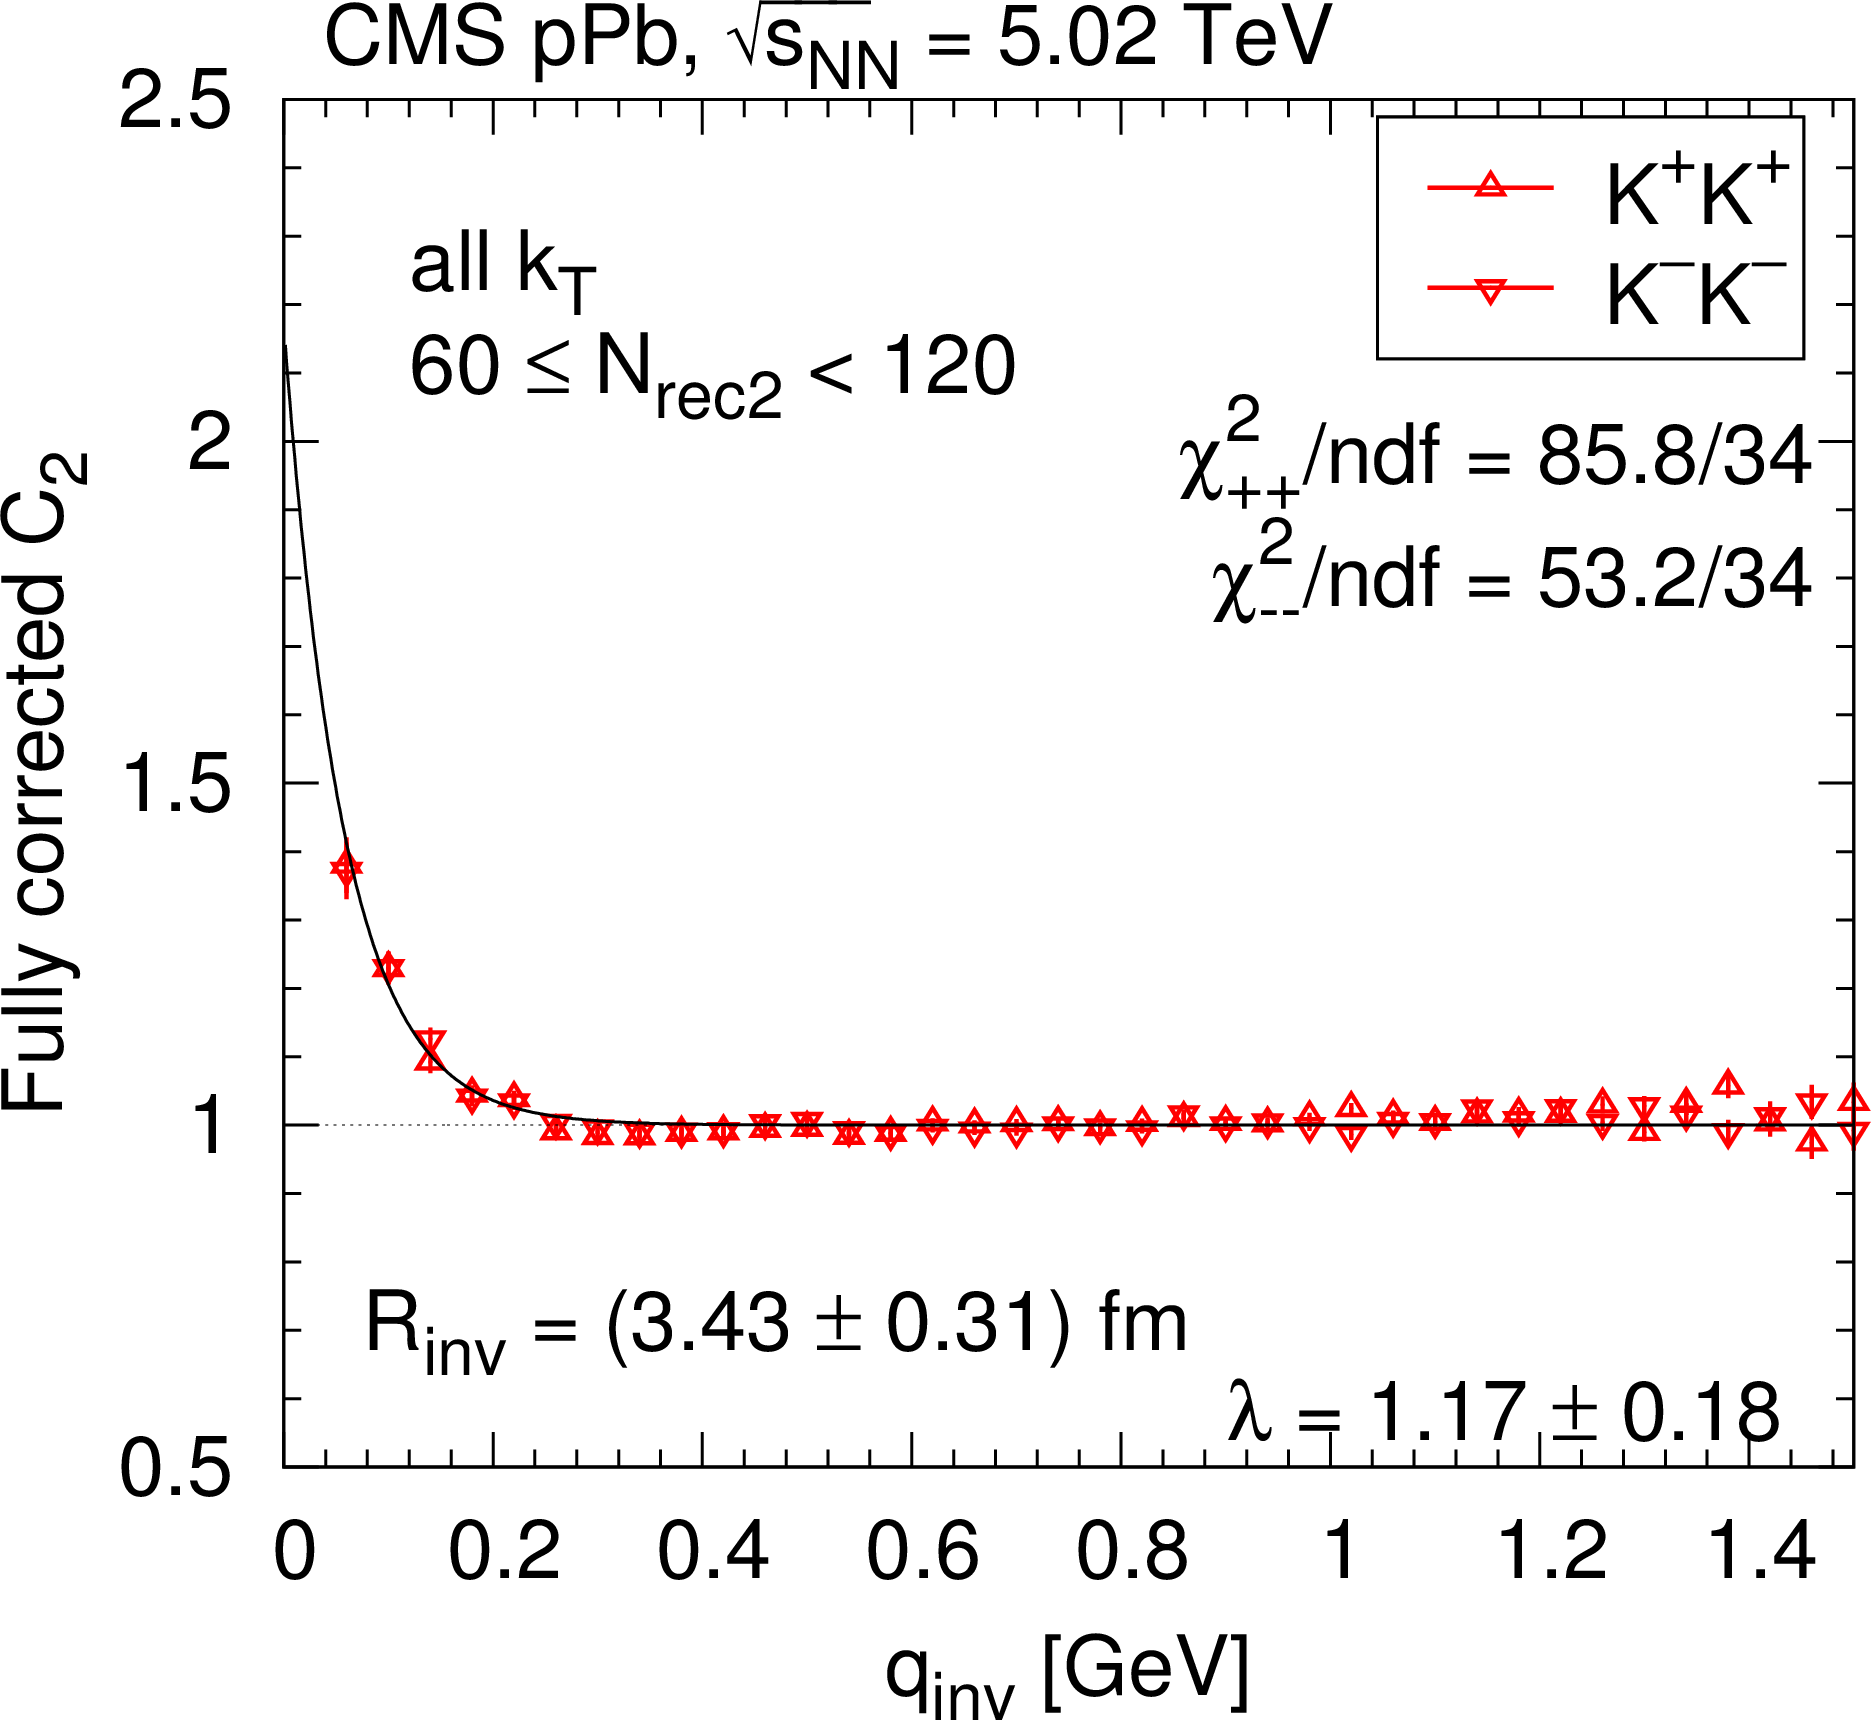
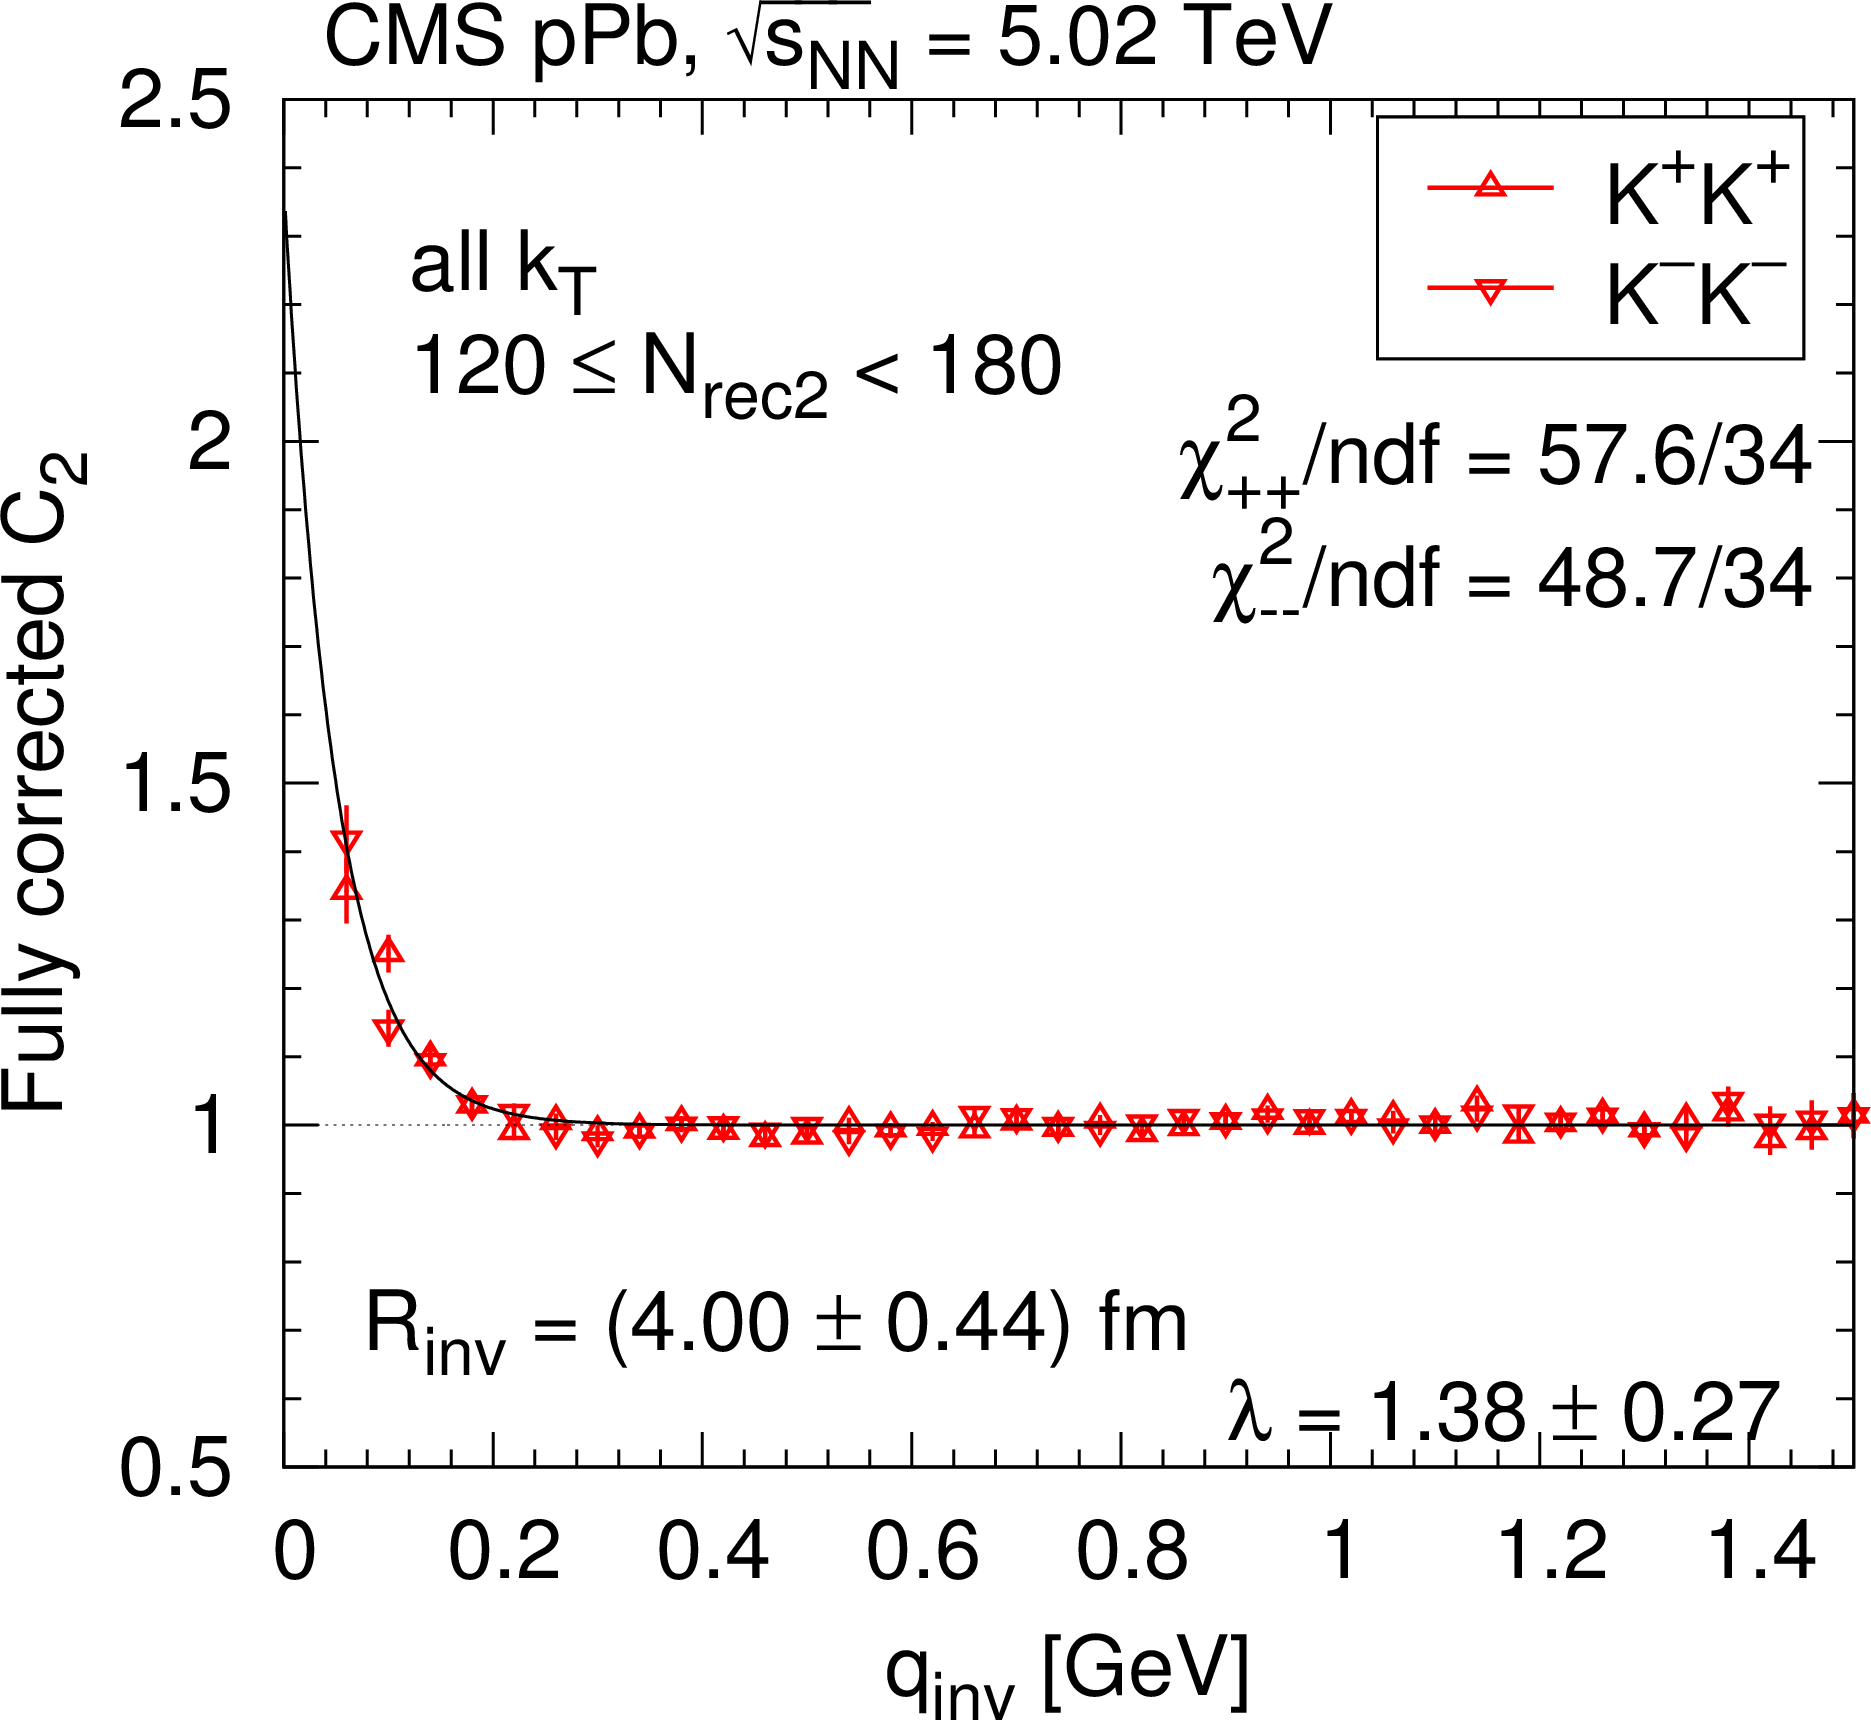
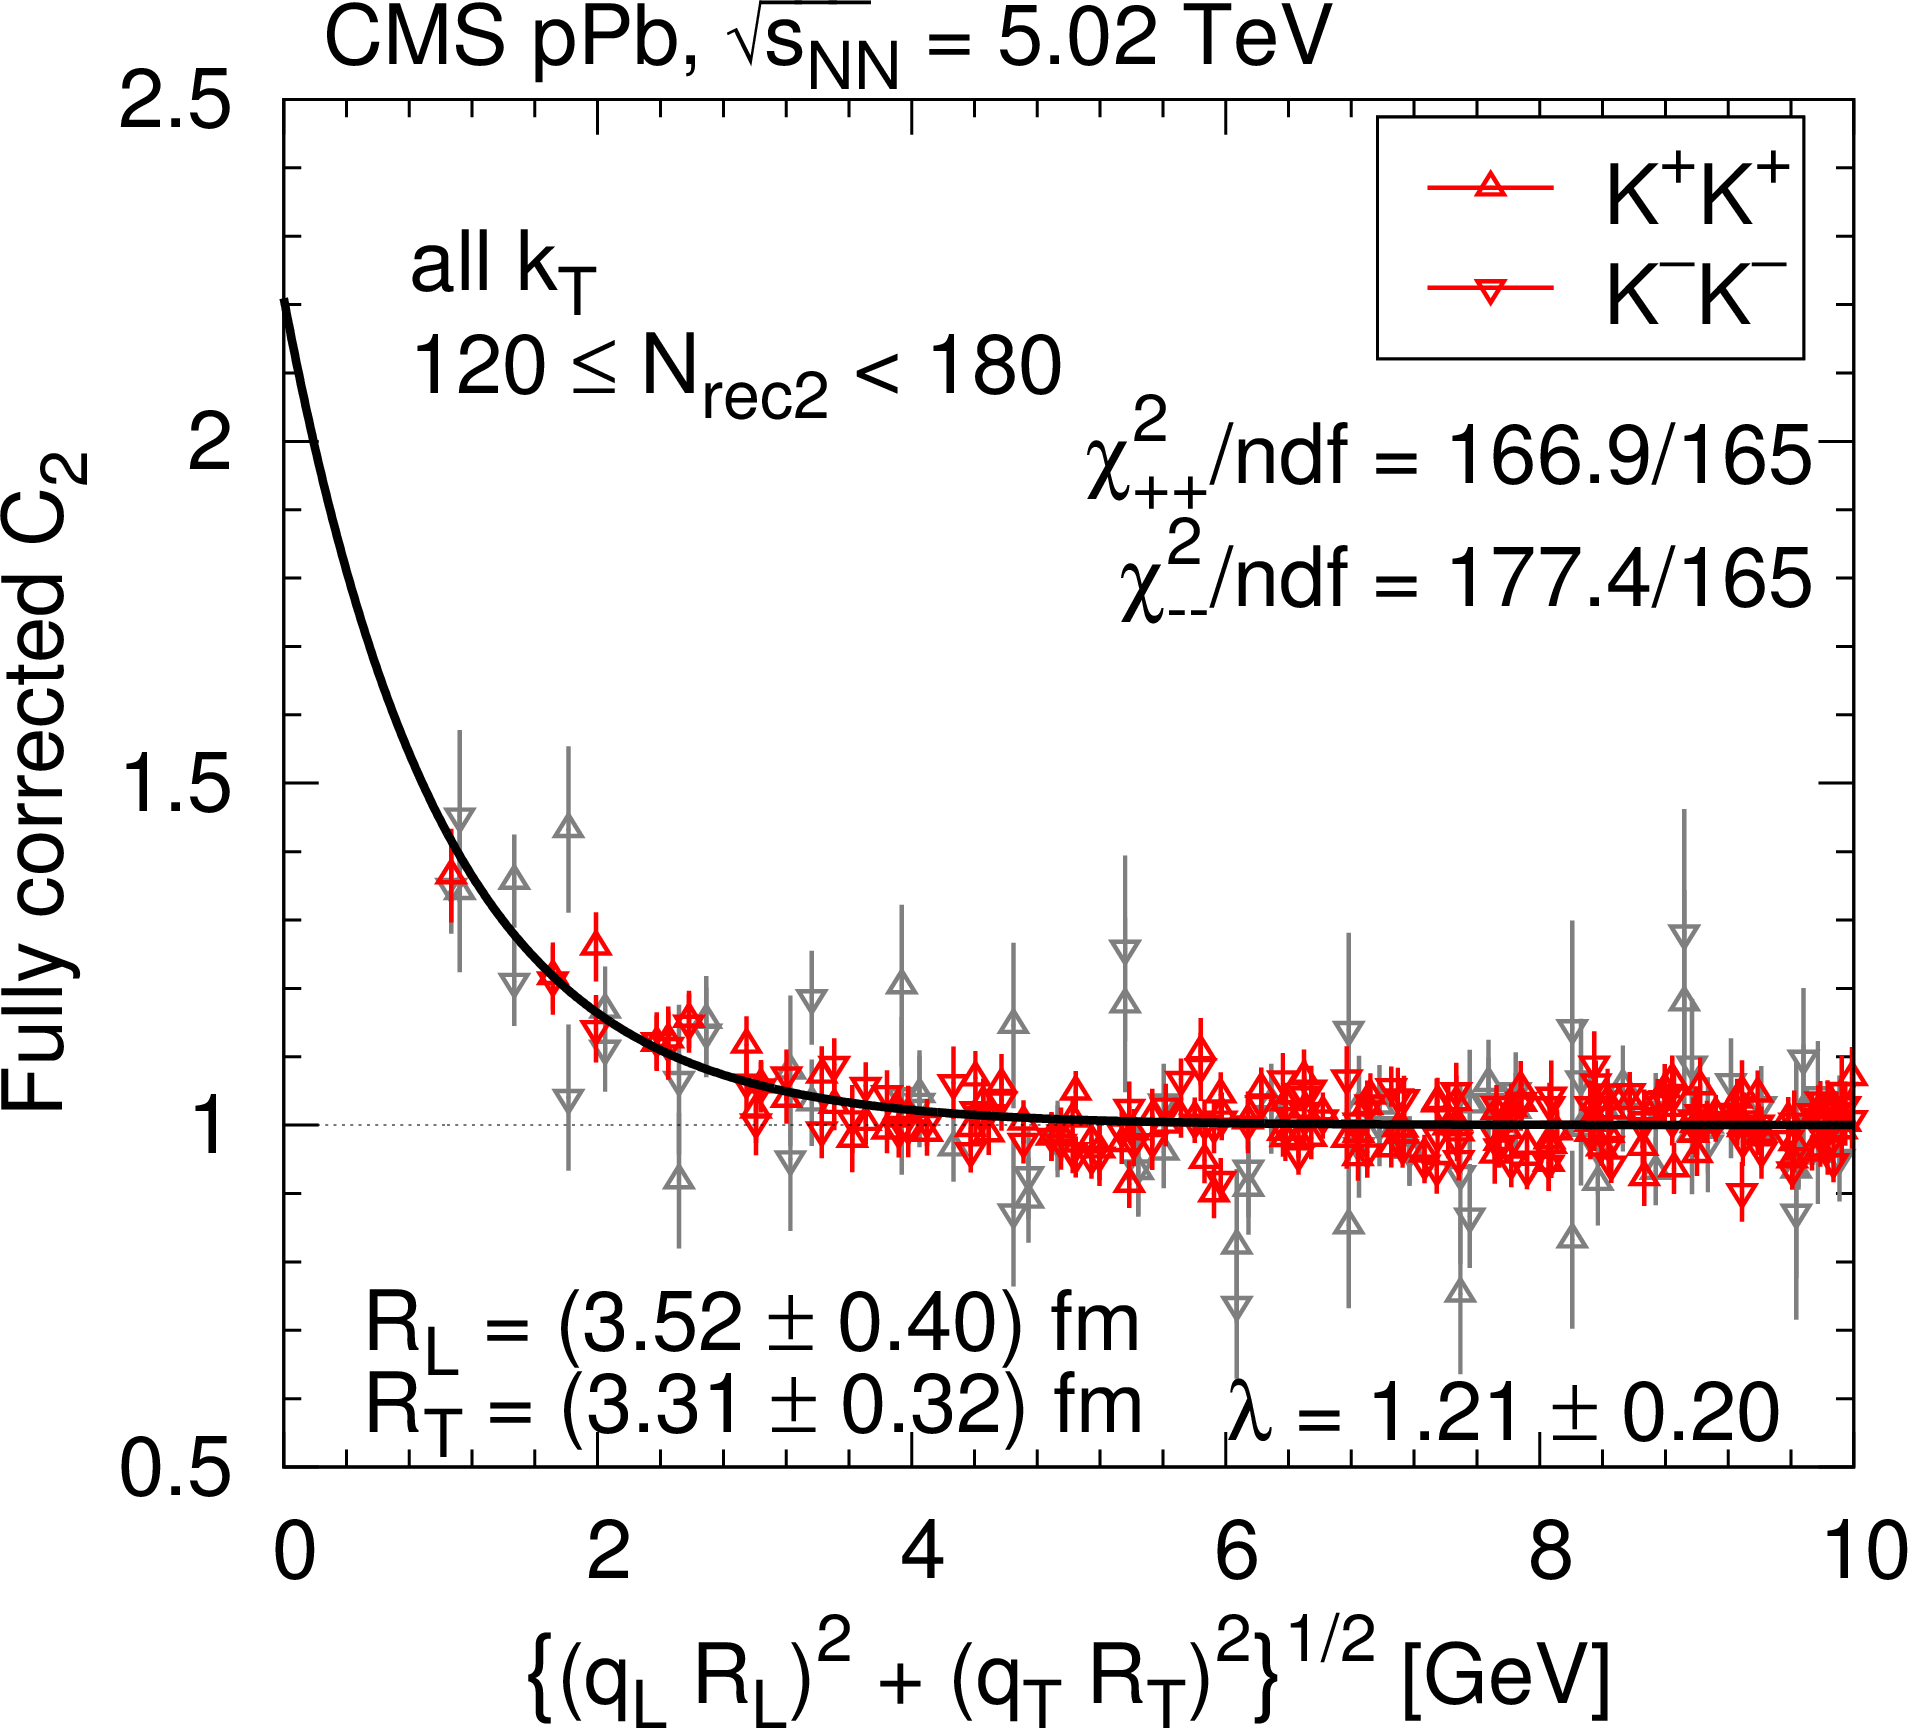
Figure 21:
SS correlation function (integrated over all $ {k_{\mathrm {T}}} $) measured in pPb collisions at 5.02 TeV as a function of $ {q_\text {inv}} $ or of the combined momentum, in two selected $ {N_\text {rec2}} $ bins (left and right), for kaon pairs (red triangles) in one (top) and two (bottom) dimensions, corrected for Coulomb interaction and cluster contributions (mini-jets and multi-body resonance decays). For better visibility, only a fraction of the points is plotted, and those with statistical uncertainty higher than 10% are in light-grey color. The solid curves indicate fits with the stretched exponential parametrization. |
png pdf |
Figure 21-a:
SS correlation function (integrated over all $ {k_{\mathrm {T}}} $) measured in pPb collisions at 5.02 TeV as a function of $ {q_\text {inv}} $ or of the combined momentum, in two selected $ {N_\text {rec2}} $ bins (left and right), for kaon pairs (red triangles) in one (top) and two (bottom) dimensions, corrected for Coulomb interaction and cluster contributions (mini-jets and multi-body resonance decays). For better visibility, only a fraction of the points is plotted, and those with statistical uncertainty higher than 10% are in light-grey color. The solid curves indicate fits with the stretched exponential parametrization. |
png pdf |
Figure 21-b:
SS correlation function (integrated over all $ {k_{\mathrm {T}}} $) measured in pPb collisions at 5.02 TeV as a function of $ {q_\text {inv}} $ or of the combined momentum, in two selected $ {N_\text {rec2}} $ bins (left and right), for kaon pairs (red triangles) in one (top) and two (bottom) dimensions, corrected for Coulomb interaction and cluster contributions (mini-jets and multi-body resonance decays). For better visibility, only a fraction of the points is plotted, and those with statistical uncertainty higher than 10% are in light-grey color. The solid curves indicate fits with the stretched exponential parametrization. |

png pdf |
Figure 21-c:
SS correlation function (integrated over all $ {k_{\mathrm {T}}} $) measured in pPb collisions at 5.02 TeV as a function of $ {q_\text {inv}} $ or of the combined momentum, in two selected $ {N_\text {rec2}} $ bins (left and right), for kaon pairs (red triangles) in one (top) and two (bottom) dimensions, corrected for Coulomb interaction and cluster contributions (mini-jets and multi-body resonance decays). For better visibility, only a fraction of the points is plotted, and those with statistical uncertainty higher than 10% are in light-grey color. The solid curves indicate fits with the stretched exponential parametrization. |
png pdf |
Figure 21-d:
SS correlation function (integrated over all $ {k_{\mathrm {T}}} $) measured in pPb collisions at 5.02 TeV as a function of $ {q_\text {inv}} $ or of the combined momentum, in two selected $ {N_\text {rec2}} $ bins (left and right), for kaon pairs (red triangles) in one (top) and two (bottom) dimensions, corrected for Coulomb interaction and cluster contributions (mini-jets and multi-body resonance decays). For better visibility, only a fraction of the points is plotted, and those with statistical uncertainty higher than 10% are in light-grey color. The solid curves indicate fits with the stretched exponential parametrization. |
png pdf |
Figure 22:
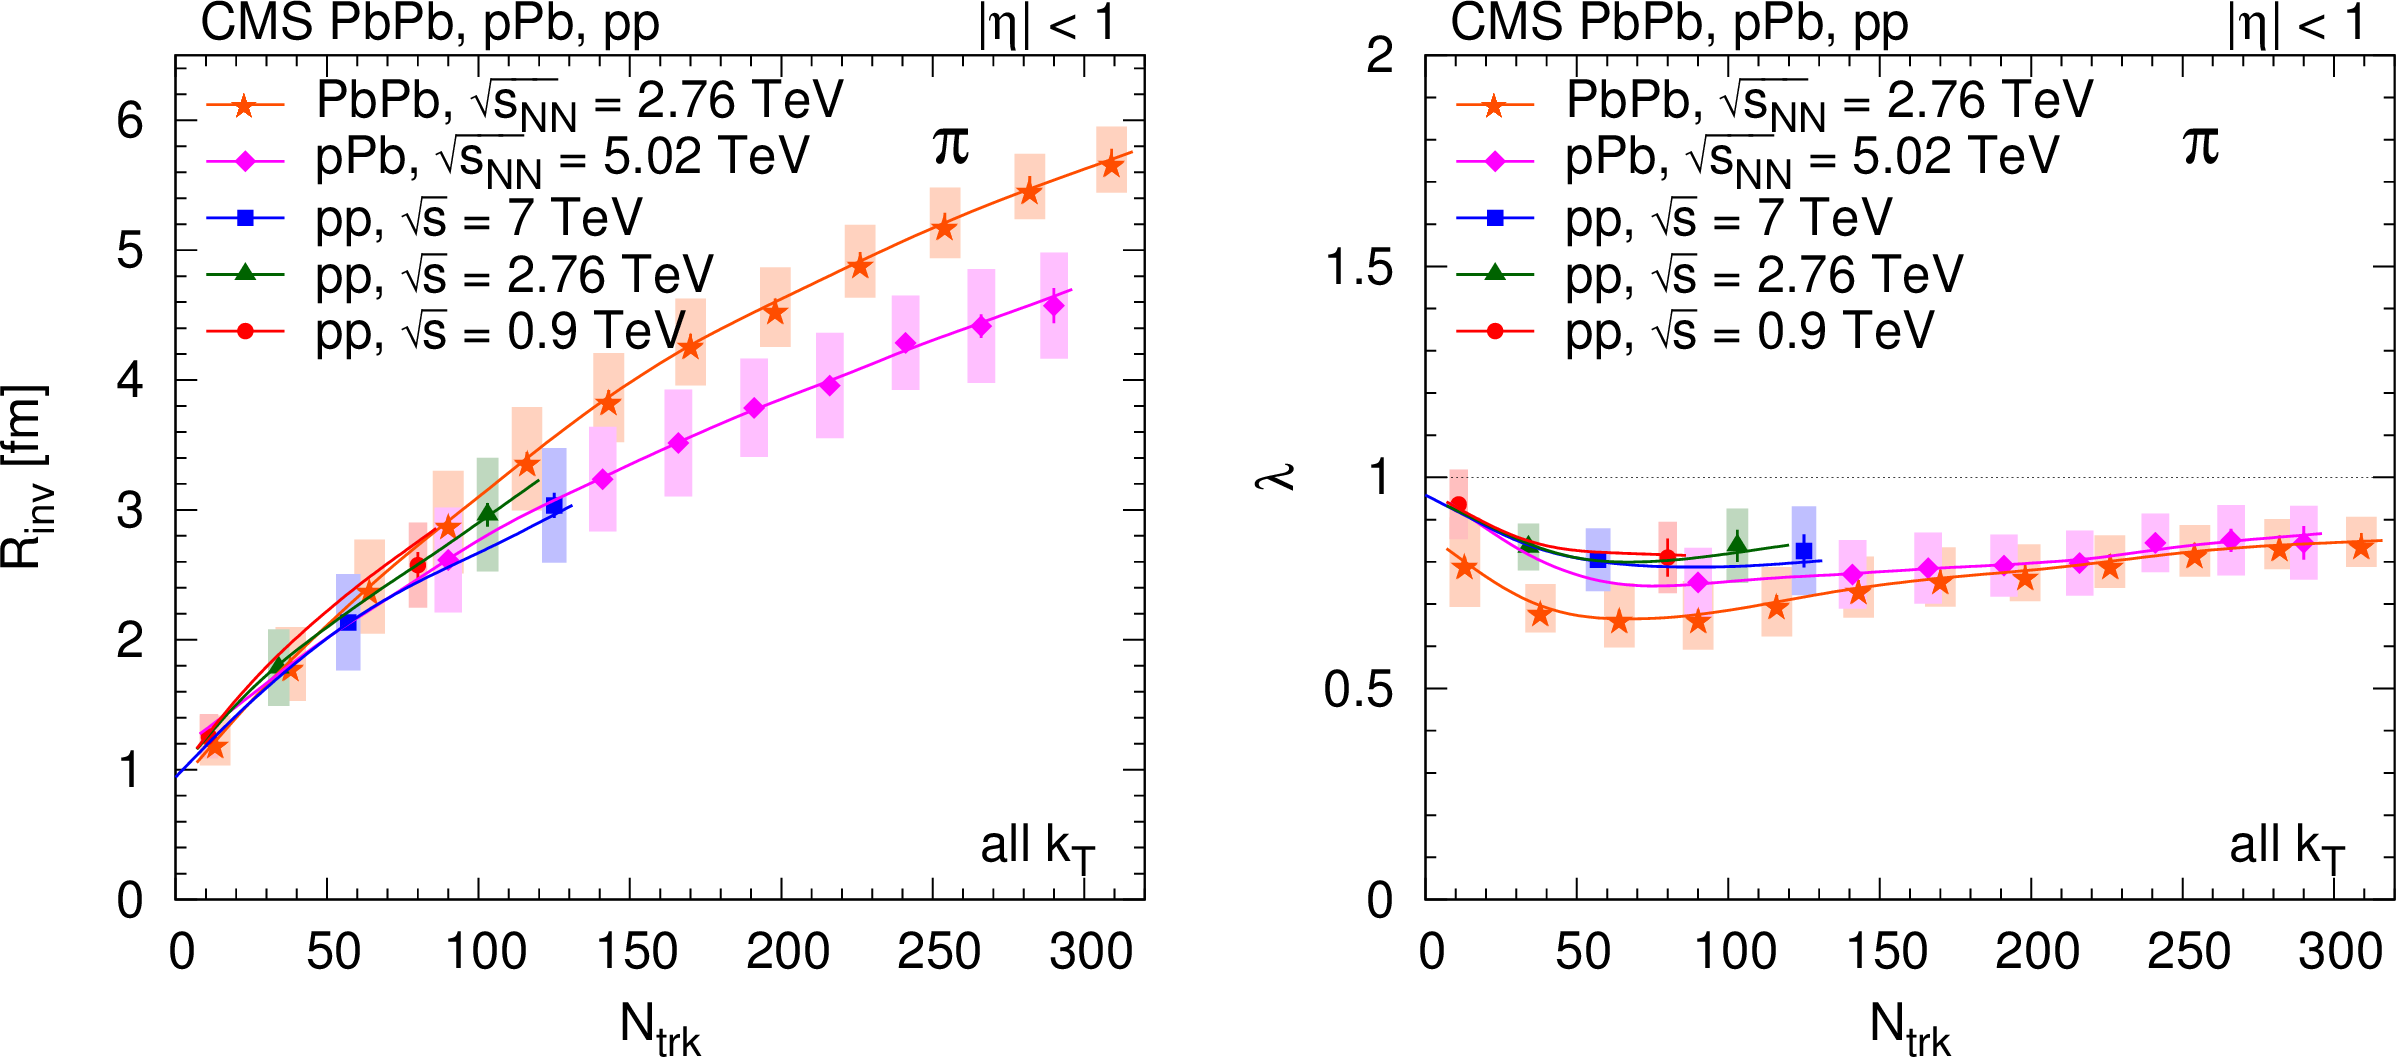
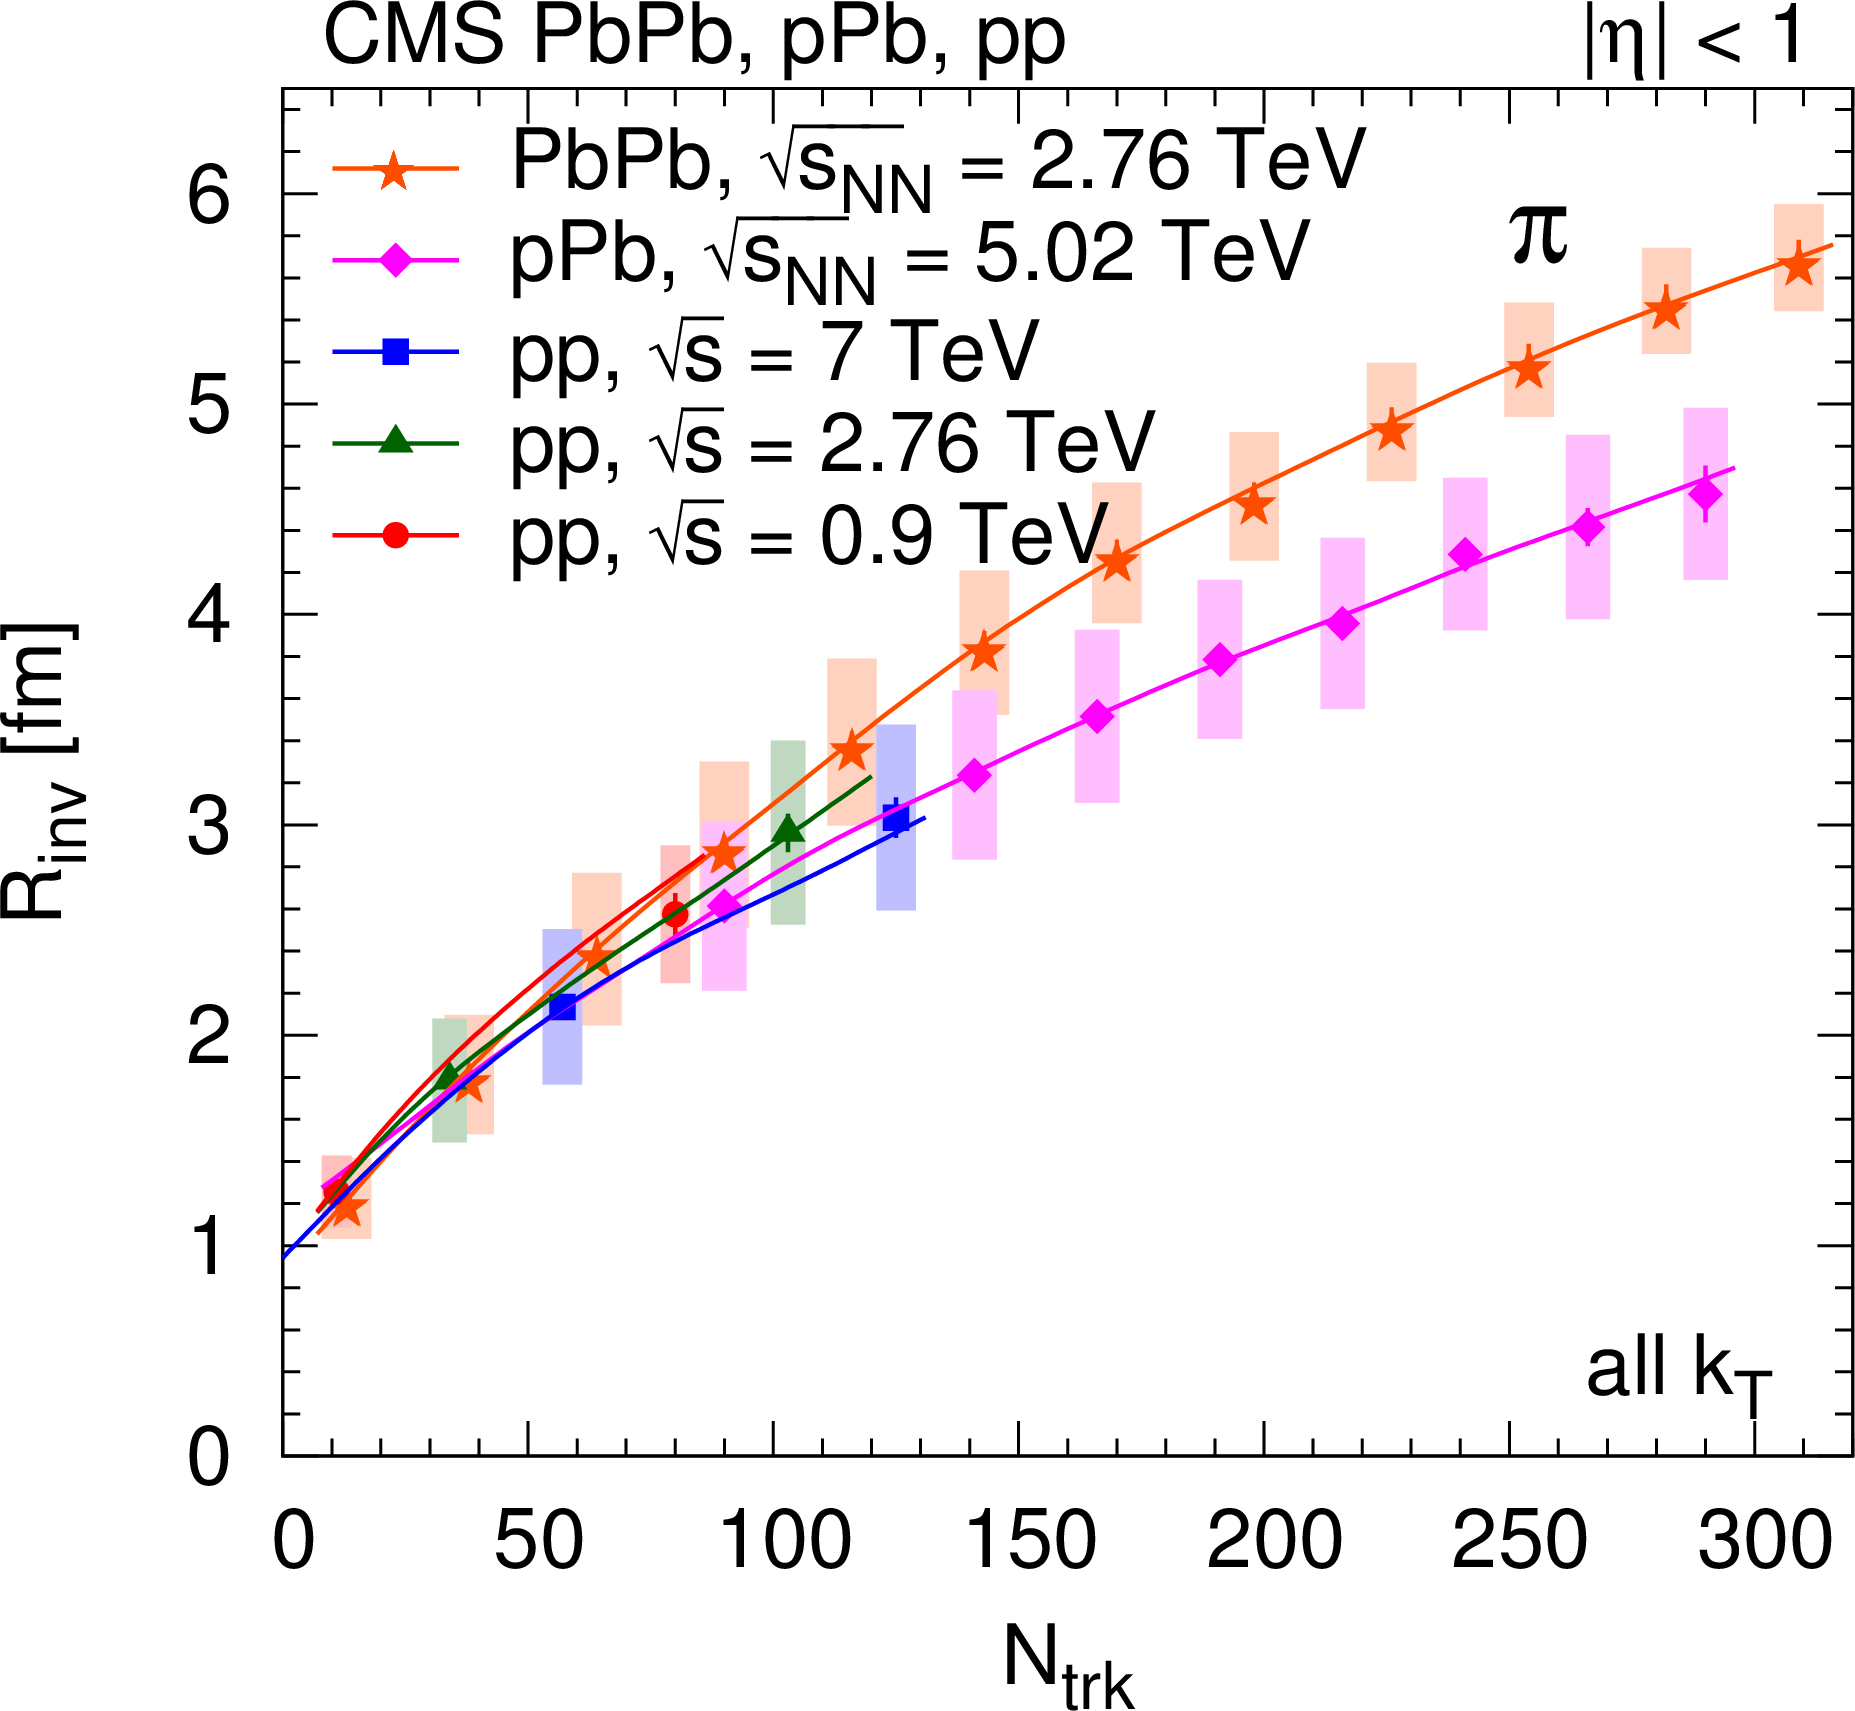
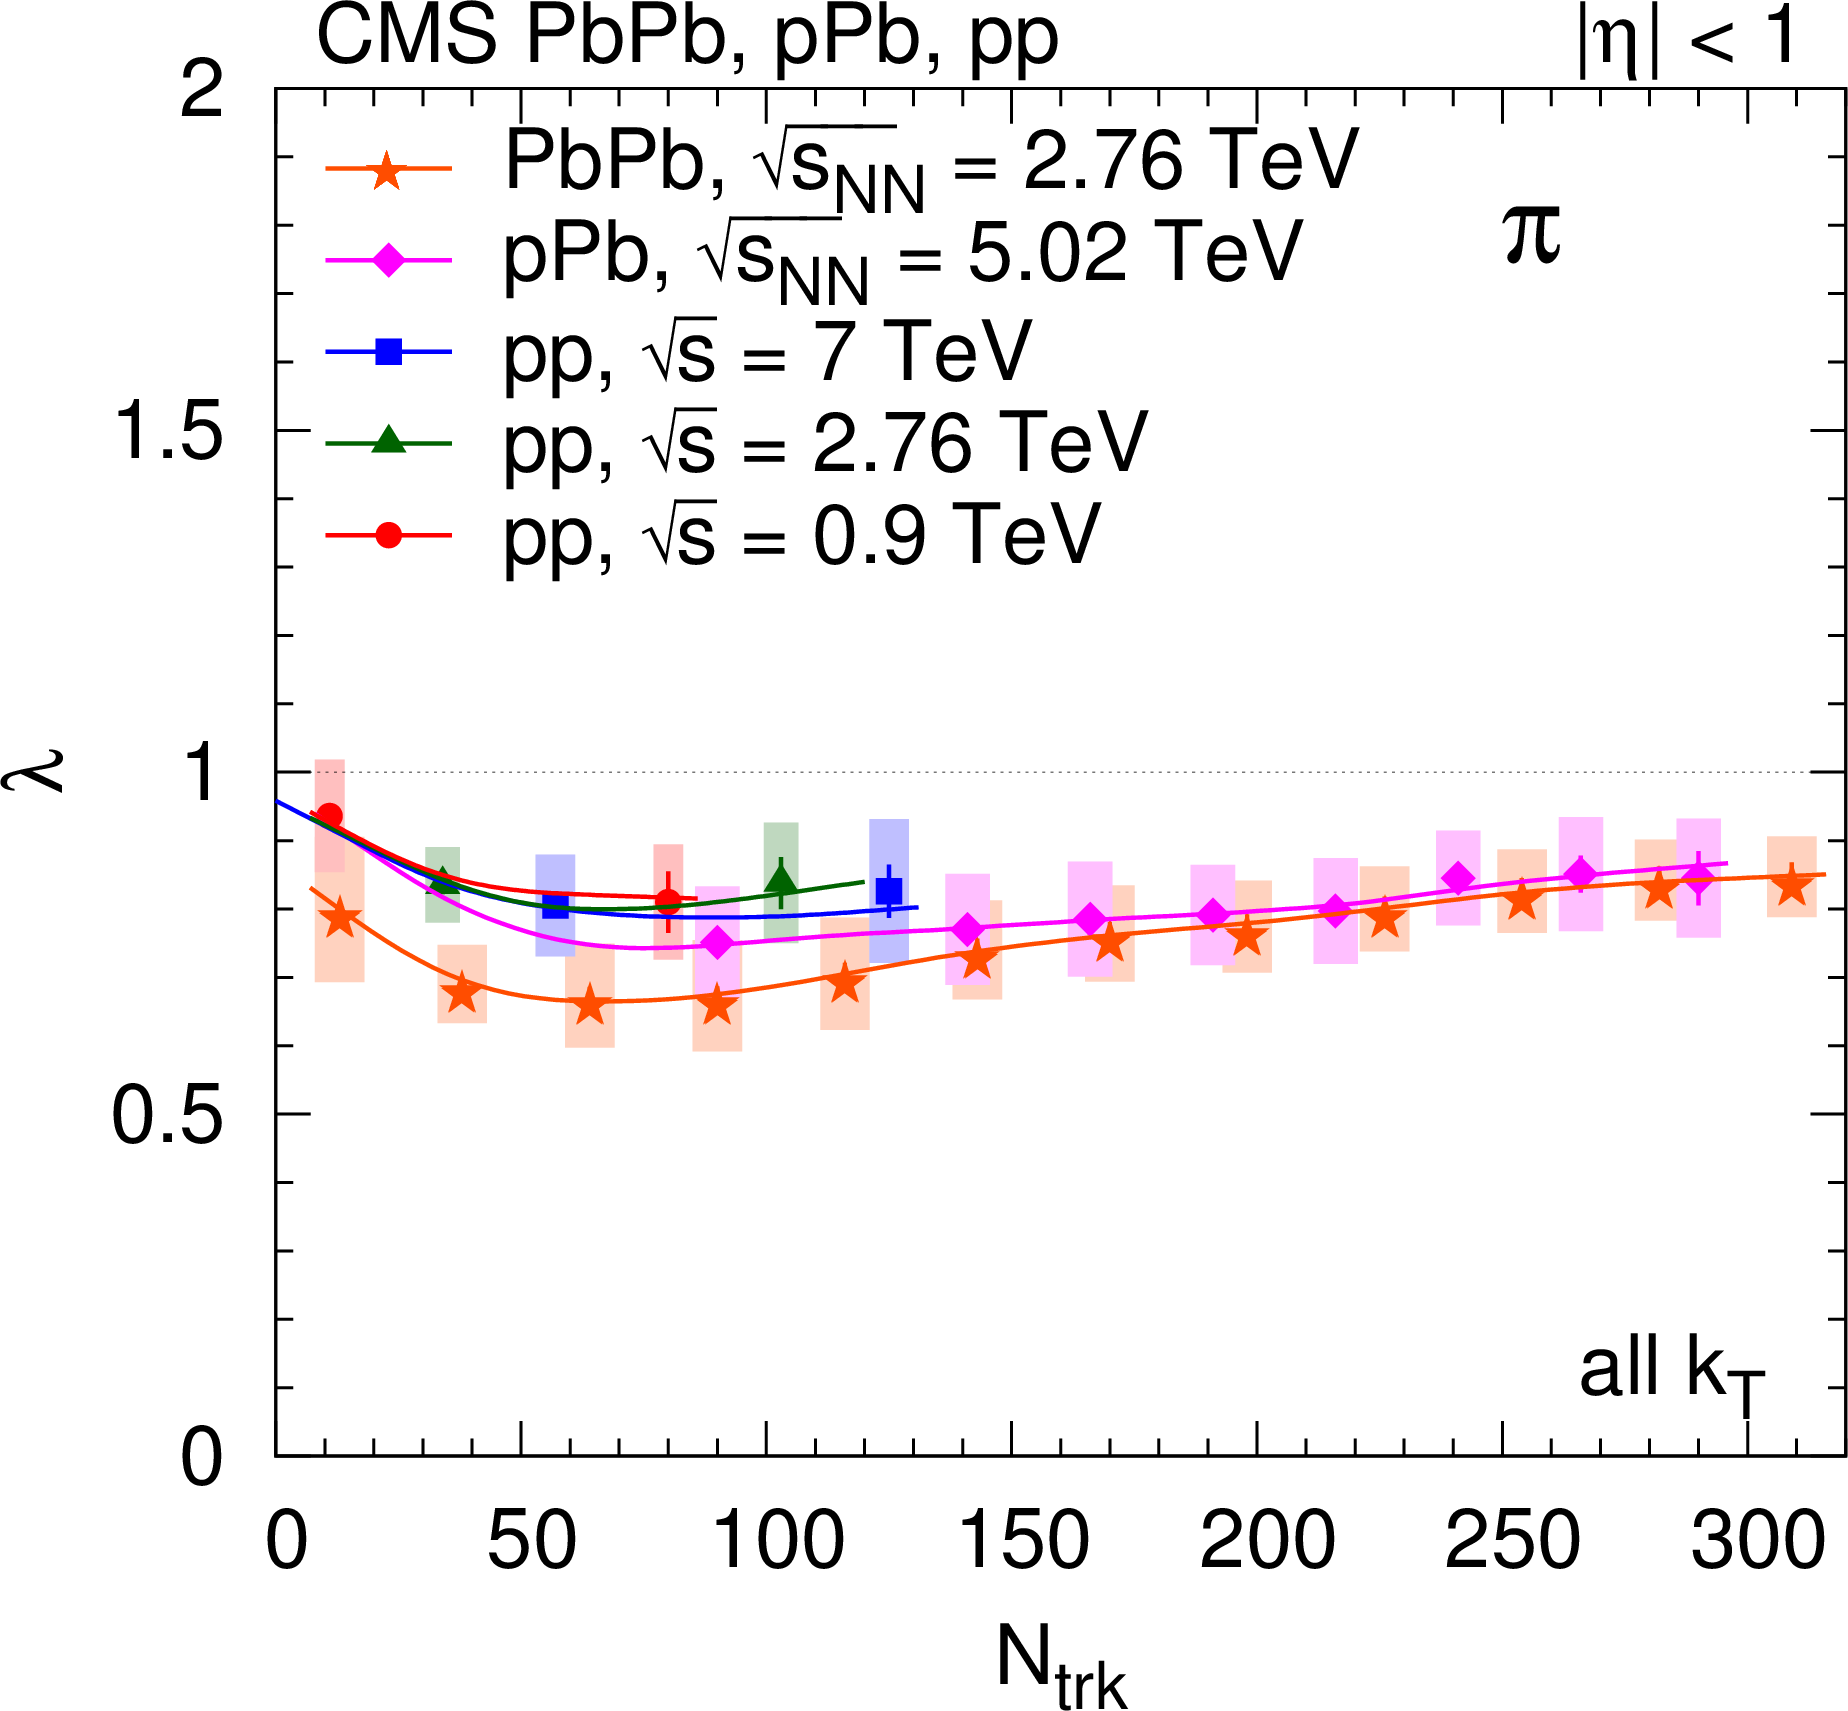
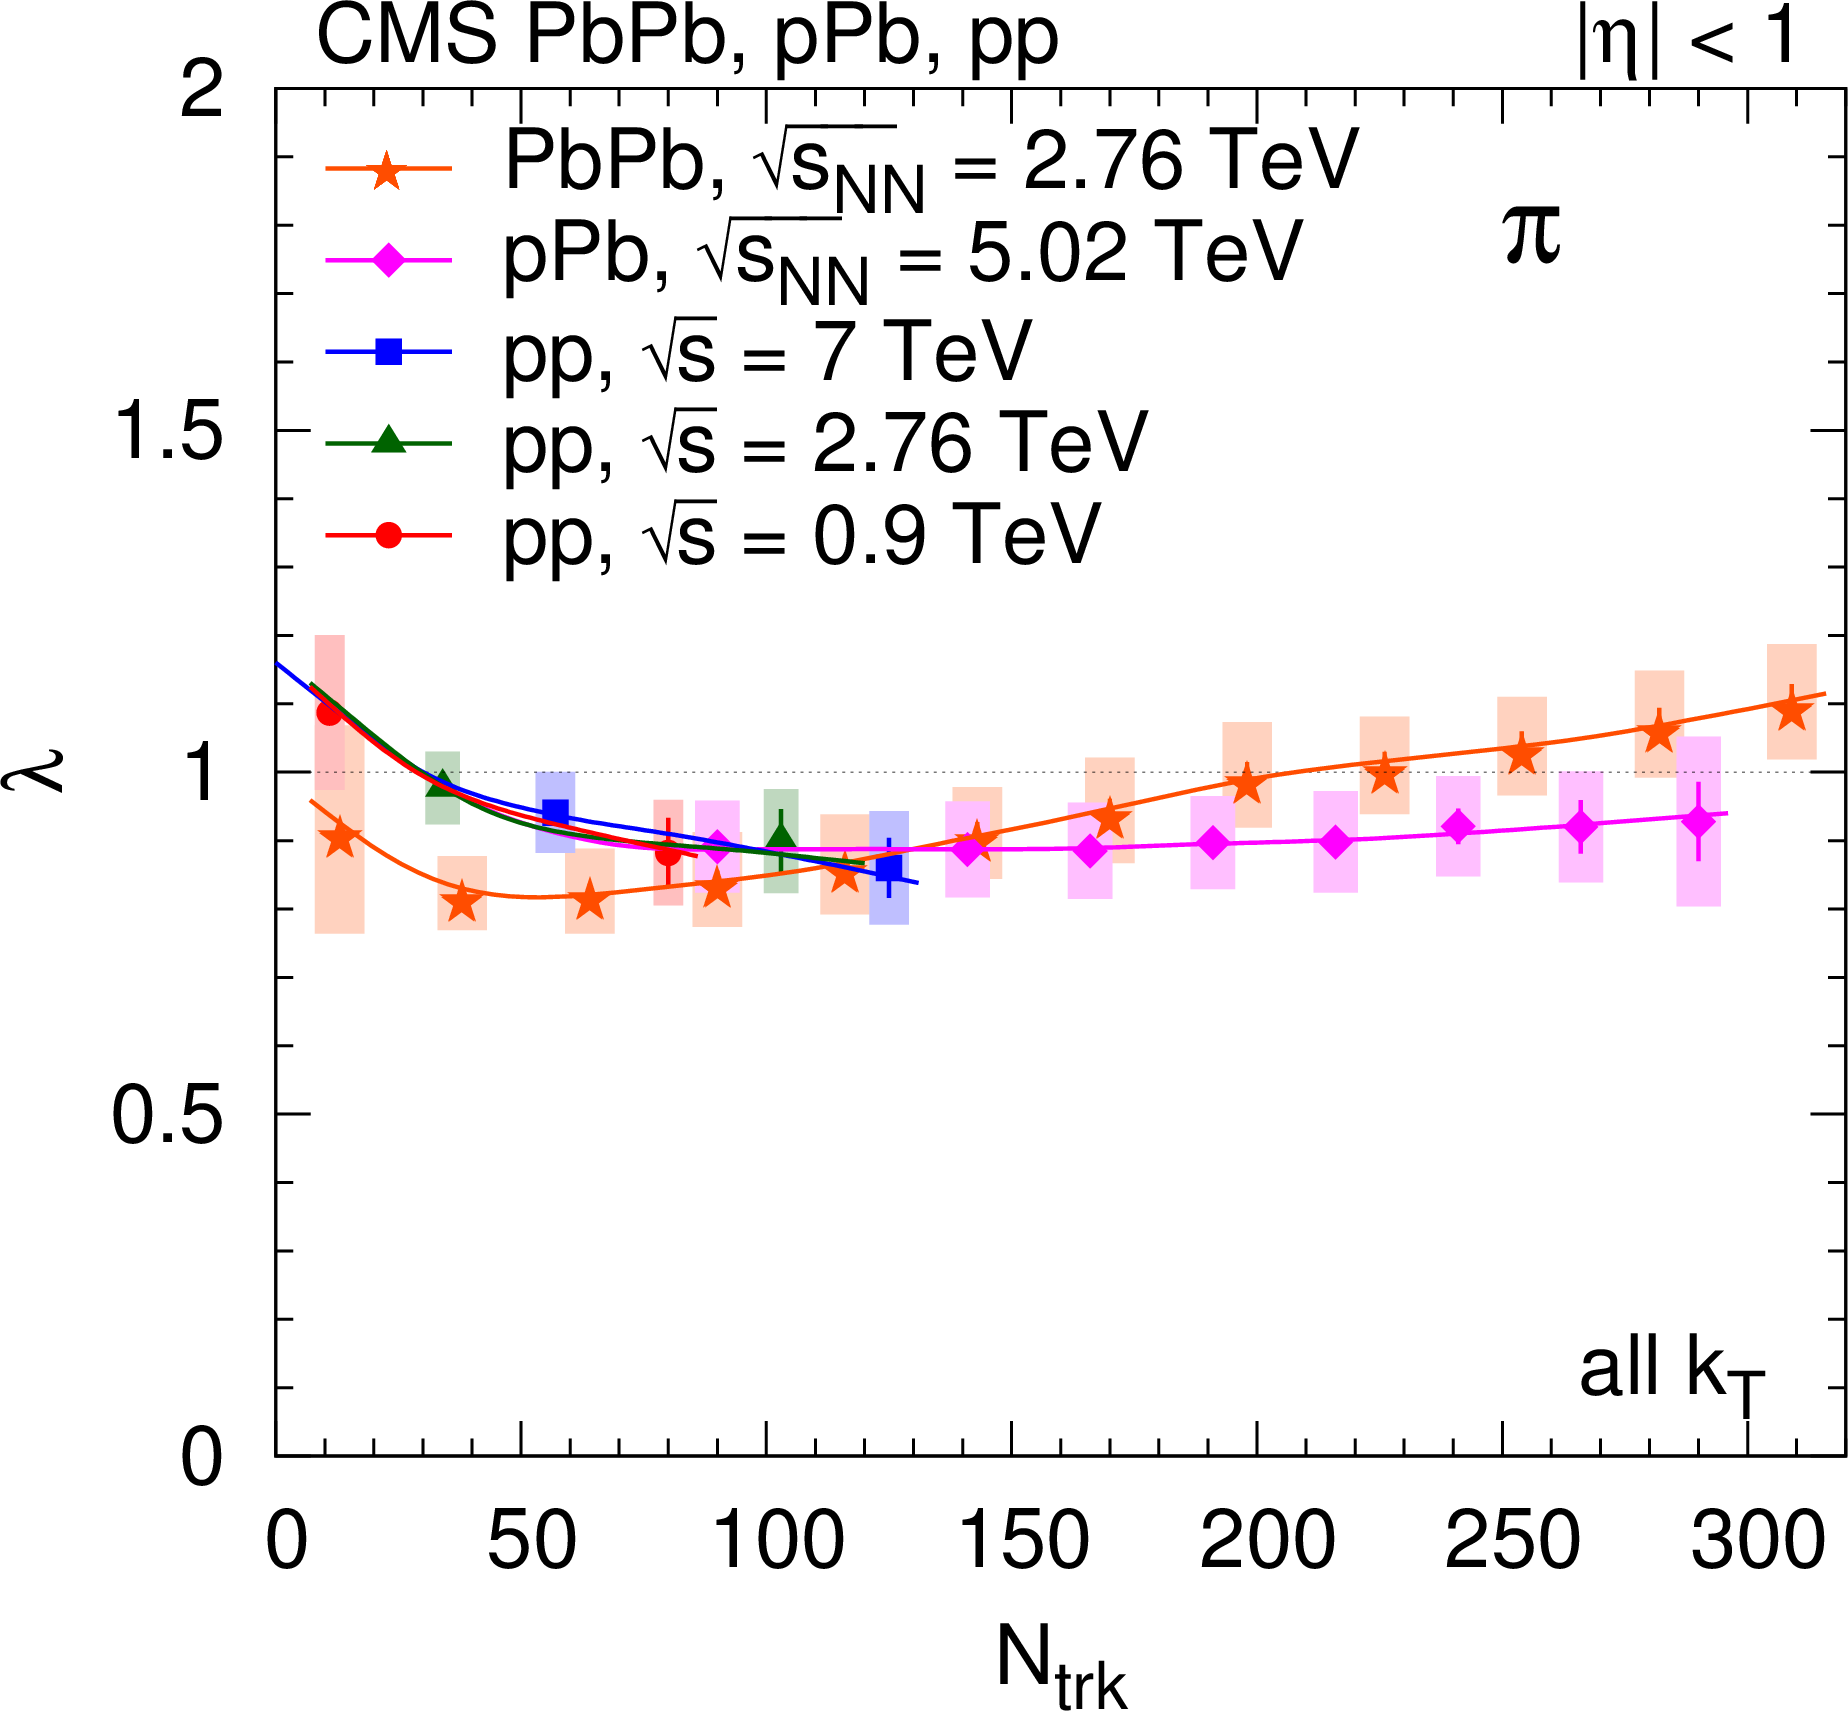
Track-multiplicity ($ {N_\text {trk}} $) dependence of the 1D pion radius parameter $ {R_\text {inv}} $ (left) and intercept parameter $\lambda $ (right), obtained from 1D fits (integrated over all $ {k_{\mathrm {T}}} $) for all collision systems studied. For better visibility, only every second measurement is plotted. Lines are drawn to guide the eye. |
png pdf |
Figure 22-a:
Track-multiplicity ($ {N_\text {trk}} $) dependence of the 1D pion radius parameter $ {R_\text {inv}} $ (left) and intercept parameter $\lambda $ (right), obtained from 1D fits (integrated over all $ {k_{\mathrm {T}}} $) for all collision systems studied. For better visibility, only every second measurement is plotted. Lines are drawn to guide the eye. |
png pdf |
Figure 22-b:
Track-multiplicity ($ {N_\text {trk}} $) dependence of the 1D pion radius parameter $ {R_\text {inv}} $ (left) and intercept parameter $\lambda $ (right), obtained from 1D fits (integrated over all $ {k_{\mathrm {T}}} $) for all collision systems studied. For better visibility, only every second measurement is plotted. Lines are drawn to guide the eye. |

png pdf |
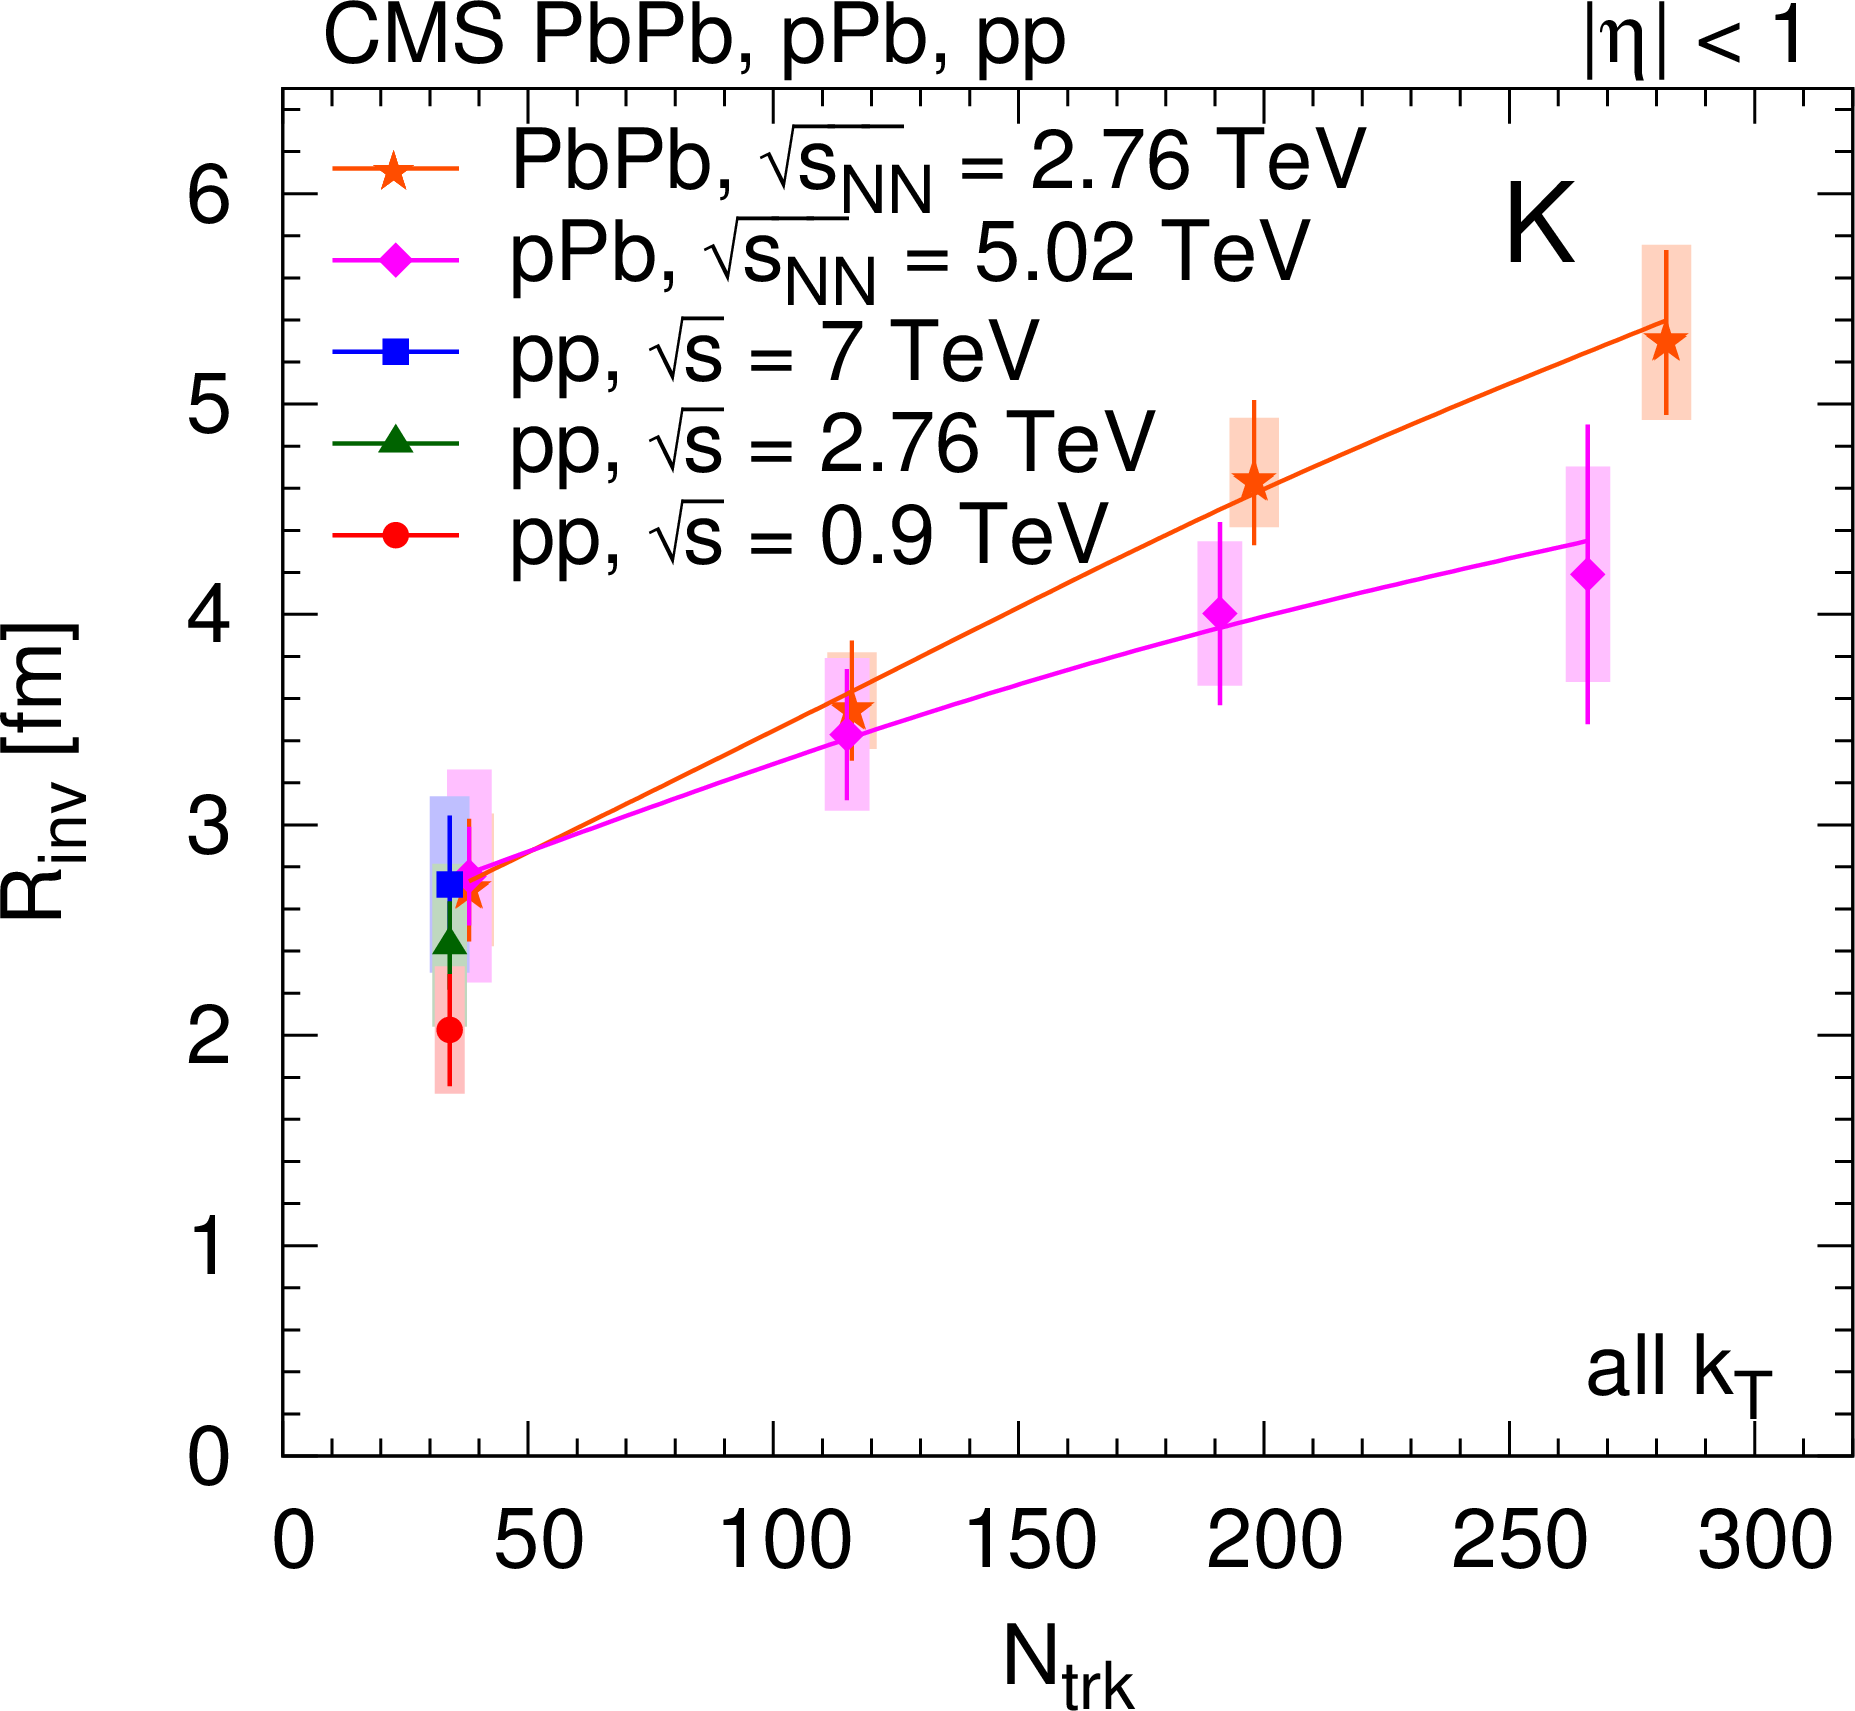
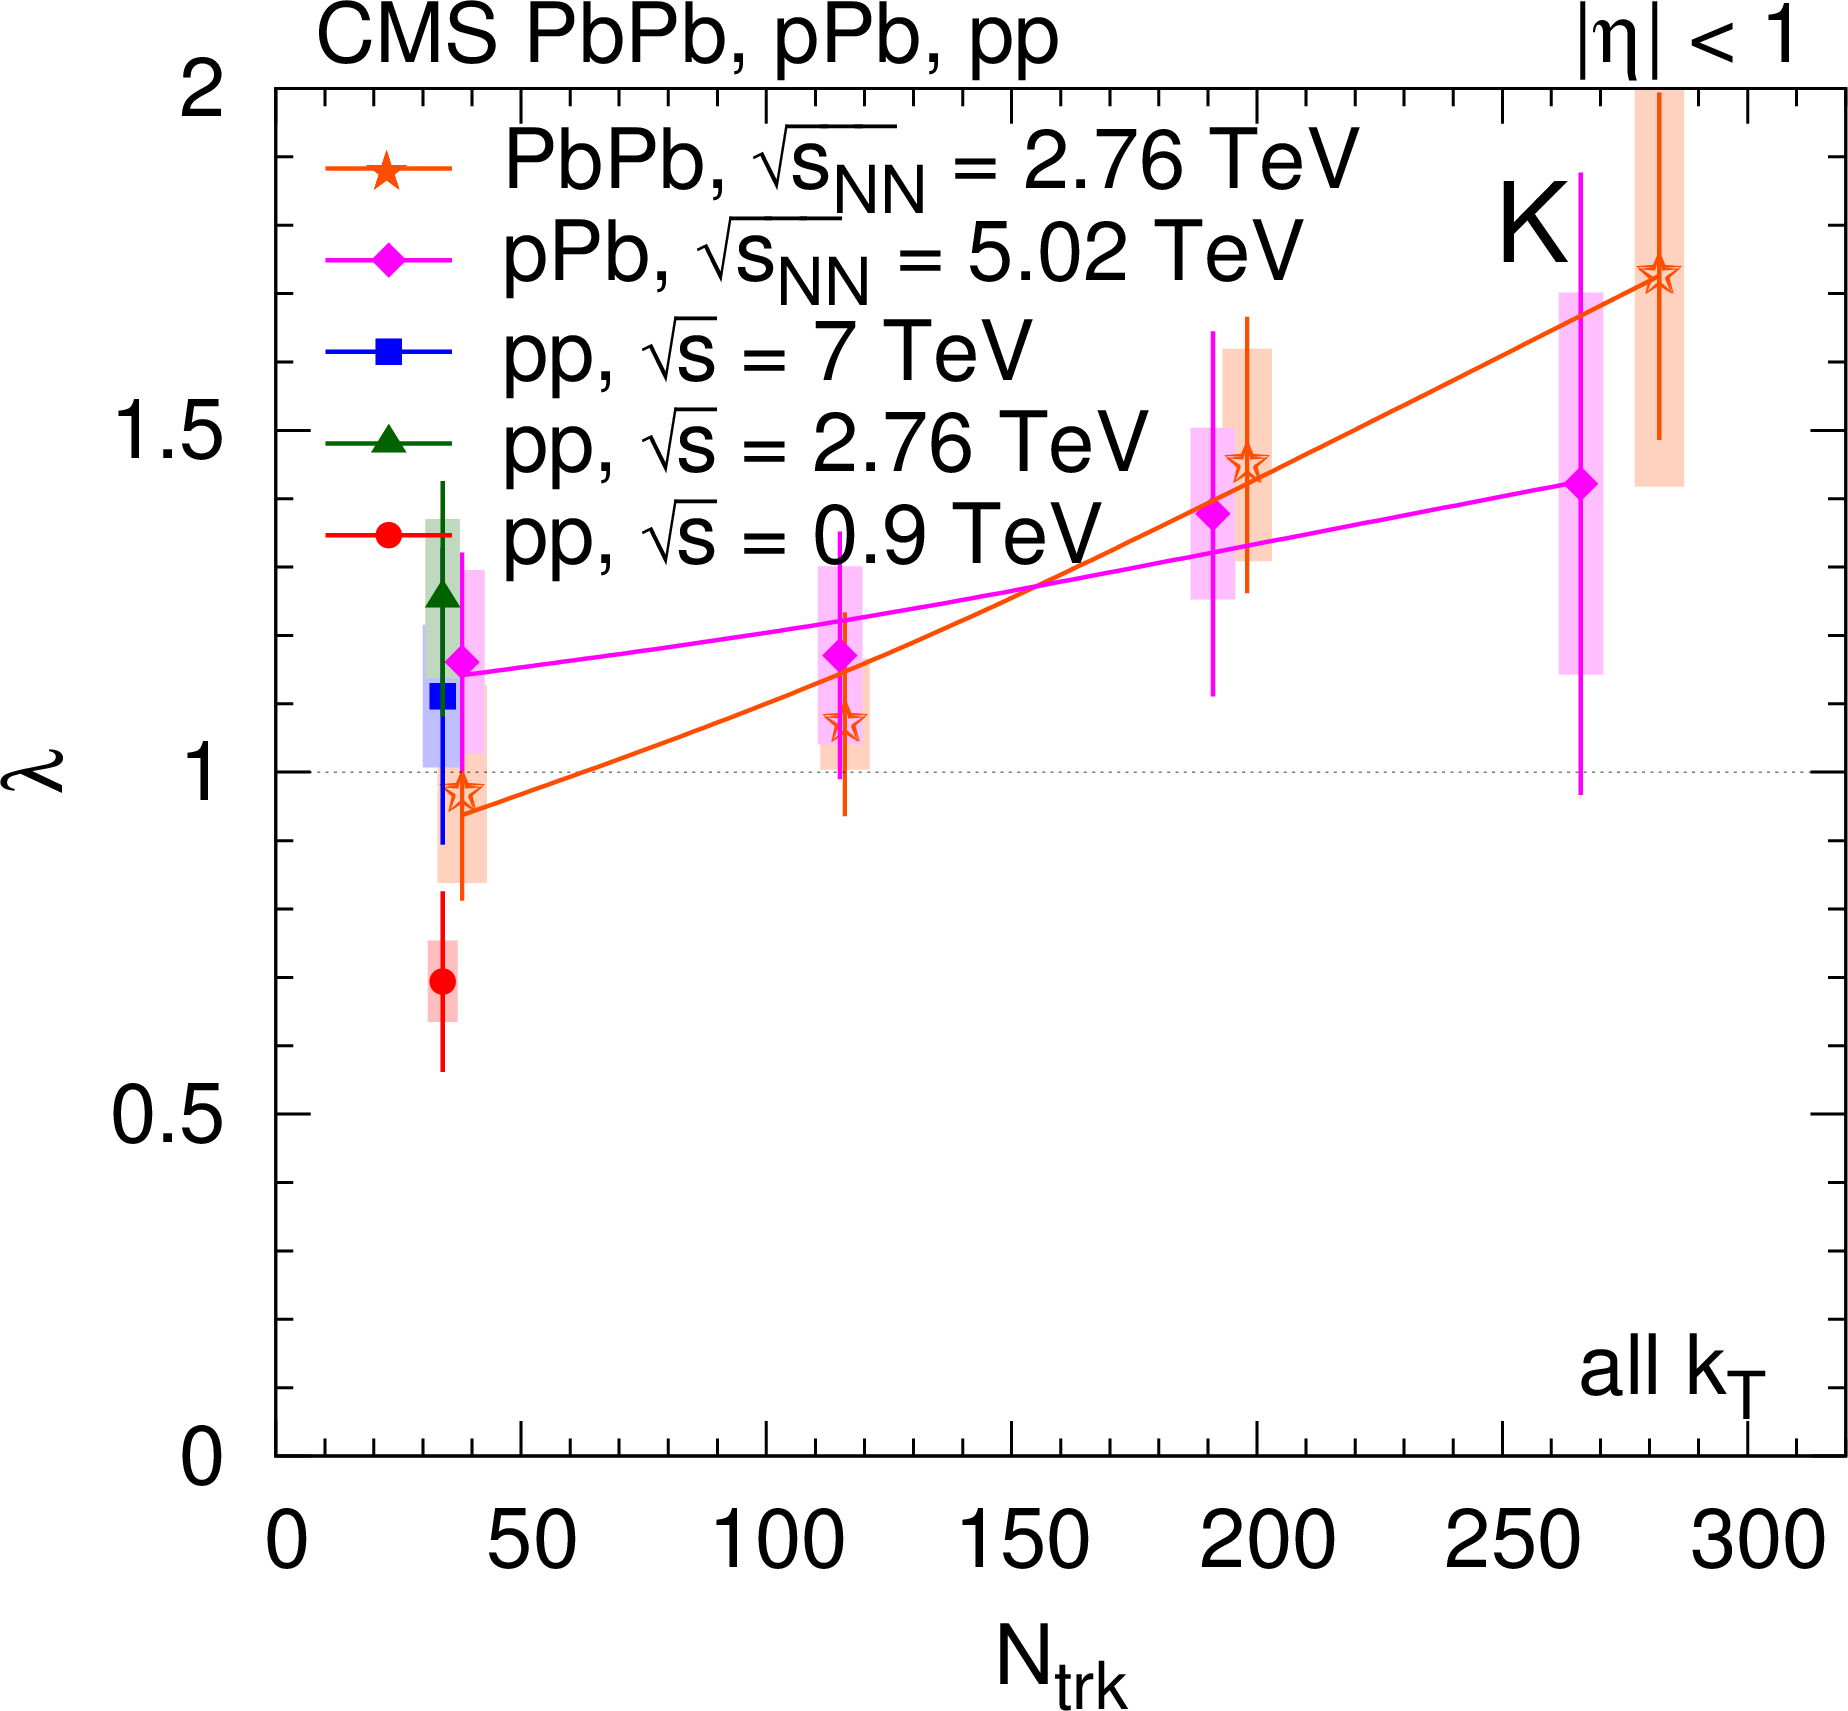
Figure 23:
Track-multiplicity ($ {N_\text {trk}} $) dependence of the 1D kaon radius parameter $ {R_\text {inv}} $ (left) and intercept parameter $\lambda $ (right), obtained from 1D fits (integrated over all $ {k_{\mathrm {T}}} $) for all collision systems studied. For better visibility, only every second measurement is plotted. Lines are drawn to guide the eye. |
png pdf |
Figure 23-a:
Track-multiplicity ($ {N_\text {trk}} $) dependence of the 1D kaon radius parameter $ {R_\text {inv}} $ (left) and intercept parameter $\lambda $ (right), obtained from 1D fits (integrated over all $ {k_{\mathrm {T}}} $) for all collision systems studied. For better visibility, only every second measurement is plotted. Lines are drawn to guide the eye. |
png pdf |
Figure 23-b:
Track-multiplicity ($ {N_\text {trk}} $) dependence of the 1D kaon radius parameter $ {R_\text {inv}} $ (left) and intercept parameter $\lambda $ (right), obtained from 1D fits (integrated over all $ {k_{\mathrm {T}}} $) for all collision systems studied. For better visibility, only every second measurement is plotted. Lines are drawn to guide the eye. |
png pdf |
Figure 24:
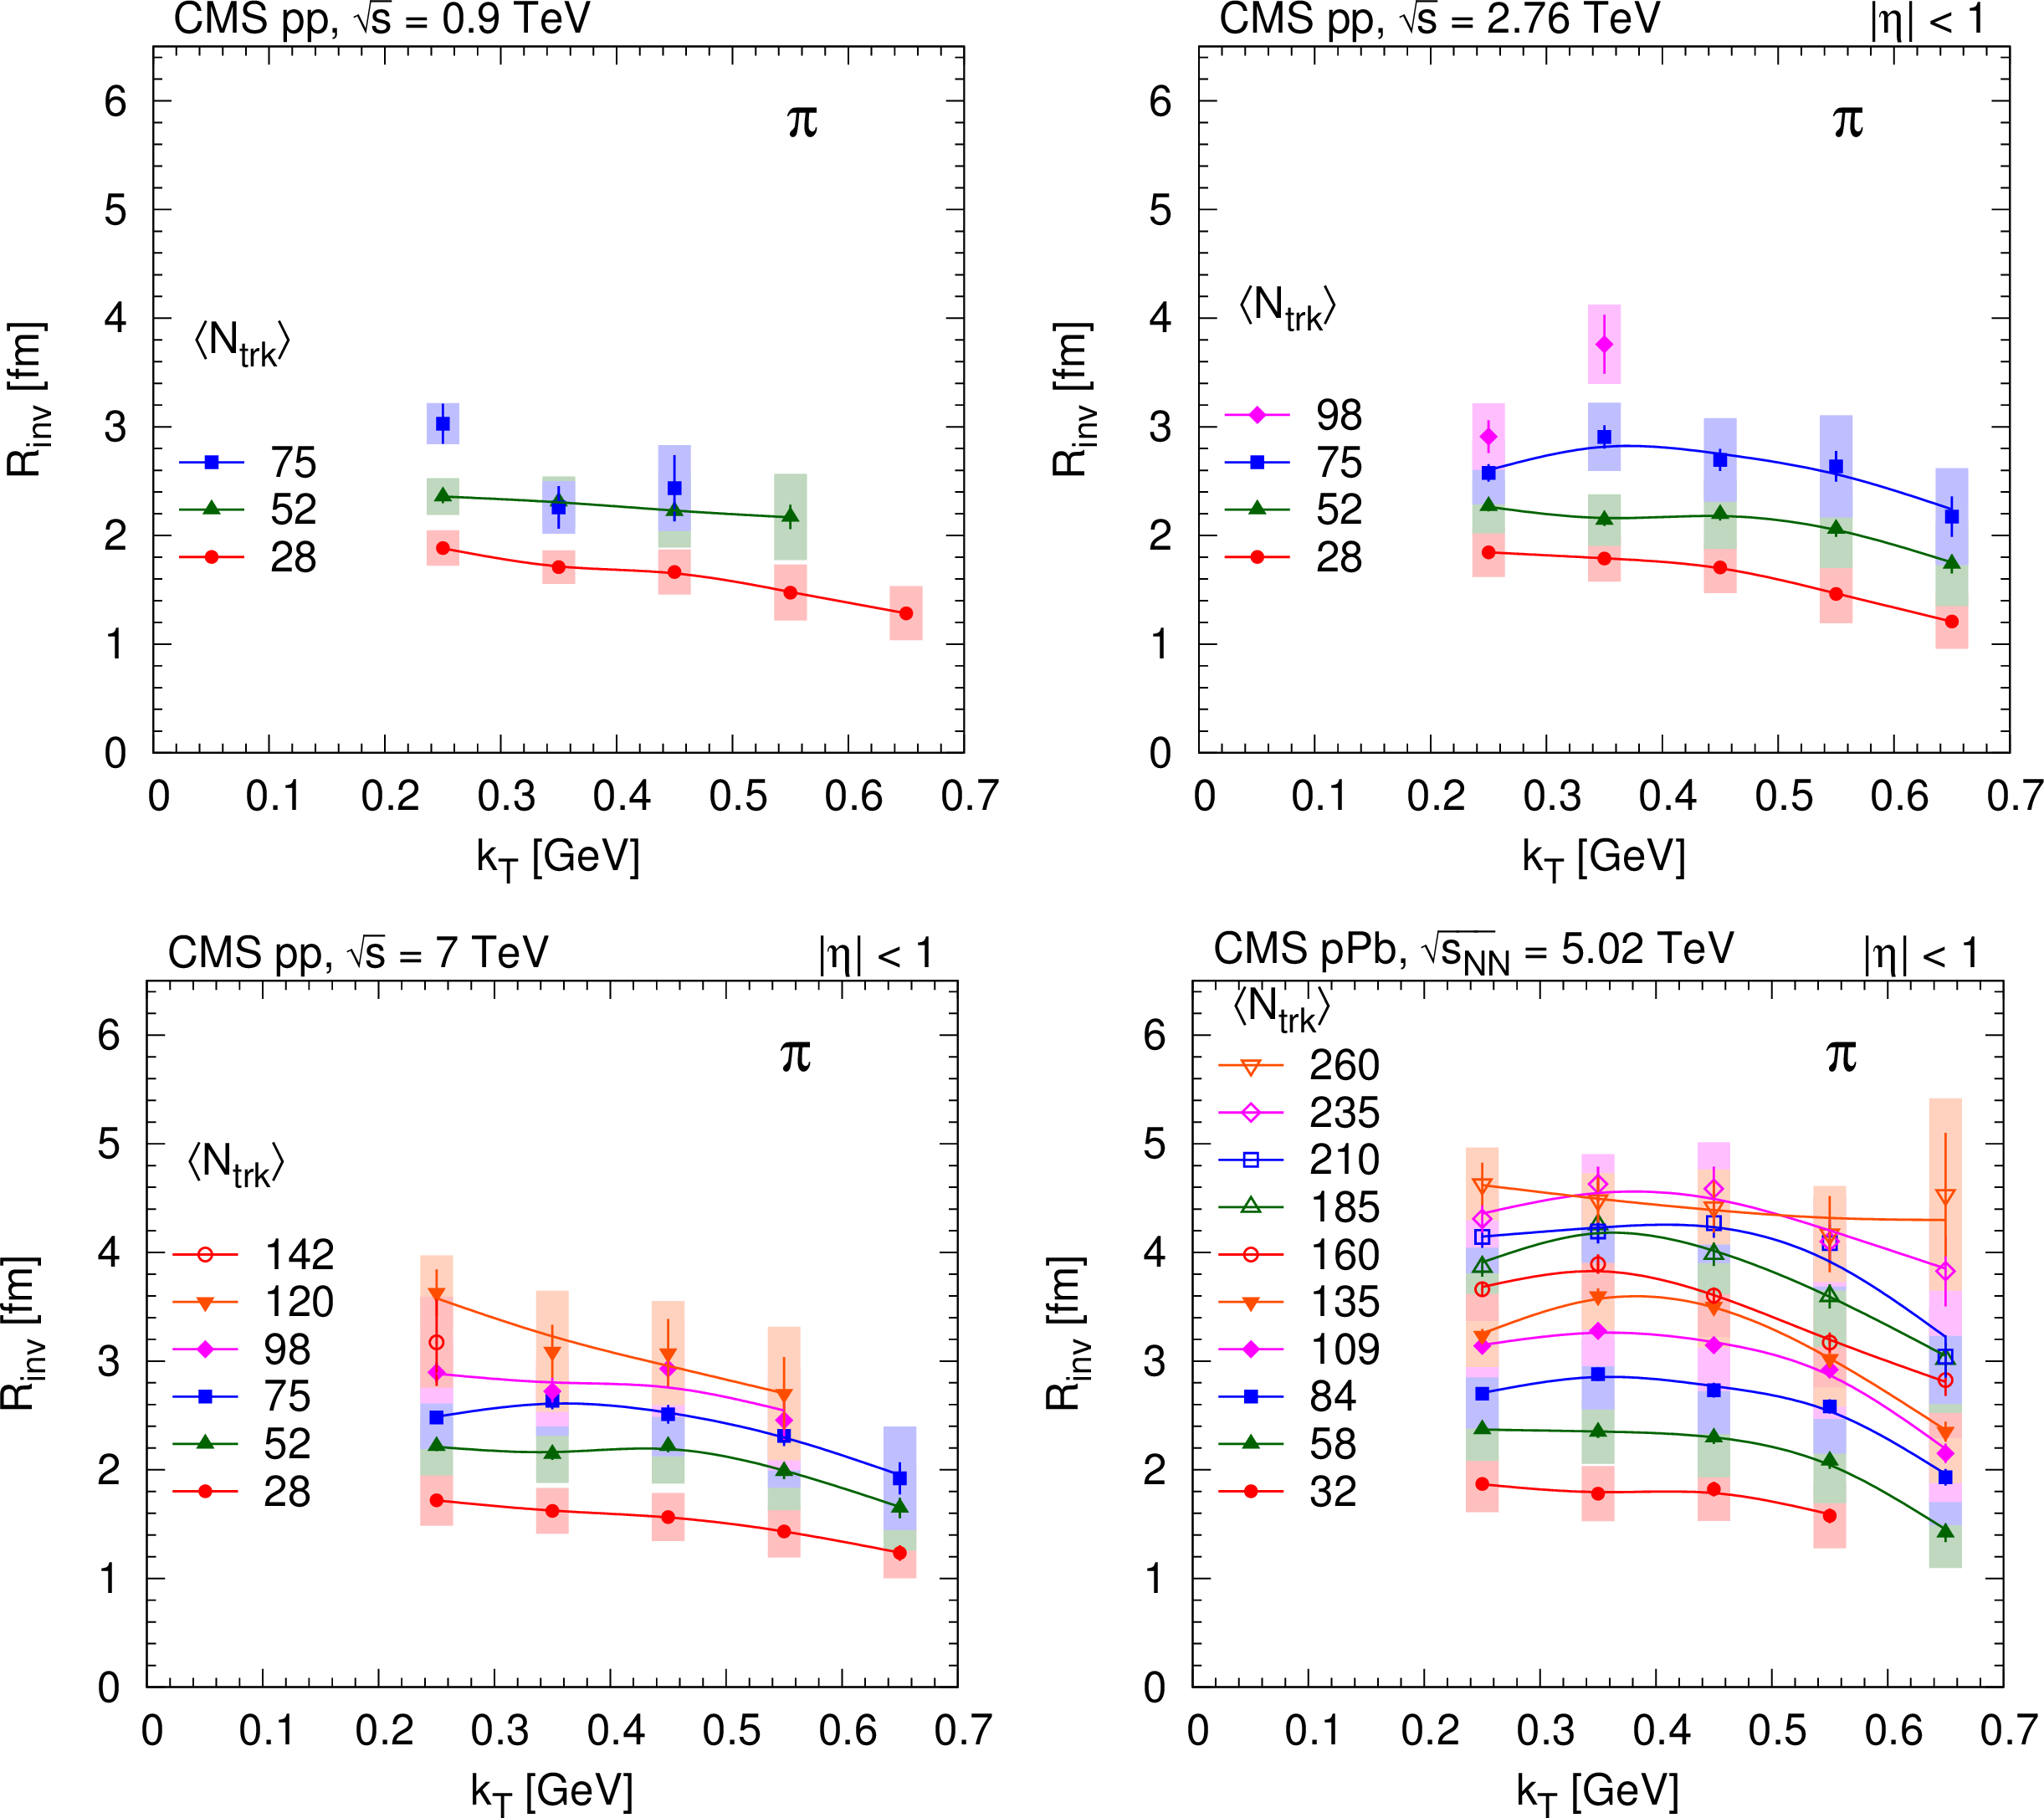
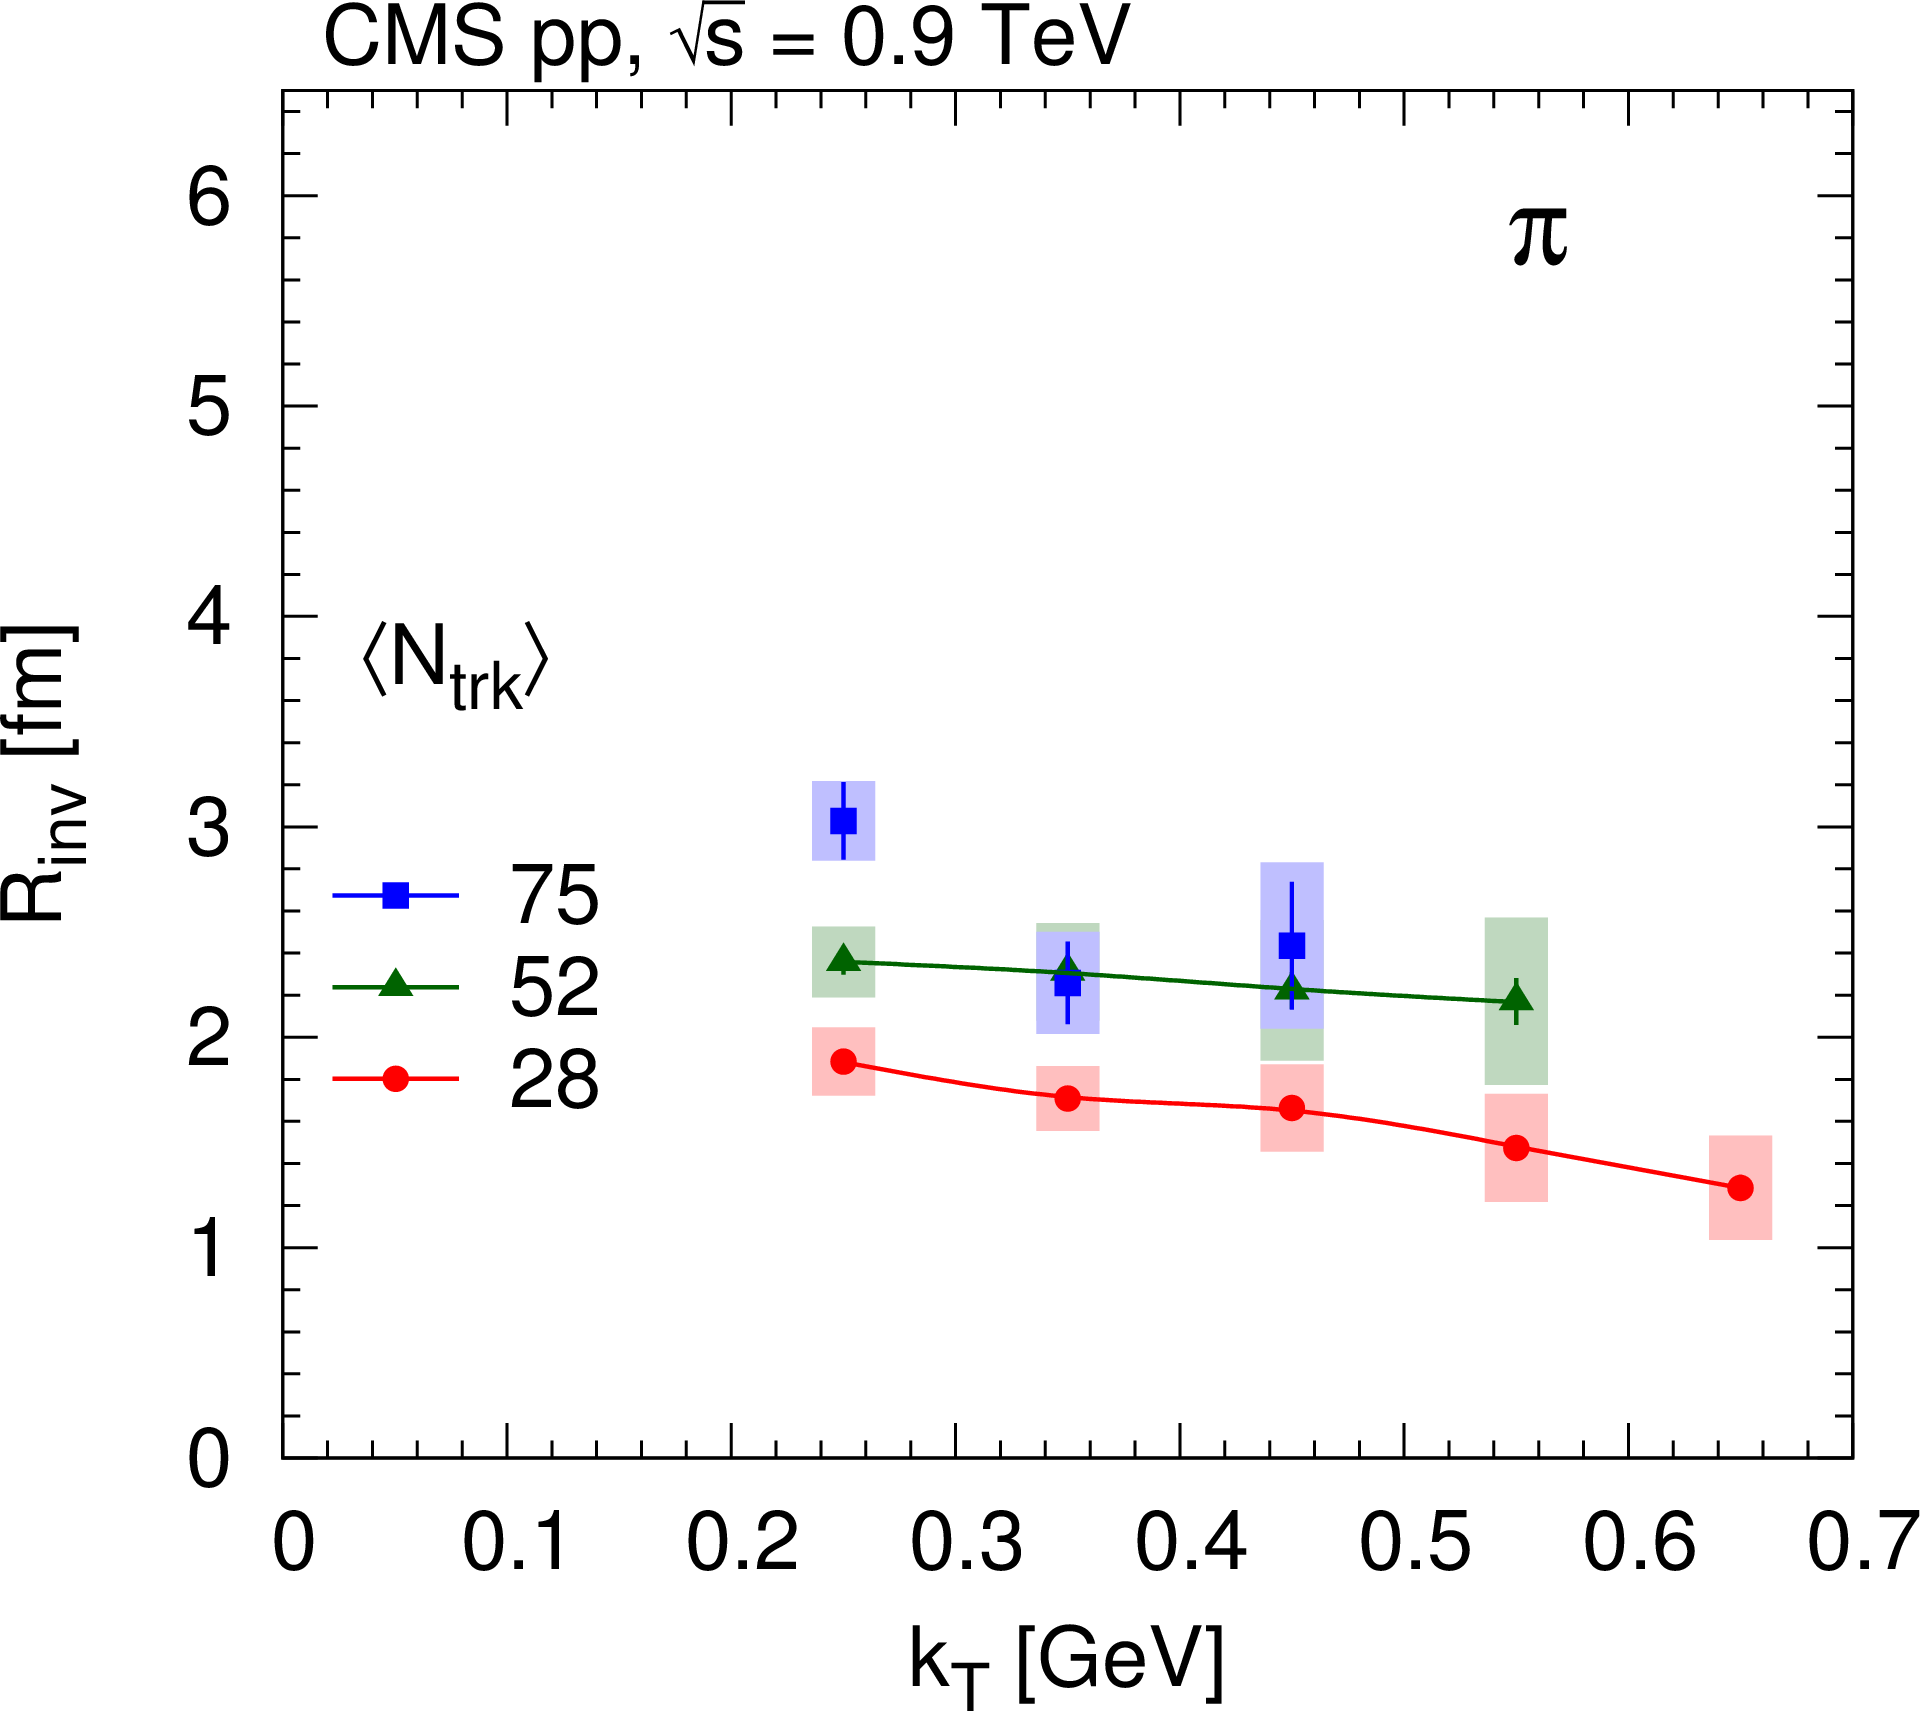
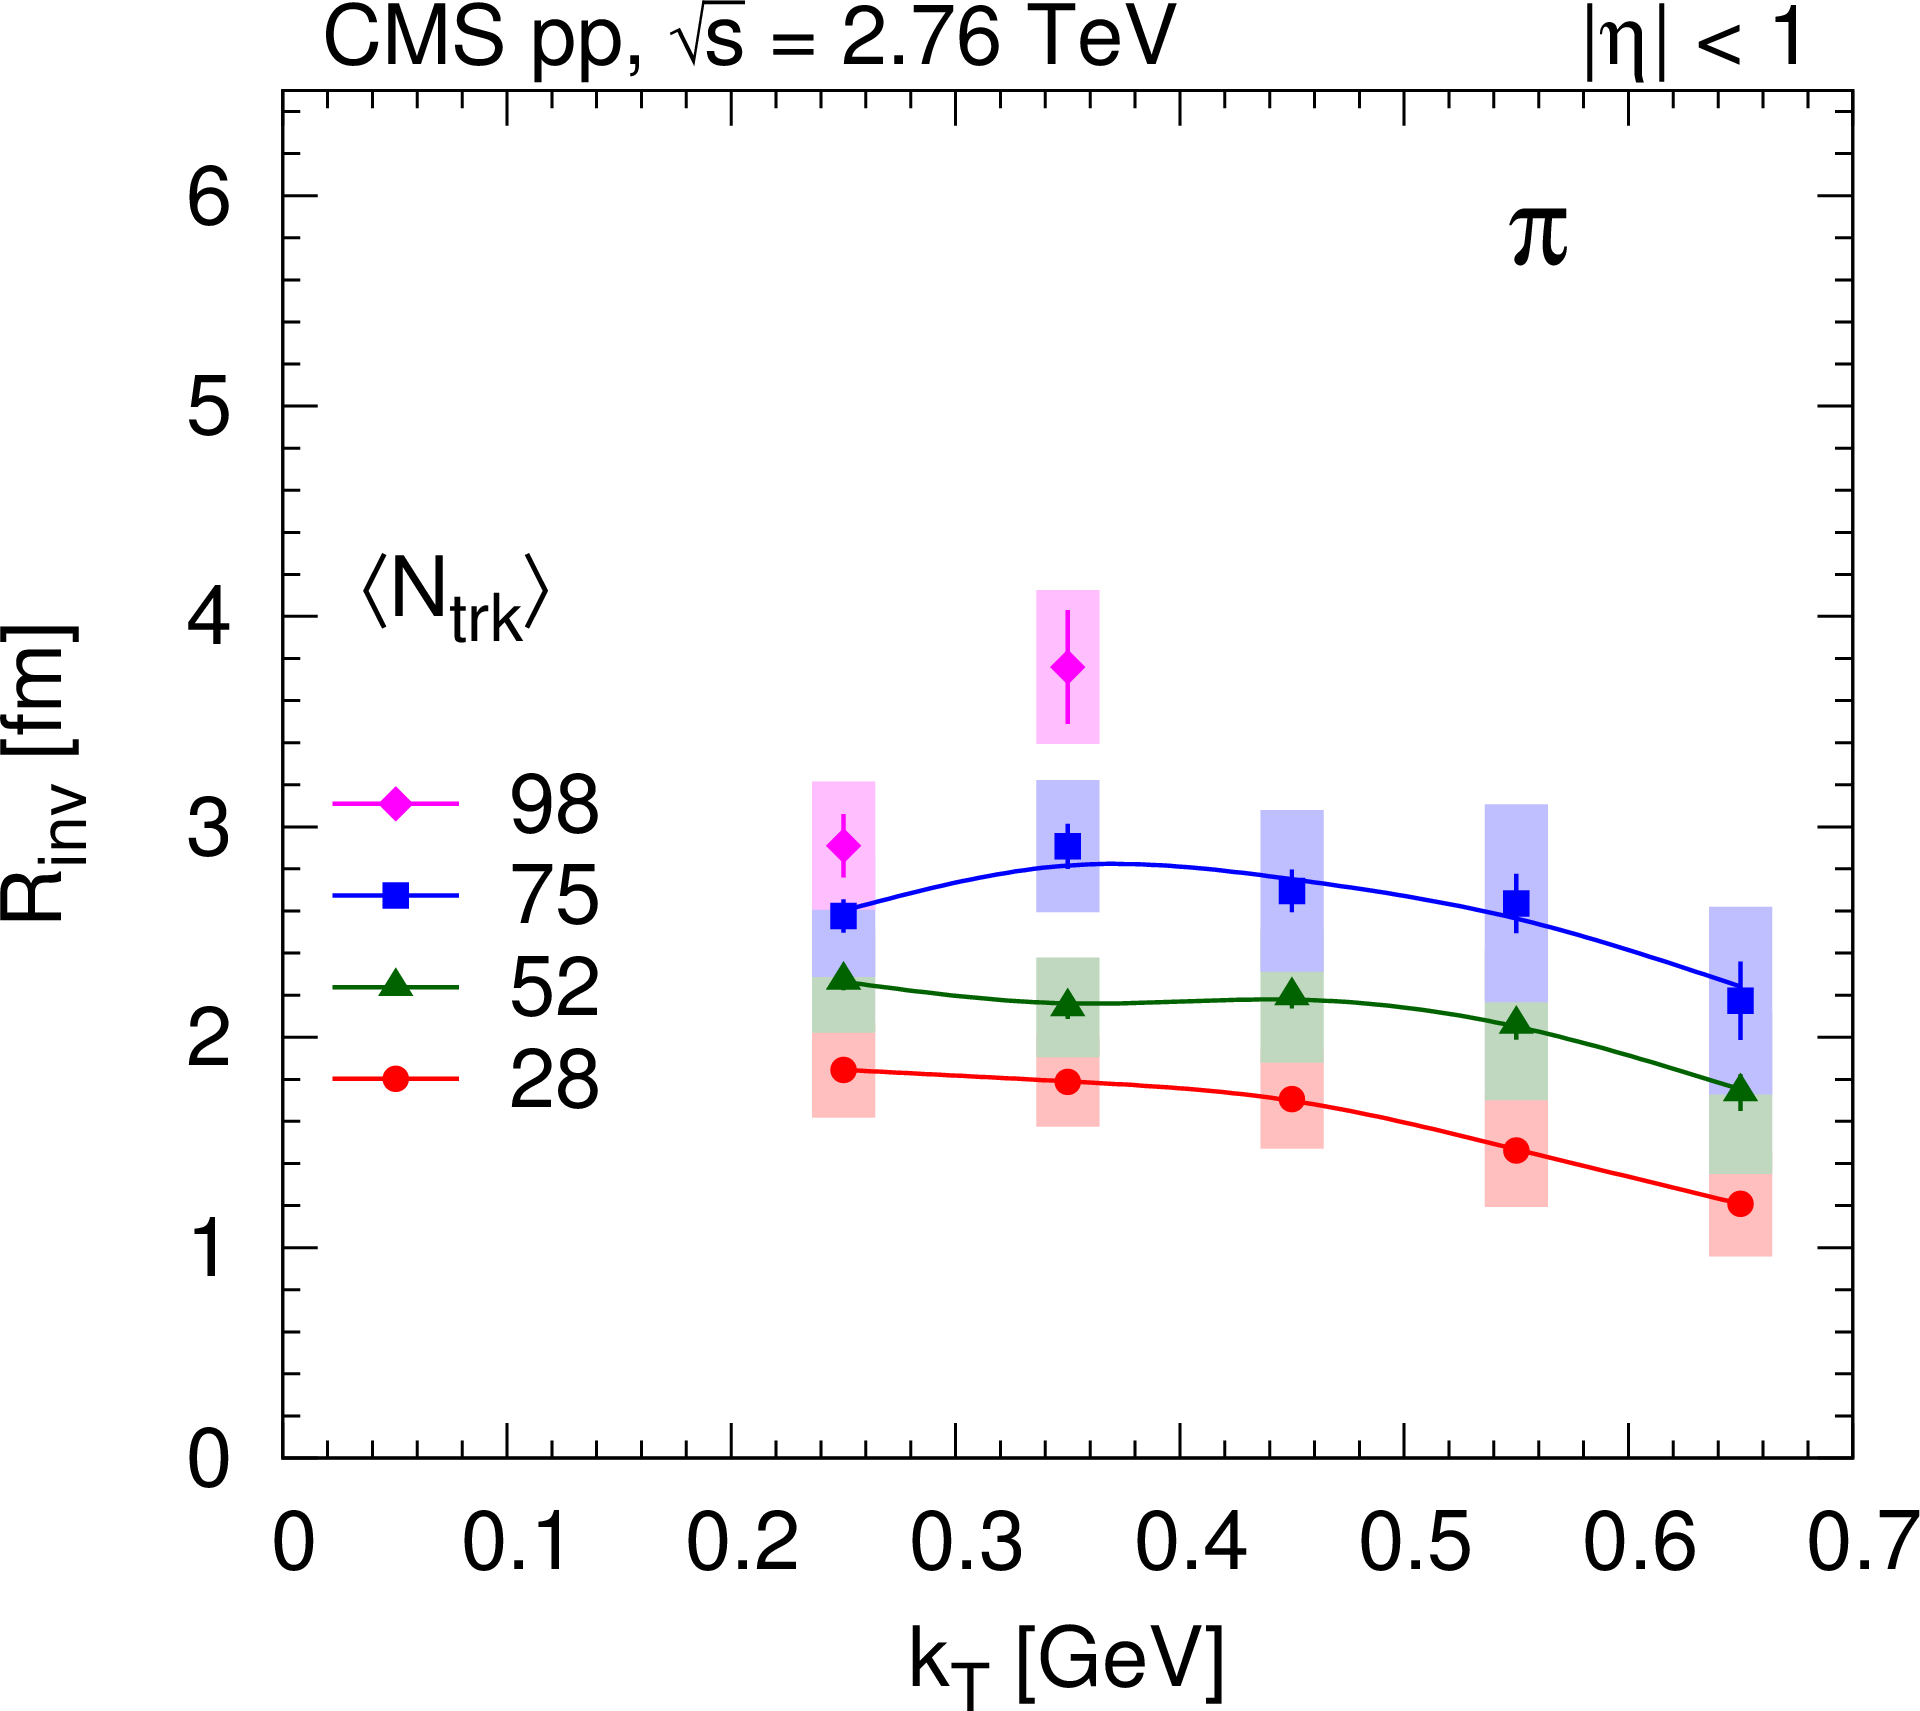
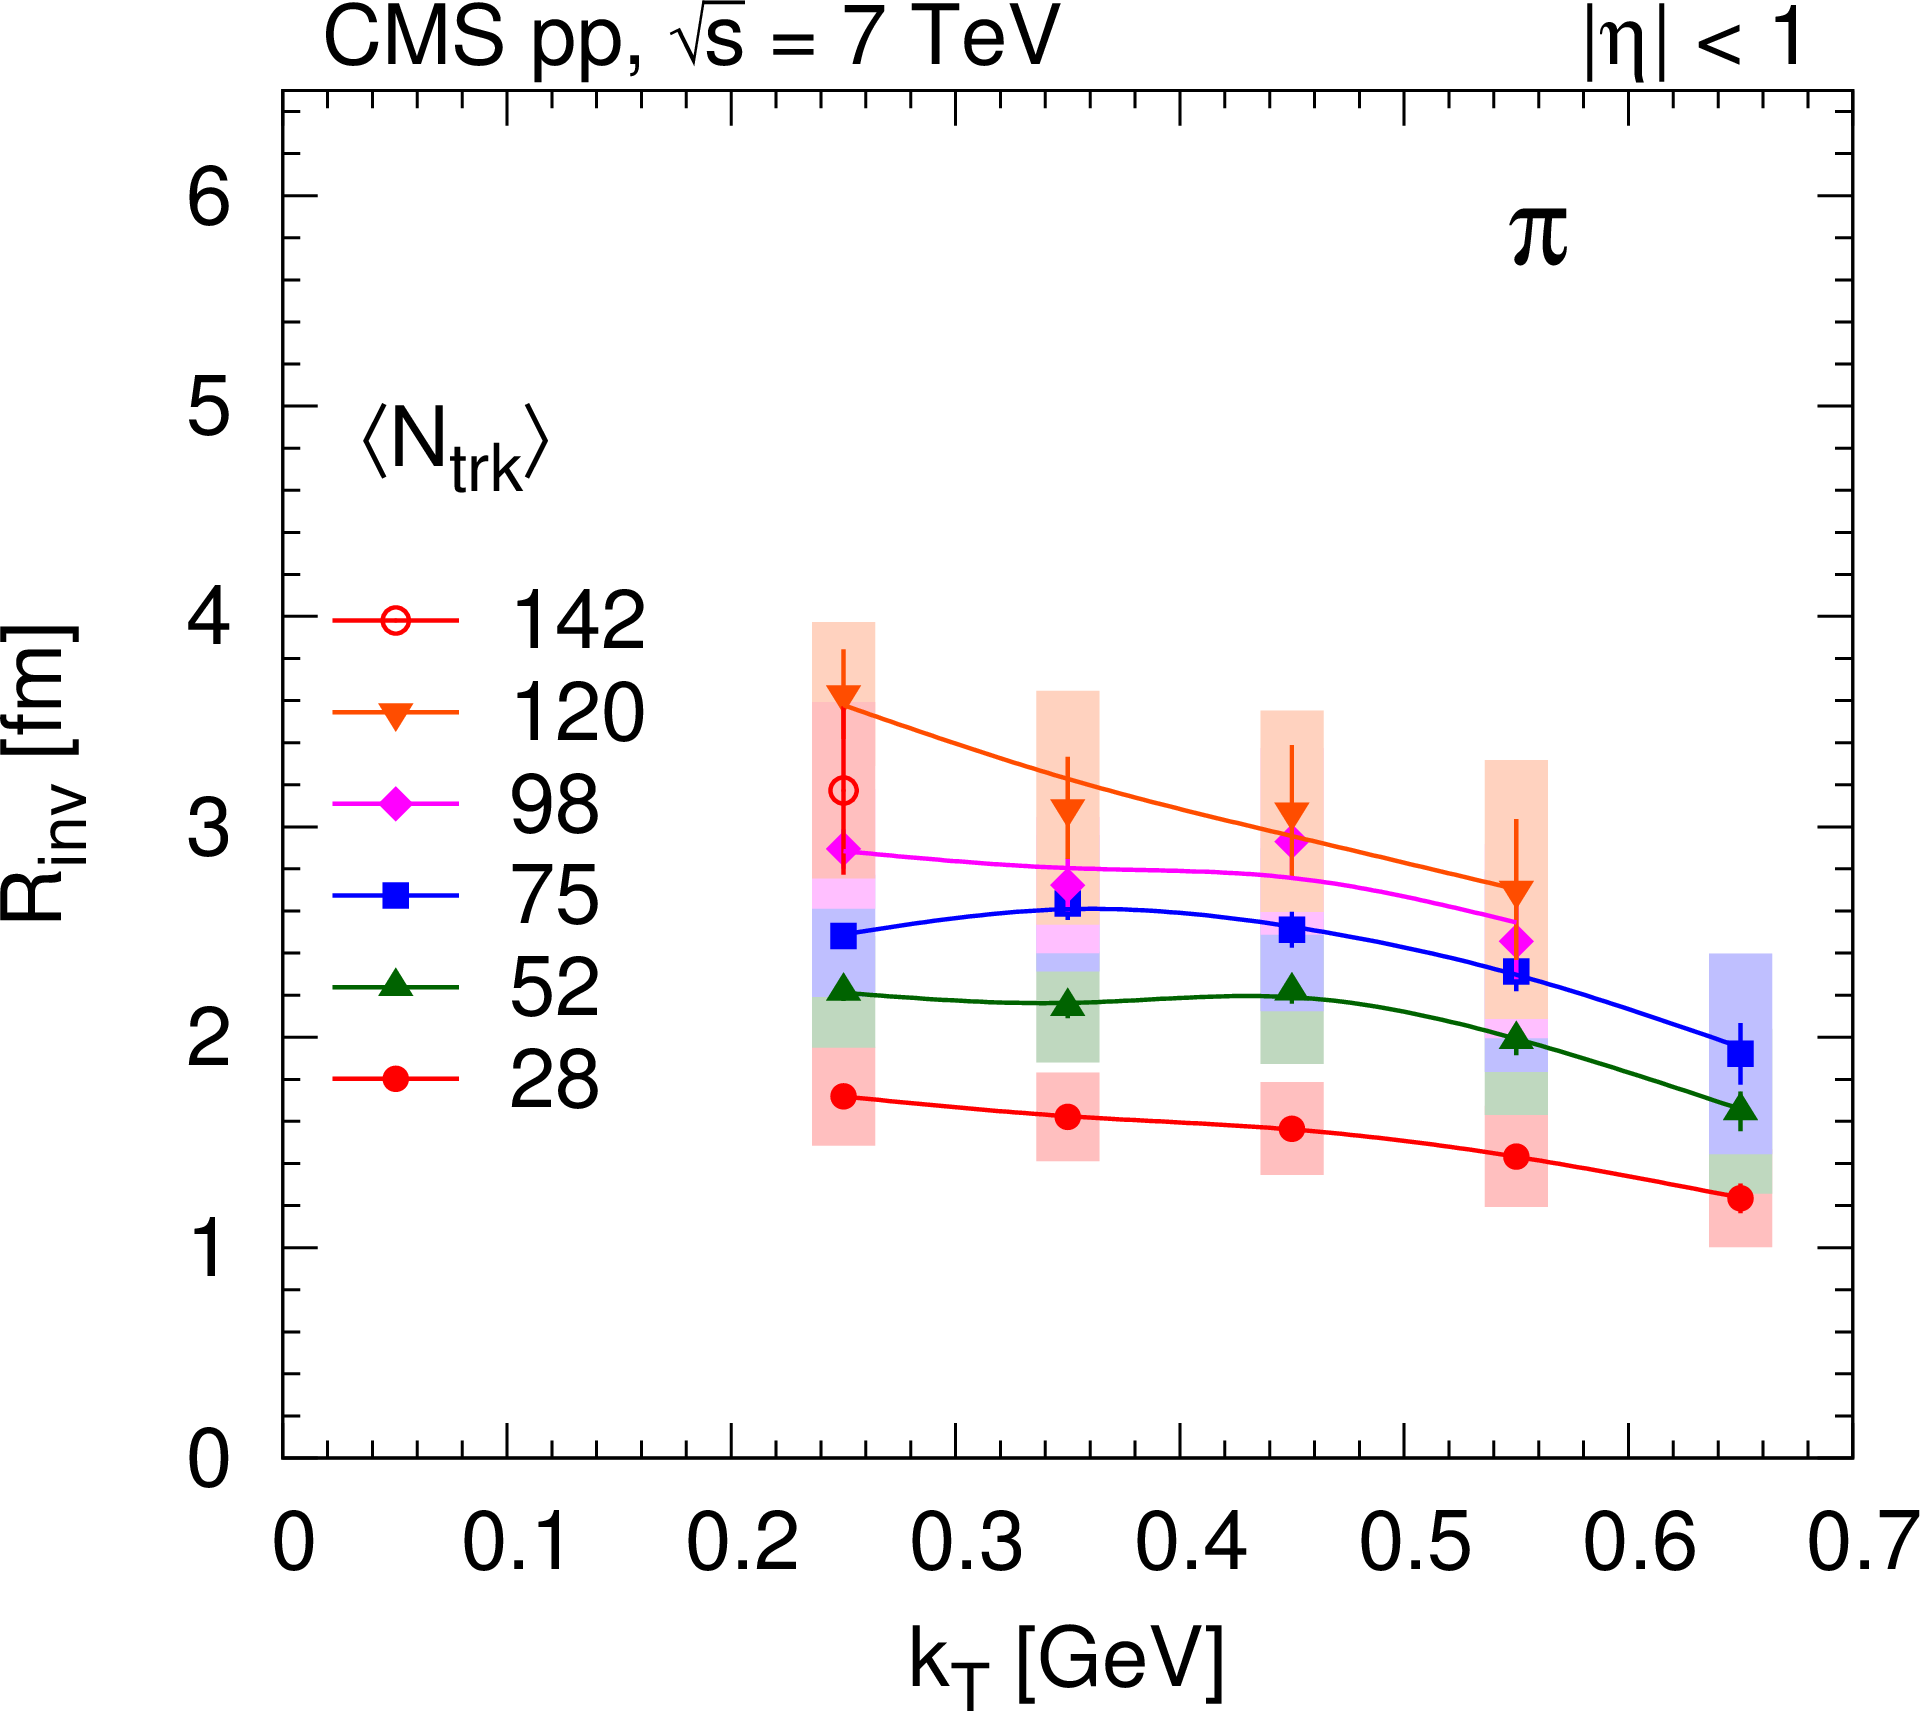
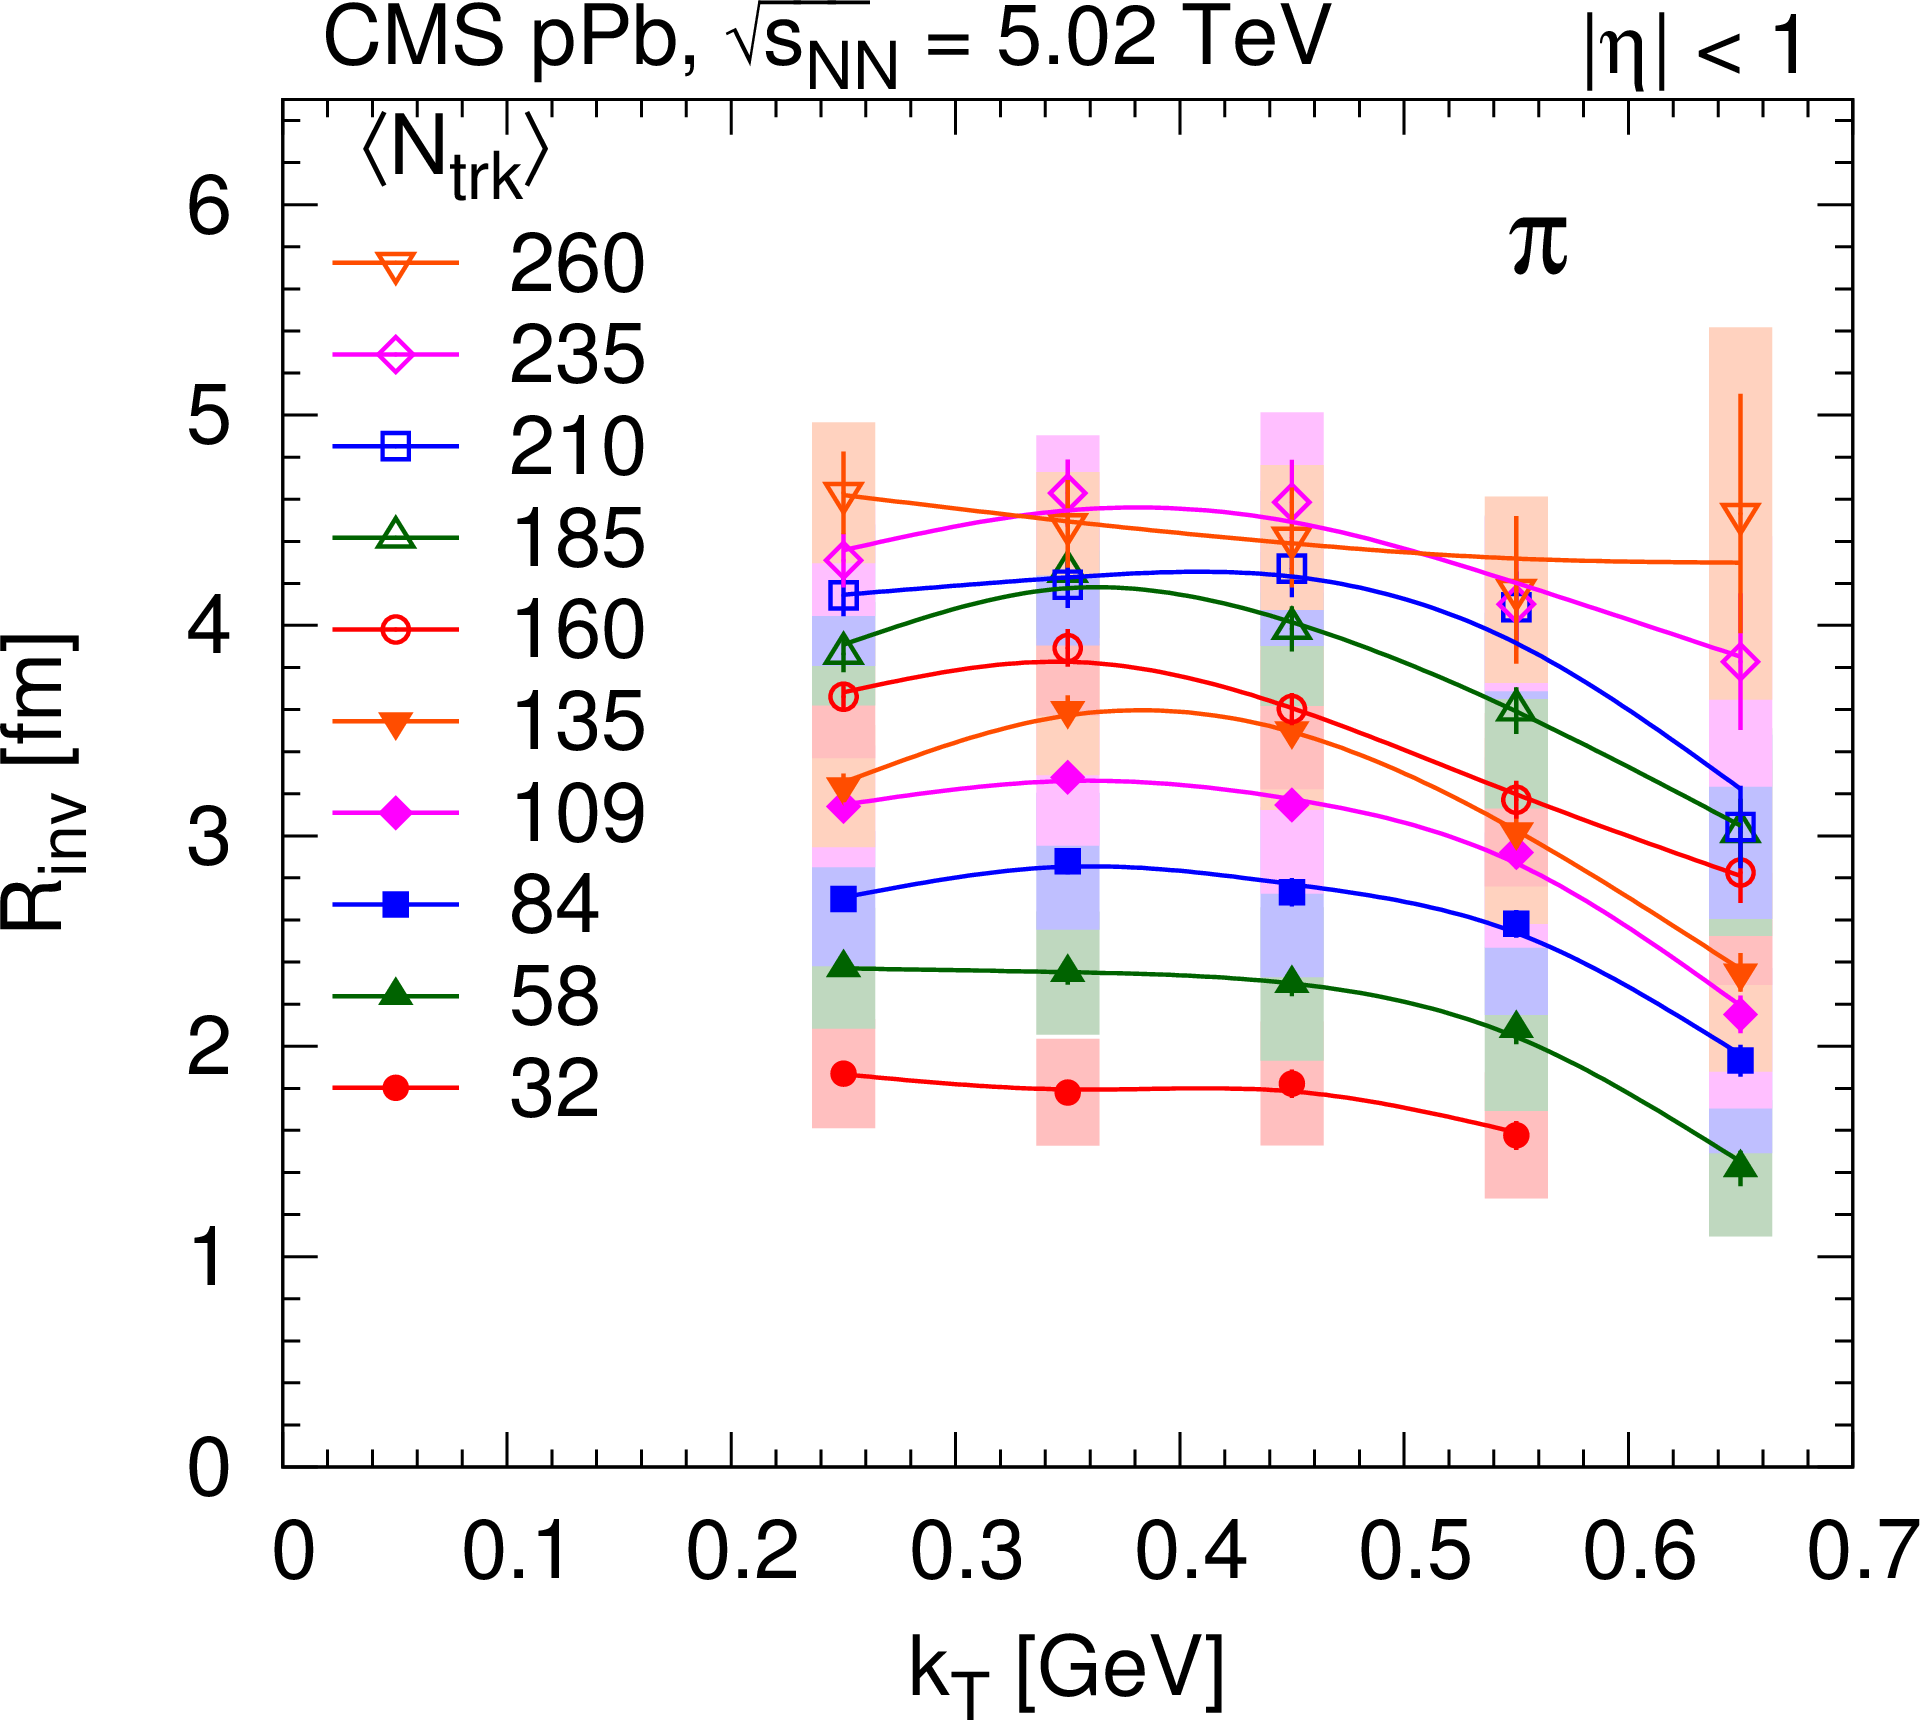
$ {k_{\mathrm {T}}} $-dependence of the 1D pion radius $ {R_\text {inv}} $, for several $ {N_\text {trk}} $ bins, extracted for the pp and pPb systems. Lines are drawn to guide the eye. |
png pdf |
Figure 24-a:
$ {k_{\mathrm {T}}} $-dependence of the 1D pion radius $ {R_\text {inv}} $, for several $ {N_\text {trk}} $ bins, extracted for the pp and pPb systems. Lines are drawn to guide the eye. |
png pdf |
Figure 24-b:
$ {k_{\mathrm {T}}} $-dependence of the 1D pion radius $ {R_\text {inv}} $, for several $ {N_\text {trk}} $ bins, extracted for the pp and pPb systems. Lines are drawn to guide the eye. |
png pdf |
Figure 24-c:
$ {k_{\mathrm {T}}} $-dependence of the 1D pion radius $ {R_\text {inv}} $, for several $ {N_\text {trk}} $ bins, extracted for the pp and pPb systems. Lines are drawn to guide the eye. |
png pdf |
Figure 24-d:
$ {k_{\mathrm {T}}} $-dependence of the 1D pion radius $ {R_\text {inv}} $, for several $ {N_\text {trk}} $ bins, extracted for the pp and pPb systems. Lines are drawn to guide the eye. |
png pdf |
Figure 25:
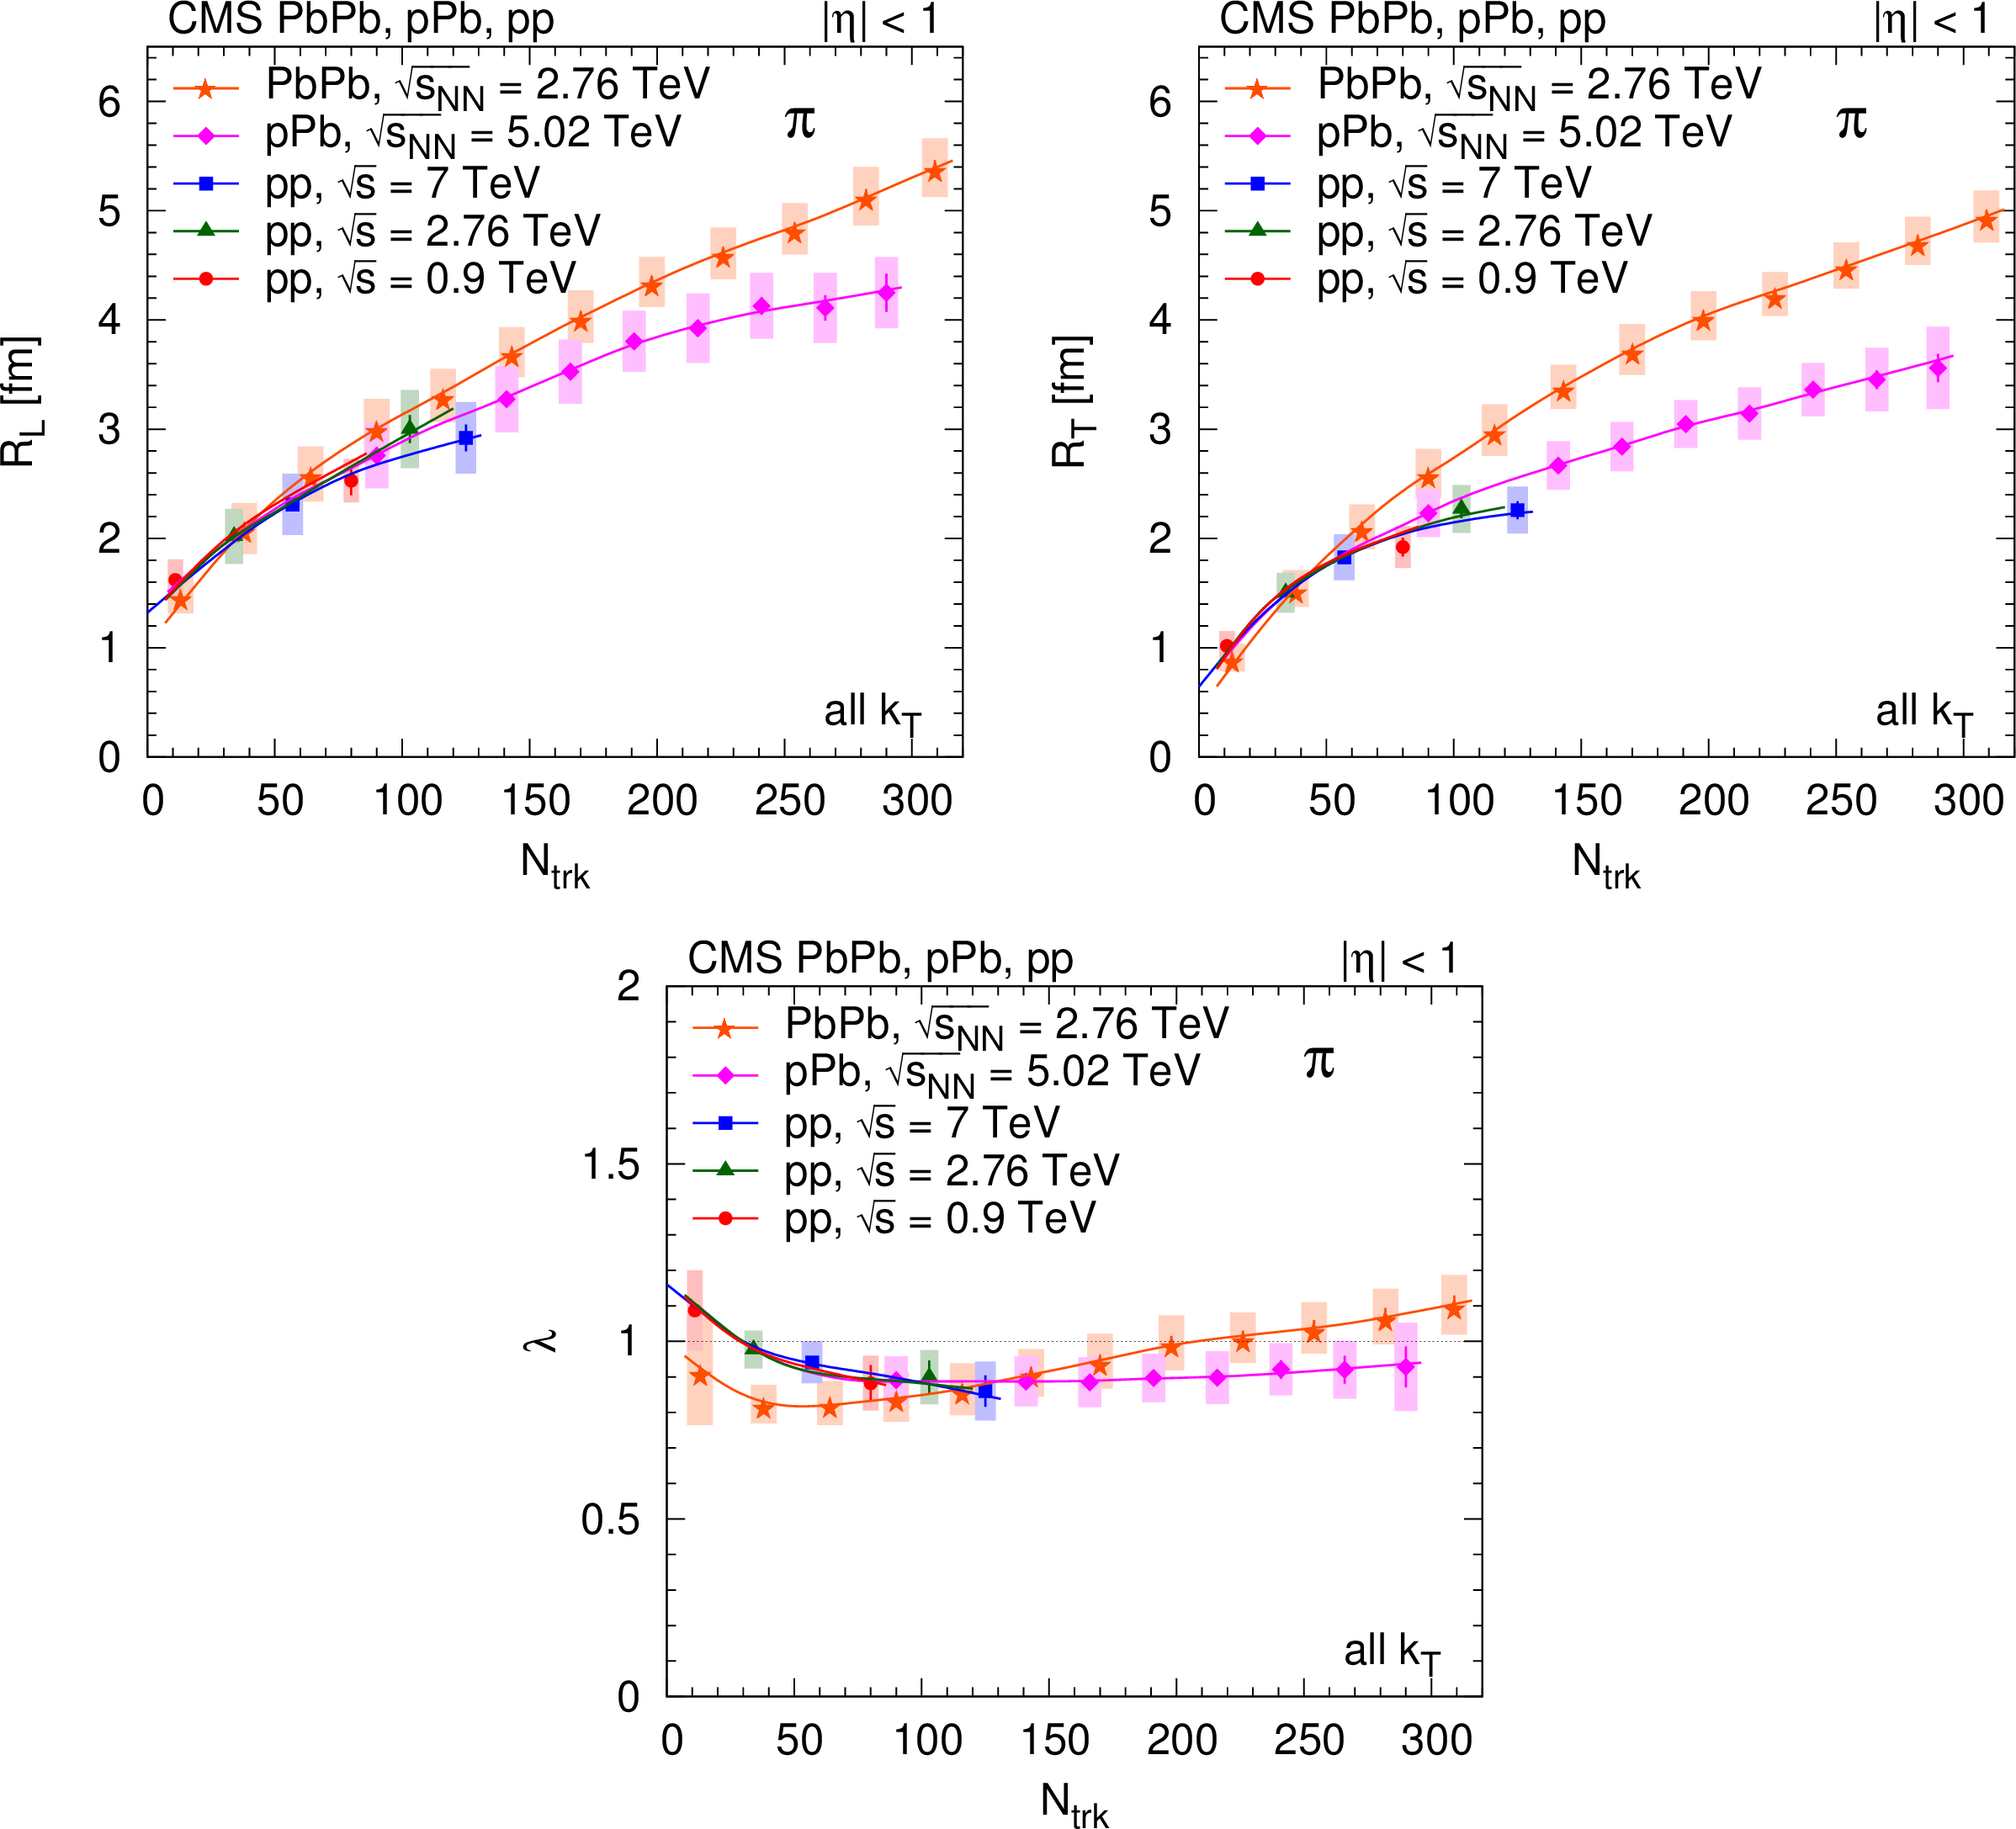
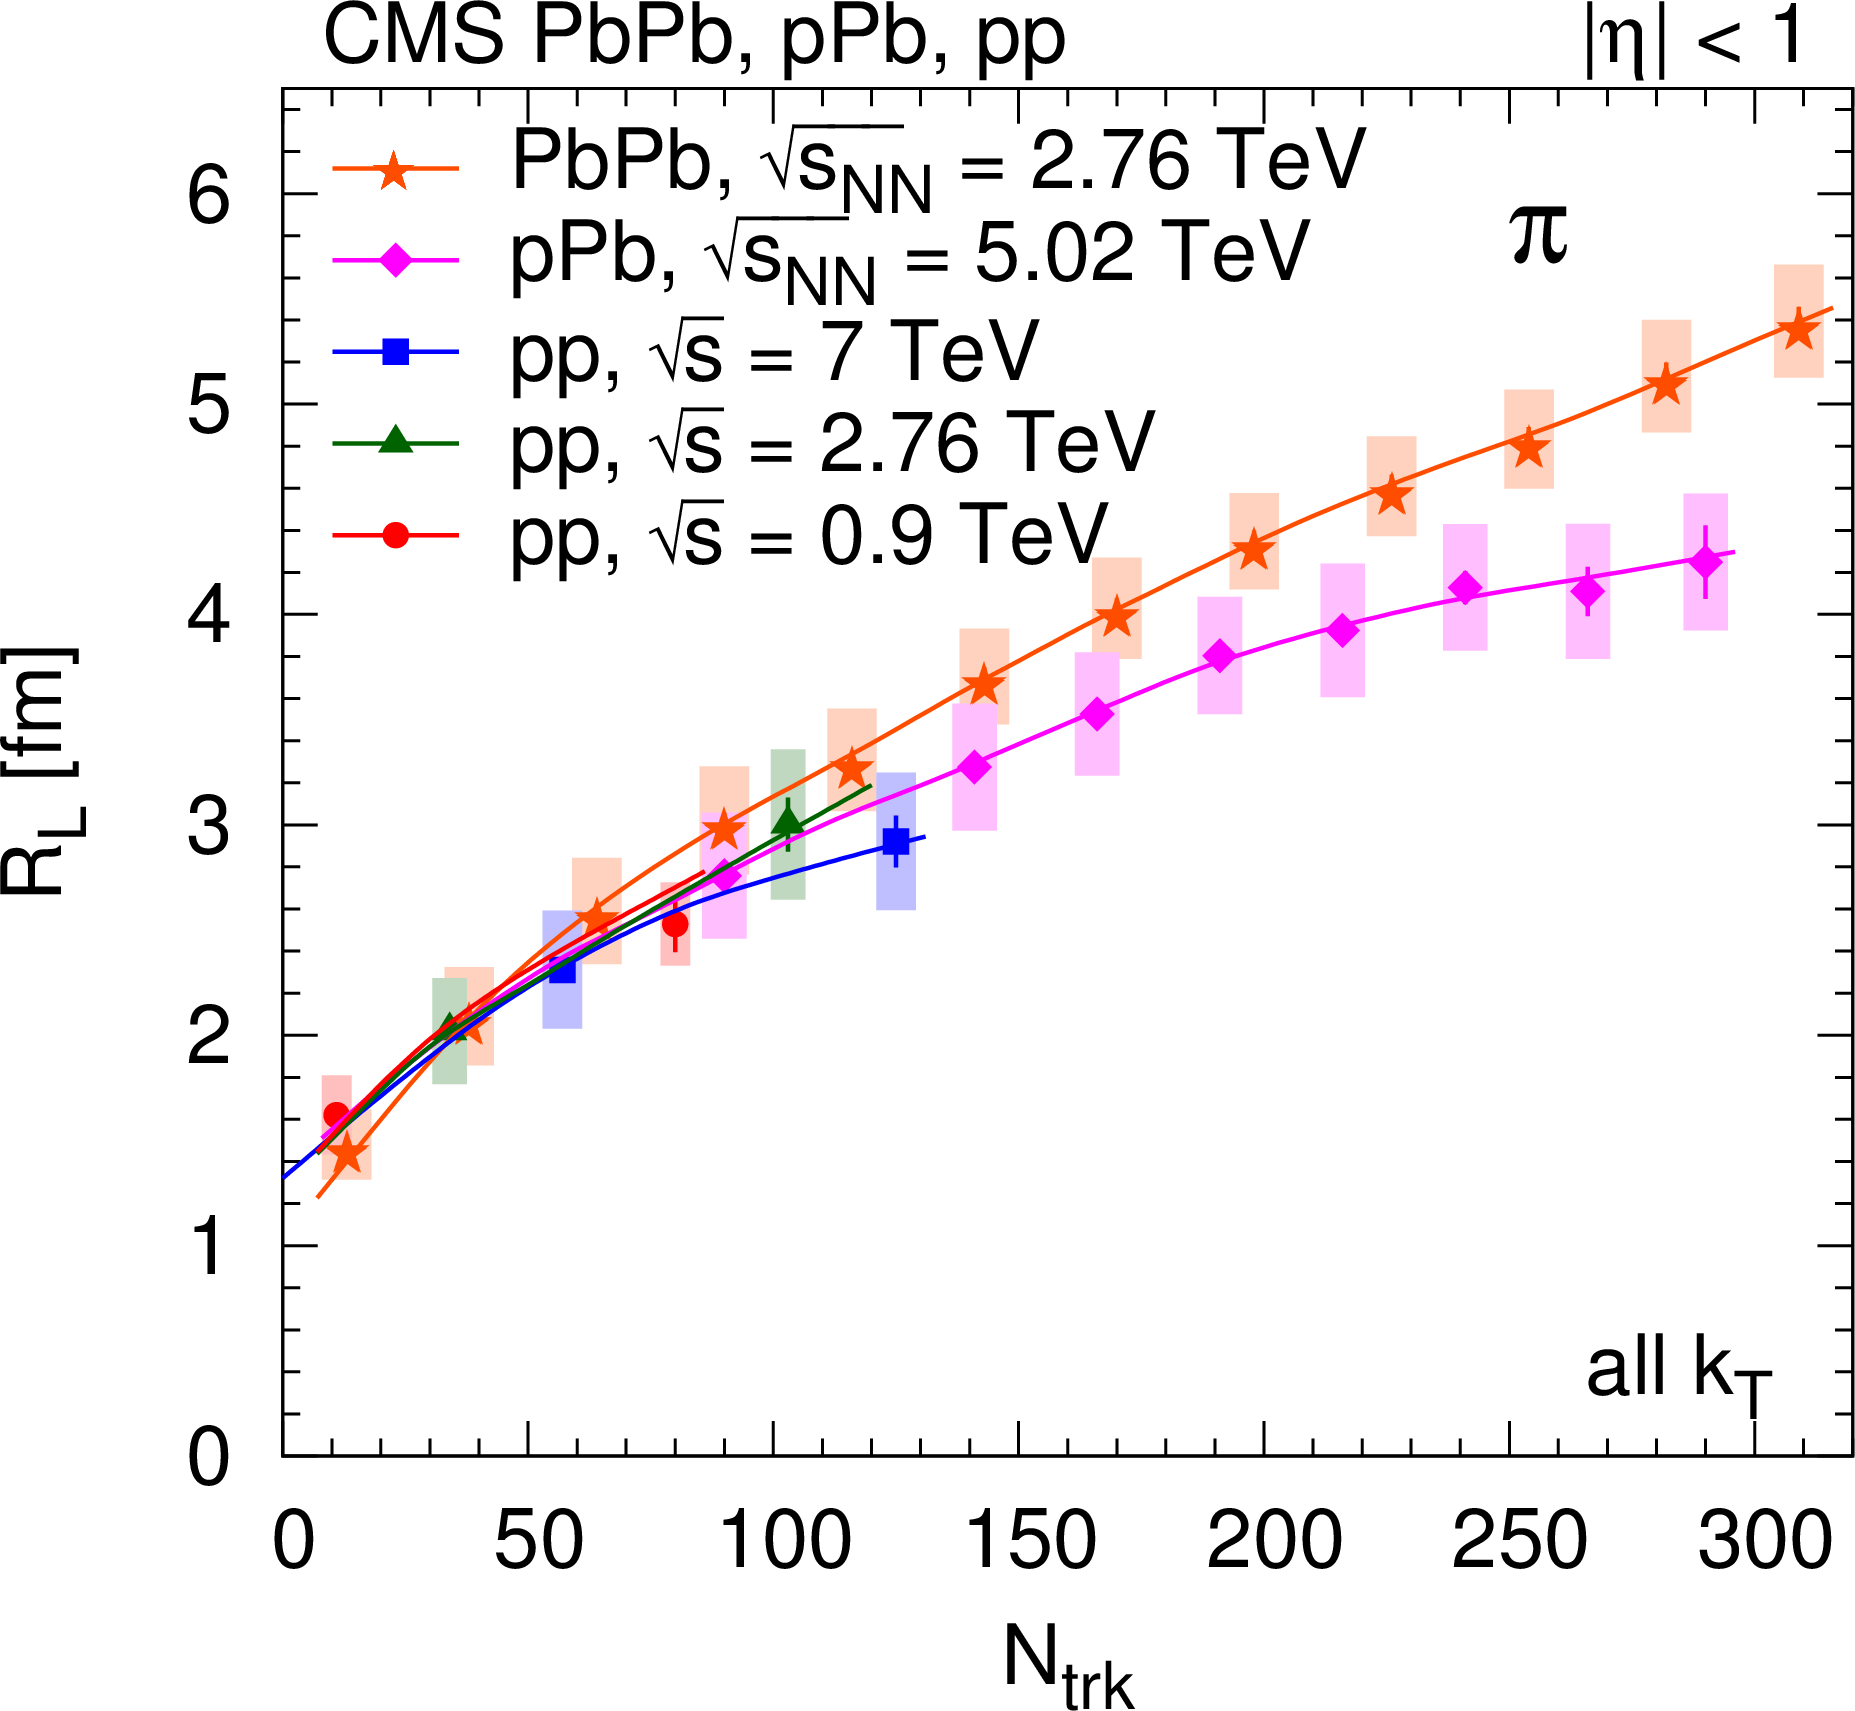
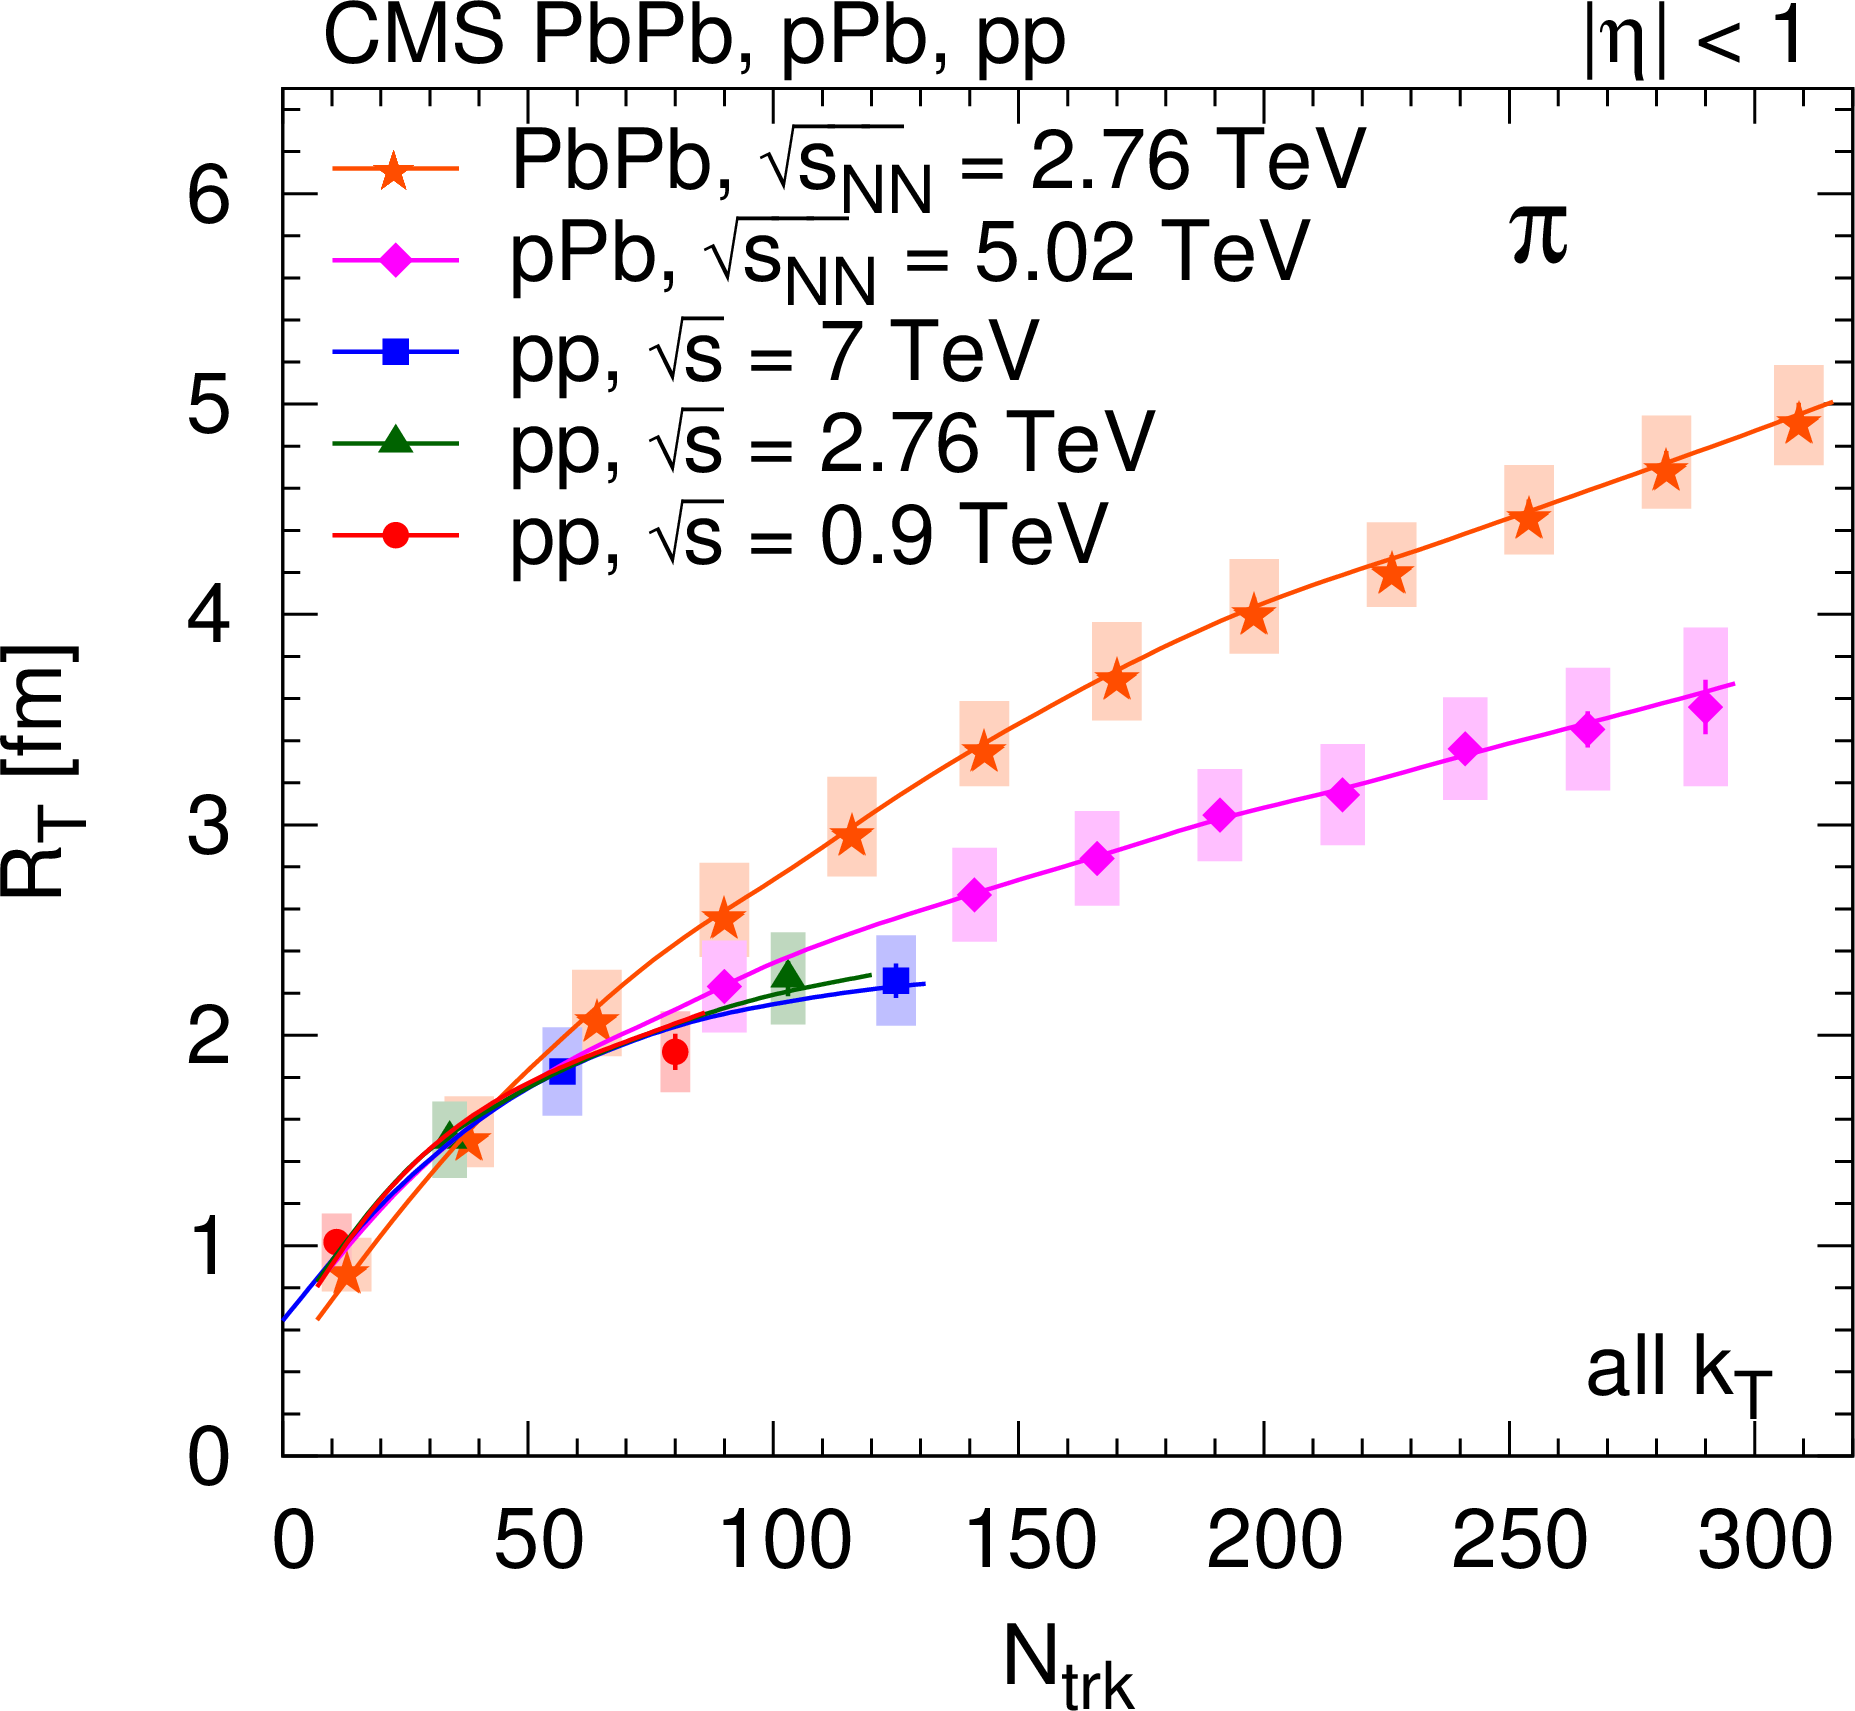
Track-multiplicity ($ {N_\text {trk}} $) dependence of the 2D pion radius parameters $ {R_\text {L}} $ and $ {R_\text {T}} $ (top), and intercept parameter $\lambda $ (bottom), obtained from fits (integrated over all $ {k_{\mathrm {T}}} $) for all collision systems studied. For better visibility, only every second measurement is plotted. Lines are drawn to guide the eye. |
png pdf |
Figure 25-a:
Track-multiplicity ($ {N_\text {trk}} $) dependence of the 2D pion radius parameters $ {R_\text {L}} $ and $ {R_\text {T}} $ (top), and intercept parameter $\lambda $ (bottom), obtained from fits (integrated over all $ {k_{\mathrm {T}}} $) for all collision systems studied. For better visibility, only every second measurement is plotted. Lines are drawn to guide the eye. |
png pdf |
Figure 25-b:
Track-multiplicity ($ {N_\text {trk}} $) dependence of the 2D pion radius parameters $ {R_\text {L}} $ and $ {R_\text {T}} $ (top), and intercept parameter $\lambda $ (bottom), obtained from fits (integrated over all $ {k_{\mathrm {T}}} $) for all collision systems studied. For better visibility, only every second measurement is plotted. Lines are drawn to guide the eye. |
png pdf |
Figure 25-c:
Track-multiplicity ($ {N_\text {trk}} $) dependence of the 2D pion radius parameters $ {R_\text {L}} $ and $ {R_\text {T}} $ (top), and intercept parameter $\lambda $ (bottom), obtained from fits (integrated over all $ {k_{\mathrm {T}}} $) for all collision systems studied. For better visibility, only every second measurement is plotted. Lines are drawn to guide the eye. |
png pdf |
Figure 26:
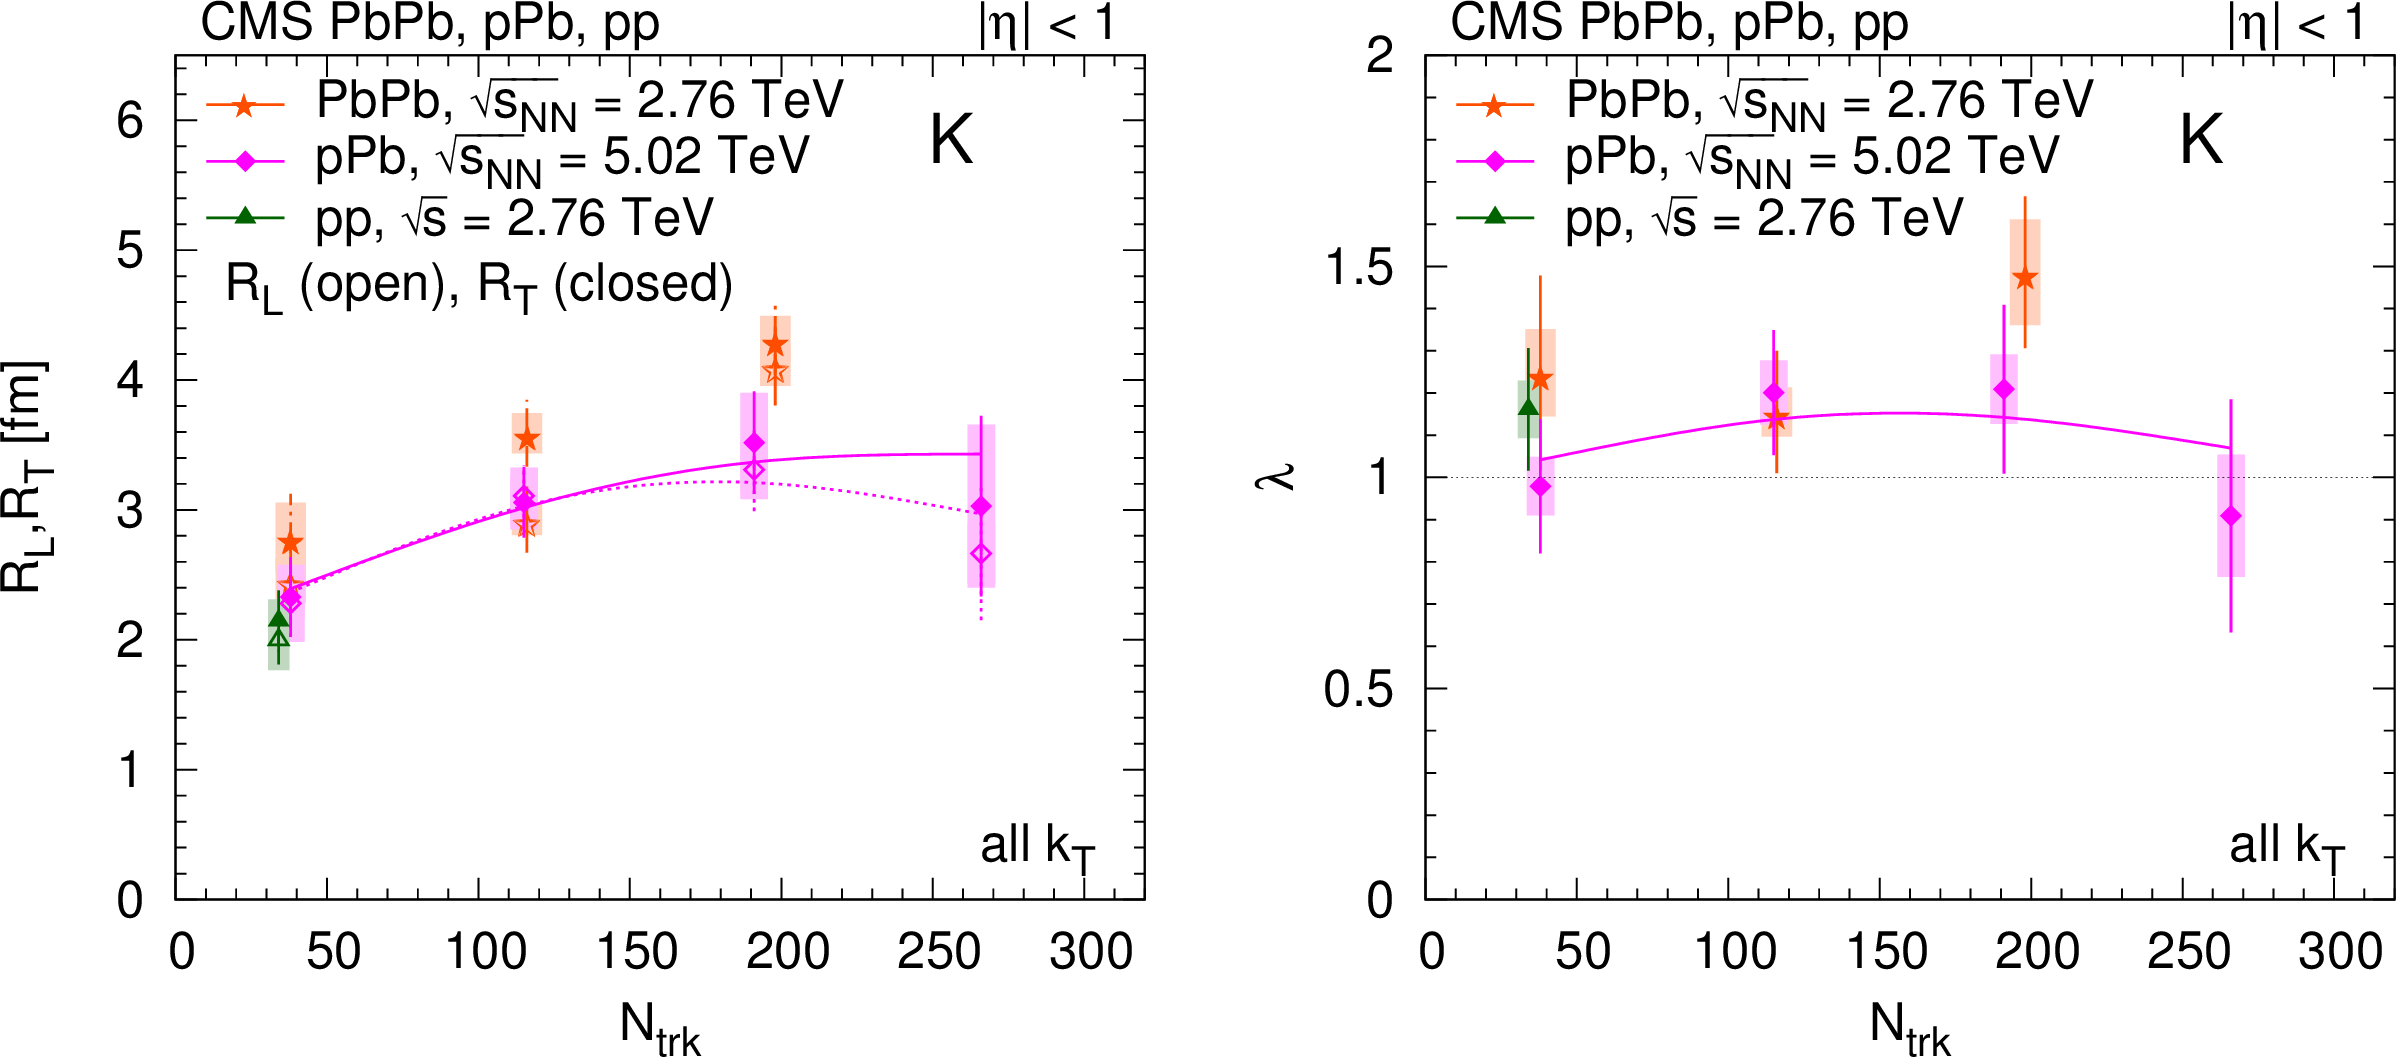
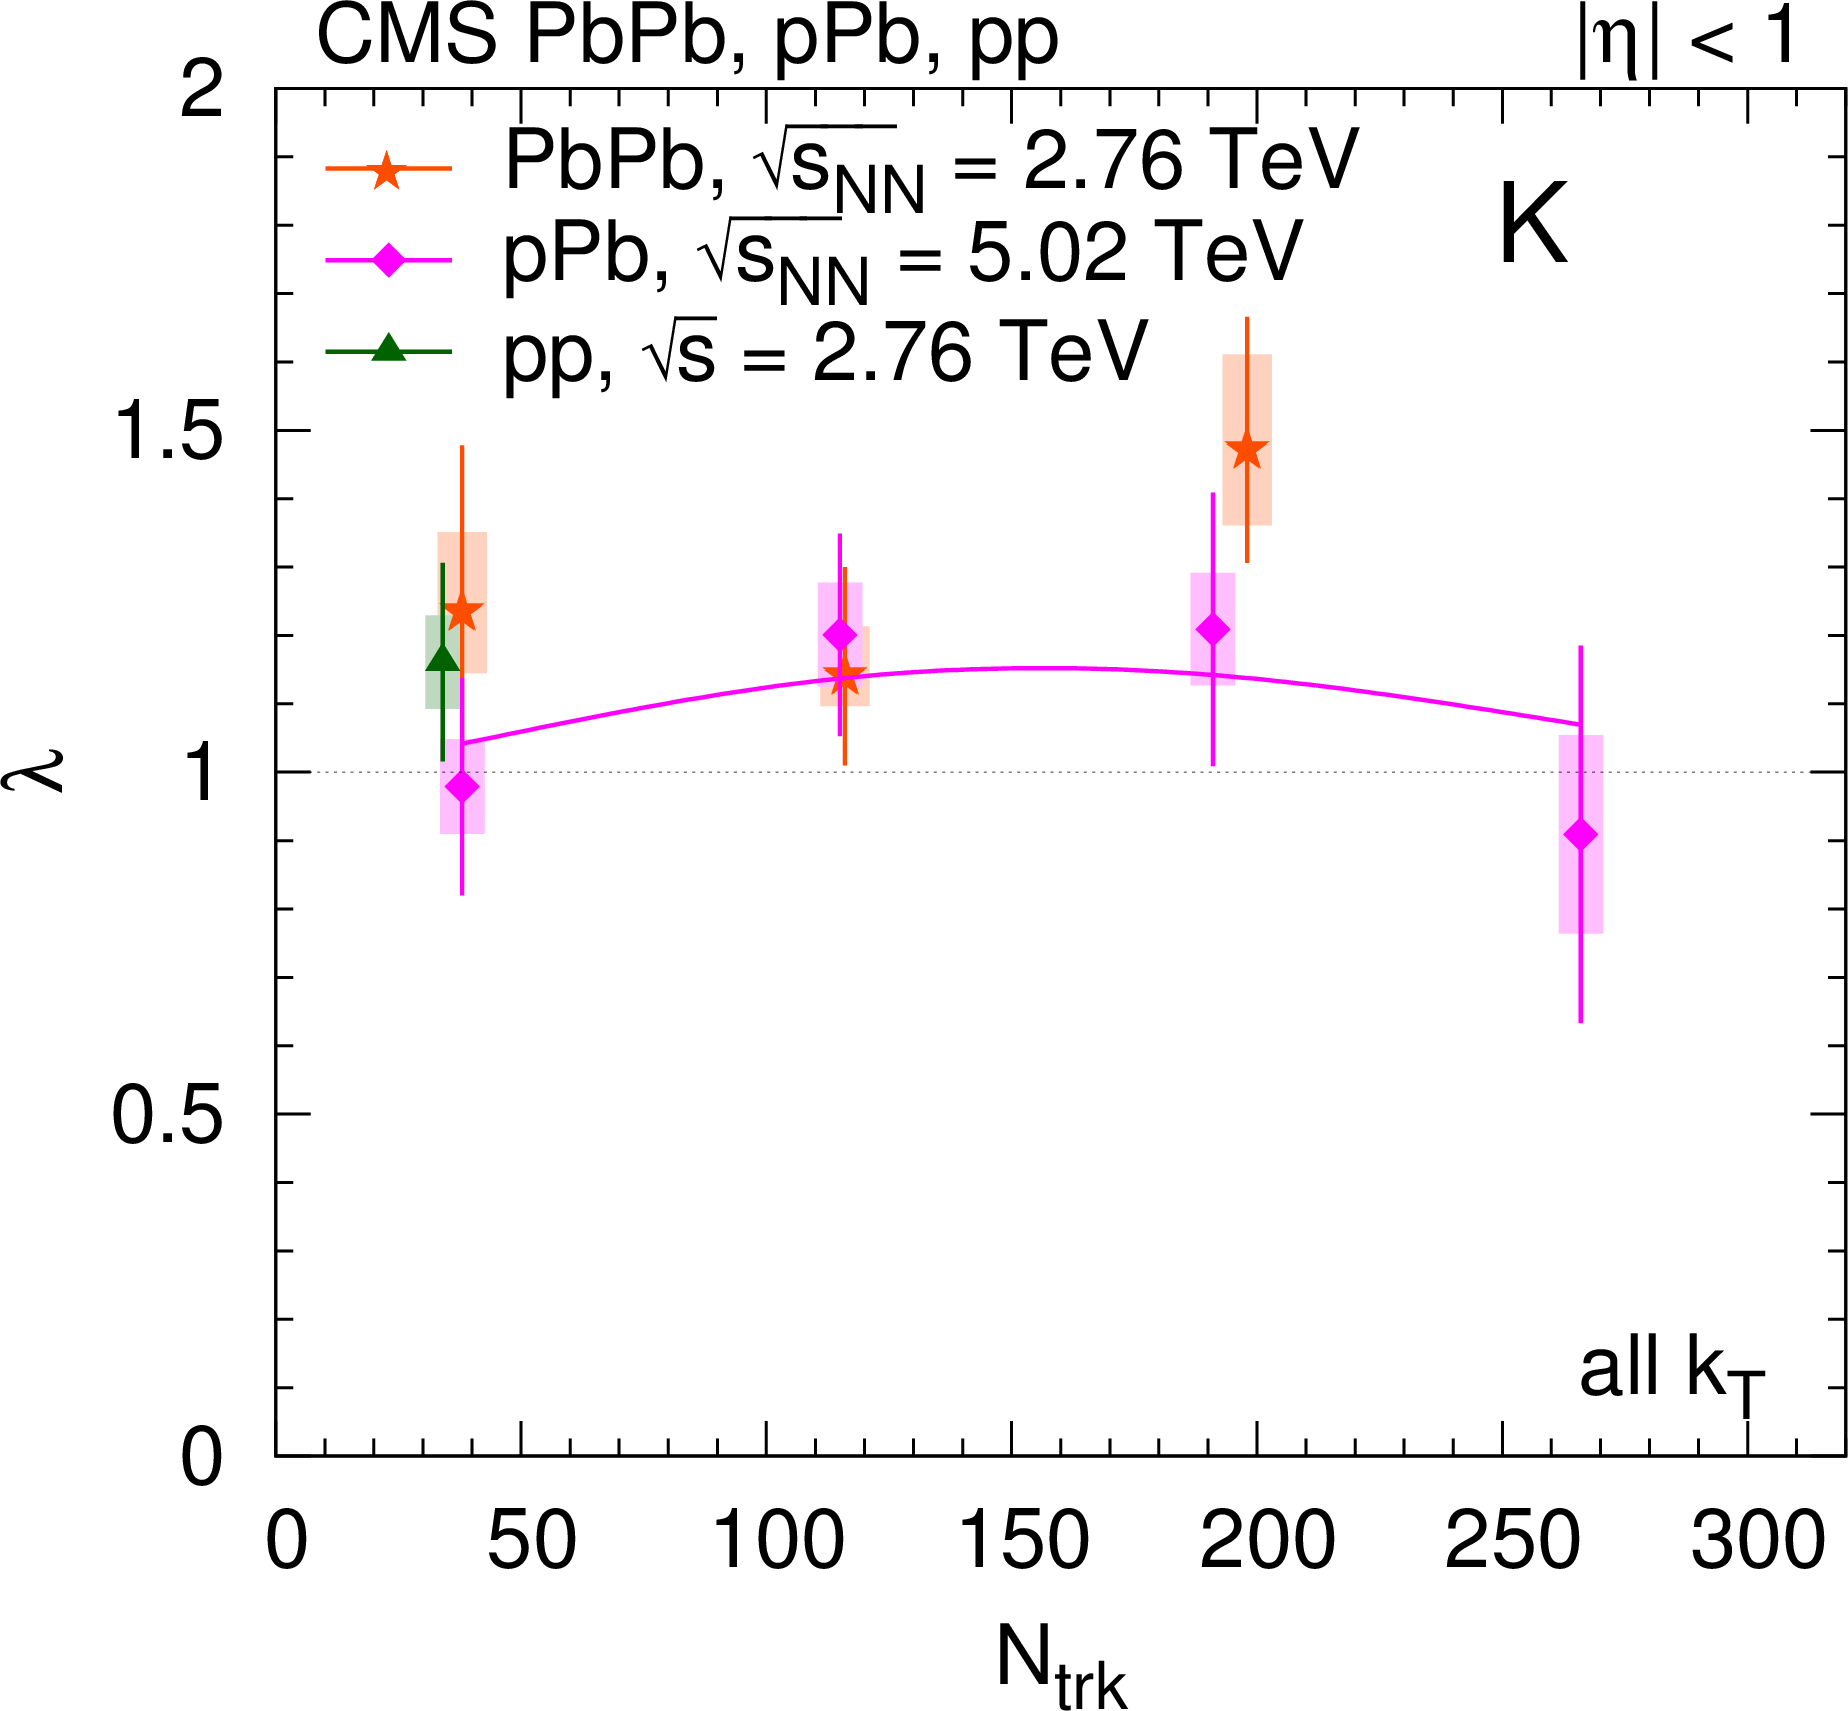
Track-multiplicity ($ {N_\text {trk}} $) dependence of the 2D kaon radius parameters (left; $ {R_\text {L}} $ - open symbols, $ {R_\text {T}} $ - closed symbols) and intercept parameter $\lambda $ (right), obtained from fits (integrated over all $ {k_{\mathrm {T}}} $) for all collision systems studied. For better visibility, only every second measurement is plotted. Lines are drawn to guide the eye. |

png pdf |
Figure 26-a:
Track-multiplicity ($ {N_\text {trk}} $) dependence of the 2D kaon radius parameters (left; $ {R_\text {L}} $ - open symbols, $ {R_\text {T}} $ - closed symbols) and intercept parameter $\lambda $ (right), obtained from fits (integrated over all $ {k_{\mathrm {T}}} $) for all collision systems studied. For better visibility, only every second measurement is plotted. Lines are drawn to guide the eye. |
png pdf |
Figure 26-b:
Track-multiplicity ($ {N_\text {trk}} $) dependence of the 2D kaon radius parameters (left; $ {R_\text {L}} $ - open symbols, $ {R_\text {T}} $ - closed symbols) and intercept parameter $\lambda $ (right), obtained from fits (integrated over all $ {k_{\mathrm {T}}} $) for all collision systems studied. For better visibility, only every second measurement is plotted. Lines are drawn to guide the eye. |
png pdf |
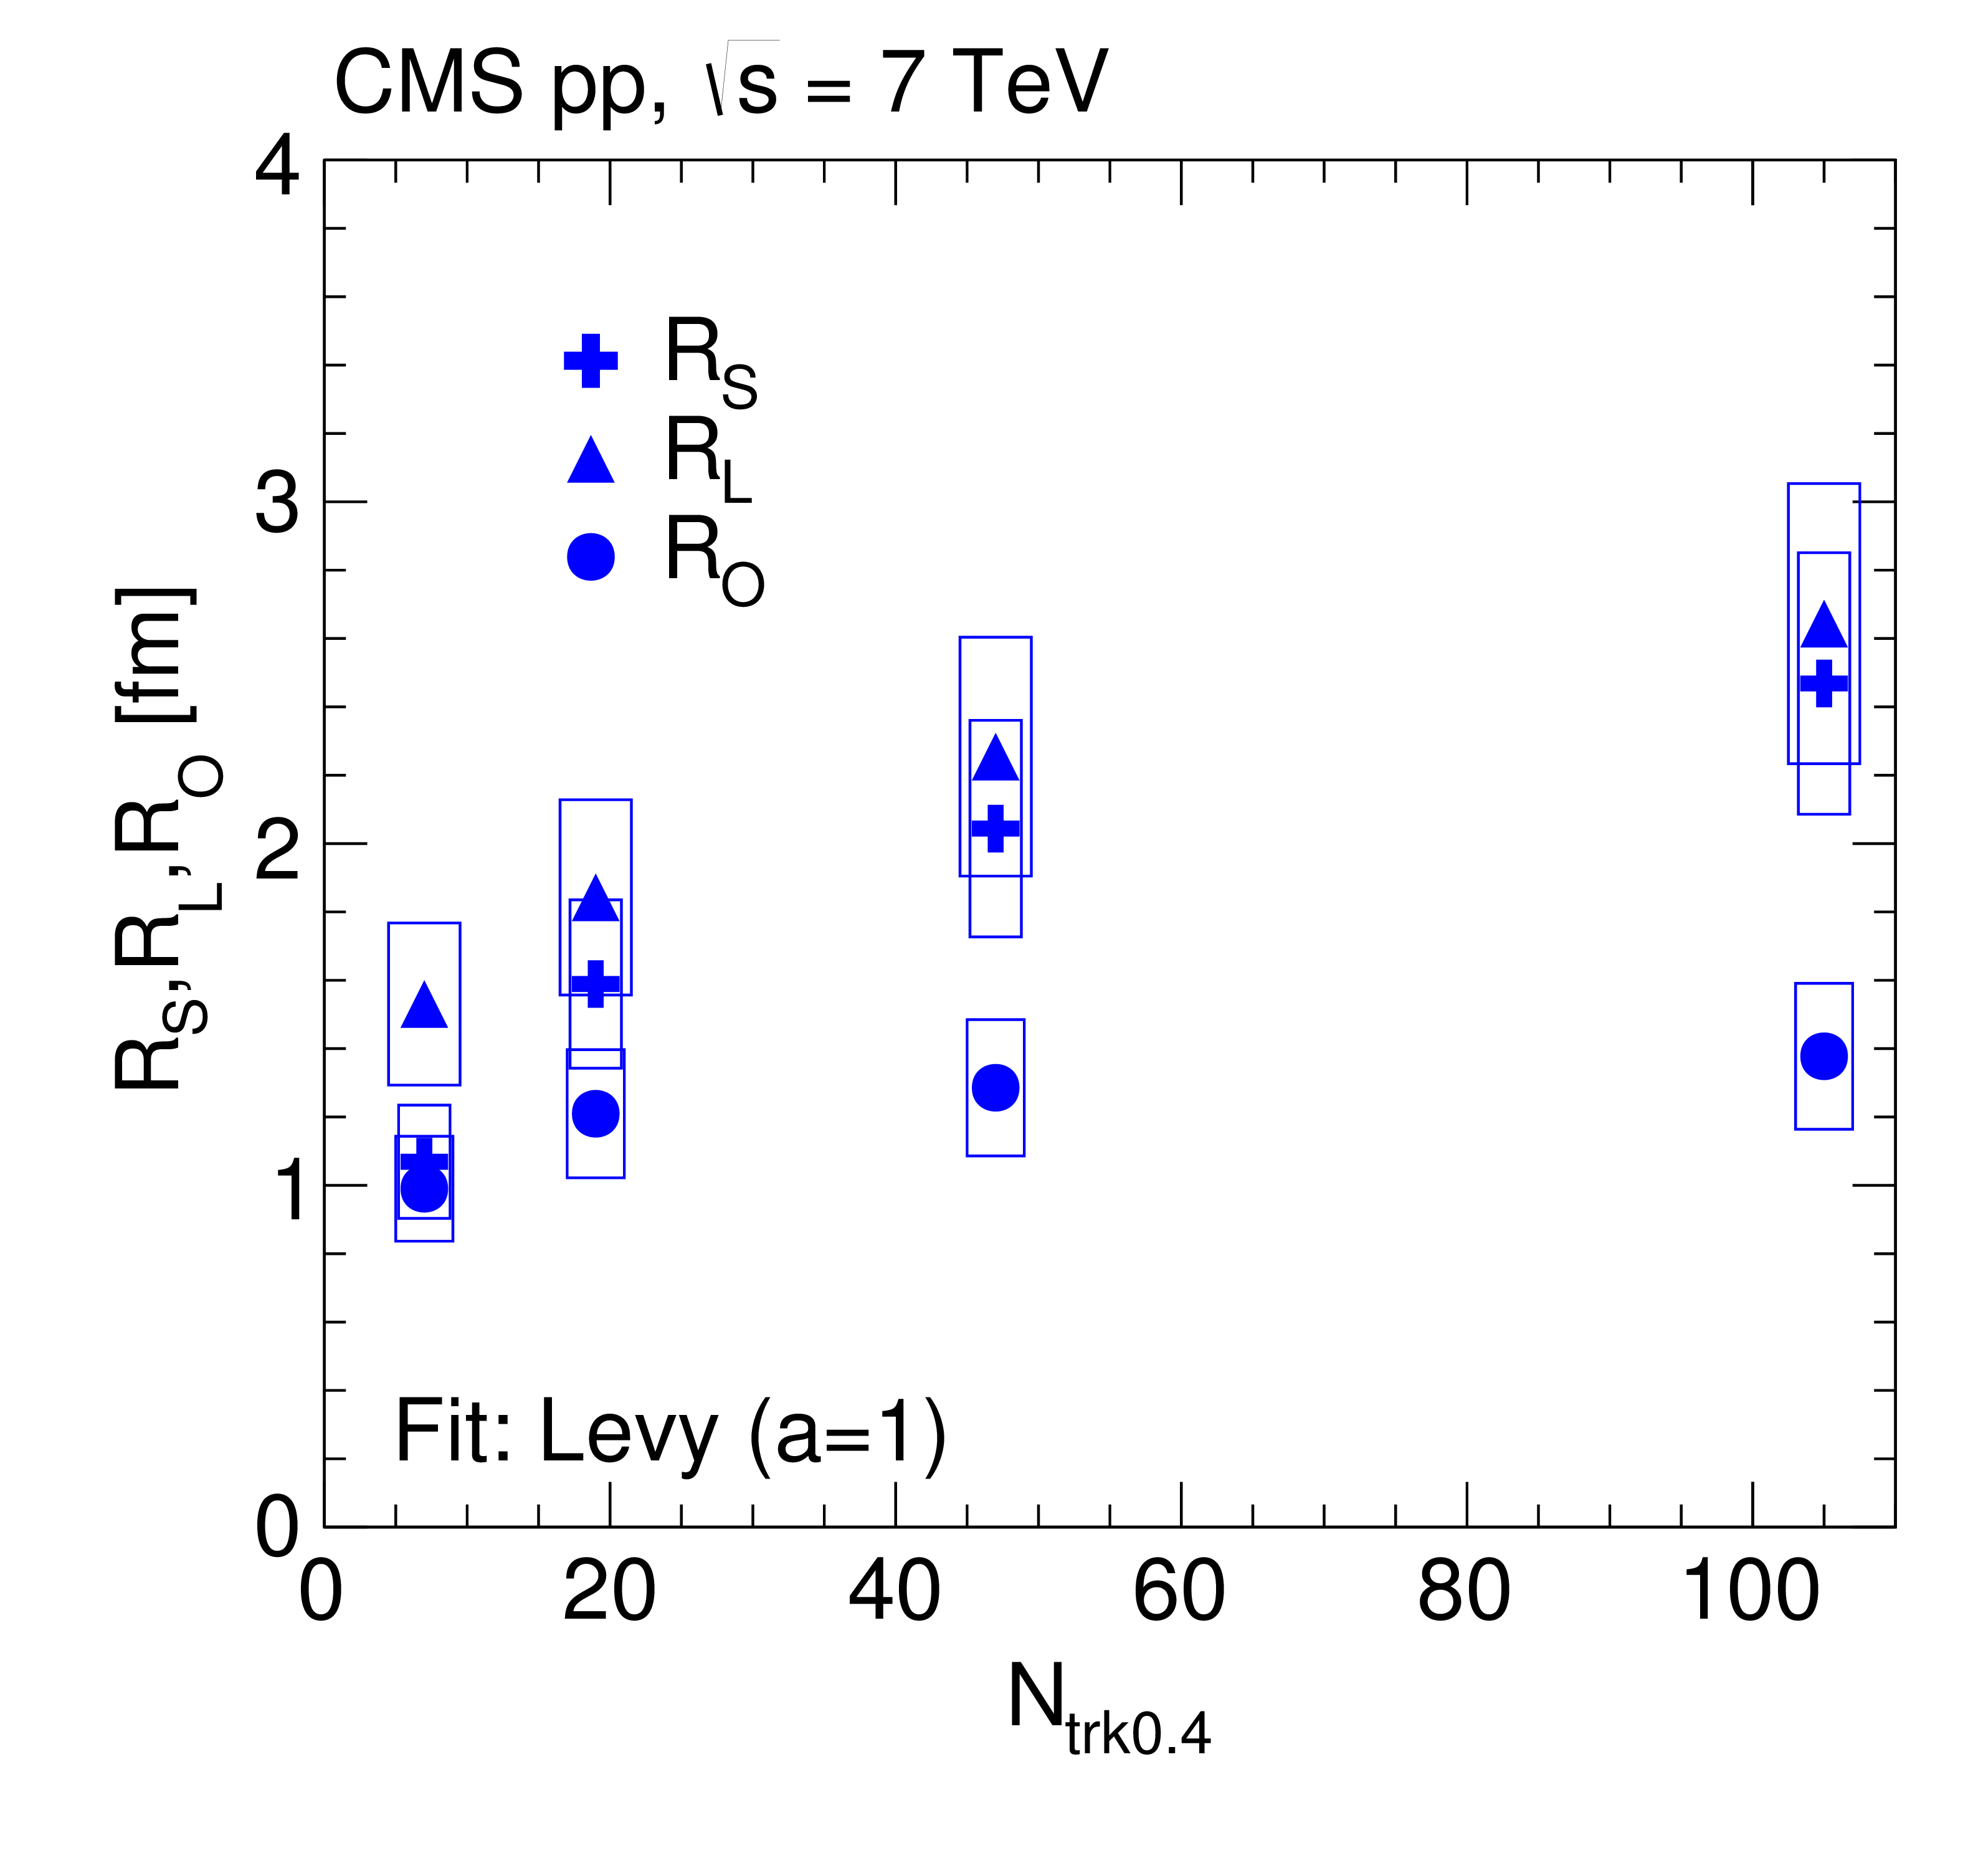
Figure 27:
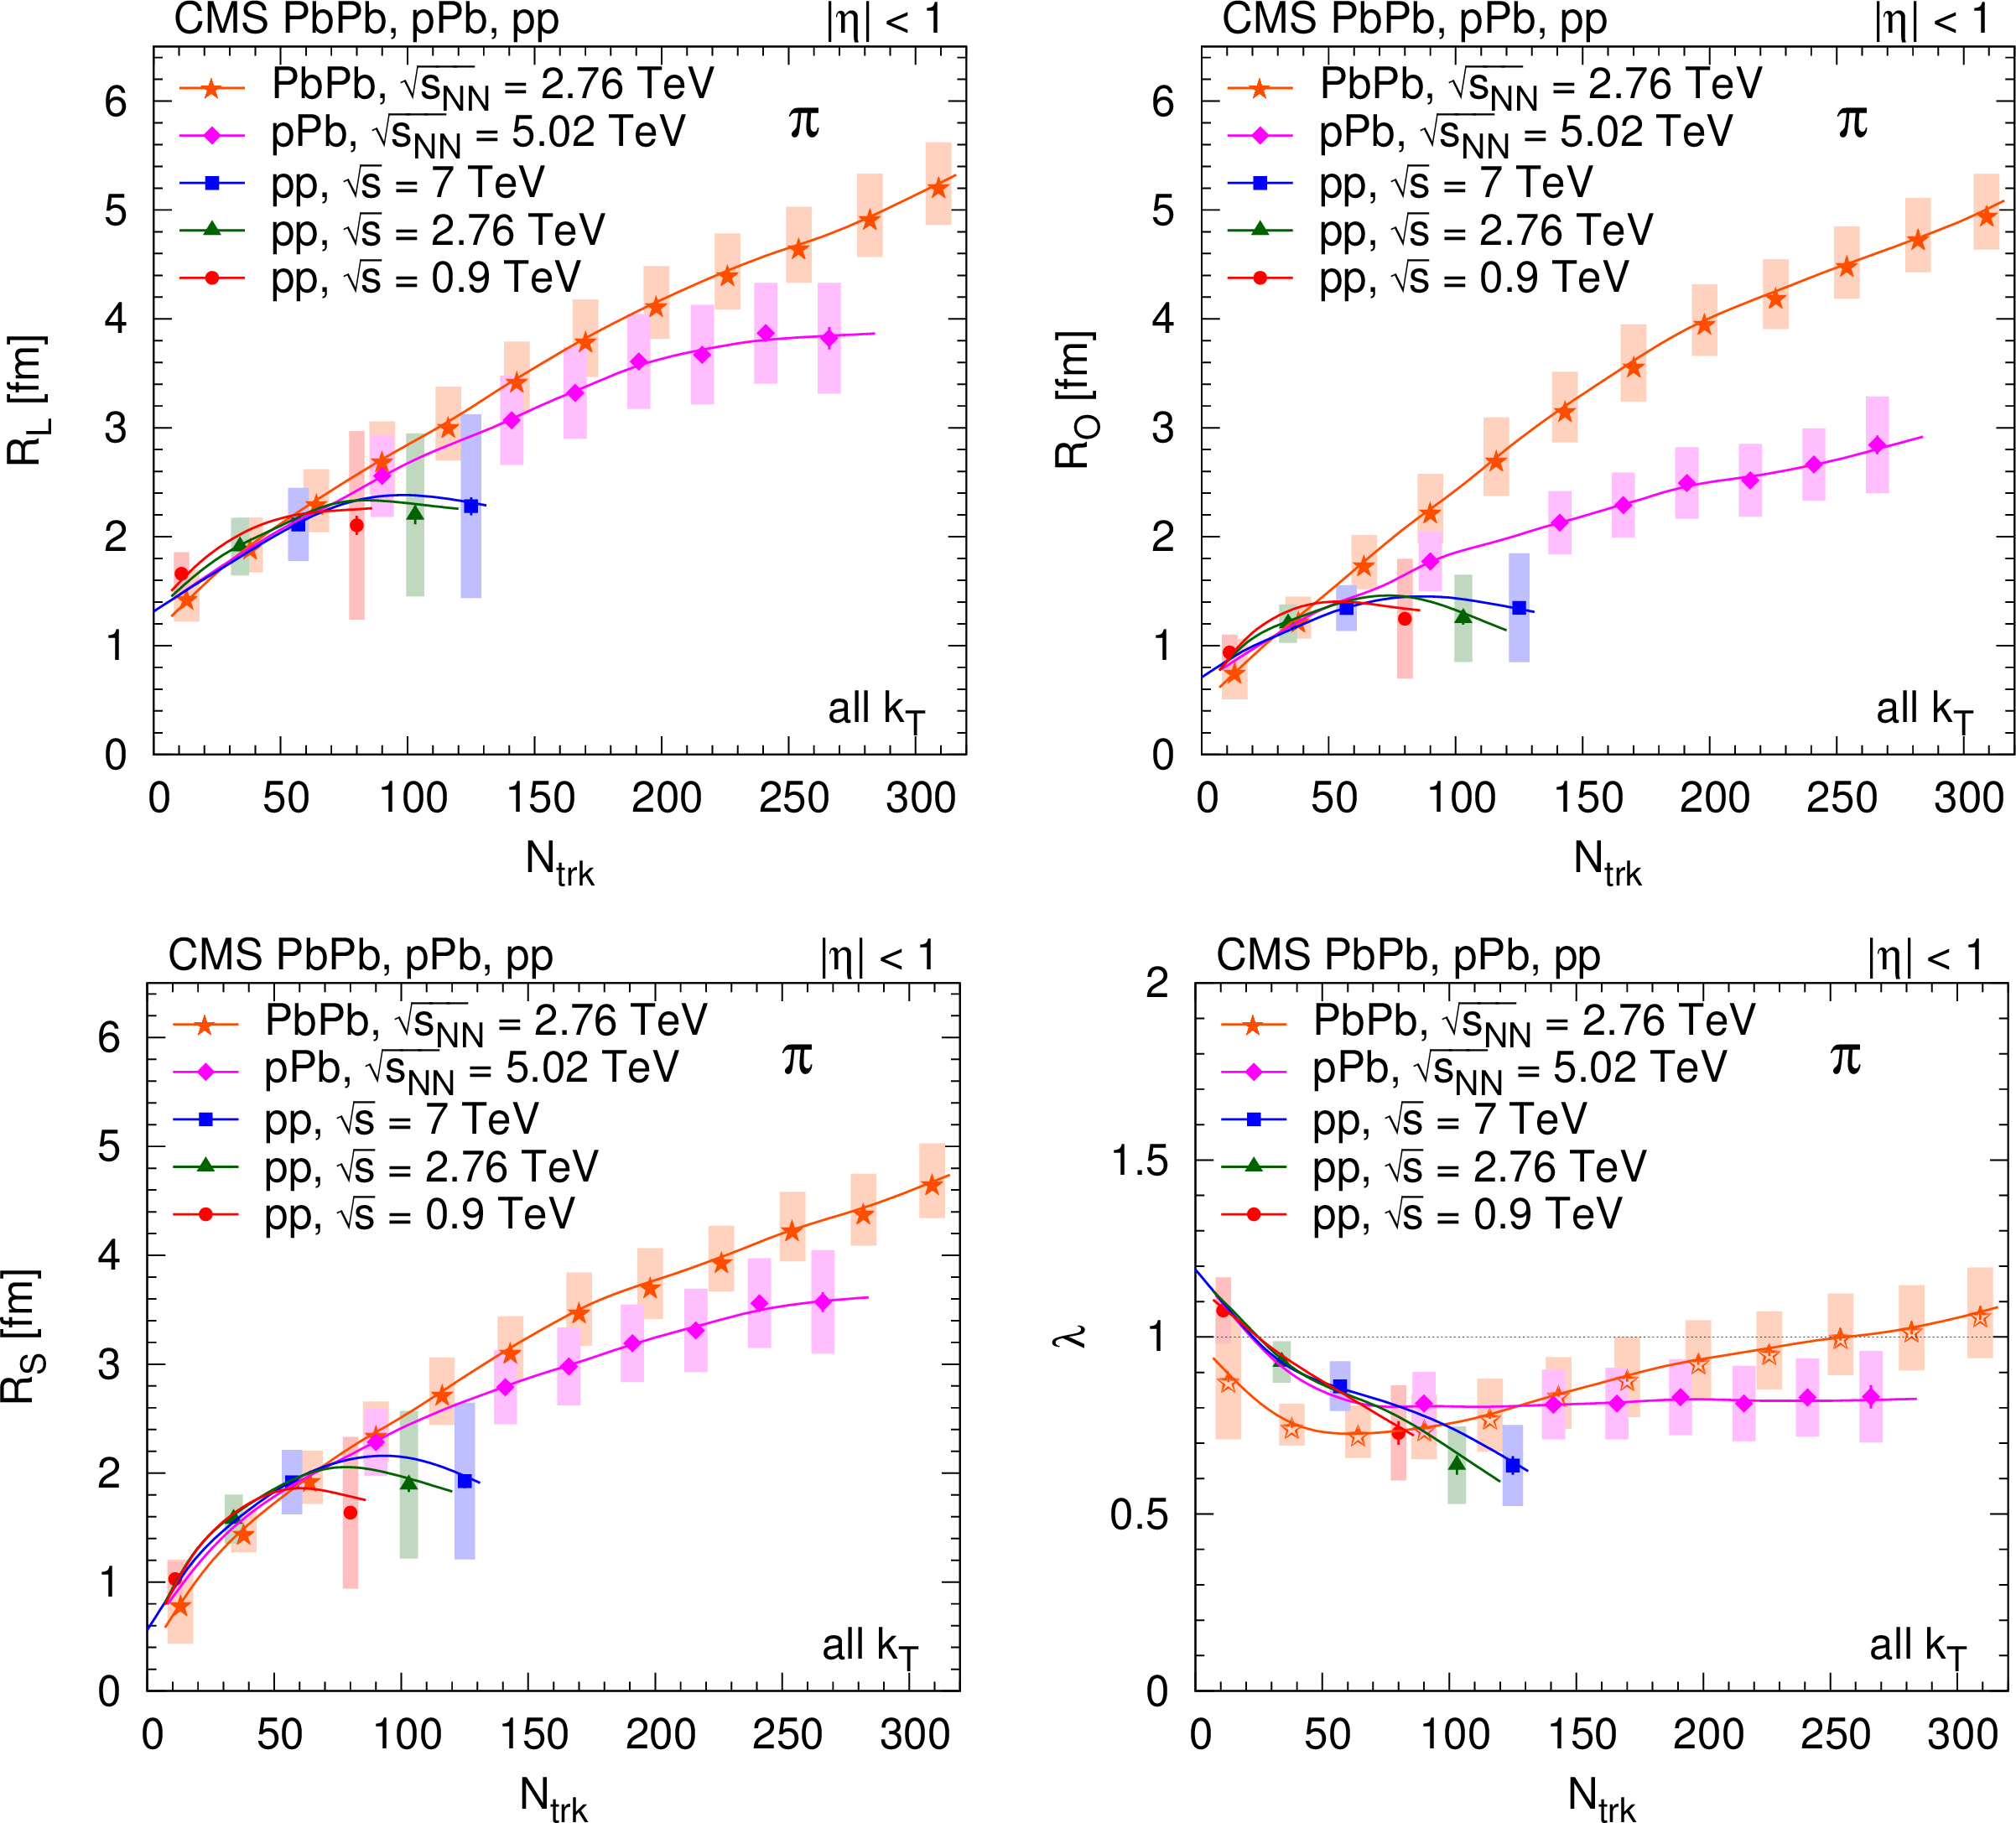
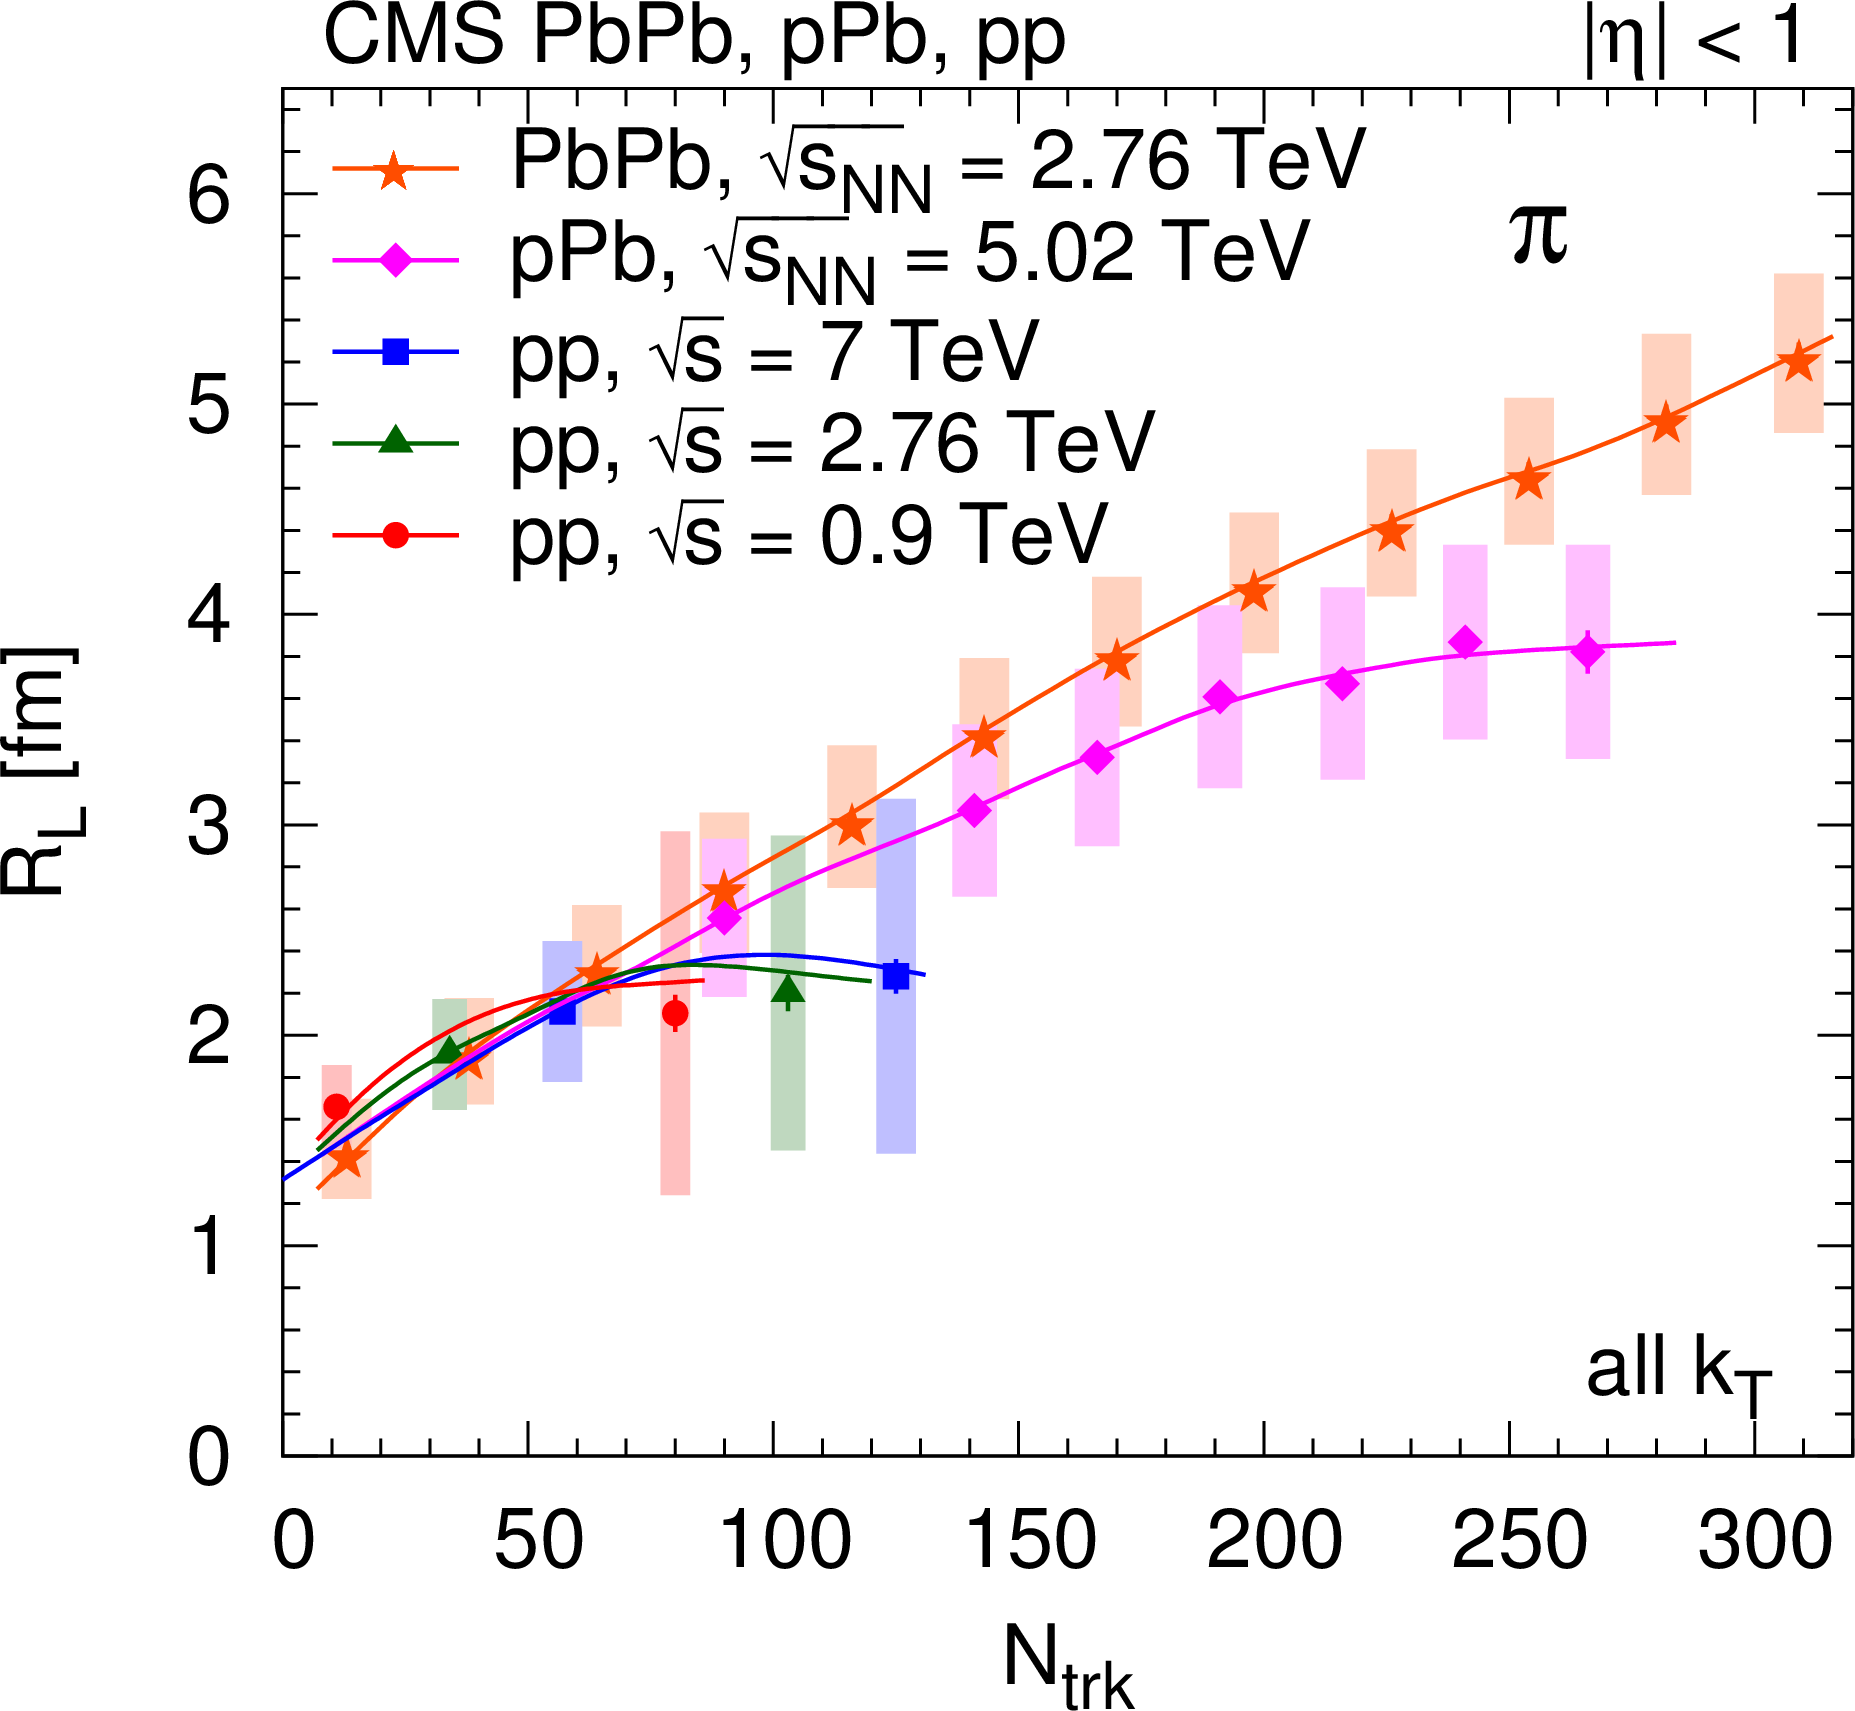
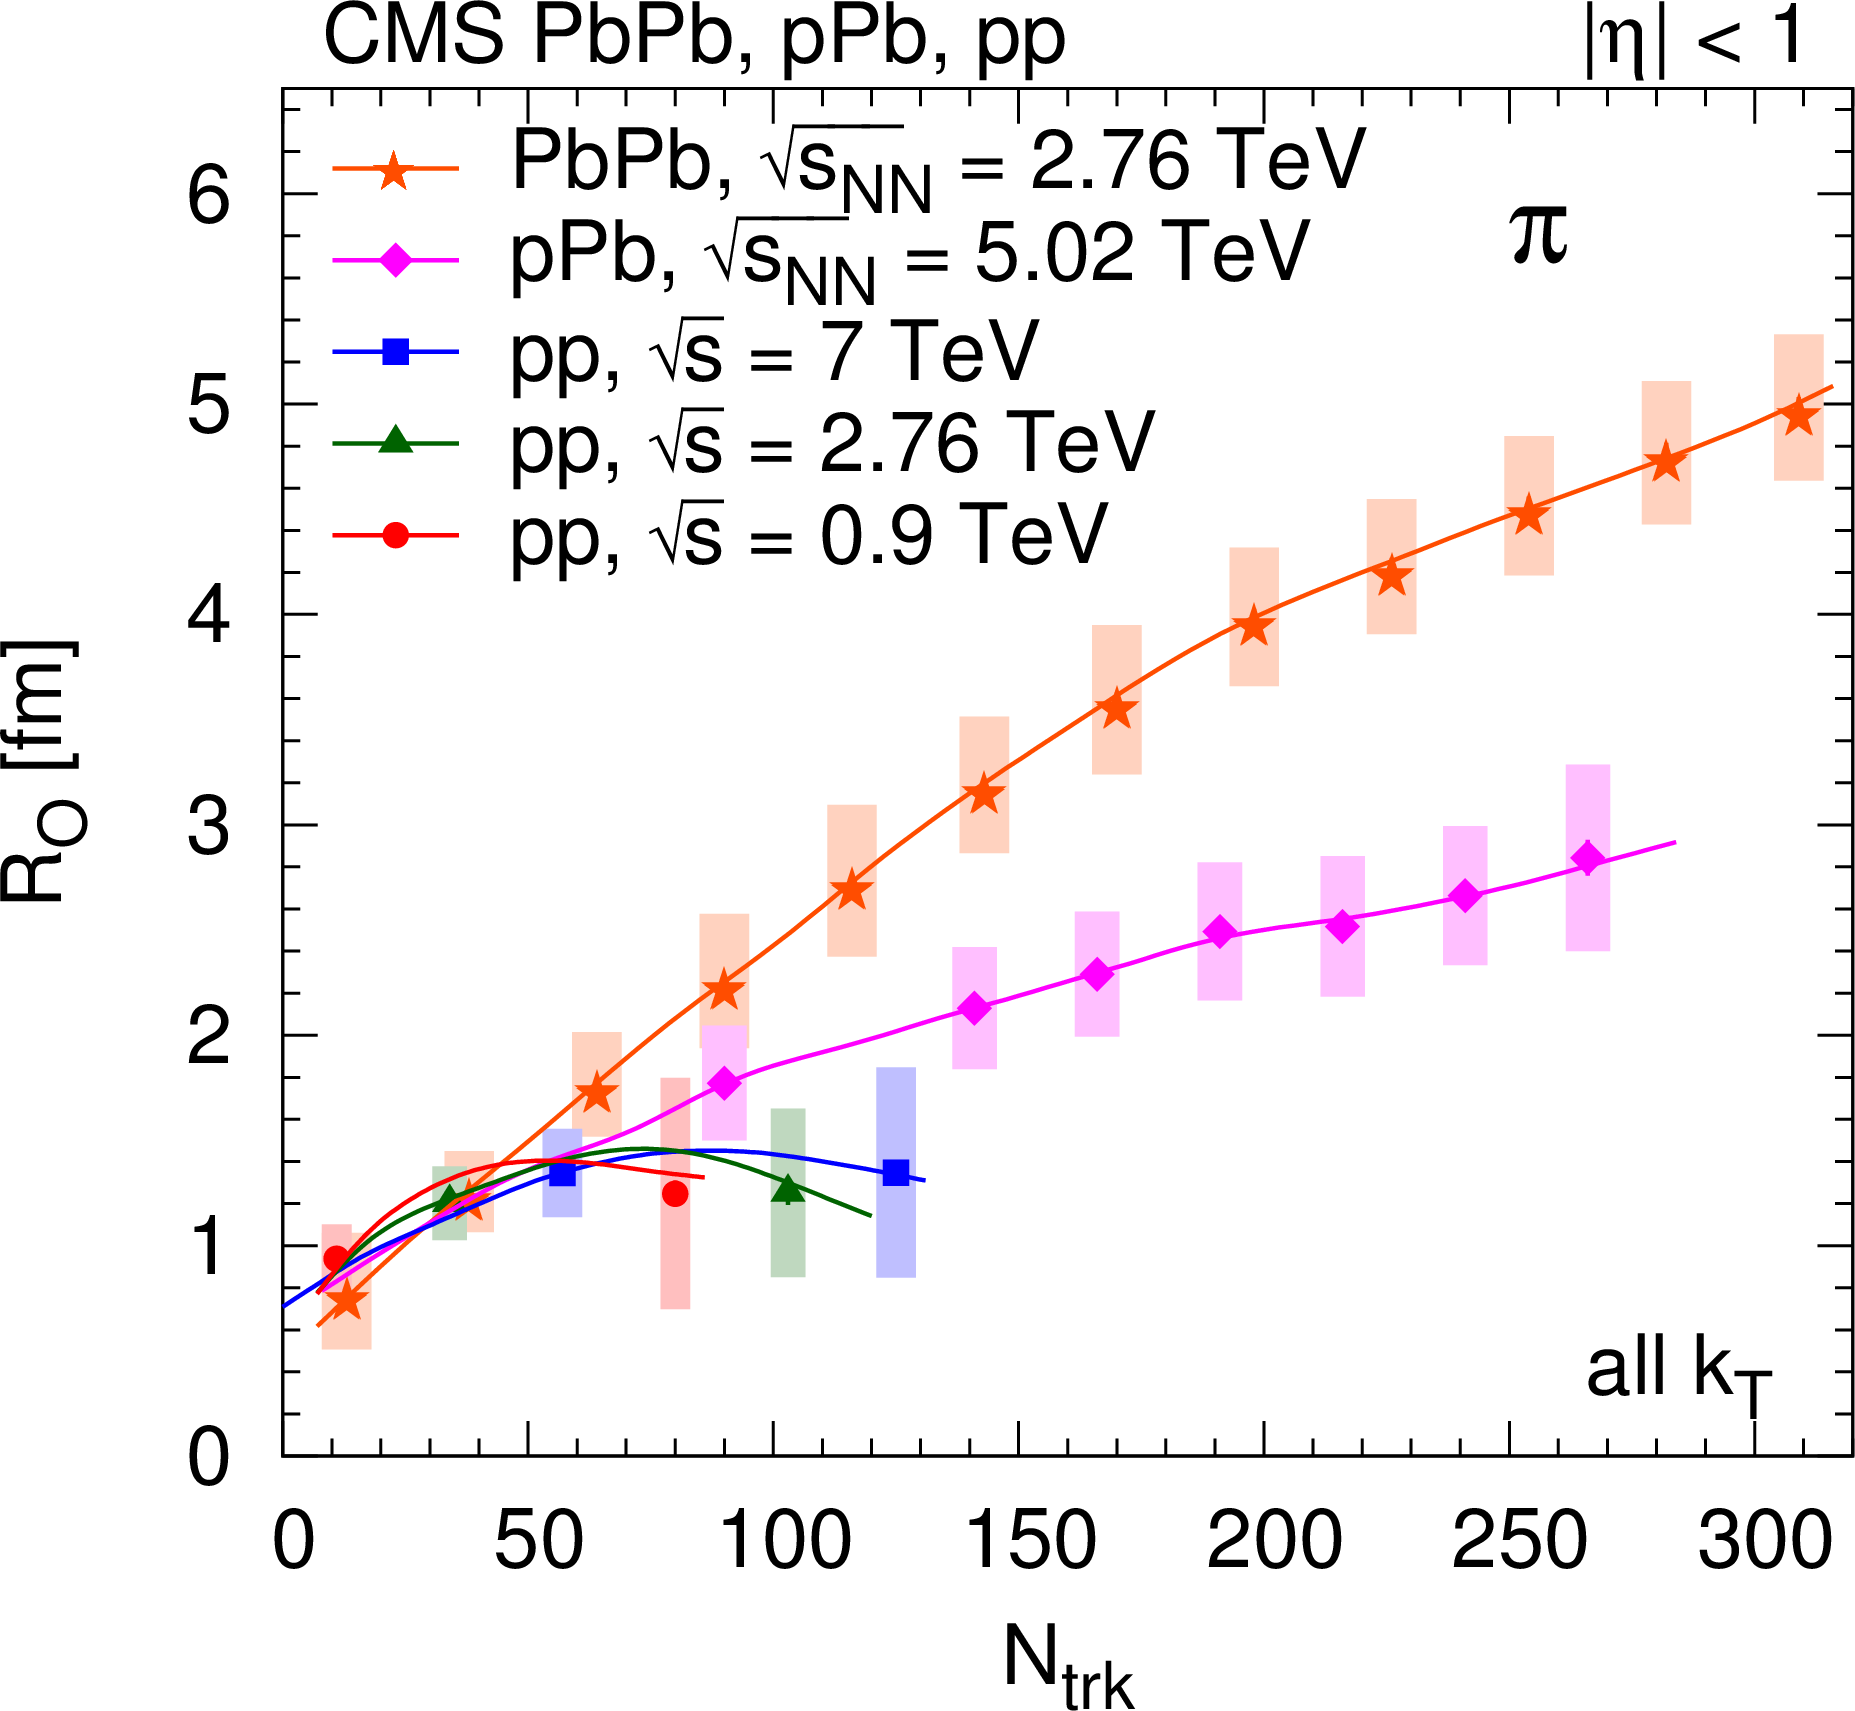
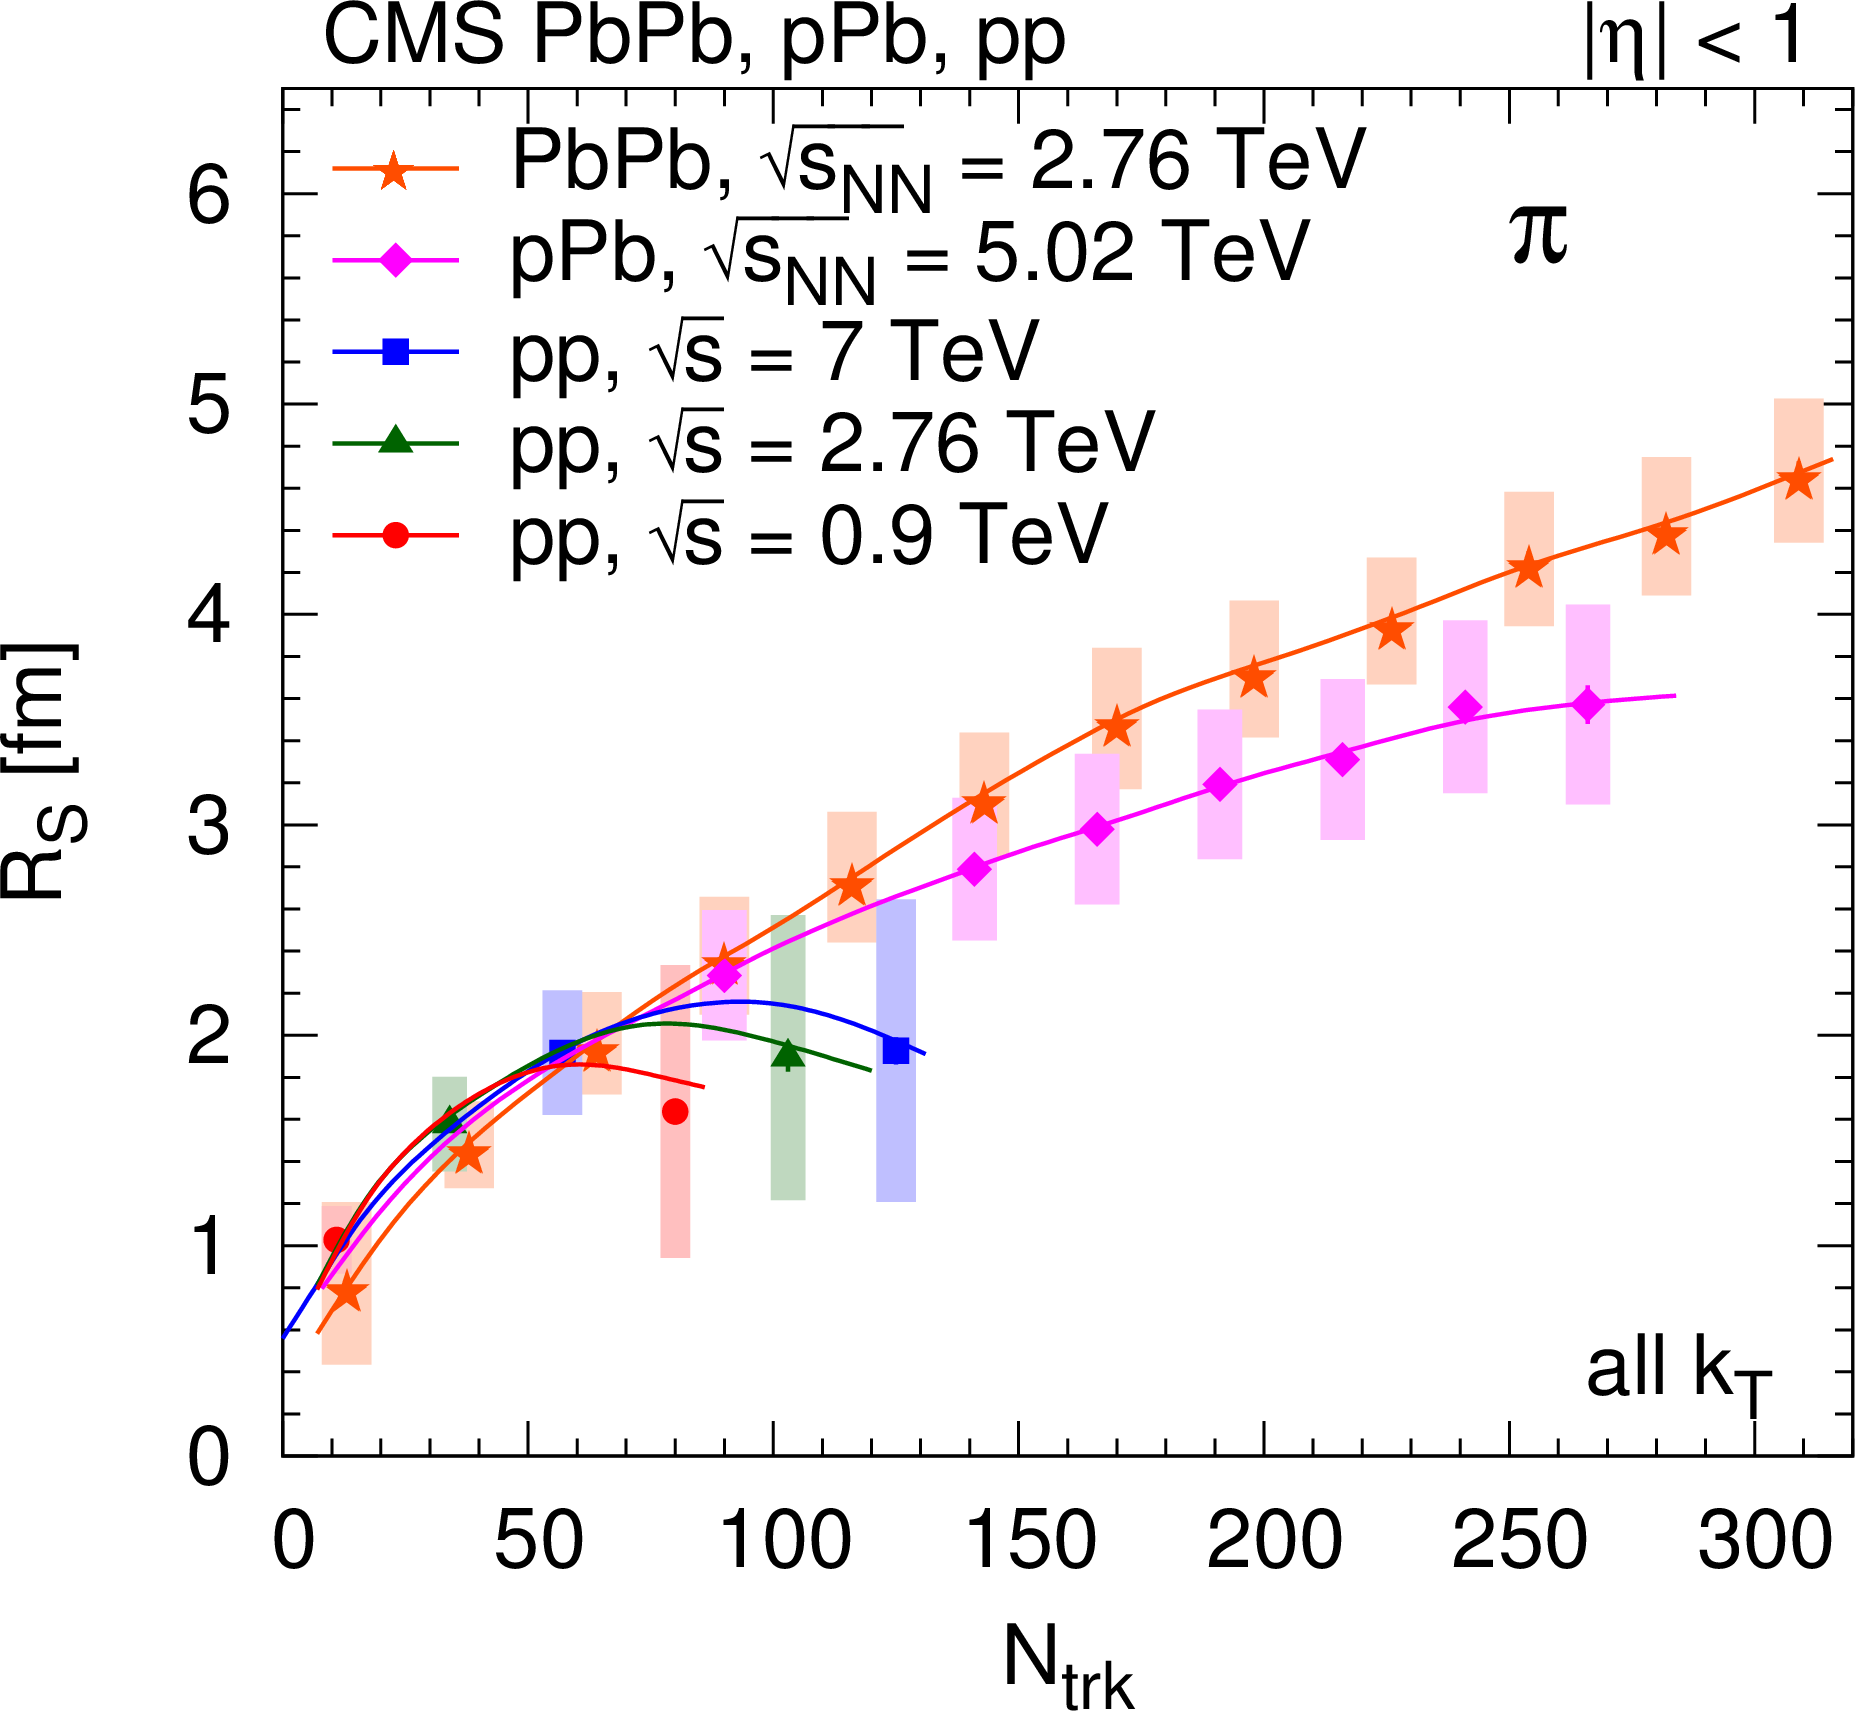
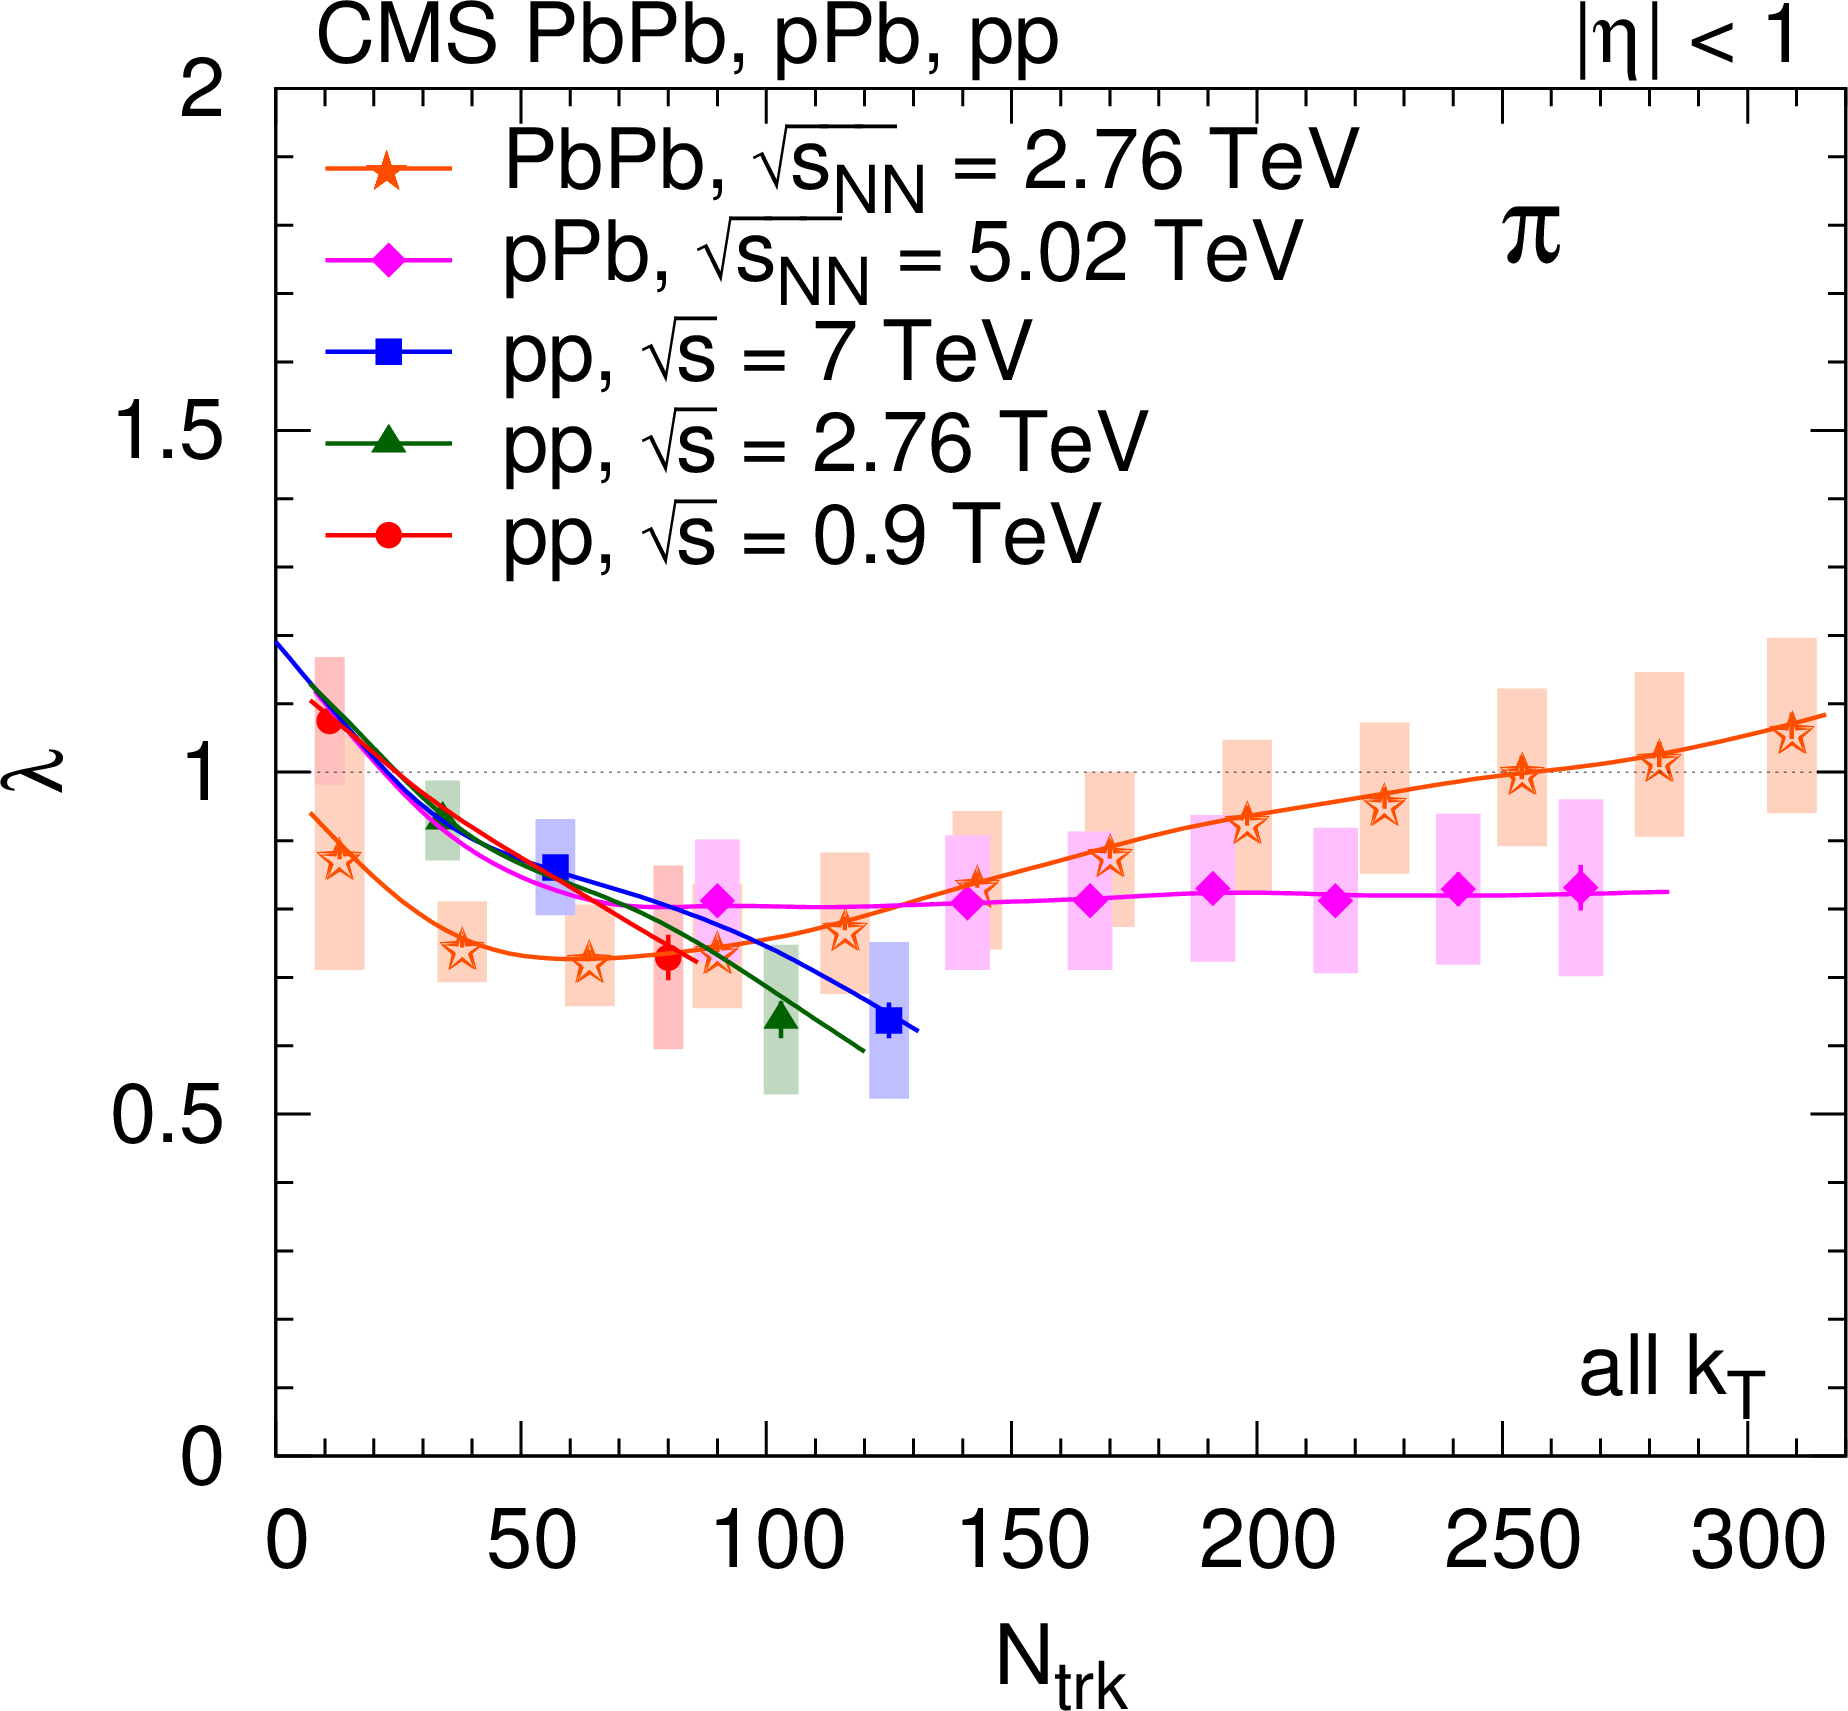
Track-multiplicity ($ {N_\text {trk}} $) dependence of the 3D pion radius parameters $ {R_\text {L}} $ (top left), $ {R_\text {O}} $ (top right), $ {R_\text {S}} $ (bottom left), and the intercept parameter $\lambda $ (bottom right), obtained from fits (integrated over all $ {k_{\mathrm {T}}} $) for all collision systems studied. For better visibility, only every second measurement is plotted. Lines are drawn to guide the eye. |
png pdf |
Figure 27-a:
Track-multiplicity ($ {N_\text {trk}} $) dependence of the 3D pion radius parameters $ {R_\text {L}} $ (top left), $ {R_\text {O}} $ (top right), $ {R_\text {S}} $ (bottom left), and the intercept parameter $\lambda $ (bottom right), obtained from fits (integrated over all $ {k_{\mathrm {T}}} $) for all collision systems studied. For better visibility, only every second measurement is plotted. Lines are drawn to guide the eye. |
png pdf |
Figure 27-b:
Track-multiplicity ($ {N_\text {trk}} $) dependence of the 3D pion radius parameters $ {R_\text {L}} $ (top left), $ {R_\text {O}} $ (top right), $ {R_\text {S}} $ (bottom left), and the intercept parameter $\lambda $ (bottom right), obtained from fits (integrated over all $ {k_{\mathrm {T}}} $) for all collision systems studied. For better visibility, only every second measurement is plotted. Lines are drawn to guide the eye. |
png pdf |
Figure 27-c:
Track-multiplicity ($ {N_\text {trk}} $) dependence of the 3D pion radius parameters $ {R_\text {L}} $ (top left), $ {R_\text {O}} $ (top right), $ {R_\text {S}} $ (bottom left), and the intercept parameter $\lambda $ (bottom right), obtained from fits (integrated over all $ {k_{\mathrm {T}}} $) for all collision systems studied. For better visibility, only every second measurement is plotted. Lines are drawn to guide the eye. |
png pdf |
Figure 27-d:
Track-multiplicity ($ {N_\text {trk}} $) dependence of the 3D pion radius parameters $ {R_\text {L}} $ (top left), $ {R_\text {O}} $ (top right), $ {R_\text {S}} $ (bottom left), and the intercept parameter $\lambda $ (bottom right), obtained from fits (integrated over all $ {k_{\mathrm {T}}} $) for all collision systems studied. For better visibility, only every second measurement is plotted. Lines are drawn to guide the eye. |
png pdf |
Figure 28:
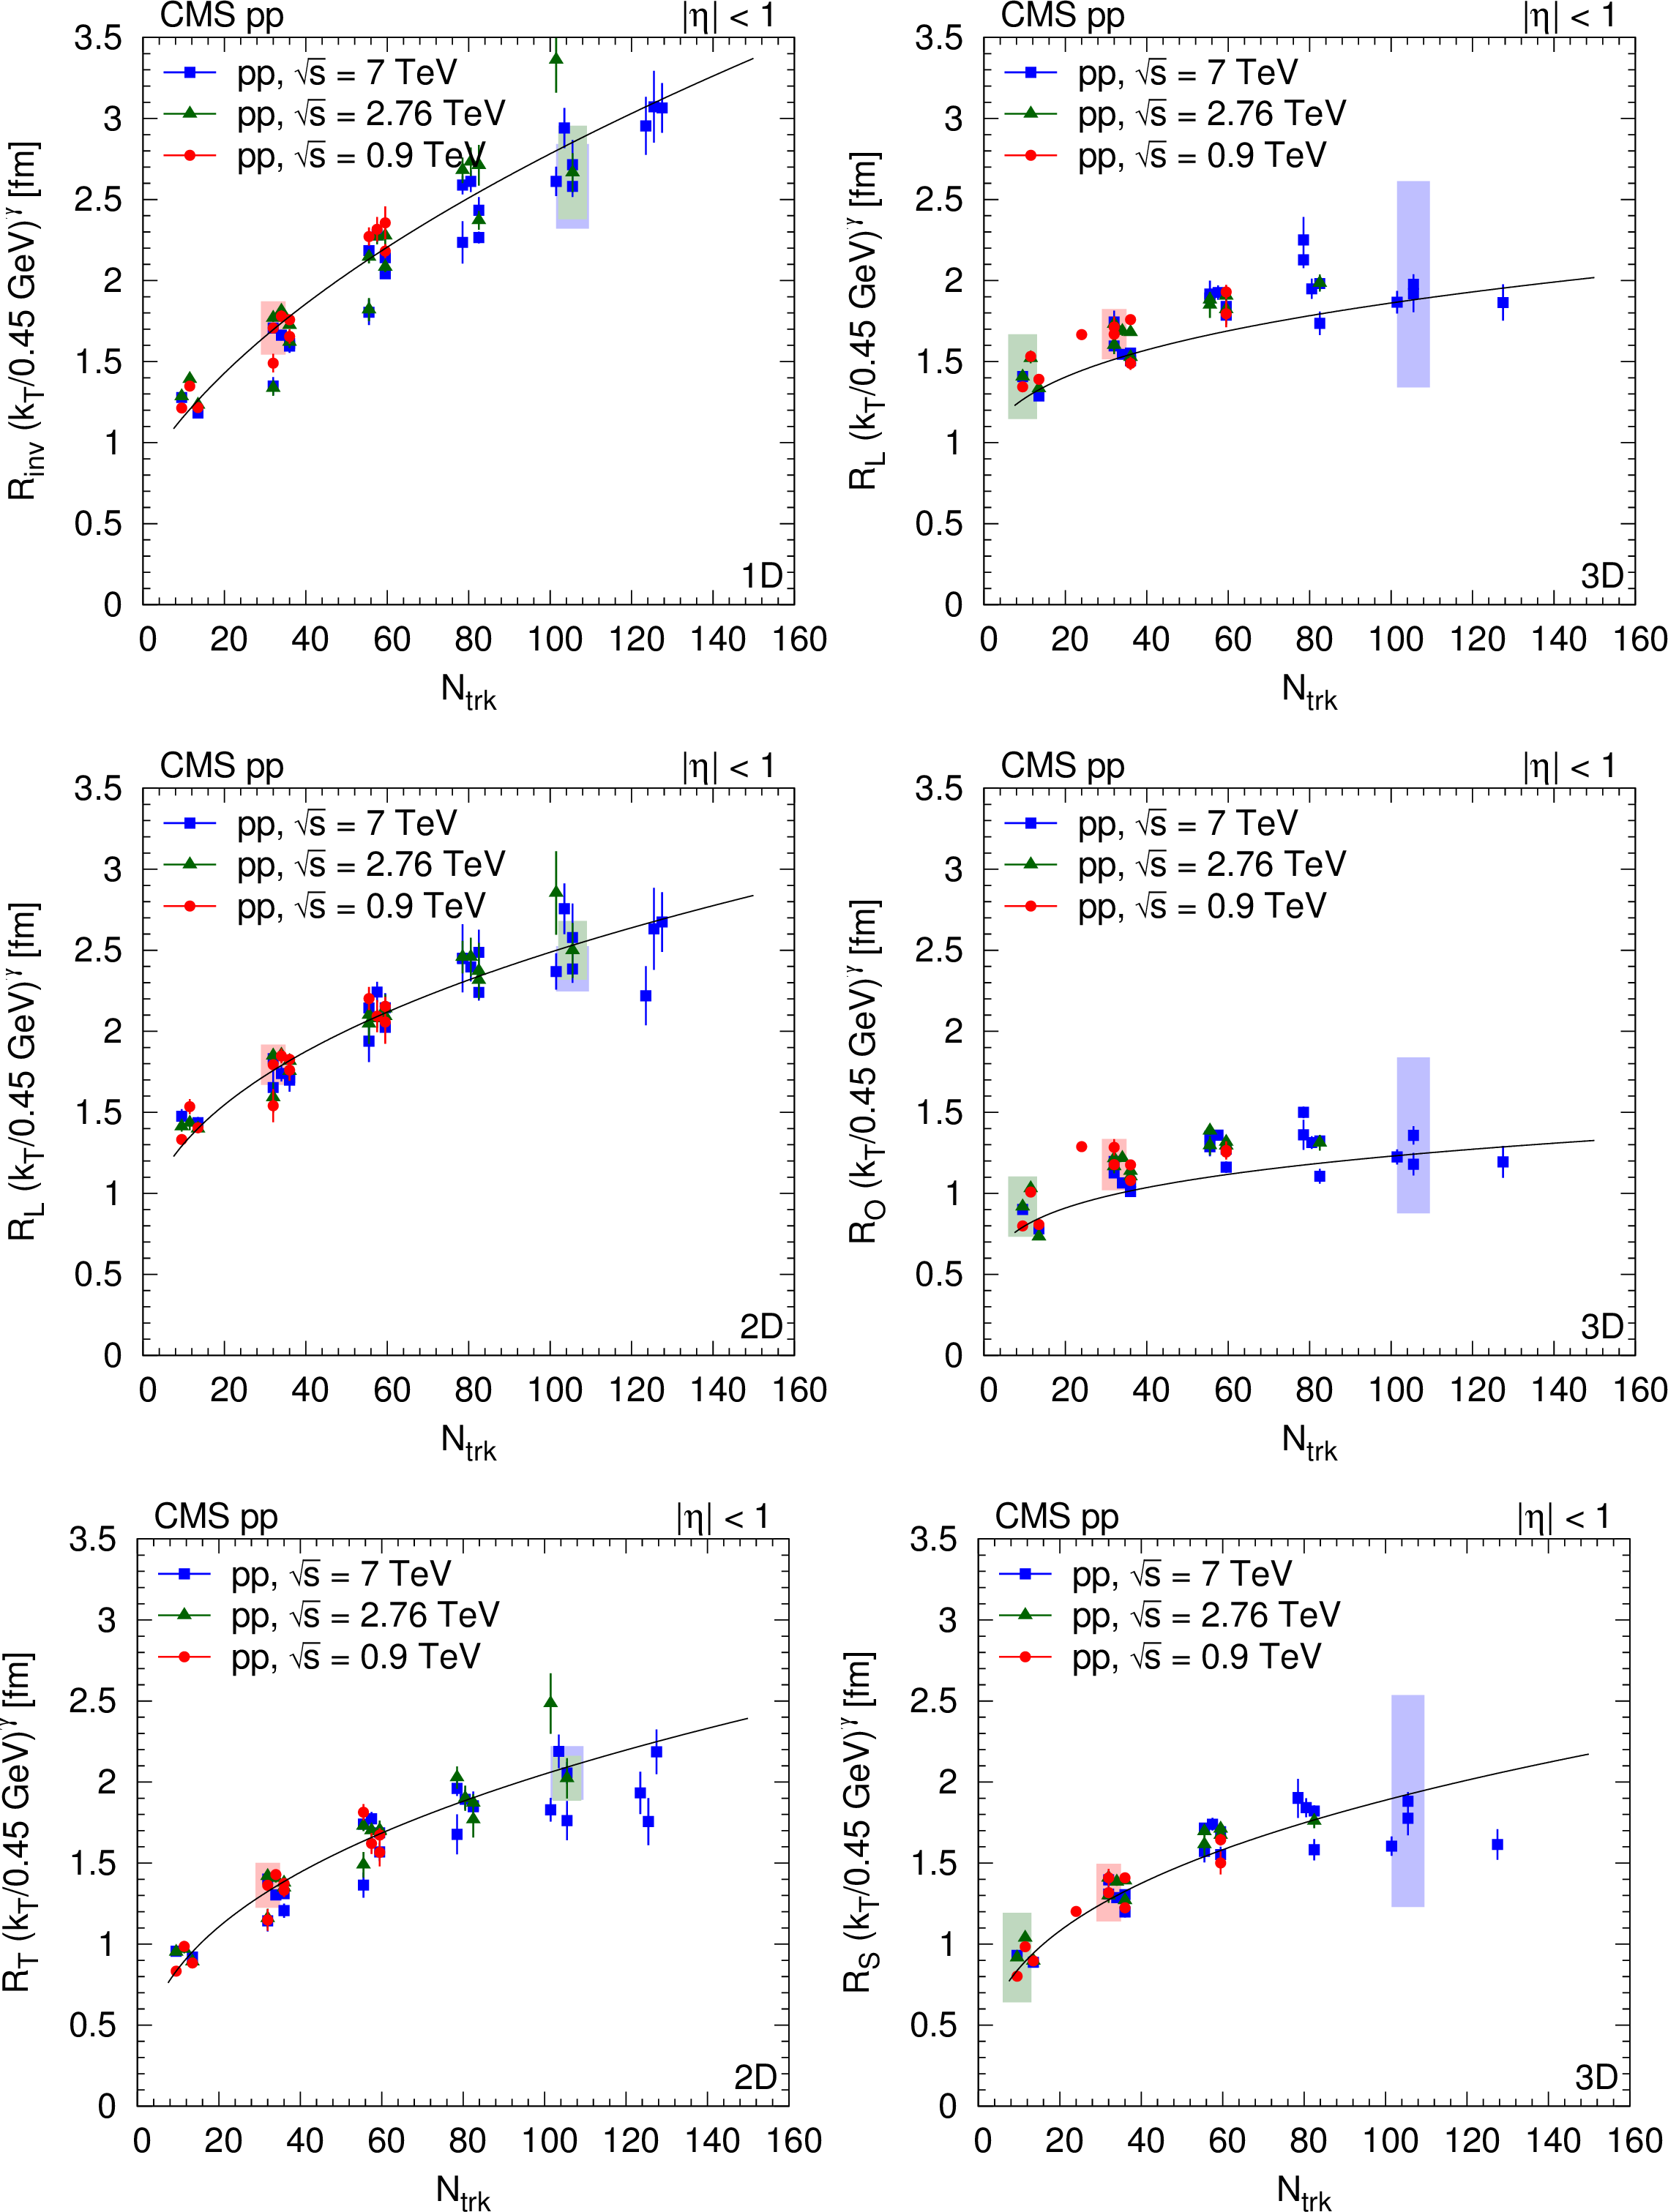
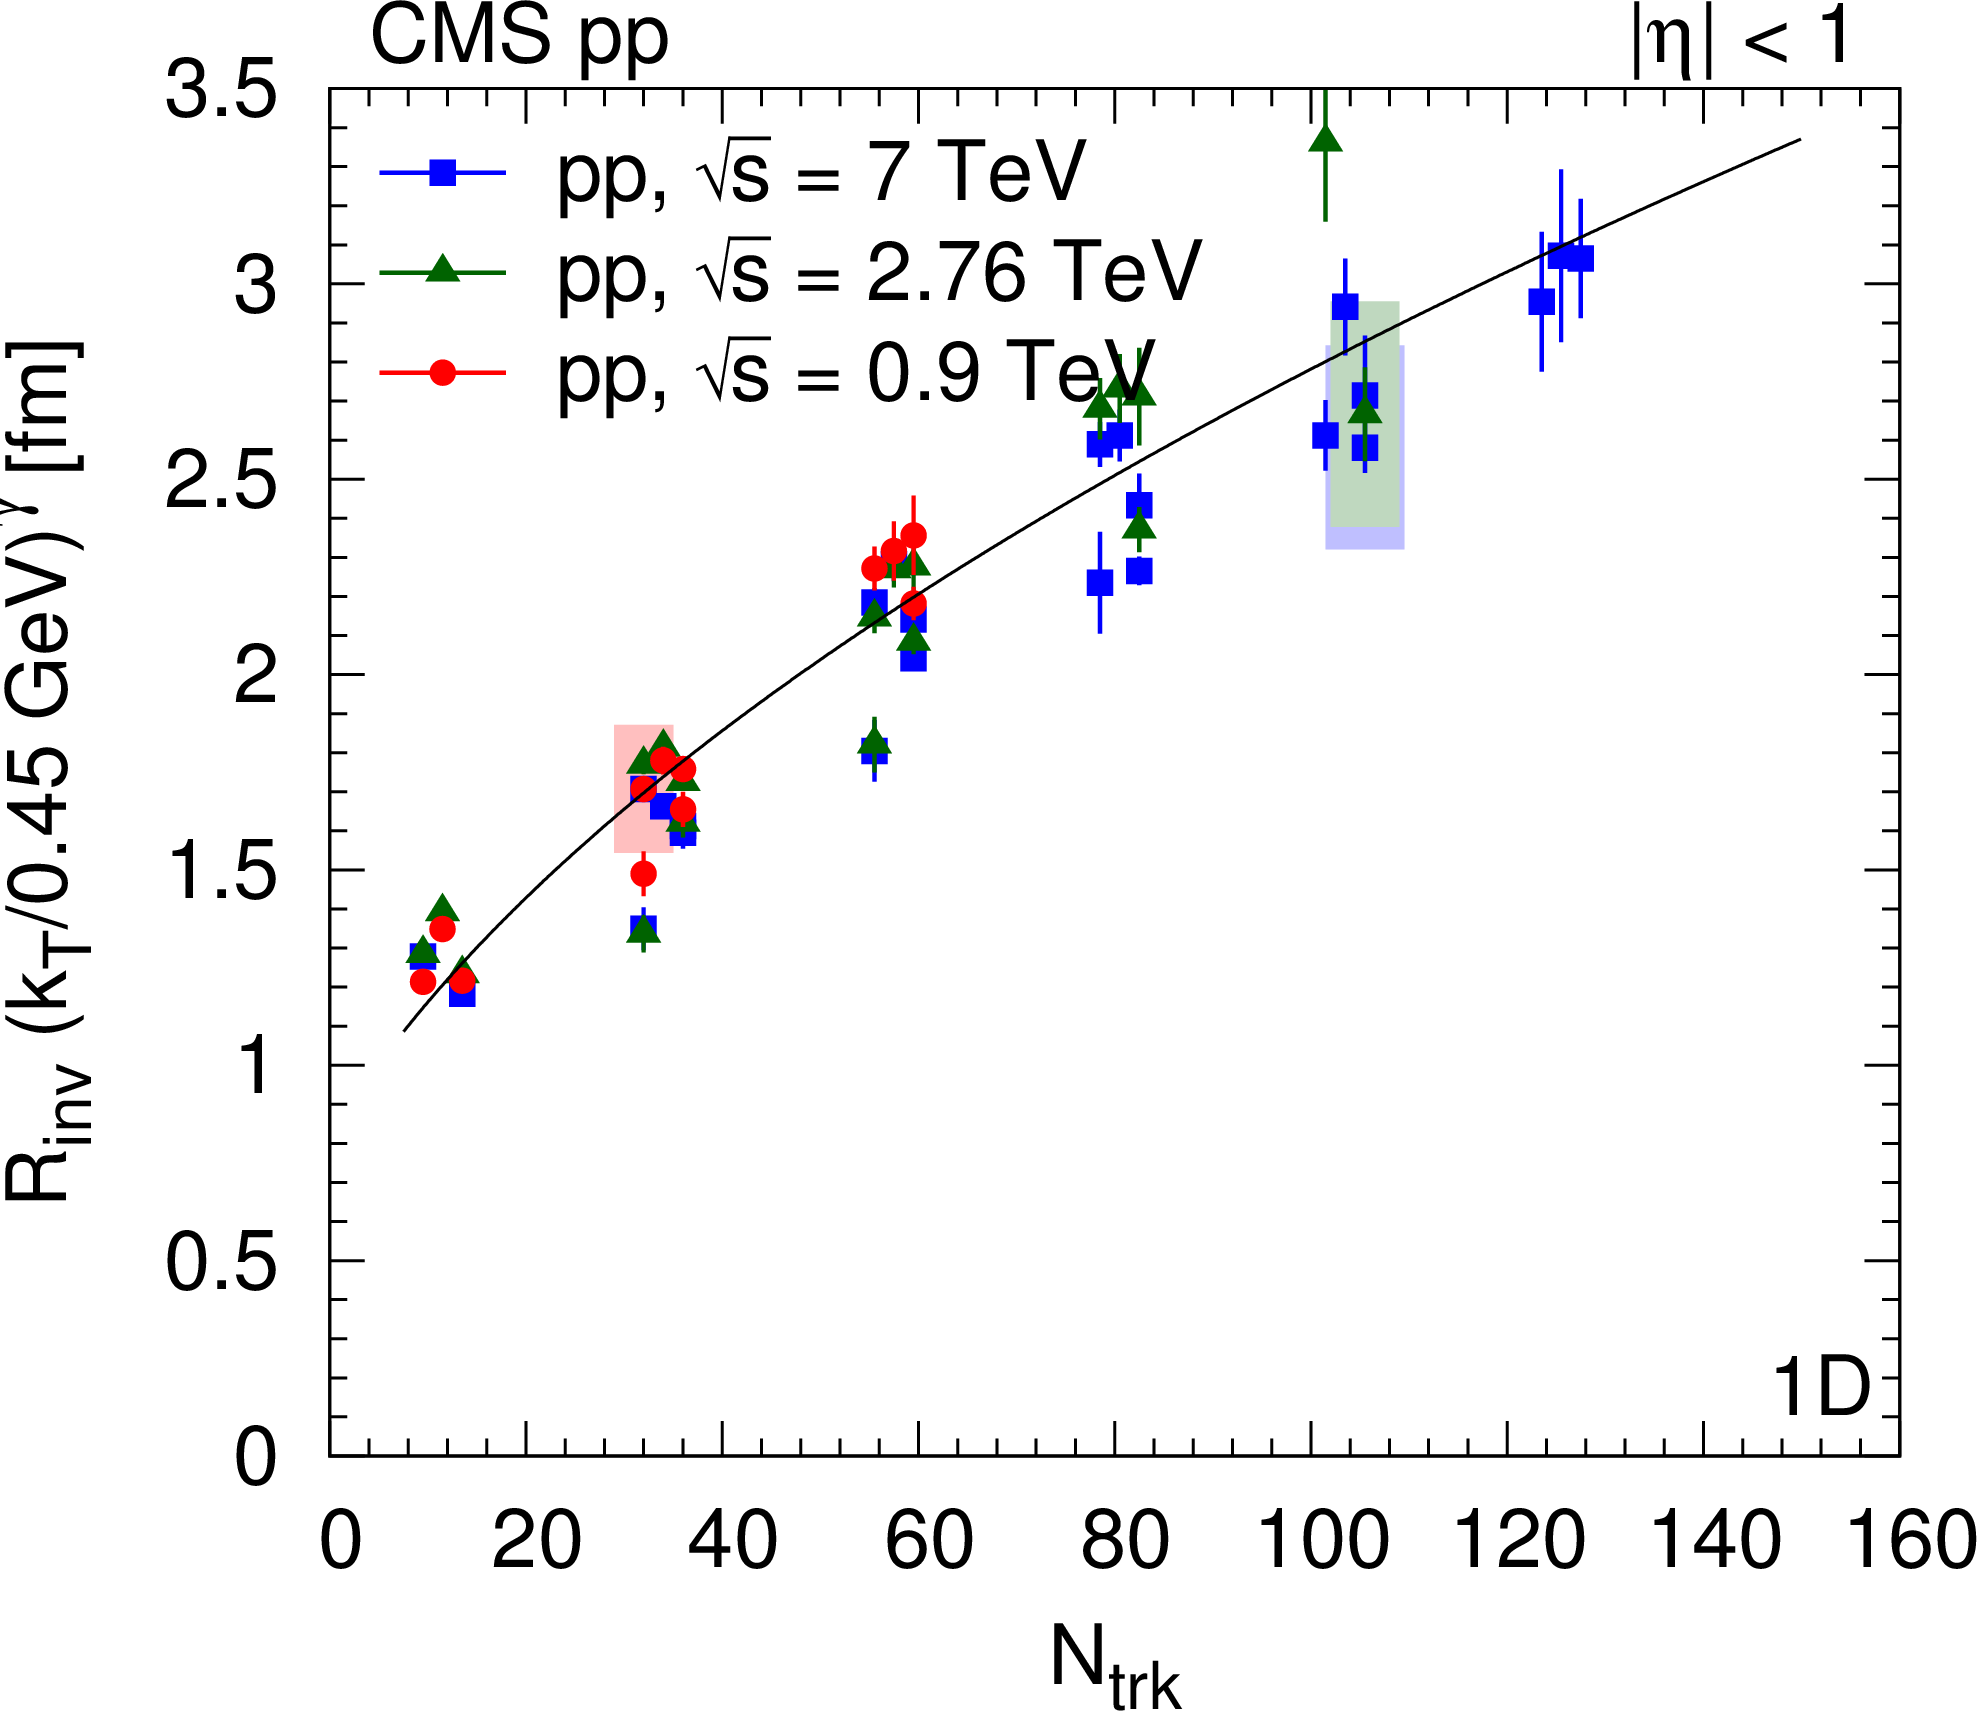
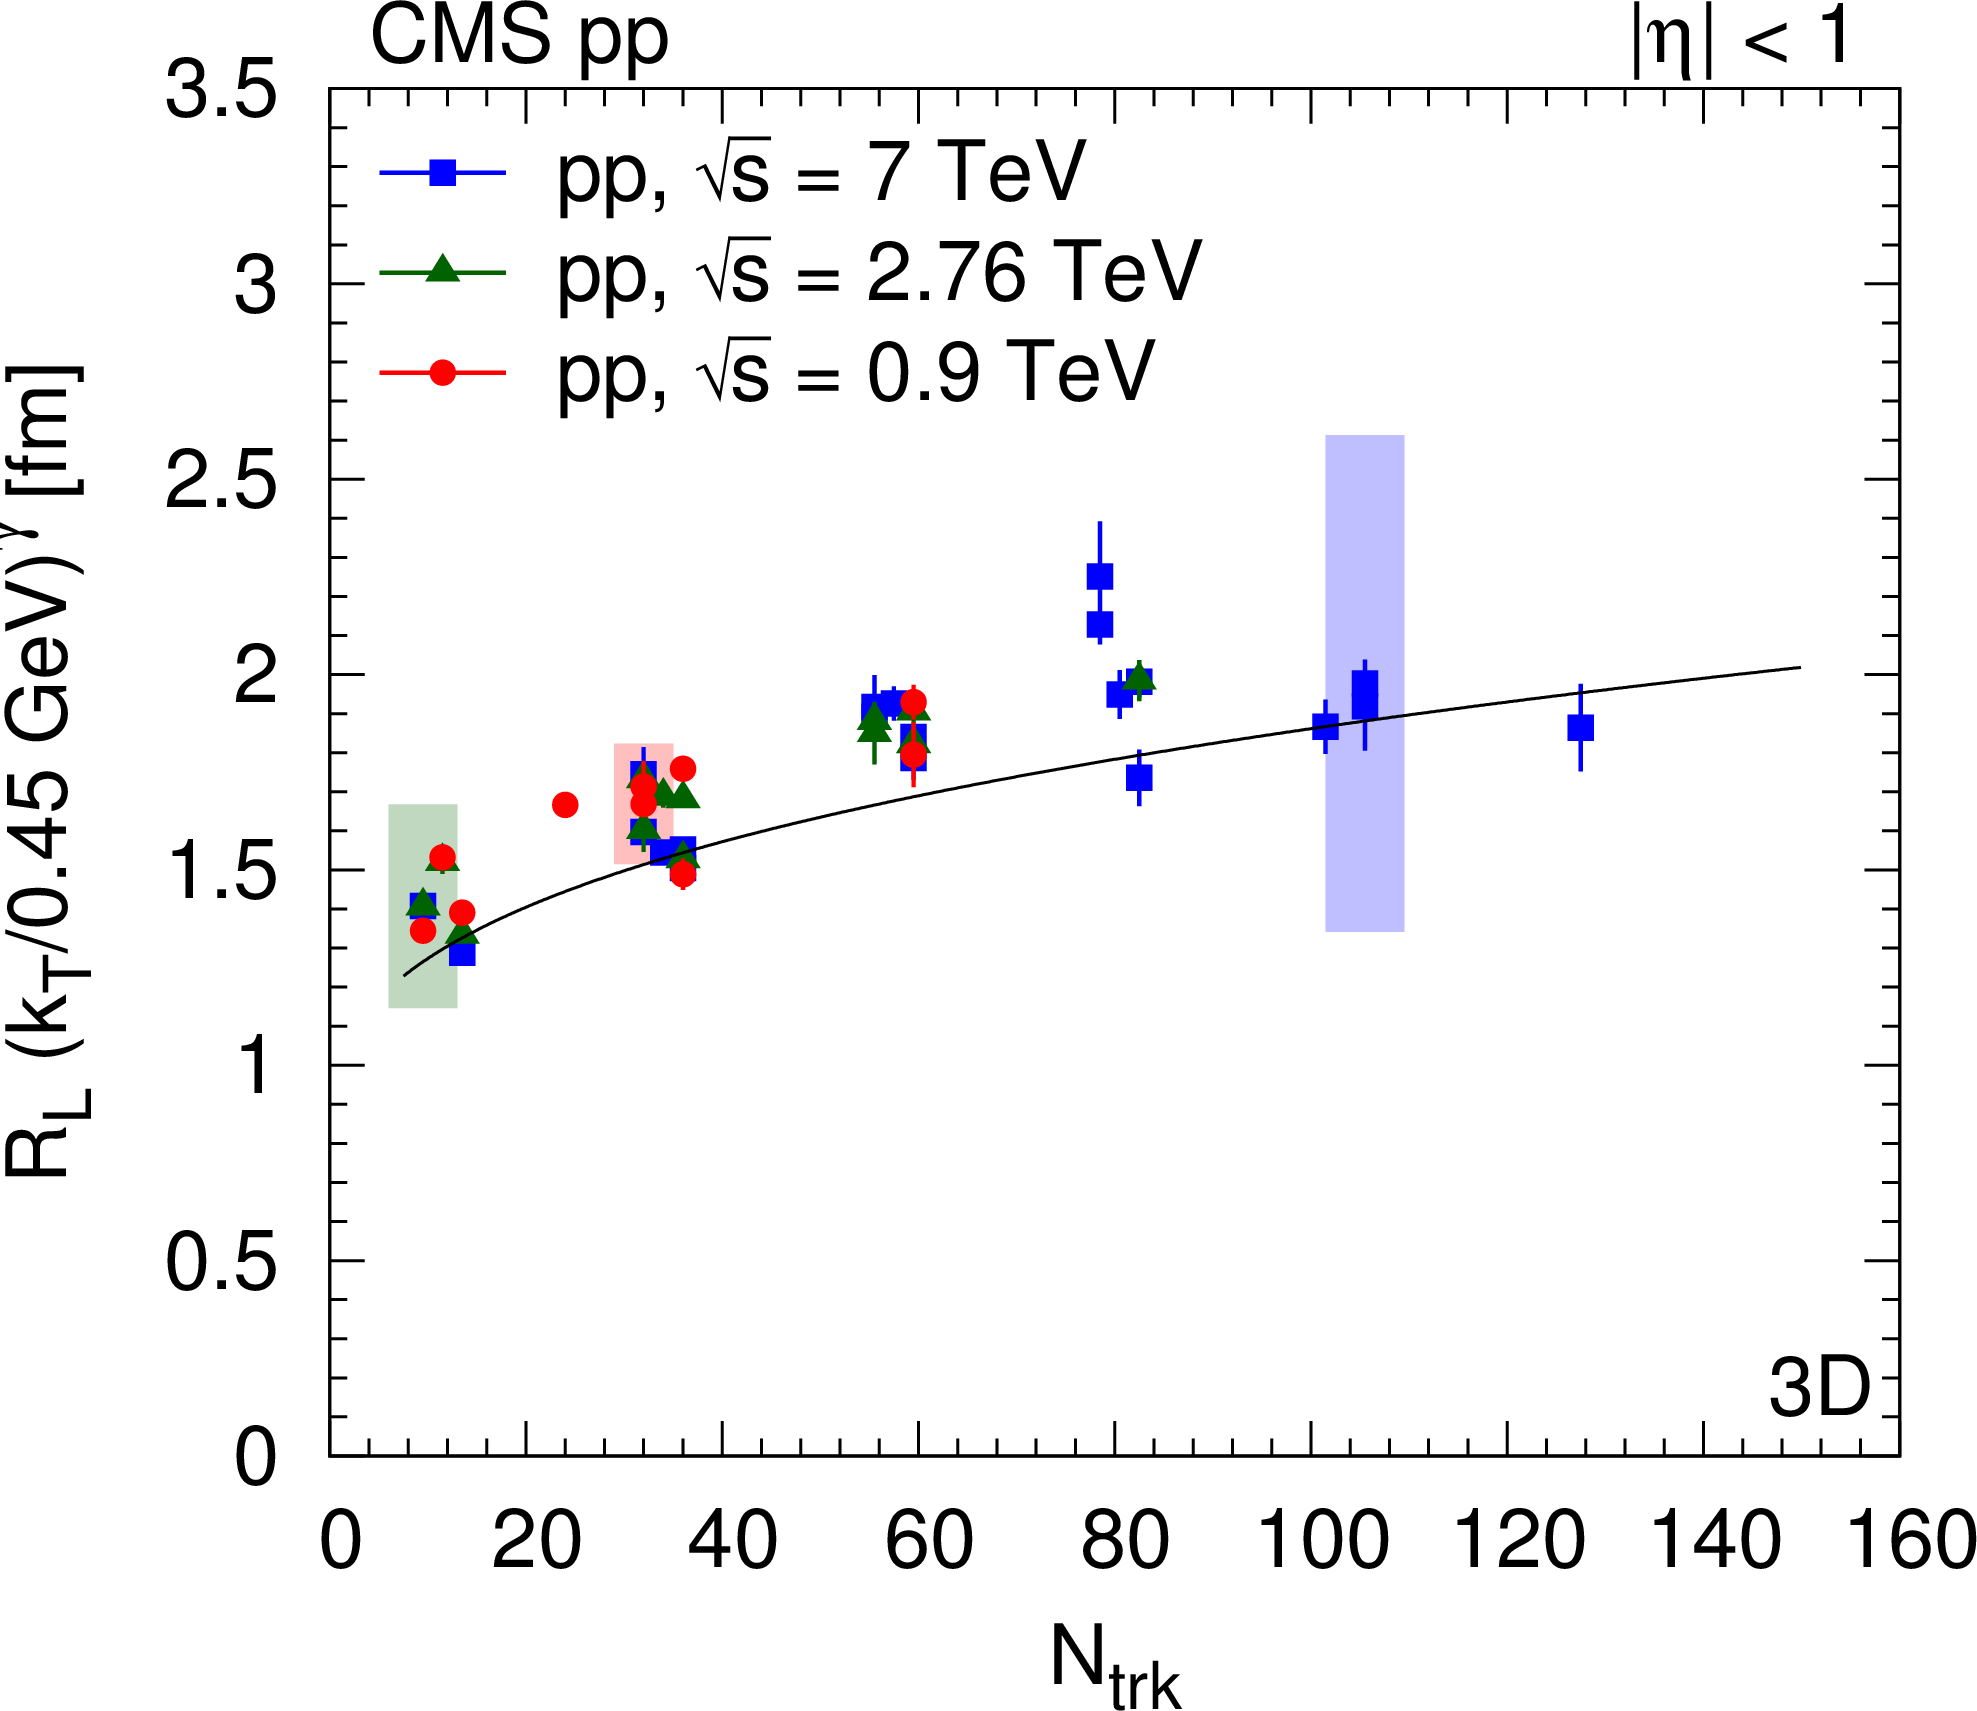
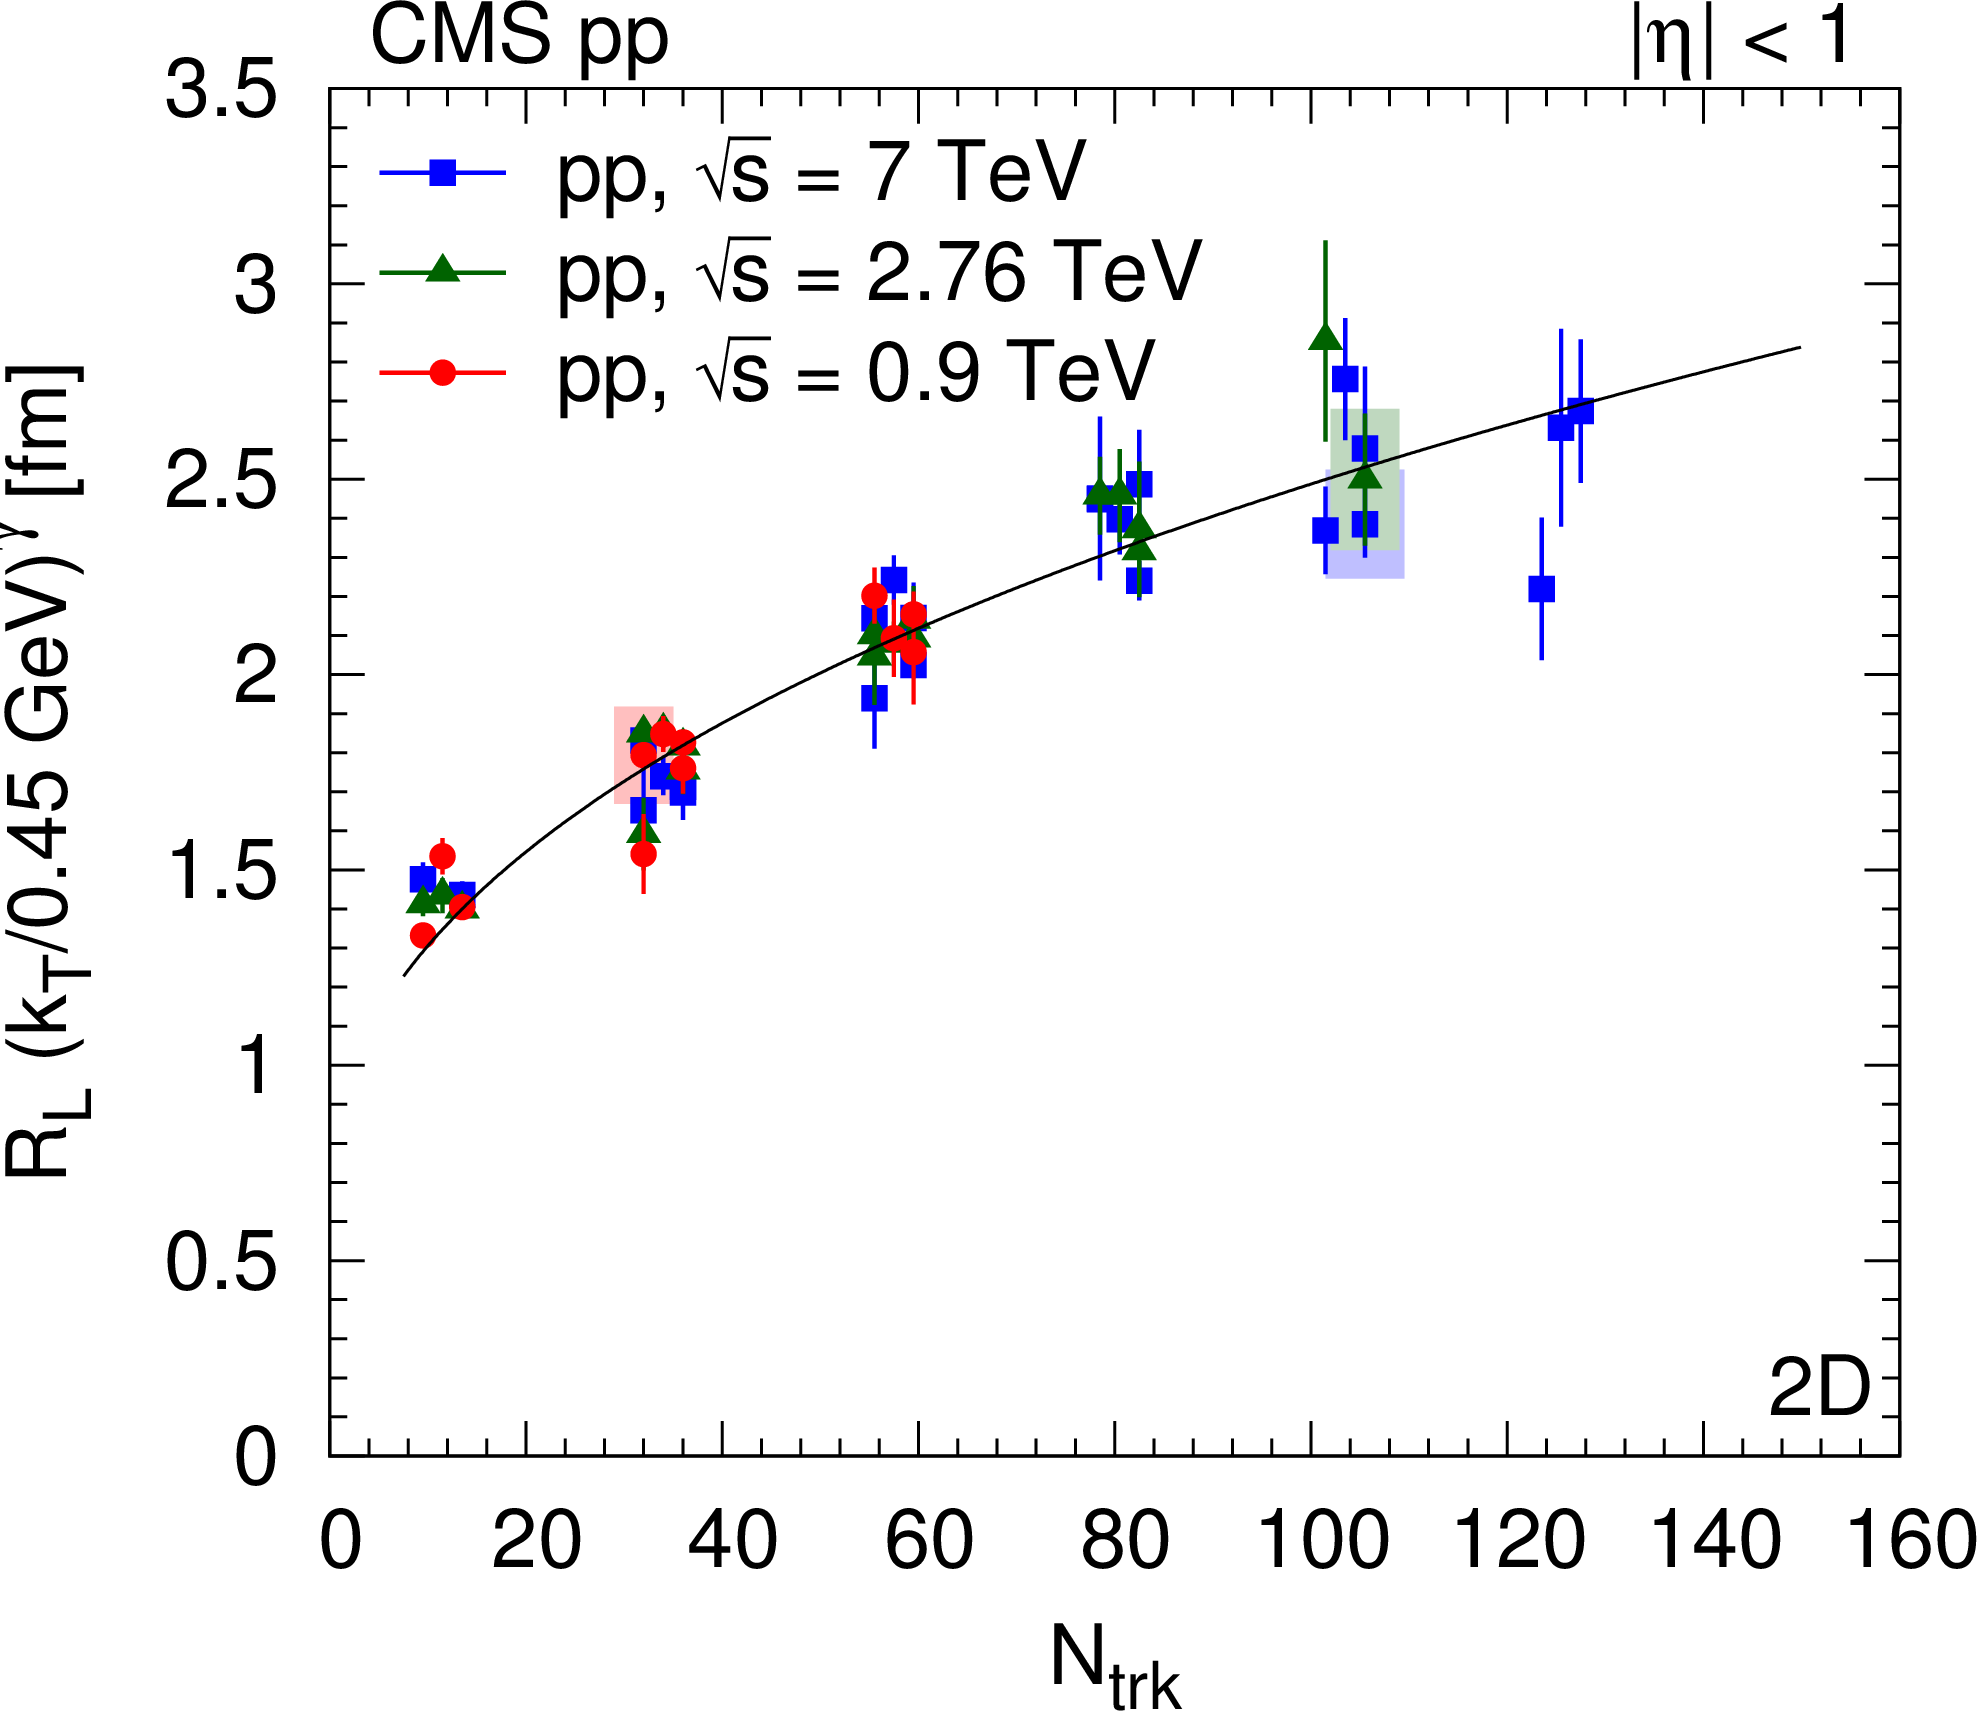
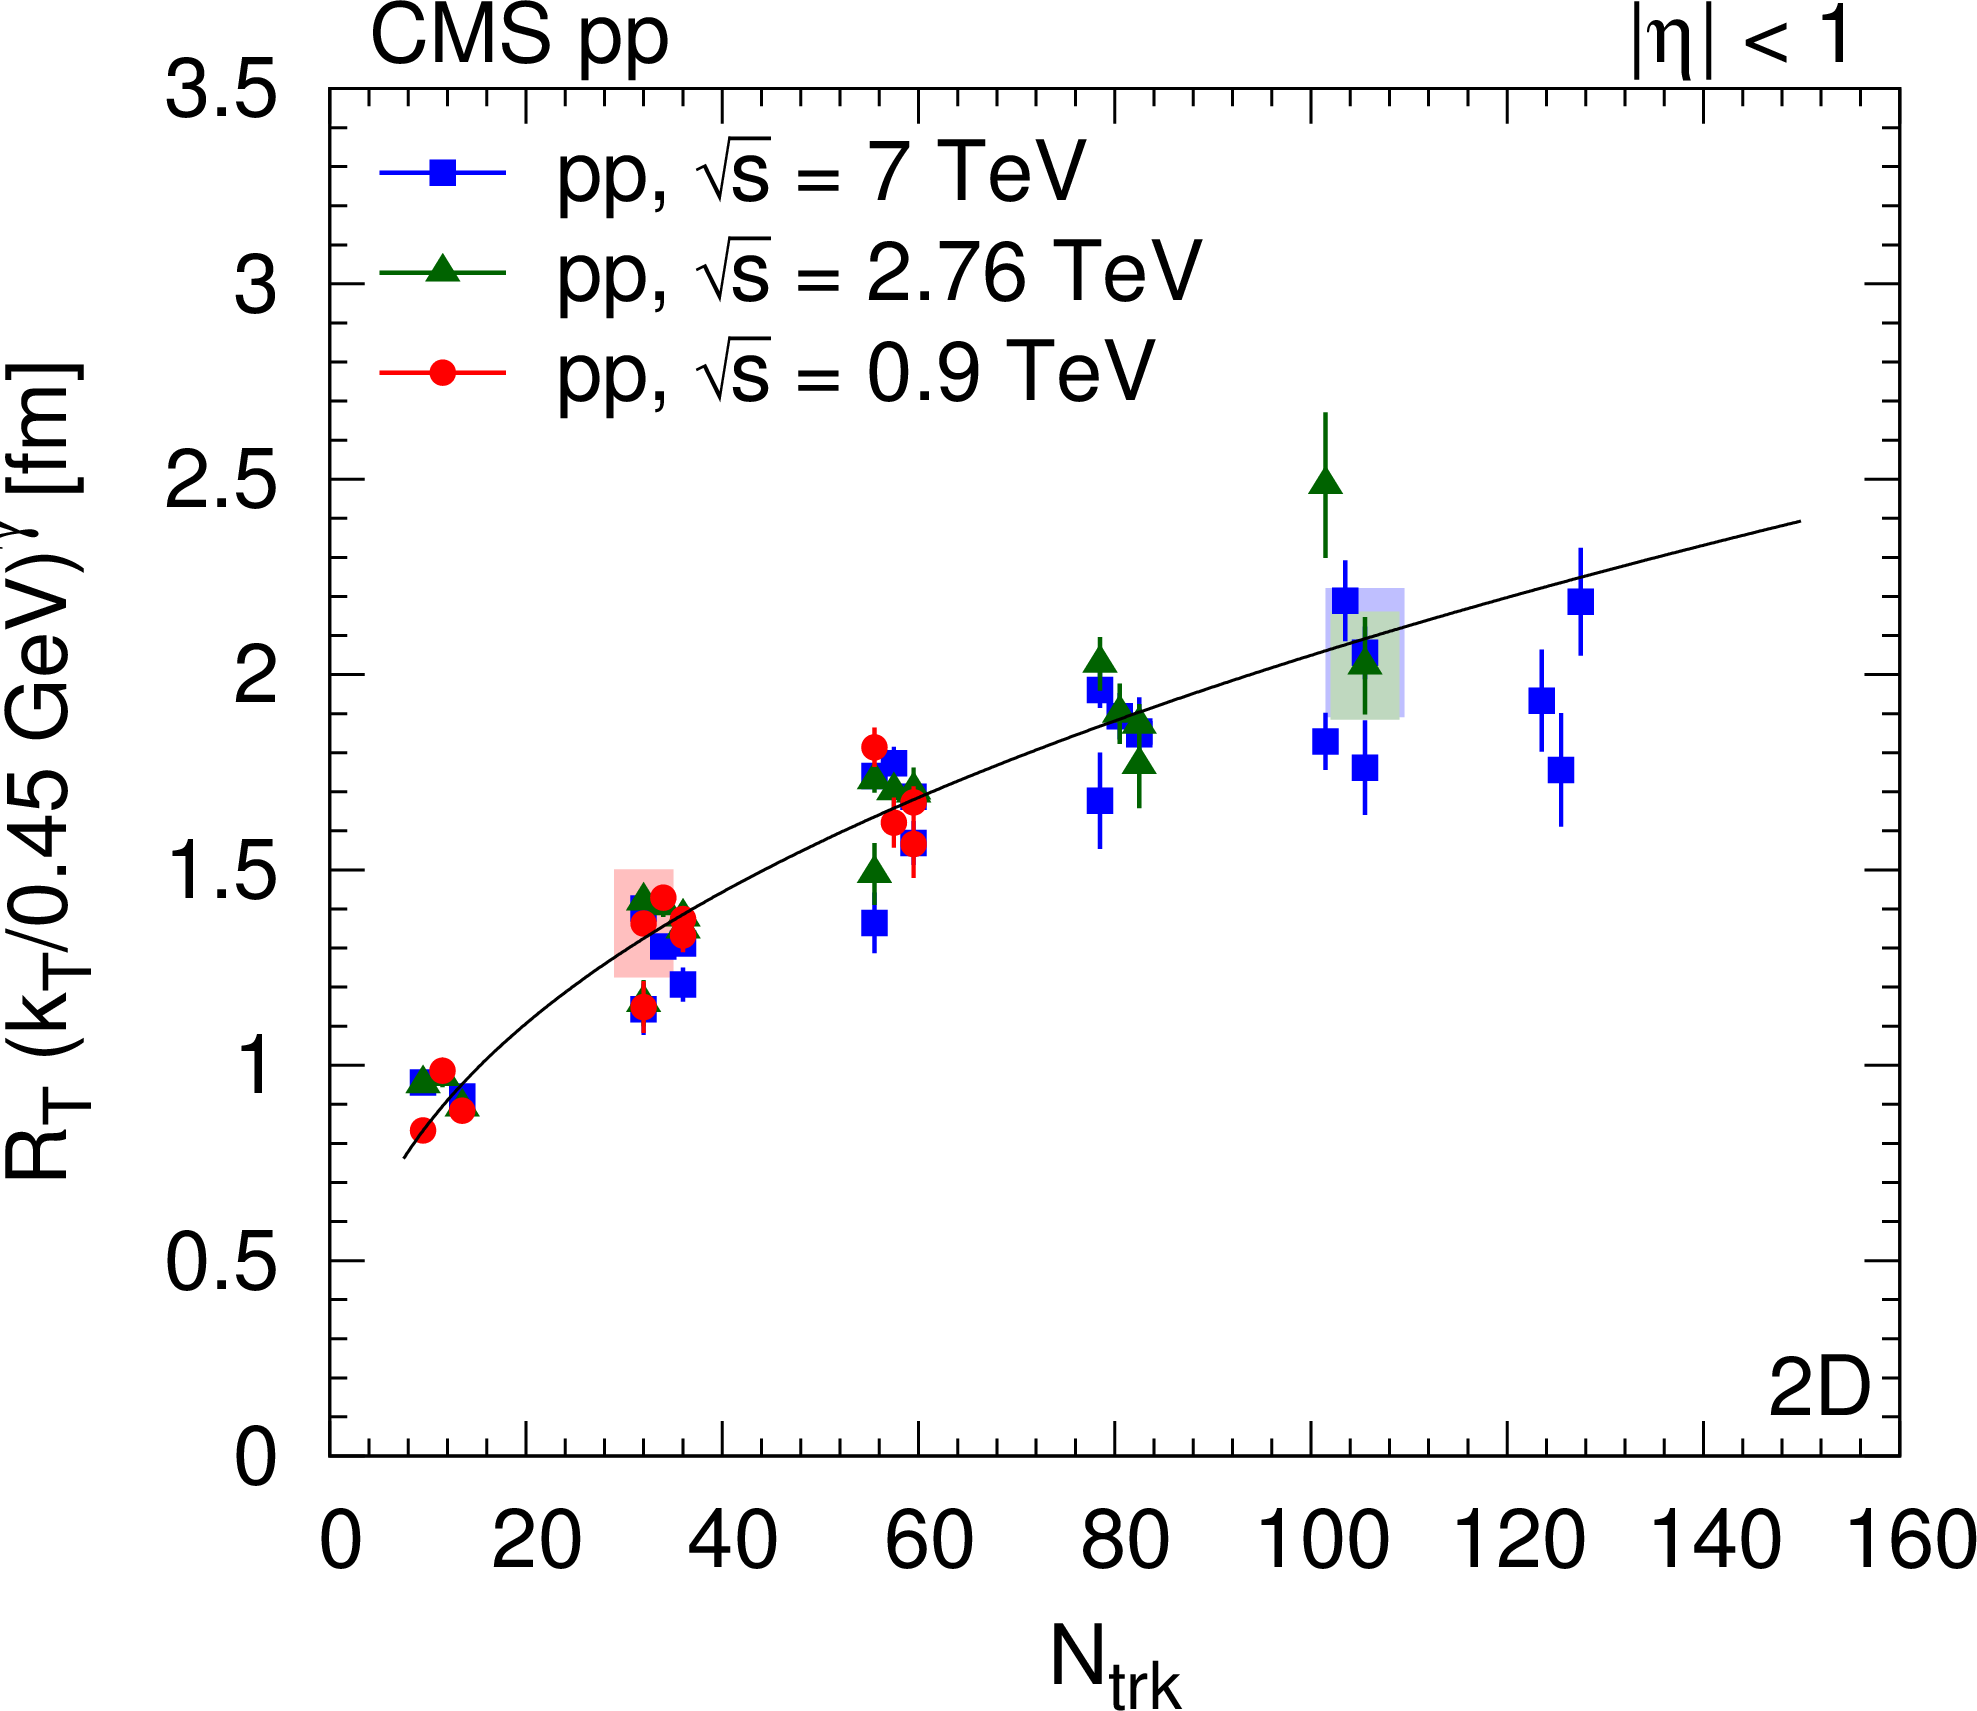
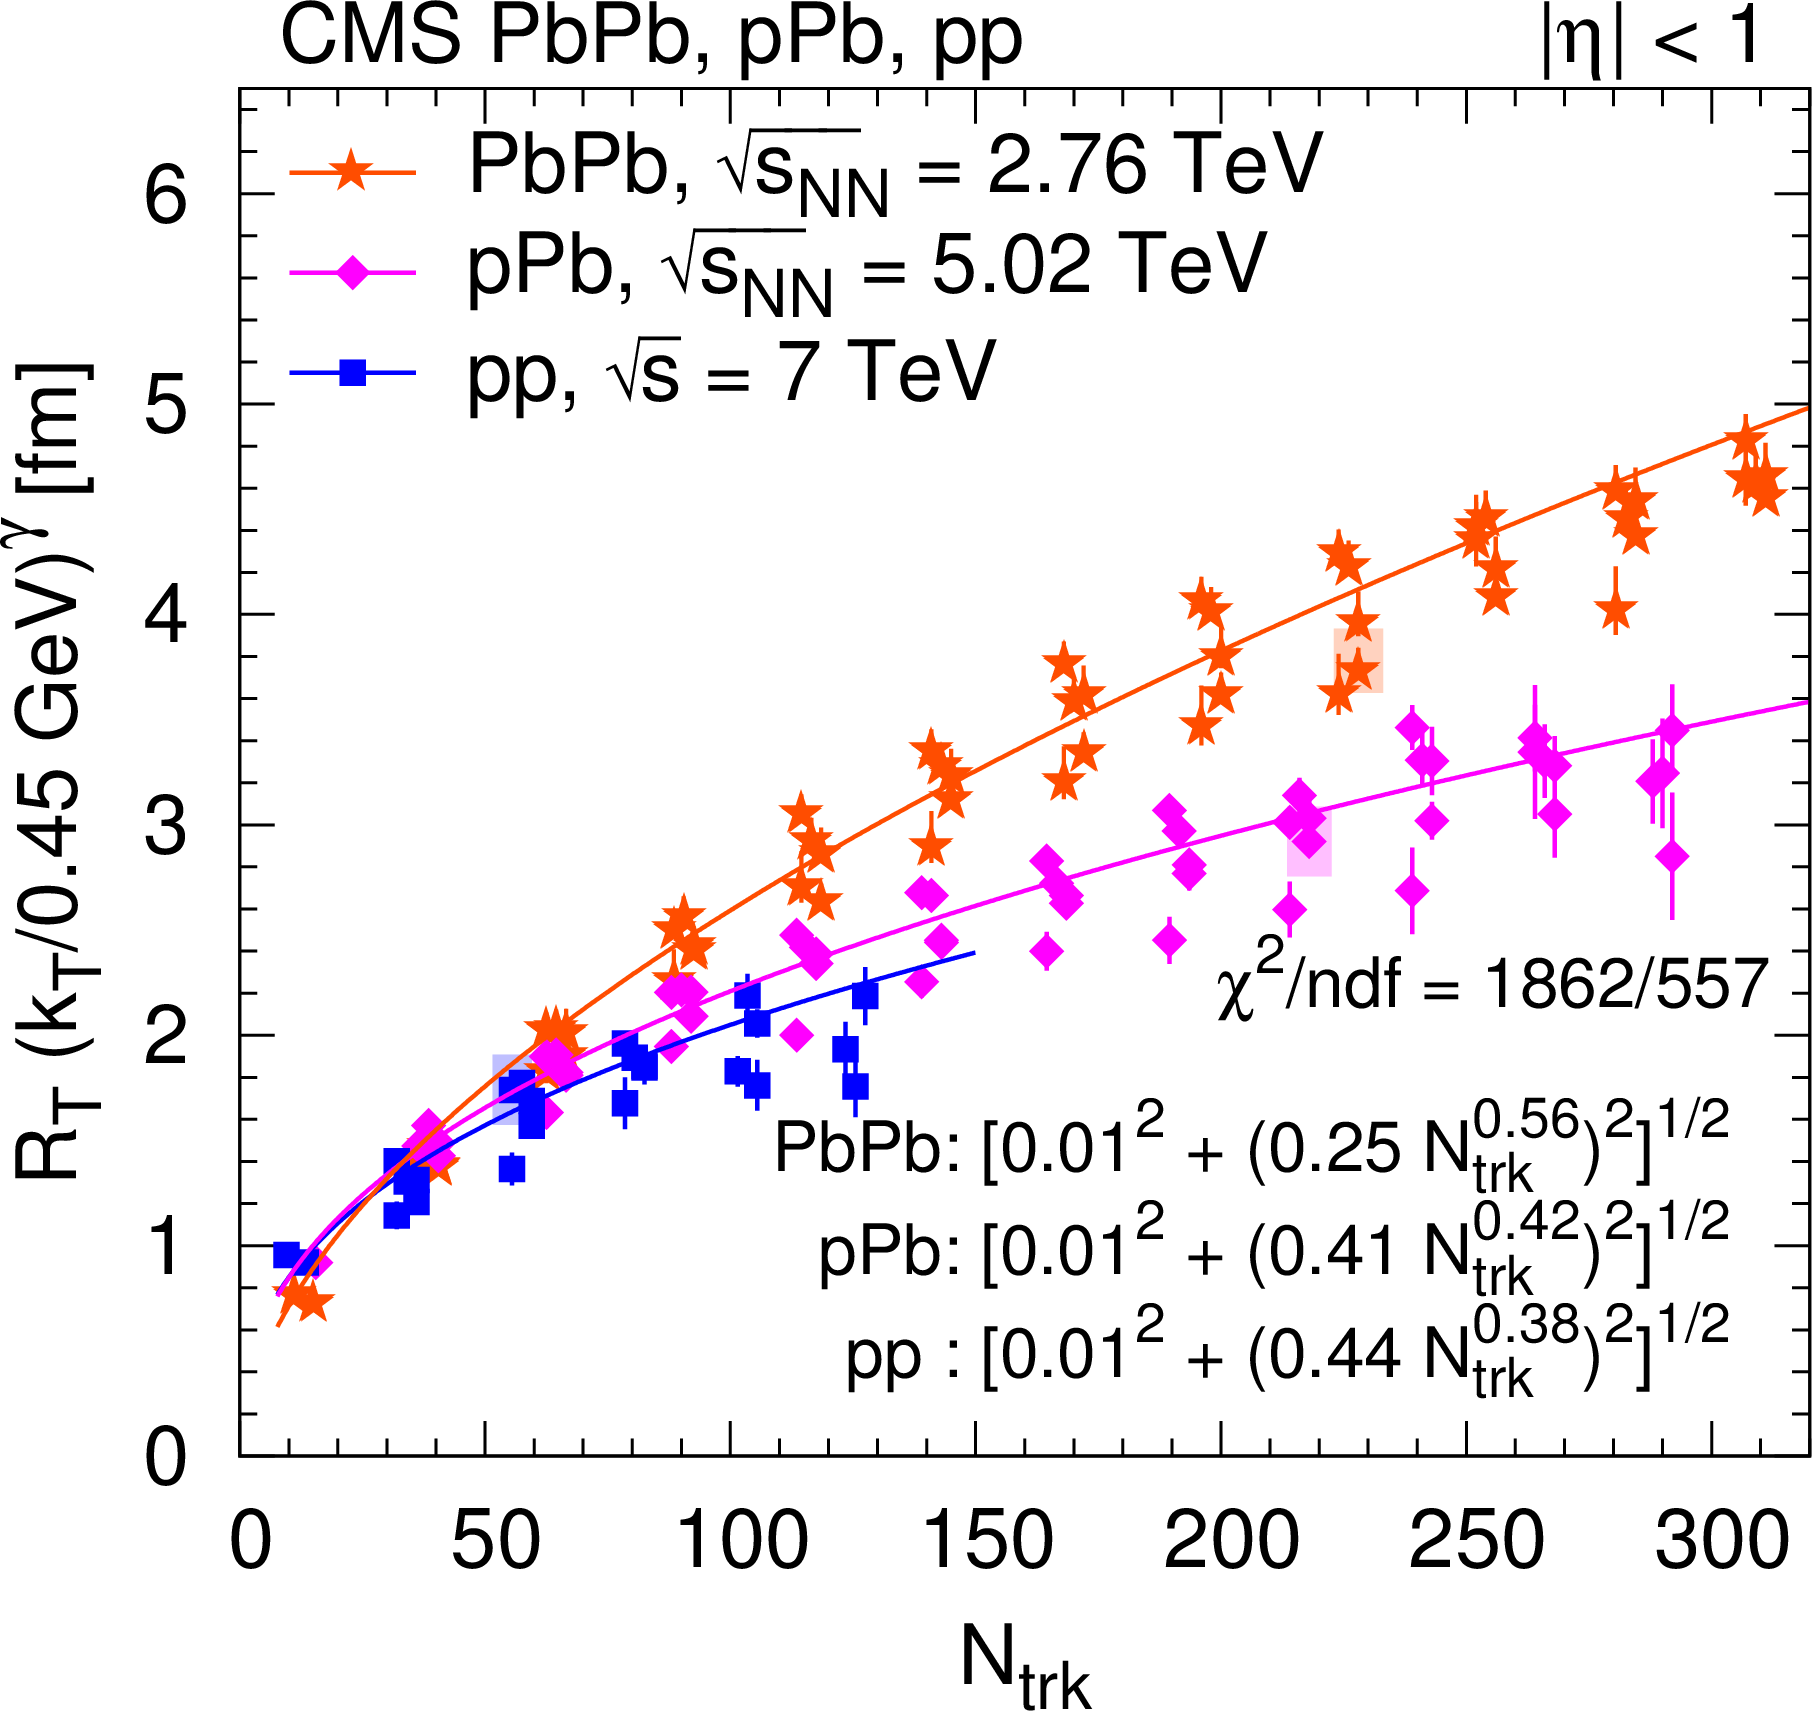
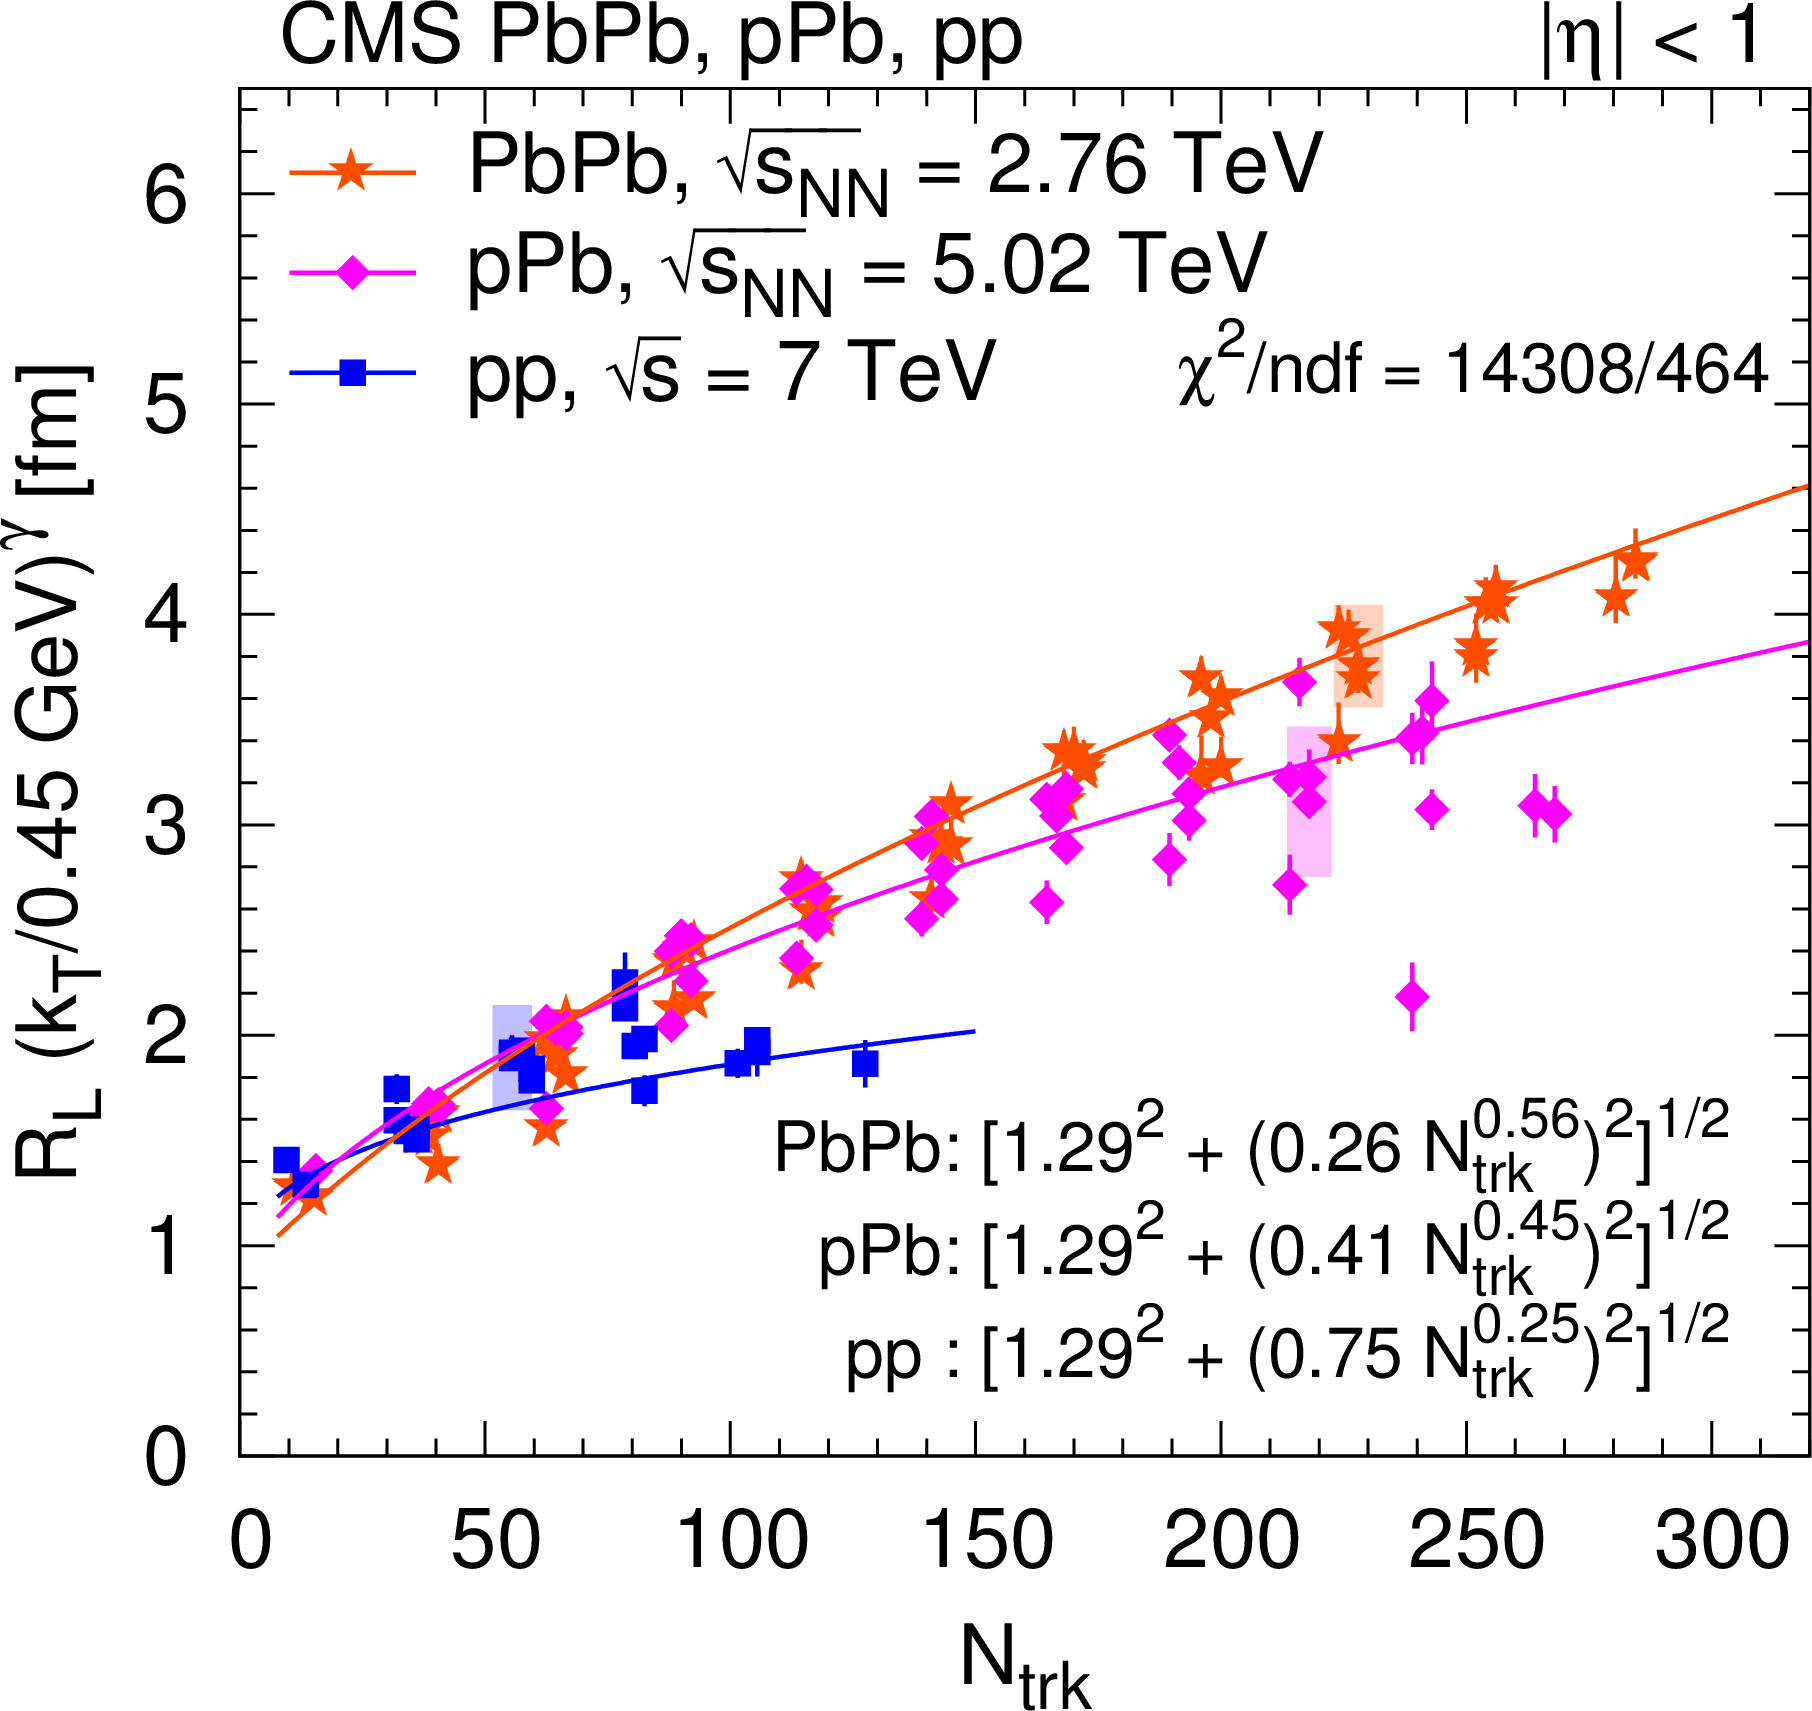
Radius parameters for pions as a function of $ {N_\text {trk}} $ scaled to $ {k_{\mathrm {T}}} = $ 0.45 GeV with help of the parametrization, as $R ({k_{\mathrm {T}}} /0.45 GeV)^\gamma $ (Eq. 15) for pp collisions. (For better visibility, systematic uncertainties are indicated with shaded boxes, only for a fraction of the points.) Left column, from upper to lower: $ {R_\text {inv}} $ from the 1D ($ {q_\text {inv}} $) analysis, $ {R_\text {L}} $ and $ {R_\text {T}} $ from the 2D $({q_\text {L}}, {q_\text {T}})$ analysis. Right column, from upper to lower: $ {R_\text {L}} $, $ {R_\text {O}} $, and $ {R_\text {S}} $ from the 3D $({q_\text {L}}$, ${q_\text {O}}$, ${q_\text {S}})$ analysis. Fit results are indicated in the figures, see text for details. |
png pdf |
Figure 28-a:
Radius parameters for pions as a function of $ {N_\text {trk}} $ scaled to $ {k_{\mathrm {T}}} = $ 0.45 GeV with help of the parametrization, as $R ({k_{\mathrm {T}}} /0.45 GeV)^\gamma $ (Eq. 15) for pp collisions. (For better visibility, systematic uncertainties are indicated with shaded boxes, only for a fraction of the points.) Left column, from upper to lower: $ {R_\text {inv}} $ from the 1D ($ {q_\text {inv}} $) analysis, $ {R_\text {L}} $ and $ {R_\text {T}} $ from the 2D $({q_\text {L}}, {q_\text {T}})$ analysis. Right column, from upper to lower: $ {R_\text {L}} $, $ {R_\text {O}} $, and $ {R_\text {S}} $ from the 3D $({q_\text {L}}$, ${q_\text {O}}$, ${q_\text {S}})$ analysis. Fit results are indicated in the figures, see text for details. |
png pdf |
Figure 28-b:
Radius parameters for pions as a function of $ {N_\text {trk}} $ scaled to $ {k_{\mathrm {T}}} = $ 0.45 GeV with help of the parametrization, as $R ({k_{\mathrm {T}}} /0.45 GeV)^\gamma $ (Eq. 15) for pp collisions. (For better visibility, systematic uncertainties are indicated with shaded boxes, only for a fraction of the points.) Left column, from upper to lower: $ {R_\text {inv}} $ from the 1D ($ {q_\text {inv}} $) analysis, $ {R_\text {L}} $ and $ {R_\text {T}} $ from the 2D $({q_\text {L}}, {q_\text {T}})$ analysis. Right column, from upper to lower: $ {R_\text {L}} $, $ {R_\text {O}} $, and $ {R_\text {S}} $ from the 3D $({q_\text {L}}$, ${q_\text {O}}$, ${q_\text {S}})$ analysis. Fit results are indicated in the figures, see text for details. |
png pdf |
Figure 28-c:
Radius parameters for pions as a function of $ {N_\text {trk}} $ scaled to $ {k_{\mathrm {T}}} = $ 0.45 GeV with help of the parametrization, as $R ({k_{\mathrm {T}}} /0.45 GeV)^\gamma $ (Eq. 15) for pp collisions. (For better visibility, systematic uncertainties are indicated with shaded boxes, only for a fraction of the points.) Left column, from upper to lower: $ {R_\text {inv}} $ from the 1D ($ {q_\text {inv}} $) analysis, $ {R_\text {L}} $ and $ {R_\text {T}} $ from the 2D $({q_\text {L}}, {q_\text {T}})$ analysis. Right column, from upper to lower: $ {R_\text {L}} $, $ {R_\text {O}} $, and $ {R_\text {S}} $ from the 3D $({q_\text {L}}$, ${q_\text {O}}$, ${q_\text {S}})$ analysis. Fit results are indicated in the figures, see text for details. |

png pdf |
Figure 28-d:
Radius parameters for pions as a function of $ {N_\text {trk}} $ scaled to $ {k_{\mathrm {T}}} = $ 0.45 GeV with help of the parametrization, as $R ({k_{\mathrm {T}}} /0.45 GeV)^\gamma $ (Eq. 15) for pp collisions. (For better visibility, systematic uncertainties are indicated with shaded boxes, only for a fraction of the points.) Left column, from upper to lower: $ {R_\text {inv}} $ from the 1D ($ {q_\text {inv}} $) analysis, $ {R_\text {L}} $ and $ {R_\text {T}} $ from the 2D $({q_\text {L}}, {q_\text {T}})$ analysis. Right column, from upper to lower: $ {R_\text {L}} $, $ {R_\text {O}} $, and $ {R_\text {S}} $ from the 3D $({q_\text {L}}$, ${q_\text {O}}$, ${q_\text {S}})$ analysis. Fit results are indicated in the figures, see text for details. |
png pdf |
Figure 28-e:
Radius parameters for pions as a function of $ {N_\text {trk}} $ scaled to $ {k_{\mathrm {T}}} = $ 0.45 GeV with help of the parametrization, as $R ({k_{\mathrm {T}}} /0.45 GeV)^\gamma $ (Eq. 15) for pp collisions. (For better visibility, systematic uncertainties are indicated with shaded boxes, only for a fraction of the points.) Left column, from upper to lower: $ {R_\text {inv}} $ from the 1D ($ {q_\text {inv}} $) analysis, $ {R_\text {L}} $ and $ {R_\text {T}} $ from the 2D $({q_\text {L}}, {q_\text {T}})$ analysis. Right column, from upper to lower: $ {R_\text {L}} $, $ {R_\text {O}} $, and $ {R_\text {S}} $ from the 3D $({q_\text {L}}$, ${q_\text {O}}$, ${q_\text {S}})$ analysis. Fit results are indicated in the figures, see text for details. |

png pdf |
Figure 28-f:
Radius parameters for pions as a function of $ {N_\text {trk}} $ scaled to $ {k_{\mathrm {T}}} = $ 0.45 GeV with help of the parametrization, as $R ({k_{\mathrm {T}}} /0.45 GeV)^\gamma $ (Eq. 15) for pp collisions. (For better visibility, systematic uncertainties are indicated with shaded boxes, only for a fraction of the points.) Left column, from upper to lower: $ {R_\text {inv}} $ from the 1D ($ {q_\text {inv}} $) analysis, $ {R_\text {L}} $ and $ {R_\text {T}} $ from the 2D $({q_\text {L}}, {q_\text {T}})$ analysis. Right column, from upper to lower: $ {R_\text {L}} $, $ {R_\text {O}} $, and $ {R_\text {S}} $ from the 3D $({q_\text {L}}$, ${q_\text {O}}$, ${q_\text {S}})$ analysis. Fit results are indicated in the figures, see text for details. |
png pdf |
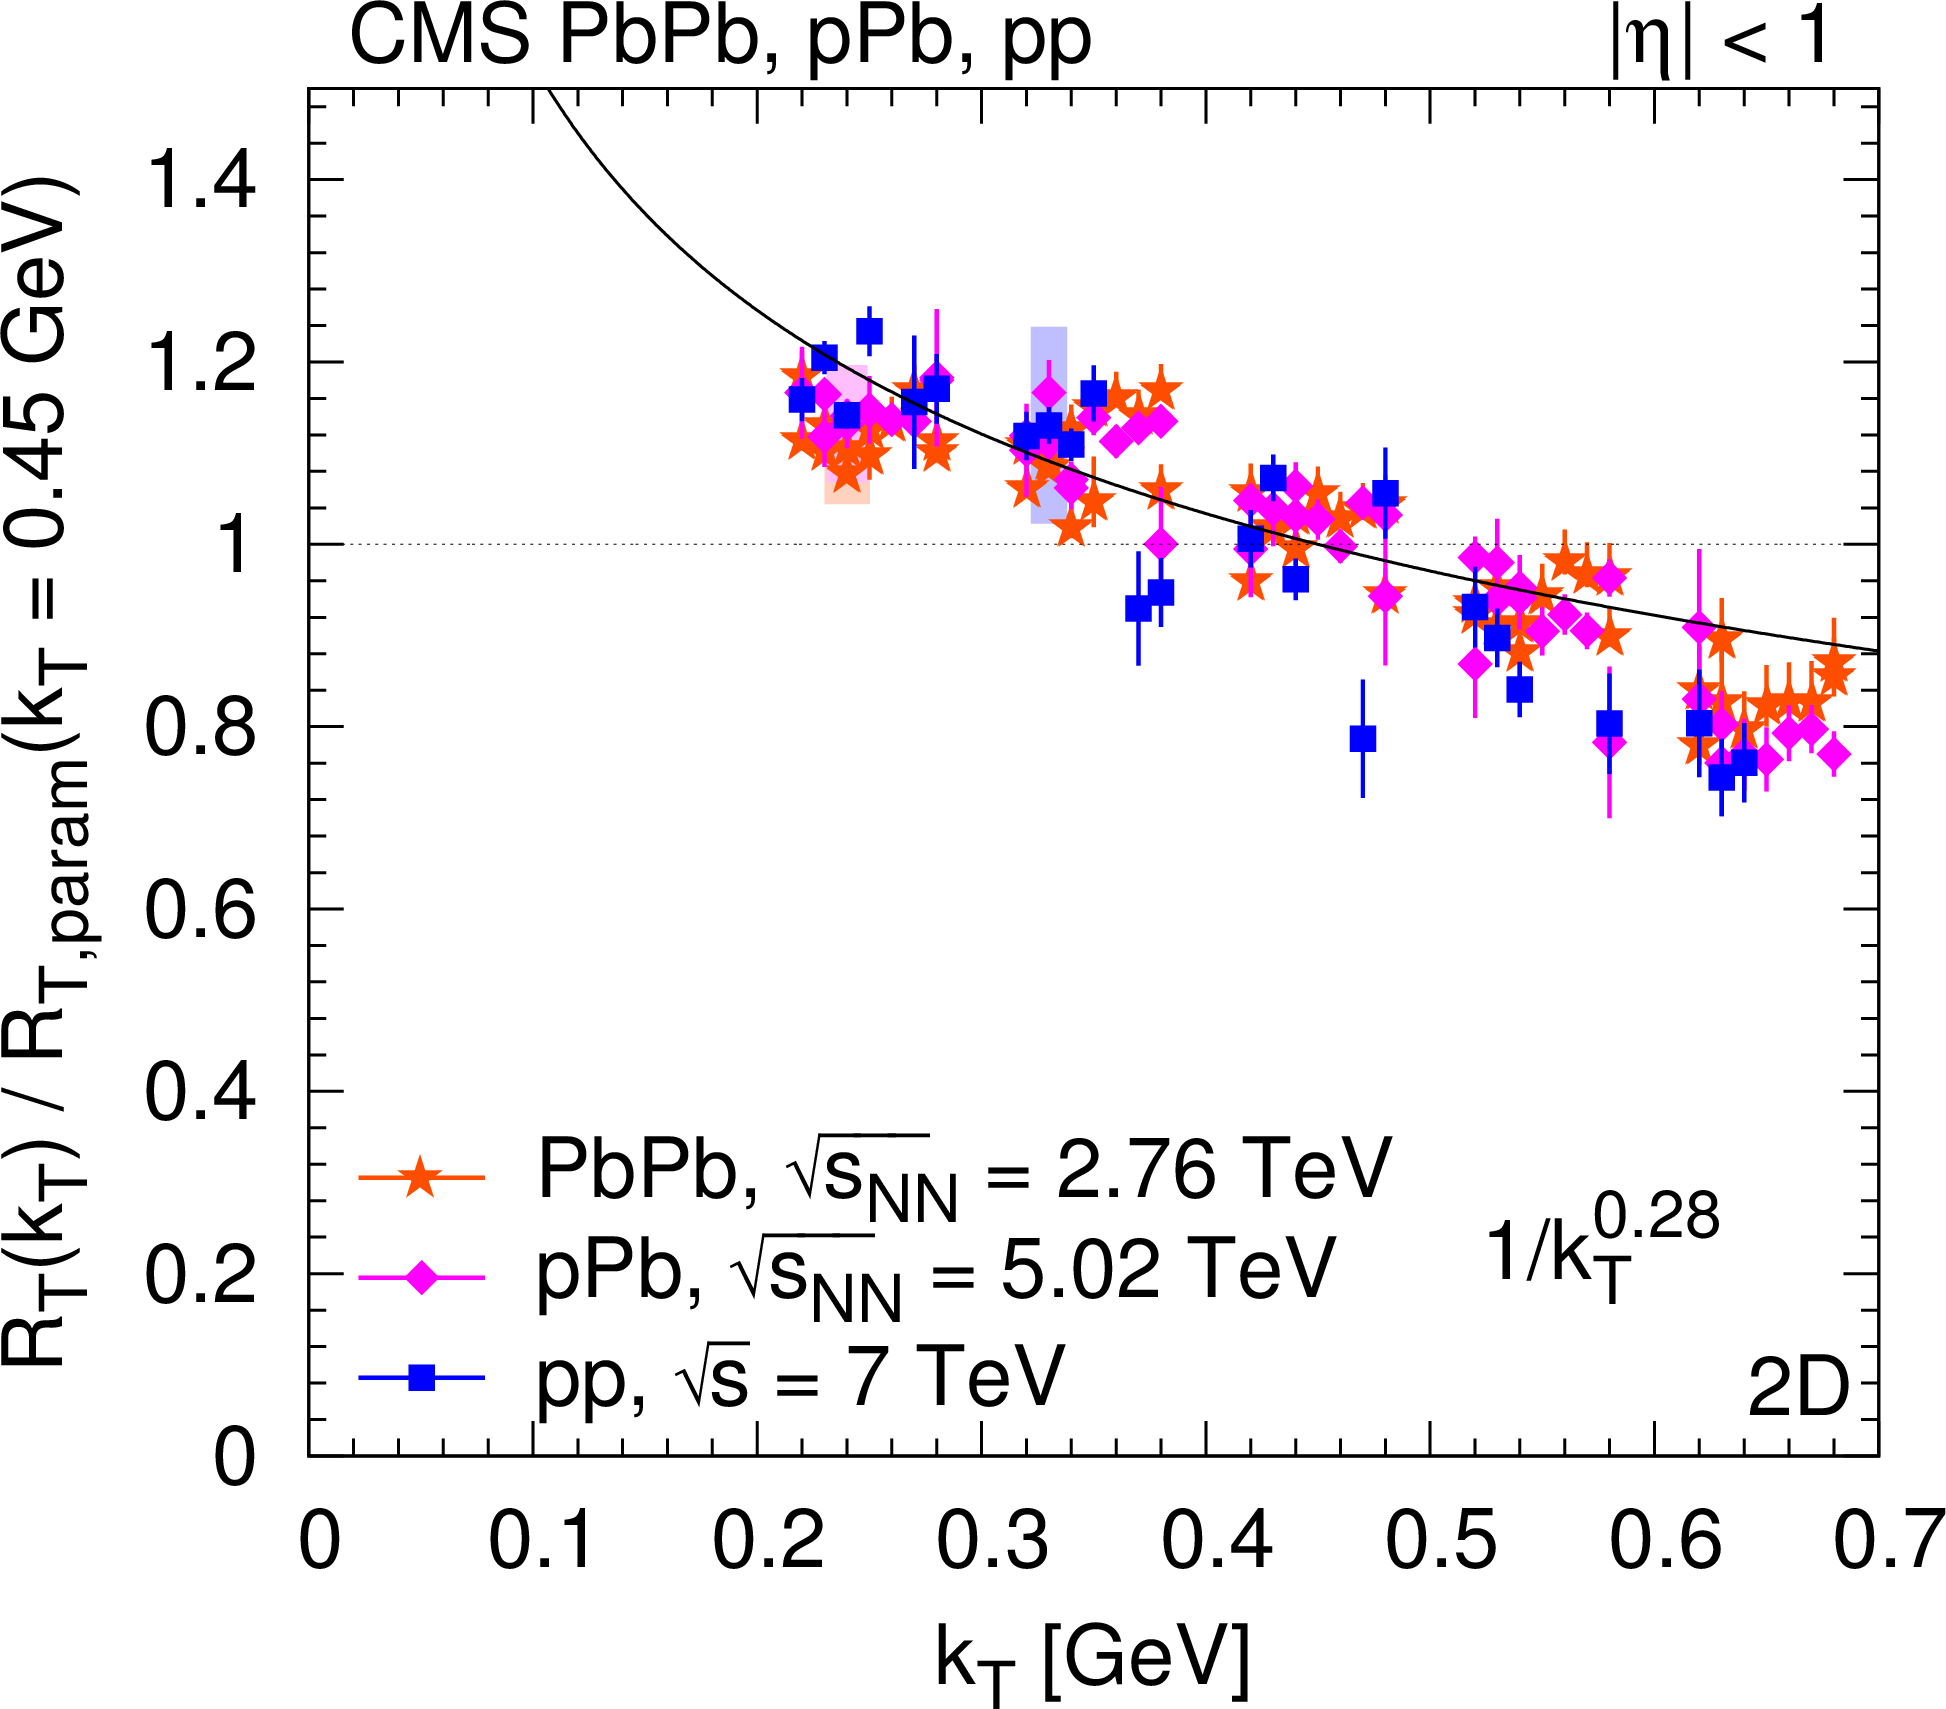
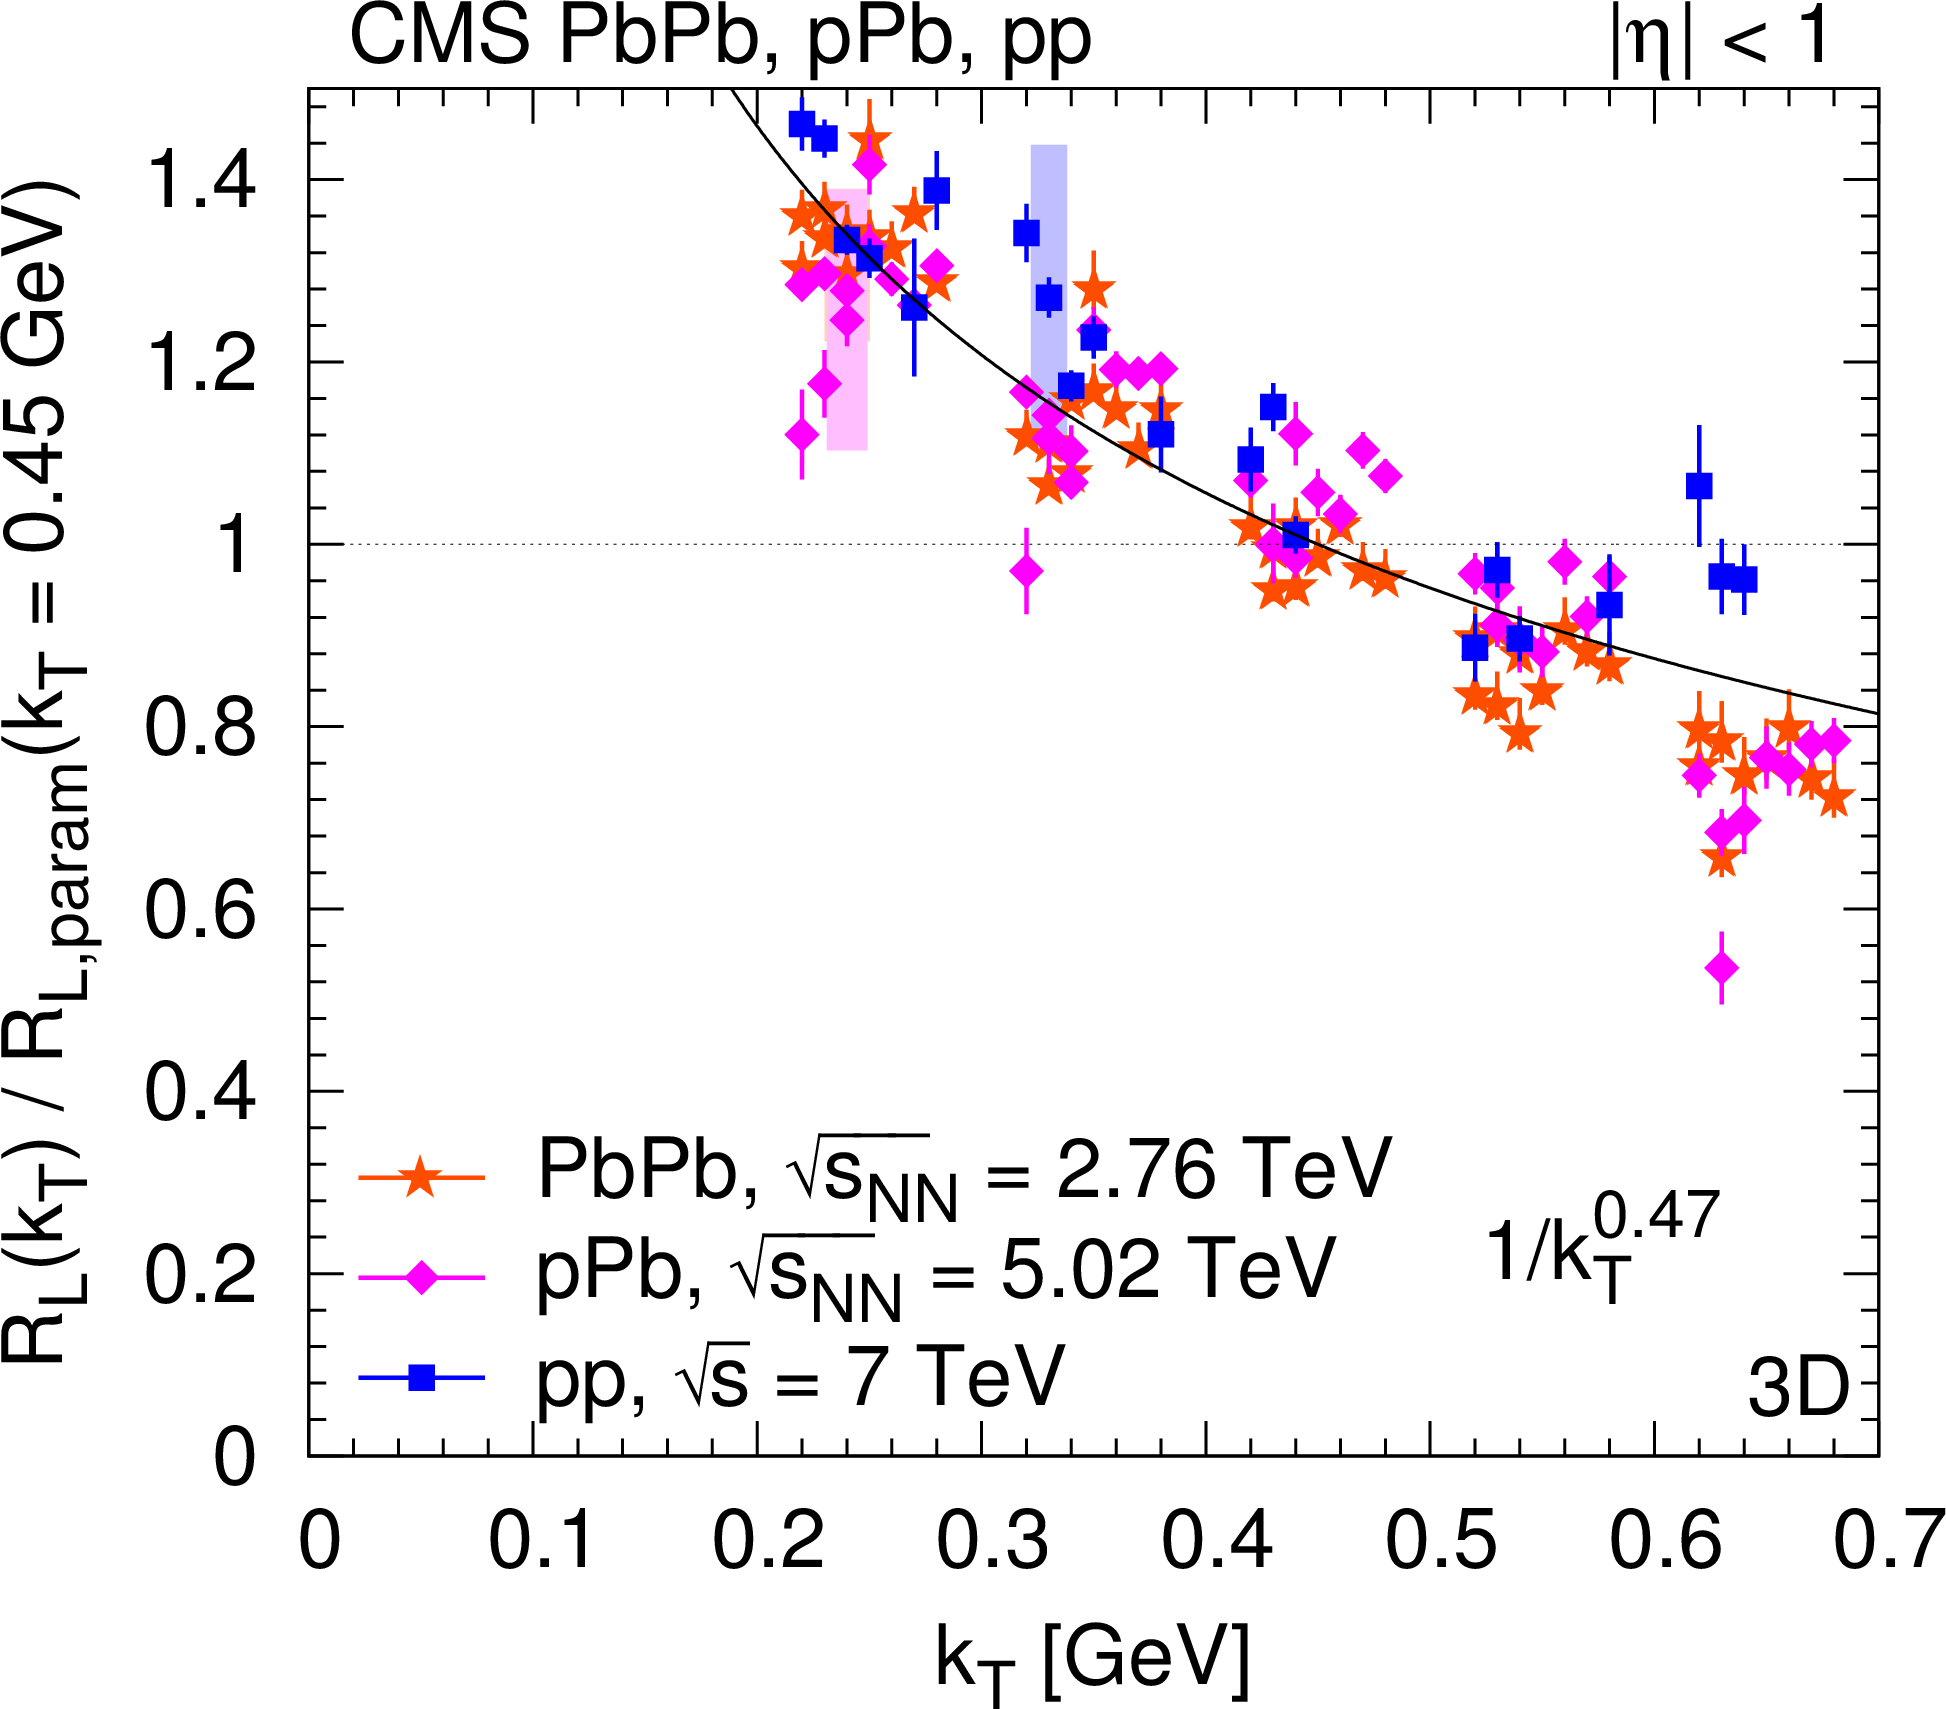
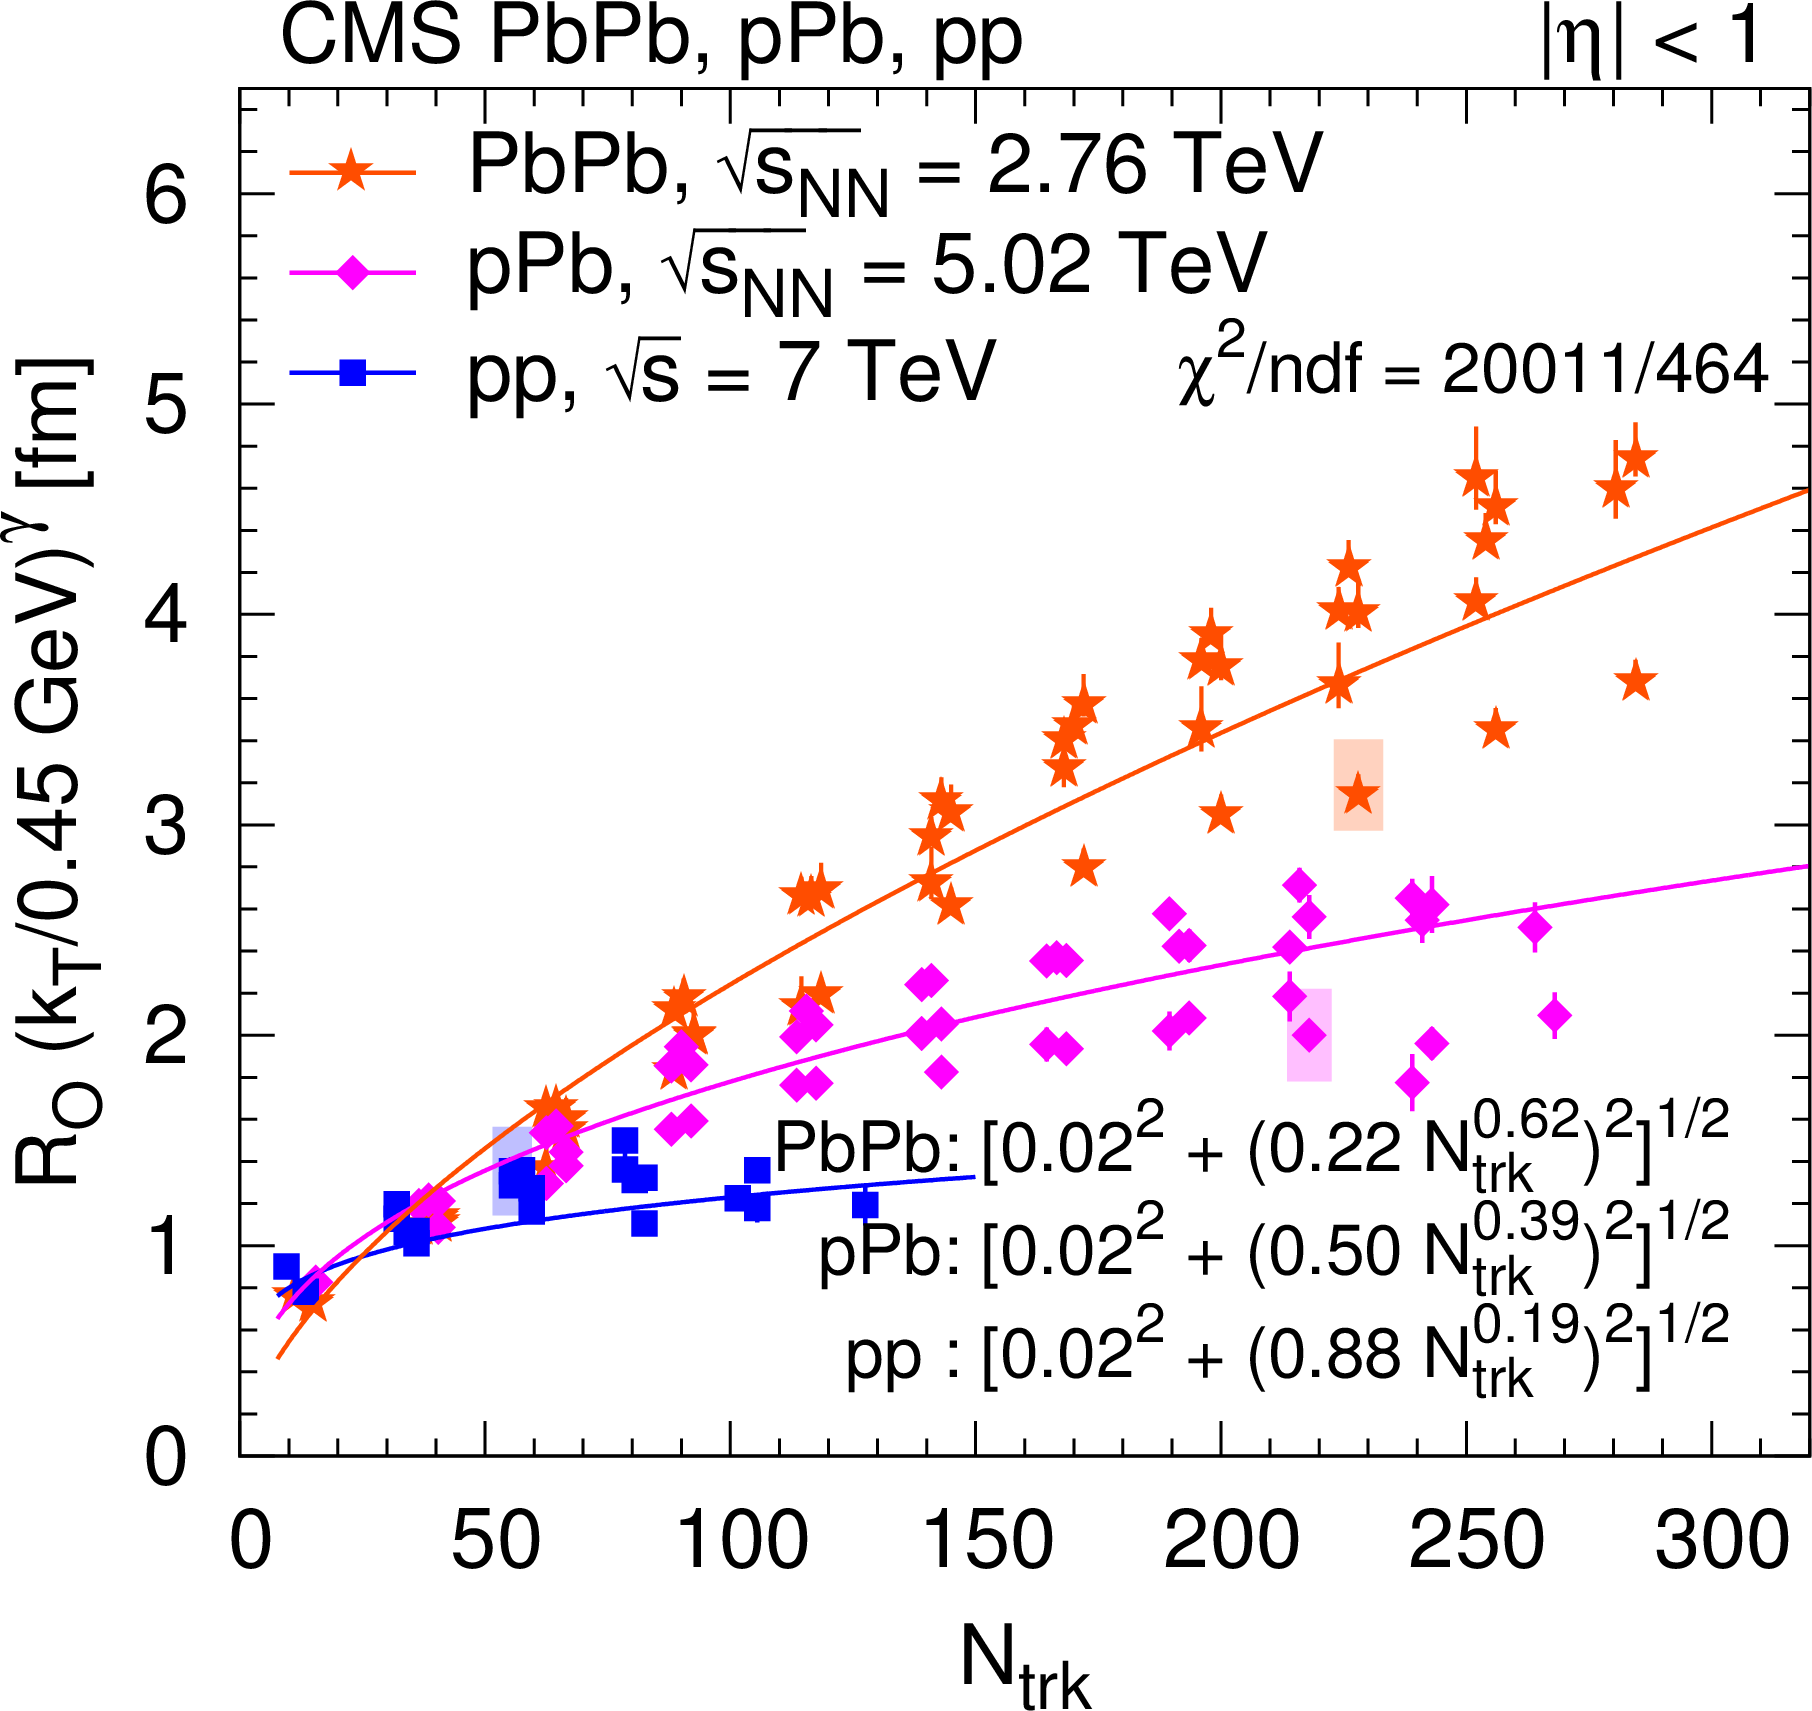
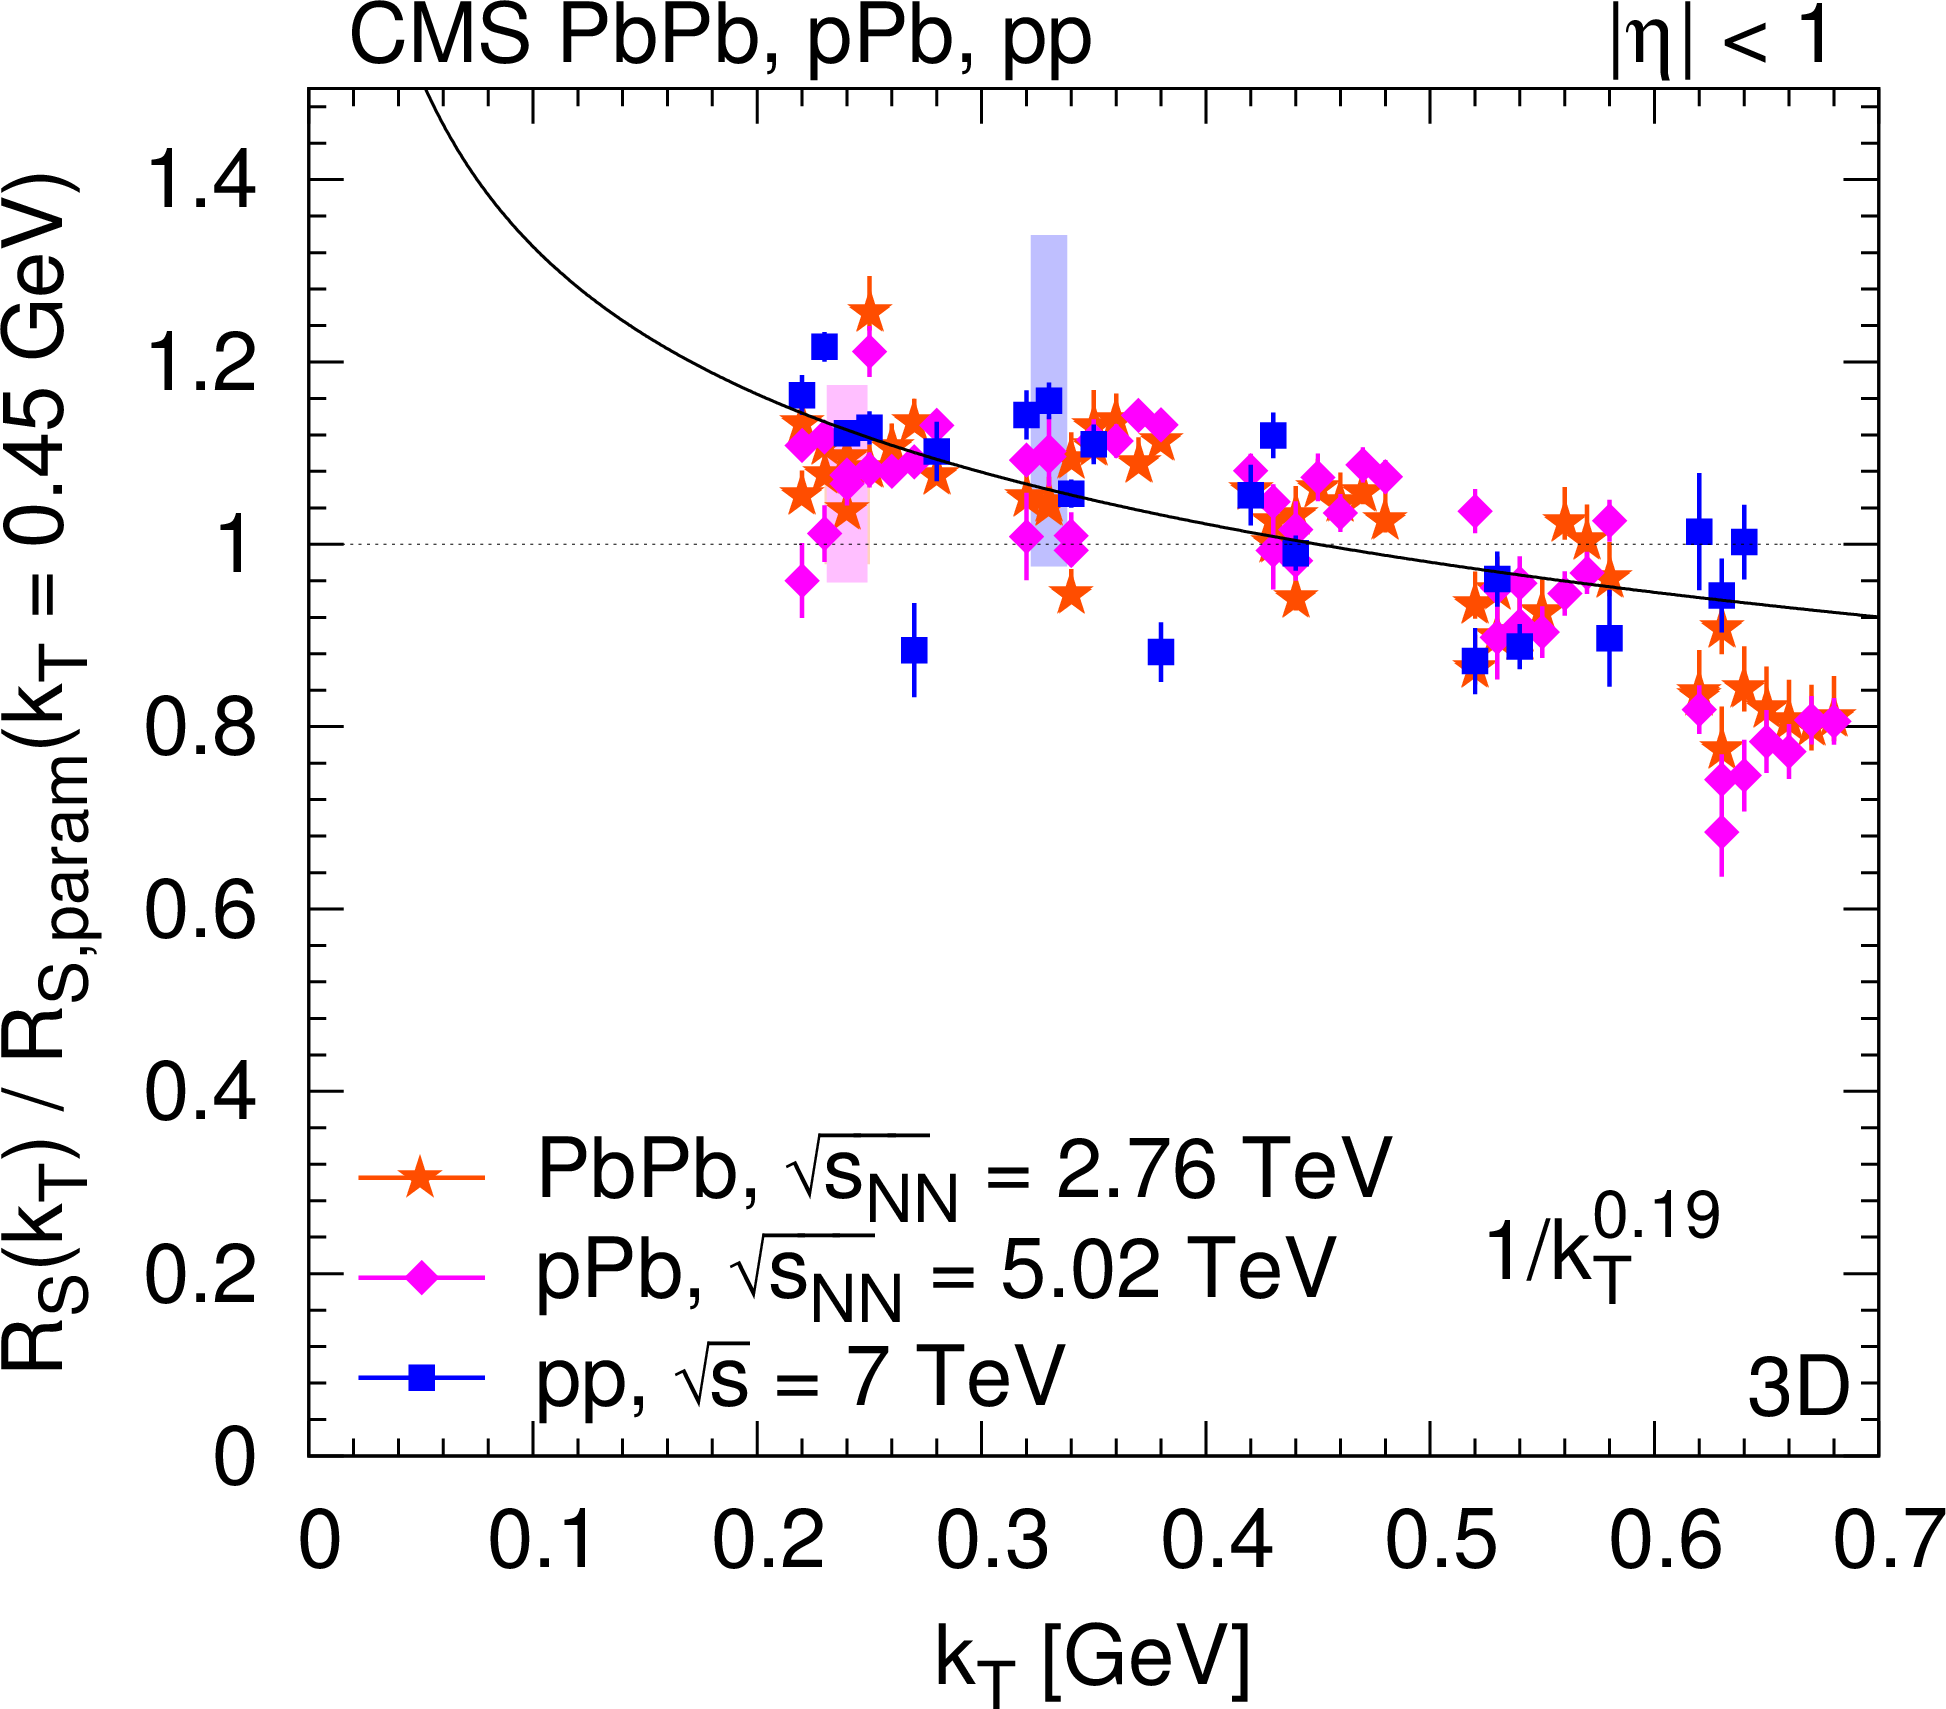
Figure 29:
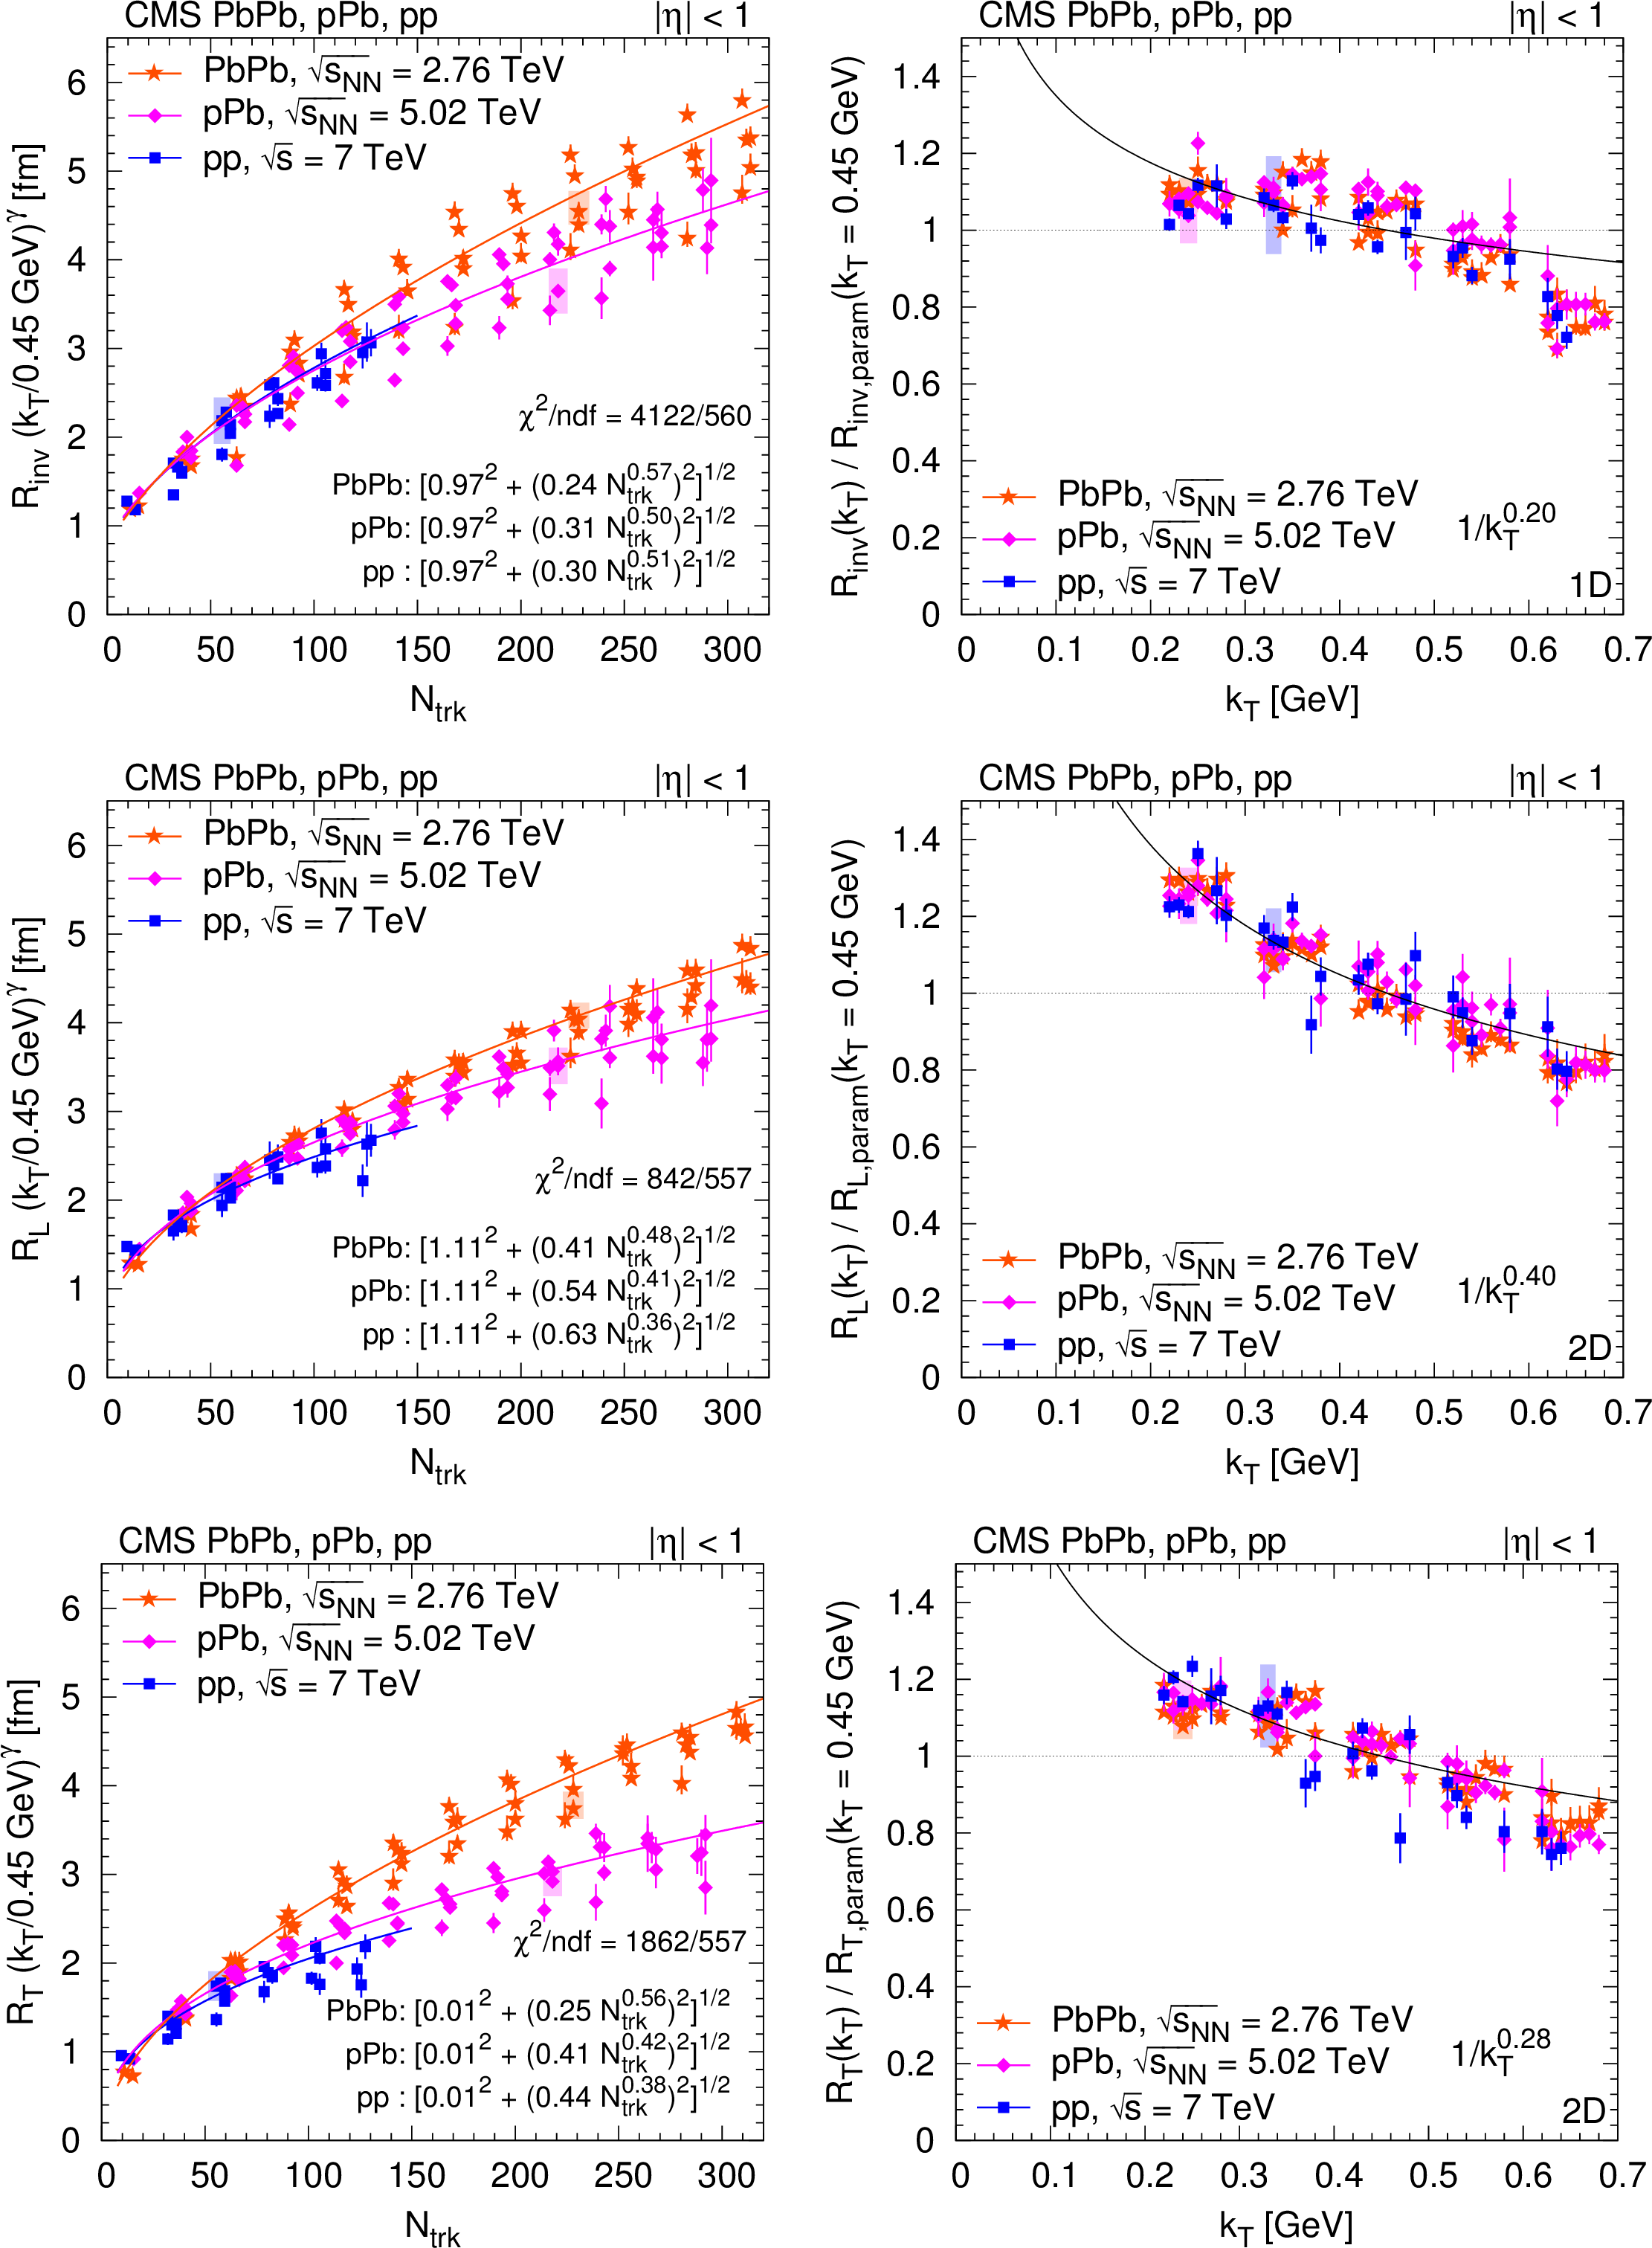
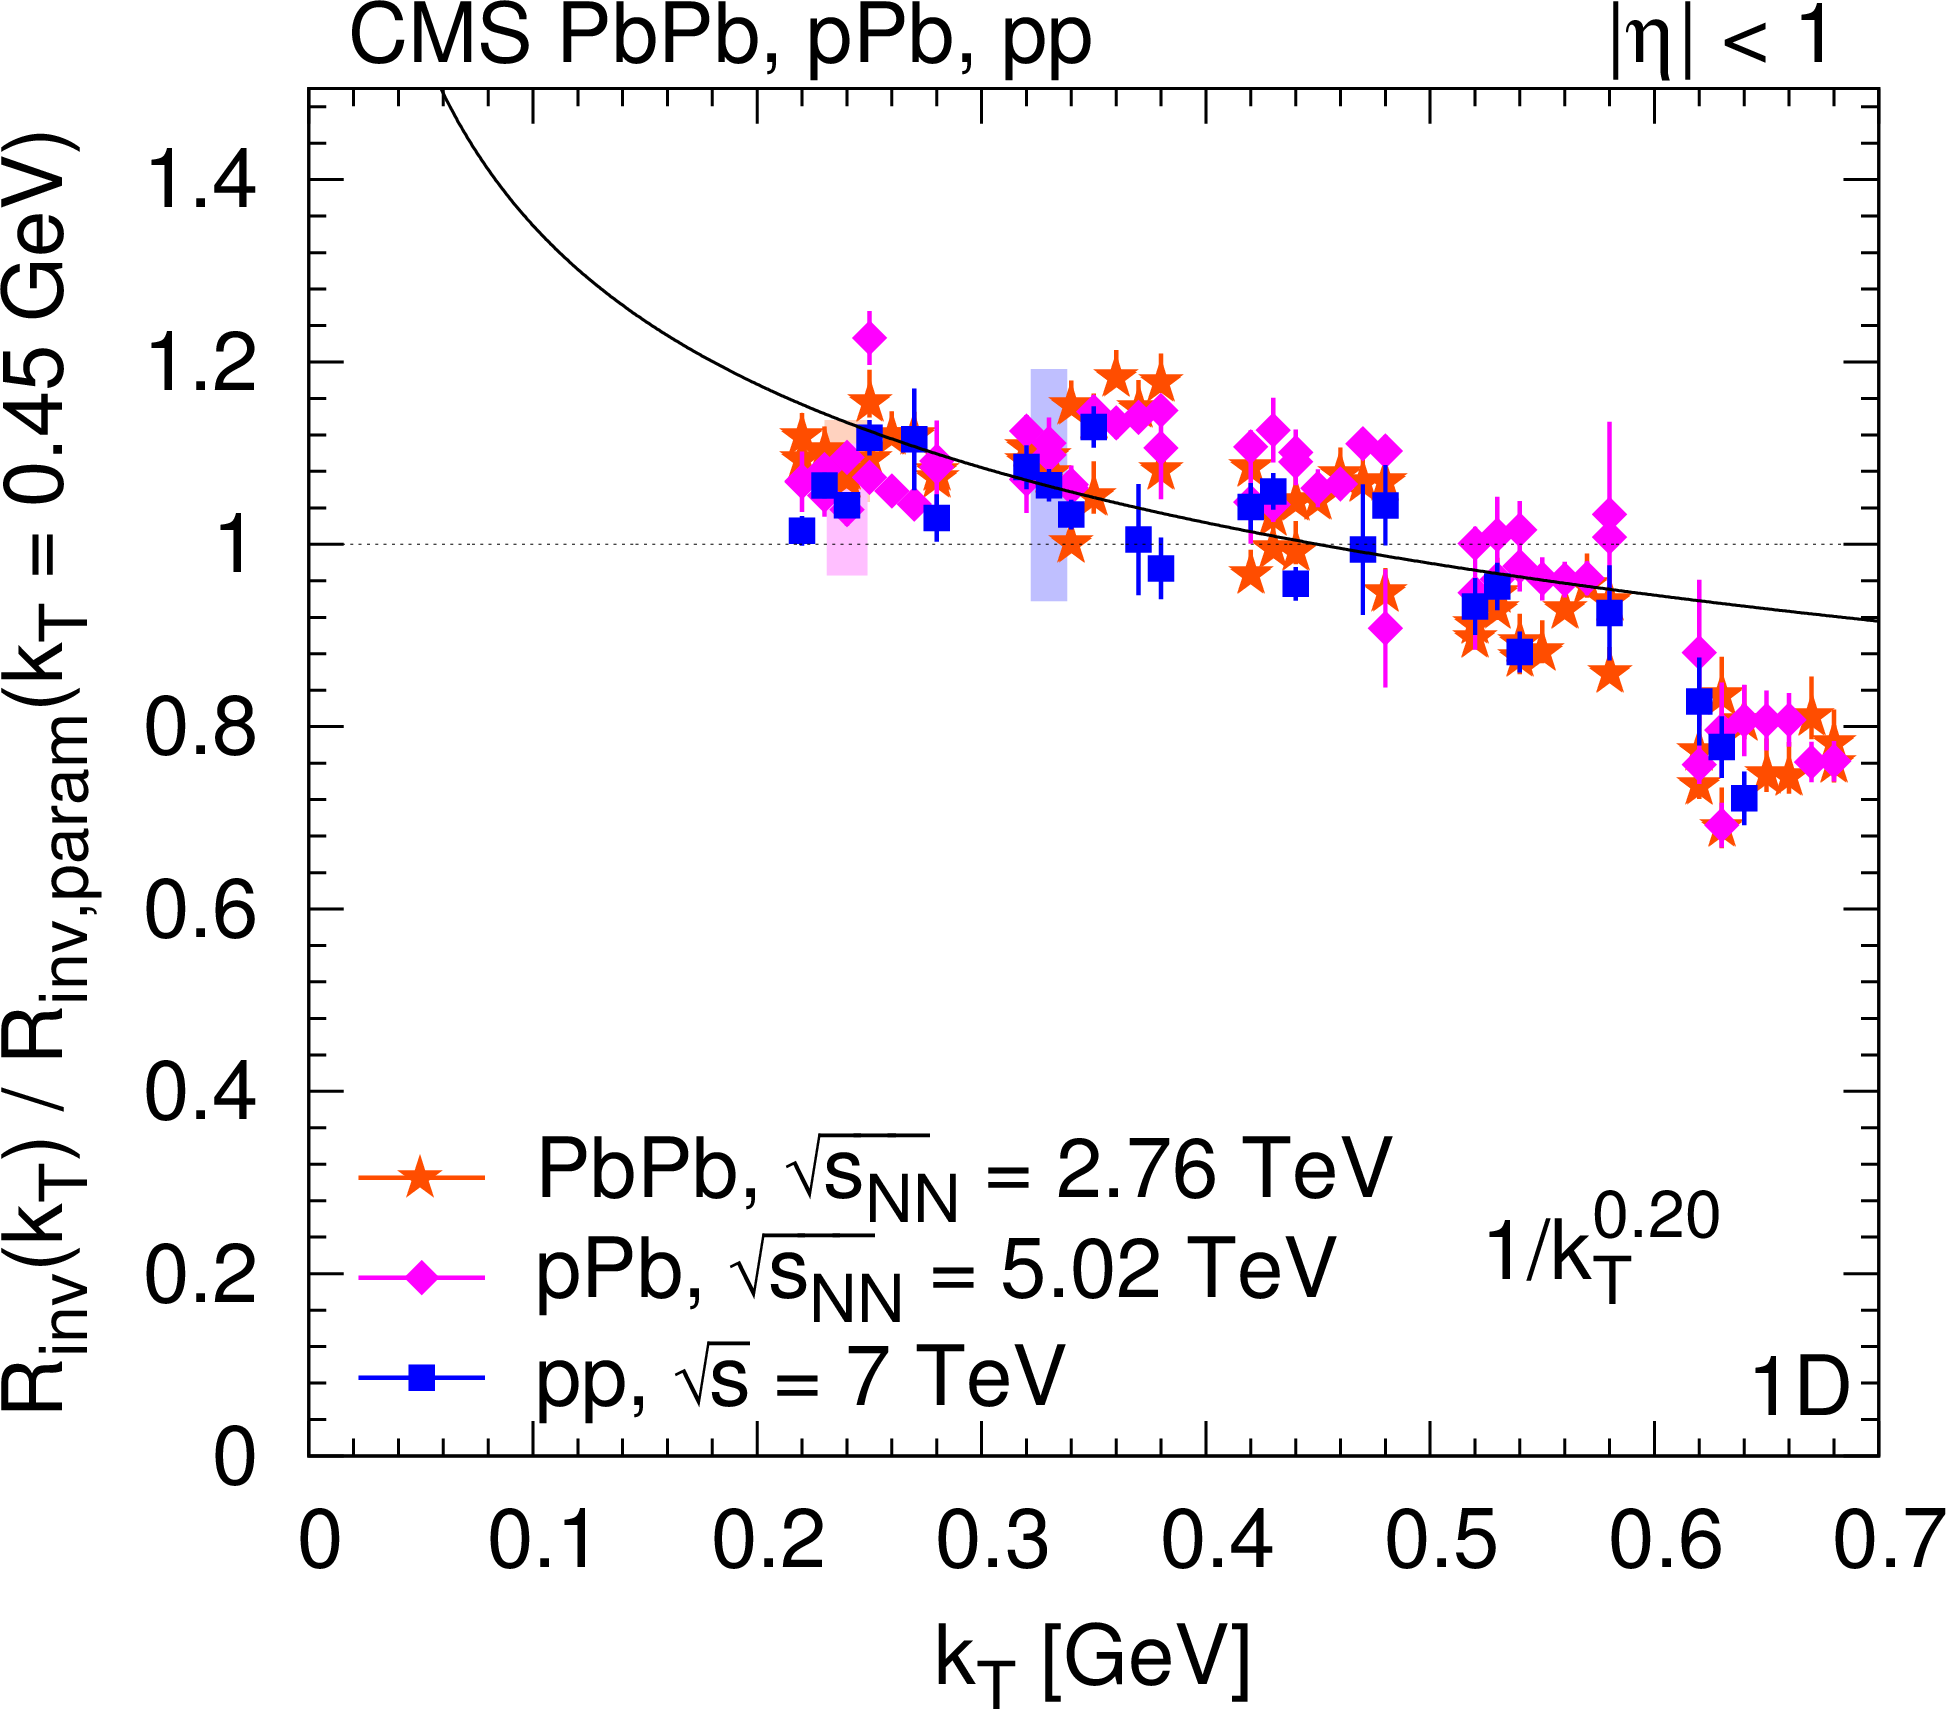
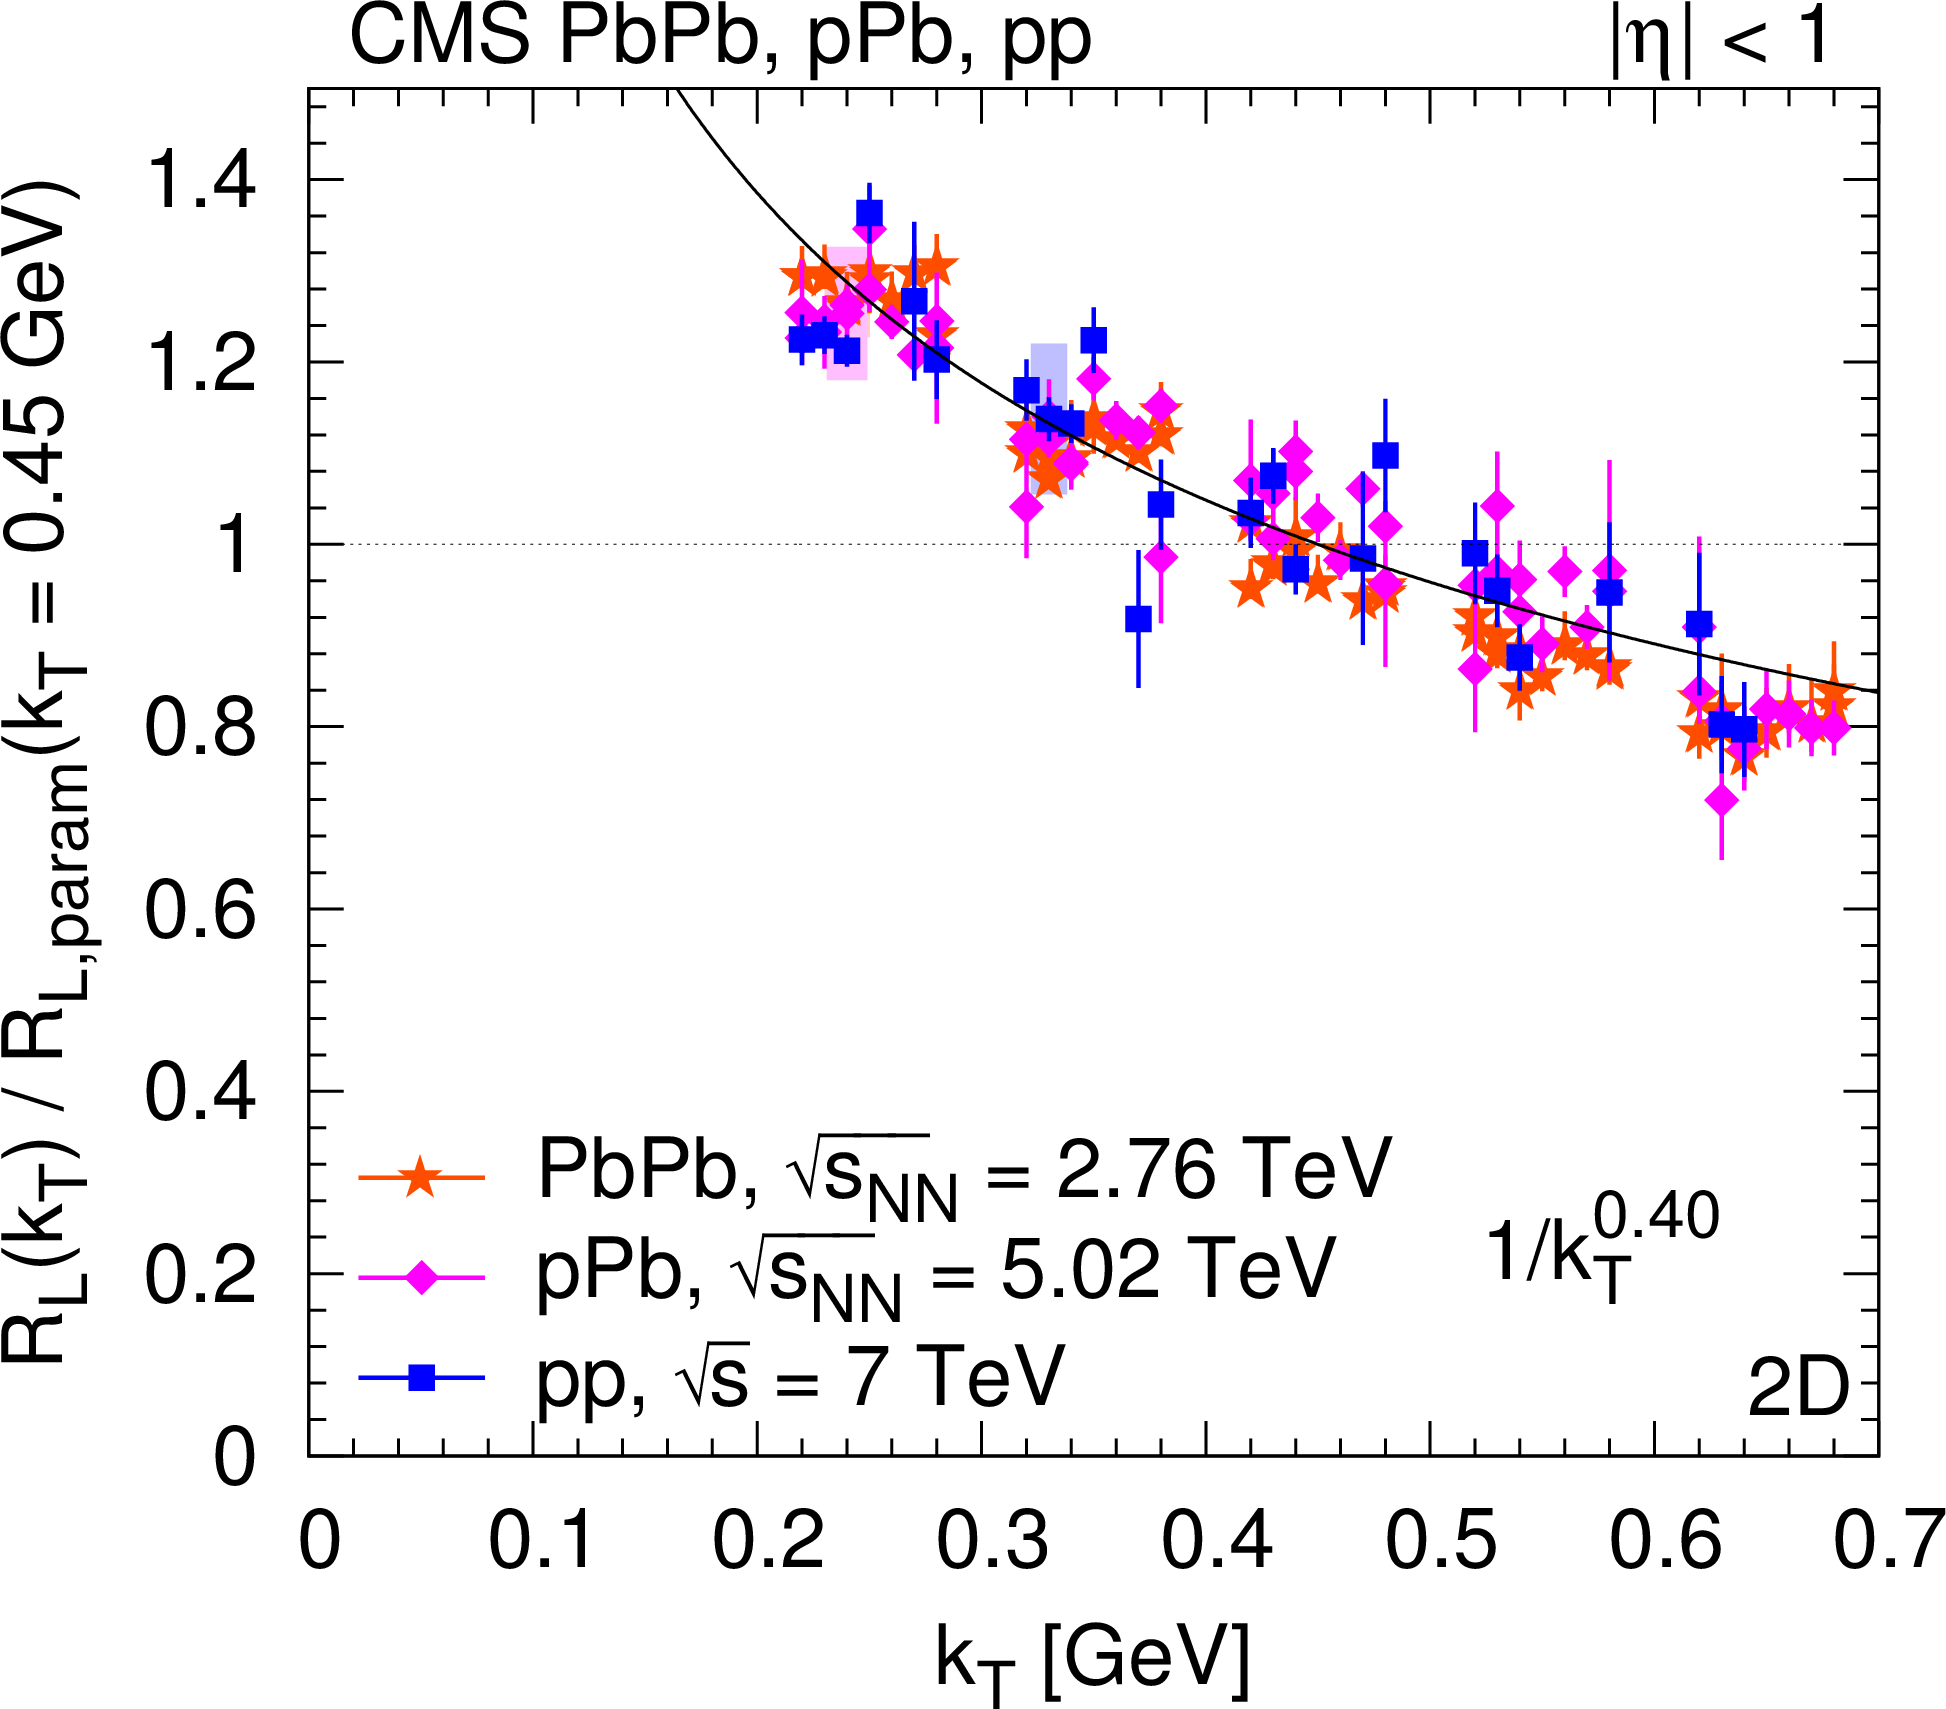
Left: Radius parameters for pions as a function of $ {N_\text {trk}} $ scaled to $ {k_{\mathrm {T}}} = $ 0.45 GeV with help of the parametrization, as $R ({k_{\mathrm {T}}} /0.45 GeV)^\gamma $ (Eq. 15). Right: Ratio of the radius parameter and the value of the parametrization $ {R_\text {param}}$ (Eq. 15) at $ {k_{\mathrm {T}}} = $ 0.45 GeV as a function $ {k_{\mathrm {T}}} $. (For better visibility, points are shifted to left and to right with respect to the center of the $ {k_{\mathrm {T}}} $ bin. Systematic uncertainties are indicated with shaded boxes, only for a fraction of the points.) Upper row: $ {R_\text {inv}} $ from the 1D ($ {q_\text {inv}} $) analysis. Middle row: $ {R_\text {L}} $ from the 2D $({q_\text {L}}, {q_\text {T}})$ analysis. Lower row: $ {R_\text {T}} $ from the 2D $({q_\text {L}}, {q_\text {T}})$ analysis. Fit results are indicated in the figures, see text for details. |

png pdf |
Figure 29-a:
Left: Radius parameters for pions as a function of $ {N_\text {trk}} $ scaled to $ {k_{\mathrm {T}}} = $ 0.45 GeV with help of the parametrization, as $R ({k_{\mathrm {T}}} /0.45 GeV)^\gamma $ (Eq. 15). Right: Ratio of the radius parameter and the value of the parametrization $ {R_\text {param}}$ (Eq. 15) at $ {k_{\mathrm {T}}} = $ 0.45 GeV as a function $ {k_{\mathrm {T}}} $. (For better visibility, points are shifted to left and to right with respect to the center of the $ {k_{\mathrm {T}}} $ bin. Systematic uncertainties are indicated with shaded boxes, only for a fraction of the points.) Upper row: $ {R_\text {inv}} $ from the 1D ($ {q_\text {inv}} $) analysis. Middle row: $ {R_\text {L}} $ from the 2D $({q_\text {L}}, {q_\text {T}})$ analysis. Lower row: $ {R_\text {T}} $ from the 2D $({q_\text {L}}, {q_\text {T}})$ analysis. Fit results are indicated in the figures, see text for details. |
png pdf |
Figure 29-b:
Left: Radius parameters for pions as a function of $ {N_\text {trk}} $ scaled to $ {k_{\mathrm {T}}} = $ 0.45 GeV with help of the parametrization, as $R ({k_{\mathrm {T}}} /0.45 GeV)^\gamma $ (Eq. 15). Right: Ratio of the radius parameter and the value of the parametrization $ {R_\text {param}}$ (Eq. 15) at $ {k_{\mathrm {T}}} = $ 0.45 GeV as a function $ {k_{\mathrm {T}}} $. (For better visibility, points are shifted to left and to right with respect to the center of the $ {k_{\mathrm {T}}} $ bin. Systematic uncertainties are indicated with shaded boxes, only for a fraction of the points.) Upper row: $ {R_\text {inv}} $ from the 1D ($ {q_\text {inv}} $) analysis. Middle row: $ {R_\text {L}} $ from the 2D $({q_\text {L}}, {q_\text {T}})$ analysis. Lower row: $ {R_\text {T}} $ from the 2D $({q_\text {L}}, {q_\text {T}})$ analysis. Fit results are indicated in the figures, see text for details. |

png pdf |
Figure 29-c:
Left: Radius parameters for pions as a function of $ {N_\text {trk}} $ scaled to $ {k_{\mathrm {T}}} = $ 0.45 GeV with help of the parametrization, as $R ({k_{\mathrm {T}}} /0.45 GeV)^\gamma $ (Eq. 15). Right: Ratio of the radius parameter and the value of the parametrization $ {R_\text {param}}$ (Eq. 15) at $ {k_{\mathrm {T}}} = $ 0.45 GeV as a function $ {k_{\mathrm {T}}} $. (For better visibility, points are shifted to left and to right with respect to the center of the $ {k_{\mathrm {T}}} $ bin. Systematic uncertainties are indicated with shaded boxes, only for a fraction of the points.) Upper row: $ {R_\text {inv}} $ from the 1D ($ {q_\text {inv}} $) analysis. Middle row: $ {R_\text {L}} $ from the 2D $({q_\text {L}}, {q_\text {T}})$ analysis. Lower row: $ {R_\text {T}} $ from the 2D $({q_\text {L}}, {q_\text {T}})$ analysis. Fit results are indicated in the figures, see text for details. |
png pdf |
Figure 29-d:
Left: Radius parameters for pions as a function of $ {N_\text {trk}} $ scaled to $ {k_{\mathrm {T}}} = $ 0.45 GeV with help of the parametrization, as $R ({k_{\mathrm {T}}} /0.45 GeV)^\gamma $ (Eq. 15). Right: Ratio of the radius parameter and the value of the parametrization $ {R_\text {param}}$ (Eq. 15) at $ {k_{\mathrm {T}}} = $ 0.45 GeV as a function $ {k_{\mathrm {T}}} $. (For better visibility, points are shifted to left and to right with respect to the center of the $ {k_{\mathrm {T}}} $ bin. Systematic uncertainties are indicated with shaded boxes, only for a fraction of the points.) Upper row: $ {R_\text {inv}} $ from the 1D ($ {q_\text {inv}} $) analysis. Middle row: $ {R_\text {L}} $ from the 2D $({q_\text {L}}, {q_\text {T}})$ analysis. Lower row: $ {R_\text {T}} $ from the 2D $({q_\text {L}}, {q_\text {T}})$ analysis. Fit results are indicated in the figures, see text for details. |
png pdf |
Figure 29-e:
Left: Radius parameters for pions as a function of $ {N_\text {trk}} $ scaled to $ {k_{\mathrm {T}}} = $ 0.45 GeV with help of the parametrization, as $R ({k_{\mathrm {T}}} /0.45 GeV)^\gamma $ (Eq. 15). Right: Ratio of the radius parameter and the value of the parametrization $ {R_\text {param}}$ (Eq. 15) at $ {k_{\mathrm {T}}} = $ 0.45 GeV as a function $ {k_{\mathrm {T}}} $. (For better visibility, points are shifted to left and to right with respect to the center of the $ {k_{\mathrm {T}}} $ bin. Systematic uncertainties are indicated with shaded boxes, only for a fraction of the points.) Upper row: $ {R_\text {inv}} $ from the 1D ($ {q_\text {inv}} $) analysis. Middle row: $ {R_\text {L}} $ from the 2D $({q_\text {L}}, {q_\text {T}})$ analysis. Lower row: $ {R_\text {T}} $ from the 2D $({q_\text {L}}, {q_\text {T}})$ analysis. Fit results are indicated in the figures, see text for details. |
png pdf |
Figure 29-f:
Left: Radius parameters for pions as a function of $ {N_\text {trk}} $ scaled to $ {k_{\mathrm {T}}} = $ 0.45 GeV with help of the parametrization, as $R ({k_{\mathrm {T}}} /0.45 GeV)^\gamma $ (Eq. 15). Right: Ratio of the radius parameter and the value of the parametrization $ {R_\text {param}}$ (Eq. 15) at $ {k_{\mathrm {T}}} = $ 0.45 GeV as a function $ {k_{\mathrm {T}}} $. (For better visibility, points are shifted to left and to right with respect to the center of the $ {k_{\mathrm {T}}} $ bin. Systematic uncertainties are indicated with shaded boxes, only for a fraction of the points.) Upper row: $ {R_\text {inv}} $ from the 1D ($ {q_\text {inv}} $) analysis. Middle row: $ {R_\text {L}} $ from the 2D $({q_\text {L}}, {q_\text {T}})$ analysis. Lower row: $ {R_\text {T}} $ from the 2D $({q_\text {L}}, {q_\text {T}})$ analysis. Fit results are indicated in the figures, see text for details. |

png pdf |
Figure 30:
Left: Radius parameters for pions as a function of $ {N_\text {trk}} $ scaled to $ {k_{\mathrm {T}}} = $ 0.45 GeV with help of the parametrization as $R ({k_{\mathrm {T}}} /0.45 GeV)^\gamma $ (Eq. 15). Right: Ratio of the radius parameter and the value of the parametrization $ {R_\text {param}}$ (Eq. 15) at $ {k_{\mathrm {T}}} = $ 0.45 GeV as a function $ {k_{\mathrm {T}}} $. (For better visibility, points are shifted to left and to right with respect to the center of the $ {k_{\mathrm {T}}} $ bin. Systematic uncertainties are indicated with shaded boxes, only for a fraction of the points.) Radii from the 3D $({q_\text {L}}$, ${q_\text {O}}$, ${q_\text {S}})$ analysis are shown, from upper to lower: $ {R_\text {L}} $, $ {R_\text {O}} $, $ {R_\text {S}} $. Fit results are indicated in the figures, see text for details. |
png pdf |
Figure 30-a:
Left: Radius parameters for pions as a function of $ {N_\text {trk}} $ scaled to $ {k_{\mathrm {T}}} = $ 0.45 GeV with help of the parametrization as $R ({k_{\mathrm {T}}} /0.45 GeV)^\gamma $ (Eq. 15). Right: Ratio of the radius parameter and the value of the parametrization $ {R_\text {param}}$ (Eq. 15) at $ {k_{\mathrm {T}}} = $ 0.45 GeV as a function $ {k_{\mathrm {T}}} $. (For better visibility, points are shifted to left and to right with respect to the center of the $ {k_{\mathrm {T}}} $ bin. Systematic uncertainties are indicated with shaded boxes, only for a fraction of the points.) Radii from the 3D $({q_\text {L}}$, ${q_\text {O}}$, ${q_\text {S}})$ analysis are shown, from upper to lower: $ {R_\text {L}} $, $ {R_\text {O}} $, $ {R_\text {S}} $. Fit results are indicated in the figures, see text for details. |
png pdf |
Figure 30-b:
Left: Radius parameters for pions as a function of $ {N_\text {trk}} $ scaled to $ {k_{\mathrm {T}}} = $ 0.45 GeV with help of the parametrization as $R ({k_{\mathrm {T}}} /0.45 GeV)^\gamma $ (Eq. 15). Right: Ratio of the radius parameter and the value of the parametrization $ {R_\text {param}}$ (Eq. 15) at $ {k_{\mathrm {T}}} = $ 0.45 GeV as a function $ {k_{\mathrm {T}}} $. (For better visibility, points are shifted to left and to right with respect to the center of the $ {k_{\mathrm {T}}} $ bin. Systematic uncertainties are indicated with shaded boxes, only for a fraction of the points.) Radii from the 3D $({q_\text {L}}$, ${q_\text {O}}$, ${q_\text {S}})$ analysis are shown, from upper to lower: $ {R_\text {L}} $, $ {R_\text {O}} $, $ {R_\text {S}} $. Fit results are indicated in the figures, see text for details. |
png pdf |
Figure 30-c:
Left: Radius parameters for pions as a function of $ {N_\text {trk}} $ scaled to $ {k_{\mathrm {T}}} = $ 0.45 GeV with help of the parametrization as $R ({k_{\mathrm {T}}} /0.45 GeV)^\gamma $ (Eq. 15). Right: Ratio of the radius parameter and the value of the parametrization $ {R_\text {param}}$ (Eq. 15) at $ {k_{\mathrm {T}}} = $ 0.45 GeV as a function $ {k_{\mathrm {T}}} $. (For better visibility, points are shifted to left and to right with respect to the center of the $ {k_{\mathrm {T}}} $ bin. Systematic uncertainties are indicated with shaded boxes, only for a fraction of the points.) Radii from the 3D $({q_\text {L}}$, ${q_\text {O}}$, ${q_\text {S}})$ analysis are shown, from upper to lower: $ {R_\text {L}} $, $ {R_\text {O}} $, $ {R_\text {S}} $. Fit results are indicated in the figures, see text for details. |

png pdf |
Figure 30-d:
Left: Radius parameters for pions as a function of $ {N_\text {trk}} $ scaled to $ {k_{\mathrm {T}}} = $ 0.45 GeV with help of the parametrization as $R ({k_{\mathrm {T}}} /0.45 GeV)^\gamma $ (Eq. 15). Right: Ratio of the radius parameter and the value of the parametrization $ {R_\text {param}}$ (Eq. 15) at $ {k_{\mathrm {T}}} = $ 0.45 GeV as a function $ {k_{\mathrm {T}}} $. (For better visibility, points are shifted to left and to right with respect to the center of the $ {k_{\mathrm {T}}} $ bin. Systematic uncertainties are indicated with shaded boxes, only for a fraction of the points.) Radii from the 3D $({q_\text {L}}$, ${q_\text {O}}$, ${q_\text {S}})$ analysis are shown, from upper to lower: $ {R_\text {L}} $, $ {R_\text {O}} $, $ {R_\text {S}} $. Fit results are indicated in the figures, see text for details. |
png pdf |
Figure 30-e:
Left: Radius parameters for pions as a function of $ {N_\text {trk}} $ scaled to $ {k_{\mathrm {T}}} = $ 0.45 GeV with help of the parametrization as $R ({k_{\mathrm {T}}} /0.45 GeV)^\gamma $ (Eq. 15). Right: Ratio of the radius parameter and the value of the parametrization $ {R_\text {param}}$ (Eq. 15) at $ {k_{\mathrm {T}}} = $ 0.45 GeV as a function $ {k_{\mathrm {T}}} $. (For better visibility, points are shifted to left and to right with respect to the center of the $ {k_{\mathrm {T}}} $ bin. Systematic uncertainties are indicated with shaded boxes, only for a fraction of the points.) Radii from the 3D $({q_\text {L}}$, ${q_\text {O}}$, ${q_\text {S}})$ analysis are shown, from upper to lower: $ {R_\text {L}} $, $ {R_\text {O}} $, $ {R_\text {S}} $. Fit results are indicated in the figures, see text for details. |

png pdf |
Figure 30-f:
Left: Radius parameters for pions as a function of $ {N_\text {trk}} $ scaled to $ {k_{\mathrm {T}}} = $ 0.45 GeV with help of the parametrization as $R ({k_{\mathrm {T}}} /0.45 GeV)^\gamma $ (Eq. 15). Right: Ratio of the radius parameter and the value of the parametrization $ {R_\text {param}}$ (Eq. 15) at $ {k_{\mathrm {T}}} = $ 0.45 GeV as a function $ {k_{\mathrm {T}}} $. (For better visibility, points are shifted to left and to right with respect to the center of the $ {k_{\mathrm {T}}} $ bin. Systematic uncertainties are indicated with shaded boxes, only for a fraction of the points.) Radii from the 3D $({q_\text {L}}$, ${q_\text {O}}$, ${q_\text {S}})$ analysis are shown, from upper to lower: $ {R_\text {L}} $, $ {R_\text {O}} $, $ {R_\text {S}} $. Fit results are indicated in the figures, see text for details. |
| Tables | |
png pdf |
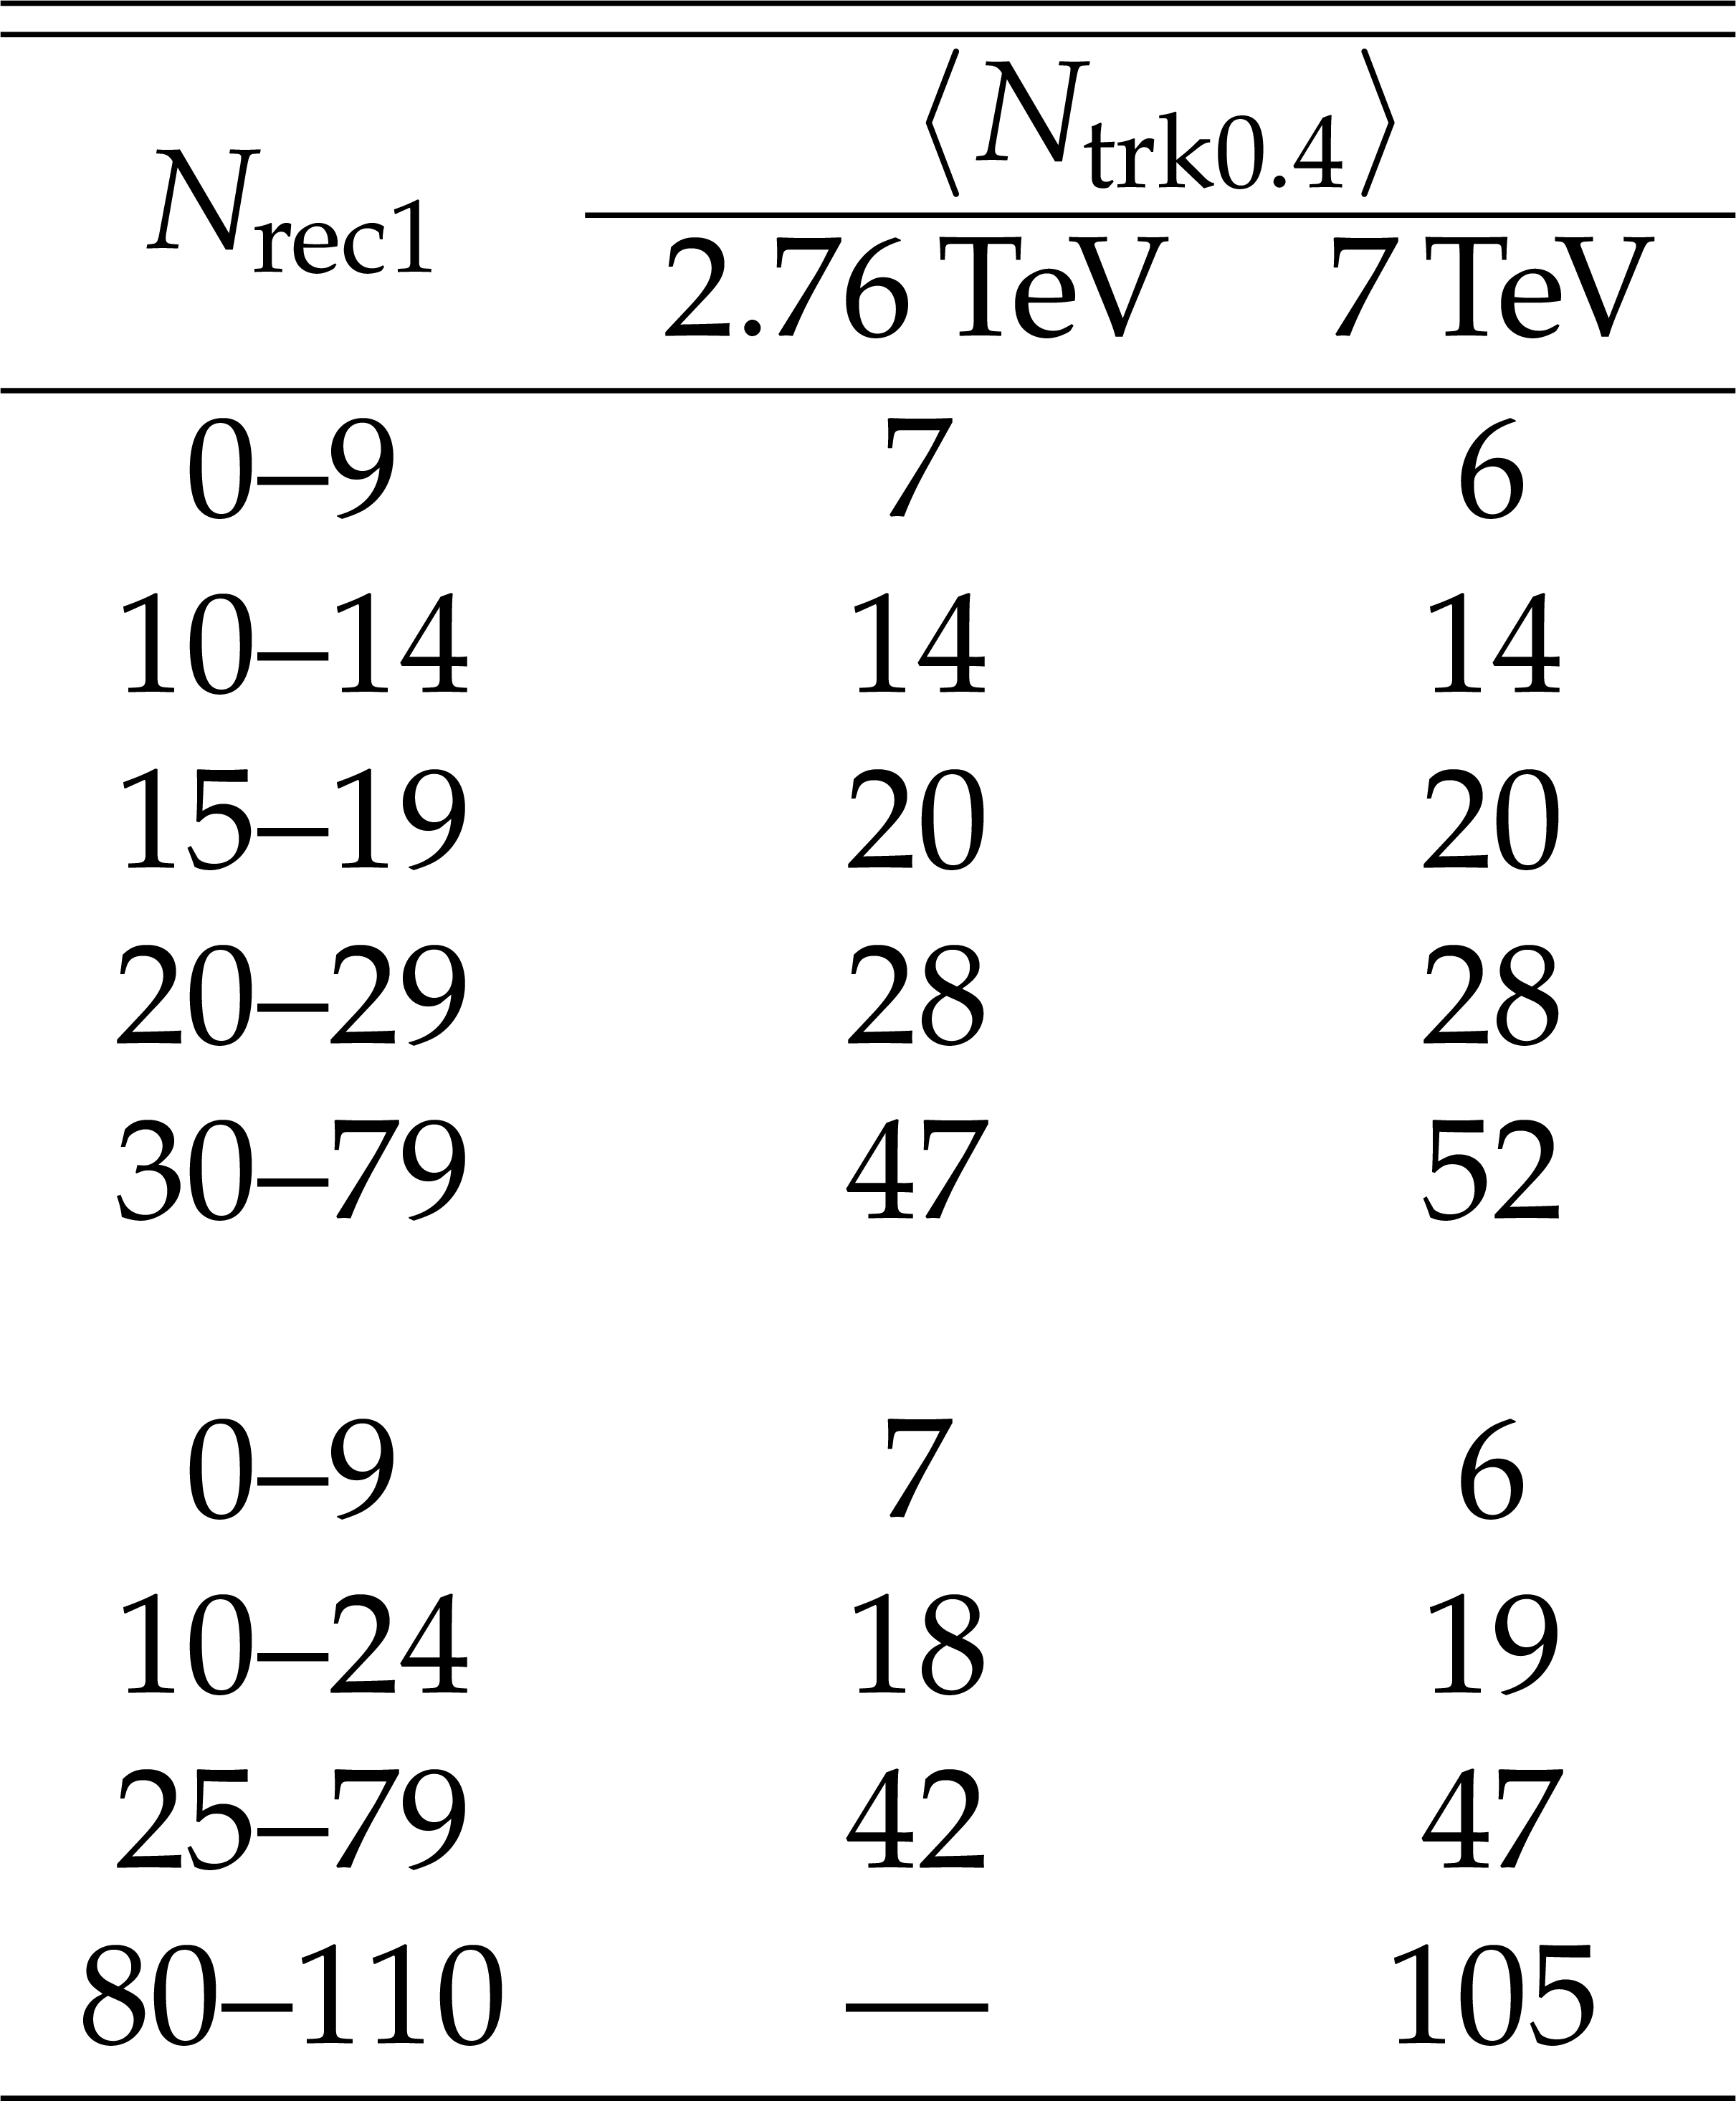
Table 1:
Ranges in charged-particle multiplicity over $ {| \eta |} < $ 2.4, $ {N_\text {rec1}} $, and corresponding average corrected number of tracks with $ {p_{\mathrm {T}}} > $ 0.4 GeV, $< {N_\text {trk0.4}} > $, in pp collisions at 2.76 and 7 TeV considered in the double ratio method. The $< {N_\text {trk0.4}} > $ values are rounded off to the nearest integer. A dash indicates that there is not enough data to allow for a good-quality measurement. |

png pdf |
Table 2:
Relation between the number of reconstructed tracks ($ {N_\text {rec2}} $, $ {p_{\mathrm {T}}} > $ 0.1 GeV) and the average number of corrected tracks ($< {N_\text {trk}} > $, $ {p_{\mathrm {T}}} > $ 0) in the region $ {| \eta |} < $ 2.4 for the 24 multiplicity classes considered in the particle identification and cluster subtraction method. The values are rounded off to the nearest integer. The corrected $< {N_\text {trk}} > $ values listed for pp collisions are common to all three measured energies. A dash indicates that there is not enough data to allow for a good-quality measurement. |

png pdf |
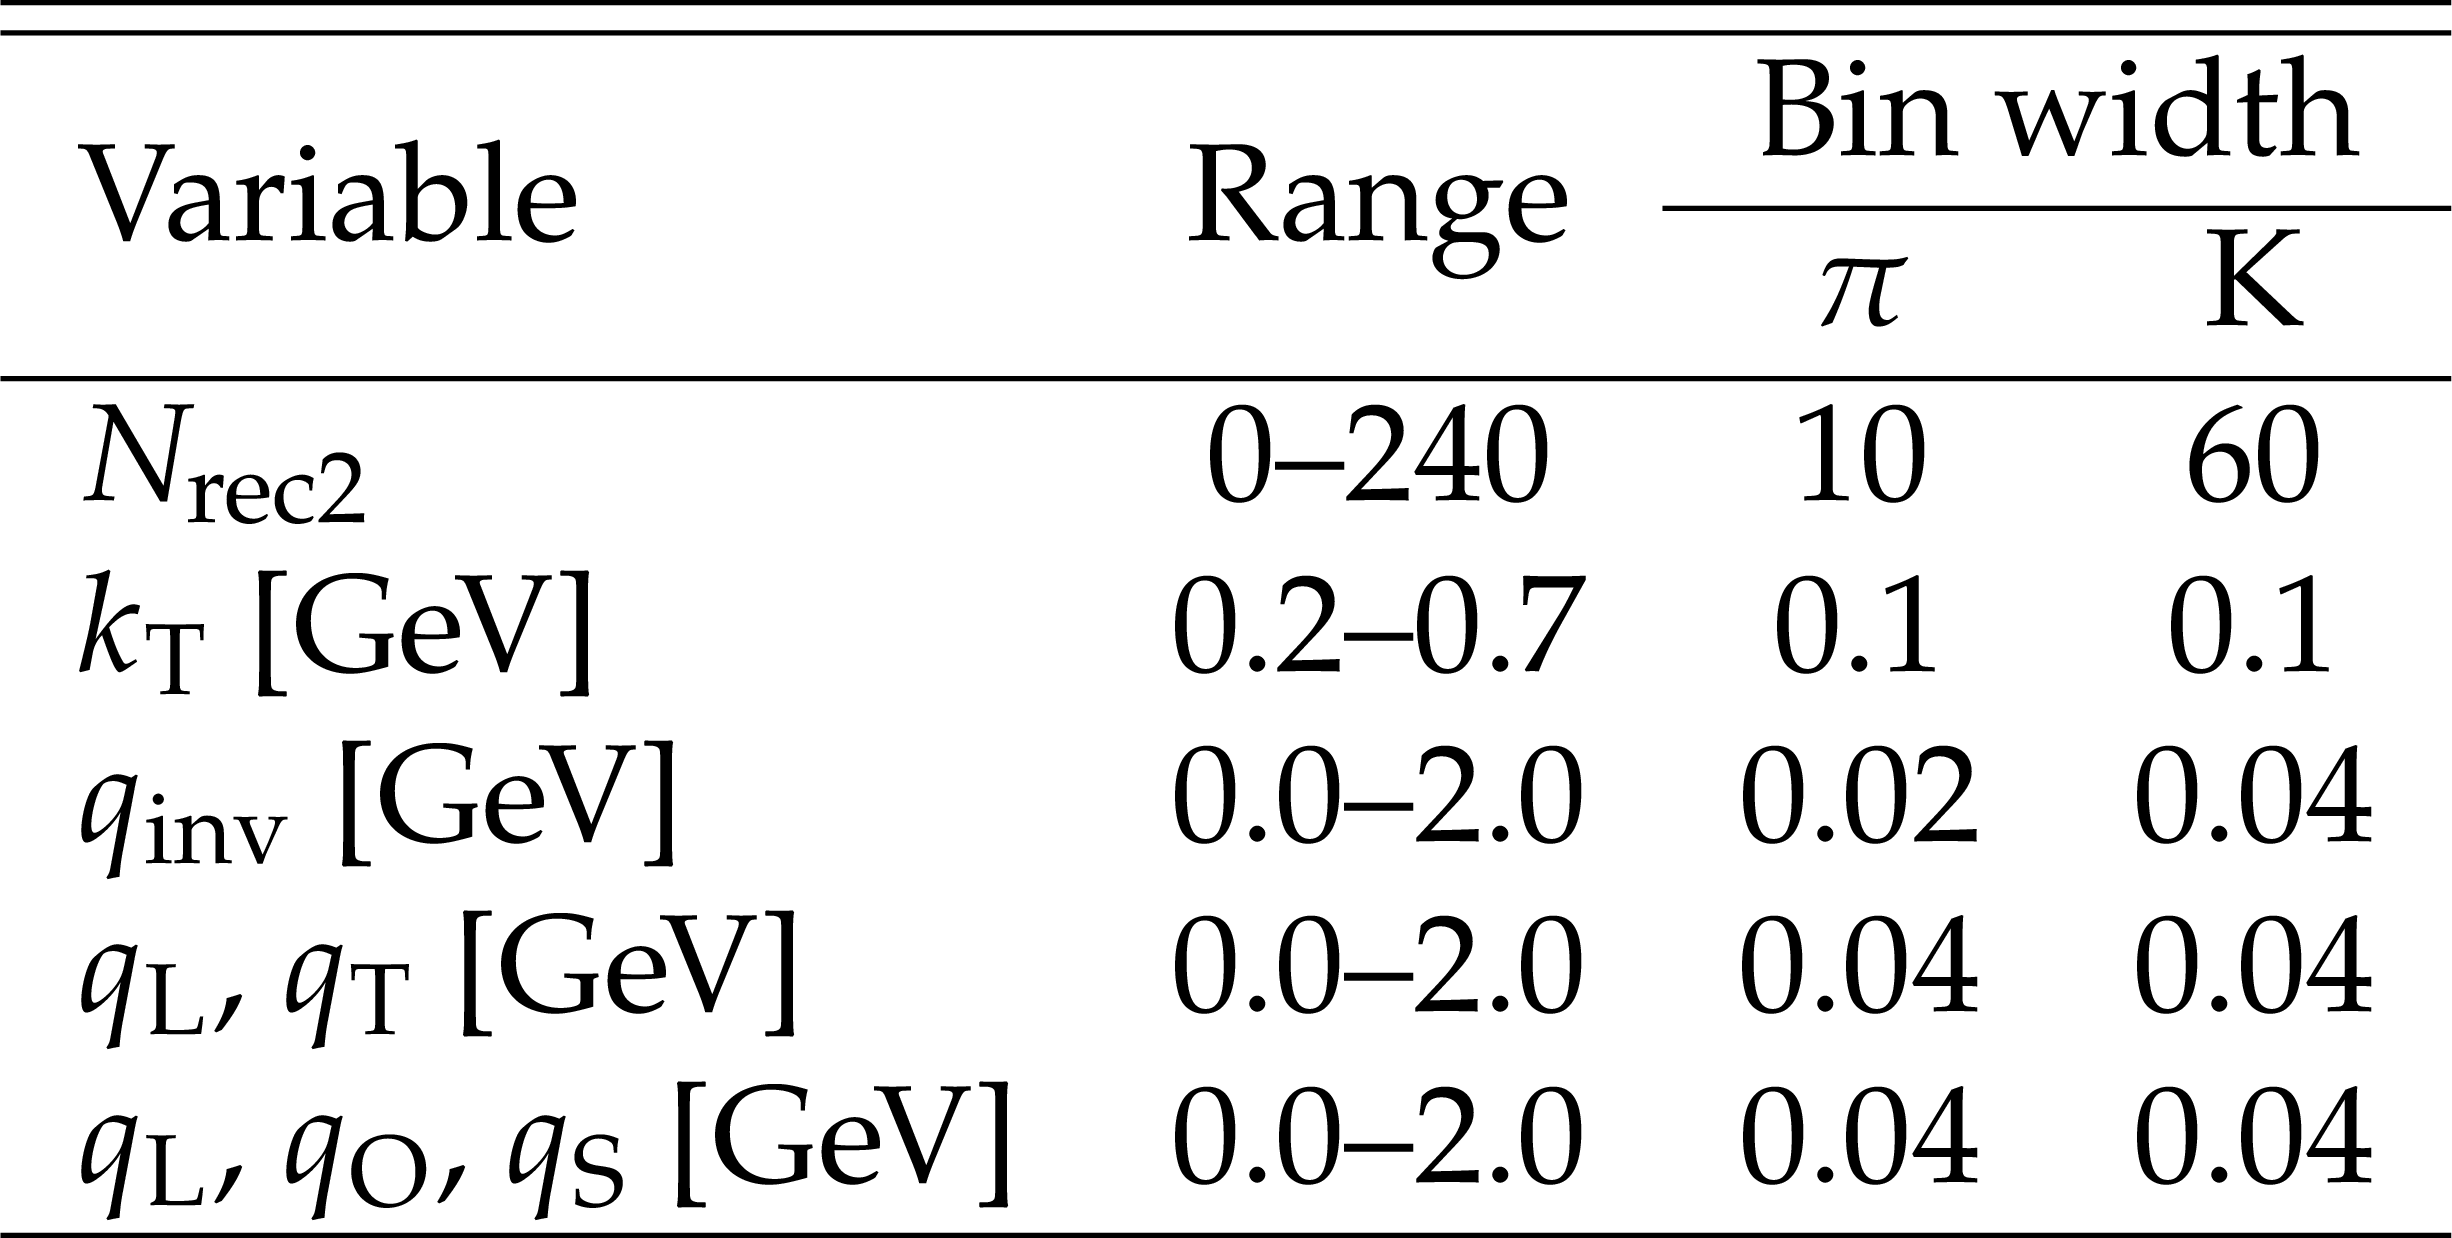
Table 3:
Bin widths chosen for the various variables studied with the double ratio method. |
png pdf |
Table 4:
Chosen bin widths for the various variables studied for pions and kaons in the particle identification and cluster subtraction method. |
png pdf |
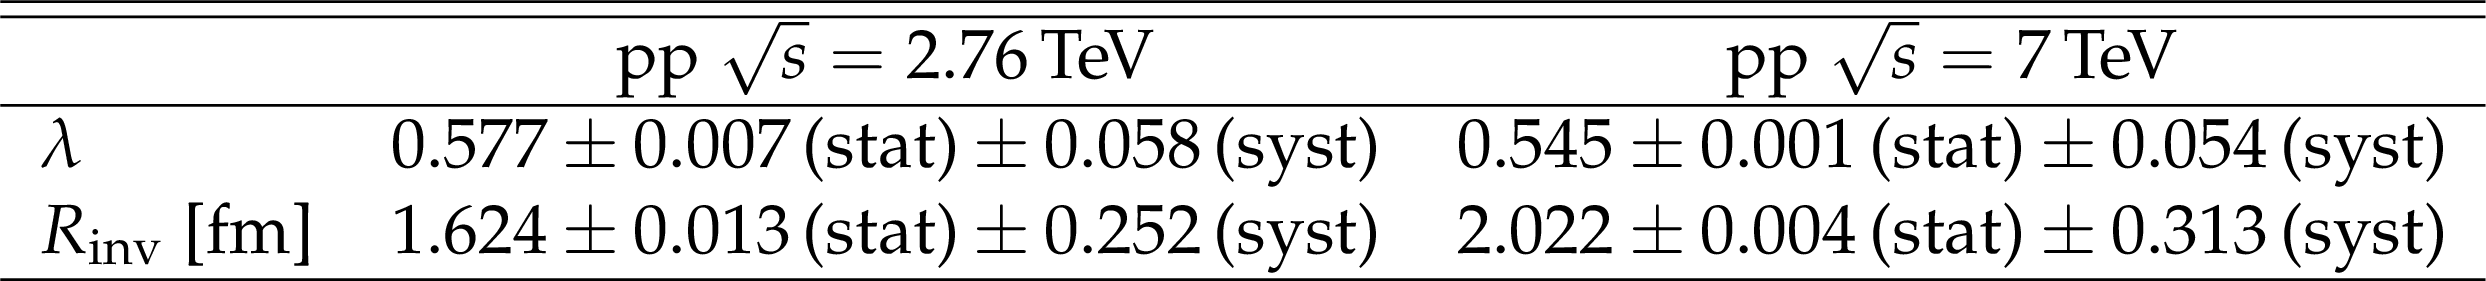
Table 5:
Fit parameters of the 1D BEC function in pp collisions at $\sqrt {s} = $ 2.76 and 7 TeV. |
png pdf |
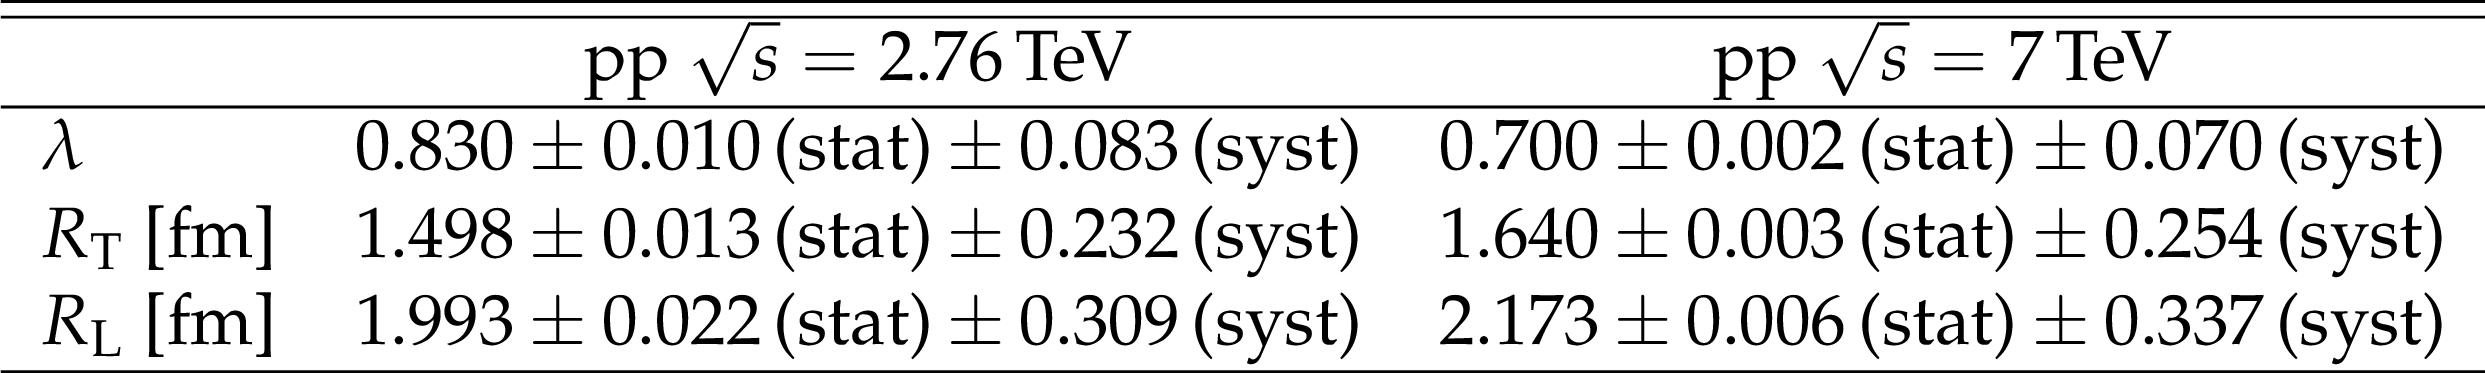
Table 6:
Fit parameters of the 2D BEC function in pp collisions at $\sqrt {s} = $ 2.76 and 7 TeV in the LCMS. |
png pdf |
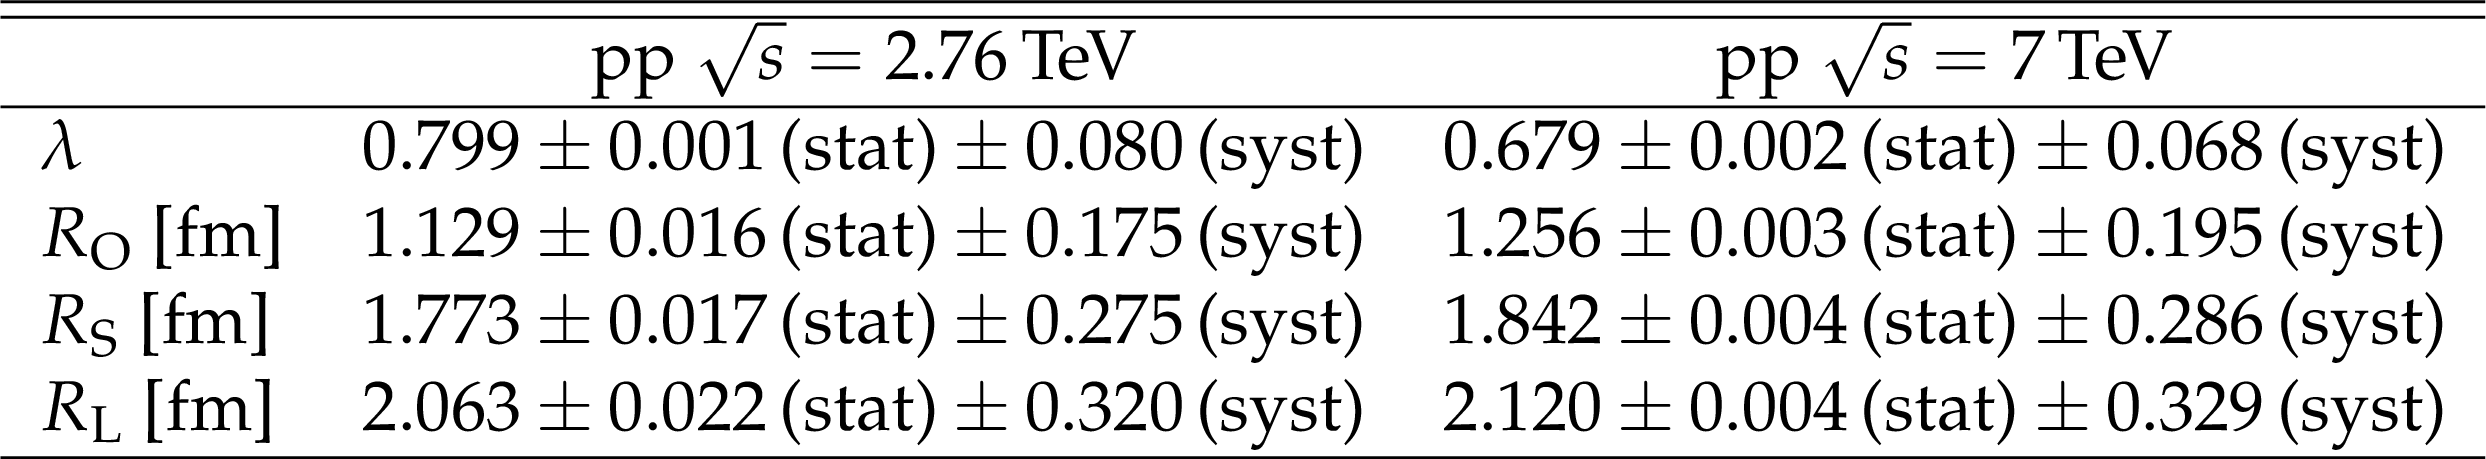
Table 7:
Parameters of the 3D BEC function, obtained from a stretched exponential fit, in pp collisions at $\sqrt {s} = $ 2.76 and 7 TeV in the LCMS. |
png pdf |
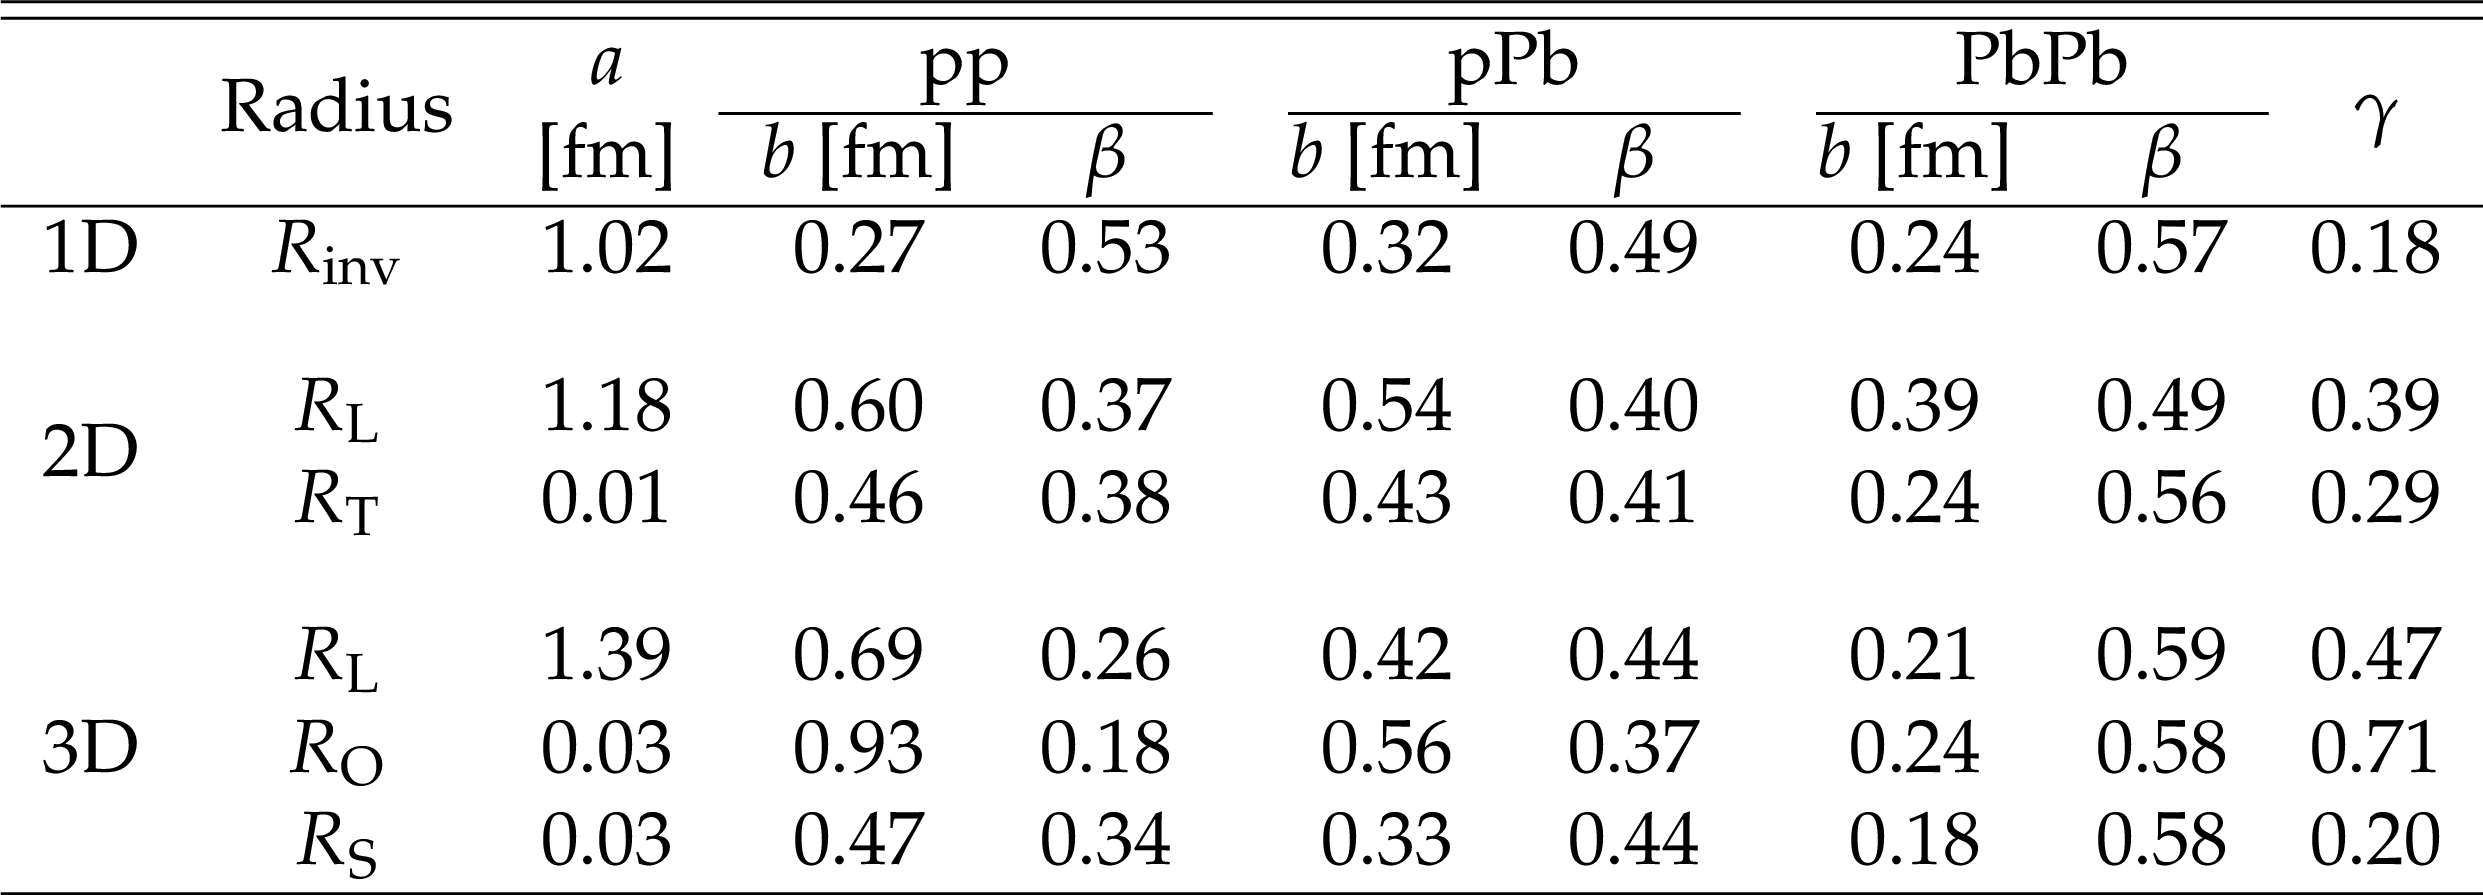
Table 8:
Values of the 1D, 2D, and 3D fit parameters for pions using Eq. 15 in pp, pPb and PbPb collisions. The estimated uncertainty in the parameters is about 10%. |
| Summary |
|
Detailed studies have been presented on femtoscopic correlations between pairs of same-sign hadrons produced in pp collisions at $\sqrt{s} = $ 0.9, 2.76, and 7 TeV, as well as in pPb collisions at ${\sqrt{\smash[b]{s_{_\text{NN}}}}} = $ 5.02 TeV and peripheral PbPb collisions at ${\sqrt{\smash[b]{s_{_\text{NN}}}}} = $ 2.76 TeV. The characteristics of two-particle Bose-Einstein correlations are investigated in one (${R_\text{inv}} $), two (${R_\text{T}} $ and ${R_\text{L}} $), and three (${R_\text{L}} $, ${R_\text{S}} $, and ${R_\text{O}} $) dimensions, as functions of charged multiplicity ${N_\text{trk}} $ and pair average transverse momentum ${k_{\mathrm{T}}}$. Two different analysis techniques are employed. The first "double ratio'' technique is used to study Bose-Einstein correlations of pairs of charged hadrons emitted in pp collisions at $\sqrt{s} = $ 2.76 and 7 TeV, both in the collision center-of-mass frame and in the local co-moving system. The second "particle identification and cluster subtraction'' method is used to study the characteristics of two-particle correlation functions of identical charged pions and kaons, identified via their energy loss in the CMS silicon tracker, in collisions of pp, pPb, and peripheral PbPb collisions at various center-of-mass energies. The similarities and differences between the three colliding systems have been investigated. The quantum correlations are well described by an exponential parametrization as a function of the relative momentum of the particle pair, both in one and in multiple dimensions, consistent with a Cauchy-Lorentz spatial source distribution. The fitted radius parameters of the emitting source, obtained for inclusive charged hadrons as well as for identified pions, increase along with charged-particle multiplicity for all colliding systems and center-of-mass energies, for one, two, and three dimensions alike. The radii are in the range 1-5 fm, reaching the largest values for very high multiplicity pPb collisions, close to those observed in peripheral PbPb collisions with similar multiplicity. In the one-dimensional case, ${R_\text{inv}} $ in pp collisions steadily increases with the charged multiplicity following a ${N_\text{trk}} ^{1/3}$ dependence, as well as showing an approximate independence of the center-of-mass energy. This behavior is also observed for the longitudinal radius parameter (${R_\text{L}} ^*$ in the center-of-mass frame, and ${R_\text{L}} $ in the local co-moving system) in the two-dimensional case. The multiplicity dependence of ${R_\text{L}} $ and ${R_\text{T}} $ is similar for pp and pPb collisions in all ${k_{\mathrm{T}}}$ bins, and that similarity also applies to peripheral PbPb collisions for ${k_{\mathrm{T}}} > $ 0.4 GeV. In general, the observed orderings, ${R_\text{L}} > {R_\text{T}} $ and ${R_\text{L}} \ge {R_\text{S}} > {R_\text{O}} $, indicate that the pp and pPb sources are elongated in the beam direction. For peripheral PbPb collisions, the source is quite symmetric, and shows a slightly different ${N_\text{trk}} $ dependence, with the largest differences between the systems for ${R_\text{T}} $ and ${R_\text{O}} $, while ${R_\text{L}} $ and ${R_\text{S}} $ are approximately equal. The most visible differences between pp, pPb, and PbPb collisions are seen in ${R_\text{O}} $, which could point to a different lifetime of the emitting systems in the three cases. The kaon radius parameters show a smaller increase with ${N_\text{trk}} $ than observed for pions. The radius parameters of charged hadrons and pions decrease with increasing ${k_{\mathrm{T}}}$, an observation compatible with expanding emitting sources. The ${k_{\mathrm{T}}}$- and ${N_\text{trk}} $-dependences of the radius parameters factorize, and are largely independent of beam energy and colliding system for lower multiplicities, although some system dependence appears at higher values of ${N_\text{trk}} $. A shallow anticorrelation (a region where the correlation function falls below one) observed using the double ratio technique in a previous analysis of pp collisions, is also seen in the present data. The depth of this dip in the one-dimensional correlation functions decreases with increasing particle multiplicity and also decreases slightly with increasing ${k_{\mathrm{T}}}$. Finally, the similar multiplicity dependencies of the radii extracted for pp, pPb, and peripheral PbPb collisions suggest a common freeze-out density of hadrons for all collision systems, since the correlation techniques measure the characteristic size of the system near the time of the last interactions. In the case of pp collisions, extending the investigation of these similarities to higher multiplicities than those accessible with the current data can provide new information on final state collective effects in such events. |
| References | ||||
| 1 | R. Hanbury-Brown and R. Q. Twiss | A new type of interferometer for use in radio astronomy | Phil. Magazine 45 (1954) 663 | |
| 2 | R. Hanbury-Brown and R. Q. Twiss | Correlation between photons in two coherent beams of light | Nature 177 (1956) 27 | |
| 3 | R. Hanbury-Brown and R. Q. Twiss | A test of new type of stellar interferometer on Sirius | Nature 178 (1956) 1046 | |
| 4 | G. Goldhaber, S. Goldhaber, W. Lee, and A. Pais | Influence of Bose-Einstein statistics in the antiproton-proton annihilation process | PR120 (1960) 300 | |
| 5 | CMS Collaboration | First measurement of Bose-Einstein correlations in proton-proton collisions at $ \sqrt{s} = $ 0.9 and 2.36 TeV at the LHC | PRL 105 (2010) 032001 | CMS-QCD-10-003 1005.3294 |
| 6 | CMS Collaboration | Measurement of Bose-Einstein Correlations in pp Collisions at $ \sqrt{s}= $ 0.9 and 7 TeV | JHEP 05 (2011) 029 | CMS-QCD-10-023 1101.3518 |
| 7 | CMS Collaboration | The CMS experiment at the CERN LHC | JINST 3 (2008) S08004 | CMS-00-001 |
| 8 | CMS Collaboration | Transverse momentum and pseudorapidity distributions of charged hadrons in pp collisions at $ \sqrt{s} = $ 0.9 and 2.36 TeV | JHEP 02 (2010) 041 | CMS-QCD-09-010 1002.0621 |
| 9 | CMS Collaboration | Description and performance of track and primary-vertex reconstruction with the CMS tracker | JINST 9 (2014) P10009 | CMS-TRK-11-001 1405.6569 |
| 10 | T. Sjostrand, S. Mrenna, and P. Skands | PYTHIA 6.4 physics and manual | JHEP 05 (2006) 026 | hep-ph/0603175 |
| 11 | R. Field | Min-bias and the underlying event at the LHC | in Soft side of the LHC. Proceedings, 51st Cracow School of Theoretical Physics, Zakopane, Poland, June 11-19, 2011, p. 2631 2011 [Acta Phys. Polon. B 42 (2011) 2631] | 1110.5530 |
| 12 | R. Field | Early LHC underlying event data -- findings and surprises | 1010.3558 | |
| 13 | CMS Collaboration | Study of the underlying event at forward rapidity in pp collisions at $ \sqrt{s} = $ 0.9, 2.76, and 7 TeV | JHEP 04 (2013) 072 | CMS-FWD-11-003 1302.2394 |
| 14 | CMS Collaboration | Event generator tunes obtained from underlying event and multiparton scattering measurements | EPJC 76 (2016) 155 | CMS-GEN-14-001 1512.00815 |
| 15 | CMS Collaboration | Transverse-momentum and pseudorapidity distributions of charged hadrons in pp collisions at $ \sqrt{s} = $ 7 TeV | PRL 105 (2010) 022002 | CMS-QCD-10-006 1005.3299 |
| 16 | CMS Collaboration | Study of the inclusive production of charged pions, kaons, and protons in pp collisions at $ \sqrt{s} = $ 0.9, 2.76, and 7 TeV | EPJC 72 (2012) 2164 | CMS-FSQ-12-014 1207.4724 |
| 17 | CMS Collaboration | Study of the production of charged pions, kaons, and protons in pPb collisions at $ \sqrt{s_\mathrm{NN}} =\ $ 5.02 TeV | EPJC 74 (2014) 2847 | CMS-HIN-12-016 1307.3442 |
| 18 | F. Sikl\'er | Study of clustering methods to improve primary vertex finding for collider detectors | NIMA 621 (2010) 526 | 0911.2767 |
| 19 | GEANT4 Collaboration | GEANT4---a simulation toolkit | NIMA 506 (2003) 250 | |
| 20 | W.-T. Deng, X.-N. Wang, and R. Xu | Hadron production in p+p, p+Pb, and Pb+Pb collisions with the HIJING 2.0 model at energies available at the CERN Large Hadron Collider | PRC 83 (2011) 014915 | 1008.1841 |
| 21 | R. Xu, W.-T. Deng, and X.-N. Wang | Nuclear modification of high-$ p_\text{T} $ hadron spectra in p+A collisions at LHC | PRC 86 (2012) 051901 | 1204.1998 |
| 22 | I. P. Lokhtin et al. | Heavy ion event generator HYDJET++ (HYDrodynamics plus JETs) | CPC 180 (2009) 779 | 0809.2708 |
| 23 | Particle Data Group Collaboration | Review of particle physics | CPC 40 (2016) 100001 | |
| 24 | F. Sikl\'er | A parametrisation of the energy loss distributions of charged particles and its applications for silicon detectors | NIMA 691 (2012) 16 | 1111.3213 |
| 25 | Y. Sinyukov et al. | Coulomb corrections for interferometry analysis of expanding hadron systems | PLB 432 (1998) 248 | |
| 26 | G. Gamow | Zur quantentheorie des atomkernes | Zeitschrift f\"ur Physik 51 (1928) 204 | |
| 27 | M. Gyulassy, S. K. Kauffman, L. W. Wilson | Pion interferometry of nuclear collisions. I. Theory | PRC 20 (1979) 2267 | |
| 28 | S. Pratt | Coherence and Coulomb effects on pion interferometry | PRD 33 (1986) 72 | |
| 29 | M. Biyajima, T. Mizoguchi, T. Osada, and G. Wilk | Improved Coulomb correction formulae for Bose-Einstein correlations | PLB 353 (1995) 340 | hep-ph/9503232 |
| 30 | M. G. Bowler | Coulomb corrections to Bose-Einstein correlations have been greatly exaggerated | PLB 270 (1991) 69 | |
| 31 | D. V. Anchishkin, W. A. Zajc, and G. M. Zinovjev | Coulomb corrections in two particle correlations for the processes of high multiplicity | hep-ph/9512279 | |
| 32 | C.-Y. Wong and L. Chatterjee | Effects of screening on quark anti-quark cross-sections in quark-gluon plasma | Z. Phys. C 75 (1997) 523 | hep-ph/9604224 |
| 33 | M. Abramowitz and I. A. Stegun | Handbook of Mathematical Functions with Formulas, Graphs, and Mathematical Tables | Dover Publications, New York, 1964 p. 231 | |
| 34 | ALICE Collaboration | Two-pion Bose-Einstein correlations in proton-proton collisions at $ \sqrt{s} = $ 900 GeV | PRD 82 (2010) 052001 | 1007.0516 |
| 35 | PHOBOS Collaboration | System size dependence of cluster properties from two-particle angular correlations in Cu+Cu and Au+Au collisions at $ \sqrt{s_\mathrm{NN}} = $ 200 GeV | PRC 81 (2010) 024904 | 0812.1172 |
| 36 | CMS Collaboration | Observation of long-range near-side angular correlations in proton-proton collisions at the LHC | JHEP 09 (2010) 091 | CMS-QCD-10-002 1009.4122 |
| 37 | CMS Collaboration | Observation of long-range near-side angular correlations in proton-lead collisions at the LHC | PLB 718 (2013) 795 | CMS-HIN-12-015 1210.5482 |
| 38 | T. Csorg\H o, S. Hegyi, and W. A. Zajc | Bose-Einstein correlations for L$ \'evy $ stable source distributions | EPJC 36 (2004) 67 | nucl-th/0310042 |
| 39 | T. Alexopoulos et al. | Study of the source size in p pbar collisions at 1.8 TeV using pion interferometry | PRD 48 (1993) 1931 | |
| 40 | STAR Collaboration | Pion interferometry in Au+Au Collisions at $ \sqrt{s_\mathrm{NN}} = $ 200 GeV | PRC 71 (2005) 044906 | nucl-ex/0411036 |
| 41 | PHOBOS Collaboration | Transverse momentum and rapidity dependence of Hanbury-Brown--Twiss correlations in Au+Au collisions at $ \sqrt{s_\mathrm{NN}} = $ 62.4 and 200 GeV | PRC 73 (2006) 031901 | nucl-ex/0409001 |
| 42 | PHENIX Collaboration | Source breakup dynamics in Au+Au collisions at $ \sqrt{s_\mathrm{NN}} = $ 200 gev via three-dimensional two-pion source imaging | PRL 100 (2008) 232301 | 0712.4372 |
| 43 | A. Bialas and K. Zalewski | Finite size of hadrons and Bose-Einstein correlations | PLB 727 (2013) 182 | 1309.6169 |
| 44 | L3 Collaboration | Test of the $ \tau $-model of Bose--Einstein correlations and reconstruction of the source function in hadronic Z-boson decay at LEP | EPJC 71 (2011) 1648 | 1105.4788 |
| 45 | T. Csorg\Ho and J. Zim\'anyi | Pion interferometry for strongly correlated space-time and momentum space | NP A 517 (1990) 588 | |
| 46 | ALICE Collaboration | Femtoscopy of pp collisions at $ \sqrt{s}= $ 0.9 and 7 TeV at the LHC with two-pion Bose-Einstein correlations | PRD 84 (2011) 112004 | 1101.3665 |
| 47 | ATLAS Collaboration | Two-particle Bose--Einstein correlations in $ pp $ collisions at $ \sqrt{s}= $ 0.9 and 7 TeV measured with the ATLAS detector | EPJC 75 (2015) 466 | 1502.07947 |
| 48 | OPAL Collaboration | Bose-Einstein correlations of $ \pi^0 $ pairs from hadronic $ Z^0 $ decays | EPJC 52 (2007) 787 | 0708.1122 |
| 49 | G. F. Bertsch | Pion interferometry as a probe of the plasma | NP A 498 (1989) 173C | |
| 50 | S. Pratt | Pion interferometry of quark-gluon plasma | PRD 33 (1986) 1314 | |
| 51 | M. Lisa | Femtoscopy in heavy ion collisions: Wherefore, whence, and whither? | AIP Conf. Proc. 828 (2006) 226 | nucl-ex/0512008 |
|
|
Compact Muon Solenoid LHC, CERN |
|

|

|

|

|

|