

Compact Muon Solenoid
LHC, CERN
| CMS-FSQ-18-001 ; CERN-EP-2019-146 | ||
| Measurement of the average very forward energy as a function of the track multiplicity at central pseudorapidities in proton-proton collisions at $\sqrt{s} = $ 13 TeV | ||
| CMS Collaboration | ||
| 5 August 2019 | ||
| Eur. Phys. J. C 79 (2019) 893 | ||
| Abstract: The average total energy as well as its hadronic and electromagnetic components are measured with the CMS detector at pseudorapidities $-6.6 < \eta < -5.2$ in proton-proton collisions at a centre-of-mass energy $\sqrt{s} = $ 13 TeV. The results are presented as a function of the charged particle multiplicity in the region $|{\eta}| < $ 2. This measurement is sensitive to correlations induced by the underlying event structure over a very wide pseudorapidity region. The predictions of Monte Carlo event generators commonly used in collider experiments and ultra-high energy cosmic ray physics are compared to the data. | ||
| Links: e-print arXiv:1908.01750 [hep-ex] (PDF) ; CDS record ; inSPIRE record ; HepData record ; CADI line (restricted) ; | ||
| Figures | |
png pdf |
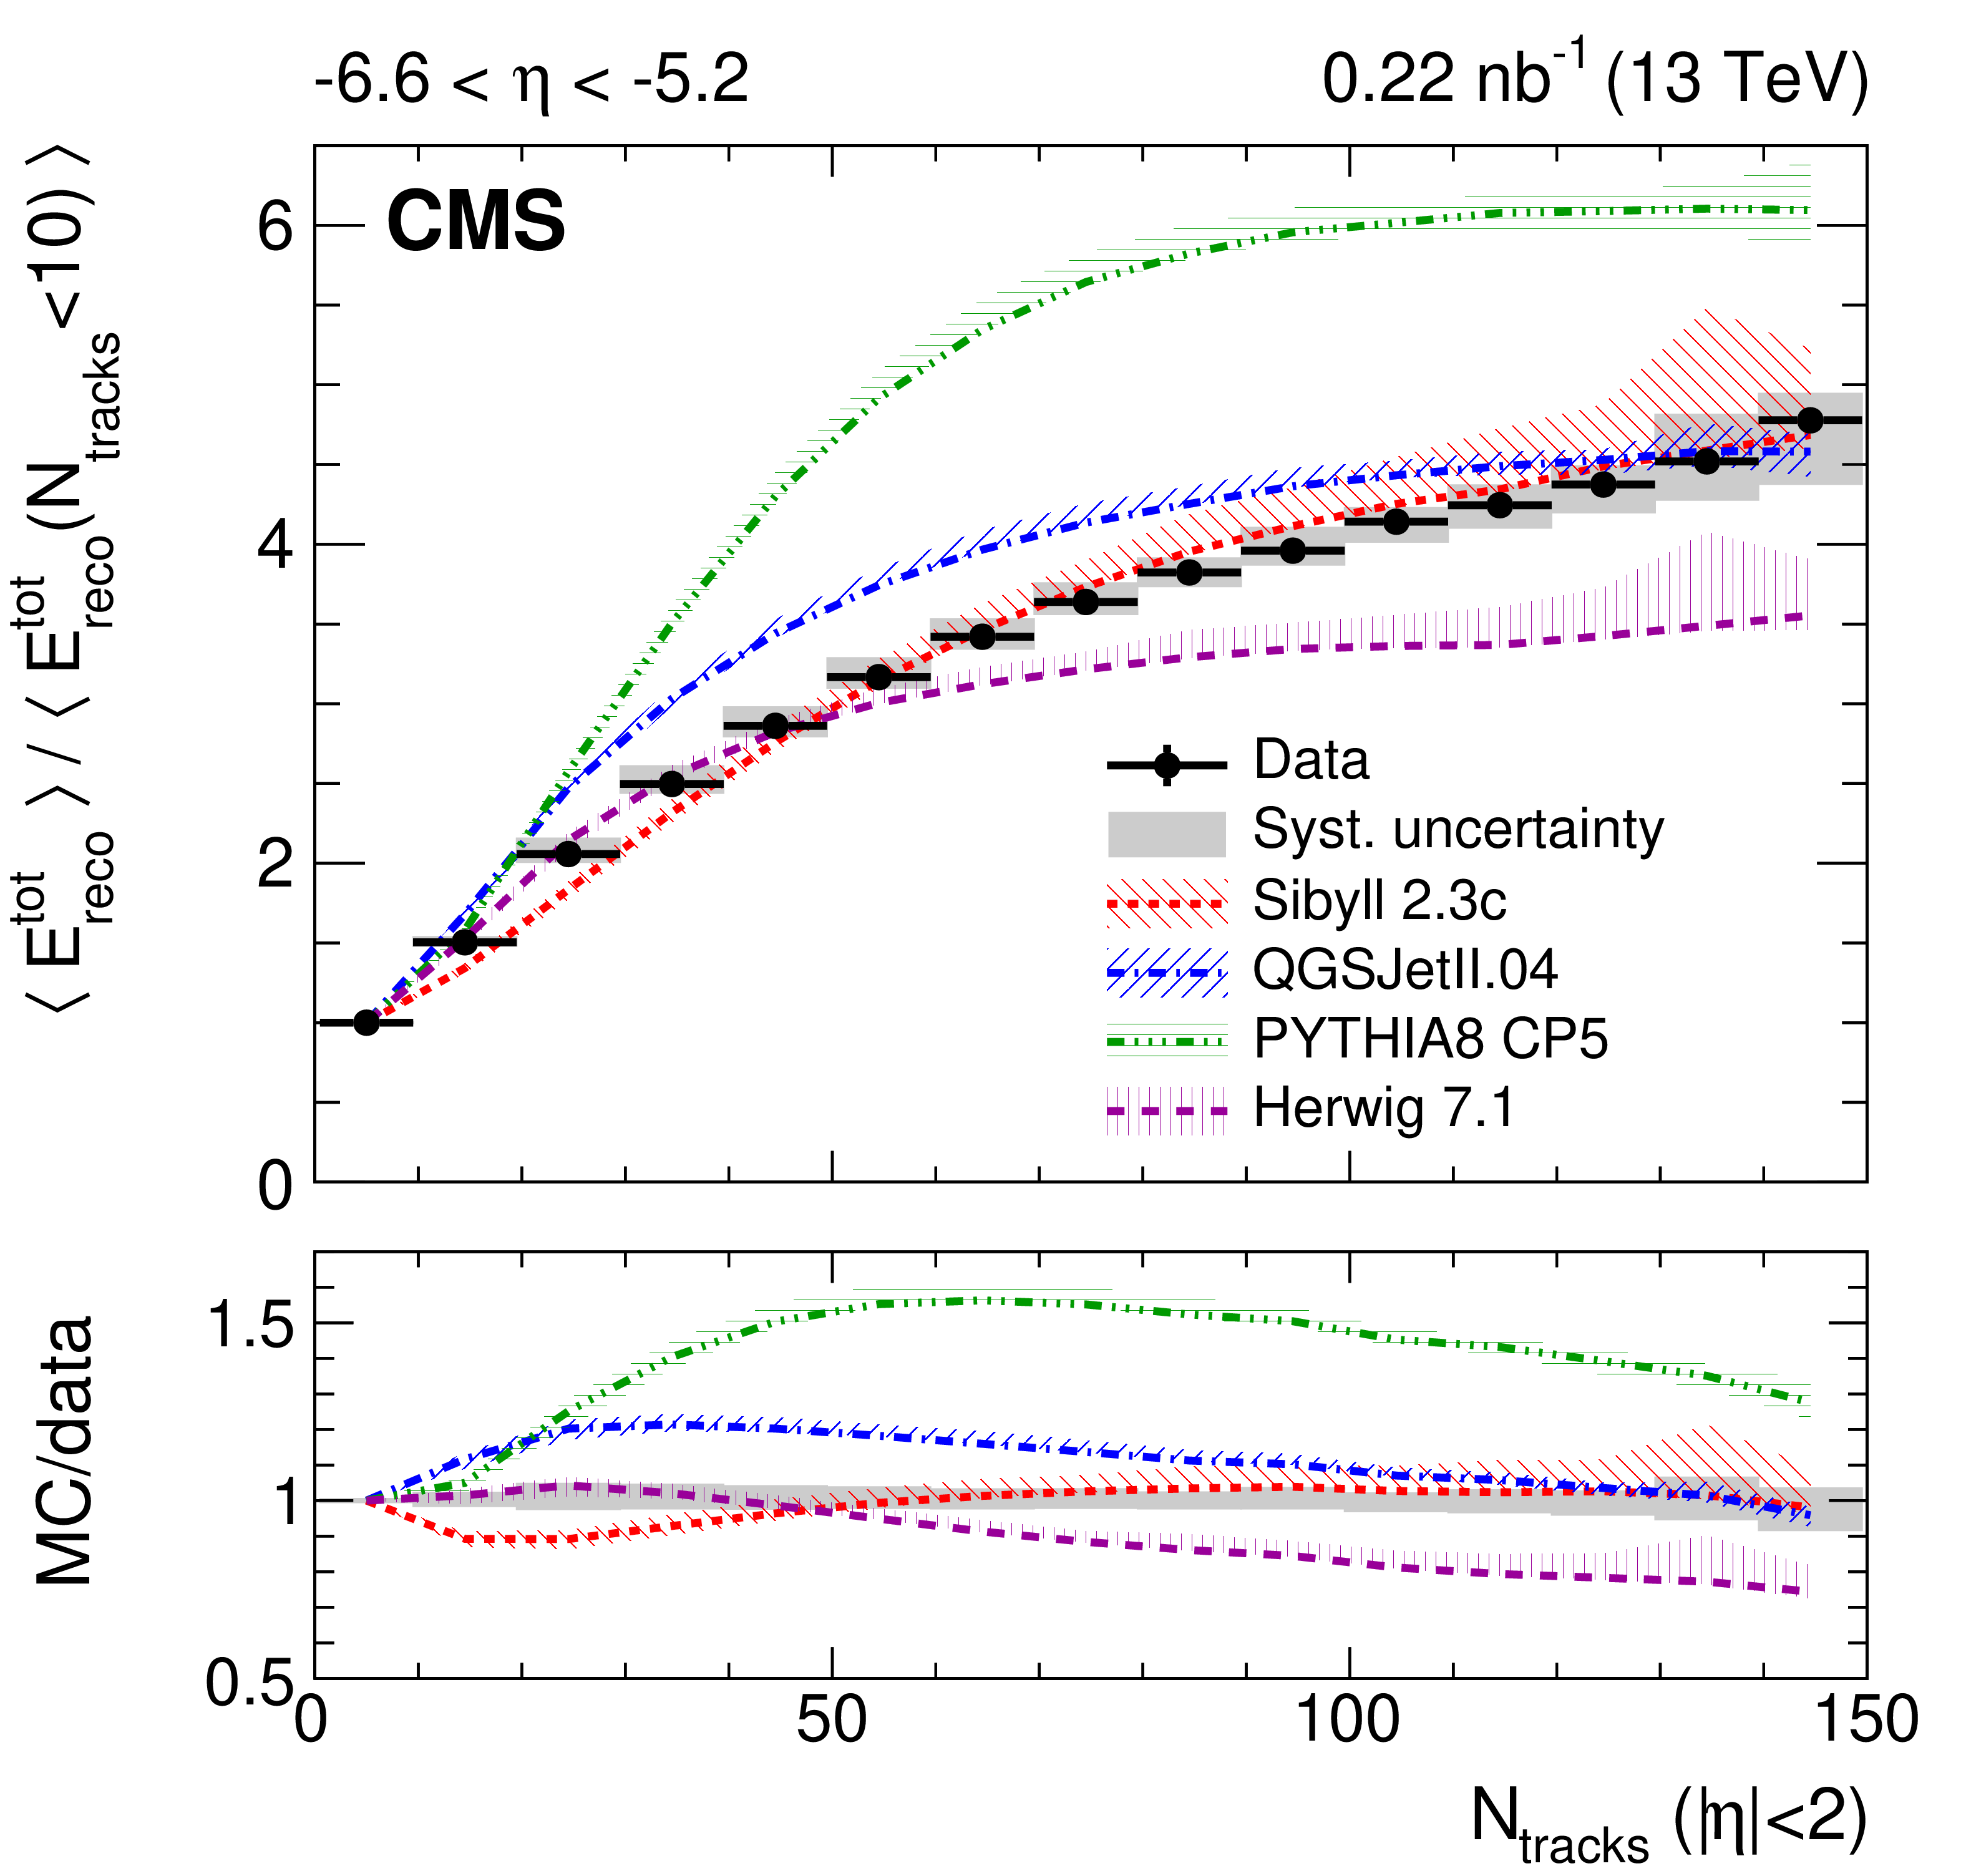
Figure 1:
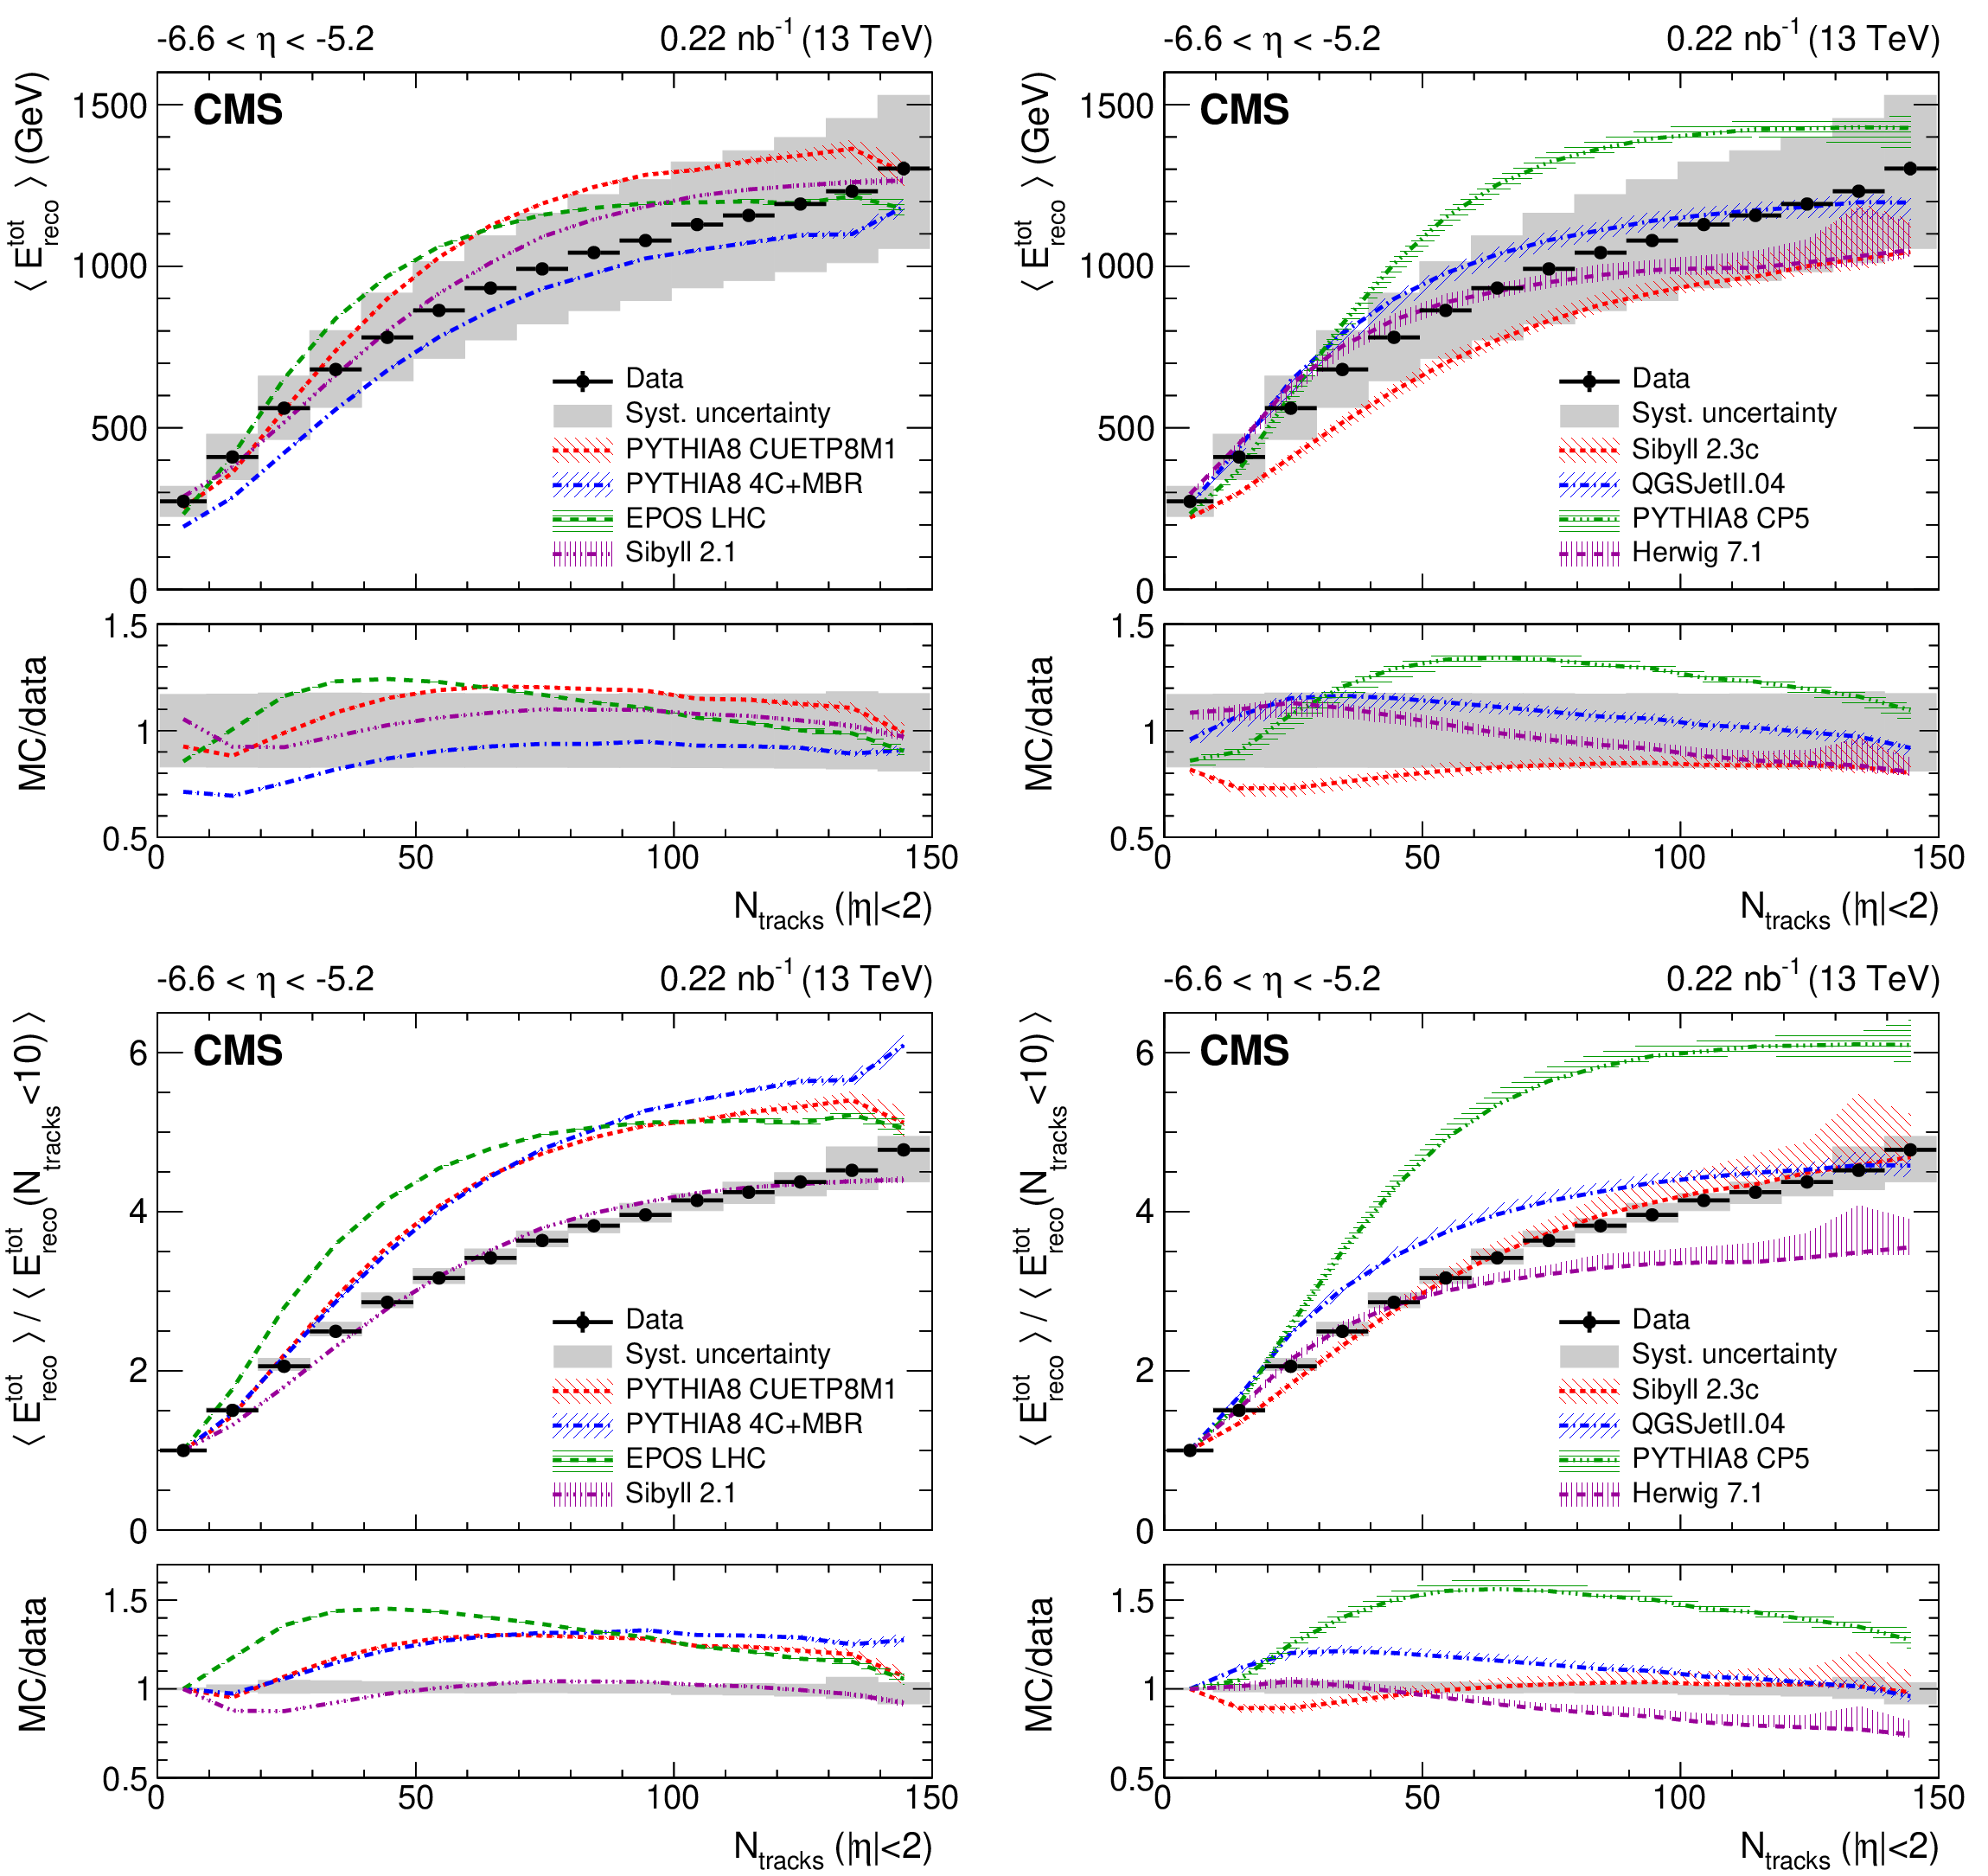
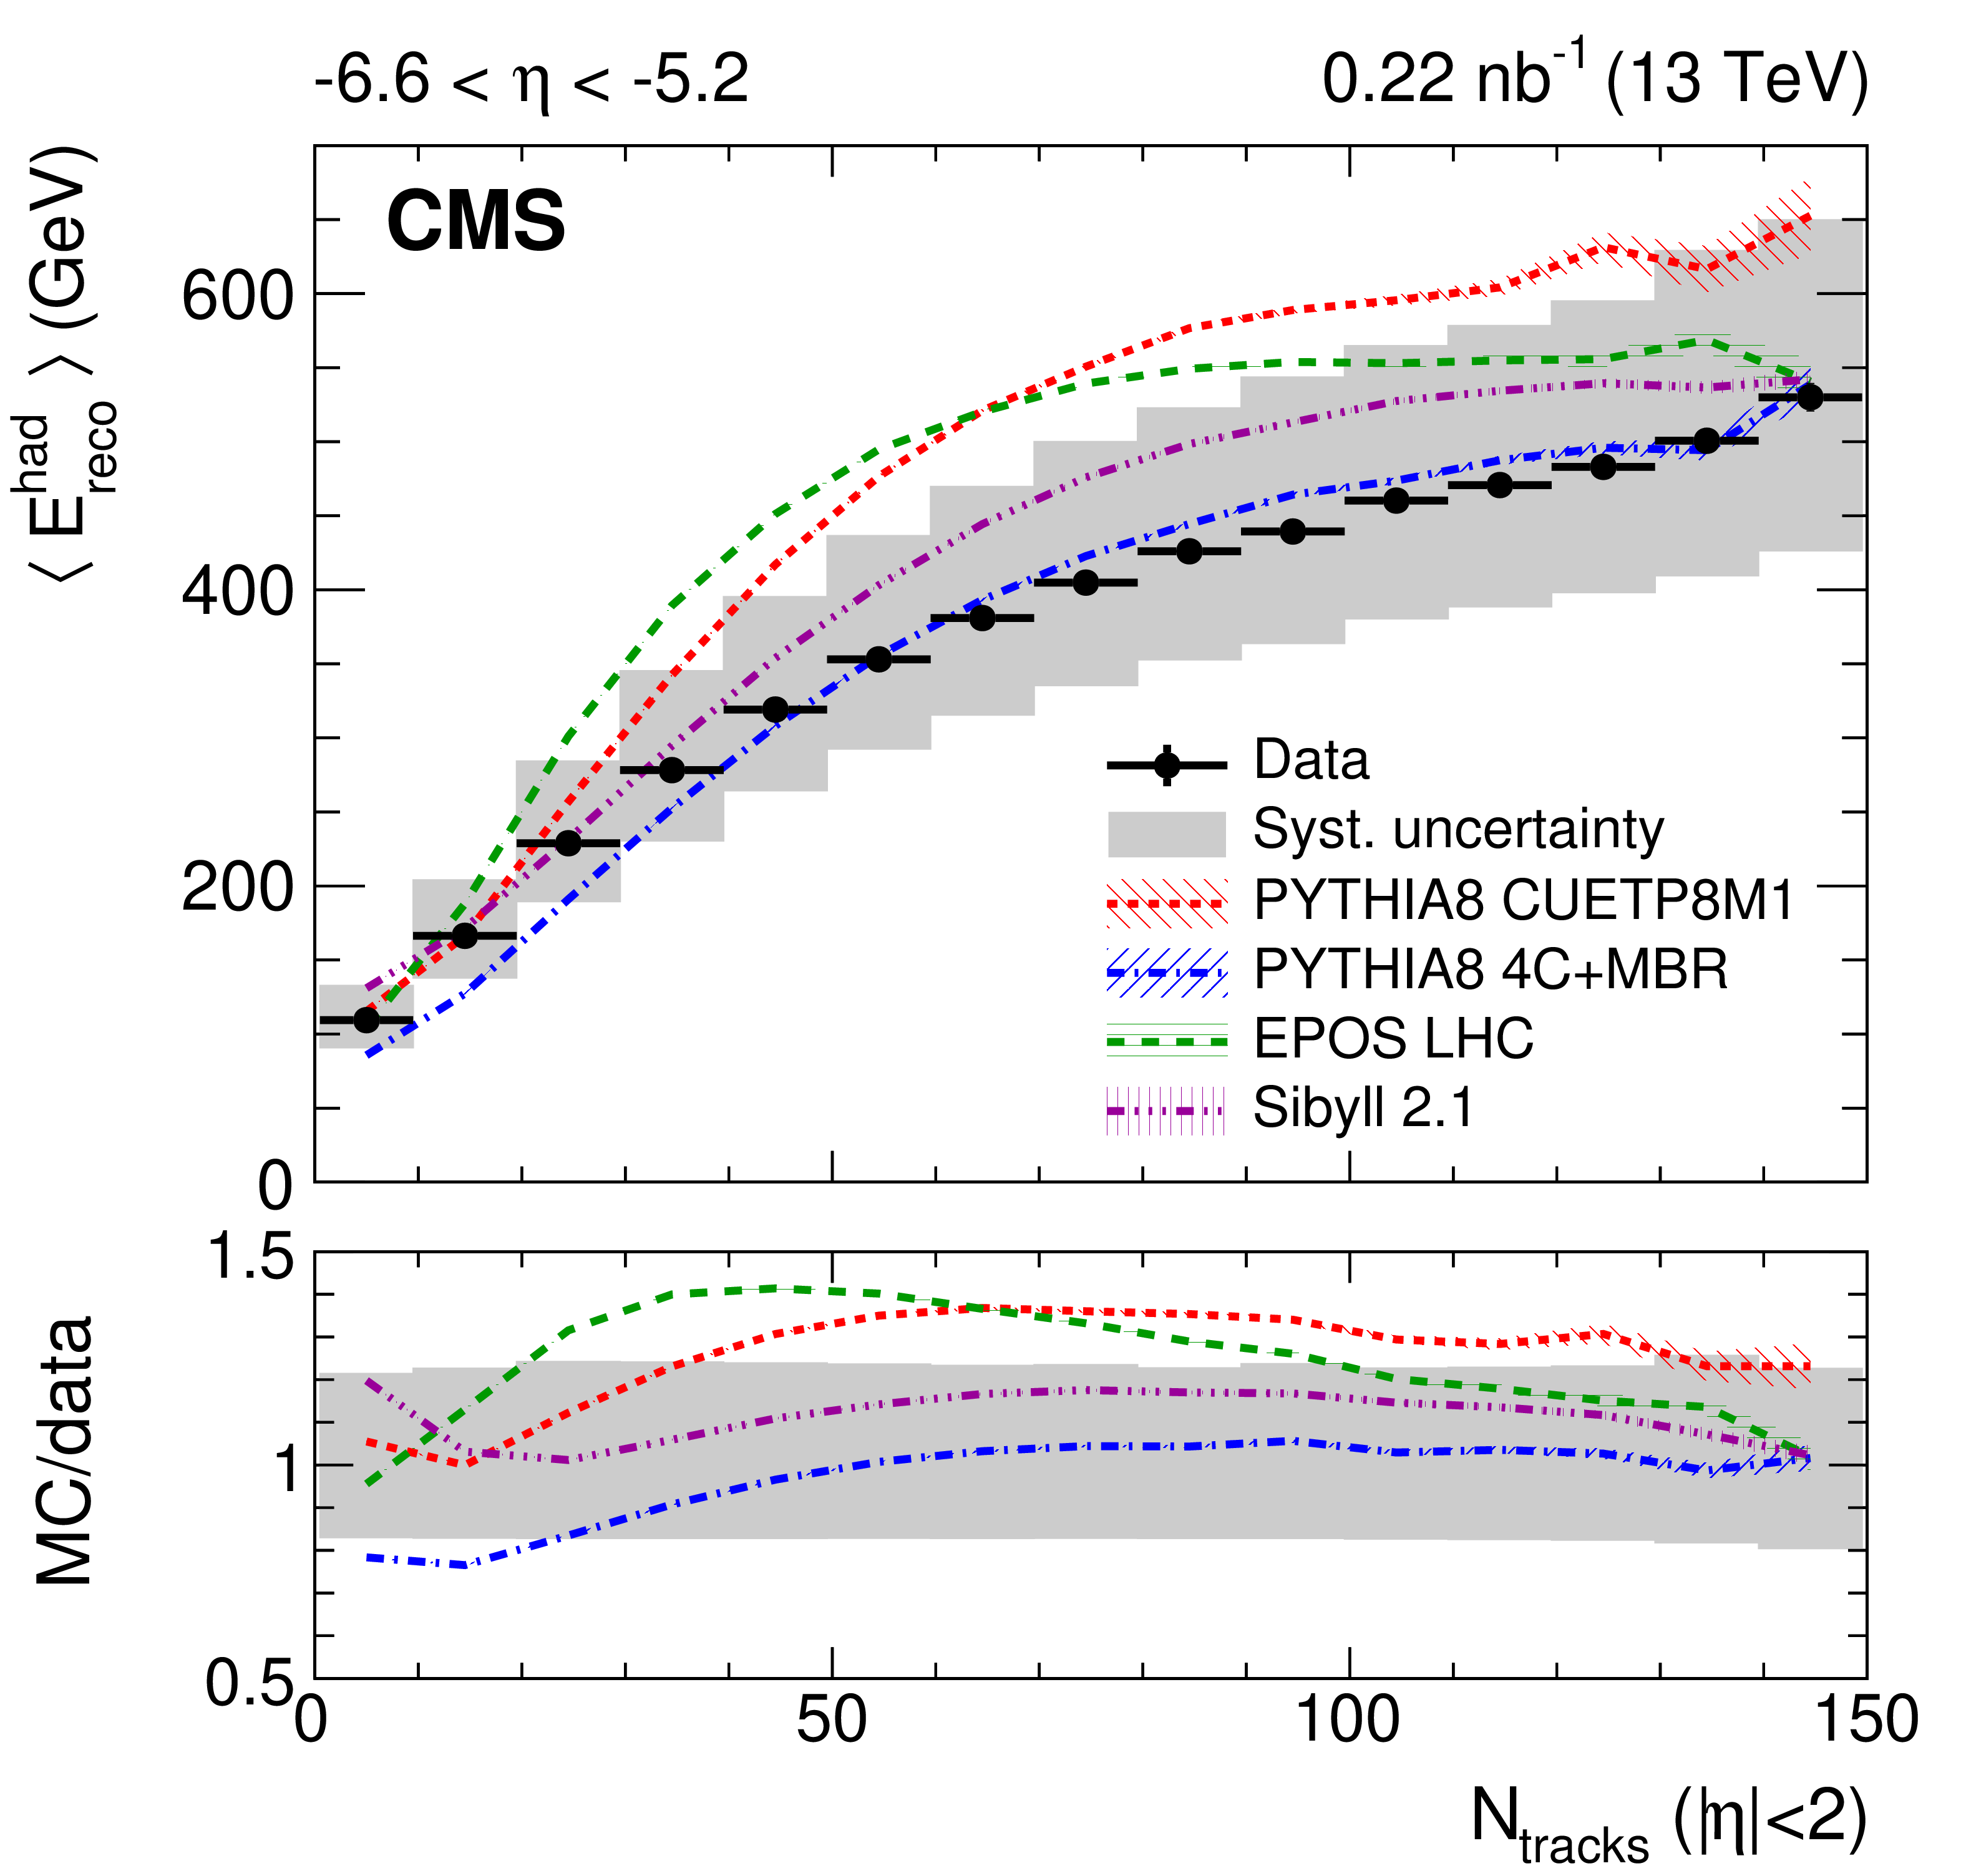
Top panel: Average total energy reconstructed in the CASTOR calorimeter as a function of the number of reconstructed tracks for $ {| \eta |} < $ 2. Bottom panel: Average total energy reconstructed in the CASTOR calorimeter normalised to that in the first bin ($N_{\mathrm {ch}} < $ 10) as a function of the number of reconstructed tracks for $ {| \eta |} < $ 2. In all figures, the data are shown as black circles and the corresponding systematic uncertainties with a gray band; horizontal bars are used to indicate the bin width. The predictions of various event generators are compared to the data, which are the same in both panels. The bands associated with the model predictions illustrate the model uncertainty. |
png pdf |
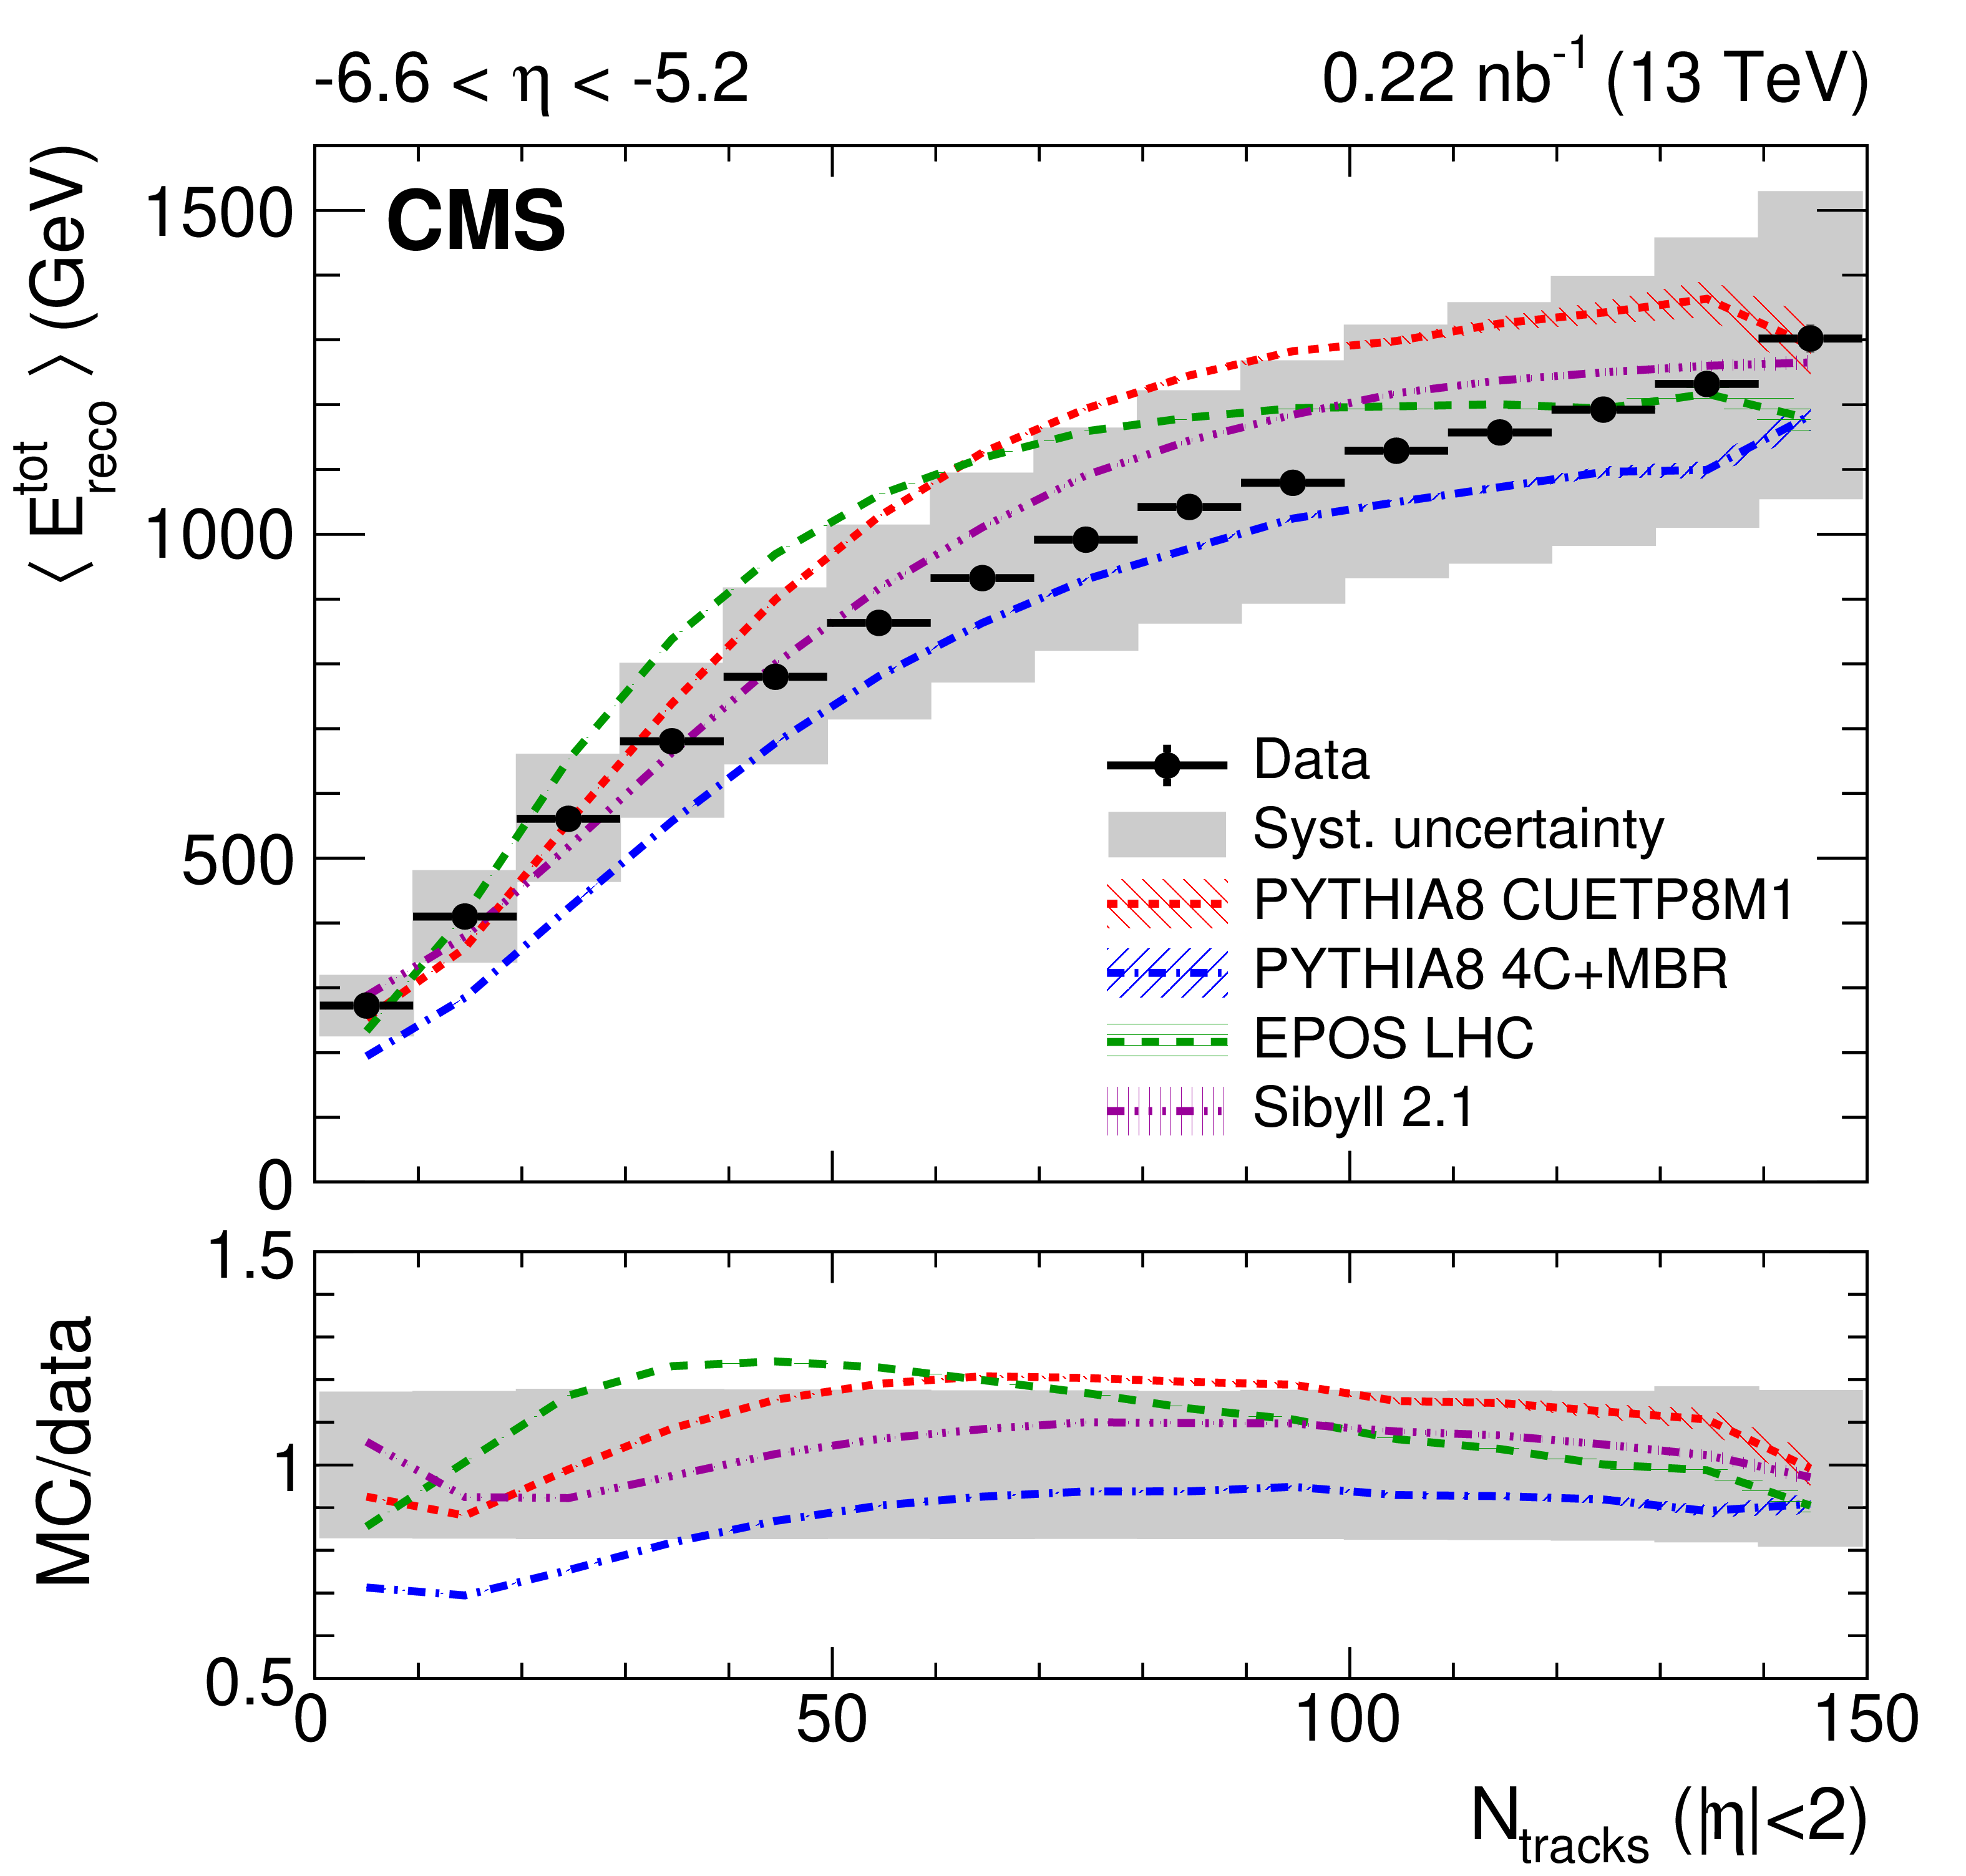
Figure 1-a:
Average total energy reconstructed in the CASTOR calorimeter as a function of the number of reconstructed tracks for $ {| \eta |} < $ 2. The data are shown as black circles and the corresponding systematic uncertainties with a gray band; horizontal bars are used to indicate the bin width. The predictions of various event generators are compared to the data. The bands associated with the model predictions illustrate the model uncertainty. |
png pdf |
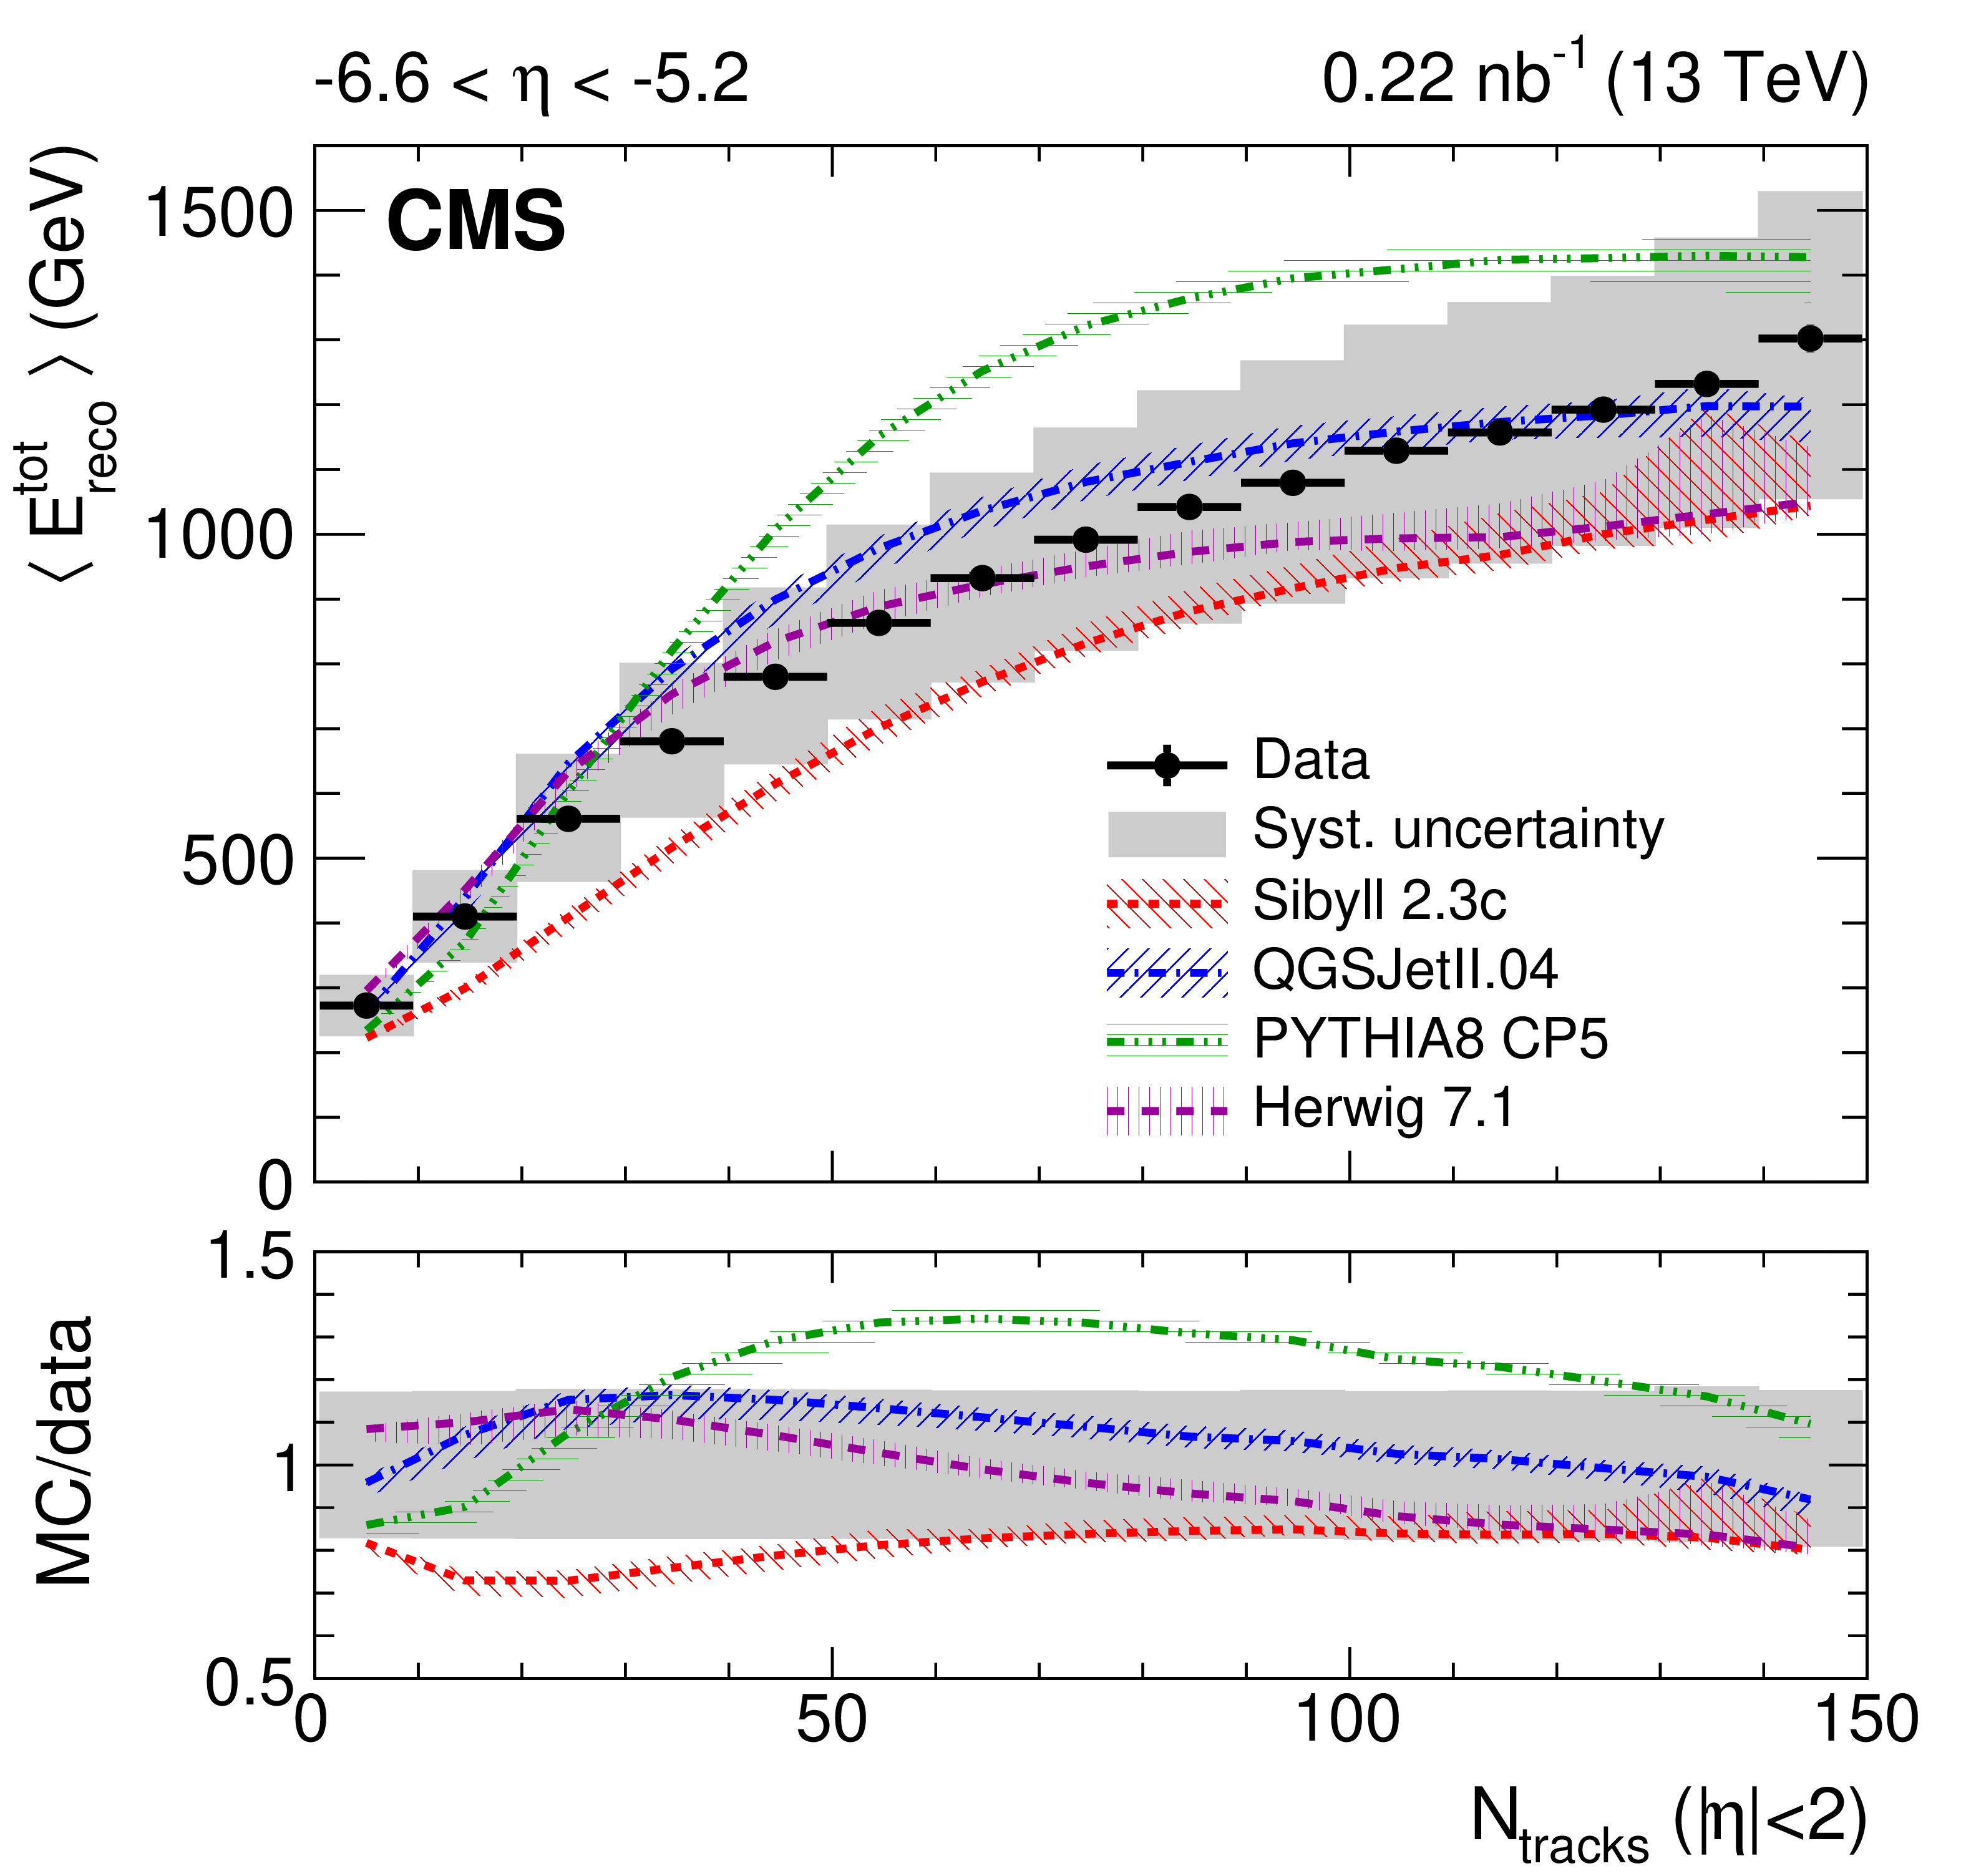
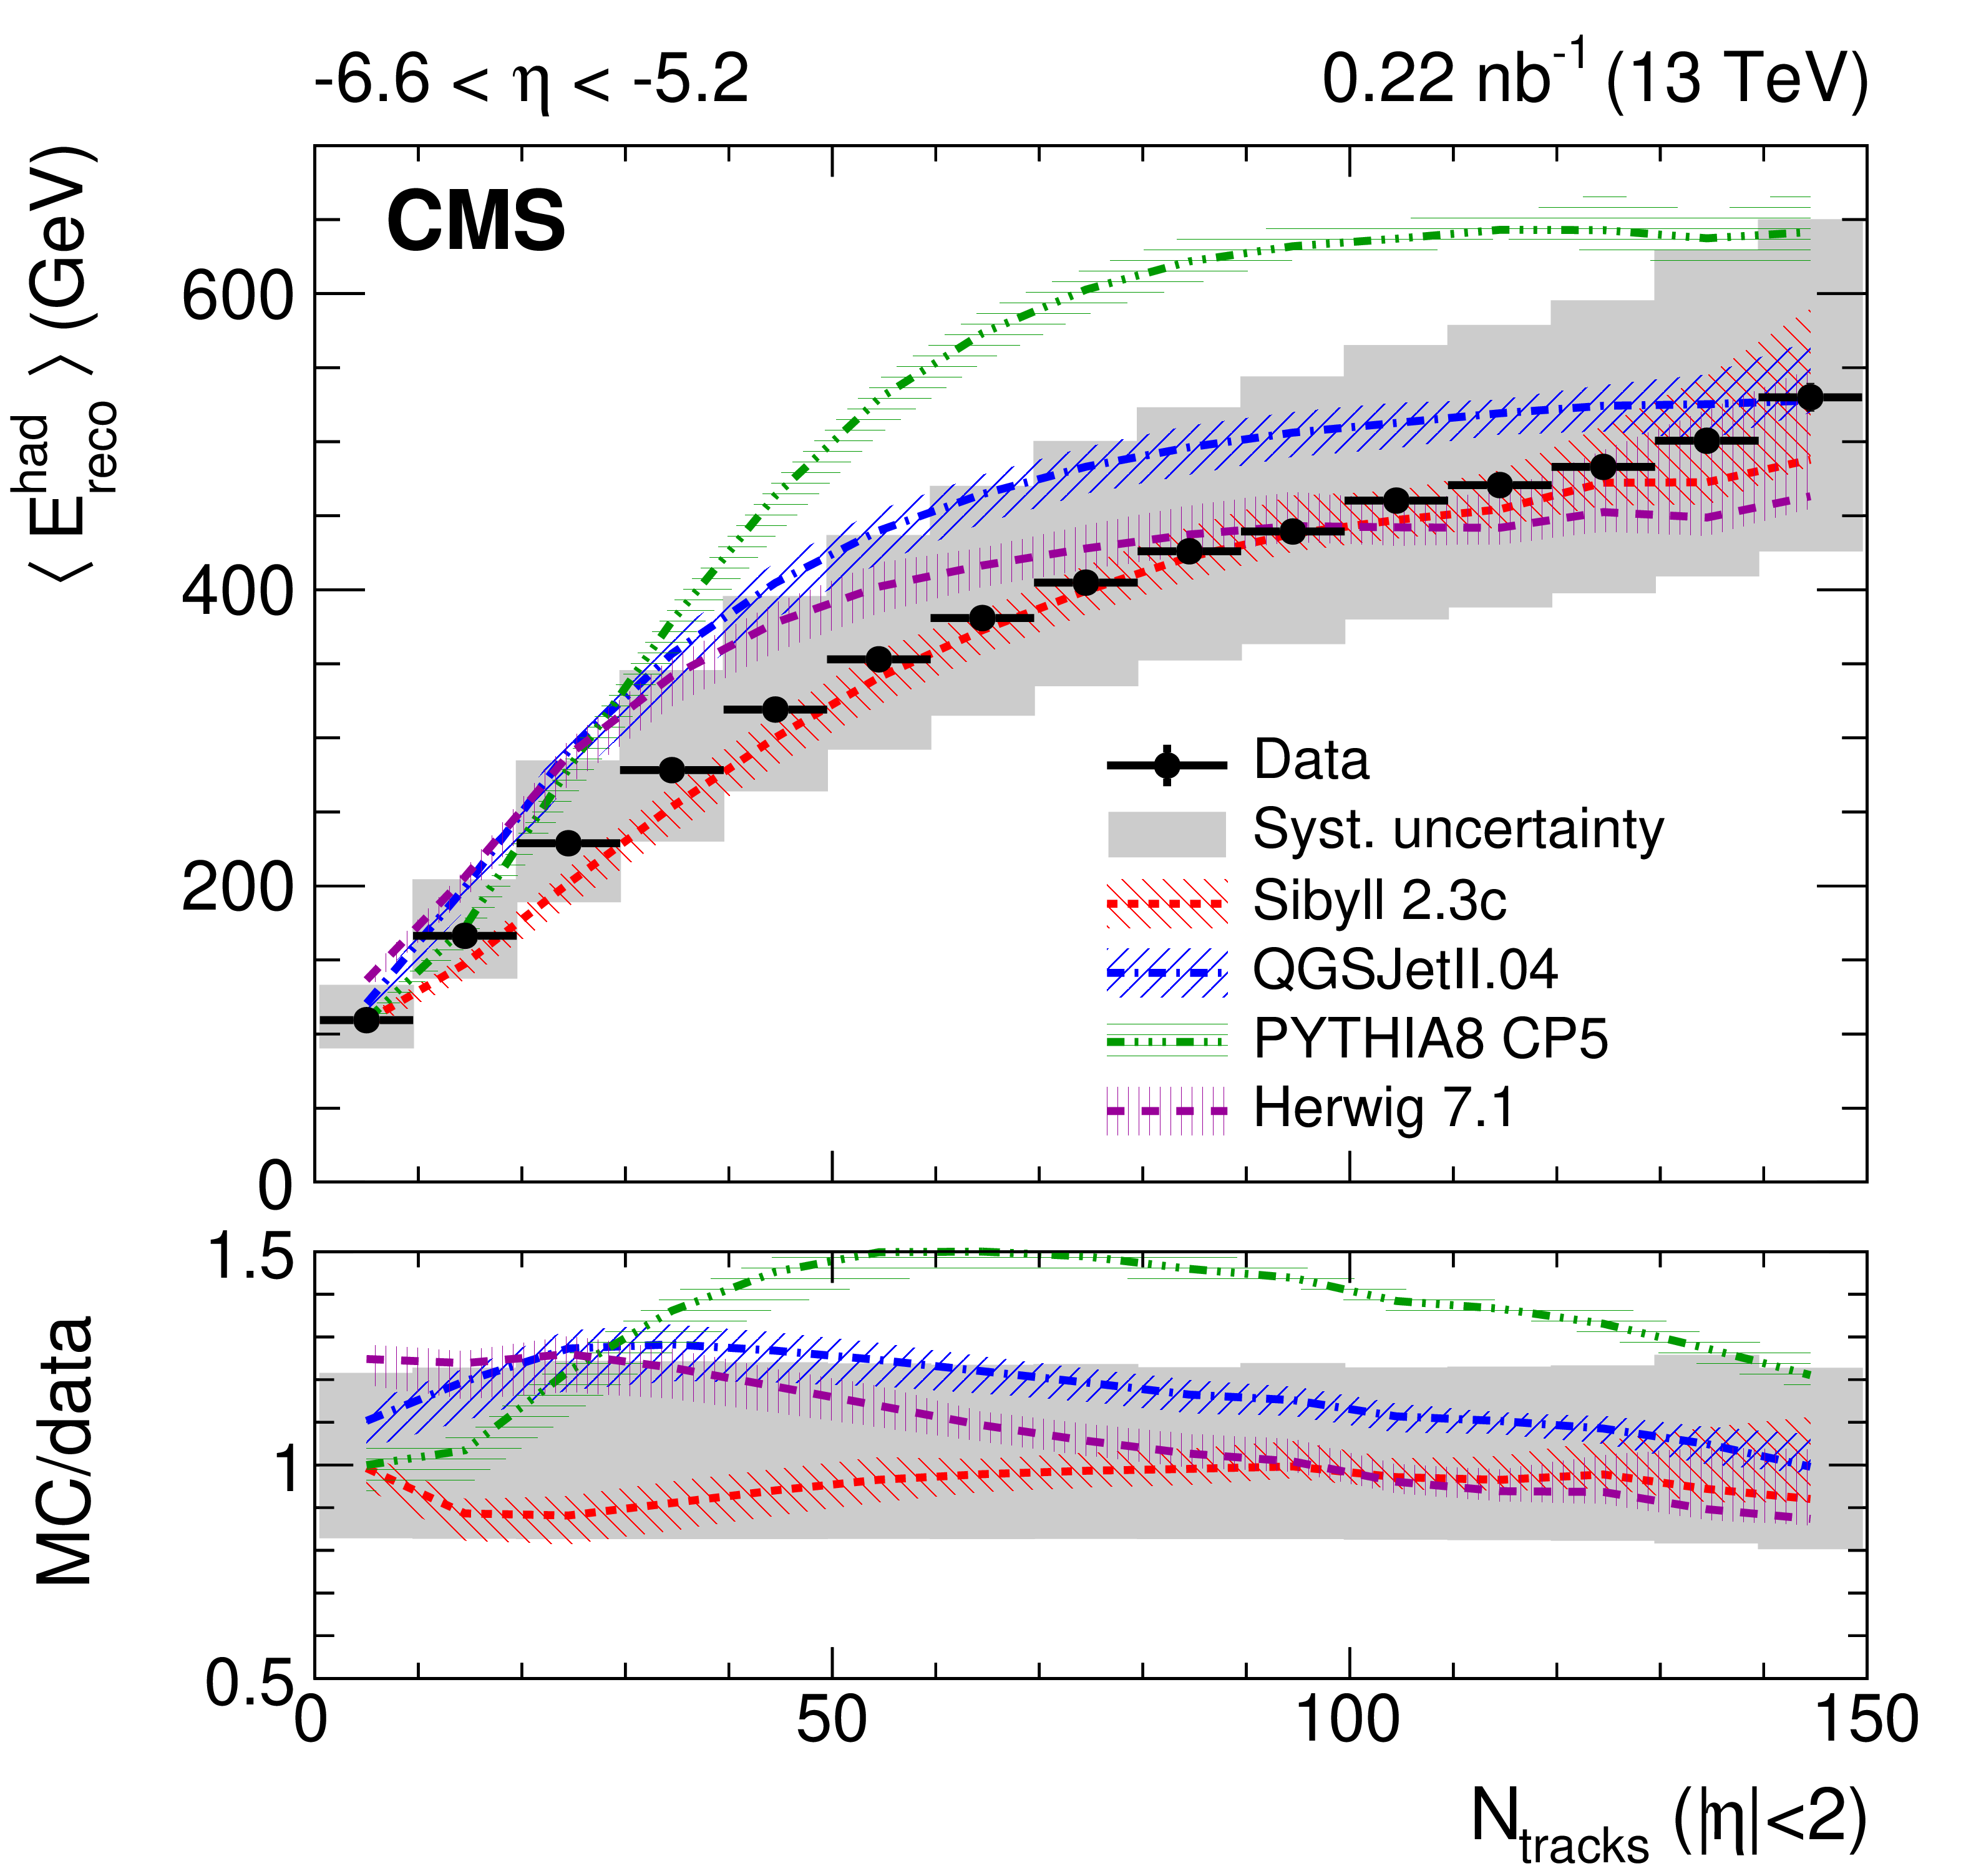
Figure 1-b:
Average total energy reconstructed in the CASTOR calorimeter as a function of the number of reconstructed tracks for $ {| \eta |} < $ 2. The data are shown as black circles and the corresponding systematic uncertainties with a gray band; horizontal bars are used to indicate the bin width. The predictions of various event generators are compared to the data. The bands associated with the model predictions illustrate the model uncertainty. |
png pdf |
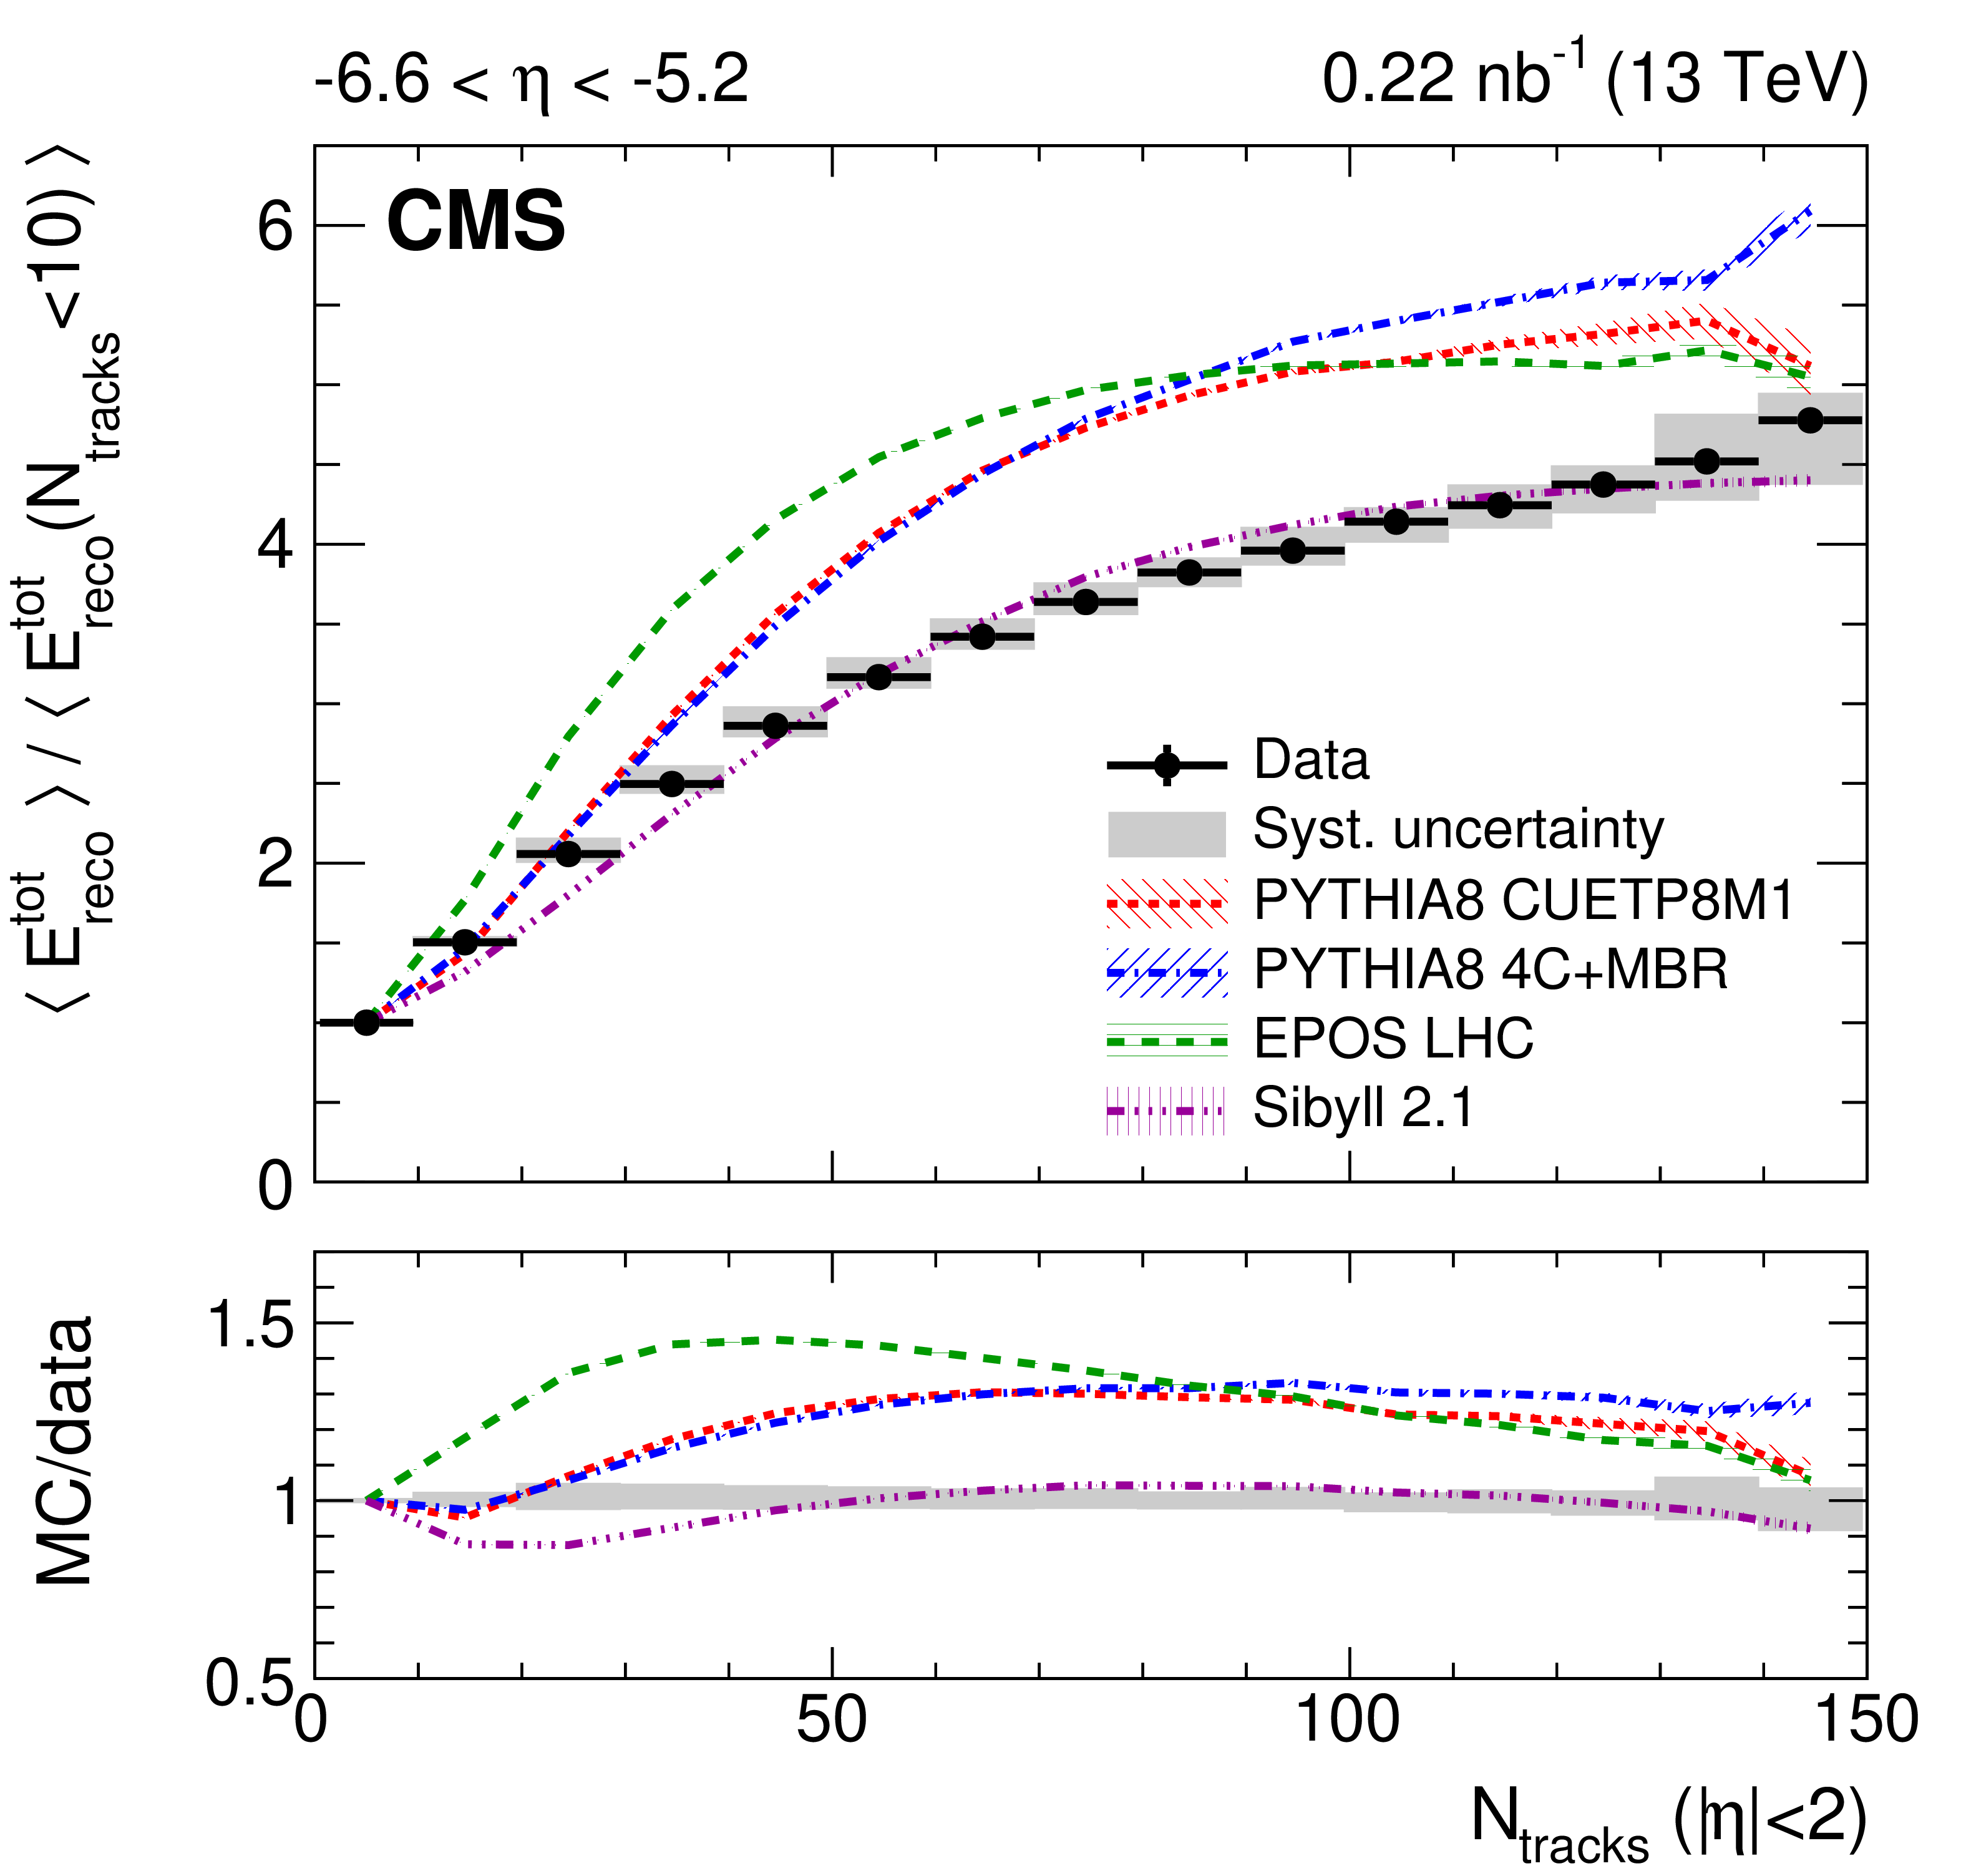
Figure 1-c:
Average total energy reconstructed in the CASTOR calorimeter normalised to that in the first bin ($N_{\mathrm {ch}} < $ 10) as a function of the number of reconstructed tracks for $ {| \eta |} < $ 2. The data are shown as black circles and the corresponding systematic uncertainties with a gray band; horizontal bars are used to indicate the bin width. The predictions of various event generators are compared to the data. The bands associated with the model predictions illustrate the model uncertainty. |
png pdf |
Figure 1-d:
Average total energy reconstructed in the CASTOR calorimeter normalised to that in the first bin ($N_{\mathrm {ch}} < $ 10) as a function of the number of reconstructed tracks for $ {| \eta |} < $ 2. The data are shown as black circles and the corresponding systematic uncertainties with a gray band; horizontal bars are used to indicate the bin width. The predictions of various event generators are compared to the data. The bands associated with the model predictions illustrate the model uncertainty. |
png pdf |
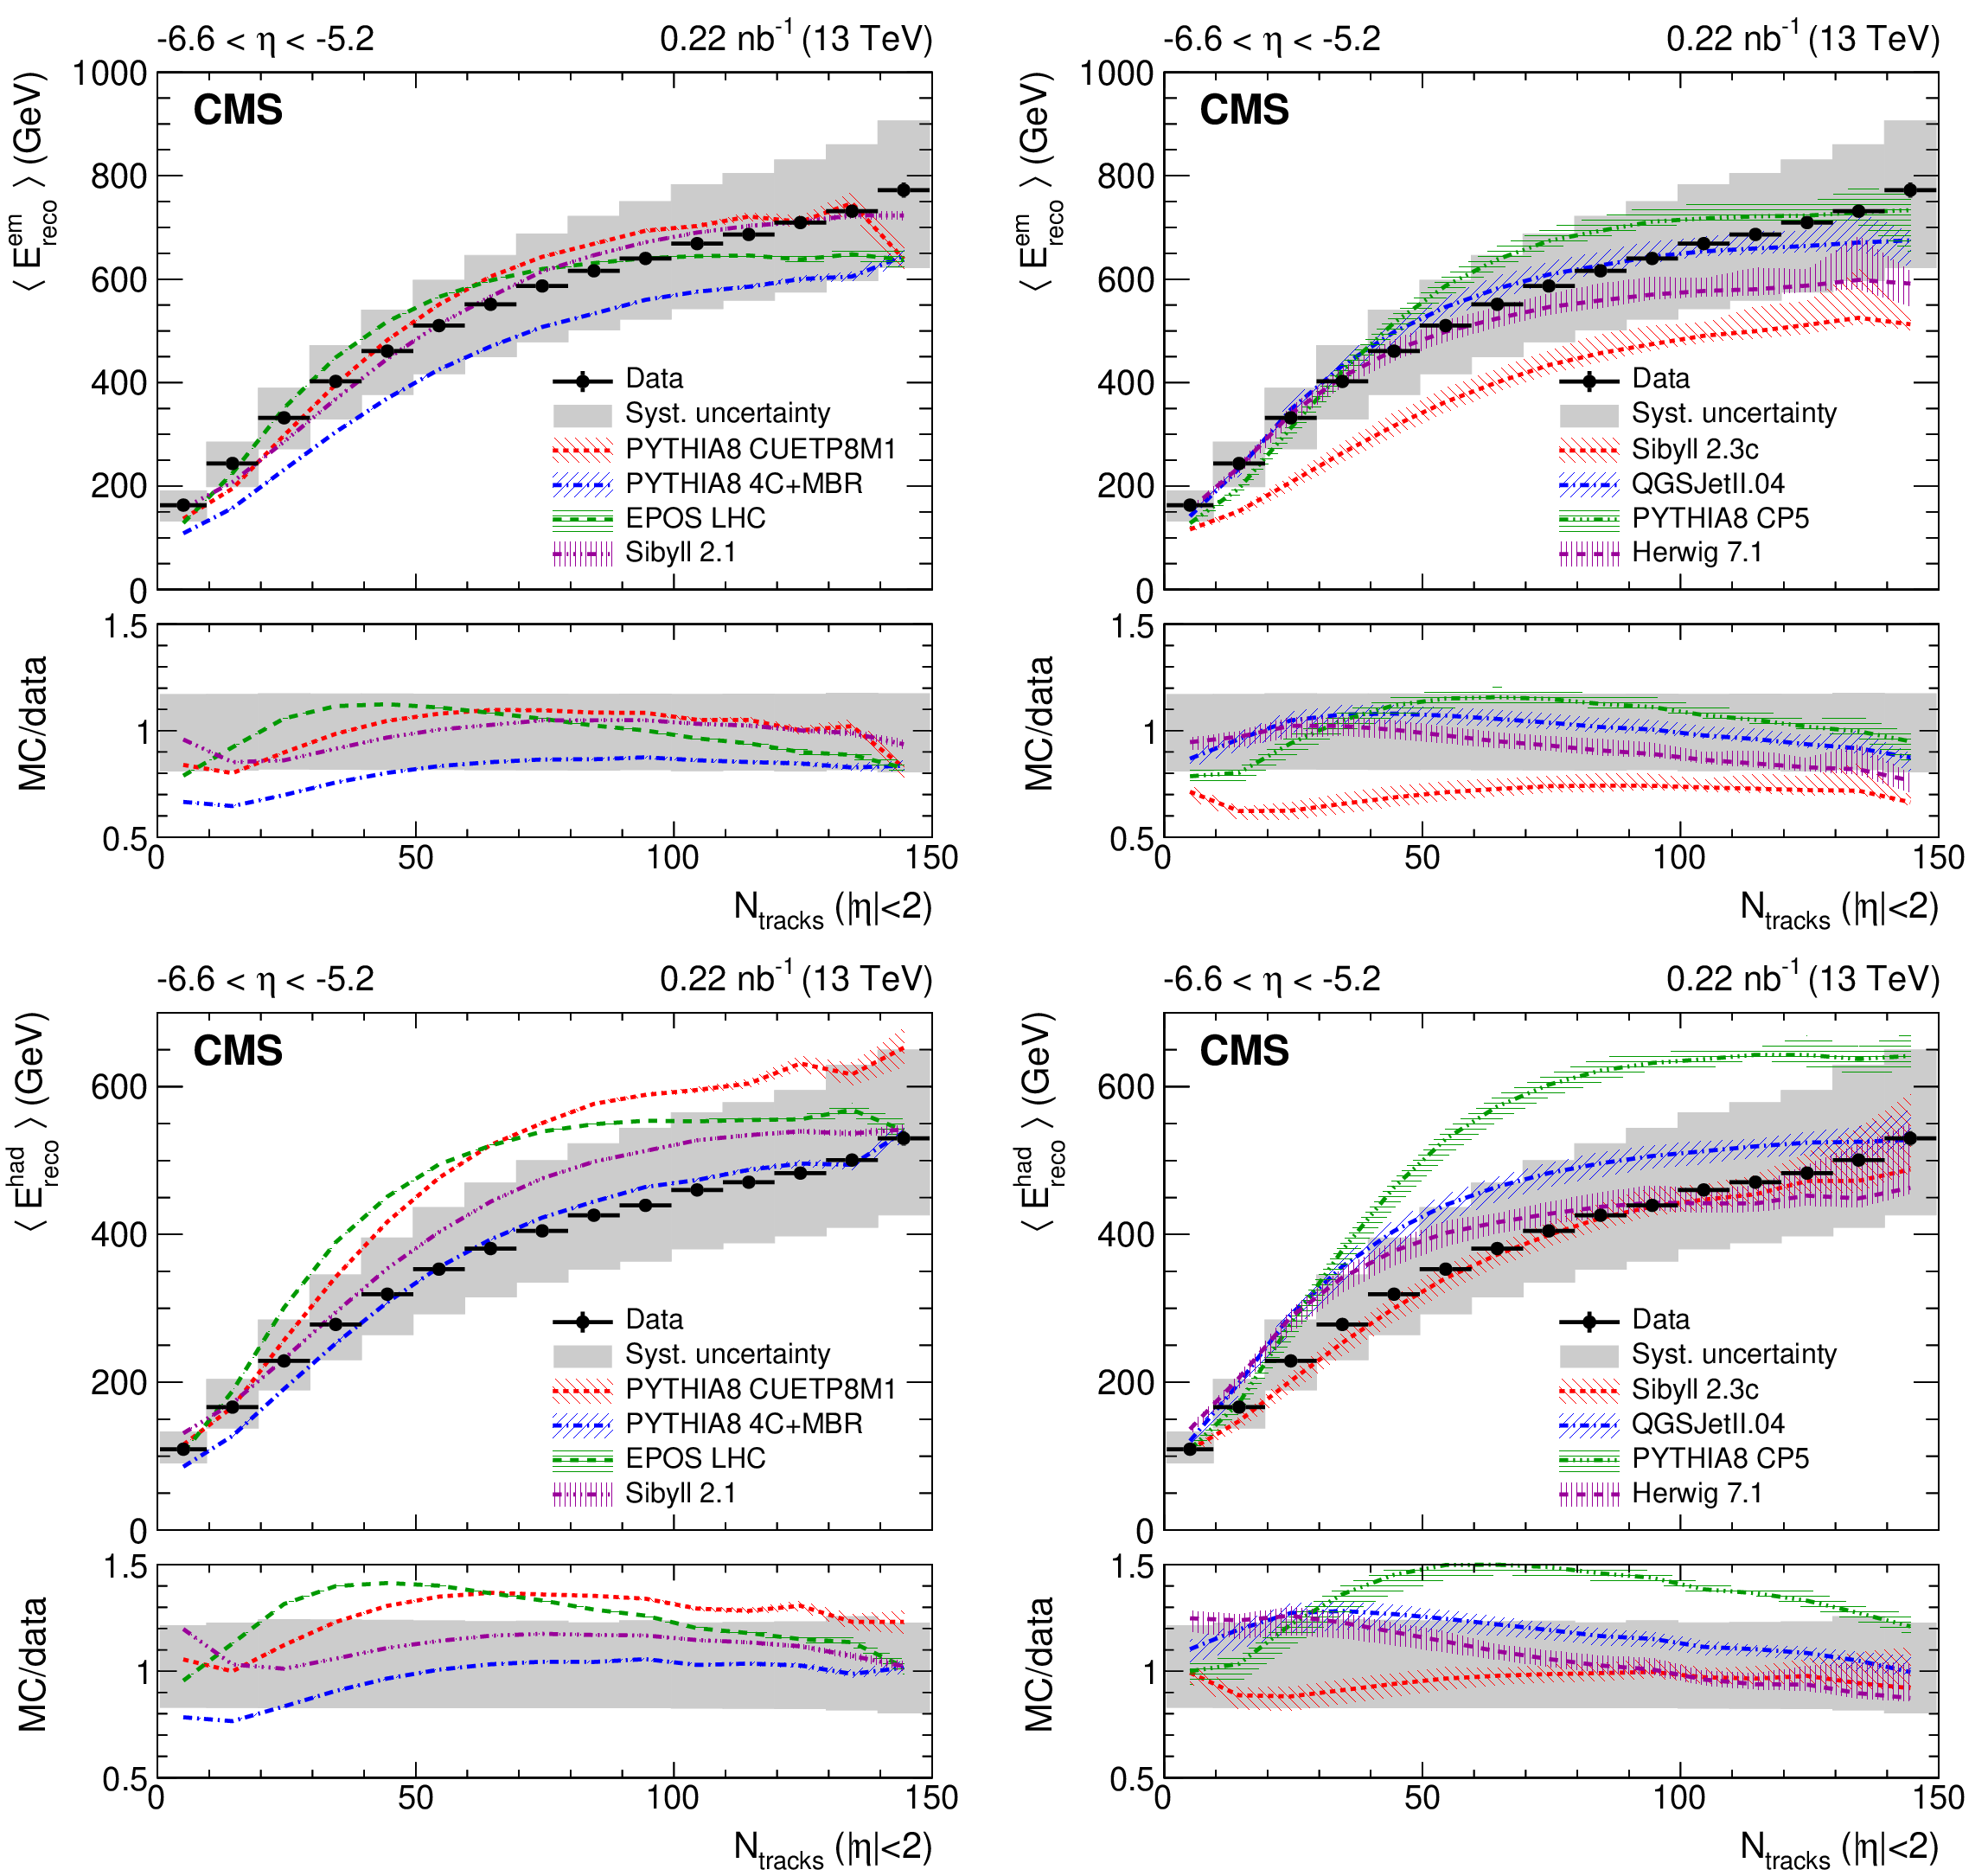
Figure 2:
Top panel: Average electromagnetic energy reconstructed in the CASTOR calorimeter as a function of the number of reconstructed tracks for $ {| \eta |} < $ 2. Bottom panel: Average hadronic energy reconstructed in the CASTOR calorimeter as a function of the number of reconstructed tracks for $ {| \eta |} < $ 2. In all figures, the data are shown with black circles and the corresponding systematic uncertainties with a gray band; horizontal bars are used to indicate the bin width. The predictions of various event generators are compared to the data, which are the same in both panels. The bands associated with the model predictions illustrate the model uncertainty. |
png pdf |
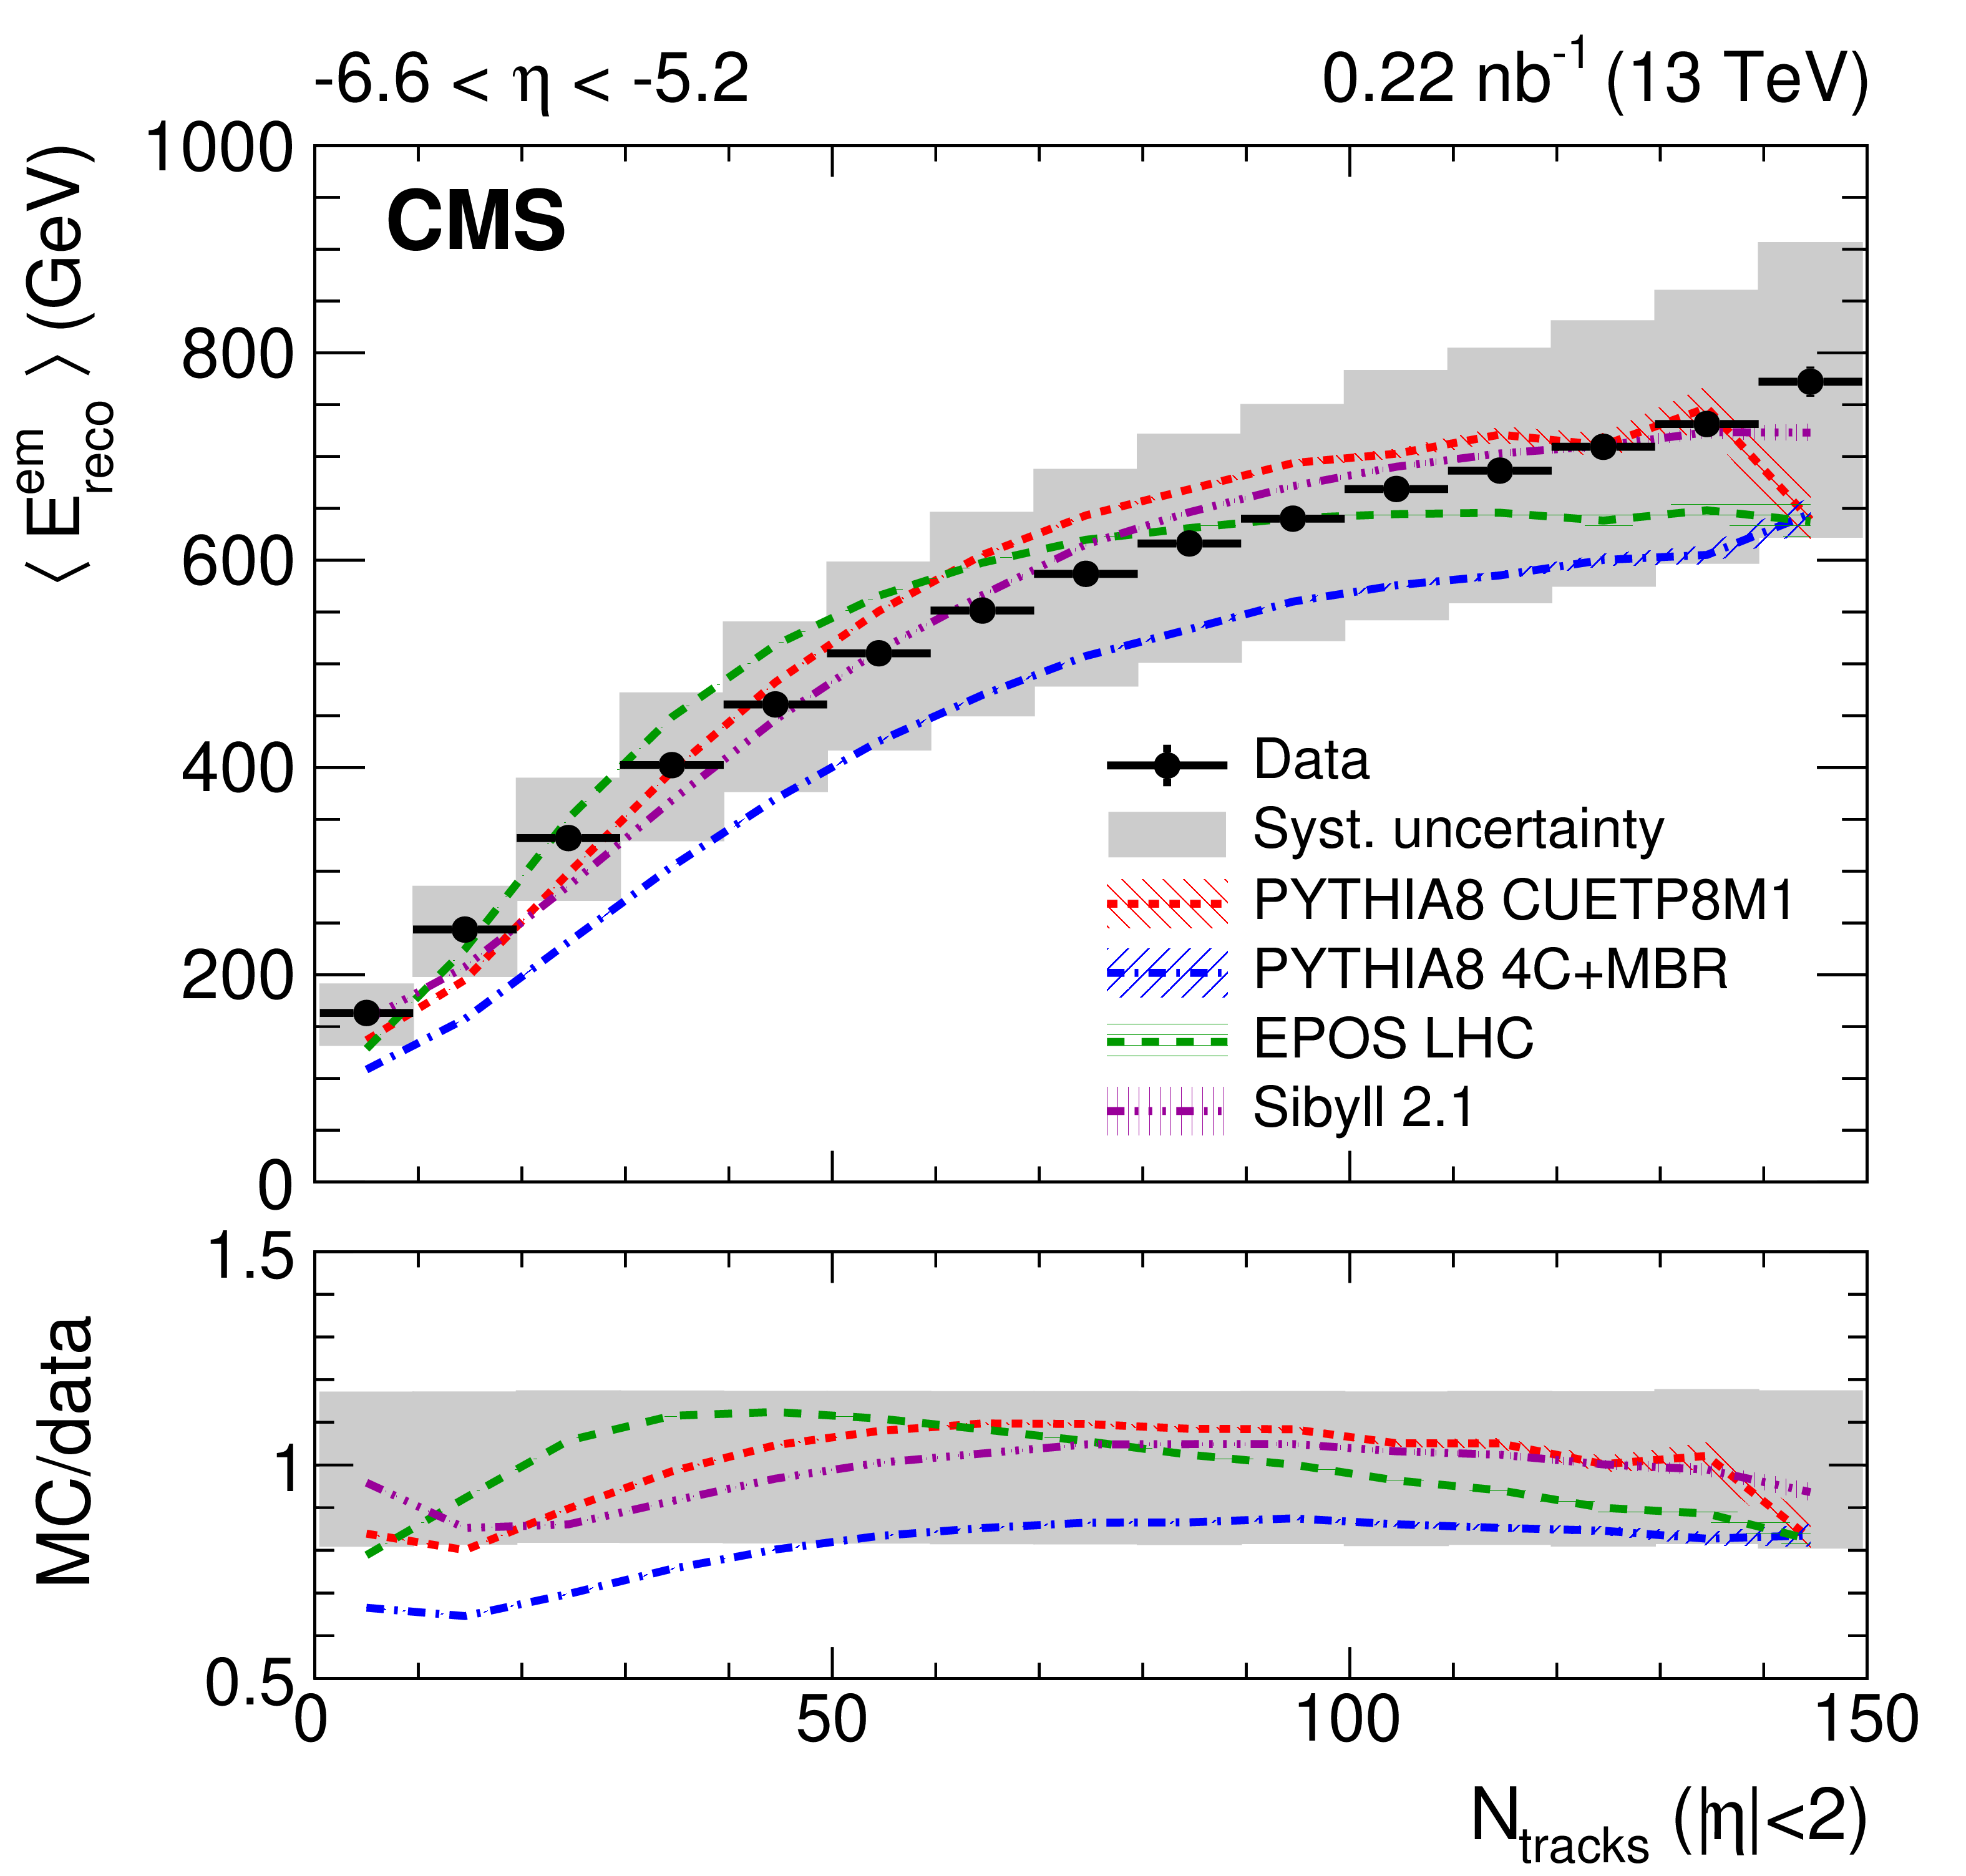
Figure 2-a:
Average electromagnetic energy reconstructed in the CASTOR calorimeter as a function of the number of reconstructed tracks for $ {| \eta |} < $ 2. The data are shown with black circles and the corresponding systematic uncertainties with a gray band; horizontal bars are used to indicate the bin width. The predictions of various event generators are compared to the data. The bands associated with the model predictions illustrate the model uncertainty. |
png pdf |
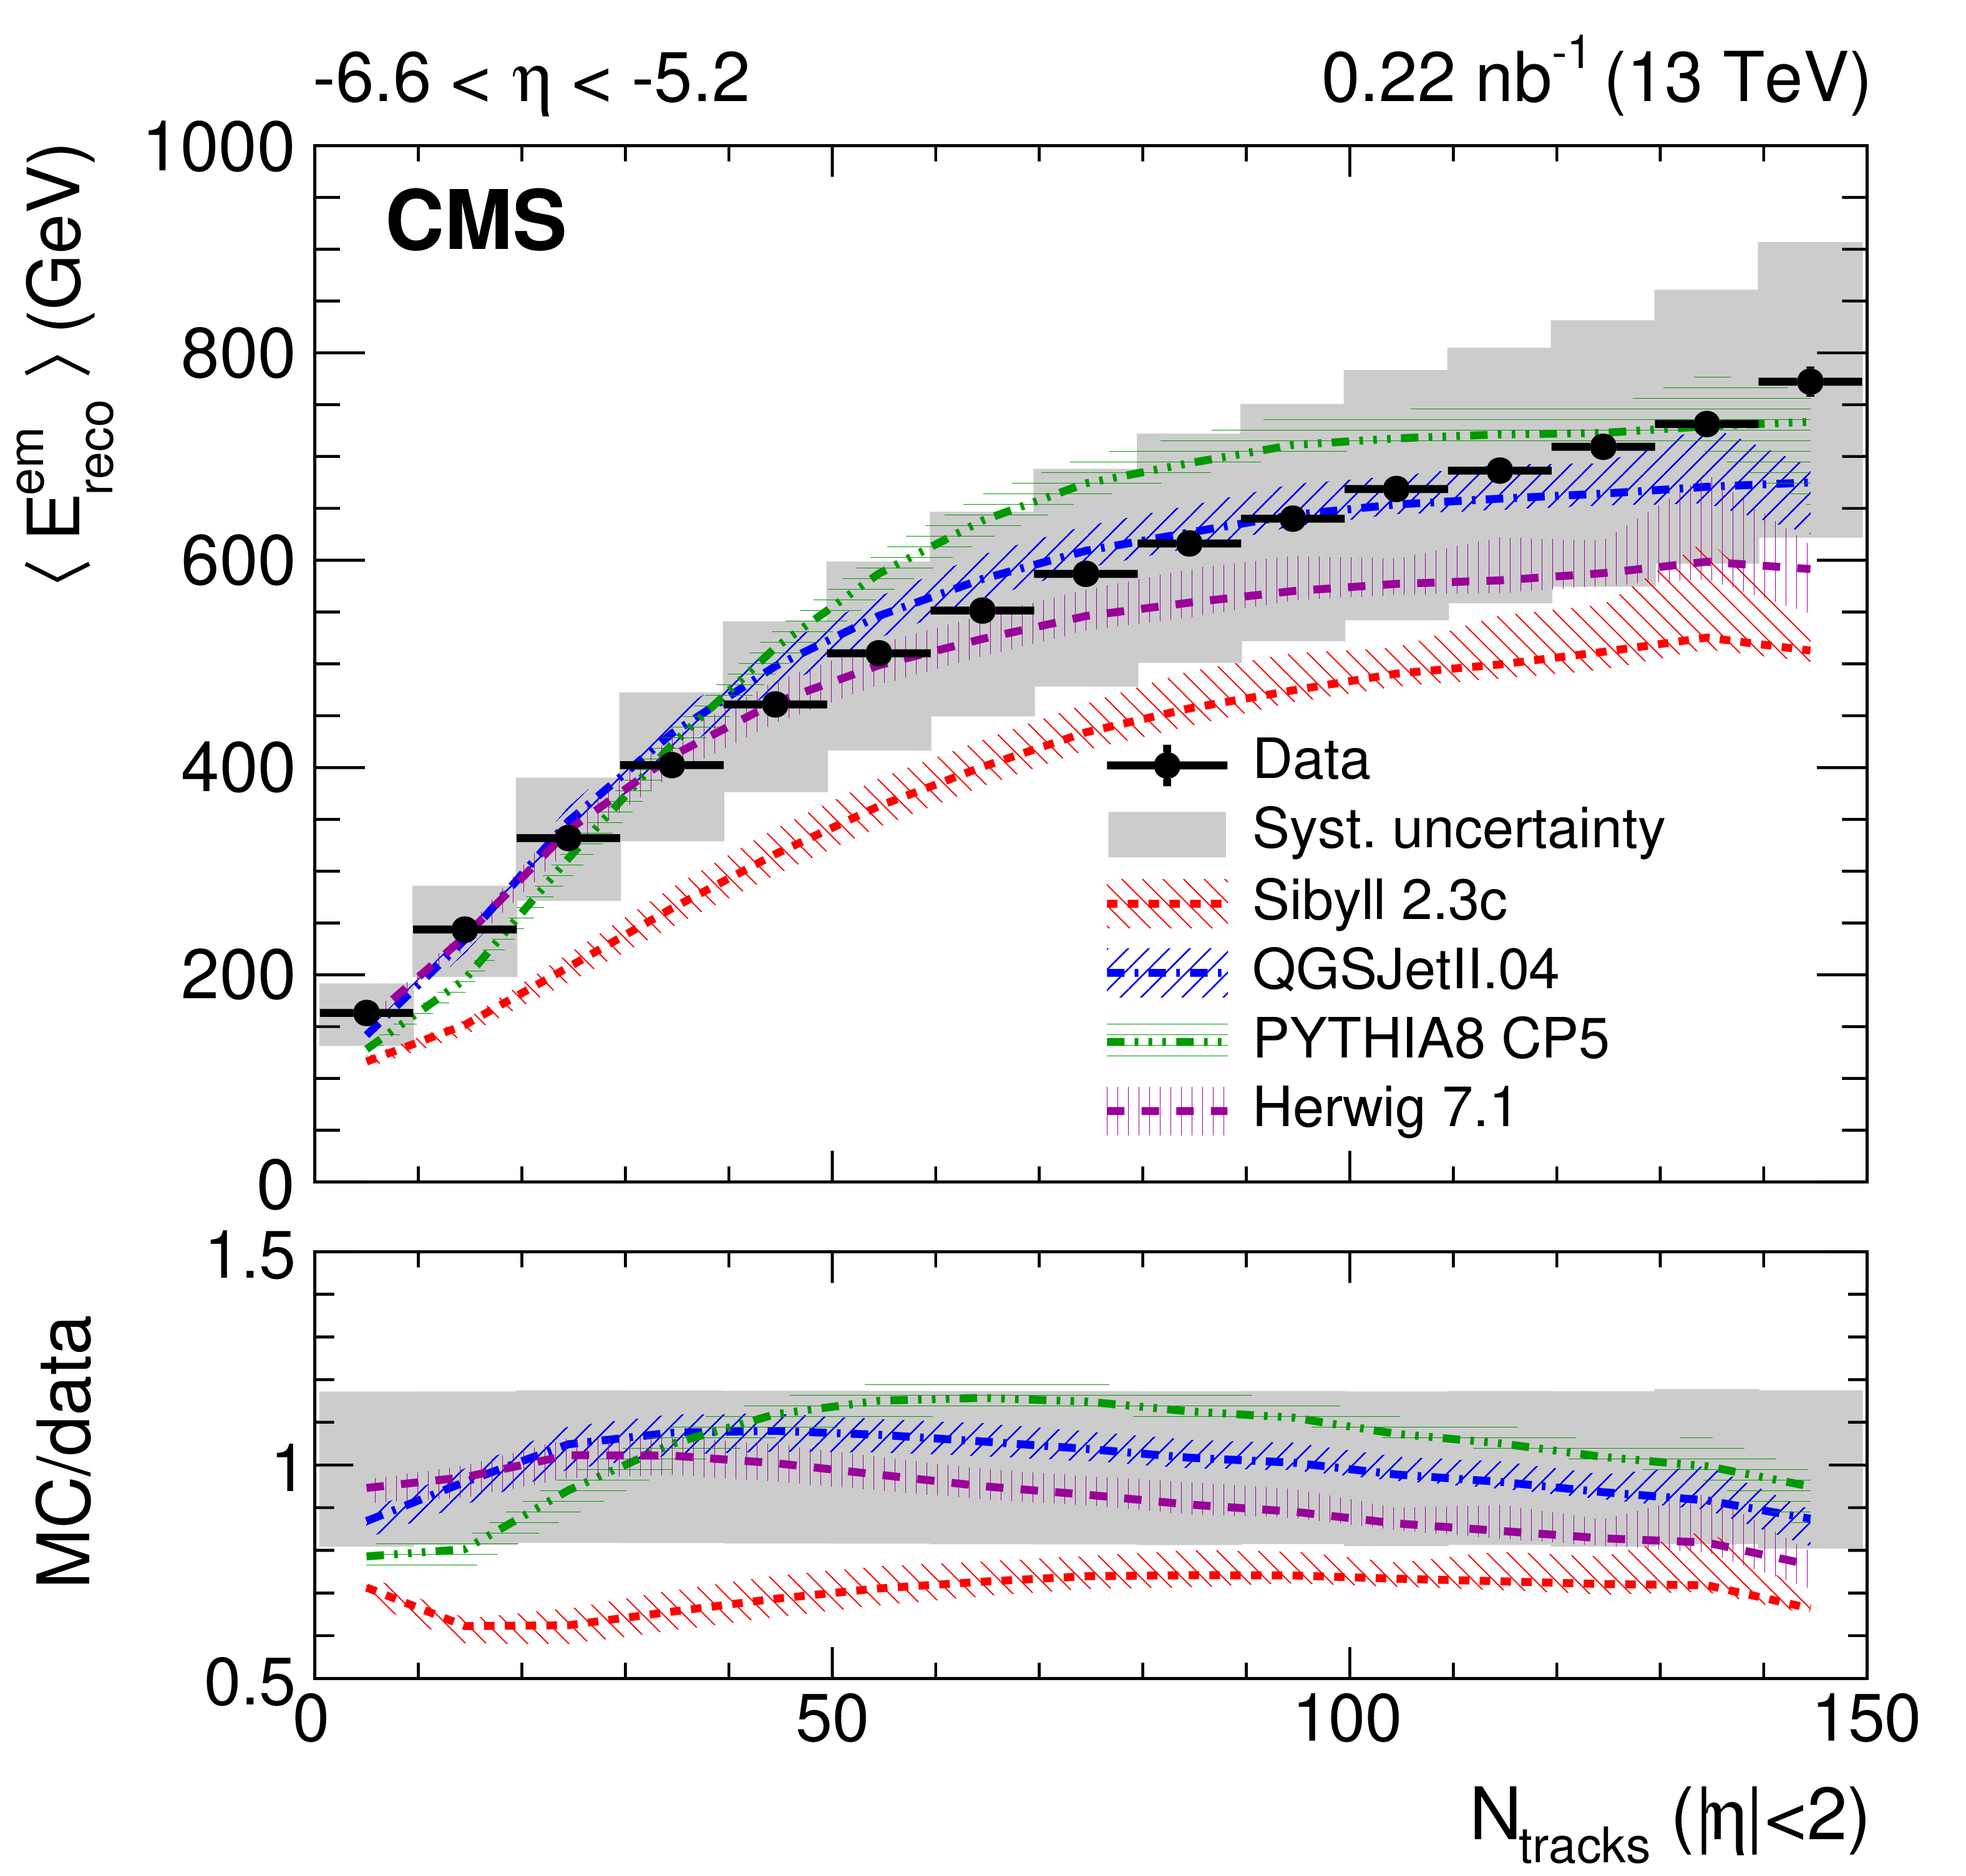
Figure 2-b:
Average electromagnetic energy reconstructed in the CASTOR calorimeter as a function of the number of reconstructed tracks for $ {| \eta |} < $ 2. The data are shown with black circles and the corresponding systematic uncertainties with a gray band; horizontal bars are used to indicate the bin width. The predictions of various event generators are compared to the data. The bands associated with the model predictions illustrate the model uncertainty. |
png pdf |
Figure 2-c:
Average hadronic energy reconstructed in the CASTOR calorimeter as a function of the number of reconstructed tracks for $ {| \eta |} < $ 2. The data are shown with black circles and the corresponding systematic uncertainties with a gray band; horizontal bars are used to indicate the bin width. The predictions of various event generators are compared to the data. The bands associated with the model predictions illustrate the model uncertainty. |
png pdf |
Figure 2-d:
Average hadronic energy reconstructed in the CASTOR calorimeter as a function of the number of reconstructed tracks for $ {| \eta |} < $ 2. The data are shown with black circles and the corresponding systematic uncertainties with a gray band; horizontal bars are used to indicate the bin width. The predictions of various event generators are compared to the data. The bands associated with the model predictions illustrate the model uncertainty. |

png pdf |
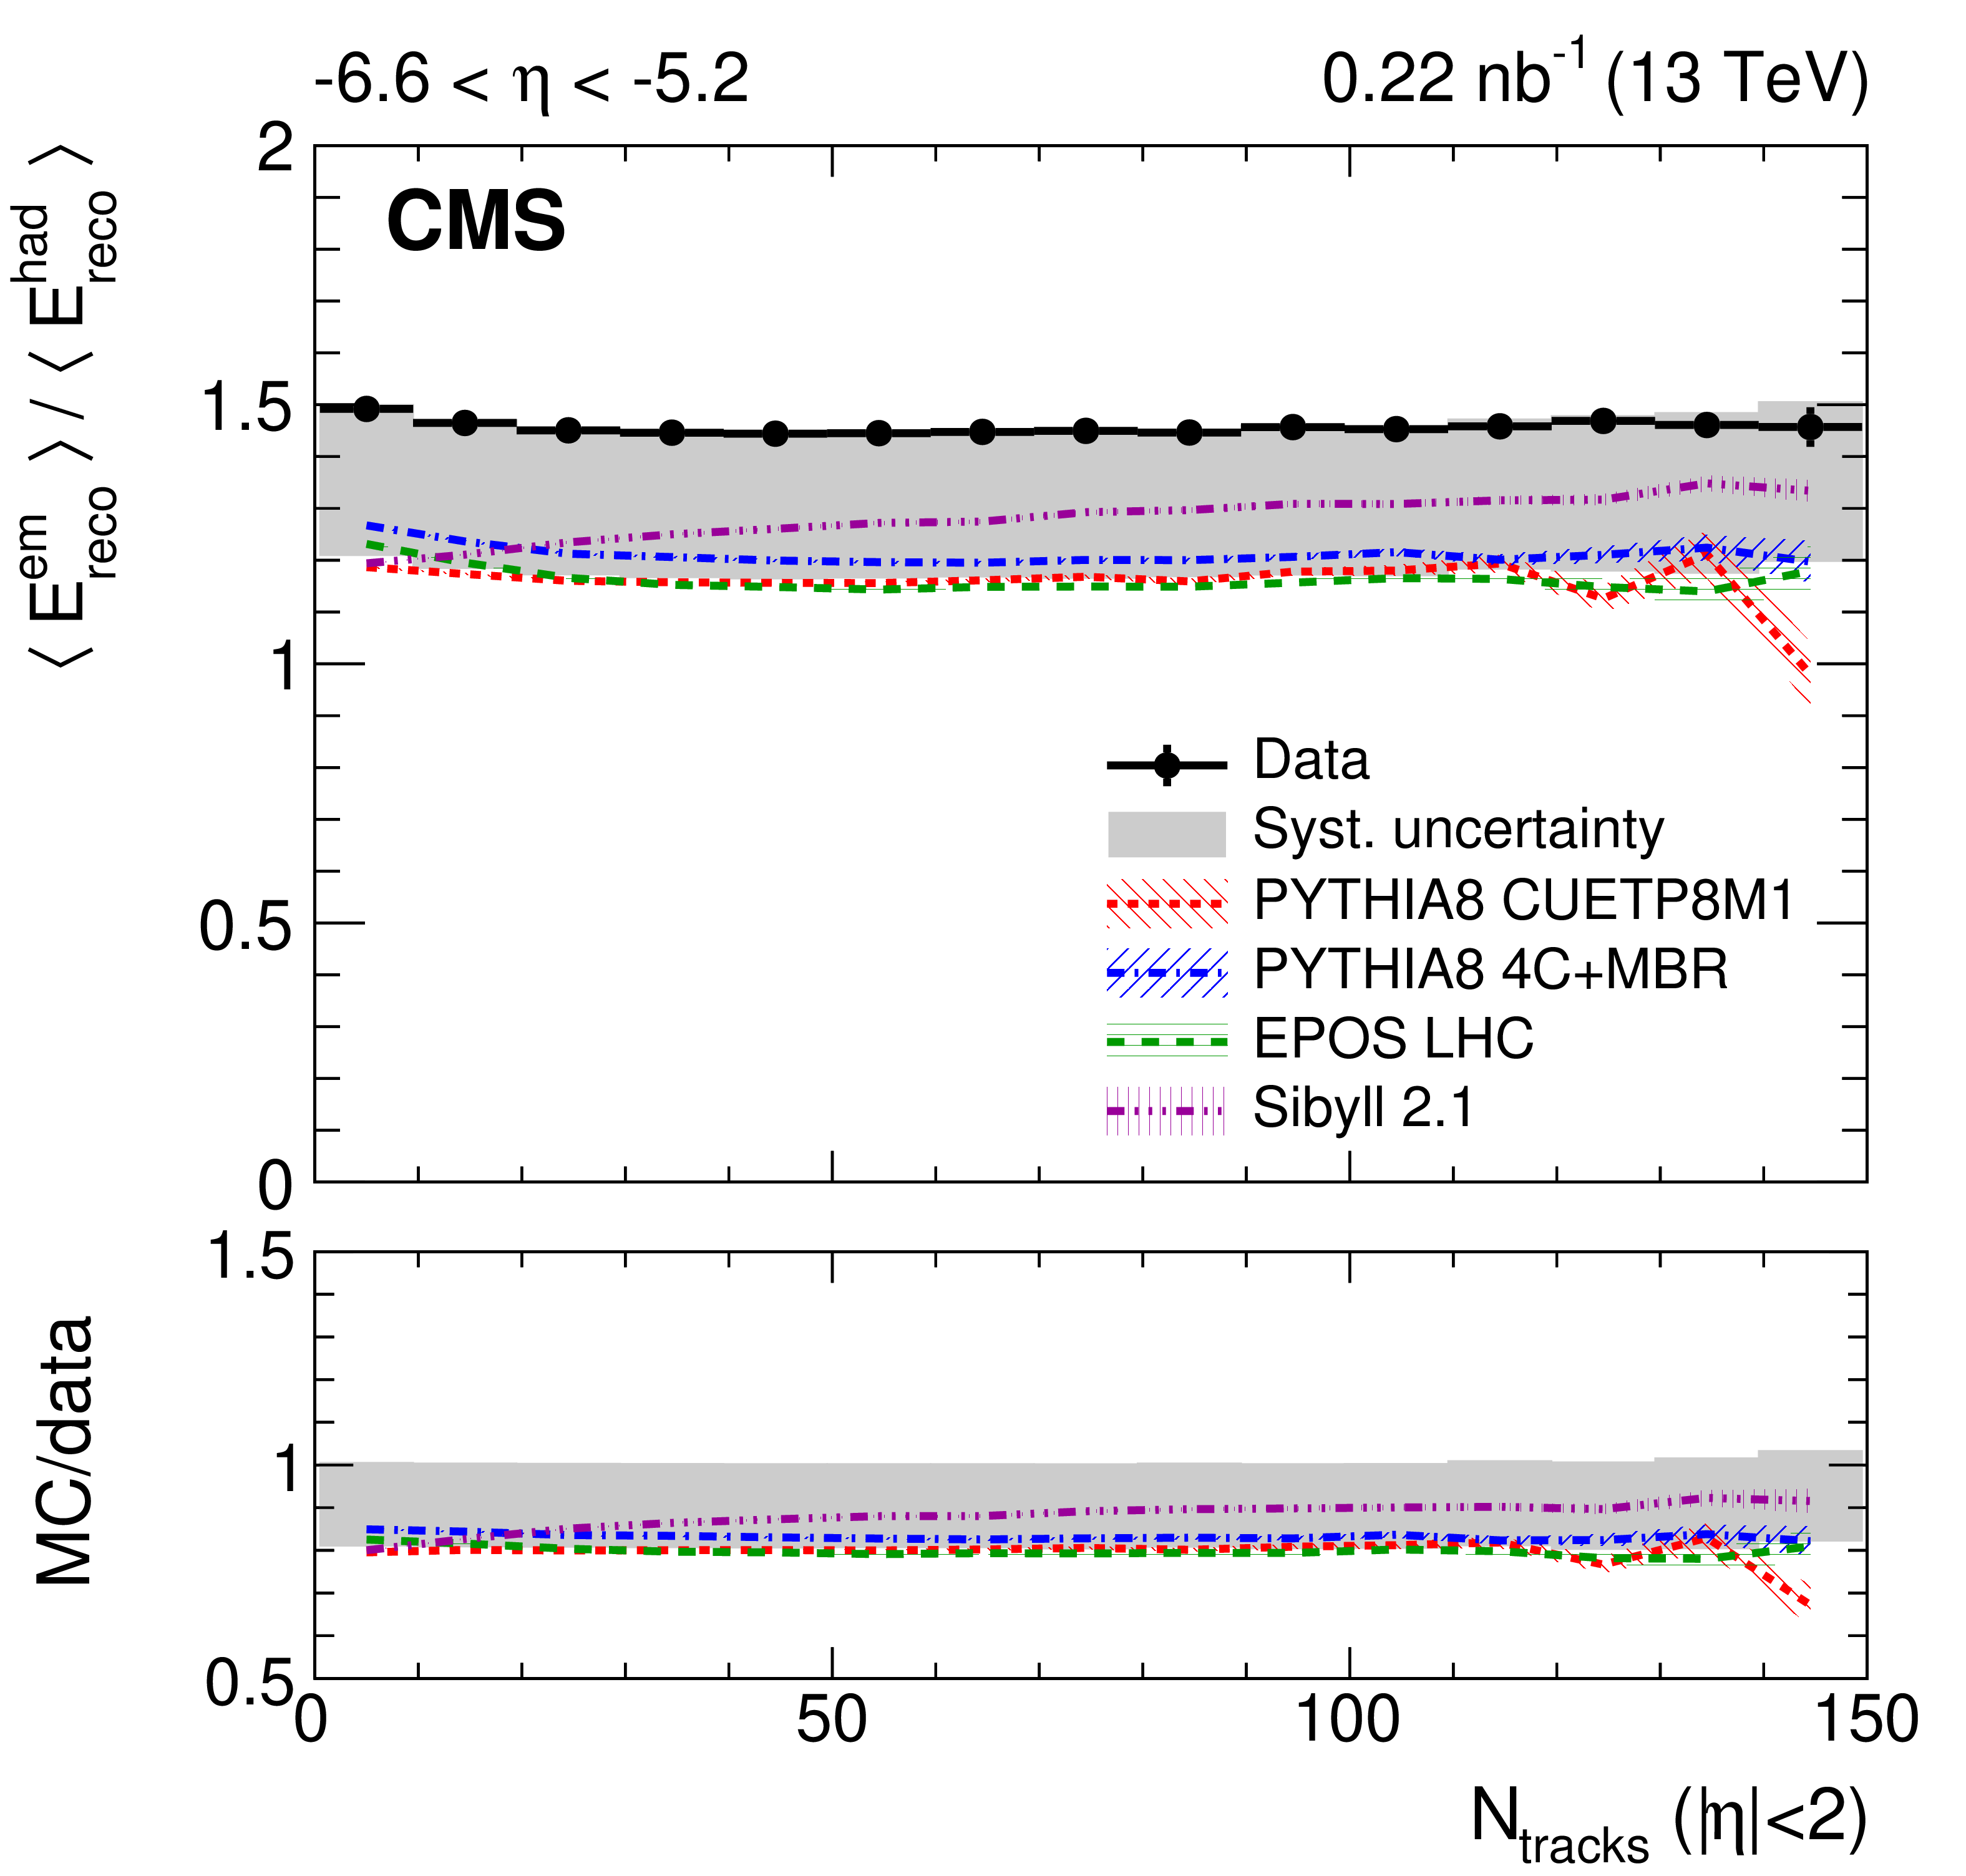
Figure 3:
Ratio of average electromagnetic and hadronic energies reconstructed in the CASTOR calorimeter as a function of the number of reconstructed tracks for $ {| \eta |} < $ 2. The data are shown with black circles and the corresponding systematic uncertainties with a gray band; horizontal bars are used to indicate the bin width. Predictions of various event generators are compared to the data, which are the same in both panels. The bands associated with the model predictions illustrate the model uncertainty. |
png pdf |
Figure 3-a:
Ratio of average electromagnetic and hadronic energies reconstructed in the CASTOR calorimeter as a function of the number of reconstructed tracks for $ {| \eta |} < $ 2. The data are shown with black circles and the corresponding systematic uncertainties with a gray band; horizontal bars are used to indicate the bin width. Predictions of various event generators are compared to the data. The bands associated with the model predictions illustrate the model uncertainty. |
png pdf |
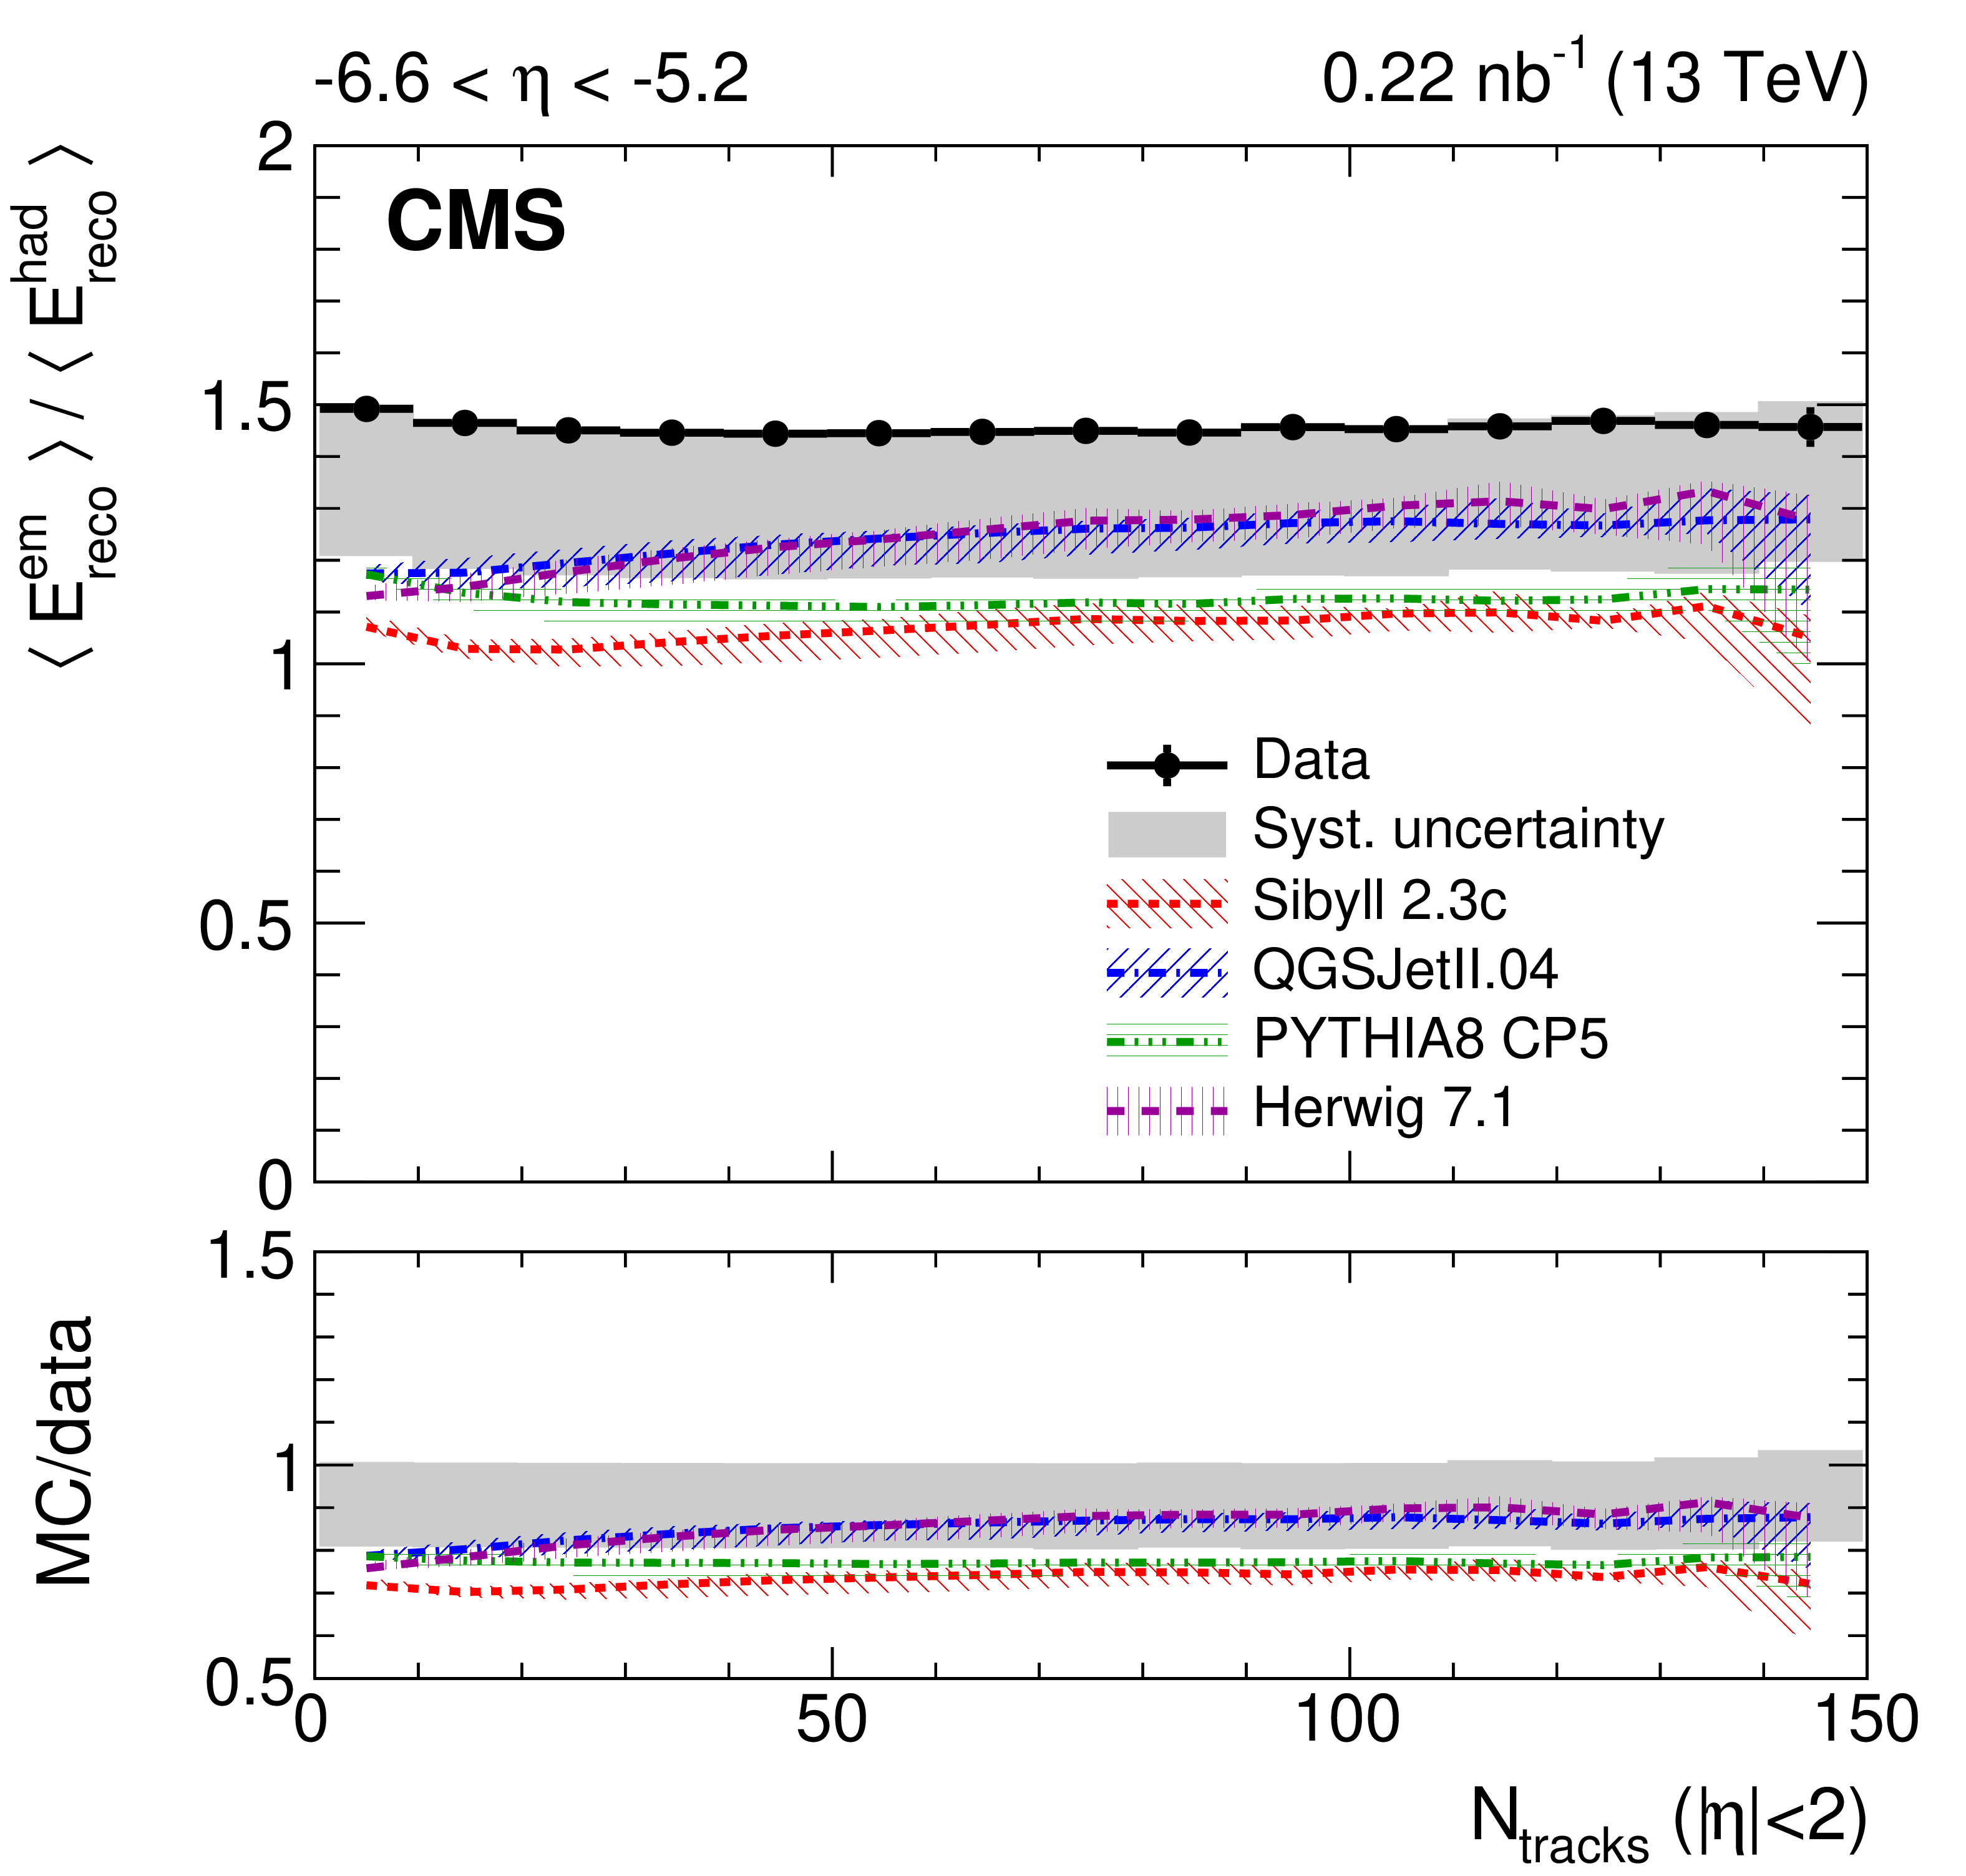
Figure 3-b:
Ratio of average electromagnetic and hadronic energies reconstructed in the CASTOR calorimeter as a function of the number of reconstructed tracks for $ {| \eta |} < $ 2. The data are shown with black circles and the corresponding systematic uncertainties with a gray band; horizontal bars are used to indicate the bin width. Predictions of various event generators are compared to the data. The bands associated with the model predictions illustrate the model uncertainty. |
| Tables | |

png pdf |
Table 1:
Uncertainties in the average energies measured with the CASTOR calorimeter on the detector level. Ranges indicate the variation as a function of the track multiplicity. |
| Summary |
|
The average energy per event in the pseudorapidity region $-6.6 < \eta < -5.2$ was measured as a function of the observed central track multiplicity ($|{\eta}| < $ 2) in proton-proton collisions at a centre-of-mass energy of 13 TeV. The data are recorded during the first days of 13 TeV running with low beam intensities. The measurement is presented in terms of the total energy as well as its electromagnetic and hadronic components. The very forward region covered by the data contains the highest energy densities studied in proton-proton collisions at the LHC so far. This makes the present data relevant for improving the modelling of multiparticle production in event generators of ultra-high energy cosmic ray air showers. The measured average total energy as a function of the track multiplicity is described by all models with reasonable discrepancies. This demonstrates that the underlying event parameter tunes determined at central rapidity can be safely extrapolated to the very forward region within experimental uncertainties. A shape analysis indicates, however, that there are significant differences among the models and large deviations from the data. The generator SIBYLL 2.1 gives the best description of the measured multiplicity dependence of the average total energy. The data are also presented in terms of the average electromagnetic and hadronic energies per event as a function of the central track multiplicity. This is useful in the study of different particle production mechanisms, since the former is primarily due to the decay of neutral pions and the latter to the production of hadrons with longer lifetimes, mostly charged pions. All models give a good description of the electromagnetic energy dependence on the multiplicity, with the exception of SIBYLL 2.3c. Conversely, the predictions for the hadronic energy have a significantly larger spread compared to the electromagnetic case. The ratio between the electromagnetic and hadronic energies is also presented. The data exhibit a larger fraction of electromagnetic energy than the models, and disagree with the two most recent model tunes, SIBYLL 2.3c and PYTHIA8 CP5. Therefore, these models cannot explain the muon deficit in ultra-high energy air shower simulations since the data indicate that even more energy must be channelled into the electromagnetic part of the cascade and is thus lost for the generation of further hadrons [17]. |
| References | ||||
| 1 | I. Sarcevic, S. D. Ellis, and P. Carruthers | QCD minijet cross sections | PRD 40 (1989) 1446 | |
| 2 | T. Sjöstrand and M. van Zijl | A multiple interaction model for the event structure in hadron collisions | PRD 36 (1987) 2019 | |
| 3 | R. Corke and T. J. Sjostrand | Interleaved parton showers and tuning prospects | JHEP 03 (2011) 032 | 1011.1759 |
| 4 | P. Skands, S. Carrazza, and J. Rojo | Tuning PYTHIA 8.1: the Monash 2013 tune | EPJC 74 (2014) 3024 | 1404.5630 |
| 5 | K. Akiba and others | LHC forward physics | JPG 43 (2016) 110201 | 1611.05079 |
| 6 | K. Werner, B. Guiot, I. Karpenko, and T. Pierog | Analyzing radial flow features in pPb and pp collisions at several TeV by studying identified-particle production with the event generator EPOS3 | PRC 89 (2014) 064903 | 1312.1233 |
| 7 | V. Andreev and otjers | Performance studies of a full-length prototype for the CASTOR forward calorimeter at the CMS experiment | EPJC 67 (2010) 601 | |
| 8 | CMS Collaboration | Study of the underlying event at forward rapidity in pp collisions at $ \sqrt{s} = $ 0.9, 2.76, and 7 TeV | JHEP 04 (2013) 072 | CMS-FWD-11-003 1302.2394 |
| 9 | CMS Collaboration | Measurement of the inclusive energy spectrum in the very forward direction in proton-proton collisions at $ \sqrt{s}= $ 13 TeV | JHEP 08 (2017) 046 | CMS-FSQ-16-002 1701.08695 |
| 10 | ATLAS Collaboration | Measurement of charged-particle distributions sensitive to the underlying event in $ \sqrt{s}= $ 13 TeV proton-proton collisions with the ATLAS detector at the LHC | JHEP 03 (2017) 157 | 1701.05390 |
| 11 | CMS Collaboration | Measurement of the underlying event activity in inclusive Z boson production in proton-proton collisions at $ \sqrt{s}= $ 13 TeV | JHEP 07 (2018) 032 | CMS-FSQ-16-008 1711.04299 |
| 12 | CMS Collaboration | Measurement of the energy density as a function of pseudorapidity in proton-proton collisions at $ \sqrt{s} = $ 13 TeV | EPJC 79 (2019) 391 | CMS-FSQ-15-006 1812.04095 |
| 13 | LHCb Collaboration | Measurement of the forward energy flow in pp collisions at $ \sqrt{s}= $ 7 TeV | EPJC 73 (2013) 2421 | 1212.4755 |
| 14 | D. d'Enterria et al. | Constraints from the first LHC data on hadronic event generators for ultra-high energy cosmic ray physics | Astropart. Phys. 35 (2011) 98 | 1101.5596 |
| 15 | Pierre Auger Collaboration | Muons in air showers at the Pierre Auger Observatory: mean number in highly inclined events | PRD 91 (2015) 032003 | 1408.1421 |
| 16 | Pierre Auger Collaboration | Testing hadronic interactions at ultrahigh energies with air showers measured by the Pierre Auger Observatory | PRL 117 (2016) 192001 | 1610.08509 |
| 17 | R. Ulrich, R. Engel, and M. Unger | Hadronic multiparticle production at ultra-high energies and extensive air showers | PRD 83 (2011) 054026 | 1010.4310 |
| 18 | CMS Collaboration | The CMS experiment at the CERN LHC | JINST 3 (2008) S08004 | CMS-00-001 |
| 19 | CMS-CASTOR Collaboration | Design and test beam studies for the CASTOR calorimeter of the CMS experiment | NIMA 623 (2010) 225 | |
| 20 | CMS Collaboration | The CMS trigger system | JINST 12 (2017) P01020 | CMS-TRG-12-001 1609.02366 |
| 21 | T. Sjöstrand et al. | An introduction to PYTHIA 8.2 | CPC 191 (2015) 159 | 1410.3012 |
| 22 | CMS Collaboration | Event generator tunes obtained from underlying event and multiparton scattering measurements | EPJC 76 (2016) 155 | CMS-GEN-14-001 1512.00815 |
| 23 | R. Ciesielski and K. Goulianos | MBR Monte Carlo simulation in PYTHIA8 | PoS ICHEP2012 (2013) 301 | 1205.1446 |
| 24 | T. Pierog et al. | EPOS LHC: test of collective hadronization with data measured at the CERN Large Hadron Collider | PRC 92 (2015) 034906 | 1306.0121 |
| 25 | E.-J. Ahn et al. | Cosmic ray interaction event generator SIBYLL 2.1 | PRD 80 (2009) 094003 | 0906.4113 |
| 26 | GEANT4 Collaboration | GEANT4---a simulation toolkit | NIMA 506 (2003) 250 | |
| 27 | S. Ostapchenko | Monte Carlo treatment of hadronic interactions in enhanced pomeron scheme: QGSJET-II model | PRD 83 (2011) 014018 | 1010.1869 |
| 28 | F. Riehn et al. | The hadronic interaction model SIBYLL 2.3c and Feynman scaling | PoS ICRC2017 (2018) 301 | 1709.07227 |
| 29 | CMS Collaboration | Extraction and validation of a new set of CMS PYTHIA8 tunes from underlying-event measurements | Submitted to: EPJC | CMS-GEN-17-001 1903.12179 |
| 30 | M. Bahr and others | Herwig++ physics and manual | EPJC 58 (2008) 639 | 0803.0883 |
| 31 | J. Bellm and others | Herwig 7.0/Herwig++ 3.0 release note | EPJC 76 (2016) 196 | 1512.01178 |
| 32 | S. Gieseke, F. Loshaj, and P. Kirchgaeßer | Soft and diffractive scattering with the cluster model in HERWIG | EPJC 77 (2017) 156 | 1612.04701 |
| 33 | CMS Collaboration | Pseudorapidity distribution of charged hadrons in proton-proton collisions at $ \sqrt{s} = $ 13 TeV | PLB 751 (2015) 143 | CMS-FSQ-15-001 1507.05915 |
| 34 | CMS Collaboration | Measurement of energy flow at large pseudorapidities in pp collisions at $ \sqrt{s}= $ 0.9 and 7 TeV | JHEP 11 (2011) 148 | CMS-FWD-10-011 1110.0211 |
| 35 | CMS Collaboration | Measurement of the inelastic proton-proton cross section at $ \sqrt{s}= $ 13 TeV | JHEP 07 (2018) 161 | CMS-FSQ-15-005 1802.02613 |
| 36 | A. Buckley et al. | Rivet user manual | CPC 184 (2013) 2803 | 1003.0694 |
|
|
Compact Muon Solenoid LHC, CERN |
|

|

|

|

|

|