

Compact Muon Solenoid
LHC, CERN
| CMS-GEN-17-001 ; CERN-EP-2019-007 | ||
| Extraction and validation of a new set of CMS PYTHIA-8 tunes from underlying-event measurements | ||
| CMS Collaboration | ||
| 28 March 2019 | ||
| Eur. Phys. J. C 80 (2020) 4 | ||
| Abstract: New sets of CMS underlying-event parameters ("tunes") are presented for the PYTHIA-8 event generator. These tunes use the NNPDF3.1 parton distribution functions (PDFs) at leading (LO), next-to-leading (NLO), or next-to-next-to-leading (NNLO) orders in perturbative quantum chromodynamics, and the strong coupling evolution at LO or NLO. Measurements of charged-particle multiplicity and transverse momentum densities at various hadron collision energies are fit simultaneously to determine the parameters of the tunes. Comparisons of the predictions of the new tunes are provided for observables sensitive to the event shapes at LEP, global underlying event, soft multiparton interactions, and double-parton scattering contributions. In addition, comparisons are made for observables measured in various specific processes, such as multijet, Drell-Yan, and top quark-antiquark pair production including jet substructure observables. The simulation of the underlying event provided by the new tunes is interfaced to a higher-order matrix-element calculation. For the first time, predictions from PYTHIA-8 obtained with tunes based on NLO or NNLO PDFs are shown to reliably describe minimum-bias and underlying-event data with a similar level of agreement to predictions from tunes using LO PDF sets. | ||
| Links: e-print arXiv:1903.12179 [hep-ex] (PDF) ; CDS record ; inSPIRE record ; CADI line (restricted) ; | ||
| Figures & Tables | Summary | Additional Tables | References | CMS Publications |
|---|
| Figures | |

png pdf |
Figure 1:
Illustration of several $\phi $ regions relative to the leading object that are sensitive to the underlying event. See the text for the details on the definitions of the regions. |
png pdf |
Figure 2:
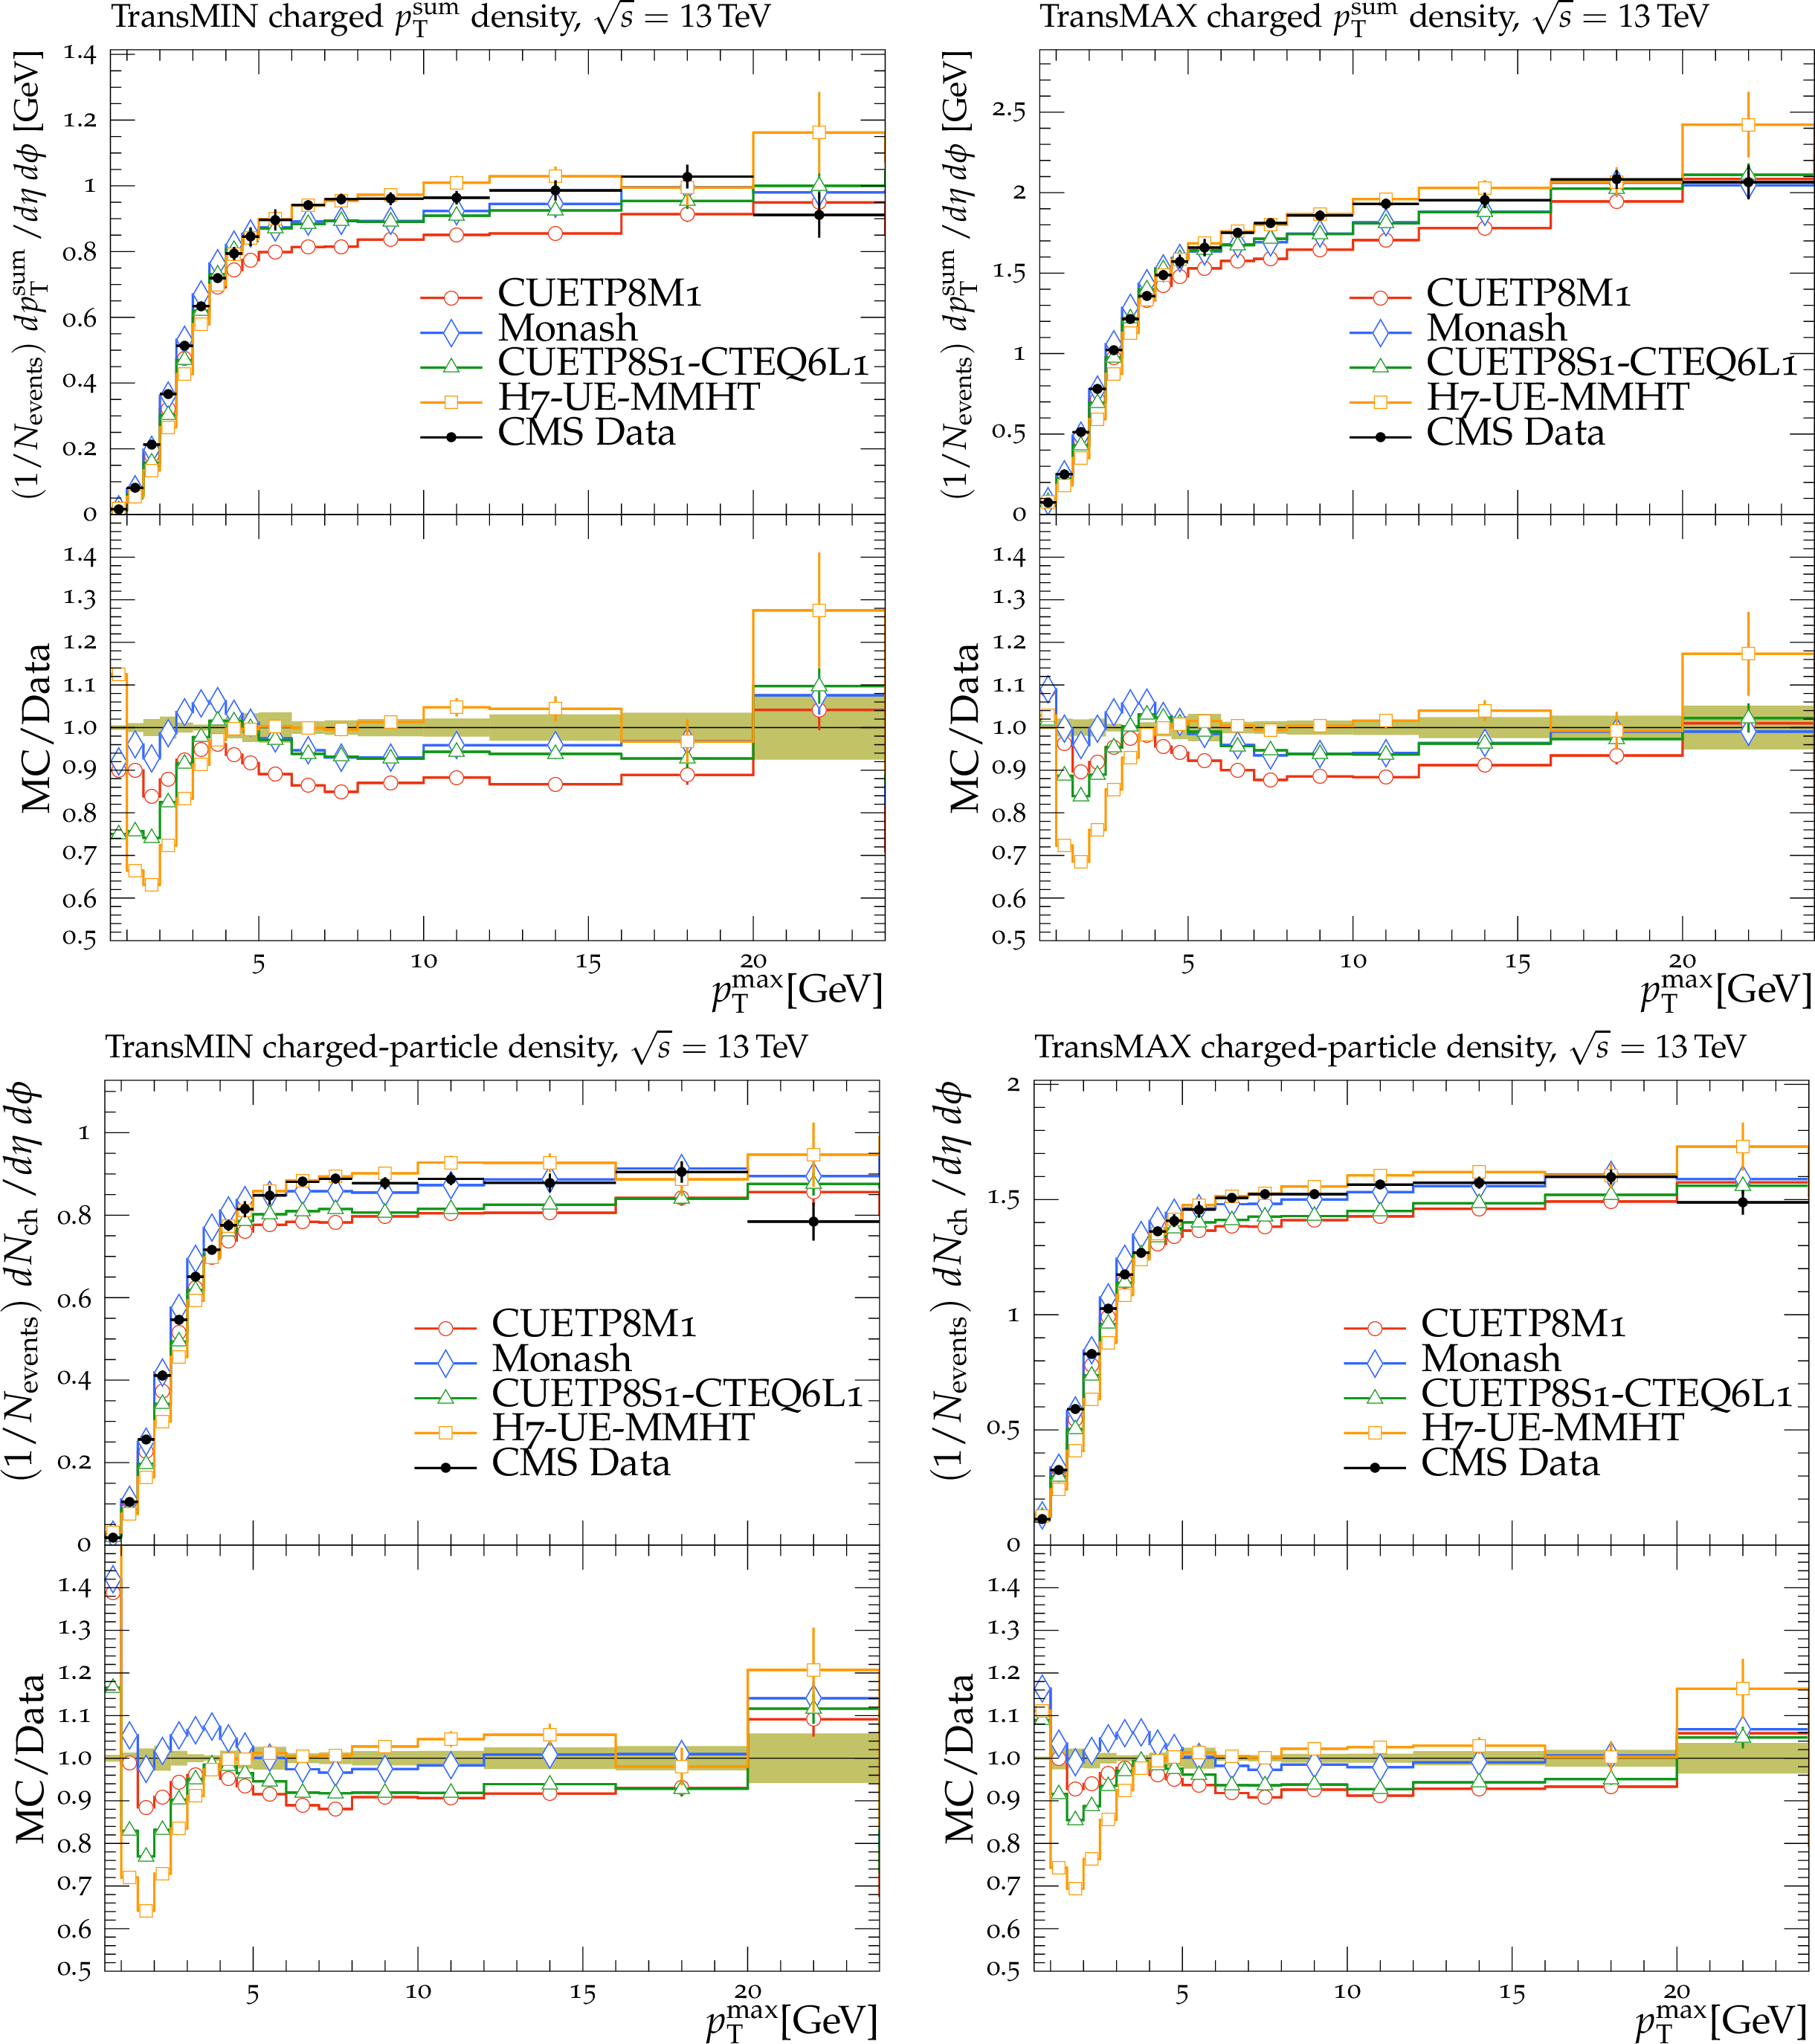
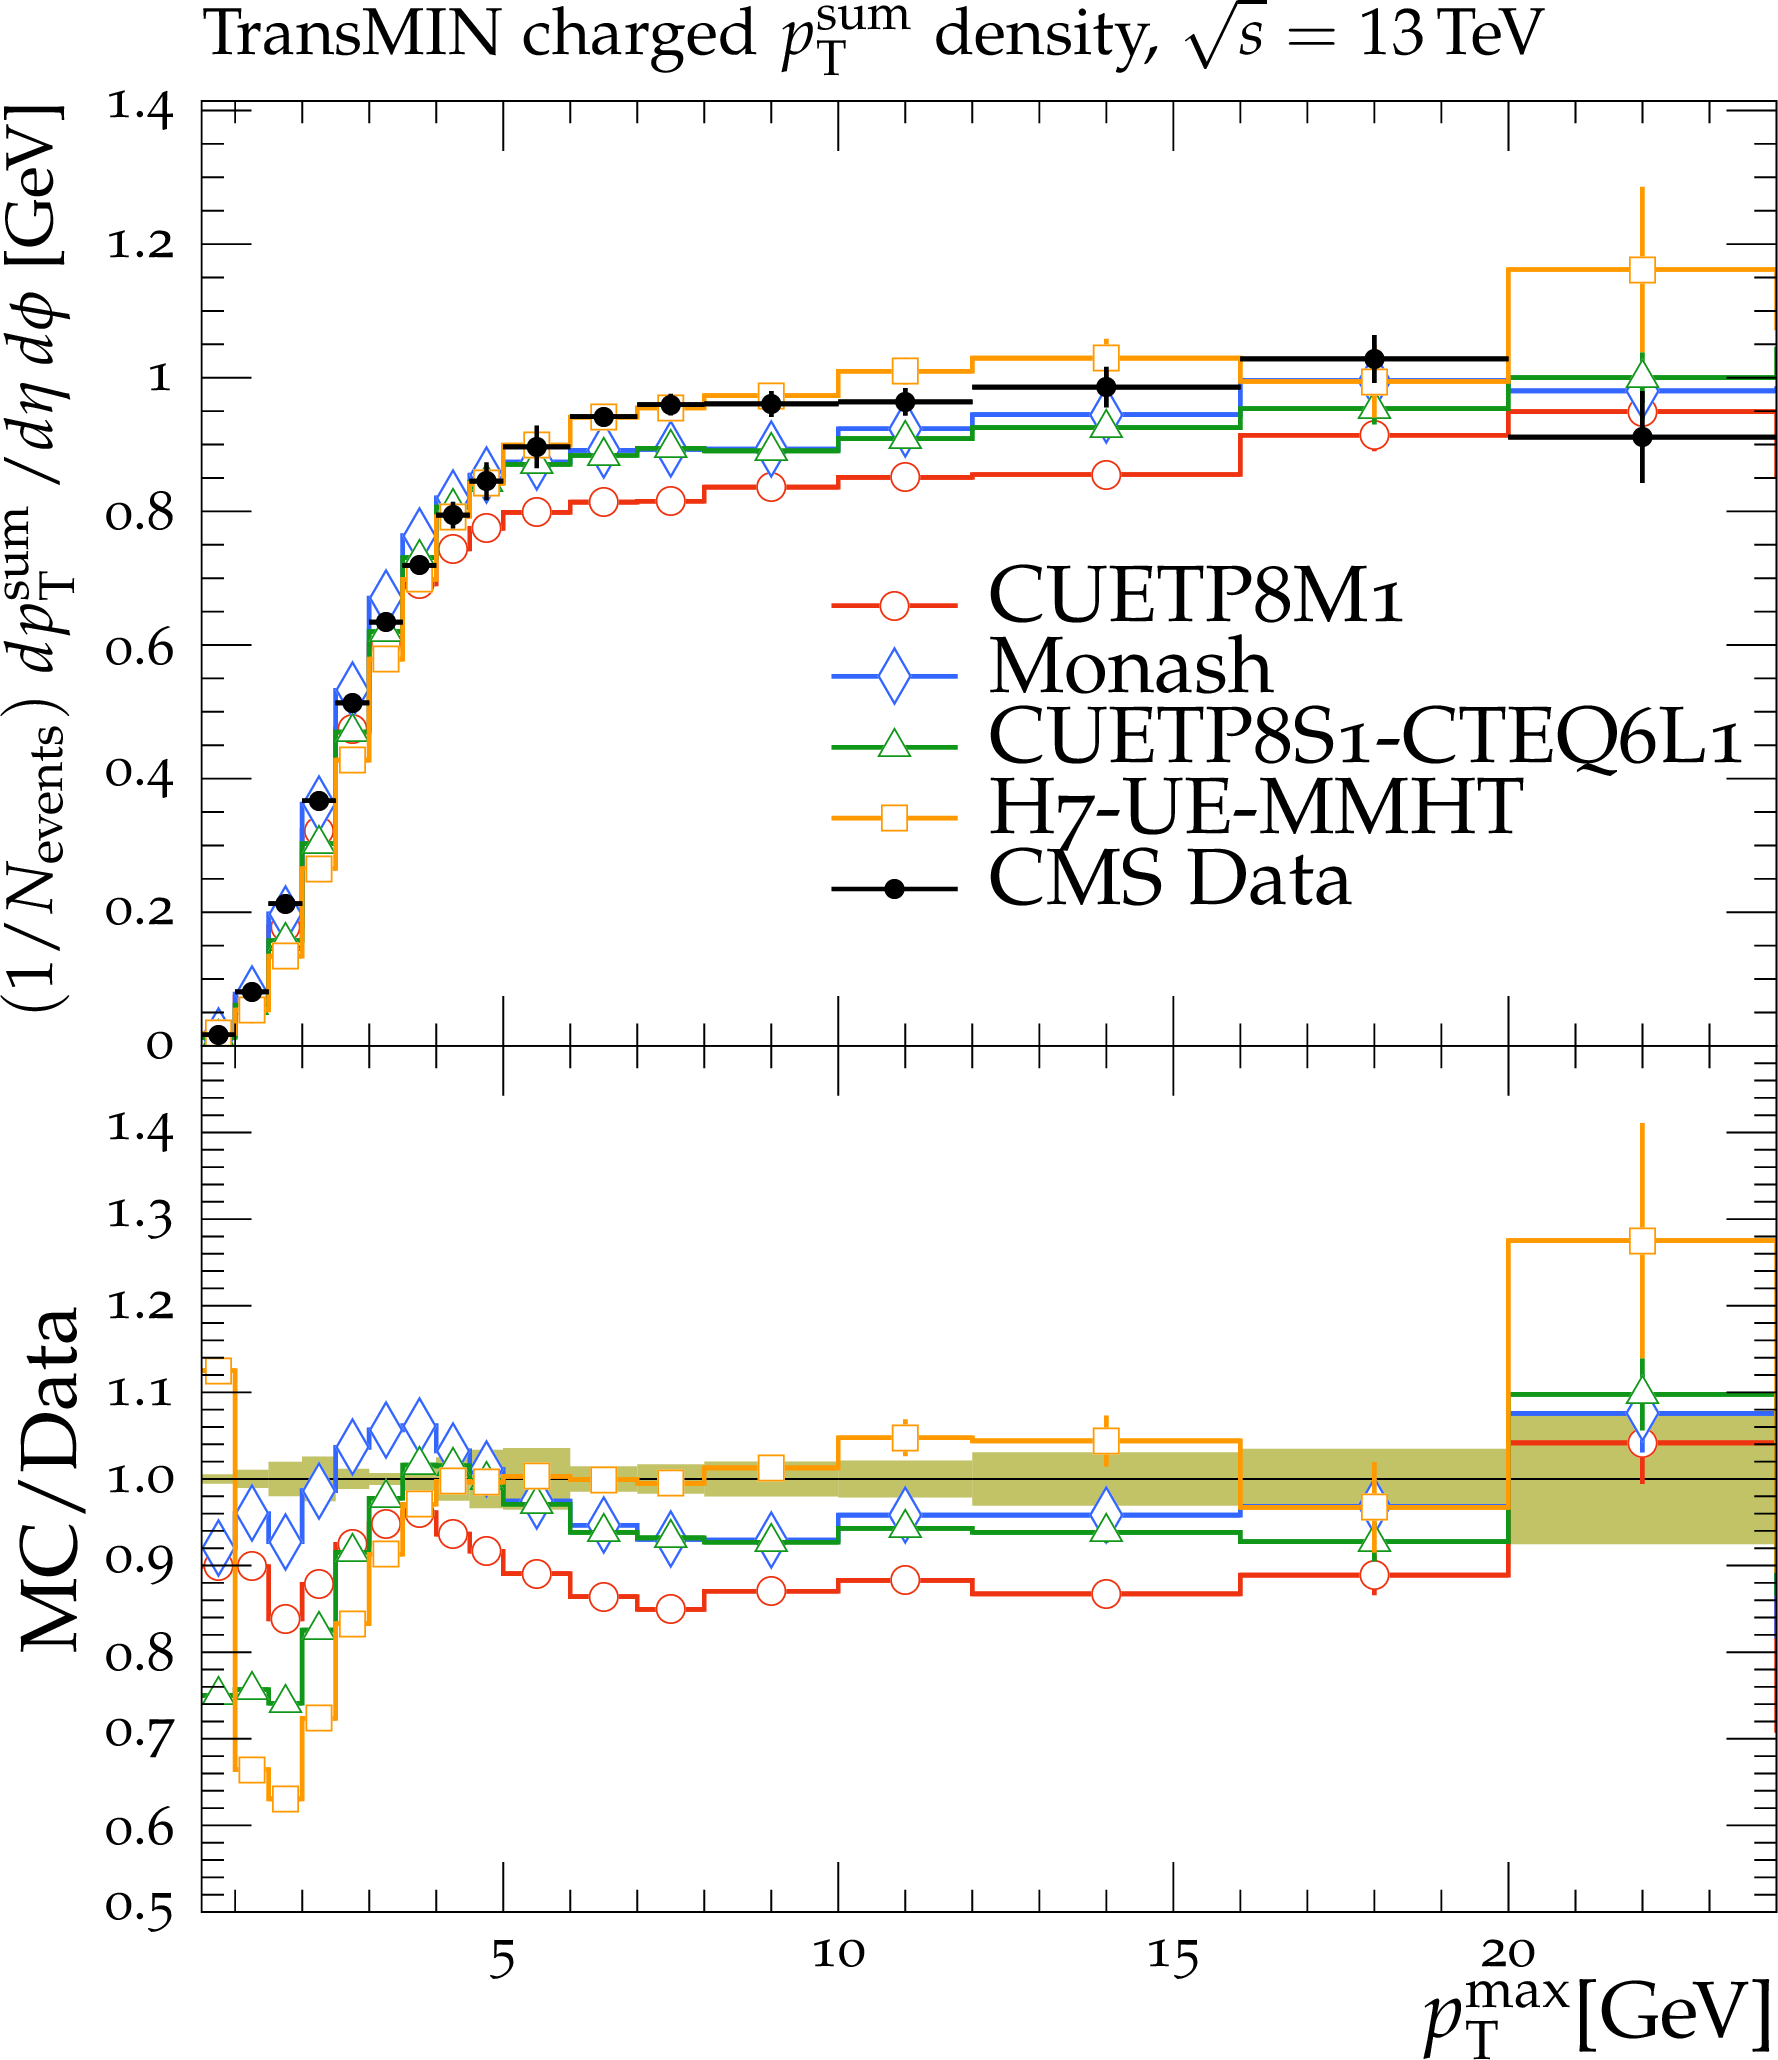
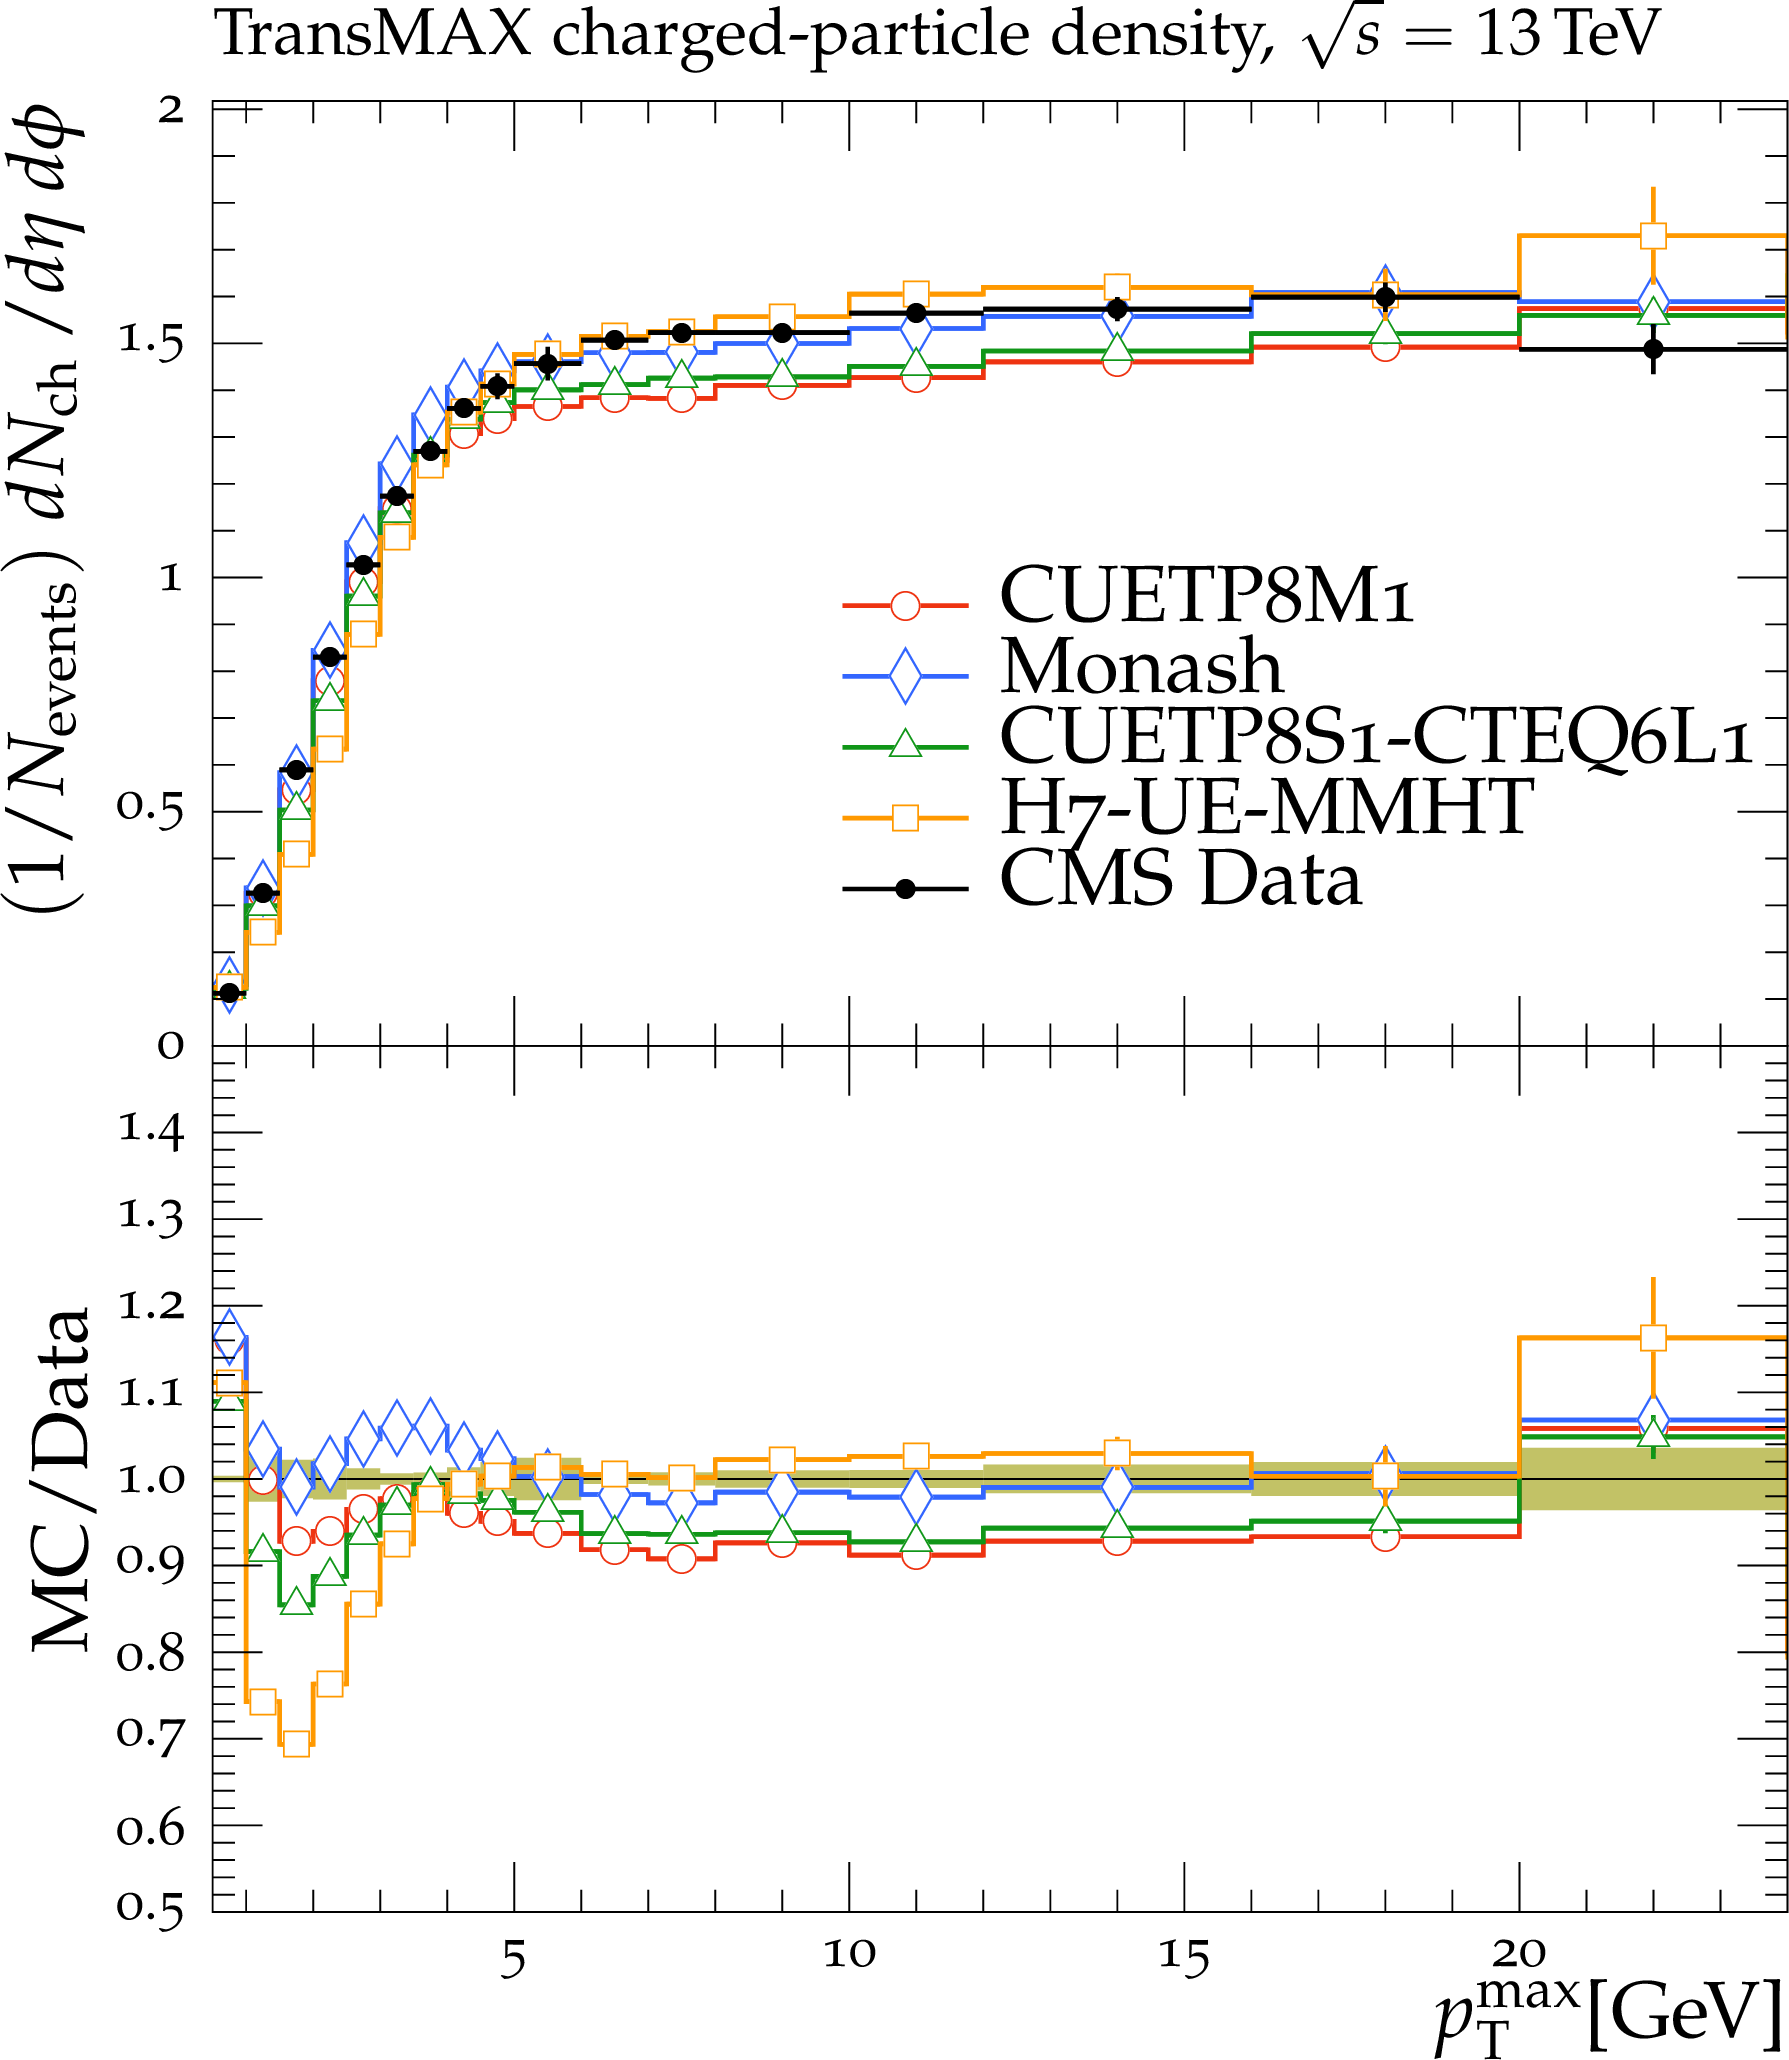
The (left column) transMIN and (right column) transMAX charged-particle ${{p_{\mathrm {T}}} ^\text {sum}}$ (upper row), and multiplicity (lower row) densities for particles with $ {p_{\mathrm {T}}} > $ 0.5 GeV in $ {| \eta |} < $ 2.0, as a function of the transverse momentum of the leading charged particle ($ {{p_{\mathrm {T}}} ^\text {max}}$), from the CMS $\sqrt {s} = $ 13 TeV analysis [16]. The data are compared with the PYTHIA 8 tune Monash, the CMS PYTHIA 8 tunes CUETP8S1-CTEQ6L1 and CUETP8M1, and the HERWIG 7 (labelled as "H7") tune UE-MMHT. The ratios of the simulations to the data (MC/Data) are also shown, where the shaded band indicates the total experimental uncertainty in the data. Vertical lines drawn on the data points refer to the total uncertainty in the data. Vertical lines drawn on the MC points refer to the statistical uncertainty in the predictions. Horizontal bars indicate the associated bin width. |
png pdf |
Figure 2-a:
The (left column) transMIN and (right column) transMAX charged-particle ${{p_{\mathrm {T}}} ^\text {sum}}$ (upper row), and multiplicity (lower row) densities for particles with $ {p_{\mathrm {T}}} > $ 0.5 GeV in $ {| \eta |} < $ 2.0, as a function of the transverse momentum of the leading charged particle ($ {{p_{\mathrm {T}}} ^\text {max}}$), from the CMS $\sqrt {s} = $ 13 TeV analysis [16]. The data are compared with the PYTHIA 8 tune Monash, the CMS PYTHIA 8 tunes CUETP8S1-CTEQ6L1 and CUETP8M1, and the HERWIG 7 (labelled as "H7") tune UE-MMHT. The ratios of the simulations to the data (MC/Data) are also shown, where the shaded band indicates the total experimental uncertainty in the data. Vertical lines drawn on the data points refer to the total uncertainty in the data. Vertical lines drawn on the MC points refer to the statistical uncertainty in the predictions. Horizontal bars indicate the associated bin width. |

png pdf |
Figure 2-b:
The (left column) transMIN and (right column) transMAX charged-particle ${{p_{\mathrm {T}}} ^\text {sum}}$ (upper row), and multiplicity (lower row) densities for particles with $ {p_{\mathrm {T}}} > $ 0.5 GeV in $ {| \eta |} < $ 2.0, as a function of the transverse momentum of the leading charged particle ($ {{p_{\mathrm {T}}} ^\text {max}}$), from the CMS $\sqrt {s} = $ 13 TeV analysis [16]. The data are compared with the PYTHIA 8 tune Monash, the CMS PYTHIA 8 tunes CUETP8S1-CTEQ6L1 and CUETP8M1, and the HERWIG 7 (labelled as "H7") tune UE-MMHT. The ratios of the simulations to the data (MC/Data) are also shown, where the shaded band indicates the total experimental uncertainty in the data. Vertical lines drawn on the data points refer to the total uncertainty in the data. Vertical lines drawn on the MC points refer to the statistical uncertainty in the predictions. Horizontal bars indicate the associated bin width. |

png pdf |
Figure 2-c:
The (left column) transMIN and (right column) transMAX charged-particle ${{p_{\mathrm {T}}} ^\text {sum}}$ (upper row), and multiplicity (lower row) densities for particles with $ {p_{\mathrm {T}}} > $ 0.5 GeV in $ {| \eta |} < $ 2.0, as a function of the transverse momentum of the leading charged particle ($ {{p_{\mathrm {T}}} ^\text {max}}$), from the CMS $\sqrt {s} = $ 13 TeV analysis [16]. The data are compared with the PYTHIA 8 tune Monash, the CMS PYTHIA 8 tunes CUETP8S1-CTEQ6L1 and CUETP8M1, and the HERWIG 7 (labelled as "H7") tune UE-MMHT. The ratios of the simulations to the data (MC/Data) are also shown, where the shaded band indicates the total experimental uncertainty in the data. Vertical lines drawn on the data points refer to the total uncertainty in the data. Vertical lines drawn on the MC points refer to the statistical uncertainty in the predictions. Horizontal bars indicate the associated bin width. |
png pdf |
Figure 2-d:
The (left column) transMIN and (right column) transMAX charged-particle ${{p_{\mathrm {T}}} ^\text {sum}}$ (upper row), and multiplicity (lower row) densities for particles with $ {p_{\mathrm {T}}} > $ 0.5 GeV in $ {| \eta |} < $ 2.0, as a function of the transverse momentum of the leading charged particle ($ {{p_{\mathrm {T}}} ^\text {max}}$), from the CMS $\sqrt {s} = $ 13 TeV analysis [16]. The data are compared with the PYTHIA 8 tune Monash, the CMS PYTHIA 8 tunes CUETP8S1-CTEQ6L1 and CUETP8M1, and the HERWIG 7 (labelled as "H7") tune UE-MMHT. The ratios of the simulations to the data (MC/Data) are also shown, where the shaded band indicates the total experimental uncertainty in the data. Vertical lines drawn on the data points refer to the total uncertainty in the data. Vertical lines drawn on the MC points refer to the statistical uncertainty in the predictions. Horizontal bars indicate the associated bin width. |

png pdf |
Figure 3:
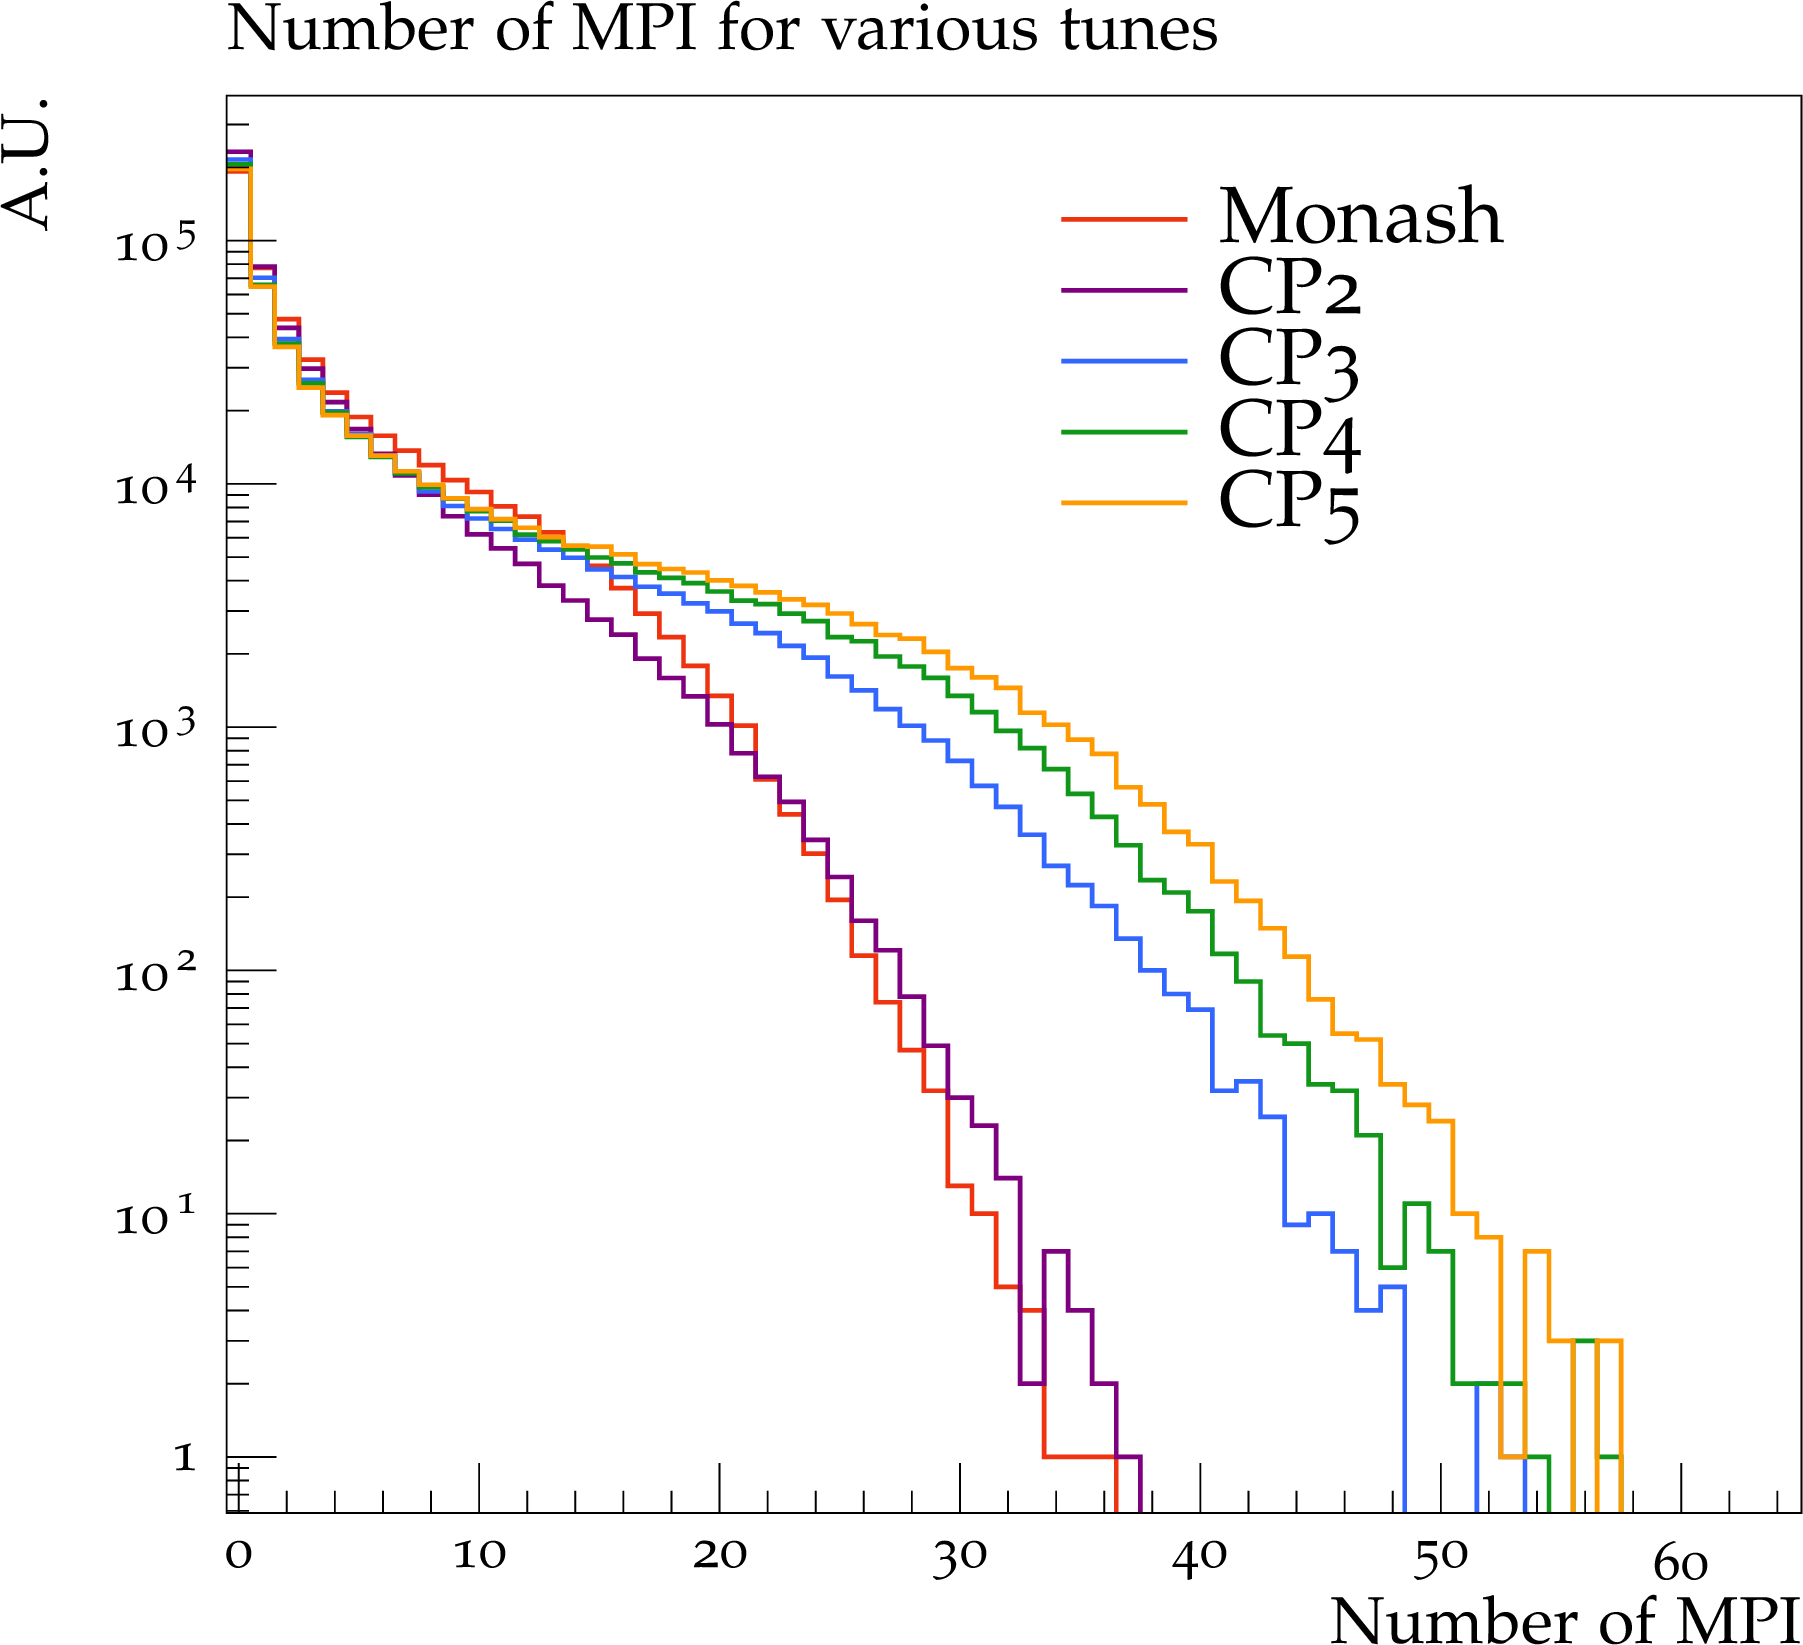
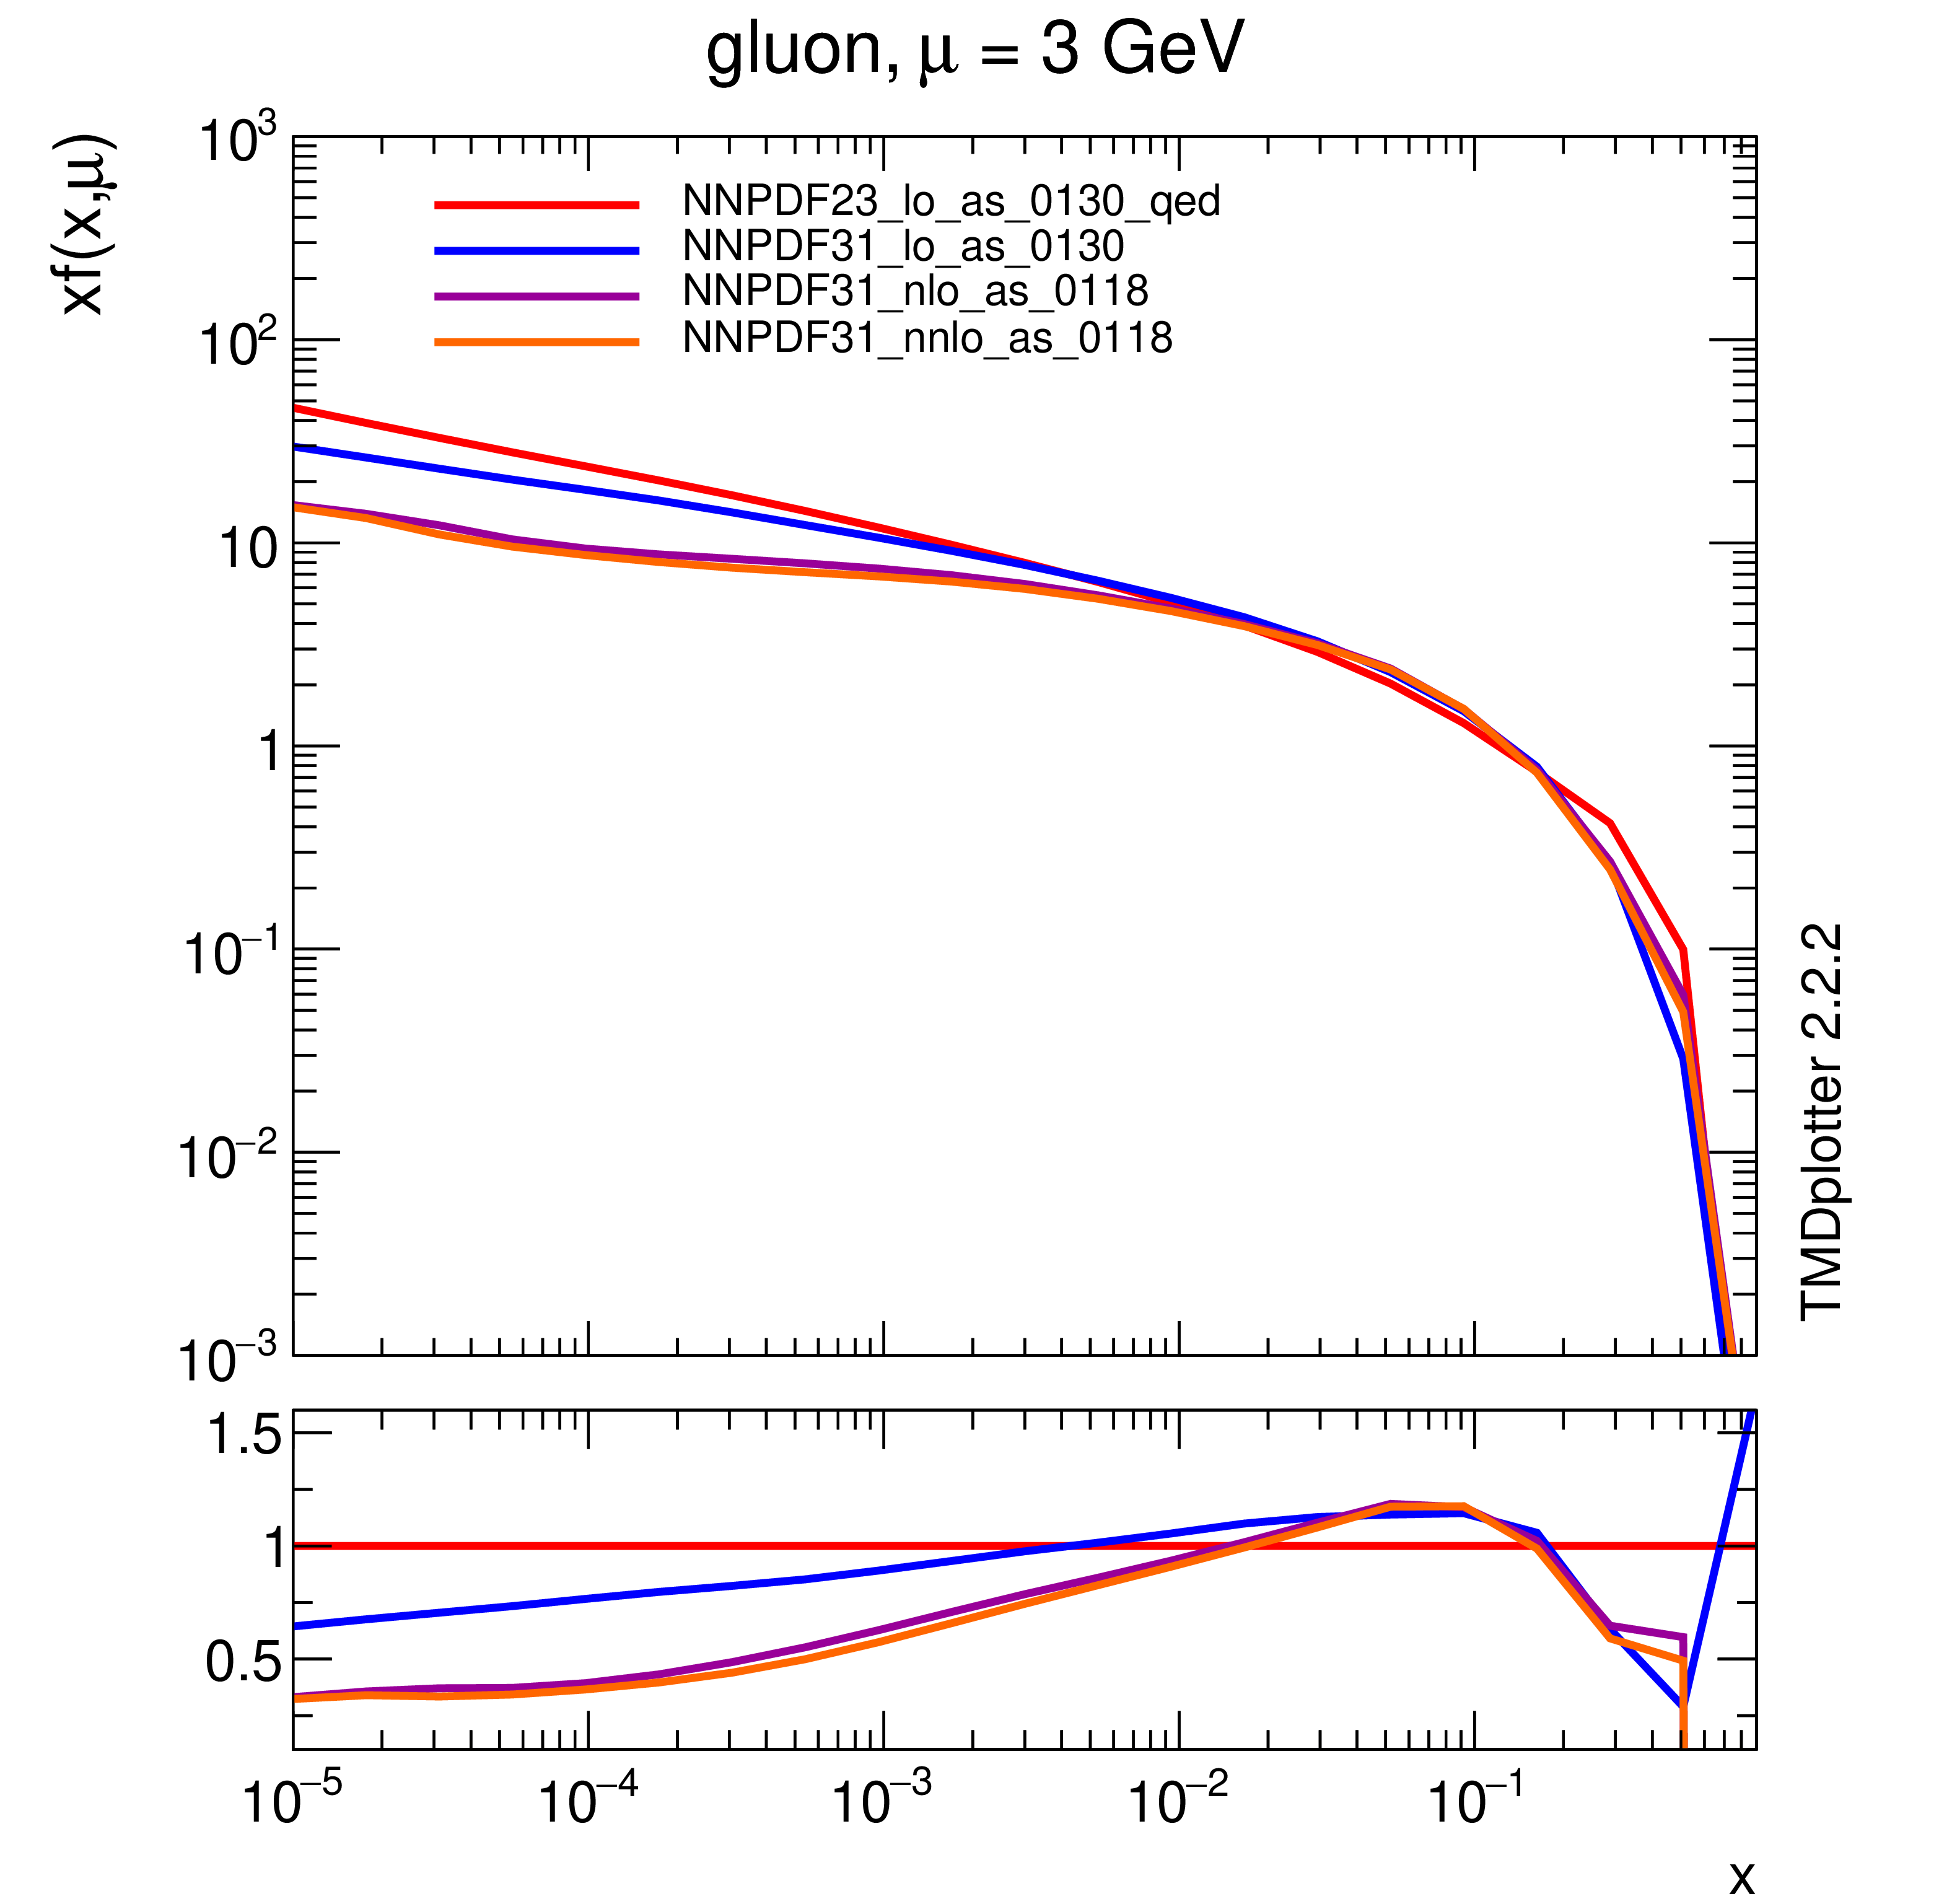
Distribution of number of MPI simulated by the tunes Monash, CP2, CP3, CP4, and CP5 (left). Gluon distribution function at a reference scale of $\mu = $ 3 GeV (right) for the NNPDF2.3LO PDF set and the different versions of the NNPDF3.1 PDF set: LO, NLO, and NNLO. The ratio of NNPDF3.1 gluon distribution functions to the NNPDF2.3LO gluon distribution function are also shown. |
png pdf |
Figure 3-a:
Distribution of number of MPI simulated by the tunes Monash, CP2, CP3, CP4, and CP5 (left). Gluon distribution function at a reference scale of $\mu = $ 3 GeV (right) for the NNPDF2.3LO PDF set and the different versions of the NNPDF3.1 PDF set: LO, NLO, and NNLO. The ratio of NNPDF3.1 gluon distribution functions to the NNPDF2.3LO gluon distribution function are also shown. |
png pdf |
Figure 3-b:
Distribution of number of MPI simulated by the tunes Monash, CP2, CP3, CP4, and CP5 (left). Gluon distribution function at a reference scale of $\mu = $ 3 GeV (right) for the NNPDF2.3LO PDF set and the different versions of the NNPDF3.1 PDF set: LO, NLO, and NNLO. The ratio of NNPDF3.1 gluon distribution functions to the NNPDF2.3LO gluon distribution function are also shown. |

png pdf |
Figure 4:
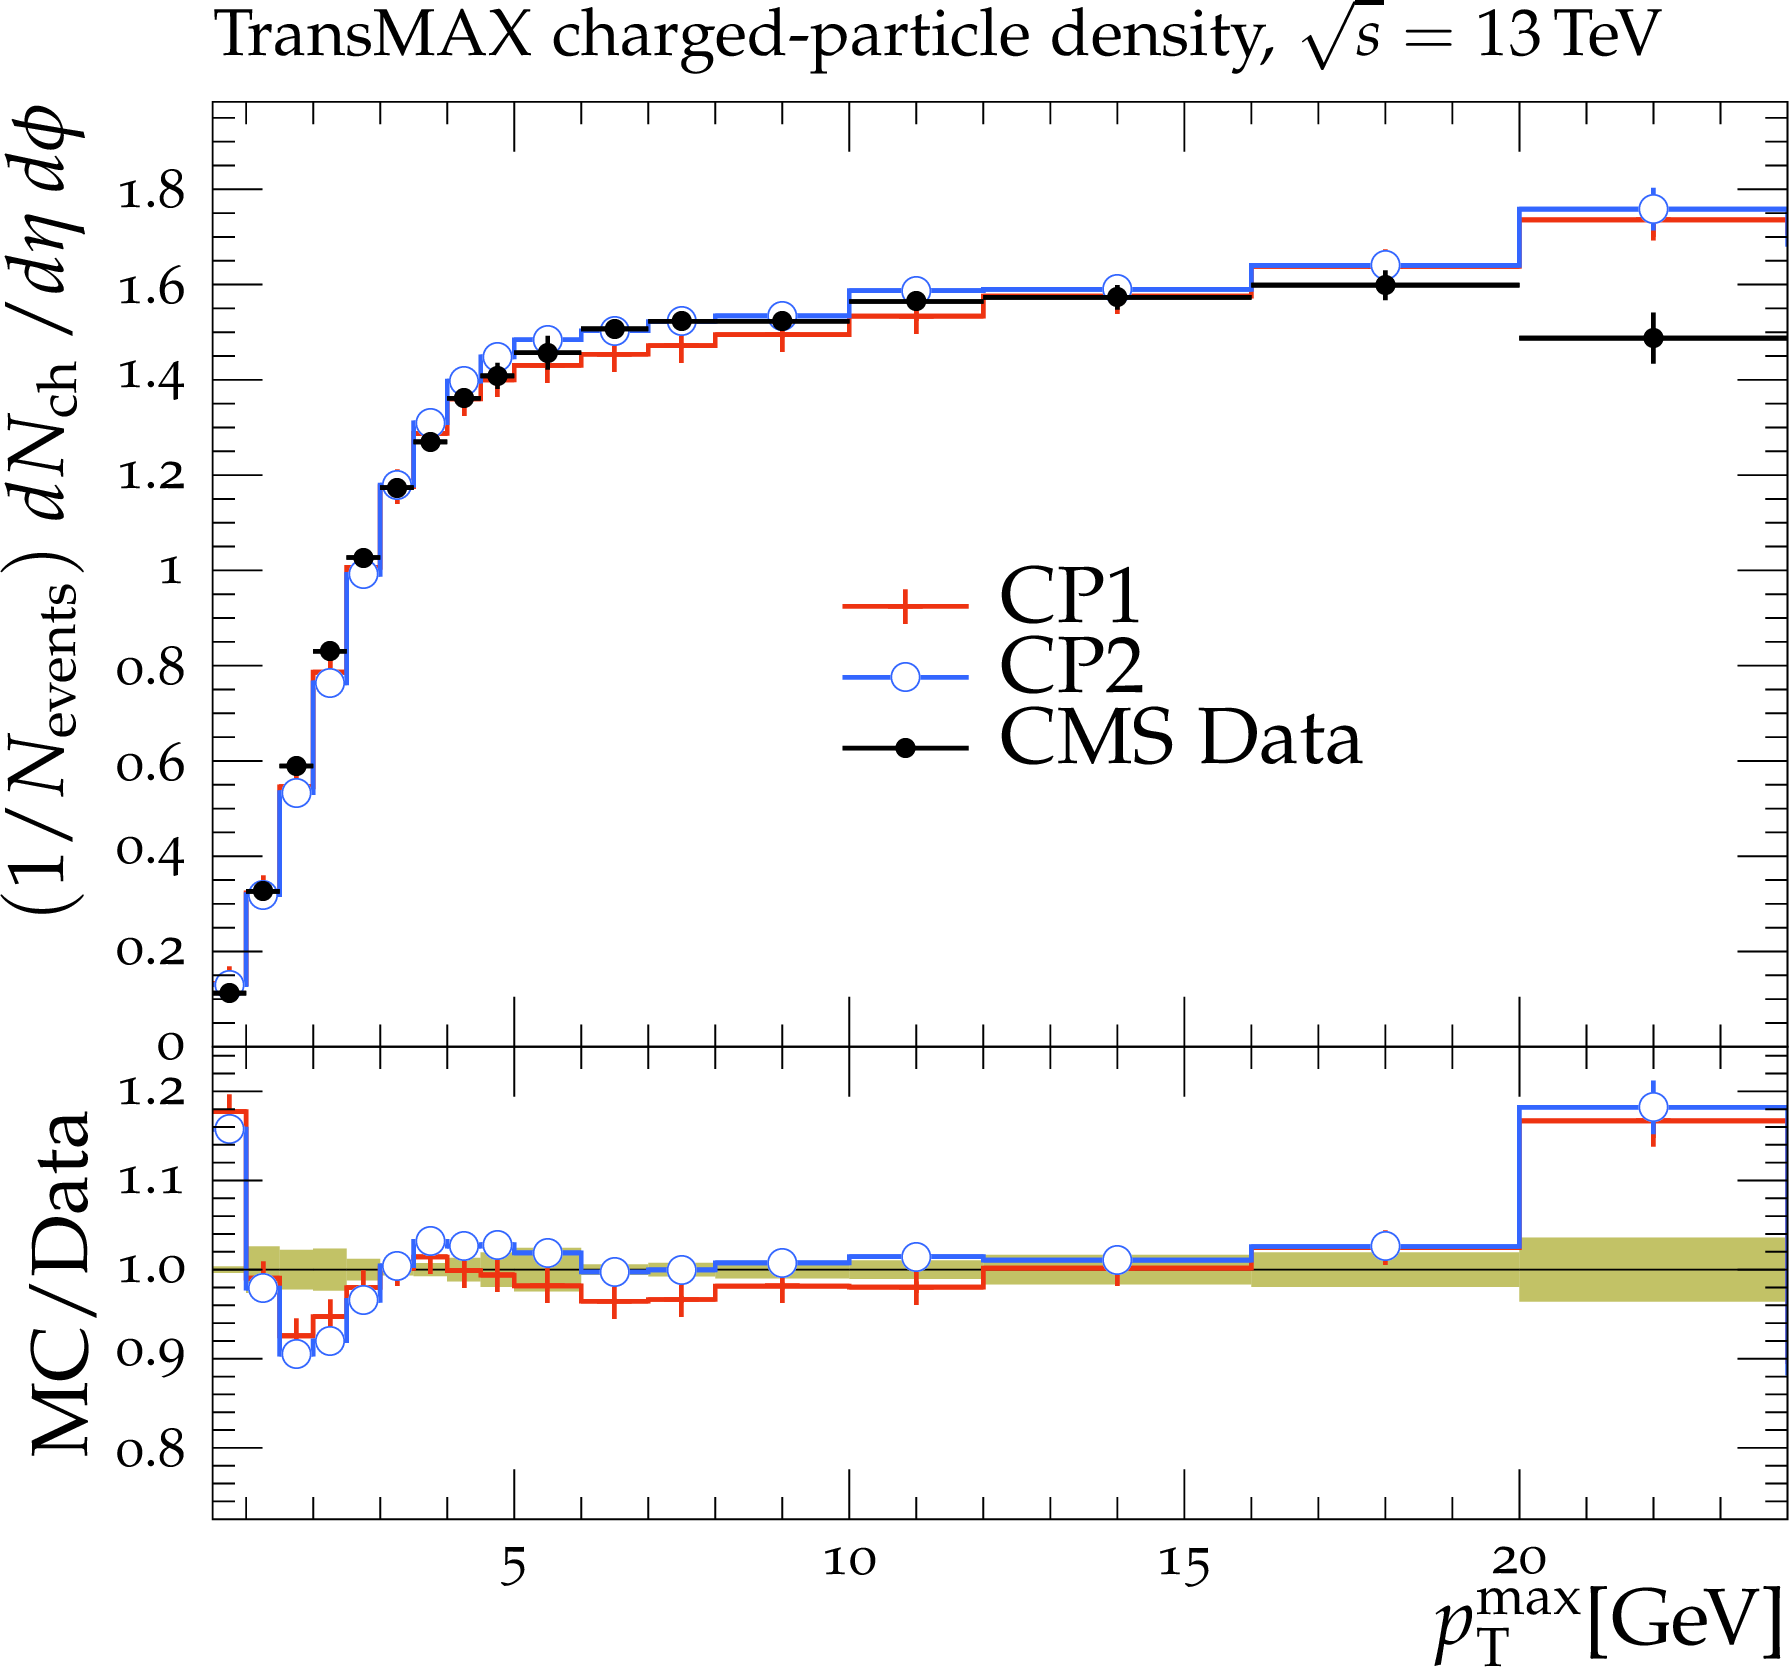
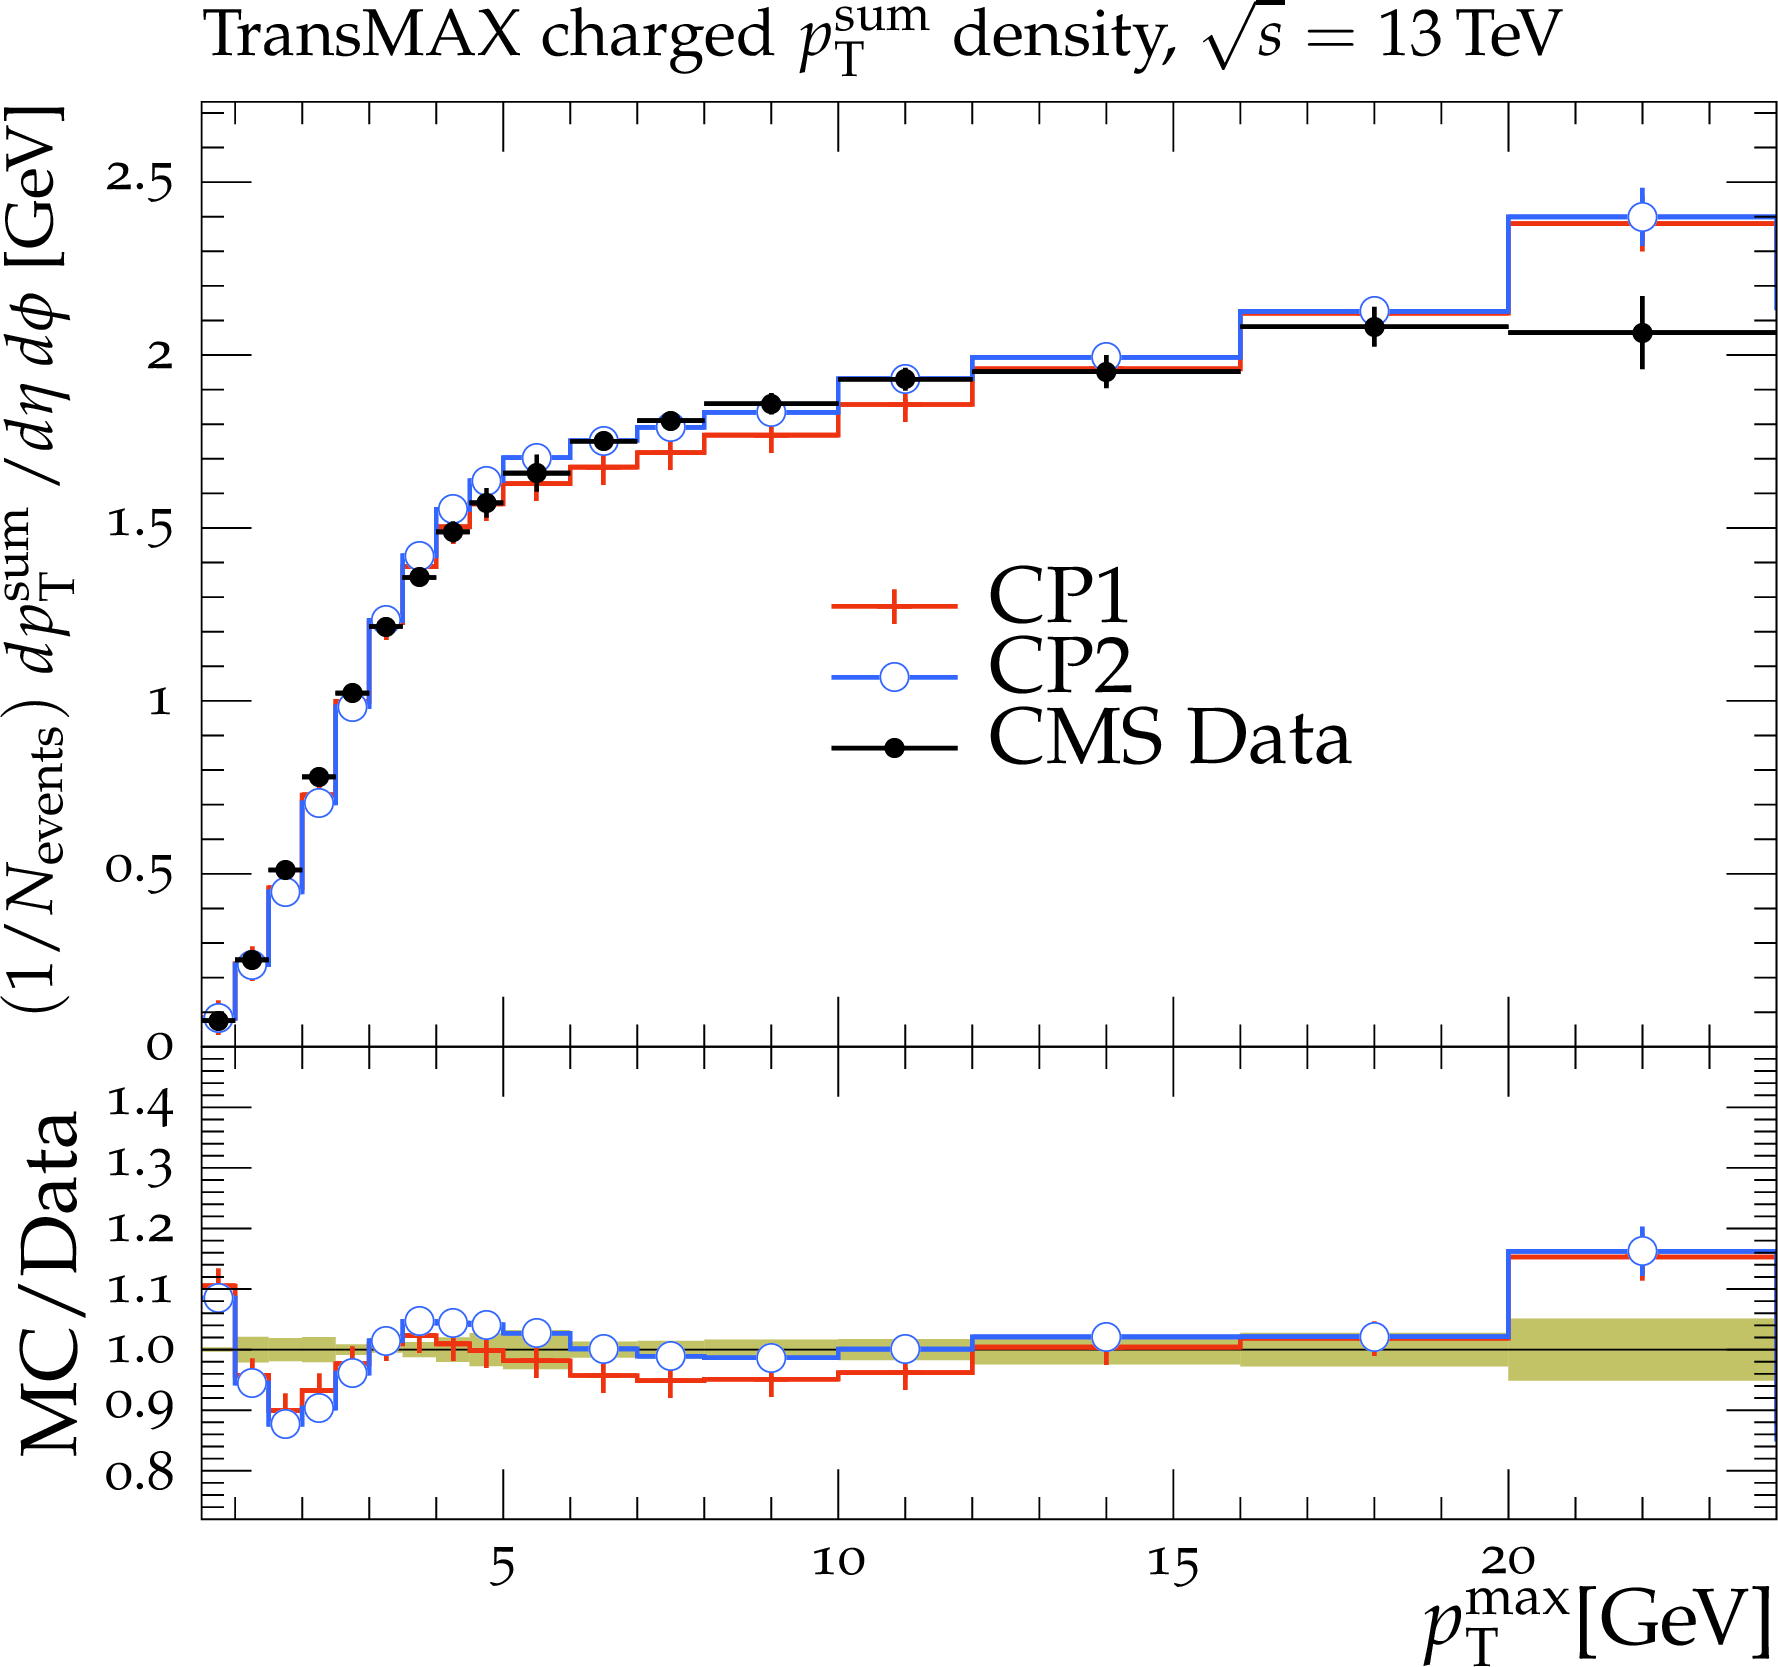
The transMIN (upper left) charged-particle and (upper right) charged ${{p_{\mathrm {T}}} ^\text {sum}}$ densities and the transMAX\ (lower left) charged-particle and (lower right) charged ${{p_{\mathrm {T}}} ^\text {sum}}$ densities, as a function of the transverse momentum of the leading charged particle, $ {{p_{\mathrm {T}}} ^\text {max}}$, from the CMS $\sqrt {s} = $ 13 TeV analysis [16]. Charged hadrons are measured with $ {p_{\mathrm {T}}} > $ 0.5 GeV in $ {| \eta |} < $ 2.0. The transMIN densities are more sensitive to the MPI, whereas the transMAX\ densities are more sensitive to ISR and FSR. The data are compared with the CMS PYTHIA 8 LO-PDF tunes CP1 and CP2. The ratios of the simulations to the data (MC/Data) are also shown, where the shaded band indicates the total experimental uncertainty in the data. Vertical lines drawn on the data points refer to the total uncertainty in the data. Vertical lines drawn on the MC points refer to the statistical uncertainty in the predictions. Horizontal bars indicate the associated bin width. |

png pdf |
Figure 4-a:
The transMIN (upper left) charged-particle and (upper right) charged ${{p_{\mathrm {T}}} ^\text {sum}}$ densities and the transMAX\ (lower left) charged-particle and (lower right) charged ${{p_{\mathrm {T}}} ^\text {sum}}$ densities, as a function of the transverse momentum of the leading charged particle, $ {{p_{\mathrm {T}}} ^\text {max}}$, from the CMS $\sqrt {s} = $ 13 TeV analysis [16]. Charged hadrons are measured with $ {p_{\mathrm {T}}} > $ 0.5 GeV in $ {| \eta |} < $ 2.0. The transMIN densities are more sensitive to the MPI, whereas the transMAX\ densities are more sensitive to ISR and FSR. The data are compared with the CMS PYTHIA 8 LO-PDF tunes CP1 and CP2. The ratios of the simulations to the data (MC/Data) are also shown, where the shaded band indicates the total experimental uncertainty in the data. Vertical lines drawn on the data points refer to the total uncertainty in the data. Vertical lines drawn on the MC points refer to the statistical uncertainty in the predictions. Horizontal bars indicate the associated bin width. |

png pdf |
Figure 4-b:
The transMIN (upper left) charged-particle and (upper right) charged ${{p_{\mathrm {T}}} ^\text {sum}}$ densities and the transMAX\ (lower left) charged-particle and (lower right) charged ${{p_{\mathrm {T}}} ^\text {sum}}$ densities, as a function of the transverse momentum of the leading charged particle, $ {{p_{\mathrm {T}}} ^\text {max}}$, from the CMS $\sqrt {s} = $ 13 TeV analysis [16]. Charged hadrons are measured with $ {p_{\mathrm {T}}} > $ 0.5 GeV in $ {| \eta |} < $ 2.0. The transMIN densities are more sensitive to the MPI, whereas the transMAX\ densities are more sensitive to ISR and FSR. The data are compared with the CMS PYTHIA 8 LO-PDF tunes CP1 and CP2. The ratios of the simulations to the data (MC/Data) are also shown, where the shaded band indicates the total experimental uncertainty in the data. Vertical lines drawn on the data points refer to the total uncertainty in the data. Vertical lines drawn on the MC points refer to the statistical uncertainty in the predictions. Horizontal bars indicate the associated bin width. |
png pdf |
Figure 4-c:
The transMIN (upper left) charged-particle and (upper right) charged ${{p_{\mathrm {T}}} ^\text {sum}}$ densities and the transMAX\ (lower left) charged-particle and (lower right) charged ${{p_{\mathrm {T}}} ^\text {sum}}$ densities, as a function of the transverse momentum of the leading charged particle, $ {{p_{\mathrm {T}}} ^\text {max}}$, from the CMS $\sqrt {s} = $ 13 TeV analysis [16]. Charged hadrons are measured with $ {p_{\mathrm {T}}} > $ 0.5 GeV in $ {| \eta |} < $ 2.0. The transMIN densities are more sensitive to the MPI, whereas the transMAX\ densities are more sensitive to ISR and FSR. The data are compared with the CMS PYTHIA 8 LO-PDF tunes CP1 and CP2. The ratios of the simulations to the data (MC/Data) are also shown, where the shaded band indicates the total experimental uncertainty in the data. Vertical lines drawn on the data points refer to the total uncertainty in the data. Vertical lines drawn on the MC points refer to the statistical uncertainty in the predictions. Horizontal bars indicate the associated bin width. |
png pdf |
Figure 4-d:
The transMIN (upper left) charged-particle and (upper right) charged ${{p_{\mathrm {T}}} ^\text {sum}}$ densities and the transMAX\ (lower left) charged-particle and (lower right) charged ${{p_{\mathrm {T}}} ^\text {sum}}$ densities, as a function of the transverse momentum of the leading charged particle, $ {{p_{\mathrm {T}}} ^\text {max}}$, from the CMS $\sqrt {s} = $ 13 TeV analysis [16]. Charged hadrons are measured with $ {p_{\mathrm {T}}} > $ 0.5 GeV in $ {| \eta |} < $ 2.0. The transMIN densities are more sensitive to the MPI, whereas the transMAX\ densities are more sensitive to ISR and FSR. The data are compared with the CMS PYTHIA 8 LO-PDF tunes CP1 and CP2. The ratios of the simulations to the data (MC/Data) are also shown, where the shaded band indicates the total experimental uncertainty in the data. Vertical lines drawn on the data points refer to the total uncertainty in the data. Vertical lines drawn on the MC points refer to the statistical uncertainty in the predictions. Horizontal bars indicate the associated bin width. |

png pdf |
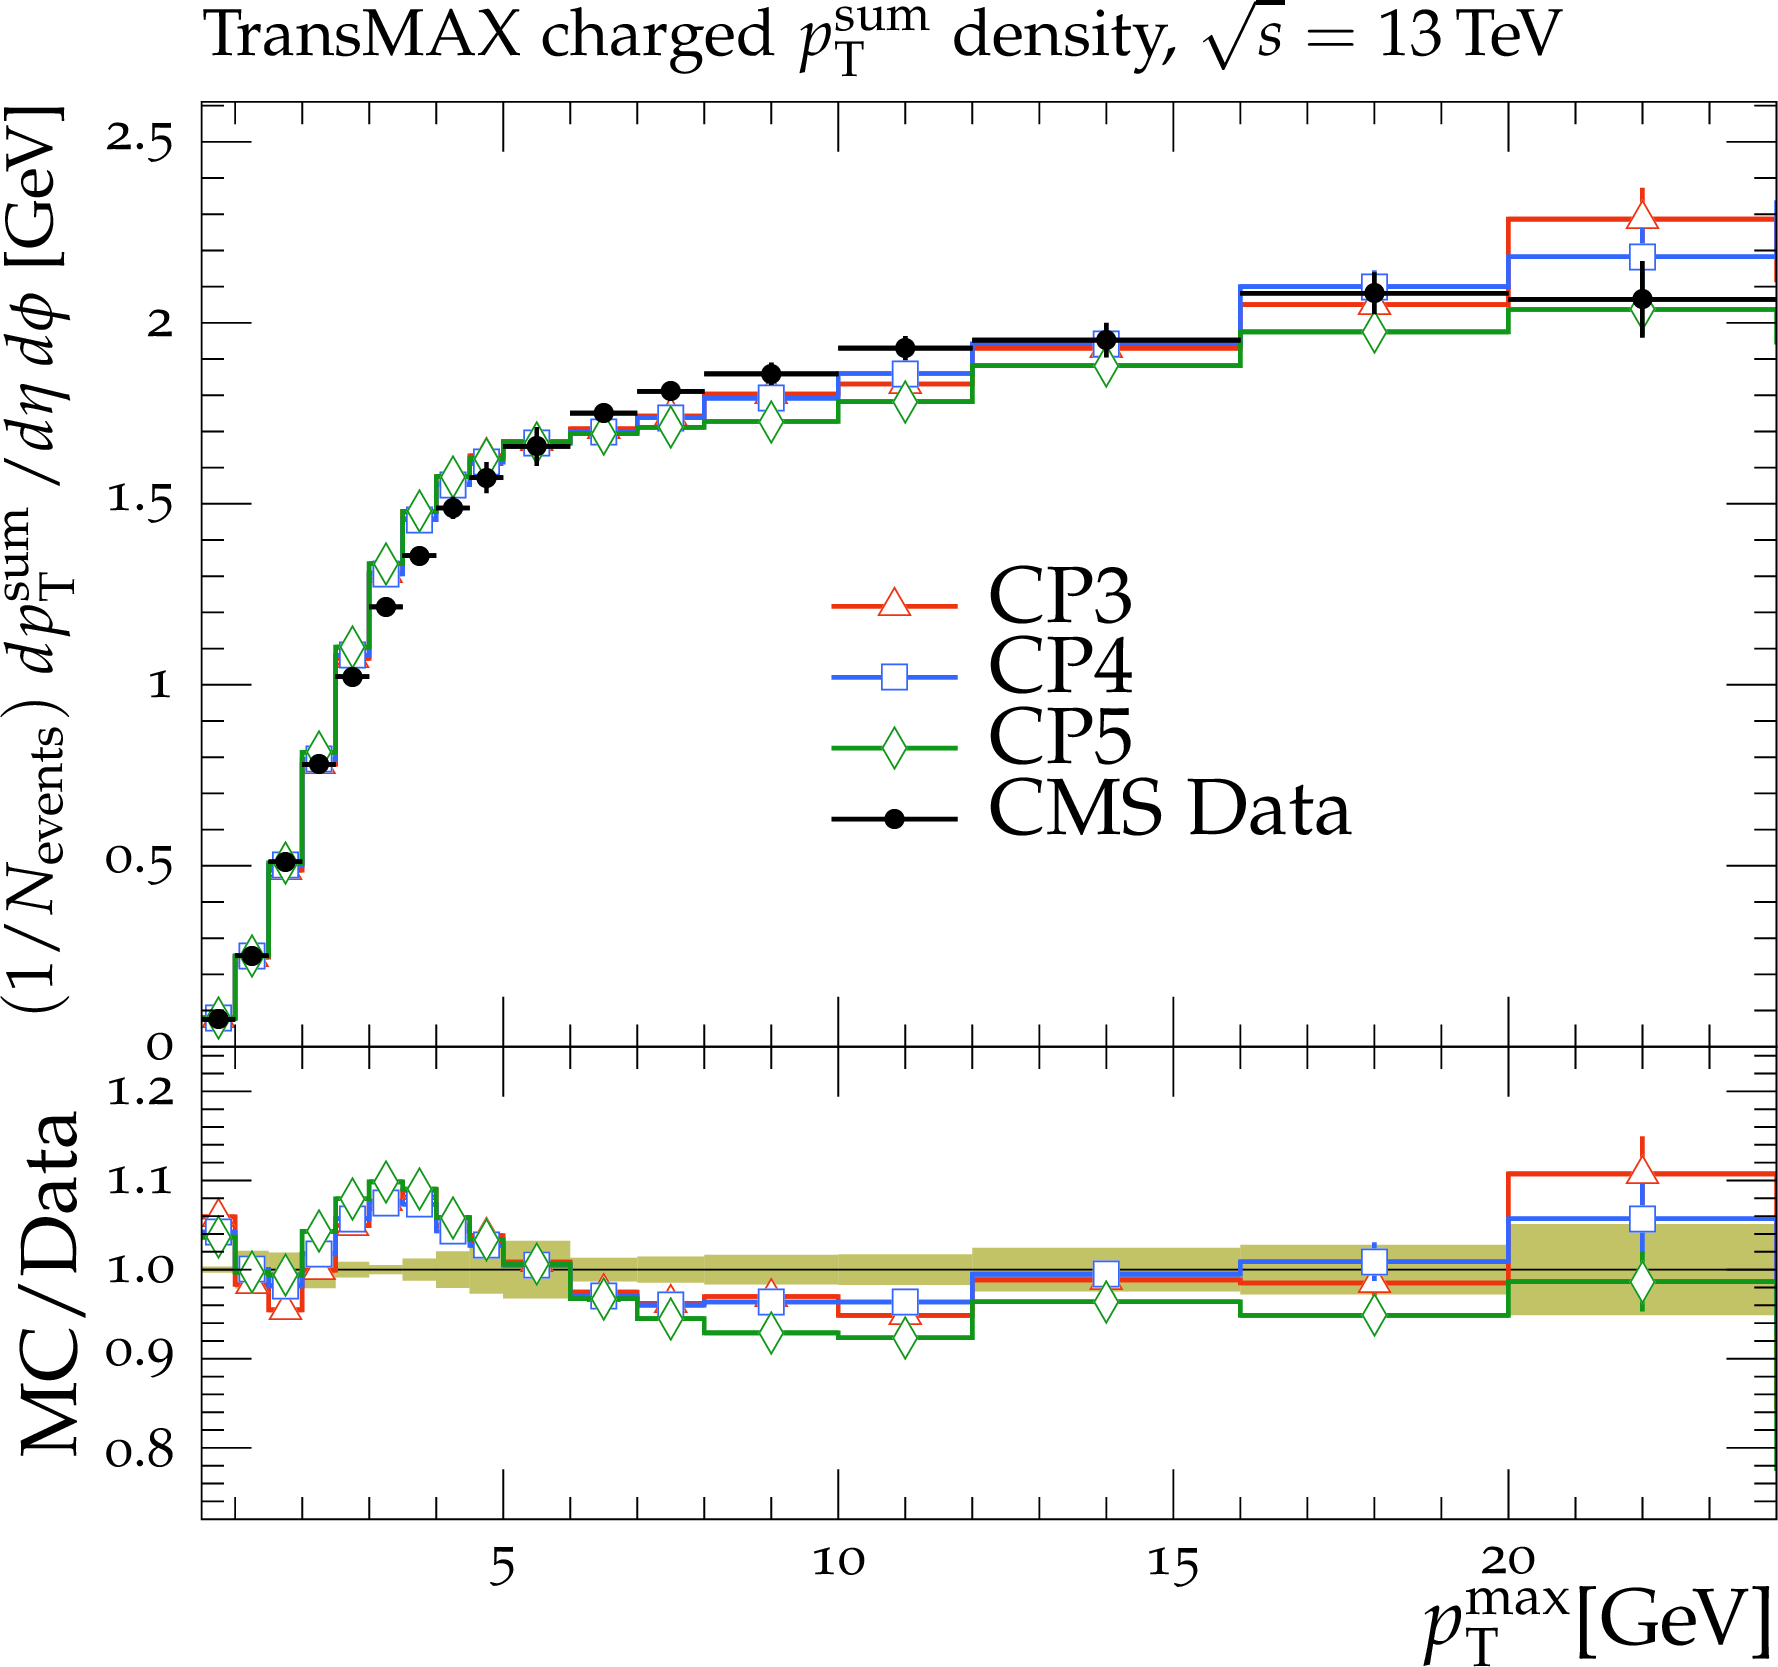
Figure 5:
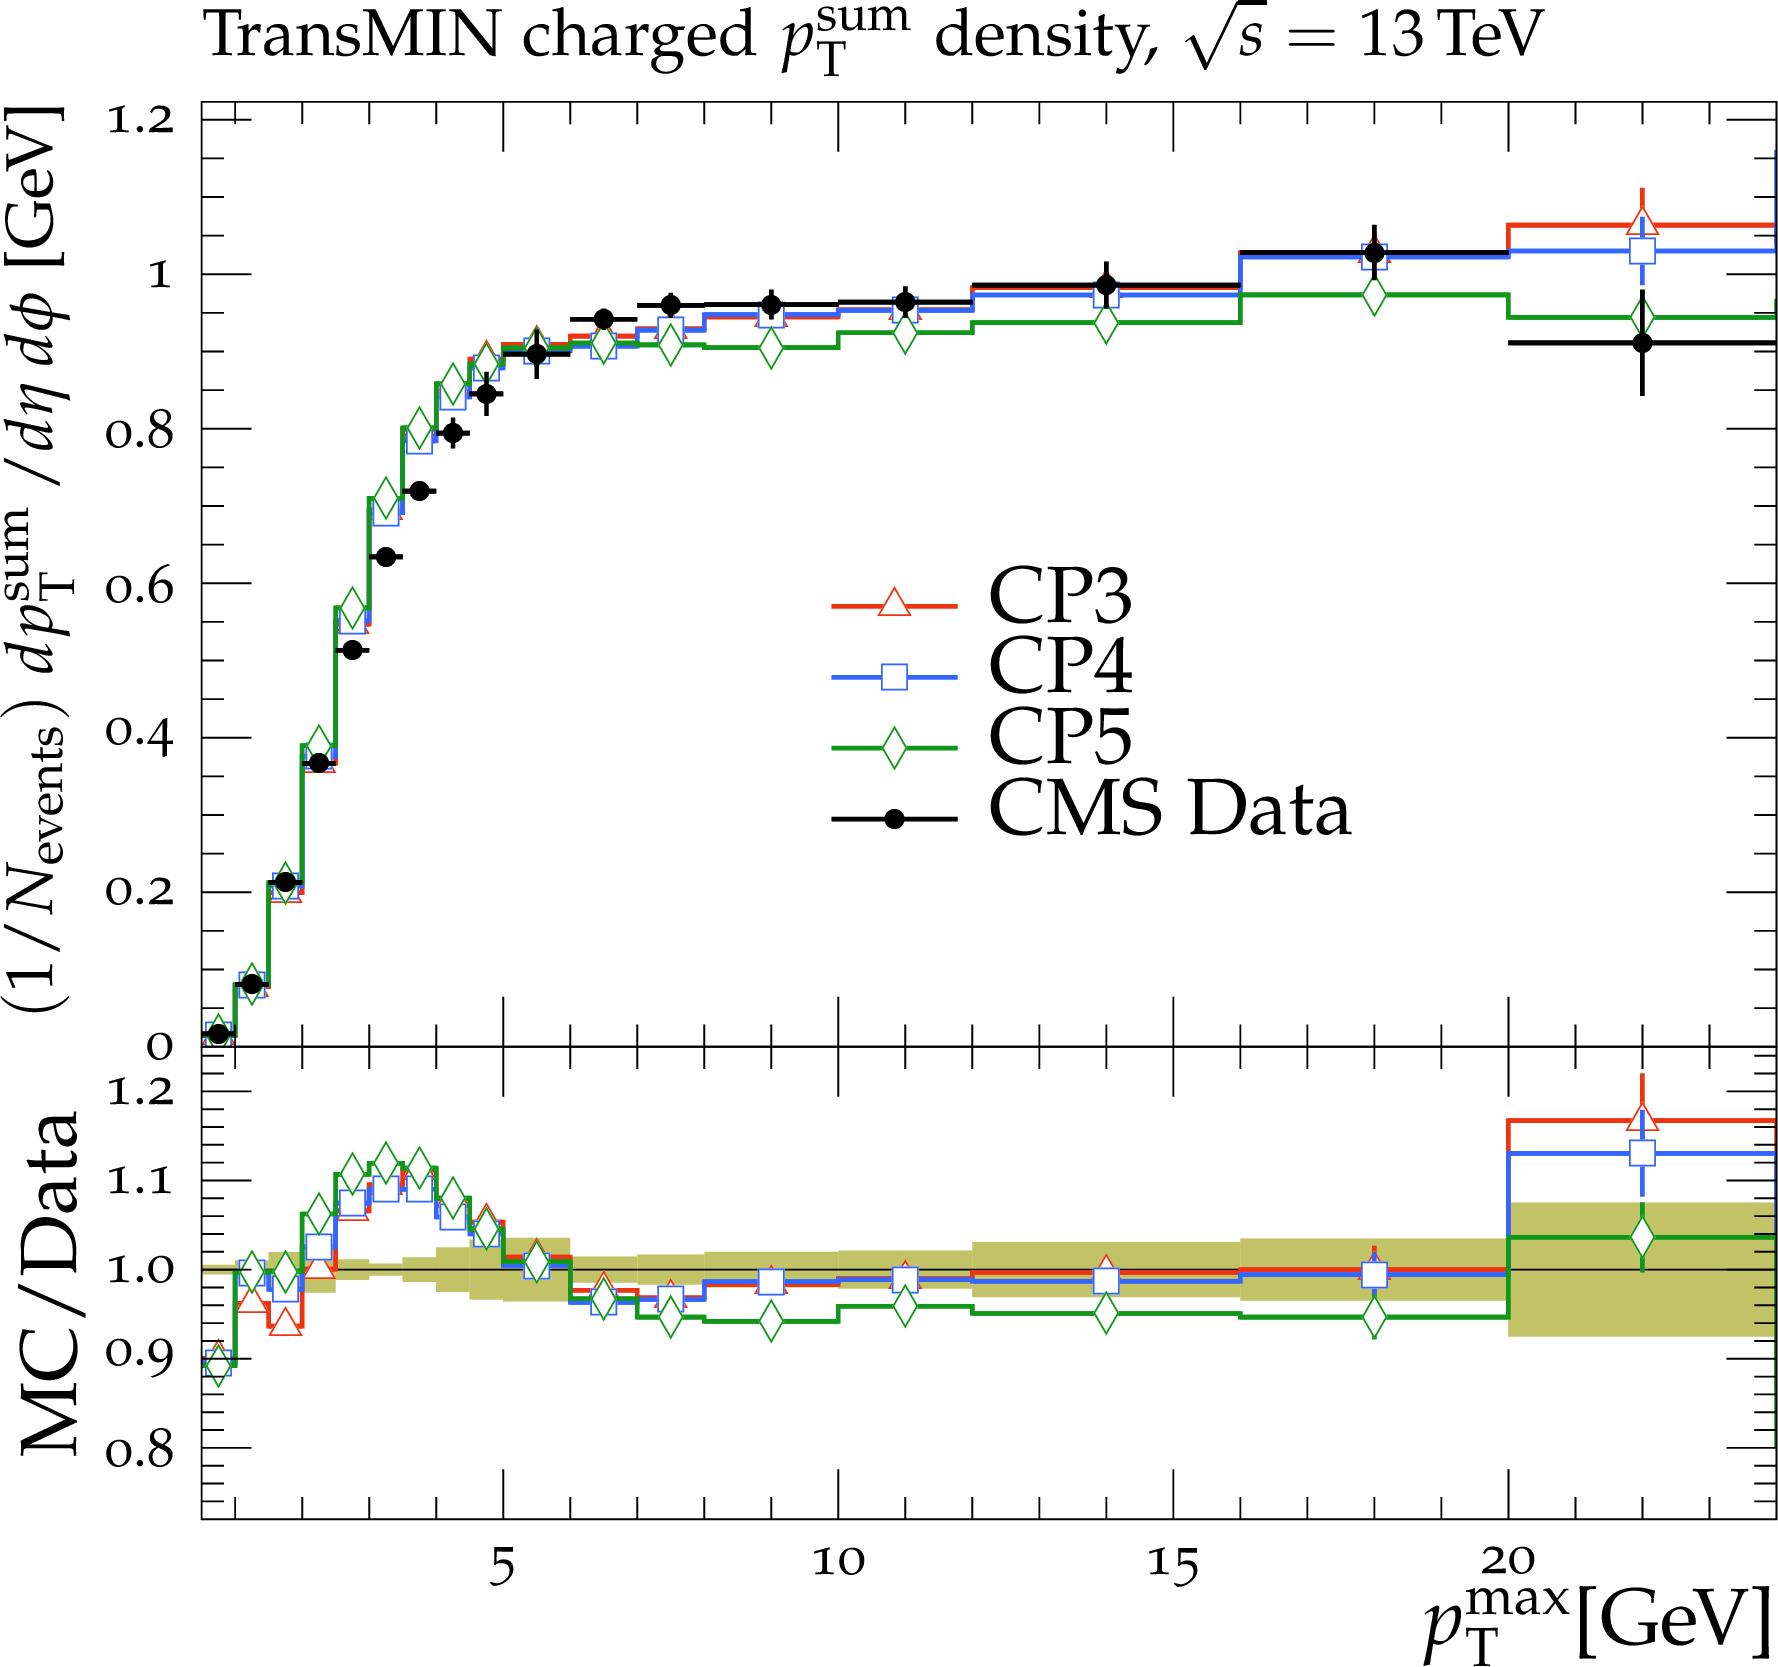
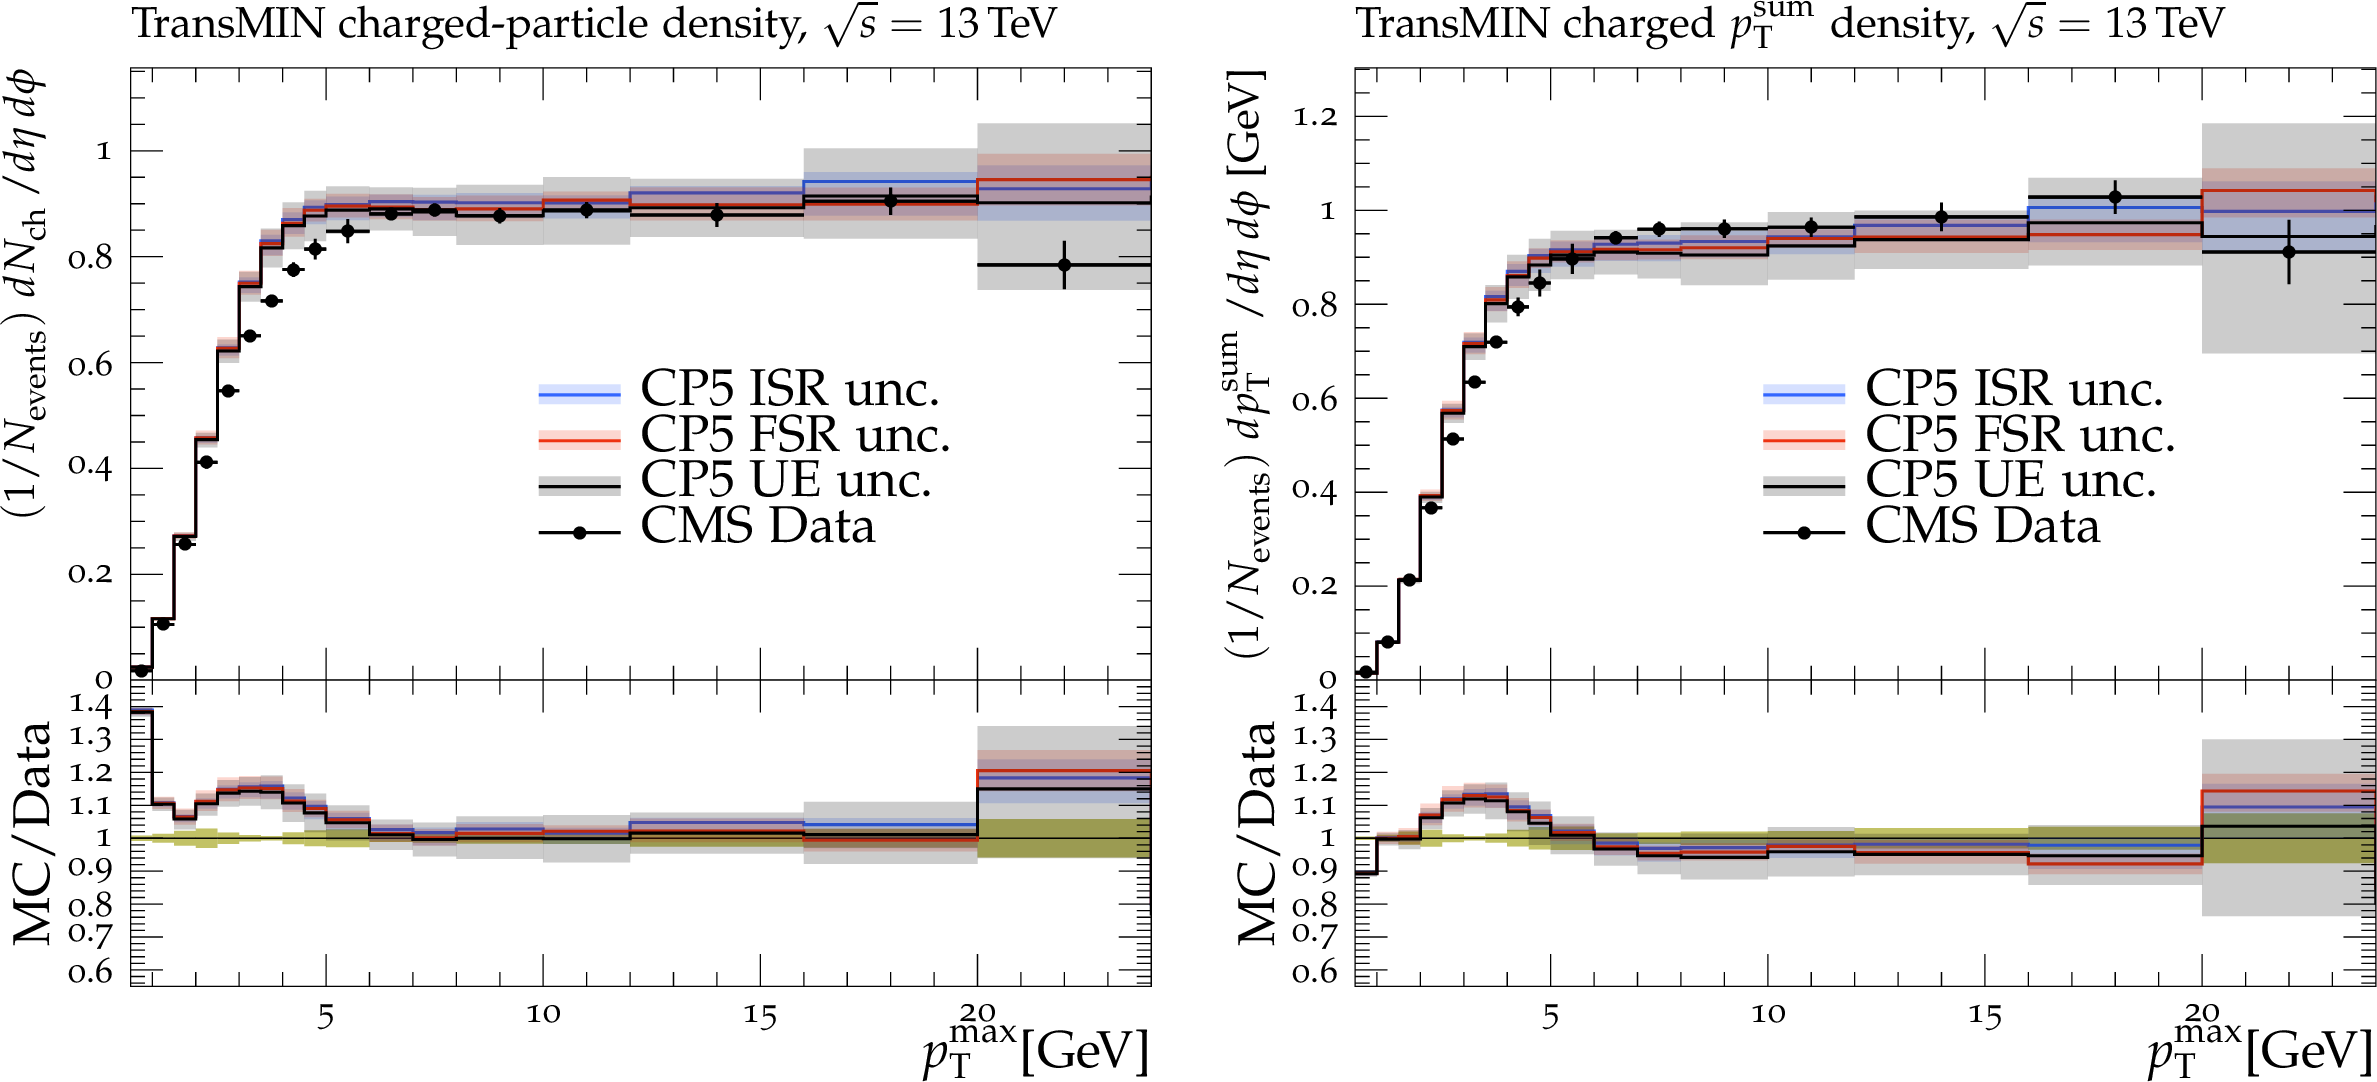
The transMIN (upper left) charged-particle and (upper right) charged ${{p_{\mathrm {T}}} ^\text {sum}}$ densities and the transMAX\ (lower left) charged-particle and (lower right) charged ${{p_{\mathrm {T}}} ^\text {sum}}$ densities, as a function of the transverse momentum of the leading charged particle, $ {{p_{\mathrm {T}}} ^\text {max}}$, from the CMS $\sqrt {s} = $ 13 TeV analysis [16]. Charged hadrons are measured with $ {p_{\mathrm {T}}} > $ 0.5 GeV in $ {| \eta |} < $ 2.0. The data are compared with the CMS PYTHIA 8 (N)NLO-PDF tunes CP3, CP4, and CP5. The ratios of simulations to the data (MC/Data) are also shown, where the shaded band indicates the total experimental uncertainty in the data. Vertical lines drawn on the data points refer to the total uncertainty in the data. Vertical lines drawn on the MC points refer to the statistical uncertainty in the predictions. Horizontal bars indicate the associated bin width. |

png pdf |
Figure 5-a:
The transMIN (upper left) charged-particle and (upper right) charged ${{p_{\mathrm {T}}} ^\text {sum}}$ densities and the transMAX\ (lower left) charged-particle and (lower right) charged ${{p_{\mathrm {T}}} ^\text {sum}}$ densities, as a function of the transverse momentum of the leading charged particle, $ {{p_{\mathrm {T}}} ^\text {max}}$, from the CMS $\sqrt {s} = $ 13 TeV analysis [16]. Charged hadrons are measured with $ {p_{\mathrm {T}}} > $ 0.5 GeV in $ {| \eta |} < $ 2.0. The data are compared with the CMS PYTHIA 8 (N)NLO-PDF tunes CP3, CP4, and CP5. The ratios of simulations to the data (MC/Data) are also shown, where the shaded band indicates the total experimental uncertainty in the data. Vertical lines drawn on the data points refer to the total uncertainty in the data. Vertical lines drawn on the MC points refer to the statistical uncertainty in the predictions. Horizontal bars indicate the associated bin width. |
png pdf |
Figure 5-b:
The transMIN (upper left) charged-particle and (upper right) charged ${{p_{\mathrm {T}}} ^\text {sum}}$ densities and the transMAX\ (lower left) charged-particle and (lower right) charged ${{p_{\mathrm {T}}} ^\text {sum}}$ densities, as a function of the transverse momentum of the leading charged particle, $ {{p_{\mathrm {T}}} ^\text {max}}$, from the CMS $\sqrt {s} = $ 13 TeV analysis [16]. Charged hadrons are measured with $ {p_{\mathrm {T}}} > $ 0.5 GeV in $ {| \eta |} < $ 2.0. The data are compared with the CMS PYTHIA 8 (N)NLO-PDF tunes CP3, CP4, and CP5. The ratios of simulations to the data (MC/Data) are also shown, where the shaded band indicates the total experimental uncertainty in the data. Vertical lines drawn on the data points refer to the total uncertainty in the data. Vertical lines drawn on the MC points refer to the statistical uncertainty in the predictions. Horizontal bars indicate the associated bin width. |

png pdf |
Figure 5-c:
The transMIN (upper left) charged-particle and (upper right) charged ${{p_{\mathrm {T}}} ^\text {sum}}$ densities and the transMAX\ (lower left) charged-particle and (lower right) charged ${{p_{\mathrm {T}}} ^\text {sum}}$ densities, as a function of the transverse momentum of the leading charged particle, $ {{p_{\mathrm {T}}} ^\text {max}}$, from the CMS $\sqrt {s} = $ 13 TeV analysis [16]. Charged hadrons are measured with $ {p_{\mathrm {T}}} > $ 0.5 GeV in $ {| \eta |} < $ 2.0. The data are compared with the CMS PYTHIA 8 (N)NLO-PDF tunes CP3, CP4, and CP5. The ratios of simulations to the data (MC/Data) are also shown, where the shaded band indicates the total experimental uncertainty in the data. Vertical lines drawn on the data points refer to the total uncertainty in the data. Vertical lines drawn on the MC points refer to the statistical uncertainty in the predictions. Horizontal bars indicate the associated bin width. |
png pdf |
Figure 5-d:
The transMIN (upper left) charged-particle and (upper right) charged ${{p_{\mathrm {T}}} ^\text {sum}}$ densities and the transMAX\ (lower left) charged-particle and (lower right) charged ${{p_{\mathrm {T}}} ^\text {sum}}$ densities, as a function of the transverse momentum of the leading charged particle, $ {{p_{\mathrm {T}}} ^\text {max}}$, from the CMS $\sqrt {s} = $ 13 TeV analysis [16]. Charged hadrons are measured with $ {p_{\mathrm {T}}} > $ 0.5 GeV in $ {| \eta |} < $ 2.0. The data are compared with the CMS PYTHIA 8 (N)NLO-PDF tunes CP3, CP4, and CP5. The ratios of simulations to the data (MC/Data) are also shown, where the shaded band indicates the total experimental uncertainty in the data. Vertical lines drawn on the data points refer to the total uncertainty in the data. Vertical lines drawn on the MC points refer to the statistical uncertainty in the predictions. Horizontal bars indicate the associated bin width. |
png pdf |
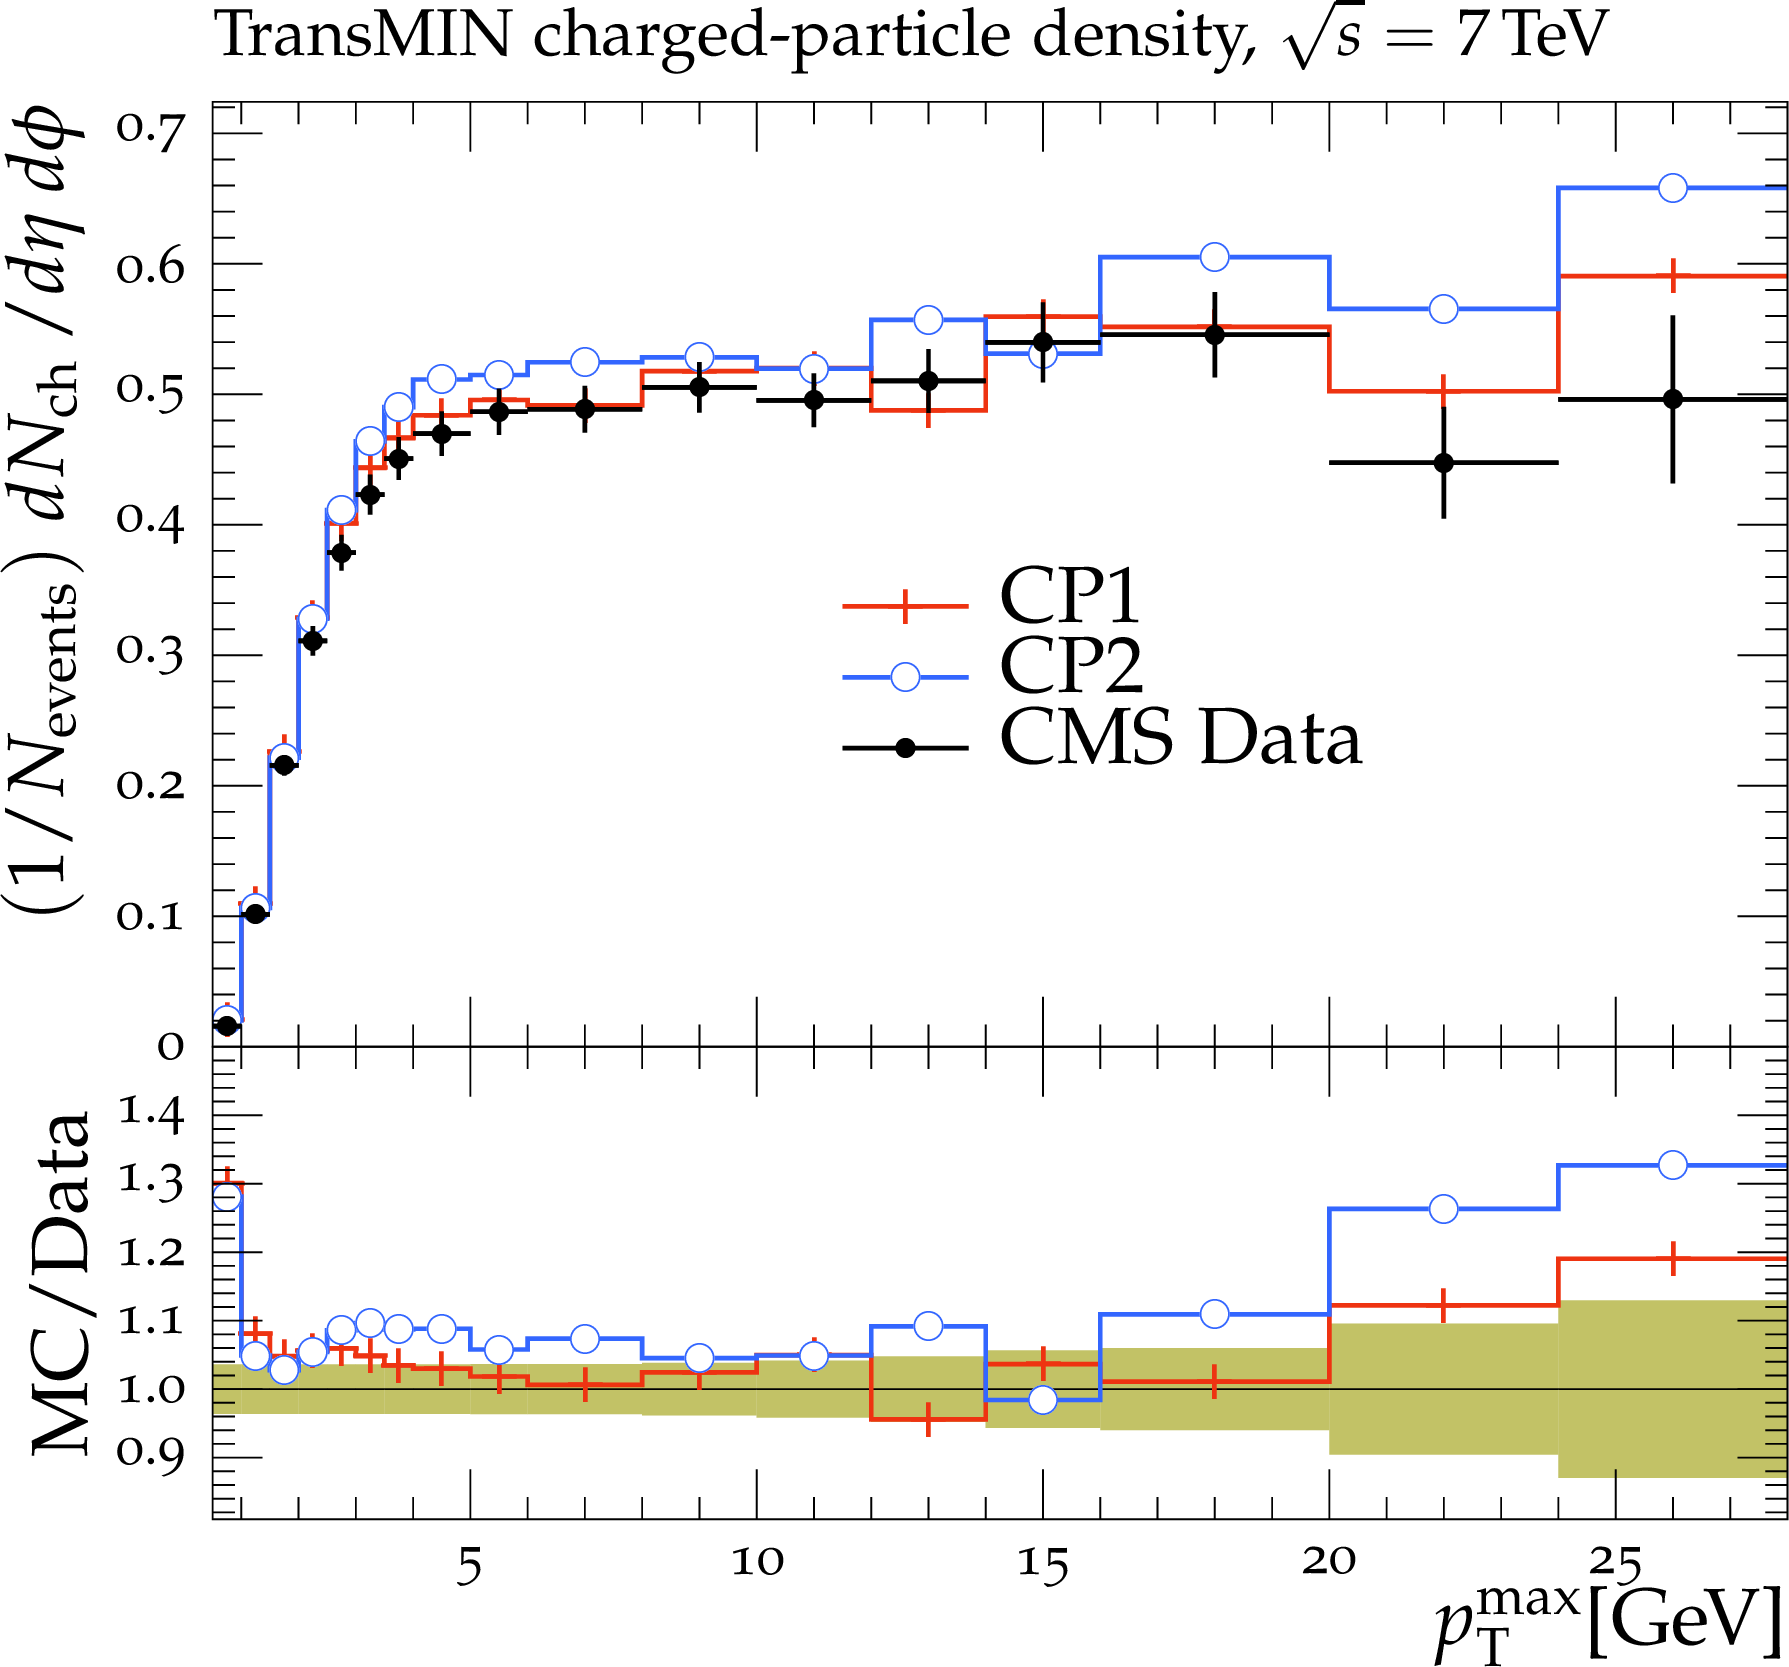
Figure 6:
The transMIN (upper left) charged-particle and (upper right) charged ${{p_{\mathrm {T}}} ^\text {sum}}$ densities and the transMAX\ (lower left) charged-particle and (lower right) charged ${{p_{\mathrm {T}}} ^\text {sum}}$ densities, as a function of the transverse momentum of the leading charged particle, $ {{p_{\mathrm {T}}} ^\text {max}}$, from the CMS $\sqrt {s} = $ 7 TeV analysis [10]. Charged hadrons are measured with $ {p_{\mathrm {T}}} > $ 0.5 GeV in $ {| \eta |} < $ 0.8. The data are compared with the CMS PYTHIA 8 LO-PDF tunes CP1 and CP2. The ratios of simulations to the data (MC/Data) are also shown, where the shaded band indicates the total experimental uncertainty in the data. Vertical lines drawn on the data points refer to the total uncertainty in the data. Vertical lines drawn on the MC points refer to the statistical uncertainty in the predictions. Horizontal bars indicate the associated bin width. |
png pdf |
Figure 6-a:
The transMIN (upper left) charged-particle and (upper right) charged ${{p_{\mathrm {T}}} ^\text {sum}}$ densities and the transMAX\ (lower left) charged-particle and (lower right) charged ${{p_{\mathrm {T}}} ^\text {sum}}$ densities, as a function of the transverse momentum of the leading charged particle, $ {{p_{\mathrm {T}}} ^\text {max}}$, from the CMS $\sqrt {s} = $ 7 TeV analysis [10]. Charged hadrons are measured with $ {p_{\mathrm {T}}} > $ 0.5 GeV in $ {| \eta |} < $ 0.8. The data are compared with the CMS PYTHIA 8 LO-PDF tunes CP1 and CP2. The ratios of simulations to the data (MC/Data) are also shown, where the shaded band indicates the total experimental uncertainty in the data. Vertical lines drawn on the data points refer to the total uncertainty in the data. Vertical lines drawn on the MC points refer to the statistical uncertainty in the predictions. Horizontal bars indicate the associated bin width. |

png pdf |
Figure 6-b:
The transMIN (upper left) charged-particle and (upper right) charged ${{p_{\mathrm {T}}} ^\text {sum}}$ densities and the transMAX\ (lower left) charged-particle and (lower right) charged ${{p_{\mathrm {T}}} ^\text {sum}}$ densities, as a function of the transverse momentum of the leading charged particle, $ {{p_{\mathrm {T}}} ^\text {max}}$, from the CMS $\sqrt {s} = $ 7 TeV analysis [10]. Charged hadrons are measured with $ {p_{\mathrm {T}}} > $ 0.5 GeV in $ {| \eta |} < $ 0.8. The data are compared with the CMS PYTHIA 8 LO-PDF tunes CP1 and CP2. The ratios of simulations to the data (MC/Data) are also shown, where the shaded band indicates the total experimental uncertainty in the data. Vertical lines drawn on the data points refer to the total uncertainty in the data. Vertical lines drawn on the MC points refer to the statistical uncertainty in the predictions. Horizontal bars indicate the associated bin width. |

png pdf |
Figure 6-c:
The transMIN (upper left) charged-particle and (upper right) charged ${{p_{\mathrm {T}}} ^\text {sum}}$ densities and the transMAX\ (lower left) charged-particle and (lower right) charged ${{p_{\mathrm {T}}} ^\text {sum}}$ densities, as a function of the transverse momentum of the leading charged particle, $ {{p_{\mathrm {T}}} ^\text {max}}$, from the CMS $\sqrt {s} = $ 7 TeV analysis [10]. Charged hadrons are measured with $ {p_{\mathrm {T}}} > $ 0.5 GeV in $ {| \eta |} < $ 0.8. The data are compared with the CMS PYTHIA 8 LO-PDF tunes CP1 and CP2. The ratios of simulations to the data (MC/Data) are also shown, where the shaded band indicates the total experimental uncertainty in the data. Vertical lines drawn on the data points refer to the total uncertainty in the data. Vertical lines drawn on the MC points refer to the statistical uncertainty in the predictions. Horizontal bars indicate the associated bin width. |

png pdf |
Figure 6-d:
The transMIN (upper left) charged-particle and (upper right) charged ${{p_{\mathrm {T}}} ^\text {sum}}$ densities and the transMAX\ (lower left) charged-particle and (lower right) charged ${{p_{\mathrm {T}}} ^\text {sum}}$ densities, as a function of the transverse momentum of the leading charged particle, $ {{p_{\mathrm {T}}} ^\text {max}}$, from the CMS $\sqrt {s} = $ 7 TeV analysis [10]. Charged hadrons are measured with $ {p_{\mathrm {T}}} > $ 0.5 GeV in $ {| \eta |} < $ 0.8. The data are compared with the CMS PYTHIA 8 LO-PDF tunes CP1 and CP2. The ratios of simulations to the data (MC/Data) are also shown, where the shaded band indicates the total experimental uncertainty in the data. Vertical lines drawn on the data points refer to the total uncertainty in the data. Vertical lines drawn on the MC points refer to the statistical uncertainty in the predictions. Horizontal bars indicate the associated bin width. |

png pdf |
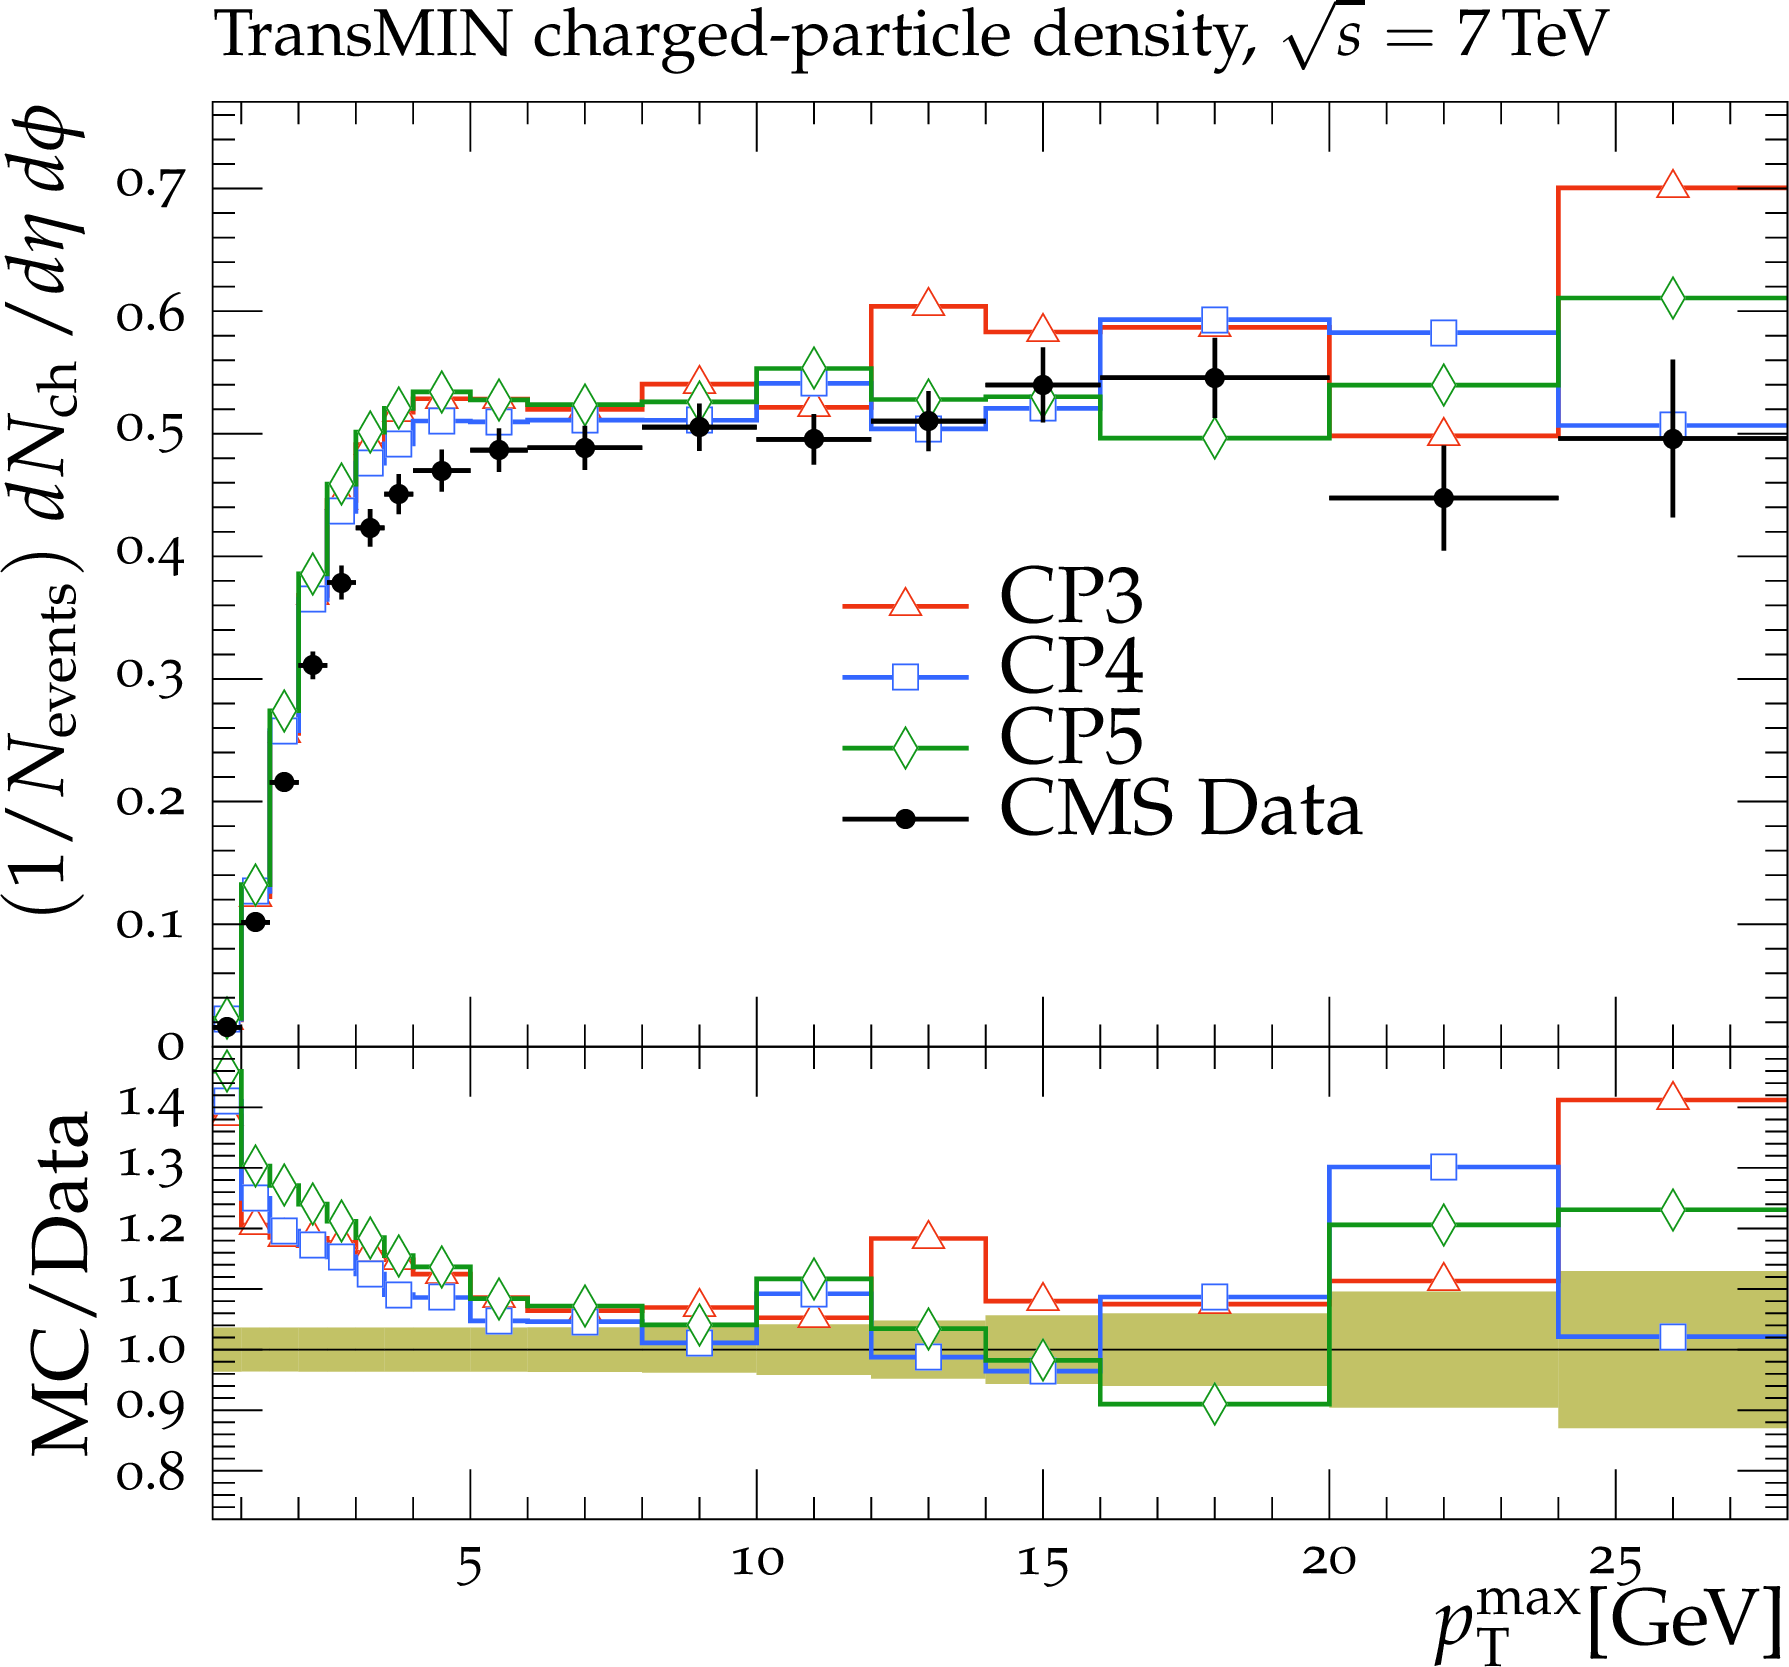
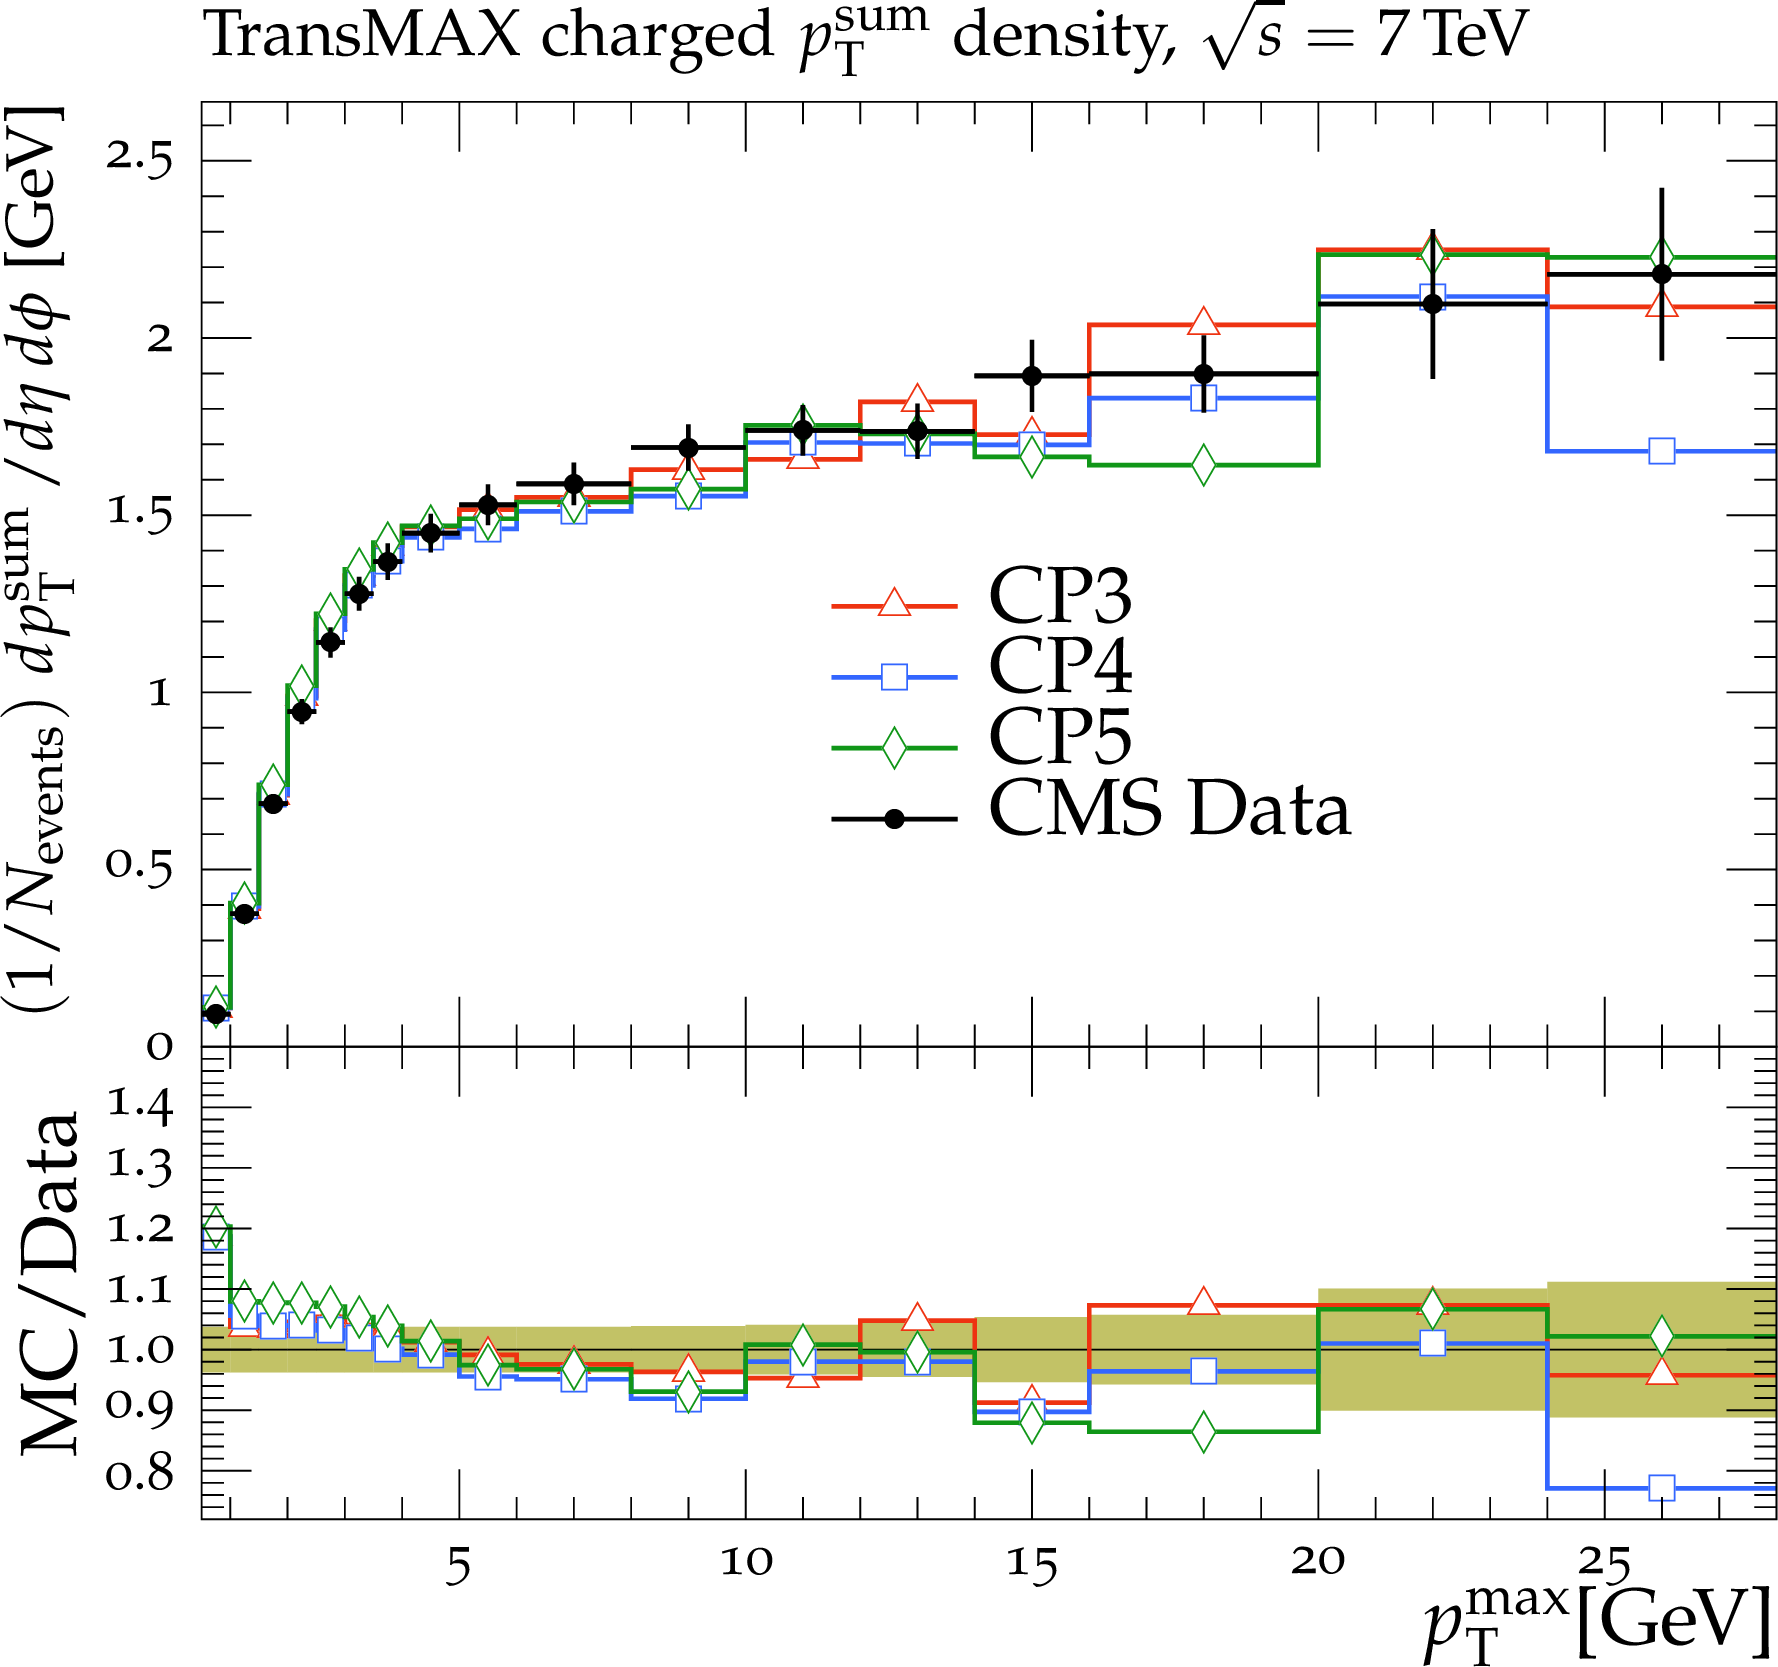
Figure 7:
The transMIN (upper left) charged-particle and (upper right) charged ${{p_{\mathrm {T}}} ^\text {sum}}$ densities and the transMAX\ (lower left) charged-particle and (lower right) charged ${{p_{\mathrm {T}}} ^\text {sum}}$ densities, as a function of the transverse momentum of the leading charged particle, $ {{p_{\mathrm {T}}} ^\text {max}}$, from the CMS $\sqrt {s} = $ 7 TeV analysis [10]. Charged hadrons are measured with $ {p_{\mathrm {T}}} > $ 0.5 GeV in $ {| \eta |} < $ 0.8. The data are compared with the CMS PYTHIA 8 (N)NLO-PDF tunes CP3, CP4, and CP5. The ratios of simulations to the data (MC/Data) are also shown, where the shaded band indicates the total experimental uncertainty in the data. Vertical lines drawn on the data points refer to the total uncertainty in the data. Vertical lines drawn on the MC points refer to the statistical uncertainty in the predictions. Horizontal bars indicate the associated bin width. |
png pdf |
Figure 7-a:
The transMIN (upper left) charged-particle and (upper right) charged ${{p_{\mathrm {T}}} ^\text {sum}}$ densities and the transMAX\ (lower left) charged-particle and (lower right) charged ${{p_{\mathrm {T}}} ^\text {sum}}$ densities, as a function of the transverse momentum of the leading charged particle, $ {{p_{\mathrm {T}}} ^\text {max}}$, from the CMS $\sqrt {s} = $ 7 TeV analysis [10]. Charged hadrons are measured with $ {p_{\mathrm {T}}} > $ 0.5 GeV in $ {| \eta |} < $ 0.8. The data are compared with the CMS PYTHIA 8 (N)NLO-PDF tunes CP3, CP4, and CP5. The ratios of simulations to the data (MC/Data) are also shown, where the shaded band indicates the total experimental uncertainty in the data. Vertical lines drawn on the data points refer to the total uncertainty in the data. Vertical lines drawn on the MC points refer to the statistical uncertainty in the predictions. Horizontal bars indicate the associated bin width. |

png pdf |
Figure 7-b:
The transMIN (upper left) charged-particle and (upper right) charged ${{p_{\mathrm {T}}} ^\text {sum}}$ densities and the transMAX\ (lower left) charged-particle and (lower right) charged ${{p_{\mathrm {T}}} ^\text {sum}}$ densities, as a function of the transverse momentum of the leading charged particle, $ {{p_{\mathrm {T}}} ^\text {max}}$, from the CMS $\sqrt {s} = $ 7 TeV analysis [10]. Charged hadrons are measured with $ {p_{\mathrm {T}}} > $ 0.5 GeV in $ {| \eta |} < $ 0.8. The data are compared with the CMS PYTHIA 8 (N)NLO-PDF tunes CP3, CP4, and CP5. The ratios of simulations to the data (MC/Data) are also shown, where the shaded band indicates the total experimental uncertainty in the data. Vertical lines drawn on the data points refer to the total uncertainty in the data. Vertical lines drawn on the MC points refer to the statistical uncertainty in the predictions. Horizontal bars indicate the associated bin width. |

png pdf |
Figure 7-c:
The transMIN (upper left) charged-particle and (upper right) charged ${{p_{\mathrm {T}}} ^\text {sum}}$ densities and the transMAX\ (lower left) charged-particle and (lower right) charged ${{p_{\mathrm {T}}} ^\text {sum}}$ densities, as a function of the transverse momentum of the leading charged particle, $ {{p_{\mathrm {T}}} ^\text {max}}$, from the CMS $\sqrt {s} = $ 7 TeV analysis [10]. Charged hadrons are measured with $ {p_{\mathrm {T}}} > $ 0.5 GeV in $ {| \eta |} < $ 0.8. The data are compared with the CMS PYTHIA 8 (N)NLO-PDF tunes CP3, CP4, and CP5. The ratios of simulations to the data (MC/Data) are also shown, where the shaded band indicates the total experimental uncertainty in the data. Vertical lines drawn on the data points refer to the total uncertainty in the data. Vertical lines drawn on the MC points refer to the statistical uncertainty in the predictions. Horizontal bars indicate the associated bin width. |
png pdf |
Figure 7-d:
The transMIN (upper left) charged-particle and (upper right) charged ${{p_{\mathrm {T}}} ^\text {sum}}$ densities and the transMAX\ (lower left) charged-particle and (lower right) charged ${{p_{\mathrm {T}}} ^\text {sum}}$ densities, as a function of the transverse momentum of the leading charged particle, $ {{p_{\mathrm {T}}} ^\text {max}}$, from the CMS $\sqrt {s} = $ 7 TeV analysis [10]. Charged hadrons are measured with $ {p_{\mathrm {T}}} > $ 0.5 GeV in $ {| \eta |} < $ 0.8. The data are compared with the CMS PYTHIA 8 (N)NLO-PDF tunes CP3, CP4, and CP5. The ratios of simulations to the data (MC/Data) are also shown, where the shaded band indicates the total experimental uncertainty in the data. Vertical lines drawn on the data points refer to the total uncertainty in the data. Vertical lines drawn on the MC points refer to the statistical uncertainty in the predictions. Horizontal bars indicate the associated bin width. |

png pdf |
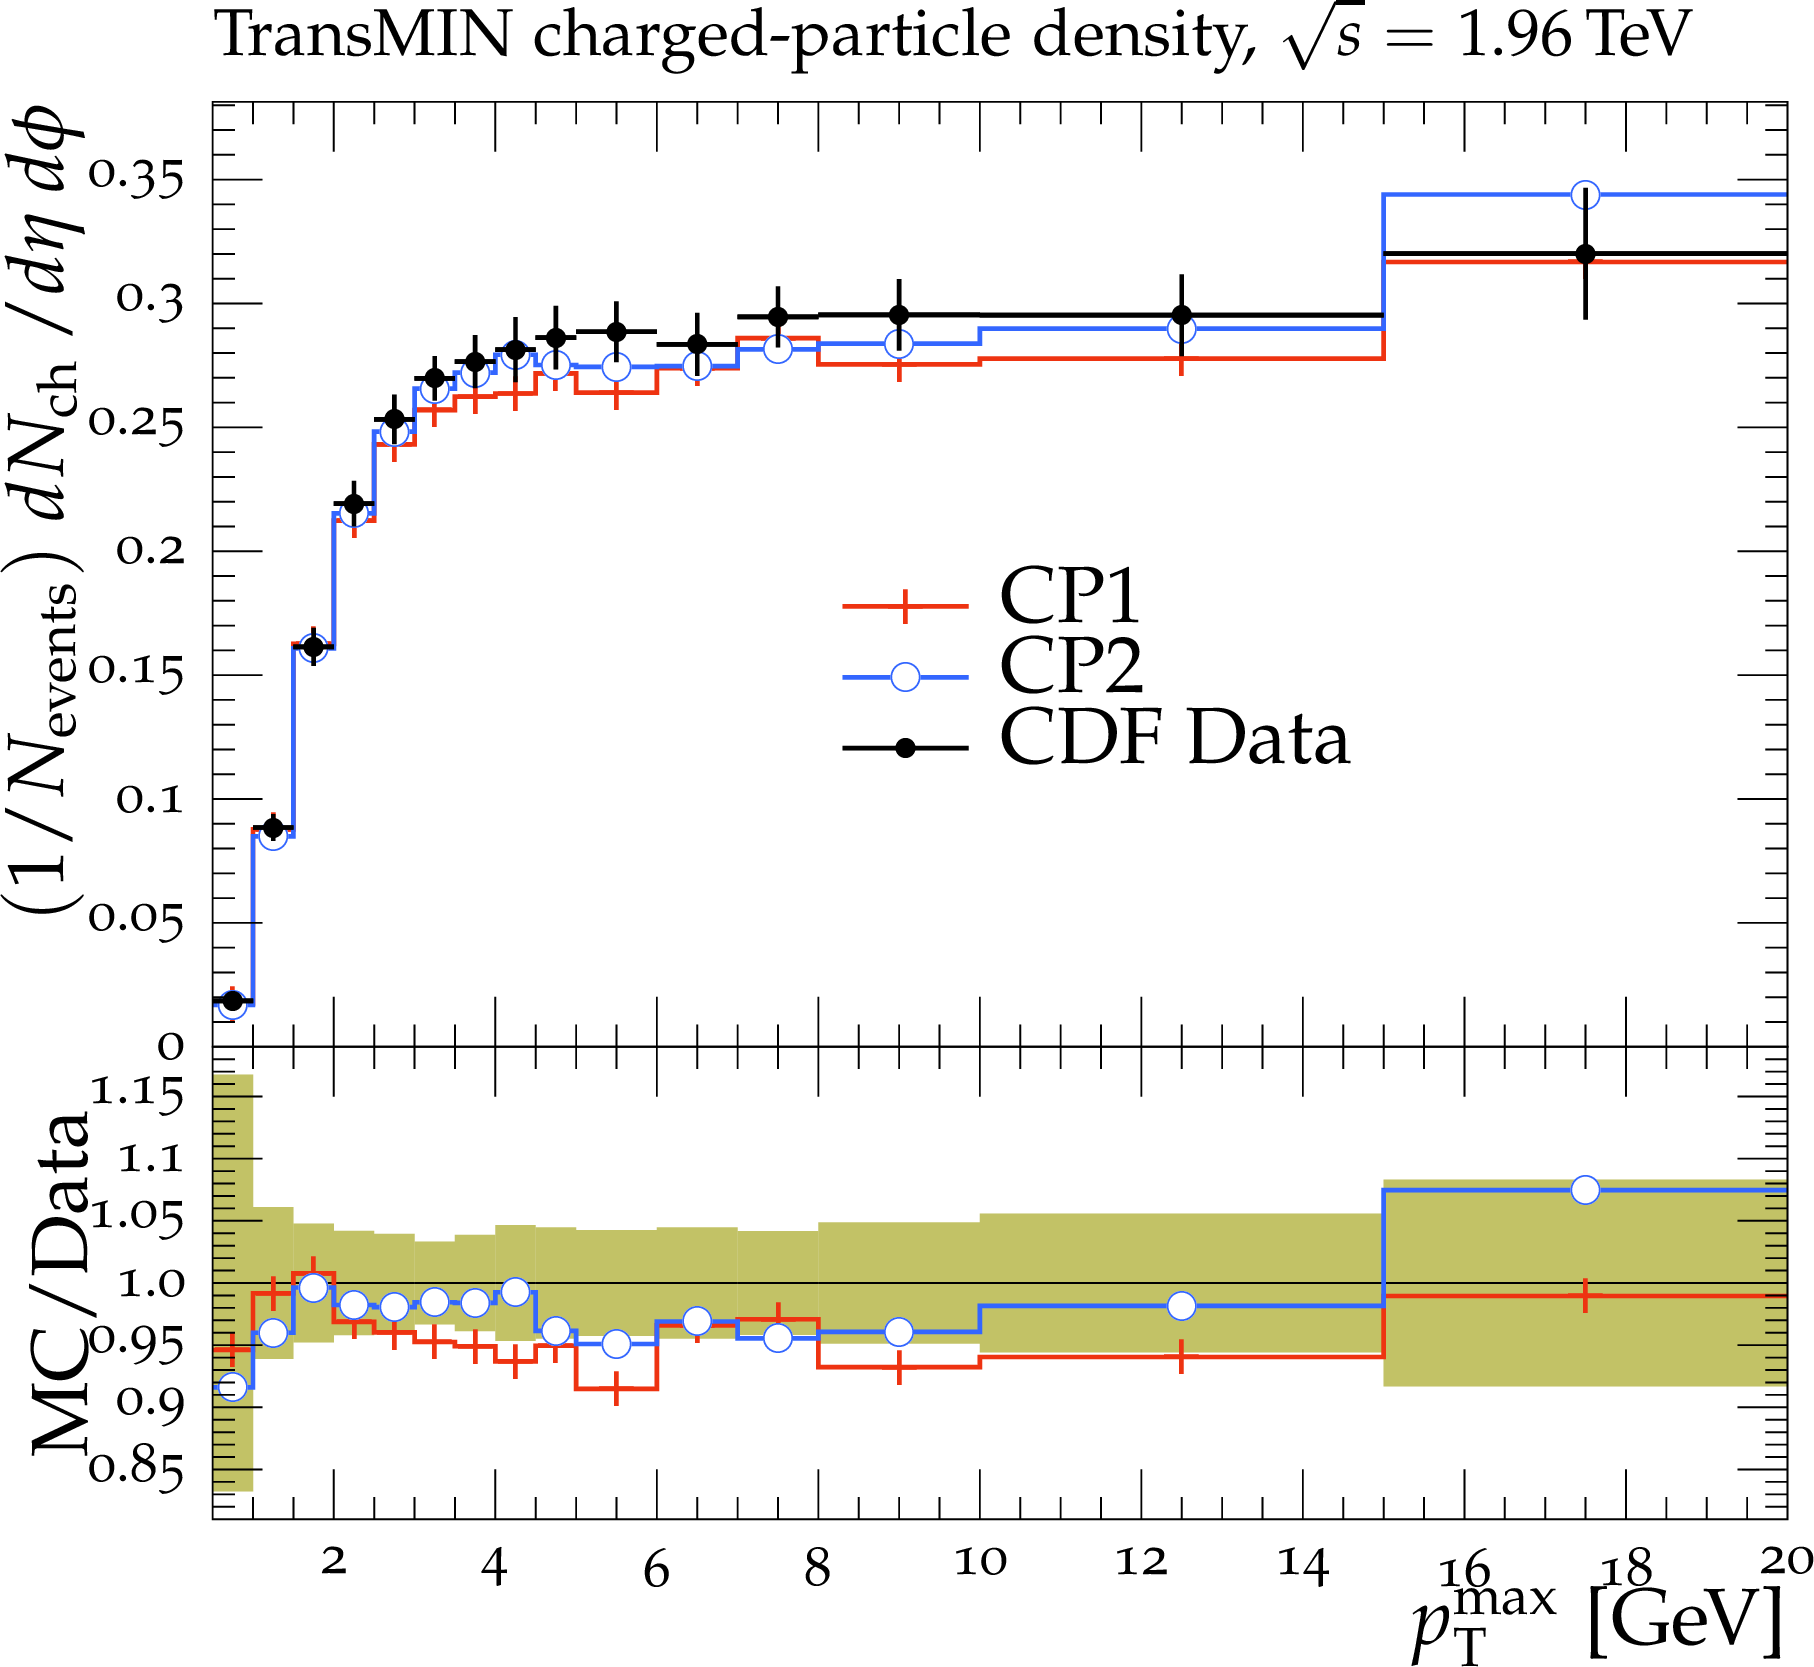
Figure 8:
The transMIN (upper left) charged-particle and (upper right) charged ${{p_{\mathrm {T}}} ^\text {sum}}$ densities and the transMAX\ (lower left) charged-particle and (lower right) charged ${{p_{\mathrm {T}}} ^\text {sum}}$ densities, as a function of the transverse momentum of the leading charged particle, $ {{p_{\mathrm {T}}} ^\text {max}}$, from the CDF $\sqrt {s} = $ 1.96 TeV analysis [9]. Charged hadrons are measured with $ {p_{\mathrm {T}}} > $ 0.5 GeV in $ {| \eta |} < $ 0.8. The data are compared with the CMS PYTHIA 8 LO-PDF tunes CP1 and CP2. The ratios of simulations to the data (MC/Data) are also shown, where the shaded band indicates the total experimental uncertainty in the data. Vertical lines drawn on the data points refer to the total uncertainty in the data. Vertical lines drawn on the MC points refer to the statistical uncertainty in the predictions. Horizontal bars indicate the associated bin width. |
png pdf |
Figure 8-a:
The transMIN (upper left) charged-particle and (upper right) charged ${{p_{\mathrm {T}}} ^\text {sum}}$ densities and the transMAX\ (lower left) charged-particle and (lower right) charged ${{p_{\mathrm {T}}} ^\text {sum}}$ densities, as a function of the transverse momentum of the leading charged particle, $ {{p_{\mathrm {T}}} ^\text {max}}$, from the CDF $\sqrt {s} = $ 1.96 TeV analysis [9]. Charged hadrons are measured with $ {p_{\mathrm {T}}} > $ 0.5 GeV in $ {| \eta |} < $ 0.8. The data are compared with the CMS PYTHIA 8 LO-PDF tunes CP1 and CP2. The ratios of simulations to the data (MC/Data) are also shown, where the shaded band indicates the total experimental uncertainty in the data. Vertical lines drawn on the data points refer to the total uncertainty in the data. Vertical lines drawn on the MC points refer to the statistical uncertainty in the predictions. Horizontal bars indicate the associated bin width. |

png pdf |
Figure 8-b:
The transMIN (upper left) charged-particle and (upper right) charged ${{p_{\mathrm {T}}} ^\text {sum}}$ densities and the transMAX\ (lower left) charged-particle and (lower right) charged ${{p_{\mathrm {T}}} ^\text {sum}}$ densities, as a function of the transverse momentum of the leading charged particle, $ {{p_{\mathrm {T}}} ^\text {max}}$, from the CDF $\sqrt {s} = $ 1.96 TeV analysis [9]. Charged hadrons are measured with $ {p_{\mathrm {T}}} > $ 0.5 GeV in $ {| \eta |} < $ 0.8. The data are compared with the CMS PYTHIA 8 LO-PDF tunes CP1 and CP2. The ratios of simulations to the data (MC/Data) are also shown, where the shaded band indicates the total experimental uncertainty in the data. Vertical lines drawn on the data points refer to the total uncertainty in the data. Vertical lines drawn on the MC points refer to the statistical uncertainty in the predictions. Horizontal bars indicate the associated bin width. |

png pdf |
Figure 8-c:
The transMIN (upper left) charged-particle and (upper right) charged ${{p_{\mathrm {T}}} ^\text {sum}}$ densities and the transMAX\ (lower left) charged-particle and (lower right) charged ${{p_{\mathrm {T}}} ^\text {sum}}$ densities, as a function of the transverse momentum of the leading charged particle, $ {{p_{\mathrm {T}}} ^\text {max}}$, from the CDF $\sqrt {s} = $ 1.96 TeV analysis [9]. Charged hadrons are measured with $ {p_{\mathrm {T}}} > $ 0.5 GeV in $ {| \eta |} < $ 0.8. The data are compared with the CMS PYTHIA 8 LO-PDF tunes CP1 and CP2. The ratios of simulations to the data (MC/Data) are also shown, where the shaded band indicates the total experimental uncertainty in the data. Vertical lines drawn on the data points refer to the total uncertainty in the data. Vertical lines drawn on the MC points refer to the statistical uncertainty in the predictions. Horizontal bars indicate the associated bin width. |

png pdf |
Figure 8-d:
The transMIN (upper left) charged-particle and (upper right) charged ${{p_{\mathrm {T}}} ^\text {sum}}$ densities and the transMAX\ (lower left) charged-particle and (lower right) charged ${{p_{\mathrm {T}}} ^\text {sum}}$ densities, as a function of the transverse momentum of the leading charged particle, $ {{p_{\mathrm {T}}} ^\text {max}}$, from the CDF $\sqrt {s} = $ 1.96 TeV analysis [9]. Charged hadrons are measured with $ {p_{\mathrm {T}}} > $ 0.5 GeV in $ {| \eta |} < $ 0.8. The data are compared with the CMS PYTHIA 8 LO-PDF tunes CP1 and CP2. The ratios of simulations to the data (MC/Data) are also shown, where the shaded band indicates the total experimental uncertainty in the data. Vertical lines drawn on the data points refer to the total uncertainty in the data. Vertical lines drawn on the MC points refer to the statistical uncertainty in the predictions. Horizontal bars indicate the associated bin width. |

png pdf |
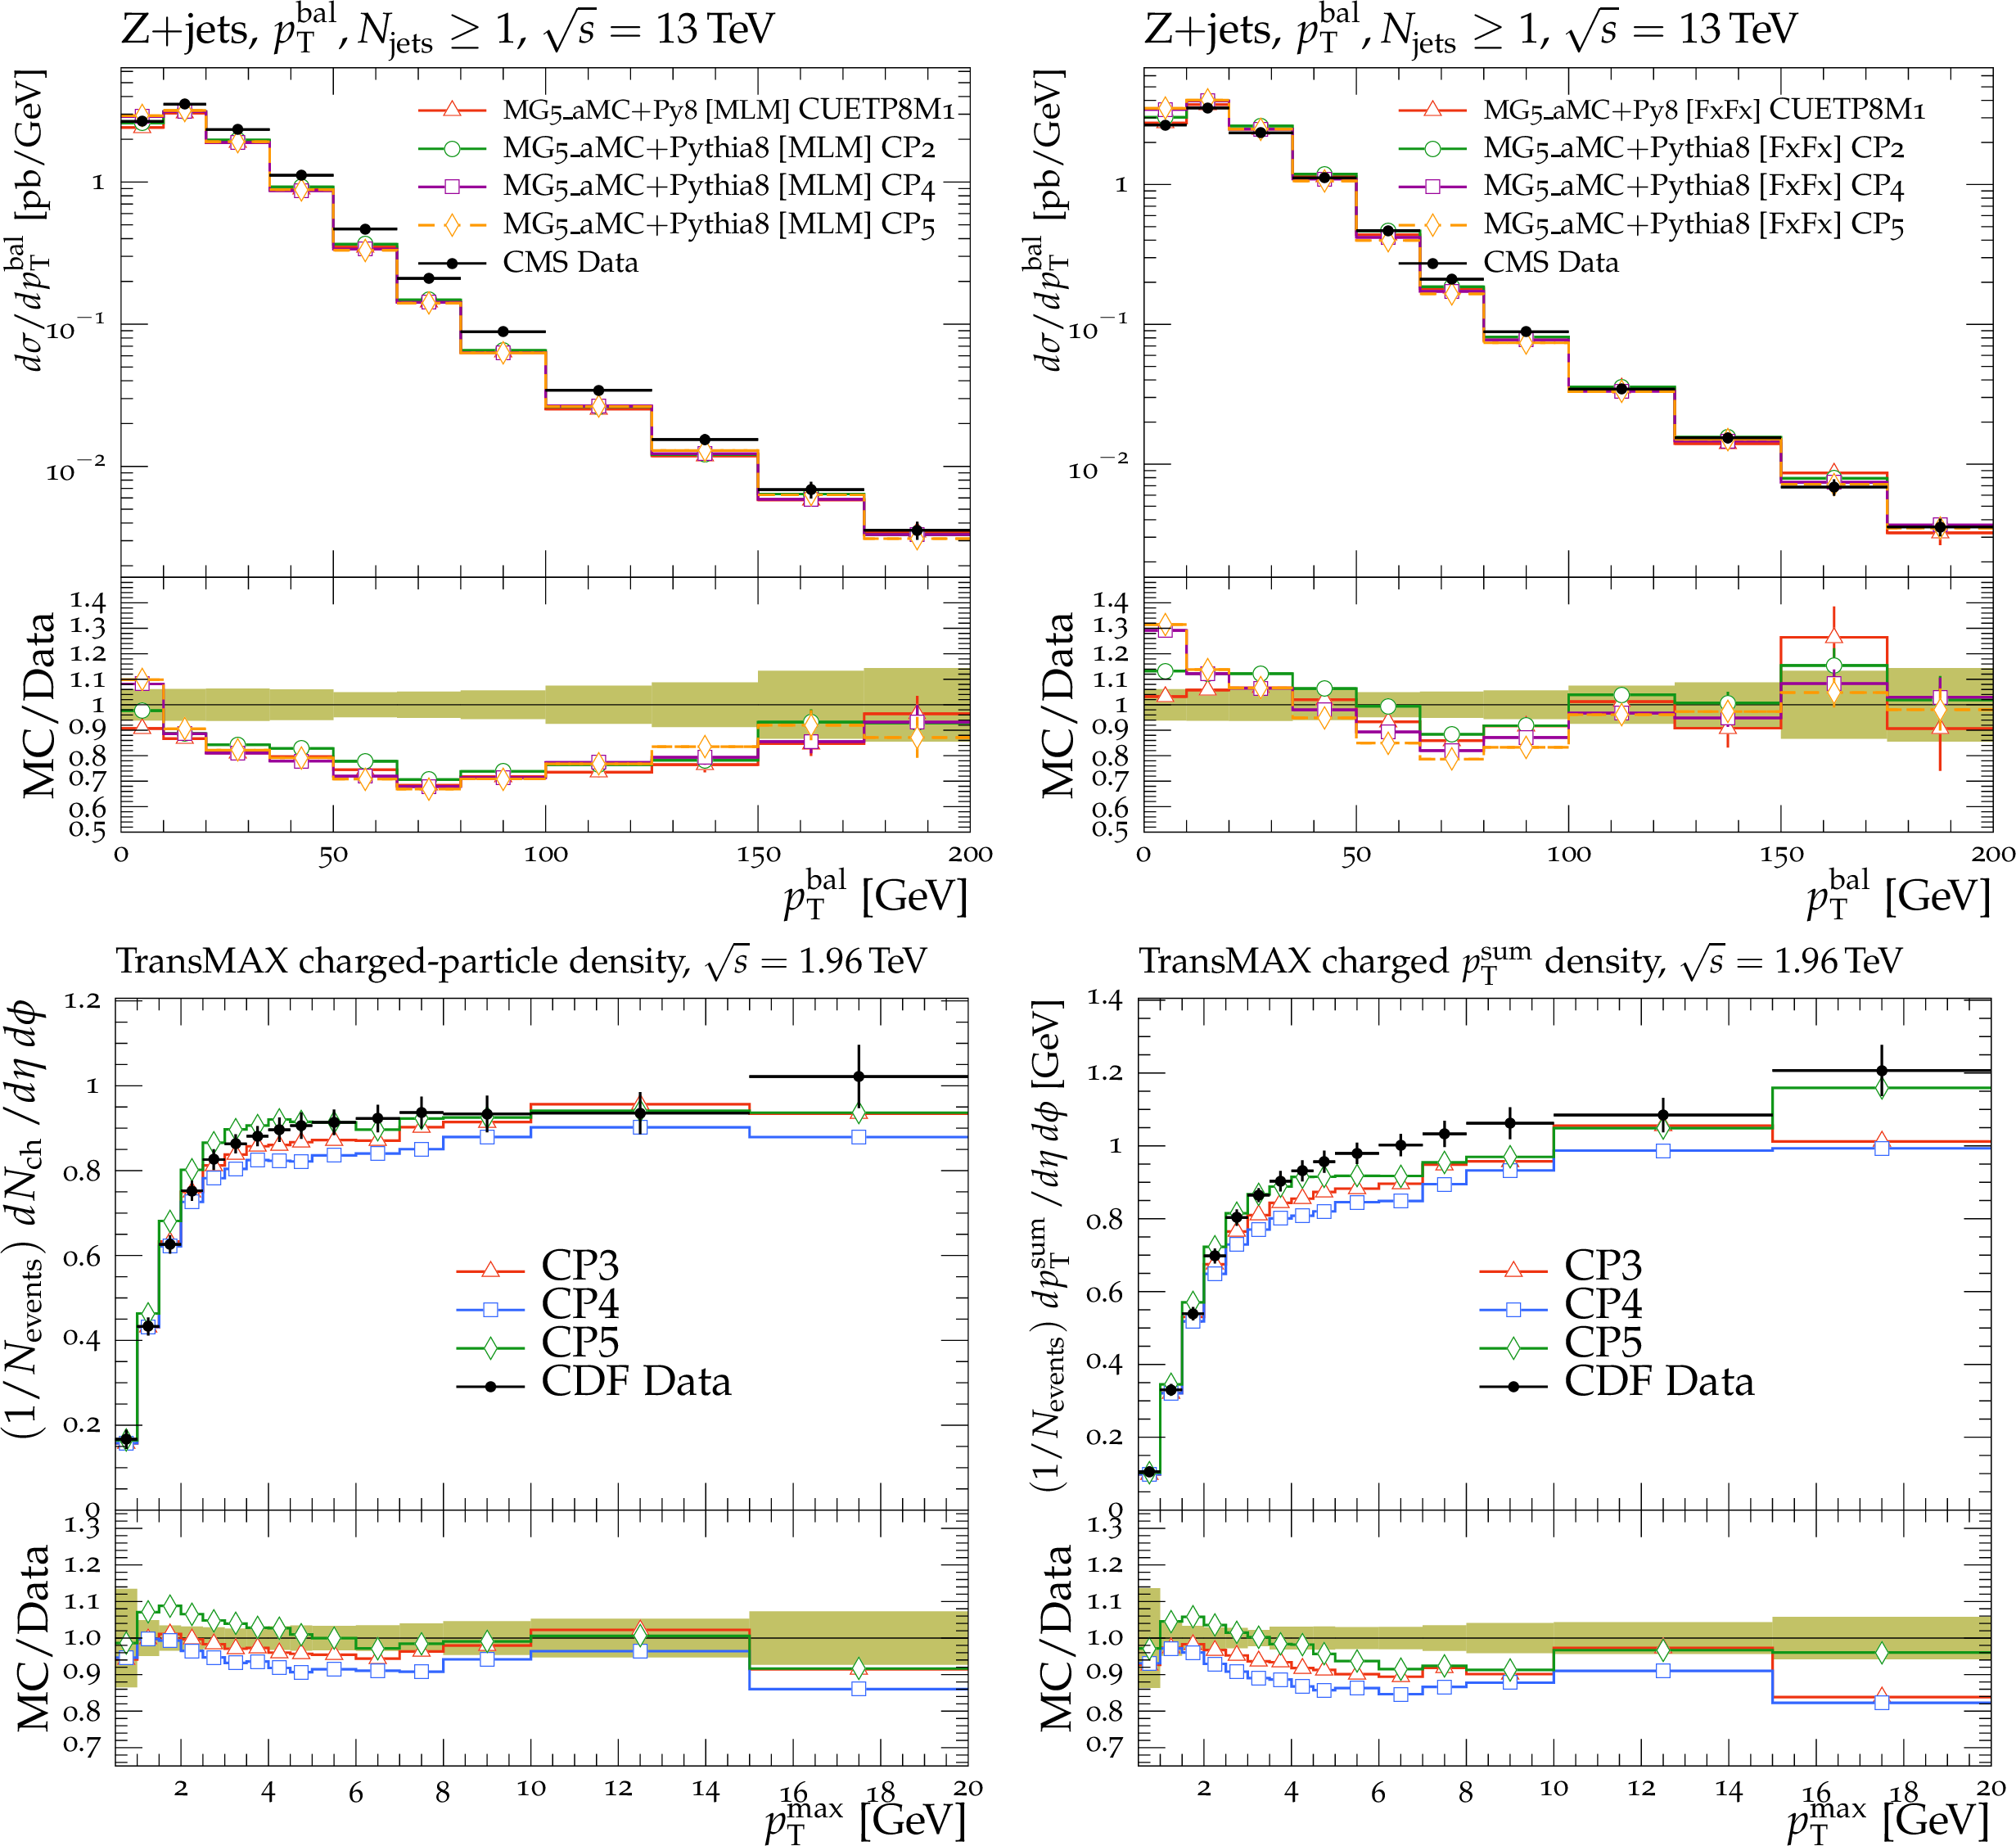
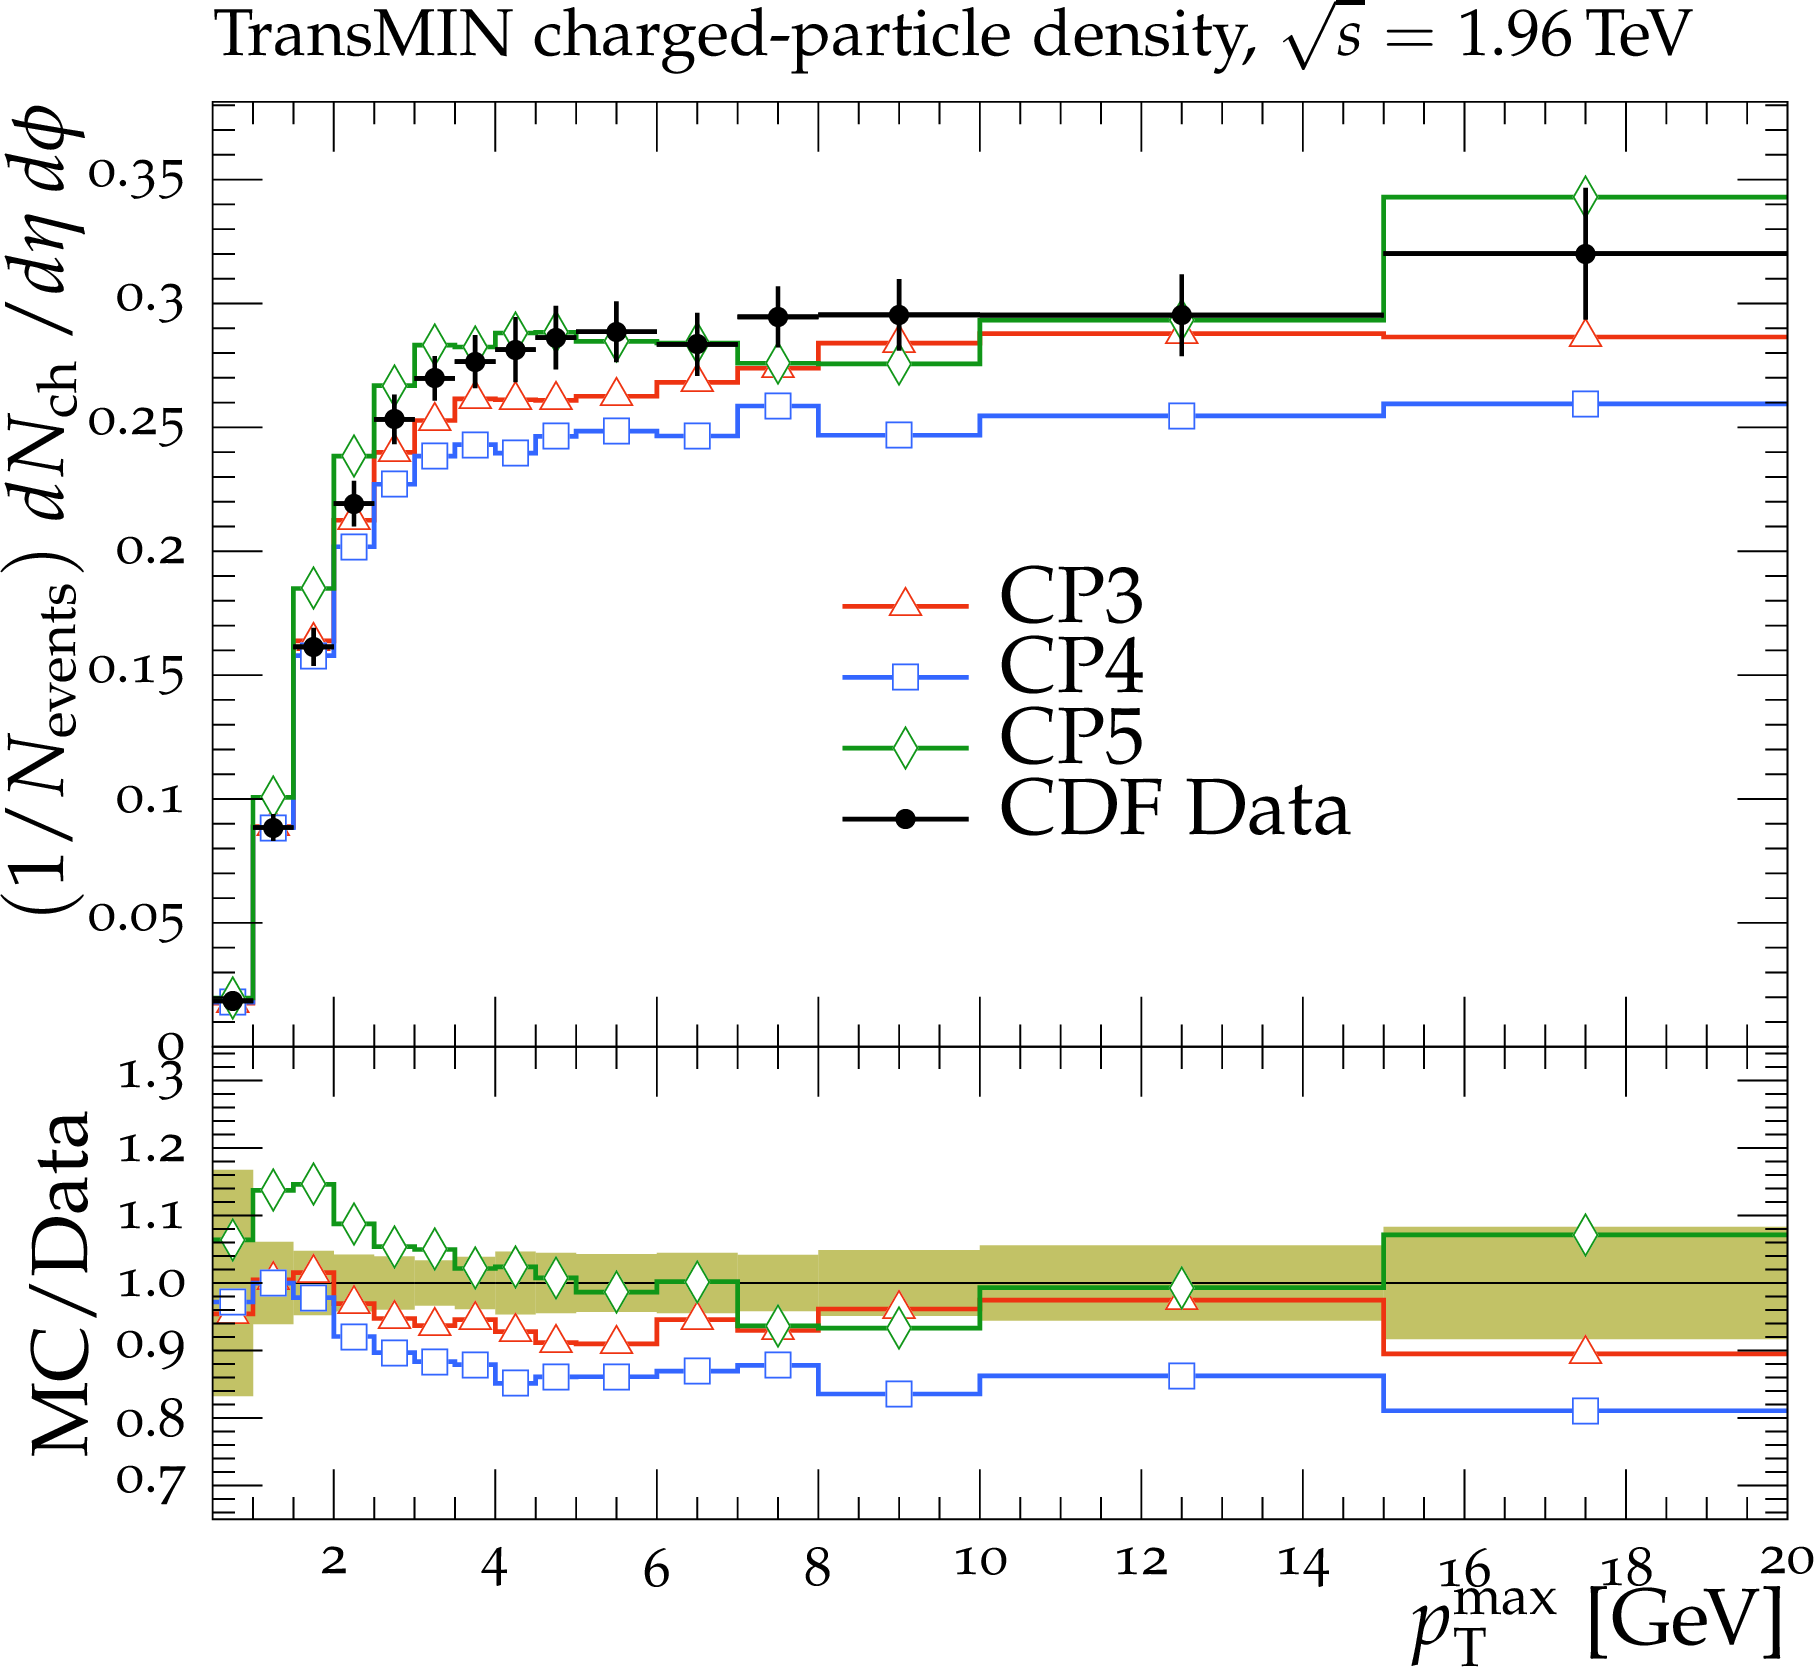
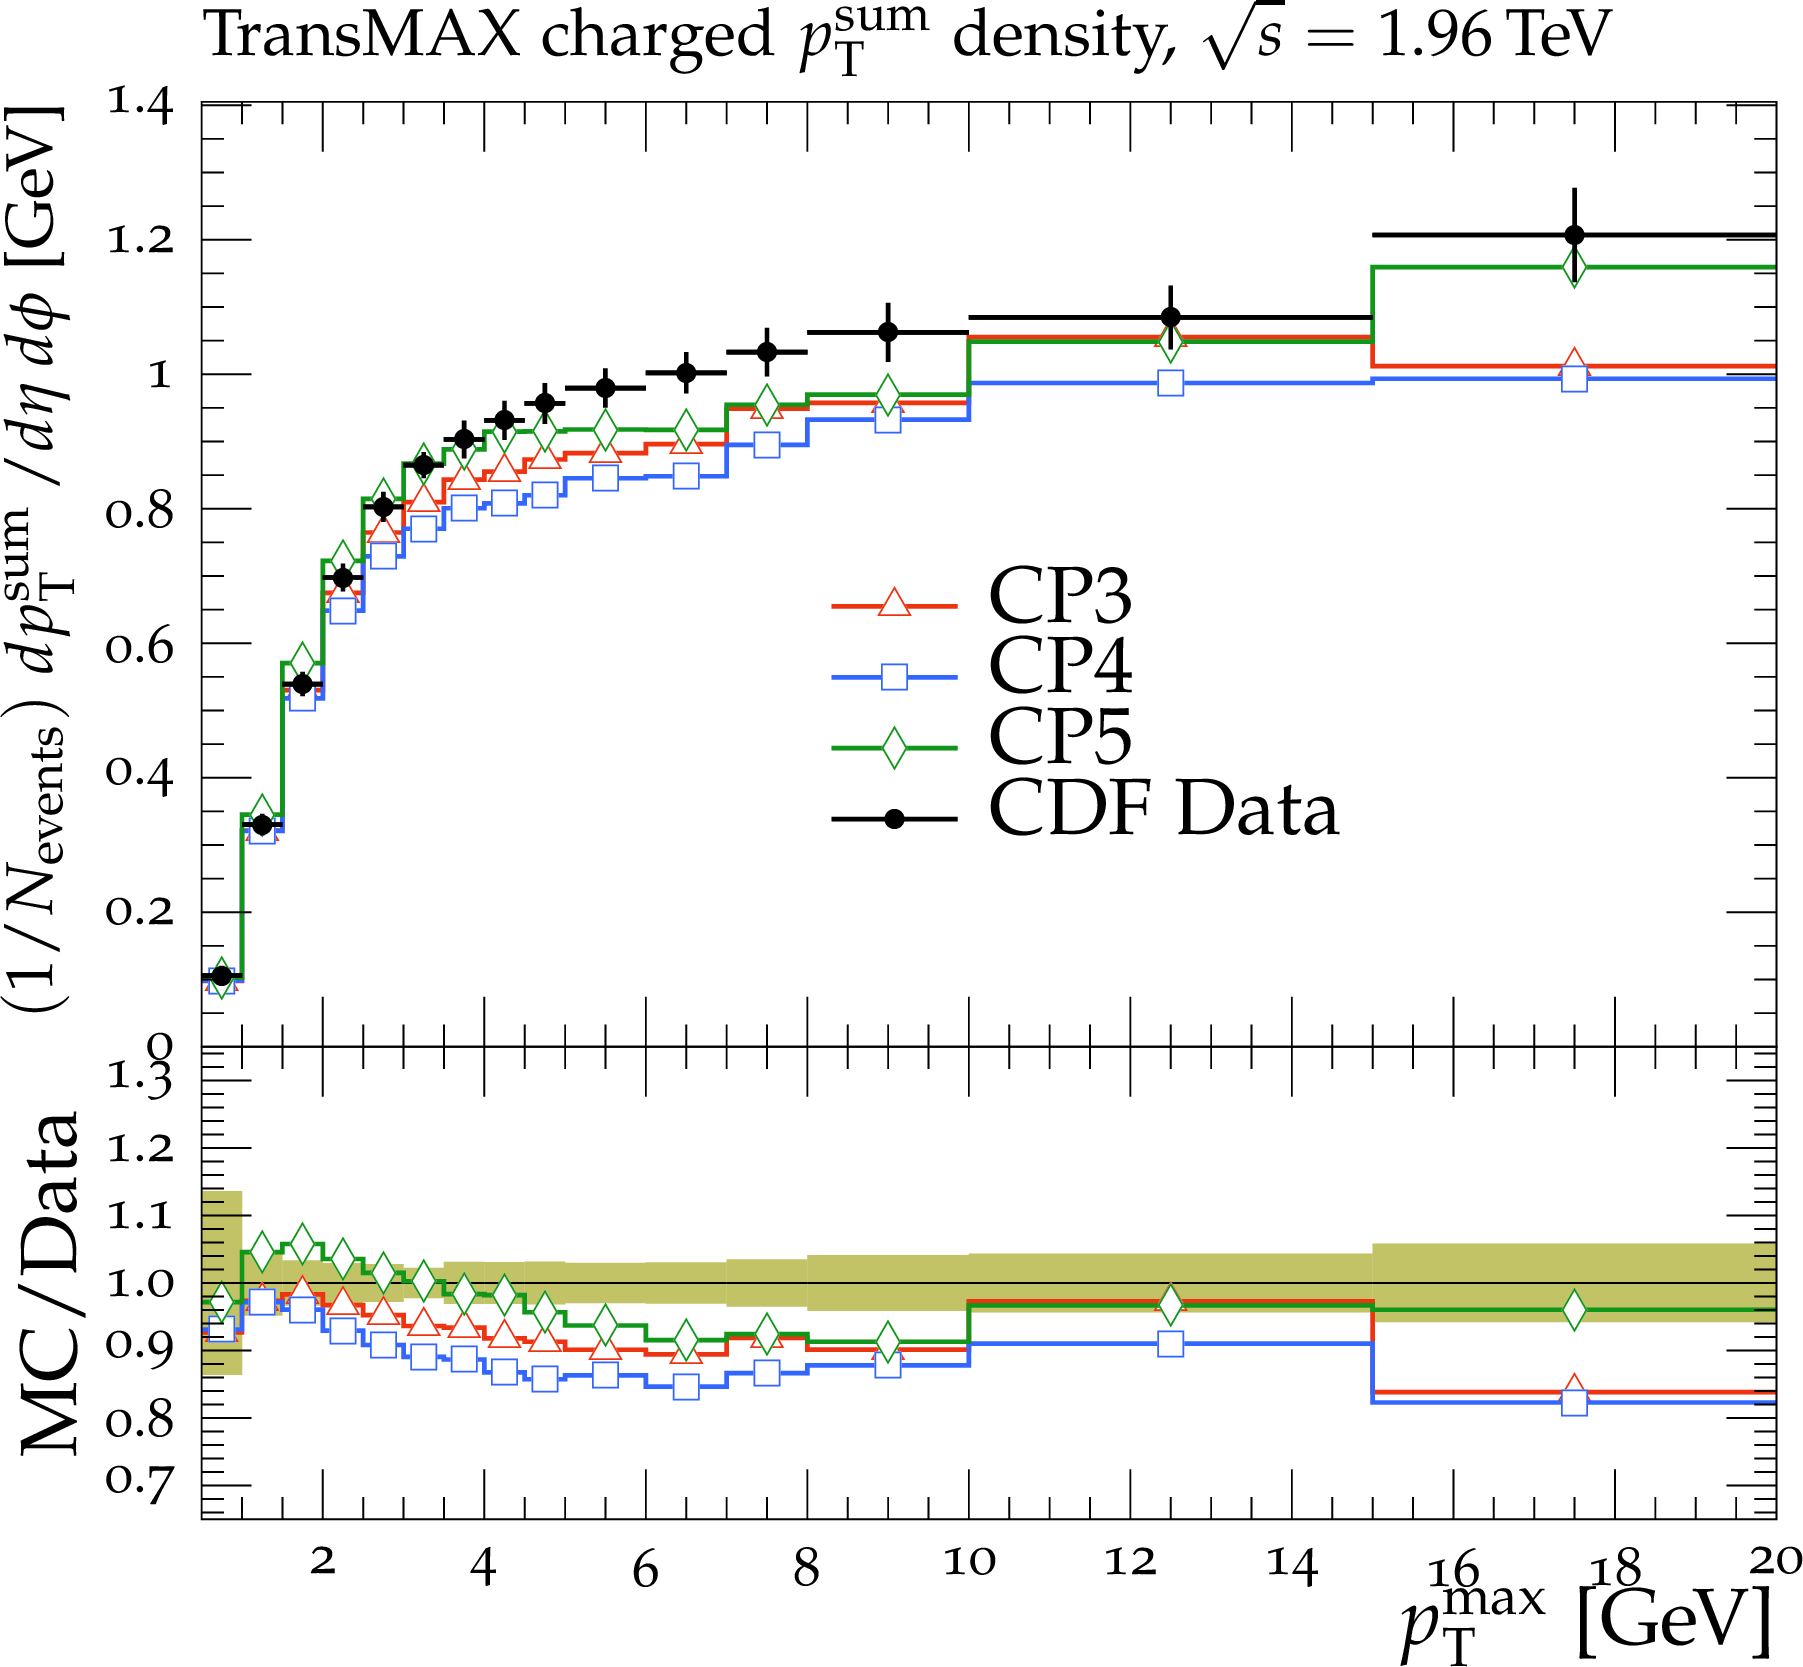
Figure 9:
The transMIN (upper left) charged-particle and (upper right) charged ${{p_{\mathrm {T}}} ^\text {sum}}$ densities and the transMAX\ (lower left) charged-particle and (lower right) charged ${{p_{\mathrm {T}}} ^\text {sum}}$ densities, as a function of the transverse momentum of the leading charged particle, $ {{p_{\mathrm {T}}} ^\text {max}}$, from the CDF $\sqrt {s} = $ 1.96 TeV analysis [9]. Charged hadrons are measured with $ {p_{\mathrm {T}}} > $ 0.5 GeV in $ {| \eta |} < $ 0.8. The data are compared with the CMS PYTHIA 8 (N)NLO-PDF tunes CP3, CP4, and CP5. The ratios of simulations to the data (MC/Data) are also shown, where the shaded band indicates the total experimental uncertainty in the data. Vertical lines drawn on the data points refer to the total uncertainty in the data. Vertical lines drawn on the MC points refer to the statistical uncertainty in the predictions. Horizontal bars indicate the associated bin width. |
png pdf |
Figure 9-a:
The transMIN (upper left) charged-particle and (upper right) charged ${{p_{\mathrm {T}}} ^\text {sum}}$ densities and the transMAX\ (lower left) charged-particle and (lower right) charged ${{p_{\mathrm {T}}} ^\text {sum}}$ densities, as a function of the transverse momentum of the leading charged particle, $ {{p_{\mathrm {T}}} ^\text {max}}$, from the CDF $\sqrt {s} = $ 1.96 TeV analysis [9]. Charged hadrons are measured with $ {p_{\mathrm {T}}} > $ 0.5 GeV in $ {| \eta |} < $ 0.8. The data are compared with the CMS PYTHIA 8 (N)NLO-PDF tunes CP3, CP4, and CP5. The ratios of simulations to the data (MC/Data) are also shown, where the shaded band indicates the total experimental uncertainty in the data. Vertical lines drawn on the data points refer to the total uncertainty in the data. Vertical lines drawn on the MC points refer to the statistical uncertainty in the predictions. Horizontal bars indicate the associated bin width. |

png pdf |
Figure 9-b:
The transMIN (upper left) charged-particle and (upper right) charged ${{p_{\mathrm {T}}} ^\text {sum}}$ densities and the transMAX\ (lower left) charged-particle and (lower right) charged ${{p_{\mathrm {T}}} ^\text {sum}}$ densities, as a function of the transverse momentum of the leading charged particle, $ {{p_{\mathrm {T}}} ^\text {max}}$, from the CDF $\sqrt {s} = $ 1.96 TeV analysis [9]. Charged hadrons are measured with $ {p_{\mathrm {T}}} > $ 0.5 GeV in $ {| \eta |} < $ 0.8. The data are compared with the CMS PYTHIA 8 (N)NLO-PDF tunes CP3, CP4, and CP5. The ratios of simulations to the data (MC/Data) are also shown, where the shaded band indicates the total experimental uncertainty in the data. Vertical lines drawn on the data points refer to the total uncertainty in the data. Vertical lines drawn on the MC points refer to the statistical uncertainty in the predictions. Horizontal bars indicate the associated bin width. |

png pdf |
Figure 9-c:
The transMIN (upper left) charged-particle and (upper right) charged ${{p_{\mathrm {T}}} ^\text {sum}}$ densities and the transMAX\ (lower left) charged-particle and (lower right) charged ${{p_{\mathrm {T}}} ^\text {sum}}$ densities, as a function of the transverse momentum of the leading charged particle, $ {{p_{\mathrm {T}}} ^\text {max}}$, from the CDF $\sqrt {s} = $ 1.96 TeV analysis [9]. Charged hadrons are measured with $ {p_{\mathrm {T}}} > $ 0.5 GeV in $ {| \eta |} < $ 0.8. The data are compared with the CMS PYTHIA 8 (N)NLO-PDF tunes CP3, CP4, and CP5. The ratios of simulations to the data (MC/Data) are also shown, where the shaded band indicates the total experimental uncertainty in the data. Vertical lines drawn on the data points refer to the total uncertainty in the data. Vertical lines drawn on the MC points refer to the statistical uncertainty in the predictions. Horizontal bars indicate the associated bin width. |
png pdf |
Figure 9-d:
The transMIN (upper left) charged-particle and (upper right) charged ${{p_{\mathrm {T}}} ^\text {sum}}$ densities and the transMAX\ (lower left) charged-particle and (lower right) charged ${{p_{\mathrm {T}}} ^\text {sum}}$ densities, as a function of the transverse momentum of the leading charged particle, $ {{p_{\mathrm {T}}} ^\text {max}}$, from the CDF $\sqrt {s} = $ 1.96 TeV analysis [9]. Charged hadrons are measured with $ {p_{\mathrm {T}}} > $ 0.5 GeV in $ {| \eta |} < $ 0.8. The data are compared with the CMS PYTHIA 8 (N)NLO-PDF tunes CP3, CP4, and CP5. The ratios of simulations to the data (MC/Data) are also shown, where the shaded band indicates the total experimental uncertainty in the data. Vertical lines drawn on the data points refer to the total uncertainty in the data. Vertical lines drawn on the MC points refer to the statistical uncertainty in the predictions. Horizontal bars indicate the associated bin width. |
png pdf |
Figure 10:
The pseudorapidity distribution of charged hadrons measured in $ {| \eta |} < $ 2 for an inclusive selection in inelastic proton-proton collisions, with zero magnetic field strength (B = 0 T), from the CMS $\sqrt {s} = $ 13 TeV analysis [18]. The data are compared with (left) the CMS PYTHIA 8 LO-PDF tunes CP1 and CP2, and with (right) the CMS PYTHIA 8 NLO-PDF tune CP3 and the CMS PYTHIA 8 NNLO-PDF tunes CP4 and CP5. The ratios of simulations to the data (MC/Data) are also shown, where the shaded band indicates the total experimental uncertainty in the data. Vertical lines drawn on the data points refer to the total uncertainty in the data. Vertical lines drawn on the MC points refer to the statistical uncertainty in the predictions. Horizontal bars indicate the associated bin width. |

png pdf |
Figure 10-a:
The pseudorapidity distribution of charged hadrons measured in $ {| \eta |} < $ 2 for an inclusive selection in inelastic proton-proton collisions, with zero magnetic field strength (B = 0 T), from the CMS $\sqrt {s} = $ 13 TeV analysis [18]. The data are compared with (left) the CMS PYTHIA 8 LO-PDF tunes CP1 and CP2, and with (right) the CMS PYTHIA 8 NLO-PDF tune CP3 and the CMS PYTHIA 8 NNLO-PDF tunes CP4 and CP5. The ratios of simulations to the data (MC/Data) are also shown, where the shaded band indicates the total experimental uncertainty in the data. Vertical lines drawn on the data points refer to the total uncertainty in the data. Vertical lines drawn on the MC points refer to the statistical uncertainty in the predictions. Horizontal bars indicate the associated bin width. |

png pdf |
Figure 10-b:
The pseudorapidity distribution of charged hadrons measured in $ {| \eta |} < $ 2 for an inclusive selection in inelastic proton-proton collisions, with zero magnetic field strength (B = 0 T), from the CMS $\sqrt {s} = $ 13 TeV analysis [18]. The data are compared with (left) the CMS PYTHIA 8 LO-PDF tunes CP1 and CP2, and with (right) the CMS PYTHIA 8 NLO-PDF tune CP3 and the CMS PYTHIA 8 NNLO-PDF tunes CP4 and CP5. The ratios of simulations to the data (MC/Data) are also shown, where the shaded band indicates the total experimental uncertainty in the data. Vertical lines drawn on the data points refer to the total uncertainty in the data. Vertical lines drawn on the MC points refer to the statistical uncertainty in the predictions. Horizontal bars indicate the associated bin width. |

png pdf |
Figure 11:
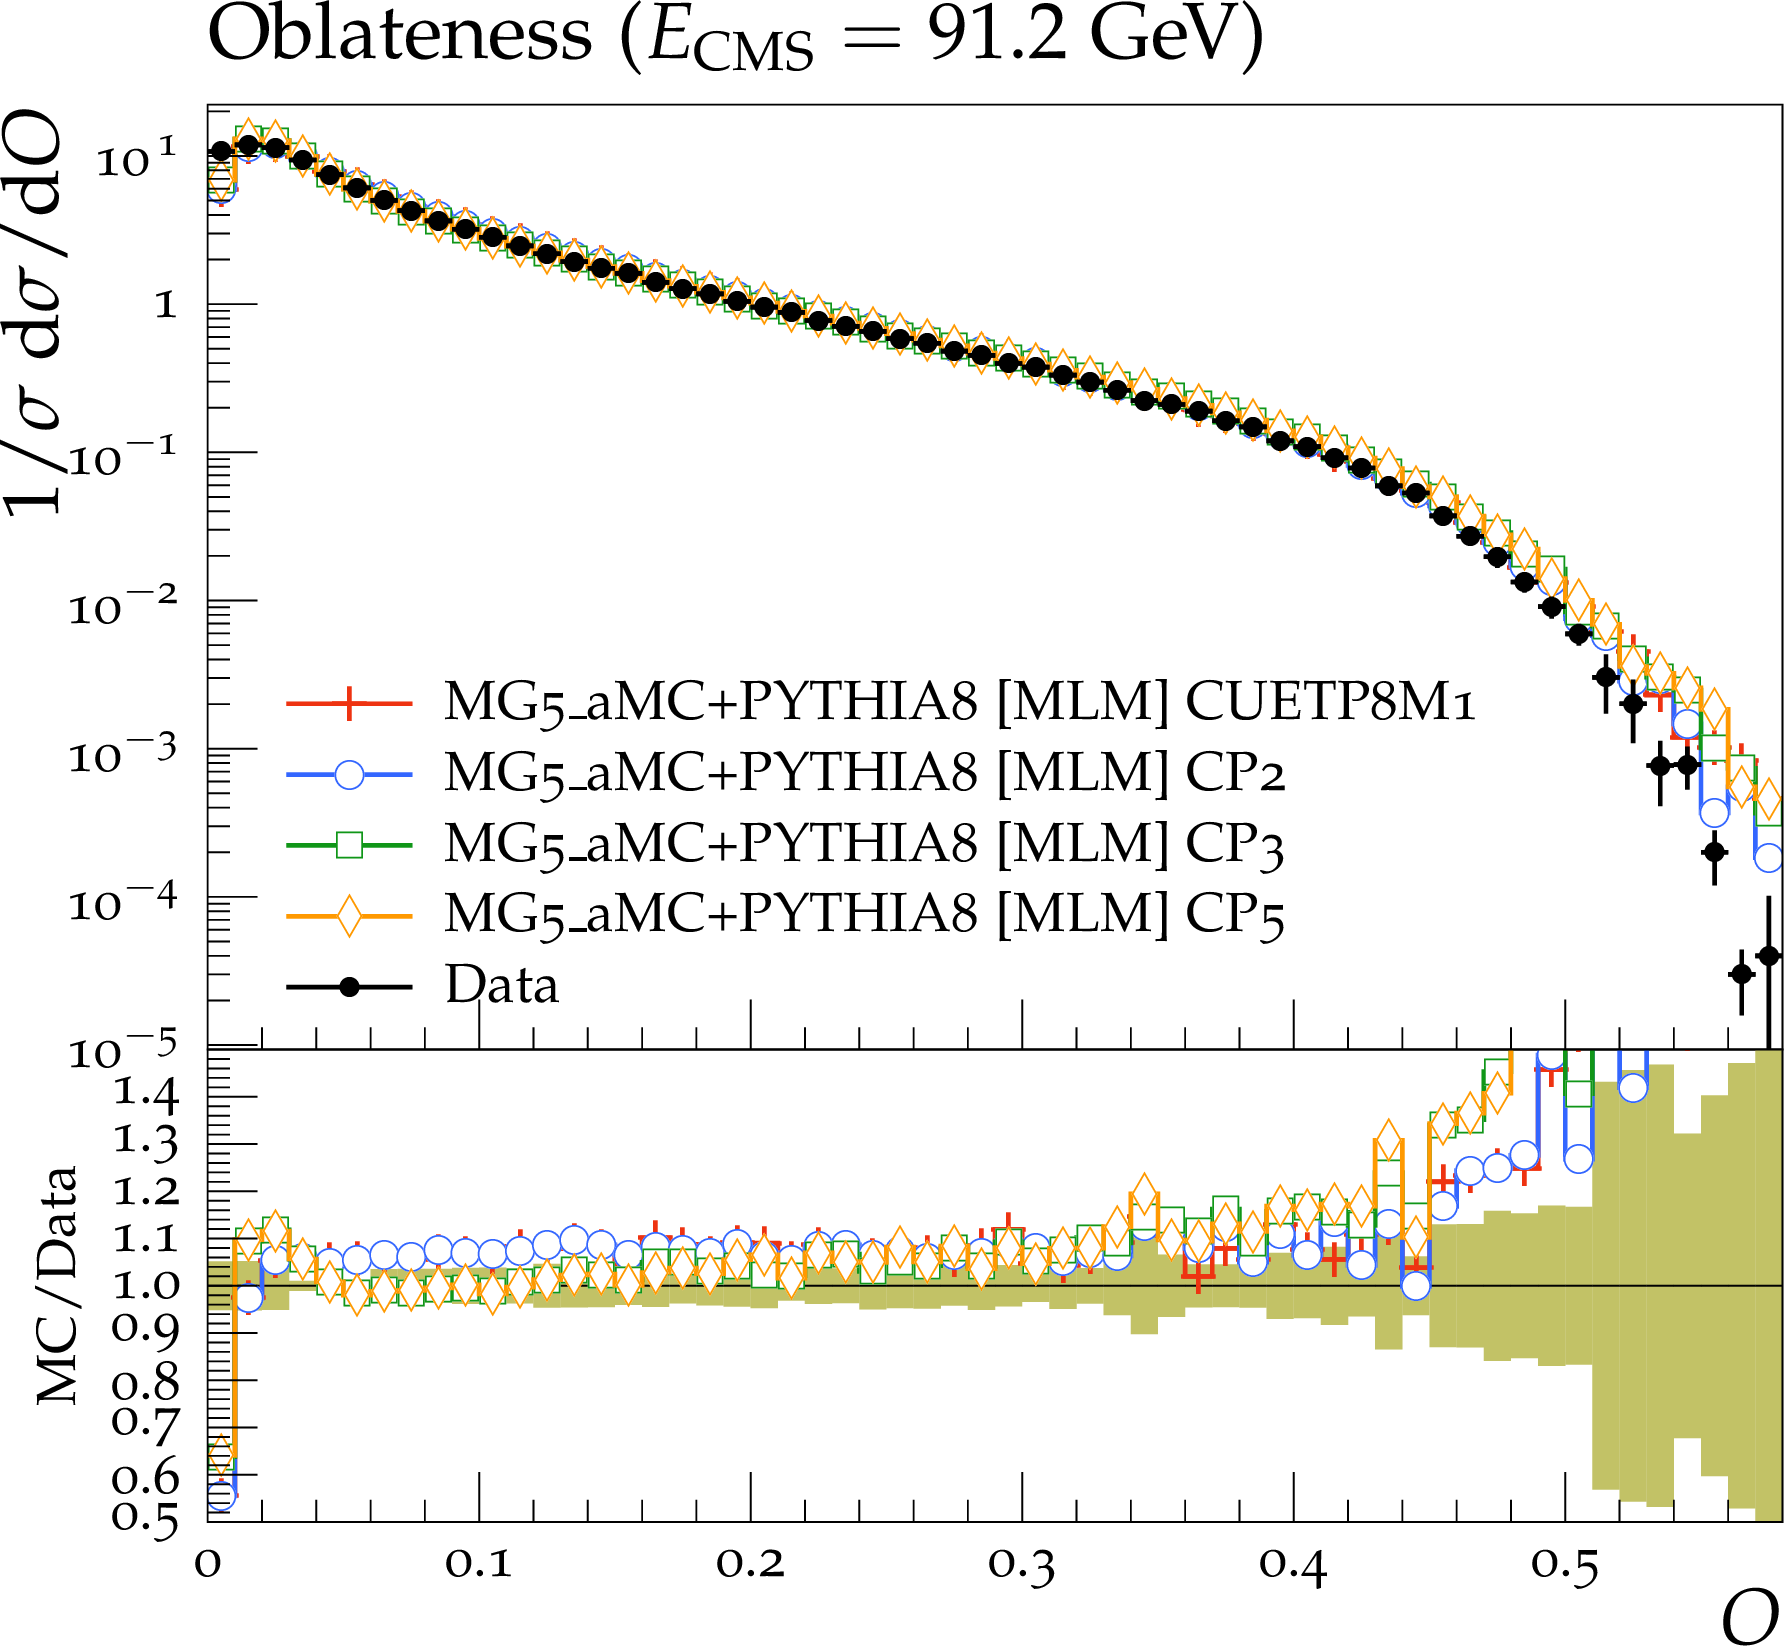
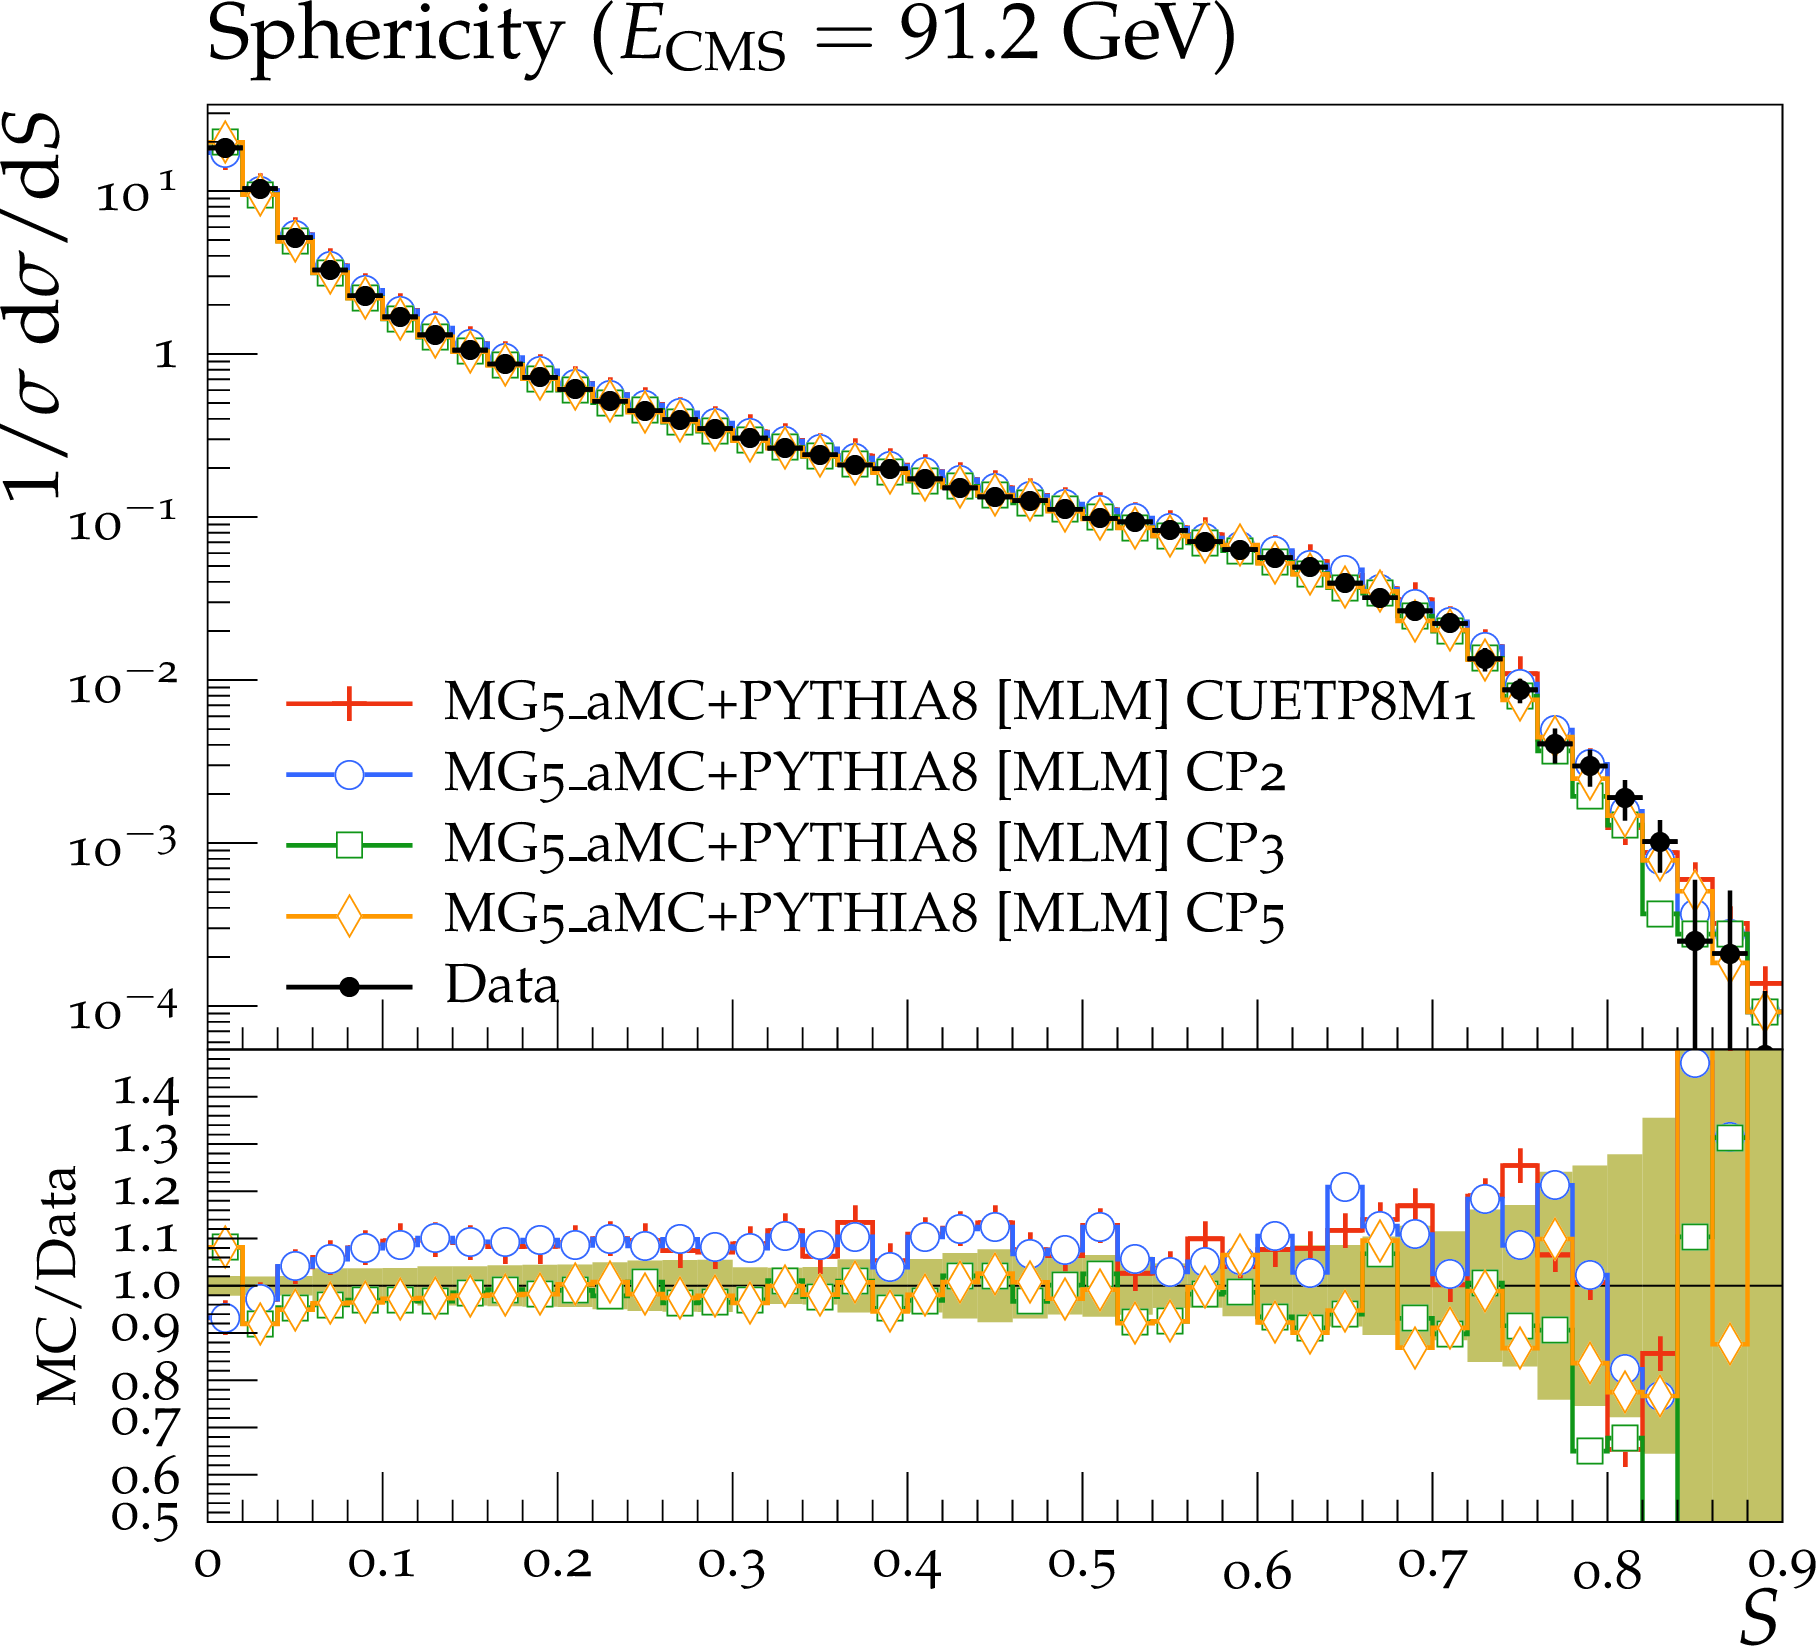
The normalized cross sections as a function of event-shape variables, oblateness (upper left), sphericity (upper right), thrust (lower left), and thrust major (lower right) from the ALEPH $\sqrt {s} = $ 91.2 GeV analysis [45], compared with the predictions by mg5\_amc + PYTHIA 8 with ${k_{\mathrm {T}}} $-MLM merging, for tunes CP2, CP3, and CP5. The ratio of the simulations to the data (MC/Data) is also shown, where the shaded band indicates the total experimental uncertainty in the data. Vertical lines drawn on the data points refer to the total uncertainty in the data. Vertical lines drawn on the MC points refer to the statistical uncertainty in the predictions. Horizontal bars indicate the associated bin width. |
png pdf |
Figure 11-a:
The normalized cross sections as a function of event-shape variables, oblateness (upper left), sphericity (upper right), thrust (lower left), and thrust major (lower right) from the ALEPH $\sqrt {s} = $ 91.2 GeV analysis [45], compared with the predictions by mg5\_amc + PYTHIA 8 with ${k_{\mathrm {T}}} $-MLM merging, for tunes CP2, CP3, and CP5. The ratio of the simulations to the data (MC/Data) is also shown, where the shaded band indicates the total experimental uncertainty in the data. Vertical lines drawn on the data points refer to the total uncertainty in the data. Vertical lines drawn on the MC points refer to the statistical uncertainty in the predictions. Horizontal bars indicate the associated bin width. |
png pdf |
Figure 11-b:
The normalized cross sections as a function of event-shape variables, oblateness (upper left), sphericity (upper right), thrust (lower left), and thrust major (lower right) from the ALEPH $\sqrt {s} = $ 91.2 GeV analysis [45], compared with the predictions by mg5\_amc + PYTHIA 8 with ${k_{\mathrm {T}}} $-MLM merging, for tunes CP2, CP3, and CP5. The ratio of the simulations to the data (MC/Data) is also shown, where the shaded band indicates the total experimental uncertainty in the data. Vertical lines drawn on the data points refer to the total uncertainty in the data. Vertical lines drawn on the MC points refer to the statistical uncertainty in the predictions. Horizontal bars indicate the associated bin width. |

png pdf |
Figure 11-c:
The normalized cross sections as a function of event-shape variables, oblateness (upper left), sphericity (upper right), thrust (lower left), and thrust major (lower right) from the ALEPH $\sqrt {s} = $ 91.2 GeV analysis [45], compared with the predictions by mg5\_amc + PYTHIA 8 with ${k_{\mathrm {T}}} $-MLM merging, for tunes CP2, CP3, and CP5. The ratio of the simulations to the data (MC/Data) is also shown, where the shaded band indicates the total experimental uncertainty in the data. Vertical lines drawn on the data points refer to the total uncertainty in the data. Vertical lines drawn on the MC points refer to the statistical uncertainty in the predictions. Horizontal bars indicate the associated bin width. |

png pdf |
Figure 11-d:
The normalized cross sections as a function of event-shape variables, oblateness (upper left), sphericity (upper right), thrust (lower left), and thrust major (lower right) from the ALEPH $\sqrt {s} = $ 91.2 GeV analysis [45], compared with the predictions by mg5\_amc + PYTHIA 8 with ${k_{\mathrm {T}}} $-MLM merging, for tunes CP2, CP3, and CP5. The ratio of the simulations to the data (MC/Data) is also shown, where the shaded band indicates the total experimental uncertainty in the data. Vertical lines drawn on the data points refer to the total uncertainty in the data. Vertical lines drawn on the MC points refer to the statistical uncertainty in the predictions. Horizontal bars indicate the associated bin width. |
png pdf |
Figure 12:
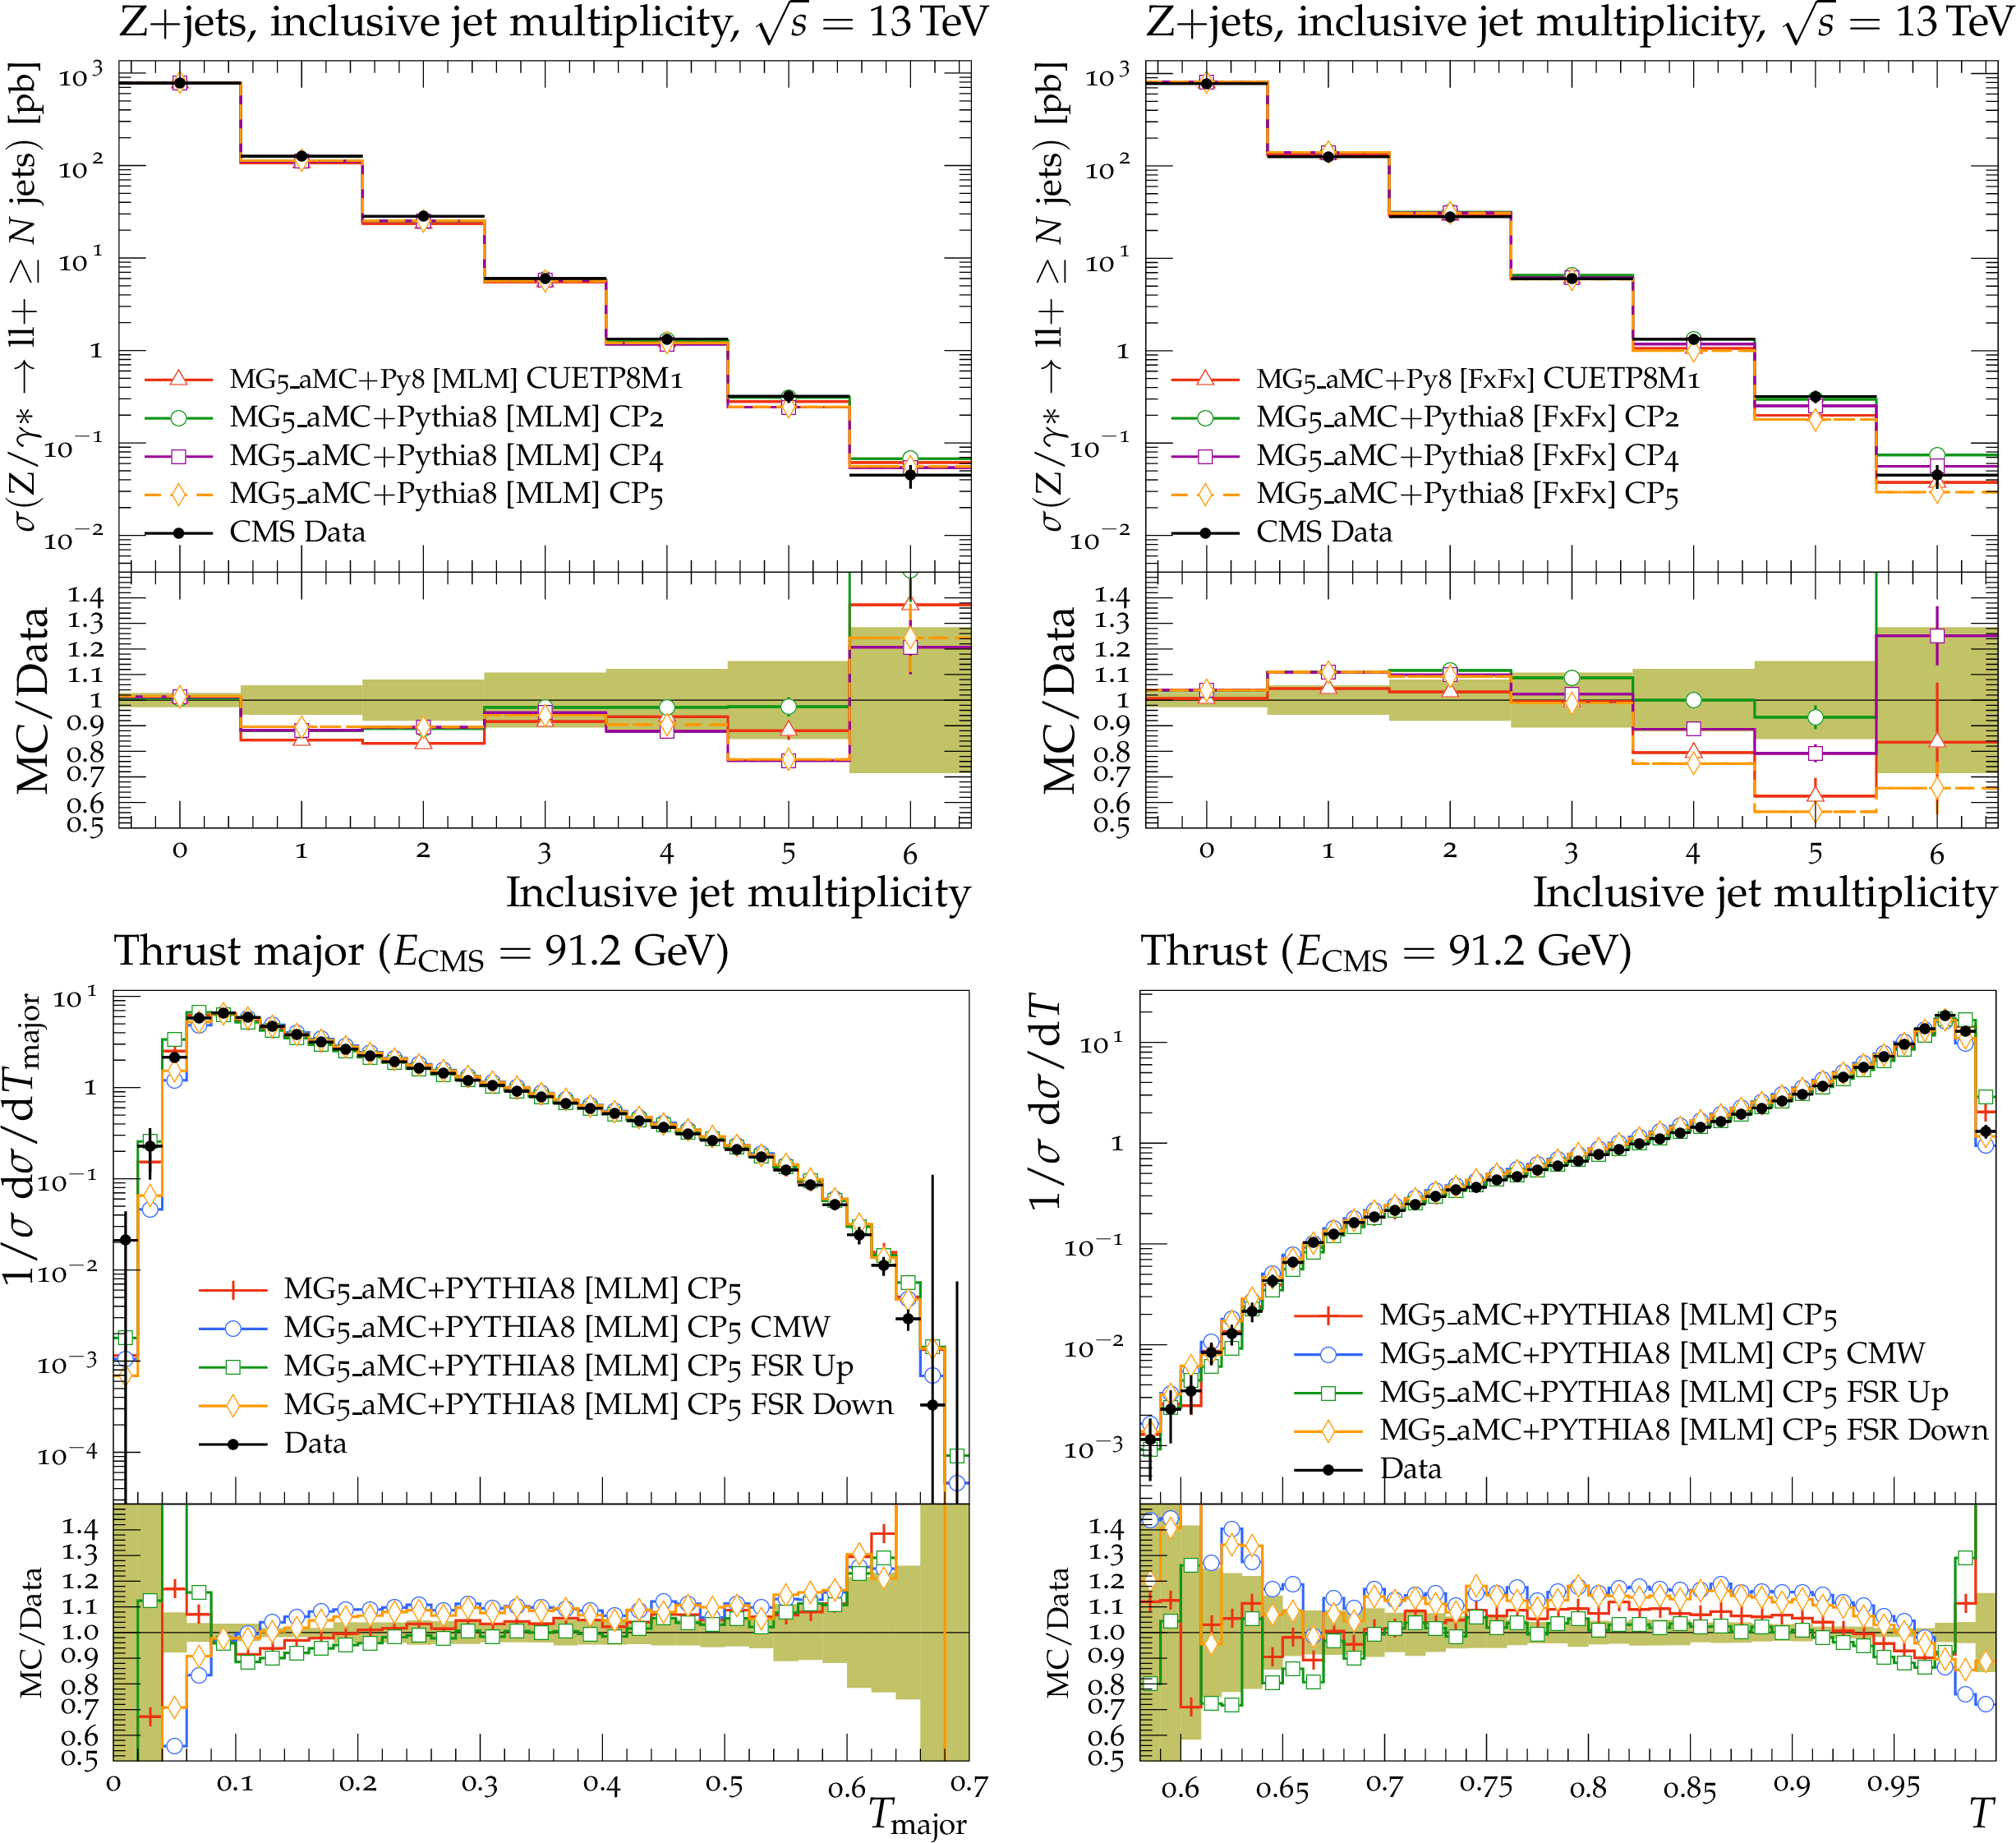
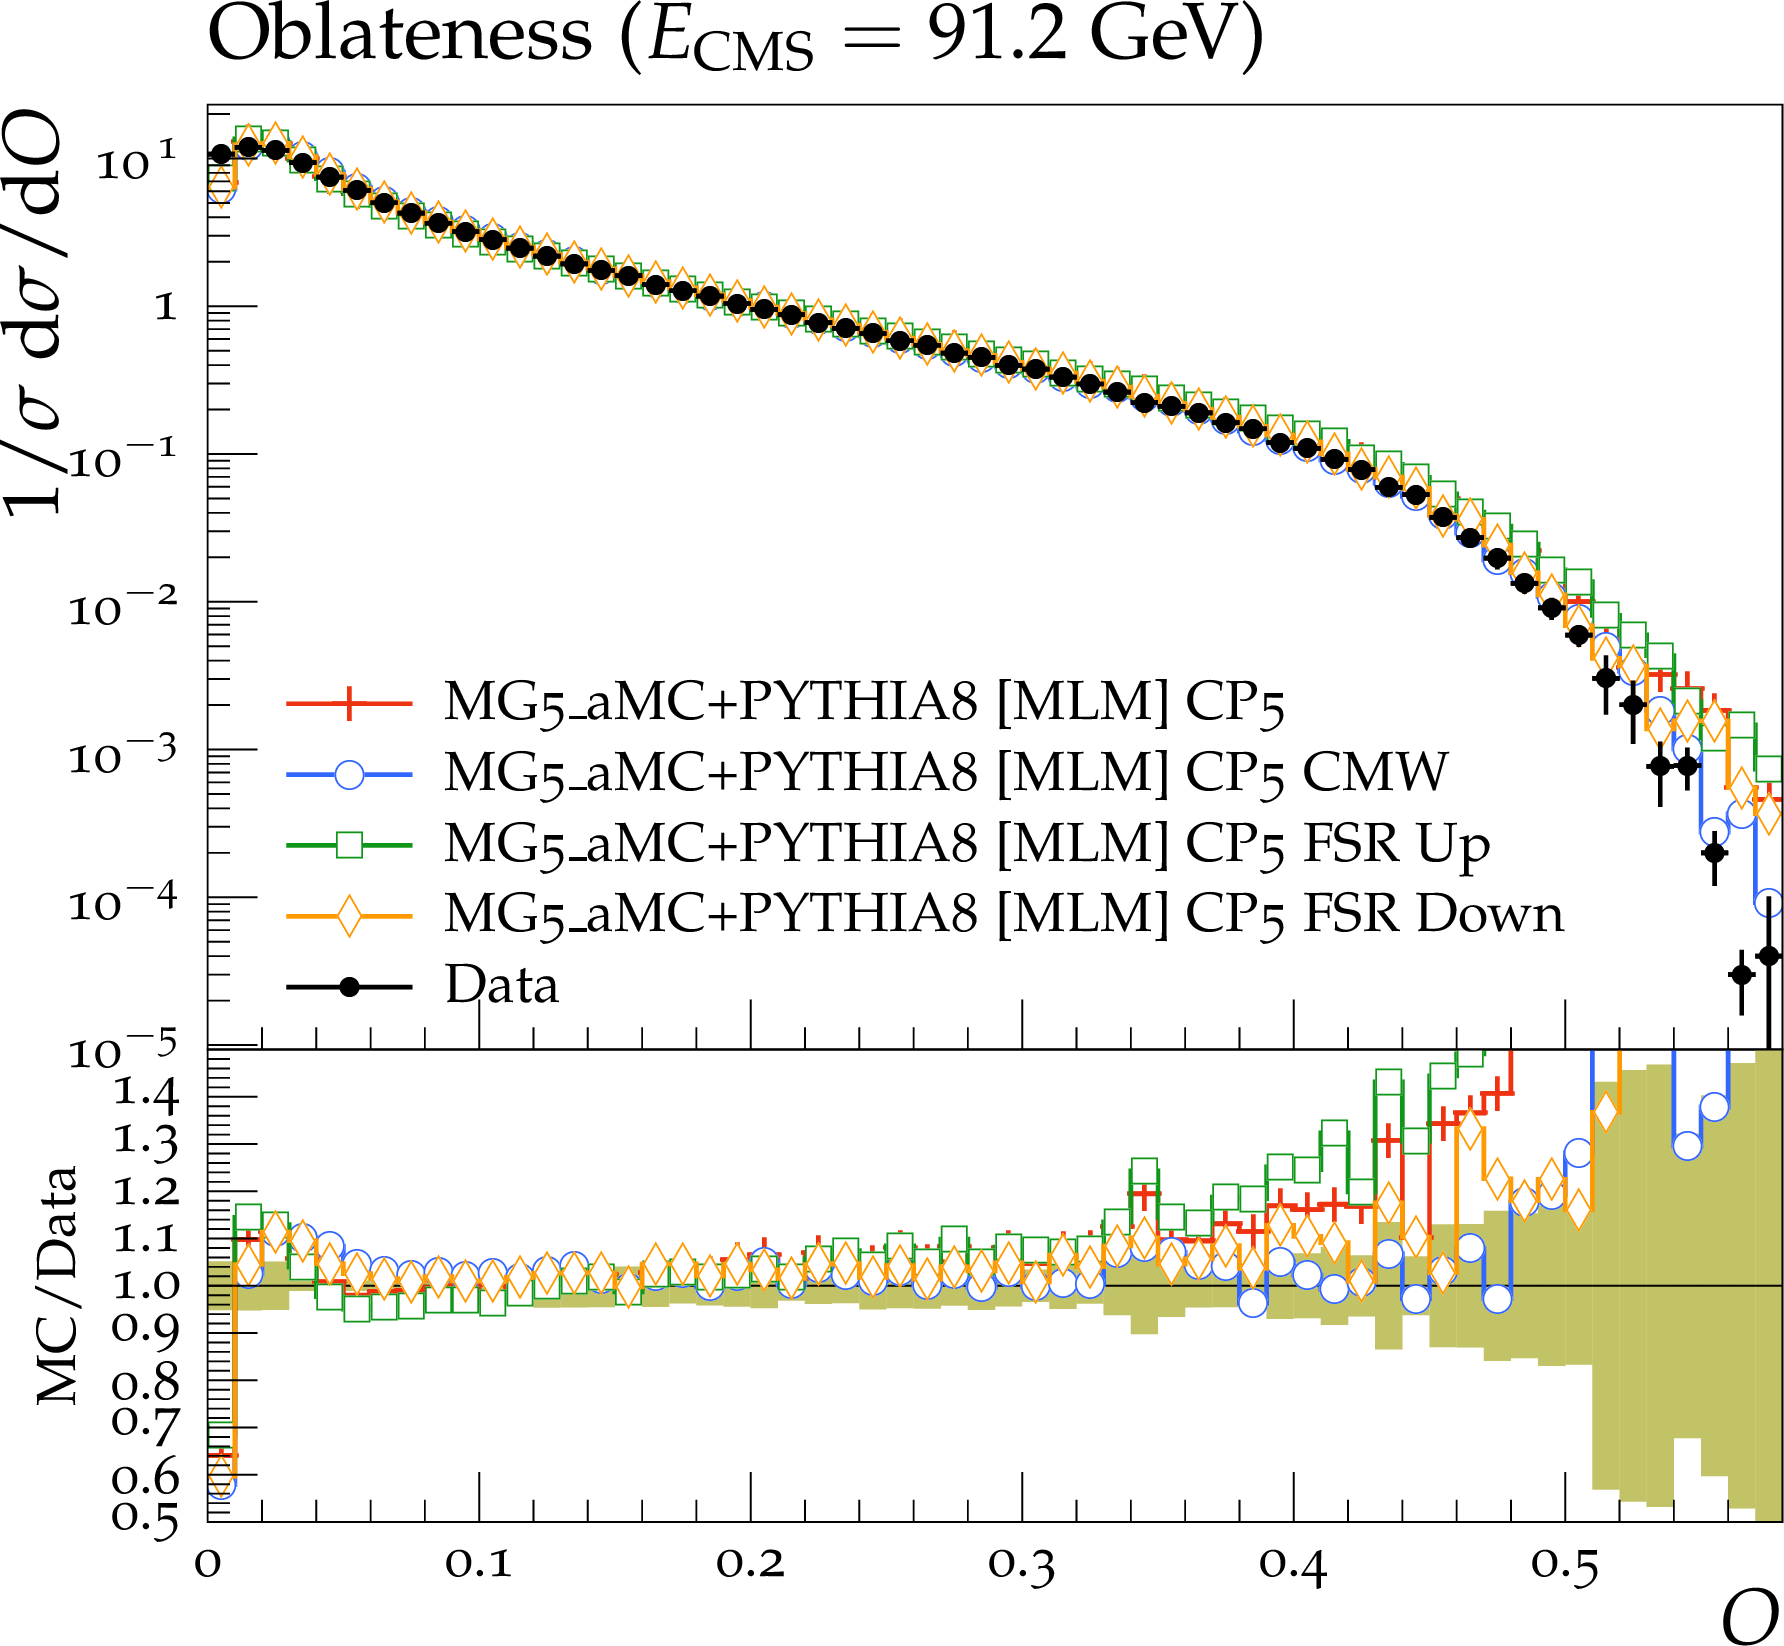
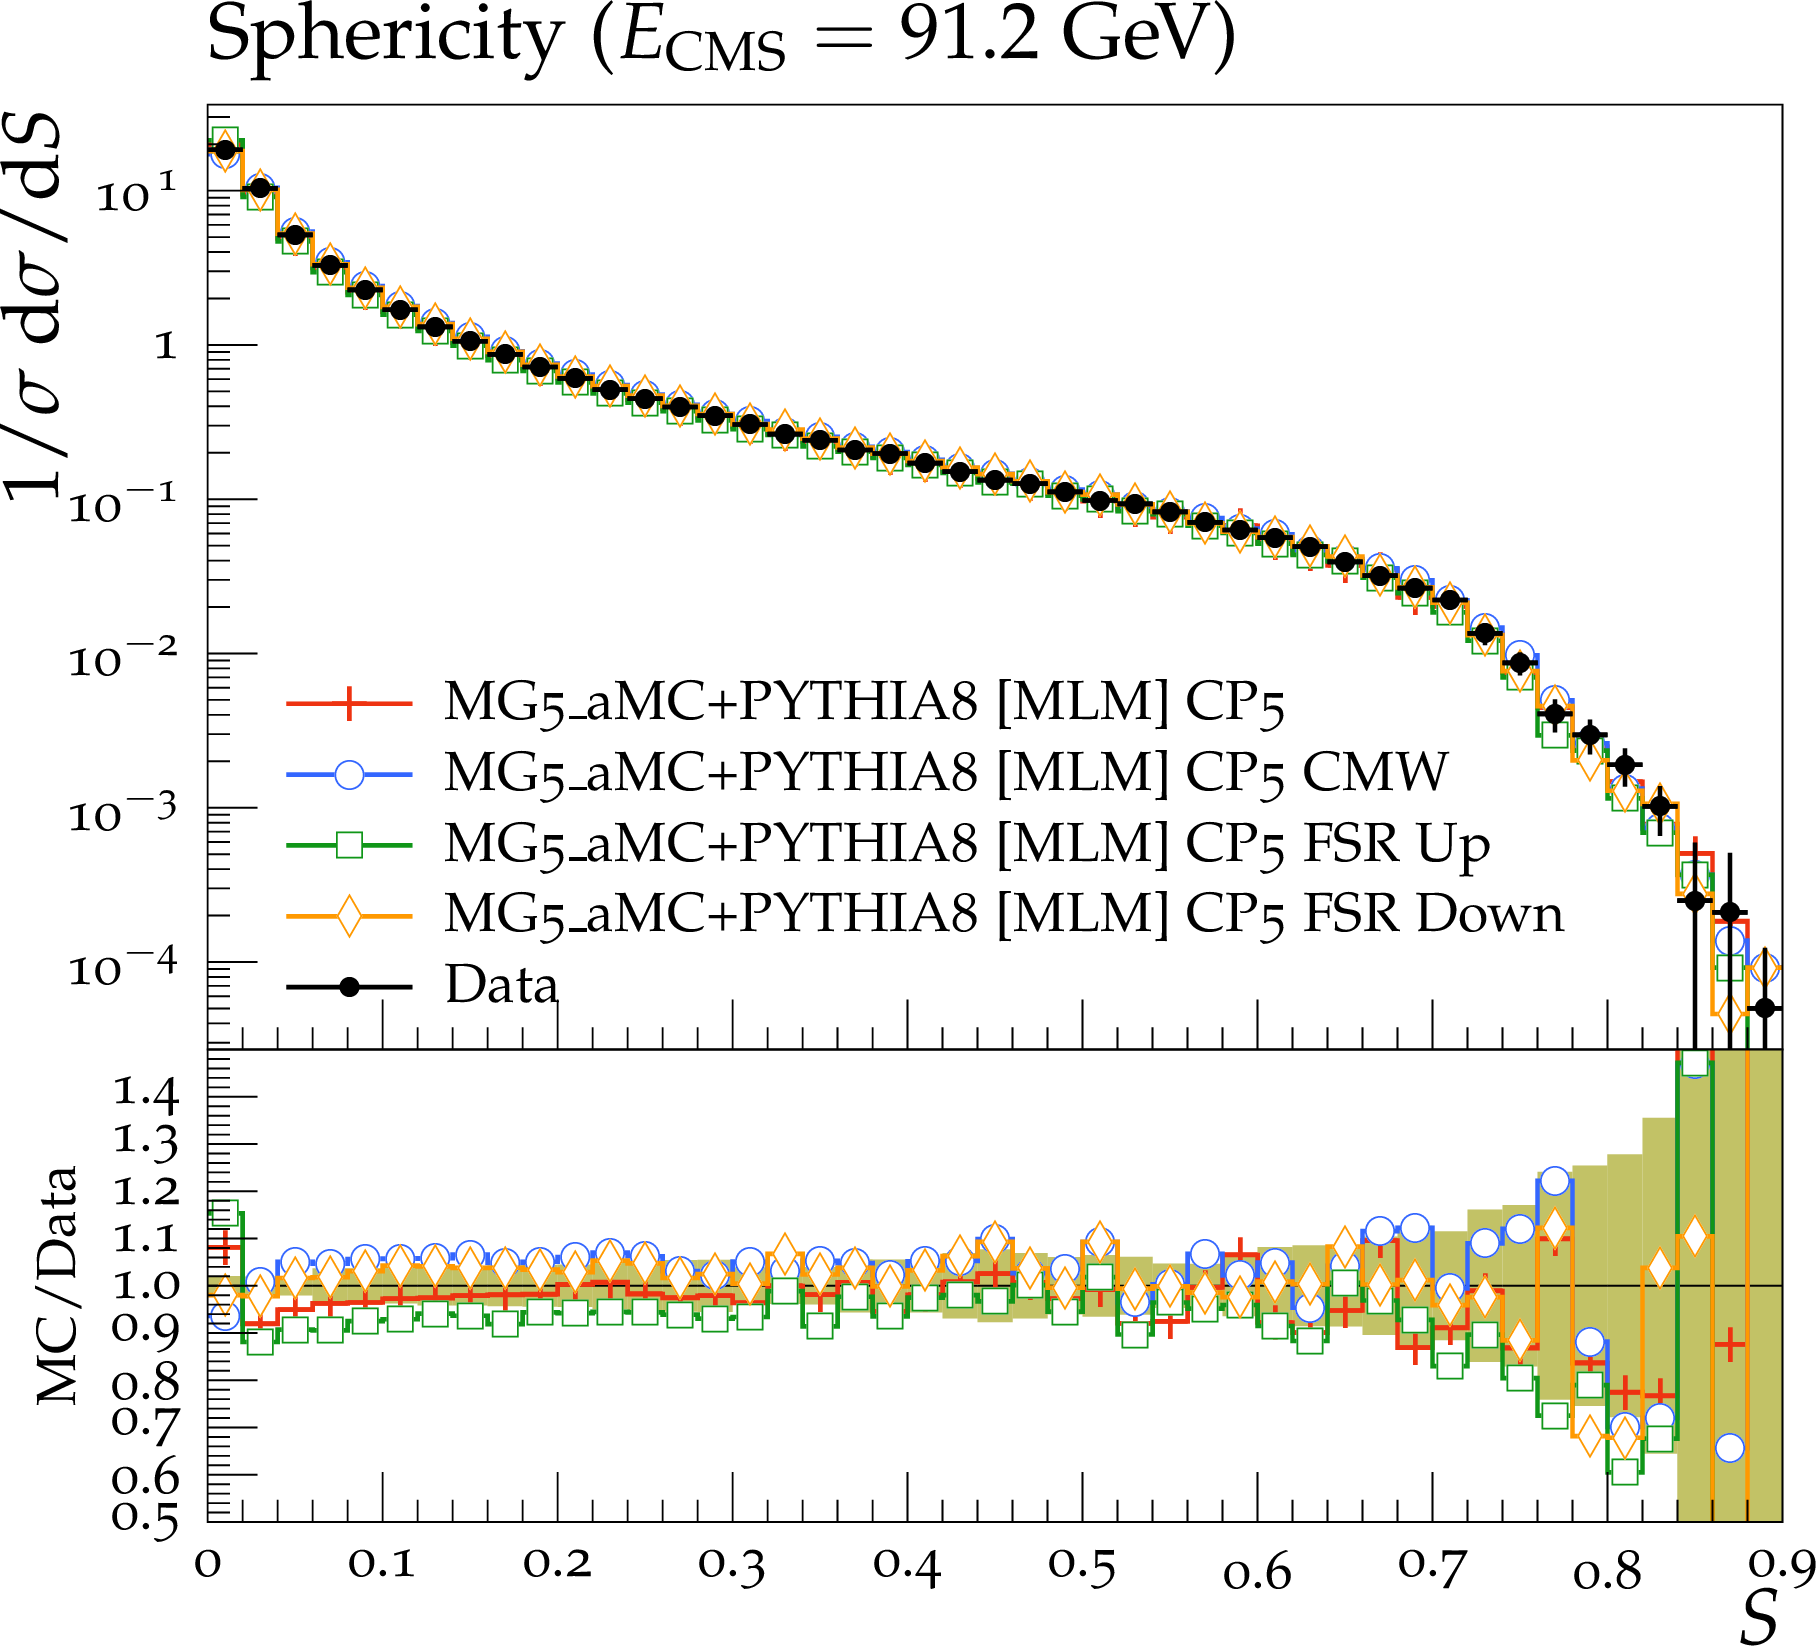
The normalized cross sections as a function of event-shape variables, oblateness (upper left), sphericity (upper right), thrust (lower left), and thrust major (lower right) from the ALEPH $\sqrt {s} = $ 91.2 GeV analysis [45], compared with the predictions by mg5\_amc + PYTHIA 8 with ${k_{\mathrm {T}}} $-MLM merging, for tune CP5, CP5 with CMW rescaling, CP5 FSR up, and CP5 FSR down. The ratio of the simulations to the data (MC/Data) is also shown, where the shaded band indicates the total experimental uncertainty in the data. Vertical lines drawn on the data points refer to the total uncertainty in the data. Vertical lines drawn on the MC points refer to the statistical uncertainty in the predictions. Horizontal bars indicate the associated bin width. |
png pdf |
Figure 12-a:
The normalized cross sections as a function of event-shape variables, oblateness (upper left), sphericity (upper right), thrust (lower left), and thrust major (lower right) from the ALEPH $\sqrt {s} = $ 91.2 GeV analysis [45], compared with the predictions by mg5\_amc + PYTHIA 8 with ${k_{\mathrm {T}}} $-MLM merging, for tune CP5, CP5 with CMW rescaling, CP5 FSR up, and CP5 FSR down. The ratio of the simulations to the data (MC/Data) is also shown, where the shaded band indicates the total experimental uncertainty in the data. Vertical lines drawn on the data points refer to the total uncertainty in the data. Vertical lines drawn on the MC points refer to the statistical uncertainty in the predictions. Horizontal bars indicate the associated bin width. |
png pdf |
Figure 12-b:
The normalized cross sections as a function of event-shape variables, oblateness (upper left), sphericity (upper right), thrust (lower left), and thrust major (lower right) from the ALEPH $\sqrt {s} = $ 91.2 GeV analysis [45], compared with the predictions by mg5\_amc + PYTHIA 8 with ${k_{\mathrm {T}}} $-MLM merging, for tune CP5, CP5 with CMW rescaling, CP5 FSR up, and CP5 FSR down. The ratio of the simulations to the data (MC/Data) is also shown, where the shaded band indicates the total experimental uncertainty in the data. Vertical lines drawn on the data points refer to the total uncertainty in the data. Vertical lines drawn on the MC points refer to the statistical uncertainty in the predictions. Horizontal bars indicate the associated bin width. |

png pdf |
Figure 12-c:
The normalized cross sections as a function of event-shape variables, oblateness (upper left), sphericity (upper right), thrust (lower left), and thrust major (lower right) from the ALEPH $\sqrt {s} = $ 91.2 GeV analysis [45], compared with the predictions by mg5\_amc + PYTHIA 8 with ${k_{\mathrm {T}}} $-MLM merging, for tune CP5, CP5 with CMW rescaling, CP5 FSR up, and CP5 FSR down. The ratio of the simulations to the data (MC/Data) is also shown, where the shaded band indicates the total experimental uncertainty in the data. Vertical lines drawn on the data points refer to the total uncertainty in the data. Vertical lines drawn on the MC points refer to the statistical uncertainty in the predictions. Horizontal bars indicate the associated bin width. |

png pdf |
Figure 12-d:
The normalized cross sections as a function of event-shape variables, oblateness (upper left), sphericity (upper right), thrust (lower left), and thrust major (lower right) from the ALEPH $\sqrt {s} = $ 91.2 GeV analysis [45], compared with the predictions by mg5\_amc + PYTHIA 8 with ${k_{\mathrm {T}}} $-MLM merging, for tune CP5, CP5 with CMW rescaling, CP5 FSR up, and CP5 FSR down. The ratio of the simulations to the data (MC/Data) is also shown, where the shaded band indicates the total experimental uncertainty in the data. Vertical lines drawn on the data points refer to the total uncertainty in the data. Vertical lines drawn on the MC points refer to the statistical uncertainty in the predictions. Horizontal bars indicate the associated bin width. |

png pdf |
Figure 13:
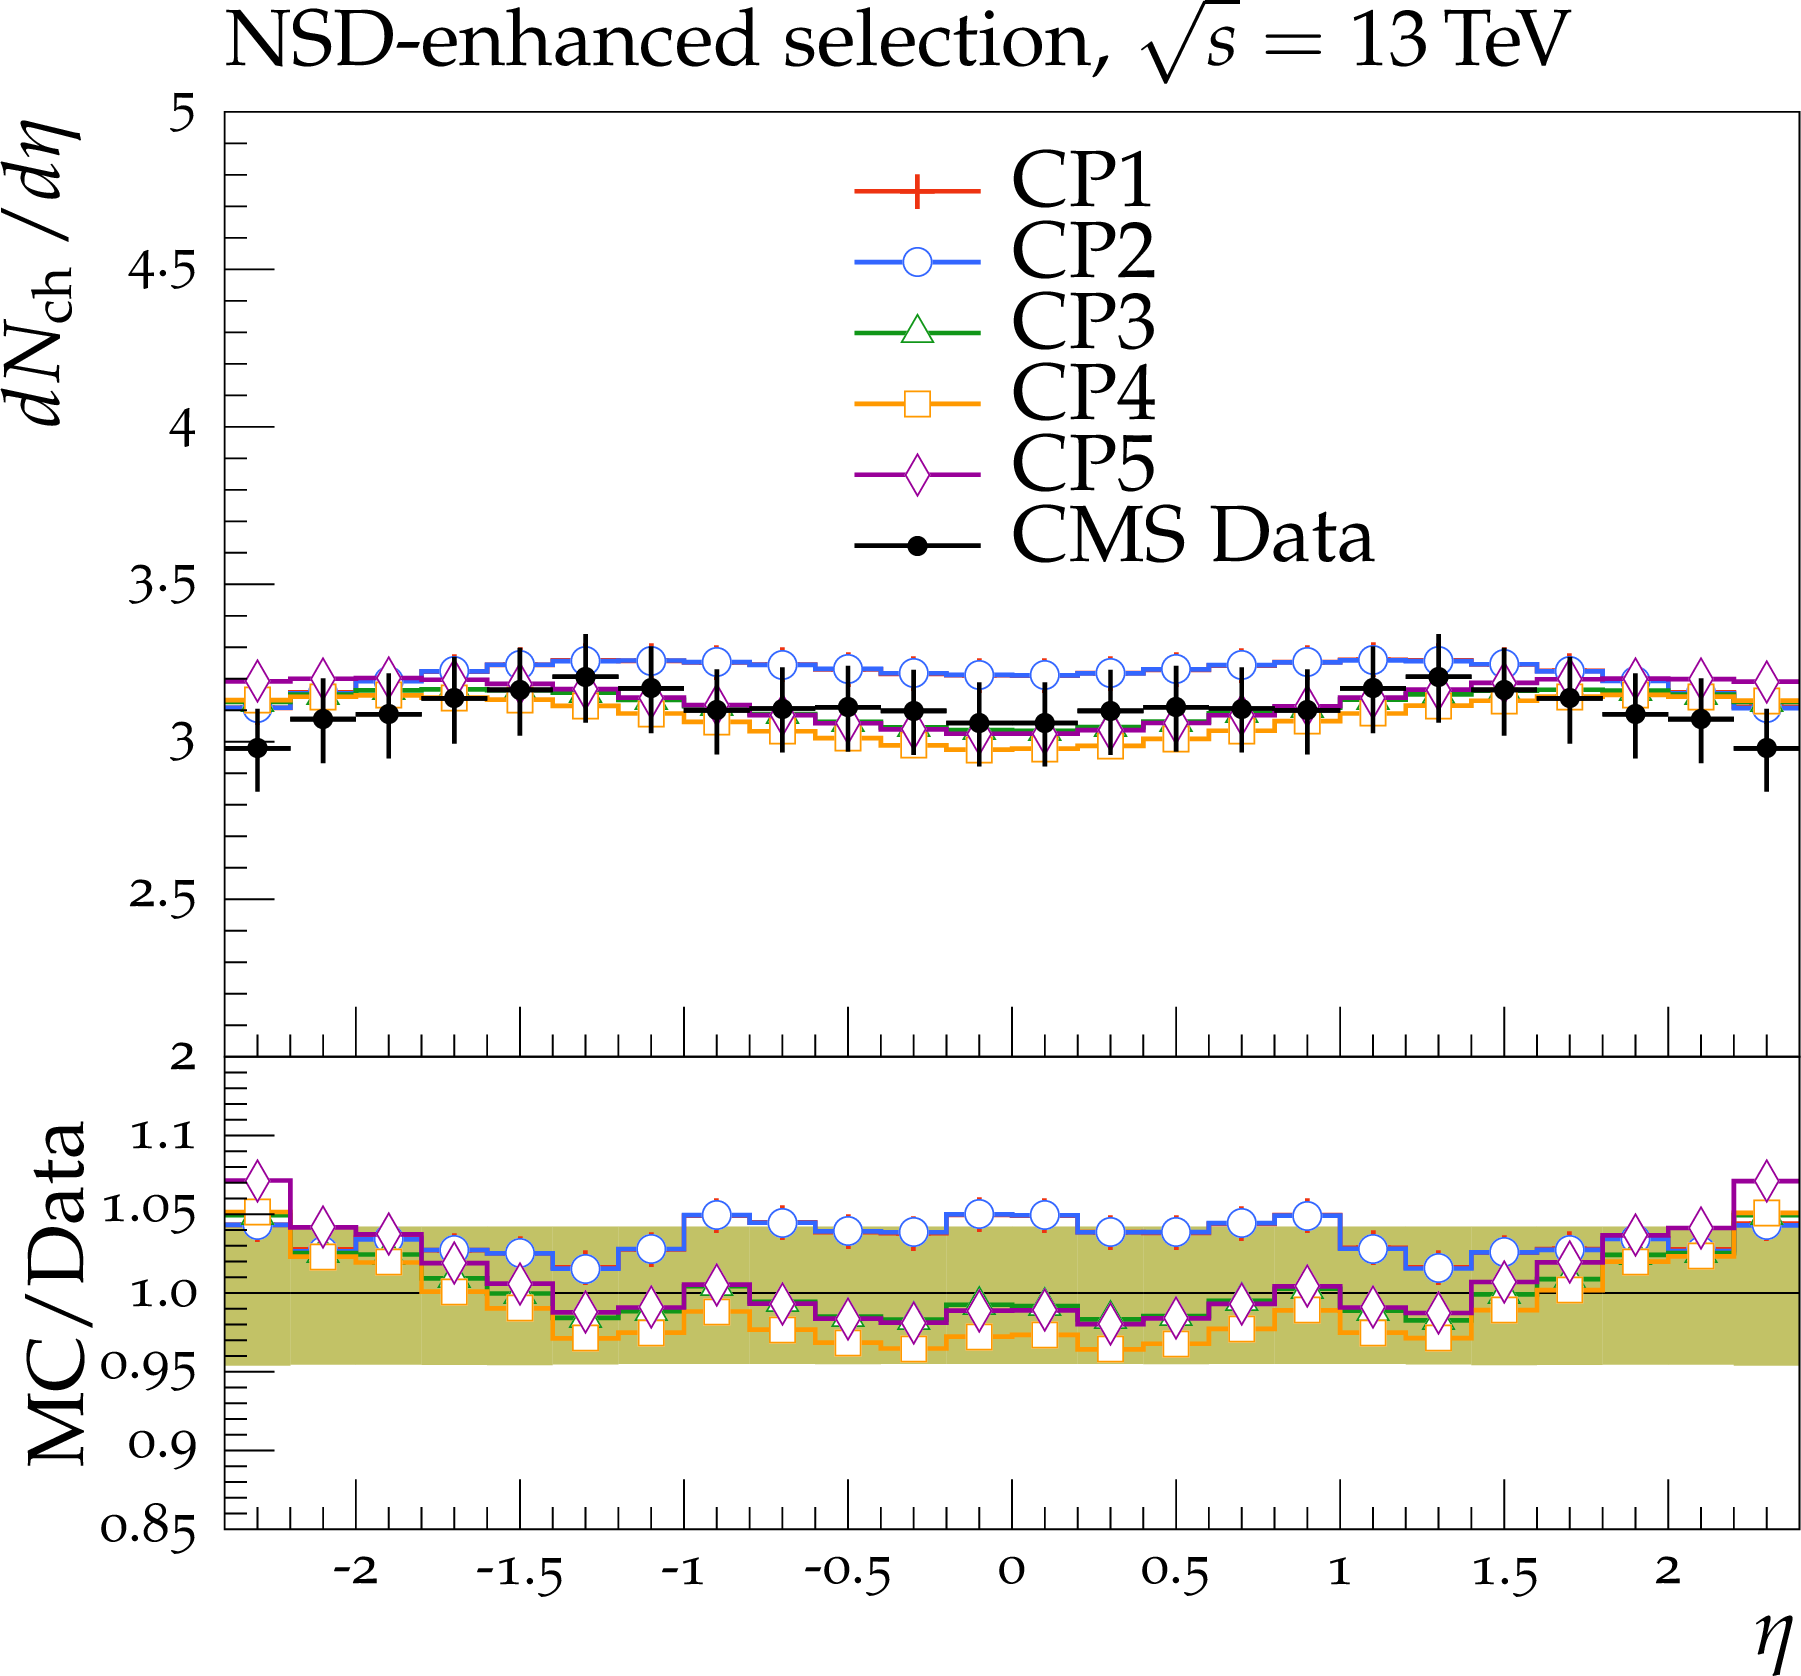
The pseudorapidity distribution ($ {p_{\mathrm {T}}} > $ 0.5 GeV, $ {| \eta |} < $ 2.4) for (left) the NSD-enhanced and (right) the SD-enhanced event selection of charged particles in inelastic proton-proton collisions, from the CMS $\sqrt {s} = $ 13 TeV analysis [24]. The data are compared with the CMS PYTHIA 8 LO-PDF tunes CP1 and CP2, the CMS PYTHIA 8 NLO-PDF tune CP3, and the CMS PYTHIA 8 NNLO-PDF tunes CP4 and CP5. The ratio of the simulations to the data (MC/Data) is also shown, where the shaded band indicates the total experimental uncertainty in the data. Vertical lines drawn on the data points refer to the total uncertainty in the data. Vertical lines drawn on the MC points refer to the statistical uncertainty in the predictions. Horizontal bars indicate the associated bin width. |
png pdf |
Figure 13-a:
The pseudorapidity distribution ($ {p_{\mathrm {T}}} > $ 0.5 GeV, $ {| \eta |} < $ 2.4) for (left) the NSD-enhanced and (right) the SD-enhanced event selection of charged particles in inelastic proton-proton collisions, from the CMS $\sqrt {s} = $ 13 TeV analysis [24]. The data are compared with the CMS PYTHIA 8 LO-PDF tunes CP1 and CP2, the CMS PYTHIA 8 NLO-PDF tune CP3, and the CMS PYTHIA 8 NNLO-PDF tunes CP4 and CP5. The ratio of the simulations to the data (MC/Data) is also shown, where the shaded band indicates the total experimental uncertainty in the data. Vertical lines drawn on the data points refer to the total uncertainty in the data. Vertical lines drawn on the MC points refer to the statistical uncertainty in the predictions. Horizontal bars indicate the associated bin width. |

png pdf |
Figure 13-b:
The pseudorapidity distribution ($ {p_{\mathrm {T}}} > $ 0.5 GeV, $ {| \eta |} < $ 2.4) for (left) the NSD-enhanced and (right) the SD-enhanced event selection of charged particles in inelastic proton-proton collisions, from the CMS $\sqrt {s} = $ 13 TeV analysis [24]. The data are compared with the CMS PYTHIA 8 LO-PDF tunes CP1 and CP2, the CMS PYTHIA 8 NLO-PDF tune CP3, and the CMS PYTHIA 8 NNLO-PDF tunes CP4 and CP5. The ratio of the simulations to the data (MC/Data) is also shown, where the shaded band indicates the total experimental uncertainty in the data. Vertical lines drawn on the data points refer to the total uncertainty in the data. Vertical lines drawn on the MC points refer to the statistical uncertainty in the predictions. Horizontal bars indicate the associated bin width. |
png pdf |
Figure 14:
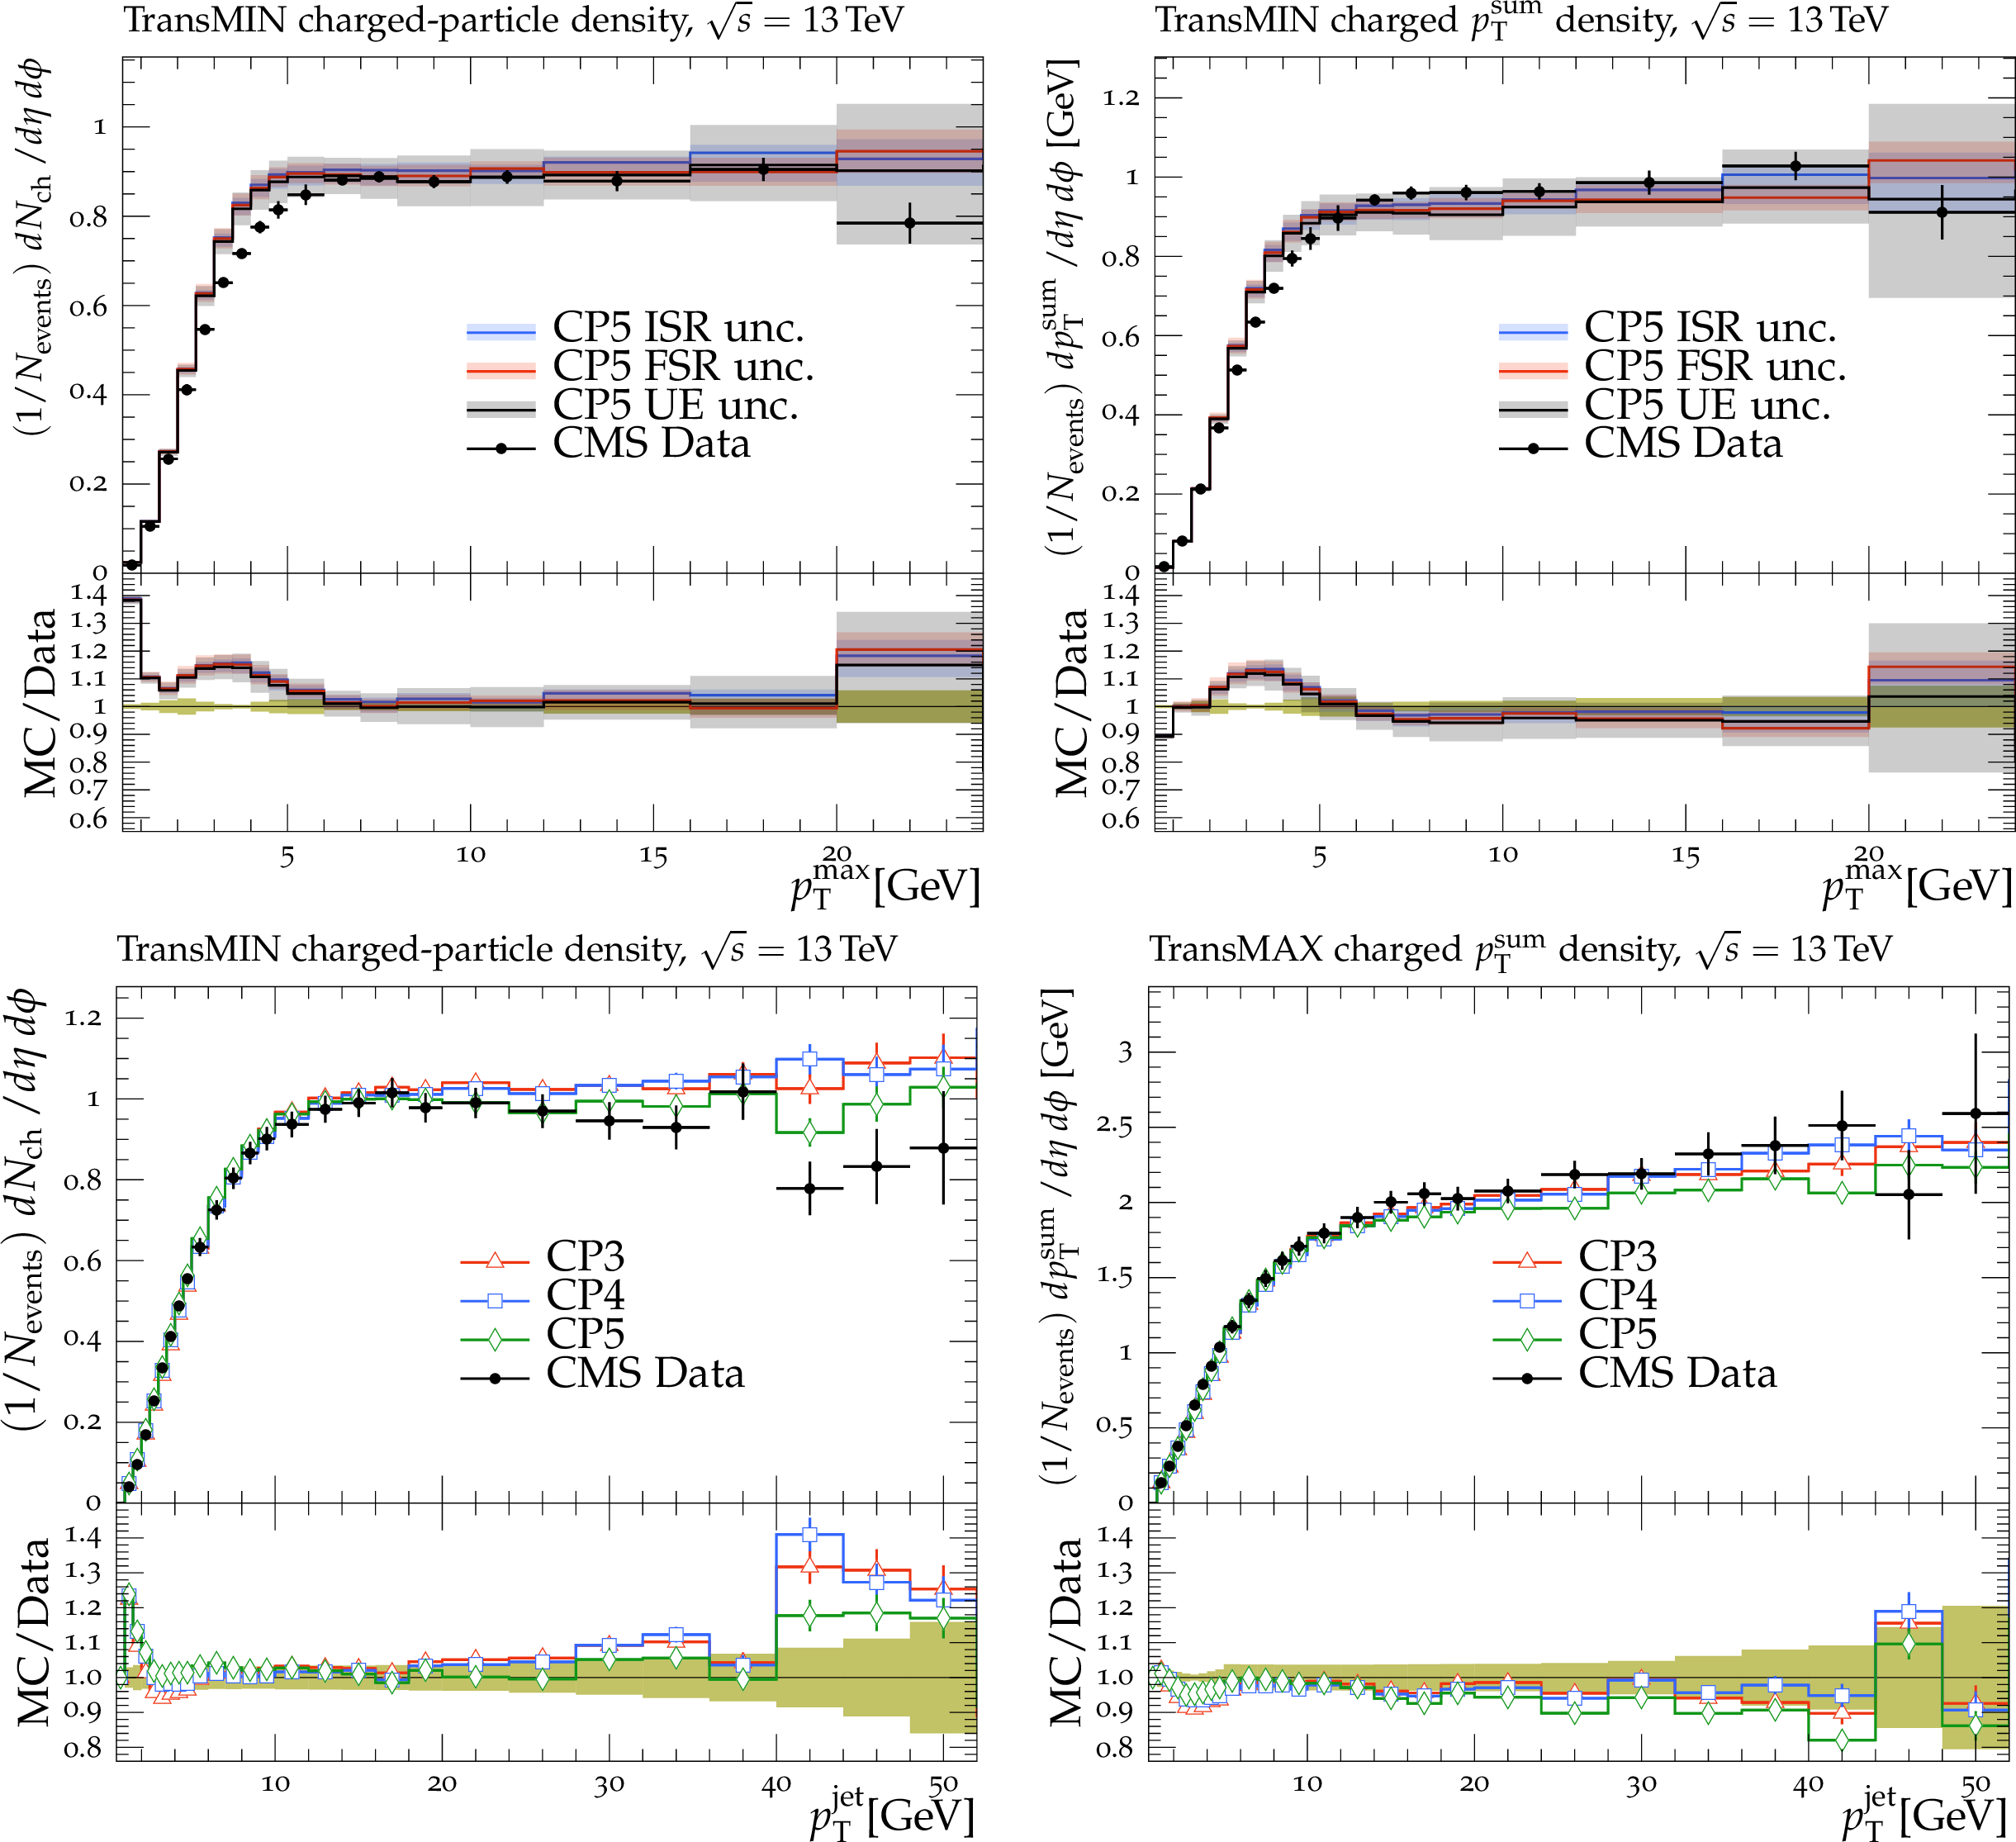
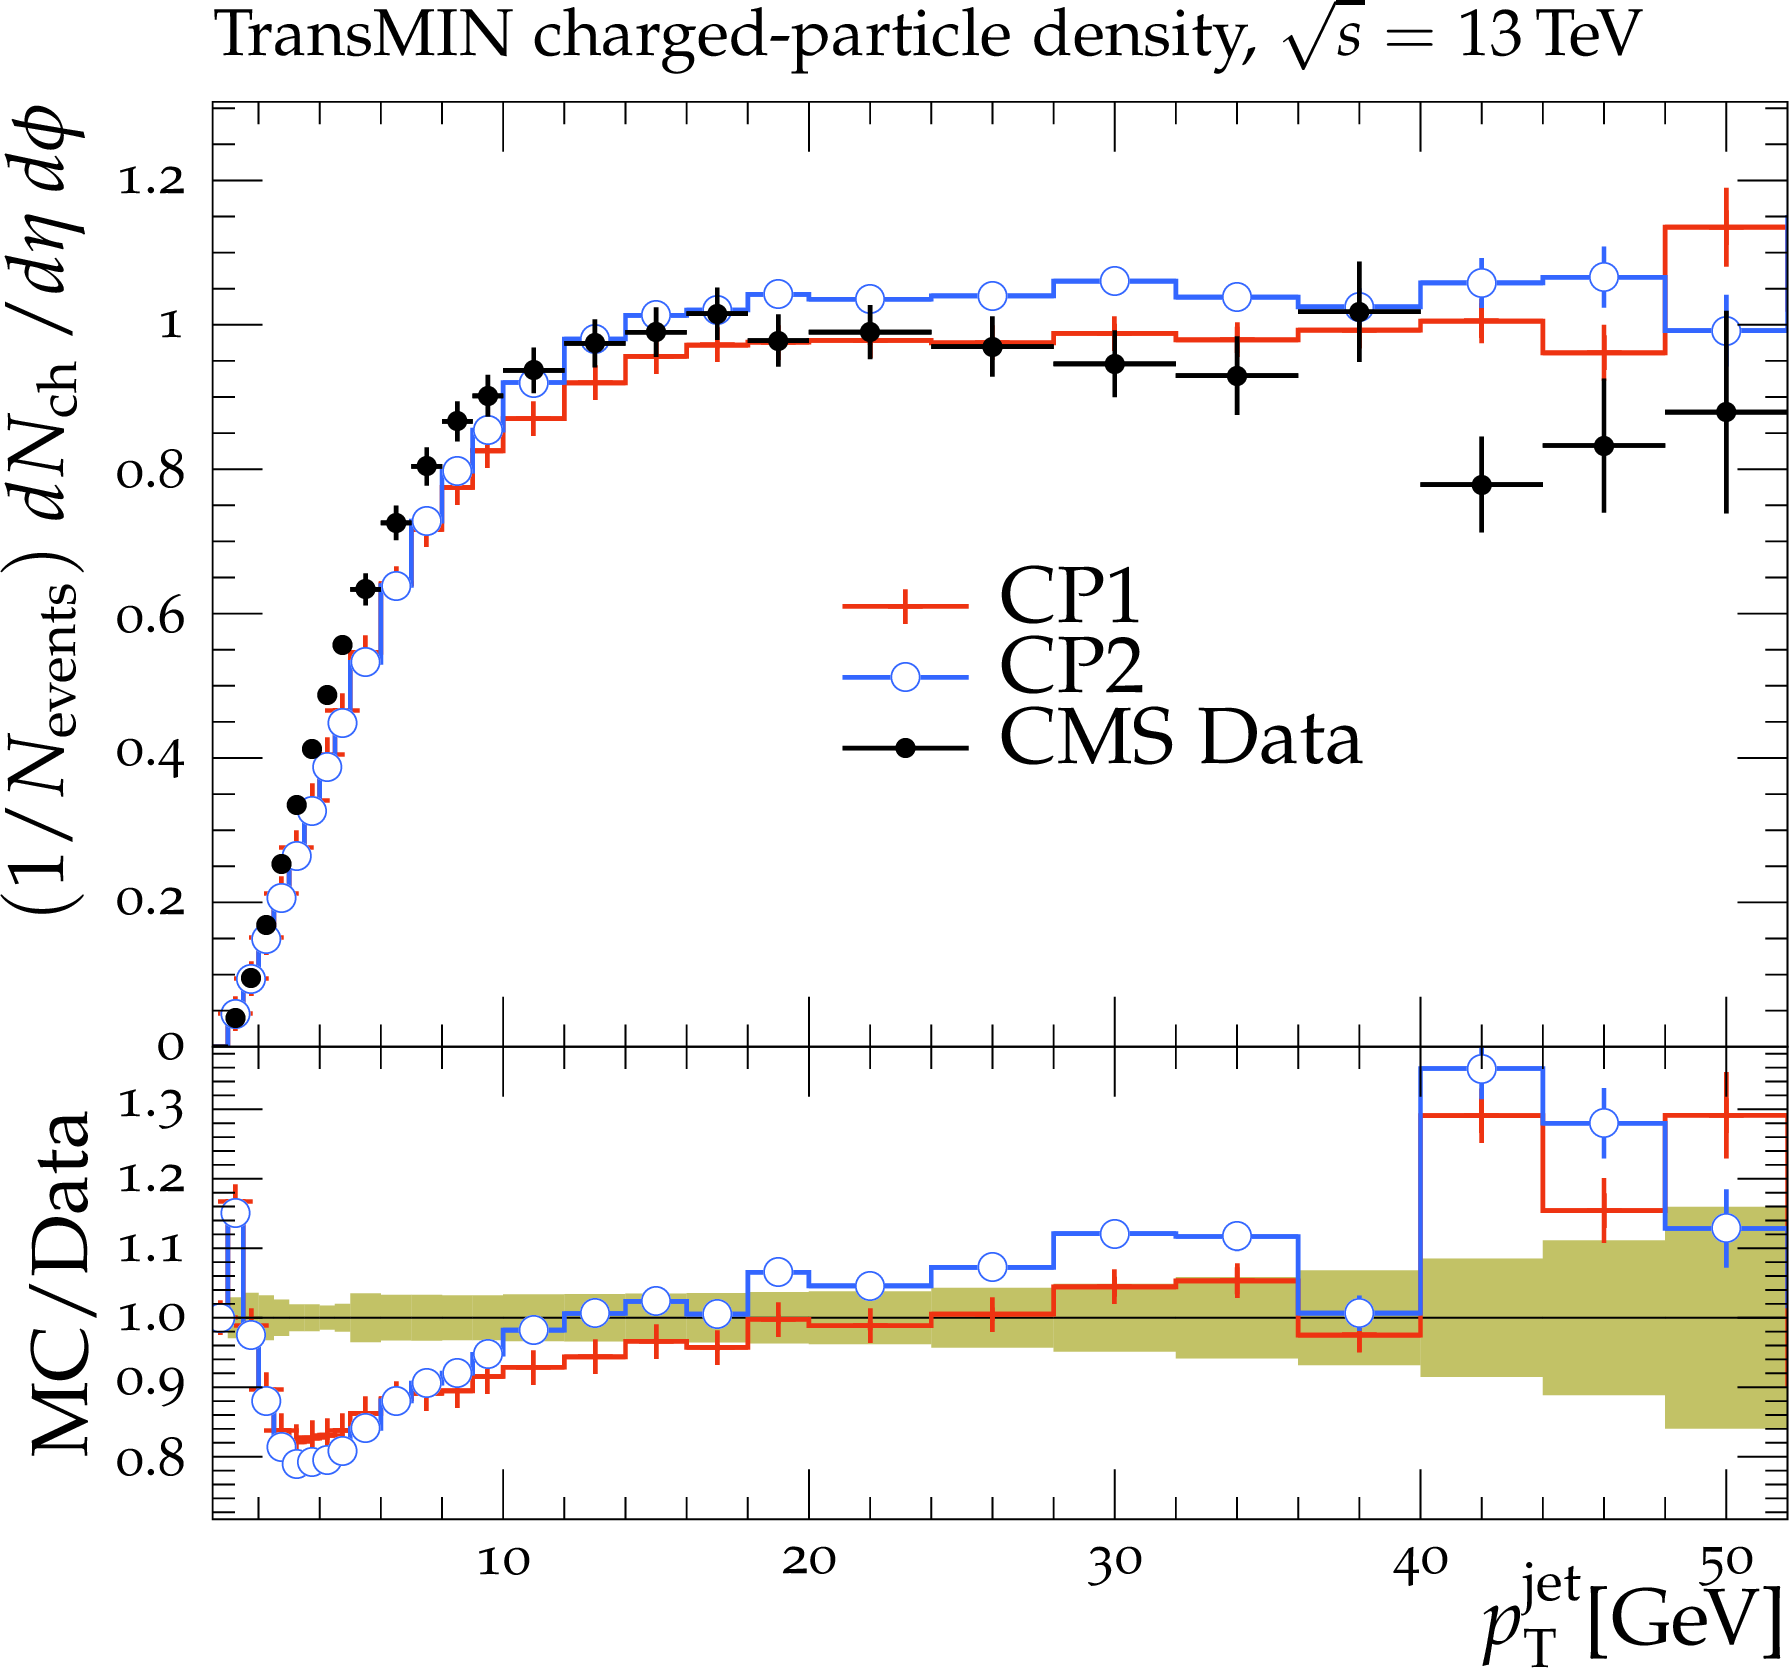
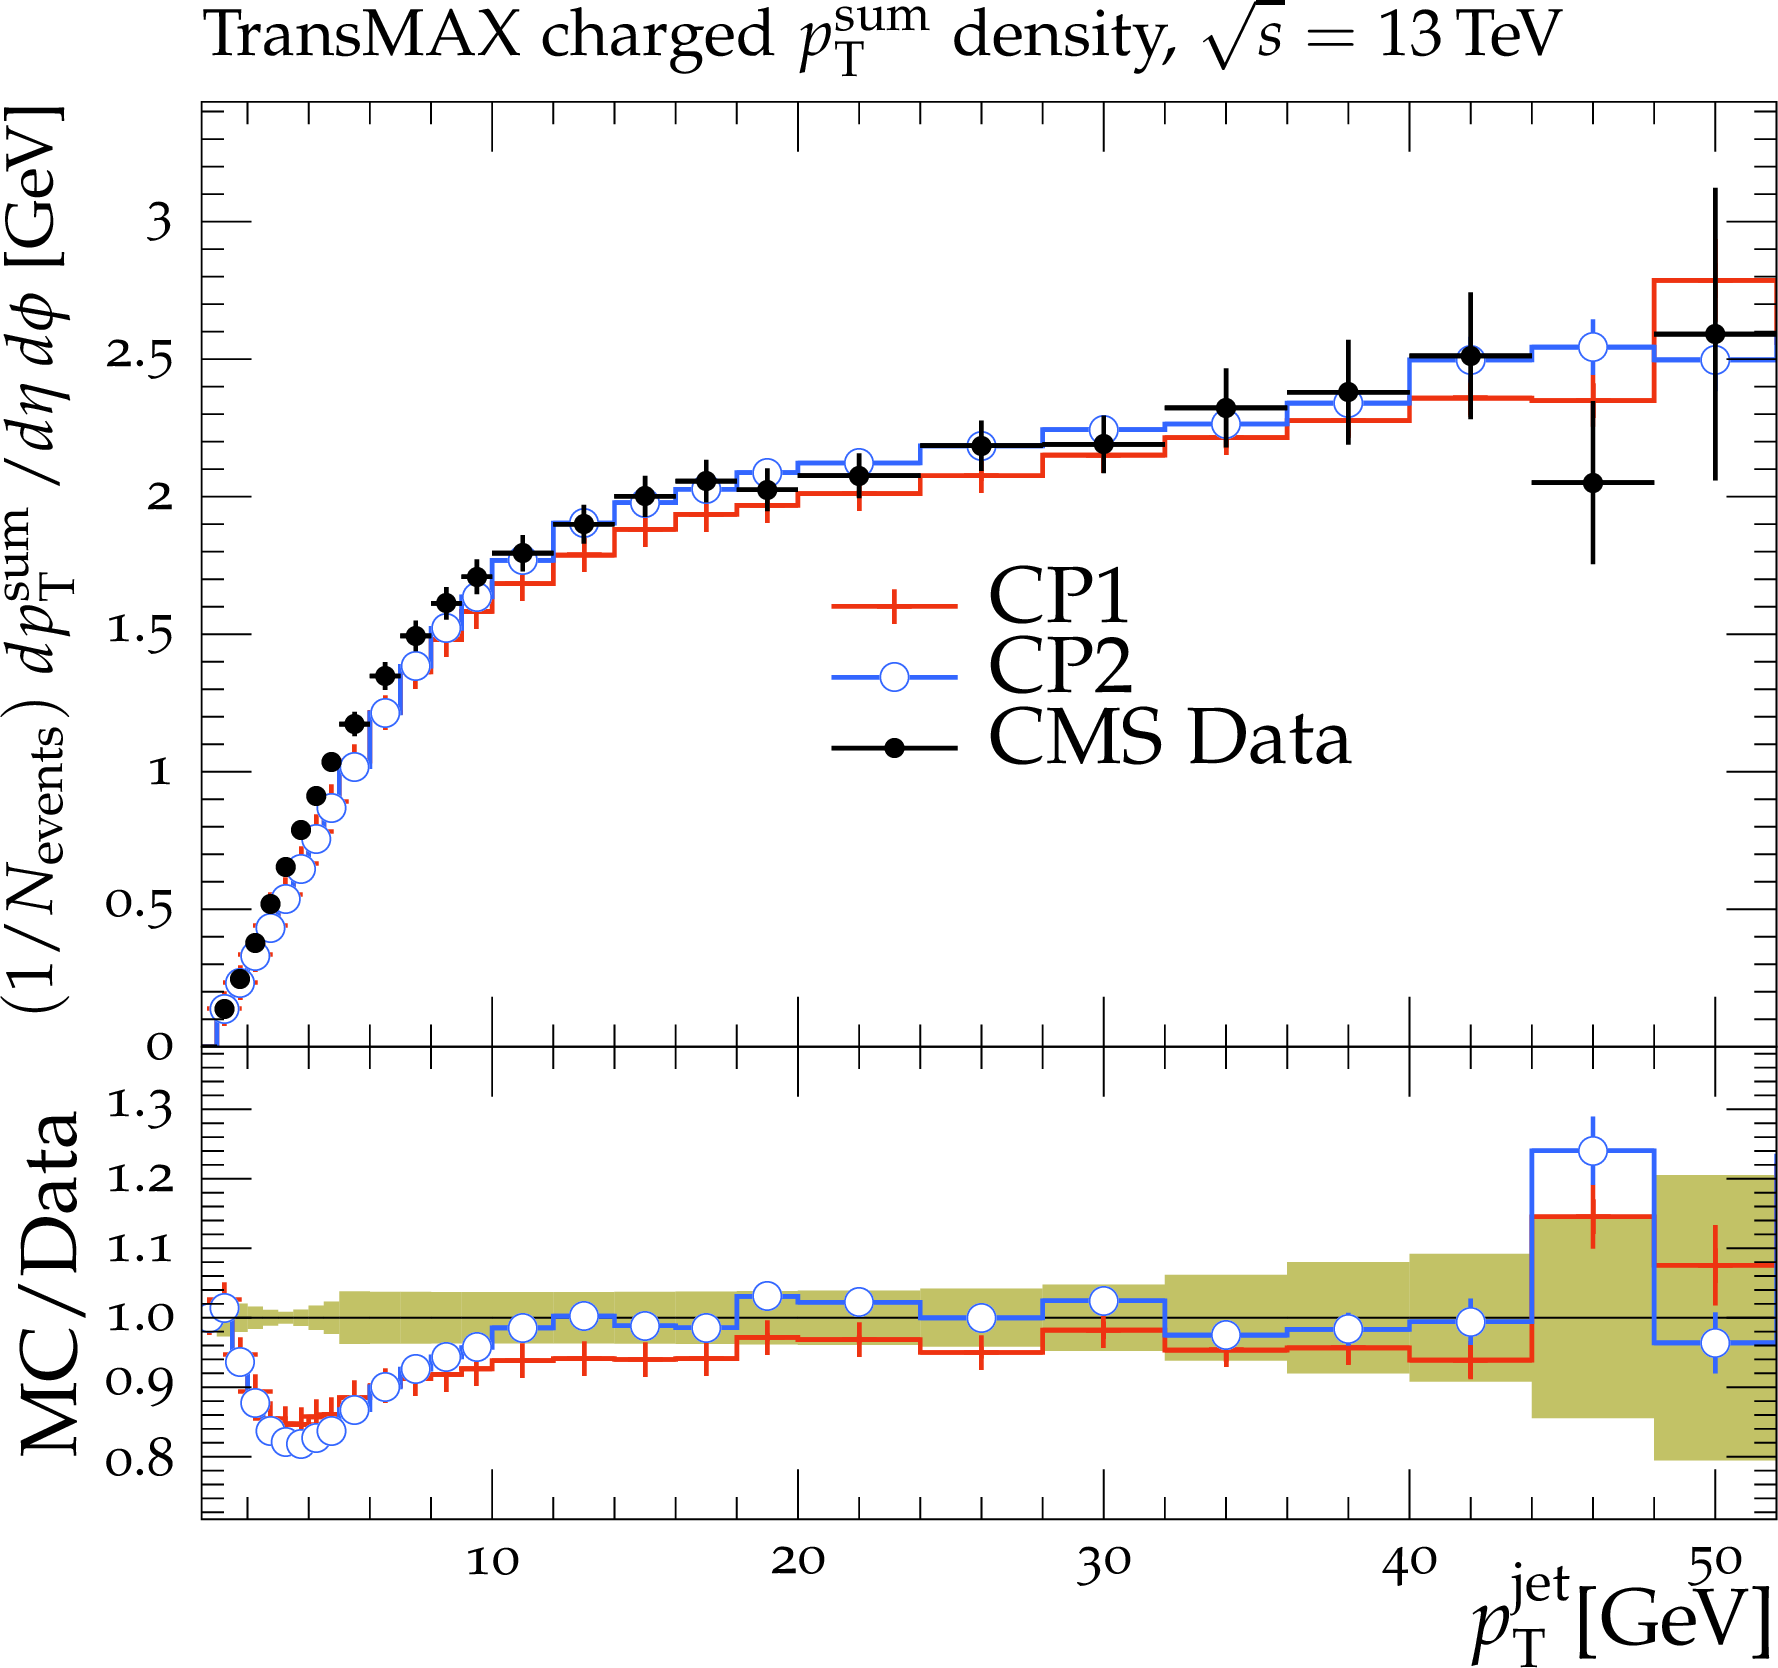
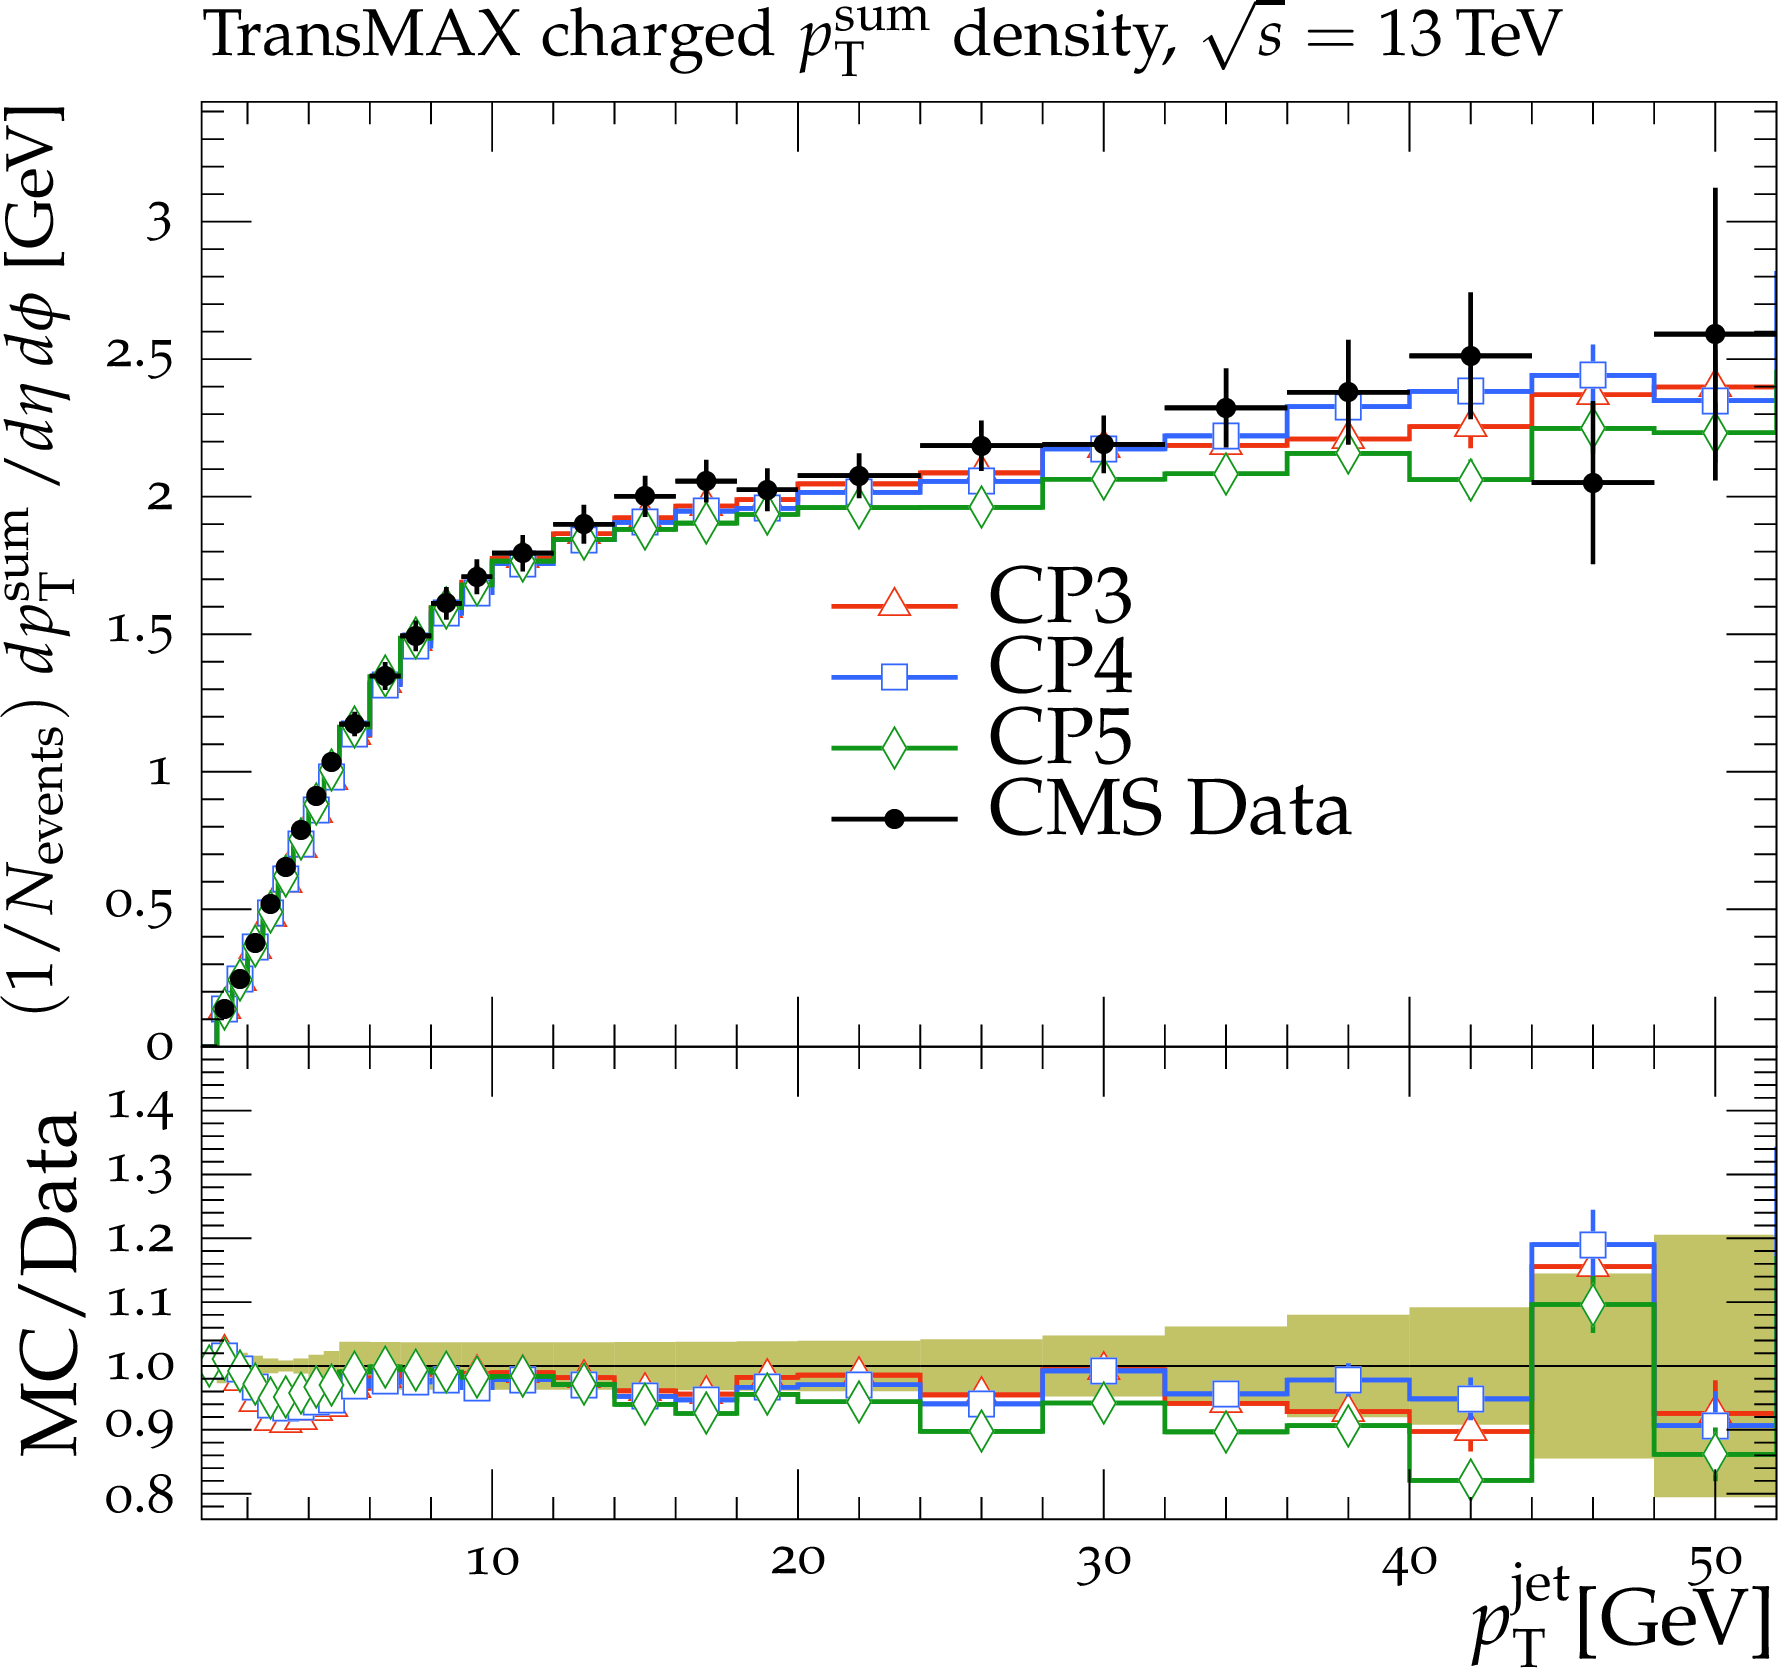
The transMIN charged-particle multiplicity (left column) and ${p_{\mathrm {T}}}$ sum densities (right column) for particles with $ {p_{\mathrm {T}}} > $ 0.5 GeV in $ {| \eta |} < $ 2.0 as a function of the transverse momentum of the leading charged-particle jet, $ {p_{\mathrm {T}}} ^\text {jet}$, from the CMS $\sqrt {s} = $ 13 TeV analysis [16]. The upper-row plots show the LO tunes, while the lower-row plots show the higher-order tunes. The ratio of the simulations to the data (MC/Data) is also shown, where the shaded band indicates the total experimental uncertainty in the data. Vertical lines drawn on the data points refer to the total uncertainty in the data. Vertical lines drawn on the MC points refer to the statistical uncertainty in the predictions. Horizontal bars indicate the associated bin width. |
png pdf |
Figure 14-a:
The transMIN charged-particle multiplicity (left column) and ${p_{\mathrm {T}}}$ sum densities (right column) for particles with $ {p_{\mathrm {T}}} > $ 0.5 GeV in $ {| \eta |} < $ 2.0 as a function of the transverse momentum of the leading charged-particle jet, $ {p_{\mathrm {T}}} ^\text {jet}$, from the CMS $\sqrt {s} = $ 13 TeV analysis [16]. The upper-row plots show the LO tunes, while the lower-row plots show the higher-order tunes. The ratio of the simulations to the data (MC/Data) is also shown, where the shaded band indicates the total experimental uncertainty in the data. Vertical lines drawn on the data points refer to the total uncertainty in the data. Vertical lines drawn on the MC points refer to the statistical uncertainty in the predictions. Horizontal bars indicate the associated bin width. |
png pdf |
Figure 14-b:
The transMIN charged-particle multiplicity (left column) and ${p_{\mathrm {T}}}$ sum densities (right column) for particles with $ {p_{\mathrm {T}}} > $ 0.5 GeV in $ {| \eta |} < $ 2.0 as a function of the transverse momentum of the leading charged-particle jet, $ {p_{\mathrm {T}}} ^\text {jet}$, from the CMS $\sqrt {s} = $ 13 TeV analysis [16]. The upper-row plots show the LO tunes, while the lower-row plots show the higher-order tunes. The ratio of the simulations to the data (MC/Data) is also shown, where the shaded band indicates the total experimental uncertainty in the data. Vertical lines drawn on the data points refer to the total uncertainty in the data. Vertical lines drawn on the MC points refer to the statistical uncertainty in the predictions. Horizontal bars indicate the associated bin width. |

png pdf |
Figure 14-c:
The transMIN charged-particle multiplicity (left column) and ${p_{\mathrm {T}}}$ sum densities (right column) for particles with $ {p_{\mathrm {T}}} > $ 0.5 GeV in $ {| \eta |} < $ 2.0 as a function of the transverse momentum of the leading charged-particle jet, $ {p_{\mathrm {T}}} ^\text {jet}$, from the CMS $\sqrt {s} = $ 13 TeV analysis [16]. The upper-row plots show the LO tunes, while the lower-row plots show the higher-order tunes. The ratio of the simulations to the data (MC/Data) is also shown, where the shaded band indicates the total experimental uncertainty in the data. Vertical lines drawn on the data points refer to the total uncertainty in the data. Vertical lines drawn on the MC points refer to the statistical uncertainty in the predictions. Horizontal bars indicate the associated bin width. |
png pdf |
Figure 14-d:
The transMIN charged-particle multiplicity (left column) and ${p_{\mathrm {T}}}$ sum densities (right column) for particles with $ {p_{\mathrm {T}}} > $ 0.5 GeV in $ {| \eta |} < $ 2.0 as a function of the transverse momentum of the leading charged-particle jet, $ {p_{\mathrm {T}}} ^\text {jet}$, from the CMS $\sqrt {s} = $ 13 TeV analysis [16]. The upper-row plots show the LO tunes, while the lower-row plots show the higher-order tunes. The ratio of the simulations to the data (MC/Data) is also shown, where the shaded band indicates the total experimental uncertainty in the data. Vertical lines drawn on the data points refer to the total uncertainty in the data. Vertical lines drawn on the MC points refer to the statistical uncertainty in the predictions. Horizontal bars indicate the associated bin width. |

png pdf |
Figure 15:
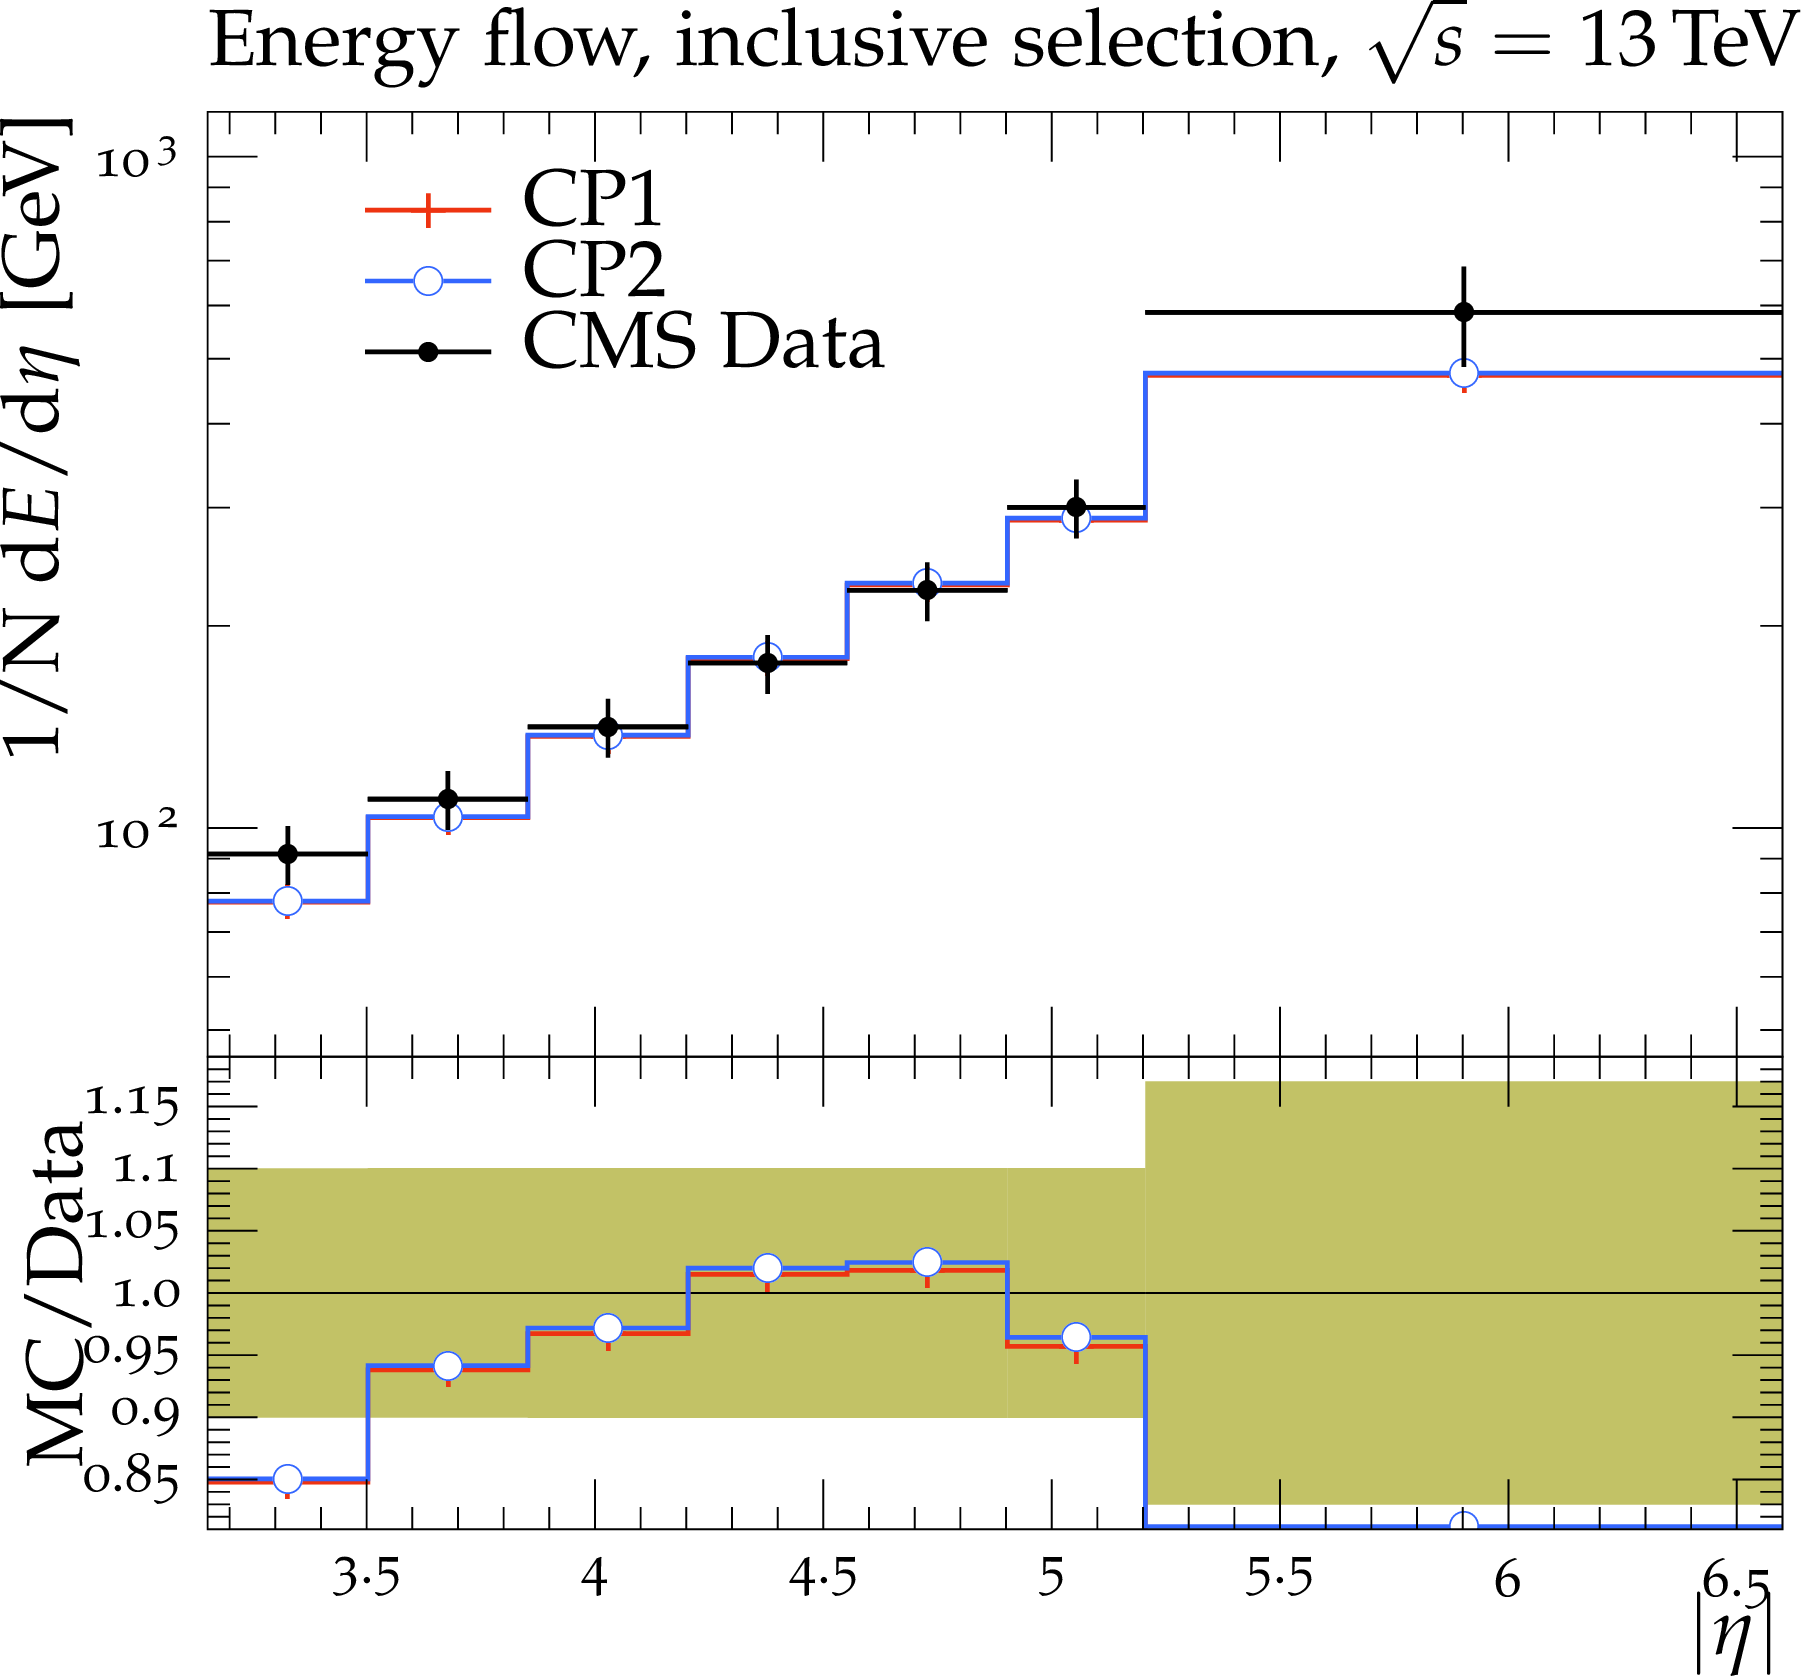
The energy flow measured in an inclusive selection as a function of pseudorapidity, from the CMS $\sqrt {s} = $ 13 TeV analysis [47]. The data are compared with (left) the CMS PYTHIA 8 LO-PDF tunes CP1 and CP2, and with (right) the CMS PYTHIA 8 NLO-PDF tune CP3 and the CMS PYTHIA 8 NNLO-PDF tunes CP4 and CP5. The ratio of the simulations to the data (MC/Data) is also shown, where the shaded band indicates the total experimental uncertainty in the data. Vertical lines drawn on the data points refer to the total uncertainty in the data. Vertical lines drawn on the MC points refer to the statistical uncertainty in the predictions. Horizontal bars indicate the associated bin width. |
png pdf |
Figure 15-a:
The energy flow measured in an inclusive selection as a function of pseudorapidity, from the CMS $\sqrt {s} = $ 13 TeV analysis [47]. The data are compared with (left) the CMS PYTHIA 8 LO-PDF tunes CP1 and CP2, and with (right) the CMS PYTHIA 8 NLO-PDF tune CP3 and the CMS PYTHIA 8 NNLO-PDF tunes CP4 and CP5. The ratio of the simulations to the data (MC/Data) is also shown, where the shaded band indicates the total experimental uncertainty in the data. Vertical lines drawn on the data points refer to the total uncertainty in the data. Vertical lines drawn on the MC points refer to the statistical uncertainty in the predictions. Horizontal bars indicate the associated bin width. |

png pdf |
Figure 15-b:
The energy flow measured in an inclusive selection as a function of pseudorapidity, from the CMS $\sqrt {s} = $ 13 TeV analysis [47]. The data are compared with (left) the CMS PYTHIA 8 LO-PDF tunes CP1 and CP2, and with (right) the CMS PYTHIA 8 NLO-PDF tune CP3 and the CMS PYTHIA 8 NNLO-PDF tunes CP4 and CP5. The ratio of the simulations to the data (MC/Data) is also shown, where the shaded band indicates the total experimental uncertainty in the data. Vertical lines drawn on the data points refer to the total uncertainty in the data. Vertical lines drawn on the MC points refer to the statistical uncertainty in the predictions. Horizontal bars indicate the associated bin width. |
png pdf |
Figure 16:
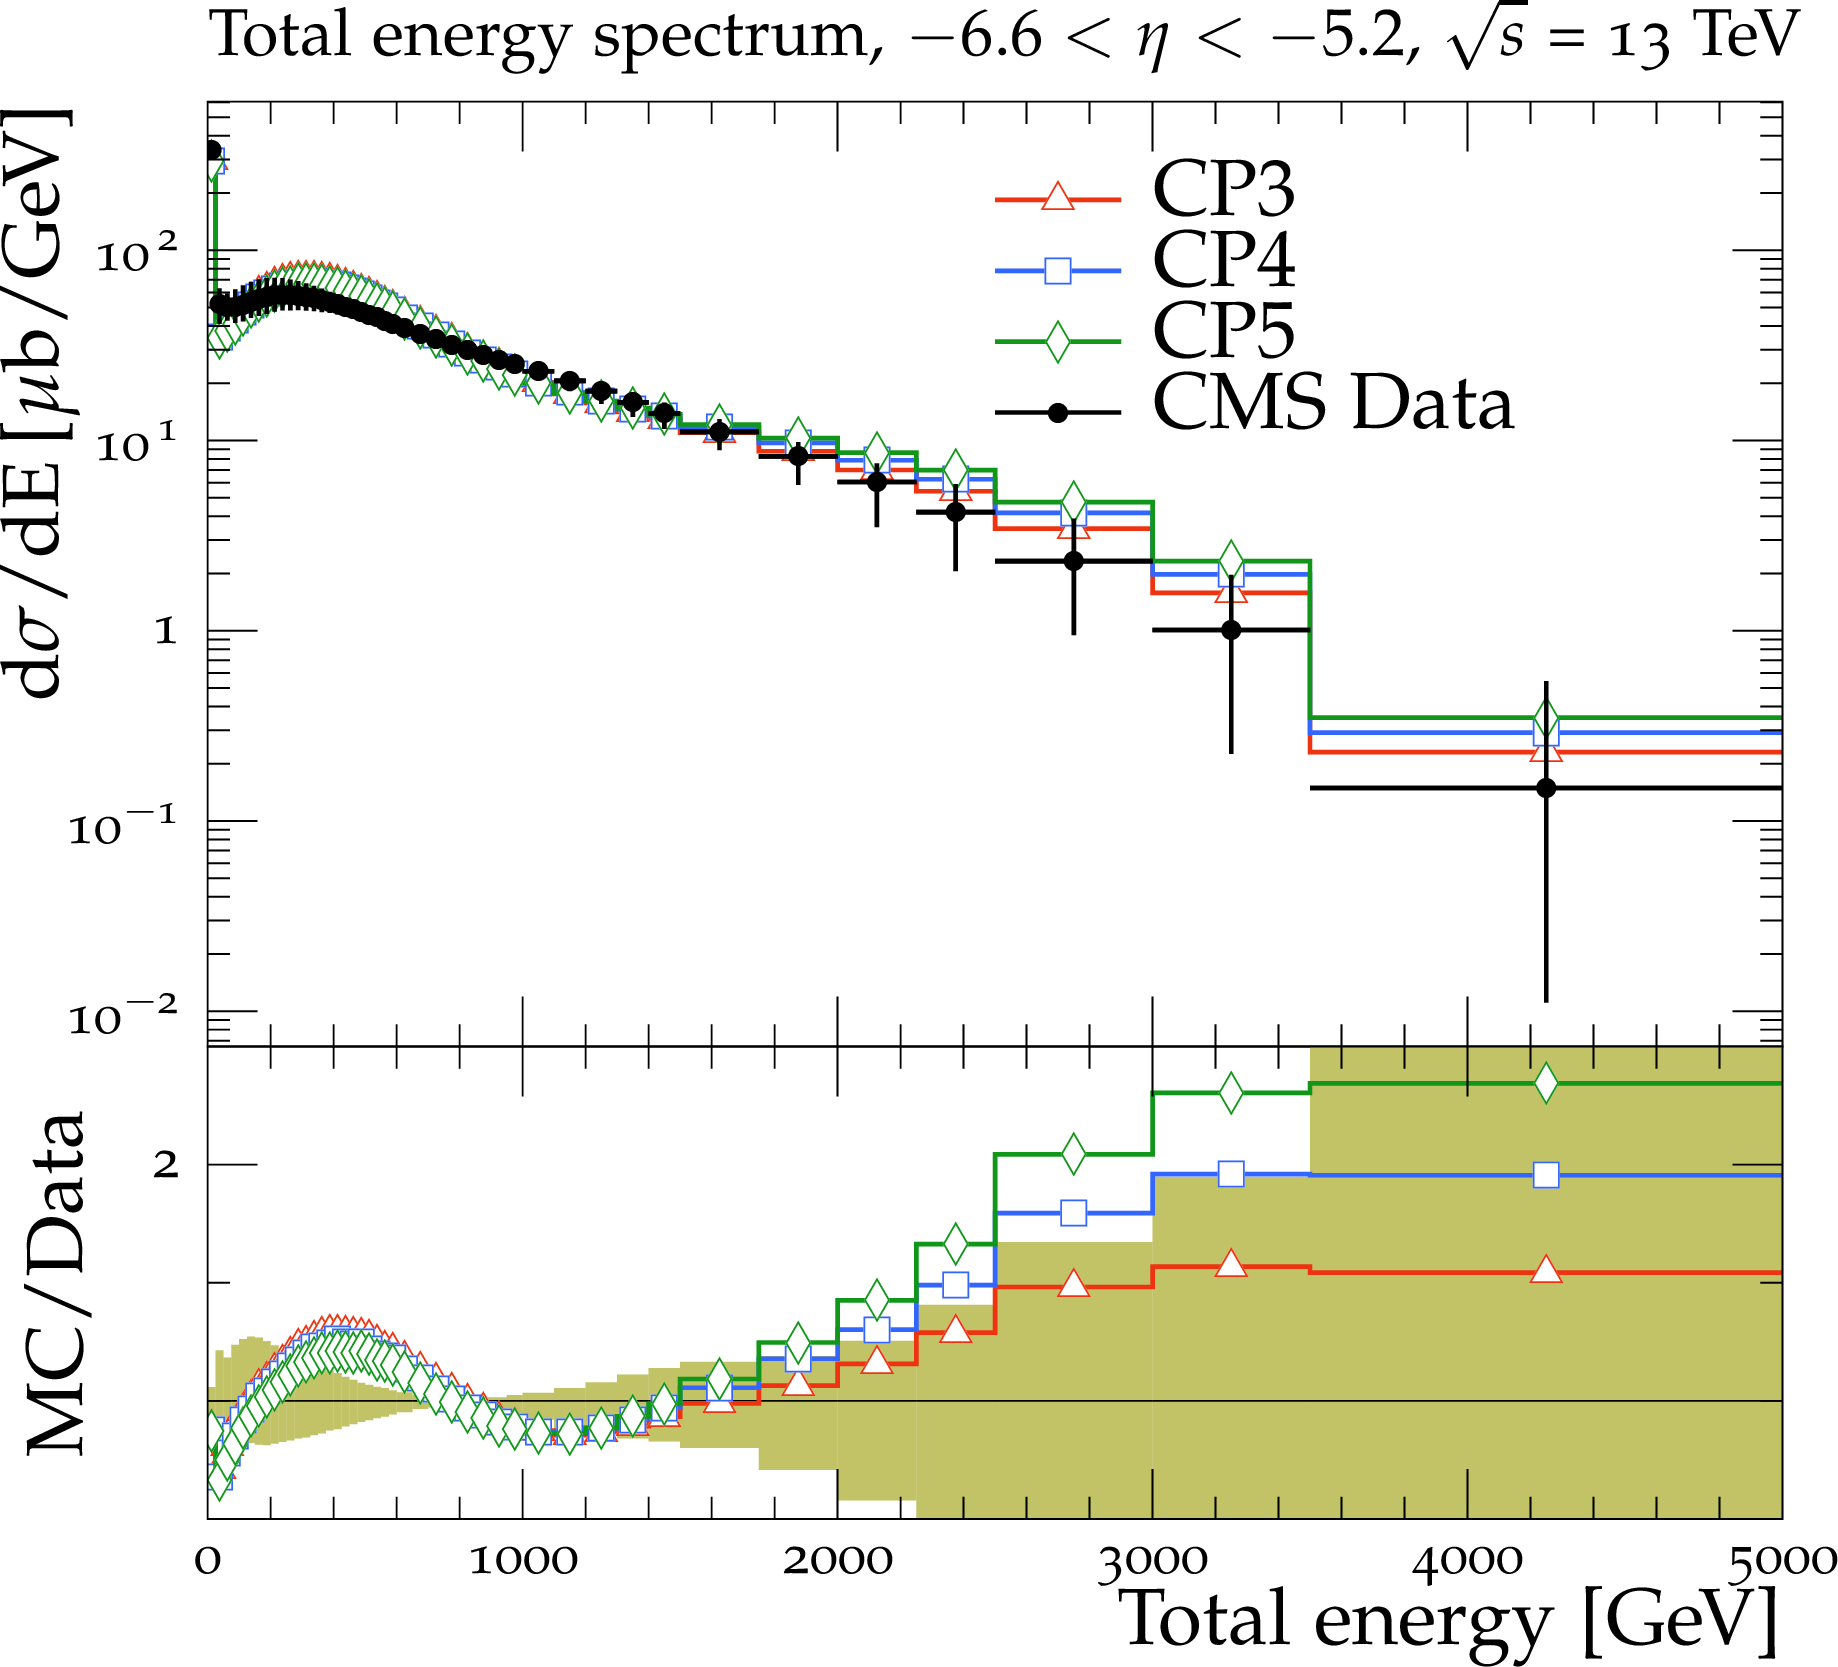
The total energy spectrum measured in the pseudorapidity interval $-6.6 < \eta < -5.2$, from the CMS $\sqrt {s} = $ 13 TeV analysis [49]. The data are compared with (left) the CMS PYTHIA 8 LO-PDF tunes CP1 and CP2, and with (right) the CMS PYTHIA 8 NLO-PDF tune CP3 and the CMS PYTHIA 8 NNLO-PDF tunes CP4 and CP5. The ratio of the simulations to the data (MC/Data) is also shown, where the shaded band indicates the total experimental uncertainty in the data. Vertical lines drawn on the data points refer to the total uncertainty in the data. Vertical lines drawn on the MC points refer to the statistical uncertainty in the predictions. Horizontal bars indicate the associated bin width. |

png pdf |
Figure 16-a:
The total energy spectrum measured in the pseudorapidity interval $-6.6 < \eta < -5.2$, from the CMS $\sqrt {s} = $ 13 TeV analysis [49]. The data are compared with (left) the CMS PYTHIA 8 LO-PDF tunes CP1 and CP2, and with (right) the CMS PYTHIA 8 NLO-PDF tune CP3 and the CMS PYTHIA 8 NNLO-PDF tunes CP4 and CP5. The ratio of the simulations to the data (MC/Data) is also shown, where the shaded band indicates the total experimental uncertainty in the data. Vertical lines drawn on the data points refer to the total uncertainty in the data. Vertical lines drawn on the MC points refer to the statistical uncertainty in the predictions. Horizontal bars indicate the associated bin width. |
png pdf |
Figure 16-b:
The total energy spectrum measured in the pseudorapidity interval $-6.6 < \eta < -5.2$, from the CMS $\sqrt {s} = $ 13 TeV analysis [49]. The data are compared with (left) the CMS PYTHIA 8 LO-PDF tunes CP1 and CP2, and with (right) the CMS PYTHIA 8 NLO-PDF tune CP3 and the CMS PYTHIA 8 NNLO-PDF tunes CP4 and CP5. The ratio of the simulations to the data (MC/Data) is also shown, where the shaded band indicates the total experimental uncertainty in the data. Vertical lines drawn on the data points refer to the total uncertainty in the data. Vertical lines drawn on the MC points refer to the statistical uncertainty in the predictions. Horizontal bars indicate the associated bin width. |
png pdf |
Figure 17:
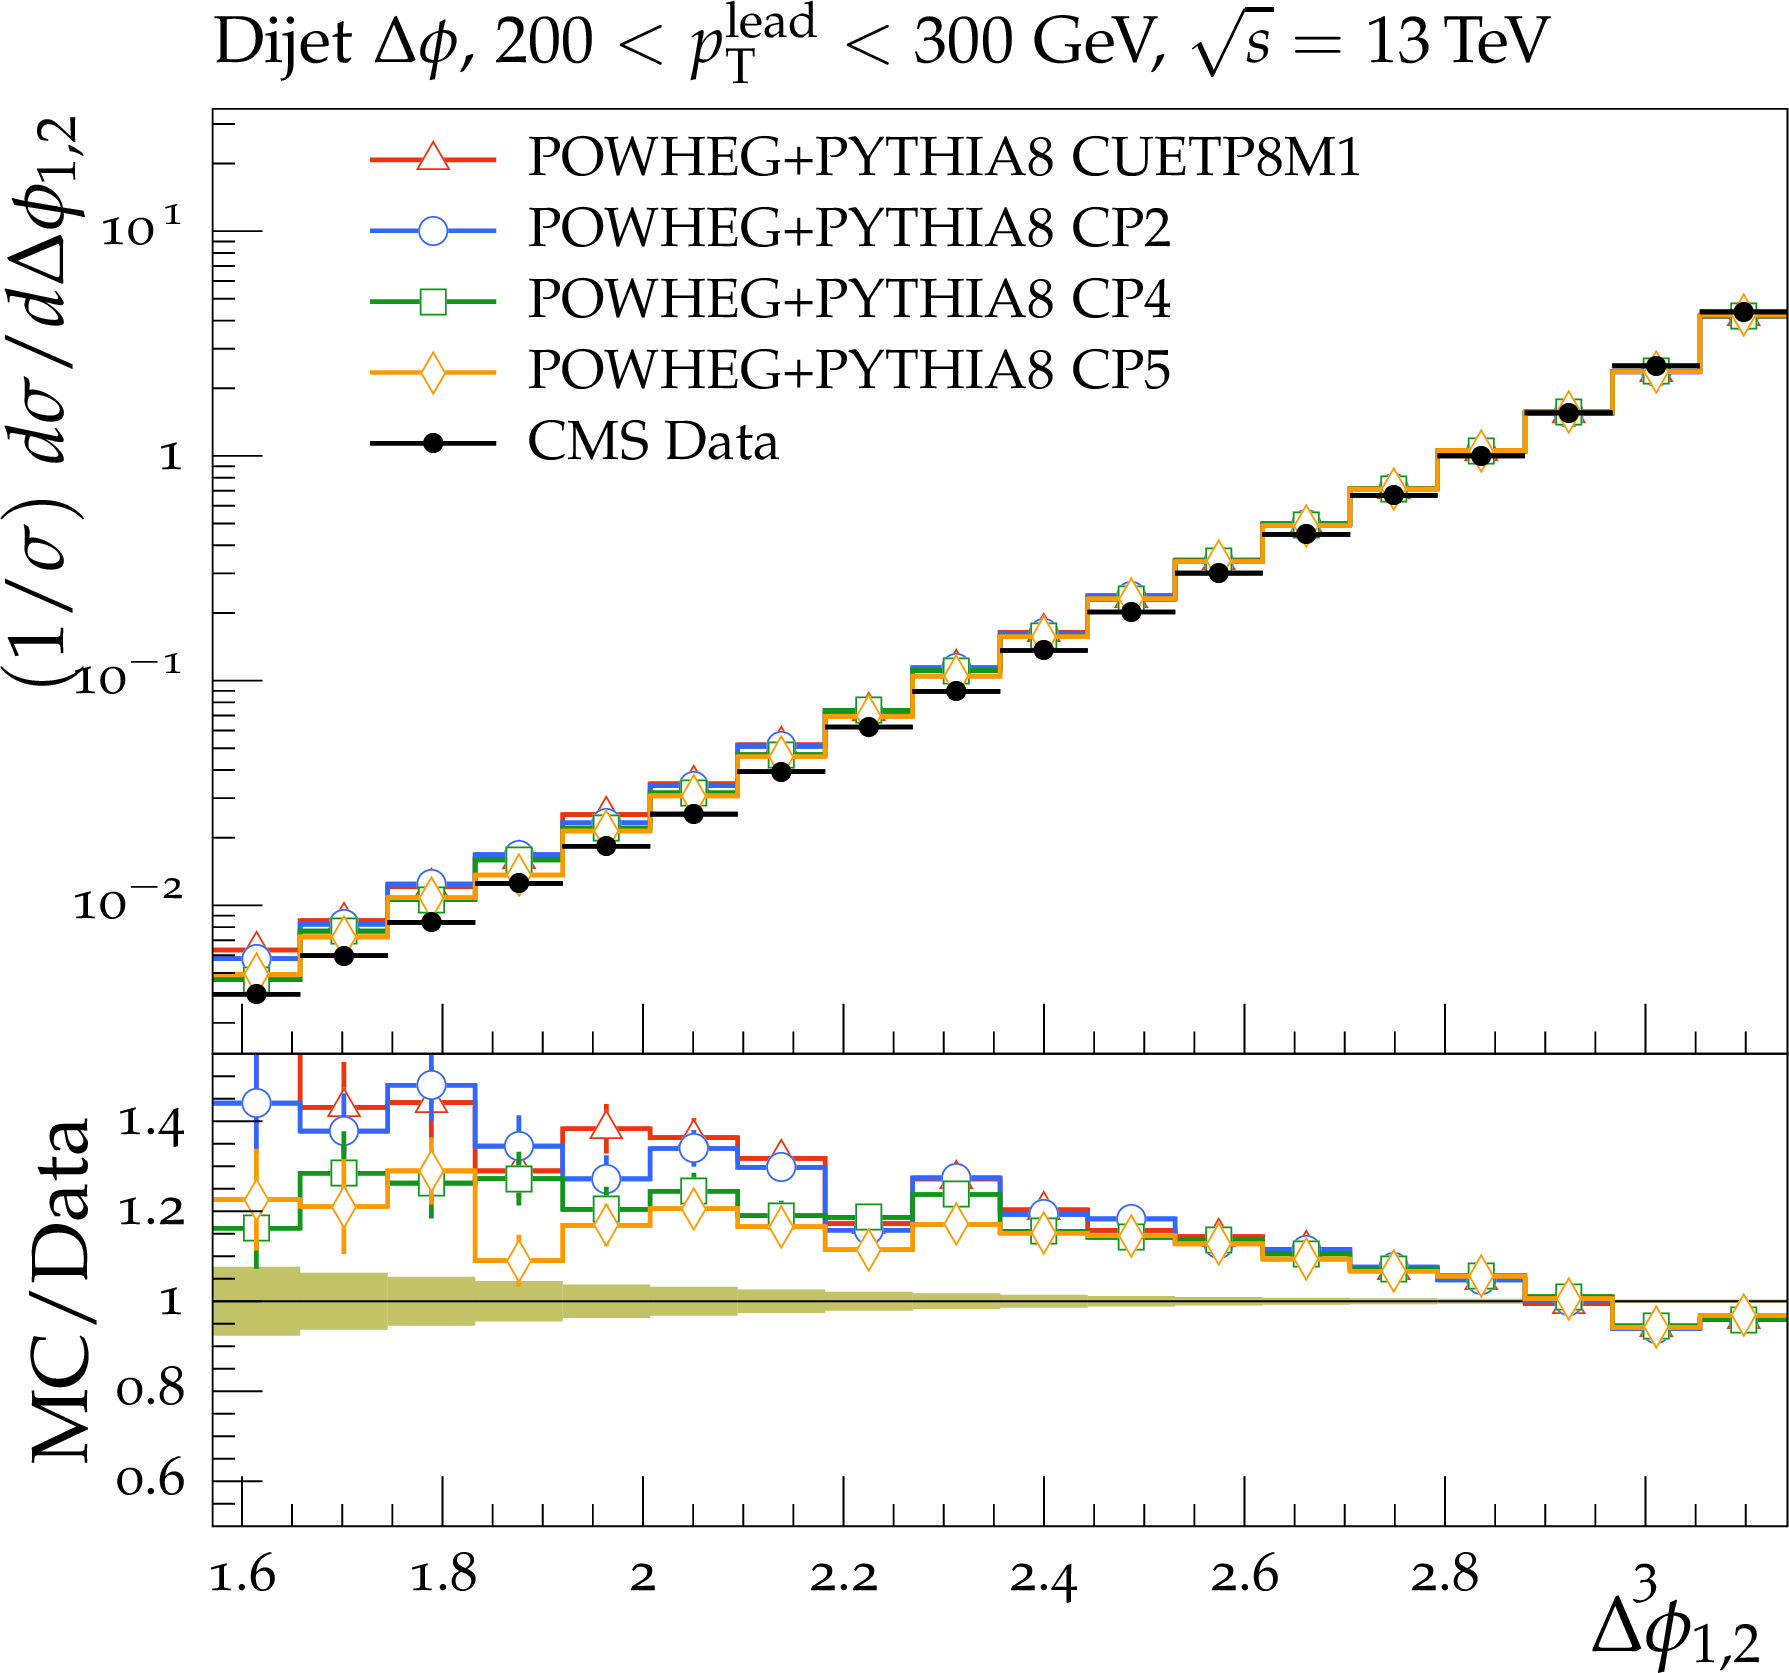
The azimuthal difference $\Delta \phi _{1,2}$ between the leading two jets with $ {| \eta |} < $ 2.4 in dijet events with leading-jet transverse momentum in the range (left) 200 $ < {p_{\mathrm {T}}} ^{\text {lead}} < $ 300 GeV and (right) 300 $ < {p_{\mathrm {T}}} ^{\text {lead}} < $ 400 GeV, from the CMS $\sqrt {s} = $ 13 TeV analysis [57]. The jets are reconstructed using the anti- ${k_{\mathrm {T}}} $ jet finding algorithm [58,59] with a distance parameter of 0.4. The data are compared with predictions of the NLO dijet ME calculation from {powheg}, interfaced to the PYTHIA 8 tunes CUETP8M1, CP2, CP4, and CP5. Tunes CP1 and CP3 are not shown in the plot but present a similar behavior as tunes CP2 and CP4. The ratios of simulations to the data (MC/Data) are also shown, where the shaded band indicates the total experimental uncertainty in the data. Vertical lines drawn on the data points refer to the total uncertainty in the data. Vertical lines drawn on the MC points refer to the statistical uncertainty in the predictions. Horizontal bars indicate the associated bin width. |

png pdf |
Figure 17-a:
The azimuthal difference $\Delta \phi _{1,2}$ between the leading two jets with $ {| \eta |} < $ 2.4 in dijet events with leading-jet transverse momentum in the range (left) 200 $ < {p_{\mathrm {T}}} ^{\text {lead}} < $ 300 GeV and (right) 300 $ < {p_{\mathrm {T}}} ^{\text {lead}} < $ 400 GeV, from the CMS $\sqrt {s} = $ 13 TeV analysis [57]. The jets are reconstructed using the anti- ${k_{\mathrm {T}}} $ jet finding algorithm [58,59] with a distance parameter of 0.4. The data are compared with predictions of the NLO dijet ME calculation from {powheg}, interfaced to the PYTHIA 8 tunes CUETP8M1, CP2, CP4, and CP5. Tunes CP1 and CP3 are not shown in the plot but present a similar behavior as tunes CP2 and CP4. The ratios of simulations to the data (MC/Data) are also shown, where the shaded band indicates the total experimental uncertainty in the data. Vertical lines drawn on the data points refer to the total uncertainty in the data. Vertical lines drawn on the MC points refer to the statistical uncertainty in the predictions. Horizontal bars indicate the associated bin width. |
png pdf |
Figure 17-b:
The azimuthal difference $\Delta \phi _{1,2}$ between the leading two jets with $ {| \eta |} < $ 2.4 in dijet events with leading-jet transverse momentum in the range (left) 200 $ < {p_{\mathrm {T}}} ^{\text {lead}} < $ 300 GeV and (right) 300 $ < {p_{\mathrm {T}}} ^{\text {lead}} < $ 400 GeV, from the CMS $\sqrt {s} = $ 13 TeV analysis [57]. The jets are reconstructed using the anti- ${k_{\mathrm {T}}} $ jet finding algorithm [58,59] with a distance parameter of 0.4. The data are compared with predictions of the NLO dijet ME calculation from {powheg}, interfaced to the PYTHIA 8 tunes CUETP8M1, CP2, CP4, and CP5. Tunes CP1 and CP3 are not shown in the plot but present a similar behavior as tunes CP2 and CP4. The ratios of simulations to the data (MC/Data) are also shown, where the shaded band indicates the total experimental uncertainty in the data. Vertical lines drawn on the data points refer to the total uncertainty in the data. Vertical lines drawn on the MC points refer to the statistical uncertainty in the predictions. Horizontal bars indicate the associated bin width. |

png pdf |
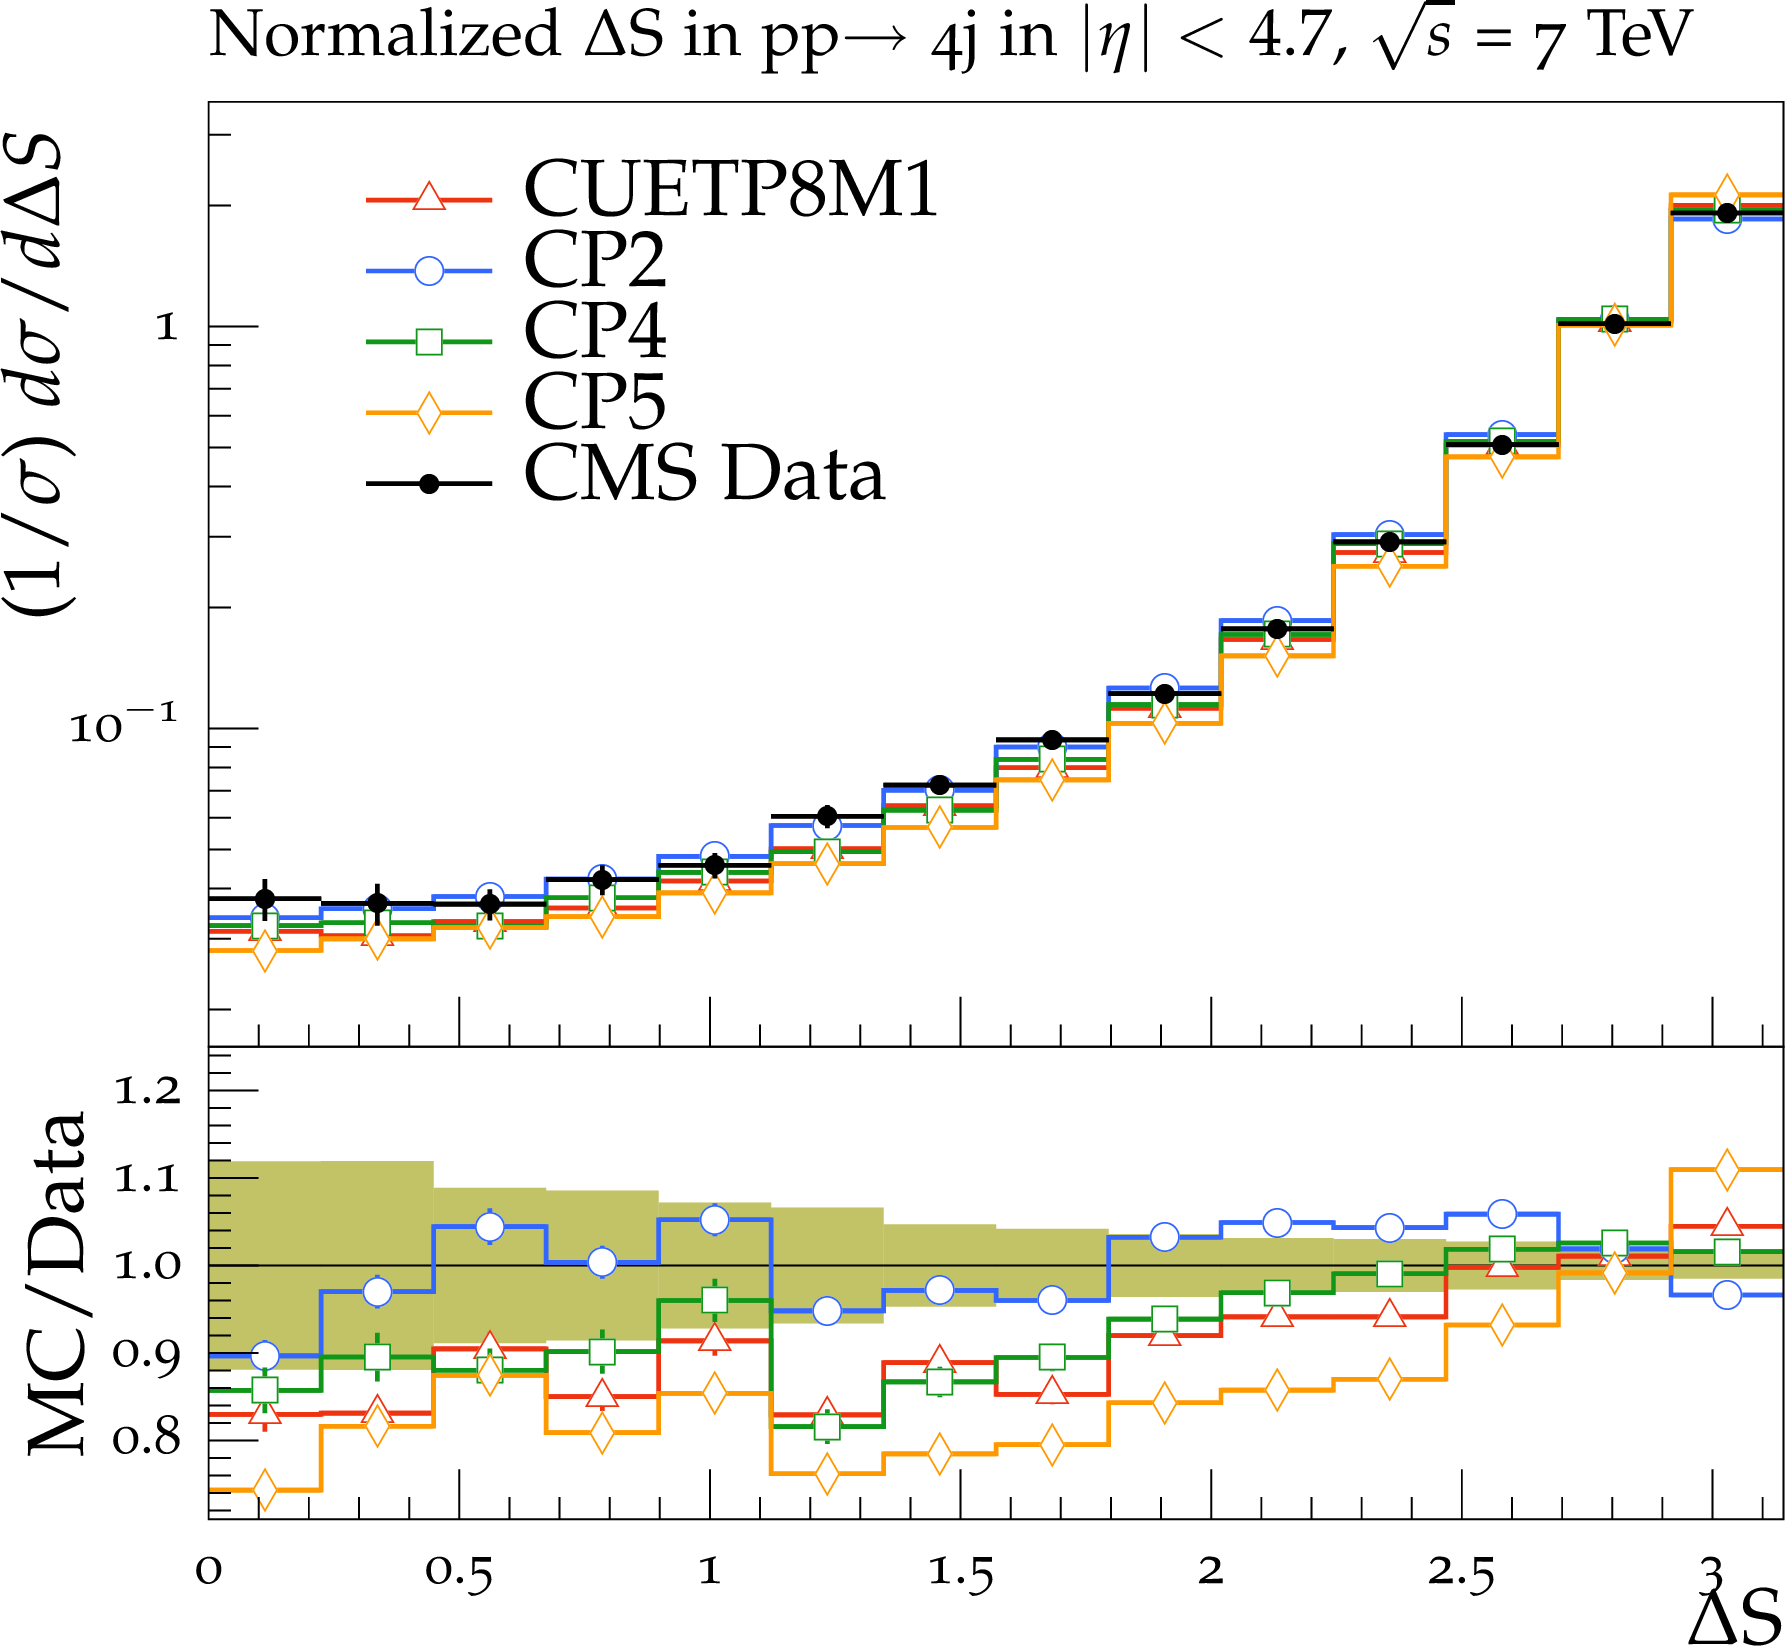
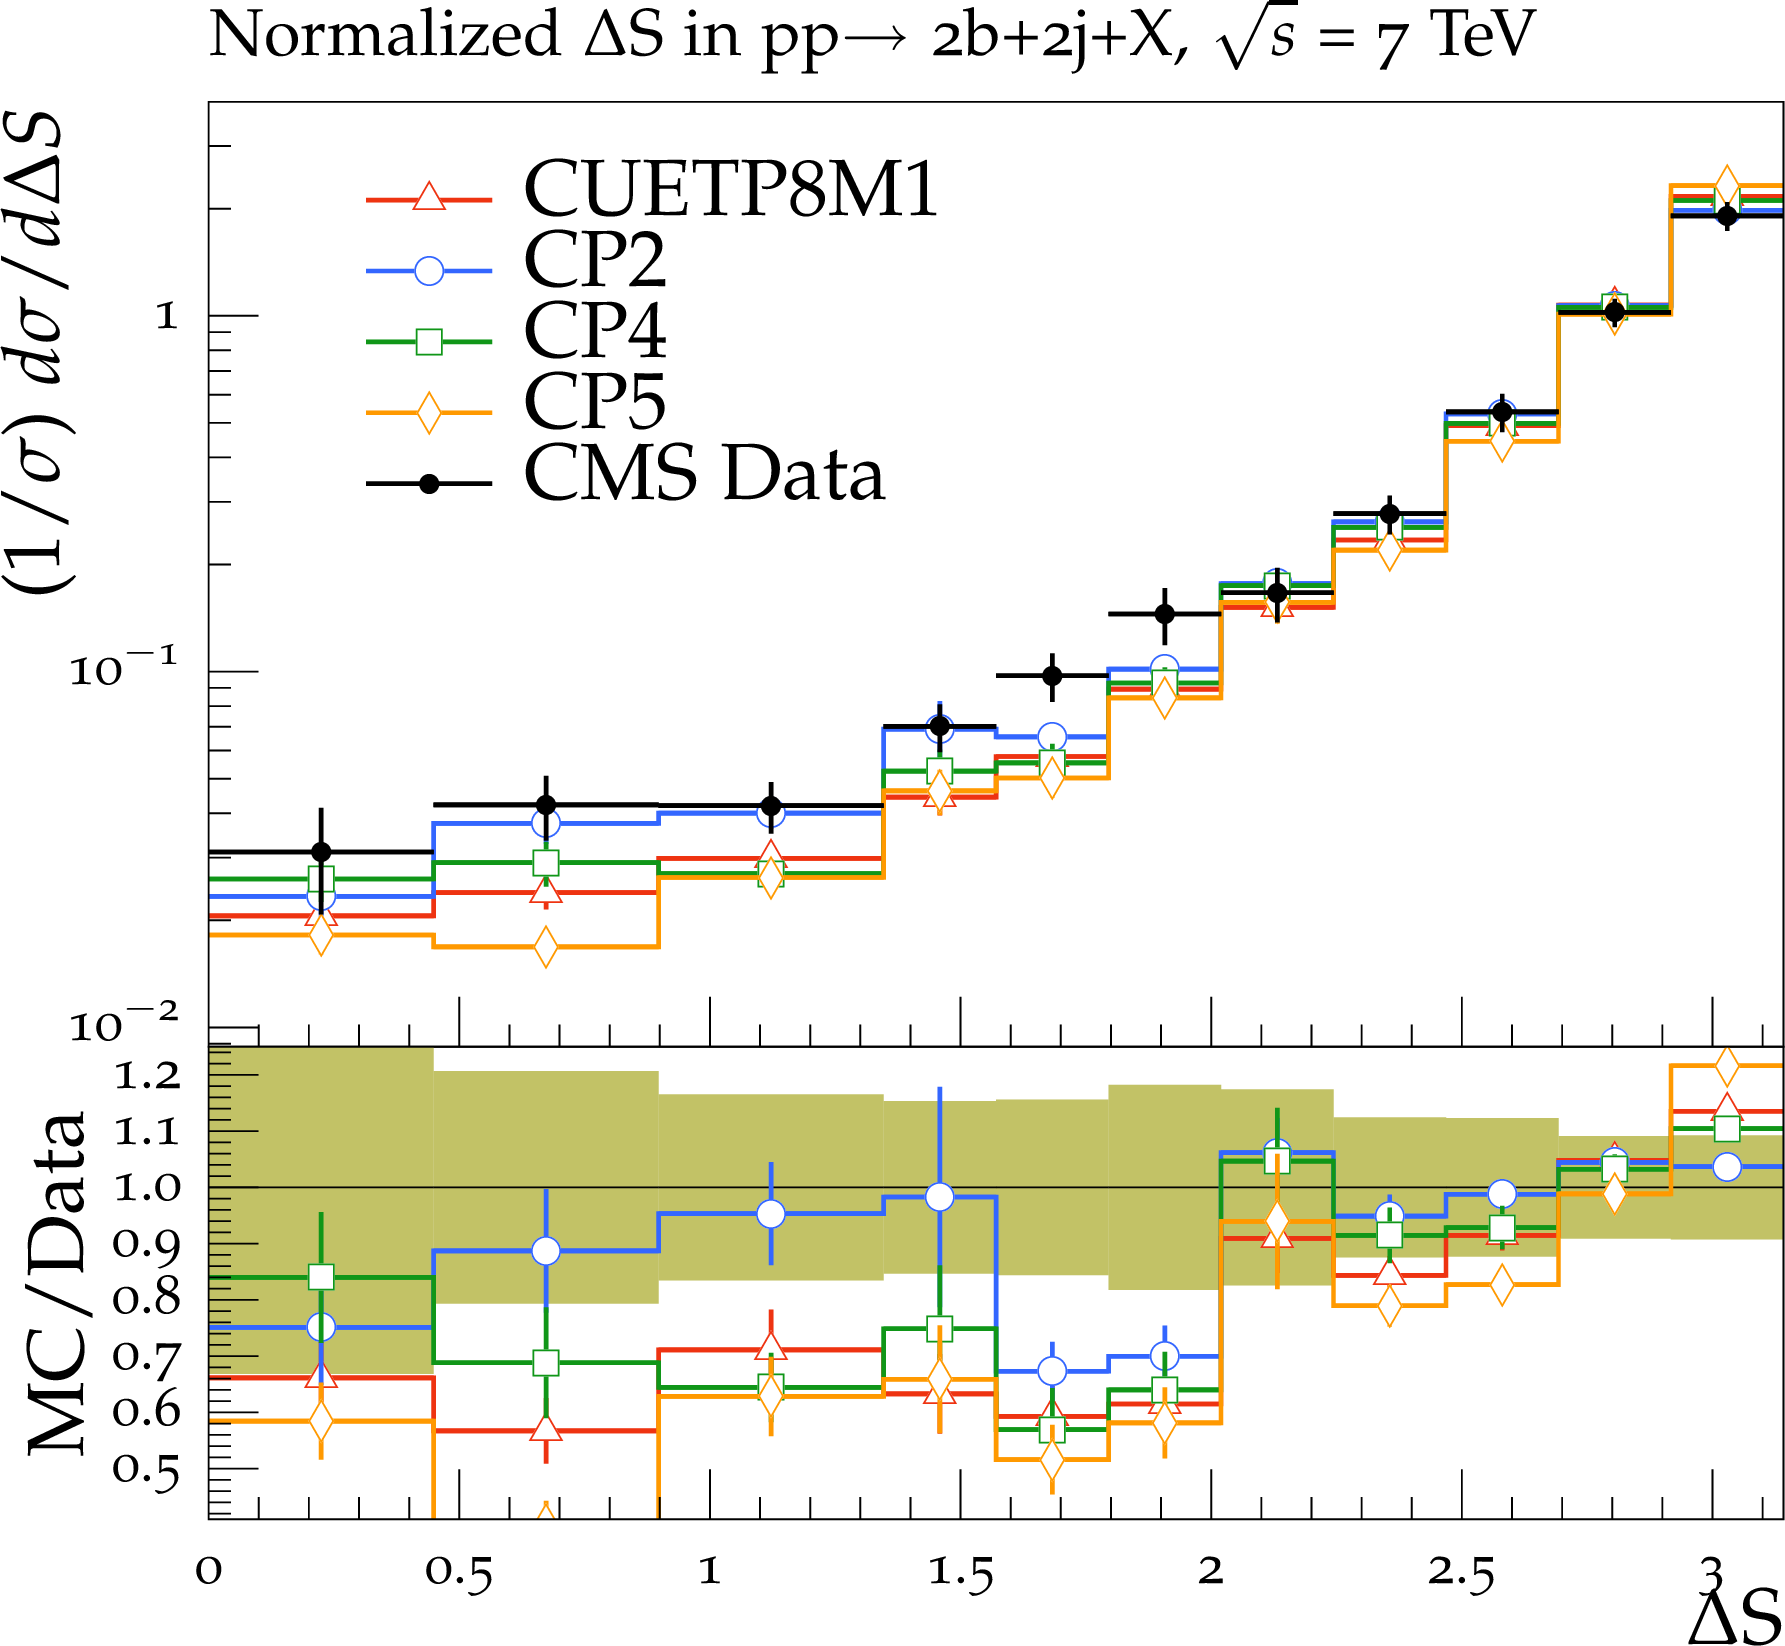
Figure 18:
The correlation observable $\Delta $S measured in 4j (left) and 2b2j (right) production, compared to predictions of PYTHIA 8 tunes CUETP8M1, CP2, CP4, and CP5, from the CMS $\sqrt {s} = $ 7 TeV analyses [61,63]. Tunes CP1 and CP3 are not shown in the plot but show\ a similar behaviour as, respectively, tunes CP2 and CP4. The ratios of simulations to the data (MC/Data) are also shown, where the shaded band indicates the total experimental uncertainty in the data. Vertical lines drawn on the data points refer to the total uncertainty in the data. Vertical lines drawn on the MC points refer to the statistical uncertainty in the predictions. Horizontal bars indicate the associated bin width. |
png pdf |
Figure 18-a:
The correlation observable $\Delta $S measured in 4j (left) and 2b2j (right) production, compared to predictions of PYTHIA 8 tunes CUETP8M1, CP2, CP4, and CP5, from the CMS $\sqrt {s} = $ 7 TeV analyses [61,63]. Tunes CP1 and CP3 are not shown in the plot but show\ a similar behaviour as, respectively, tunes CP2 and CP4. The ratios of simulations to the data (MC/Data) are also shown, where the shaded band indicates the total experimental uncertainty in the data. Vertical lines drawn on the data points refer to the total uncertainty in the data. Vertical lines drawn on the MC points refer to the statistical uncertainty in the predictions. Horizontal bars indicate the associated bin width. |
png pdf |
Figure 18-b:
The correlation observable $\Delta $S measured in 4j (left) and 2b2j (right) production, compared to predictions of PYTHIA 8 tunes CUETP8M1, CP2, CP4, and CP5, from the CMS $\sqrt {s} = $ 7 TeV analyses [61,63]. Tunes CP1 and CP3 are not shown in the plot but show\ a similar behaviour as, respectively, tunes CP2 and CP4. The ratios of simulations to the data (MC/Data) are also shown, where the shaded band indicates the total experimental uncertainty in the data. Vertical lines drawn on the data points refer to the total uncertainty in the data. Vertical lines drawn on the MC points refer to the statistical uncertainty in the predictions. Horizontal bars indicate the associated bin width. |

png pdf |
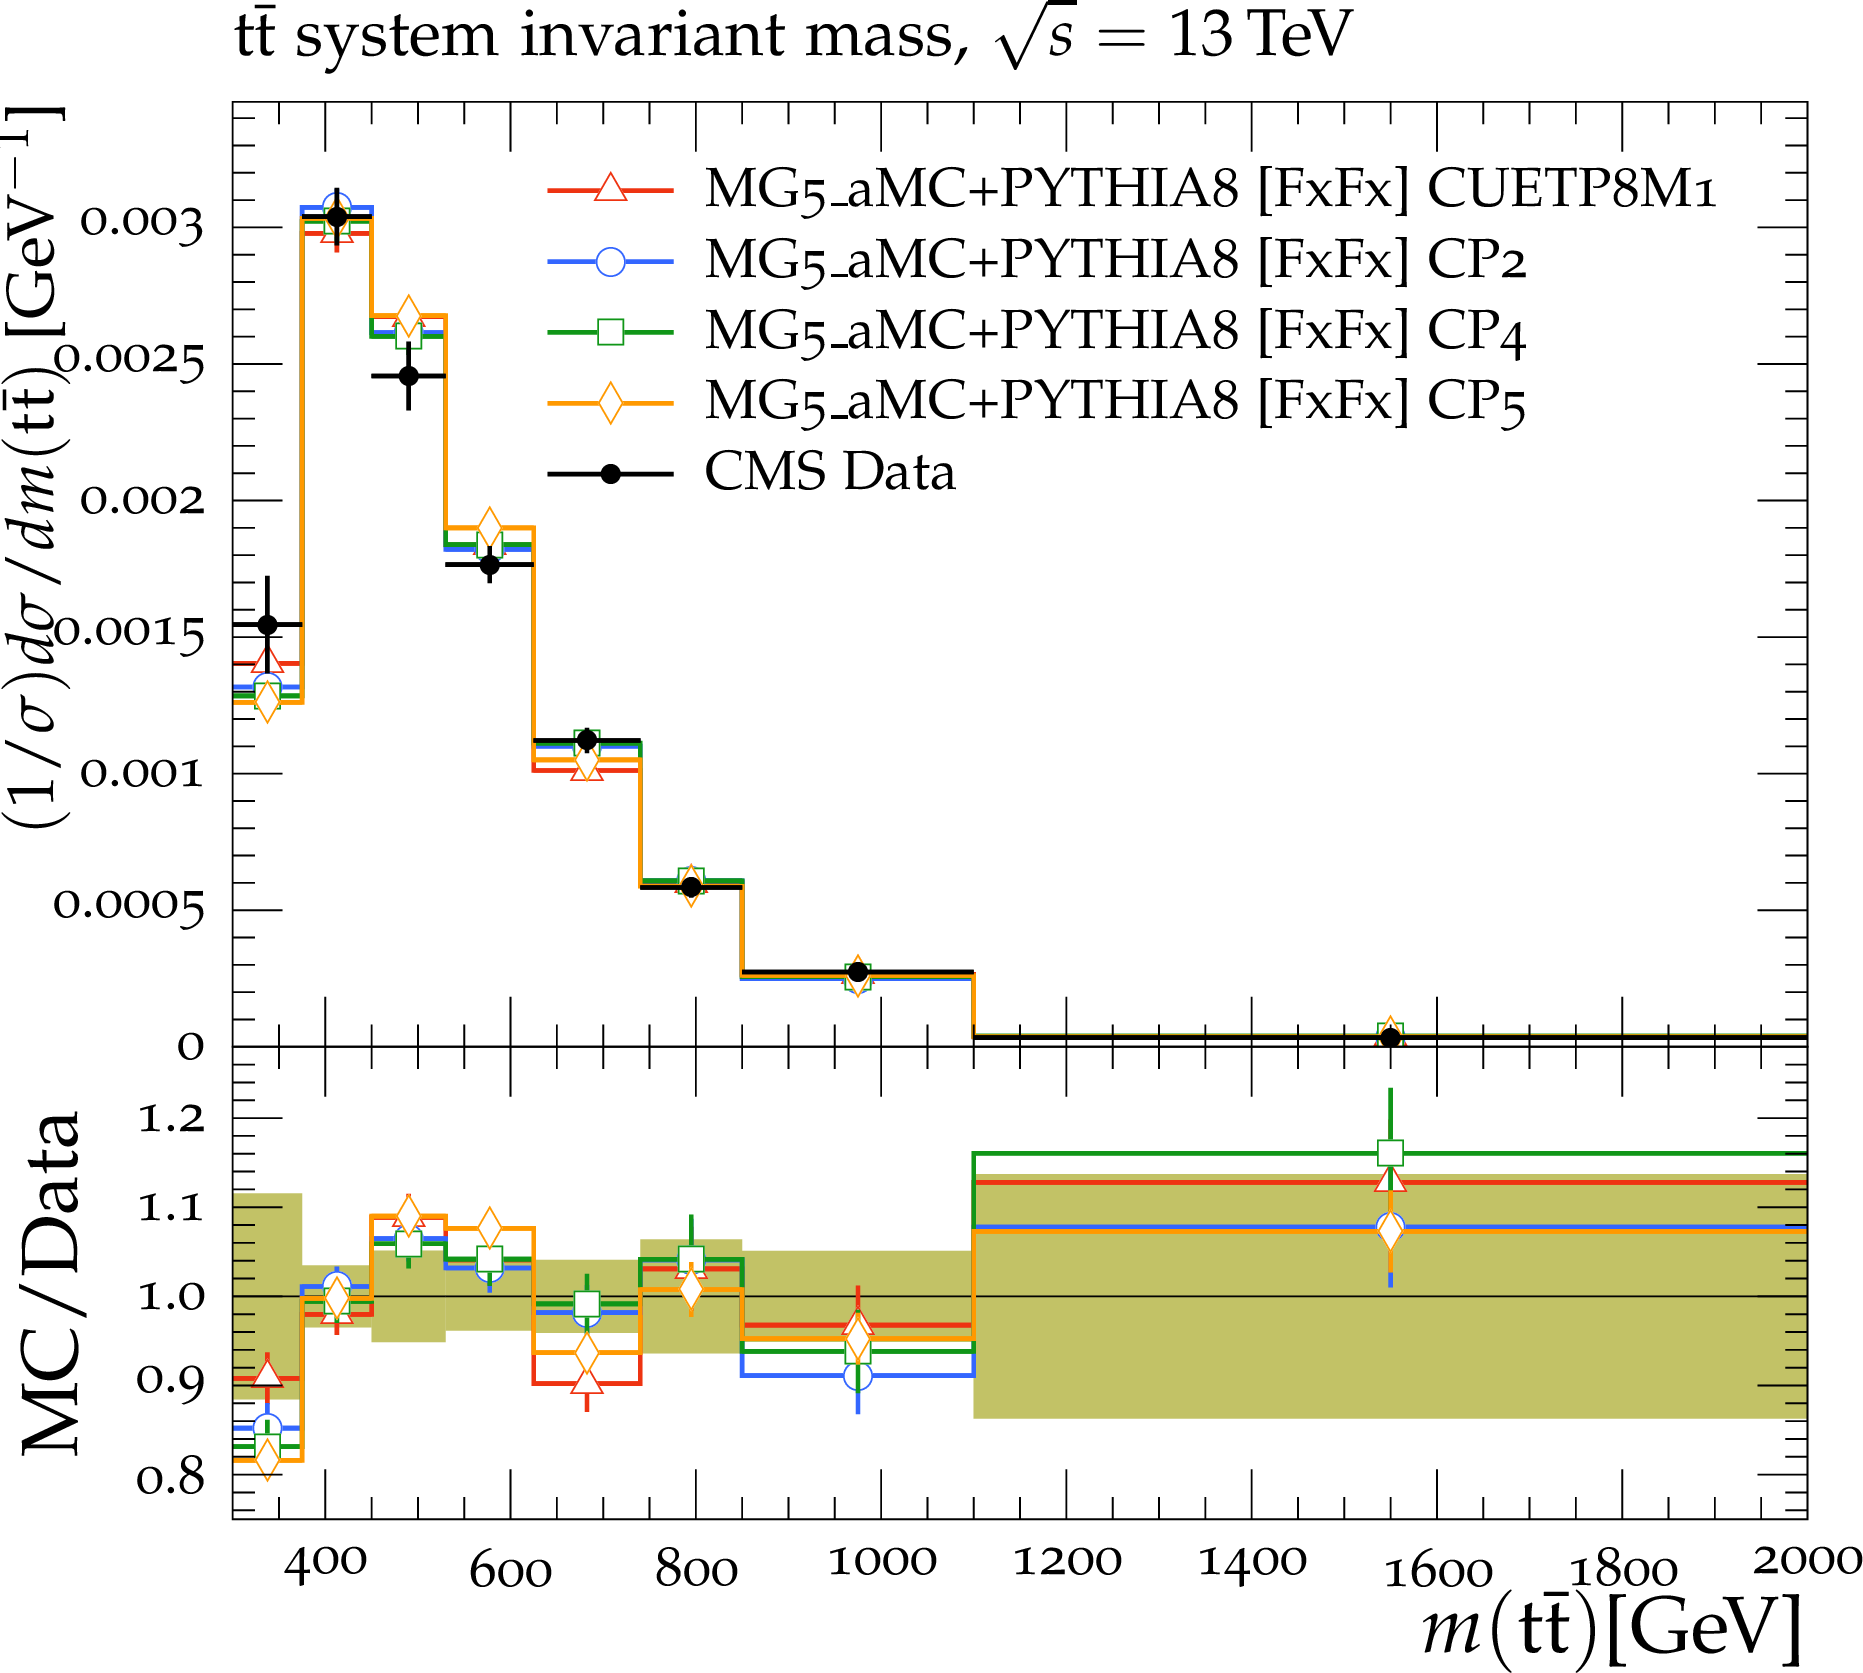
Figure 19:
The normalized ${\mathrm{t} \mathrm{\bar{t}}}$ cross section in the lepton+jets channel, as a function of the transverse momentum of the top quark for leptonically decaying top quarks ($t_\ell $) (upper), the invariant mass of the ${\mathrm{t} \mathrm{\bar{t}}}$ system, $m({\mathrm{t} \mathrm{\bar{t}}})$ (middle), and in bins of number of additional jets (lower) from CMS $\sqrt {s} = $ 13 TeV analysis [69]. The data are compared with the predictions of {powheg} (left) and mg5\_amc [FxFx] (right). In both cases, the PS simulation is done with the PYTHIA 8 tunes CUETP8M1, CP2, CP4, or CP5. Tunes CP1 and CP3 are not shown in the plot but present a similar behaviour as, respectively, tunes CP2 and CP4. The ratios of simulations to the data (MC/Data) are also shown, where the shaded band indicates the total experimental uncertainty in the data. Vertical lines drawn on the data points refer to the total uncertainty in the data. Vertical lines drawn on the MC points refer to the statistical uncertainty in the predictions. Horizontal bars indicate the associated bin width. |

png pdf |
Figure 19-a:
The normalized ${\mathrm{t} \mathrm{\bar{t}}}$ cross section in the lepton+jets channel, as a function of the transverse momentum of the top quark for leptonically decaying top quarks ($t_\ell $) (upper), the invariant mass of the ${\mathrm{t} \mathrm{\bar{t}}}$ system, $m({\mathrm{t} \mathrm{\bar{t}}})$ (middle), and in bins of number of additional jets (lower) from CMS $\sqrt {s} = $ 13 TeV analysis [69]. The data are compared with the predictions of {powheg} (left) and mg5\_amc [FxFx] (right). In both cases, the PS simulation is done with the PYTHIA 8 tunes CUETP8M1, CP2, CP4, or CP5. Tunes CP1 and CP3 are not shown in the plot but present a similar behaviour as, respectively, tunes CP2 and CP4. The ratios of simulations to the data (MC/Data) are also shown, where the shaded band indicates the total experimental uncertainty in the data. Vertical lines drawn on the data points refer to the total uncertainty in the data. Vertical lines drawn on the MC points refer to the statistical uncertainty in the predictions. Horizontal bars indicate the associated bin width. |

png pdf |
Figure 19-b:
The normalized ${\mathrm{t} \mathrm{\bar{t}}}$ cross section in the lepton+jets channel, as a function of the transverse momentum of the top quark for leptonically decaying top quarks ($t_\ell $) (upper), the invariant mass of the ${\mathrm{t} \mathrm{\bar{t}}}$ system, $m({\mathrm{t} \mathrm{\bar{t}}})$ (middle), and in bins of number of additional jets (lower) from CMS $\sqrt {s} = $ 13 TeV analysis [69]. The data are compared with the predictions of {powheg} (left) and mg5\_amc [FxFx] (right). In both cases, the PS simulation is done with the PYTHIA 8 tunes CUETP8M1, CP2, CP4, or CP5. Tunes CP1 and CP3 are not shown in the plot but present a similar behaviour as, respectively, tunes CP2 and CP4. The ratios of simulations to the data (MC/Data) are also shown, where the shaded band indicates the total experimental uncertainty in the data. Vertical lines drawn on the data points refer to the total uncertainty in the data. Vertical lines drawn on the MC points refer to the statistical uncertainty in the predictions. Horizontal bars indicate the associated bin width. |

png pdf |
Figure 19-c:
The normalized ${\mathrm{t} \mathrm{\bar{t}}}$ cross section in the lepton+jets channel, as a function of the transverse momentum of the top quark for leptonically decaying top quarks ($t_\ell $) (upper), the invariant mass of the ${\mathrm{t} \mathrm{\bar{t}}}$ system, $m({\mathrm{t} \mathrm{\bar{t}}})$ (middle), and in bins of number of additional jets (lower) from CMS $\sqrt {s} = $ 13 TeV analysis [69]. The data are compared with the predictions of {powheg} (left) and mg5\_amc [FxFx] (right). In both cases, the PS simulation is done with the PYTHIA 8 tunes CUETP8M1, CP2, CP4, or CP5. Tunes CP1 and CP3 are not shown in the plot but present a similar behaviour as, respectively, tunes CP2 and CP4. The ratios of simulations to the data (MC/Data) are also shown, where the shaded band indicates the total experimental uncertainty in the data. Vertical lines drawn on the data points refer to the total uncertainty in the data. Vertical lines drawn on the MC points refer to the statistical uncertainty in the predictions. Horizontal bars indicate the associated bin width. |
png pdf |
Figure 19-d:
The normalized ${\mathrm{t} \mathrm{\bar{t}}}$ cross section in the lepton+jets channel, as a function of the transverse momentum of the top quark for leptonically decaying top quarks ($t_\ell $) (upper), the invariant mass of the ${\mathrm{t} \mathrm{\bar{t}}}$ system, $m({\mathrm{t} \mathrm{\bar{t}}})$ (middle), and in bins of number of additional jets (lower) from CMS $\sqrt {s} = $ 13 TeV analysis [69]. The data are compared with the predictions of {powheg} (left) and mg5\_amc [FxFx] (right). In both cases, the PS simulation is done with the PYTHIA 8 tunes CUETP8M1, CP2, CP4, or CP5. Tunes CP1 and CP3 are not shown in the plot but present a similar behaviour as, respectively, tunes CP2 and CP4. The ratios of simulations to the data (MC/Data) are also shown, where the shaded band indicates the total experimental uncertainty in the data. Vertical lines drawn on the data points refer to the total uncertainty in the data. Vertical lines drawn on the MC points refer to the statistical uncertainty in the predictions. Horizontal bars indicate the associated bin width. |

png pdf |
Figure 19-e:
The normalized ${\mathrm{t} \mathrm{\bar{t}}}$ cross section in the lepton+jets channel, as a function of the transverse momentum of the top quark for leptonically decaying top quarks ($t_\ell $) (upper), the invariant mass of the ${\mathrm{t} \mathrm{\bar{t}}}$ system, $m({\mathrm{t} \mathrm{\bar{t}}})$ (middle), and in bins of number of additional jets (lower) from CMS $\sqrt {s} = $ 13 TeV analysis [69]. The data are compared with the predictions of {powheg} (left) and mg5\_amc [FxFx] (right). In both cases, the PS simulation is done with the PYTHIA 8 tunes CUETP8M1, CP2, CP4, or CP5. Tunes CP1 and CP3 are not shown in the plot but present a similar behaviour as, respectively, tunes CP2 and CP4. The ratios of simulations to the data (MC/Data) are also shown, where the shaded band indicates the total experimental uncertainty in the data. Vertical lines drawn on the data points refer to the total uncertainty in the data. Vertical lines drawn on the MC points refer to the statistical uncertainty in the predictions. Horizontal bars indicate the associated bin width. |

png pdf |
Figure 19-f:
The normalized ${\mathrm{t} \mathrm{\bar{t}}}$ cross section in the lepton+jets channel, as a function of the transverse momentum of the top quark for leptonically decaying top quarks ($t_\ell $) (upper), the invariant mass of the ${\mathrm{t} \mathrm{\bar{t}}}$ system, $m({\mathrm{t} \mathrm{\bar{t}}})$ (middle), and in bins of number of additional jets (lower) from CMS $\sqrt {s} = $ 13 TeV analysis [69]. The data are compared with the predictions of {powheg} (left) and mg5\_amc [FxFx] (right). In both cases, the PS simulation is done with the PYTHIA 8 tunes CUETP8M1, CP2, CP4, or CP5. Tunes CP1 and CP3 are not shown in the plot but present a similar behaviour as, respectively, tunes CP2 and CP4. The ratios of simulations to the data (MC/Data) are also shown, where the shaded band indicates the total experimental uncertainty in the data. Vertical lines drawn on the data points refer to the total uncertainty in the data. Vertical lines drawn on the MC points refer to the statistical uncertainty in the predictions. Horizontal bars indicate the associated bin width. |
png pdf |
Figure 20:
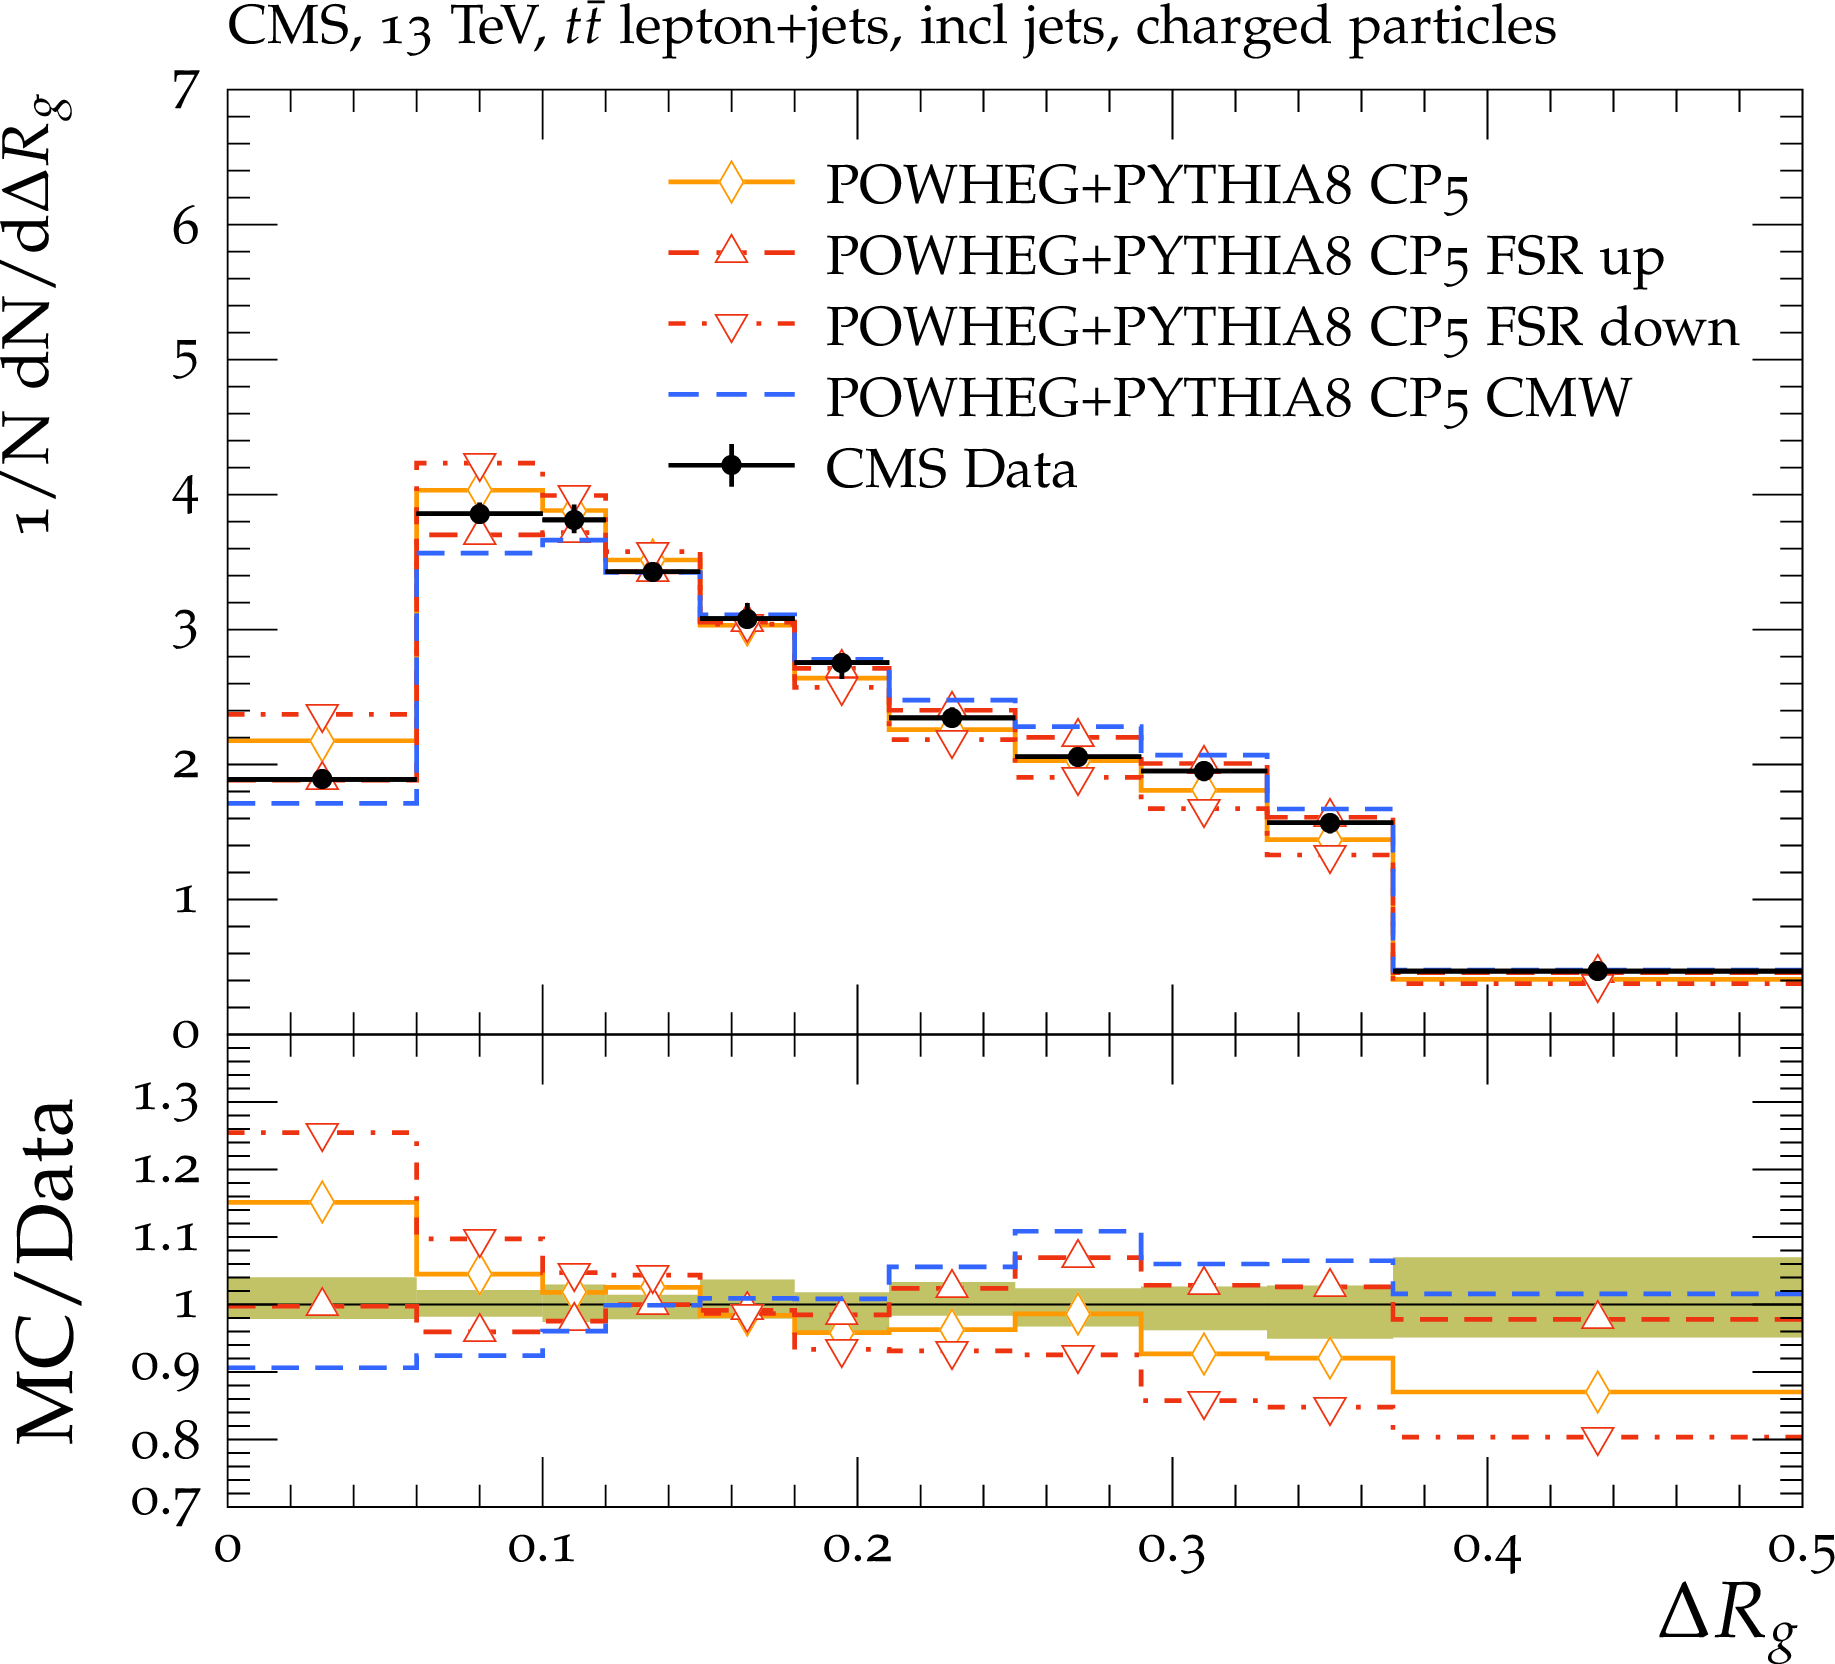
Comparison with the measurement [70] of the angle between two groomed subjets, $\Delta R_g$ in ${\mathrm{t} \mathrm{\bar{t}}}$ events predicted by {powheg} + PYTHIA 8 for the different tunes. The data are compared to tunes CUETP8M1, CP2, CP4, and CP5 (left). Tunes CP1 and CP3 are not displayed but they present a similar behavior as tunes CP2 and CP4, respectively. The data are also compared to CP5, CP5 FSR up, CP5 FSR down, and CP5 with CMW rescaling (right). The ratios of simulations to the data (MC/Data) are also shown, where the shaded band indicates the total experimental uncertainty in data. Vertical lines drawn on the data points refer to the total uncertainty in the data. Horizontal bars indicate the associated bin width. |

png pdf |
Figure 20-a:
Comparison with the measurement [70] of the angle between two groomed subjets, $\Delta R_g$ in ${\mathrm{t} \mathrm{\bar{t}}}$ events predicted by {powheg} + PYTHIA 8 for the different tunes. The data are compared to tunes CUETP8M1, CP2, CP4, and CP5 (left). Tunes CP1 and CP3 are not displayed but they present a similar behavior as tunes CP2 and CP4, respectively. The data are also compared to CP5, CP5 FSR up, CP5 FSR down, and CP5 with CMW rescaling (right). The ratios of simulations to the data (MC/Data) are also shown, where the shaded band indicates the total experimental uncertainty in data. Vertical lines drawn on the data points refer to the total uncertainty in the data. Horizontal bars indicate the associated bin width. |
png pdf |
Figure 20-b:
Comparison with the measurement [70] of the angle between two groomed subjets, $\Delta R_g$ in ${\mathrm{t} \mathrm{\bar{t}}}$ events predicted by {powheg} + PYTHIA 8 for the different tunes. The data are compared to tunes CUETP8M1, CP2, CP4, and CP5 (left). Tunes CP1 and CP3 are not displayed but they present a similar behavior as tunes CP2 and CP4, respectively. The data are also compared to CP5, CP5 FSR up, CP5 FSR down, and CP5 with CMW rescaling (right). The ratios of simulations to the data (MC/Data) are also shown, where the shaded band indicates the total experimental uncertainty in data. Vertical lines drawn on the data points refer to the total uncertainty in the data. Horizontal bars indicate the associated bin width. |

png pdf |
Figure 21:
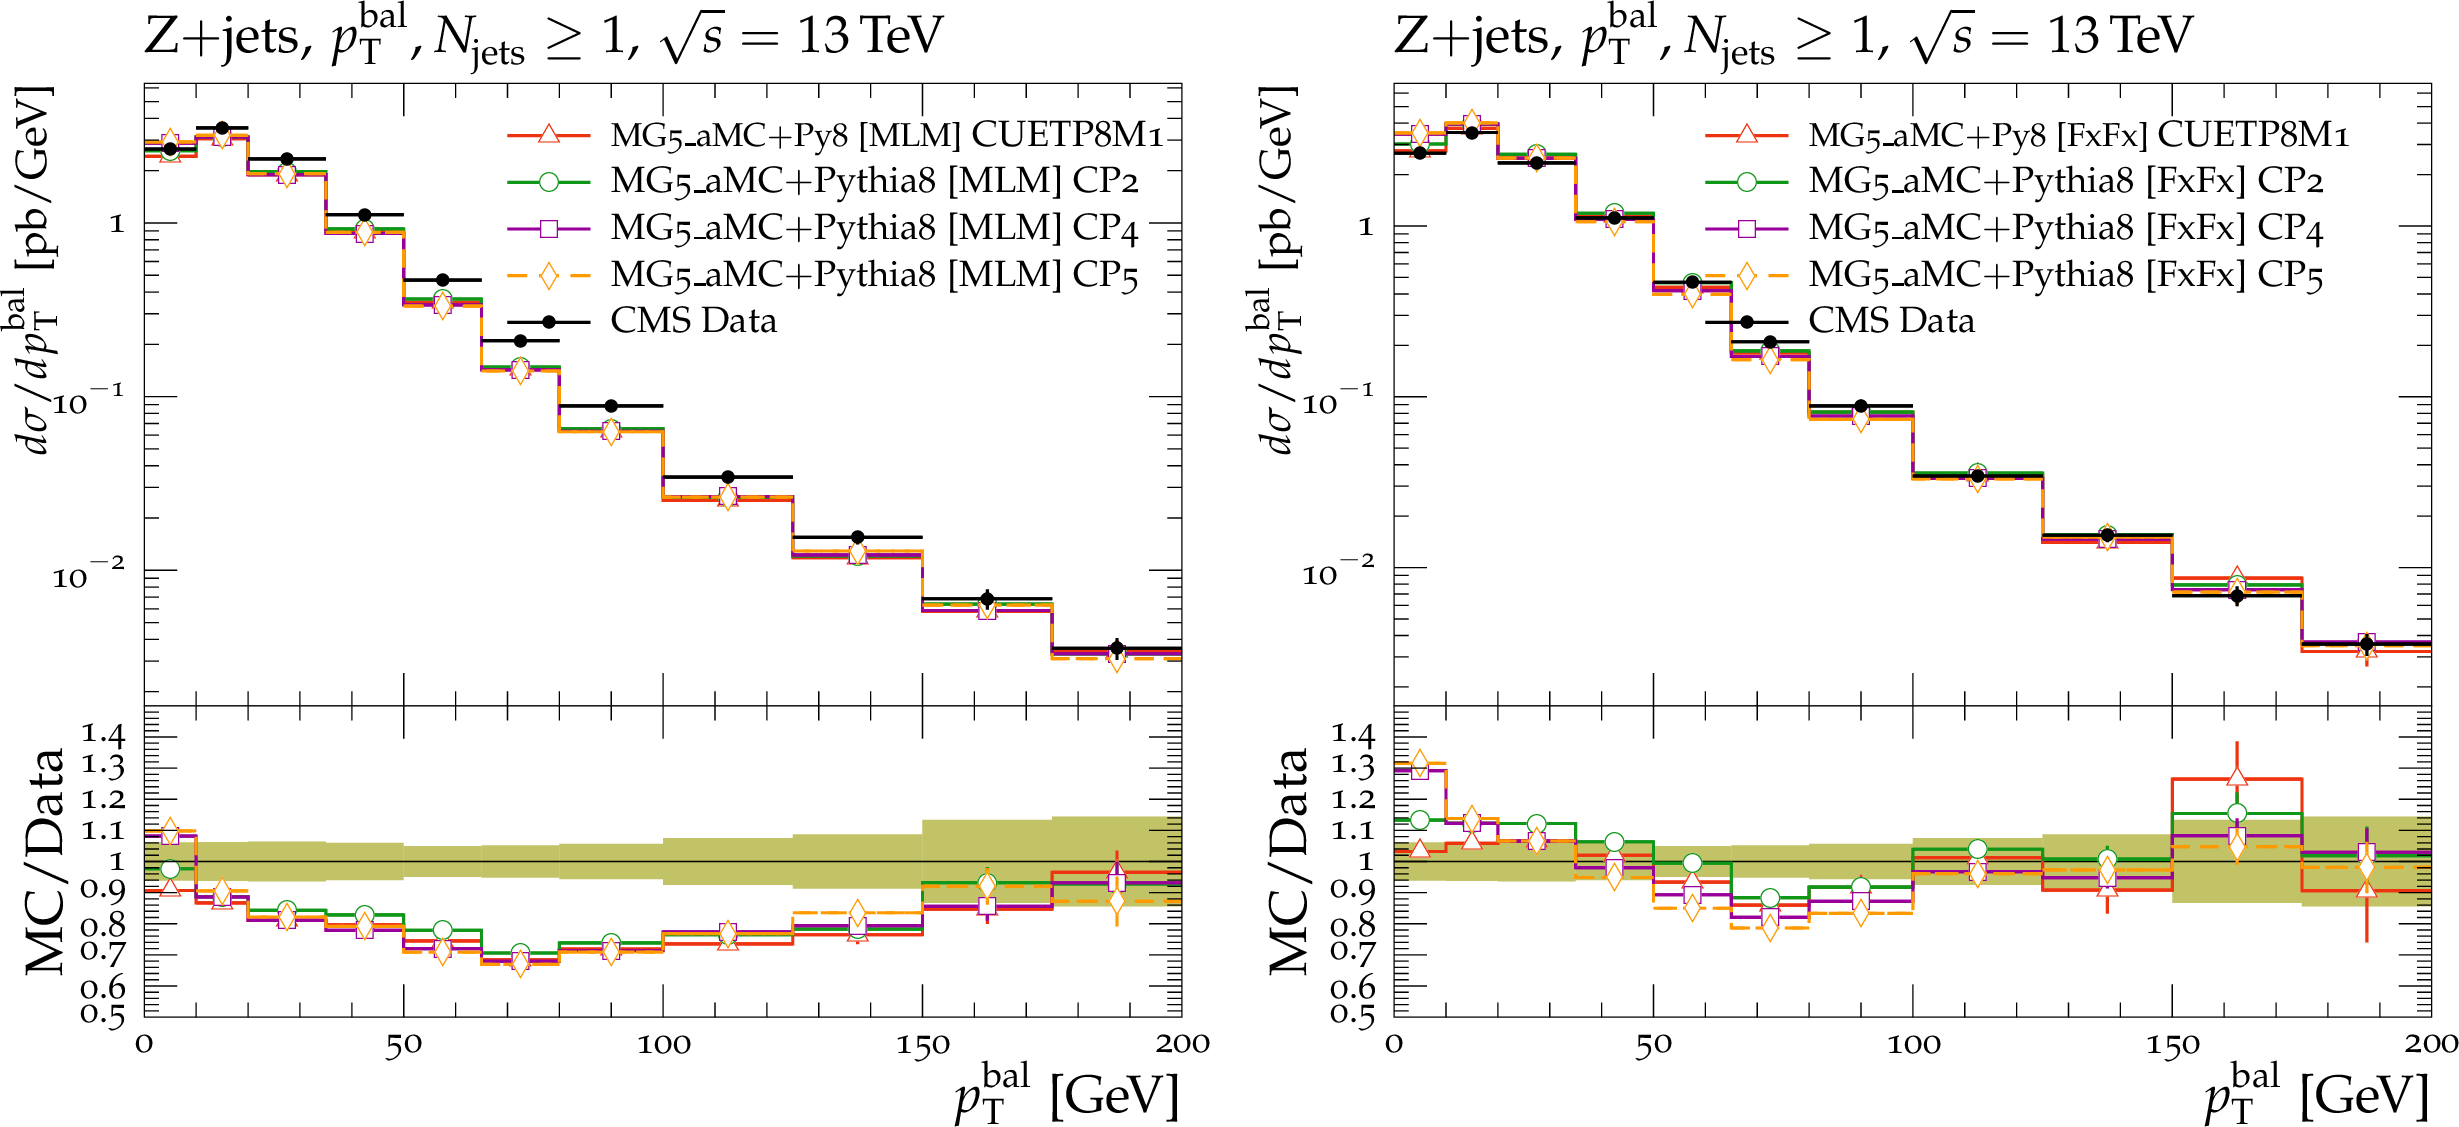
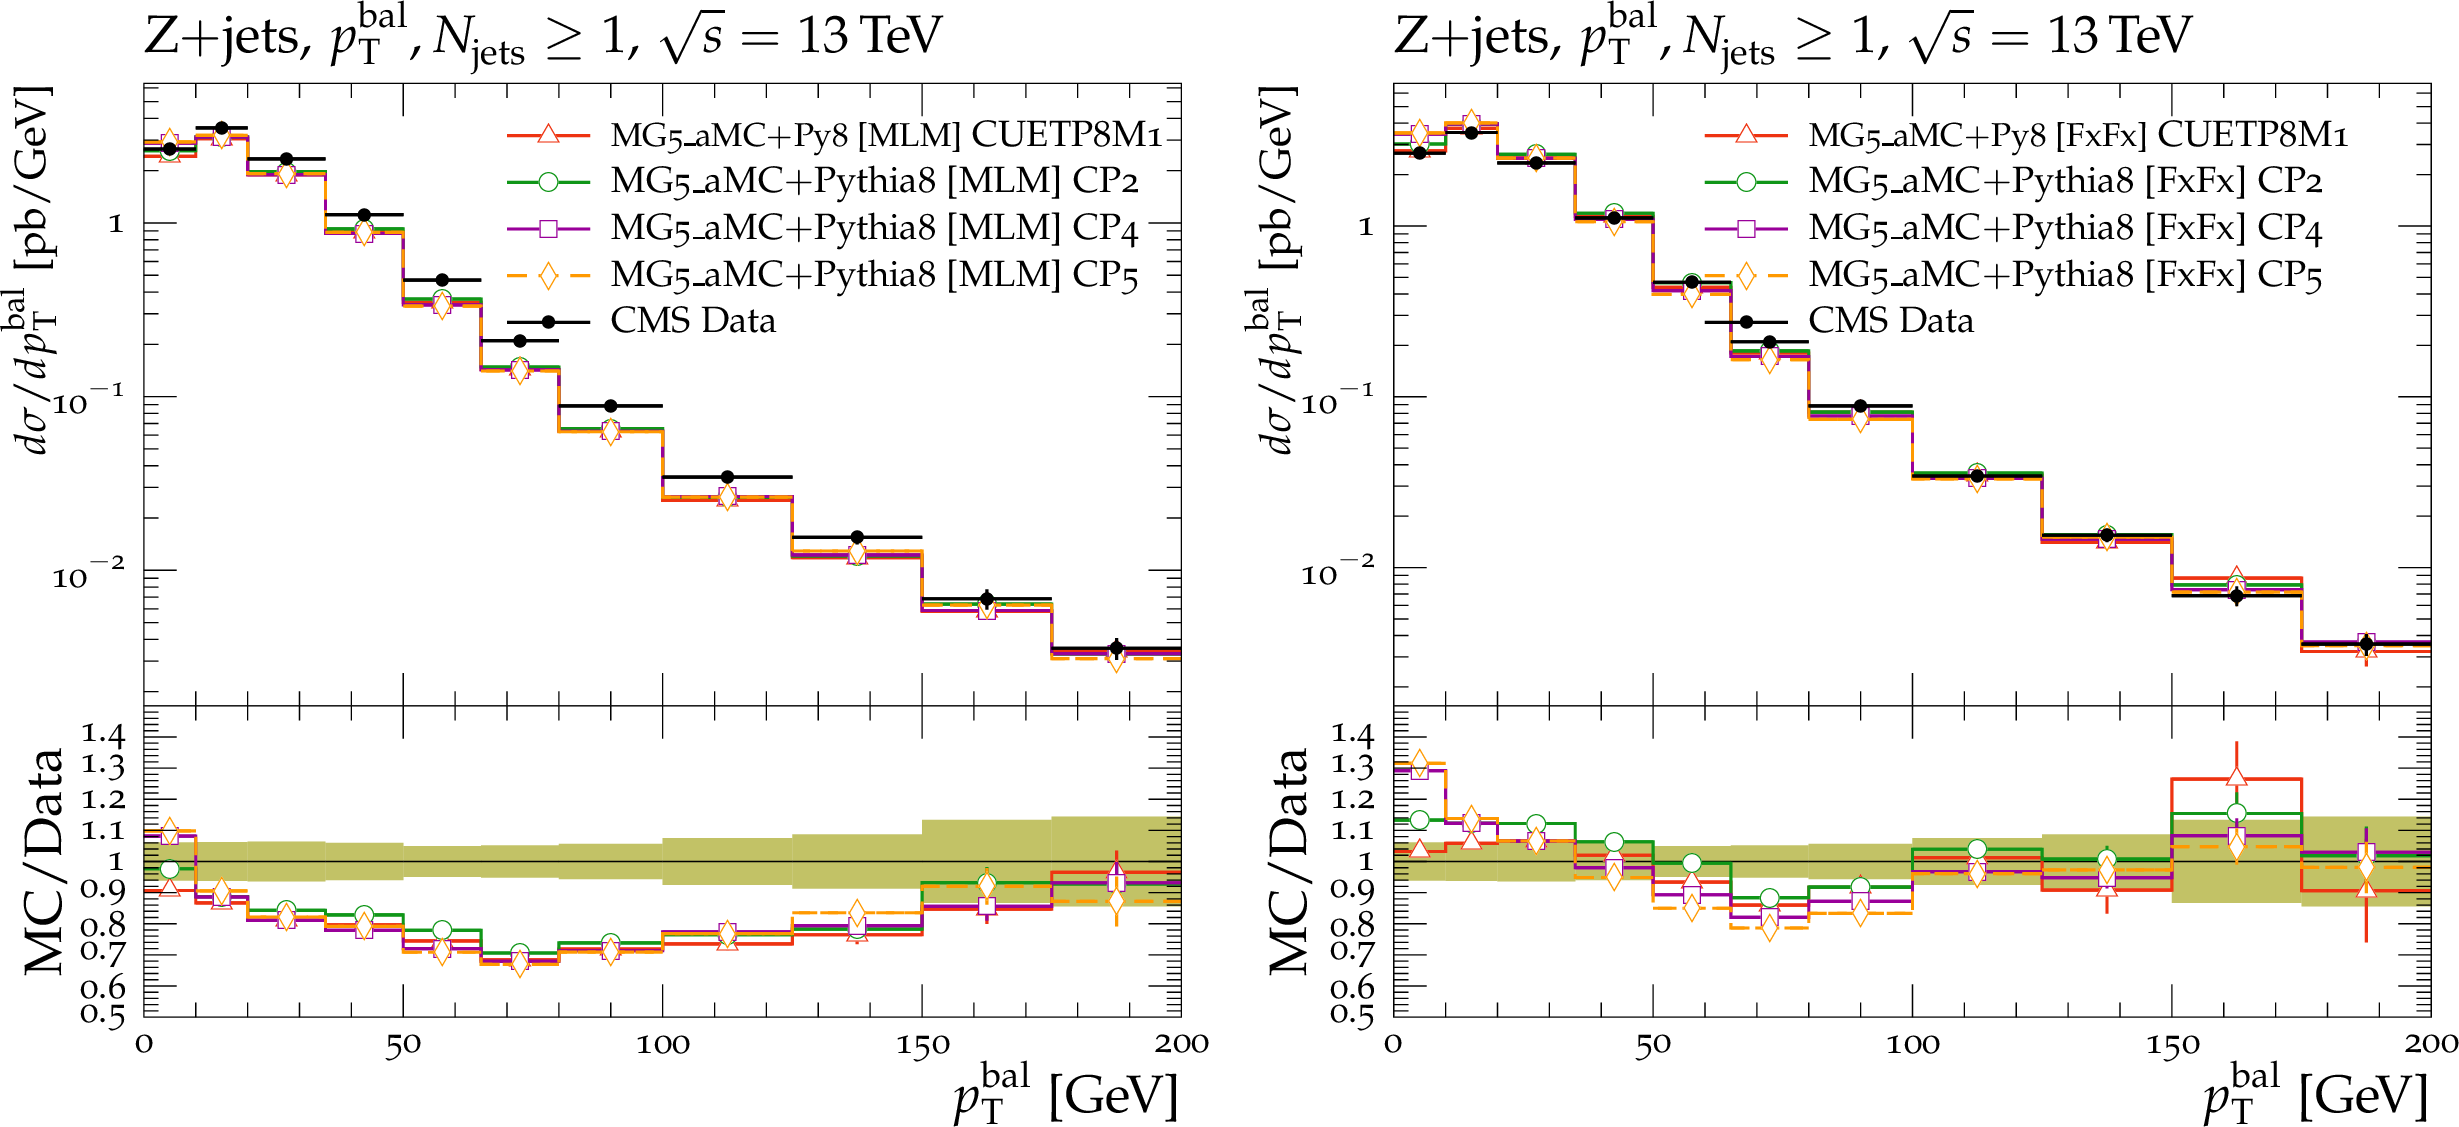
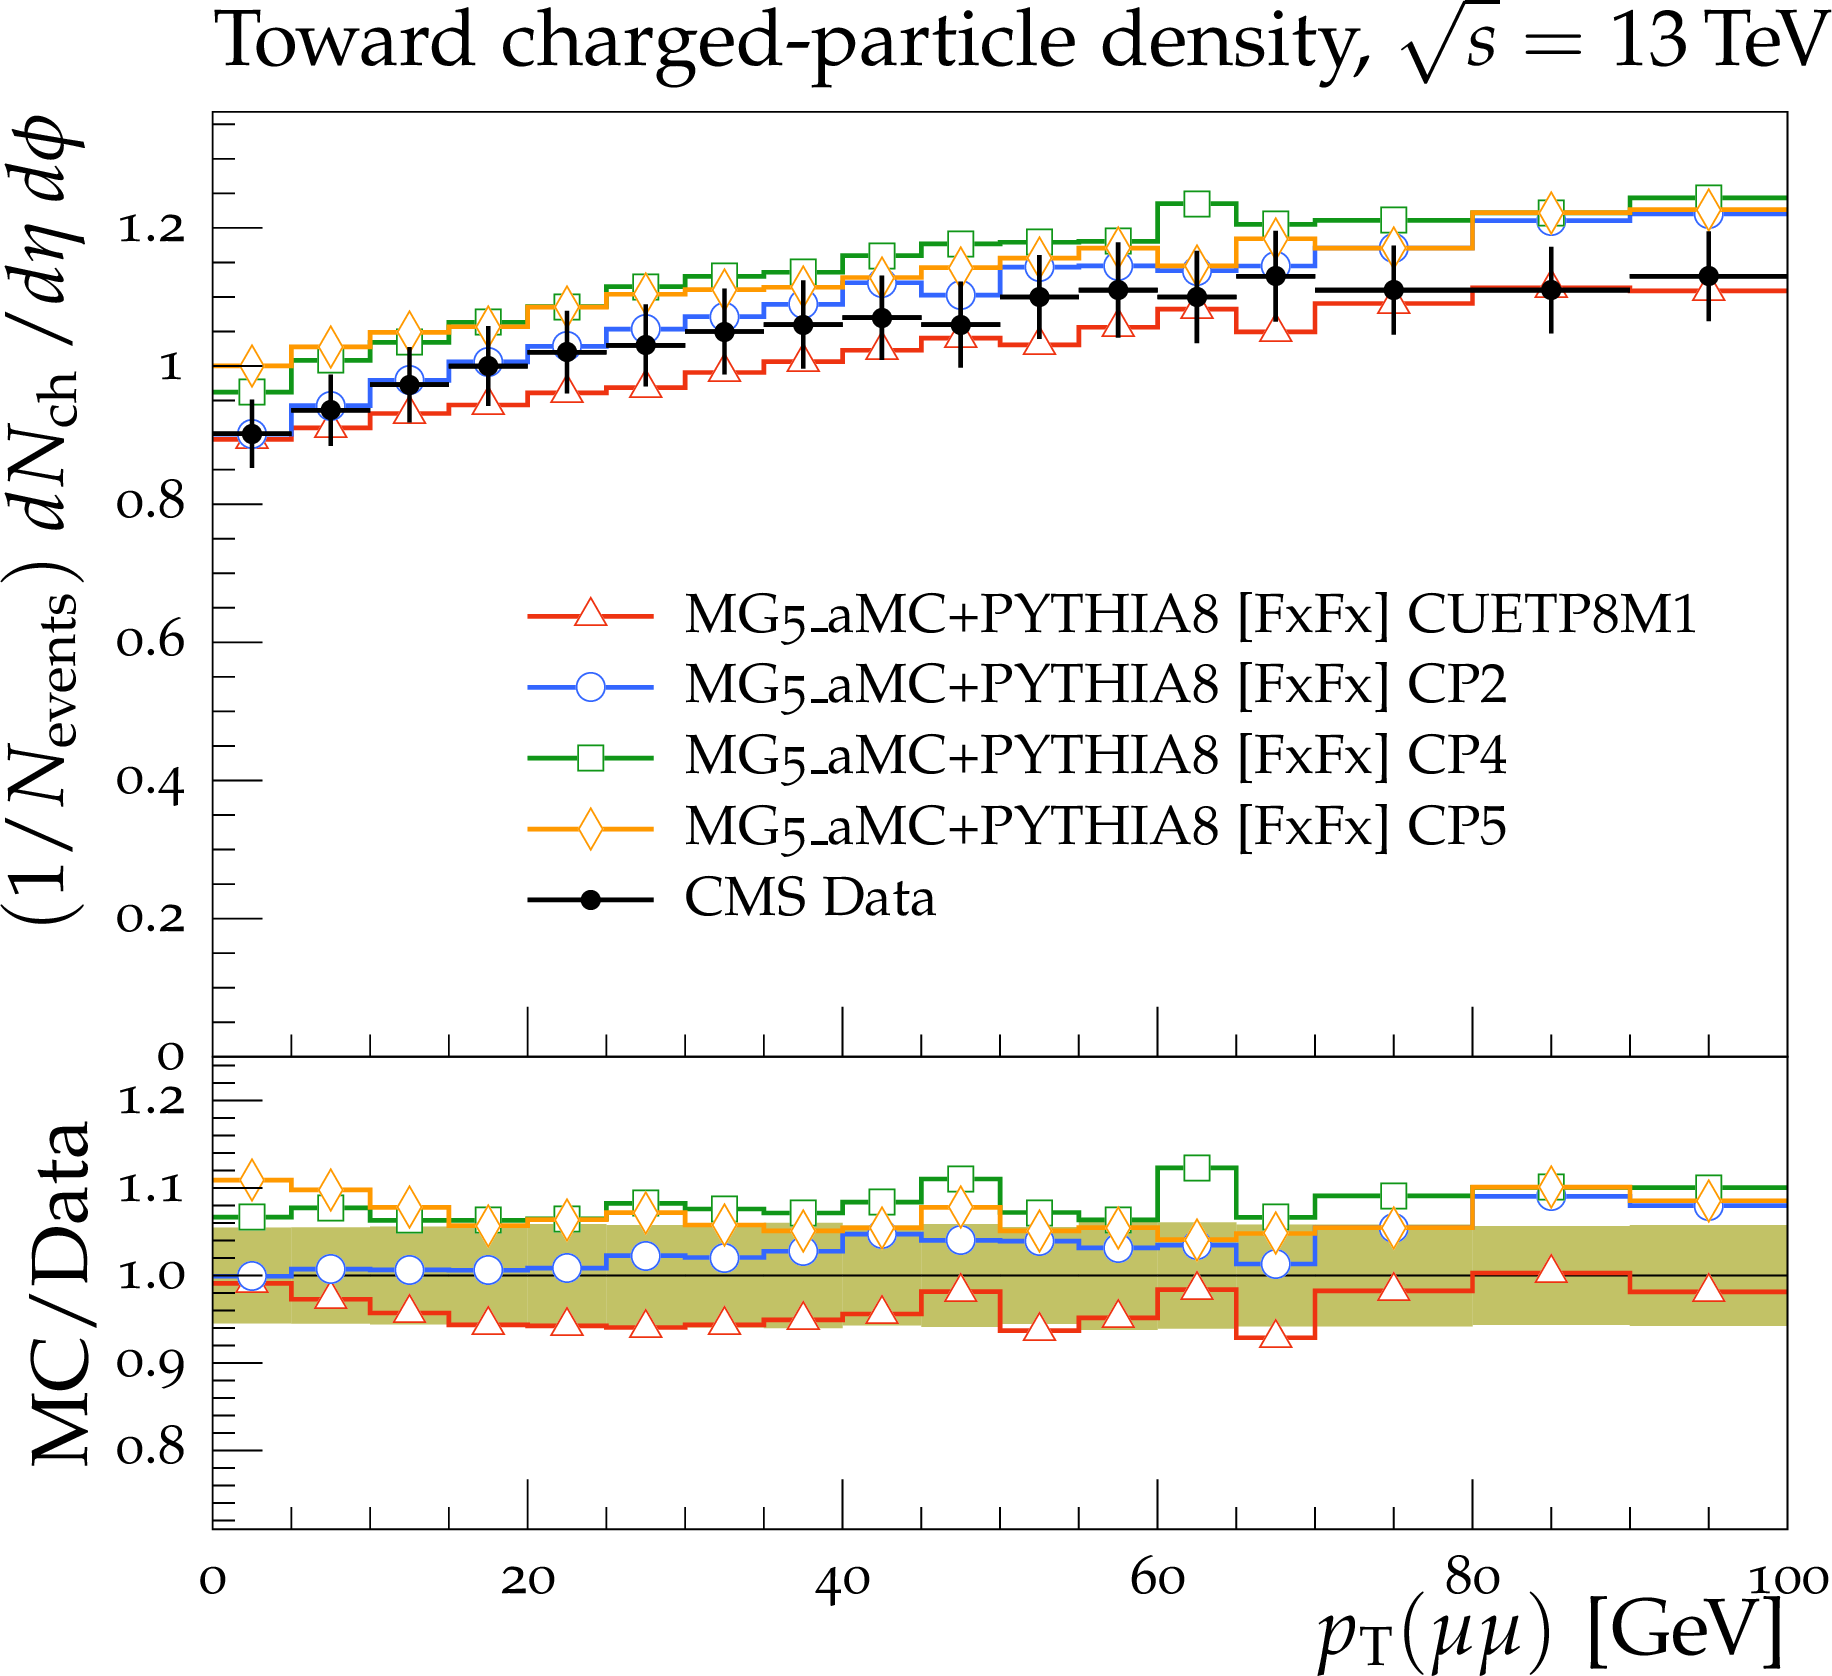
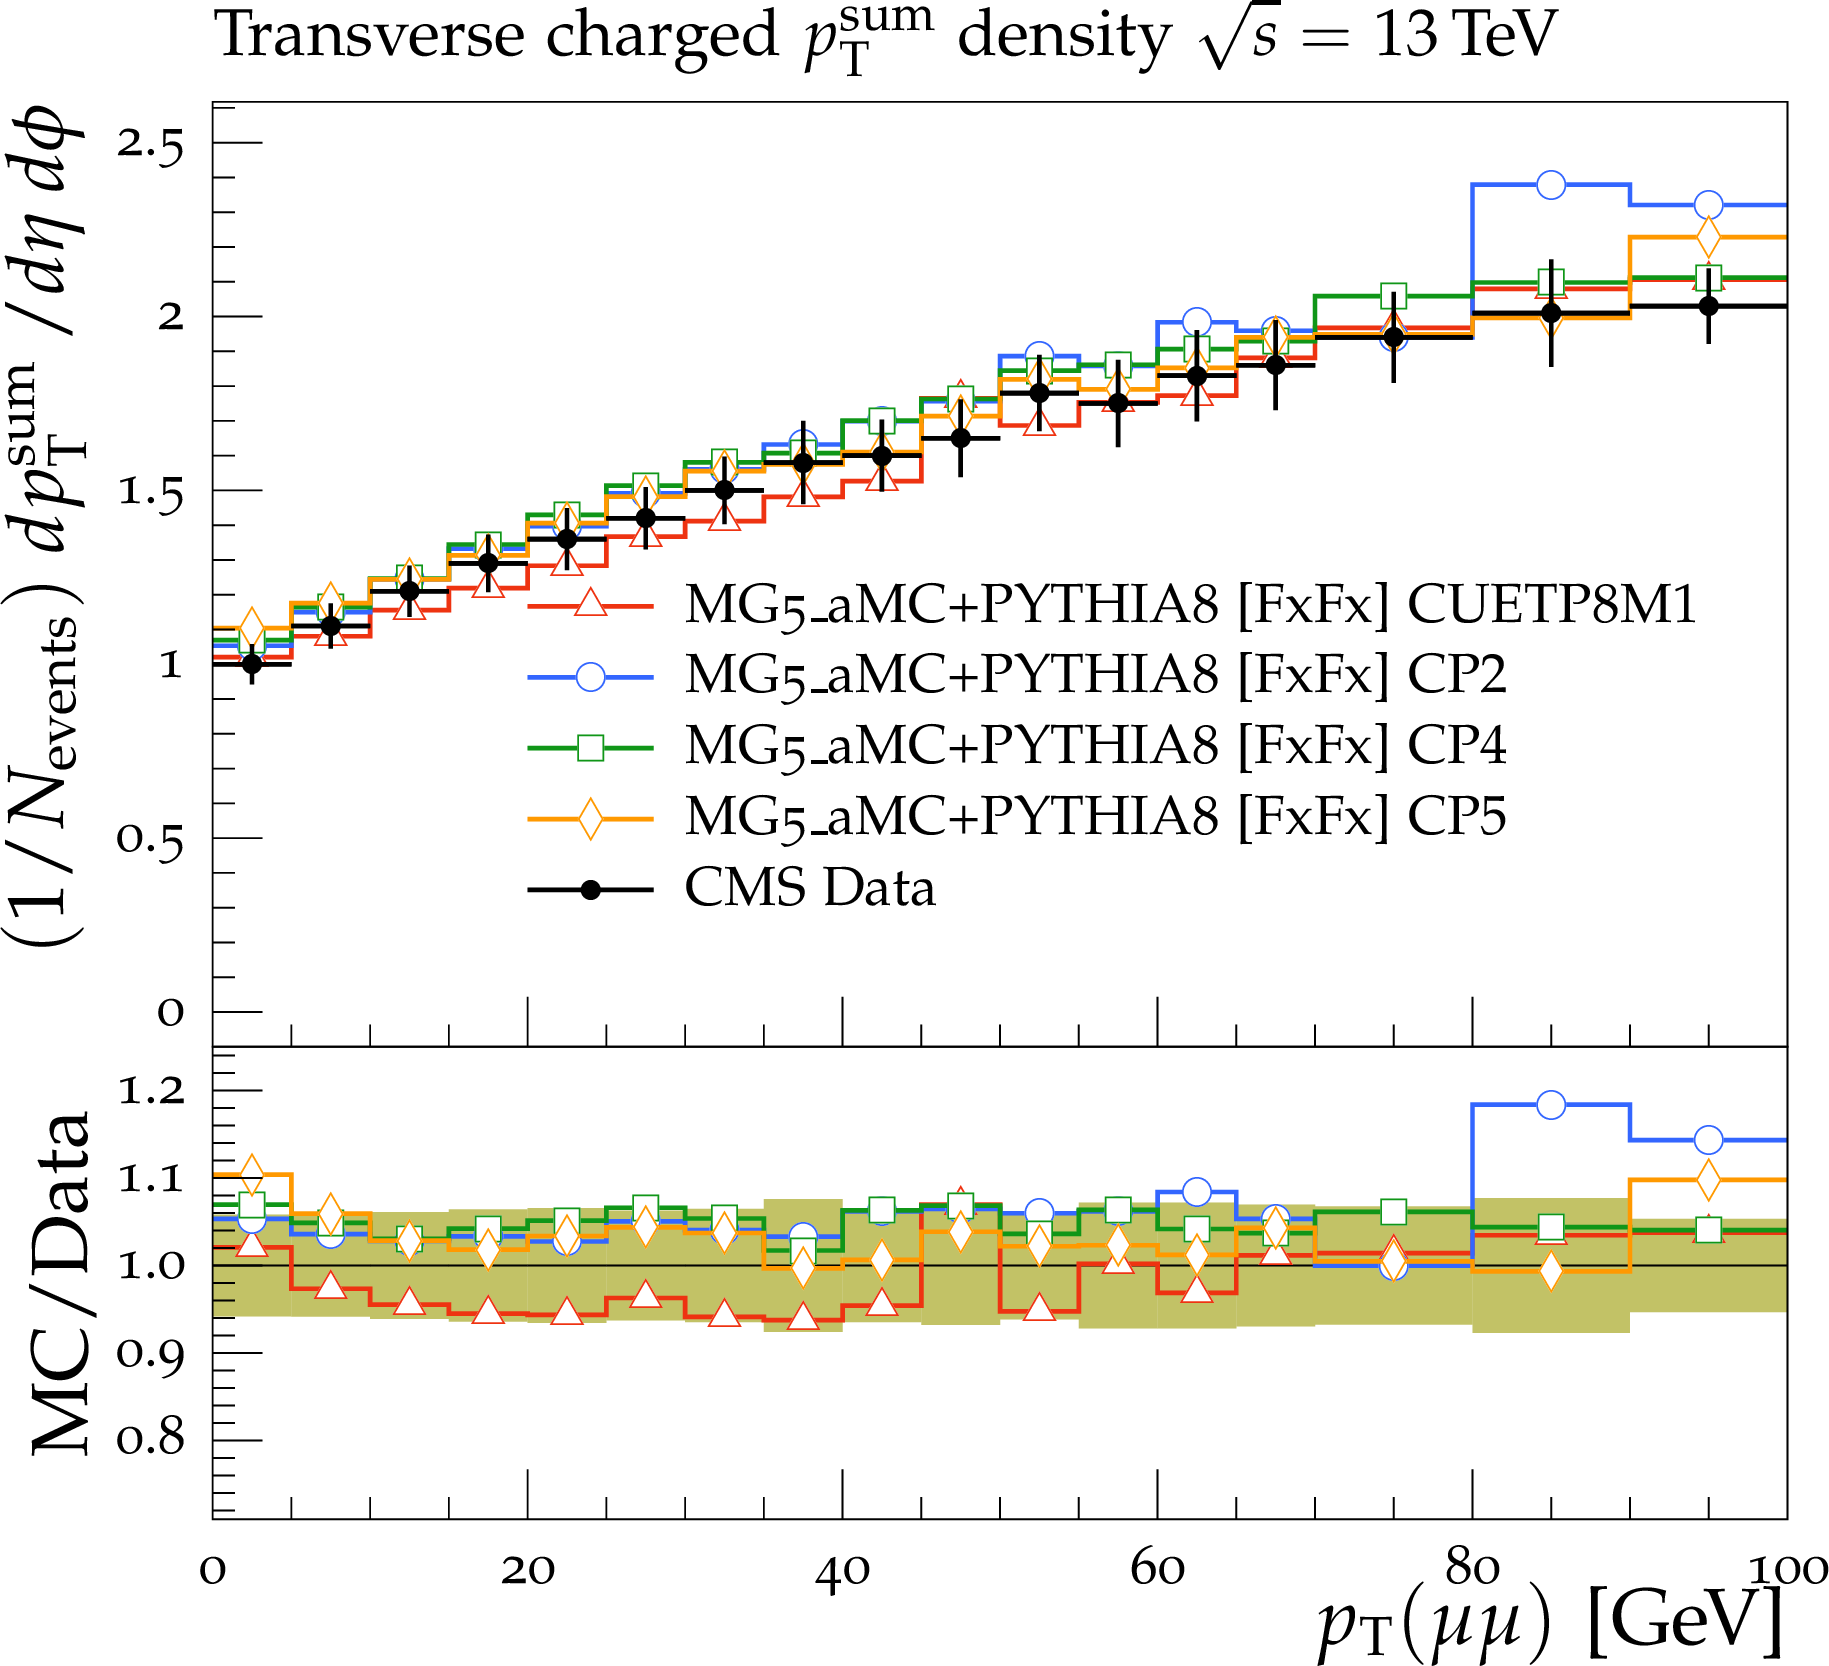
The charged-particle multiplicity (left) and ${{p_{\mathrm {T}}} ^\text {sum}}$ (right) in the toward (upper), transverse (middle), and away (lower) regions measured as a function of the Z boson ${p_{\mathrm {T}}}$ in Drell-Yan events at $\sqrt {s} = $ 13 TeV [21], and compared with the predictions obtained by an inclusive NLO ME calculated by mg5\_amc, interfaced to the UE simulation of PYTHIA 8 with the CUETP8M1, CP2, CP4, and CP5 tunes. Tunes CP1 and CP3 are not shown in the plot but present a similar behaviour as, respectively, tunes CP2 and CP4. The ratios of simulations to the data (MC/Data) are also shown, where the shaded band indicates the total experimental uncertainty of the data. Vertical lines drawn on the data points refer to the total uncertainty in the data. Vertical lines drawn on the MC points refer to the statistical uncertainty in the predictions. Horizontal bars indicate the associated bin width. |
png pdf |
Figure 21-a:
The charged-particle multiplicity (left) and ${{p_{\mathrm {T}}} ^\text {sum}}$ (right) in the toward (upper), transverse (middle), and away (lower) regions measured as a function of the Z boson ${p_{\mathrm {T}}}$ in Drell-Yan events at $\sqrt {s} = $ 13 TeV [21], and compared with the predictions obtained by an inclusive NLO ME calculated by mg5\_amc, interfaced to the UE simulation of PYTHIA 8 with the CUETP8M1, CP2, CP4, and CP5 tunes. Tunes CP1 and CP3 are not shown in the plot but present a similar behaviour as, respectively, tunes CP2 and CP4. The ratios of simulations to the data (MC/Data) are also shown, where the shaded band indicates the total experimental uncertainty of the data. Vertical lines drawn on the data points refer to the total uncertainty in the data. Vertical lines drawn on the MC points refer to the statistical uncertainty in the predictions. Horizontal bars indicate the associated bin width. |

png pdf |
Figure 21-b:
The charged-particle multiplicity (left) and ${{p_{\mathrm {T}}} ^\text {sum}}$ (right) in the toward (upper), transverse (middle), and away (lower) regions measured as a function of the Z boson ${p_{\mathrm {T}}}$ in Drell-Yan events at $\sqrt {s} = $ 13 TeV [21], and compared with the predictions obtained by an inclusive NLO ME calculated by mg5\_amc, interfaced to the UE simulation of PYTHIA 8 with the CUETP8M1, CP2, CP4, and CP5 tunes. Tunes CP1 and CP3 are not shown in the plot but present a similar behaviour as, respectively, tunes CP2 and CP4. The ratios of simulations to the data (MC/Data) are also shown, where the shaded band indicates the total experimental uncertainty of the data. Vertical lines drawn on the data points refer to the total uncertainty in the data. Vertical lines drawn on the MC points refer to the statistical uncertainty in the predictions. Horizontal bars indicate the associated bin width. |

png pdf |
Figure 21-c:
The charged-particle multiplicity (left) and ${{p_{\mathrm {T}}} ^\text {sum}}$ (right) in the toward (upper), transverse (middle), and away (lower) regions measured as a function of the Z boson ${p_{\mathrm {T}}}$ in Drell-Yan events at $\sqrt {s} = $ 13 TeV [21], and compared with the predictions obtained by an inclusive NLO ME calculated by mg5\_amc, interfaced to the UE simulation of PYTHIA 8 with the CUETP8M1, CP2, CP4, and CP5 tunes. Tunes CP1 and CP3 are not shown in the plot but present a similar behaviour as, respectively, tunes CP2 and CP4. The ratios of simulations to the data (MC/Data) are also shown, where the shaded band indicates the total experimental uncertainty of the data. Vertical lines drawn on the data points refer to the total uncertainty in the data. Vertical lines drawn on the MC points refer to the statistical uncertainty in the predictions. Horizontal bars indicate the associated bin width. |
png pdf |
Figure 21-d:
The charged-particle multiplicity (left) and ${{p_{\mathrm {T}}} ^\text {sum}}$ (right) in the toward (upper), transverse (middle), and away (lower) regions measured as a function of the Z boson ${p_{\mathrm {T}}}$ in Drell-Yan events at $\sqrt {s} = $ 13 TeV [21], and compared with the predictions obtained by an inclusive NLO ME calculated by mg5\_amc, interfaced to the UE simulation of PYTHIA 8 with the CUETP8M1, CP2, CP4, and CP5 tunes. Tunes CP1 and CP3 are not shown in the plot but present a similar behaviour as, respectively, tunes CP2 and CP4. The ratios of simulations to the data (MC/Data) are also shown, where the shaded band indicates the total experimental uncertainty of the data. Vertical lines drawn on the data points refer to the total uncertainty in the data. Vertical lines drawn on the MC points refer to the statistical uncertainty in the predictions. Horizontal bars indicate the associated bin width. |
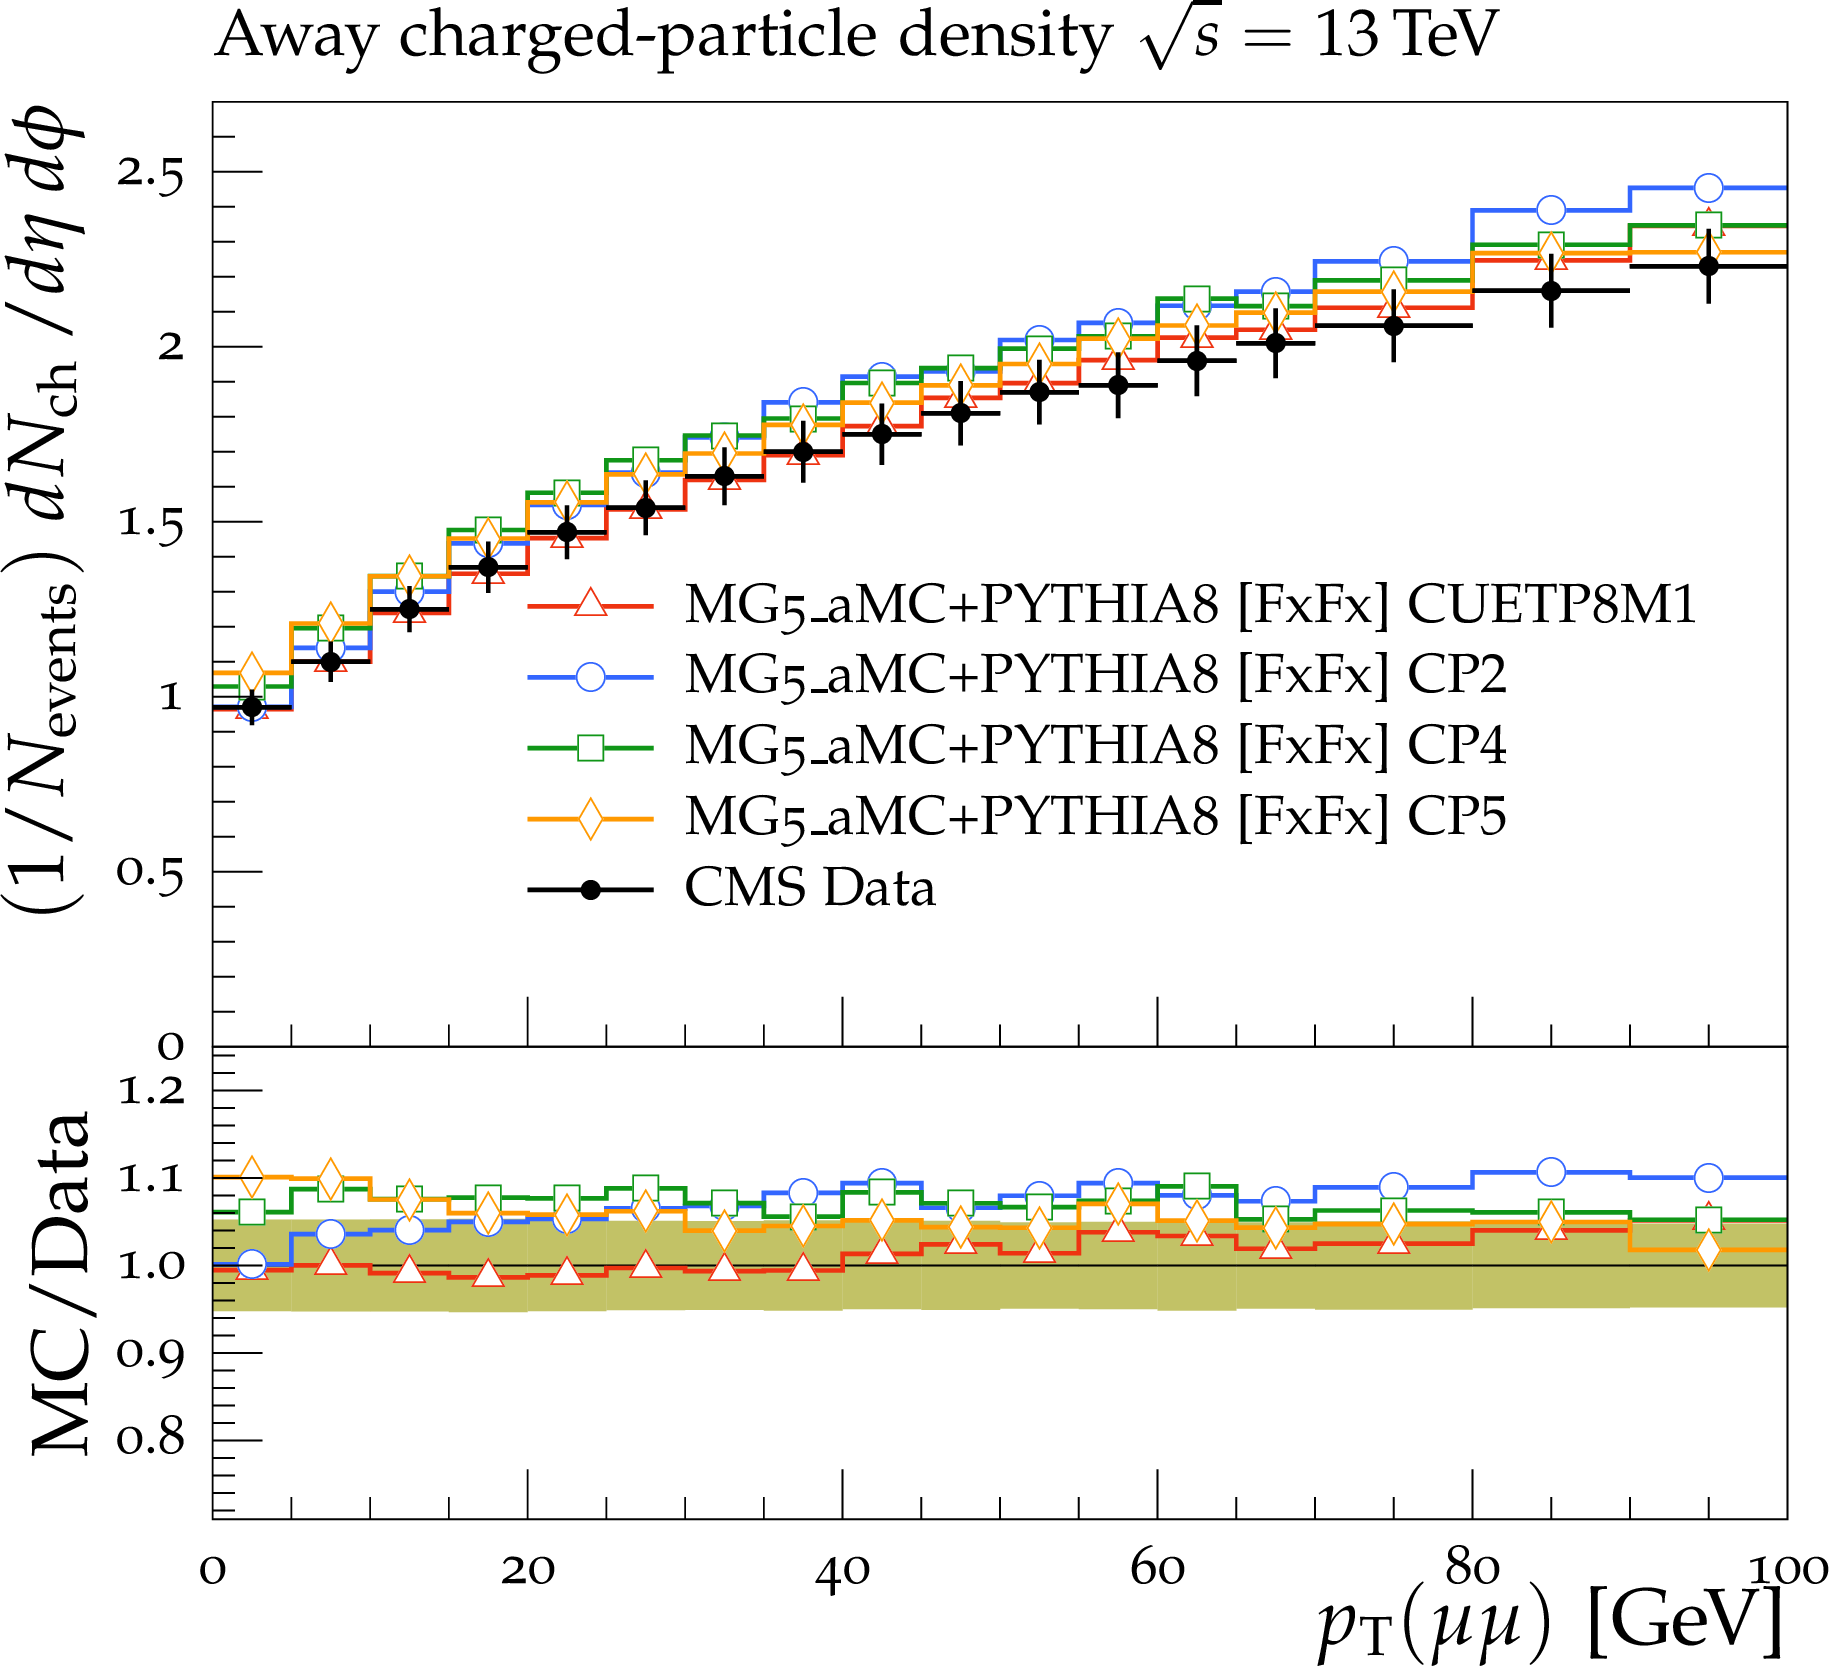
png pdf |
Figure 21-e:
The charged-particle multiplicity (left) and ${{p_{\mathrm {T}}} ^\text {sum}}$ (right) in the toward (upper), transverse (middle), and away (lower) regions measured as a function of the Z boson ${p_{\mathrm {T}}}$ in Drell-Yan events at $\sqrt {s} = $ 13 TeV [21], and compared with the predictions obtained by an inclusive NLO ME calculated by mg5\_amc, interfaced to the UE simulation of PYTHIA 8 with the CUETP8M1, CP2, CP4, and CP5 tunes. Tunes CP1 and CP3 are not shown in the plot but present a similar behaviour as, respectively, tunes CP2 and CP4. The ratios of simulations to the data (MC/Data) are also shown, where the shaded band indicates the total experimental uncertainty of the data. Vertical lines drawn on the data points refer to the total uncertainty in the data. Vertical lines drawn on the MC points refer to the statistical uncertainty in the predictions. Horizontal bars indicate the associated bin width. |

png pdf |
Figure 21-f:
The charged-particle multiplicity (left) and ${{p_{\mathrm {T}}} ^\text {sum}}$ (right) in the toward (upper), transverse (middle), and away (lower) regions measured as a function of the Z boson ${p_{\mathrm {T}}}$ in Drell-Yan events at $\sqrt {s} = $ 13 TeV [21], and compared with the predictions obtained by an inclusive NLO ME calculated by mg5\_amc, interfaced to the UE simulation of PYTHIA 8 with the CUETP8M1, CP2, CP4, and CP5 tunes. Tunes CP1 and CP3 are not shown in the plot but present a similar behaviour as, respectively, tunes CP2 and CP4. The ratios of simulations to the data (MC/Data) are also shown, where the shaded band indicates the total experimental uncertainty of the data. Vertical lines drawn on the data points refer to the total uncertainty in the data. Vertical lines drawn on the MC points refer to the statistical uncertainty in the predictions. Horizontal bars indicate the associated bin width. |
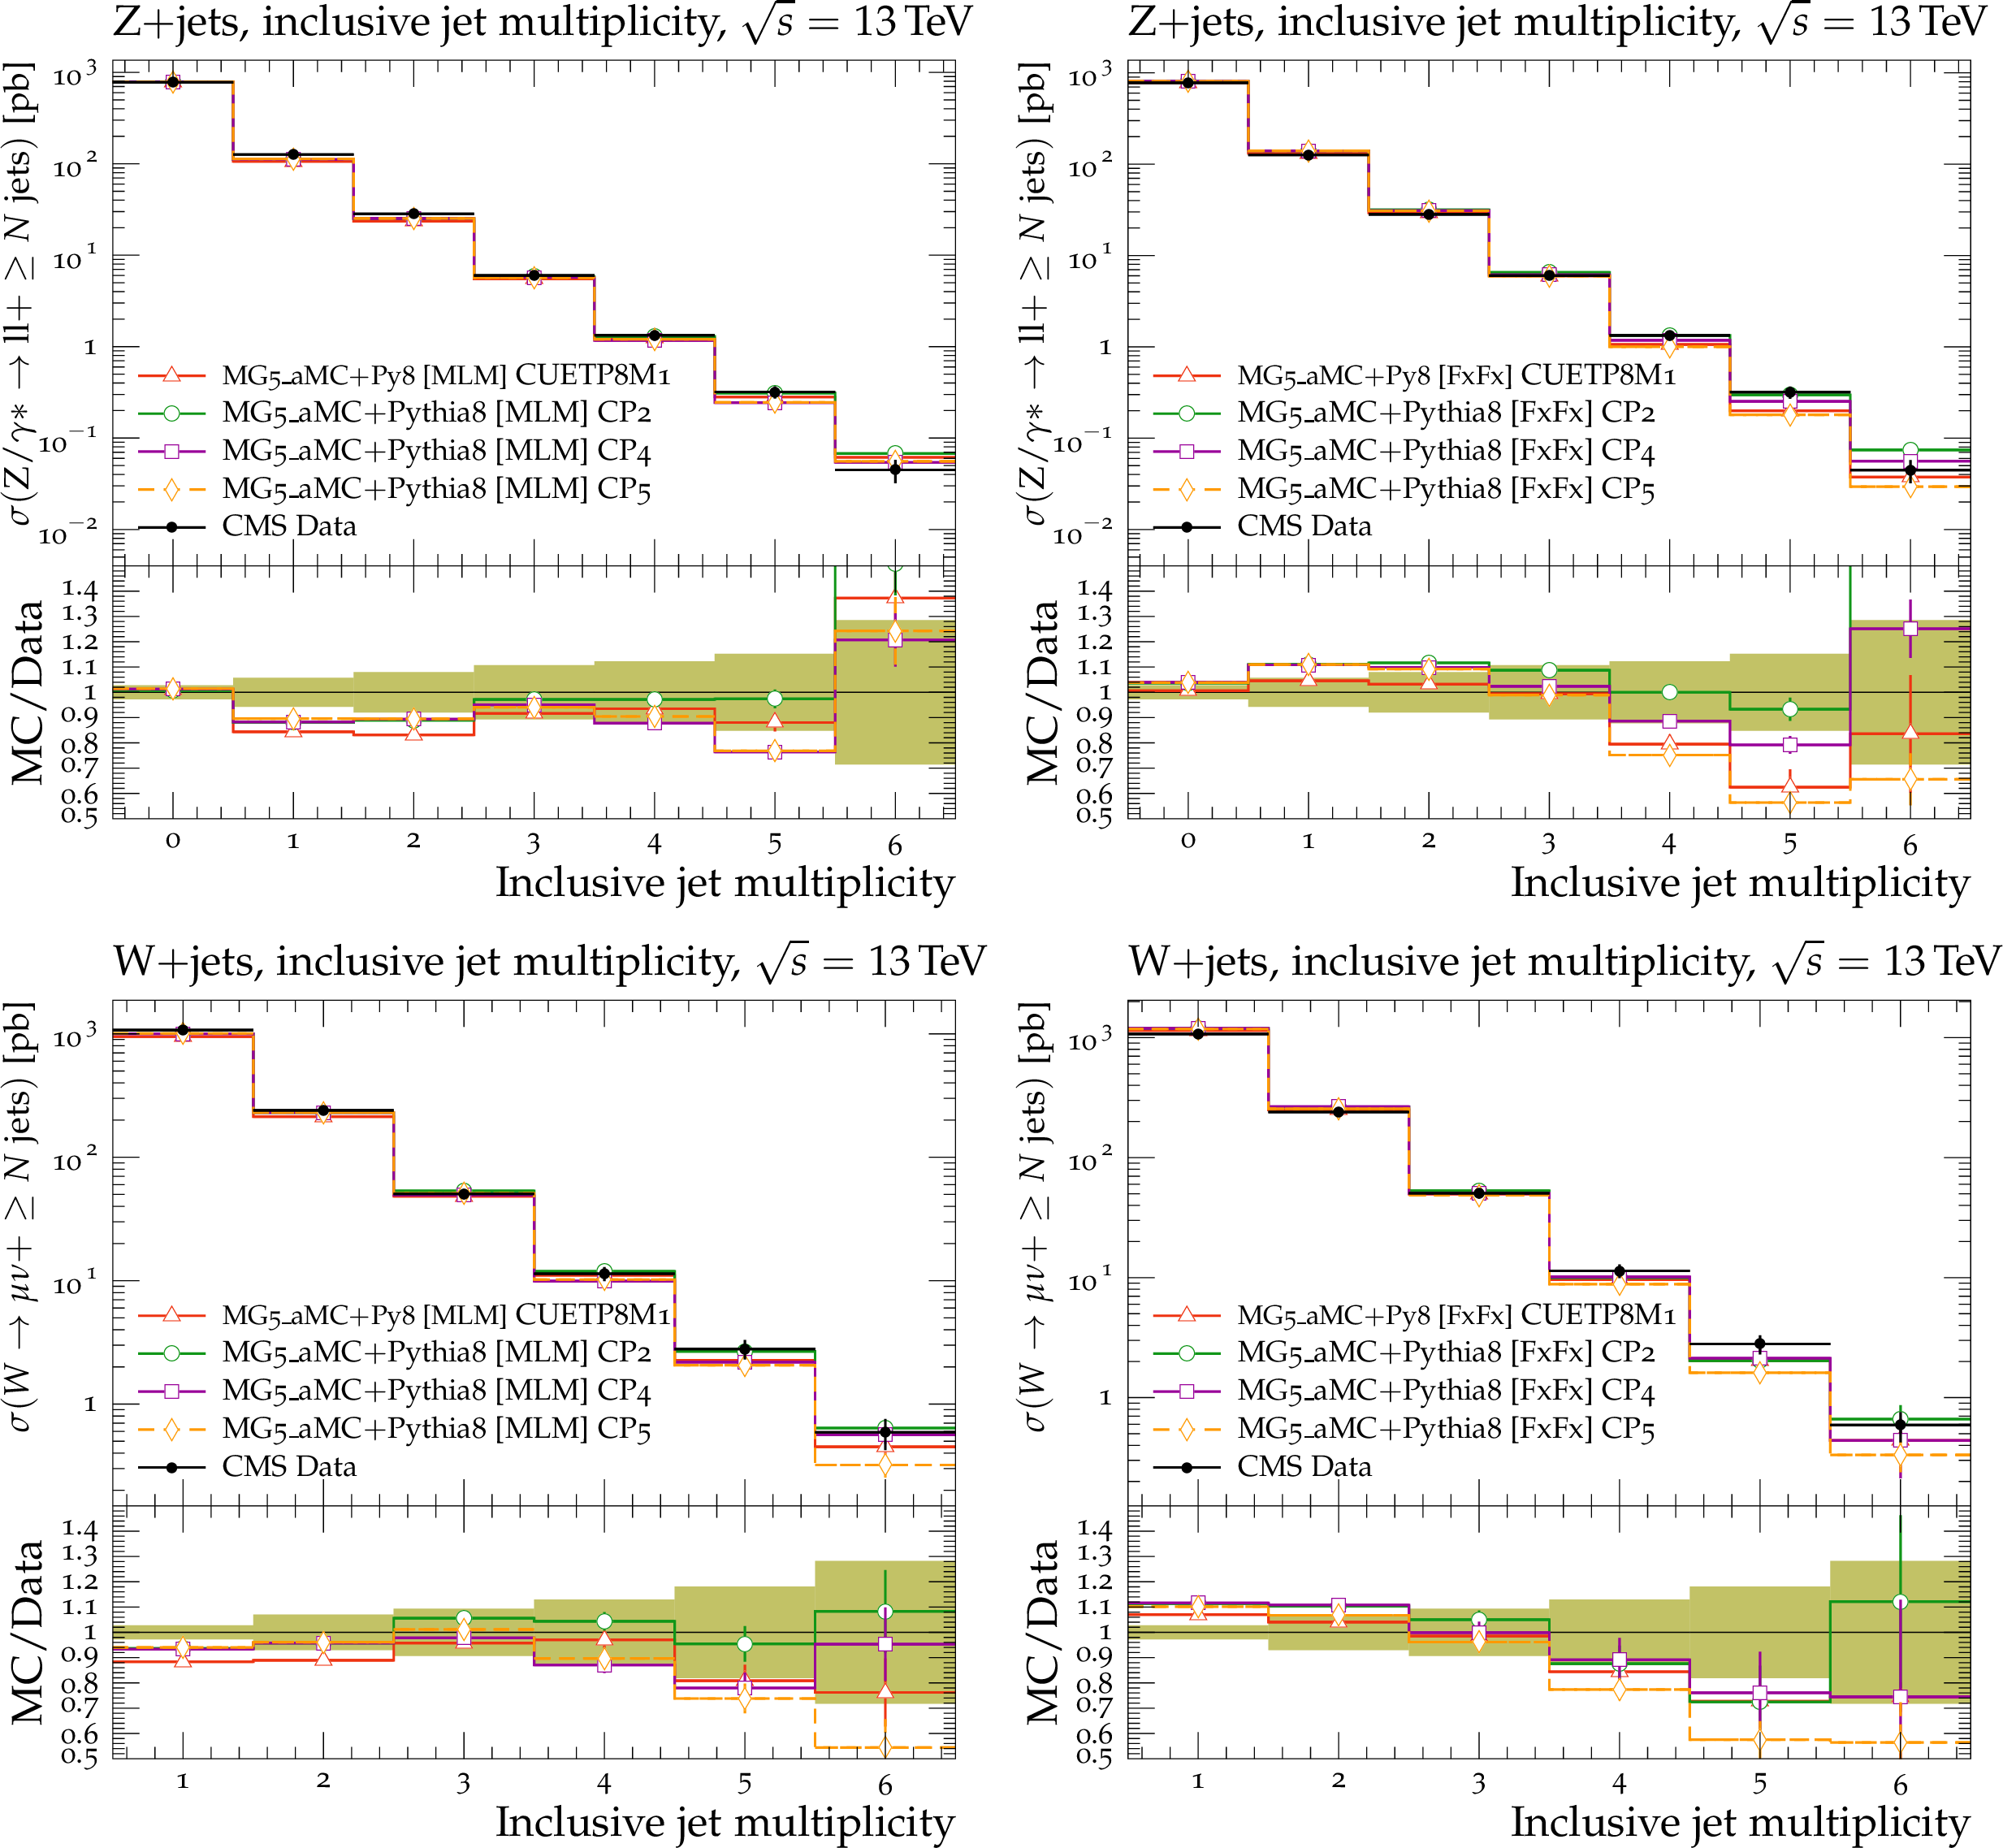
png pdf |
Figure 22:
Comparison with the measurement [71,72] of the inclusive jet multiplicity in Z+jets (upper) and W+jets (lower) events predicted by mg5\_amc + PYTHIA 8 with ${k_{\mathrm {T}}} $-MLM merging (left) and FxFx merging (right) for the different tunes. Tunes CP1 and CP3 are not shown in the plot but present a similar behaviour as, respectively, tunes CP2 and CP4. The ratios of simulations to the data (MC/Data) are also shown, where the shaded band indicates the total experimental uncertainty in the data. Vertical lines drawn on the data points refer to the total uncertainty in the data. Vertical lines drawn on the MC points refer to the statistical uncertainty in the predictions. Horizontal bars indicate the associated bin width. |

png pdf |
Figure 22-a:
Comparison with the measurement [71,72] of the inclusive jet multiplicity in Z+jets (upper) and W+jets (lower) events predicted by mg5\_amc + PYTHIA 8 with ${k_{\mathrm {T}}} $-MLM merging (left) and FxFx merging (right) for the different tunes. Tunes CP1 and CP3 are not shown in the plot but present a similar behaviour as, respectively, tunes CP2 and CP4. The ratios of simulations to the data (MC/Data) are also shown, where the shaded band indicates the total experimental uncertainty in the data. Vertical lines drawn on the data points refer to the total uncertainty in the data. Vertical lines drawn on the MC points refer to the statistical uncertainty in the predictions. Horizontal bars indicate the associated bin width. |

png pdf |
Figure 22-b:
Comparison with the measurement [71,72] of the inclusive jet multiplicity in Z+jets (upper) and W+jets (lower) events predicted by mg5\_amc + PYTHIA 8 with ${k_{\mathrm {T}}} $-MLM merging (left) and FxFx merging (right) for the different tunes. Tunes CP1 and CP3 are not shown in the plot but present a similar behaviour as, respectively, tunes CP2 and CP4. The ratios of simulations to the data (MC/Data) are also shown, where the shaded band indicates the total experimental uncertainty in the data. Vertical lines drawn on the data points refer to the total uncertainty in the data. Vertical lines drawn on the MC points refer to the statistical uncertainty in the predictions. Horizontal bars indicate the associated bin width. |
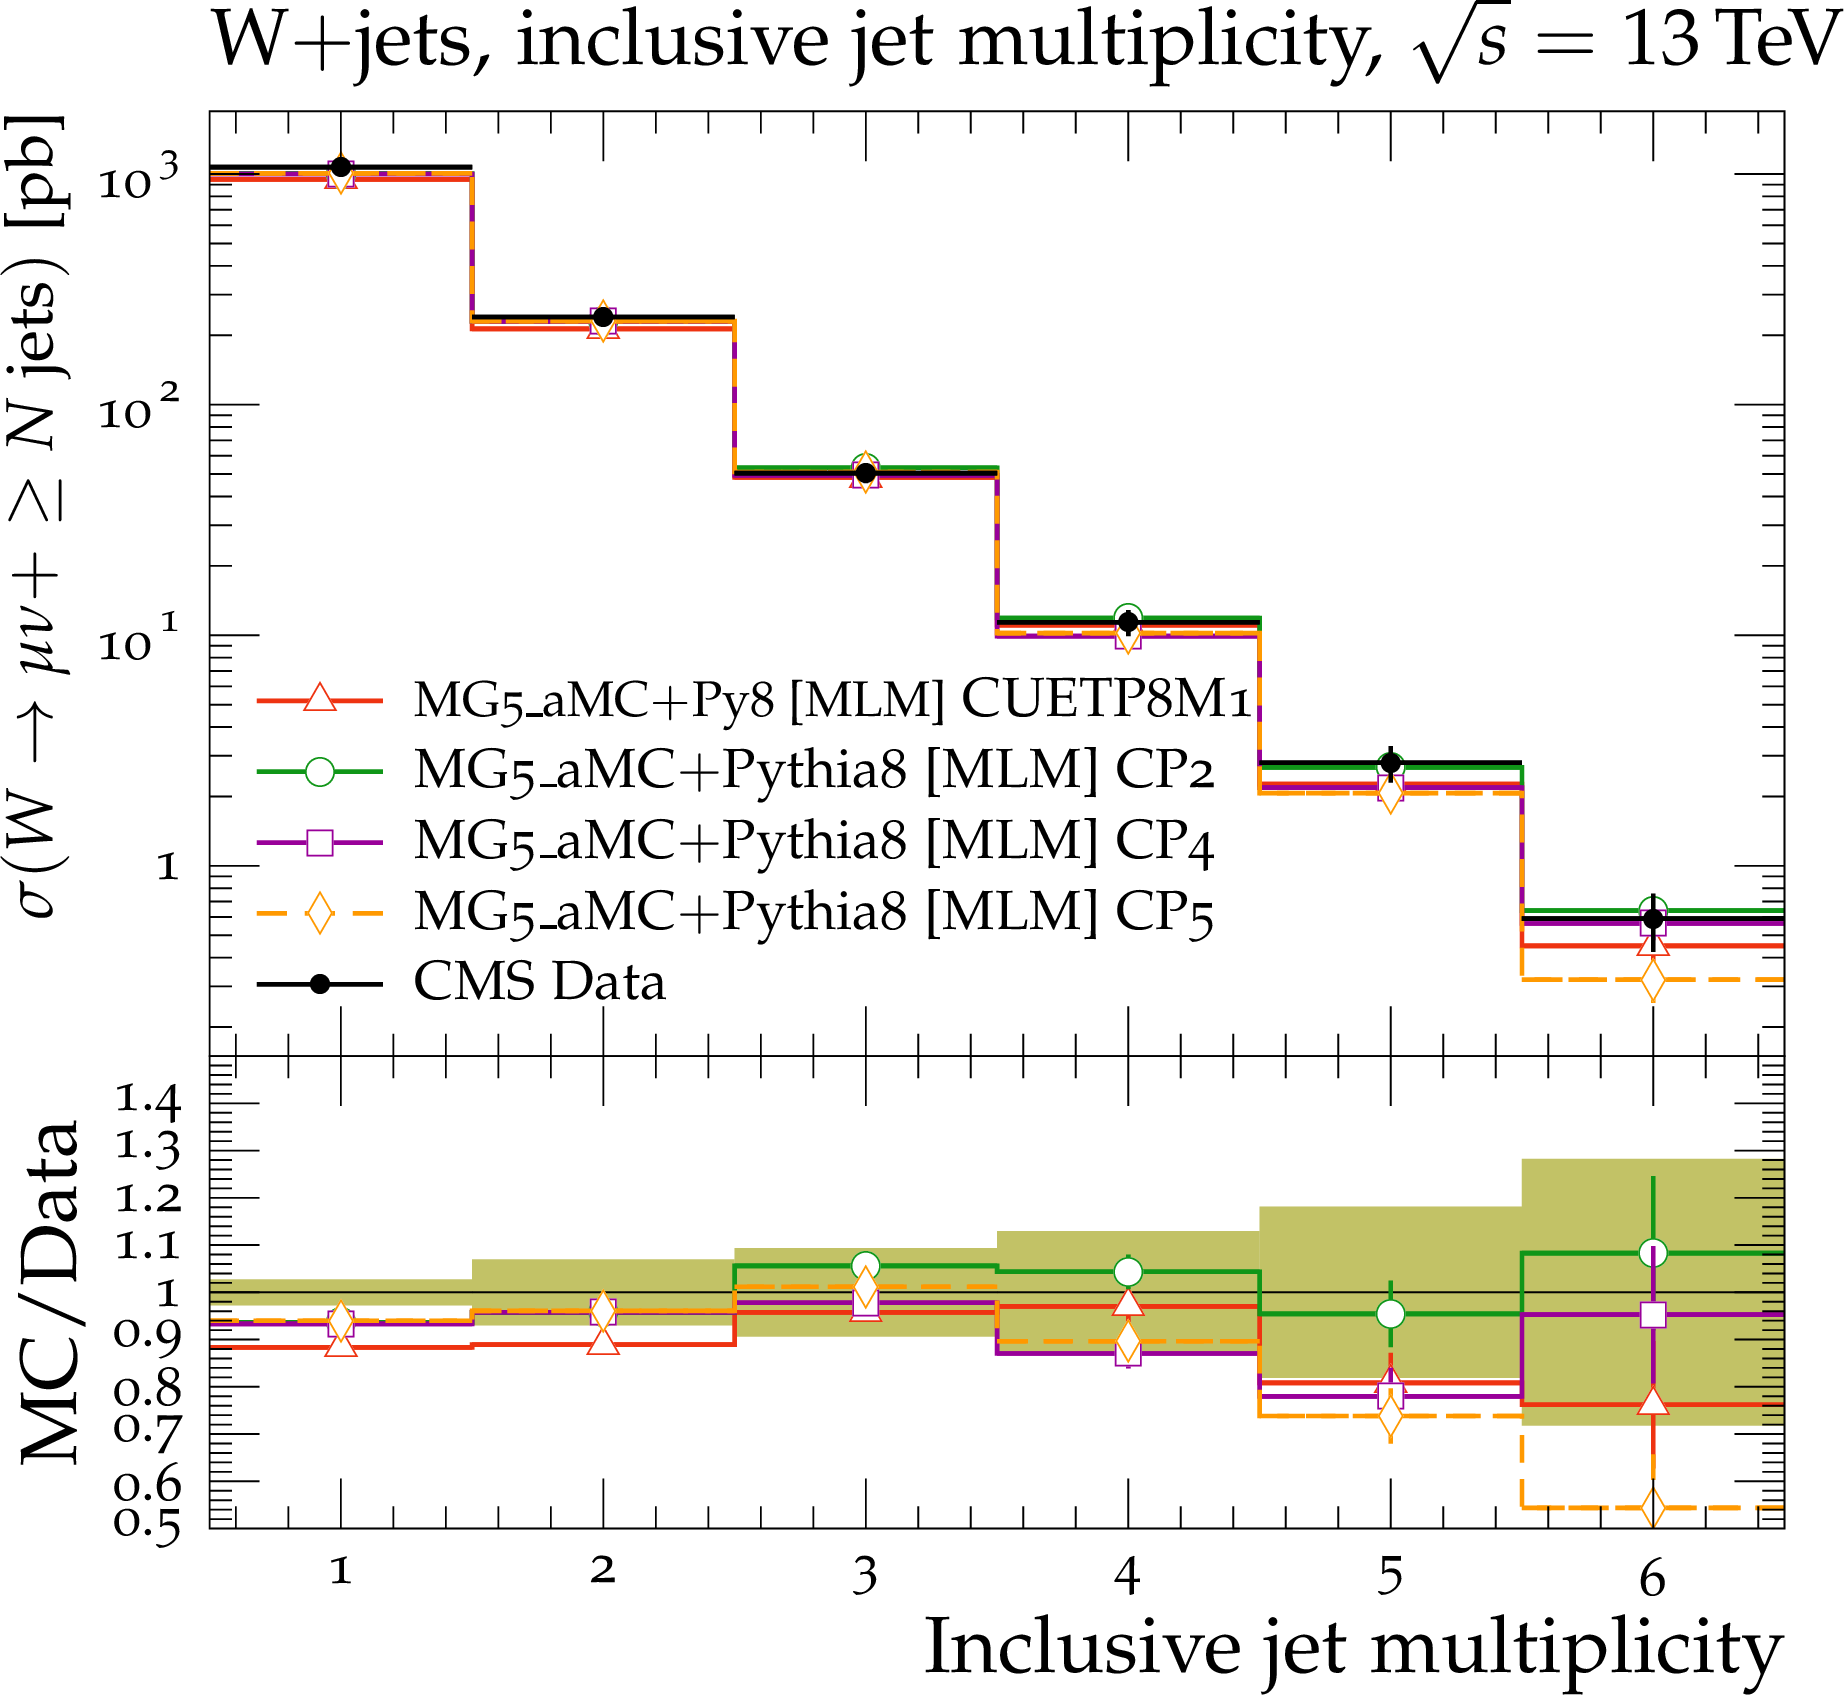
png pdf |
Figure 22-c:
Comparison with the measurement [71,72] of the inclusive jet multiplicity in Z+jets (upper) and W+jets (lower) events predicted by mg5\_amc + PYTHIA 8 with ${k_{\mathrm {T}}} $-MLM merging (left) and FxFx merging (right) for the different tunes. Tunes CP1 and CP3 are not shown in the plot but present a similar behaviour as, respectively, tunes CP2 and CP4. The ratios of simulations to the data (MC/Data) are also shown, where the shaded band indicates the total experimental uncertainty in the data. Vertical lines drawn on the data points refer to the total uncertainty in the data. Vertical lines drawn on the MC points refer to the statistical uncertainty in the predictions. Horizontal bars indicate the associated bin width. |

png pdf |
Figure 22-d:
Comparison with the measurement [71,72] of the inclusive jet multiplicity in Z+jets (upper) and W+jets (lower) events predicted by mg5\_amc + PYTHIA 8 with ${k_{\mathrm {T}}} $-MLM merging (left) and FxFx merging (right) for the different tunes. Tunes CP1 and CP3 are not shown in the plot but present a similar behaviour as, respectively, tunes CP2 and CP4. The ratios of simulations to the data (MC/Data) are also shown, where the shaded band indicates the total experimental uncertainty in the data. Vertical lines drawn on the data points refer to the total uncertainty in the data. Vertical lines drawn on the MC points refer to the statistical uncertainty in the predictions. Horizontal bars indicate the associated bin width. |

png pdf |
Figure 23:
Comparison with the measurement [71] of the ${p_{\mathrm {T}}}$ balance predicted by mg5\_amc + PYTHIA 8 with ${k_{\mathrm {T}}} $-MLM merging (left) and FxFx merging (right) for the different tunes for events with at least one jet. Tunes CP1 and CP3 are not shown in the plot but they present a similar behaviour as tunes CP2 and CP4, respectively. The ratios of simulations to the data (MC/Data) are also shown, where the shaded band indicates the total experimental uncertainty in the data. Vertical lines drawn on the data points refer to the total uncertainty in the data. Vertical lines drawn on the MC points refer to the statistical uncertainty in the predictions. Horizontal bars indicate the associated bin width. |
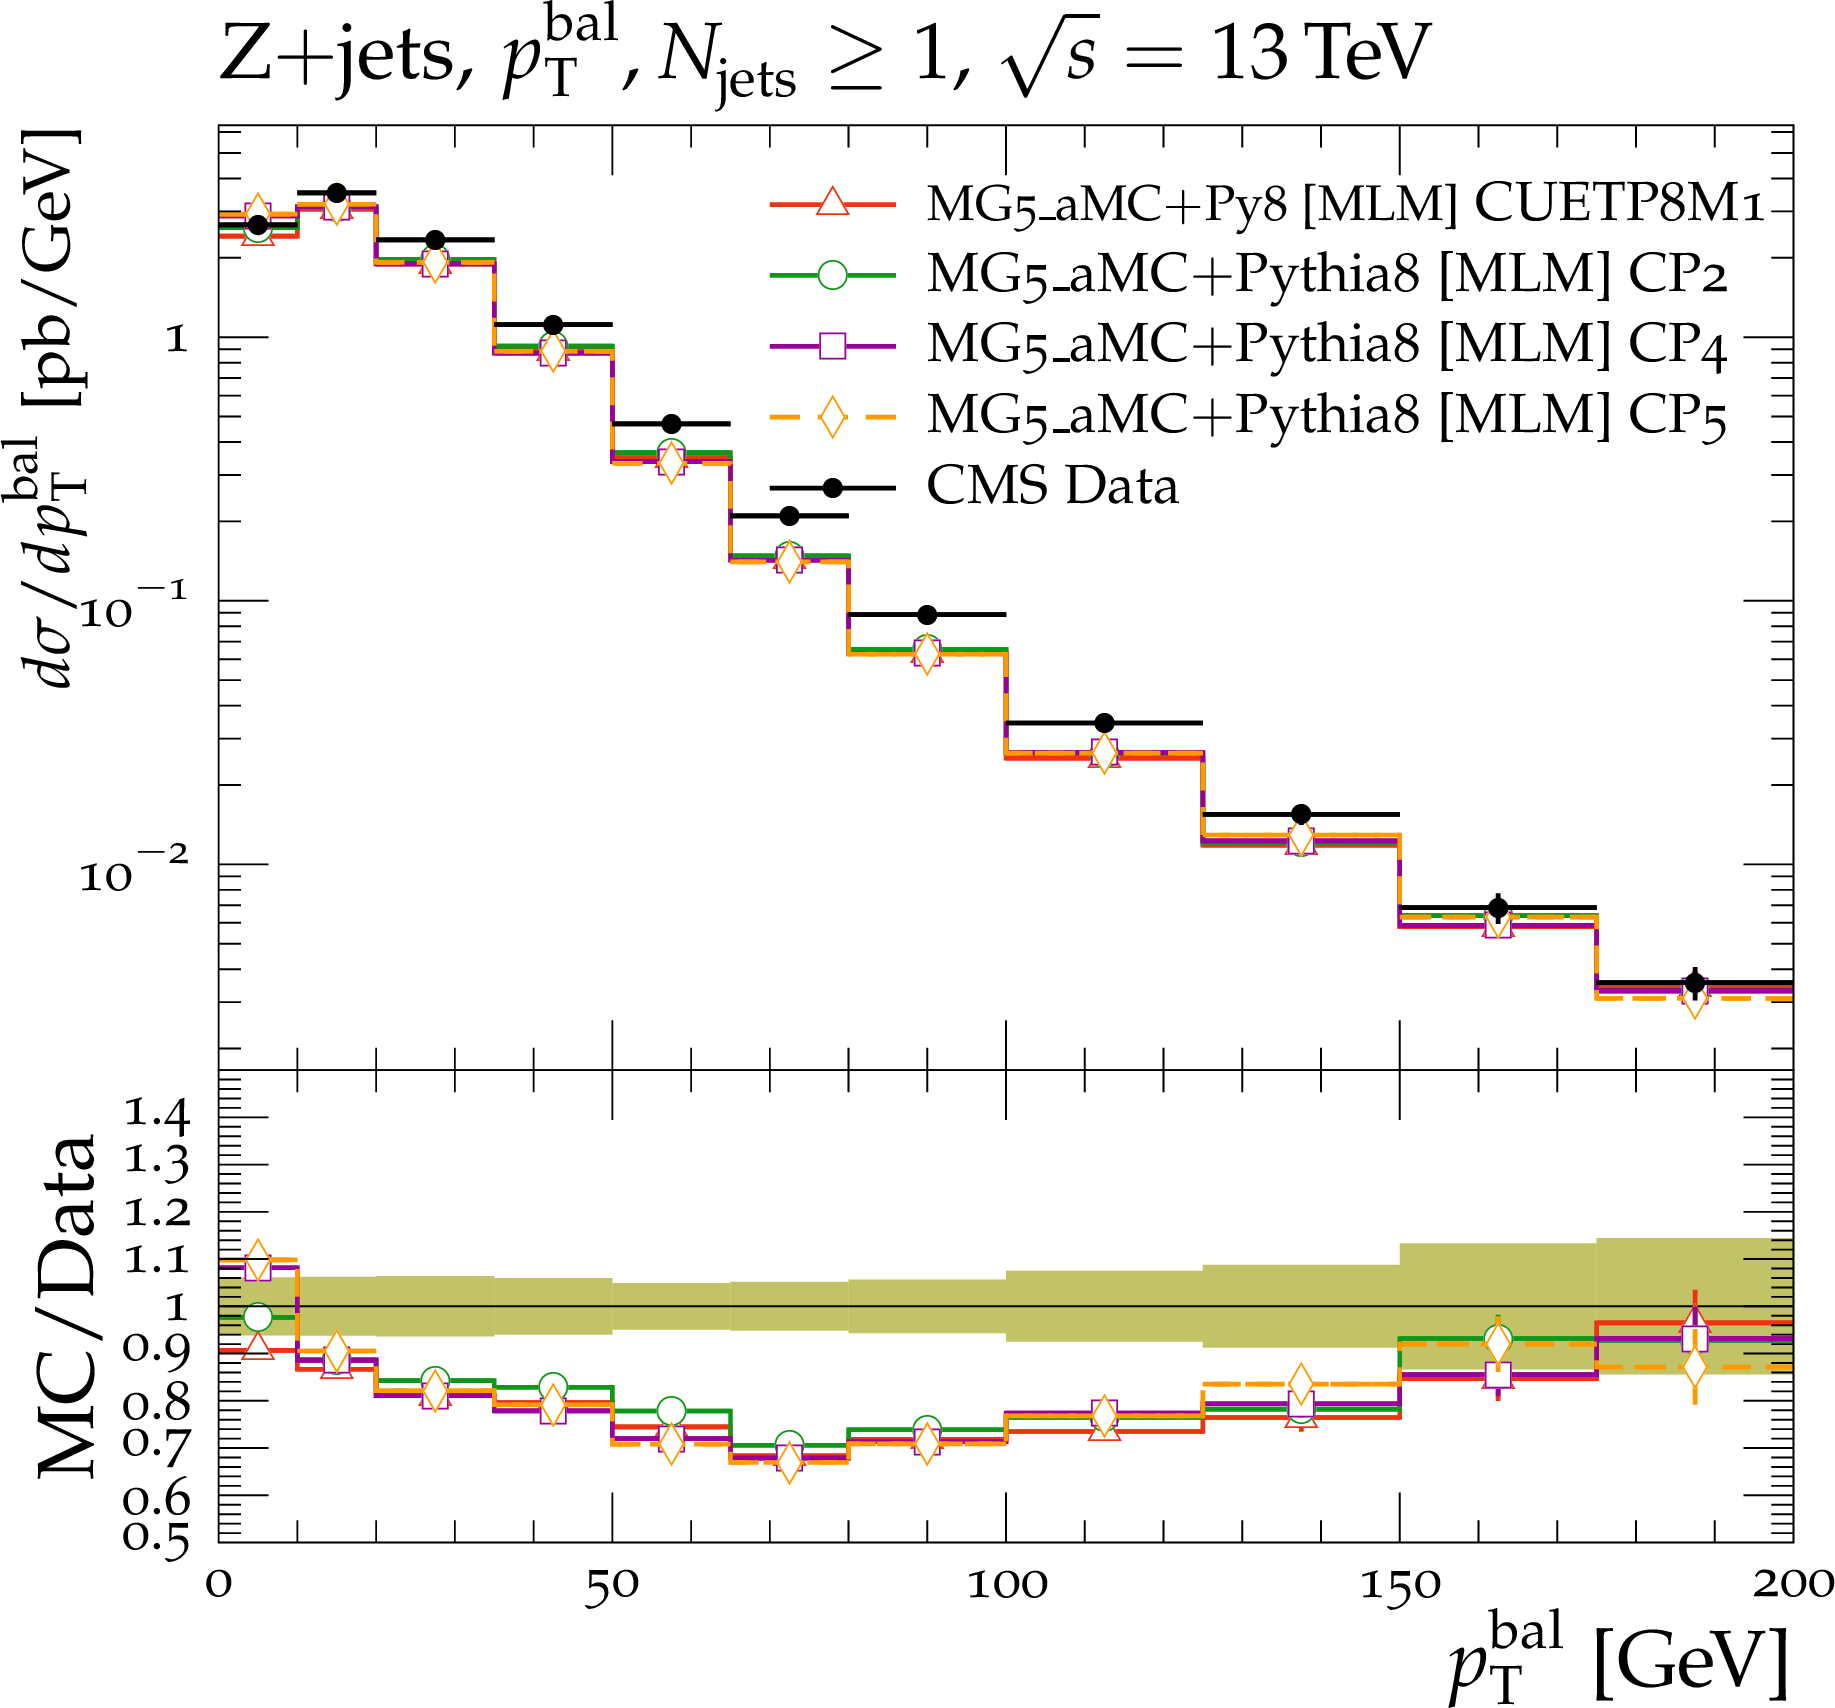
png pdf |
Figure 23-a:
Comparison with the measurement [71] of the ${p_{\mathrm {T}}}$ balance predicted by mg5\_amc + PYTHIA 8 with ${k_{\mathrm {T}}} $-MLM merging (left) and FxFx merging (right) for the different tunes for events with at least one jet. Tunes CP1 and CP3 are not shown in the plot but they present a similar behaviour as tunes CP2 and CP4, respectively. The ratios of simulations to the data (MC/Data) are also shown, where the shaded band indicates the total experimental uncertainty in the data. Vertical lines drawn on the data points refer to the total uncertainty in the data. Vertical lines drawn on the MC points refer to the statistical uncertainty in the predictions. Horizontal bars indicate the associated bin width. |

png pdf |
Figure 23-b:
Comparison with the measurement [71] of the ${p_{\mathrm {T}}}$ balance predicted by mg5\_amc + PYTHIA 8 with ${k_{\mathrm {T}}} $-MLM merging (left) and FxFx merging (right) for the different tunes for events with at least one jet. Tunes CP1 and CP3 are not shown in the plot but they present a similar behaviour as tunes CP2 and CP4, respectively. The ratios of simulations to the data (MC/Data) are also shown, where the shaded band indicates the total experimental uncertainty in the data. Vertical lines drawn on the data points refer to the total uncertainty in the data. Vertical lines drawn on the MC points refer to the statistical uncertainty in the predictions. Horizontal bars indicate the associated bin width. |

png pdf |
Figure 24:
Comparison with the measurement [71] of the ${p_{\mathrm {T}}}$ (Z) predicted by mg5\_amc + PYTHIA 8 with ${k_{\mathrm {T}}} $-MLM merging (left) and FxFx merging (right) for the different tunes. Tunes CP1 and CP3 are not shown in the plot but they present a similar behaviour as tunes CP2 and CP4, respectively. The ratios of simulations to the data (MC/Data) are also shown, where the shaded band indicates the total experimental uncertainty in data. Vertical lines drawn on the data points refer to the total uncertainty in the data. Vertical lines drawn on the MC points refer to the statistical uncertainty in the predictions. Horizontal bars indicate the associated bin width. |
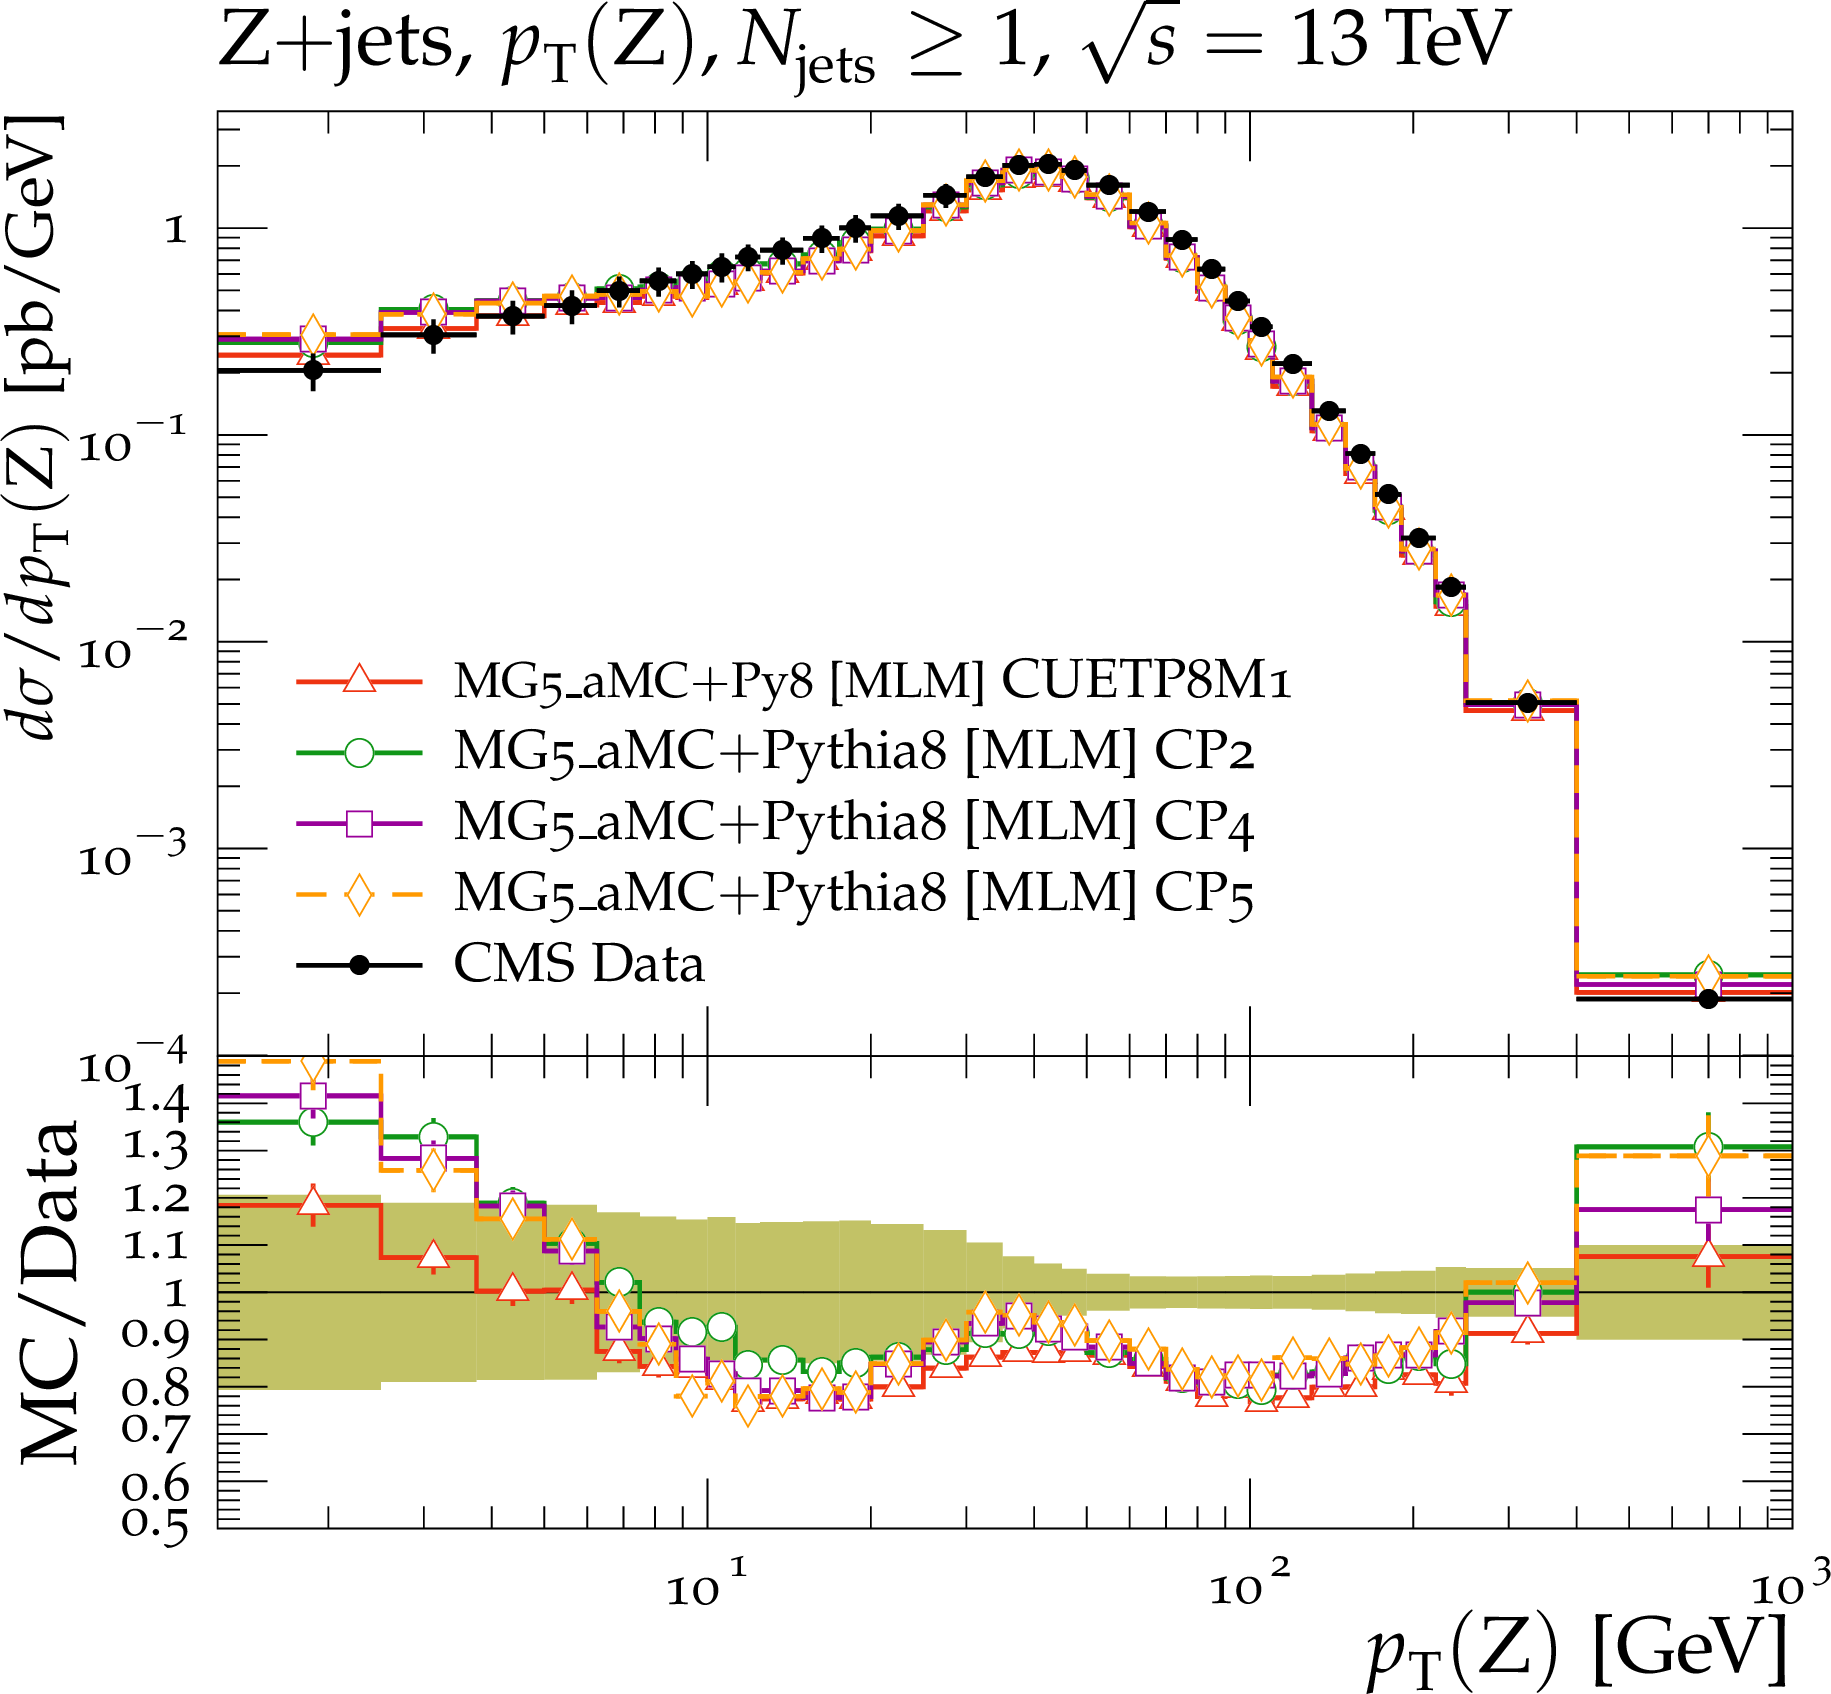
png pdf |
Figure 24-a:
Comparison with the measurement [71] of the ${p_{\mathrm {T}}}$ (Z) predicted by mg5\_amc + PYTHIA 8 with ${k_{\mathrm {T}}} $-MLM merging (left) and FxFx merging (right) for the different tunes. Tunes CP1 and CP3 are not shown in the plot but they present a similar behaviour as tunes CP2 and CP4, respectively. The ratios of simulations to the data (MC/Data) are also shown, where the shaded band indicates the total experimental uncertainty in data. Vertical lines drawn on the data points refer to the total uncertainty in the data. Vertical lines drawn on the MC points refer to the statistical uncertainty in the predictions. Horizontal bars indicate the associated bin width. |

png pdf |
Figure 24-b:
Comparison with the measurement [71] of the ${p_{\mathrm {T}}}$ (Z) predicted by mg5\_amc + PYTHIA 8 with ${k_{\mathrm {T}}} $-MLM merging (left) and FxFx merging (right) for the different tunes. Tunes CP1 and CP3 are not shown in the plot but they present a similar behaviour as tunes CP2 and CP4, respectively. The ratios of simulations to the data (MC/Data) are also shown, where the shaded band indicates the total experimental uncertainty in data. Vertical lines drawn on the data points refer to the total uncertainty in the data. Vertical lines drawn on the MC points refer to the statistical uncertainty in the predictions. Horizontal bars indicate the associated bin width. |
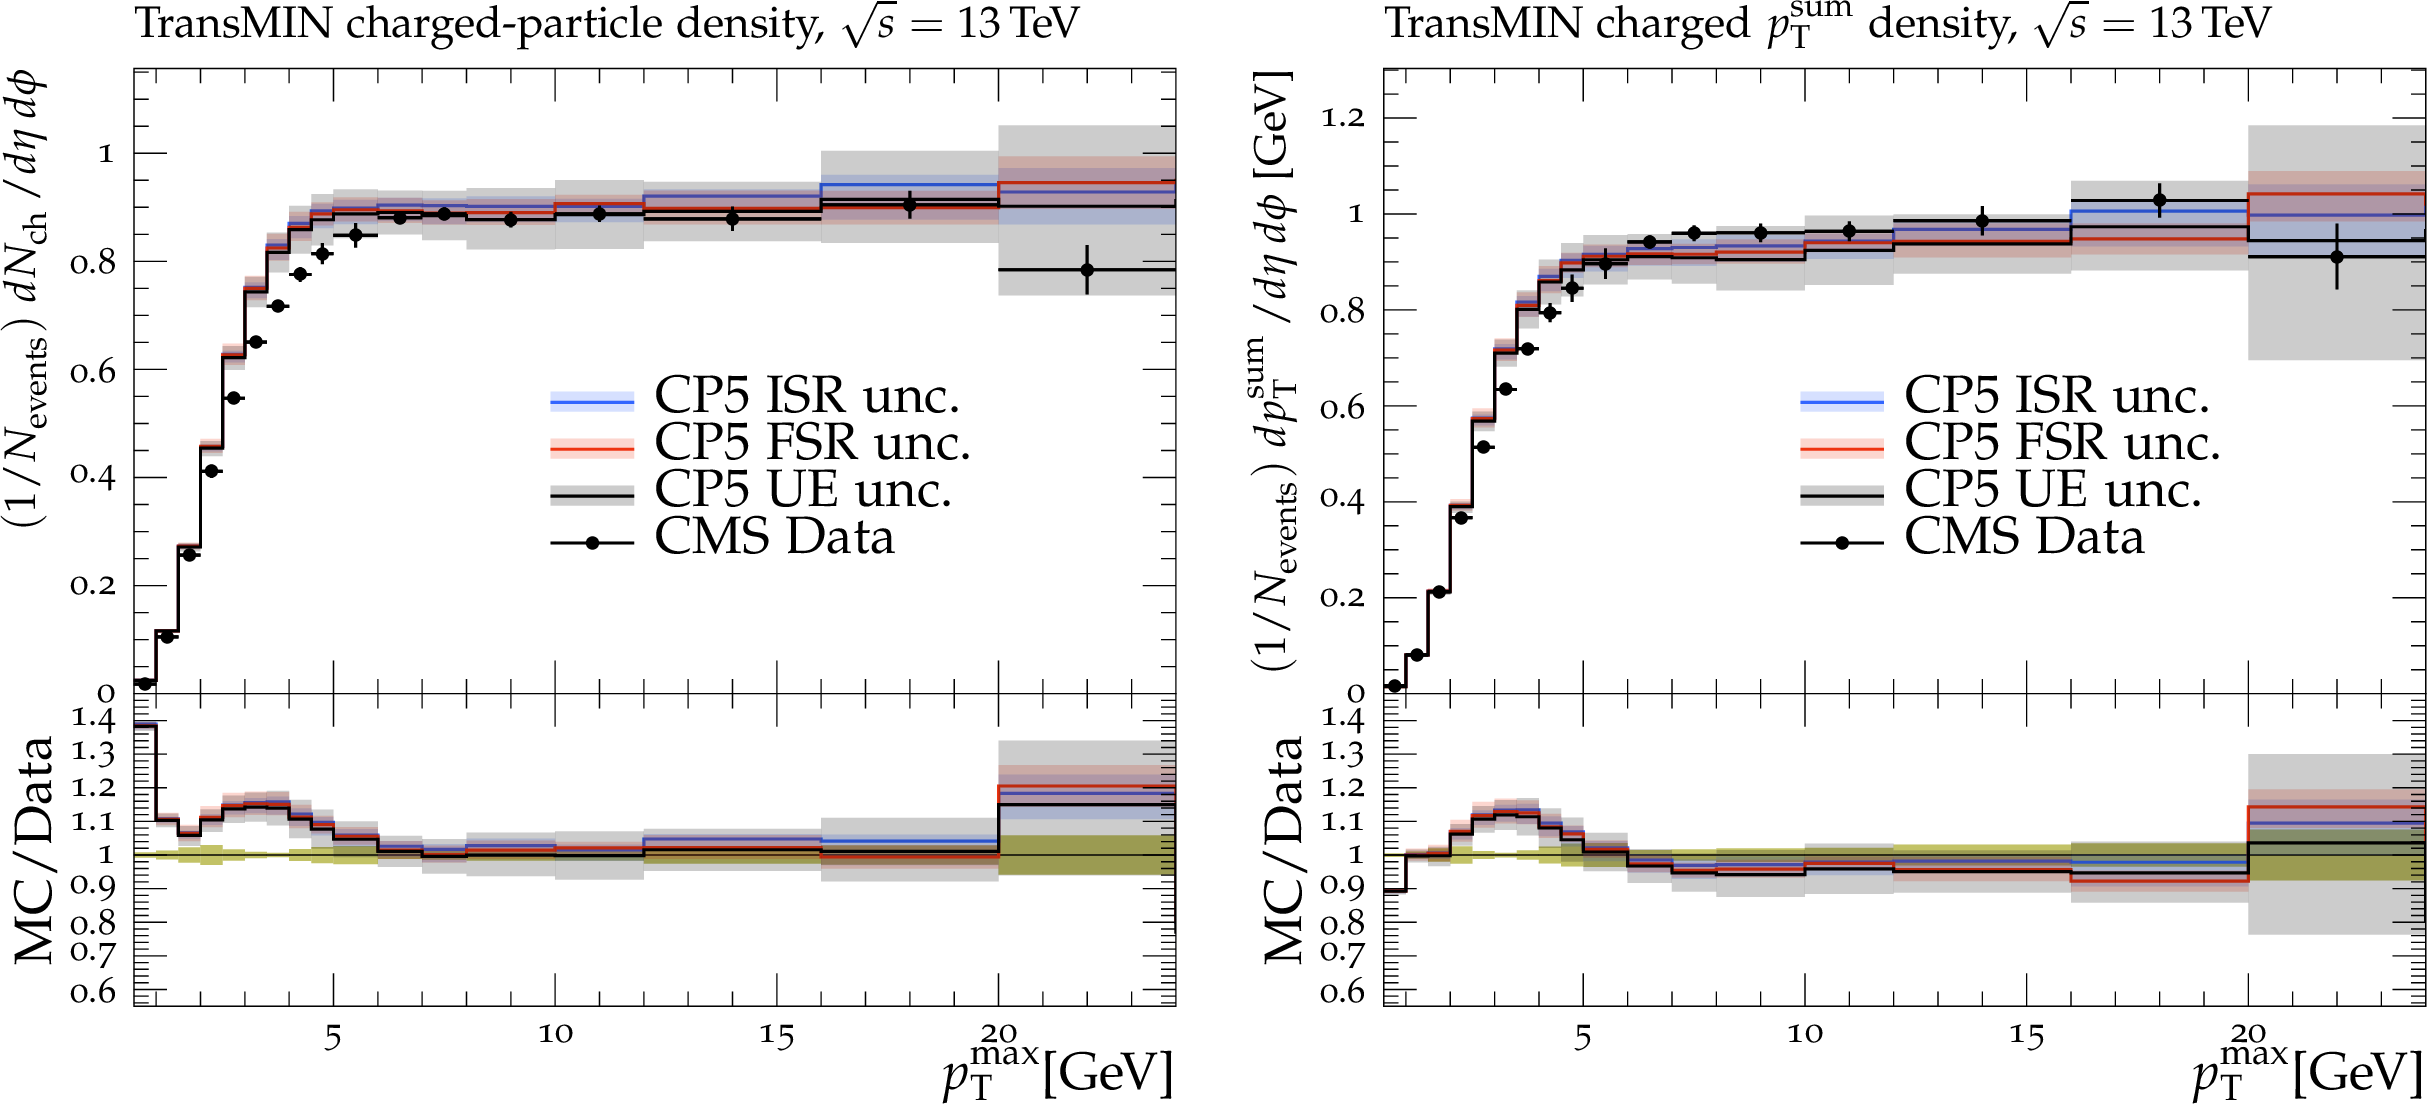
png pdf |
Figure 25:
The variations allowed by the CP5 tune when $ {\alpha _S} ^\mathrm {ISR}(m_{\mathrm{Z}})$ (blue band) and $ {\alpha _S} ^\mathrm {FSR}(m_{\mathrm{Z}})$ (red band) are left free in the fit for charged-particle (left) and charged ${{p_{\mathrm {T}}} ^\text {sum}}$ (right) density in the transMIN region at $\sqrt {s} = $ 13 TeV. Vertical lines drawn on the data points refer to the total uncertainty in the data. The grey band represents the total UE uncertainty for the tune CP5. Horizontal bars indicate the associated bin width. |
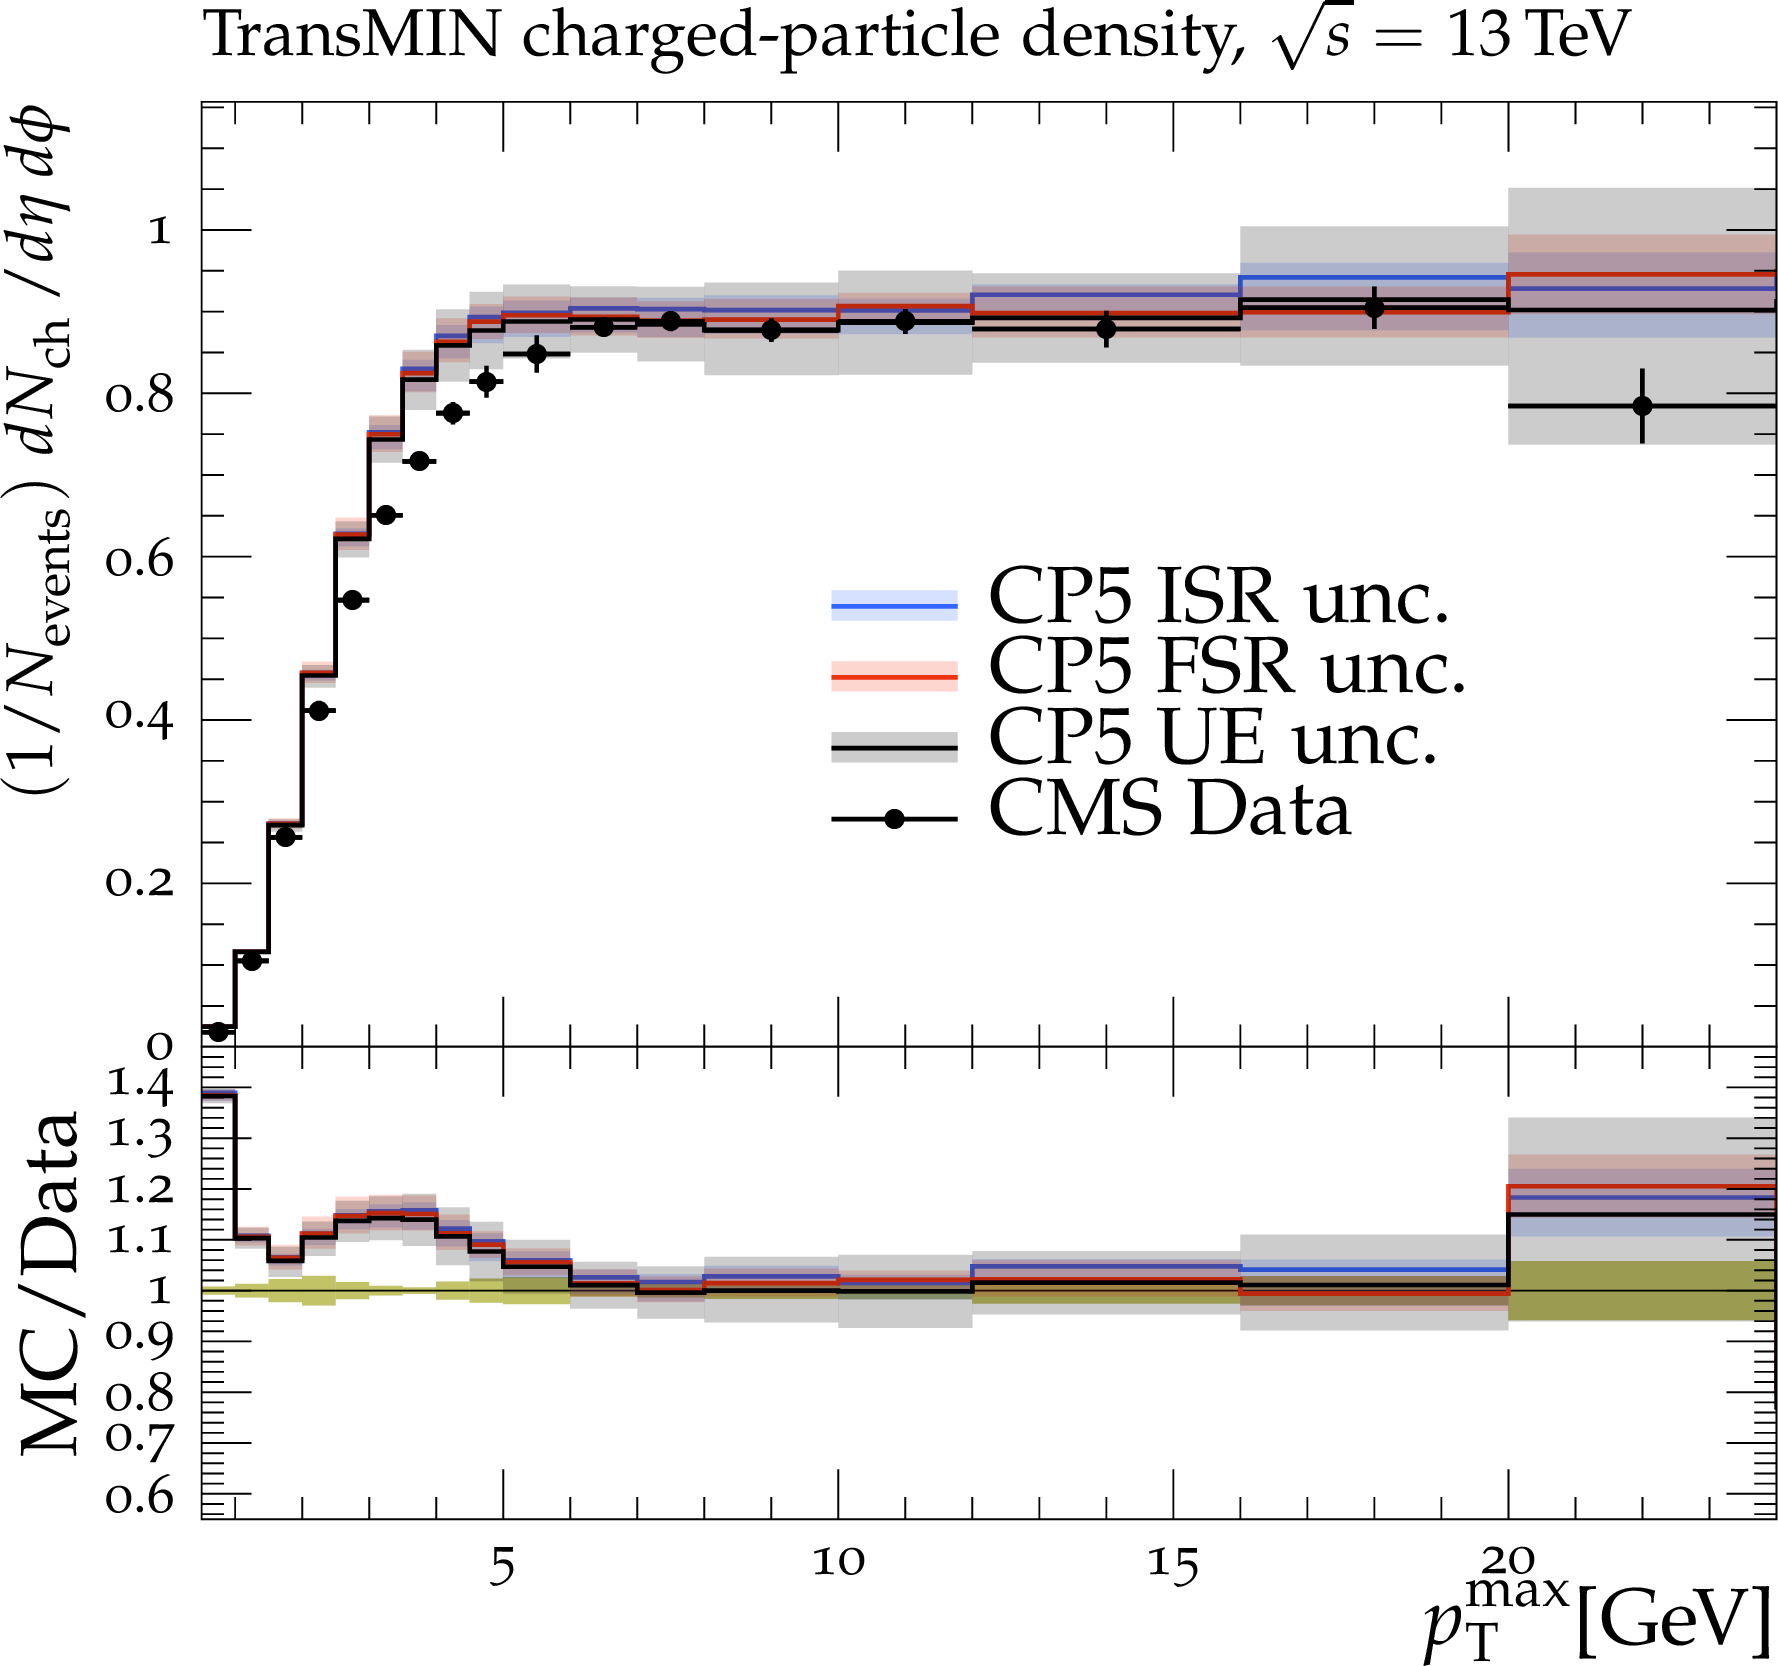
png pdf |
Figure 25-a:
The variations allowed by the CP5 tune when $ {\alpha _S} ^\mathrm {ISR}(m_{\mathrm{Z}})$ (blue band) and $ {\alpha _S} ^\mathrm {FSR}(m_{\mathrm{Z}})$ (red band) are left free in the fit for charged-particle (left) and charged ${{p_{\mathrm {T}}} ^\text {sum}}$ (right) density in the transMIN region at $\sqrt {s} = $ 13 TeV. Vertical lines drawn on the data points refer to the total uncertainty in the data. The grey band represents the total UE uncertainty for the tune CP5. Horizontal bars indicate the associated bin width. |
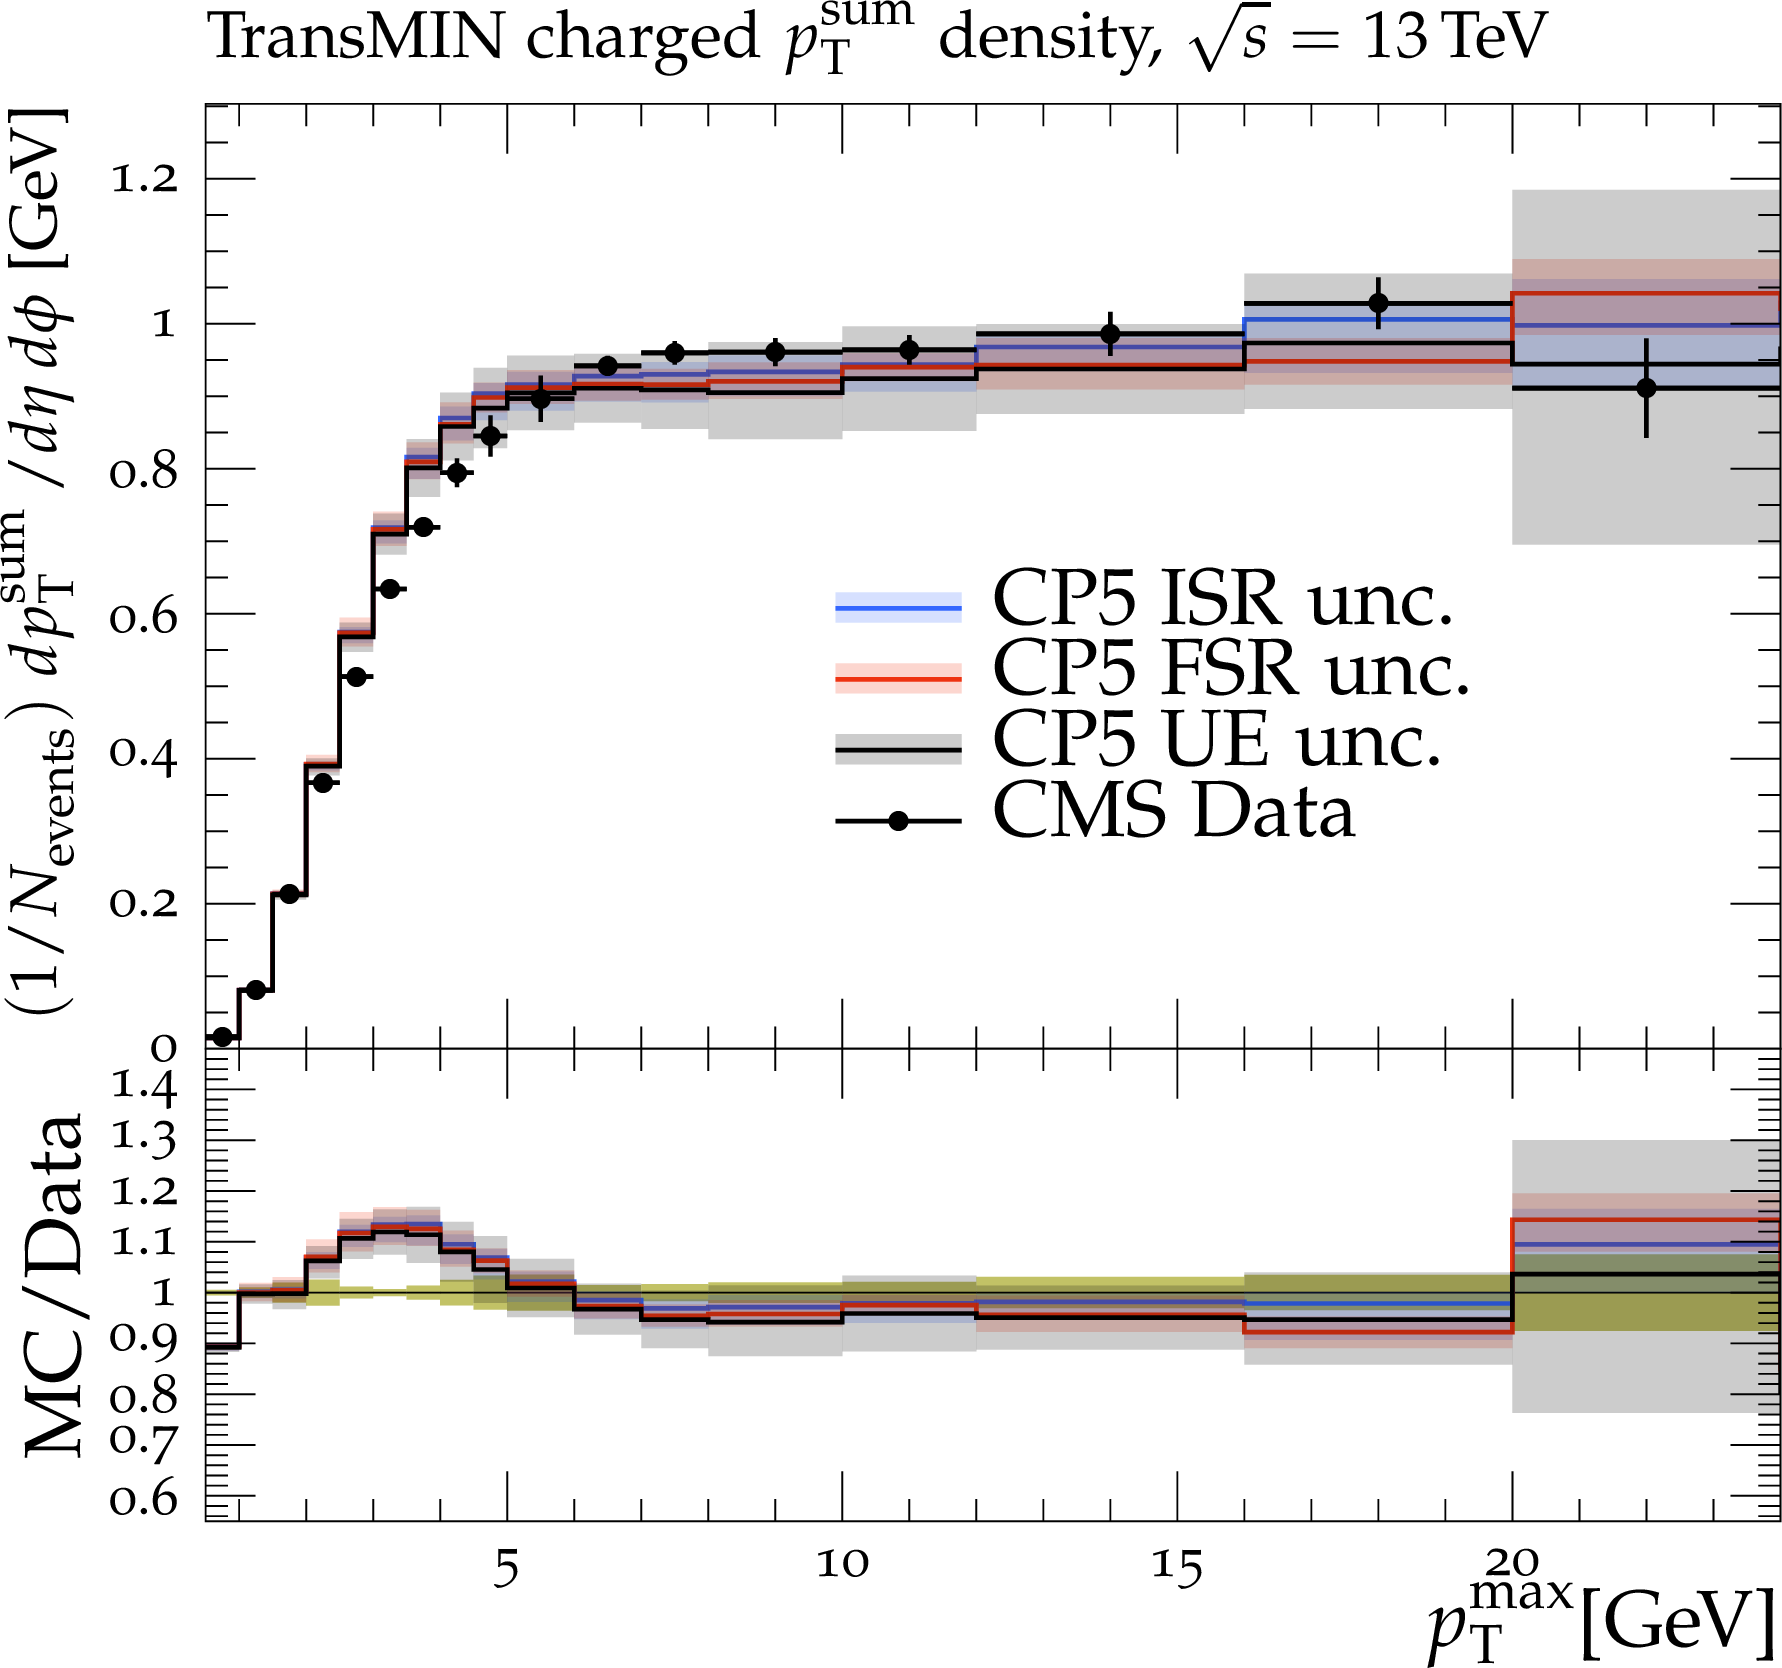
png pdf |
Figure 25-b:
The variations allowed by the CP5 tune when $ {\alpha _S} ^\mathrm {ISR}(m_{\mathrm{Z}})$ (blue band) and $ {\alpha _S} ^\mathrm {FSR}(m_{\mathrm{Z}})$ (red band) are left free in the fit for charged-particle (left) and charged ${{p_{\mathrm {T}}} ^\text {sum}}$ (right) density in the transMIN region at $\sqrt {s} = $ 13 TeV. Vertical lines drawn on the data points refer to the total uncertainty in the data. The grey band represents the total UE uncertainty for the tune CP5. Horizontal bars indicate the associated bin width. |
| Tables | |
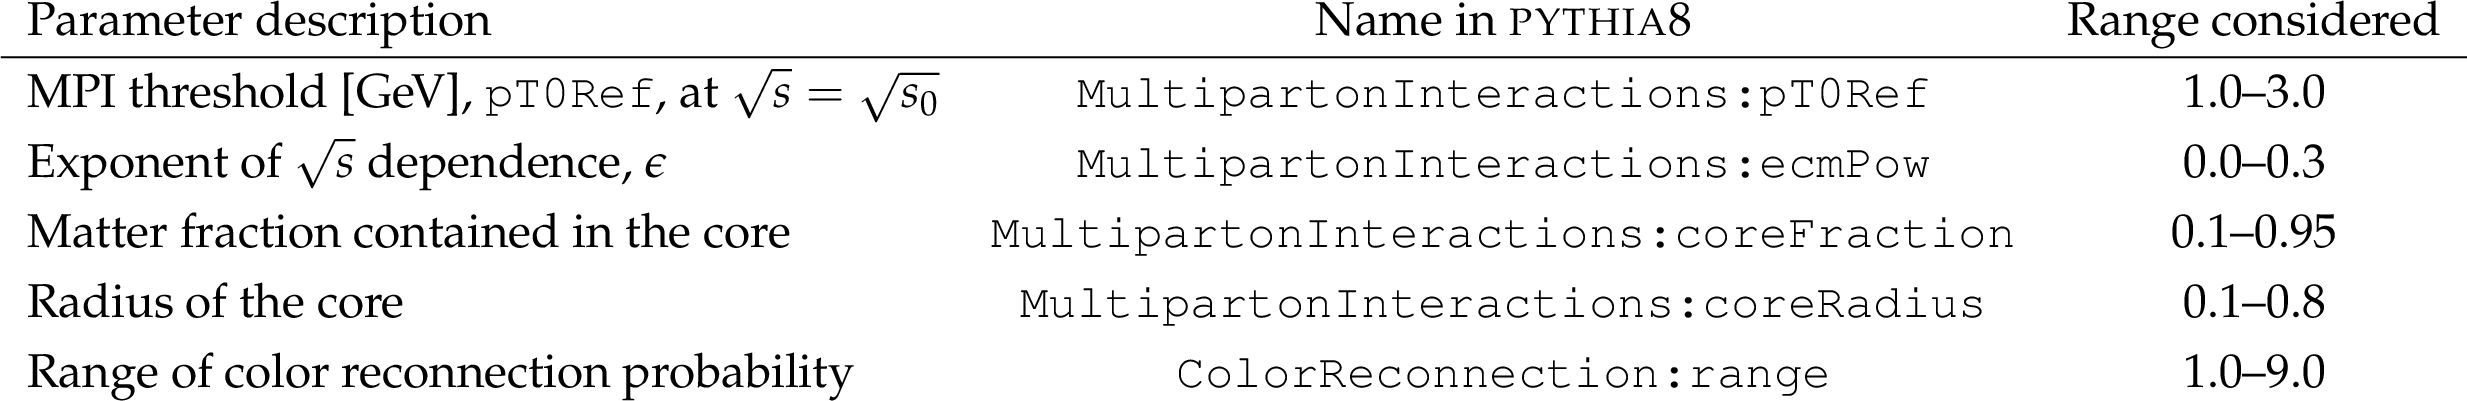
png pdf |
Table 1:
Parameters in the PYTHIA 8 MC event generator together with the PDFs determine the energy dependence of MPI, the overlap matter distribution function, and the amount of simulated color reconnection. The parameter ranges used for the fits are also listed. |

png pdf |
Table 2:
CMS PYTHIA 8 LO-PDF tunes CP1 and CP2. Both the values at $Q = m_{\mathrm{Z}} $ and the order of running with $Q^2$ of the strong coupling $ {\alpha _S} (m_{\mathrm{Z}})$ are listed. In these tunes, we use the Schuler-Sjostrand diffraction model [44] and also include the simulation of CD processes. The number of degrees of freedom for tunes CP1 and CP2 is 63. |
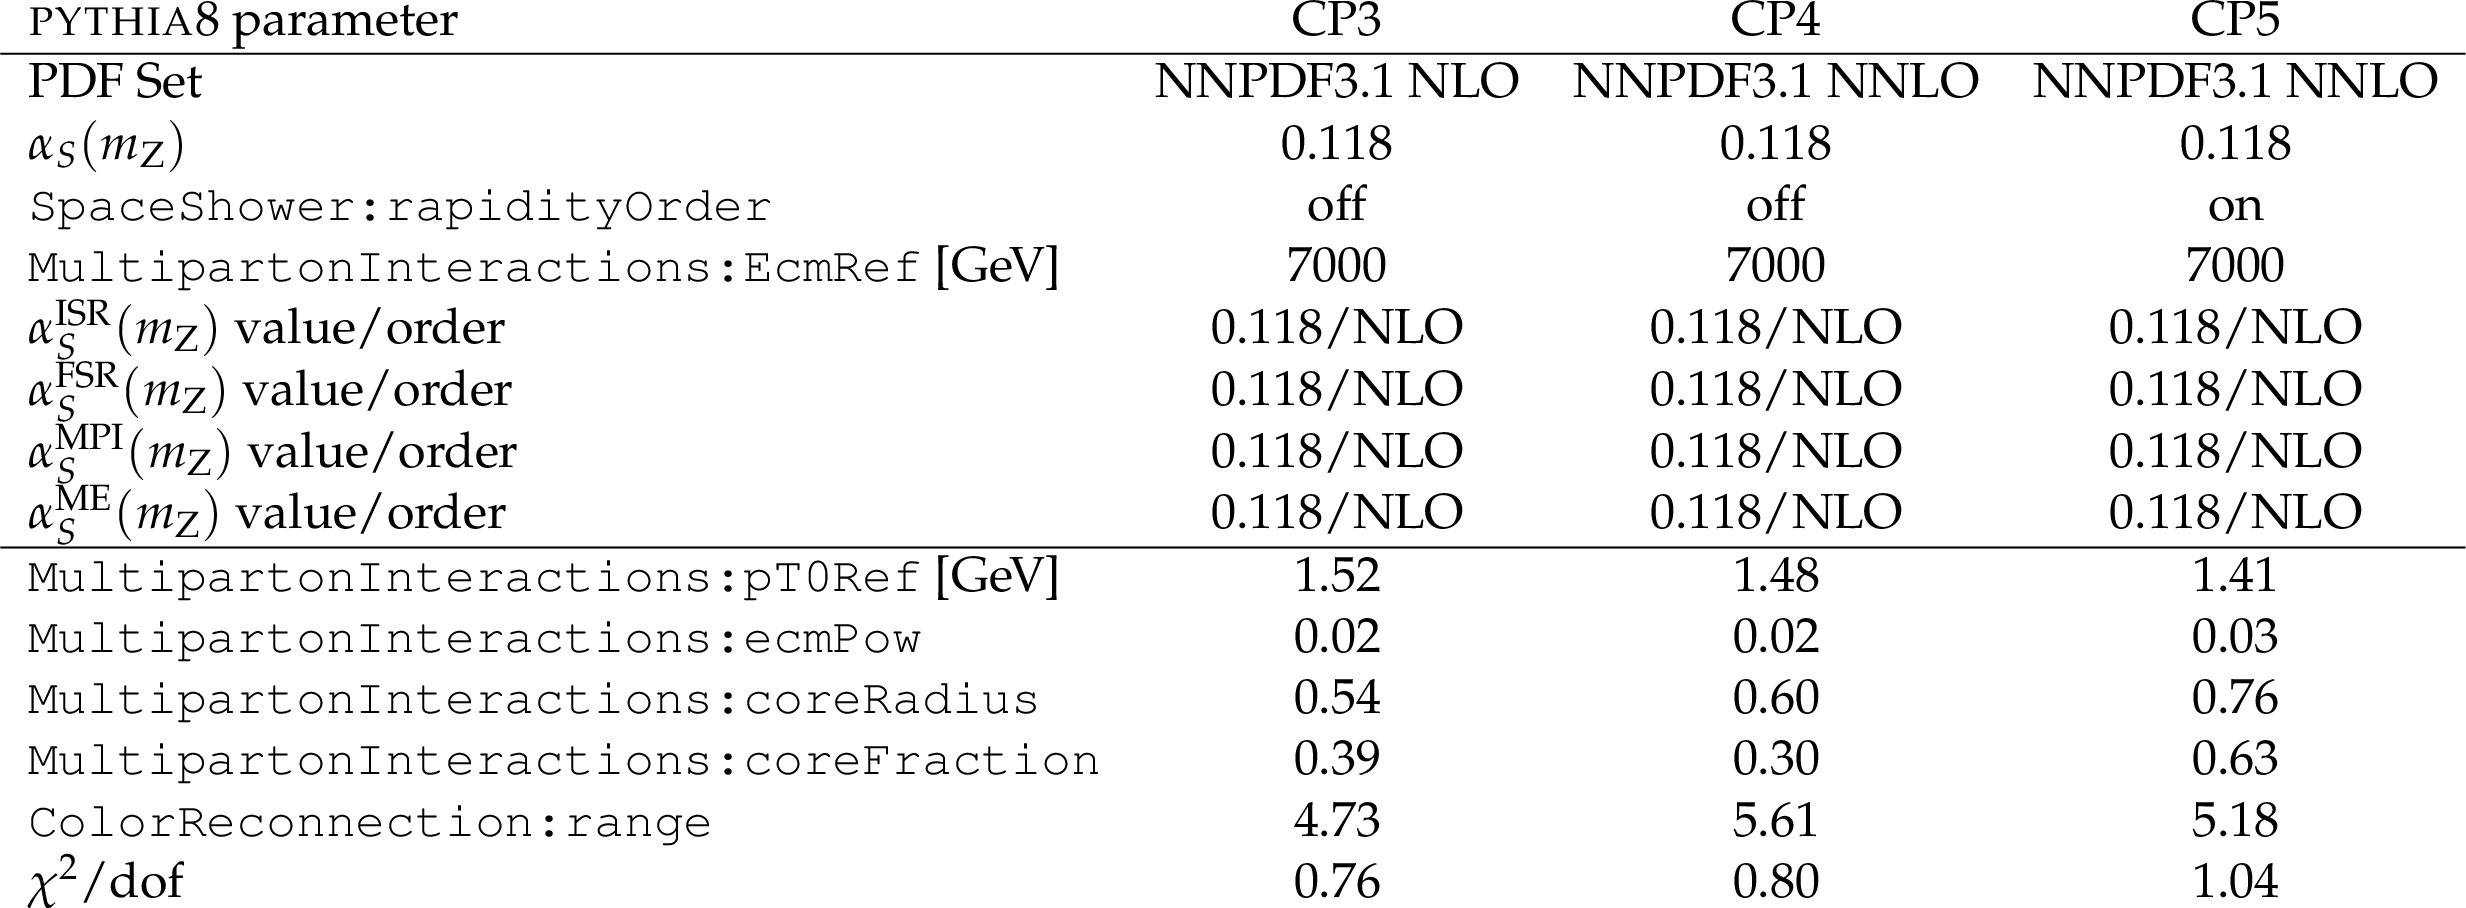
png pdf |
Table 3:
CMS PYTHIA 8 NLO-PDF tune CP3 and NNLO-PDF tunes CP4 and CP5. Both the values at $Q = m_{\mathrm{Z}} $ and the order of running with $Q^2$ of the strong coupling $ {\alpha _S} $ are listed. In these tunes, we use the Schuler-Sjostrand diffraction model [44] and also include the simulation of CD processes. The number of degrees of freedom for tunes CP3, CP4, and CP5 is 63. |
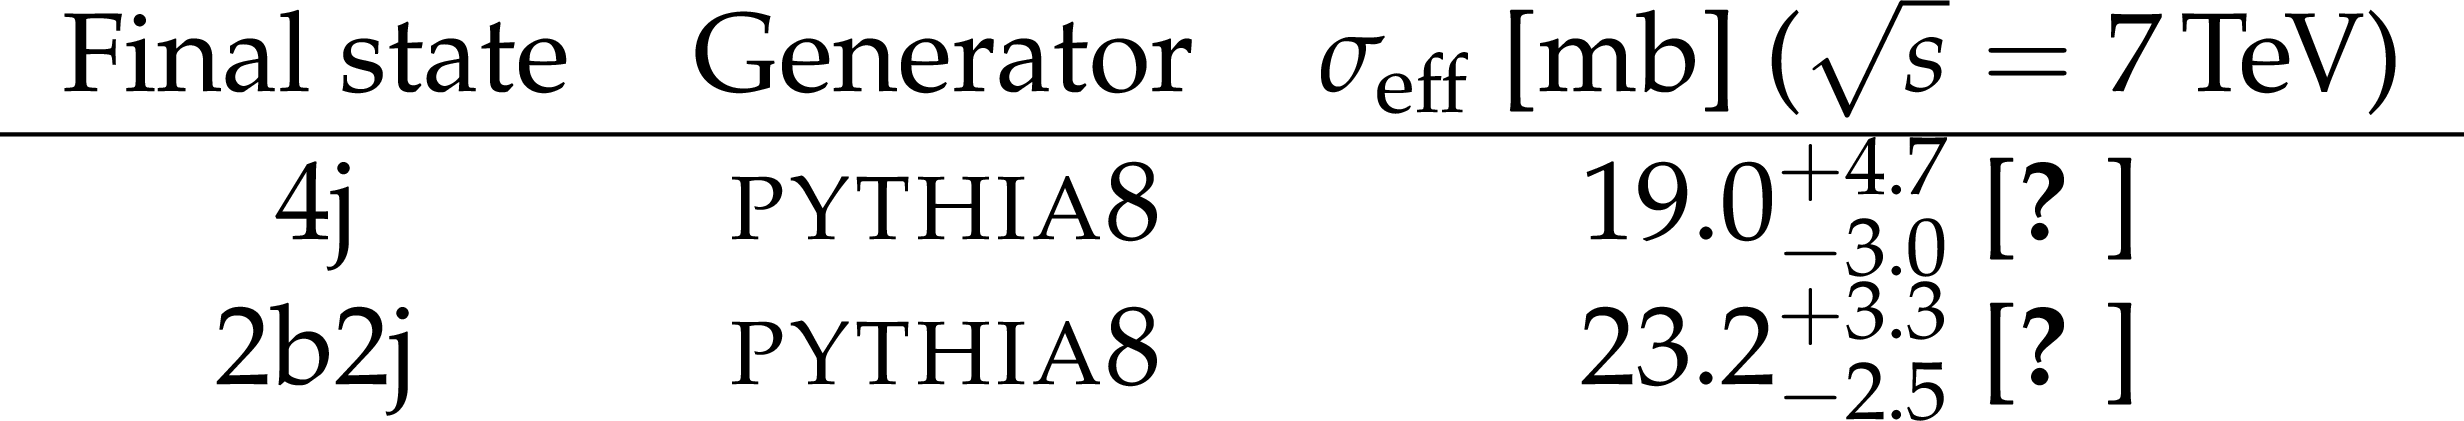
png pdf |
Table 4:
Values of ${\sigma _{\text {eff}}}$ at $\sqrt {s} = $ 7 TeV published by the CMS Collaboration for the four-jet final states, obtained by fitting predictions of the PYTHIA 8 MC event generator to DPS-sensitive measured observables. |
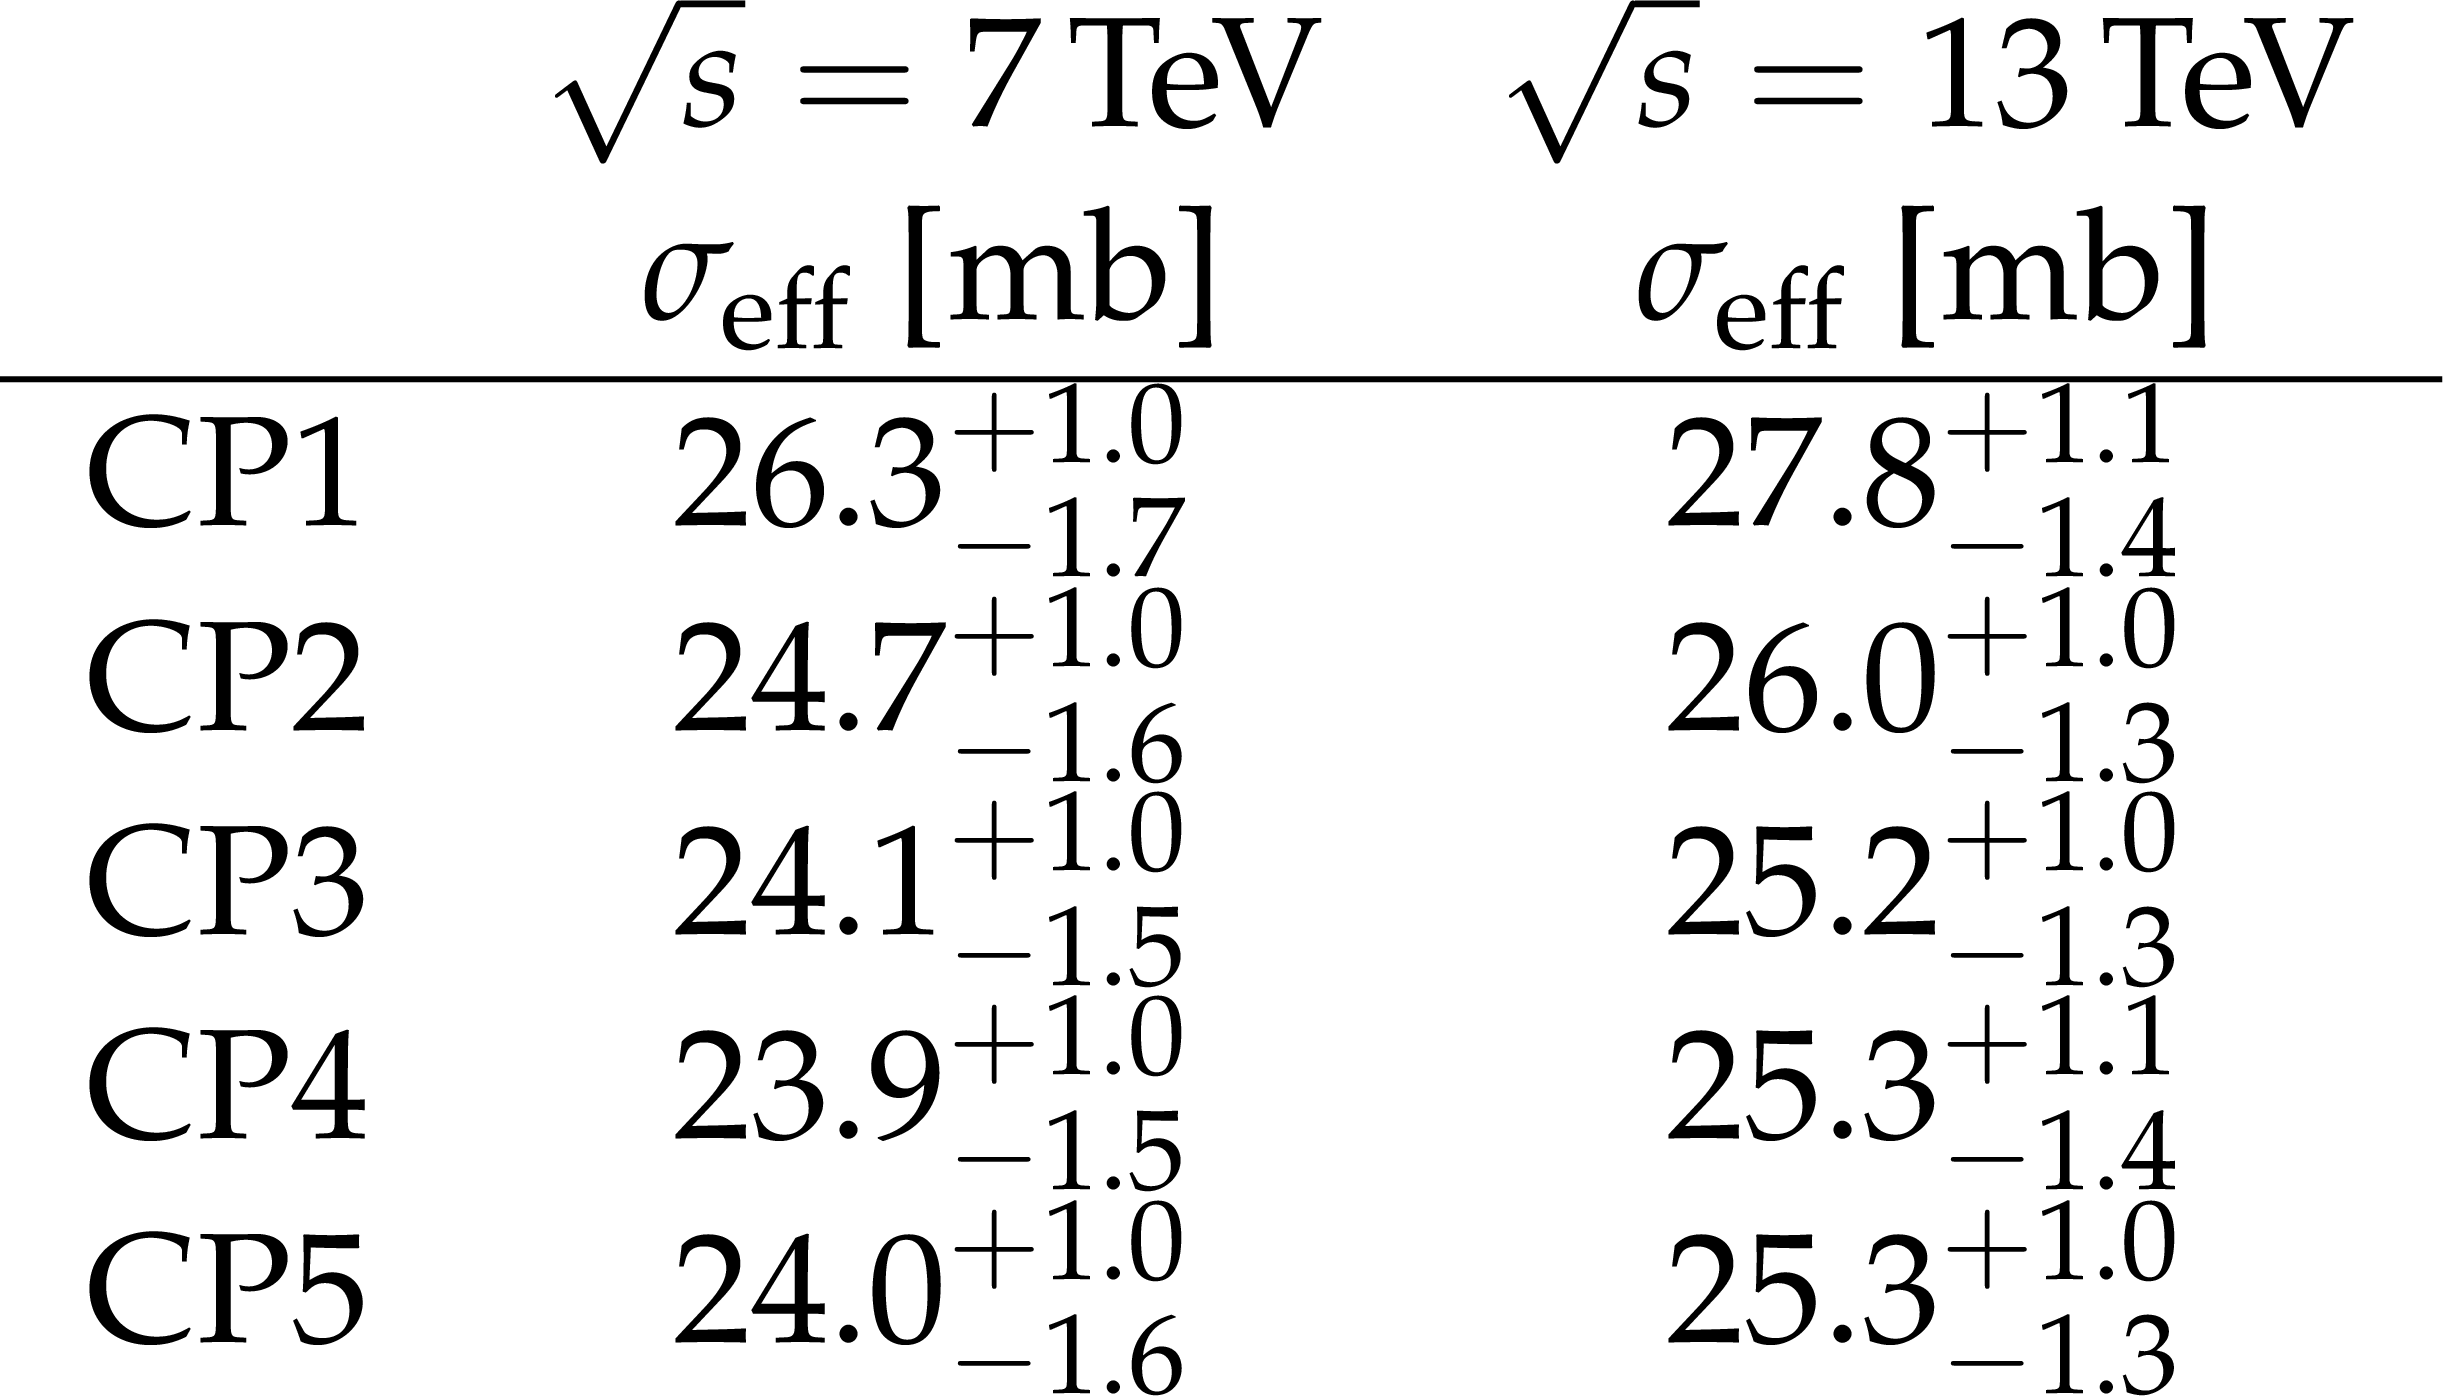
png pdf |
Table 5:
Values of ${\sigma _{\text {eff}}}$ at $\sqrt {s}=$ 7 and 13 TeV obtained with the new CMS UE tunes. |
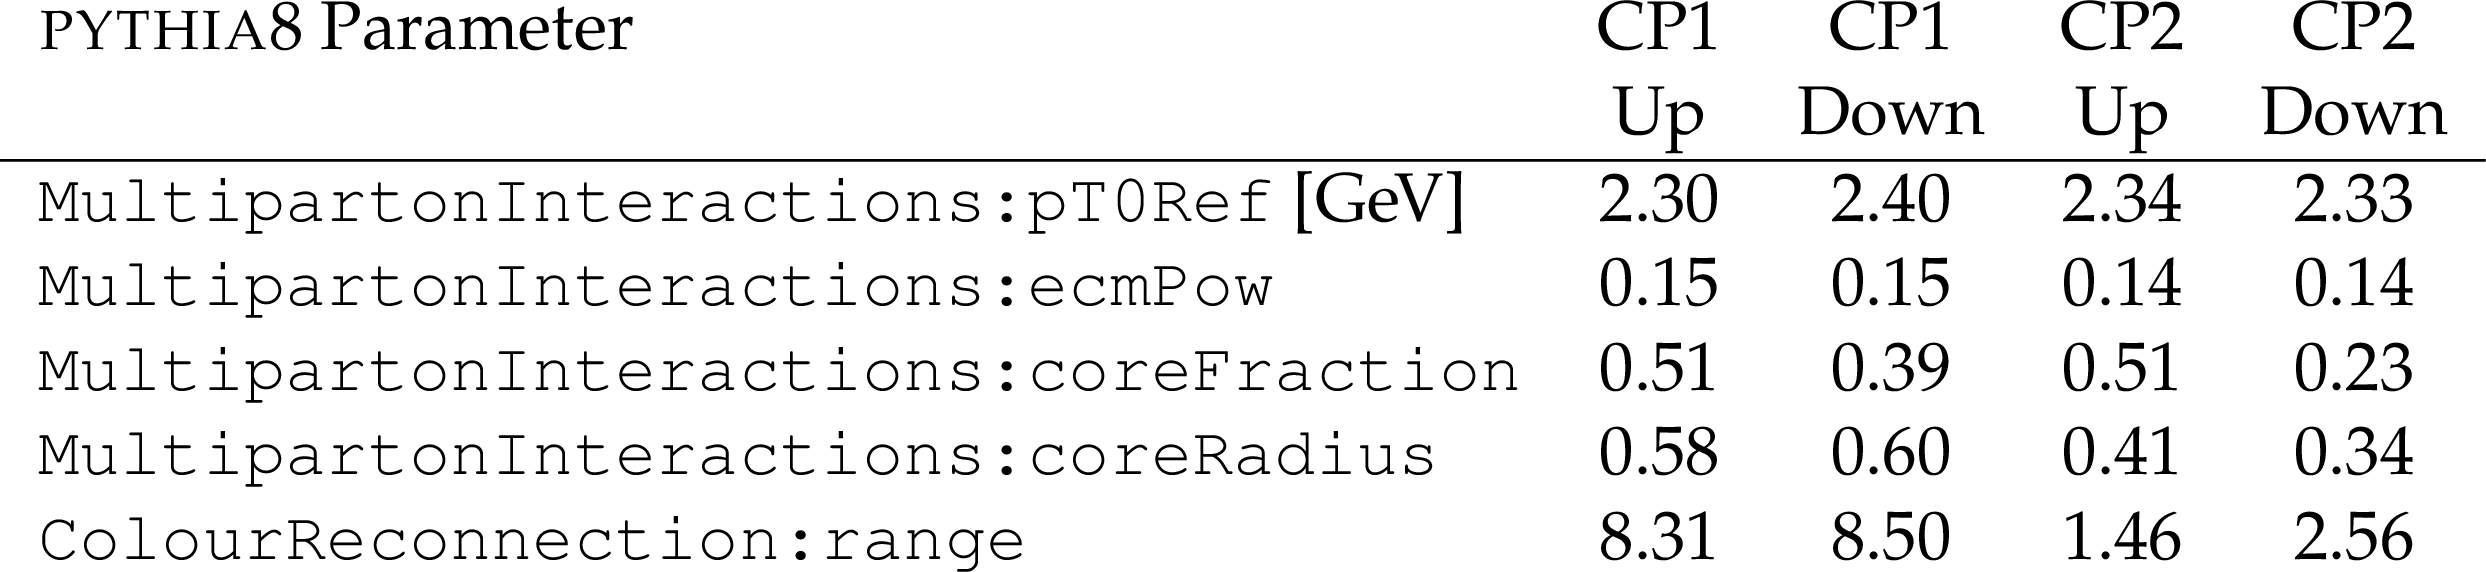
png pdf |
Table 6:
Parameters of the "up-" and "down-"variation eigentunes for the PYTHIA 8 CP1, and CP2 tunes. |

png pdf |
Table 7:
Parameters of the "up-" and "down-"variation eigentunes for the PYTHIA 8 CP3, CP4, and CP5 tunes. |

png pdf |
Table 8:
The correlation matrix, retrieved when extracting the CP5 tune. This is obtained by evaluating the correlation values of the parameter variations obtained in the eigentunes. |
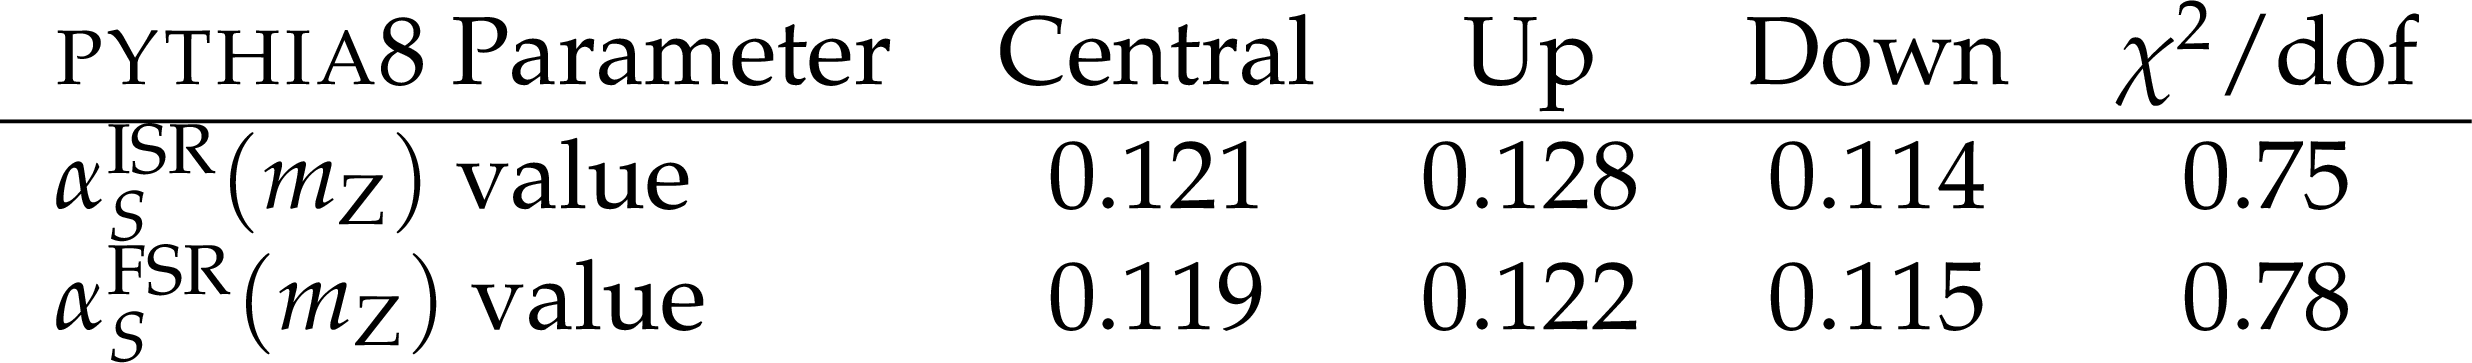
png pdf |
Table 9:
"Up" and "Down" ISR and FSR variations for CP5 when $ {\alpha _S} ^\mathrm {ISR}(m_{\mathrm{Z}})$ or $ {\alpha _S} ^\mathrm {FSR}(m_{\mathrm{Z}})$ is treated as a free parameter. |
| Summary |
|
A new set of tunes for the underlying-event (UE) simulation in the PYTHIA-8 event generator is obtained by fitting various measurements sensitive to soft and semihard multipartonic interactions at different collision energies. To derive these tunes, the leading order (LO), next-to-leading order (NLO), or next-to-next-to-leading order (NNLO) versions of the NNPDF3.1 parton distribution function (PDF) set for the simulation of the underlying-event components are used. In these tunes, the values of the strong coupling, ${\alpha_S}(m_{\mathrm{Z}})$, used for the simulation of hard scattering, initial- and final-state radiation, and multiple-parton interactions are chosen consistent with the order of the PDF used. In the LO NNPDF3.1 set, ${\alpha_S}(m_{\mathrm{Z}}) = $ 0.130, whereas for the NLO and NNLO NNPDF3.1 sets, ${\alpha_S}(m_{\mathrm{Z}}) = $ 0.118. In general, the combination of contributions from multiple-parton interactions and parton-shower emissions is crucial to give a good description of variables measured in soft-collision events. The infrared threshold is relatively independent of center-of-mass energy when using NLO or NNLO PDF sets. Irrespective of the specific PDF used, predictions from the new tunes reproduce well the UE measurements at center-of-mass energies $\sqrt{s}=$ 1.96 and 7 TeV. A significant improvement in the description of UE measurements at 13 TeV is observed with respect to predictions from old tunes that were extracted using data at lower collision energies. For the first time, predictions based on higher-order PDF sets are shown to give a reliable description of minimum-bias (MB) and UE measurements, with a similar level of agreement as predictions from tunes using LO PDF sets. Predictions of the new tunes agree well with the data for MB observables measured at pseudorapidities in the central ($|\eta| < $ 2.4) and forward (3.2 $ < |\eta| < $ 4.7) regions. The new CMS tunes simultaneously describe the number of charged particles produced in diffractive processes and MB collisions. Neither the new CMS tunes nor the CUETP8M1 tune describe the very forward region ($-6.6 < \eta < -5.2$) well. Measurements sensitive to double-parton scattering contributions are reproduced better by predictions using the LO PDF set in the UE simulation, without rapidity ordering of the initial-state shower. The UE simulation provided by the new tunes can be interfaced to higher-order and multileg matrix element generators, such as POWHEG and MG5\_aMC, without degrading the good description of UE observables. Such predictions also reproduce well observables measured in multijet final states, Drell-Yan, and top quark production processes. The central values of the normalized $\mathrm{t\bar{t}}$ cross section in bins of the number of additional jets predicted by POWHEG +PYTHIA-8 overestimate the data when a high value of ${\alpha_S}^\mathrm{ISR}(m_{\mathrm{Z}})\gtrsim$ 0.130 is used (CMS PYTHIA-8 CP1 and CP2 tunes). Even when ${\alpha_S}^\mathrm{ISR}(m_{\mathrm{Z}})=$ 0.118 is used, the CP4 tune overestimates the data at high jet multiplicities. This is cured by the rapidity ordering of the initial-state shower (CP5 tune). Measurements of azimuthal dijet correlations are also better described when a value of ${\alpha_S}^\mathrm{ISR}(m_{\mathrm{Z}})=$ 0.118 is used in predictions obtained with POWHEG merged with PYTHIA-8. Comparisons with LEP event-shape observables and the distribution of the angle between two groomed subjets ($\Delta R_g$) in $\mathrm{t\bar{t}}$ events at the LHC show that in ME-PS merged configurations CMW rescaling is disfavored. It is also found that $\Delta R_g$ is better described by tunes with ${\alpha_S}^\mathrm{FSR}(m_{\mathrm{Z}})$ higher than $\sim$0.120 while LEP event-shape observables and UE event observables in $\mathrm{t\bar{t}}$ events prefer a central value $\sim$0.120 [22]. All of the new CMS tunes are supplied with their eigentunes, which can also be used to determine the uncertainties associated with the theoretical predictions. We show that predictions using the new tunes based on PDFs determined at LO, NLO, and NNLO agree reasonably well with the measurements, and that the new tunes can also be applied to LO and NLO calculations merged with parton showers, multiple-parton interactions, and hadronization. |
| Additional Tables | |
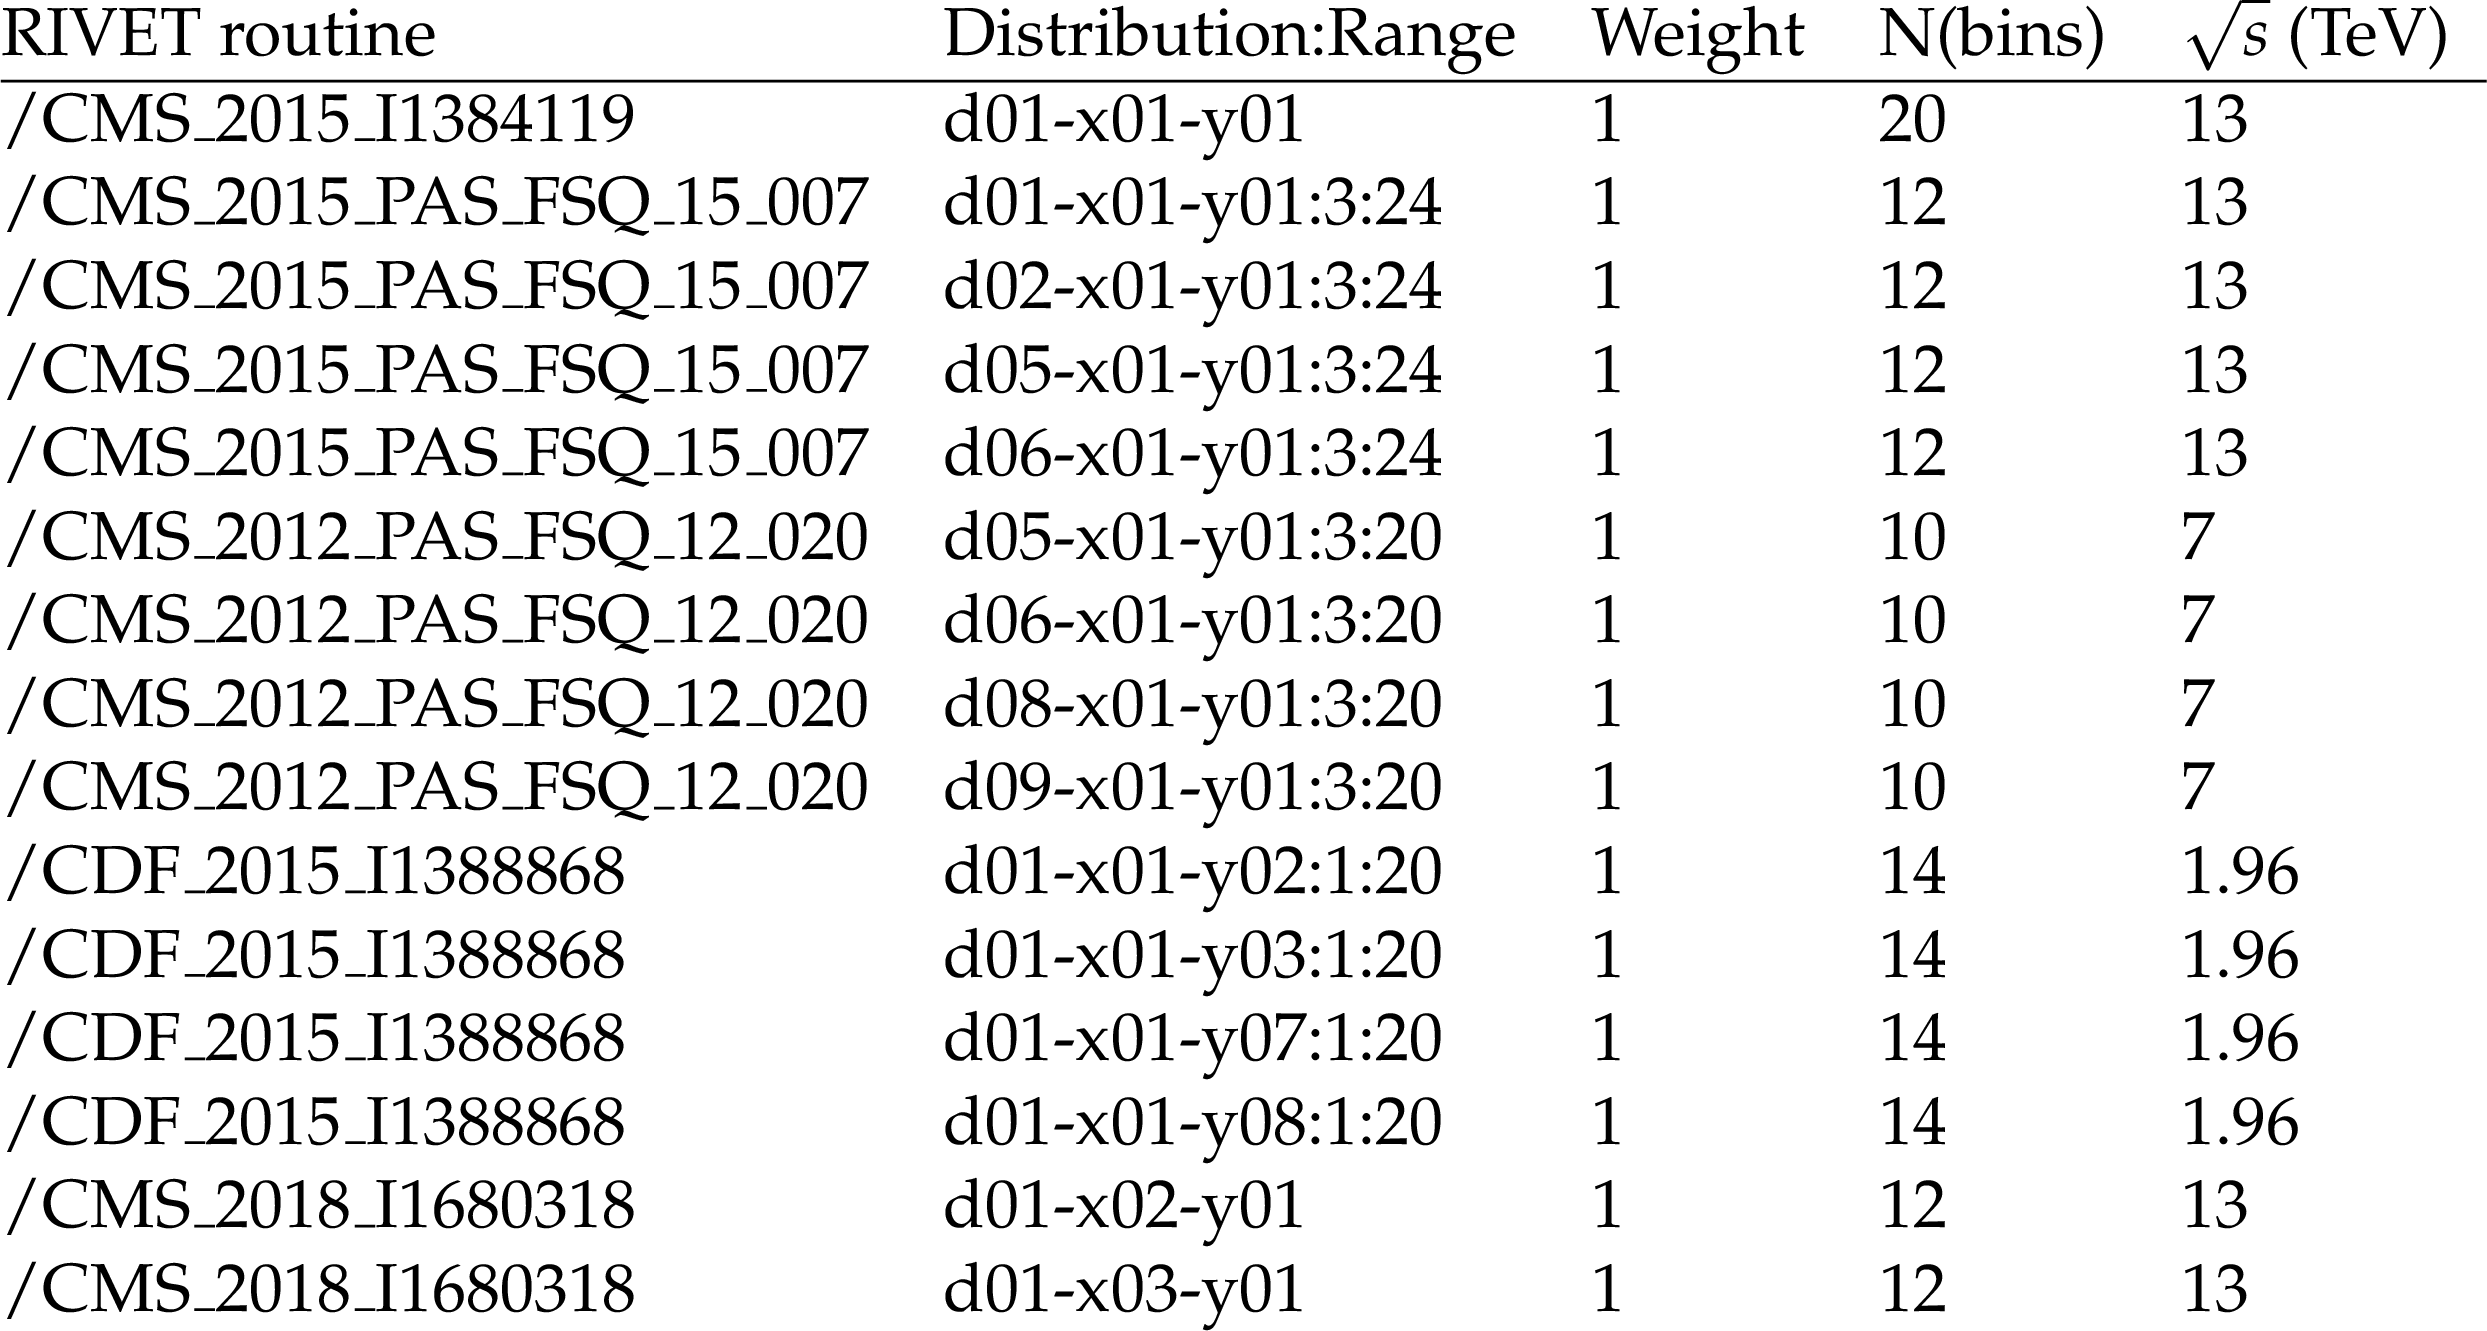
png pdf |
Additional Table 1:
List of input RIVET routines, distributions, ranges, number of bins and the center-of-mass energy used in the fits to derive the CP1,2,3,4,5 tunes. |
| References | ||||
| 1 | T. Sjostrand et al. | An introduction to Pythia 8.2 | CPC 191 (2015) 159 | 1410.3012 |
| 2 | M. Bahr et al. | Herwig++ physics and manual | EPJC 58 (2008) 639 | 0803.0883 |
| 3 | J. Bellm et al. | Herwig 7.0/Herwig++ 3.0 release note | EPJC 76 (2016) 196 | 1512.01178 |
| 4 | T. Gleisberg et al. | Event generation with SHERPA 1.1 | JHEP 02 (2009) 7 | 0811.4622 |
| 5 | CMS Collaboration | Event generator tunes obtained from underlying event and multiparton scattering measurements | EPJC 76 (2016) 155 | CMS-GEN-14-001 1512.00815 |
| 6 | P. Skands, S. Carrazza, and J. Rojo | Tuning PYTHIA~8.1: the Monash 2013 tune | EPJC 74 (2014) 3024 | 1404.5630 |
| 7 | S. Carrazza, S. Forte, and J. Rojo | Parton distributions and event generators | in Proceedings, 43rd International symposium on multiparticle dynamics (ISMD 13) 2013 | 1311.5887 |
| 8 | R. Corke and T. Sjostrand | Interleaved parton showers and tuning prospects | JHEP 03 (2011) 032 | 1011.1759 |
| 9 | CDF Collaboration | Study of the energy dependence of the underlying event in proton-antiproton collisions | PRD 92 (2015) 092009 | 1508.05340 |
| 10 | CMS Collaboration | Measurement of the underlying event activity in pp collisions at the LHC at 7 TeV and comparison with 0.9 TeV | CDS | |
| 11 | J. Pumplin et al. | New generation of parton distributions with uncertainties from global QCD analysis | JHEP 07 (2002) 12 | hep-ph/0201195 |
| 12 | ATLAS Collaboration | ATLAS PYTHIA~8 tunes to 7 TeV data | ATL-PHYS-PUB-2014-021 | |
| 13 | ATLAS Collaboration | Summary of ATLAS PYTHIA~8 tunes | ||
| 14 | ATLAS Collaboration | Measurement of the $ Z/\gamma^* $ boson transverse momentum distribution in $ pp $ collisions at $ \sqrt{s} = $ 7 TeV with the ATLAS detector | JHEP 09 (2014) 145 | 1406.3660 |
| 15 | N. Fischer and T. Sjostrand | Thermodynamical string fragmentation | JHEP 01 (2017) 140 | 1610.09818 |
| 16 | CMS Collaboration | Underlying event measurements with leading particles and jets in pp collisions at $ \sqrt{s} = $ 13 TeV | CMS-PAS-FSQ-15-007 | CMS-PAS-FSQ-15-007 |
| 17 | NNPDF Collaboration | Parton distributions from high-precision collider data | EPJC 77 (2017) 663 | 1706.00428 |
| 18 | CMS Collaboration | Pseudorapidity distribution of charged hadrons in proton-proton collisions at $ \sqrt{s} = $ 13 TeV | PLB 751 (2015) 143 | CMS-FSQ-15-001 1507.05915 |
| 19 | P. D. B. Collins | An introduction to Regge theory and high-energy physics | Cambridge Monographs on Mathematical Physics. Cambridge Univ. Press, Cambridge, UK, 2009 ,ISBN 9780521110358 | |
| 20 | CMS Collaboration | Measurement of the underlying event in the Drell-Yan process in proton-proton collisions at $ \sqrt{s}= $ 7 TeV | EPJC 72 (2012) 2080 | CMS-QCD-11-012 1204.1411 |
| 21 | CMS Collaboration | Measurement of the underlying event activity in inclusive Z boson production in proton-proton collisions at $ \sqrt{s}= $ 13 TeV | JHEP 07 (2018) 32 | CMS-FSQ-16-008 1711.04299 |
| 22 | CMS Collaboration | Study of the underlying event in top quark pair production in $ \mathrm {p}\mathrm {p} $ collisions at 13 $ \text {Te}\text {V} $ | EPJC 79 (2019) 123 | CMS-TOP-17-015 1807.02810 |
| 23 | S. Navin | Diffraction in PYTHIA | 1005.3894 | |
| 24 | CMS Collaboration | Measurement of charged particle spectra in minimum-bias events from proton-proton collisions at $ \sqrt{s}= $ 13 TeV | EPJC 78 (2018) 697 | CMS-FSQ-16-011 1806.11245 |
| 25 | CMS Collaboration | Measurement of normalized differential $ \mathrm{t}\overline{\mathrm{t}} $ cross sections in the dilepton channel from pp collisions at $ \sqrt{s}= $ 13 TeV | JHEP 04 (2018) 60 | CMS-TOP-16-007 1708.07638 |
| 26 | CMS Collaboration | Investigations of the impact of the parton shower tuning in PYTHIA 8 in the modelling of $ \mathrm{t\overline{t}} $ at $ \sqrt{s}= $ 8 and 13 TeV | CMS-PAS-TOP-16-021 | CMS-PAS-TOP-16-021 |
| 27 | ATLAS Collaboration | Measurement of charged-particle distributions sensitive to the underlying event in $ \sqrt{s}= $ 13 TeV proton-proton collisions with the ATLAS detector at the LHC | JHEP 03 (2017) 157 | 1701.05390 |
| 28 | P. Gunnellini, H. Jung, and R. Maharucksit | Investigation of the energy dependence of the $ p_{\text {T0}} $ parameter in the PYTHIA 8 Monte Carlo event generator | EPJC 78 (2018) 521 | 1801.02536 |
| 29 | L. A. Harland-Lang, A. D. Martin, P. Motylinski, and R. S. Thorne | Parton distributions in the LHC era: MMHT 2014 PDFs | EPJC 75 (2015) 204 | 1412.3989 |
| 30 | S. Gieseke, F. Loshaj, and P. Kirchgaeber | Soft and diffractive scattering with the cluster model in Herwig | EPJC 77 (2017) 156 | 1612.04701 |
| 31 | J. Alwall et al. | Comparative study of various algorithms for the merging of parton showers and matrix elements in hadronic collisions | EPJC 53 (2008) 473 | 0706.2569 |
| 32 | S. Catani, F. Krauss, R. Kuhn, and B. R. Webber | QCD matrix elements + parton showers | JHEP 11 (2001) 063 | hep-ph/0109231 |
| 33 | F. Krauss | Matrix elements and parton showers in hadronic interactions | JHEP 08 (2002) 015 | hep-ph/0205283 |
| 34 | B. Cooper et al. | Importance of a consistent choice of $ {\alpha_S} $ in the matching of AlpGen and PYTHIA | EPJC 72 (2012) 2078 | 1109.5295 |
| 35 | Particle Data Group Collaboration | Review of particle physics | PRD 98 (2018) 30001 | |
| 36 | S. Alioli, P. Nason, C. Oleari, and E. Re | A general framework for implementing NLO calculations in shower Monte Carlo programs: the POWHEG BOX | JHEP 06 (2010) 43 | 1002.2581 |
| 37 | J. Alwall et al. | The automated computation of tree-level and next-to-leading order differential cross sections, and their matching to parton shower simulations | JHEP 07 (2014) 79 | 1405.0301 |
| 38 | R. Frederix and S. Frixione | Merging meets matching in MC@NLO | JHEP 12 (2012) 61 | 1209.6215 |
| 39 | S. Frixione, P. Nason, and C. Oleari | Matching NLO QCD computations with parton shower simulations: the POWHEG method | JHEP 11 (2007) 70 | 0709.2092 |
| 40 | T. Sjostrand and M. van Zijl | A multiple interaction model for the event structure in hadron collisions | PRD 36 (1987) 2019 | |
| 41 | T. Sjostrand and P. Z. Skands | Multiple interactions and the structure of beam remnants | JHEP 03 (2004) 53 | hep-ph/0402078 |
| 42 | D. G. Andy Buckley, Jonathan Butterworth | Rivet user manual | CPC 184 (2013) 2803 | 1003.0694 |
| 43 | A. Buckley et al. | Systematic event generator tuning for the LHC | EPJC 65 (2010) 331 | 0907.2973 |
| 44 | G. A. Schuler and T. Sjostrand | Hadronic diffractive cross sections and the rise of the total cross section | PRD 49 (1994) 2257 | |
| 45 | ALEPH Collaboration | Studies of QCD at e+ e- centre-of-mass energies between 91 GeV and 209 GeV | EPJC 35 (2004) 457 | |
| 46 | S. Catani, B. R. Webber, and G. Marchesini | QCD coherent branching and semiinclusive processes at large x | NPB 349 (1991) 635 | |
| 47 | CMS Collaboration | Measurement of the energy density as a function of pseudorapidity in proton-proton collisions at $ \sqrt{s}= $ 13 TeV | Submitted to: EPJC | CMS-FSQ-15-006 1812.04095 |
| 48 | CMS Collaboration | The CMS Experiment at the CERN LHC | JINST 3 (2008) S08004 | CMS-00-001 |
| 49 | CMS Collaboration | Measurement of the inclusive energy spectrum in the very forward direction in proton-proton collisions at $ \sqrt{s}= $ 13 TeV | JHEP 08 (2017) 46 | CMS-FSQ-16-002 1701.08695 |
| 50 | CMS Collaboration | Measurement of the inelastic proton-proton cross section at $ \sqrt{s}= $ 13 TeV | JHEP 07 (2018) 161 | CMS-FSQ-15-005 1802.02613 |
| 51 | A. Donnachie and P. V. Landshoff | Elastic Scattering and Diffraction Dissociation | NPB 244 (1984) 322 | |
| 52 | R. Ciesielski and K. Goulianos | MBR Monte Carlo simulation in PYTHIA~8 | in Proceedings, 36th International Conference on High Energy Physics (ICHEP2012), p. 301 Melbourne, Australia, July, 2013 [PoS(DIS 2013)091] | 1205.1446 |
| 53 | S. Alioli et al. | Jet pair production in POWHEG | JHEP 04 (2011) 81 | 1012.3380 |
| 54 | CMS Collaboration | Determination of jet energy calibration and transverse momentum resolution in CMS | JINST 6 (2011) 11002 | CMS-JME-10-011 1107.4277 |
| 55 | CMS Collaboration | Jet energy scale and resolution in the CMS experiment in pp collisions at 8 TeV | JINST 12 (2017) P02014 | CMS-JME-13-004 1607.03663 |
| 56 | CMS Collaboration | Measurement of the double-differential inclusive jet cross section in proton-proton collisions at $ \sqrt{s} = $ 13 TeV | EPJC 76 (2016) 451 | CMS-SMP-15-007 1605.04436 |
| 57 | CMS Collaboration | Azimuthal correlations for inclusive 2-jet, 3-jet, and 4-jet events in pp collisions at $ \sqrt{s}= $ 13 TeV | EPJC 78 (2018) 566 | CMS-SMP-16-014 1712.05471 |
| 58 | M. Cacciari, G. P. Salam, and G. Soyez | The anti-$ {k_{\mathrm{T}}} $ jet clustering algorithm | JHEP 04 (2008) 63 | 0802.1189 |
| 59 | M. Cacciari, G. P. Salam, and G. Soyez | FastJet user manual | EPJC 72 (2012) 1896 | 1111.6097 |
| 60 | D0 Collaboration | Measurement of dijet azimuthal decorrelations at central rapidities in $ p\overline{p} $ collisions at $ \sqrt{s}=$ 1.96 TeV | PRL 94 (2005) 221801 | |
| 61 | CMS Collaboration | Measurement of four-jet production in proton-proton collisions at $ \sqrt{s}= $ 7 TeV | PRD 89 (2014) 092010 | CMS-FSQ-12-013 1312.6440 |
| 62 | ATLAS Collaboration | Measurement of the inelastic proton-proton cross section at $ \sqrt{s} = $ 13 TeV with the ATLAS detector at the LHC | PRL 117 (2016) 182002 | 1606.02625 |
| 63 | CMS Collaboration | Studies of inclusive four-jet production with two b-tagged jets in proton-proton collisions at 7 TeV | PRD 94 (2016) 112005 | CMS-FSQ-13-010 1609.03489 |
| 64 | B. Humpert and R. Odorico | Multi-parton scattering and QCD radiation as sources of four-jet events | PLB 154 (1985) 211 | |
| 65 | M. Mangano | Four-jet production at the Tevatron Collider | Z. Phys. C 42 (1989) 331 | |
| 66 | CMS Collaboration | Probing color coherence effects in pp collisions at $ \sqrt{s}= $ 7 TeV | EPJC 74 (2014) | CMS-SMP-12-010 1311.5815 |
| 67 | P. Gunnellini | Study of double parton scattering using four-jet scenarios in proton-proton collisions at $ \sqrt{s} =$ 7 TeV with the CMS experiment at the Large Hadron Collider | PhD thesis, U. Hamburg, Dept. Phys. | |
| 68 | P. Nason | A New method for combining NLO QCD with shower Monte Carlo algorithms | JHEP 11 (2004) 40 | hep-ph/0409146 |
| 69 | CMS Collaboration | Measurement of differential cross sections for top quark pair production using the lepton+jets final state in proton-proton collisions at 13 TeV | PRD 95 (2017) 092001 | CMS-TOP-16-008 1610.04191 |
| 70 | CMS Collaboration | Measurement of jet substructure observables in $ \mathrm{t\overline{t}} $ events from proton-proton collisions at $ \sqrt{s}= $ 13 TeV | PRD 98 (2018) 092014 | CMS-TOP-17-013 1808.07340 |
| 71 | CMS Collaboration | Measurement of differential cross sections for Z boson production in association with jets in proton-proton collisions at $ \sqrt{s} = $ 13 TeV | EPJC 78 (2018) 965 | CMS-SMP-16-015 1804.05252 |
| 72 | CMS Collaboration | Measurement of the differential cross sections for the associated production of a $ W $ boson and jets in proton-proton collisions at $ \sqrt{s}= $ 13 TeV | PRD 96 (2017) 72005 | CMS-SMP-16-005 1707.05979 |
|
|
Compact Muon Solenoid LHC, CERN |
|

|

|

|

|

|