

Compact Muon Solenoid
LHC, CERN
| CMS-HIN-17-007 ; CERN-EP-2018-283 | ||
| Observation of nuclear modifications in ${\mathrm{W^{\pm}}}$ boson production in pPb collisions at ${\sqrt {\smash [b]{s_{_{\mathrm {NN}}}}}} = $ 8.16 TeV | ||
| CMS Collaboration | ||
| 4 May 2019 | ||
| Phys. Lett. B 800 (2020) 135048 | ||
| Abstract: The production of ${\mathrm{W^{\pm}}}$ bosons is studied in proton-lead pPb collisions at a nucleon-nucleon centre-of-mass energy of ${\sqrt {\smash [b]{s_{_{\mathrm {NN}}}}}} = $ 8.16 TeV. Measurements are performed in the ${\mathrm{W^{\pm}}\to\mu^{\pm}\nu_{\mu}}$ channel using a data sample corresponding to an integrated luminosity of 173.4 $\pm$ 8.7 nb$^{-1}$, collected by the CMS Collaboration at the LHC. The number of positively and negatively charged W bosons is determined separately in the muon pseudorapidity region in the laboratory frame $|{{{\eta_{\text{lab}}} ^{\mu}} }| < $ 2.4 and transverse momentum $|{p_{\mathrm{T}}}^{\mu} > $ 25 GeV/$c$. The ${\mathrm{W^{\pm}}}$ boson differential cross sections, muon charge asymmetry, and the ratios of ${\mathrm{W^{\pm}}}$ boson yields for the proton-going over the Pb-going beam directions are reported as a function of the muon pseudorapidity in the nucleon-nucleon centre-of-mass frame. The measurements are compared to the predictions from theoretical calculations based on parton distribution functions (PDFs) at next-to-leading-order. The results favour PDF calculations that include nuclear modifications and provide constraints on the nuclear PDF global fits. | ||
| Links: e-print arXiv:1905.01486 [hep-ex] (PDF) ; CDS record ; inSPIRE record ; HepData record ; CADI line (restricted) ; | ||
| Figures & Tables | Summary | Additional Figures | References | CMS Publications |
|---|
| Figures | |
png pdf |
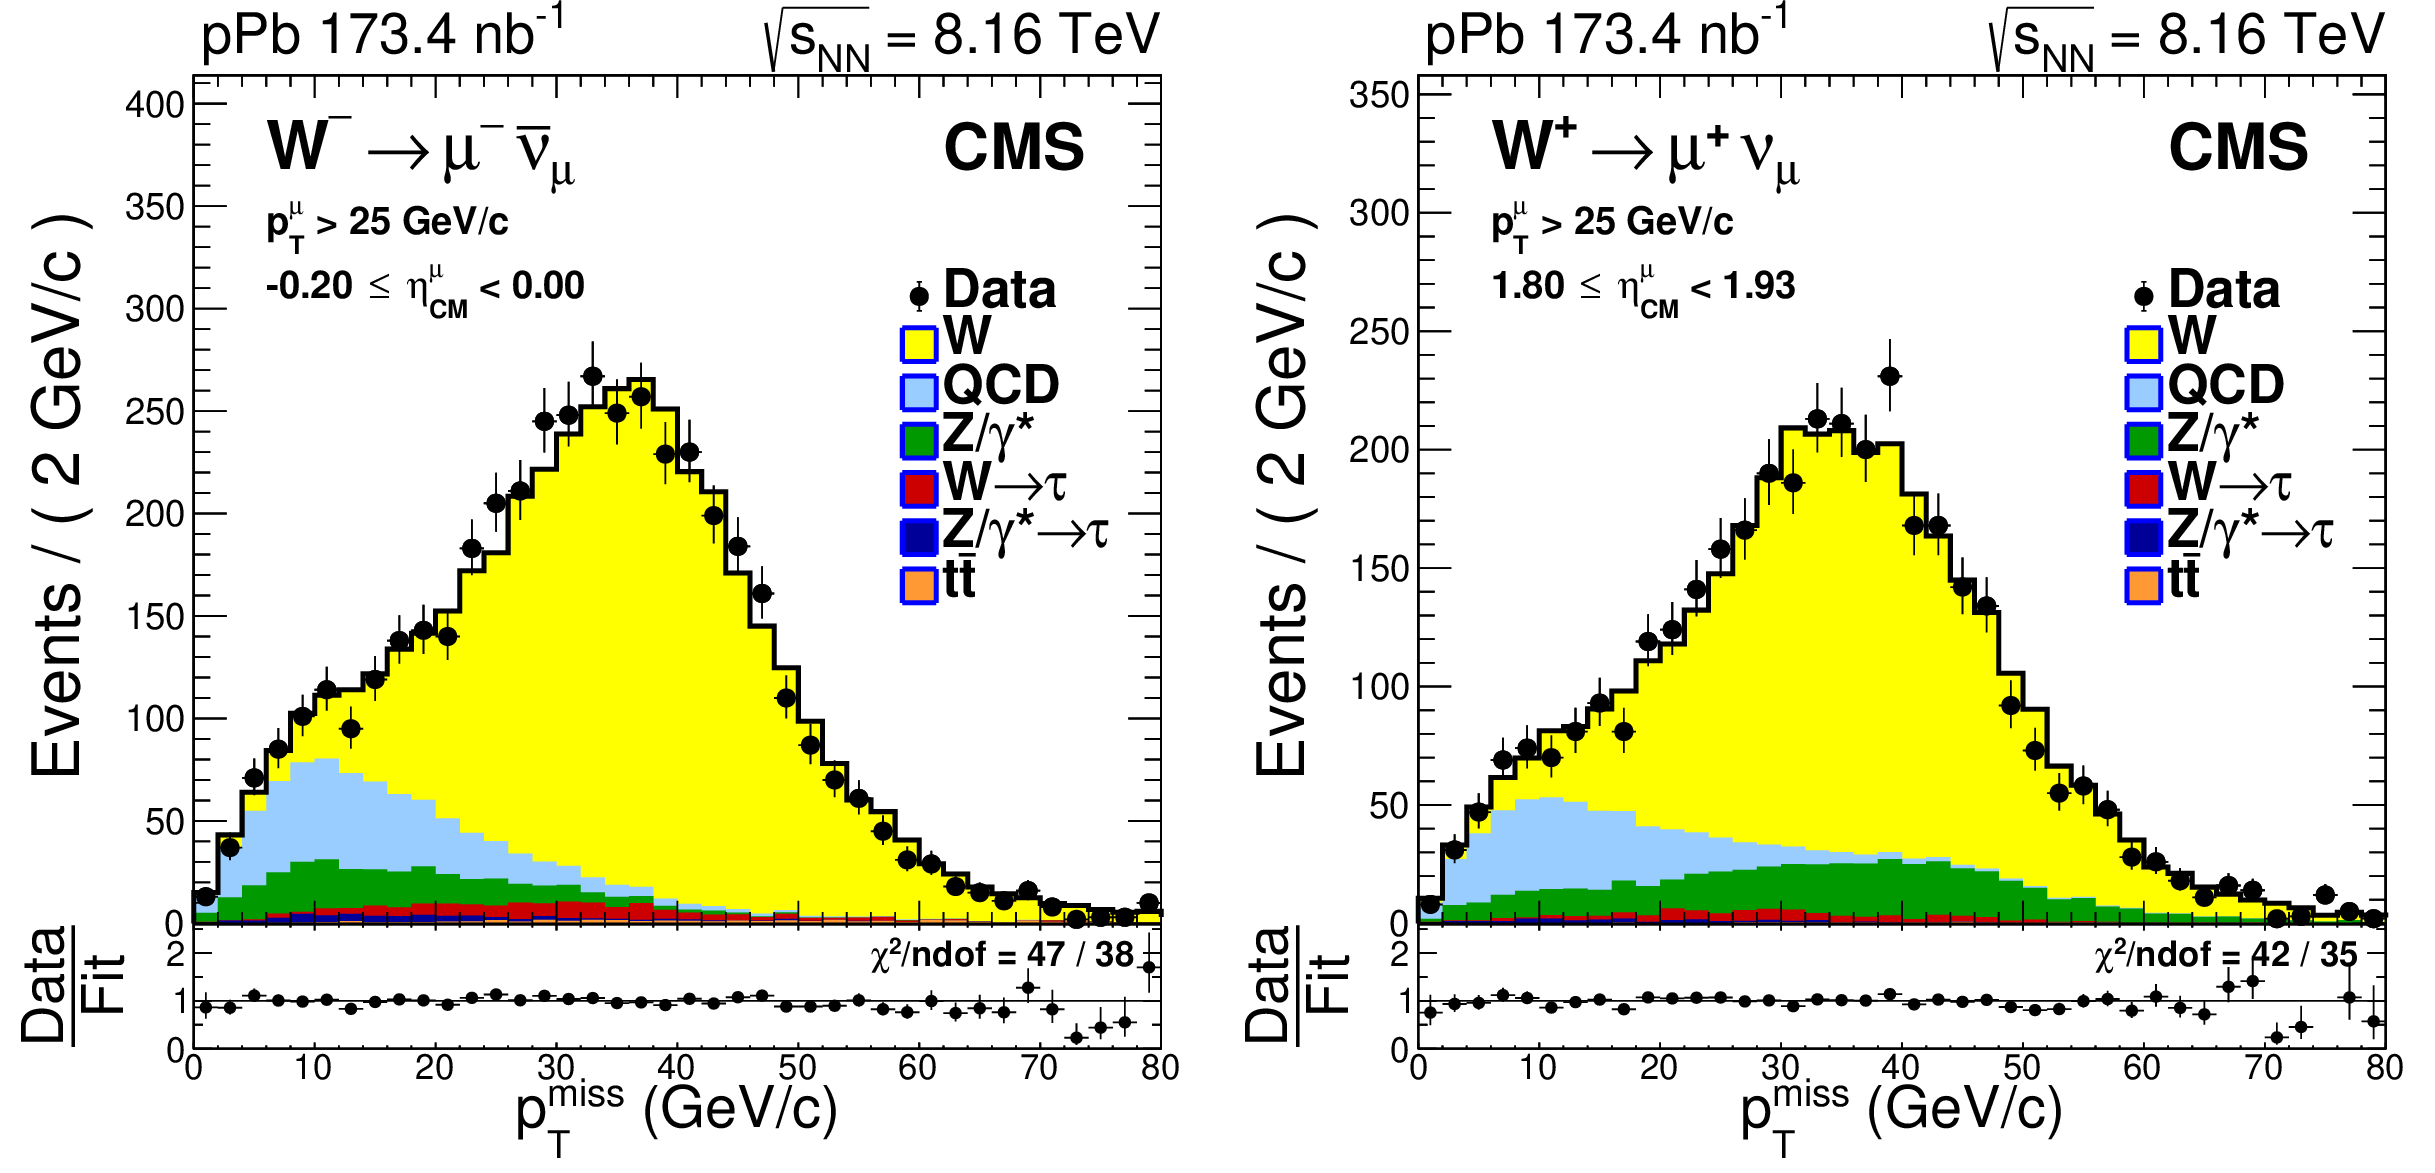
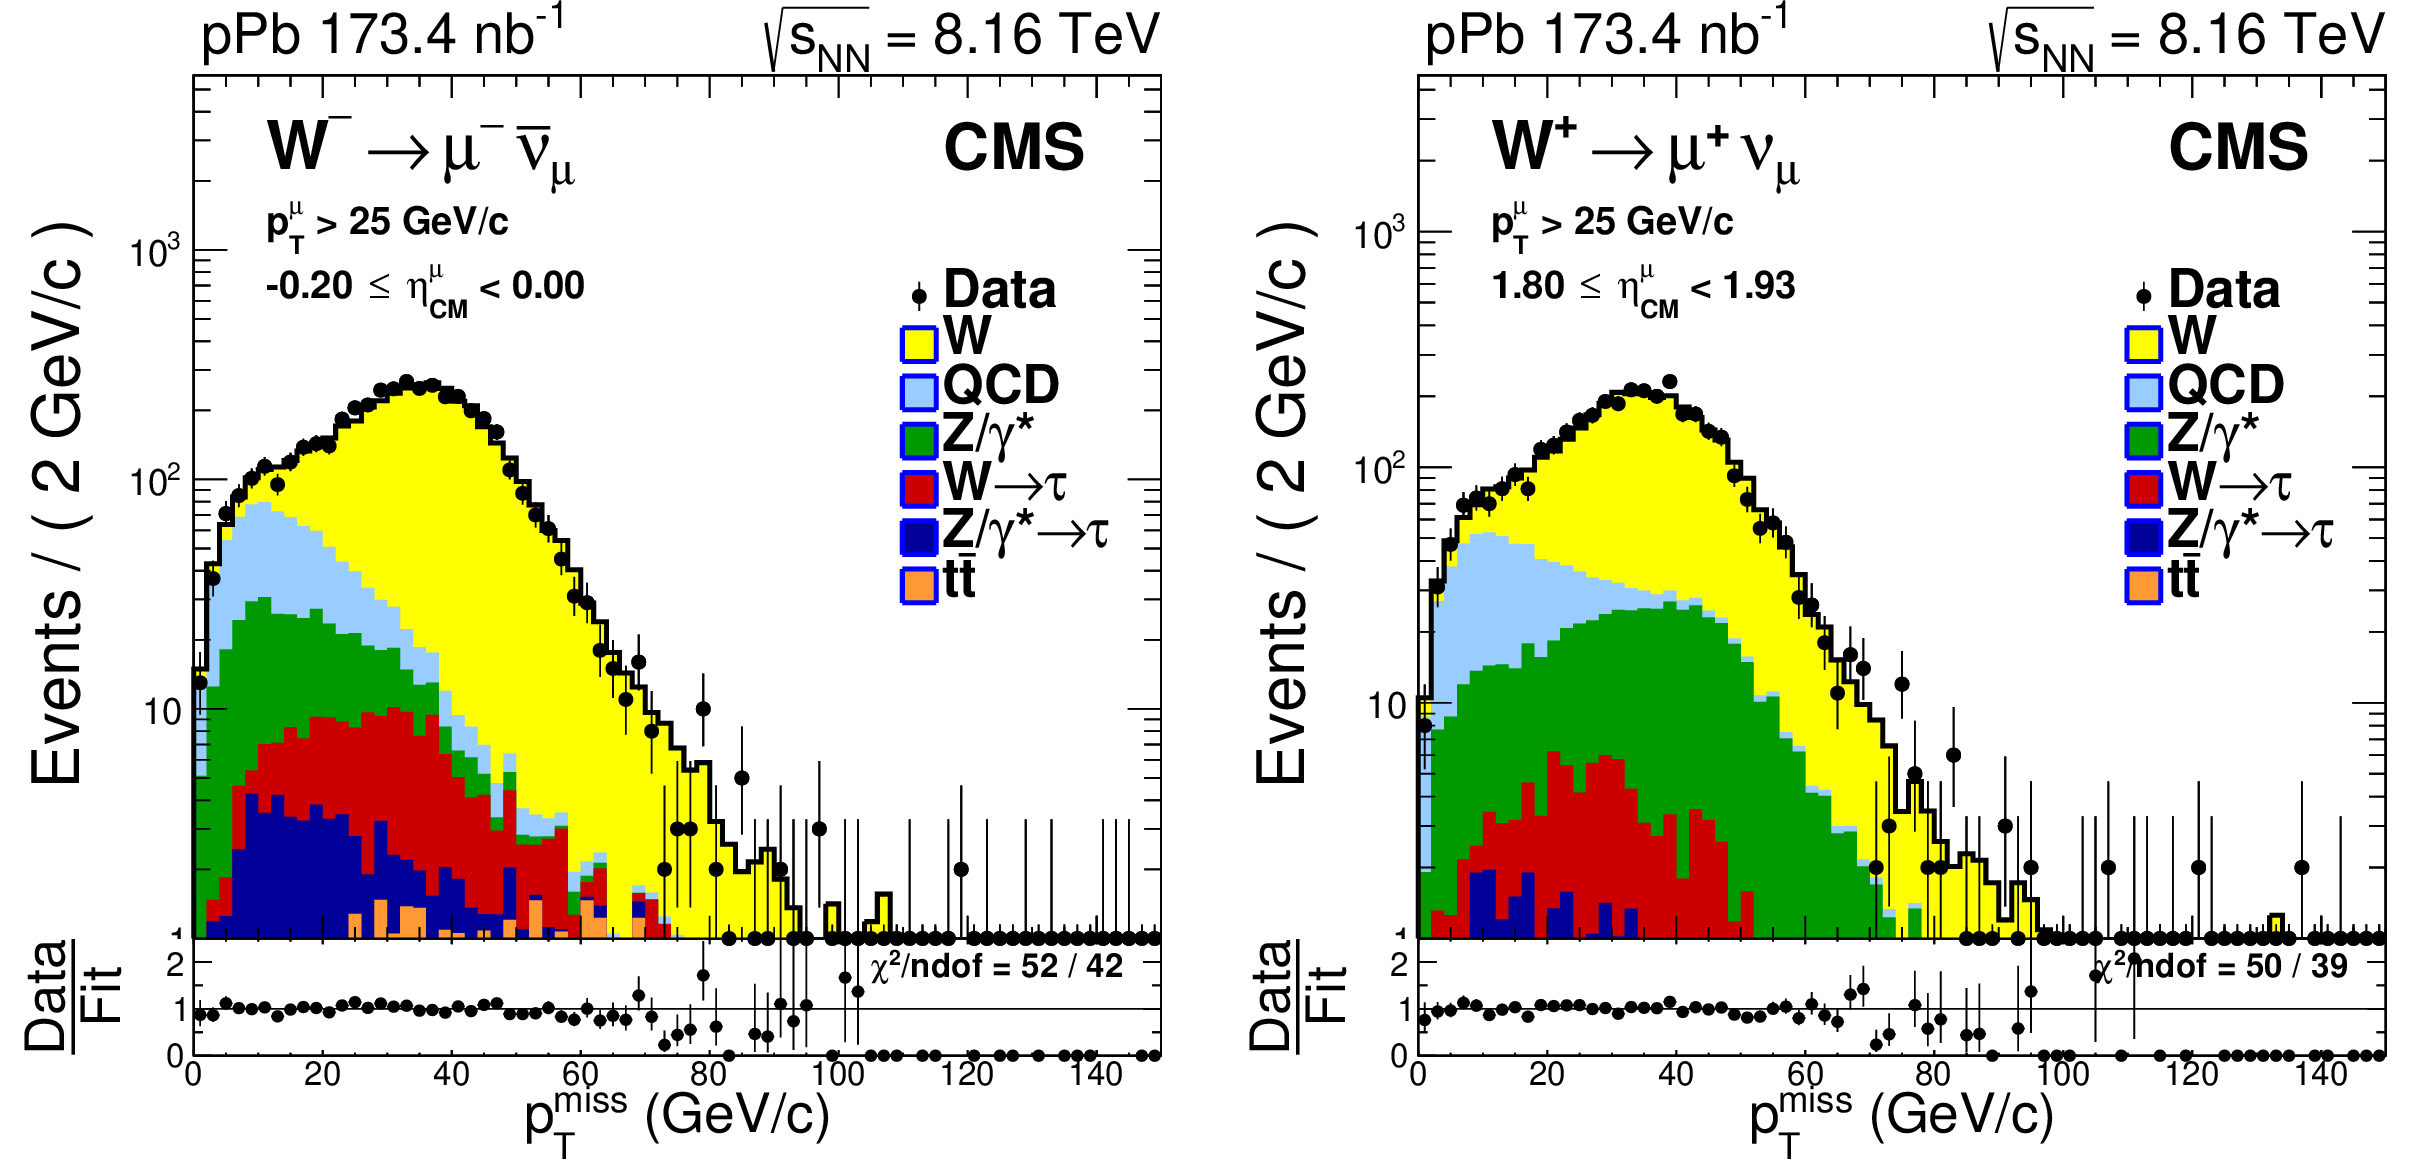
Figure 1:
The missing transverse momentum ${{p_{\mathrm {T}}} ^\text {miss}}$ distribution for ${{\mathrm {W^-}}\to {\mu ^-} {\overline {\nu}_ {\mu}}}$ events within the $-0.2 < {{\eta _{\text {CM}}} ^{{\mu}}} < 0.0$ (left) range and for ${{\mathrm {W^+}}\to {\mu ^+} {\nu _ {\mu}}}$ events within the 1.80 $ < {{\eta _{\text {CM}}} ^{{\mu}}} < $ 1.93 (right) range. Unbinned fits to the data (black points) are performed with six contributions, stacked from bottom to top: ${{\mathrm {t}\overline {\mathrm {t}}}}$ (orange), ${{{\mathrm {Z}} / {\gamma}^{*}} \to {{\tau}^{+} {\tau}^{-}}}$ (dark blue), ${ {\mathrm {W}^{\pm}} \to {\tau} ^{\pm} {\nu _ {\tau}} }$ (red), ${{{\mathrm {Z}} / {\gamma}^{*}} \to {{{\mu ^+}} {{\mu ^-}}}}$ (green), QCD multijet (light blue) and ${{\mathrm {W}^{\pm}} \to {\mu ^\pm} {\nu _ {\mu}}}$ (yellow). The ${{\eta _{\text {CM}}} ^{{\mu}}}$ regions are defined such that the proton is moving towards positive pseudorapidity. Error bars represent statistical uncertainties. The lower panels display the data divided by the result of the fit. |
png pdf |
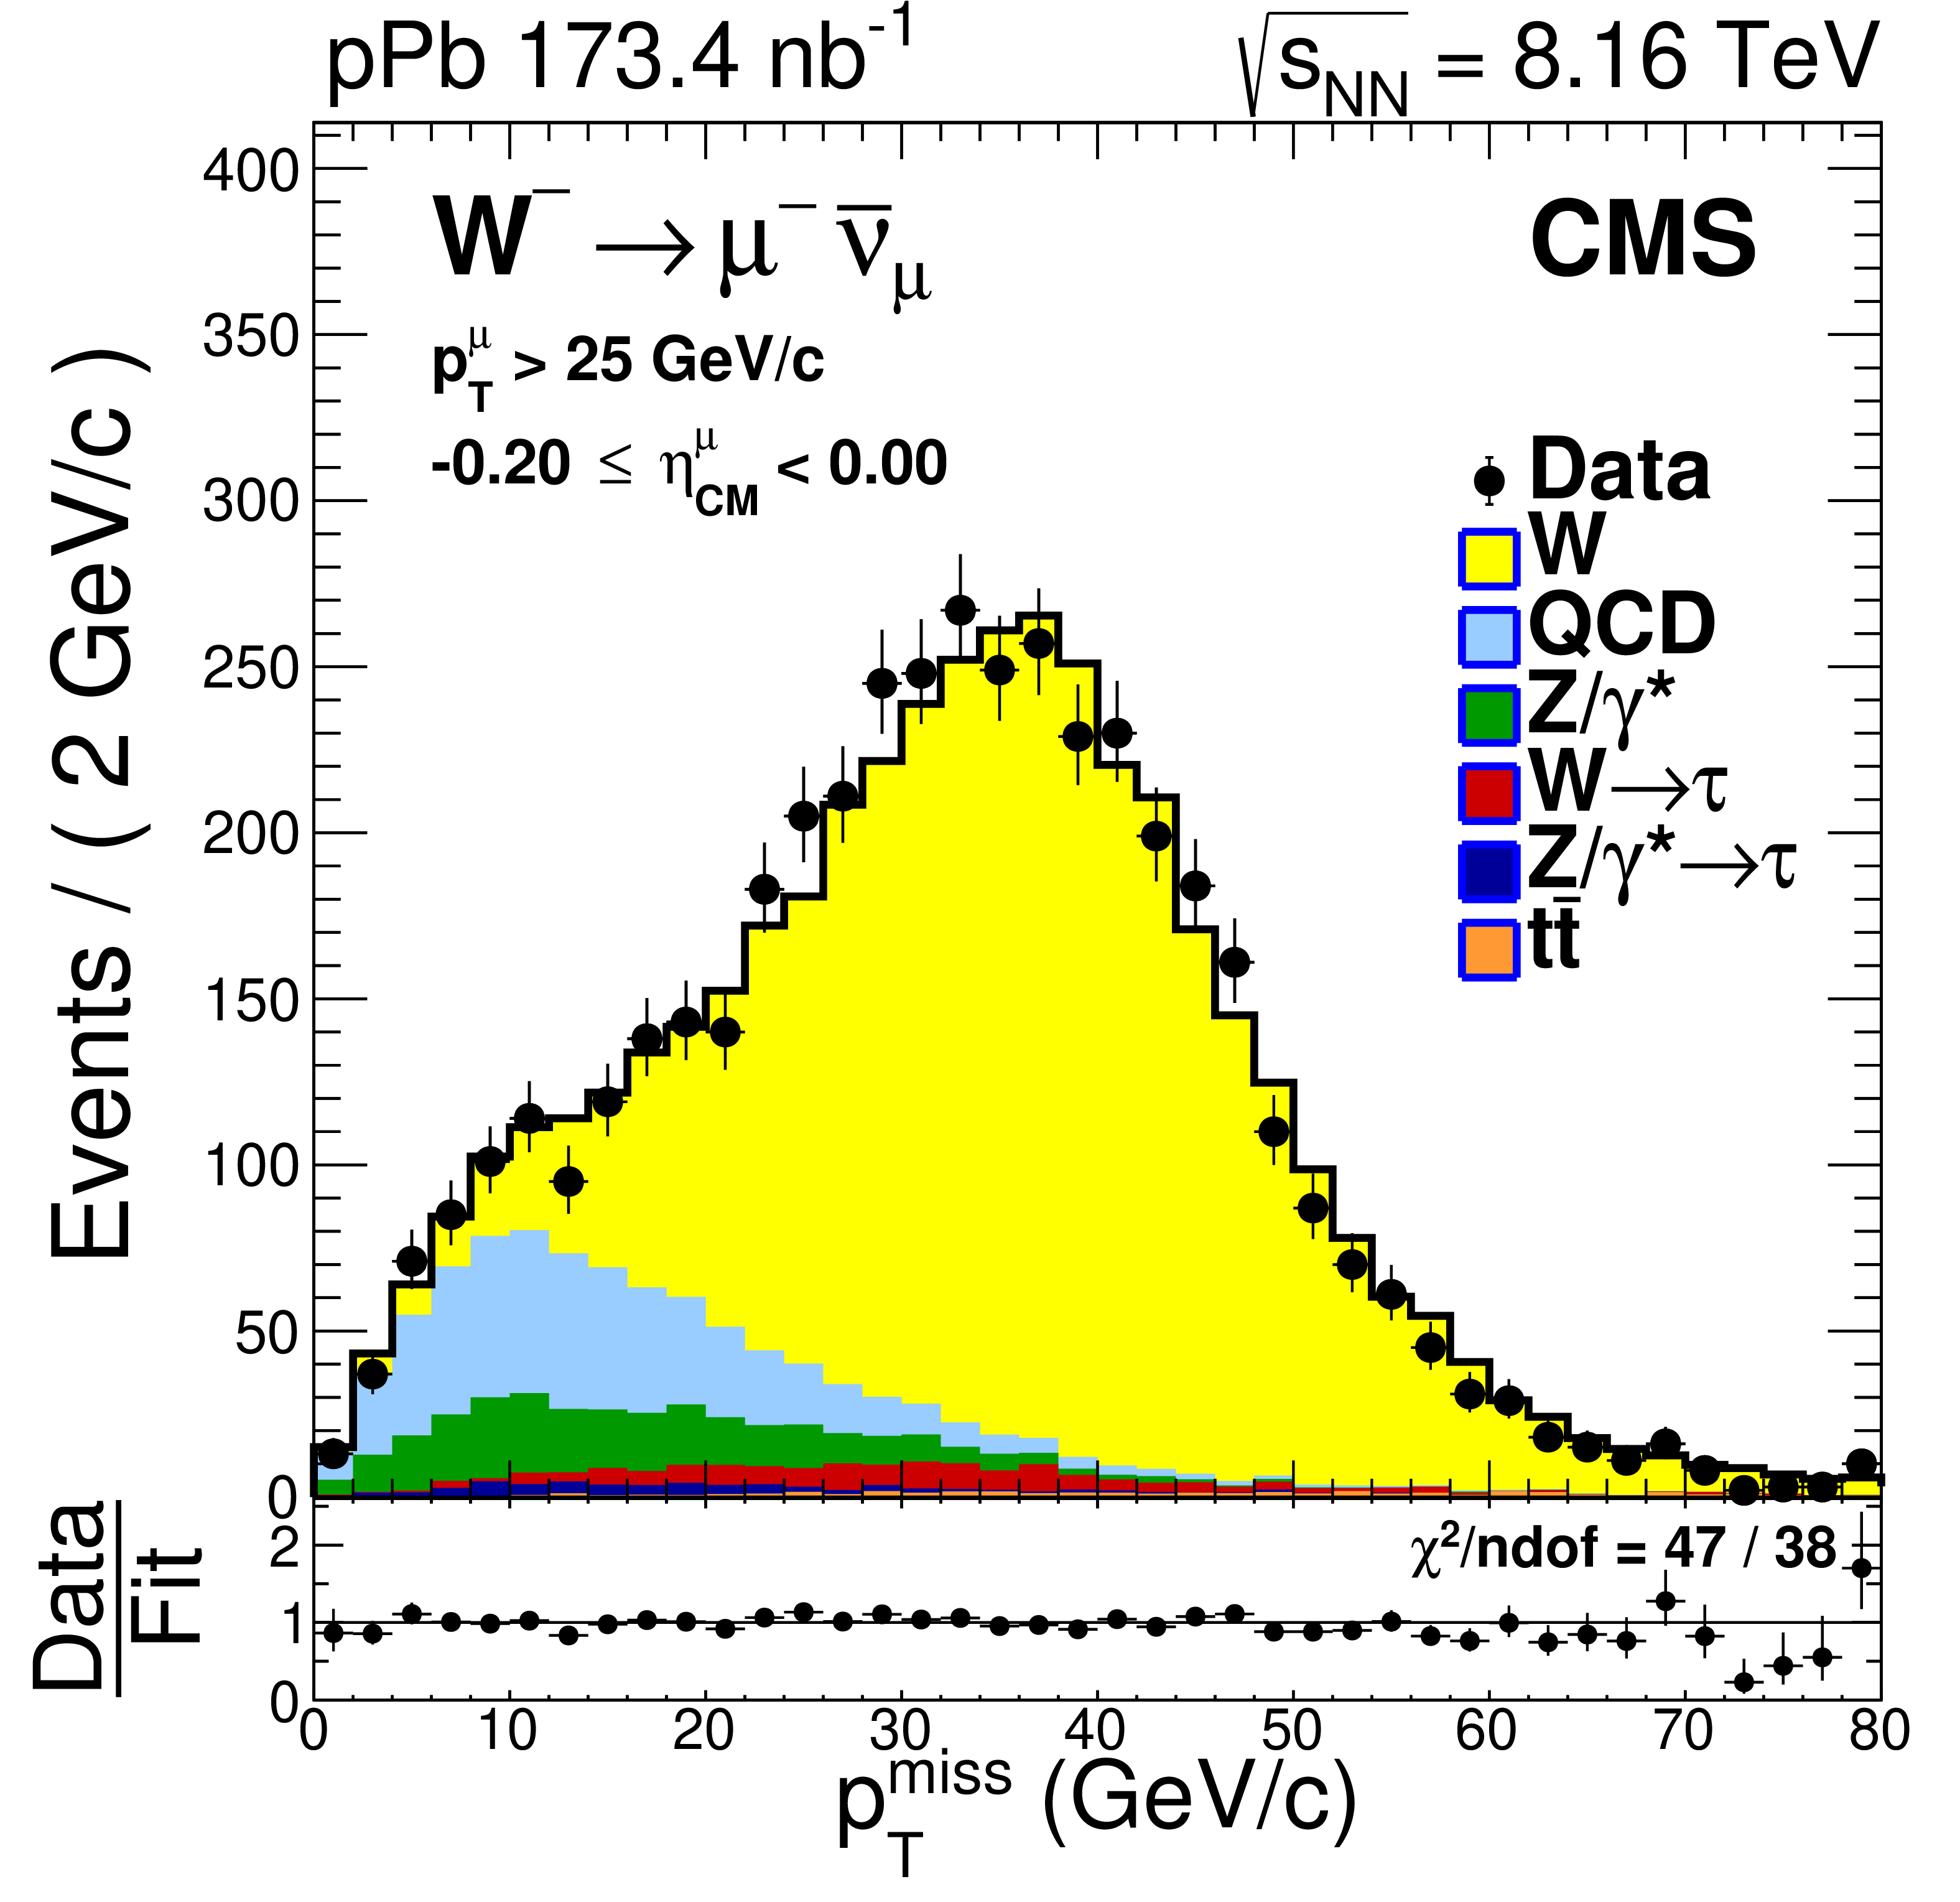
Figure 1-a:
The missing transverse momentum ${{p_{\mathrm {T}}} ^\text {miss}}$ distribution for ${{\mathrm {W^-}}\to {\mu ^-} {\overline {\nu}_ {\mu}}}$ events within the $-0.2 < {{\eta _{\text {CM}}} ^{{\mu}}} < 0.0$ range. Unbinned fits to the data (black points) are performed with six contributions, stacked from bottom to top: ${{\mathrm {t}\overline {\mathrm {t}}}}$ (orange), ${{{\mathrm {Z}} / {\gamma}^{*}} \to {{\tau}^{+} {\tau}^{-}}}$ (dark blue), ${ {\mathrm {W}^{\pm}} \to {\tau} ^{\pm} {\nu _ {\tau}} }$ (red), ${{{\mathrm {Z}} / {\gamma}^{*}} \to {{{\mu ^+}} {{\mu ^-}}}}$ (green), QCD multijet (light blue) and ${{\mathrm {W}^{\pm}} \to {\mu ^\pm} {\nu _ {\mu}}}$ (yellow). The ${{\eta _{\text {CM}}} ^{{\mu}}}$ regions are defined such that the proton is moving towards positive pseudorapidity. Error bars represent statistical uncertainties. The lower panel displays the data divided by the result of the fit. |
png pdf |
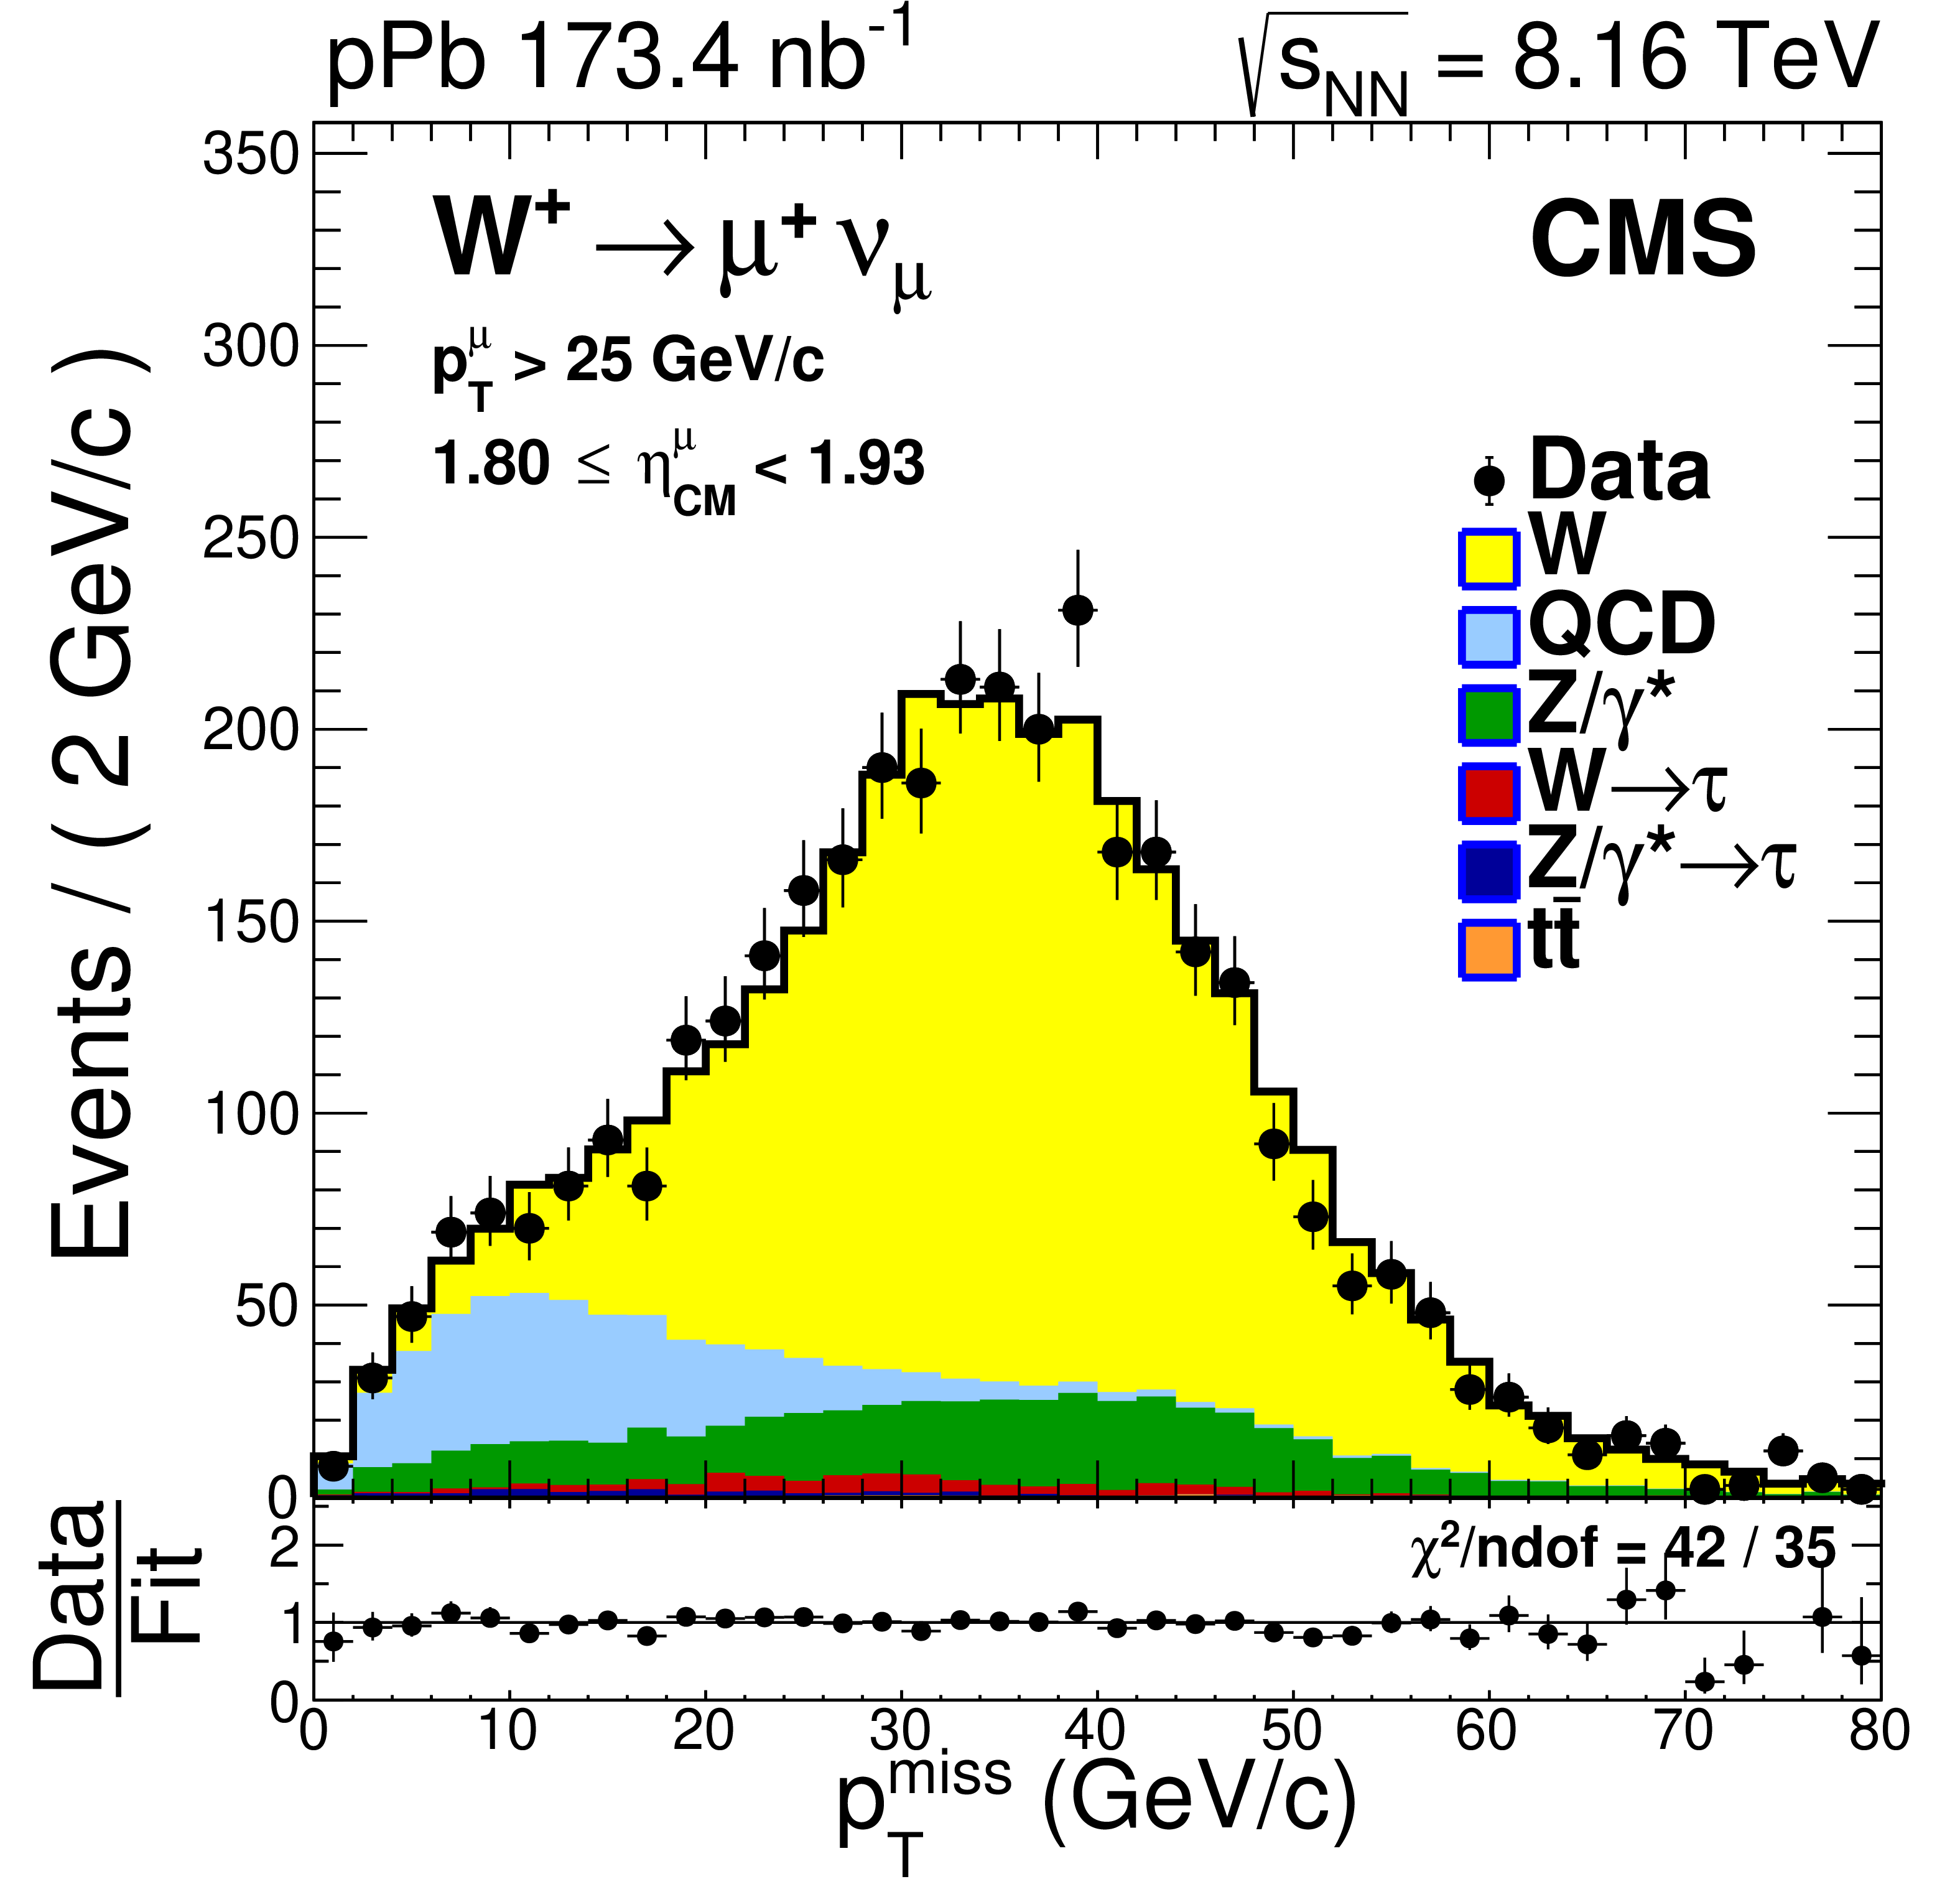
Figure 1-b:
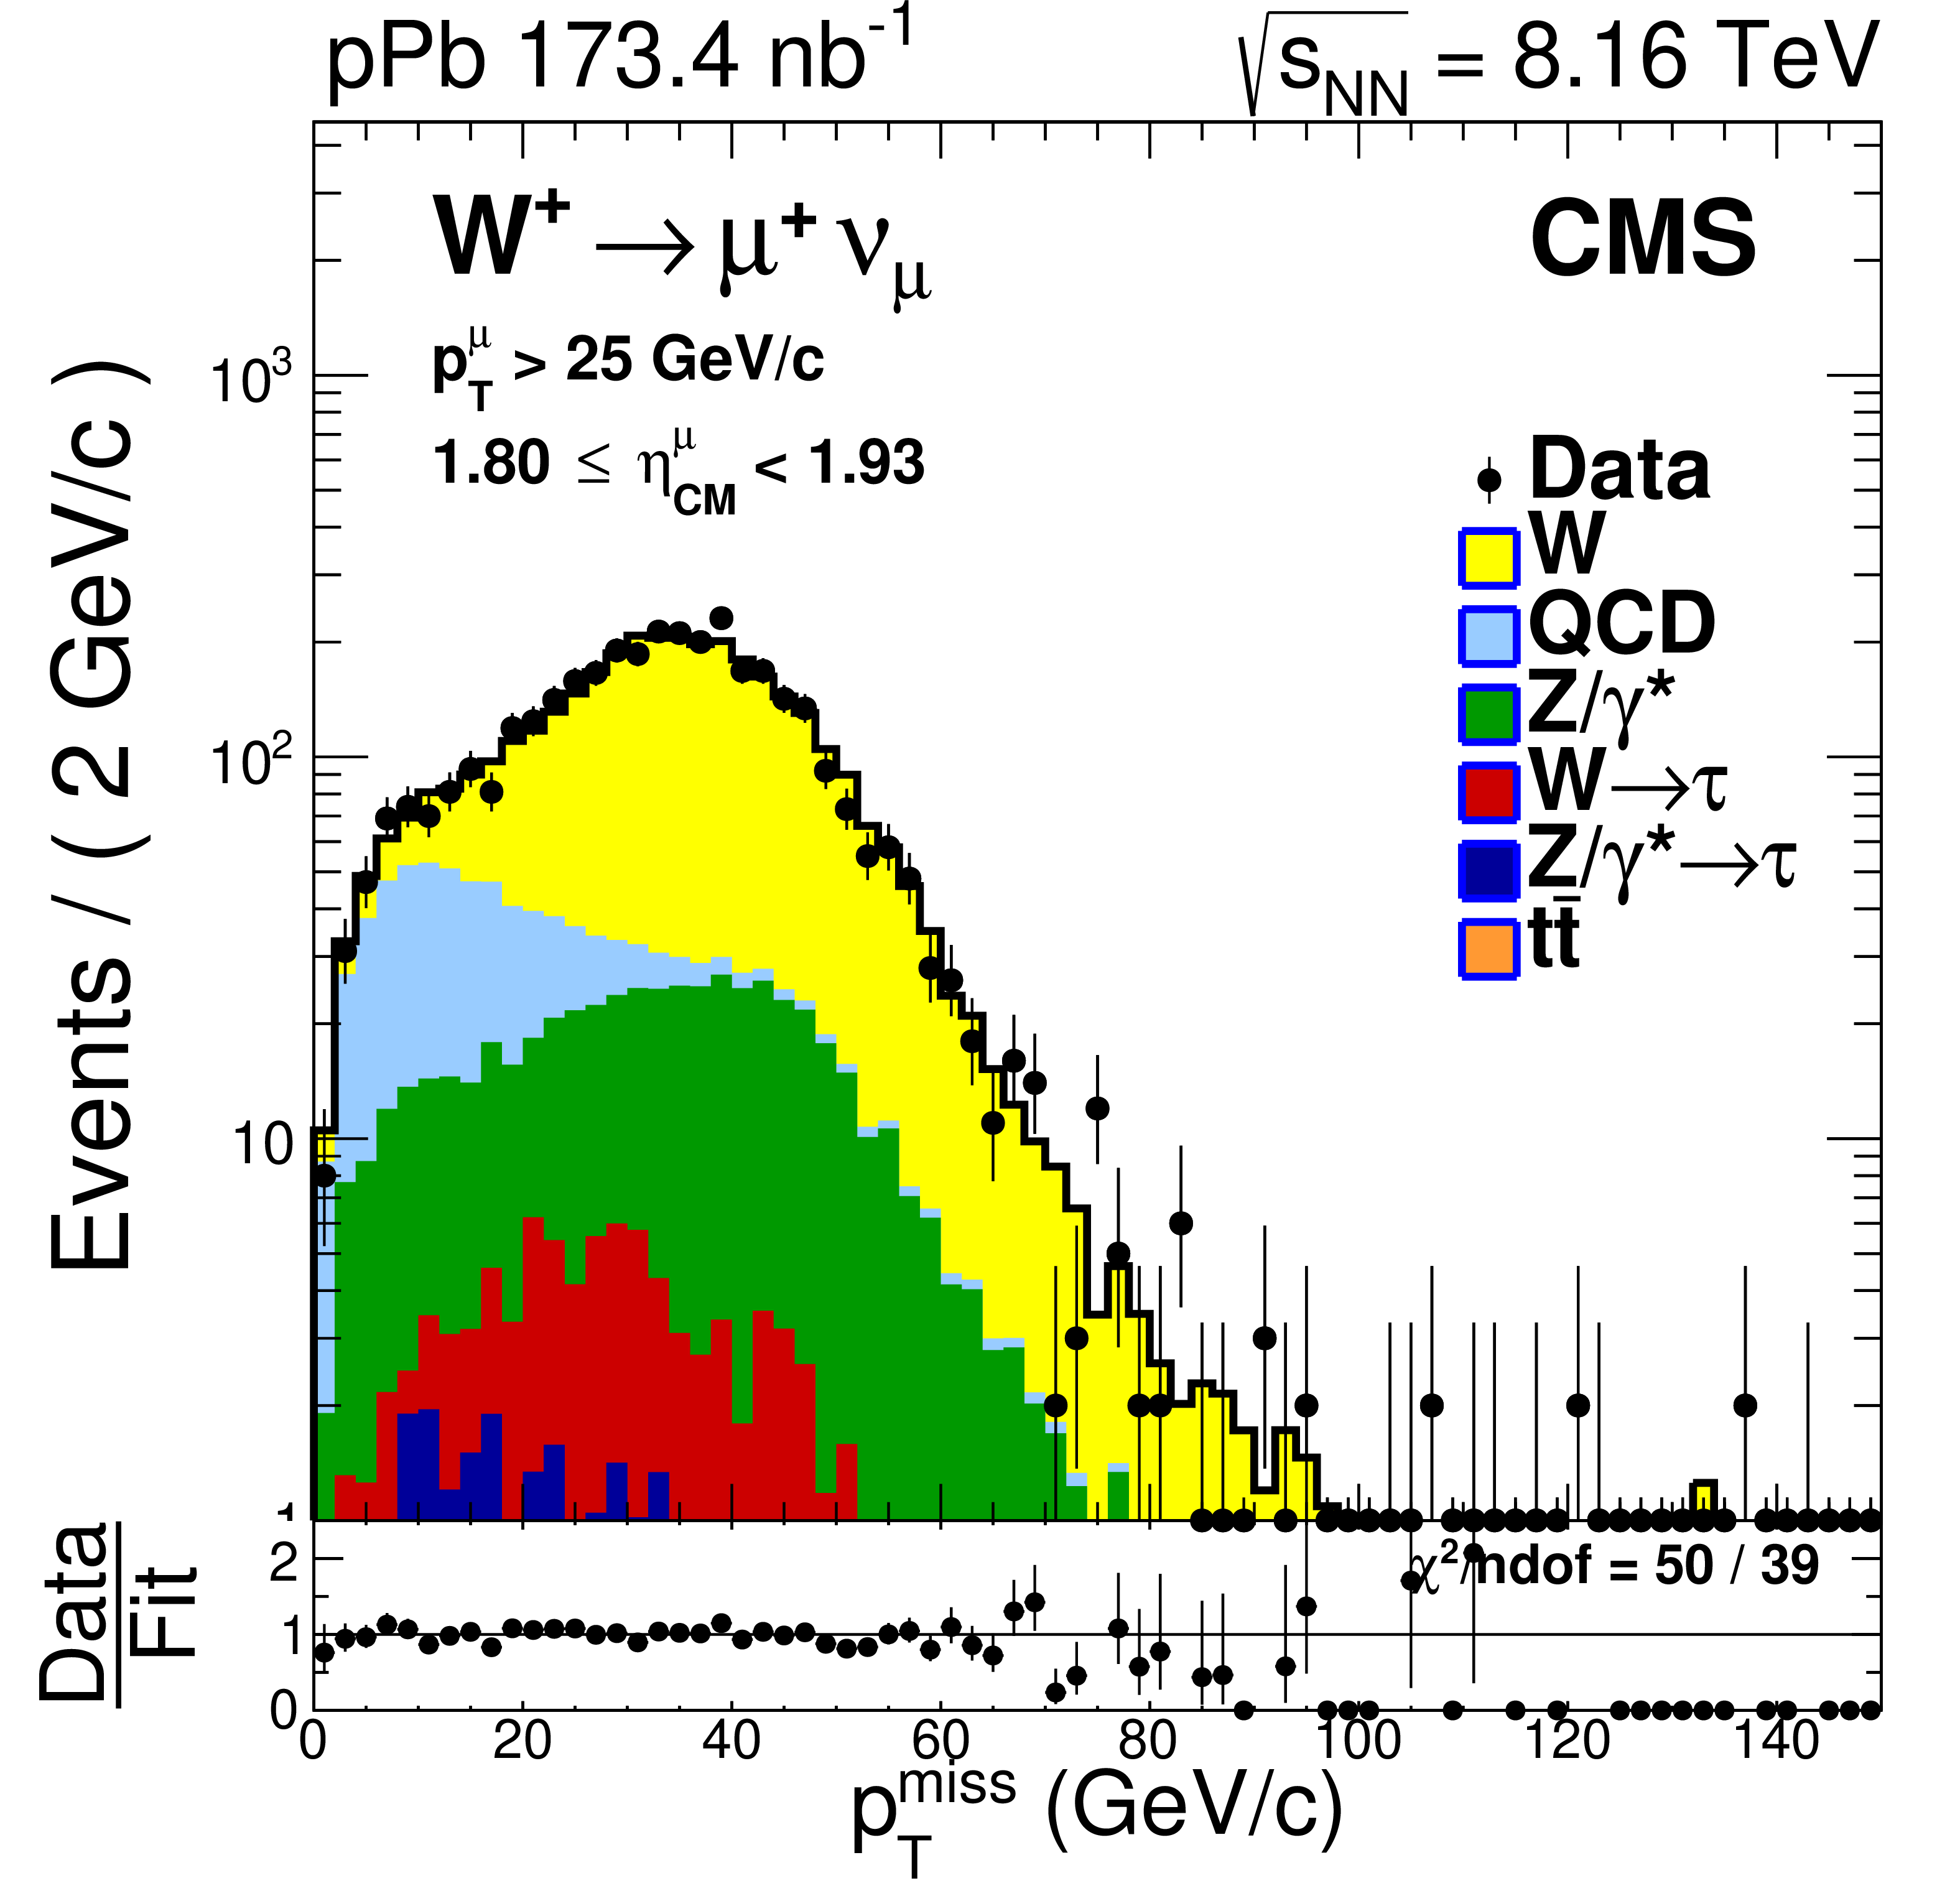
The missing transverse momentum ${{p_{\mathrm {T}}} ^\text {miss}}$ distribution for ${{\mathrm {W^+}}\to {\mu ^+} {\nu _ {\mu}}}$ events within the 1.80 $ < {{\eta _{\text {CM}}} ^{{\mu}}} < $ 1.93 range. Unbinned fits to the data (black points) are performed with six contributions, stacked from bottom to top: ${{\mathrm {t}\overline {\mathrm {t}}}}$ (orange), ${{{\mathrm {Z}} / {\gamma}^{*}} \to {{\tau}^{+} {\tau}^{-}}}$ (dark blue), ${ {\mathrm {W}^{\pm}} \to {\tau} ^{\pm} {\nu _ {\tau}} }$ (red), ${{{\mathrm {Z}} / {\gamma}^{*}} \to {{{\mu ^+}} {{\mu ^-}}}}$ (green), QCD multijet (light blue) and ${{\mathrm {W}^{\pm}} \to {\mu ^\pm} {\nu _ {\mu}}}$ (yellow). The ${{\eta _{\text {CM}}} ^{{\mu}}}$ regions are defined such that the proton is moving towards positive pseudorapidity. Error bars represent statistical uncertainties. The lower panel displays the data divided by the result of the fit. |
png pdf |
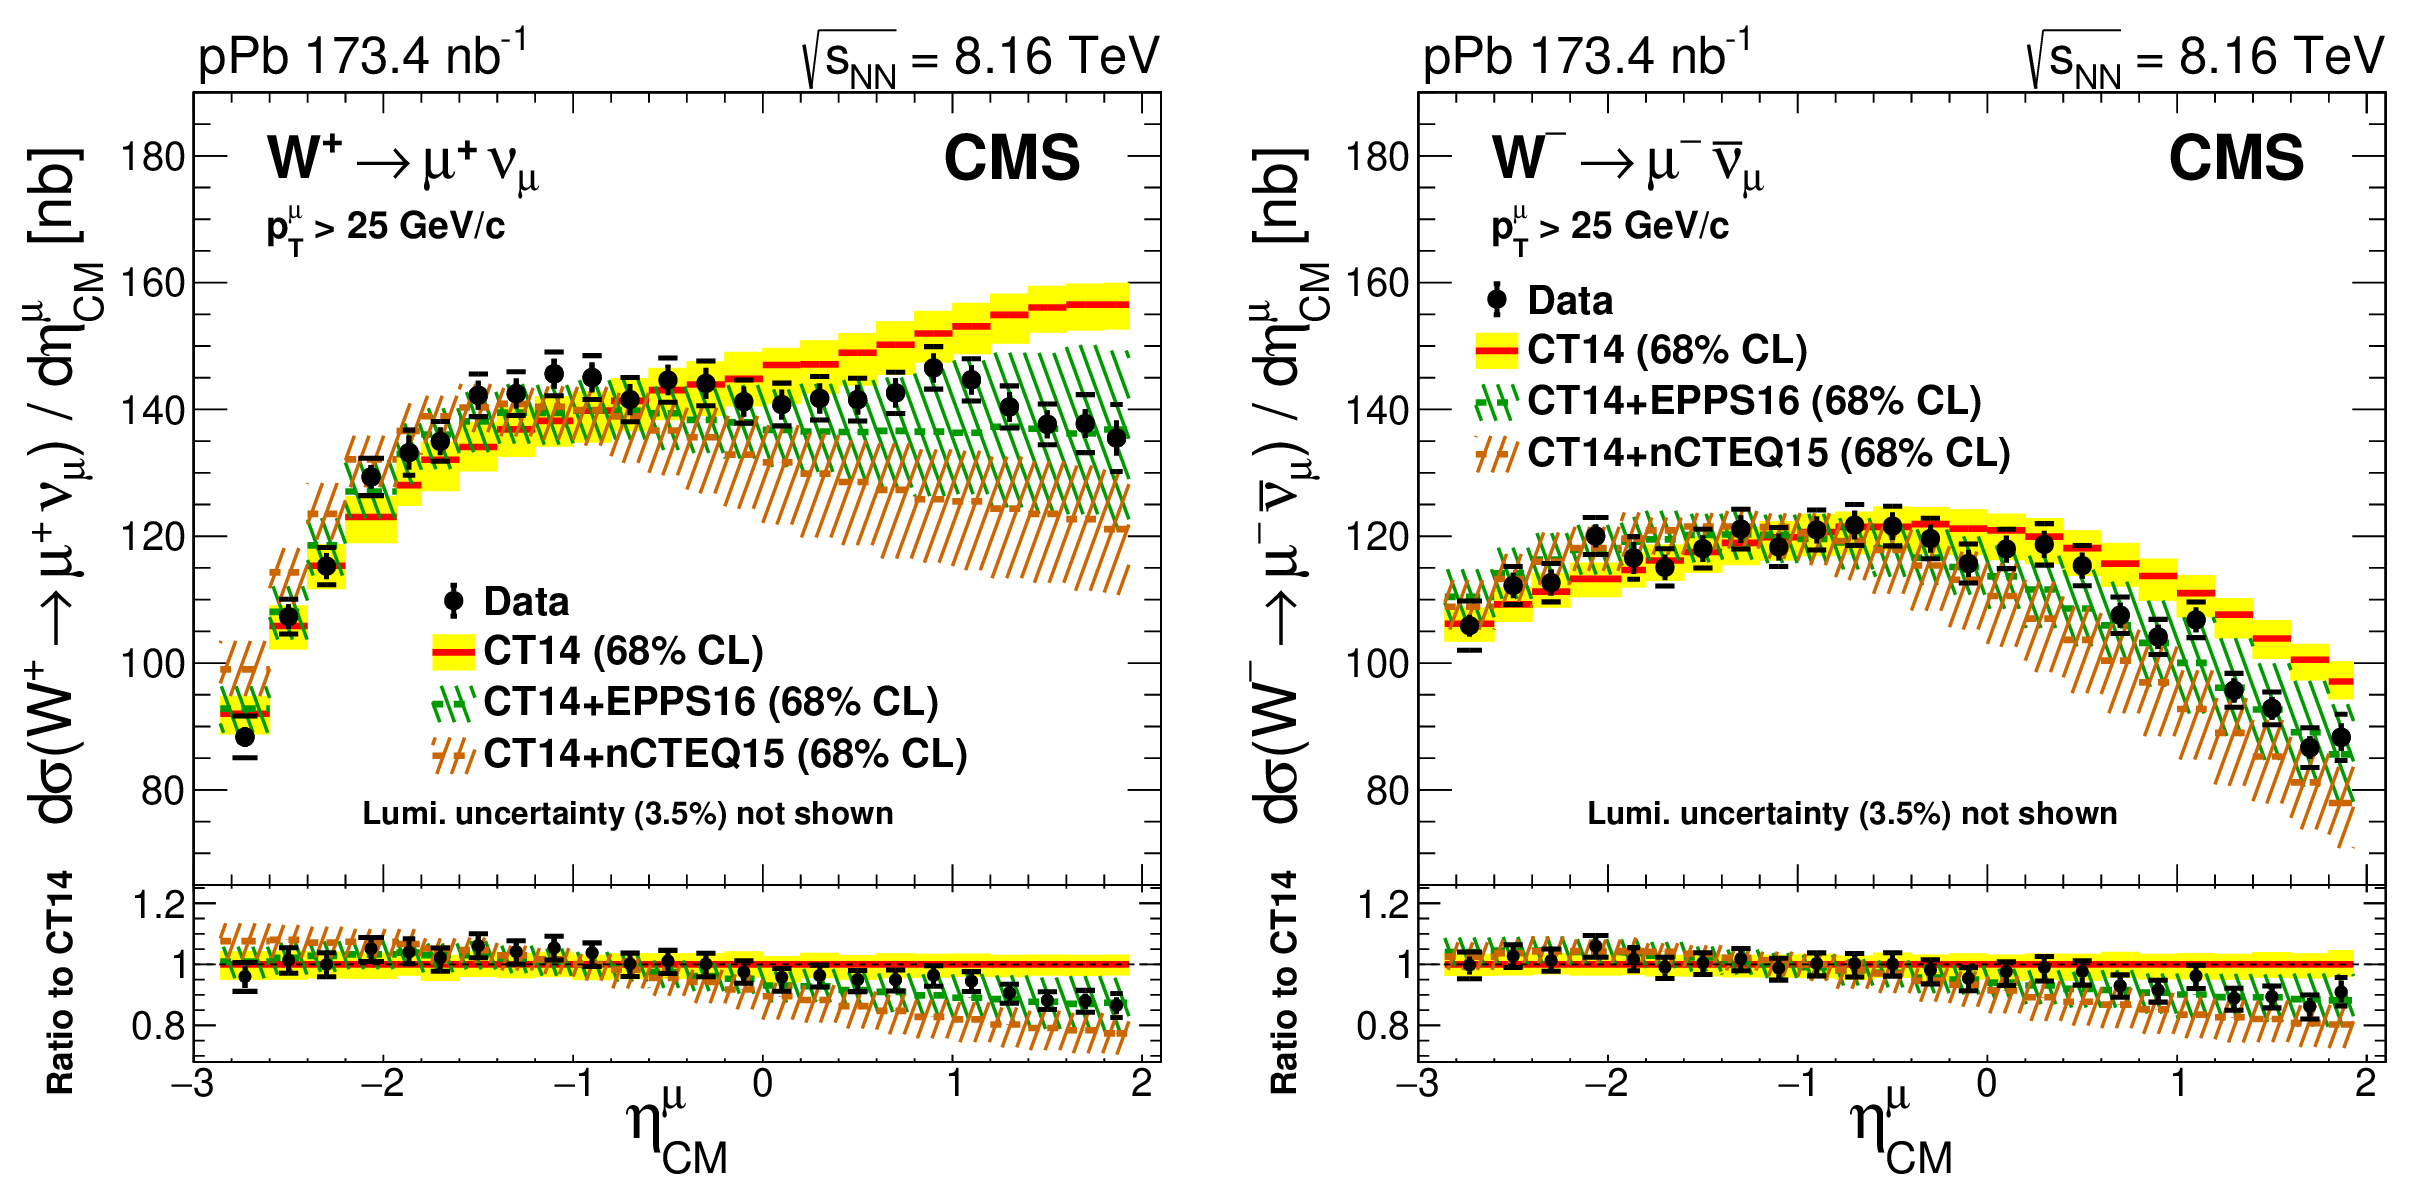
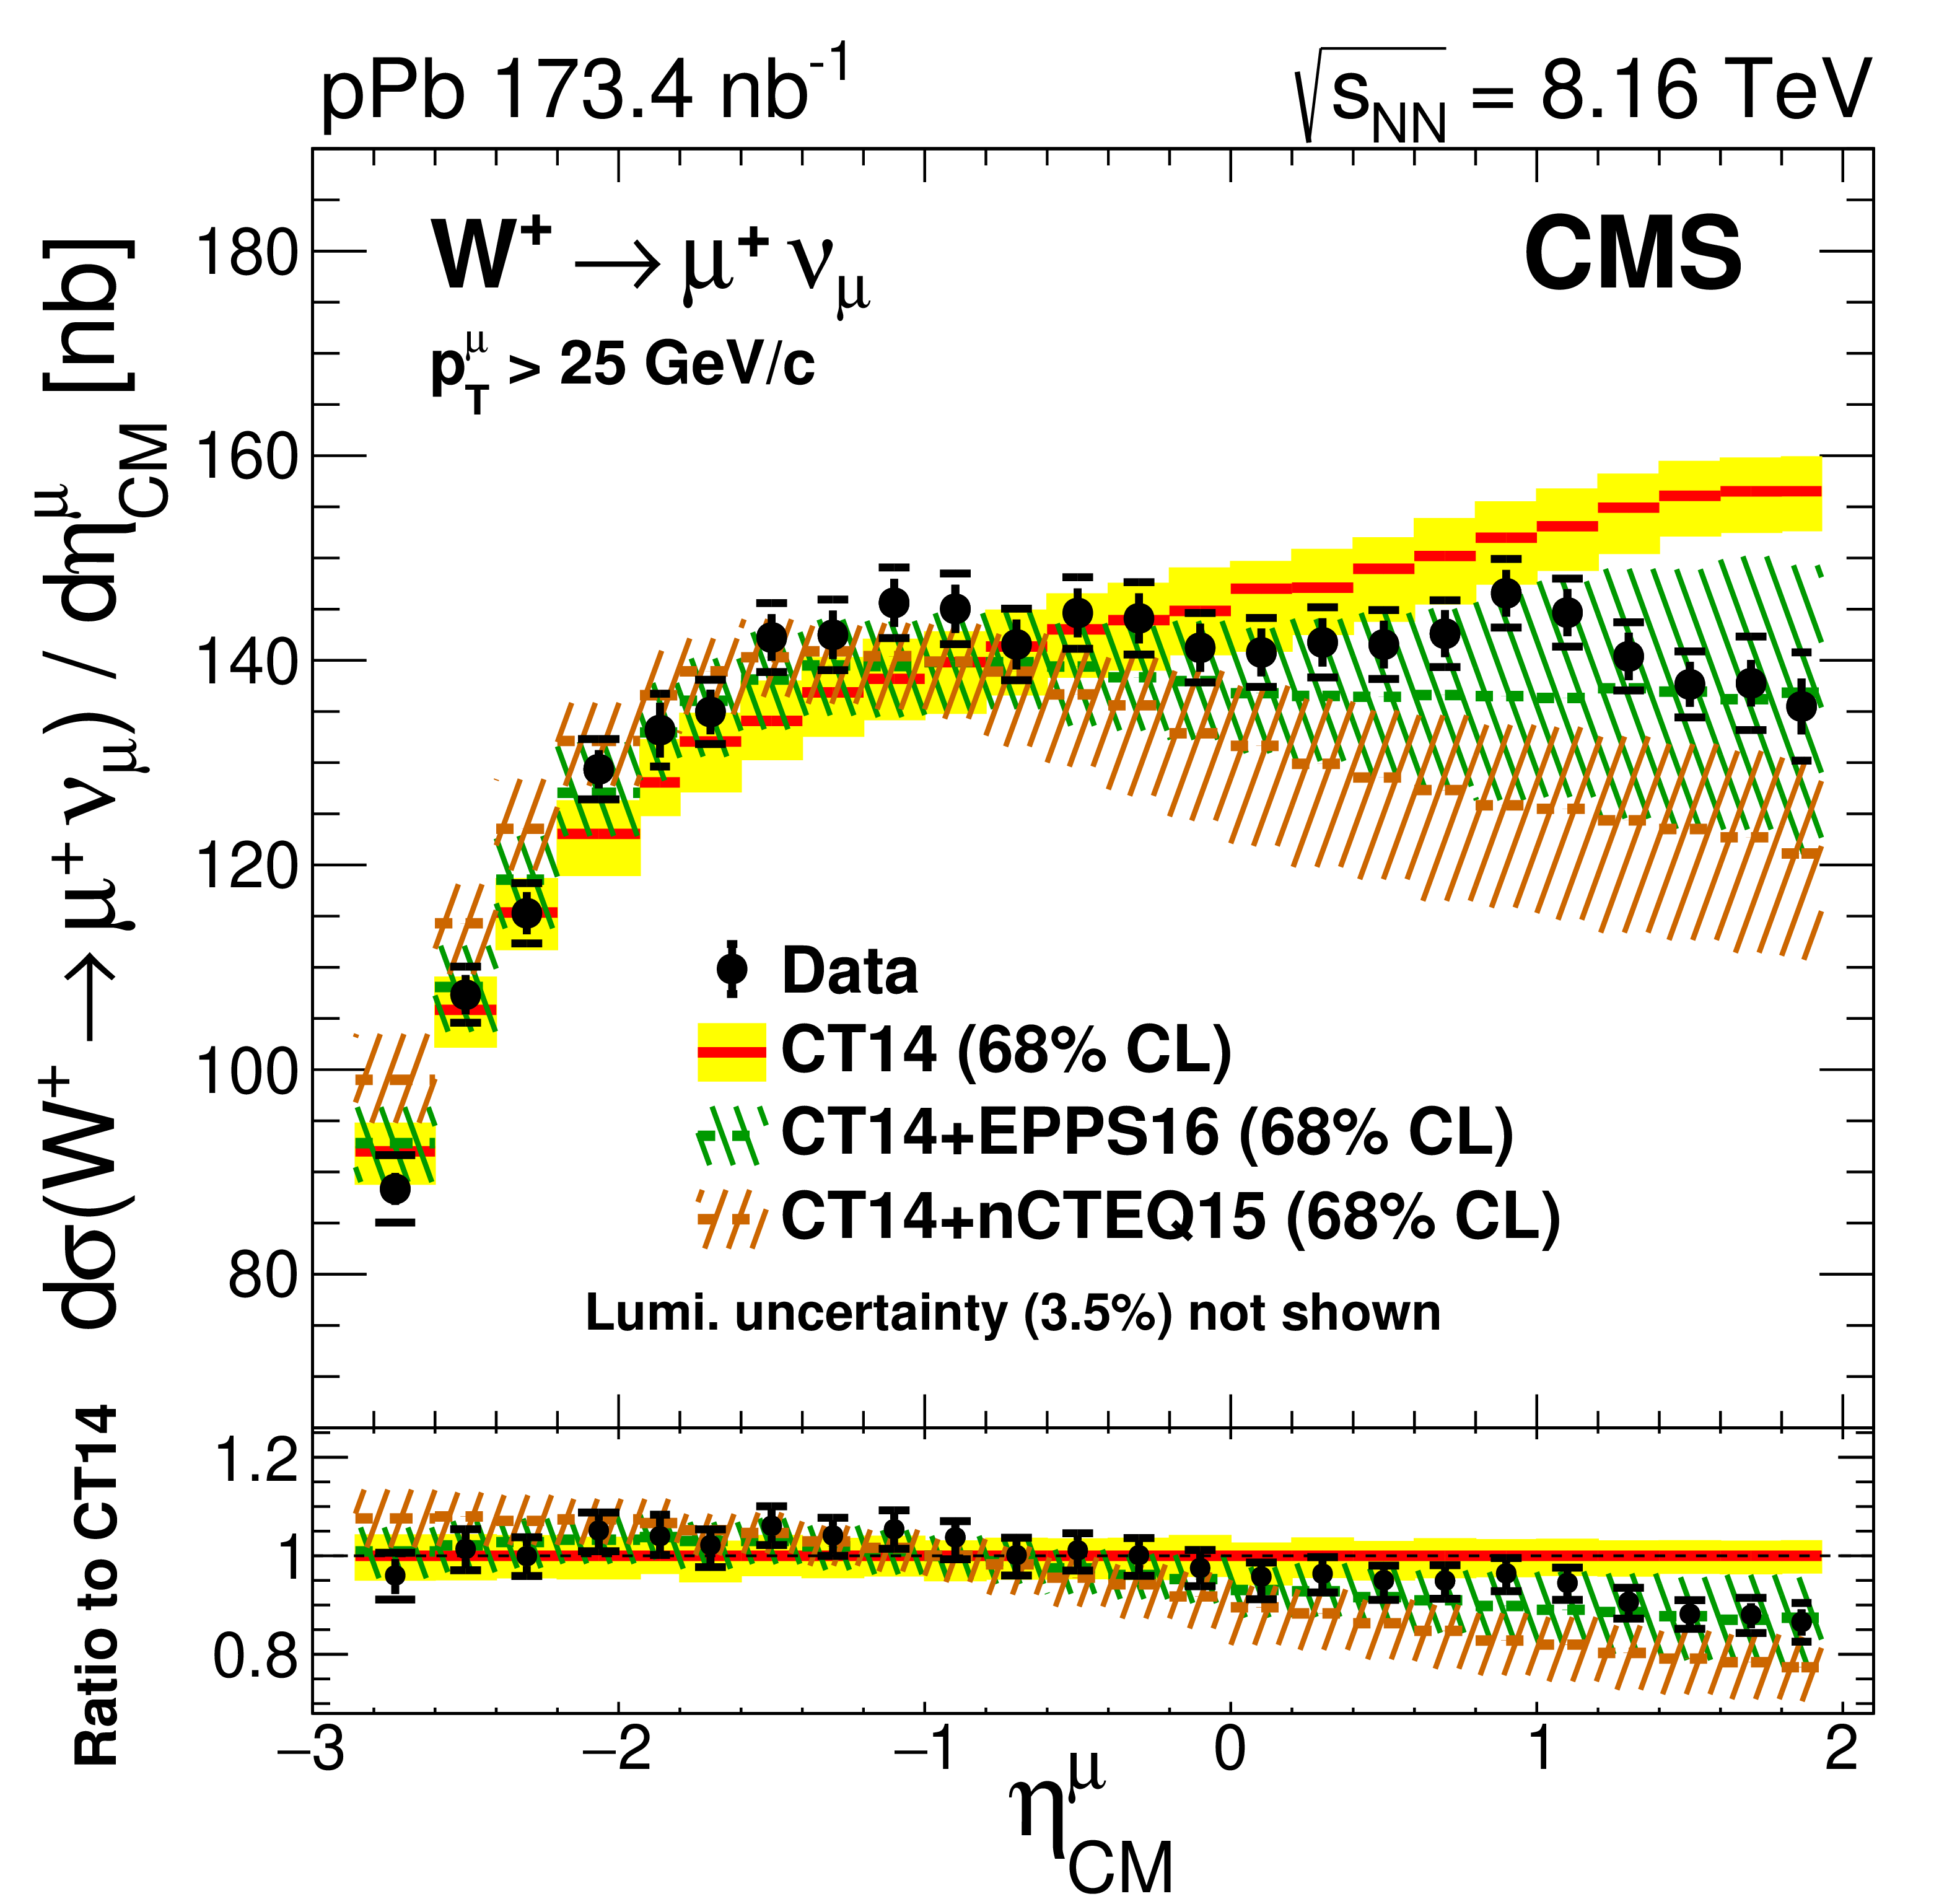
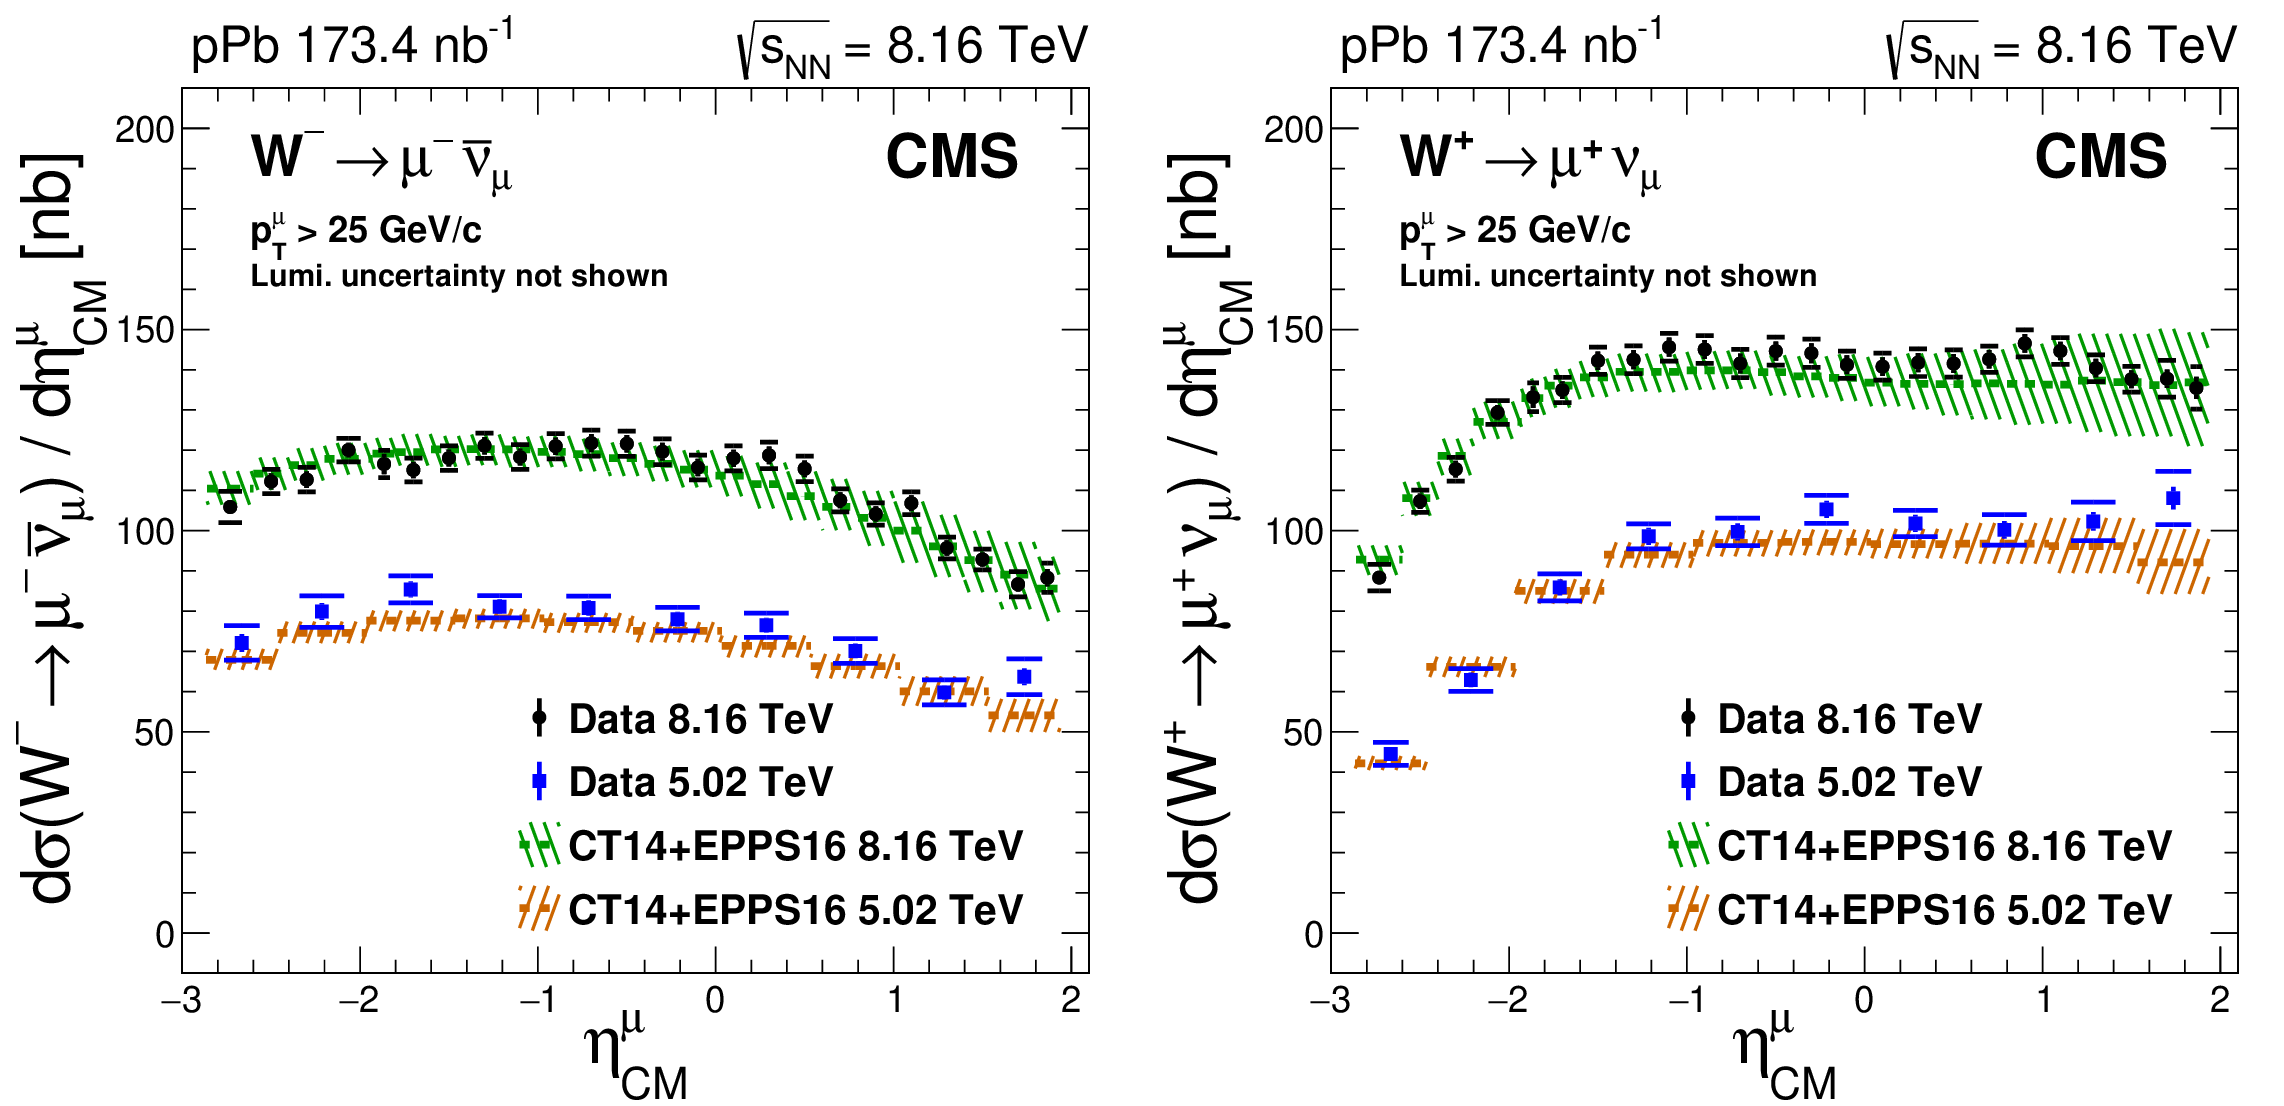
Figure 2:
Differential production cross sections for ${{\mathrm {W^+}}\to {\mu ^+} {\nu _ {\mu}}}$ (left) and ${{\mathrm {W^-}}\to {\mu ^-} {\overline {\nu}_ {\mu}}}$ (right), as a function of the muon pseudorapidity in the centre-of-mass frame. The small horizontal lines represent the statistical and systematic uncertainties summed in quadrature, whereas the error bars show the statistical uncertainties only. The global integrated luminosity uncertainty of $\pm $3.5% is not shown. The NLO calculations with CT14 PDF, and CT14+EPPS16 and CT14+nCTEQ15 nPDFs, are also displayed, including their 68% confidence interval PDF uncertainty bands. The bottom panels show the ratio of data, CT14+EPPS16 and CT14+nCTEQ15 with respect to CT14. |
png pdf |
Figure 2-a:
Differential production cross sections for ${{\mathrm {W^+}}\to {\mu ^+} {\nu _ {\mu}}}$, as a function of the muon pseudorapidity in the centre-of-mass frame. The small horizontal lines represent the statistical and systematic uncertainties summed in quadrature, whereas the error bars show the statistical uncertainties only. The global integrated luminosity uncertainty of $\pm $3.5% is not shown. The NLO calculations with CT14 PDF, and CT14+EPPS16 and CT14+nCTEQ15 nPDFs, are also displayed, including their 68% confidence interval PDF uncertainty bands. The bottom panel shows the ratio of data, CT14+EPPS16 and CT14+nCTEQ15 with respect to CT14. |

png pdf |
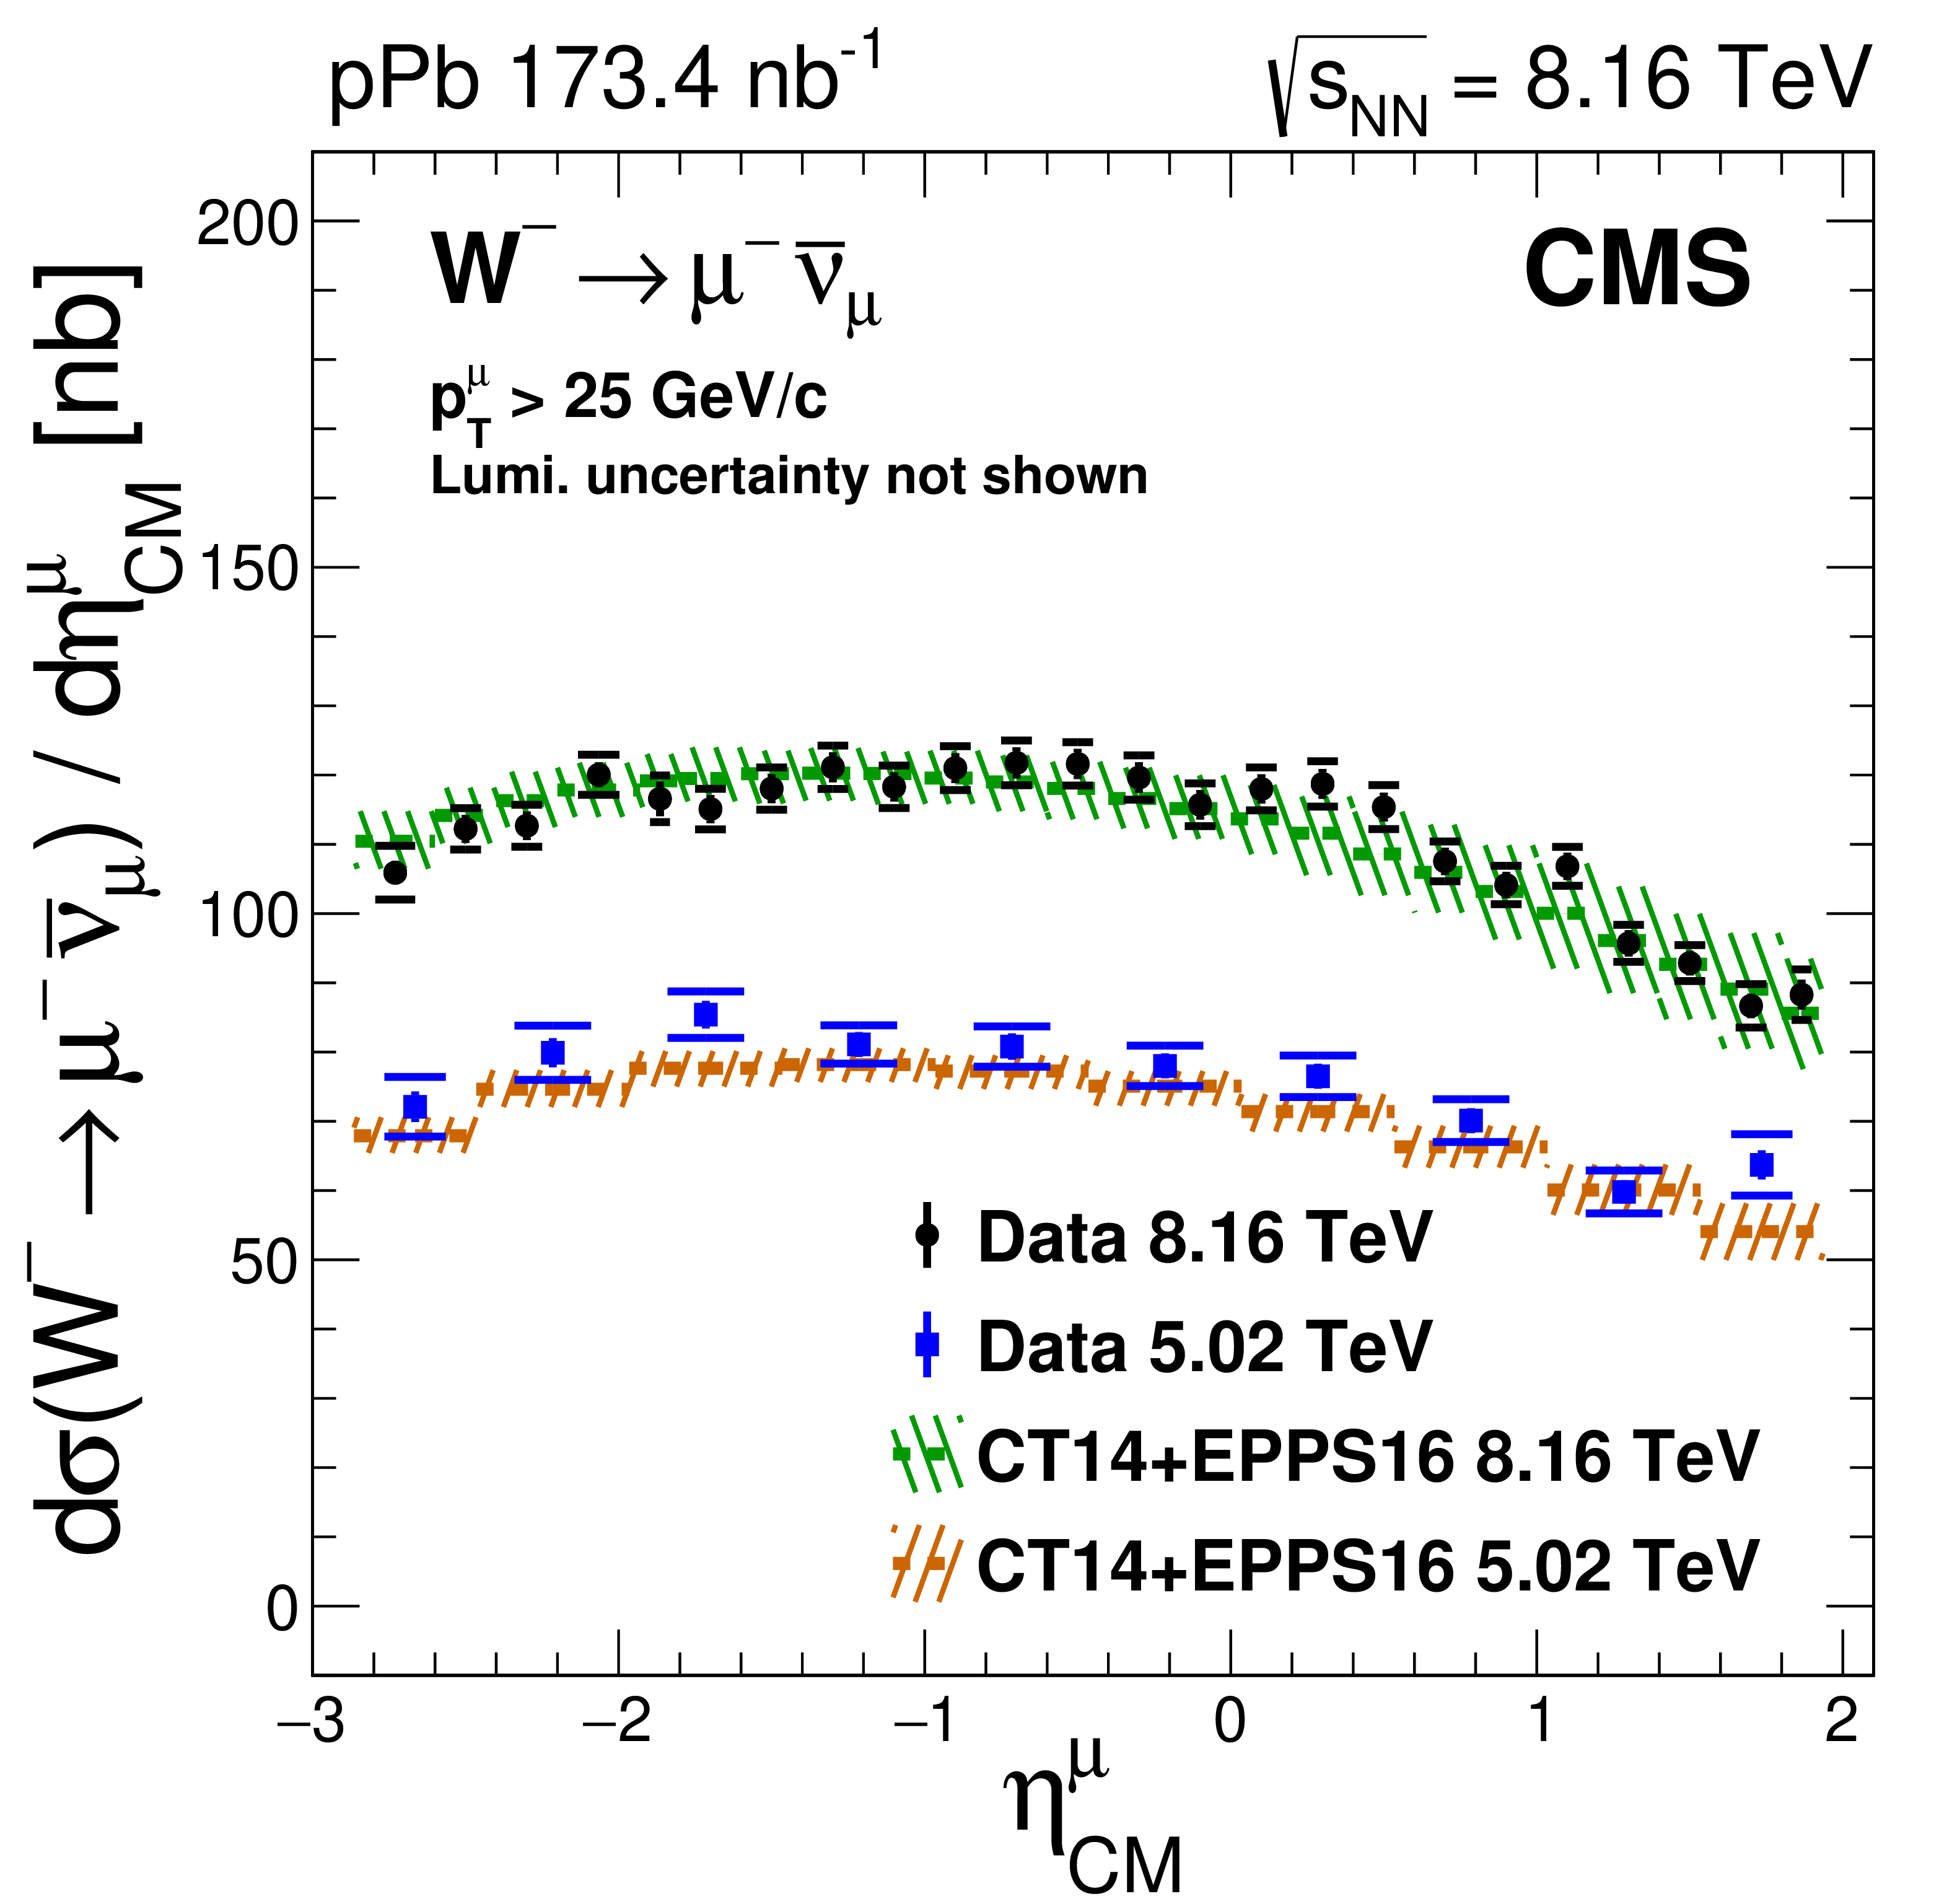
Figure 2-b:
Differential production cross sections for ${{\mathrm {W^-}}\to {\mu ^-} {\overline {\nu}_ {\mu}}}$, as a function of the muon pseudorapidity in the centre-of-mass frame. The small horizontal lines represent the statistical and systematic uncertainties summed in quadrature, whereas the error bars show the statistical uncertainties only. The global integrated luminosity uncertainty of $\pm $3.5% is not shown. The NLO calculations with CT14 PDF, and CT14+EPPS16 and CT14+nCTEQ15 nPDFs, are also displayed, including their 68% confidence interval PDF uncertainty bands. The bottom panel shows the ratio of data, CT14+EPPS16 and CT14+nCTEQ15 with respect to CT14. |
png pdf |
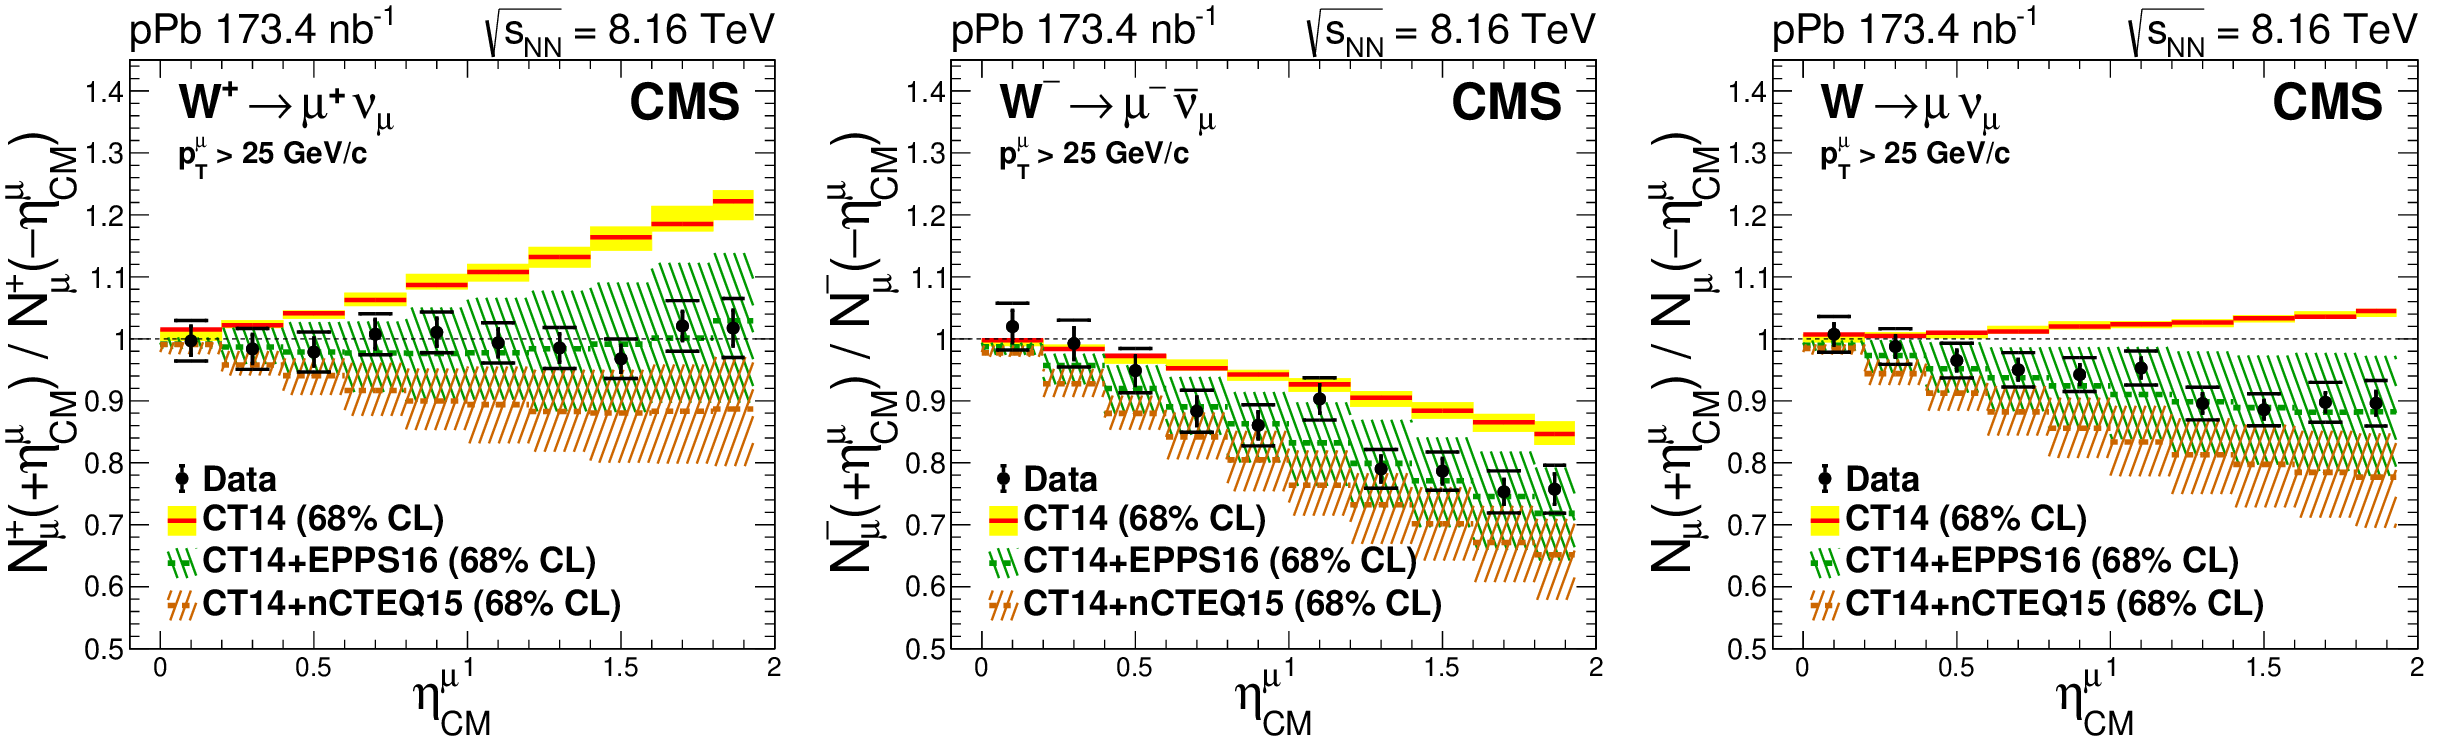
Figure 3:
Forward-backward ratios, ${N_{{\mu}}^{\pm}(+ {{\eta _{\text {CM}}} ^{{\mu}}})/N_{{\mu}}^{\pm}(- {{\eta _{\text {CM}}} ^{{\mu}}})}$, for the positively (left) and negatively (middle) charged muons, and the forward-backward ratio for muons of both signs, ${N_{{\mu}}(+ {{\eta _{\text {CM}}} ^{{\mu}}})/N_{{\mu}}(- {{\eta _{\text {CM}}} ^{{\mu}}})}$ (right), as a function of ${{\eta _{\text {CM}}} ^{{\mu}}}$. The small horizontal lines represent the statistical and systematic uncertainties summed in quadrature, whereas the error bars show the statistical uncertainties only. The NLO calculations with CT14 PDF, CT14+EPPS16 nPDF, and CT14+nCTEQ15 nPDF, are also displayed, including their 68% confidence interval PDF uncertainty bands. |
png pdf |
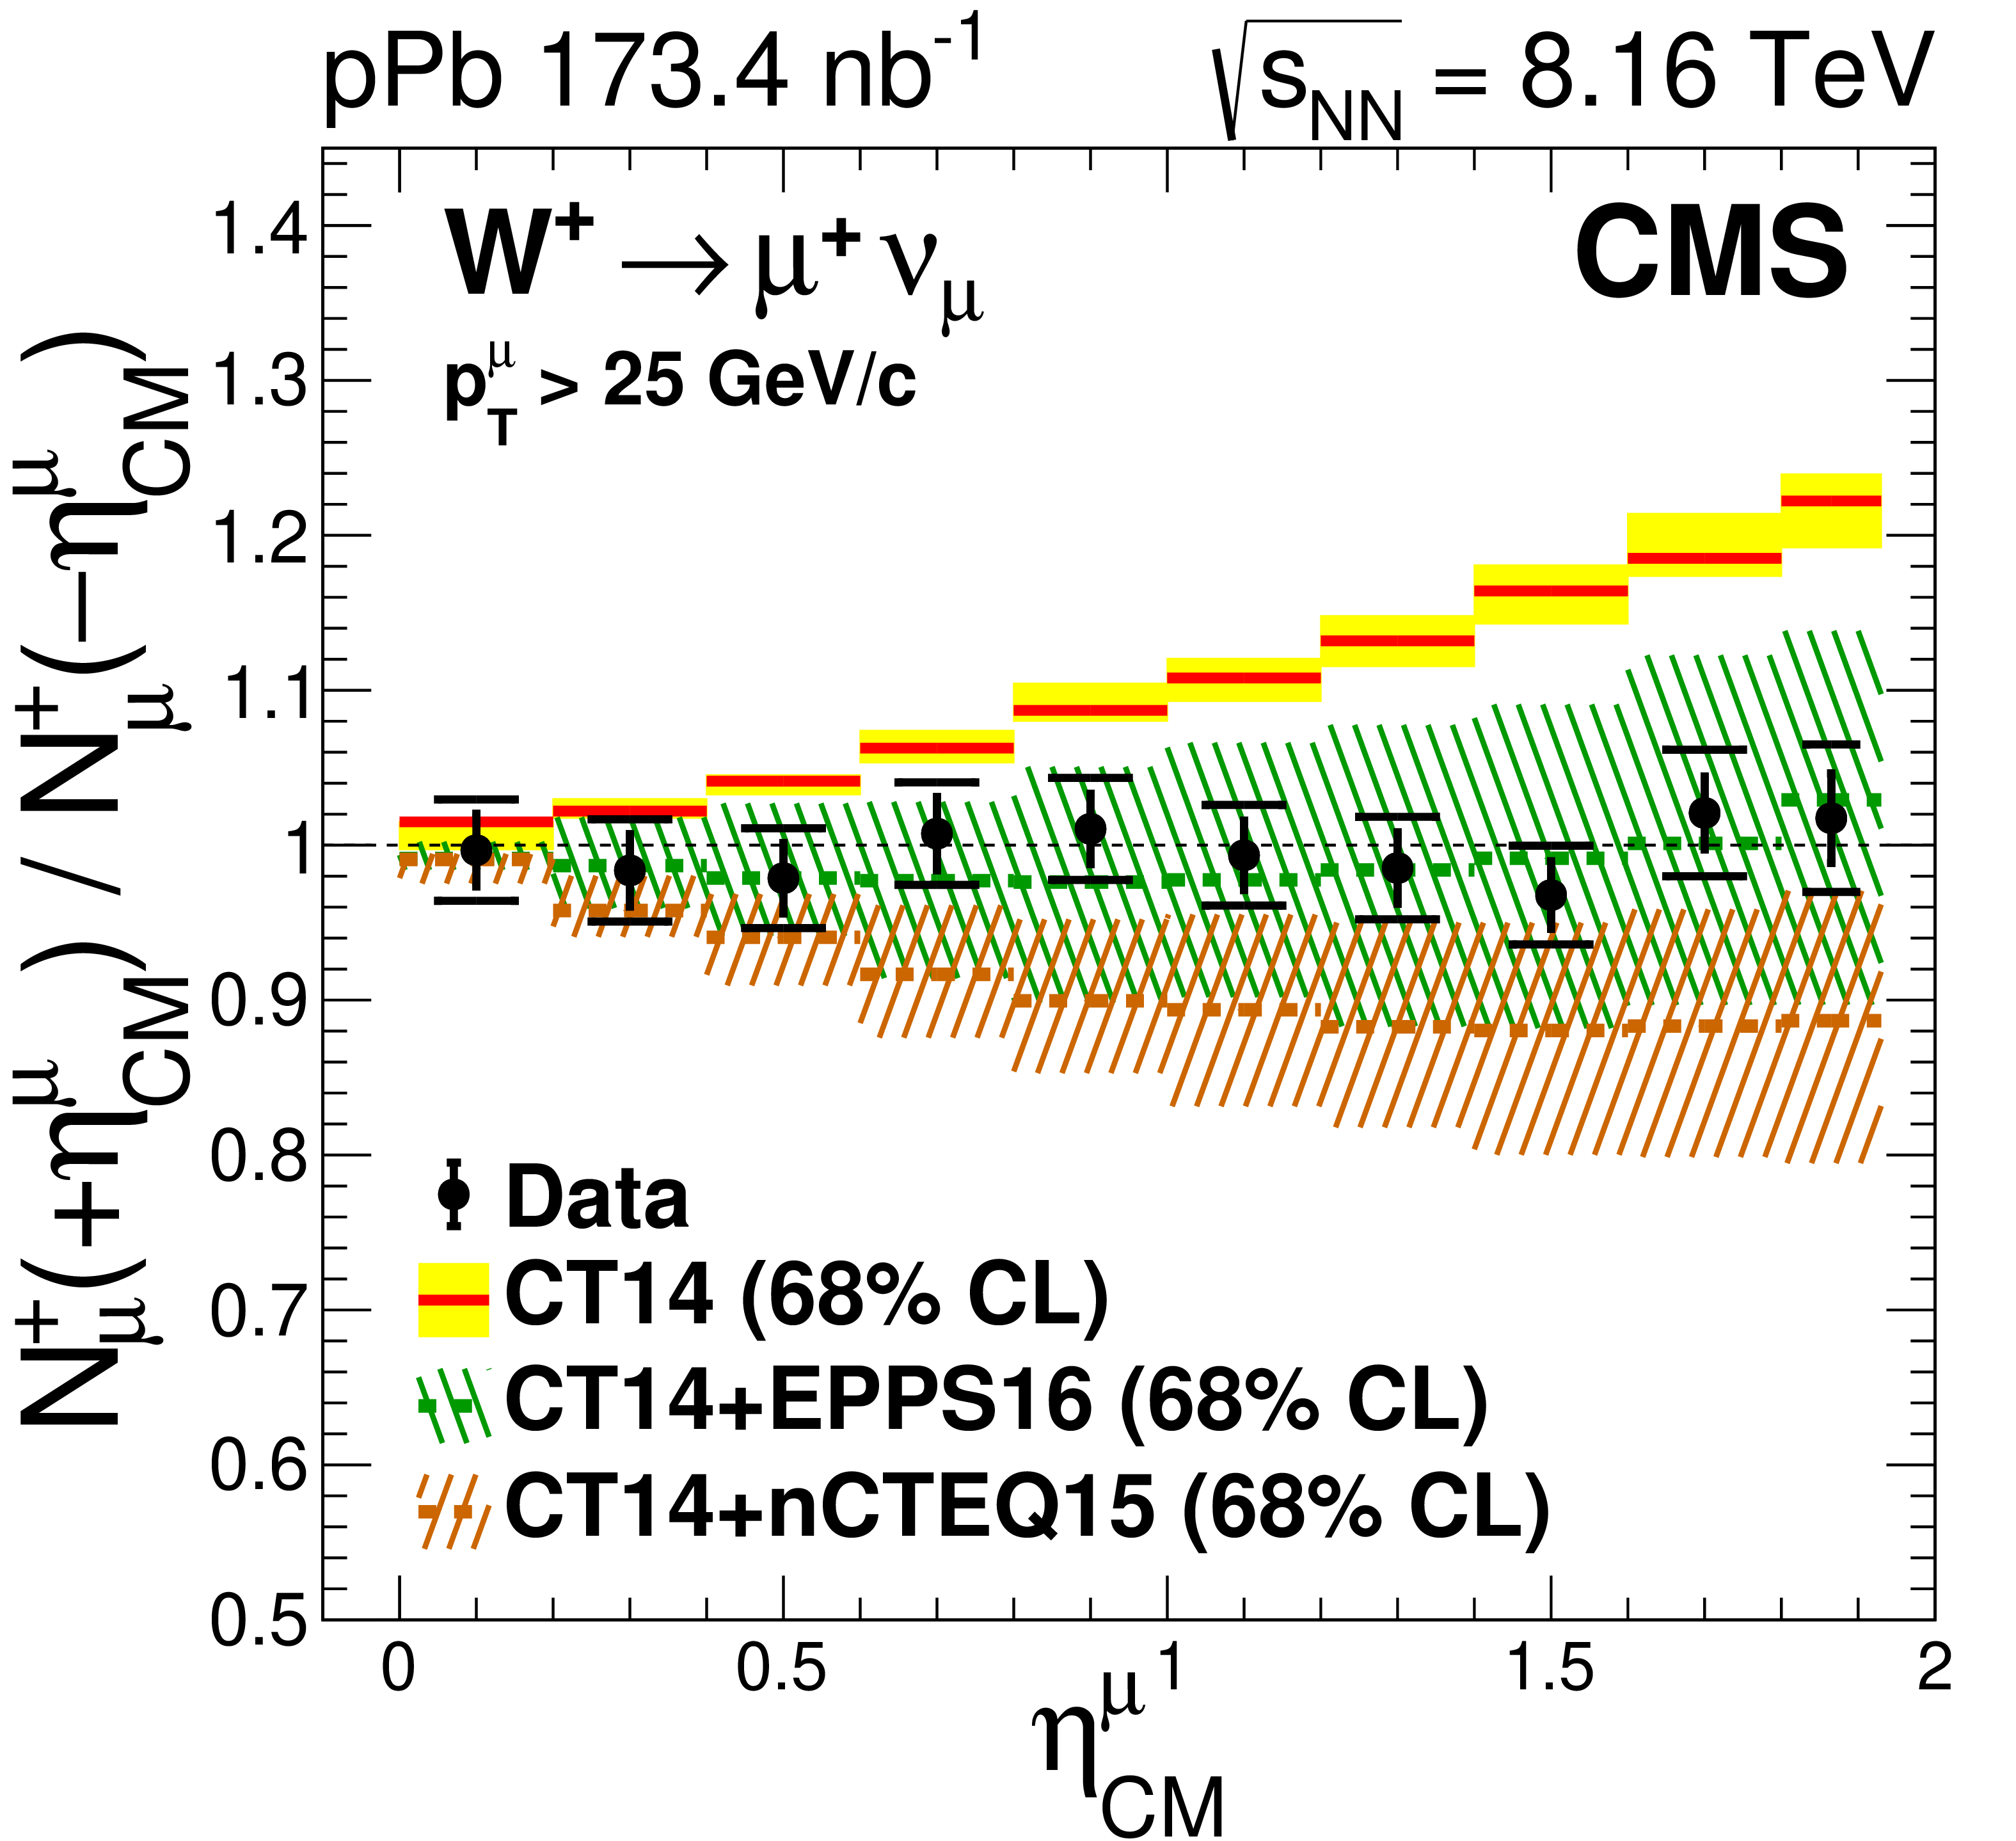
Figure 3-a:
Forward-backward ratios, ${N_{{\mu}}^{\pm}(+ {{\eta _{\text {CM}}} ^{{\mu}}})/N_{{\mu}}^{\pm}(- {{\eta _{\text {CM}}} ^{{\mu}}})}$, for the positively charged muons, as a function of ${{\eta _{\text {CM}}} ^{{\mu}}}$. The small horizontal lines represent the statistical and systematic uncertainties summed in quadrature, whereas the error bars show the statistical uncertainties only. The NLO calculations with CT14 PDF, CT14+EPPS16 nPDF, and CT14+nCTEQ15 nPDF, are also displayed, including their 68% confidence interval PDF uncertainty bands. |
png pdf |
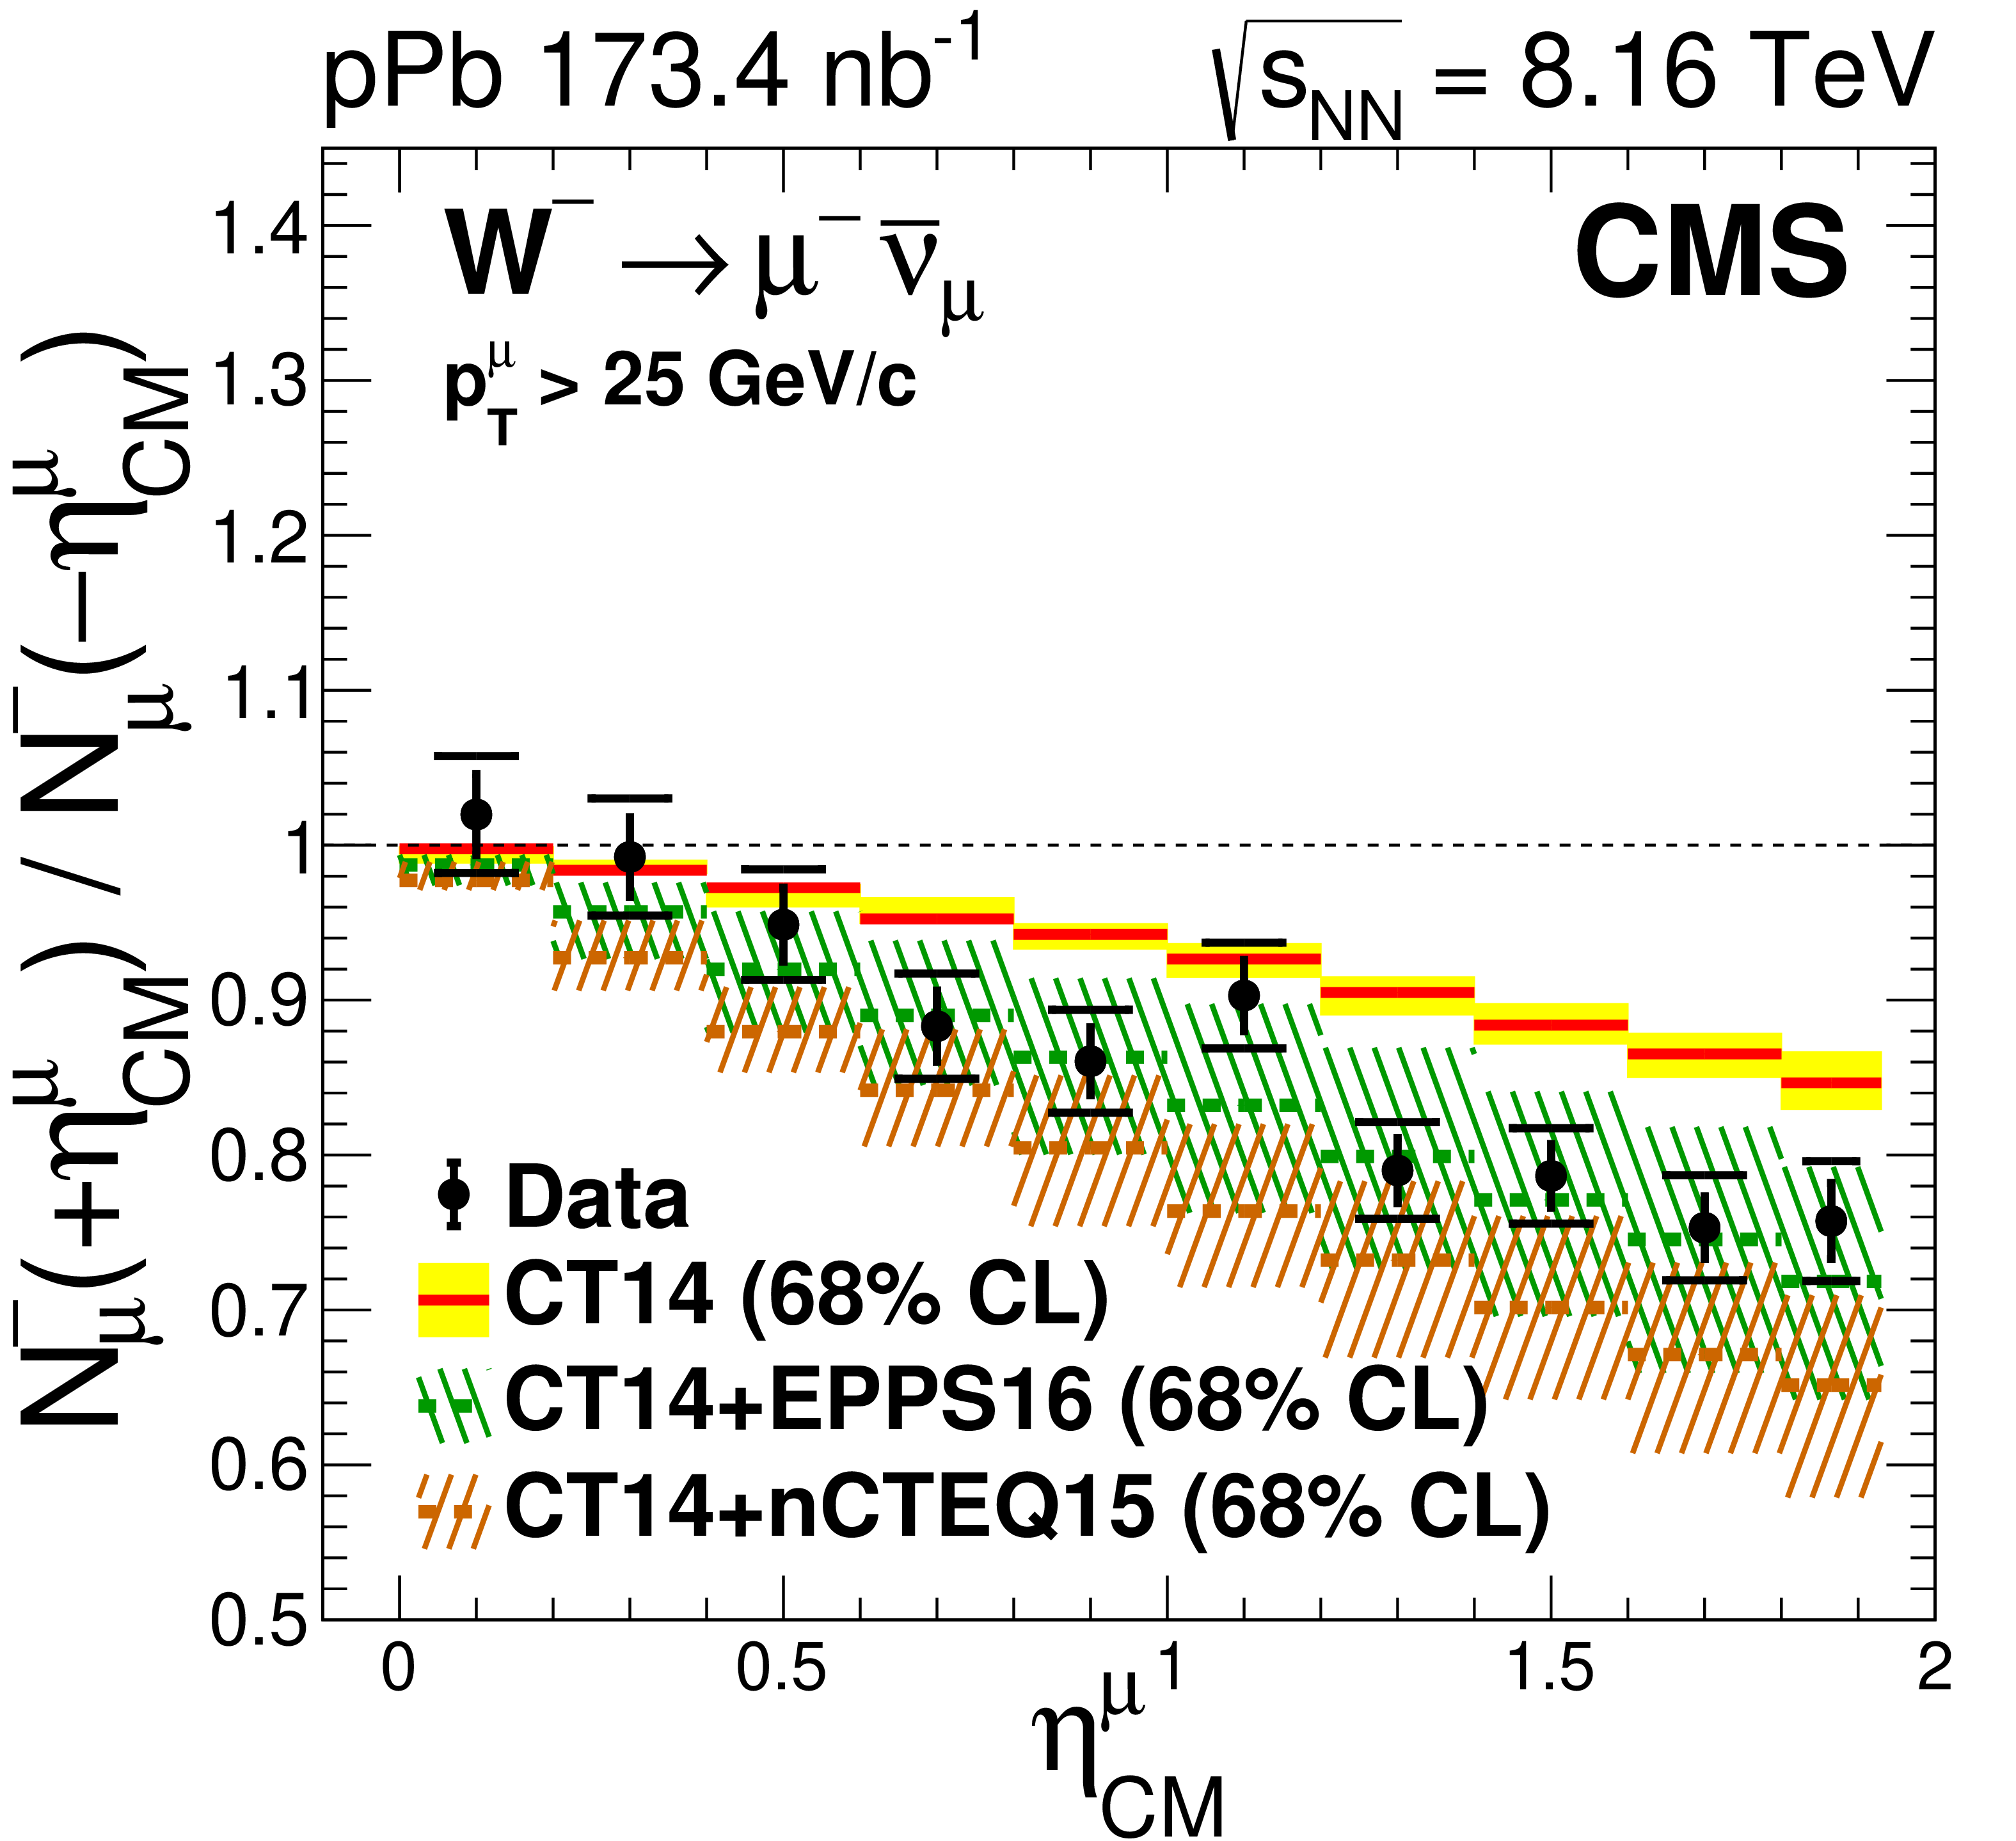
Figure 3-b:
Forward-backward ratios, ${N_{{\mu}}^{\pm}(+ {{\eta _{\text {CM}}} ^{{\mu}}})/N_{{\mu}}^{\pm}(- {{\eta _{\text {CM}}} ^{{\mu}}})}$, for the negatively charged muons, as a function of ${{\eta _{\text {CM}}} ^{{\mu}}}$. The small horizontal lines represent the statistical and systematic uncertainties summed in quadrature, whereas the error bars show the statistical uncertainties only. The NLO calculations with CT14 PDF, CT14+EPPS16 nPDF, and CT14+nCTEQ15 nPDF, are also displayed, including their 68% confidence interval PDF uncertainty bands. |
png pdf |
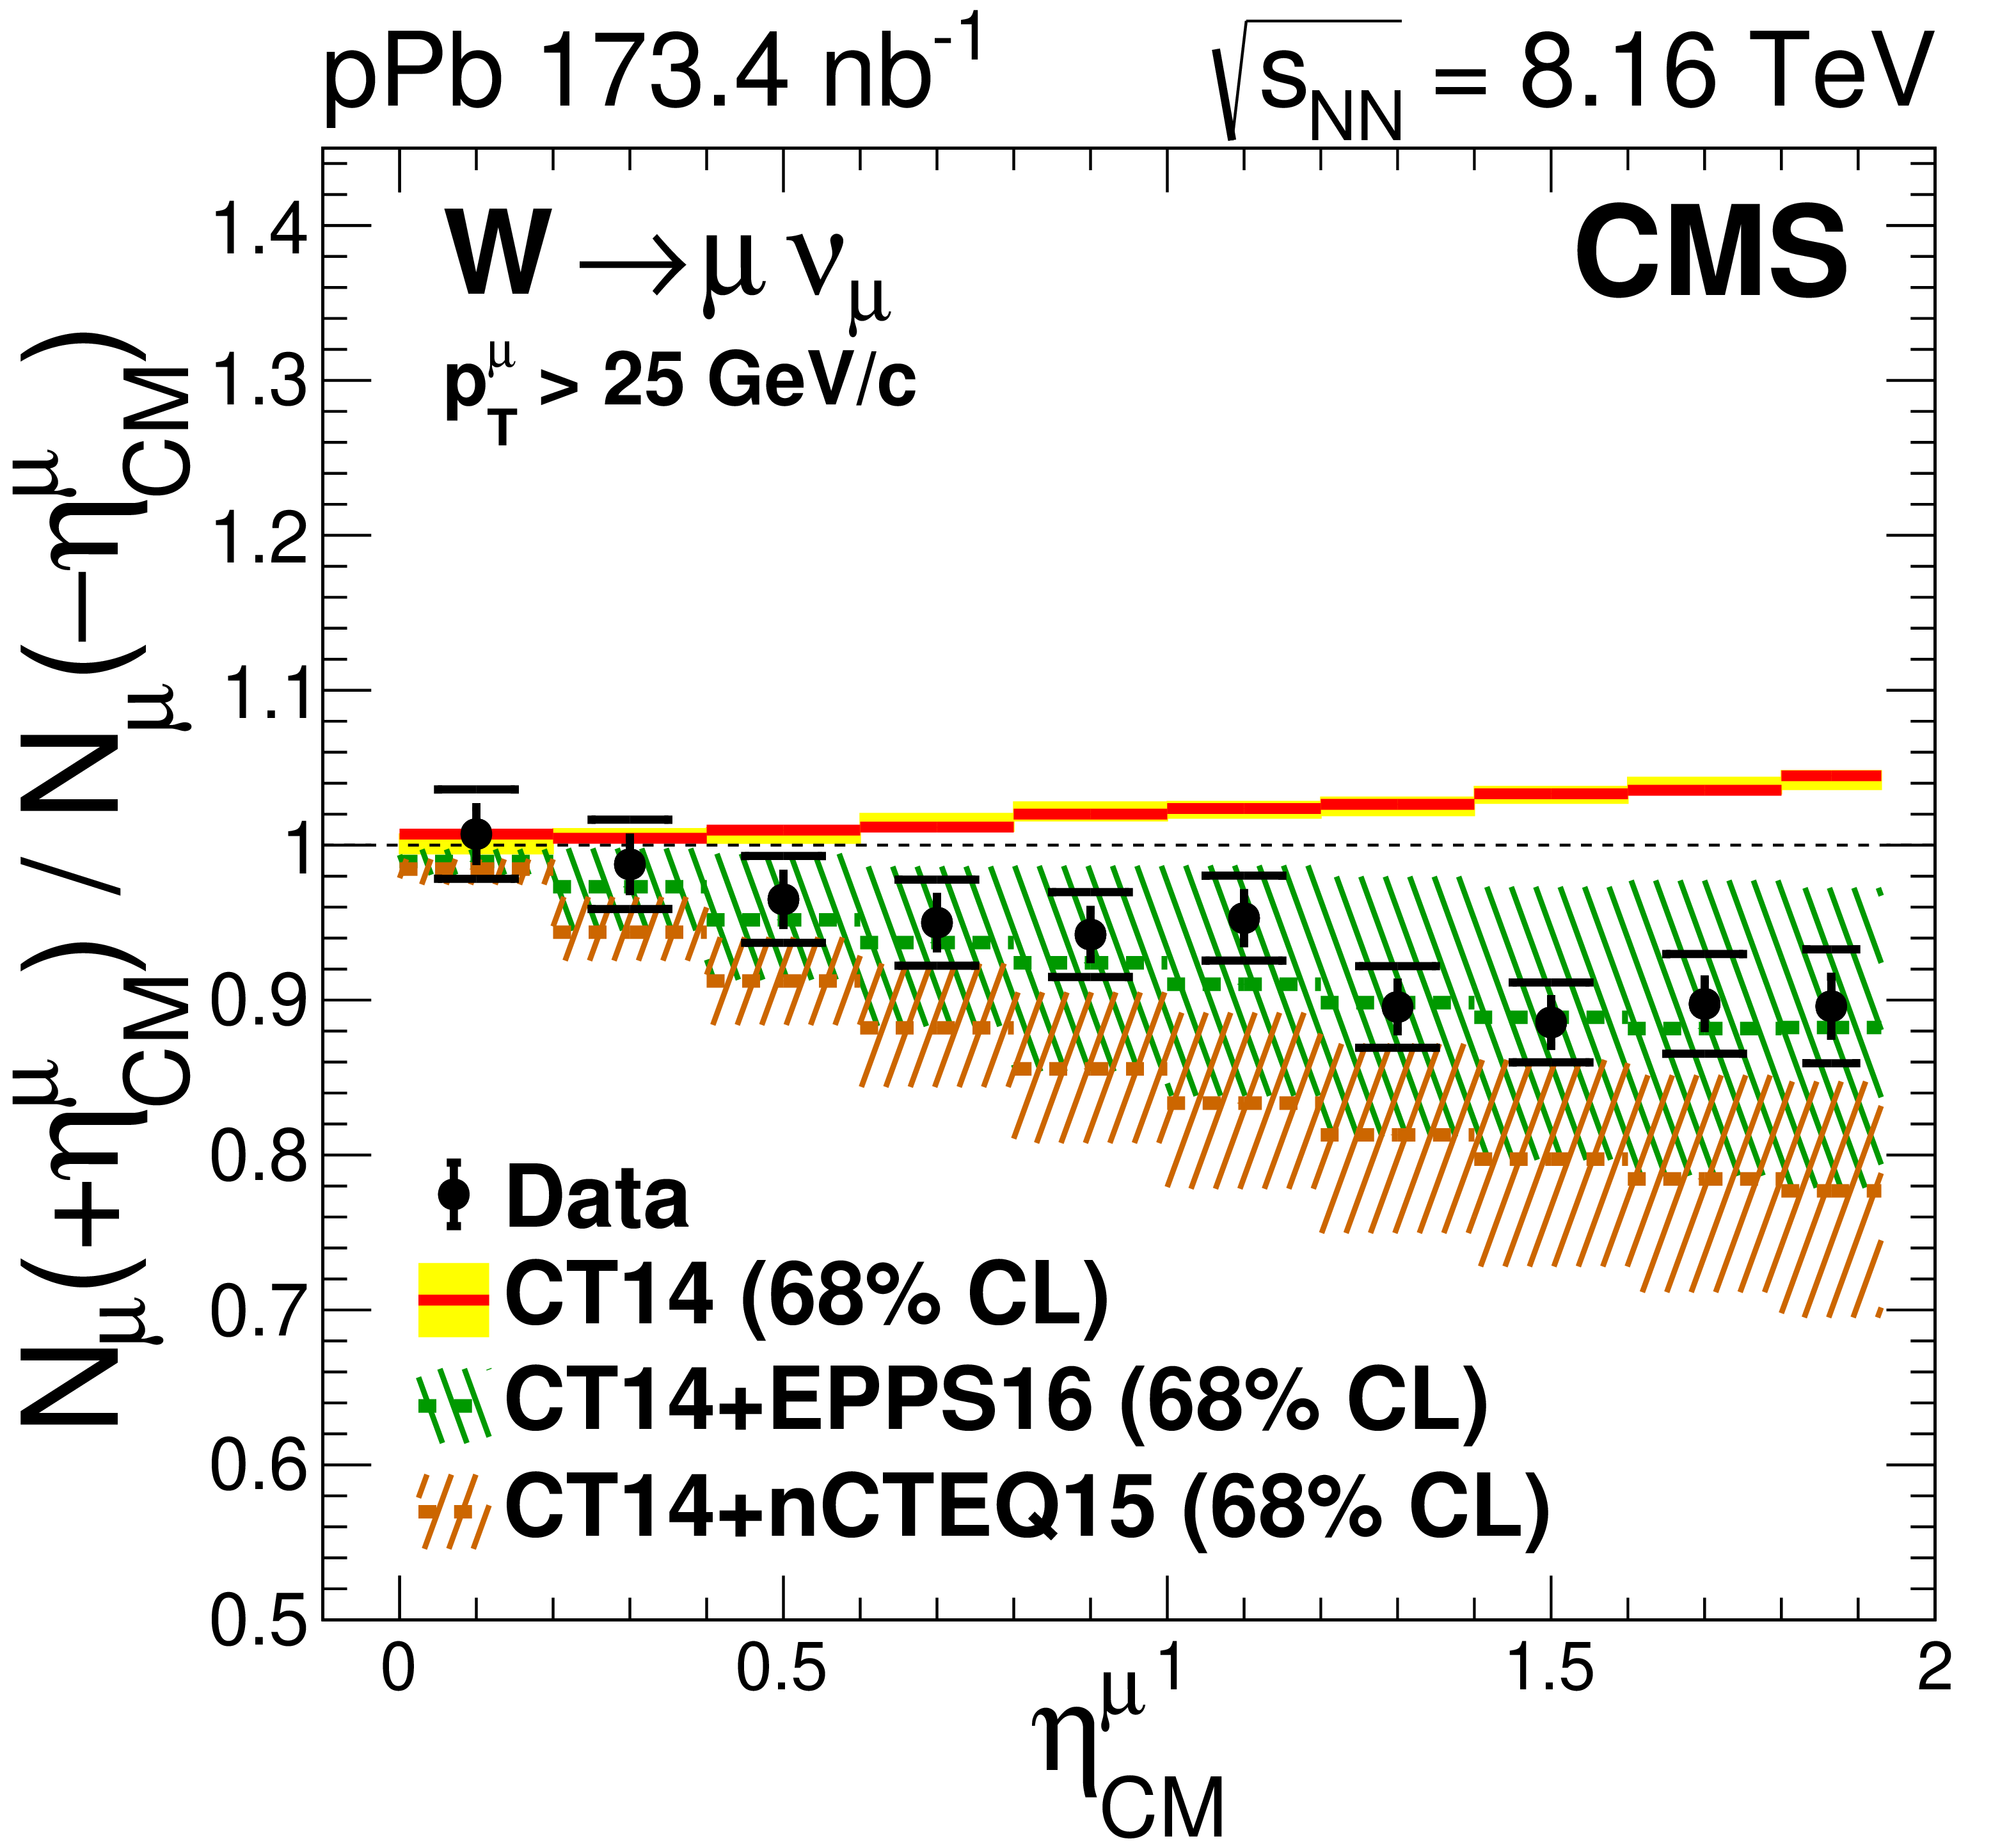
Figure 3-c:
Forward-backward ratio for muons of both signs, ${N_{{\mu}}(+ {{\eta _{\text {CM}}} ^{{\mu}}})/N_{{\mu}}(- {{\eta _{\text {CM}}} ^{{\mu}}})}$, as a function of ${{\eta _{\text {CM}}} ^{{\mu}}}$. The small horizontal lines represent the statistical and systematic uncertainties summed in quadrature, whereas the error bars show the statistical uncertainties only. The NLO calculations with CT14 PDF, CT14+EPPS16 nPDF, and CT14+nCTEQ15 nPDF, are also displayed, including their 68% confidence interval PDF uncertainty bands. |

png pdf |
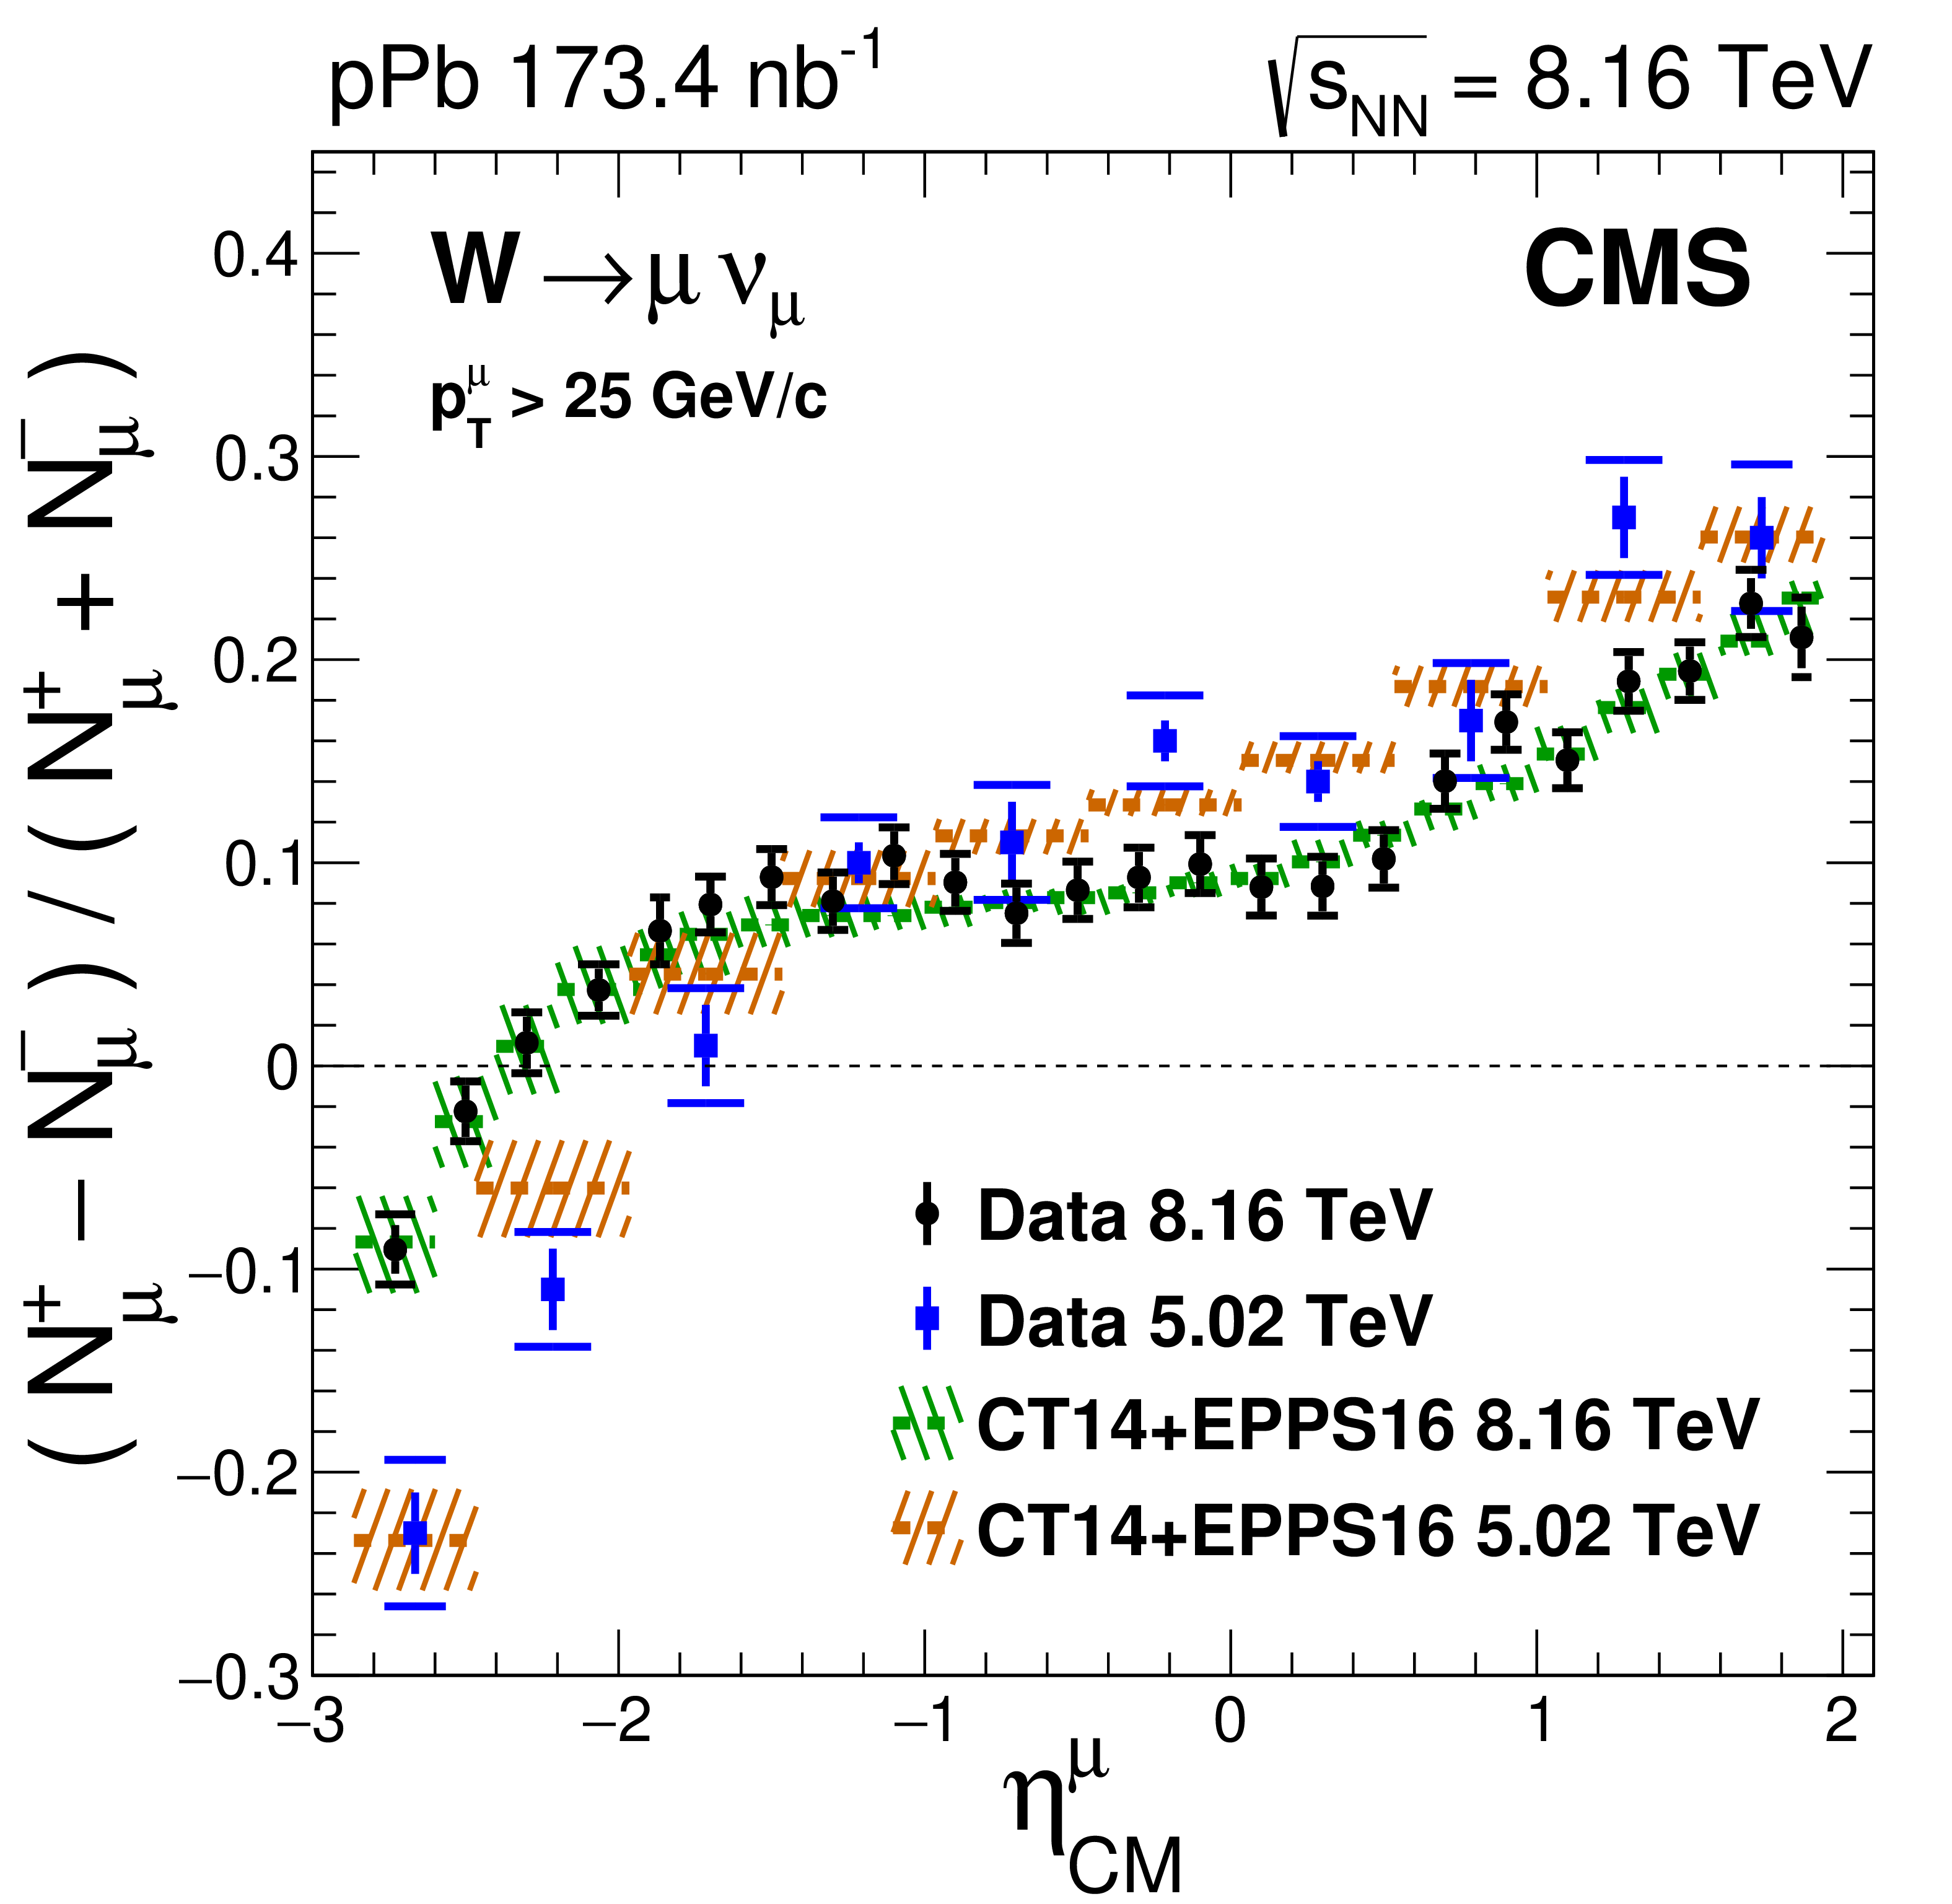
Figure 4:
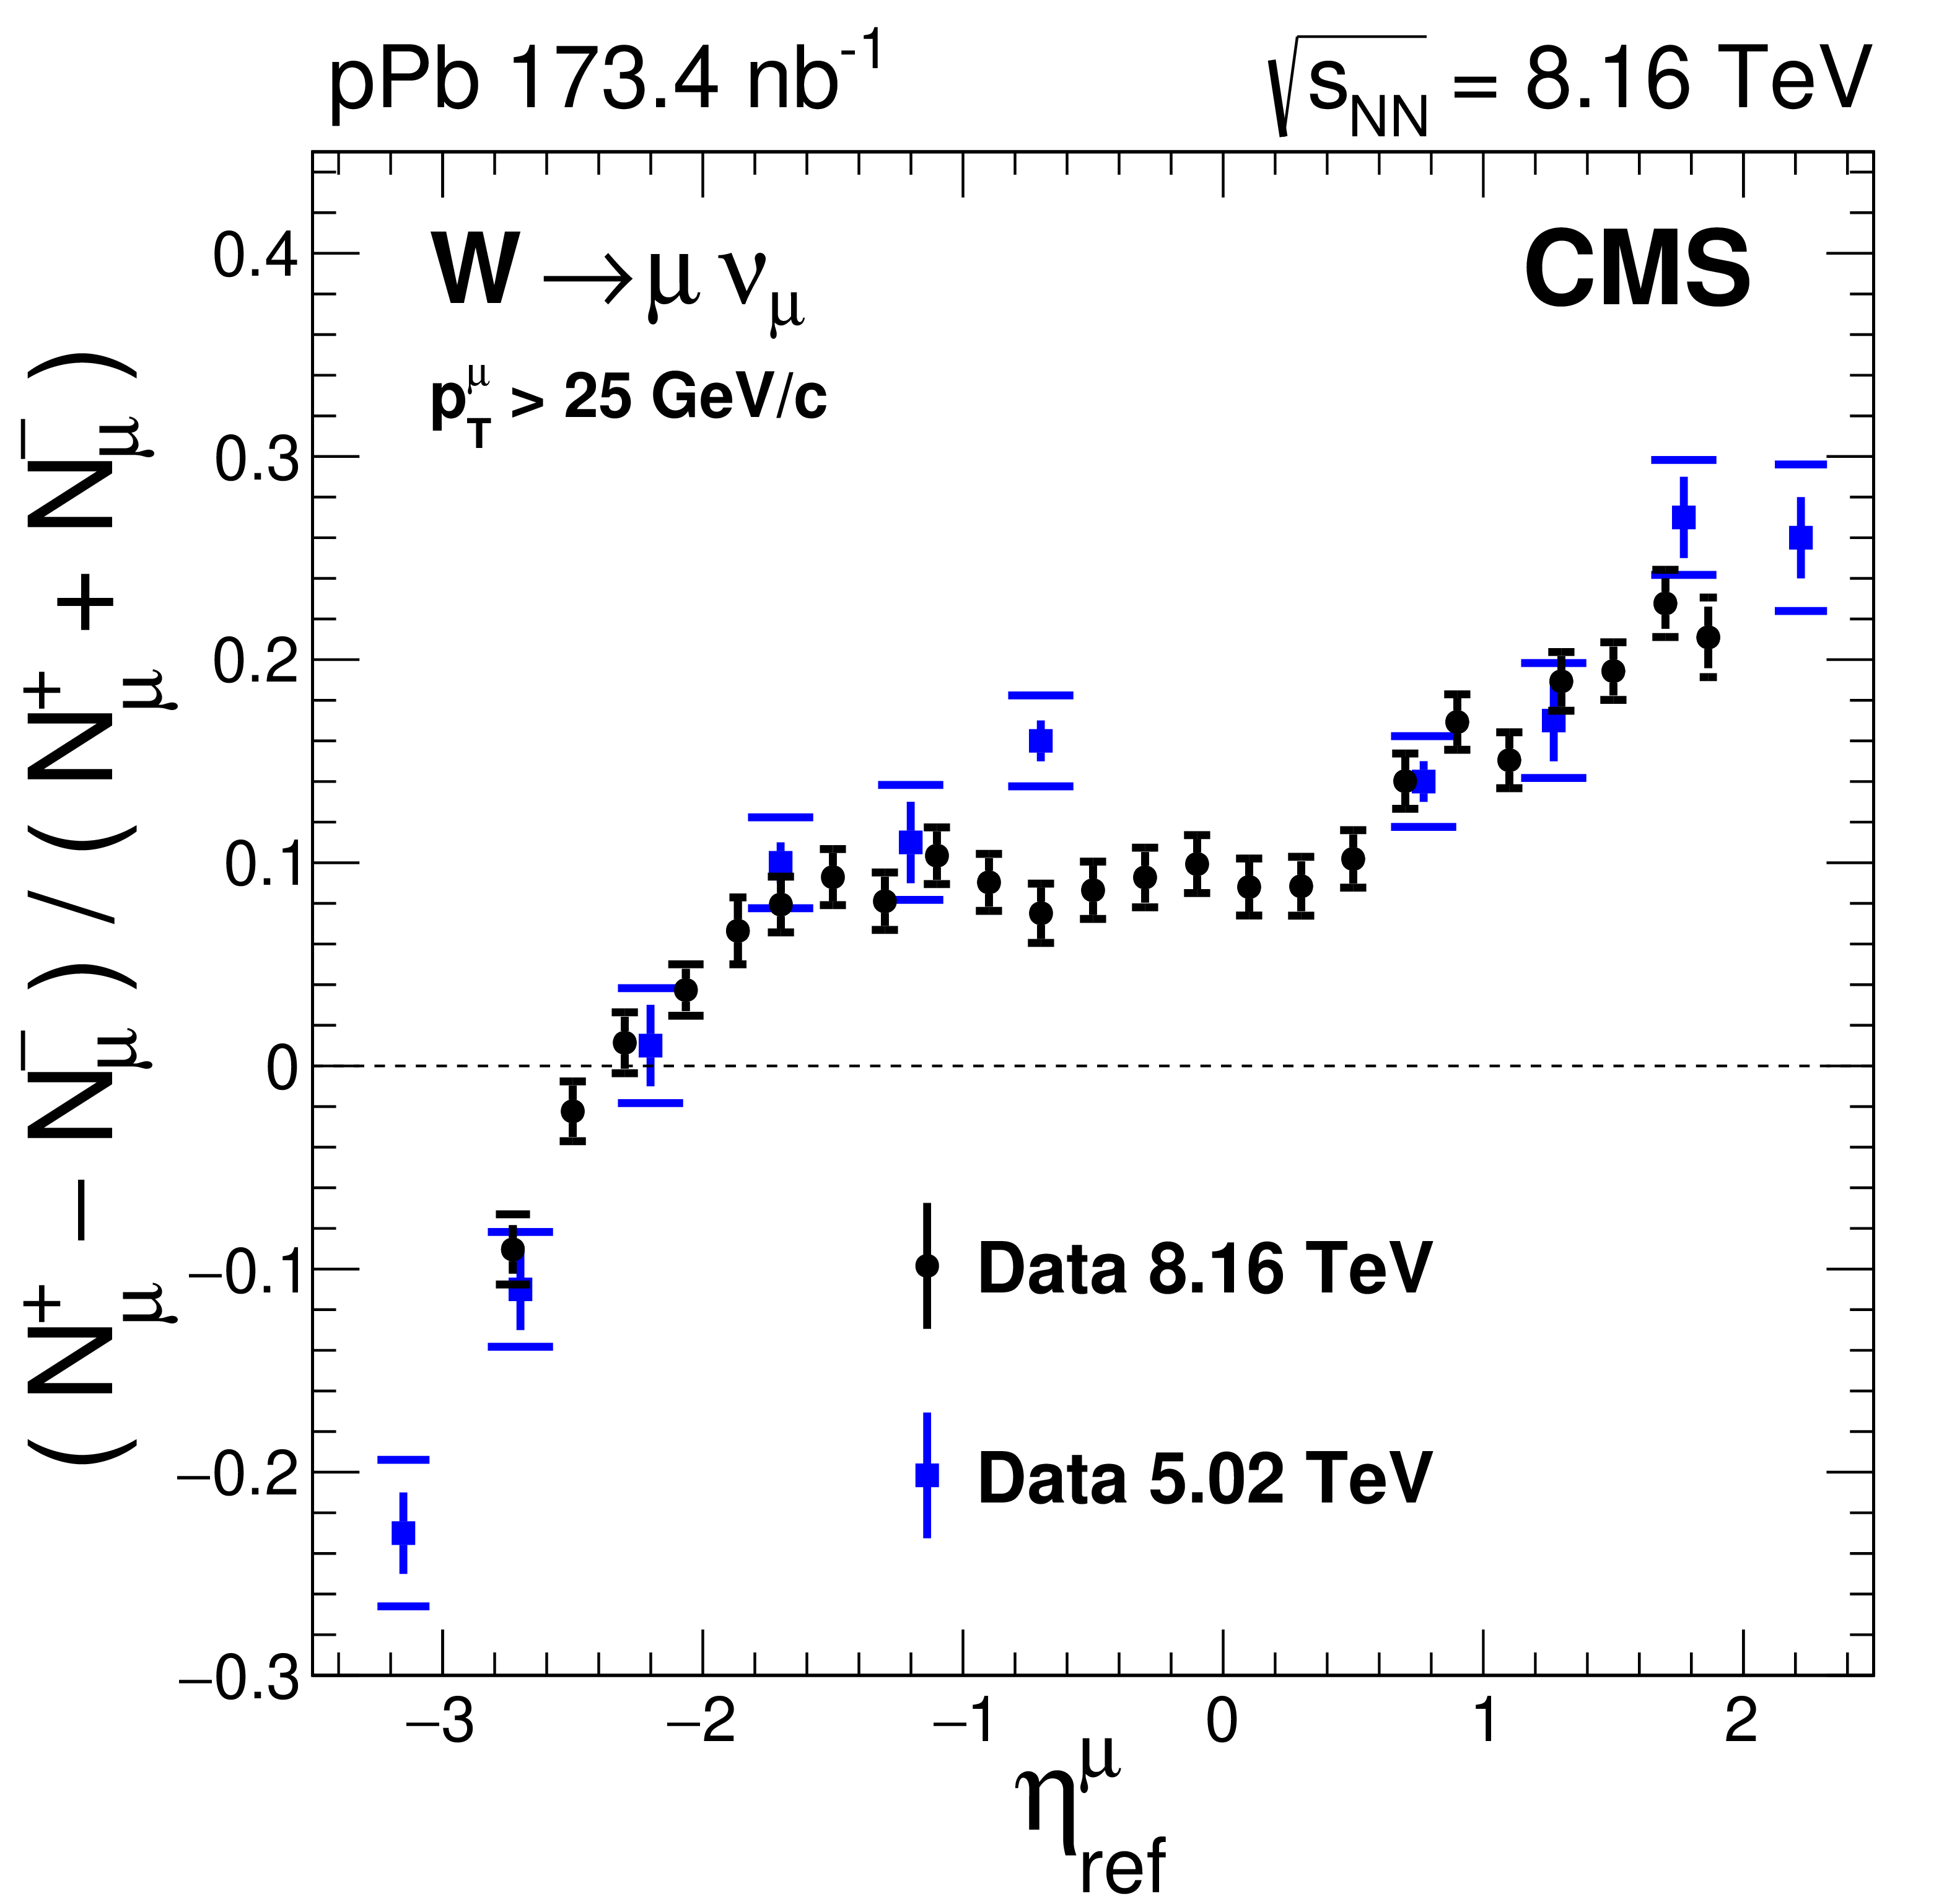
Muon charge asymmetry, ${(N_{{\mu}}^{+} - N_{{\mu}}^{-})/(N_{{\mu}}^{+} + N_{{\mu}}^{-})}$, as a function of the muon pseudorapidity in the centre-of-mass frame. The small horizontal lines represent the statistical and systematic uncertainties summed in quadrature, whereas the error bars show the statistical uncertainties only. The NLO calculations with CT14 PDF, CT14+EPPS16 nPDF, and CT14+nCTEQ15 nPDF, are also displayed, including their 68% confidence interval PDF uncertainty bands. |
png pdf |
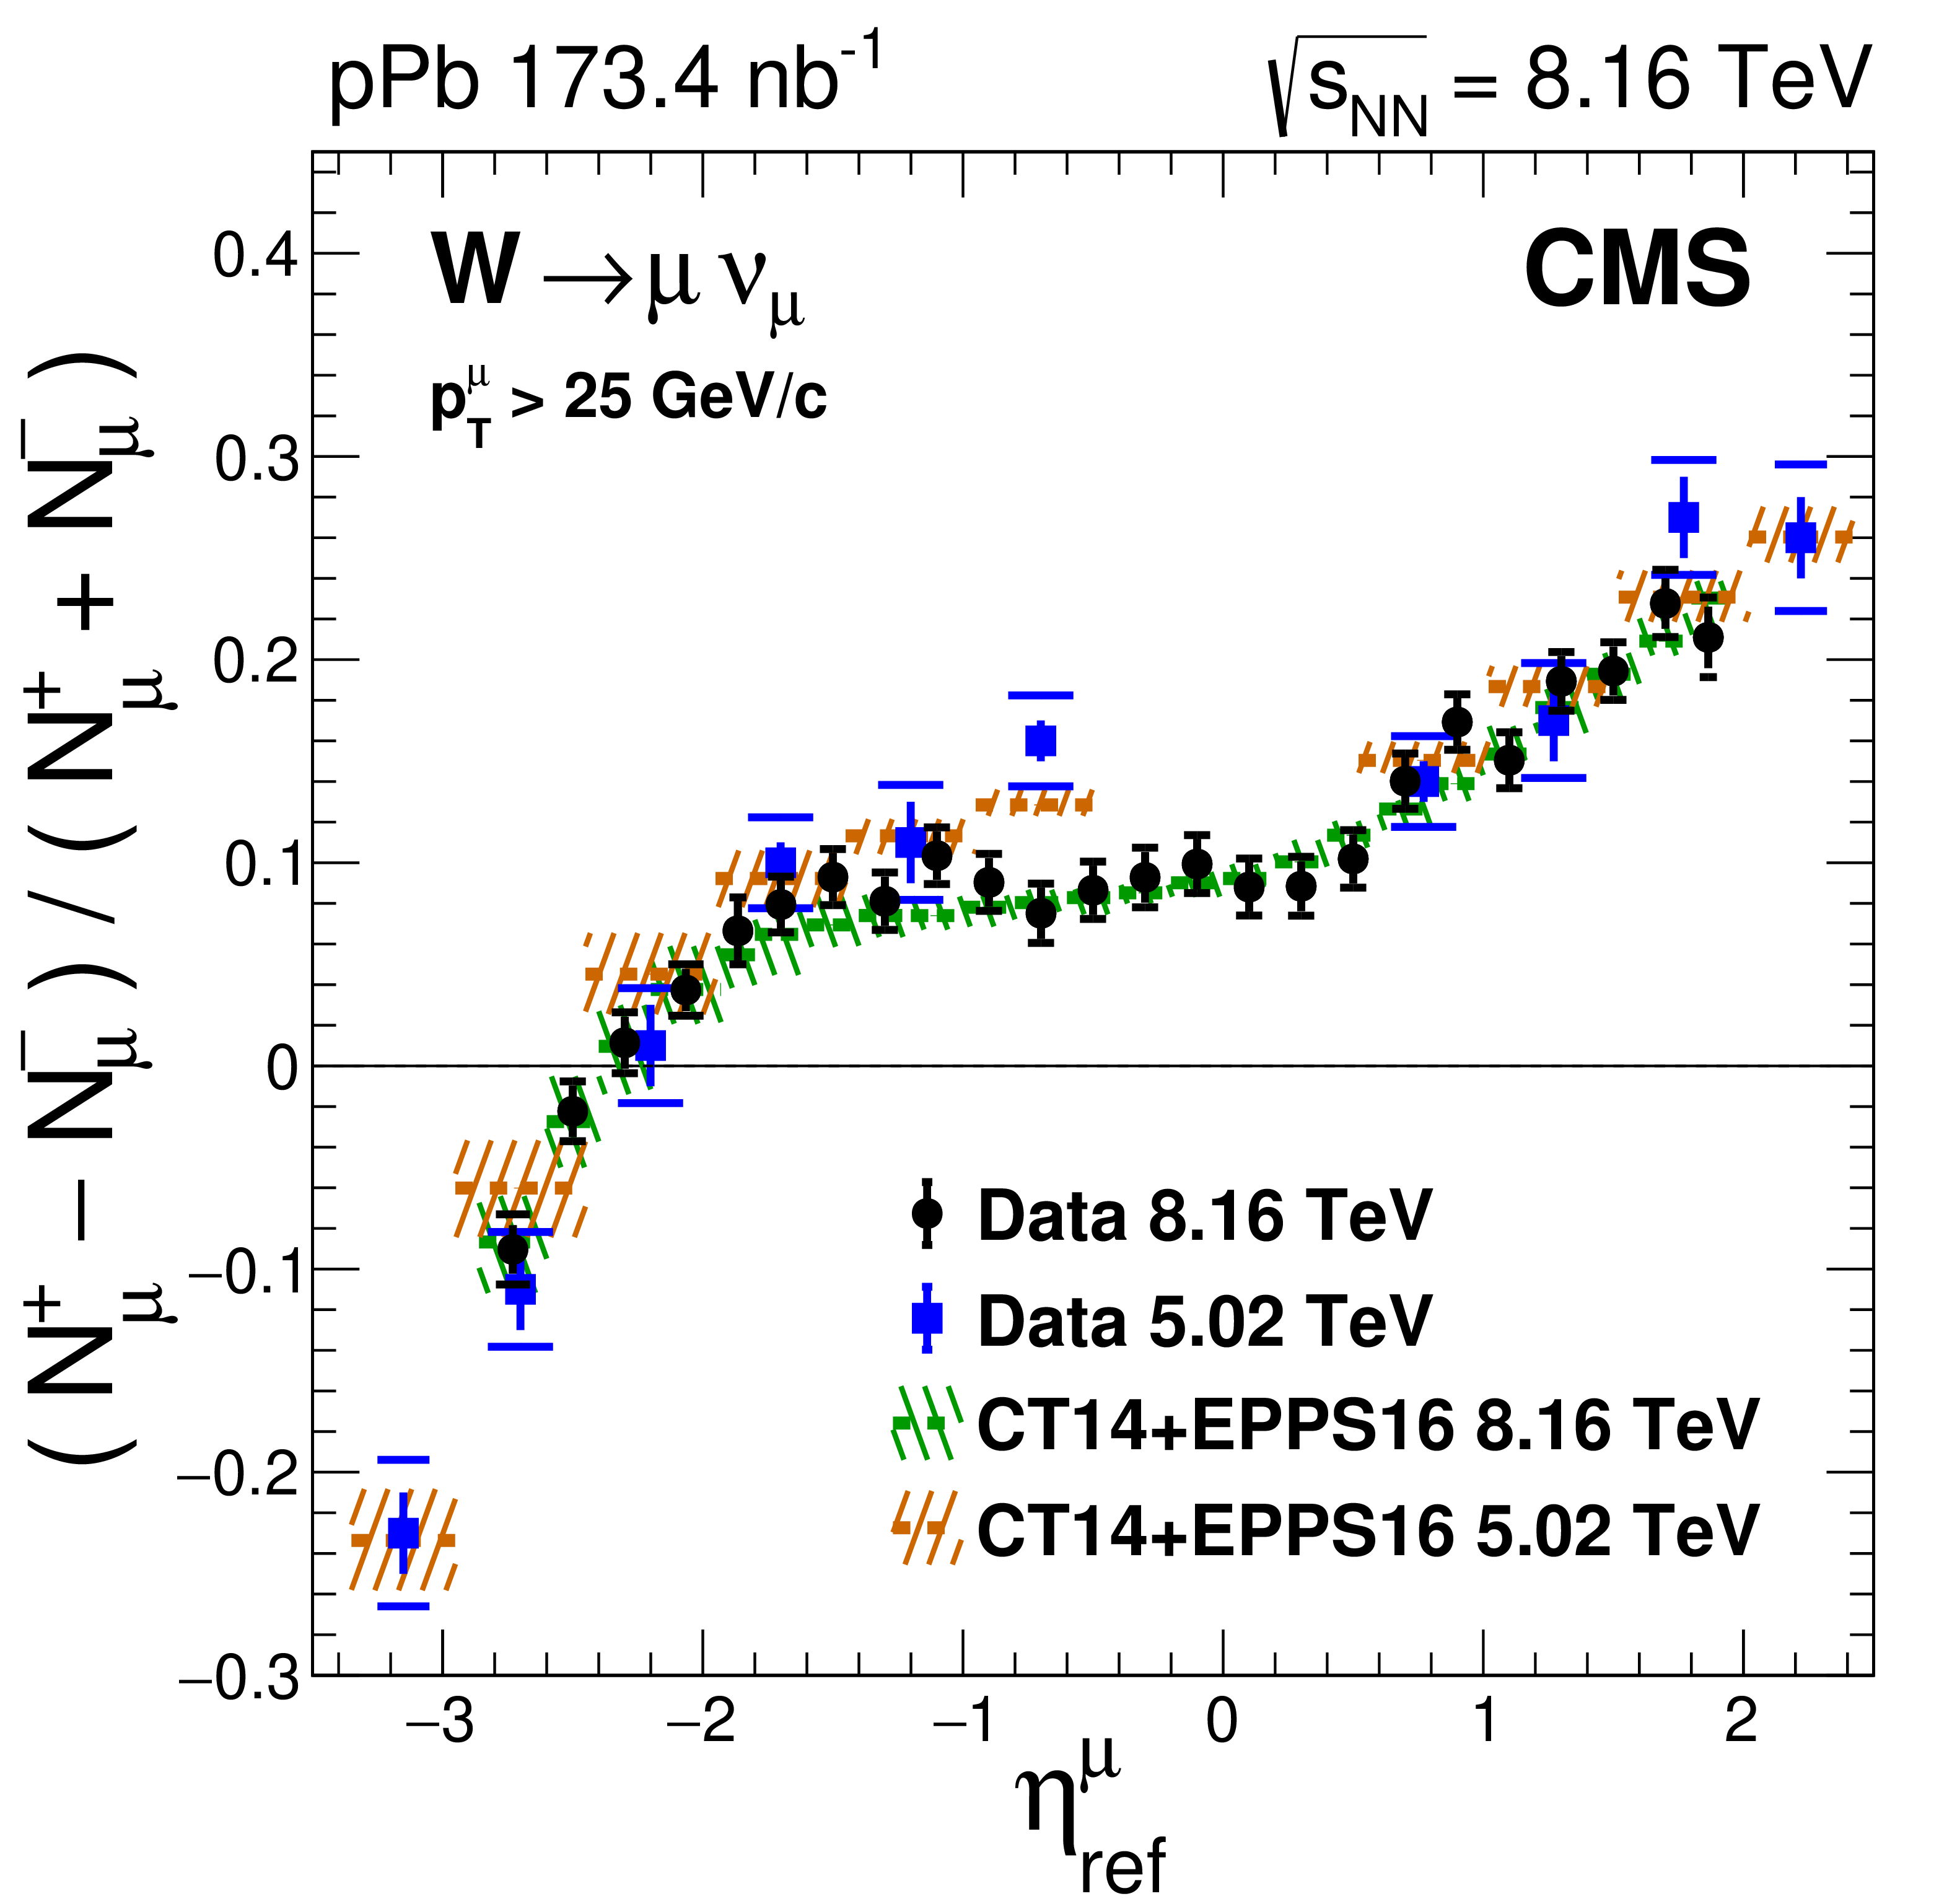
Figure 5:
Comparison of the muon charge asymmetry measured at $ {\sqrt {\smash [b]{s_{_{\mathrm {NN}}}}}} = $ 8.16 TeV (circles) and at $ {\sqrt {\smash [b]{s_{_{\mathrm {NN}}}}}} = $ 5.02 TeV [13] (squares). The muon pseudorapidity of the measurements at 5.02 TeV has been shifted (see text for details) [54]. The small horizontal lines represent the statistical and systematic uncertainties summed in quadrature, whereas the error bars show the statistical uncertainties only. The NLO calculations with CT14+EPPS16 nPDF at 8.16 TeV and at 5.02 TeV, are also displayed, including their 68% confidence interval PDF uncertainty bands. |

png pdf |
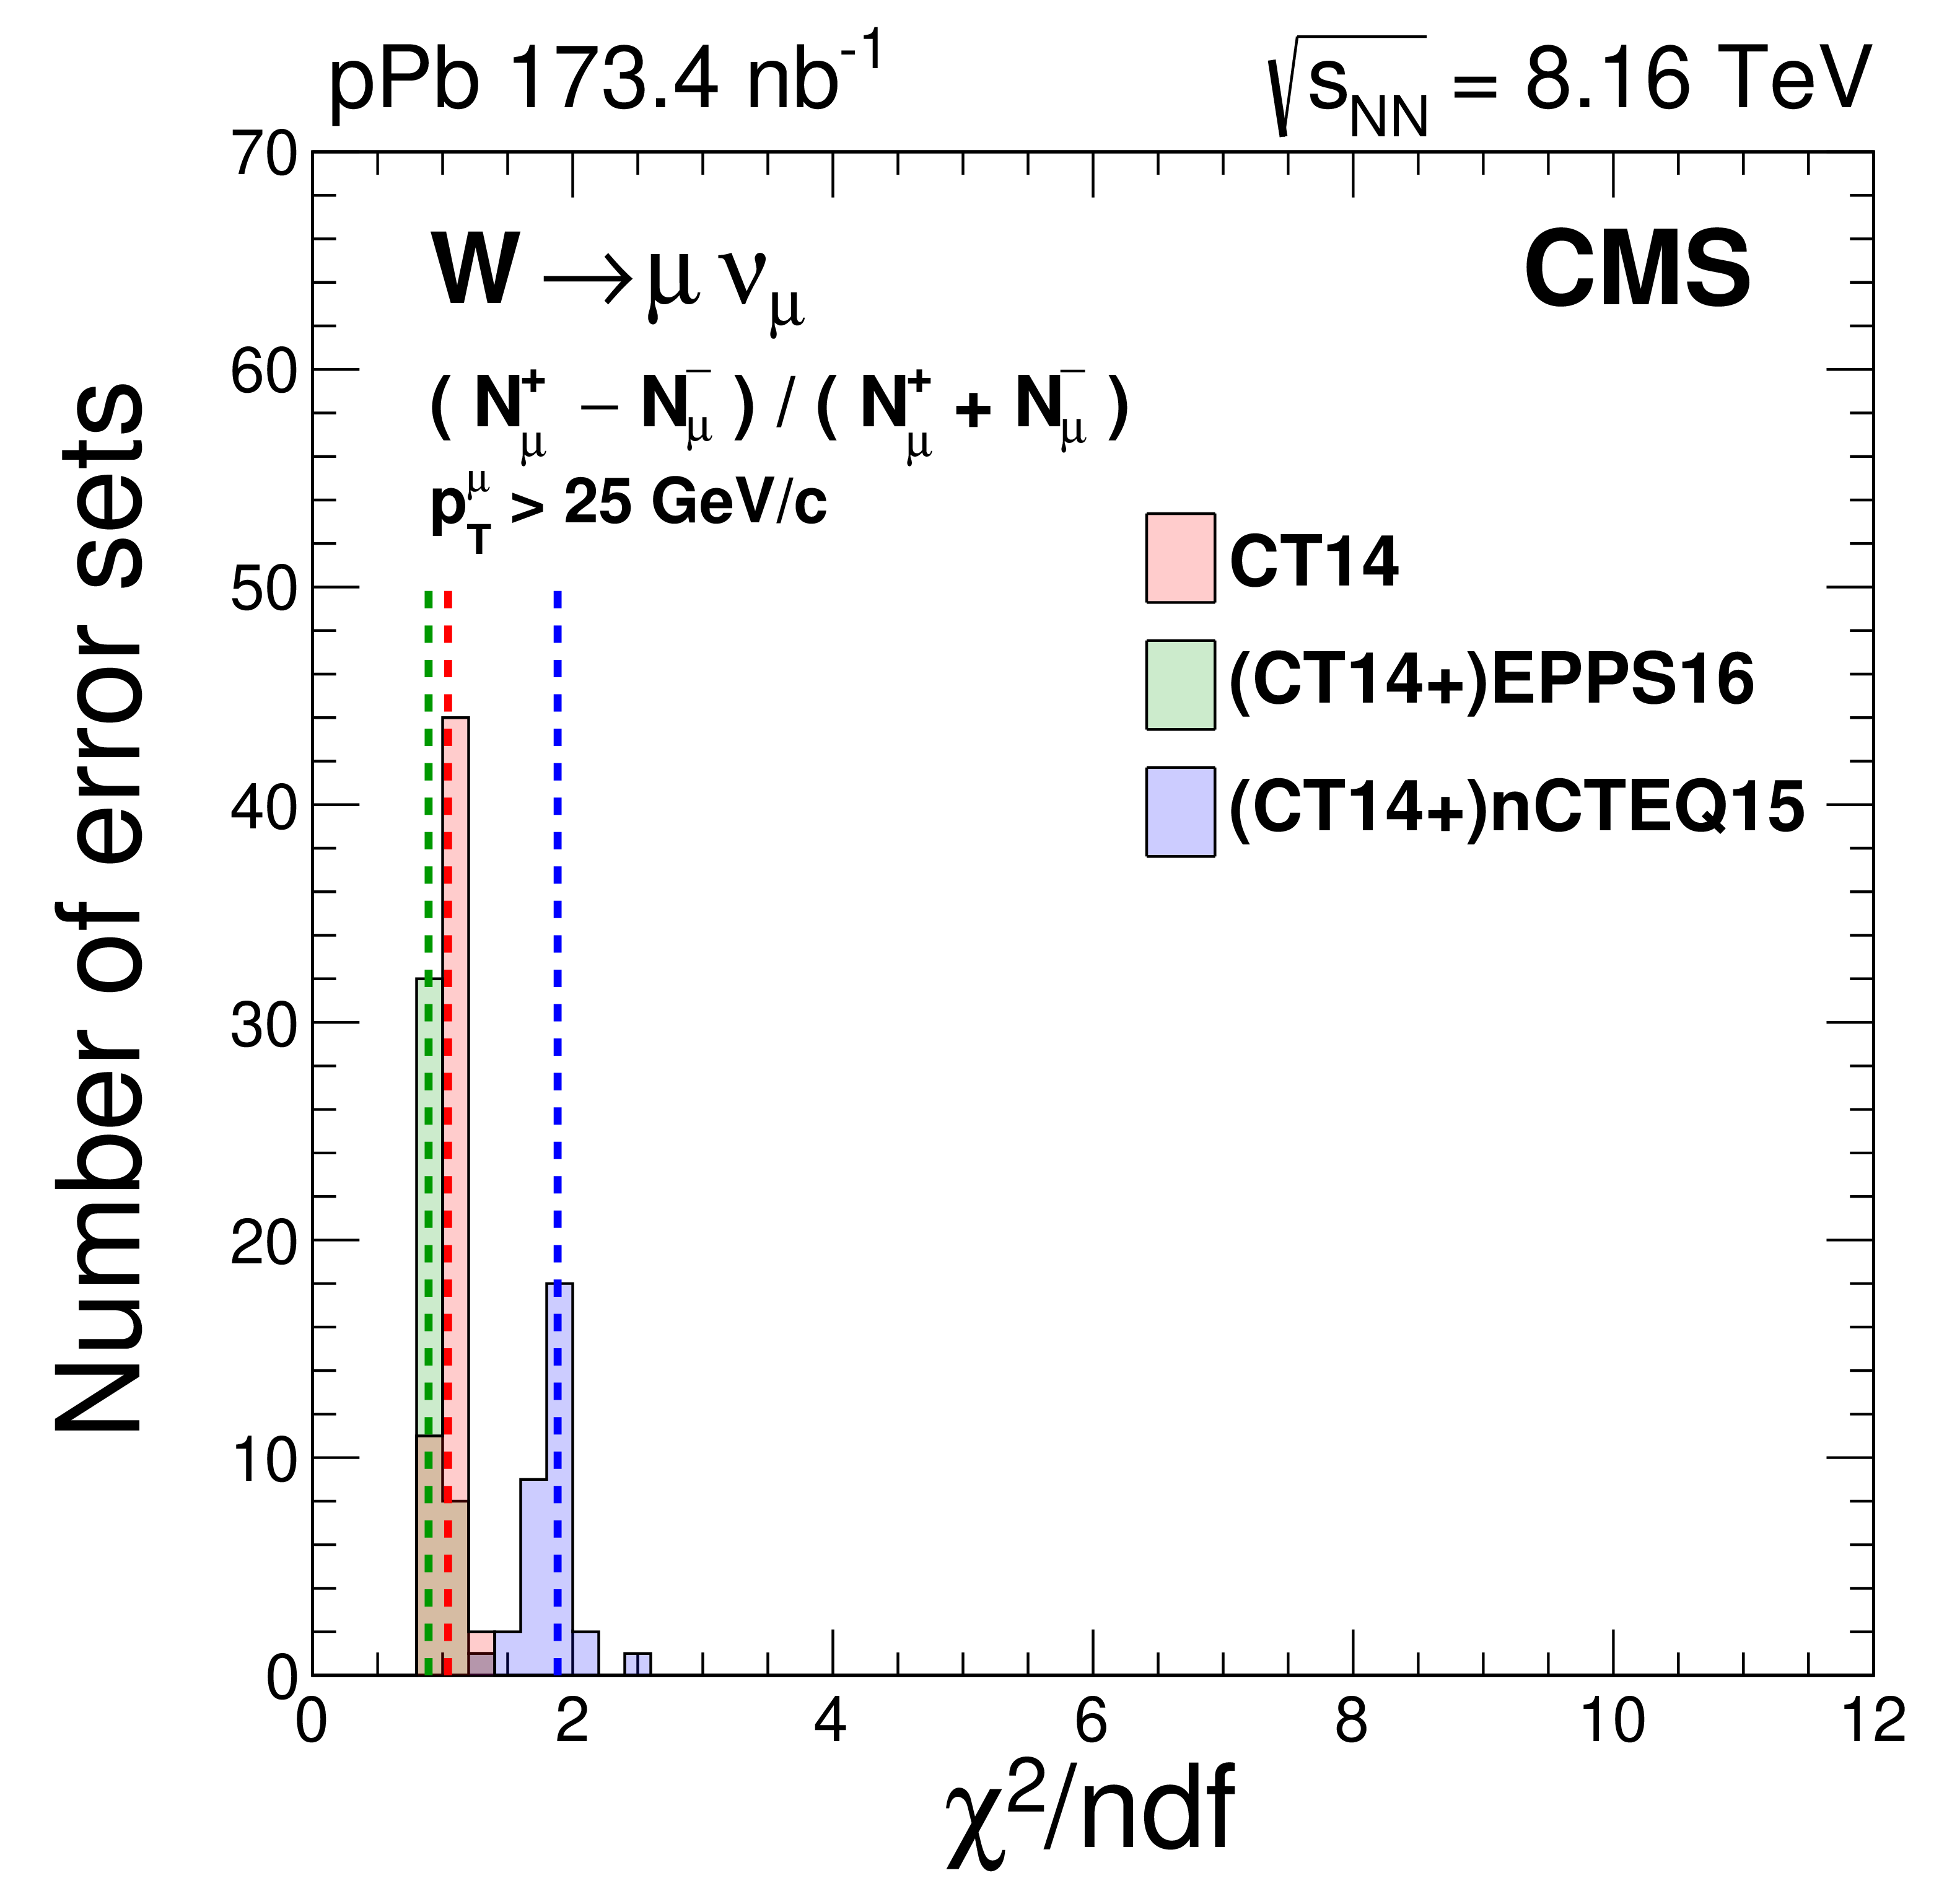
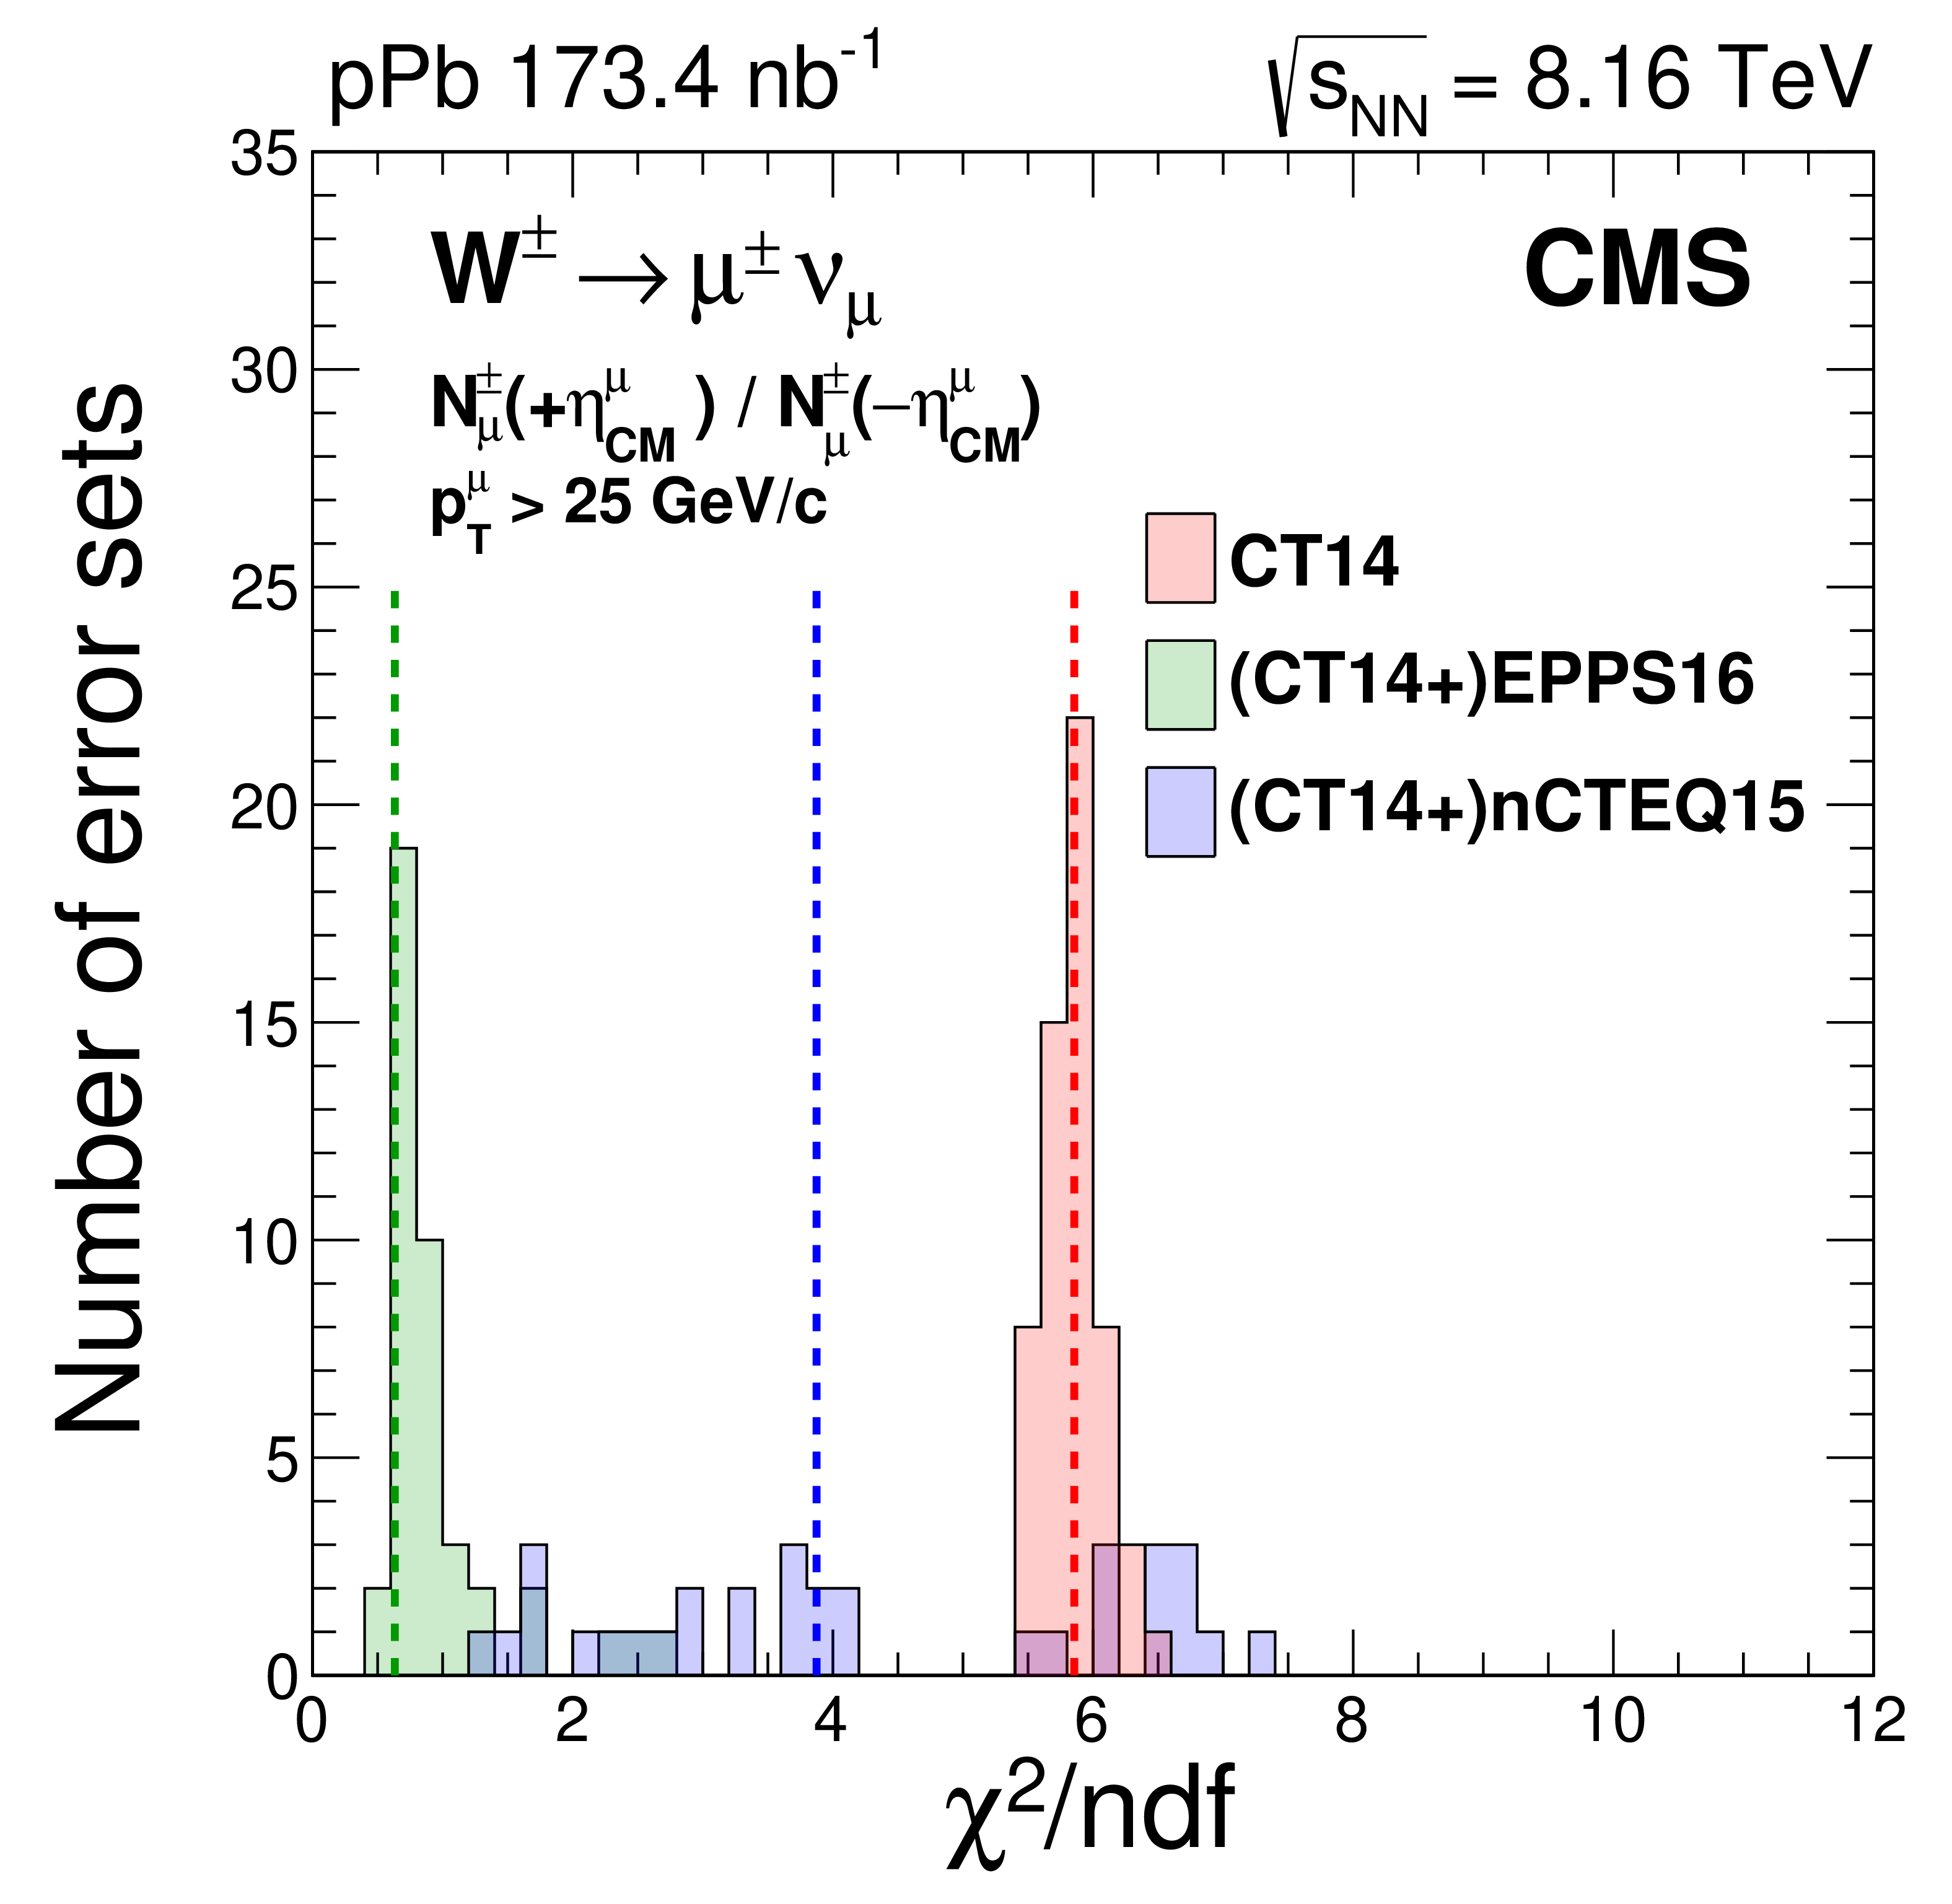
Figure 6:
Distribution of the $\chi ^2$/dof values from the comparison of data (cross section measurements) and theoretical calculations, for the CT14, nCTEQ15, and EPPS16 individual error sets. The vertical dashed lines represent the prediction corresponding to the central set of CT14, nCTEQ15, and EPPS16. |
| Tables | |
png pdf |
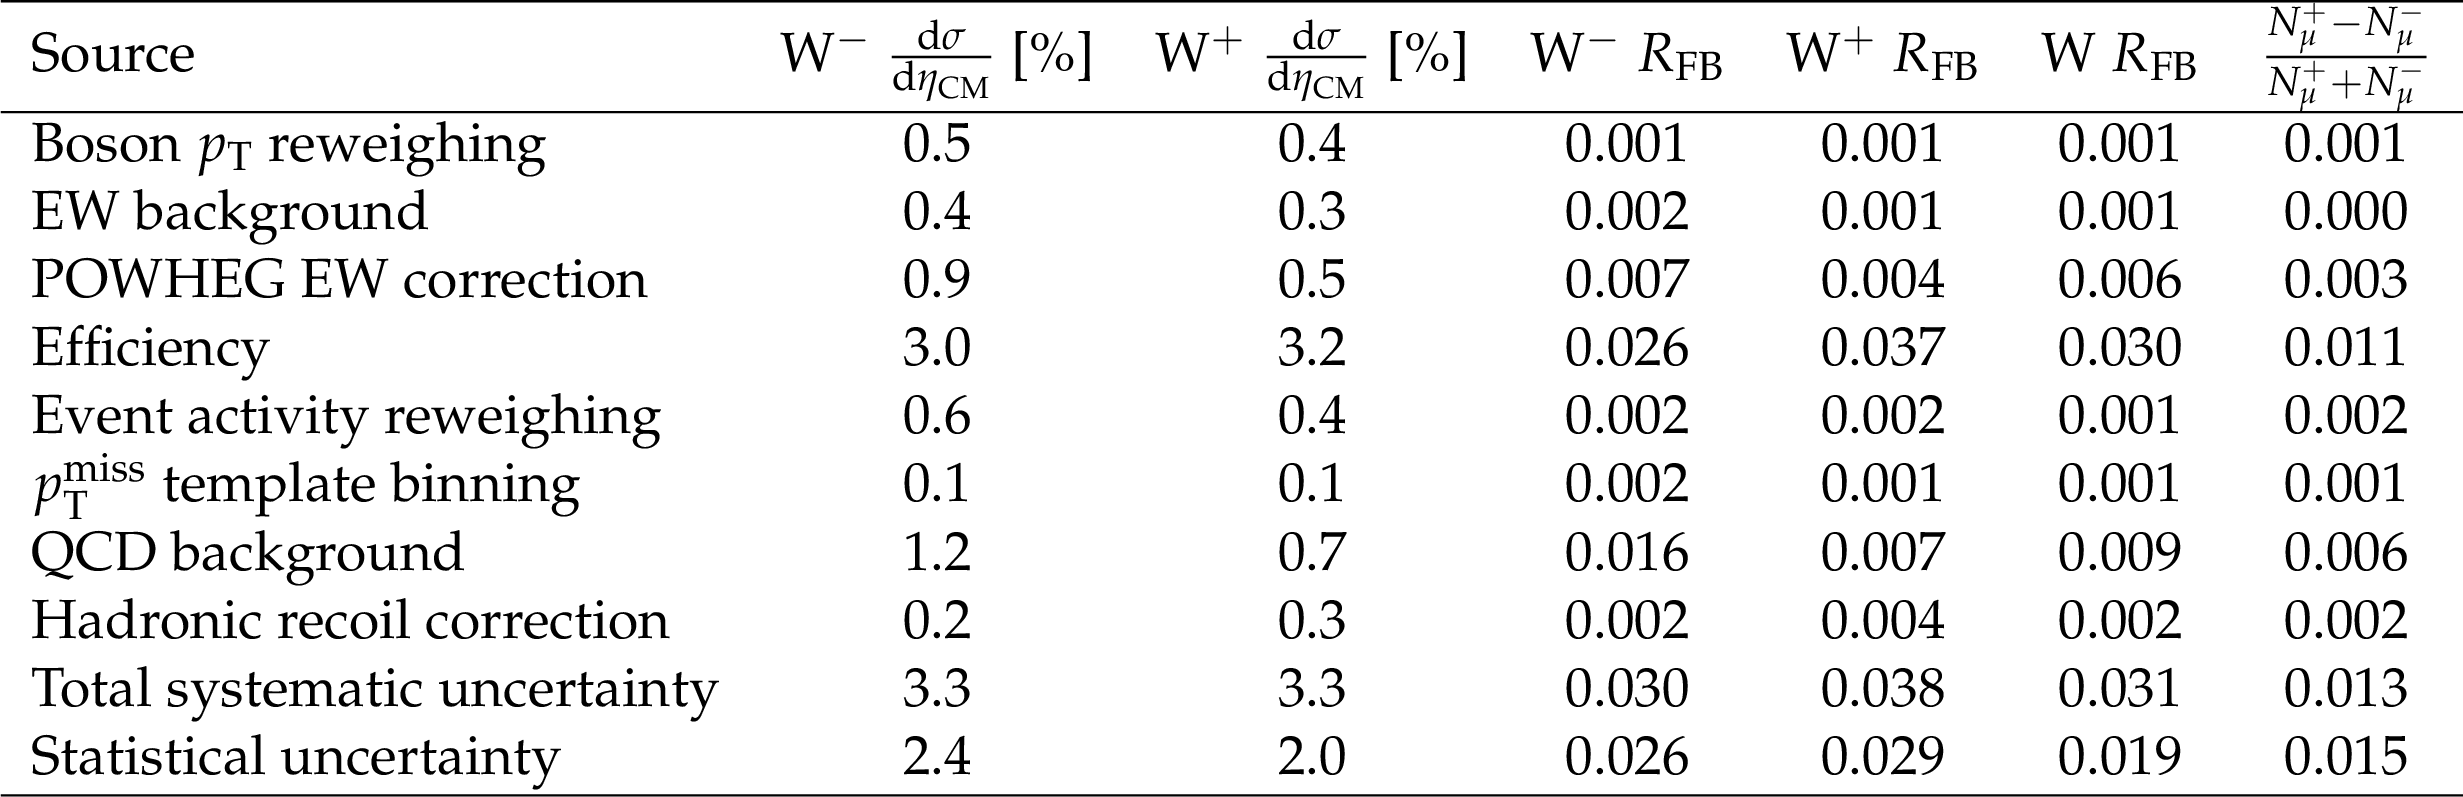
Table 1:
Maximum uncertainty in the measured observables among the ${{\eta _{\text {CM}}} ^{{\mu}}}$ bins determined for each source. The uncertainties in the cross sections are relative, whereas those for the asymmetries are absolute. The global integrated luminosity uncertainty of $\pm $3.5% is not included in the total systematic uncertainty in the cross sections. |
png pdf |
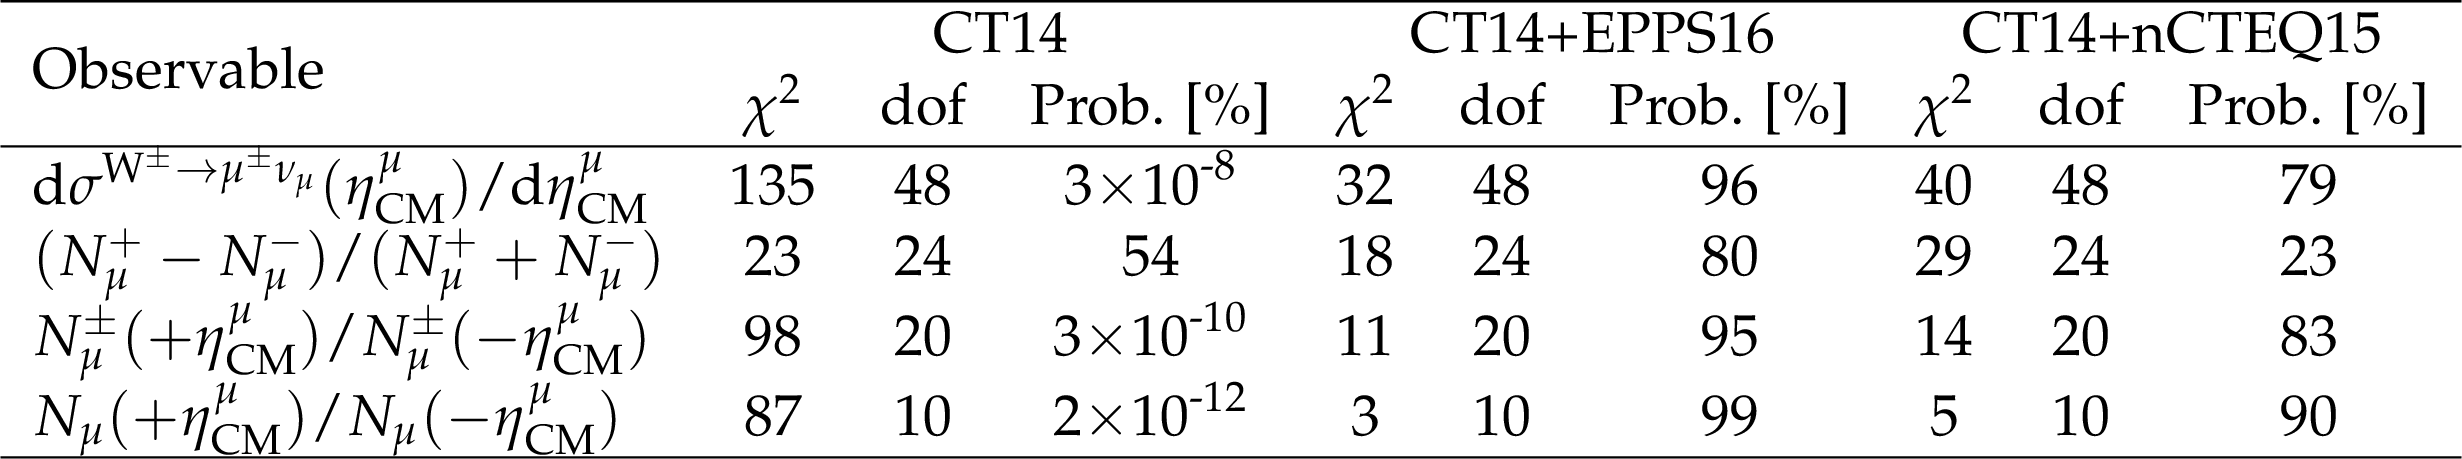
Table 2:
Results of the $\chi ^{2}$ statistical test between the measurements and the nPDF calculations from the CT14 PDF, CT14+EPPS16 nPDF, and CT14+nCTEQ15 nPDF sets. The value of the $\chi ^{2}$, the number of degrees of freedom (dof) and the $\chi ^{2}$ probability (Prob.), are presented for the ${{\mathrm {W}^{\pm}}}$ boson differential cross sections, the muon charge asymmetries, the charged muon forward-backward ratios, and the forward-backward ratios of all muons, respectively. |
| Summary |
|
A study of ${\mathrm{W^{\pm}}}$ boson production in pPb collisions at a nucleon-nucleon centre-of-mass energy of ${\sqrt {\smash [b]{s_{_{\mathrm {NN}}}}}} = $ 8.16 TeV is reported, using the muon decay channel for muons with transverse momenta greater than 25 GeV/$c$ and for absolute values of the pseudorapidity in the laboratory frame $|{{{\eta_{\text{lab}}} ^{\mu}} } < $ 2.4. The differential production cross sections for positively and negatively charged ${\mathrm{W}\to\mu\nu_{\mu}}$ decays, the muon charge asymmetry, and the muon forward-backward ratios, are measured as functions of the muon pseudorapidity in the centre-of-mass frame, in the range $-2.86 < {{\eta_{\text{CM}}} ^{\mu}} < 1.93$. The measurements are compared to theoretical predictions from both proton parton distribution functions (PDFs) (CT14) and nuclear PDF (CT14+EPPS16, CT14+nCTEQ15) sets. The cross sections and the forward-backward asymmetries exhibit significant deviations from the CT14 prediction, revealing nuclear modifications of the PDFs unambiguously for the first time in the production of electroweak bosons in nuclear collisions. Both the CT14+EPPS16, and the CT14+nCTEQ15 calculations show a good overall agreement with the data, with the measurements favouring the former nPDF set. In the latter case, only the individual sets that exhibit the smallest nuclear PDF modifications at small values of $x$ (in the shadowing region) turn out to be compatible with experimental measurements. The small experimental uncertainties allow for a significant reduction in the current uncertainties on the quark and antiquark nuclear PDFs in the range $10^{-3} \lesssim x \lesssim 10^{-1}$. |
| Additional Figures | |
png pdf |
Additional Figure 1:
Comparison of the production cross section for $\mathrm {W}\rightarrow \mu ^{-}\bar{\nu}_{\mu}$ (left) and $\mathrm {W}\rightarrow \mu ^{+}\nu _{\mu}$ (right) measured at 8.16 TeV (black points) and at 5.02 TeV [Phys. Lett. B 750 (2015) 565] (blue squares). The brackets represent the statistical and systematic uncertainties summed in quadrature, while the error bars show the statistical uncertainties only. The global luminosity uncertainty of $\pm $3.5% for the data at 8.16 TeV and at 5.02 TeV are not shown. Calculations using with CT14+EPPS16 nPDF [Eur. Phys. J. C 77, 163 (2017)] at 8.16 TeV (green line) and at 5.02 TeV (brown line), are also displayed, including their PDF uncertainty bands at 68% confidence interval. |
png pdf |
Additional Figure 1-a:
Comparison of the production cross section for $\mathrm {W}\rightarrow \mu ^{-}\bar{\nu}_{\mu}$ measured at 8.16 TeV (black points) and at 5.02 TeV [Phys. Lett. B 750 (2015) 565] (blue squares). The brackets represent the statistical and systematic uncertainties summed in quadrature, while the error bars show the statistical uncertainties only. The global luminosity uncertainty of $\pm $3.5% for the data at 8.16 TeV and at 5.02 TeV are not shown. Calculations using with CT14+EPPS16 nPDF [Eur. Phys. J. C 77, 163 (2017)] at 8.16 TeV (green line) and at 5.02 TeV (brown line), are also displayed, including their PDF uncertainty bands at 68% confidence interval. |

png pdf |
Additional Figure 1-b:
Comparison of the production cross section for $\mathrm {W}\rightarrow \mu ^{+}\nu _{\mu}$ measured at 8.16 TeV (black points) and at 5.02 TeV [Phys. Lett. B 750 (2015) 565] (blue squares). The brackets represent the statistical and systematic uncertainties summed in quadrature, while the error bars show the statistical uncertainties only. The global luminosity uncertainty of $\pm $3.5% for the data at 8.16 TeV and at 5.02 TeV are not shown. Calculations using with CT14+EPPS16 nPDF [Eur. Phys. J. C 77, 163 (2017)] at 8.16 TeV (green line) and at 5.02 TeV (brown line), are also displayed, including their PDF uncertainty bands at 68% confidence interval. |
png pdf |
Additional Figure 2:
Comparison of the muon charge asymmetry measured at 8.16 TeV (black points) and at 5.02 TeV [Phys. Lett. B 750 (2015) 565] (blue squares). The brackets represent the statistical and systematic uncertainties summed in quadrature, while the error bars show the statistical uncertainties only. Calculations using with CT14+EPPS16 nPDF [Eur. Phys. J. C 77, 163 (2017)] at 8.16 TeV (green line) and at 5.02 TeV (brown line), are also displayed, including their PDF uncertainty bands at 68% confidence interval. |
png pdf |
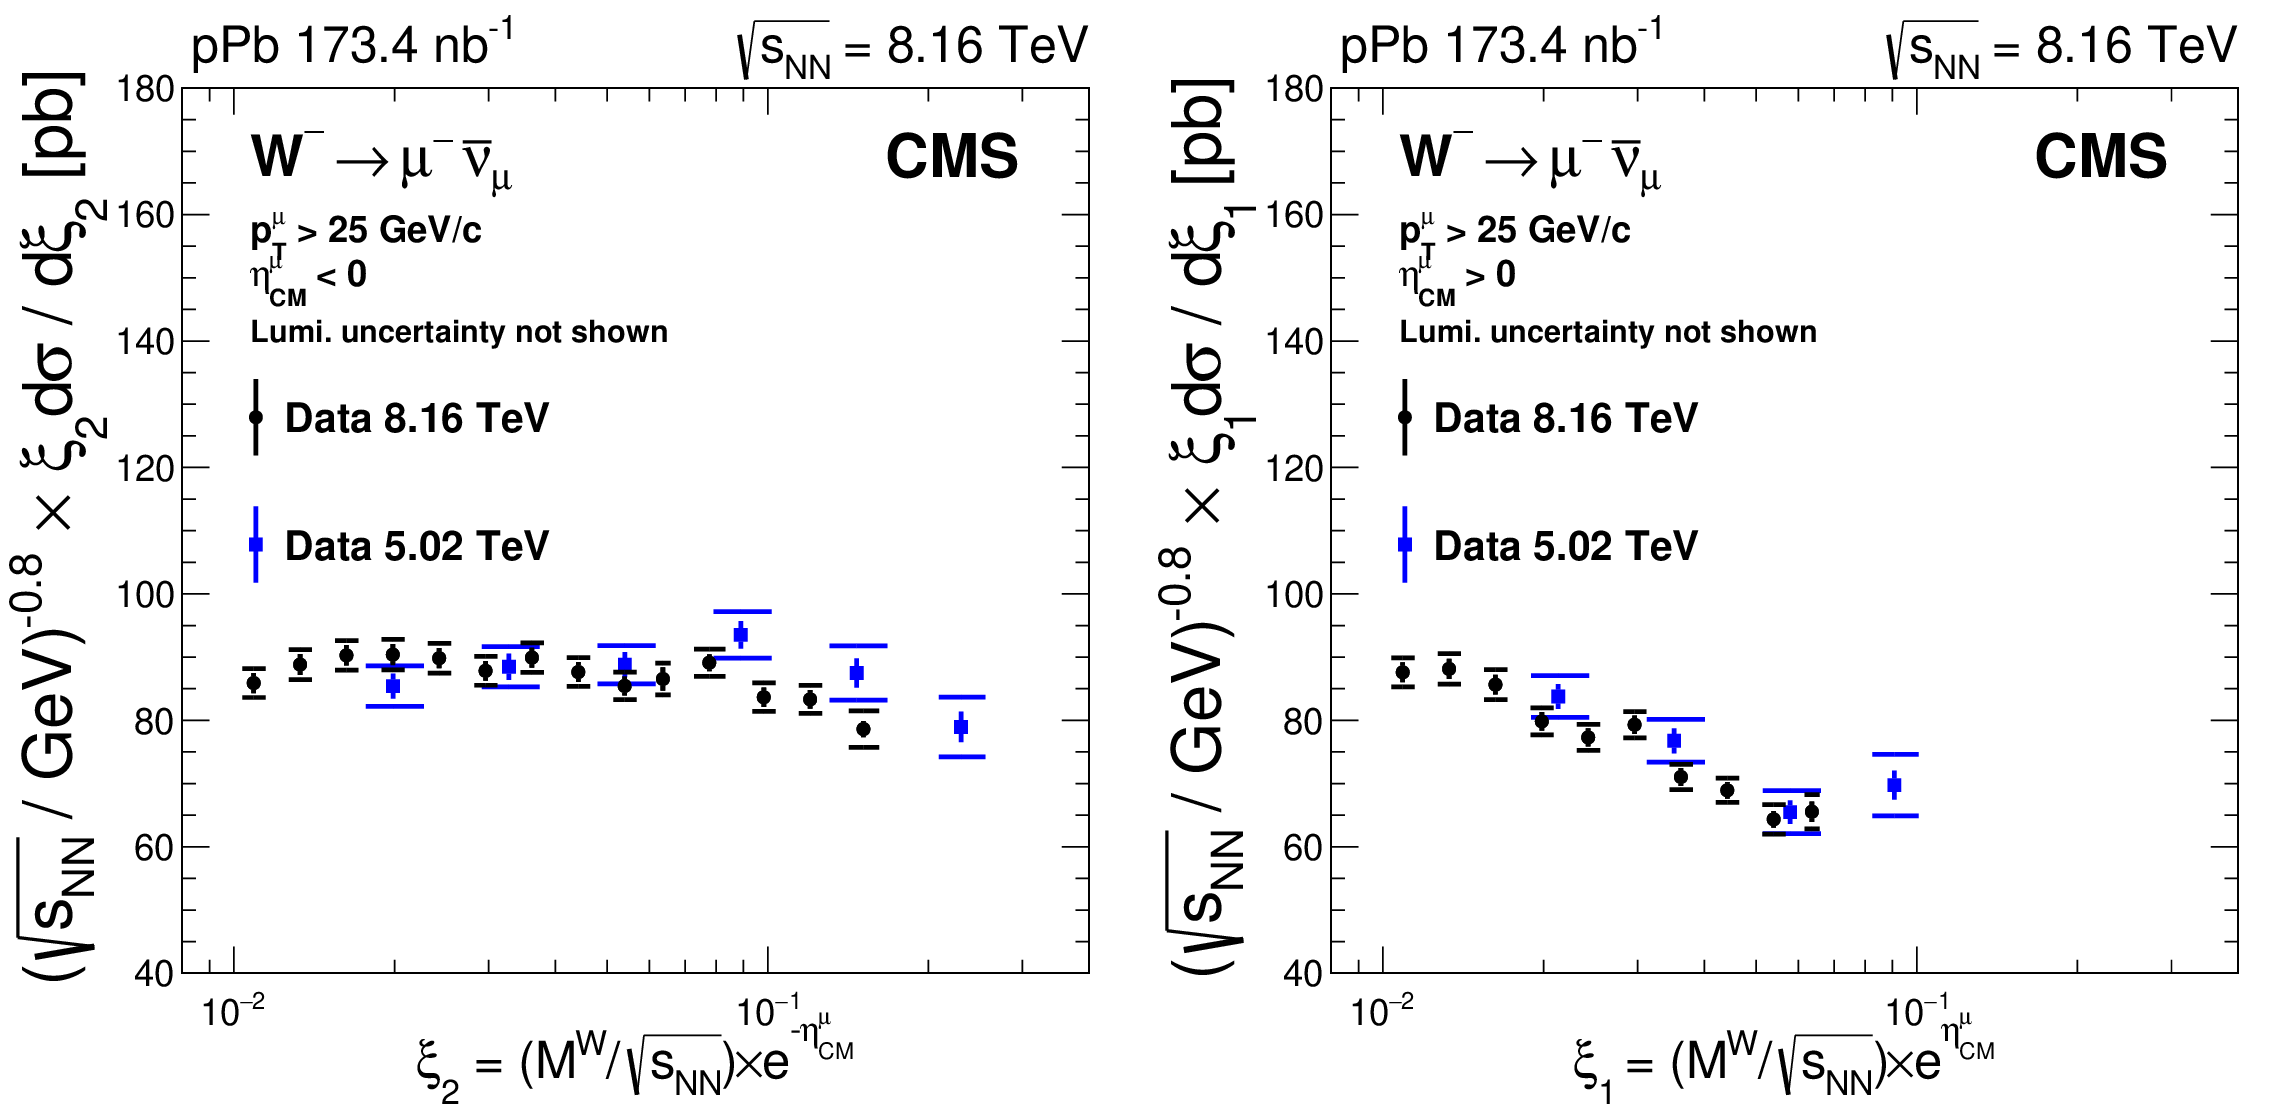
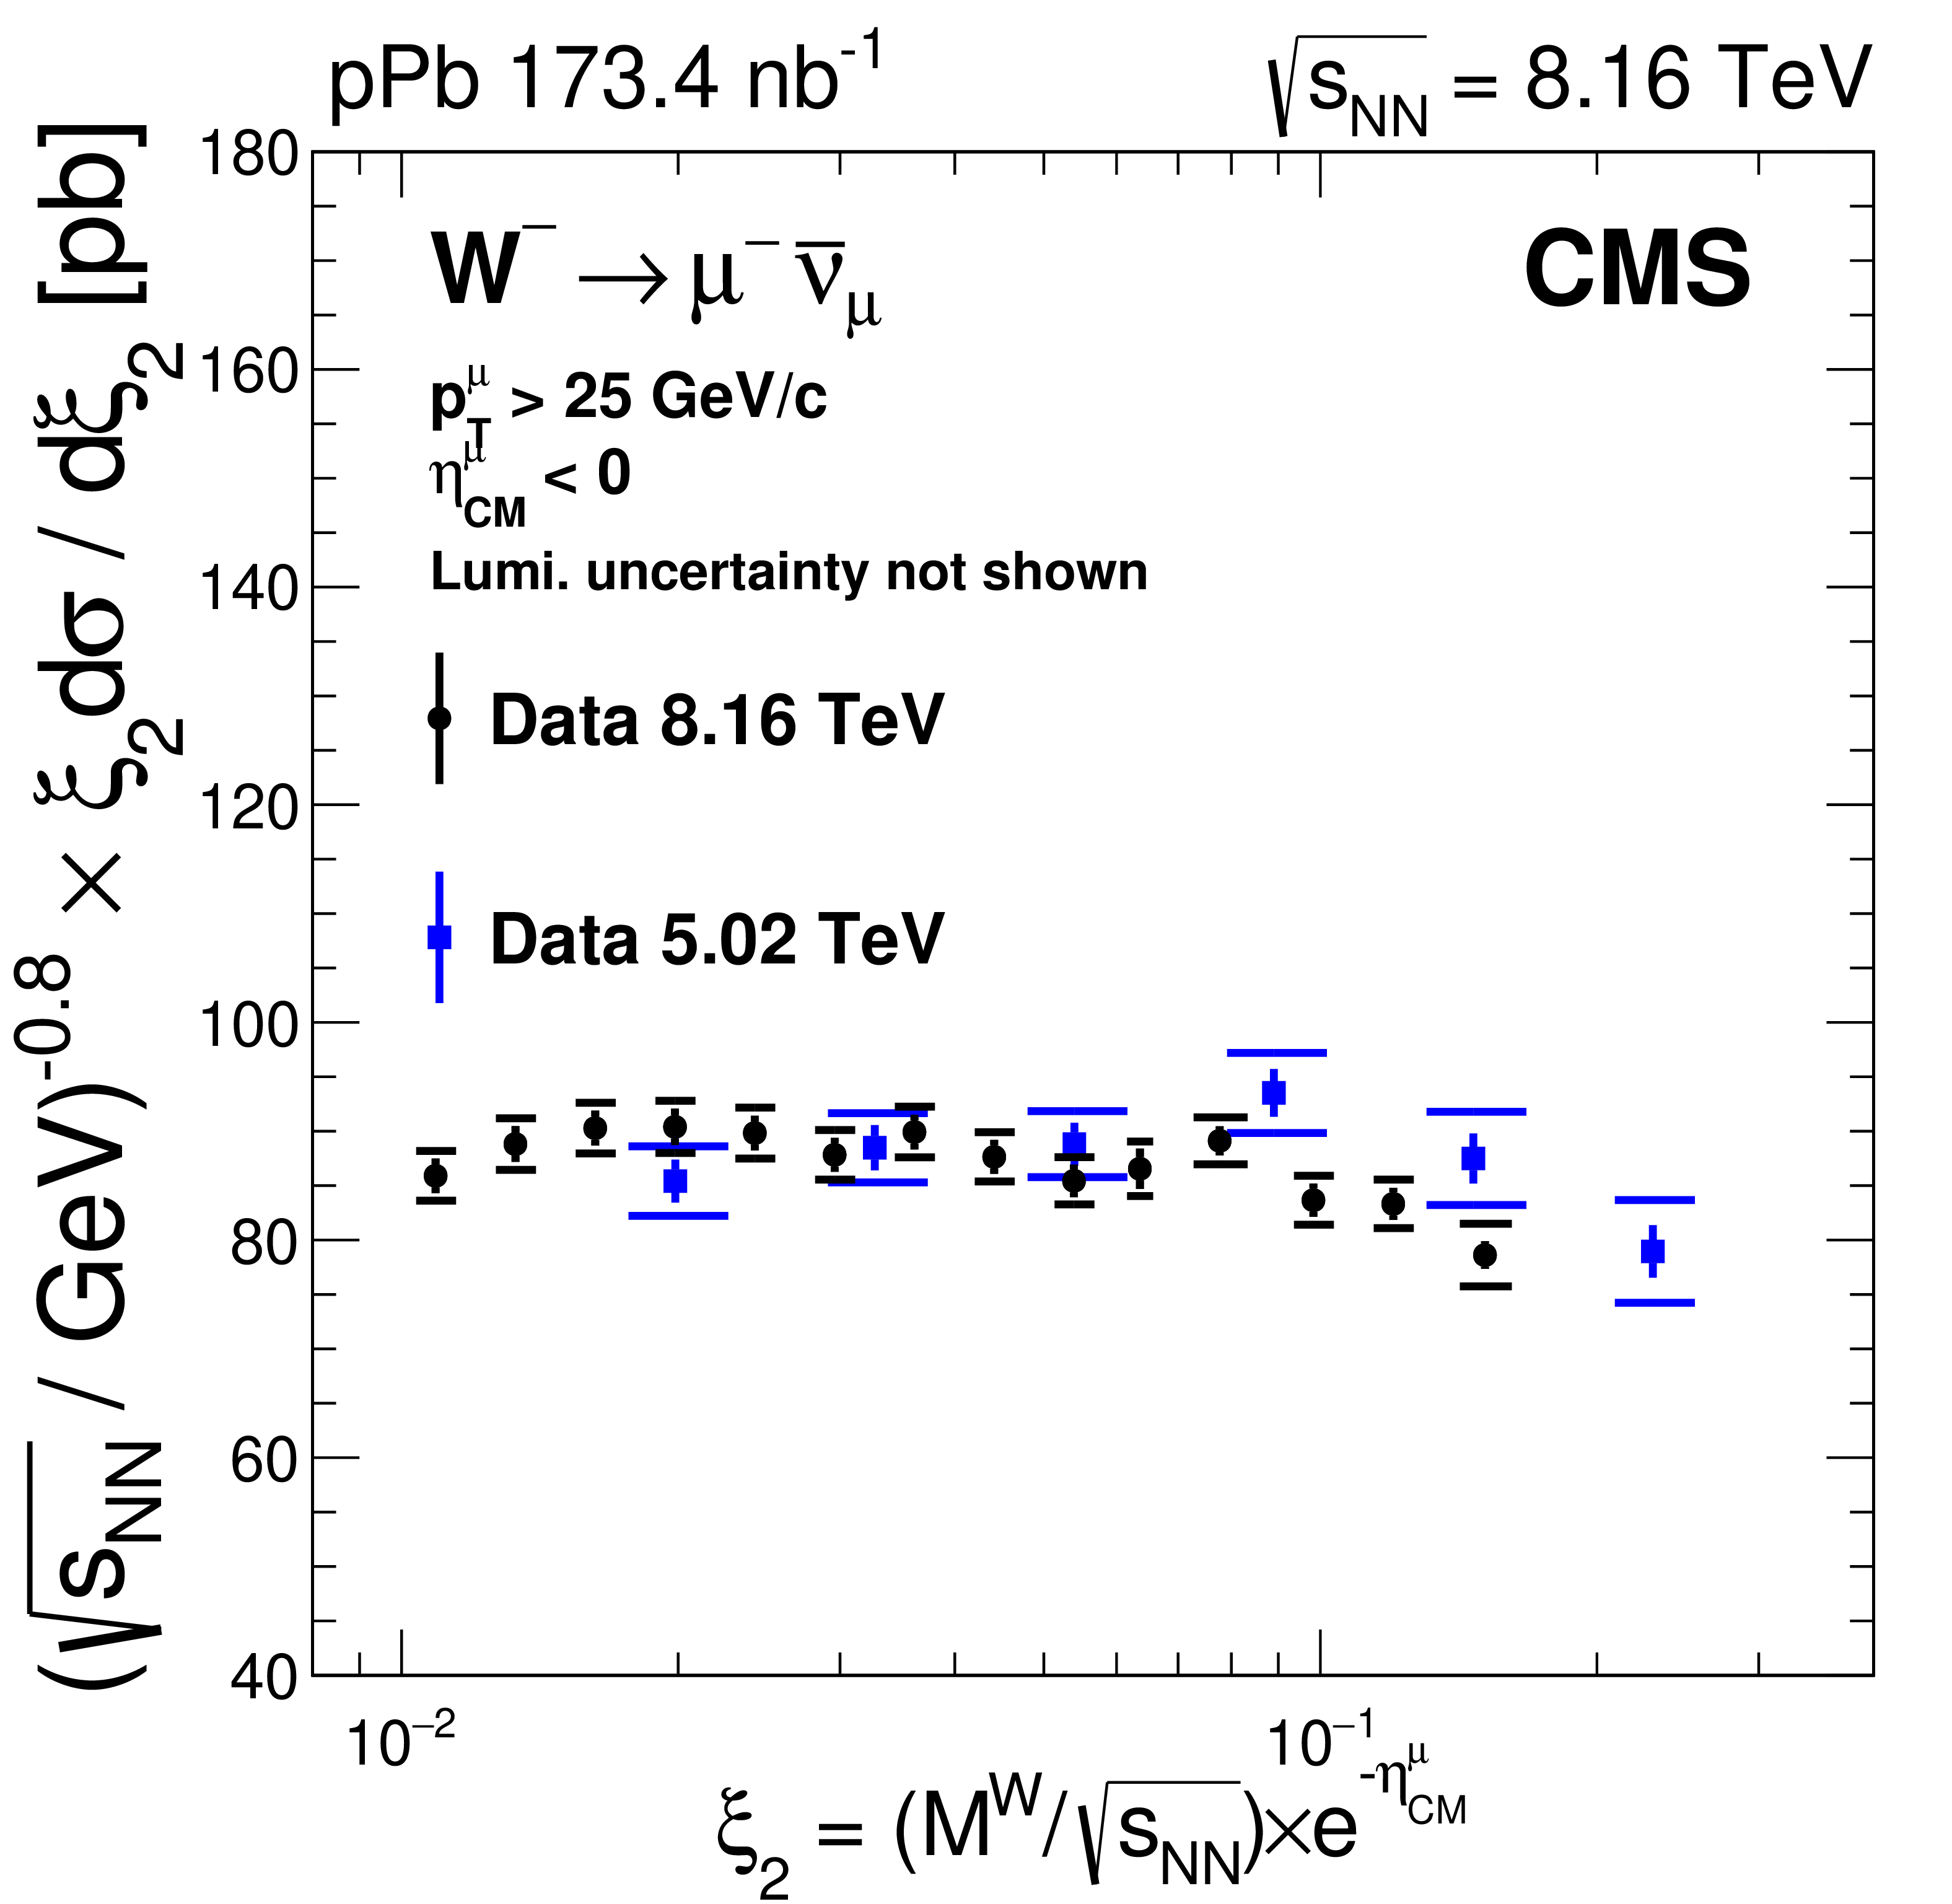
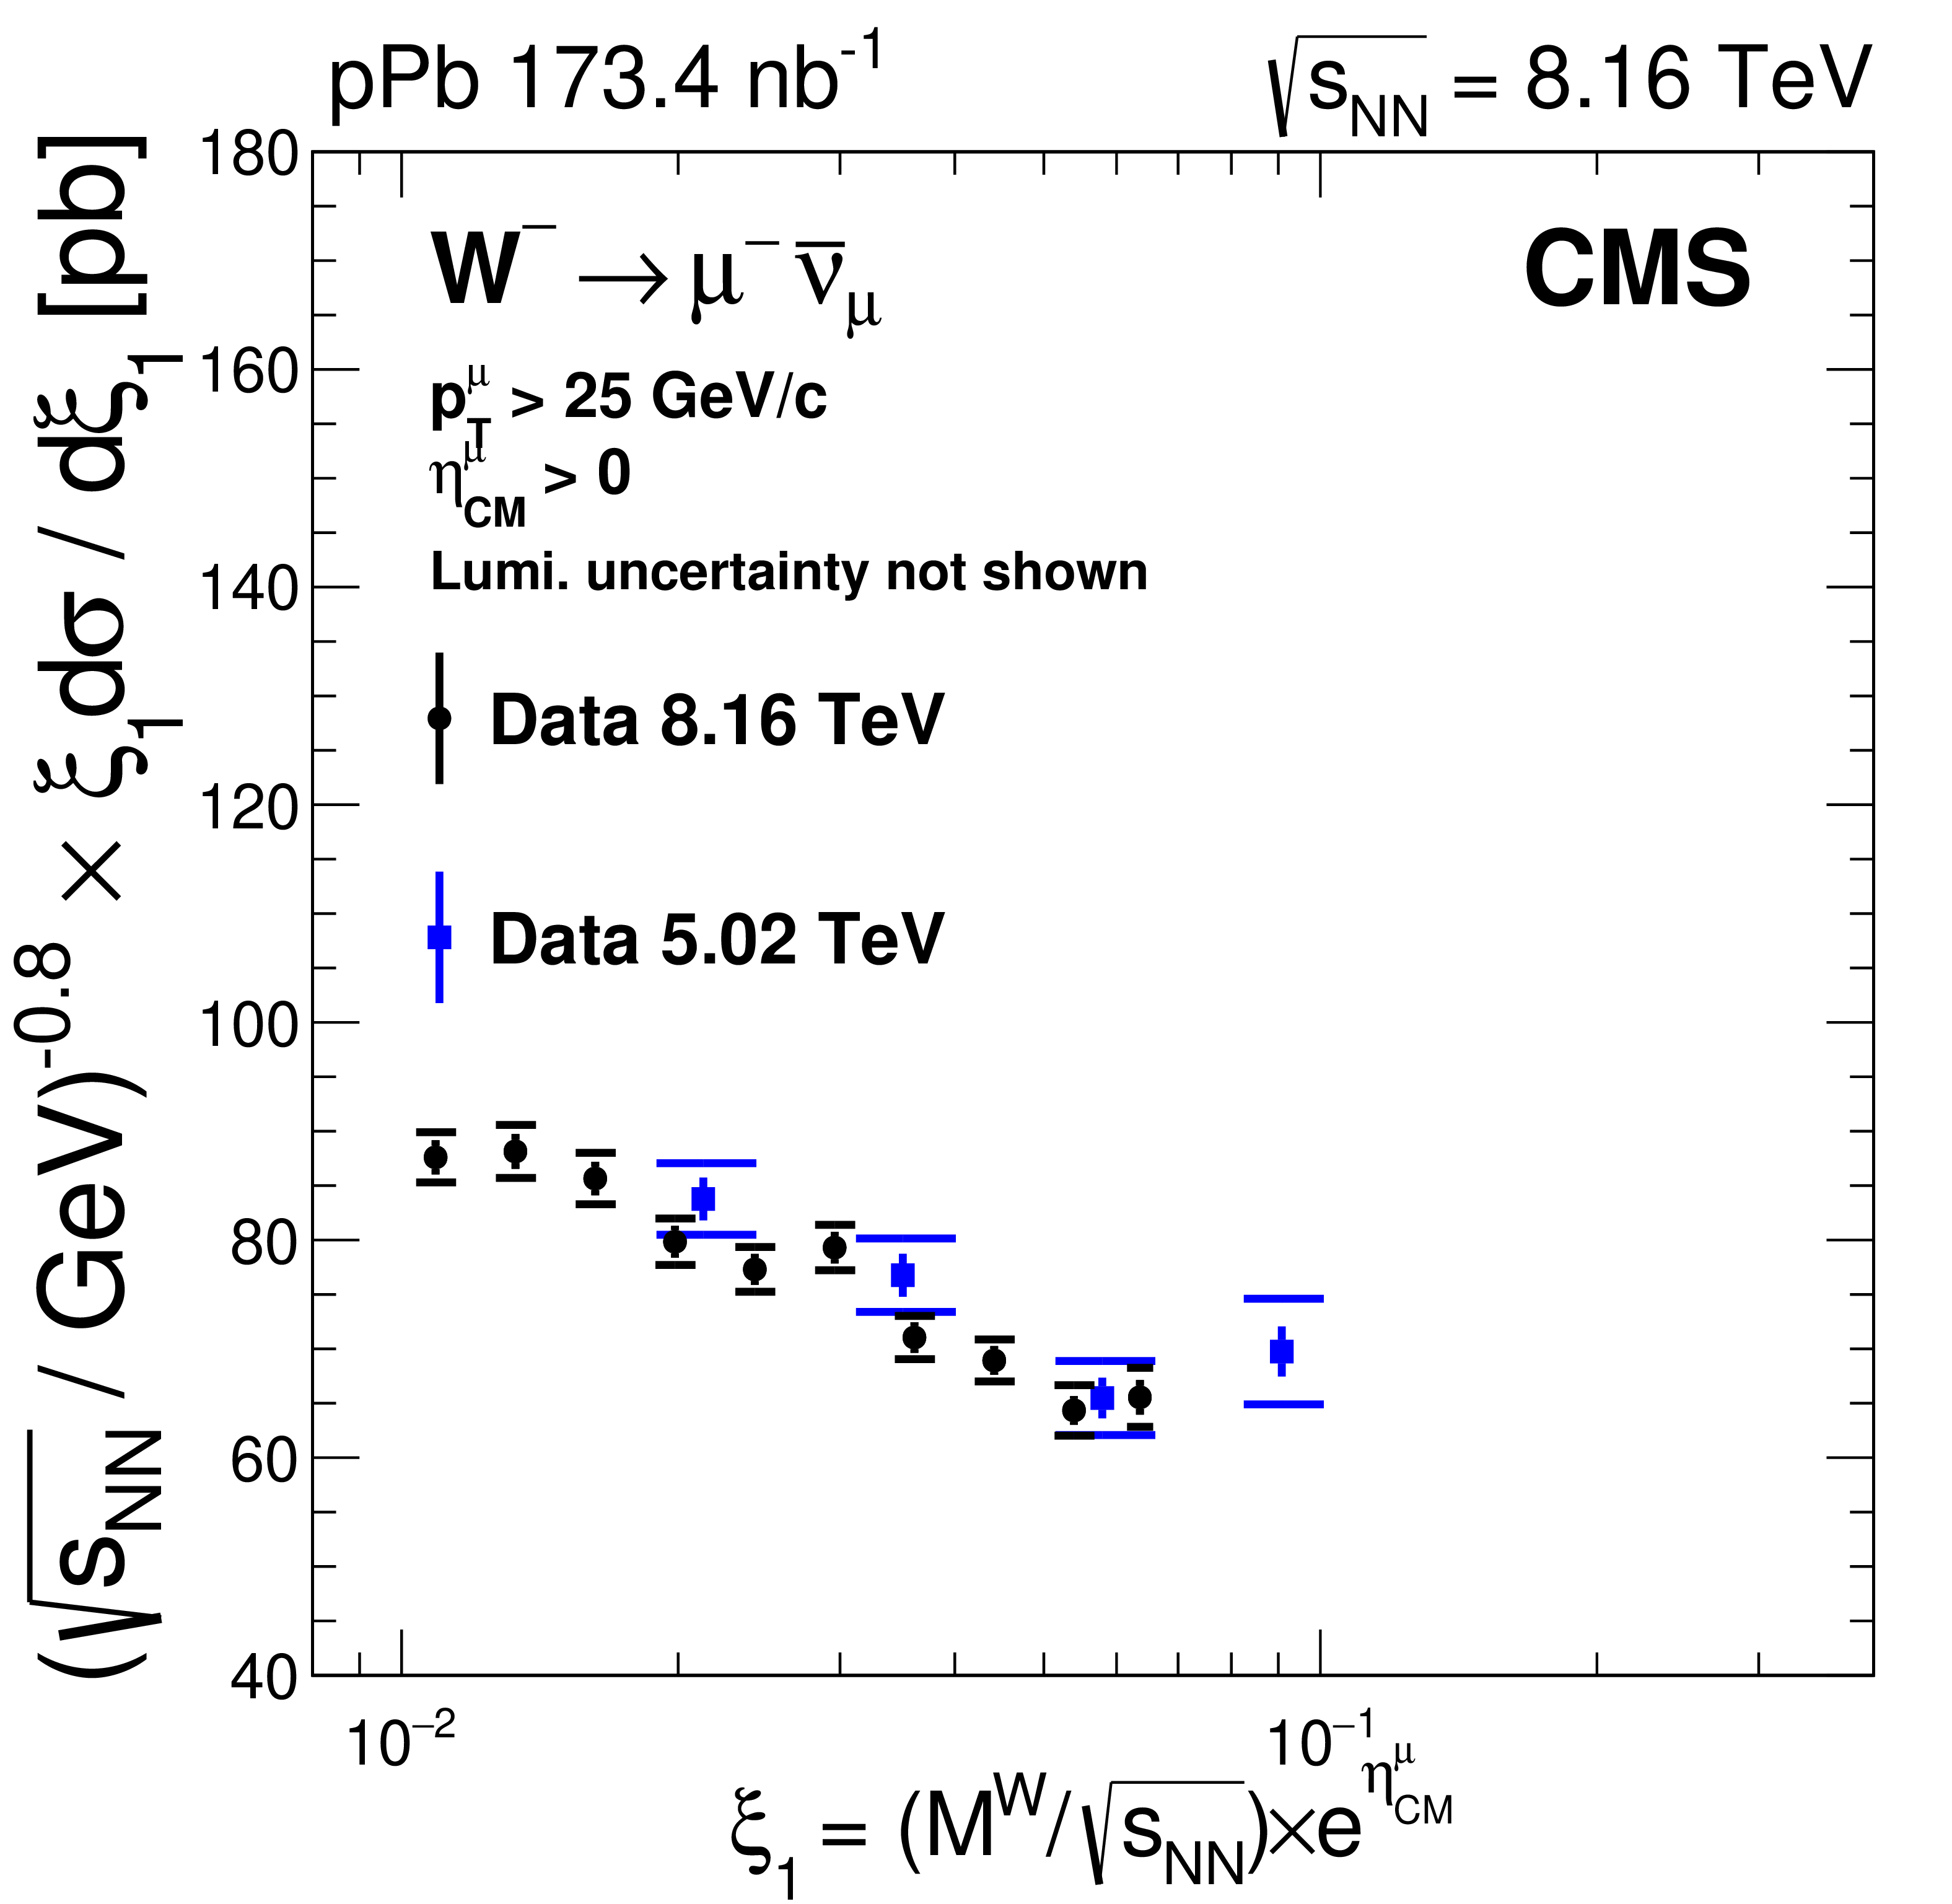
Additional Figure 3:
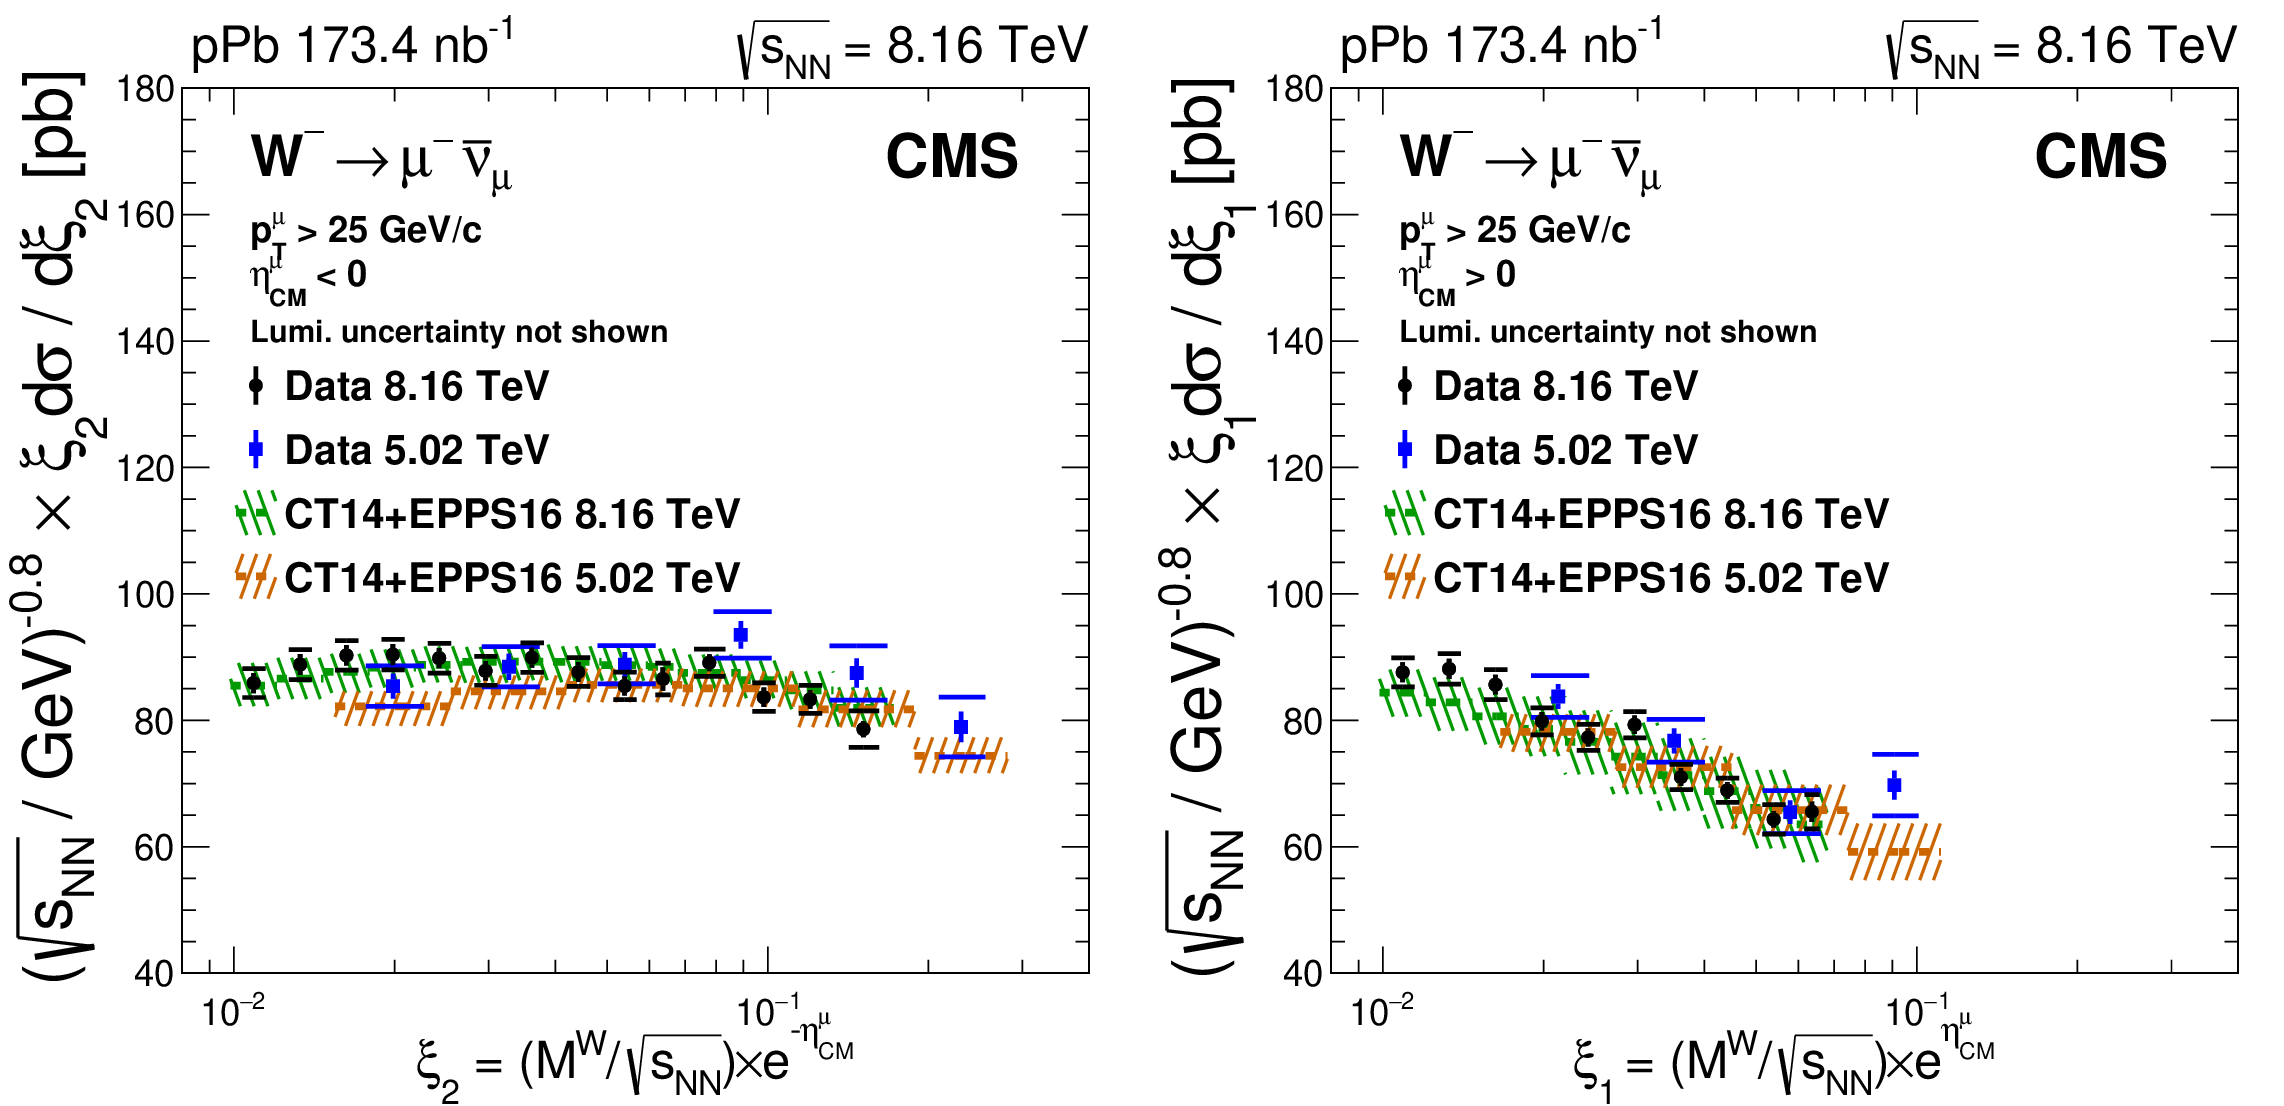
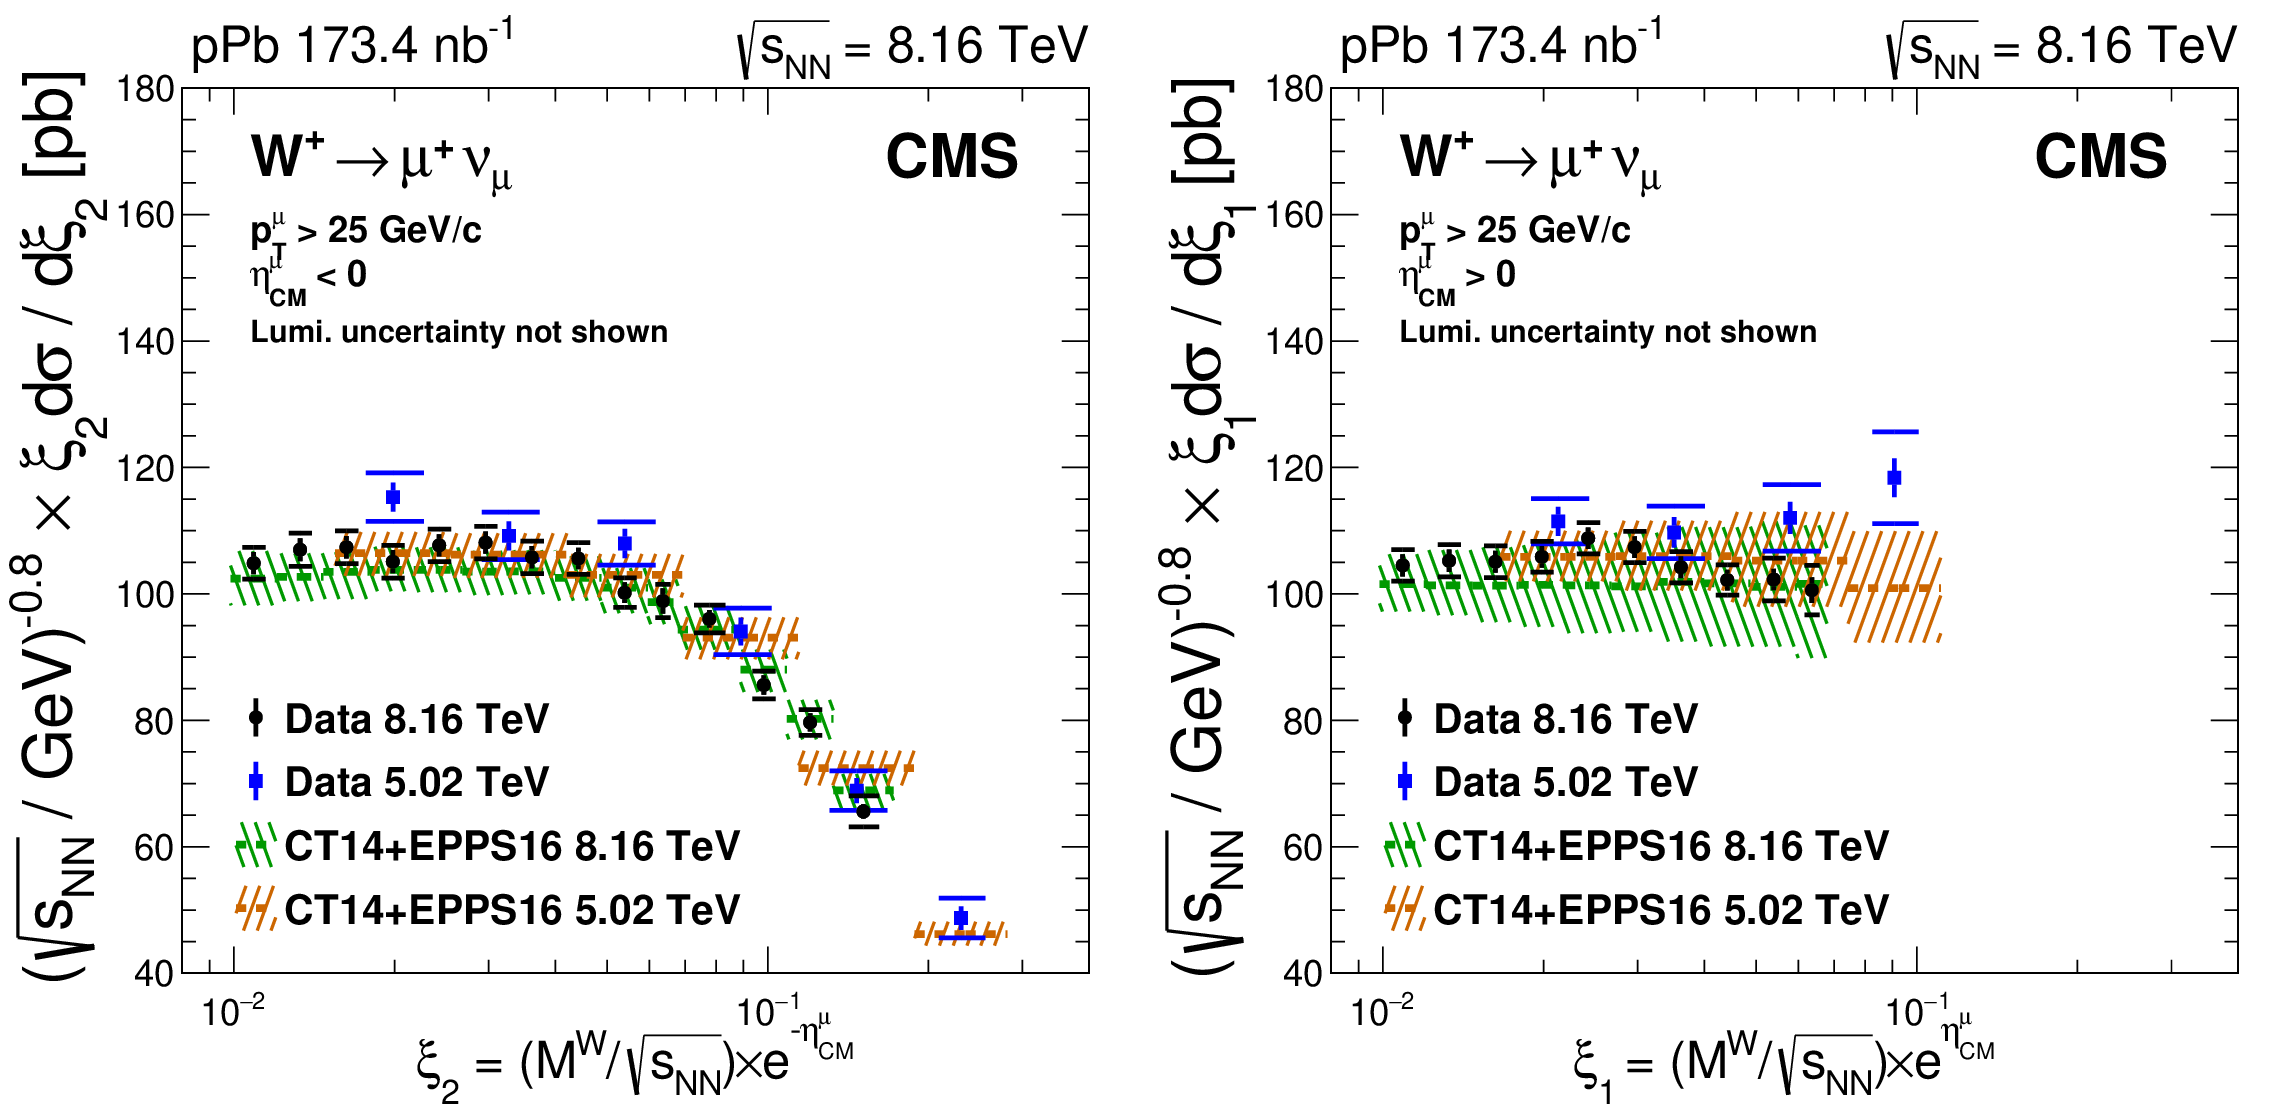
Comparison of the production cross section for $\mathrm {W}\rightarrow \mu ^{-}\bar{\nu}_{\mu}$ measured at 8.16 TeV (black points) and at 5.02 TeV [Phys. Lett. B 750 (2015) 565] (blue squares). The comparison is presented in two muon pseudorapidity regions: $\eta _{\mathrm {CM}} < $ 0 (left plot) and $\eta _{\mathrm {CM}} > $ 0 (right plot). The brackets represent the statistical and systematic uncertainties summed in quadrature, while the error bars show the statistical uncertainties only. The global luminosity uncertainty of $\pm $3.5% for the data at 8.16 TeV and at 5.02 TeV are not shown. |
png pdf |
Additional Figure 3-a:
Comparison of the production cross section for $\mathrm {W}\rightarrow \mu ^{-}\bar{\nu}_{\mu}$ measured at 8.16 TeV (black points) and at 5.02 TeV [Phys. Lett. B 750 (2015) 565] (blue squares). The comparison is presented in pseudorapidity region $\eta _{\mathrm {CM}} < $ 0. The brackets represent the statistical and systematic uncertainties summed in quadrature, while the error bars show the statistical uncertainties only. The global luminosity uncertainty of $\pm $3.5% for the data at 8.16 TeV and at 5.02 TeV are not shown. |
png pdf |
Additional Figure 3-b:
Comparison of the production cross section for $\mathrm {W}\rightarrow \mu ^{-}\bar{\nu}_{\mu}$ measured at 8.16 TeV (black points) and at 5.02 TeV [Phys. Lett. B 750 (2015) 565] (blue squares). The comparison is presented in pseudorapidity region $\eta _{\mathrm {CM}} > $ 0. The brackets represent the statistical and systematic uncertainties summed in quadrature, while the error bars show the statistical uncertainties only. The global luminosity uncertainty of $\pm $3.5% for the data at 8.16 TeV and at 5.02 TeV are not shown. |

png pdf |
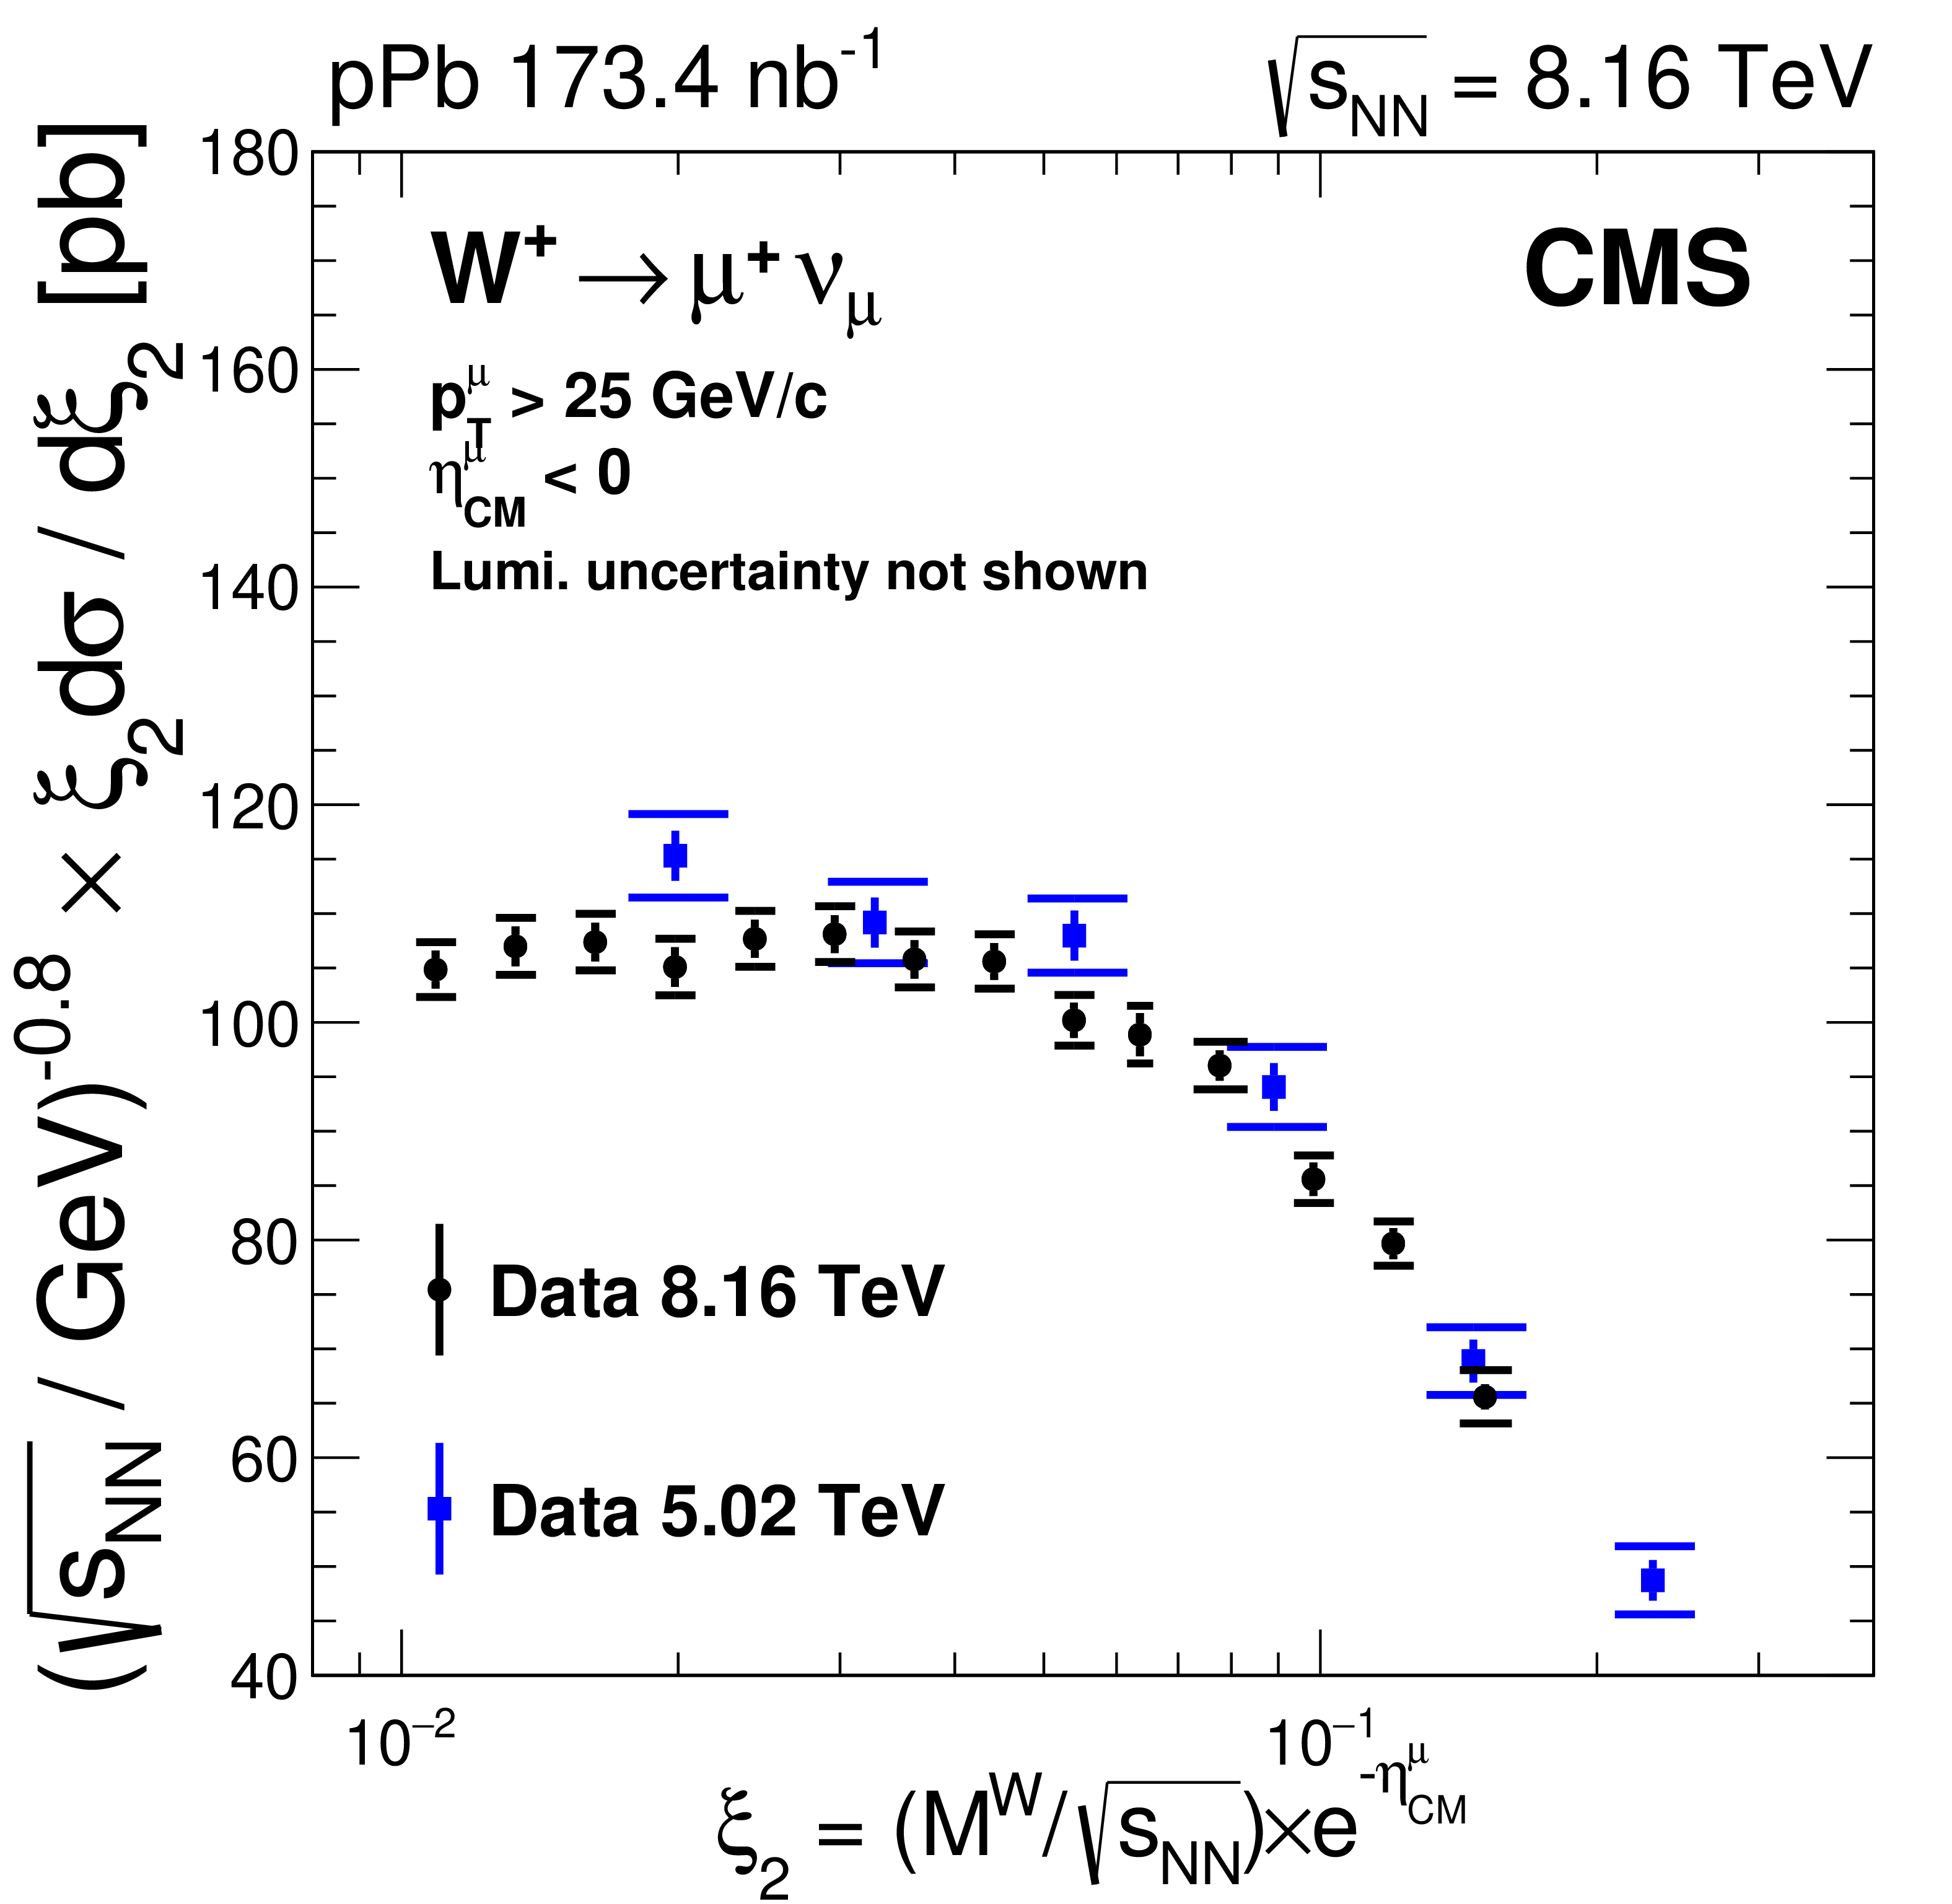
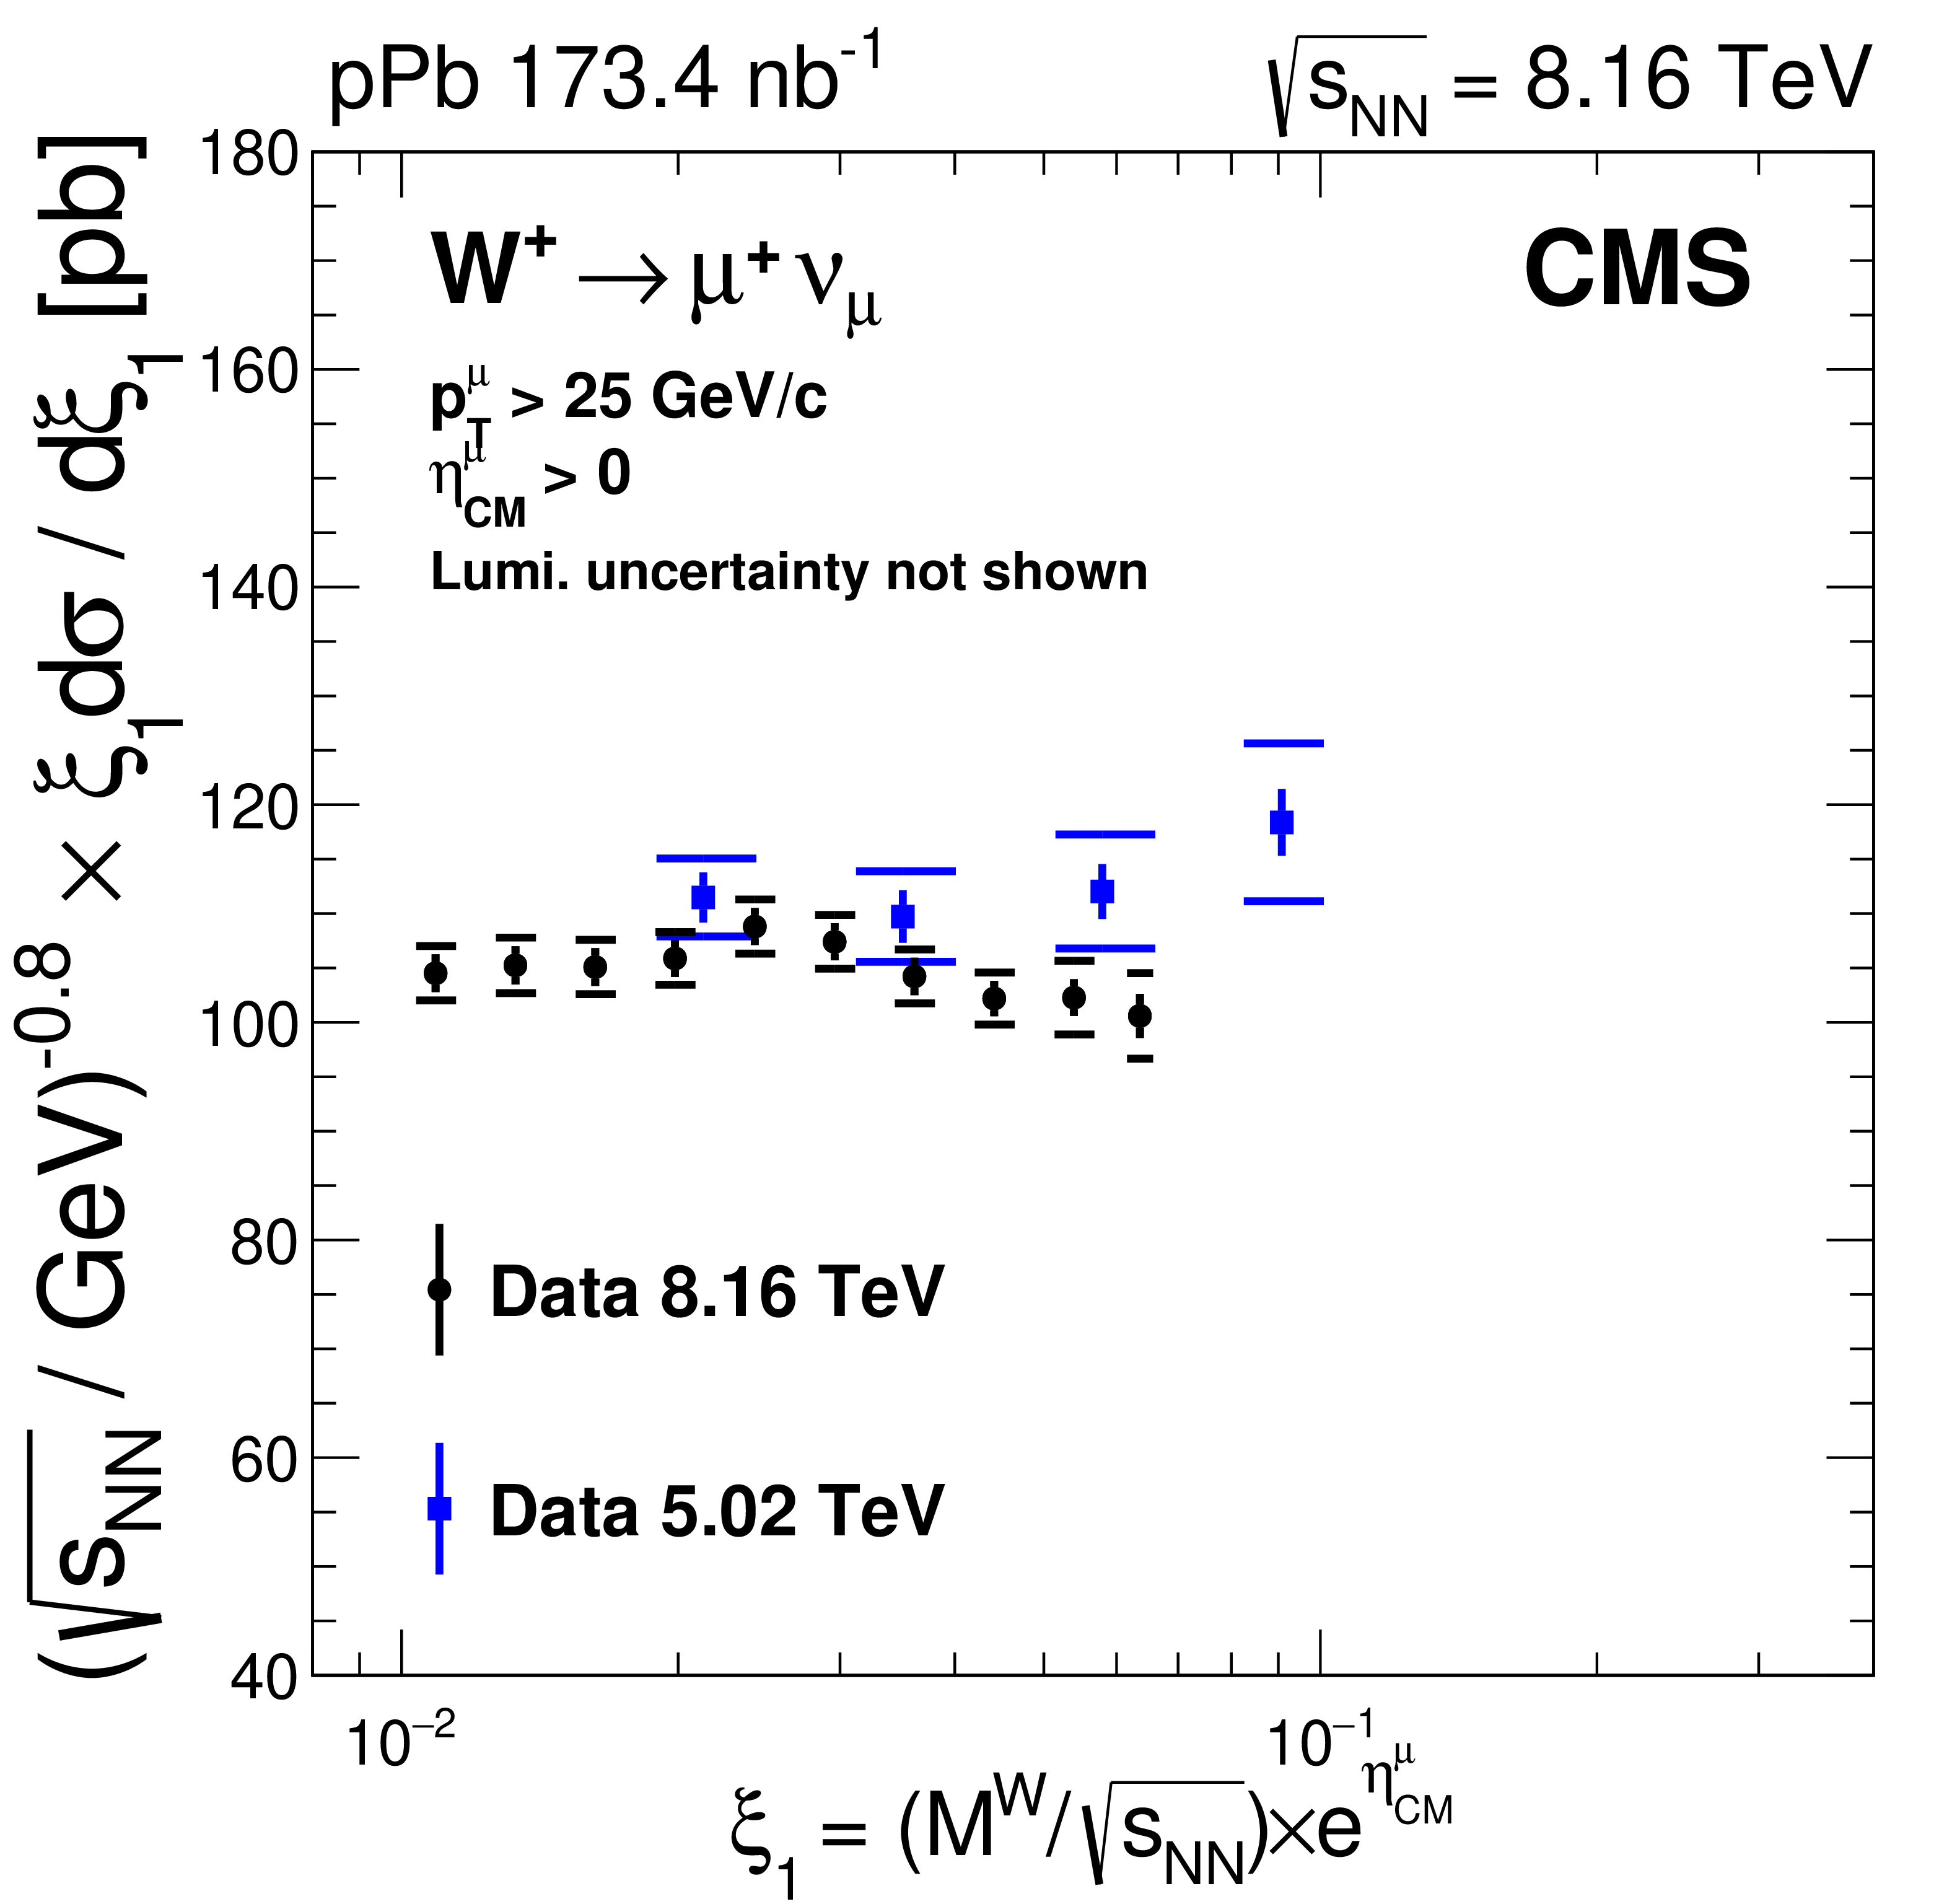
Additional Figure 4:
Comparison of the production cross section for $\mathrm {W}\rightarrow \mu ^{+}\nu _{\mu}$ measured at 8.16 TeV (black points) and at 5.02 TeV [Phys. Lett. B 750 (2015) 565] (blue squares). The comparison is presented in two muon pseudorapidity regions: $\eta _{\mathrm {CM}} < $ 0 (left plot) and $\eta _{\mathrm {CM}} > $ 0 (right plot). The brackets represent the statistical and systematic uncertainties summed in quadrature, while the error bars show the statistical uncertainties only. The global luminosity uncertainty of $\pm $3.5% for the data at 8.16 TeV and at 5.02 TeV are not shown. |
png pdf |
Additional Figure 4-a:
Comparison of the production cross section for $\mathrm {W}\rightarrow \mu ^{+}\nu _{\mu}$ measured at 8.16 TeV (black points) and at 5.02 TeV [Phys. Lett. B 750 (2015) 565] (blue squares). The comparison is presented in two muon pseudorapidity regions: $\eta _{\mathrm {CM}} < $ 0 (left plot) and $\eta _{\mathrm {CM}} > $ 0 (right plot). The brackets represent the statistical and systematic uncertainties summed in quadrature, while the error bars show the statistical uncertainties only. The global luminosity uncertainty of $\pm $3.5% for the data at 8.16 TeV and at 5.02 TeV are not shown. |
png pdf |
Additional Figure 4-b:
Comparison of the production cross section for $\mathrm {W}\rightarrow \mu ^{+}\nu _{\mu}$ measured at 8.16 TeV (black points) and at 5.02 TeV [Phys. Lett. B 750 (2015) 565] (blue squares). The comparison is presented in two muon pseudorapidity regions: $\eta _{\mathrm {CM}} < $ 0 (left plot) and $\eta _{\mathrm {CM}} > $ 0 (right plot). The brackets represent the statistical and systematic uncertainties summed in quadrature, while the error bars show the statistical uncertainties only. The global luminosity uncertainty of $\pm $3.5% for the data at 8.16 TeV and at 5.02 TeV are not shown. |
png pdf |
Additional Figure 5:
Comparison of the muon charge asymmetry measured at 8.16 TeV (black points) and at 5.02 TeV [Phys. Lett. B 750 (2015) 565] (blue squares). The muon pseudorapidity has been shifted according to ${= {{\eta _{\text {CM}}} ^{{\mu}}} }$ $\pm $ ln (8.16 TeV). The brackets represent the statistical and systematic uncertainties summed in quadrature, while the error bars show the statistical uncertainties only. |
png pdf |
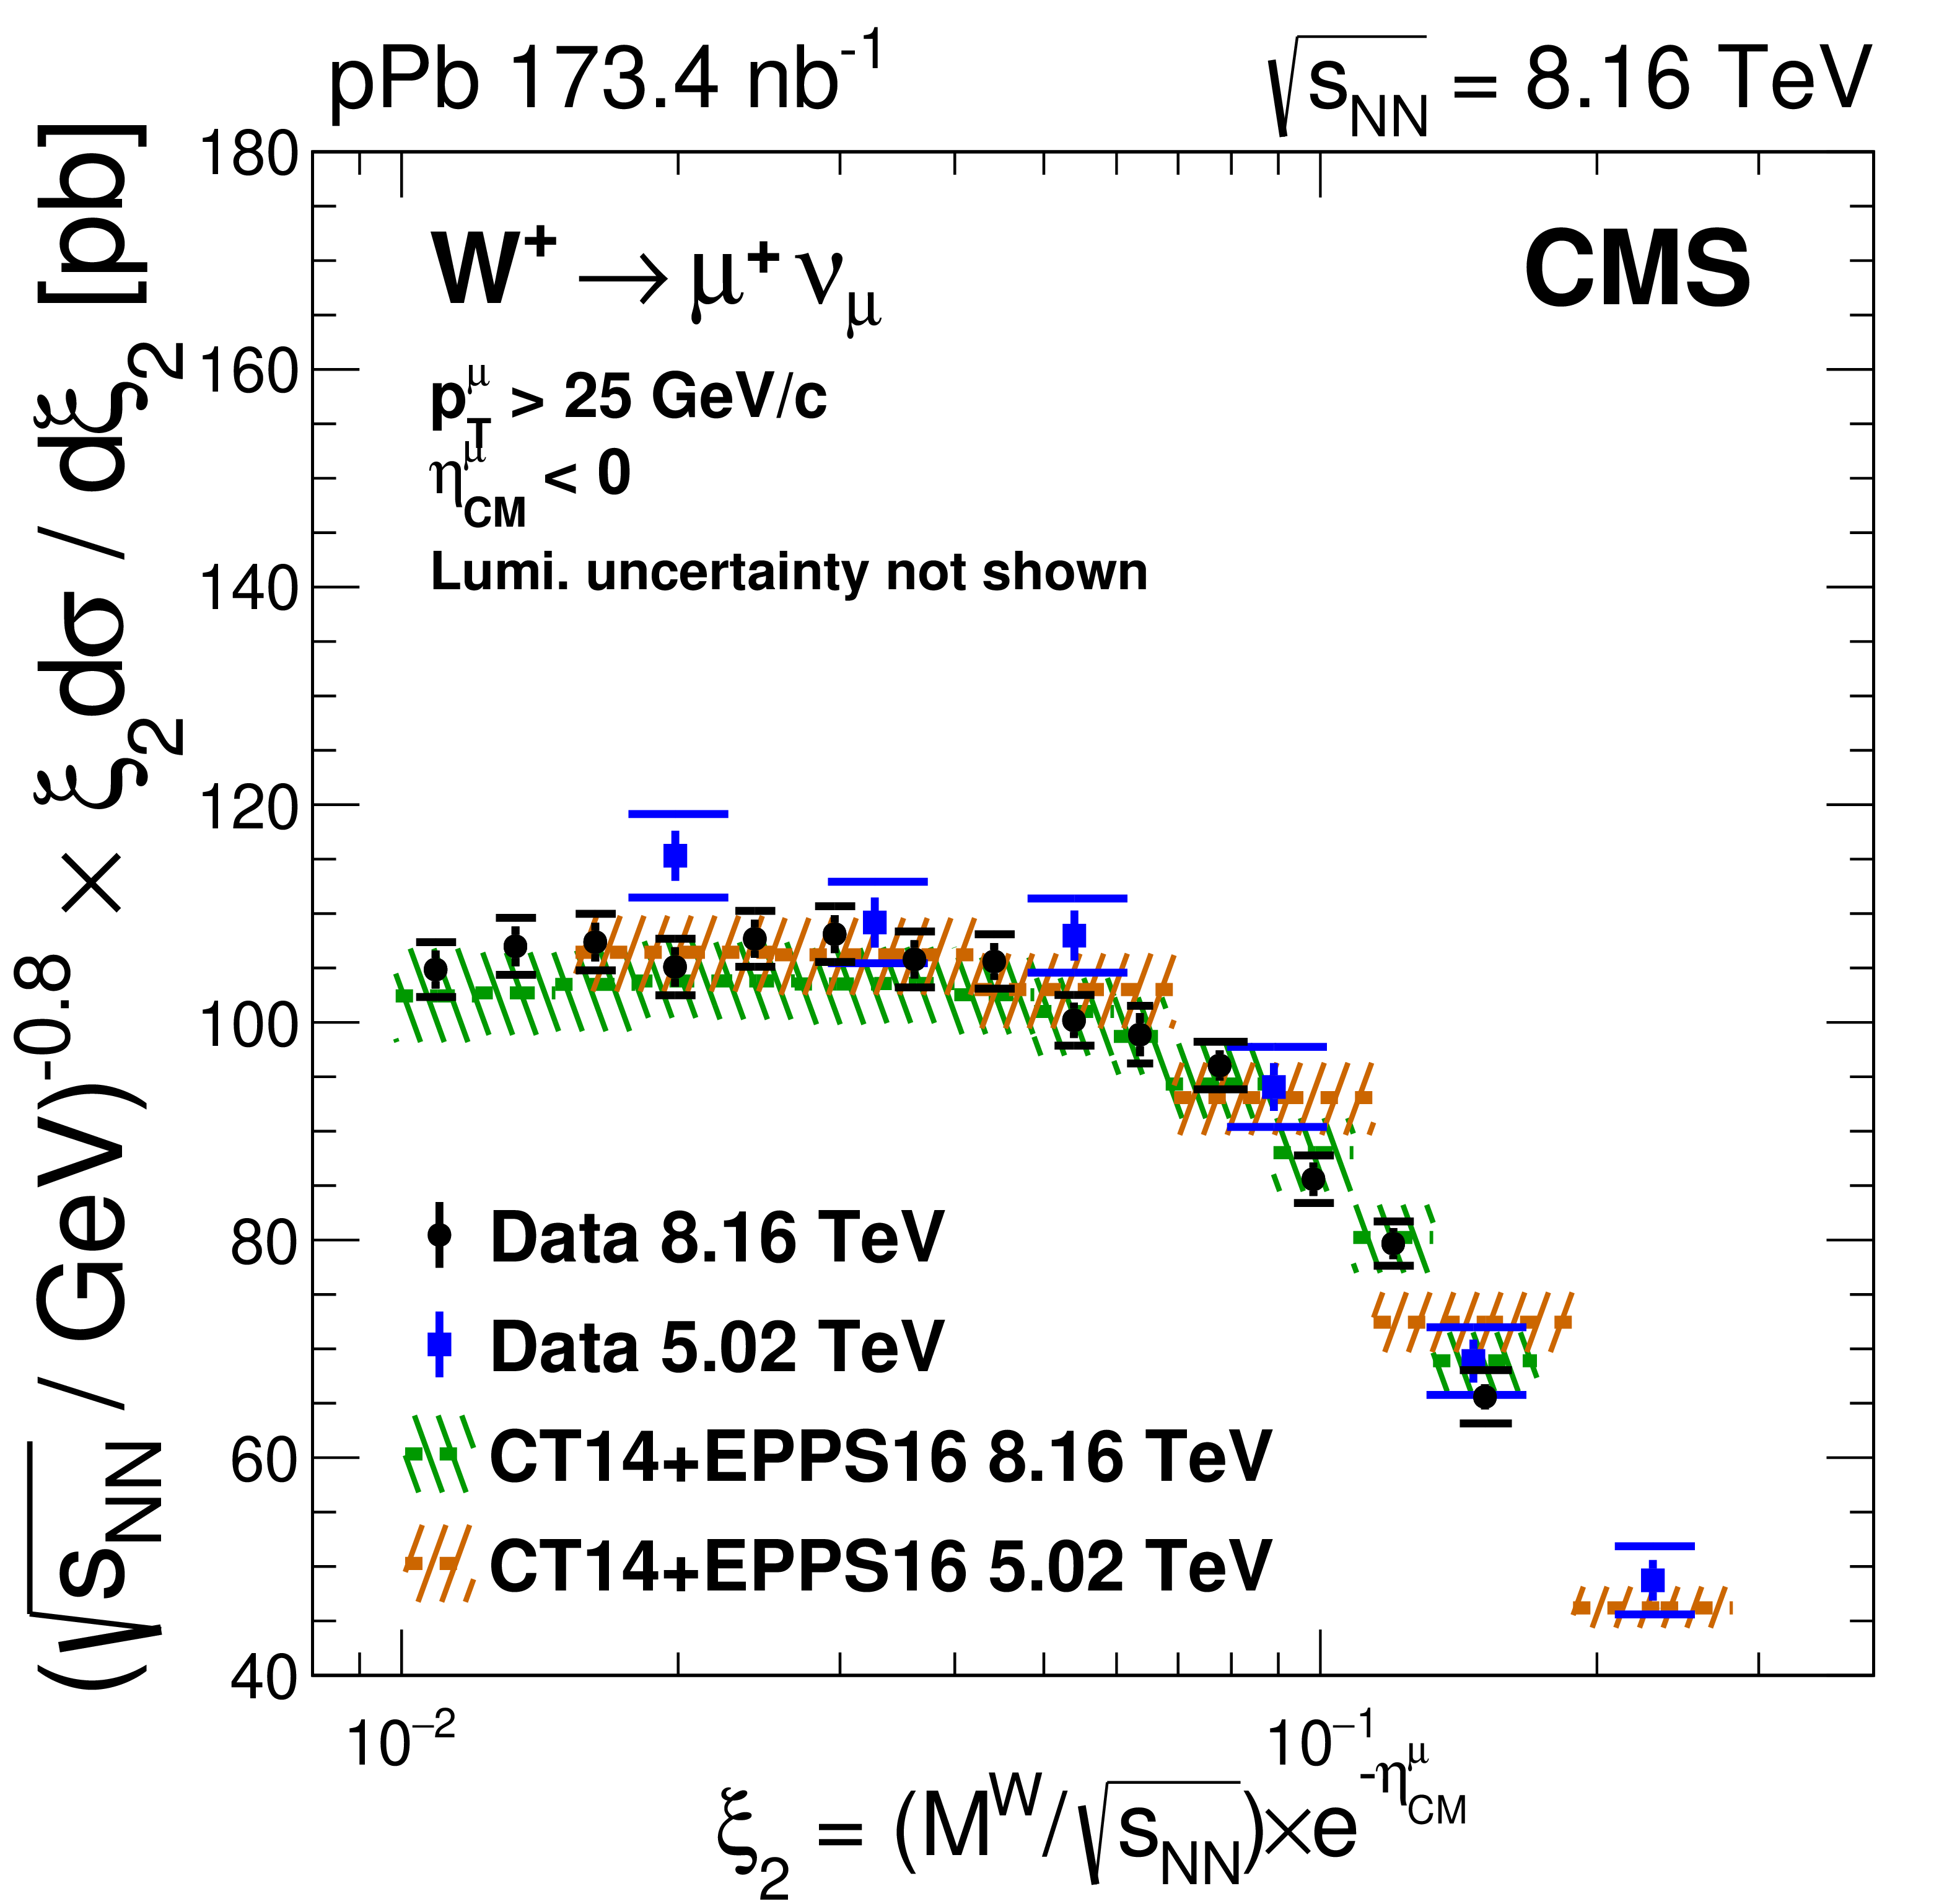
Additional Figure 6:
Comparison of the production cross section for $\mathrm {W}\rightarrow \mu ^{-}\bar{\nu}_{\mu}$ measured at 8.16 TeV (black points) and at 5.02 TeV [Phys. Lett. B 750 (2015) 565] (blue squares). The comparison is presented in two muon pseudorapidity regions: $\eta _{\mathrm {CM}} < $ 0 (left plot) and $\eta _{\mathrm {CM}} > $ 0 (right plot). The brackets represent the statistical and systematic uncertainties summed in quadrature, while the error bars show the statistical uncertainties only. The global luminosity uncertainty of $\pm $3.5% for the data at 8.16 TeV and at 5.02 TeV are not shown. Calculations using with CT14+EPPS16 nPDF [Eur. Phys. J. C 77, 163 (2017)] at 8.16 TeV (green line) and at 5.02 TeV (brown line), are also displayed, including their PDF uncertainty bands at 68% confidence interval. |
png pdf |
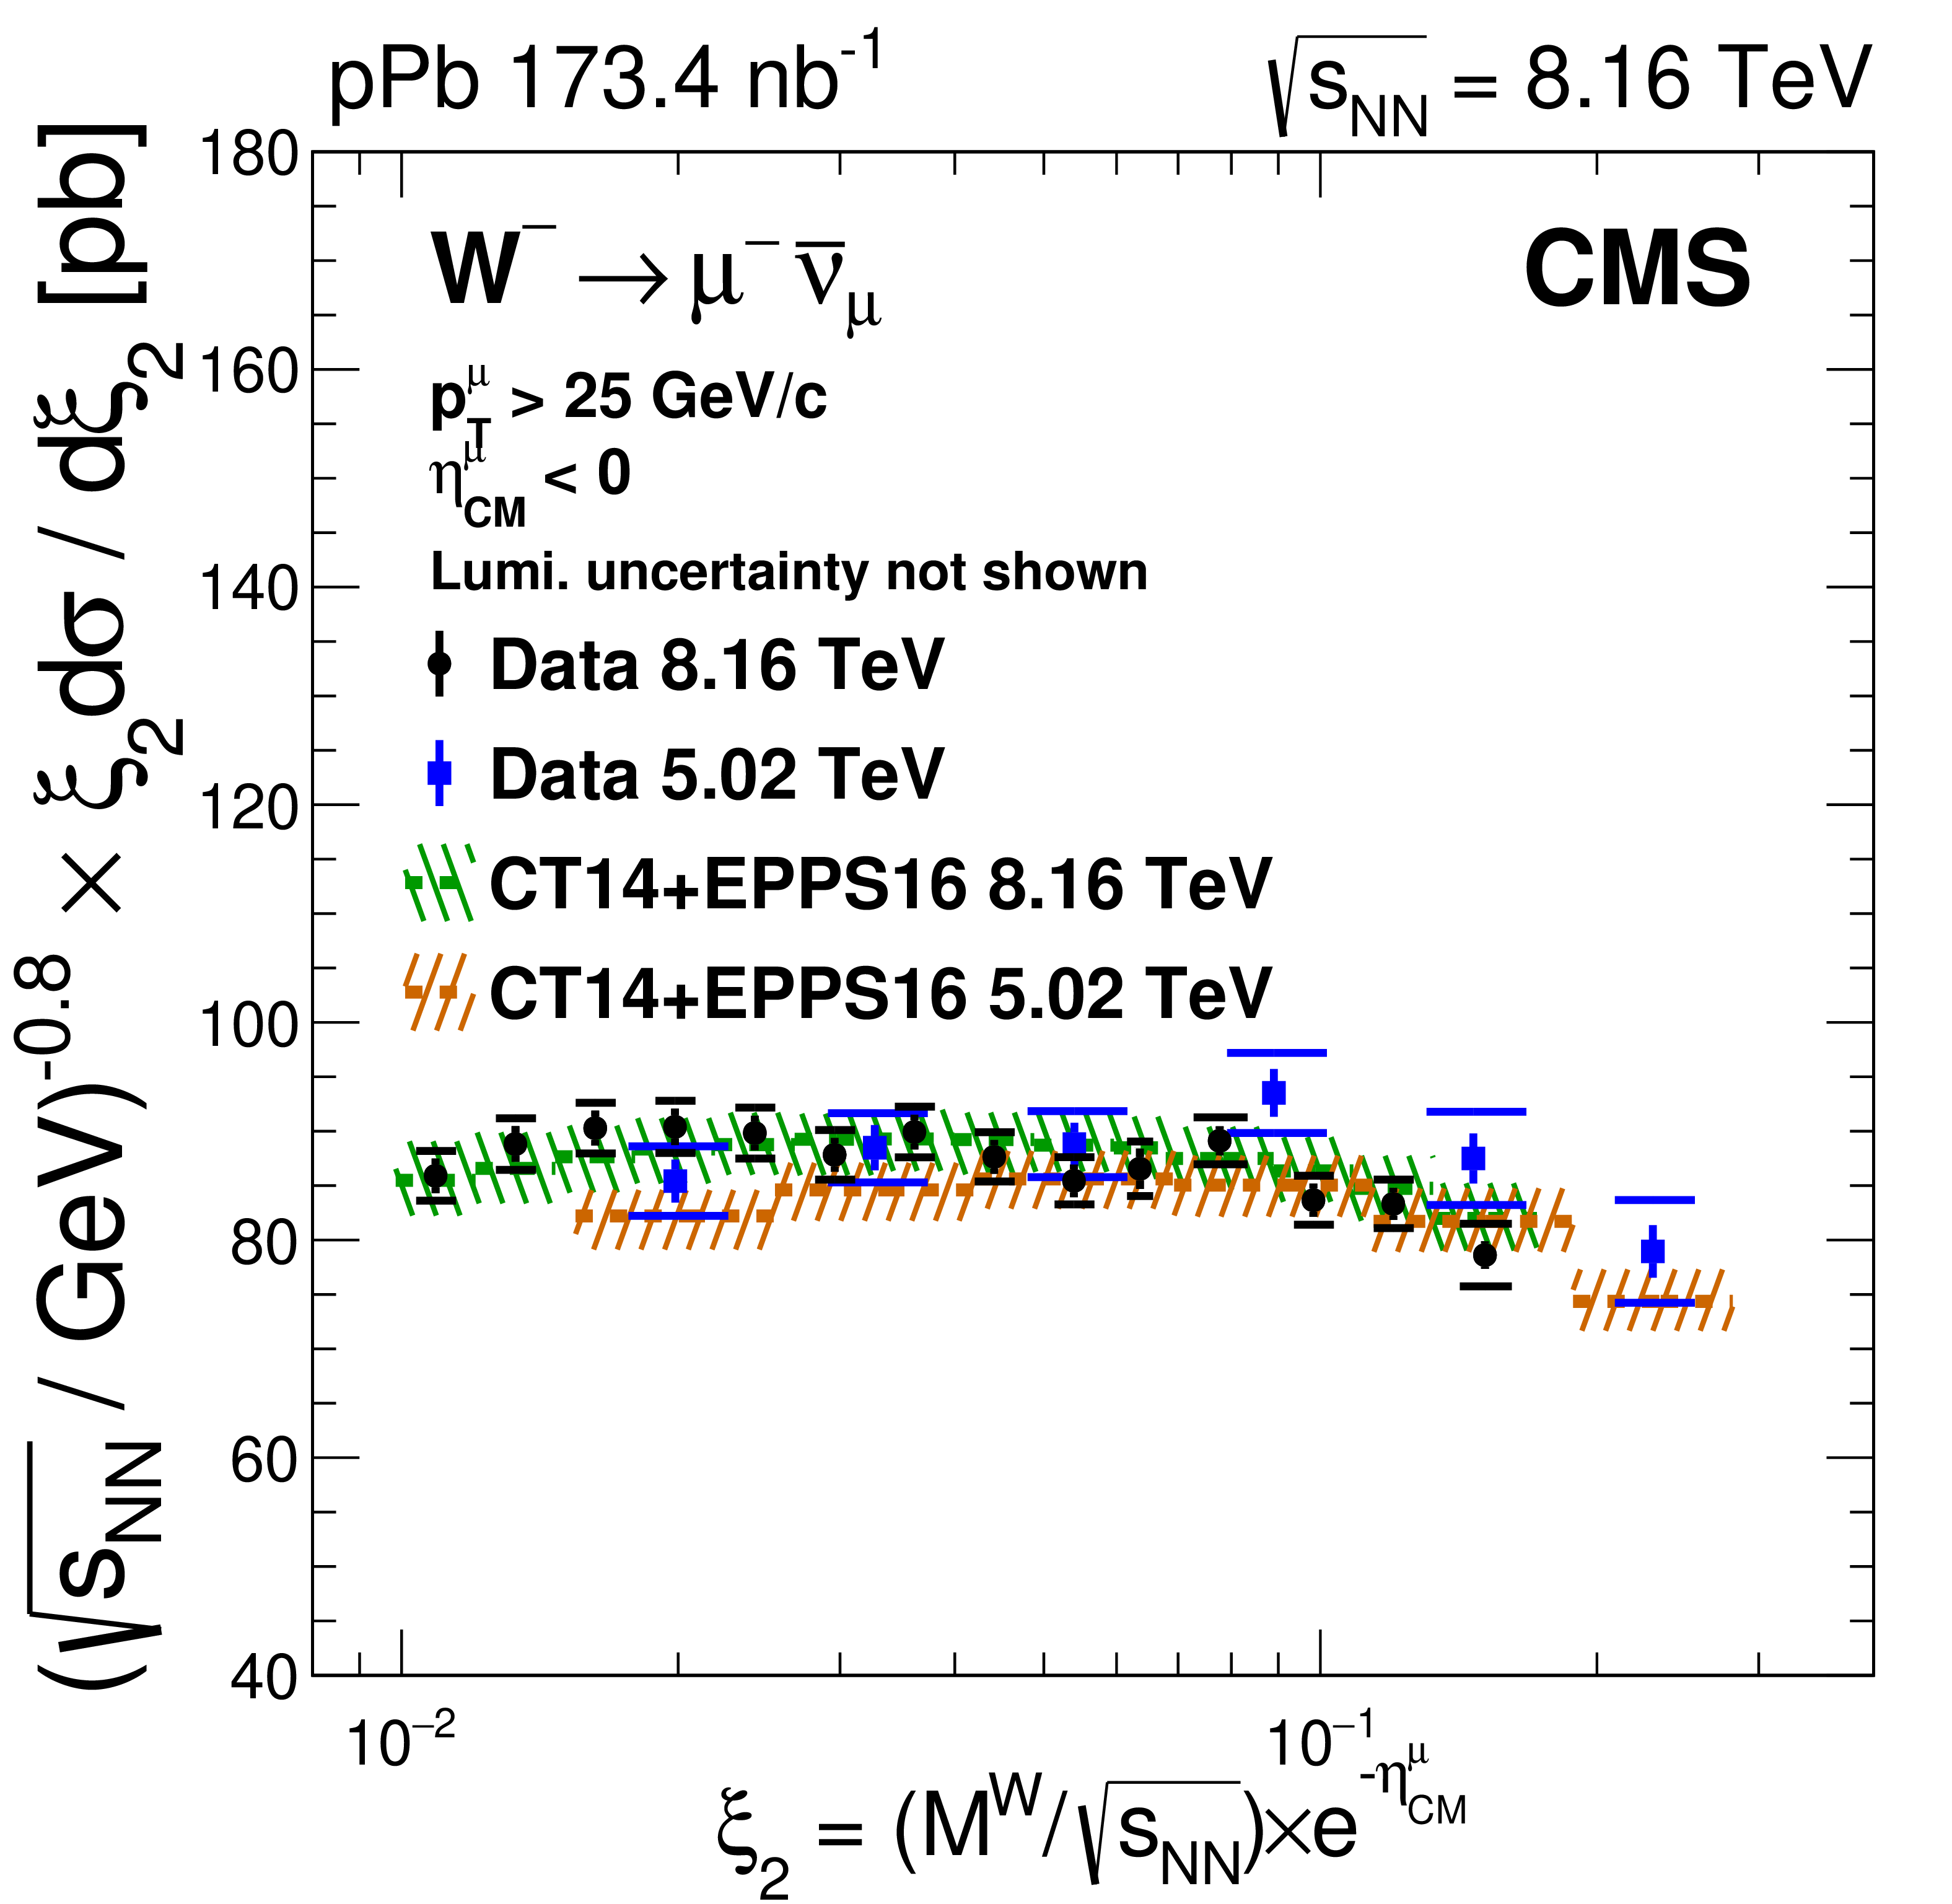
Additional Figure 6-a:
Comparison of the production cross section for $\mathrm {W}\rightarrow \mu ^{-}\bar{\nu}_{\mu}$ measured at 8.16 TeV (black points) and at 5.02 TeV [Phys. Lett. B 750 (2015) 565] (blue squares). The comparison is presented in the muon pseudorapidity region $\eta _{\mathrm {CM}} < $ 0. The brackets represent the statistical and systematic uncertainties summed in quadrature, while the error bars show the statistical uncertainties only. The global luminosity uncertainty of $\pm $3.5% for the data at 8.16 TeV and at 5.02 TeV are not shown. Calculations using with CT14+EPPS16 nPDF [Eur. Phys. J. C 77, 163 (2017)] at 8.16 TeV (green line) and at 5.02 TeV (brown line), are also displayed, including their PDF uncertainty bands at 68% confidence interval. |
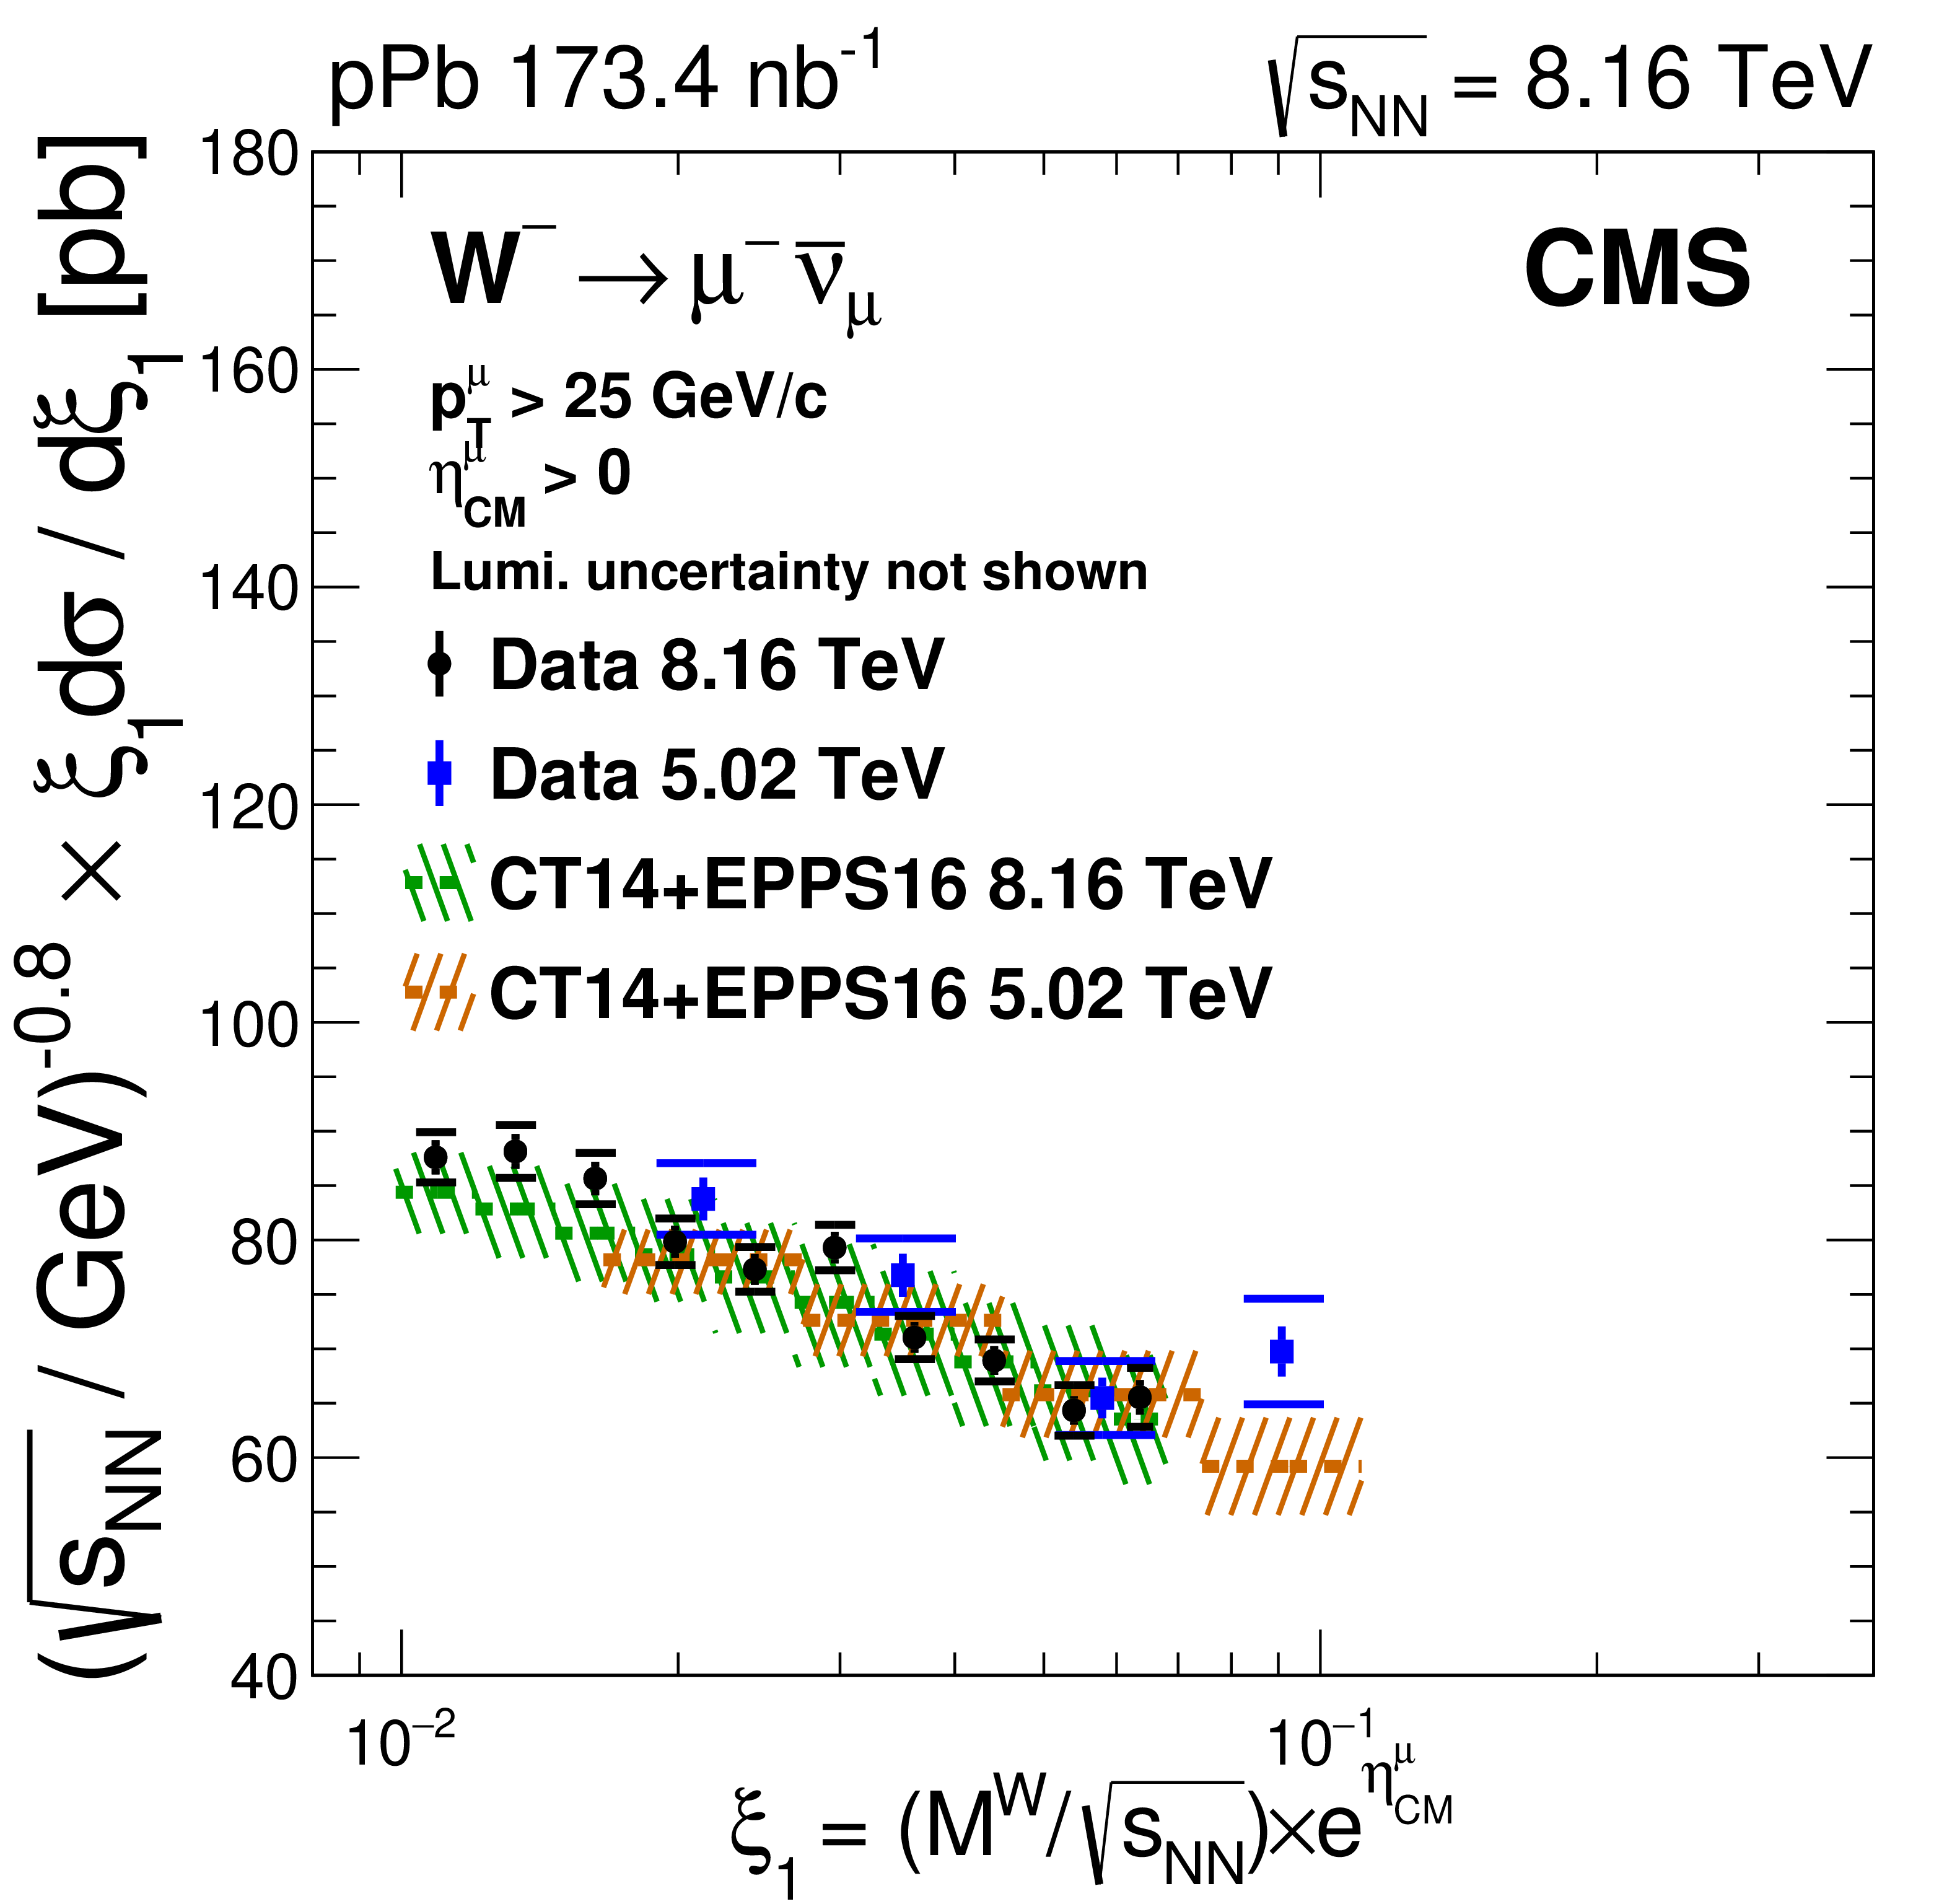
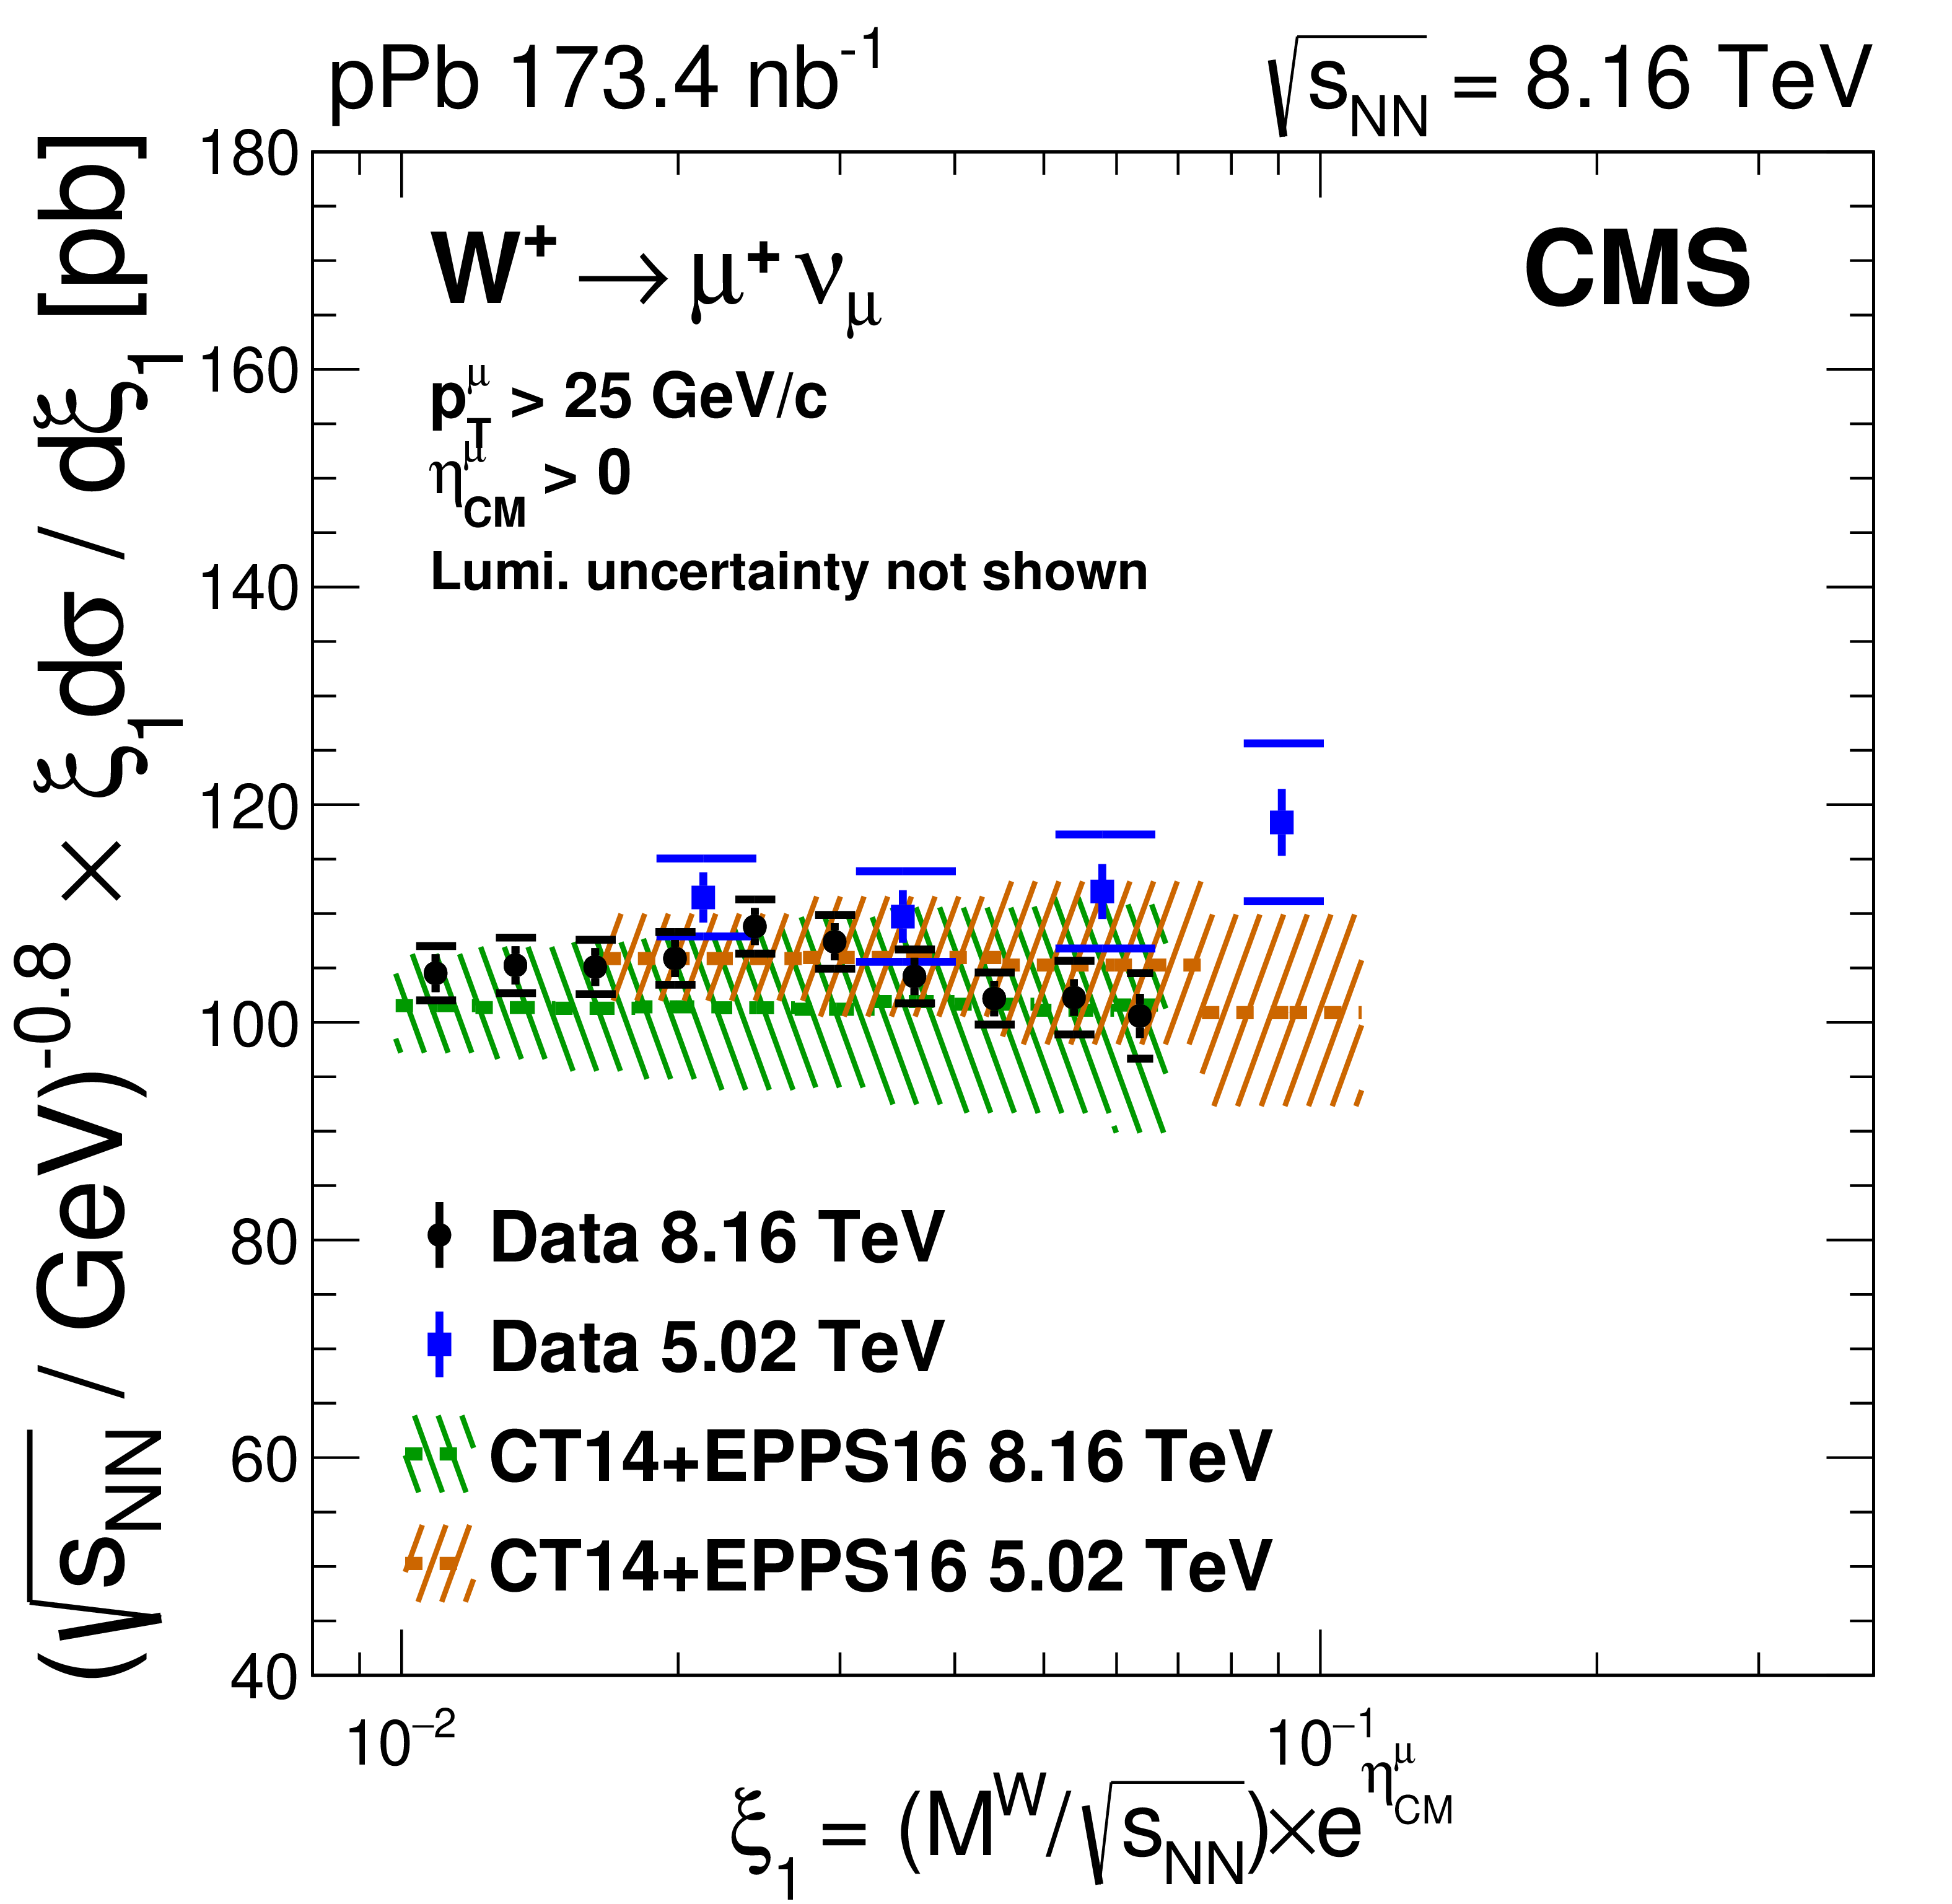
png pdf |
Additional Figure 6-b:
Comparison of the production cross section for $\mathrm {W}\rightarrow \mu ^{-}\bar{\nu}_{\mu}$ measured at 8.16 TeV (black points) and at 5.02 TeV [Phys. Lett. B 750 (2015) 565] (blue squares). The comparison is presented in the muon pseudorapidity region $\eta _{\mathrm {CM}} > $ 0. The brackets represent the statistical and systematic uncertainties summed in quadrature, while the error bars show the statistical uncertainties only. The global luminosity uncertainty of $\pm $3.5% for the data at 8.16 TeV and at 5.02 TeV are not shown. Calculations using with CT14+EPPS16 nPDF [Eur. Phys. J. C 77, 163 (2017)] at 8.16 TeV (green line) and at 5.02 TeV (brown line), are also displayed, including their PDF uncertainty bands at 68% confidence interval. |
png pdf |
Additional Figure 7:
Comparison of the production cross section for $\mathrm {W}\rightarrow \mu ^{+}\nu _{\mu}$ measured at 8.16 TeV (black points) and at 5.02 TeV [Phys. Lett. B 750 (2015) 565] (blue squares). The comparison is presented in two muon pseudorapidity regions: $\eta _{\mathrm {CM}} < $ 0 (left plot) and $\eta _{\mathrm {CM}} > $ 0 (right plot). The brackets represent the statistical and systematic uncertainties summed in quadrature, while the error bars show the statistical uncertainties only. The global luminosity uncertainty of $\pm $3.5% for the data at 8.16 TeV and at 5.02 TeV are not shown. Calculations using with CT14+EPPS16 nPDF [Eur. Phys. J. C 77, 163 (2017)] at 8.16 TeV (green line) and at 5.02 TeV (brown line), are also displayed, including their PDF uncertainty bands at 68% confidence interval. |
png pdf |
Additional Figure 7-a:
Comparison of the production cross section for $\mathrm {W}\rightarrow \mu ^{+}\nu _{\mu}$ measured at 8.16 TeV (black points) and at 5.02 TeV [Phys. Lett. B 750 (2015) 565] (blue squares). The comparison is presented in the muon pseudorapidity region $\eta _{\mathrm {CM}} < $ 0. The brackets represent the statistical and systematic uncertainties summed in quadrature, while the error bars show the statistical uncertainties only. The global luminosity uncertainty of $\pm $3.5% for the data at 8.16 TeV and at 5.02 TeV are not shown. Calculations using with CT14+EPPS16 nPDF [Eur. Phys. J. C 77, 163 (2017)] at 8.16 TeV (green line) and at 5.02 TeV (brown line), are also displayed, including their PDF uncertainty bands at 68% confidence interval. |
png pdf |
Additional Figure 7-b:
Comparison of the production cross section for $\mathrm {W}\rightarrow \mu ^{+}\nu _{\mu}$ measured at 8.16 TeV (black points) and at 5.02 TeV [Phys. Lett. B 750 (2015) 565] (blue squares). The comparison is presented in the muon pseudorapidity region $\eta _{\mathrm {CM}} > $ 0. The brackets represent the statistical and systematic uncertainties summed in quadrature, while the error bars show the statistical uncertainties only. The global luminosity uncertainty of $\pm $3.5% for the data at 8.16 TeV and at 5.02 TeV are not shown. Calculations using with CT14+EPPS16 nPDF [Eur. Phys. J. C 77, 163 (2017)] at 8.16 TeV (green line) and at 5.02 TeV (brown line), are also displayed, including their PDF uncertainty bands at 68% confidence interval. |
png pdf |
Additional Figure 8:
Distribution of the $\chi ^2$/ndf values from the comparison of data (muon charge asymmetry) and theoretical calculations, for the CT14 [Phys. Rev. D 93, 033006 (2016)], nCTEQ15 [Phys. Rev. D 93, 085037 (2016)] and EPPS16 [Eur. Phys. J. C 77, 163 (2017)] individual sets. The vertical dashed lines represent the prediction corresponding to the central set of CT14, nCTEQ15, and EPPS16. |
png pdf |
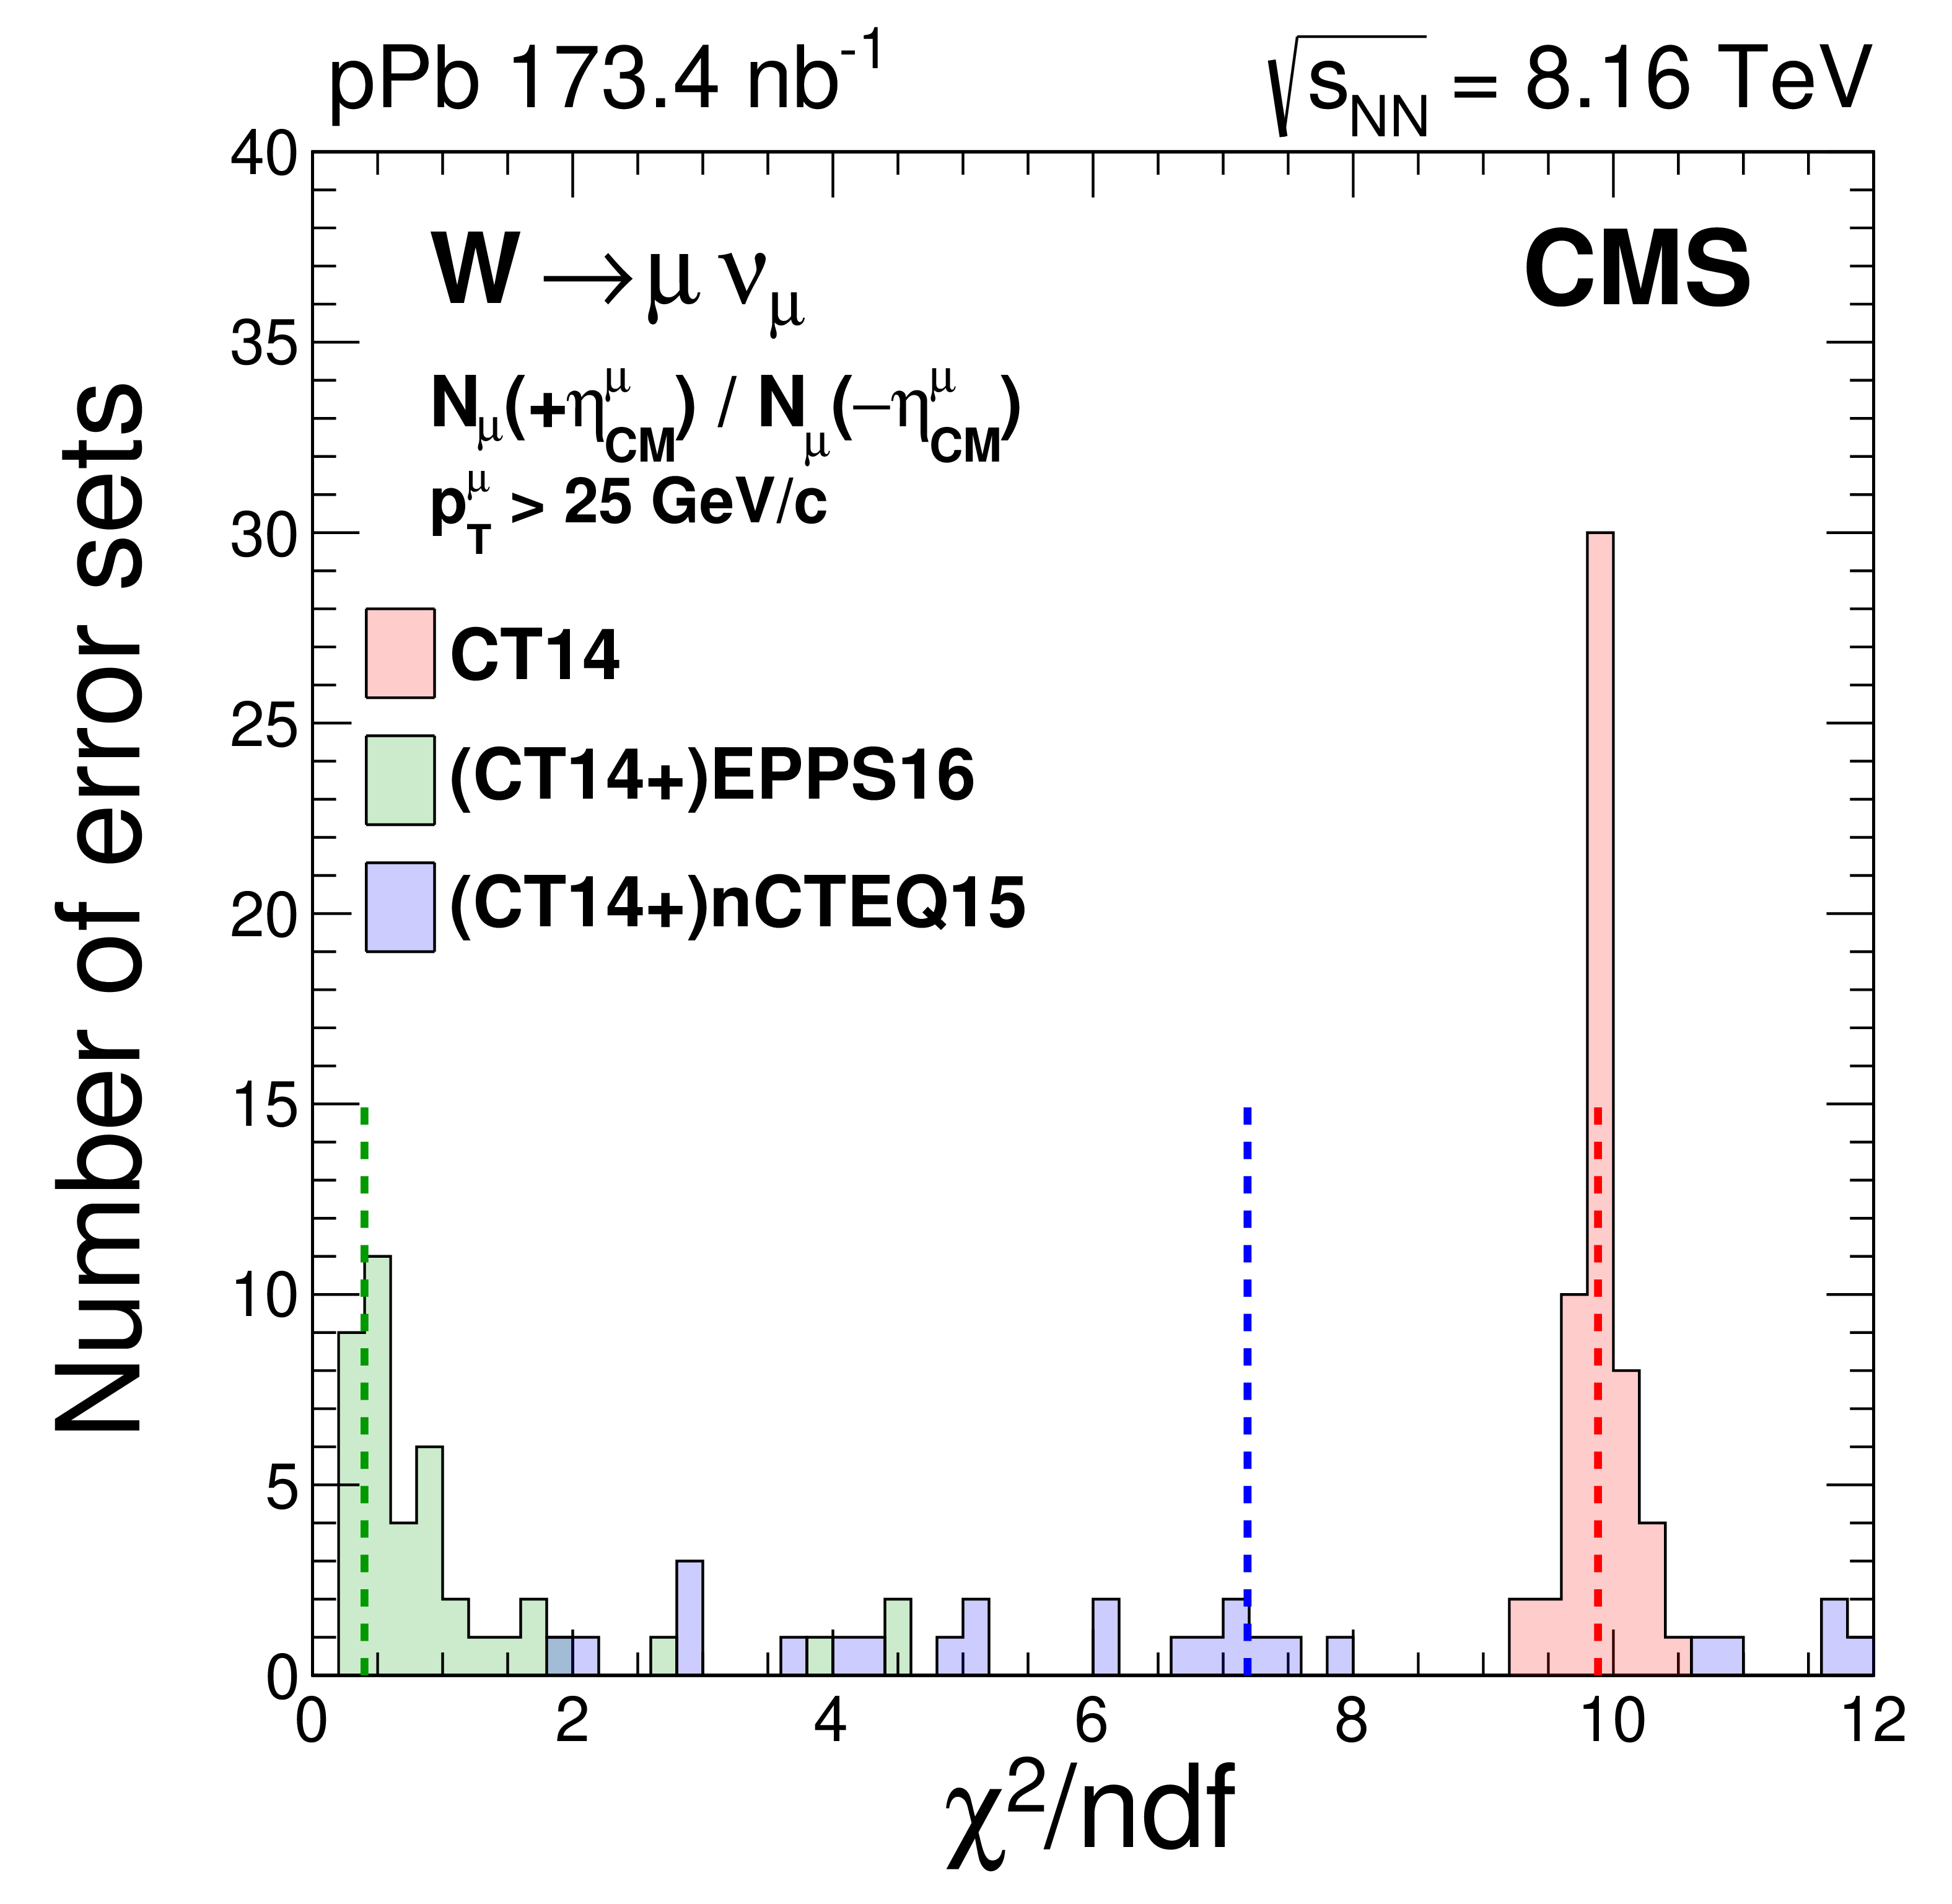
Additional Figure 9:
Distribution of the $\chi ^2$/ndf values from the comparison of data (muon forward-backward ratio) and theoretical calculations, for the CT14 [Phys. Rev. D 93, 033006 (2016)], nCTEQ15 [Phys. Rev. D 93, 085037 (2016)] and EPPS16 [Eur. Phys. J. C 77, 163 (2017)] individual sets. The vertical dashed lines represent the prediction corresponding to the central set of CT14, nCTEQ15, and EPPS16. |
png pdf |
Additional Figure 10:
Distribution of the $\chi ^2$/ndf values from the comparison of data (forward-backward ratio of all muons) and theoretical calculations, for the CT14 [Phys. Rev. D 93, 033006 (2016)], nCTEQ15 [Phys. Rev. D 93, 085037 (2016)] and EPPS16 [Eur. Phys. J. C 77, 163 (2017)] individual sets. The vertical dashed lines represent the prediction corresponding to the central set of CT14, nCTEQ15, and EPPS16. |
png pdf |
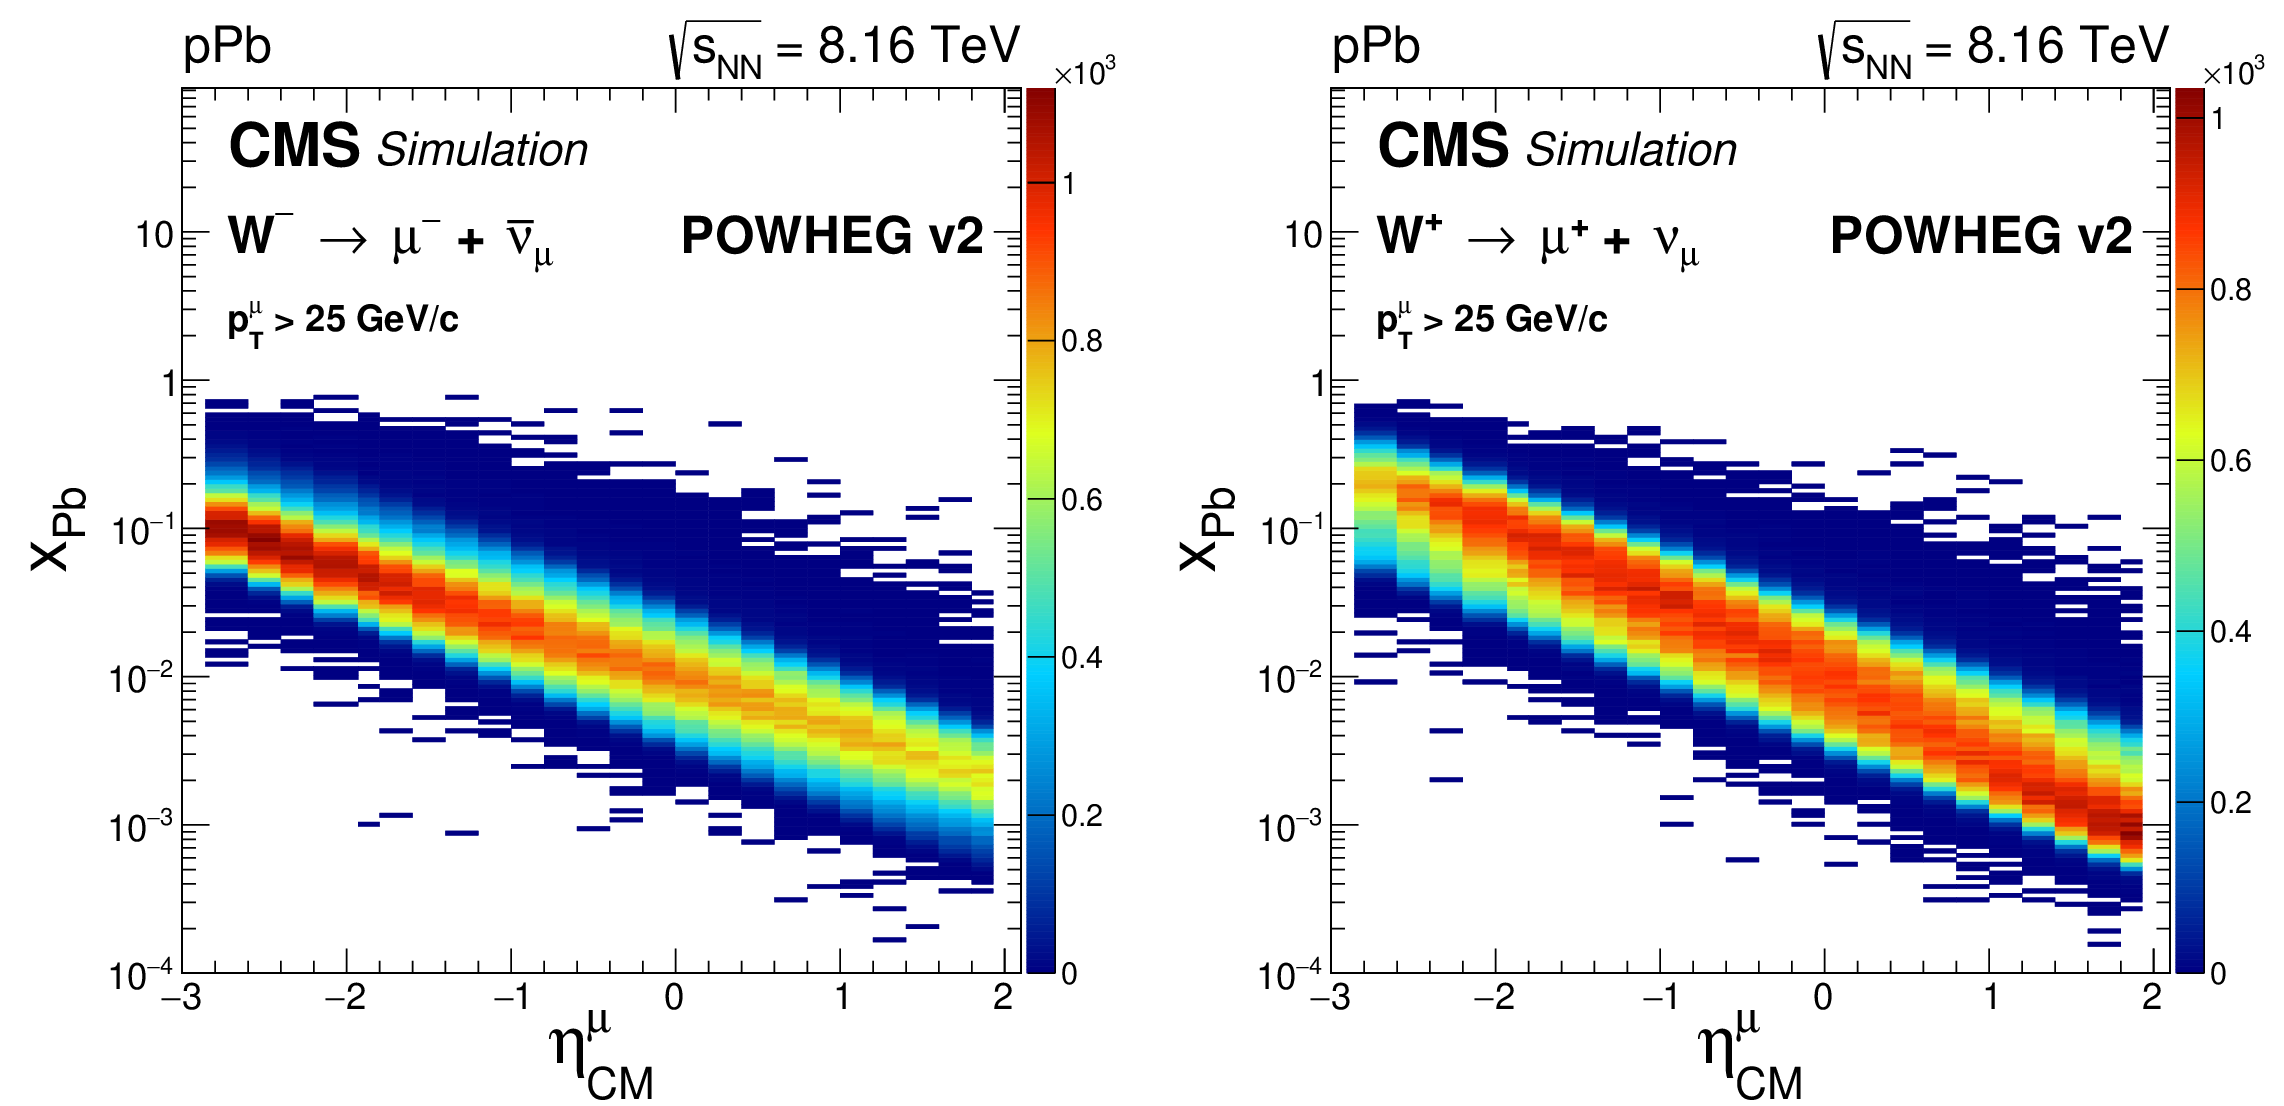
Additional Figure 11:
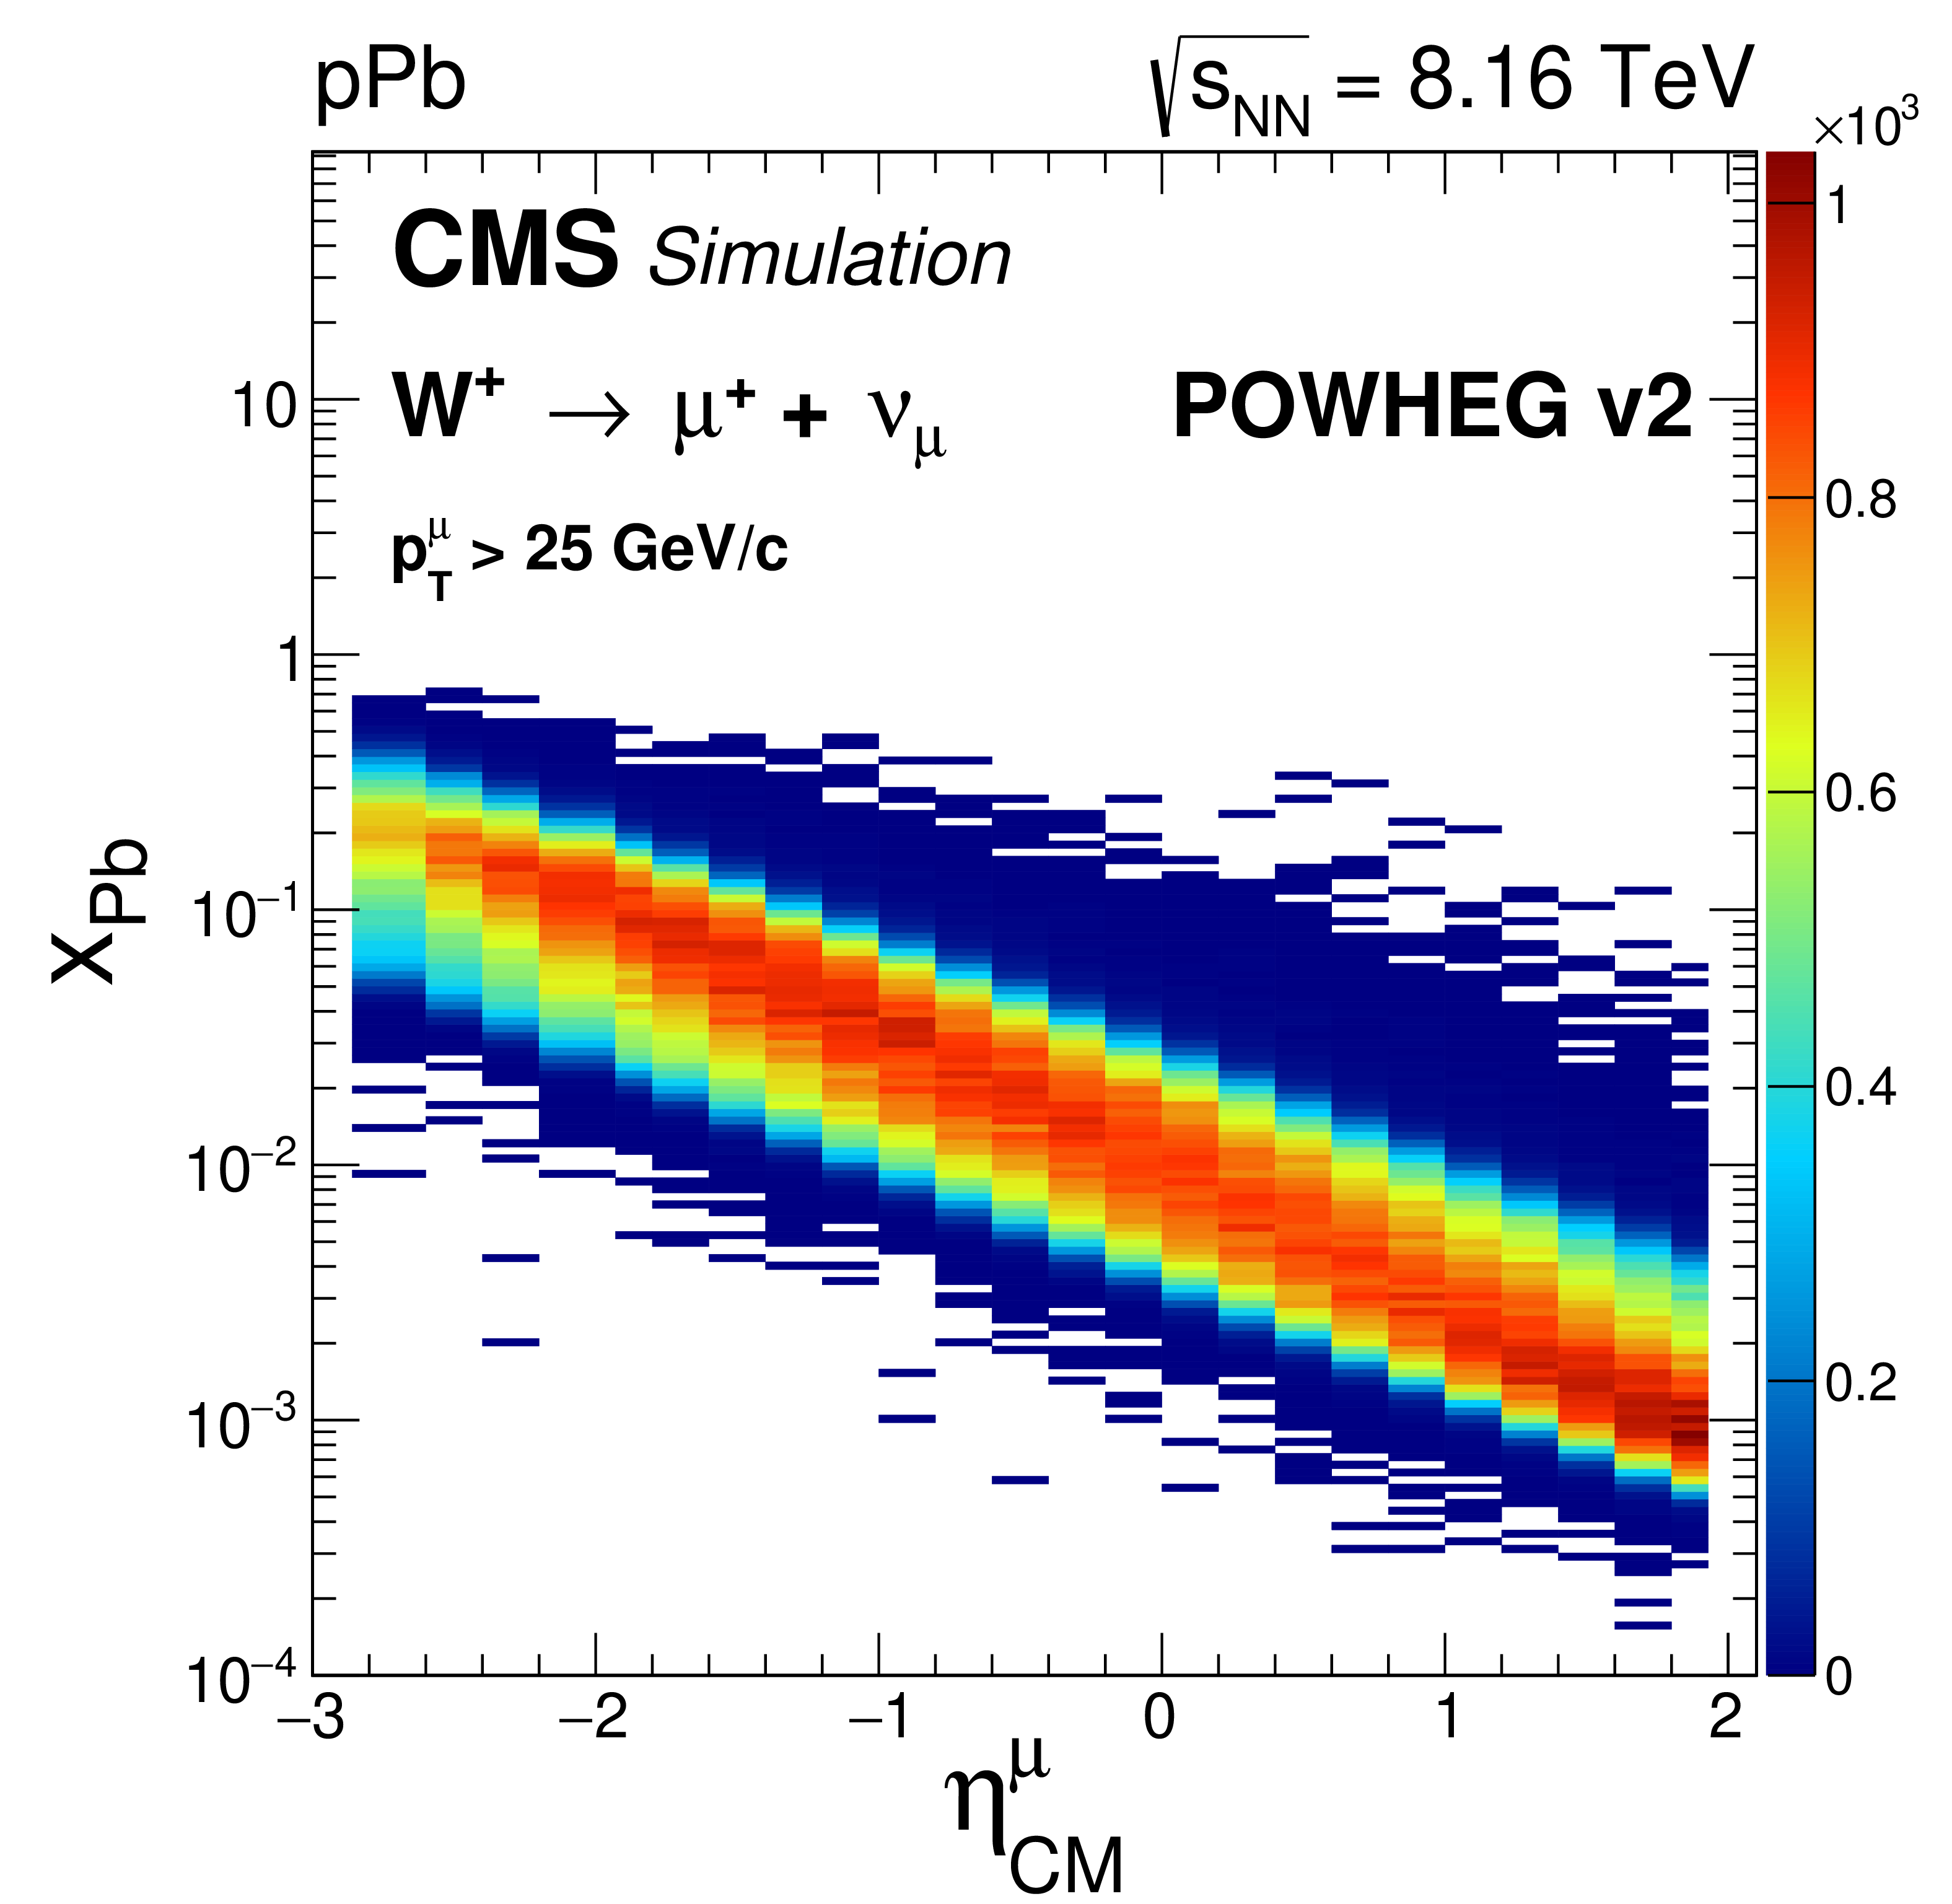
Distribution of the simulated Bjorken x in the Pb ion as a function of the muon pseudorapidity for $\mathrm {W}\rightarrow \mu ^{-}\bar{\nu}_{\mu}$ (left) and $\mathrm {W}\rightarrow \mu ^{+}\nu _{\mu}$ (right) generated at 8.16 TeV. The W boson production have been simulated using the NLO generator POWHEG v2 with the POWHEG BOX W.ew.BMNNP using the CT14+EPPS16 nPDF [Eur. Phys. J. C 77, 163 (2017)]. |
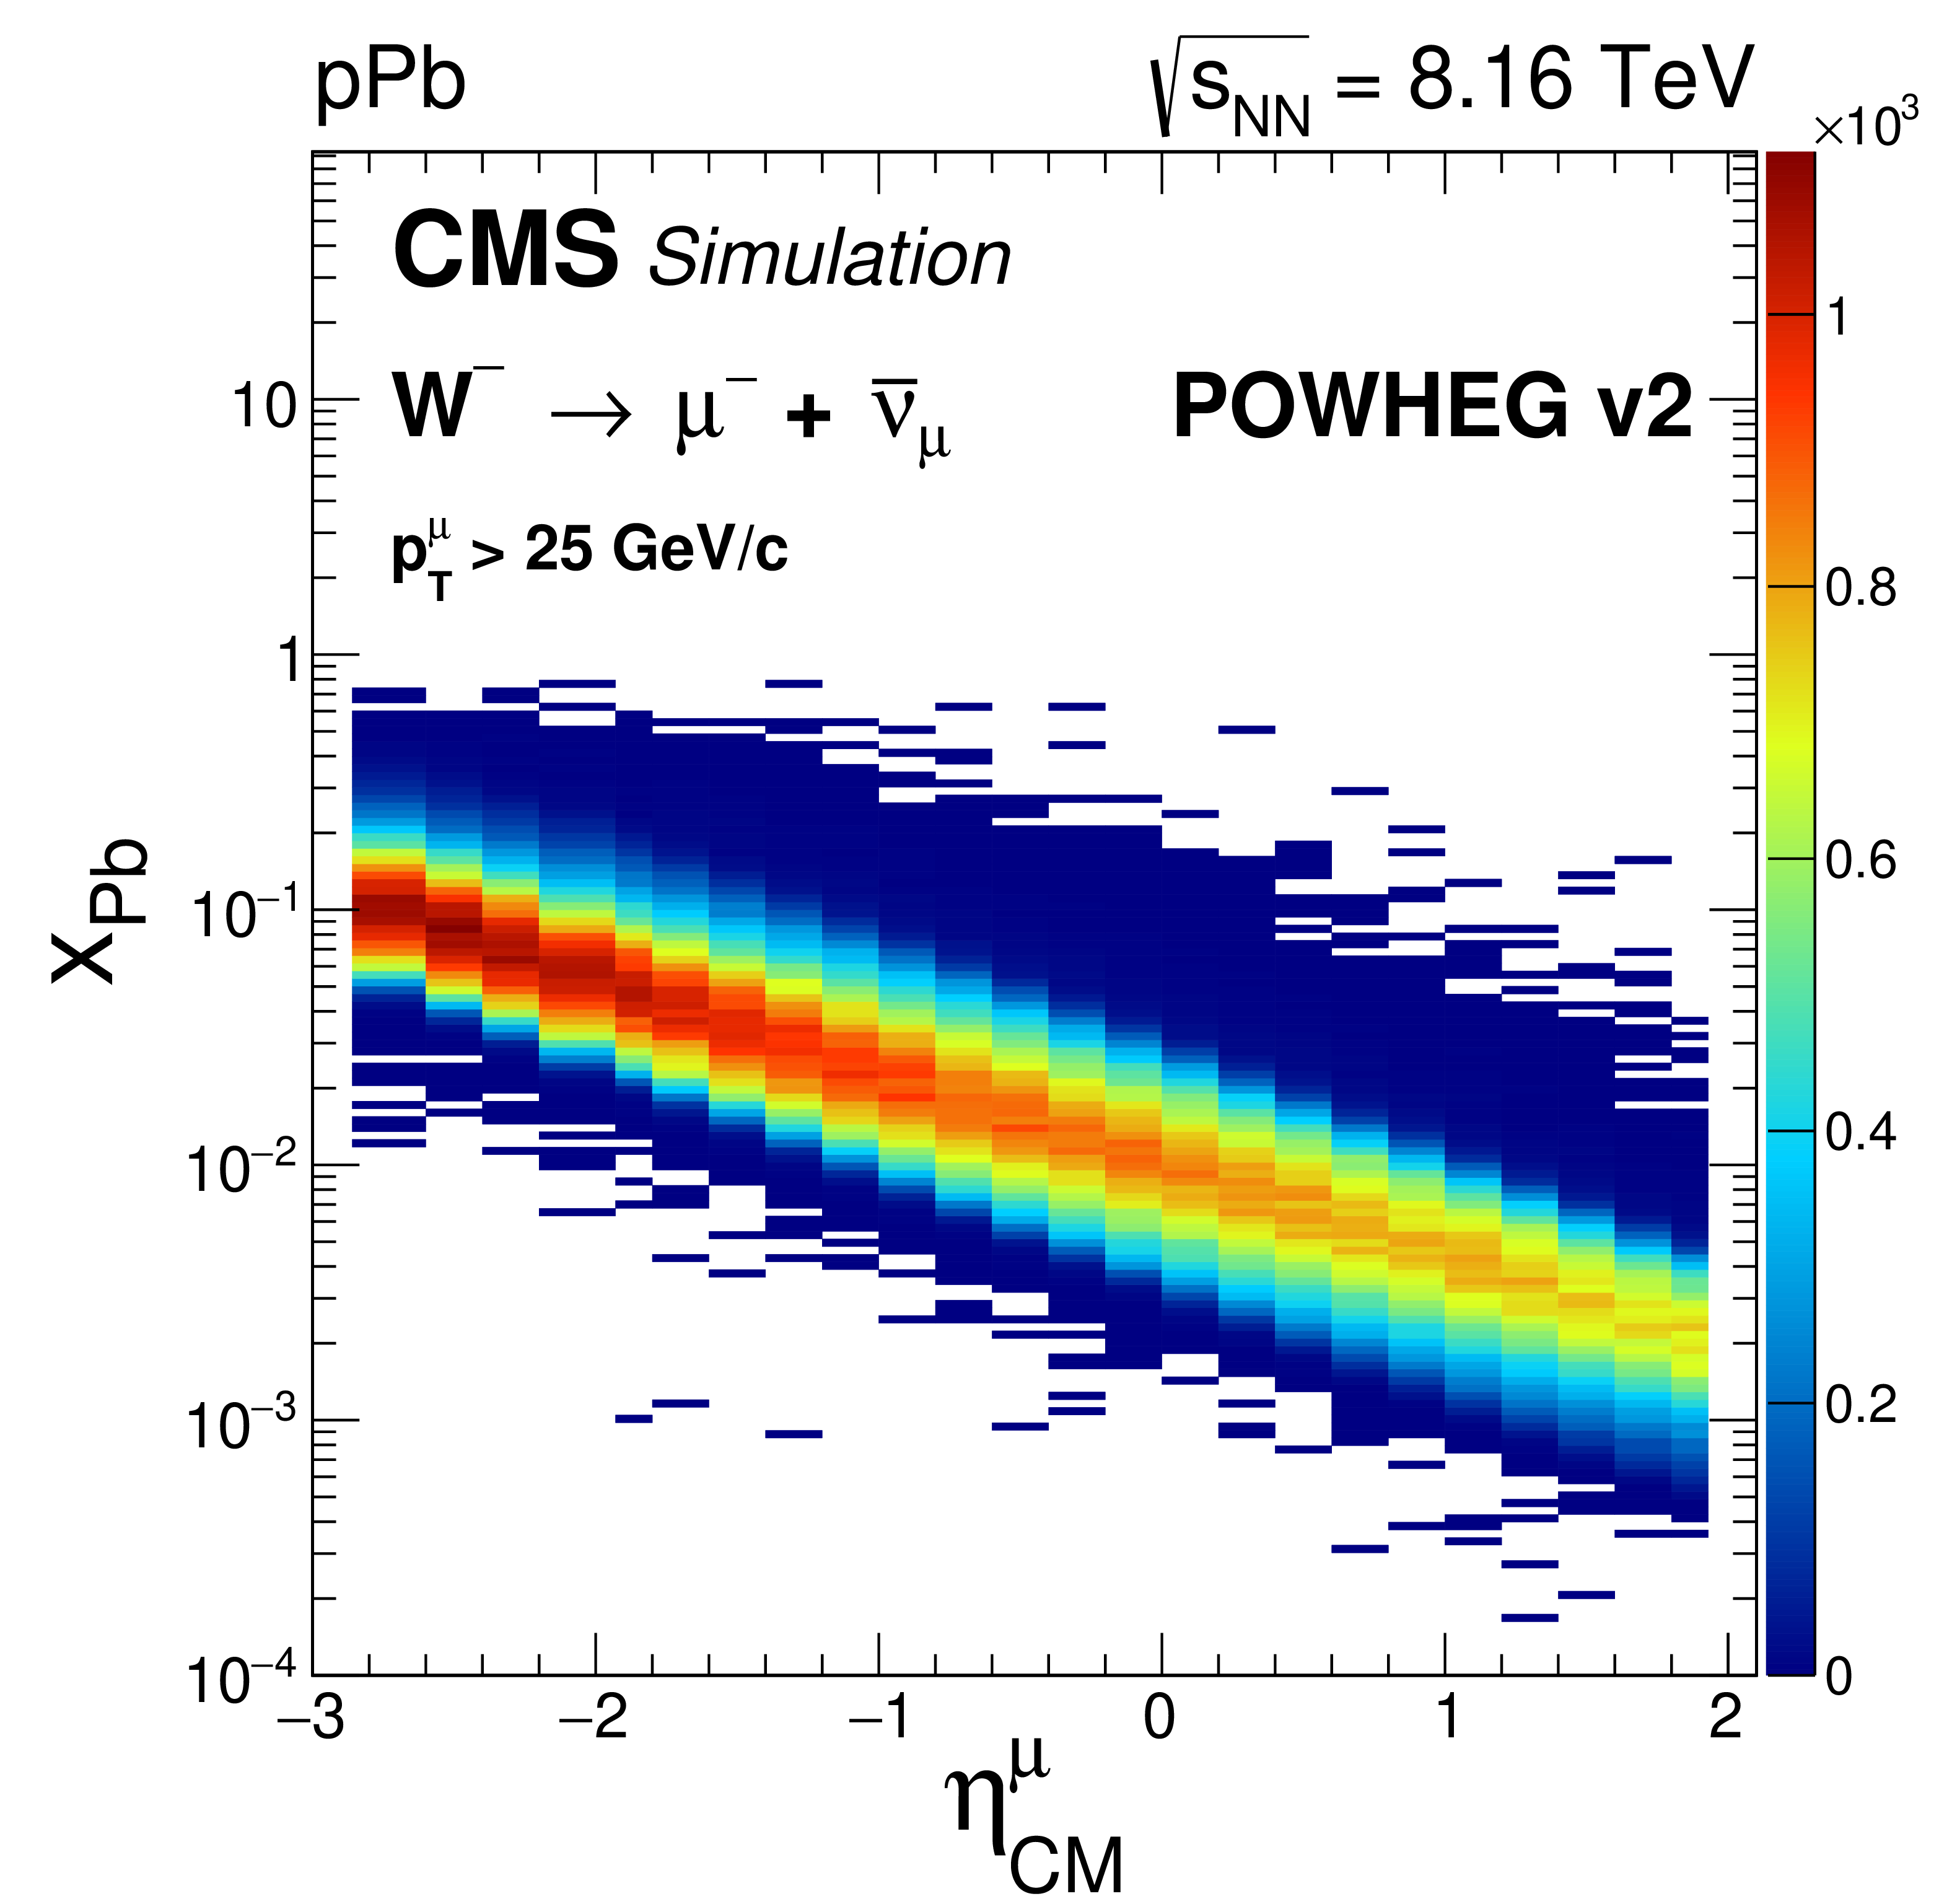
png pdf |
Additional Figure 11-a:
Distribution of the simulated Bjorken x in the Pb ion as a function of the muon pseudorapidity for $\mathrm {W}\rightarrow \mu ^{-}\bar{\nu}_{\mu}$ generated at 8.16 TeV. The W boson production have been simulated using the NLO generator POWHEG v2 with the POWHEG BOX W.ew.BMNNP using the CT14+EPPS16 nPDF [Eur. Phys. J. C 77, 163 (2017)]. |
png pdf |
Additional Figure 11-b:
Distribution of the simulated Bjorken x in the Pb ion as a function of the muon pseudorapidity for $\mathrm {W}\rightarrow \mu ^{+}\nu _{\mu}$ generated at 8.16 TeV. The W boson production have been simulated using the NLO generator POWHEG v2 with the POWHEG BOX W.ew.BMNNP using the CT14+EPPS16 nPDF [Eur. Phys. J. C 77, 163 (2017)]. |
png pdf |
Additional Figure 12:
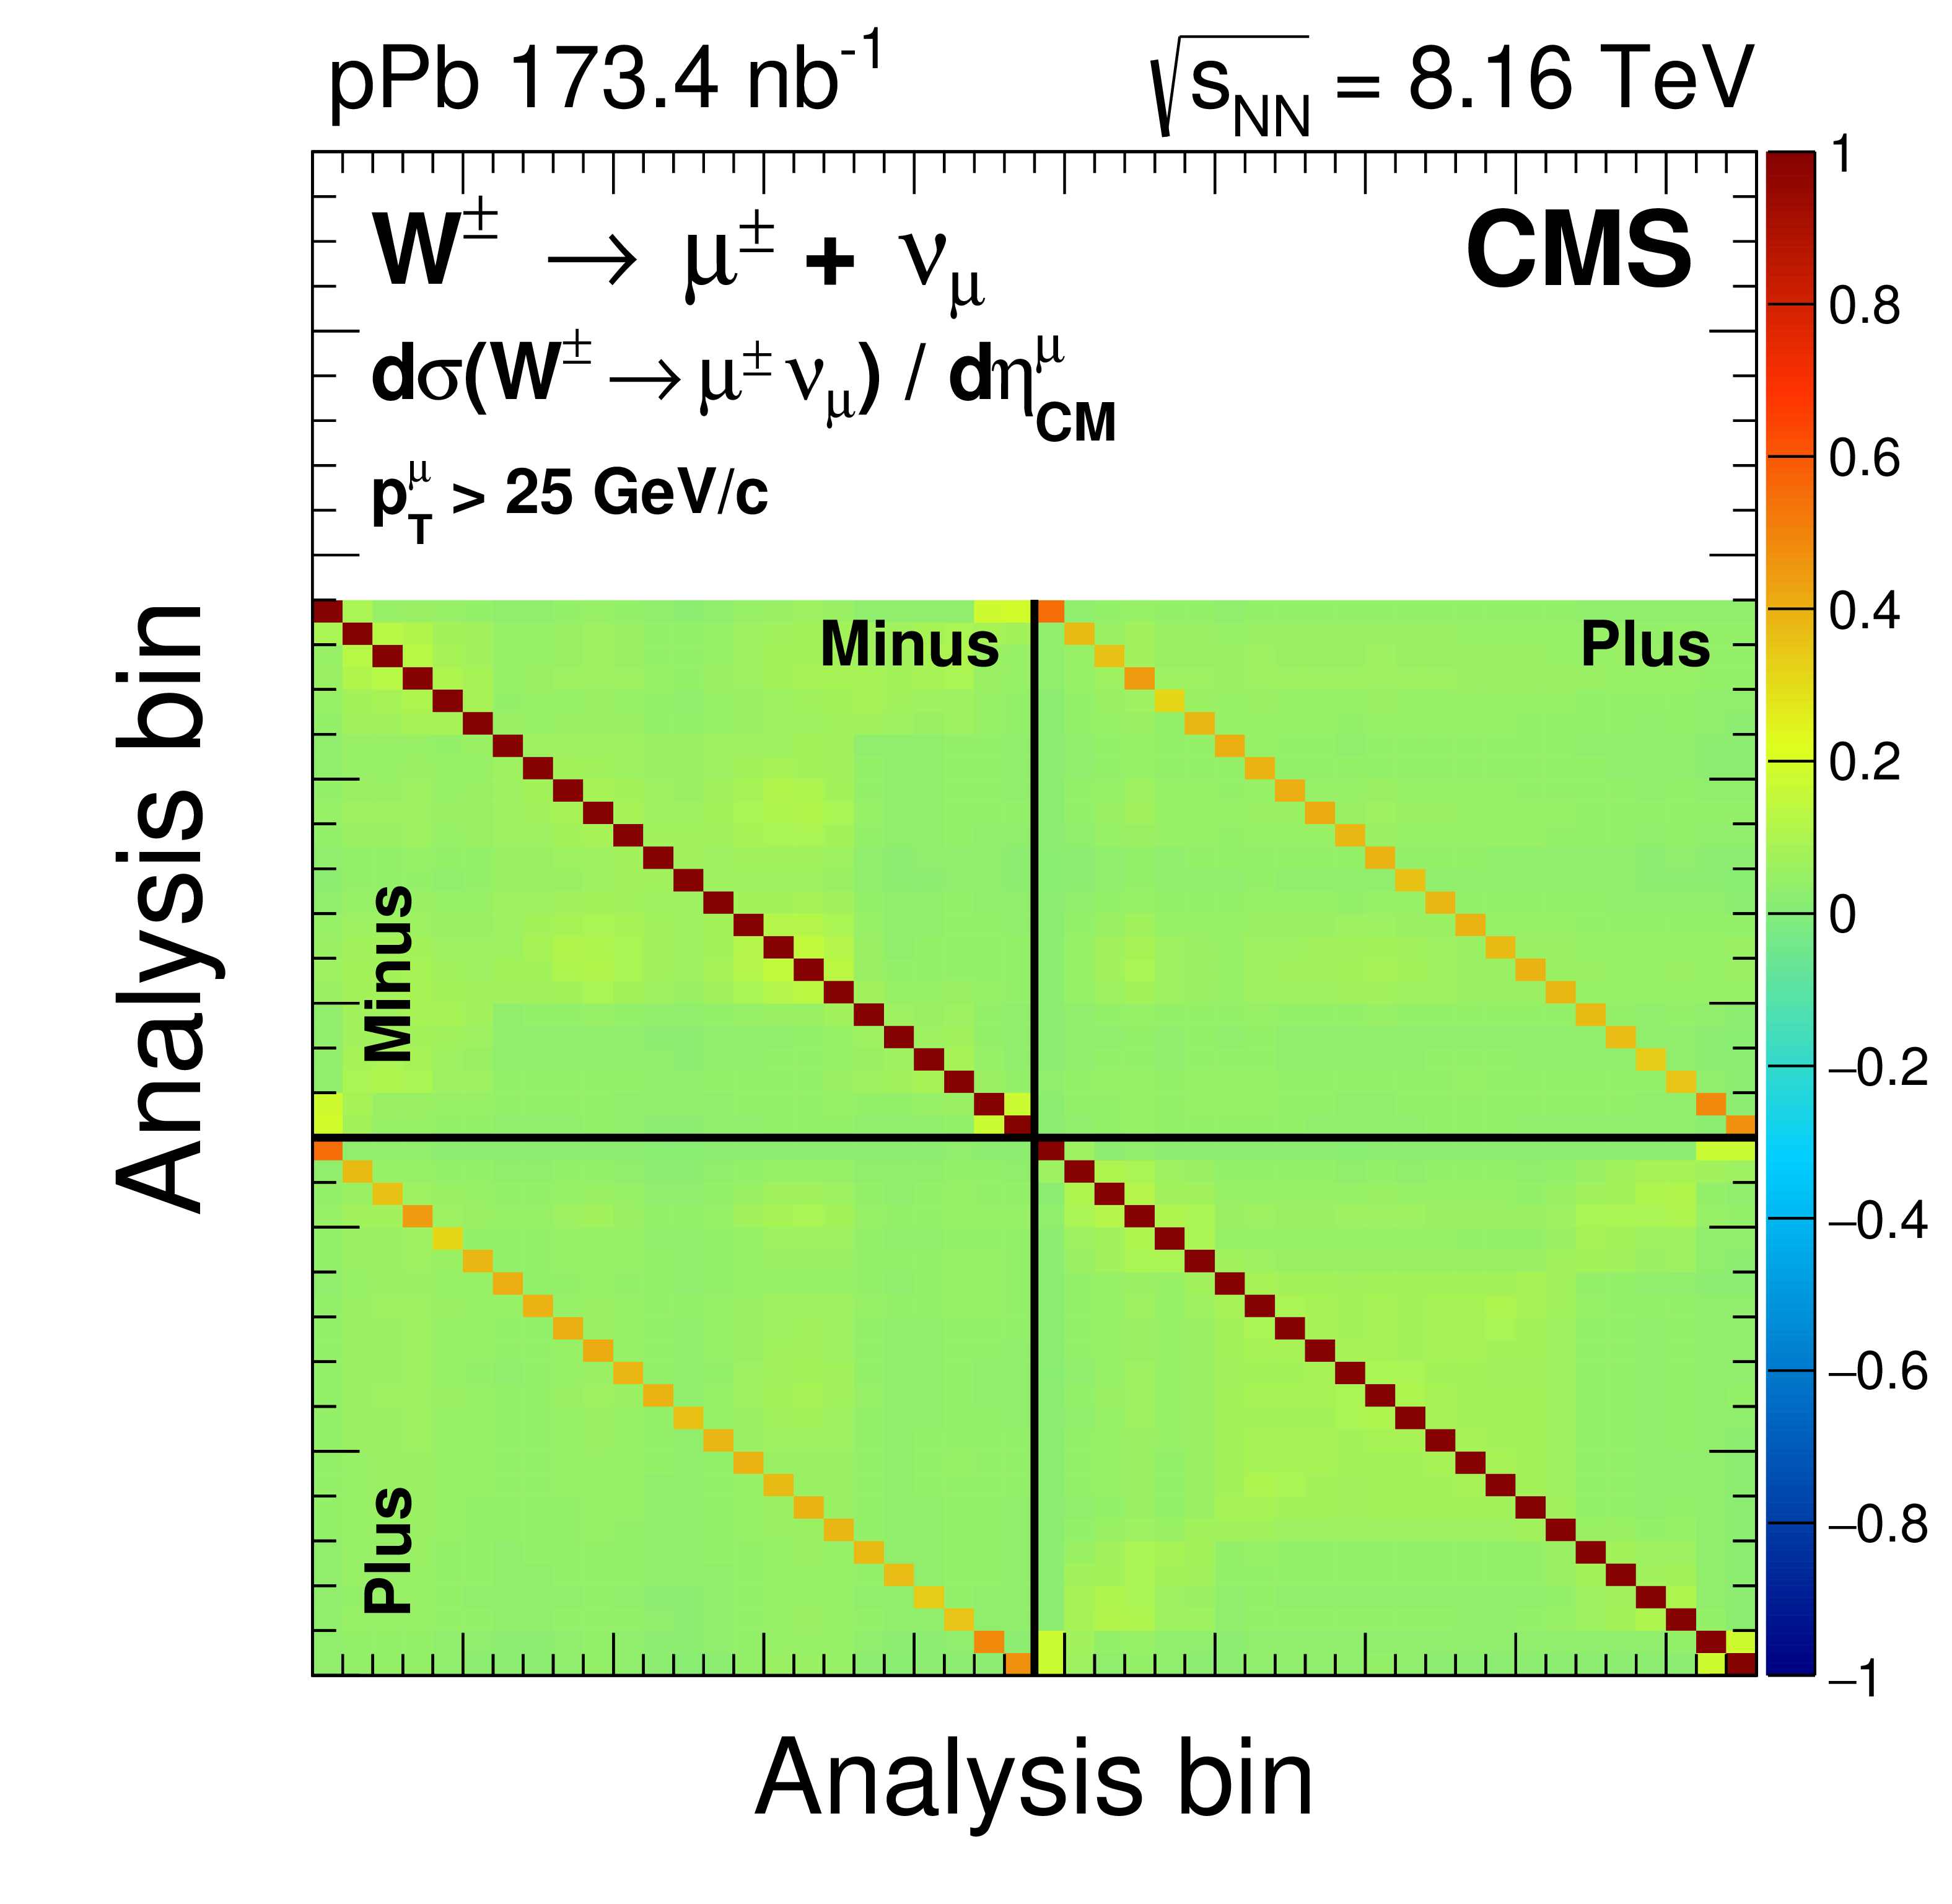
Correlation matrix of the W boson production cross section measurements. The statistical and systematic uncertainties have been included except for the luminosity uncertainty. The black lines are used to distinguish the different bins of muon charge which are ordered from top to bottom as: Minus-Minus, Minus-Plus, Plus-Minus and Plus-Plus. |
png pdf |
Additional Figure 13:
The missing transverse momentum ${{p_{\mathrm {T}}} ^\text {miss}}$ distribution for ${{\mathrm {W^-}}\to {\mu ^-} {\overline {\nu}_ {\mu}}}$ events within the $-0.2 < {{\eta _{\text {CM}}} ^{{\mu}}} < 0.0 $ (left) range and for ${{\mathrm {W^+}}\to {\mu ^+} {\nu _ {\mu}}}$ events within the 1.80 $ < {{\eta _{\text {CM}}} ^{{\mu}}} < $ 1.93 (right) range, presented in log-scale. Unbinned fits to the data (black points) are performed with six contributions, stacked from bottom to top: ${{\mathrm {t}\overline {\mathrm {t}}}}$ (orange), ${{{\mathrm {Z}} / {\gamma}^{*}} \to {{\tau}^{+} {\tau}^{-}}}$ (dark blue), (red), ${{{\mathrm {Z}} / {\gamma}^{*}} \to {{{\mu ^+}} {{\mu ^-}}}}$ (green), QCD multijet (light blue) and ${{\mathrm {W^+}}\to {\mu ^+} {\nu _ {\mu}}}$ (yellow). The ${{\eta _{\text {CM}}} ^{{\mu}}}$ regions are defined such that the proton is moving towards positive pseudorapidity. Error bars represent statistical uncertainties. The lower panels display the data divided by the result of the fit, for each ${{p_{\mathrm {T}}} ^\text {miss}}$ bin. |

png pdf |
Additional Figure 13-a:
The missing transverse momentum ${{p_{\mathrm {T}}} ^\text {miss}}$ distribution for ${{\mathrm {W^-}}\to {\mu ^-} {\overline {\nu}_ {\mu}}}$ events within the $-0.2 < {{\eta _{\text {CM}}} ^{{\mu}}} < 0.0 $ range, presented in log-scale. Unbinned fits to the data (black points) are performed with six contributions, stacked from bottom to top: ${{\mathrm {t}\overline {\mathrm {t}}}}$ (orange), ${{{\mathrm {Z}} / {\gamma}^{*}} \to {{\tau}^{+} {\tau}^{-}}}$ (dark blue), (red), ${{{\mathrm {Z}} / {\gamma}^{*}} \to {{{\mu ^+}} {{\mu ^-}}}}$ (green), QCD multijet (light blue) and ${{\mathrm {W^+}}\to {\mu ^+} {\nu _ {\mu}}}$ (yellow). The ${{\eta _{\text {CM}}} ^{{\mu}}}$ regions are defined such that the proton is moving towards positive pseudorapidity. Error bars represent statistical uncertainties. The lower panel displays the data divided by the result of the fit, for each ${{p_{\mathrm {T}}} ^\text {miss}}$ bin. |
png pdf |
Additional Figure 13-b:
The missing transverse momentum ${{p_{\mathrm {T}}} ^\text {miss}}$ distribution for ${{\mathrm {W^+}}\to {\mu ^+} {\nu _ {\mu}}}$ events within the 1.80 $ < {{\eta _{\text {CM}}} ^{{\mu}}} < $ 1.93 range, presented in log-scale. Unbinned fits to the data (black points) are performed with six contributions, stacked from bottom to top: ${{\mathrm {t}\overline {\mathrm {t}}}}$ (orange), ${{{\mathrm {Z}} / {\gamma}^{*}} \to {{\tau}^{+} {\tau}^{-}}}$ (dark blue), (red), ${{{\mathrm {Z}} / {\gamma}^{*}} \to {{{\mu ^+}} {{\mu ^-}}}}$ (green), QCD multijet (light blue) and ${{\mathrm {W^+}}\to {\mu ^+} {\nu _ {\mu}}}$ (yellow). The ${{\eta _{\text {CM}}} ^{{\mu}}}$ regions are defined such that the proton is moving towards positive pseudorapidity. Error bars represent statistical uncertainties. The lower panel displays the data divided by the result of the fit, for each ${{p_{\mathrm {T}}} ^\text {miss}}$ bin. |
| References | ||||
| 1 | J. Butterworth et al. | PDF4LHC recommendations for LHC Run II | JPG 43 (2016) 023001 | 1510.03865 |
| 2 | S. Dulat et al. | New parton distribution functions from a global analysis of quantum chromodynamics | PRD 93 (2016) 033006 | 1506.07443 |
| 3 | NNPDF Collaboration | Parton distributions for the LHC Run II | JHEP 04 (2015) 040 | 1410.8849 |
| 4 | L. A. Harland-Lang, A. D. Martin, P. Motylinski, and R. S. Thorne | Parton distributions in the LHC era: MMHT 2014 PDFs | EPJC 75 (2015) 204 | 1412.3989 |
| 5 | R. Vogt | Shadowing effects on vector boson production | PRC 64 (2001) 044901 | hep-ph/0011242 |
| 6 | X.-F. Zhang and G. I. Fai | $ {\mathrm{Z^0}} $ production as a test of nuclear effects at the LHC | PLB 545 (2002) 91 | hep-ph/0205155 |
| 7 | H. Paukkunen and C. A. Salgado | Constraints for the nuclear parton distributions from $ \mathrm{Z} $ and $ \mathrm{W} $ production at the LHC | JHEP 03 (2011) 071 | 1010.5392 |
| 8 | A. Kusina et al. | Vector boson production in pPb and PbPb collisions at the LHC and its impact on nCTEQ15 PDFs | EPJC 77 (2017) 488 | 1610.02925 |
| 9 | N. Armesto | Nuclear shadowing | JPG 32 (2006) R367 | hep-ph/0604108 |
| 10 | CDF Collaboration | Direct measurement of the $ \mathrm{W} $ production charge asymmetry in $ {\mathrm{p}}\mathrm{\bar{p}} $ collisions at $ \sqrt{s} = $ 1.96 TeV | PRL 102 (2009) 181801 | 0901.2169 |
| 11 | CMS Collaboration | Measurement of the muon charge asymmetry in inclusive $ {\mathrm{p}}{\mathrm{p}} \to \mathrm{W}+X $ production at $ \sqrt{s} = $ 7 TeV and an improved determination of light parton distribution functions | PRD 90 (2014) 032004 | CMS-SMP-12-021 1312.6283 |
| 12 | CMS Collaboration | Measurement of the electron charge asymmetry in inclusive $ \mathrm{W} $ production in pp collisions at $ \sqrt{s} = $ 7 TeV | PRL 109 (2012) 111806 | CMS-SMP-12-001 1206.2598 |
| 13 | CMS Collaboration | Study of $ \mathrm{W} $ boson production in pPb collisions at $ {\sqrt {\smash [b]{s_{_{\mathrm {NN}}}}}} = $ 5.02 TeV | PLB 750 (2015) 565 | CMS-HIN-13-007 1503.05825 |
| 14 | Z. Conesa del Valle et al. | Effect of heavy-quark energy loss on the muon differential production cross section in Pb-Pb collisions at $ {\sqrt {\smash [b]{s_{_{\mathrm {NN}}}}}} = $ 5.5 TeV | PLB 663 (2008) 202 | 0712.0051 |
| 15 | Z. Conesa del Valle | Vector bosons in heavy-ion collisions at the LHC | EPJC 61 (2009) 729 | 0903.1432 |
| 16 | ATLAS Collaboration | Measurement of the centrality dependence of $ \mathrm{J}/\psi $ yields and observation of $ \mathrm{Z} $ production in lead-lead collisions with the ATLAS detector at the LHC | PLB 697 (2011) 294 | 1012.5419 |
| 17 | ATLAS Collaboration | Measurement of $ \mathrm{Z} $ boson production in PbPb collisions at $ {\sqrt {\smash [b]{s_{_{\mathrm {NN}}}}}} = $ 2.76 TeV with the ATLAS detector | PRL 110 (2013) 022301 | 1210.6486 |
| 18 | ATLAS Collaboration | Measurement of the production and lepton charge asymmetry of $ \mathrm{W} $ bosons in Pb+Pb collisions at $ {\sqrt {\smash [b]{s_{_{\mathrm {NN}}}}}} = $ 2.76 TeV with the ATLAS detector | EPJC 75 (2015) 23 | 1408.4674 |
| 19 | CMS Collaboration | Study of $ \mathrm{Z} $ boson production in PbPb collisions at nucleon-nucleon centre of mass energy = 2.76 TeV | PRL 106 (2011) 212301 | CMS-HIN-10-003 1102.5435 |
| 20 | CMS Collaboration | Study of $ \mathrm{Z} $ production in PbPb and pp collisions at $ {\sqrt {\smash [b]{s_{_{\mathrm {NN}}}}}} = $ 2.76 TeV in the dimuon and dielectron decay channels | JHEP 03 (2015) 022 | CMS-HIN-13-004 1410.4825 |
| 21 | CMS Collaboration | Study of $ \mathrm{W} $ boson production in PbPb and pp collisions at $ {\sqrt {\smash [b]{s_{_{\mathrm {NN}}}}}} = $ 2.76 TeV | PLB 715 (2012) 66 | CMS-HIN-11-008 1205.6334 |
| 22 | ALICE Collaboration | $ \mathrm{W} $ and $ \mathrm{Z} $ boson production in p-Pb collisions at $ {\sqrt {\smash [b]{s_{_{\mathrm {NN}}}}}} = $ 5.02 TeV | JHEP 02 (2017) 077 | 1611.03002 |
| 23 | CMS Collaboration | Study of $ \mathrm{Z} $ boson production in pPb collisions at $ {\sqrt {\smash [b]{s_{_{\mathrm {NN}}}}}} = $ 5.02 TeV | PLB 759 (2016) 36 | CMS-HIN-15-002 1512.06461 |
| 24 | K. J. Eskola, P. Paakkinen, H. Paukkunen, and C. A. Salgado | EPPS16: Nuclear parton distributions with LHC data | EPJC 77 (2017) 163 | 1612.05741 |
| 25 | CMS Collaboration | Luminosity calibration for the 2013 proton-lead and proton-proton data taking | CMS-PAS-LUM-13-002 | CMS-PAS-LUM-13-002 |
| 26 | CMS Collaboration | CMS luminosity measurement using 2016 proton-nucleus collisions at $ {\sqrt {\smash [b]{s_{_{\mathrm {NN}}}}}} = $ 8.16 TeV | CMS-PAS-LUM-17-002 | CMS-PAS-LUM-17-002 |
| 27 | K. Kovařìk et al. | nCTEQ15: Global analysis of nuclear parton distributions with uncertainties in the CTEQ framework | PRD 93 (2016) 085037 | 1509.00792 |
| 28 | CMS Collaboration | The CMS experiment at the CERN LHC | JINST 3 (2008) S08004 | CMS-00-001 |
| 29 | CMS Collaboration | Particle-flow reconstruction and global event description with the CMS detector | JINST 12 (2017) P10003 | CMS-PRF-14-001 1706.04965 |
| 30 | CMS Collaboration | The CMS trigger system | JINST 12 (2017) P01020 | CMS-TRG-12-001 1609.02366 |
| 31 | CMS Collaboration | Performance of CMS muon reconstruction in pp collision events at $ \sqrt{s} = $ 7 TeV | JINST 7 (2012) P10002 | CMS-MUO-10-004 1206.4071 |
| 32 | CMS Collaboration | Observation of top quark production in proton-nucleus collisions | PRL 119 (2017) 242001 | CMS-HIN-17-002 1709.07411 |
| 33 | S. Frixione, P. Nason, and C. Oleari | Matching NLO QCD computations with parton shower simulations: the POWHEG method | JHEP 11 (2007) 070 | 0709.2092 |
| 34 | P. Nason | A new method for combining NLO QCD with shower Monte Carlo algorithms | JHEP 11 (2004) 040 | hep-ph/0409146 |
| 35 | S. Alioli, P. Nason, C. Oleari, and E. Re | A general framework for implementing NLO calculations in shower Monte Carlo programs: the POWHEG BOX | JHEP 06 (2010) 043 | 1002.2581 |
| 36 | L. Barze et al. | Implementation of electroweak corrections in the POWHEG BOX: single $ \mathrm{W} $ production | JHEP 04 (2012) 037 | 1202.0465 |
| 37 | L. Barze et al. | Neutral current Drell--Yan with combined QCD and electroweak corrections in the POWHEG BOX | EPJC 73 (2013) 2474 | 1302.4606 |
| 38 | S. Frixione, P. Nason, and G. Ridolfi | A positive-weight next-to-leading-order Monte Carlo for heavy flavour hadroproduction | JHEP 09 (2007) 126 | 0707.3088 |
| 39 | T. Sjöstrand et al. | An introduction to PYTHIA 8.2 | CPC 191 (2015) 159 | 1410.3012 |
| 40 | CMS Collaboration | Event generator tunes obtained from underlying event and multiparton scattering measurements | EPJC 76 (2016) 155 | CMS-GEN-14-001 1512.00815 |
| 41 | CMS Collaboration | Study of the underlying event at forward rapidity in pp collisions at $ \sqrt{s} = $ 0.9, 2.76, and 7 TeV | JHEP 04 (2013) 072 | CMS-FWD-11-003 1302.2394 |
| 42 | T. Pierog et al. | EPOS LHC: Test of collective hadronization with data measured at the CERN Large Hadron Collider | PRC 92 (2015) 034906 | 1306.0121 |
| 43 | CMS Collaboration | Pseudorapidity distributions of charged hadrons in proton-lead collisions at $ {{\sqrt {\smash [b]{s_{_{\mathrm {NN}}}}}}} = $ 5.02 and 8.16 TeV | JHEP 01 (2018) 045 | CMS-HIN-16-021 1710.09355 |
| 44 | GEANT4 Collaboration | GEANT4--a simulation toolkit | NIMA 506 (2003) 250 | |
| 45 | CMS Collaboration | Measurement of inclusive $ \mathrm{W} $ and $ \mathrm{Z} $ boson production cross sections in pp collisions at $ \sqrt{s} = $ 8 TeV | PRL 112 (2014) 191802 | CMS-SMP-12-011 1402.0923 |
| 46 | CMS Collaboration | Missing transverse energy performance of the CMS detector | JINST 6 (2011) P09001 | CMS-JME-10-009 1106.5048 |
| 47 | CMS Collaboration | Performance of missing energy reconstruction in 13 TeV pp collision data using the CMS detector | CMS-PAS-JME-16-004 | CMS-PAS-JME-16-004 |
| 48 | CMS Collaboration | Measurements of inclusive $ \mathrm{W} $ and $ \mathrm{Z} $ cross sections in pp collisions at $ \sqrt{s} = $ 7 TeV | JHEP 01 (2011) 080 | CMS-EWK-10-002 1012.2466 |
| 49 | Particle Data Group, M. Tanabashi et al. | Review of particle physics | PRD 98 (2018) 030001 | |
| 50 | S. Alioli, P. Nason, C. Oleari, and E. Re | NLO vector-boson production matched with shower in POWHEG | JHEP 07 (2008) 060 | 0805.4802 |
| 51 | R. Boughezal et al. | Color singlet production at NNLO in MCFM | EPJC 77 (2017) 7 | 1605.08011 |
| 52 | ATLAS Collaboration | $ \mathrm{Z} $ boson production in $ p+ $Pb collisions at $ {\sqrt {\smash [b]{s_{_{\mathrm {NN}}}}}} = $ 5.02 TeV measured with the ATLAS detector | PRC 92 (2015) 044915 | 1507.06232 |
| 53 | CMS Collaboration | Studies of dijet transverse momentum balance and pseudorapidity distributions in pPb collisions at $ {\sqrt {\smash [b]{s_{_{\mathrm {NN}}}}}} = $ 5.02 TeV | EPJC 74 (2014) 2951 | CMS-HIN-13-001 1401.4433 |
| 54 | F. Arleo, E. Chapon, and H. Paukkunen | Scaling properties of inclusive $ \mathrm{W^{\pm}} $ production at hadron colliders | EPJC 76 (2016) 214 | 1509.03993 |
| 55 | A. Buckley et al. | LHAPDF6: parton density access in the LHC precision era | EPJC 75 (2015) 132 | 1412.7420 |
| 56 | J. Pumplin et al. | Uncertainties of predictions from parton distribution functions. II. The Hessian method | PRD 65 (2001) 014013 | hep-ph/0101032 |
|
|
Compact Muon Solenoid LHC, CERN |
|

|

|

|

|

|