

Compact Muon Solenoid
LHC, CERN
| CMS-HIN-17-002 ; CERN-EP-2017-239 | ||
| Observation of top quark production in proton-nucleus collisions | ||
| CMS Collaboration | ||
| 21 September 2017 | ||
| Phys. Rev. Lett. 119 (2017) 242001 | ||
| Abstract: The first observation of top quark production in proton-nucleus collisions is reported using proton-lead data collected by the CMS experiment at the CERN LHC at a nucleon-nucleon center-of-mass energy of $\sqrt{\smash[b]{s_{\mathrm{NN}}}} = $ 8.16 TeV. The measurement is performed using events with exactly one isolated electron or muon and at least four jets. The data sample corresponds to an integrated luminosity of 174 nb$^{-1}$. The significance of the $\mathrm{t\bar{t}}$ signal against the background-only hypothesis is above five standard deviations. The measured cross section is $\sigma_{\mathrm{t\bar{t}}} = $ 45 $\pm$ 8 nb, consistent with predictions from perturbative quantum chromodynamics. | ||
| Links: e-print arXiv:1709.07411 [nucl-ex] (PDF) ; CDS record ; inSPIRE record ; HepData record ; CADI line (restricted) ; | ||
| Figures | Summary | Additional Figures | References | CMS Publications |
|---|
| Figures | |

png pdf |
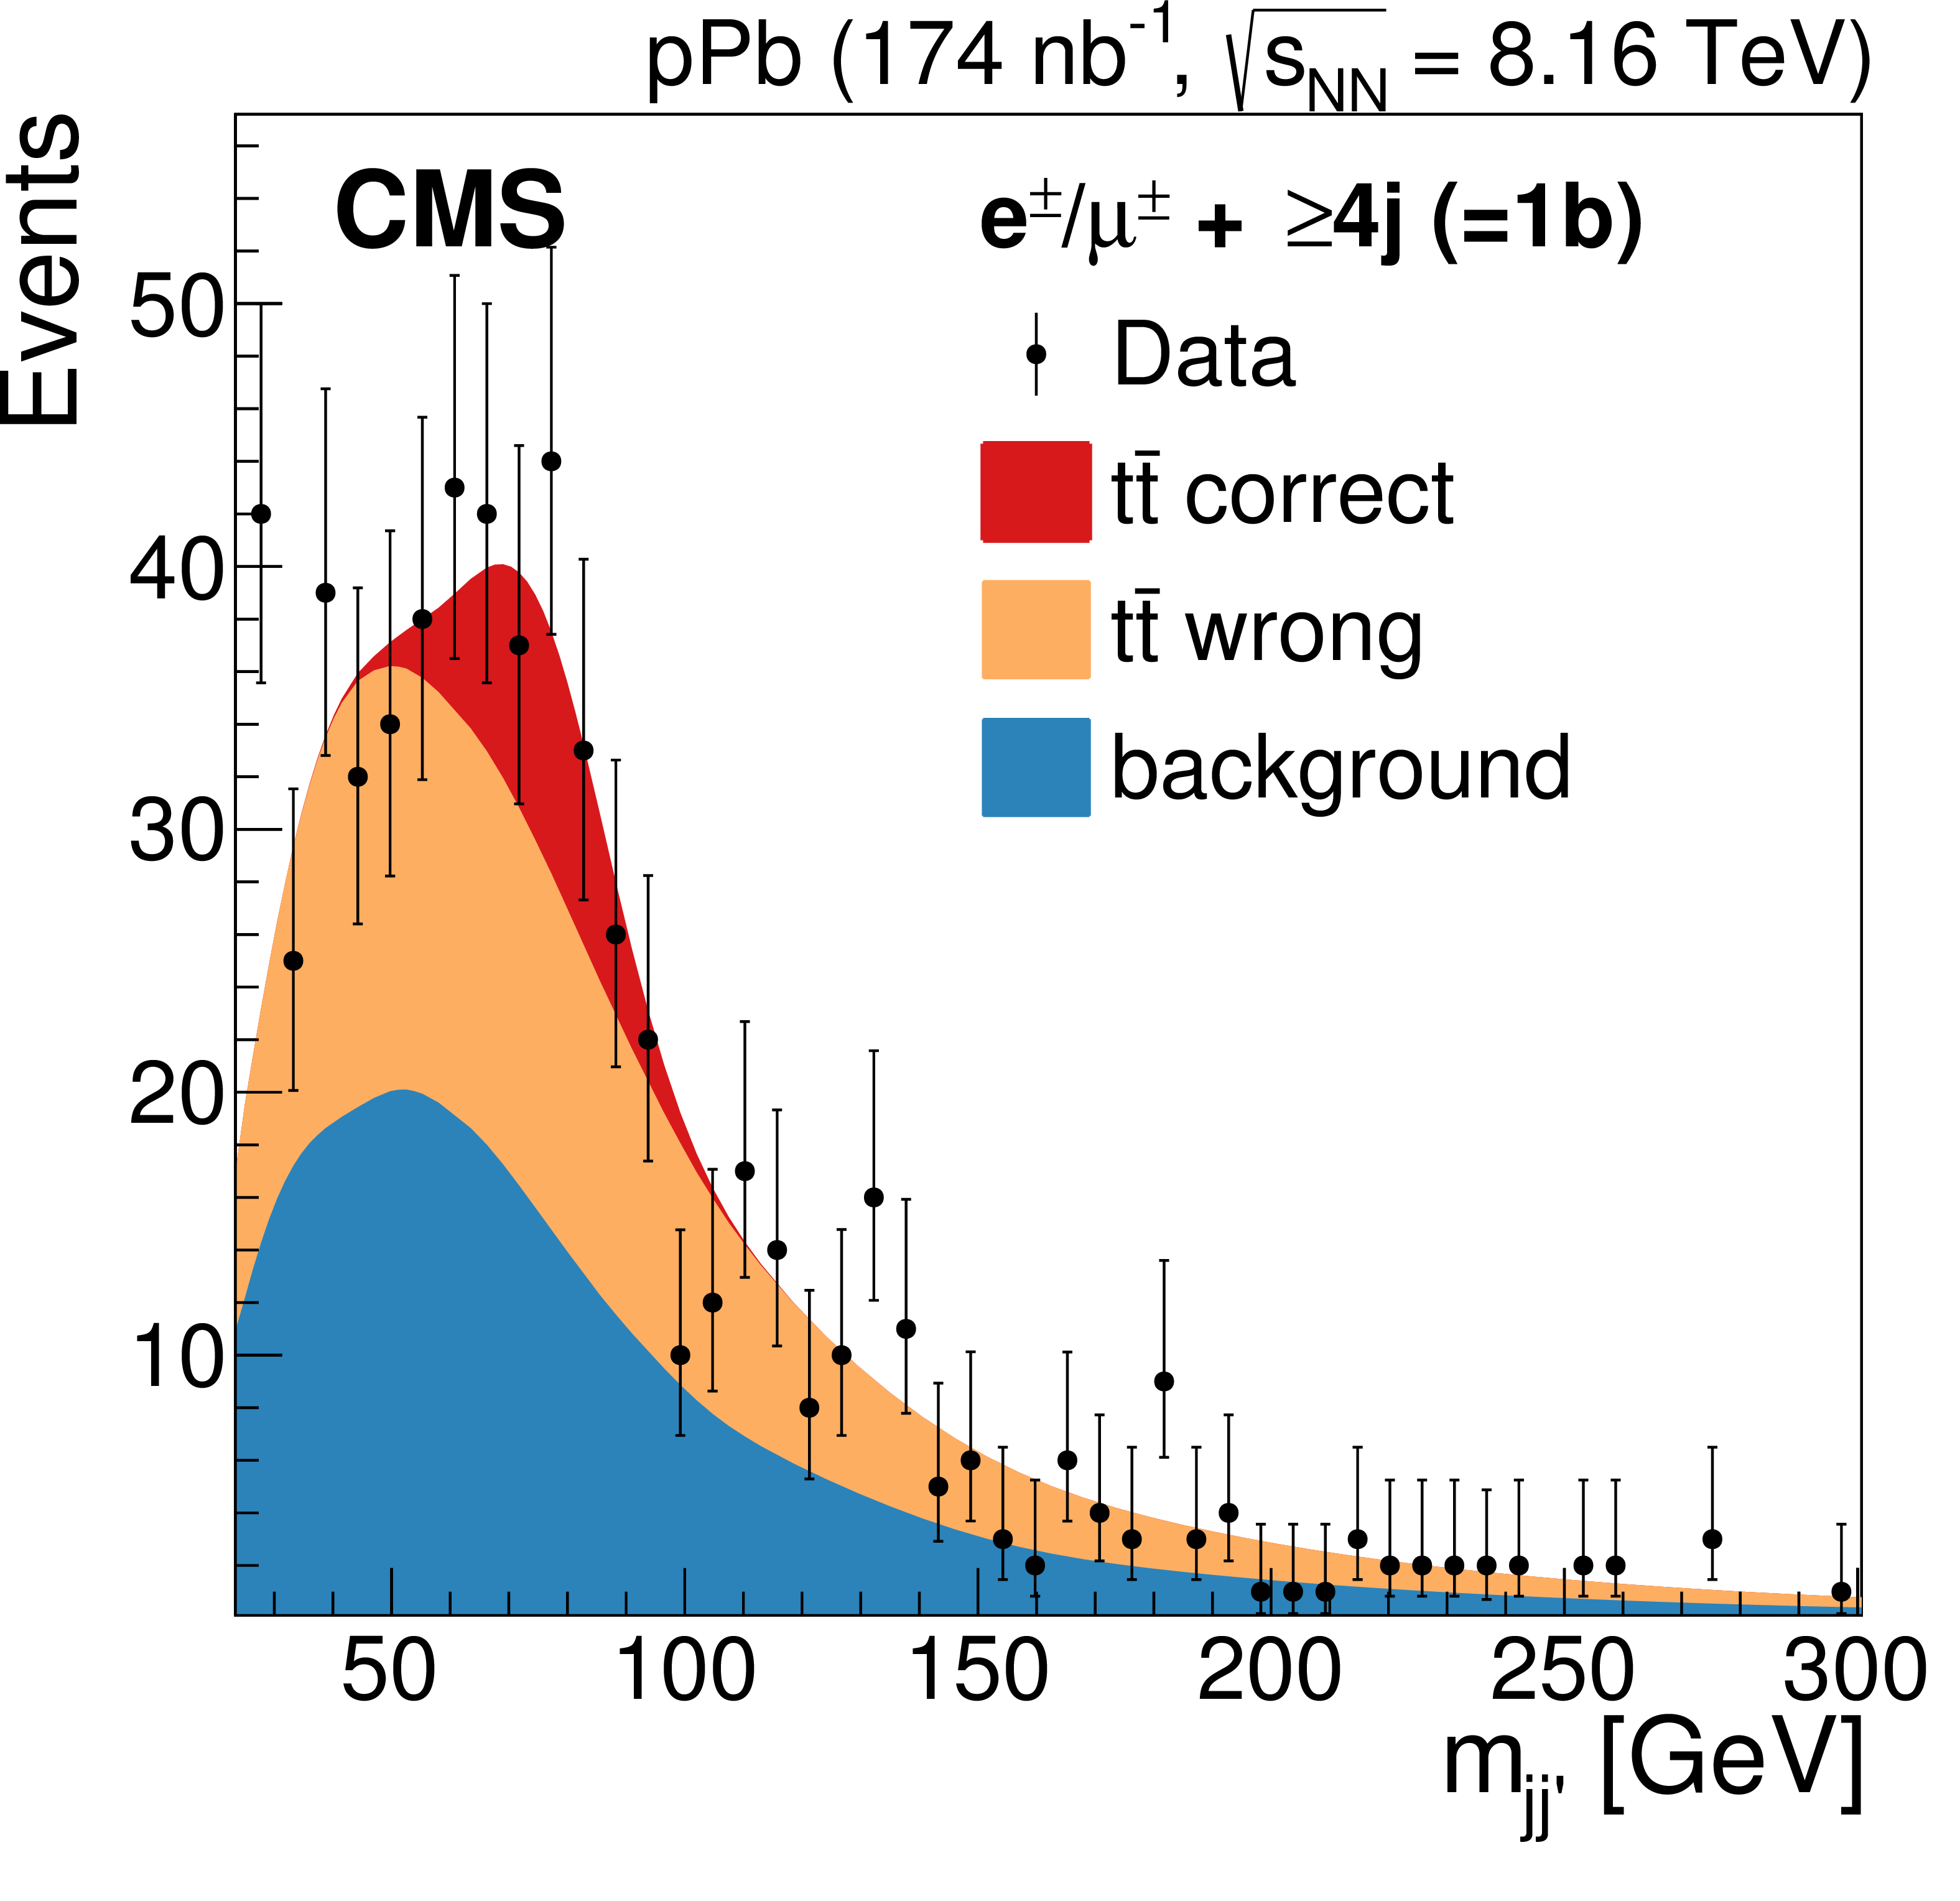
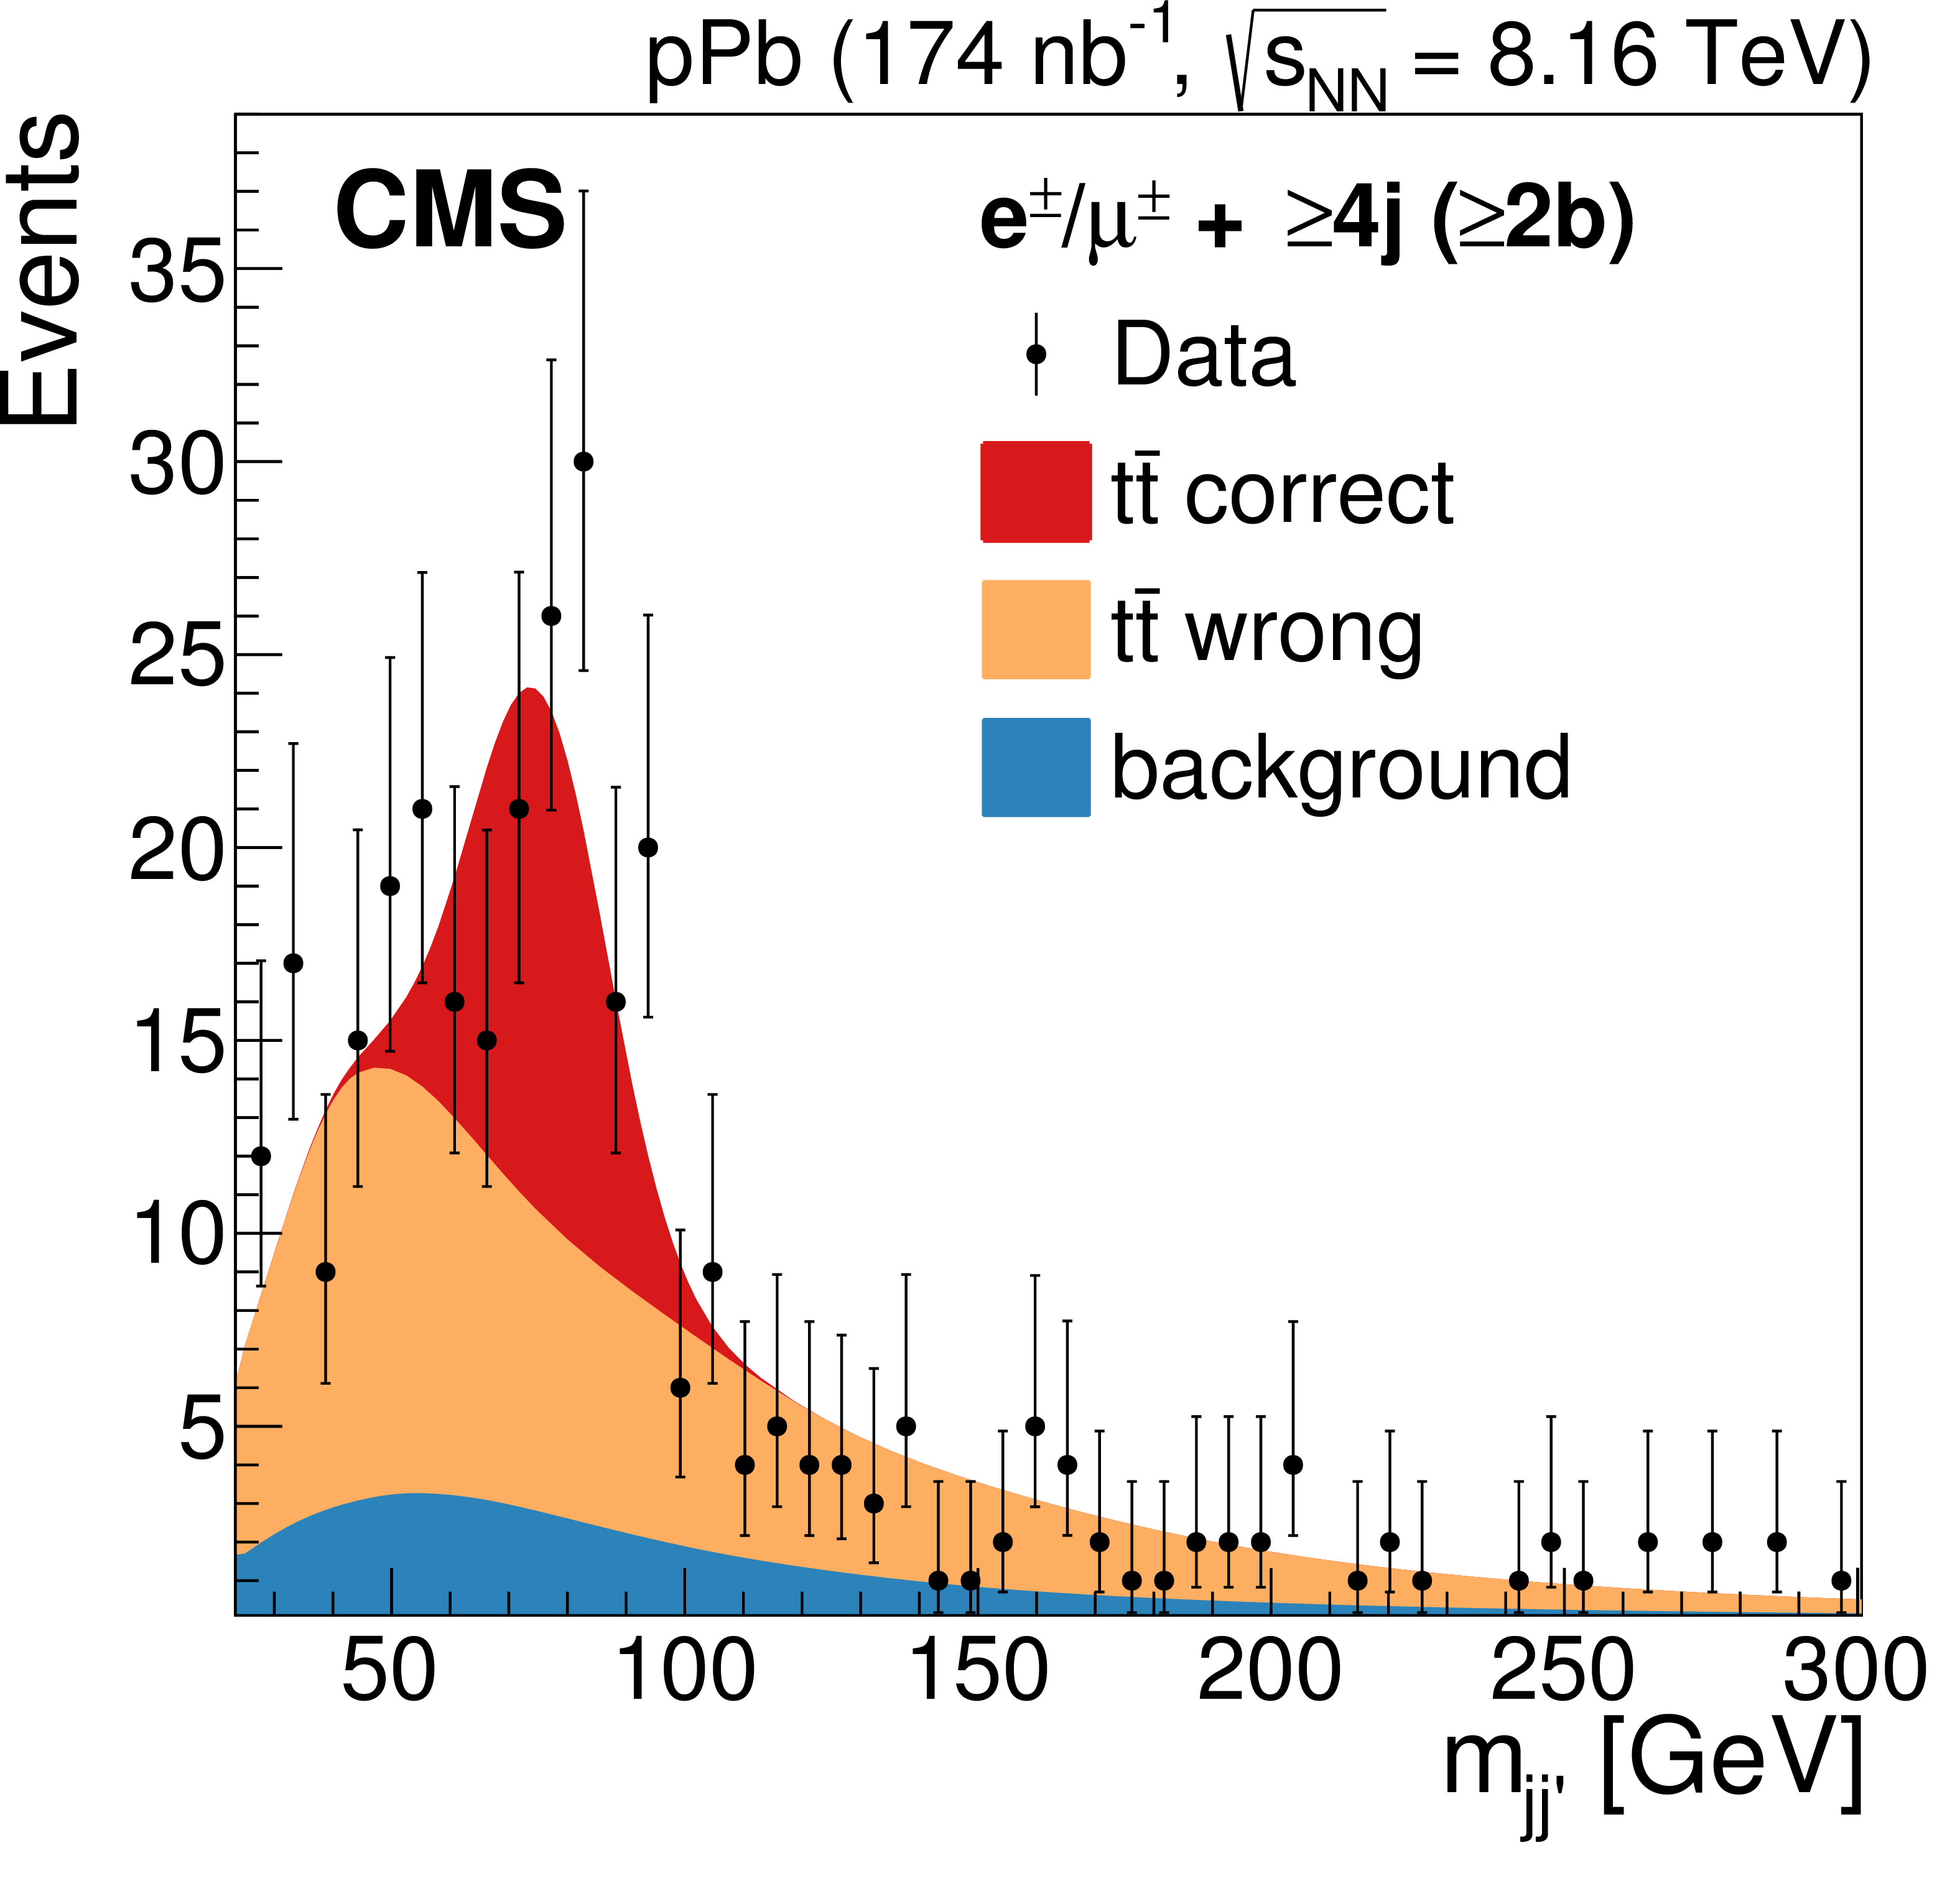
Figure 1:
Invariant mass distributions of the W candidate, ${m_{{\mathrm {j} \mathrm {j}^{\prime}}}}$, in the 0 (left), 1 (center), and 2 (right) b-tagged jet categories after all selections. The red and orange areas correspond to the signal simulation (correct and wrong assignments, respectively) while the blue one corresponds to the estimated non-top background contributions. The error bars indicate the statistical uncertainties. |

png pdf |
Figure 1-a:
Invariant mass distribution of the W candidate, ${m_{{\mathrm {j} \mathrm {j}^{\prime}}}}$, in the 0 b-tagged jet category after all selections. The red and orange areas correspond to the signal simulation (correct and wrong assignments, respectively) while the blue one corresponds to the estimated non-top background contributions. The error bars indicate the statistical uncertainties. |
png pdf |
Figure 1-b:
Invariant mass distribution of the W candidate, ${m_{{\mathrm {j} \mathrm {j}^{\prime}}}}$, in the 1 b-tagged jet category after all selections. The red and orange areas correspond to the signal simulation (correct and wrong assignments, respectively) while the blue one corresponds to the estimated non-top background contributions. The error bars indicate the statistical uncertainties. |
png pdf |
Figure 1-c:
Invariant mass distribution of the W candidate, ${m_{{\mathrm {j} \mathrm {j}^{\prime}}}}$, in the 2 b-tagged jet category after all selections. The red and orange areas correspond to the signal simulation (correct and wrong assignments, respectively) while the blue one corresponds to the estimated non-top background contributions. The error bars indicate the statistical uncertainties. |

png pdf |
Figure 2:
Invariant mass distributions of the $\mathrm{t} \to {\mathrm {j} \mathrm {j}^{\prime}} \mathrm{b} $ candidates, ${m_\text {top}}$, in the 0 (left), 1 (center), and 2 (right) b-tagged jet categories after all selections. All signal and background parameters are kept fixed to the outcome of the ${m_{{\mathrm {j} \mathrm {j}^{\prime}}}}$ fit. Symbols and patterns are the same as in Fig. xxxxx. |

png pdf |
Figure 2-a:
Invariant mass distribution of the $\mathrm{t} \to {\mathrm {j} \mathrm {j}^{\prime}} \mathrm{b} $ candidates, ${m_\text {top}}$, in the 0 b-tagged jet categories after all selections. All signal and background parameters are kept fixed to the outcome of the ${m_{{\mathrm {j} \mathrm {j}^{\prime}}}}$ fit. Symbols and patterns are the same as in Fig. 1. |

png pdf |
Figure 2-b:
Invariant mass distribution of the $\mathrm{t} \to {\mathrm {j} \mathrm {j}^{\prime}} \mathrm{b} $ candidates, ${m_\text {top}}$, in the 1 b-tagged jet categories after all selections. All signal and background parameters are kept fixed to the outcome of the ${m_{{\mathrm {j} \mathrm {j}^{\prime}}}}$ fit. Symbols and patterns are the same as in Fig. 1. |

png pdf |
Figure 2-c:
Invariant mass distribution of the $\mathrm{t} \to {\mathrm {j} \mathrm {j}^{\prime}} \mathrm{b} $ candidates, ${m_\text {top}}$, in the 2 b-tagged jet categories after all selections. All signal and background parameters are kept fixed to the outcome of the ${m_{{\mathrm {j} \mathrm {j}^{\prime}}}}$ fit. Symbols and patterns are the same as in Fig. 1. |
png pdf |
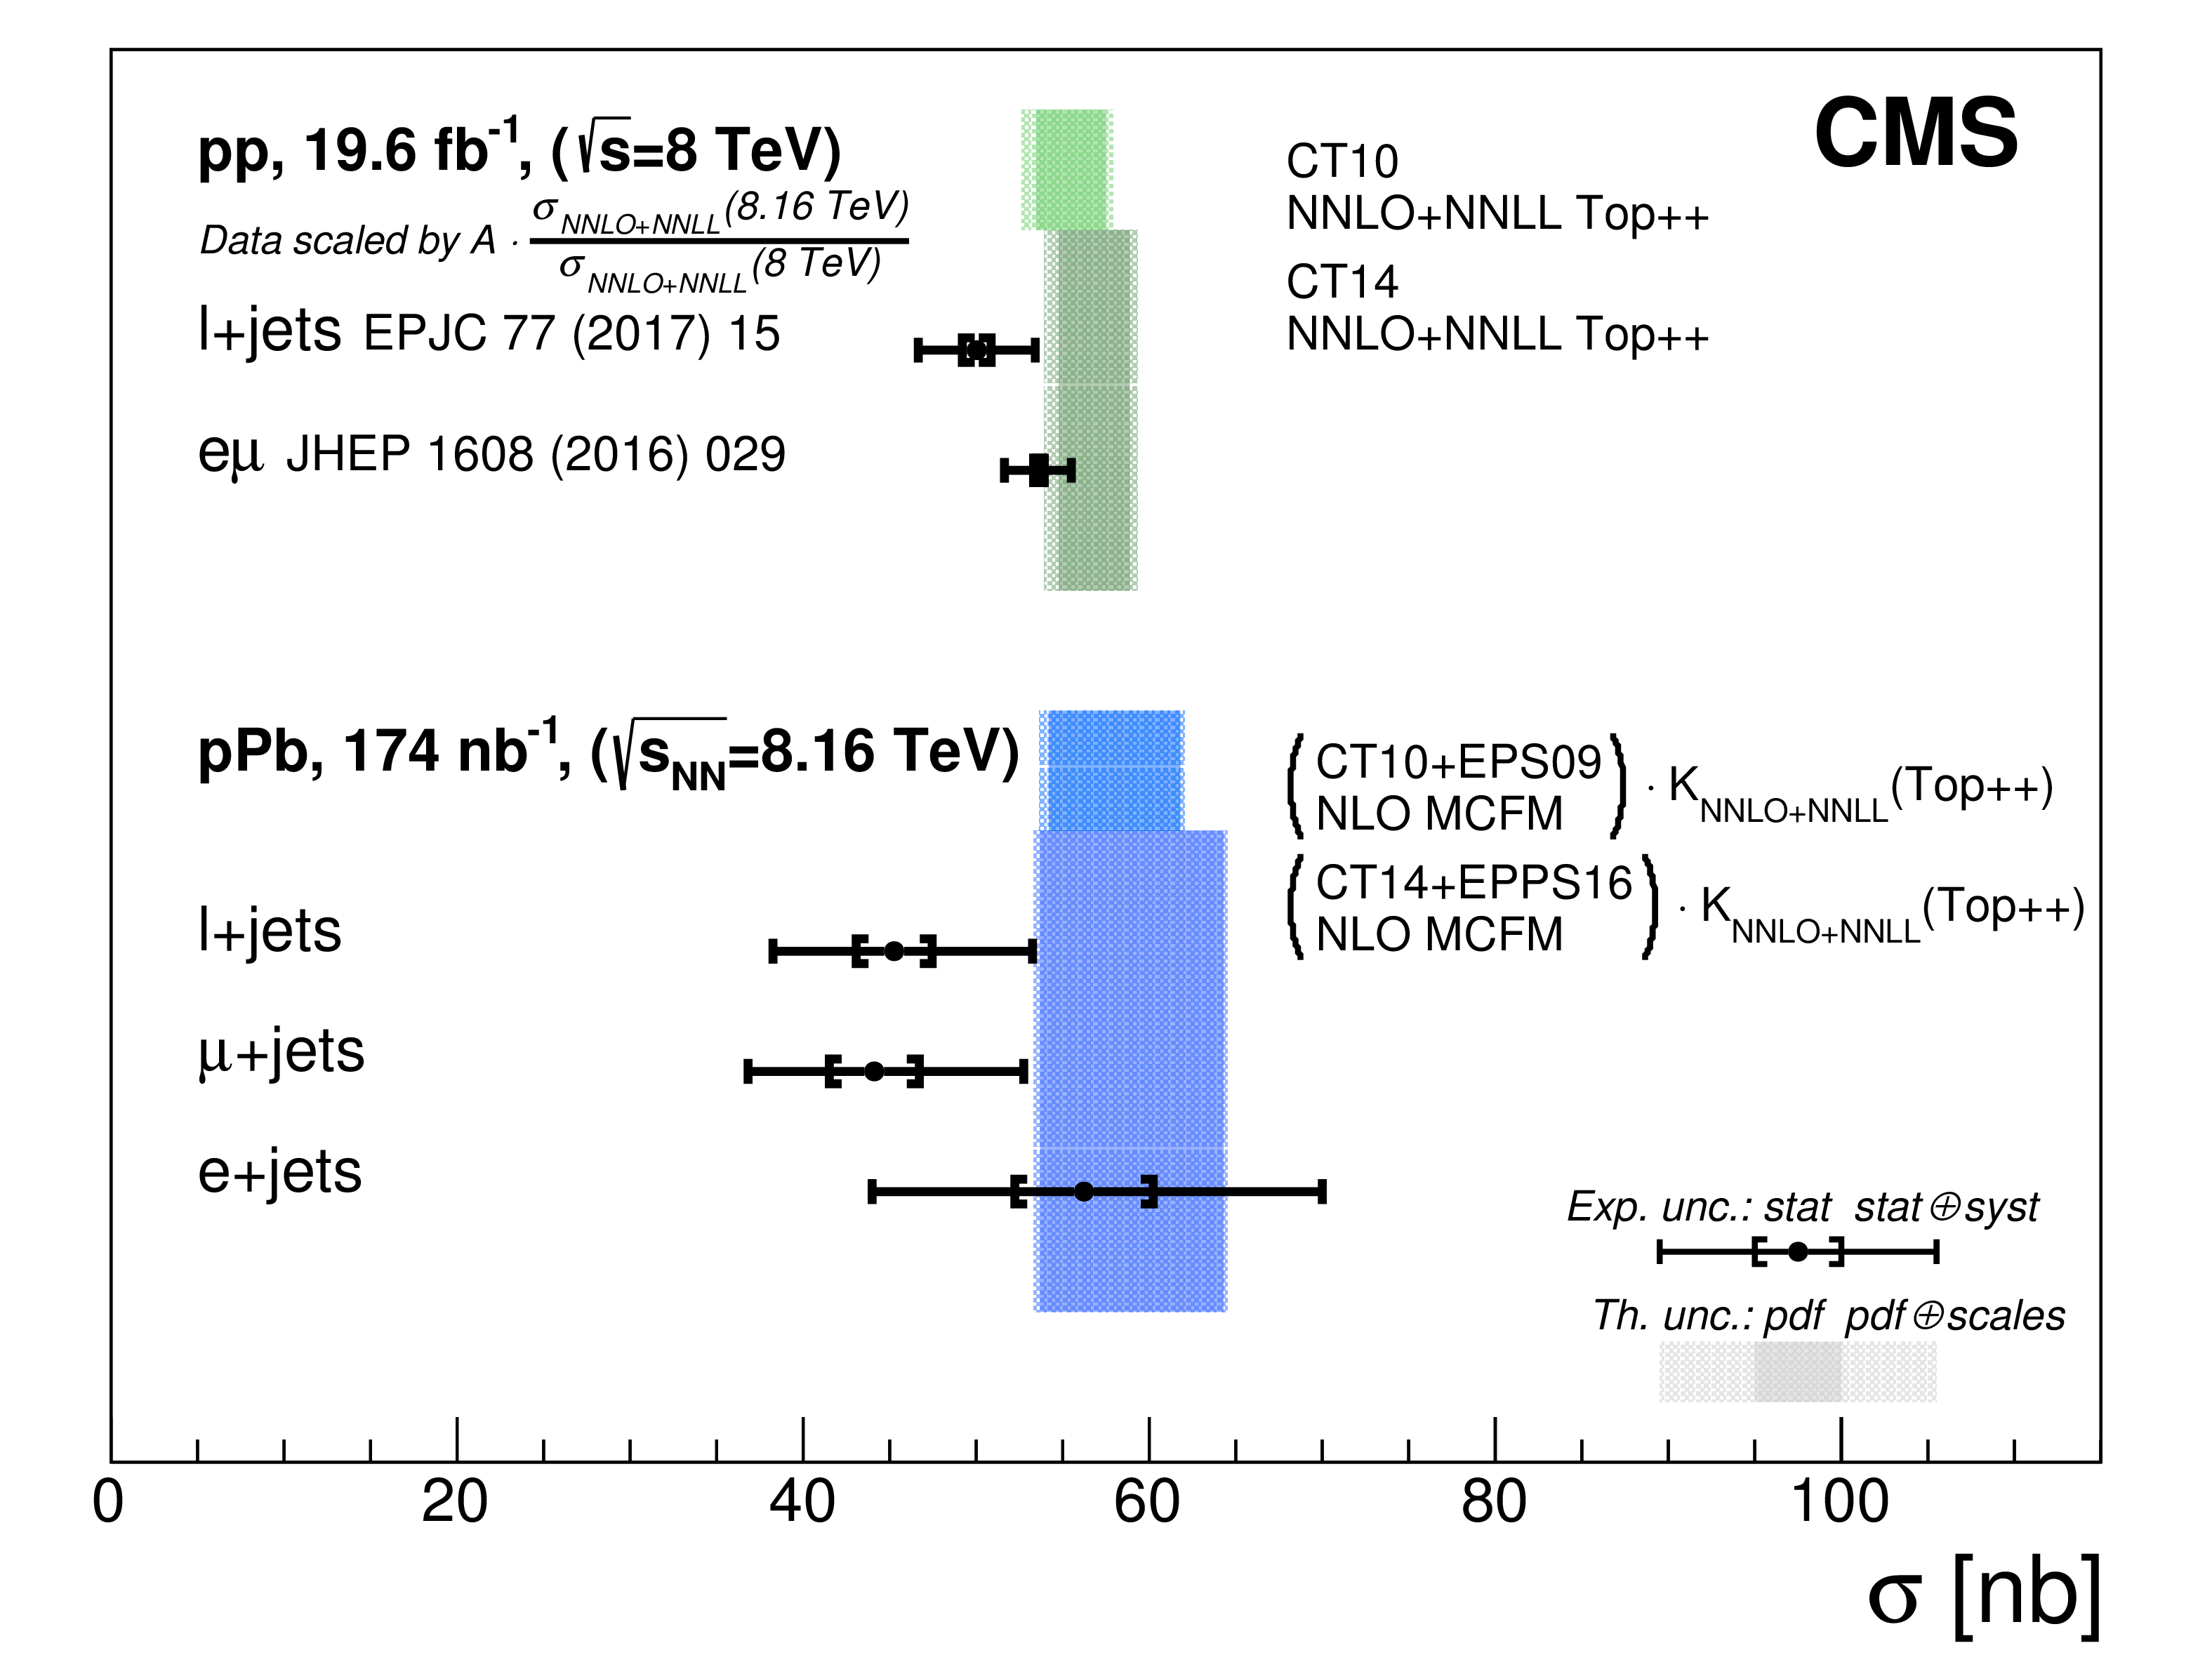
Figure 3:
Total ${\mathrm{t} {}\mathrm{\bar{t}}} $ cross sections measured in the e+jets, $\mu $+jets, and combined $\ell $+jets channels in pPb collisions at $ {\sqrt {\smash [b]{s_{_{\mathrm {NN}}}}}} = $ 8.16 TeV, compared to theoretical NNLO+NNLL predictions, and to scaled $ {\sqrt {\smash [b]{s}}} = $ 8 TeV pp results [38,39]. The total experimental error bars (theoretical error bands) include statistical and systematic (PDF and scale) uncertainties added in quadrature. |
| Summary |
| In summary, the top pair production cross section has been measured for the first time in proton-nucleus collisions, using pPb data at $\sqrt{\smash[b]{s_{\mathrm{NN}}}} = $ 8.16 TeV with a total integrated luminosity of 174 nb$^{-1}$. The measurement is performed by analyzing events with exactly one isolated electron or muon and at least four jets. The significance of the $\mathrm{t\bar{t}}$ signal against the background-only hypothesis is above five standard deviations.The measured cross section is $\sigma_{\mathrm{t\bar{t}}} = $ 45 $\pm$ 8 nb, consistent with the expectations from scaled pp data as well as perturbative quantum chromodynamics calculations. This first measurement paves the way for further detailed investigations of top quark production in nuclear interactions, providing in particular a new tool for studies of the strongly interacting matter created in nucleus-nucleus collisions. |
| Additional Figures | |

png pdf |
Additional Figure 1:
Dijet invariant mass spectrum ($ {m_{{\mathrm {j} \mathrm {j}^{\prime}}}} $) obtained by using different algorithms in the pairing of the jets in each event: distance-based ($\min\Delta R_{\mathrm{jj}}$), $ {p_{\mathrm {T}}} $-based (leading $ {p_{\mathrm {T}}} $), and by minimizing the distance to the W boson mass $ m_{\mathrm{W}} $ ($\mathrm{min}( | {m_{{\mathrm {j} \mathrm {j}^{\prime}}}} -m_\mathrm{W} | )$). Pairs fully matched to $\mathrm{W} \rightarrow \mathrm{q} \mathrm{\bar{q}} $ decays are shown in the left panel, while pairs where at least one reconstructed jet can not be matched at parton level are shown in right panel. The results are based on a PYTHIA 6 $ {\mathrm{t} {}\mathrm{\bar{t}}} $ sample. |

png pdf |
Additional Figure 1-a:
Dijet invariant mass spectrum ($ {m_{{\mathrm {j} \mathrm {j}^{\prime}}}} $) obtained by using different algorithms in the pairing of the jets in each event: distance-based ($\min\Delta R_{\mathrm{jj}}$), $ {p_{\mathrm {T}}} $-based (leading $ {p_{\mathrm {T}}} $), and by minimizing the distance to the W boson mass $ m_{\mathrm{W}} $ ($\mathrm{min}( | {m_{{\mathrm {j} \mathrm {j}^{\prime}}}} -m_\mathrm{W} | )$). Pairs fully matched to $\mathrm{W} \rightarrow \mathrm{q} \mathrm{\bar{q}} $ decays are shown. The results are based on a PYTHIA 6 $ {\mathrm{t} {}\mathrm{\bar{t}}} $ sample. |

png pdf |
Additional Figure 1-b:
Dijet invariant mass spectrum ($ {m_{{\mathrm {j} \mathrm {j}^{\prime}}}} $) obtained by using different algorithms in the pairing of the jets in each event: distance-based ($\min\Delta R_{\mathrm{jj}}$), $ {p_{\mathrm {T}}} $-based (leading $ {p_{\mathrm {T}}} $), and by minimizing the distance to the W boson mass $ m_{\mathrm{W}} $ ($\mathrm{min}( | {m_{{\mathrm {j} \mathrm {j}^{\prime}}}} -m_\mathrm{W} | )$). Pairs where at least one reconstructed jet can not be matched at parton level are shown. The results are based on a PYTHIA 6 $ {\mathrm{t} {}\mathrm{\bar{t}}} $ sample. |
png pdf |
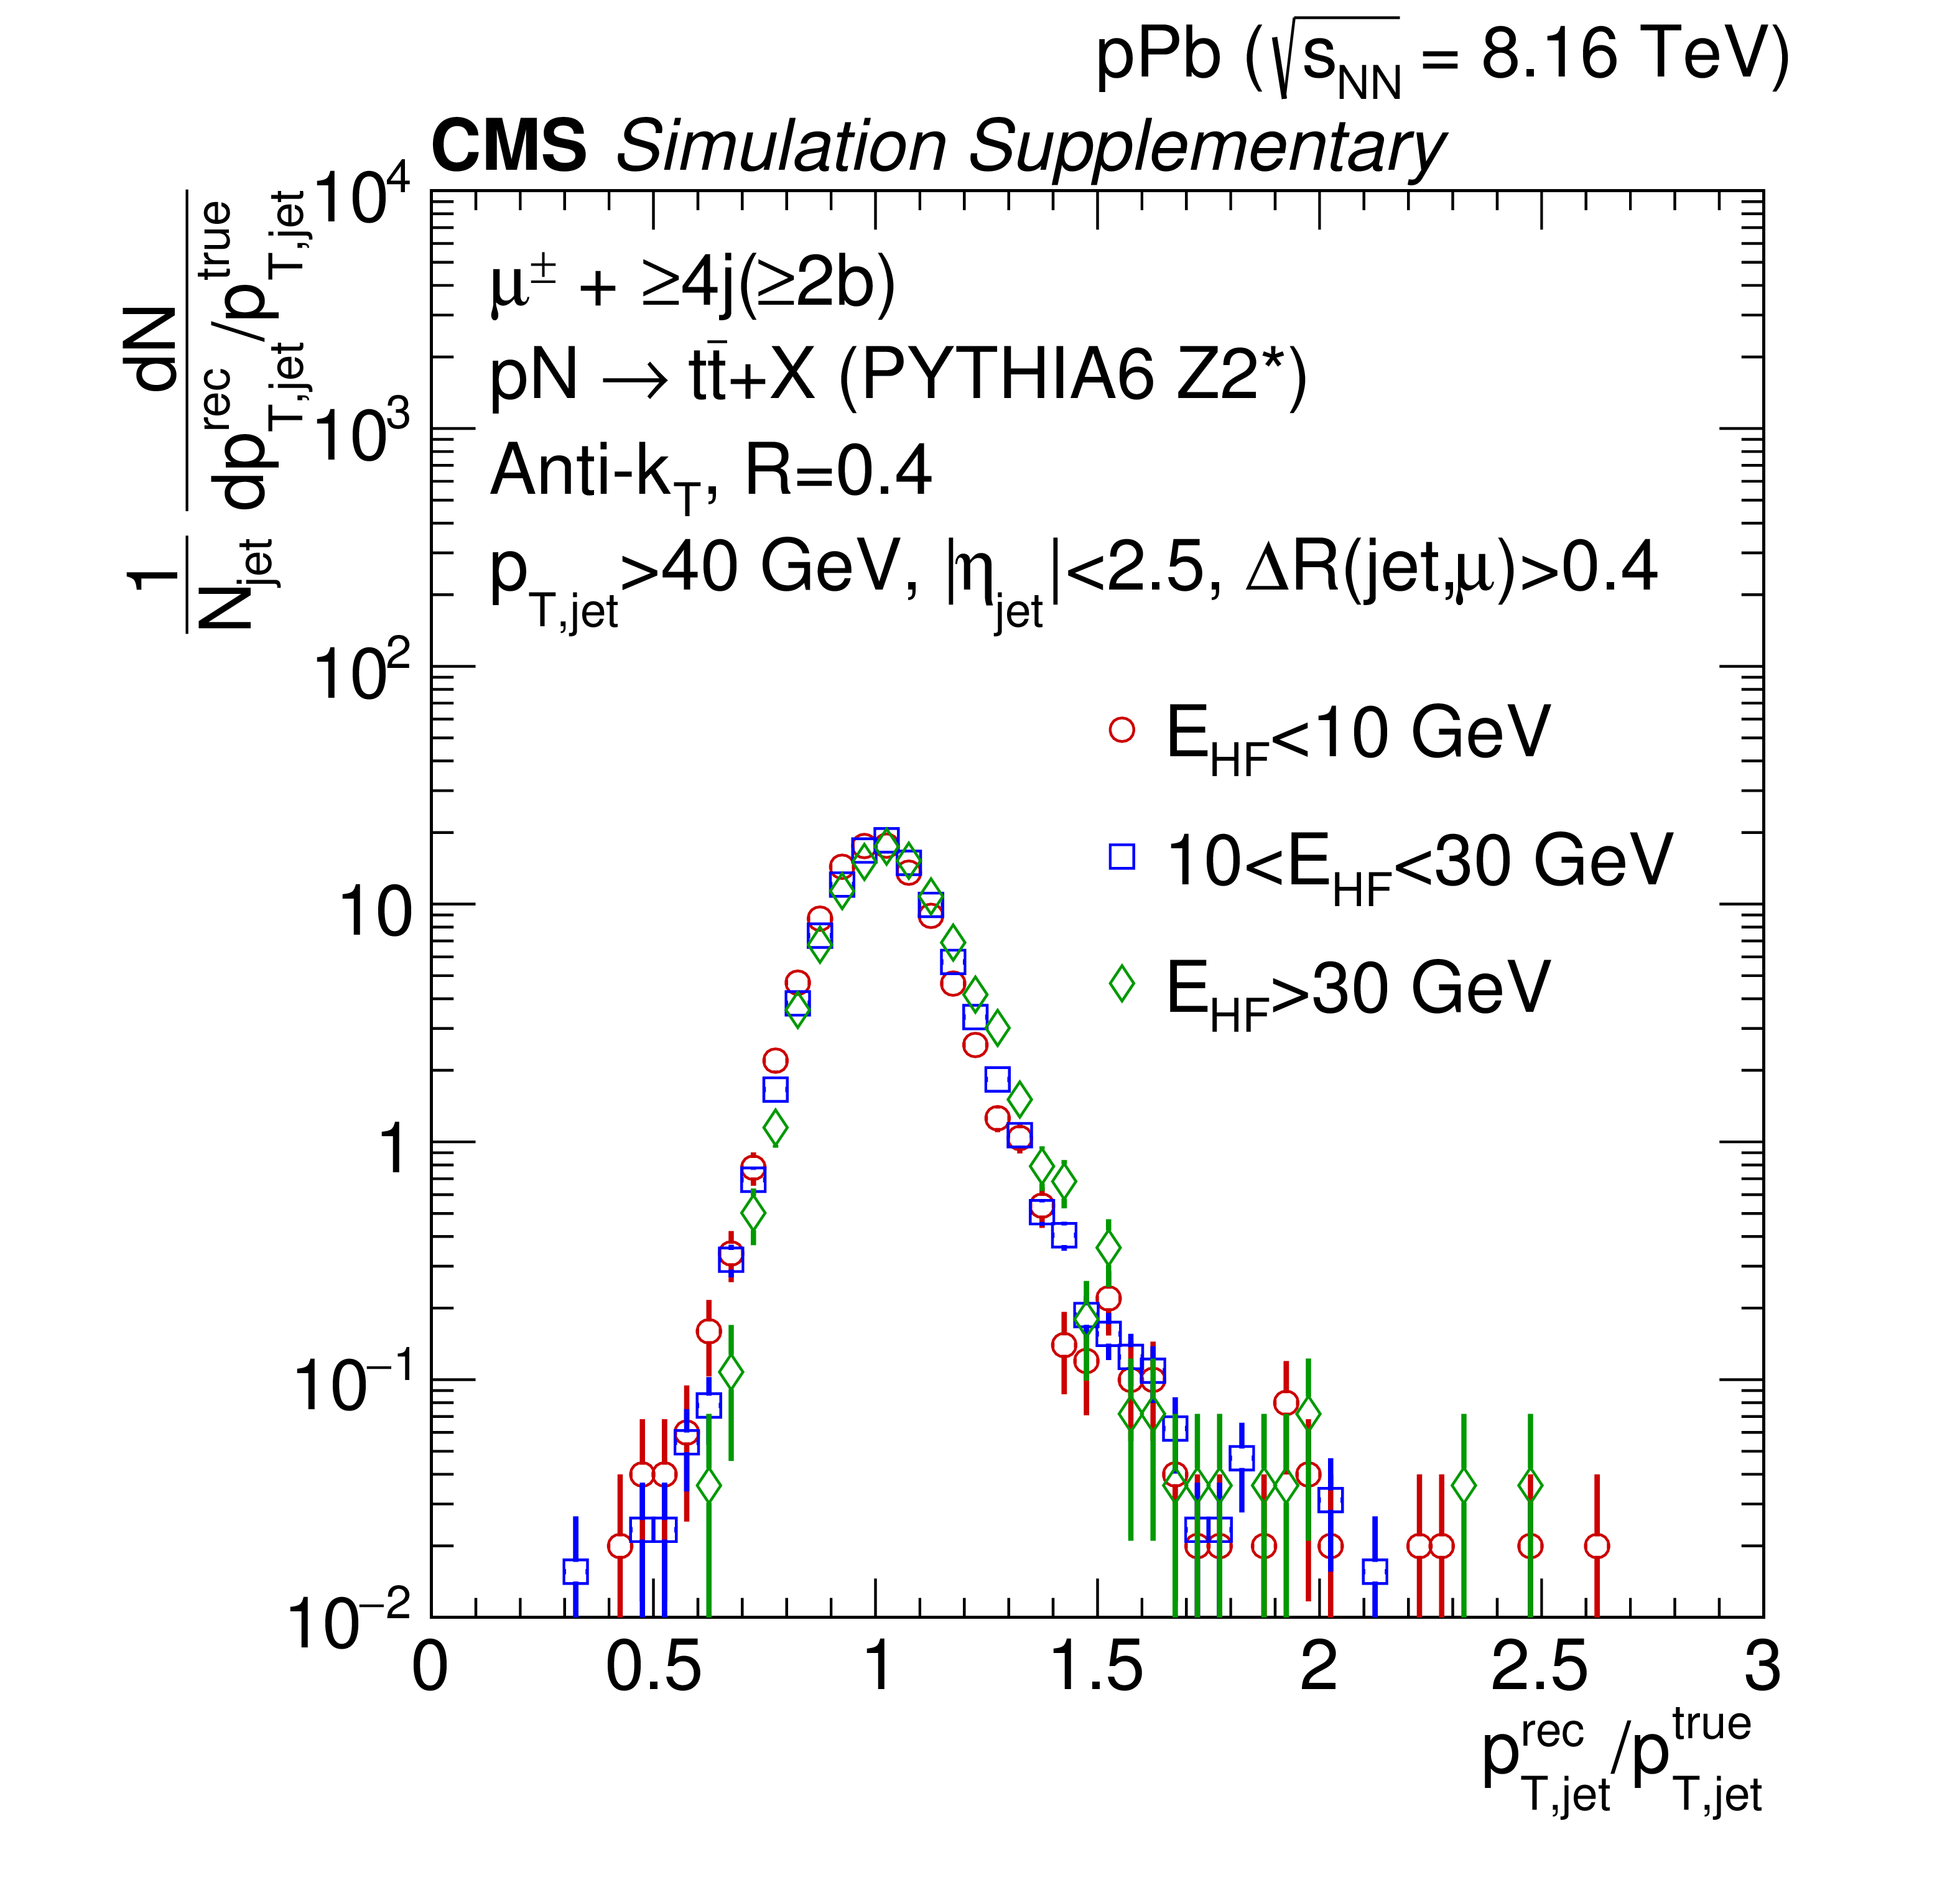
Additional Figure 2:
Jet energy scale for jets in simulated $ {\mathrm{t} {}\mathrm{\bar{t}}} $ events passing the analysis selection in the $\mu $+jets channel. Jet energy scale is shown for various selection of the summed transverse energy in the forward calorimeters ($\rm {E}_{\rm {HF}}$) in the Pb-going direction which is a measure of the uncorrelated underlying event produced in pPb collisions. Reconstructed jets overlapping with the isolated muon are excluded. |

png pdf |
Additional Figure 3:
Dijet invariant mass ($ {m_{{\mathrm {j} \mathrm {j}^{\prime}}}} $) distributions in the 0 (left), 1 (center), and 2 (right) b-tagged jet categories after the complete event selection. In the upper panels the reconstructed data are compared to the stacked expected contributions from signal and the main background processes. The $ {\mathrm{t} {}\mathrm{\bar{t}}} $, W+jets, and Drell-Yan (DY) processes are simulated with PYTHIA 6 (v.6.424, tune Z2*) and normalized to the expected cross sections and integrated luminosity. The simulations including a mixture of pp and pn interactions corresponding to their ratio in pPb collisions. The QCD multijet (Multijets) contribution is estimated from data using a control region where the muon (electron) candidate fails the isolation (identification) requirements used in the selection of the signal. The normalization is performed using events with missing transverse momentum less than 20 GeV. The bottom panels display the ratio between the data and the expectations. The shaded band represents the relative uncertainty due to the statistics in the simulated samples and in the estimate of the normalization of the QCD multijet background. |

png pdf |
Additional Figure 3-a:
Dijet invariant mass ($ {m_{{\mathrm {j} \mathrm {j}^{\prime}}}} $) distribution in the 0 b-tagged jet category after the complete event selection. In the upper panel the reconstructed data are compared to the stacked expected contributions from signal and the main background processes. The $ {\mathrm{t} {}\mathrm{\bar{t}}} $, W+jets, and Drell-Yan (DY) processes are simulated with PYTHIA 6 (v.6.424, tune Z2*) and normalized to the expected cross sections and integrated luminosity. The simulations including a mixture of pp and pn interactions corresponding to their ratio in pPb collisions. The QCD multijet (Multijets) contribution is estimated from data using a control region where the muon (electron) candidate fails the isolation (identification) requirements used in the selection of the signal. The normalization is performed using events with missing transverse momentum less than 20 GeV. The bottom panel displays the ratio between the data and the expectations. The shaded band represents the relative uncertainty due to the statistics in the simulated samples and in the estimate of the normalization of the QCD multijet background. |

png pdf |
Additional Figure 3-b:
Dijet invariant mass ($ {m_{{\mathrm {j} \mathrm {j}^{\prime}}}} $) distribution in the 1 b-tagged jet category after the complete event selection. In the upper panel the reconstructed data are compared to the stacked expected contributions from signal and the main background processes. The $ {\mathrm{t} {}\mathrm{\bar{t}}} $, W+jets, and Drell-Yan (DY) processes are simulated with PYTHIA 6 (v.6.424, tune Z2*) and normalized to the expected cross sections and integrated luminosity. The simulations including a mixture of pp and pn interactions corresponding to their ratio in pPb collisions. The QCD multijet (Multijets) contribution is estimated from data using a control region where the muon (electron) candidate fails the isolation (identification) requirements used in the selection of the signal. The normalization is performed using events with missing transverse momentum less than 20 GeV. The bottom panel displays the ratio between the data and the expectations. The shaded band represents the relative uncertainty due to the statistics in the simulated samples and in the estimate of the normalization of the QCD multijet background. |

png pdf |
Additional Figure 3-c:
Dijet invariant mass ($ {m_{{\mathrm {j} \mathrm {j}^{\prime}}}} $) distribution in the 2 b-tagged jet category after the complete event selection. In the upper panel the reconstructed data are compared to the stacked expected contributions from signal and the main background processes. The $ {\mathrm{t} {}\mathrm{\bar{t}}} $, W+jets, and Drell-Yan (DY) processes are simulated with PYTHIA 6 (v.6.424, tune Z2*) and normalized to the expected cross sections and integrated luminosity. The simulations including a mixture of pp and pn interactions corresponding to their ratio in pPb collisions. The QCD multijet (Multijets) contribution is estimated from data using a control region where the muon (electron) candidate fails the isolation (identification) requirements used in the selection of the signal. The normalization is performed using events with missing transverse momentum less than 20 GeV. The bottom panel displays the ratio between the data and the expectations. The shaded band represents the relative uncertainty due to the statistics in the simulated samples and in the estimate of the normalization of the QCD multijet background. |
png pdf |
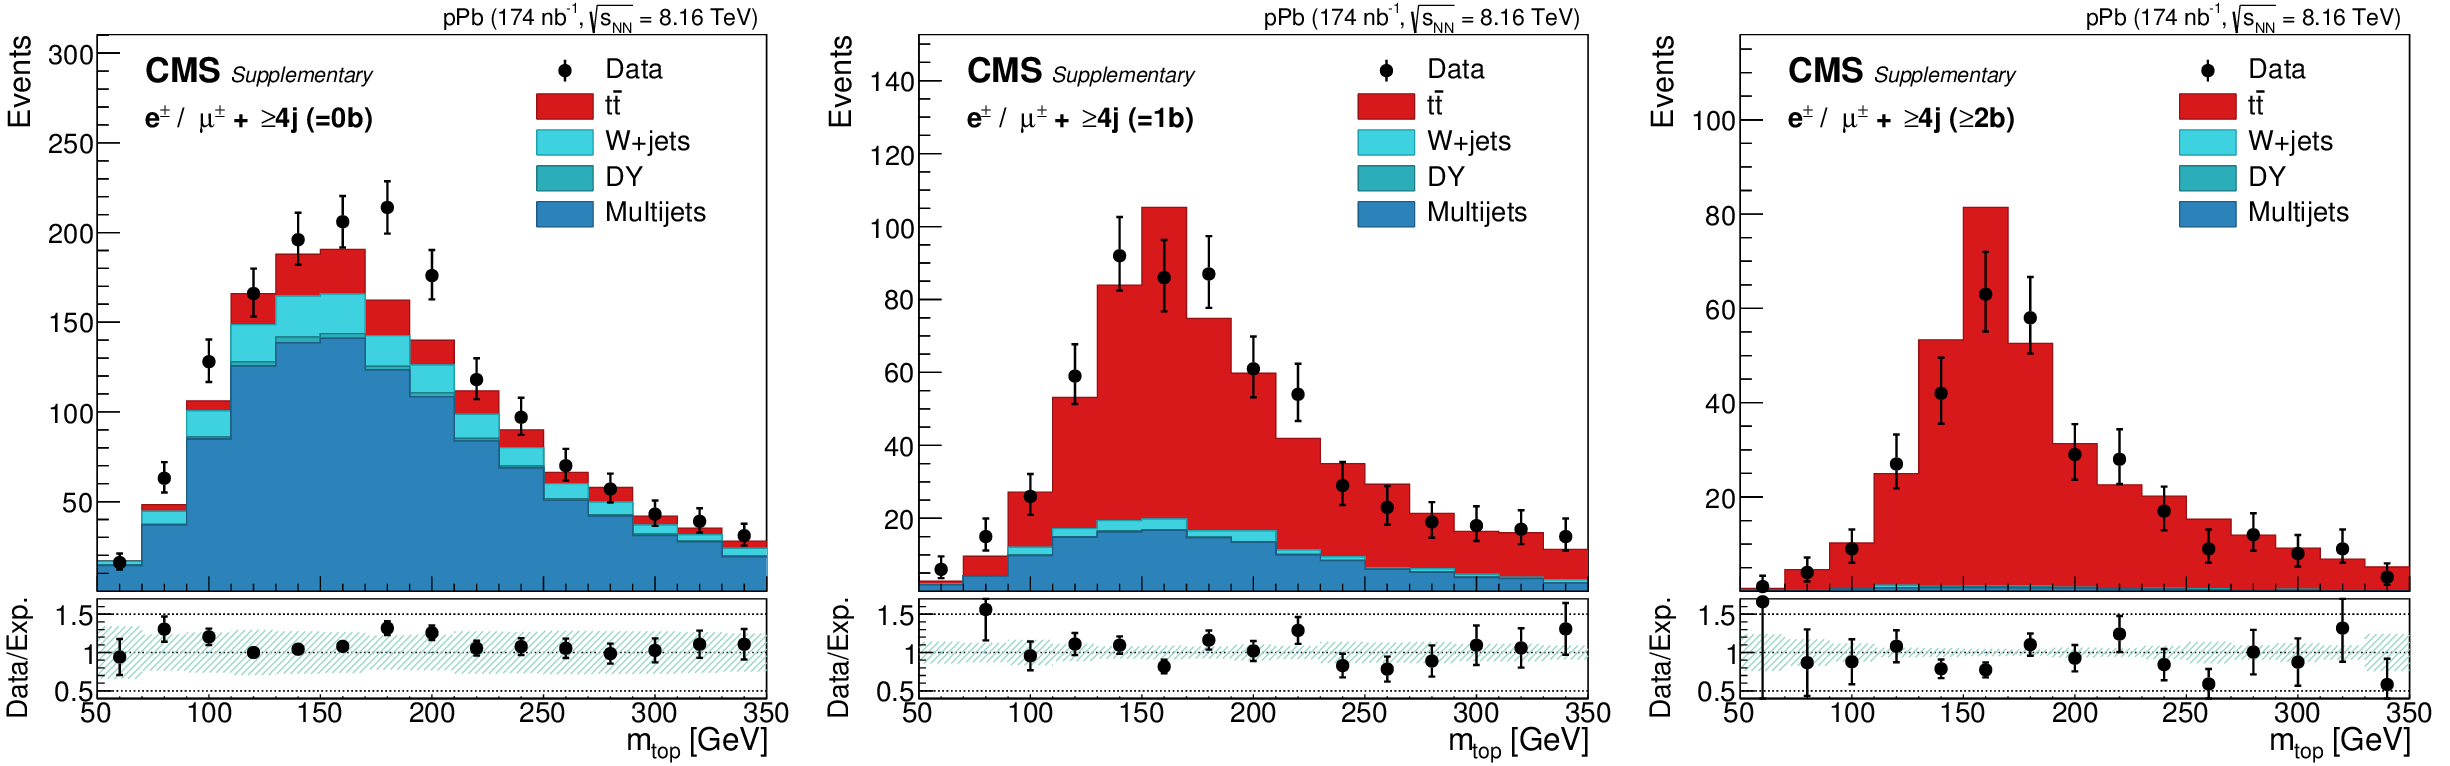
Additional Figure 4:
Hadronic top mass ($ {m_\text {top}} $) distributions in the 0 (left), 1 (center), and 2 (right) b-tagged jet categories after all selections. In the upper panels the reconstructed data are compared to the stacked expected contributions from signal and the main background processes. The $ {\mathrm{t} {}\mathrm{\bar{t}}} $, W+jets, and Drell-Yan (DY) processes are simulated with PYTHIA 6 (v.6.424, tune Z2*) and normalized to the expected cross sections and integrated luminosity. The simulations including a mixture of pp and pn interactions corresponding to their ratio in pPb collisions. The QCD multijet (Multiijets) contribution is estimated from data using a control region where the muon (electron) candidate fails the isolation (identification) requirements used in the selection of the signal. The normalization is performed using events with missing transverse momentum less than $20 GeV $. The bottom panels display the ratio between the data and the expectations. The shaded band represents the relative uncertainty due to the statistics in the simulated samples and in the estimate of the normalization of the QCD multijet background. |

png pdf |
Additional Figure 4-a:
Hadronic top mass ($ {m_\text {top}} $) distributions in the 0 b-tagged jet categories after all selections. In the upper panel the reconstructed data are compared to the stacked expected contributions from signal and the main background processes. The $ {\mathrm{t} {}\mathrm{\bar{t}}} $, W+jets, and Drell-Yan (DY) processes are simulated with PYTHIA 6 (v.6.424, tune Z2*) and normalized to the expected cross sections and integrated luminosity. The simulations including a mixture of pp and pn interactions corresponding to their ratio in pPb collisions. The QCD multijet (Multiijets) contribution is estimated from data using a control region where the muon (electron) candidate fails the isolation (identification) requirements used in the selection of the signal. The normalization is performed using events with missing transverse momentum less than $20 GeV $. The bottom panel displays the ratio between the data and the expectations. The shaded band represents the relative uncertainty due to the statistics in the simulated samples and in the estimate of the normalization of the QCD multijet background. |

png pdf |
Additional Figure 4-b:
Hadronic top mass ($ {m_\text {top}} $) distributions in the 1 b-tagged jet categories after all selections. In the upper panel the reconstructed data are compared to the stacked expected contributions from signal and the main background processes. The $ {\mathrm{t} {}\mathrm{\bar{t}}} $, W+jets, and Drell-Yan (DY) processes are simulated with PYTHIA 6 (v.6.424, tune Z2*) and normalized to the expected cross sections and integrated luminosity. The simulations including a mixture of pp and pn interactions corresponding to their ratio in pPb collisions. The QCD multijet (Multiijets) contribution is estimated from data using a control region where the muon (electron) candidate fails the isolation (identification) requirements used in the selection of the signal. The normalization is performed using events with missing transverse momentum less than $20 GeV $. The bottom panel displays the ratio between the data and the expectations. The shaded band represents the relative uncertainty due to the statistics in the simulated samples and in the estimate of the normalization of the QCD multijet background. |

png pdf |
Additional Figure 4-c:
Hadronic top mass ($ {m_\text {top}} $) distributions in the 2 b-tagged jet categories after all selections. In the upper panel the reconstructed data are compared to the stacked expected contributions from signal and the main background processes. The $ {\mathrm{t} {}\mathrm{\bar{t}}} $, W+jets, and Drell-Yan (DY) processes are simulated with PYTHIA 6 (v.6.424, tune Z2*) and normalized to the expected cross sections and integrated luminosity. The simulations including a mixture of pp and pn interactions corresponding to their ratio in pPb collisions. The QCD multijet (Multiijets) contribution is estimated from data using a control region where the muon (electron) candidate fails the isolation (identification) requirements used in the selection of the signal. The normalization is performed using events with missing transverse momentum less than $20 GeV $. The bottom panel displays the ratio between the data and the expectations. The shaded band represents the relative uncertainty due to the statistics in the simulated samples and in the estimate of the normalization of the QCD multijet background. |

png pdf |
Additional Figure 5:
Top mass variable reconstructed from the isolated charged lepton, the b jet not associated to the hadronic top decay and the neutrino - $m_{\ell\nu \mathrm{b}}$. The reconstructed missing transverse momentum vector is assumed to correspond to the $ p_{\mathrm{T}} $ of the neutrino, being the momentum in the longitudinal plane reconstructed from the four-momentum conservation in the $ \mathrm{W}\rightarrow\ell\nu $ decay, assuming the world average W mass. The $m_{\ell\nu \mathrm{b}}$ distributions are shown for the 0 (left), 1 (center), and 2 (right) b-tagged jet categories after all selections. In the upper panels the reconstructed data are compared to the stacked expected contributions from signal and the main background processes. The $ \mathrm{t\bar{t}} $, W+jets, and Drell-Yan (DY) processes are simulated with PYTHIA 6 (v.6.424, tune Z2*) and normalized to the expected cross sections and integrated luminosity. The simulations including a mixture of pp and pn interactions corresponding to their ratio in pPb collisions. The QCD multijet (Multijets) contribution is estimated from and from data using a control region where the muon (electron) candidate fails the isolation (identification) requirements used in the selection of the signal. The normalization is performed using events with missing transverse momentum less than 20 GeV. The bottom panels display the ratio between the data and the expectations. The shaded band represents the relative uncertainty due to the statistics in the simulated samples and in the estimate of the normalization of the QCD multijet background. |

png pdf |
Additional Figure 5-a:
Top mass variable reconstructed from the isolated charged lepton, the b jet not associated to the hadronic top decay and the neutrino - $m_{\ell\nu \mathrm{b}}$. The reconstructed missing transverse momentum vector is assumed to correspond to the $ p_{\mathrm{T}} $ of the neutrino, being the momentum in the longitudinal plane reconstructed from the four-momentum conservation in the $ \mathrm{W}\rightarrow\ell\nu $ decay, assuming the world average W mass. The $m_{\ell\nu \mathrm{b}}$ distributions are shown for the 0 b-tagged jet categories after all selections. In the upper panel the reconstructed data are compared to the stacked expected contributions from signal and the main background processes. The $ \mathrm{t\bar{t}} $, W+jets, and Drell-Yan (DY) processes are simulated with PYTHIA 6 (v.6.424, tune Z2*) and normalized to the expected cross sections and integrated luminosity. The simulations including a mixture of pp and pn interactions corresponding to their ratio in pPb collisions. The QCD multijet (Multijets) contribution is estimated from and from data using a control region where the muon (electron) candidate fails the isolation (identification) requirements used in the selection of the signal. The normalization is performed using events with missing transverse momentum less than 20 GeV. The bottom panel displays the ratio between the data and the expectations. The shaded band represents the relative uncertainty due to the statistics in the simulated samples and in the estimate of the normalization of the QCD multijet background. |

png pdf |
Additional Figure 5-b:
Top mass variable reconstructed from the isolated charged lepton, the b jet not associated to the hadronic top decay and the neutrino - $m_{\ell\nu \mathrm{b}}$. The reconstructed missing transverse momentum vector is assumed to correspond to the $ p_{\mathrm{T}} $ of the neutrino, being the momentum in the longitudinal plane reconstructed from the four-momentum conservation in the $ \mathrm{W}\rightarrow\ell\nu $ decay, assuming the world average W mass. The $m_{\ell\nu \mathrm{b}}$ distributions are shown for the 1 b-tagged jet categories after all selections. In the upper panel the reconstructed data are compared to the stacked expected contributions from signal and the main background processes. The $ \mathrm{t\bar{t}} $, W+jets, and Drell-Yan (DY) processes are simulated with PYTHIA 6 (v.6.424, tune Z2*) and normalized to the expected cross sections and integrated luminosity. The simulations including a mixture of pp and pn interactions corresponding to their ratio in pPb collisions. The QCD multijet (Multijets) contribution is estimated from and from data using a control region where the muon (electron) candidate fails the isolation (identification) requirements used in the selection of the signal. The normalization is performed using events with missing transverse momentum less than 20 GeV. The bottom panel displays the ratio between the data and the expectations. The shaded band represents the relative uncertainty due to the statistics in the simulated samples and in the estimate of the normalization of the QCD multijet background. |

png pdf |
Additional Figure 5-c:
Top mass variable reconstructed from the isolated charged lepton, the b jet not associated to the hadronic top decay and the neutrino - $m_{\ell\nu \mathrm{b}}$. The reconstructed missing transverse momentum vector is assumed to correspond to the $ p_{\mathrm{T}} $ of the neutrino, being the momentum in the longitudinal plane reconstructed from the four-momentum conservation in the $ \mathrm{W}\rightarrow\ell\nu $ decay, assuming the world average W mass. The $m_{\ell\nu \mathrm{b}}$ distributions are shown for the 2 b-tagged jet categories after all selections. In the upper panel the reconstructed data are compared to the stacked expected contributions from signal and the main background processes. The $ \mathrm{t\bar{t}} $, W+jets, and Drell-Yan (DY) processes are simulated with PYTHIA 6 (v.6.424, tune Z2*) and normalized to the expected cross sections and integrated luminosity. The simulations including a mixture of pp and pn interactions corresponding to their ratio in pPb collisions. The QCD multijet (Multijets) contribution is estimated from and from data using a control region where the muon (electron) candidate fails the isolation (identification) requirements used in the selection of the signal. The normalization is performed using events with missing transverse momentum less than 20 GeV. The bottom panel displays the ratio between the data and the expectations. The shaded band represents the relative uncertainty due to the statistics in the simulated samples and in the estimate of the normalization of the QCD multijet background. |

png pdf |
Additional Figure 6:
Results of the fits to the invariant mass distributions of the W candidate, $ {m_{{\mathrm {j} \mathrm {j}^{\prime}}}} $, in the electron (top) and muon (bottom) channels. From left to right the distributions correspond to events with 0, 1 or at least two b-tagged jets. The red and orange areas correspond to the signal simulation (correct and wrong assignments, respectively) while the blue one corresponds to the estimated non-top background contributions. The error bars indicate the statistical uncertainties. |

png pdf |
Additional Figure 6-a:
Results of the fits to the invariant mass distributions of the W candidate, $ {m_{{\mathrm {j} \mathrm {j}^{\prime}}}} $, in the electron channel. The distribution corresponds to events with 0 b-tagged jet. The red and orange areas correspond to the signal simulation (correct and wrong assignments, respectively) while the blue one corresponds to the estimated non-top background contributions. The error bars indicate the statistical uncertainties. |

png pdf |
Additional Figure 6-b:
Results of the fits to the invariant mass distributions of the W candidate, $ {m_{{\mathrm {j} \mathrm {j}^{\prime}}}} $, in the electron channel. The distribution corresponds to events with 1 b-tagged jet. The red and orange areas correspond to the signal simulation (correct and wrong assignments, respectively) while the blue one corresponds to the estimated non-top background contributions. The error bars indicate the statistical uncertainties. |
png pdf |
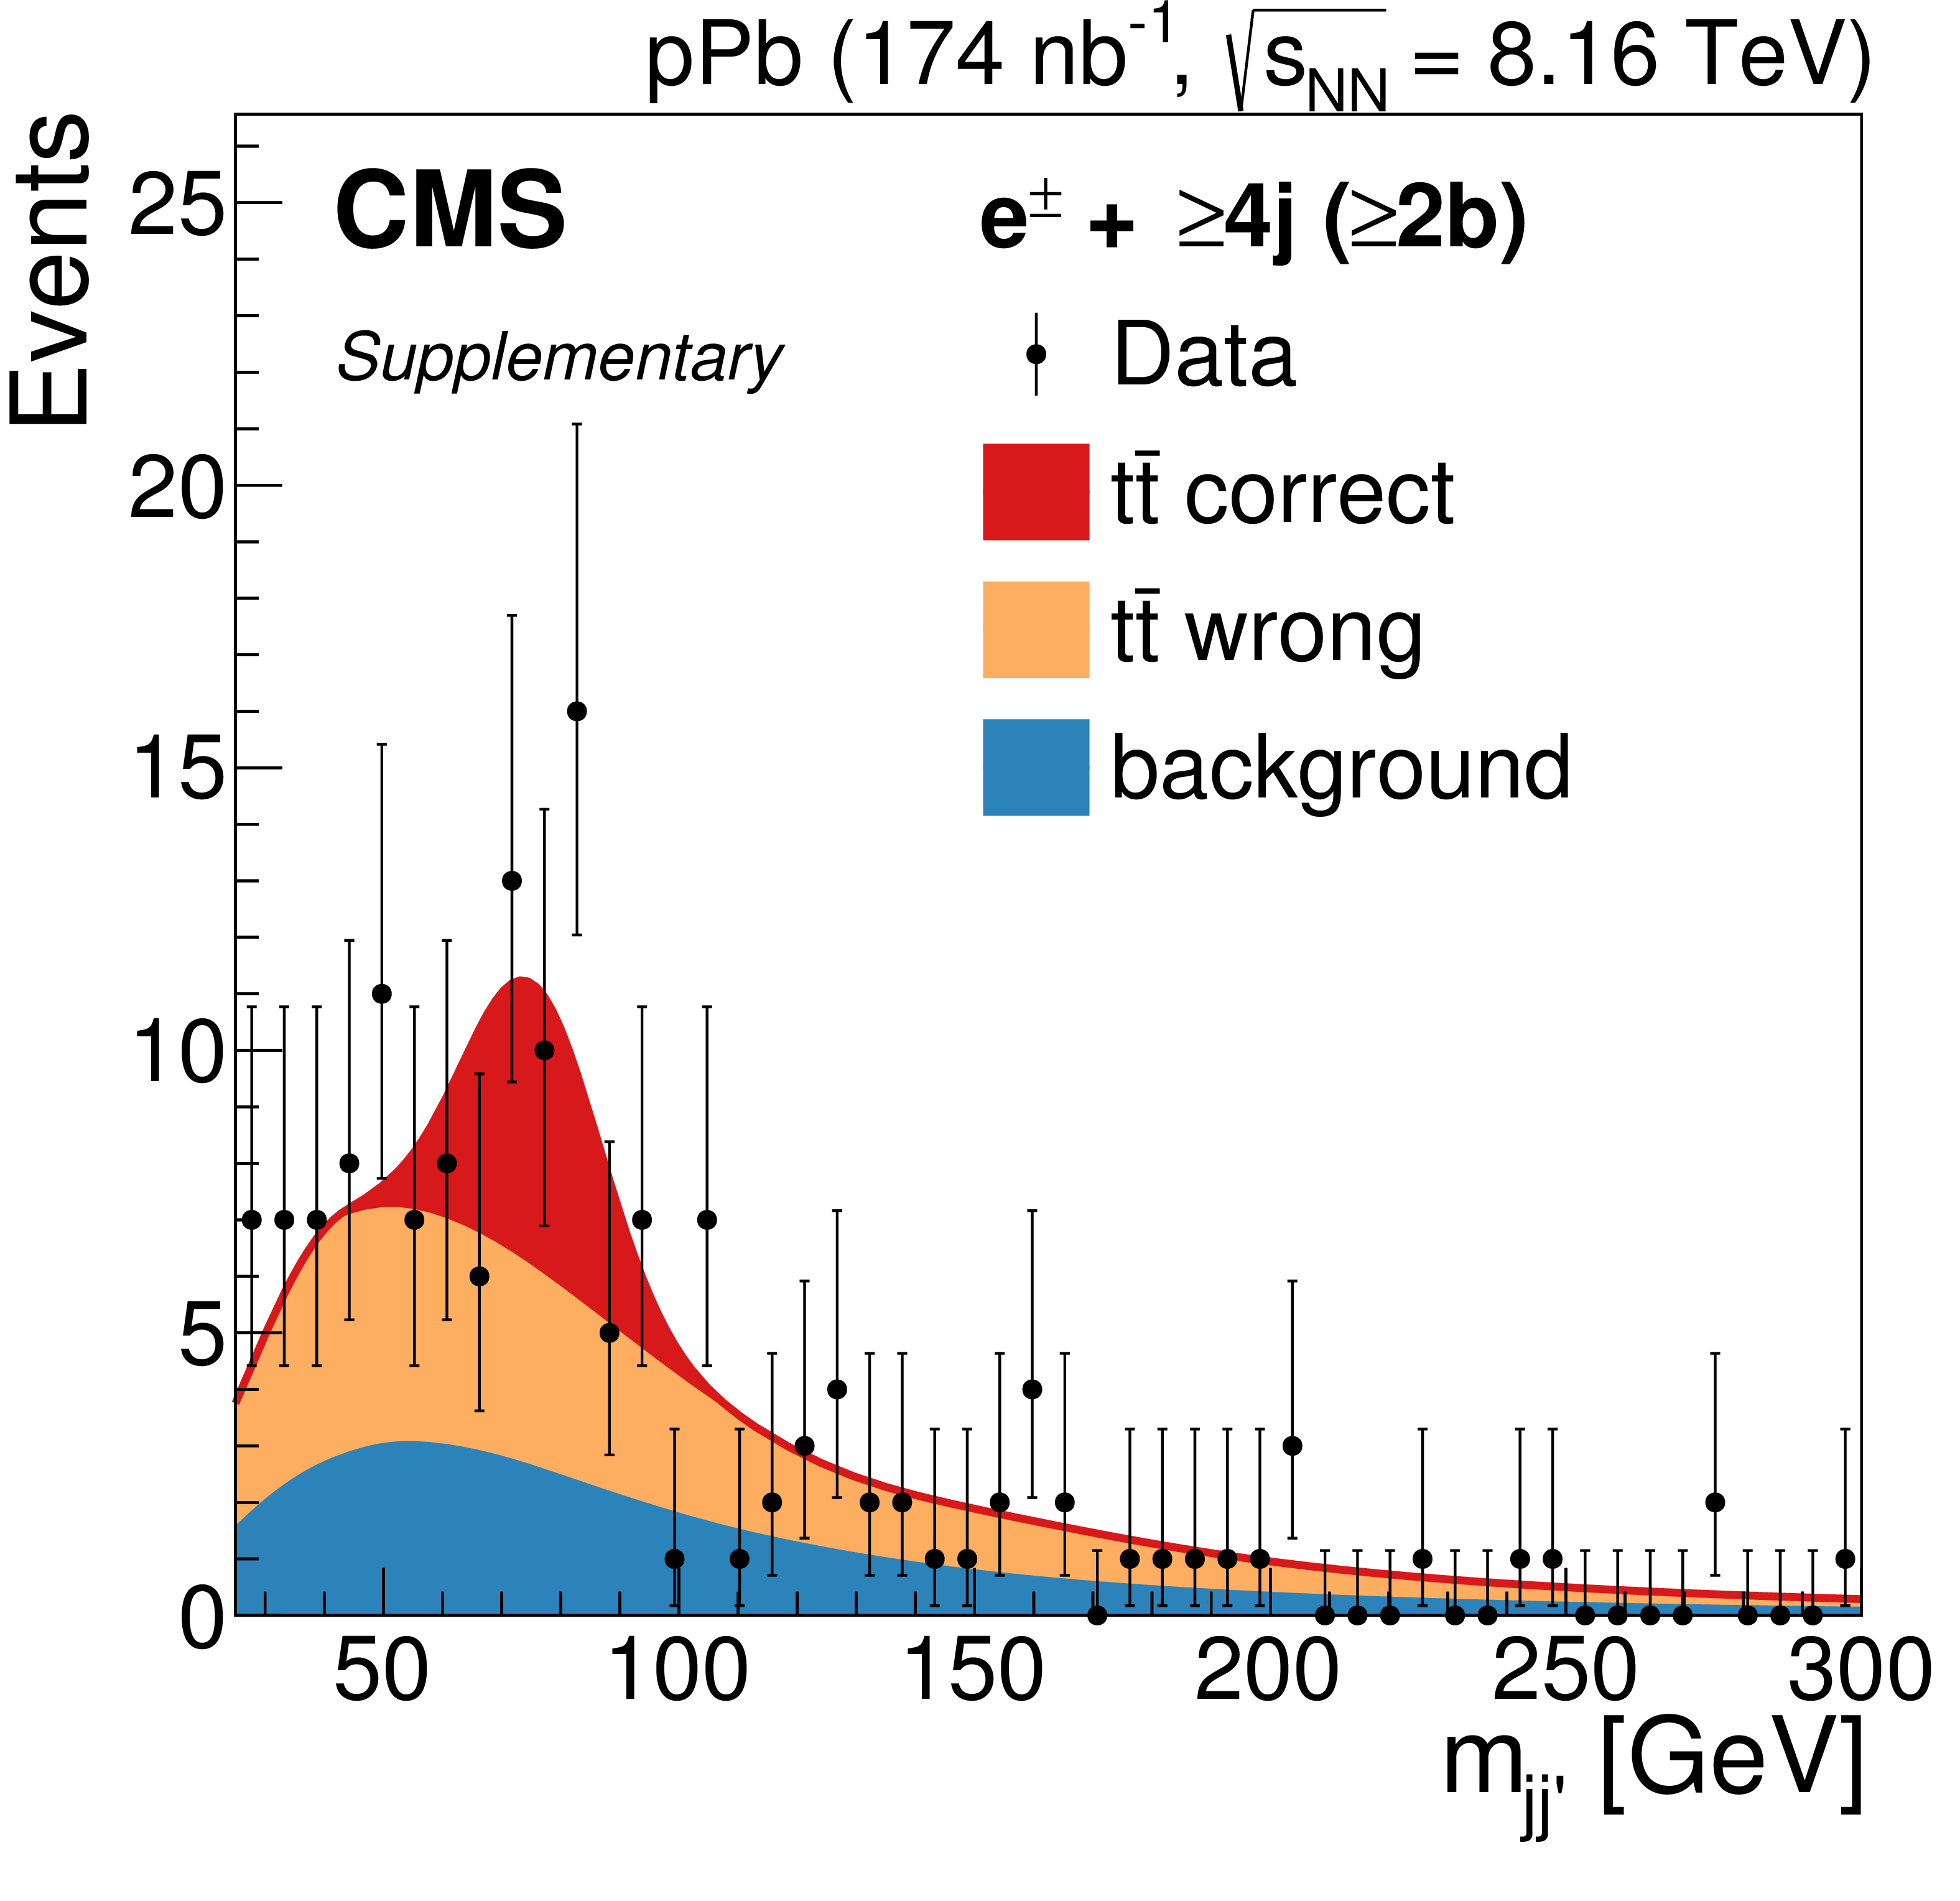
Additional Figure 6-c:
Results of the fits to the invariant mass distributions of the W candidate, $ {m_{{\mathrm {j} \mathrm {j}^{\prime}}}} $, in the electron channel. The distribution corresponds to events with at least two b-tagged jets. The red and orange areas correspond to the signal simulation (correct and wrong assignments, respectively) while the blue one corresponds to the estimated non-top background contributions. The error bars indicate the statistical uncertainties. |

png pdf |
Additional Figure 6-d:
Results of the fits to the invariant mass distributions of the W candidate, $ {m_{{\mathrm {j} \mathrm {j}^{\prime}}}} $, in the muon channel. The distribution corresponds to events with 0 b-tagged jet. The red and orange areas correspond to the signal simulation (correct and wrong assignments, respectively) while the blue one corresponds to the estimated non-top background contributions. The error bars indicate the statistical uncertainties. |

png pdf |
Additional Figure 6-e:
Results of the fits to the invariant mass distributions of the W candidate, $ {m_{{\mathrm {j} \mathrm {j}^{\prime}}}} $, in the muon channel. The distribution corresponds to events with 1 b-tagged jet. The red and orange areas correspond to the signal simulation (correct and wrong assignments, respectively) while the blue one corresponds to the estimated non-top background contributions. The error bars indicate the statistical uncertainties. |

png pdf |
Additional Figure 6-f:
Results of the fits to the invariant mass distributions of the W candidate, $ {m_{{\mathrm {j} \mathrm {j}^{\prime}}}} $, in the muon channel. The distribution corresponds to events with at least two b-tagged jets. The red and orange areas correspond to the signal simulation (correct and wrong assignments, respectively) while the blue one corresponds to the estimated non-top background contributions. The error bars indicate the statistical uncertainties. |

png pdf |
Additional Figure 7:
Invariant mass distributions, $ {m_\text {top}} $, of the $\mathrm{t} \rightarrow {\mathrm {j} \mathrm {j}^{\prime}} \mathrm{b} $ candidates in the 0 (left), 1 (center), and 2 (right) b-tagged jet categories after all selections. The top (bottom) plots correspond to the electron (muon) channel. All signal and background parameters are kept fixed to the outcome of the $ {m_{{\mathrm {j} \mathrm {j}^{\prime}}}} $ fit. The red and orange areas correspond to the signal simulation (correct and wrong assignments, respectively) while the blue one corresponds to the estimated non-top background contributions. The error bars indicate the statistical uncertainties. |

png pdf |
Additional Figure 7-a:
Invariant mass distribution, $ {m_\text {top}} $, of the $\mathrm{t} \rightarrow {\mathrm {j} \mathrm {j}^{\prime}} \mathrm{b} $ candidates in the 0 b-tagged jet category after all selections. The plot corresponds to the electron channel. All signal and background parameters are kept fixed to the outcome of the $ {m_{{\mathrm {j} \mathrm {j}^{\prime}}}} $ fit. The red and orange areas correspond to the signal simulation (correct and wrong assignments, respectively) while the blue one corresponds to the estimated non-top background contributions. The error bars indicate the statistical uncertainties. |

png pdf |
Additional Figure 7-b:
Invariant mass distribution, $ {m_\text {top}} $, of the $\mathrm{t} \rightarrow {\mathrm {j} \mathrm {j}^{\prime}} \mathrm{b} $ candidates in the 1 b-tagged jet category after all selections. The plot corresponds to the electron channel. All signal and background parameters are kept fixed to the outcome of the $ {m_{{\mathrm {j} \mathrm {j}^{\prime}}}} $ fit. The red and orange areas correspond to the signal simulation (correct and wrong assignments, respectively) while the blue one corresponds to the estimated non-top background contributions. The error bars indicate the statistical uncertainties. |
png pdf |
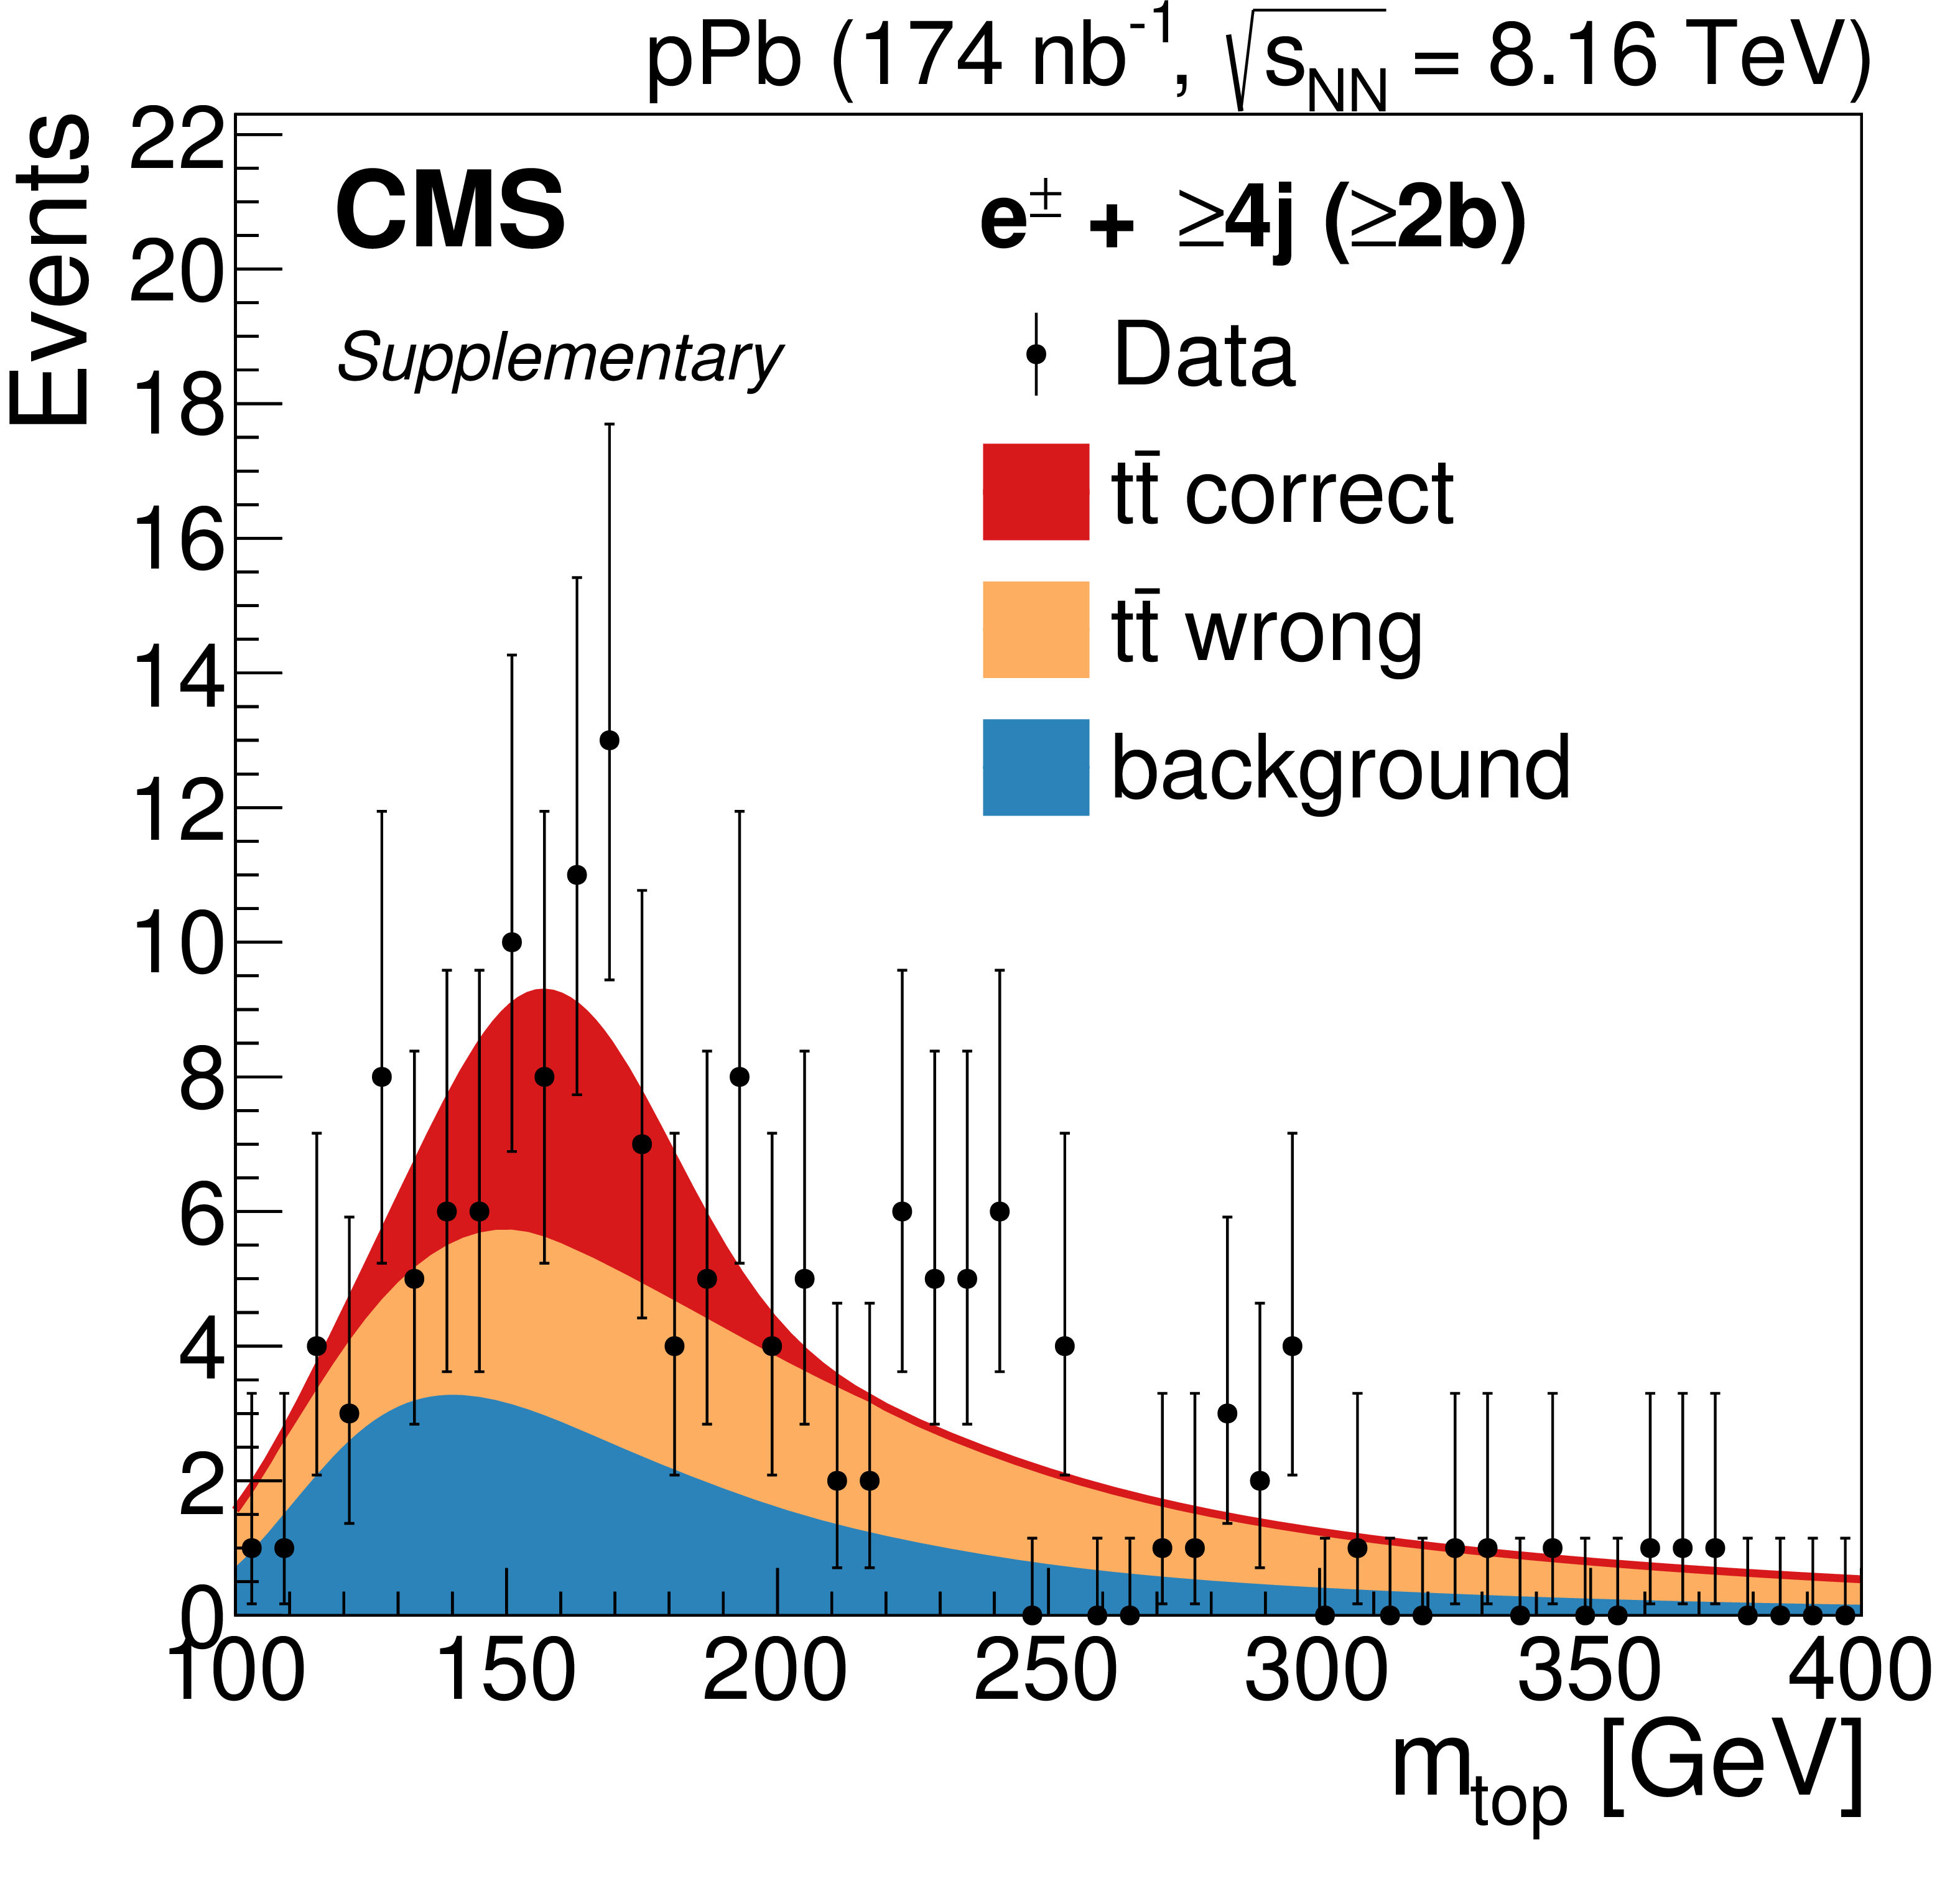
Additional Figure 7-c:
Invariant mass distribution, $ {m_\text {top}} $, of the $\mathrm{t} \rightarrow {\mathrm {j} \mathrm {j}^{\prime}} \mathrm{b} $ candidates in the 2 b-tagged jet category after all selections. The plot corresponds to the electron channel. All signal and background parameters are kept fixed to the outcome of the $ {m_{{\mathrm {j} \mathrm {j}^{\prime}}}} $ fit. The red and orange areas correspond to the signal simulation (correct and wrong assignments, respectively) while the blue one corresponds to the estimated non-top background contributions. The error bars indicate the statistical uncertainties. |

png pdf |
Additional Figure 7-d:
Invariant mass distribution, $ {m_\text {top}} $, of the $\mathrm{t} \rightarrow {\mathrm {j} \mathrm {j}^{\prime}} \mathrm{b} $ candidates in the 0 b-tagged jet category after all selections. The plot corresponds to the muon channel. All signal and background parameters are kept fixed to the outcome of the $ {m_{{\mathrm {j} \mathrm {j}^{\prime}}}} $ fit. The red and orange areas correspond to the signal simulation (correct and wrong assignments, respectively) while the blue one corresponds to the estimated non-top background contributions. The error bars indicate the statistical uncertainties. |

png pdf |
Additional Figure 7-e:
Invariant mass distribution, $ {m_\text {top}} $, of the $\mathrm{t} \rightarrow {\mathrm {j} \mathrm {j}^{\prime}} \mathrm{b} $ candidates in the 1 b-tagged jet category after all selections. The plot corresponds to the muon channel. All signal and background parameters are kept fixed to the outcome of the $ {m_{{\mathrm {j} \mathrm {j}^{\prime}}}} $ fit. The red and orange areas correspond to the signal simulation (correct and wrong assignments, respectively) while the blue one corresponds to the estimated non-top background contributions. The error bars indicate the statistical uncertainties. |

png pdf |
Additional Figure 7-f:
Invariant mass distribution, $ {m_\text {top}} $, of the $\mathrm{t} \rightarrow {\mathrm {j} \mathrm {j}^{\prime}} \mathrm{b} $ candidates in the 2 b-tagged jet category after all selections. The plot corresponds to the muon channel. All signal and background parameters are kept fixed to the outcome of the $ {m_{{\mathrm {j} \mathrm {j}^{\prime}}}} $ fit. The red and orange areas correspond to the signal simulation (correct and wrong assignments, respectively) while the blue one corresponds to the estimated non-top background contributions. The error bars indicate the statistical uncertainties. |

png pdf |
Additional Figure 8:
Profile likelihood ratio distribution from pseudo-data generated from the background-only model. The value of the test statistic in data is also indicated by the black arrow. Dashed lines show the approximate location of the expected test statistic value, based on asymptotic formulae, for various z-values. |

png pdf |
Additional Figure 8-a:
The observed variation of the likelihood as a function of the signal strength. The two horizontal lines represent the values in the profile likelihood that are used to determine the 68% and 95% confidence level intervals for the signal strength. |

png pdf |
Additional Figure 8-b:
Profile likelihood ratio distribution from pseudo-data generated from the background-only model. The value of the test statistic in data is also indicated by the black arrow. Dashed lines show the approximate location of the expected test statistic value, based on asymptotic formulae, for various z-values. |

png pdf |
Additional Figure 9:
Top quark pair production cross section in pp and pPb collisions collisions as a function of the center-of-mass energy per nucleon pair; the CMS results at different center-of-mass energies in the dilepton and $\ell $+jets channels. The measurements are compared to the NNLO+NNLL theory predictions. |
| References | ||||
| 1 | Particle Data Group, C. Patrignani et al. | Review of particle physics | CPC 40 (2016) 100001 | |
| 2 | M. Czakon and A. Mitov | Top++: a program for the calculation of the top-pair cross-section at hadron colliders | CPC 185 (2014) 2930 | 1112.5675 |
| 3 | M. Czakon, P. Fiedler and A. Mitov | Total top-quark pair-production cross section at hadron colliders through O($ \alpha_S^4 $) | PRL 110 (2013) 252004 | 1303.6254 |
| 4 | D. d'Enterria, K. Krajcz\'ar, and H. Paukkunen | Top-quark production in proton--nucleus and nucleus--nucleus collisions at LHC energies and beyond | PLB 746 (2015) 64 | 1501.05879 |
| 5 | D. d'Enterria | Top-quark pair production cross sections at NNLO+NNLL in pPb collisions at $ \sqrt{s_{\mathrm{NN}}} = $ 8.16 TeV | 1706.09521 | |
| 6 | European Muon Collaboration | The ratio of the nucleon structure functions $ F_2^N $ for iron and deuterium | PLB 123 (1983) 275 | |
| 7 | K. J. Eskola, H. Paukkunen, and C. A. Salgado | EPS09: A new generation of NLO and LO nuclear parton distribution functions | JHEP 04 (2009) 065 | 0902.4154 |
| 8 | K. J. Eskola, P. Paakkinen, H. Paukkunen, and C. A. Salgado | EPPS16: Nuclear parton distributions with LHC data | EPJC 77 (2017) 163 | 1612.05741 |
| 9 | CMS Collaboration | Study of W boson production in pPb collisions at $ \sqrt{s_{\mathrm{NN}}} = $ 5.02 TeV | PLB 750 (2015) 565 | CMS-HIN-13-007 1503.05825 |
| 10 | CMS Collaboration | Study of Z boson production in pPb collisions at $ \sqrt{s_{\mathrm{NN}}} = $ 5.02 TeV | PLB 759 (2016) 36 | CMS-HIN-15-002 1512.06461 |
| 11 | A. Dainese et al. | Heavy ions at the future circular collider | CERN Yellow Report (2017) 635 | 1605.01389 |
| 12 | CMS Collaboration | The CMS experiment at the CERN LHC | JINST 3 (2008) S08004 | CMS-00-001 |
| 13 | T. Sjostrand, S. Mrenna, and P. Skands | $ PYTHIA $ 6.4 physics and manual | JHEP 05 (2006) 026 | hep-ph/0603175 |
| 14 | CMS Collaboration | Study of the underlying event at forward rapidity in pp collisions at $ \sqrt{s} = $ 0.9, 2.76, and 7 TeV | JHEP 04 (2013) 072 | CMS-FWD-11-003 1302.2394 |
| 15 | CMS Collaboration | Event generator tunes obtained from underlying event and multiparton scattering measurements | EPJC 76 (2016) 155 | CMS-GEN-14-001 1512.00815 |
| 16 | T. Pierog et al. | EPOS LHC: Test of collective hadronization with data measured at the CERN Large Hadron Collider | PRC 92 (2015) 034906 | hep-ph/1306.0121 |
| 17 | GEANT4 Collaboration | GEANT4 --- a simulation toolkit | NIMA 506 (2003) 250 | |
| 18 | CMS Collaboration | The CMS trigger system | JINST 12 (2017) P01020 | CMS-TRG-12-001 1609.02366 |
| 19 | CMS Collaboration | Particle-flow reconstruction and global event description with the CMS detector | Submitted to \it JINST | CMS-PRF-14-001 1706.04965 |
| 20 | CMS Collaboration | The performance of the CMS muon detector in proton-proton collisions at $ \sqrt{s} = $ 7 TeV at the LHC | JINST 8 (2013) P11002 | CMS-MUO-11-001 1306.6905 |
| 21 | CMS Collaboration | Performance of electron reconstruction and selection with the CMS detector in proton-proton collisions at $ \sqrt{s} = $ 8 TeV | JINST 10 (2015) P06005 | CMS-EGM-13-001 1502.02701 |
| 22 | CMS Collaboration | Measurements of inclusive W and Z cross sections in pp collisions at $ \sqrt{s} = $ 7 TeV | JHEP 01 (2011) 080 | CMS-EWK-10-002 1012.2466 |
| 23 | M. Cacciari, G. P. Salam, and G. Soyez | The anti-$ k_t $ jet clustering algorithm | JHEP 04 (2008) 063 | 0802.1189 |
| 24 | CMS Collaboration | Determination of jet energy calibration and transverse momentum resolution in CMS | JINST 6 (2011) P11002 | CMS-JME-10-011 1107.4277 |
| 25 | CMS Collaboration | Jet energy scale and resolution in the CMS experiment in pp collisions at 8 TeV | JINST 12 (2017) P02014 | CMS-JME-13-004 1607.03663 |
| 26 | CMS Collaboration | Identification of b-quark jets with the CMS experiment | JINST 8 (2013) P04013 | CMS-BTV-12-001 1211.4462 |
| 27 | M. J. Oreglia | A study of the reactions $\psi' \to \gamma\gamma \psi$ | PhD thesis, Stanford University, 1980 SLAC Report SLAC-R-236, see Appendix D | |
| 28 | W. Verkerke and D. P. Kirkby | The ROOFIT toolkit for data modeling | in Computing in High Energy and Nuclear Physics (CHEP03), La Jolla, CA, USA, March 2003 | physics/0306116 |
| 29 | K. S. Cranmer | Kernel estimation in high-energy physics | CPC 136 (2001) 198 | hep-ex/0011057 |
| 30 | E. Todesco and J. Wenninger | Large Hadron Collider momentum calibration and accuracy | PRAccel. Beams 20 (2017) 081003 | |
| 31 | ATLAS and CMS Collaborations | Procedure for the LHC Higgs boson search combination in summer 2011 | CMS-NOTE-2011-005 | |
| 32 | S. Frixione, P. Nason, and C. Oleari | Matching NLO QCD computations with parton shower simulations: the POWHEG method | JHEP 11 (2007) 070 | 0709.2092 |
| 33 | S. Alioli, P. Nason, C. Oleari, and E. Re | A general framework for implementing NLO calculations in shower Monte Carlo programs: the POWHEG BOX | JHEP 06 (2010) 043 | 1002.2581 |
| 34 | S. Frixione, P. Nason, and G. Ridolfi | A positive-weight next-to-leading-order Monte Carlo for heavy flavour hadroproduction | JHEP 09 (2007) 126 | 0707.3088 |
| 35 | J. M. Campbell and R. K. Ellis | $ MCFM $ for the Tevatron and the LHC | NPPS 205 (2010) 10 | 1007.3492 |
| 36 | S. Dulat et al. | New parton distribution functions from a global analysis of quantum chromodynamics | PRD 93 (2016) 033006 | 1506.07443 |
| 37 | J. Gao et al. | CT10 next-to-next-to-leading order global analysis of QCD | PRD 89 (2014) 033009 | 1302.6246 |
| 38 | CMS Collaboration | Measurement of the $ \rm t \bar t $ production cross section in the e$ \mu $ channel in proton-proton collisions at $ \sqrt{s} = $ 7 and 8 TeV | JHEP 08 (2016) 029 | CMS-TOP-13-004 1603.02303 |
| 39 | CMS Collaboration | Measurements of the $ \mathrm{t}\overline{\mathrm{t}} $ production cross section in lepton+jets final states in pp collisions at 8 TeV and ratio of 8 to 7 TeV cross sections | EPJC 77 (2017) 15 | CMS-TOP-12-006 1602.09024 |
|
|
Compact Muon Solenoid LHC, CERN |
|

|

|

|

|

|