

Compact Muon Solenoid
LHC, CERN
| CMS-HIN-18-005 ; CERN-EP-2020-181 | ||
| Nuclear modification of $ \Upsilon $ states in pPb collisions at $ \sqrt{\smash[b]{s_{_{\mathrm{NN}}}}} = $ 5.02 TeV | ||
| CMS Collaboration | ||
| 23 February 2022 | ||
| Phys. Lett. B 835 (2022) 137397 | ||
| Abstract: Production cross sections of $ \Upsilon$(1S), $ \Upsilon$(2S), and $ \Upsilon$(3S) states decaying into $ \mu^{+}\mu^{-} $ in proton-lead (pPb) collisions are reported using data collected by the CMS experiment at $ \sqrt{\smash[b]{s_{_{\mathrm{NN}}}}} = $ 5.02 TeV. A comparison is made with corresponding cross sections obtained with pp data measured at the same collision energy and scaled by the Pb nucleus mass number. The nuclear modification factor for $ \Upsilon$(1S) is found to be $ R_{\mathrm{p}\mathrm{Pb}}(\Upsilon{\textrm{(1S)}}) = $ 0.806 $ \pm $ 0.024 (stat) $ \pm $ 0.059 (syst). Similar results for the excited states indicate a sequential suppression pattern, such that $ R_{\mathrm{p}\mathrm{Pb}}(\Upsilon{\textrm{(1S)}}) > R_{\mathrm{p}\mathrm{Pb}}(\Upsilon{\textrm{(2S)}}) > R_{\mathrm{p}\mathrm{Pb}}(\Upsilon{\textrm{(3S)}}) $. The suppression of all states is much less pronounced in pPb than in PbPb collisions, and independent of transverse momentum $ p^{\Upsilon}_{\mathrm{T}} $ and center-of-mass rapidity $ y^{\Upsilon}_{\mathrm{CM}} $ of the individual $ \Upsilon $ state in the studied range $ p^{\Upsilon}_{\mathrm{T}} < $ 30 GeV/$c$ and $ |y^{\Upsilon}_{\mathrm{CM}}| < $ 1.93. Models that incorporate final-state effects of bottomonia in pPb collisions are in better agreement with the data than those which only assume initial-state modifications. | ||
| Links: e-print arXiv:2202.11807 [hep-ex] (PDF) ; CDS record ; inSPIRE record ; HepData record ; CADI line (restricted) ; | ||
| Figures | |
png pdf |
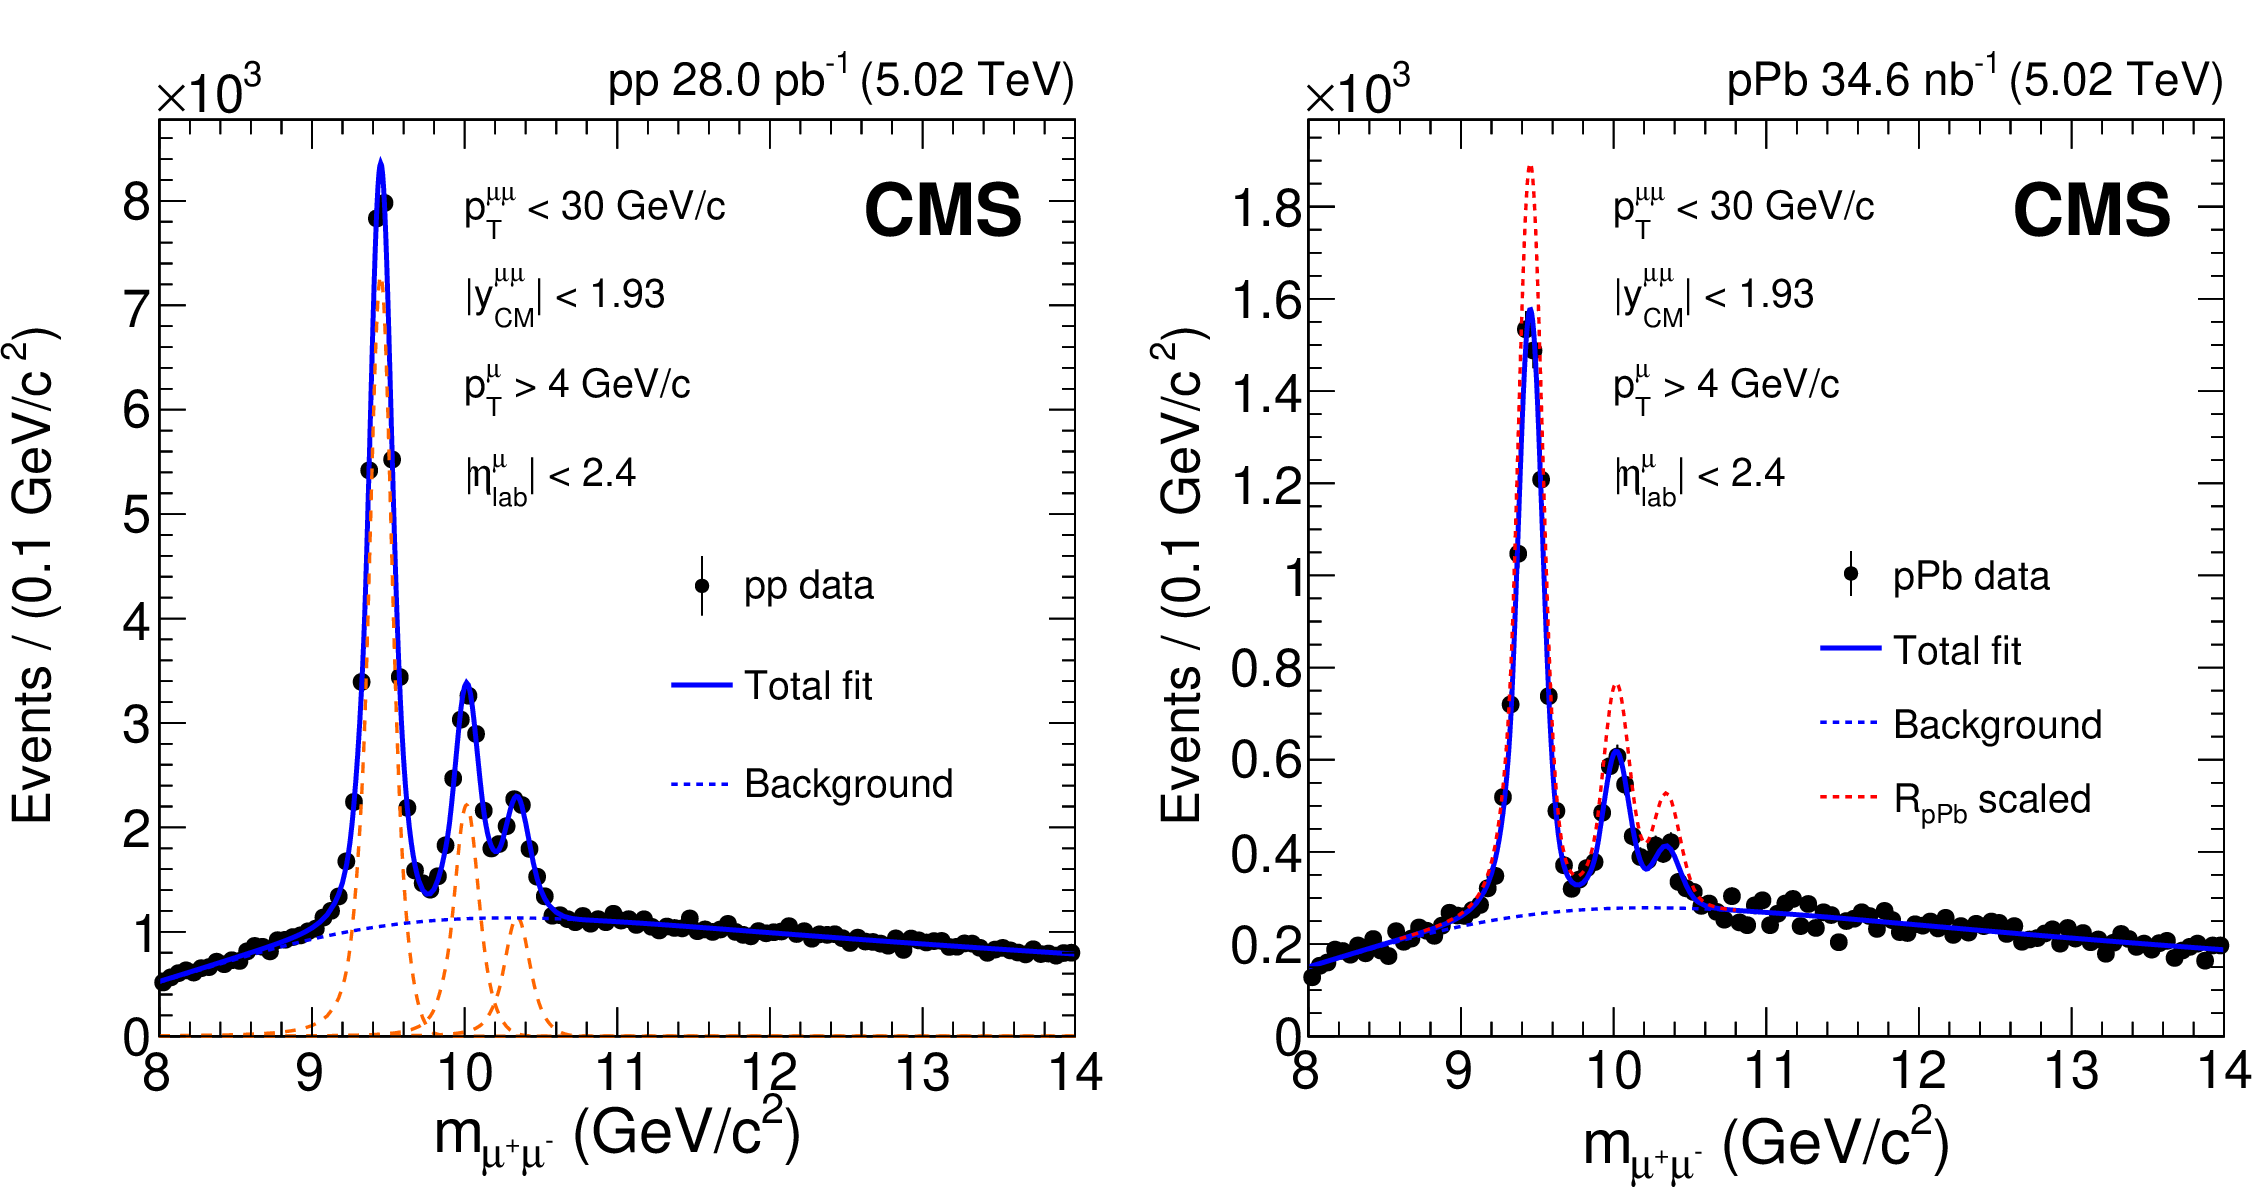
Figure 1:
Measured dimuon invariant mass distributions (closed circles) for pp (left) and pPb (right) collisions. The total unbinned maximum-likelihood fits to the data are shown as solid blue lines, with the background component indicated by dashed blue lines. The individual $ \Upsilon$(1S), $ \Upsilon$(2S), and $ \Upsilon$(3S) signal shapes in pp are depicted as dashed orange lines in the left panel. The dashed red line in the right panel is obtained by scaling the $ \Upsilon$(1S), $ \Upsilon$(2S), and $ \Upsilon$(3S) signal shapes in pPb (solid blue line) under the assumption that $ R_{\mathrm{p}\mathrm{Pb}} $ is unity. |
png pdf |
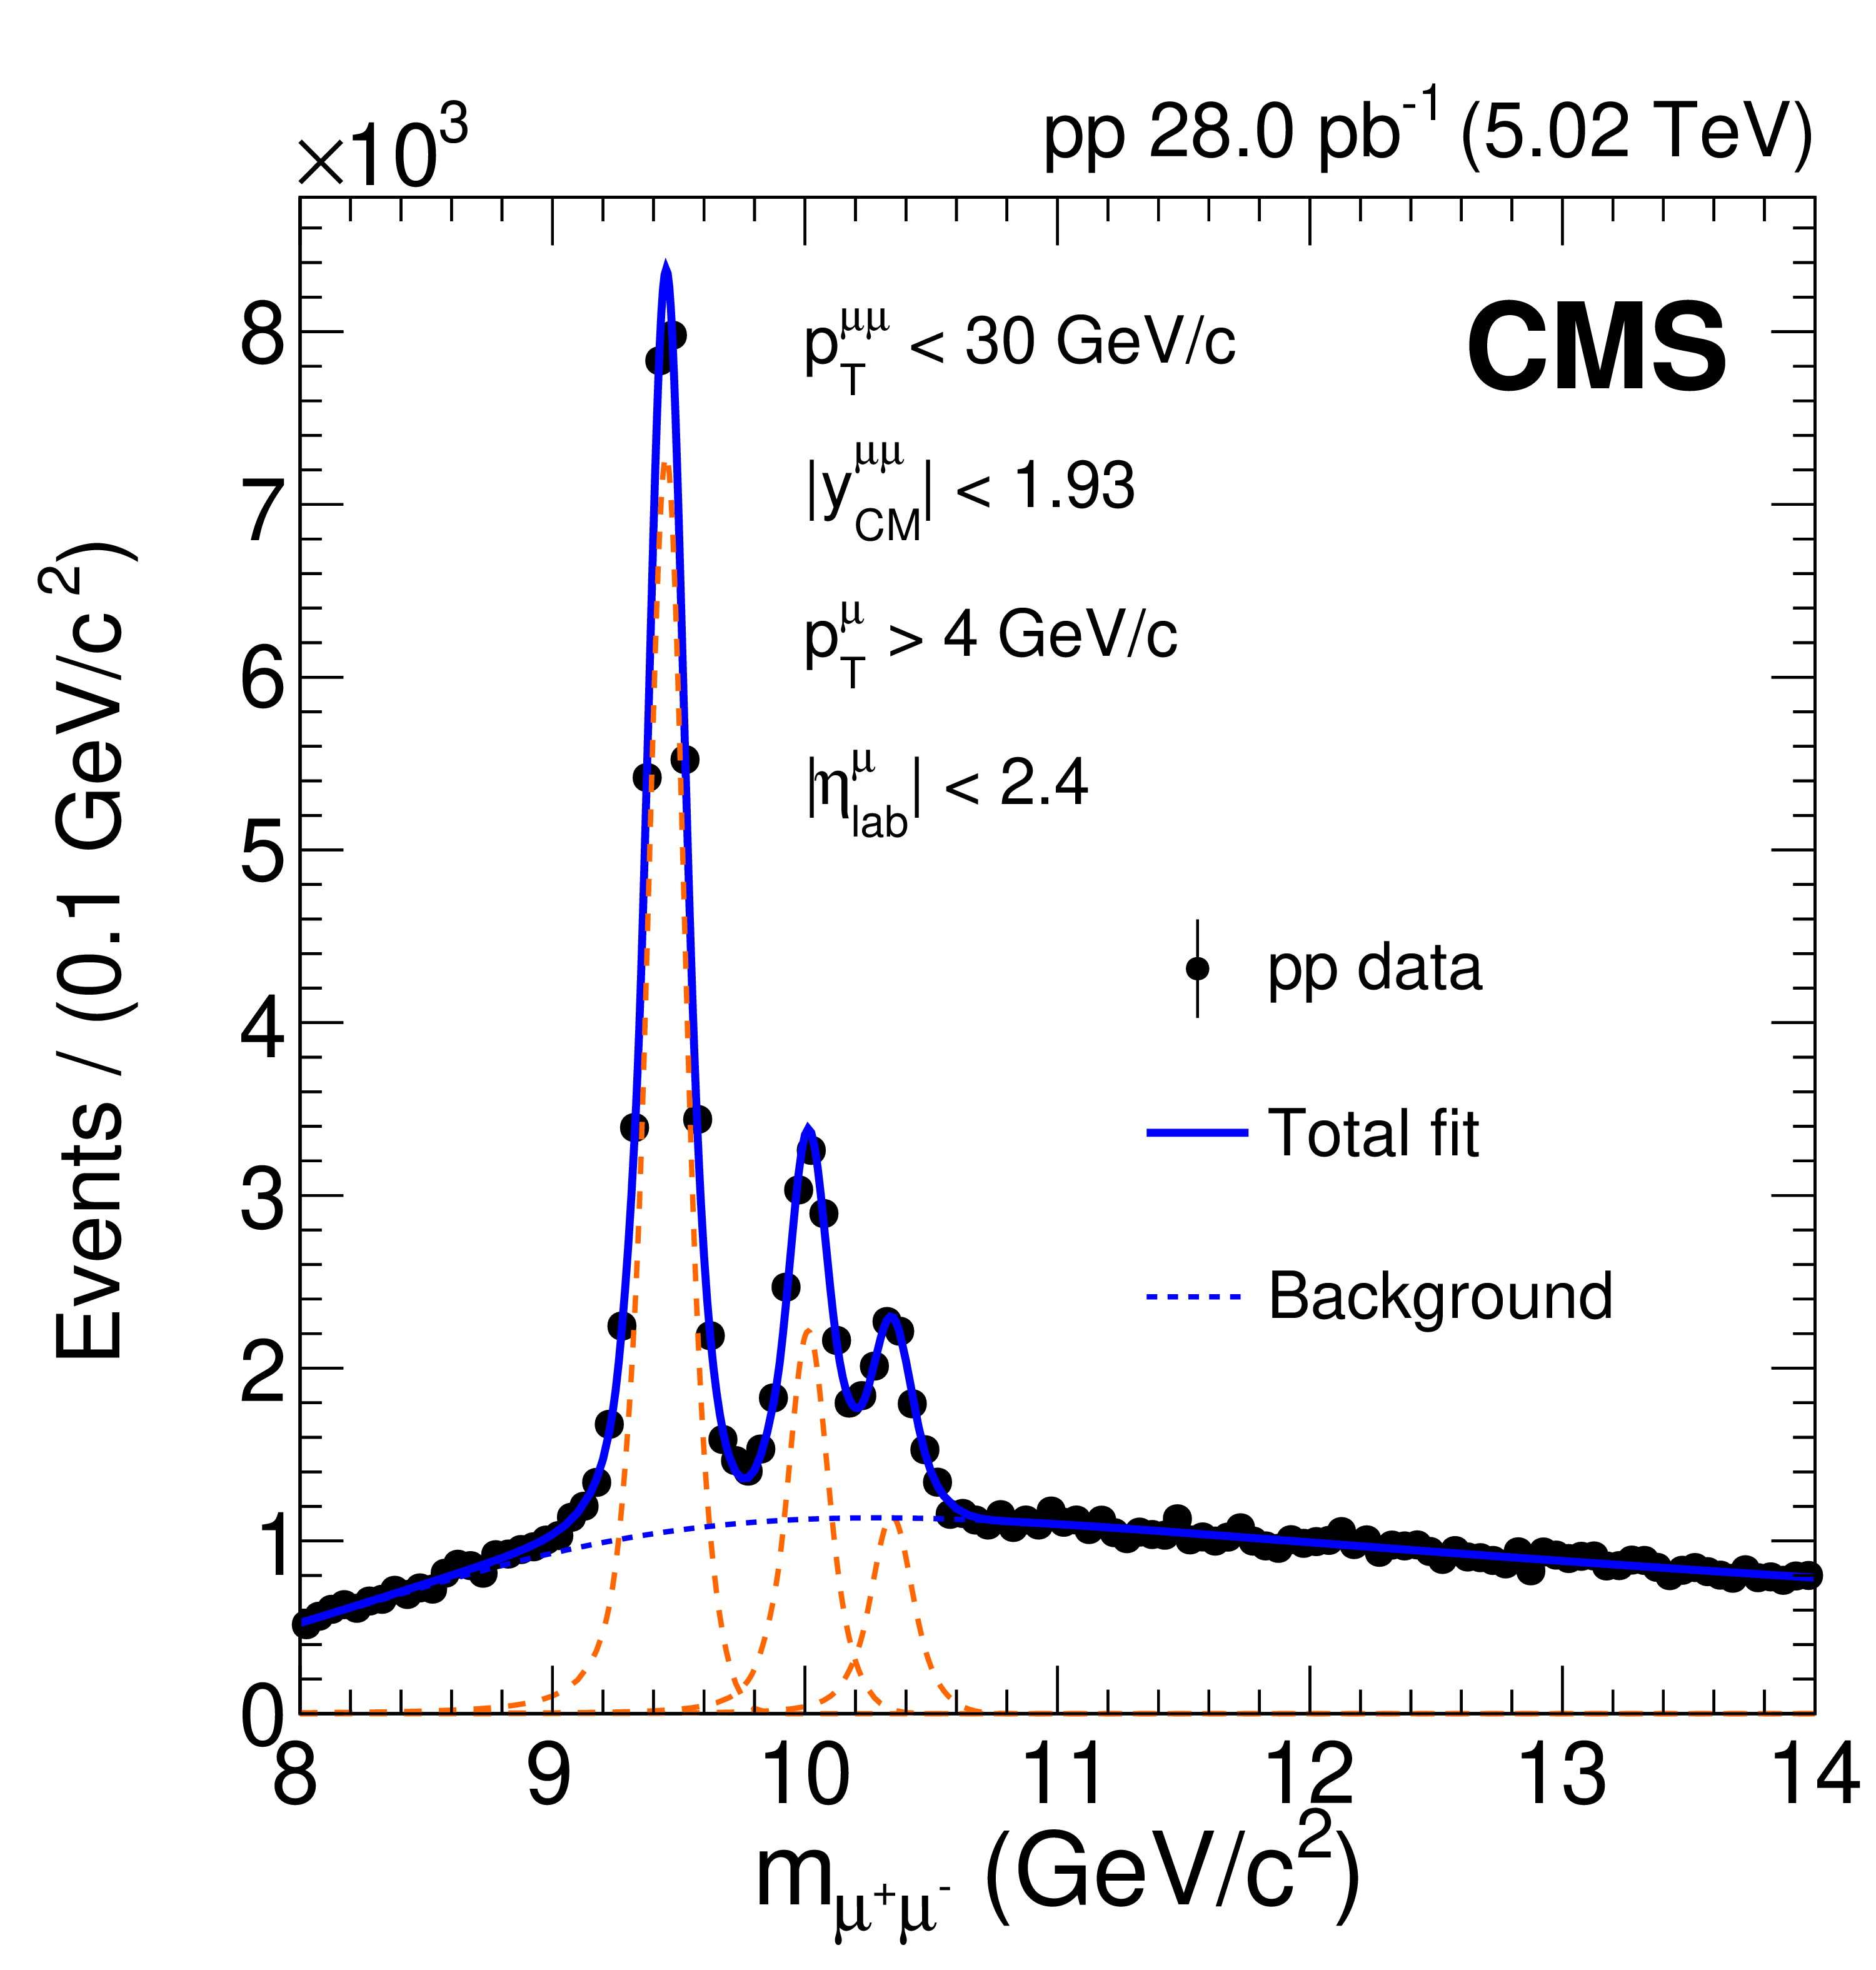
Figure 1-a:
Measured dimuon invariant mass distributions (closed circles) for pp (left) and pPb (right) collisions. The total unbinned maximum-likelihood fits to the data are shown as solid blue lines, with the background component indicated by dashed blue lines. The individual $ \Upsilon$(1S), $ \Upsilon$(2S), and $ \Upsilon$(3S) signal shapes in pp are depicted as dashed orange lines in the left panel. The dashed red line in the right panel is obtained by scaling the $ \Upsilon$(1S), $ \Upsilon$(2S), and $ \Upsilon$(3S) signal shapes in pPb (solid blue line) under the assumption that $ R_{\mathrm{p}\mathrm{Pb}} $ is unity. |
png pdf |
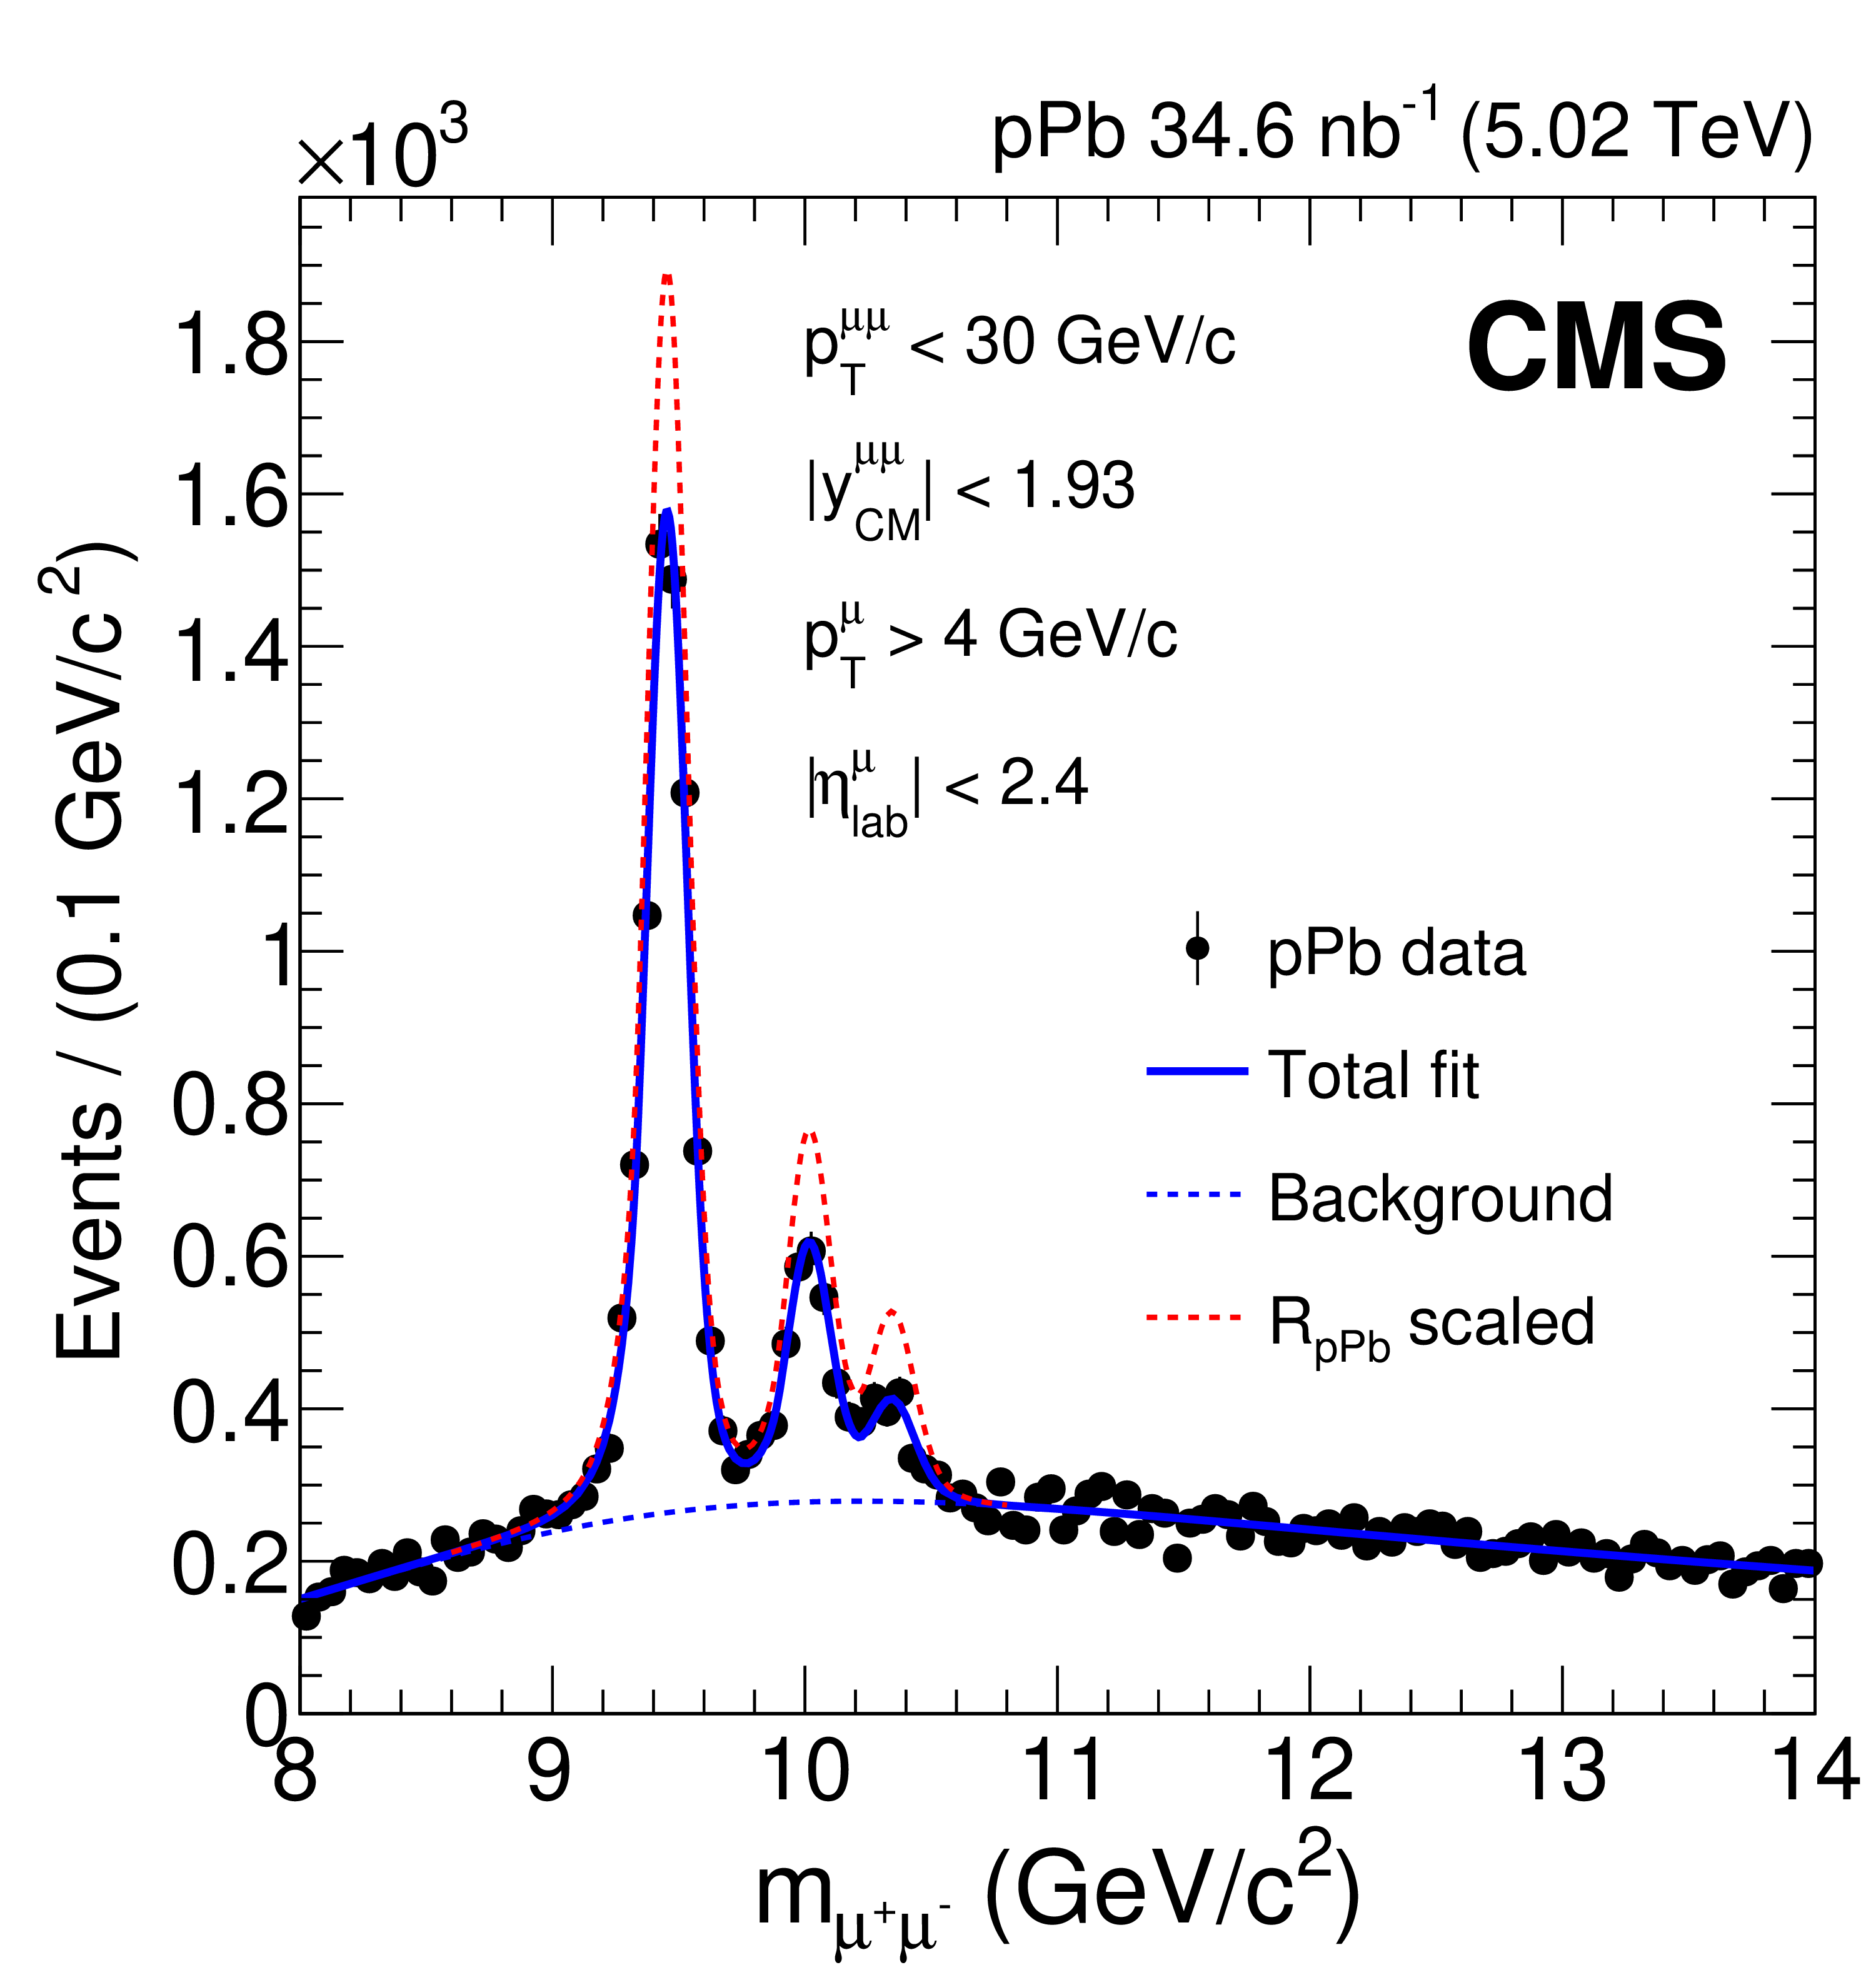
Figure 1-b:
Measured dimuon invariant mass distributions (closed circles) for pp (left) and pPb (right) collisions. The total unbinned maximum-likelihood fits to the data are shown as solid blue lines, with the background component indicated by dashed blue lines. The individual $ \Upsilon$(1S), $ \Upsilon$(2S), and $ \Upsilon$(3S) signal shapes in pp are depicted as dashed orange lines in the left panel. The dashed red line in the right panel is obtained by scaling the $ \Upsilon$(1S), $ \Upsilon$(2S), and $ \Upsilon$(3S) signal shapes in pPb (solid blue line) under the assumption that $ R_{\mathrm{p}\mathrm{Pb}} $ is unity. |
png pdf |
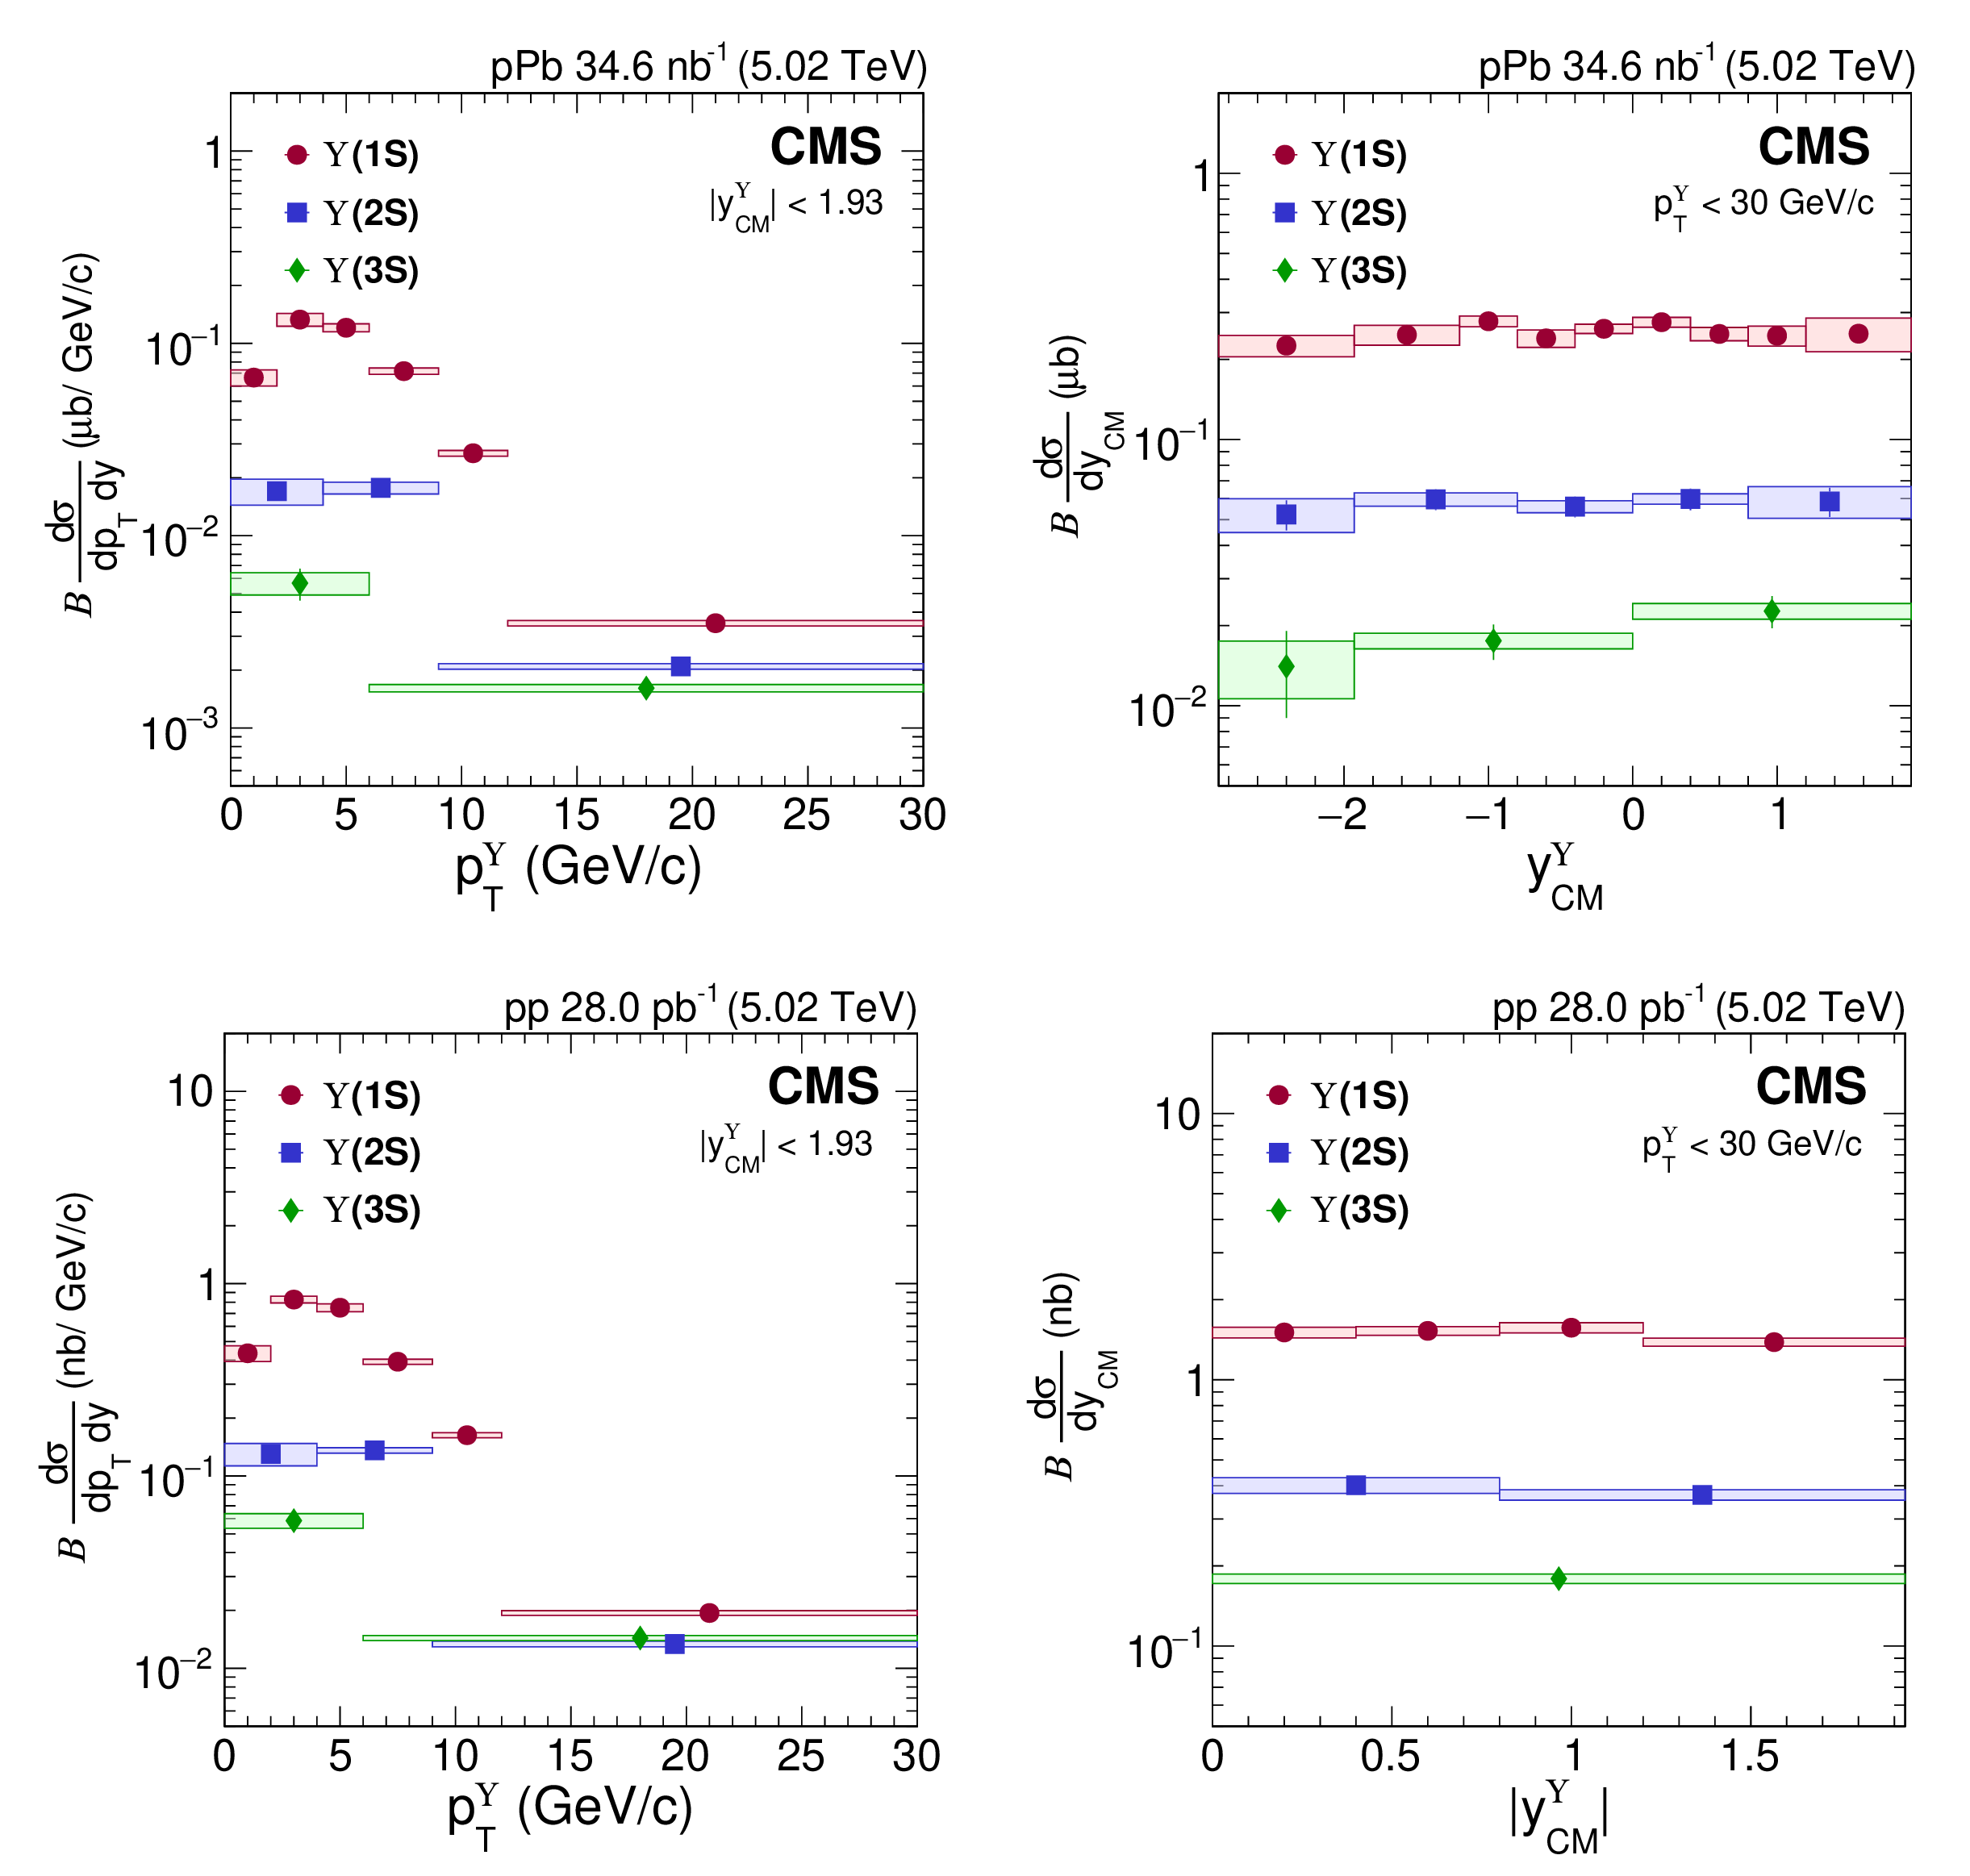
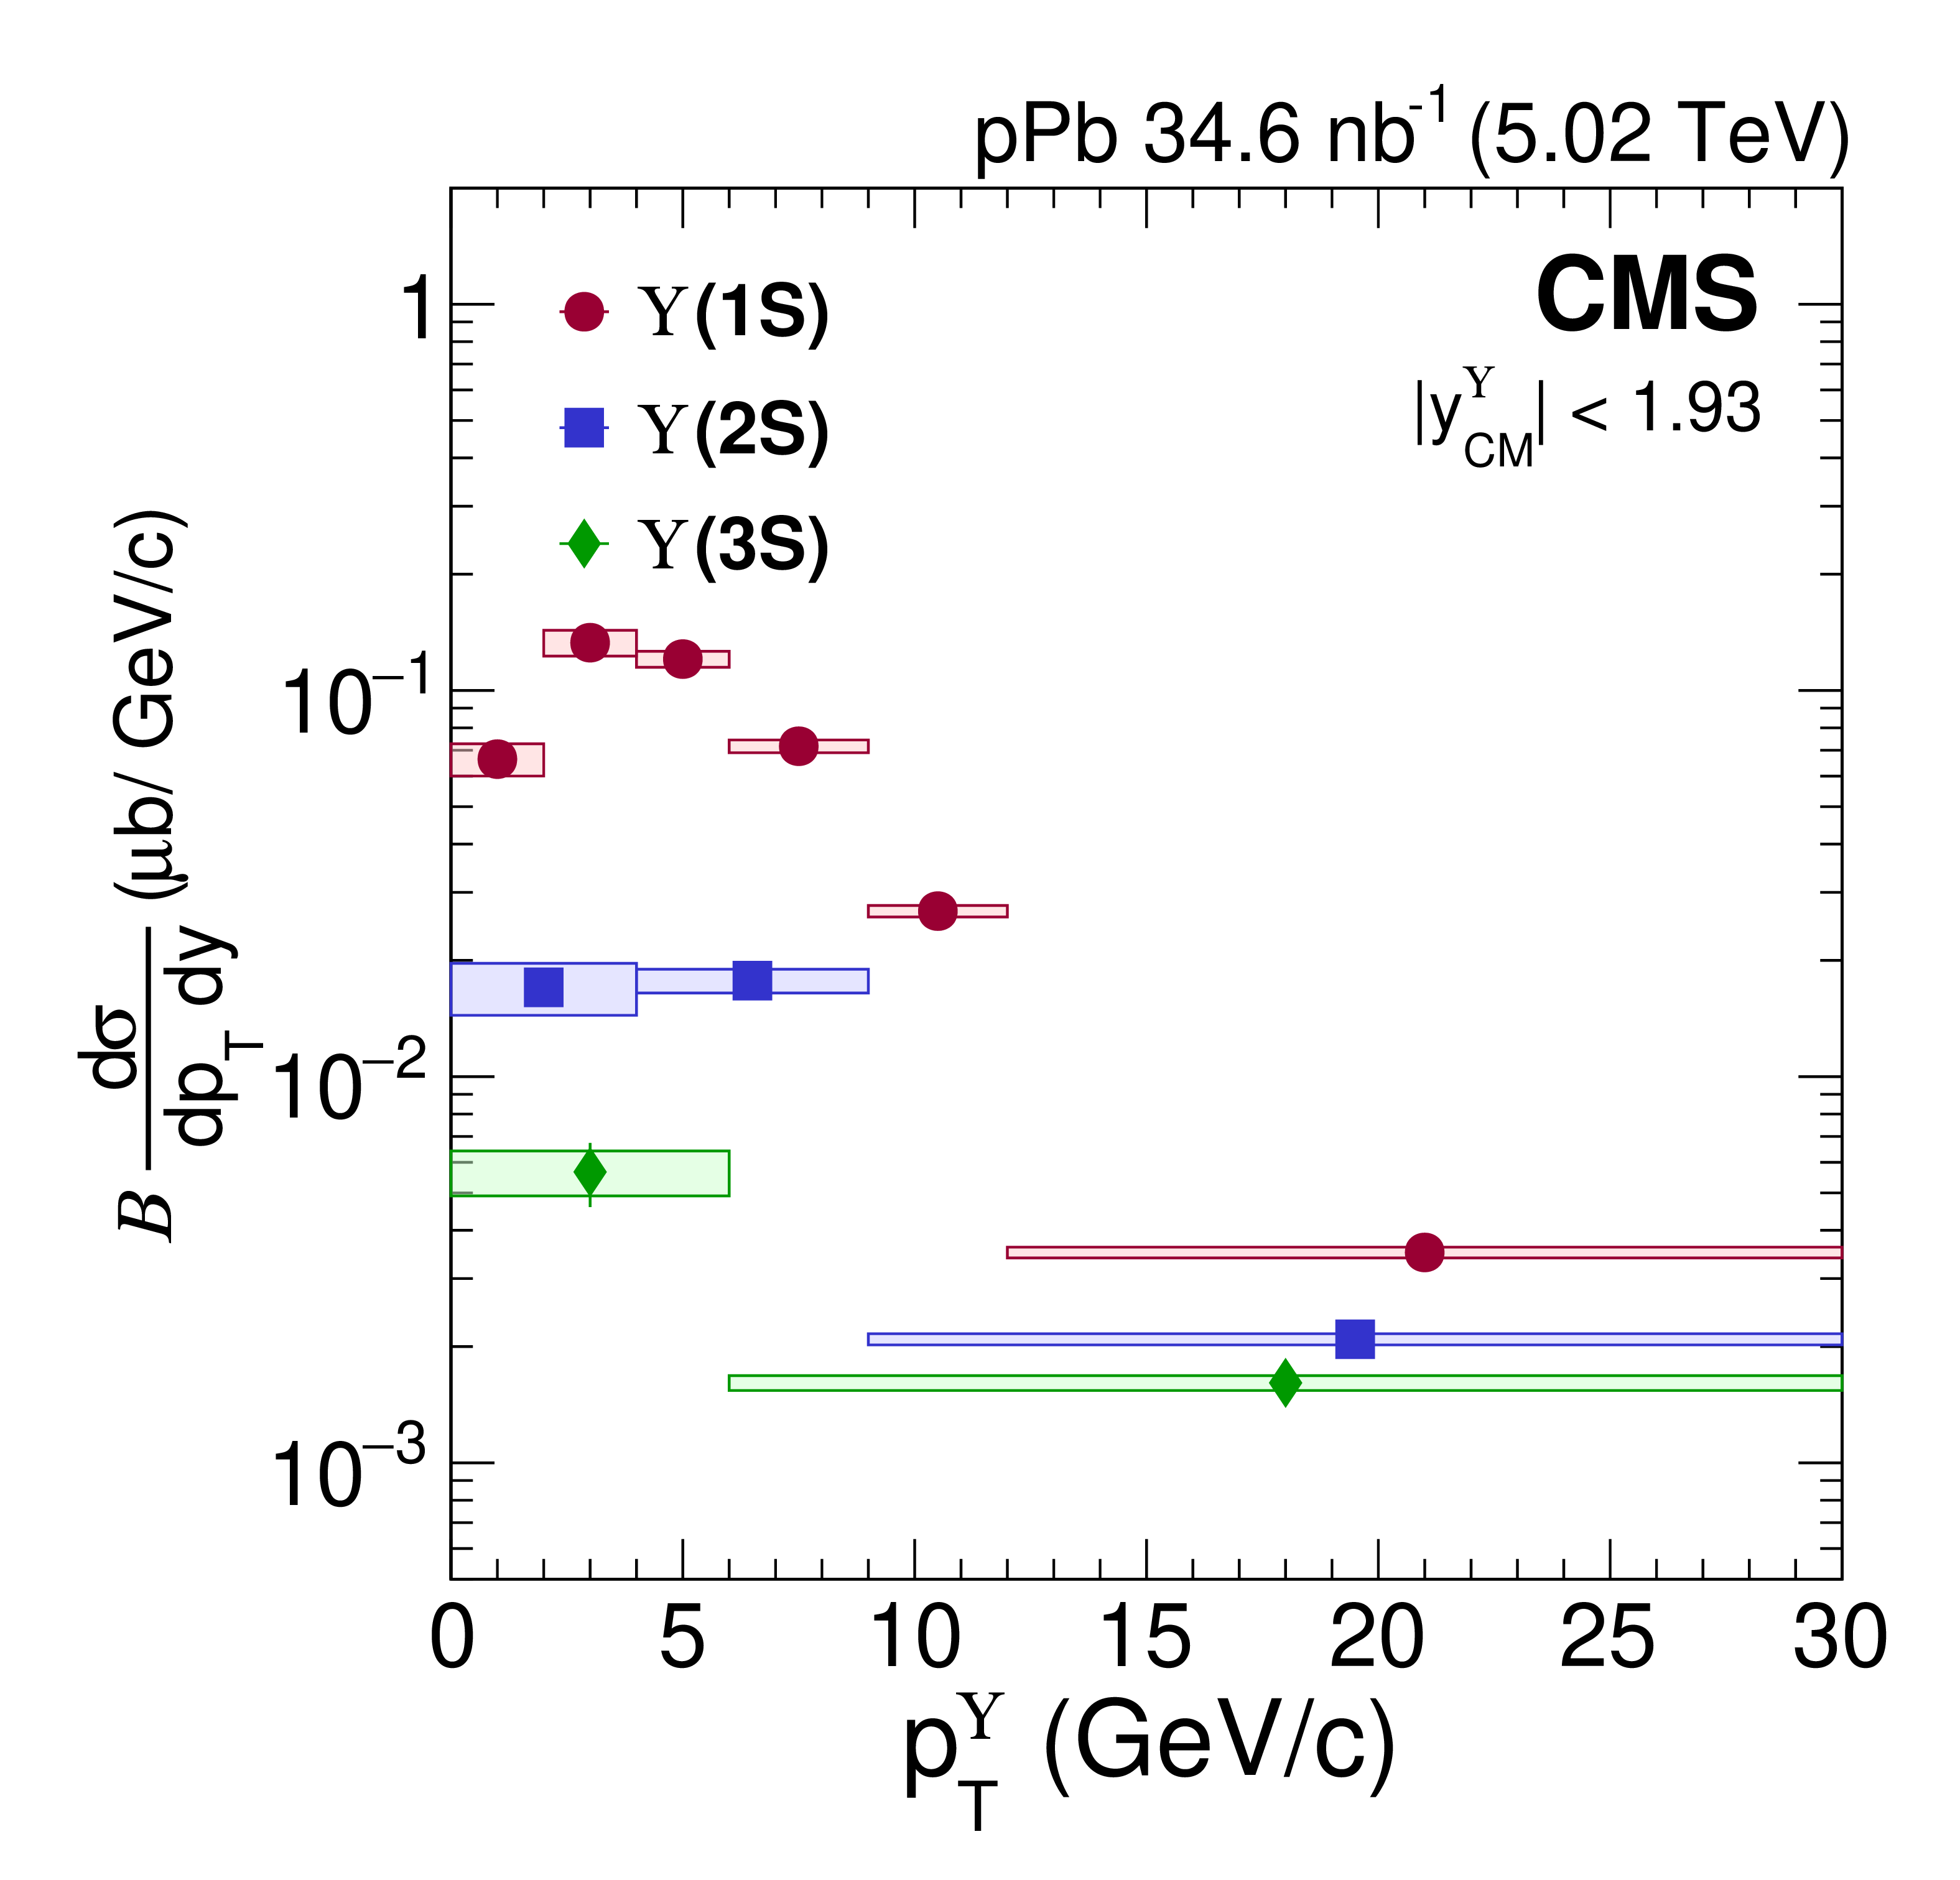
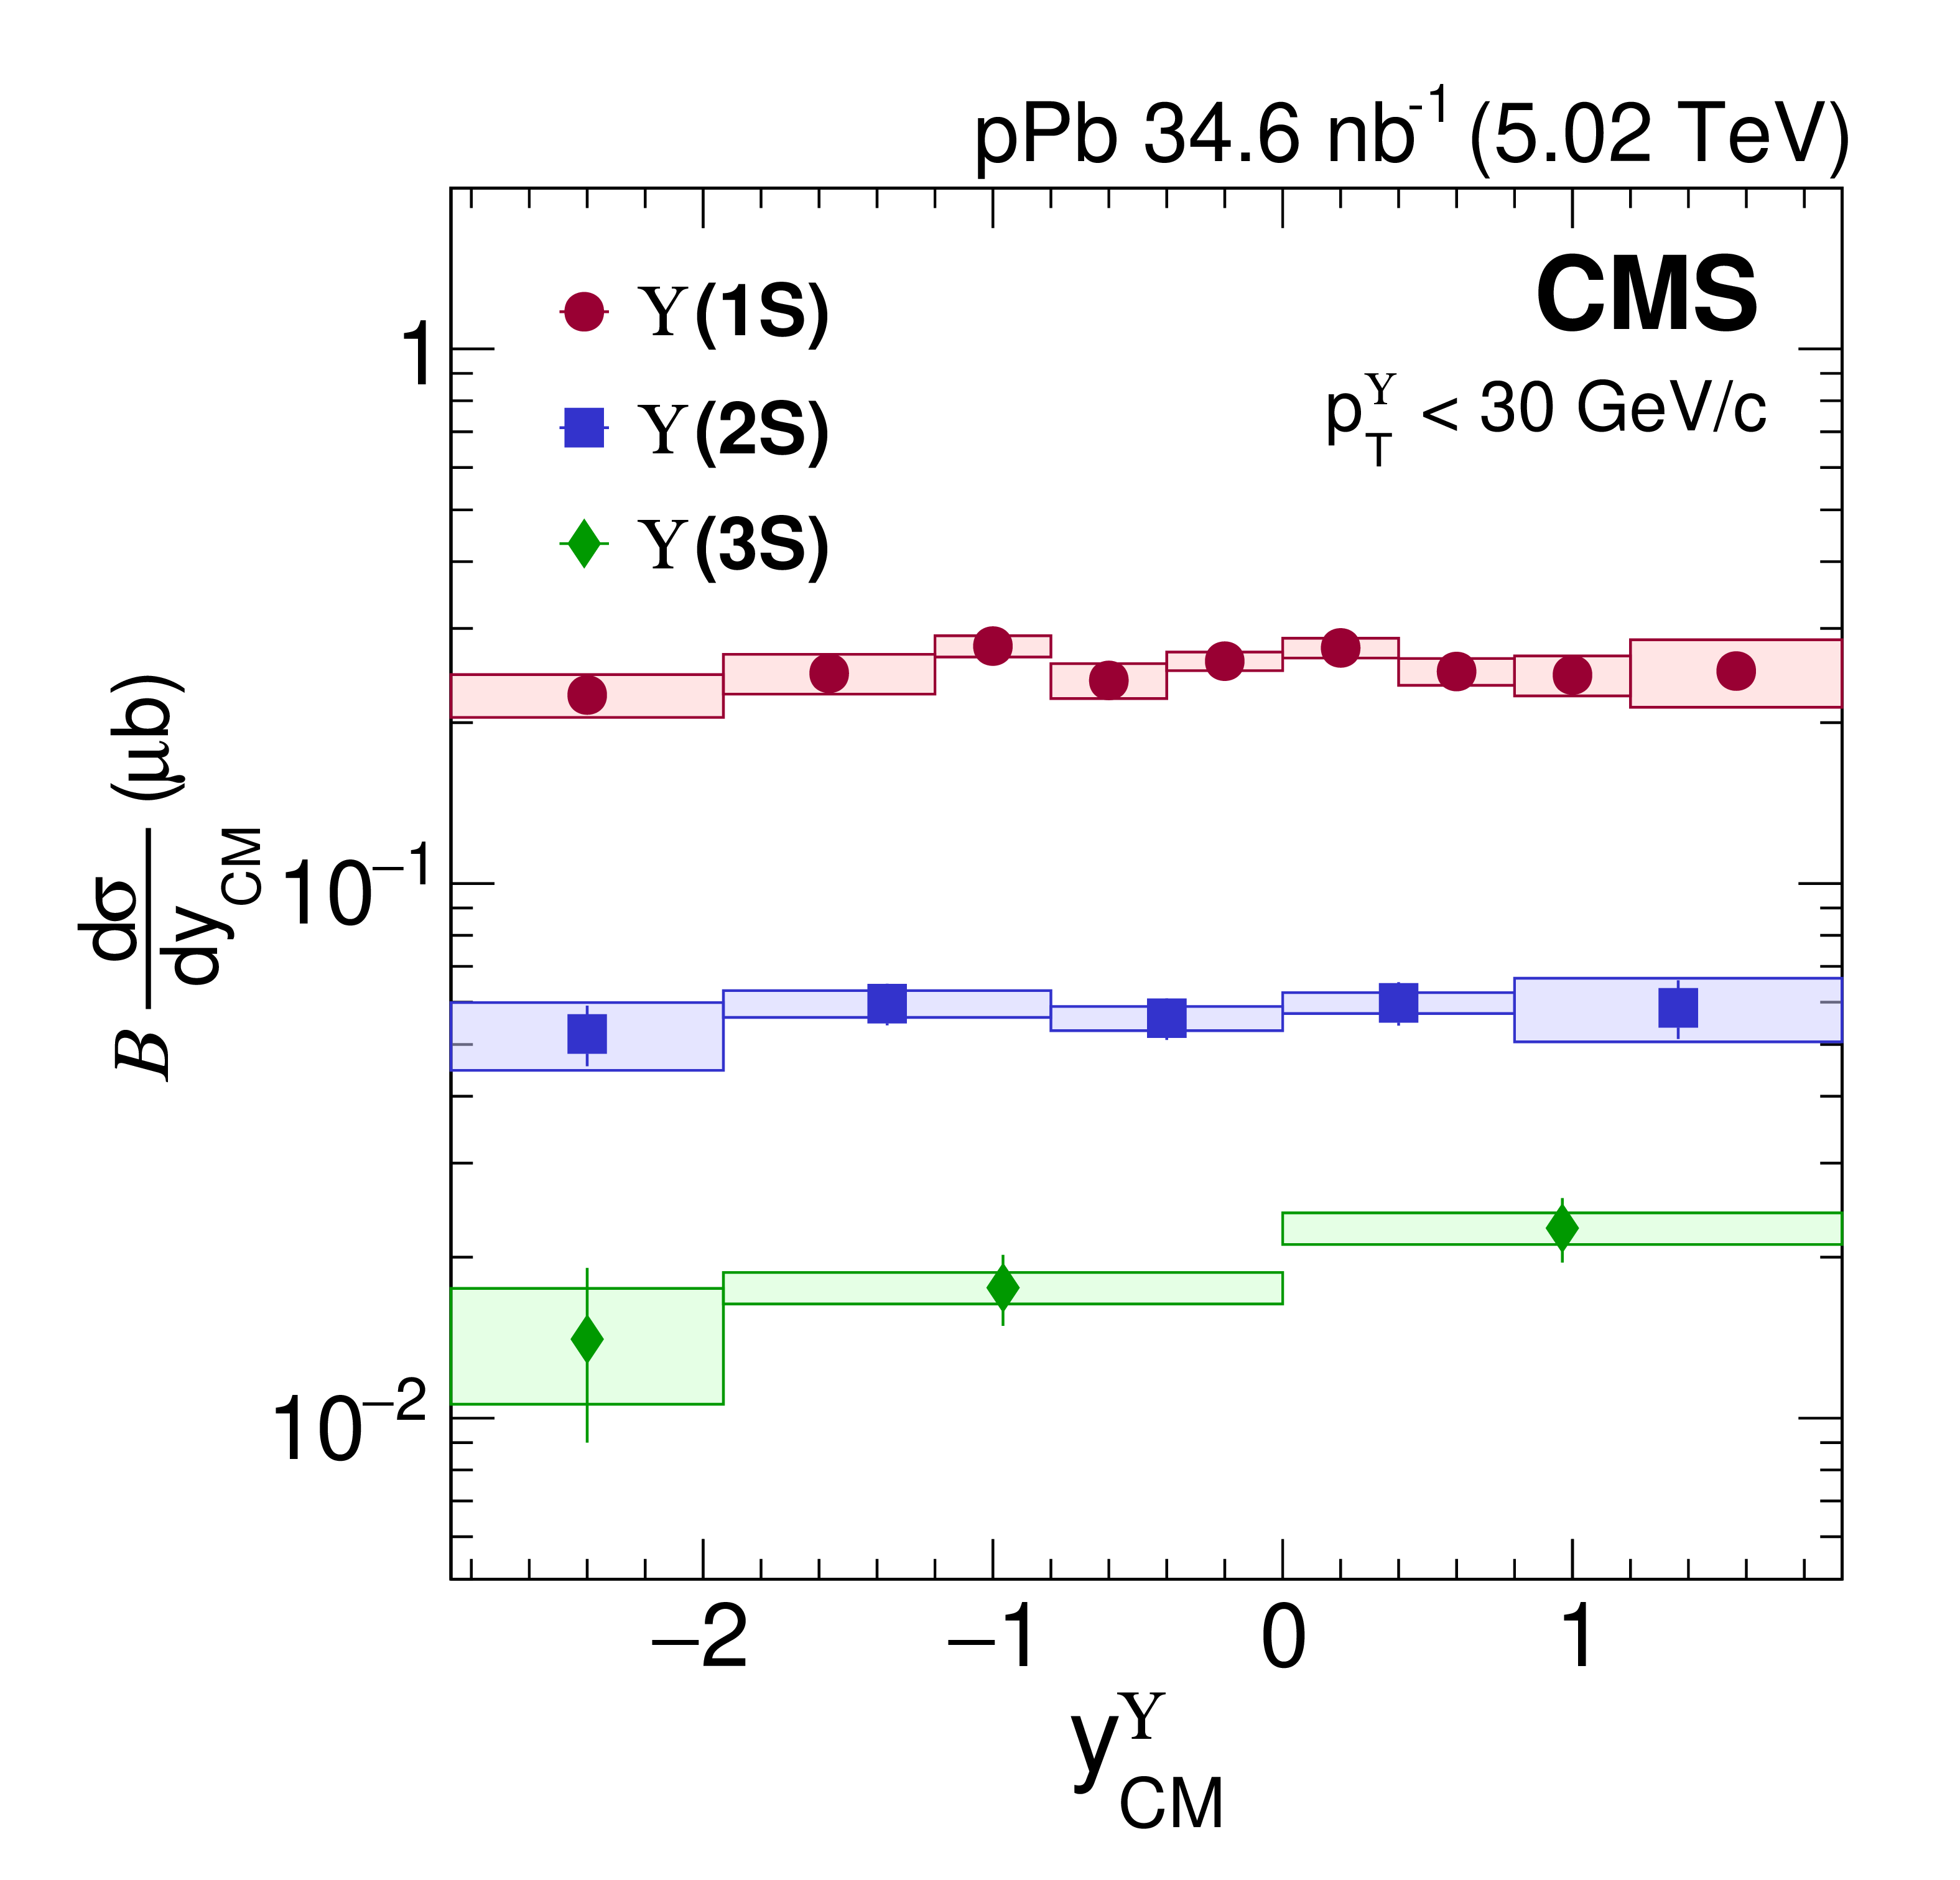
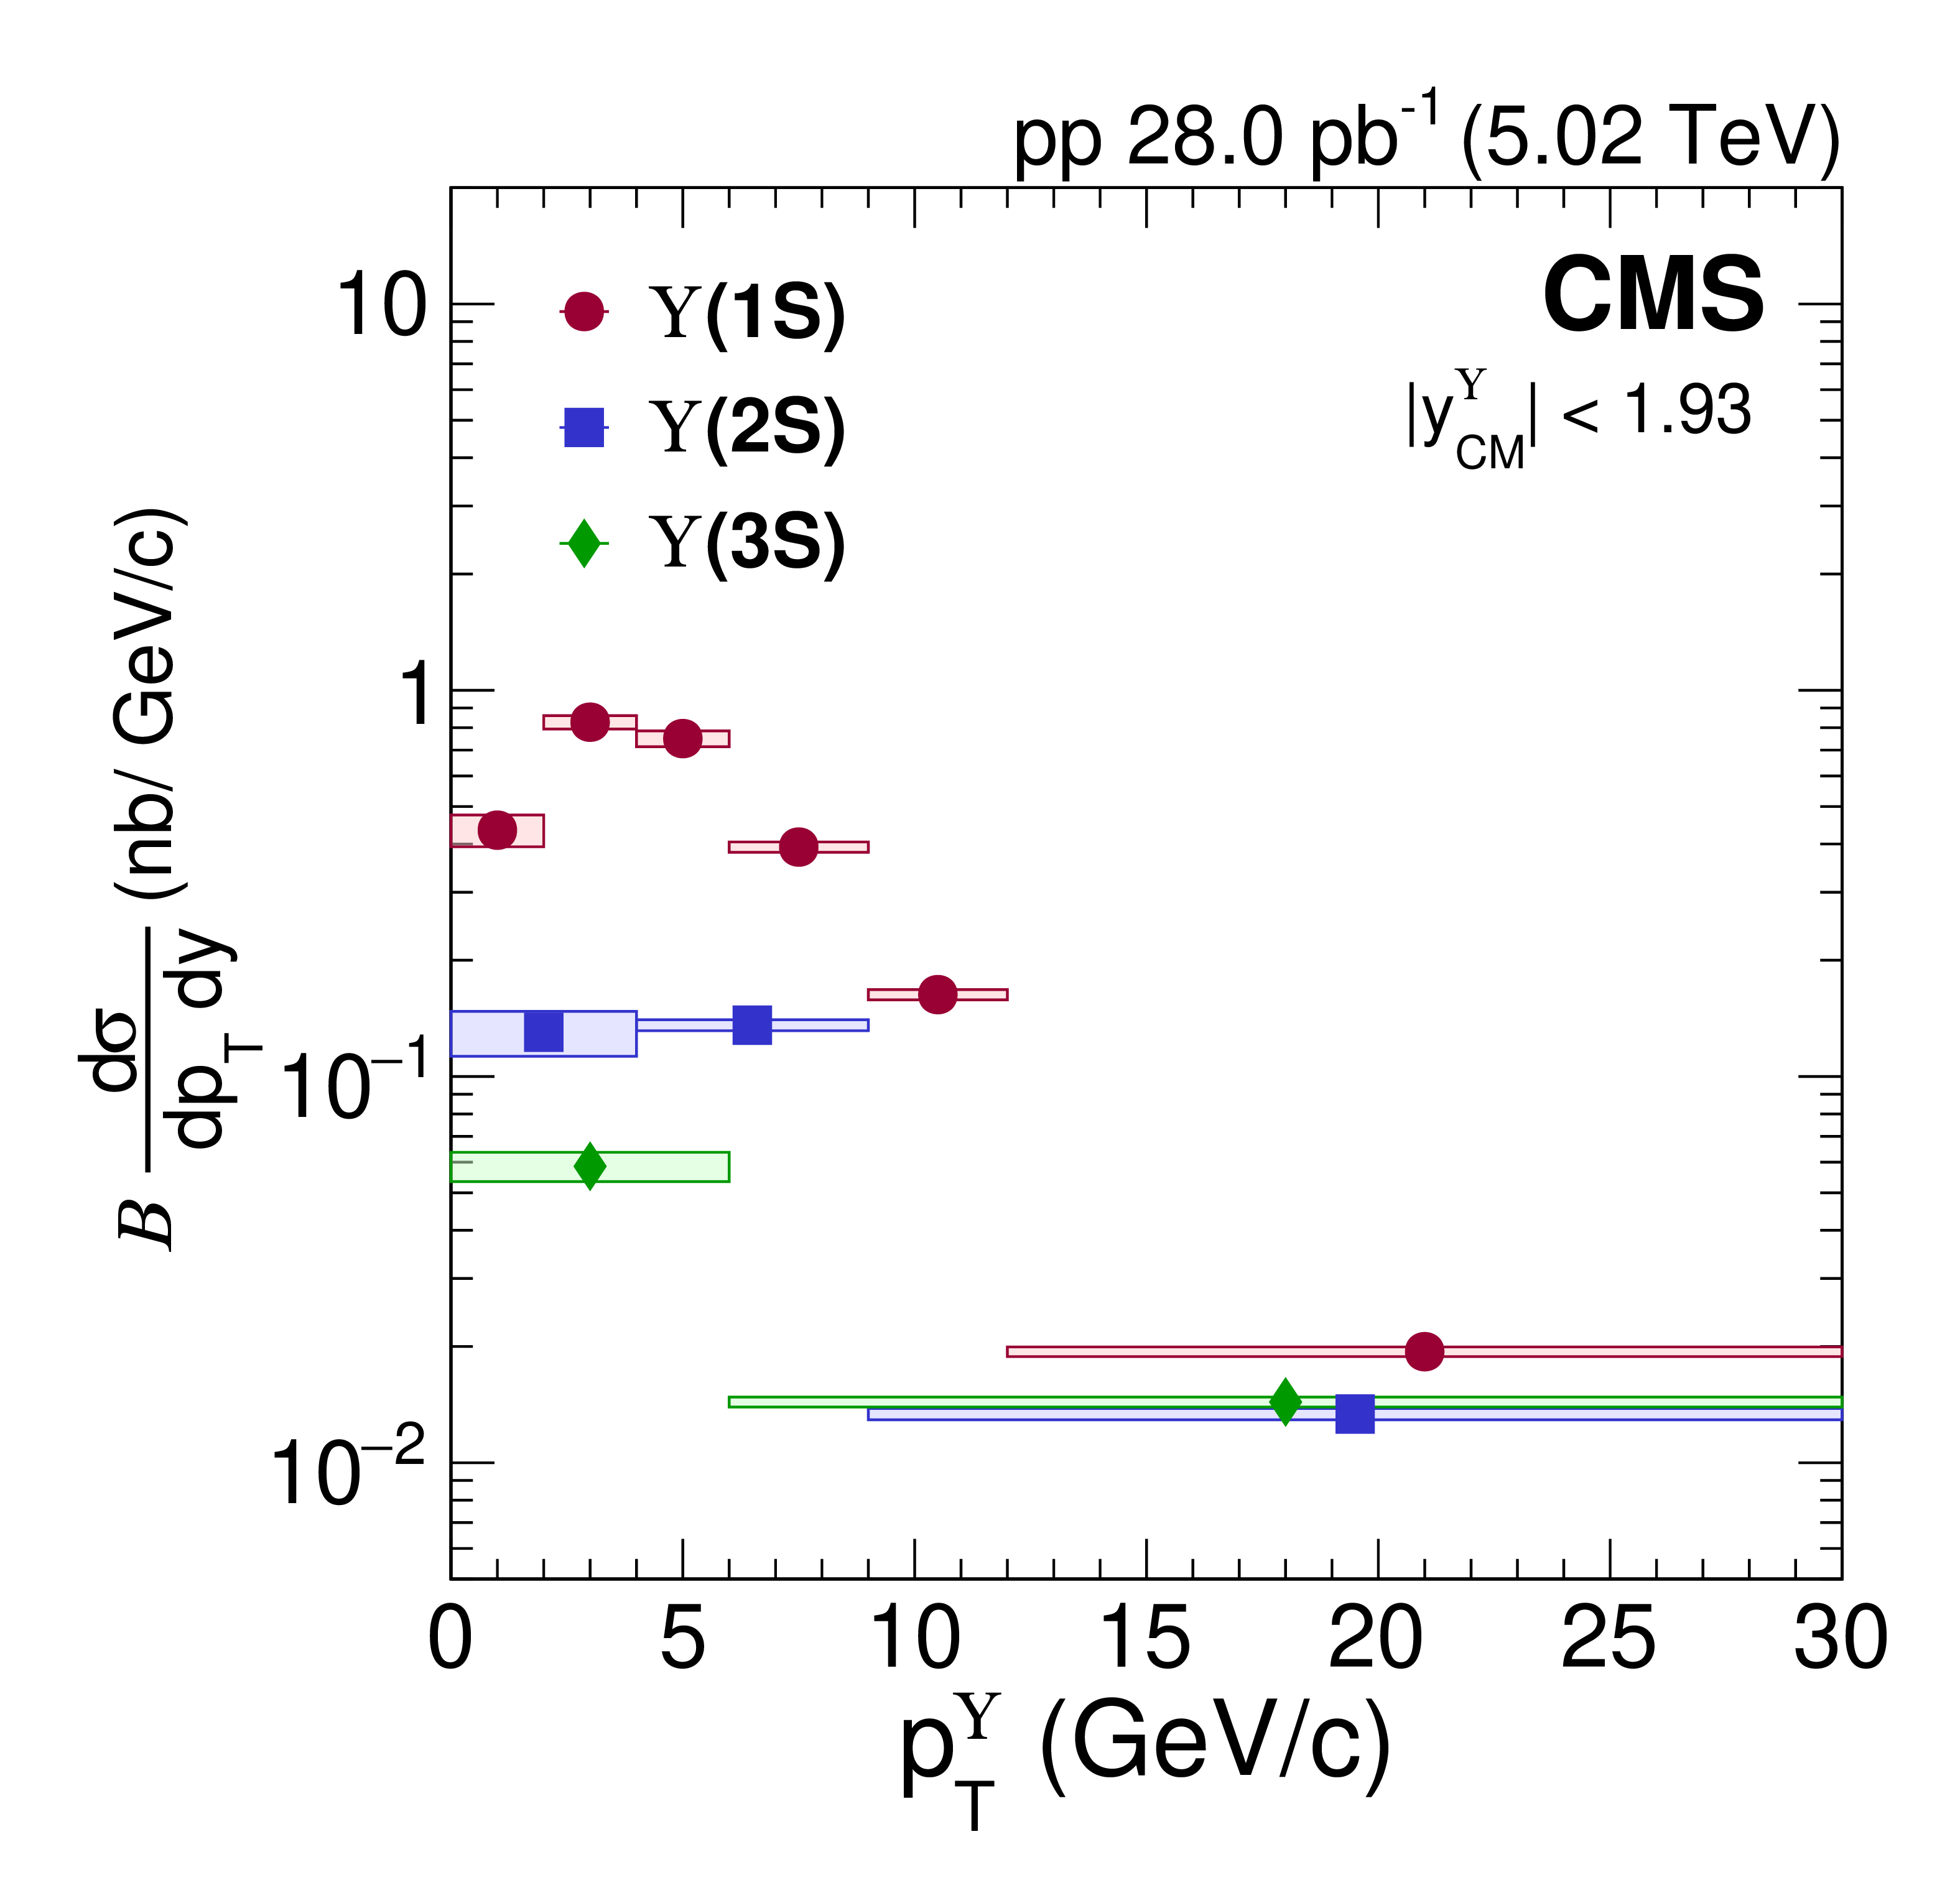
Figure 2:
Cross section times dimuon branching fraction of $ \Upsilon$(1S) (red circles), $ \Upsilon$(2S) (blue squares), and $ \Upsilon$(3S) (green diamonds) as functions of $ p^{\Upsilon}_{\mathrm{T}} $ (left) and $ y^{\Upsilon}_{\mathrm{CM}} $ (right) in pPb (upper row) and pp (lower row) collisions. For pPb collisions, the p-going side corresponds to $ y^{\Upsilon}_{\mathrm{CM}} > $ 0. Because pp collisions are symmetric in the center-of-mass frame, the absolute value of rapidity $ |y^{\Upsilon}_{\mathrm{CM}}| $ is used in the lower right panel. Vertical bars represent statistical and fit uncertainties and filled boxes represent systematic uncertainties. A 3.5 (2.3)% global uncertainty in determining the integrated luminosity of pPb (pp) collisions, applicable to all points, is not included in the point-by-point uncertainties. |
png pdf |
Figure 2-a:
Cross section times dimuon branching fraction of $ \Upsilon$(1S) (red circles), $ \Upsilon$(2S) (blue squares), and $ \Upsilon$(3S) (green diamonds) as functions of $ p^{\Upsilon}_{\mathrm{T}} $ (left) and $ y^{\Upsilon}_{\mathrm{CM}} $ (right) in pPb (upper row) and pp (lower row) collisions. For pPb collisions, the p-going side corresponds to $ y^{\Upsilon}_{\mathrm{CM}} > $ 0. Because pp collisions are symmetric in the center-of-mass frame, the absolute value of rapidity $ |y^{\Upsilon}_{\mathrm{CM}}| $ is used in the lower right panel. Vertical bars represent statistical and fit uncertainties and filled boxes represent systematic uncertainties. A 3.5 (2.3)% global uncertainty in determining the integrated luminosity of pPb (pp) collisions, applicable to all points, is not included in the point-by-point uncertainties. |
png pdf |
Figure 2-b:
Cross section times dimuon branching fraction of $ \Upsilon$(1S) (red circles), $ \Upsilon$(2S) (blue squares), and $ \Upsilon$(3S) (green diamonds) as functions of $ p^{\Upsilon}_{\mathrm{T}} $ (left) and $ y^{\Upsilon}_{\mathrm{CM}} $ (right) in pPb (upper row) and pp (lower row) collisions. For pPb collisions, the p-going side corresponds to $ y^{\Upsilon}_{\mathrm{CM}} > $ 0. Because pp collisions are symmetric in the center-of-mass frame, the absolute value of rapidity $ |y^{\Upsilon}_{\mathrm{CM}}| $ is used in the lower right panel. Vertical bars represent statistical and fit uncertainties and filled boxes represent systematic uncertainties. A 3.5 (2.3)% global uncertainty in determining the integrated luminosity of pPb (pp) collisions, applicable to all points, is not included in the point-by-point uncertainties. |
png pdf |
Figure 2-c:
Cross section times dimuon branching fraction of $ \Upsilon$(1S) (red circles), $ \Upsilon$(2S) (blue squares), and $ \Upsilon$(3S) (green diamonds) as functions of $ p^{\Upsilon}_{\mathrm{T}} $ (left) and $ y^{\Upsilon}_{\mathrm{CM}} $ (right) in pPb (upper row) and pp (lower row) collisions. For pPb collisions, the p-going side corresponds to $ y^{\Upsilon}_{\mathrm{CM}} > $ 0. Because pp collisions are symmetric in the center-of-mass frame, the absolute value of rapidity $ |y^{\Upsilon}_{\mathrm{CM}}| $ is used in the lower right panel. Vertical bars represent statistical and fit uncertainties and filled boxes represent systematic uncertainties. A 3.5 (2.3)% global uncertainty in determining the integrated luminosity of pPb (pp) collisions, applicable to all points, is not included in the point-by-point uncertainties. |

png pdf |
Figure 2-d:
Cross section times dimuon branching fraction of $ \Upsilon$(1S) (red circles), $ \Upsilon$(2S) (blue squares), and $ \Upsilon$(3S) (green diamonds) as functions of $ p^{\Upsilon}_{\mathrm{T}} $ (left) and $ y^{\Upsilon}_{\mathrm{CM}} $ (right) in pPb (upper row) and pp (lower row) collisions. For pPb collisions, the p-going side corresponds to $ y^{\Upsilon}_{\mathrm{CM}} > $ 0. Because pp collisions are symmetric in the center-of-mass frame, the absolute value of rapidity $ |y^{\Upsilon}_{\mathrm{CM}}| $ is used in the lower right panel. Vertical bars represent statistical and fit uncertainties and filled boxes represent systematic uncertainties. A 3.5 (2.3)% global uncertainty in determining the integrated luminosity of pPb (pp) collisions, applicable to all points, is not included in the point-by-point uncertainties. |
png pdf |
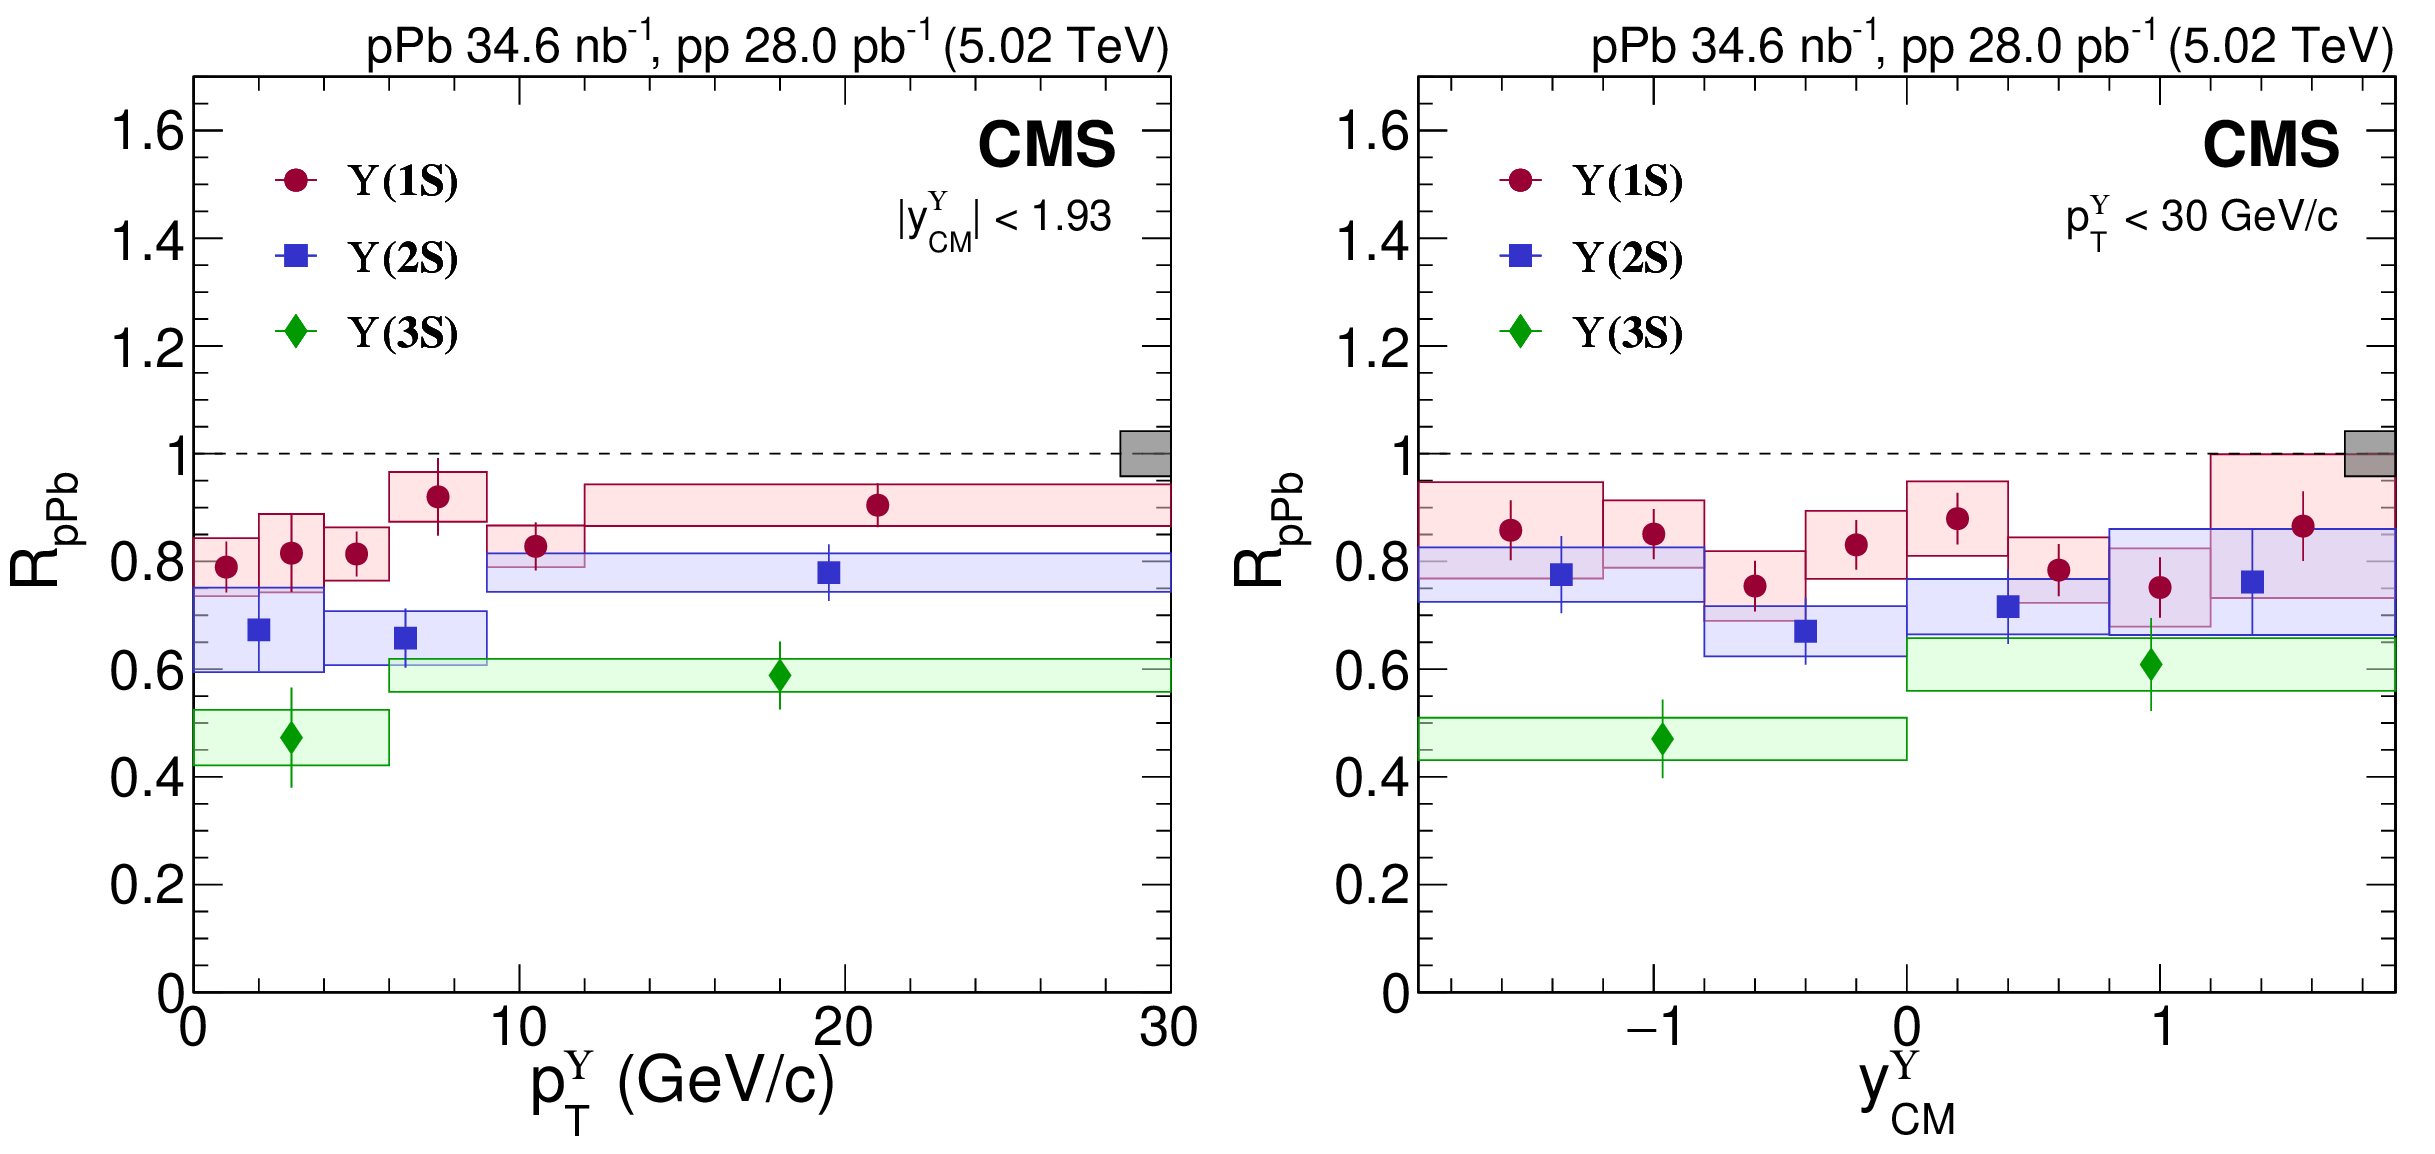
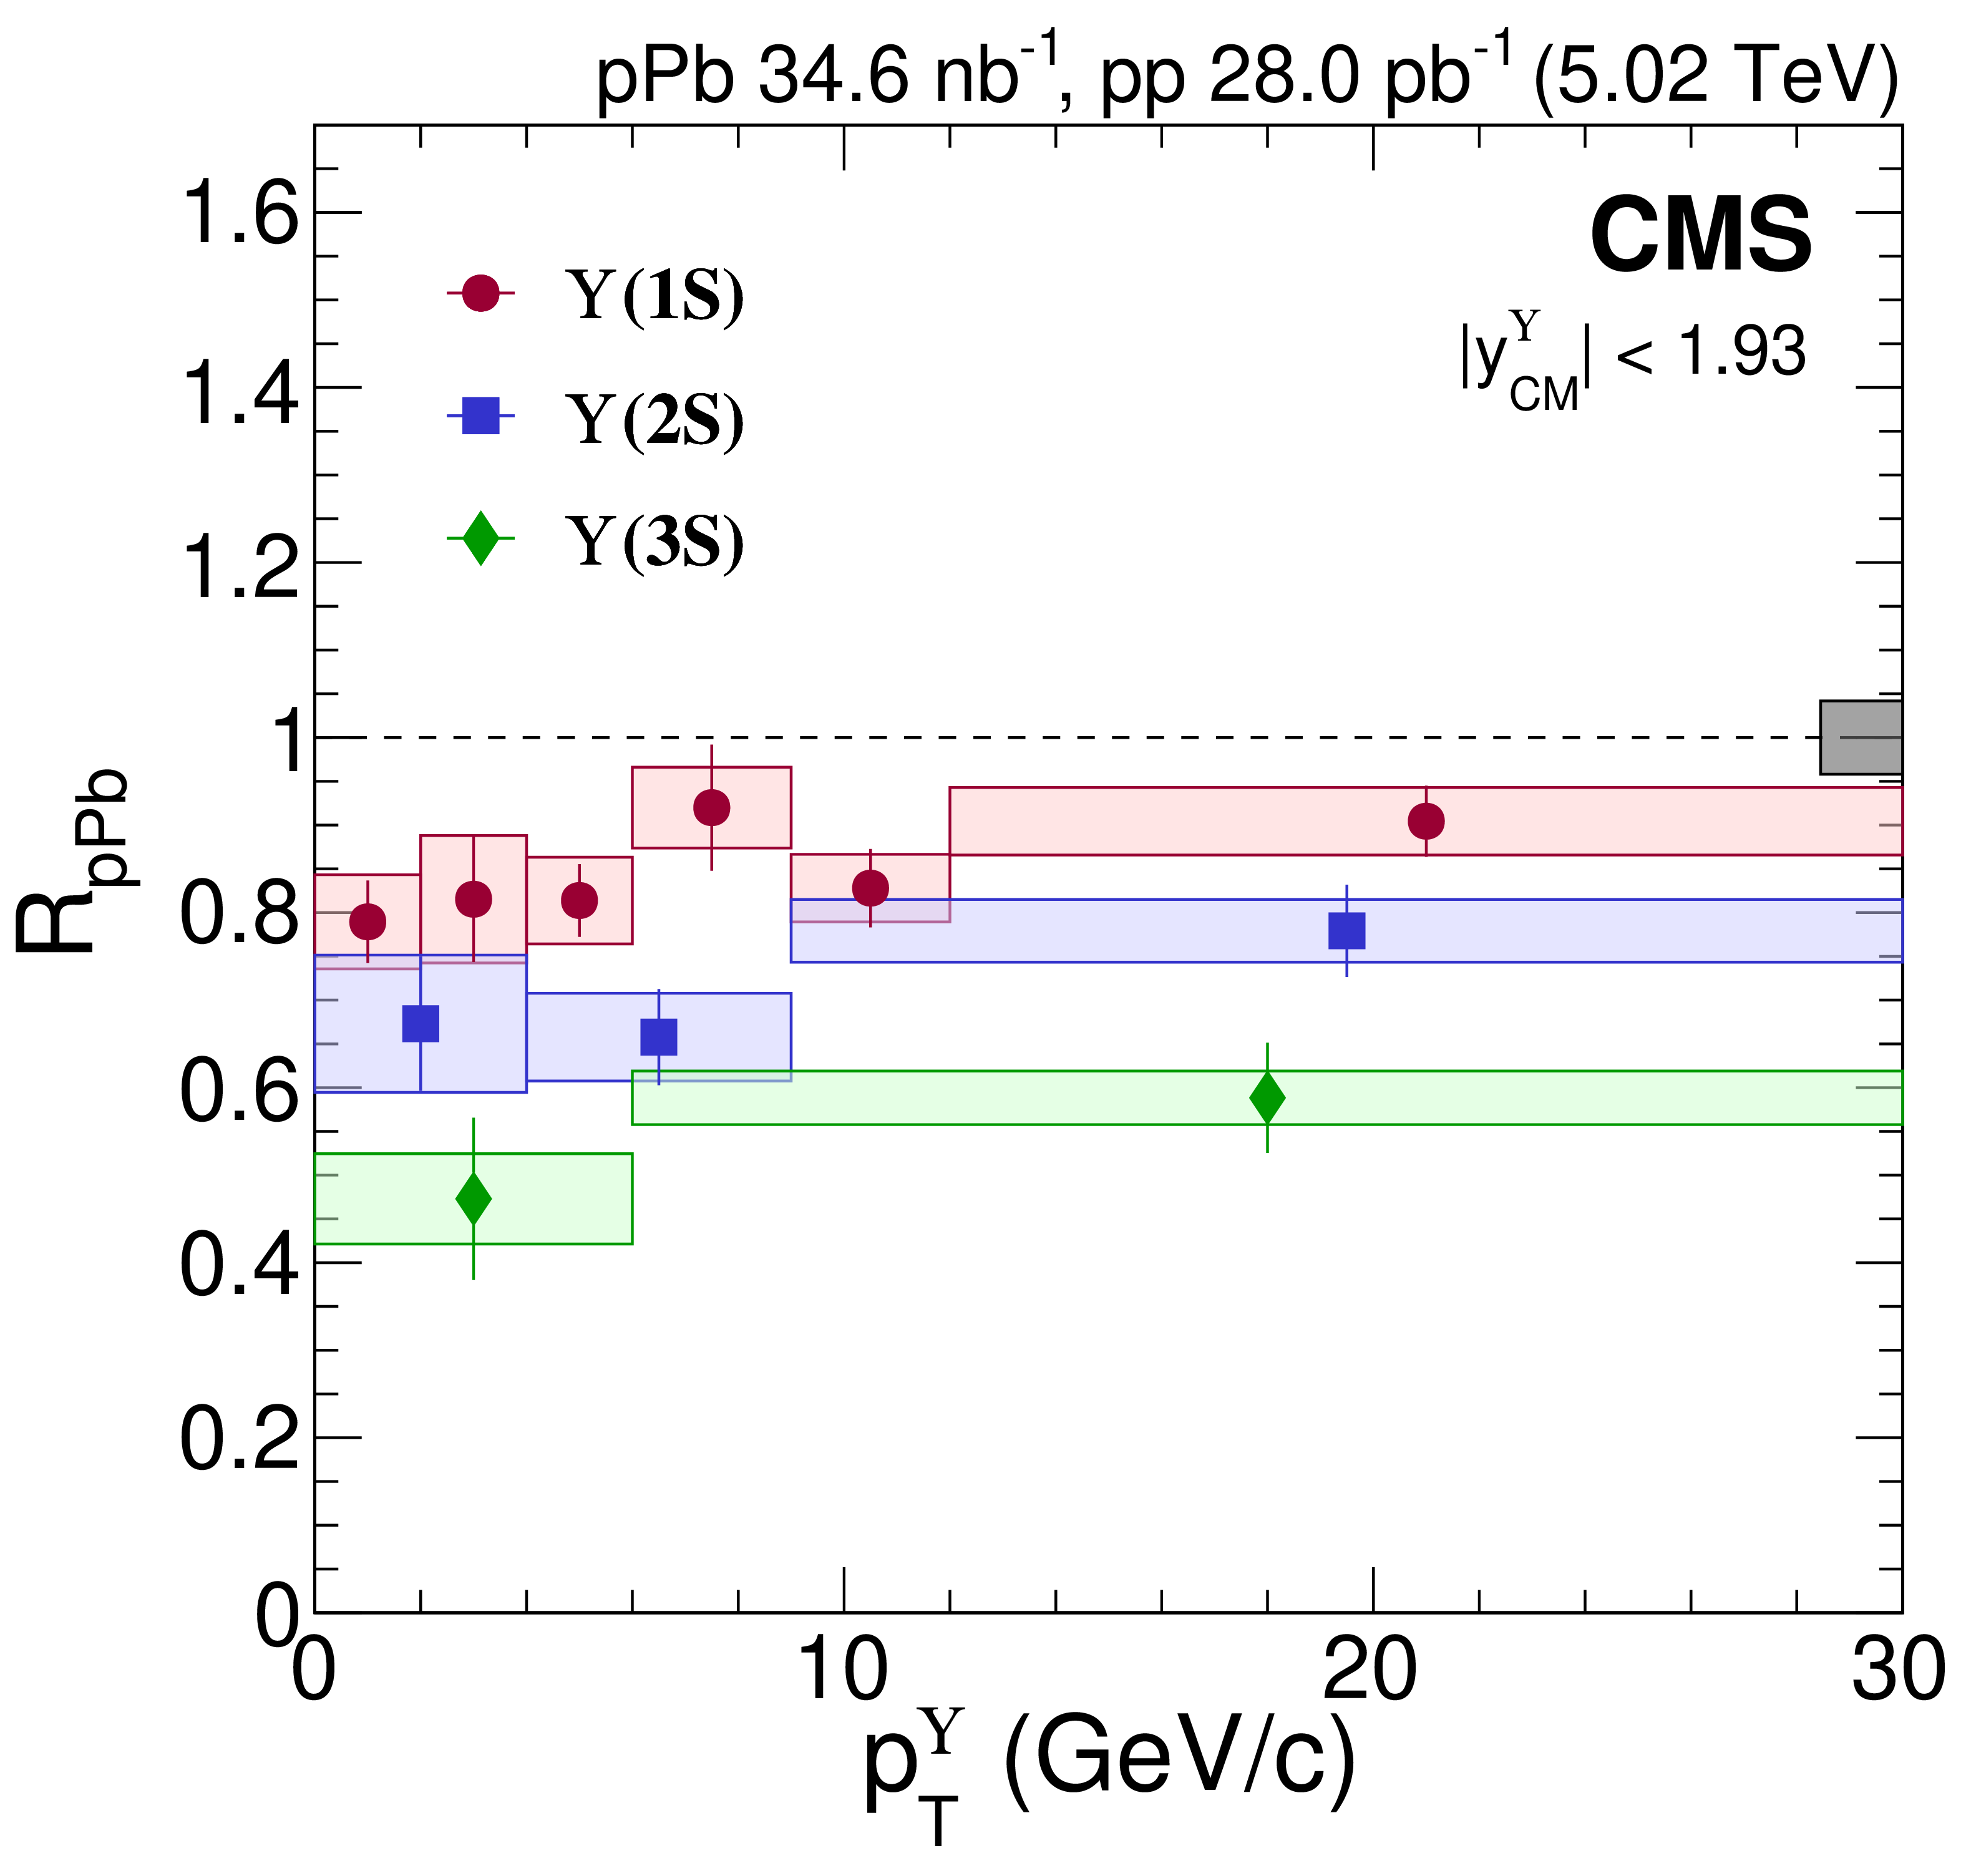
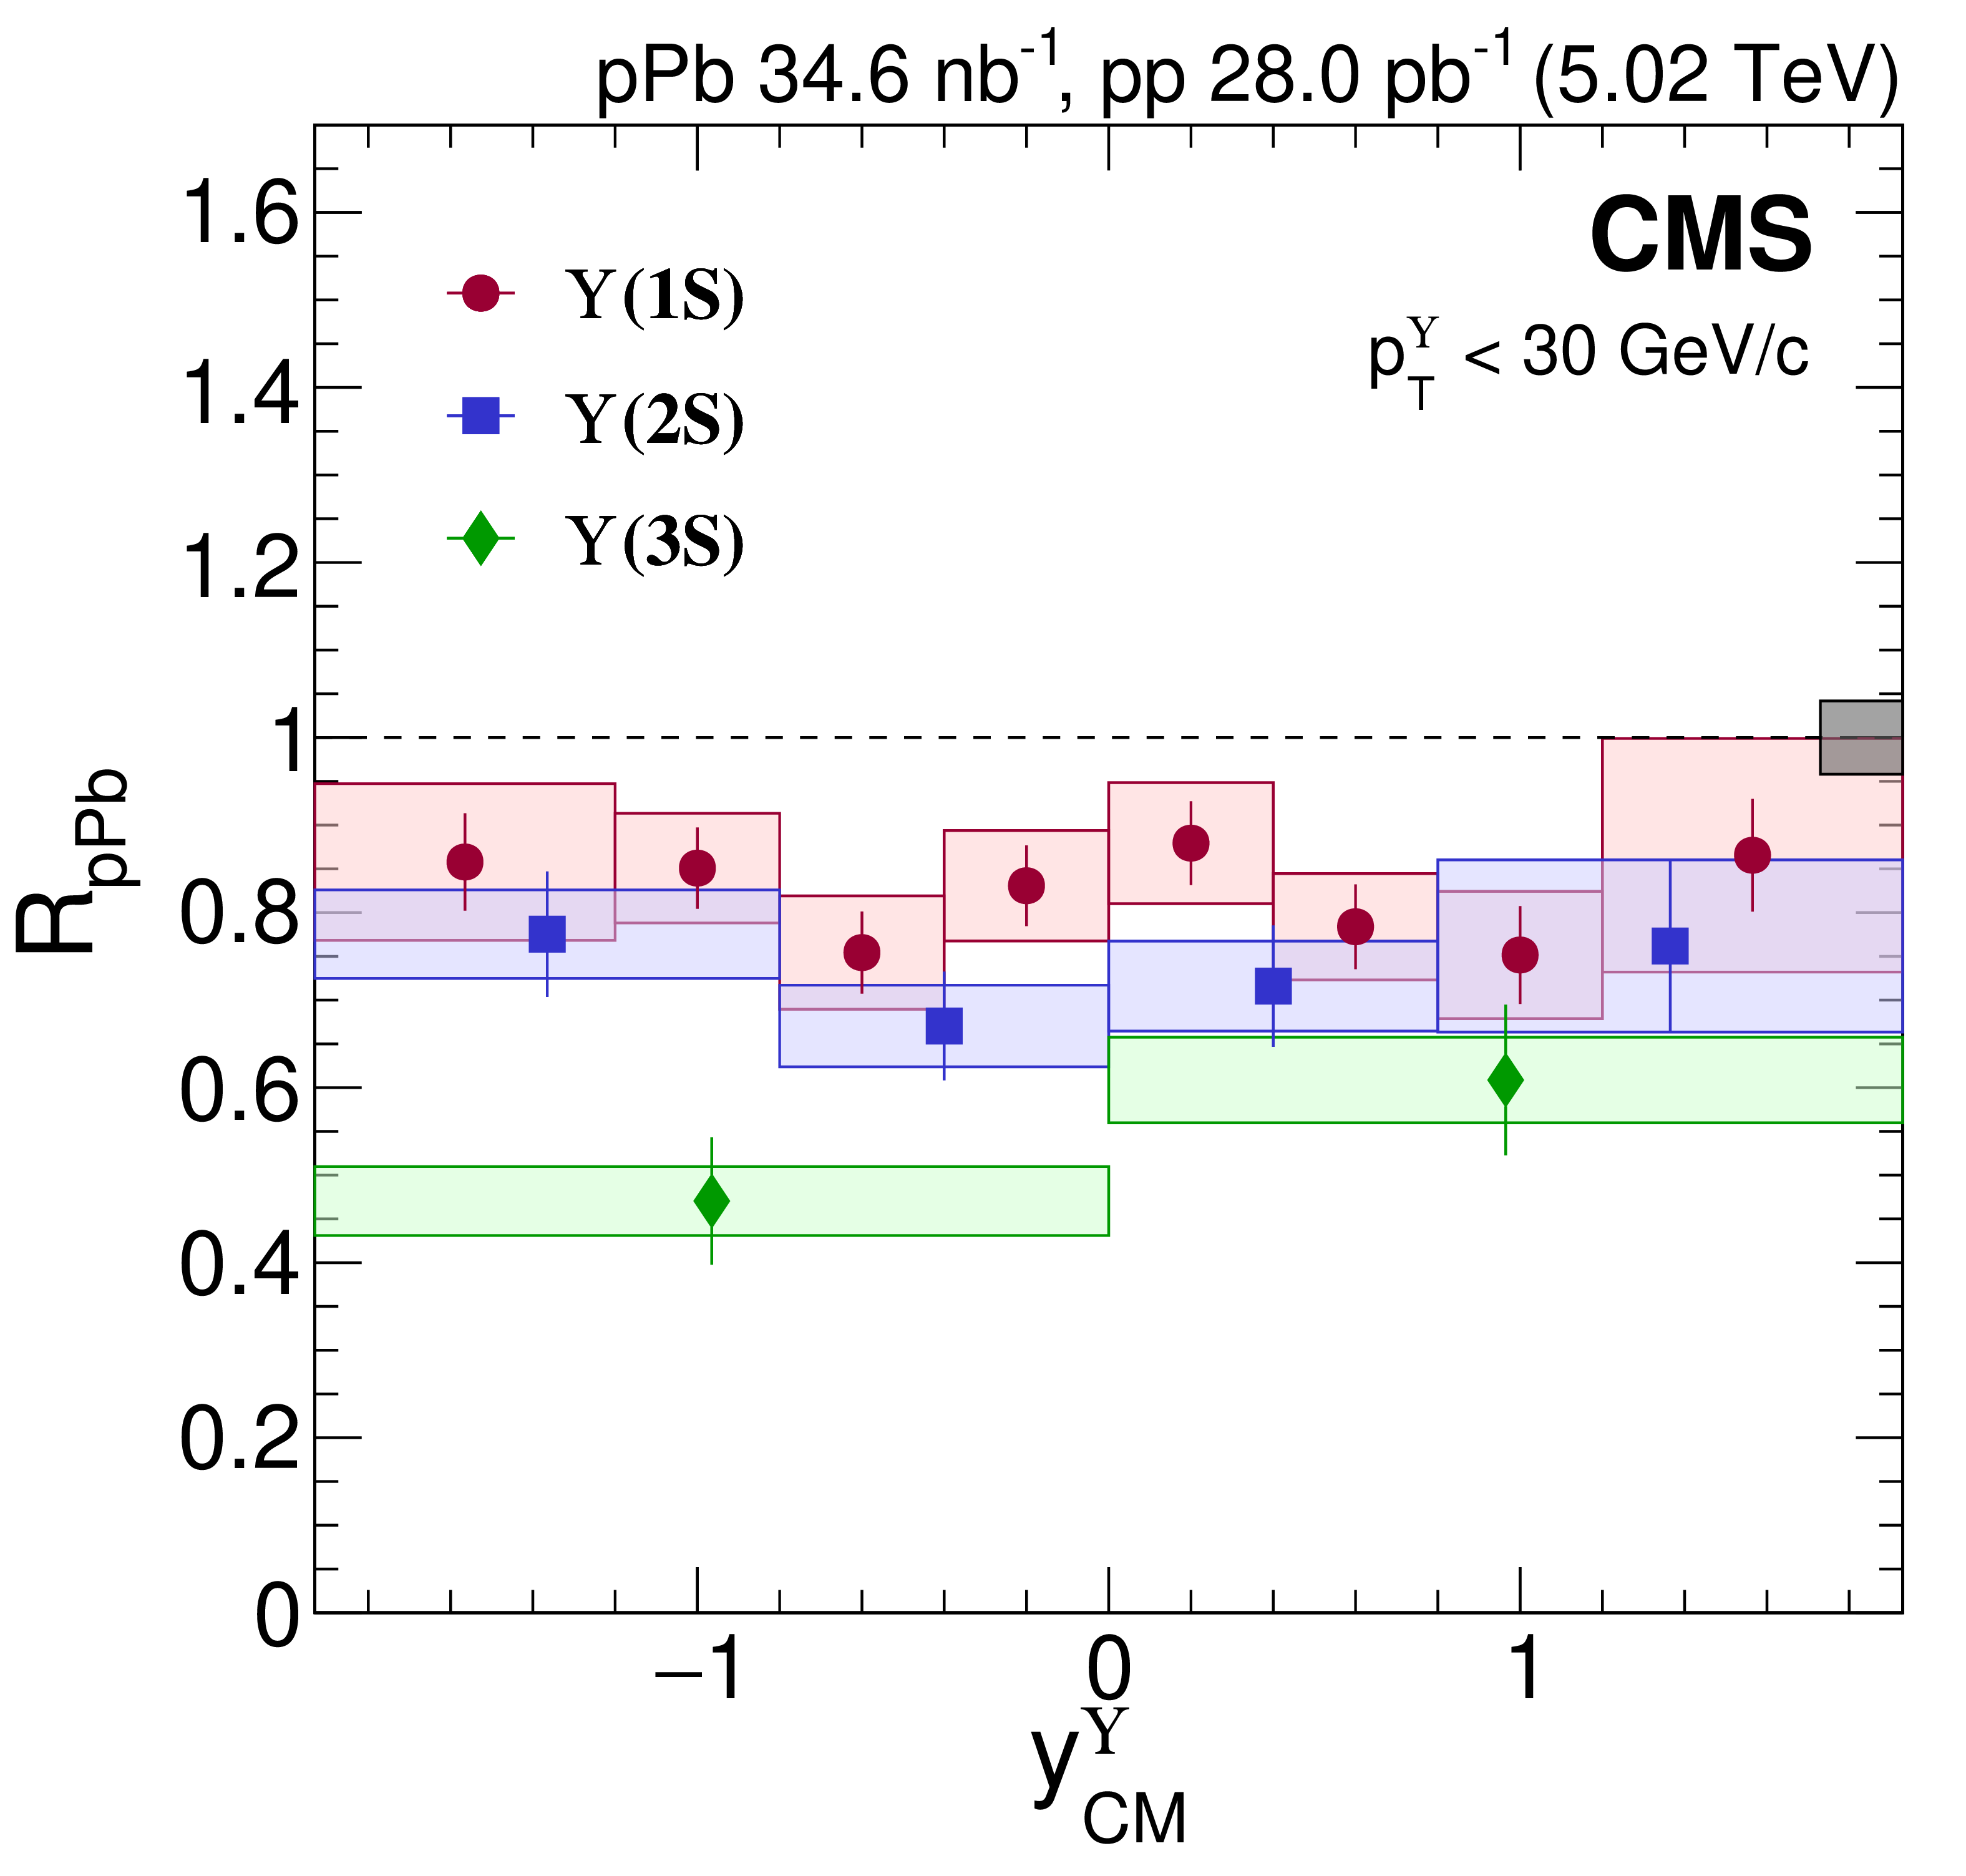
Figure 3:
$ R_{\mathrm{p}\mathrm{Pb}} $ of $ \Upsilon$(1S) (red circles), $ \Upsilon$(2S) (blue squares), and $ \Upsilon$(3S) (green diamonds) as functions of $ p^{\Upsilon}_{\mathrm{T}} $\ (left) and $ y^{\Upsilon}_{\mathrm{CM}} $ (right), where the right panel is integrated over $ p^{\Upsilon}_{\mathrm{T}} < $ 30 GeV/$c$. Vertical bars on the points represent statistical and fit uncertainties and filled boxes represent systematic uncertainties. The gray box around the line at unity represents the global uncertainty due to luminosity normalization (4.2%). |
png pdf |
Figure 3-a:
$ R_{\mathrm{p}\mathrm{Pb}} $ of $ \Upsilon$(1S) (red circles), $ \Upsilon$(2S) (blue squares), and $ \Upsilon$(3S) (green diamonds) as functions of $ p^{\Upsilon}_{\mathrm{T}} $\ (left) and $ y^{\Upsilon}_{\mathrm{CM}} $ (right), where the right panel is integrated over $ p^{\Upsilon}_{\mathrm{T}} < $ 30 GeV/$c$. Vertical bars on the points represent statistical and fit uncertainties and filled boxes represent systematic uncertainties. The gray box around the line at unity represents the global uncertainty due to luminosity normalization (4.2%). |
png pdf |
Figure 3-b:
$ R_{\mathrm{p}\mathrm{Pb}} $ of $ \Upsilon$(1S) (red circles), $ \Upsilon$(2S) (blue squares), and $ \Upsilon$(3S) (green diamonds) as functions of $ p^{\Upsilon}_{\mathrm{T}} $\ (left) and $ y^{\Upsilon}_{\mathrm{CM}} $ (right), where the right panel is integrated over $ p^{\Upsilon}_{\mathrm{T}} < $ 30 GeV/$c$. Vertical bars on the points represent statistical and fit uncertainties and filled boxes represent systematic uncertainties. The gray box around the line at unity represents the global uncertainty due to luminosity normalization (4.2%). |
png pdf |
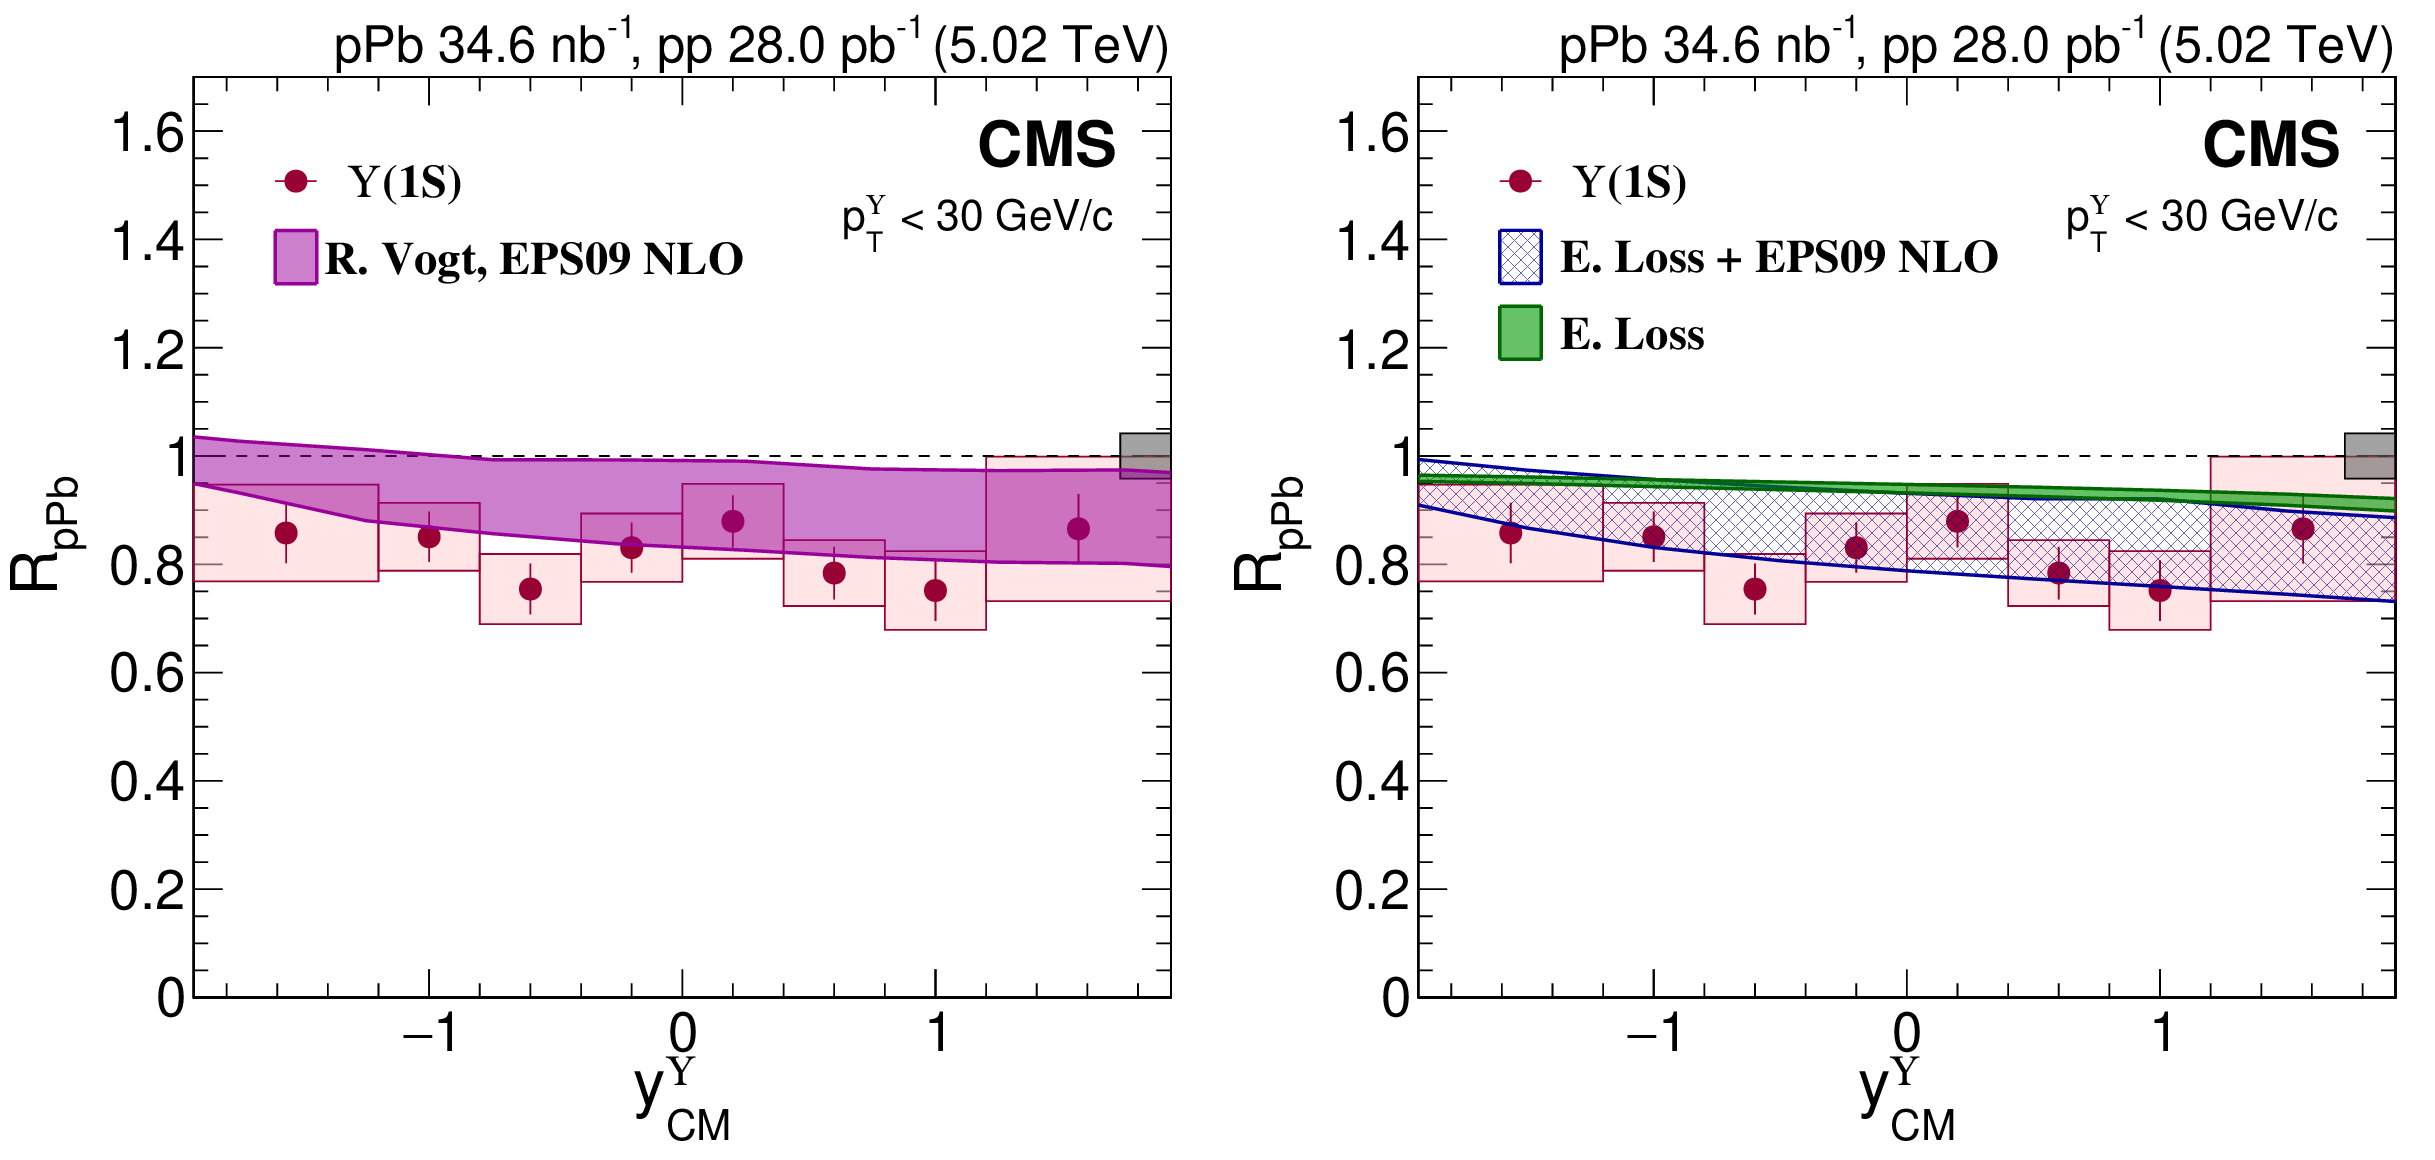
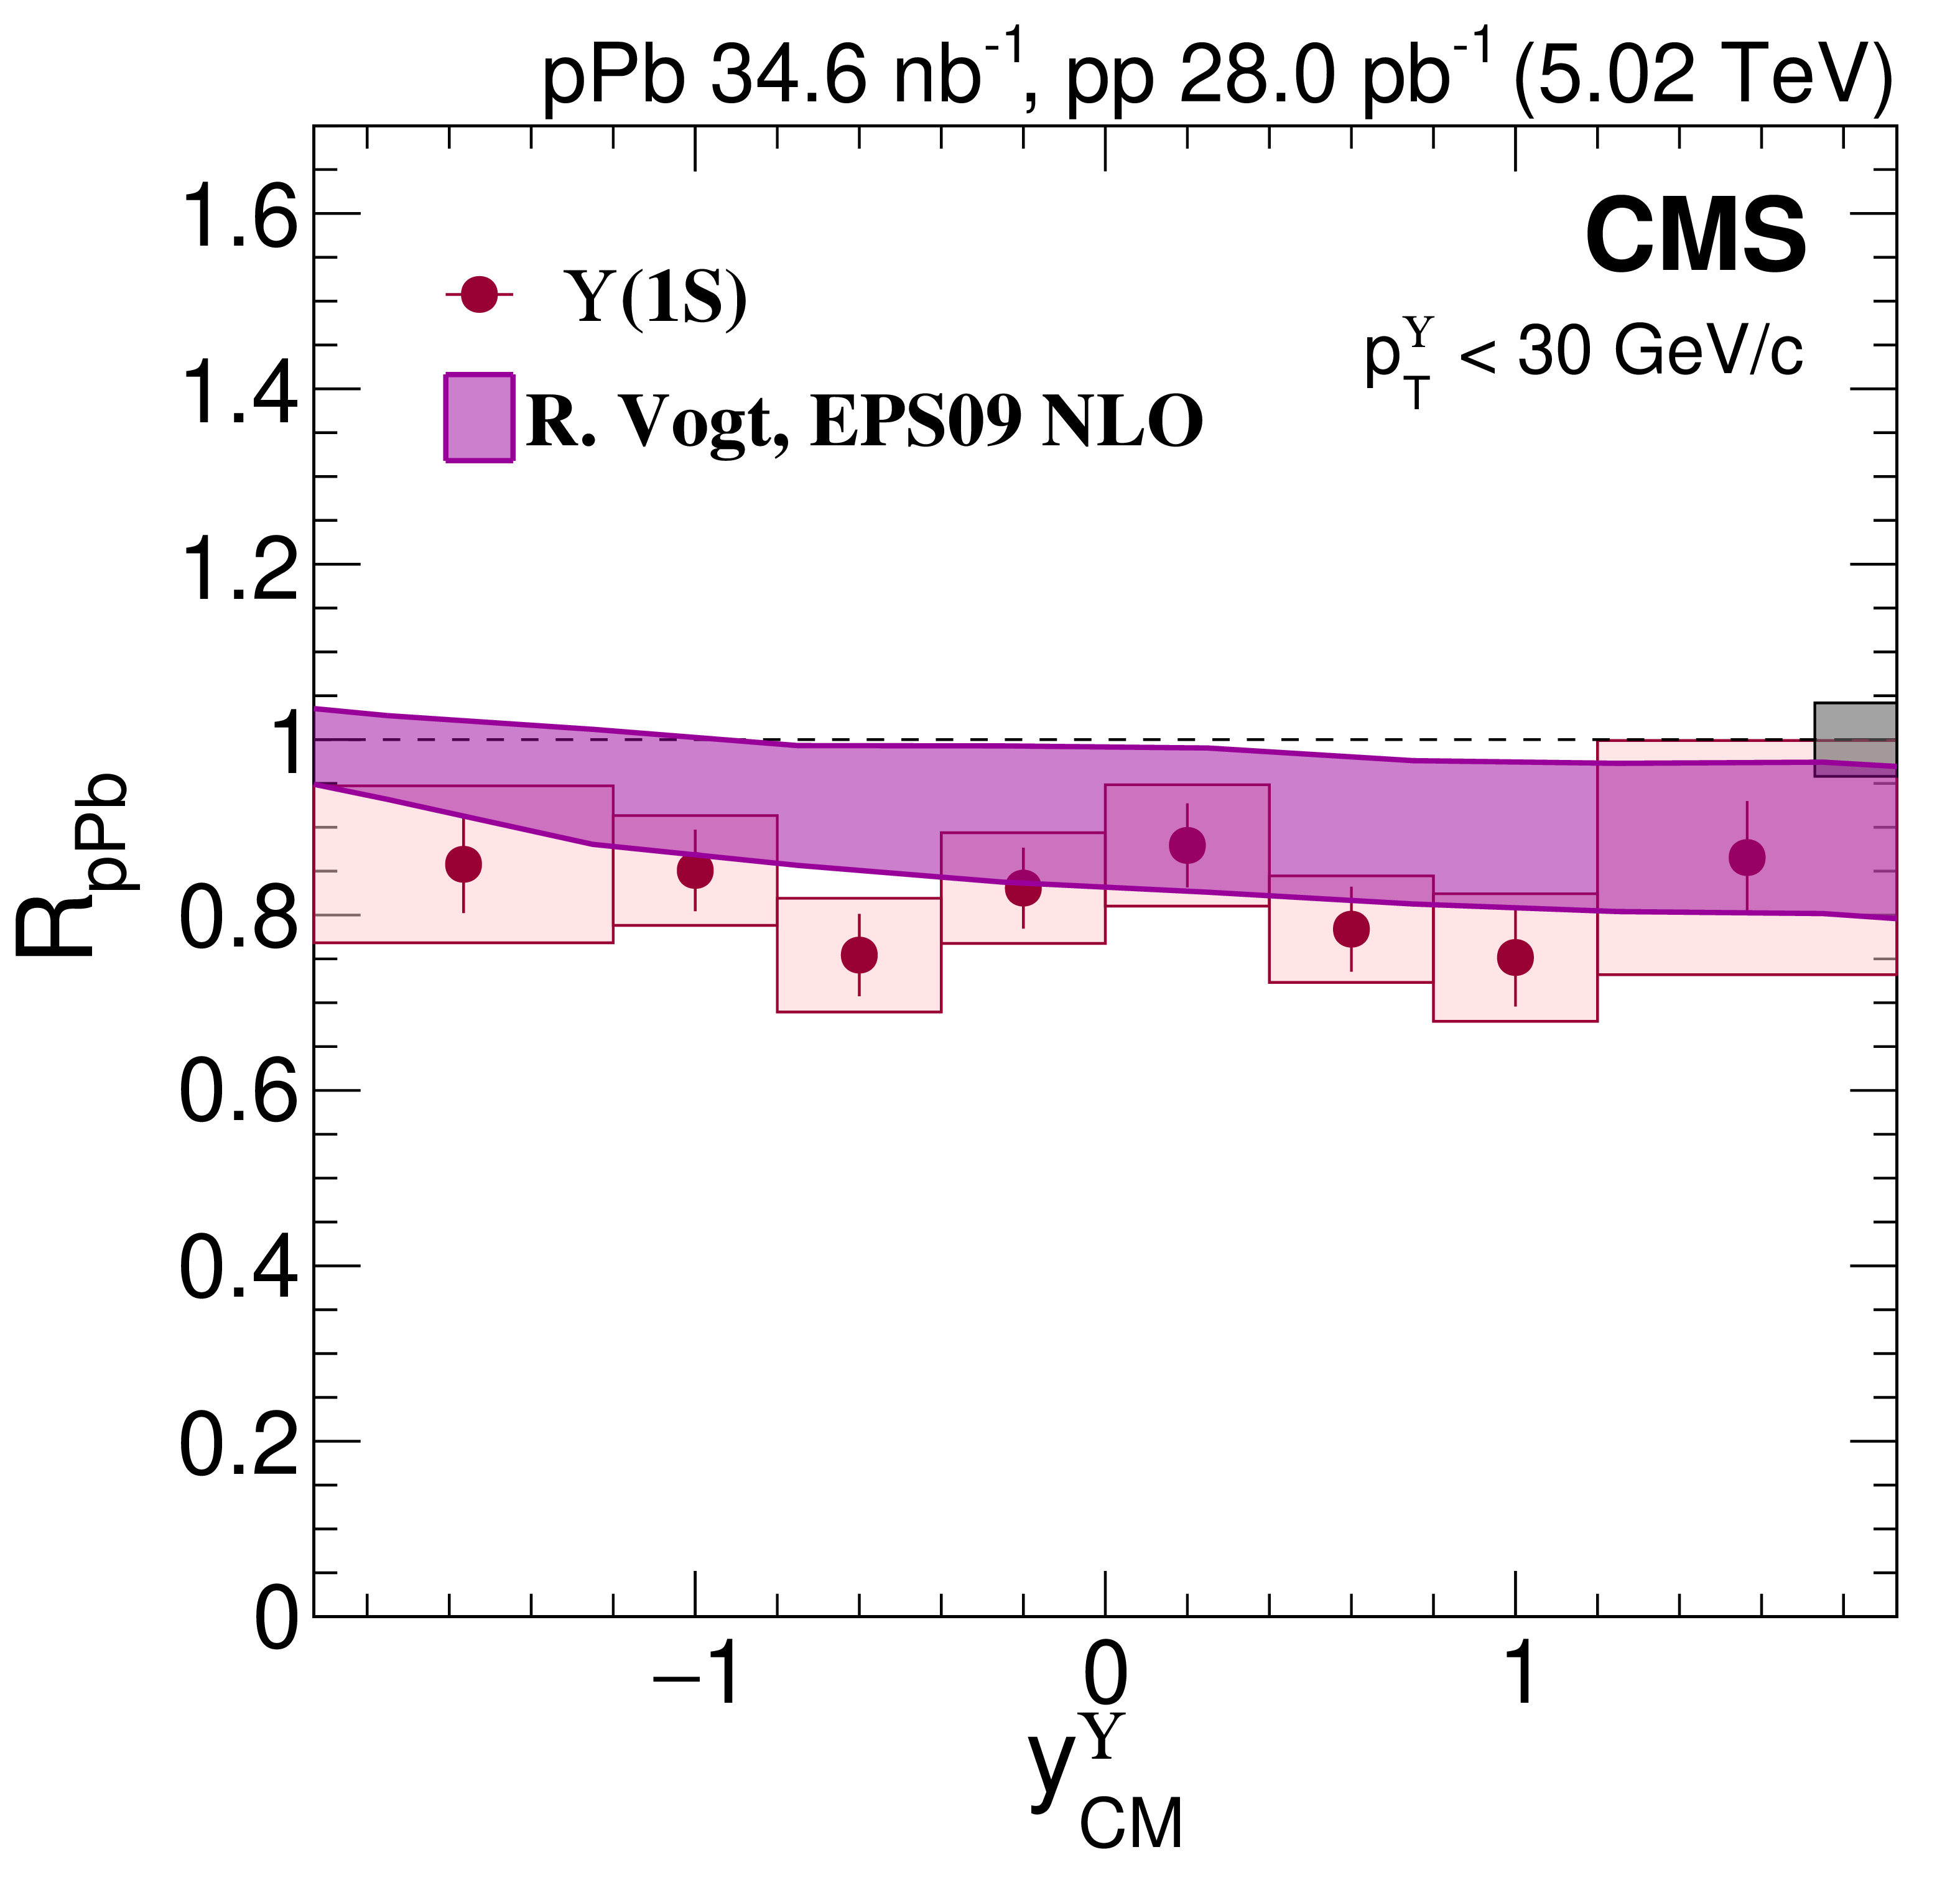
Figure 4:
$ R_{\mathrm{p}\mathrm{Pb}} $ of $ \Upsilon$(1S) (red circles) versus $ y^{\Upsilon}_{\mathrm{CM}} $ with initial-state model calculations: nPDF modification [16] (left) and energy loss (E. Loss) with and without shadowing corrections [17] (right). The uncertainty range for each model calculation is shown. Vertical bars on the points represent statistical and fit uncertainties and filled boxes represent systematic uncertainties. The gray box around the line at unity represents the global uncertainty due to luminosity normalization (4.2%). |
png pdf |
Figure 4-a:
$ R_{\mathrm{p}\mathrm{Pb}} $ of $ \Upsilon$(1S) (red circles) versus $ y^{\Upsilon}_{\mathrm{CM}} $ with initial-state model calculations: nPDF modification [16] (left) and energy loss (E. Loss) with and without shadowing corrections [17] (right). The uncertainty range for each model calculation is shown. Vertical bars on the points represent statistical and fit uncertainties and filled boxes represent systematic uncertainties. The gray box around the line at unity represents the global uncertainty due to luminosity normalization (4.2%). |

png pdf |
Figure 4-b:
$ R_{\mathrm{p}\mathrm{Pb}} $ of $ \Upsilon$(1S) (red circles) versus $ y^{\Upsilon}_{\mathrm{CM}} $ with initial-state model calculations: nPDF modification [16] (left) and energy loss (E. Loss) with and without shadowing corrections [17] (right). The uncertainty range for each model calculation is shown. Vertical bars on the points represent statistical and fit uncertainties and filled boxes represent systematic uncertainties. The gray box around the line at unity represents the global uncertainty due to luminosity normalization (4.2%). |
png pdf |
Figure 5:
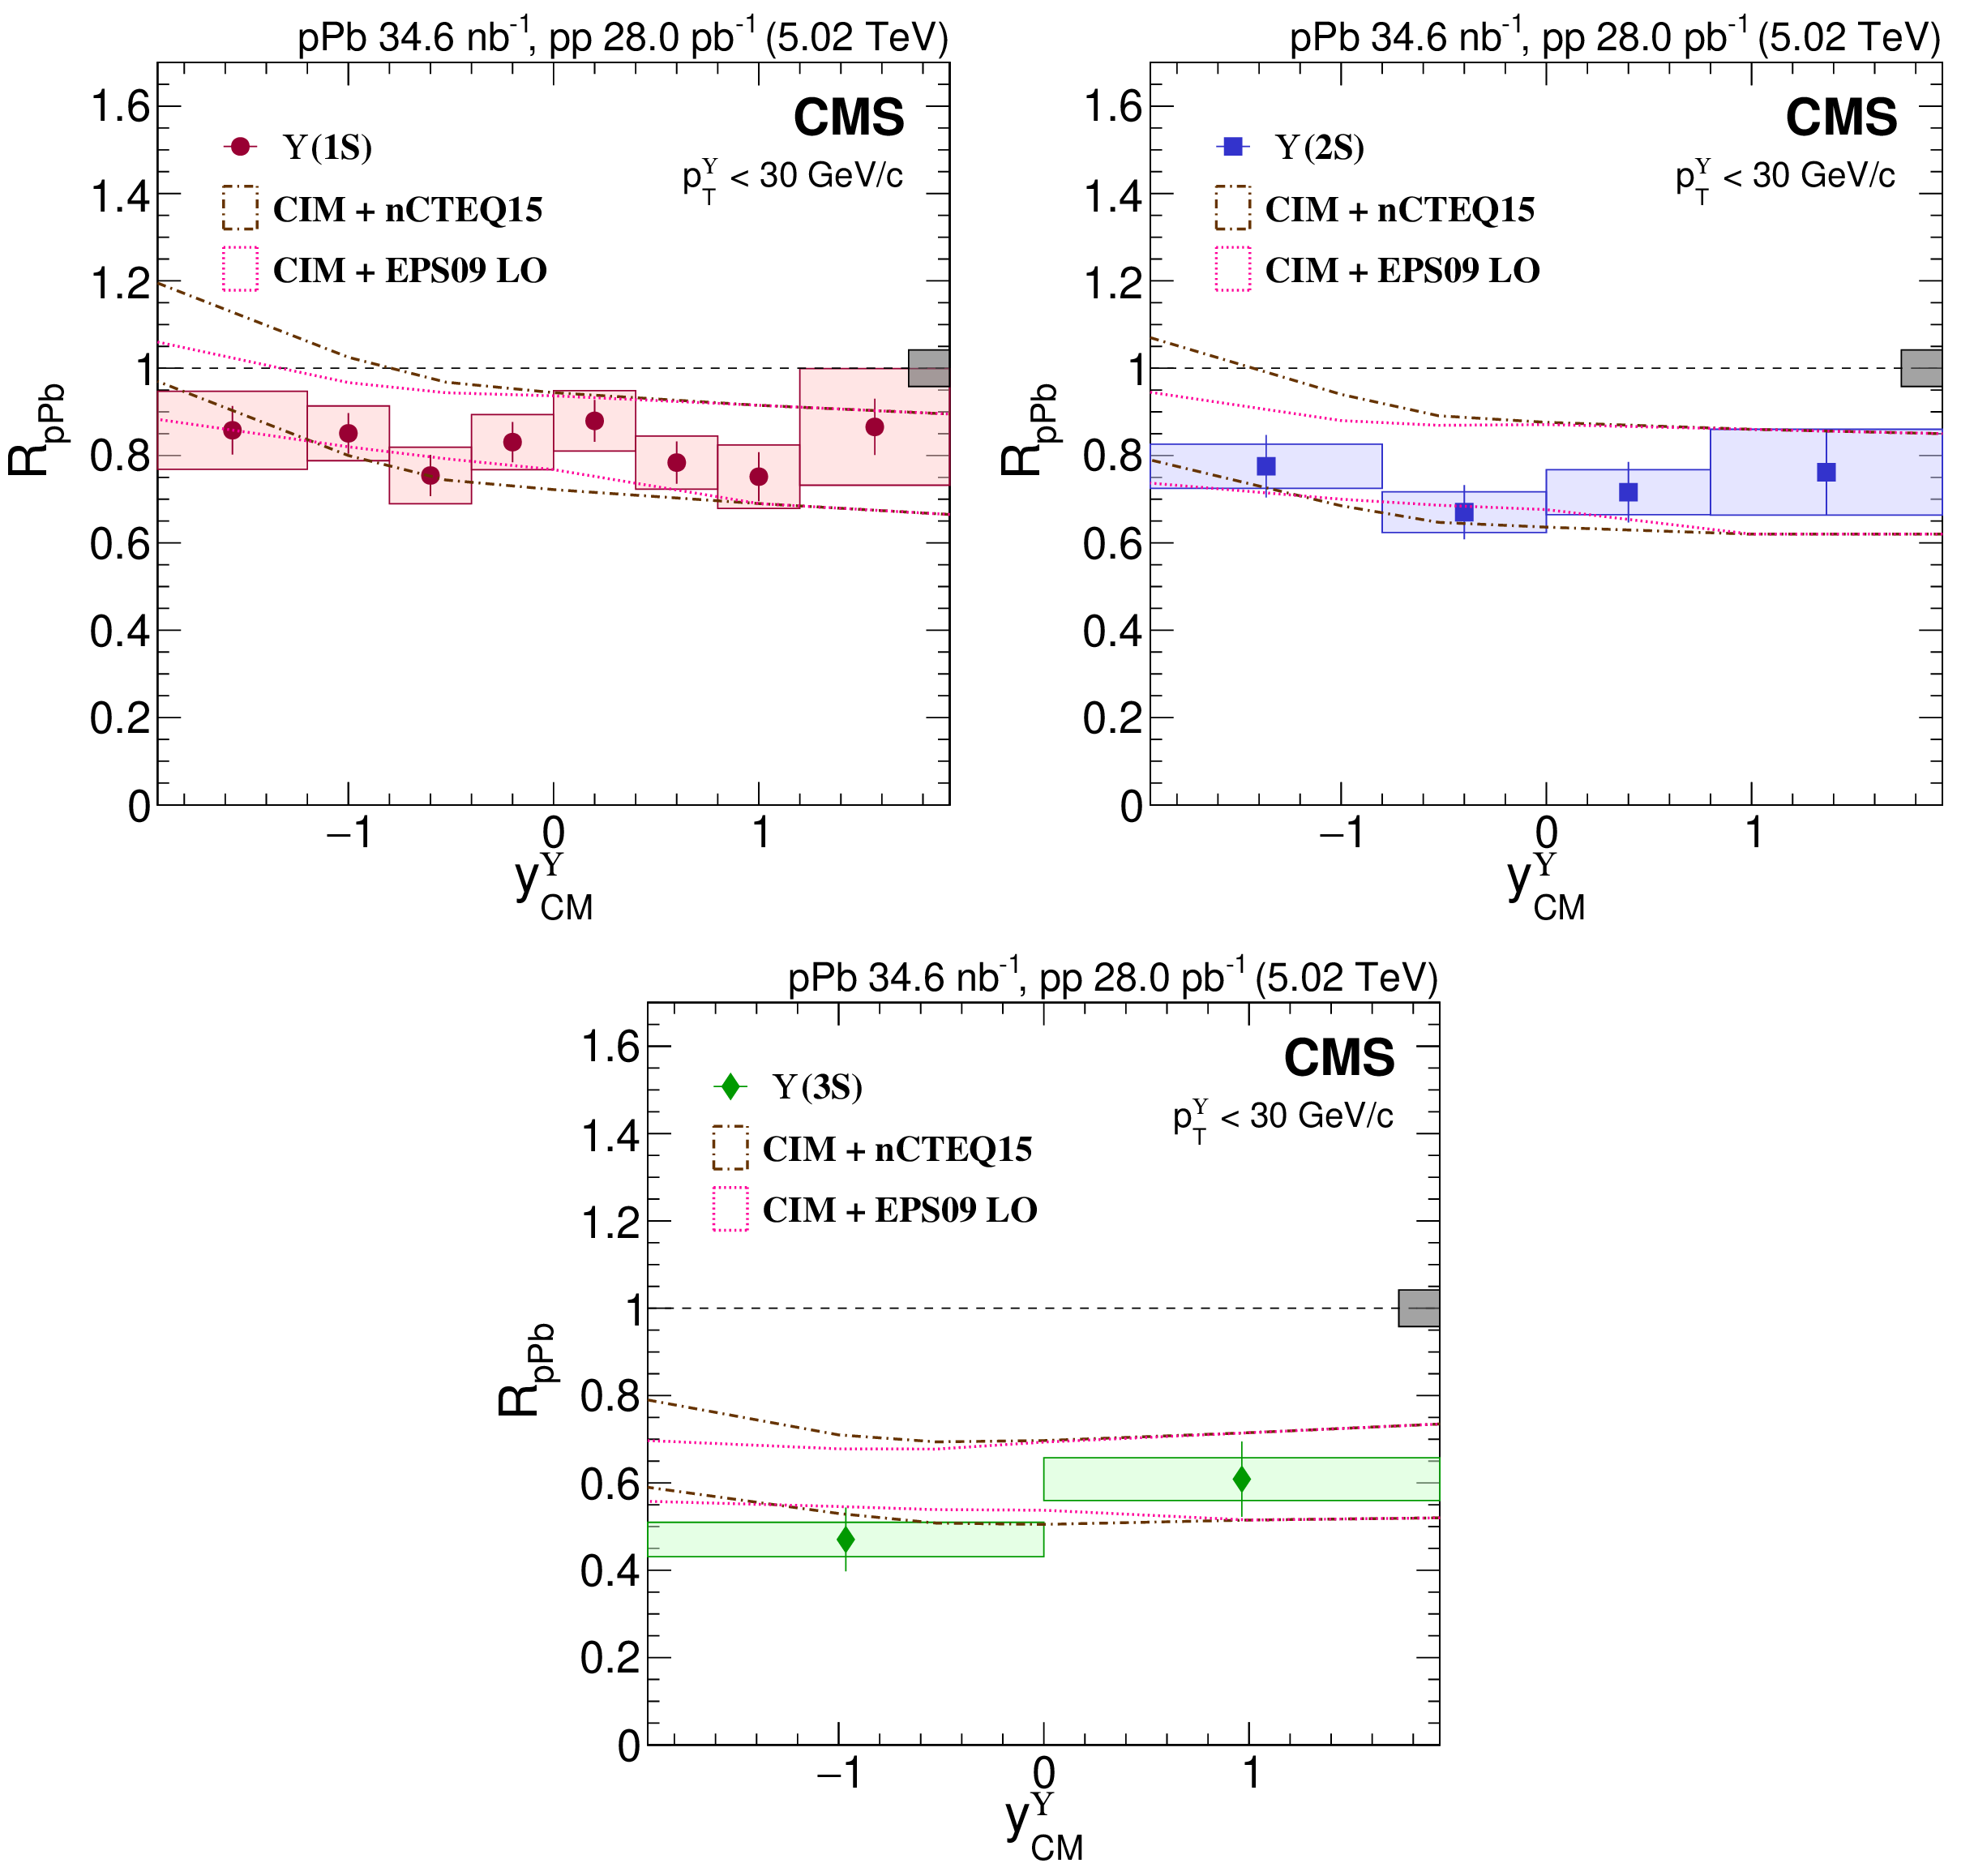
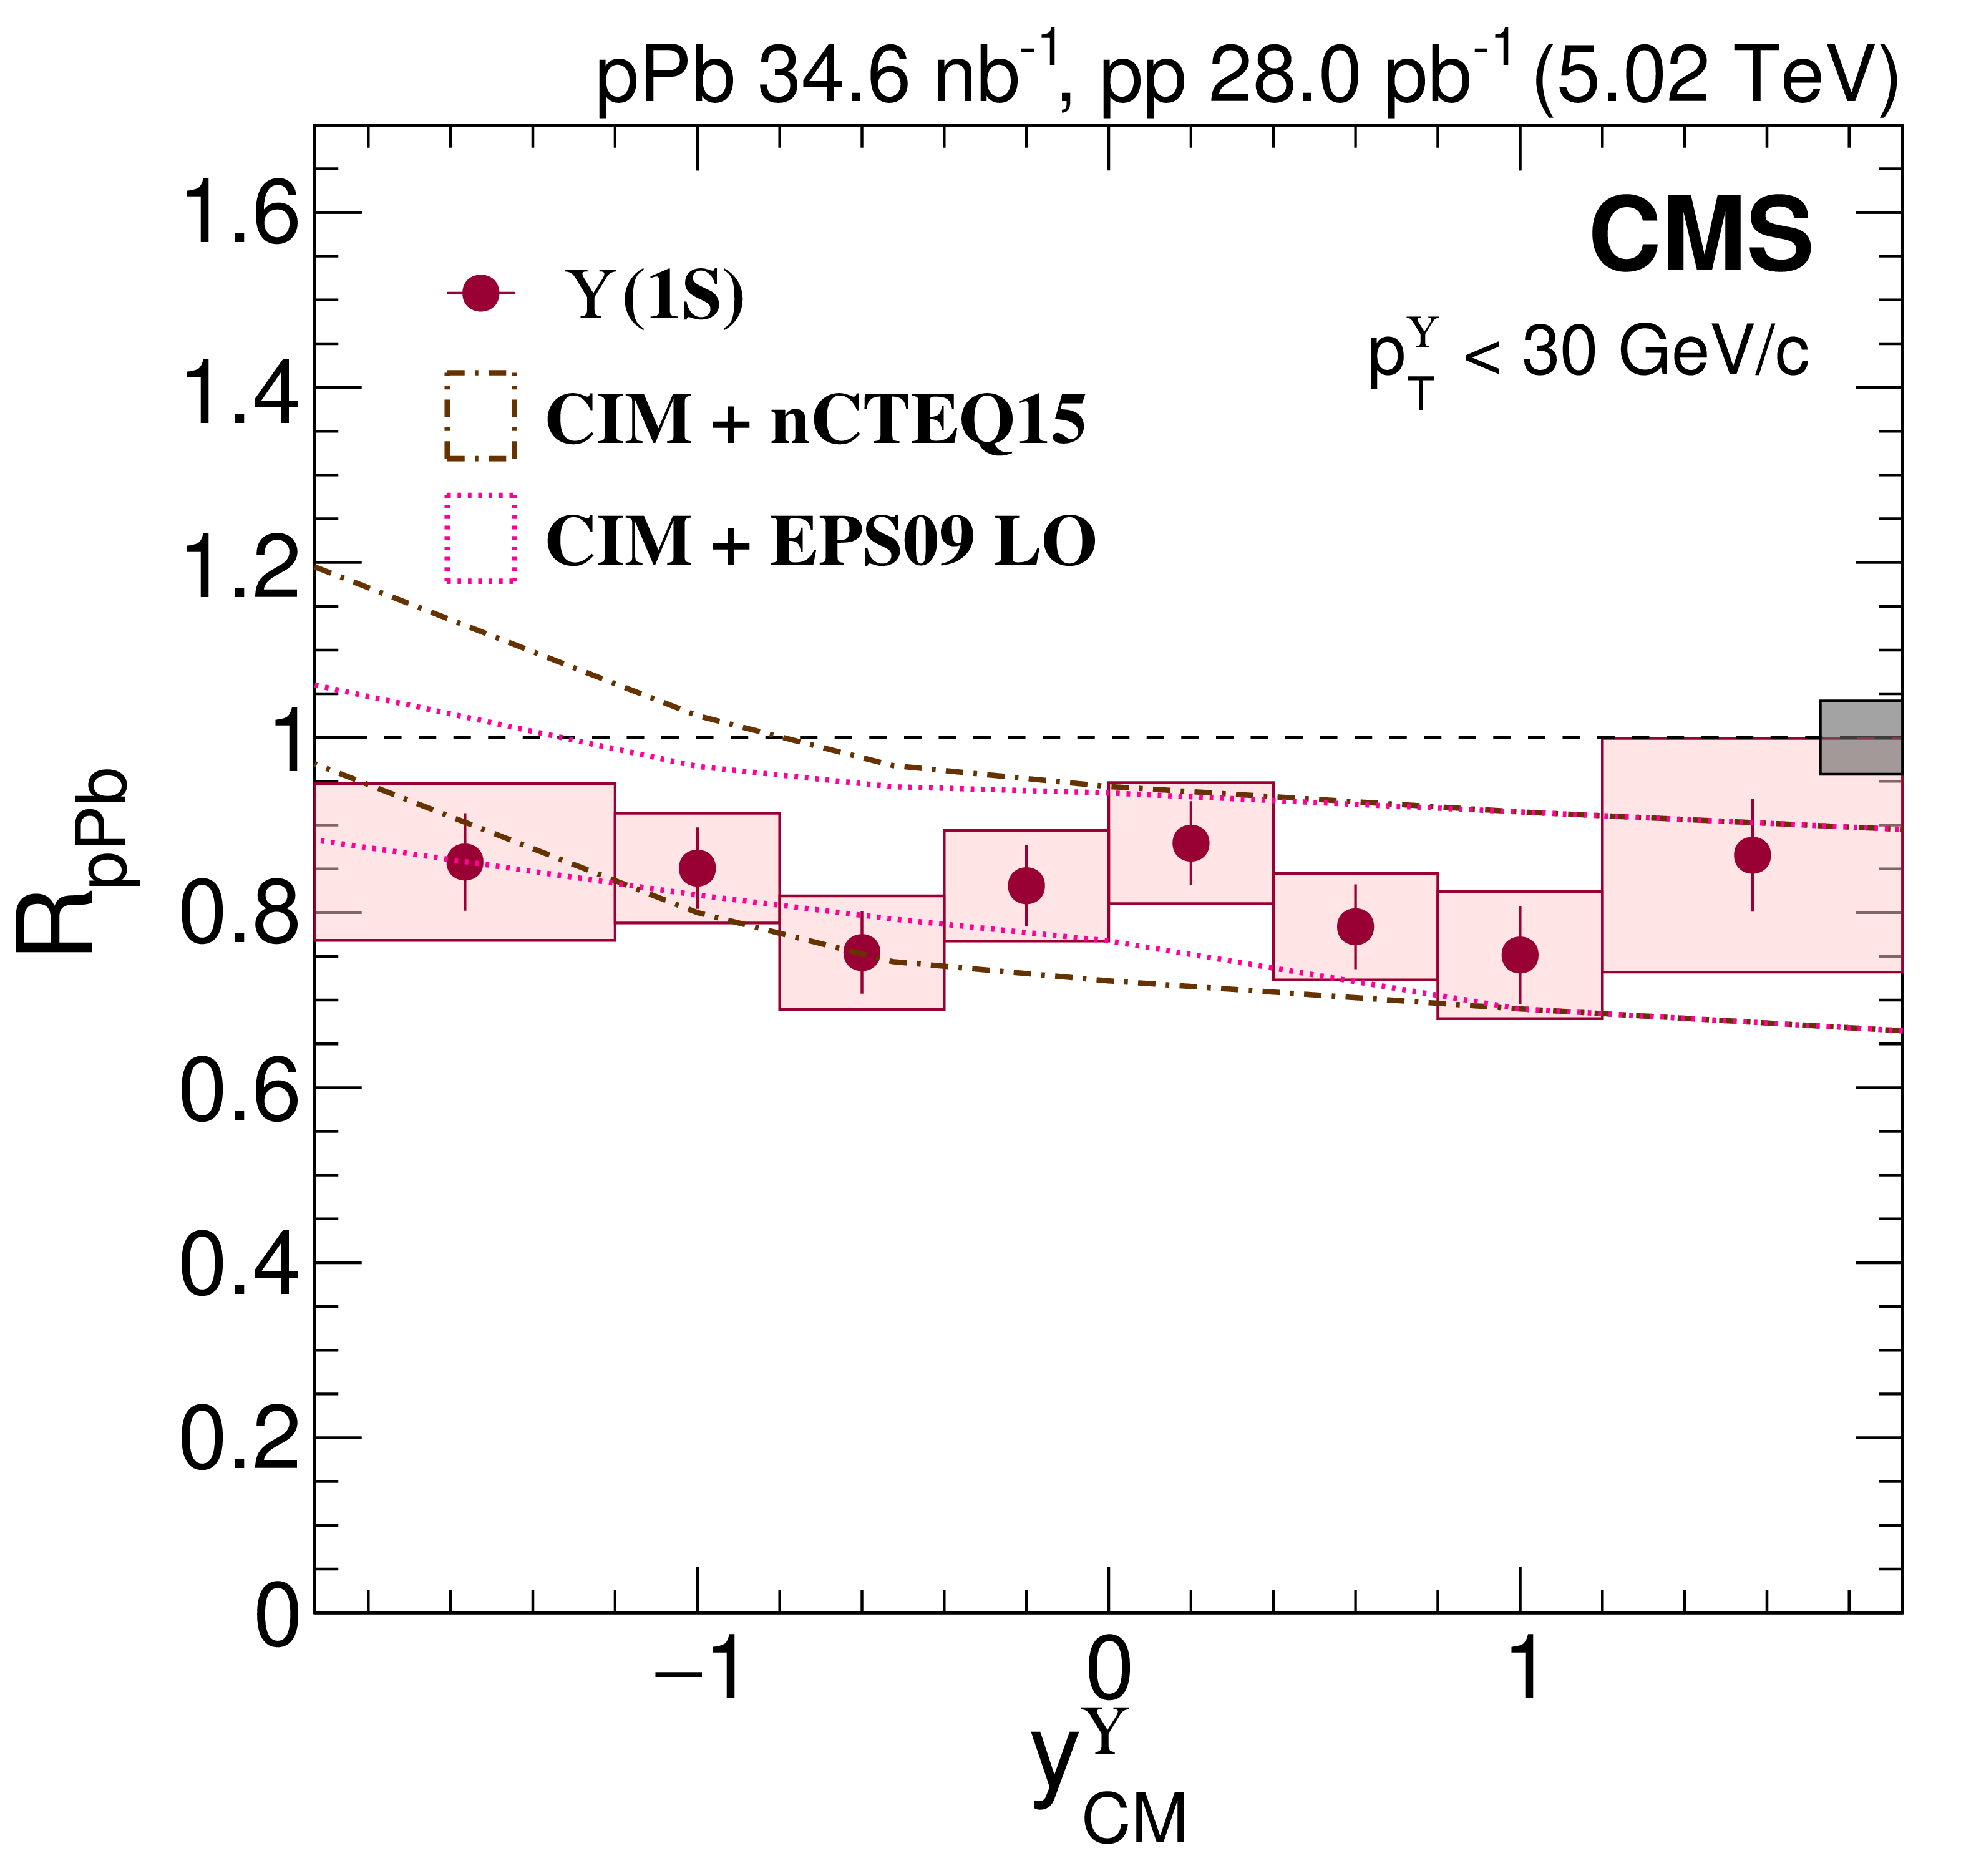
$ R_{\mathrm{p}\mathrm{Pb}} $ versus $ y^{\Upsilon}_{\mathrm{CM}} $ with CIM predictions [18] with shadowing corrections using nCTEQ15 and EPS09 for $ \Upsilon$(1S) (upper left; red circles), $ \Upsilon$(2S) (upper right; blue squares) and $ \Upsilon$(3S) (lower; green diamonds). The uncertainty range for each model calculation is shown. Vertical bars on the points represent statistical and fit uncertainties and filled boxes represent systematic uncertainties. The gray box around the line at unity represents the global uncertainty due to luminosity normalization (4.2%). |
png pdf |
Figure 5-a:
$ R_{\mathrm{p}\mathrm{Pb}} $ versus $ y^{\Upsilon}_{\mathrm{CM}} $ with CIM predictions [18] with shadowing corrections using nCTEQ15 and EPS09 for $ \Upsilon$(1S) (upper left; red circles), $ \Upsilon$(2S) (upper right; blue squares) and $ \Upsilon$(3S) (lower; green diamonds). The uncertainty range for each model calculation is shown. Vertical bars on the points represent statistical and fit uncertainties and filled boxes represent systematic uncertainties. The gray box around the line at unity represents the global uncertainty due to luminosity normalization (4.2%). |
png pdf |
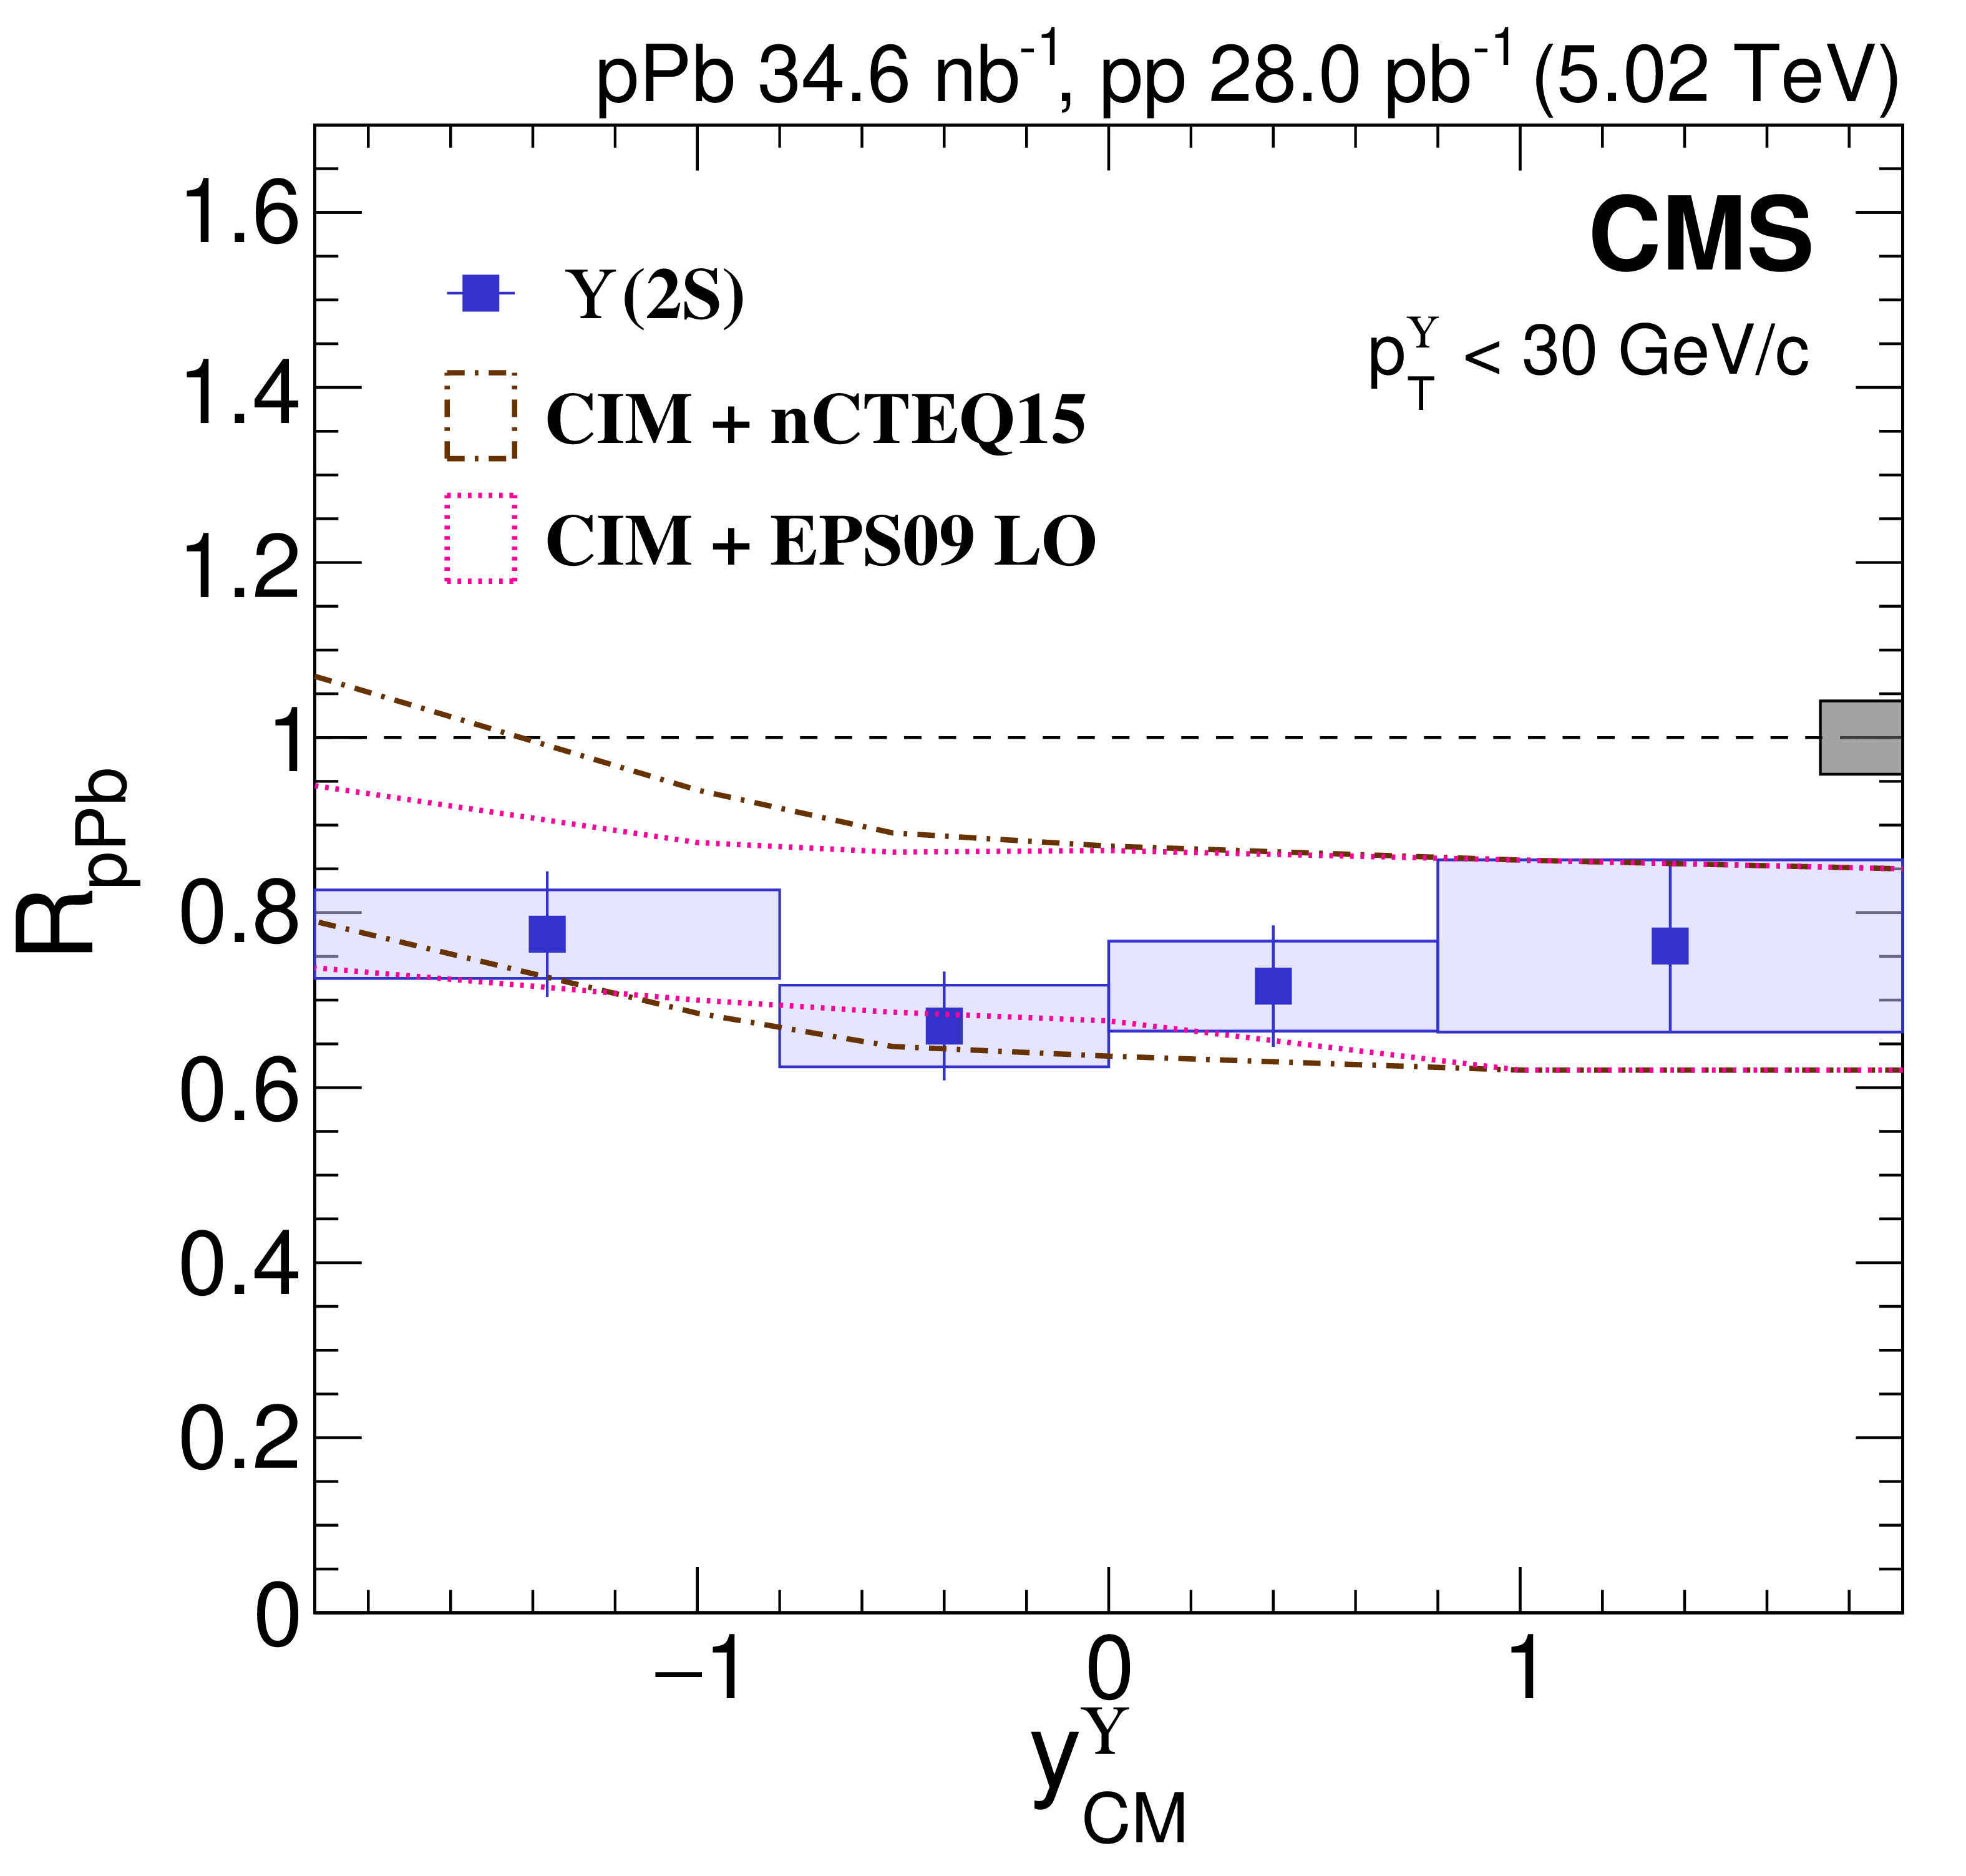
Figure 5-b:
$ R_{\mathrm{p}\mathrm{Pb}} $ versus $ y^{\Upsilon}_{\mathrm{CM}} $ with CIM predictions [18] with shadowing corrections using nCTEQ15 and EPS09 for $ \Upsilon$(1S) (upper left; red circles), $ \Upsilon$(2S) (upper right; blue squares) and $ \Upsilon$(3S) (lower; green diamonds). The uncertainty range for each model calculation is shown. Vertical bars on the points represent statistical and fit uncertainties and filled boxes represent systematic uncertainties. The gray box around the line at unity represents the global uncertainty due to luminosity normalization (4.2%). |
png pdf |
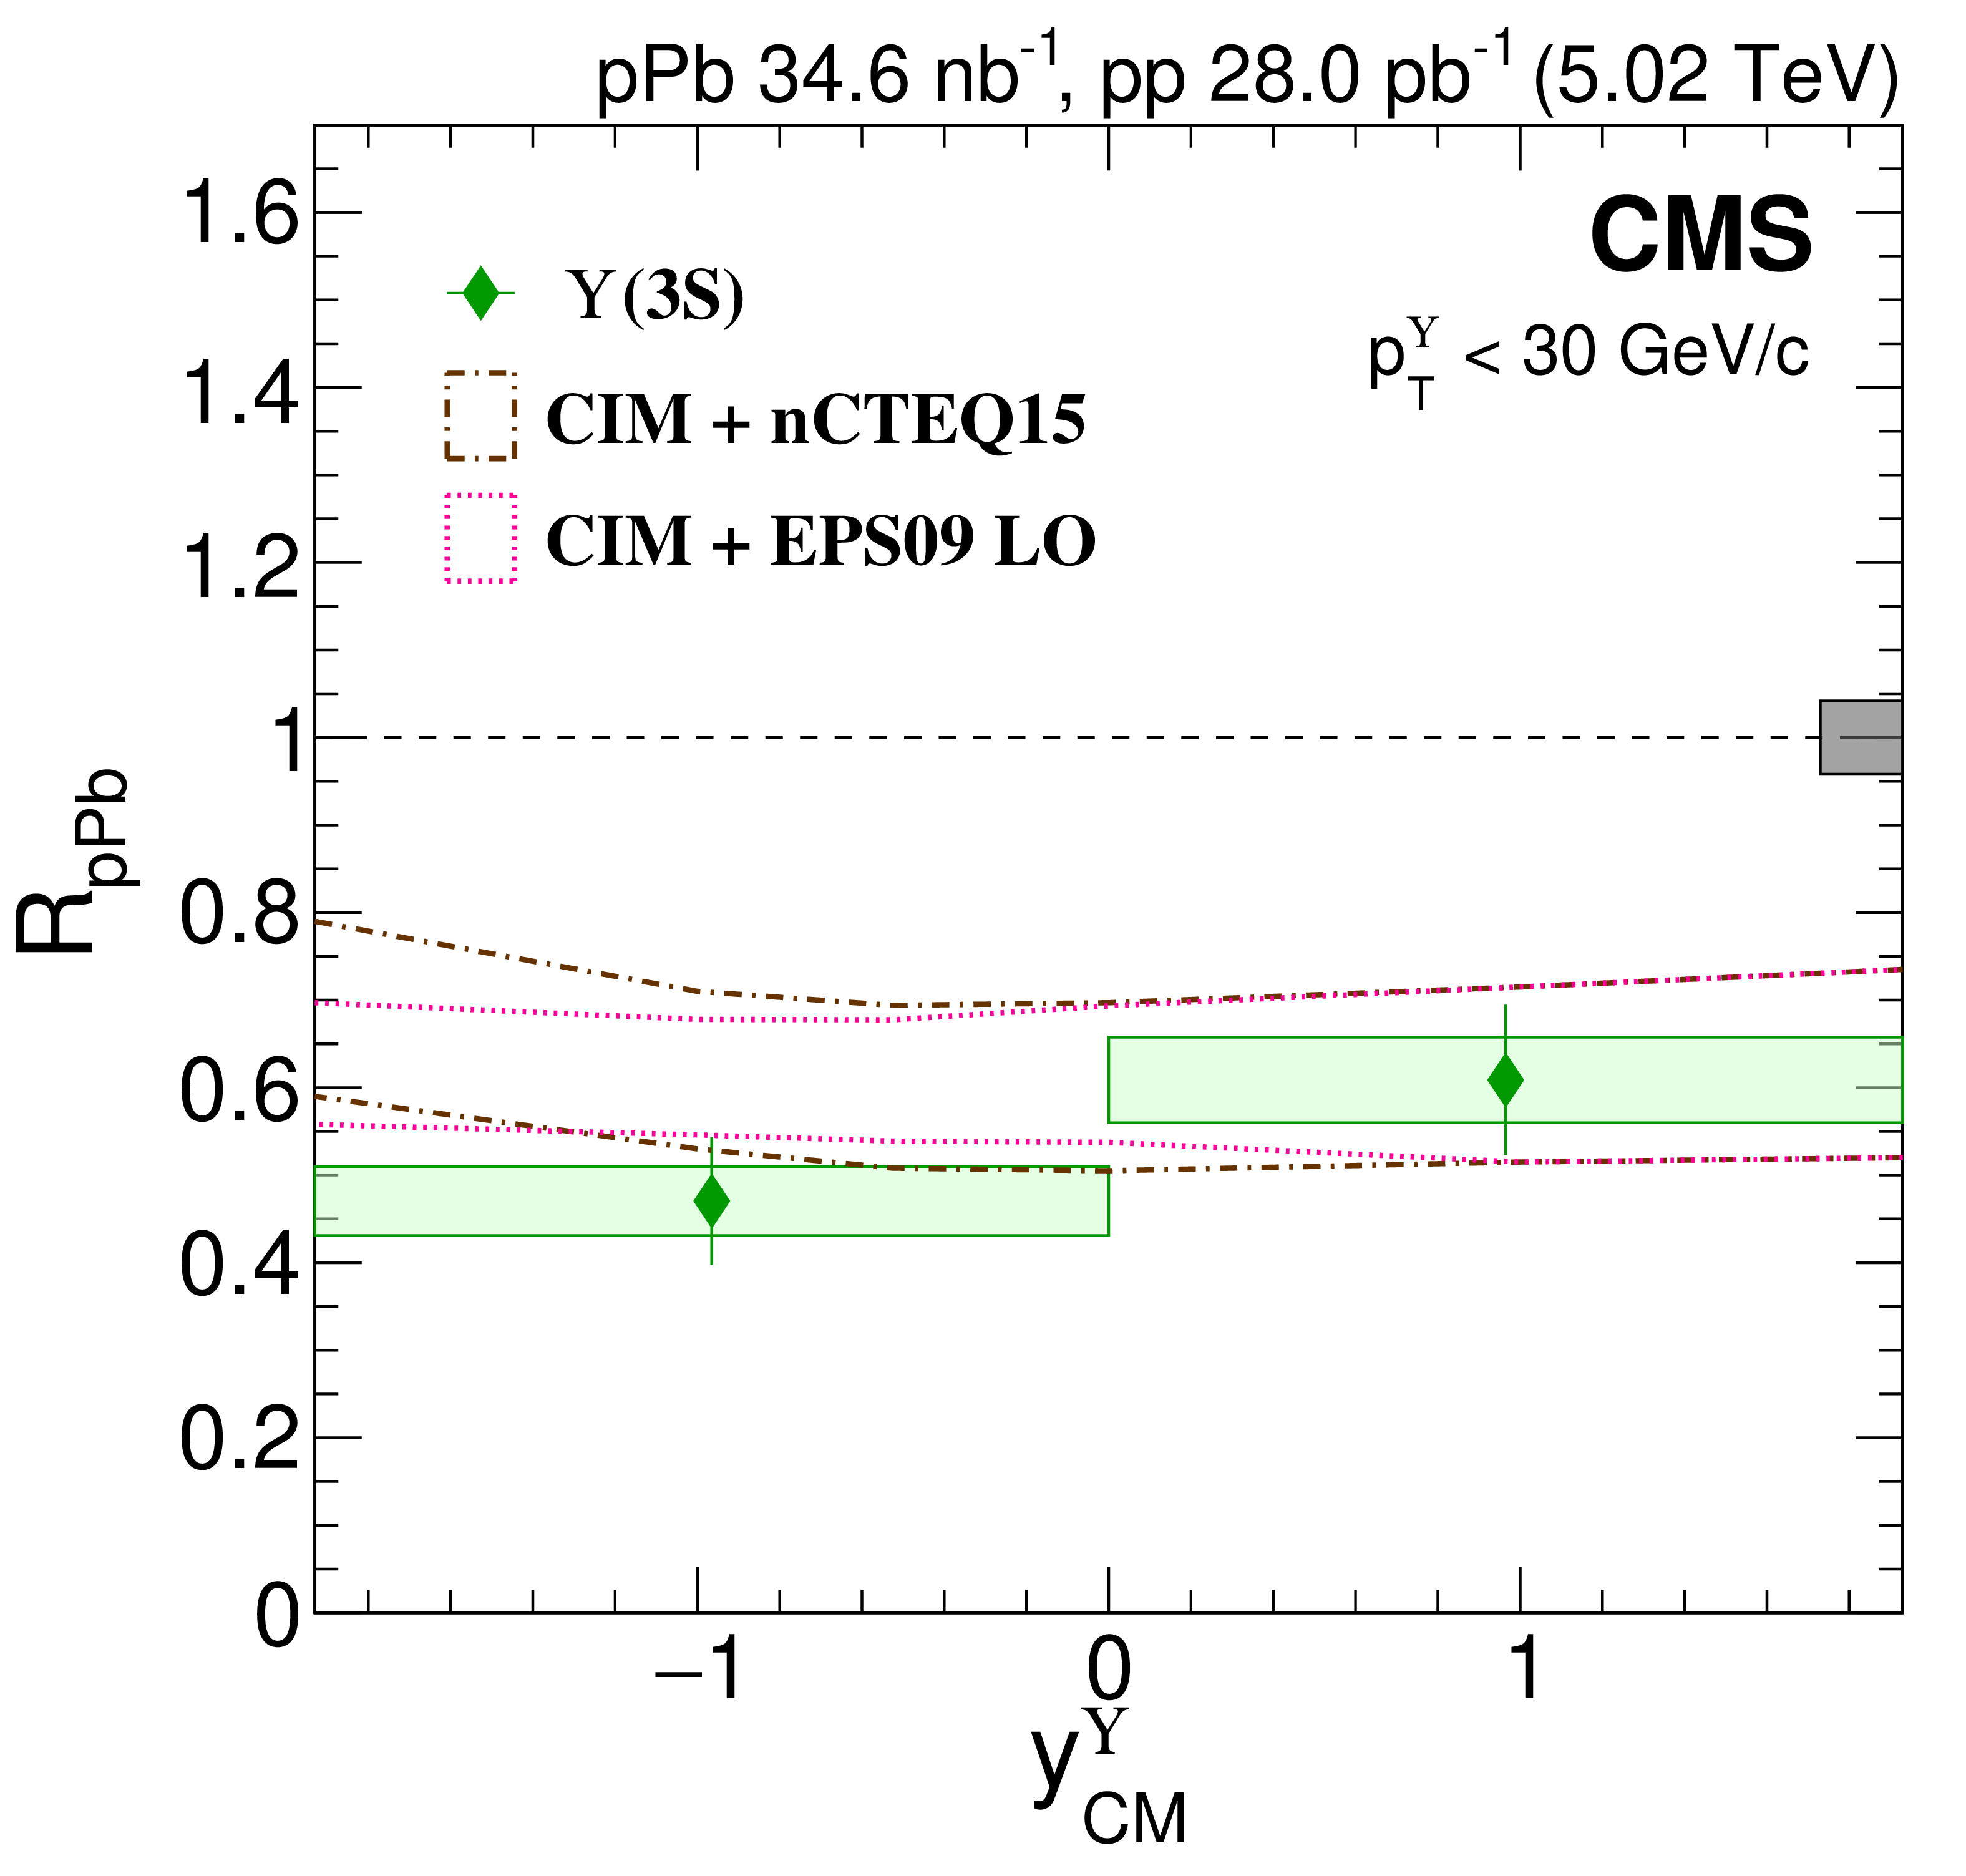
Figure 5-c:
$ R_{\mathrm{p}\mathrm{Pb}} $ versus $ y^{\Upsilon}_{\mathrm{CM}} $ with CIM predictions [18] with shadowing corrections using nCTEQ15 and EPS09 for $ \Upsilon$(1S) (upper left; red circles), $ \Upsilon$(2S) (upper right; blue squares) and $ \Upsilon$(3S) (lower; green diamonds). The uncertainty range for each model calculation is shown. Vertical bars on the points represent statistical and fit uncertainties and filled boxes represent systematic uncertainties. The gray box around the line at unity represents the global uncertainty due to luminosity normalization (4.2%). |
png pdf |
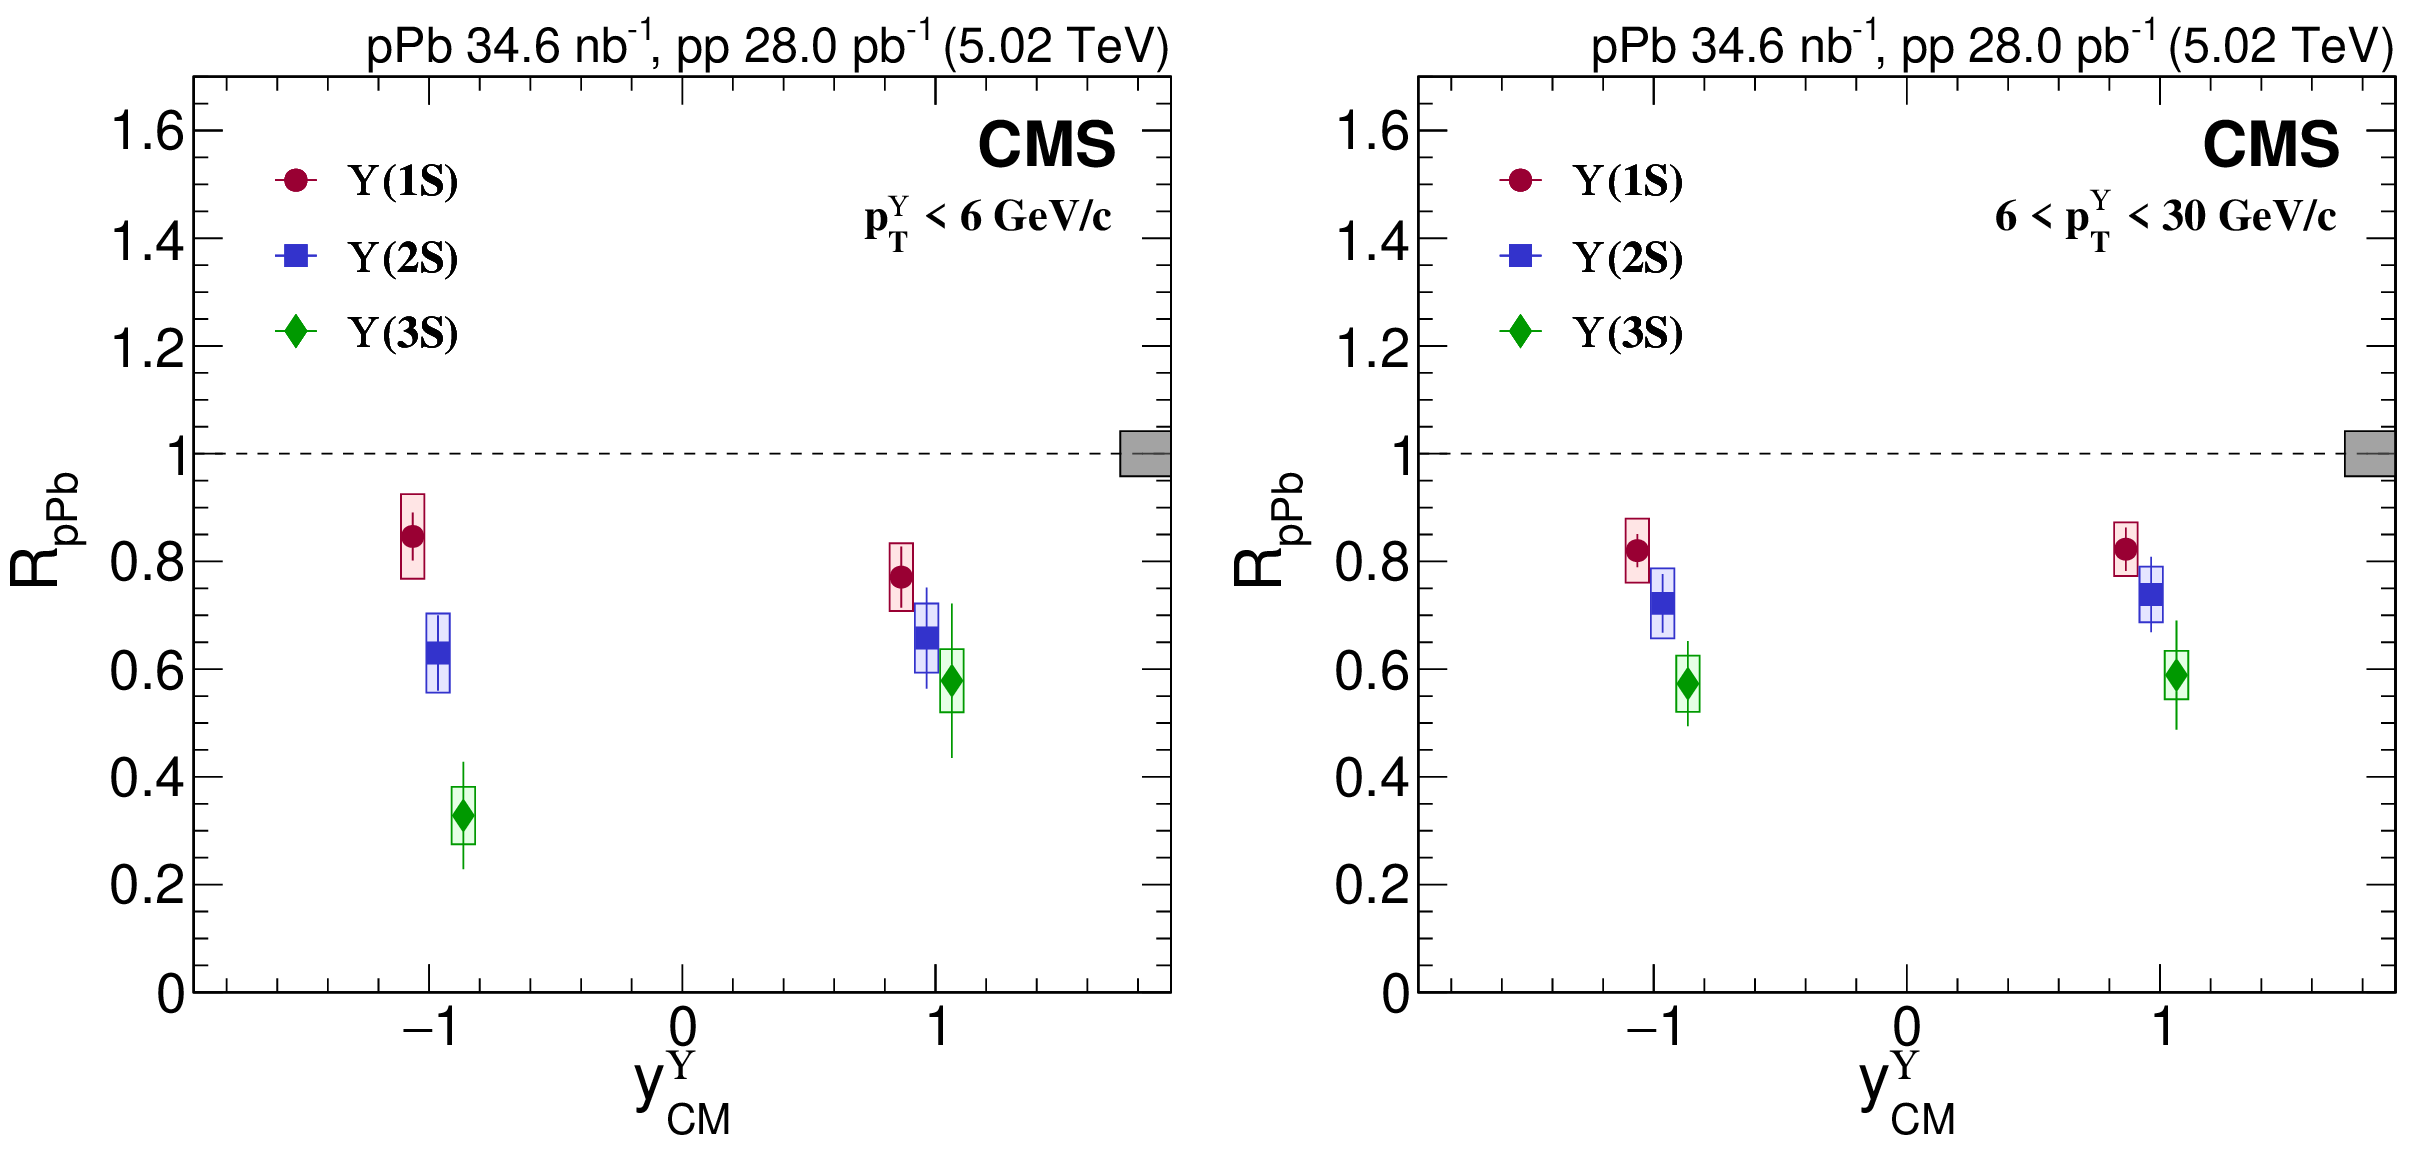
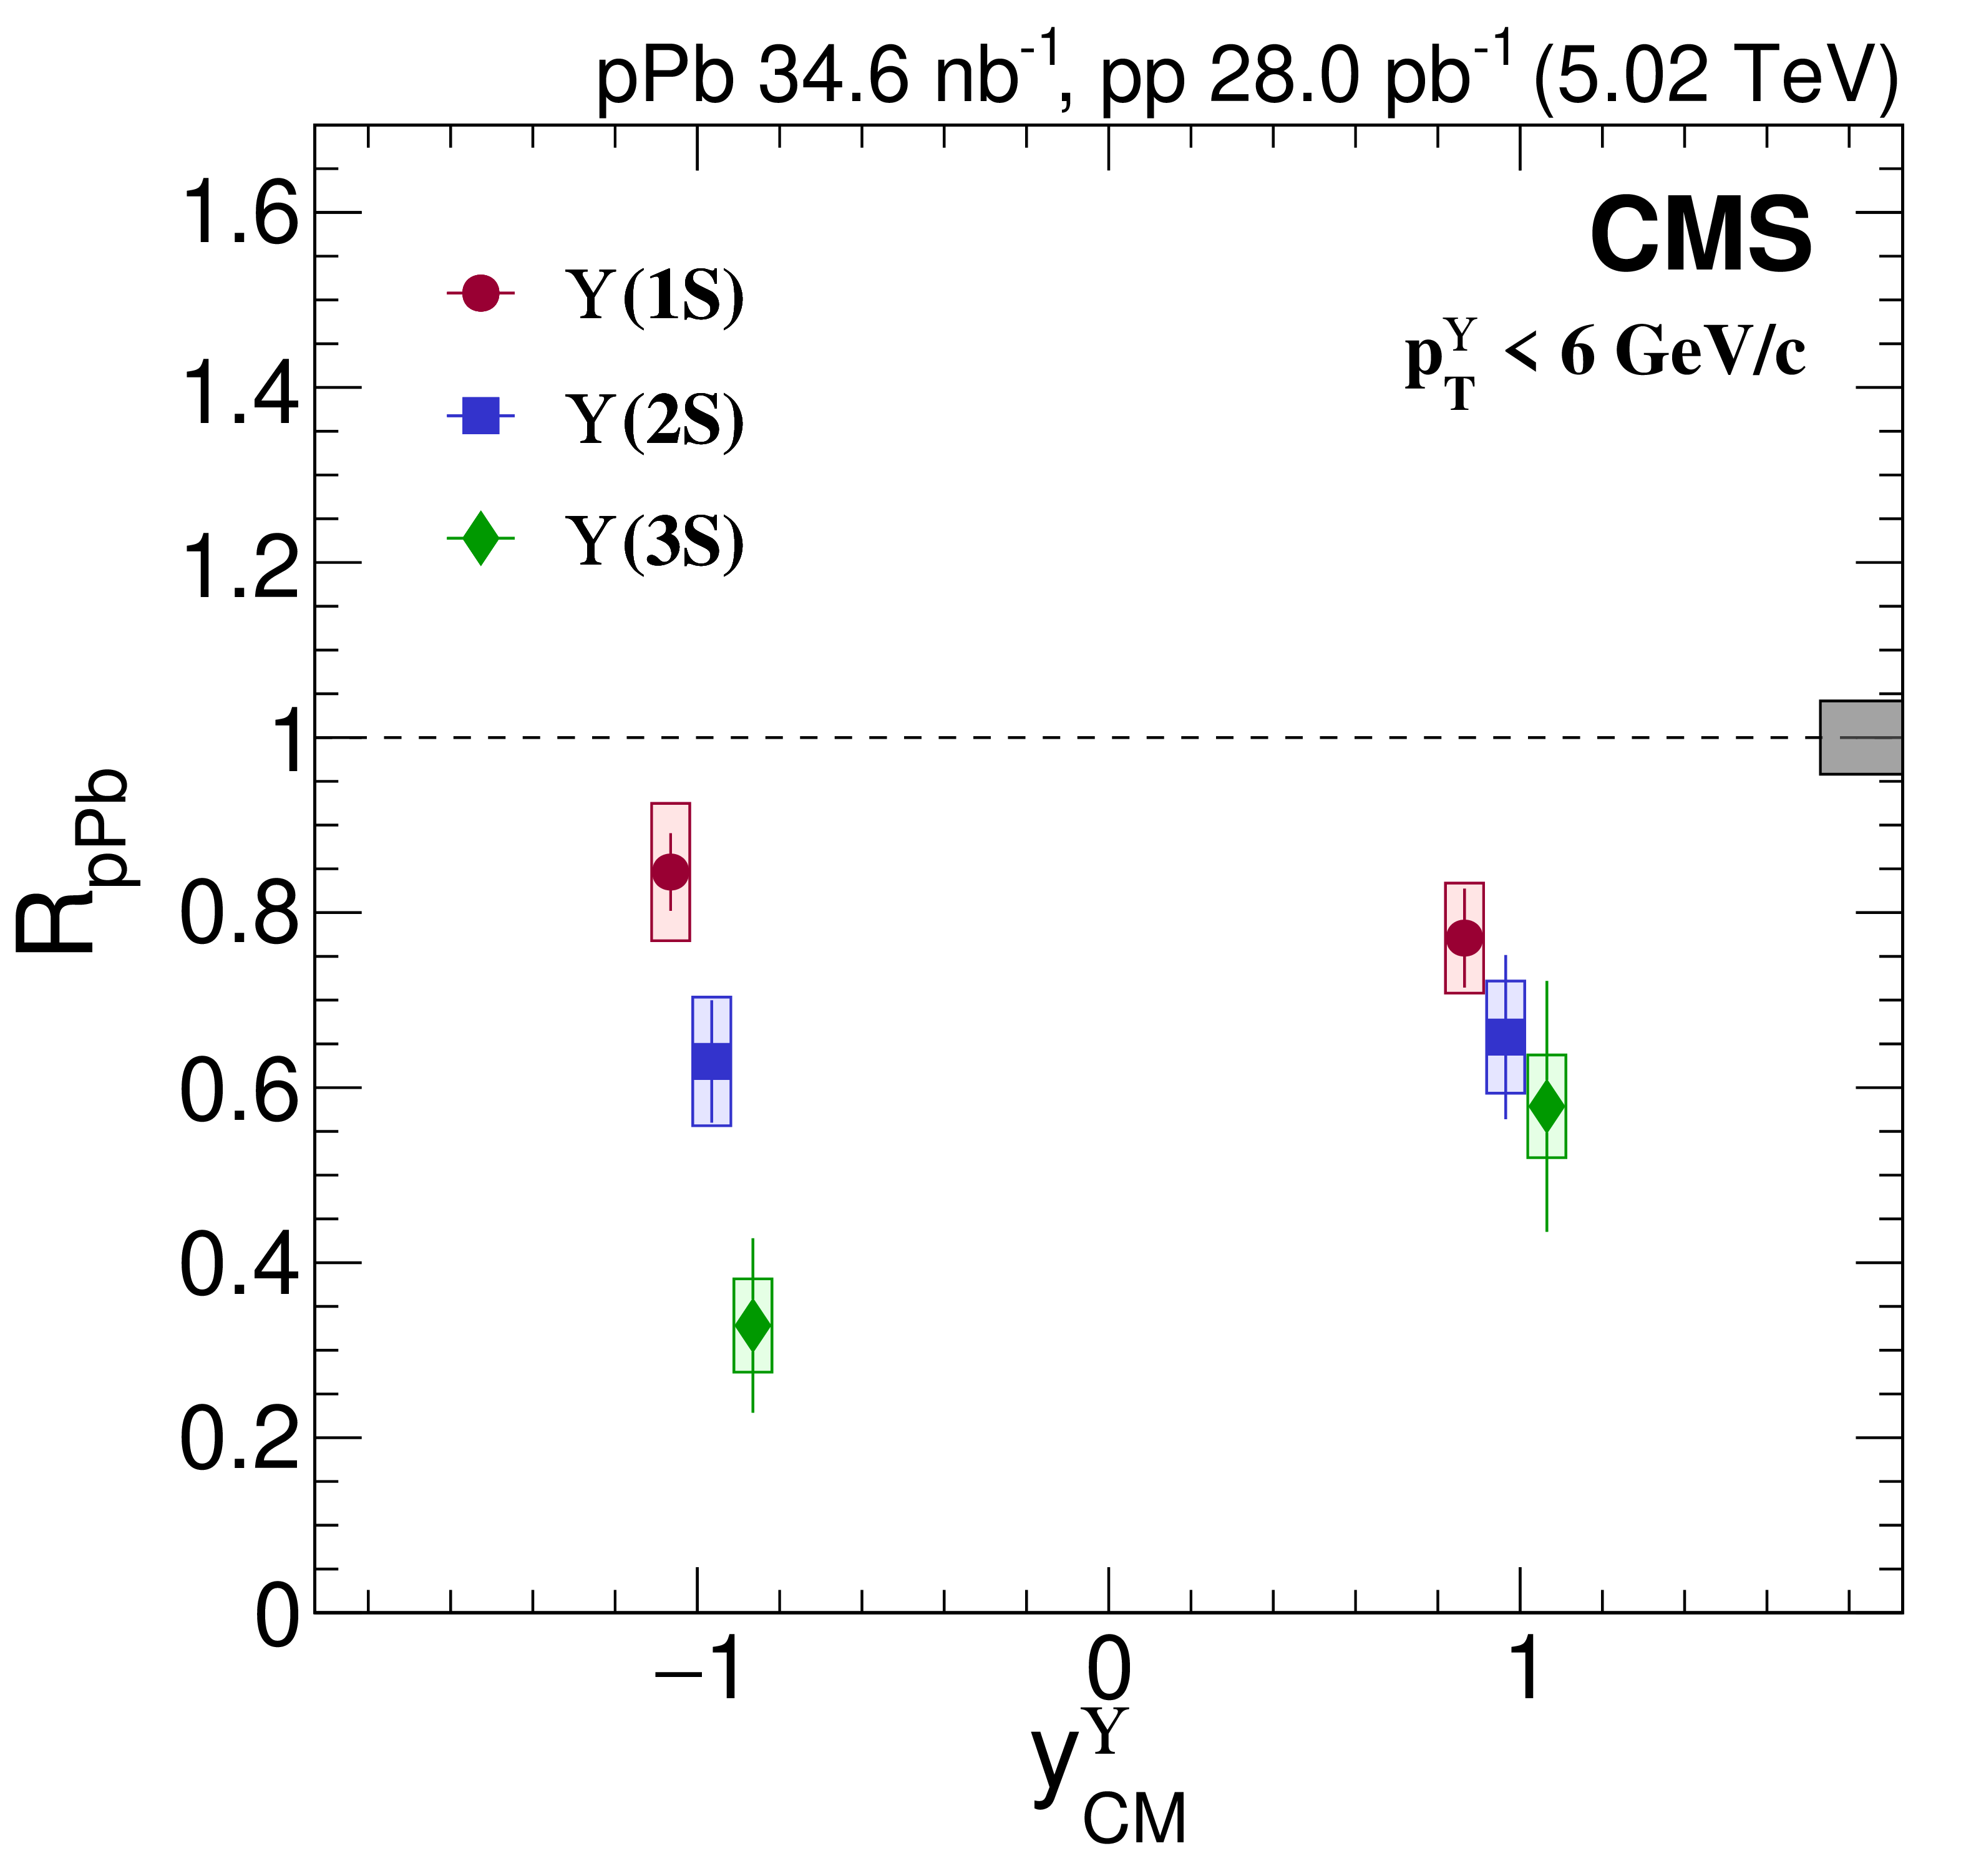
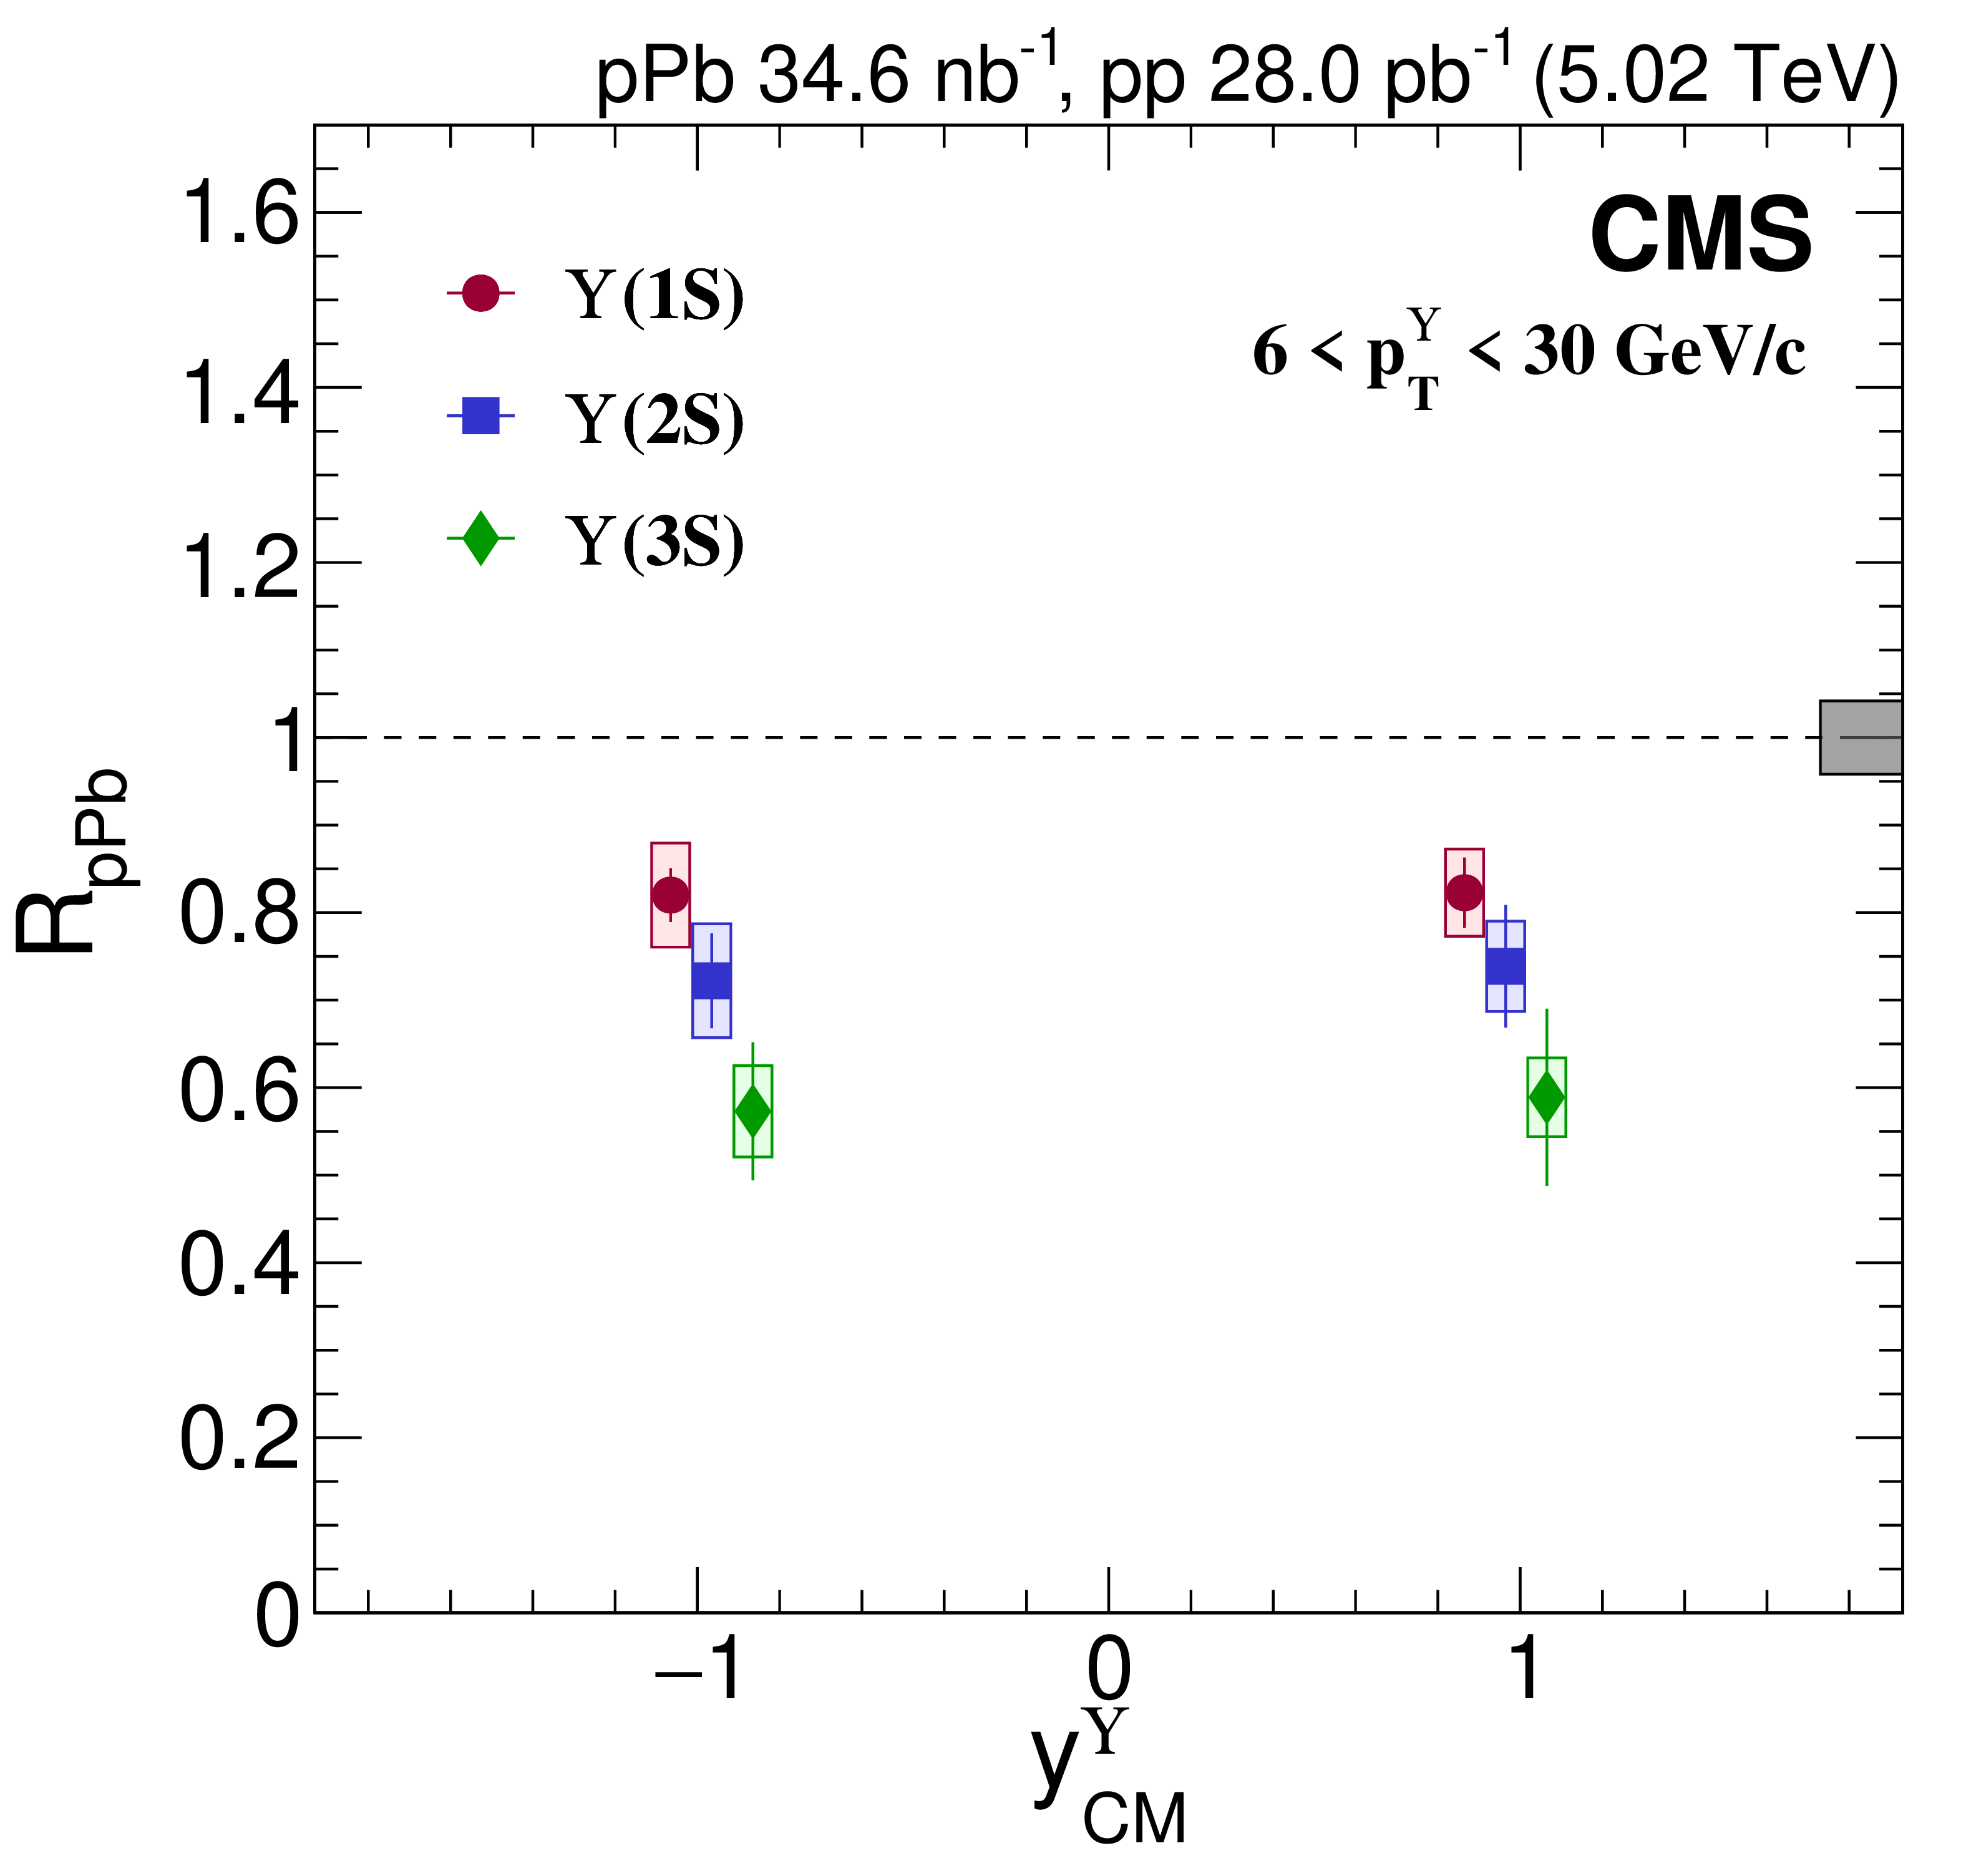
Figure 6:
$ R_{\mathrm{p}\mathrm{Pb}} $ of $ \Upsilon$(1S) (red circles), $ \Upsilon$(2S) (blue squares), and $ \Upsilon$(3S) (green diamonds) at forward and backward rapidity for 0 $ < p^{\Upsilon}_{\mathrm{T}} < $ 6 GeV/$c$ (left) and 6 $ < p^{\Upsilon}_{\mathrm{T}} < $ 30 GeV/$c$ (right). The points are shifted horizontally for better visibility. Vertical bars on the points represent statistical and fit uncertainties and filled boxes represent systematic uncertainties. The gray box around the line at unity represents the global uncertainty due to luminosity normalization (4.2%). |
png pdf |
Figure 6-a:
$ R_{\mathrm{p}\mathrm{Pb}} $ of $ \Upsilon$(1S) (red circles), $ \Upsilon$(2S) (blue squares), and $ \Upsilon$(3S) (green diamonds) at forward and backward rapidity for 0 $ < p^{\Upsilon}_{\mathrm{T}} < $ 6 GeV/$c$ (left) and 6 $ < p^{\Upsilon}_{\mathrm{T}} < $ 30 GeV/$c$ (right). The points are shifted horizontally for better visibility. Vertical bars on the points represent statistical and fit uncertainties and filled boxes represent systematic uncertainties. The gray box around the line at unity represents the global uncertainty due to luminosity normalization (4.2%). |
png pdf |
Figure 6-b:
$ R_{\mathrm{p}\mathrm{Pb}} $ of $ \Upsilon$(1S) (red circles), $ \Upsilon$(2S) (blue squares), and $ \Upsilon$(3S) (green diamonds) at forward and backward rapidity for 0 $ < p^{\Upsilon}_{\mathrm{T}} < $ 6 GeV/$c$ (left) and 6 $ < p^{\Upsilon}_{\mathrm{T}} < $ 30 GeV/$c$ (right). The points are shifted horizontally for better visibility. Vertical bars on the points represent statistical and fit uncertainties and filled boxes represent systematic uncertainties. The gray box around the line at unity represents the global uncertainty due to luminosity normalization (4.2%). |
png pdf |
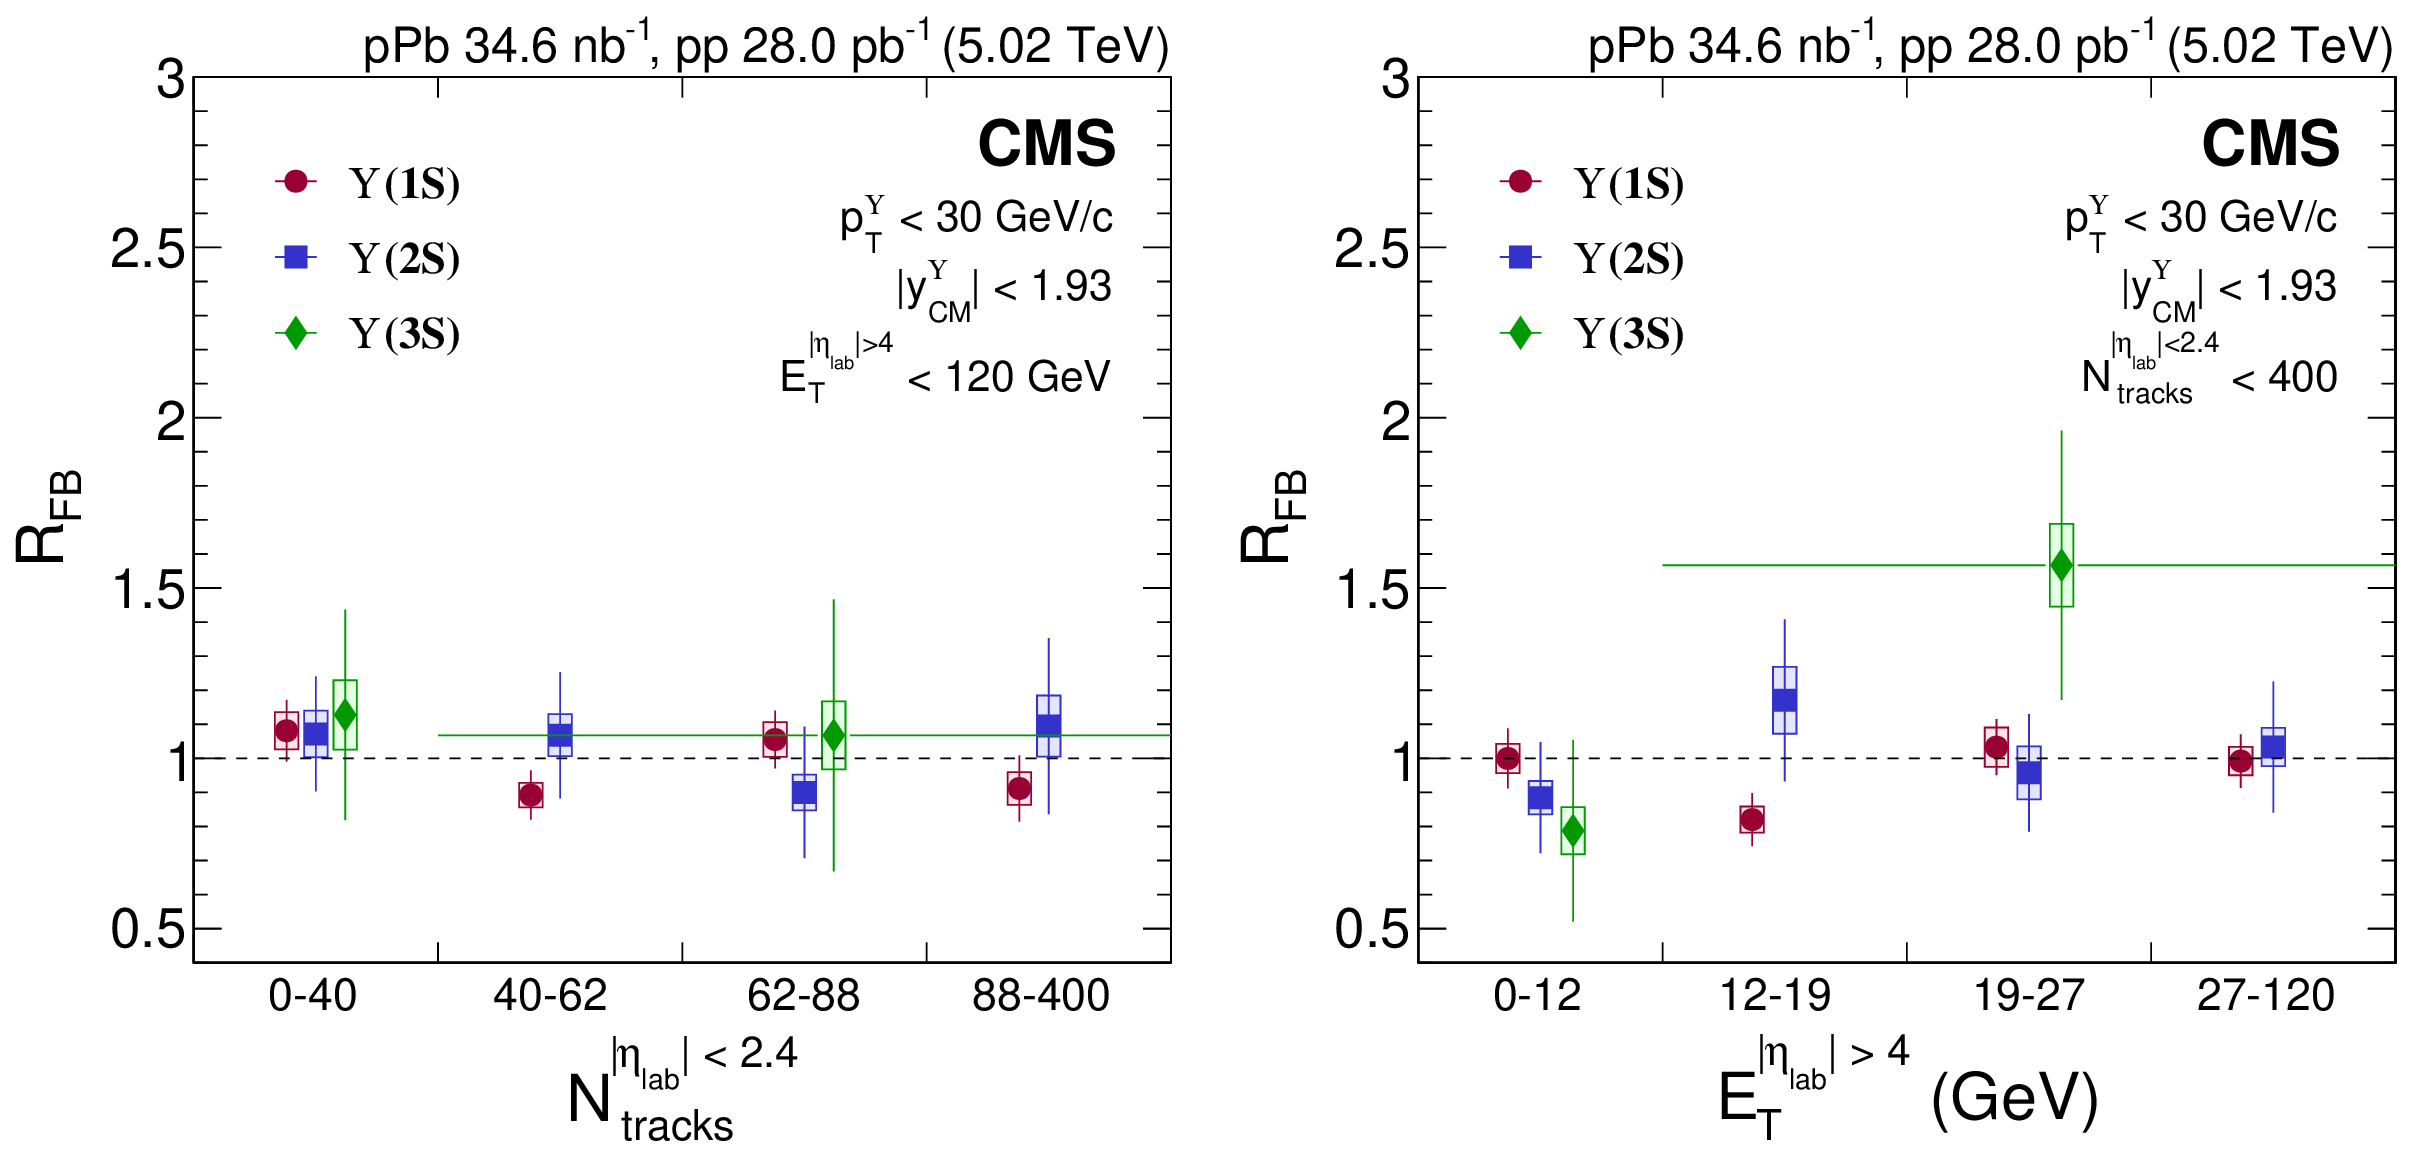
Figure 7:
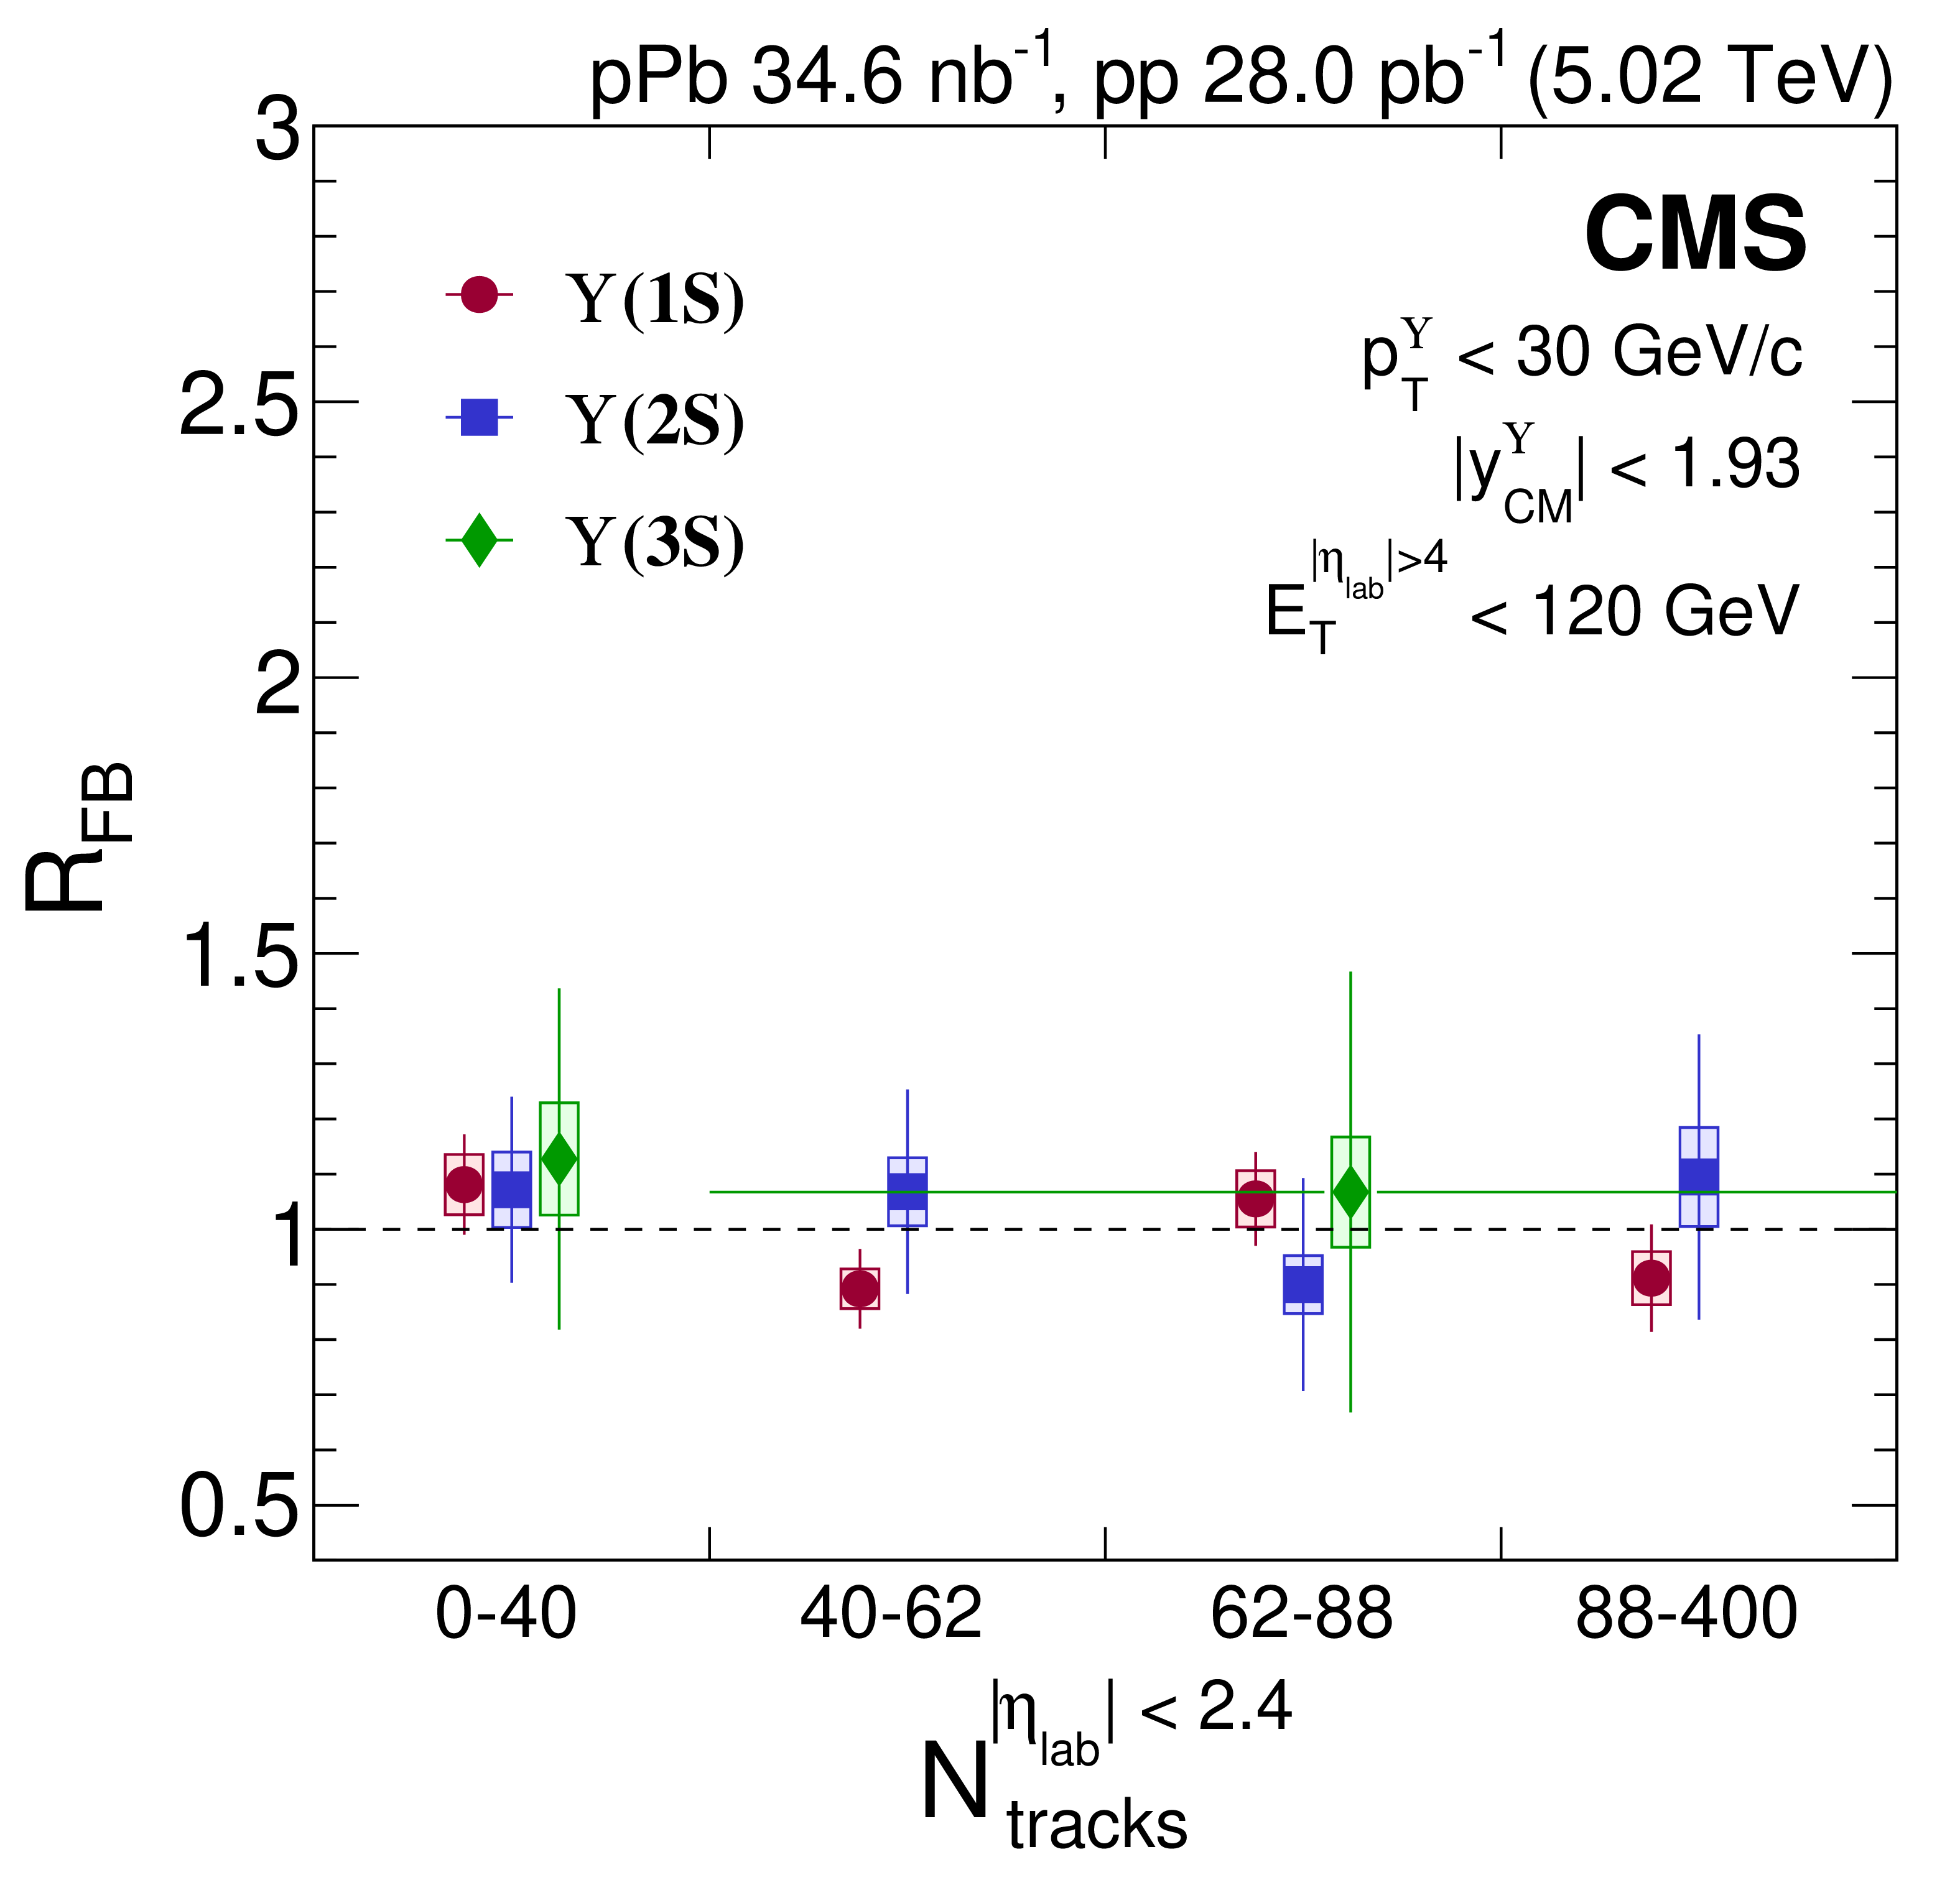
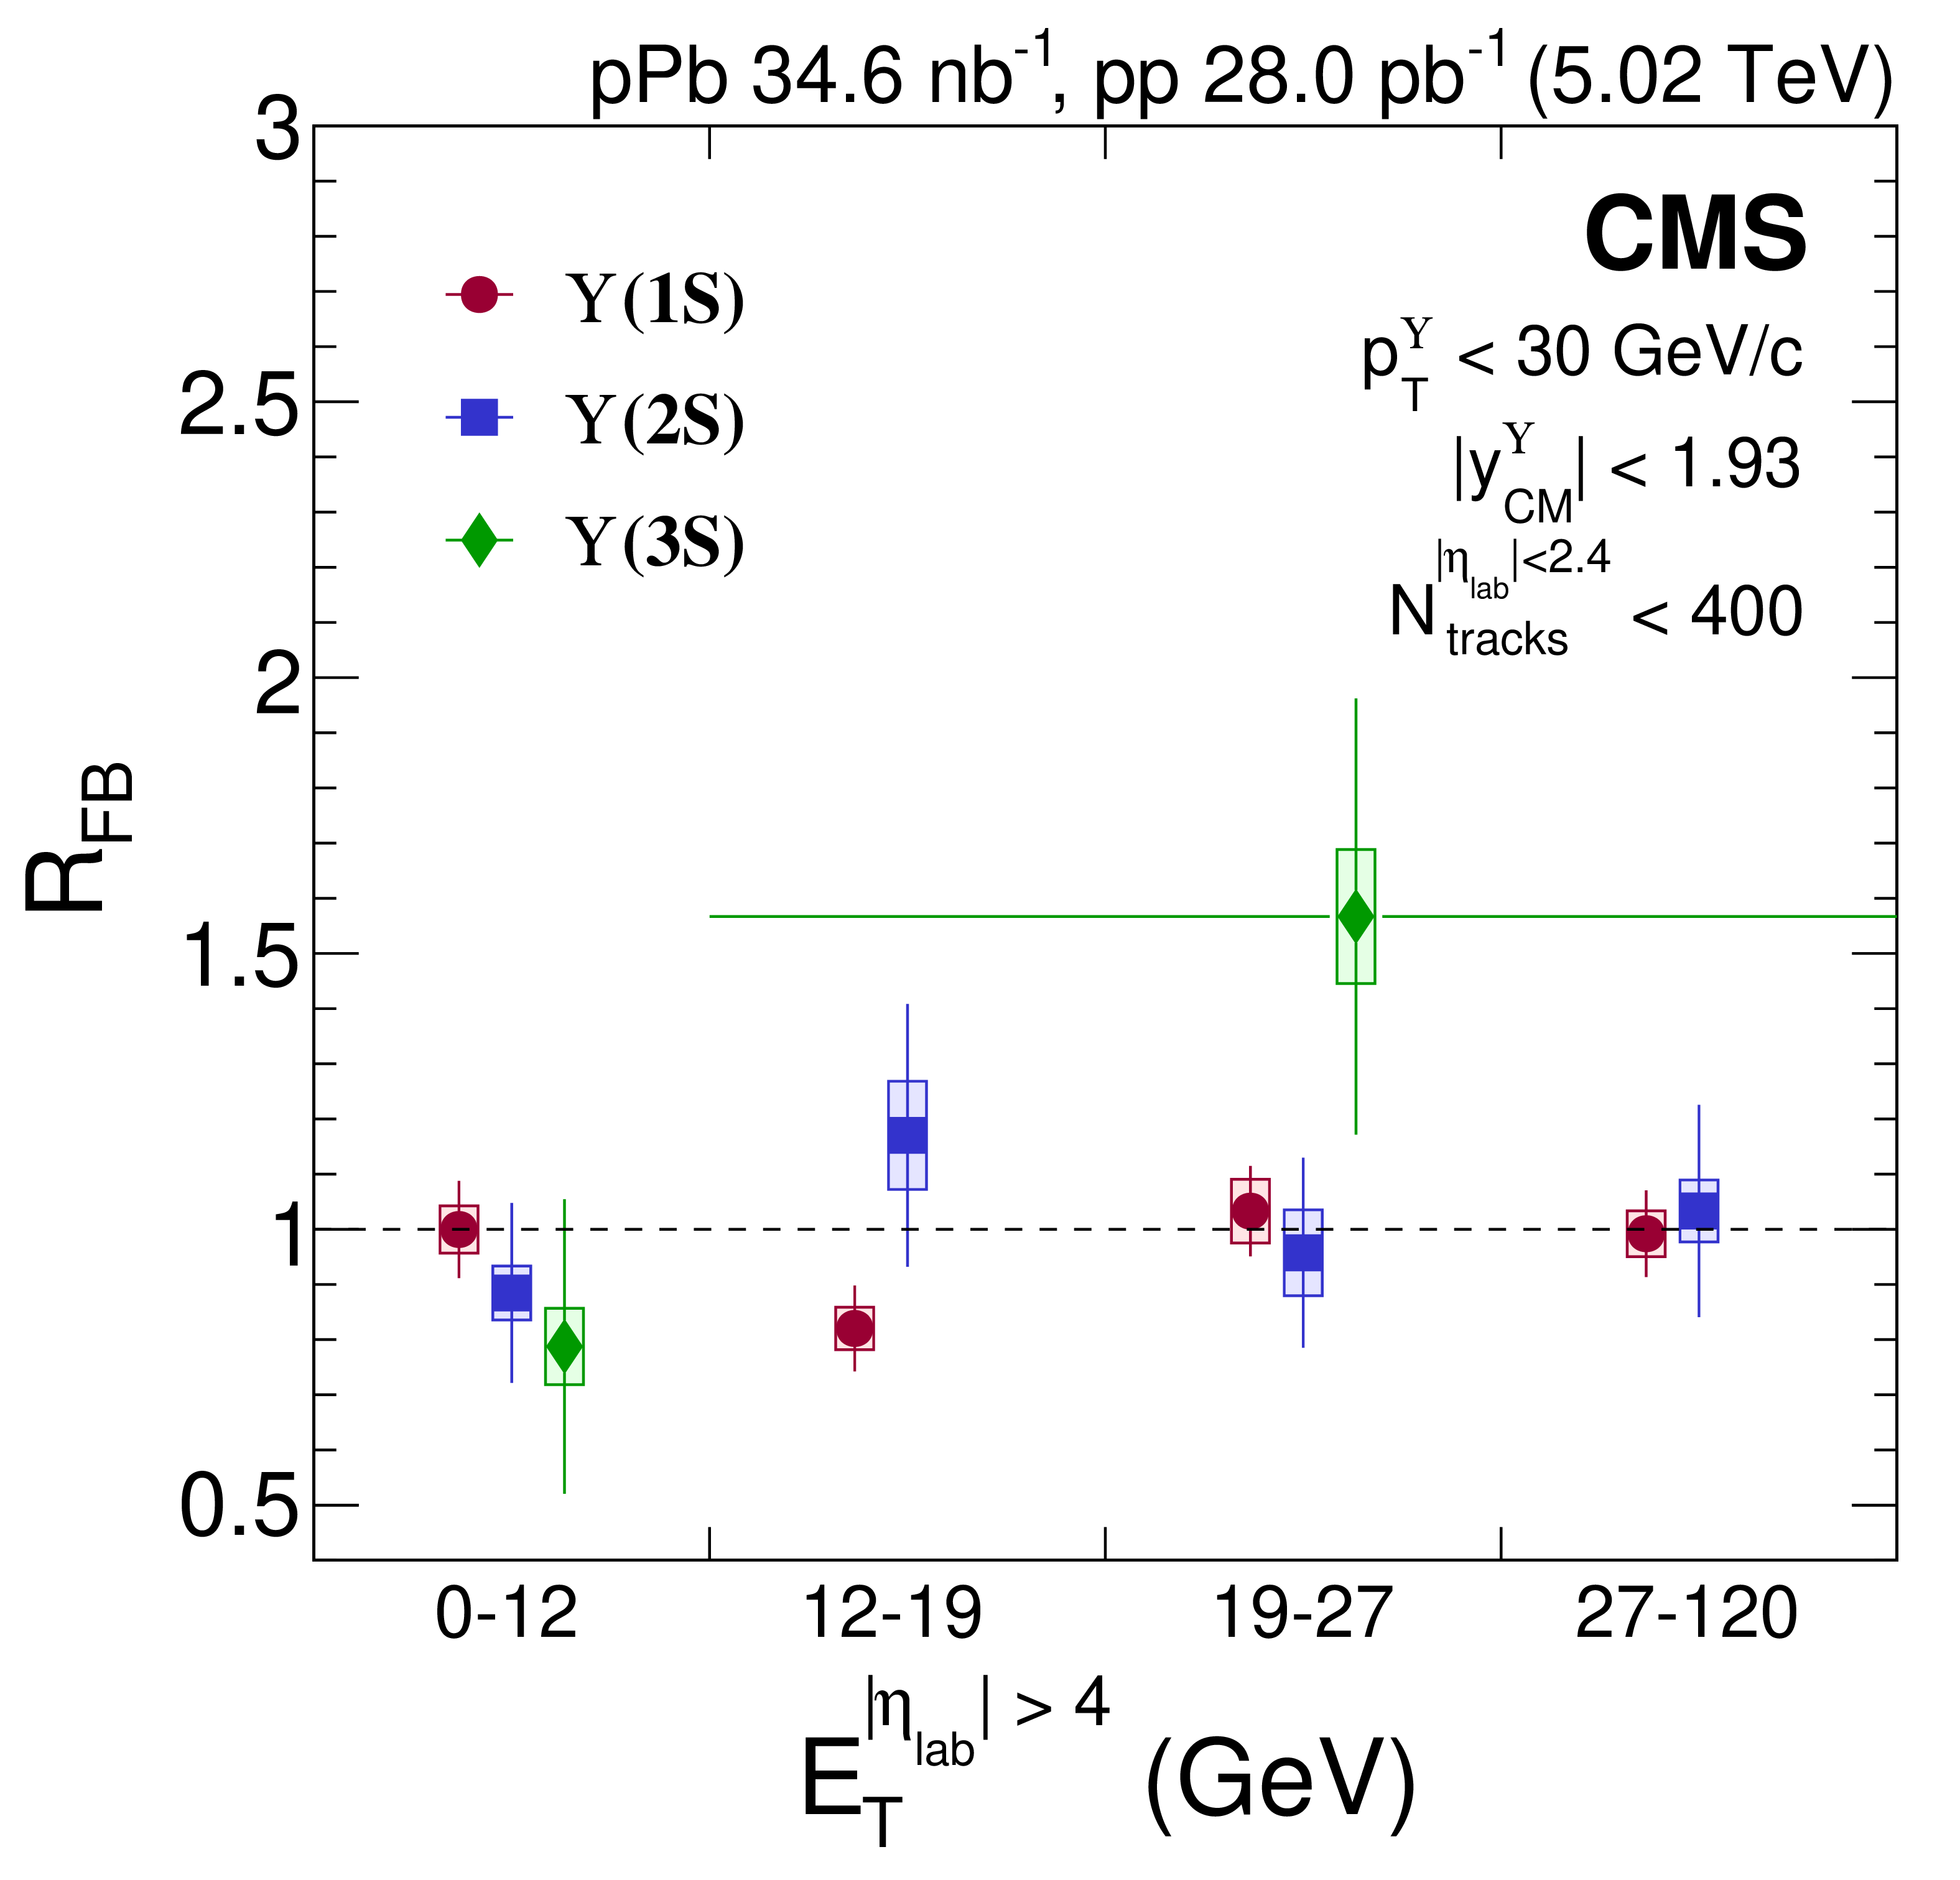
$ R_{\mathrm{FB}} $ versus $ N_{\text{tracks}} $ at mid-pseudorapidity (left) and $ \mbox{\textsl{vs.}} E_{\mathrm{T}} $ at forward/backward pseudorapidity (right) of $ \Upsilon$(1S) (red circles), $ \Upsilon$(2S) (blue squares), and $ \Upsilon$(3S) (green diamonds) for $ p^{\Upsilon}_{\mathrm{T}} < $ 30 GeV/$c$ and $ |y^{\Upsilon}_{\mathrm{CM}}| < $ 1.93. Vertical bars on the points represent statistical and fit uncertainties and filled boxes represent systematic uncertainties. For $ \Upsilon$(3S), a wide bin is used for high event activity, with the width indicated by a horizontal bar. |
png pdf |
Figure 7-a:
$ R_{\mathrm{FB}} $ versus $ N_{\text{tracks}} $ at mid-pseudorapidity (left) and $ \mbox{\textsl{vs.}} E_{\mathrm{T}} $ at forward/backward pseudorapidity (right) of $ \Upsilon$(1S) (red circles), $ \Upsilon$(2S) (blue squares), and $ \Upsilon$(3S) (green diamonds) for $ p^{\Upsilon}_{\mathrm{T}} < $ 30 GeV/$c$ and $ |y^{\Upsilon}_{\mathrm{CM}}| < $ 1.93. Vertical bars on the points represent statistical and fit uncertainties and filled boxes represent systematic uncertainties. For $ \Upsilon$(3S), a wide bin is used for high event activity, with the width indicated by a horizontal bar. |
png pdf |
Figure 7-b:
$ R_{\mathrm{FB}} $ versus $ N_{\text{tracks}} $ at mid-pseudorapidity (left) and $ \mbox{\textsl{vs.}} E_{\mathrm{T}} $ at forward/backward pseudorapidity (right) of $ \Upsilon$(1S) (red circles), $ \Upsilon$(2S) (blue squares), and $ \Upsilon$(3S) (green diamonds) for $ p^{\Upsilon}_{\mathrm{T}} < $ 30 GeV/$c$ and $ |y^{\Upsilon}_{\mathrm{CM}}| < $ 1.93. Vertical bars on the points represent statistical and fit uncertainties and filled boxes represent systematic uncertainties. For $ \Upsilon$(3S), a wide bin is used for high event activity, with the width indicated by a horizontal bar. |

png pdf |
Figure 8:
$ R_{\mathrm{p}\mathrm{Pb}} $ of $ \Upsilon$(1S), $ \Upsilon$(2S) and $ \Upsilon$(3S) (red circles) for the integrated kinematic range 0 $ < p^{\Upsilon}_{\mathrm{T}} < $ 30 GeV/$c$ and $ |y^{\Upsilon}_{\mathrm{CM}}| < $ 1.93. The $ R_{\mathrm{p}\mathrm{Pb}} $ results are compared to the CMS results on $ \Upsilon{\textrm{ (nS) }} R_{\mathrm{AA}} $ (blue squares for $ \Upsilon$(1S) and $ \Upsilon$(2S) and blue arrow for the upper limit at 95% confidence level (CL) on $ \Upsilon$(3S)) for 0 $ < p^{\Upsilon}_{\mathrm{T}} < $ 30 GeV/$c$ and $ |y^{\Upsilon}_{\mathrm{CM}}| < $ 2.4, at the same energy [36]. Vertical bars represent statistical and fit uncertainties and filled boxes around points represent systematic uncertainties. The gray and red boxes around the line at unity depict the uncertainty in the pp and pPb luminosity normalizations (2.3 and 3.5%), respectively. The blue box around unity depicts the global uncertainty pertaining to PbPb data ($ {}^{+3.6\%}_{-4.1\%} $) [36]. |
| Tables | |
png pdf |
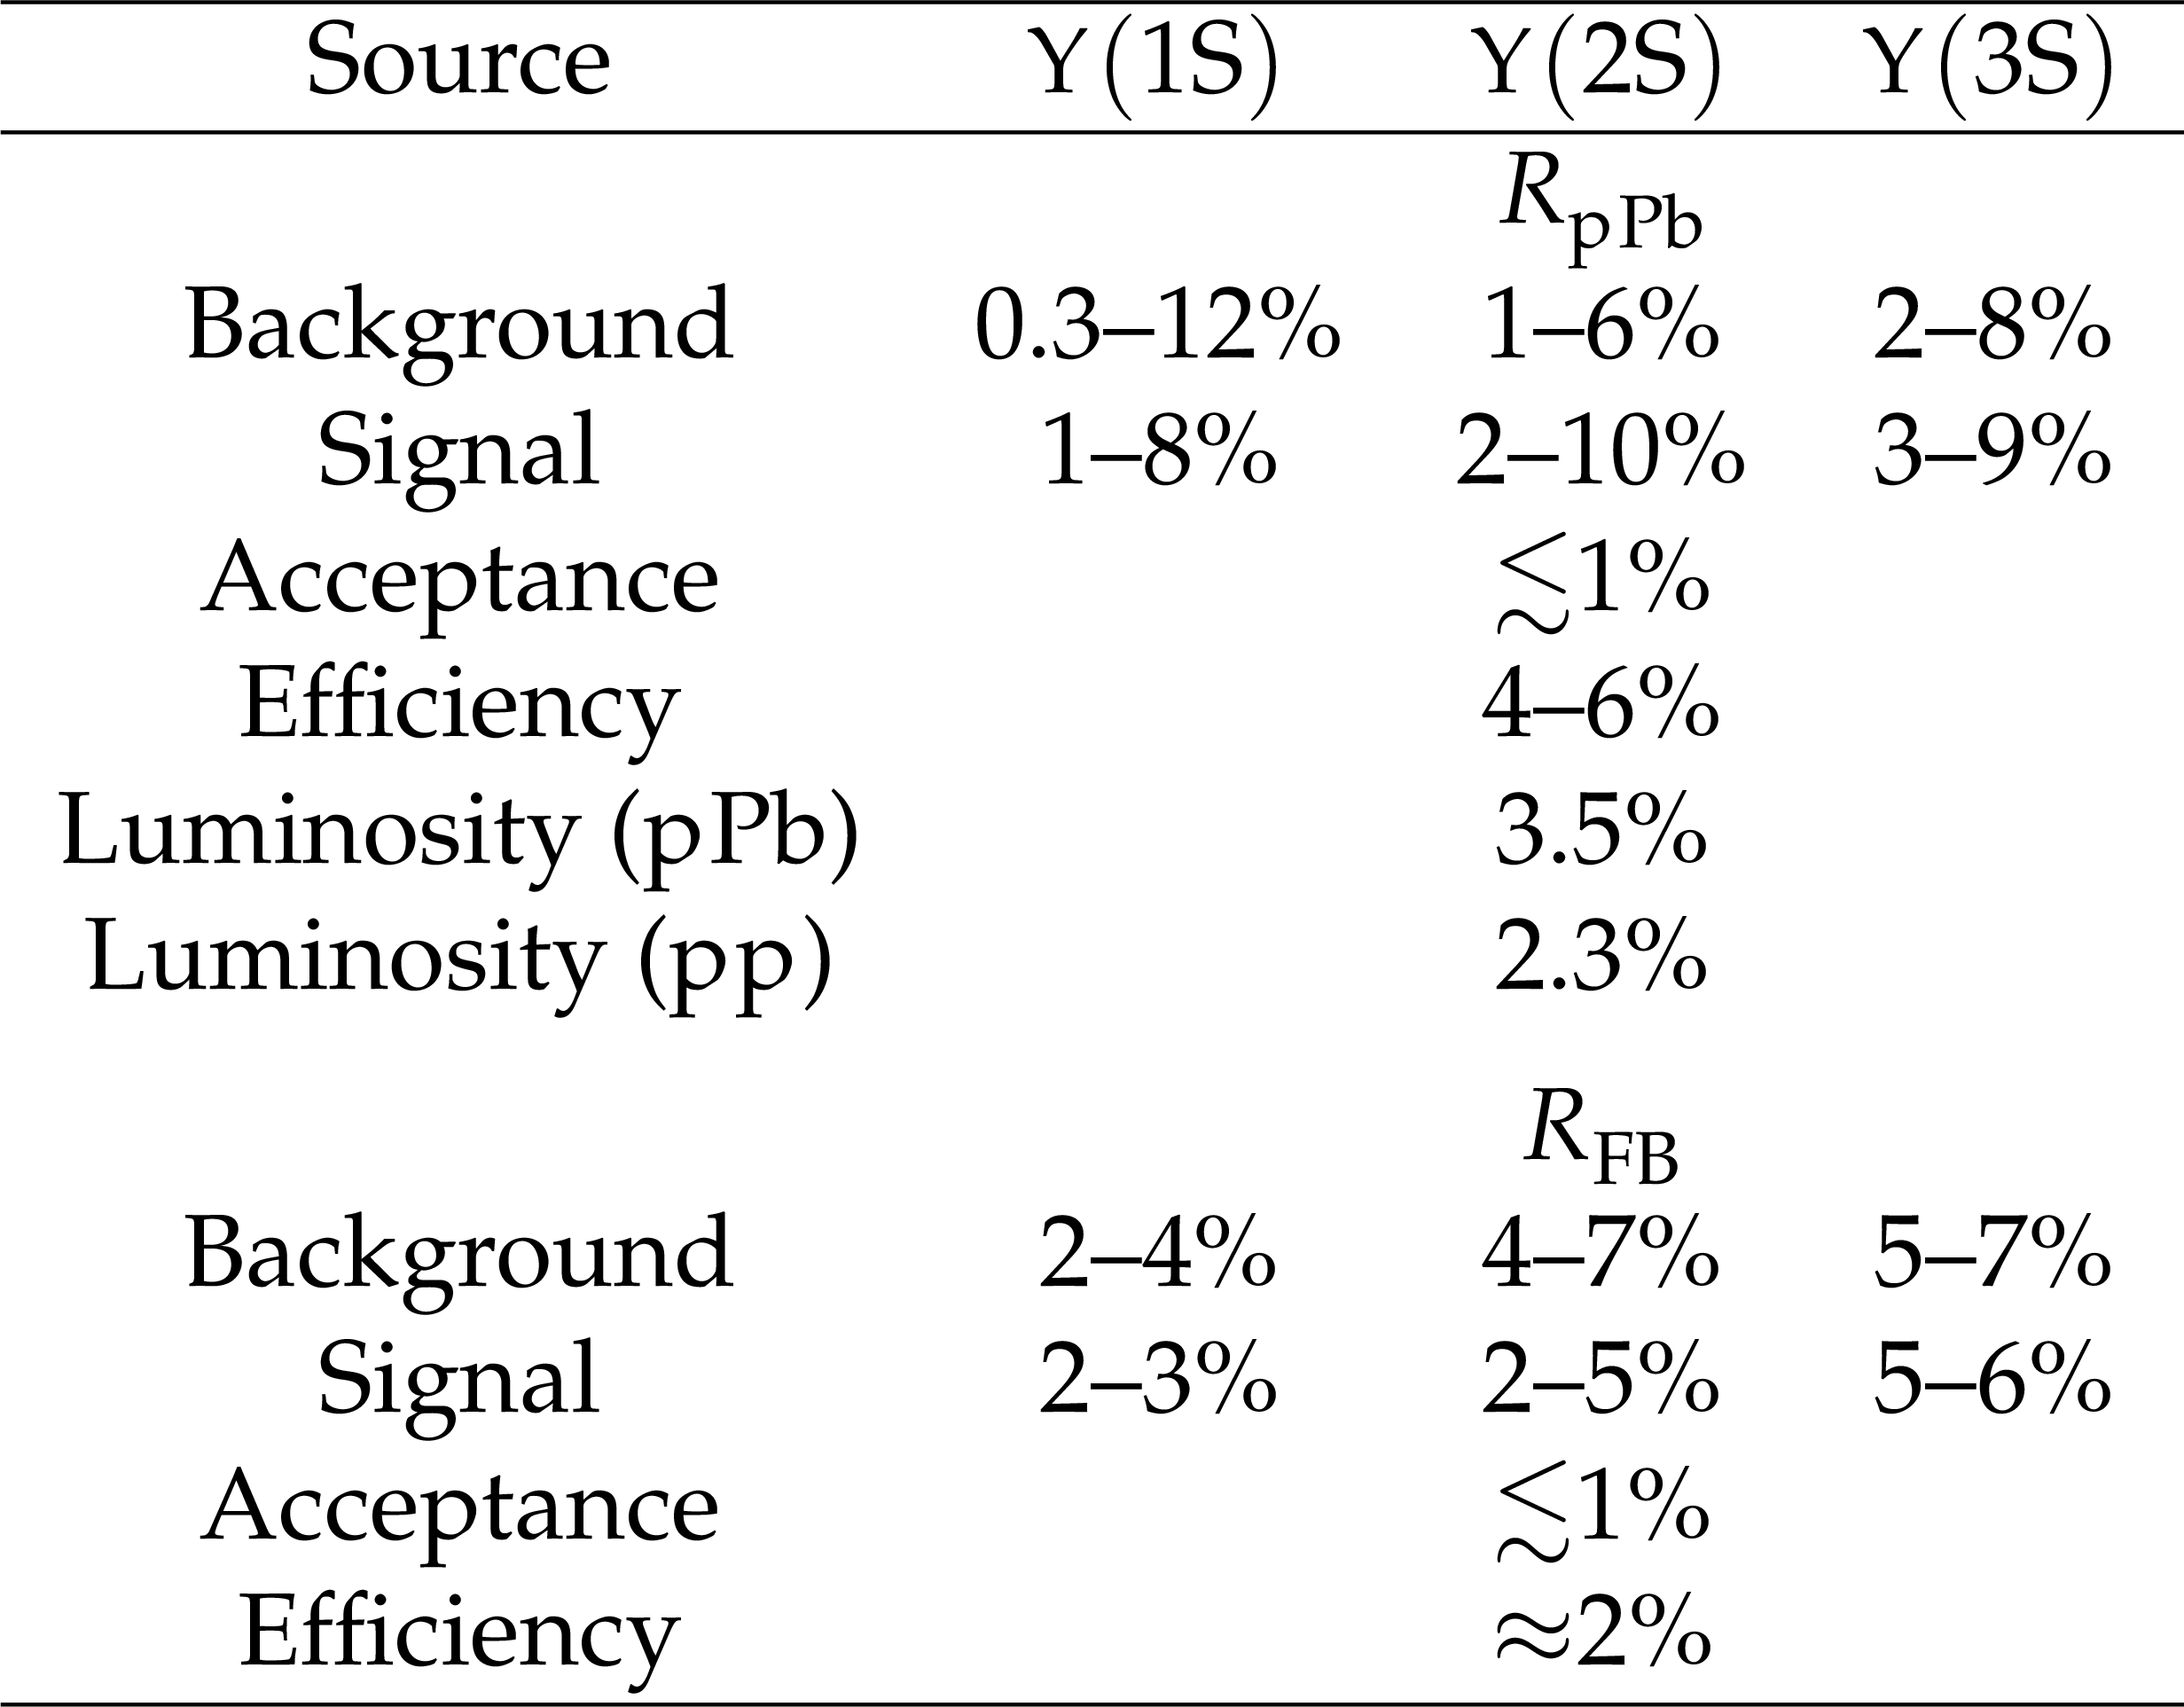
Table 1:
Ranges of typical systematic uncertainties in $ R_{\mathrm{p}\mathrm{Pb}} $ and $ R_{\mathrm{FB}} $ for $ \Upsilon$(nS). For acceptance and efficiency the range quoted covers the efficiency of all three $ \Upsilon $ states. The uncertainties in luminosity are global uncertainties that apply to all three $ \Upsilon $ states. The luminosity uncertainty cancels in the calculation of the $ R_{\mathrm{FB}} $. |
| Summary |
| The $ \Upsilon$(nS) (where $ n= $ 1, 2, 3) family is studied in proton-lead (pPb) collisions at $ \sqrt{\smash[b]{s_{_{\mathrm{NN}}}}}= $ 5.02 TeV and the production cross sections are presented. Using pp collision data obtained at the same collision energy, the nuclear modification factors $ R_{\mathrm{p}\mathrm{Pb}} $ in pPb collisions for the three $ \Upsilon $ states are measured. Compared to the hypothesis of scaling by the number of nucleons $ A $, we find the $ \Upsilon$(nS) yields to be suppressed. This suppression is observed over the entire kinematic range that is studied, i.e.,, transverse momentum $ p^{\Upsilon}_{\mathrm{T}} < $ 30 GeV/$c$ and center-of-mass rapidity $ |y^{\Upsilon}_{\mathrm{CM}}| < $ 1.93. The suppression level is constant both as a function of $ p^{\Upsilon}_{\mathrm{T}} $\ and of $ y^{\Upsilon}_{\mathrm{CM}} $ within the experimental uncertainties. An indication of higher separation of the excited states with $ p^{\Upsilon}_{\mathrm{T}} < $ 6 GeV/$c$ is observed in the Pb-going direction. The forward-backward production ratios $ R_{\mathrm{FB}} $ of $ \Upsilon$(nS) states are studied as a function of event activity in two regions: A midrapidity region (where the $ \Upsilon$(nS) states were measured), and a region with at least two units of rapidity separation from any measured $ \Upsilon$(nS) state. The $ R_{\mathrm{FB}} $ values are consistent with unity for all states, independent of the region used to measure the event activity. The integrated nuclear modification factors for $ \Upsilon$(nS) in pPb collisions are compared with those measured in PbPb collisions. The nuclear modification factors $ R_{\mathrm{AA}} $ in PbPb collisions are much smaller than the corresponding $ R_{\mathrm{p}\mathrm{Pb}} $ value for each state. However, a similar ordering of the measured $ R_{\mathrm{p}\mathrm{Pb}} $($ \Upsilon$(nS)) is observed, with $ \Upsilon$(1S) the least suppressed. This suggests the presence of final-state effects in pPb collisions, consistent with predictions from models that break up the bound quarkonium states via interactions with comoving particles from the underlying event. These results will help us to understand how bottomonia are modified in heavy-ion collisions. |
| References | ||||
| 1 | T. Matsui and H. Satz | J/$\psi $ suppression by quark-gluon plasma formation | PLB 178 (1986) 416 | |
| 2 | J. W. Harris and B. Müller | The search for the quark gluon plasma | Ann. Rev. Nucl. Part. Sci 46 (1996) 71 | hep-ph/9602235 |
| 3 | J. F. Gunion and R. Vogt | Determining the existence and nature of the quark-gluon plasma by upsilon suppression at the LHC | NPB 492 (1997) 301 | hep-ph/9610420 |
| 4 | S. Kim, P. Petreczky, and A. Rothkopf | In-medium quarkonium properties from a lattice QCD based effective field theory | Nucl. Phys. A 956 (2016) 713 | 1512.05289 |
| 5 | A. Emerick, X. Zhao, and R. Rapp | Bottomonia in the quark-gluon plasma and their production at RHIC and LHC | Eur. Phys. J. A 48 (2012) 72 | 1111.6537 |
| 6 | A. Rothkopf | What lattice QCD spectral functions can tell us about heavy quarkonium in the QGP | PoS ICHE ) 362, 2016 link |
1611.06517 |
| 7 | A. Andronic et al. | Heavy-flavour and quarkonium production in the LHC era: from proton-proton to heavy-ion collisions | EPJC 76 (2016) 107 | 1506.03981 |
| 8 | S. Digal, P. Petreczky, and H. Satz | Quarkonium feed down and sequential suppression | PRD 64 (2001) 094015 | hep-ph/0106017 |
| 9 | Y. Burnier, O. Kaczmarek, and A. Rothkopf | Quarkonium at finite temperature: Towards realistic phenomenology from first principles | JHEP 12 (2015) 101 | 1509.07366 |
| 10 | M. Laine, O. Philipsen, P. Romatschke, and M. Tassler | Real-time static potential in hot QCD | JHEP 03 (2007) 054 | hep-ph/0611300 |
| 11 | J.-P. Blaizot, D. De Boni, P. Faccioli, and G. Garberoglio | Heavy quark bound states in a quark-gluon plasma: Dissociation and recombination | Nucl. Phys. A 946 (2016) 49 | 1503.03857 |
| 12 | S. Chen and M. He | Gluo-dissociation of heavy quarkonium in the quark-gluon plasma reexamined | PRC 96 (2017) 034901 | 1705.10110 |
| 13 | M. C. Chu and T. Matsui | Dynamic Debye screening for a heavy-quark-anti-quark pair traversing a quark-gluon plasma | PRD 39 (1989) 1892 | |
| 14 | N. Brambilla, J. Ghiglieri, A. Vairo, and P. Petreczky | Static quark-antiquark pairs at finite temperature | PRD 78 (2008) 014017 | 0804.0993 |
| 15 | Y. Burnier and A. Rothkopf | Complex heavy-quark potential and Debye mass in a gluonic medium from lattice QCD | PRD 95 (2017) 054511 | 1607.04049 |
| 16 | R. Vogt | Shadowing effects on J/$\psi $ and $ \Upsilon $ production at energies available at the CERN Large Hadron Collider | PRC 92 (2015) 034909 | 1507.04418 |
| 17 | F. Arleo and S. Peigné | Quarkonium suppression in heavy-ion collisions from coherent energy loss in cold nuclear matter | JHEP 10 (2014) 073 | 1407.5054 |
| 18 | E. G. Ferreiro and J.-P. Lansberg | Is bottomonium suppression in proton-nucleus and nucleus-nucleus collisions at LHC energies due to the same effects? | JHEP 10 (2018) 094 | 1804.04474 |
| 19 | CMS Collaboration | Observation of long-range near-side angular correlations in proton-proton collisions at the LHC | JHEP 09 (2010) 091 | CMS-QCD-10-002 1009.4122 |
| 20 | CMS Collaboration | Observation of long-range, near-side angular correlations in pPb collisions at the LHC | PLB 718 (2013) 795 | CMS-HIN-12-015 1210.5482 |
| 21 | ALICE Collaboration | Enhanced production of multi-strange hadrons in high-multiplicity proton-proton collisions | Nature Phys. 13 (2017) 535 | 1606.07424 |
| 22 | CMS Collaboration | Evidence for collective multiparticle correlations in p-Pb collisions | PRL 115 (2015) 012301 | CMS-HIN-14-006 1502.05382 |
| 23 | ATLAS Collaboration | Observation of associated near-side and away-side long-range correlations in $ \sqrt{\smash[b]{s_{_{\mathrm{NN}}}}}= $ 5.02 TeV proton-lead collisions with the ATLAS detector | PRL 110 (2013) 182302 | 1212.5198 |
| 24 | ATLAS Collaboration | Measurements of long-range azimuthal anisotropies and associated Fourier coefficients for pp collisions at $ \sqrt{\smash[b]{s_{_{\mathrm{NN}}}}}= $ 5.02 and 13 TeV and p+Pb collisions at $ \sqrt{\smash[b]{s_{_{\mathrm{NN}}}}}= $ 5.02 TeV with the ATLAS detector | PRC 96 (2017) 024908 | 1609.06213 |
| 25 | ATLAS Collaboration | Measurement of azimuthal anisotropy of muons from charm and bottom hadrons in pp collisions at $ \sqrt{\smash[b]{s_{_{\mathrm{NN}}}}}= $ 13 TeV with the ATLAS detector | PRL 124 (2020) 082301 | 1909.01650 |
| 26 | K. Dusling, W. Li, and B. Schenke | Novel collective phenomena in high-energy proton-proton and proton-nucleus collisions | Int. J. Mod. Phys. E 25 (2016) 1630002 | 1509.07939 |
| 27 | R. Vogt | Cold nuclear matter effects on J/$\psi $ and $ {\Upsilon} $ production at the LHC | PRC 81 (2010) 044903 | 1003.3497 |
| 28 | M. Strickland | Thermal bottomonium suppression | AIP Conf. Proc. 1520 (2013) 179 | 1207.5327 |
| 29 | F. Arleo and S. Peigne | Heavy-quarkonium suppression in p-A collisions from parton energy loss in cold QCD matter | JHEP 03 (2013) 122 | 1212.0434 |
| 30 | B. Krouppa, A. Rothkopf, and M. Strickland | Bottomonium suppression using a lattice QCD vetted potential | PRD 97 (2018) 016017 | 1710.02319 |
| 31 | B. Chen and J. Zhao | Bottomonium continuous production from unequilibrium bottom quarks in ultrarelativistic heavy ion collisions | PLB 772 (2017) 819 | 1704.05622 |
| 32 | X. Du, R. Rapp, and M. He | Color screening and regeneration of bottomonia in high-energy heavy-ion collisions | PRC 96 (2017) 054901 | 1706.08670 |
| 33 | CMS Collaboration | Indications of suppression of excited $ \Upsilon $ states in PbPb collisions at $ \sqrt{\smash[b]{s_{_{\mathrm{NN}}}}} $ = 2.76 TeV | PRL 107 (2011) 052302 | CMS-HIN-11-007 1105.4894 |
| 34 | CMS Collaboration | Suppression of $ \Upsilon$(1S), $ \Upsilon$(2S) and $ \Upsilon$(3S) production in PbPb collisions at $ \sqrt{\smash[b]{s_{_{\mathrm{NN}}}}} $ = 2.76 TeV | PLB 770 (2017) 357 | CMS-HIN-15-001 1611.01510 |
| 35 | CMS Collaboration | Suppression of excited $ \Upsilon $ states relative to the ground state in Pb-Pb collisions at $ \sqrt{\smash[b]{s_{_{\mathrm{NN}}}}}= $ 5.02 TeV | PRL 120 (2018) 142301 | CMS-HIN-16-008 1706.05984 |
| 36 | CMS Collaboration | Measurement of nuclear modification factors of $ \Upsilon $(1S), $ \Upsilon $(2S), and $ \Upsilon $(3S) mesons in PbPb collisions at $ \sqrt{\smash[b]{s_{_{\mathrm{NN}}}}} = $ 5.02 TeV | PLB 790 (2019) 270 | CMS-HIN-16-023 1805.09215 |
| 37 | B. Krouppa and M. Strickland | Predictions for bottomonia suppression in 5.023 TeV Pb-Pb collisions | Universe 2 (2016) 16 | 1605.03561 |
| 38 | CMS Collaboration | Measurement of prompt and nonprompt J/$\psi $ production in pp and pPb collisions at $ \sqrt{\smash[b]{s_{_{\mathrm{NN}}}}} =$ 5.02 TeV | EPJC 77 (2017) 269 | CMS-HIN-14-009 1702.01462 |
| 39 | CMS Collaboration | Measurement of prompt $ \psi$(2S) production cross sections in proton-lead and proton-proton collisions at $ \sqrt{\smash[b]{s_{_{\mathrm{NN}}}}}= $ 5.02 TeV | %%CITATION$ = $arXiv:1805.02248;%%, 2019 PLB 790 (2019) 509 |
CMS-HIN-16-015 1805.02248 |
| 40 | E. G. Ferreiro | Excited charmonium suppression in proton-nucleus collisions as a consequence of comovers | PLB 749 (2015) 98 | 1411.0549 |
| 41 | LHCb Collaboration | Study of $ \Upsilon $ production and cold nuclear matter effects in pPb collisions at $ \sqrt{\smash[b]{s_{_{\mathrm{NN}}}}}= $ 5 TeV | JHEP 07 (2014) 094 | 1405.5152 |
| 42 | ALICE Collaboration | Production of inclusive $ \Upsilon $(1S) and $ \Upsilon $(2S) in p-Pb collisions at $ \sqrt{\smash[b]{s_{_{\mathrm{NN}}}}} = $ 5.02 TeV | PLB 740 (2015) 105 | 1410.2234 |
| 43 | ATLAS Collaboration | Measurement of quarkonium production in proton-lead and proton-proton collisions at 5.02 TeV with the ATLAS detector | EPJC 78 (2018) 171 | 1709.03089 |
| 44 | CMS Collaboration | Event activity dependence of Y(nS) production in $ \sqrt{\smash[b]{s_{_{\mathrm{NN}}}}}= $ 5.02 TeV pPb and $ \sqrt{s}= $ 2.76 TeV pp collisions | JHEP 04 (2014) 103 | CMS-HIN-13-003 1312.6300 |
| 45 | CMS Collaboration | Investigation into the event-activity dependence of $ \Upsilon $(nS) relative production in proton-proton collisions at $ \sqrt{s} $ = 7 TeV | JHEP 11 (2020) 001 | CMS-BPH-14-009 2007.04277 |
| 46 | LHCb Collaboration | Study of $ \Upsilon $ production in pPb collisions at $ \sqrt{\smash[b]{s_{_{\mathrm{NN}}}}}= $ 8.16 TeV | JHEP 11 (2018) 194 | 1810.07655 |
| 47 | ALICE Collaboration | $ \Upsilon $ production in p-Pb collisions at $ \sqrt{\smash[b]{s_{_{\mathrm{NN}}}}} $ = 8.16 TeV | PLB 806 (2020) 135486 | 1910.14405 |
| 48 | CMS Collaboration | Performance of CMS muon reconstruction in pp collision events at $ \sqrt{s}= $ 7 TeV | JINST 7 (2012) P10002 | CMS-MUO-10-004 1206.4071 |
| 49 | CMS Collaboration | The CMS experiment at the CERN LHC | JINST 3 (2008) S08004 | |
| 50 | CMS Collaboration | Performance of the CMS level-1 trigger in proton-proton collisions at $ \sqrt{\smash[b]{s_{_{\mathrm{NN}}}}} = $ 13\,TeV | JINST 15 (2020) P10017 | CMS-TRG-17-001 2006.10165 |
| 51 | CMS Collaboration | The CMS trigger system | JINST 12 (2017) P01020 | CMS-TRG-12-001 1609.02366 |
| 52 | CMS Collaboration | CMS luminosity calibration for the pp reference run at $ \sqrt{s}= $ 5.02 TeV | CMS Physics Analysis Summary, 2016 CMS-PAS-LUM-16-001 |
CMS-PAS-LUM-16-001 |
| 53 | CMS Collaboration | Luminosity calibration for the 2013 proton-lead and proton-proton data taking | CMS Physics Analysis Summary, 2014 CMS-PAS-LUM-13-002 |
CMS-PAS-LUM-13-002 |
| 54 | CMS Collaboration | Technical proposal for the Phase-II upgrade of the Compact Muon Solenoid | CMS Technical proposal CERN-LHCC-2015-010, CMS-TDR-15-02, CERN, 2015 CDS |
|
| 55 | R. Kalman | A new approach to linear filtering and prediction problems | J. Basic Eng. D 82 (1960) 35 | |
| 56 | T. Sjöstrand et al. | An introduction to PYTHIA 8.2 | Comput. Phys. Commun. 191 (2015) 159 | 1410.3012 |
| 57 | CMS Collaboration | Measurement of the $ \Upsilon$(1S), $ \Upsilon$(2S) and $ \Upsilon$(3S) polarizations in pp collisions at $ \sqrt{\smash[b]{s_{_{\mathrm{NN}}}}}= $ 7 TeV | PRL 110 (2013) 081802 | CMS-BPH-11-023 1209.2922 |
| 58 | LHCb Collaboration | Measurement of the $ \Upsilon $(nS) polarizations in pp collisions at $ \sqrt{\smash[b]{s_{_{\mathrm{NN}}}}}= $ 7 and 8 TeV | JHEP 12 (2017) 110 | 1709.01301 |
| 59 | GEANT4 Collaboration | GEANT 4---a simulation toolkit | NIM A 506 (2003) 250 | |
| 60 | M. J. Oreglia | A study of the reactions $ \psi^\prime \to \gamma \gamma \psi $ | PhD thesis, Stanford University. SLAC Report R-236 (1980). | |
| 61 | Particle Data Group , M. Tanabashi et al. | Review of particle physics | PRD 98 (2018) 030001 | |
| 62 | K. J. Eskola, H. Paukkunen, and C. A. Salgado | EPS09: A new generation of NLO and LO nuclear parton distribution functions | JHEP 04 (2009) 065 | 0902.4154 |
| 63 | K. Kovarík et al. | nCTEQ15 -- global analysis of nuclear parton distributions with uncertainties in the CTEQ framework | PRD 93 (2016) 085037 | 1509.00792 |
| 64 | N. Brambilla et al. | Heavy quarkonium: progress, puzzles, and opportunities | EPJC 71 (2011) 1534 | 1010.5827 |
| 65 | CMS Collaboration | HEPData record for this analysis | link | |
|
|
Compact Muon Solenoid LHC, CERN |
|

|

|

|

|

|