

Compact Muon Solenoid
LHC, CERN
| CMS-SMP-14-013 ; CERN-EP-2016-256 | ||
| Measurements of differential production cross sections for a Z boson in association with jets in pp collisions at $ \sqrt{s} = $ 8 TeV | ||
| CMS Collaboration | ||
| 11 November 2016 | ||
| JHEP 04 (2017) 022 | ||
| Abstract: Cross sections for the production of a Z boson in association with jets in proton-proton collisions at a centre-of-mass energy of $\sqrt{s}= $ 8 TeV are measured using a data sample collected by the CMS experiment at the LHC corresponding to 19.6 fb$^{-1}$. Differential cross sections are presented as functions of up to three observables that describe the jet kinematics and the jet activity. Correlations between the azimuthal directions and the rapidities of the jets and the Z boson are studied in detail. The predictions of a number of multileg generators with leading or next-to-leading order accuracy are compared with the measurements. The comparison shows the importance of including multi-parton contributions in the matrix elements and the improvement in the predictions when next-to-leading order terms are included. | ||
| Links: e-print arXiv:1611.03844 [hep-ex] (PDF) ; CDS record ; inSPIRE record ; HepData record ; CADI line (restricted) ; | ||
| Figures | |
png pdf |
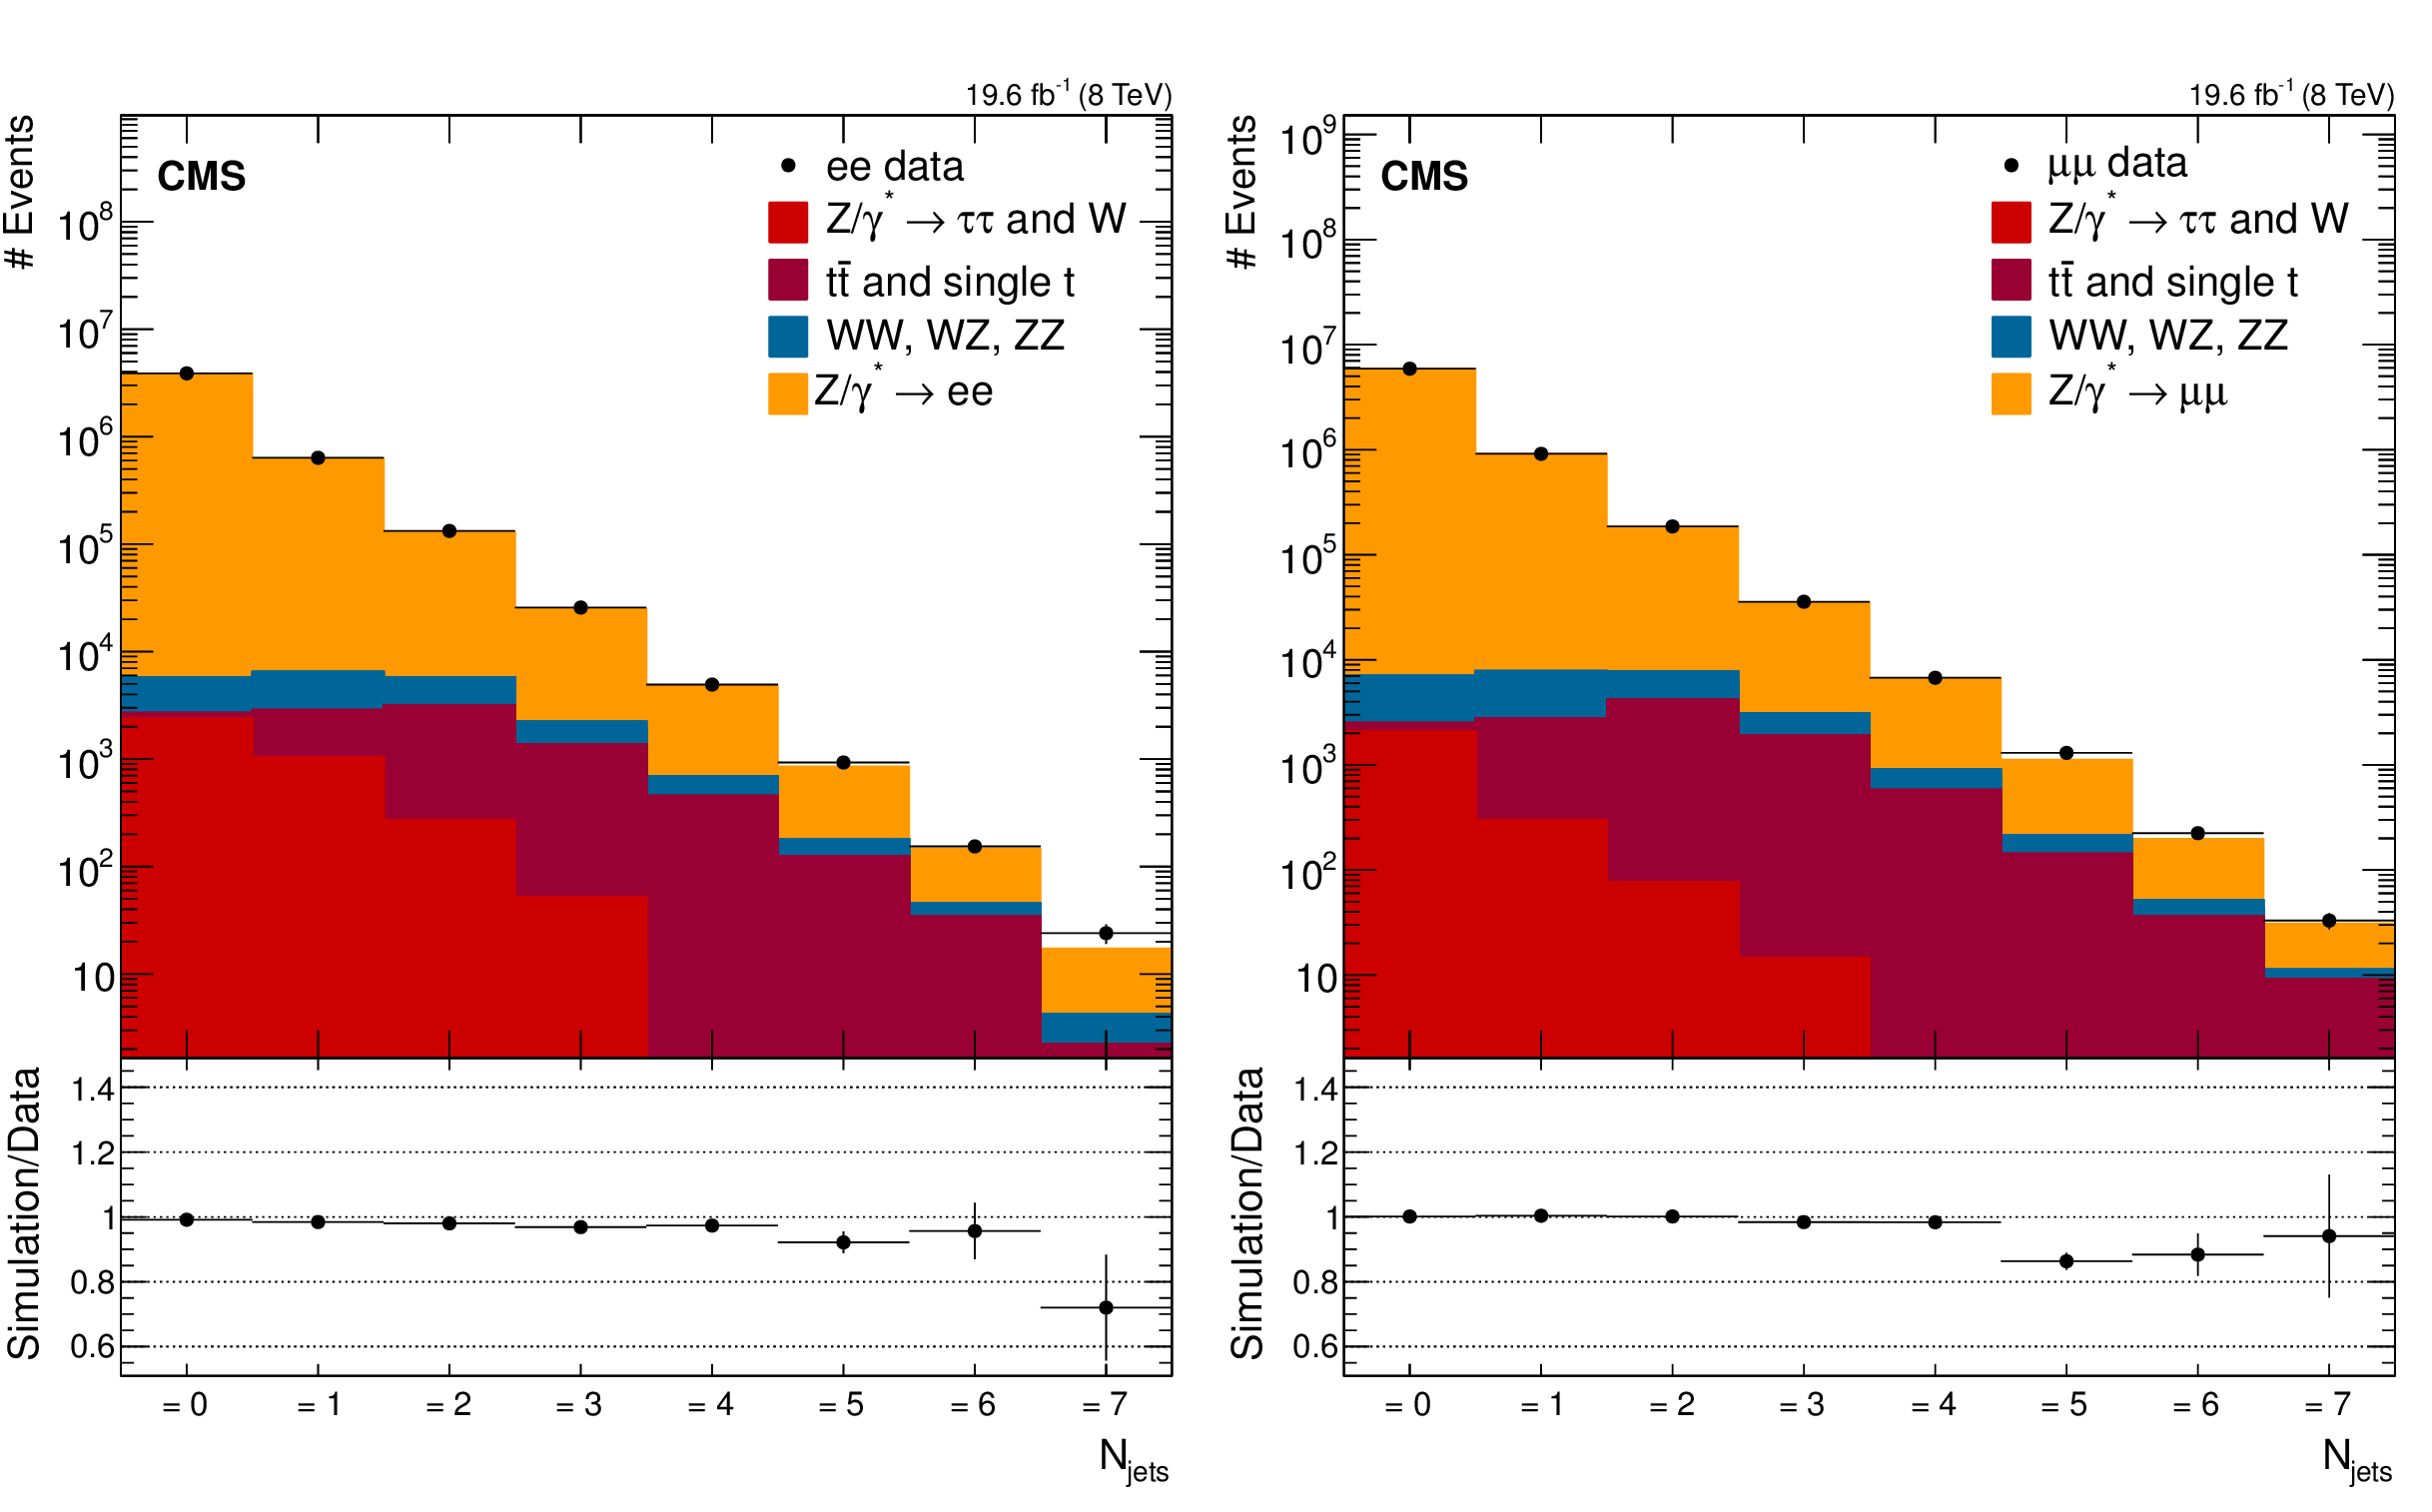
Figure 1:
Exclusive jet multiplicity for (left) the electron and (right) the muon channels at detector level in the jet rapidity region $ {| y | } < $ 2.4. The data points are shown with statistical error bars. Beneath each plot the ratio of the number of events predicted by the simulation to the measured values is displayed, together with the statistical uncertainties in simulation and data added in quadrature. |
png pdf |
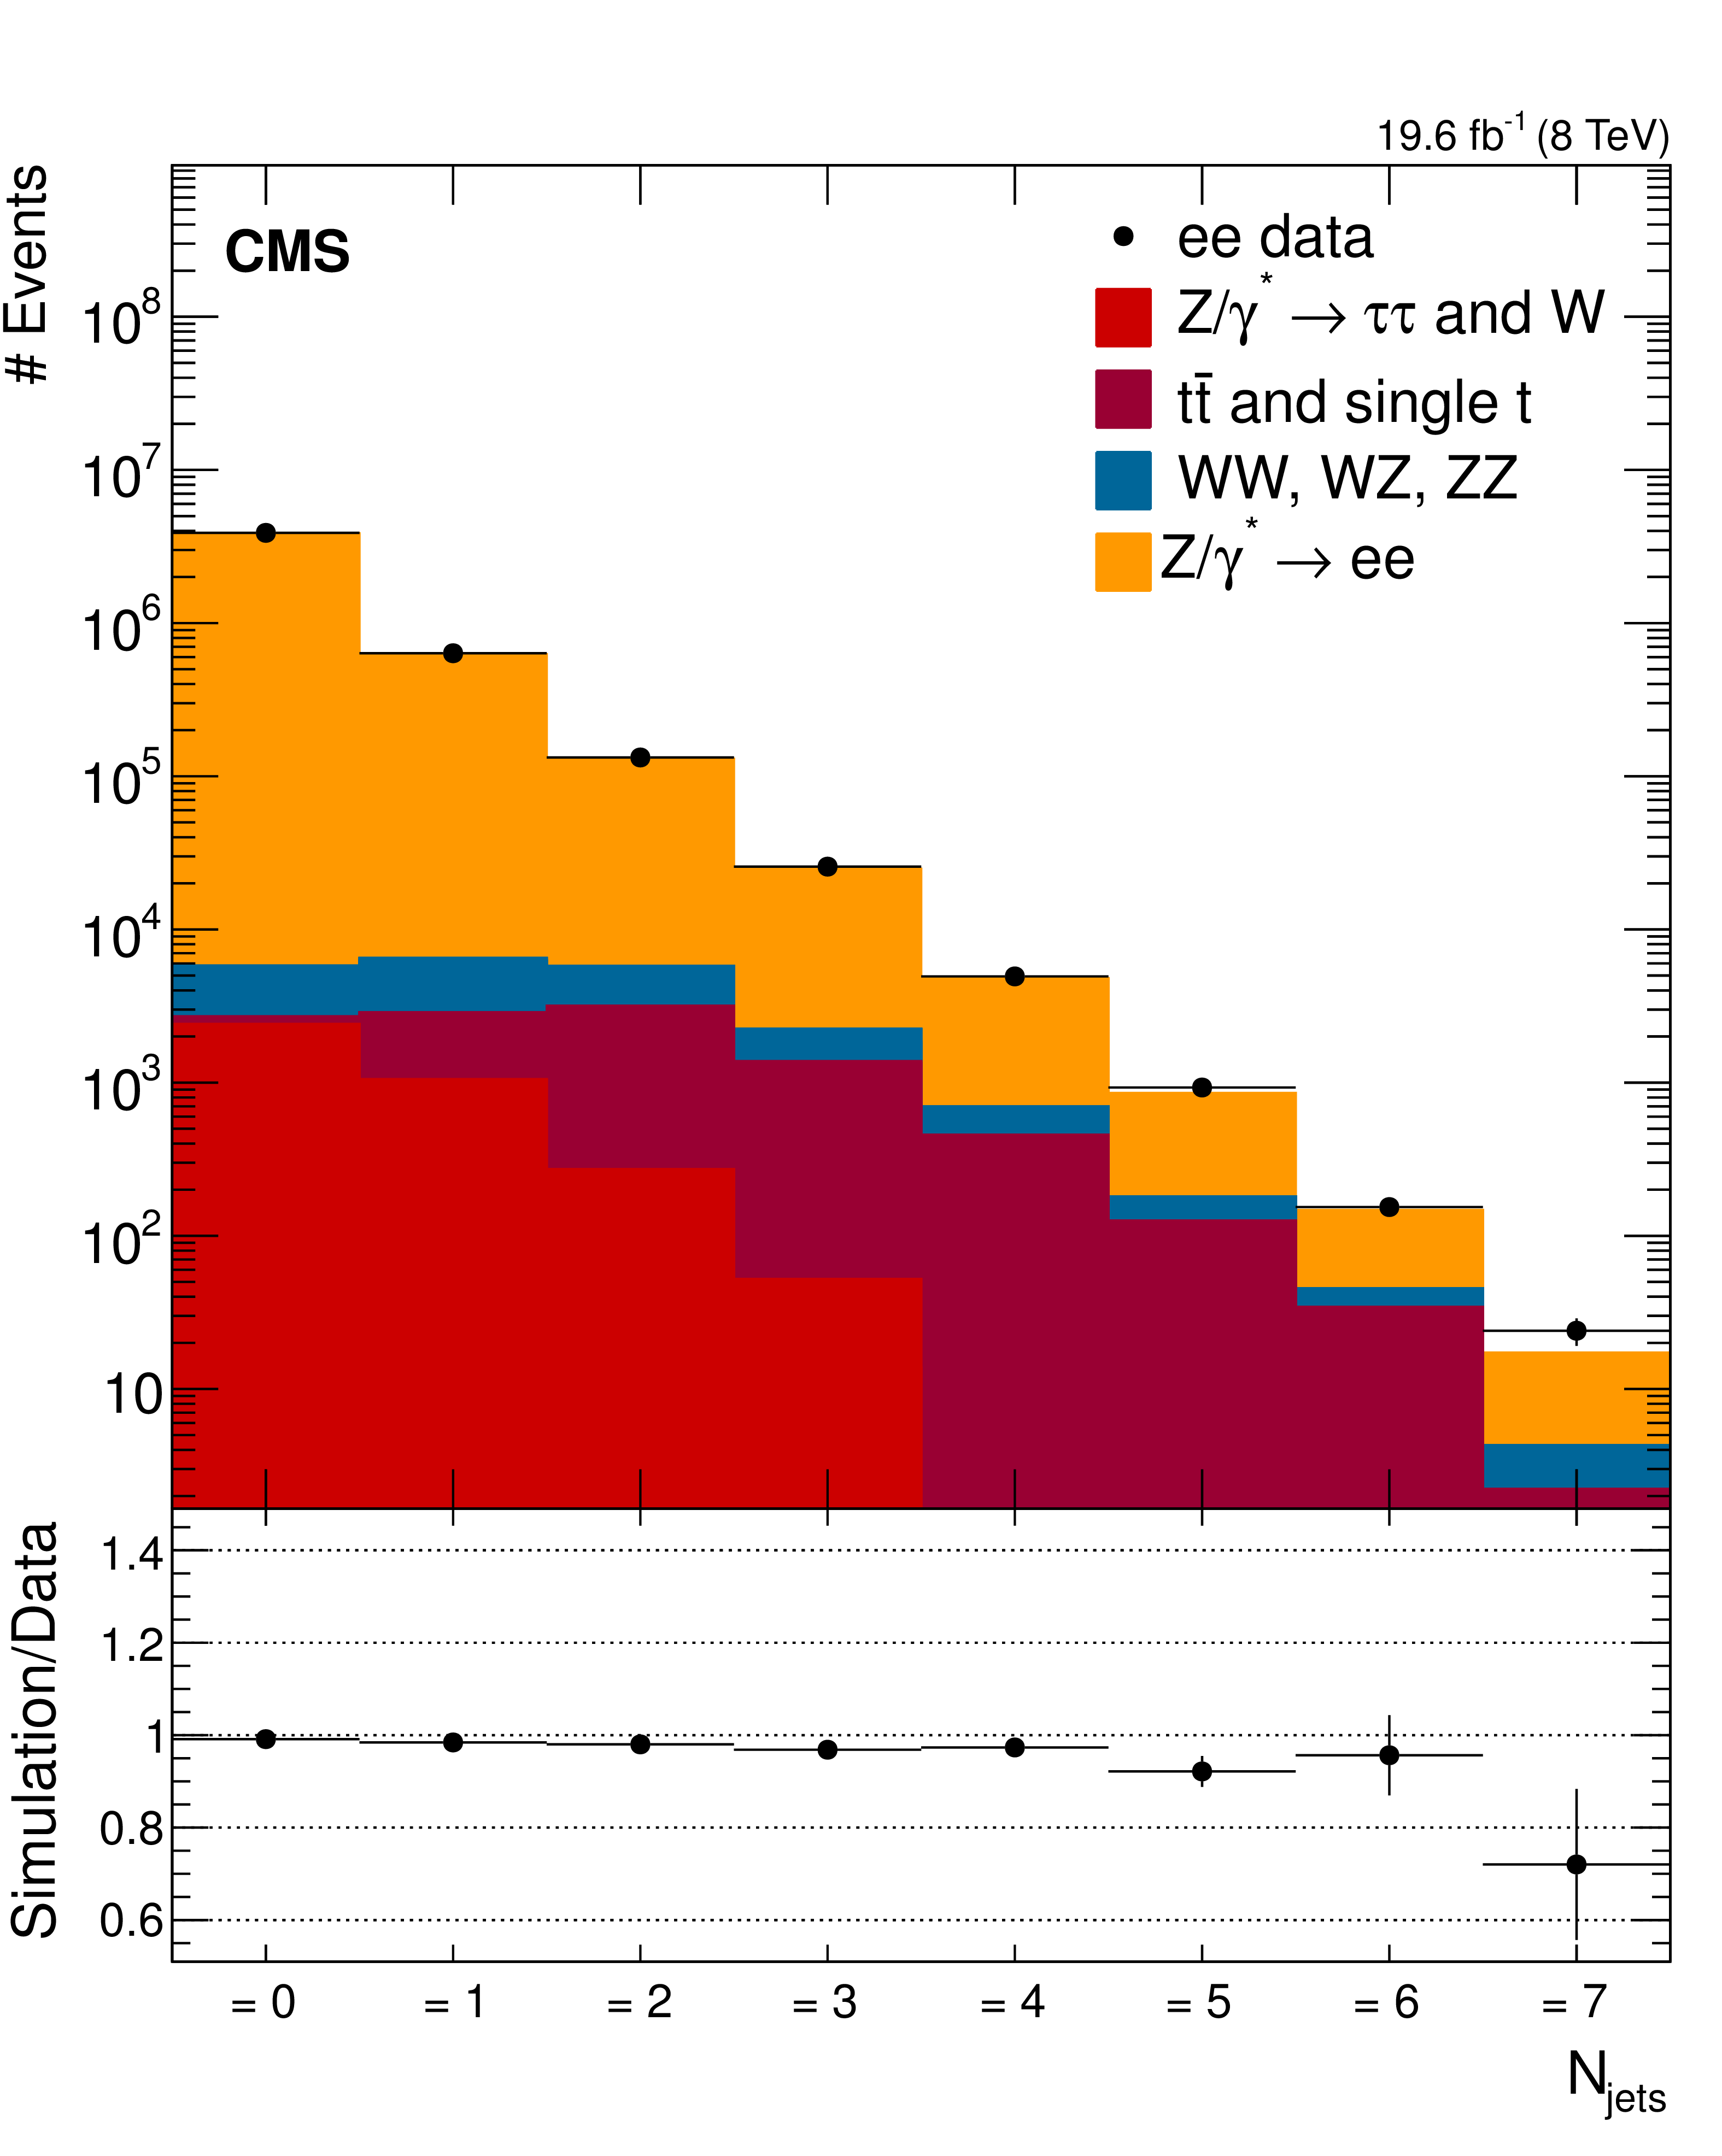
Figure 1-a:
Exclusive jet multiplicity for (left) the electron and (right) the muon channels at detector level in the jet rapidity region $ {| y | } < $ 2.4. The data points are shown with statistical error bars. Beneath each plot the ratio of the number of events predicted by the simulation to the measured values is displayed, together with the statistical uncertainties in simulation and data added in quadrature. |
png pdf |
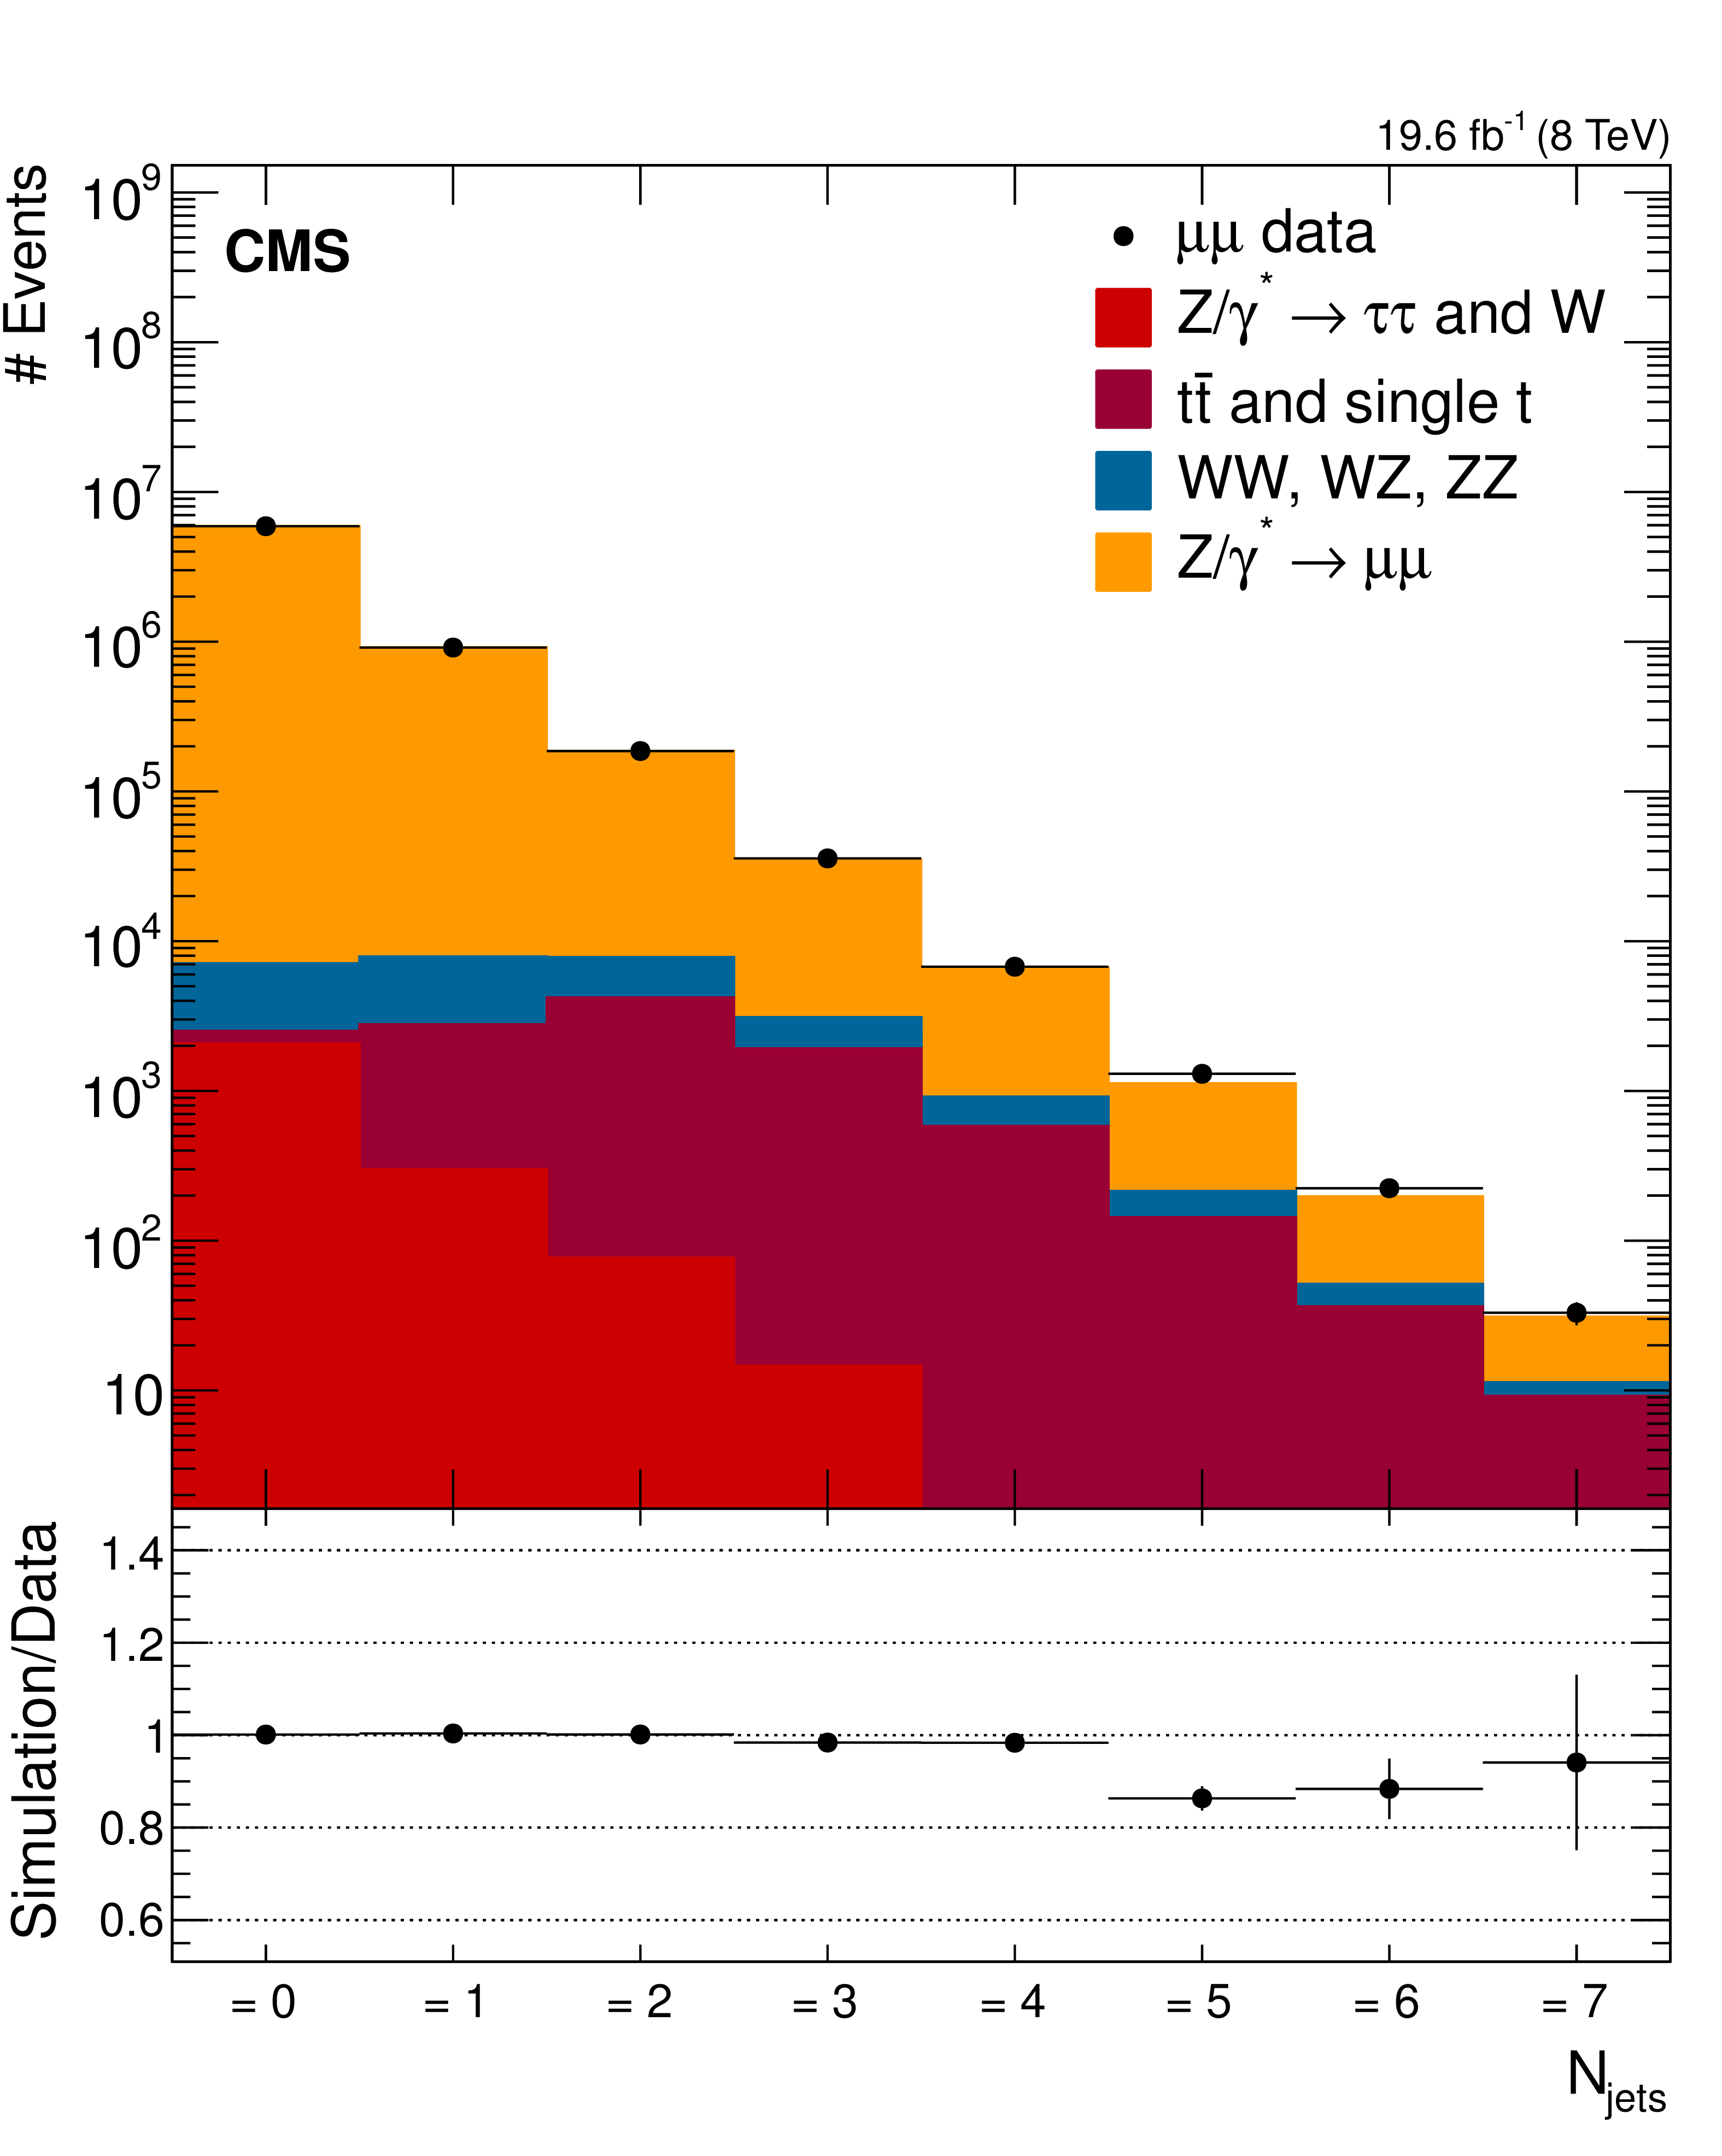
Figure 1-b:
Exclusive jet multiplicity for (left) the electron and (right) the muon channels at detector level in the jet rapidity region $ {| y | } < $ 2.4. The data points are shown with statistical error bars. Beneath each plot the ratio of the number of events predicted by the simulation to the measured values is displayed, together with the statistical uncertainties in simulation and data added in quadrature. |
png pdf |
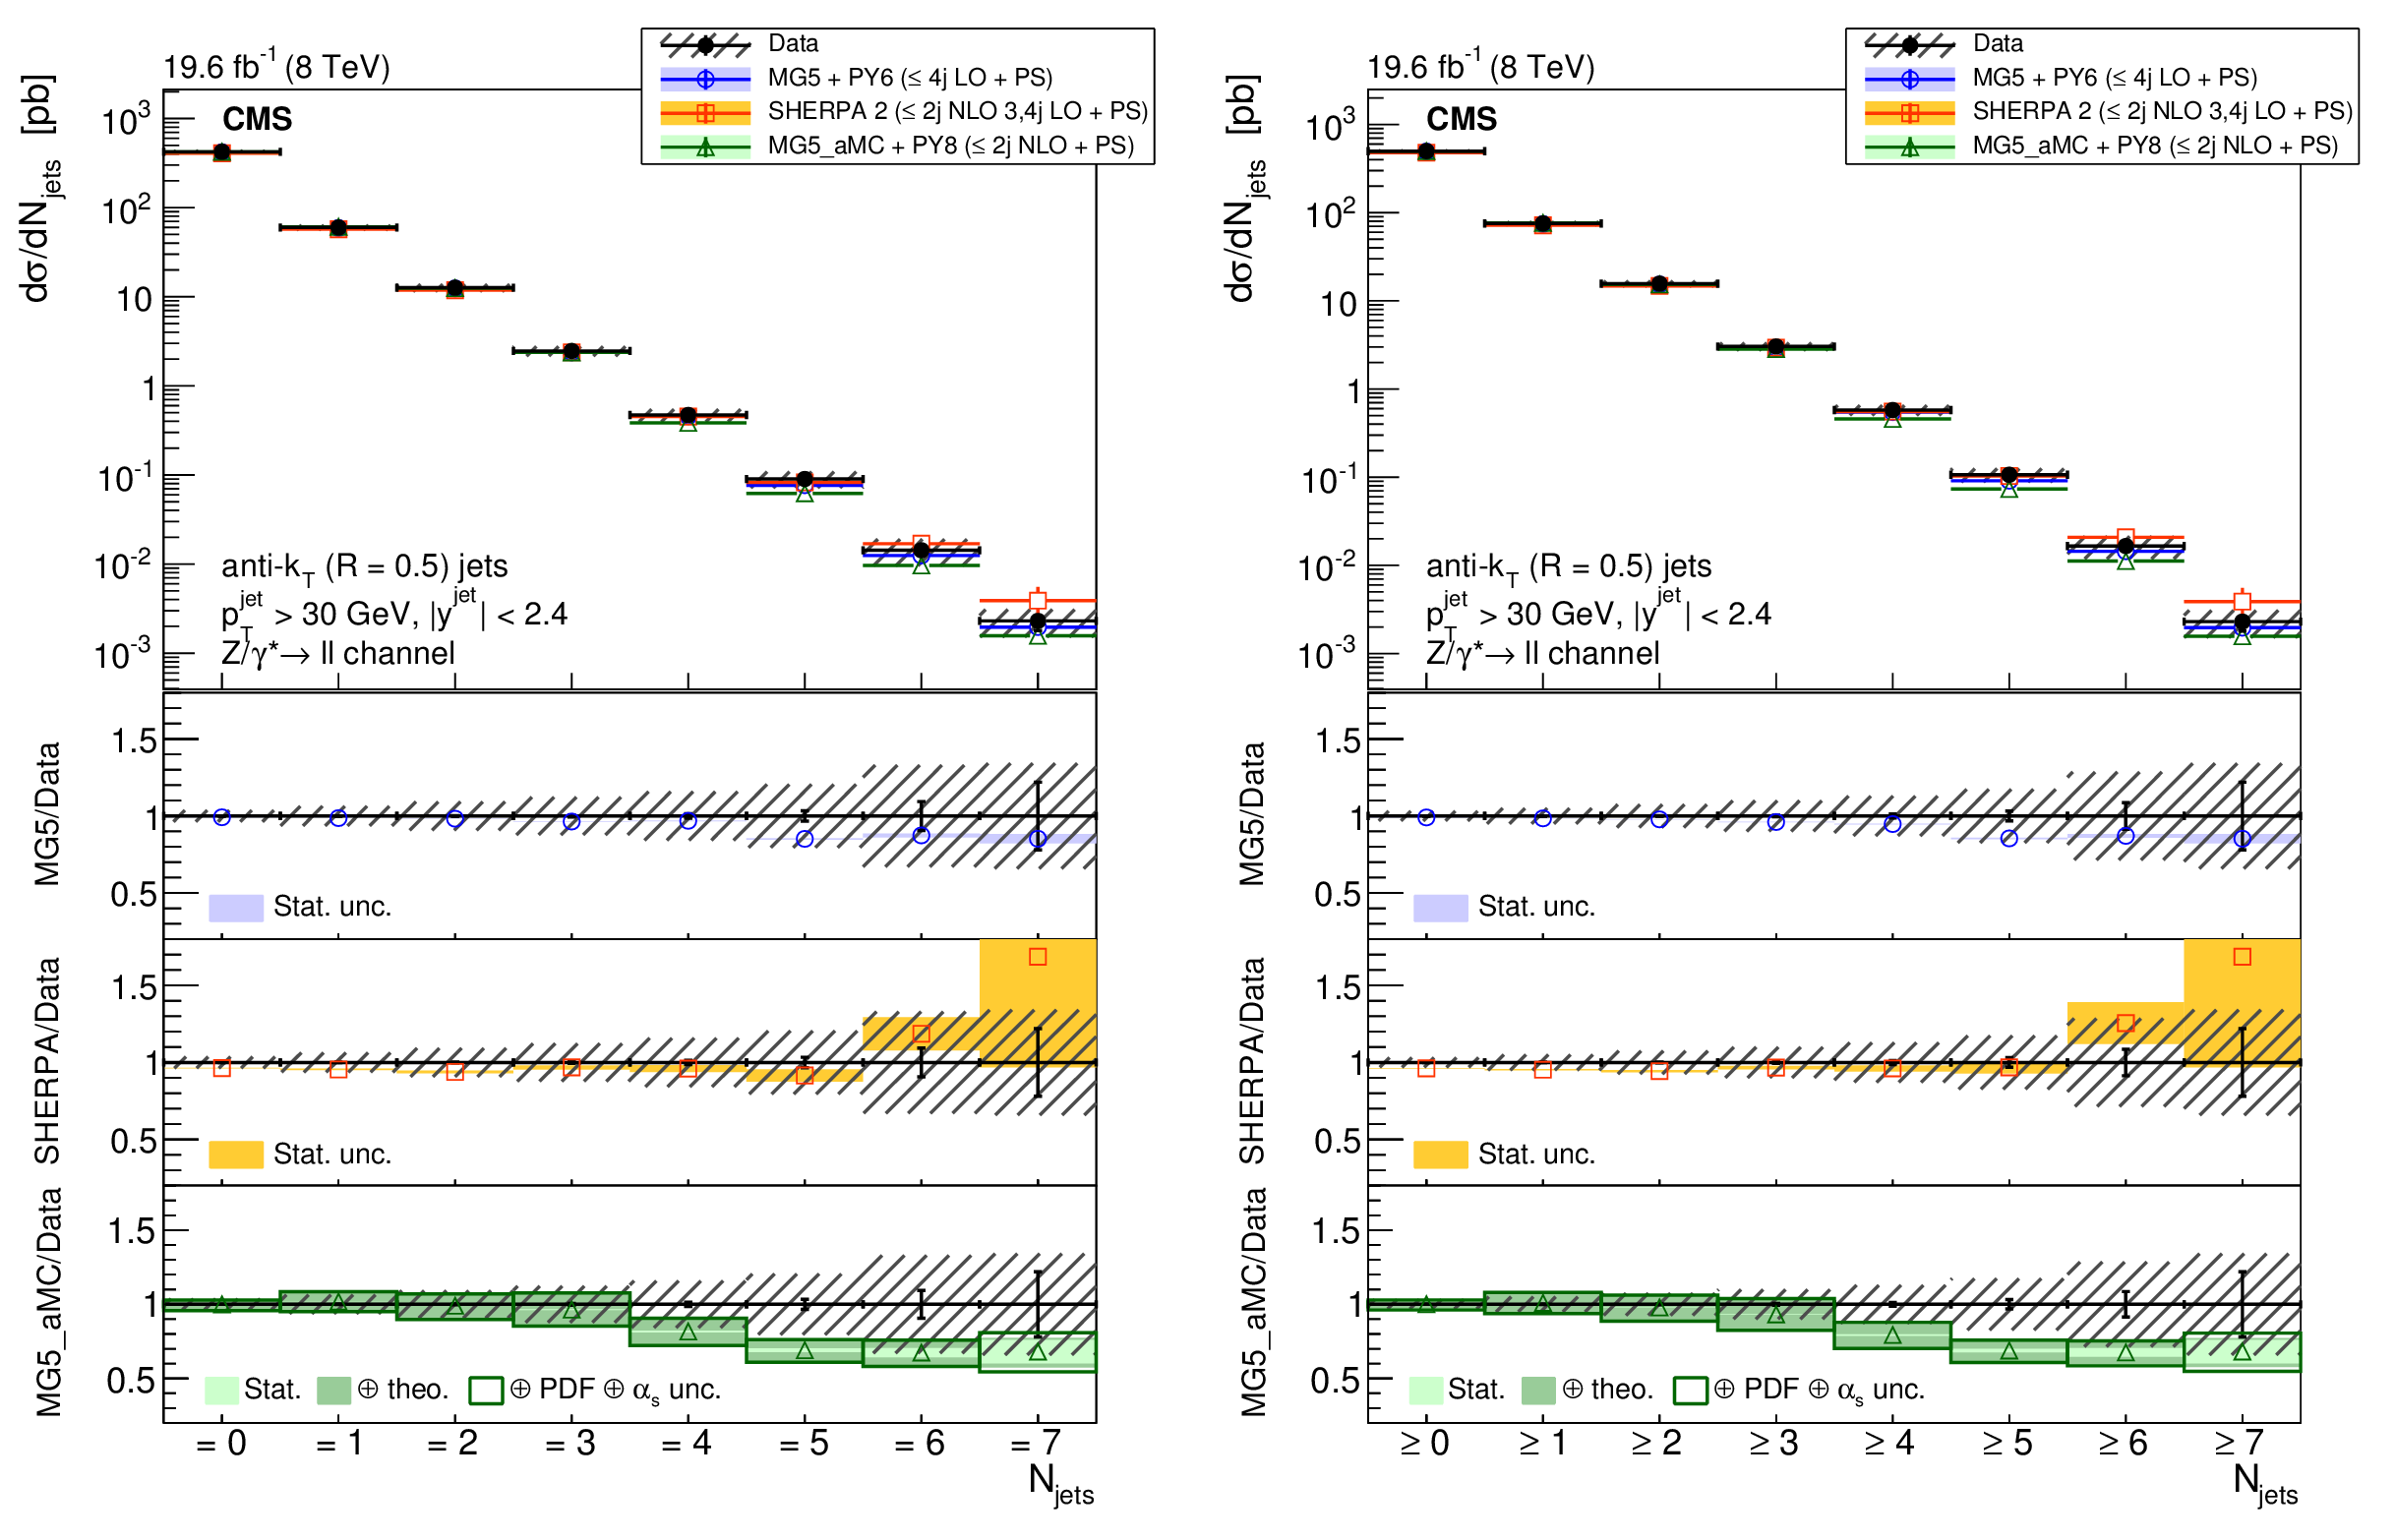
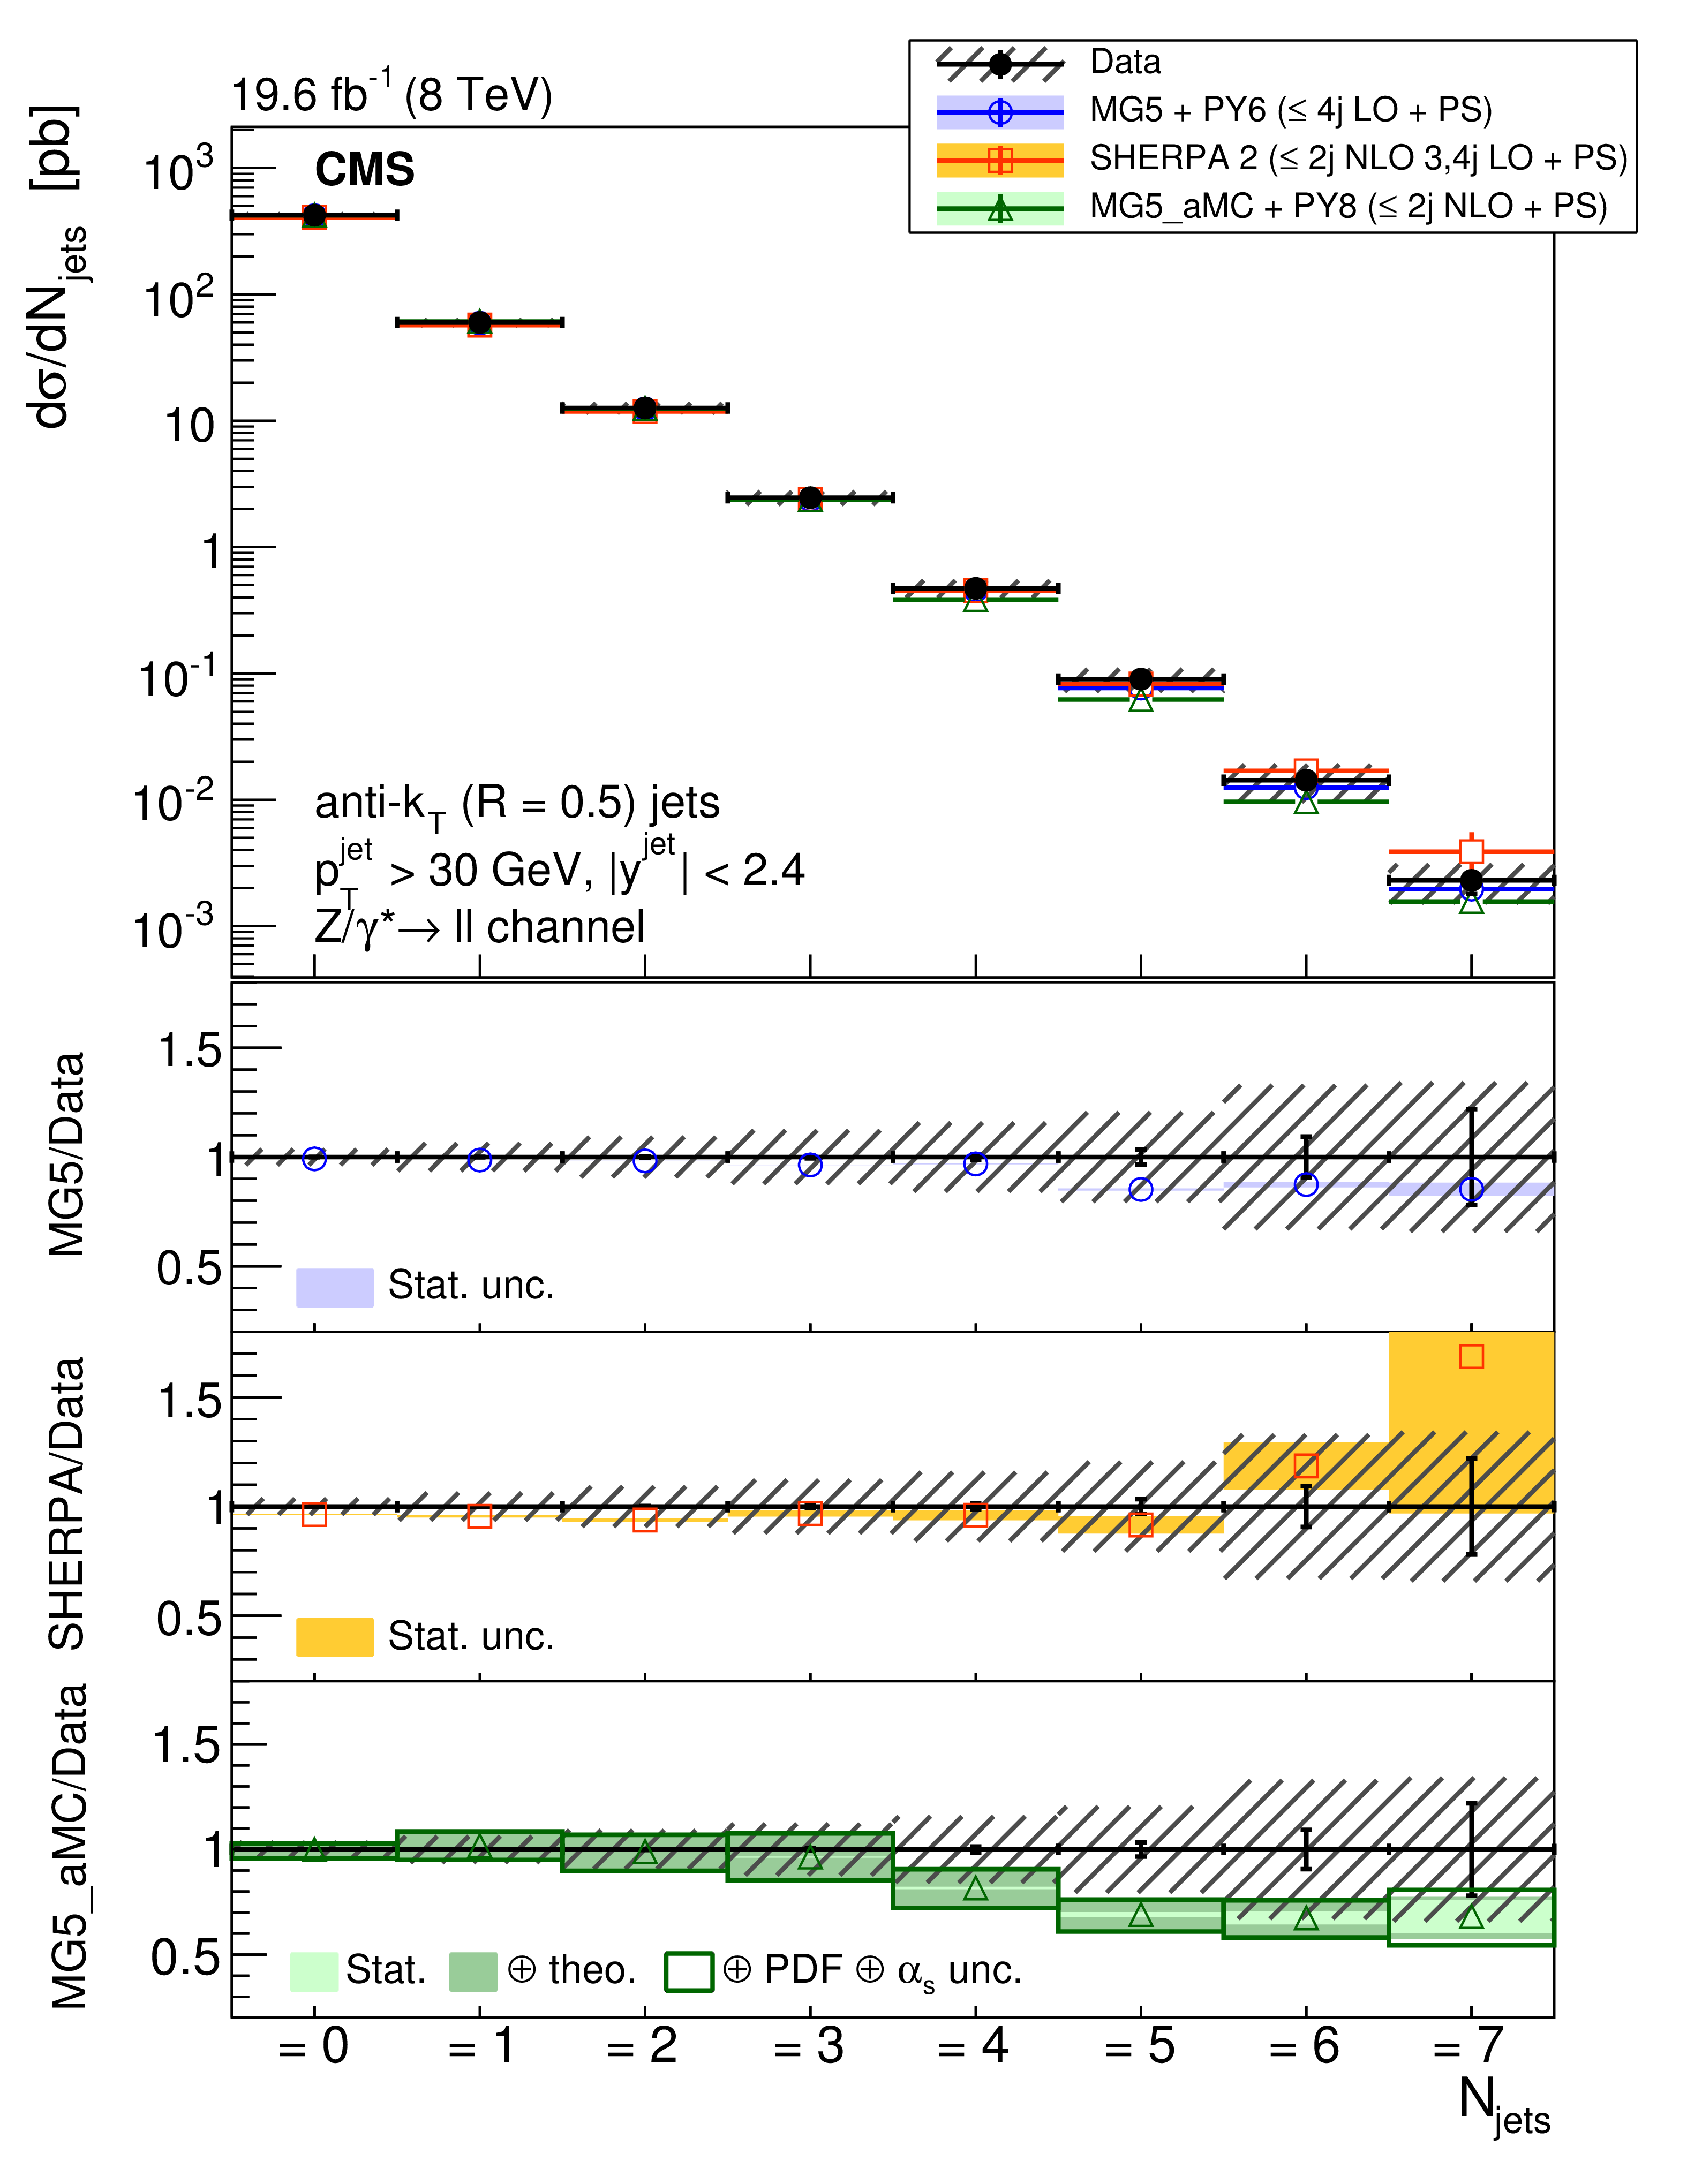
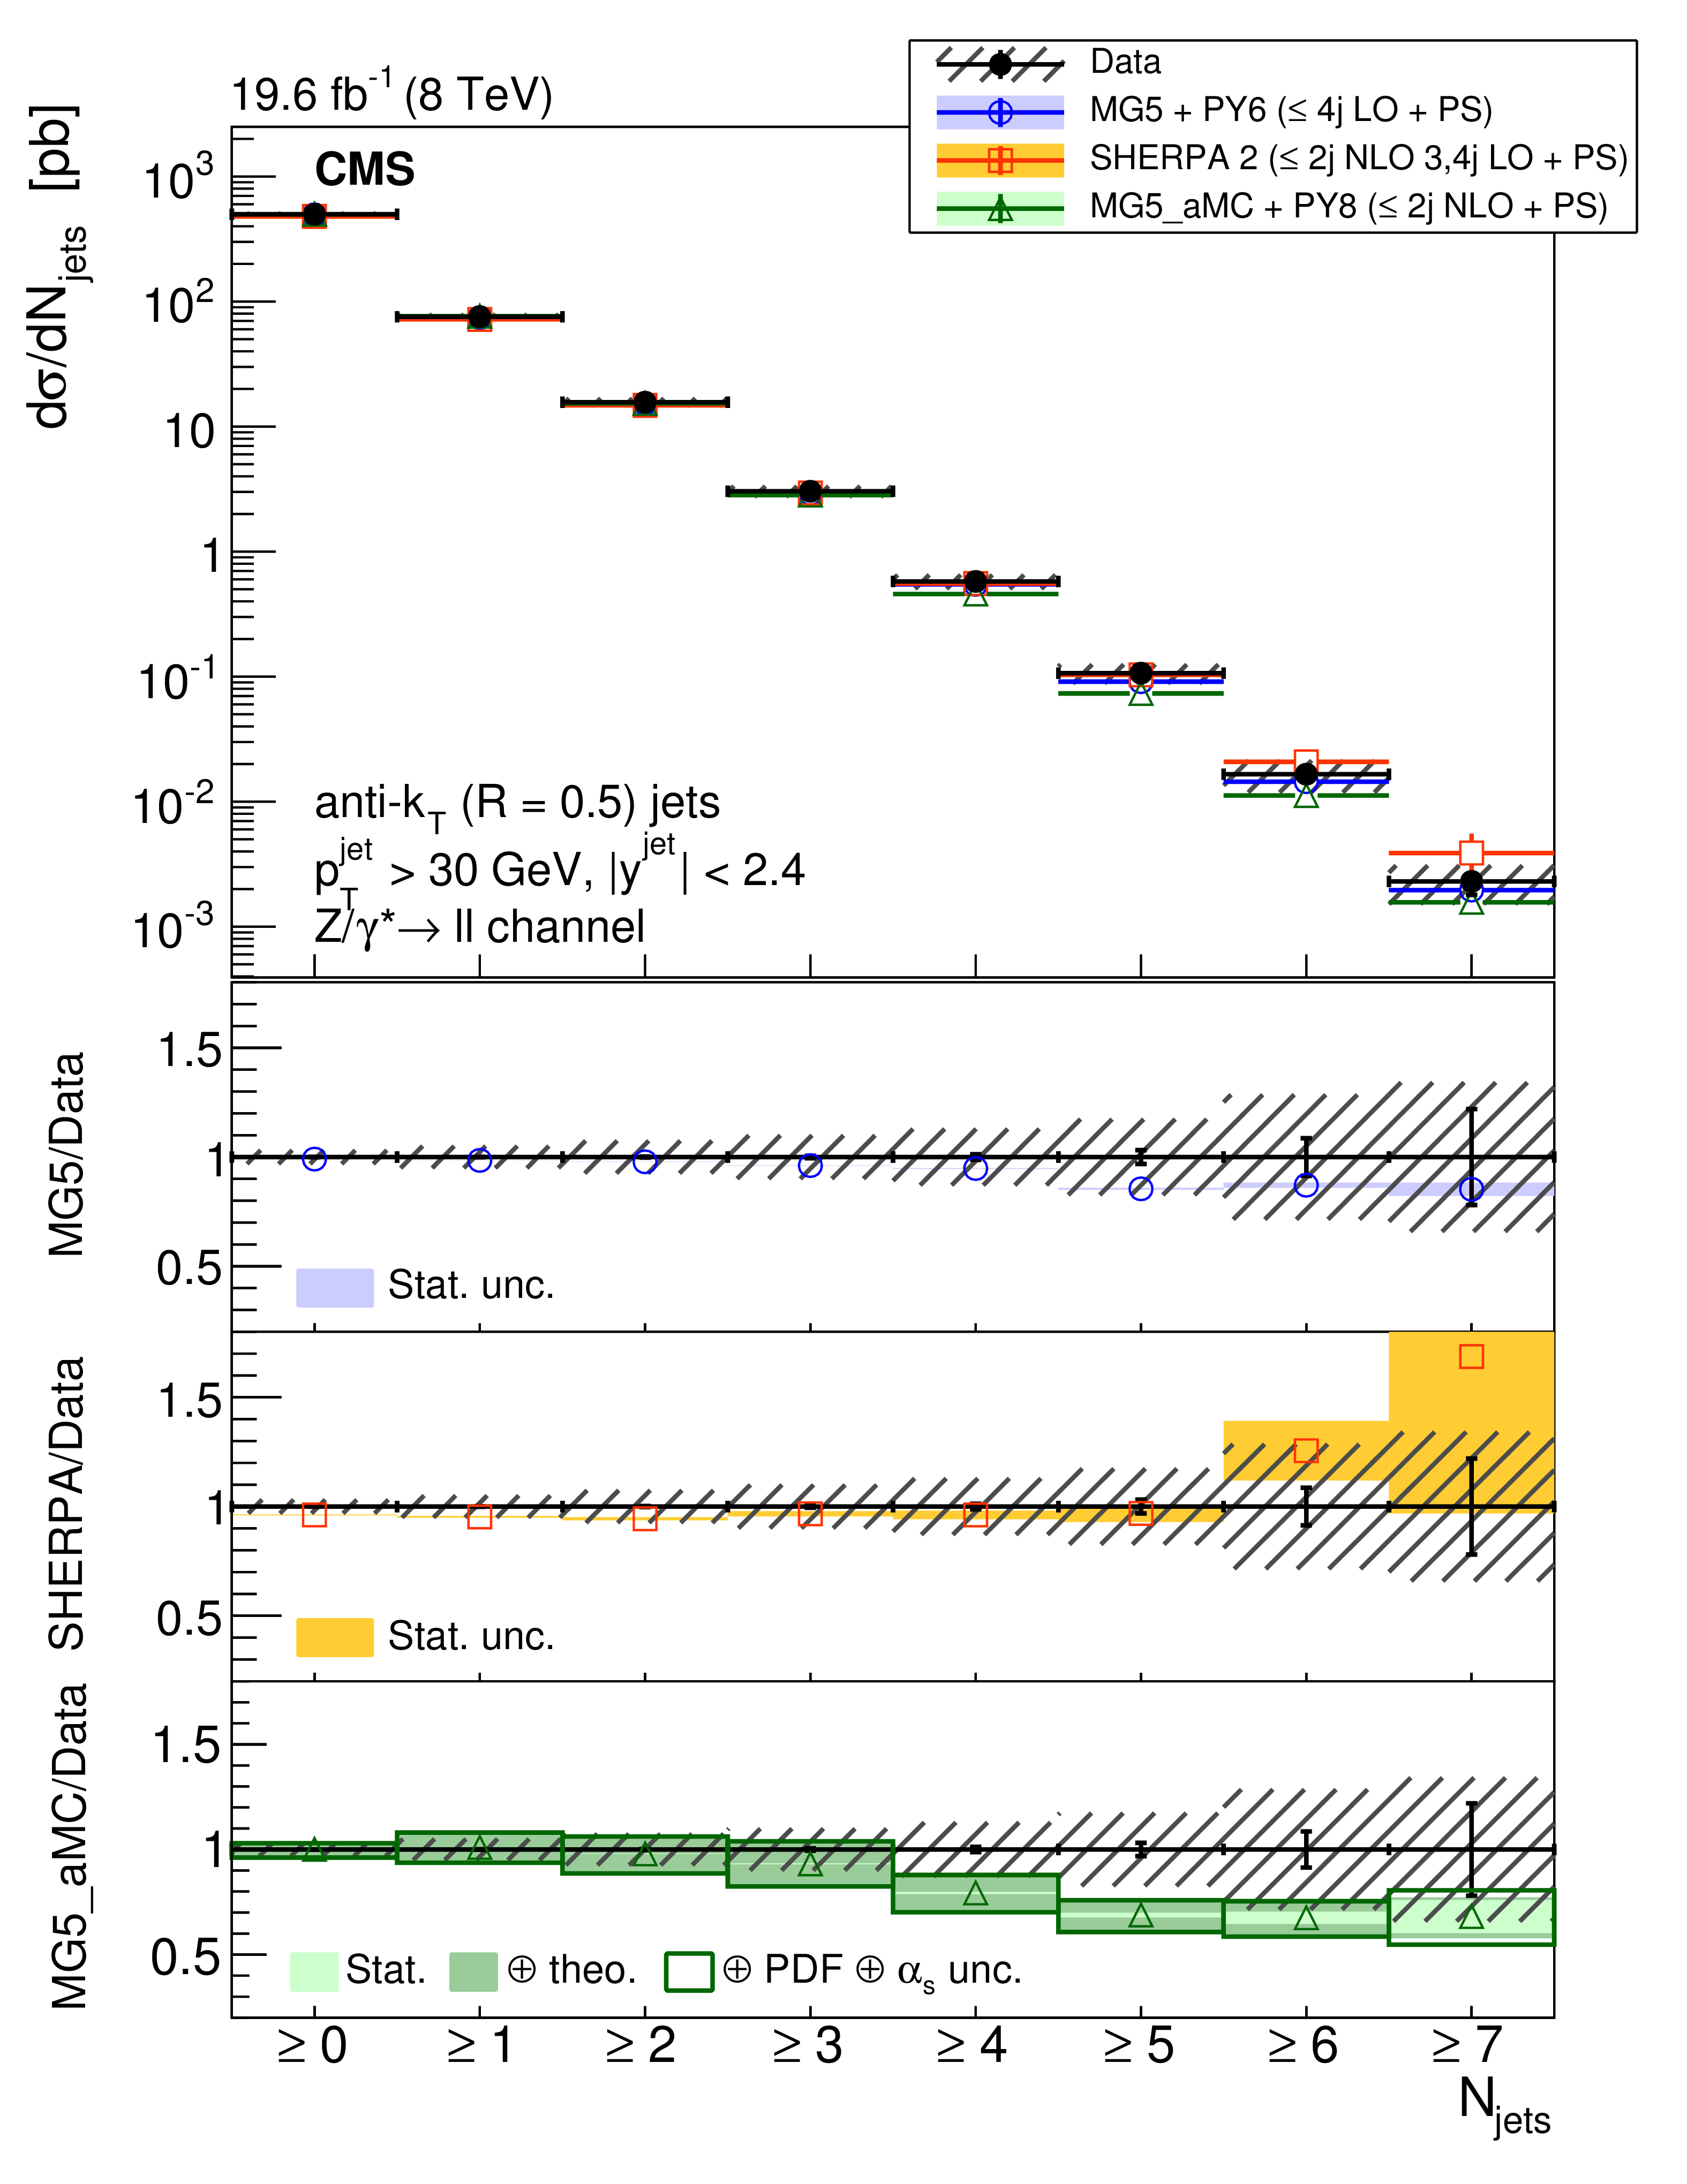
Figure 2:
The cross section for $ {\mathrm{ Z } (\to \ell \ell )+\text {jets}} $ production measured as a function of the (left) exclusive and (right) inclusive jet multiplicity distributions compared to the predictions calculated with MadGraph 5+PYTHIA 6, SHERPA 2, and mg5-amc +PYTHIA 8. The lower panels show the ratios of the theoretical predictions to the measurements. Error bars around the experimental points show the statistical uncertainty, while the cross-hatched bands indicate the statistical and systematic uncertainties added in quadrature. The boxes around the mg5-amc + PYTHIA 8 to measurement ratio represent the uncertainty on the prediction, including statistical, theoretical (from scale variations), and PDF uncertainties. The dark green area represents the statistical and theoretical uncertainties only, while the light green area represents the statistical uncertainty alone. |
png pdf |
Figure 2-a:
The cross section for $ {\mathrm{ Z } (\to \ell \ell )+\text {jets}} $ production measured as a function of the (left) exclusive and (right) inclusive jet multiplicity distributions compared to the predictions calculated with MadGraph 5+PYTHIA 6, SHERPA 2, and mg5-amc +PYTHIA 8. The lower panels show the ratios of the theoretical predictions to the measurements. Error bars around the experimental points show the statistical uncertainty, while the cross-hatched bands indicate the statistical and systematic uncertainties added in quadrature. The boxes around the mg5-amc + PYTHIA 8 to measurement ratio represent the uncertainty on the prediction, including statistical, theoretical (from scale variations), and PDF uncertainties. The dark green area represents the statistical and theoretical uncertainties only, while the light green area represents the statistical uncertainty alone. |
png pdf |
Figure 2-b:
The cross section for $ {\mathrm{ Z } (\to \ell \ell )+\text {jets}} $ production measured as a function of the (left) exclusive and (right) inclusive jet multiplicity distributions compared to the predictions calculated with MadGraph 5+PYTHIA 6, SHERPA 2, and mg5-amc +PYTHIA 8. The lower panels show the ratios of the theoretical predictions to the measurements. Error bars around the experimental points show the statistical uncertainty, while the cross-hatched bands indicate the statistical and systematic uncertainties added in quadrature. The boxes around the mg5-amc + PYTHIA 8 to measurement ratio represent the uncertainty on the prediction, including statistical, theoretical (from scale variations), and PDF uncertainties. The dark green area represents the statistical and theoretical uncertainties only, while the light green area represents the statistical uncertainty alone. |
png pdf |
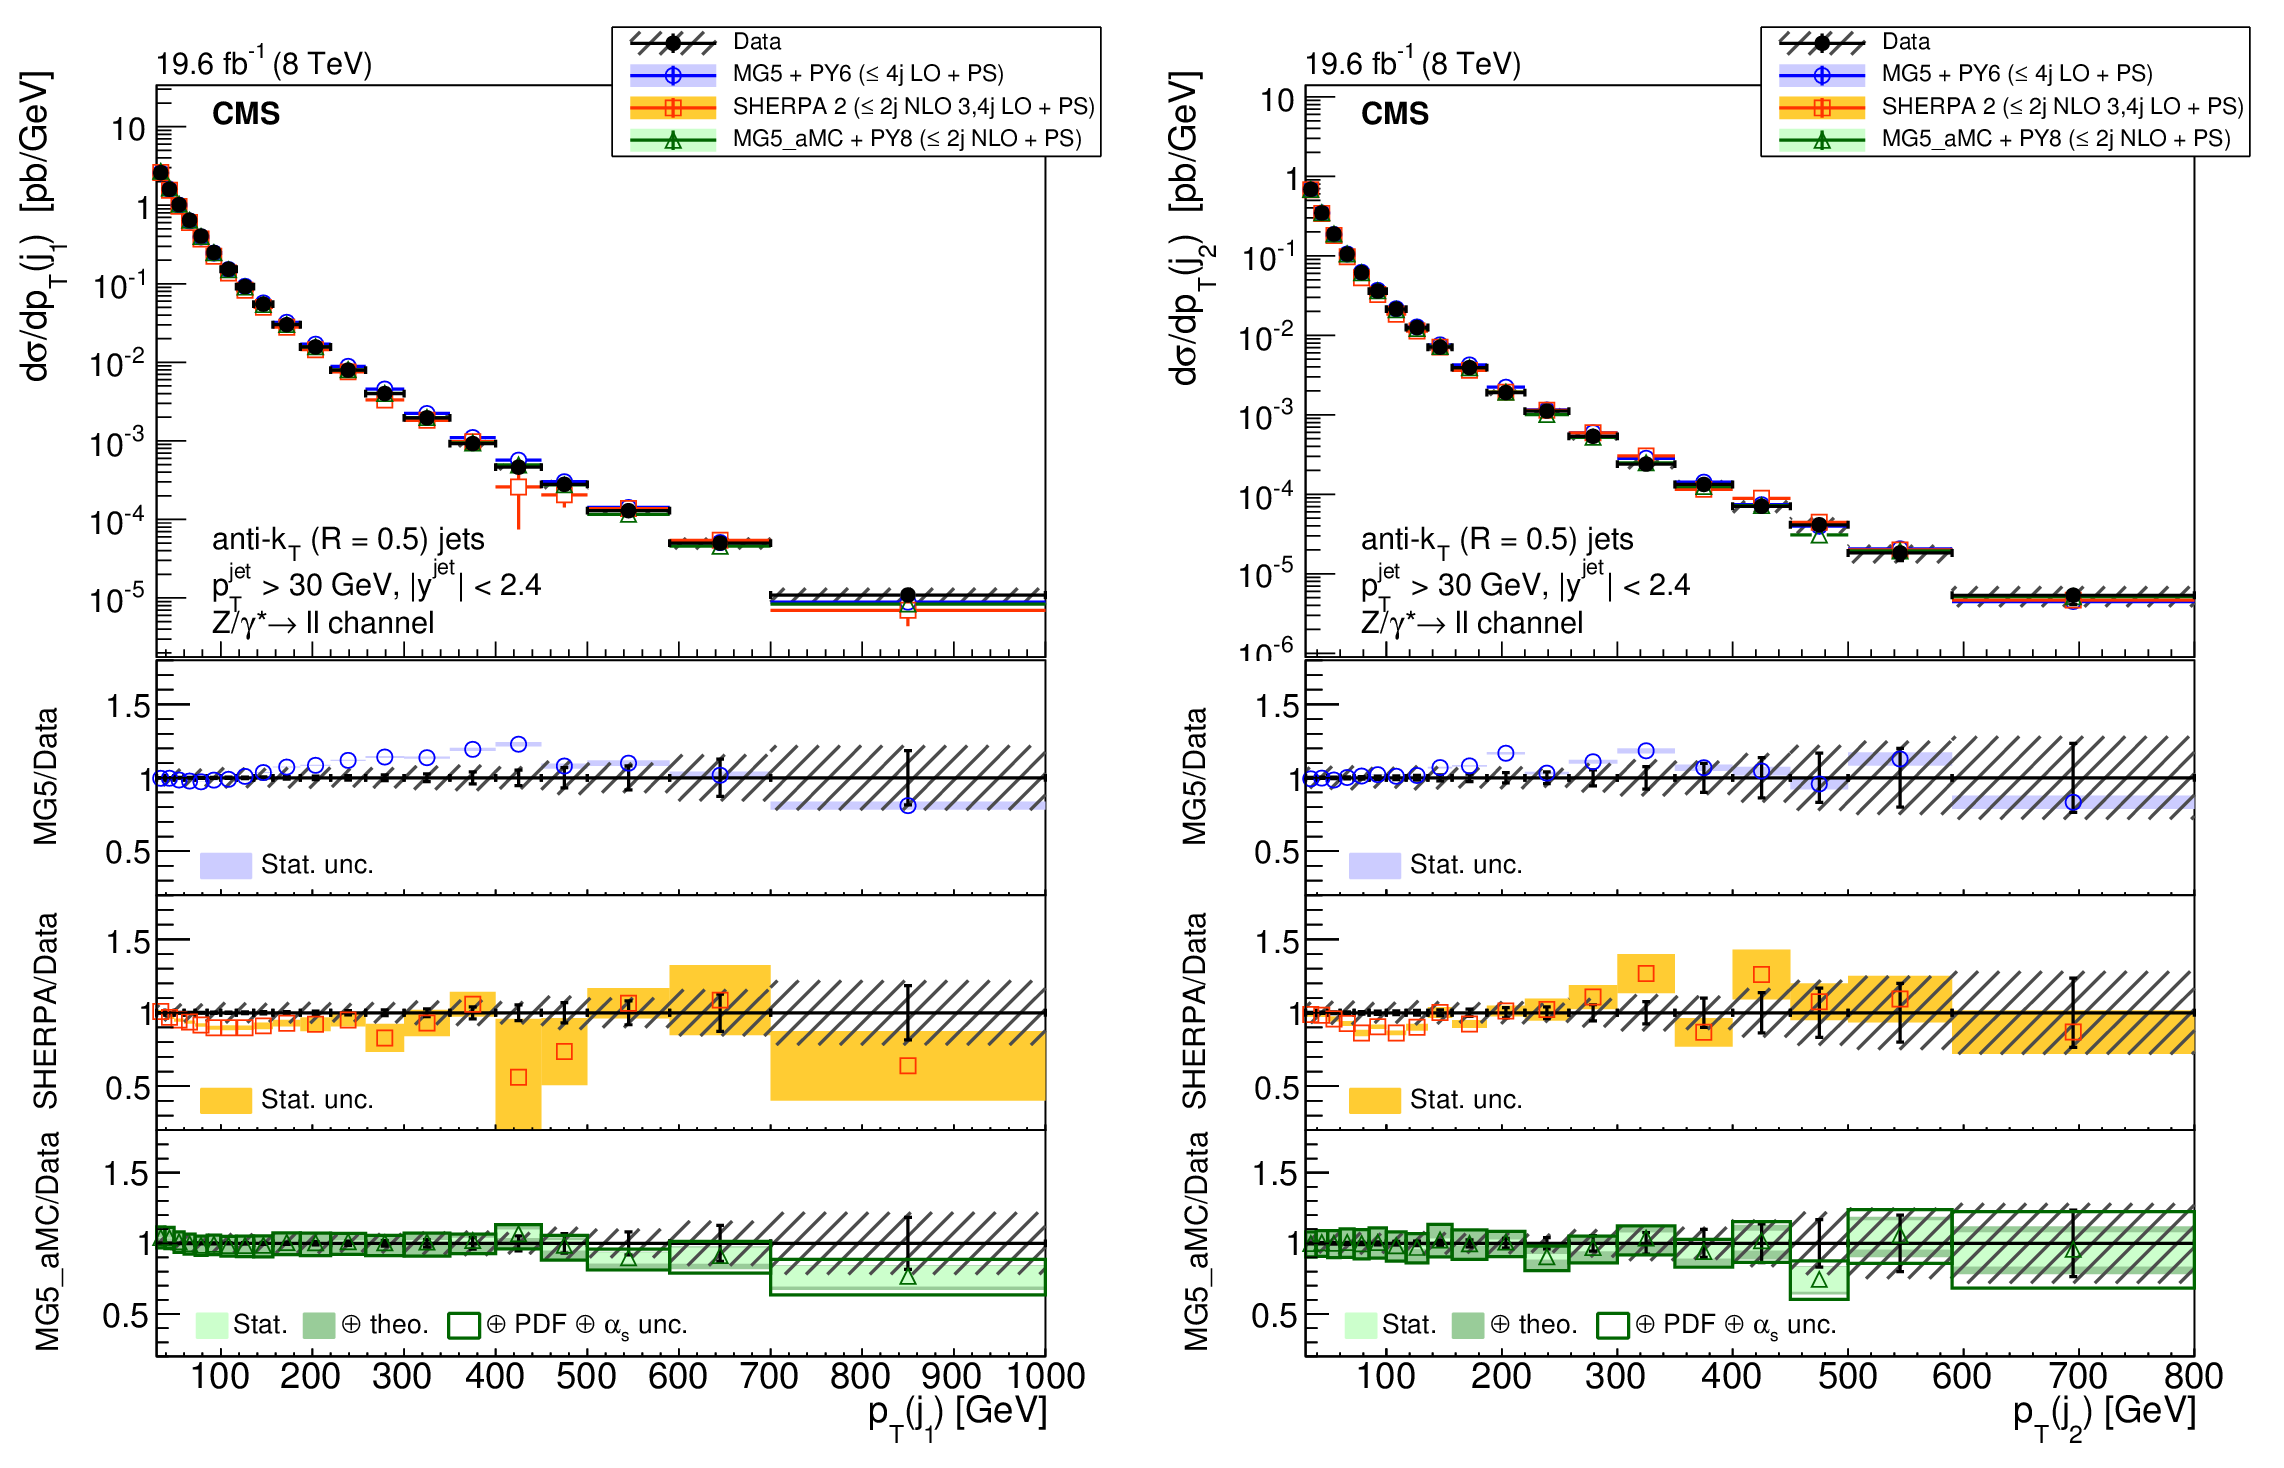
Figure 3:
The differential cross section for $ {\mathrm{ Z } (\to \ell \ell )+\text {jets}} $ production measured as a function of the (left) $1^{\text {st}}$ and (right) $2^{\text {nd}}$ jet $ {p_{\mathrm {T}}} $ compared to the predictions calculated with MadGraph 5+PYTHIA 6, SHERPA 2, and mg5-amc +PYTHIA 8. The lower panels show the ratios of the theoretical predictions to the measurements. Error bars around the experimental points show the statistical uncertainty, while the cross-hatched bands indicate the statistical and systematic uncertainties added in quadrature. The boxes around the mg5-amc + PYTHIA 8 to measurement ratio represent the uncertainty on the prediction, including statistical, theoretical (from scale variations), and PDF uncertainties. The dark green area represents the statistical and theoretical uncertainties only, while the light green area represents the statistical uncertainty alone. |

png pdf |
Figure 3-a:
The differential cross section for $ {\mathrm{ Z } (\to \ell \ell )+\text {jets}} $ production measured as a function of the (left) $1^{\text {st}}$ and (right) $2^{\text {nd}}$ jet $ {p_{\mathrm {T}}} $ compared to the predictions calculated with MadGraph 5+PYTHIA 6, SHERPA 2, and mg5-amc +PYTHIA 8. The lower panels show the ratios of the theoretical predictions to the measurements. Error bars around the experimental points show the statistical uncertainty, while the cross-hatched bands indicate the statistical and systematic uncertainties added in quadrature. The boxes around the mg5-amc + PYTHIA 8 to measurement ratio represent the uncertainty on the prediction, including statistical, theoretical (from scale variations), and PDF uncertainties. The dark green area represents the statistical and theoretical uncertainties only, while the light green area represents the statistical uncertainty alone. |

png pdf |
Figure 3-b:
The differential cross section for $ {\mathrm{ Z } (\to \ell \ell )+\text {jets}} $ production measured as a function of the (left) $1^{\text {st}}$ and (right) $2^{\text {nd}}$ jet $ {p_{\mathrm {T}}} $ compared to the predictions calculated with MadGraph 5+PYTHIA 6, SHERPA 2, and mg5-amc +PYTHIA 8. The lower panels show the ratios of the theoretical predictions to the measurements. Error bars around the experimental points show the statistical uncertainty, while the cross-hatched bands indicate the statistical and systematic uncertainties added in quadrature. The boxes around the mg5-amc + PYTHIA 8 to measurement ratio represent the uncertainty on the prediction, including statistical, theoretical (from scale variations), and PDF uncertainties. The dark green area represents the statistical and theoretical uncertainties only, while the light green area represents the statistical uncertainty alone. |

png pdf |
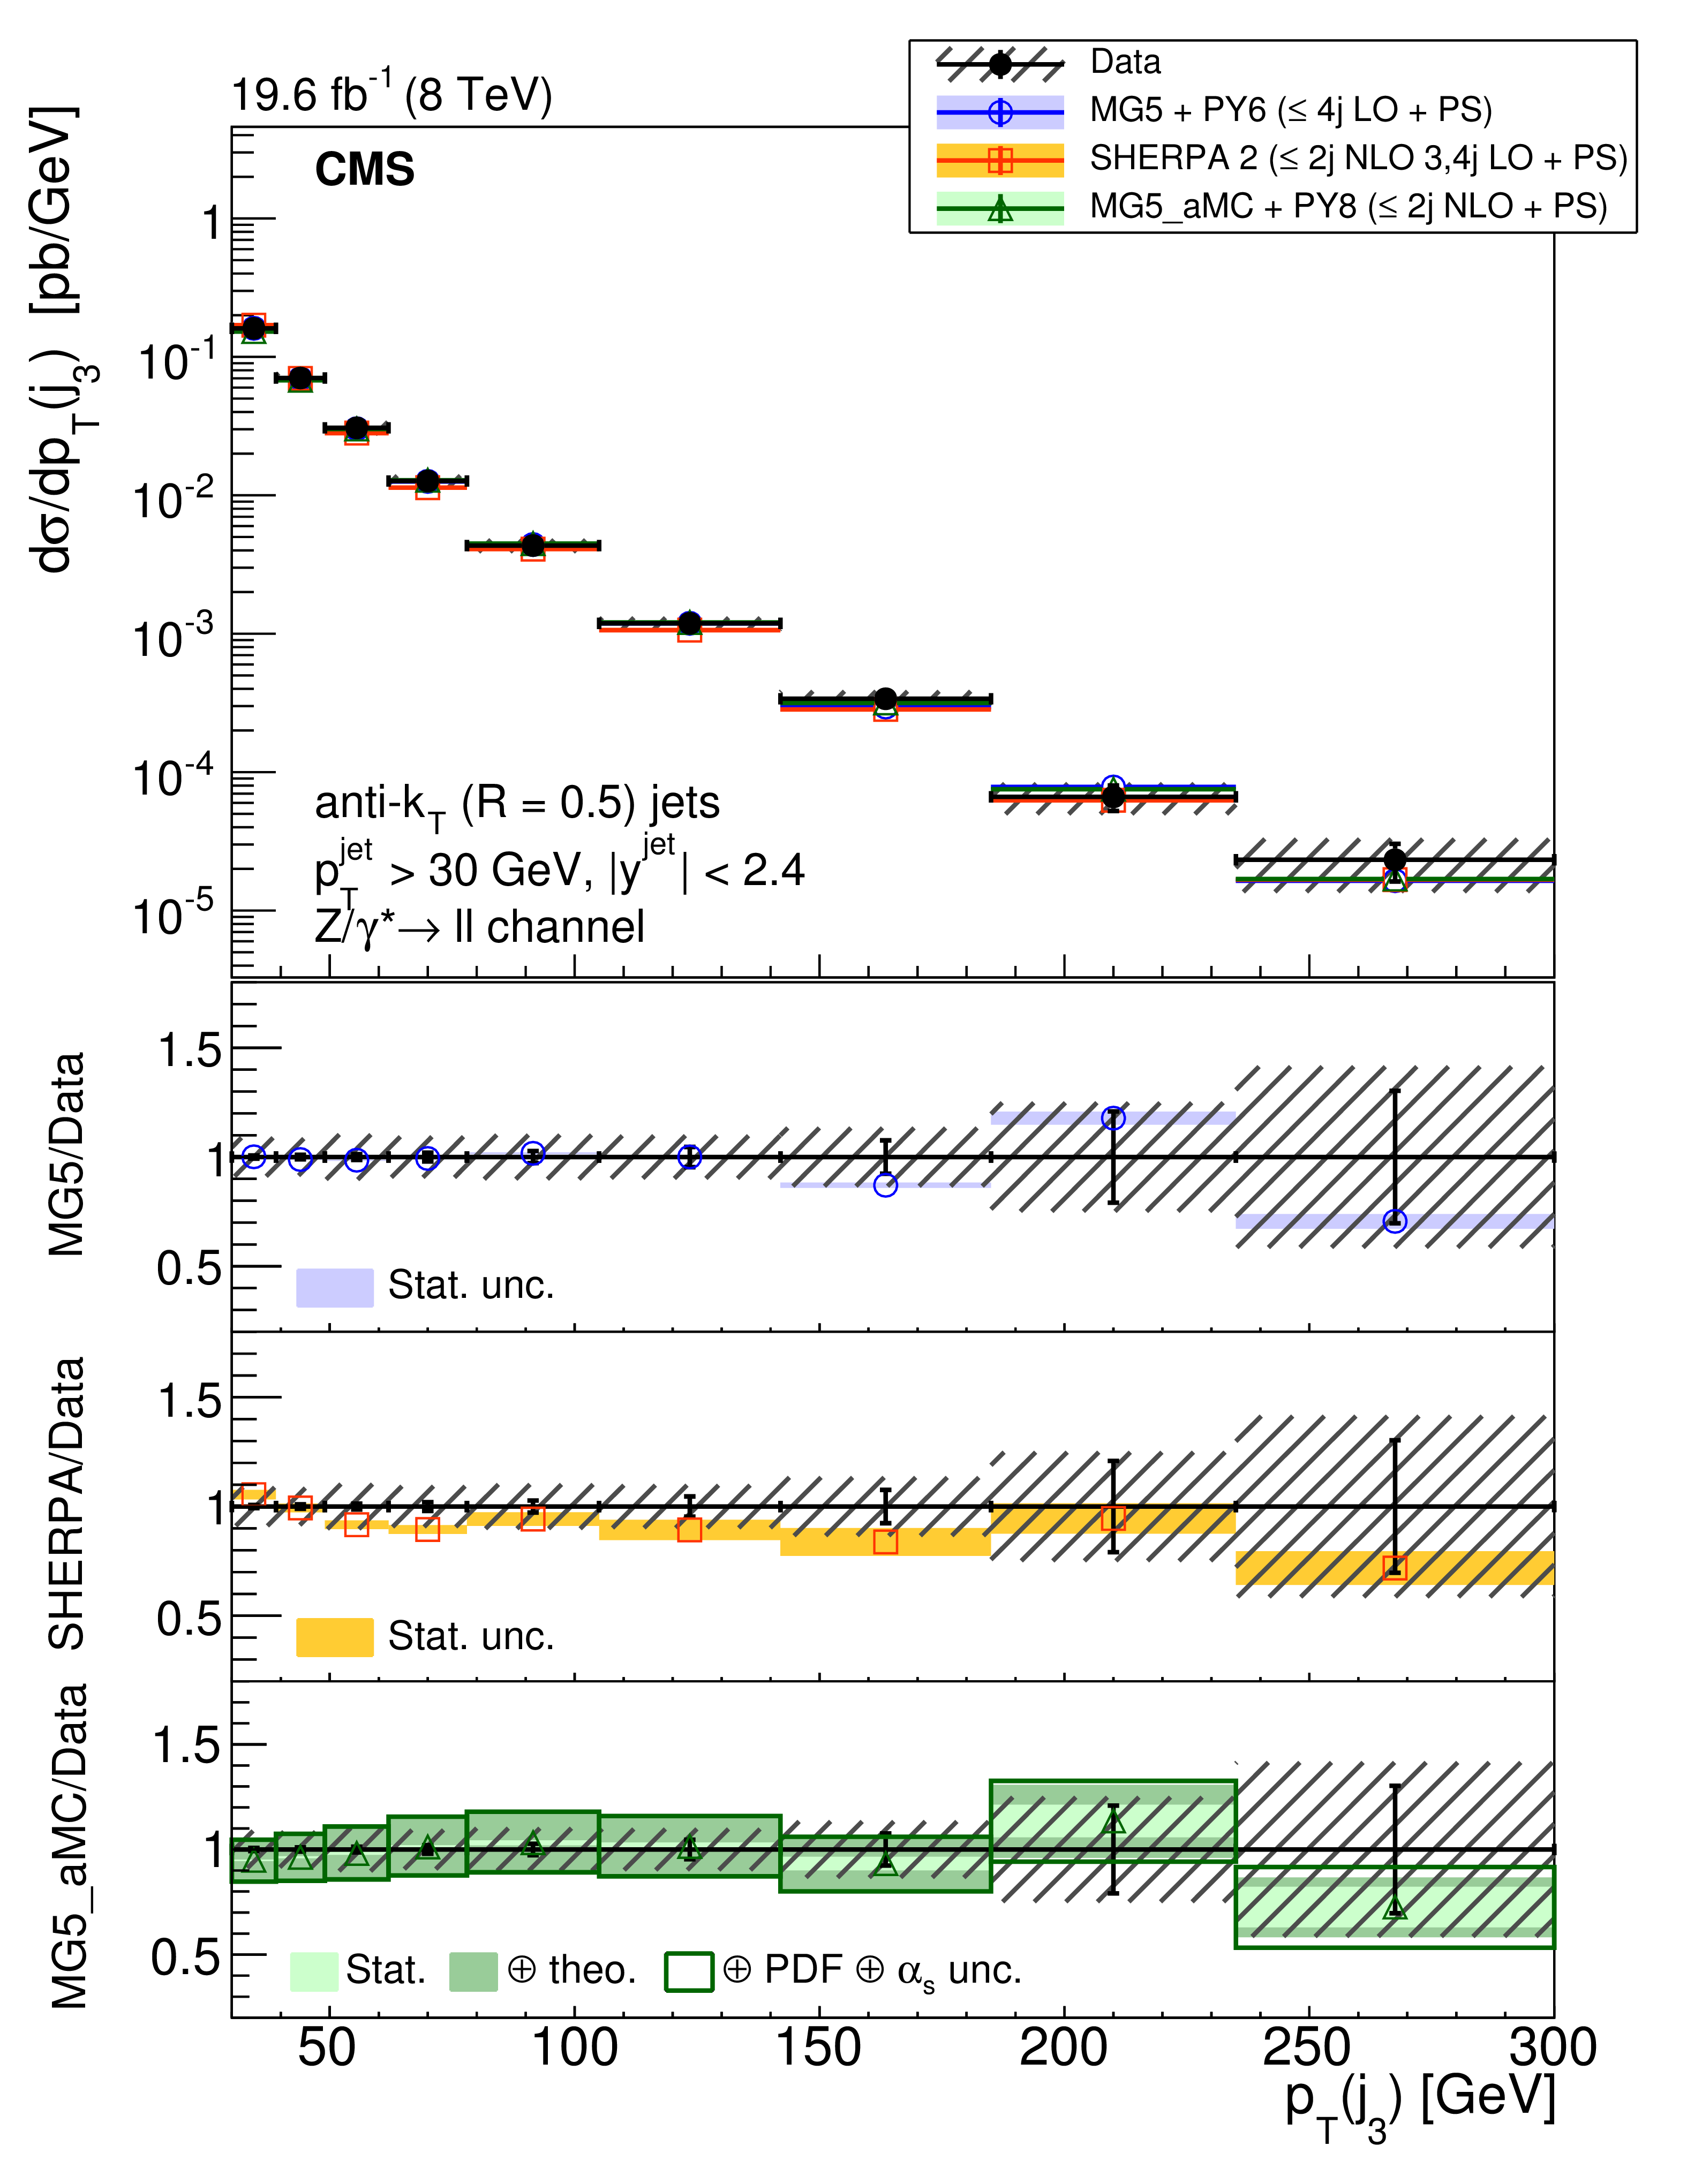
Figure 4:
The differential cross section for $ {\mathrm{ Z } (\to \ell \ell )+\text {jets}} $ production measured as a function of the (left) $3^{\text {rd}}$ and (right) $4^{\text {th}}$ jet $ {p_{\mathrm {T}}} $ compared to the predictions calculated with MadGraph 5+PYTHIA 6, SHERPA 2, and mg5-amc +PYTHIA 8. The lower panels show the ratios of the theoretical predictions to the measurements. Error bars around the experimental points show the statistical uncertainty, while the cross-hatched bands indicate the statistical and systematic uncertainties added in quadrature. The boxes around the mg5-amc + PYTHIA 8 to measurement ratio represent the uncertainty on the prediction, including statistical, theoretical (from scale variations), and PDF uncertainties. The dark green area represents the statistical and theoretical uncertainties only, while the light green area represents the statistical uncertainty alone. |
png pdf |
Figure 4-a:
The differential cross section for $ {\mathrm{ Z } (\to \ell \ell )+\text {jets}} $ production measured as a function of the (left) $3^{\text {rd}}$ and (right) $4^{\text {th}}$ jet $ {p_{\mathrm {T}}} $ compared to the predictions calculated with MadGraph 5+PYTHIA 6, SHERPA 2, and mg5-amc +PYTHIA 8. The lower panels show the ratios of the theoretical predictions to the measurements. Error bars around the experimental points show the statistical uncertainty, while the cross-hatched bands indicate the statistical and systematic uncertainties added in quadrature. The boxes around the mg5-amc + PYTHIA 8 to measurement ratio represent the uncertainty on the prediction, including statistical, theoretical (from scale variations), and PDF uncertainties. The dark green area represents the statistical and theoretical uncertainties only, while the light green area represents the statistical uncertainty alone. |

png pdf |
Figure 4-b:
The differential cross section for $ {\mathrm{ Z } (\to \ell \ell )+\text {jets}} $ production measured as a function of the (left) $3^{\text {rd}}$ and (right) $4^{\text {th}}$ jet $ {p_{\mathrm {T}}} $ compared to the predictions calculated with MadGraph 5+PYTHIA 6, SHERPA 2, and mg5-amc +PYTHIA 8. The lower panels show the ratios of the theoretical predictions to the measurements. Error bars around the experimental points show the statistical uncertainty, while the cross-hatched bands indicate the statistical and systematic uncertainties added in quadrature. The boxes around the mg5-amc + PYTHIA 8 to measurement ratio represent the uncertainty on the prediction, including statistical, theoretical (from scale variations), and PDF uncertainties. The dark green area represents the statistical and theoretical uncertainties only, while the light green area represents the statistical uncertainty alone. |
png pdf |
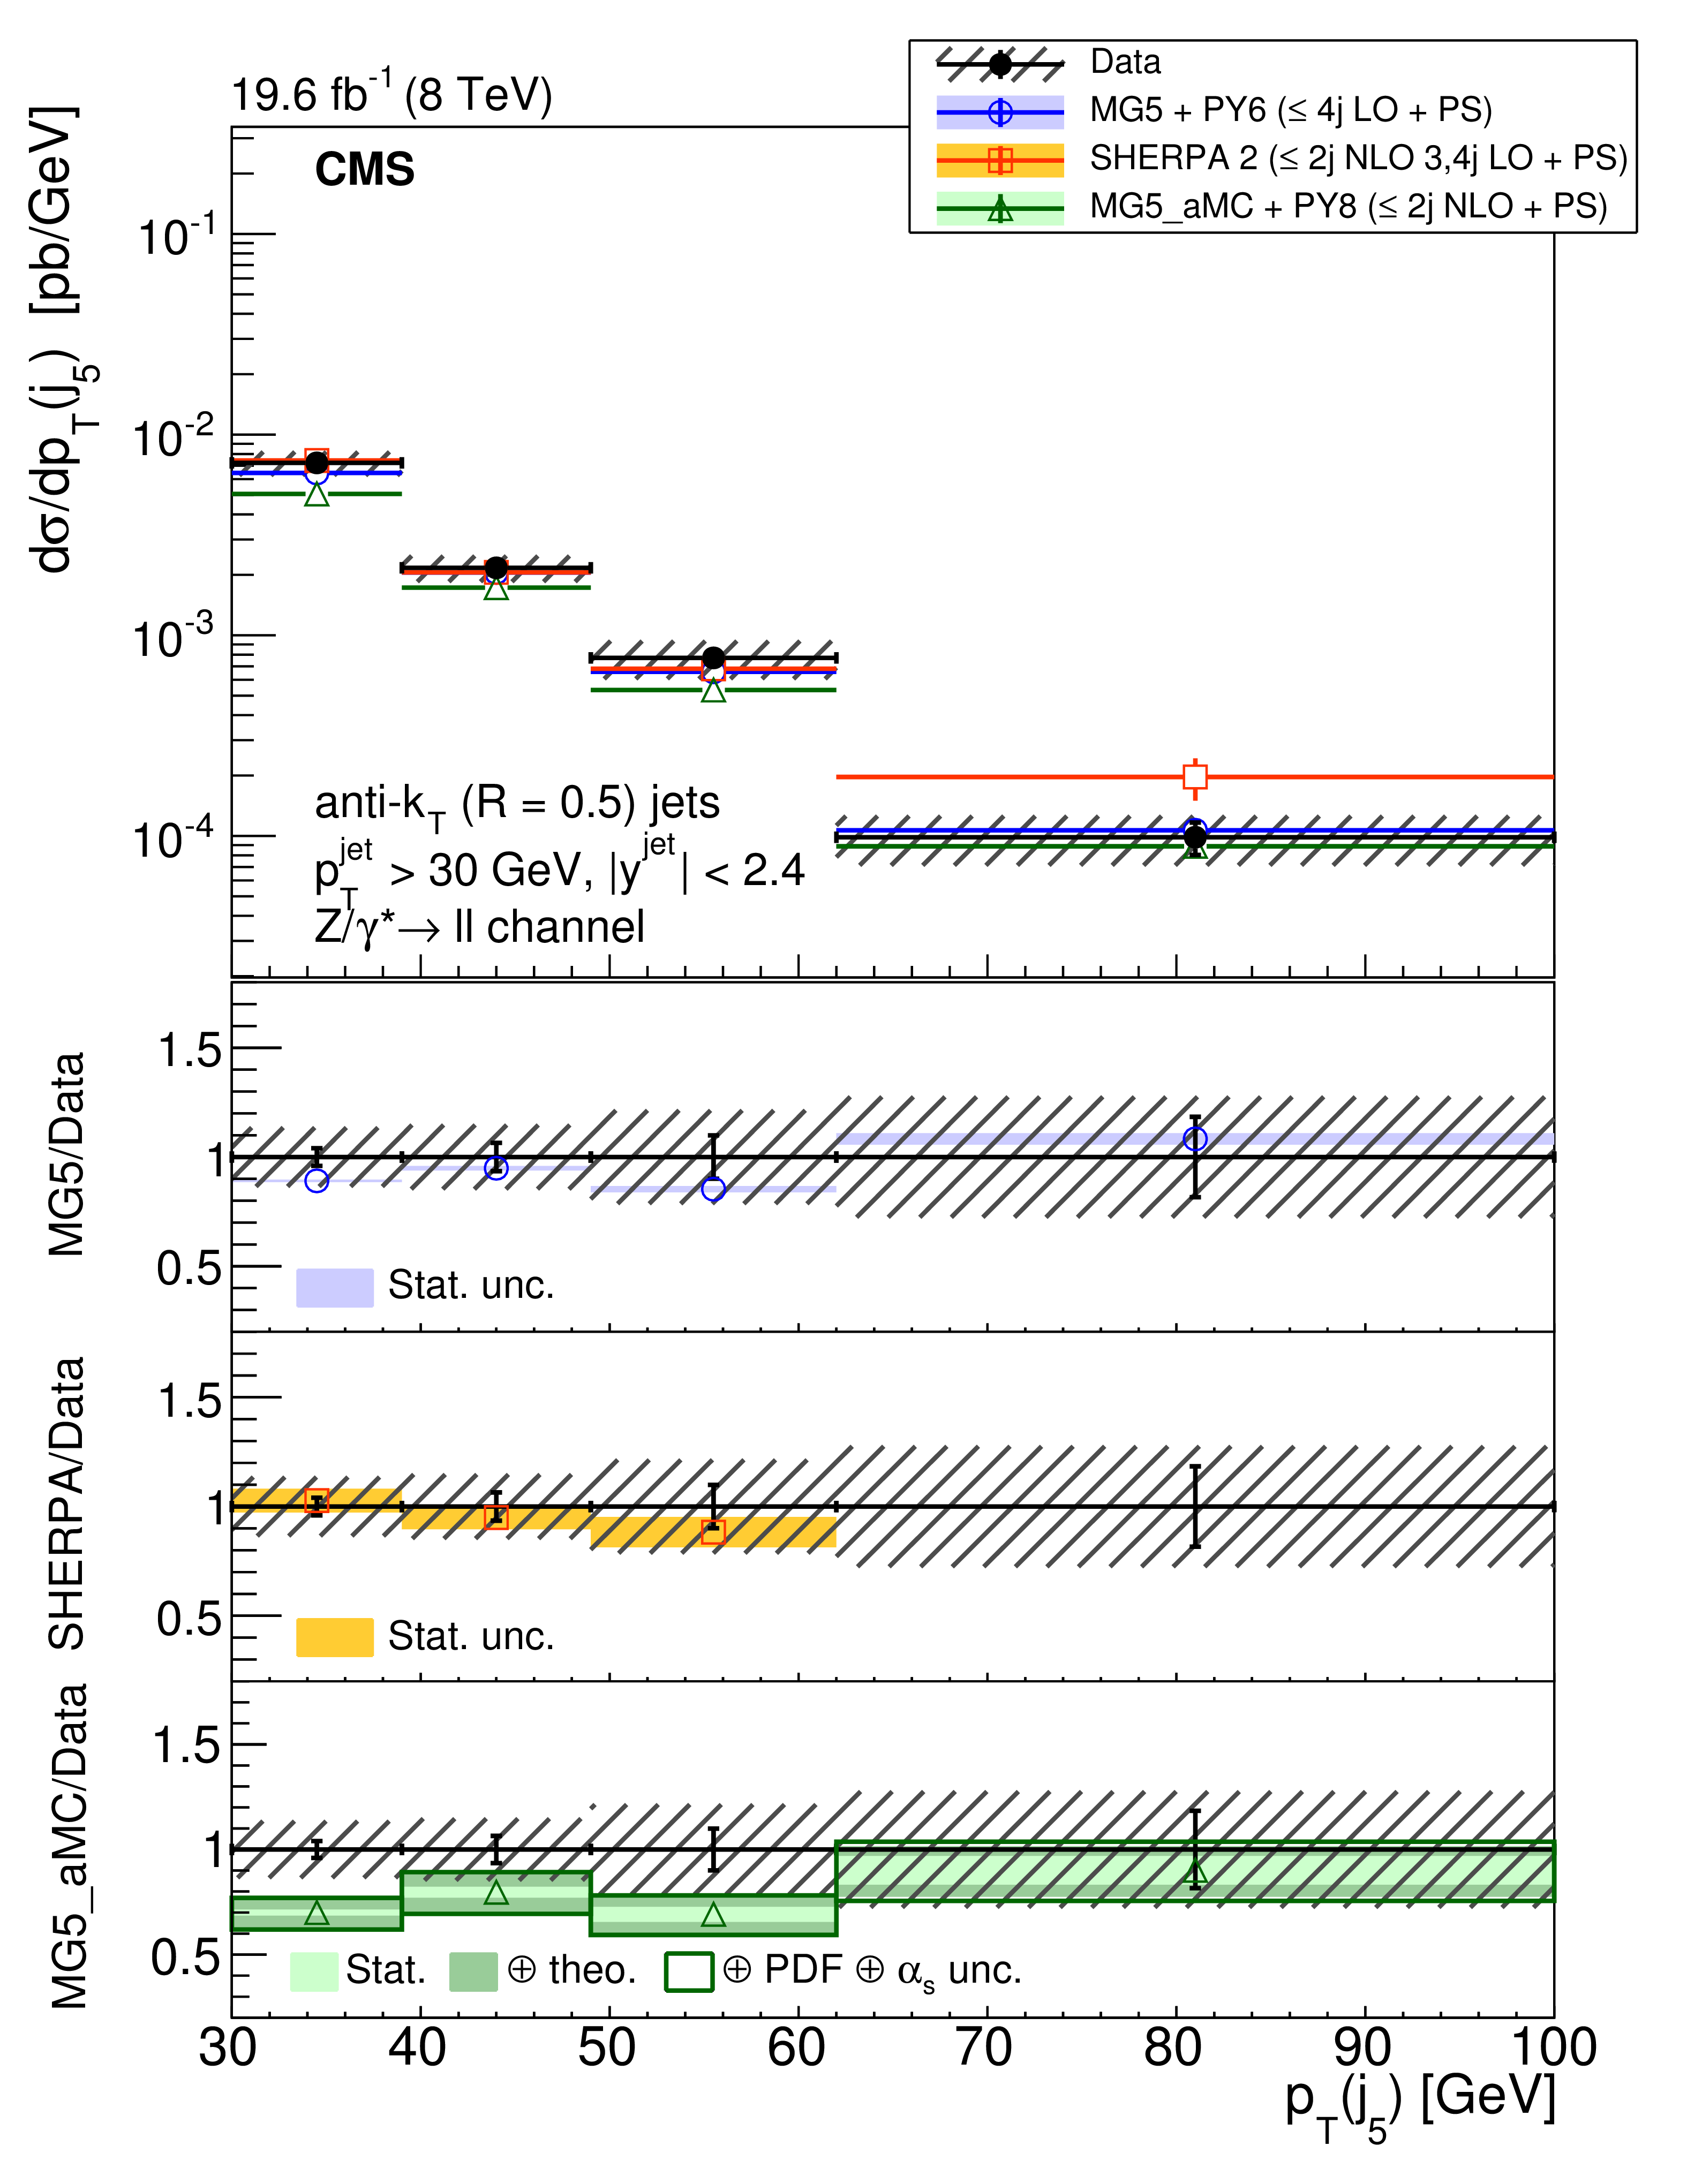
Figure 5:
The differential cross section for $ {\mathrm{ Z } (\to \ell \ell )+\text {jets}} $ production measured as a function of the $5^{\text {th}}$ jet $ {p_{\mathrm {T}}} $ compared to the predictions calculated with MadGraph 5+ PYTHIA 6, SHERPA 2, and mg5-amc +PYTHIA 8. The lower panels show the ratios of the theoretical predictions to the measurements. Error bars around the experimental points show the statistical uncertainty, while the cross-hatched bands indicate the statistical and systematic uncertainties added in quadrature. The boxes around the mg5-amc + PYTHIA 8 to measurement ratio represent the uncertainty on the prediction, including statistical, theoretical (from scale variations), and PDF uncertainties. The dark green area represents the statistical and theoretical uncertainties only, while the light green area represents the statistical uncertainty alone. |
png pdf |
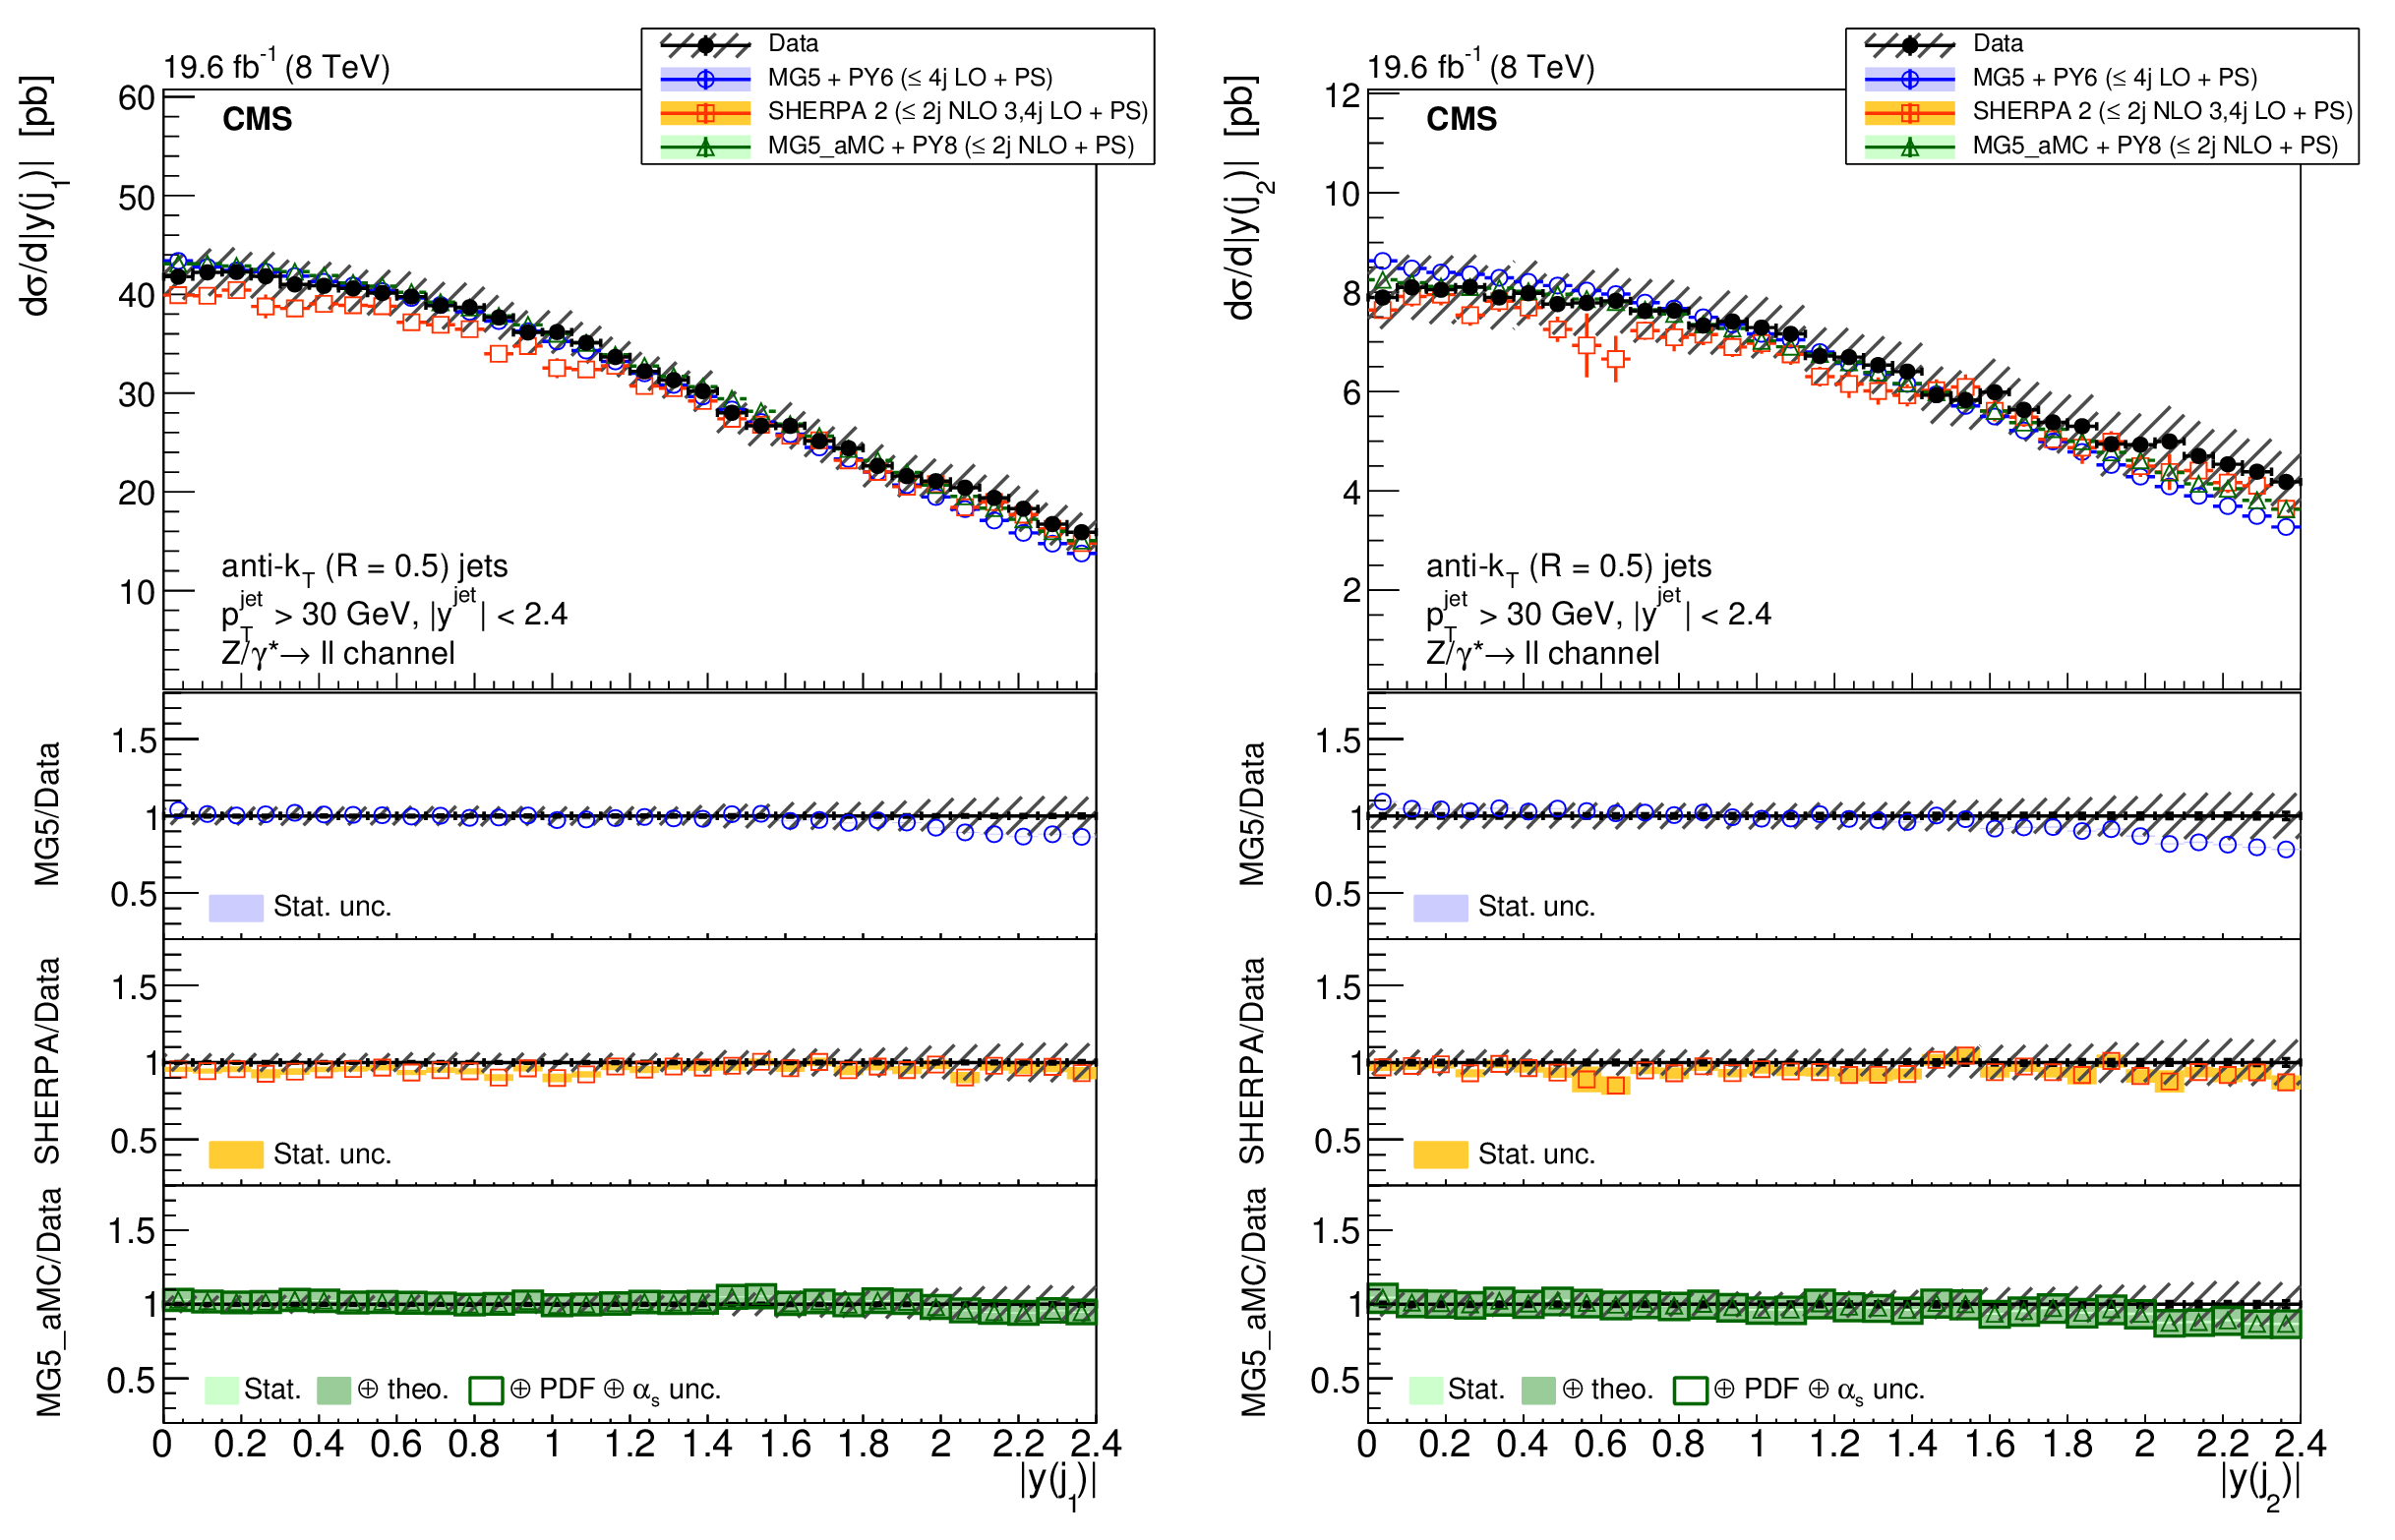
Figure 6:
The differential cross section for $ {\mathrm{ Z } (\to \ell \ell )+\text {jets}} $ production measured as a function of the (left) $1^{\text {st}}$ and (right) $2^{\text {nd}}$ jet $< y > $ compared to the predictions calculated with MadGraph 5+PYTHIA 6, SHERPA 2, and mg5-amc +PYTHIA 8. The lower panels show the ratios of the theoretical predictions to the measurements. Error bars around the experimental points show the statistical uncertainty, while the cross-hatched bands indicate the statistical and systematic uncertainties added in quadrature. The boxes around the mg5-amc + PYTHIA 8 to measurement ratio represent the uncertainty on the prediction, including statistical, theoretical (from scale variations), and PDF uncertainties. The dark green area represents the statistical and theoretical uncertainties only, while the light green area represents the statistical uncertainty alone. |

png pdf |
Figure 6-a:
The differential cross section for $ {\mathrm{ Z } (\to \ell \ell )+\text {jets}} $ production measured as a function of the (left) $1^{\text {st}}$ and (right) $2^{\text {nd}}$ jet $< y > $ compared to the predictions calculated with MadGraph 5+PYTHIA 6, SHERPA 2, and mg5-amc +PYTHIA 8. The lower panels show the ratios of the theoretical predictions to the measurements. Error bars around the experimental points show the statistical uncertainty, while the cross-hatched bands indicate the statistical and systematic uncertainties added in quadrature. The boxes around the mg5-amc + PYTHIA 8 to measurement ratio represent the uncertainty on the prediction, including statistical, theoretical (from scale variations), and PDF uncertainties. The dark green area represents the statistical and theoretical uncertainties only, while the light green area represents the statistical uncertainty alone. |

png pdf |
Figure 6-b:
The differential cross section for $ {\mathrm{ Z } (\to \ell \ell )+\text {jets}} $ production measured as a function of the (left) $1^{\text {st}}$ and (right) $2^{\text {nd}}$ jet $< y > $ compared to the predictions calculated with MadGraph 5+PYTHIA 6, SHERPA 2, and mg5-amc +PYTHIA 8. The lower panels show the ratios of the theoretical predictions to the measurements. Error bars around the experimental points show the statistical uncertainty, while the cross-hatched bands indicate the statistical and systematic uncertainties added in quadrature. The boxes around the mg5-amc + PYTHIA 8 to measurement ratio represent the uncertainty on the prediction, including statistical, theoretical (from scale variations), and PDF uncertainties. The dark green area represents the statistical and theoretical uncertainties only, while the light green area represents the statistical uncertainty alone. |

png pdf |
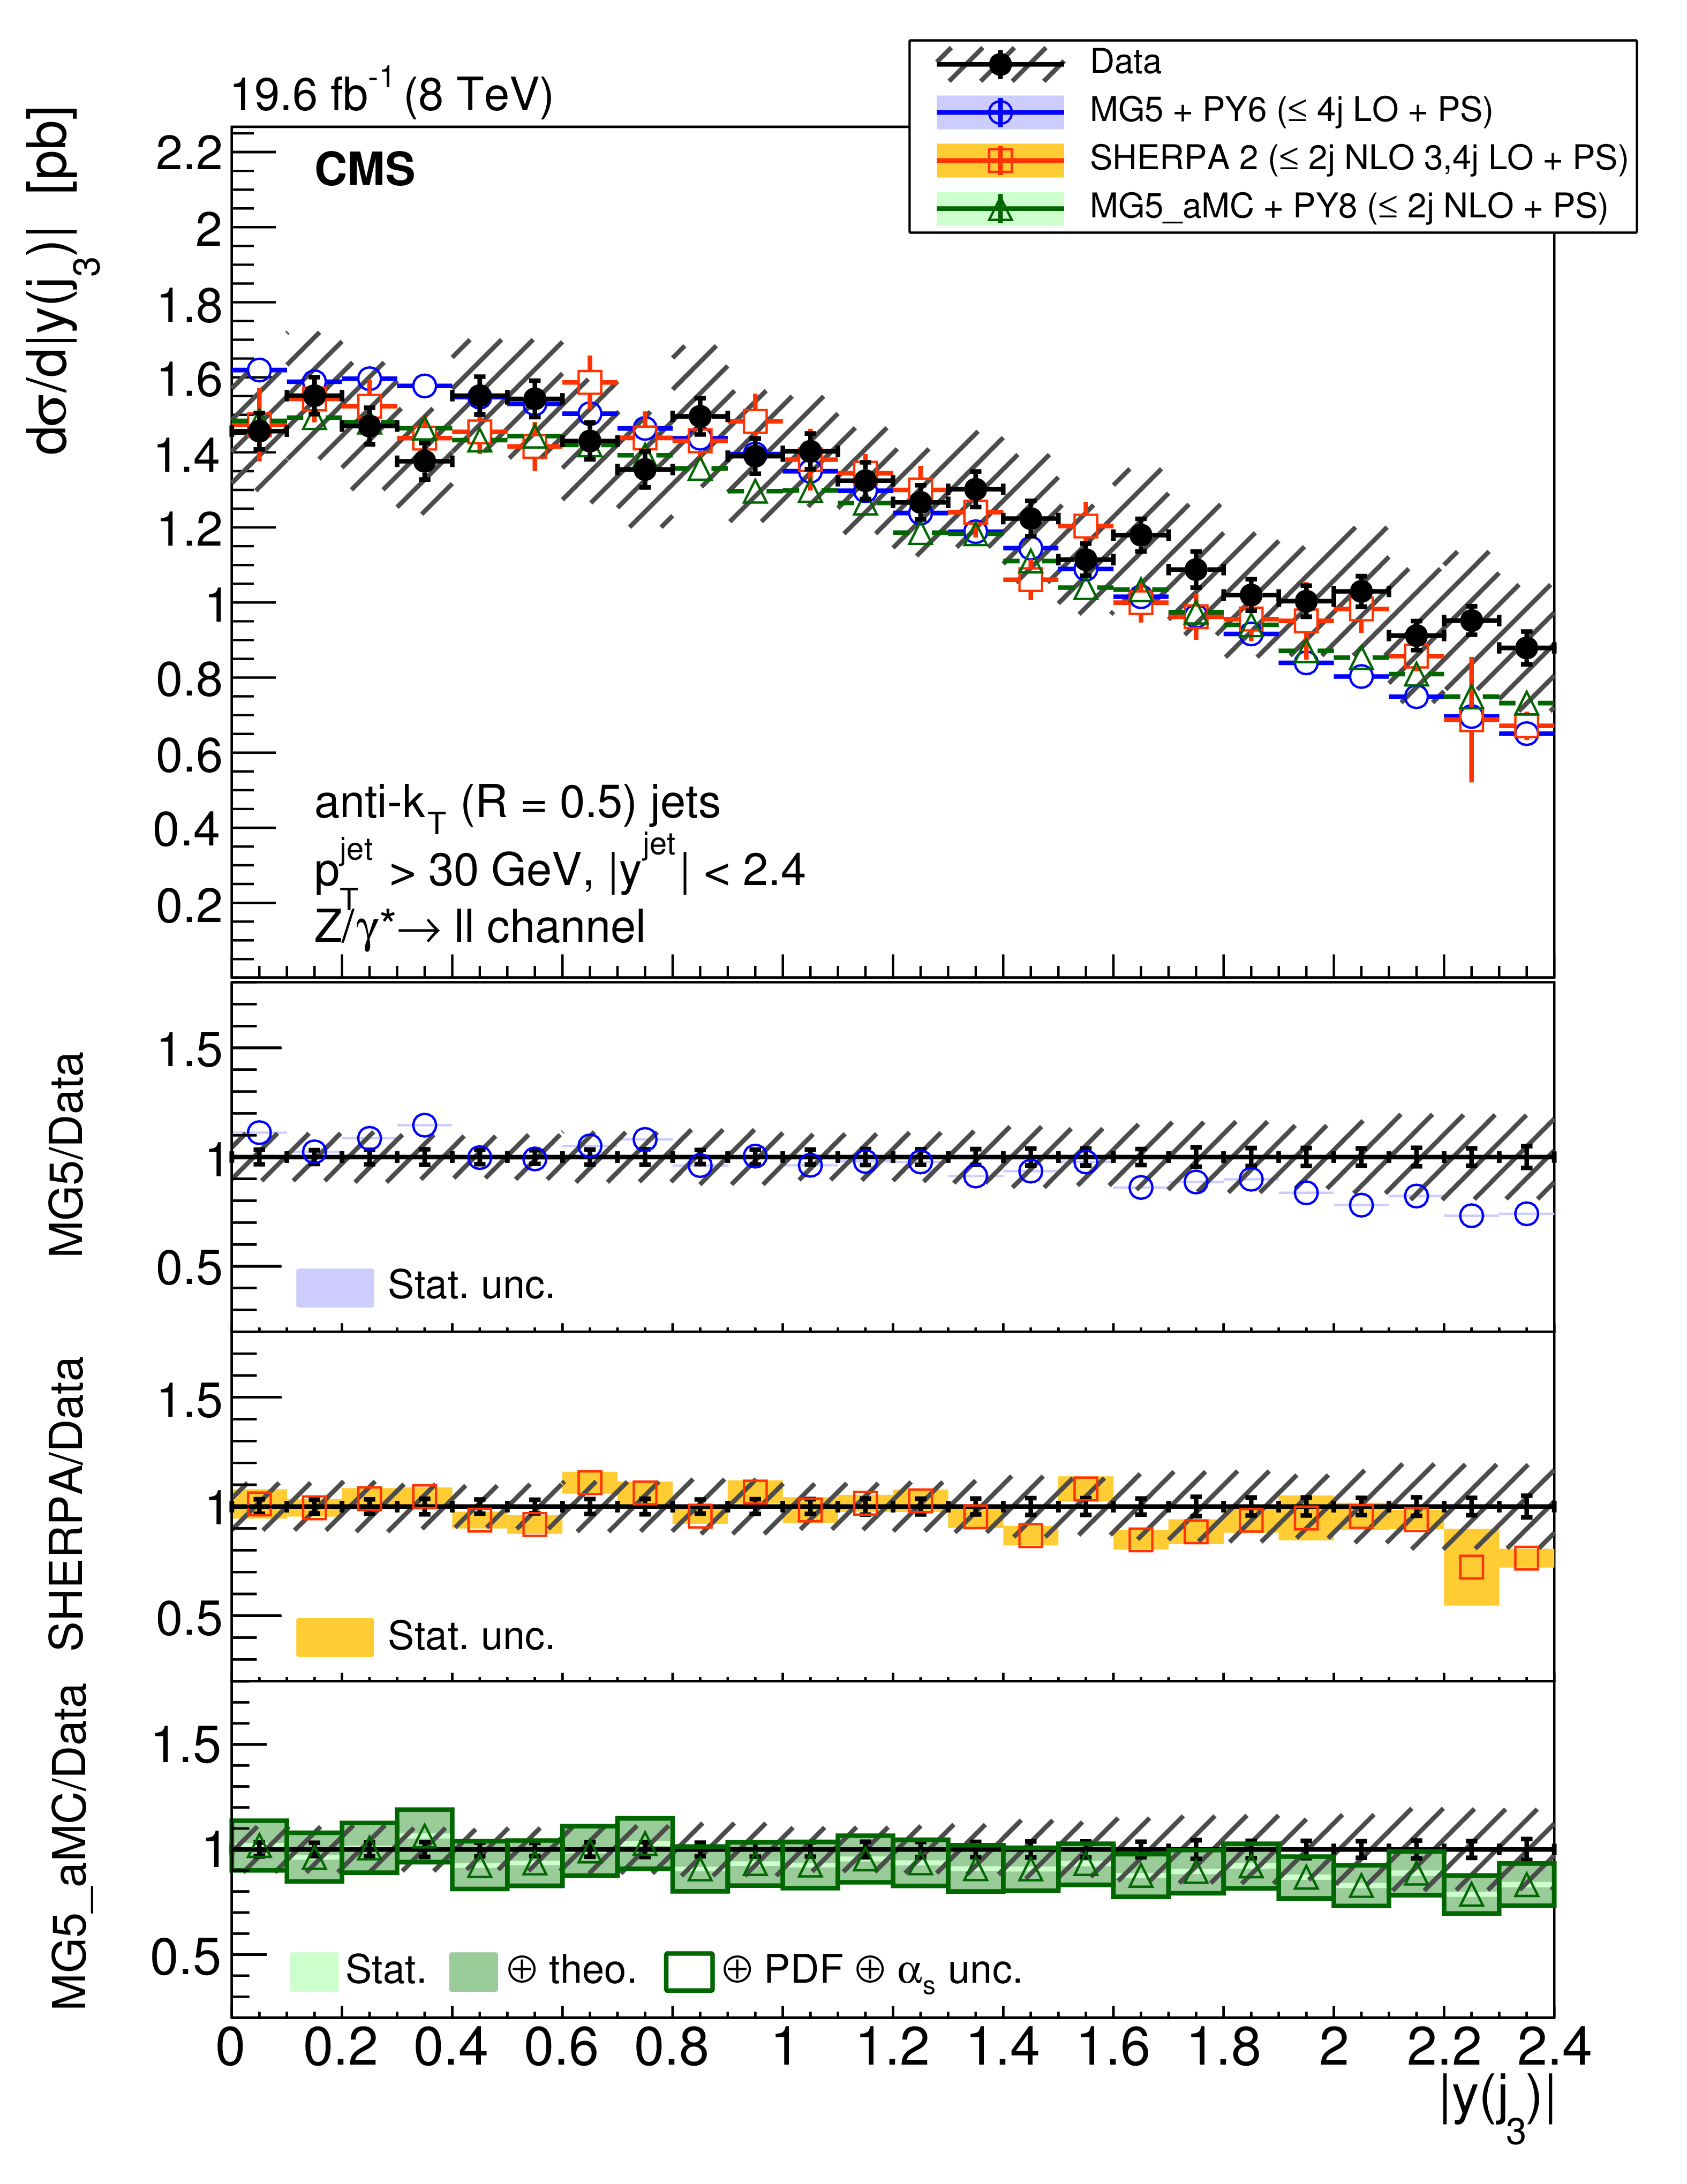
Figure 7:
The differential cross section for $ {\mathrm{ Z } (\to \ell \ell )+\text {jets}} $ production measured as a function of the (left) $3^{\text {rd}}$ and (right) $4^{\text {th}}$ jet $ {| y | }$ compared to the predictions calculated with MadGraph 5+PYTHIA 6, SHERPA 2, and mg5-amc +PYTHIA 8. The lower panels show the ratios of the theoretical predictions to the measurements. Error bars around the experimental points show the statistical uncertainty, while the cross-hatched bands indicate the statistical and systematic uncertainties added in quadrature. The boxes around the mg5-amc + PYTHIA 8 to measurement ratio represent the uncertainty on the prediction, including statistical, theoretical (from scale variations), and PDF uncertainties. The dark green area represents the statistical and theoretical uncertainties only, while the light green area represents the statistical uncertainty alone. |
png pdf |
Figure 7-a:
The differential cross section for $ {\mathrm{ Z } (\to \ell \ell )+\text {jets}} $ production measured as a function of the (left) $3^{\text {rd}}$ and (right) $4^{\text {th}}$ jet $ {| y | }$ compared to the predictions calculated with MadGraph 5+PYTHIA 6, SHERPA 2, and mg5-amc +PYTHIA 8. The lower panels show the ratios of the theoretical predictions to the measurements. Error bars around the experimental points show the statistical uncertainty, while the cross-hatched bands indicate the statistical and systematic uncertainties added in quadrature. The boxes around the mg5-amc + PYTHIA 8 to measurement ratio represent the uncertainty on the prediction, including statistical, theoretical (from scale variations), and PDF uncertainties. The dark green area represents the statistical and theoretical uncertainties only, while the light green area represents the statistical uncertainty alone. |

png pdf |
Figure 7-b:
The differential cross section for $ {\mathrm{ Z } (\to \ell \ell )+\text {jets}} $ production measured as a function of the (left) $3^{\text {rd}}$ and (right) $4^{\text {th}}$ jet $ {| y | }$ compared to the predictions calculated with MadGraph 5+PYTHIA 6, SHERPA 2, and mg5-amc +PYTHIA 8. The lower panels show the ratios of the theoretical predictions to the measurements. Error bars around the experimental points show the statistical uncertainty, while the cross-hatched bands indicate the statistical and systematic uncertainties added in quadrature. The boxes around the mg5-amc + PYTHIA 8 to measurement ratio represent the uncertainty on the prediction, including statistical, theoretical (from scale variations), and PDF uncertainties. The dark green area represents the statistical and theoretical uncertainties only, while the light green area represents the statistical uncertainty alone. |
png pdf |
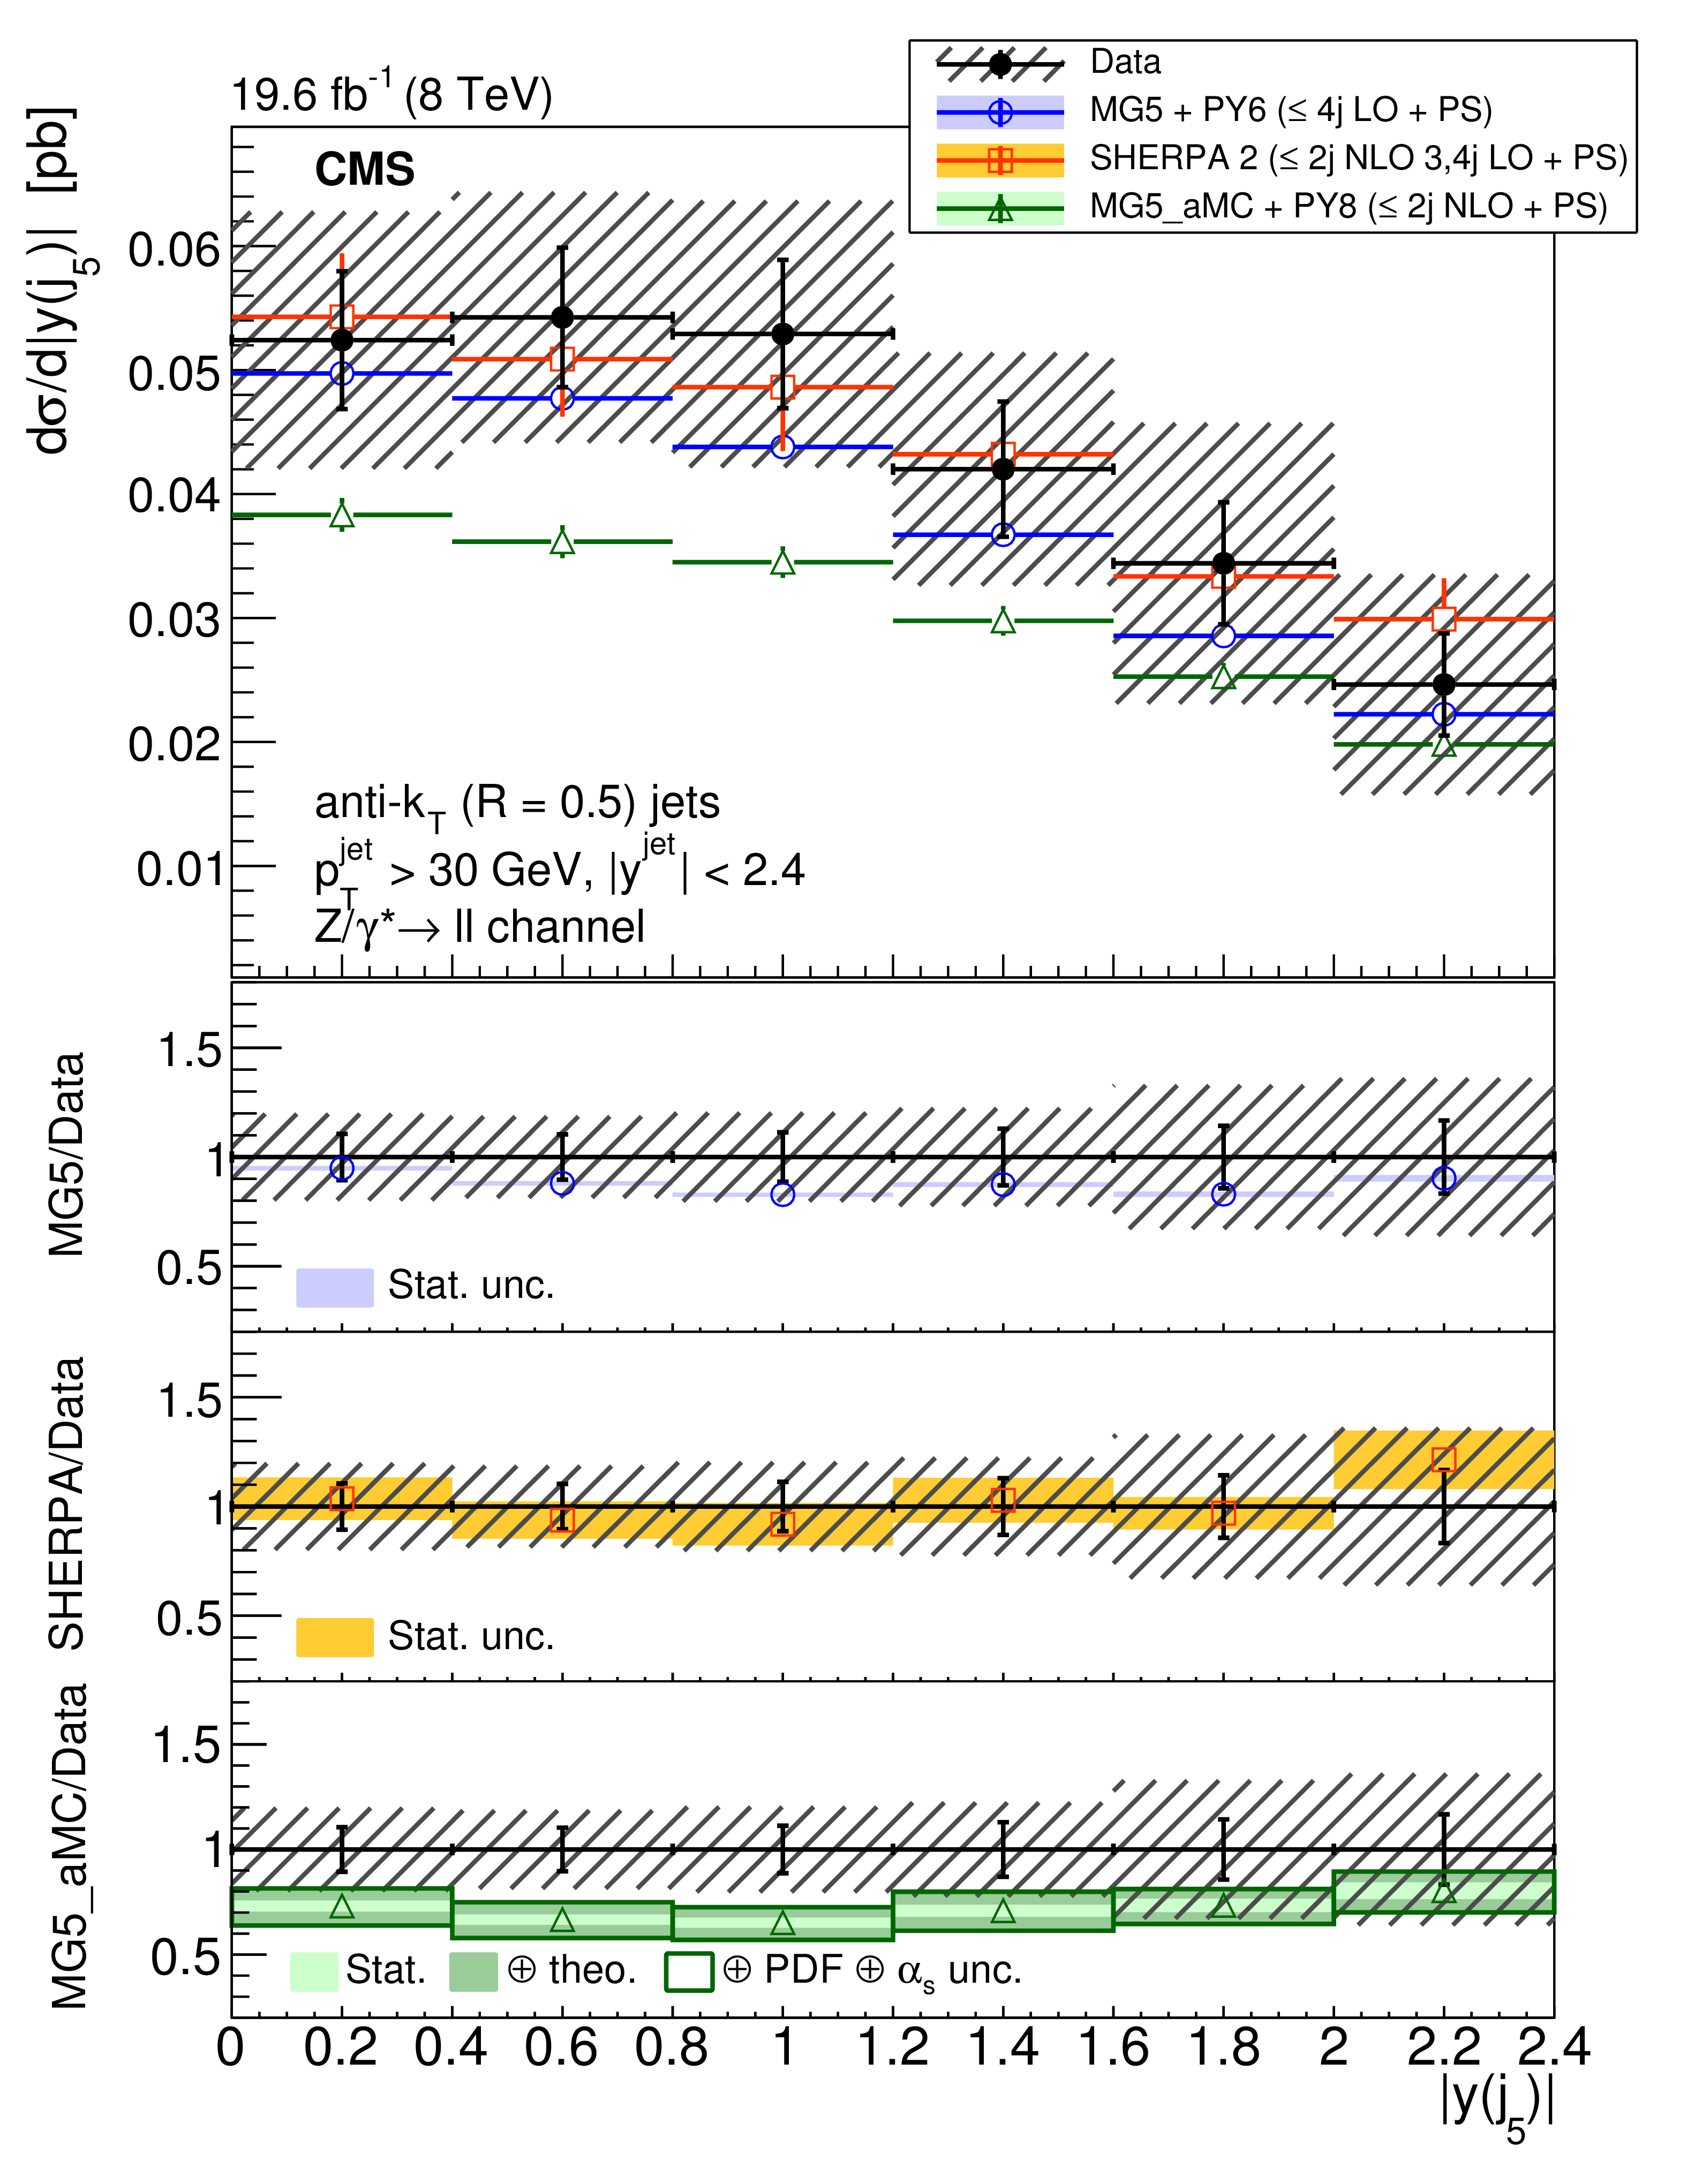
Figure 8:
The differential cross section for $ {\mathrm{ Z } (\to \ell \ell )+\text {jets}} $ production measured as a function of the $5^{\text {th}}$ jet $< y > $ compared to the predictions calculated with MadGraph 5+PYTHIA 6, SHERPA 2, and mg5-amc +PYTHIA 8. The lower panels show the ratios of the theoretical predictions to the measurements. Error bars around the experimental points show the statistical uncertainty, while the cross-hatched bands indicate the statistical and systematic uncertainties added in quadrature. The boxes around the mg5-amc + PYTHIA 8 to measurement ratio represent the uncertainty on the prediction, including statistical, theoretical (from scale variations), and PDF uncertainties. The dark green area represents the statistical and theoretical uncertainties only, while the light green area represents the statistical uncertainty alone. |

png pdf |
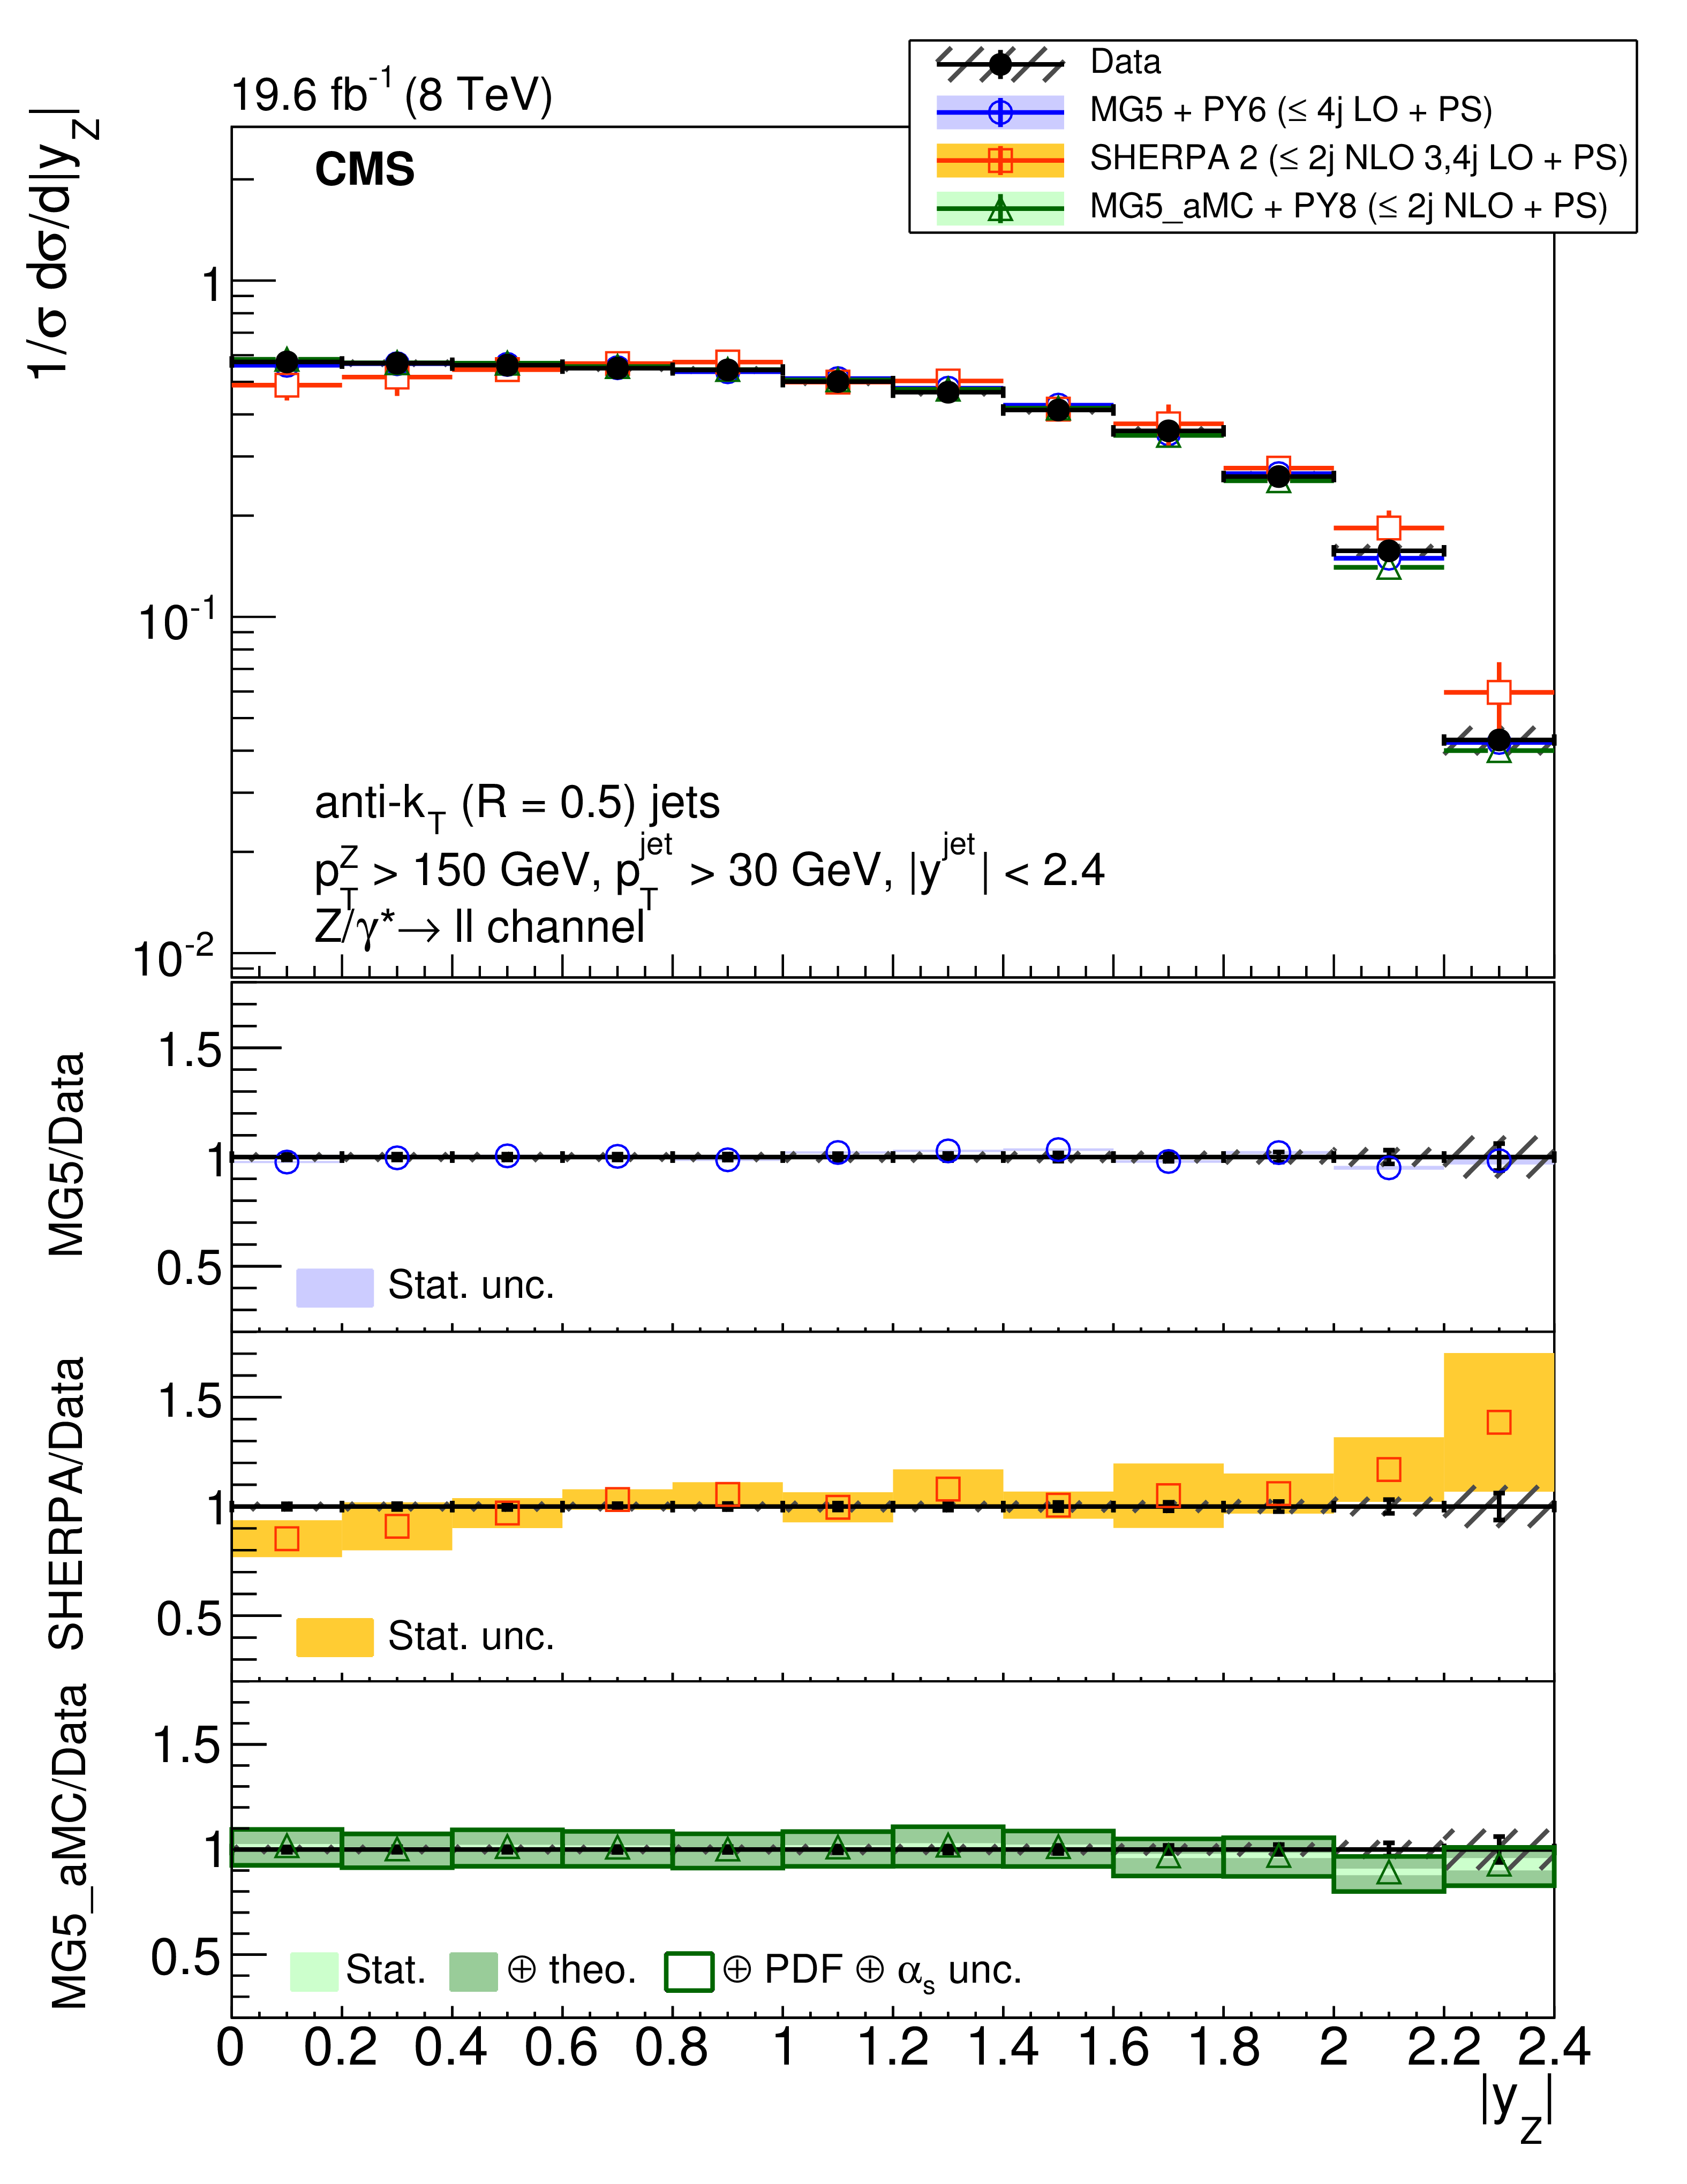
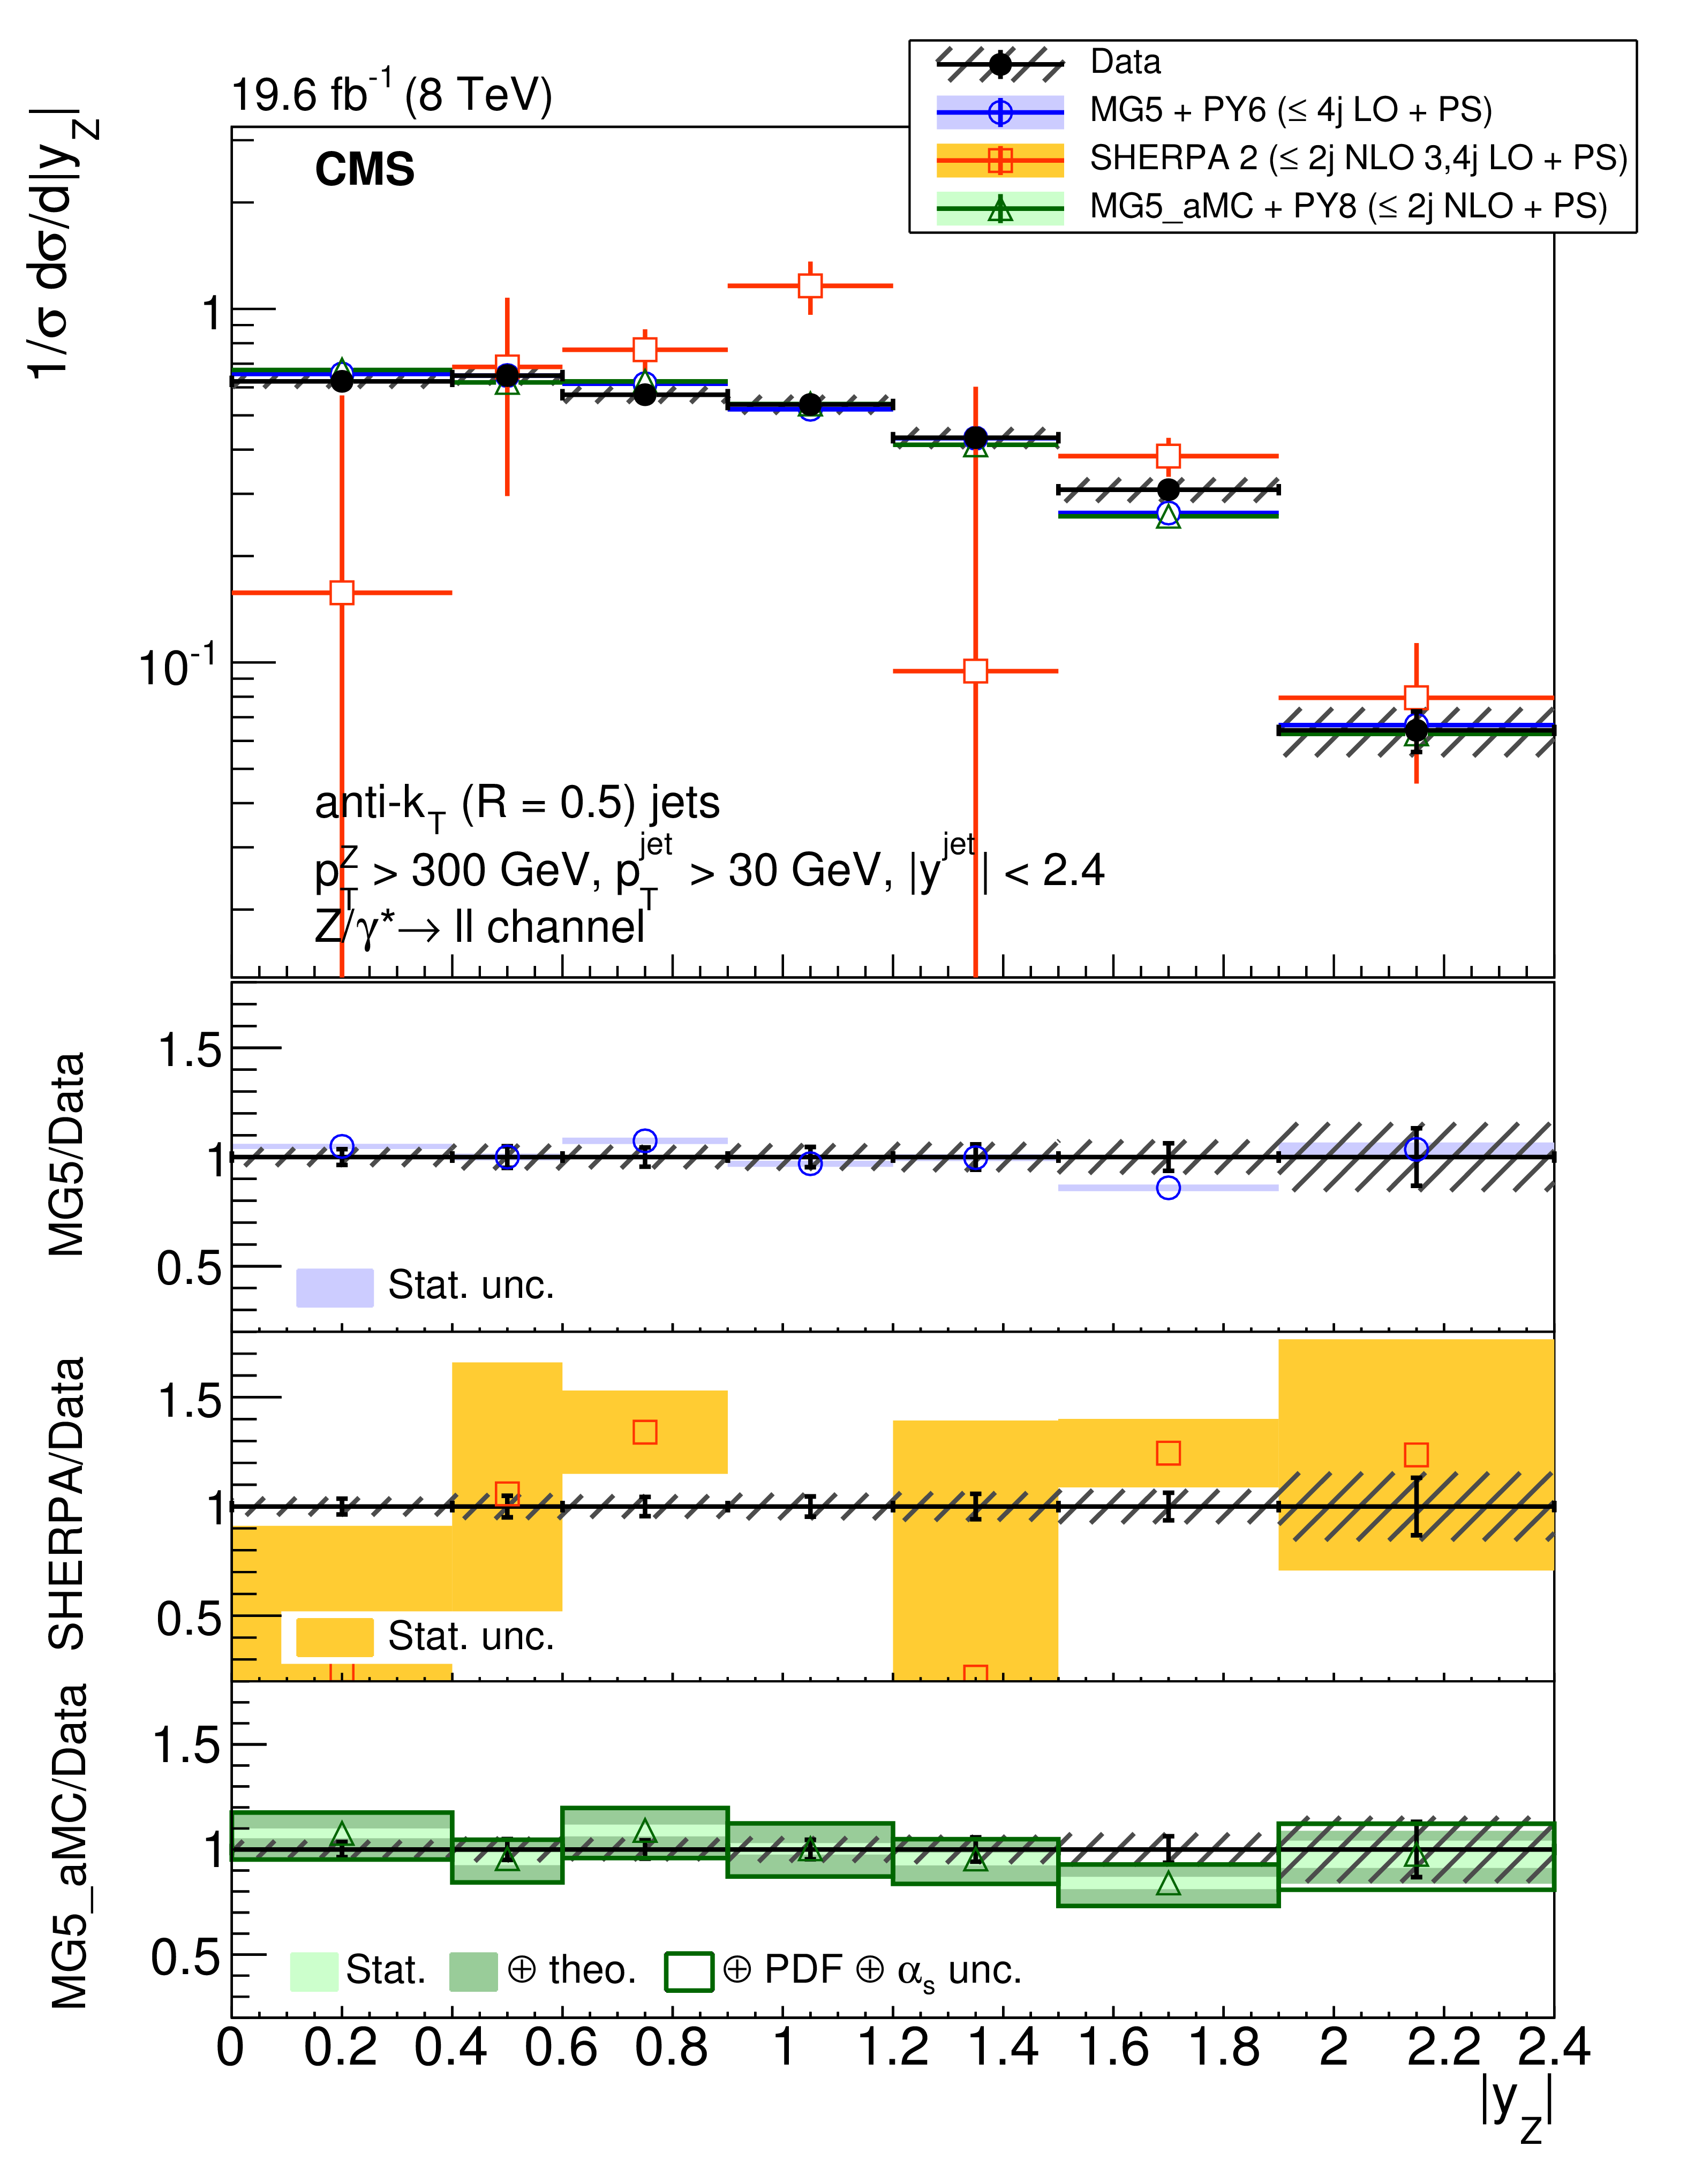
Figure 9:
The normalised differential cross section for $ {\mathrm{ Z } (\to \ell \ell )+\text {jets}} $ production measured as a function of Z boson rapidity compared to the predictions calculated with MadGraph 5+PYTHIA 6, SHERPA 2, and mg5-amc +PYTHIA 8. The cross section is measured (left) inclusively with respect to the Z boson $ {p_{\mathrm {T}}} $ , (middle) for $ {p_{\mathrm {T}}} >150 GeV $, and (right) for $ {p_{\mathrm {T}}} >300 GeV $. The lower panels show the ratios of the theoretical predictions to the measurements. Error bars around the experimental points show the statistical uncertainty, while the cross-hatched bands indicate the statistical and systematic uncertainties added in quadrature. The boxes around the mg5-amc + PYTHIA 8 to measurement ratio represent the uncertainty on the prediction, including statistical, theoretical (from scale variations), and PDF uncertainties. The dark green area represents the statistical and theoretical uncertainties only, while the light green area represents the statistical uncertainty alone. |

png pdf |
Figure 9-a:
The normalised differential cross section for $ {\mathrm{ Z } (\to \ell \ell )+\text {jets}} $ production measured as a function of Z boson rapidity compared to the predictions calculated with MadGraph 5+PYTHIA 6, SHERPA 2, and mg5-amc +PYTHIA 8. The cross section is measured (left) inclusively with respect to the Z boson $ {p_{\mathrm {T}}} $ , (middle) for $ {p_{\mathrm {T}}} >150 GeV $, and (right) for $ {p_{\mathrm {T}}} >300 GeV $. The lower panels show the ratios of the theoretical predictions to the measurements. Error bars around the experimental points show the statistical uncertainty, while the cross-hatched bands indicate the statistical and systematic uncertainties added in quadrature. The boxes around the mg5-amc + PYTHIA 8 to measurement ratio represent the uncertainty on the prediction, including statistical, theoretical (from scale variations), and PDF uncertainties. The dark green area represents the statistical and theoretical uncertainties only, while the light green area represents the statistical uncertainty alone. |
png pdf |
Figure 9-b:
The normalised differential cross section for $ {\mathrm{ Z } (\to \ell \ell )+\text {jets}} $ production measured as a function of Z boson rapidity compared to the predictions calculated with MadGraph 5+PYTHIA 6, SHERPA 2, and mg5-amc +PYTHIA 8. The cross section is measured (left) inclusively with respect to the Z boson $ {p_{\mathrm {T}}} $ , (middle) for $ {p_{\mathrm {T}}} >150 GeV $, and (right) for $ {p_{\mathrm {T}}} >300 GeV $. The lower panels show the ratios of the theoretical predictions to the measurements. Error bars around the experimental points show the statistical uncertainty, while the cross-hatched bands indicate the statistical and systematic uncertainties added in quadrature. The boxes around the mg5-amc + PYTHIA 8 to measurement ratio represent the uncertainty on the prediction, including statistical, theoretical (from scale variations), and PDF uncertainties. The dark green area represents the statistical and theoretical uncertainties only, while the light green area represents the statistical uncertainty alone. |
png pdf |
Figure 9-c:
The normalised differential cross section for $ {\mathrm{ Z } (\to \ell \ell )+\text {jets}} $ production measured as a function of Z boson rapidity compared to the predictions calculated with MadGraph 5+PYTHIA 6, SHERPA 2, and mg5-amc +PYTHIA 8. The cross section is measured (left) inclusively with respect to the Z boson $ {p_{\mathrm {T}}} $ , (middle) for $ {p_{\mathrm {T}}} >150 GeV $, and (right) for $ {p_{\mathrm {T}}} >300 GeV $. The lower panels show the ratios of the theoretical predictions to the measurements. Error bars around the experimental points show the statistical uncertainty, while the cross-hatched bands indicate the statistical and systematic uncertainties added in quadrature. The boxes around the mg5-amc + PYTHIA 8 to measurement ratio represent the uncertainty on the prediction, including statistical, theoretical (from scale variations), and PDF uncertainties. The dark green area represents the statistical and theoretical uncertainties only, while the light green area represents the statistical uncertainty alone. |

png pdf |
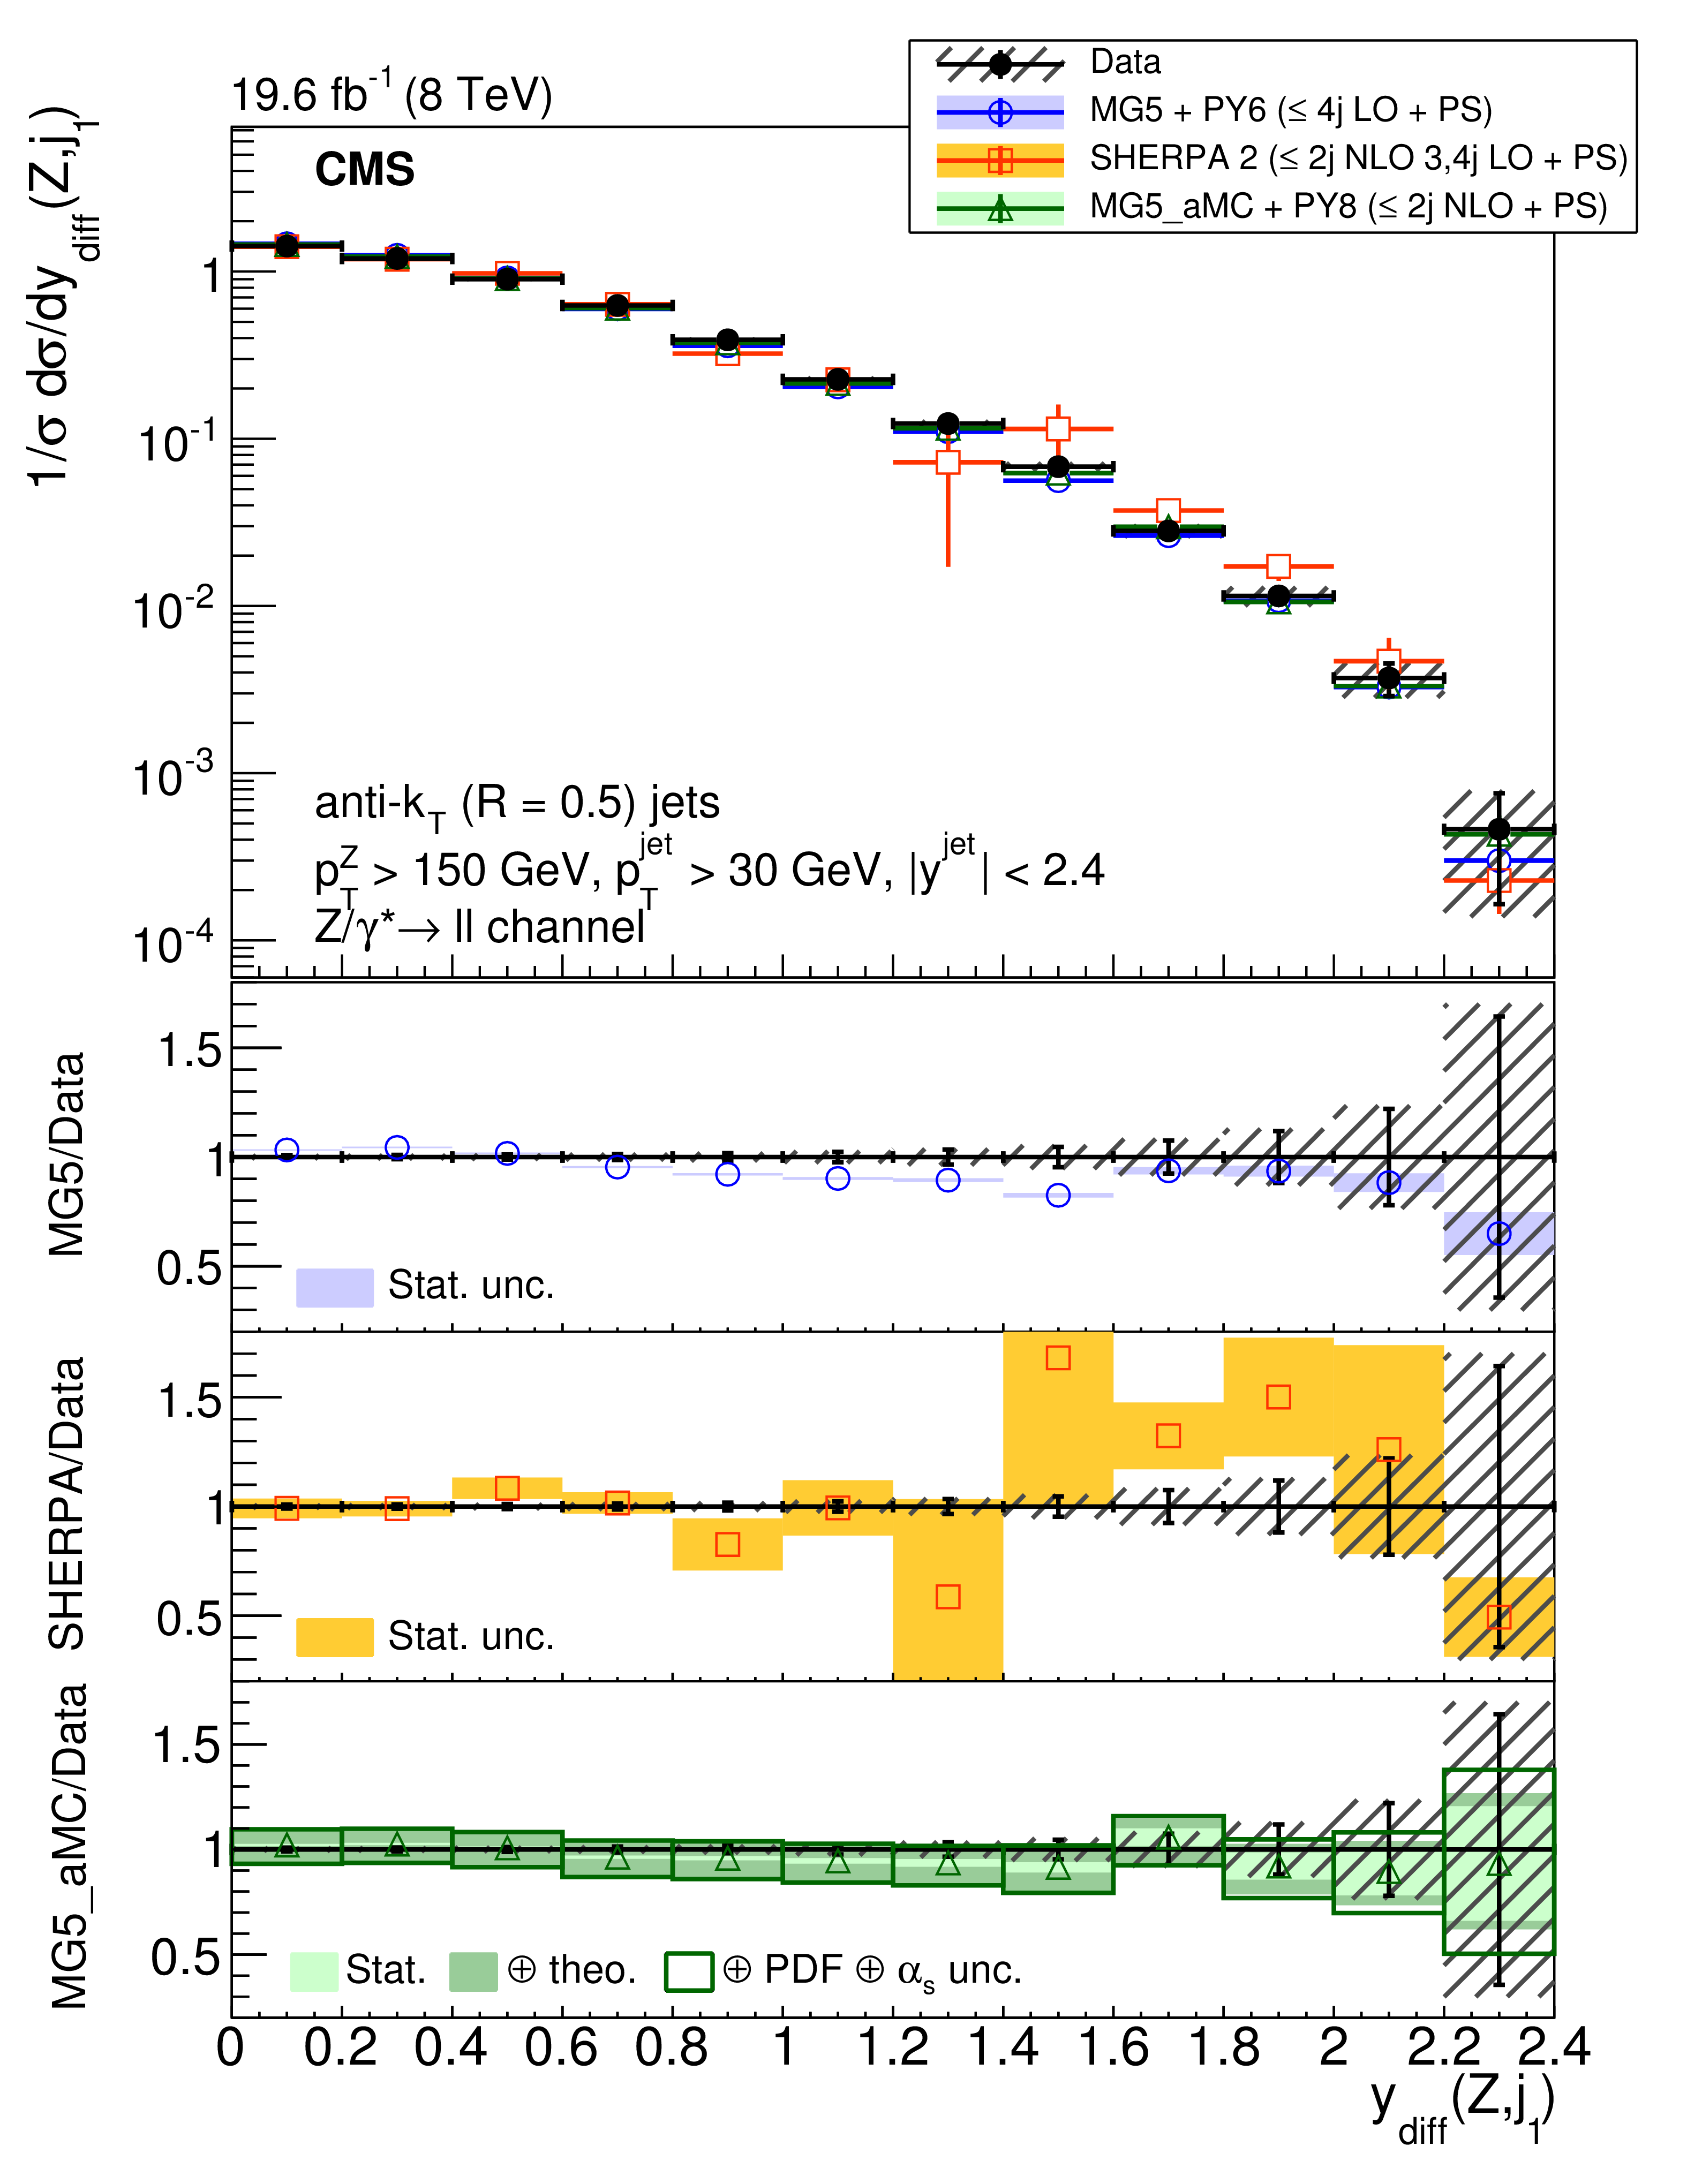
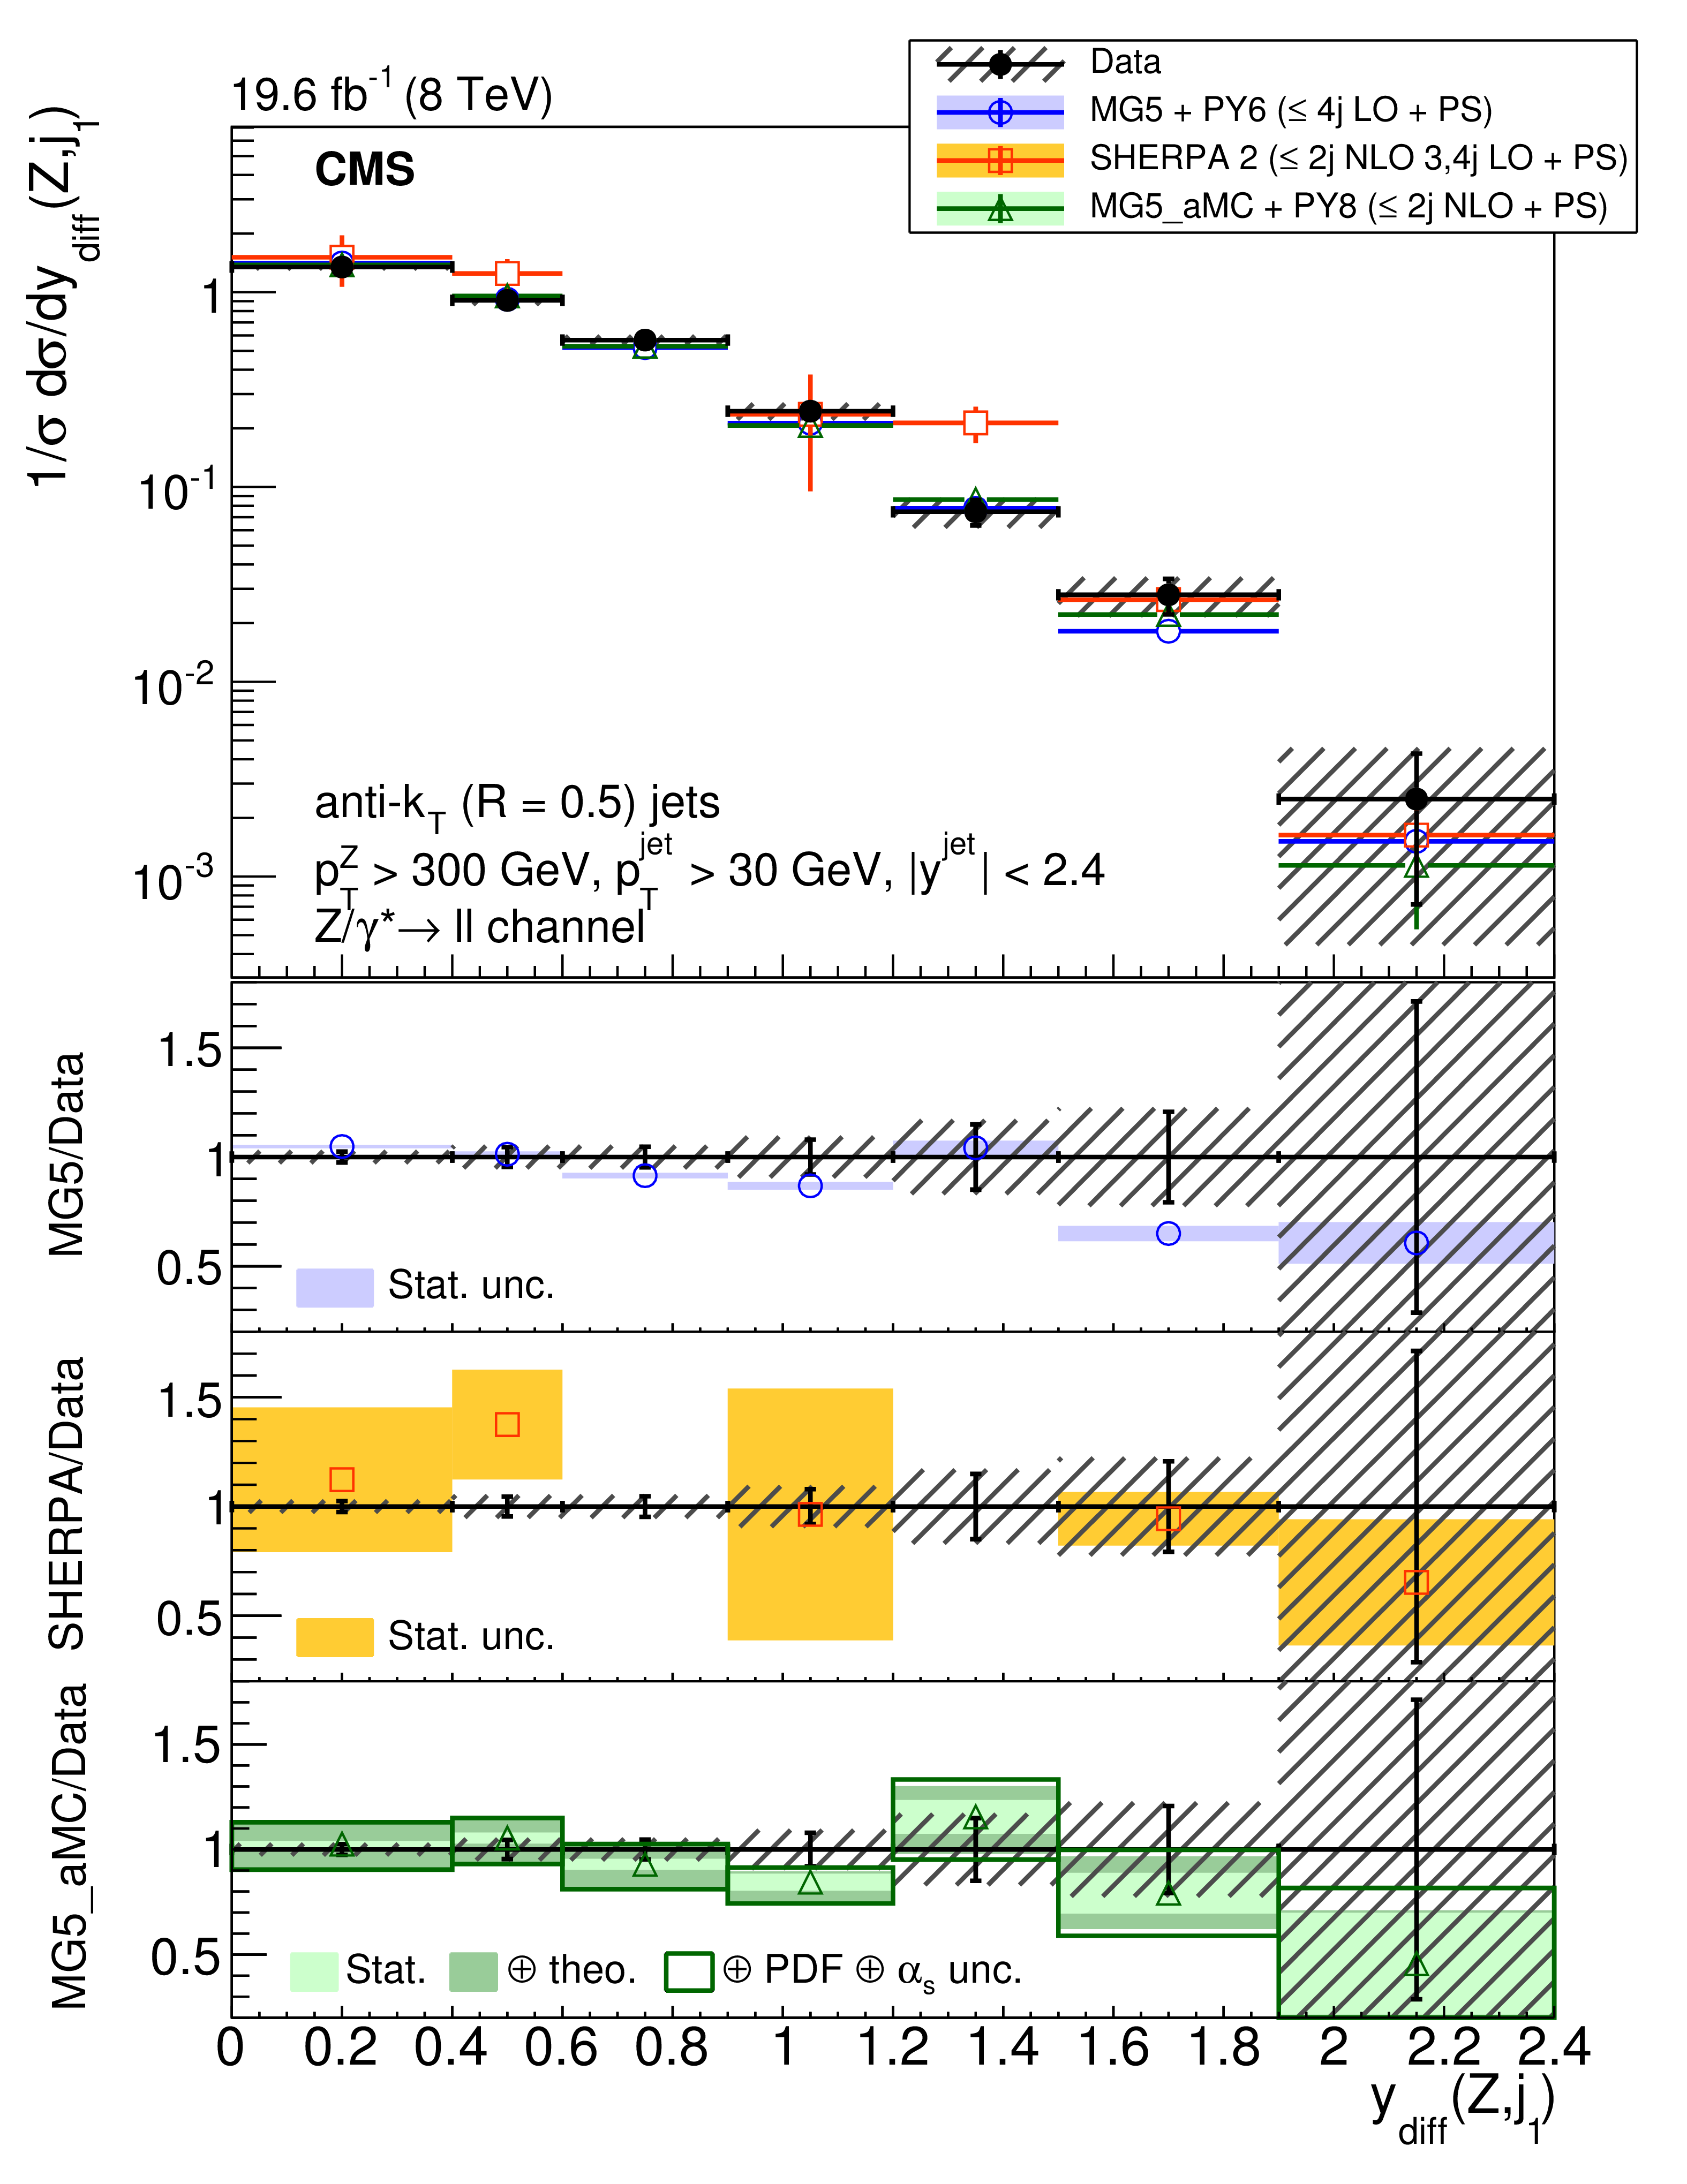
Figure 10:
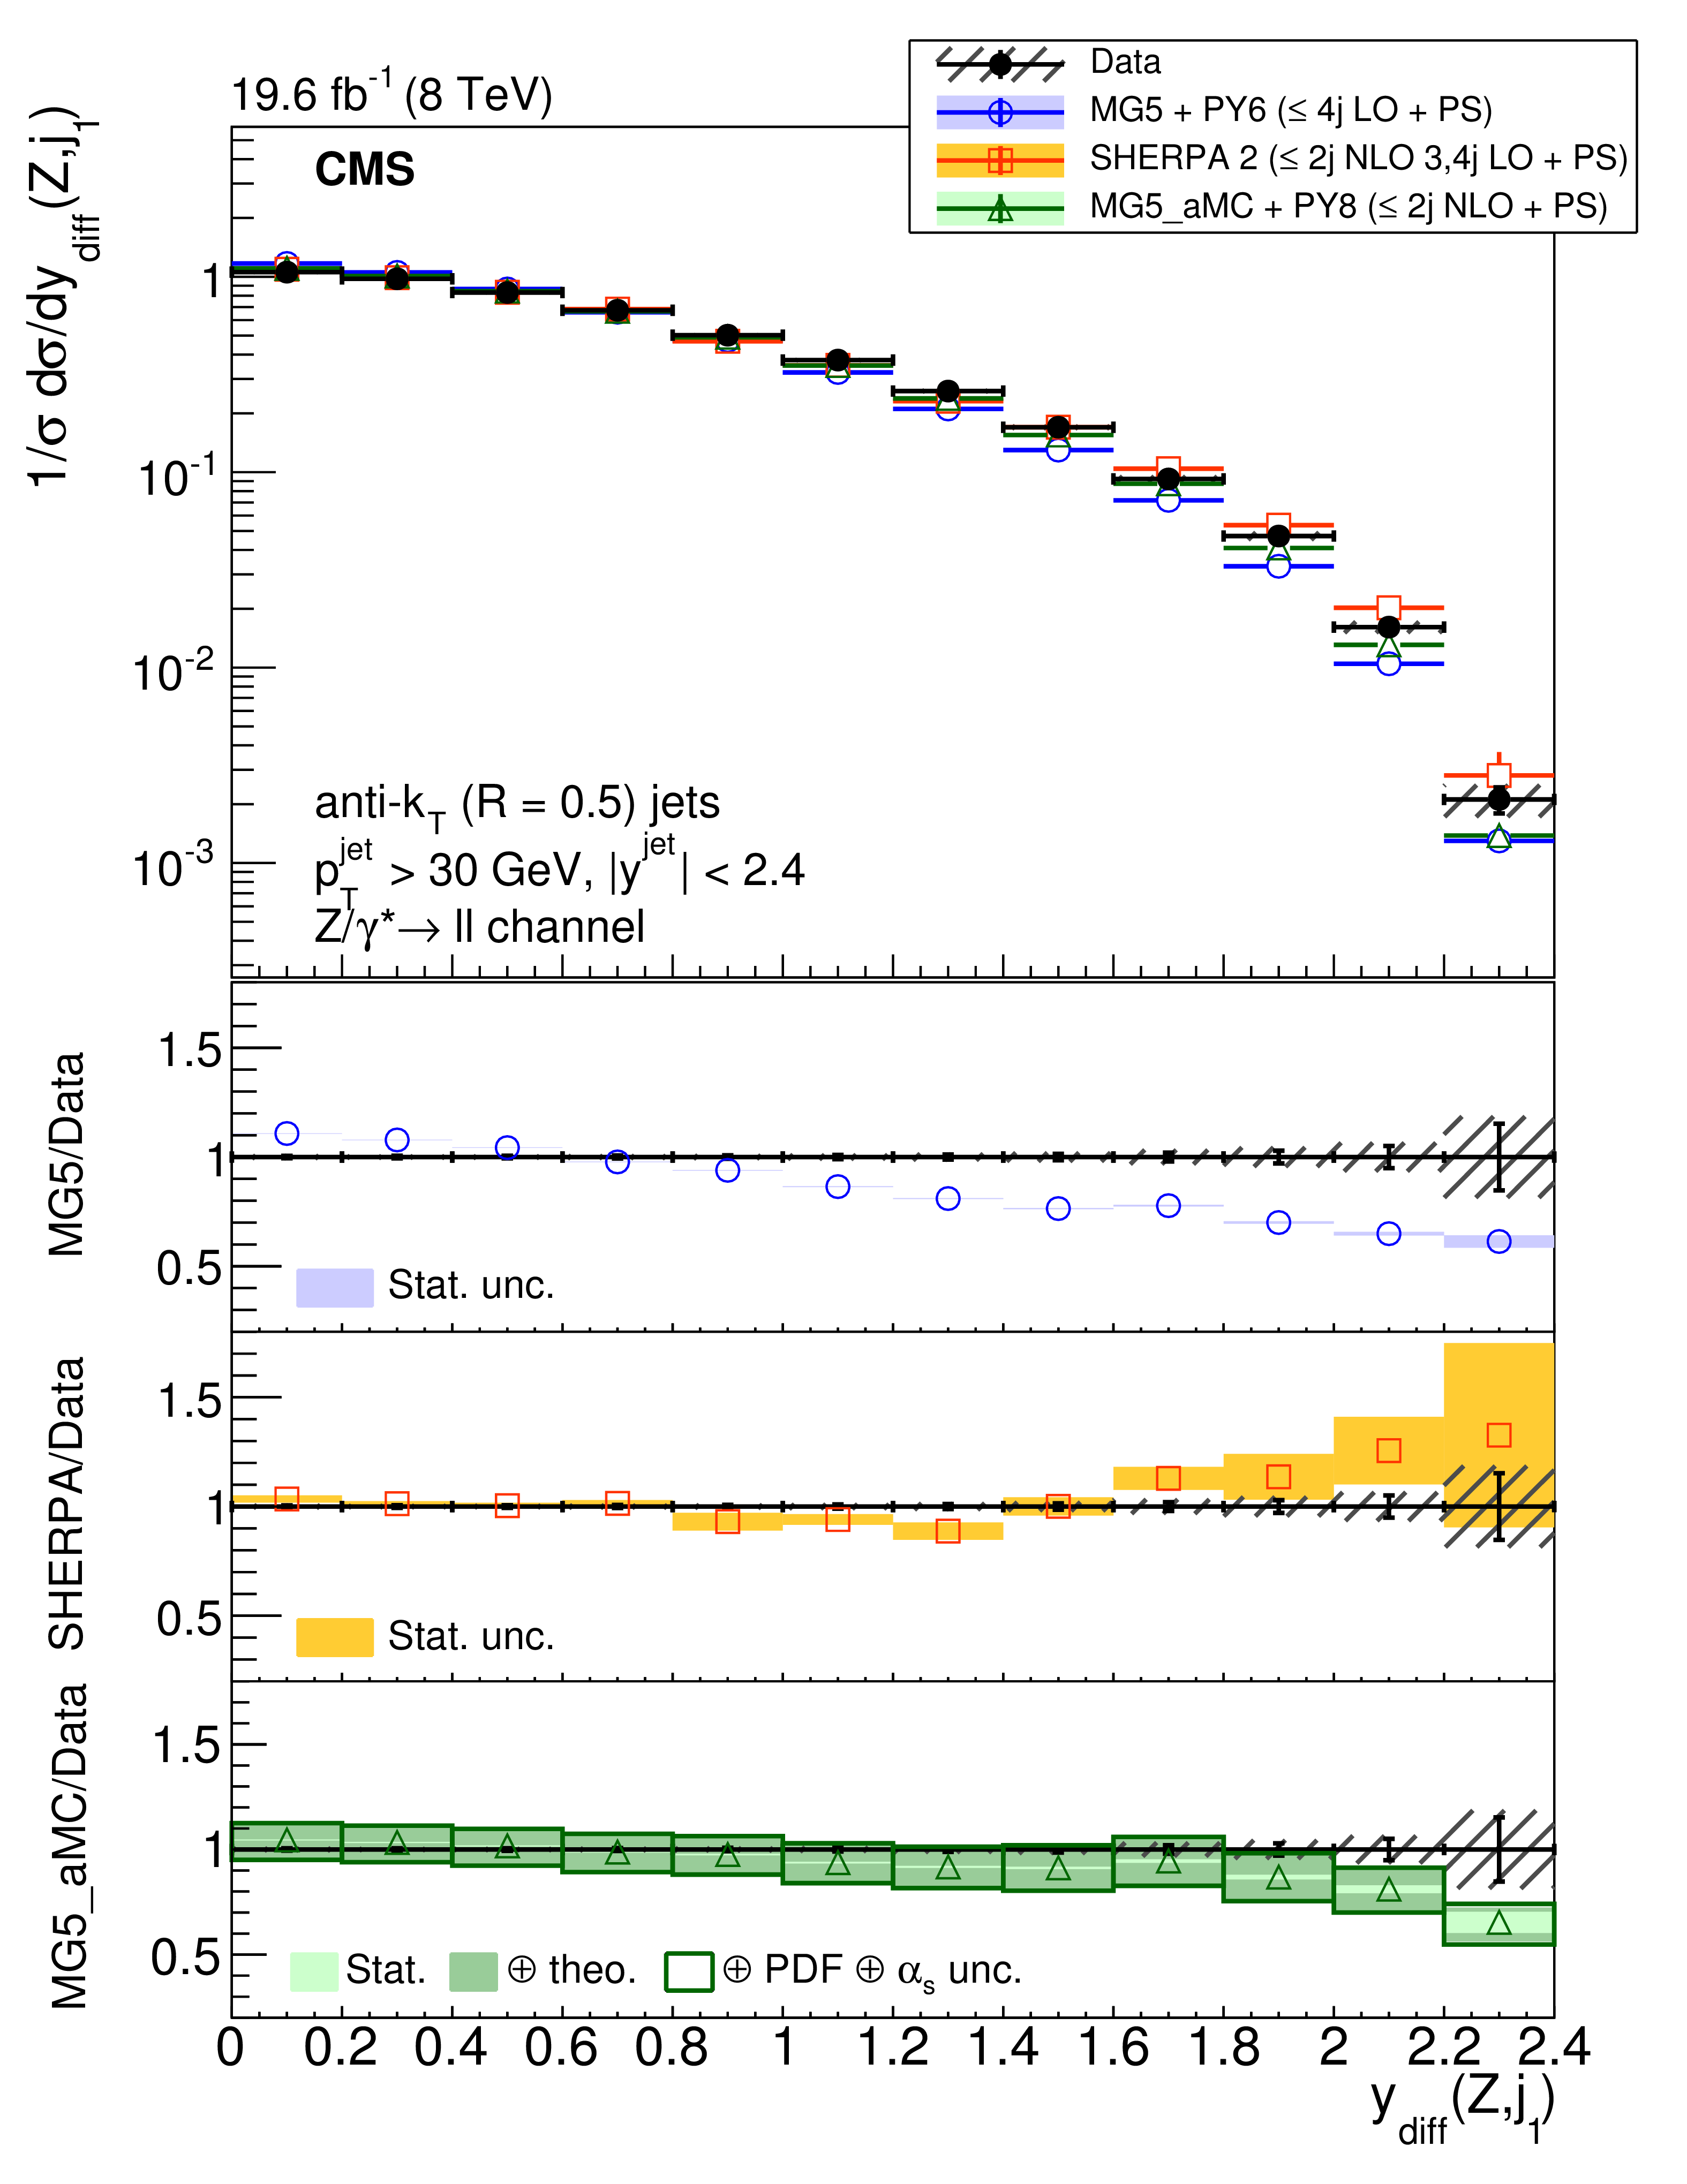
The normalised differential cross section for $ {\mathrm{ Z } (\to \ell \ell )+\text {jets}} $ ($N_{\text {jets}} \geq $ 1) production measured as a function of the $ {y_{\text {diff}} } $ of the Z boson and the leading jet compared to the predictions calculated with MadGraph 5+PYTHIA 6, SHERPA 2, and mg5-amc +PYTHIA 8. (left) The cross section is measured inclusively with respect to the Z boson $ {p_{\mathrm {T}}} $ and for two different Z $ {p_{\mathrm {T}}} $ thresholds. The ratio of the prediction to the measurements is shown for (left) $ {p_{\mathrm {T}}} >0 GeV $, (middle) $ {p_{\mathrm {T}}} >150 GeV $, and (right) $ {p_{\mathrm {T}}} >300 GeV $. The lower panels show the ratios of the theoretical predictions to the measurements. Error bars around the experimental points show the statistical uncertainty, while the cross-hatched bands indicate the statistical and systematic uncertainties added in quadrature. The boxes around the mg5-amc + PYTHIA 8 to measurement ratio represent the uncertainty on the prediction, including statistical, theoretical (from scale variations), and PDF uncertainties. The dark green area represents the statistical and theoretical uncertainties only, while the light green area represents the statistical uncertainty alone. |

png pdf |
Figure 10-a:
The normalised differential cross section for $ {\mathrm{ Z } (\to \ell \ell )+\text {jets}} $ ($N_{\text {jets}} \geq $ 1) production measured as a function of the $ {y_{\text {diff}} } $ of the Z boson and the leading jet compared to the predictions calculated with MadGraph 5+PYTHIA 6, SHERPA 2, and mg5-amc +PYTHIA 8. (left) The cross section is measured inclusively with respect to the Z boson $ {p_{\mathrm {T}}} $ and for two different Z $ {p_{\mathrm {T}}} $ thresholds. The ratio of the prediction to the measurements is shown for (left) $ {p_{\mathrm {T}}} >0 GeV $, (middle) $ {p_{\mathrm {T}}} >150 GeV $, and (right) $ {p_{\mathrm {T}}} >300 GeV $. The lower panels show the ratios of the theoretical predictions to the measurements. Error bars around the experimental points show the statistical uncertainty, while the cross-hatched bands indicate the statistical and systematic uncertainties added in quadrature. The boxes around the mg5-amc + PYTHIA 8 to measurement ratio represent the uncertainty on the prediction, including statistical, theoretical (from scale variations), and PDF uncertainties. The dark green area represents the statistical and theoretical uncertainties only, while the light green area represents the statistical uncertainty alone. |
png pdf |
Figure 10-b:
The normalised differential cross section for $ {\mathrm{ Z } (\to \ell \ell )+\text {jets}} $ ($N_{\text {jets}} \geq $ 1) production measured as a function of the $ {y_{\text {diff}} } $ of the Z boson and the leading jet compared to the predictions calculated with MadGraph 5+PYTHIA 6, SHERPA 2, and mg5-amc +PYTHIA 8. (left) The cross section is measured inclusively with respect to the Z boson $ {p_{\mathrm {T}}} $ and for two different Z $ {p_{\mathrm {T}}} $ thresholds. The ratio of the prediction to the measurements is shown for (left) $ {p_{\mathrm {T}}} >0 GeV $, (middle) $ {p_{\mathrm {T}}} >150 GeV $, and (right) $ {p_{\mathrm {T}}} >300 GeV $. The lower panels show the ratios of the theoretical predictions to the measurements. Error bars around the experimental points show the statistical uncertainty, while the cross-hatched bands indicate the statistical and systematic uncertainties added in quadrature. The boxes around the mg5-amc + PYTHIA 8 to measurement ratio represent the uncertainty on the prediction, including statistical, theoretical (from scale variations), and PDF uncertainties. The dark green area represents the statistical and theoretical uncertainties only, while the light green area represents the statistical uncertainty alone. |
png pdf |
Figure 10-c:
The normalised differential cross section for $ {\mathrm{ Z } (\to \ell \ell )+\text {jets}} $ ($N_{\text {jets}} \geq $ 1) production measured as a function of the $ {y_{\text {diff}} } $ of the Z boson and the leading jet compared to the predictions calculated with MadGraph 5+PYTHIA 6, SHERPA 2, and mg5-amc +PYTHIA 8. (left) The cross section is measured inclusively with respect to the Z boson $ {p_{\mathrm {T}}} $ and for two different Z $ {p_{\mathrm {T}}} $ thresholds. The ratio of the prediction to the measurements is shown for (left) $ {p_{\mathrm {T}}} >0 GeV $, (middle) $ {p_{\mathrm {T}}} >150 GeV $, and (right) $ {p_{\mathrm {T}}} >300 GeV $. The lower panels show the ratios of the theoretical predictions to the measurements. Error bars around the experimental points show the statistical uncertainty, while the cross-hatched bands indicate the statistical and systematic uncertainties added in quadrature. The boxes around the mg5-amc + PYTHIA 8 to measurement ratio represent the uncertainty on the prediction, including statistical, theoretical (from scale variations), and PDF uncertainties. The dark green area represents the statistical and theoretical uncertainties only, while the light green area represents the statistical uncertainty alone. |

png pdf |
Figure 11:
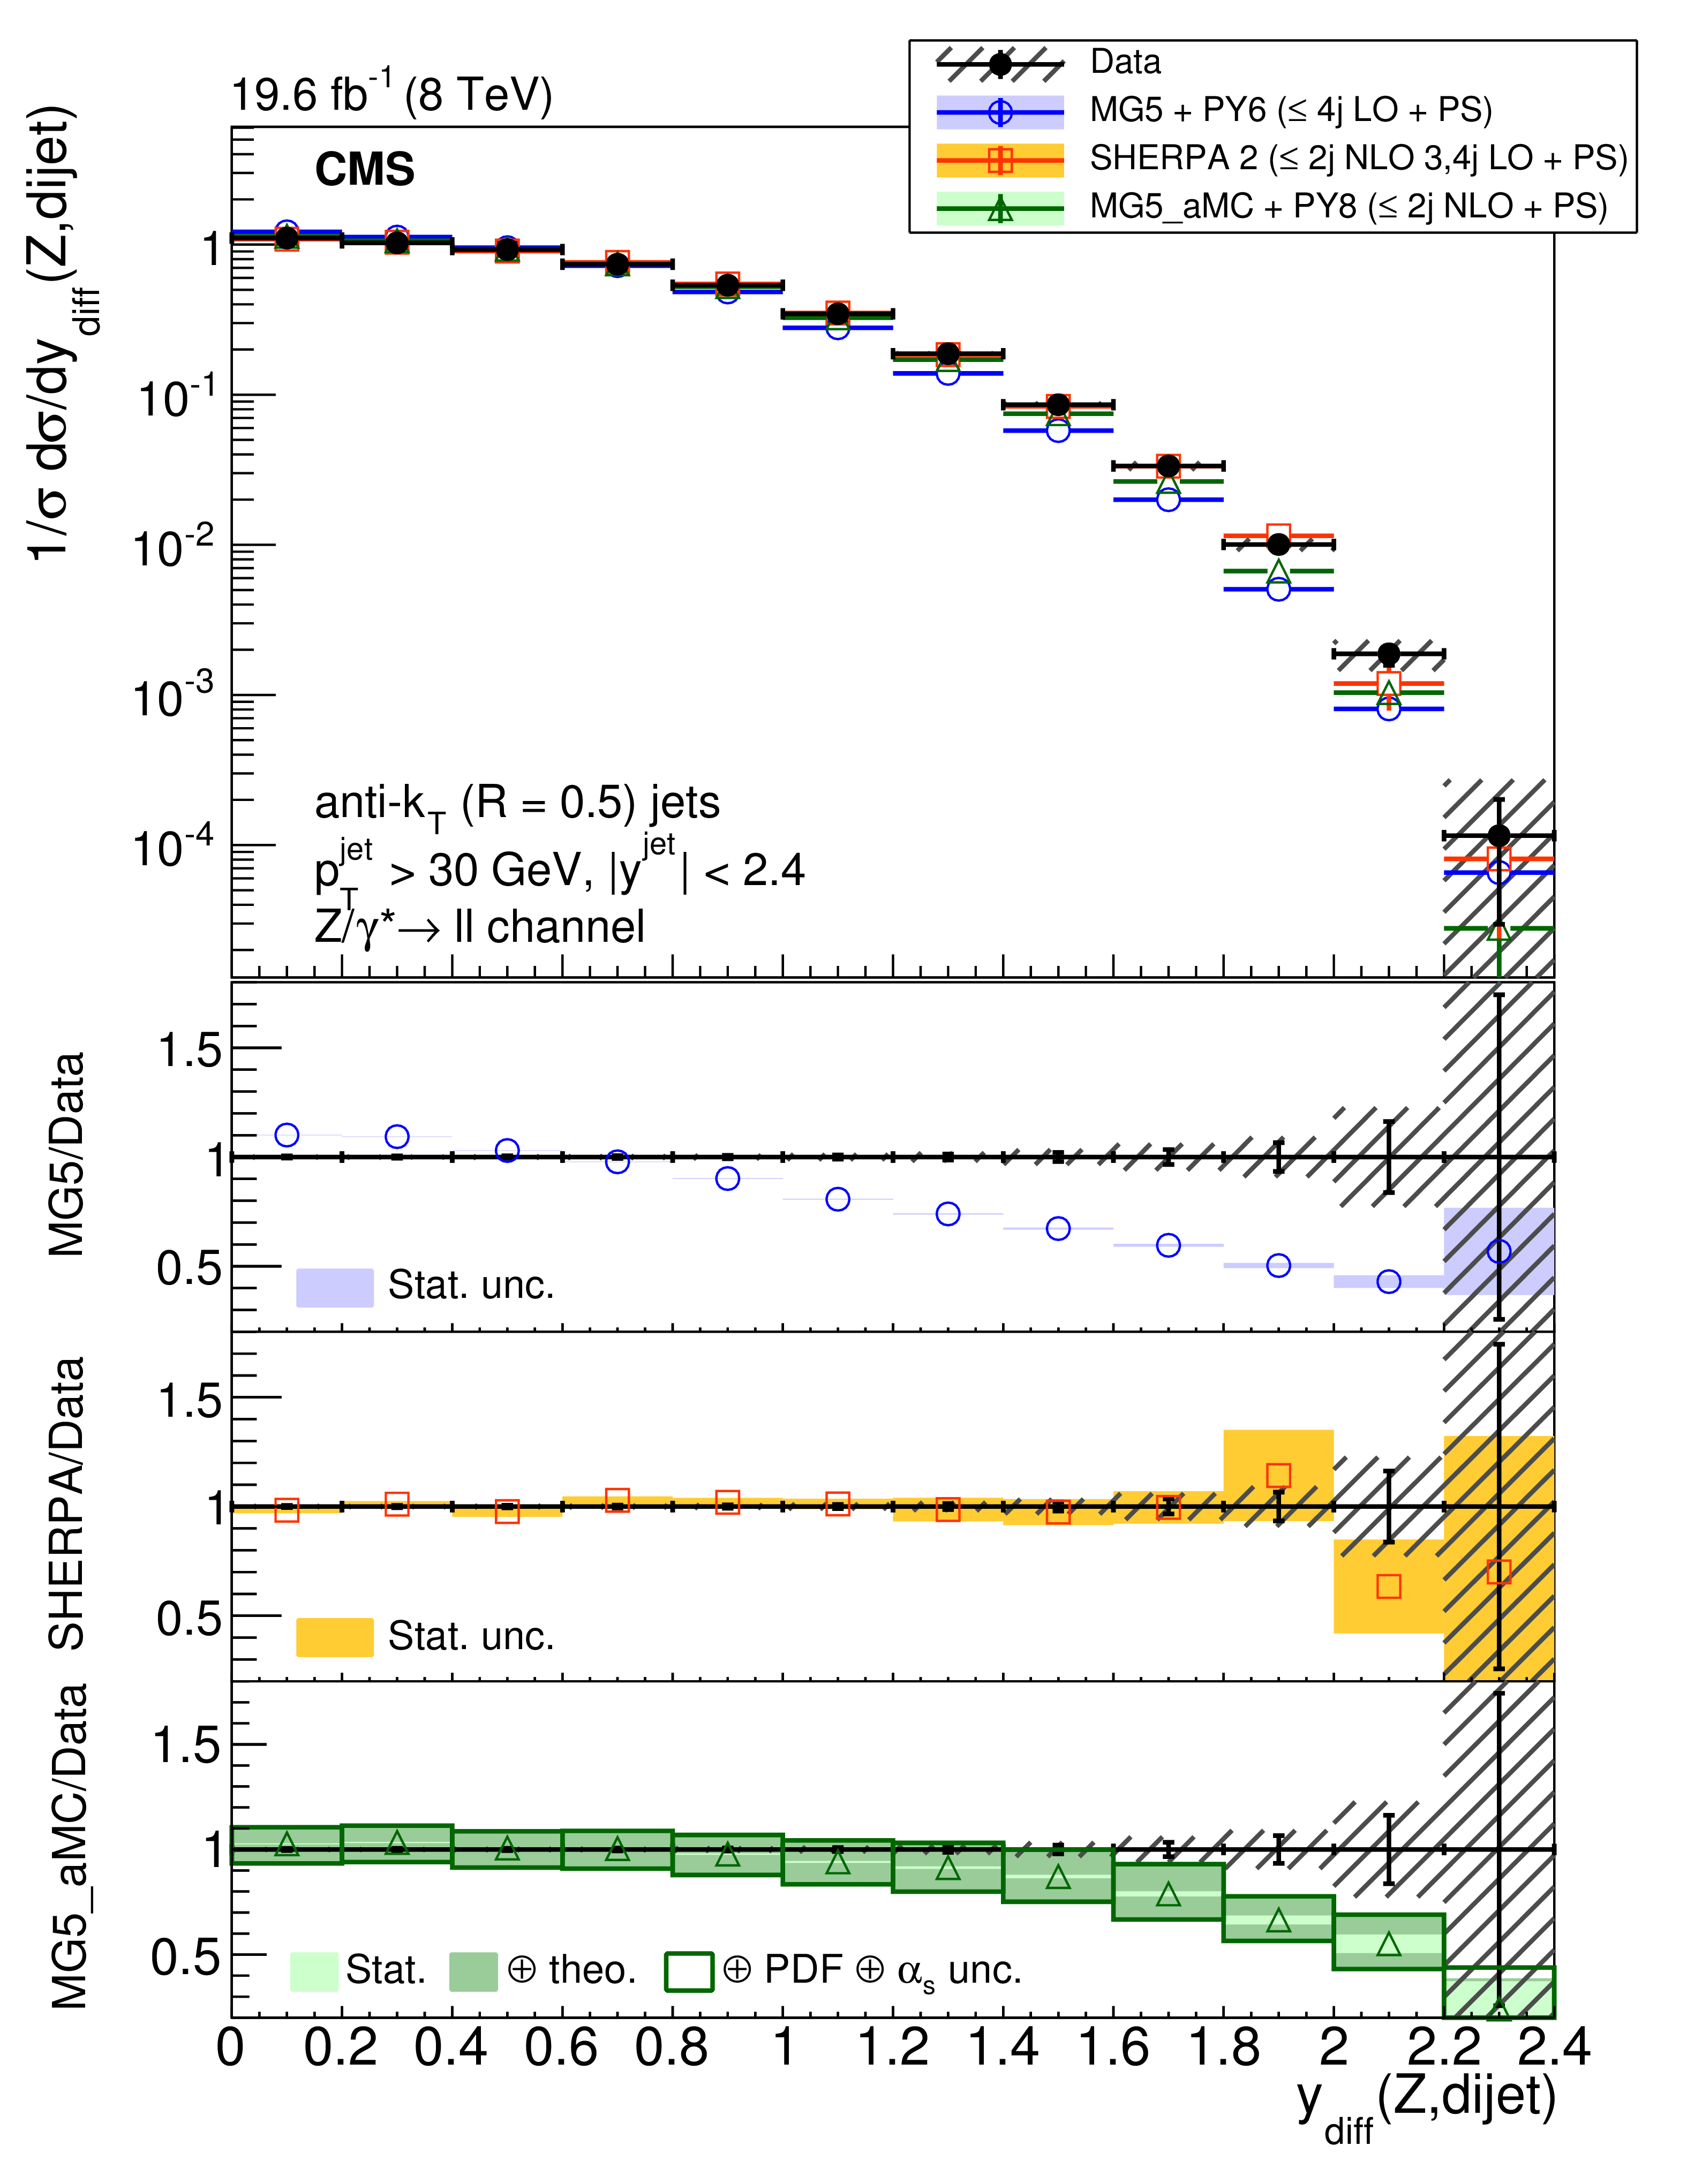
The normalised differential cross section for $ {\mathrm{ Z } (\to \ell \ell )+\text {jets}} $ ($N_{\text {jets}} \geq $ 2) production measured as a function of the $ {y_{\text {diff}} } $ of the Z boson and (left) the leading jet, (middle) the second-leading jet, and (right) the system constituted by these two jets. The measurement is compared to the predictions calculated with MadGraph 5+ PYTHIA 6, SHERPA 2, and mg5-amc +PYTHIA 8. The lower panels show the ratios of the theoretical predictions to the measurements. Error bars around the experimental points show the statistical uncertainty, while the cross-hatched bands indicate the statistical and systematic uncertainties added in quadrature. The boxes around the mg5-amc + PYTHIA 8 to measurement ratio represent the uncertainty on the prediction, including statistical, theoretical (from scale variations), and PDF uncertainties. The dark green area represents the statistical and theoretical uncertainties only, while the light green area represents the statistical uncertainty alone. |
png pdf |
Figure 11-a:
The normalised differential cross section for $ {\mathrm{ Z } (\to \ell \ell )+\text {jets}} $ ($N_{\text {jets}} \geq $ 2) production measured as a function of the $ {y_{\text {diff}} } $ of the Z boson and (left) the leading jet, (middle) the second-leading jet, and (right) the system constituted by these two jets. The measurement is compared to the predictions calculated with MadGraph 5+ PYTHIA 6, SHERPA 2, and mg5-amc +PYTHIA 8. The lower panels show the ratios of the theoretical predictions to the measurements. Error bars around the experimental points show the statistical uncertainty, while the cross-hatched bands indicate the statistical and systematic uncertainties added in quadrature. The boxes around the mg5-amc + PYTHIA 8 to measurement ratio represent the uncertainty on the prediction, including statistical, theoretical (from scale variations), and PDF uncertainties. The dark green area represents the statistical and theoretical uncertainties only, while the light green area represents the statistical uncertainty alone. |

png pdf |
Figure 11-b:
The normalised differential cross section for $ {\mathrm{ Z } (\to \ell \ell )+\text {jets}} $ ($N_{\text {jets}} \geq $ 2) production measured as a function of the $ {y_{\text {diff}} } $ of the Z boson and (left) the leading jet, (middle) the second-leading jet, and (right) the system constituted by these two jets. The measurement is compared to the predictions calculated with MadGraph 5+ PYTHIA 6, SHERPA 2, and mg5-amc +PYTHIA 8. The lower panels show the ratios of the theoretical predictions to the measurements. Error bars around the experimental points show the statistical uncertainty, while the cross-hatched bands indicate the statistical and systematic uncertainties added in quadrature. The boxes around the mg5-amc + PYTHIA 8 to measurement ratio represent the uncertainty on the prediction, including statistical, theoretical (from scale variations), and PDF uncertainties. The dark green area represents the statistical and theoretical uncertainties only, while the light green area represents the statistical uncertainty alone. |
png pdf |
Figure 11-c:
The normalised differential cross section for $ {\mathrm{ Z } (\to \ell \ell )+\text {jets}} $ ($N_{\text {jets}} \geq $ 2) production measured as a function of the $ {y_{\text {diff}} } $ of the Z boson and (left) the leading jet, (middle) the second-leading jet, and (right) the system constituted by these two jets. The measurement is compared to the predictions calculated with MadGraph 5+ PYTHIA 6, SHERPA 2, and mg5-amc +PYTHIA 8. The lower panels show the ratios of the theoretical predictions to the measurements. Error bars around the experimental points show the statistical uncertainty, while the cross-hatched bands indicate the statistical and systematic uncertainties added in quadrature. The boxes around the mg5-amc + PYTHIA 8 to measurement ratio represent the uncertainty on the prediction, including statistical, theoretical (from scale variations), and PDF uncertainties. The dark green area represents the statistical and theoretical uncertainties only, while the light green area represents the statistical uncertainty alone. |

png pdf |
Figure 12:
The normalised differential cross section for $ {\mathrm{ Z } (\to \ell \ell )+\text {jets}} $ ($N_{\text {jets}} \geq $ 2) production measured as a function of the (left) $ {y_{\text {diff}} } $ and (right) $ {y_{\text {sum}}} $ of the two leading jets. The measurement is compared to the predictions calculated with MadGraph 5+PYTHIA 6, SHERPA 2, and mg5-amc +PYTHIA 8. The lower panels show the ratios of the theoretical predictions to the measurements. Error bars around the experimental points show the statistical uncertainty, while the cross-hatched bands indicate the statistical and systematic uncertainties added in quadrature. The boxes around the mg5-amc + PYTHIA 8 to measurement ratio represent the uncertainty on the prediction, including statistical, theoretical (from scale variations), and PDF uncertainties. The dark green area represents the statistical and theoretical uncertainties only, while the light green area represents the statistical uncertainty alone. |

png pdf |
Figure 12-a:
The normalised differential cross section for $ {\mathrm{ Z } (\to \ell \ell )+\text {jets}} $ ($N_{\text {jets}} \geq $ 2) production measured as a function of the (left) $ {y_{\text {diff}} } $ and (right) $ {y_{\text {sum}}} $ of the two leading jets. The measurement is compared to the predictions calculated with MadGraph 5+PYTHIA 6, SHERPA 2, and mg5-amc +PYTHIA 8. The lower panels show the ratios of the theoretical predictions to the measurements. Error bars around the experimental points show the statistical uncertainty, while the cross-hatched bands indicate the statistical and systematic uncertainties added in quadrature. The boxes around the mg5-amc + PYTHIA 8 to measurement ratio represent the uncertainty on the prediction, including statistical, theoretical (from scale variations), and PDF uncertainties. The dark green area represents the statistical and theoretical uncertainties only, while the light green area represents the statistical uncertainty alone. |

png pdf |
Figure 12-b:
The normalised differential cross section for $ {\mathrm{ Z } (\to \ell \ell )+\text {jets}} $ ($N_{\text {jets}} \geq $ 2) production measured as a function of the (left) $ {y_{\text {diff}} } $ and (right) $ {y_{\text {sum}}} $ of the two leading jets. The measurement is compared to the predictions calculated with MadGraph 5+PYTHIA 6, SHERPA 2, and mg5-amc +PYTHIA 8. The lower panels show the ratios of the theoretical predictions to the measurements. Error bars around the experimental points show the statistical uncertainty, while the cross-hatched bands indicate the statistical and systematic uncertainties added in quadrature. The boxes around the mg5-amc + PYTHIA 8 to measurement ratio represent the uncertainty on the prediction, including statistical, theoretical (from scale variations), and PDF uncertainties. The dark green area represents the statistical and theoretical uncertainties only, while the light green area represents the statistical uncertainty alone. |

png pdf |
Figure 13:
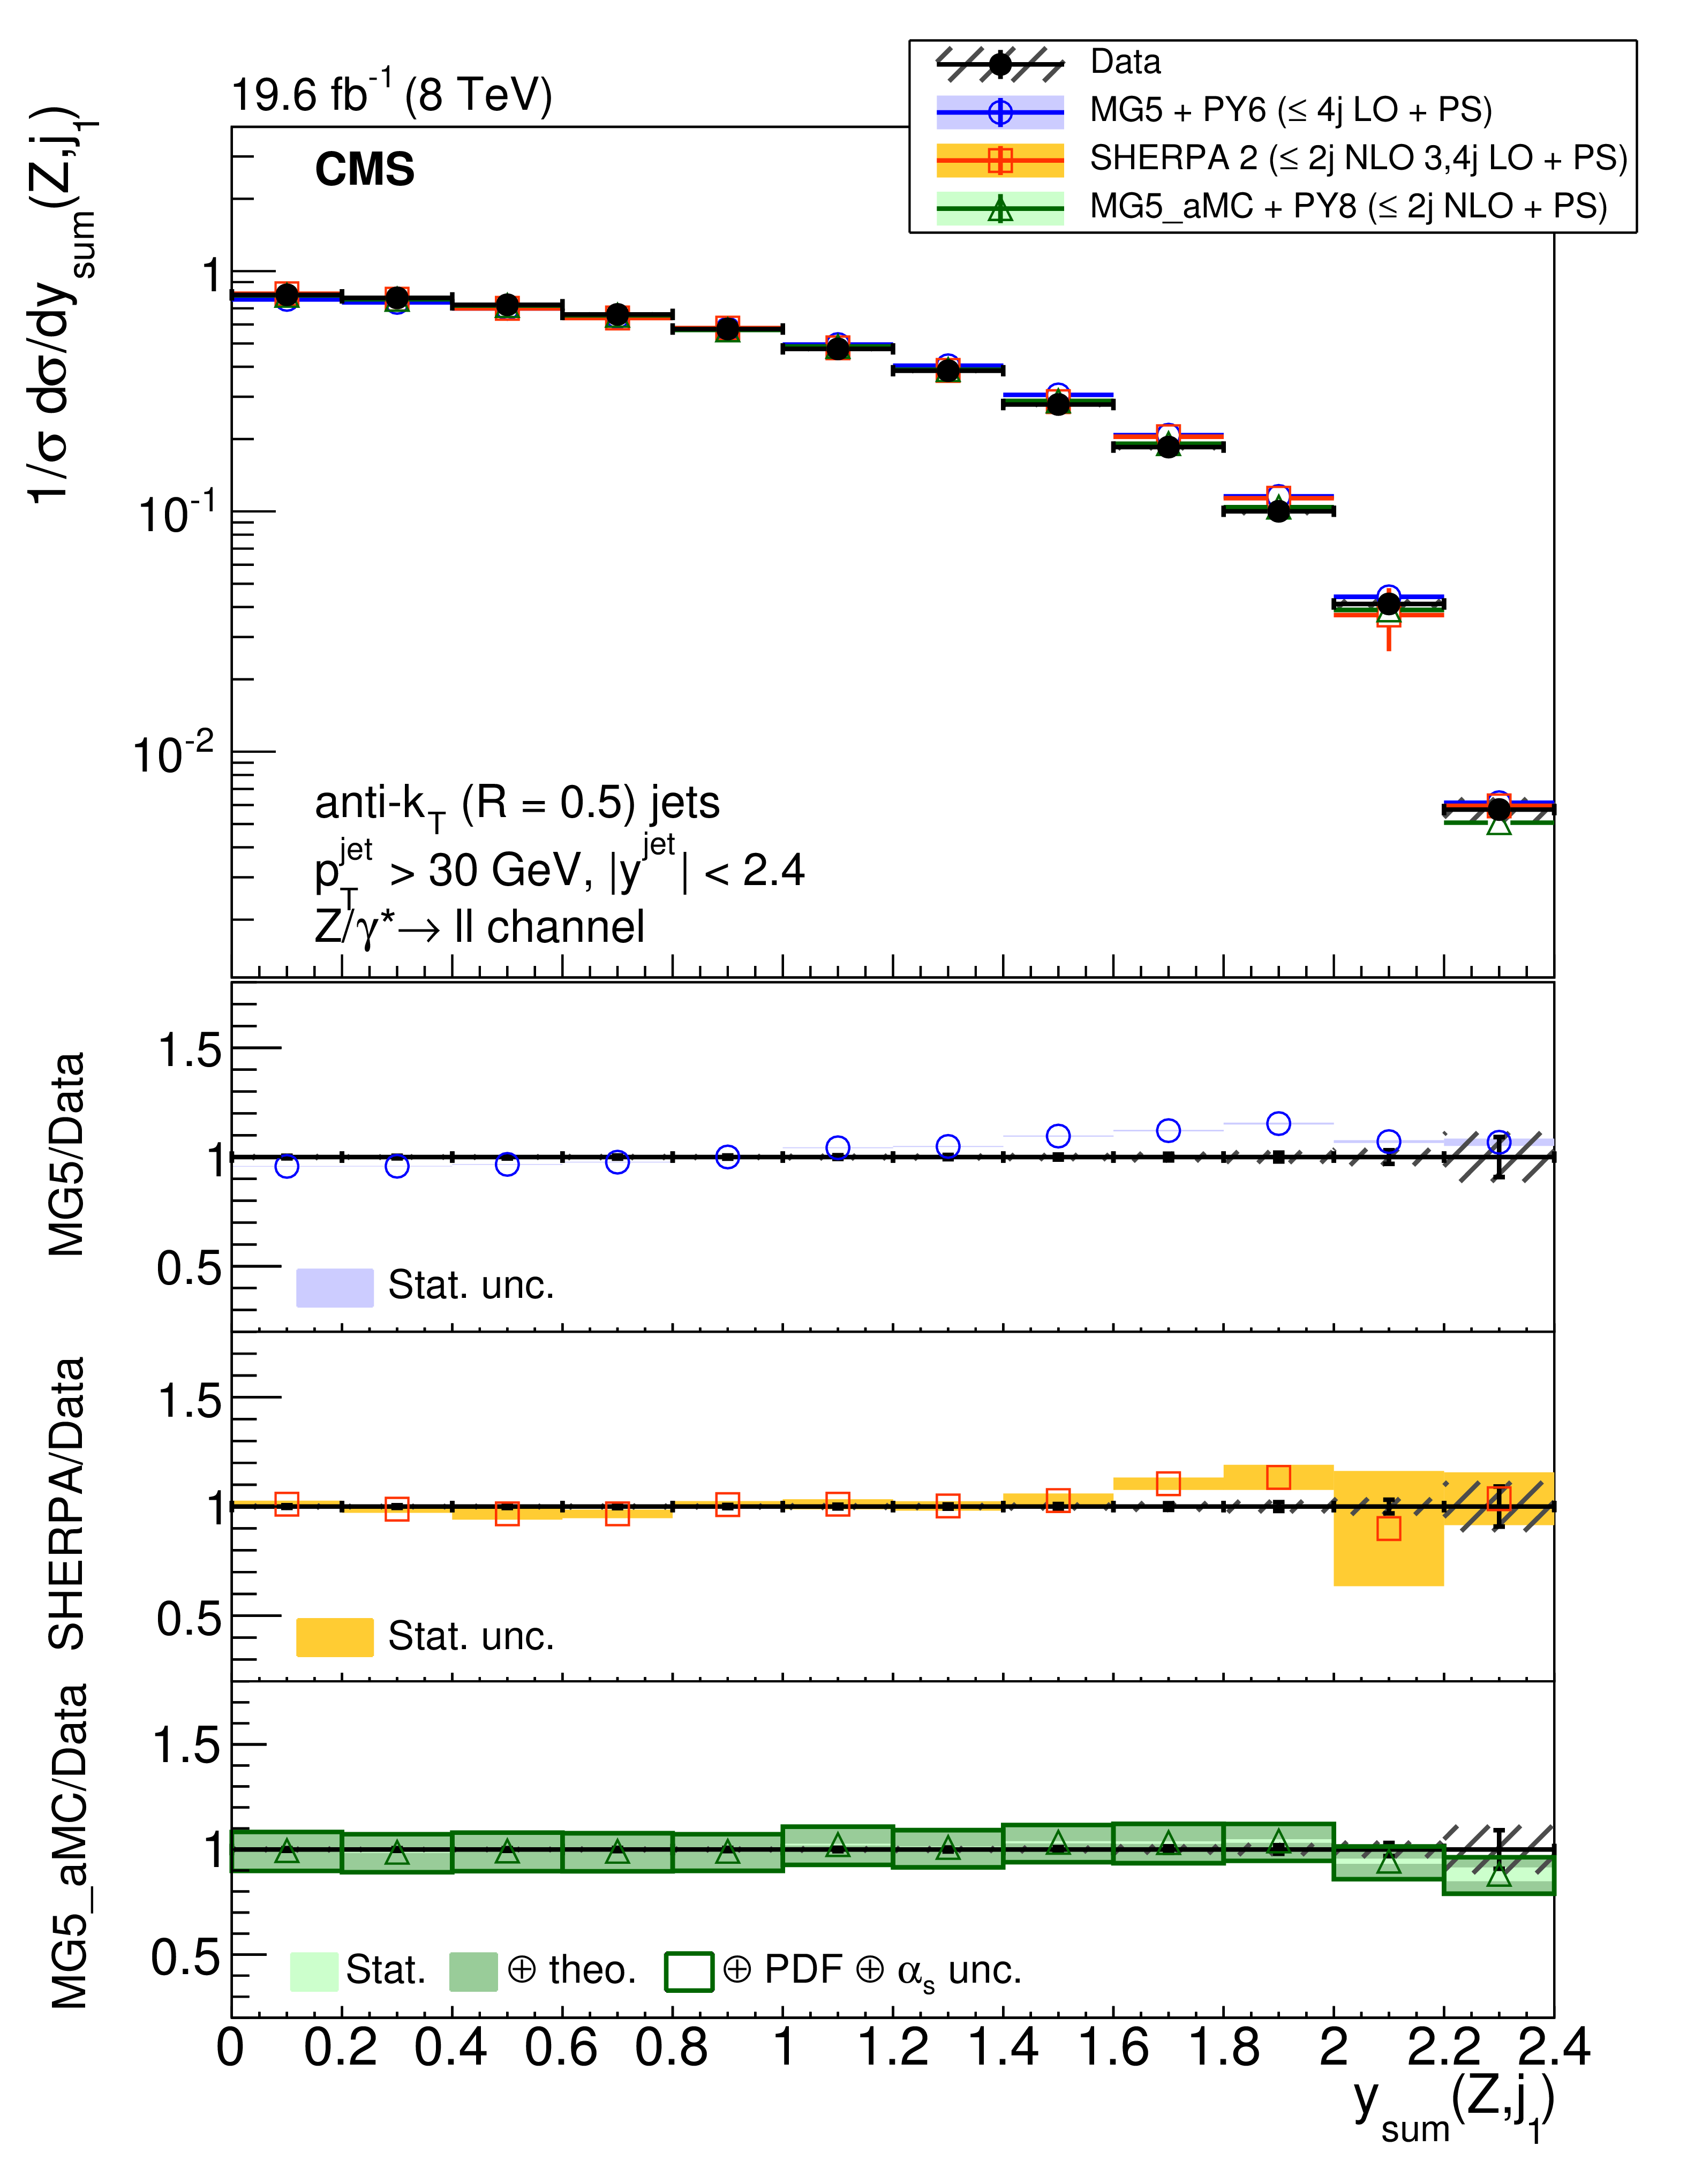
The normalised differential cross section for $ {\mathrm{ Z } (\to \ell \ell )+\text {jets}} $ ($N_{\text {jets}} \geq 1$) production measured as a function of the $ {y_{\text {sum}}} $ of the Z boson and the leading jet compared to the predictions calculated with MadGraph 5+PYTHIA 6, SHERPA 2, and mg5-amc +PYTHIA 8. The cross section is measured inclusively with respect to the Z boson $ {p_{\mathrm {T}}} $ and for two different Z $ {p_{\mathrm {T}}} $ thresholds. The ratio of the prediction to the measurements is shown for (left) $ {p_{\mathrm {T}}} >0 GeV $, (middle) $ {p_{\mathrm {T}}} >150 GeV $, and (right) $ {p_{\mathrm {T}}} >300 GeV $. The lower panels show the ratios of the theoretical predictions to the measurements. Error bars around the experimental points show the statistical uncertainty, while the cross-hatched bands indicate the statistical and systematic uncertainties added in quadrature. The boxes around the mg5-amc + PYTHIA 8 to measurement ratio represent the uncertainty on the prediction, including statistical, theoretical (from scale variations), and PDF uncertainties. The dark green area represents the statistical and theoretical uncertainties only, while the light green area represents the statistical uncertainty alone. |

png pdf |
Figure 13-a:
The normalised differential cross section for $ {\mathrm{ Z } (\to \ell \ell )+\text {jets}} $ ($N_{\text {jets}} \geq 1$) production measured as a function of the $ {y_{\text {sum}}} $ of the Z boson and the leading jet compared to the predictions calculated with MadGraph 5+PYTHIA 6, SHERPA 2, and mg5-amc +PYTHIA 8. The cross section is measured inclusively with respect to the Z boson $ {p_{\mathrm {T}}} $ and for two different Z $ {p_{\mathrm {T}}} $ thresholds. The ratio of the prediction to the measurements is shown for (left) $ {p_{\mathrm {T}}} >0 GeV $, (middle) $ {p_{\mathrm {T}}} >150 GeV $, and (right) $ {p_{\mathrm {T}}} >300 GeV $. The lower panels show the ratios of the theoretical predictions to the measurements. Error bars around the experimental points show the statistical uncertainty, while the cross-hatched bands indicate the statistical and systematic uncertainties added in quadrature. The boxes around the mg5-amc + PYTHIA 8 to measurement ratio represent the uncertainty on the prediction, including statistical, theoretical (from scale variations), and PDF uncertainties. The dark green area represents the statistical and theoretical uncertainties only, while the light green area represents the statistical uncertainty alone. |

png pdf |
Figure 13-b:
The normalised differential cross section for $ {\mathrm{ Z } (\to \ell \ell )+\text {jets}} $ ($N_{\text {jets}} \geq 1$) production measured as a function of the $ {y_{\text {sum}}} $ of the Z boson and the leading jet compared to the predictions calculated with MadGraph 5+PYTHIA 6, SHERPA 2, and mg5-amc +PYTHIA 8. The cross section is measured inclusively with respect to the Z boson $ {p_{\mathrm {T}}} $ and for two different Z $ {p_{\mathrm {T}}} $ thresholds. The ratio of the prediction to the measurements is shown for (left) $ {p_{\mathrm {T}}} >0 GeV $, (middle) $ {p_{\mathrm {T}}} >150 GeV $, and (right) $ {p_{\mathrm {T}}} >300 GeV $. The lower panels show the ratios of the theoretical predictions to the measurements. Error bars around the experimental points show the statistical uncertainty, while the cross-hatched bands indicate the statistical and systematic uncertainties added in quadrature. The boxes around the mg5-amc + PYTHIA 8 to measurement ratio represent the uncertainty on the prediction, including statistical, theoretical (from scale variations), and PDF uncertainties. The dark green area represents the statistical and theoretical uncertainties only, while the light green area represents the statistical uncertainty alone. |

png pdf |
Figure 13-c:
The normalised differential cross section for $ {\mathrm{ Z } (\to \ell \ell )+\text {jets}} $ ($N_{\text {jets}} \geq 1$) production measured as a function of the $ {y_{\text {sum}}} $ of the Z boson and the leading jet compared to the predictions calculated with MadGraph 5+PYTHIA 6, SHERPA 2, and mg5-amc +PYTHIA 8. The cross section is measured inclusively with respect to the Z boson $ {p_{\mathrm {T}}} $ and for two different Z $ {p_{\mathrm {T}}} $ thresholds. The ratio of the prediction to the measurements is shown for (left) $ {p_{\mathrm {T}}} >0 GeV $, (middle) $ {p_{\mathrm {T}}} >150 GeV $, and (right) $ {p_{\mathrm {T}}} >300 GeV $. The lower panels show the ratios of the theoretical predictions to the measurements. Error bars around the experimental points show the statistical uncertainty, while the cross-hatched bands indicate the statistical and systematic uncertainties added in quadrature. The boxes around the mg5-amc + PYTHIA 8 to measurement ratio represent the uncertainty on the prediction, including statistical, theoretical (from scale variations), and PDF uncertainties. The dark green area represents the statistical and theoretical uncertainties only, while the light green area represents the statistical uncertainty alone. |

png pdf |
Figure 14:
The normalised differential cross section for $ {\mathrm{ Z } (\to \ell \ell )+\text {jets}} $ ($N_{\text {jets}} \geq $ 2) production measured as a function of the $ {y_{\text {sum}}} $ of the Z boson and (left) the leading jet, (middle) the second-leading jet, and (right) the system constituted by these two jets. The measurement is compared to the predictions calculated with MadGraph 5+ PYTHIA 6, SHERPA 2, and mg5-amc +PYTHIA 8. The lower panels show the ratios of the theoretical predictions to the measurements. Error bars around the experimental points show the statistical uncertainty, while the cross-hatched bands indicate the statistical and systematic uncertainties added in quadrature. The boxes around the mg5-amc + PYTHIA 8 to measurement ratio represent the uncertainty on the prediction, including statistical, theoretical (from scale variations), and PDF uncertainties. The dark green area represents the statistical and theoretical uncertainties only, while the light green area represents the statistical uncertainty alone. |
png pdf |
Figure 14-a:
The normalised differential cross section for $ {\mathrm{ Z } (\to \ell \ell )+\text {jets}} $ ($N_{\text {jets}} \geq $ 2) production measured as a function of the $ {y_{\text {sum}}} $ of the Z boson and (left) the leading jet, (middle) the second-leading jet, and (right) the system constituted by these two jets. The measurement is compared to the predictions calculated with MadGraph 5+ PYTHIA 6, SHERPA 2, and mg5-amc +PYTHIA 8. The lower panels show the ratios of the theoretical predictions to the measurements. Error bars around the experimental points show the statistical uncertainty, while the cross-hatched bands indicate the statistical and systematic uncertainties added in quadrature. The boxes around the mg5-amc + PYTHIA 8 to measurement ratio represent the uncertainty on the prediction, including statistical, theoretical (from scale variations), and PDF uncertainties. The dark green area represents the statistical and theoretical uncertainties only, while the light green area represents the statistical uncertainty alone. |

png pdf |
Figure 14-b:
The normalised differential cross section for $ {\mathrm{ Z } (\to \ell \ell )+\text {jets}} $ ($N_{\text {jets}} \geq $ 2) production measured as a function of the $ {y_{\text {sum}}} $ of the Z boson and (left) the leading jet, (middle) the second-leading jet, and (right) the system constituted by these two jets. The measurement is compared to the predictions calculated with MadGraph 5+ PYTHIA 6, SHERPA 2, and mg5-amc +PYTHIA 8. The lower panels show the ratios of the theoretical predictions to the measurements. Error bars around the experimental points show the statistical uncertainty, while the cross-hatched bands indicate the statistical and systematic uncertainties added in quadrature. The boxes around the mg5-amc + PYTHIA 8 to measurement ratio represent the uncertainty on the prediction, including statistical, theoretical (from scale variations), and PDF uncertainties. The dark green area represents the statistical and theoretical uncertainties only, while the light green area represents the statistical uncertainty alone. |

png pdf |
Figure 14-c:
The normalised differential cross section for $ {\mathrm{ Z } (\to \ell \ell )+\text {jets}} $ ($N_{\text {jets}} \geq $ 2) production measured as a function of the $ {y_{\text {sum}}} $ of the Z boson and (left) the leading jet, (middle) the second-leading jet, and (right) the system constituted by these two jets. The measurement is compared to the predictions calculated with MadGraph 5+ PYTHIA 6, SHERPA 2, and mg5-amc +PYTHIA 8. The lower panels show the ratios of the theoretical predictions to the measurements. Error bars around the experimental points show the statistical uncertainty, while the cross-hatched bands indicate the statistical and systematic uncertainties added in quadrature. The boxes around the mg5-amc + PYTHIA 8 to measurement ratio represent the uncertainty on the prediction, including statistical, theoretical (from scale variations), and PDF uncertainties. The dark green area represents the statistical and theoretical uncertainties only, while the light green area represents the statistical uncertainty alone. |

png pdf |
Figure 15:
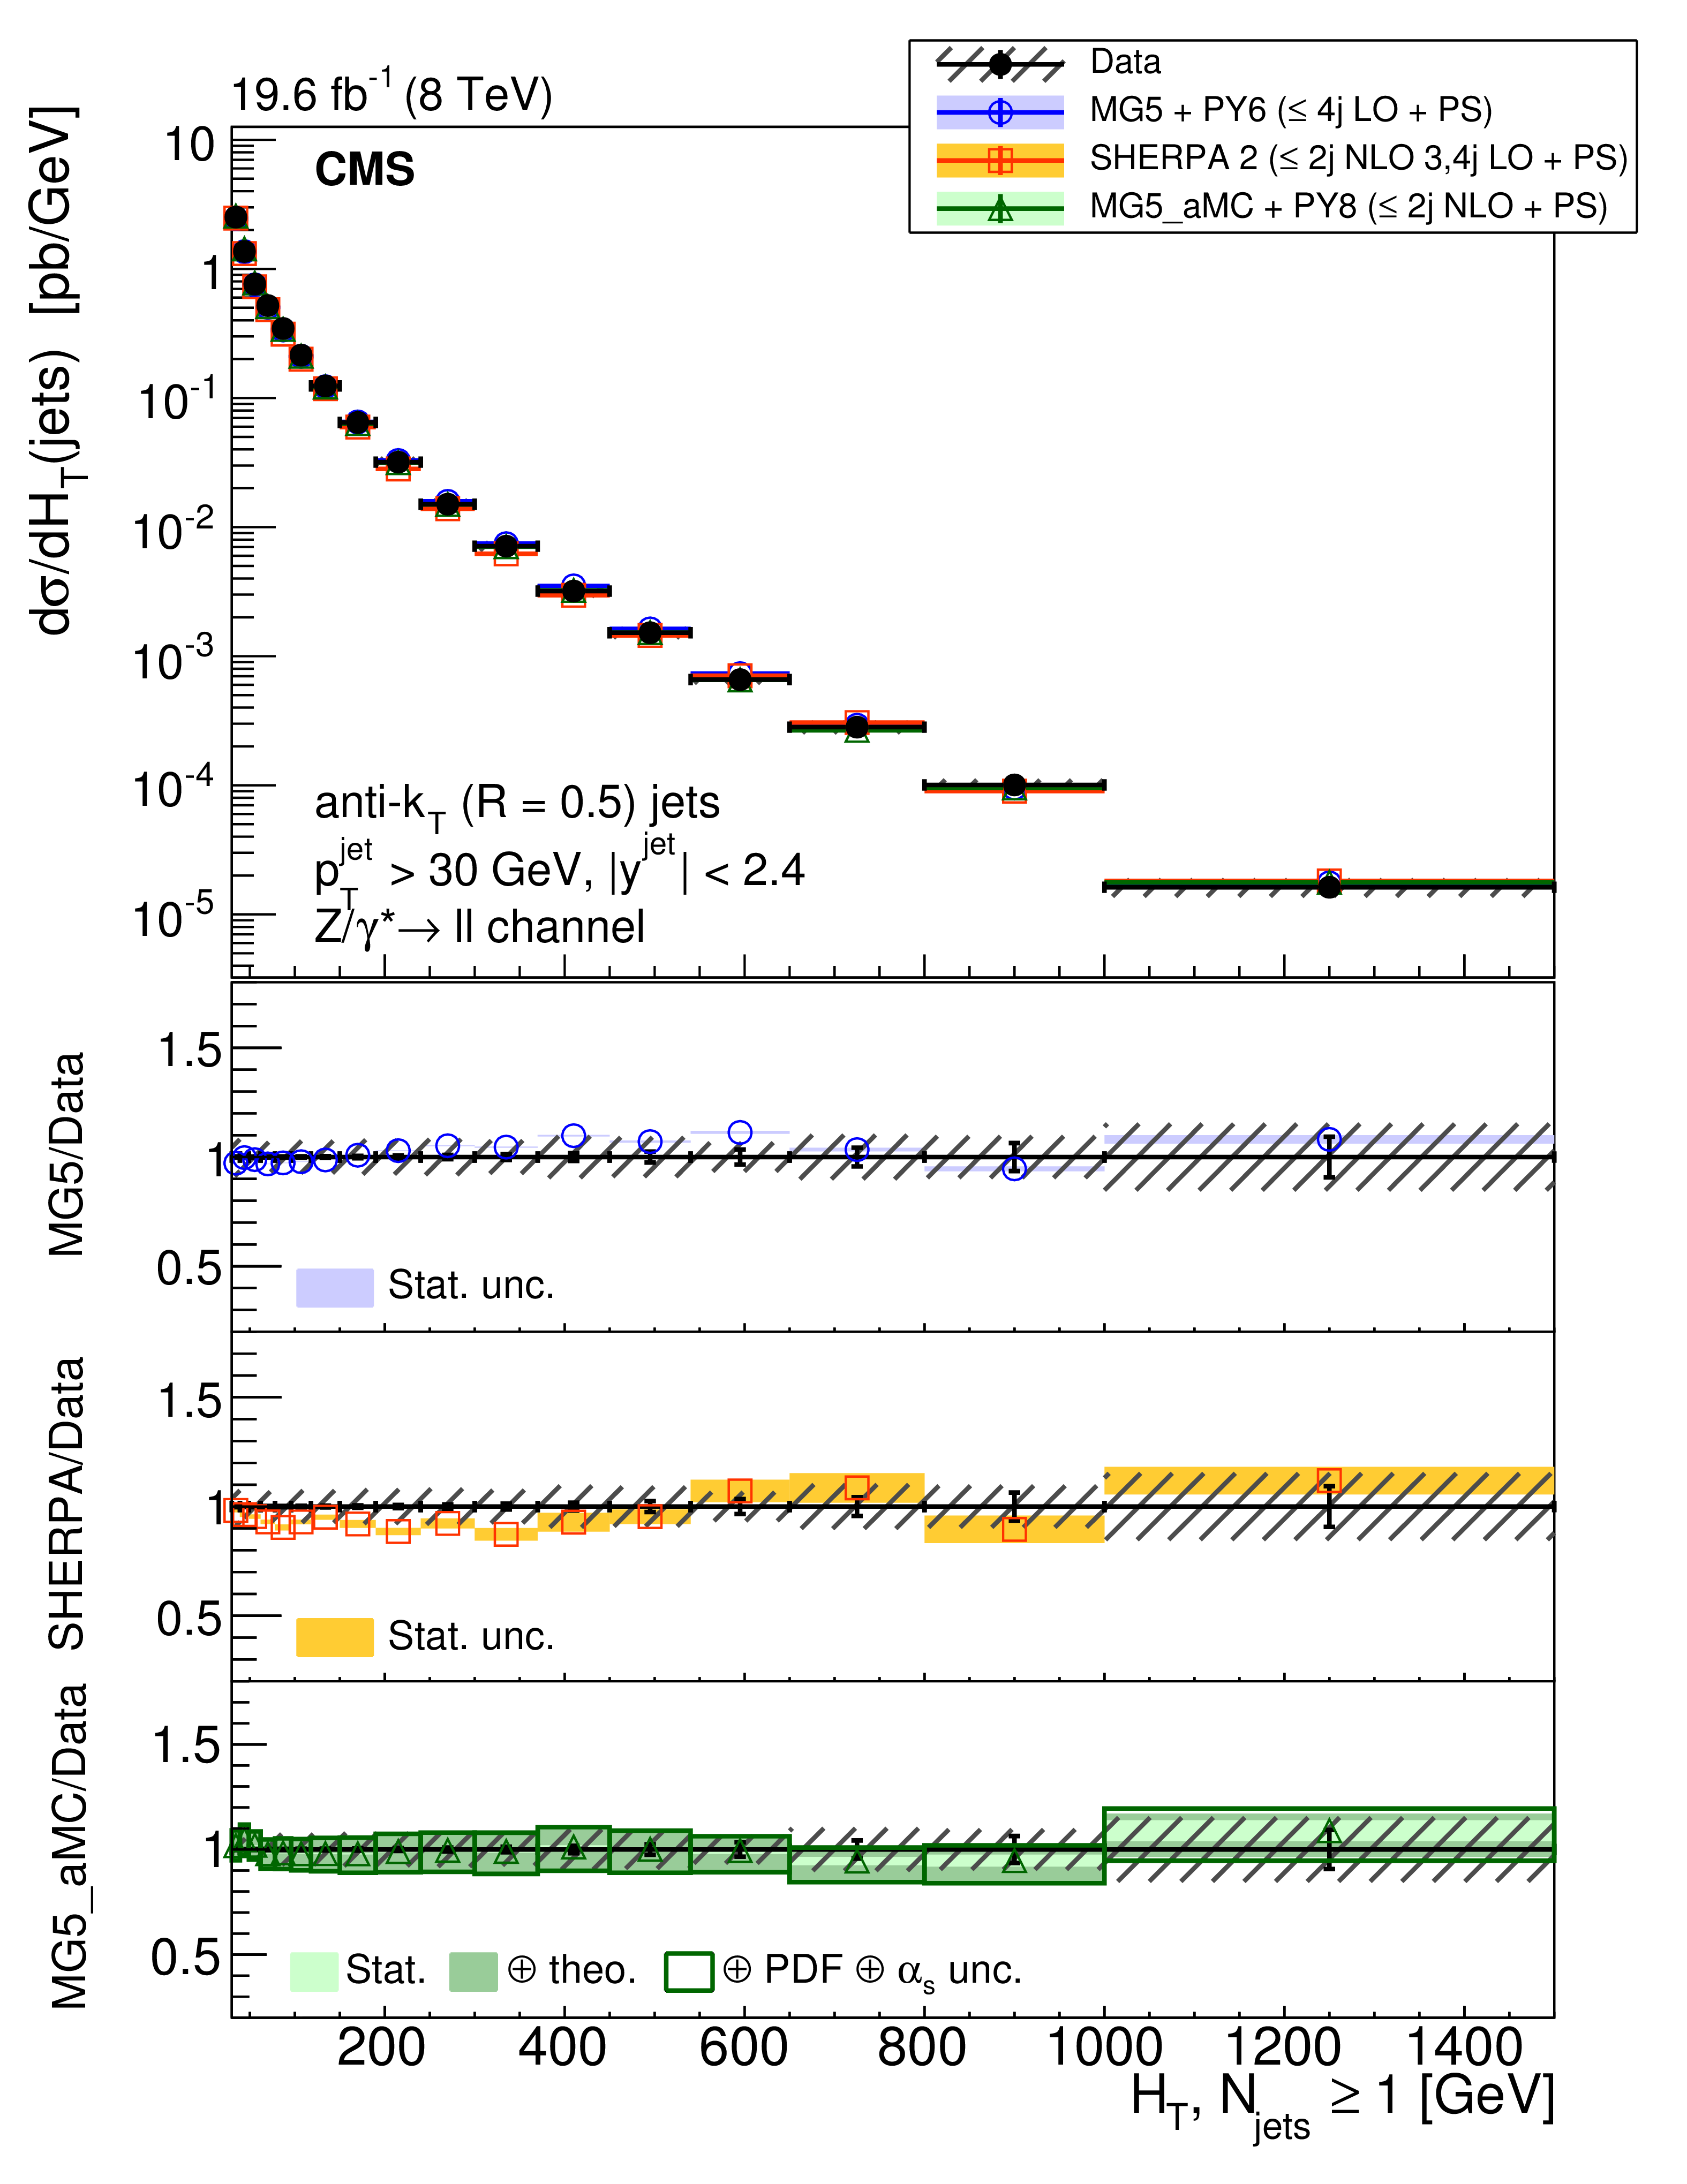
The differential cross section for $ {\mathrm{ Z } (\to \ell \ell )+\text {jets}} $ production measured as a function of $ {H_{\mathrm {T}}} $ for (left) $N_{\text {jets}} \geq 1$ and (right) $N_{\text {jets}} \geq 2$ compared to the predictions calculated with MadGraph 5+PYTHIA 6, SHERPA 2, and mg5-amc +PYTHIA 8. The lower panels show the ratios of the theoretical predictions to the measurements. Error bars around the experimental points show the statistical uncertainty, while the cross-hatched bands indicate the statistical and systematic uncertainties added in quadrature. The boxes around the mg5-amc + PYTHIA 8 to measurement ratio represent the uncertainty on the prediction, including statistical, theoretical (from scale variations), and PDF uncertainties. The dark green area represents the statistical and theoretical uncertainties only, while the light green area represents the statistical uncertainty alone. |
png pdf |
Figure 15-a:
The differential cross section for $ {\mathrm{ Z } (\to \ell \ell )+\text {jets}} $ production measured as a function of $ {H_{\mathrm {T}}} $ for (left) $N_{\text {jets}} \geq 1$ and (right) $N_{\text {jets}} \geq 2$ compared to the predictions calculated with MadGraph 5+PYTHIA 6, SHERPA 2, and mg5-amc +PYTHIA 8. The lower panels show the ratios of the theoretical predictions to the measurements. Error bars around the experimental points show the statistical uncertainty, while the cross-hatched bands indicate the statistical and systematic uncertainties added in quadrature. The boxes around the mg5-amc + PYTHIA 8 to measurement ratio represent the uncertainty on the prediction, including statistical, theoretical (from scale variations), and PDF uncertainties. The dark green area represents the statistical and theoretical uncertainties only, while the light green area represents the statistical uncertainty alone. |

png pdf |
Figure 15-b:
The differential cross section for $ {\mathrm{ Z } (\to \ell \ell )+\text {jets}} $ production measured as a function of $ {H_{\mathrm {T}}} $ for (left) $N_{\text {jets}} \geq 1$ and (right) $N_{\text {jets}} \geq 2$ compared to the predictions calculated with MadGraph 5+PYTHIA 6, SHERPA 2, and mg5-amc +PYTHIA 8. The lower panels show the ratios of the theoretical predictions to the measurements. Error bars around the experimental points show the statistical uncertainty, while the cross-hatched bands indicate the statistical and systematic uncertainties added in quadrature. The boxes around the mg5-amc + PYTHIA 8 to measurement ratio represent the uncertainty on the prediction, including statistical, theoretical (from scale variations), and PDF uncertainties. The dark green area represents the statistical and theoretical uncertainties only, while the light green area represents the statistical uncertainty alone. |
png pdf |
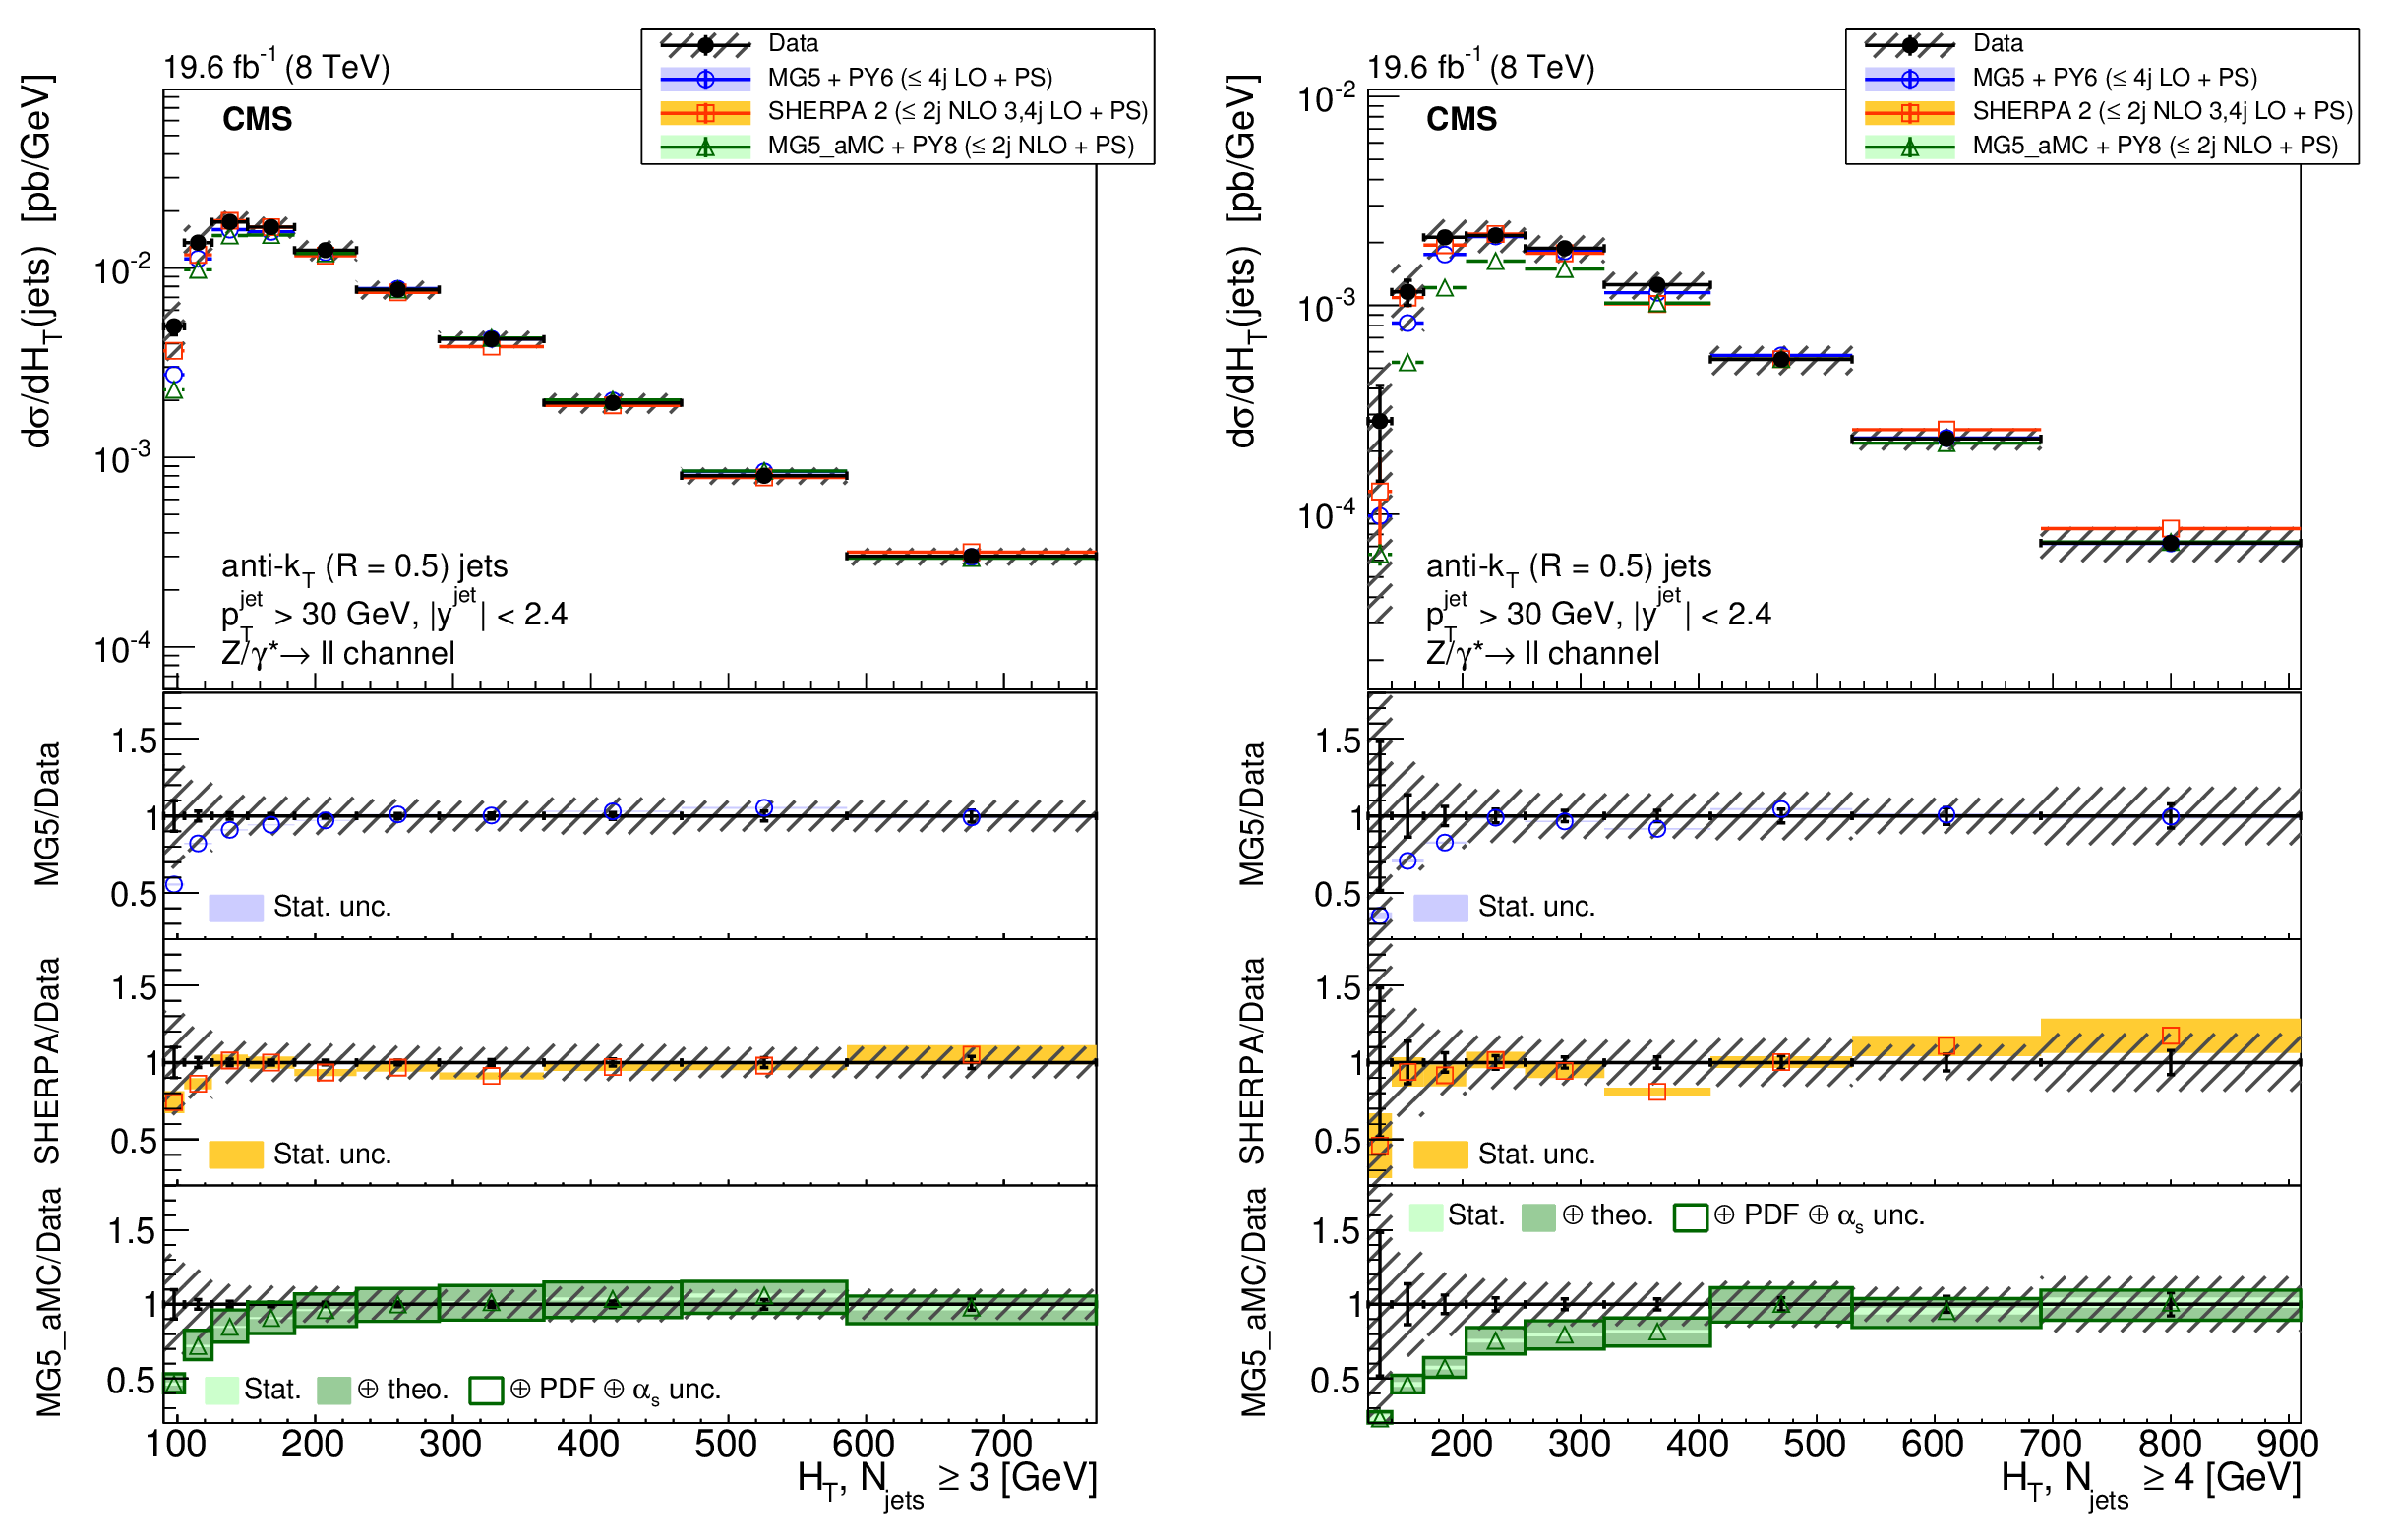
Figure 16:
The differential cross section for $ {\mathrm{ Z } (\to \ell \ell )+\text {jets}} $ production measured as a function of $ {H_{\mathrm {T}}} $ for (left) $N_{\text {jets}} \geq 3$ and (right) $N_{\text {jets}} \geq 4$ compared to the predictions calculated with MadGraph 5+PYTHIA 6, SHERPA 2, and mg5-amc +PYTHIA 8. The lower panels show the ratios of the theoretical predictions to the measurements. Error bars around the experimental points show the statistical uncertainty, while the cross-hatched bands indicate the statistical and systematic uncertainties added in quadrature. The boxes around the mg5-amc + PYTHIA 8 to measurement ratio represent the uncertainty on the prediction, including statistical, theoretical (from scale variations), and PDF uncertainties. The dark green area represents the statistical and theoretical uncertainties only, while the light green area represents the statistical uncertainty alone. |
png pdf |
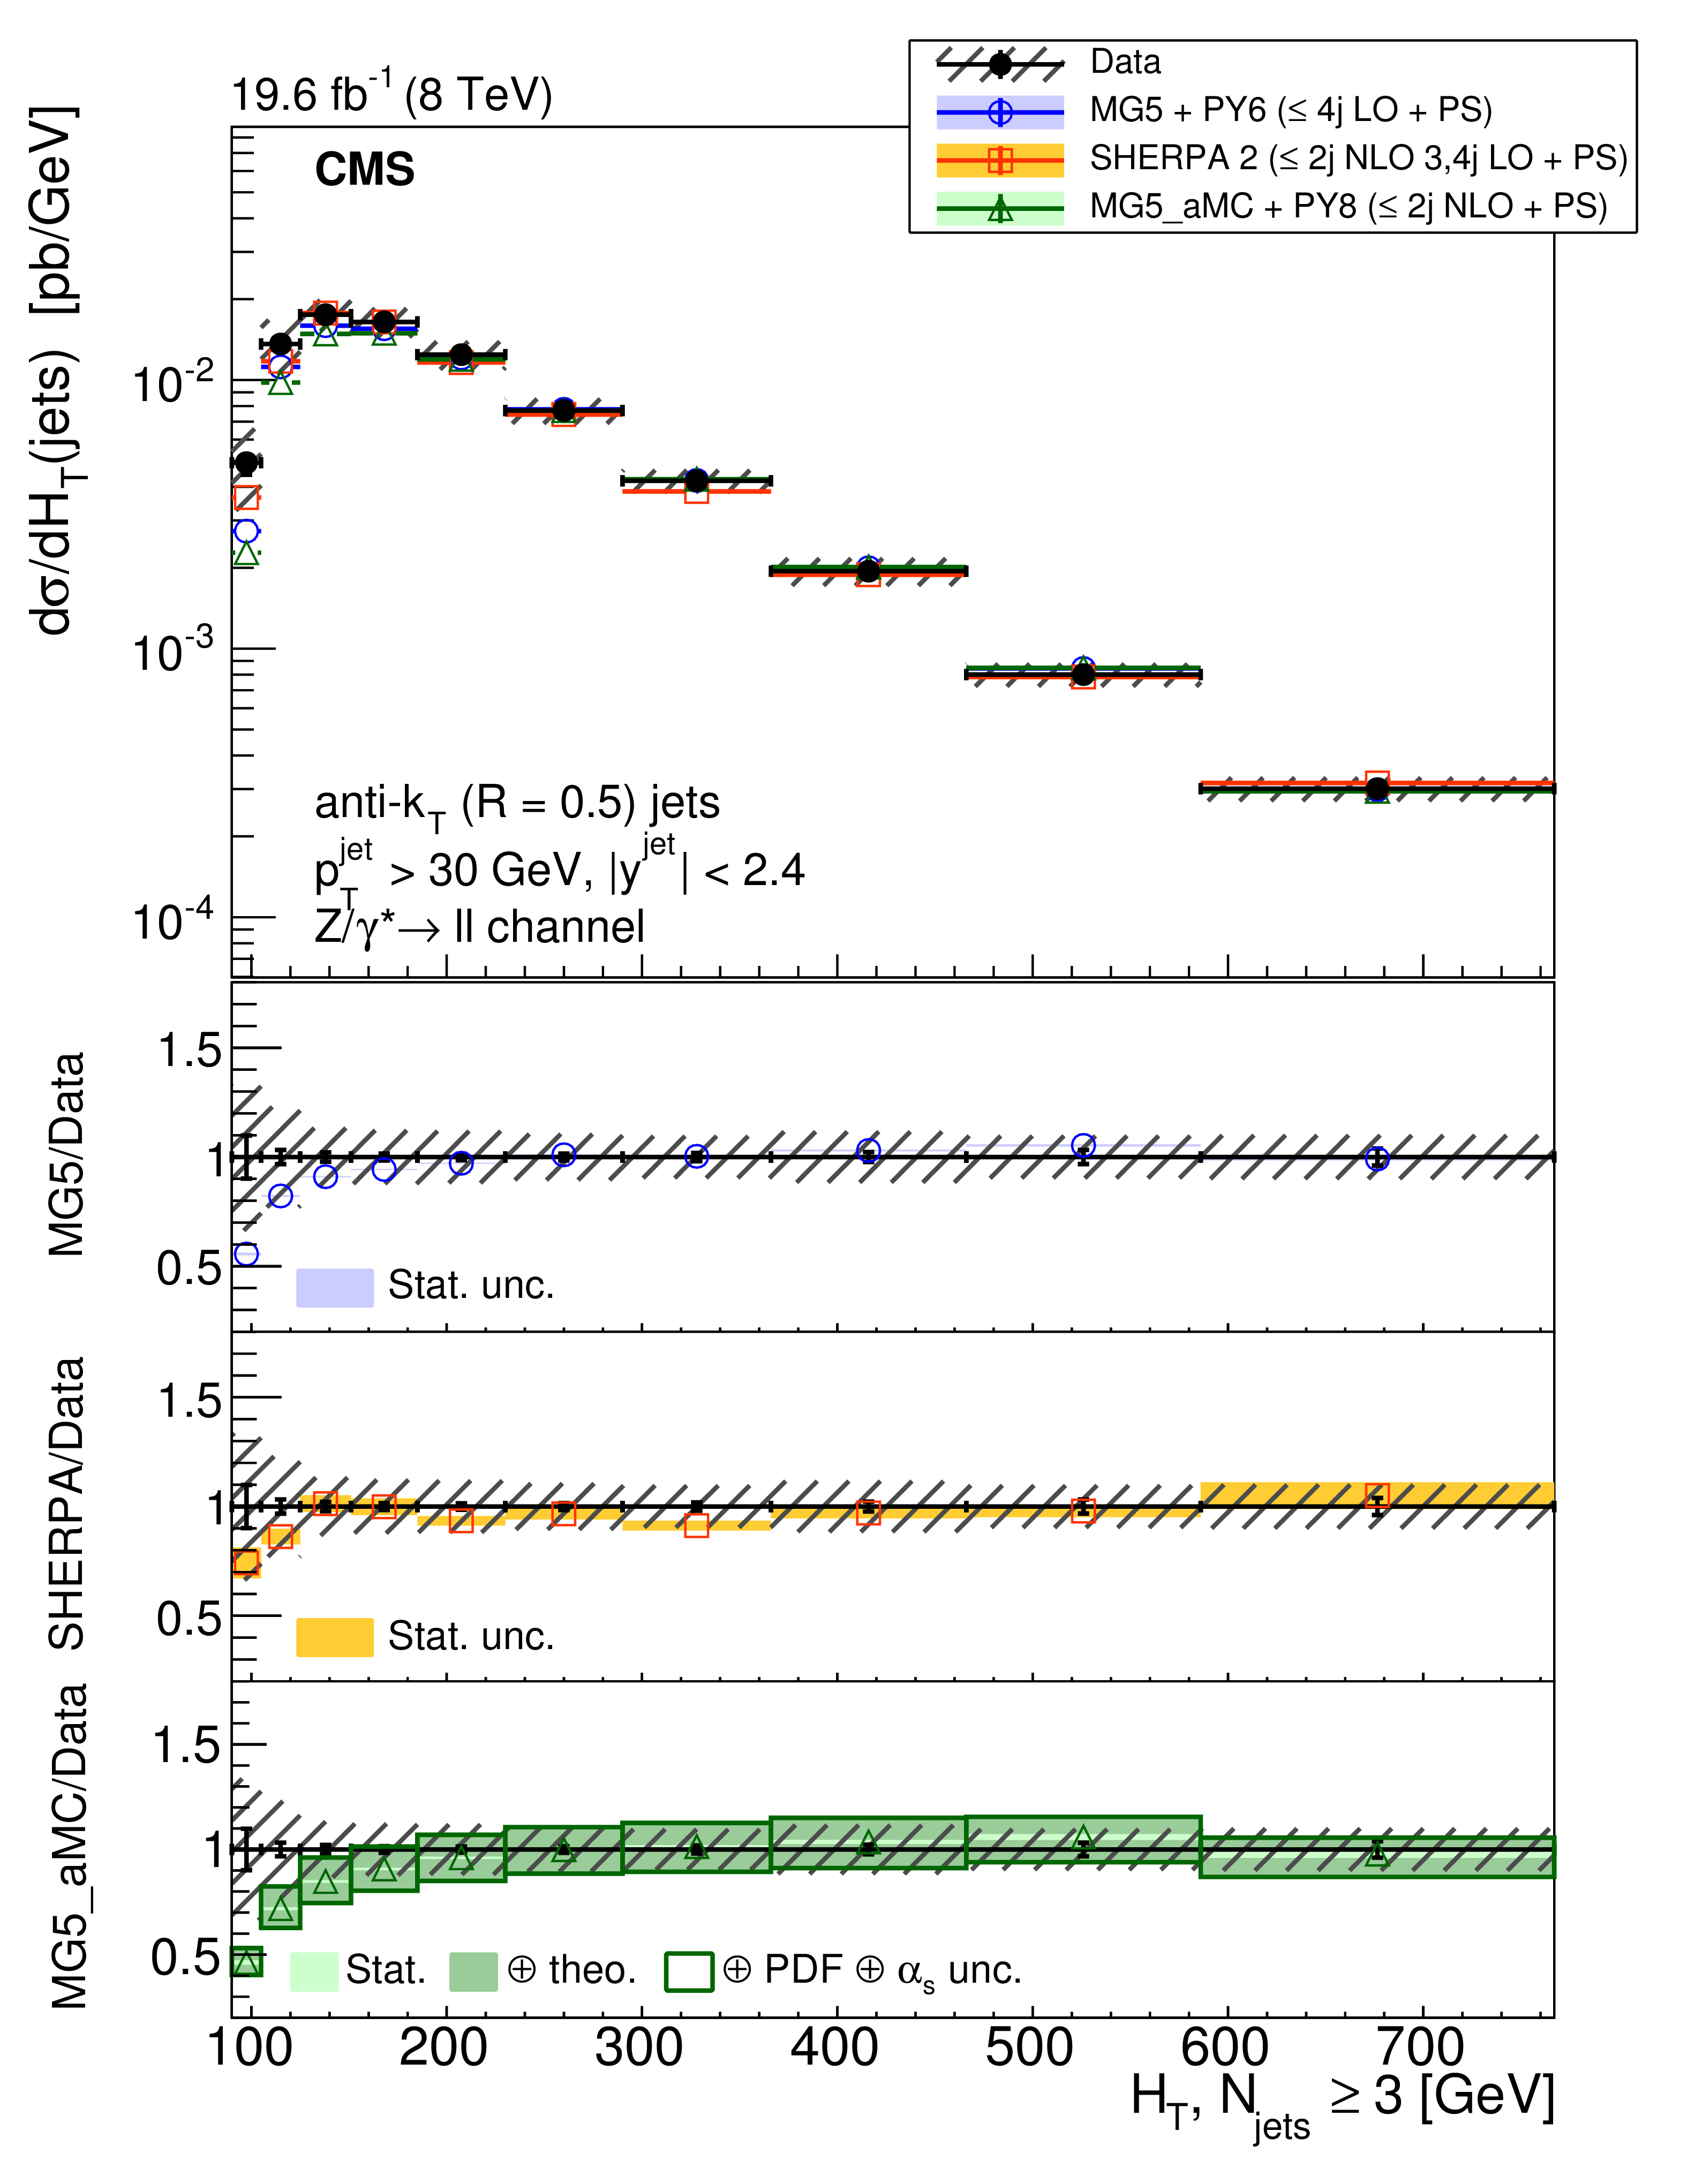
Figure 16-a:
The differential cross section for $ {\mathrm{ Z } (\to \ell \ell )+\text {jets}} $ production measured as a function of $ {H_{\mathrm {T}}} $ for (left) $N_{\text {jets}} \geq 3$ and (right) $N_{\text {jets}} \geq 4$ compared to the predictions calculated with MadGraph 5+PYTHIA 6, SHERPA 2, and mg5-amc +PYTHIA 8. The lower panels show the ratios of the theoretical predictions to the measurements. Error bars around the experimental points show the statistical uncertainty, while the cross-hatched bands indicate the statistical and systematic uncertainties added in quadrature. The boxes around the mg5-amc + PYTHIA 8 to measurement ratio represent the uncertainty on the prediction, including statistical, theoretical (from scale variations), and PDF uncertainties. The dark green area represents the statistical and theoretical uncertainties only, while the light green area represents the statistical uncertainty alone. |
png pdf |
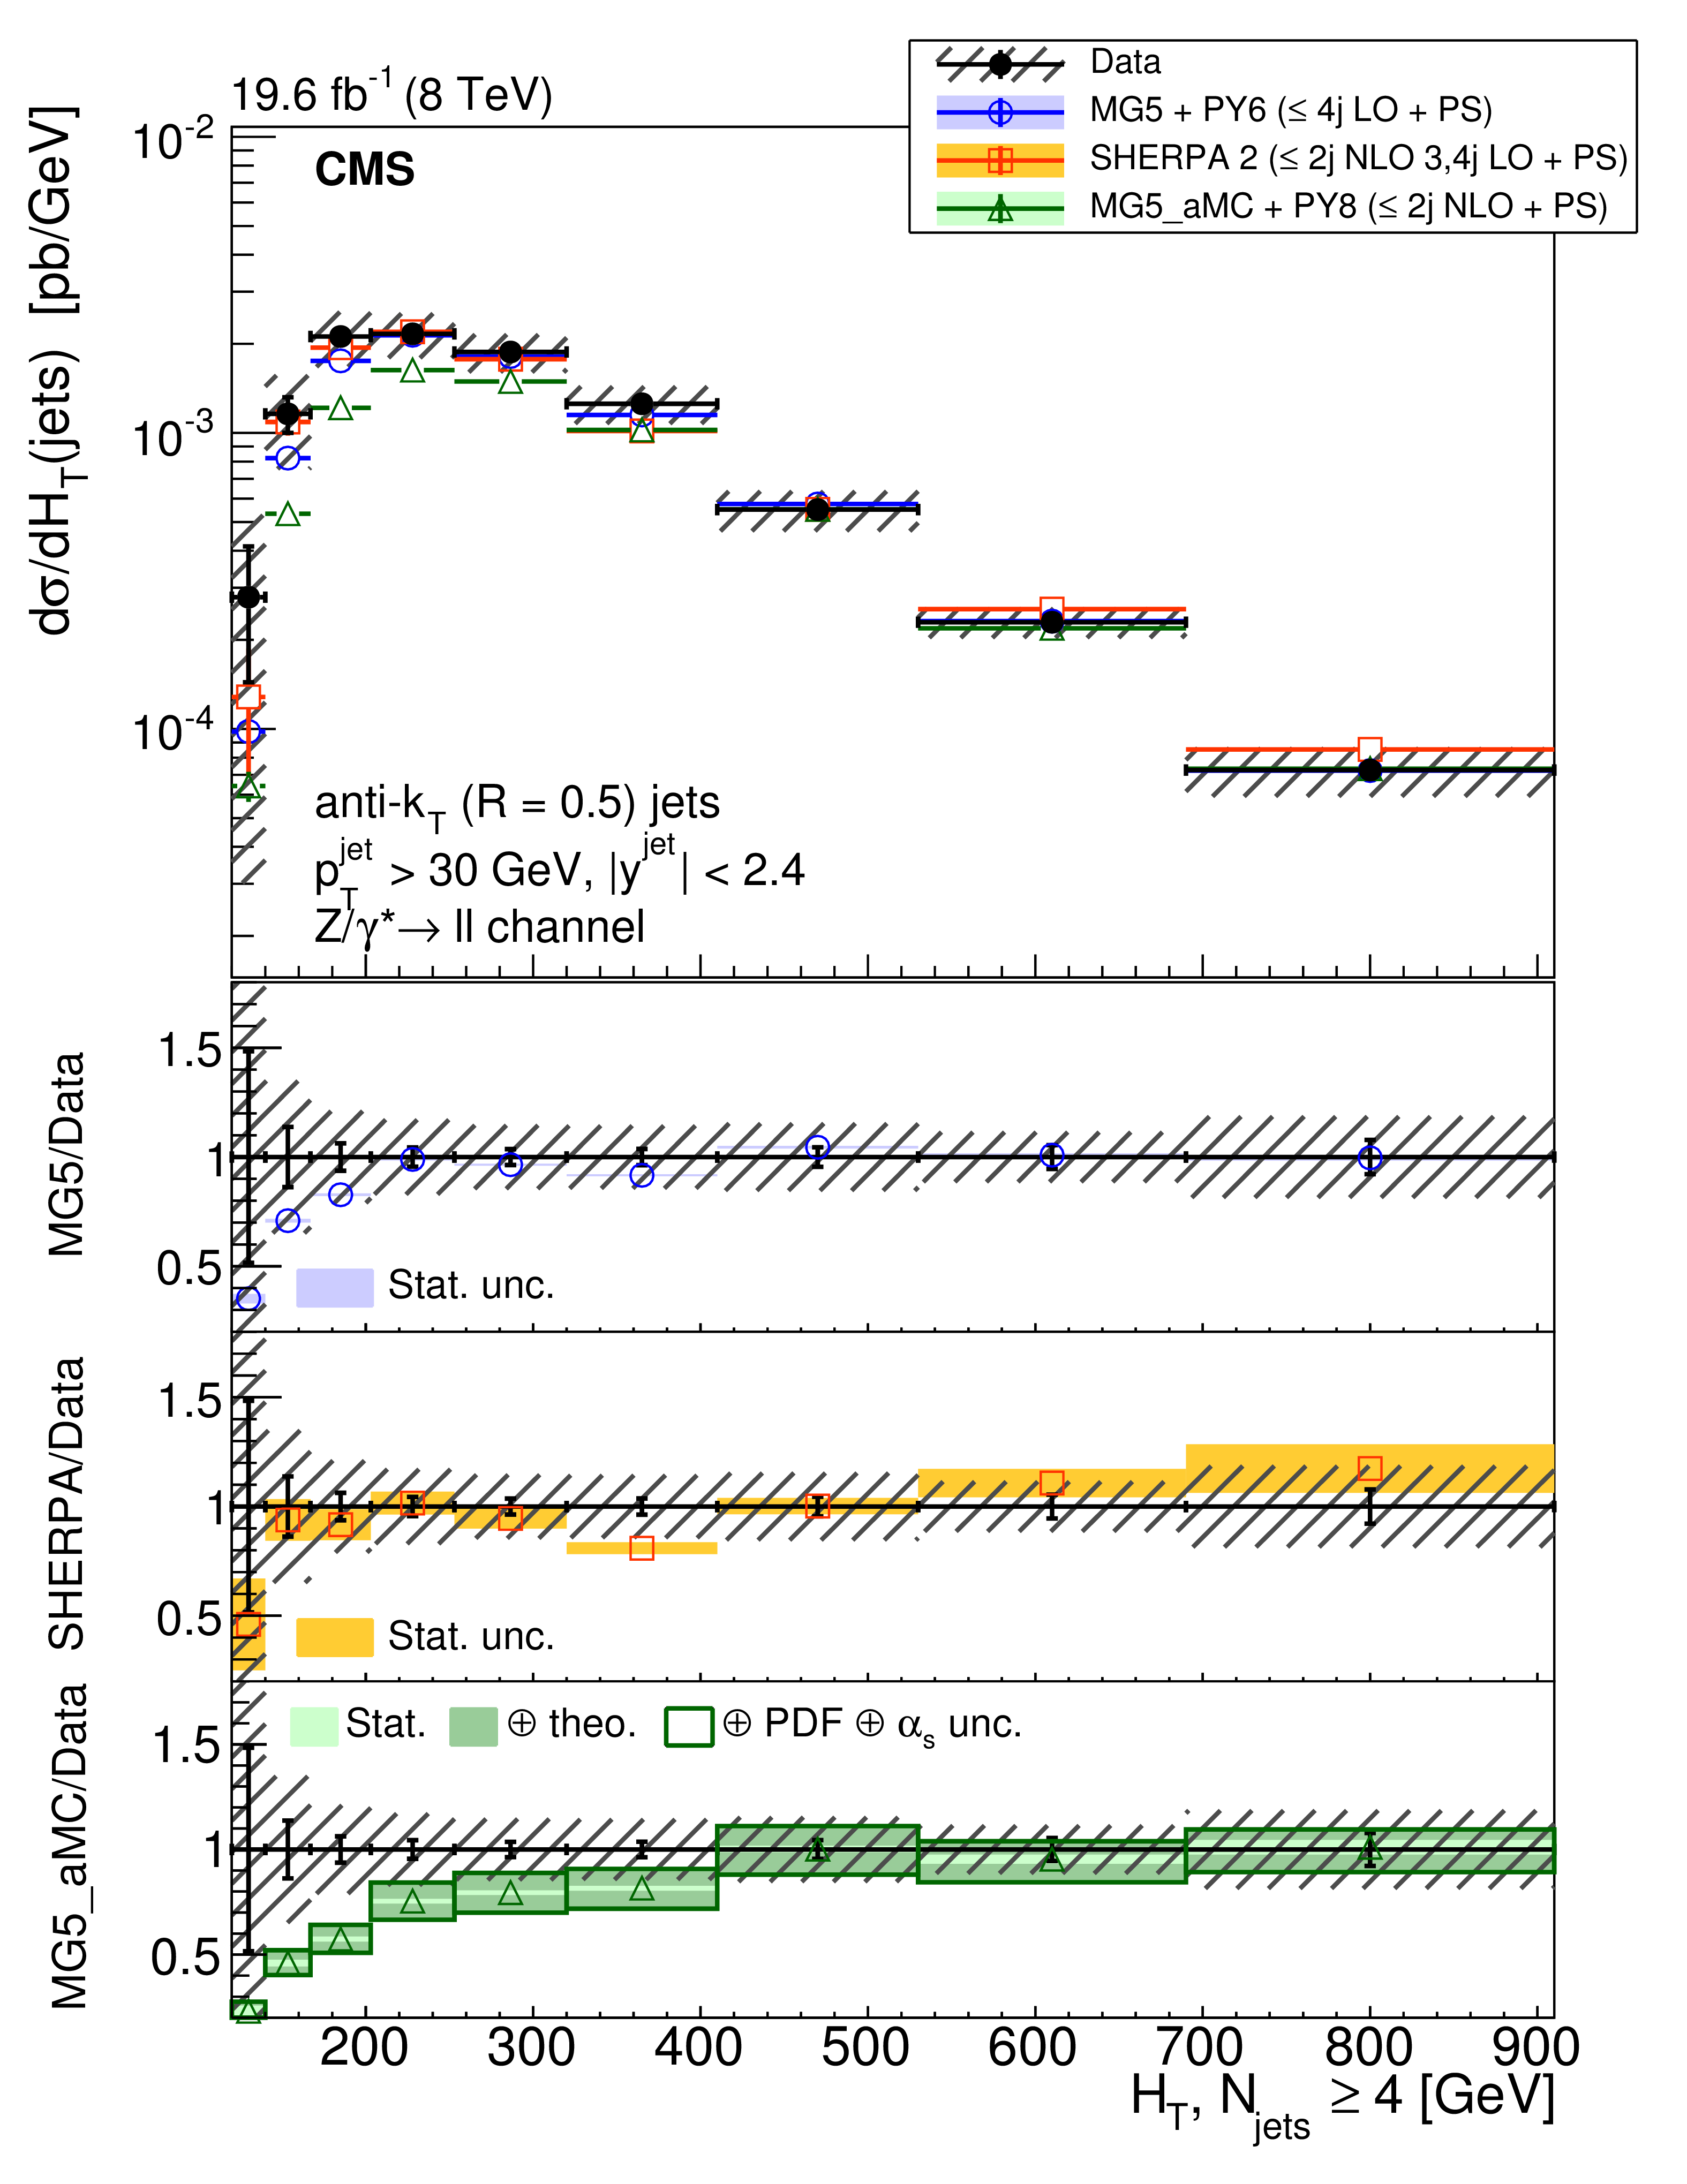
Figure 16-b:
The differential cross section for $ {\mathrm{ Z } (\to \ell \ell )+\text {jets}} $ production measured as a function of $ {H_{\mathrm {T}}} $ for (left) $N_{\text {jets}} \geq 3$ and (right) $N_{\text {jets}} \geq 4$ compared to the predictions calculated with MadGraph 5+PYTHIA 6, SHERPA 2, and mg5-amc +PYTHIA 8. The lower panels show the ratios of the theoretical predictions to the measurements. Error bars around the experimental points show the statistical uncertainty, while the cross-hatched bands indicate the statistical and systematic uncertainties added in quadrature. The boxes around the mg5-amc + PYTHIA 8 to measurement ratio represent the uncertainty on the prediction, including statistical, theoretical (from scale variations), and PDF uncertainties. The dark green area represents the statistical and theoretical uncertainties only, while the light green area represents the statistical uncertainty alone. |

png pdf |
Figure 17:
The differential cross section for $ {\mathrm{ Z } (\to \ell \ell )+\text {jets}} $ production measured as a function of $ {H_{\mathrm {T}}} $ for $N_{\text {jets}} \geq 5$ compared to the predictions calculated with MadGraph 5+PYTHIA 6, SHERPA 2, and mg5-amc +PYTHIA 8. The lower panels show the ratios of the theoretical predictions to the measurements. Error bars around the experimental points show the statistical uncertainty, while the cross-hatched bands indicate the statistical and systematic uncertainties added in quadrature. The boxes around the mg5-amc + PYTHIA 8 to measurement ratio represent the uncertainty on the prediction, including statistical, theoretical (from scale variations), and PDF uncertainties. The dark green area represents the statistical and theoretical uncertainties only, while the light green area represents the statistical uncertainty alone. |
png pdf |
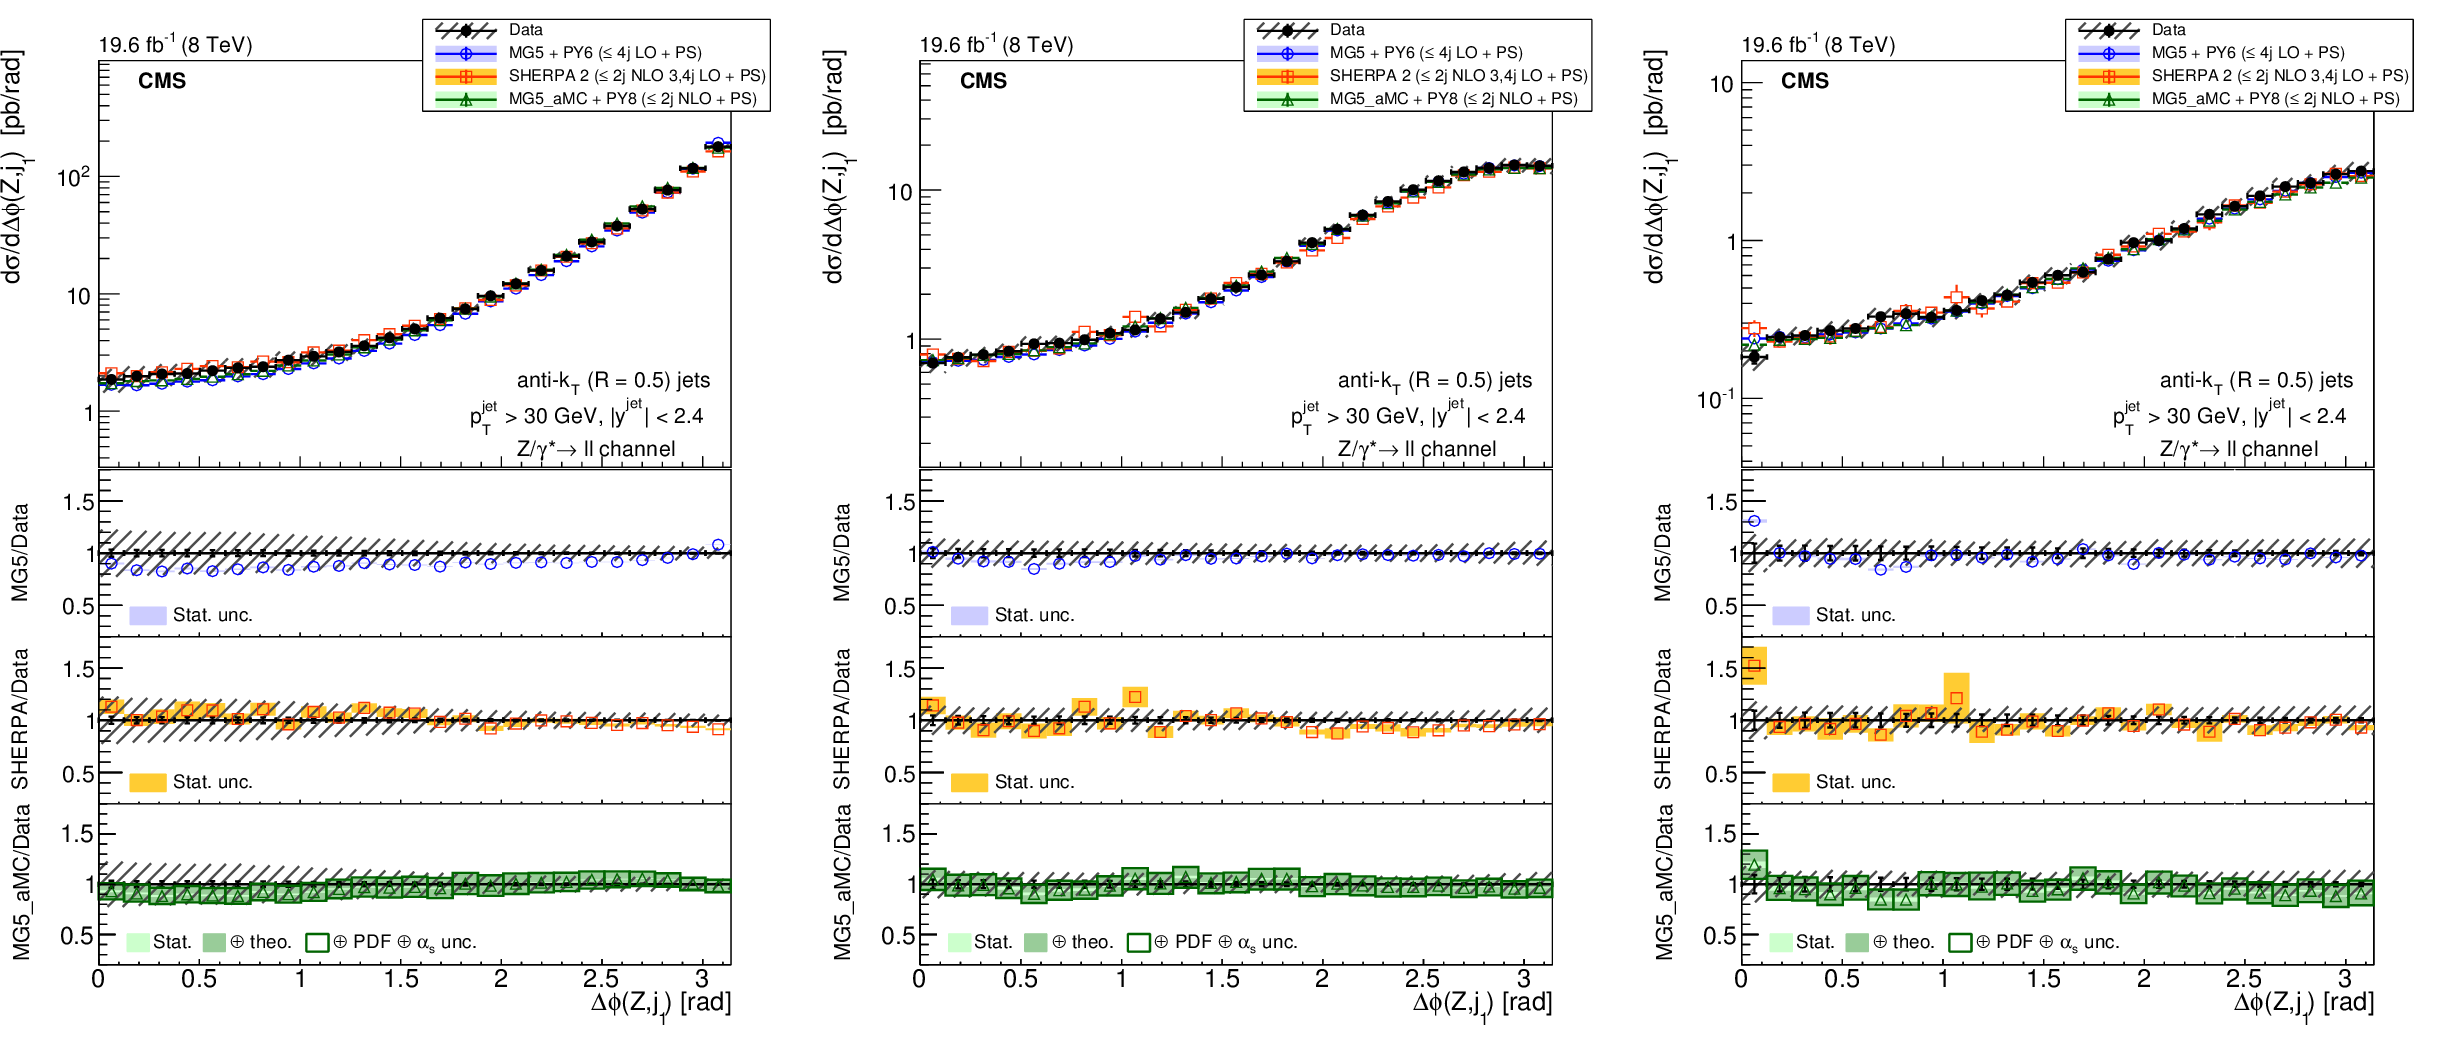
Figure 18:
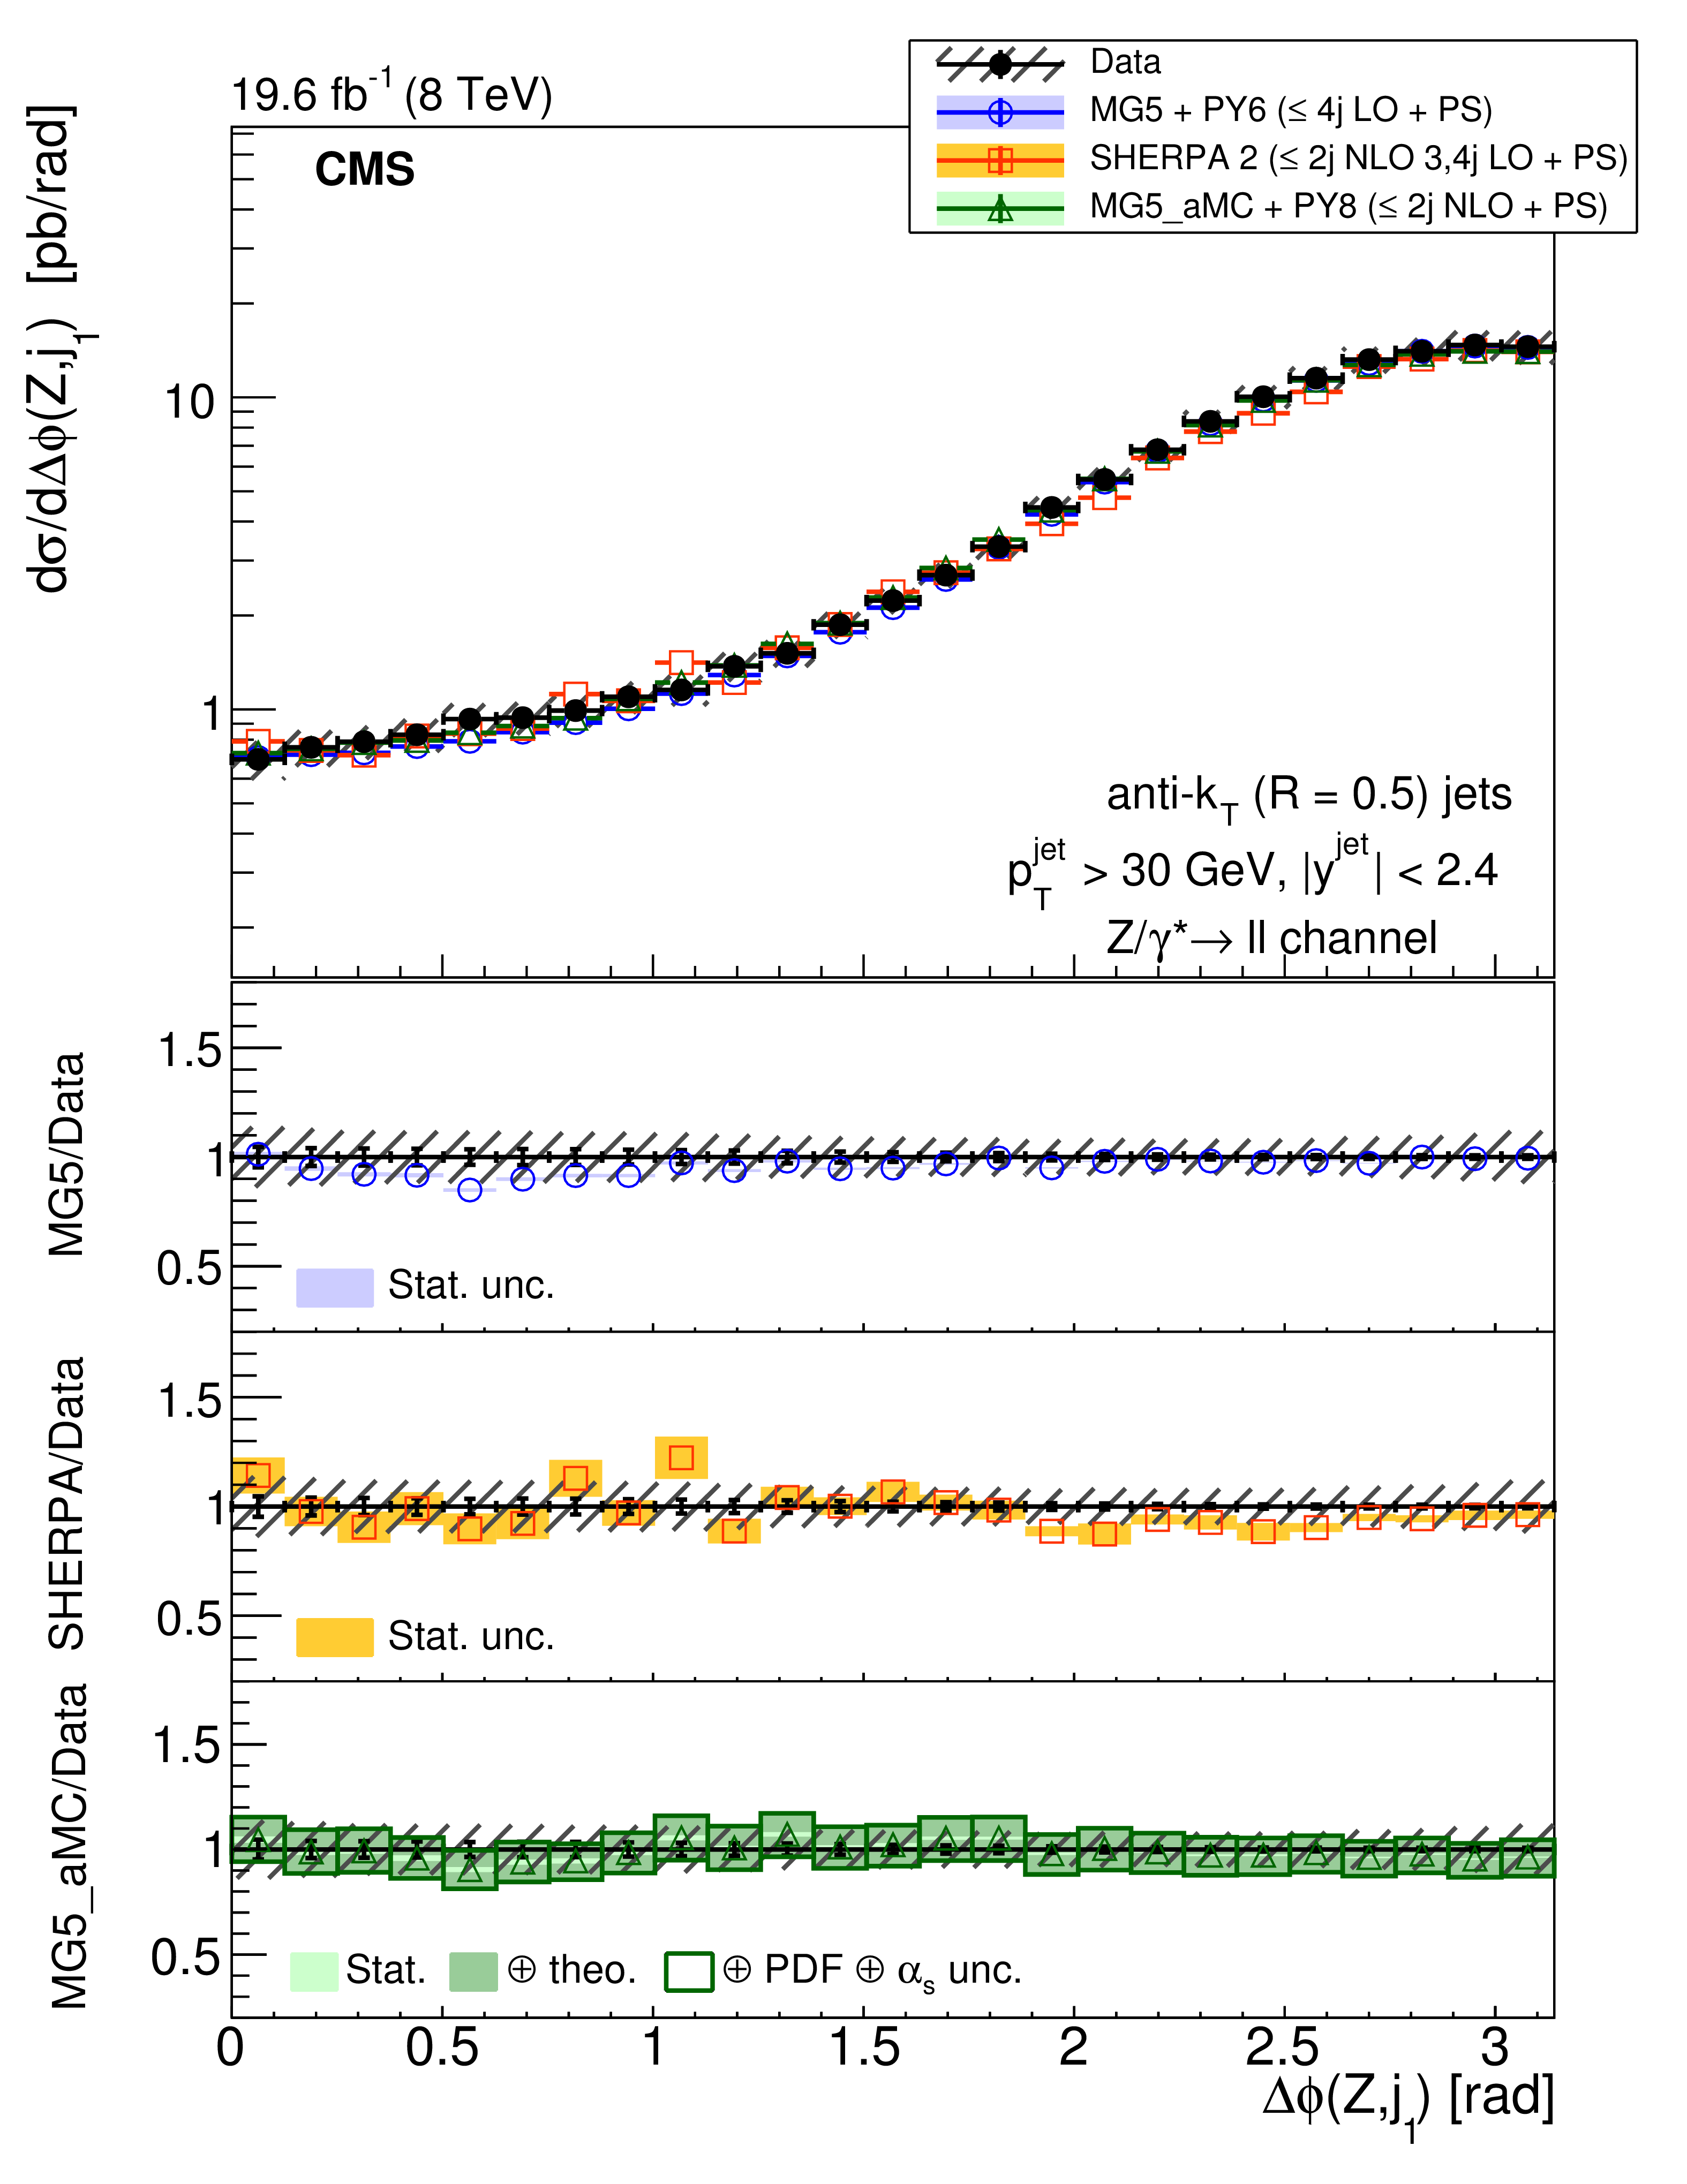
The differential cross section as a function of the azimuthal angle between the Z boson and the leading jet for different jet multiplicities, (left) $N_{\text {jets}}\ge 1$, (middle) $N_{\text {jets}}\ge 2$, and (right) $N_{\text {jets}}\ge 3$. The lower panels show the ratios of the theoretical predictions to the measurements. Error bars around the experimental points show the statistical uncertainty, while the cross-hatched bands indicate the statistical and systematic uncertainties added in quadrature. The boxes around the mg5-amc + PYTHIA 8 to measurement ratio represent the uncertainty on the prediction, including statistical, theoretical (from scale variations), and PDF uncertainties. The dark green area represents the statistical and theoretical uncertainties only, while the light green area represents the statistical uncertainty alone. |

png pdf |
Figure 18-a:
The differential cross section as a function of the azimuthal angle between the Z boson and the leading jet for different jet multiplicities, (left) $N_{\text {jets}}\ge 1$, (middle) $N_{\text {jets}}\ge 2$, and (right) $N_{\text {jets}}\ge 3$. The lower panels show the ratios of the theoretical predictions to the measurements. Error bars around the experimental points show the statistical uncertainty, while the cross-hatched bands indicate the statistical and systematic uncertainties added in quadrature. The boxes around the mg5-amc + PYTHIA 8 to measurement ratio represent the uncertainty on the prediction, including statistical, theoretical (from scale variations), and PDF uncertainties. The dark green area represents the statistical and theoretical uncertainties only, while the light green area represents the statistical uncertainty alone. |
png pdf |
Figure 18-b:
The differential cross section as a function of the azimuthal angle between the Z boson and the leading jet for different jet multiplicities, (left) $N_{\text {jets}}\ge 1$, (middle) $N_{\text {jets}}\ge 2$, and (right) $N_{\text {jets}}\ge 3$. The lower panels show the ratios of the theoretical predictions to the measurements. Error bars around the experimental points show the statistical uncertainty, while the cross-hatched bands indicate the statistical and systematic uncertainties added in quadrature. The boxes around the mg5-amc + PYTHIA 8 to measurement ratio represent the uncertainty on the prediction, including statistical, theoretical (from scale variations), and PDF uncertainties. The dark green area represents the statistical and theoretical uncertainties only, while the light green area represents the statistical uncertainty alone. |

png pdf |
Figure 18-c:
The differential cross section as a function of the azimuthal angle between the Z boson and the leading jet for different jet multiplicities, (left) $N_{\text {jets}}\ge 1$, (middle) $N_{\text {jets}}\ge 2$, and (right) $N_{\text {jets}}\ge 3$. The lower panels show the ratios of the theoretical predictions to the measurements. Error bars around the experimental points show the statistical uncertainty, while the cross-hatched bands indicate the statistical and systematic uncertainties added in quadrature. The boxes around the mg5-amc + PYTHIA 8 to measurement ratio represent the uncertainty on the prediction, including statistical, theoretical (from scale variations), and PDF uncertainties. The dark green area represents the statistical and theoretical uncertainties only, while the light green area represents the statistical uncertainty alone. |
png pdf |
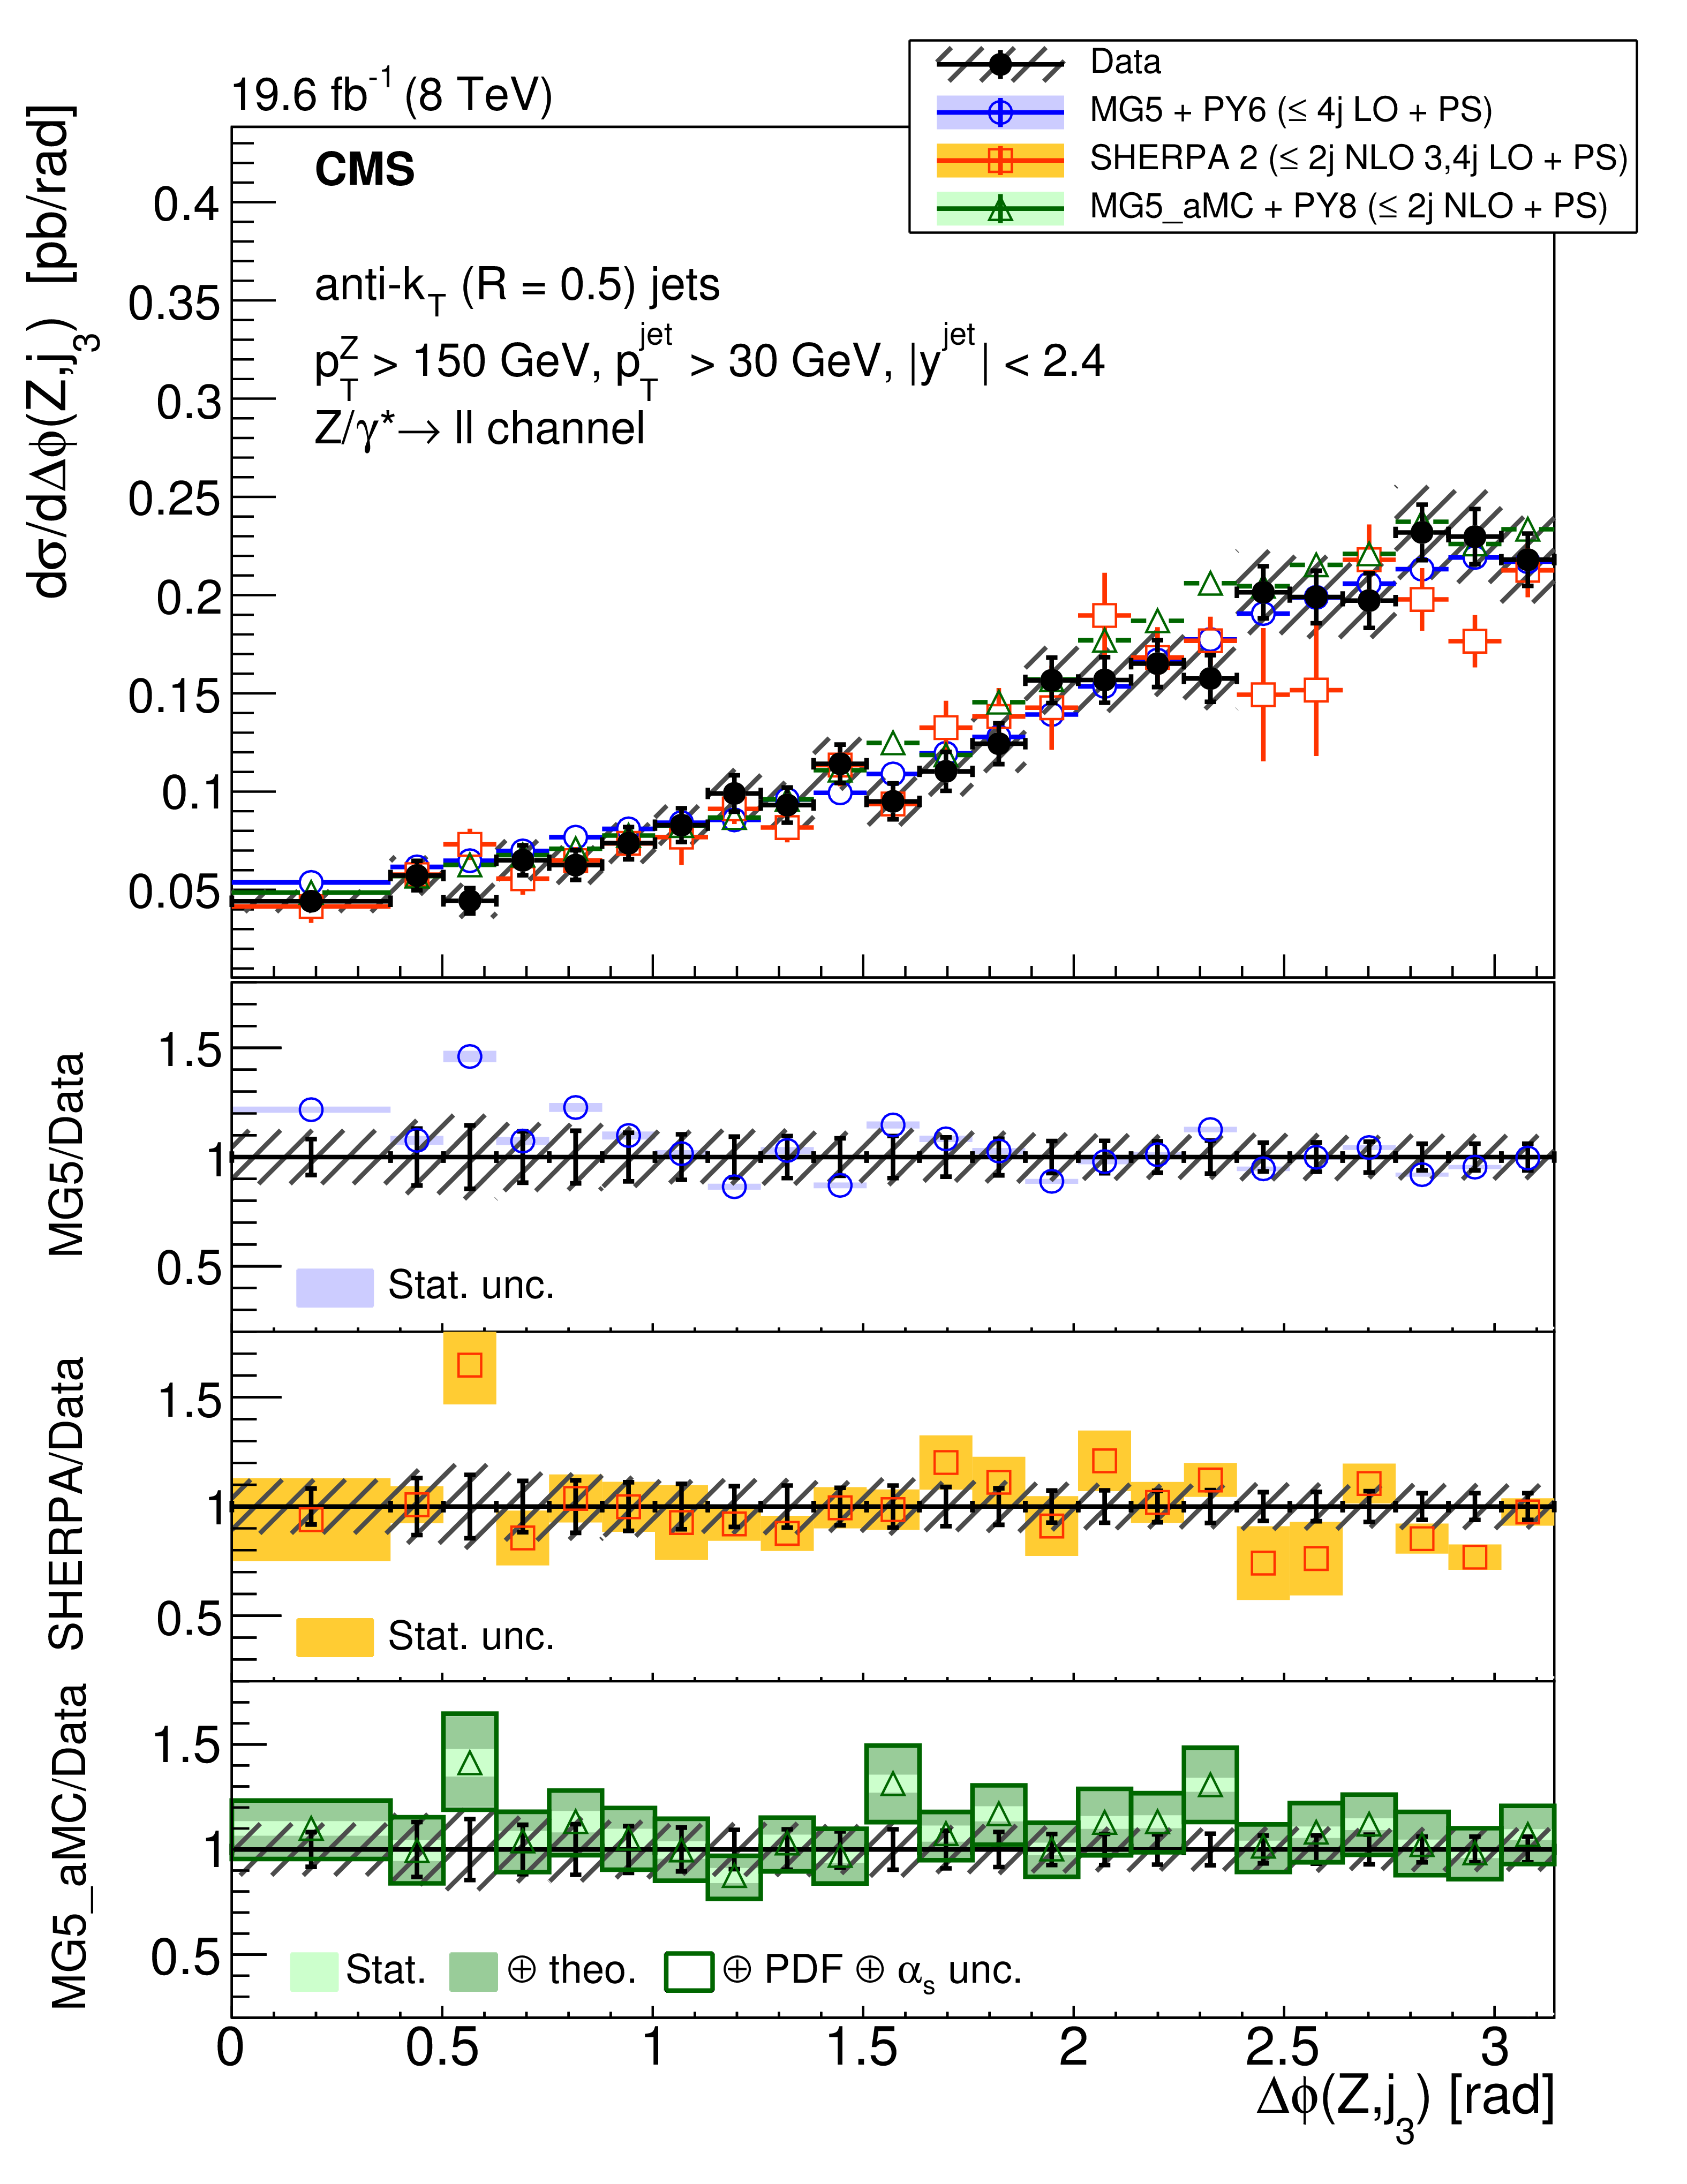
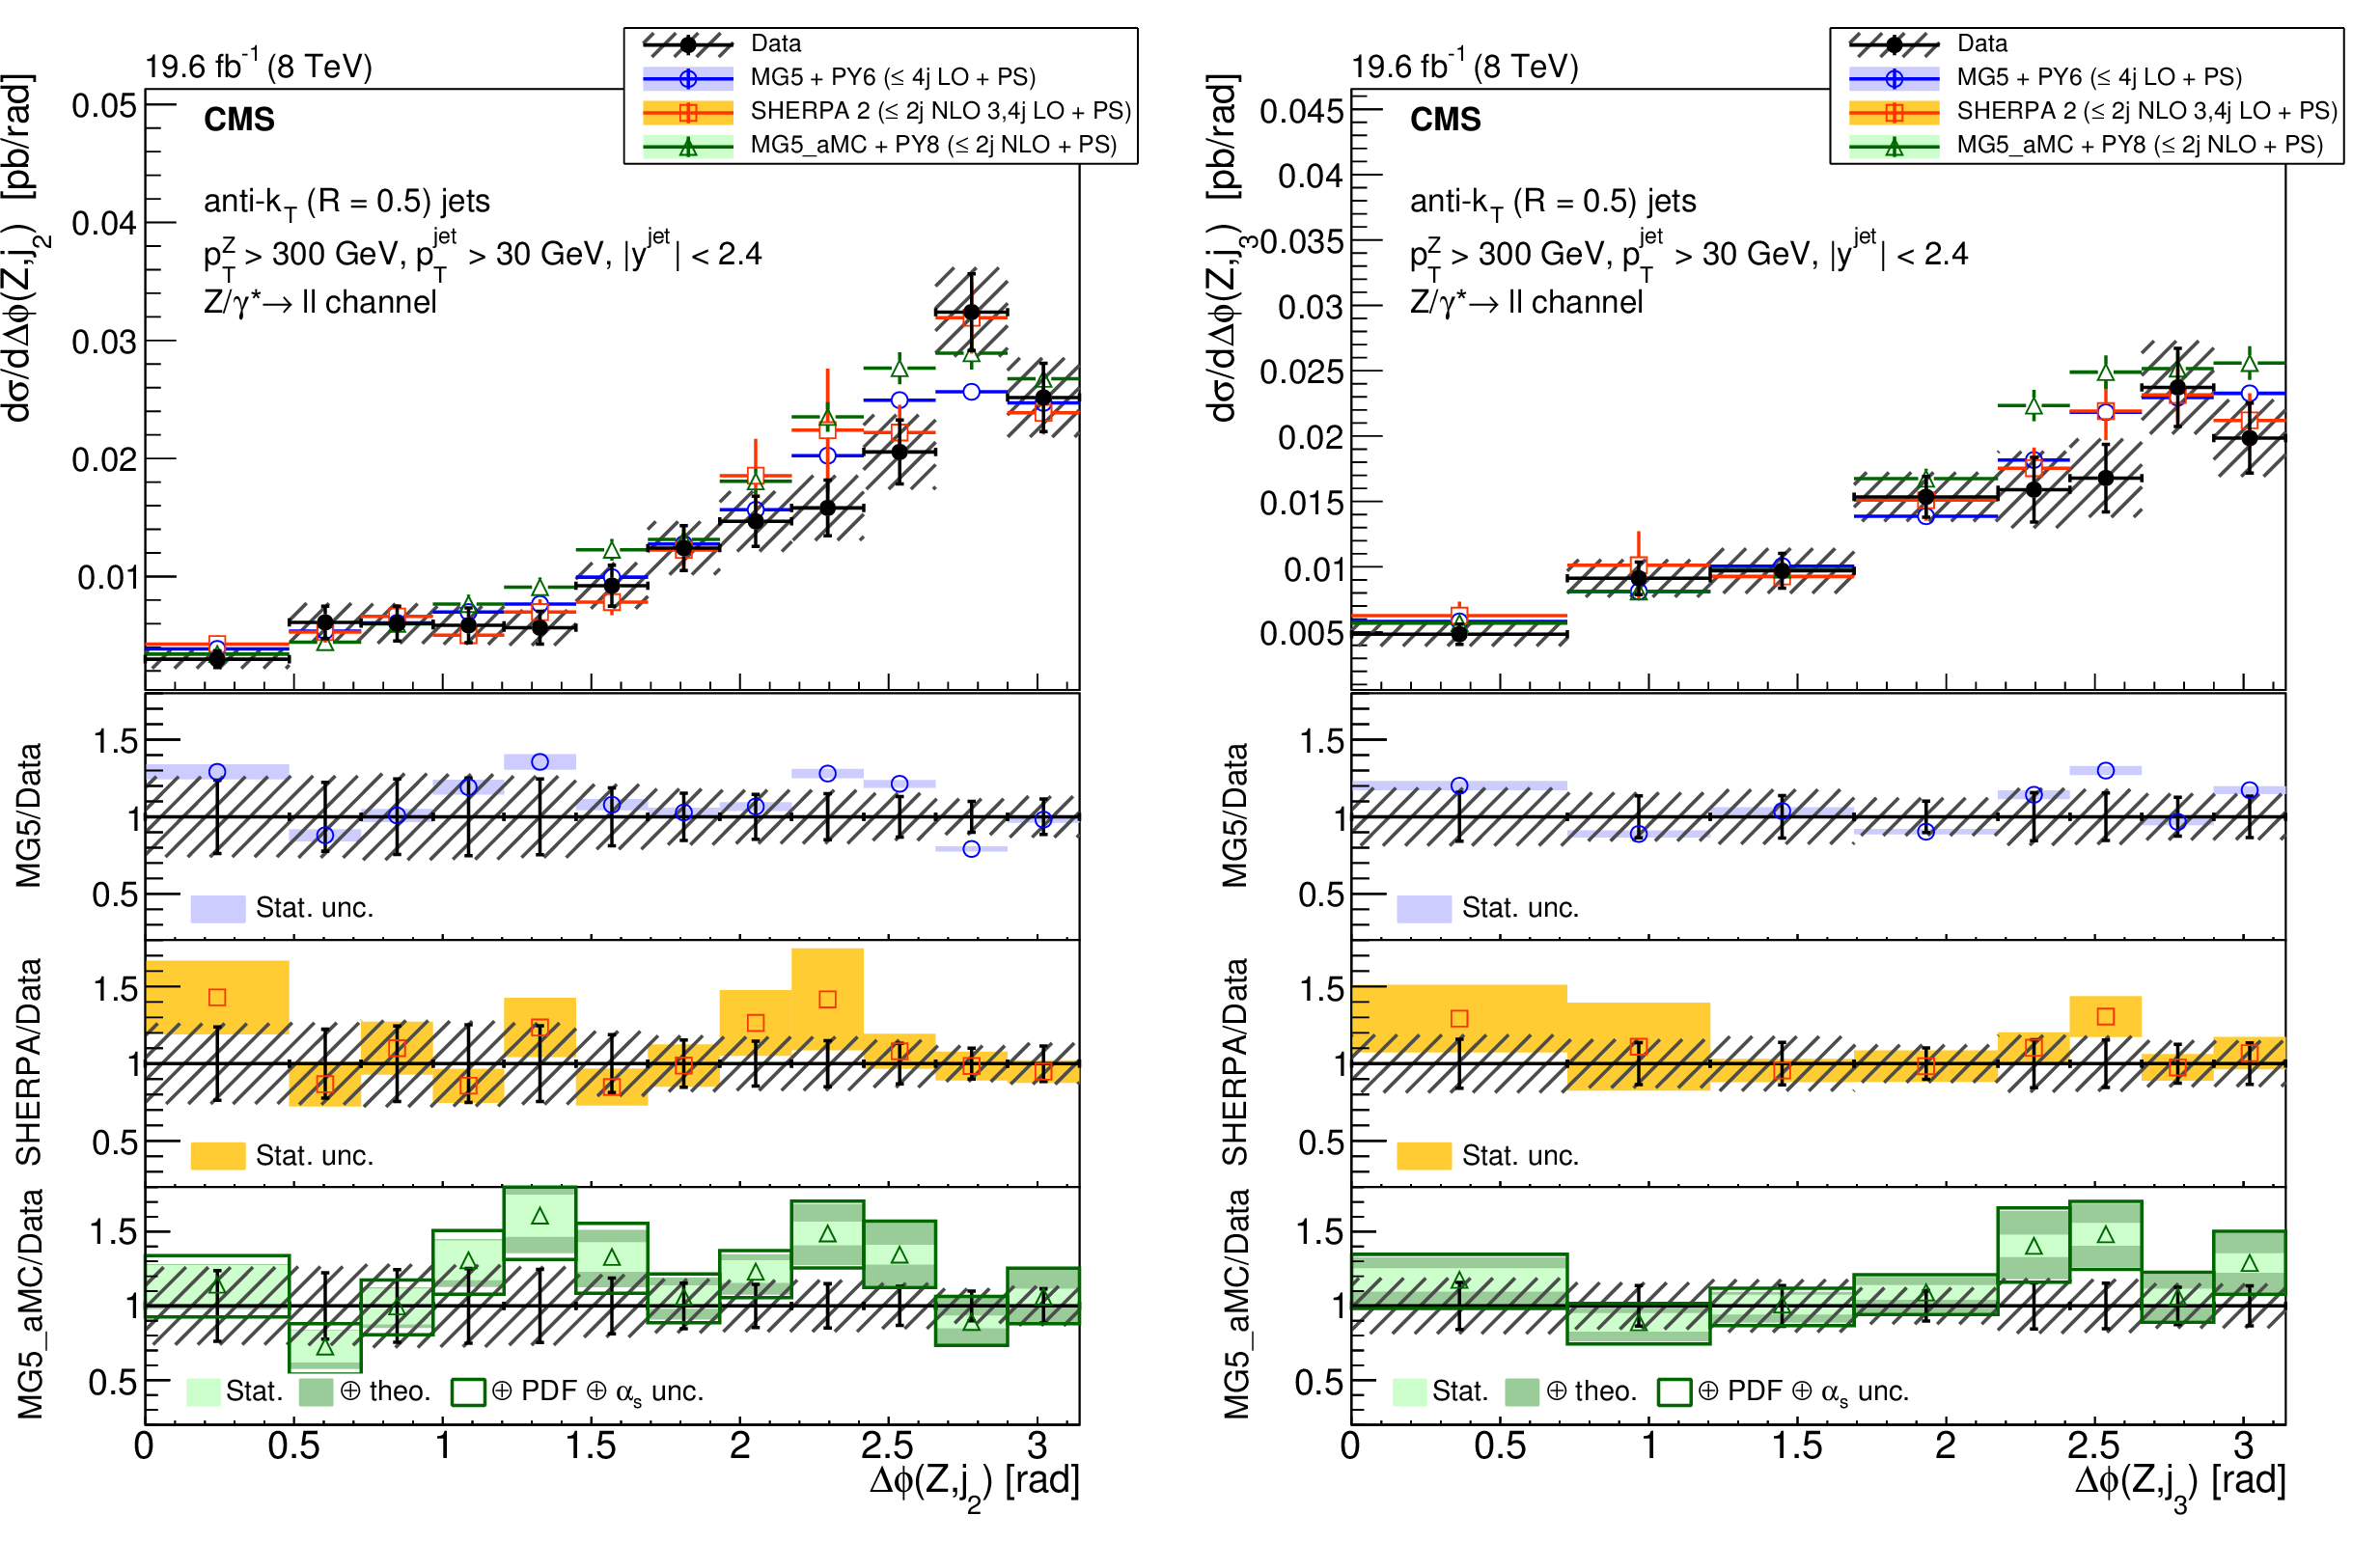
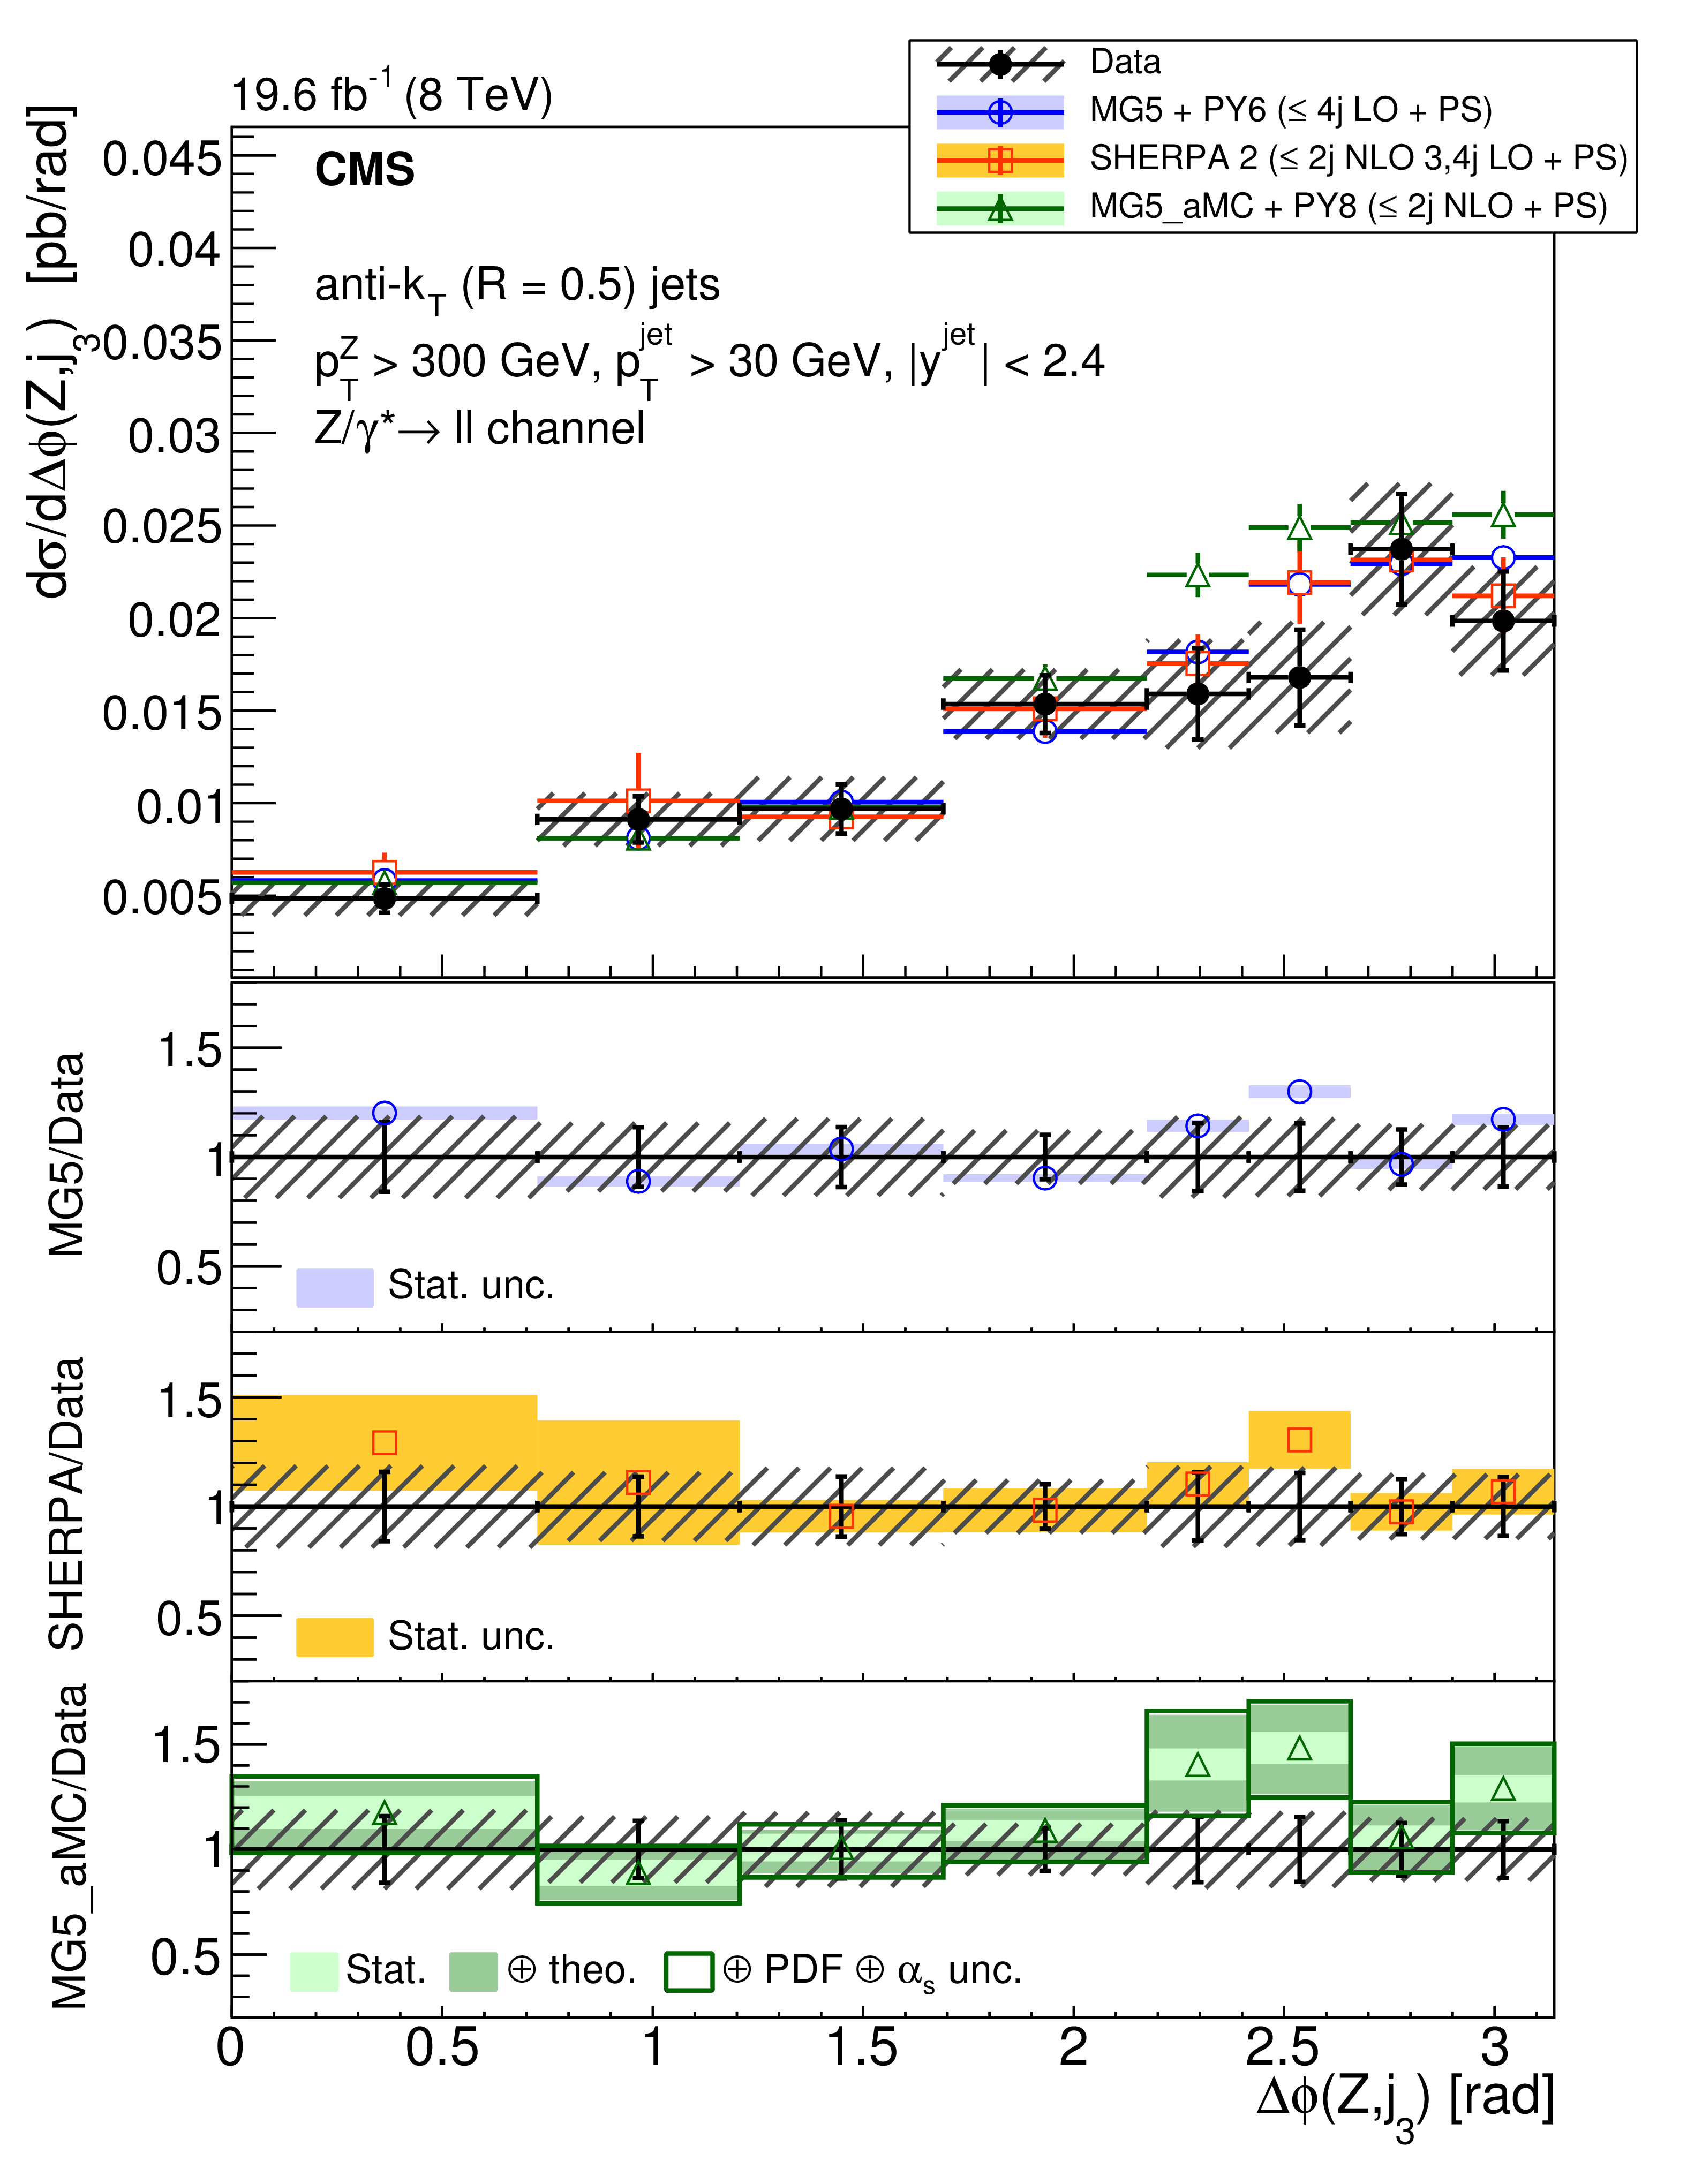
Figure 19:
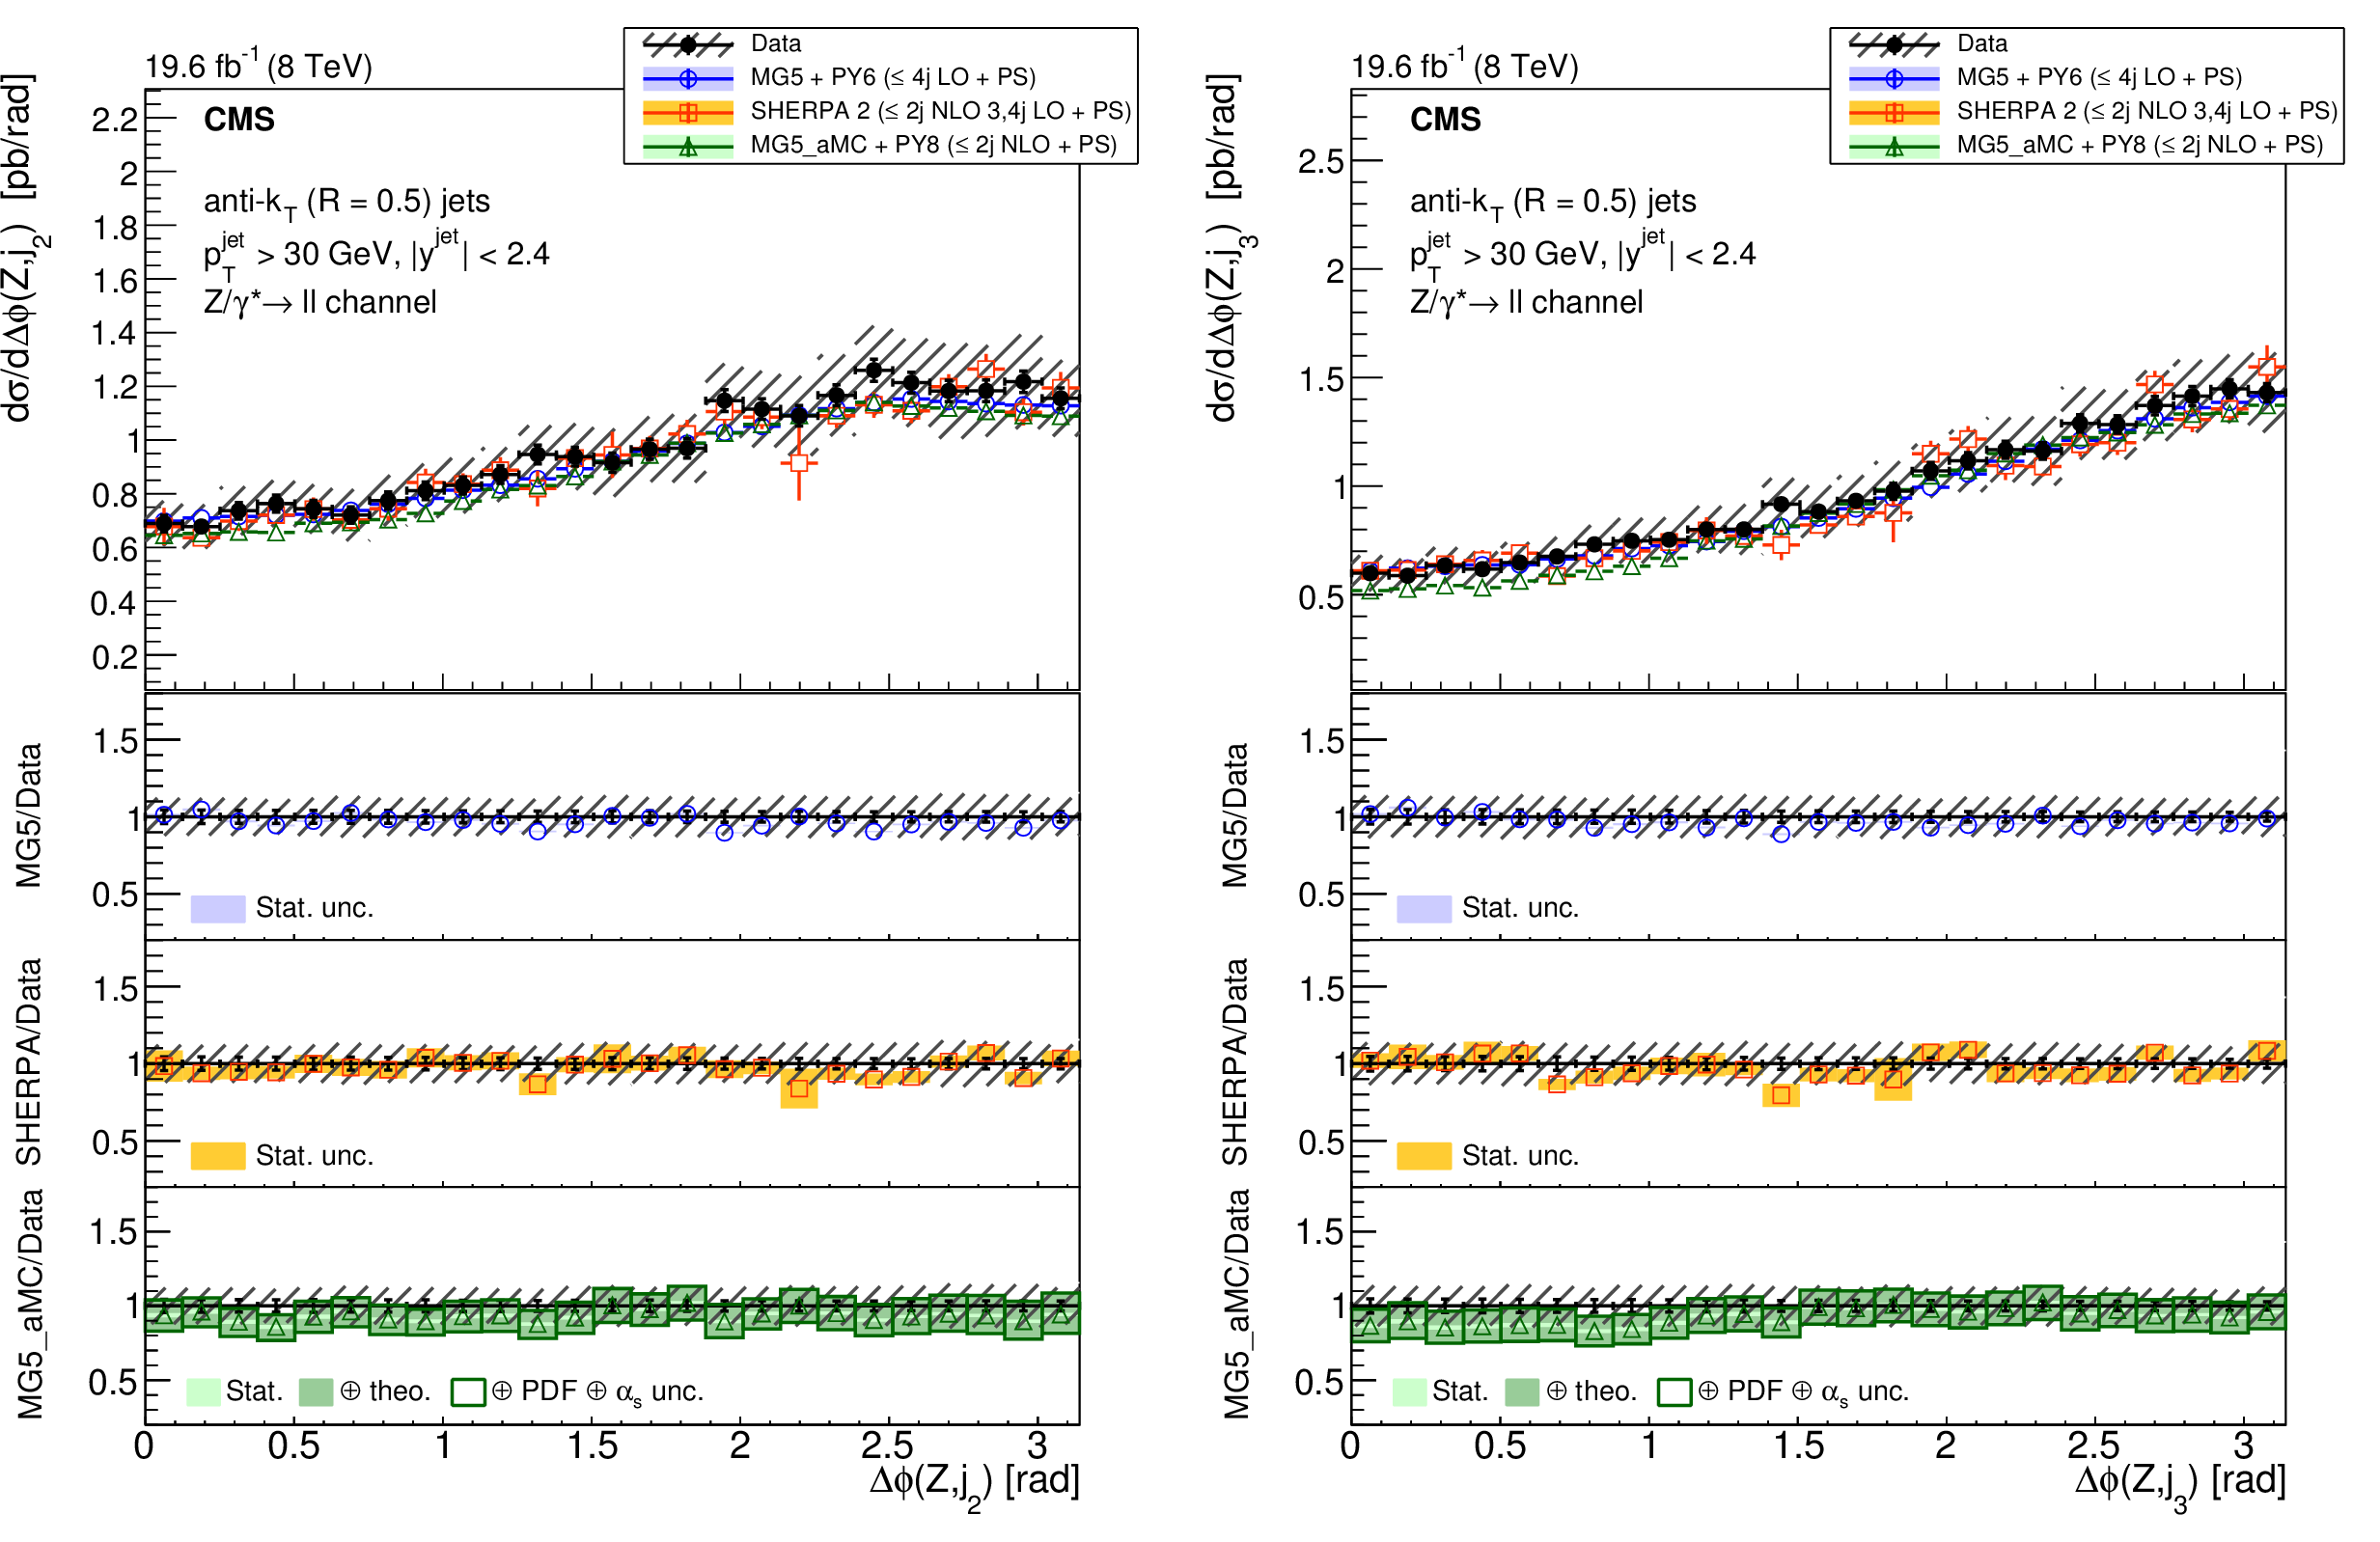
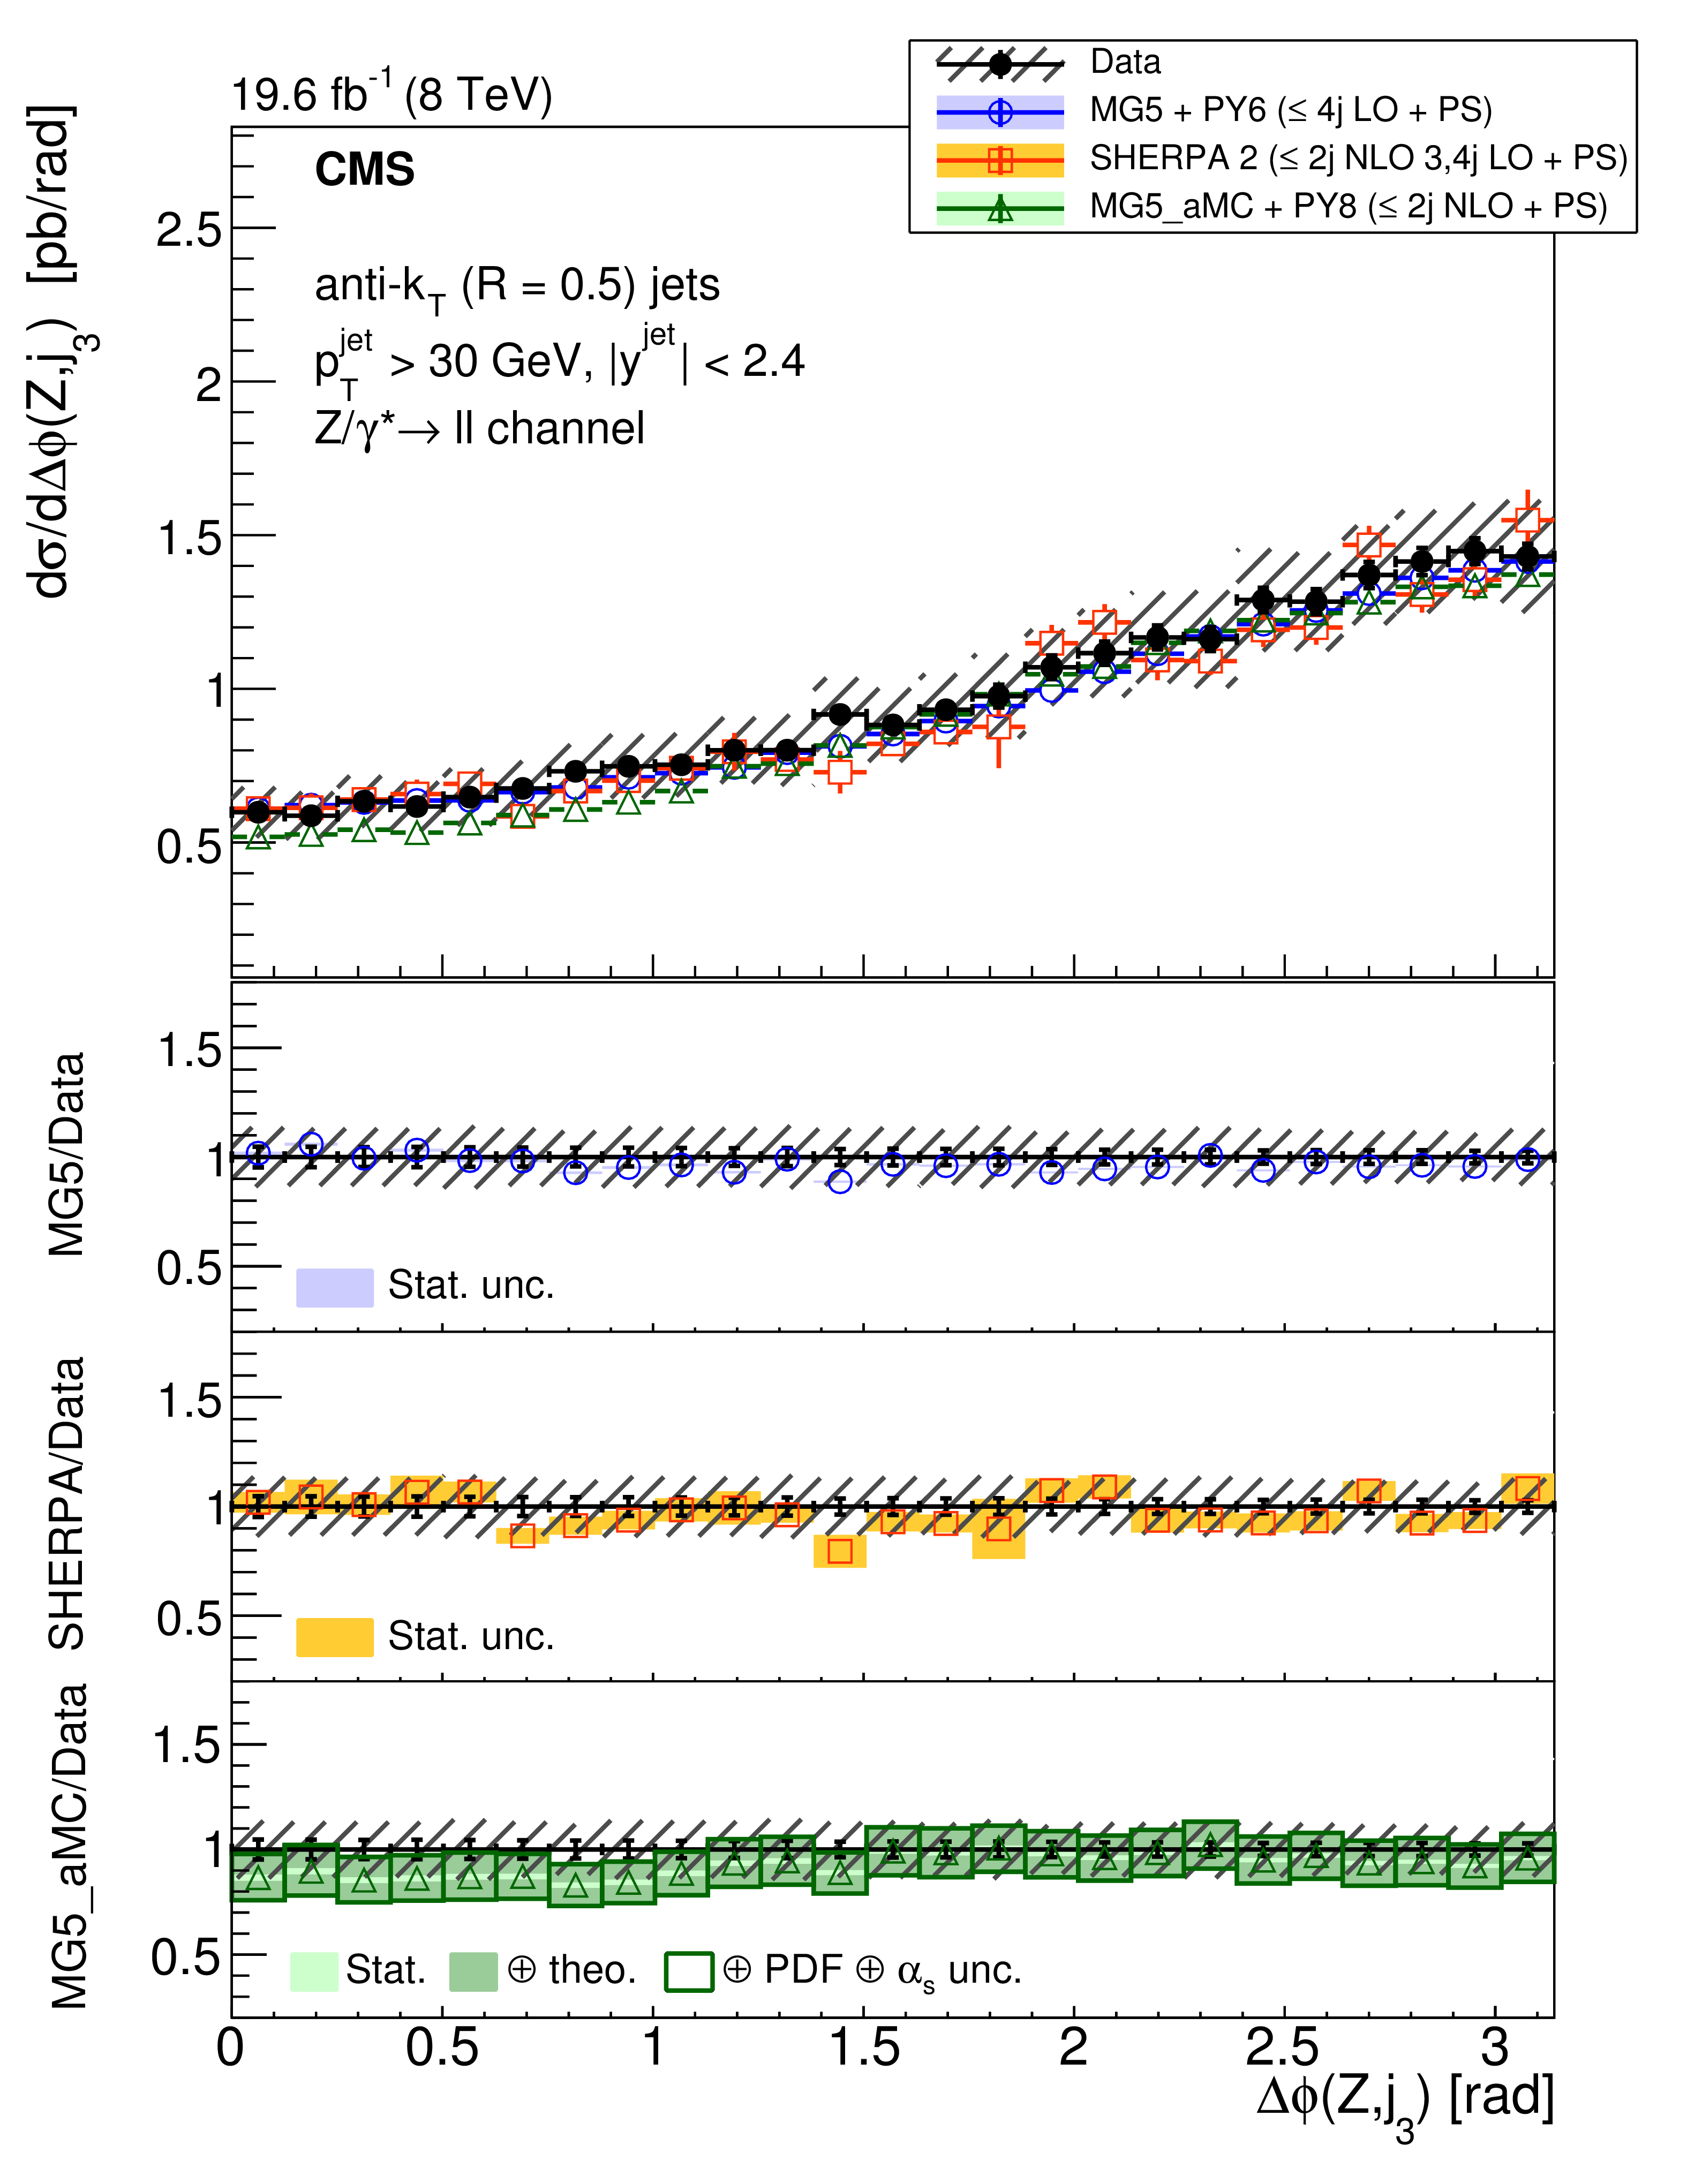
The differential cross section for $ {\mathrm{ Z } (\to \ell \ell )+\text {jets}} $ production for $N_{\text {jets}}\ge 3$ as a function of the azimuthal angle between (left) the Z boson and the second leading jet, (right) the Z boson and the third leading jet. The lower panels show the ratios of the theoretical predictions to the measurements. Error bars around the experimental points show the statistical uncertainty, while the cross-hatched bands indicate the statistical and systematic uncertainties added in quadrature. The boxes around the mg5-amc + PYTHIA 8 to measurement ratio represent the uncertainty on the prediction, including statistical, theoretical (from scale variations), and PDF uncertainties. The dark green area represents the statistical and theoretical uncertainties only, while the light green area represents the statistical uncertainty alone. |

png pdf |
Figure 19-a:
The differential cross section for $ {\mathrm{ Z } (\to \ell \ell )+\text {jets}} $ production for $N_{\text {jets}}\ge 3$ as a function of the azimuthal angle between (left) the Z boson and the second leading jet, (right) the Z boson and the third leading jet. The lower panels show the ratios of the theoretical predictions to the measurements. Error bars around the experimental points show the statistical uncertainty, while the cross-hatched bands indicate the statistical and systematic uncertainties added in quadrature. The boxes around the mg5-amc + PYTHIA 8 to measurement ratio represent the uncertainty on the prediction, including statistical, theoretical (from scale variations), and PDF uncertainties. The dark green area represents the statistical and theoretical uncertainties only, while the light green area represents the statistical uncertainty alone. |
png pdf |
Figure 19-b:
The differential cross section for $ {\mathrm{ Z } (\to \ell \ell )+\text {jets}} $ production for $N_{\text {jets}}\ge 3$ as a function of the azimuthal angle between (left) the Z boson and the second leading jet, (right) the Z boson and the third leading jet. The lower panels show the ratios of the theoretical predictions to the measurements. Error bars around the experimental points show the statistical uncertainty, while the cross-hatched bands indicate the statistical and systematic uncertainties added in quadrature. The boxes around the mg5-amc + PYTHIA 8 to measurement ratio represent the uncertainty on the prediction, including statistical, theoretical (from scale variations), and PDF uncertainties. The dark green area represents the statistical and theoretical uncertainties only, while the light green area represents the statistical uncertainty alone. |

png pdf |
Figure 20:
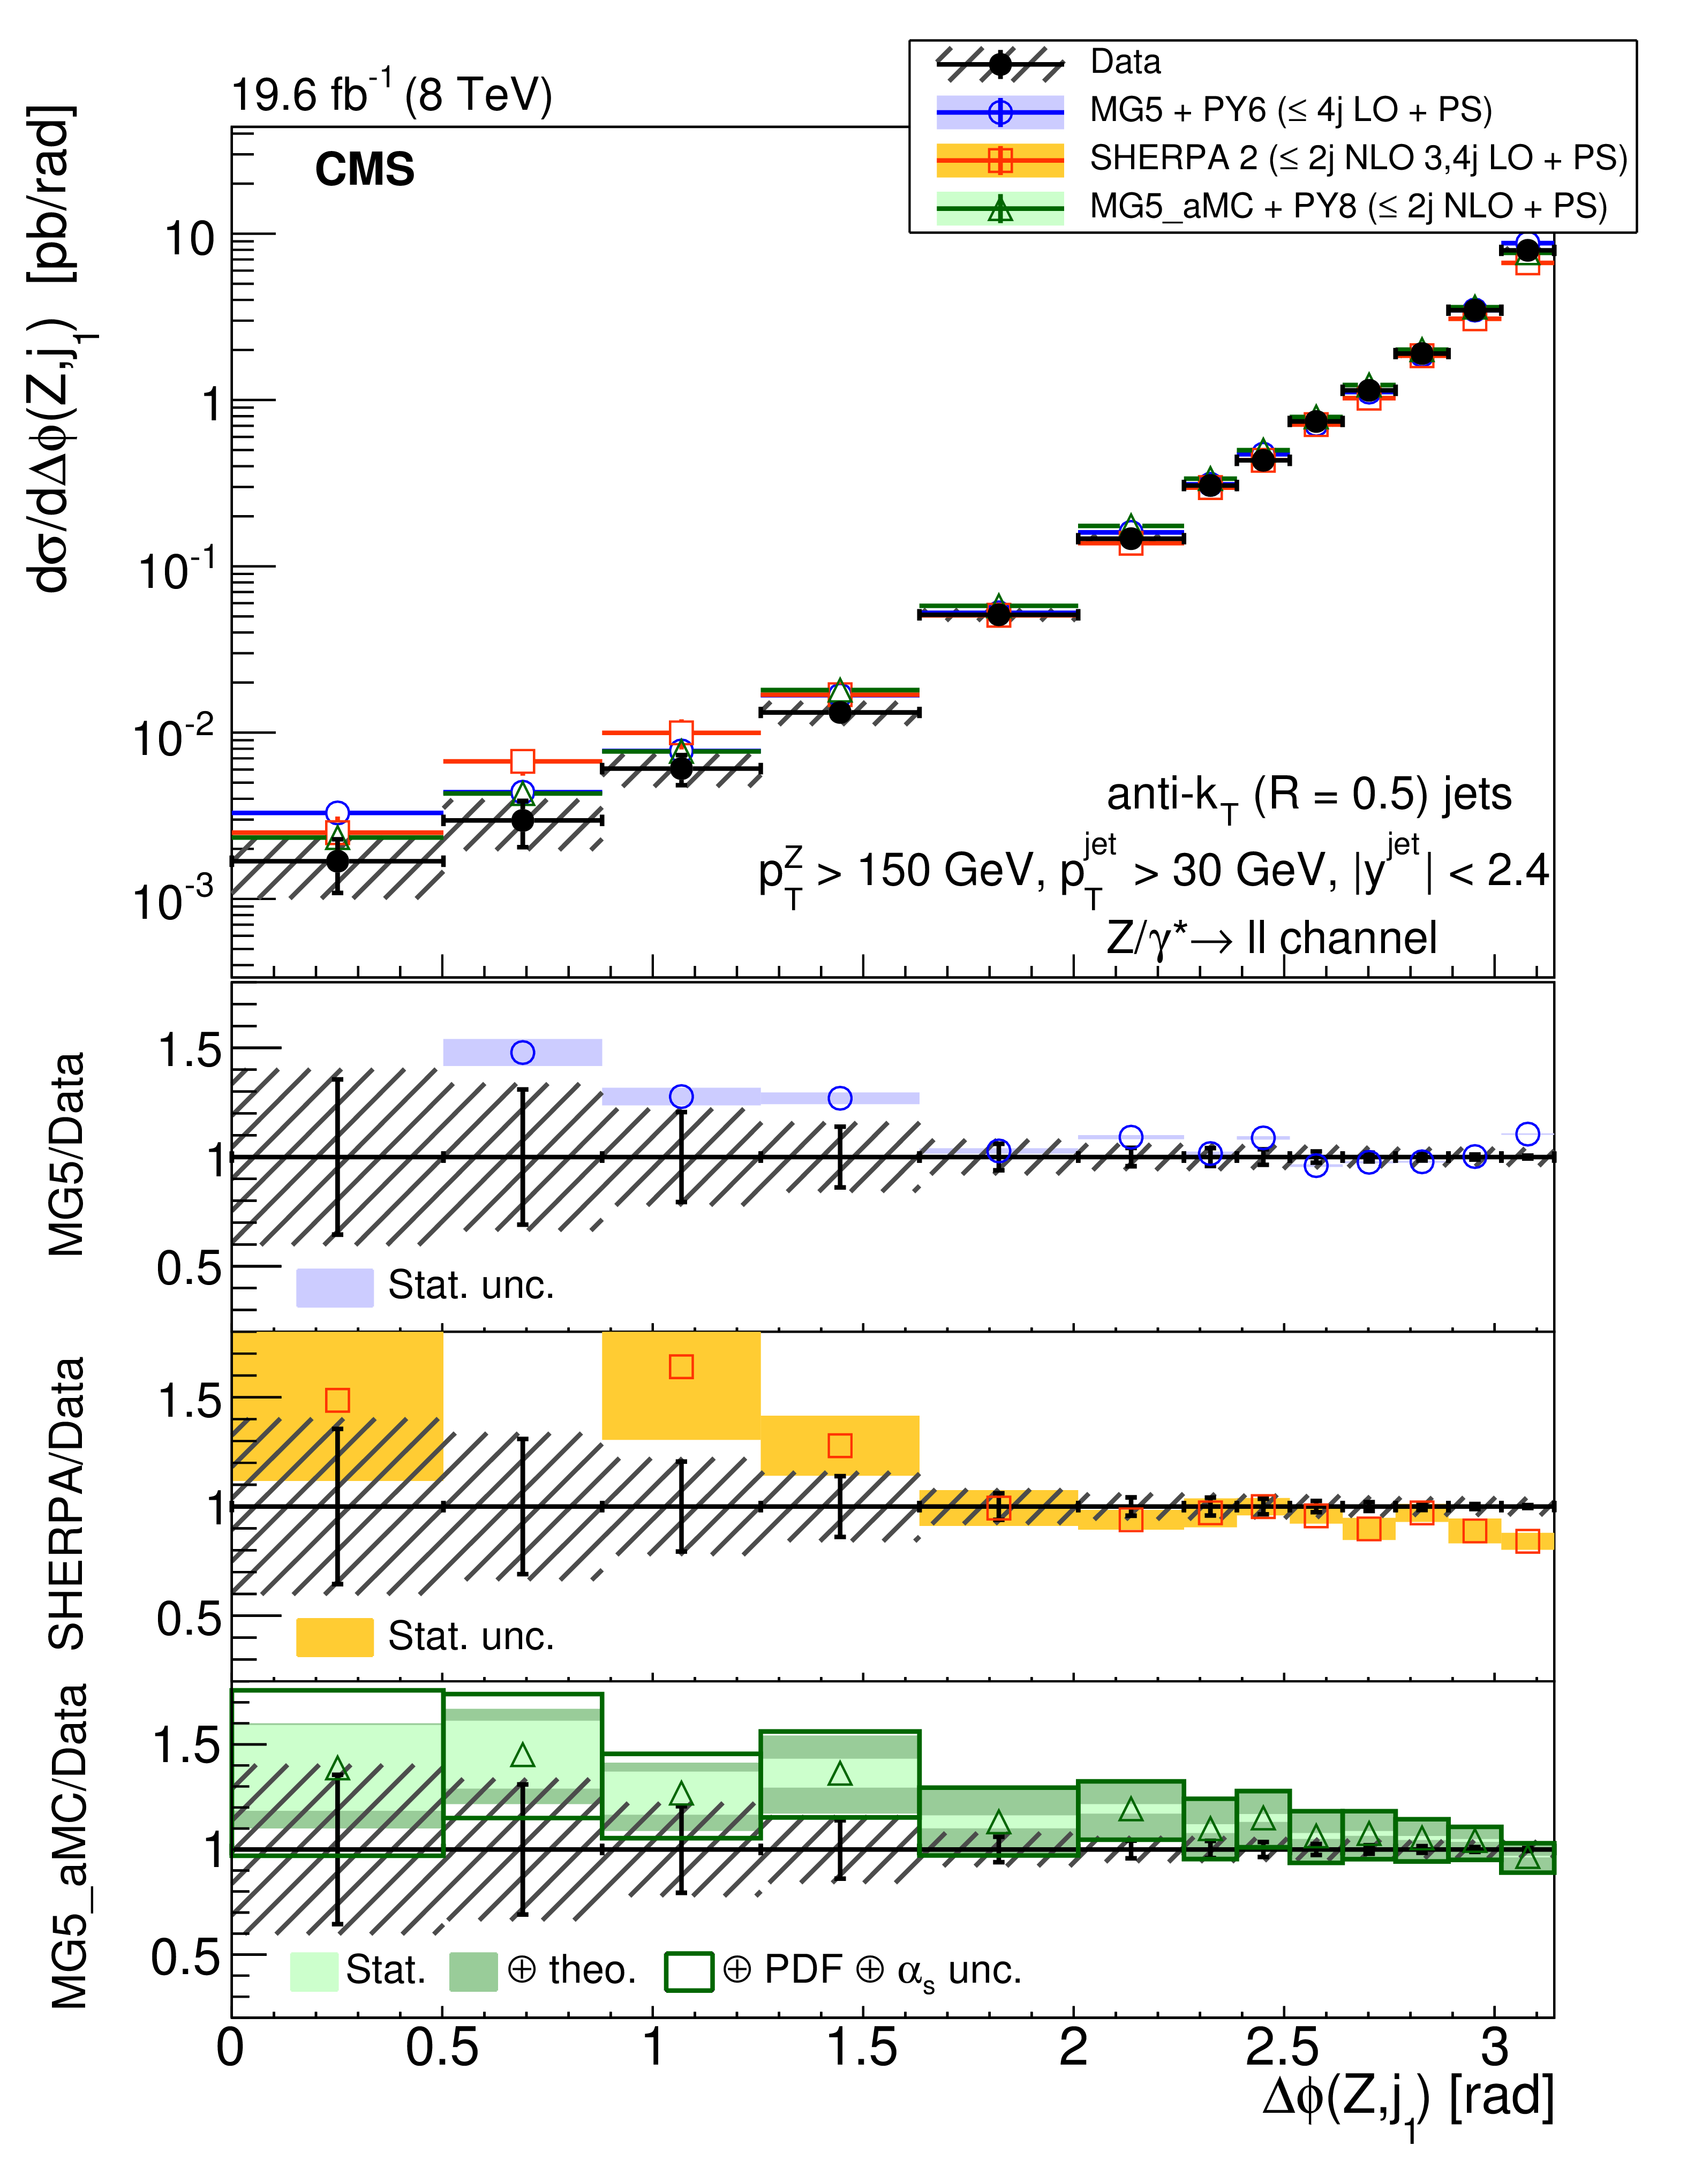
The differential cross section as a function of the azimuthal angle between the Z boson and the leading jet, for $ {p_{\mathrm {T}}} (\mathrm{ Z } )>150 GeV $ and (left) $N_{\text {jets}}\ge 1$, (middle) $N_{\text {jets}}\ge 2$, and (right) $N_{\text {jets}}\ge 3$. The lower panels show the ratios of the theoretical predictions to the measurements. Error bars around the experimental points show the statistical uncertainty, while the cross-hatched bands indicate the statistical and systematic uncertainties added in quadrature. The boxes around the mg5-amc + PYTHIA 8 to measurement ratio represent the uncertainty on the prediction, including statistical, theoretical (from scale variations), and PDF uncertainties. The dark green area represents the statistical and theoretical uncertainties only, while the light green area represents the statistical uncertainty alone. |
png pdf |
Figure 20-a:
The differential cross section as a function of the azimuthal angle between the Z boson and the leading jet, for $ {p_{\mathrm {T}}} (\mathrm{ Z } )>150 GeV $ and (left) $N_{\text {jets}}\ge 1$, (middle) $N_{\text {jets}}\ge 2$, and (right) $N_{\text {jets}}\ge 3$. The lower panels show the ratios of the theoretical predictions to the measurements. Error bars around the experimental points show the statistical uncertainty, while the cross-hatched bands indicate the statistical and systematic uncertainties added in quadrature. The boxes around the mg5-amc + PYTHIA 8 to measurement ratio represent the uncertainty on the prediction, including statistical, theoretical (from scale variations), and PDF uncertainties. The dark green area represents the statistical and theoretical uncertainties only, while the light green area represents the statistical uncertainty alone. |

png pdf |
Figure 20-b:
The differential cross section as a function of the azimuthal angle between the Z boson and the leading jet, for $ {p_{\mathrm {T}}} (\mathrm{ Z } )>150 GeV $ and (left) $N_{\text {jets}}\ge 1$, (middle) $N_{\text {jets}}\ge 2$, and (right) $N_{\text {jets}}\ge 3$. The lower panels show the ratios of the theoretical predictions to the measurements. Error bars around the experimental points show the statistical uncertainty, while the cross-hatched bands indicate the statistical and systematic uncertainties added in quadrature. The boxes around the mg5-amc + PYTHIA 8 to measurement ratio represent the uncertainty on the prediction, including statistical, theoretical (from scale variations), and PDF uncertainties. The dark green area represents the statistical and theoretical uncertainties only, while the light green area represents the statistical uncertainty alone. |

png pdf |
Figure 20-c:
The differential cross section as a function of the azimuthal angle between the Z boson and the leading jet, for $ {p_{\mathrm {T}}} (\mathrm{ Z } )>150 GeV $ and (left) $N_{\text {jets}}\ge 1$, (middle) $N_{\text {jets}}\ge 2$, and (right) $N_{\text {jets}}\ge 3$. The lower panels show the ratios of the theoretical predictions to the measurements. Error bars around the experimental points show the statistical uncertainty, while the cross-hatched bands indicate the statistical and systematic uncertainties added in quadrature. The boxes around the mg5-amc + PYTHIA 8 to measurement ratio represent the uncertainty on the prediction, including statistical, theoretical (from scale variations), and PDF uncertainties. The dark green area represents the statistical and theoretical uncertainties only, while the light green area represents the statistical uncertainty alone. |

png pdf |
Figure 21:
The differential cross section for $ {\mathrm{ Z } (\to \ell \ell )+\text {jets}} $ production for $N_{\text {jets}}\ge 3$ and $ {p_{\mathrm {T}}} (\mathrm{ Z } )>150 GeV $ as a function of the azimuthal angle (left) between the Z boson and the second leading jet and (right) between Z boson and third-leading jet. The lower panels show the ratios of the theoretical predictions to the measurements. Error bars around the experimental points show the statistical uncertainty, while the cross-hatched bands indicate the statistical and systematic uncertainties added in quadrature. The boxes around the mg5-amc + PYTHIA 8 to measurement ratio represent the uncertainty on the prediction, including statistical, theoretical (from scale variations), and PDF uncertainties. The dark green area represents the statistical and theoretical uncertainties only, while the light green area represents the statistical uncertainty alone. |

png pdf |
Figure 21-a:
The differential cross section for $ {\mathrm{ Z } (\to \ell \ell )+\text {jets}} $ production for $N_{\text {jets}}\ge 3$ and $ {p_{\mathrm {T}}} (\mathrm{ Z } )>150 GeV $ as a function of the azimuthal angle (left) between the Z boson and the second leading jet and (right) between Z boson and third-leading jet. The lower panels show the ratios of the theoretical predictions to the measurements. Error bars around the experimental points show the statistical uncertainty, while the cross-hatched bands indicate the statistical and systematic uncertainties added in quadrature. The boxes around the mg5-amc + PYTHIA 8 to measurement ratio represent the uncertainty on the prediction, including statistical, theoretical (from scale variations), and PDF uncertainties. The dark green area represents the statistical and theoretical uncertainties only, while the light green area represents the statistical uncertainty alone. |
png pdf |
Figure 21-b:
The differential cross section for $ {\mathrm{ Z } (\to \ell \ell )+\text {jets}} $ production for $N_{\text {jets}}\ge 3$ and $ {p_{\mathrm {T}}} (\mathrm{ Z } )>150 GeV $ as a function of the azimuthal angle (left) between the Z boson and the second leading jet and (right) between Z boson and third-leading jet. The lower panels show the ratios of the theoretical predictions to the measurements. Error bars around the experimental points show the statistical uncertainty, while the cross-hatched bands indicate the statistical and systematic uncertainties added in quadrature. The boxes around the mg5-amc + PYTHIA 8 to measurement ratio represent the uncertainty on the prediction, including statistical, theoretical (from scale variations), and PDF uncertainties. The dark green area represents the statistical and theoretical uncertainties only, while the light green area represents the statistical uncertainty alone. |
png pdf |
Figure 22:
The differential cross section as a function of the azimuthal angle between the Z boson and the leading jet, for $ {p_{\mathrm {T}}} (\mathrm{ Z } )>300 GeV $ and (left) $N_{\text {jets}}\ge 1$, (middle) $N_{\text {jets}}\ge 2$, and (right) $N_{\text {jets}}\ge 3$. The lower panels show the ratios of the theoretical predictions to the measurements. Error bars around the experimental points show the statistical uncertainty, while the cross-hatched bands indicate the statistical and systematic uncertainties added in quadrature. The boxes around the mg5-amc + PYTHIA 8 to measurement ratio represent the uncertainty on the prediction, including statistical, theoretical (from scale variations), and PDF uncertainties. The dark green area represents the statistical and theoretical uncertainties only, while the light green area represents the statistical uncertainty alone. |
png pdf |
Figure 22-a:
The differential cross section as a function of the azimuthal angle between the Z boson and the leading jet, for $ {p_{\mathrm {T}}} (\mathrm{ Z } )>300 GeV $ and (left) $N_{\text {jets}}\ge 1$, (middle) $N_{\text {jets}}\ge 2$, and (right) $N_{\text {jets}}\ge 3$. The lower panels show the ratios of the theoretical predictions to the measurements. Error bars around the experimental points show the statistical uncertainty, while the cross-hatched bands indicate the statistical and systematic uncertainties added in quadrature. The boxes around the mg5-amc + PYTHIA 8 to measurement ratio represent the uncertainty on the prediction, including statistical, theoretical (from scale variations), and PDF uncertainties. The dark green area represents the statistical and theoretical uncertainties only, while the light green area represents the statistical uncertainty alone. |

png pdf |
Figure 22-b:
The differential cross section as a function of the azimuthal angle between the Z boson and the leading jet, for $ {p_{\mathrm {T}}} (\mathrm{ Z } )>300 GeV $ and (left) $N_{\text {jets}}\ge 1$, (middle) $N_{\text {jets}}\ge 2$, and (right) $N_{\text {jets}}\ge 3$. The lower panels show the ratios of the theoretical predictions to the measurements. Error bars around the experimental points show the statistical uncertainty, while the cross-hatched bands indicate the statistical and systematic uncertainties added in quadrature. The boxes around the mg5-amc + PYTHIA 8 to measurement ratio represent the uncertainty on the prediction, including statistical, theoretical (from scale variations), and PDF uncertainties. The dark green area represents the statistical and theoretical uncertainties only, while the light green area represents the statistical uncertainty alone. |
png pdf |
Figure 22-c:
The differential cross section as a function of the azimuthal angle between the Z boson and the leading jet, for $ {p_{\mathrm {T}}} (\mathrm{ Z } )>300 GeV $ and (left) $N_{\text {jets}}\ge 1$, (middle) $N_{\text {jets}}\ge 2$, and (right) $N_{\text {jets}}\ge 3$. The lower panels show the ratios of the theoretical predictions to the measurements. Error bars around the experimental points show the statistical uncertainty, while the cross-hatched bands indicate the statistical and systematic uncertainties added in quadrature. The boxes around the mg5-amc + PYTHIA 8 to measurement ratio represent the uncertainty on the prediction, including statistical, theoretical (from scale variations), and PDF uncertainties. The dark green area represents the statistical and theoretical uncertainties only, while the light green area represents the statistical uncertainty alone. |
png pdf |
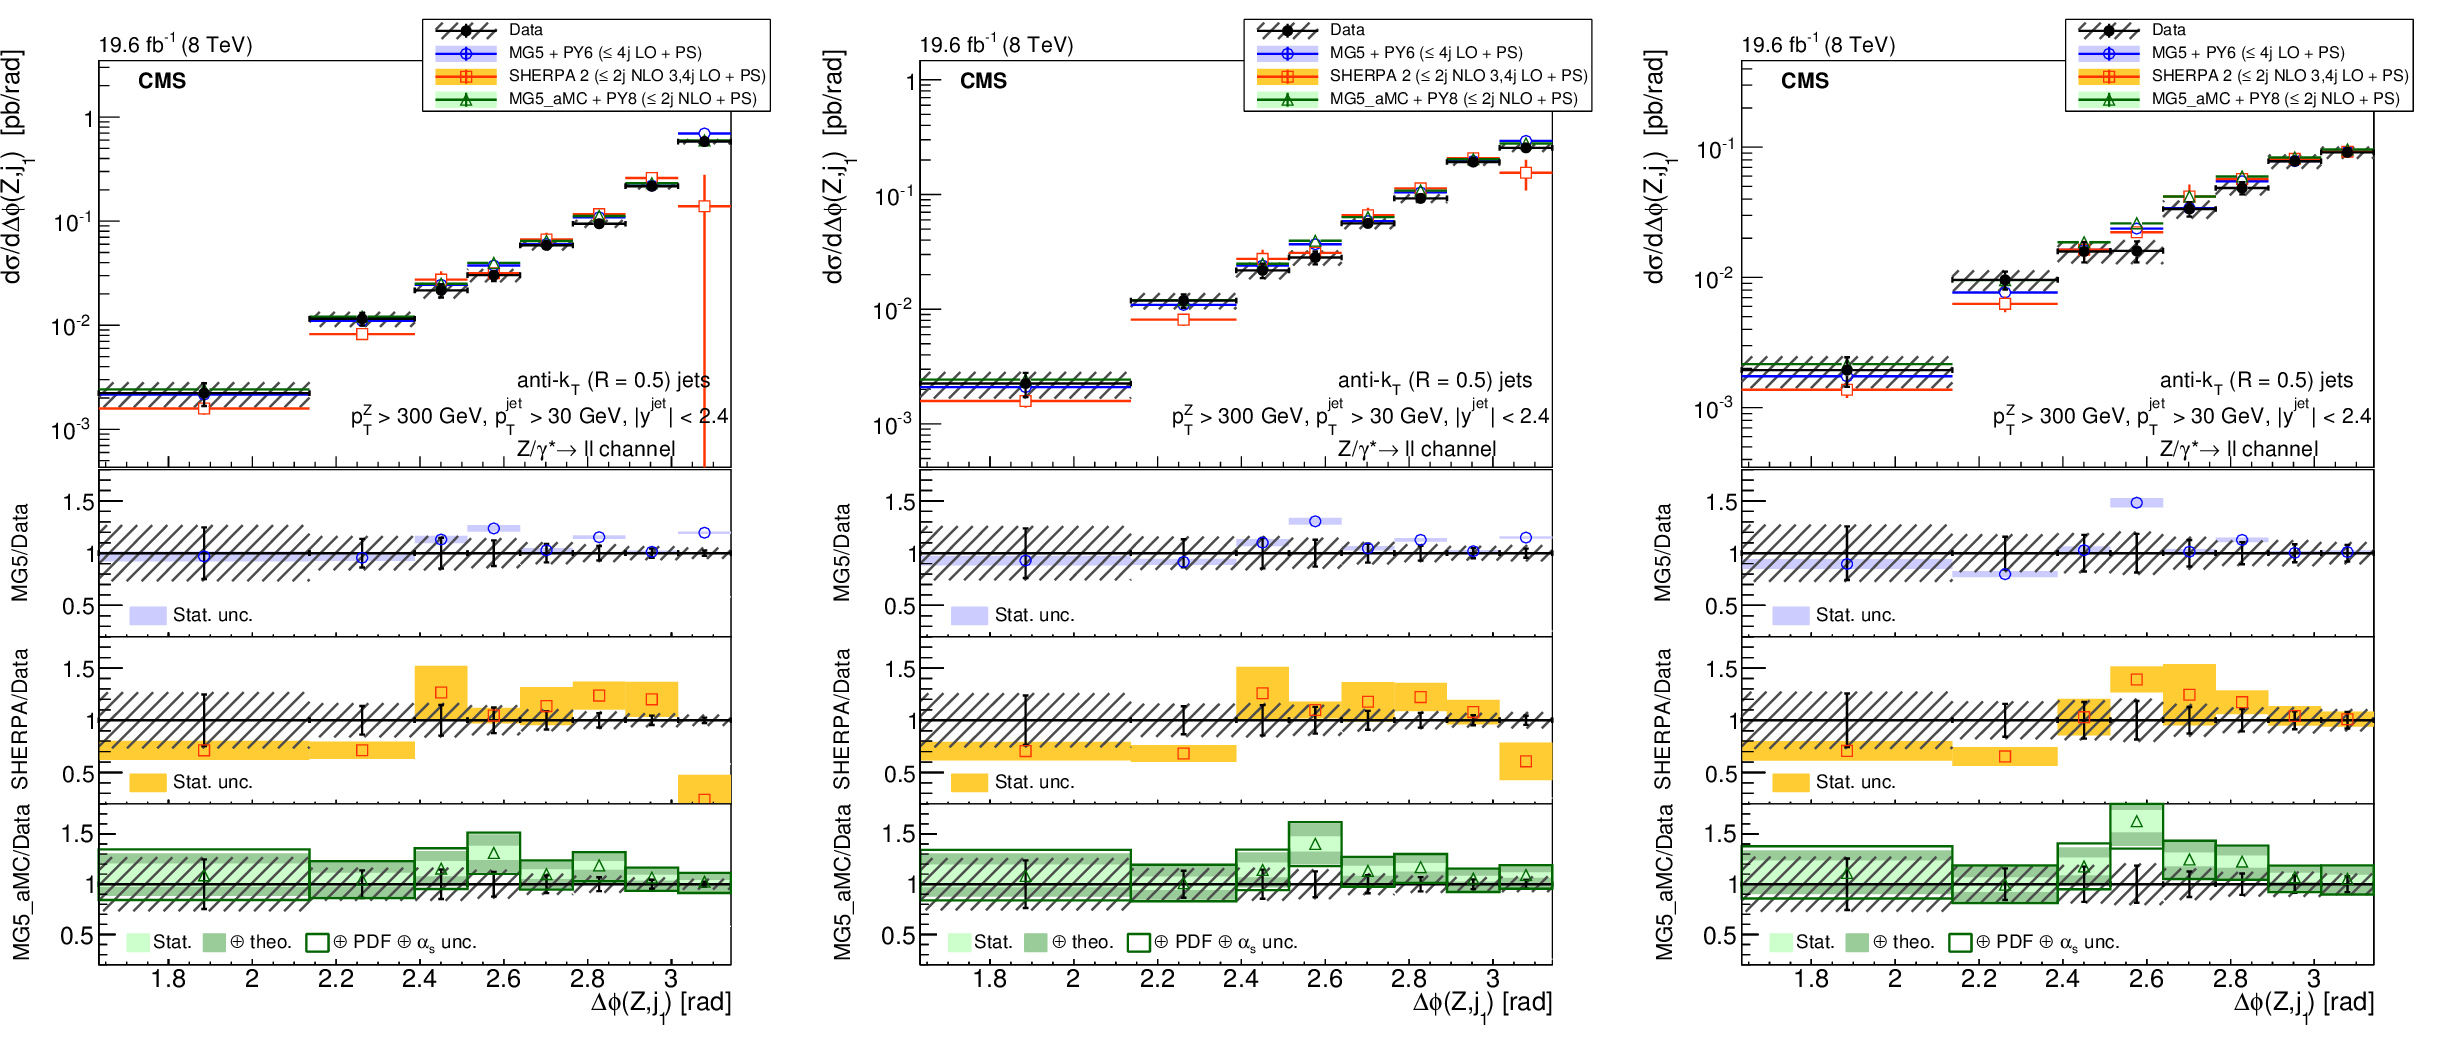
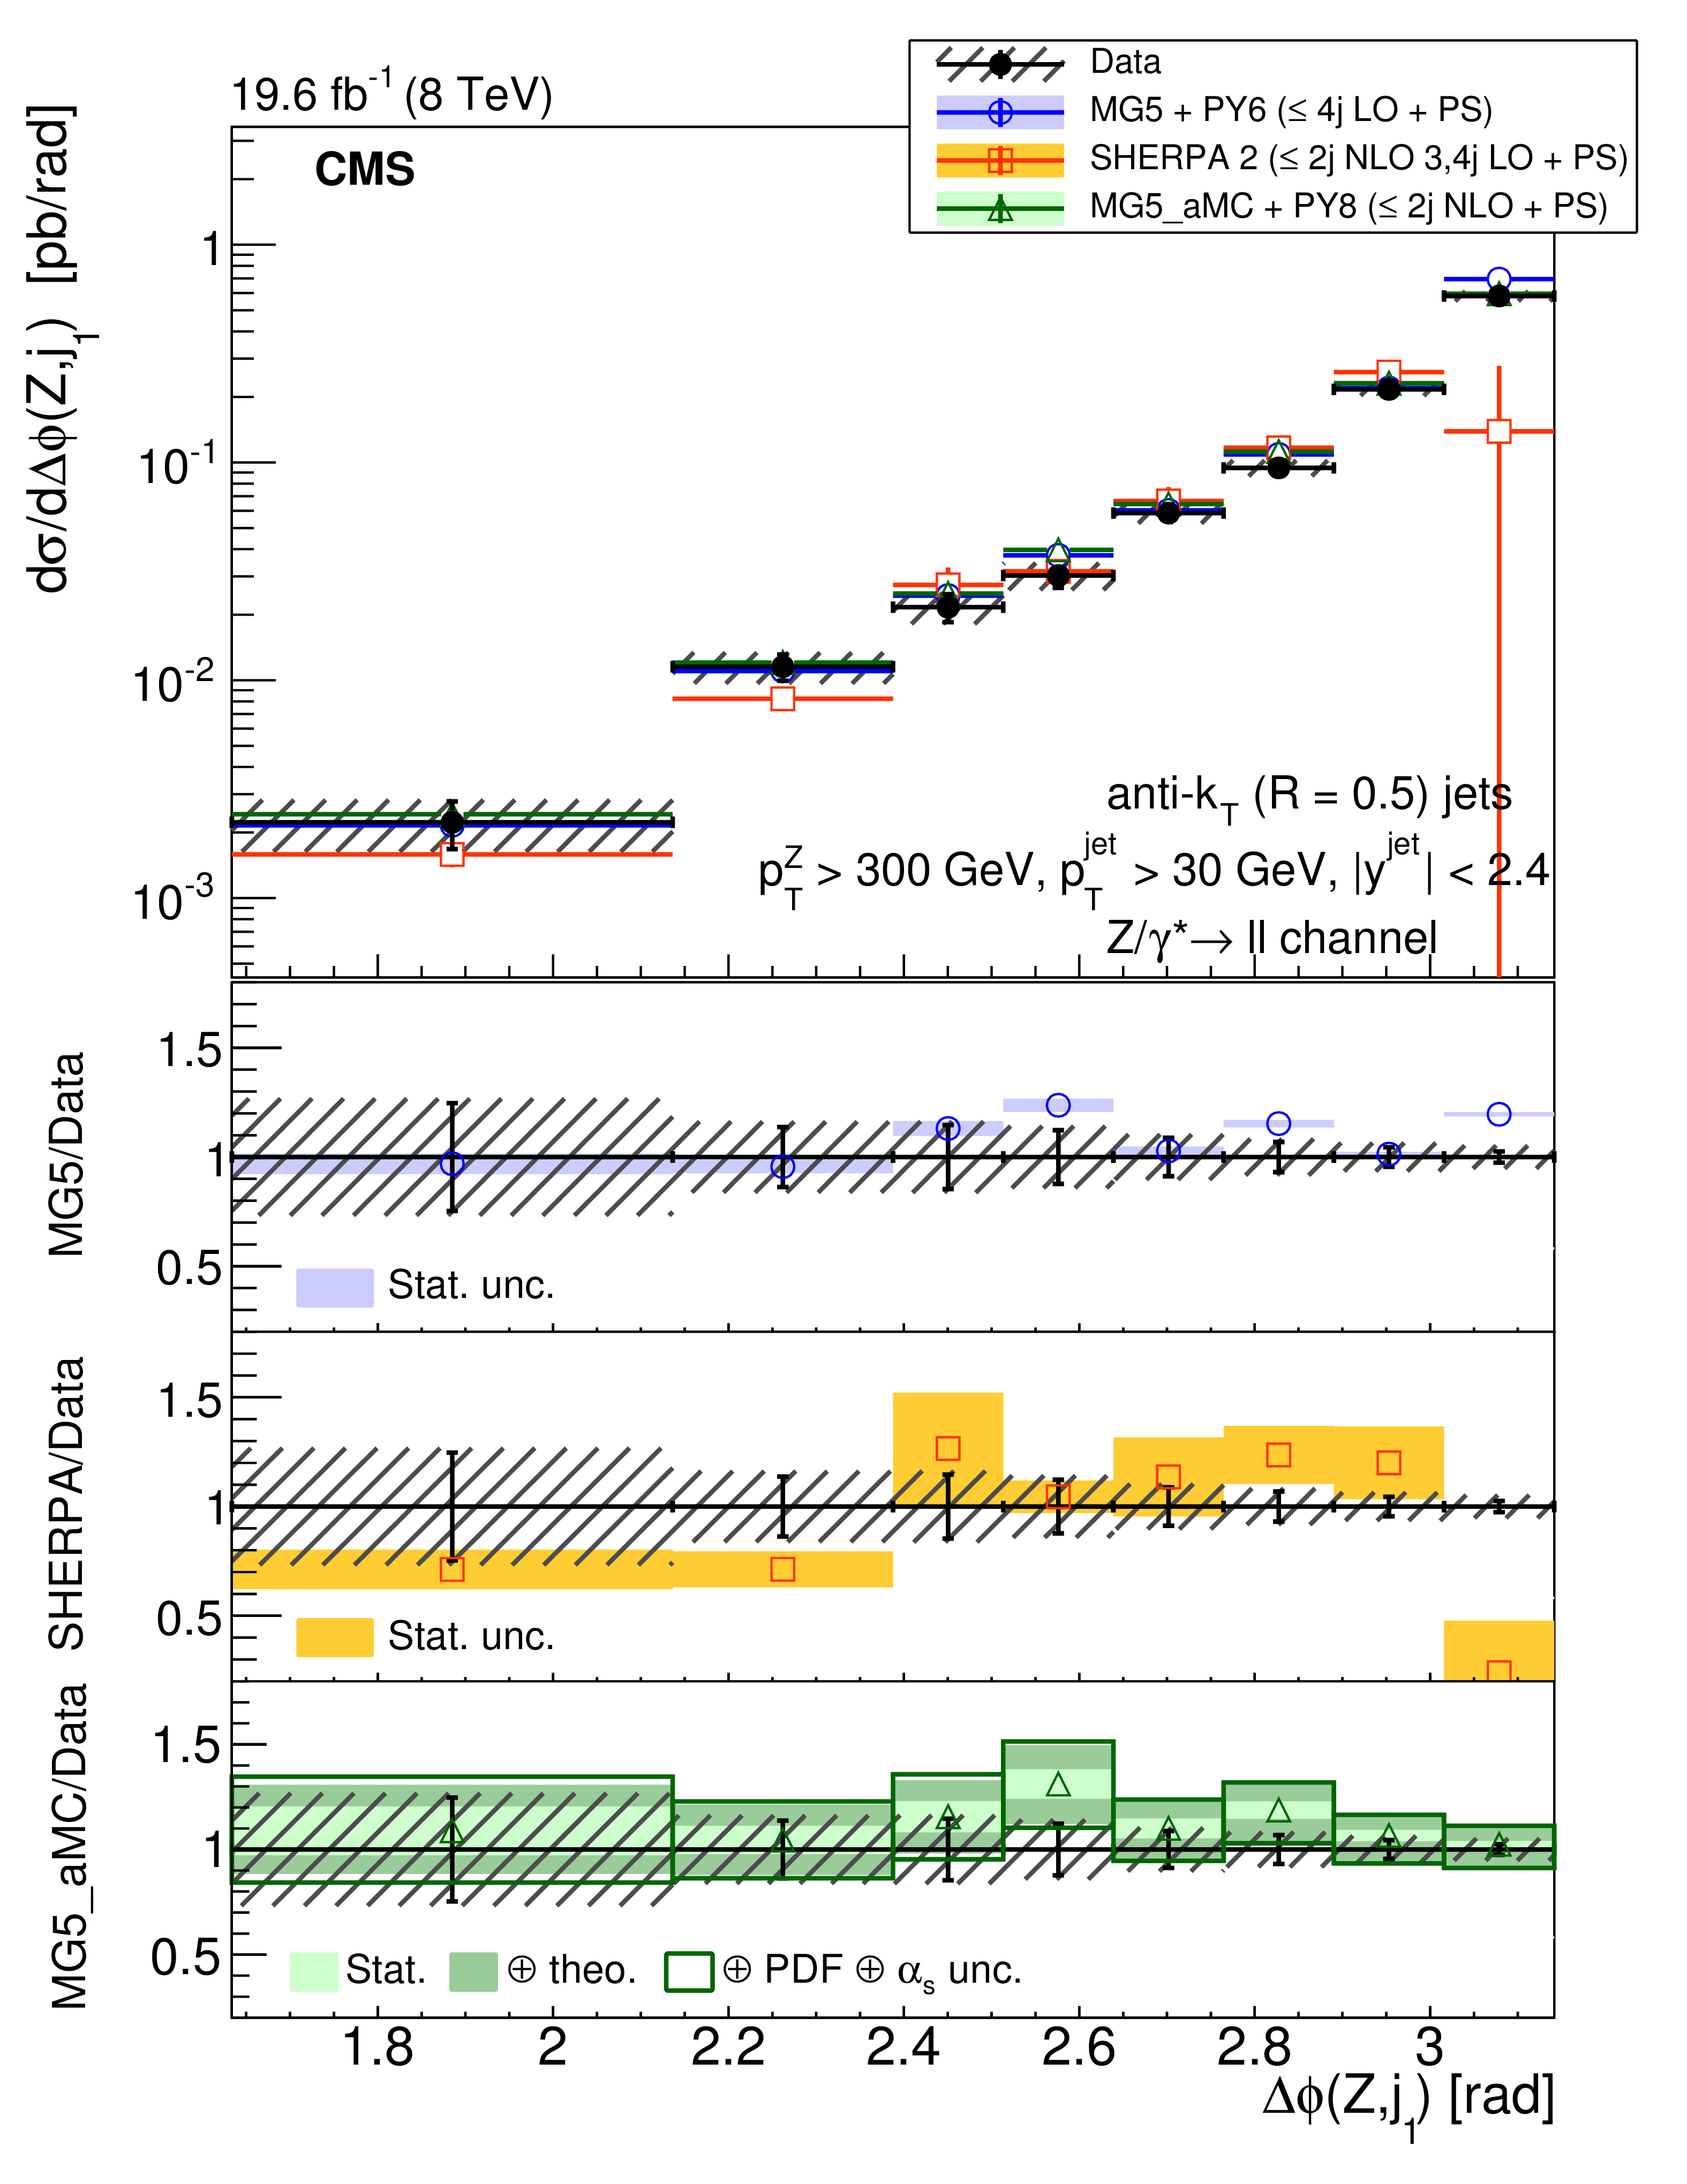
Figure 23:
The differential cross section for $ {\mathrm{ Z } (\to \ell \ell )+\text {jets}} $ production for $N_{\text {jets}}\ge 3$ and $ {p_{\mathrm {T}}} (\mathrm{ Z } ) > 300 GeV $ as a function of the azimuthal angle (left) between the Z boson and the second-leading jet and (right) between the Z boson and the third-leading jet. The lower panels show the ratios of the theoretical predictions to the measurements. Error bars around the experimental points show the statistical uncertainty, while the cross-hatched bands indicate the statistical and systematic uncertainties added in quadrature. The boxes around the mg5-amc + PYTHIA 8 to measurement ratio represent the uncertainty on the prediction, including statistical, theoretical (from scale variations), and PDF uncertainties. The dark green area represents the statistical and theoretical uncertainties only, while the light green area represents the statistical uncertainty alone. |

png pdf |
Figure 23-a:
The differential cross section for $ {\mathrm{ Z } (\to \ell \ell )+\text {jets}} $ production for $N_{\text {jets}}\ge 3$ and $ {p_{\mathrm {T}}} (\mathrm{ Z } ) > 300 GeV $ as a function of the azimuthal angle (left) between the Z boson and the second-leading jet and (right) between the Z boson and the third-leading jet. The lower panels show the ratios of the theoretical predictions to the measurements. Error bars around the experimental points show the statistical uncertainty, while the cross-hatched bands indicate the statistical and systematic uncertainties added in quadrature. The boxes around the mg5-amc + PYTHIA 8 to measurement ratio represent the uncertainty on the prediction, including statistical, theoretical (from scale variations), and PDF uncertainties. The dark green area represents the statistical and theoretical uncertainties only, while the light green area represents the statistical uncertainty alone. |
png pdf |
Figure 23-b:
The differential cross section for $ {\mathrm{ Z } (\to \ell \ell )+\text {jets}} $ production for $N_{\text {jets}}\ge 3$ and $ {p_{\mathrm {T}}} (\mathrm{ Z } ) > 300 GeV $ as a function of the azimuthal angle (left) between the Z boson and the second-leading jet and (right) between the Z boson and the third-leading jet. The lower panels show the ratios of the theoretical predictions to the measurements. Error bars around the experimental points show the statistical uncertainty, while the cross-hatched bands indicate the statistical and systematic uncertainties added in quadrature. The boxes around the mg5-amc + PYTHIA 8 to measurement ratio represent the uncertainty on the prediction, including statistical, theoretical (from scale variations), and PDF uncertainties. The dark green area represents the statistical and theoretical uncertainties only, while the light green area represents the statistical uncertainty alone. |

png pdf |
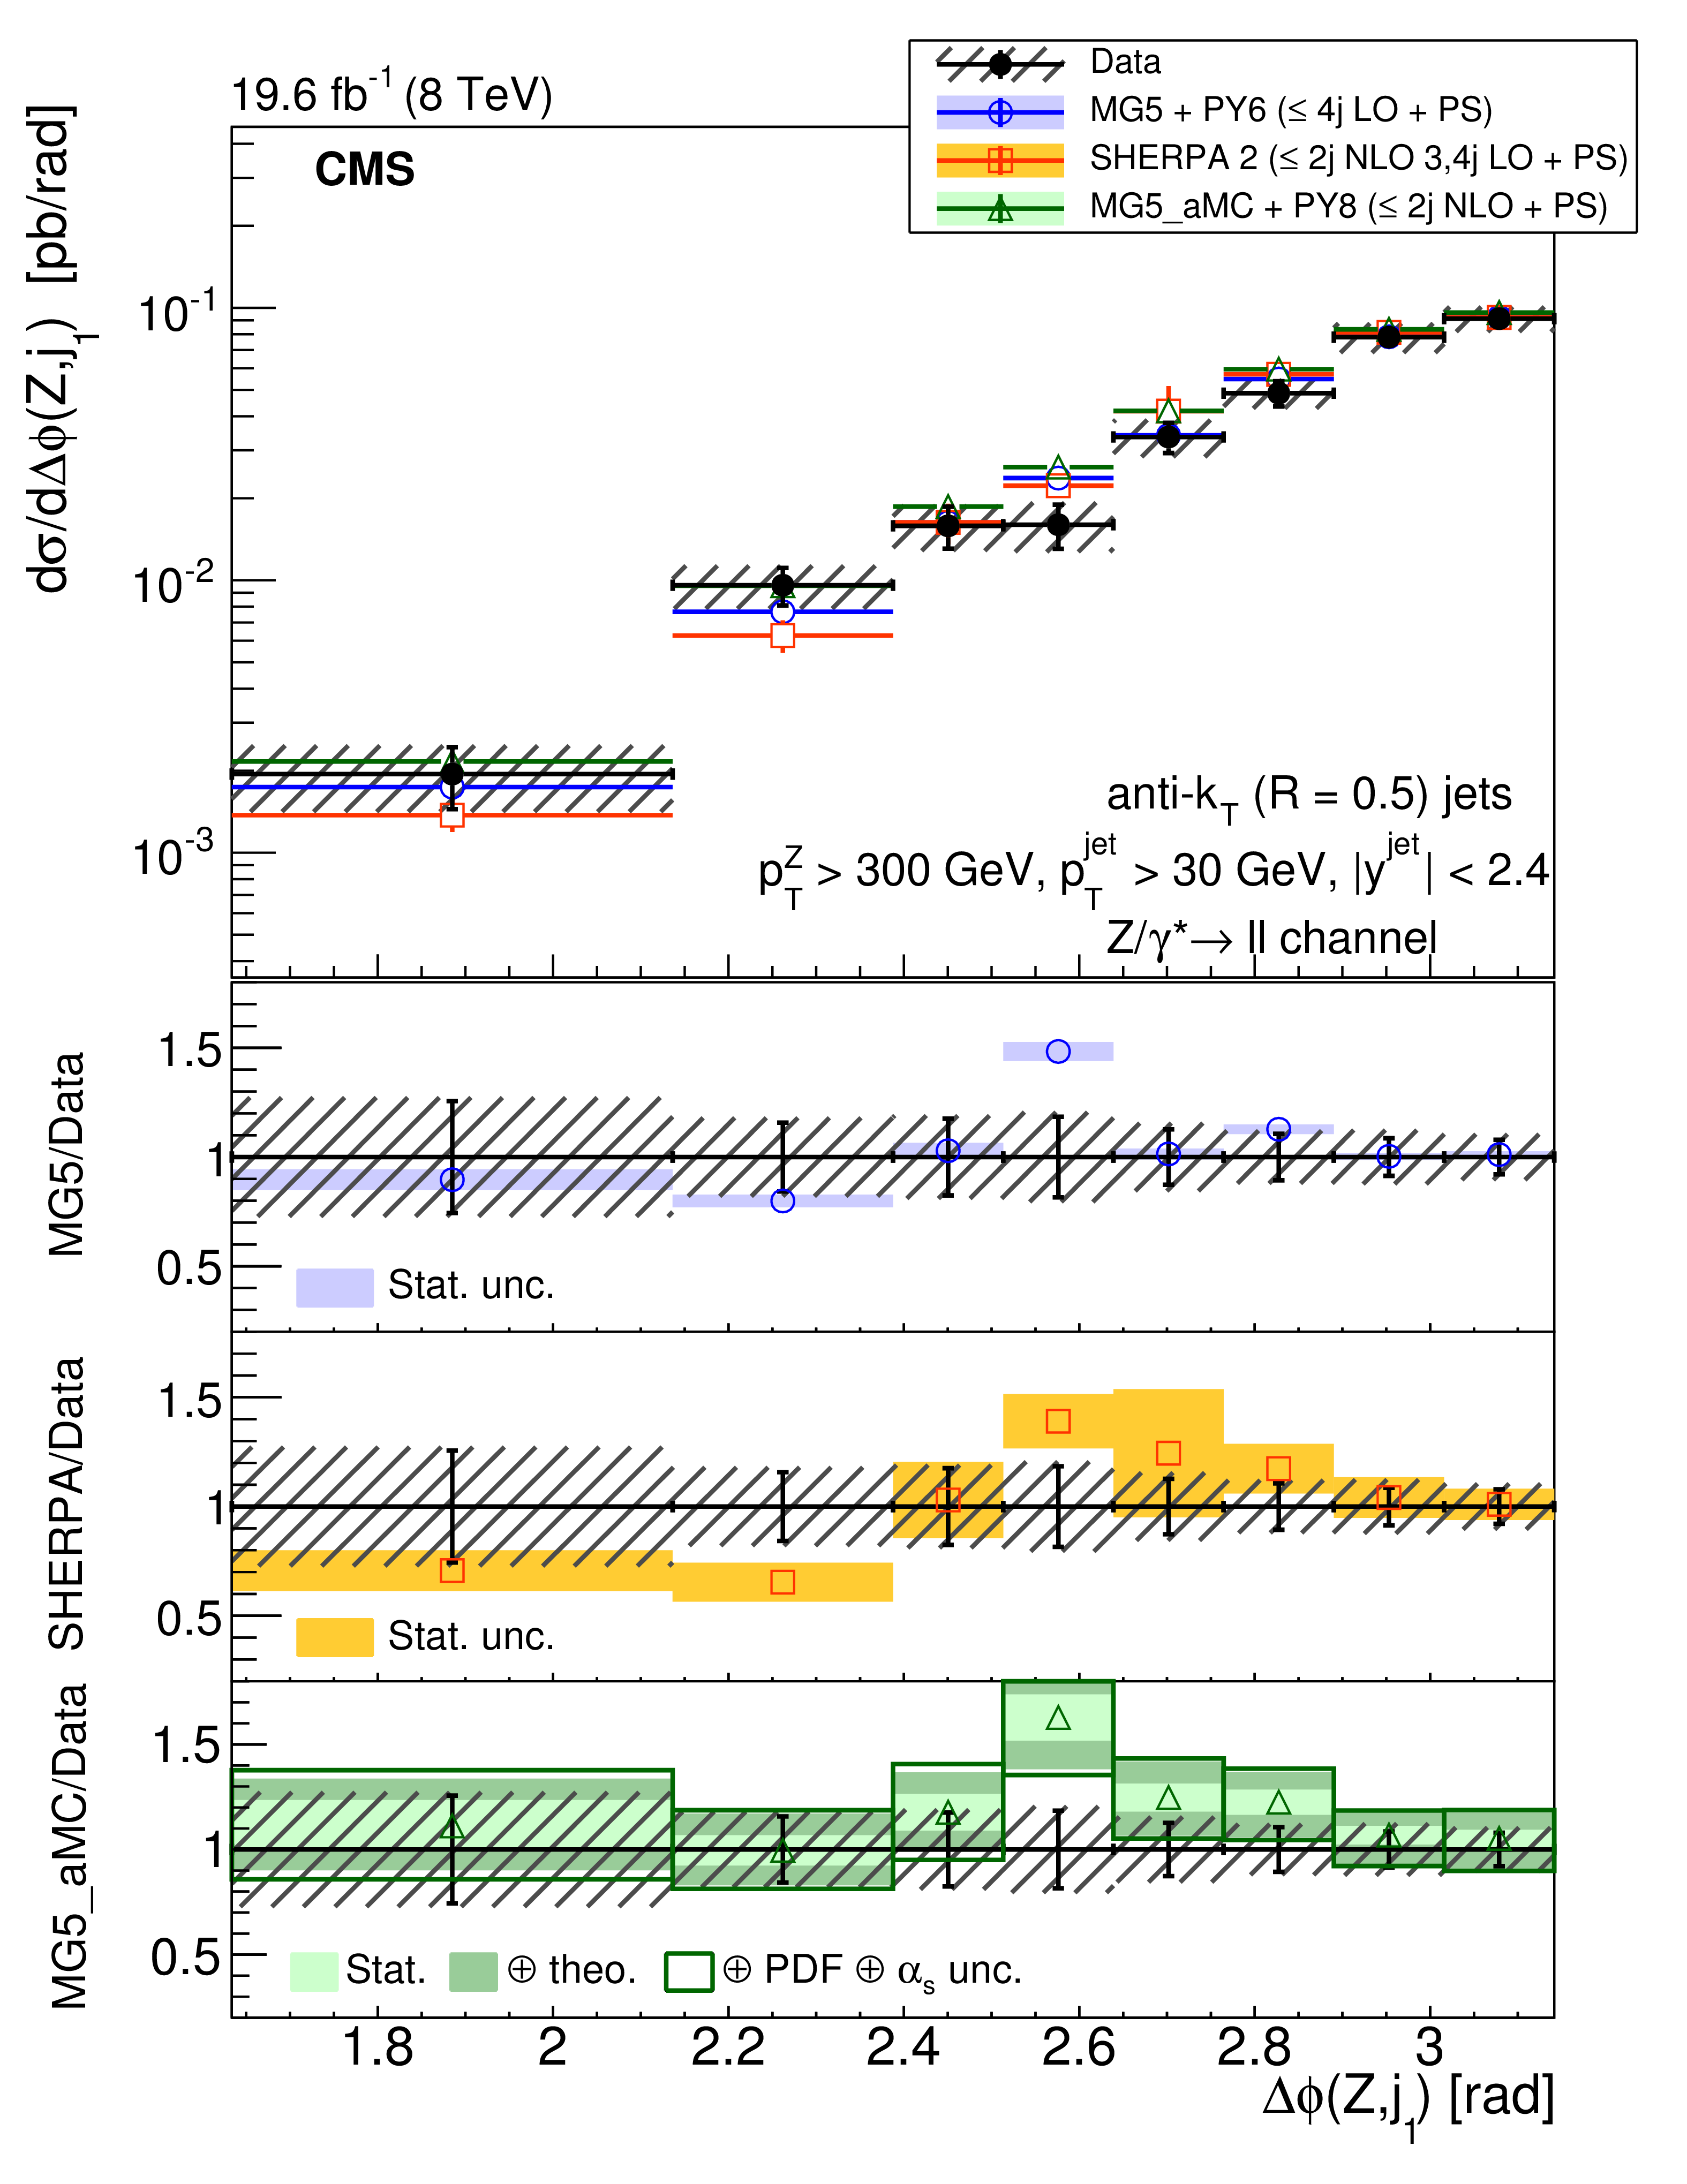
Figure 24:
The differential cross section for $ {\mathrm{ Z } (\to \ell \ell )+\text {jets}} $ production for $N_{\text {jets}}\ge 3$, $ {p_{\mathrm {T}}} ^{\text {Z}} > 150 GeV $, and $ {H_{\mathrm {T}}} ^{\text {jet}}> $ 300 GeV as a function of the azimuthal angle between the Z boson and the (left) first-, (middle) second-, and (right) third-leading jet. The lower panels show the ratios of the theoretical predictions to the measurements. Error bars around the experimental points show the statistical uncertainty, while the cross-hatched bands indicate the statistical and systematic uncertainties added in quadrature. The boxes around the mg5-amc + PYTHIA 8 to measurement ratio represent the uncertainty on the prediction, including statistical, theoretical (from scale variations), and PDF uncertainties. The dark green area represents the statistical and theoretical uncertainties only, while the light green area represents the statistical uncertainty alone. |

png pdf |
Figure 24-a:
The differential cross section for $ {\mathrm{ Z } (\to \ell \ell )+\text {jets}} $ production for $N_{\text {jets}}\ge 3$, $ {p_{\mathrm {T}}} ^{\text {Z}} > 150 GeV $, and $ {H_{\mathrm {T}}} ^{\text {jet}}> $ 300 GeV as a function of the azimuthal angle between the Z boson and the (left) first-, (middle) second-, and (right) third-leading jet. The lower panels show the ratios of the theoretical predictions to the measurements. Error bars around the experimental points show the statistical uncertainty, while the cross-hatched bands indicate the statistical and systematic uncertainties added in quadrature. The boxes around the mg5-amc + PYTHIA 8 to measurement ratio represent the uncertainty on the prediction, including statistical, theoretical (from scale variations), and PDF uncertainties. The dark green area represents the statistical and theoretical uncertainties only, while the light green area represents the statistical uncertainty alone. |

png pdf |
Figure 24-b:
The differential cross section for $ {\mathrm{ Z } (\to \ell \ell )+\text {jets}} $ production for $N_{\text {jets}}\ge 3$, $ {p_{\mathrm {T}}} ^{\text {Z}} > 150 GeV $, and $ {H_{\mathrm {T}}} ^{\text {jet}}> $ 300 GeV as a function of the azimuthal angle between the Z boson and the (left) first-, (middle) second-, and (right) third-leading jet. The lower panels show the ratios of the theoretical predictions to the measurements. Error bars around the experimental points show the statistical uncertainty, while the cross-hatched bands indicate the statistical and systematic uncertainties added in quadrature. The boxes around the mg5-amc + PYTHIA 8 to measurement ratio represent the uncertainty on the prediction, including statistical, theoretical (from scale variations), and PDF uncertainties. The dark green area represents the statistical and theoretical uncertainties only, while the light green area represents the statistical uncertainty alone. |

png pdf |
Figure 24-c:
The differential cross section for $ {\mathrm{ Z } (\to \ell \ell )+\text {jets}} $ production for $N_{\text {jets}}\ge 3$, $ {p_{\mathrm {T}}} ^{\text {Z}} > 150 GeV $, and $ {H_{\mathrm {T}}} ^{\text {jet}}> $ 300 GeV as a function of the azimuthal angle between the Z boson and the (left) first-, (middle) second-, and (right) third-leading jet. The lower panels show the ratios of the theoretical predictions to the measurements. Error bars around the experimental points show the statistical uncertainty, while the cross-hatched bands indicate the statistical and systematic uncertainties added in quadrature. The boxes around the mg5-amc + PYTHIA 8 to measurement ratio represent the uncertainty on the prediction, including statistical, theoretical (from scale variations), and PDF uncertainties. The dark green area represents the statistical and theoretical uncertainties only, while the light green area represents the statistical uncertainty alone. |
png pdf |
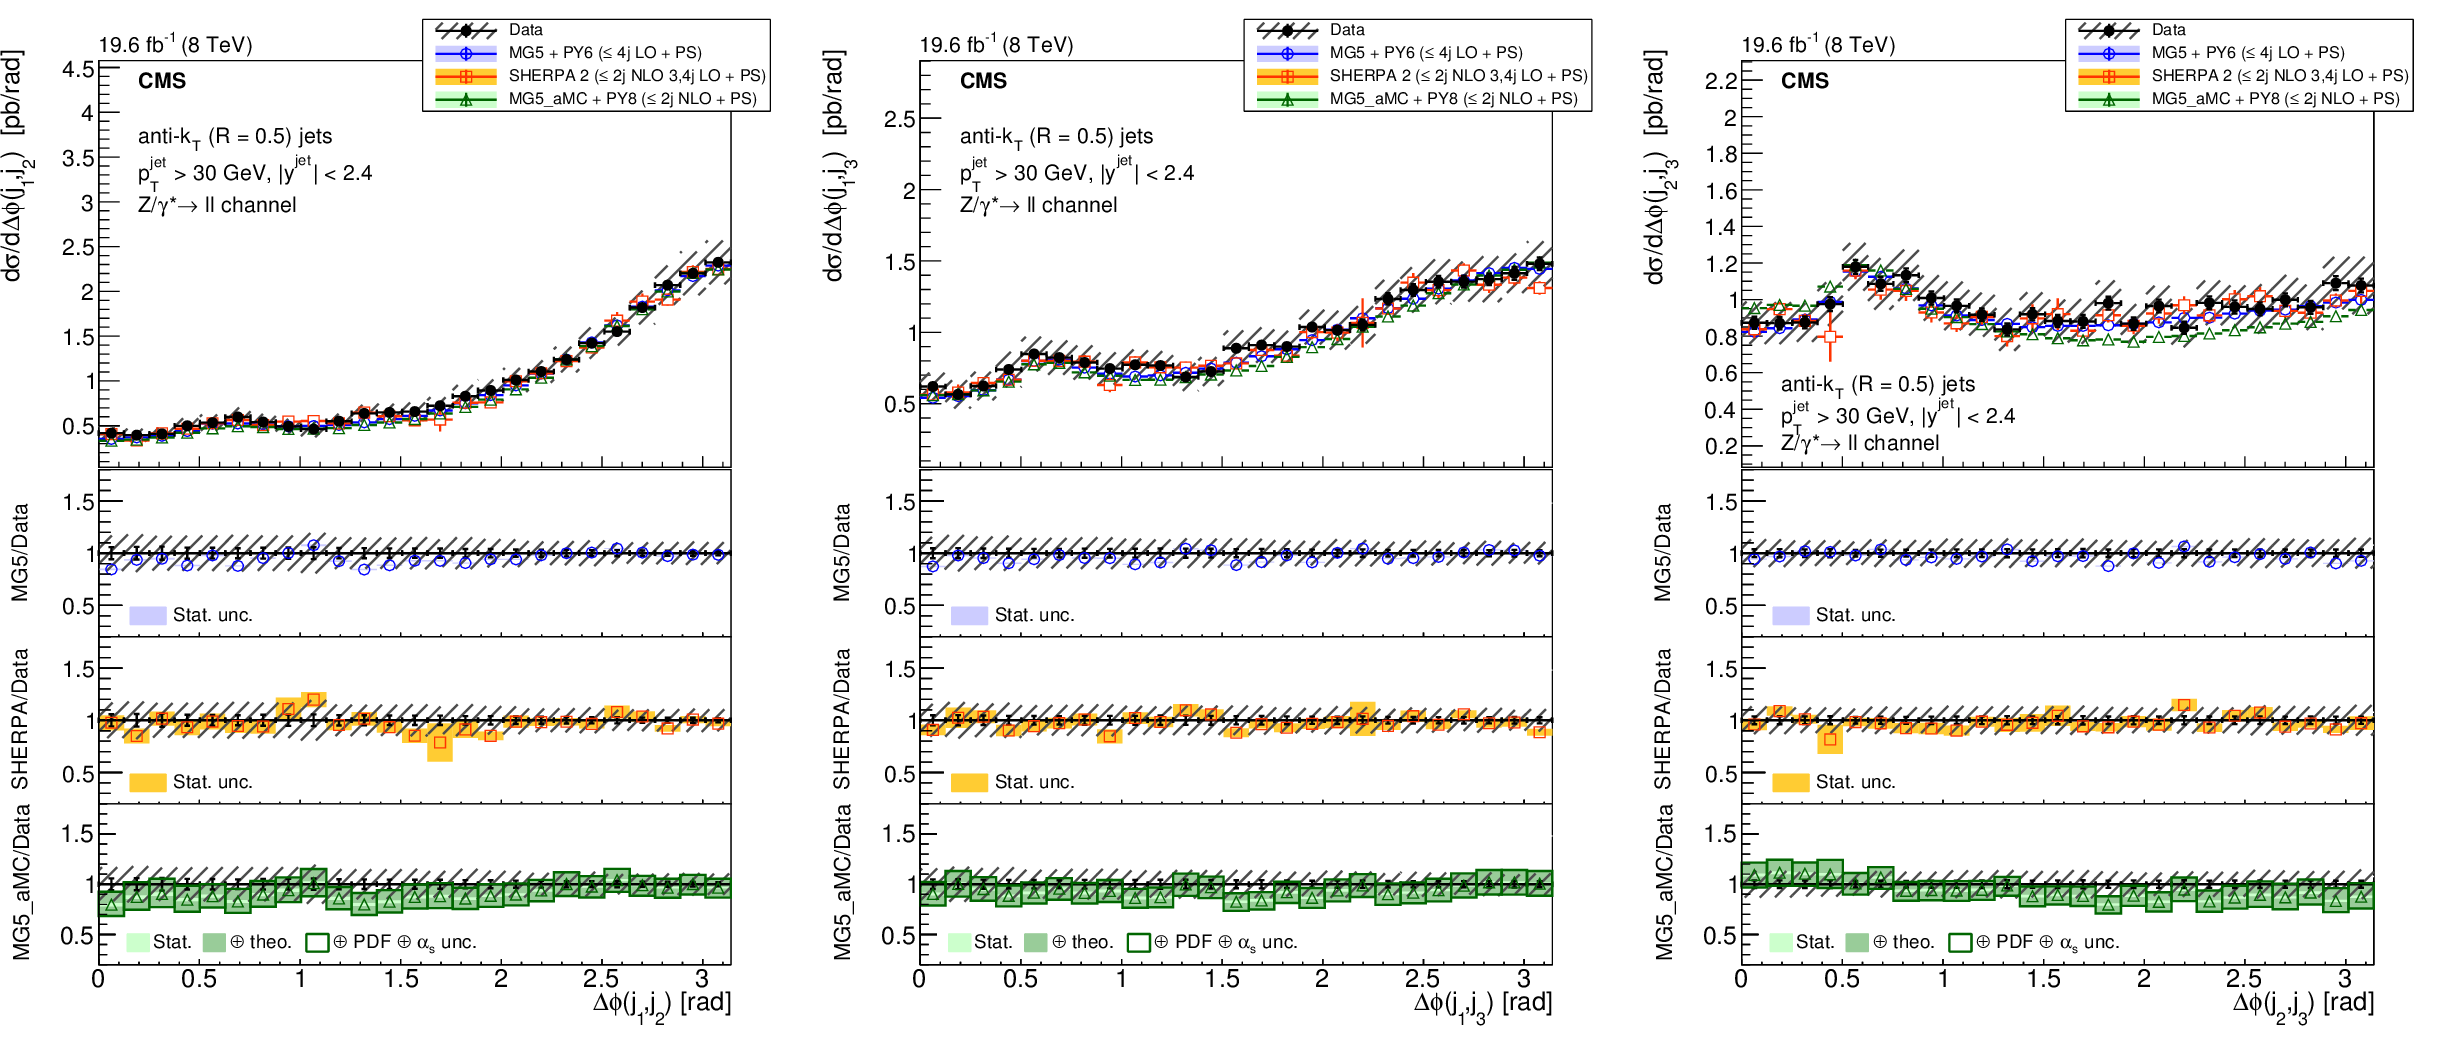
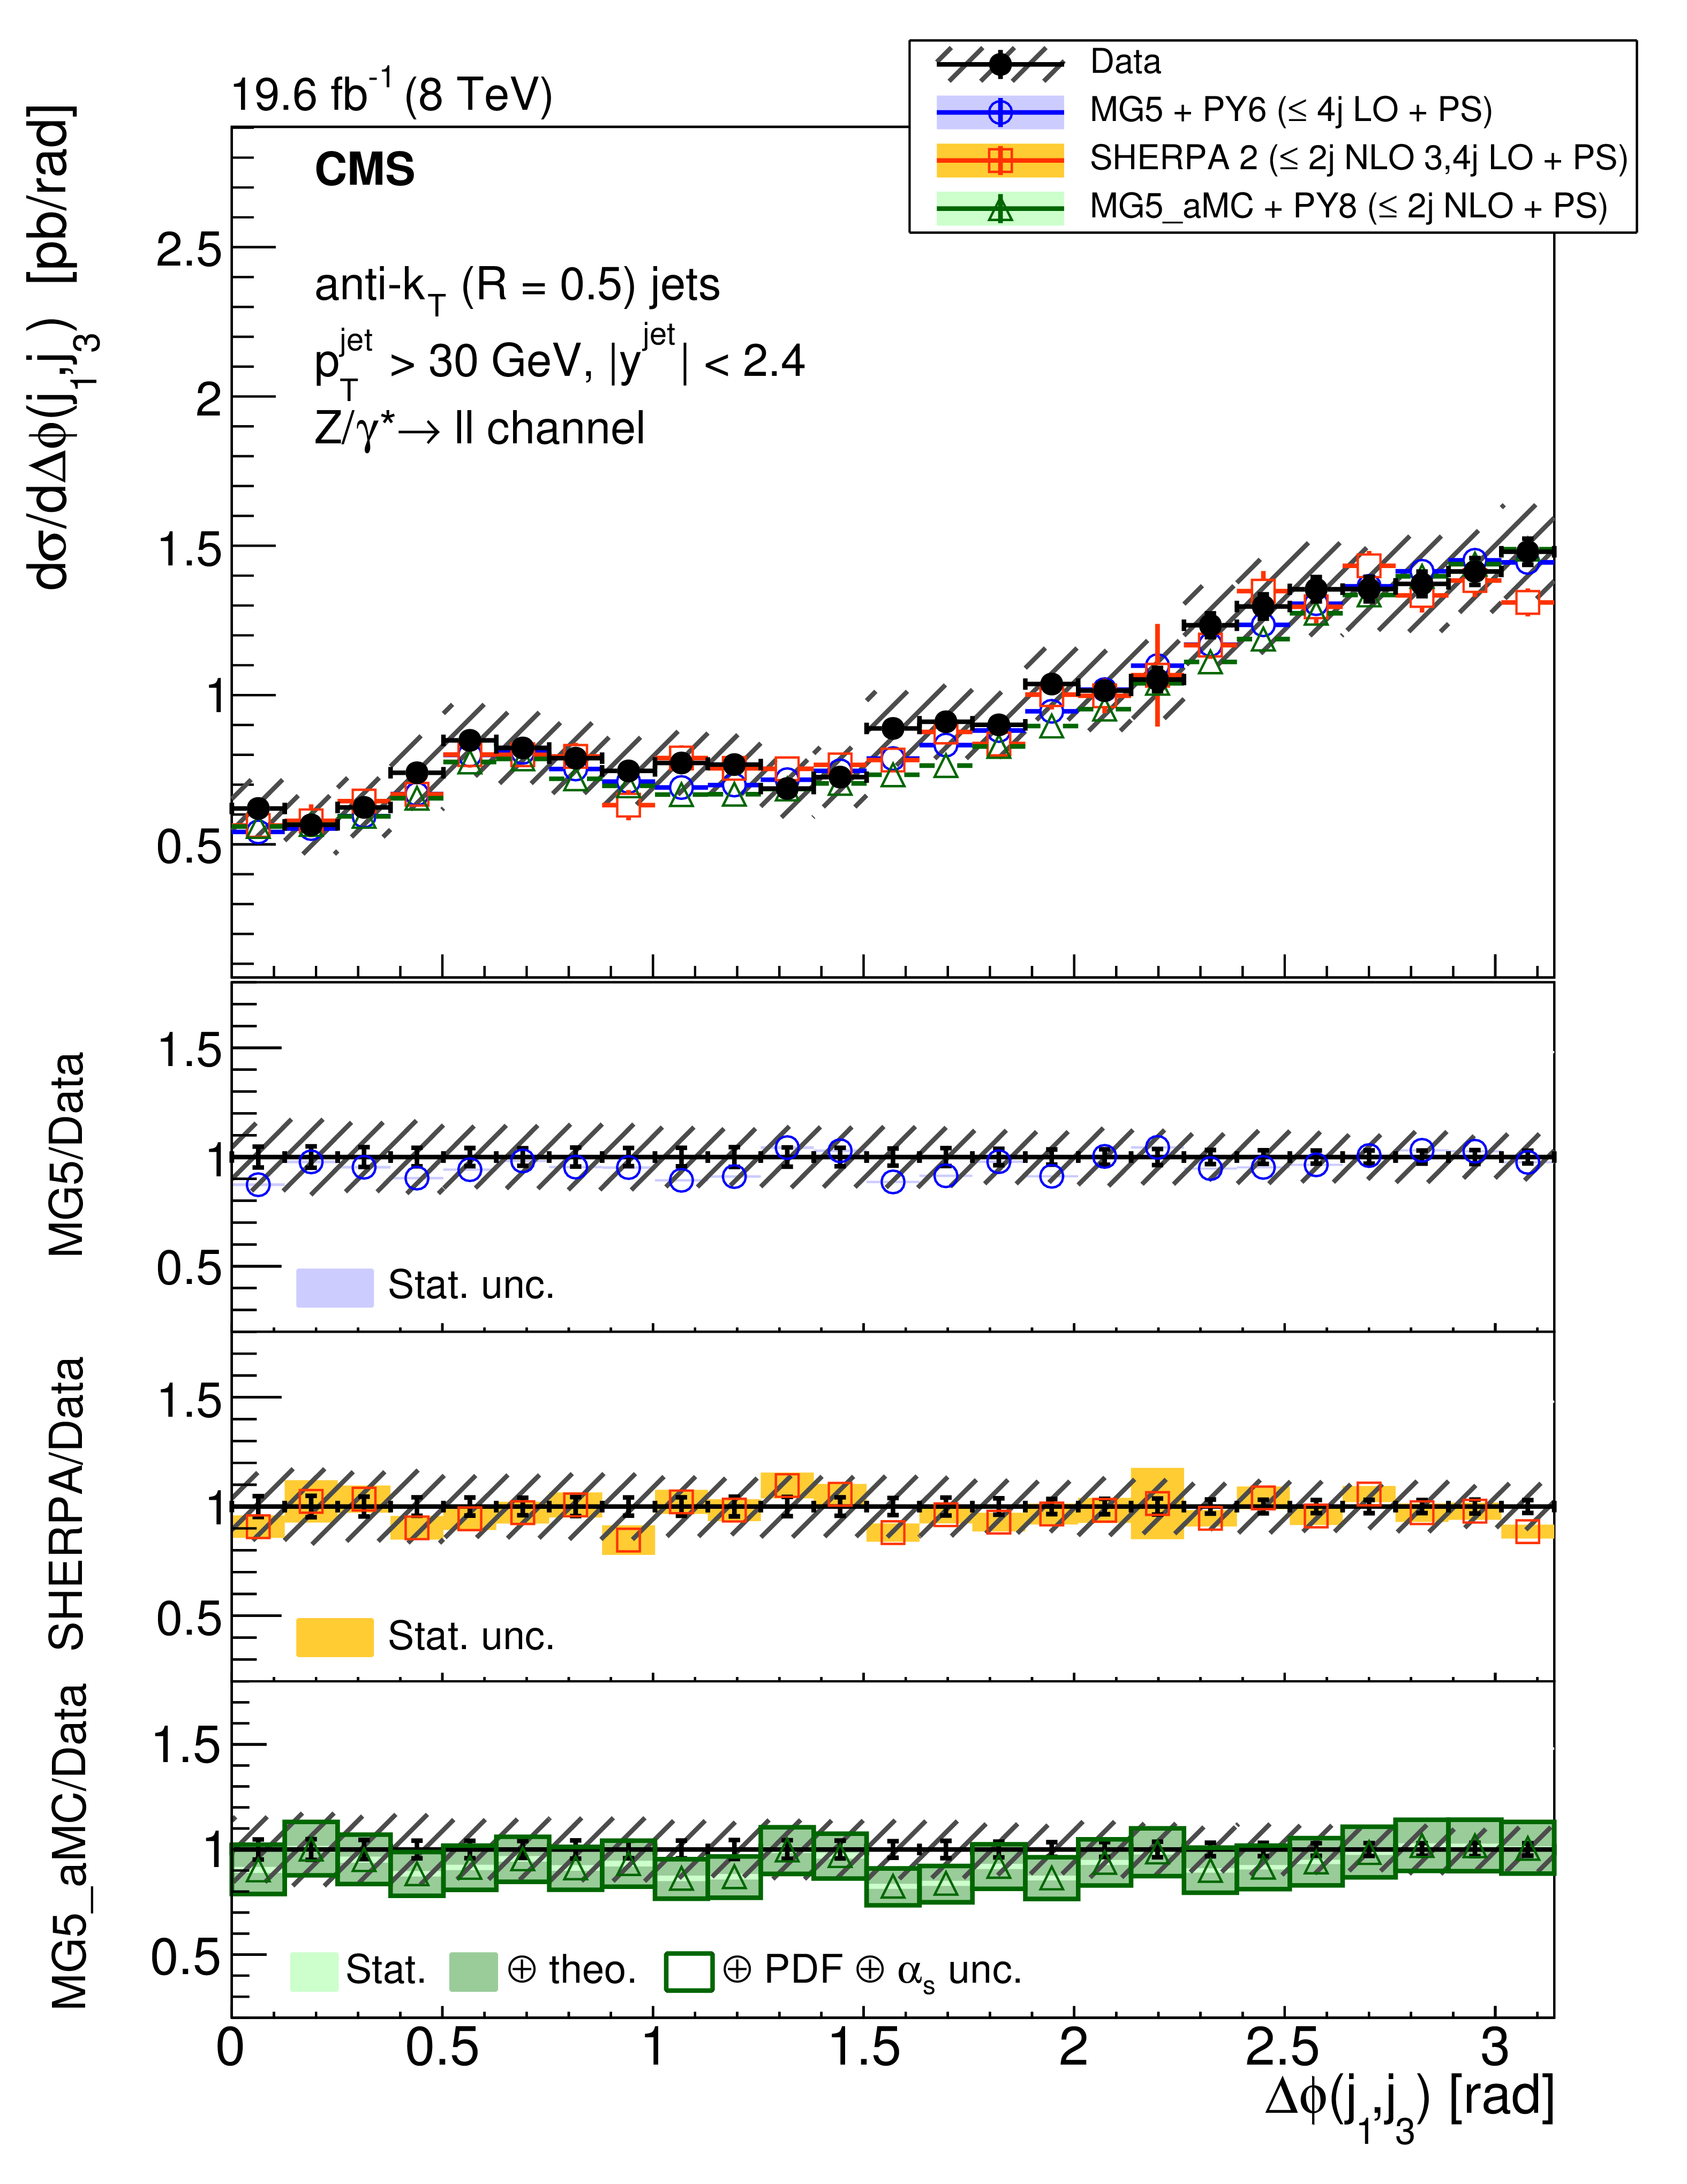
Figure 25:
The differential cross section for $ {\mathrm{ Z } (\to \ell \ell )+\text {jets}} $ production for $N_{\text {jets}}\ge 3$ as a function of the azimuthal angle between (left) the first- and second-, (middle) the first- and third-, and (right) the second- and third-leading jets. The lower panels show the ratios of the theoretical predictions to the measurements. Error bars around the experimental points show the statistical uncertainty, while the cross-hatched bands indicate the statistical and systematic uncertainties added in quadrature. The boxes around the mg5-amc + PYTHIA 8 to measurement ratio represent the uncertainty on the prediction, including statistical, theoretical (from scale variations), and PDF uncertainties. The dark green area represents the statistical and theoretical uncertainties only, while the light green area represents the statistical uncertainty alone. |

png pdf |
Figure 25-a:
The differential cross section for $ {\mathrm{ Z } (\to \ell \ell )+\text {jets}} $ production for $N_{\text {jets}}\ge 3$ as a function of the azimuthal angle between (left) the first- and second-, (middle) the first- and third-, and (right) the second- and third-leading jets. The lower panels show the ratios of the theoretical predictions to the measurements. Error bars around the experimental points show the statistical uncertainty, while the cross-hatched bands indicate the statistical and systematic uncertainties added in quadrature. The boxes around the mg5-amc + PYTHIA 8 to measurement ratio represent the uncertainty on the prediction, including statistical, theoretical (from scale variations), and PDF uncertainties. The dark green area represents the statistical and theoretical uncertainties only, while the light green area represents the statistical uncertainty alone. |
png pdf |
Figure 25-b:
The differential cross section for $ {\mathrm{ Z } (\to \ell \ell )+\text {jets}} $ production for $N_{\text {jets}}\ge 3$ as a function of the azimuthal angle between (left) the first- and second-, (middle) the first- and third-, and (right) the second- and third-leading jets. The lower panels show the ratios of the theoretical predictions to the measurements. Error bars around the experimental points show the statistical uncertainty, while the cross-hatched bands indicate the statistical and systematic uncertainties added in quadrature. The boxes around the mg5-amc + PYTHIA 8 to measurement ratio represent the uncertainty on the prediction, including statistical, theoretical (from scale variations), and PDF uncertainties. The dark green area represents the statistical and theoretical uncertainties only, while the light green area represents the statistical uncertainty alone. |

png pdf |
Figure 25-c:
The differential cross section for $ {\mathrm{ Z } (\to \ell \ell )+\text {jets}} $ production for $N_{\text {jets}}\ge 3$ as a function of the azimuthal angle between (left) the first- and second-, (middle) the first- and third-, and (right) the second- and third-leading jets. The lower panels show the ratios of the theoretical predictions to the measurements. Error bars around the experimental points show the statistical uncertainty, while the cross-hatched bands indicate the statistical and systematic uncertainties added in quadrature. The boxes around the mg5-amc + PYTHIA 8 to measurement ratio represent the uncertainty on the prediction, including statistical, theoretical (from scale variations), and PDF uncertainties. The dark green area represents the statistical and theoretical uncertainties only, while the light green area represents the statistical uncertainty alone. |

png pdf |
Figure 26:
The differential cross section for $ {\mathrm{ Z } (\to \ell \ell )+\text {jets}} $ production for $N_{\text {jets}}\ge 3$ and $ {p_{\mathrm {T}}} (\mathrm{ Z } ) > 150 GeV $ as a function of the azimuthal angle between (left) the first- and second-, (middle) the first- and third-, and (right) the second- and third-leading jets. The lower panels show the ratios of the theoretical predictions to the measurements. Error bars around the experimental points show the statistical uncertainty, while the cross-hatched bands indicate the statistical and systematic uncertainties added in quadrature. The boxes around the mg5-amc + PYTHIA 8 to measurement ratio represent the uncertainty on the prediction, including statistical, theoretical (from scale variations), and PDF uncertainties. The dark green area represents the statistical and theoretical uncertainties only, while the light green area represents the statistical uncertainty alone. |

png pdf |
Figure 26-a:
The differential cross section for $ {\mathrm{ Z } (\to \ell \ell )+\text {jets}} $ production for $N_{\text {jets}}\ge 3$ and $ {p_{\mathrm {T}}} (\mathrm{ Z } ) > 150 GeV $ as a function of the azimuthal angle between (left) the first- and second-, (middle) the first- and third-, and (right) the second- and third-leading jets. The lower panels show the ratios of the theoretical predictions to the measurements. Error bars around the experimental points show the statistical uncertainty, while the cross-hatched bands indicate the statistical and systematic uncertainties added in quadrature. The boxes around the mg5-amc + PYTHIA 8 to measurement ratio represent the uncertainty on the prediction, including statistical, theoretical (from scale variations), and PDF uncertainties. The dark green area represents the statistical and theoretical uncertainties only, while the light green area represents the statistical uncertainty alone. |

png pdf |
Figure 26-b:
The differential cross section for $ {\mathrm{ Z } (\to \ell \ell )+\text {jets}} $ production for $N_{\text {jets}}\ge 3$ and $ {p_{\mathrm {T}}} (\mathrm{ Z } ) > 150 GeV $ as a function of the azimuthal angle between (left) the first- and second-, (middle) the first- and third-, and (right) the second- and third-leading jets. The lower panels show the ratios of the theoretical predictions to the measurements. Error bars around the experimental points show the statistical uncertainty, while the cross-hatched bands indicate the statistical and systematic uncertainties added in quadrature. The boxes around the mg5-amc + PYTHIA 8 to measurement ratio represent the uncertainty on the prediction, including statistical, theoretical (from scale variations), and PDF uncertainties. The dark green area represents the statistical and theoretical uncertainties only, while the light green area represents the statistical uncertainty alone. |
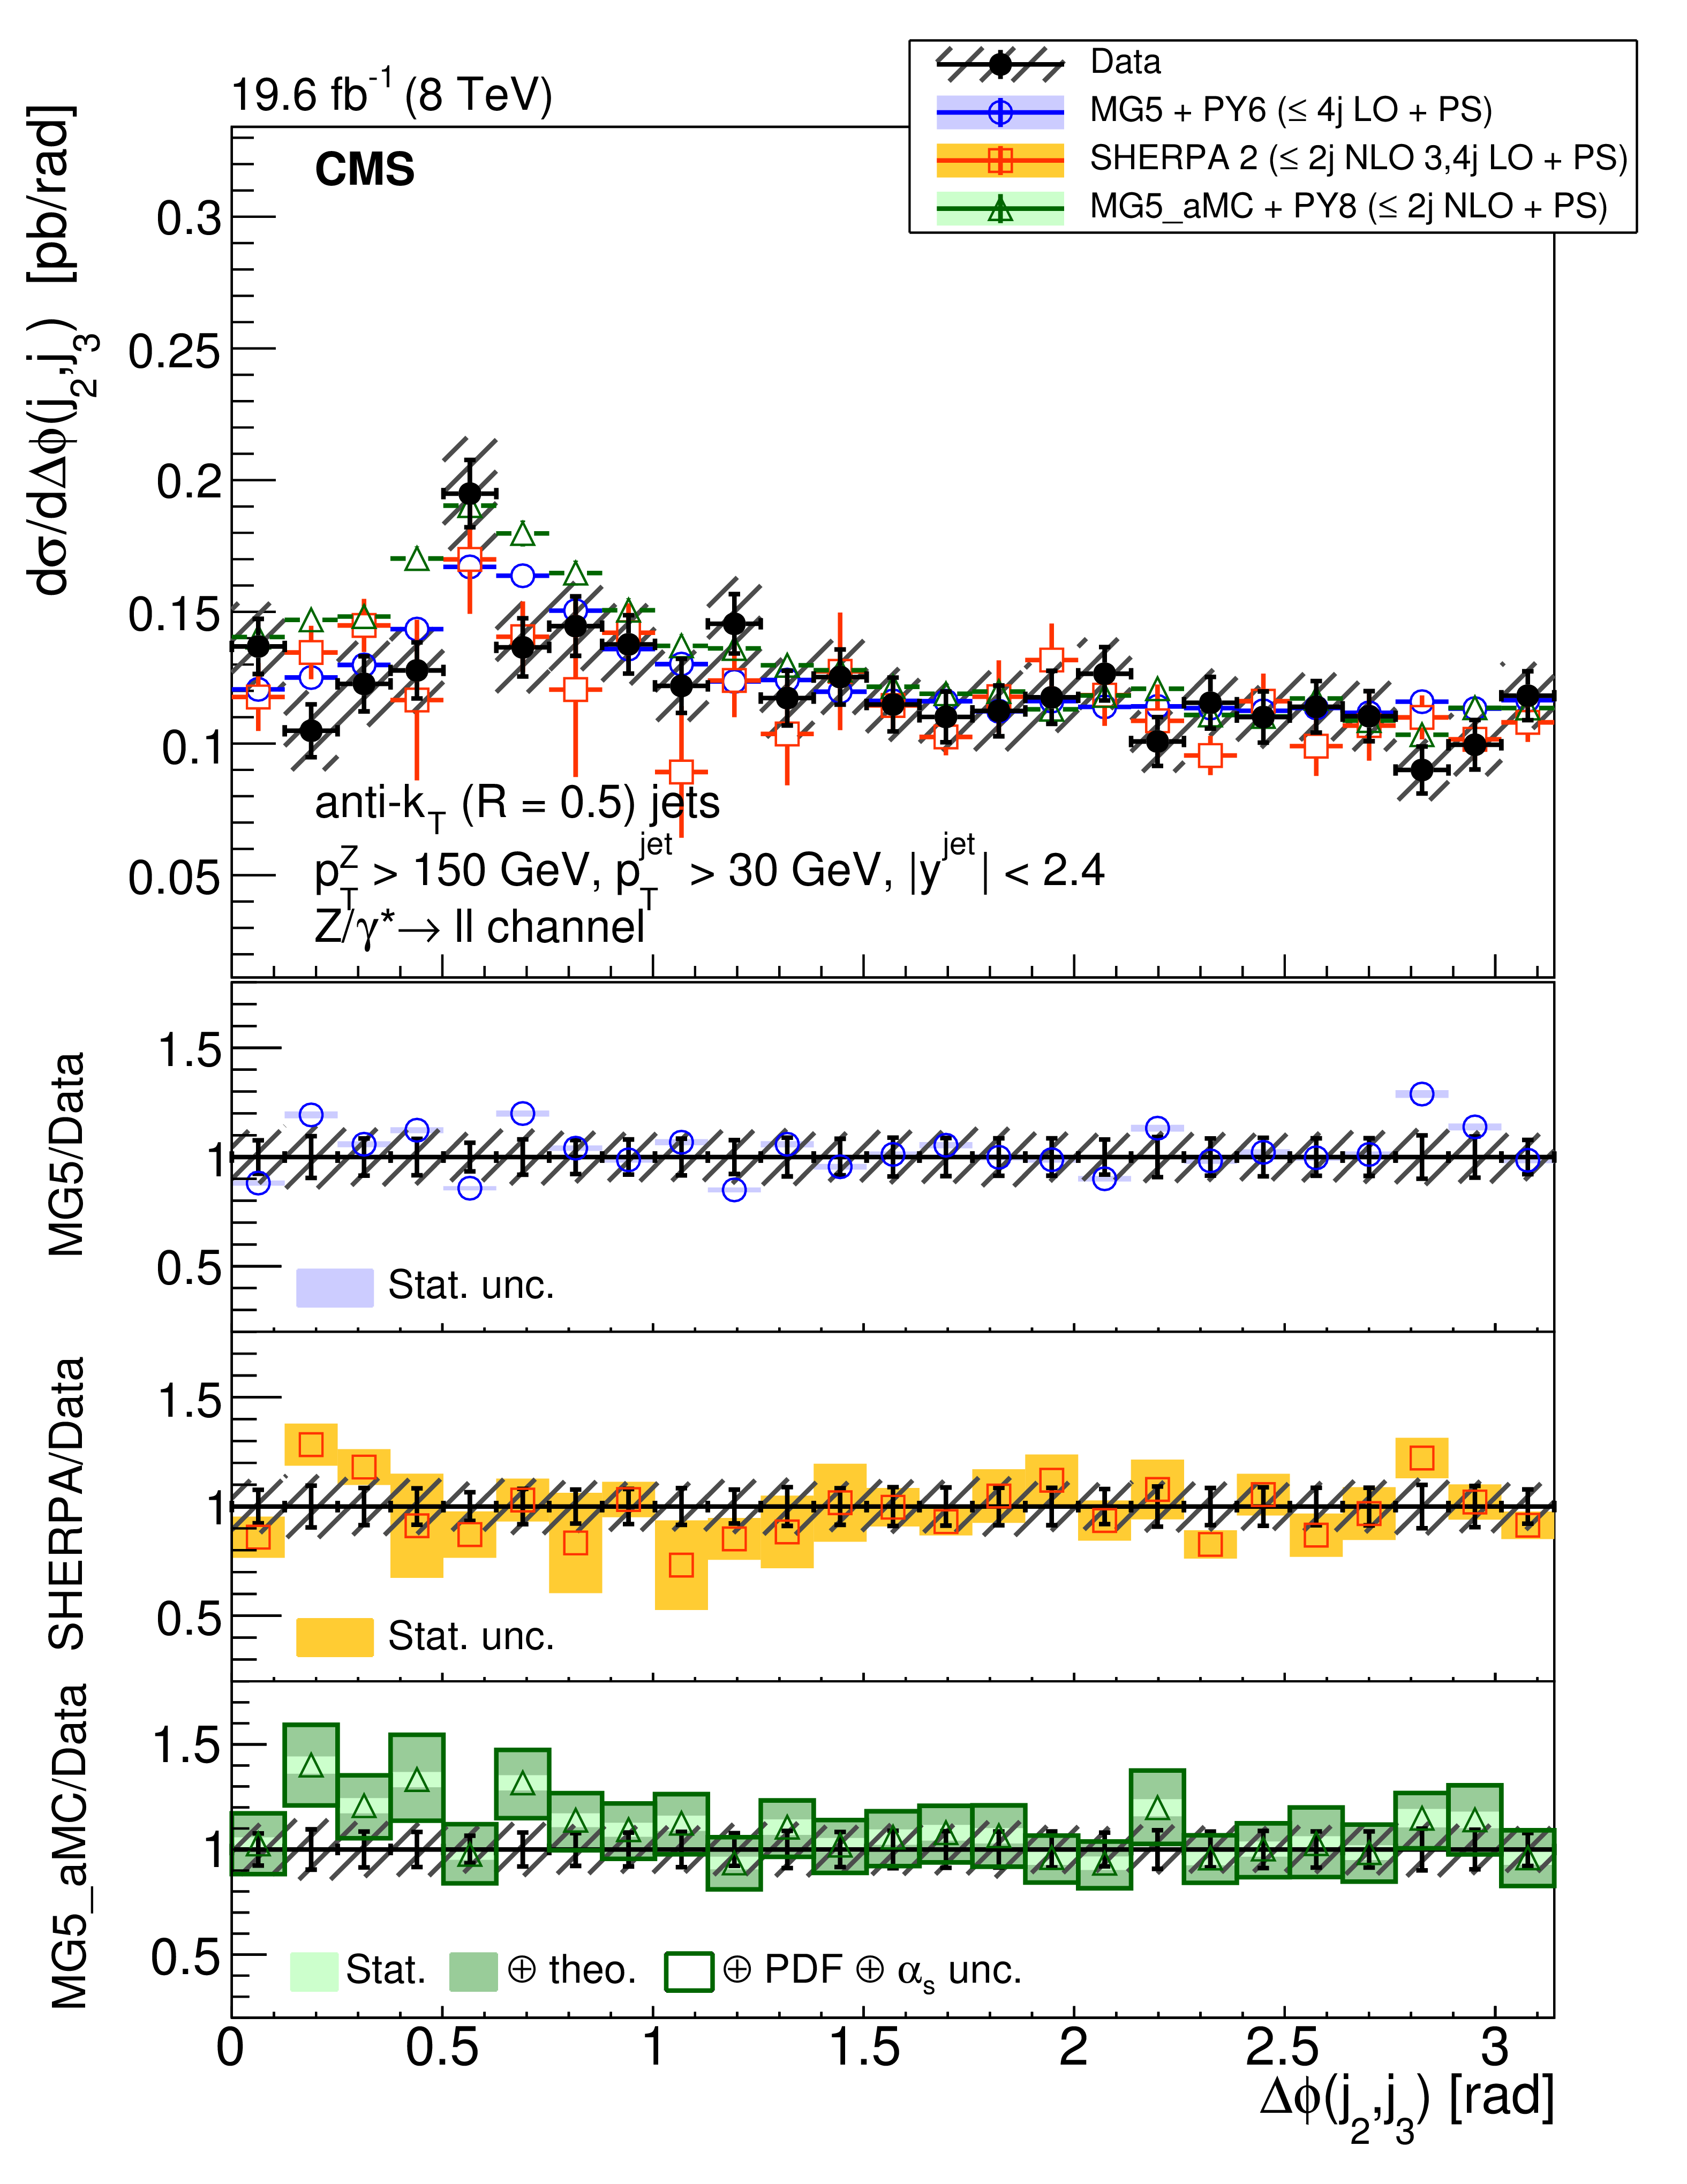
png pdf |
Figure 26-c:
The differential cross section for $ {\mathrm{ Z } (\to \ell \ell )+\text {jets}} $ production for $N_{\text {jets}}\ge 3$ and $ {p_{\mathrm {T}}} (\mathrm{ Z } ) > 150 GeV $ as a function of the azimuthal angle between (left) the first- and second-, (middle) the first- and third-, and (right) the second- and third-leading jets. The lower panels show the ratios of the theoretical predictions to the measurements. Error bars around the experimental points show the statistical uncertainty, while the cross-hatched bands indicate the statistical and systematic uncertainties added in quadrature. The boxes around the mg5-amc + PYTHIA 8 to measurement ratio represent the uncertainty on the prediction, including statistical, theoretical (from scale variations), and PDF uncertainties. The dark green area represents the statistical and theoretical uncertainties only, while the light green area represents the statistical uncertainty alone. |

png pdf |
Figure 27:
The differential cross section for $ {\mathrm{ Z } (\to \ell \ell )+\text {jets}} $ production for $N_{\text {jets}}\ge 3$ and $ {p_{\mathrm {T}}} ({\mathrm{ Z } } ) > 300 GeV $ as a function of the azimuthal angle between (left) the first- and second-, (middle) the first- and third-, and (right) the second- and third- leading-jets. The lower panels show the ratios of the theoretical predictions to the measurements. Error bars around the experimental points show the statistical uncertainty, while the cross-hatched bands indicate the statistical and systematic uncertainties added in quadrature. The boxes around the mg5-amc + PYTHIA 8 to measurement ratio represent the uncertainty on the prediction, including statistical, theoretical (from scale variations), and PDF uncertainties. The dark green area represents the statistical and theoretical uncertainties only, while the light green area represents the statistical uncertainty alone. |

png pdf |
Figure 27-a:
The differential cross section for $ {\mathrm{ Z } (\to \ell \ell )+\text {jets}} $ production for $N_{\text {jets}}\ge 3$ and $ {p_{\mathrm {T}}} ({\mathrm{ Z } } ) > 300 GeV $ as a function of the azimuthal angle between (left) the first- and second-, (middle) the first- and third-, and (right) the second- and third- leading-jets. The lower panels show the ratios of the theoretical predictions to the measurements. Error bars around the experimental points show the statistical uncertainty, while the cross-hatched bands indicate the statistical and systematic uncertainties added in quadrature. The boxes around the mg5-amc + PYTHIA 8 to measurement ratio represent the uncertainty on the prediction, including statistical, theoretical (from scale variations), and PDF uncertainties. The dark green area represents the statistical and theoretical uncertainties only, while the light green area represents the statistical uncertainty alone. |

png pdf |
Figure 27-b:
The differential cross section for $ {\mathrm{ Z } (\to \ell \ell )+\text {jets}} $ production for $N_{\text {jets}}\ge 3$ and $ {p_{\mathrm {T}}} ({\mathrm{ Z } } ) > 300 GeV $ as a function of the azimuthal angle between (left) the first- and second-, (middle) the first- and third-, and (right) the second- and third- leading-jets. The lower panels show the ratios of the theoretical predictions to the measurements. Error bars around the experimental points show the statistical uncertainty, while the cross-hatched bands indicate the statistical and systematic uncertainties added in quadrature. The boxes around the mg5-amc + PYTHIA 8 to measurement ratio represent the uncertainty on the prediction, including statistical, theoretical (from scale variations), and PDF uncertainties. The dark green area represents the statistical and theoretical uncertainties only, while the light green area represents the statistical uncertainty alone. |

png pdf |
Figure 27-c:
The differential cross section for $ {\mathrm{ Z } (\to \ell \ell )+\text {jets}} $ production for $N_{\text {jets}}\ge 3$ and $ {p_{\mathrm {T}}} ({\mathrm{ Z } } ) > 300 GeV $ as a function of the azimuthal angle between (left) the first- and second-, (middle) the first- and third-, and (right) the second- and third- leading-jets. The lower panels show the ratios of the theoretical predictions to the measurements. Error bars around the experimental points show the statistical uncertainty, while the cross-hatched bands indicate the statistical and systematic uncertainties added in quadrature. The boxes around the mg5-amc + PYTHIA 8 to measurement ratio represent the uncertainty on the prediction, including statistical, theoretical (from scale variations), and PDF uncertainties. The dark green area represents the statistical and theoretical uncertainties only, while the light green area represents the statistical uncertainty alone. |
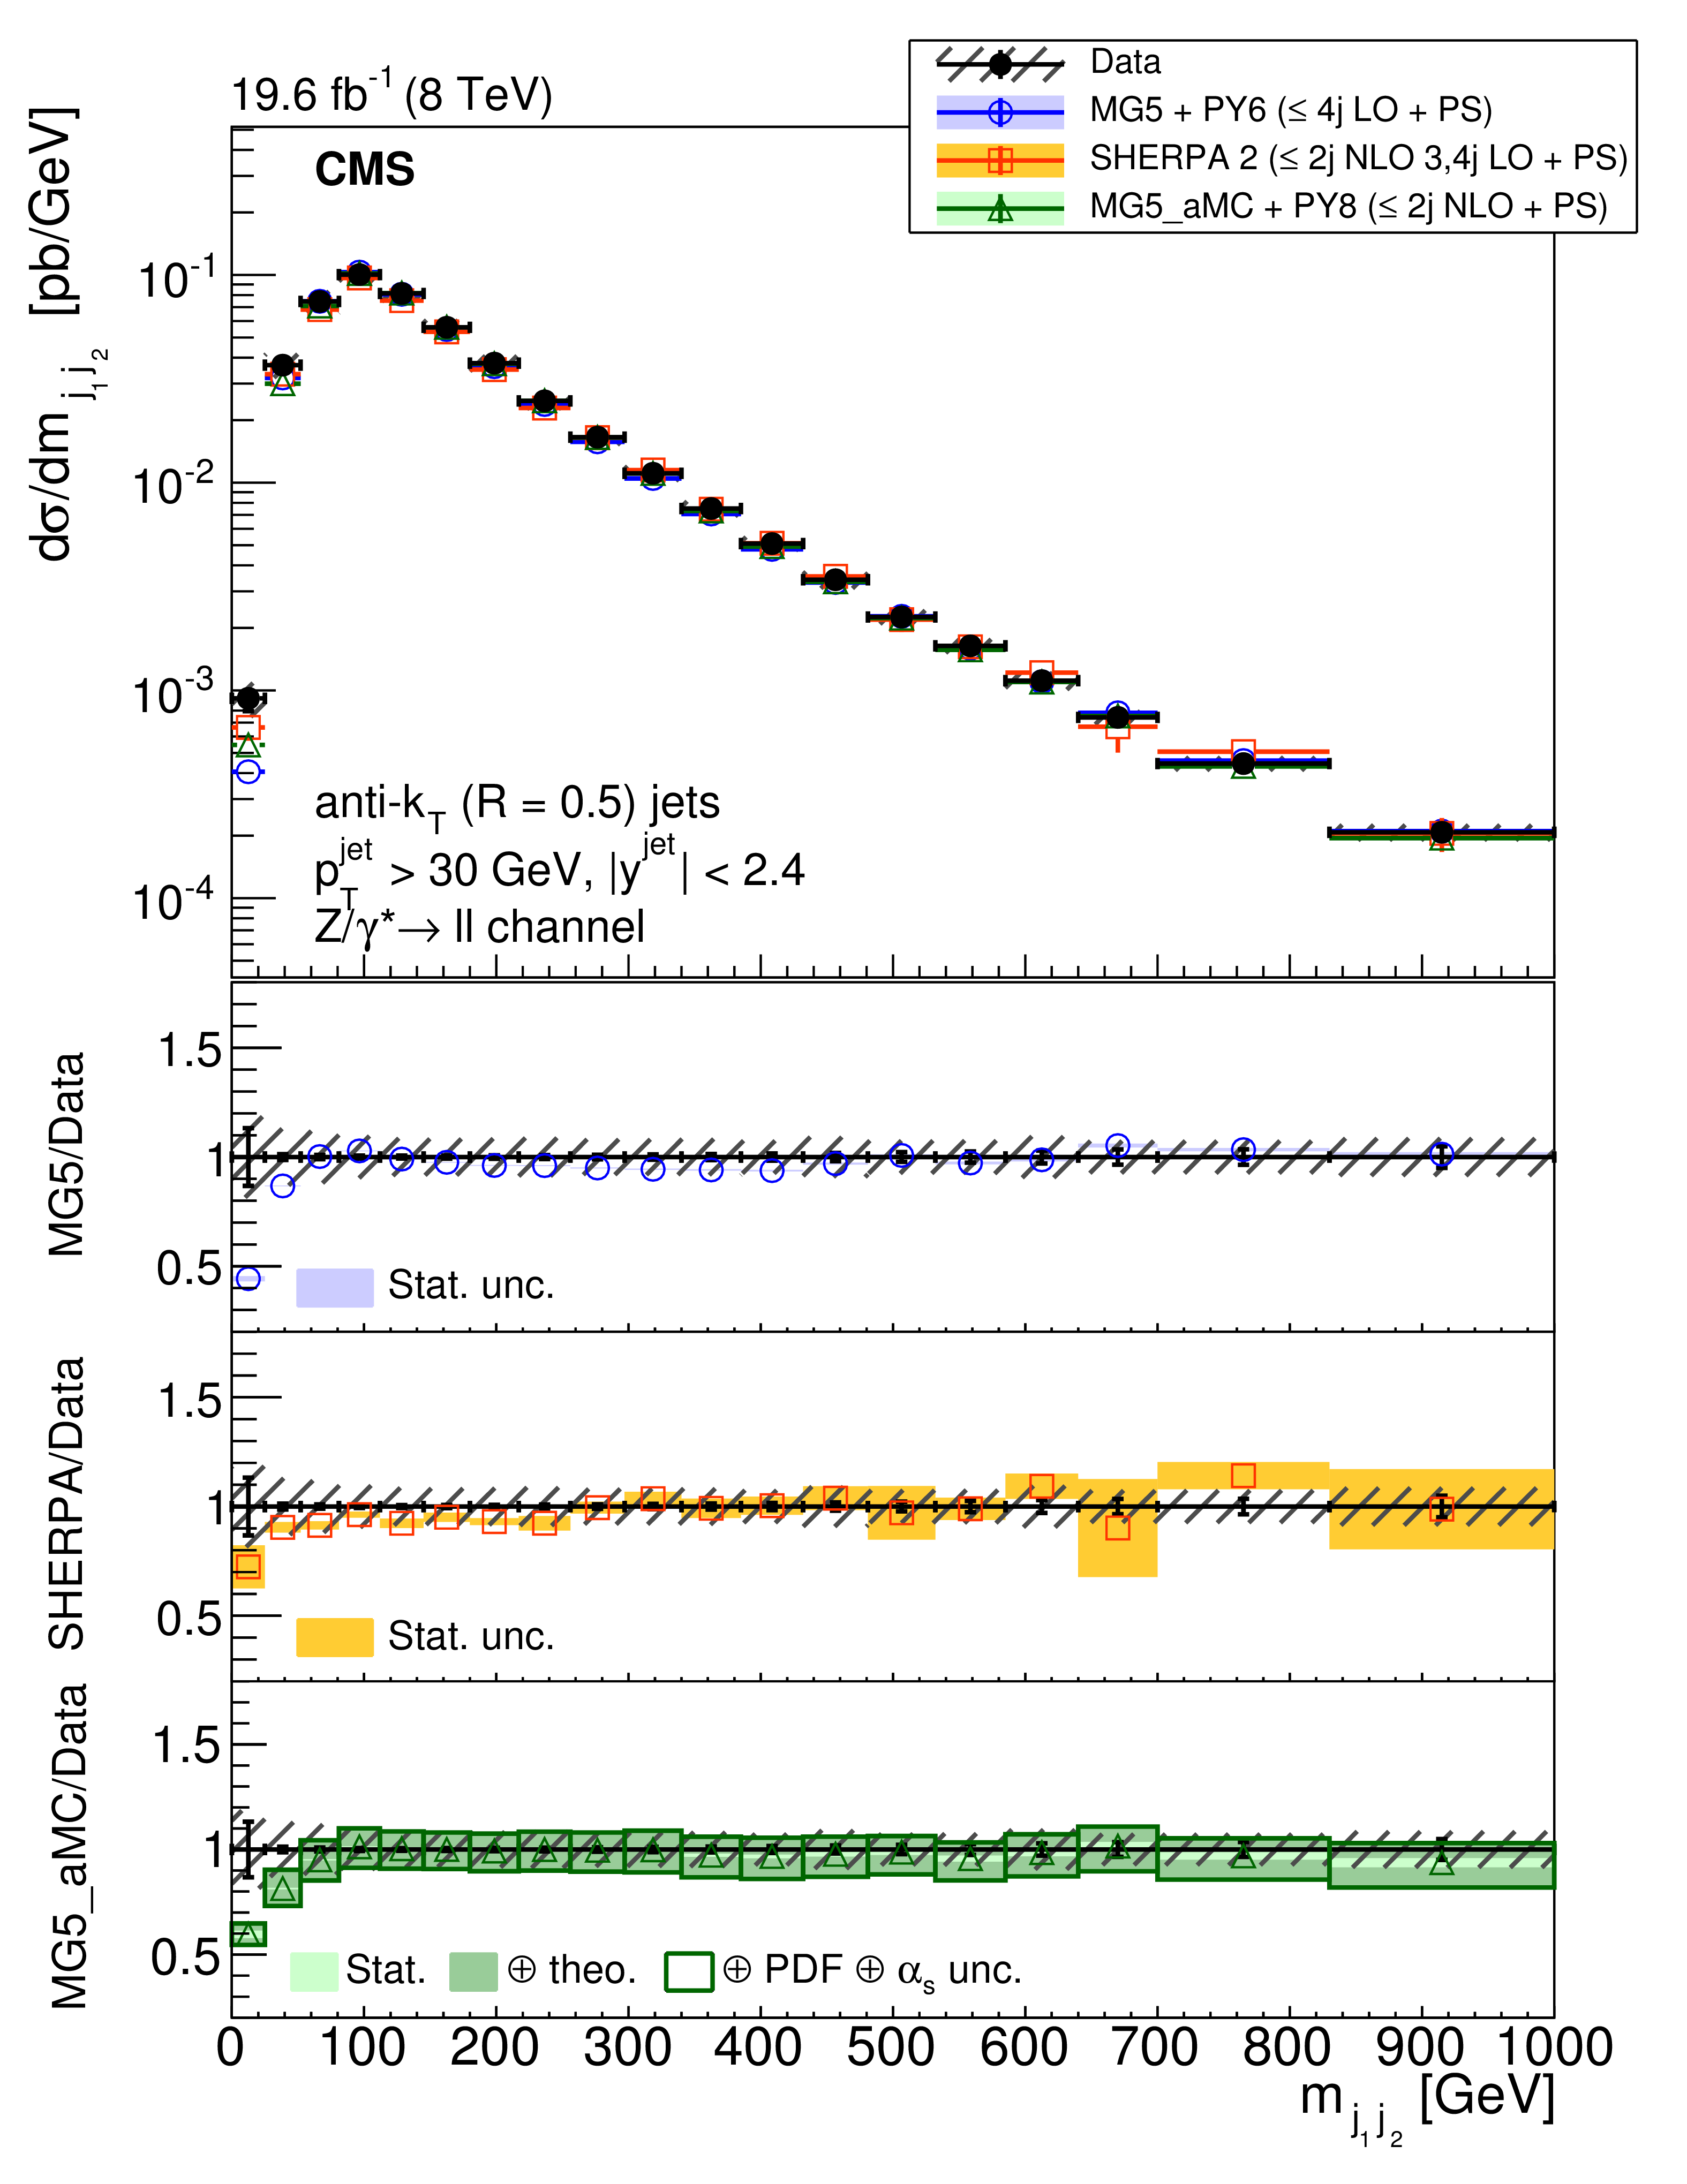
png pdf |
Figure 28:
The differential cross section for $ {\mathrm{ Z } (\to \ell \ell )+\text {jets}} $ production as a function of the dijet invariant mass for $N_{\text {jets}} \geq 2$ compared to the predictions calculated with MadGraph 5+PYTHIA 6, SHERPA 2, and mg5-amc +PYTHIA 8. The lower panels show the ratios of the theoretical predictions to the measurements. Error bars around the experimental points show the statistical uncertainty, while the cross-hatched bands indicate the statistical and systematic uncertainties added in quadrature. The boxes around the mg5-amc + PYTHIA 8 to measurement ratio represent the uncertainty on the prediction, including statistical, theoretical (from scale variations), and PDF uncertainties. The dark green area represents the statistical and theoretical uncertainties only, while the light green area represents the statistical uncertainty alone. |
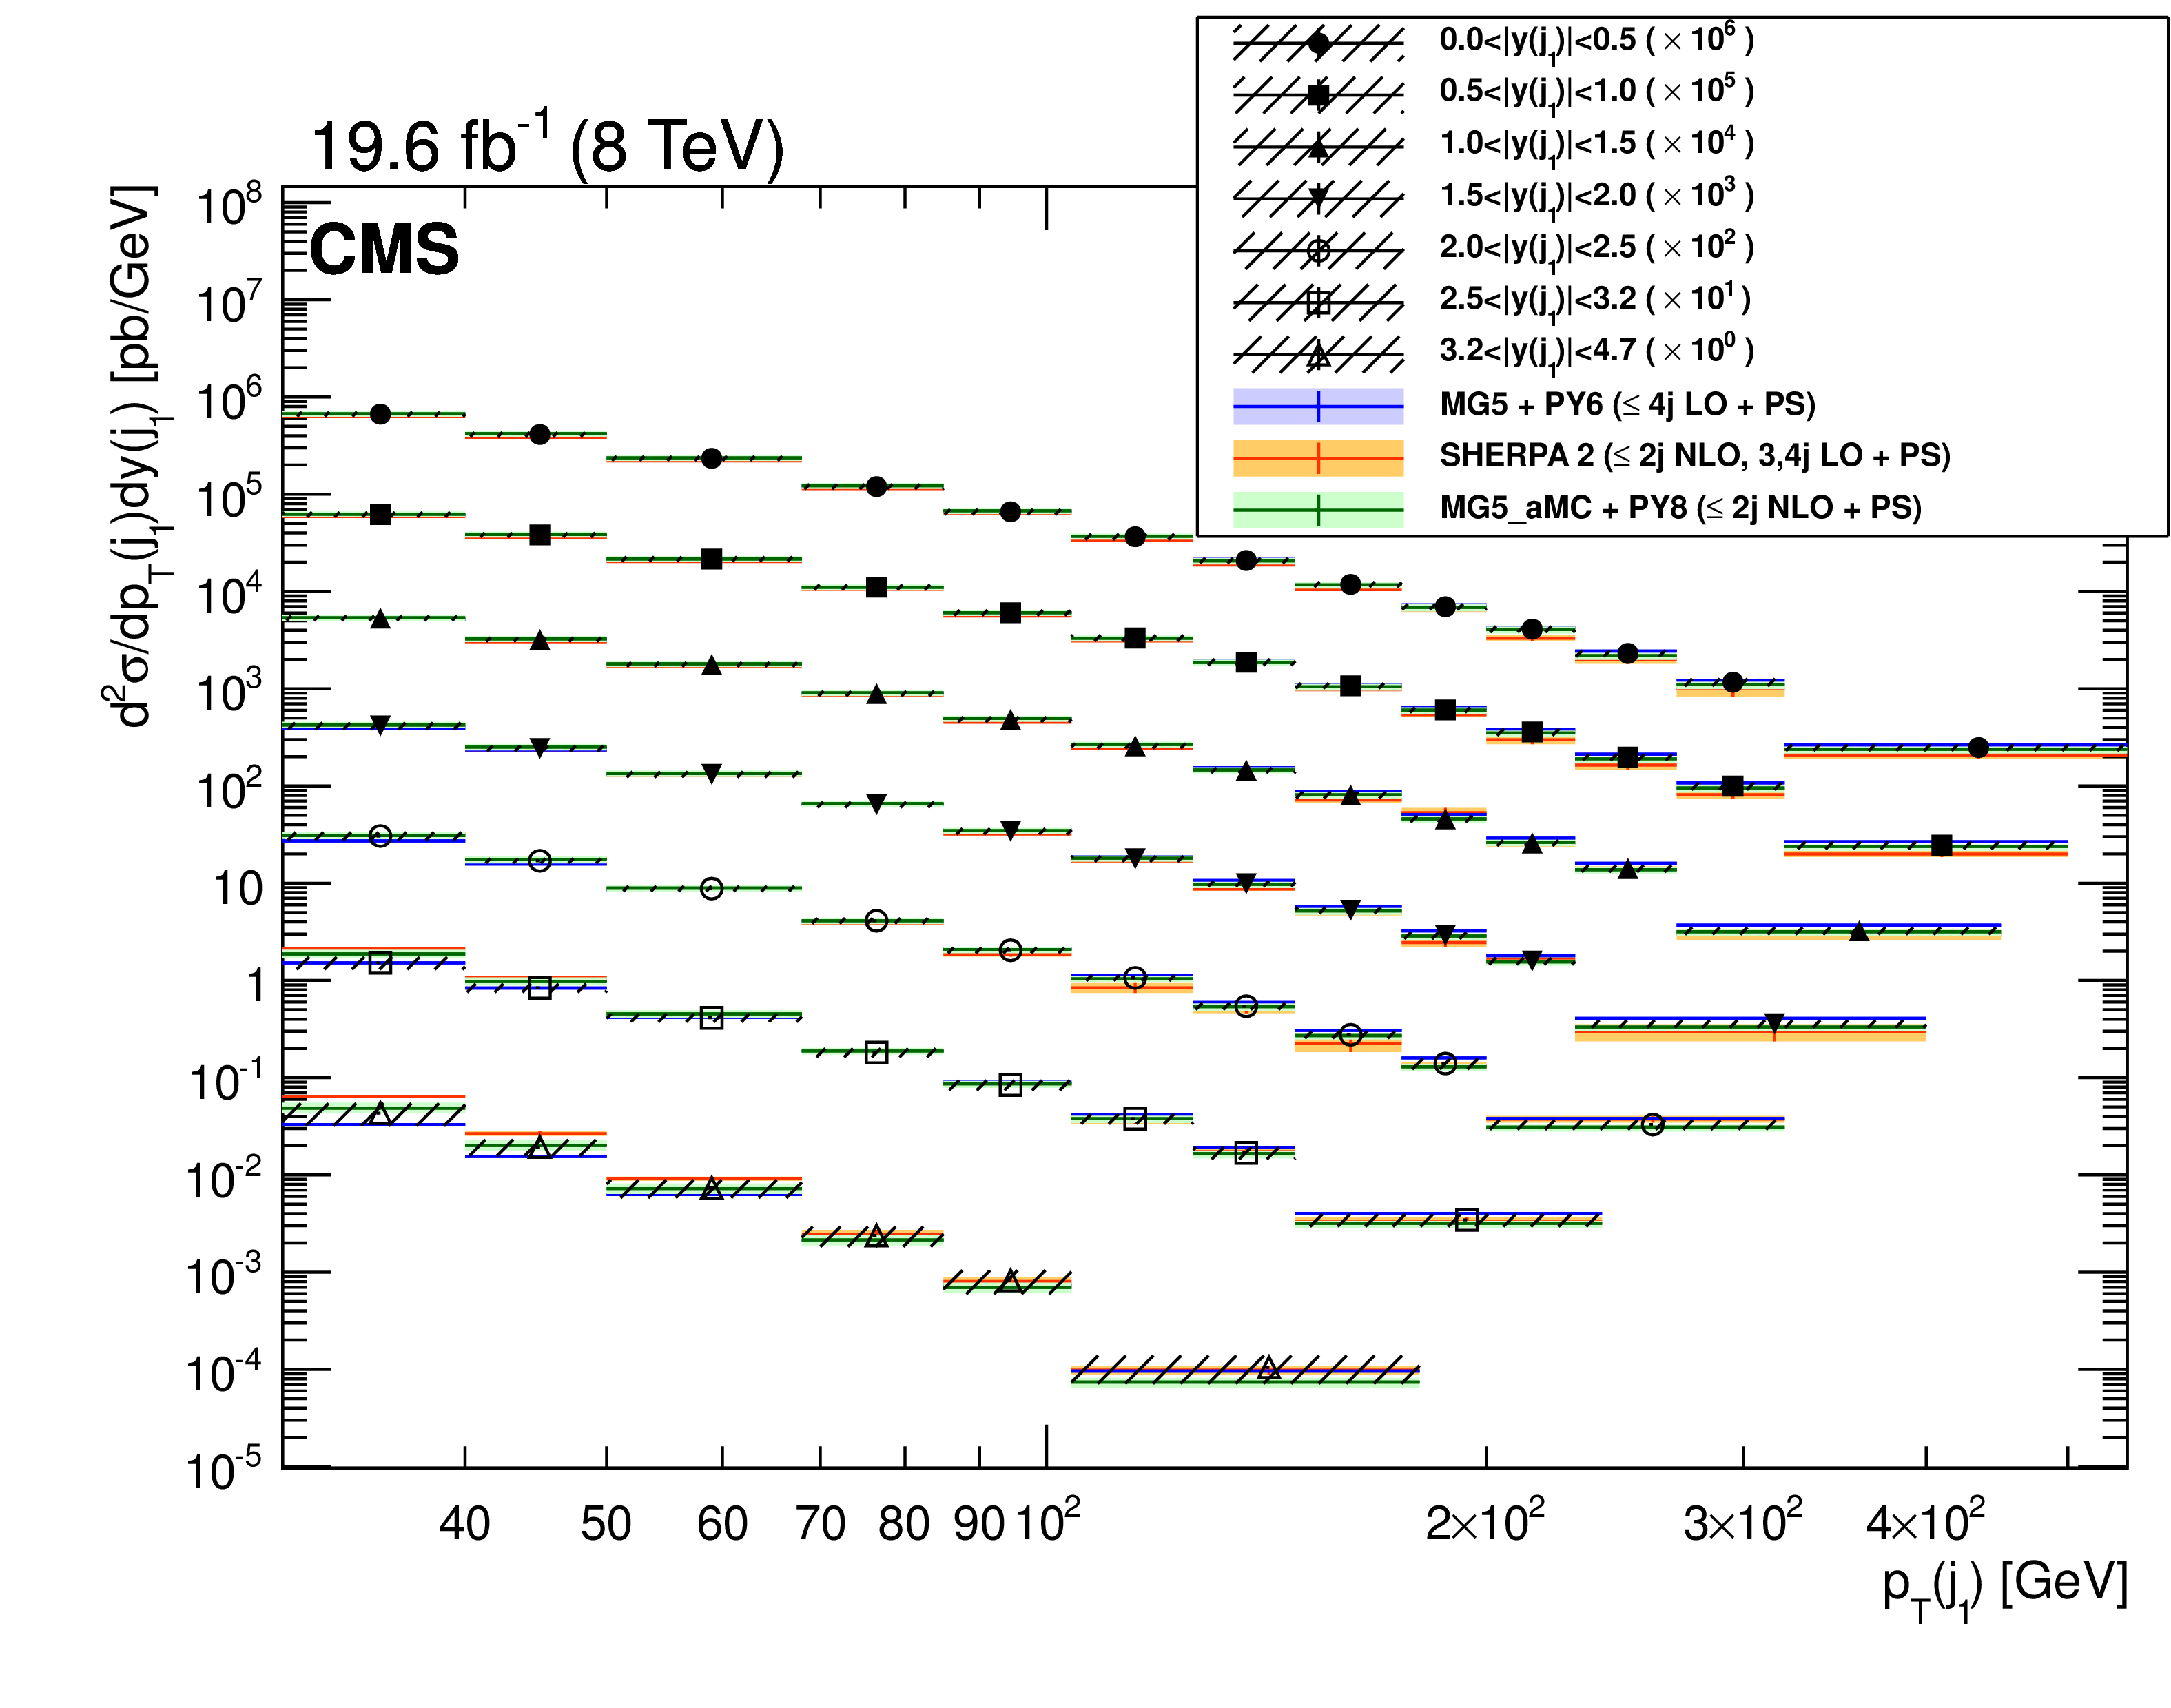
png pdf |
Figure 29:
The differential cross section for $ {\mathrm{ Z } (\to \ell \ell )+\text {jets}} $ production as a function of the leading jet transverse momentum and rapidity. The bands around the measurement points represent the total measurement uncertainties. The bands around the prediction points represent the total uncertainty, and its statistical, theoretical, and PDF components for mg5-amc +PYTHIA 8, and the statistical uncertainty alone for MadGraph 5+PYTHIA 6 and SHERPA 2. |

png pdf |
Figure 30:
Ratio to the measurement of the differential cross section $ {\mathrm {d}}^2\sigma / {\mathrm {d}} {p_{\mathrm {T}}} (\text {j}_1) {\mathrm {d}}y(\text {j}_1)$ obtained with MadGraph 5+PYTHIA 6, with up to four jets at LO. The total experimental uncertainty is shown as a band around 1. Uncertainties in the predictions are shown on the ratio points and include the statistical uncertainty only. |
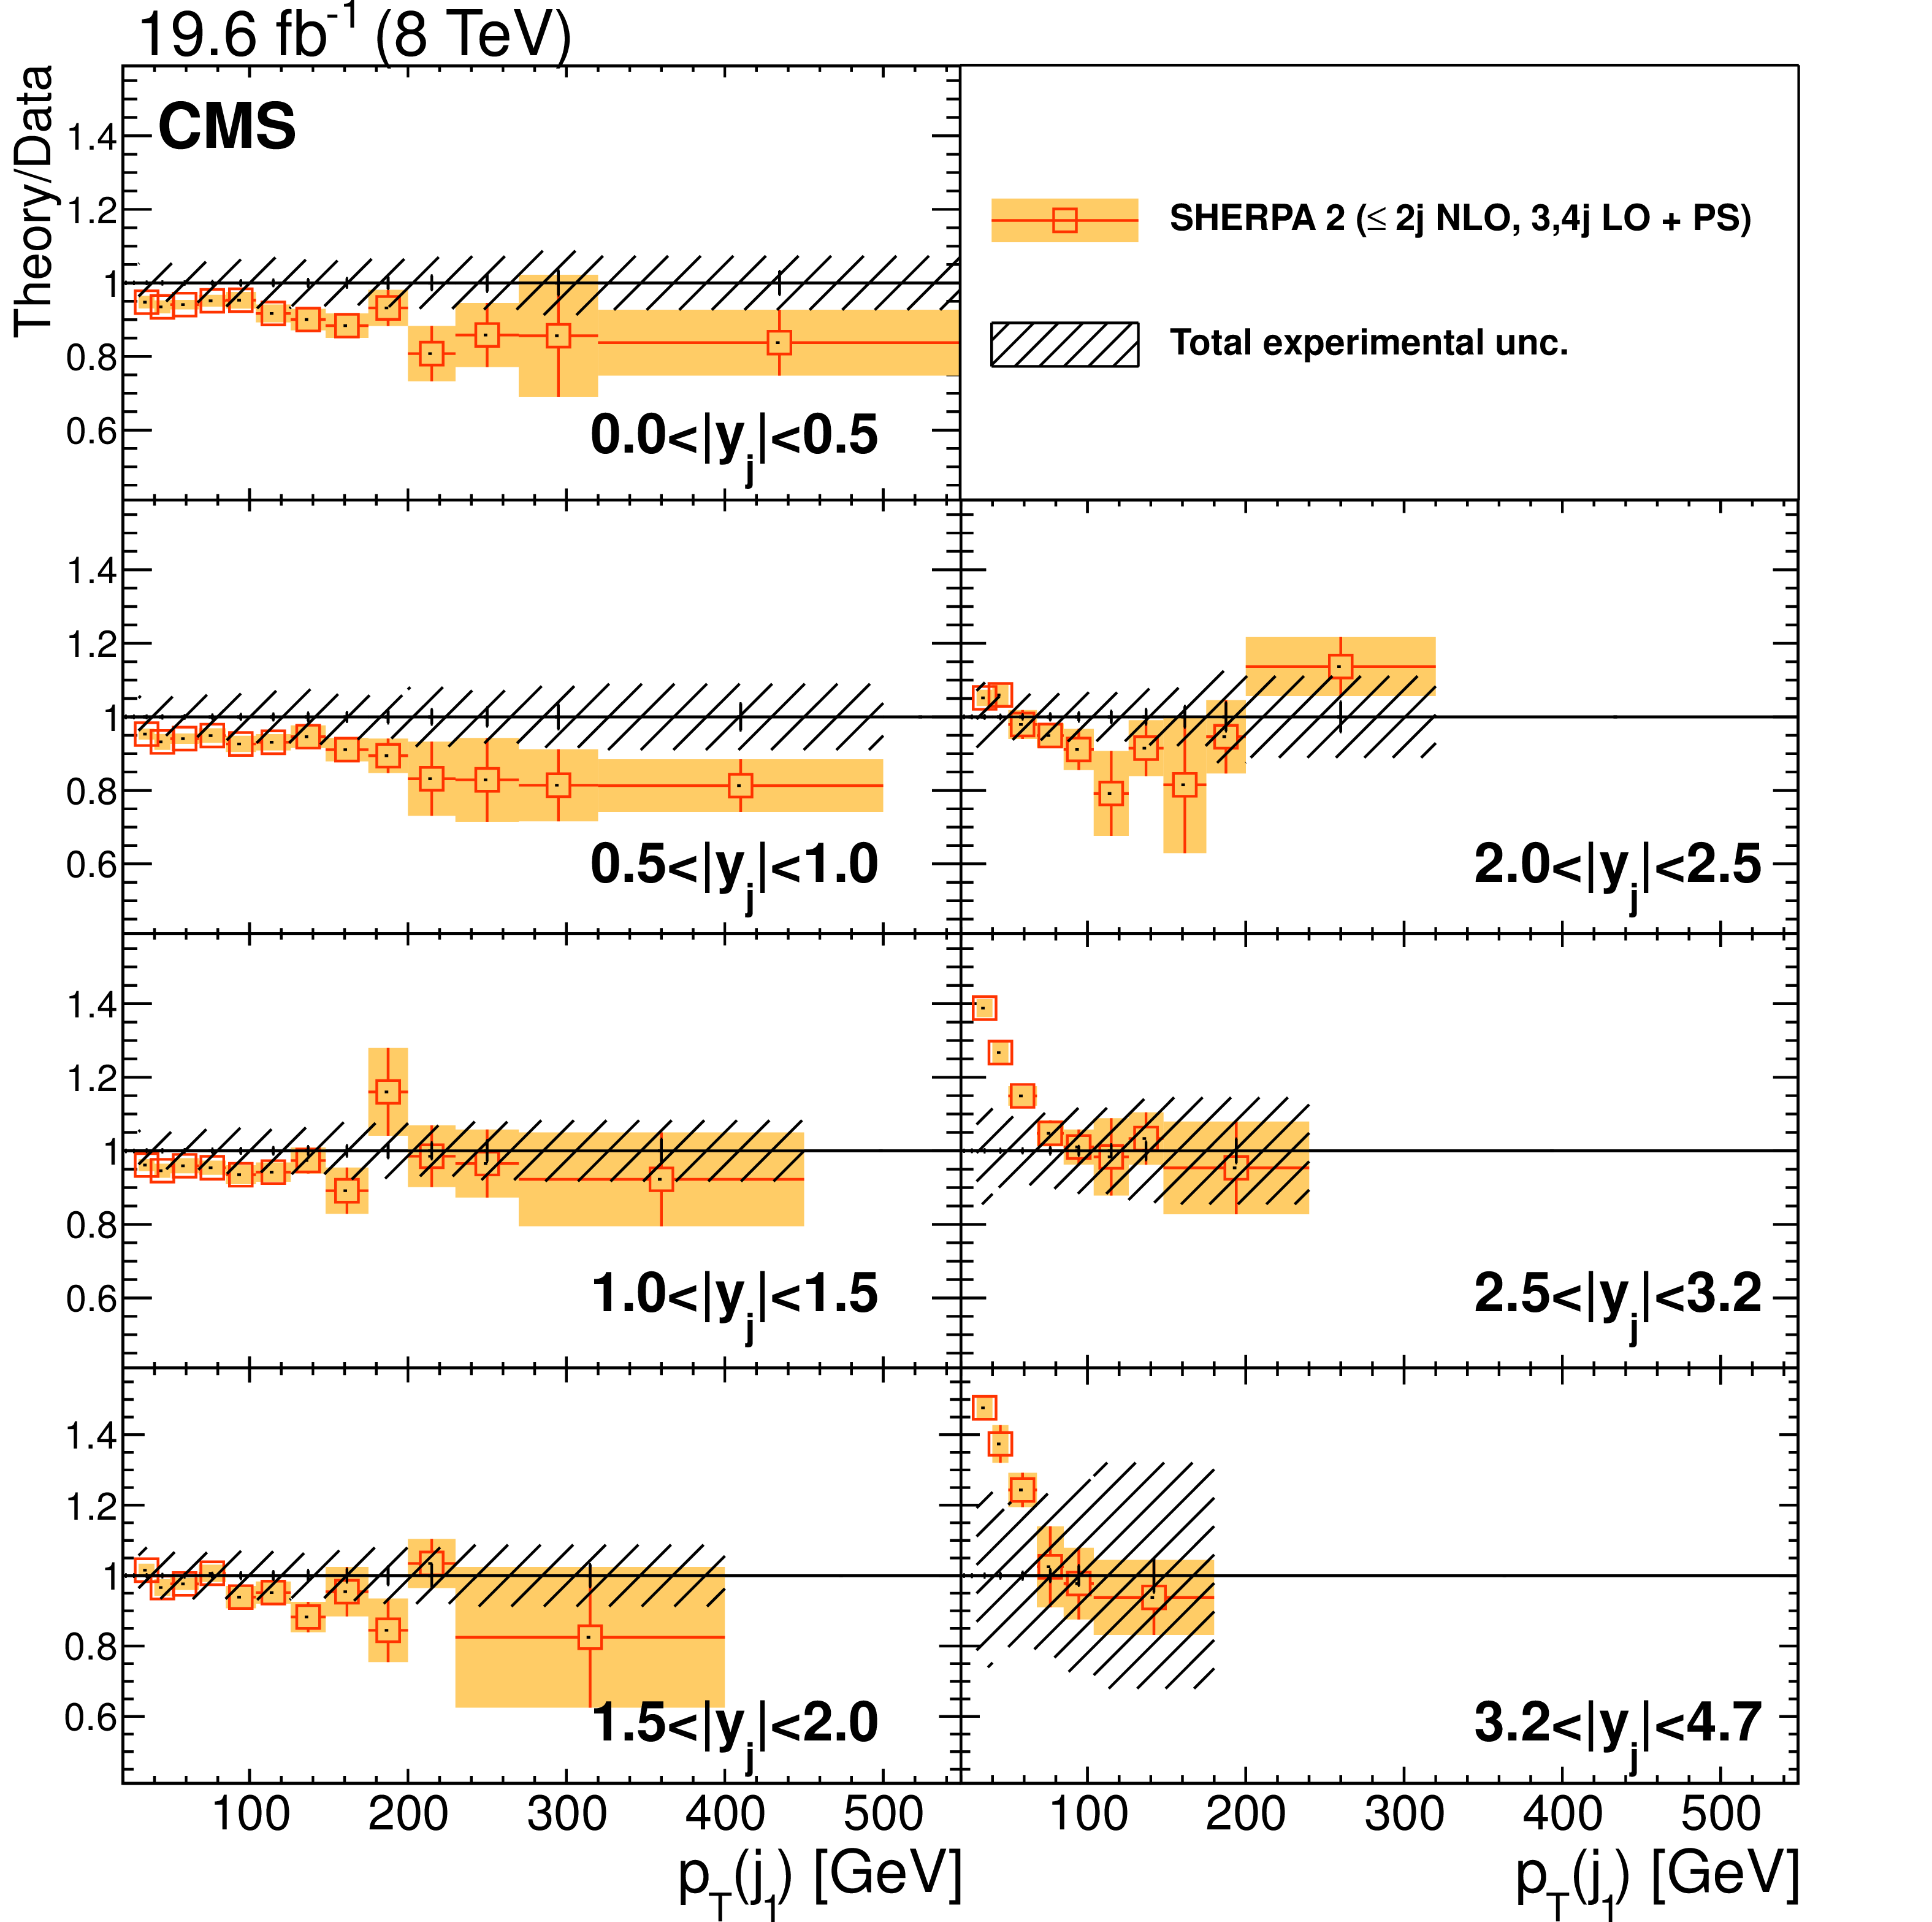
png pdf |
Figure 31:
Ratio to the measurement of the differential cross section $ {\mathrm {d}}^2\sigma / {\mathrm {d}} {p_{\mathrm {T}}} (\text {j}_1) {\mathrm {d}}y(\text {j}_1)$ obtained with SHERPA 2, with up to two jets at NLO and up to four jets at LO. The total experimental uncertainty is shown as a band around 1. Uncertainties in the predictions are shown on the ratio points and include the statistical uncertainty only. |

png pdf |
Figure 32:
Ratio to the measurement of the differential cross section $ {\mathrm {d}}^2\sigma / {\mathrm {d}} {p_{\mathrm {T}}} (\text {j}_1) {\mathrm {d}}y(\text {j}_1)$ obtained with mg5-amc +PYTHIA 8, with up to two jets at NLO. The total experimental uncertainty is shown as a band around 1. Uncertainties in the predictions are shown on the ratio points and include the statistical, theoretical, and PDF uncertainties. The dark green area represents the statistical and theoretical uncertainties only, while the light green area represents the statistical uncertainty alone. |
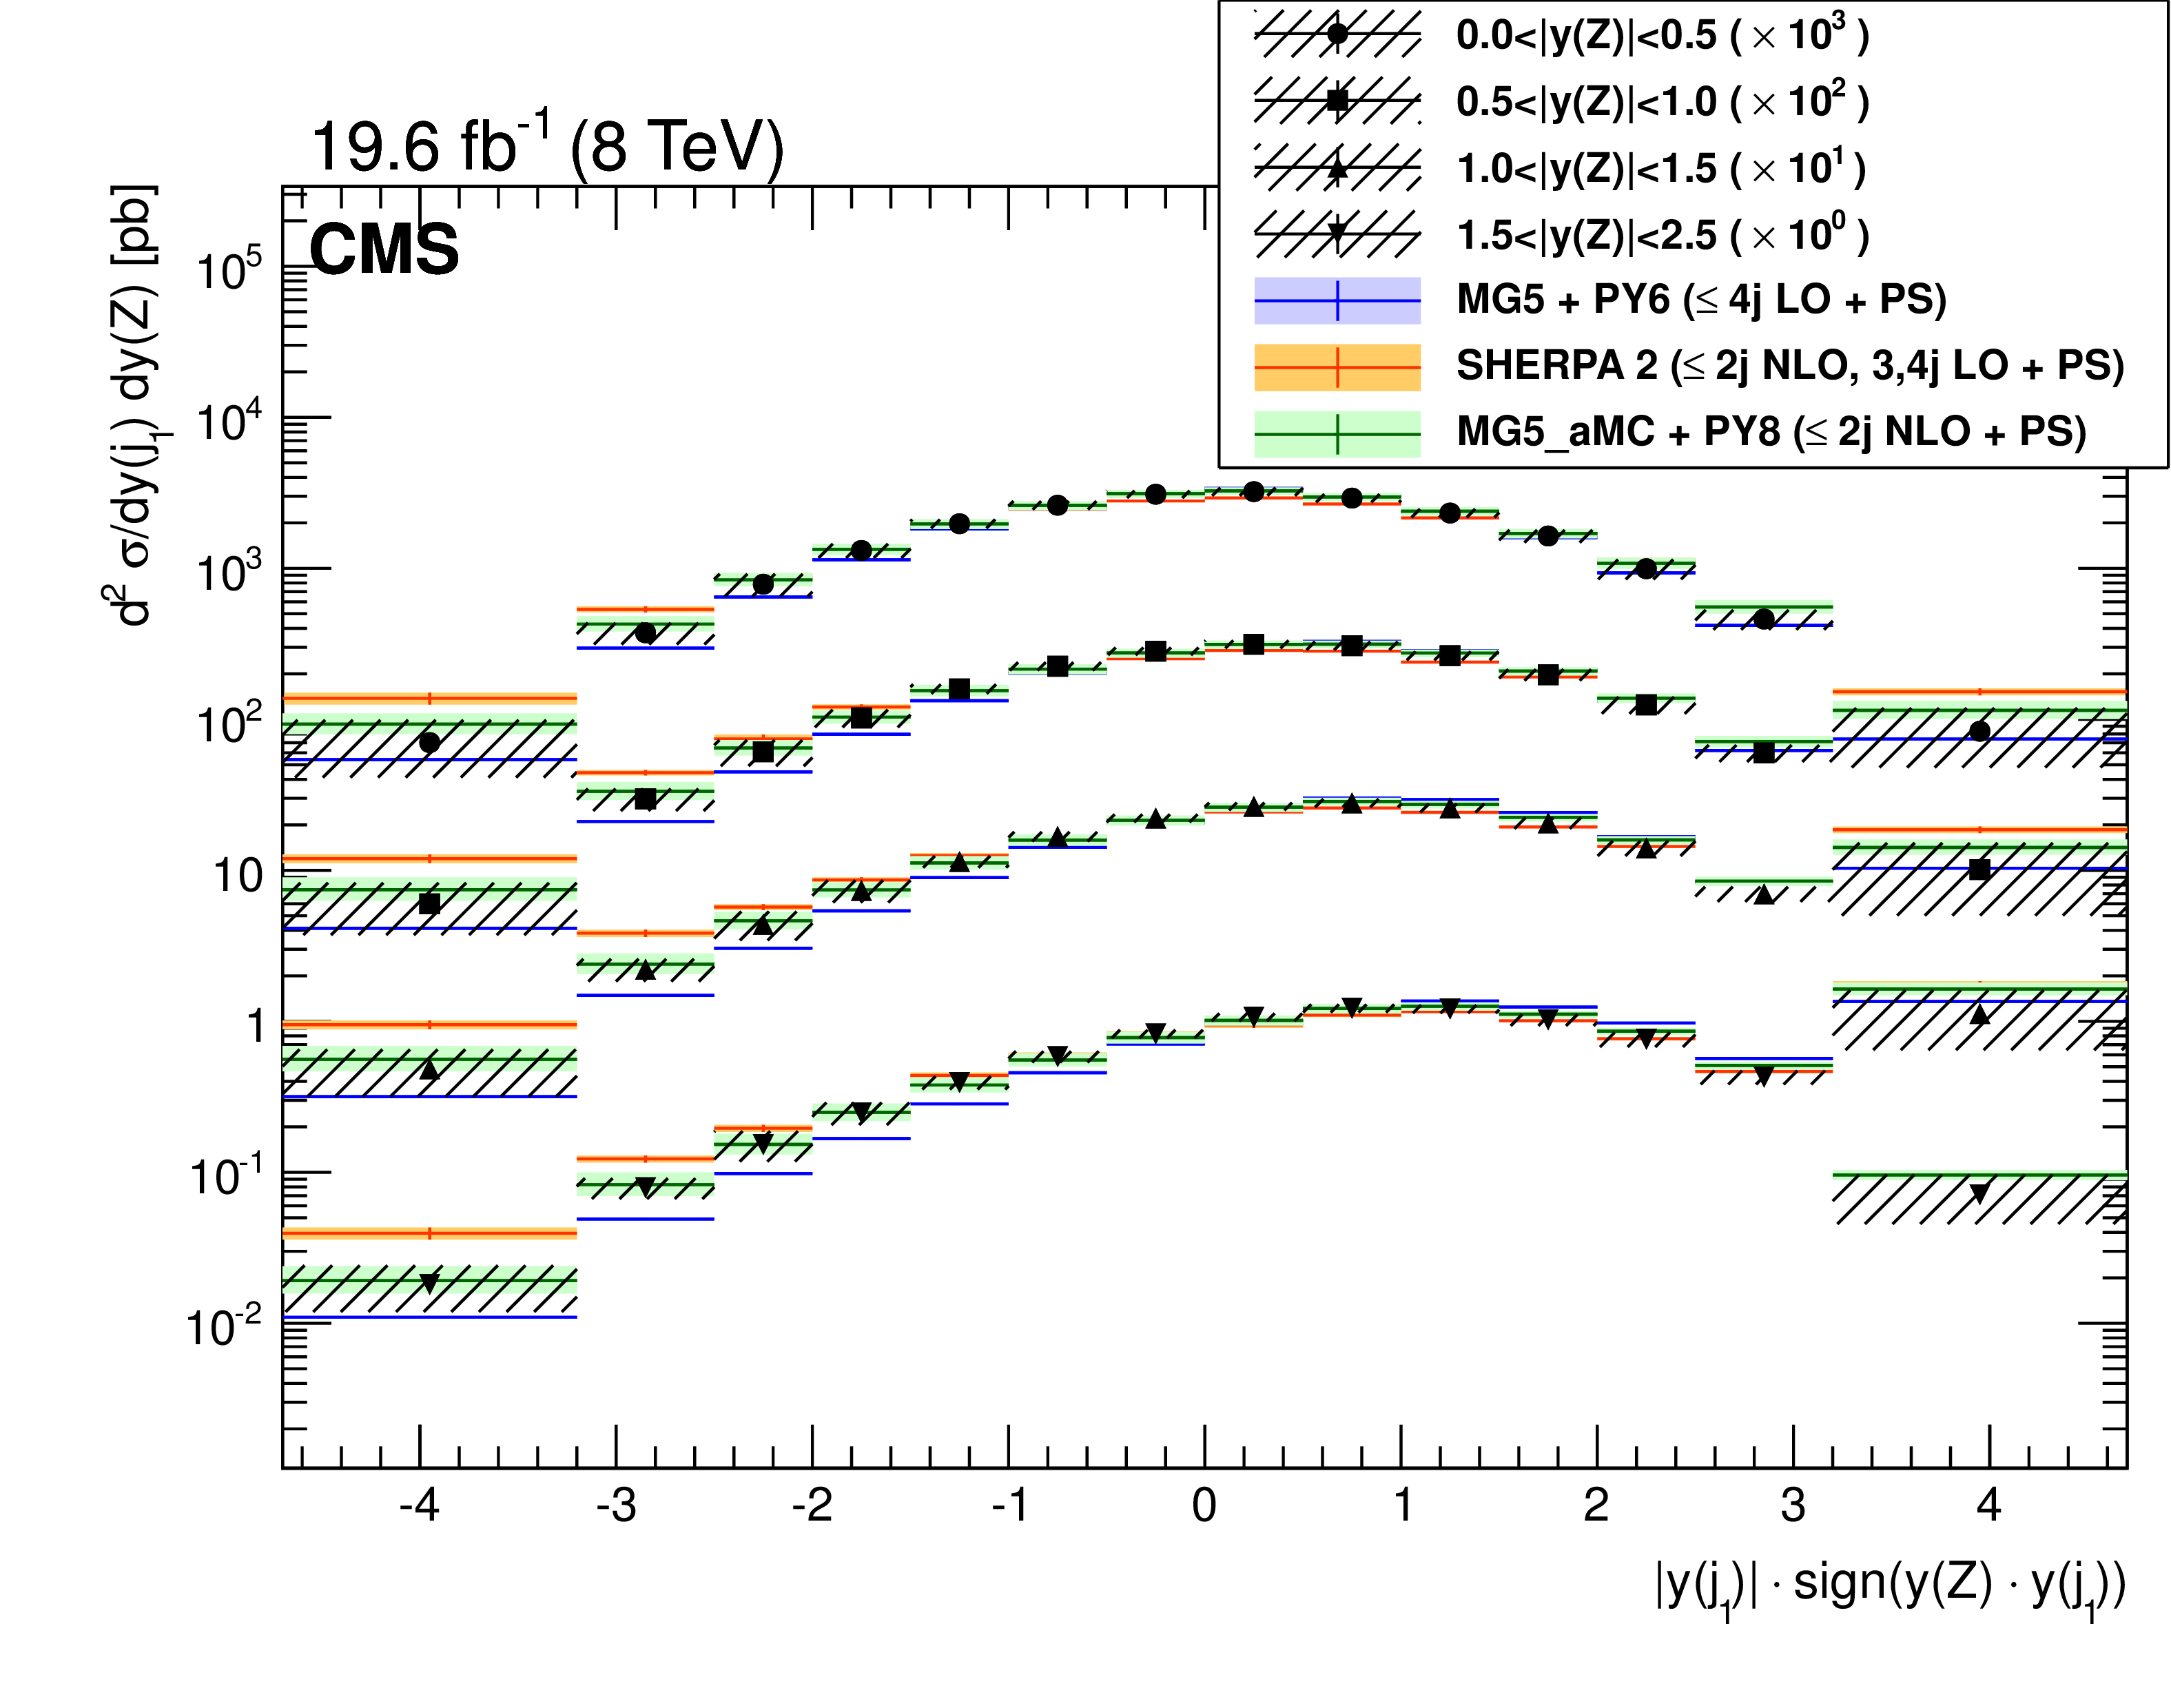
png pdf |
Figure 33:
The differential cross section for $ {\mathrm{ Z } (\to \ell \ell )+\text {jets}} $ production as a function of the Z boson and leading jet rapidity. The bands around the measurement points represent the total measurement uncertainties. The bands around the prediction points represent the total uncertainty, statistical, theoretical, and PDF components for mg5-amc +PYTHIA 8, and the statistical uncertainty alone for MadGraph 5+PYTHIA 6 and SHERPA 2. |
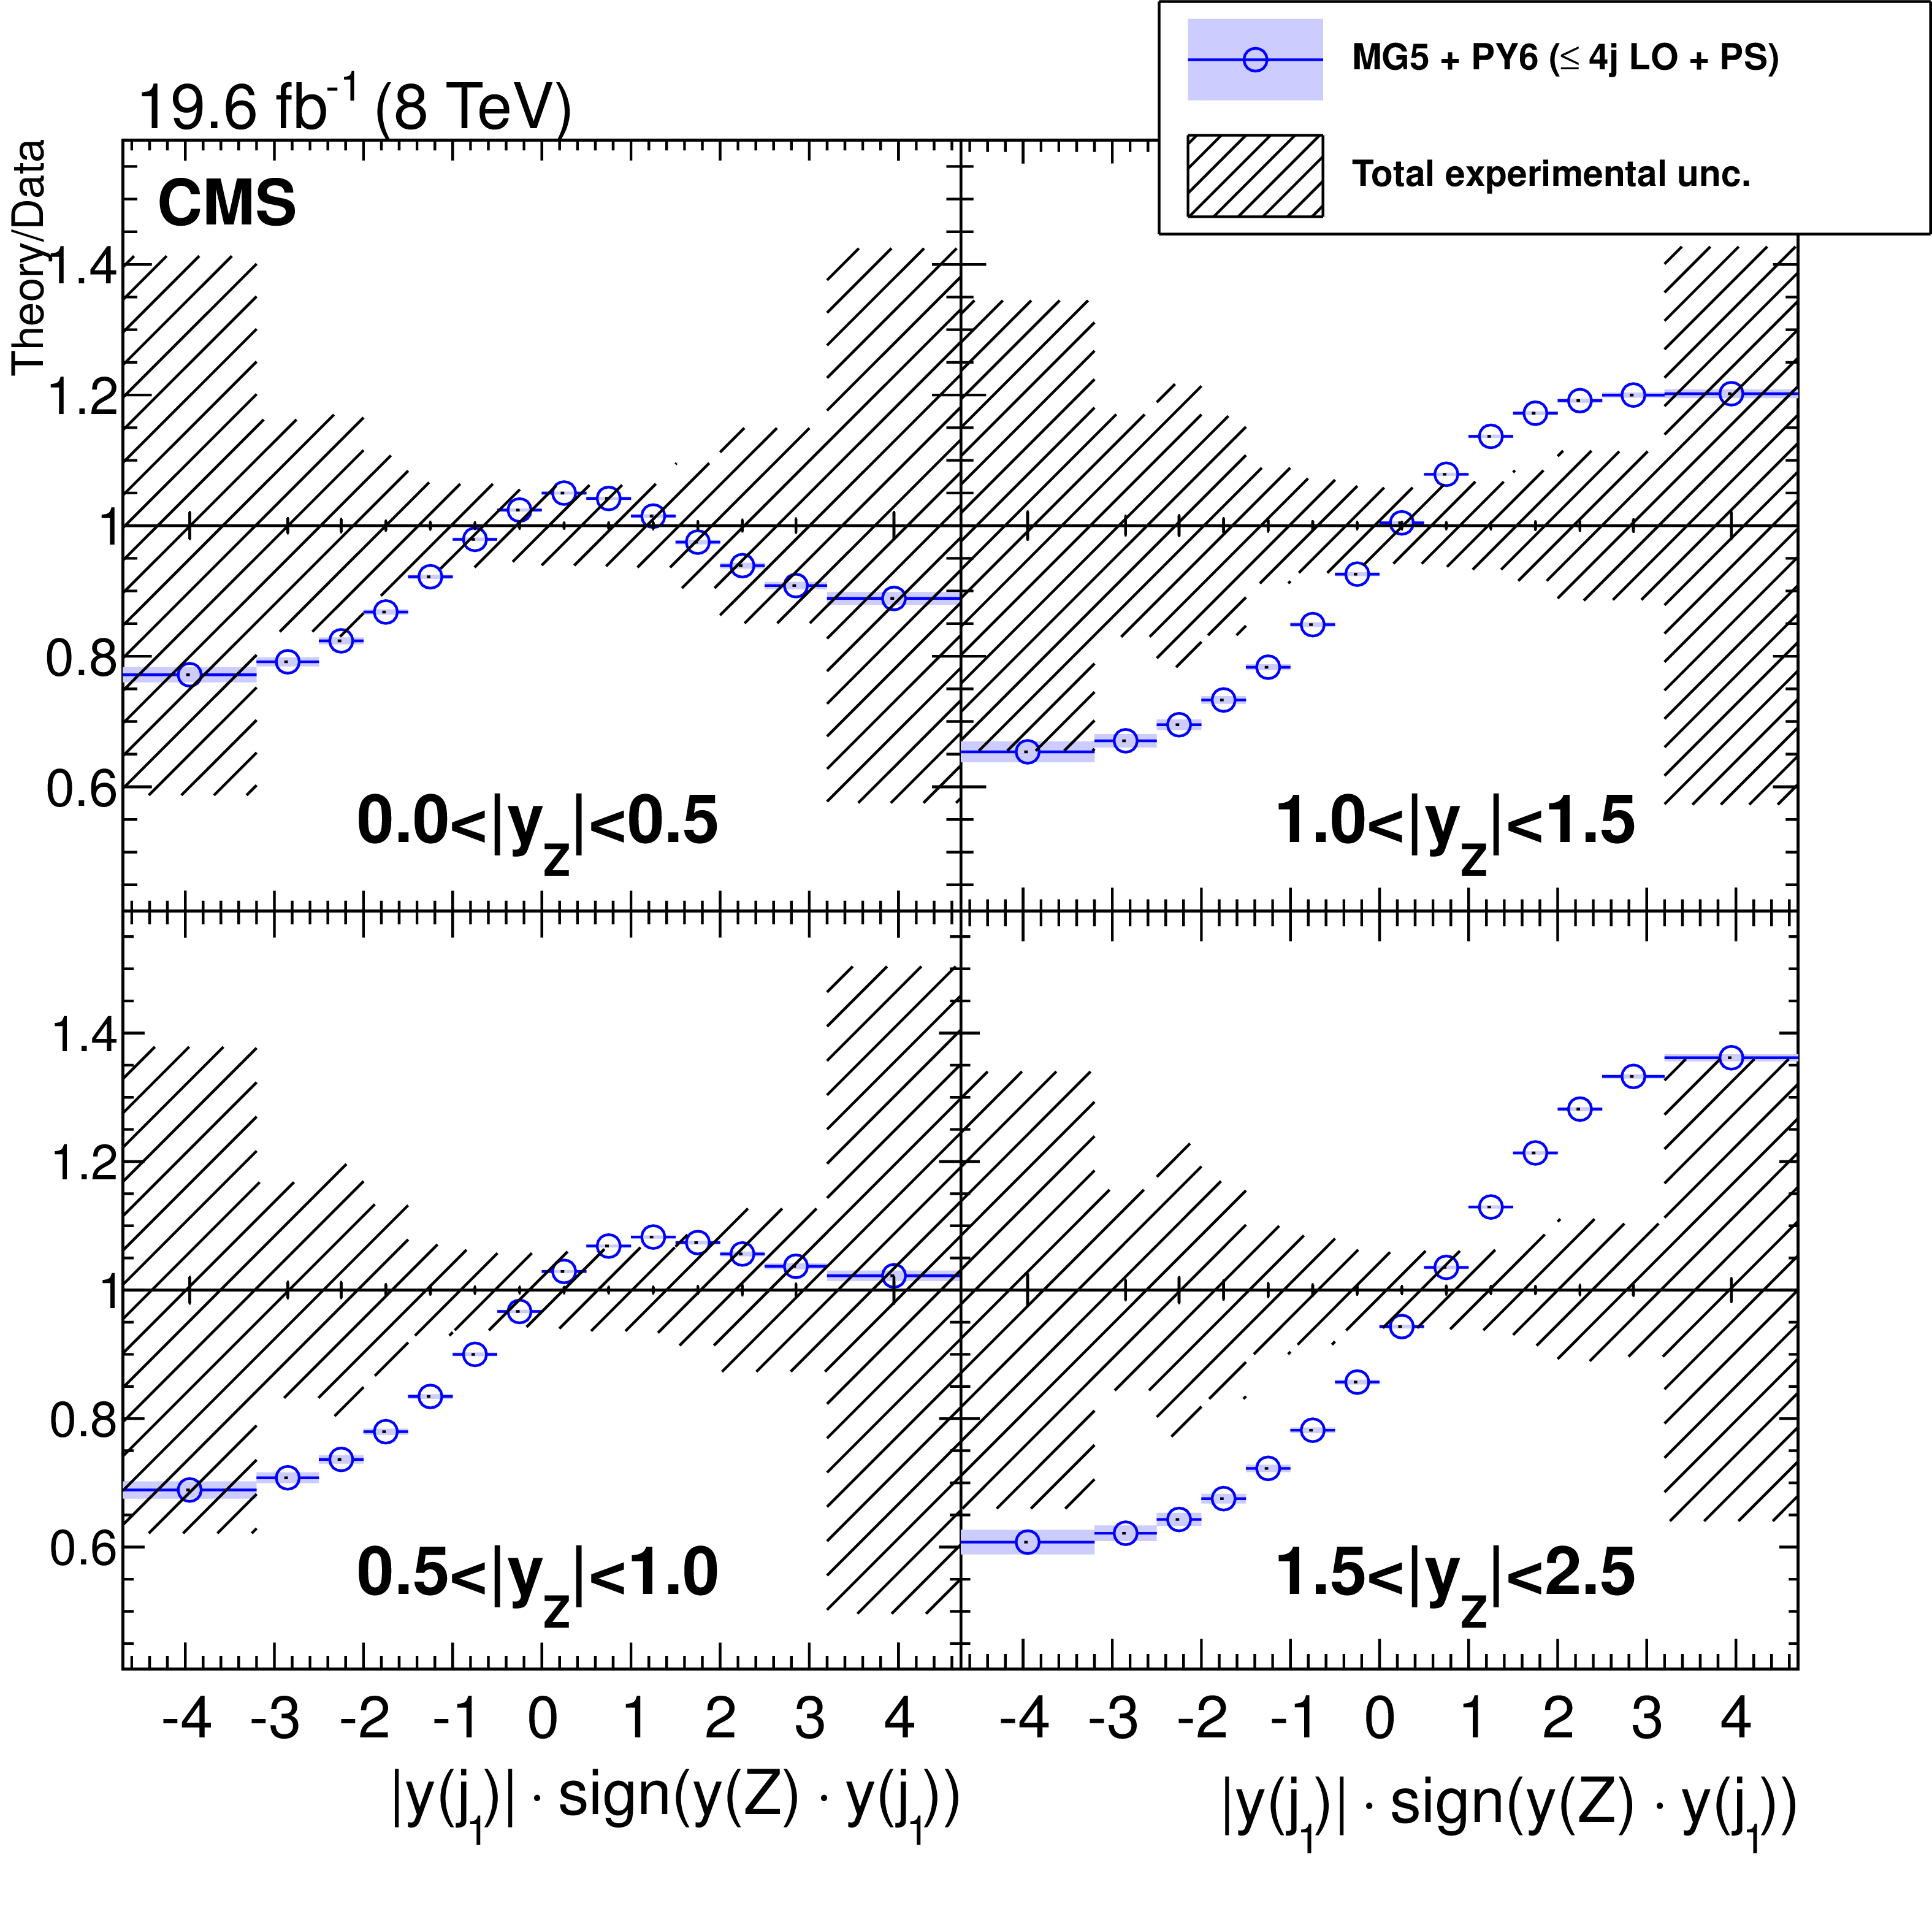
png pdf |
Figure 34:
Ratio to the measurement of the differential cross section $ {\mathrm {d}}^2\sigma / {\mathrm {d}}y(\mathrm{ Z } ) {\mathrm {d}}y(\text {j}_1)$ obtained with MadGraph 5+PYTHIA 6, with up to four jets at LO. The total experimental uncertainty is shown as a band around 1. Uncertainties in the predictions are shown on the ratio points and represent the statistical uncertainty alone. |
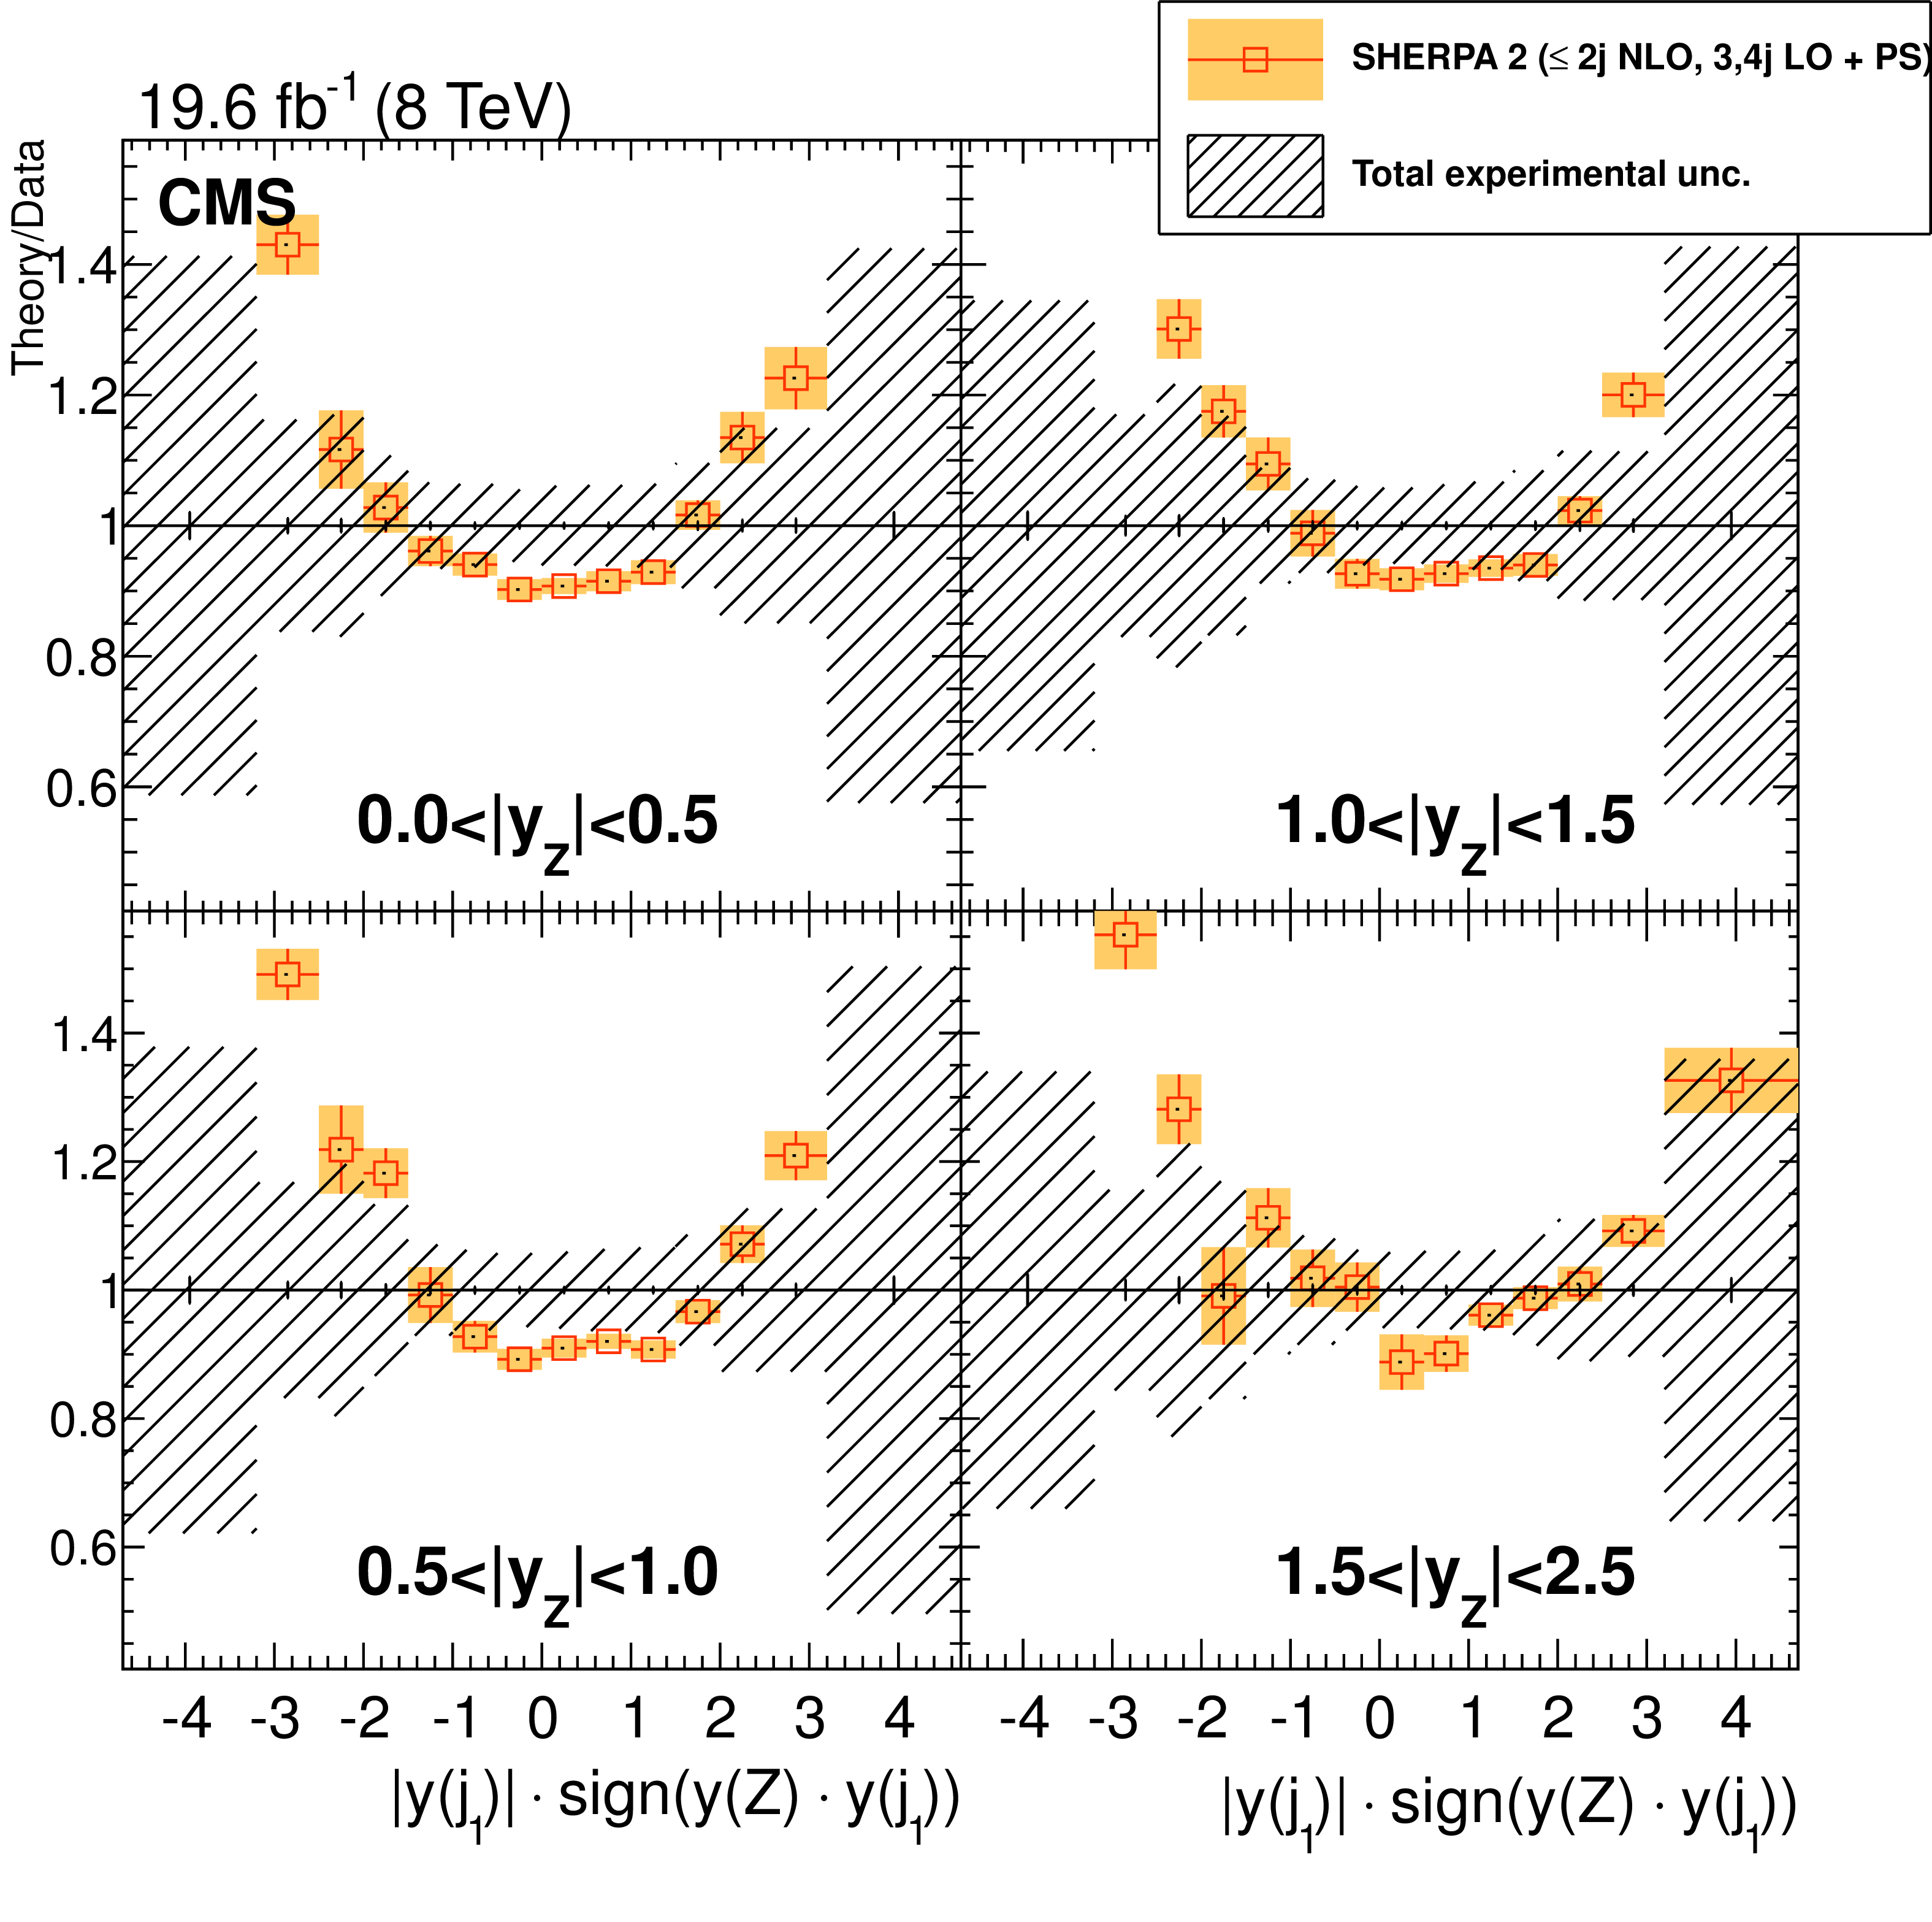
png pdf |
Figure 35:
Ratio to the measurement of the differential cross section $ {\mathrm {d}}^2\sigma / {\mathrm {d}}y(\mathrm{ Z } ) {\mathrm {d}}y(\text {j}_1)$ obtained with SHERPA 2, with up to two jets at NLO and up to four jets at LO. The total experimental uncertainty is shown as a band around 1. Uncertainties in the predictions are shown on the ratio points and include the statistical uncertainty only. |
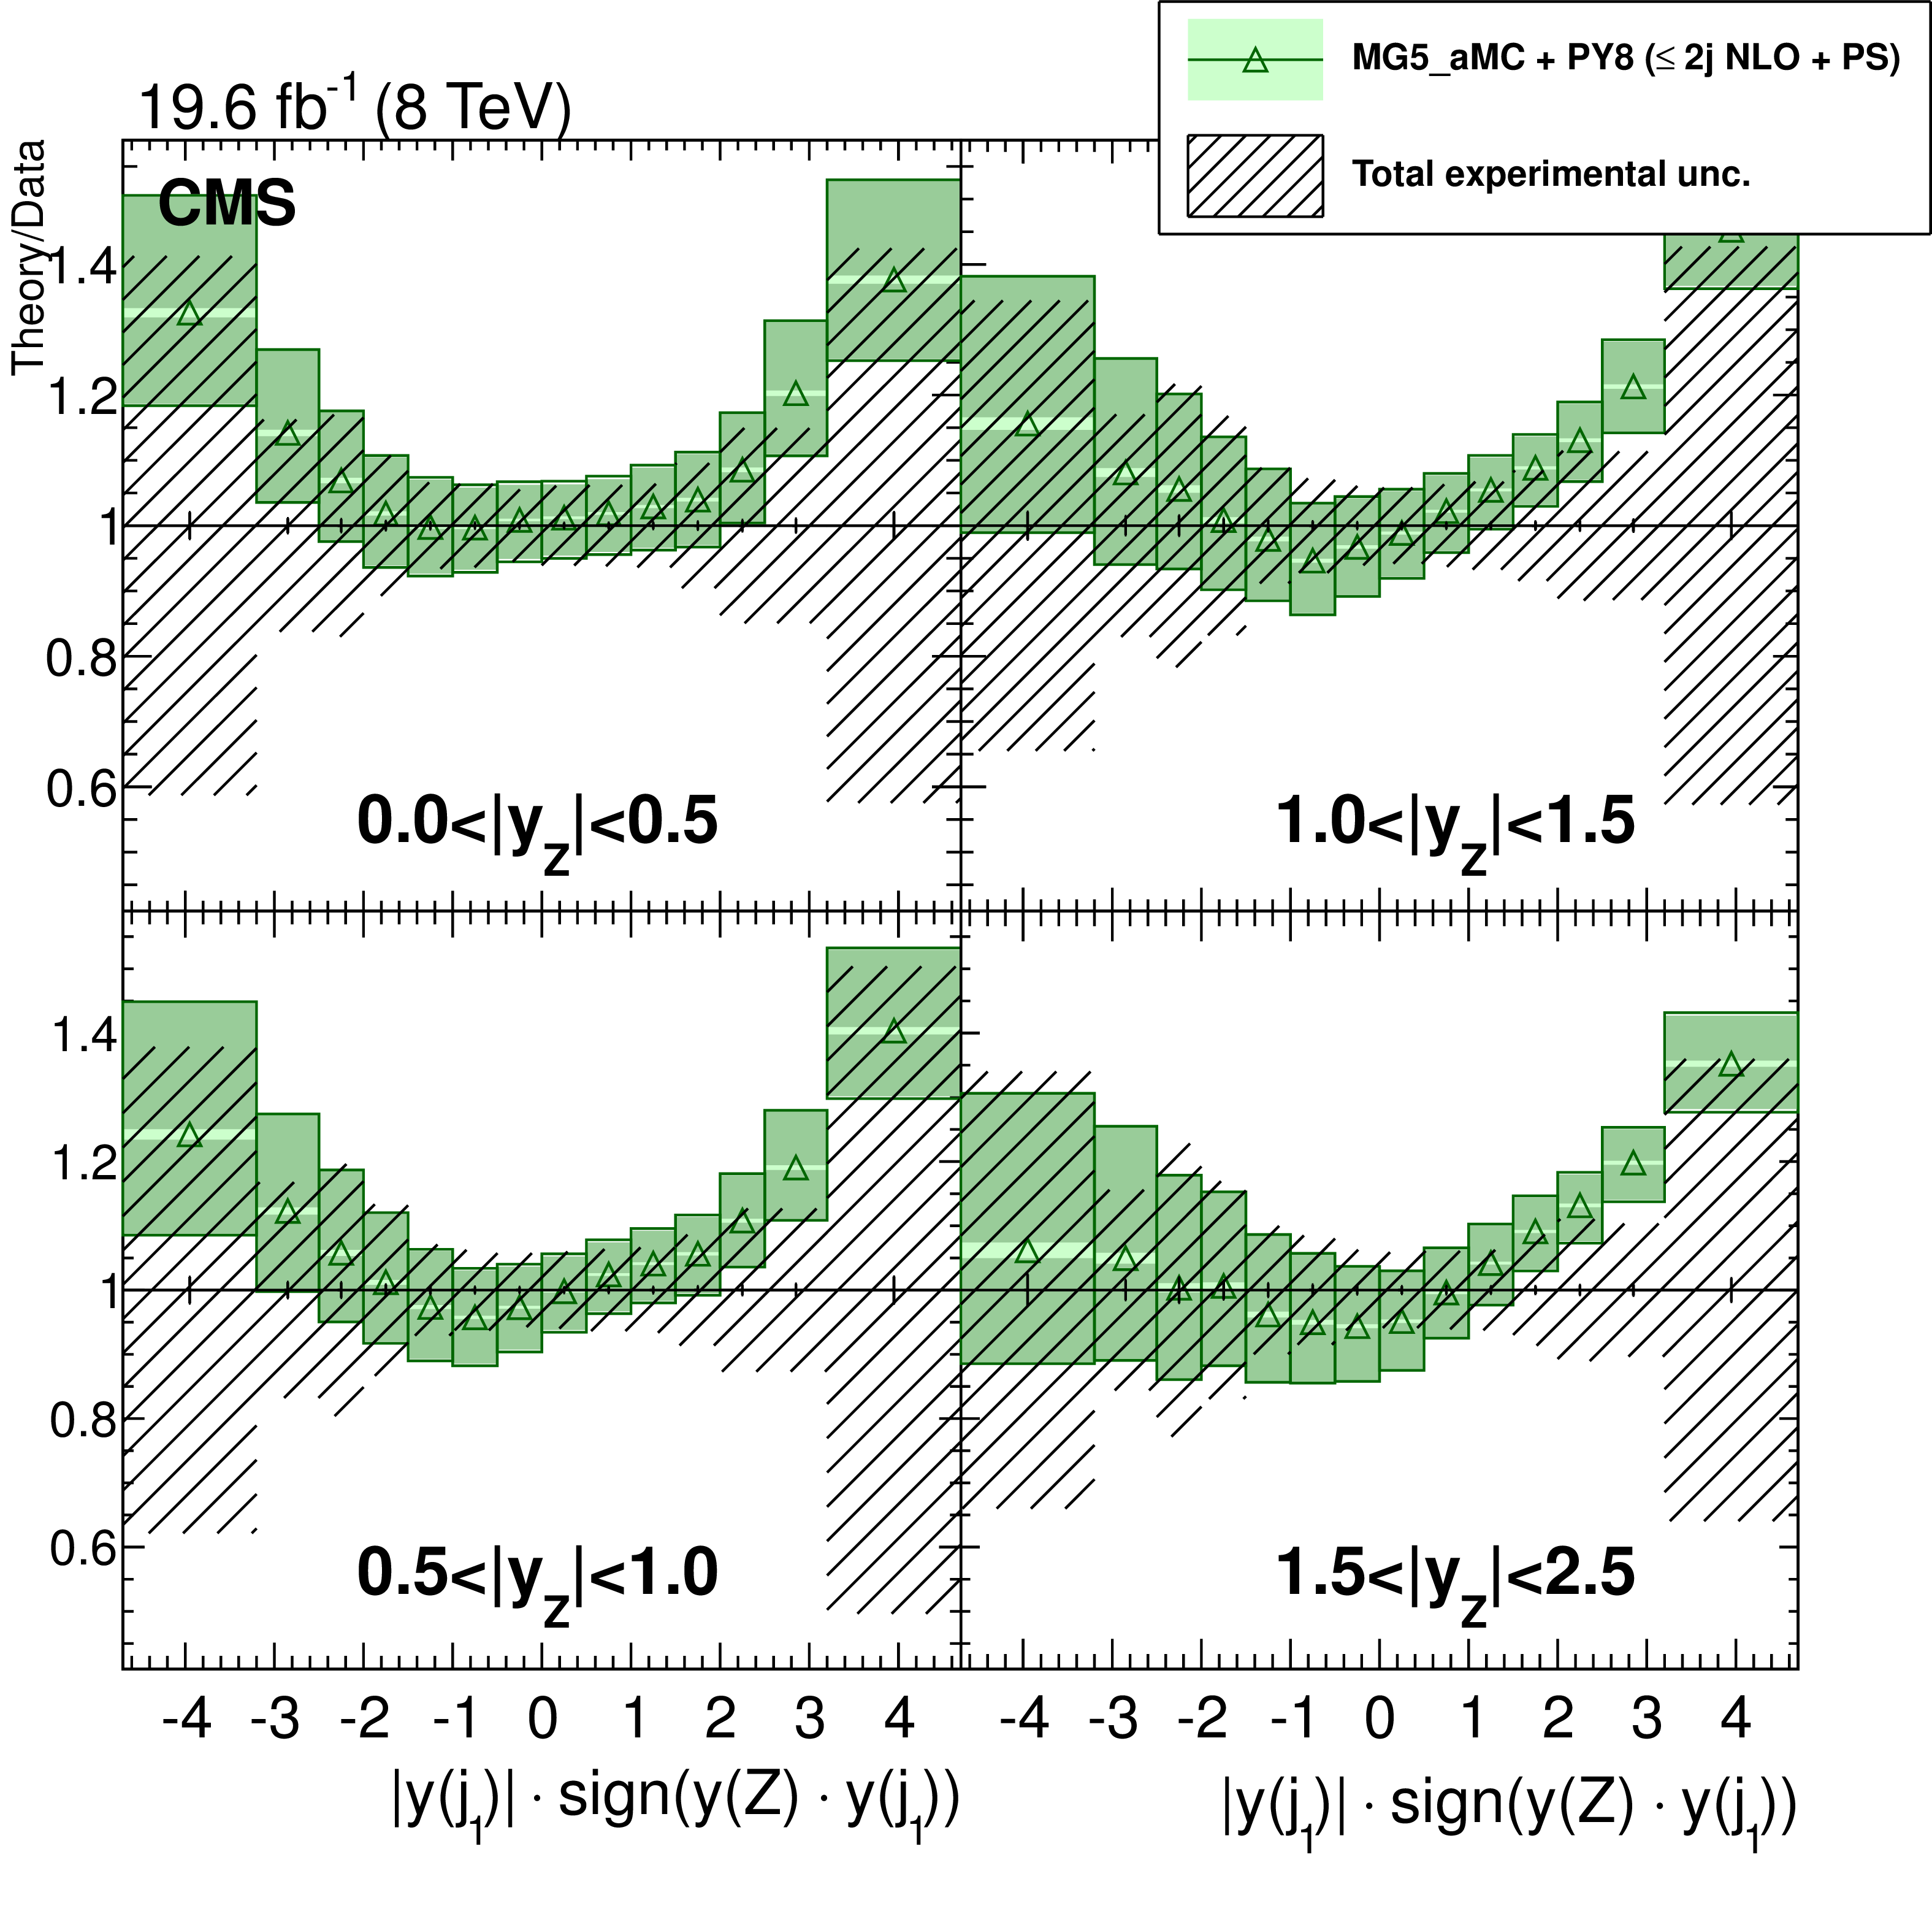
png pdf |
Figure 36:
Ratio to the measurement of the differential cross section $ {\mathrm {d}}^2\sigma / {\mathrm {d}}y(\mathrm{ Z } ) {\mathrm {d}}y(\text {j}_1)$ obtained with mg5-amc +PYTHIA 8, with up to two jets at NLO. The total experimental uncertainty is shown as a band around 1. Uncertainties in the predictions are shown on the ratio points and include the statistical, theoretical, and PDF uncertainties. The dark green area represents the statistical and theoretical uncertainties only, while the light green area represents the statistical uncertainty alone. |

png pdf |
Figure 37:
The differential cross section for $ {\mathrm{ Z } (\to \ell \ell )+\text {jets}} $ production as a function of the rapidities of the Z boson and leading jet, and of the transverse momentum of the jet for the configuration. The bottom plots correspond to the configuration where the boson and the jet are in different hemispheres ($y(\mathrm{ Z } )y(\text {j}_1)<0$), while the top plots correspond to both objects in the same hemisphere. The left and right plots show the respective Z boson rapidity ranges, $ {| y(\mathrm{ Z } ) | }<1$ and $ {| y(\mathrm{ Z } ) | }\in (1,2.5)$. The bands around the measurement points represent the total measurement uncertainties. The bands around the prediction points represent the total uncertainty, statistical, theoretical, and PDF components for mg5-amc +PYTHIA 8, and the statistical uncertainty alone for MadGraph 5+PYTHIA 6 and SHERPA 2. |
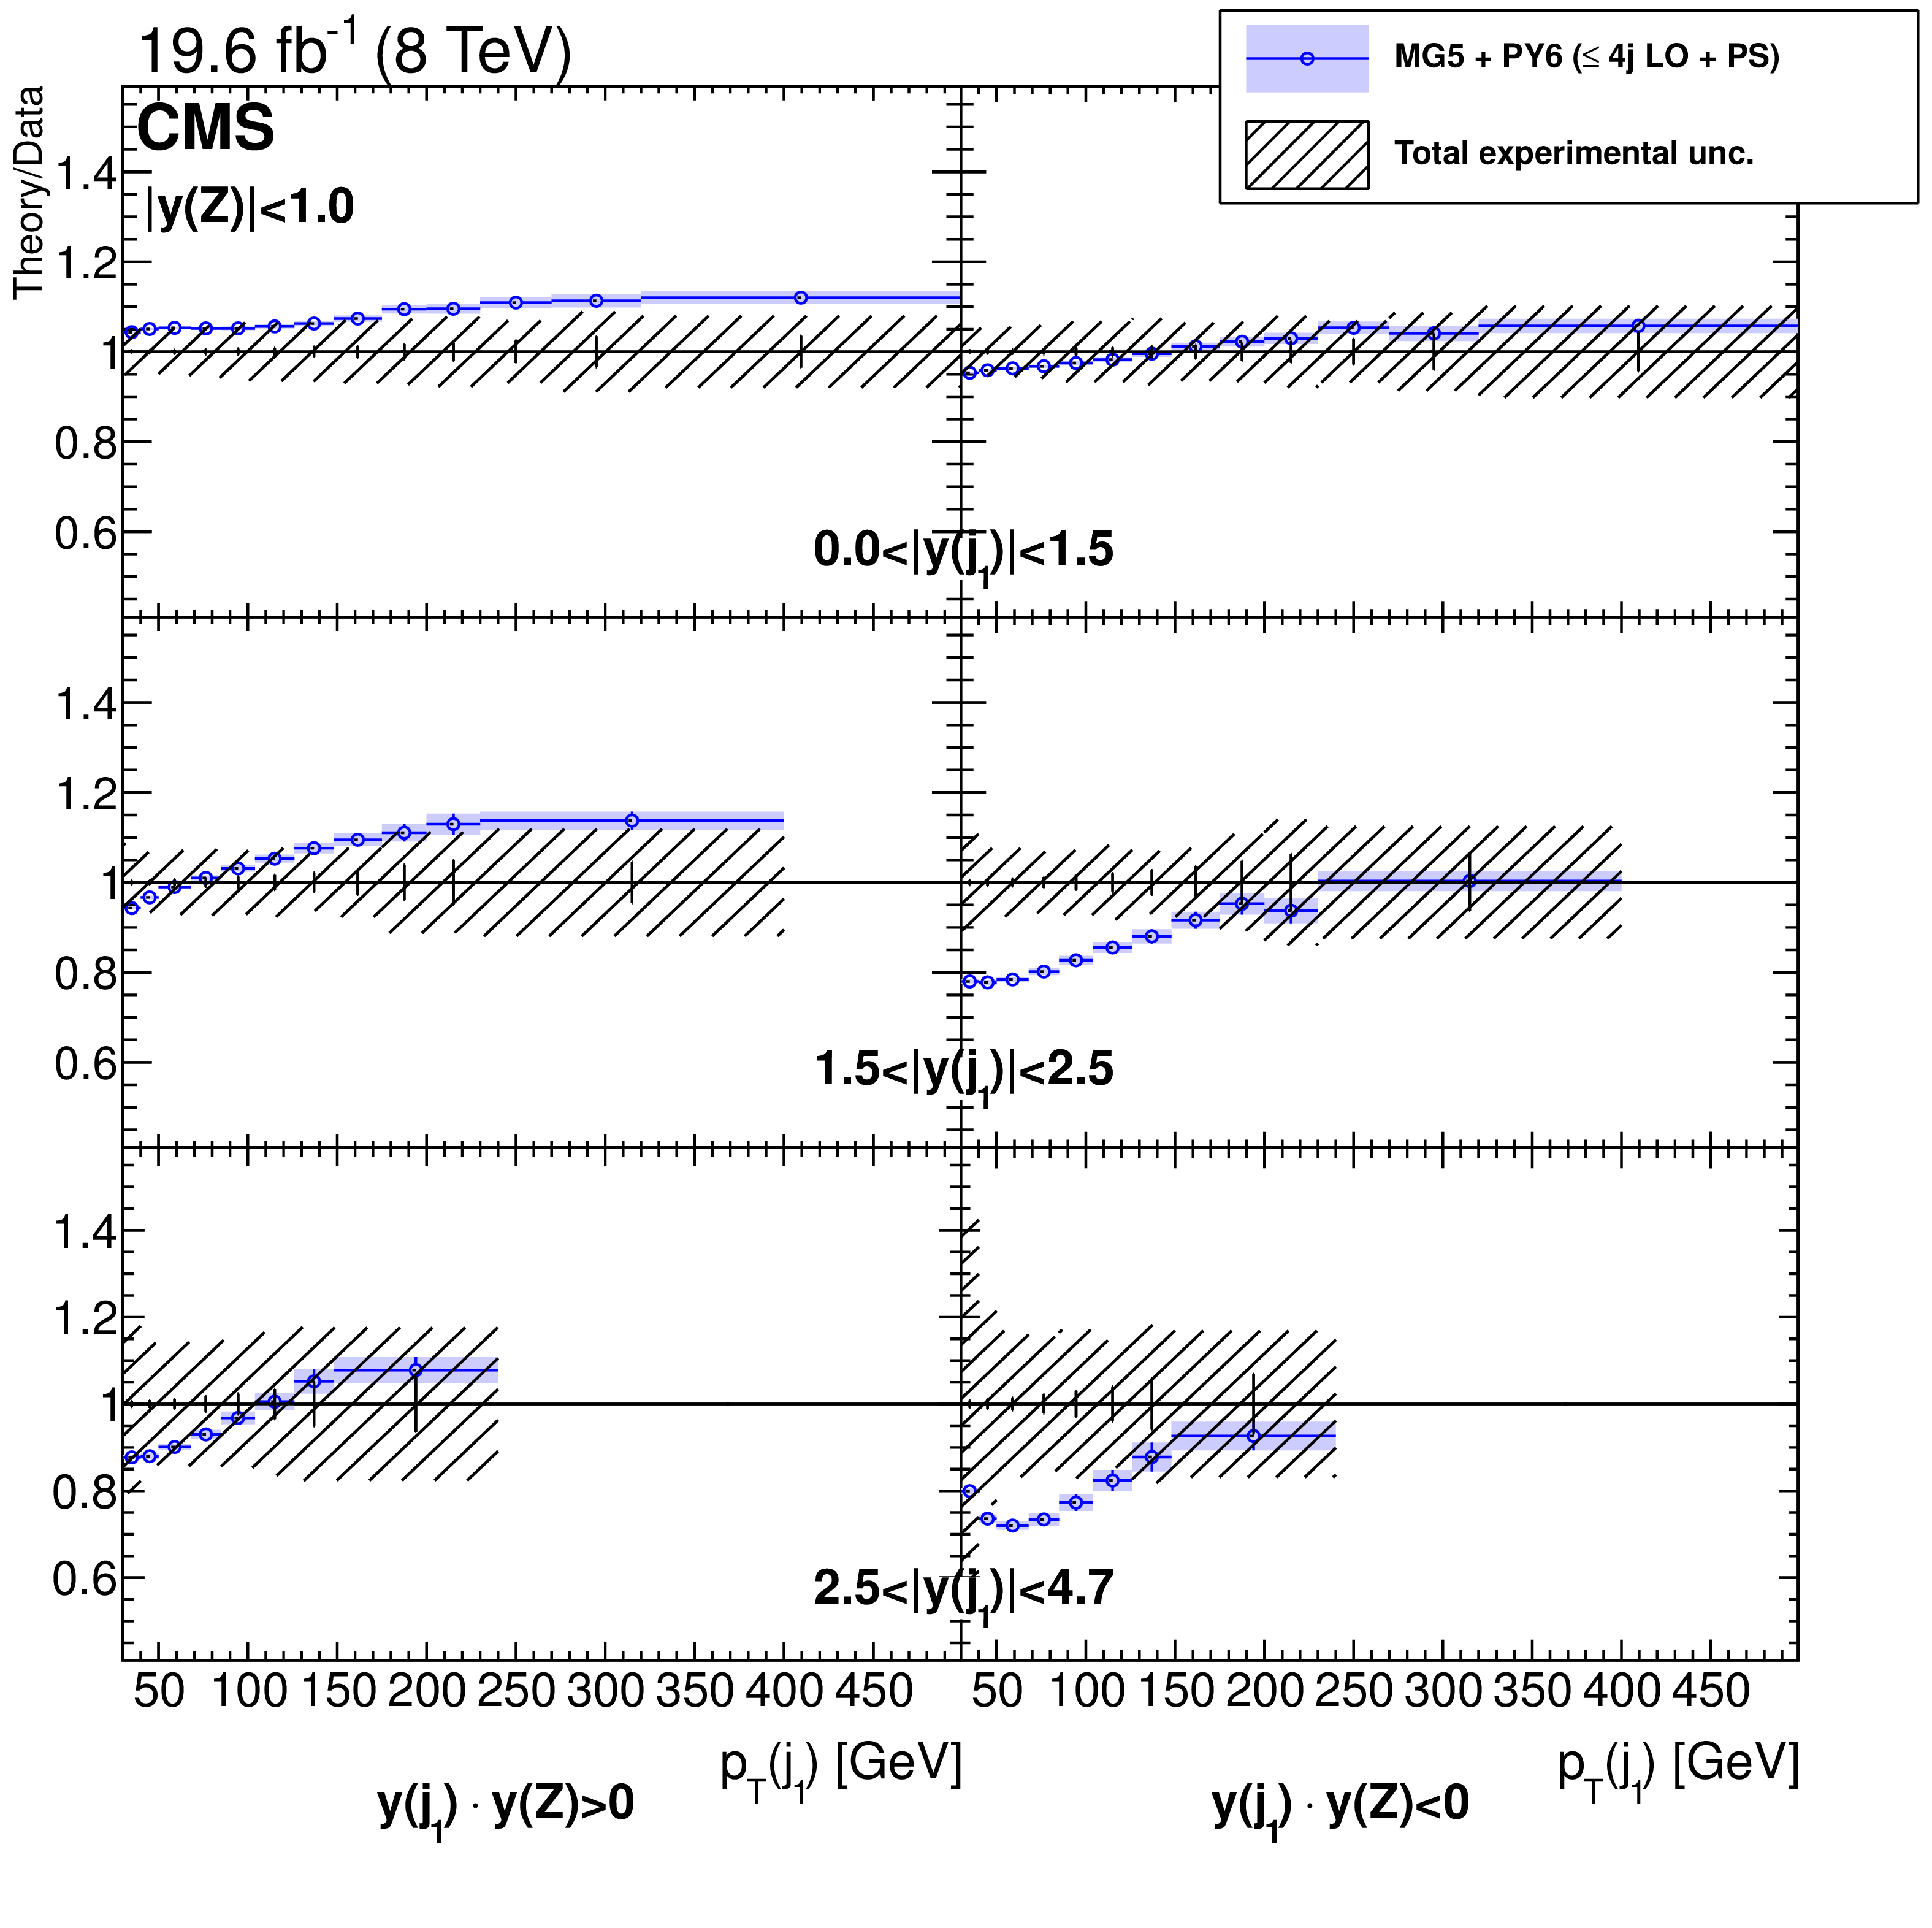
png pdf |
Figure 38:
Ratio to the measurement of the differential cross section $ {\mathrm {d}}^3\sigma / {\mathrm {d}} {p_{\mathrm {T}}} (\text {j}_1) {\mathrm {d}}y(\text {j}_1) {\mathrm {d}}y(\mathrm{ Z } )$ obtained with MadGraph 5+PYTHIA 6, with up to four jets at LO, for $ {| y(\mathrm{ Z } ) | }<1$. Left column corresponds to $y(\text {j}_1)y(\mathrm{ Z } )>0$ and right column to $y(\text {j}_1)y(\mathrm{ Z } )<0$. The total experimental uncertainty is shown as a band around 1. Uncertainties in the predictions are shown on the ratio points and include the statistical uncertainty only. |

png pdf |
Figure 39:
Ratio to the measurement of the differential cross section $ {\mathrm {d}}^3\sigma / {\mathrm {d}} {p_{\mathrm {T}}} (\text {j}_1) {\mathrm {d}}y(\text {j}_1) {\mathrm {d}}y(\text {Z})$ obtained with MadGraph 5+PYTHIA 6, with up to four jets at LO, for $ {| y(\mathrm{ Z } ) | }\in (1,2.5)$. Left column corresponds to $y(\text {j}_1)y(\mathrm{ Z } )>0$ and right column to $y(\text {j}_1)y(\mathrm{ Z } )<0$. The total experimental uncertainty is shown as a band around 1. Uncertainties in the predictions are shown on the ratio points and include the statistical uncertainty only. |
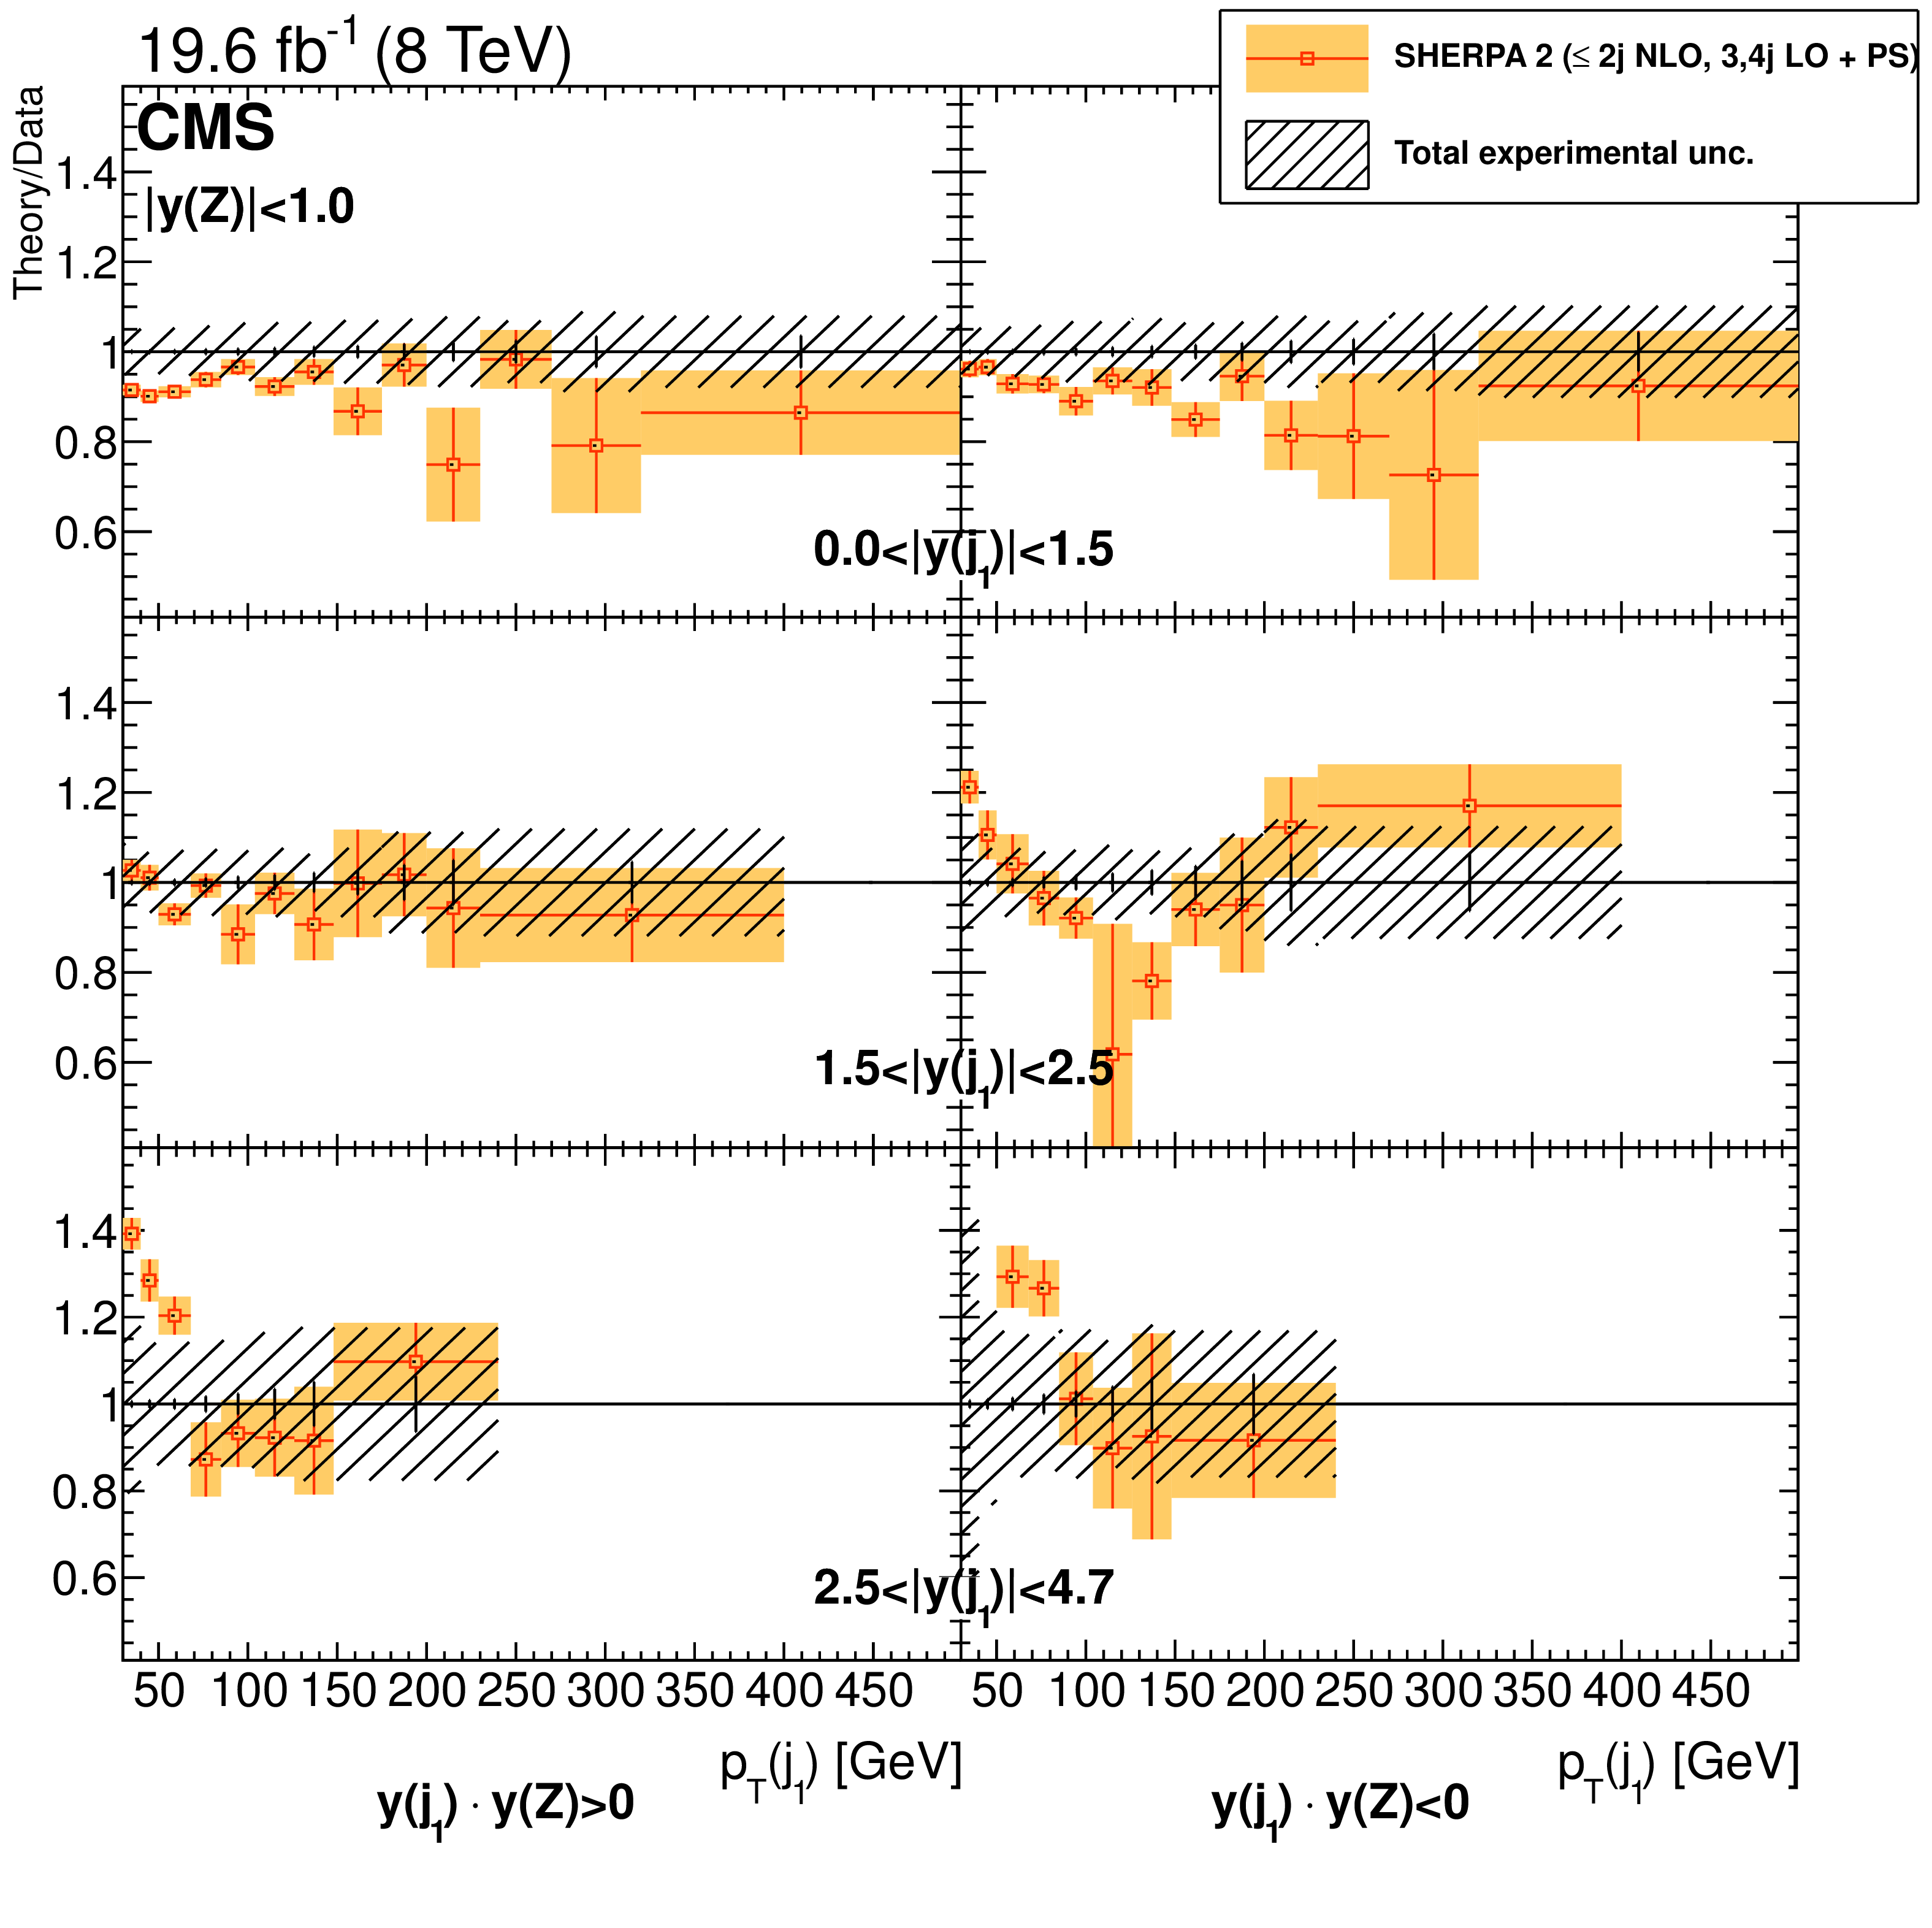
png pdf |
Figure 40:
Ratio to the measurement of the differential cross section $ {\mathrm {d}}^3\sigma / {\mathrm {d}} {p_{\mathrm {T}}} (\text {j}_1) {\mathrm {d}}y(\text {j}_1) {\mathrm {d}}y(\mathrm{ Z } )$ obtained with SHERPA 2, with up to two jets at NLO and up to four jets at LO, for $ {| y(\mathrm{ Z } ) | }<1$. Left column corresponds to $y(\text {j}_1)y(\mathrm{ Z } )>0$ and right column to $y(\text {j}_1)y(\mathrm{ Z } )<0$. The total experimental uncertainty is shown as a band around 1. Uncertainties in the predictions are shown on the ratio points and include the statistical uncertainty only. |

png pdf |
Figure 41:
Ratio to the measurement of the differential cross section $ {\mathrm {d}}^3\sigma / {\mathrm {d}} {p_{\mathrm {T}}} (\text {j}_1) {\mathrm {d}}y(\text {j}_1) {\mathrm {d}}y(\mathrm{ Z } )$ obtained with SHERPA 2, with up to two jets at NLO and up to four jets at LO, for $ {| y(\mathrm{ Z } ) | }\in (1,2.5)$. Left column corresponds to $y(\text {j}_1)y(\mathrm{ Z } )>0$ and right column to $y(\text {j}_1)y(\mathrm{ Z } )<0$. The total experimental uncertainty is shown as a band around 1. Uncertainties in the predictions are shown on the ratio points and include the statistical uncertainty only. |
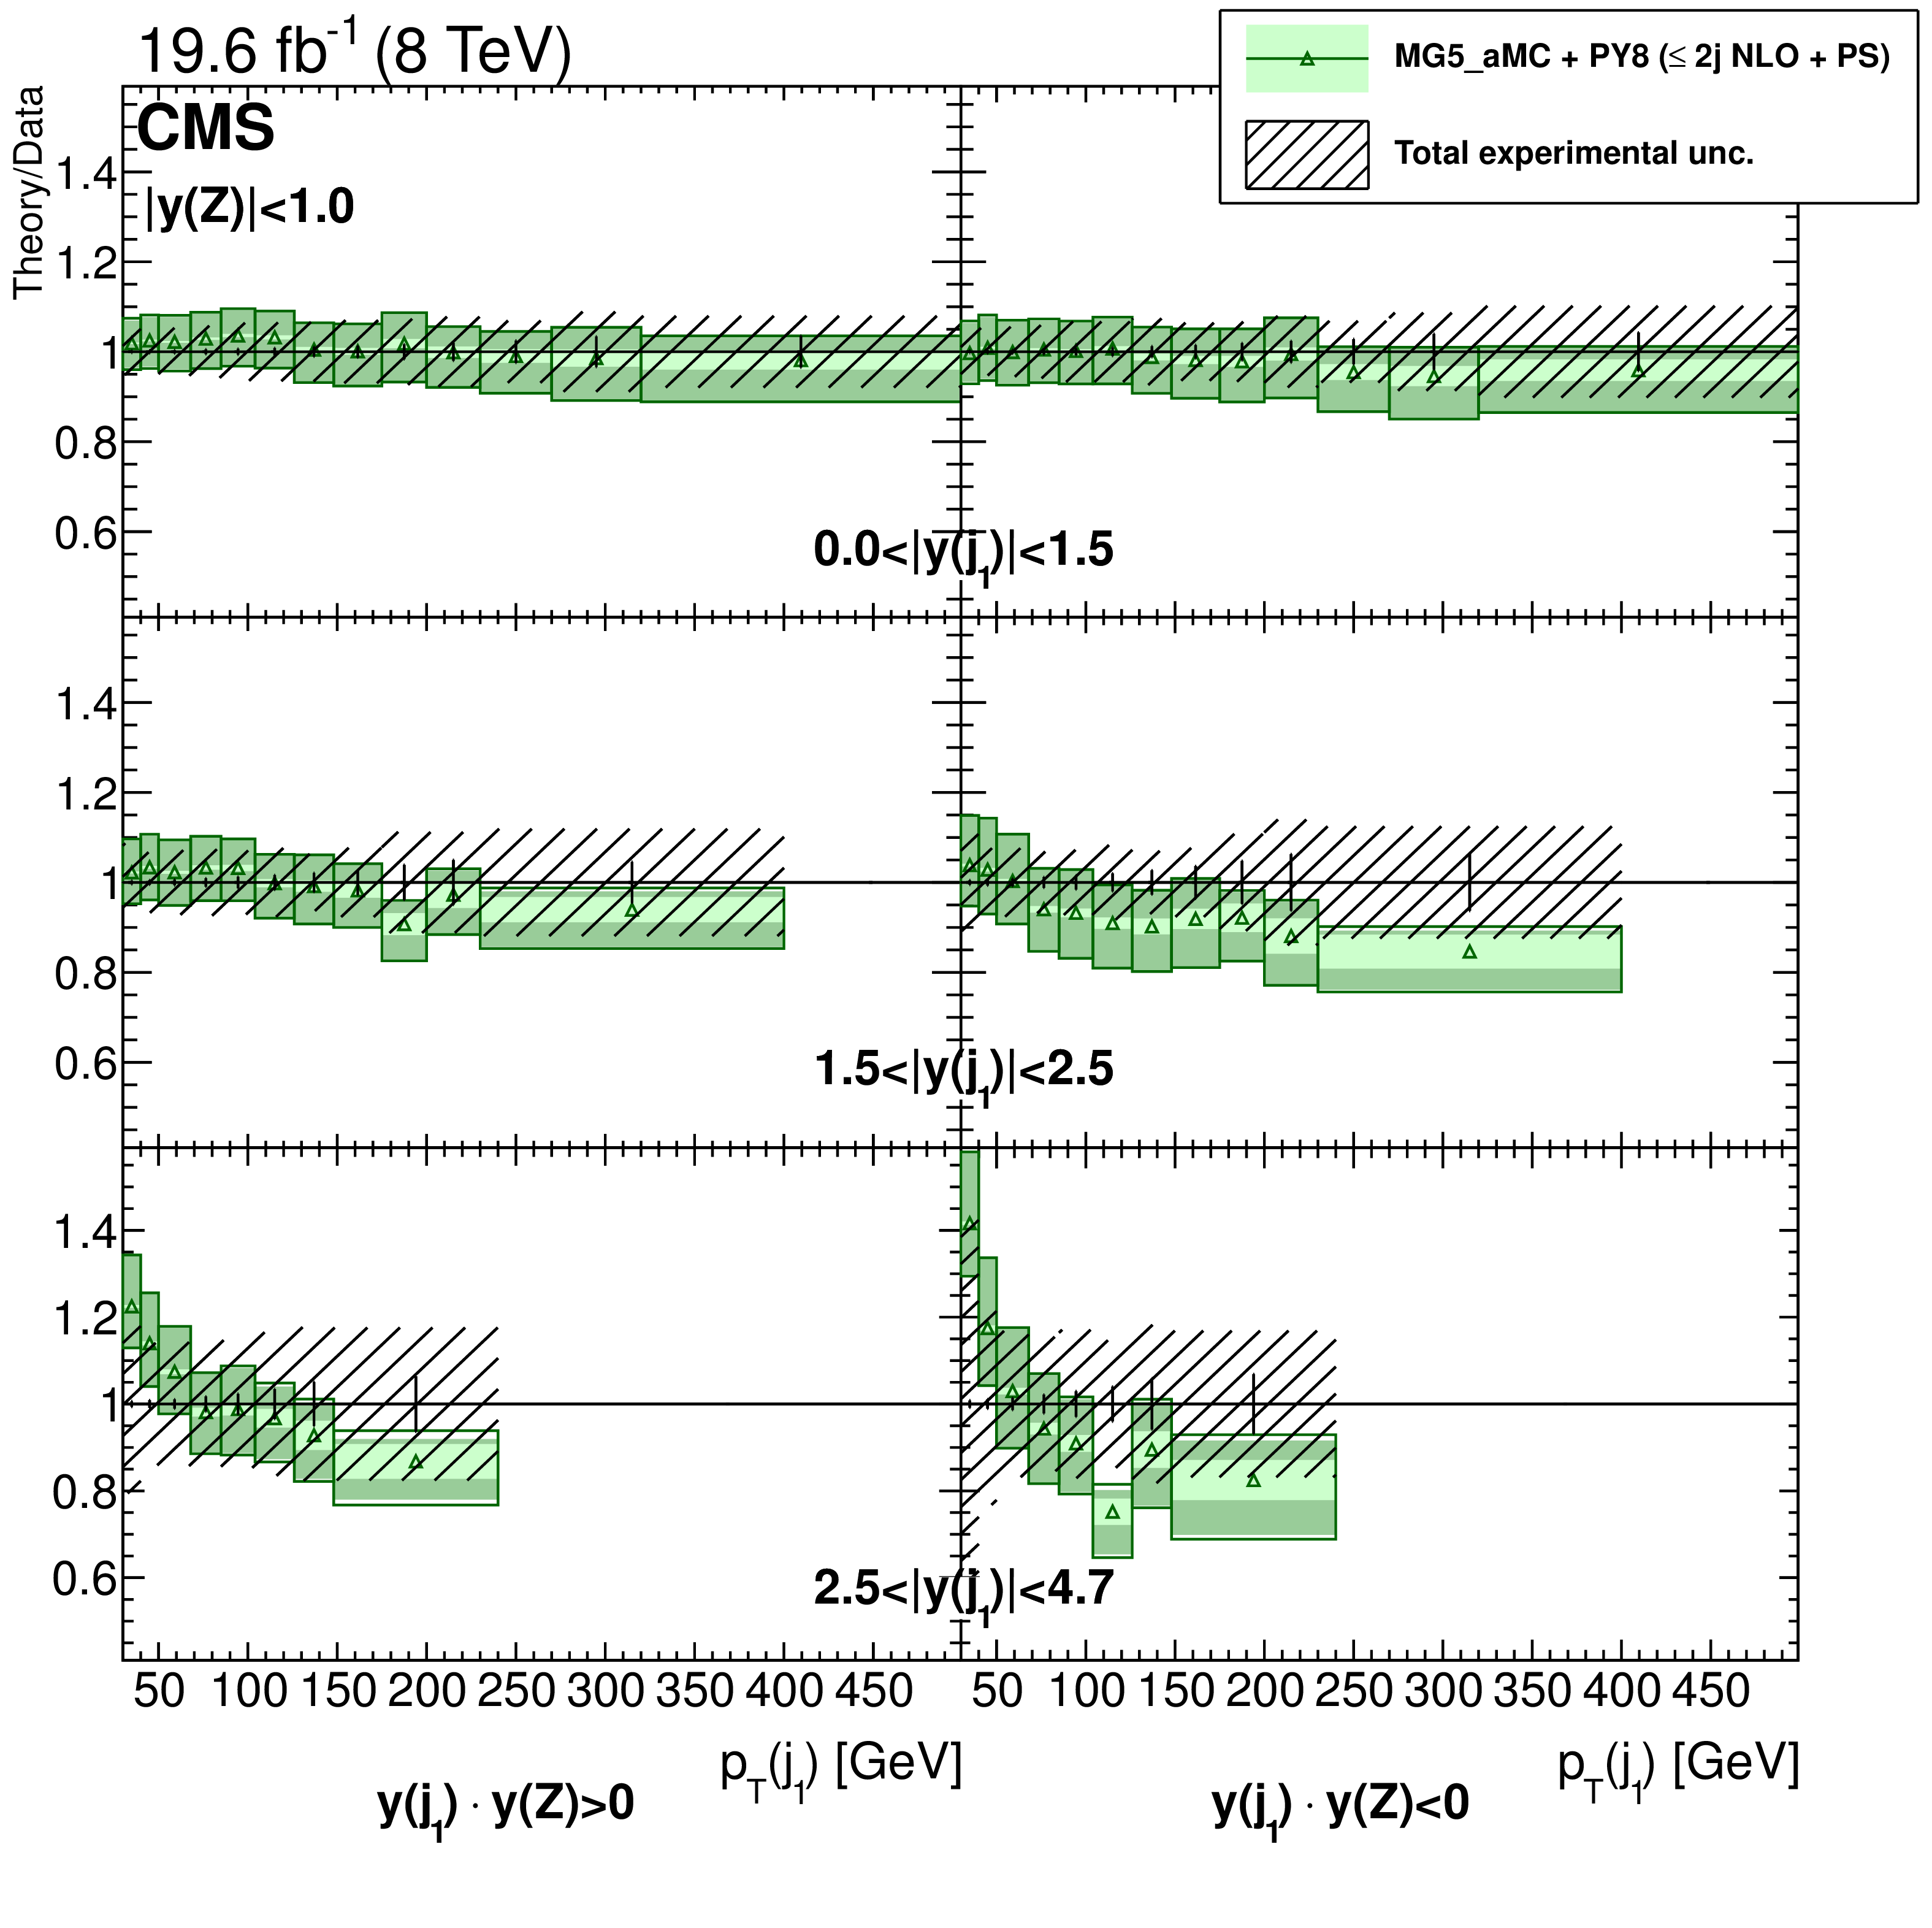
png pdf |
Figure 42:
Ratio to the measurement of the differential cross section $ {\mathrm {d}}^3\sigma / {\mathrm {d}} {p_{\mathrm {T}}} (\text {j}_1) {\mathrm {d}}y(\text {j}_1) {\mathrm {d}}y(\mathrm{ Z } )$ obtained with mg5-amc +PYTHIA 8, with up to two jets at NLO, for $ {| y(\mathrm{ Z } ) | }<1$. Left column corresponds to $y(\text {j}_1)y(\mathrm{ Z } )>0$ and right column to $y(\text {j}_1)y(\mathrm{ Z } )<0$. The total experimental uncertainty is shown as a band around 1. Uncertainties in the predictions are shown on the ratio points and include the statistical, theoretical, and PDF uncertainties. The dark green area represents the statistical and theoretical uncertainties only, while the light green area represents the statistical uncertainty alone. |
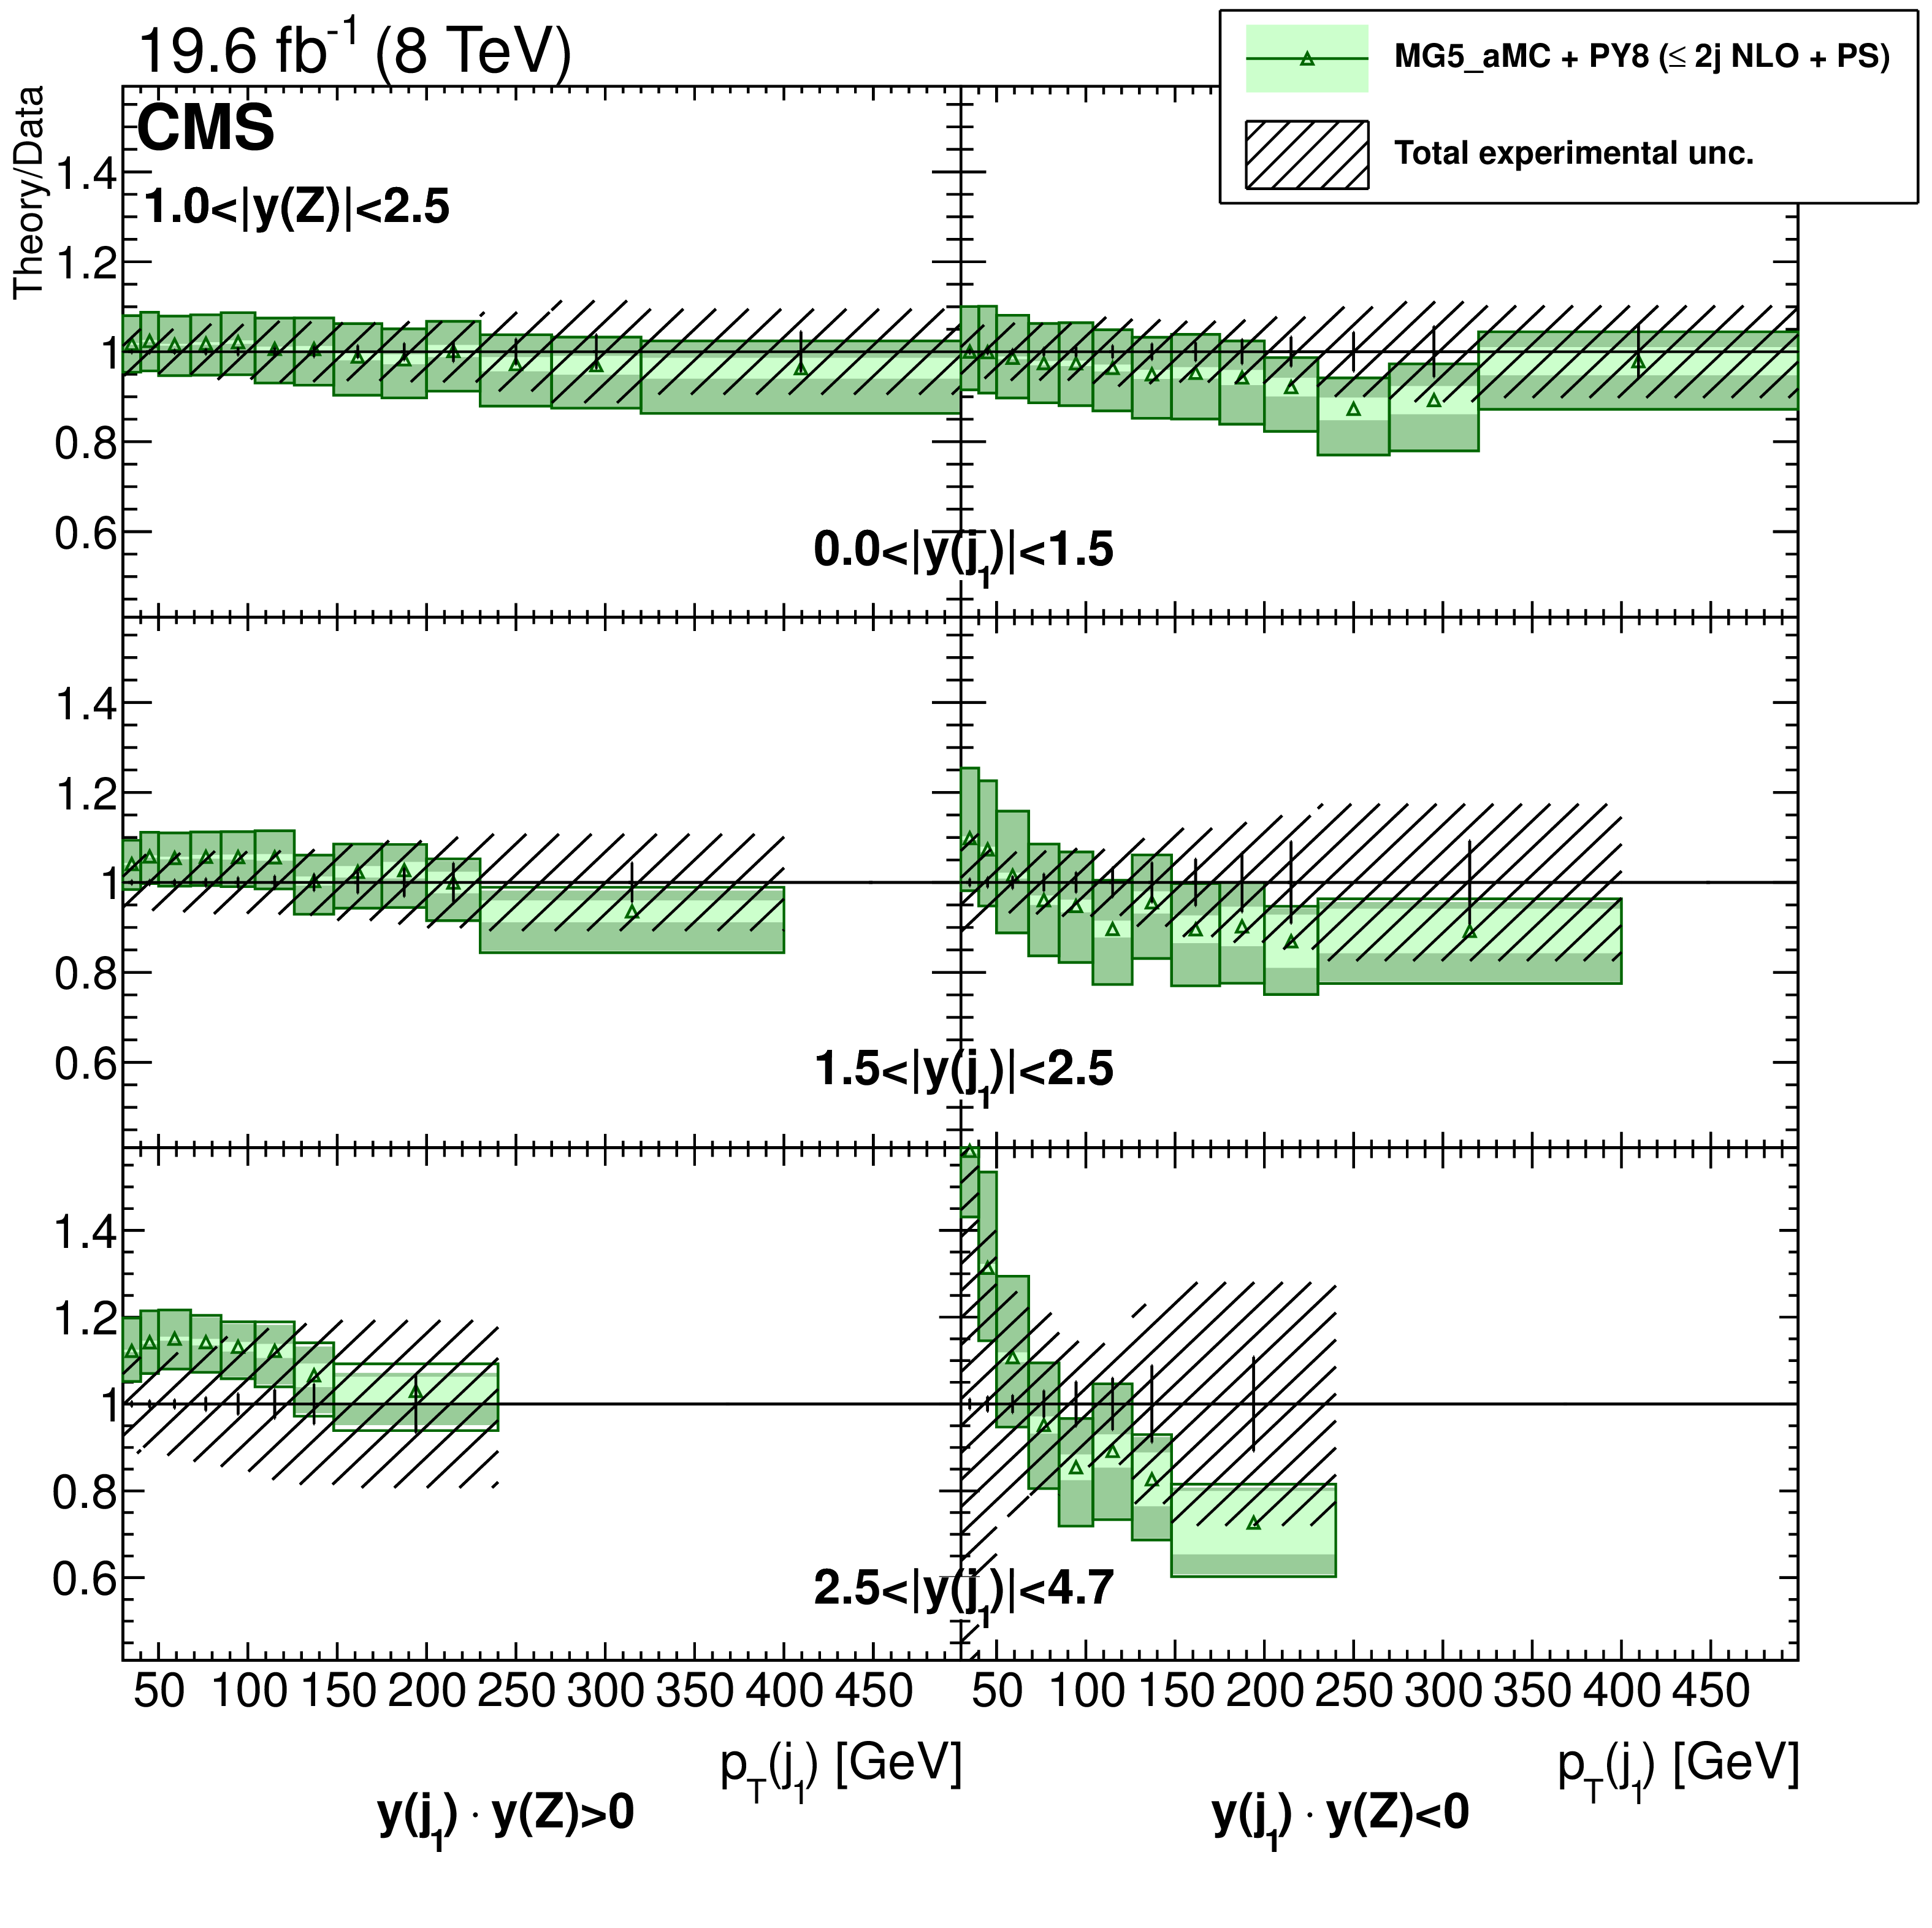
png pdf |
Figure 43:
Ratio to the measurement of the differential cross section $ {\mathrm {d}}^3\sigma / {\mathrm {d}} {p_{\mathrm {T}}} (\text {j}_1) {\mathrm {d}}y(\text {j}_1) {\mathrm {d}}y(\text {Z})$ obtained with mg5-amc + PYTHIA 8, with up to two jets at NLO, for $ {| y(\mathrm{ Z } ) | }\in (1,2.5)$. Left column corresponds to $y(\text {j}_1)y(\mathrm{ Z } )>0$ and right column to $y(\text {j}_1)y(\mathrm{ Z } )<0$. The total experimental uncertainty is shown as a band around 1. Uncertainties in the predictions are shown on the ratio points and include the statistical, theoretical, and PDF uncertainties. The dark green area represents the statistical and theoretical uncertainties only, while the light green area represents the statistical uncertainty alone. |
| Tables | |

png pdf |
Table 1:
Cross section results obtained from the combination of the muon and electron channels as a function of the exclusive jet multiplicity and details of the systematic uncertainties. The column denoted "Tot unc" contains the total uncertainty; the column denoted "Stat" contains the statistical uncertainty; the remaining columns contain the systematic uncertainties. |
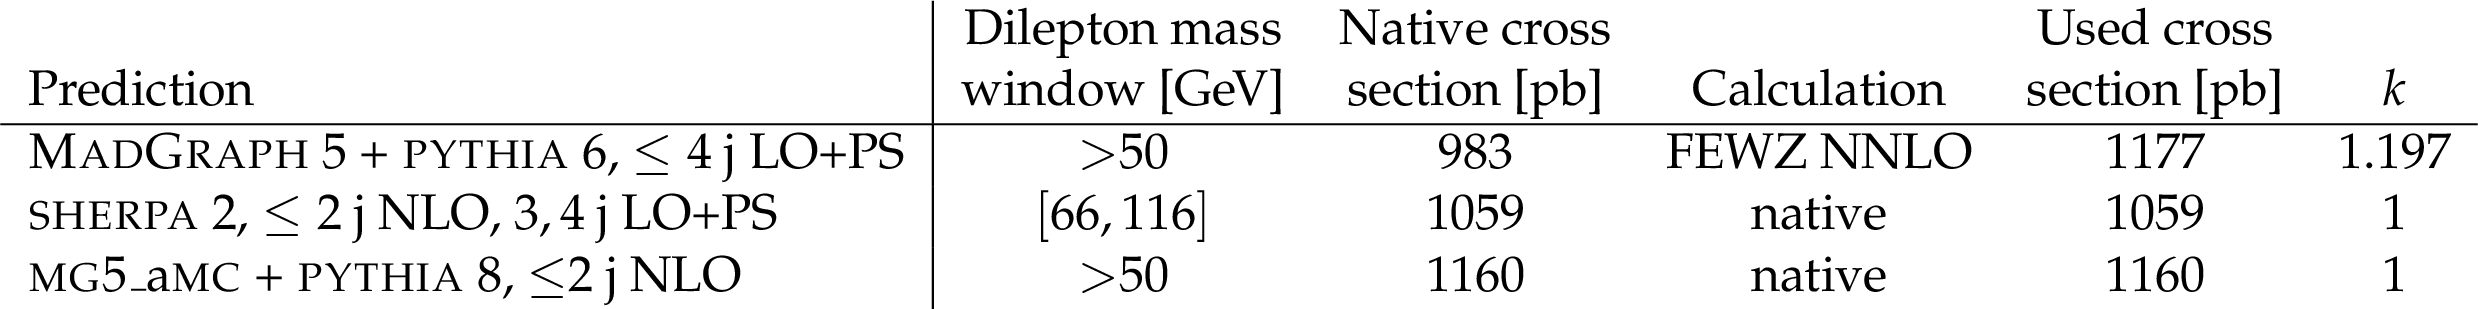
png pdf |
Table 2:
Values of the $\mathrm{ p } \mathrm{ p } \to \ell ^+\ell ^-$ total cross section used in the predictions in data-theory comparison plots. The cross section used for the plots together with the one obtained from the generated sample (``native'') and their ratio ($k$) are provided. The cross section values correspond to the dilepton mass windows used for the respective samples and indicated in the table. |

png pdf |
Table 3:
Measured ($\sigma _{\text {data}}$) and calculated cross sections of the production of ${\mathrm{ Z } } +N_{\text {jets}}\text { jets}$ events. The cross section calculated with mg5-amc is given in the third column together with the total uncertainty that covers the theoretical (standard method), PDF, $\alpha _s$, and statistical uncertainties. The theoretical uncertainty obtained with the standard and ST methods are compared in the two last columns. The uncertainty on the measurement is separated in systematic and statistical components when the latter is not negligible. |
| Summary |
| The kinematics of Z+jets events in pp collisions at the centre-of-mass energy of $ \sqrt{s} = $ 8 TeV have been studied and the differential cross sections have been measured as a function of numerous observables. Multidimensional cross section measurements have been performed with respect to up to three variables. The results have been compared with predictions from several multileg generators at different fixed-order accuracies, tree-level and NLO up to 2 partons, and employing different showering algorithms, as implemented in PYTHIA 6, PYTHIA 8, and SHERPA 2. The comparisons show that it is essential to include a large number of final-state partons in the matrix element calculations in order to correctly describe the kinematics of the leading jets. Besides the individual jet $p_{\mathrm{T}}$, the observable $H_{\mathrm{T}}$, used in searches for physics beyond the SM and defined in this measurement for jets with $p_{\mathrm{T}}> $ 30 GeV is modelled correctly at low values of $H_{\mathrm{T}}$ only when a sufficiently large number of partons is included in the matrix element calculations. The discrepancies found for large values of the jet momentum, first observed in the $ \sqrt{s} = $ 7 TeV measurements [8,5], are confirmed at $ \sqrt{s} = $ 8 TeV with a larger data set. Such discrepancies are not seen when including the NLO corrections. The differences observed between tree-level predictions and the measurements of the leading jet are larger when the jet is more forward ($| y |>2.5$). Discrepancies with LO and NLO predictions have been observed for the dijet mass spectrum at low mass in the region where the angle between the two jet directions is smaller than $\pi/2$. Nevertheless, the azimuthal angles between the Z boson and the jet and between the jets are very well reproduced by the predictions including the tree-level one. The excellent agreement remains when restricting the phase space by applying a threshold on the Z boson $p_{\mathrm{T}}$, on $H_{\mathrm{T}}$, or on both. The rapidity distributions of the Z boson and jets are fairly well modelled by the generators, but the correlations between the rapidities, which have been studied by measuring multidimensional differential cross sections and distributions of rapidity differences and sums, are not well reproduced by the multileg tree-level calculation. We have shown that the multileg event generators including NLO terms reproduce the rapidity difference distributions very well. The rapidity sum is also successfully described. For this variable the discrepancy with the tree-level calculation could also be due to a different choice of the parton distribution functions. In summary, kinematics of Z+jets events have been studied in detail and apart from a few discrepancies, the measurements show a very good agreement with the considered NLO multileg predictions. |
| References | ||||
| 1 | S. Hoche, F. Krauss, M. Schonherr, F. Siegert | QCD matrix elements + parton showers: The NLO case | JHEP 04 (2013) 027 | 1207.5030 |
| 2 | R. Frederix and S. Frixione | Merging meets matching in MC@NLO | JHEP 12 (2012) 061 | 1209.6215 |
| 3 | CDF Collaboration | Measurement of Inclusive Jet Cross Sections in $ Z/\gamma^*\to e^+e^- + \text{jets} $ Production in $ p\bar{p} $ Collisions at $ \sqrt{s} = 1.96 $ TeV | PRL 100 (2008) 102001 | 0711.3717 |
| 4 | D0 Collaboration | Measurement of differential $ \mathrm{ Z } / \gamma^{*} $ + jet + $ X $ cross sections in $ \mathrm{p} \bar{\mathrm{p}} $ collisions at $ \sqrt{s} $ = 1.96 TeV | PLB 669 (2008) 278 | 0808.1296 |
| 5 | ATLAS Collaboration | Measurement of the production cross section of jets in association with a $ \mathrm{ Z } $ boson in $ \mathrm{ p }\mathrm{ p } $ collisions at $ \sqrt{s} = $ 7 TeV with the ATLAS detector | JHEP 07 (2013) 032 | 1304.7098 |
| 6 | ATLAS Collaboration | Measurement of the production cross section for $ Z/\gamma^* $ in association with jets in $ pp $ collisions at $ \sqrt{s}=7 $ TeV with the ATLAS detector | PRD 85 (2012) 032009 | 1111.2690 |
| 7 | CMS Collaboration | Jet production rates in association with $ \mathrm{W} $ and $ \mathrm{ Z } $ bosons in $ \mathrm{ p }\mathrm{ p } $ collisions at $ \sqrt{s}=7 $ TeV | JHEP 01 (2012) 010 | CMS-EWK-10-012 1110.3226 |
| 8 | CMS Collaboration | Measurements of jet multiplicity and differential production cross sections of $ \mathrm{ Z } + $ jets events in proton-proton collisions at $ \sqrt{s} = $ 7 TeV | PRD 91 (2015) 052008 | CMS-SMP-12-017 1408.3104 |
| 9 | M. Cacciari, G. P. Salam, and G. Soyez | The anti-$ k_t $ jet clustering algorithm | JHEP 04 (2008) 063 | 0802.1189 |
| 10 | CMS Collaboration | Event shapes and azimuthal correlations in $ \mathrm{ Z } $ + jets events in $ \mathrm{ p }\mathrm{ p } $ collisions at $ \sqrt{s}=7 $ TeV | PLB 722 (2013) 238 | CMS-EWK-11-021 1301.1646 |
| 11 | CMS Collaboration | The CMS experiment at the CERN LHC | JINST 3 (2008) S08004 | CMS-00-001 |
| 12 | J. Alwall et al. | MadGraph 5: Going Beyond | JHEP 06 (2011) 128 | 1106.0522 |
| 13 | T. Sjostrand, S. Mrenna, and P. Z. Skands | PYTHIA 6.4 physics and manual | JHEP 05 (2006) 026 | hep-ph/0603175 |
| 14 | J. Pumplin et al. | New generation of parton distributions with uncertainties from global QCD analysis | JHEP 07 (2002) 012 | hep-ph/0201195 |
| 15 | CMS Collaboration | Study of the underlying event at forward rapidity in $ \mathrm{ p }\mathrm{ p } $ collisions at $ \sqrt{s} $ = 0.9, 2.76, and 7 TeV | JHEP 04 (2013) 072 | CMS-FWD-11-003 1302.2394 |
| 16 | CMS Collaboration | Event generator tunes obtained from underlying event and multiparton scattering measurements | EPJC 76 (2016) 155 | CMS-GEN-14-001 1512.00815 |
| 17 | J. Alwall et al. | Comparative study of various algorithms for the merging of parton showers and matrix elements in hadronic collisions | EPJC 53 (2008) 473 | 0706.2569 |
| 18 | J. Alwall, S. de Visscher, and F. Maltoni | QCD radiation in the production of heavy colored particles at the LHC | JHEP 02 (2009) 017 | 0810.5350 |
| 19 | R. Gavin, Y. Li, F. Petriello, and S. Quackenbush | FEWZ 2.0: A code for hadronic $ \mathrm{Z} $ production at next-to-next-to-leading order | CPC 182 (2011) 2388 | 1011.3540 |
| 20 | J. M. Campbell and R. K. Ellis | MCFM for the Tevatron and the LHC | NPPS 205-206 (2010) 10 | 1007.3492 |
| 21 | M. Czakon, P. Fiedler, and A. Mitov | Total Top-Quark Pair-Production Cross Section at Hadron Colliders Through $ O(\alpha_{s}^{4}) $ | PRL 110 (2013) 252004 | 1303.6254 |
| 22 | GEANT4 Collaboration | GEANT4---a simulation toolkit | NIMA 506 (2003) 250 | |
| 23 | CMS Collaboration | Particle--Flow Event Reconstruction in CMS and Performance for Jets, Taus and $ E_{\mathrm{T}}^{\text{miss}} $ | CDS | |
| 24 | CMS Collaboration | Commissioning of the Particle-flow Event Reconstruction with the first LHC collisions recorded in the CMS detector | CDS | |
| 25 | CMS Collaboration | Performance of electron reconstruction and selection with the CMS detector in proton-proton collisions at $ \sqrt{s} $ = 8 TeV | JINST 10 (2015) P06005 | CMS-EGM-13-001 1502.02701 |
| 26 | M. Cacciari and G. P. Salam | Pileup subtraction using jet areas | PLB 659 (2008) 119 | 0707.1378 |
| 27 | CMS Collaboration | Performance of CMS muon reconstruction in $ \mathrm{ p }\mathrm{ p } $ collision events at $ \sqrt{s}=7 $ TeV | JINST 7 (2012) P10002 | CMS-MUO-10-004 1206.4071 |
| 28 | CMS Collaboration | Measurement of the inclusive $ \mathrm{W} $ and $ \mathrm{ Z } $ production cross sections in $ \mathrm{ p }\mathrm{ p } $ collisions at $ \sqrt{s}=7 $ TeV with the CMS experiment | JHEP 10 (2011) 132 | CMS-EWK-10-005 1107.4789 |
| 29 | M. Cacciari, G. P. Salam, and G. Soyez | The catchment area of jets | JHEP 04 (2008) 005 | 0802.1188 |
| 30 | CMS Collaboration | Determination of Jet Energy Calibration and Transverse Momentum Resolution in CMS | JINST 6 (2011) P11002 | CMS-JME-10-011 1107.4277 |
| 31 | G. D'Agostini | A multidimensional unfolding method based on Bayes' theorem | NIMA 362 (1995) 487 | |
| 32 | T. Adye | Unfolding algorithms and tests using RooUnfold | in PHYSTAT 2011 Workshop on Statistical Issues Related to Discovery Claims in Search Experiments and Unfolding, H. Prosper and L. Lyons, eds., Geneva | 1105.1160 |
| 33 | CMS Collaboration | Jet energy scale and resolution in the CMS experiment in pp collisions at 8 TeV | Submitted to JINST | CMS-JME-13-004 1607.03663 |
| 34 | T. Gleisberg et al. | Event generation with SHERPA 1.1 | JHEP 02 (2009) 007 | 0811.4622 |
| 35 | CMS Collaboration | CMS Luminosity Based on Pixel Cluster Counting - Summer 2013 Update | CMS-PAS-LUM-13-001 | CMS-PAS-LUM-13-001 |
| 36 | S. Frixione and B. R. Webber | Matching NLO QCD computations and parton shower simulations | JHEP 06 (2002) 029 | hep-ph/0204244 |
| 37 | C. F. Berger et al. | One-Loop Calculations with BlackHat | NPPS 183 (2008) 313 | 0807.3705 |
| 38 | C. F. Berger et al. | Vector Boson + Jets with BlackHat and SHERPA | in Loops and Legs in Quantum Field Theory --- Proceedings of the 10th DESY Workshop on Elementary Particle Theory 2010 | 1005.3728 |
| 39 | J. Gao et al. | CT10 next-to-next-to-leading order global analysis of QCD | PRD 89 (2014) 033009 | 1302.6246 |
| 40 | J. Alwall et al. | The automated computation of tree-level and next-to-leading order differential cross sections, and their matching to parton shower simulations | JHEP 07 (2014) 079 | 1405.0301 |
| 41 | P. Skands, S. Carrazza and J. Rojo | Tuning PYTHIA 8.1: the Monash 2013 Tune | EPJC 74 (2014) 3024 | 1404.5630 |
| 42 | NNPDF Collaboration | Parton distributions for the LHC run II | JHEP 04 (2015) 040 | 1410.8849 |
| 43 | NNPDF Collaboration | A first unbiased global NLO determination of parton distributions and their uncertainties | Nucl. Phys. B 838 (2010) 136 | 1002.4407 |
| 44 | NNPDF Collaboration | Impact of heavy quark masses on parton distributions and LHC phenomenology | Nucl. Phys. B 849 (2011) 296 | 1101.1300 |
| 45 | Particle Data Group, K. A. Olive et al. | Review of Particle Physics | CPC 38 (2014) 090001 | |
| 46 | R. Frederix et al. | Four-lepton production at hadron colliders: aMC@NLO predictions with theoretical uncertainties | JHEP 02 (2012) 099 | 1110.4738 |
| 47 | I. W. Stewart and F. J. Tackmann | Theory uncertainties for Higgs mass and other searches using jet bins | PRD 85 (2012) 034011 | 1107.2117 |
| 48 | M. L. Mangano et al. | ALPGEN, a generator for hard multiparton processes in hadronic collisions | JHEP 07 (2003) 001 | hep-ph/0206293 |
| 49 | G. Corcella et al. | HERWIG 6: an event generator for hadron emission reactions with interfering gluons (including supersymmetric processes) | JHEP 01 (2001) 010 | hep-ph/0011363 |
| 50 | CMS Collaboration | Rapidity distributions in exclusive $ \mathrm{ Z } $ + jet and $ \gamma $ + jet events in $ \mathrm{ p }\mathrm{ p } $ collisions at $ \sqrt{s} $ = 7 TeV | PRD 88 (2013) 112009 | CMS-SMP-12-004 1310.3082 |
|
|
Compact Muon Solenoid LHC, CERN |
|

|

|

|

|

|