

Compact Muon Solenoid
LHC, CERN
| CMS-SMP-16-003 ; CERN-EP-2018-167 | ||
| Measurement of differential cross sections for inclusive isolated-photon and photon+jets production in proton-proton collisions at $\sqrt{s} = $ 13 TeV | ||
| CMS Collaboration | ||
| 2 July 2018 | ||
| Eur. Phys. J. C 79 (2019) 20 | ||
| Abstract: Measurements of inclusive isolated-photon and photon+jets production in proton-proton collisions at $\sqrt{s} = $ 13 TeV are presented. The analysis uses data collected by the CMS experiment in 2015, corresponding to an integrated luminosity of 2.26 fb$^{-1}$. The cross section for inclusive isolated-photon production is measured as a function of the photon transverse energy, for $E_{\mathrm{T}} > $ 190 GeV, and rapidity, for $| y | < $ 2.5. The cross section for photon+jets production is measured as a function of the photon transverse energy, for $E_{\mathrm{T}} > $ 190 GeV, the photon rapidity, for $| y | < $ 2.5, and the rapidity of the jet with highest transverse momentum, up to $| y | < $ 2.4. The experimental measurements are found to be in agreement with predictions from perturbative QCD. | ||
| Links: e-print arXiv:1807.00782 [hep-ex] (PDF) ; CDS record ; inSPIRE record ; HepData record ; CADI line (restricted) ; | ||
| Figures | |

png pdf |
Figure 1:
Distributions of the BDT for background photons in the 200-220 GeV bin for the EB region. The points show events from a sideband region of the photon isolation selection criteria, the solid histogram shows the events in the signal region in simulated QCD multijet events, and the dashed histogram shows the sideband region for simulated QCD multijet events. All three samples have their statistical uncertainties shown as error bars. |
png pdf |
Figure 2:
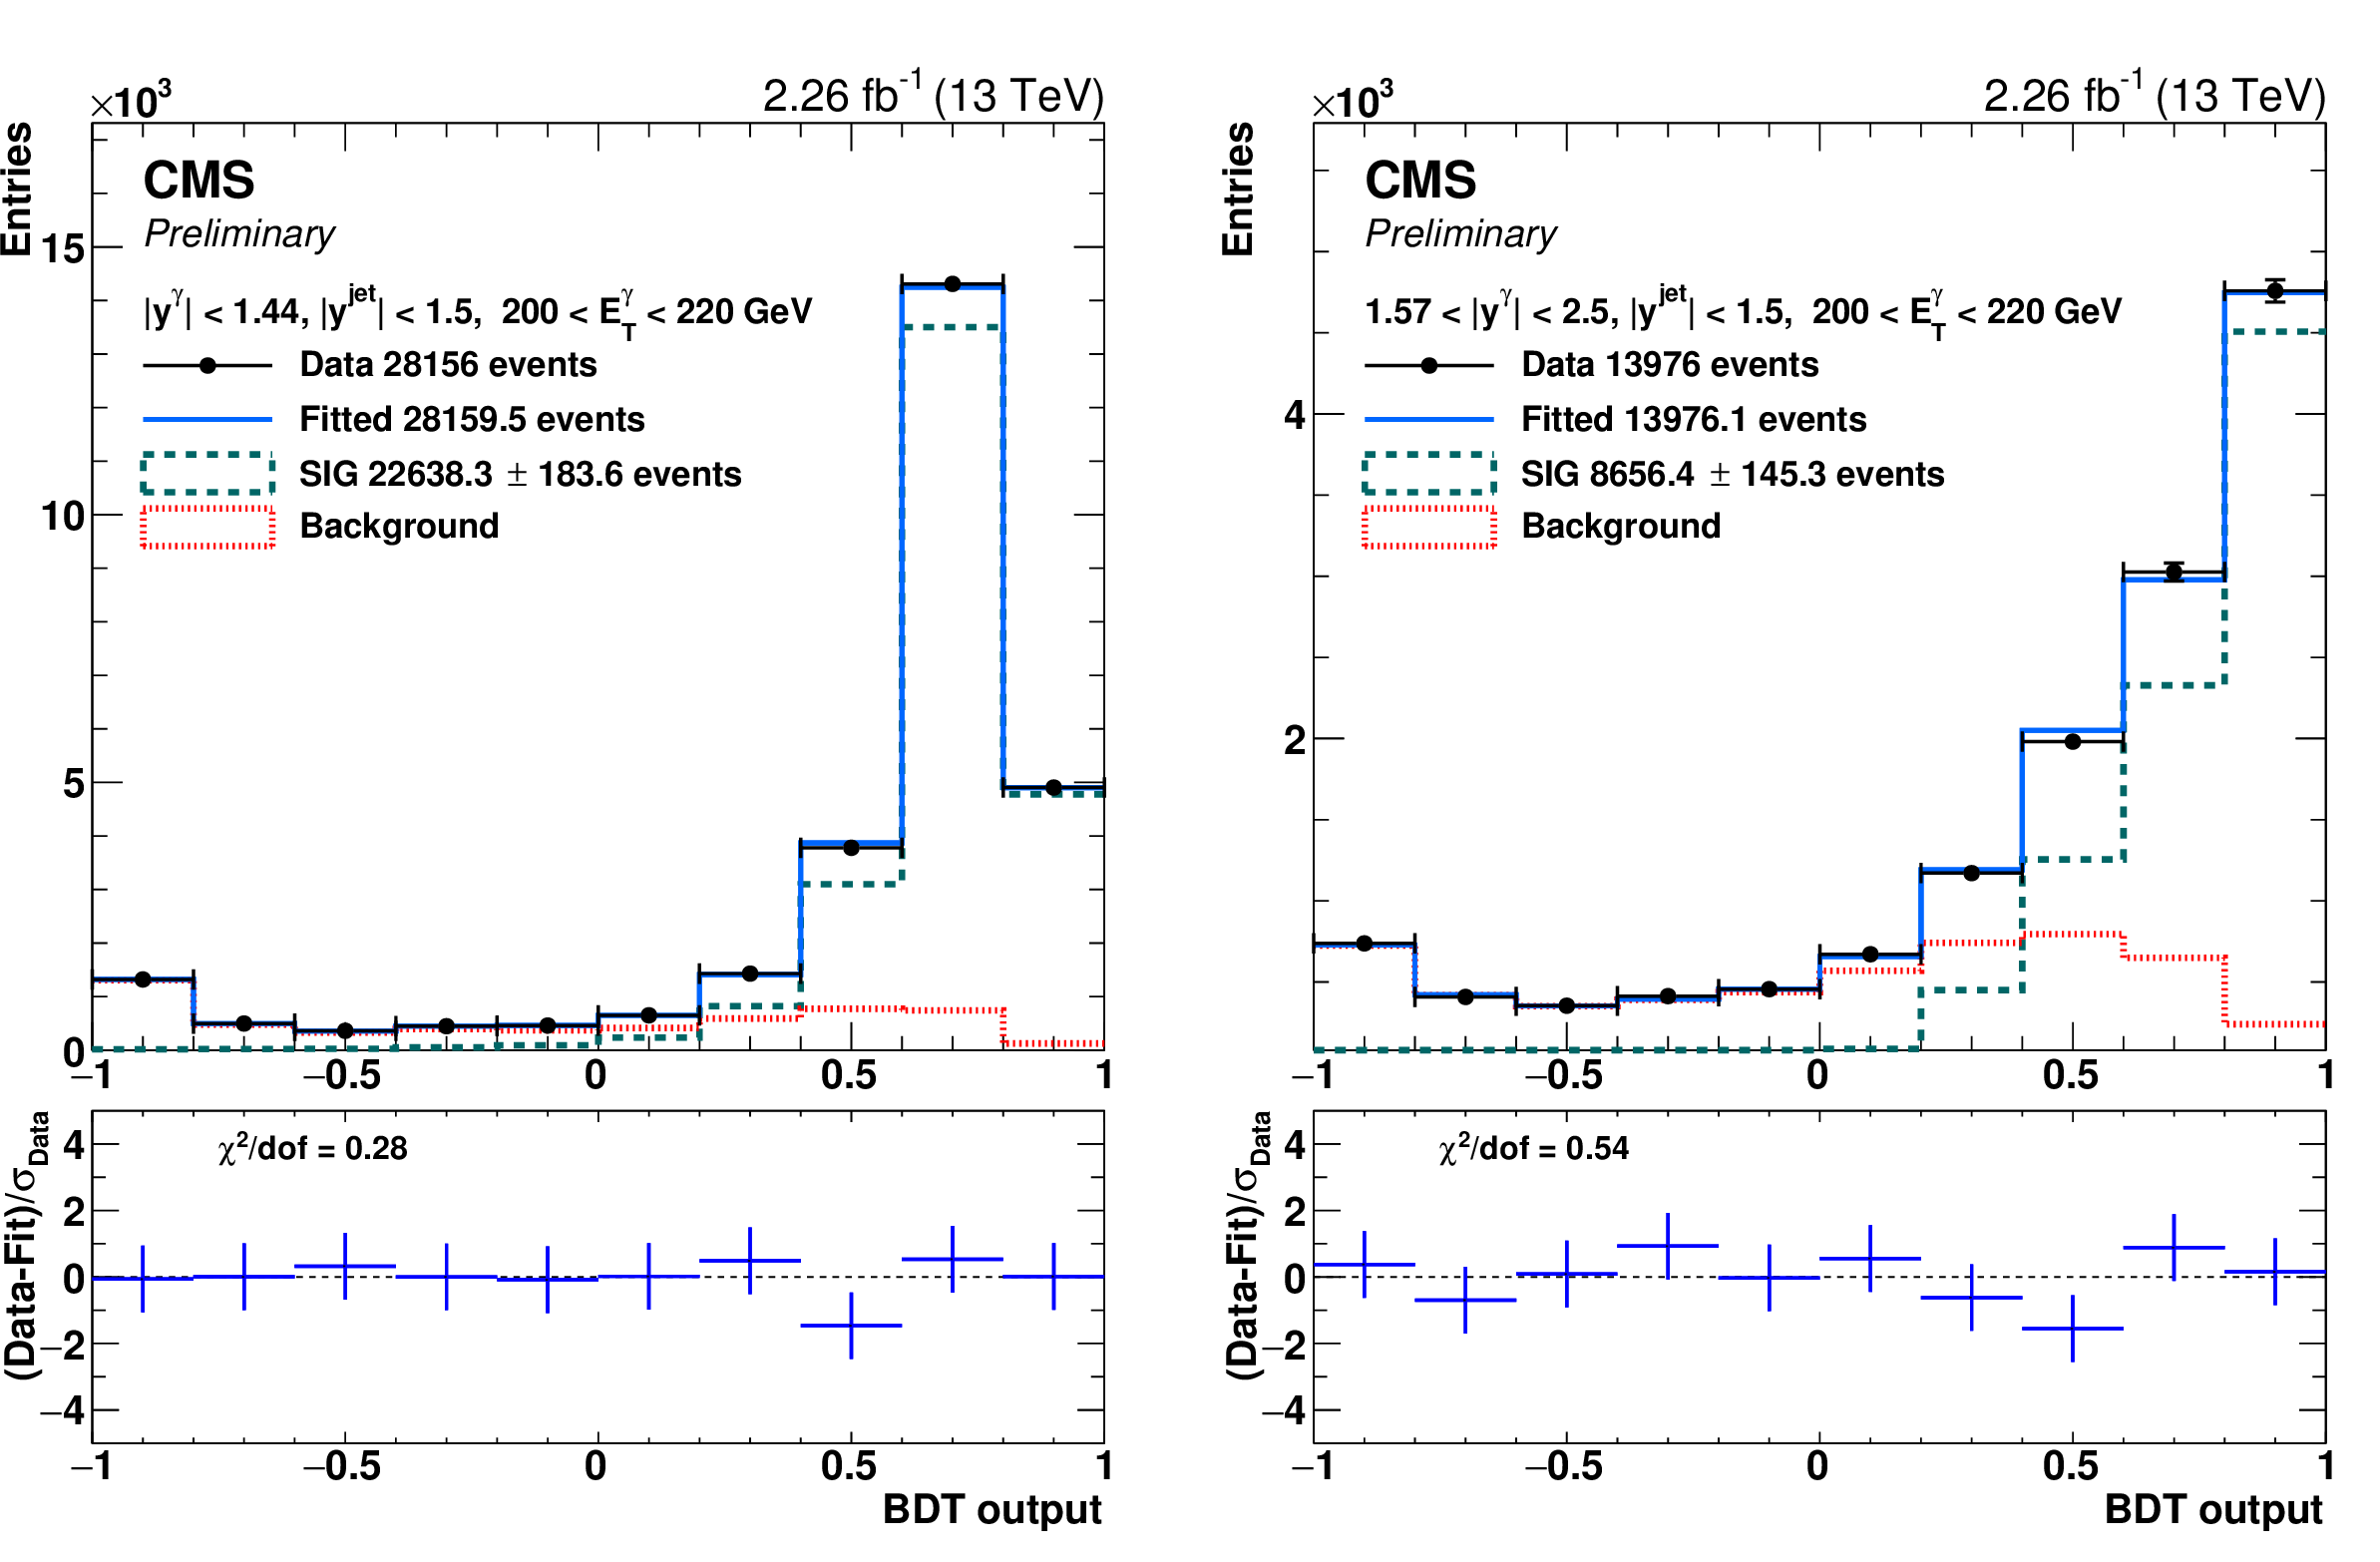
Distributions of the BDT output for an EB (left) and an EE (right) bin with photon $ {E_{\mathrm {T}}} $ between 200-220 GeV and $ {| y^{\text {jet}} |} < $ 1.5. The points represent data, and the solid histograms, approaching the data points, represent the fit results with the signal (dashed) and background (dotted) components displayed. The bottom panels show the ratio of the difference between the data and the fit to the statistical uncertainty in the data, along with the resulting reduced $\chi ^2$ over degrees of freedom (dof). |
png pdf |
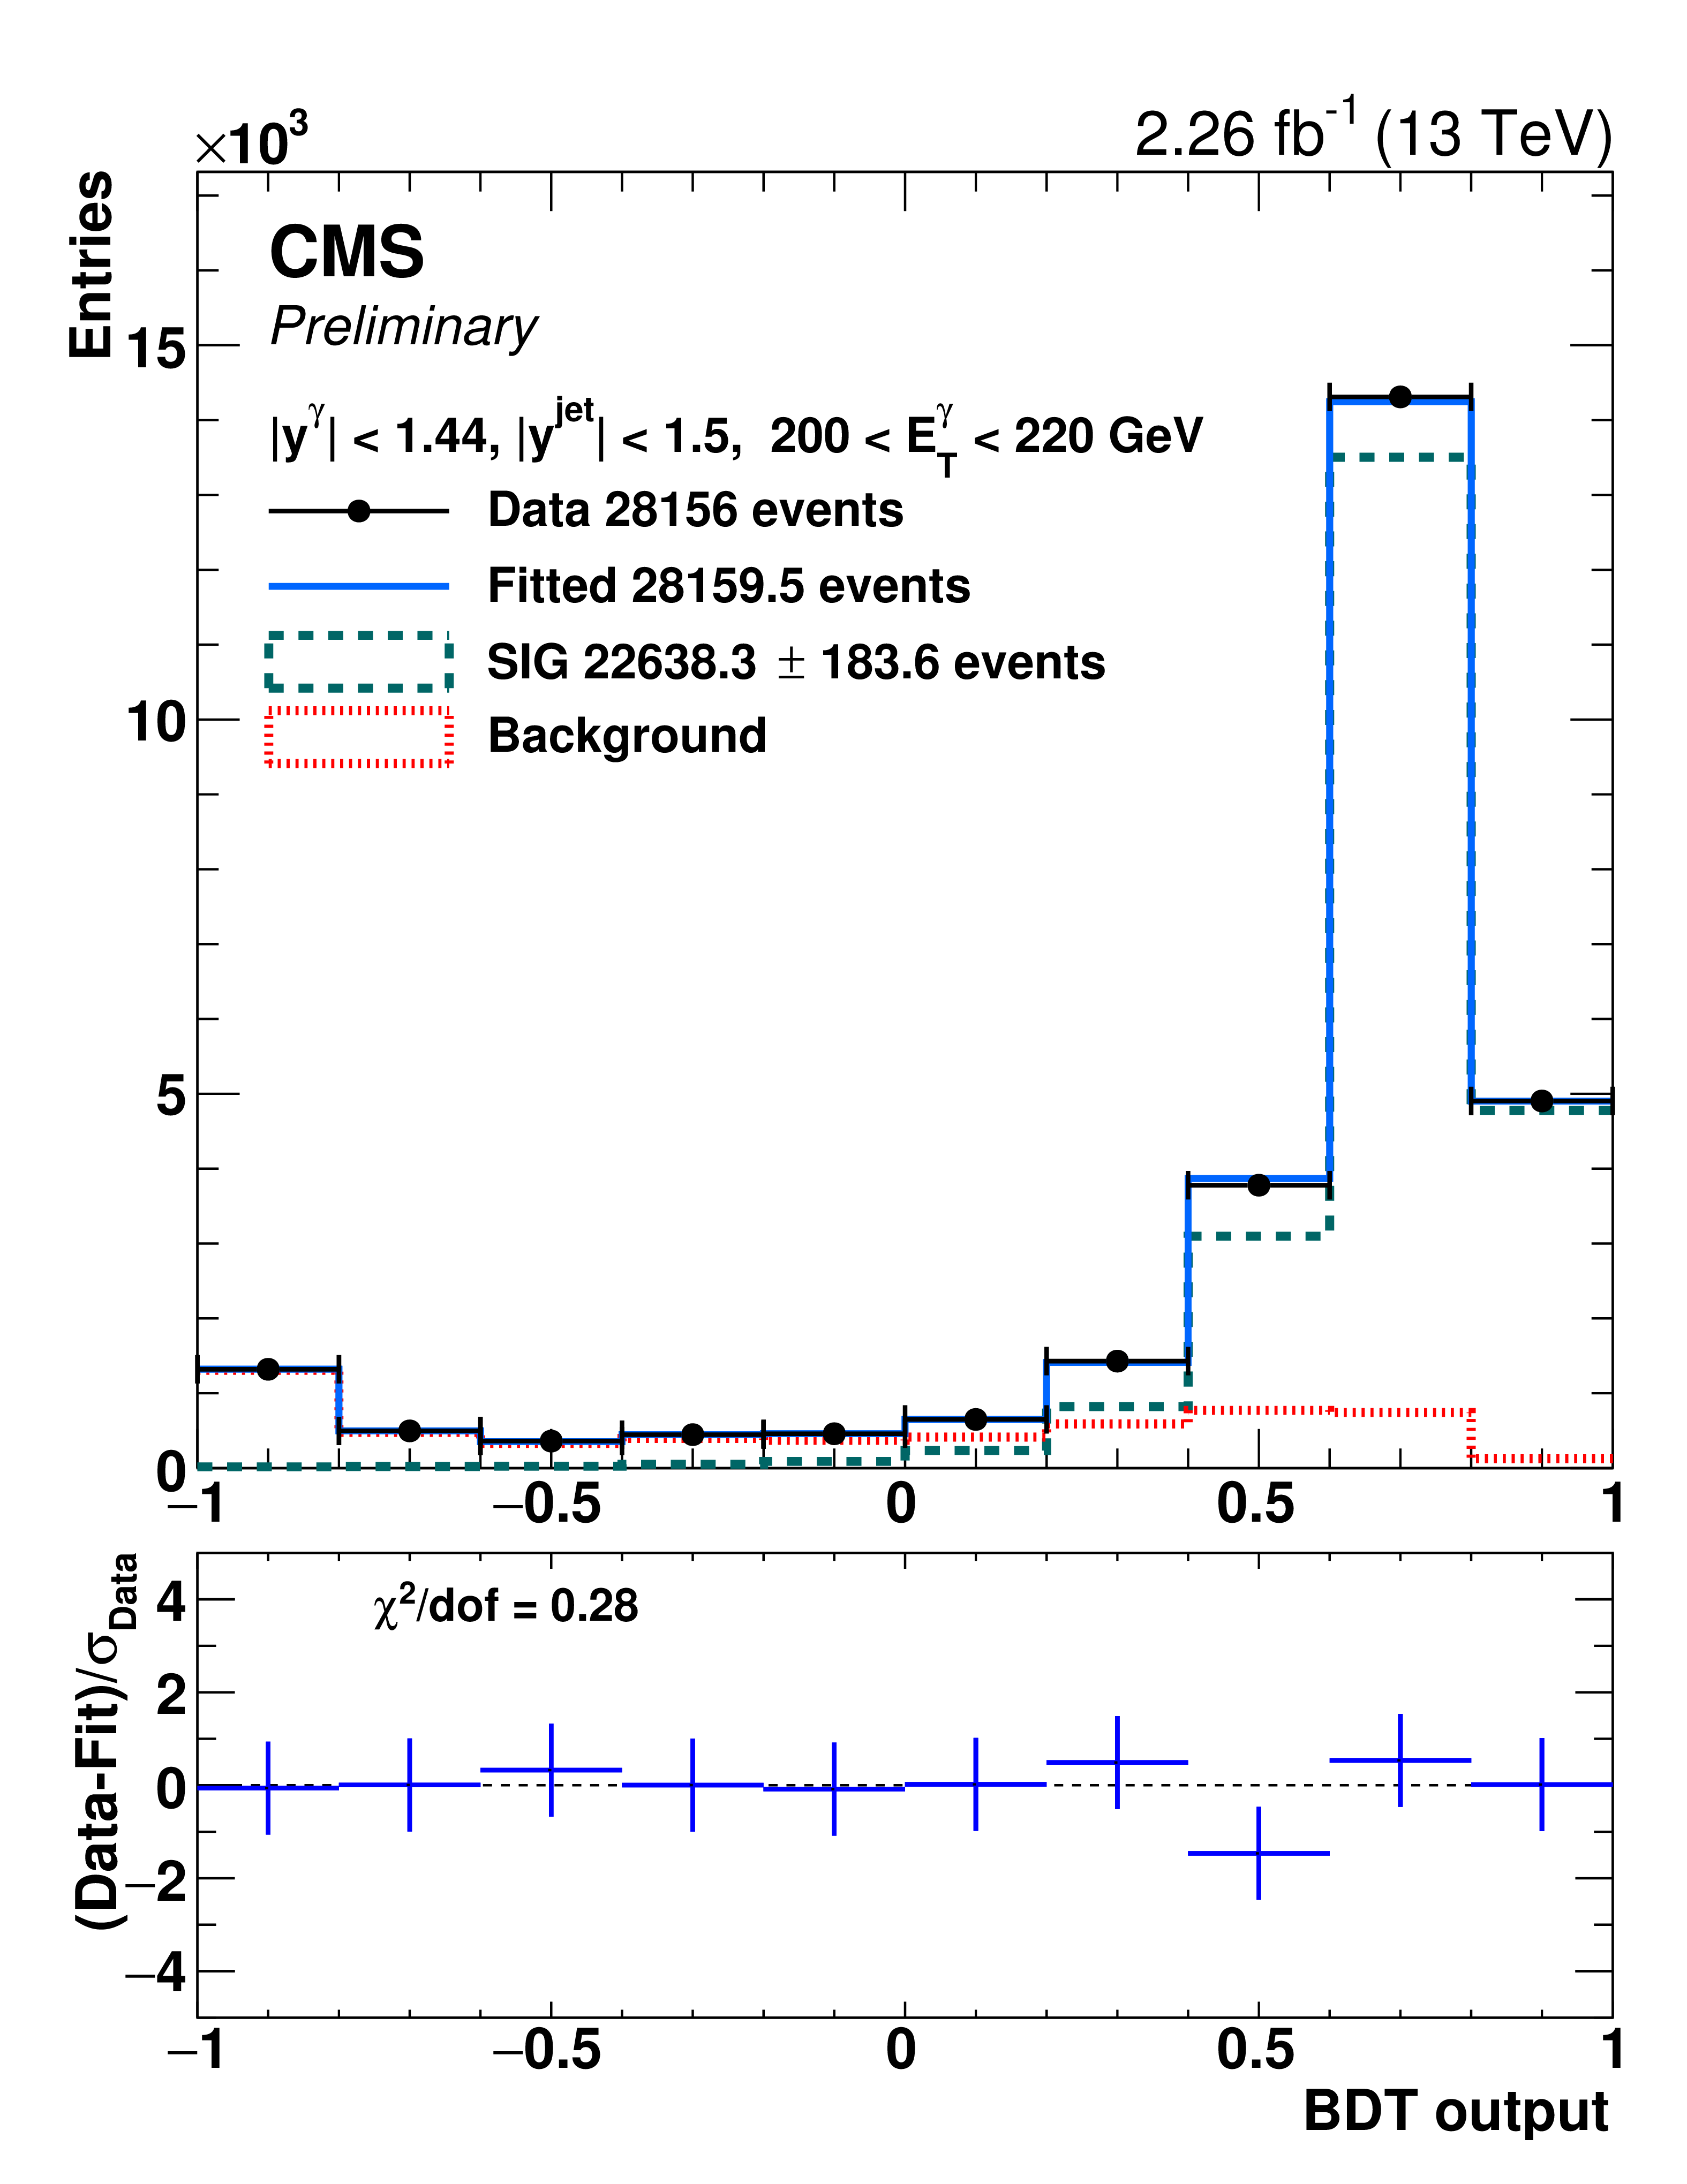
Figure 2-a:
Distribution of the BDT output for an EB bin with photon $ {E_{\mathrm {T}}} $ between 200-220 GeV and $ {| y^{\text {jet}} |} < $ 1.5. The points represent data, and the solid histograms, approaching the data points, represent the fit results with the signal (dashed) and background (dotted) components displayed. The bottom panel shows the ratio of the difference between the data and the fit to the statistical uncertainty in the data, along with the resulting reduced $\chi ^2$ over degrees of freedom (dof). |
png pdf |
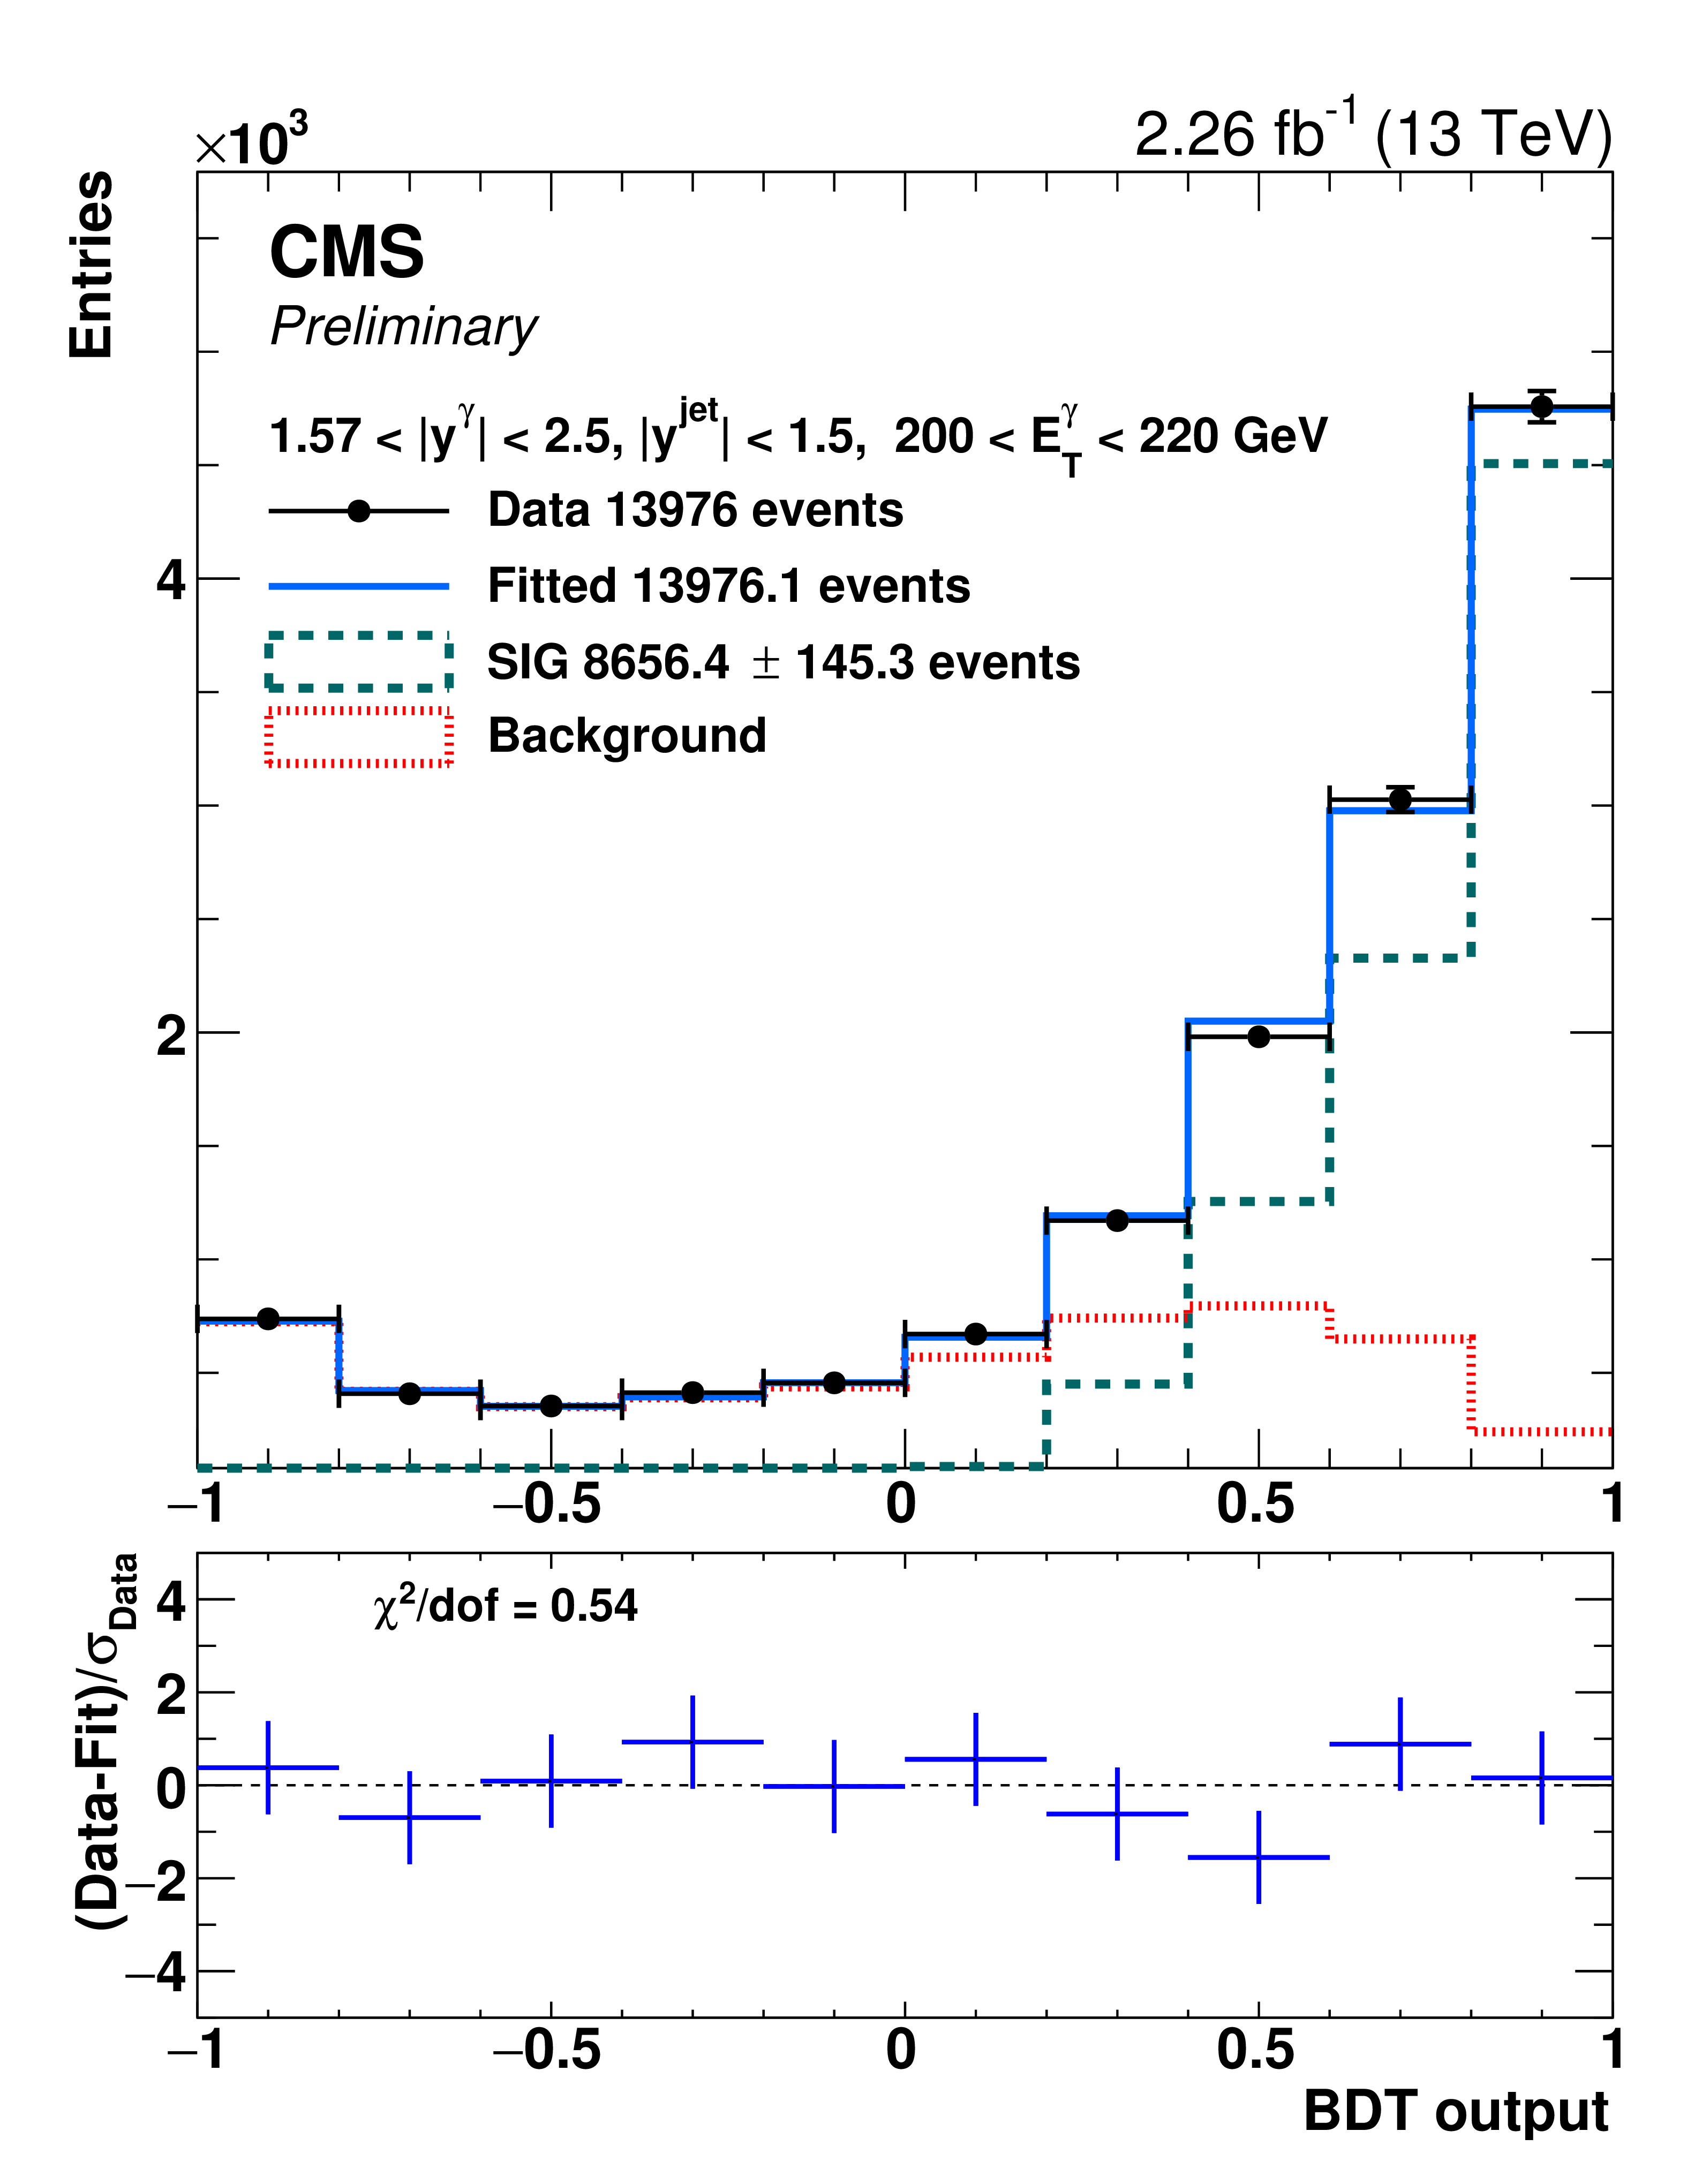
Figure 2-b:
Distribution of the BDT output for an EE bin with photon $ {E_{\mathrm {T}}} $ between 200-220 GeV and $ {| y^{\text {jet}} |} < $ 1.5. The points represent data, and the solid histograms, approaching the data points, represent the fit results with the signal (dashed) and background (dotted) components displayed. The bottom panel shows the ratio of the difference between the data and the fit to the statistical uncertainty in the data, along with the resulting reduced $\chi ^2$ over degrees of freedom (dof). |
png pdf |
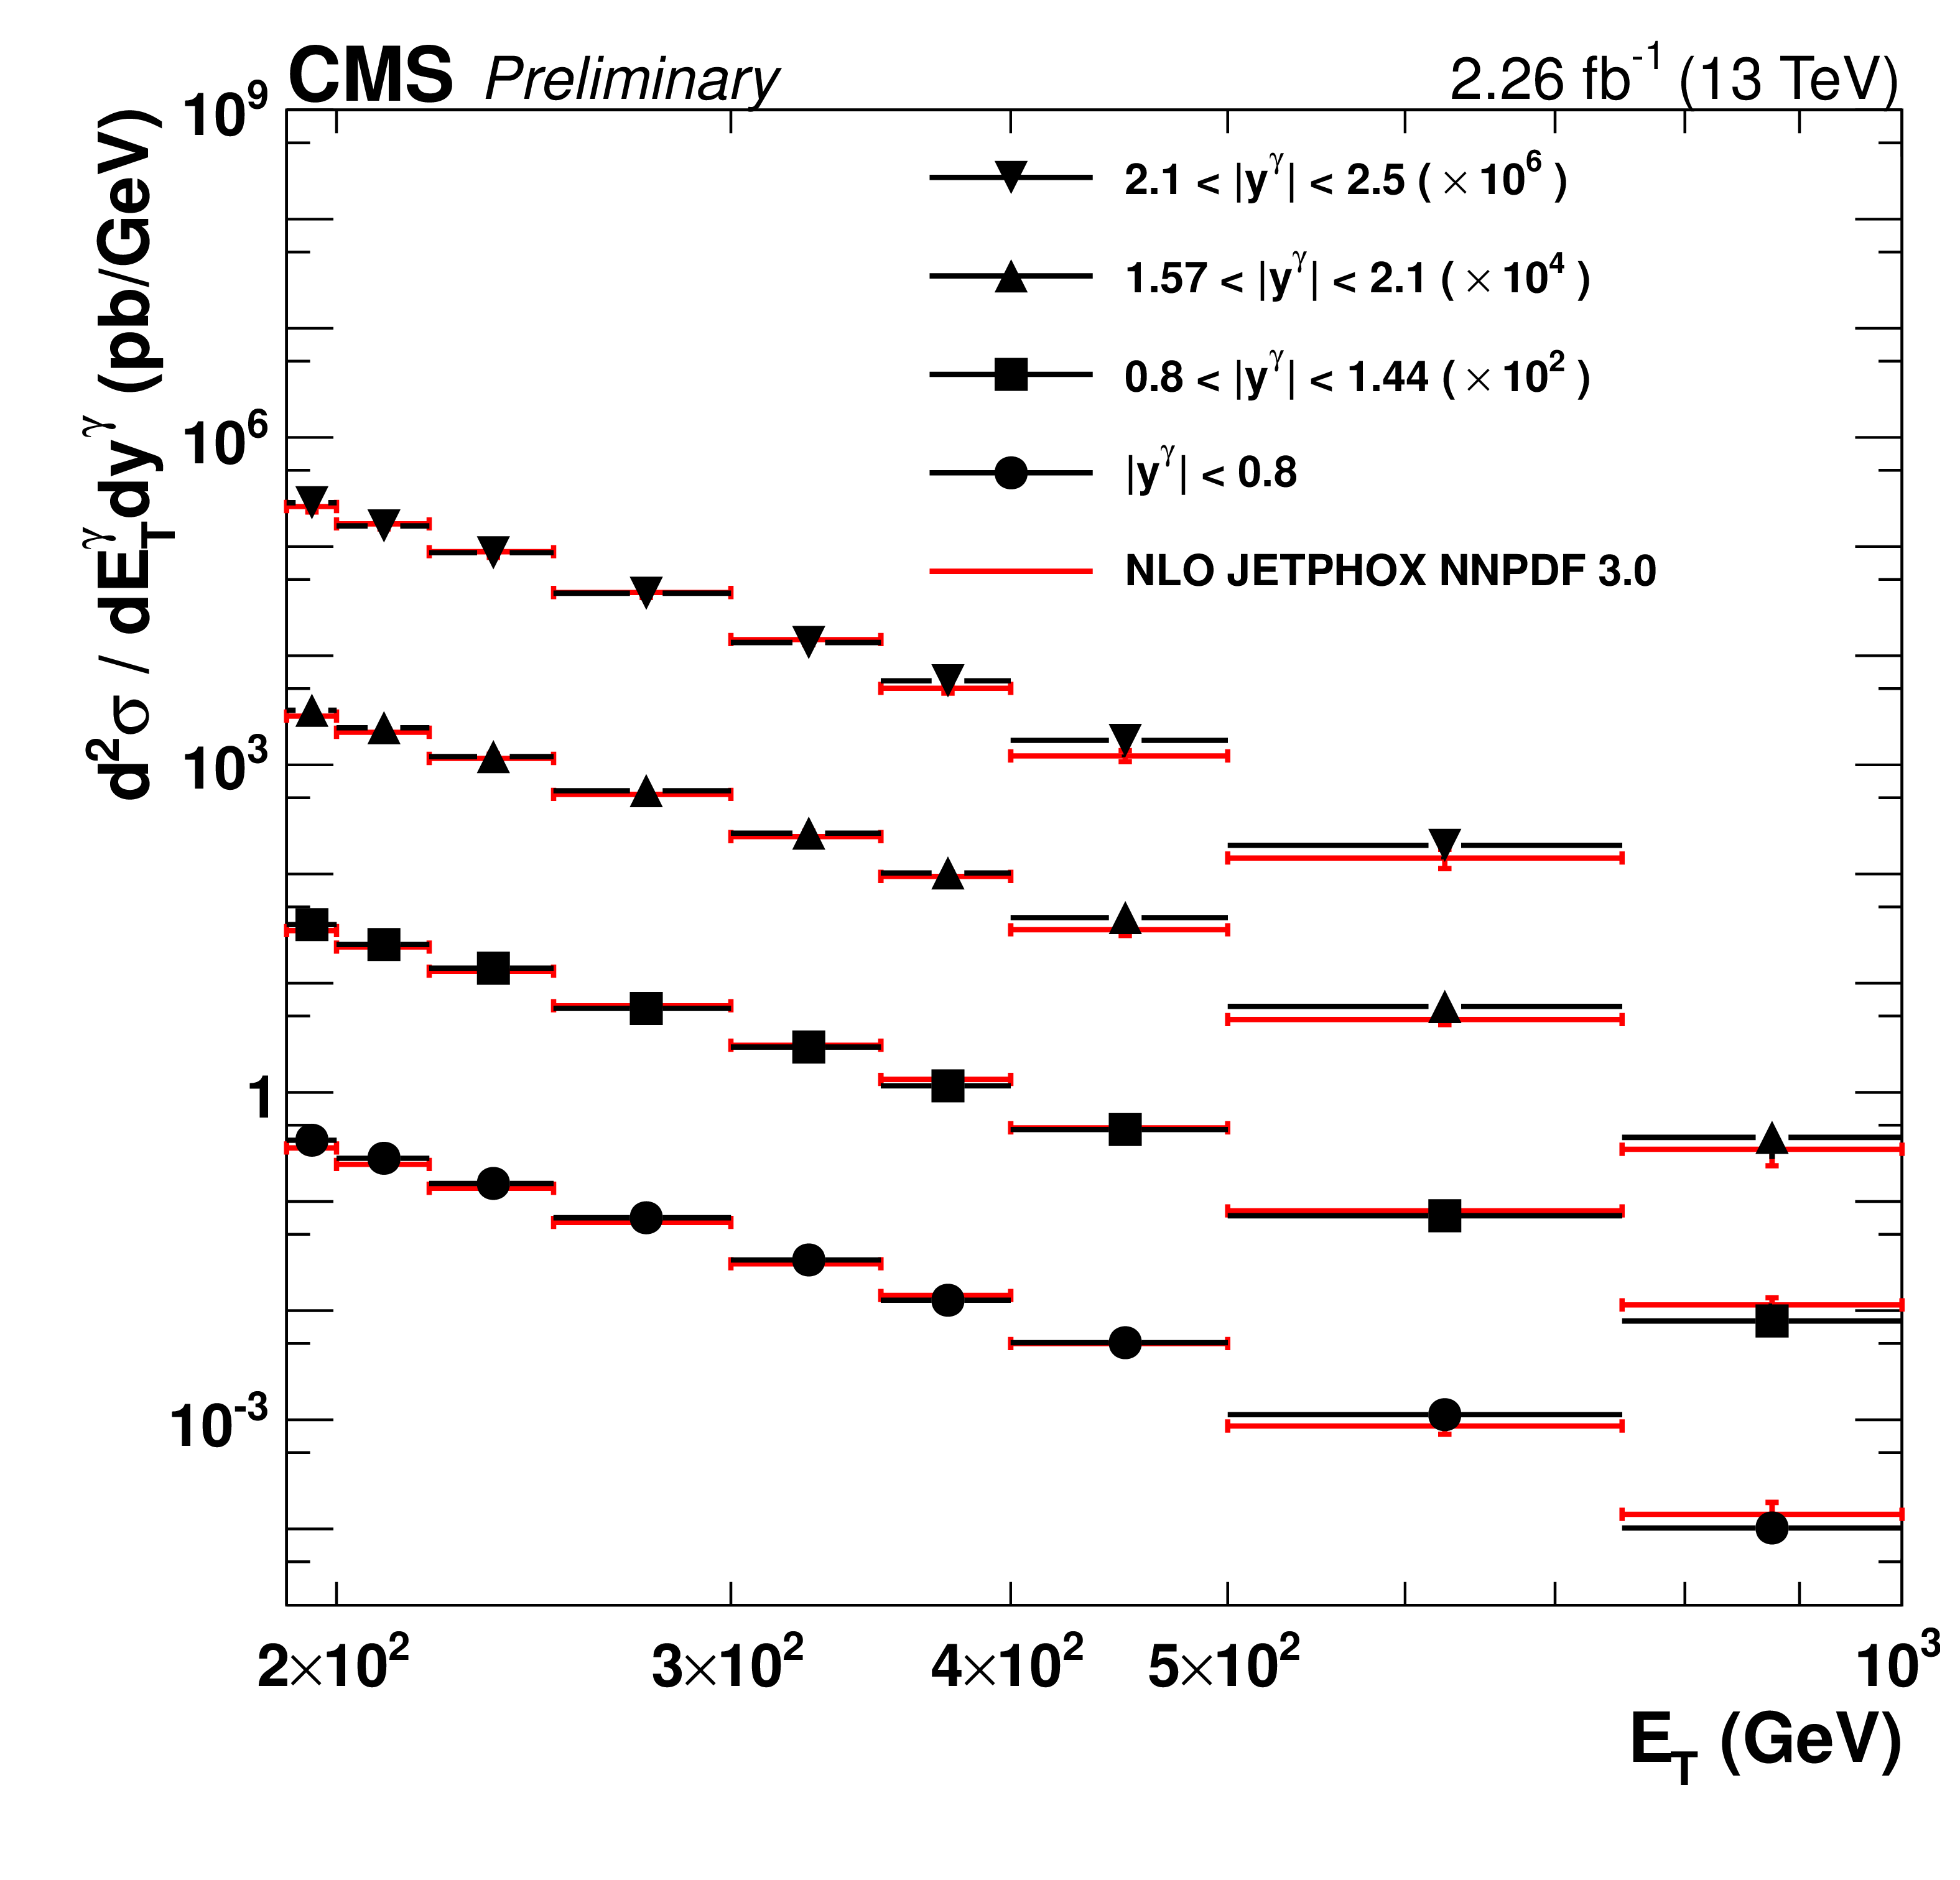
Figure 3:
Differential cross sections for isolated-photon production in photon rapidity bins, $ {| y^{\gamma} |} < $ 0.8, 0.8 $ < {| y^{\gamma} |} < $ 1.44, 1.57 $ < {| y^{\gamma} |} < $ 2.1, and 2.1 $ < {| y^{\gamma} |} < $ 2.5. The points show the measured values and their total uncertainties; the lines show the NLO JETPHOX predictions with the NNPDF3.0 PDF set. |

png pdf |
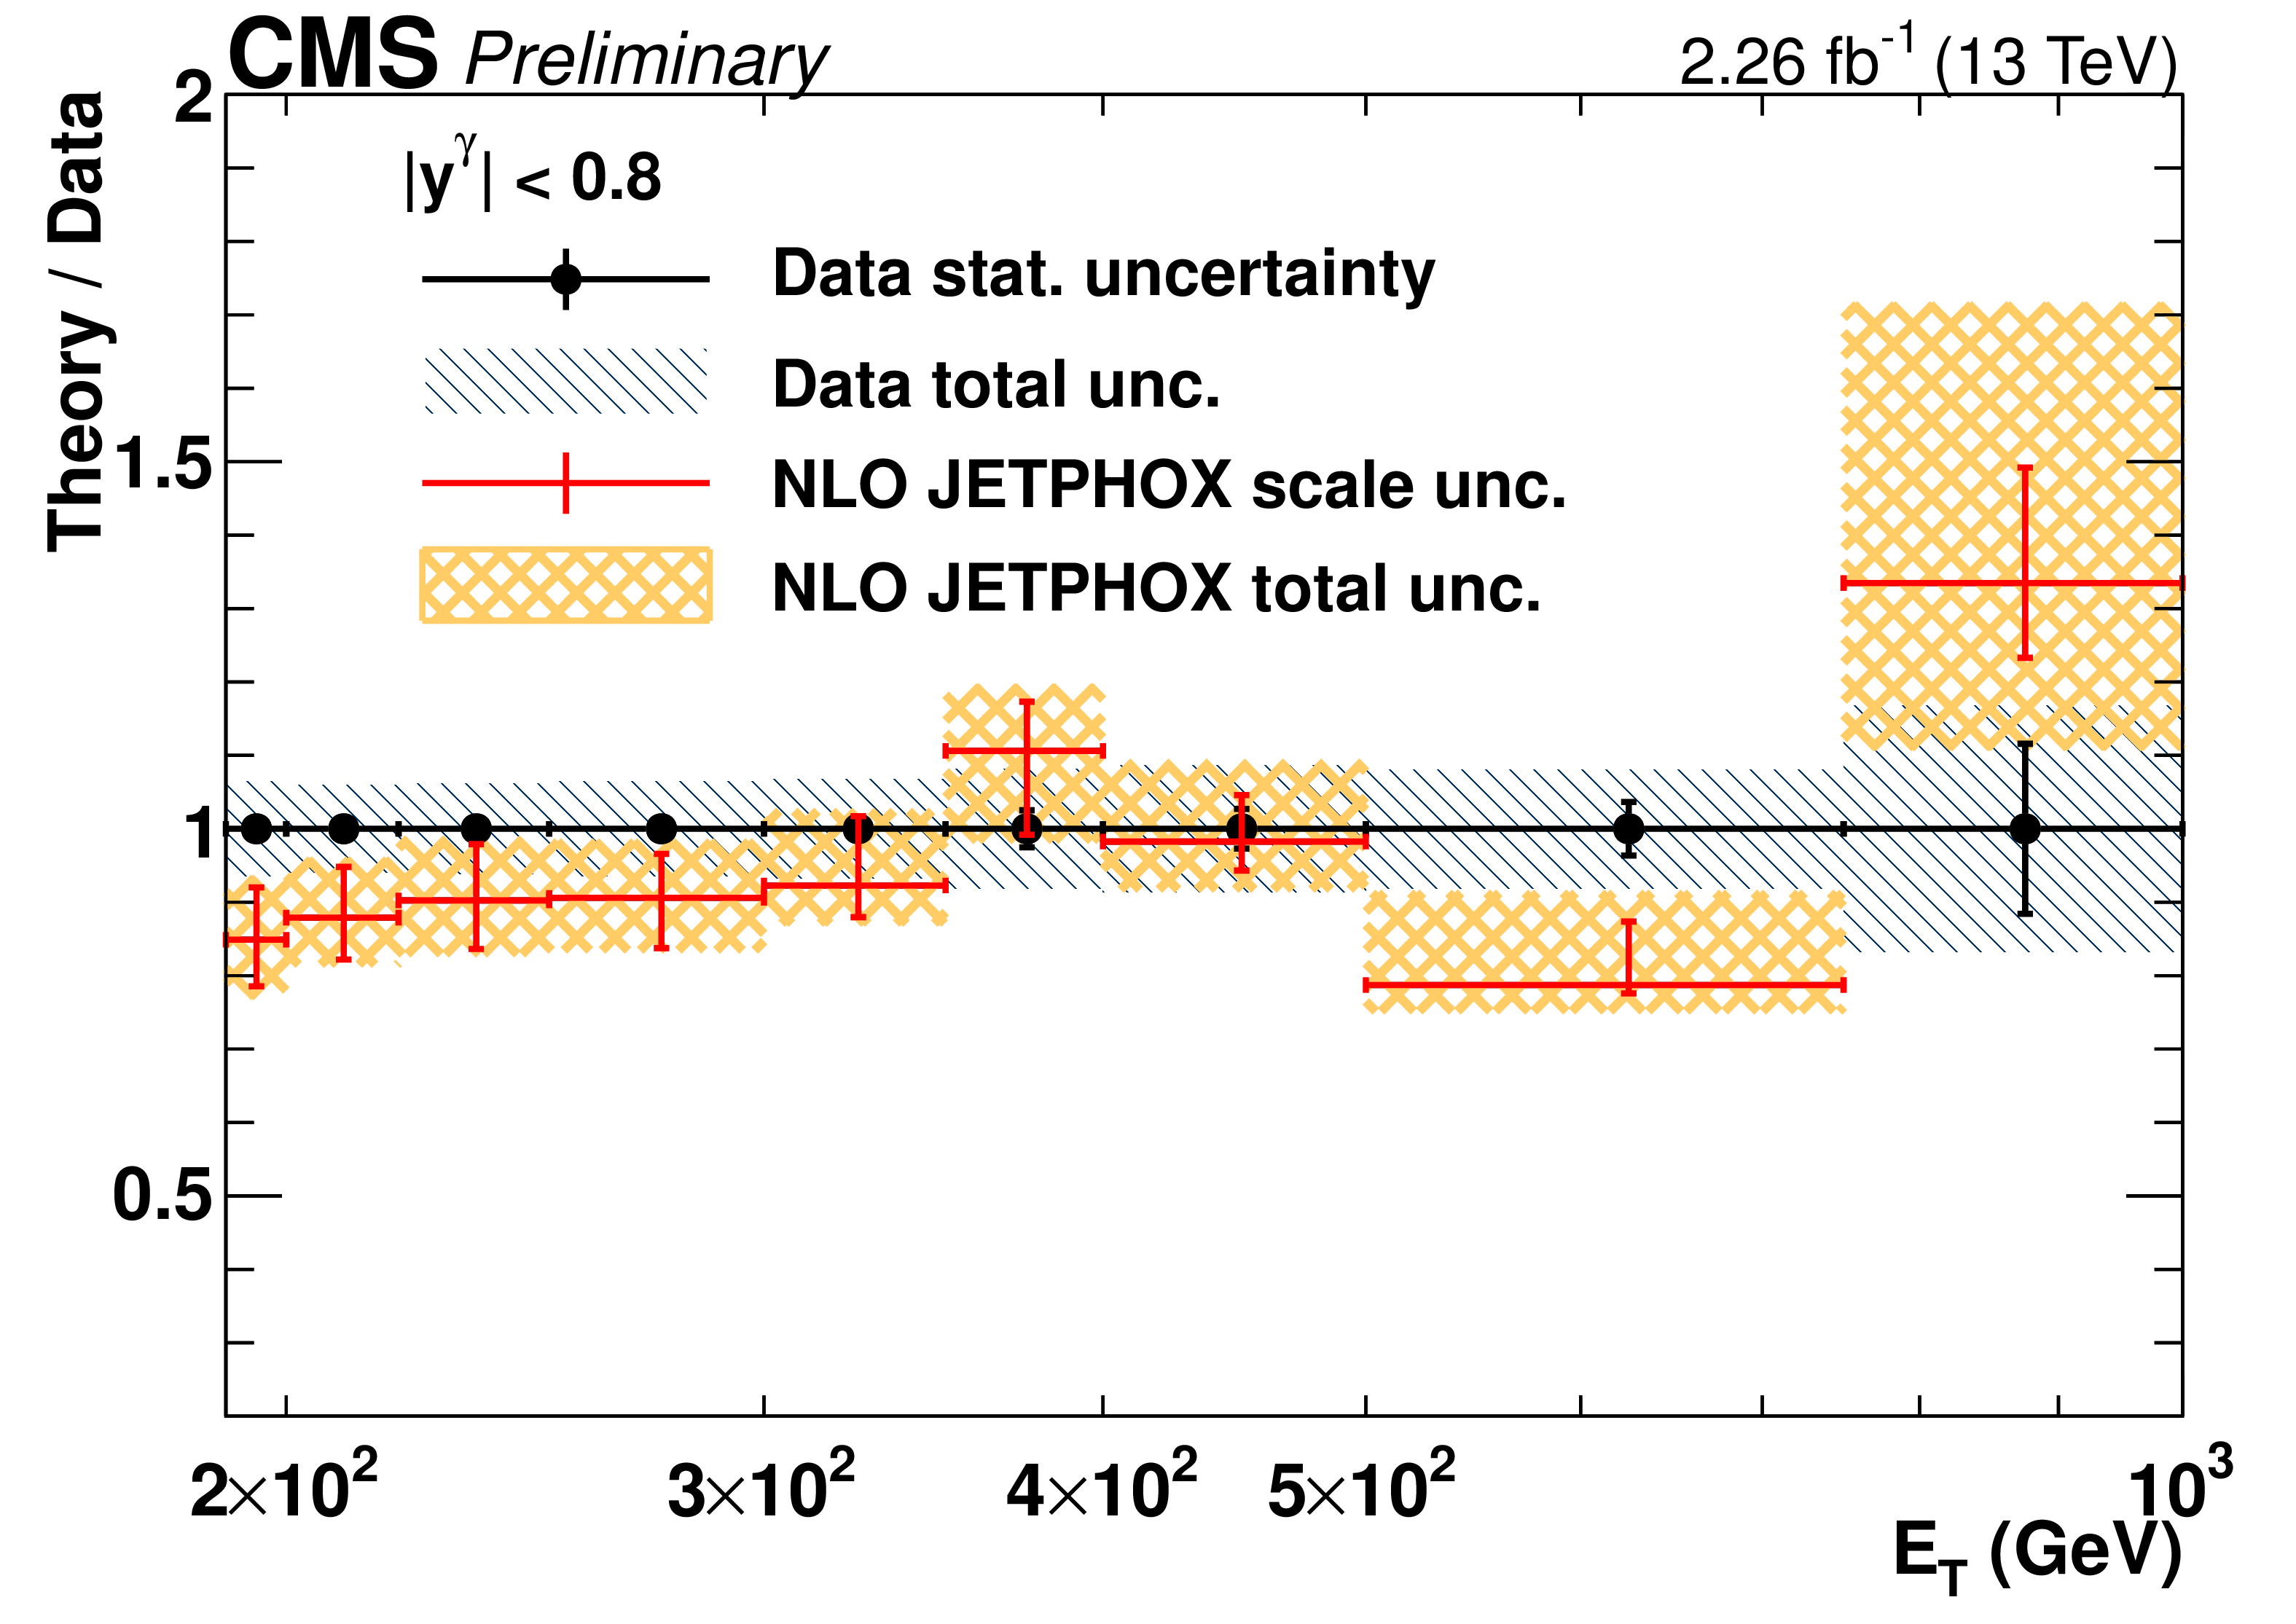
Figure 4:
The ratios of theoretical NLO predictions to data for the differential cross sections for isolated-photon production in four photon rapidity bins, $ {| y^{\gamma} |} < $ 0.8, 0.8 $ < {| y^{\gamma} |} < $ 1.44, 1.57 $ < {| y^{\gamma} |} < $ 2.1, and 2.1 $ < {| y^{\gamma} |} < $ 2.5, are shown. The error bars on data points represent the statistical uncertainty, while the hatched area shows the total experimental uncertainty. The errors on the ratio represent scale uncertainties, and the shaded regions represent the total theoretical uncertainties. |
png pdf |
Figure 4-a:
The ratio of theoretical NLO predictions to data for the differential cross sections for isolated-photon production, in photon rapidity bin $ {| y^{\gamma} |} < $ 0.8, is shown. The error bars on data points represent the statistical uncertainty, while the hatched area shows the total experimental uncertainty. The errors on the ratio represent scale uncertainties, and the shaded regions represent the total theoretical uncertainties. |
png pdf |
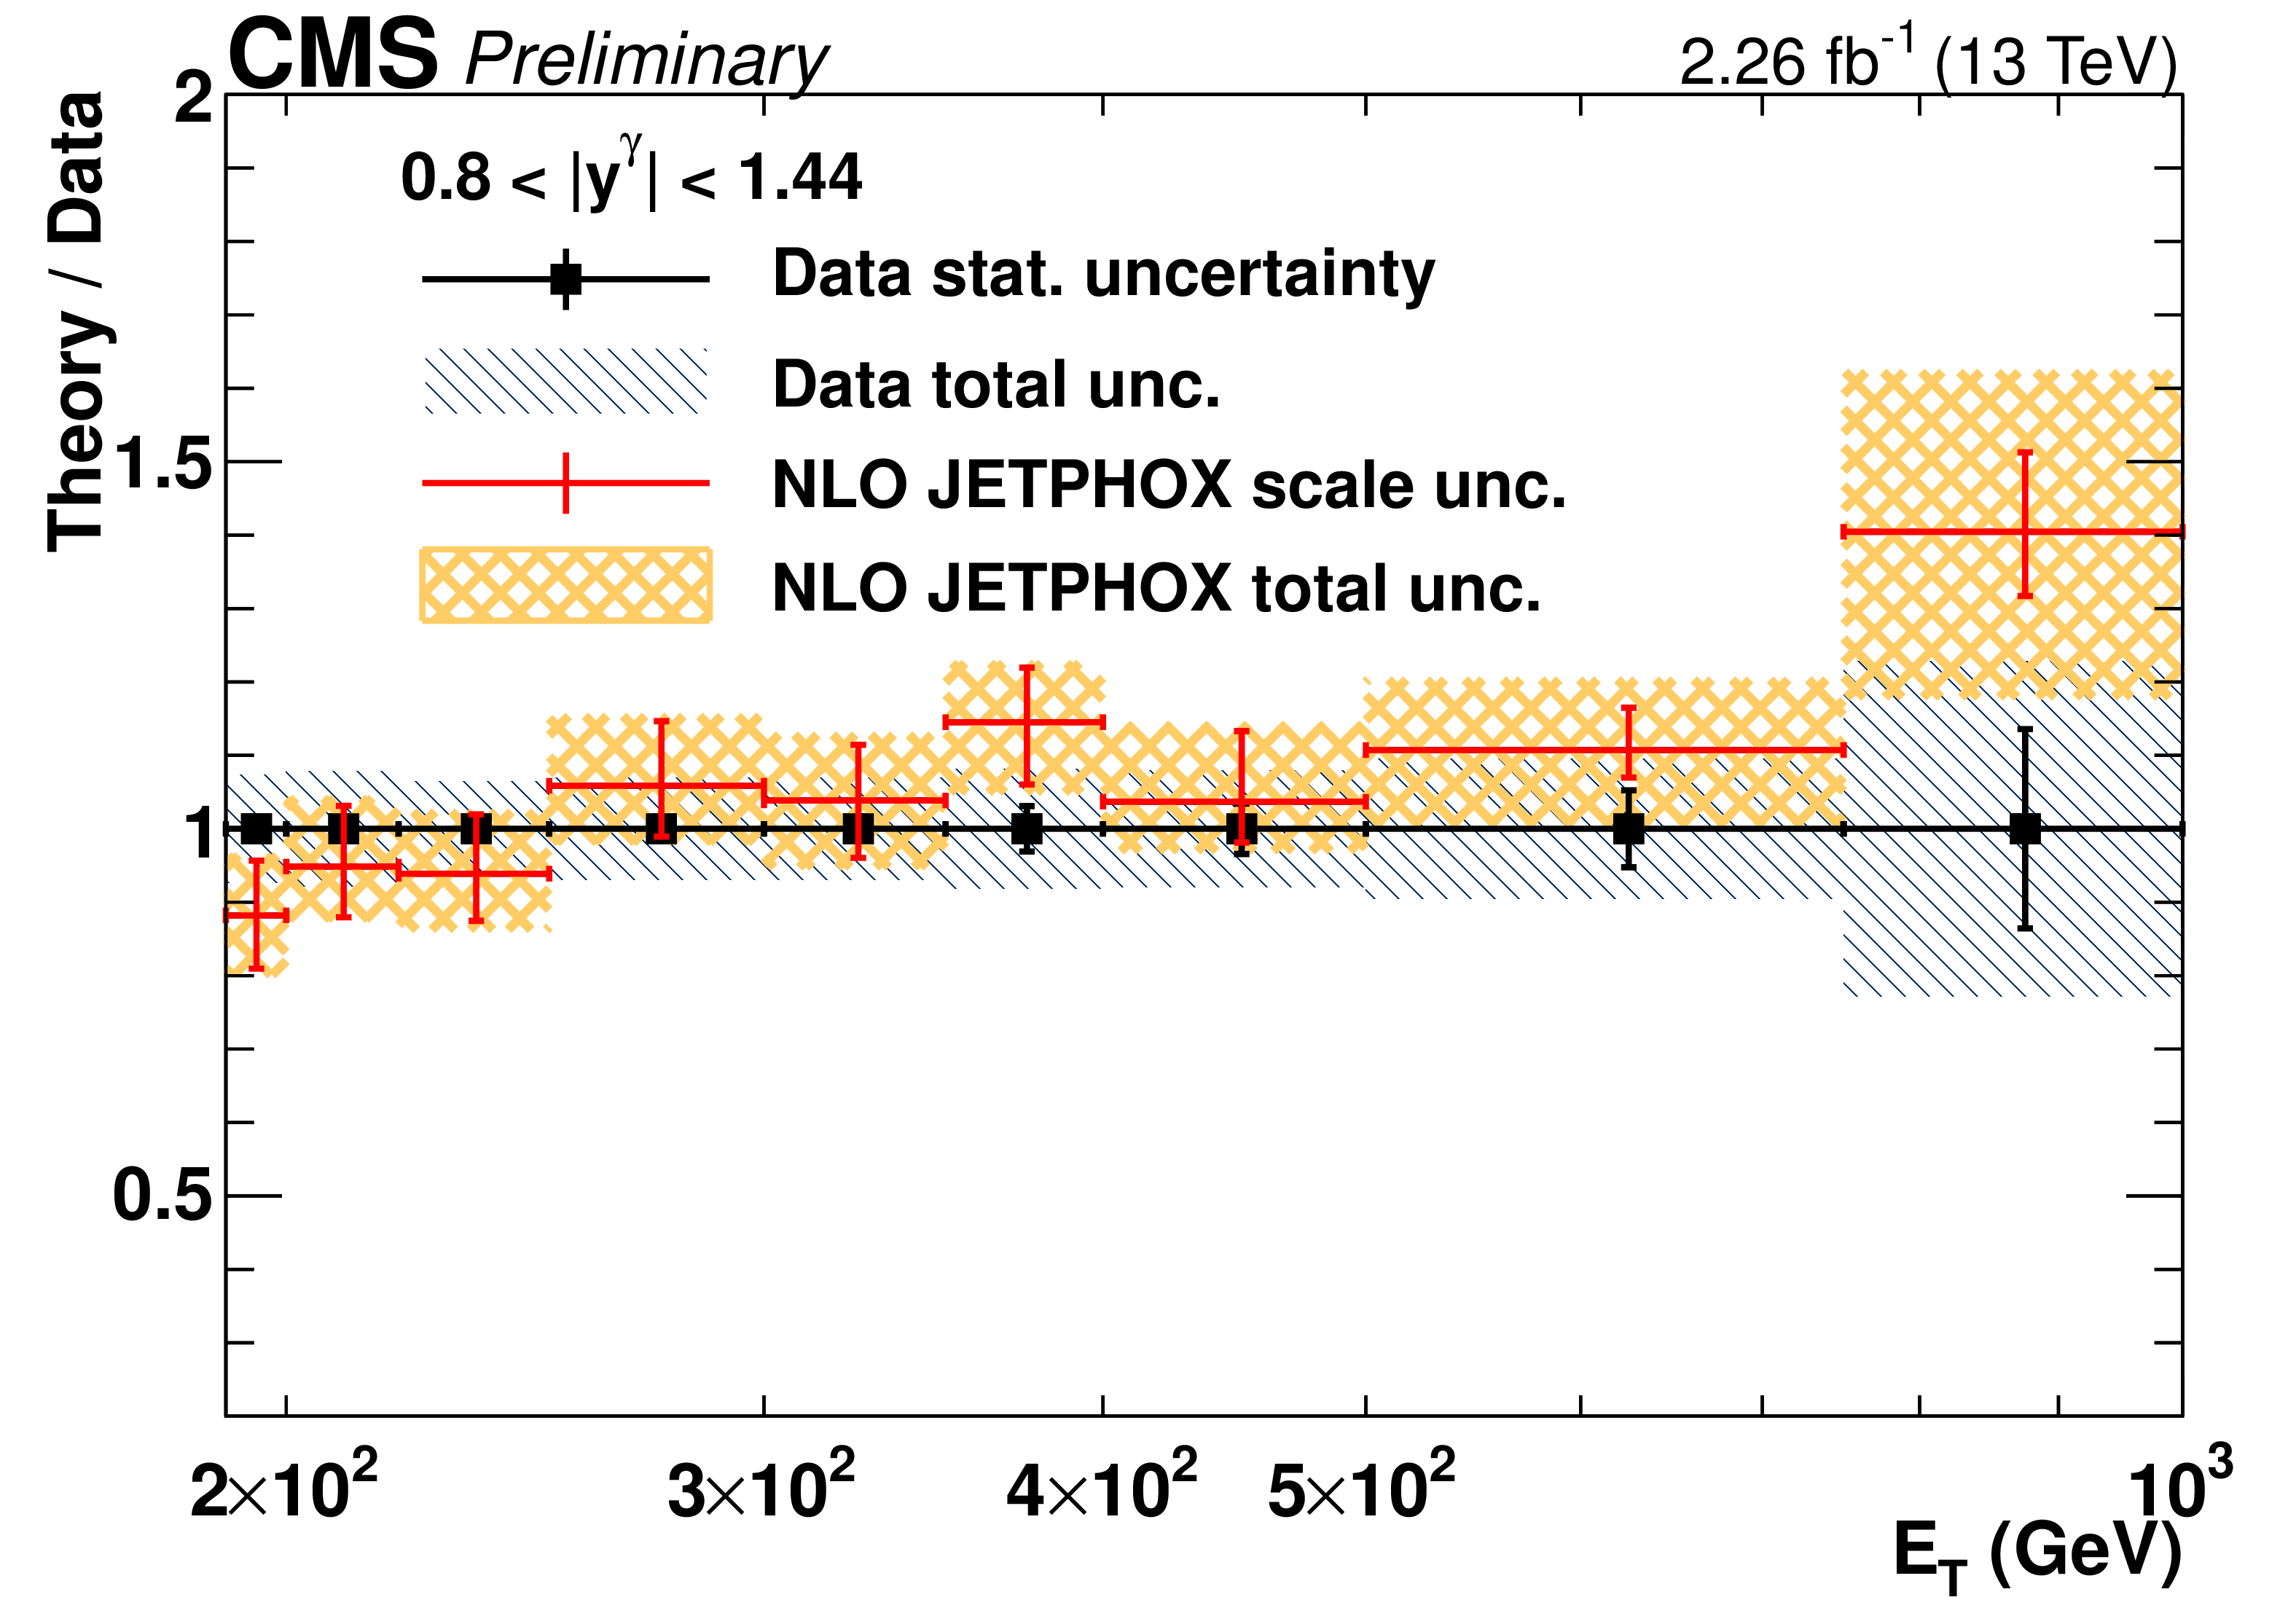
Figure 4-b:
The ratio of theoretical NLO predictions to data for the differential cross sections for isolated-photon production, in photon rapidity bin 0.8 $ < {| y^{\gamma} |} < $ 1.44, is shown. The error bars on data points represent the statistical uncertainty, while the hatched area shows the total experimental uncertainty. The errors on the ratio represent scale uncertainties, and the shaded regions represent the total theoretical uncertainties. |
png pdf |
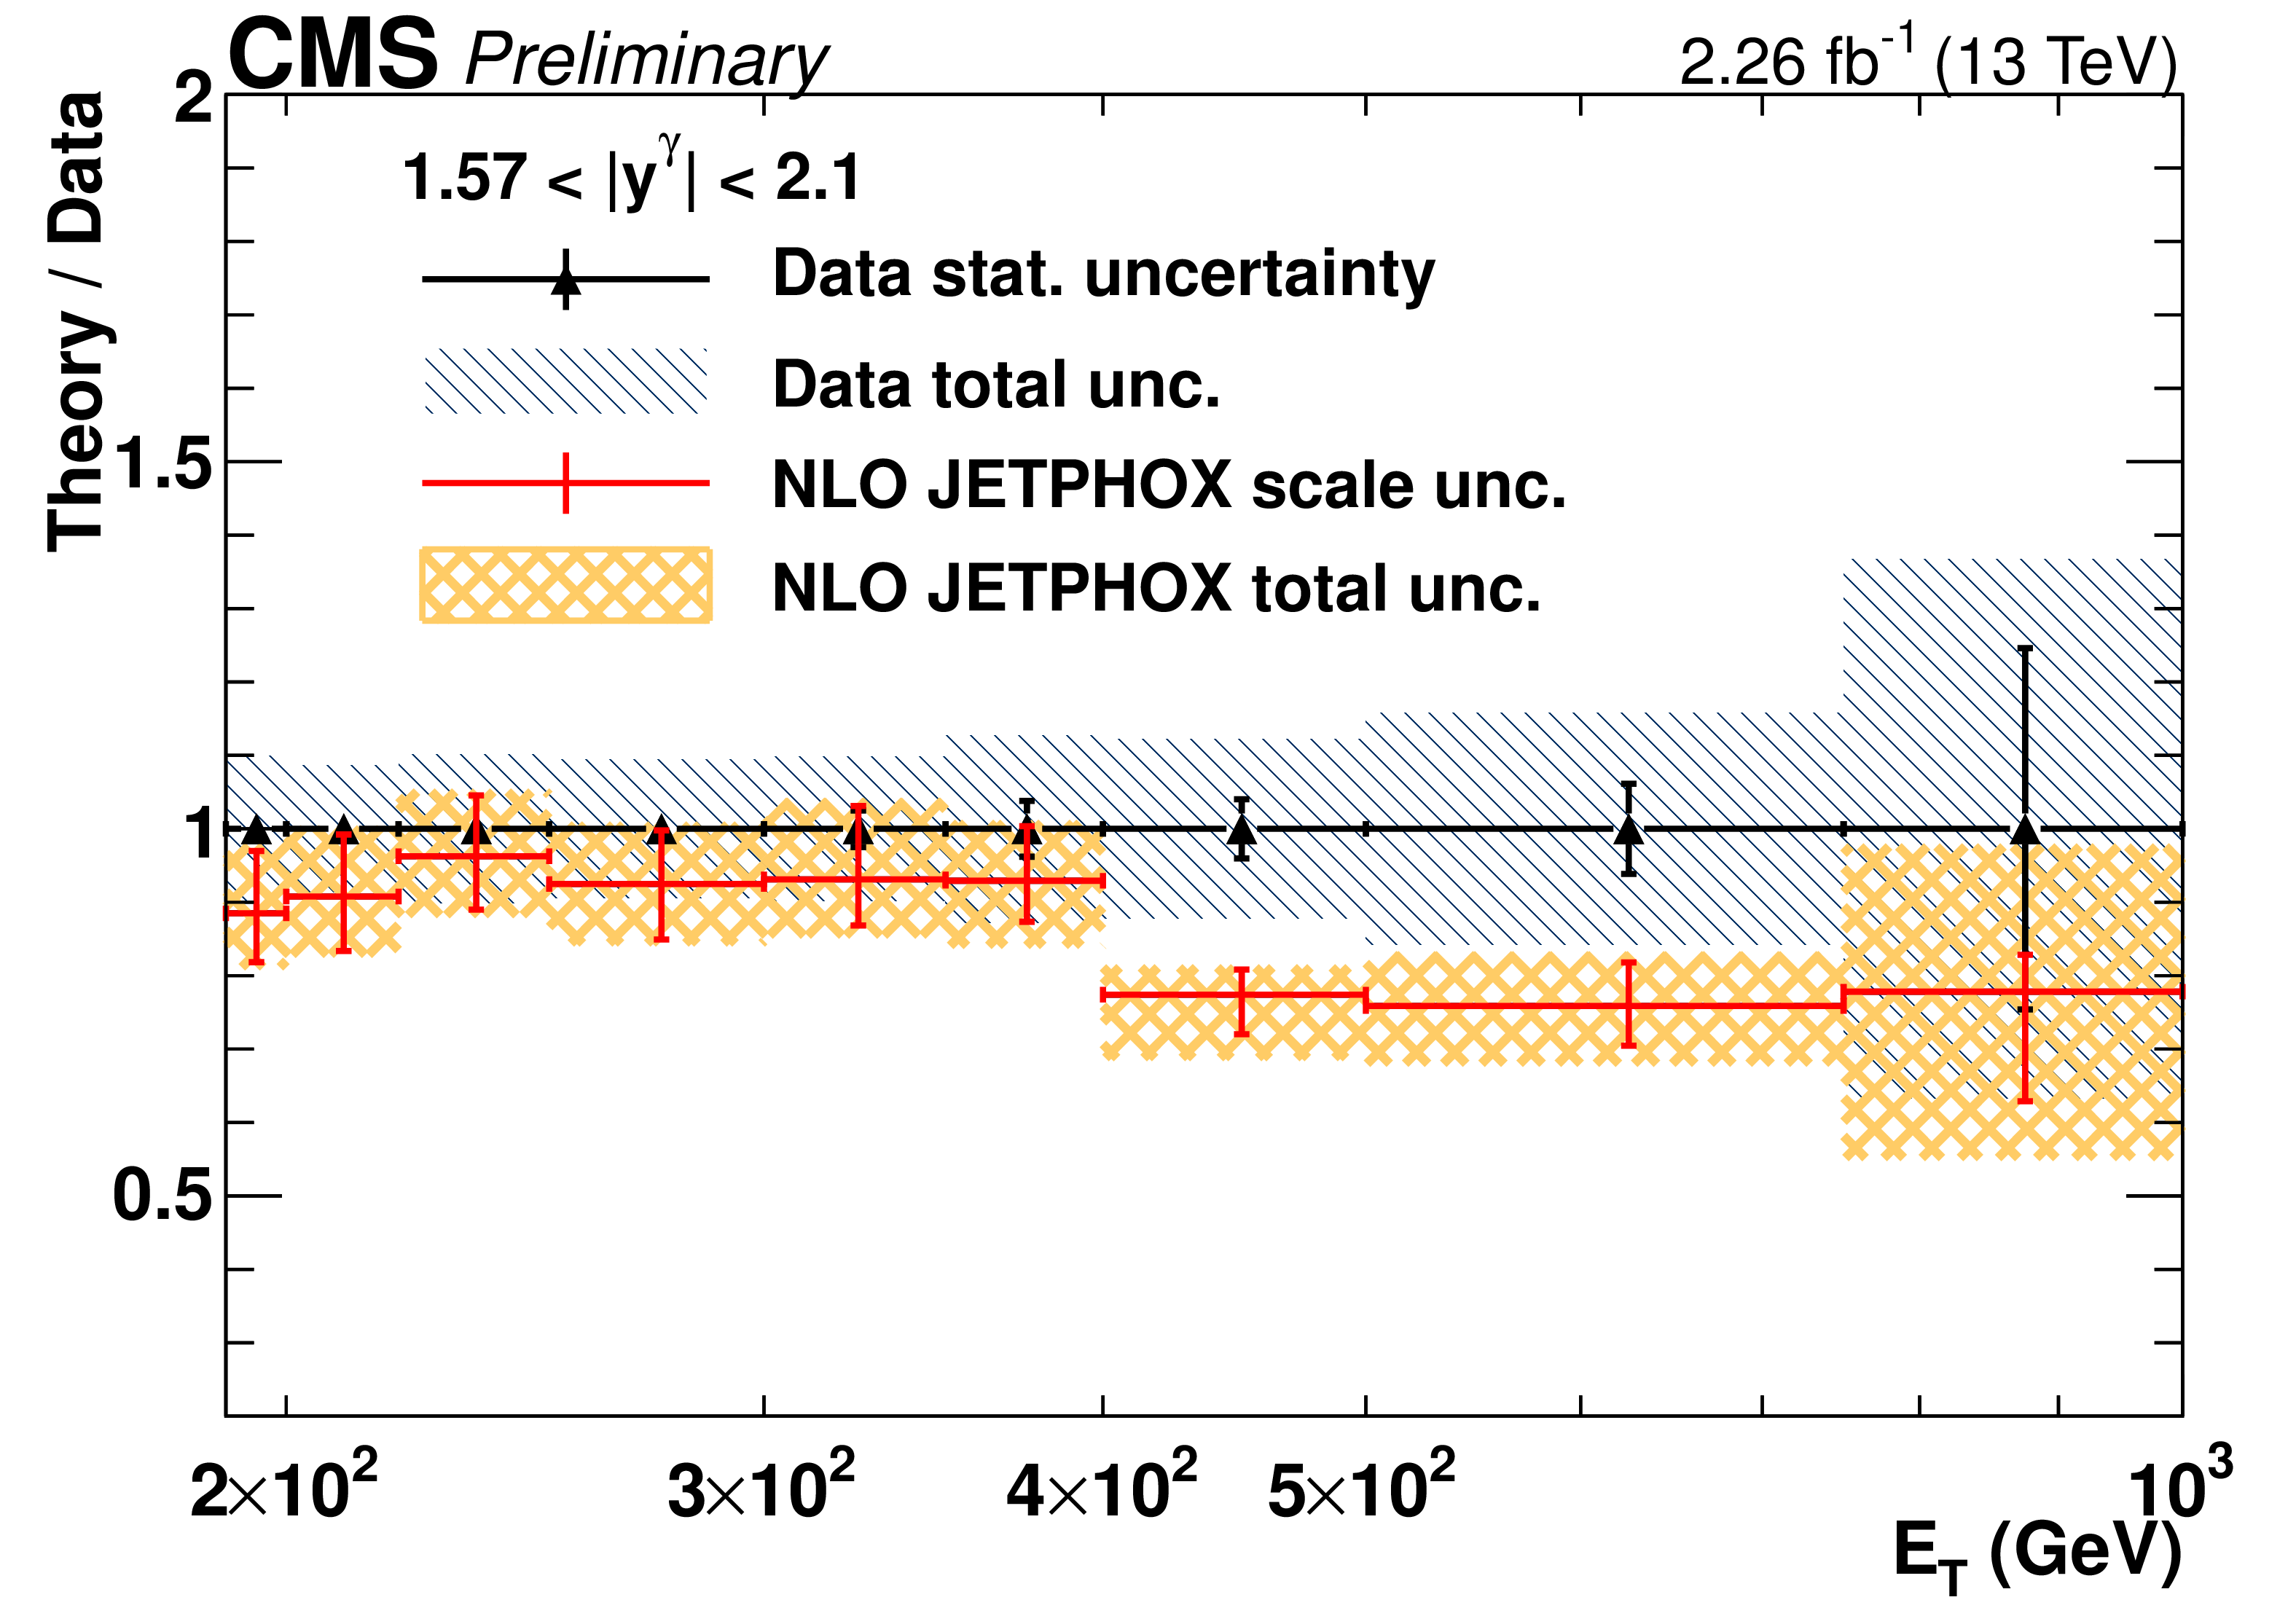
Figure 4-c:
The ratio of theoretical NLO predictions to data for the differential cross sections for isolated-photon production, in photon rapidity bin 1.57 $ < {| y^{\gamma} |} < $ 2.1, is shown. The error bars on data points represent the statistical uncertainty, while the hatched area shows the total experimental uncertainty. The errors on the ratio represent scale uncertainties, and the shaded regions represent the total theoretical uncertainties. |

png pdf |
Figure 4-d:
The ratio of theoretical NLO predictions to data for the differential cross sections for isolated-photon production, in photon rapidity bin 2.1 $ < {| y^{\gamma} |} < $ 2.5, is shown. The error bars on data points represent the statistical uncertainty, while the hatched area shows the total experimental uncertainty. The errors on the ratio represent scale uncertainties, and the shaded regions represent the total theoretical uncertainties. |
png pdf |
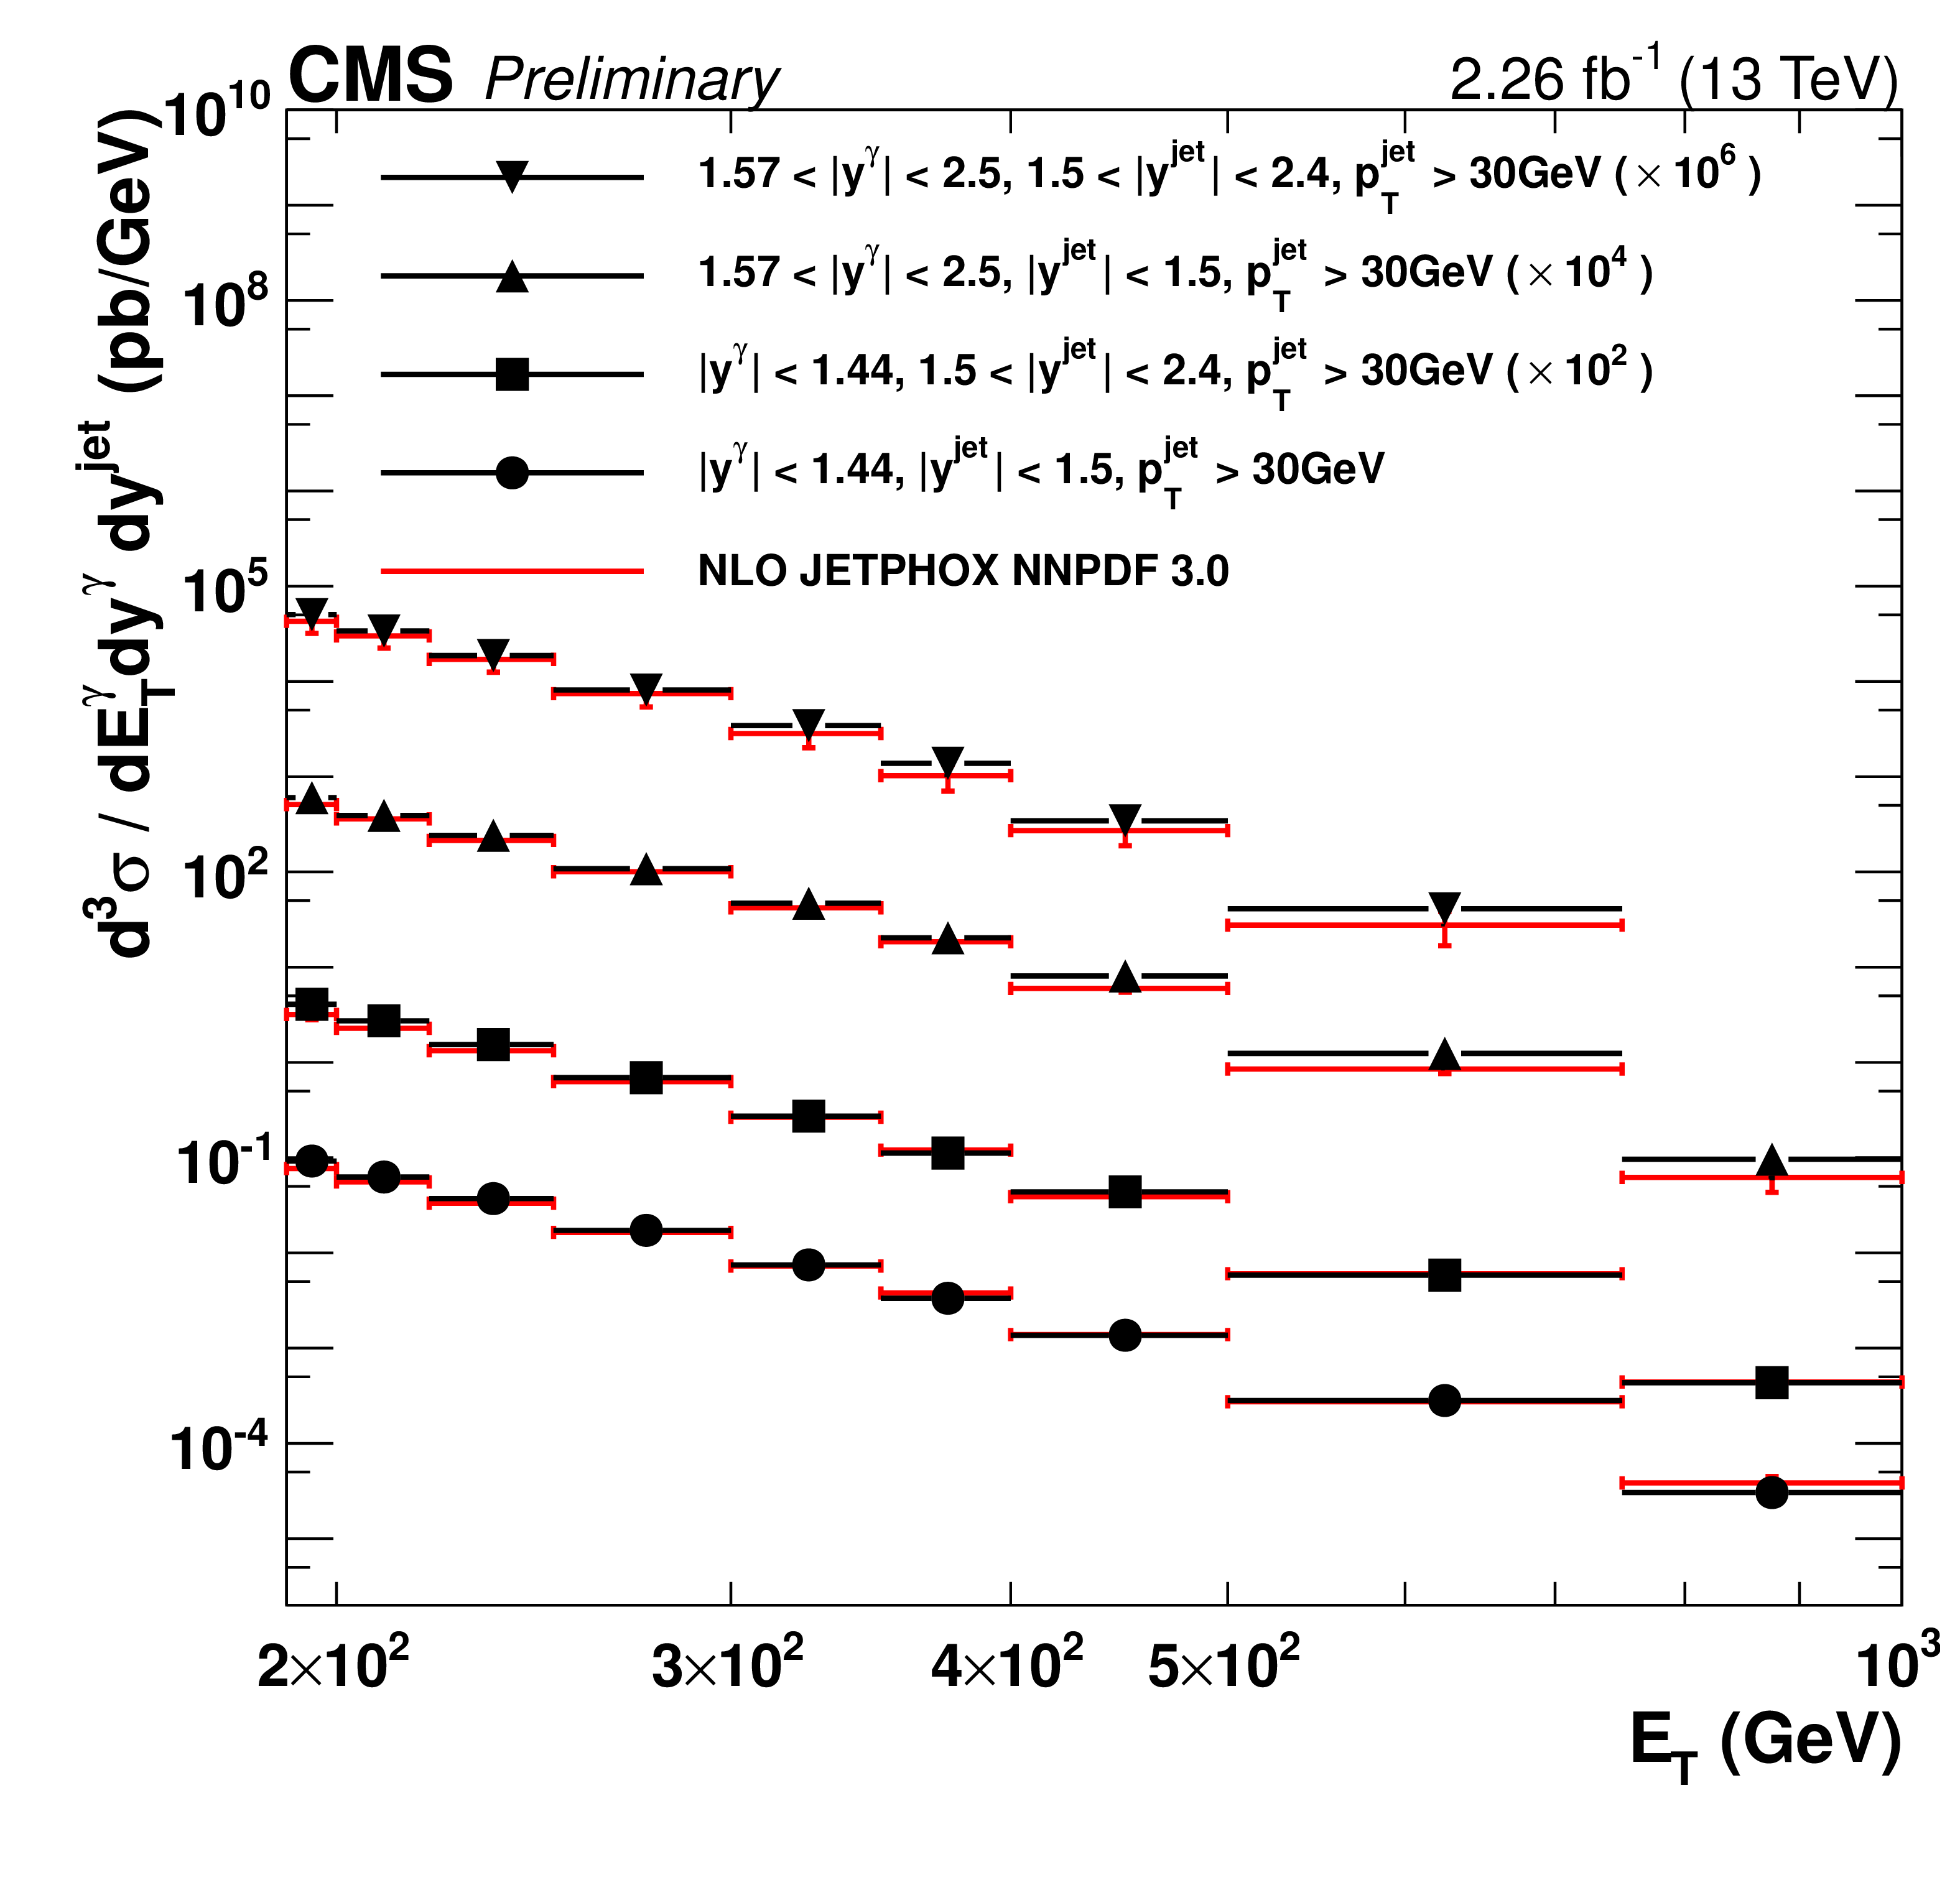
Figure 5:
Differential cross sections for photon+jets production in two photon rapidity bins, $ {| y^{\gamma} |} < $ 1.44 and 1.57 $ < {| y^{\gamma} |} < $ 2.5, and two jet rapidity bins, $ {| y^{\text {jet}} |} < $ 1.5 and 1.5 $ < {| y^{\text {jet}} |} < $ 2.4. The points show the measured values with their total uncertainties, and the lines show the NLO JETPHOX predictions with the NNPDF3.0 PDF set. |
png pdf |
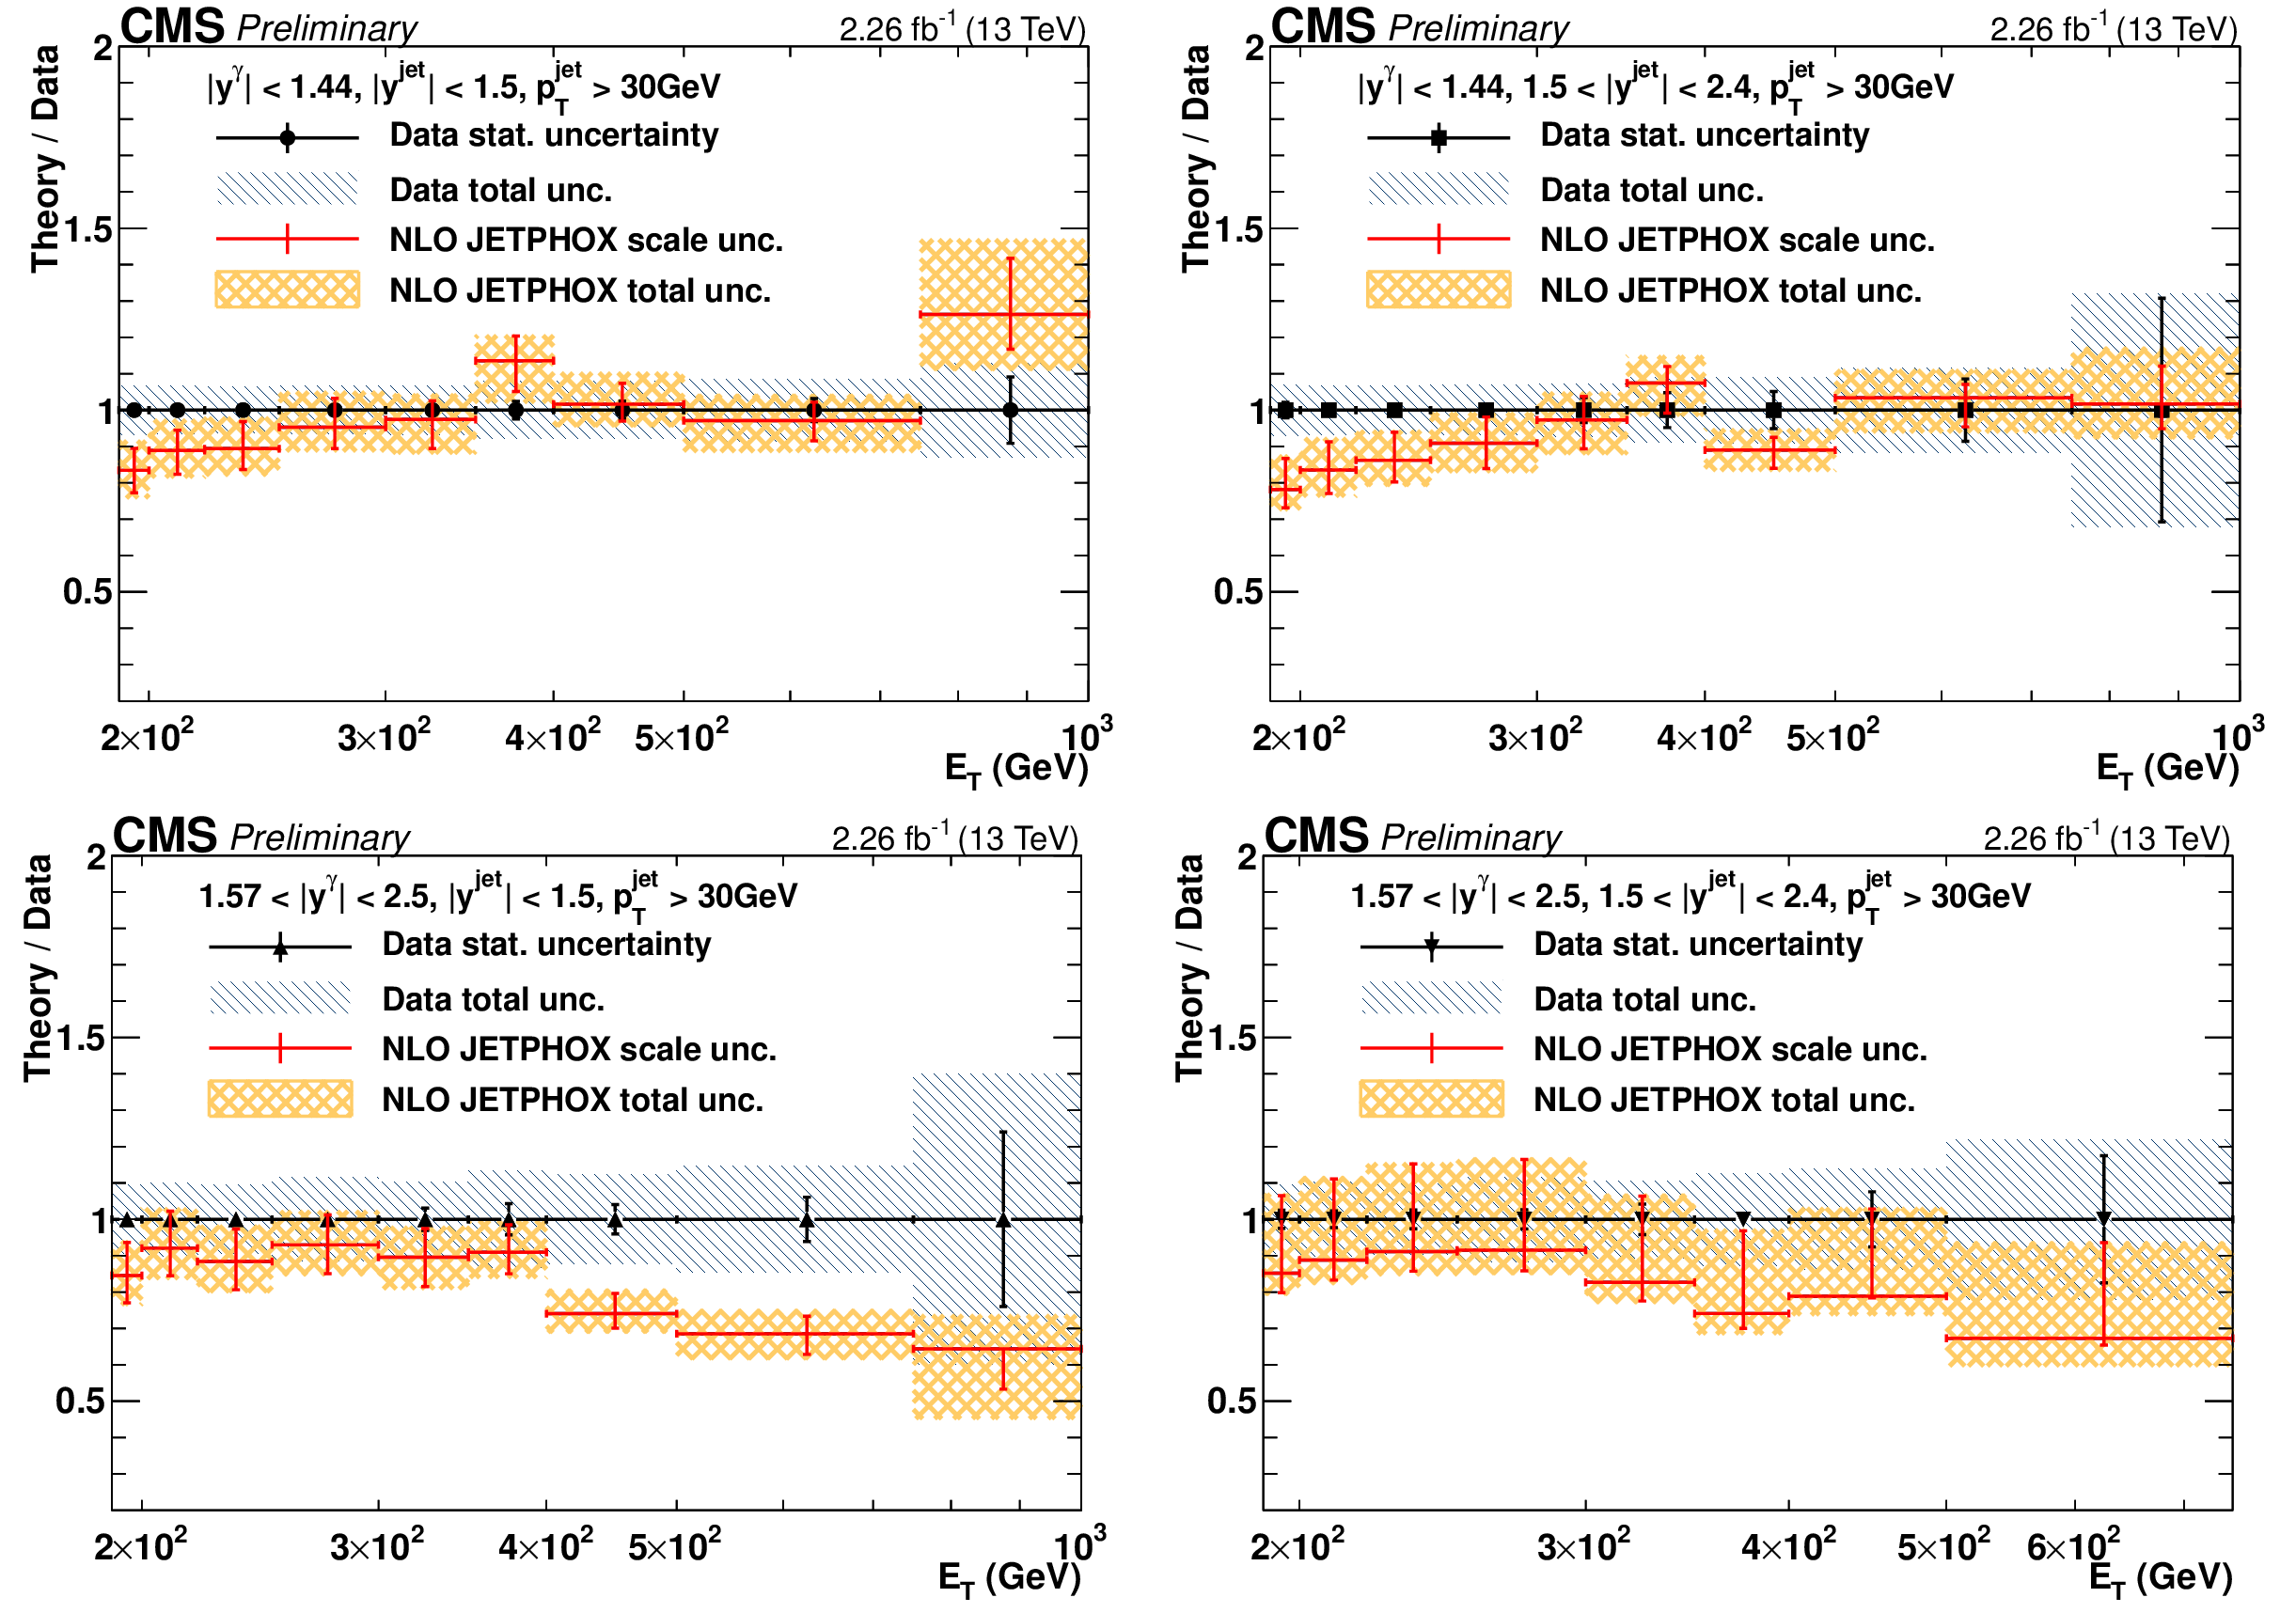
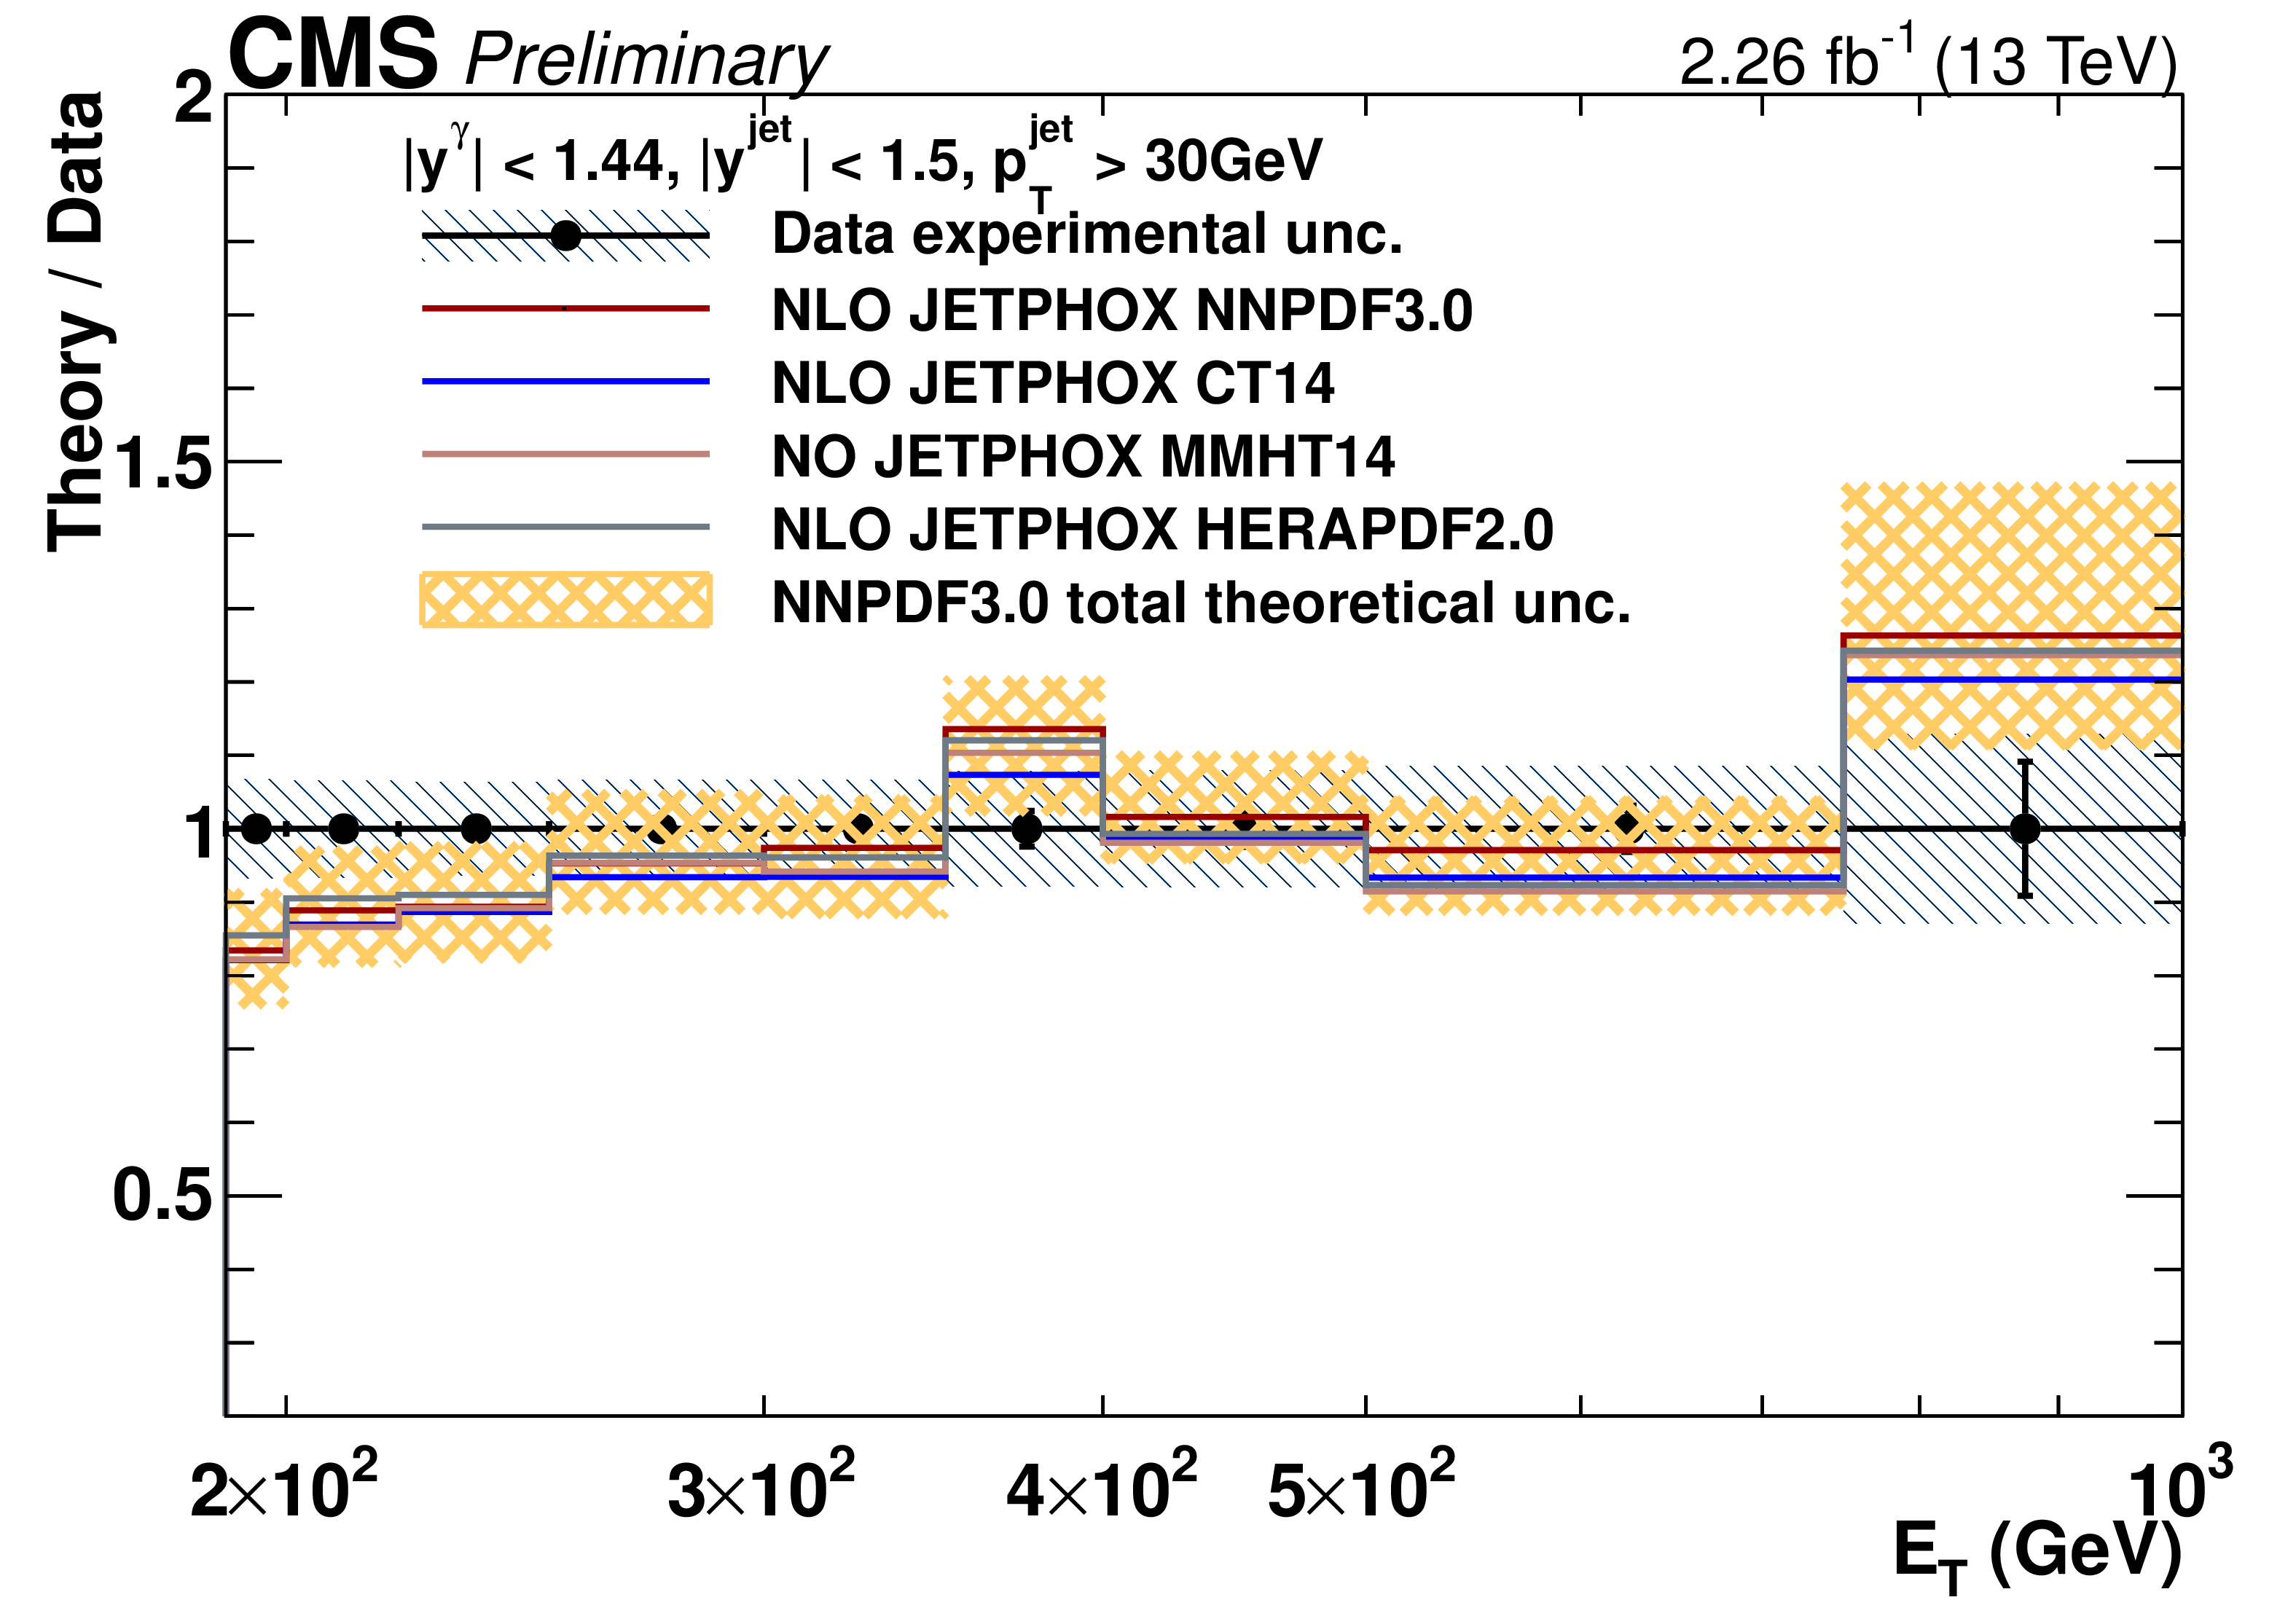
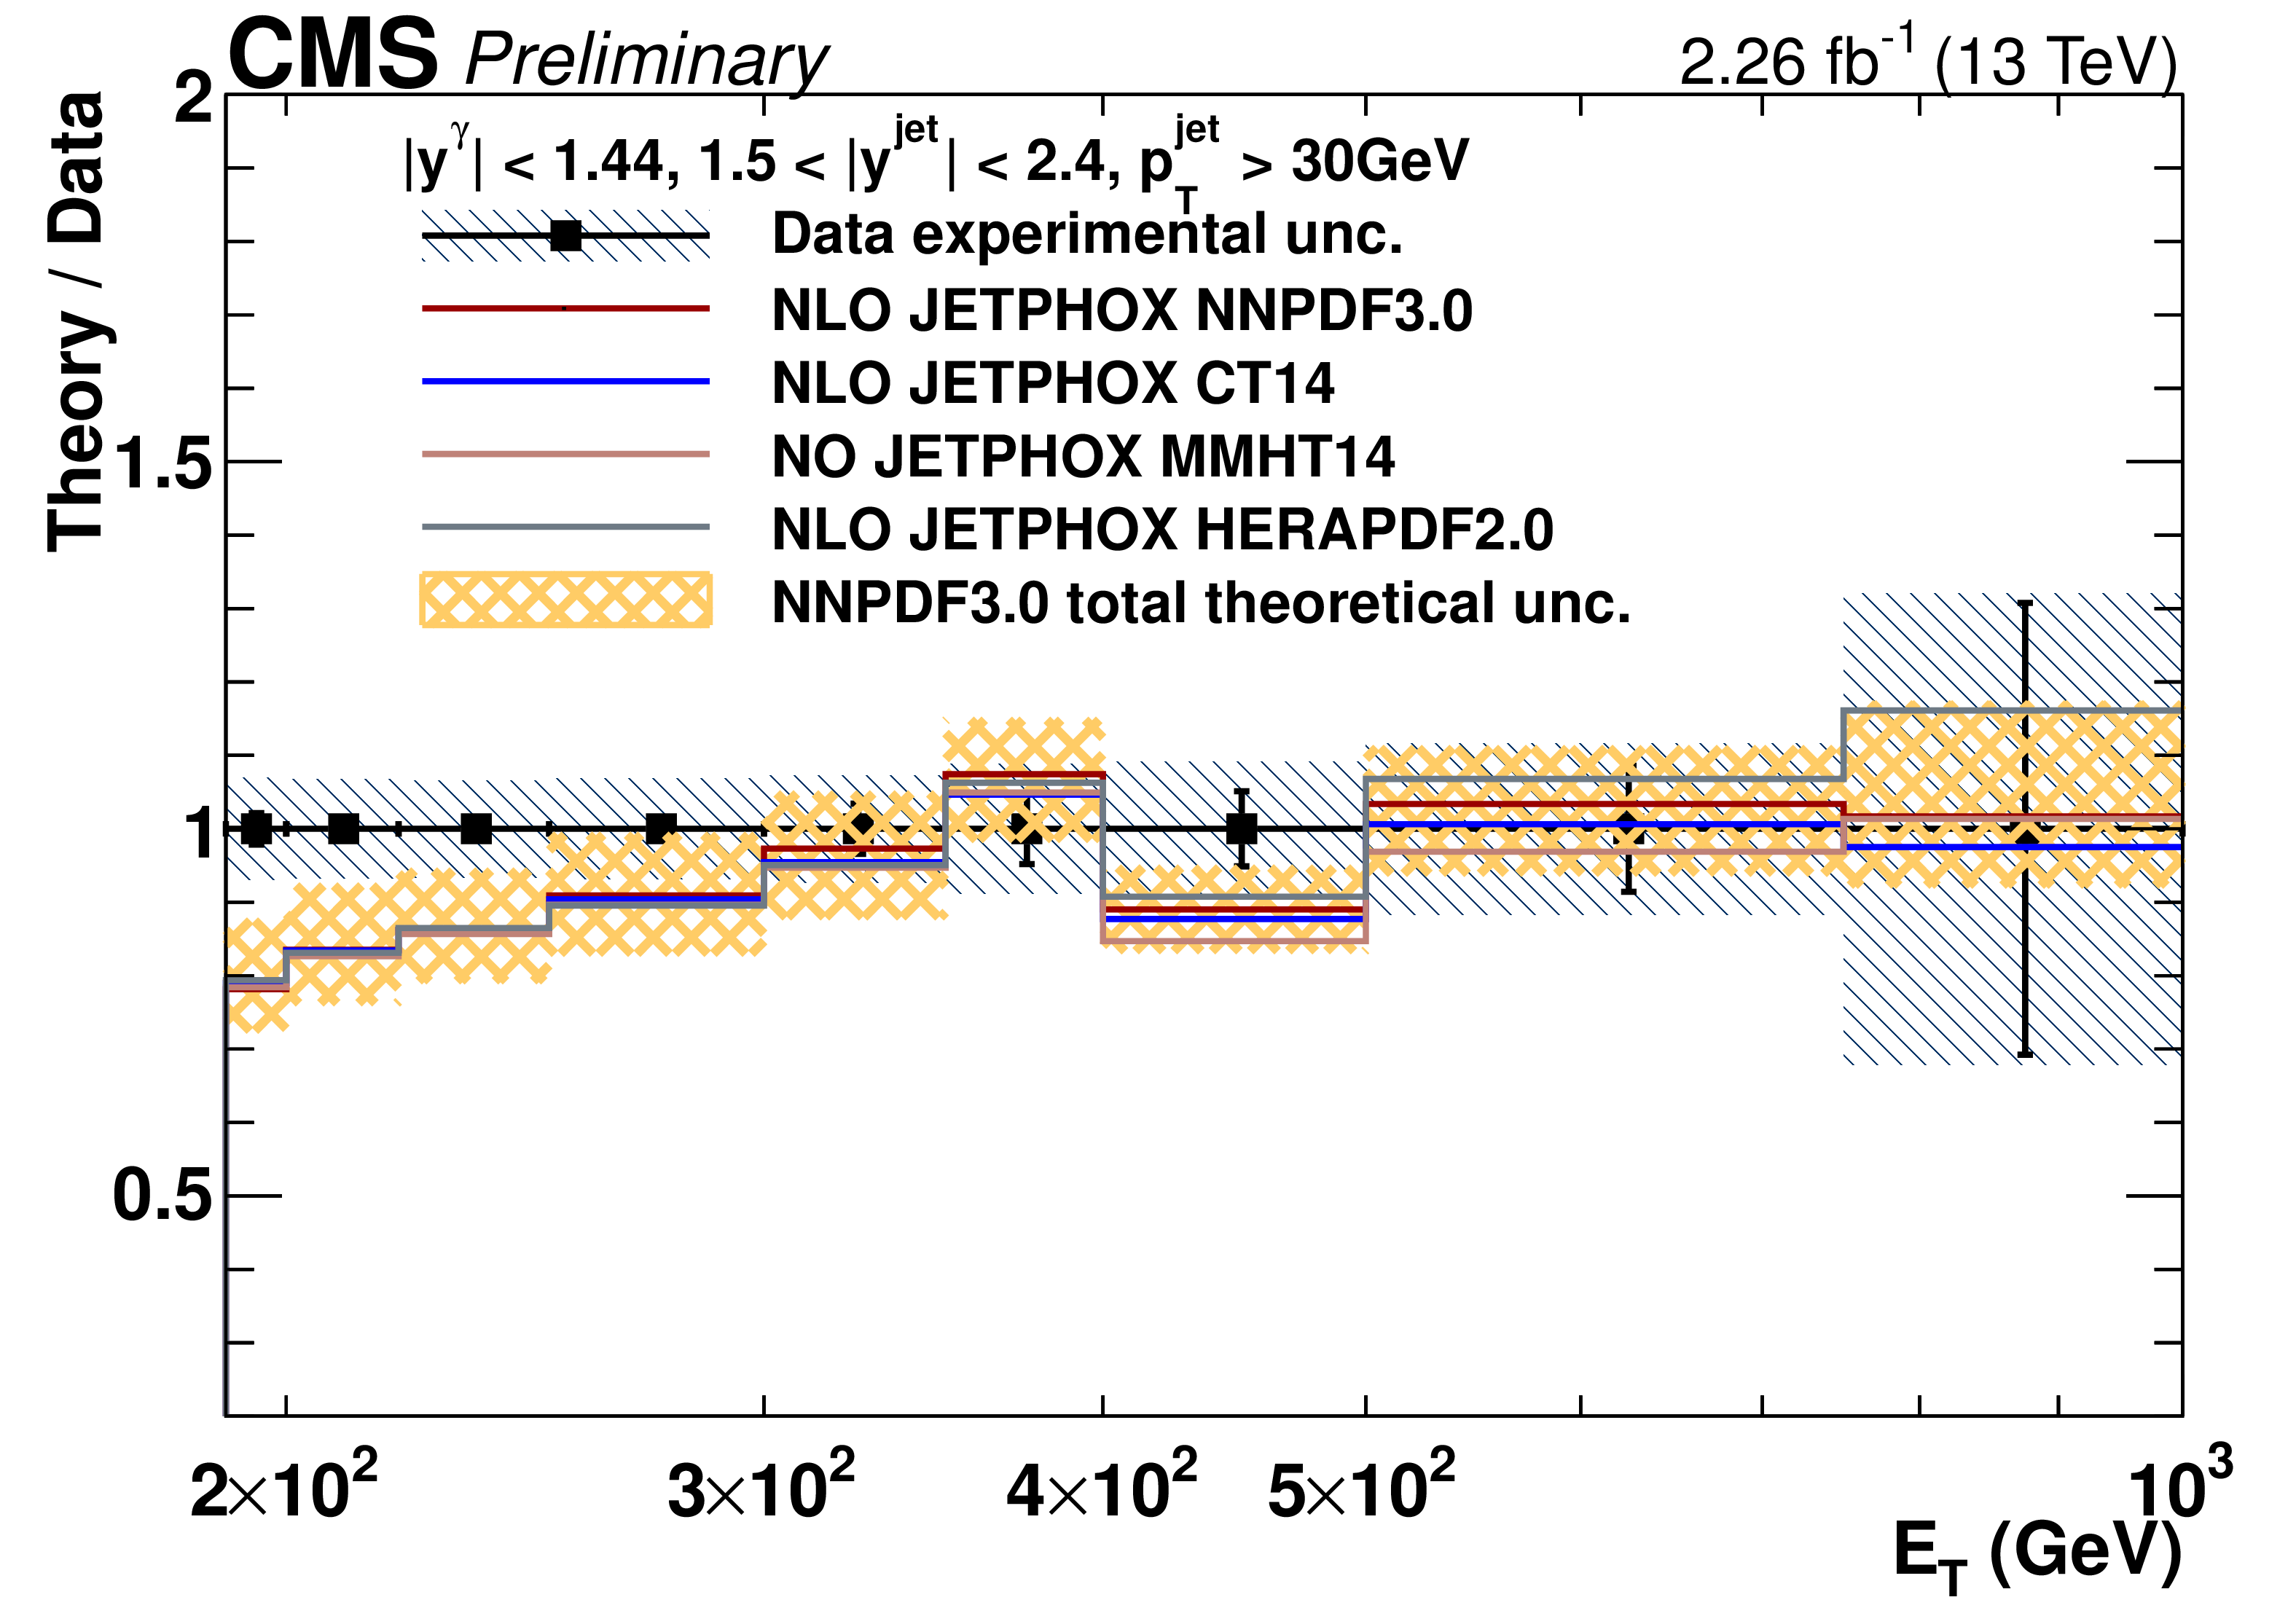
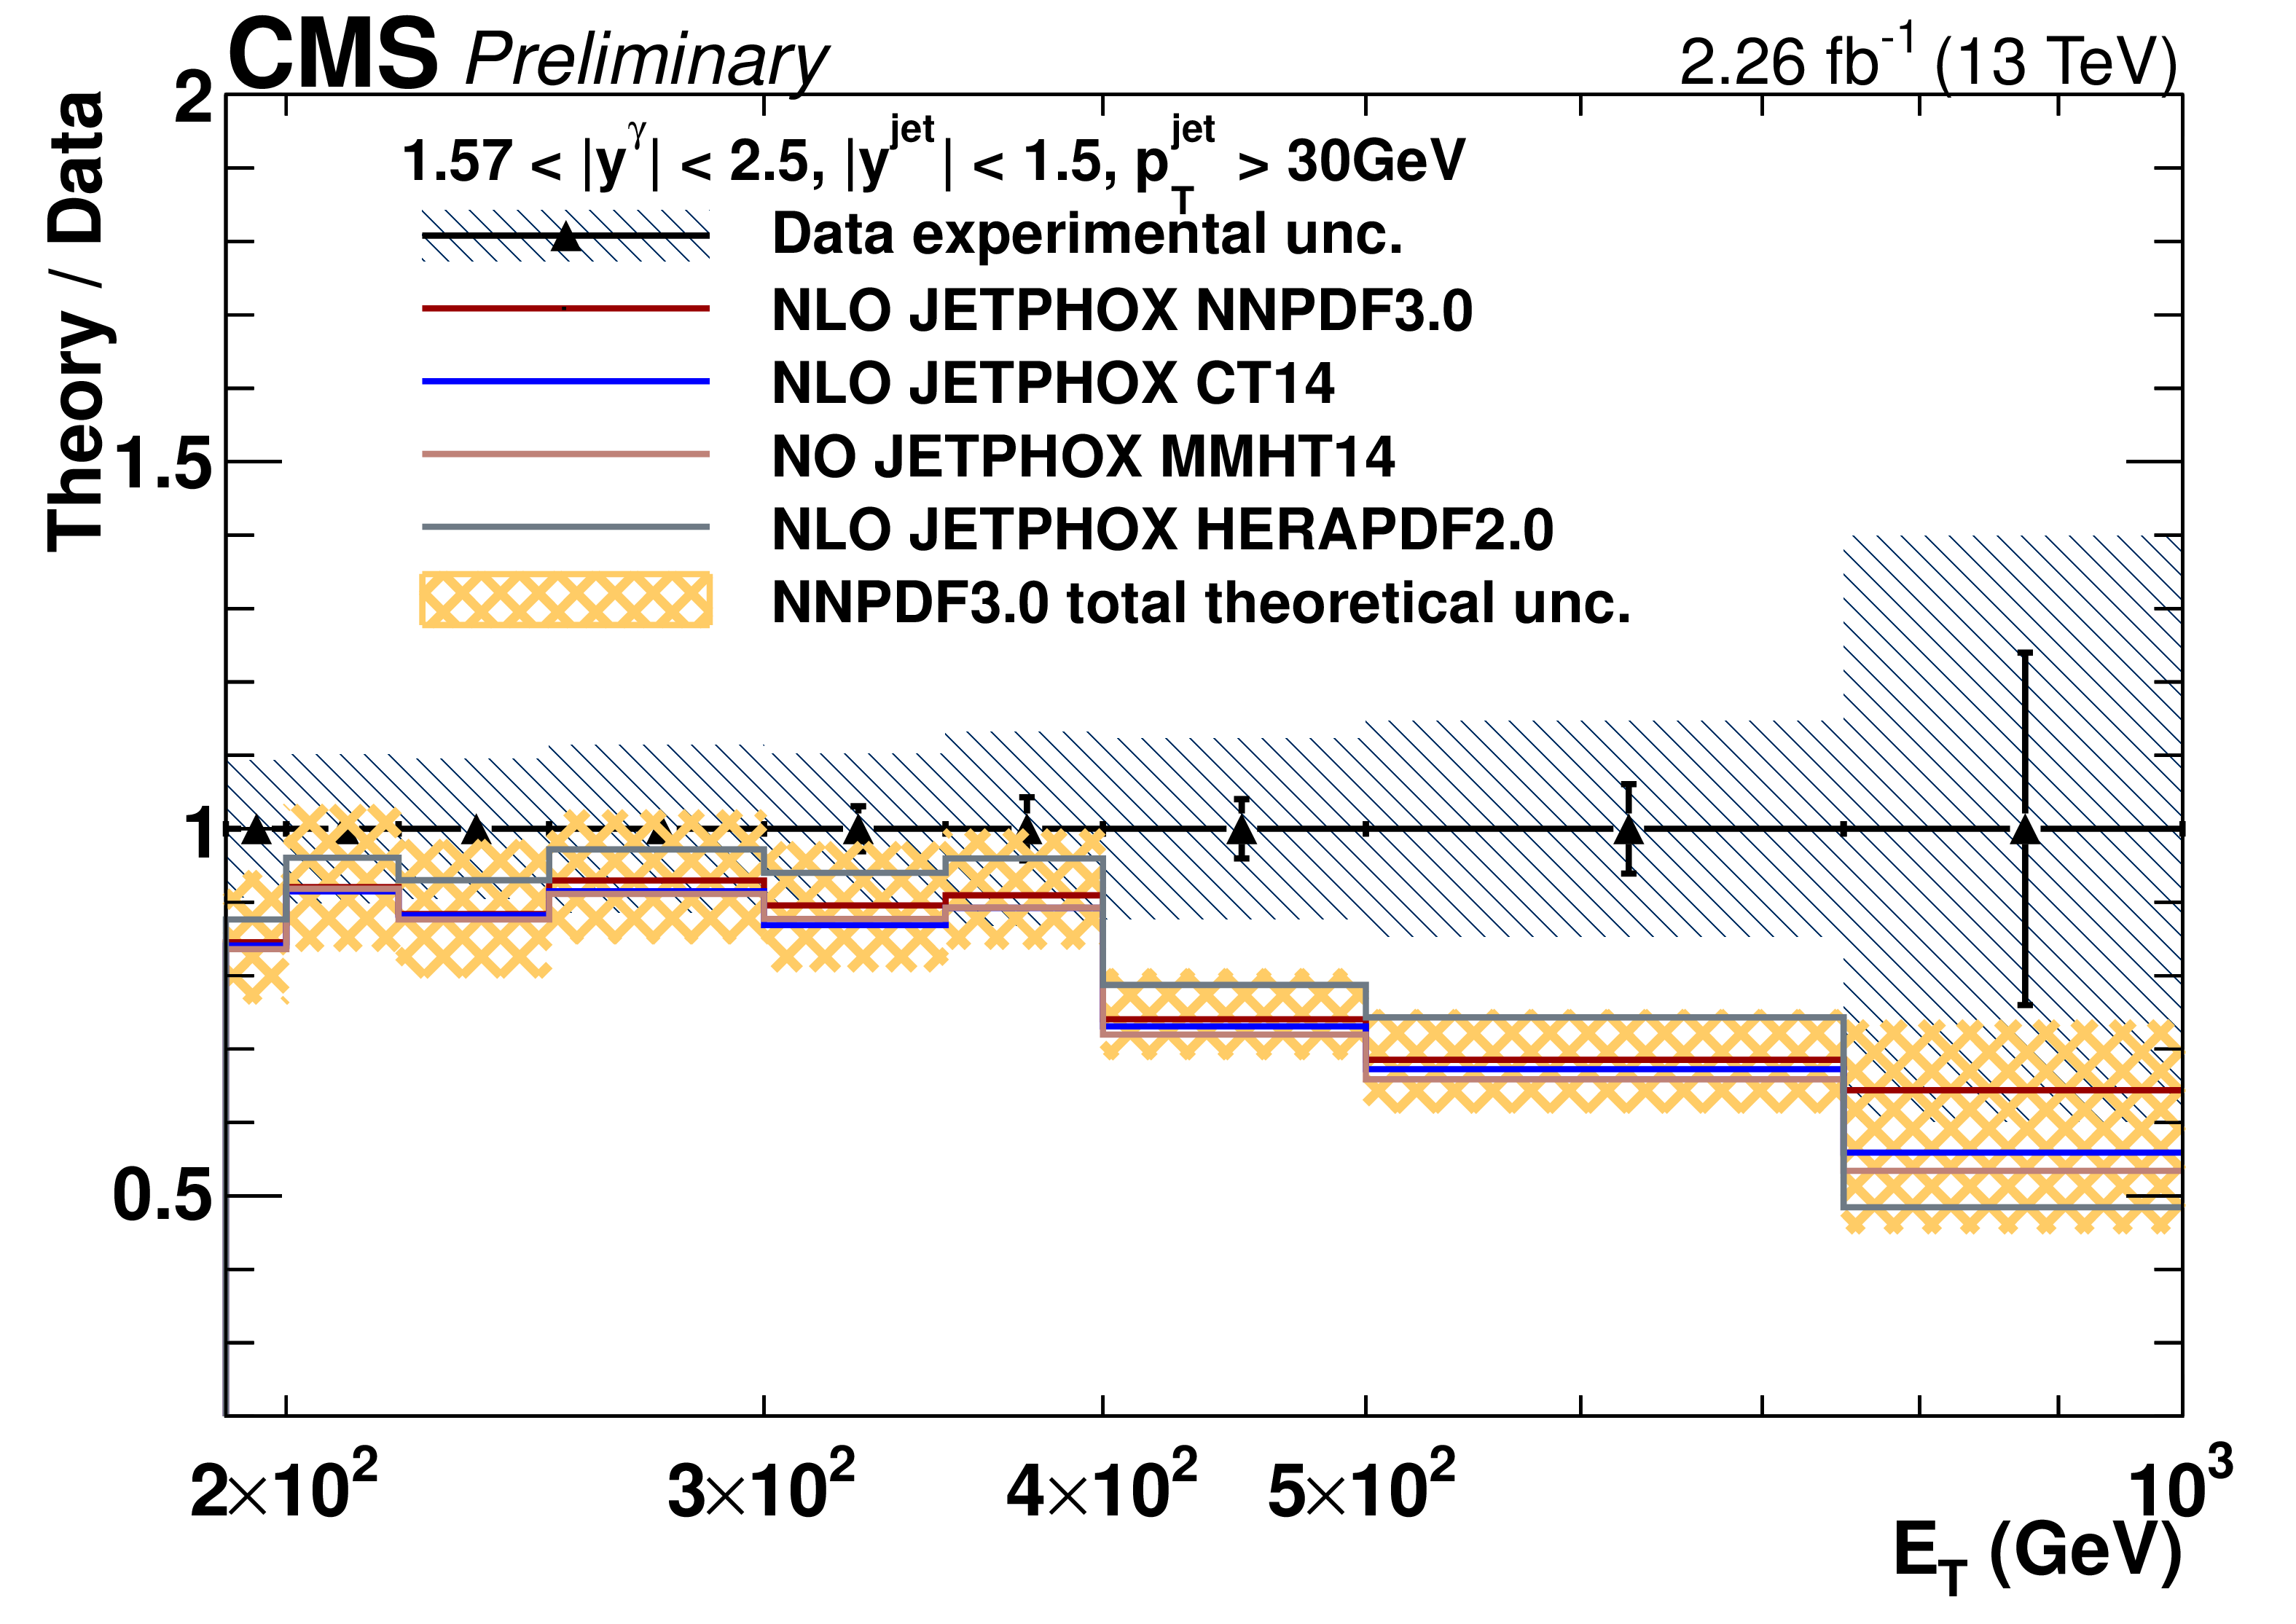
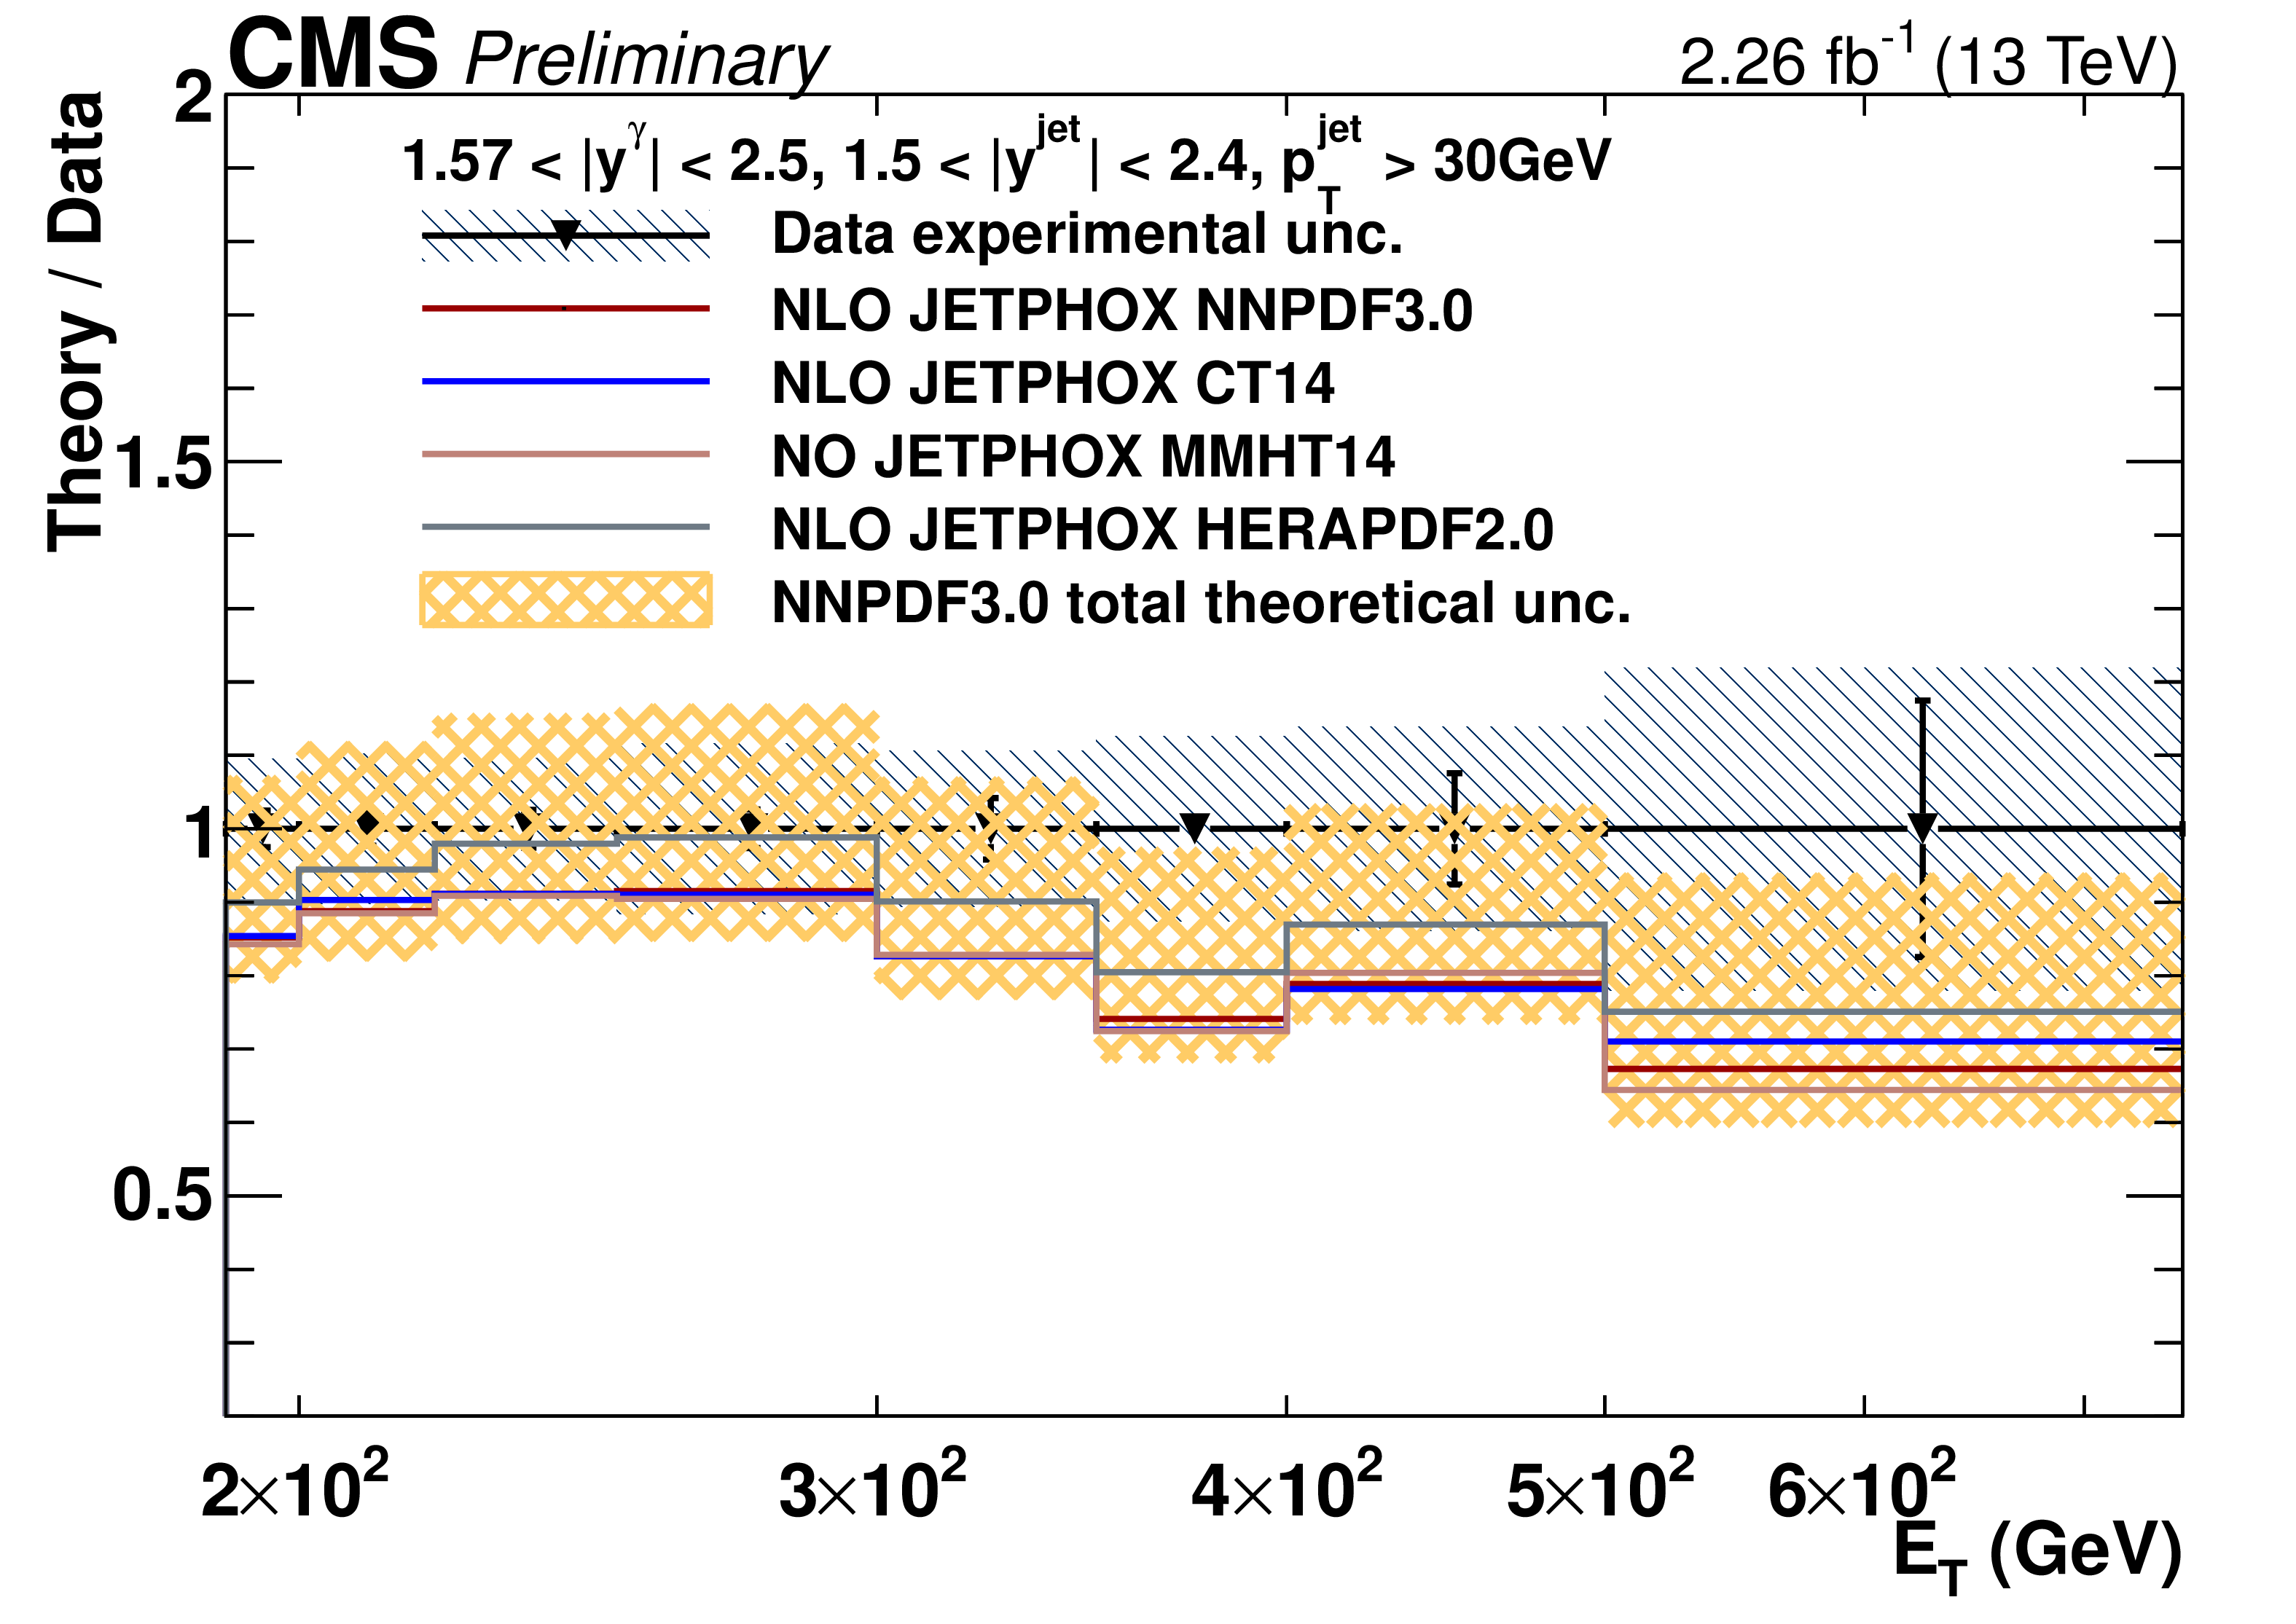
Figure 6:
The ratios of theoretical NLO prediction to data for the differential cross sections for photon+jets production in two photon rapidity ($ {| y^{\gamma} |} < $ 1.44 and 1.57 $ < {| y^{\gamma} |} < $ 2.5) and two jet rapidity ($ {| y^{\text {jet}} |} < $ 1.5 and 1.5 $ < {| y^{\text {jet}} |} < $ 2.4) bins, are shown. The error bars on the data points represent their statistical uncertainty, while the hatched area shows the total experimental uncertainty. The error bars on the ratios show the scale uncertainties, and the shaded area shows the total theoretical uncertainties. |
png pdf |
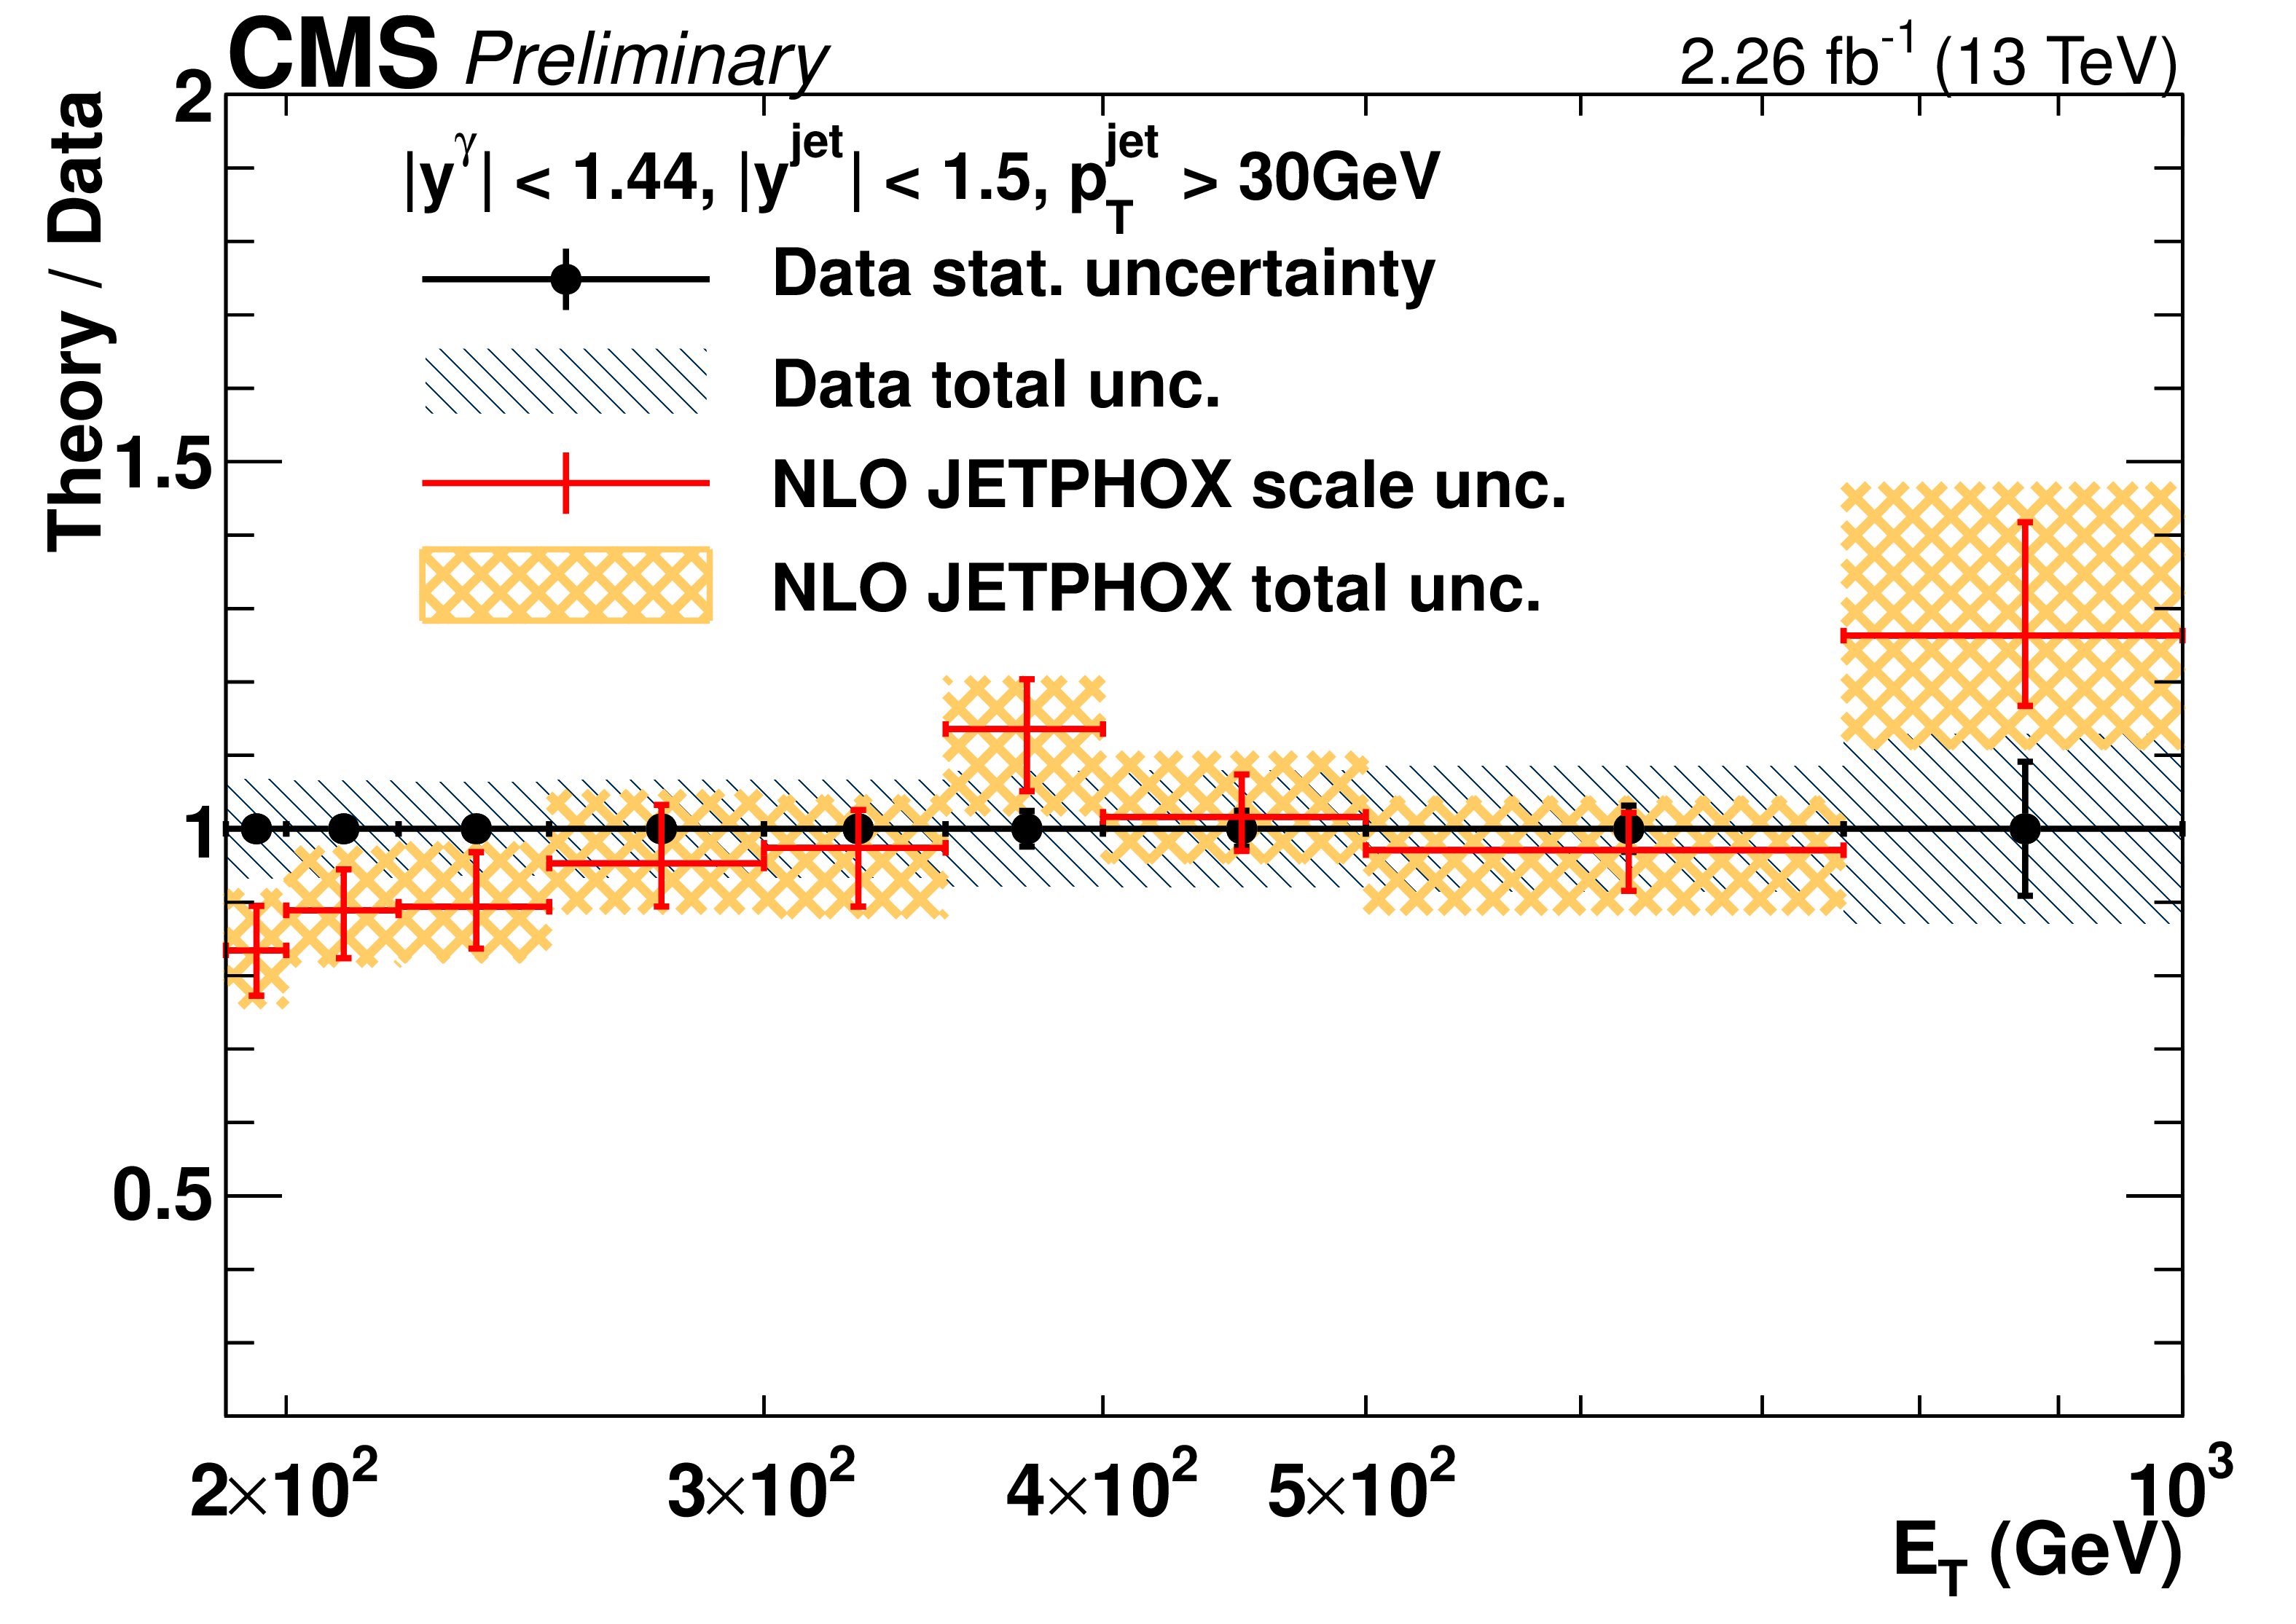
Figure 6-a:
The ratio of theoretical NLO prediction to data for the differential cross sections for photon+jets production in photon rapidity bin $ {| y^{\gamma} |} < $ 1.44 and jet rapidity bin $ {| y^{\text {jet}} |} < $ 1.5, are shown. The error bars on the data points represent their statistical uncertainty, while the hatched area shows the total experimental uncertainty. The error bars on the ratios show the scale uncertainties, and the shaded area shows the total theoretical uncertainties. |
png pdf |
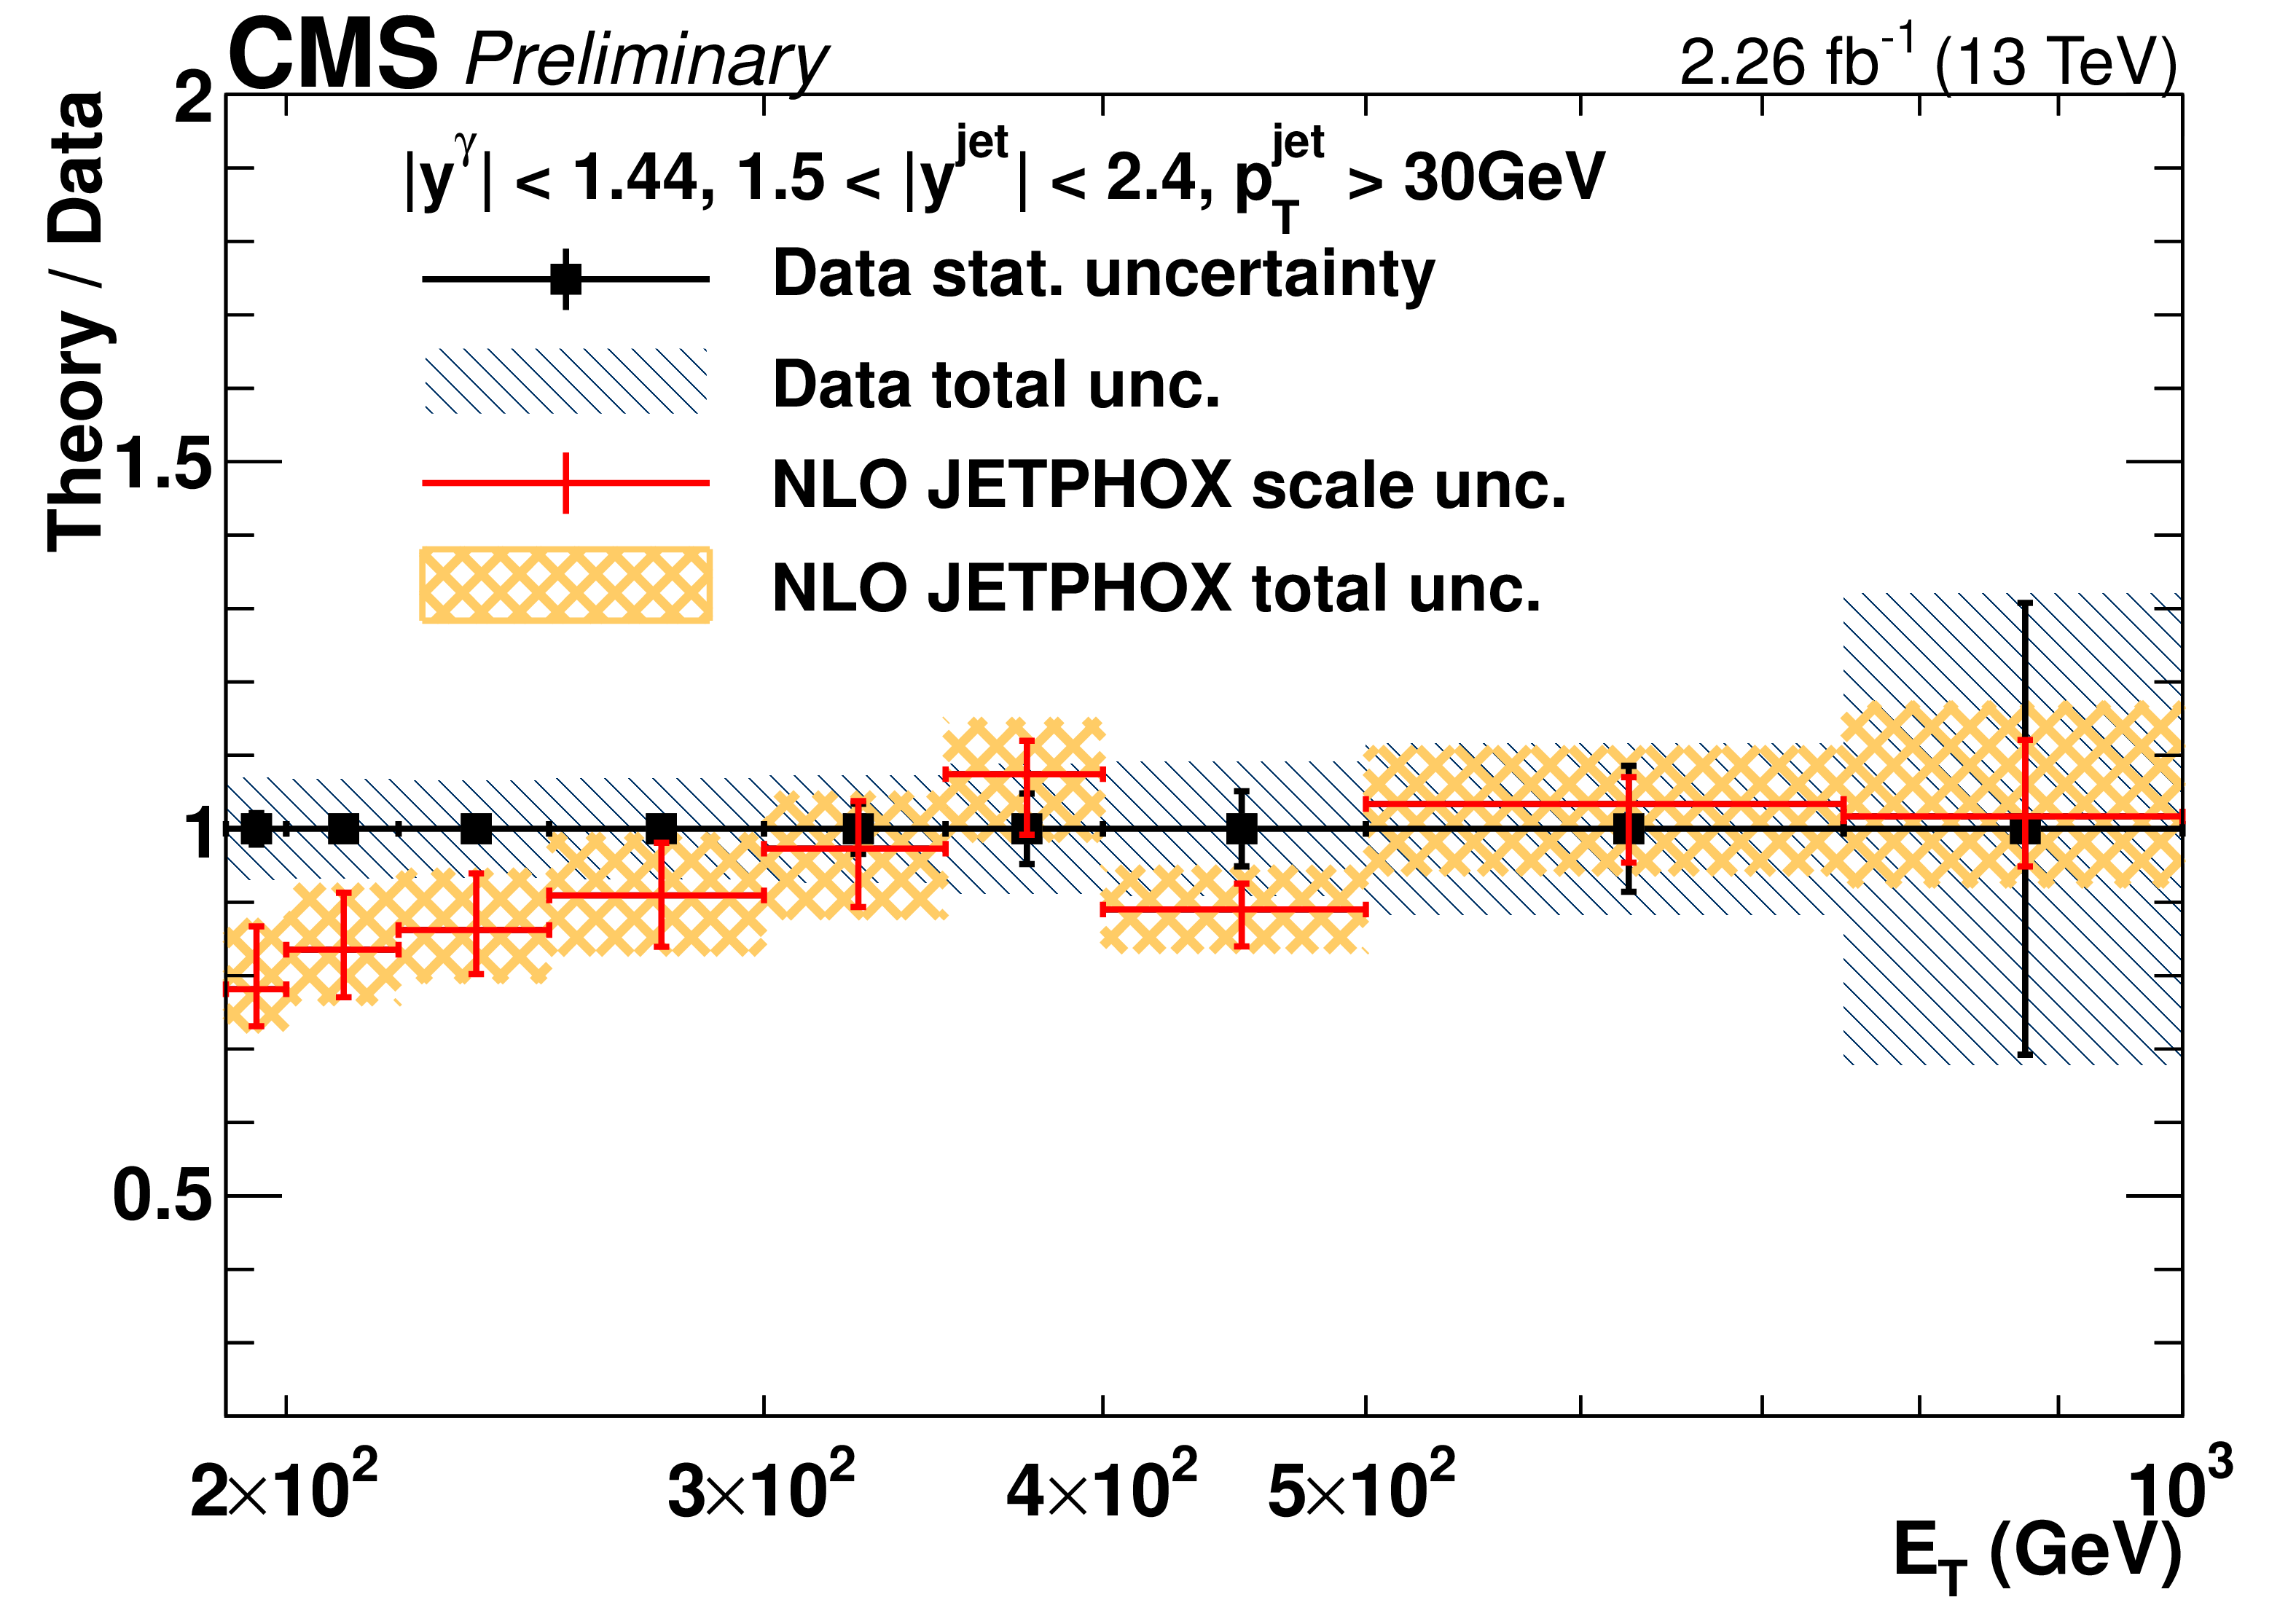
Figure 6-b:
The ratio of theoretical NLO prediction to data for the differential cross sections for photon+jets production in photon rapidity bin $ {| y^{\gamma} |} < $ 1.44 and jet rapidity bin 1.5 $ < {| y^{\text {jet}} |} < $ 2.4, are shown. The error bars on the data points represent their statistical uncertainty, while the hatched area shows the total experimental uncertainty. The error bars on the ratios show the scale uncertainties, and the shaded area shows the total theoretical uncertainties. |
png pdf |
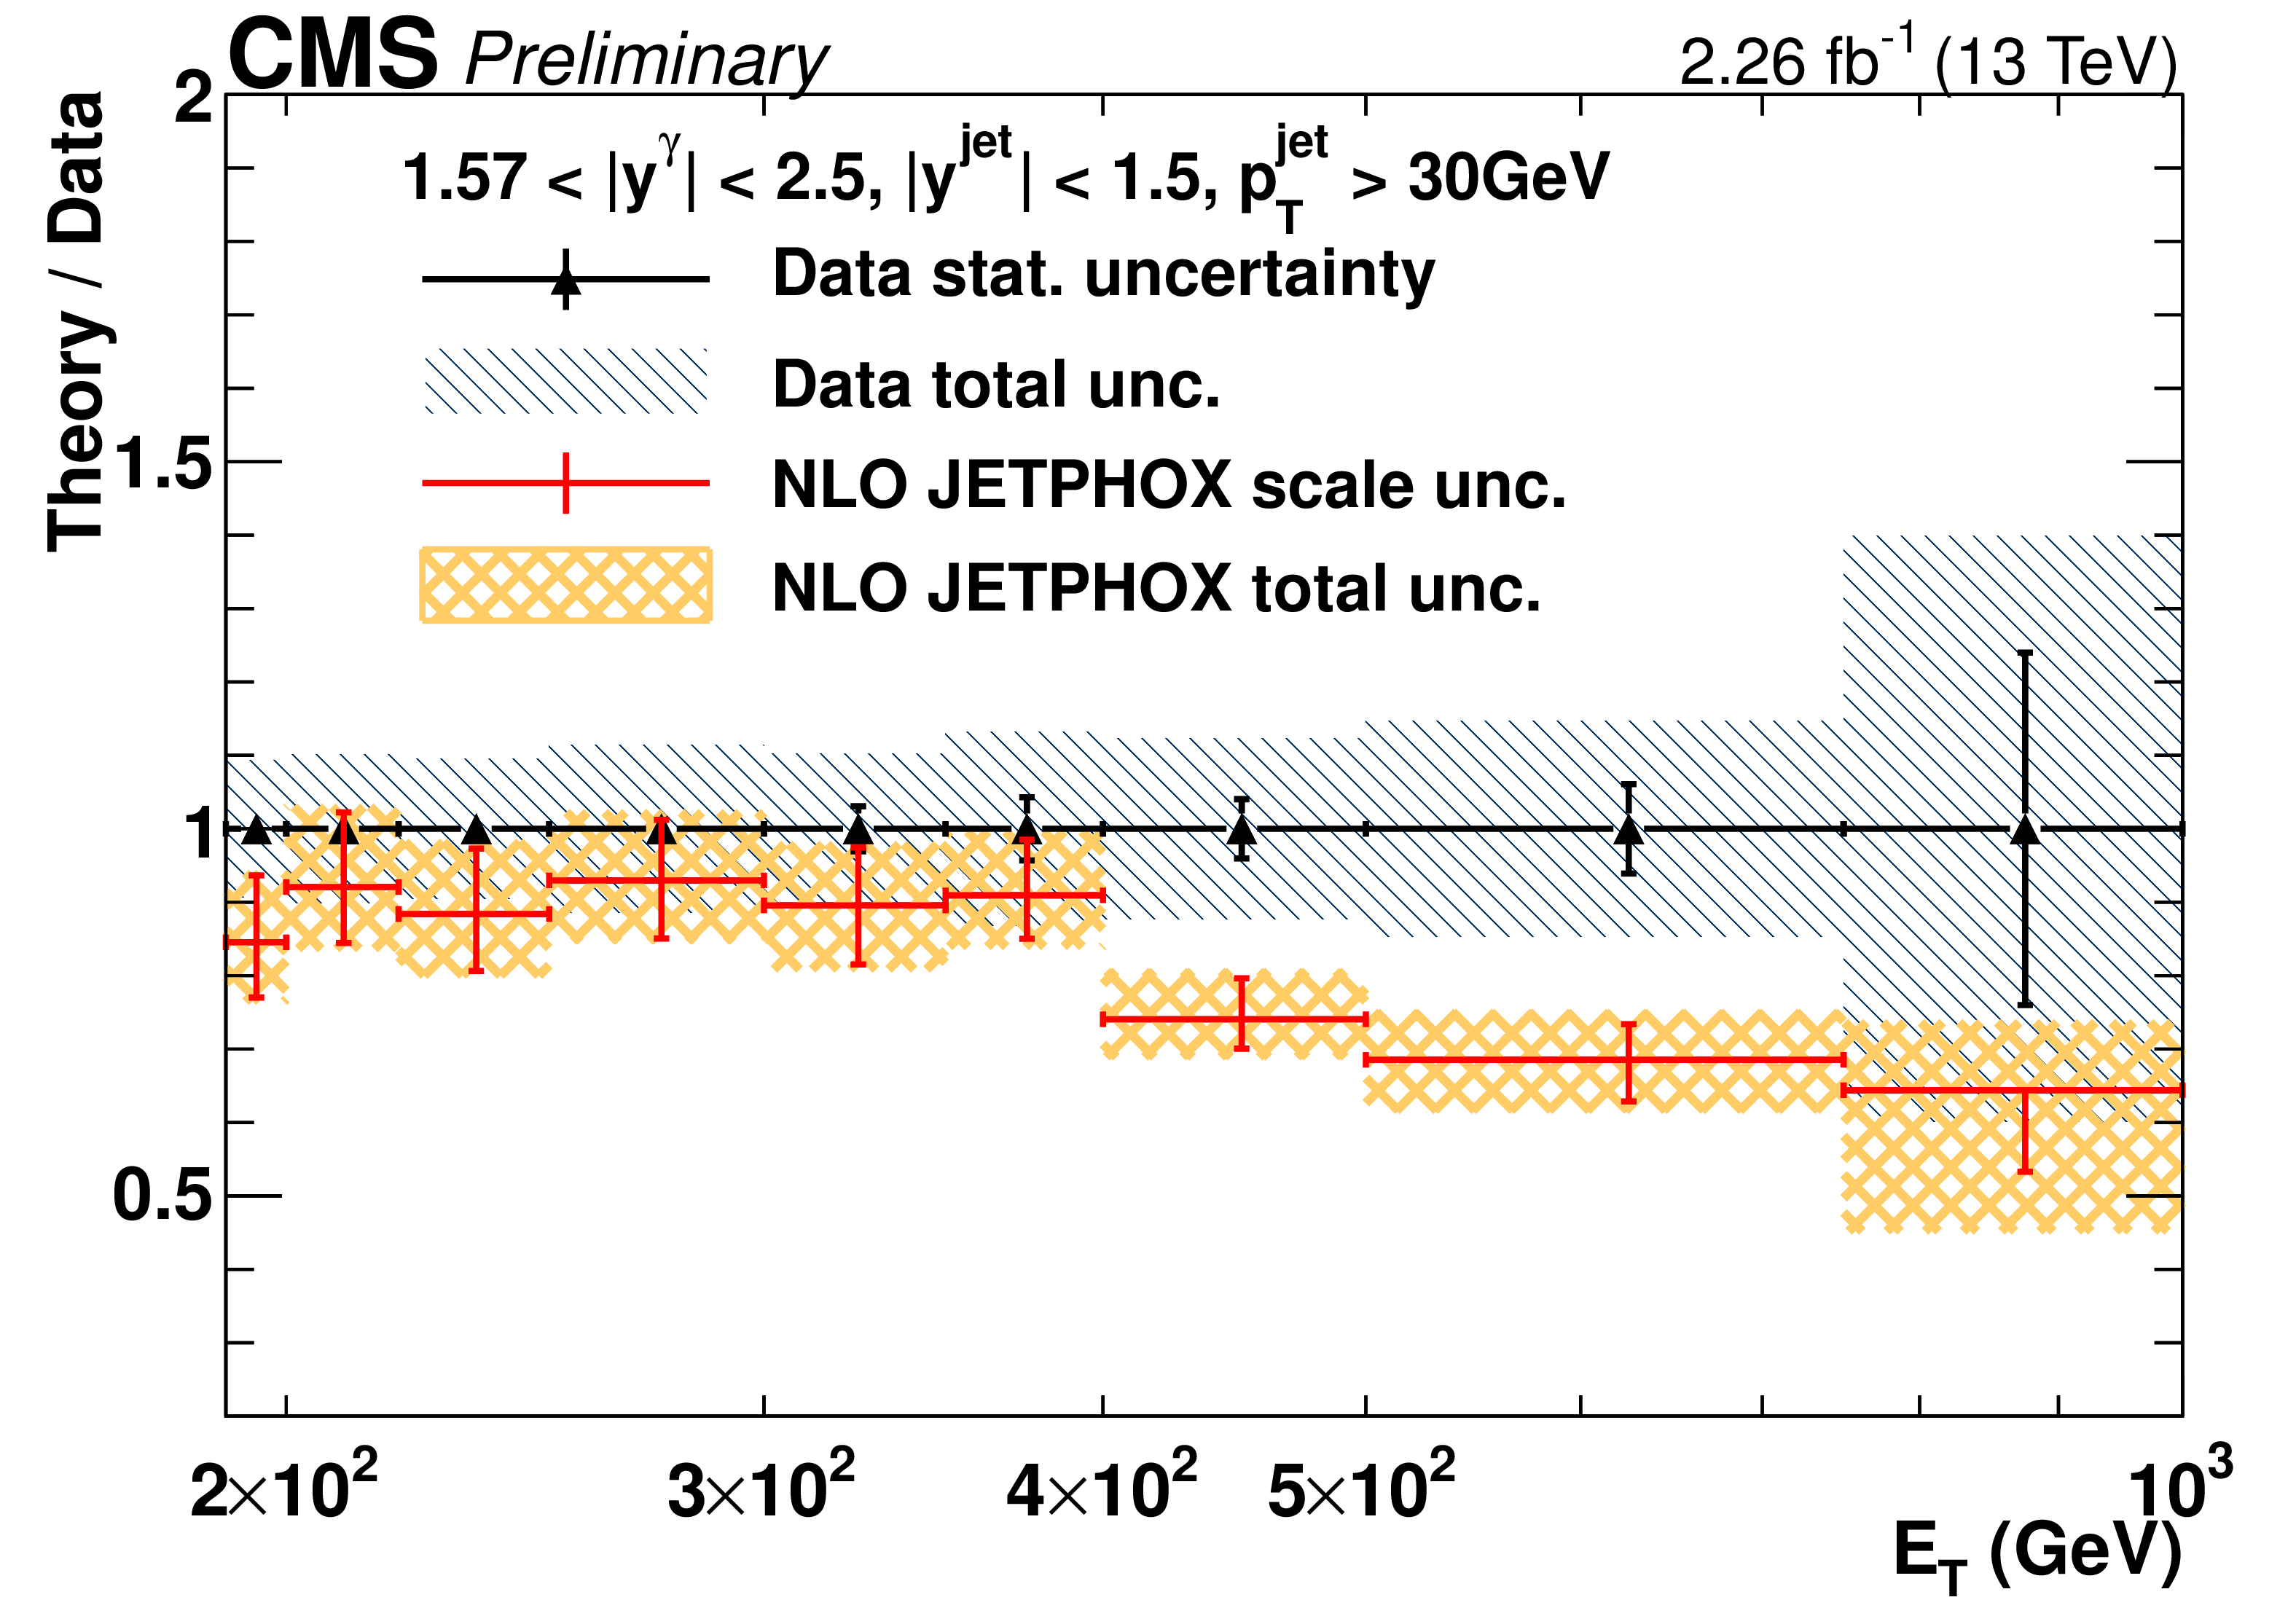
Figure 6-c:
The ratio of theoretical NLO prediction to data for the differential cross sections for photon+jets production in photon rapidity bin 1.57 $ < {| y^{\gamma} |} < $ 2.5 and jet rapidity bin $ {| y^{\text {jet}} |} < $ 1.5, are shown. The error bars on the data points represent their statistical uncertainty, while the hatched area shows the total experimental uncertainty. The error bars on the ratios show the scale uncertainties, and the shaded area shows the total theoretical uncertainties. |

png pdf |
Figure 6-d:
The ratio of theoretical NLO prediction to data for the differential cross sections for photon+jets production in photon rapidity bin 1.57 $ < {| y^{\gamma} |} < $ 2.5 and jet rapidity bin 1.5 $ < {| y^{\text {jet}} |} < $ 2.4, are shown. The error bars on the data points represent their statistical uncertainty, while the hatched area shows the total experimental uncertainty. The error bars on the ratios show the scale uncertainties, and the shaded area shows the total theoretical uncertainties. |
png pdf |
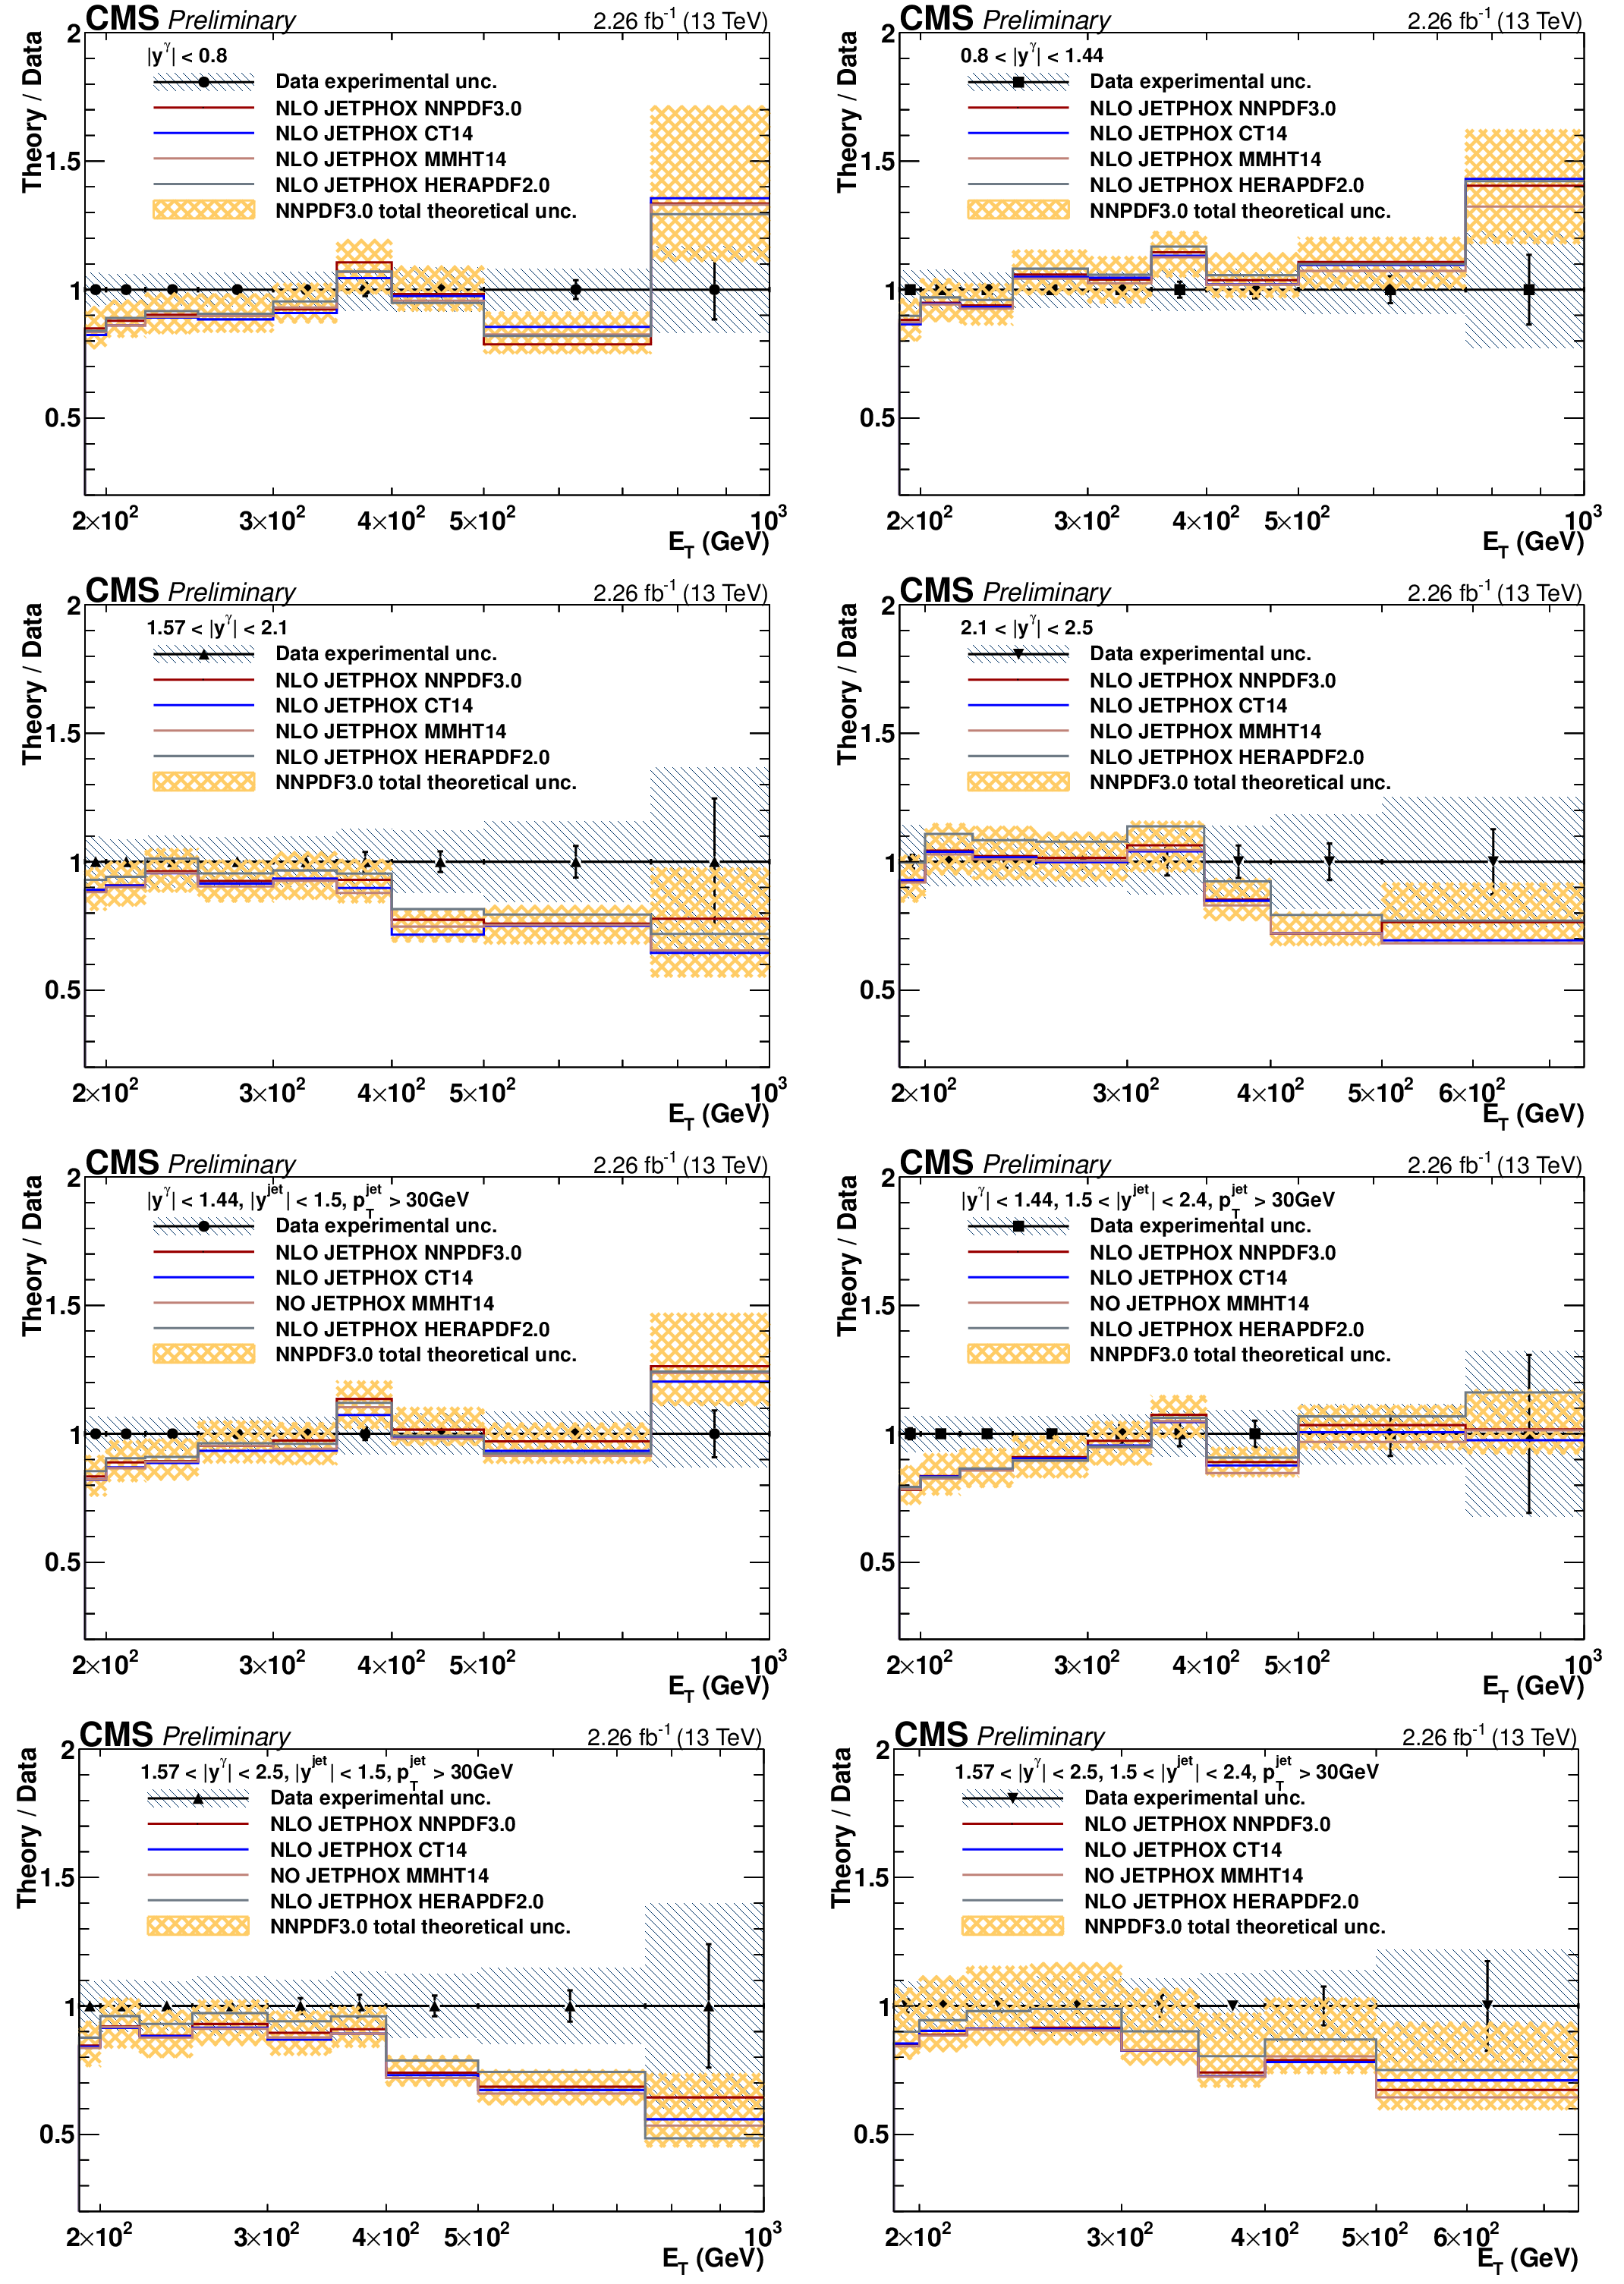
Figure 7:
Ratios of JETPHOX NLO predictions to data for various PDF sets as a function of photon $ {E_{\mathrm {T}}} $ for inclusive isolated-photons (top four panels) and photon+jets (four bottom panels). Data are shown as points, the error bars represent statistical uncertainties, while the hatched area represents the total experimental uncertainties. The theoretical uncertainty in the NNPDF3.0 prediction is shown as a shaded area. |

png pdf |
Figure 7-a:
Ratio of JETPHOX NLO predictions to data for various PDF sets as a function of photon $ {E_{\mathrm {T}}} $ for inclusive isolated-photons. Data are shown as points, the error bars represent statistical uncertainties, while the hatched area represents the total experimental uncertainties. The theoretical uncertainty in the NNPDF3.0 prediction is shown as a shaded area. |
png pdf |
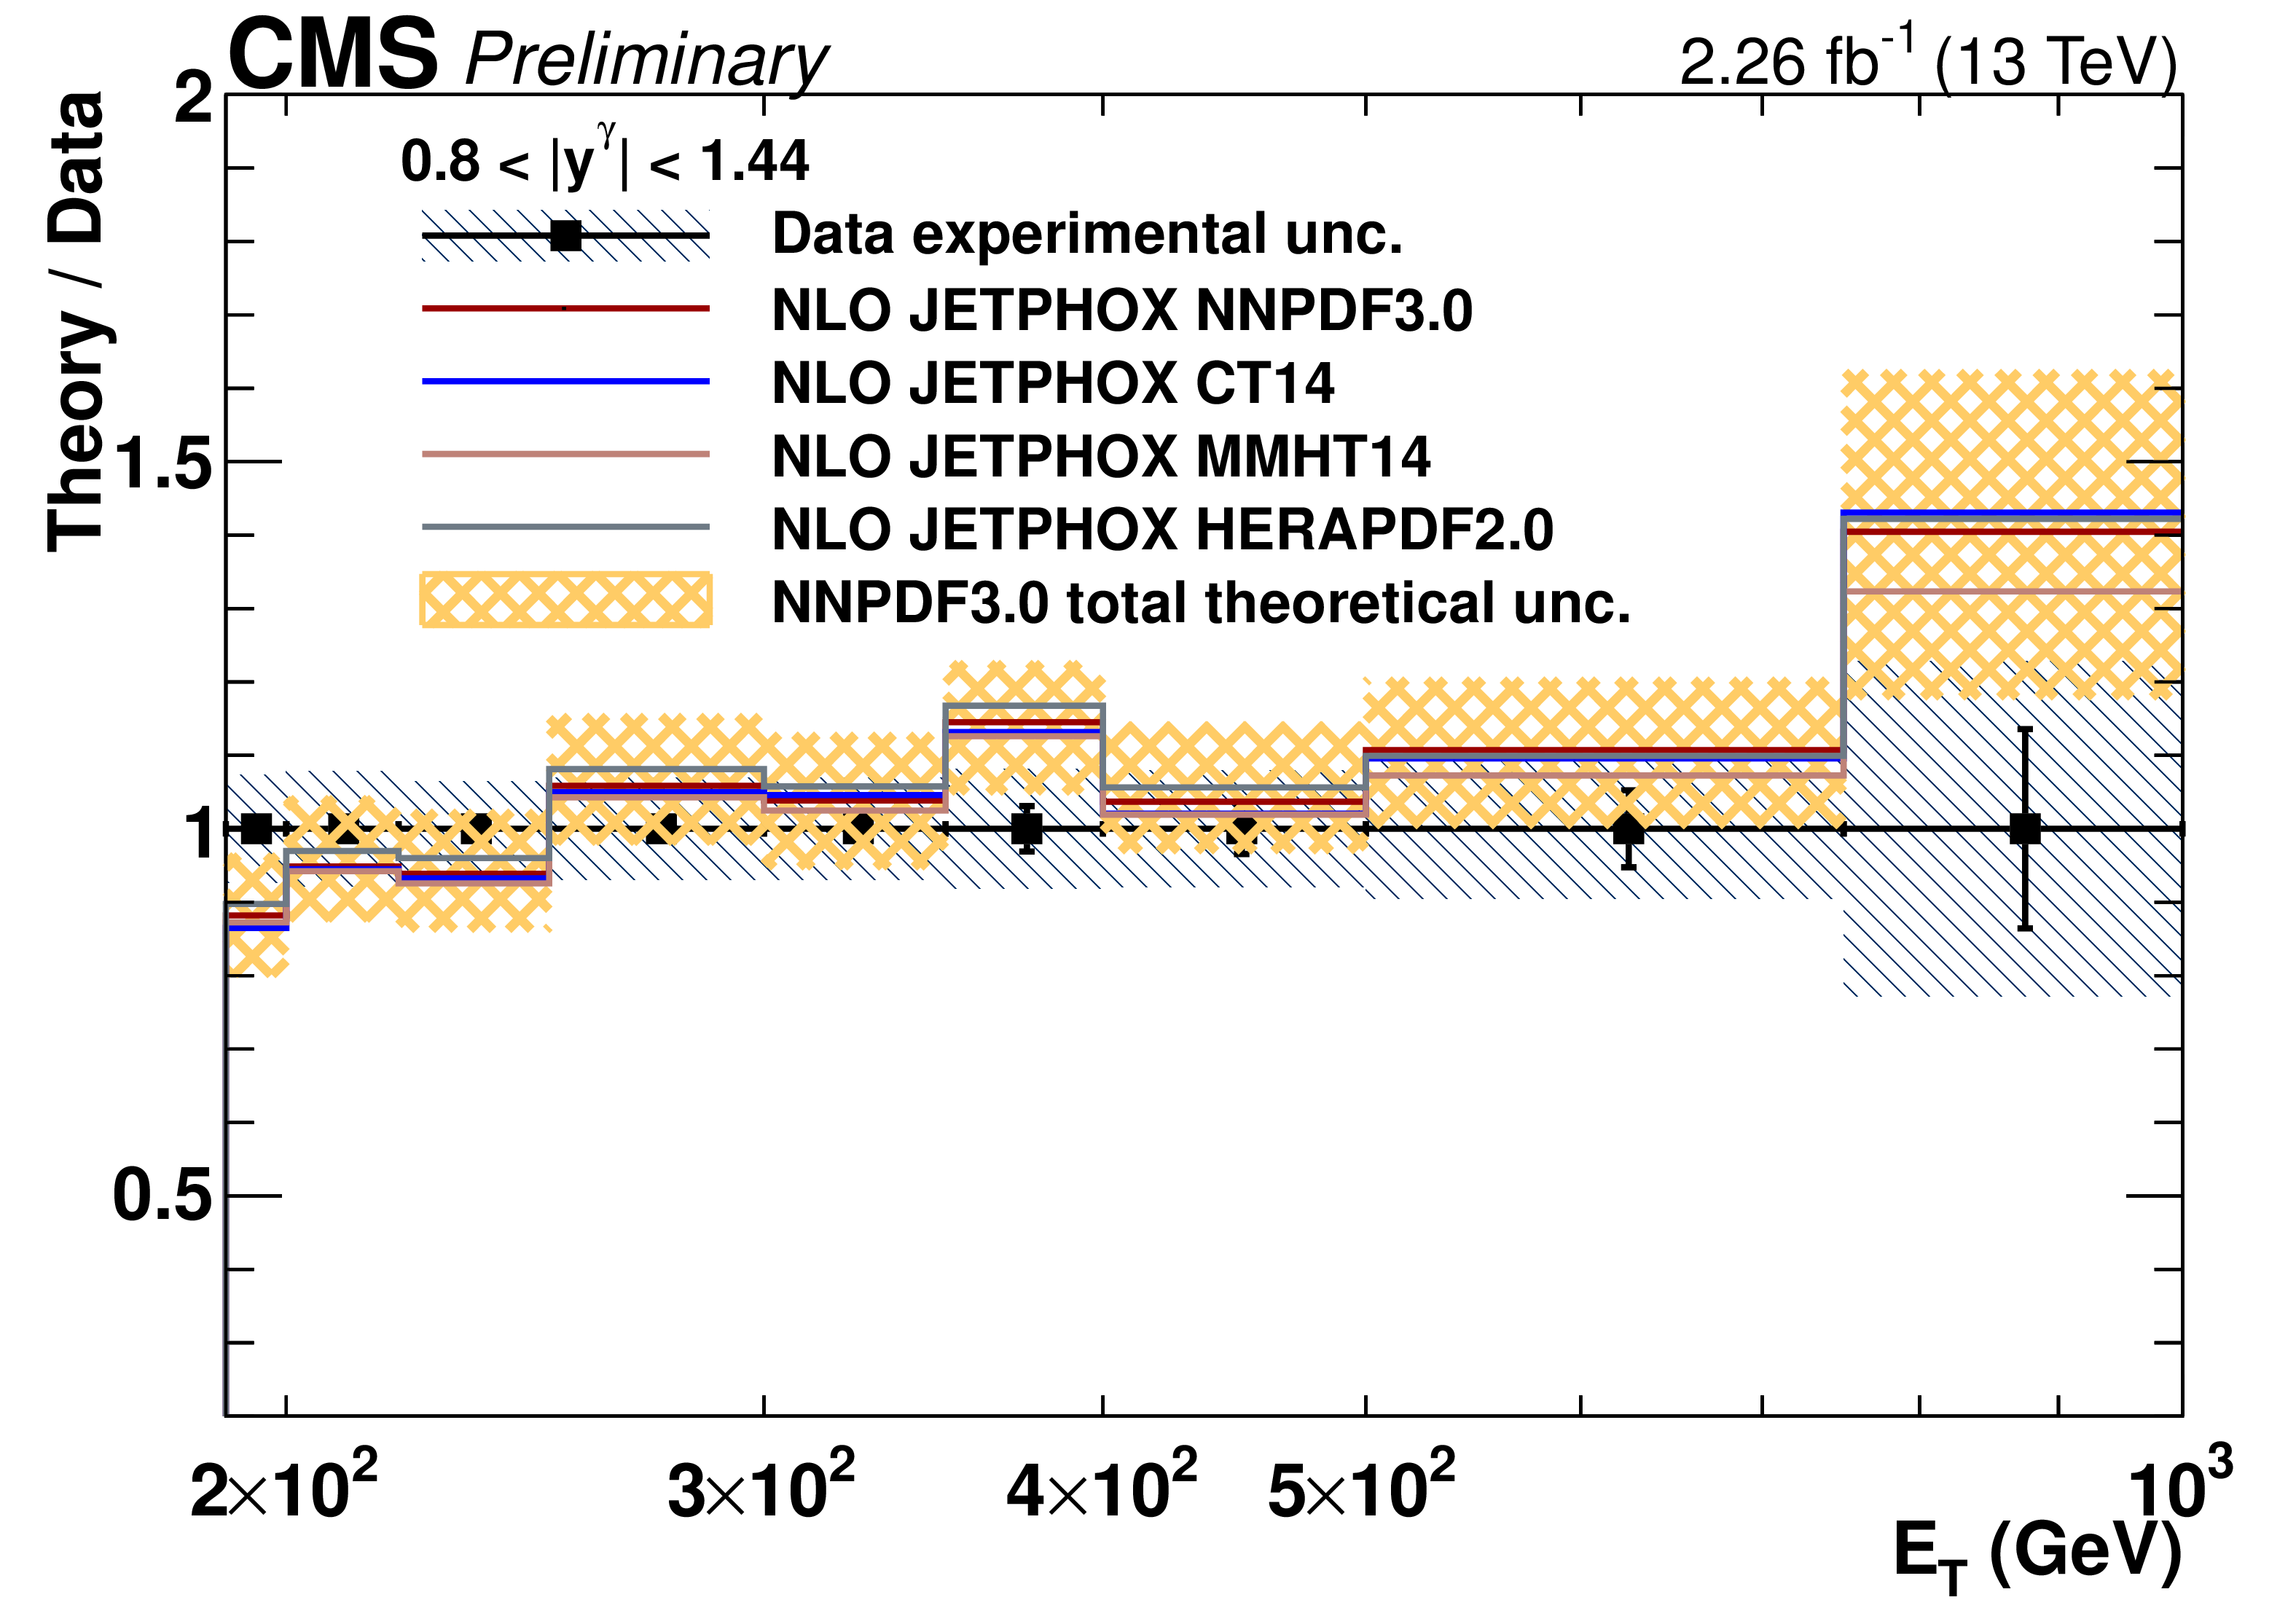
Figure 7-b:
Ratio of JETPHOX NLO predictions to data for various PDF sets as a function of photon $ {E_{\mathrm {T}}} $ for inclusive isolated-photons. Data are shown as points, the error bars represent statistical uncertainties, while the hatched area represents the total experimental uncertainties. The theoretical uncertainty in the NNPDF3.0 prediction is shown as a shaded area. |
png pdf |
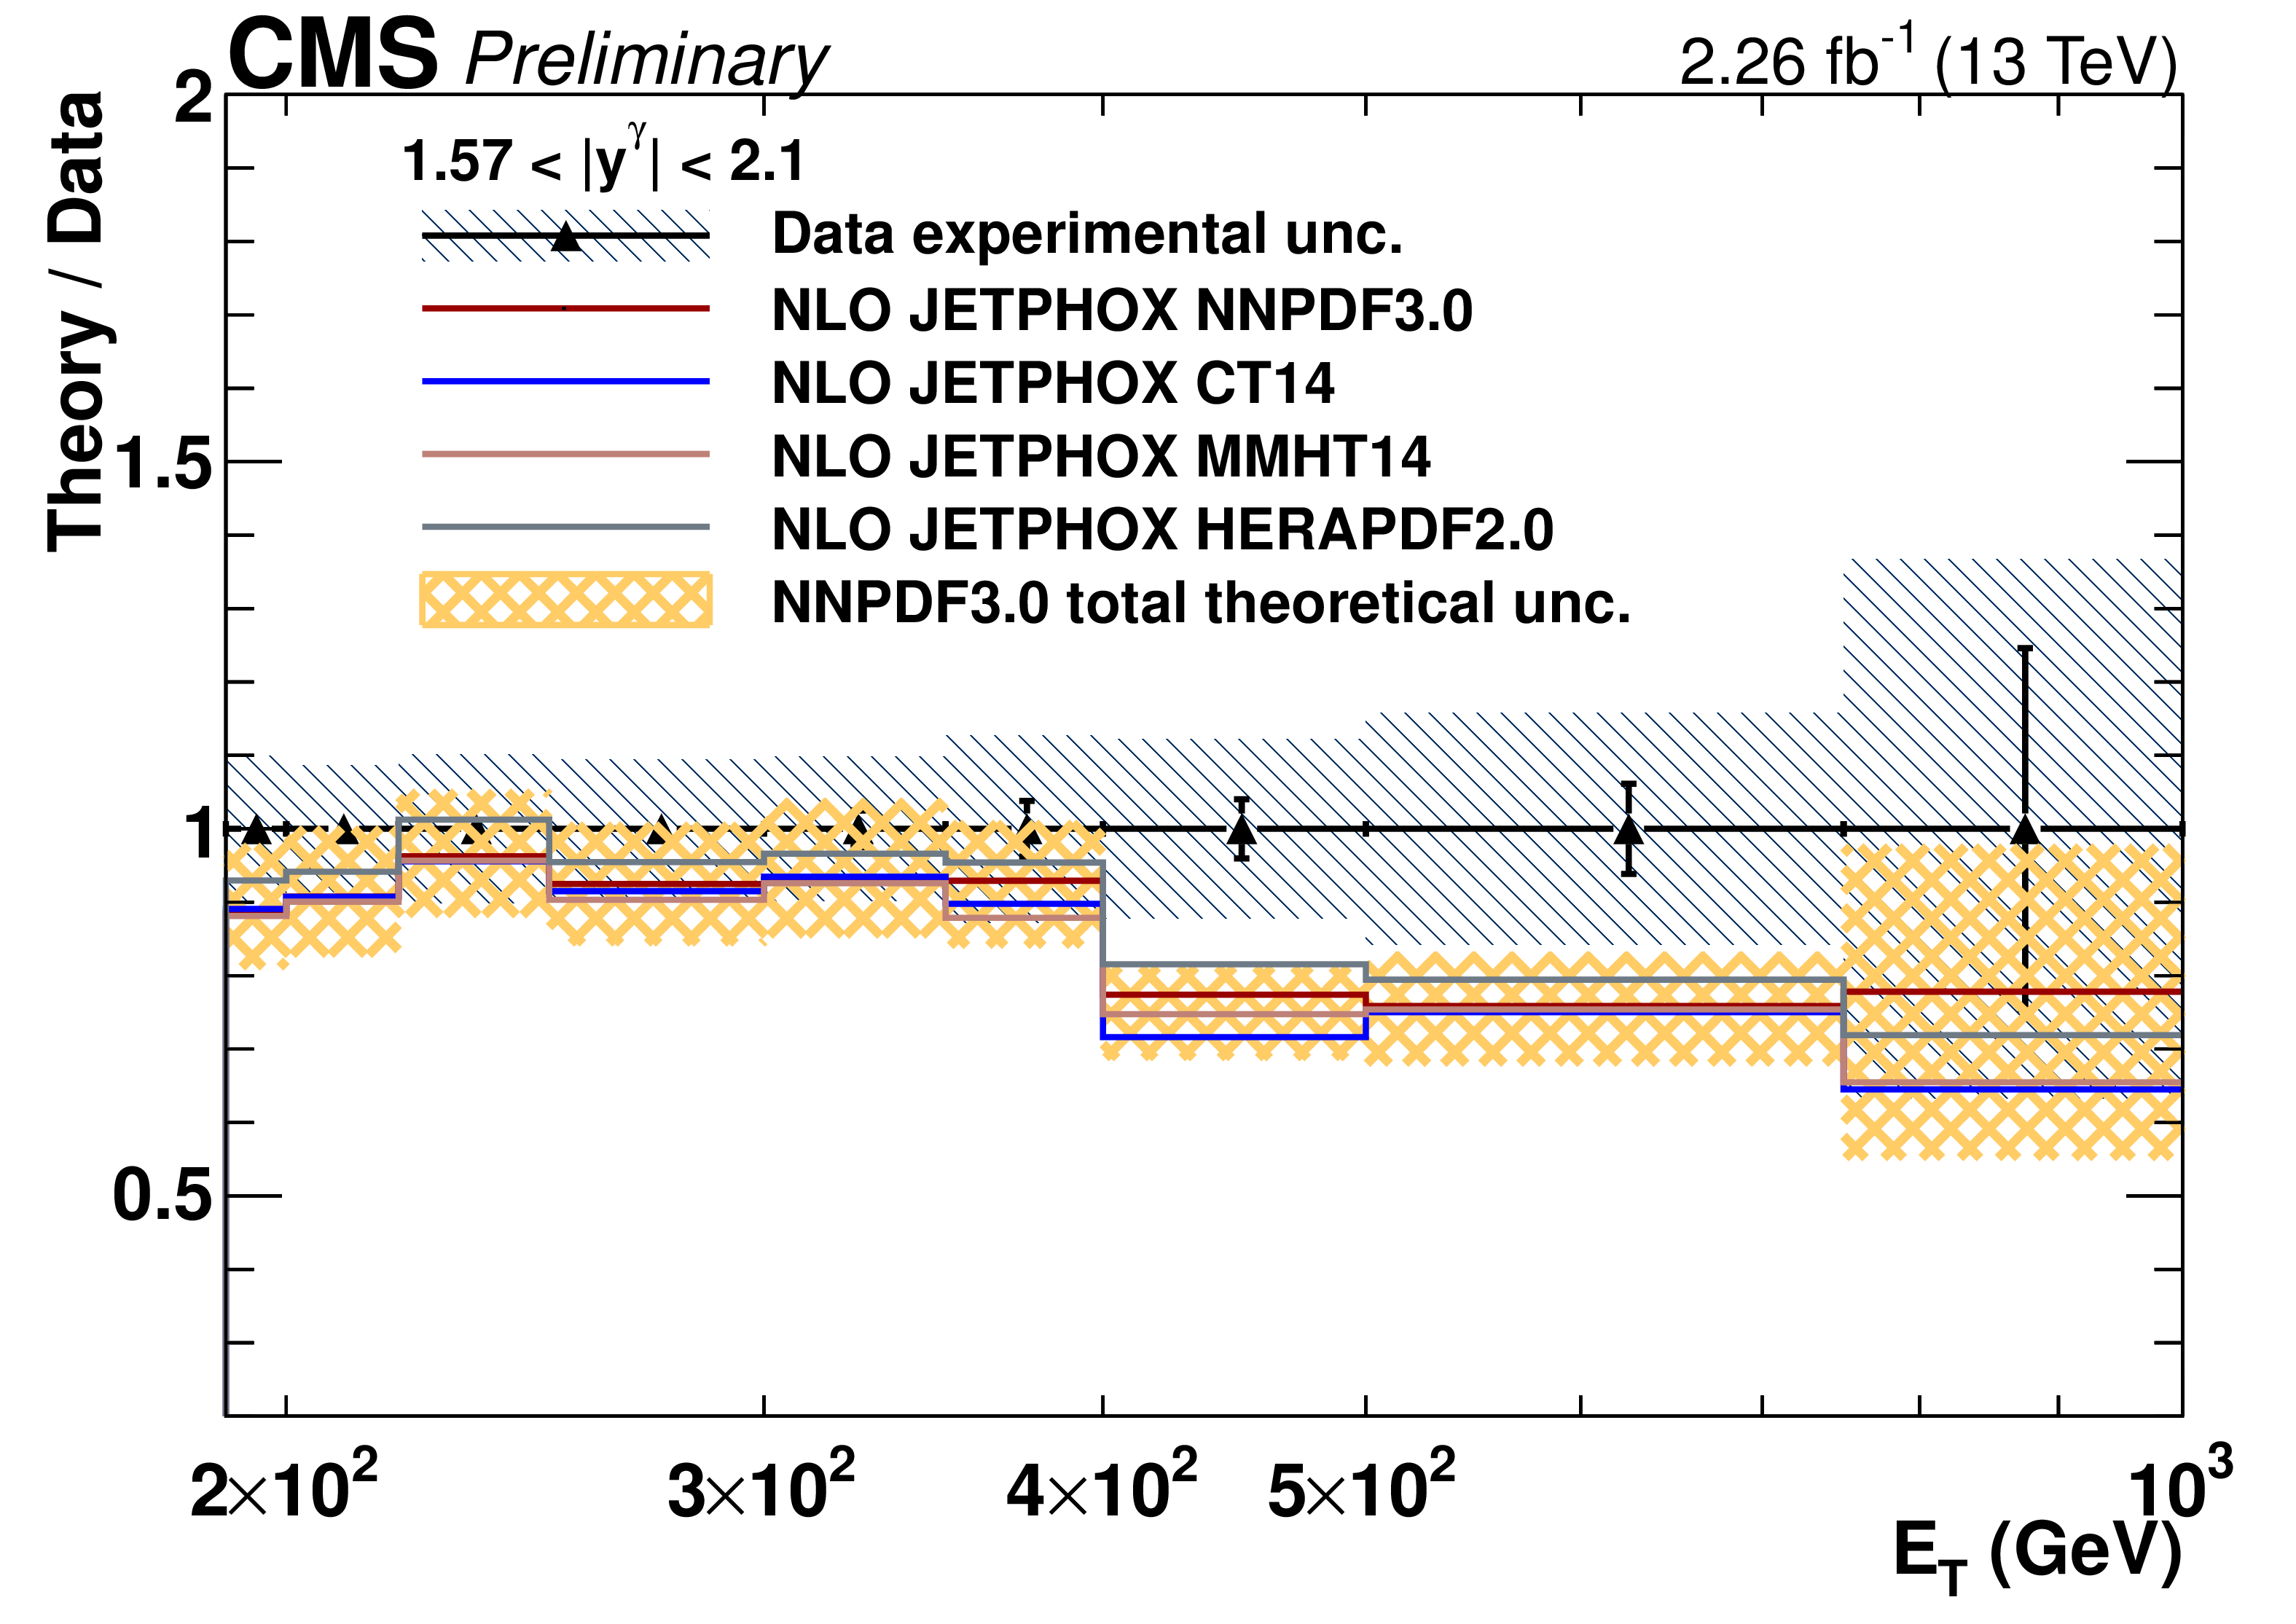
Figure 7-c:
Ratio of JETPHOX NLO predictions to data for various PDF sets as a function of photon $ {E_{\mathrm {T}}} $ for inclusive isolated-photons. Data are shown as points, the error bars represent statistical uncertainties, while the hatched area represents the total experimental uncertainties. The theoretical uncertainty in the NNPDF3.0 prediction is shown as a shaded area. |
png pdf |
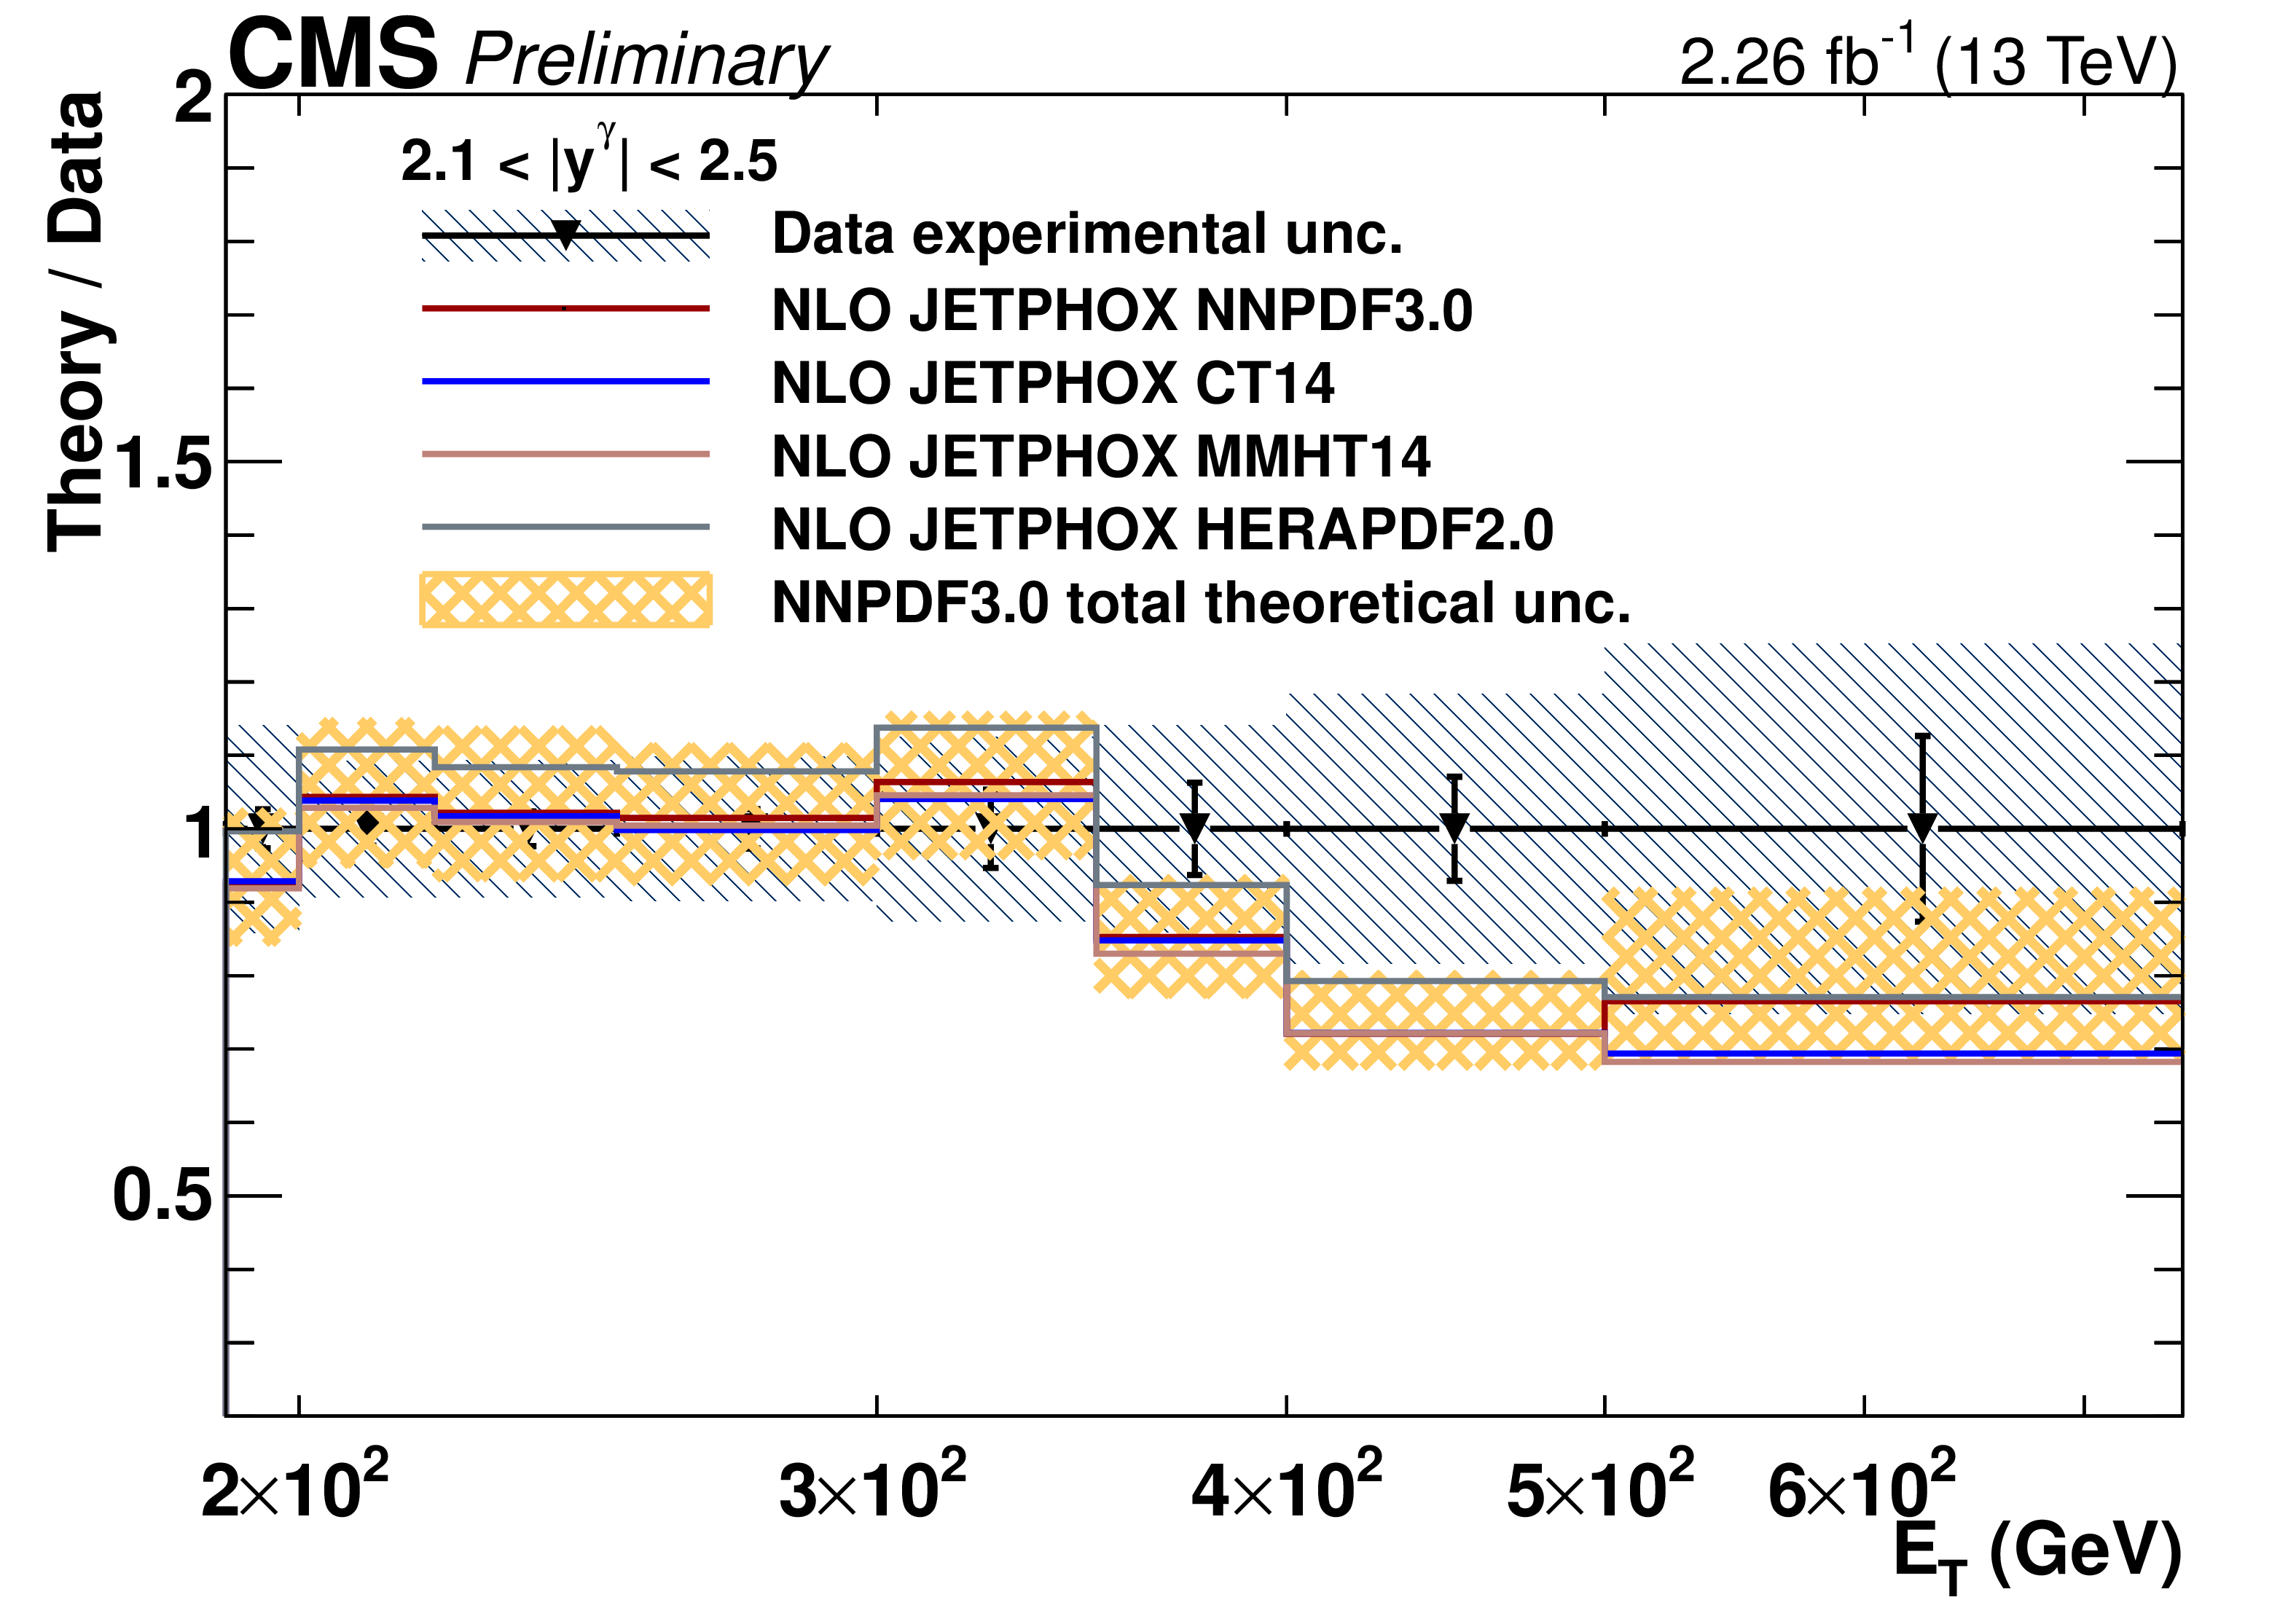
Figure 7-d:
Ratio of JETPHOX NLO predictions to data for various PDF sets as a function of photon $ {E_{\mathrm {T}}} $ for inclusive isolated-photons. Data are shown as points, the error bars represent statistical uncertainties, while the hatched area represents the total experimental uncertainties. The theoretical uncertainty in the NNPDF3.0 prediction is shown as a shaded area. |
png pdf |
Figure 7-e:
Ratio of JETPHOX NLO predictions to data for various PDF sets as a function of photon $ {E_{\mathrm {T}}} $ for photon+jets. Data are shown as points, the error bars represent statistical uncertainties, while the hatched area represents the total experimental uncertainties. The theoretical uncertainty in the NNPDF3.0 prediction is shown as a shaded area. |
png pdf |
Figure 7-f:
Ratio of JETPHOX NLO predictions to data for various PDF sets as a function of photon $ {E_{\mathrm {T}}} $ for photon+jets. Data are shown as points, the error bars represent statistical uncertainties, while the hatched area represents the total experimental uncertainties. The theoretical uncertainty in the NNPDF3.0 prediction is shown as a shaded area. |
png pdf |
Figure 7-g:
Ratio of JETPHOX NLO predictions to data for various PDF sets as a function of photon $ {E_{\mathrm {T}}} $ for photon+jets. Data are shown as points, the error bars represent statistical uncertainties, while the hatched area represents the total experimental uncertainties. The theoretical uncertainty in the NNPDF3.0 prediction is shown as a shaded area. |
png pdf |
Figure 7-h:
Ratio of JETPHOX NLO predictions to data for various PDF sets as a function of photon $ {E_{\mathrm {T}}} $ for photon+jets. Data are shown as points, the error bars represent statistical uncertainties, while the hatched area represents the total experimental uncertainties. The theoretical uncertainty in the NNPDF3.0 prediction is shown as a shaded area. |
| Tables | |
png pdf |
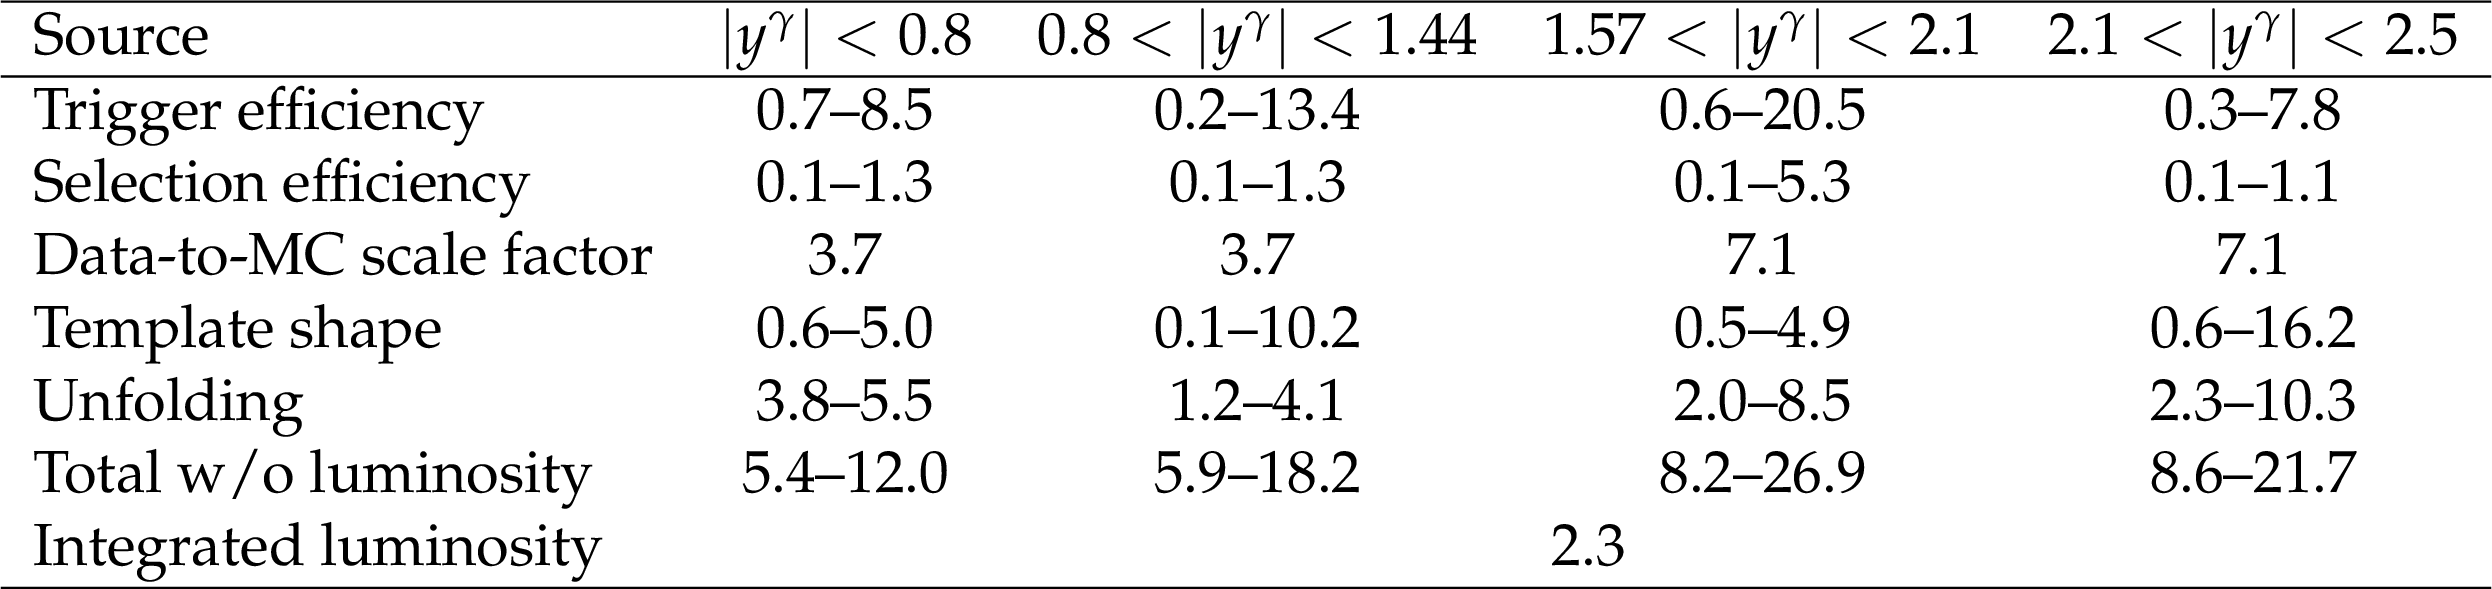
Table 1:
Impact on cross sections, in percent, for each systematic uncertainty source in the four photon rapidity regions, $ {| y^{\gamma} |} < $ 0.8, 0.8 $ < {| y^{\gamma} |} < $ 1.44, 1.57 $ < {| y^{\gamma} |} < $ 2.1, and 2.1 $ < {| y^{\gamma} |} < $ 2.5. The ranges, when quoted, indicate the variation over photon $ {E_{\mathrm {T}}} $ between 190-1000 GeV. |
png pdf |
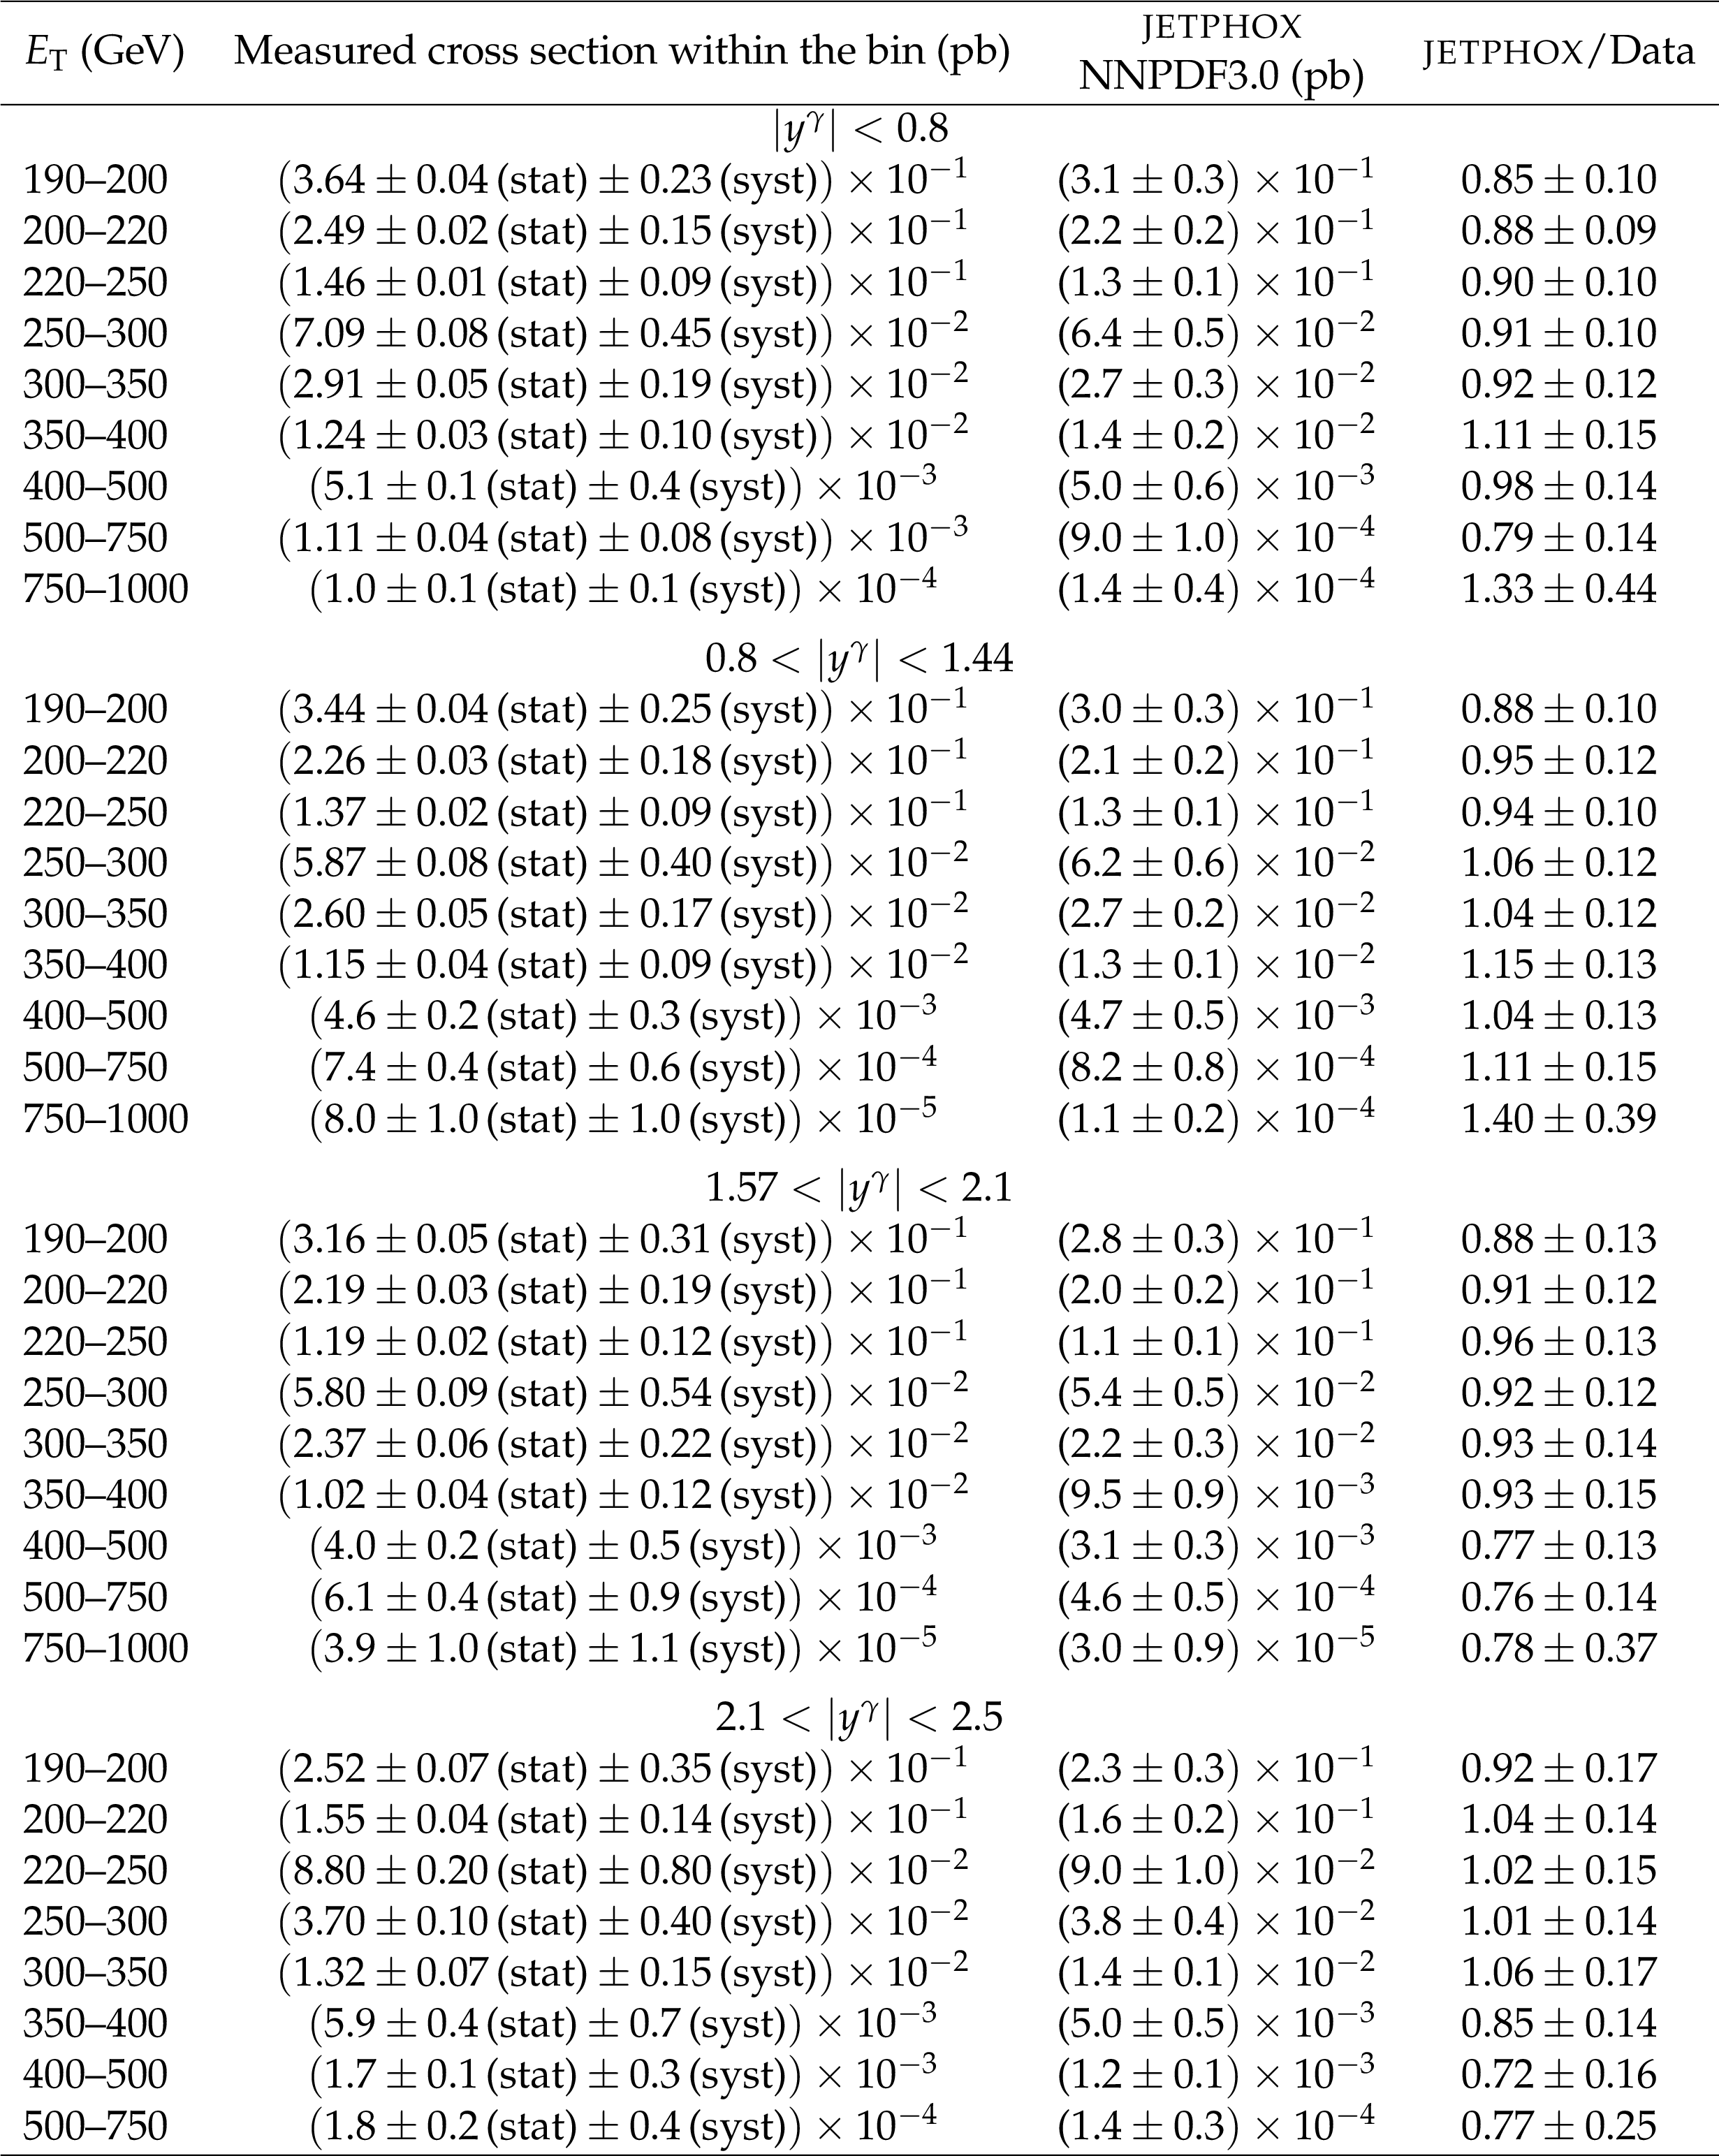
Table 2:
Measured and predicted differential cross section for isolated-photon production, along with the statistical and systematical uncertainties in the various $ {E_{\mathrm {T}}} $ and $y$ bins. Predictions use JETPHOX at NLO with the NNPDF3.0 PDF set. The ratio of the JETPHOX predictions to data are listed in the last column, with the total uncertainty estimated assuming uncorrelated experimental and theoretical uncertainties. |
png pdf |
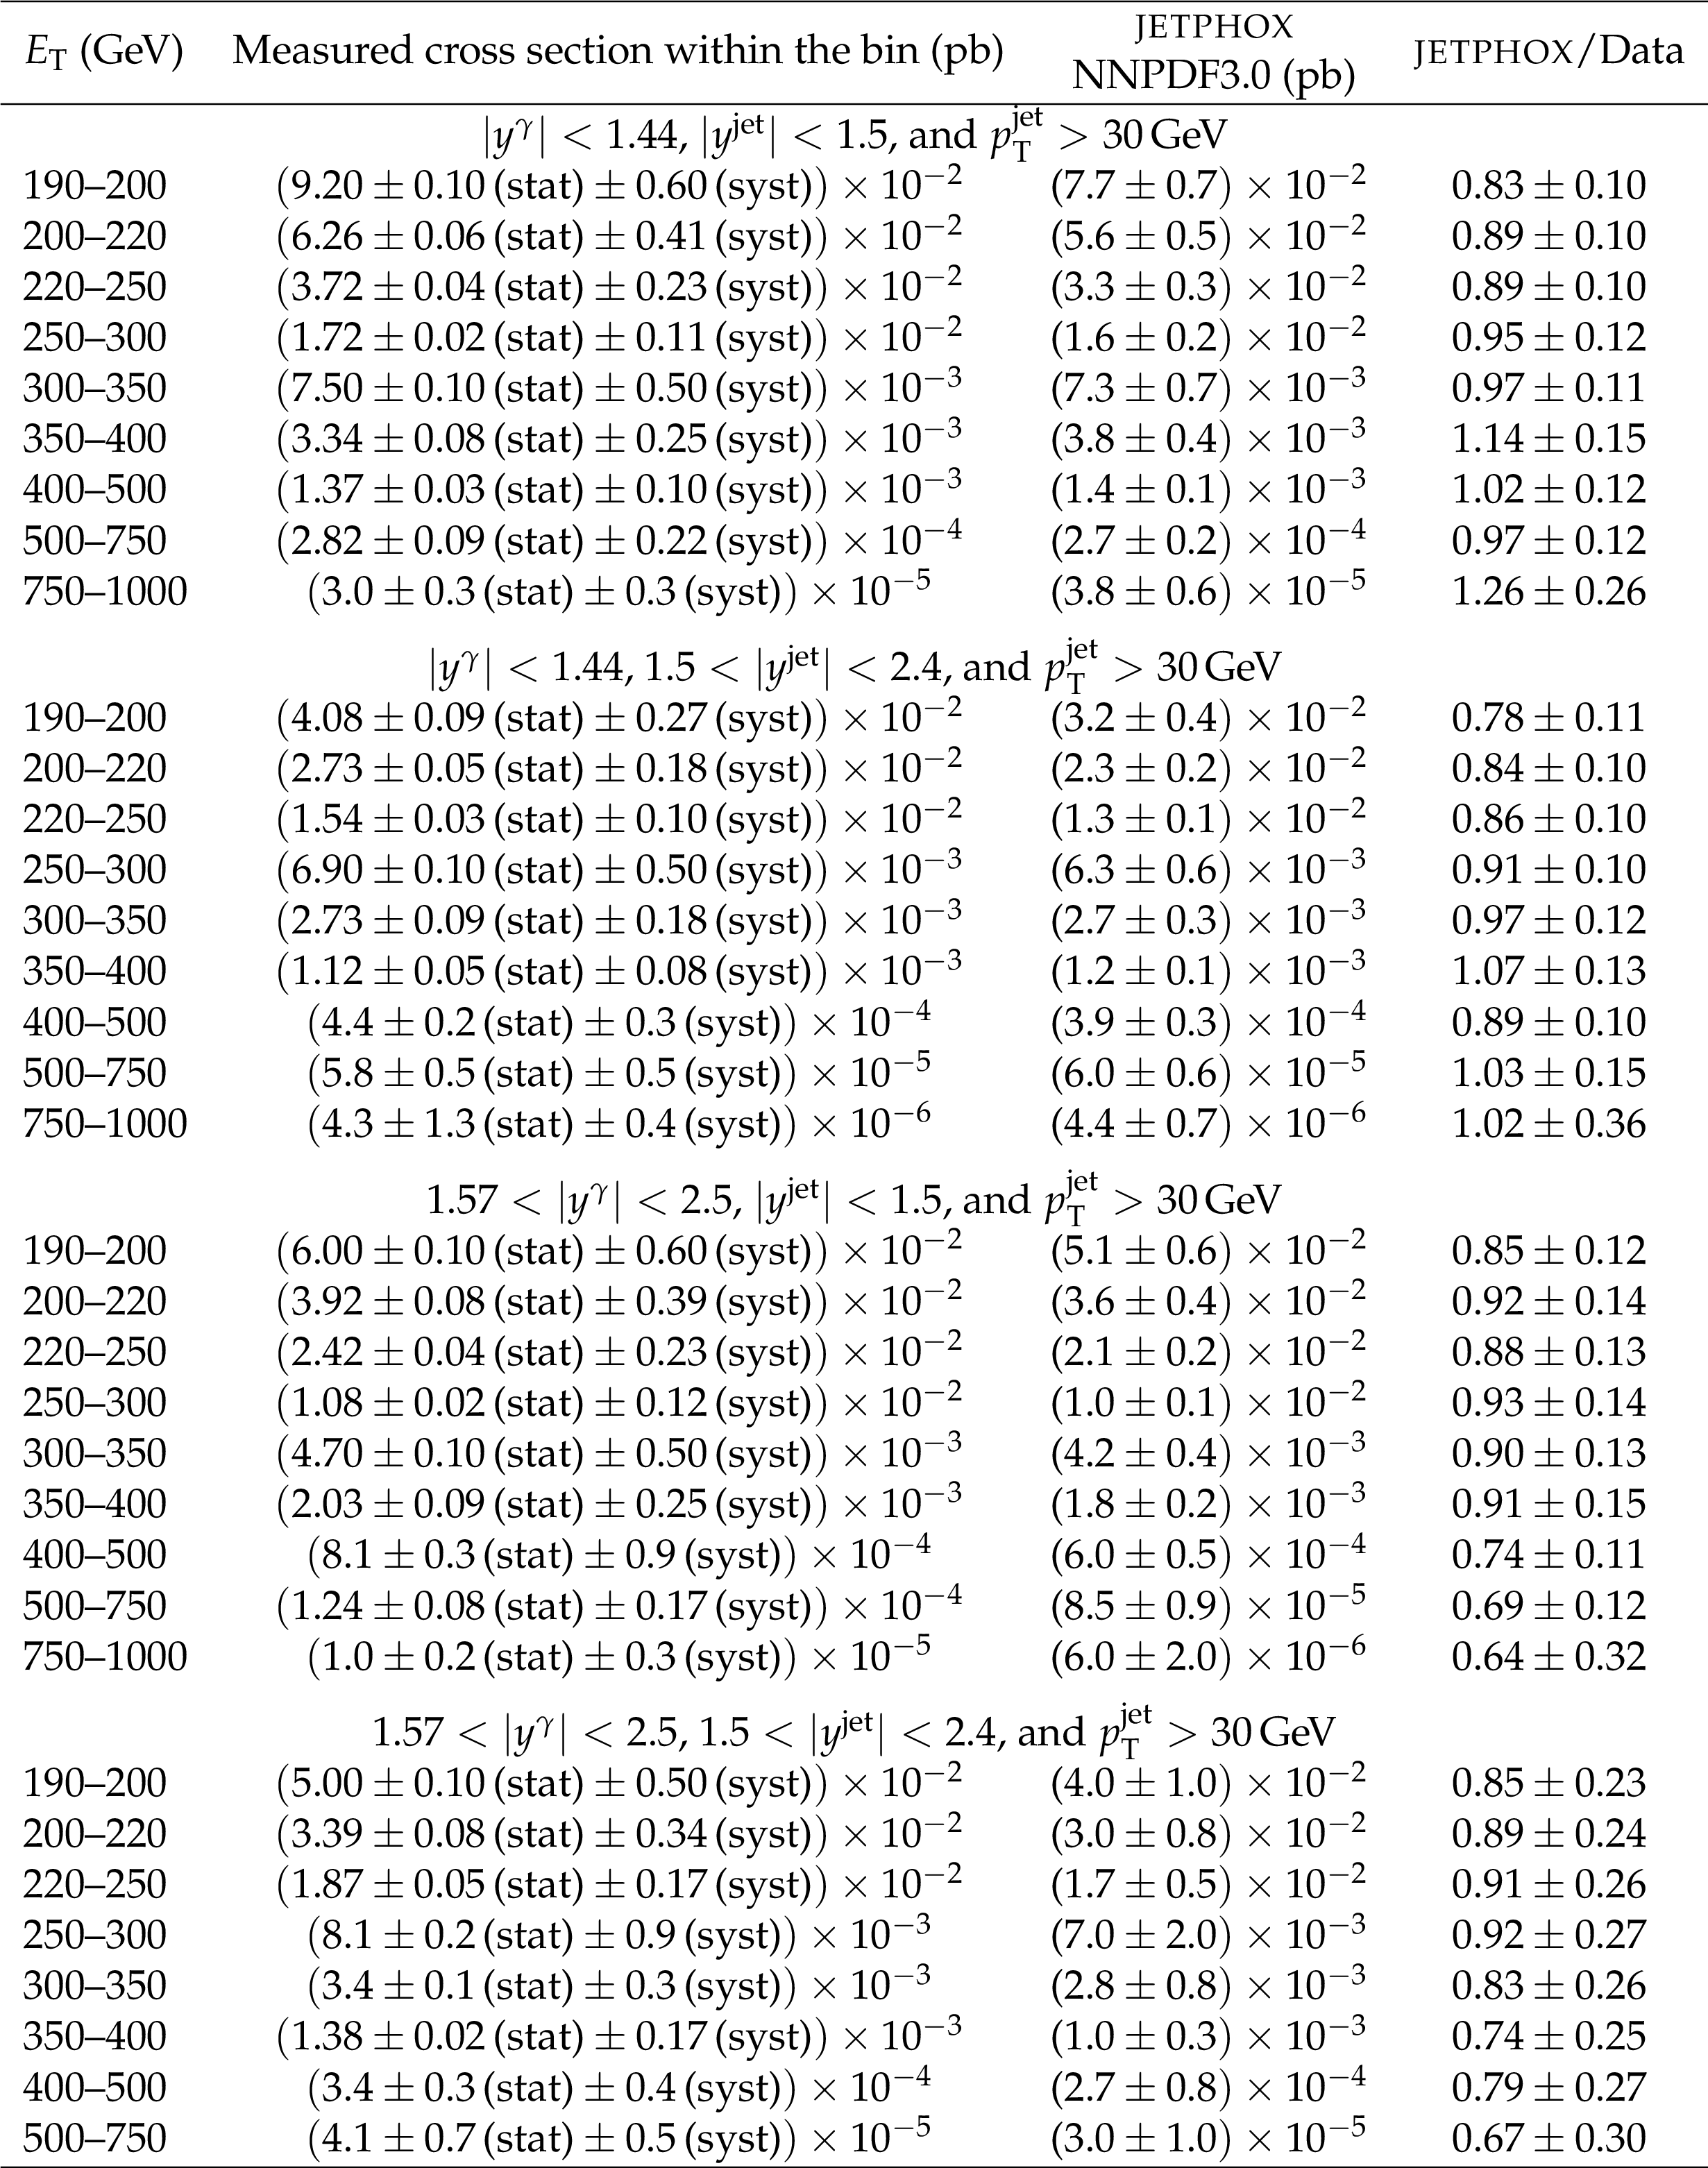
Table 3:
Measured and predicted differential cross section for photon+jets production, along with statistical and systematical uncertainties in the various $ {E_{\mathrm {T}}} $ and $y$ bins. Predictions are based on JETPHOX at NLO with the NNPDF3.0 PDF set. The ratio of the JETPHOX predictions to the data are listed in the last column, with the total uncertainty estimated assuming uncorrelated experimental and theoretical uncertainties. |
| Summary |
|
The differential cross sections for inclusive isolated-photon and photon+jets production in proton-proton collisions at a center-of-mass energy of 13 TeV are measured with a data sample collected by the CMS experiment corresponding to an integrated luminosity of 2.26 fb$^{-1}$. The measurements of inclusive isolated-photon production cross sections are presented as functions of photon transverse energy and rapidity. The photon+jets production cross sections are presented as functions of photon transverse energy, and photon and jet rapidities. The measurements are compared with theoretical predictions produced using the jetphox next-to-leading order calculations using different parton distribution functions. The theoretical predictions agree with the experimental measurements within the statistical and systematic uncertainties. For low to middle range in photon $ E_{\mathrm{T}} $, where the experimental uncertainties are smaller or comparable to theoretical uncertainties, these measurements provide the potential to further constrain the proton PDFs. The agreement between data and theory, and the new next-to-next-to-leading-order (NNLO) calculations [46] motivate the use of additional measurements to better estimate the gluon and other PDFs. |
| References | ||||
| 1 | CMS Collaboration | Measurement of the isolated prompt photon production cross section in pp collisions at $ \sqrt{s} = $ 7 ~TeV | PRL 106 (2011) 082001 | CMS-QCD-10-019 1012.0799 |
| 2 | CMS Collaboration | Measurement of the differential cross section for isolated prompt photon production in pp collisions at 7 TeV | PRD 84 (2011) 052011 | CMS-QCD-10-037 1108.2044 |
| 3 | CMS Collaboration | Measurement of isolated photon production in pp and PbPb collisions at $ \sqrt{s_{NN}}= $ 2.76 TeV | PLB 710 (2012) 256 | CMS-HIN-11-002 1201.3093 |
| 4 | ATLAS Collaboration | Measurement of the inclusive isolated prompt photons cross section in pp collisions at $ \sqrt{s}= $ 7 TeV with the ATLAS detector using 4.6 $ fb$^{-1} | PRD 89 (2014) 052004 | 1311.1440 |
| 5 | ATLAS Collaboration | Measurement of the inclusive isolated prompt photon cross section in pp collisions at $ \sqrt{s}= $ 8 TeV with the ATLAS detector | JHEP 08 (2016) 005 | 1605.03495 |
| 6 | CMS Collaboration | Measurement of the triple-differential cross section for photon+jets production in proton-proton collisions at $ \sqrt{s}= $ 7 TeV | JHEP 06 (2014) 009 | CMS-QCD-11-005 1311.6141 |
| 7 | ATLAS Collaboration | Measurement of the production cross section of an isolated photon associated with jets in proton-proton collisions at $ \sqrt{s}= $ 7 TeV with the ATLAS detector | PRD 85 (2012) 092014 | 1203.3161 |
| 8 | ATLAS Collaboration | High-$ E_{\rm T} $ isolated-photon plus jets production in pp collisions at $ \sqrt s= $ 8 TeV with the ATLAS detector | NPB 918 (2017) 257 | 1611.06586 |
| 9 | ATLAS Collaboration | Measurement of the cross section for inclusive isolated-photon production in pp collisions at $ \sqrt s= $ 13 TeV using the ATLAS detector | PLB 770 (2017) 473 | 1701.06882 |
| 10 | ATLAS Collaboration | Measurement of the cross section for isolated-photon plus jet production in pp collisions at $ \sqrt s= $ 13 TeV using the ATLAS detector | PLB 780 (2017) 578 | 1801.00112 |
| 11 | P. Aurenche et al. | A new critical study of photon production in hadronic collisions | PRD 73 (2006) 094007 | hep-ph/0602133 |
| 12 | R. Ichou and D. d'Enterria | Sensitivity of isolated photon production at TeV hadron colliders to the gluon distribution in the proton | PRD 82 (2010) 014015 | 1005.4529 |
| 13 | NNPDF Collaboration | Parton distributions for the LHC Run II | JHEP 04 (2015) 040 | 1410.8849 |
| 14 | L. A. Harland-Lang, A. D. Martin, P. Motylinski, and R. S. Thorne | Parton distributions in the LHC era: MMHT 2014 PDFs | EPJC 75 (2015) 204 | 1412.3989 |
| 15 | S. Dulat et al. | New parton distribution functions from a global analysis of quantum chromodynamics | PRD 93 (2016) 033006 | 1506.07443 |
| 16 | W. Vogelsang and A. Vogt | Constraints on the proton's gluon distribution from prompt photon production | NPB 453 (1995) 334 | hep-ph/9505404 |
| 17 | D. d'Enterria and J. Rojo | Quantitative constraints on the gluon distribution function in the proton from collider isolated-photon data | NPB 860 (2012) 311 | 1202.1762 |
| 18 | L. Carminati et al. | Sensitivity of the LHC isolated-gamma+jet data to the parton distribution functions of the proton | EPL 101 (2013) 61002 | 1212.5511 |
| 19 | CMS Collaboration | CMS luminosity measurement for the 2015 data-taking period | CMS-PAS-LUM-15-001 | CMS-PAS-LUM-15-001 |
| 20 | H. Voss, A. Hocker, J. Stelzer, and F. Tegenfeldt | TMVA, the toolkit for multivariate data analysis with ROOT | in XIth International Workshop on Advanced Computing and Analysis Techniques in Physics Research (ACAT), p. 40 2007 | physics/0703039 |
| 21 | CMS Collaboration | The CMS Experiment at the CERN LHC | JINST 3 (2008) S08004 | CMS-00-001 |
| 22 | CMS Collaboration | Description and performance of track and primary-vertex reconstruction with the CMS tracker | JINST 9 (2014) P10009 | CMS-TRK-11-001 1405.6569 |
| 23 | CMS Collaboration | Particle-flow reconstruction and global event description with the CMS detector | JINST 12 (2017) P10003 | CMS-PRF-14-001 1706.04965 |
| 24 | CMS Collaboration | Energy calibration and resolution of the CMS electromagnetic calorimeter in pp collisions at $ \sqrt{s} = $ 7 TeV | JINST 8 (2013) P09009 | CMS-EGM-11-001 1306.2016 |
| 25 | CMS Collaboration | Performance of photon reconstruction and identification with the CMS detector in proton-proton collisions at $ \sqrt{s} = $ 8 TeV | JINST 10 (2015) P08010 | CMS-EGM-14-001 1502.02702 |
| 26 | M. Cacciari, G. P. Salam, and G. Soyez | The anti-$ {k_{\mathrm{T}}} $ jet clustering algorithm | JHEP 04 (2008) 063 | 0802.1189 |
| 27 | M. Cacciari, G. P. Salam, and G. Soyez | FastJet user manual | EPJC 72 (2012) 1896 | 1111.6097 |
| 28 | CMS Collaboration | Determination of jet energy calibration and transverse momentum resolution in CMS | JINST 6 (2011) P11002 | CMS-JME-10-011 1107.4277 |
| 29 | T. Sjostrand et al. | An Introduction to PYTHIA 8.2 | CPC 191 (2015) 159 | 1410.3012 |
| 30 | J. Alwall et al. | The automated computation of tree-level and next-to-leading order differential cross sections, and their matching to parton shower simulations | JHEP 07 (2014) 079 | 1405.0301 |
| 31 | J. Alwall et al. | Comparative study of various algorithms for the merging of parton showers and matrix elements in hadronic collisions | EPJC 53 (2008) 473 | 0706.2569 |
| 32 | R. Frederix and S. Frixione | Merging meets matching in MC@NLO | JHEP 12 (2012) 061 | 1209.6215 |
| 33 | CMS Collaboration | Event generator tunes obtained from underlying event and multiparton scattering measurements | EPJC 76 (2016) 155 | CMS-GEN-14-001 1512.00815 |
| 34 | NNPDF Collaboration | Parton distributions with LHC data | NPB 867 (2013) 244 | 1207.1303 |
| 35 | GEANT4 Collaboration | $ GEANT4--a $ simulation toolkit | NIMA 506 (2003) 250 | |
| 36 | CMS Collaboration | The CMS trigger system | JINST 12 (2017) P01020 | CMS-TRG-12-001 1609.02366 |
| 37 | CMS Collaboration | Performance of missing energy reconstruction in 13 TeV pp collision data using the CMS detector | CMS-PAS-JME-16-004 | CMS-PAS-JME-16-004 |
| 38 | CMS Collaboration | Jet algorithms performance in 13 TeV data | CMS-PAS-JME-16-003 | CMS-PAS-JME-16-003 |
| 39 | G. D'Agostini | A multidimensional unfolding method based on Bayes' theorem | NIMA 362 (1995) 487 | |
| 40 | T. Adye | Unfolding algorithms and tests using RooUnfold | Proceedings, PHYSTAT 2011 Workshop on Statistical Issues Related to Discovery Claims in Search Experiments and Unfolding (2011) 313 | 1105.1160 |
| 41 | ATLAS and CMS Collaborations, LHC Higgs Combination Group | Procedure for the LHC Higgs boson search combination in summer 2011 | CMS/ATLAS joint note ATL-PHYS-PUB-2011-11, CMS NOTE 2011/005 | |
| 42 | S. Catani, M. Fontannaz, J. P. Guillet, and E. Pilon | Cross section of isolated prompt photons in hadron-hadron collisions | JHEP 05 (2002) 028 | hep-ph/0204023 |
| 43 | Z. Belghobsi et al. | Photon-jet correlations and constraints on fragmentation functions | PRD 79 (2009) 114024 | 0903.4834 |
| 44 | L. Bourhis, M. Fontannaz, and J. P. Guillet | Quark and gluon fragmentation functions into photons | EPJC 2 (1998) 529 | hep-ph/9704447 |
| 45 | H1 and ZEUS Collaborations | Combination of measurements of inclusive deep inelastic $ {\mathrm{e}^{\pm}{\mathrm{p}}} $ scattering cross sections and QCD analysis of HERA data | EPJC 75 (2015) 580 | 1506.06042 |
| 46 | J. M. Campbell, R. K. Ellis, and C. Williams | Direct photon production at next-to-next-to-leading order | PRL 118 (2017) 222001 | 1612.04333 |
|
|
Compact Muon Solenoid LHC, CERN |
|

|

|

|

|

|