

Compact Muon Solenoid
LHC, CERN
| CMS-SMP-16-005 ; CERN-EP-2017-142 | ||
| Measurement of the differential cross sections for the associated production of a W boson and jets in proton-proton collisions at $ \sqrt{s} = $ 13 TeV | ||
| CMS Collaboration | ||
| 19 July 2017 | ||
| Phys. Rev. D 96 (2017) 072005 | ||
| Abstract: A measurement of the differential cross sections for a W boson produced in association with jets in the muon decay channel is presented. The measurement is based on 13 TeV proton-proton collision data corresponding to an integrated luminosity of 2.2 fb$^{-1}$, recorded by the CMS detector at the LHC. The cross sections are reported as functions of jet multiplicity, jet transverse momentum $p_{\mathrm{T}}$, jet rapidity, the scalar $p_{\mathrm{T}}$ sum of the jets, and angular correlations between the muon and the jet for different jet multiplicities. The measured cross sections are in agreement with predictions that include multileg leading-order (LO) and next-to-LO matrix element calculations interfaced with parton showers, as well as a next-to-next-to-LO calculation for the W boson and one jet production. | ||
| Links: e-print arXiv:1707.05979 [hep-ex] (PDF) ; CDS record ; inSPIRE record ; HepData record ; CADI line (restricted) ; | ||
| Figures | |
png pdf |
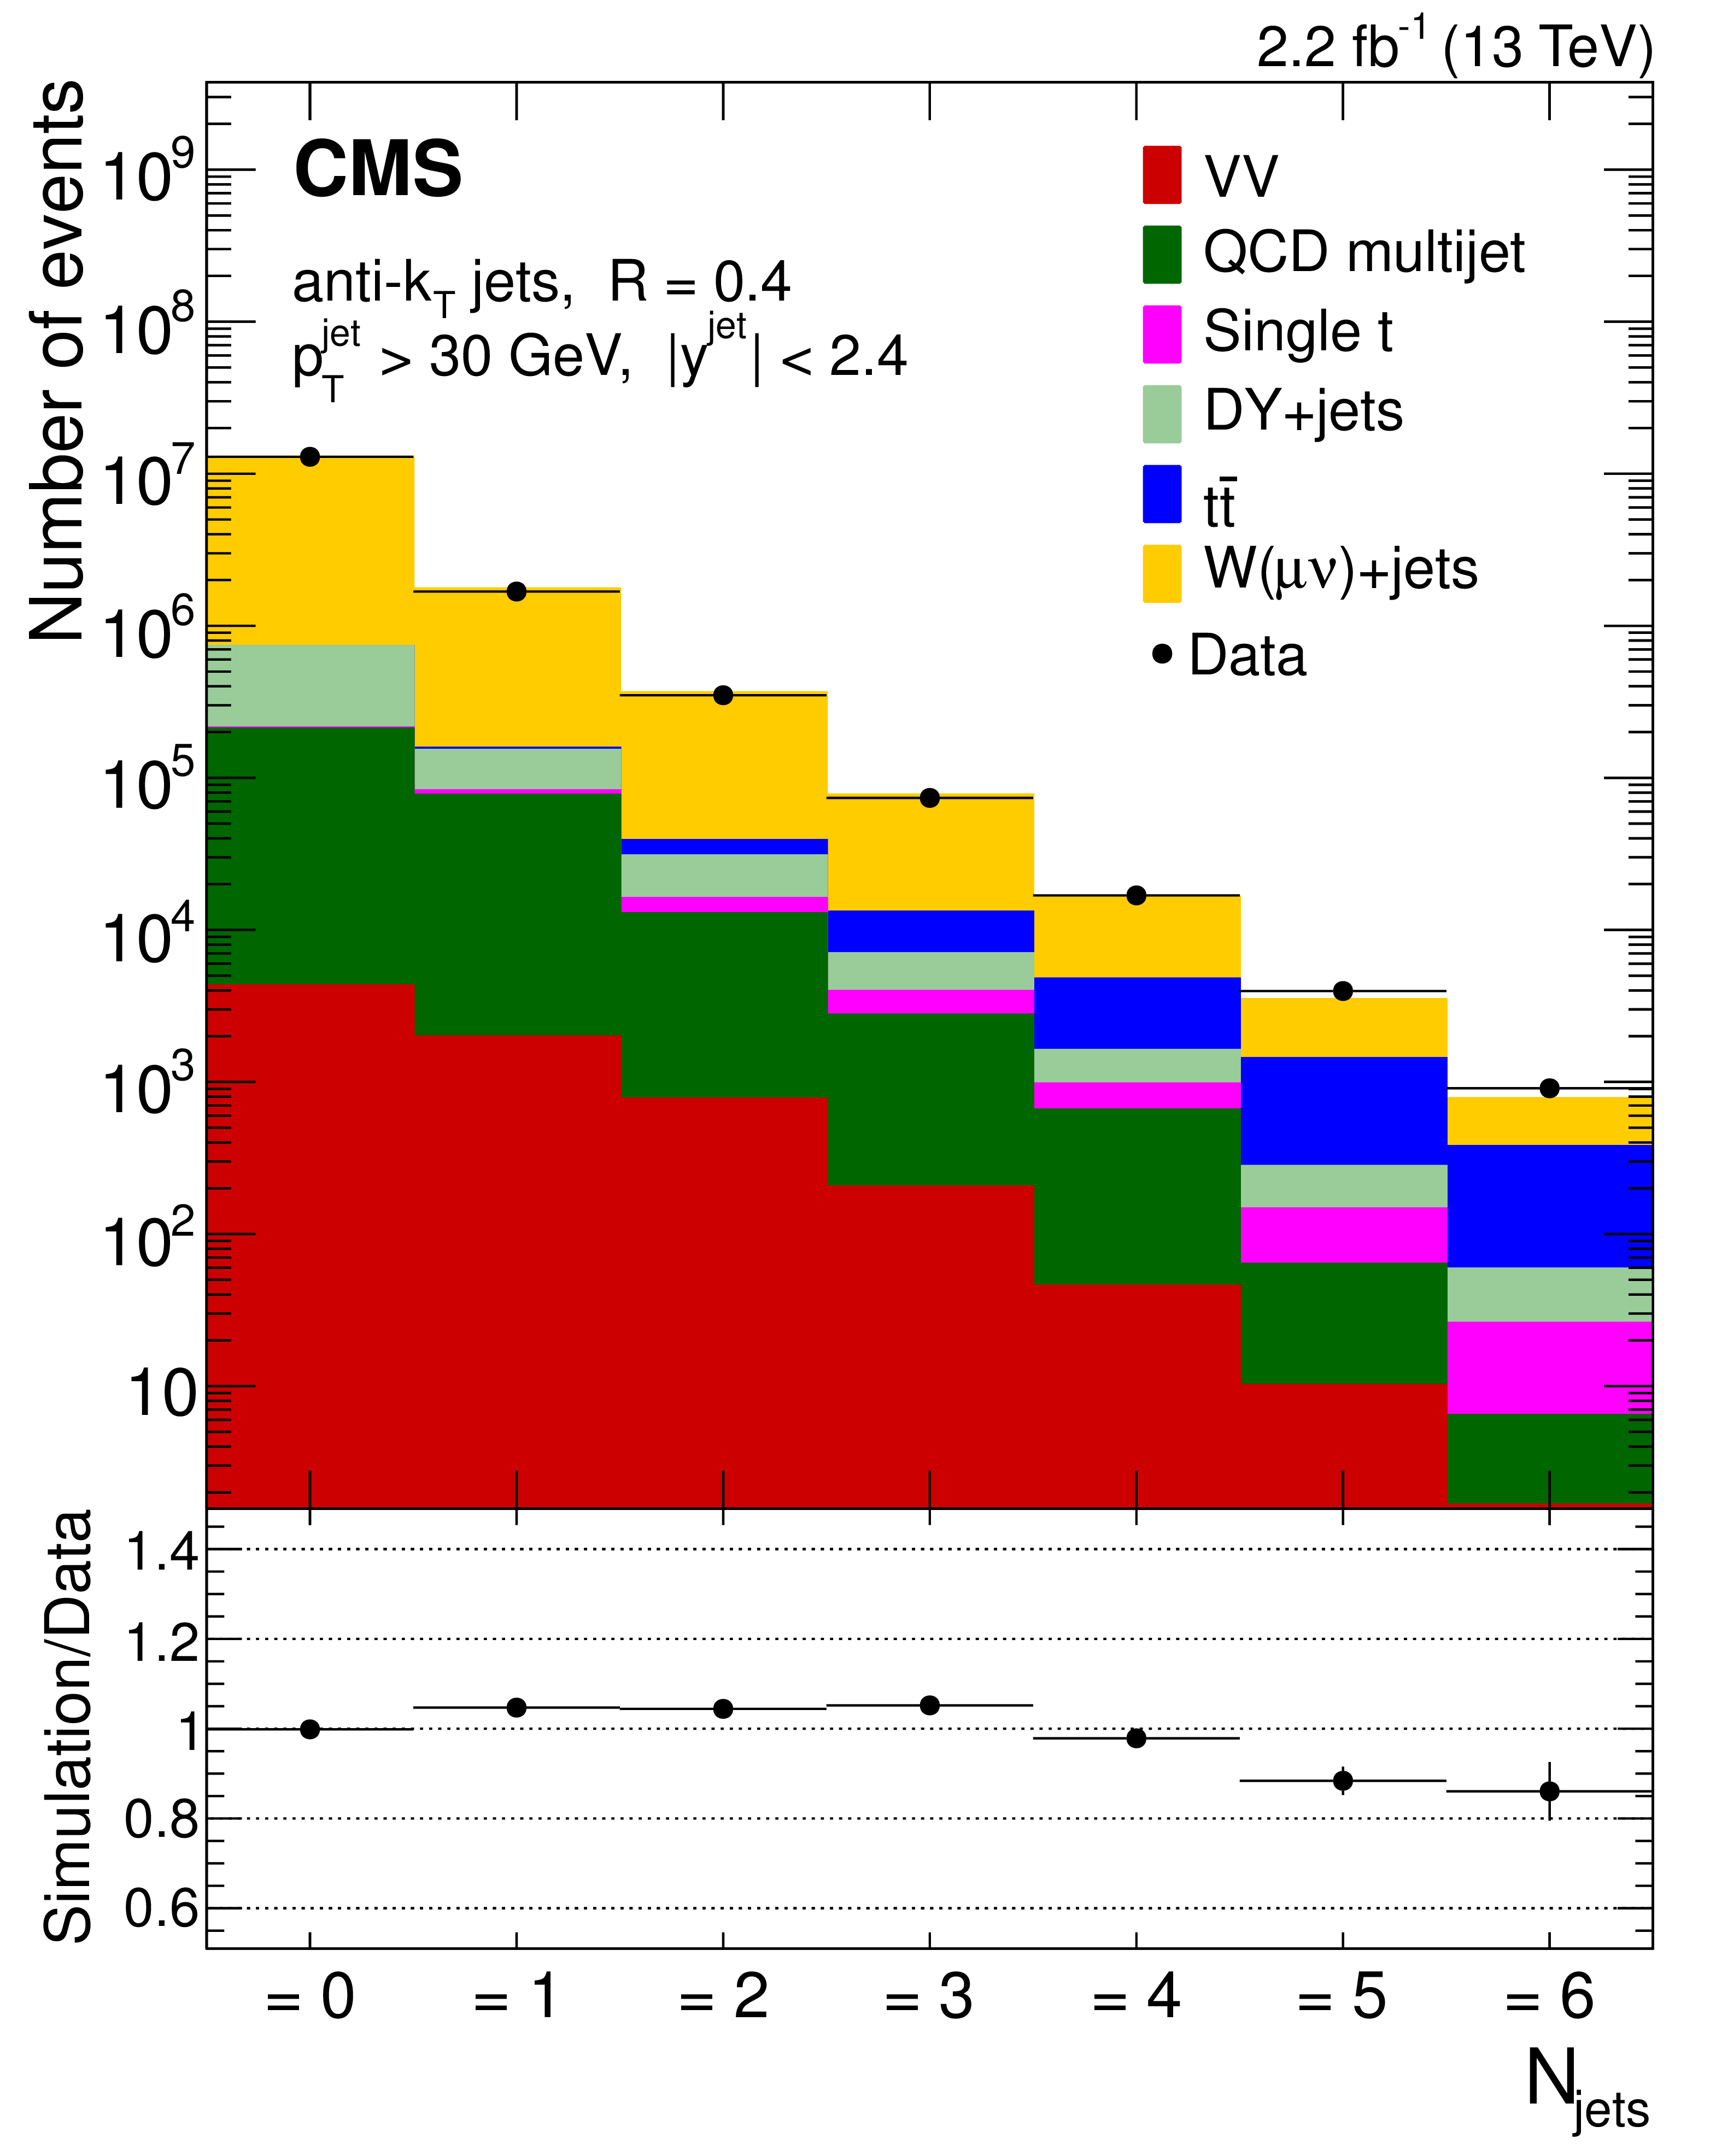
Figure 1:
Data-to-simulation comparison as a function of the jet multiplicity. The processes included are listed in Table 1. The QCD multijet background is estimated using control samples in data. The ${\mathrm{ t } {}\mathrm{ \bar{t} } } $ background is scaled as discussed in Section 6. The error bars in the ratio panel represent the combined statistical uncertainty of the data and simulation. |
png pdf |
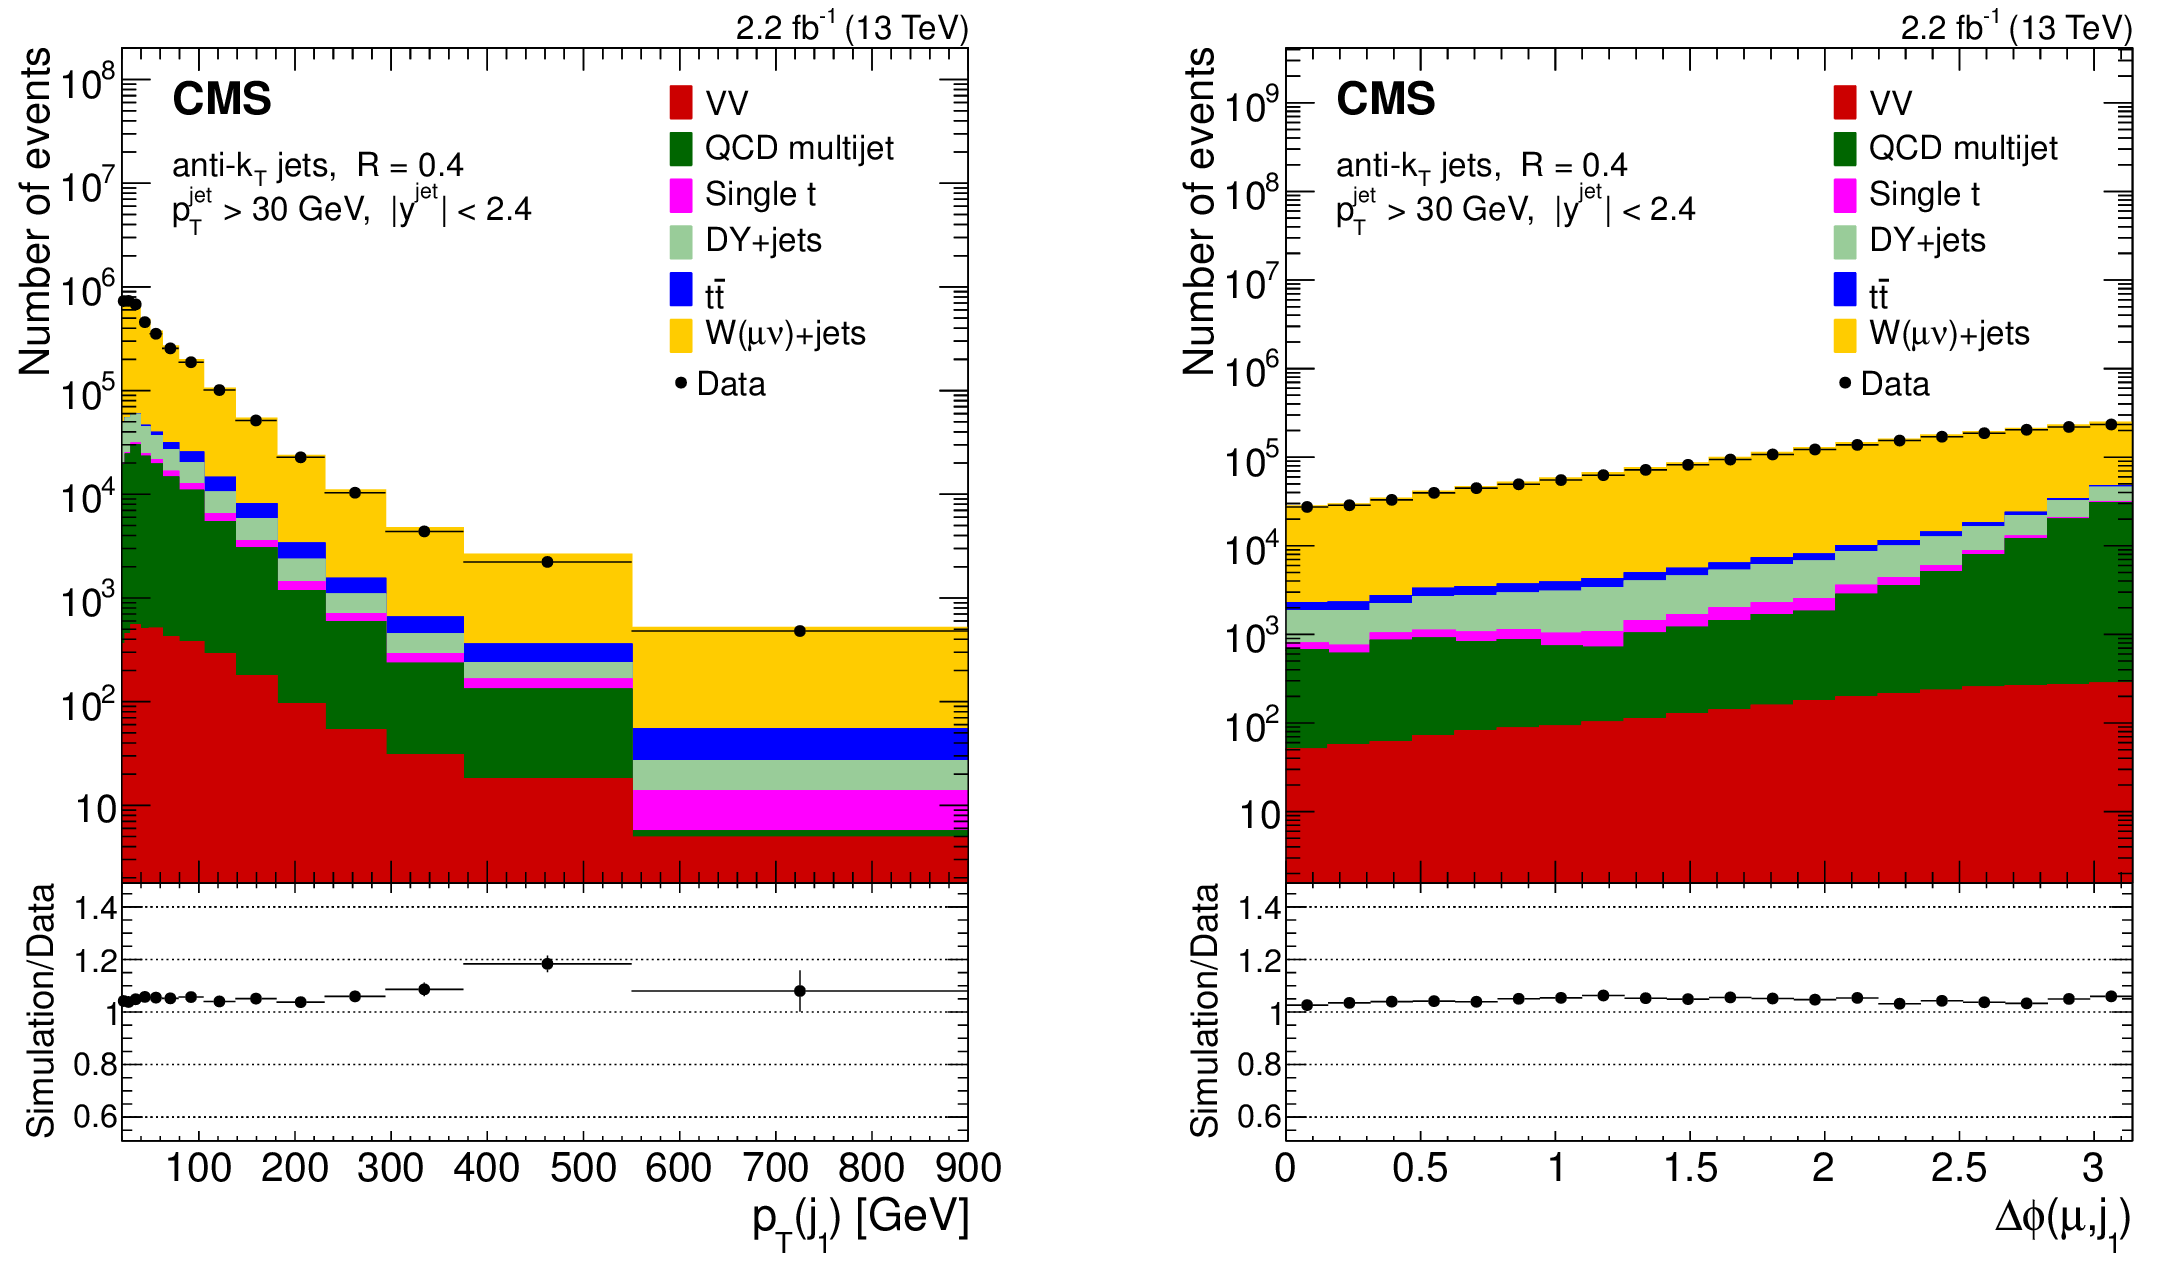
Figure 2:
Data-to-simulation comparison as functions of the leading jet $ {p_{\mathrm {T}}} $ (left) and $\Delta \phi (\text {$\mu $, $j_{1}$})$ between the muon and the leading jet (right) for one jet inclusive production. The processes included are listed in Table 1. The QCD multijet background is estimated using control samples in data. The ${\mathrm{ t } {}\mathrm{ \bar{t} } } $ background is scaled as discussed in Section 6. The error bars in the ratio panel represent the combined statistical uncertainty of the data and simulation. |
png pdf |
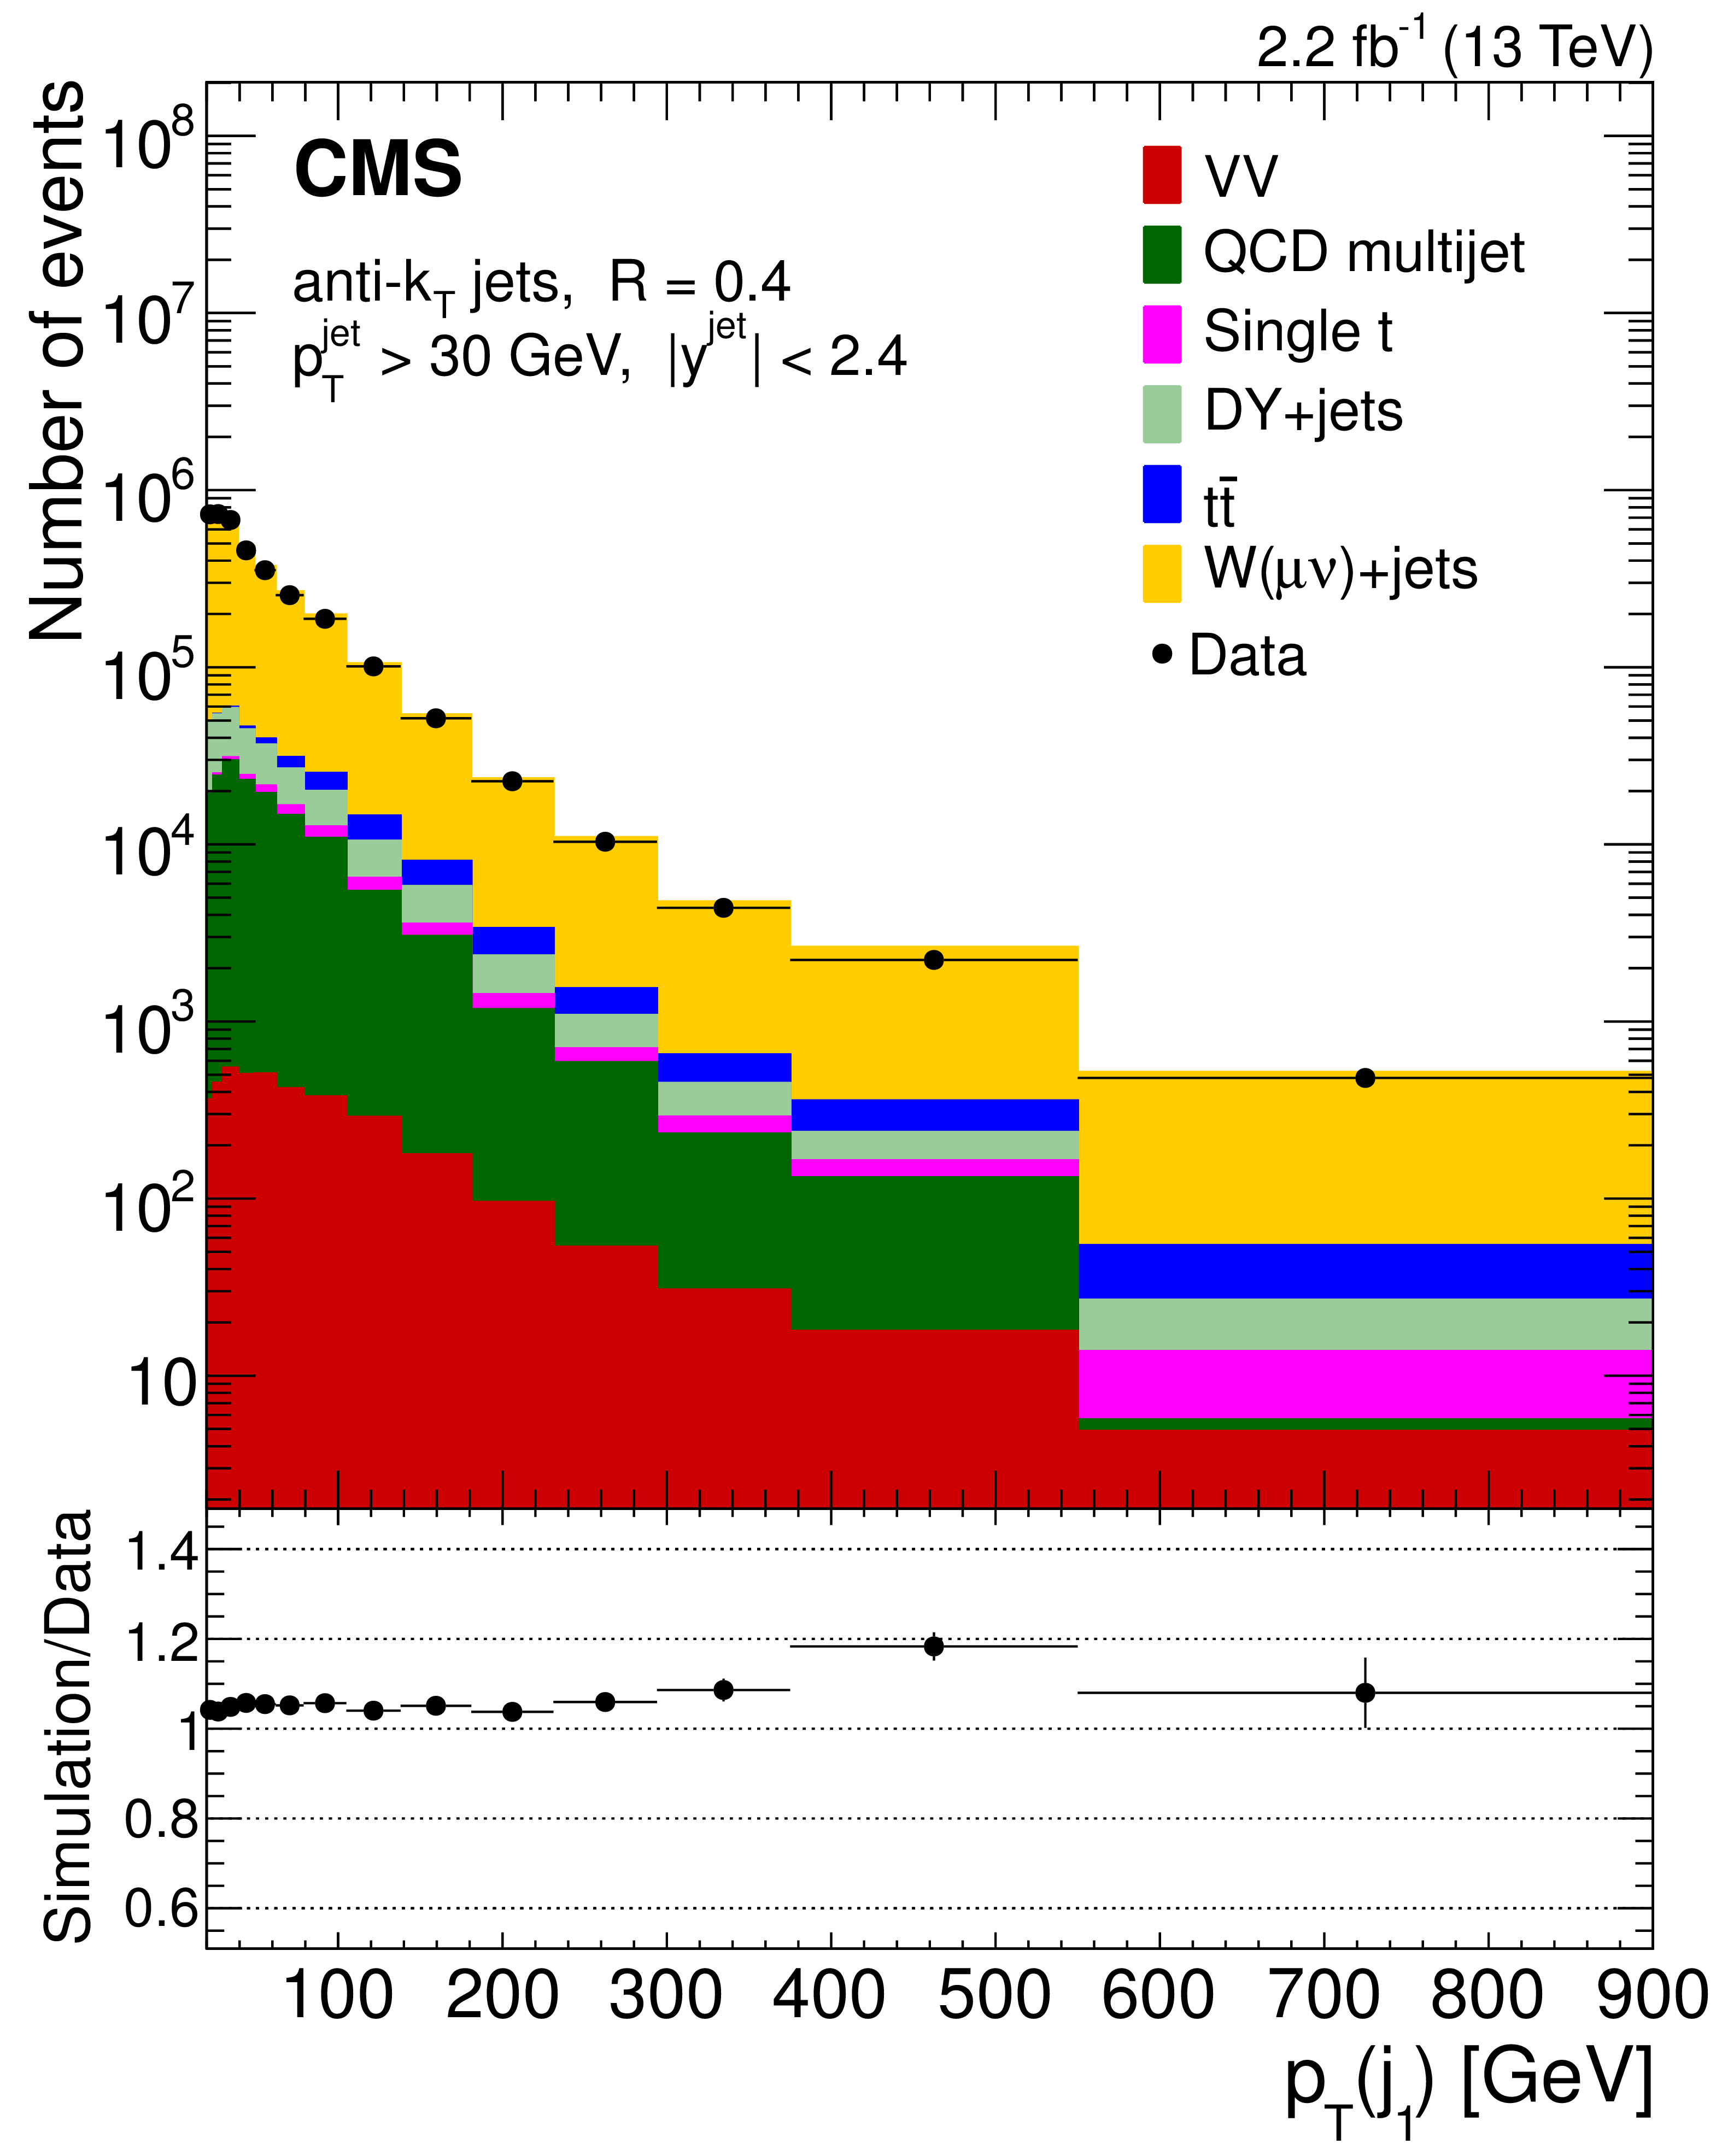
Figure 2-a:
Data-to-simulation comparison as functions of the leading jet $ {p_{\mathrm {T}}} $ for one jet inclusive production. The processes included are listed in Table 1. The QCD multijet background is estimated using control samples in data. The ${\mathrm{ t } {}\mathrm{ \bar{t} } } $ background is scaled as discussed in Section 6. The error bars in the ratio panel represent the combined statistical uncertainty of the data and simulation. |
png pdf |
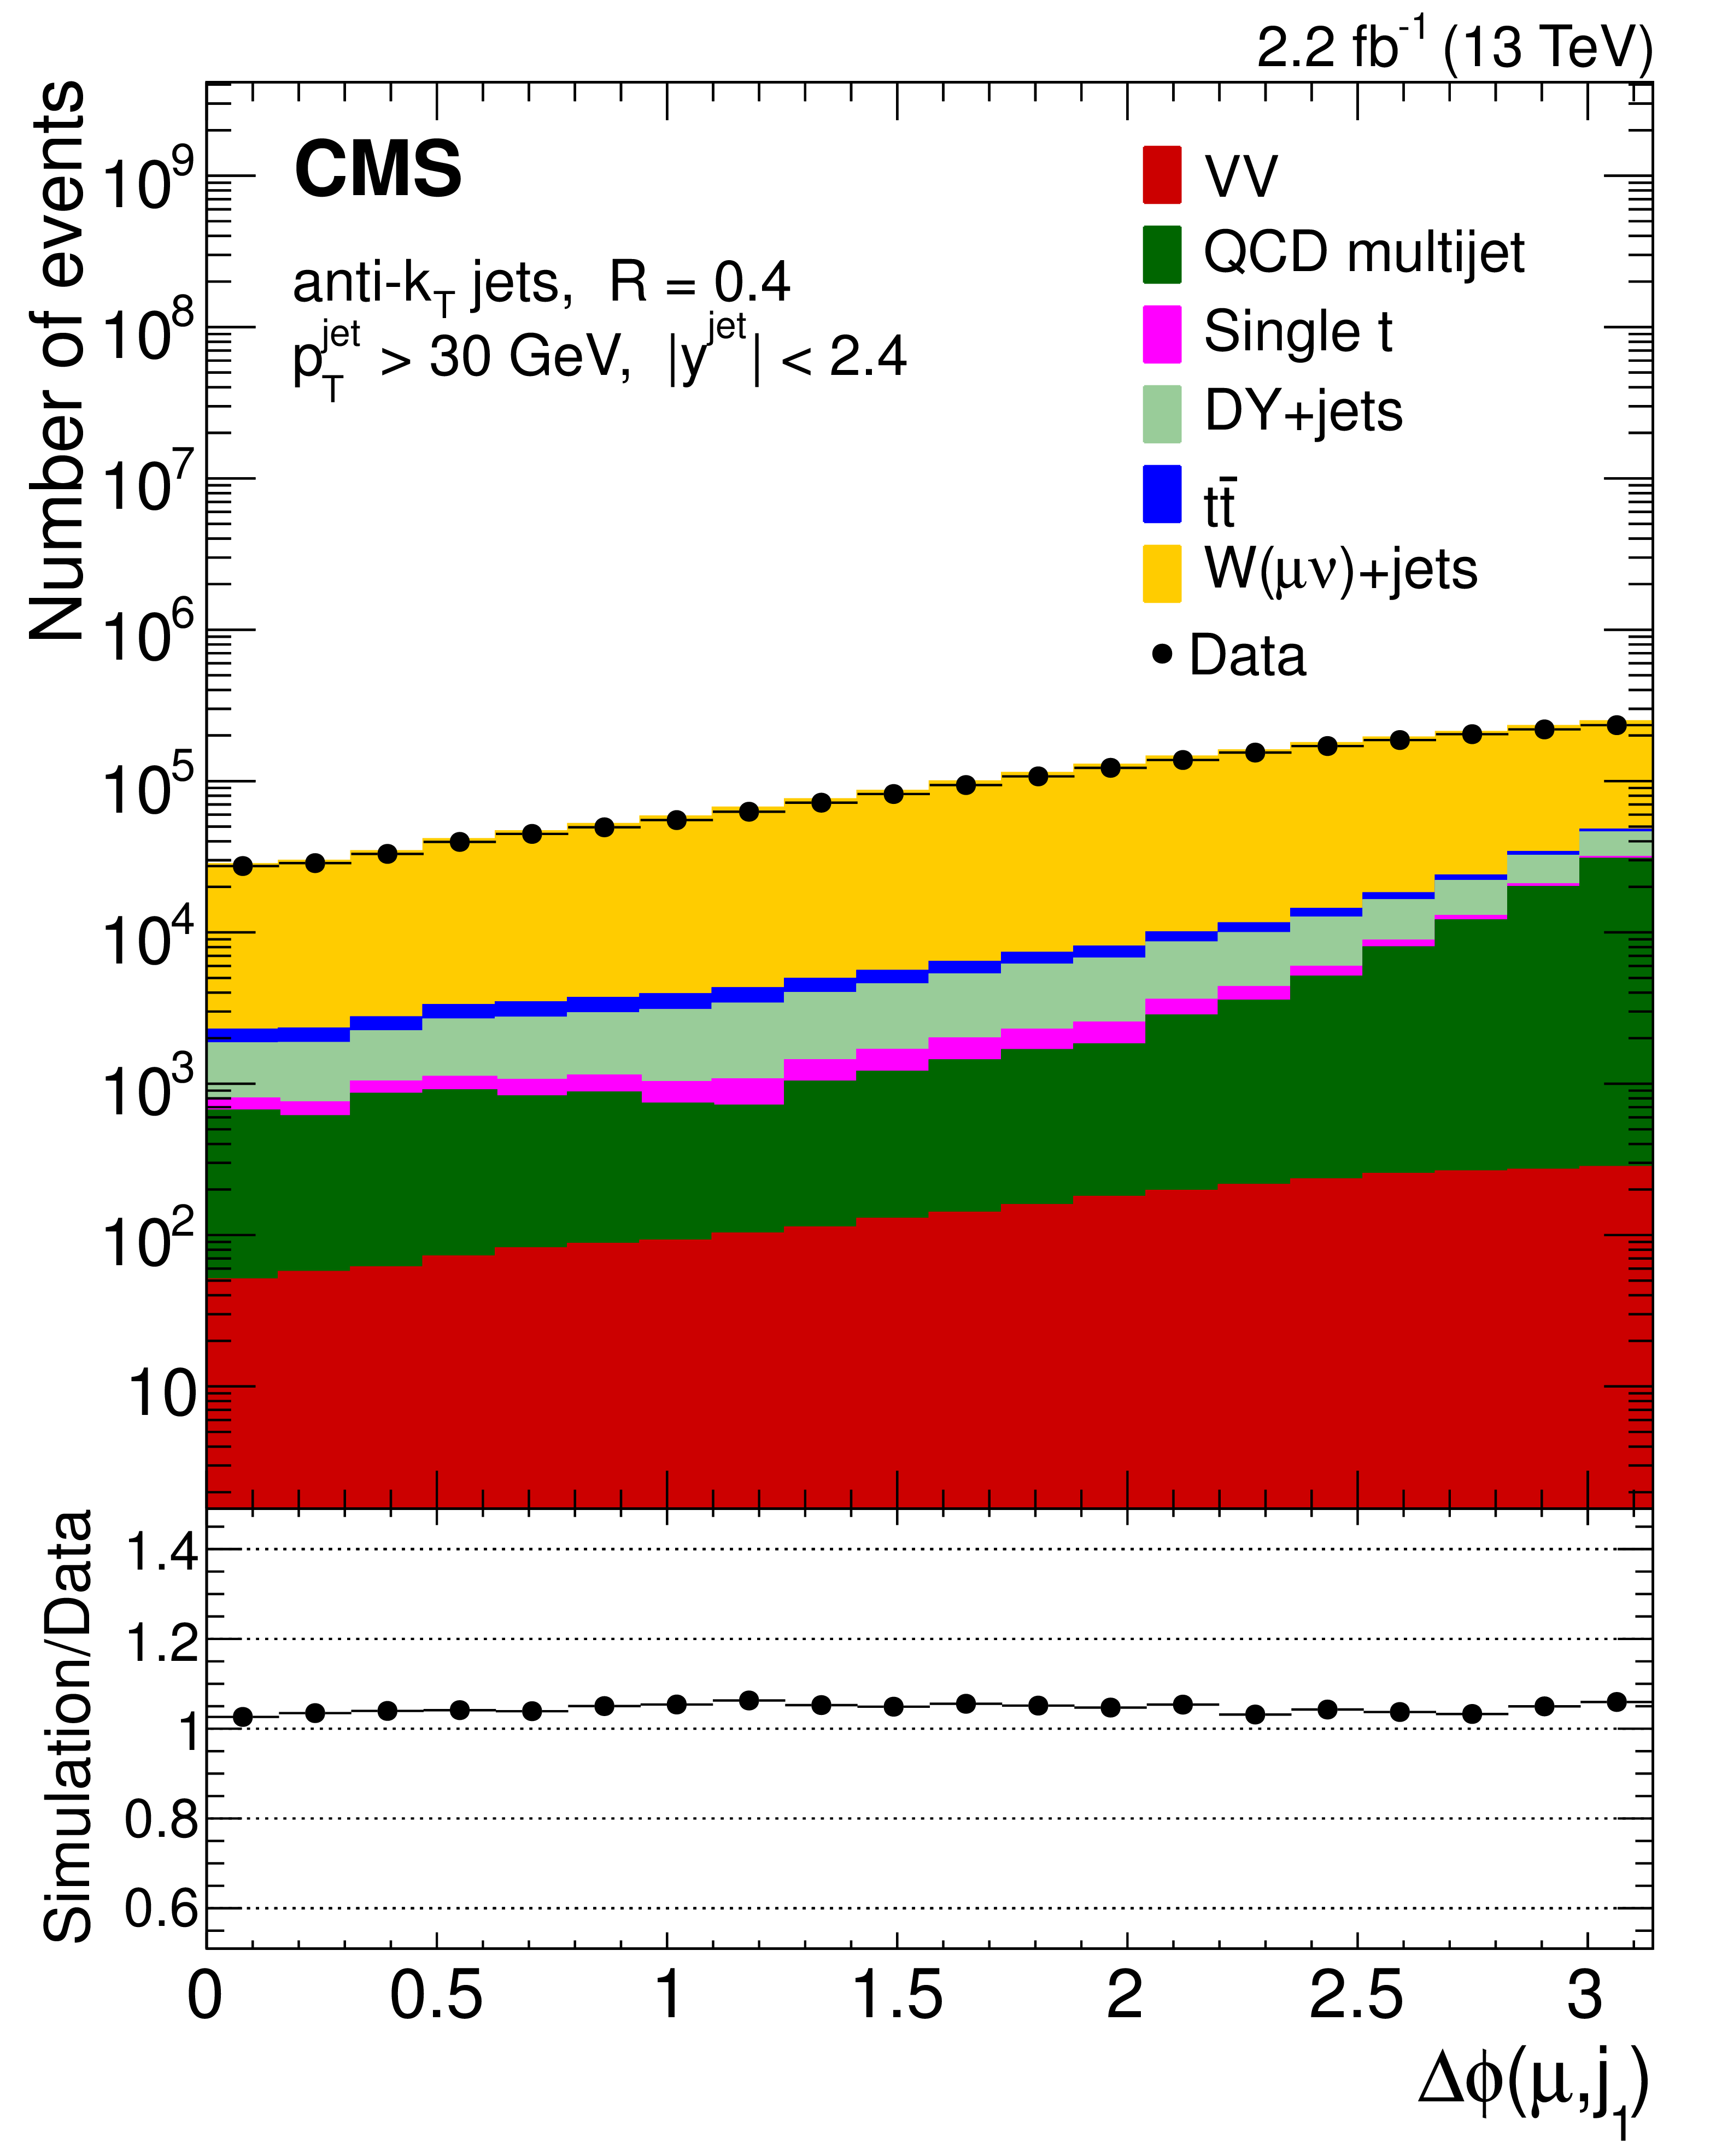
Figure 2-b:
$\Delta \phi (\text {$\mu $, $j_{1}$})$ between the muon and the leading jet for one jet inclusive production. The processes included are listed in Table 1. The QCD multijet background is estimated using control samples in data. The ${\mathrm{ t } {}\mathrm{ \bar{t} } } $ background is scaled as discussed in Section 6. The error bars in the ratio panel represent the combined statistical uncertainty of the data and simulation. |

png pdf |
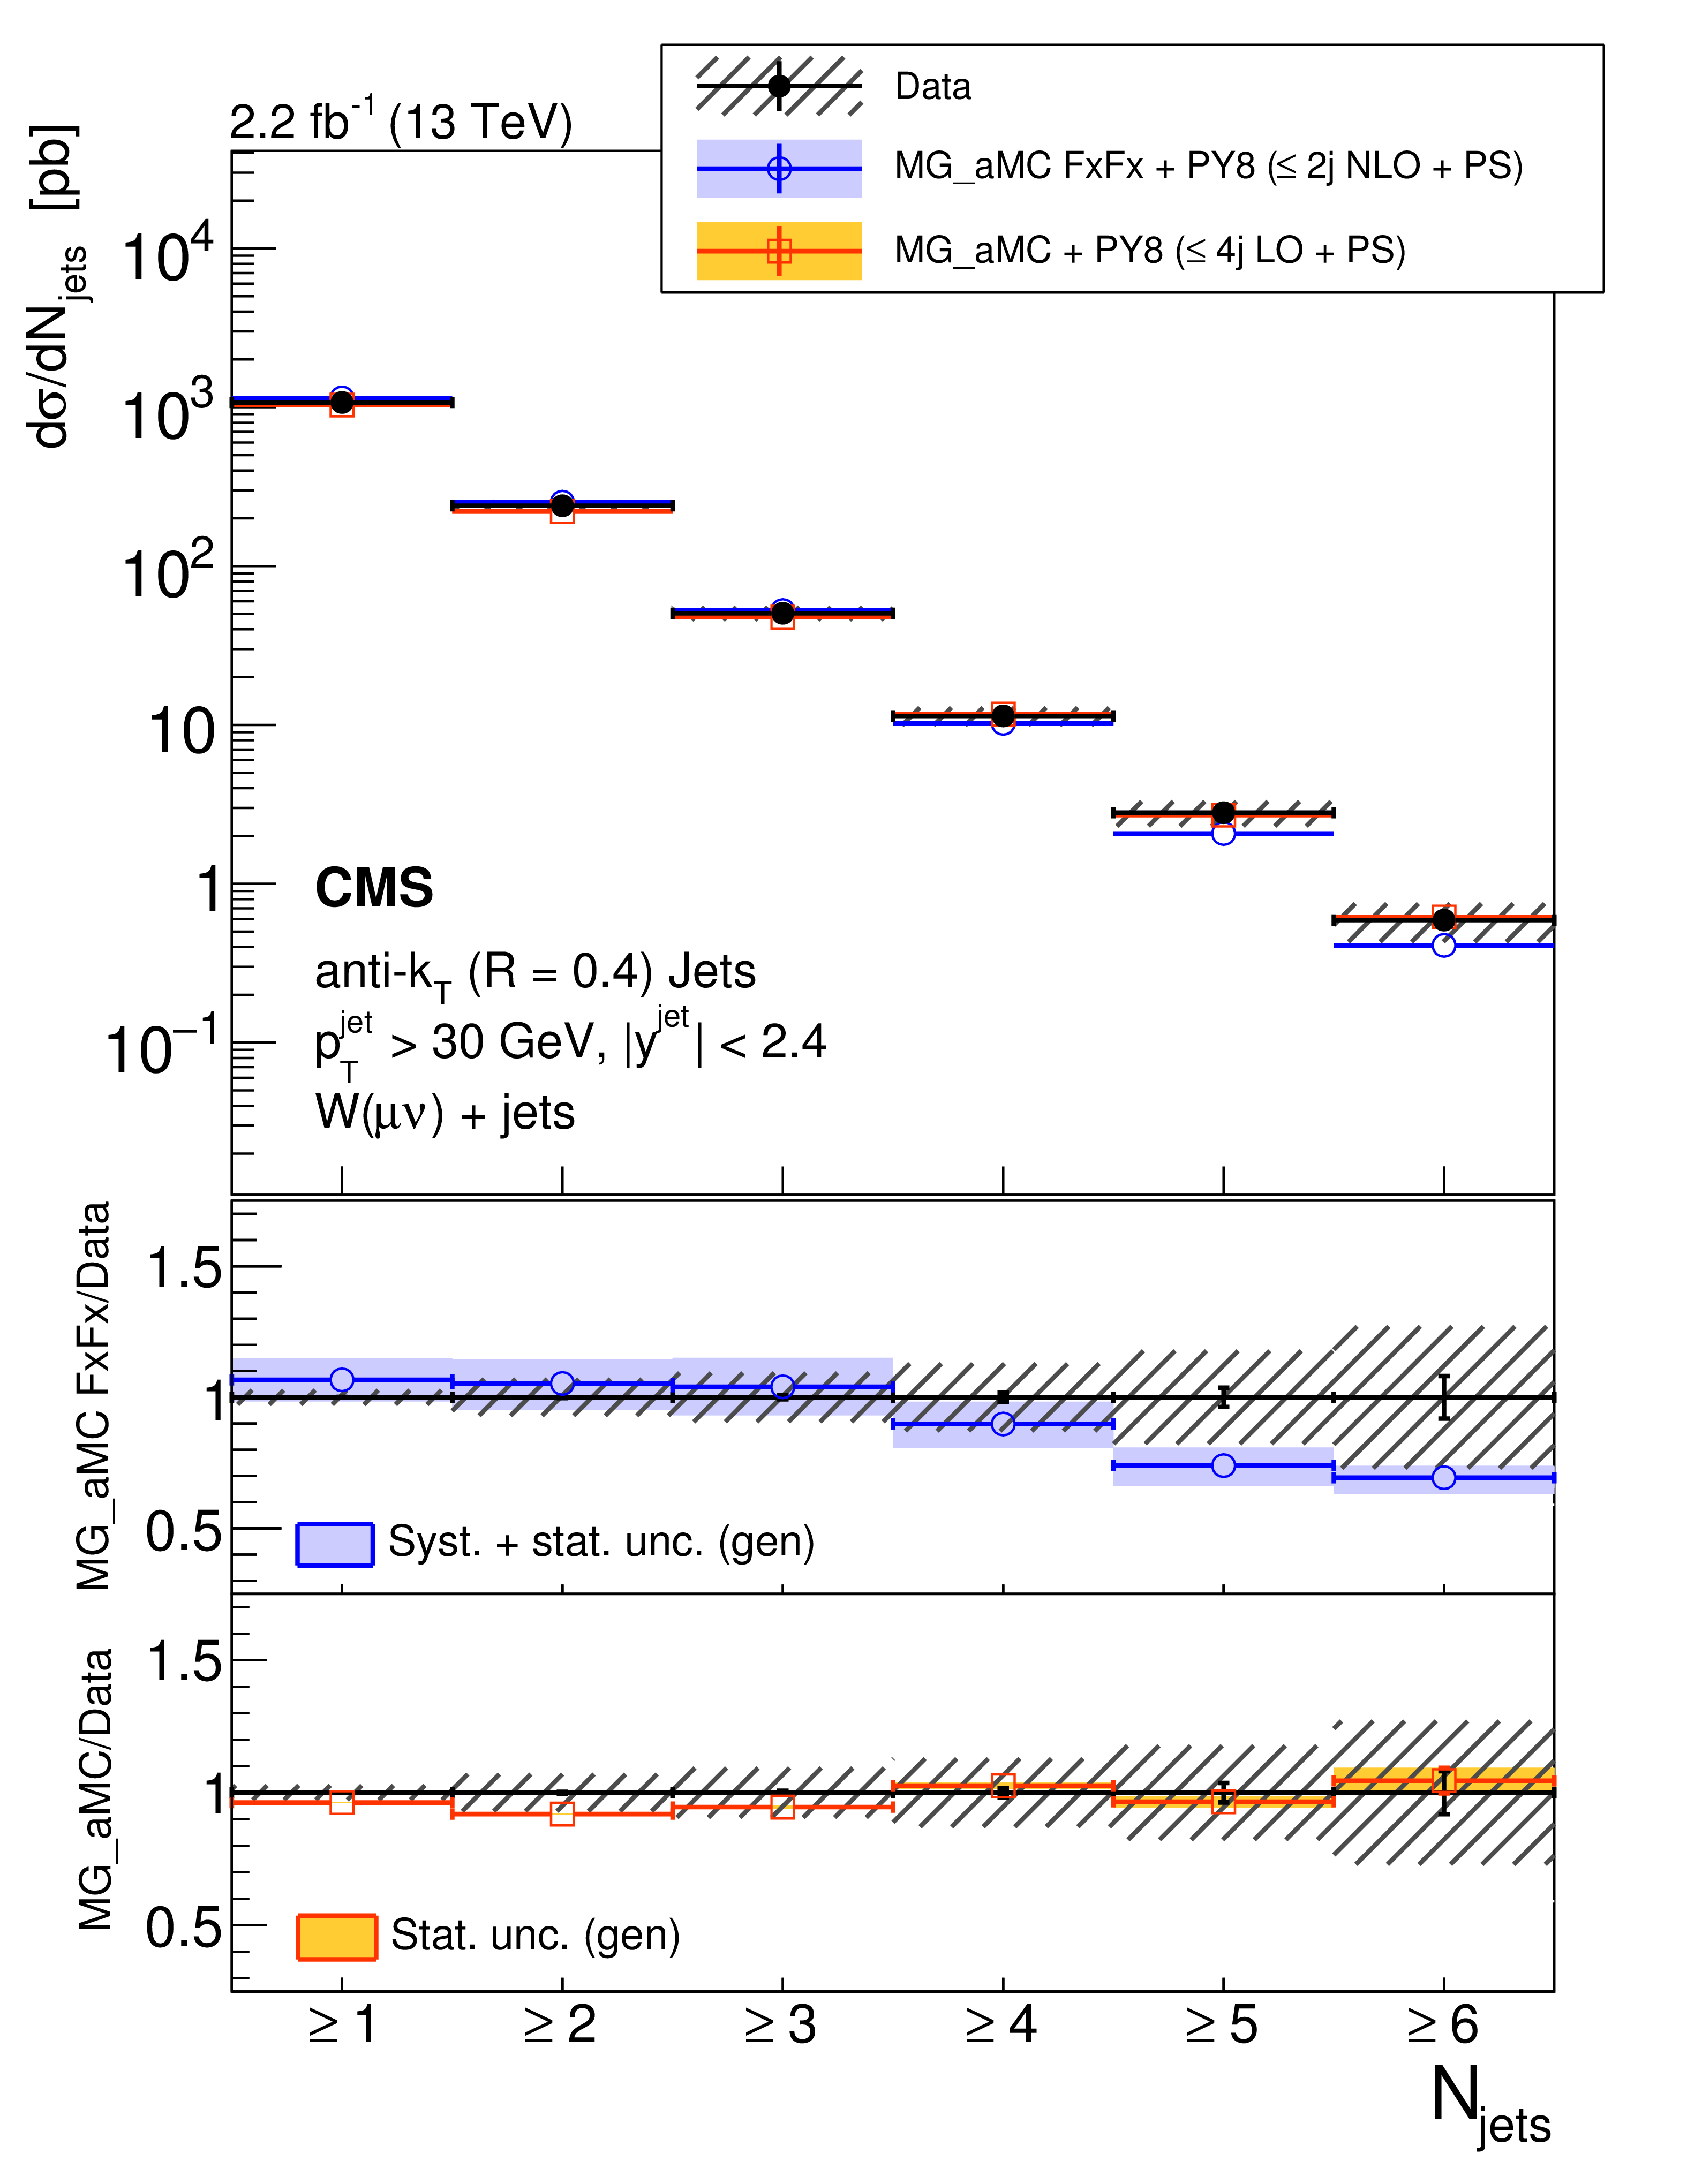
Figure 3:
Differential cross section measurement for the exclusive (left) and inclusive jet multiplicities (right), compared to the predictions of MG_aMC FxFx and MG_aMC. The black circular markers with the gray hatched band represent the unfolded data measurement and the total experimental uncertainty. The MG_aMC prediction is given only with its statistical uncertainty. The band around the MG_aMC FxFx prediction represents its theoretical uncertainty including both statistical and systematic components. The lower panels show the ratios of the prediction to the unfolded data. |

png pdf |
Figure 3-a:
Differential cross section measurement for the exclusive jet multiplicity, compared to the predictions of MG_aMC FxFx and MG_aMC. The black circular markers with the gray hatched band represent the unfolded data measurement and the total experimental uncertainty. The MG_aMC prediction is given only with its statistical uncertainty. The band around the MG_aMC FxFx prediction represents its theoretical uncertainty including both statistical and systematic components. The lower panel shows the ratios of the prediction to the unfolded data. |
png pdf |
Figure 3-b:
Differential cross section measurement for the inclusive jet multiplicity, compared to the predictions of MG_aMC FxFx and MG_aMC. The black circular markers with the gray hatched band represent the unfolded data measurement and the total experimental uncertainty. The MG_aMC prediction is given only with its statistical uncertainty. The band around the MG_aMC FxFx prediction represents its theoretical uncertainty including both statistical and systematic components. The lower panel shows the ratios of the prediction to the unfolded data. |
png pdf |
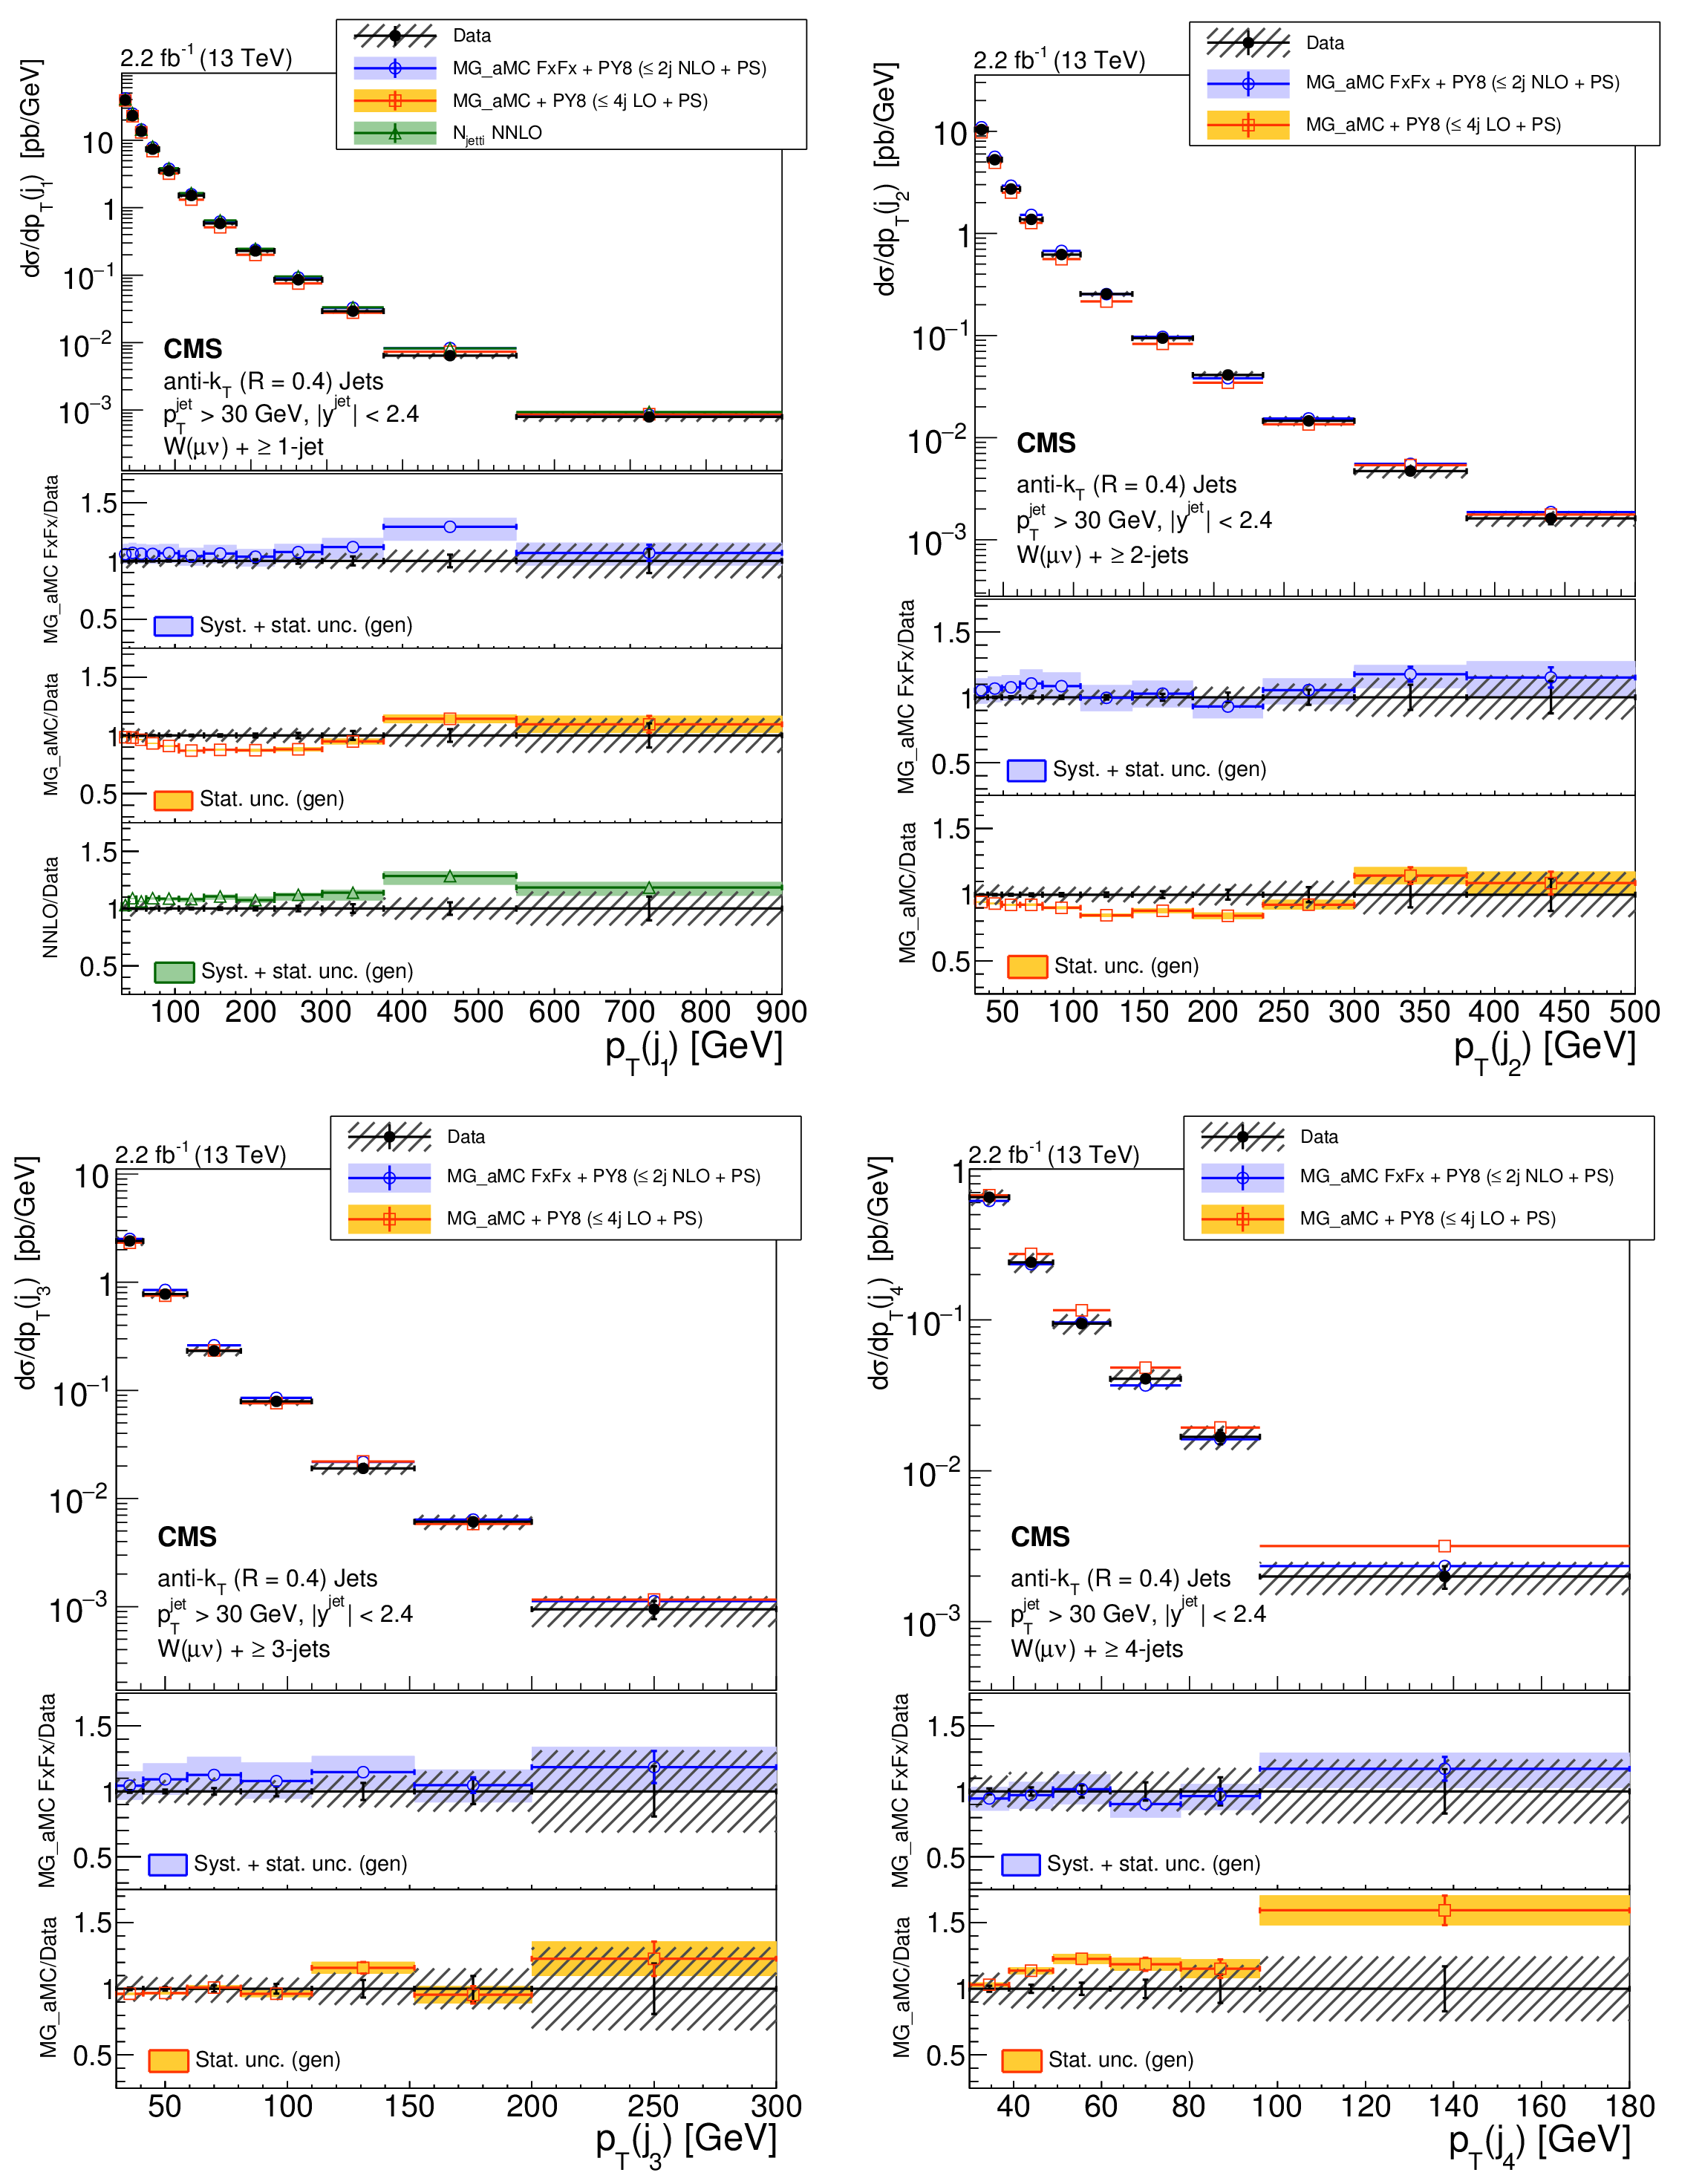
Figure 4:
Differential cross section measurement for the transverse momenta of the four leading jets, shown from left to right for at least 1 and 2 jets (upper) and for at least 3 and 4 jets (lower) on the figures, compared to the predictions of MG_aMC FxFx and MG_aMC. The NNLO prediction for $\mathrm{ W } $+1-jet is included in the first leading jet $ {p_{\mathrm {T}}} $. The black circular markers with the gray hatched band represent the unfolded data measurement and the total experimental uncertainty. The MG_aMC prediction is given only with its statistical uncertainty. The bands around the MG_aMC FxFx and NNLO predictions represent their theoretical uncertainties including both statistical and systematic components. The lower panels show the ratios of the prediction to the unfolded data. |

png pdf |
Figure 4-a:
Differential cross section measurement for the transverse momenta of the four leading jets, shown for at least 1 jet, compared to the predictions of MG_aMC FxFx and MG_aMC. The NNLO prediction for $\mathrm{ W } $+1-jet is included in the first leading jet $ {p_{\mathrm {T}}} $. The black circular markers with the gray hatched band represent the unfolded data measurement and the total experimental uncertainty. The MG_aMC prediction is given only with its statistical uncertainty. The bands around the MG_aMC FxFx and NNLO predictions represent their theoretical uncertainties including both statistical and systematic components. The lower panel shows the ratios of the prediction to the unfolded data. |

png pdf |
Figure 4-b:
Differential cross section measurement for the transverse momenta of the four leading jets, shown for at least 2 jets, compared to the predictions of MG_aMC FxFx and MG_aMC. The NNLO prediction for $\mathrm{ W } $+1-jet is included in the first leading jet $ {p_{\mathrm {T}}} $. The black circular markers with the gray hatched band represent the unfolded data measurement and the total experimental uncertainty. The MG_aMC prediction is given only with its statistical uncertainty. The bands around the MG_aMC FxFx and NNLO predictions represent their theoretical uncertainties including both statistical and systematic components. The lower panel shows the ratios of the prediction to the unfolded data. |
png pdf |
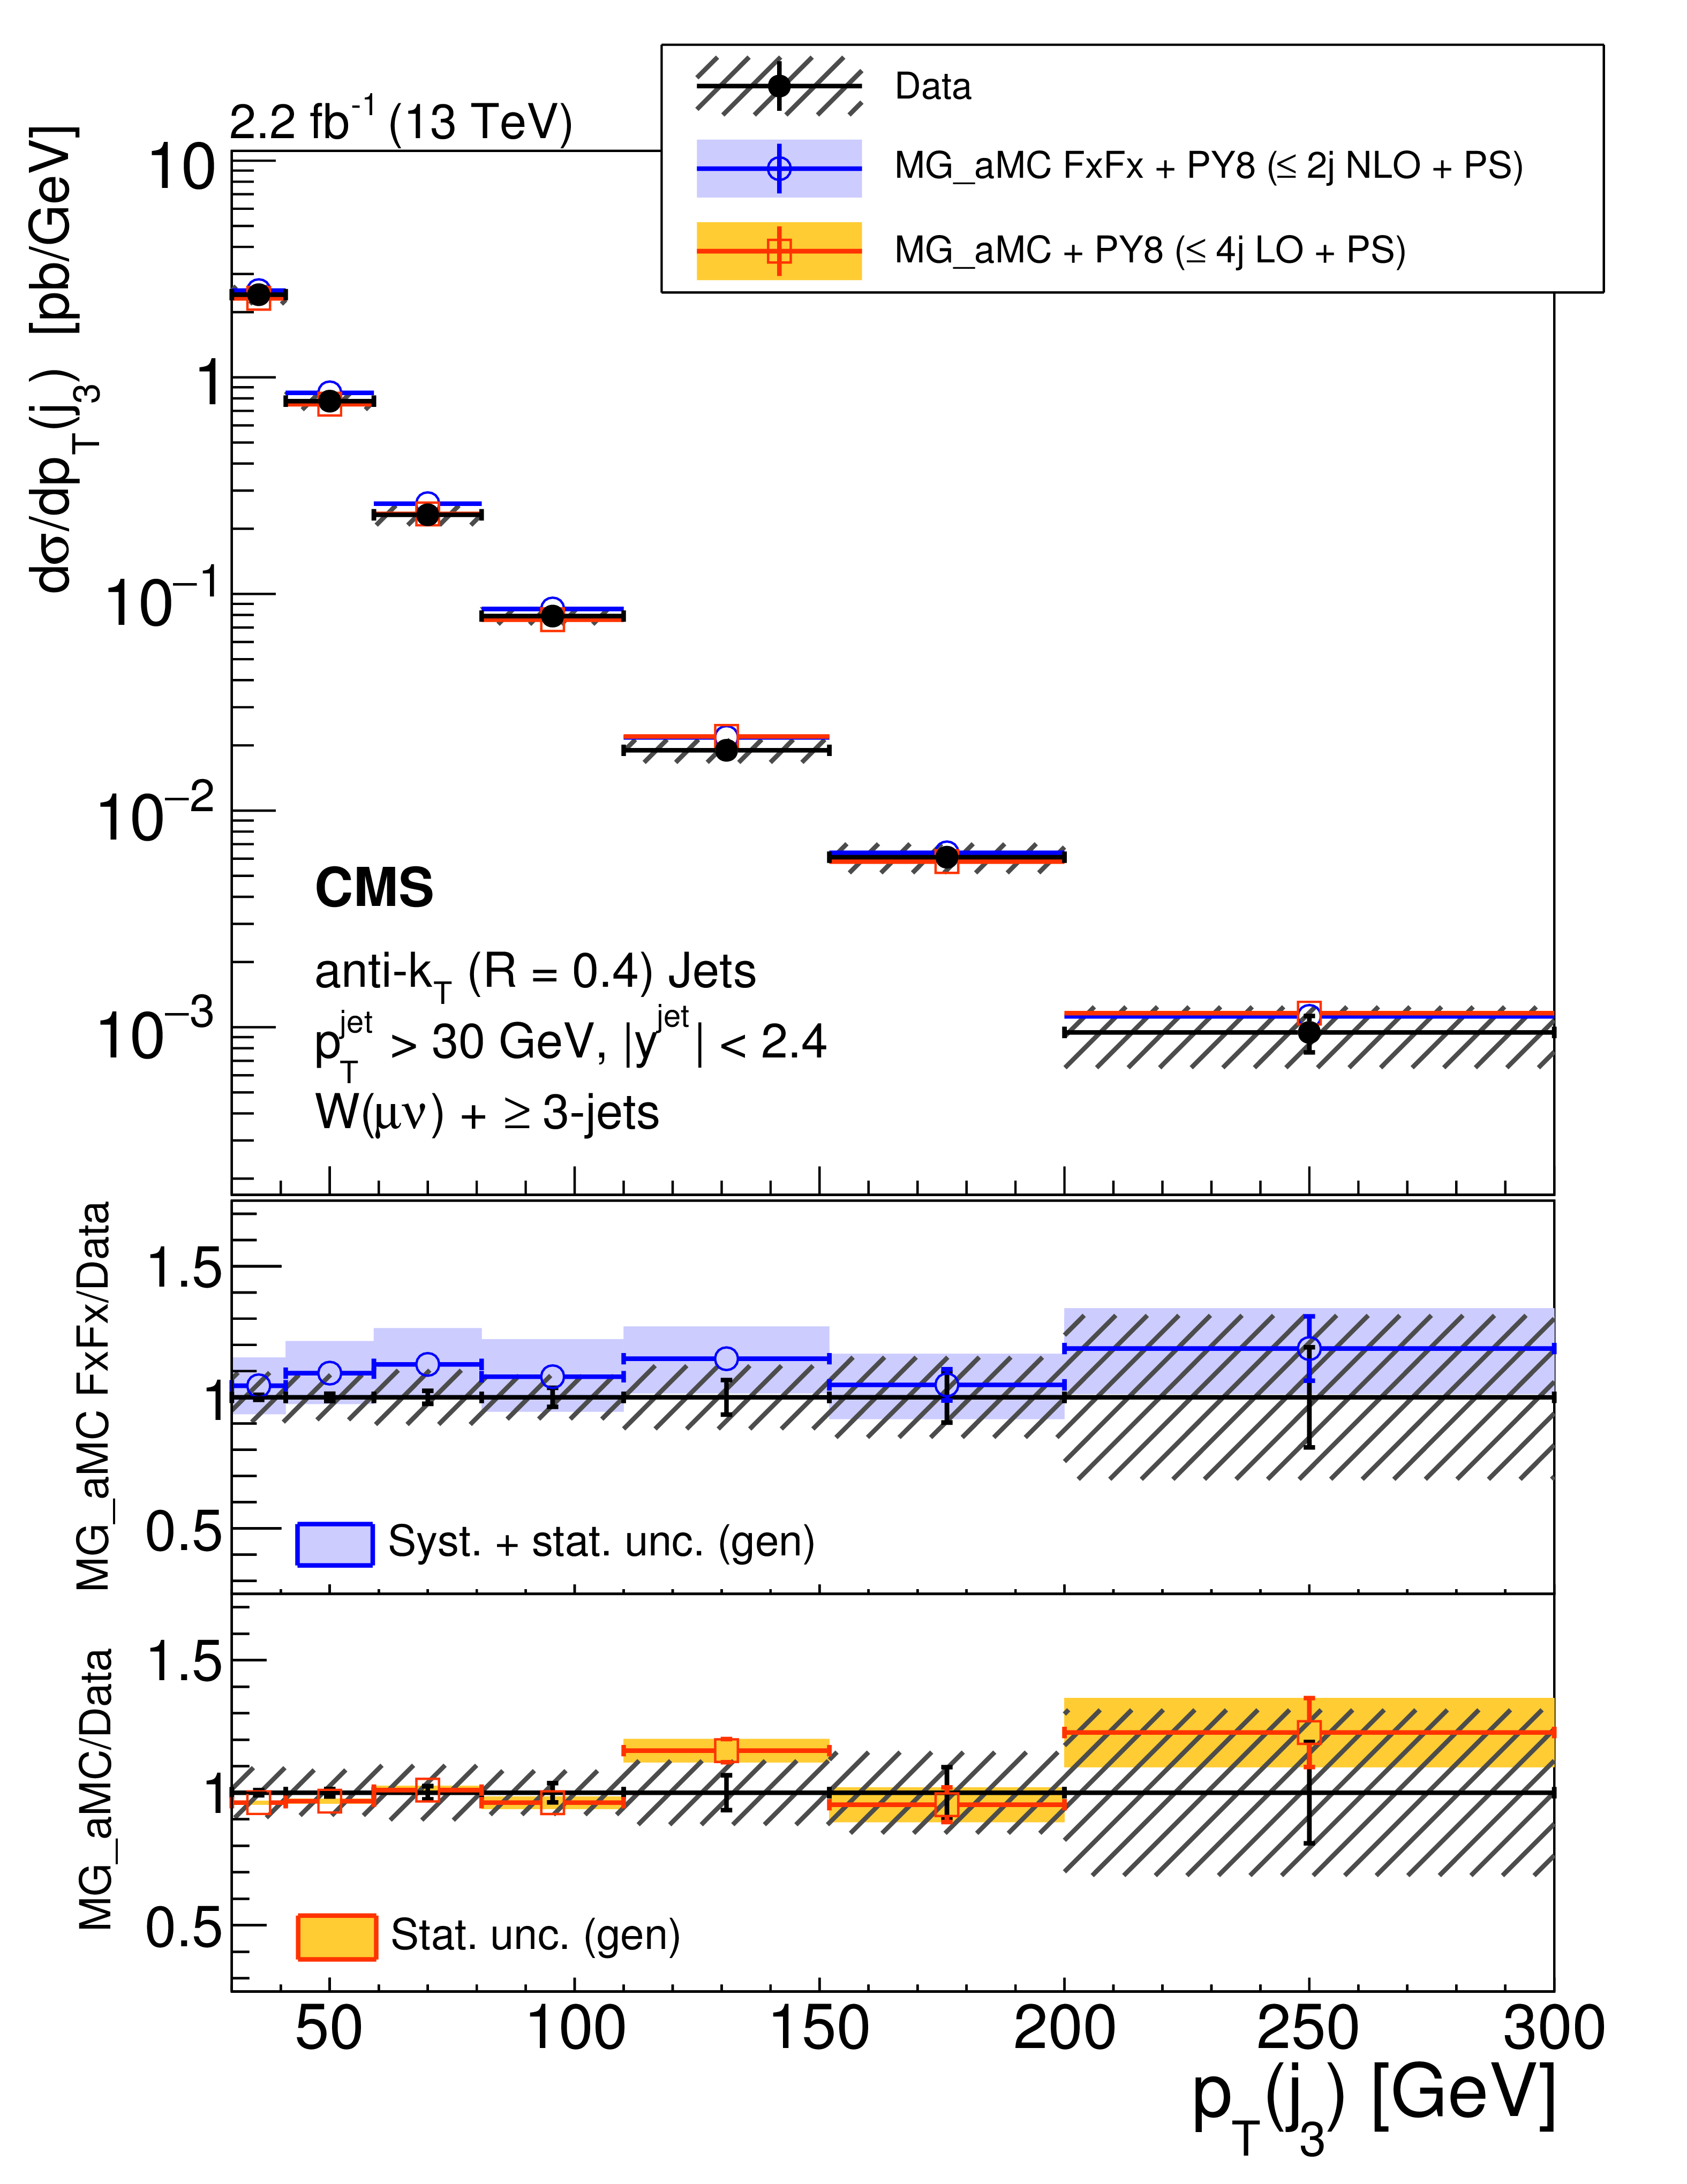
Figure 4-c:
Differential cross section measurement for the transverse momenta of the four leading jets, shown for at least 3 jets, compared to the predictions of MG_aMC FxFx and MG_aMC. The NNLO prediction for $\mathrm{ W } $+1-jet is included in the first leading jet $ {p_{\mathrm {T}}} $. The black circular markers with the gray hatched band represent the unfolded data measurement and the total experimental uncertainty. The MG_aMC prediction is given only with its statistical uncertainty. The bands around the MG_aMC FxFx and NNLO predictions represent their theoretical uncertainties including both statistical and systematic components. The lower panel shows the ratios of the prediction to the unfolded data. |
png pdf |
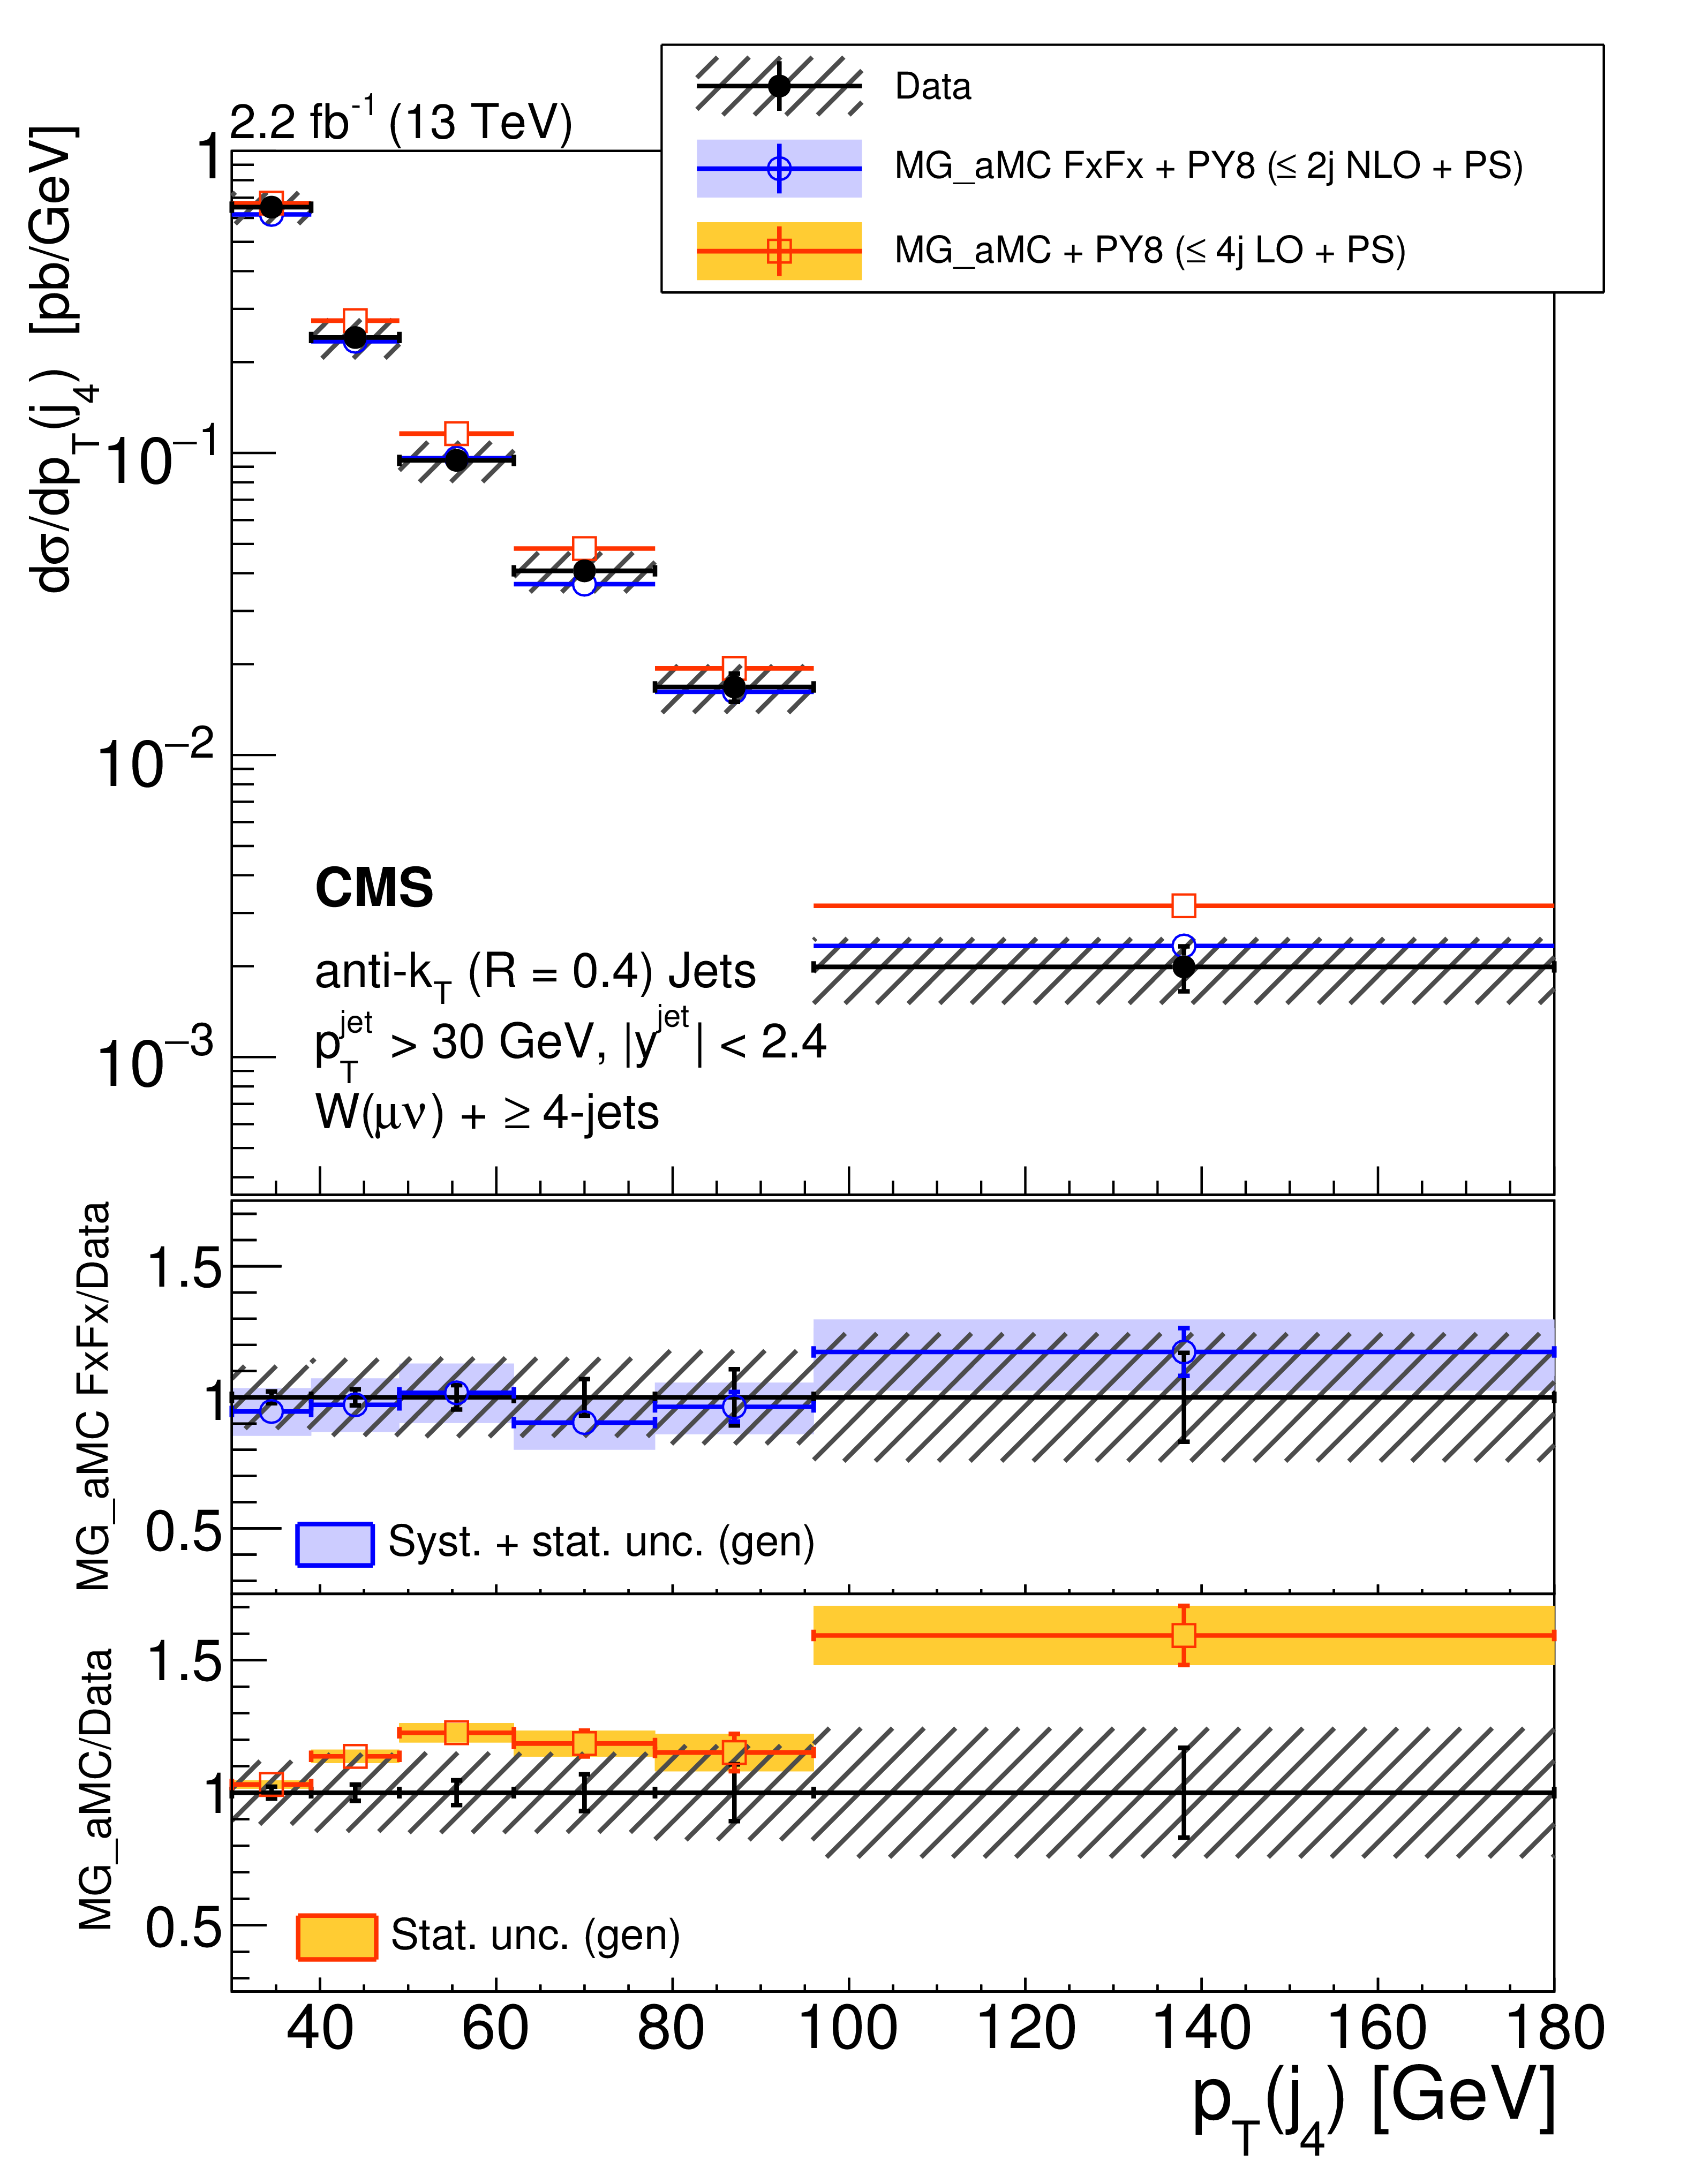
Figure 4-d:
Differential cross section measurement for the transverse momenta of the four leading jets, shown for at least 4 jets, compared to the predictions of MG_aMC FxFx and MG_aMC. The NNLO prediction for $\mathrm{ W } $+1-jet is included in the first leading jet $ {p_{\mathrm {T}}} $. The black circular markers with the gray hatched band represent the unfolded data measurement and the total experimental uncertainty. The MG_aMC prediction is given only with its statistical uncertainty. The bands around the MG_aMC FxFx and NNLO predictions represent their theoretical uncertainties including both statistical and systematic components. The lower panel shows the ratios of the prediction to the unfolded data. |
png pdf |
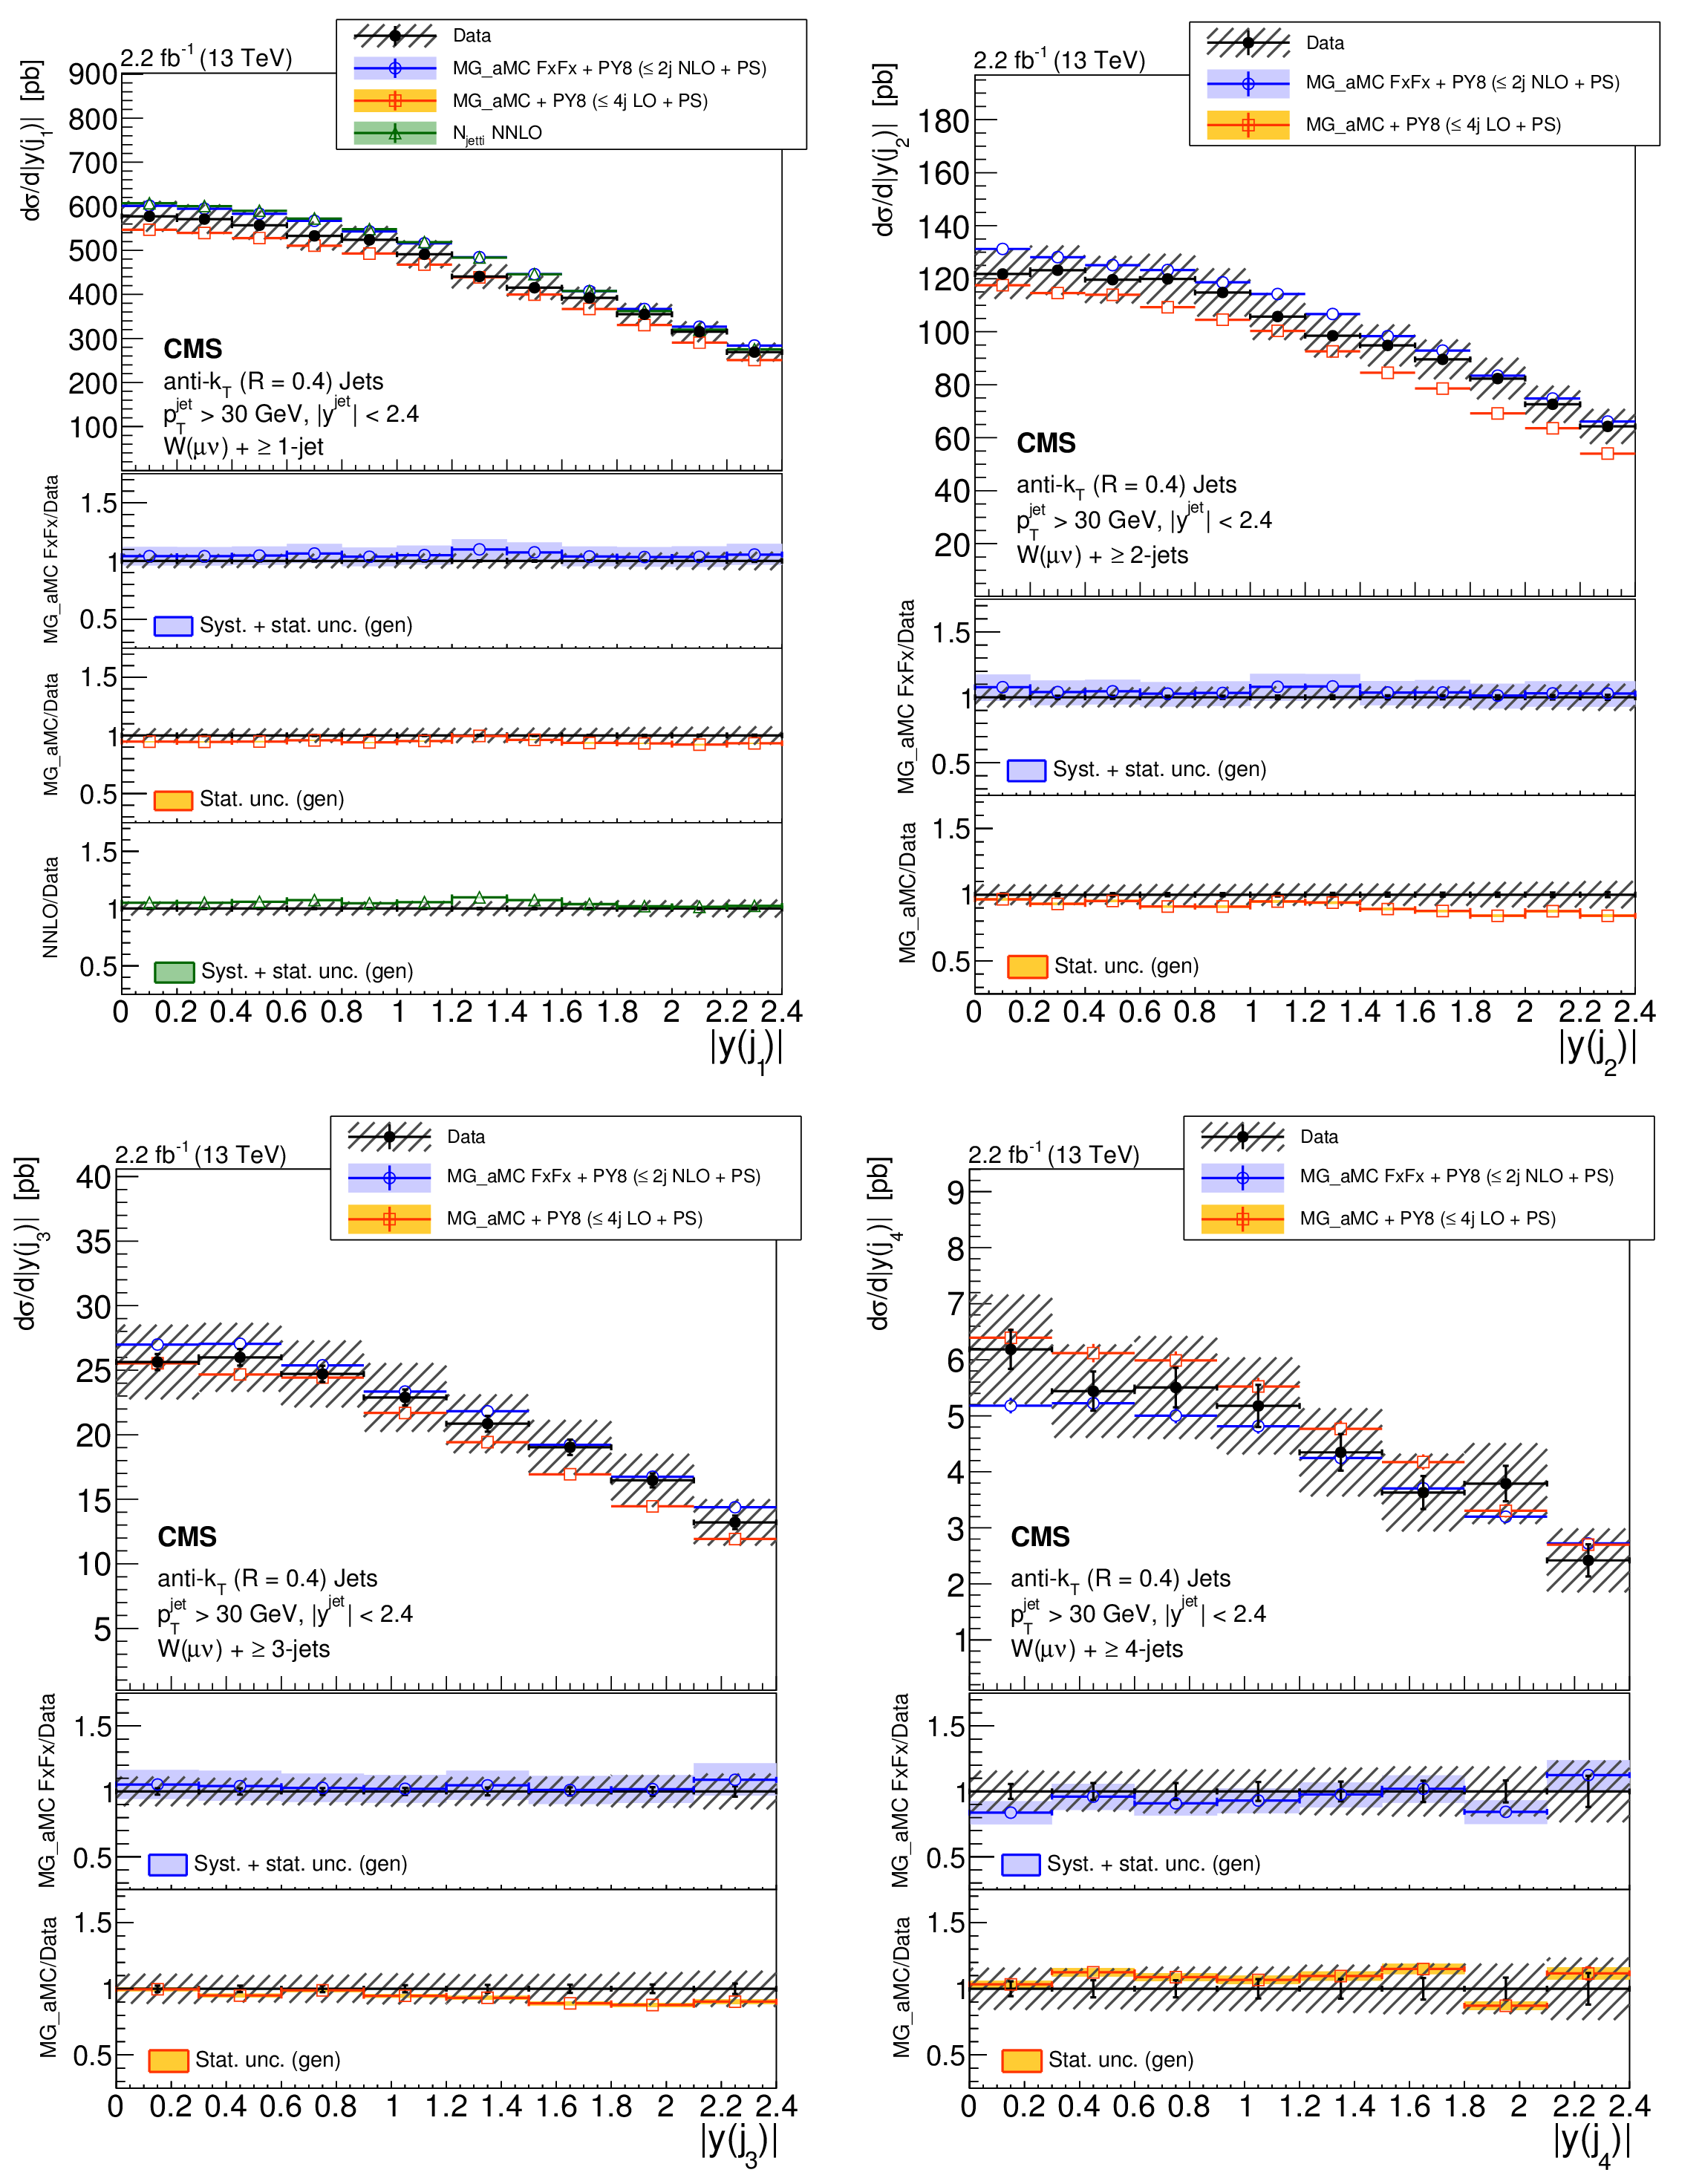
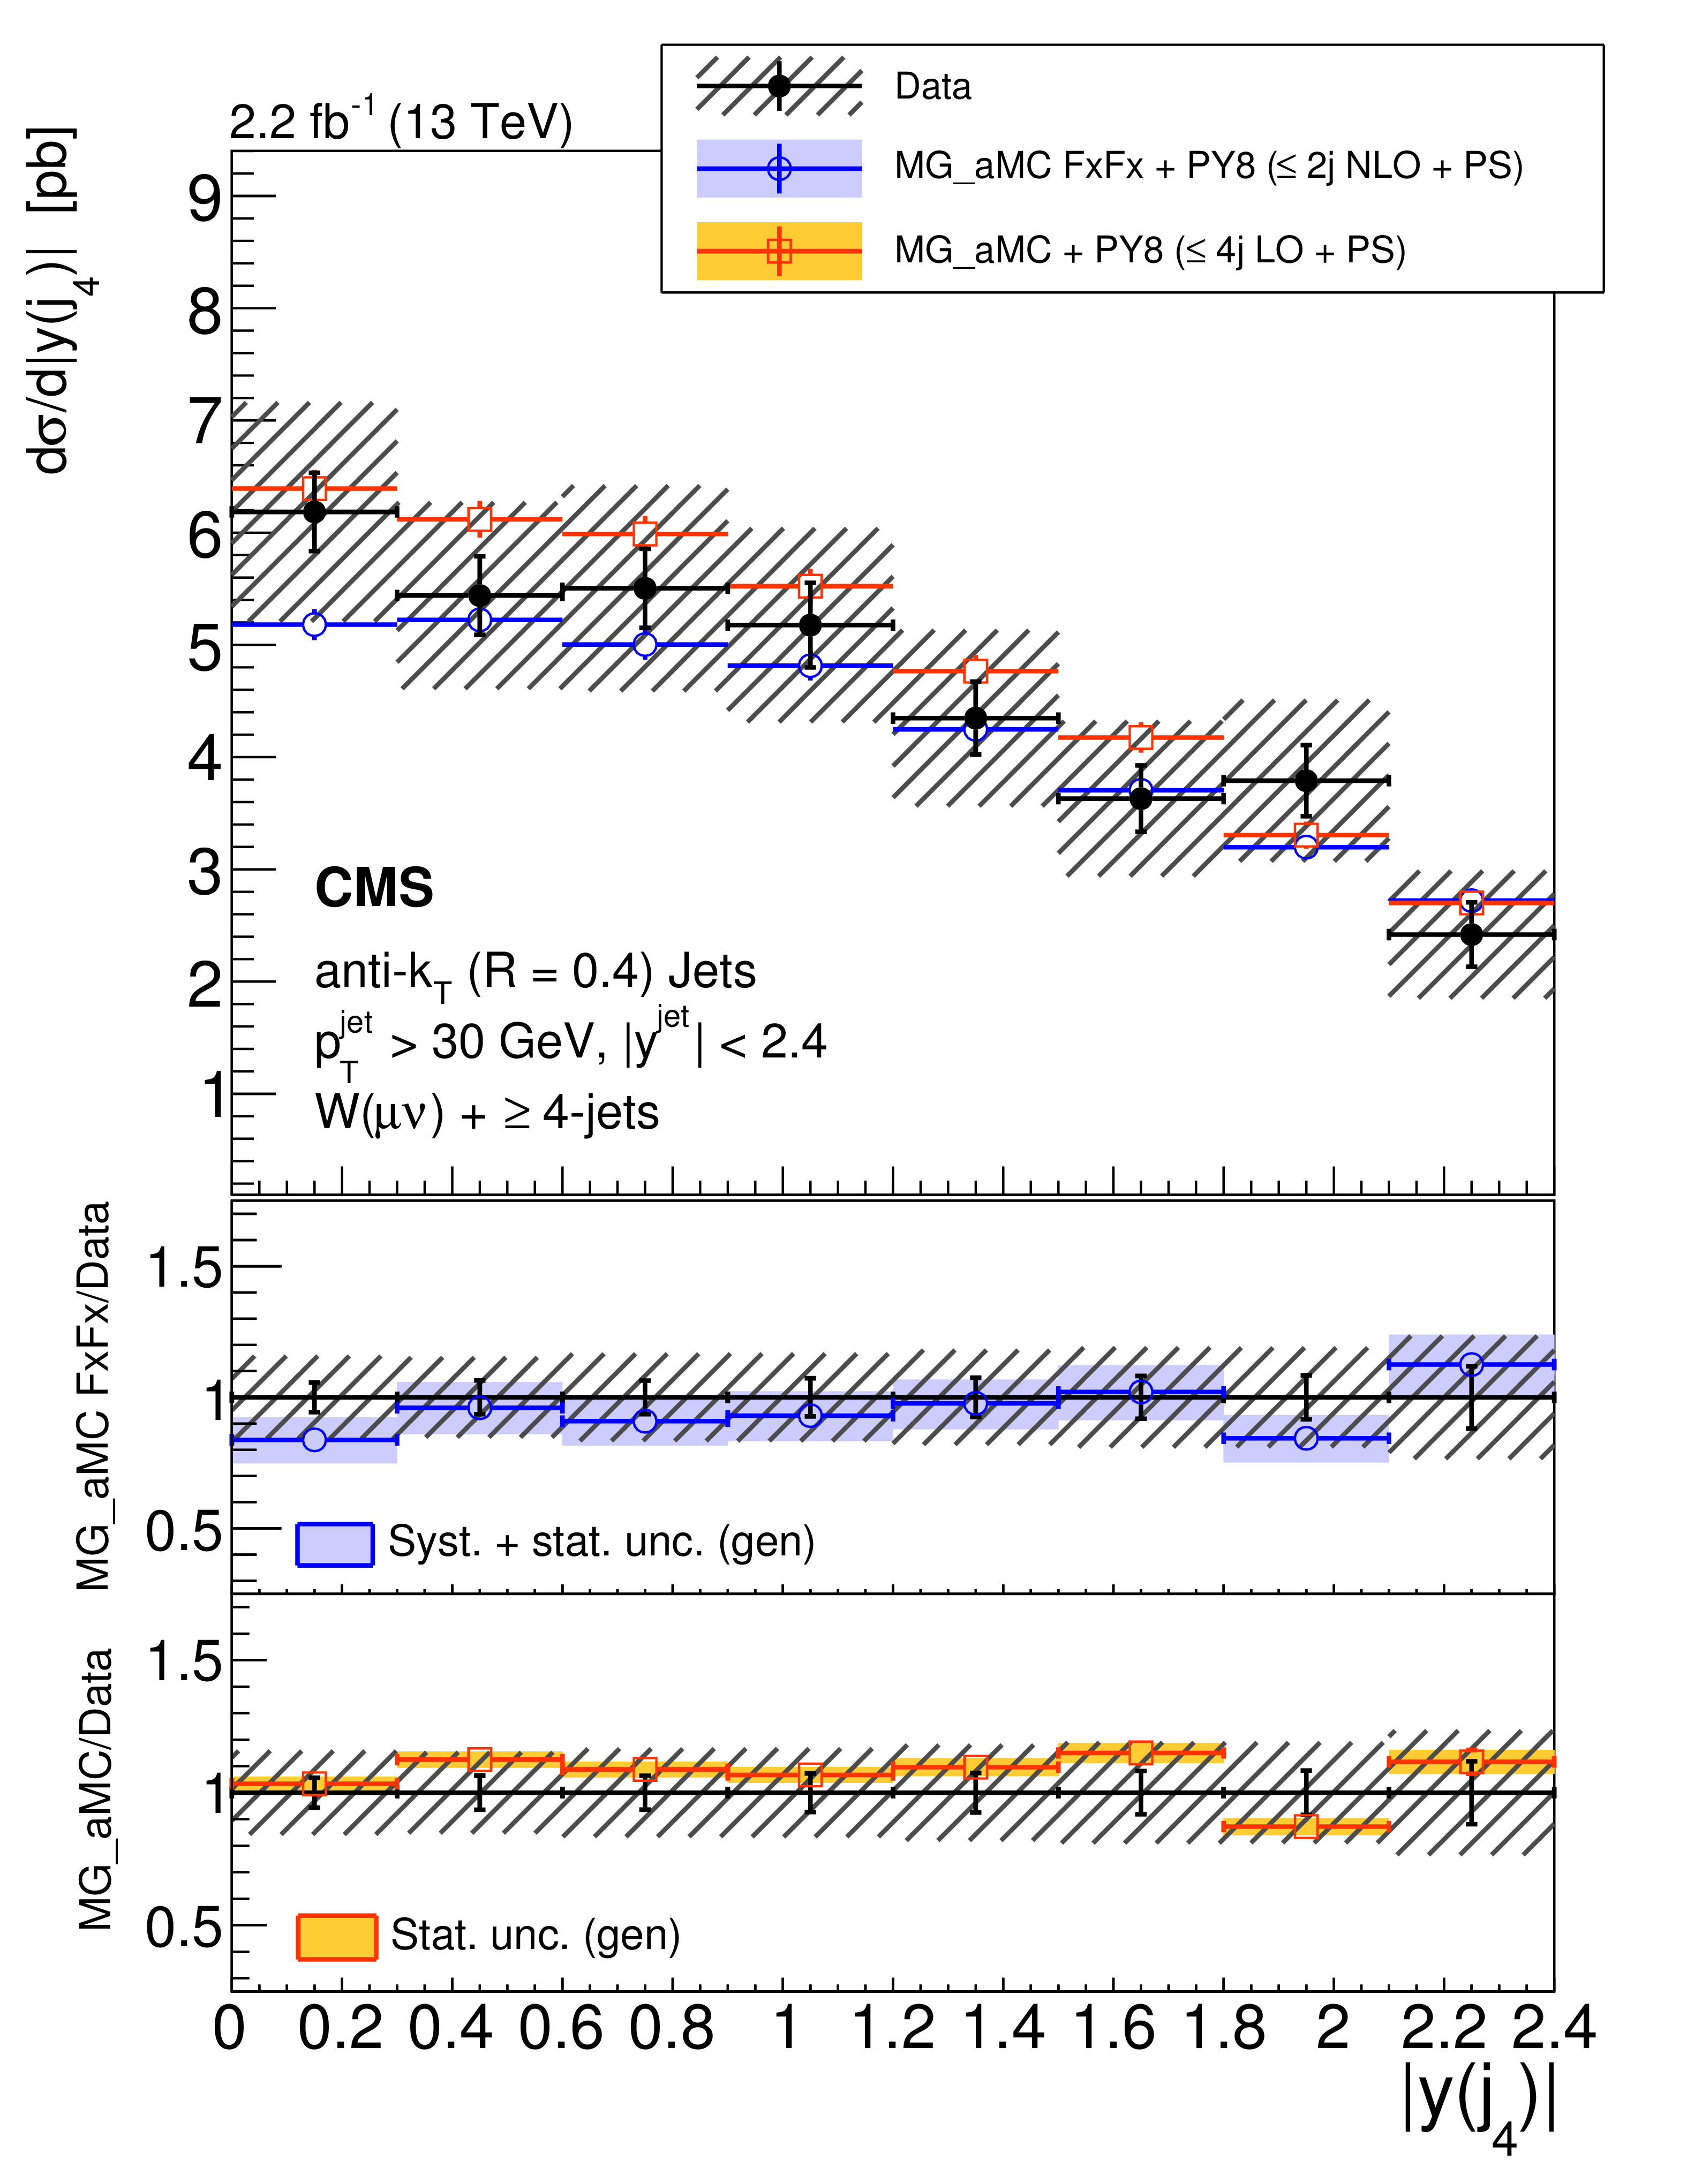
Figure 5:
Differential cross section measurement for the absolute rapidities of the four leading jets, shown from left to right for at least 1 and 2 jets (upper) and for at least 3 and 4 jets (lower) on the figures, compared to the predictions of MG_aMC FxFx and MG_aMC. The NNLO prediction for $\mathrm{ W } $+1-jet is included in the first leading jet $|y|$. The black circular markers with the gray hatched band represent the unfolded data measurement and the total experimental uncertainty. The MG_aMC prediction is given only with its statistical uncertainty. The bands around the MG_aMC FxFx and NNLO predictions represent their theoretical uncertainties including both statistical and systematic components. The lower panels show the ratios of the prediction to the unfolded data. |
png pdf |
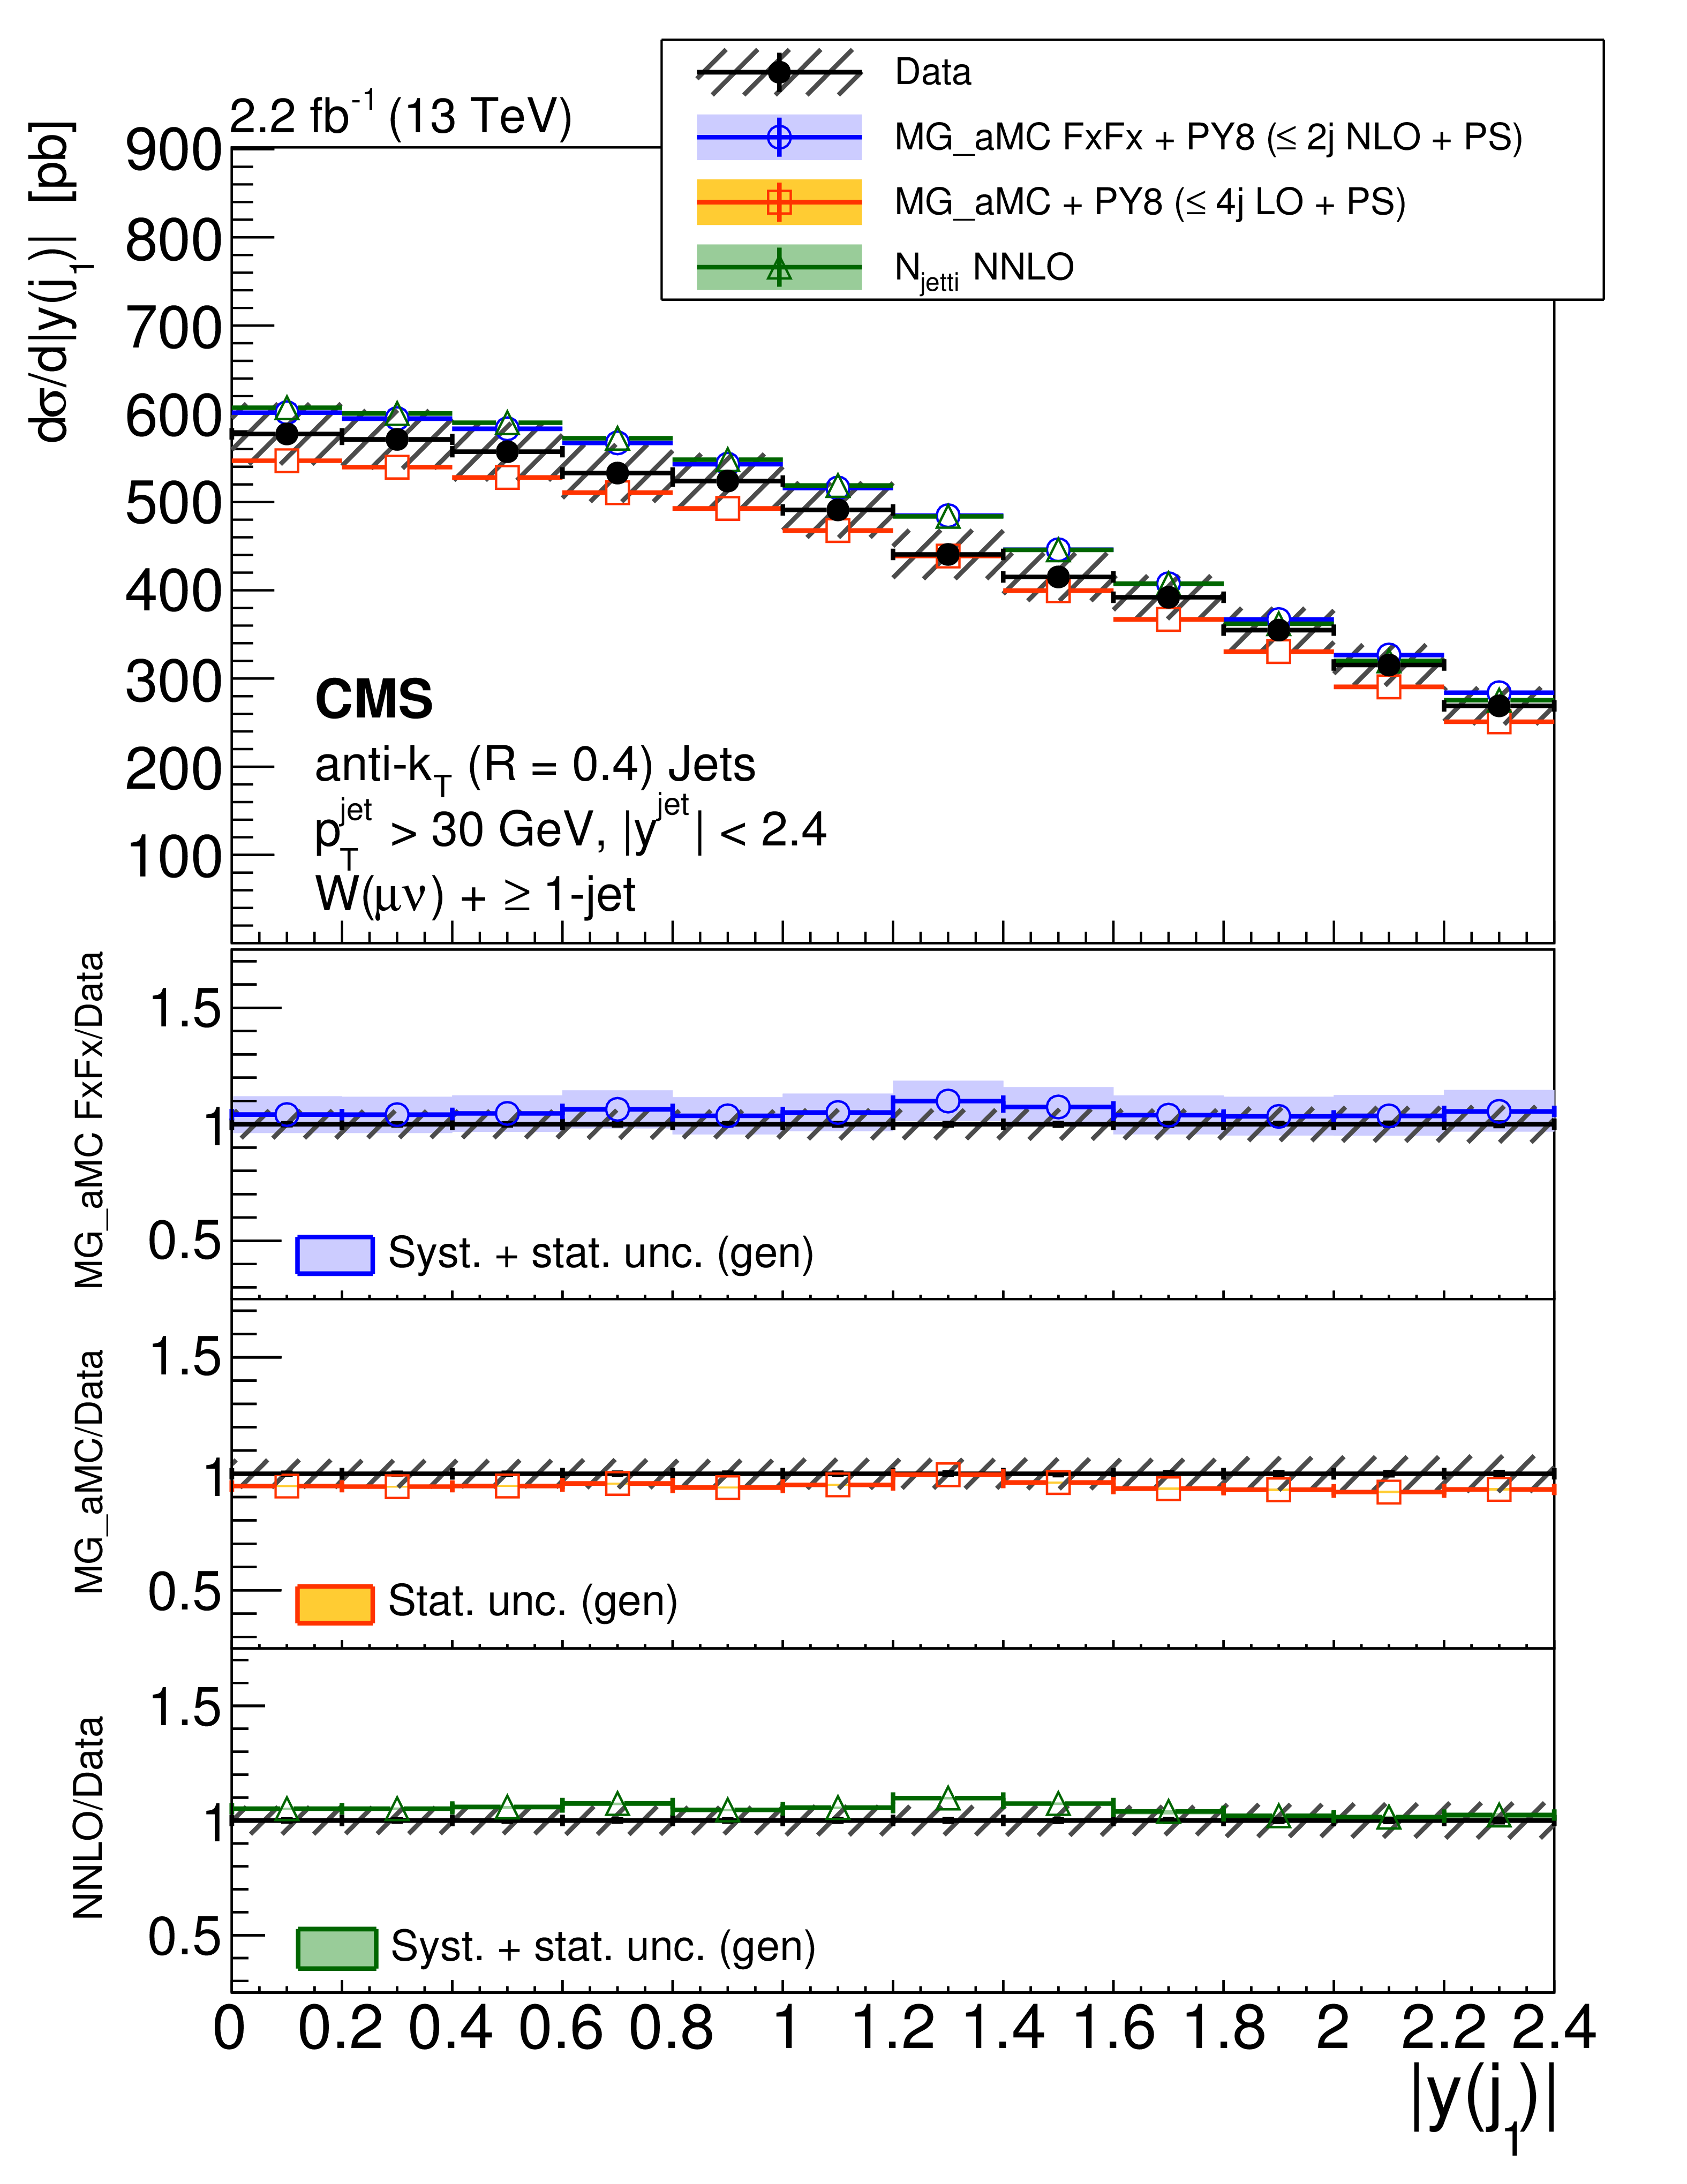
Figure 5-a:
Differential cross section measurement for the absolute rapidities of the four leading jets, shown from least 1 jet, compared to the predictions of MG_aMC FxFx and MG_aMC. The NNLO prediction for $\mathrm{ W } $+1-jet is included in the first leading jet $|y|$. The black circular markers with the gray hatched band represent the unfolded data measurement and the total experimental uncertainty. The MG_aMC prediction is given only with its statistical uncertainty. The bands around the MG_aMC FxFx and NNLO predictions represent their theoretical uncertainties including both statistical and systematic components. The lower panel shows the ratios of the prediction to the unfolded data. |
png pdf |
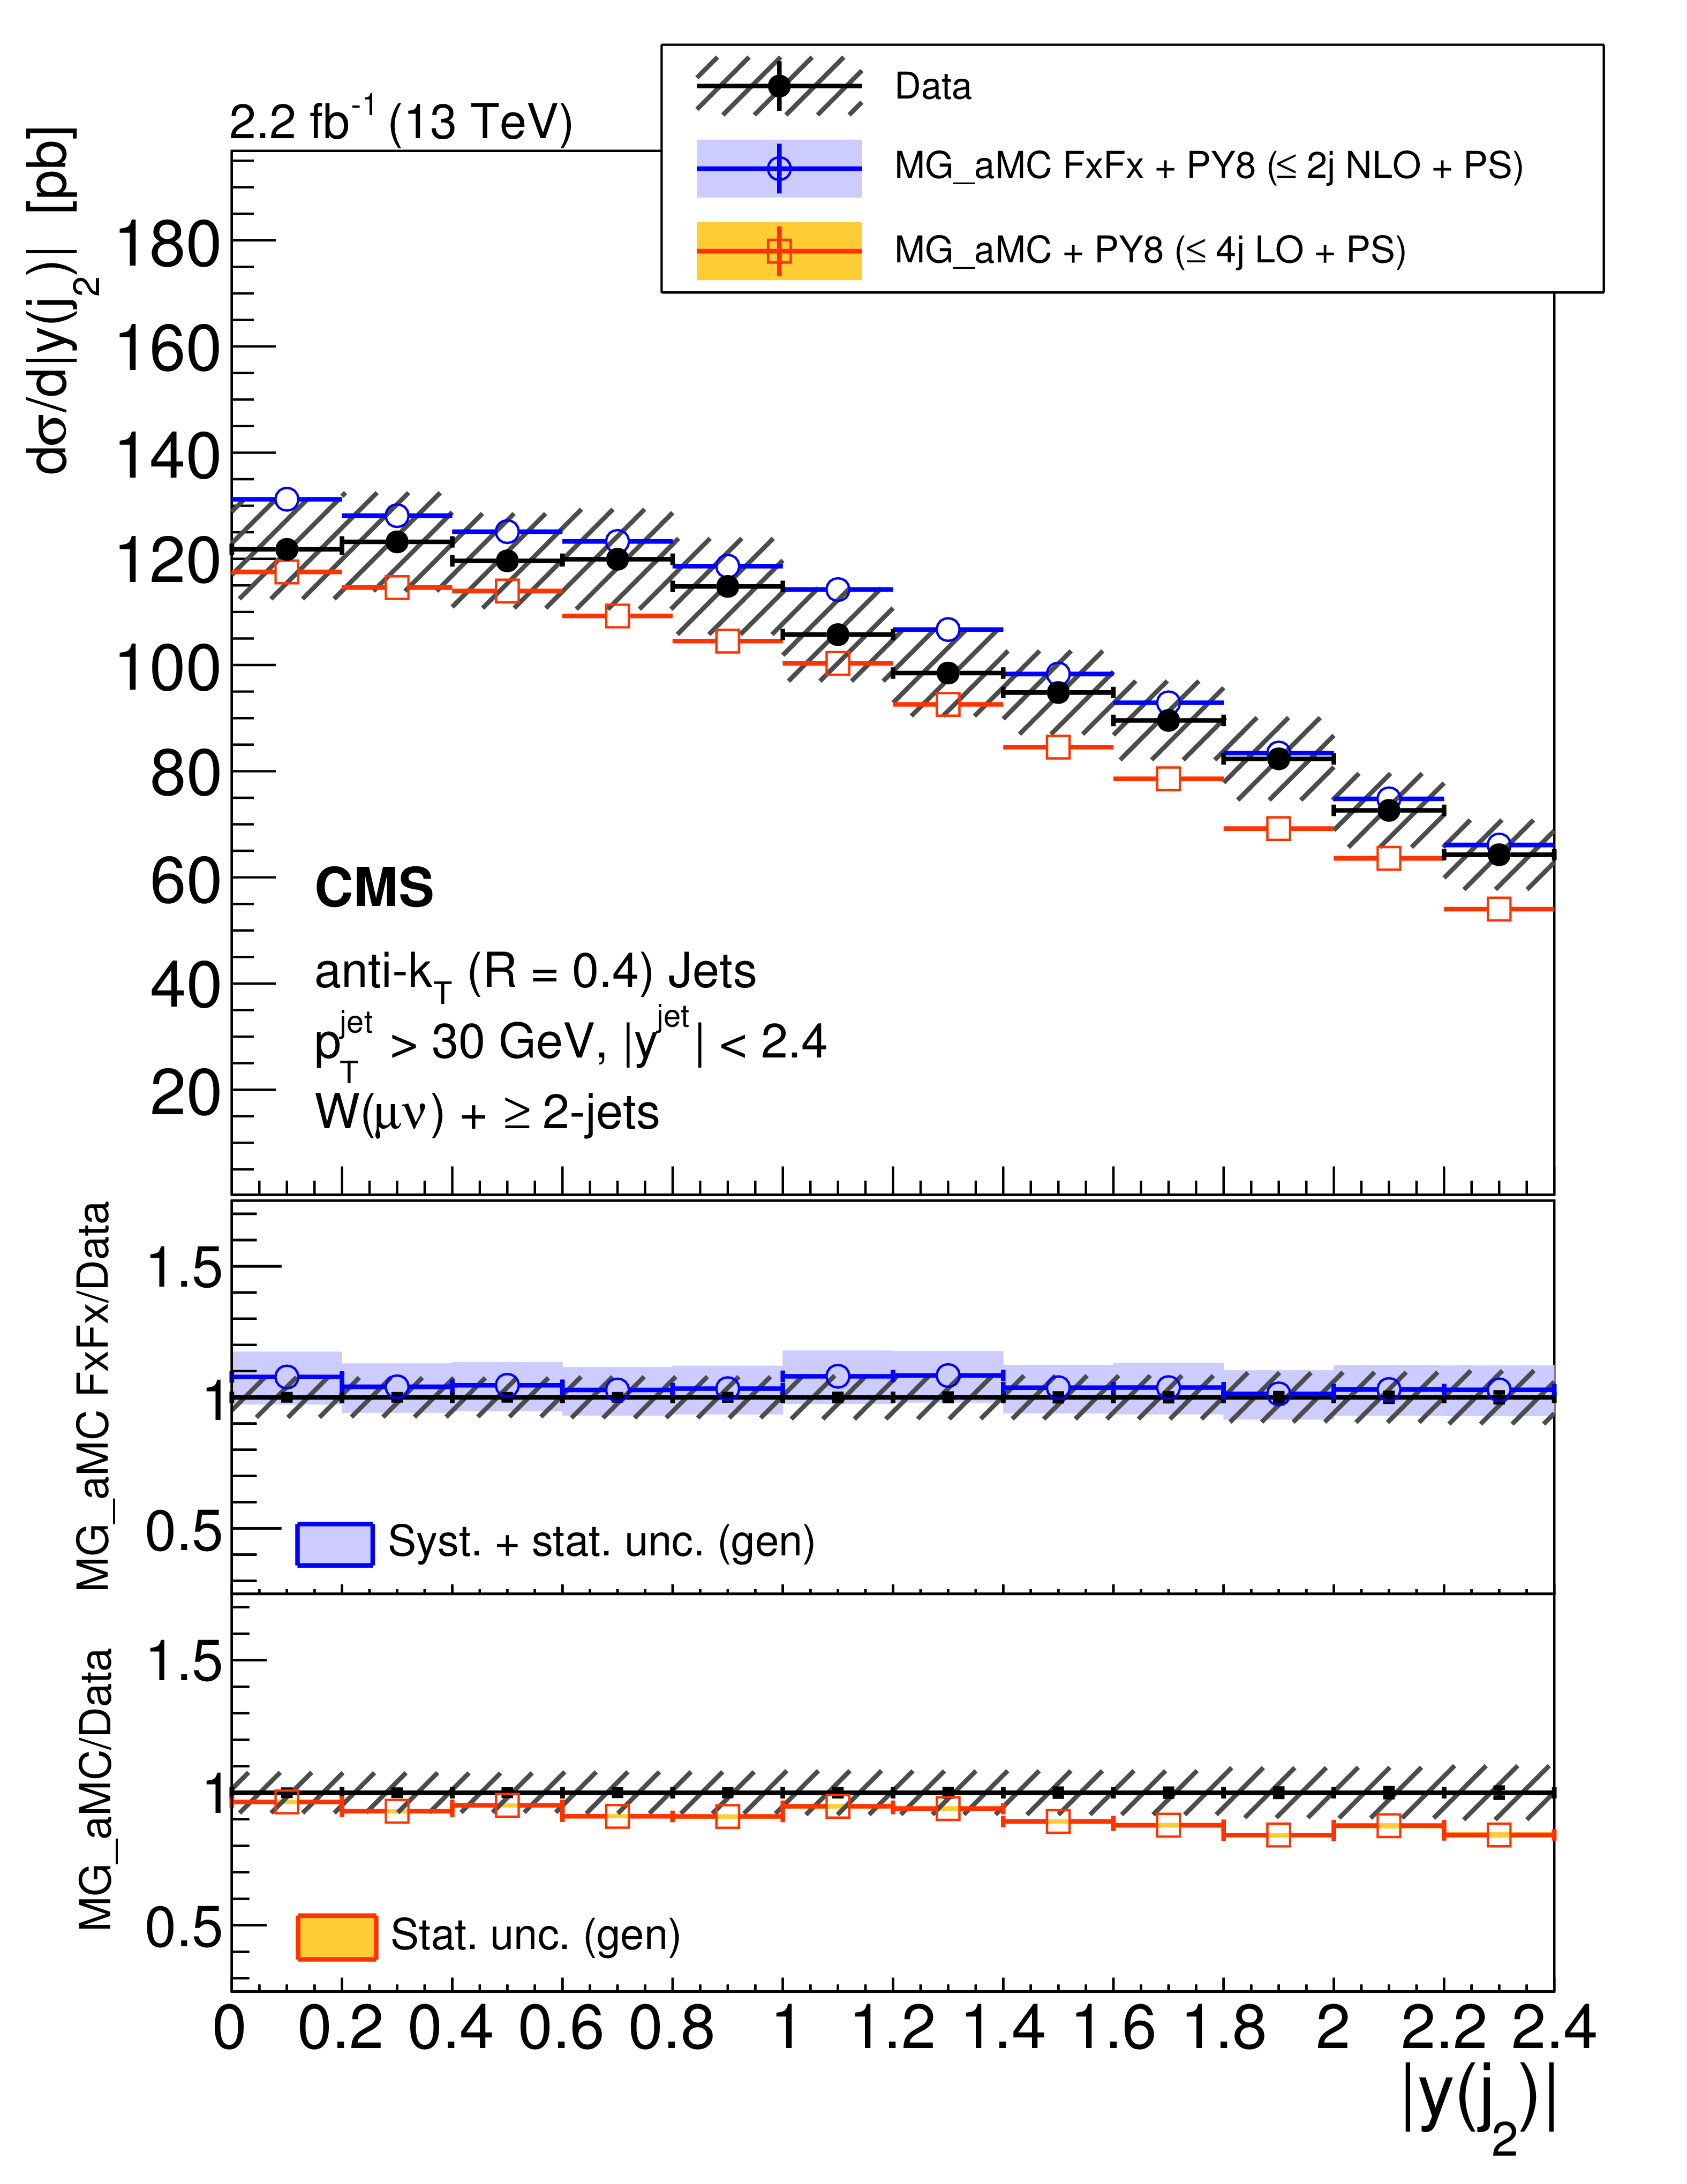
Figure 5-b:
Differential cross section measurement for the absolute rapidities of the four leading jets, shown from least 2 jets, compared to the predictions of MG_aMC FxFx and MG_aMC. The NNLO prediction for $\mathrm{ W } $+1-jet is included in the first leading jet $|y|$. The black circular markers with the gray hatched band represent the unfolded data measurement and the total experimental uncertainty. The MG_aMC prediction is given only with its statistical uncertainty. The bands around the MG_aMC FxFx and NNLO predictions represent their theoretical uncertainties including both statistical and systematic components. The lower panel shows the ratios of the prediction to the unfolded data. |
png pdf |
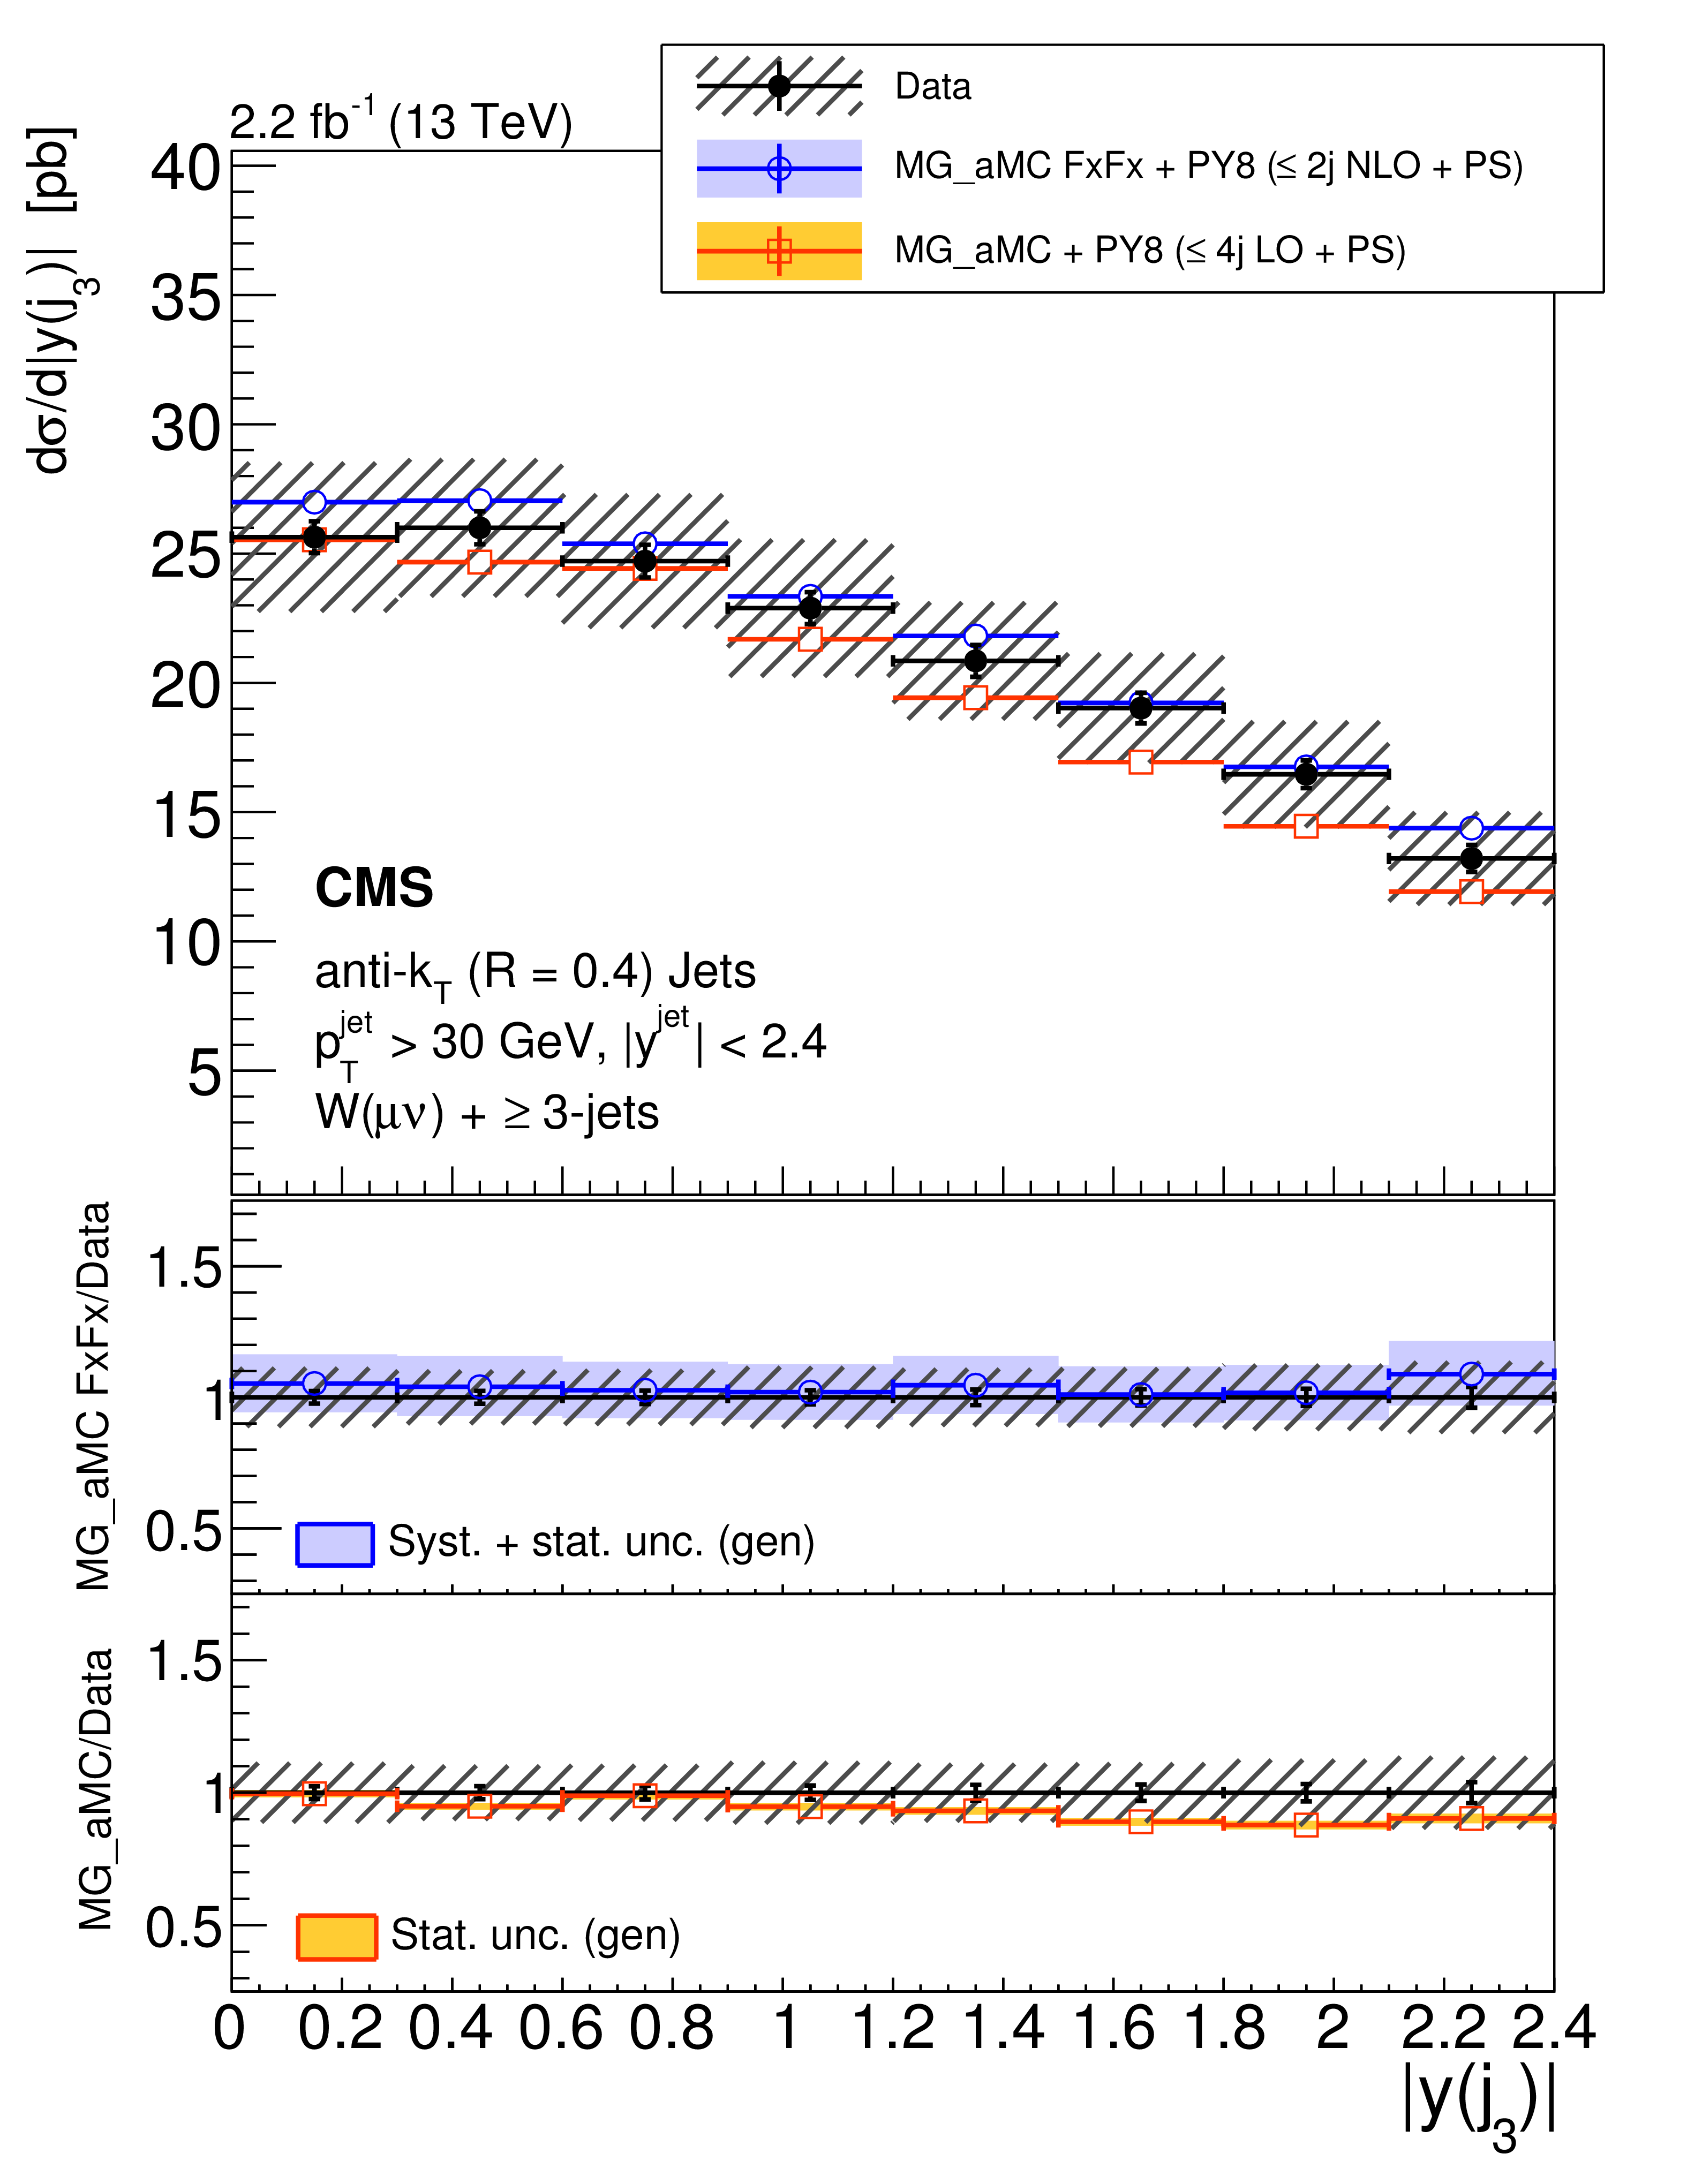
Figure 5-c:
Differential cross section measurement for the absolute rapidities of the four leading jets, shown from least 3 jets, compared to the predictions of MG_aMC FxFx and MG_aMC. The NNLO prediction for $\mathrm{ W } $+1-jet is included in the first leading jet $|y|$. The black circular markers with the gray hatched band represent the unfolded data measurement and the total experimental uncertainty. The MG_aMC prediction is given only with its statistical uncertainty. The bands around the MG_aMC FxFx and NNLO predictions represent their theoretical uncertainties including both statistical and systematic components. The lower panel shows the ratios of the prediction to the unfolded data. |
png pdf |
Figure 5-d:
Differential cross section measurement for the absolute rapidities of the four leading jets, shown from least 4 jets, compared to the predictions of MG_aMC FxFx and MG_aMC. The NNLO prediction for $\mathrm{ W } $+1-jet is included in the first leading jet $|y|$. The black circular markers with the gray hatched band represent the unfolded data measurement and the total experimental uncertainty. The MG_aMC prediction is given only with its statistical uncertainty. The bands around the MG_aMC FxFx and NNLO predictions represent their theoretical uncertainties including both statistical and systematic components. The lower panel shows the ratios of the prediction to the unfolded data. |

png pdf |
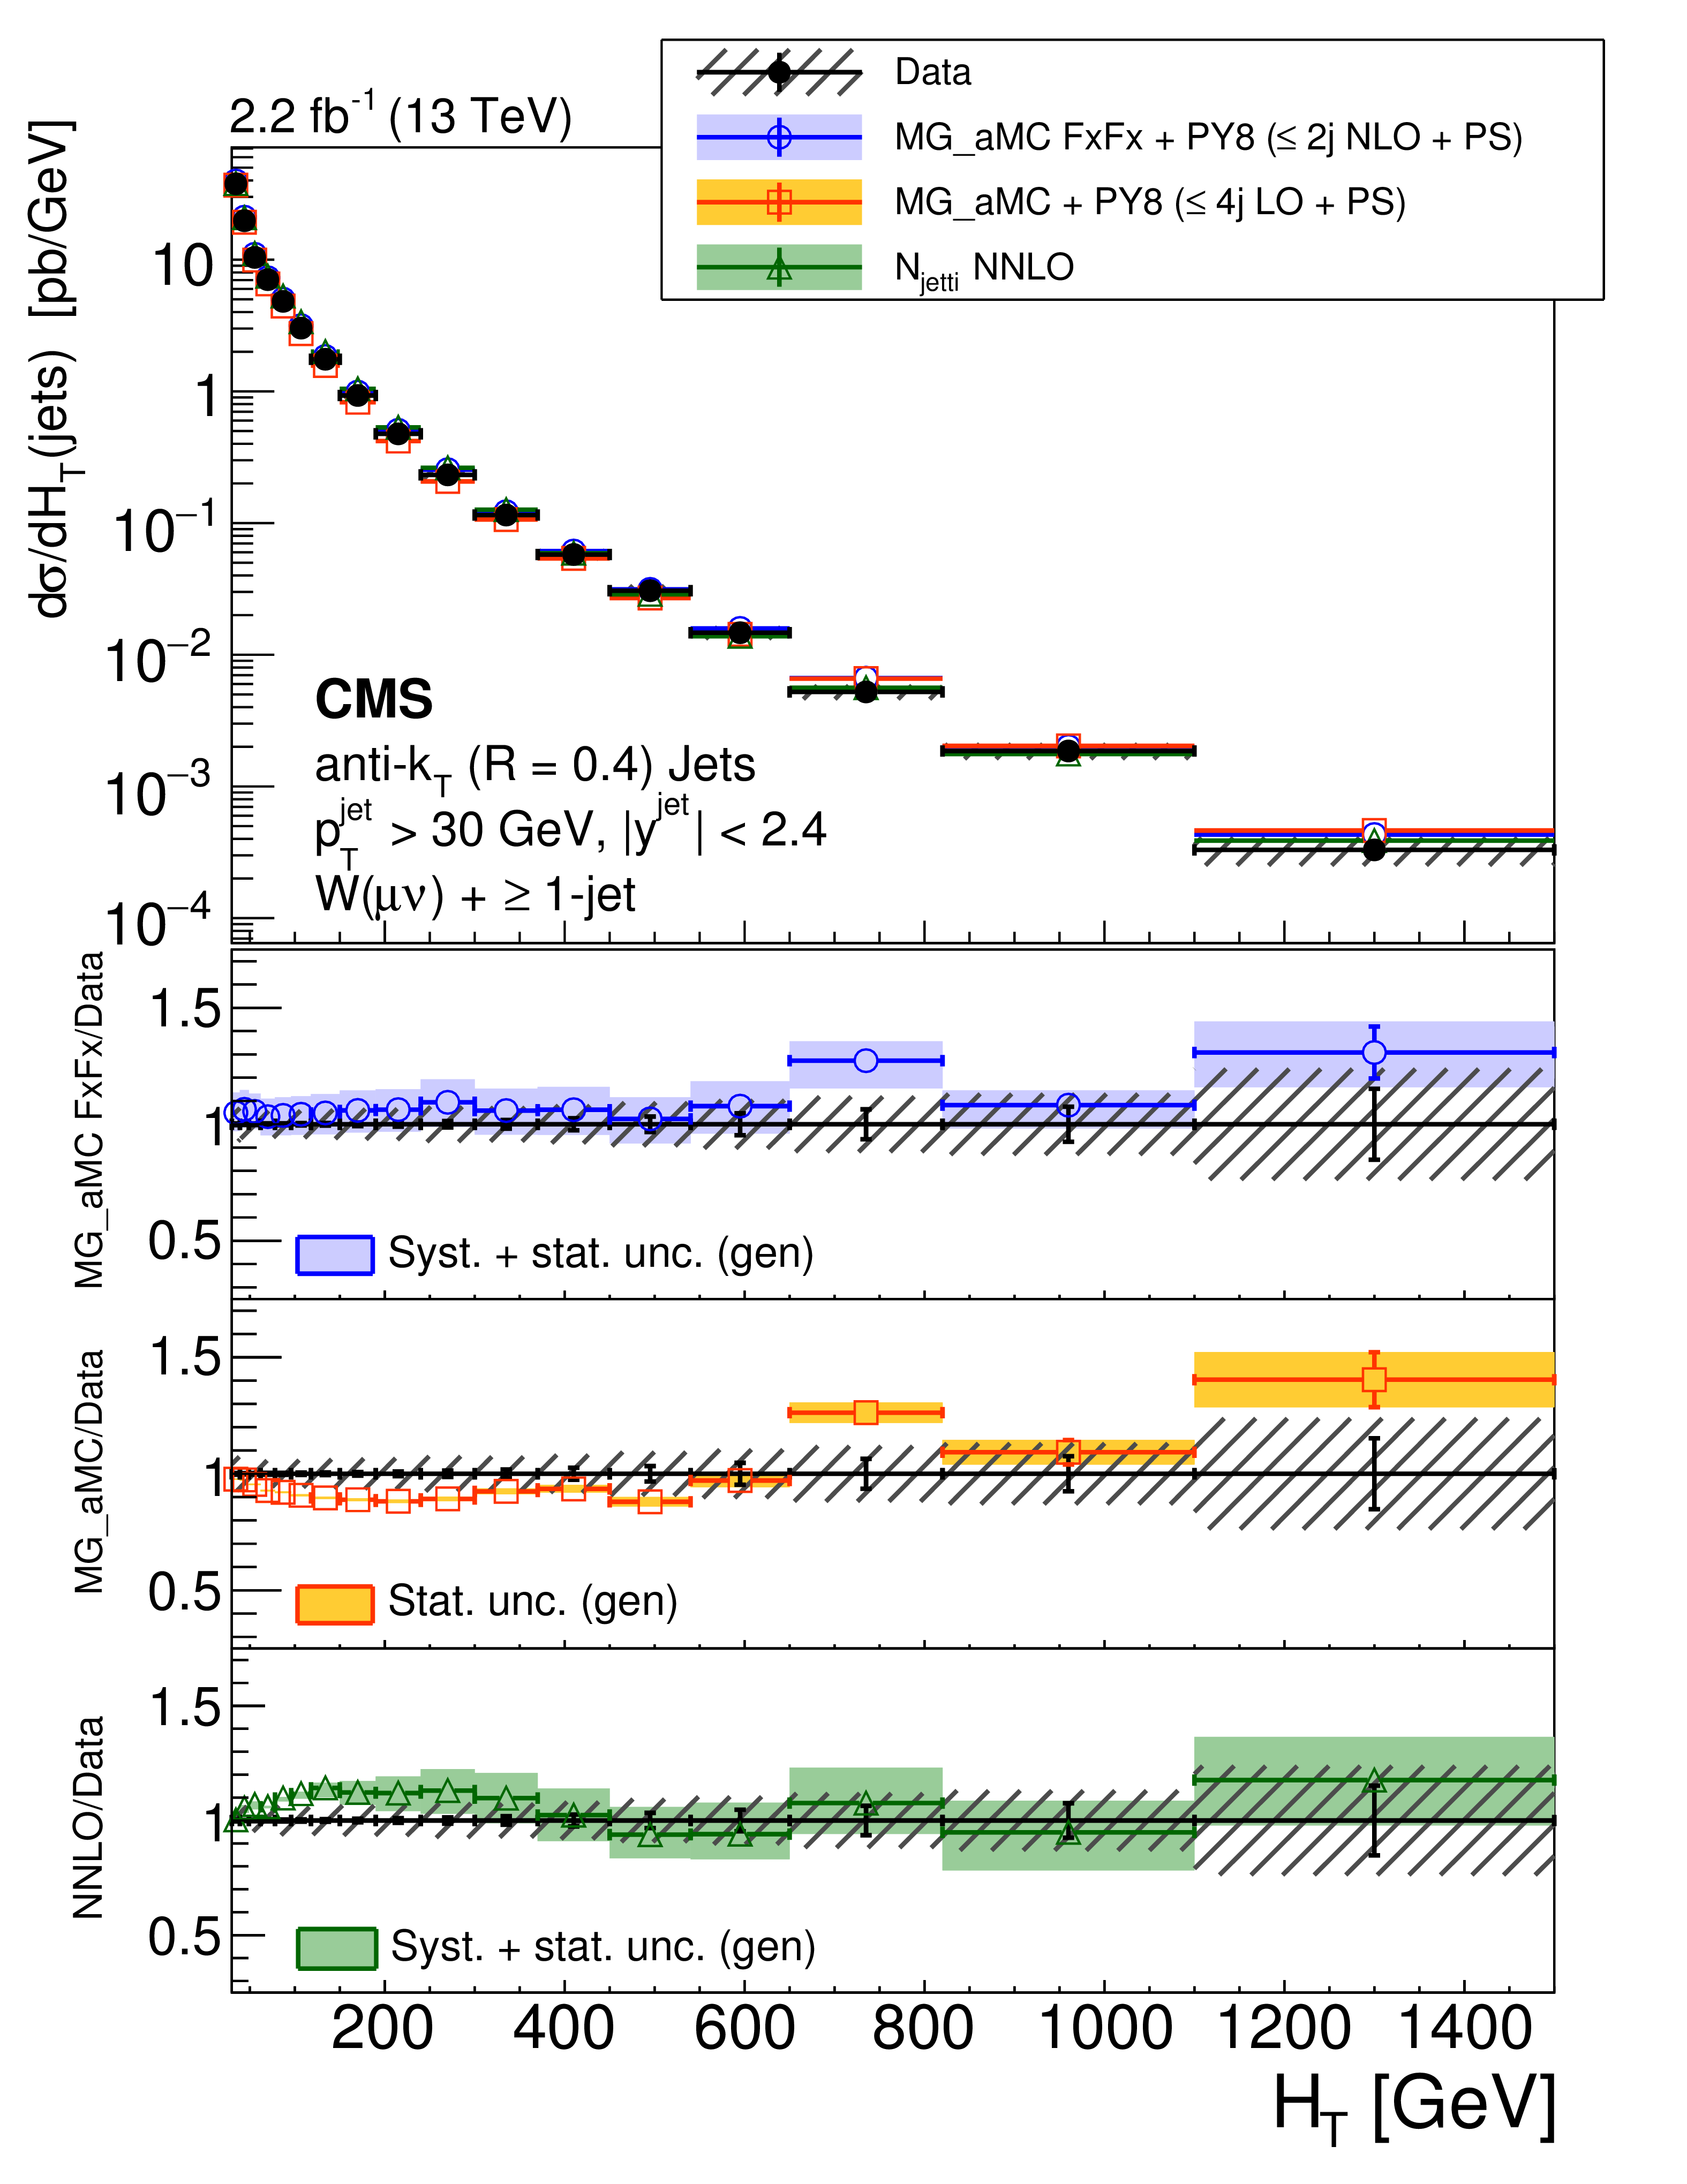
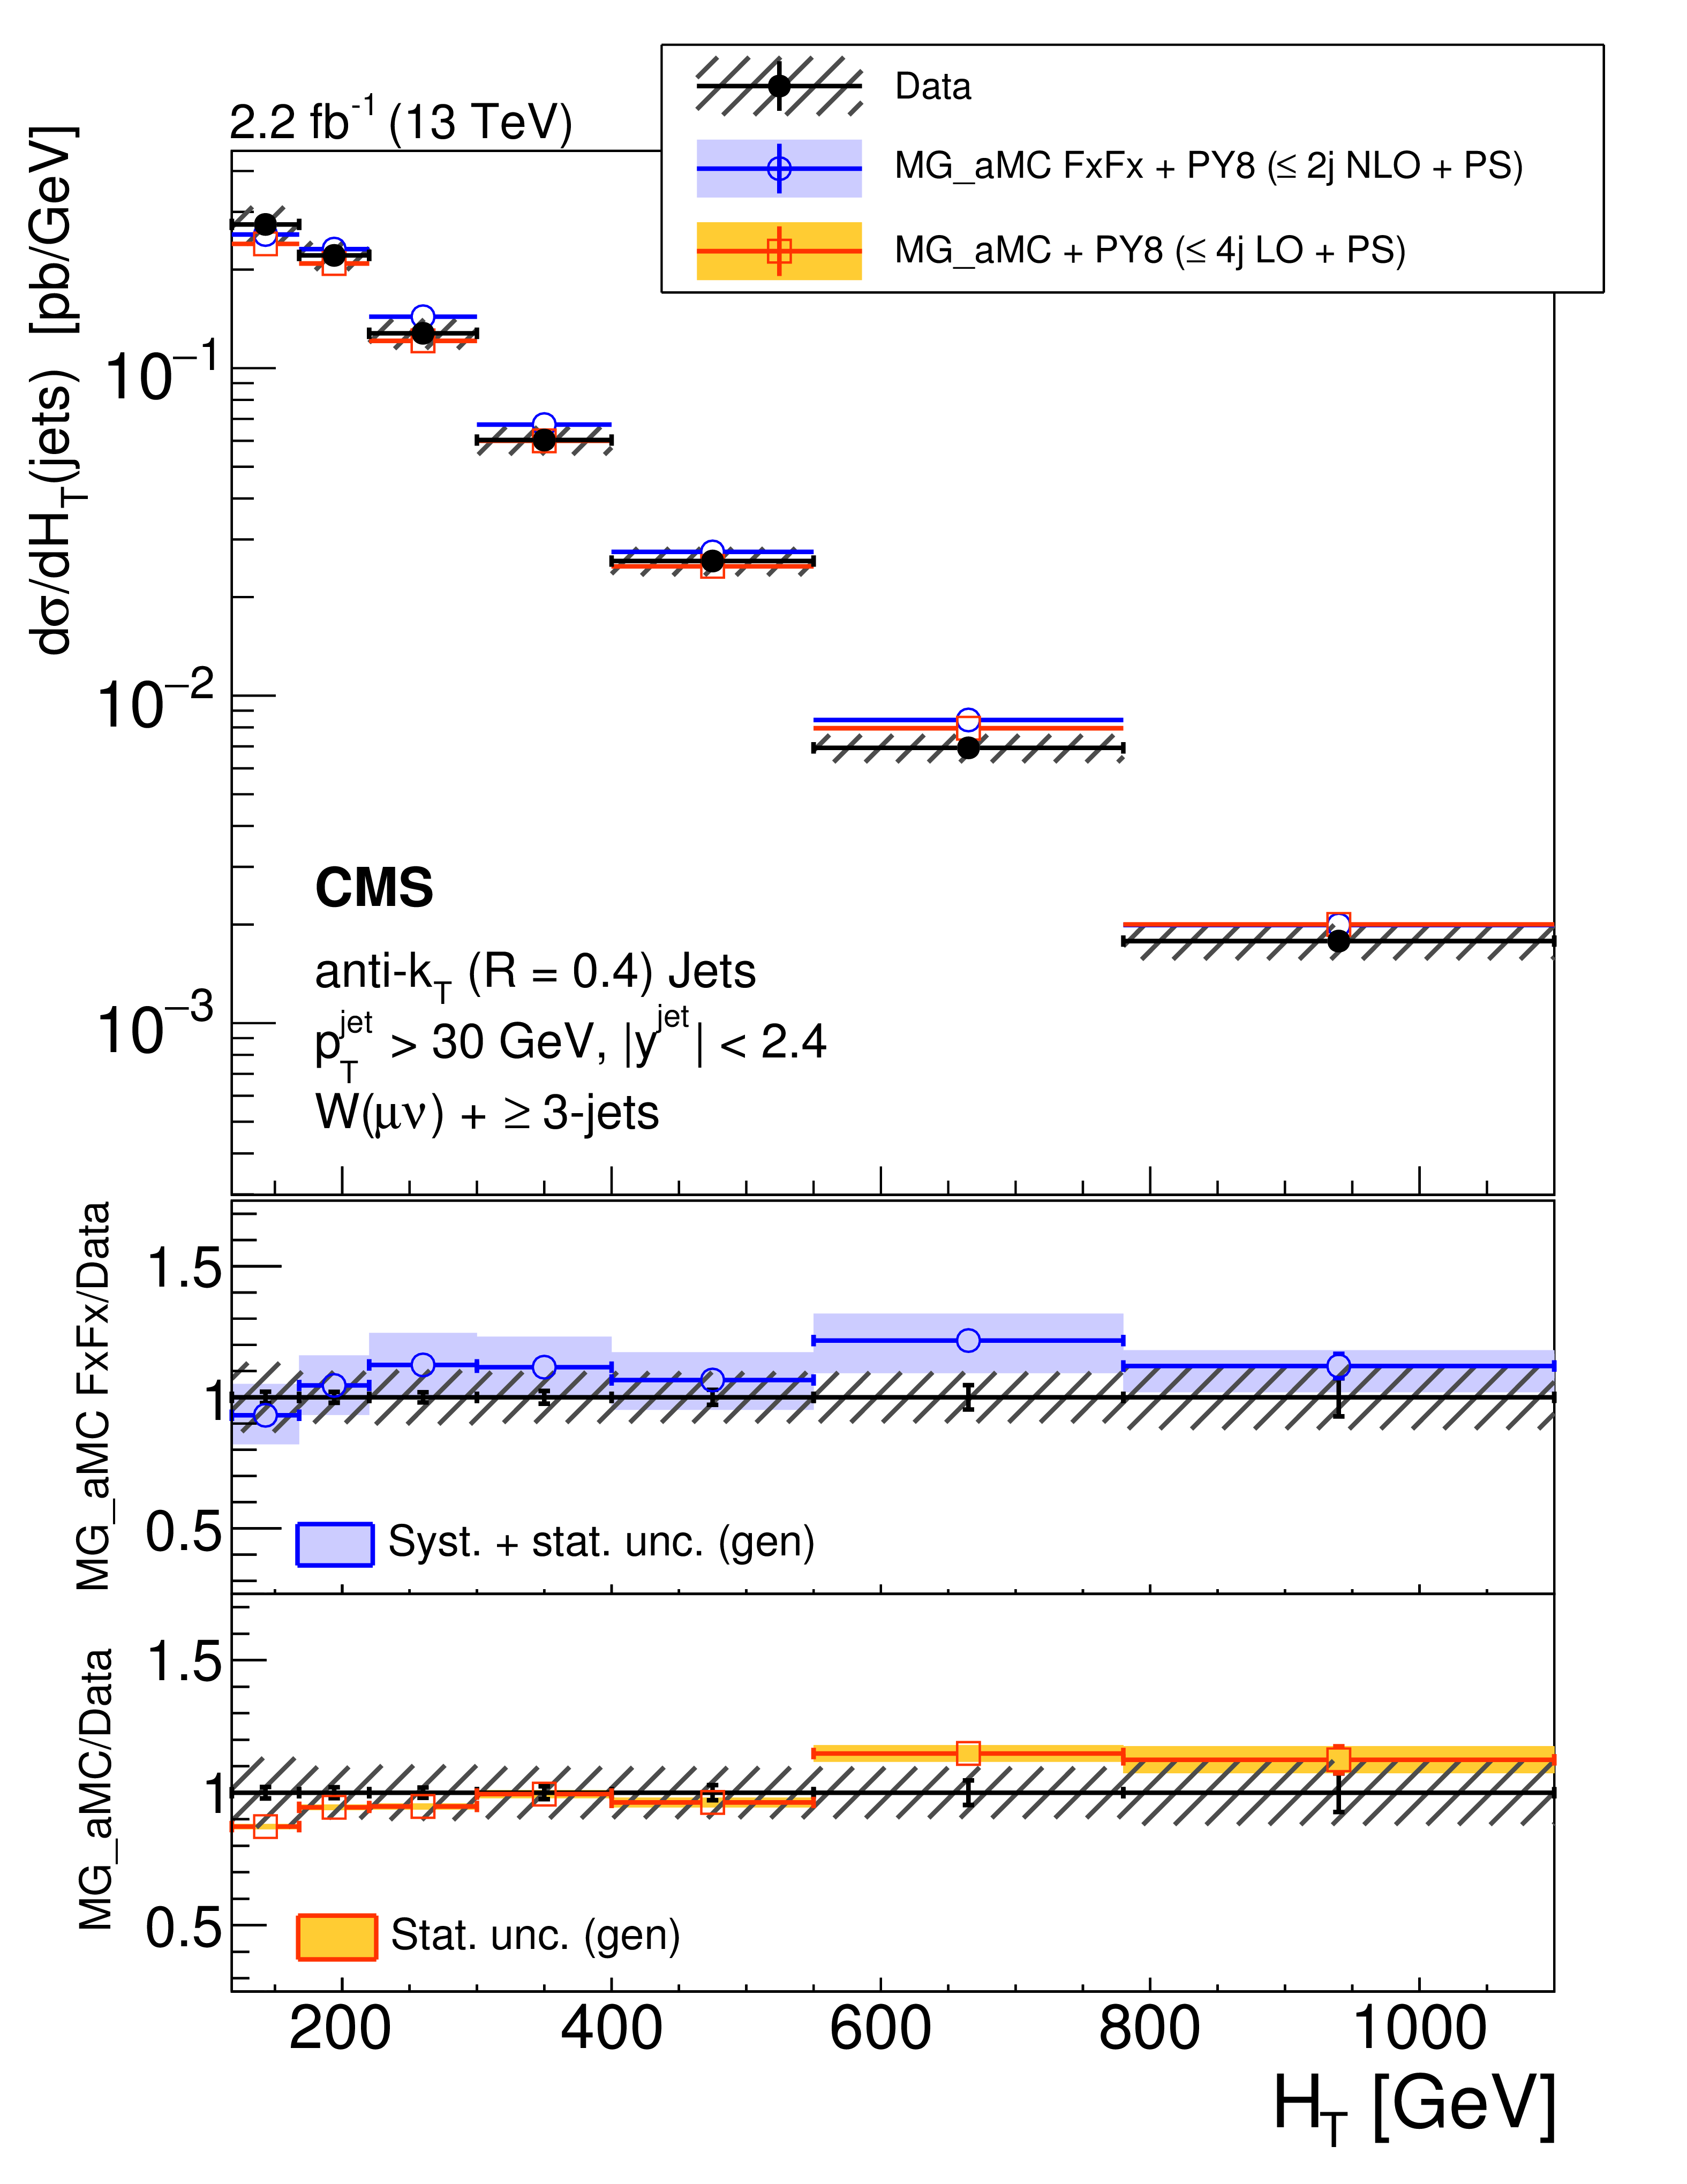
Figure 6:
Differential cross section measurement for the jets $ {H_{\mathrm {T}}} $, shown from left to right for at least 1 and 2 jets (upper) and for at least 3 and 4 jets (lower) on the figures, compared to the predictions of MG_aMC FxFx and MG_aMC. The NNLO prediction for $\mathrm{ W } $+1-jet is included in the jets $ {H_{\mathrm {T}}} $ for one jet inclusive production. The black circular markers with the gray hatched band represent the unfolded data measurement and the total experimental uncertainty. The MG_aMC prediction is given only with its statistical uncertainty. The bands around the MG_aMC FxFx and NNLO predictions represent their theoretical uncertainties including both statistical and systematic components. The lower panels show the ratio of the prediction to the unfolded data. |
png pdf |
Figure 6-a:
Differential cross section measurement for the jets $ {H_{\mathrm {T}}} $, shown for at least 1 jet, compared to the predictions of MG_aMC FxFx and MG_aMC. The NNLO prediction for $\mathrm{ W } $+1-jet is included in the jets $ {H_{\mathrm {T}}} $ for one jet inclusive production. The black circular markers with the gray hatched band represent the unfolded data measurement and the total experimental uncertainty. The MG_aMC prediction is given only with its statistical uncertainty. The bands around the MG_aMC FxFx and NNLO predictions represent their theoretical uncertainties including both statistical and systematic components. The lower panels show the ratio of the predictions to the unfolded data. |

png pdf |
Figure 6-b:
Differential cross section measurement for the jets $ {H_{\mathrm {T}}} $, shown for at least 2 jets, compared to the predictions of MG_aMC FxFx and MG_aMC. The NNLO prediction for $\mathrm{ W } $+1-jet is included in the jets $ {H_{\mathrm {T}}} $ for one jet inclusive production. The black circular markers with the gray hatched band represent the unfolded data measurement and the total experimental uncertainty. The MG_aMC prediction is given only with its statistical uncertainty. The bands around the MG_aMC FxFx and NNLO predictions represent their theoretical uncertainties including both statistical and systematic components. The lower panels show the ratio of the predictions to the unfolded data. |
png pdf |
Figure 6-c:
Differential cross section measurement for the jets $ {H_{\mathrm {T}}} $, shown for at least 3 jets, compared to the predictions of MG_aMC FxFx and MG_aMC. The NNLO prediction for $\mathrm{ W } $+1-jet is included in the jets $ {H_{\mathrm {T}}} $ for one jet inclusive production. The black circular markers with the gray hatched band represent the unfolded data measurement and the total experimental uncertainty. The MG_aMC prediction is given only with its statistical uncertainty. The bands around the MG_aMC FxFx and NNLO predictions represent their theoretical uncertainties including both statistical and systematic components. The lower panels show the ratio of the predictions to the unfolded data. |

png pdf |
Figure 6-d:
Differential cross section measurement for the jets $ {H_{\mathrm {T}}} $, shown for at least 4 jets, compared to the predictions of MG_aMC FxFx and MG_aMC. The NNLO prediction for $\mathrm{ W } $+1-jet is included in the jets $ {H_{\mathrm {T}}} $ for one jet inclusive production. The black circular markers with the gray hatched band represent the unfolded data measurement and the total experimental uncertainty. The MG_aMC prediction is given only with its statistical uncertainty. The bands around the MG_aMC FxFx and NNLO predictions represent their theoretical uncertainties including both statistical and systematic components. The lower panels show the ratio of the predictions to the unfolded data. |
png pdf |
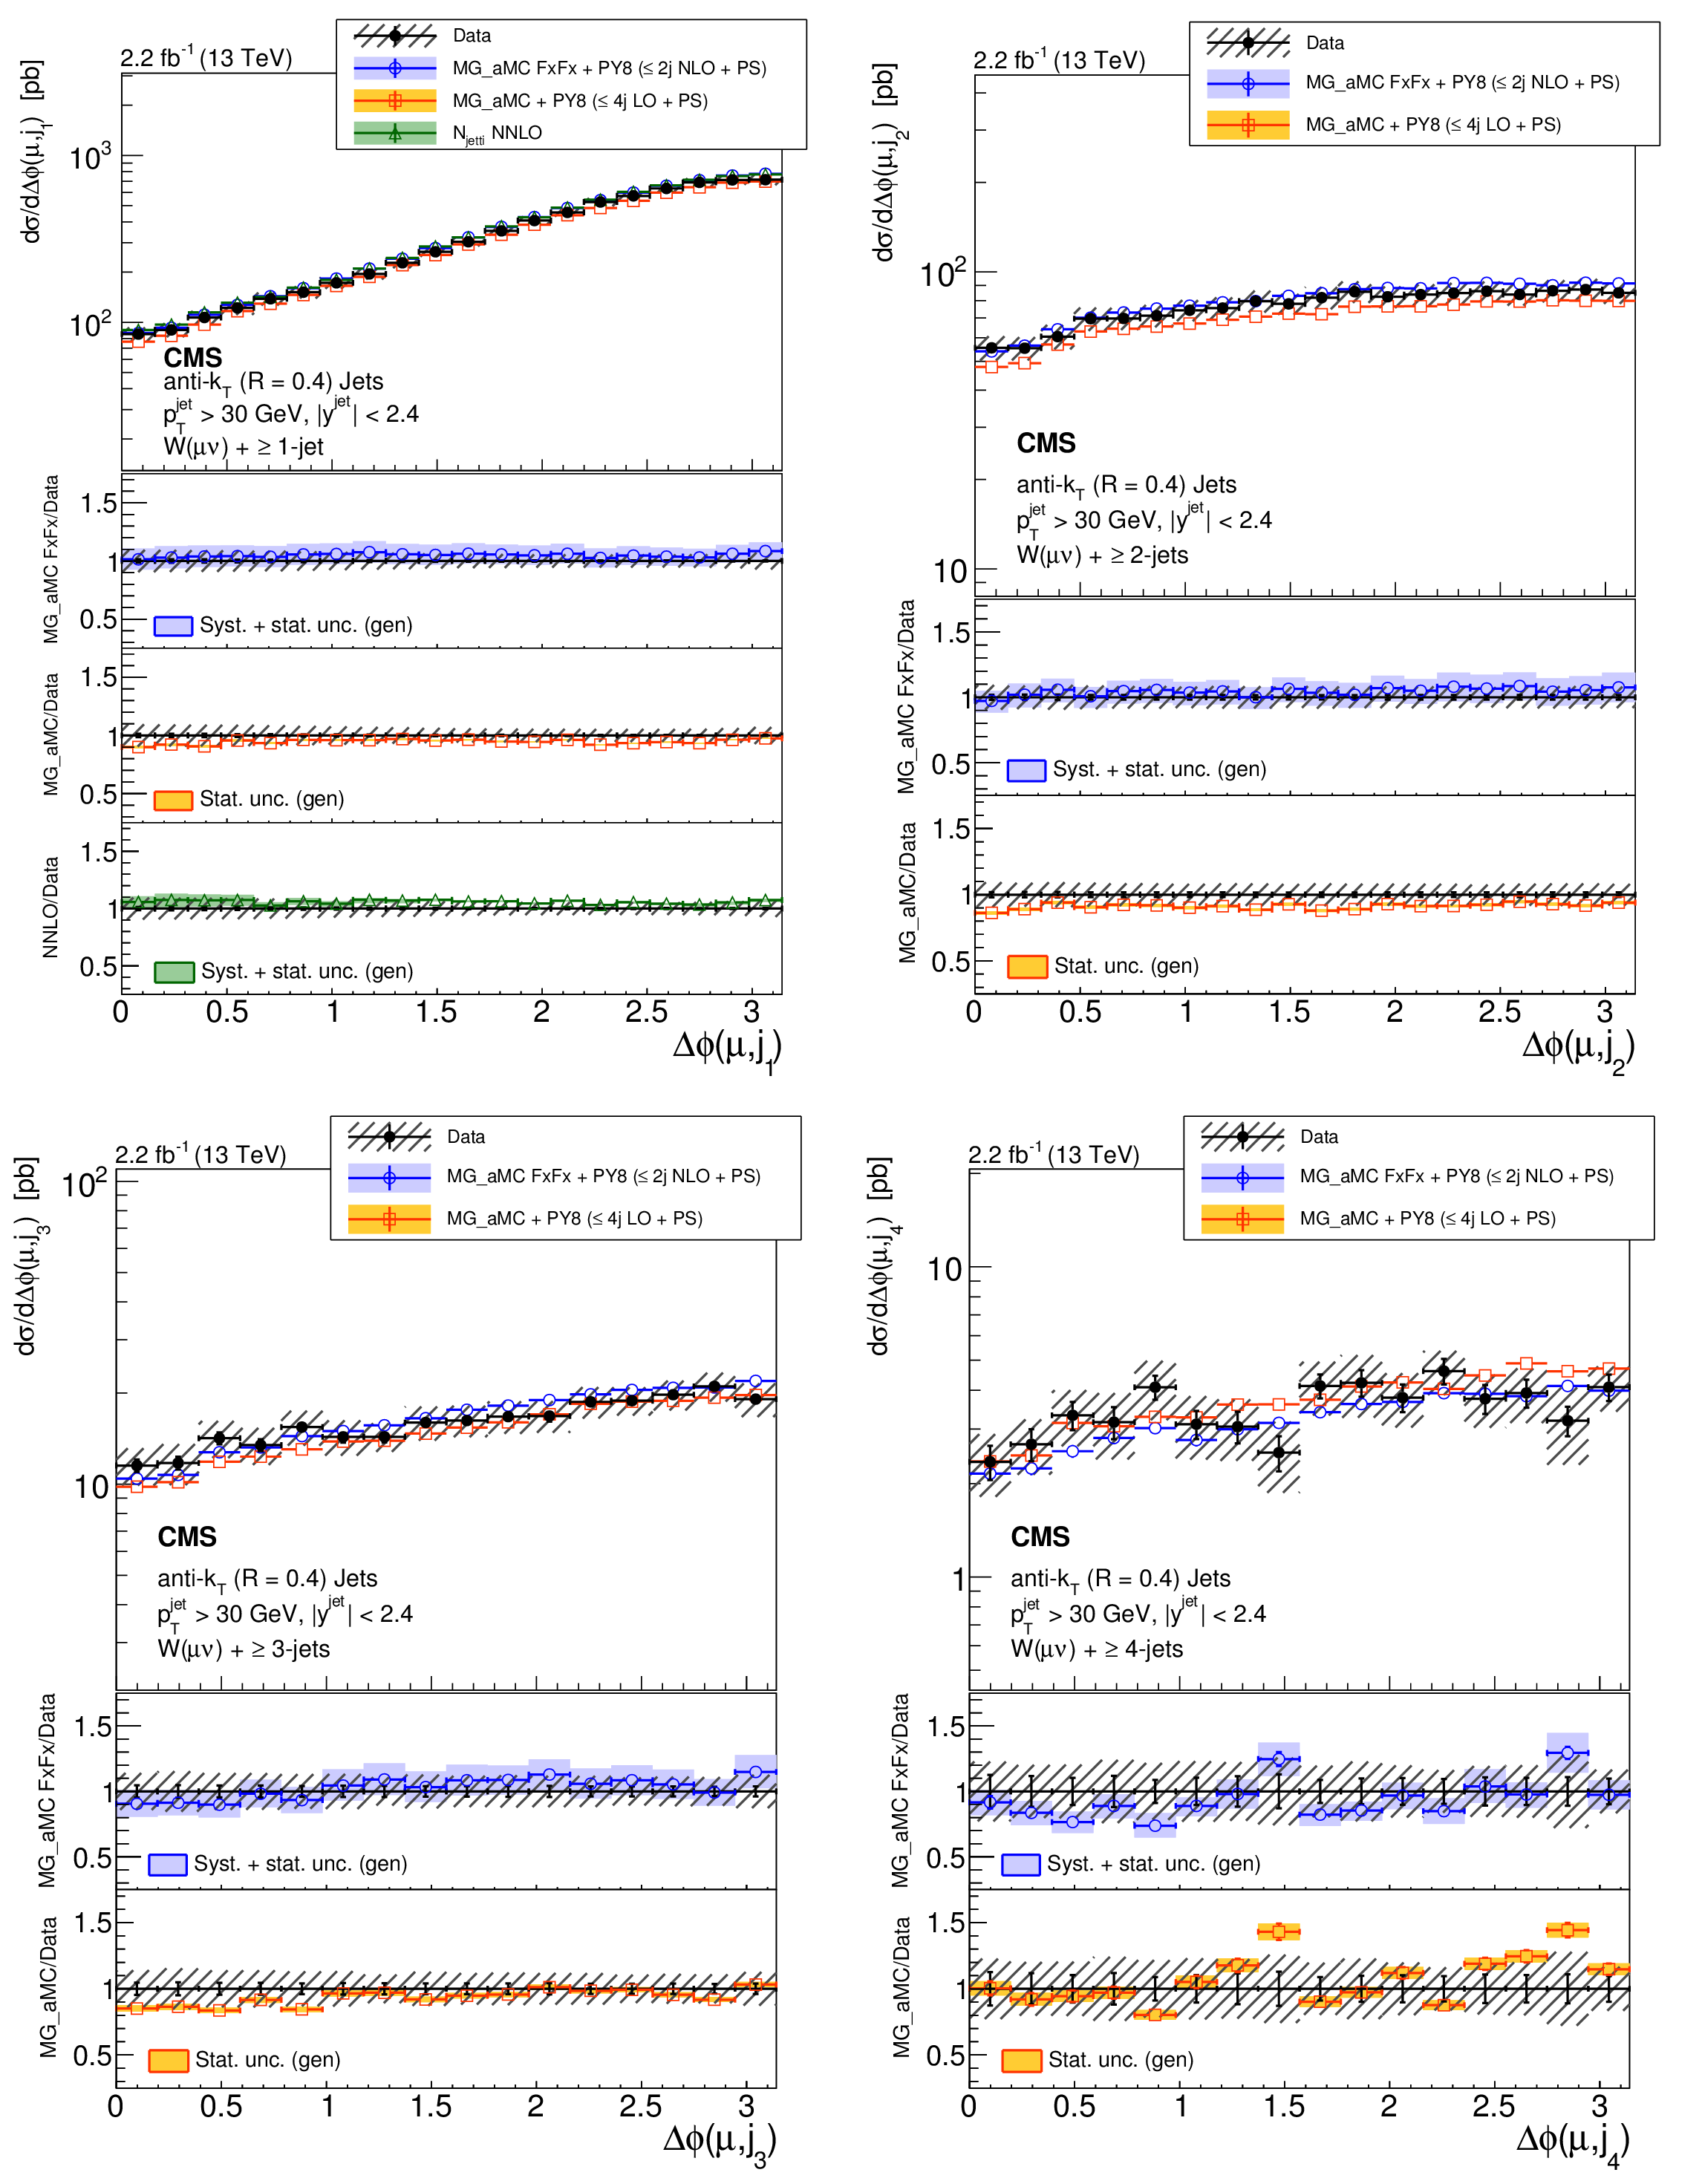
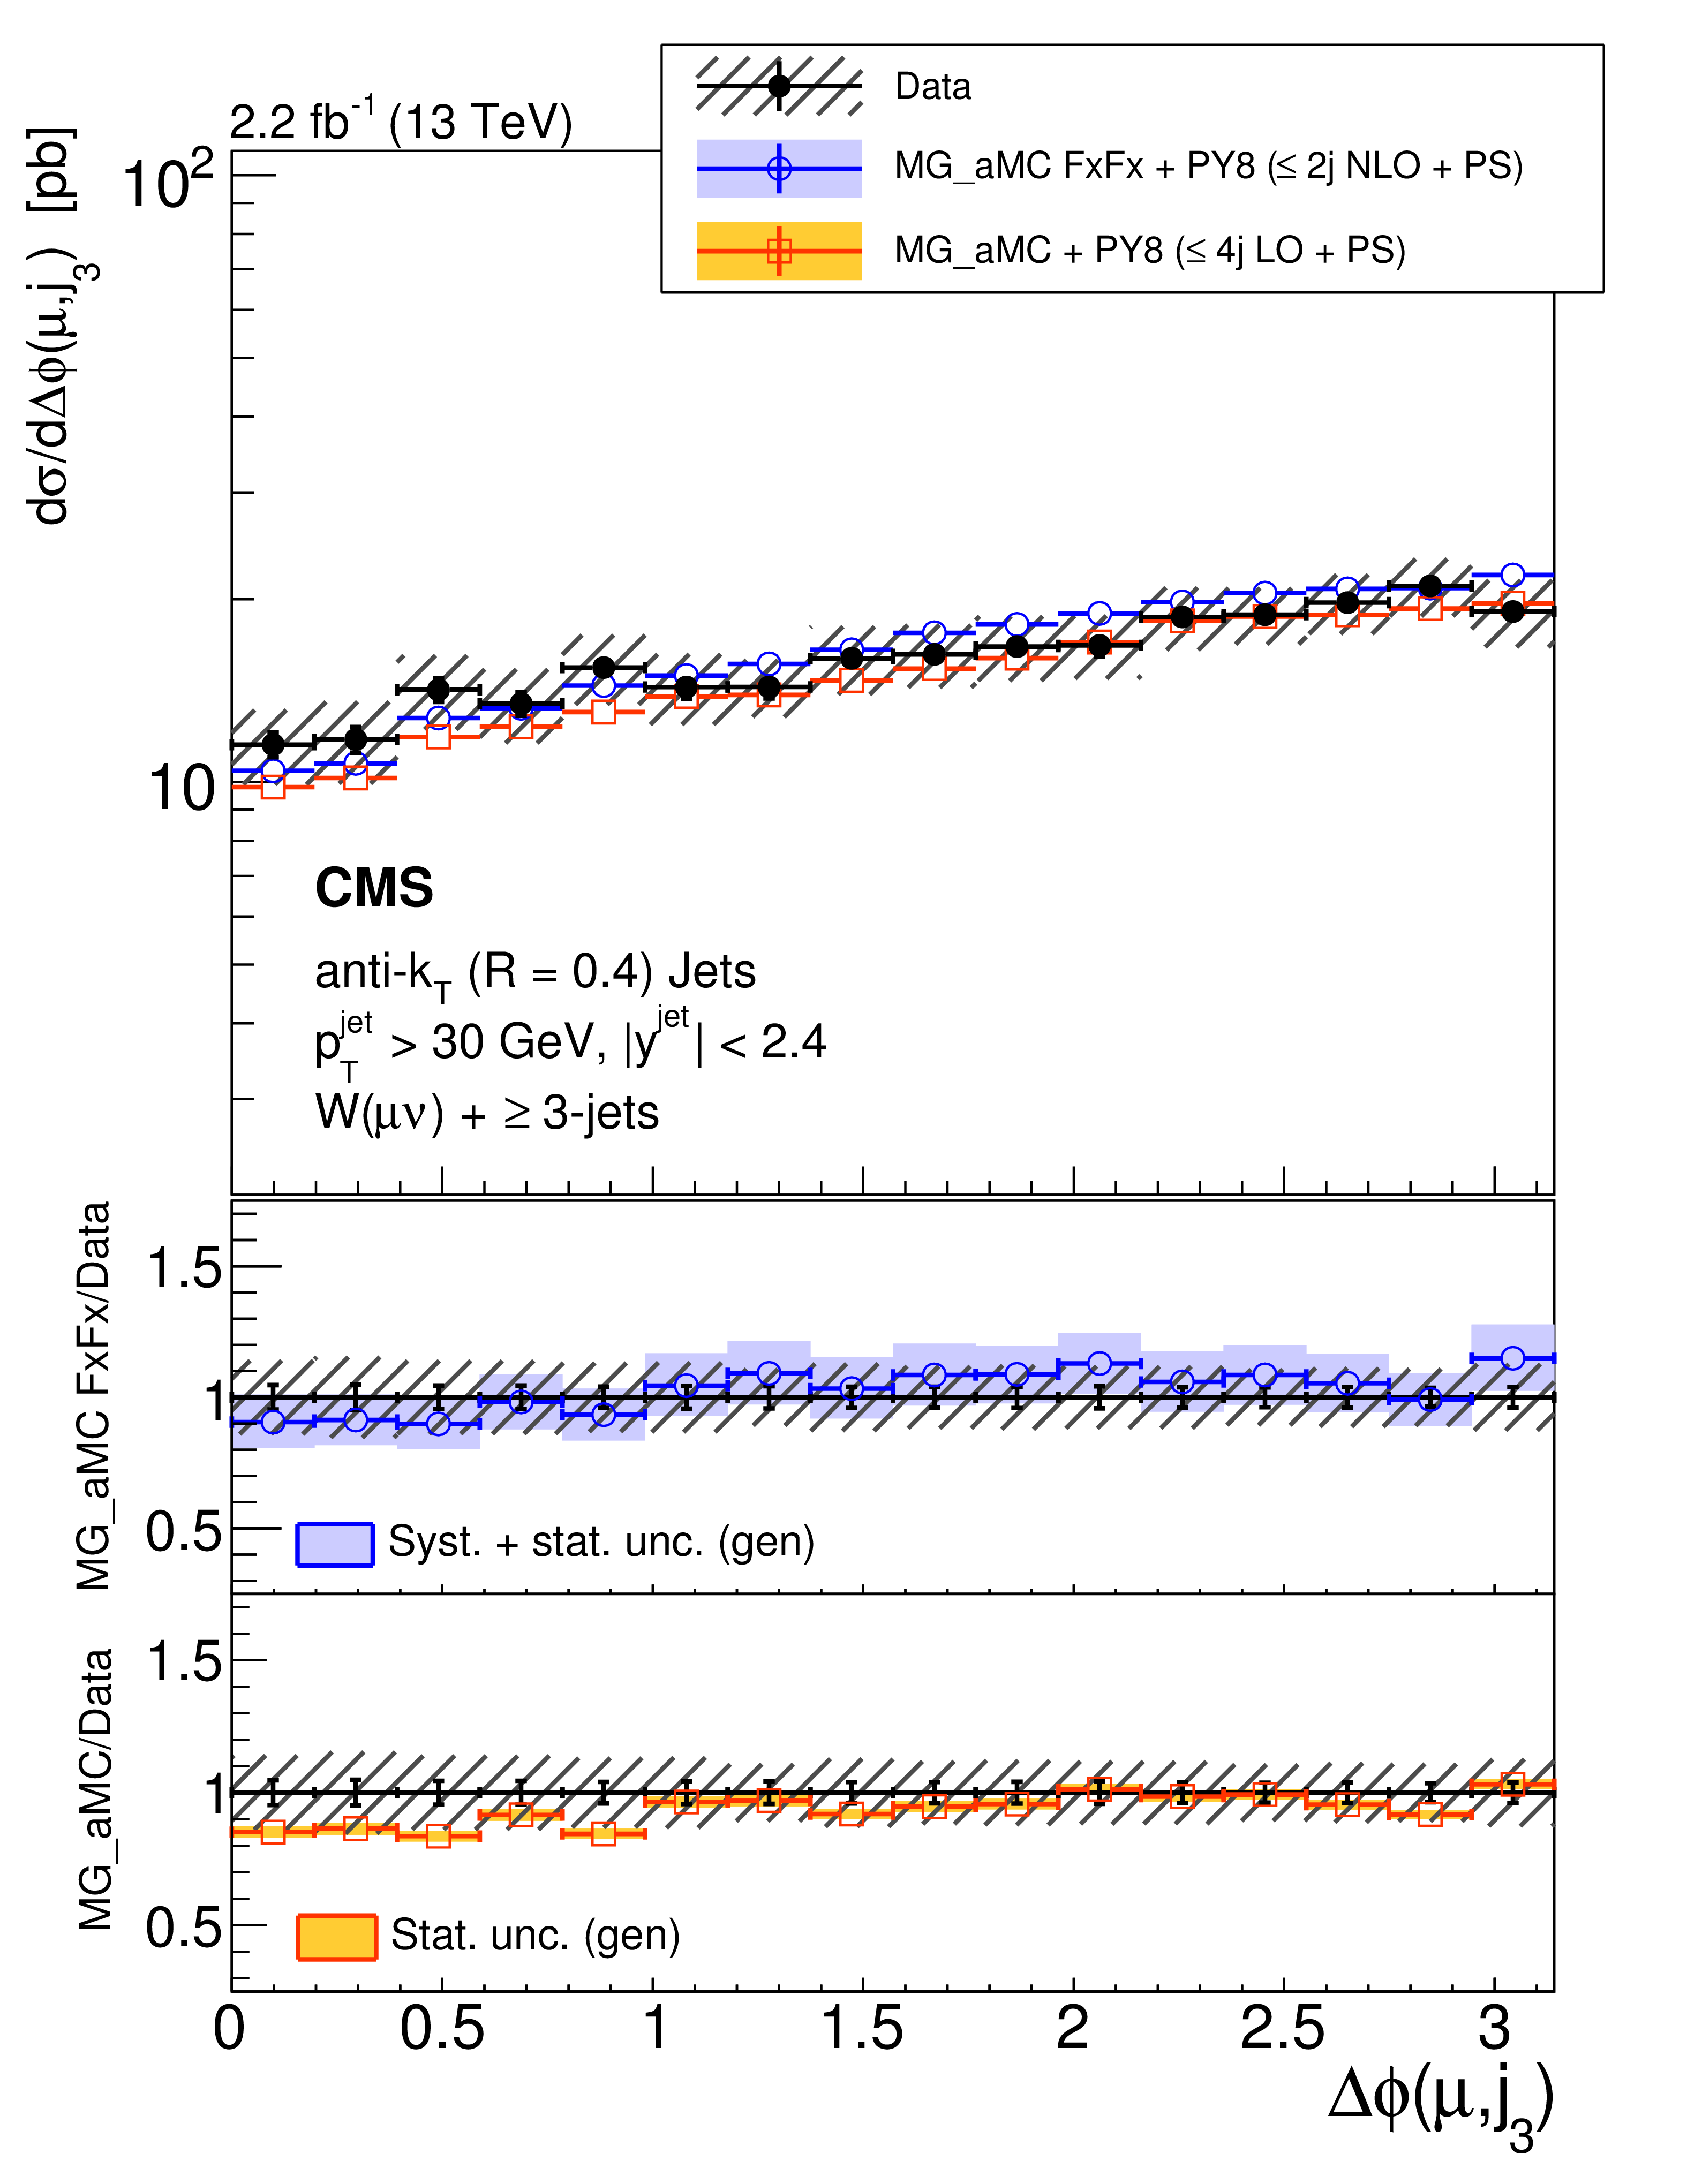
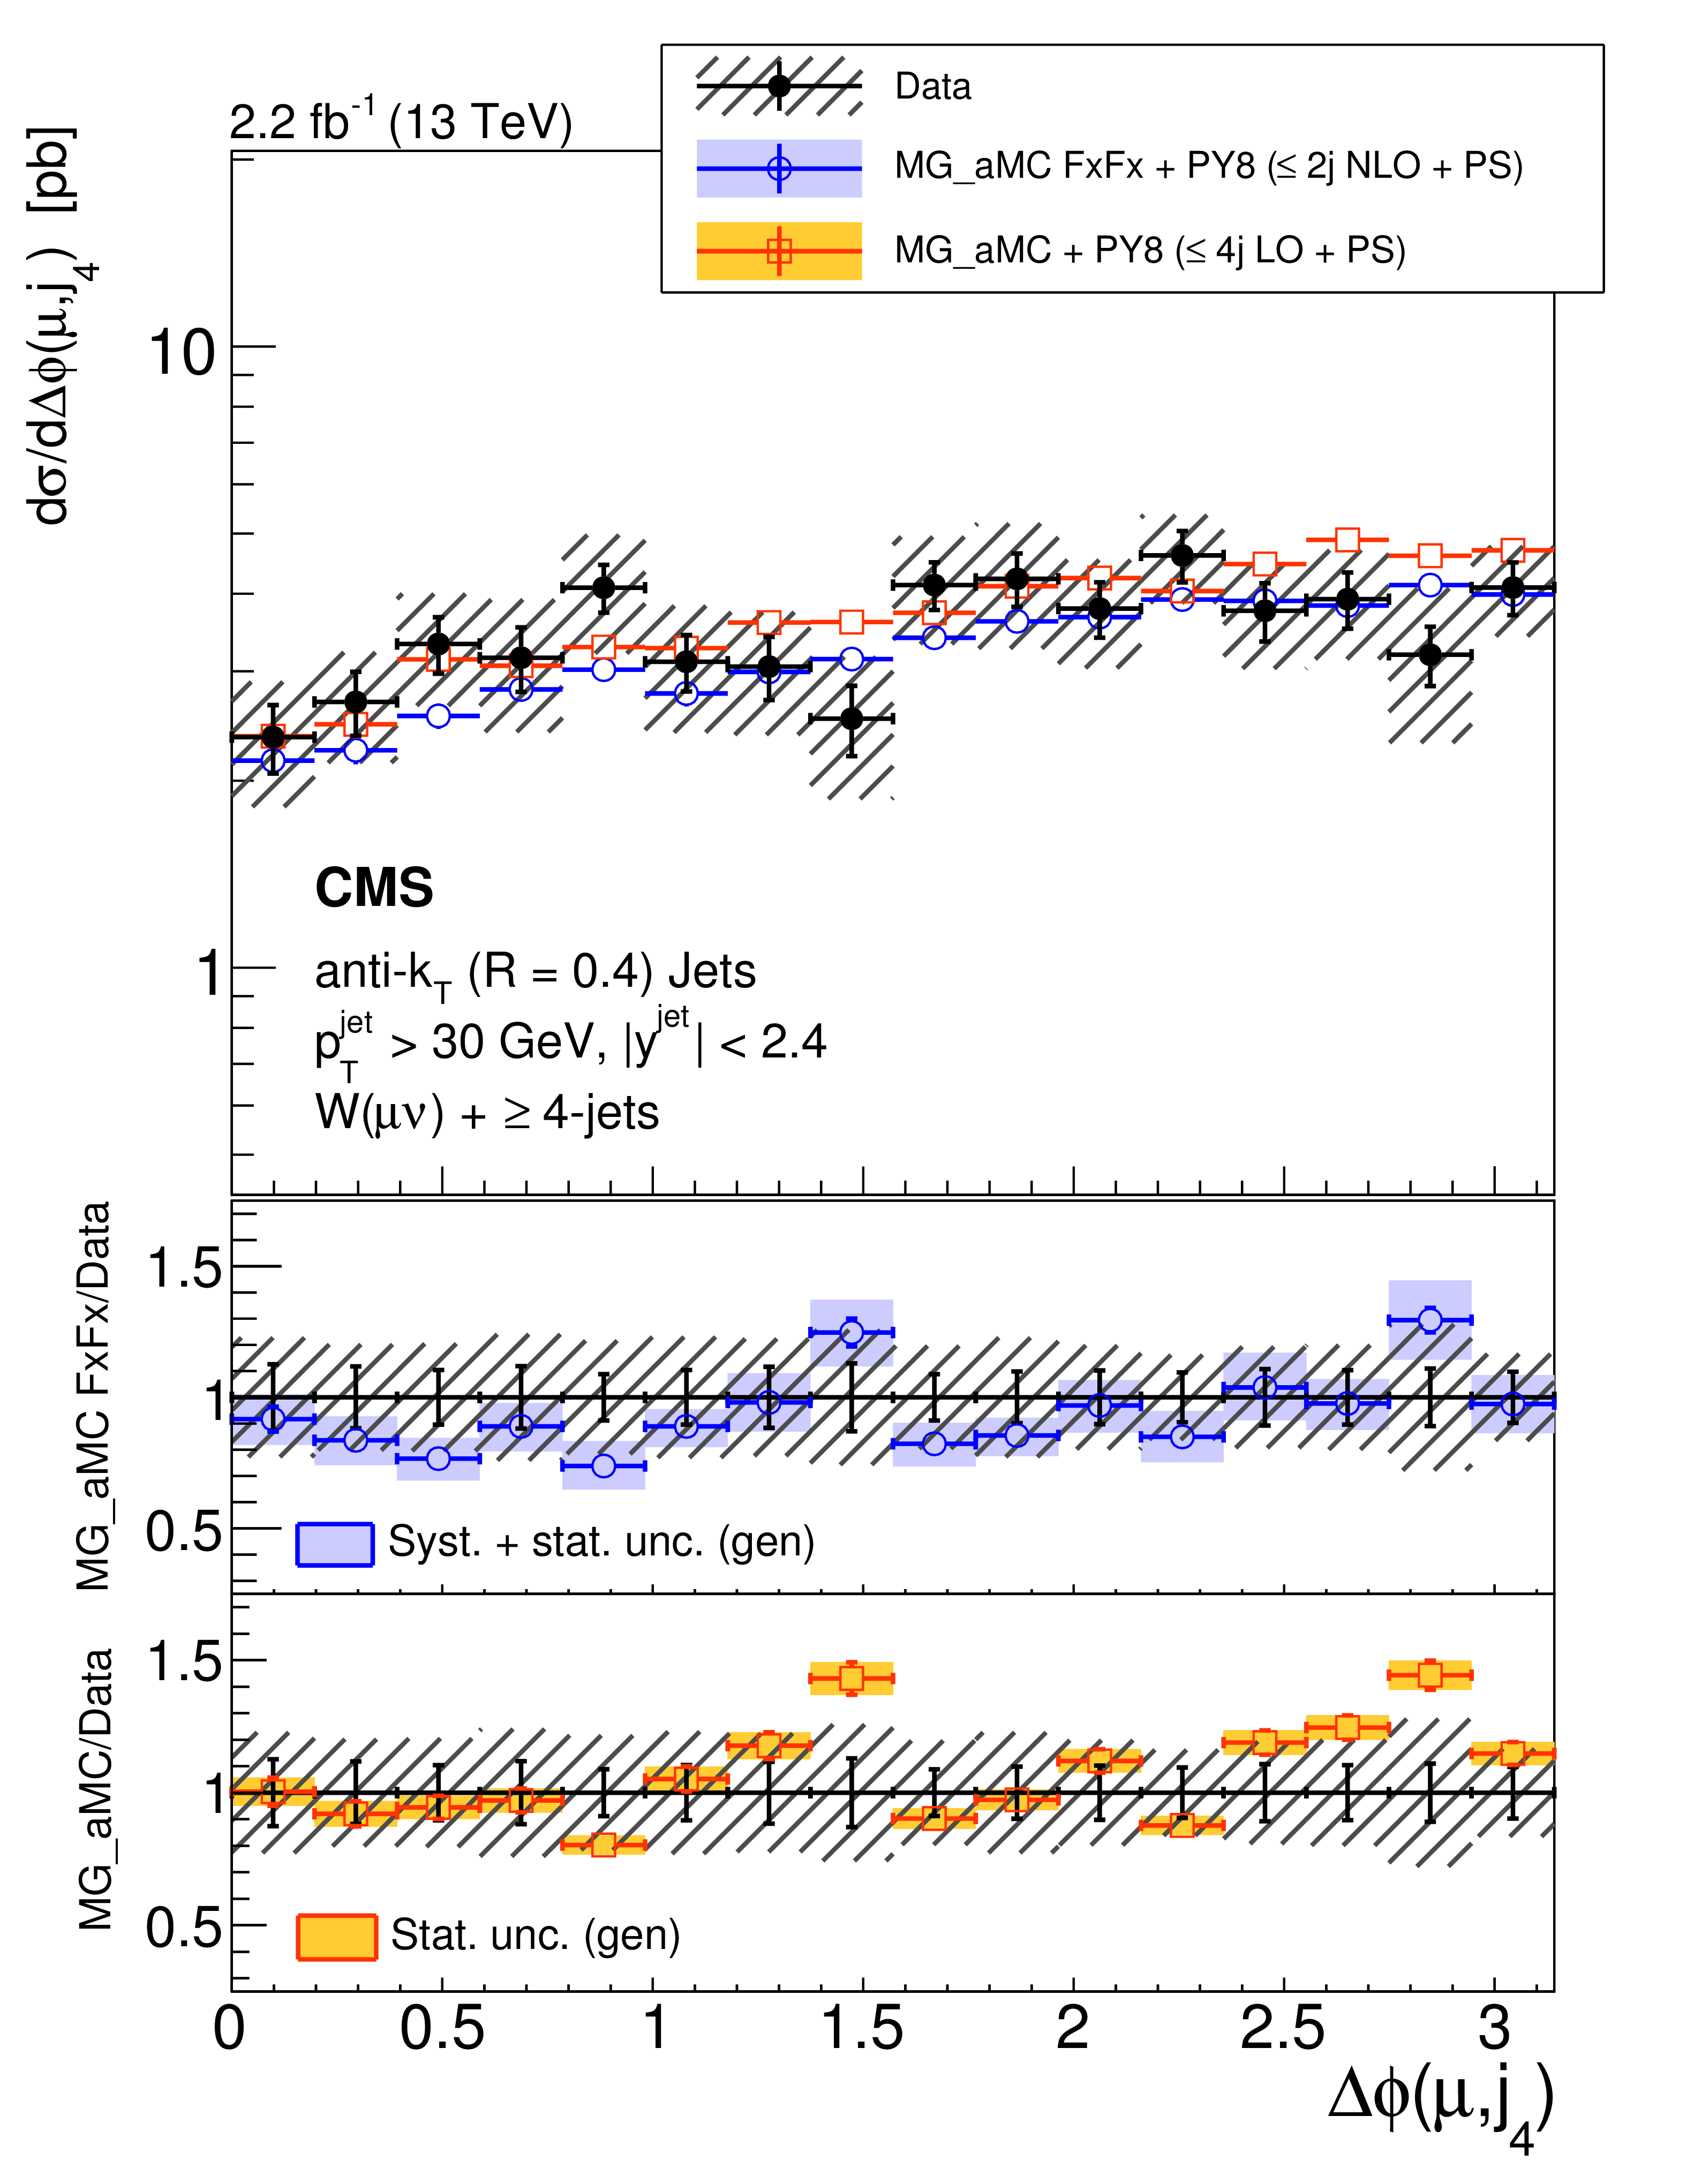
Figure 7:
Differential cross section measurement for $\Delta \phi (\text {$\mu $, $j_{i}$})$, shown from left to right for at least 1 and 2 jets (upper) and for at least 3 and 4 jets (lower) on the figures, compared to the predictions of MG_aMC FxFx and MG_aMC. The NNLO prediction for $\mathrm{ W } $+1-jet is included in $\Delta \phi (\text {$\mu $, $j_{1}$})$ for one jet inclusive production. The black circular markers with the gray hatched band represent the unfolded data measurement and the total experimental uncertainty. The MG_aMC prediction is given only with its statistical uncertainty. The bands around the MG_aMC FxFx and NNLO predictions represent their theoretical uncertainties including both statistical and systematic components. The lower panels show the ratio of the prediction to the unfolded data. |

png pdf |
Figure 7-a:
Differential cross section measurement for $\Delta \phi (\text {$\mu $, $j_{i}$})$, shown for at least 1 jet, compared to the predictions of MG_aMC FxFx and MG_aMC. The NNLO prediction for $\mathrm{ W } $+1-jet is included in $\Delta \phi (\text {$\mu $, $j_{1}$})$ for one jet inclusive production. The black circular markers with the gray hatched band represent the unfolded data measurement and the total experimental uncertainty. The MG_aMC prediction is given only with its statistical uncertainty. The bands around the MG_aMC FxFx and NNLO predictions represent their theoretical uncertainties including both statistical and systematic components. The lower panels show the ratio of the predictions to the unfolded data. |

png pdf |
Figure 7-b:
Differential cross section measurement for $\Delta \phi (\text {$\mu $, $j_{i}$})$, shown for at least 2 jets, compared to the predictions of MG_aMC FxFx and MG_aMC. The NNLO prediction for $\mathrm{ W } $+1-jet is included in $\Delta \phi (\text {$\mu $, $j_{1}$})$ for one jet inclusive production. The black circular markers with the gray hatched band represent the unfolded data measurement and the total experimental uncertainty. The MG_aMC prediction is given only with its statistical uncertainty. The bands around the MG_aMC FxFx and NNLO predictions represent their theoretical uncertainties including both statistical and systematic components. The lower panels show the ratio of the predictions to the unfolded data. |
png pdf |
Figure 7-c:
Differential cross section measurement for $\Delta \phi (\text {$\mu $, $j_{i}$})$, shown for at least 3 jets, compared to the predictions of MG_aMC FxFx and MG_aMC. The NNLO prediction for $\mathrm{ W } $+1-jet is included in $\Delta \phi (\text {$\mu $, $j_{1}$})$ for one jet inclusive production. The black circular markers with the gray hatched band represent the unfolded data measurement and the total experimental uncertainty. The MG_aMC prediction is given only with its statistical uncertainty. The bands around the MG_aMC FxFx and NNLO predictions represent their theoretical uncertainties including both statistical and systematic components. The lower panels show the ratio of the predictions to the unfolded data. |
png pdf |
Figure 7-d:
Differential cross section measurement for $\Delta \phi (\text {$\mu $, $j_{i}$})$, shown for at least 4 jets, compared to the predictions of MG_aMC FxFx and MG_aMC. The NNLO prediction for $\mathrm{ W } $+1-jet is included in $\Delta \phi (\text {$\mu $, $j_{1}$})$ for one jet inclusive production. The black circular markers with the gray hatched band represent the unfolded data measurement and the total experimental uncertainty. The MG_aMC prediction is given only with its statistical uncertainty. The bands around the MG_aMC FxFx and NNLO predictions represent their theoretical uncertainties including both statistical and systematic components. The lower panels show the ratio of the predictions to the unfolded data. |
png pdf |
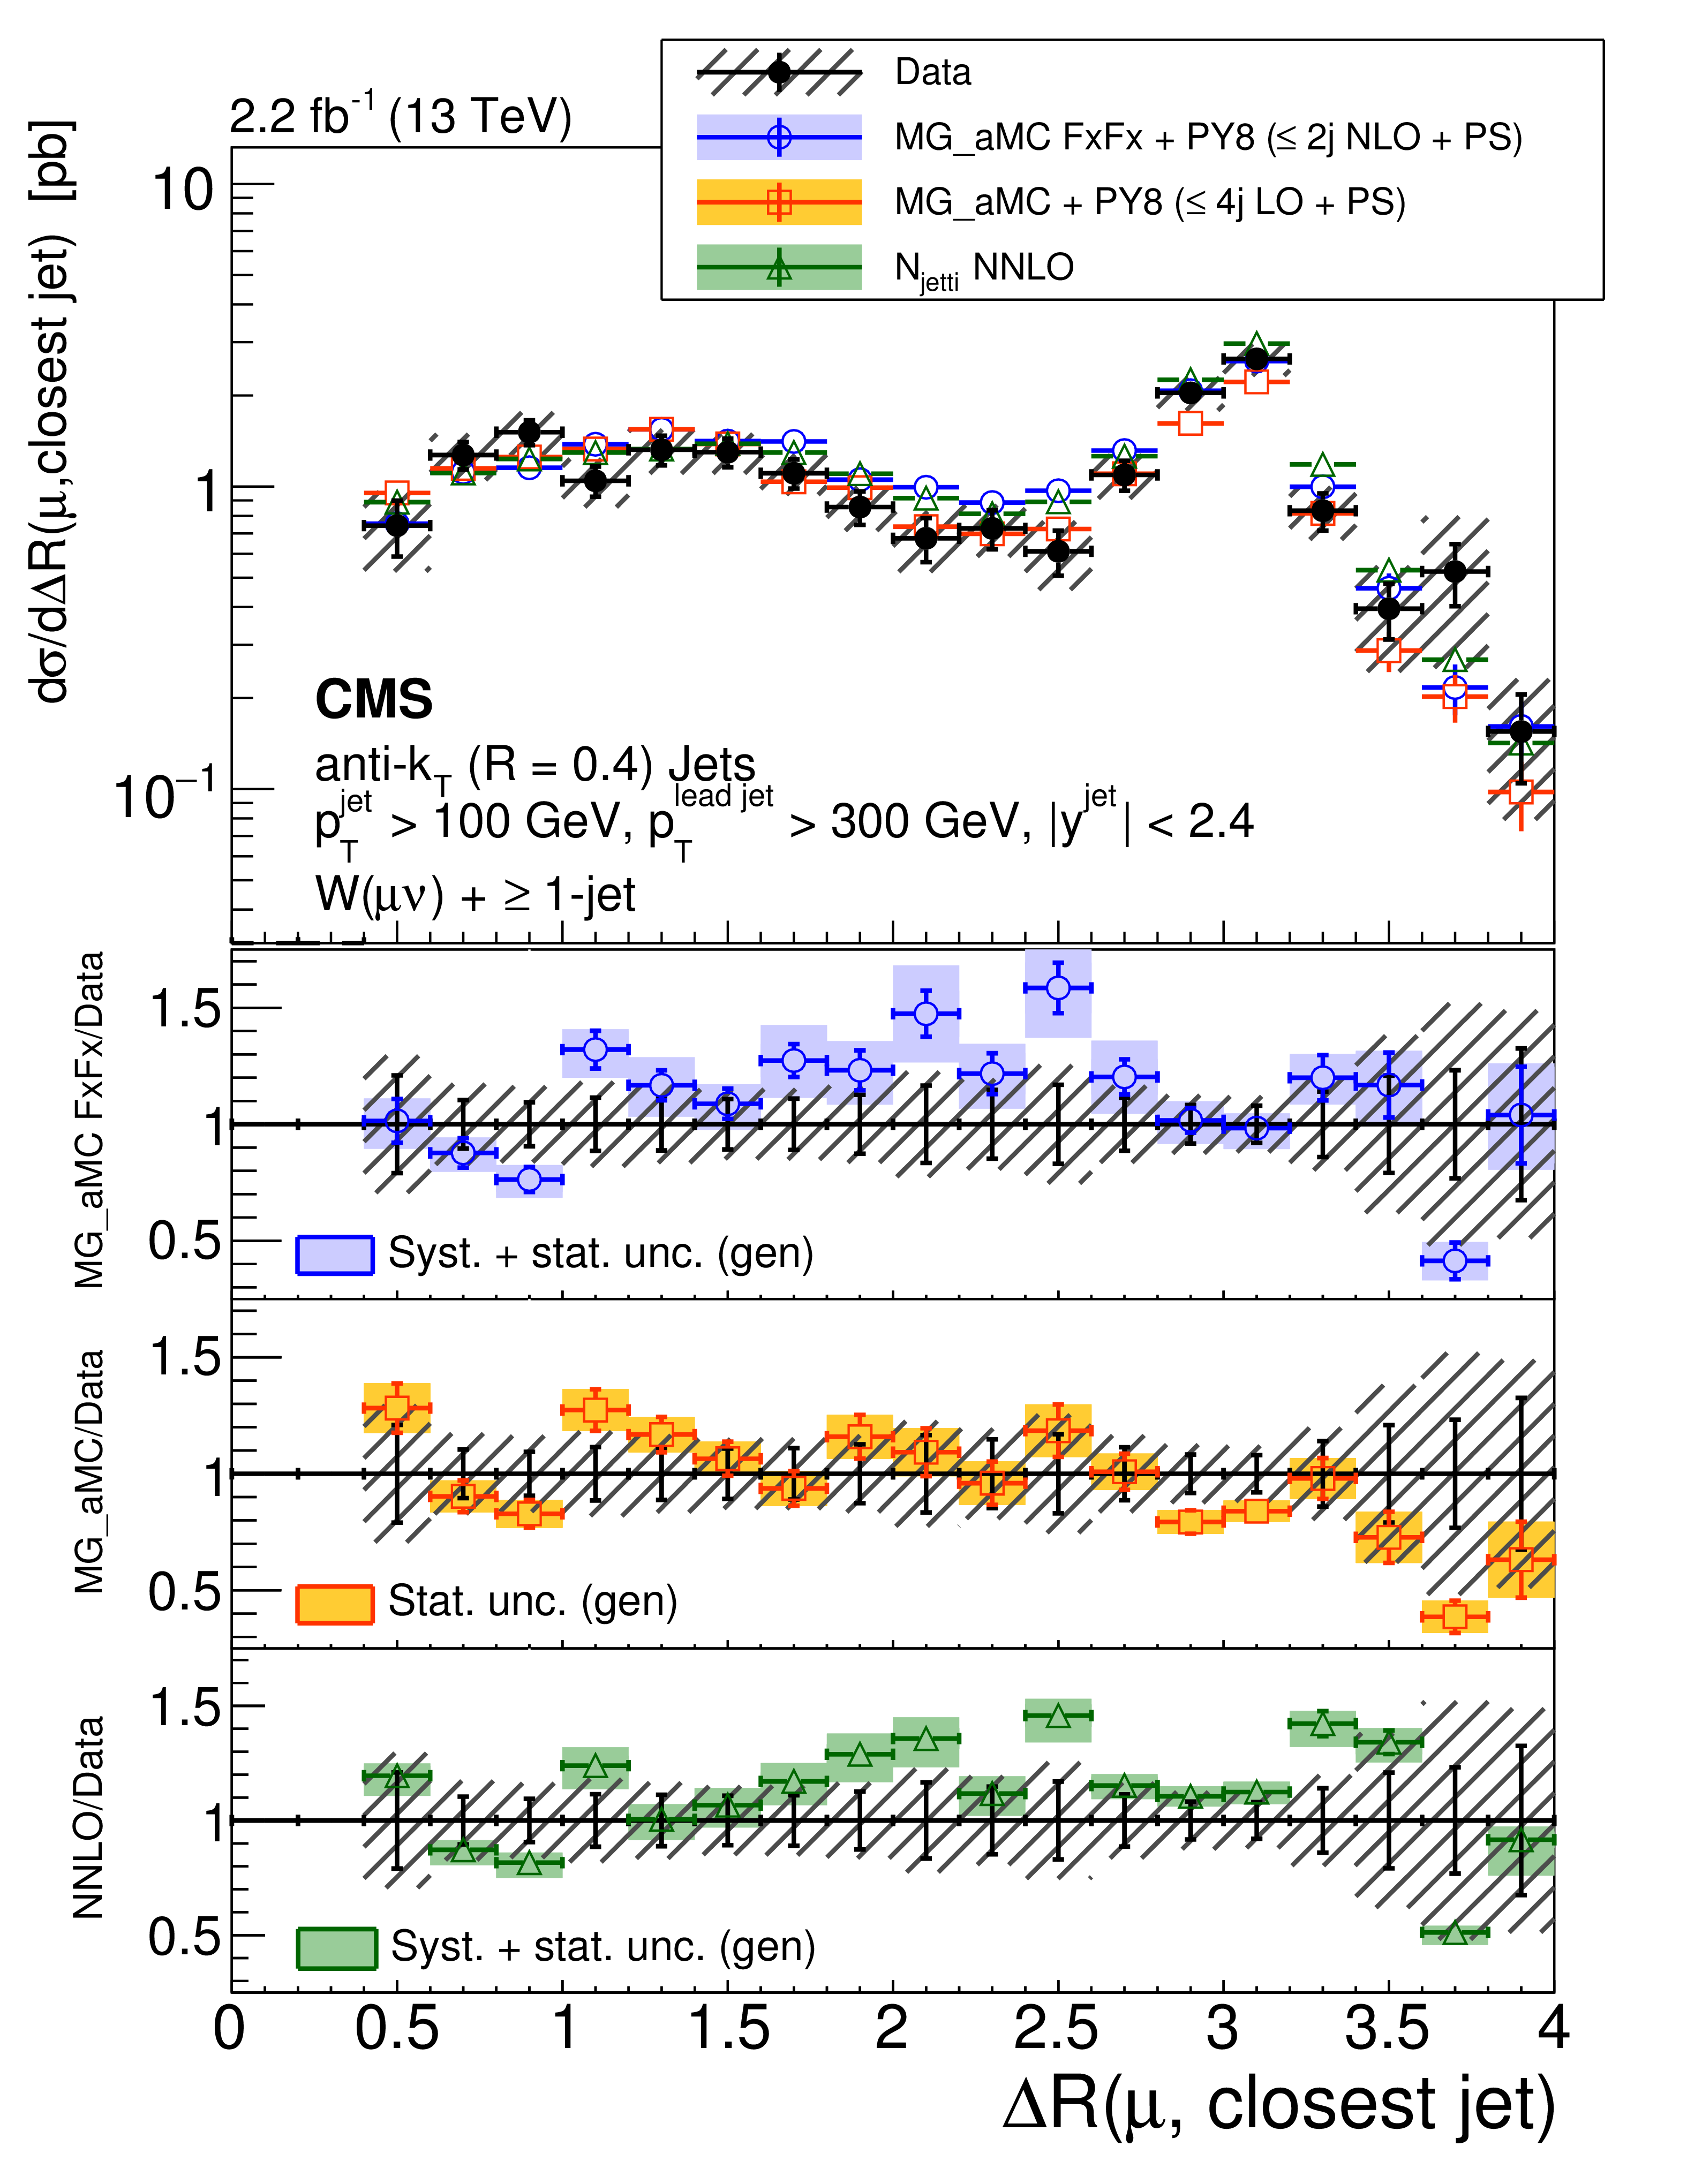
Figure 8:
Differential cross section measurement for $\Delta R(\text {$\mu $, closest jet})$ for one jet inclusive production, compared to the predictions of MG_aMC FxFx, MG_aMC, and the NNLO calculation. The black circular markers with the gray hatched band represent the unfolded data measurement and the total experimental uncertainty. The MG_aMC prediction is given only with its statistical uncertainty. The bands around the MG_aMC FxFx and NNLO predictions represent their theoretical uncertainties including both statistical and systematic components. The lower panels show the ratio of the prediction to the unfolded data. |
| Tables | |

png pdf |
Table 1:
Numbers of events in simulation and data as a function of the exclusive jet multiplicity after the implementation of b tag veto. The processes included are: WW, WZ, and ZZ diboson (VV), QCD multijet, single top quark (Single t), $\mathrm{ Z } /\gamma ^{*}$+jets Drell-Yan (DY+jets), ${\mathrm{ t } {}\mathrm{ \bar{t} } } $, and $\mathrm{ W } (\mu \nu )$+jets signal processes. The QCD multijet background is estimated using control data samples. The ${\mathrm{ t } {}\mathrm{ \bar{t} } } $ background is scaled as discussed in Section 6. |
| Summary |
|
The first measurement of the differential cross sections for a W boson produced in association with jets in proton-proton collisions at a center-of-mass energy of 13 TeV was presented. The collision data correspond to an integrated luminosity of 2.2 fb$^{-1}$ and were collected with the CMS detector during 2015 at the LHC. The differential cross sections are measured using the muon decay mode of the W boson as functions of the exclusive and inclusive jet multiplicities up to a multiplicity of six, the jet transverse momentum $p_{\mathrm{T}}$ and absolute value of rapidity $|y|$ for the four leading jets, and the scalar $p_{\mathrm{T}}$ sum of the jets $H_{\mathrm{T}}$ for an inclusive jet multiplicity up to four. The differential cross sections are also measured as a function of the azimuthal separation between the muon direction from the W boson decay and the direction of the leading jet for up to four inclusive jets, and of the angular distance between the muon and the closest jet in events with at least one jet. The background-subtracted data distributions are corrected for all detector effects by means of regularized unfolding and compared with the predictions of MadGraph{}5_aMC at leading-order (LO) accuracy (MG_aMC) and at next-to-LO (NLO) accuracy (MG_aMC FxFx). The measured data are also compared with a calculation based on the $N$-jettiness subtraction scheme at next-to-NLO (NNLO) accuracy for W+1-jet production. The predictions describe the data well within uncertainties as functions of the exclusive and inclusive jet multiplicities and are in good agreement with data for the jet $p_{\mathrm{T}}$ spectra, with the exception of the MG_aMC LO prediction, which underestimates the data at low to moderate jet $p_{\mathrm{T}}$. The measured $H_{\mathrm{T}}$ distributions are well modeled both by the MG_aMC FxFx NLO prediction for all inclusive jet multiplicities and the NNLO calculation for W+1-jet. The MG_aMC LO prediction underestimates the measured cross sections at low $H_{\mathrm{T}}$. All predictions accurately describe the jet $|y|$ distributions and the cross sections as a function of the azimuthal correlation between the muon and the leading jet. The measured cross section as a function of the angular distance between the muon and the closest jet, which is sensitive to electroweak emission of W bosons, is best described by the NNLO calculation. |
| References | ||||
| 1 | CMS Collaboration | Differential cross section measurements for the production of a W boson in association with jets in proton-proton collisions at $ \sqrt{s} = $ 7 TeV | PLB 741 (2015) 12 | CMS-SMP-12-023 1406.7533 |
| 2 | CMS Collaboration | Measurements of differential cross sections for associated production of a W boson and jets in proton-proton collisions at $ \sqrt{s} = $ 8 TeV | PRD 95 (2017) 052002 | CMS-SMP-14-023 1610.04222 |
| 3 | ATLAS Collaboration | Measurements of the $ W $ production cross sections in association with jets with the ATLAS detector | EPJC 75 (2015) 82 | 1409.8639 |
| 4 | ATLAS Collaboration | Measurement of $ W $ boson angular distributions in events with high transverse momentum jets at $ \sqrt{s} = $ 8 TeV using the ATLAS detector | PLB 765 (2017) 132 | 1609.07045 |
| 5 | U. Baur | Weak boson emission in hadron collider processes | PRD 75 (2007) 013005 | hep-ph/0611241 |
| 6 | J. R. Christiansen and T. Sjostrand | Weak gauge boson radiation in parton showers | JHEP 04 (2014) 115 | 1401.5238 |
| 7 | F. Krauss, P. Petrov, M. Schonherr, and M. Spannowsky | Measuring collinear $ W $ emissions inside jets | PRD 89 (2014) 114006 | 1403.4788 |
| 8 | R. Boughezal, C. Focke, and X. Liu | Jet vetoes versus giant $ K $-factors in the exclusive $ Z $+1-jet cross section | PRD 92 (2015) 094002 | 1501.01059 |
| 9 | R. Boughezal, X. Liu, and F. Petriello | $ W $-boson plus jet differential distributions at NNLO in QCD | PRD 94 (2016) 113009 | 1602.06965 |
| 10 | J. R. Christiansen and S. Prestel | Merging weak and QCD showers with matrix elements | EPJC 76 (2016) 39 | 1510.01517 |
| 11 | CMS Collaboration | Performance of CMS muon reconstruction in pp collision events at $ \sqrt{s} = $ 7 TeV | JINST 7 (2012) P10002 | CMS-MUO-10-004 1206.4071 |
| 12 | CMS Collaboration | The CMS trigger system | JINST 12 (2017) P01020 | CMS-TRG-12-001 1609.02366 |
| 13 | CMS Collaboration | The CMS experiment at the CERN LHC | JINST 3 (2008) S08004 | CMS-00-001 |
| 14 | GEANT4 Collaboration | GEANT4---a simulation toolkit | NIMA 506 (2003) 250 | |
| 15 | J. Alwall et al. | The automated computation of tree-level and next-to-leading order differential cross sections, and their matching to parton shower simulations | JHEP 07 (2014) 079 | 1405.0301 |
| 16 | R. Frederix and S. Frixione | Merging meets matching in MC@NLO | JHEP 12 (2012) 061 | 1209.6215 |
| 17 | P. Nason | A new method for combining NLO QCD with shower Monte Carlo algorithms | JHEP 11 (2004) 040 | hep-ph/0409146 |
| 18 | S. Frixione, P. Nason, and C. Oleari | Matching NLO QCD computations with parton shower simulations: the POWHEG method | JHEP 11 (2007) 070 | 0709.2092 |
| 19 | S. Alioli, P. Nason, C. Oleari, and E. Re | A general framework for implementing NLO calculations in shower Monte Carlo programs: the POWHEG BOX | JHEP 06 (2010) 043 | 1002.2581 |
| 20 | E. Re | Single-top $ Wt $-channel production matched with parton showers using the POWHEG method | EPJC 71 (2011) 1547 | 1009.2450 |
| 21 | T. Melia, P. Nason, R. Rontsch, and G. Zanderighi | $ \mathrm{W^{+}W^{-}} $, $ \mathrm{WZ} $ and $ \mathrm{ZZ} $ production in the POWHEG BOX | JHEP 11 (2011) 078 | 1107.5051 |
| 22 | T. Sjostrand, S. Mrenna, and P. Z. Skands | PYTHIA 6.4 physics and manual | JHEP 05 (2006) 026 | hep-ph/0603175 |
| 23 | T. Sjostrand et al. | An introduction to PYTHIA 8.2 | CPC 191 (2015) 159 | 1410.3012 |
| 24 | CMS Collaboration | Event generator tunes obtained from underlying event and multiparton scattering measurements | EPJC 76 (2016) 155 | CMS-GEN-14-001 1512.00815 |
| 25 | R. D. Ball et al. | A first unbiased global NLO determination of parton distributions and their uncertainties | NPB 838 (2010) 136 | 1002.4407 |
| 26 | R. D. Ball et al. | Impact of heavy quark masses on parton distributions and LHC phenomenology | NPB 849 (2011) 296 | 1101.1300 |
| 27 | NNPDF Collaboration | Parton distributions for the LHC Run II | JHEP 04 (2015) 040 | 1410.8849 |
| 28 | J. Alwall et al. | Comparative study of various algorithms for the merging of parton showers and matrix elements in hadronic collisions | EPJC 53 (2008) 473 | 0706.2569 |
| 29 | J. Alwall, S. de Visscher, and F. Maltoni | QCD radiation in the production of heavy colored particles at the LHC | JHEP 02 (2009) 017 | 0810.5350 |
| 30 | R. Gavin, Y. Li, F. Petriello, and S. Quackenbush | W physics at the LHC with FEWZ 2.1 | CPC 184 (2013) 209 | 1201.5896 |
| 31 | R. Boughezal, C. Focke, X. Liu, and F. Petriello | $ W $-boson production in association with a jet at next-to-next-to-leading order in perturbative QCD | PRL 115 (2015) 062002 | 1504.02131 |
| 32 | CMS Collaboration | Particle-flow reconstruction and global event description with the CMS detector | JINST 12 (2017) P10003 | CMS-PRF-14-001 1706.04965 |
| 33 | M. Cacciari, G. P. Salam, and G. Soyez | The anti-$ k_{t} $ jet clustering algorithm | JHEP 04 (2008) 063 | 0802.1189 |
| 34 | M. Cacciari, G. P. Salam, and G. Soyez | FastJet user manual | EPJC 72 (2012) 1896 | 1111.6097 |
| 35 | CMS Collaboration | Jet energy scale and resolution in the CMS experiment in pp collisions at 8 TeV | JINST 12 (2017) P02014 | CMS-JME-13-004 1607.03663 |
| 36 | CMS Collaboration | Jet algorithms performance in 13 TeV data | CMS-PAS-JME-16-003 | CMS-PAS-JME-16-003 |
| 37 | CMS Collaboration | Performance of missing energy reconstruction in 13 TeV pp collision data using the CMS detector | CMS-PAS-JME-16-004 | CMS-PAS-JME-16-004 |
| 38 | CMS Collaboration | Identification of b-quark jets with the CMS experiment | JINST 8 (2013) P04013 | CMS-BTV-12-001 1211.4462 |
| 39 | CMS Collaboration | Identification of b quark jets at the CMS experiment in the LHC Run 2 | CMS-PAS-BTV-15-001 | CMS-PAS-BTV-15-001 |
| 40 | G. D'Agostini | A multidimensional unfolding method based on Bayes' theorem | NIMA 362 (1995) 487 | |
| 41 | W. H. Richardson | Bayesian-based iterative method of image restoration | J. Opt. Soc. Am. 62 (1972) 55 | |
| 42 | L. B. Lucy | An iterative technique for the rectification of observed distributions | Astron. J. 79 (1974) 745 | |
| 43 | T. Adye | Unfolding algorithms and tests using RooUnfold | in Proceedings of the PHYSTAT 2011 Workshop, CERN, Geneva, Switzerland, January 2011, CERN-2011-006, p. 313 | 1105.1160 |
| 44 | J. M. Campbell and R. K. Ellis | MCFM for the Tevatron and the LHC | NPPS 205 (2010) 10 | 1007.3492 |
| 45 | CMS Collaboration | CMS luminosity measurement for the 2015 data-taking period | CMS-PAS-LUM-15-001 | CMS-PAS-LUM-15-001 |
| 46 | S. Gangal and F. J. Tackmann | Next-to-leading-order uncertainties in Higgs+2 jets from gluon fusion | PRD 87 (2013) 093008 | 1302.5437 |
| 47 | I. W. Stewart and F. J. Tackmann | Theory uncertainties for Higgs and other searches using jet bins | PRD 85 (2012) 034011 | 1107.2117 |
|
|
Compact Muon Solenoid LHC, CERN |
|

|

|

|

|

|