

Compact Muon Solenoid
LHC, CERN
| CMS-SMP-16-010 ; CERN-EP-2018-180 | ||
| Measurements of the differential jet cross section as a function of the jet mass in dijet events from proton-proton collisions at $\sqrt{s} = $ 13 TeV | ||
| CMS Collaboration | ||
| 16 July 2018 | ||
| JHEP 11 (2018) 113 | ||
| Abstract: Measurements of the differential jet cross section are presented as a function of jet mass in dijet events, in bins of jet transverse momentum, with and without a jet grooming algorithm. The data have been recorded by the CMS Collaboration in proton-proton collisions at the LHC at a center-of-mass energy of 13 TeV and correspond to an integrated luminosity of 2.3 fb$^{-1}$. The absolute cross sections show slightly different jet transverse momentum spectra in data and Monte Carlo event generators for the settings used. Removing this transverse momentum dependence, the normalized cross section for ungroomed jets is consistent with the prediction from Monte Carlo event generators for masses below 30% of the transverse momentum. The normalized cross section for groomed jets is measured with higher precision than the ungroomed cross section. Semi-analytical calculations of the jet mass beyond leading logarithmic accuracy are compared to data, as well as predictions at leading order and next-to-leading order, which include parton showering and hadronization. Overall, in the normalized cross section, the theoretical predictions agree with the measured cross sections within the uncertainties for masses from 10 to 30% of the jet transverse momentum. | ||
| Links: e-print arXiv:1807.05974 [hep-ex] (PDF) ; CDS record ; inSPIRE record ; HepData record ; CADI line (restricted) ; | ||
| Figures & Tables | Summary | Additional Figures | References | CMS Publications |
|---|
| Figures | |
png pdf |
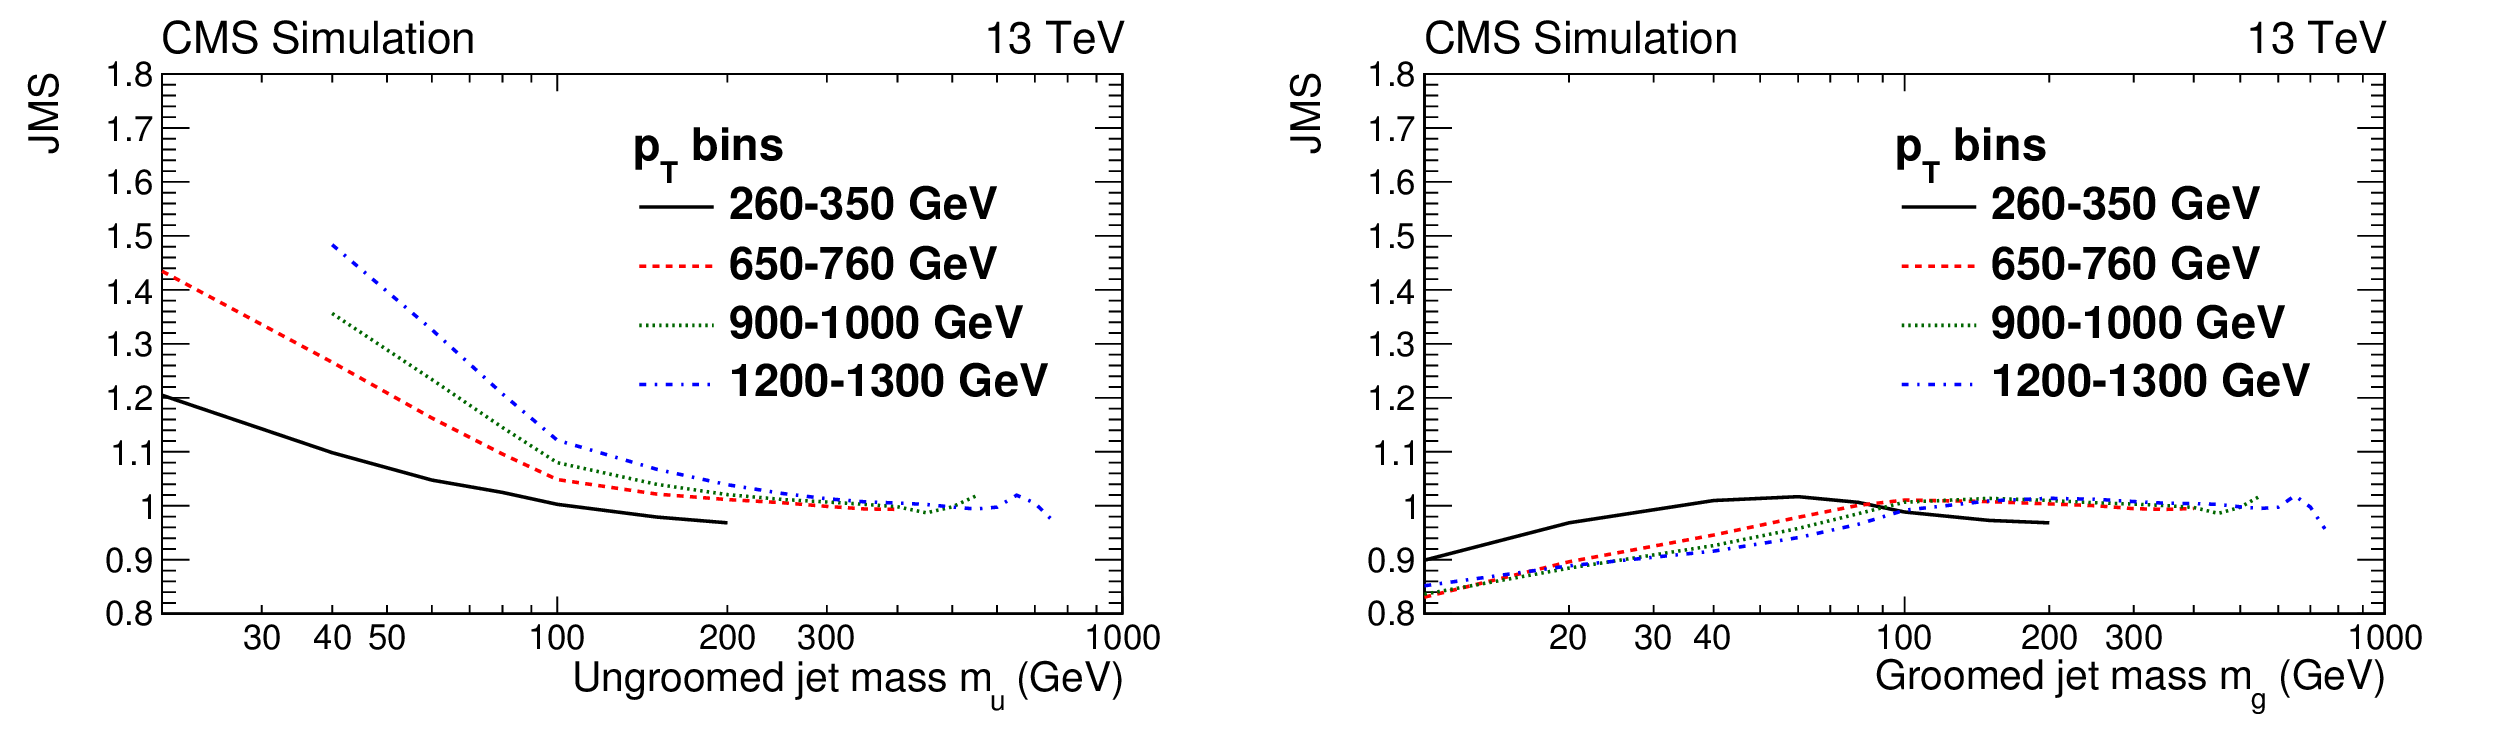
Figure 1:
JMS in simulation (mean of a fit to $m_{\text {reco}}/m_{\text {gen}}$) for ungroomed (left) and groomed (right) jets in different generated ${{p_{\mathrm {T}}}}$ bins, as a function of generated mass. |
png pdf |
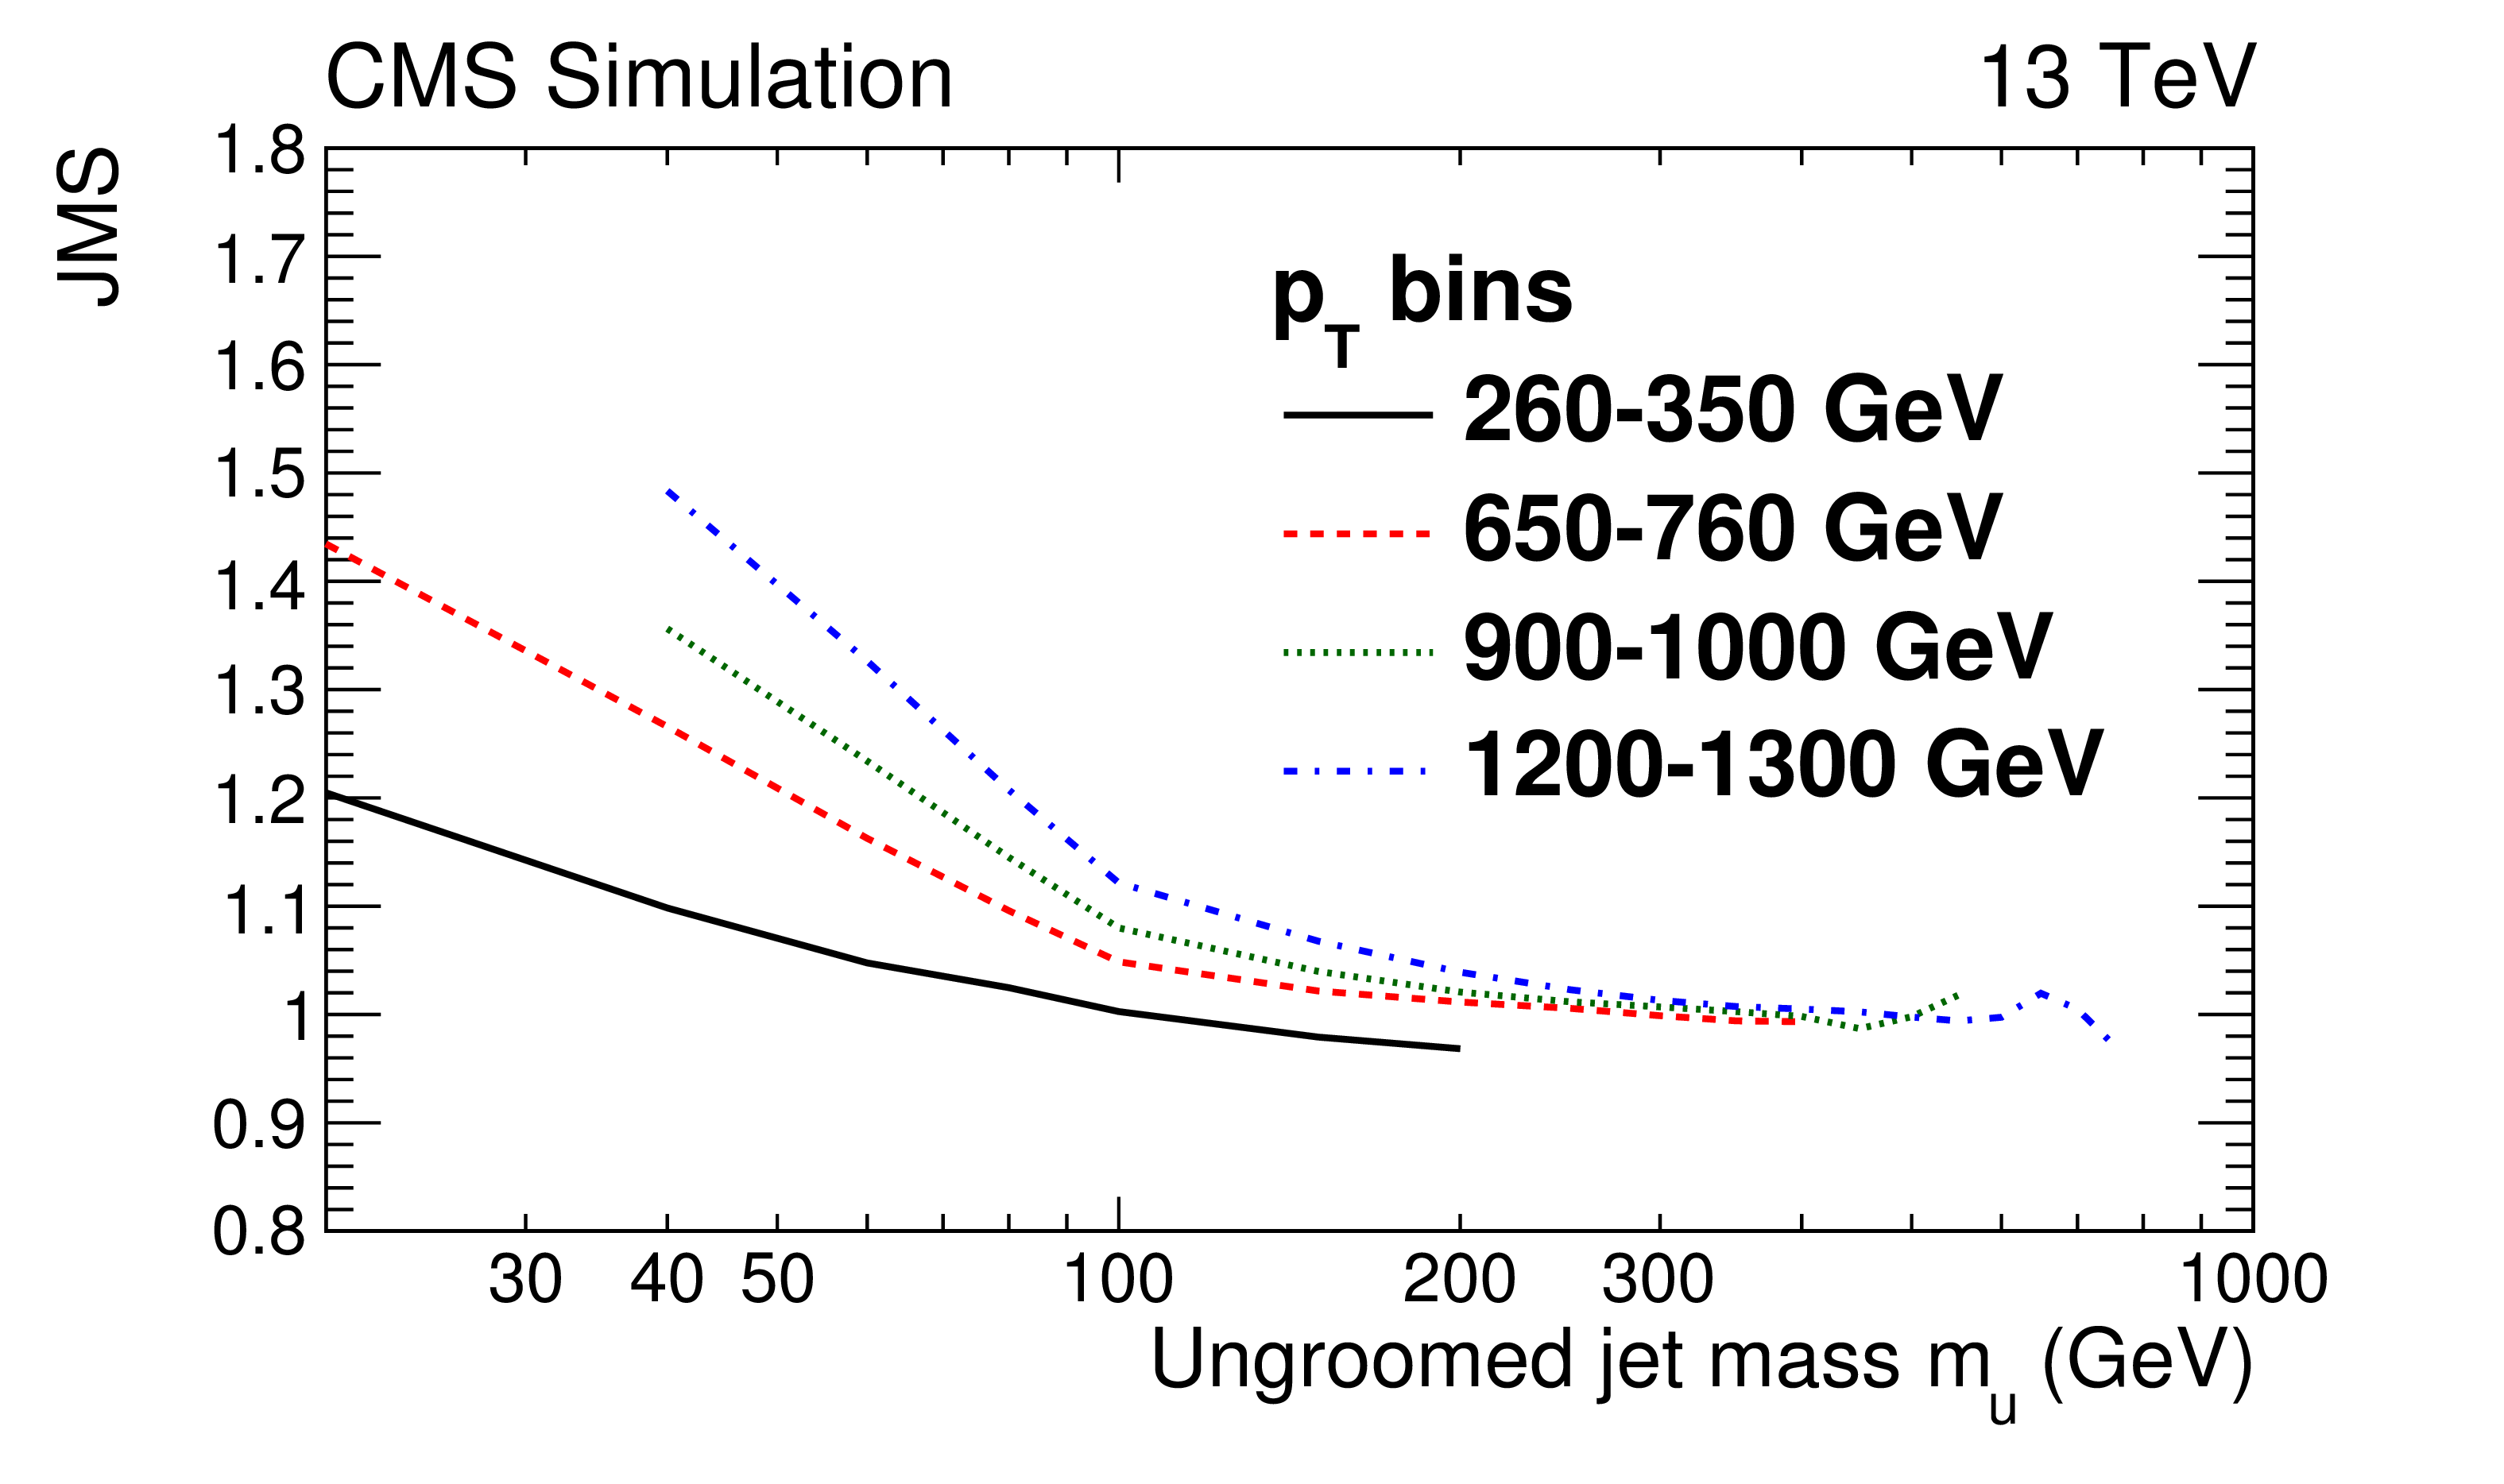
Figure 1-a:
JMS in simulation (mean of a fit to $m_{\text {reco}}/m_{\text {gen}}$) for ungroomed jets in different generated ${{p_{\mathrm {T}}}}$ bins, as a function of generated mass. |
png pdf |
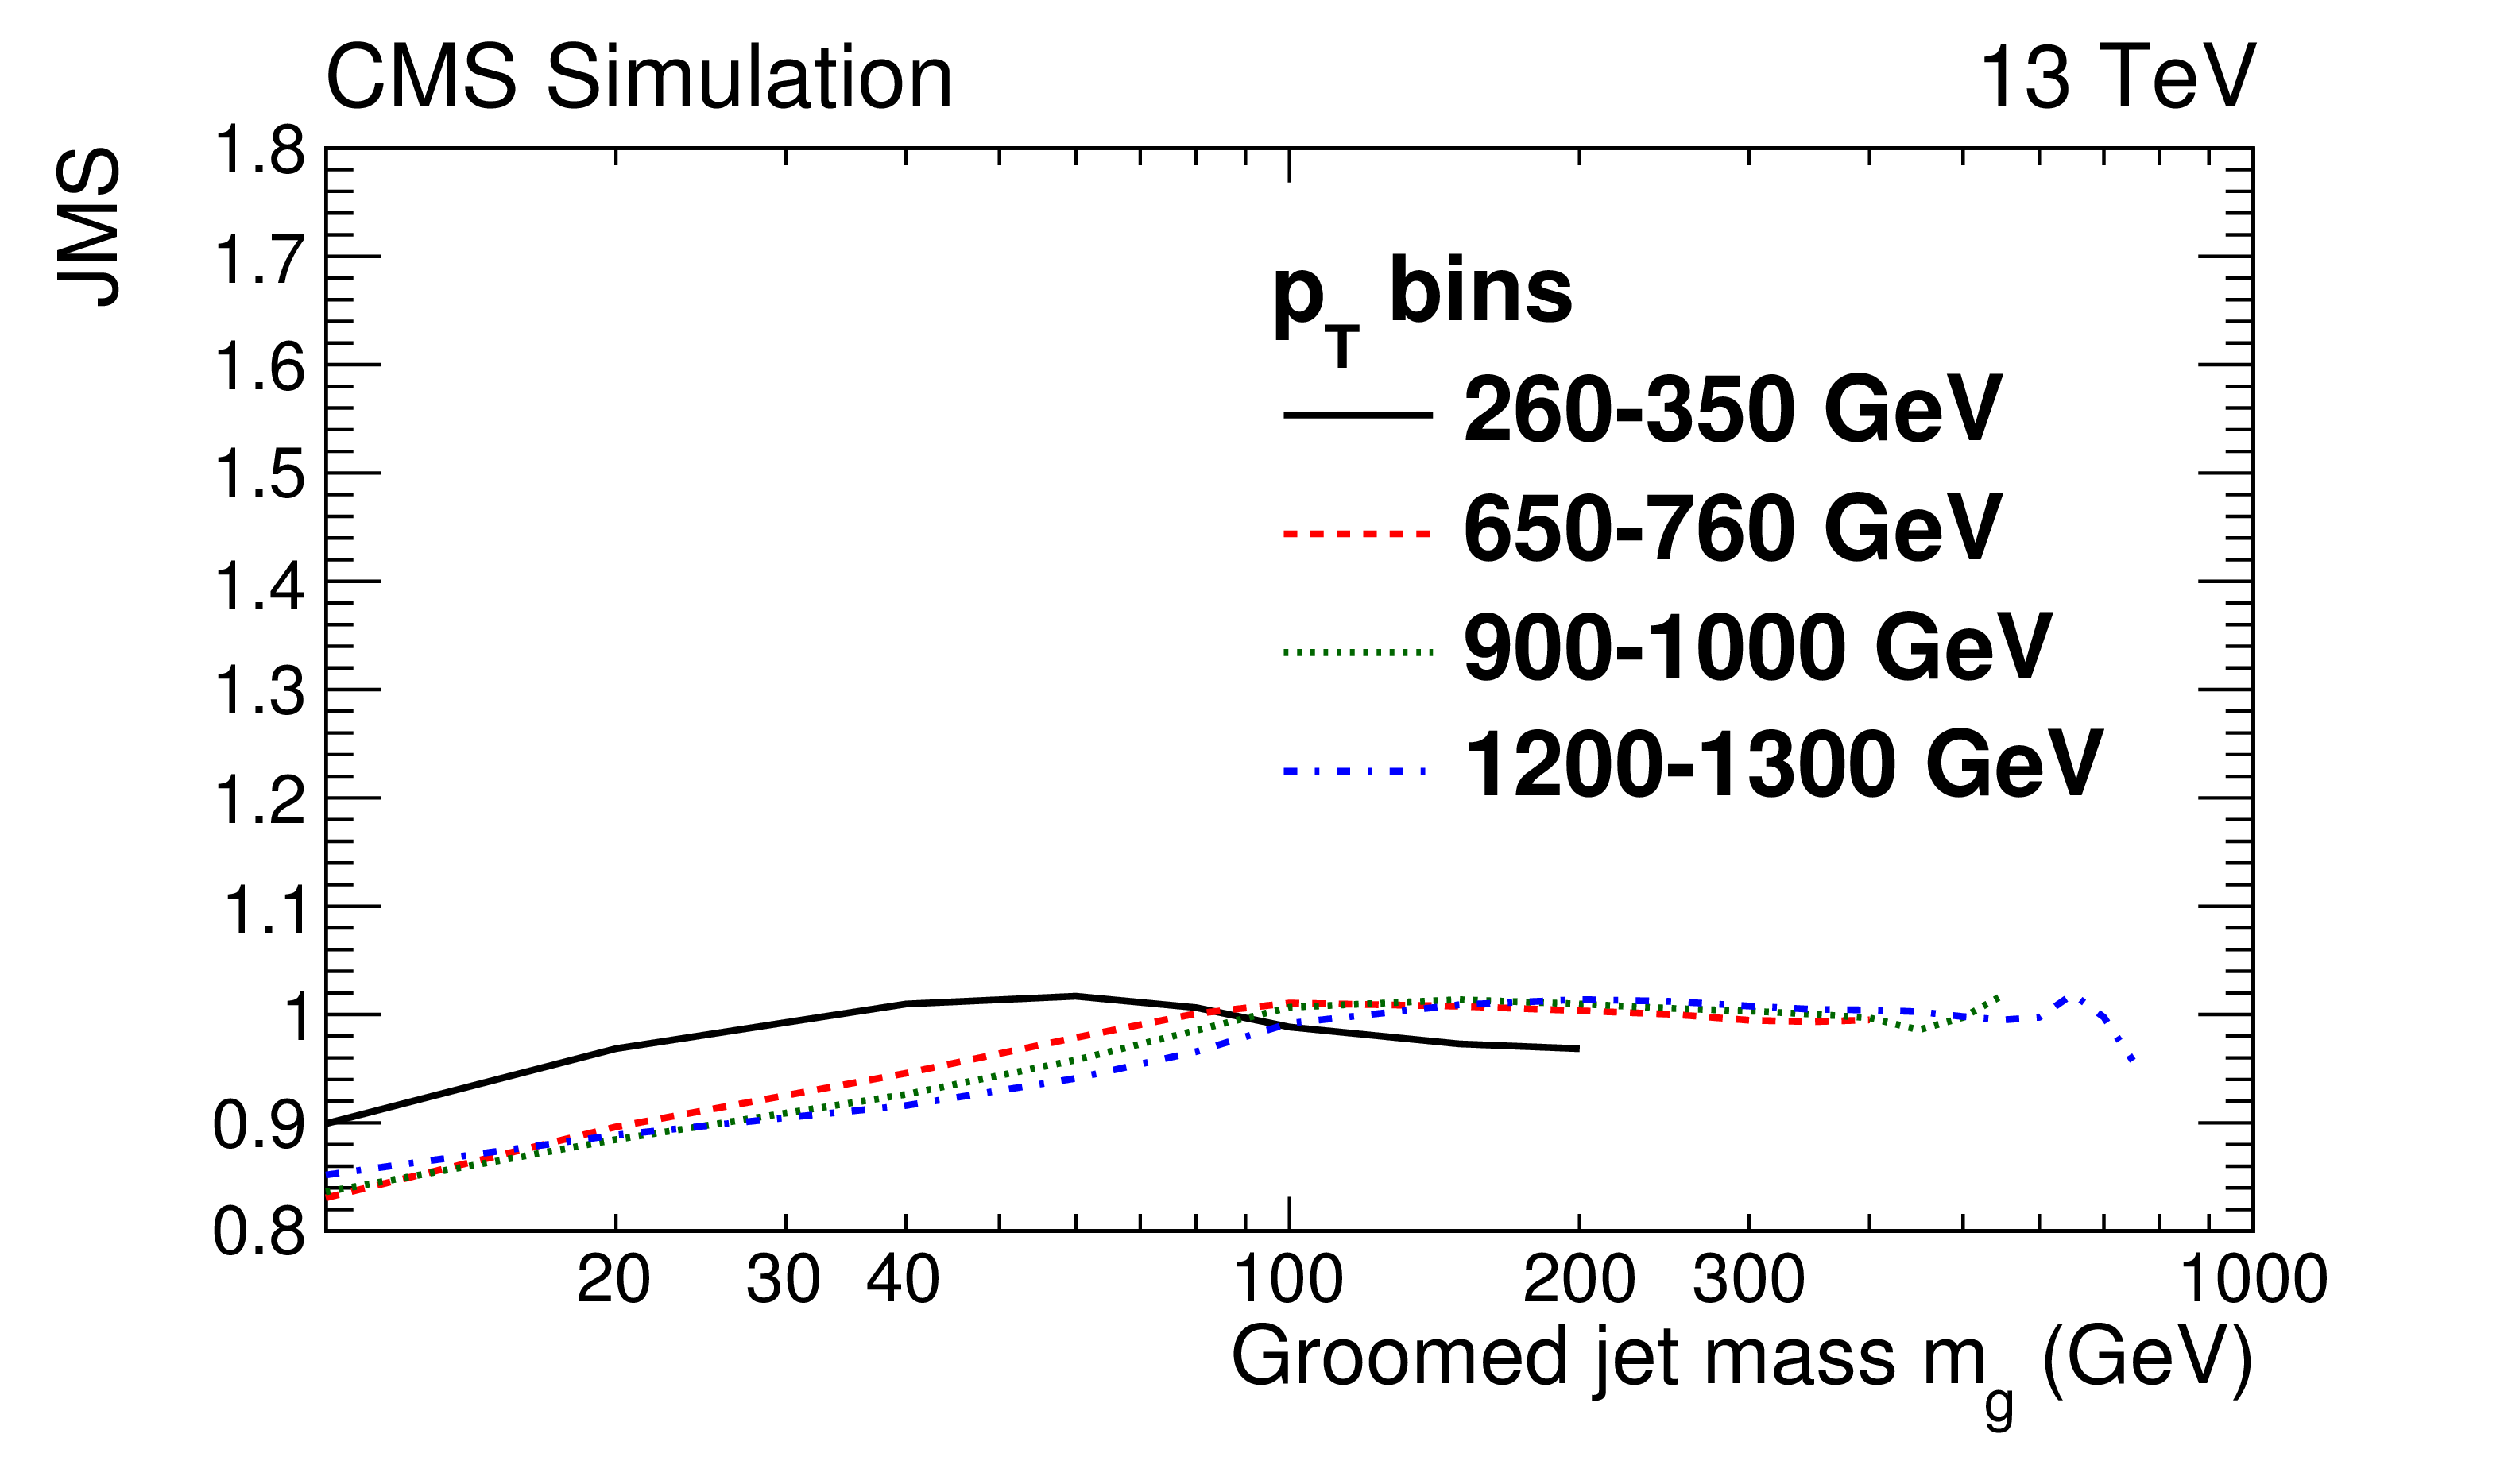
Figure 1-b:
JMS in simulation (mean of a fit to $m_{\text {reco}}/m_{\text {gen}}$) for groomed jets in different generated ${{p_{\mathrm {T}}}}$ bins, as a function of generated mass. |
png pdf |
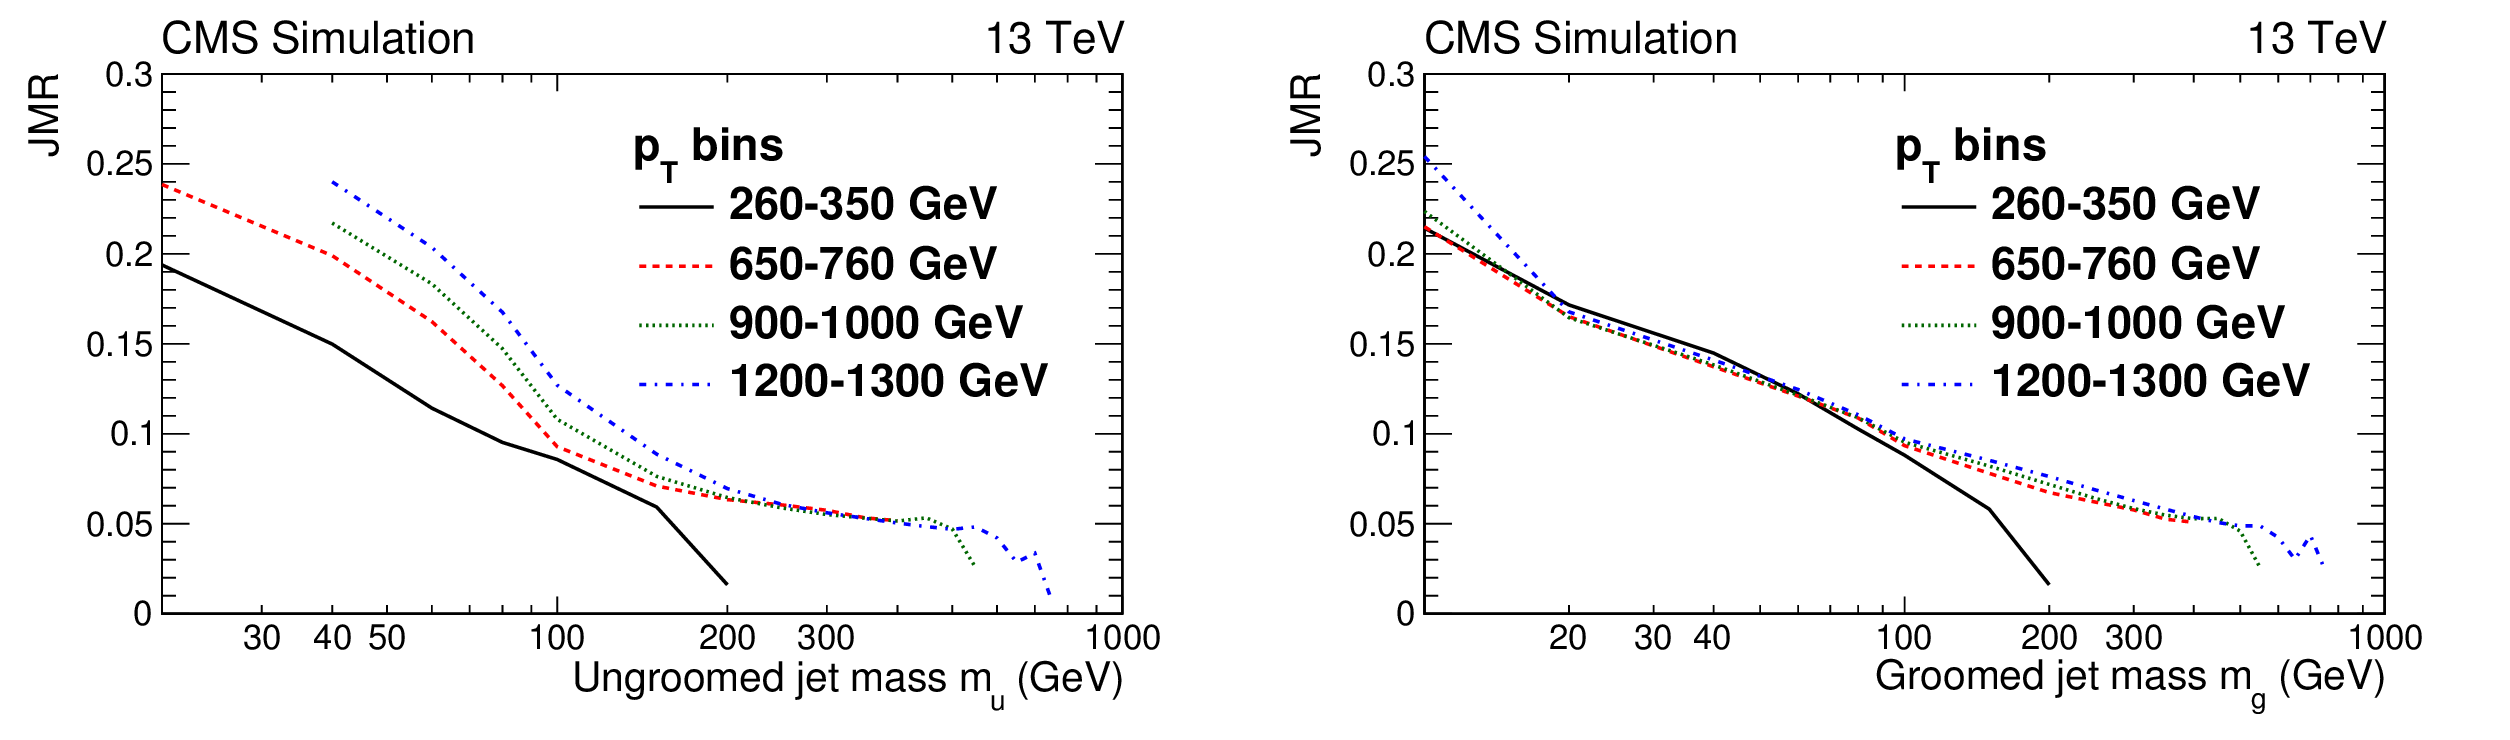
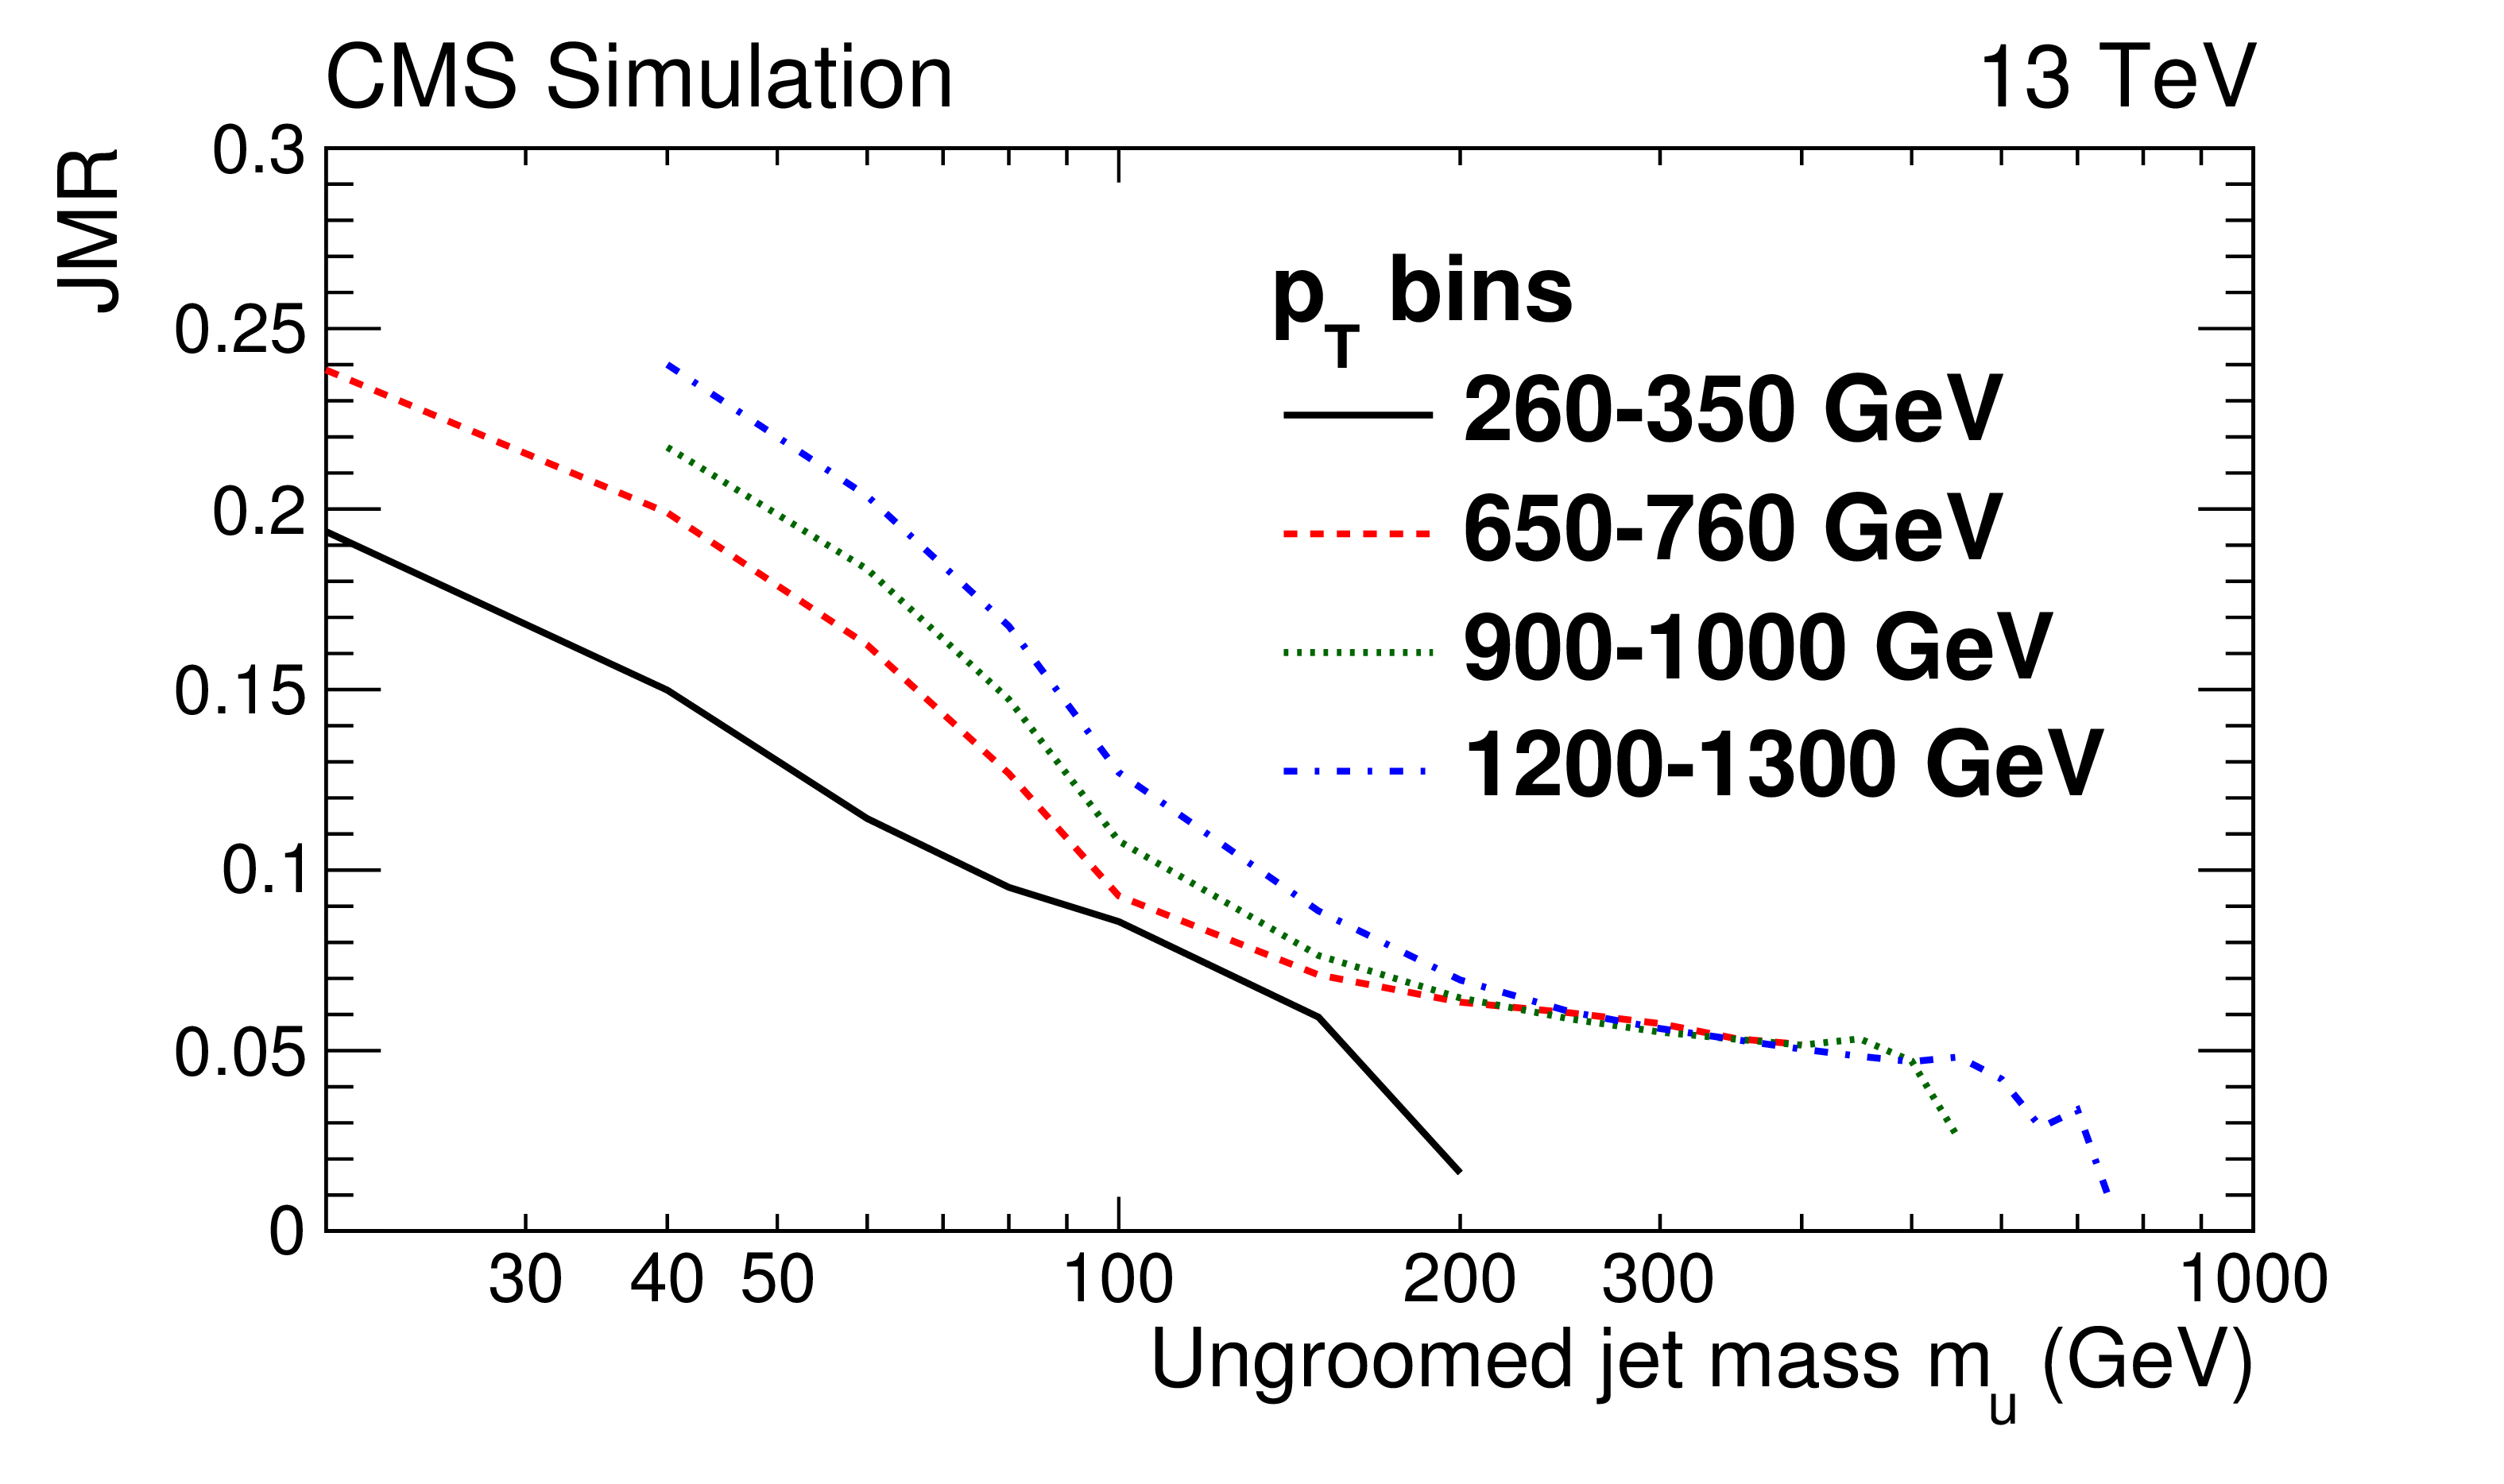
Figure 2:
JMR in simulation (width of a fit to $m_{\text {reco}}/m_{\text {gen}}$) for ungroomed (left) and groomed (right) jets in different generated $ {p_{\mathrm {T}}} $ bins, as a function of generated mass. |
png pdf |
Figure 2-a:
JMR in simulation (width of a fit to $m_{\text {reco}}/m_{\text {gen}}$) for ungroomed jets in different generated $ {p_{\mathrm {T}}} $ bins, as a function of generated mass. |

png pdf |
Figure 2-b:
JMR in simulation (width of a fit to $m_{\text {reco}}/m_{\text {gen}}$) for groomed jets in different generated $ {p_{\mathrm {T}}} $ bins, as a function of generated mass. |
png pdf |
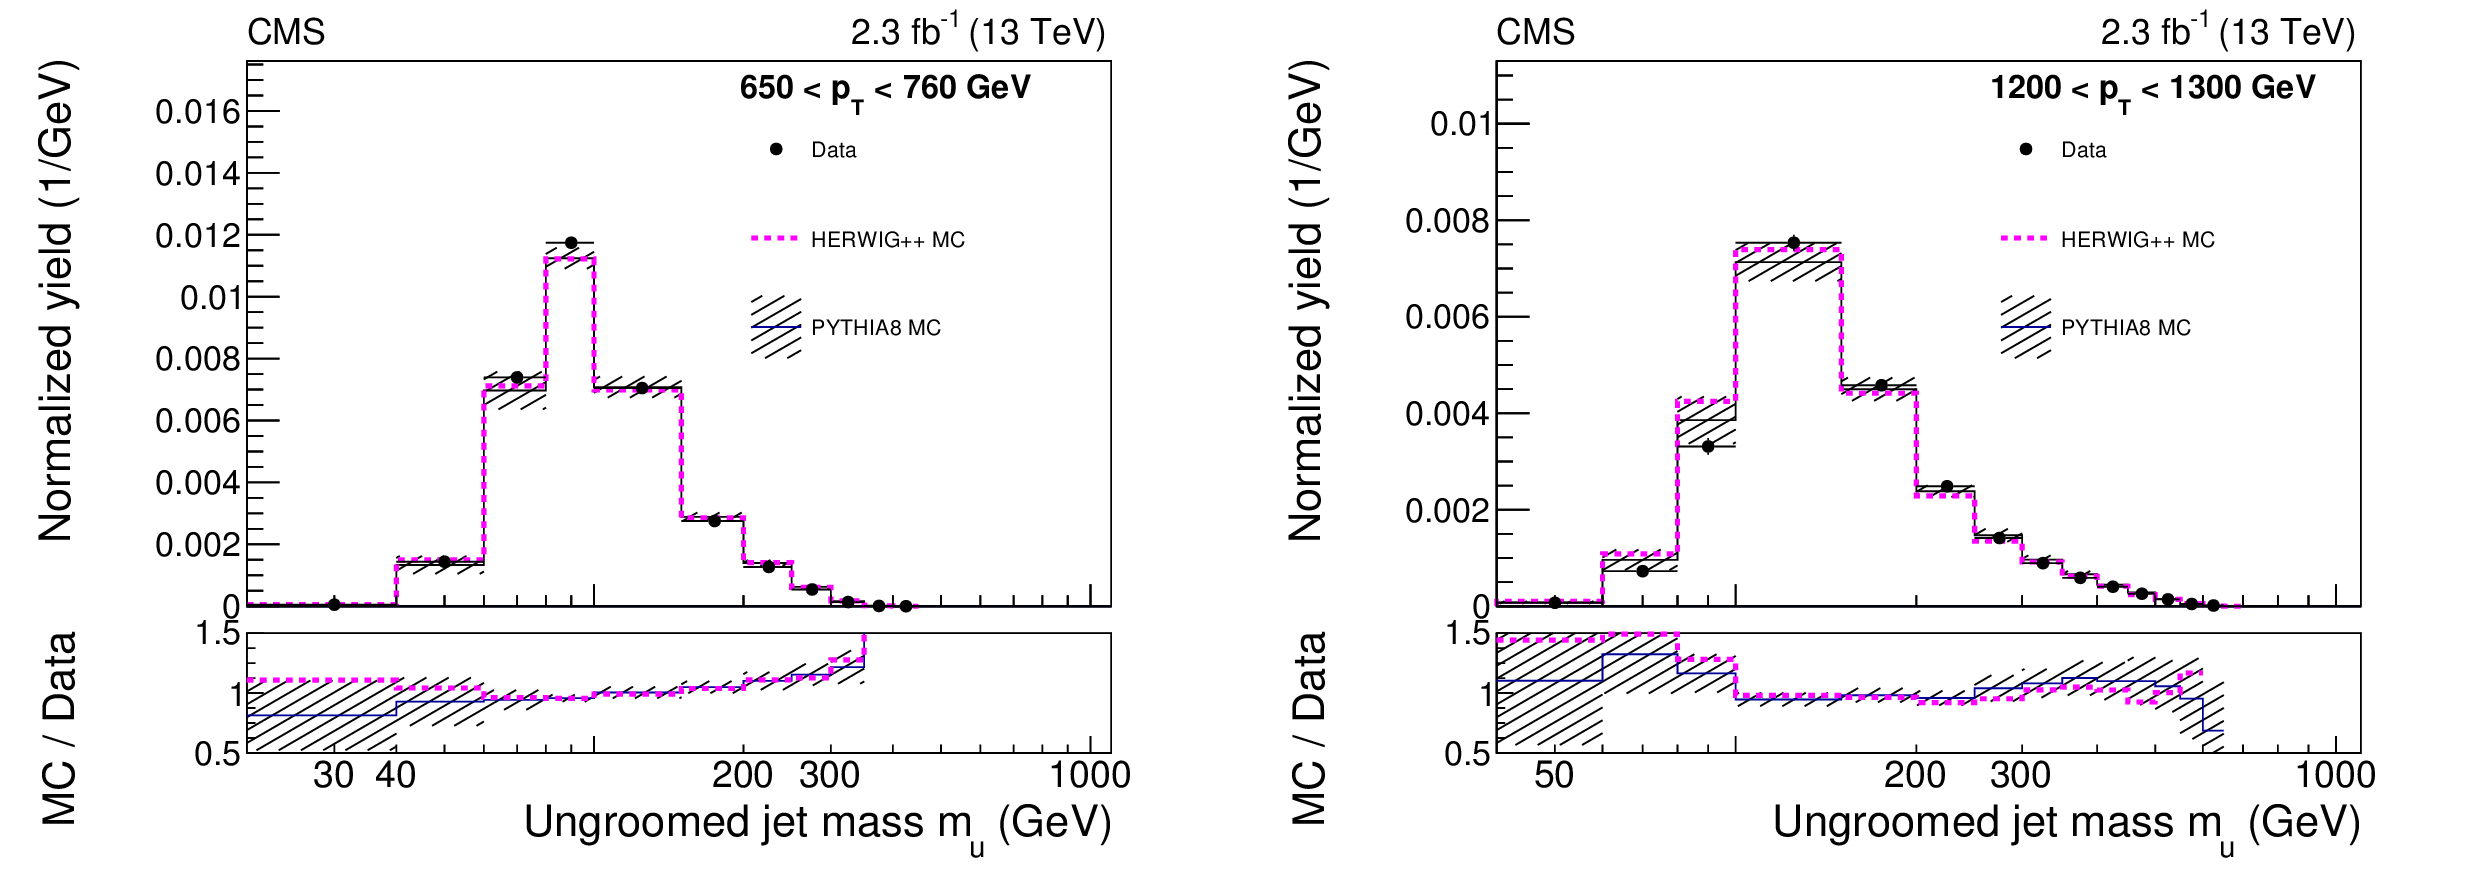
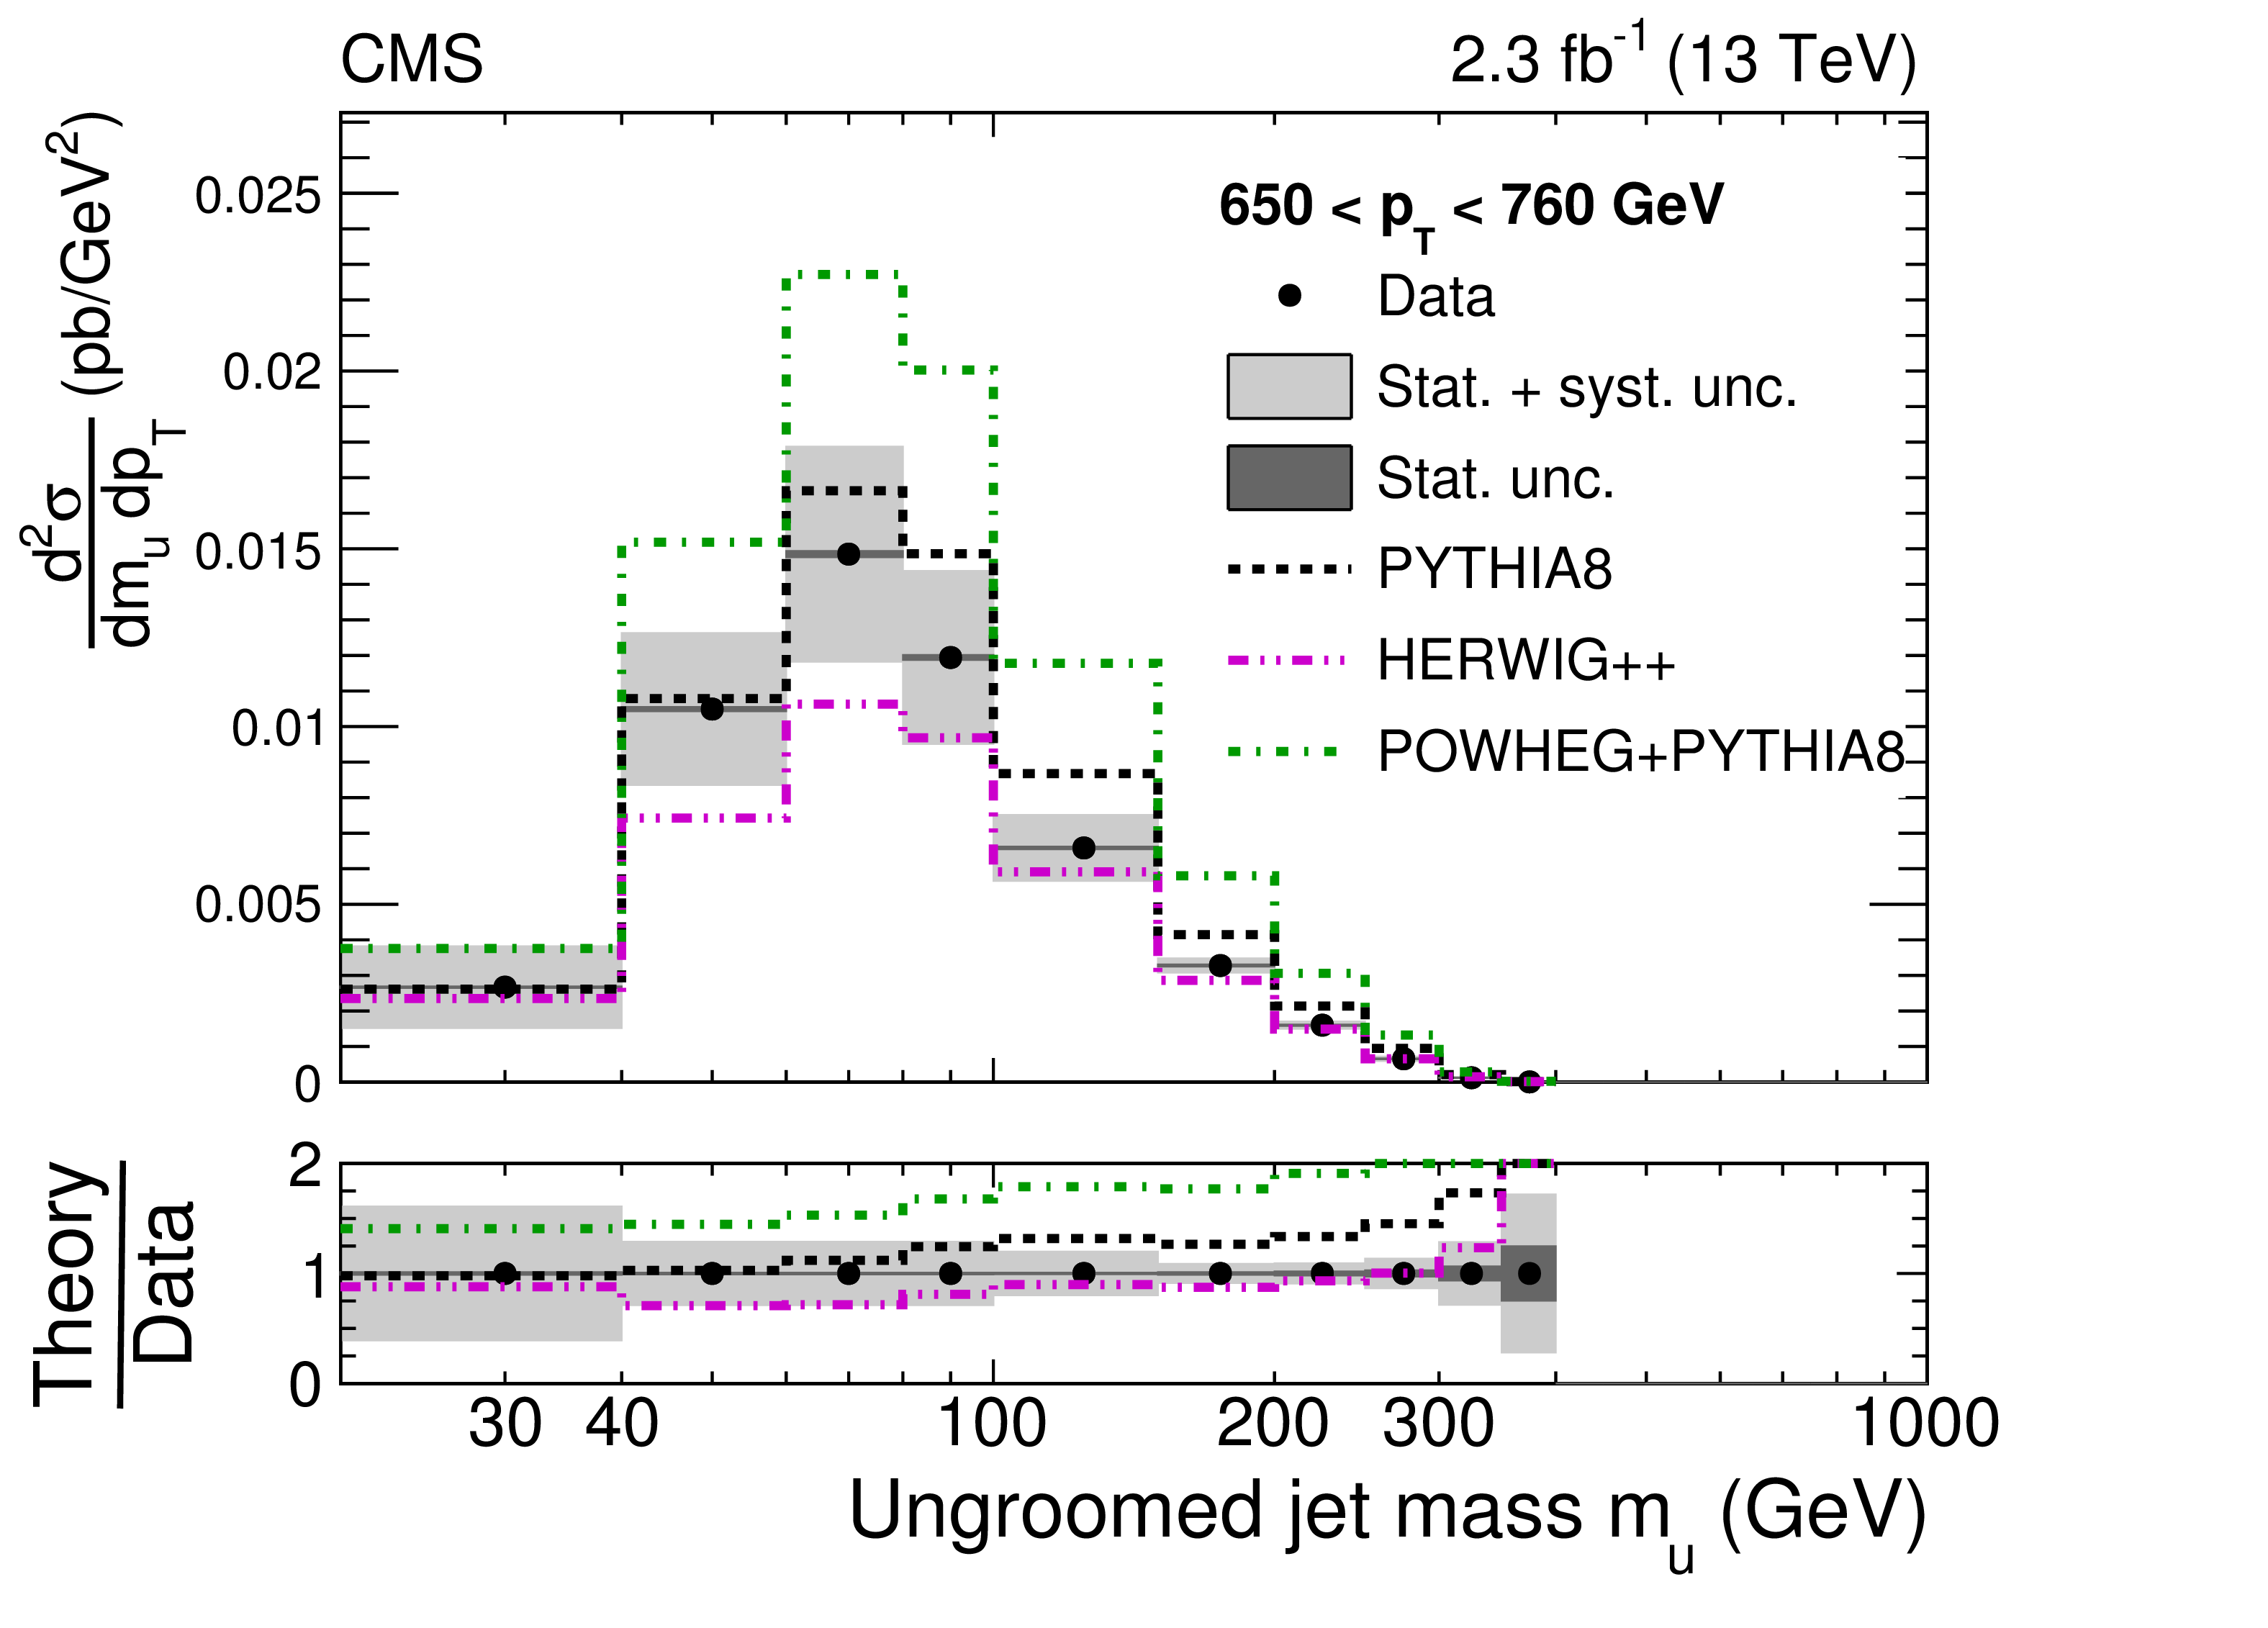
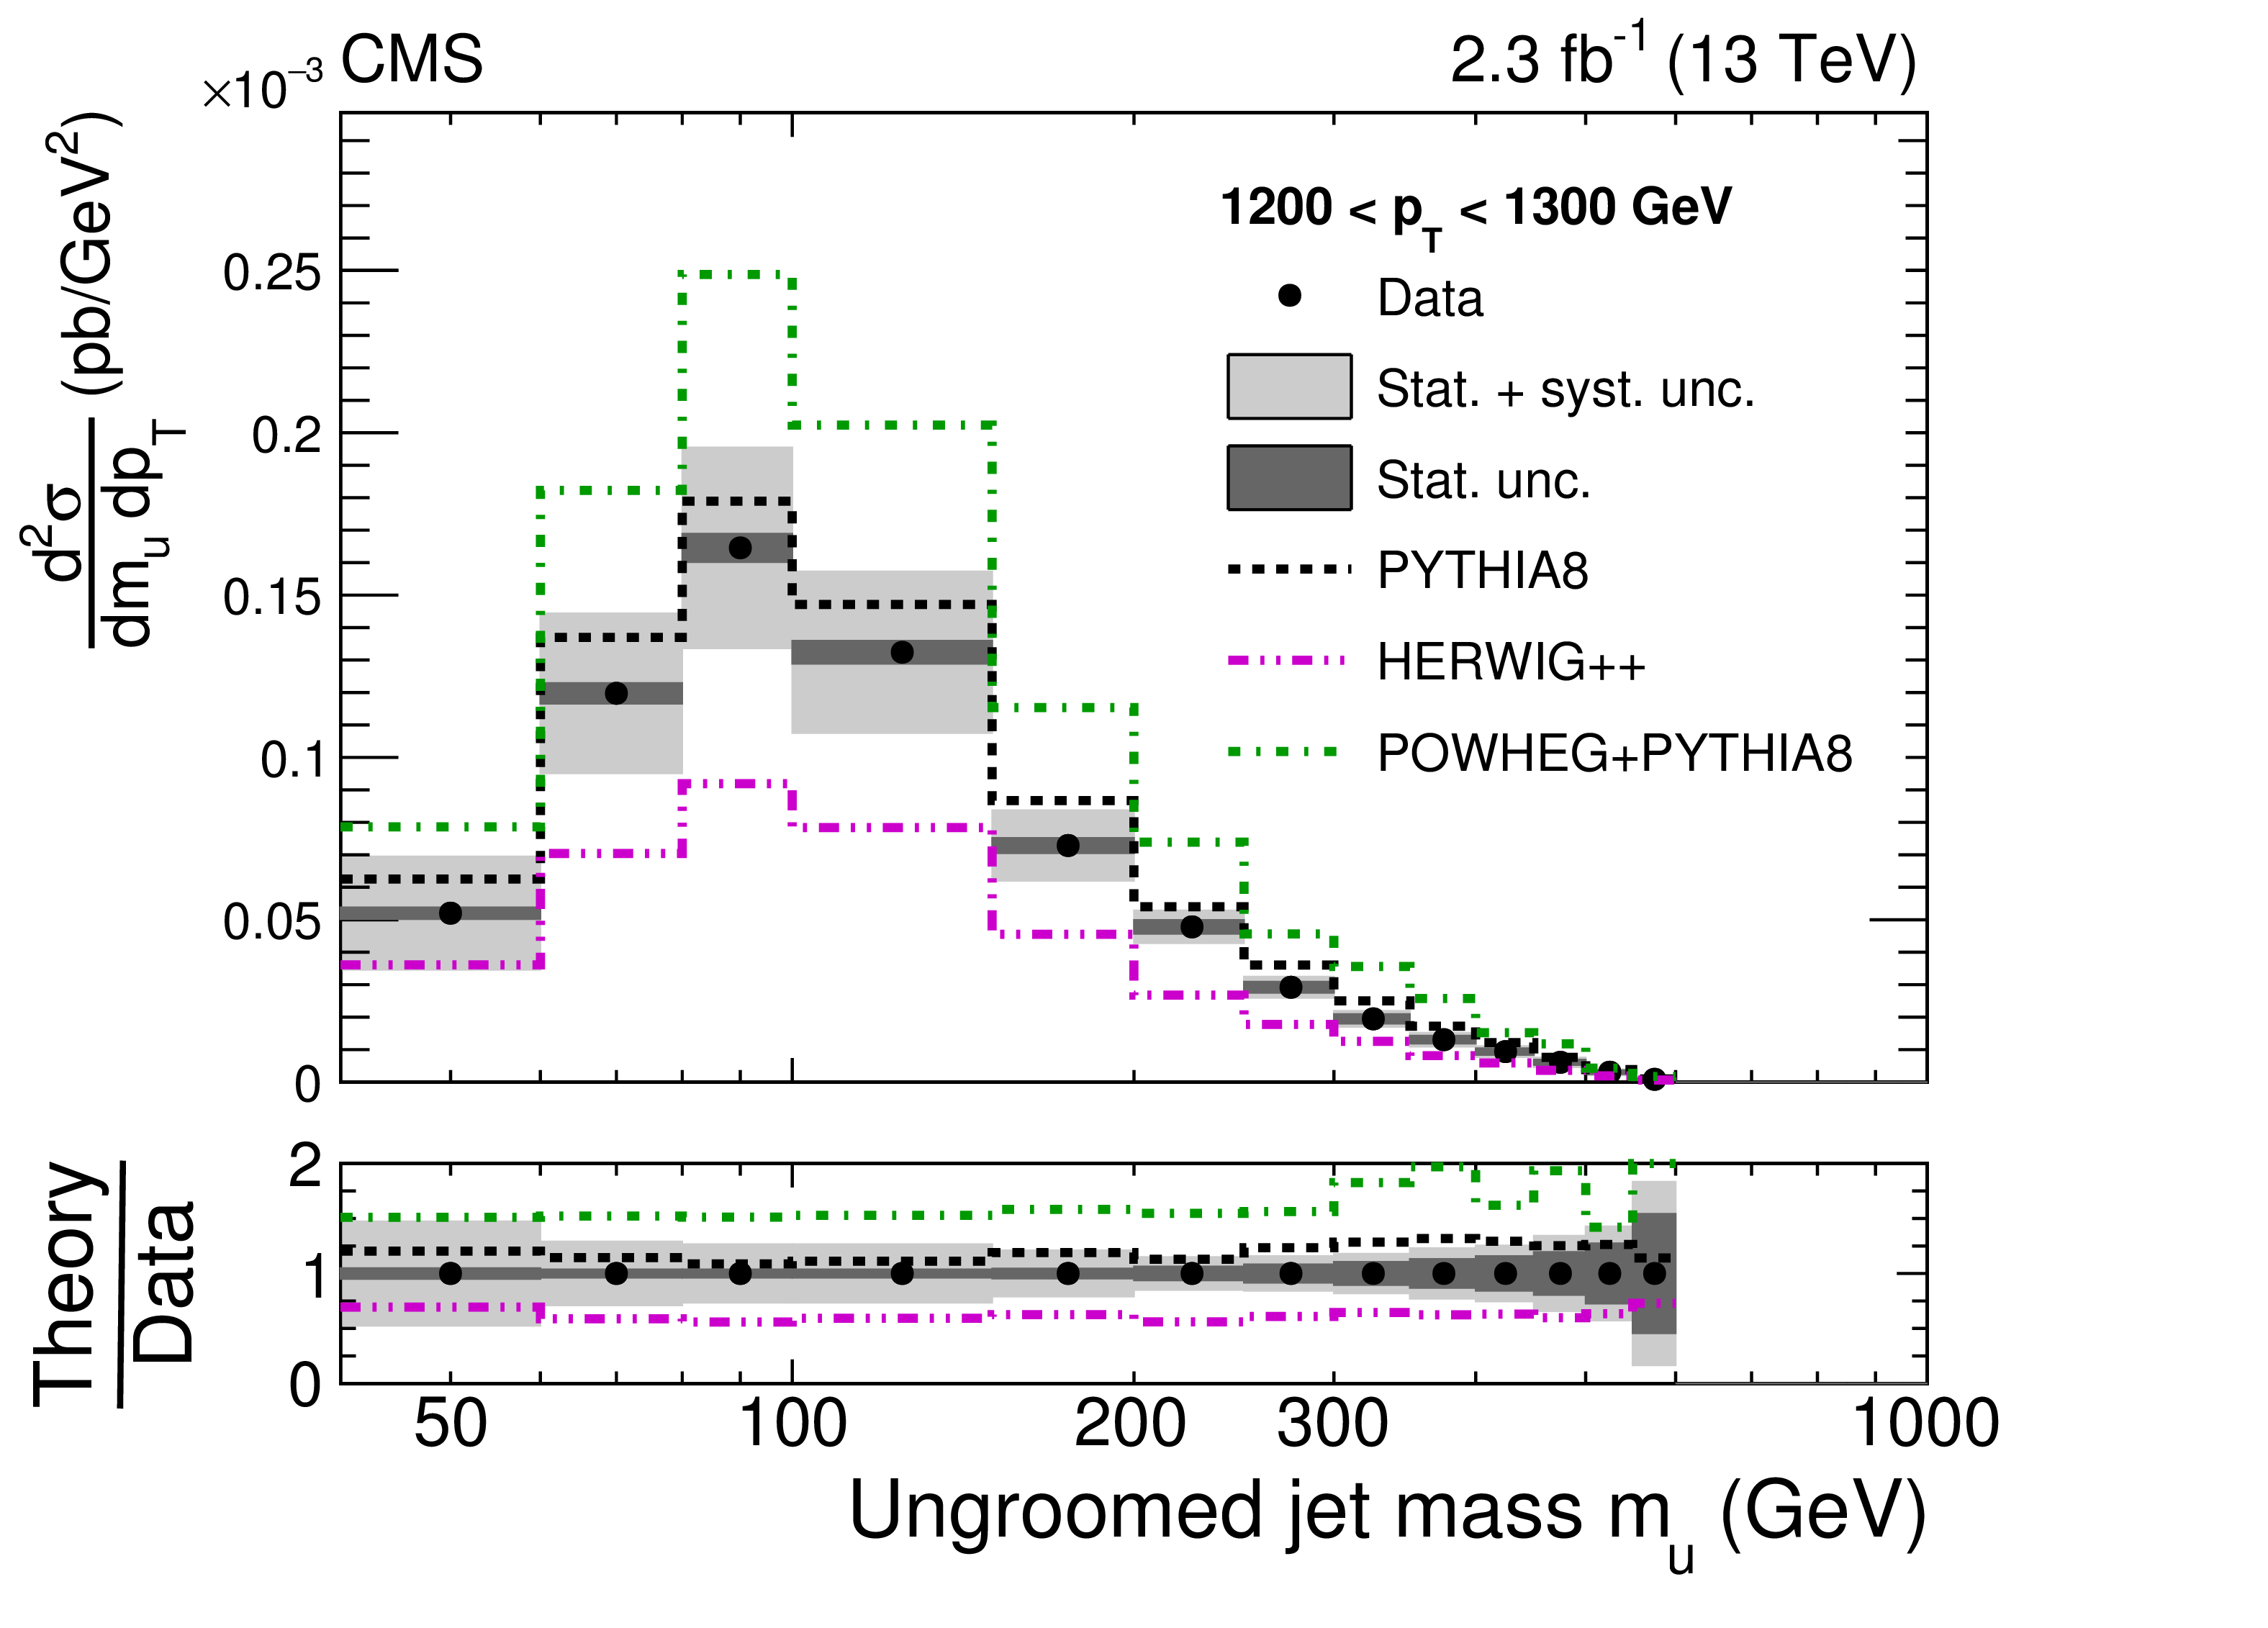
Figure 3:
Comparison of data to MC simulation for ungroomed jets for two $ {p_{\mathrm {T}}} $ bins at the detector level. The data and their statistical uncertainties are shown by the black points with the error bars. The PYTHIA8 results before the unfolding are shown in the shaded histograms, including experimental and theoretical systematic uncertainties. The HERWIG++ results before unfolding are shown without uncertainties as a dashed magenta histogram. |
png pdf |
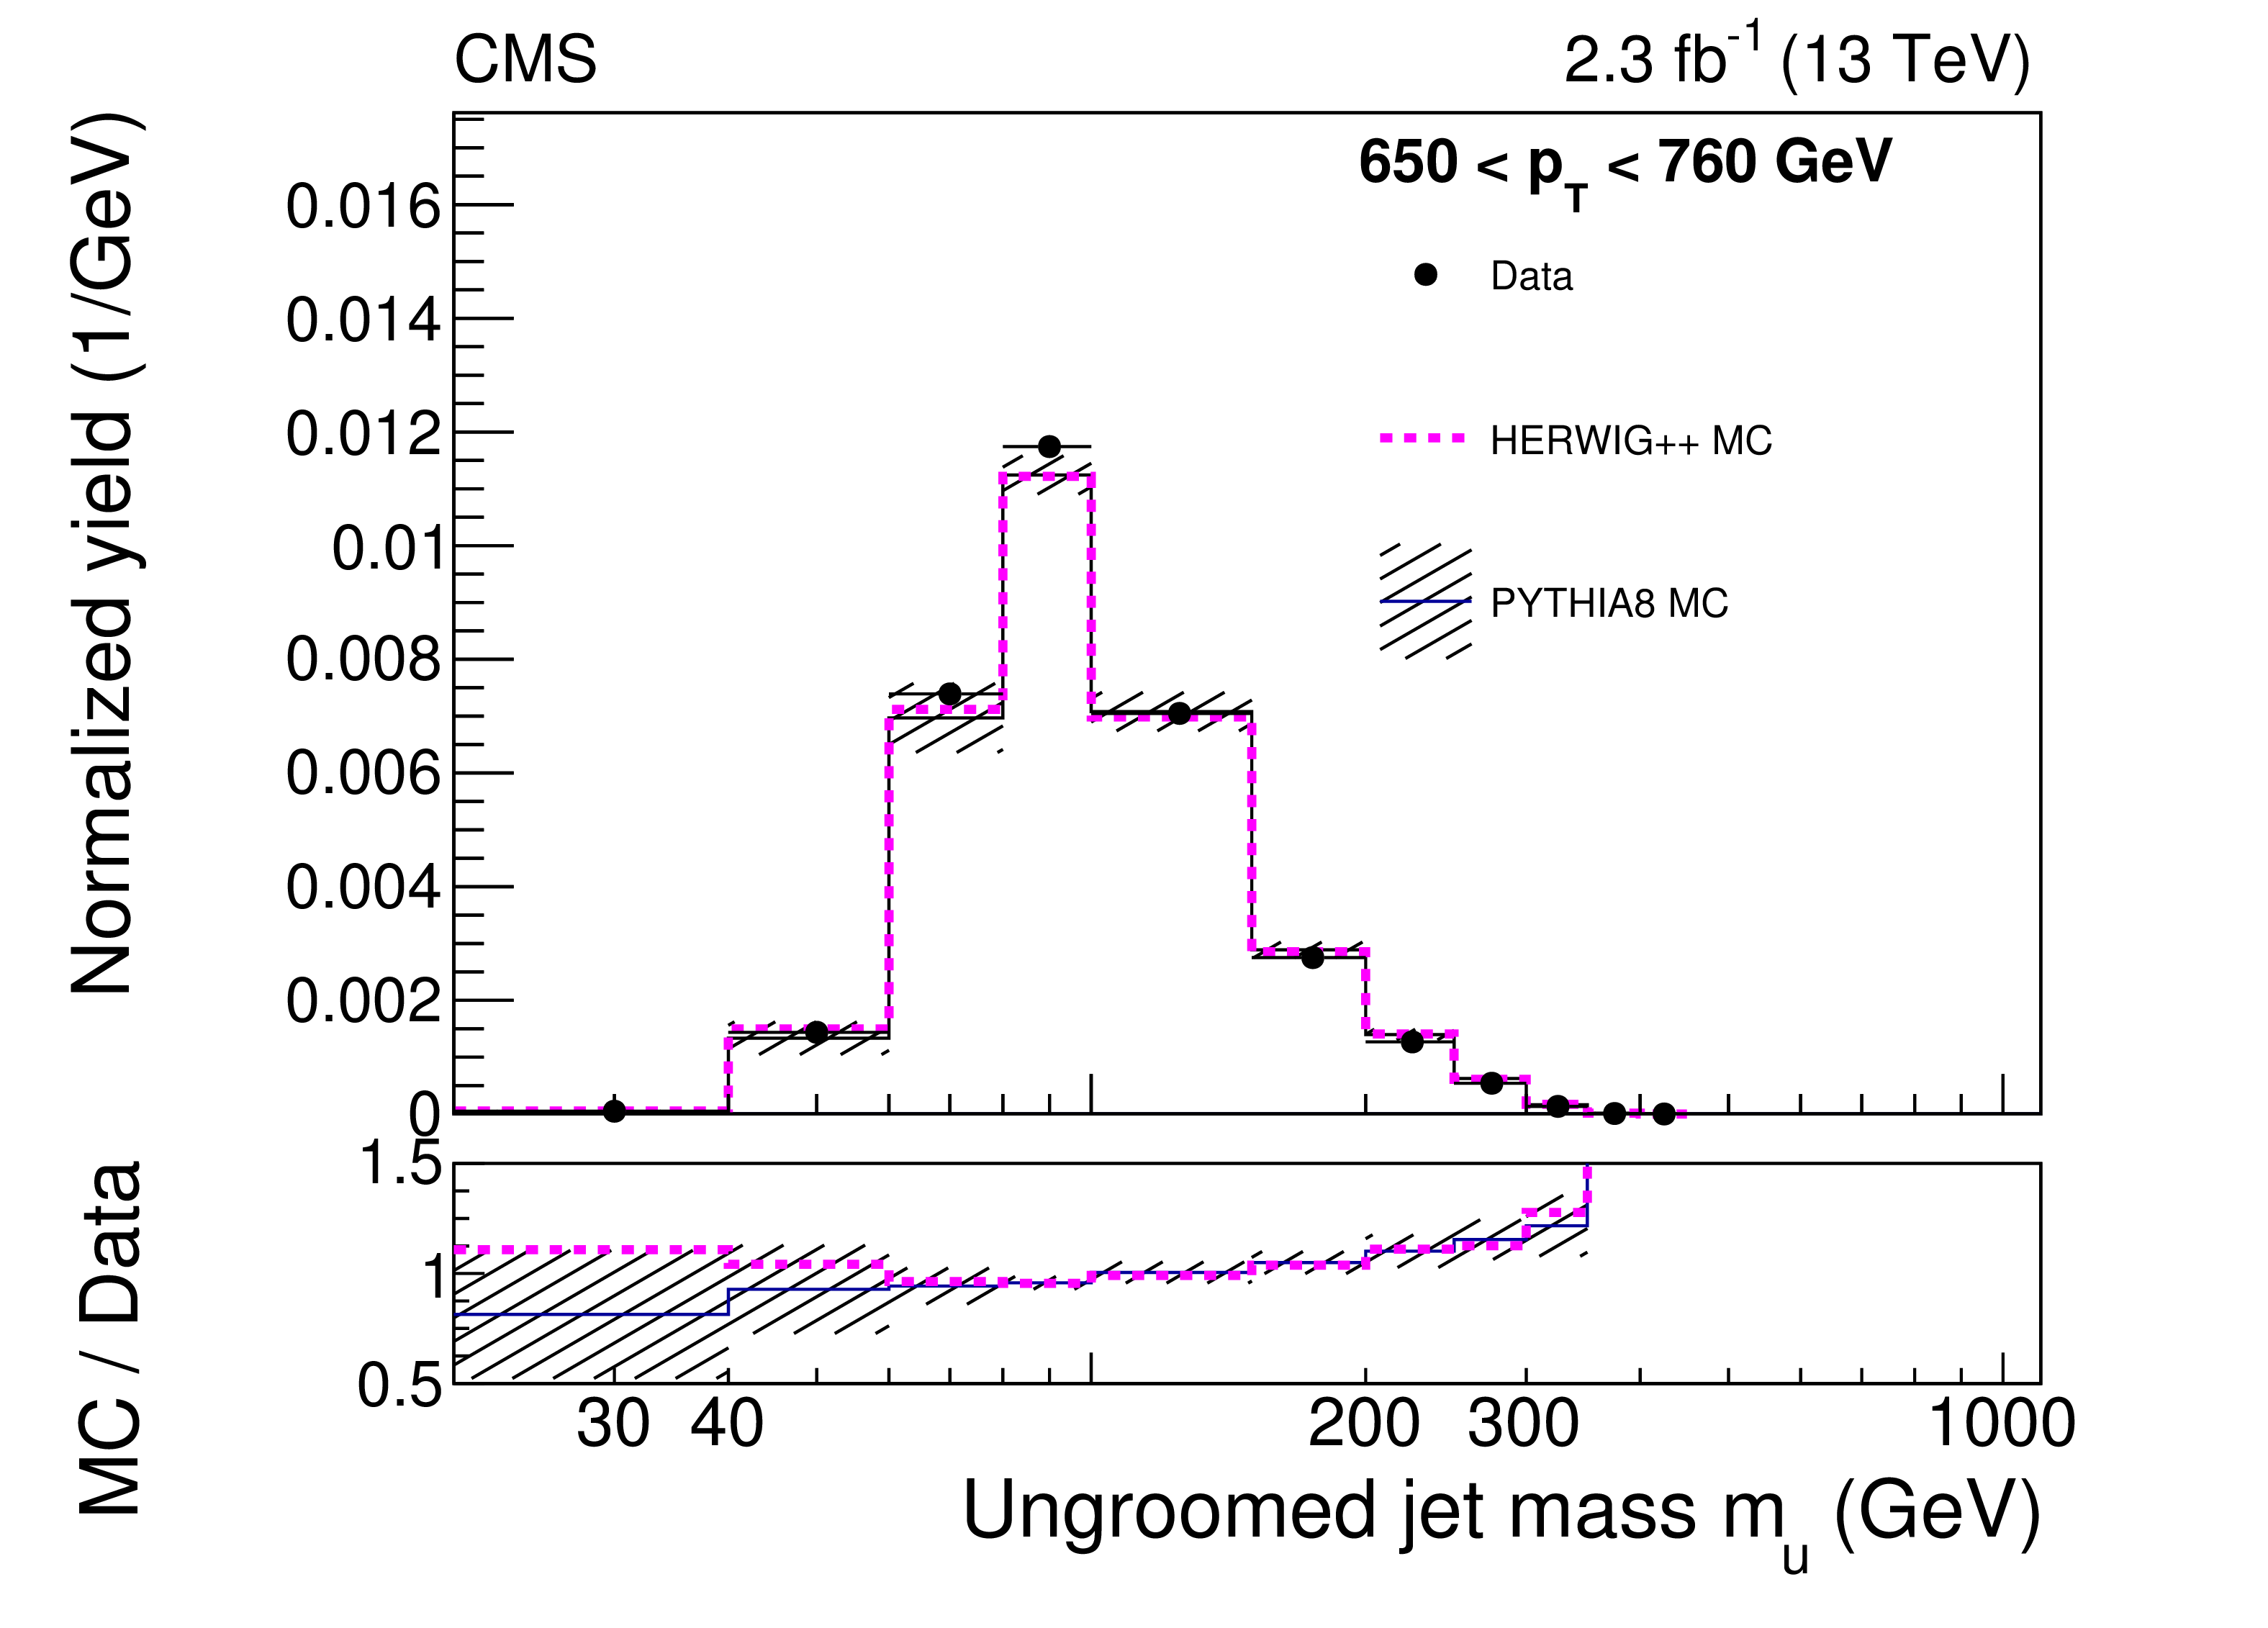
Figure 3-a:
Comparison of data to MC simulation for ungroomed jets for 650 $ < {p_{\mathrm {T}}} < $ 760 GeV, at the detector level. The data and their statistical uncertainties are shown by the black points with the error bars. The PYTHIA8 results before the unfolding are shown in the shaded histograms, including experimental and theoretical systematic uncertainties. The HERWIG++ results before unfolding are shown without uncertainties as a dashed magenta histogram. |
png pdf |
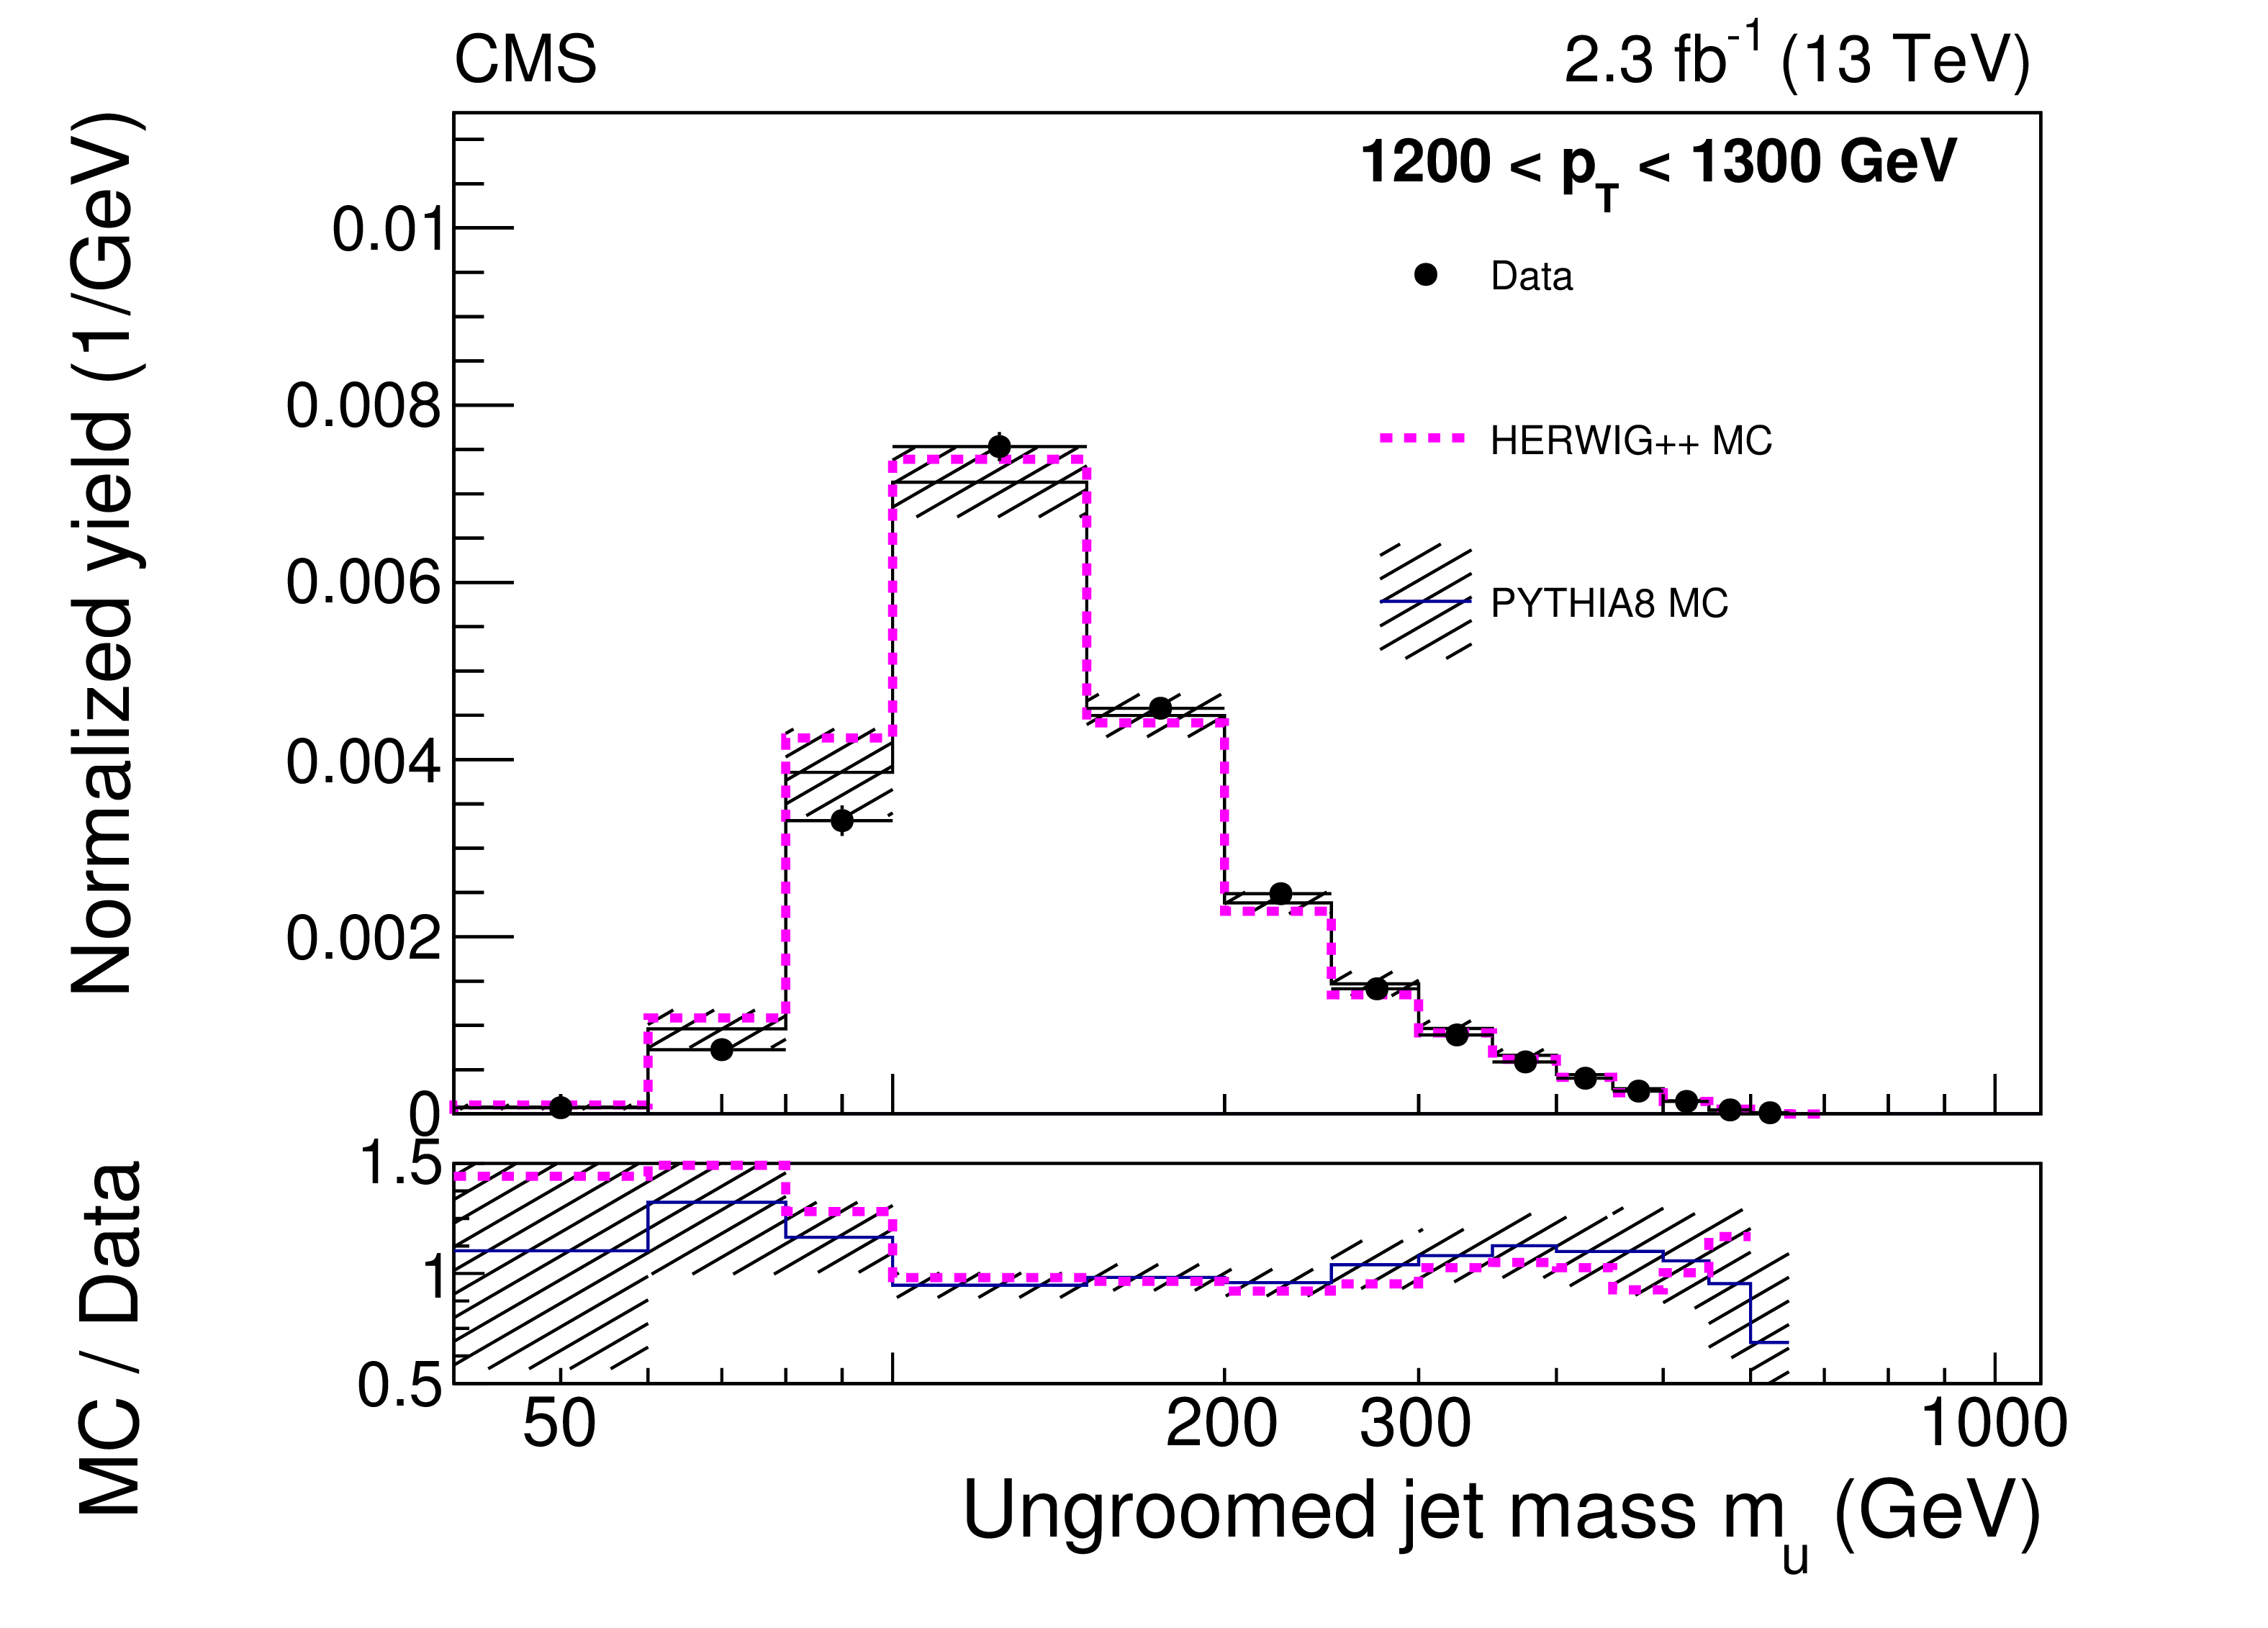
Figure 3-b:
Comparison of data to MC simulation for ungroomed jets for 1200 $ < {p_{\mathrm {T}}} < $ 1300 GeV, at the detector level. The data and their statistical uncertainties are shown by the black points with the error bars. The PYTHIA8 results before the unfolding are shown in the shaded histograms, including experimental and theoretical systematic uncertainties. The HERWIG++ results before unfolding are shown without uncertainties as a dashed magenta histogram. |

png pdf |
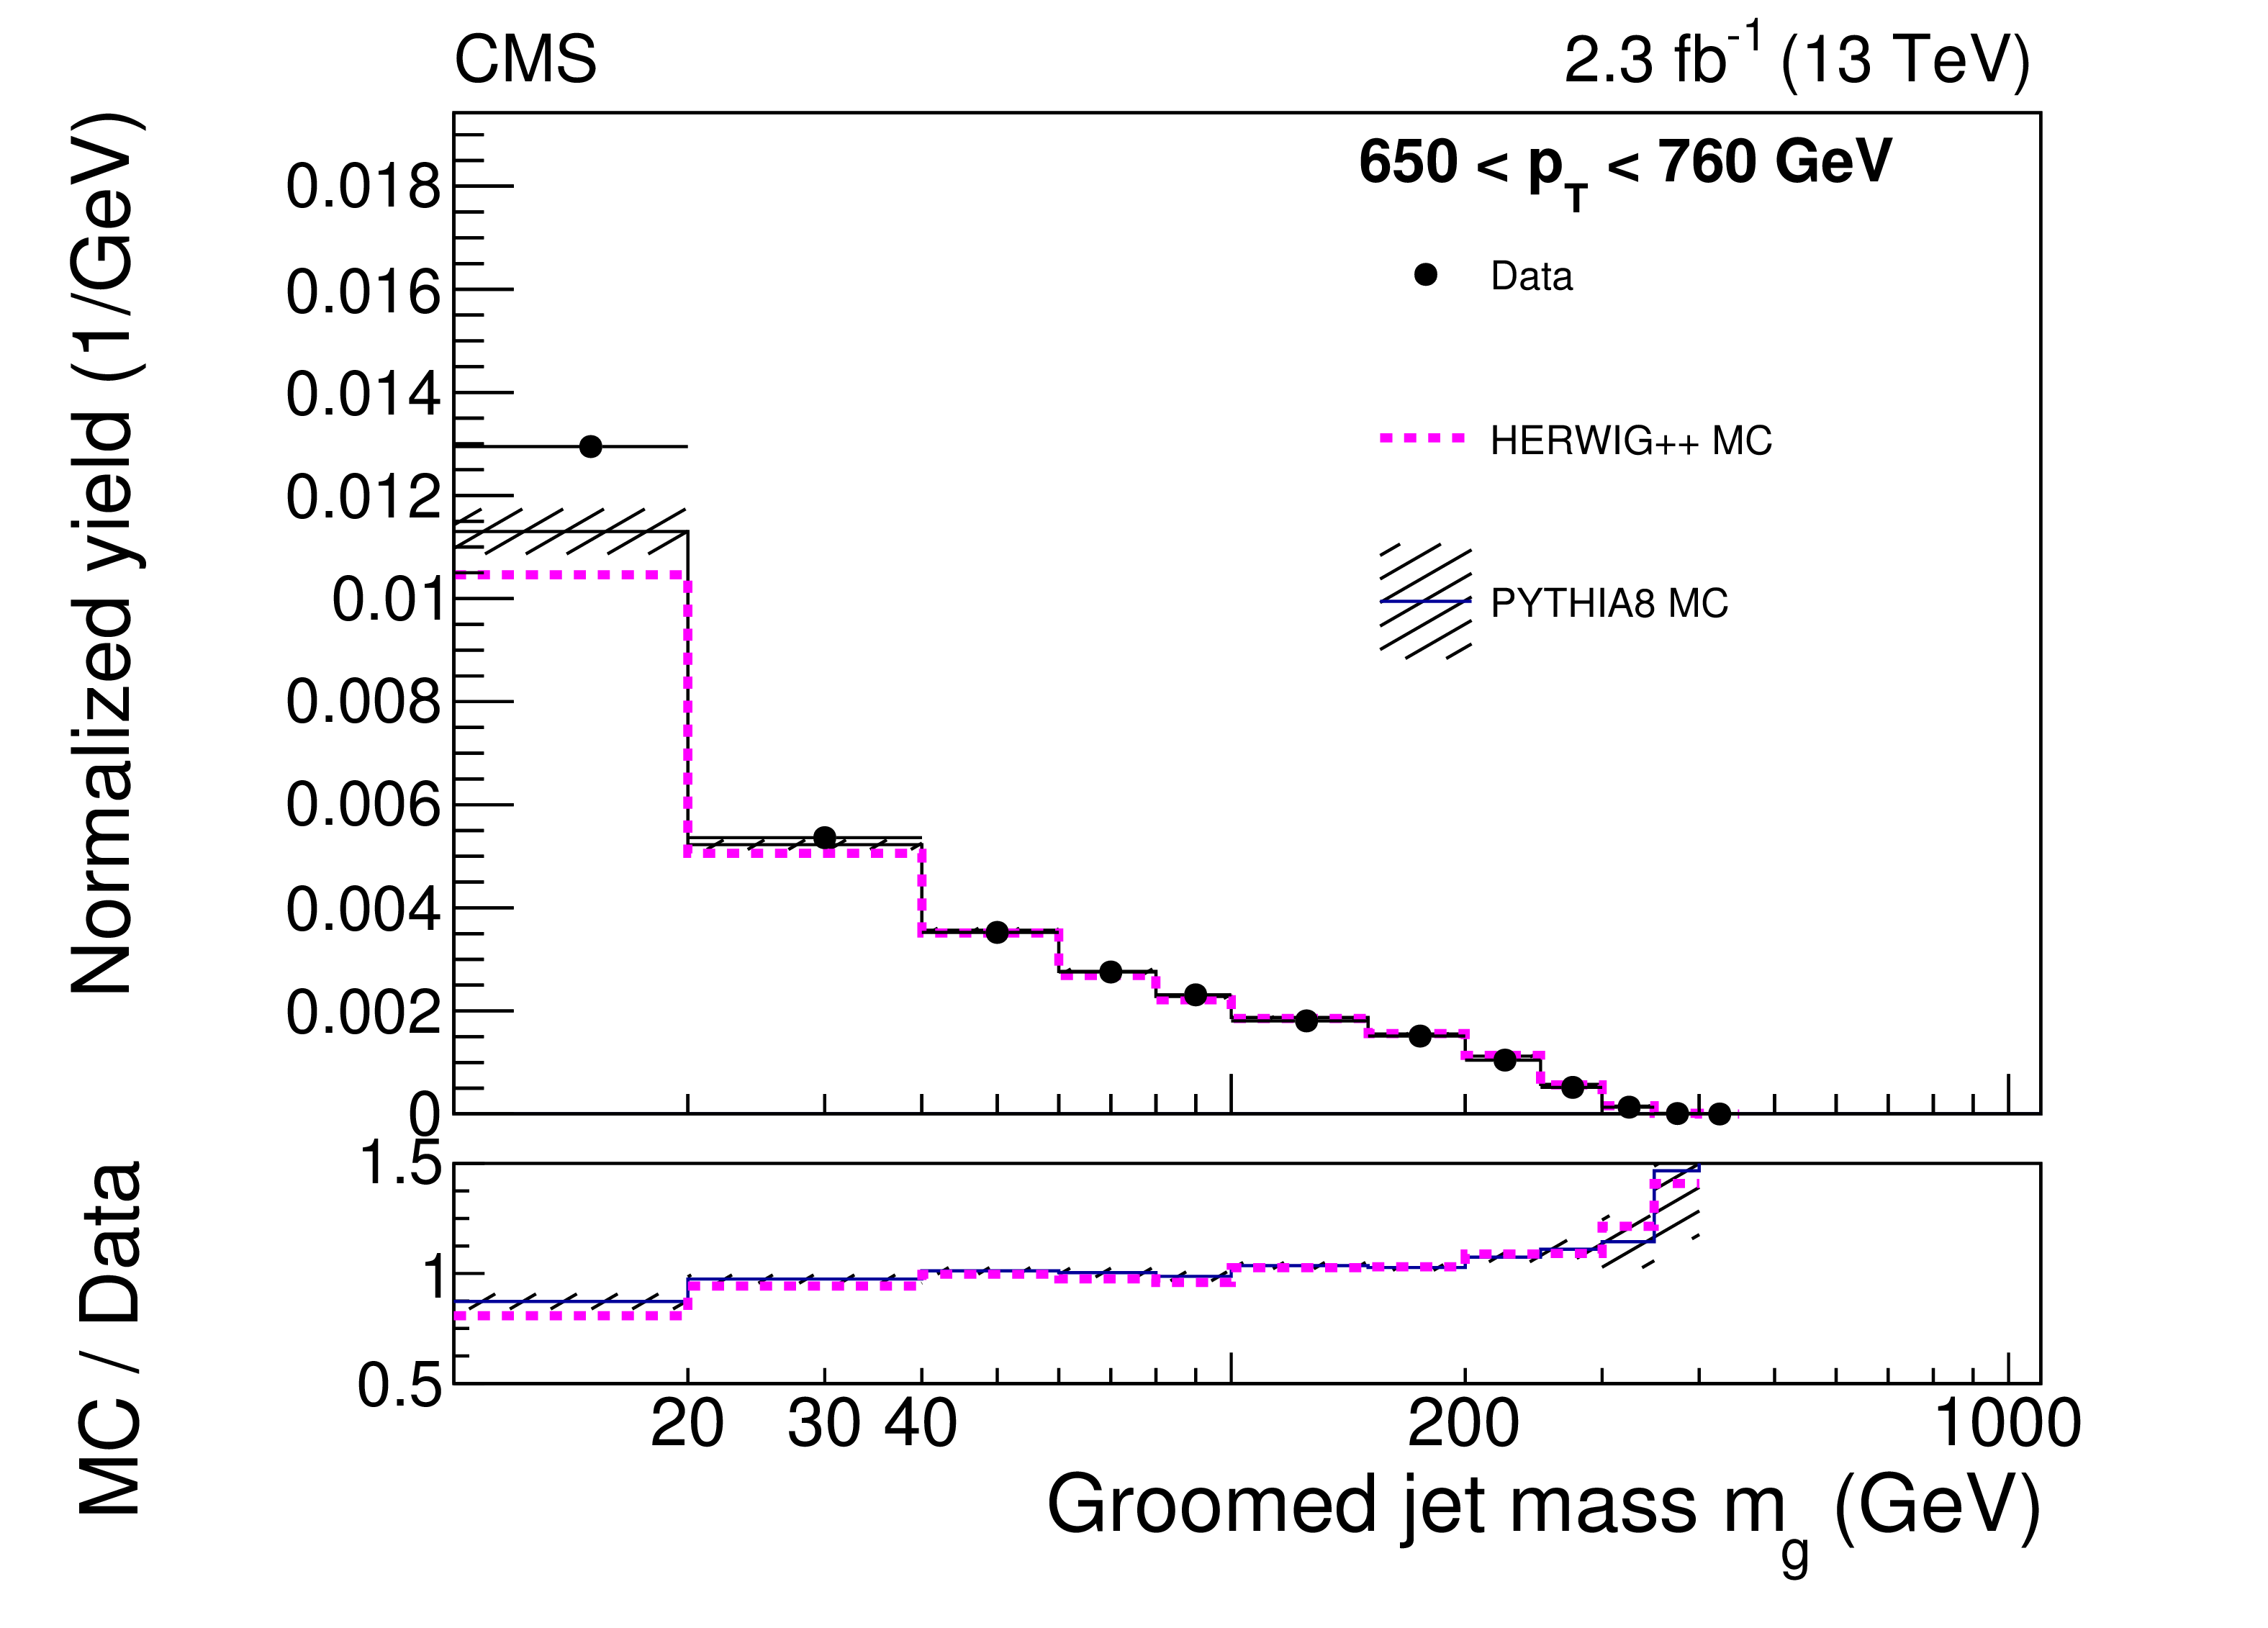
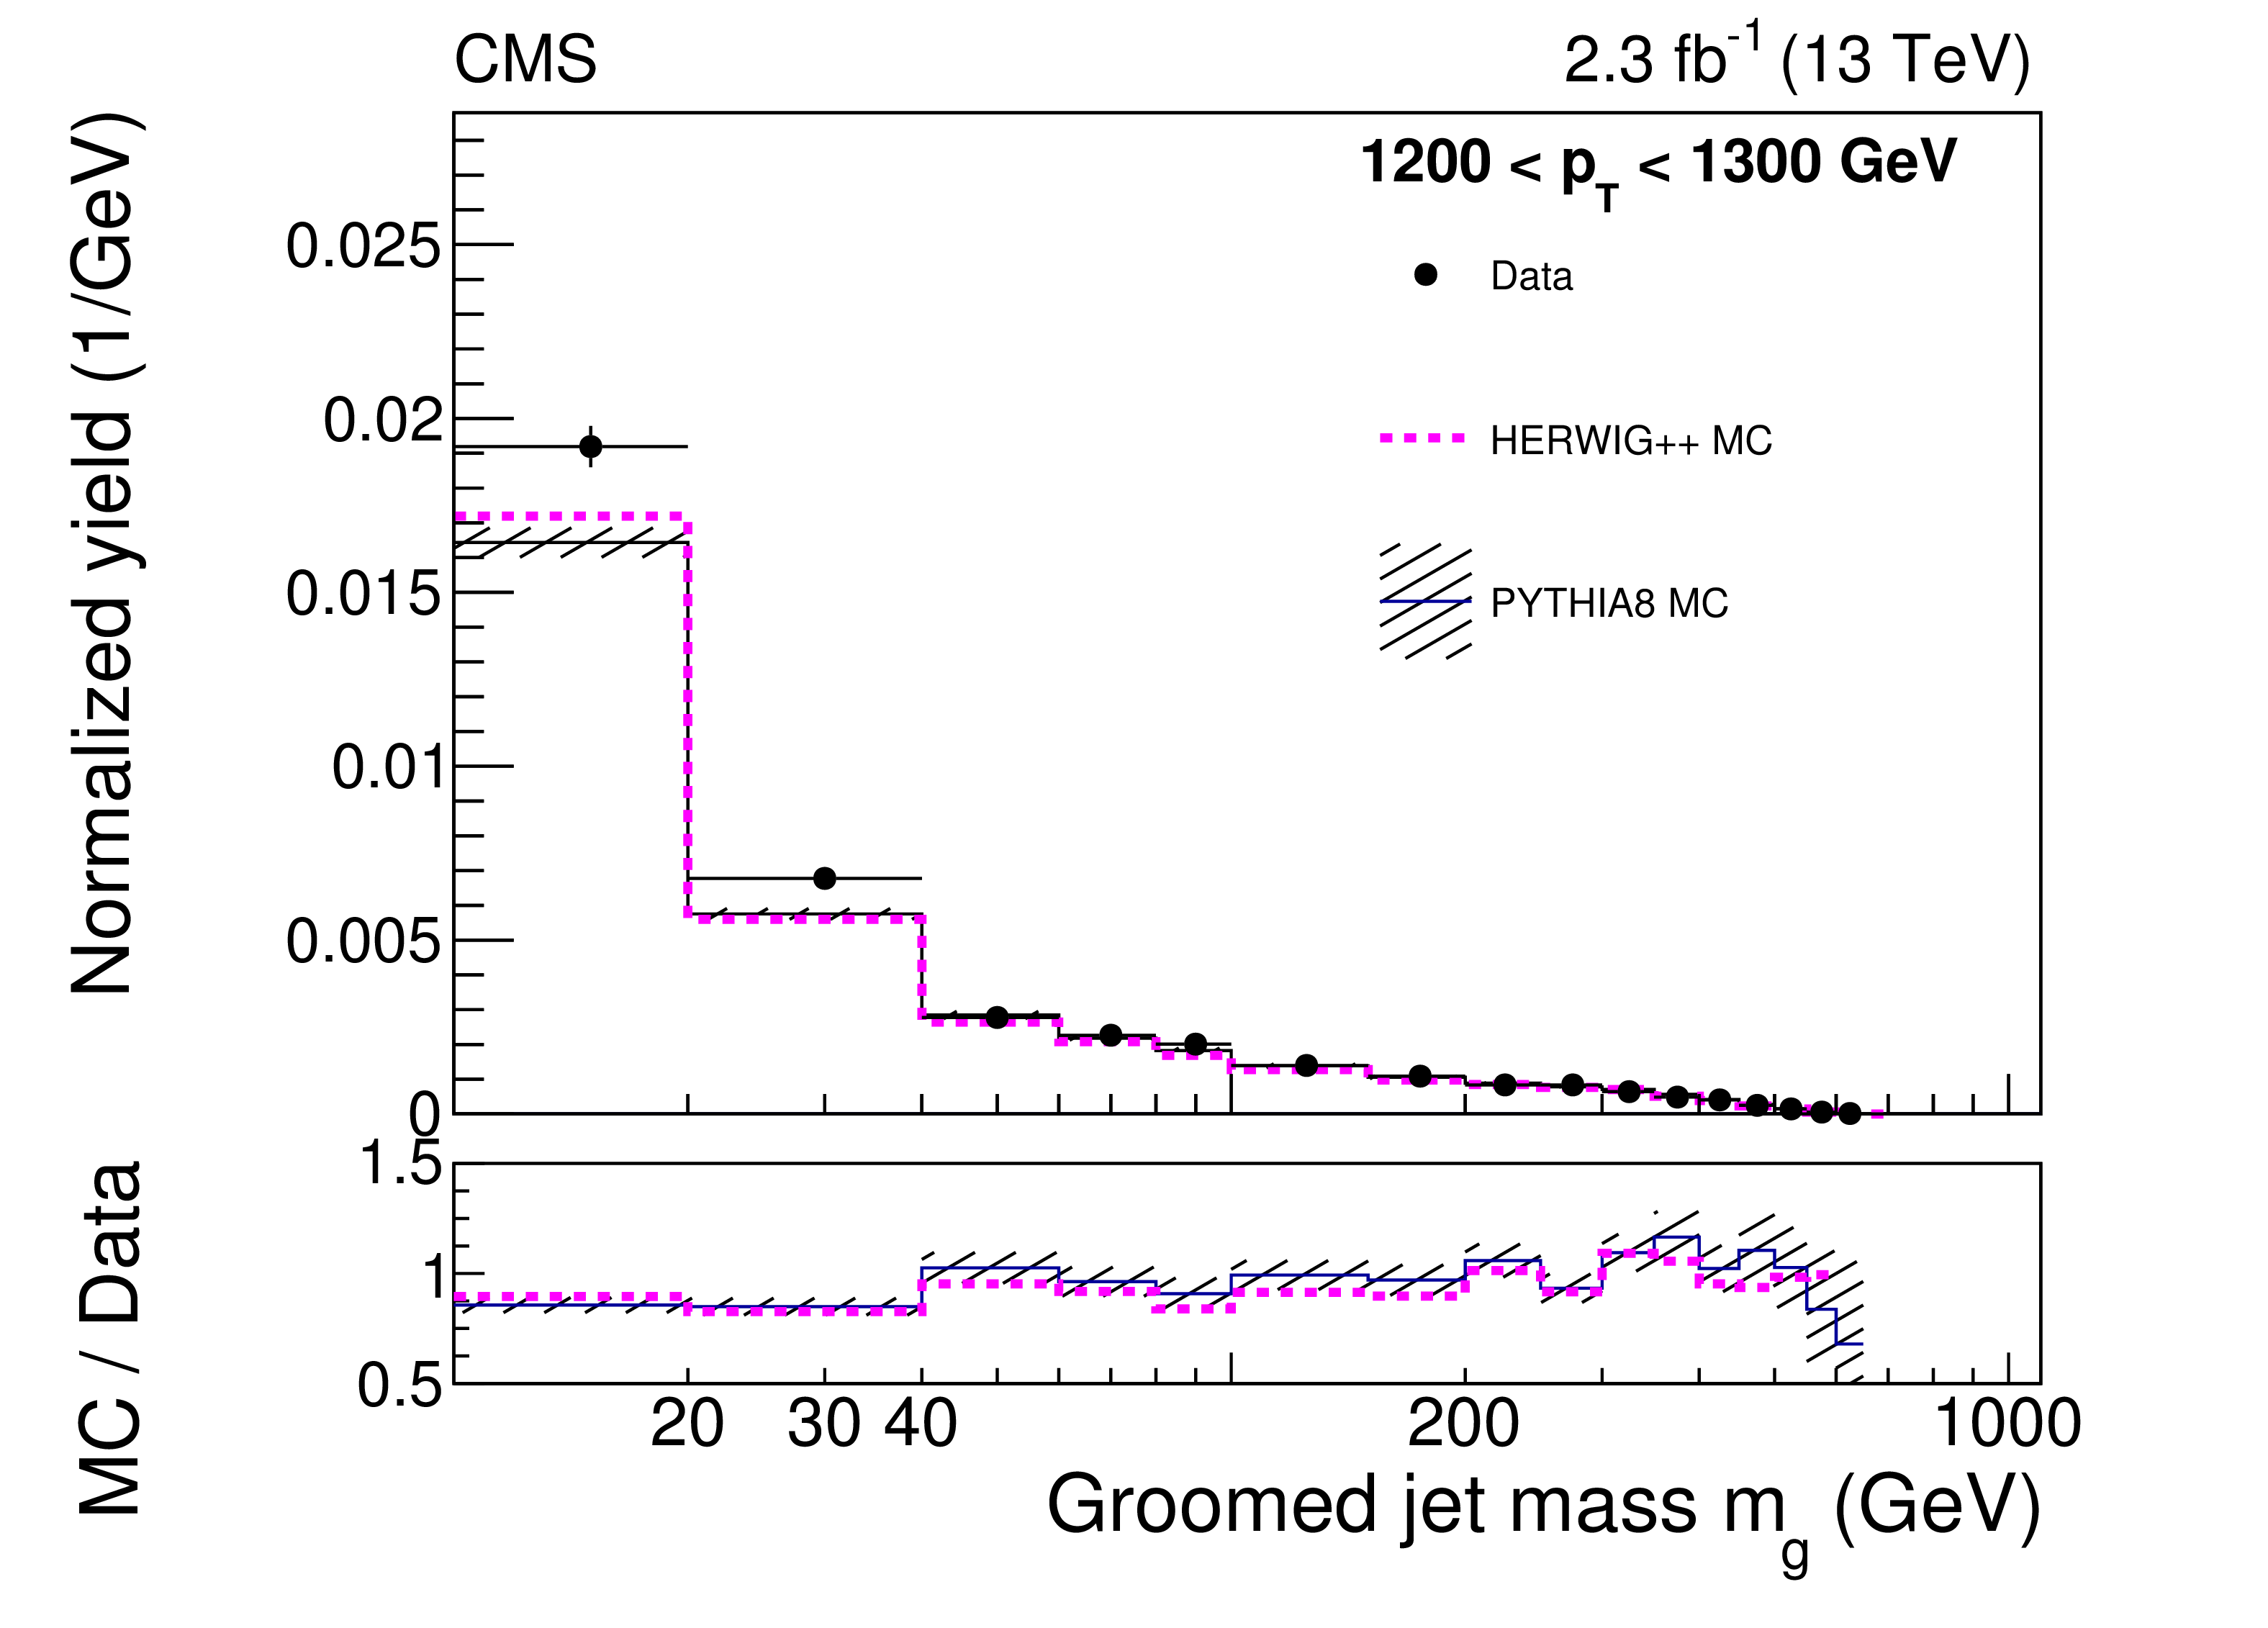
Figure 4:
Comparison of data to MC simulation for groomed jets for two $ {p_{\mathrm {T}}} $ bins at the detector level. The data and their statistical uncertainties are shown by the black points with the error bars. The PYTHIA8 results before the unfolding are shown in the shaded histograms, including experimental and theoretical systematic uncertainties. The HERWIG++ results before unfolding are shown without uncertainties as a dashed magenta histogram. |
png pdf |
Figure 4-a:
Comparison of data to MC simulation for groomed jets for 650 $ < {p_{\mathrm {T}}} < $ 760 GeV, at the detector level. The data and their statistical uncertainties are shown by the black points with the error bars. The PYTHIA8 results before the unfolding are shown in the shaded histograms, including experimental and theoretical systematic uncertainties. The HERWIG++ results before unfolding are shown without uncertainties as a dashed magenta histogram. |
png pdf |
Figure 4-b:
Comparison of data to MC simulation for groomed jets for 1200 $ < {p_{\mathrm {T}}} < $ 1300 GeV, at the detector level. The data and their statistical uncertainties are shown by the black points with the error bars. The PYTHIA8 results before the unfolding are shown in the shaded histograms, including experimental and theoretical systematic uncertainties. The HERWIG++ results before unfolding are shown without uncertainties as a dashed magenta histogram. |
png pdf |
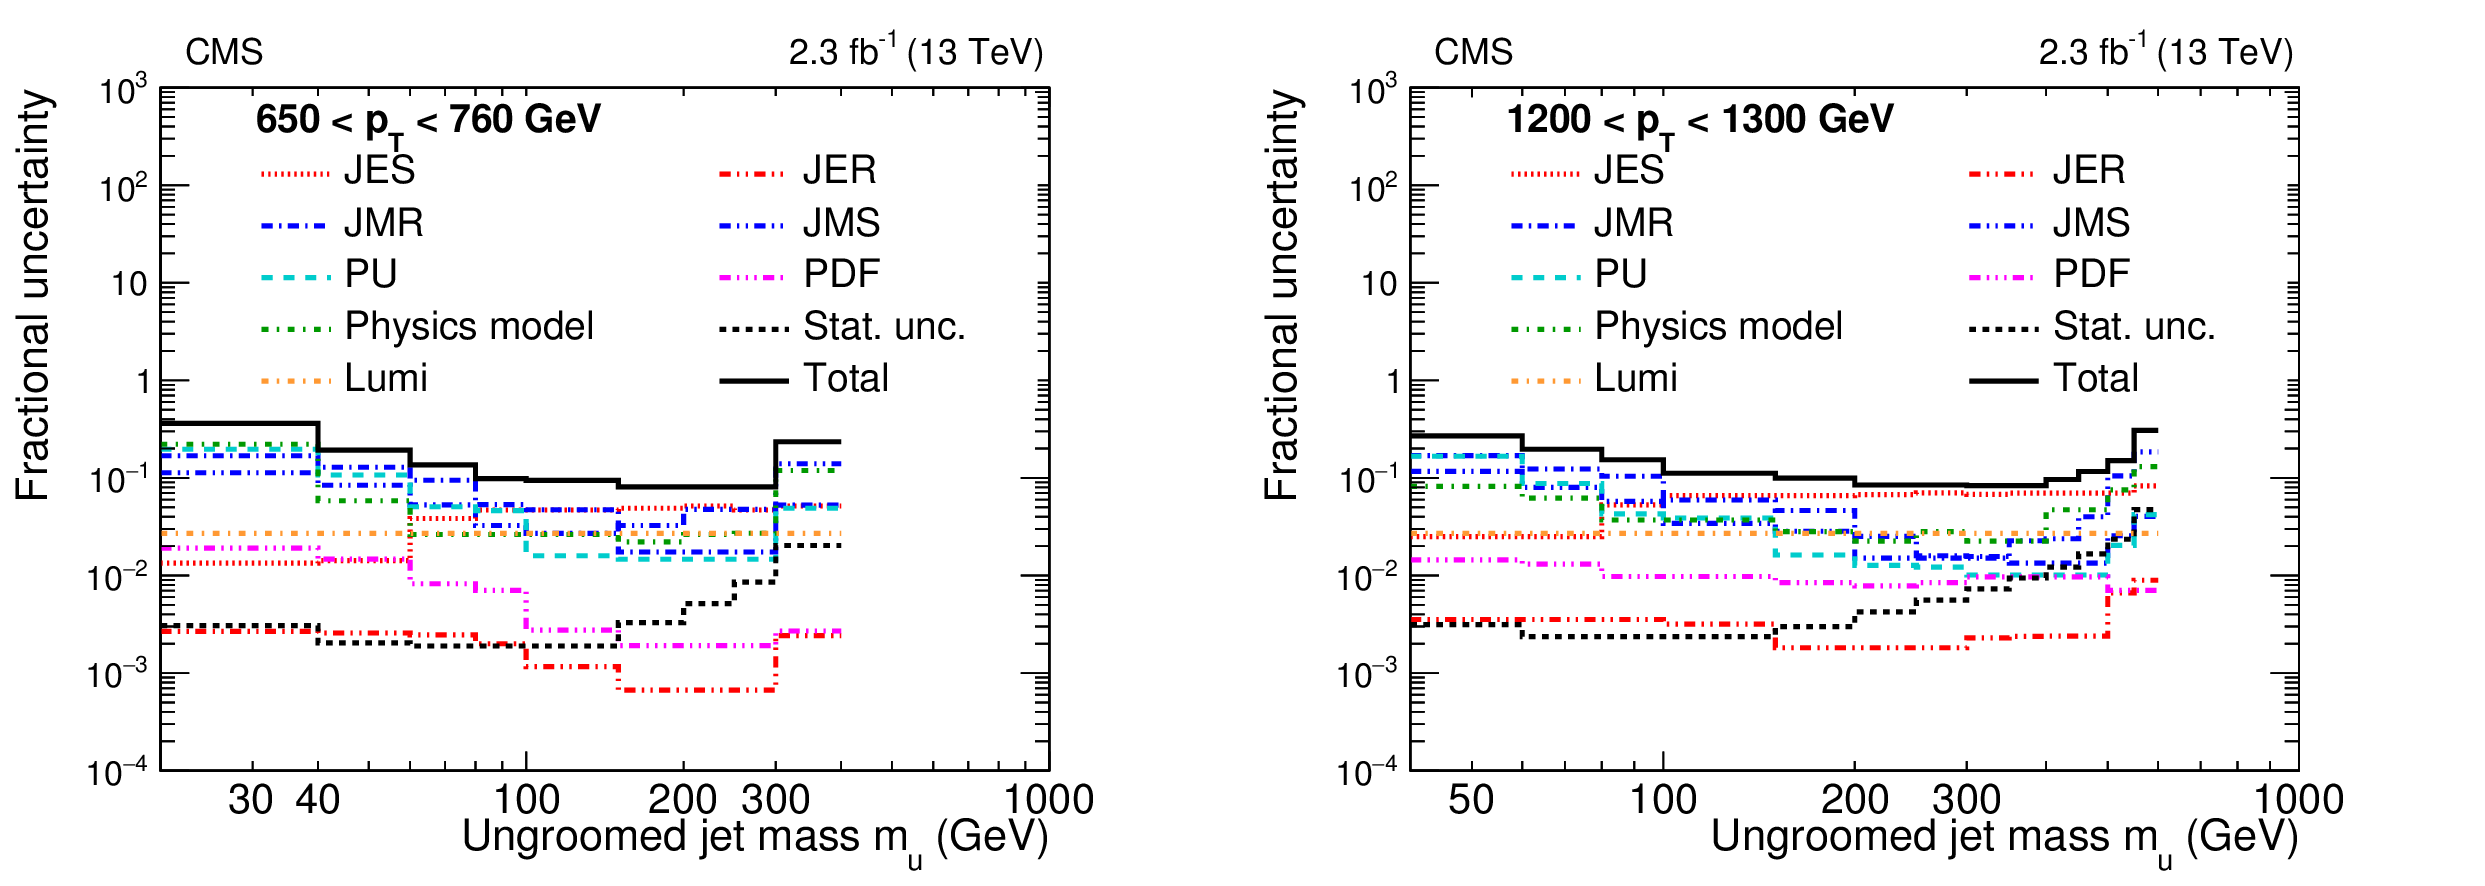
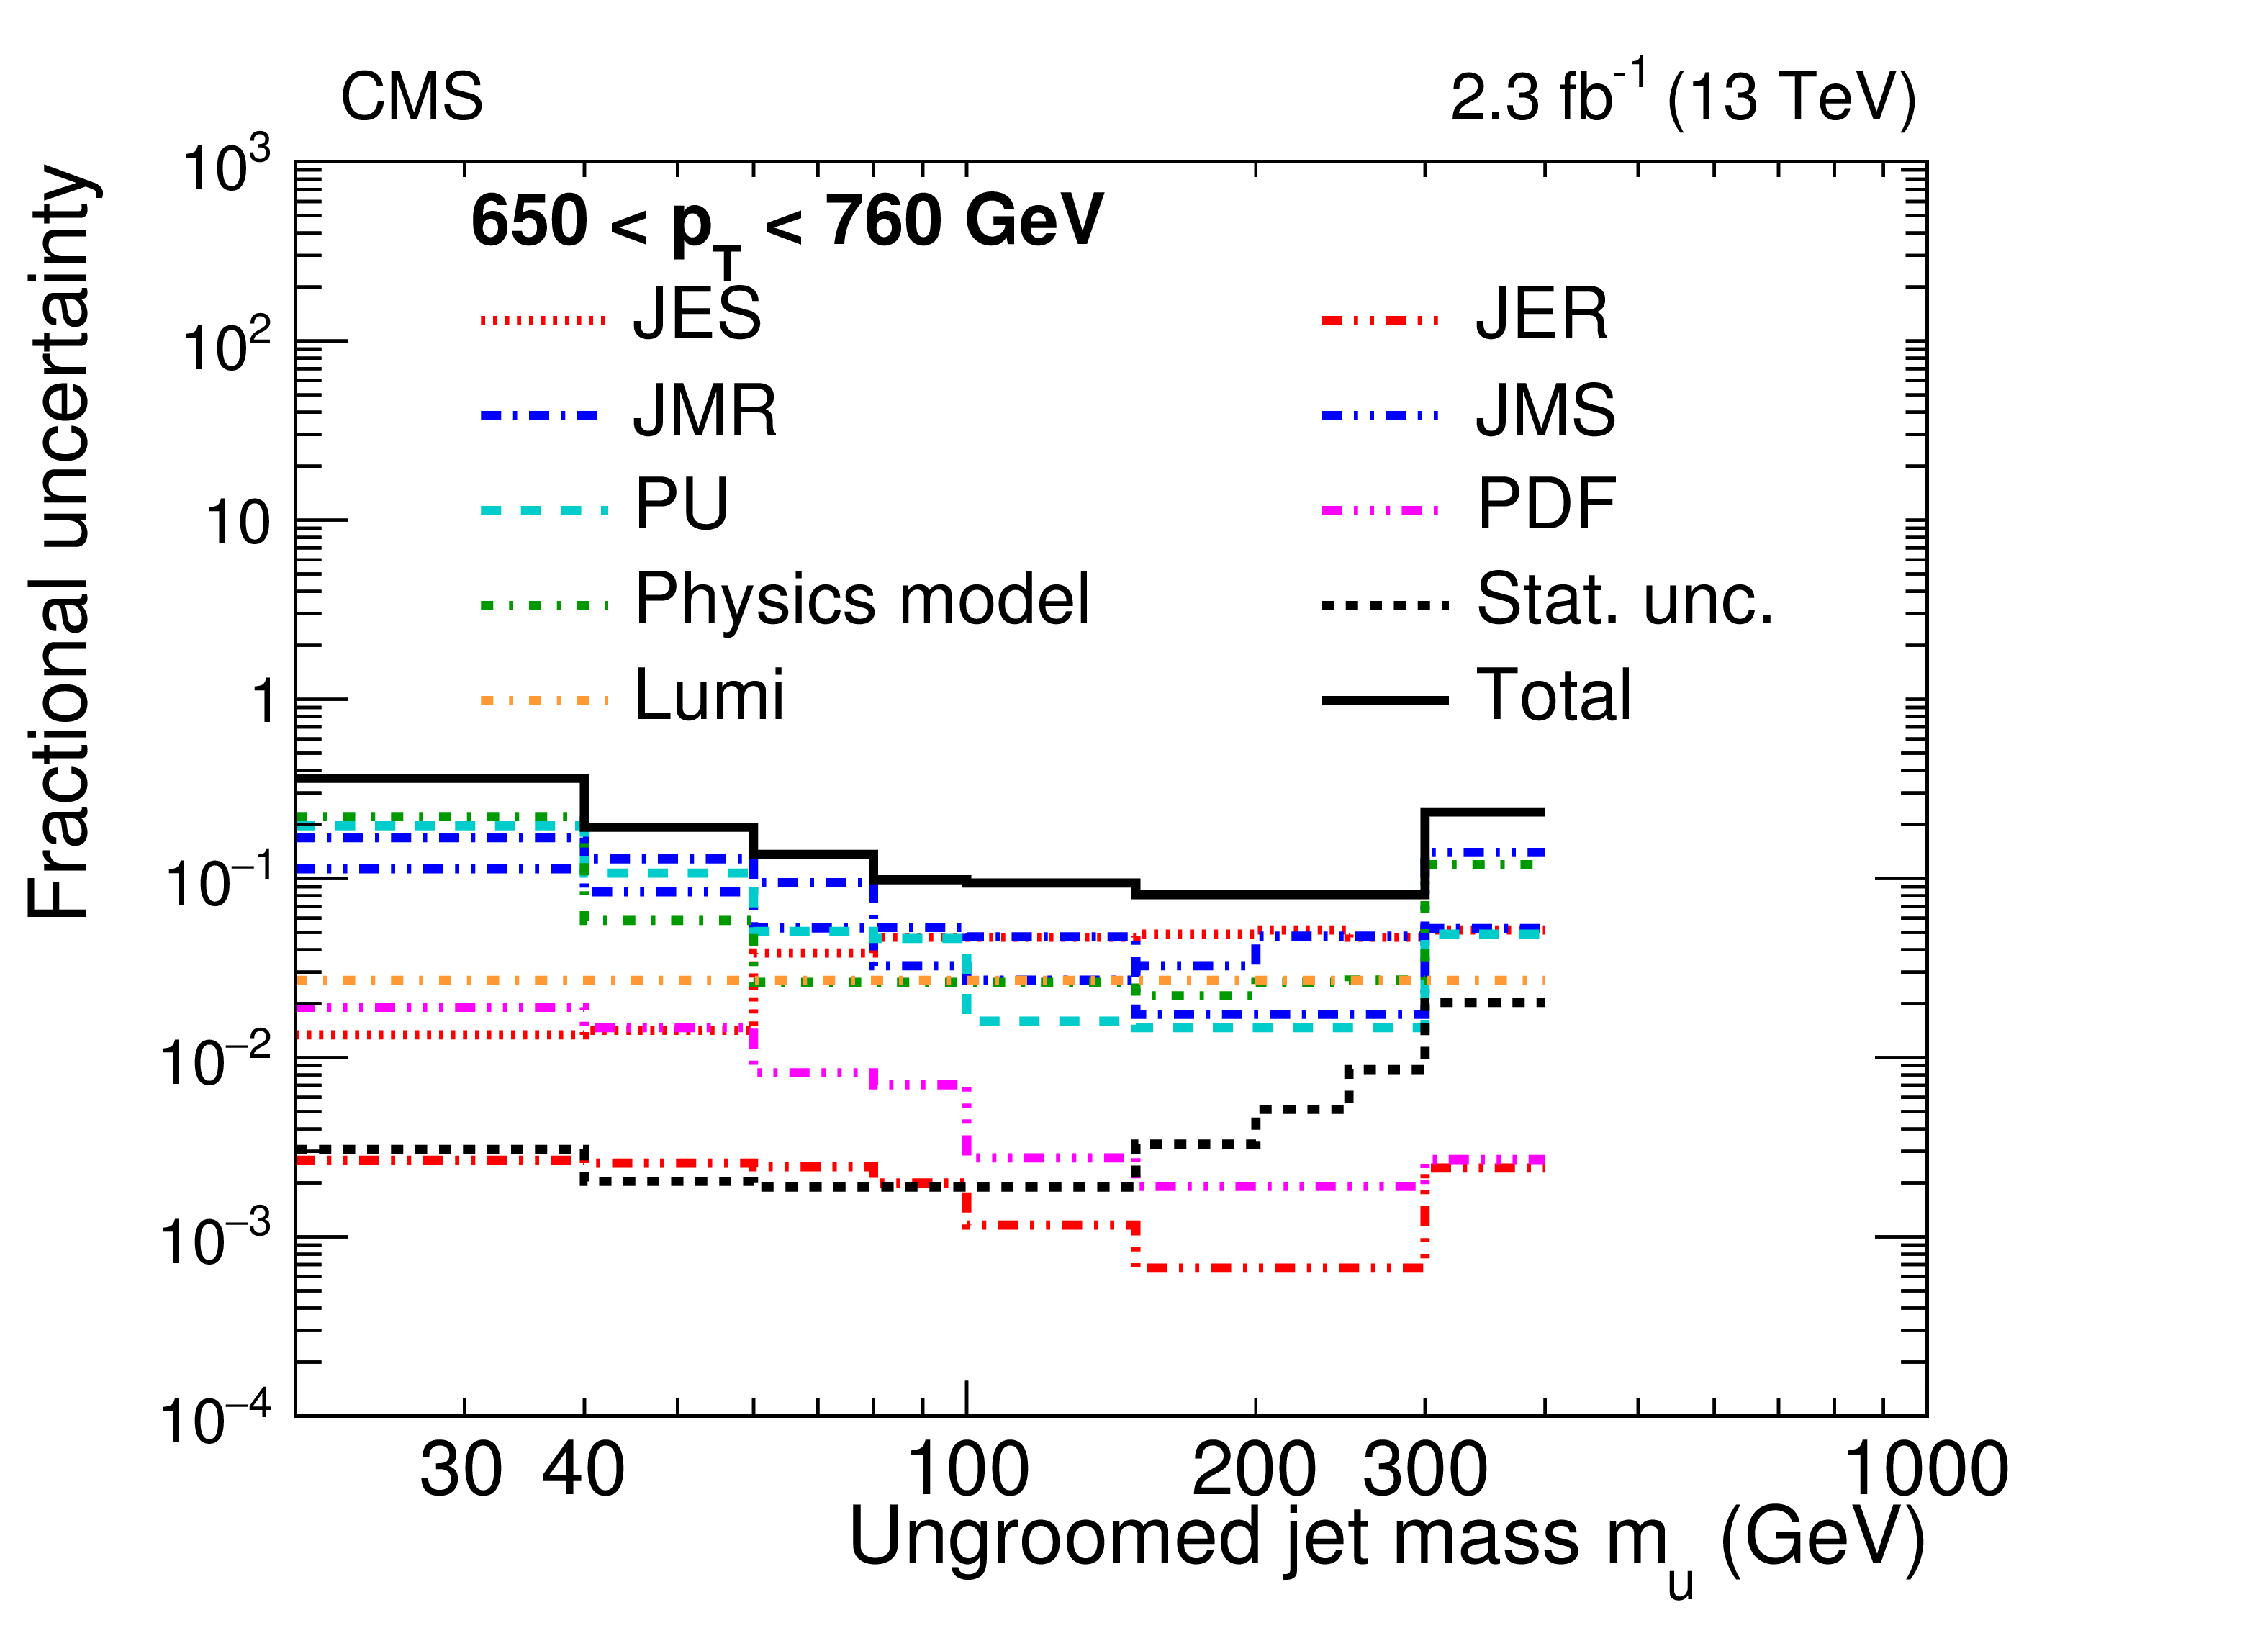
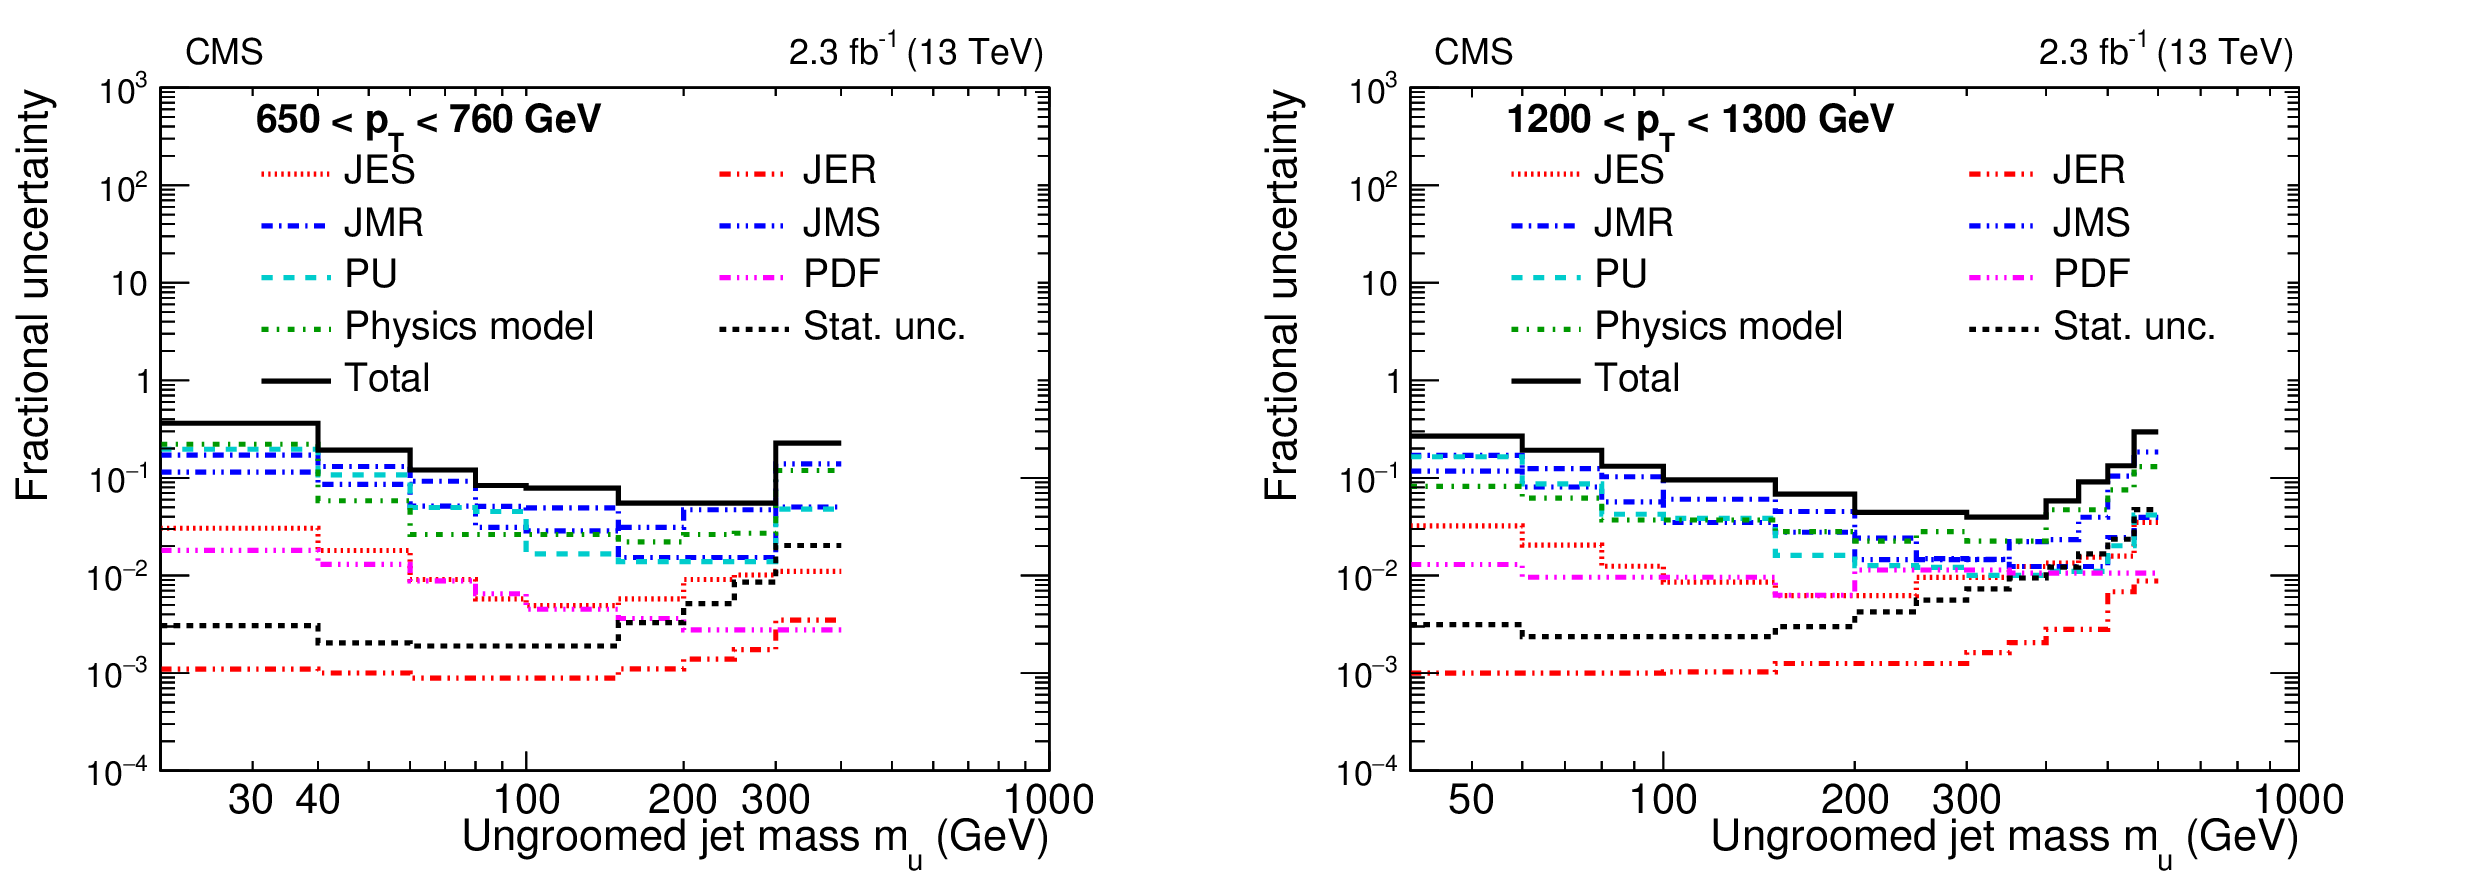
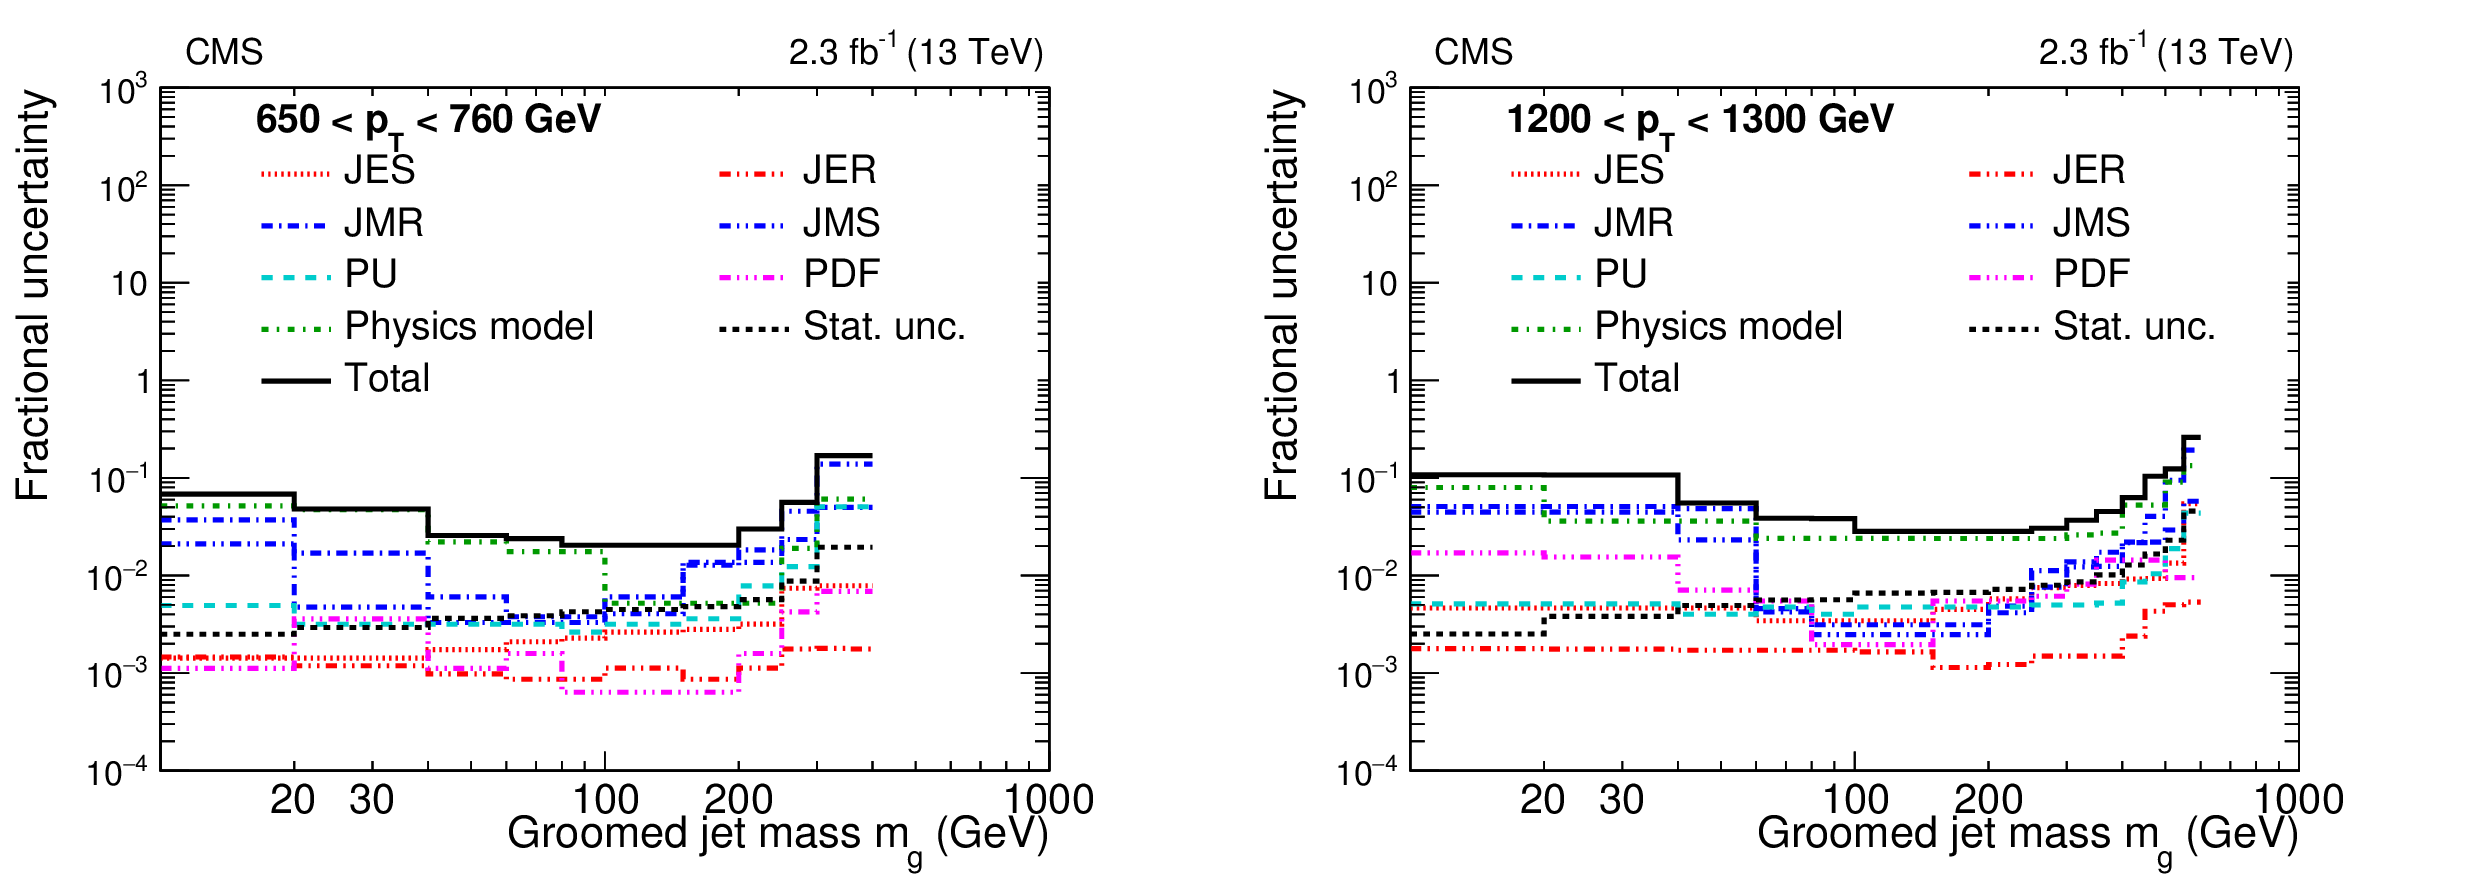
Figure 5:
Systematic uncertainties in the absolute cross section after unfolding for two $ {p_{\mathrm {T}}} $ bins before grooming. The red dotted lines show the JES uncertainties. The red dash-dot-dotted lines show the JER uncertainties. The blue dash-dotted lines show the JMR uncertainties. The blue dash-dot-dotted lines show the JMS uncertainties. The cyan dashed lines show the PU uncertainties. The orange dash-dotted lines show the luminosity uncertainties. The magenta dash-dot-dot-dotted lines show the PDF uncertainties. The green dash-dotted lines show the physics model uncertainties. The black short-dash-short-dashed lines show the statistical uncertainties. |
png pdf |
Figure 5-a:
Systematic uncertainties in the absolute cross section after unfolding for 650 $ < {p_{\mathrm {T}}} < $ 760 GeV, before grooming. The red dotted lines show the JES uncertainties. The red dash-dot-dotted lines show the JER uncertainties. The blue dash-dotted lines show the JMR uncertainties. The blue dash-dot-dotted lines show the JMS uncertainties. The cyan dashed lines show the PU uncertainties. The orange dash-dotted lines show the luminosity uncertainties. The magenta dash-dot-dot-dotted lines show the PDF uncertainties. The green dash-dotted lines show the physics model uncertainties. The black short-dash-short-dashed lines show the statistical uncertainties. |
png pdf |
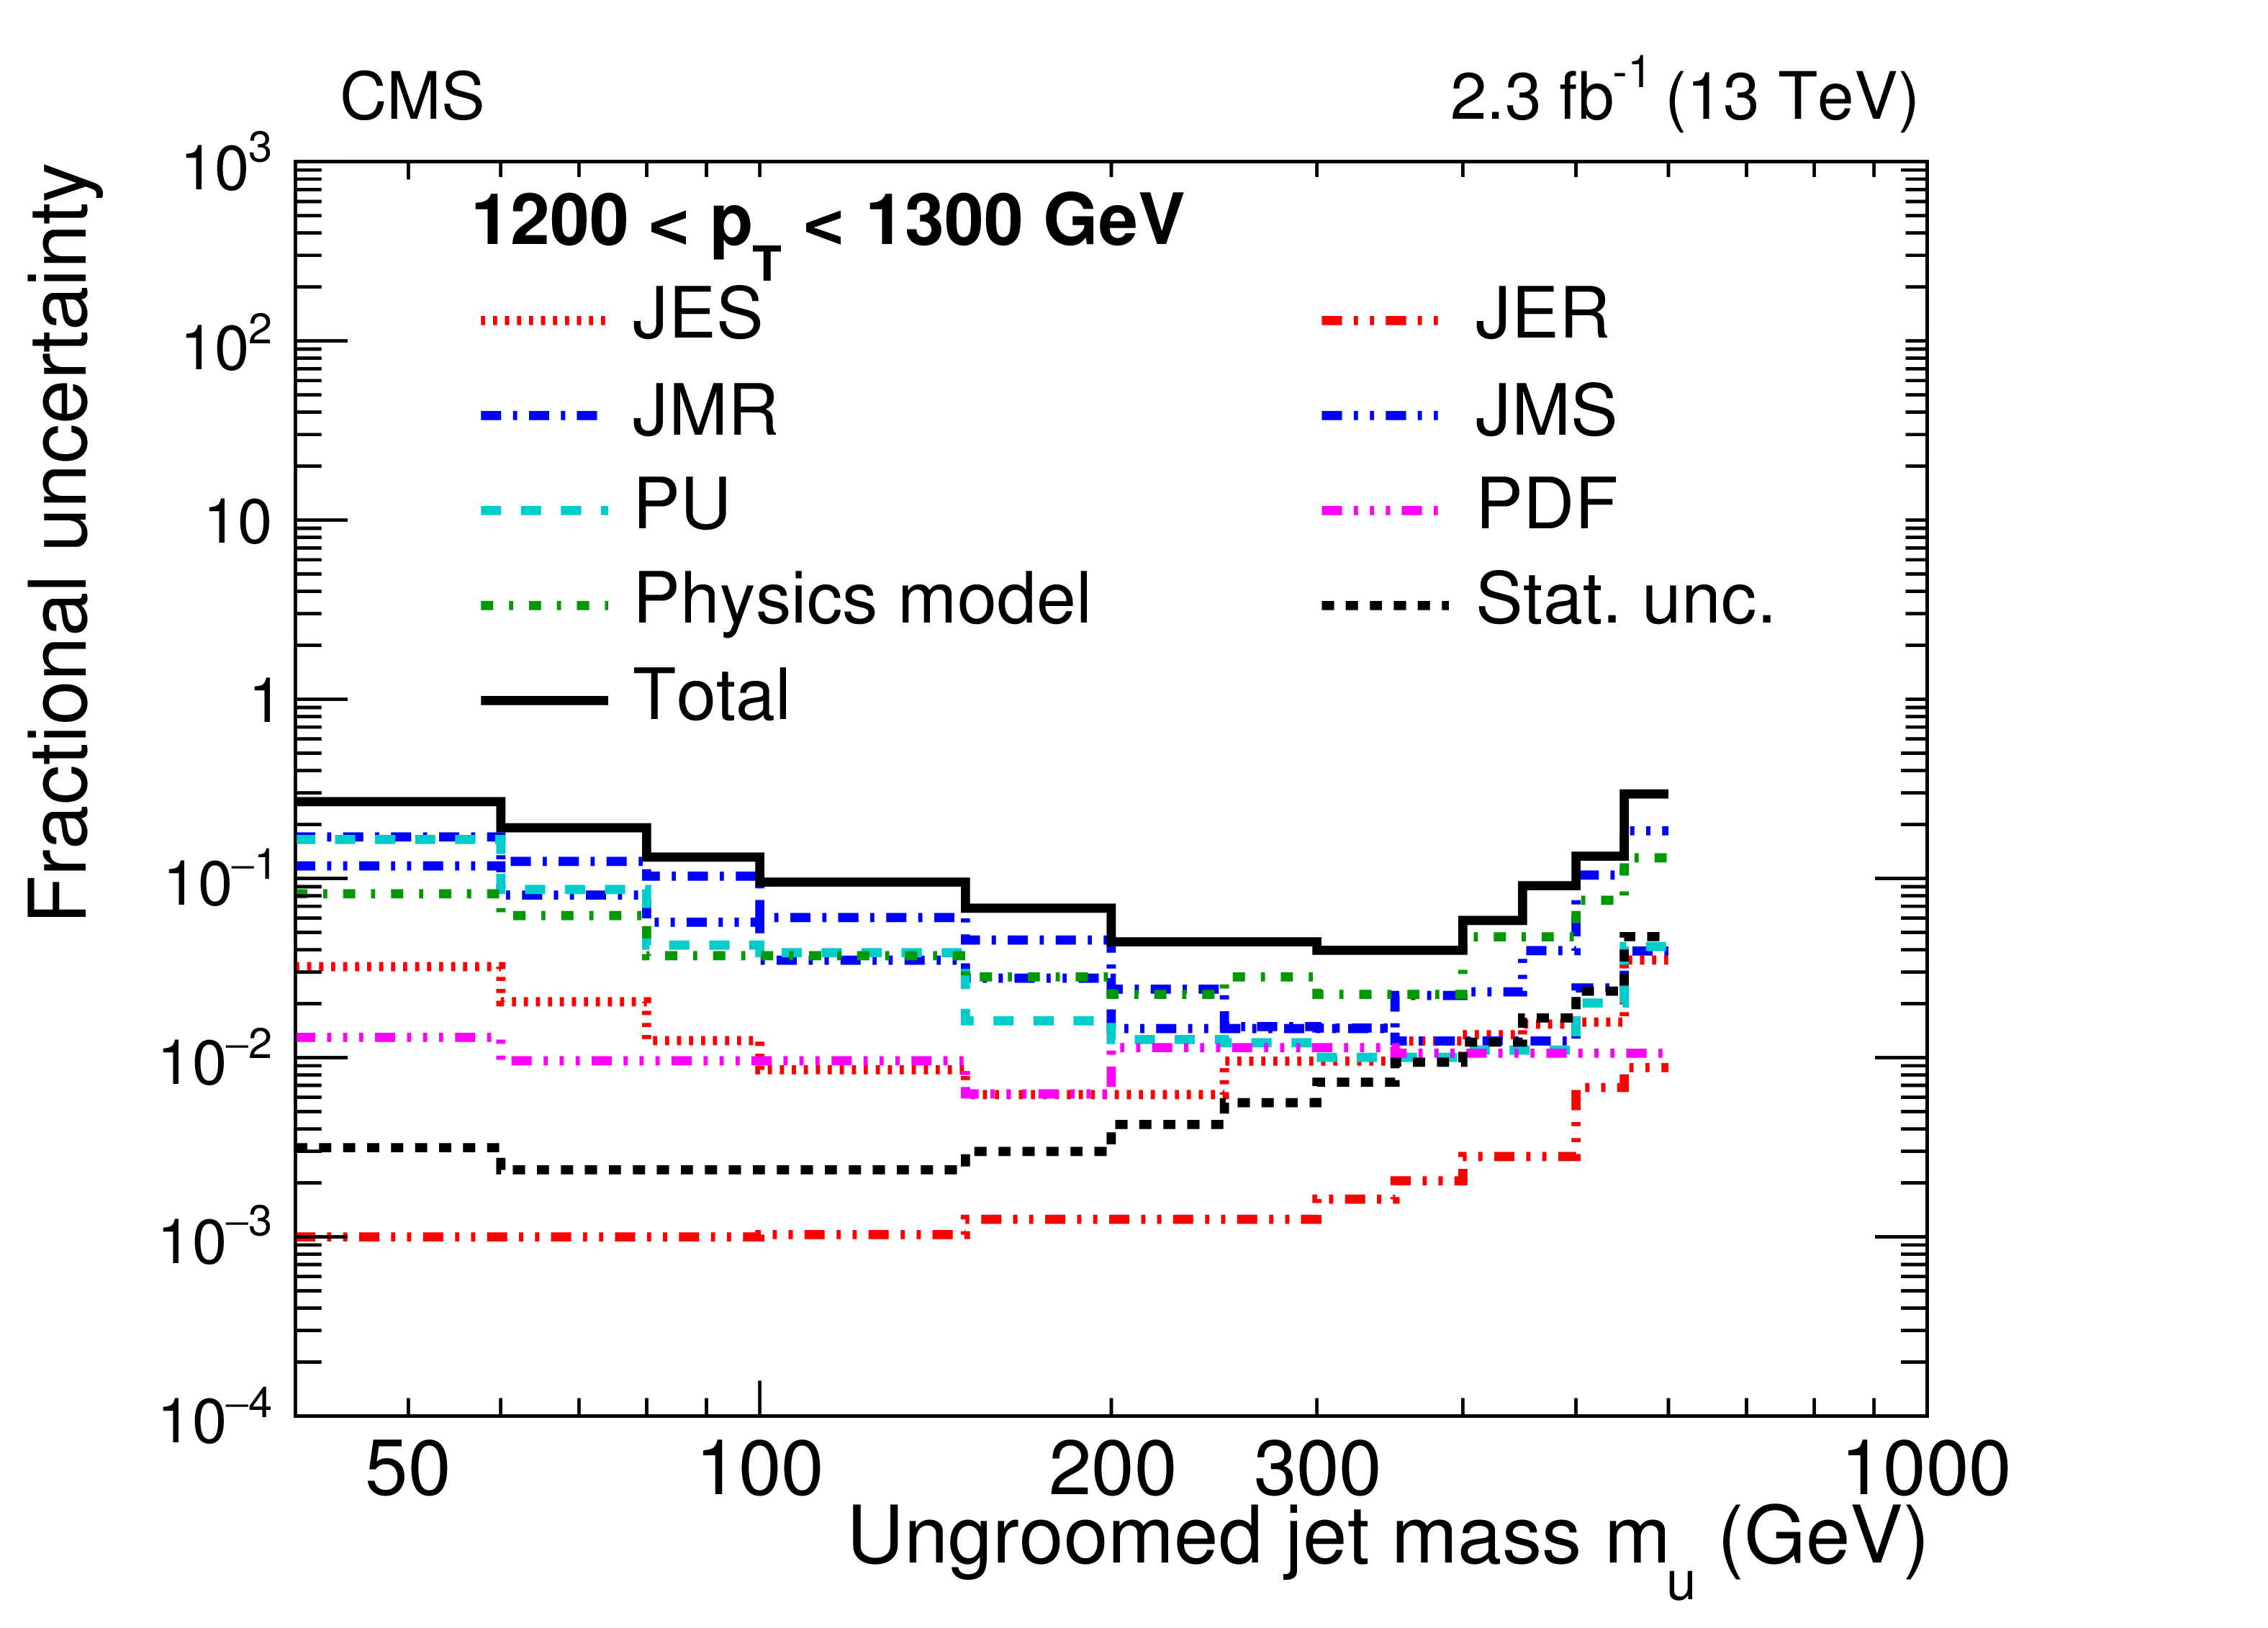
Figure 5-b:
Systematic uncertainties in the absolute cross section after unfolding for 1200 $ < {p_{\mathrm {T}}} < $ 1300 GeV, before grooming. The red dotted lines show the JES uncertainties. The red dash-dot-dotted lines show the JER uncertainties. The blue dash-dotted lines show the JMR uncertainties. The blue dash-dot-dotted lines show the JMS uncertainties. The cyan dashed lines show the PU uncertainties. The orange dash-dotted lines show the luminosity uncertainties. The magenta dash-dot-dot-dotted lines show the PDF uncertainties. The green dash-dotted lines show the physics model uncertainties. The black short-dash-short-dashed lines show the statistical uncertainties. |

png pdf |
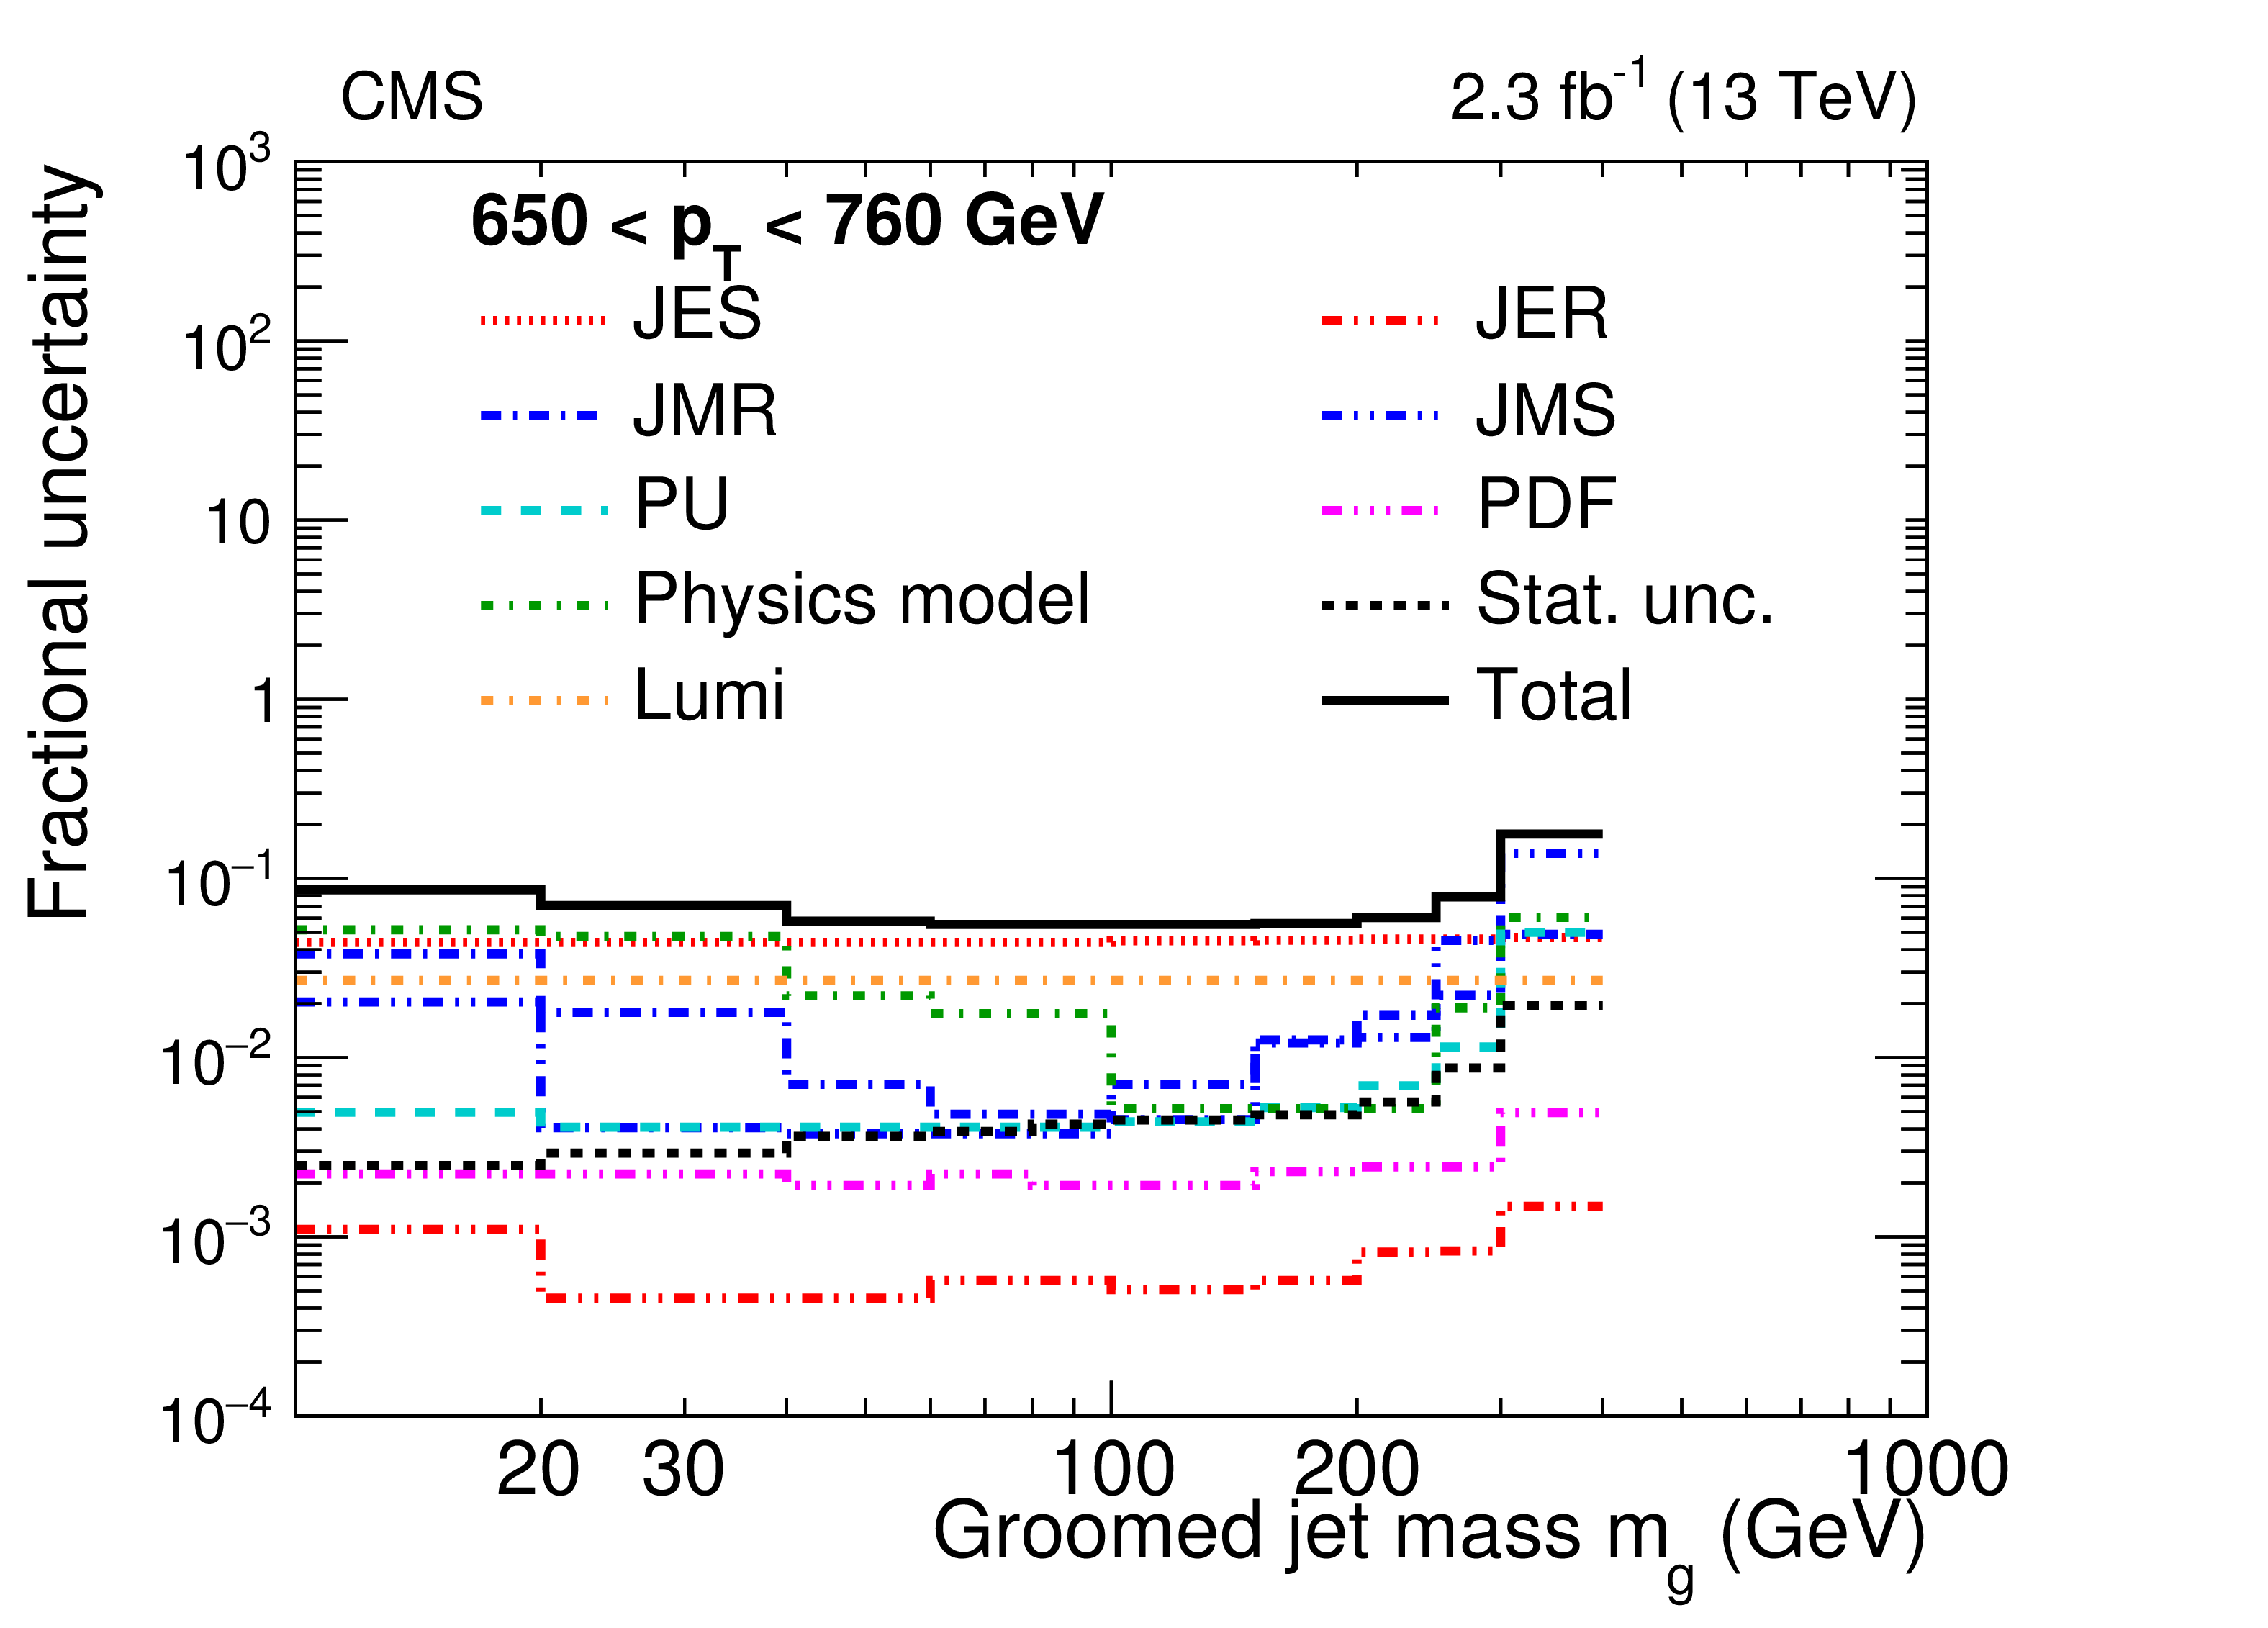
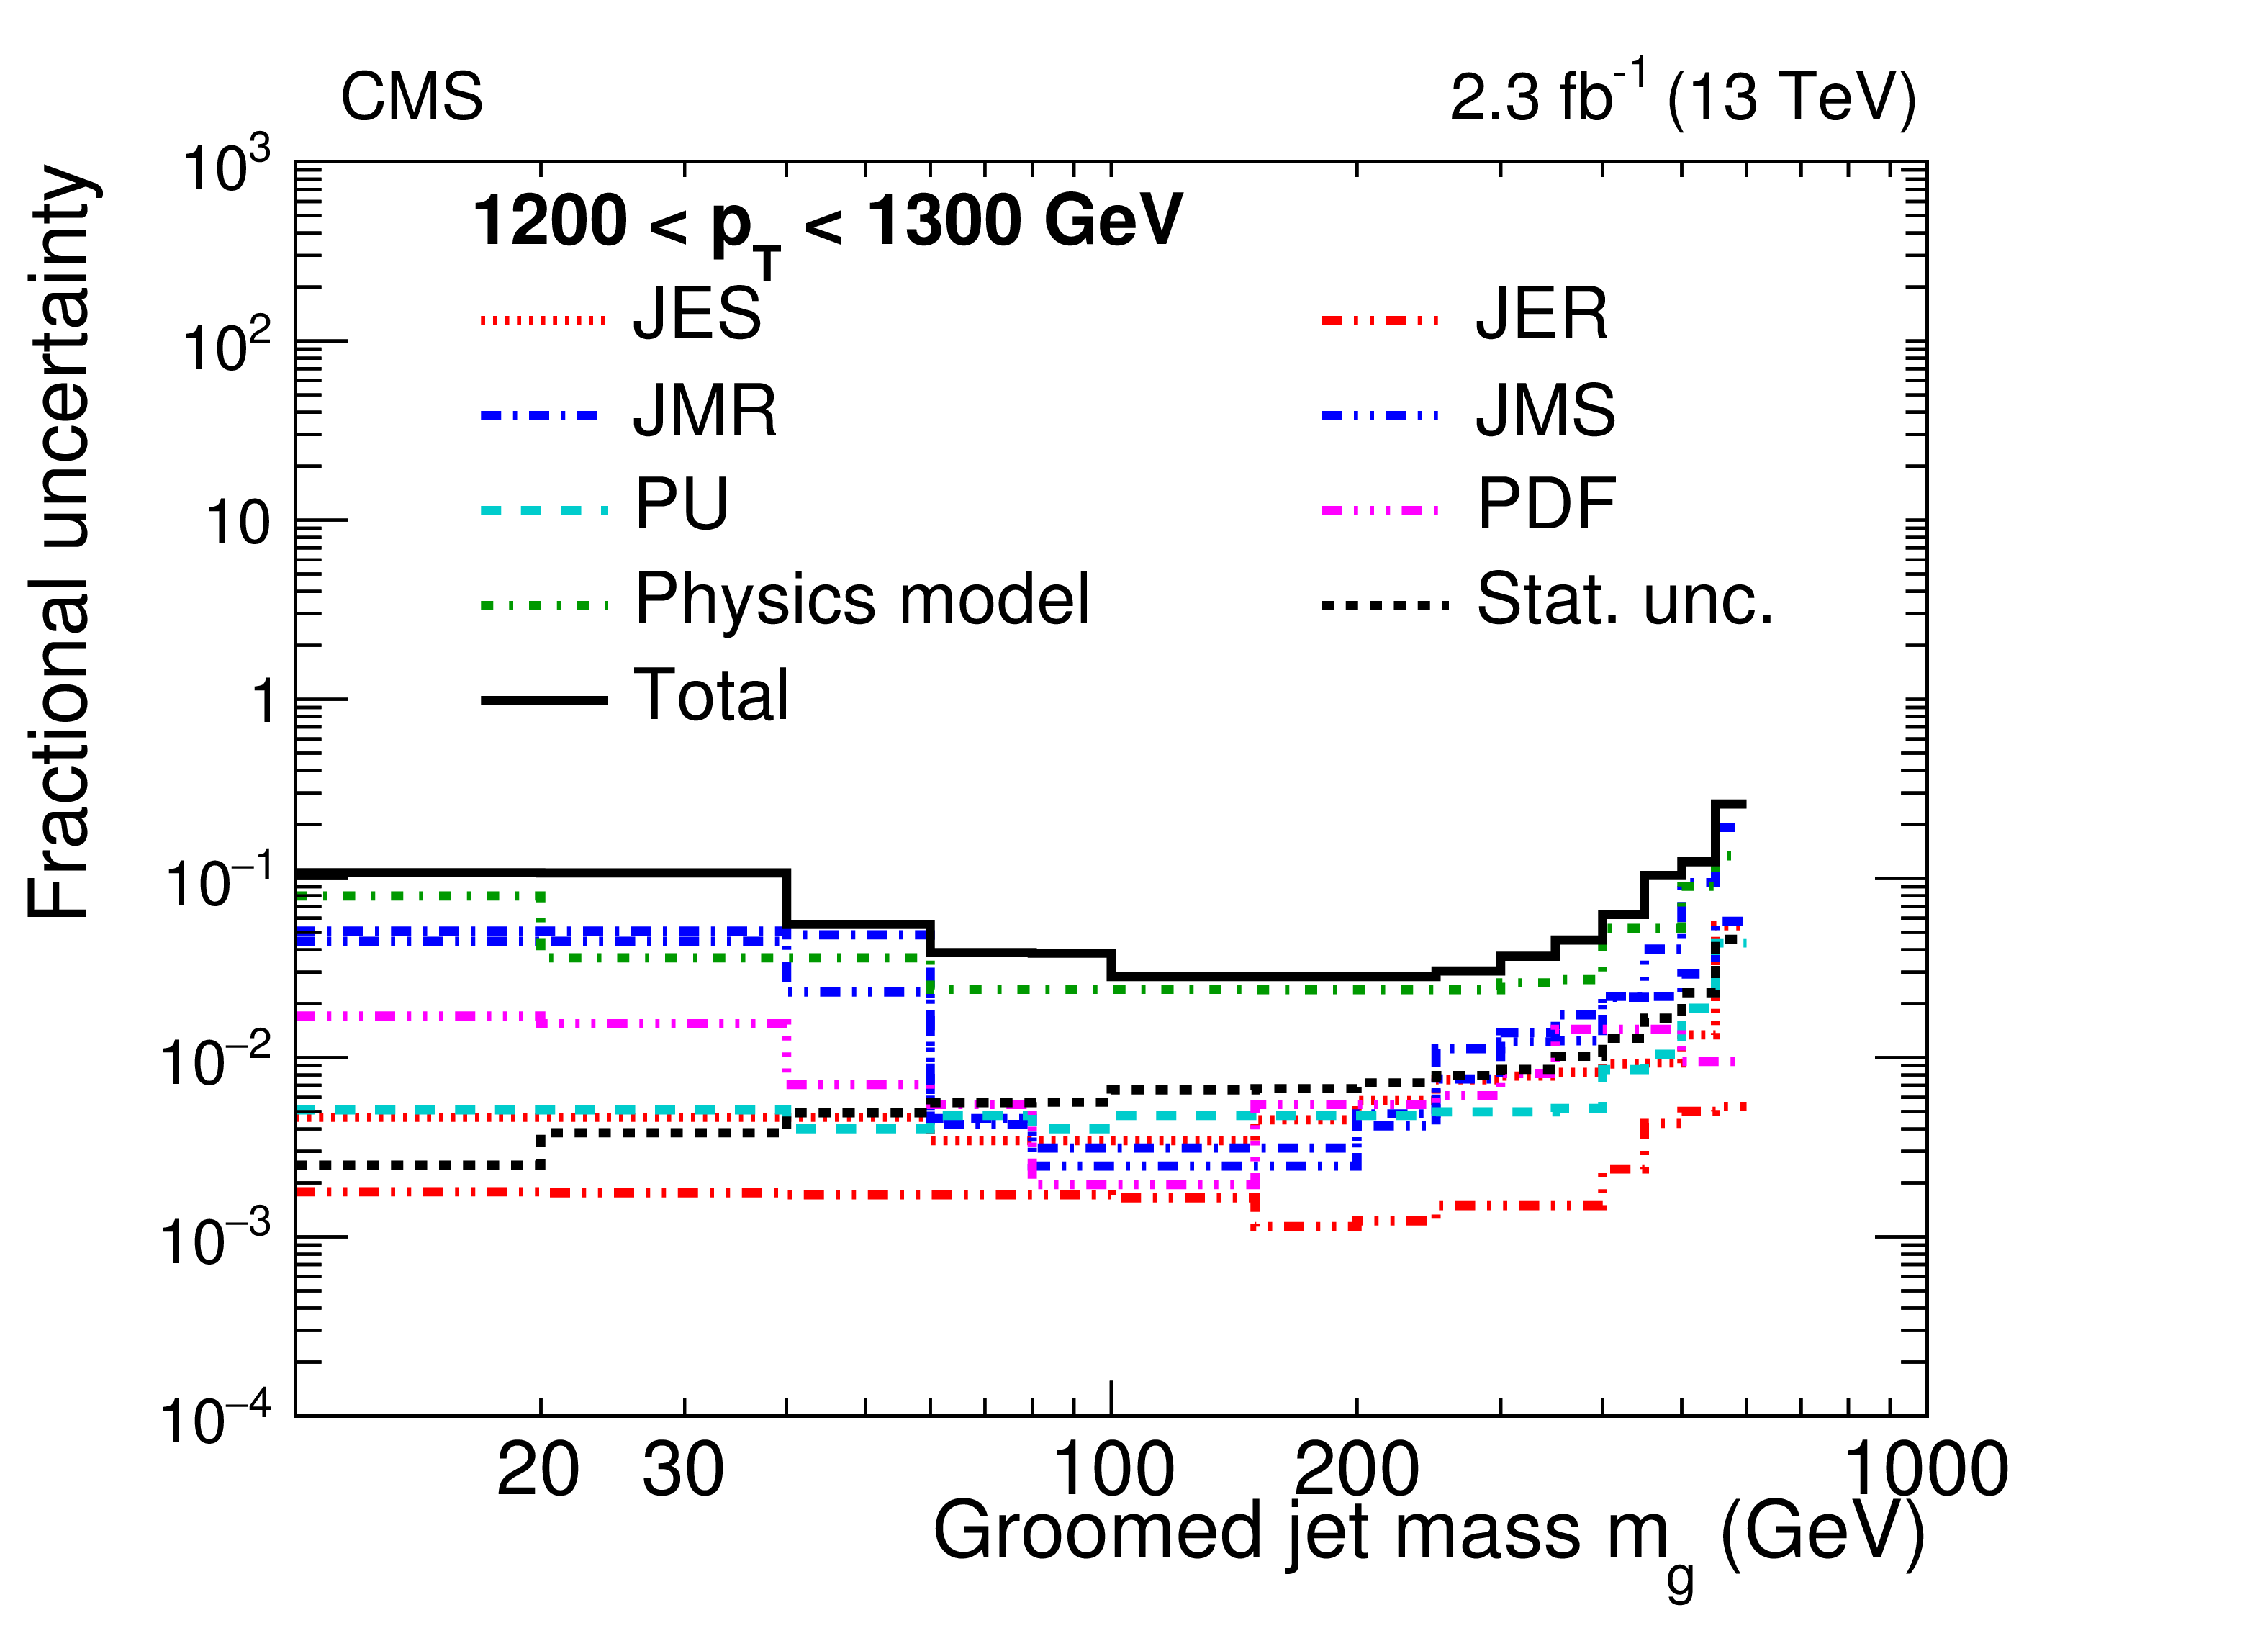
Figure 6:
Systematic uncertainties in the absolute cross section after unfolding for two $ {p_{\mathrm {T}}} $ bins after grooming. The red dotted lines show the JES uncertainties. The red dash-dot-dotted lines show the JER uncertainties. The blue dash-dotted lines show the JMR uncertainties. The blue dash-dot-dotted lines show the JMS uncertainties. The cyan dashed lines show the PU uncertainties. The orange dash-dotted lines show the luminosity uncertainties. The magenta dash-dot-dot-dotted lines show the PDF uncertainties. The green dash-dotted lines show the physics model uncertainties. The black short-dash-short-dashed lines show the statistical uncertainties. |
png pdf |
Figure 6-a:
Systematic uncertainties in the absolute cross section after unfolding for 650 $ < {p_{\mathrm {T}}} < $ 760 GeV, after grooming. The red dotted lines show the JES uncertainties. The red dash-dot-dotted lines show the JER uncertainties. The blue dash-dotted lines show the JMR uncertainties. The blue dash-dot-dotted lines show the JMS uncertainties. The cyan dashed lines show the PU uncertainties. The orange dash-dotted lines show the luminosity uncertainties. The magenta dash-dot-dot-dotted lines show the PDF uncertainties. The green dash-dotted lines show the physics model uncertainties. The black short-dash-short-dashed lines show the statistical uncertainties. |

png pdf |
Figure 6-b:
Systematic uncertainties in the absolute cross section after unfolding for 1200 $ < {p_{\mathrm {T}}} < $ 1300 GeV, after grooming. The red dotted lines show the JES uncertainties. The red dash-dot-dotted lines show the JER uncertainties. The blue dash-dotted lines show the JMR uncertainties. The blue dash-dot-dotted lines show the JMS uncertainties. The cyan dashed lines show the PU uncertainties. The orange dash-dotted lines show the luminosity uncertainties. The magenta dash-dot-dot-dotted lines show the PDF uncertainties. The green dash-dotted lines show the physics model uncertainties. The black short-dash-short-dashed lines show the statistical uncertainties. |
png pdf |
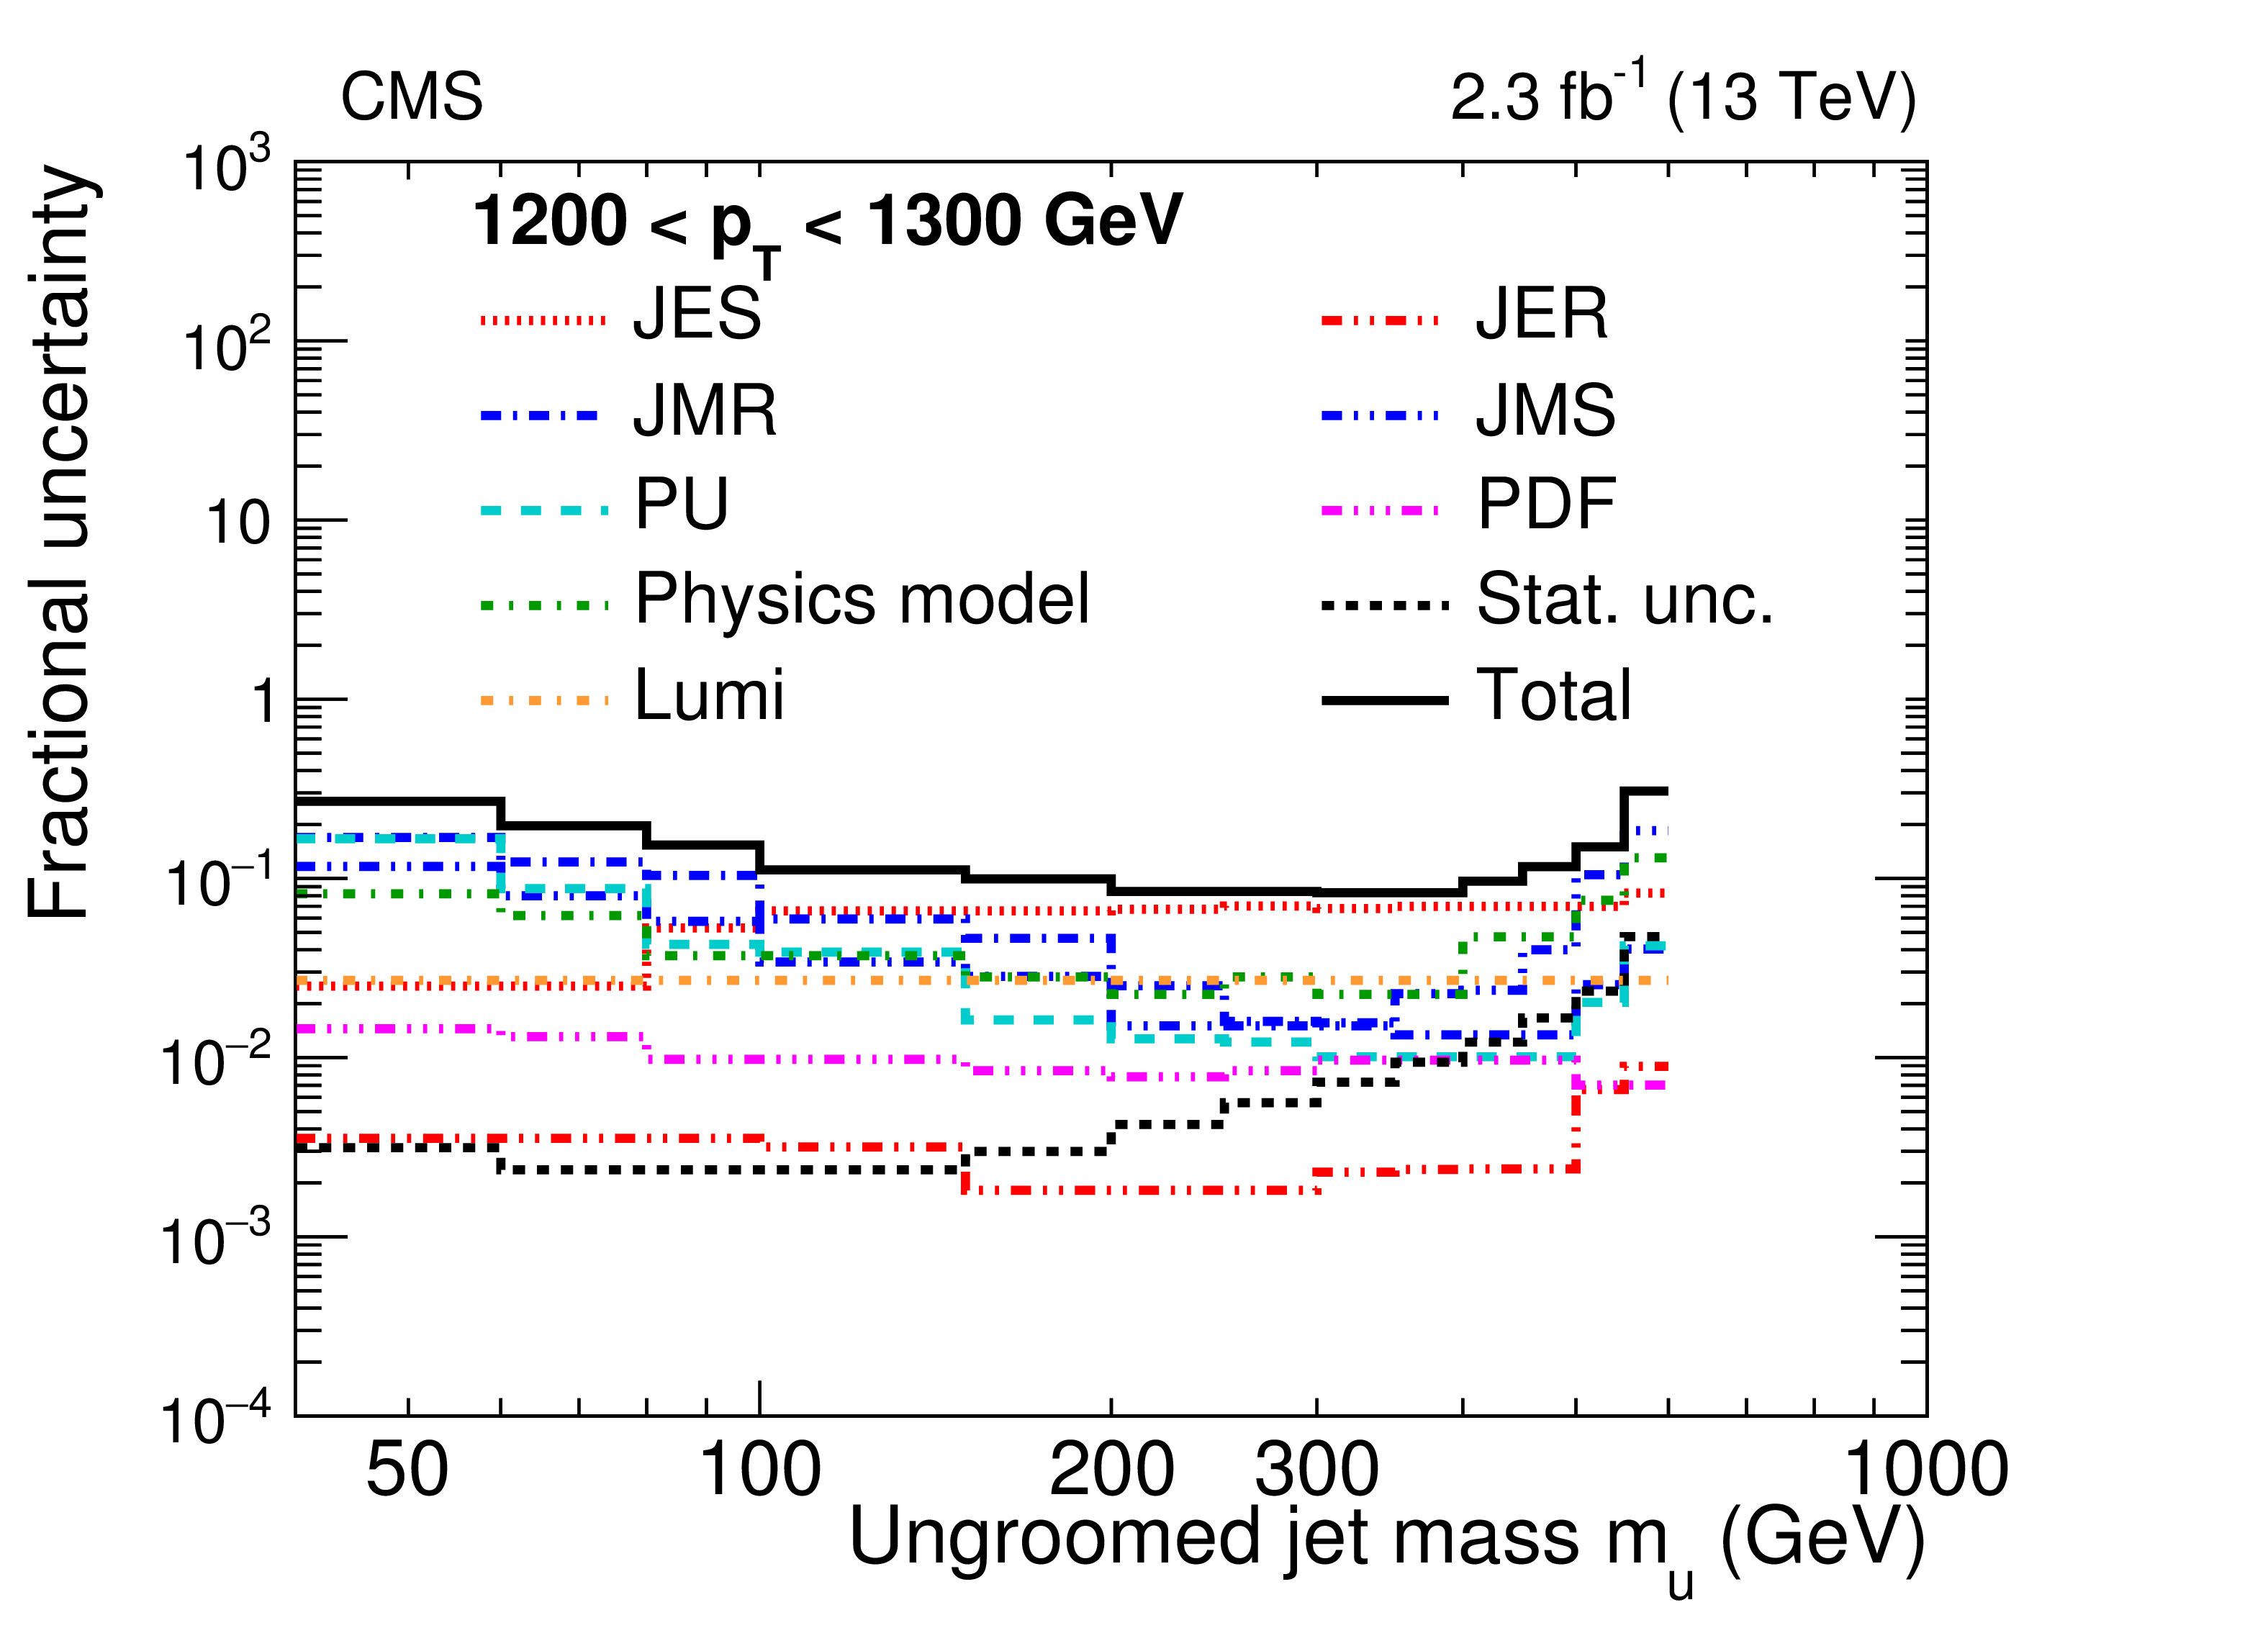
Figure 7:
Systematic uncertainties in the normalized cross section after unfolding for two $ {p_{\mathrm {T}}} $ bins before grooming. The red dotted lines show the JES uncertainties. The red dash-dot-dotted lines show the JER uncertainties. The blue dash-dotted lines show the JMR uncertainties. The blue dash-dot-dotted lines show the JMS uncertainties. The cyan dashed lines show the PU uncertainties. The orange dash-dotted lines show the luminosity uncertainties. The magenta dash-dot-dot-dotted lines show the PDF uncertainties. The green dash-dotted lines show the physics model uncertainties. The black short-dash-short-dashed lines show the statistical uncertainties. |

png pdf |
Figure 7-a:
Systematic uncertainties in the normalized cross section after unfolding for 1200 $ < {p_{\mathrm {T}}} < $ 1300 GeV, before grooming. The red dotted lines show the JES uncertainties. The red dash-dot-dotted lines show the JER uncertainties. The blue dash-dotted lines show the JMR uncertainties. The blue dash-dot-dotted lines show the JMS uncertainties. The cyan dashed lines show the PU uncertainties. The orange dash-dotted lines show the luminosity uncertainties. The magenta dash-dot-dot-dotted lines show the PDF uncertainties. The green dash-dotted lines show the physics model uncertainties. The black short-dash-short-dashed lines show the statistical uncertainties. |
png pdf |
Figure 7-b:
Systematic uncertainties in the normalized cross section after unfolding for two $ {p_{\mathrm {T}}} $ bins before grooming. The red dotted lines show the JES uncertainties. The red dash-dot-dotted lines show the JER uncertainties. The blue dash-dotted lines show the JMR uncertainties. The blue dash-dot-dotted lines show the JMS uncertainties. The cyan dashed lines show the PU uncertainties. The orange dash-dotted lines show the luminosity uncertainties. The magenta dash-dot-dot-dotted lines show the PDF uncertainties. The green dash-dotted lines show the physics model uncertainties. The black short-dash-short-dashed lines show the statistical uncertainties. |
png pdf |
Figure 8:
Systematic uncertainties in the normalized cross section after unfolding for two $ {p_{\mathrm {T}}} $ bins after grooming. The red dotted lines show the JES uncertainties. The red dash-dot-dotted lines show the JER uncertainties. The blue dash-dotted lines show the JMR uncertainties. The blue dash-dot-dotted lines show the JMS uncertainties. The cyan dashed lines show the PU uncertainties. The orange dash-dotted lines show the luminosity uncertainties. The magenta dash-dot-dot-dotted lines show the PDF uncertainties. The green dash-dotted lines show the physics model uncertainties. The black short-dash-short-dashed lines show the statistical uncertainties. |

png pdf |
Figure 8-a:
Systematic uncertainties in the normalized cross section after unfolding for 650 $ < {p_{\mathrm {T}}} < $ 760 GeV, after grooming. The red dotted lines show the JES uncertainties. The red dash-dot-dotted lines show the JER uncertainties. The blue dash-dotted lines show the JMR uncertainties. The blue dash-dot-dotted lines show the JMS uncertainties. The cyan dashed lines show the PU uncertainties. The orange dash-dotted lines show the luminosity uncertainties. The magenta dash-dot-dot-dotted lines show the PDF uncertainties. The green dash-dotted lines show the physics model uncertainties. The black short-dash-short-dashed lines show the statistical uncertainties. |
png pdf |
Figure 8-b:
Systematic uncertainties in the normalized cross section after unfolding for 1200 $ < {p_{\mathrm {T}}} < $ 1300 GeV, after grooming. The red dotted lines show the JES uncertainties. The red dash-dot-dotted lines show the JER uncertainties. The blue dash-dotted lines show the JMR uncertainties. The blue dash-dot-dotted lines show the JMS uncertainties. The cyan dashed lines show the PU uncertainties. The orange dash-dotted lines show the luminosity uncertainties. The magenta dash-dot-dot-dotted lines show the PDF uncertainties. The green dash-dotted lines show the physics model uncertainties. The black short-dash-short-dashed lines show the statistical uncertainties. |

png pdf |
Figure 9:
Absolute cross section for ungroomed jets for two $ {p_{\mathrm {T}}} $ bins. The data are shown by the black points, with dark grey bands for the statistical uncertainty (Stat. unc.) and with light grey bands for the total uncertainty (Stat.+sys. unc., added in quadrature). The predictions from PYTHIA8, HERWIG++, and POWHEG+PYTHIA are shown with dashed black, dash-dot-dotted magenta, and dash-dotted green histograms, respectively, with no uncertainties shown. The MC simulations are normalized to the data over the entire $ {p_{\mathrm {T}}} $ range. |
png pdf |
Figure 9-a:
Absolute cross section for ungroomed jets for 650 $ < {p_{\mathrm {T}}} < $ 760 GeV. The data are shown by the black points, with dark grey bands for the statistical uncertainty (Stat. unc.) and with light grey bands for the total uncertainty (Stat.+sys. unc., added in quadrature). The predictions from PYTHIA8, HERWIG++, and POWHEG+PYTHIA are shown with dashed black, dash-dot-dotted magenta, and dash-dotted green histograms, respectively, with no uncertainties shown. The MC simulations are normalized to the data over the entire $ {p_{\mathrm {T}}} $ range. |
png pdf |
Figure 9-b:
Absolute cross section for ungroomed jets for 1200 $ < {p_{\mathrm {T}}} < $ 1300 GeV. The data are shown by the black points, with dark grey bands for the statistical uncertainty (Stat. unc.) and with light grey bands for the total uncertainty (Stat.+sys. unc., added in quadrature). The predictions from PYTHIA8, HERWIG++, and POWHEG+PYTHIA are shown with dashed black, dash-dot-dotted magenta, and dash-dotted green histograms, respectively, with no uncertainties shown. The MC simulations are normalized to the data over the entire $ {p_{\mathrm {T}}} $ range. |

png pdf |
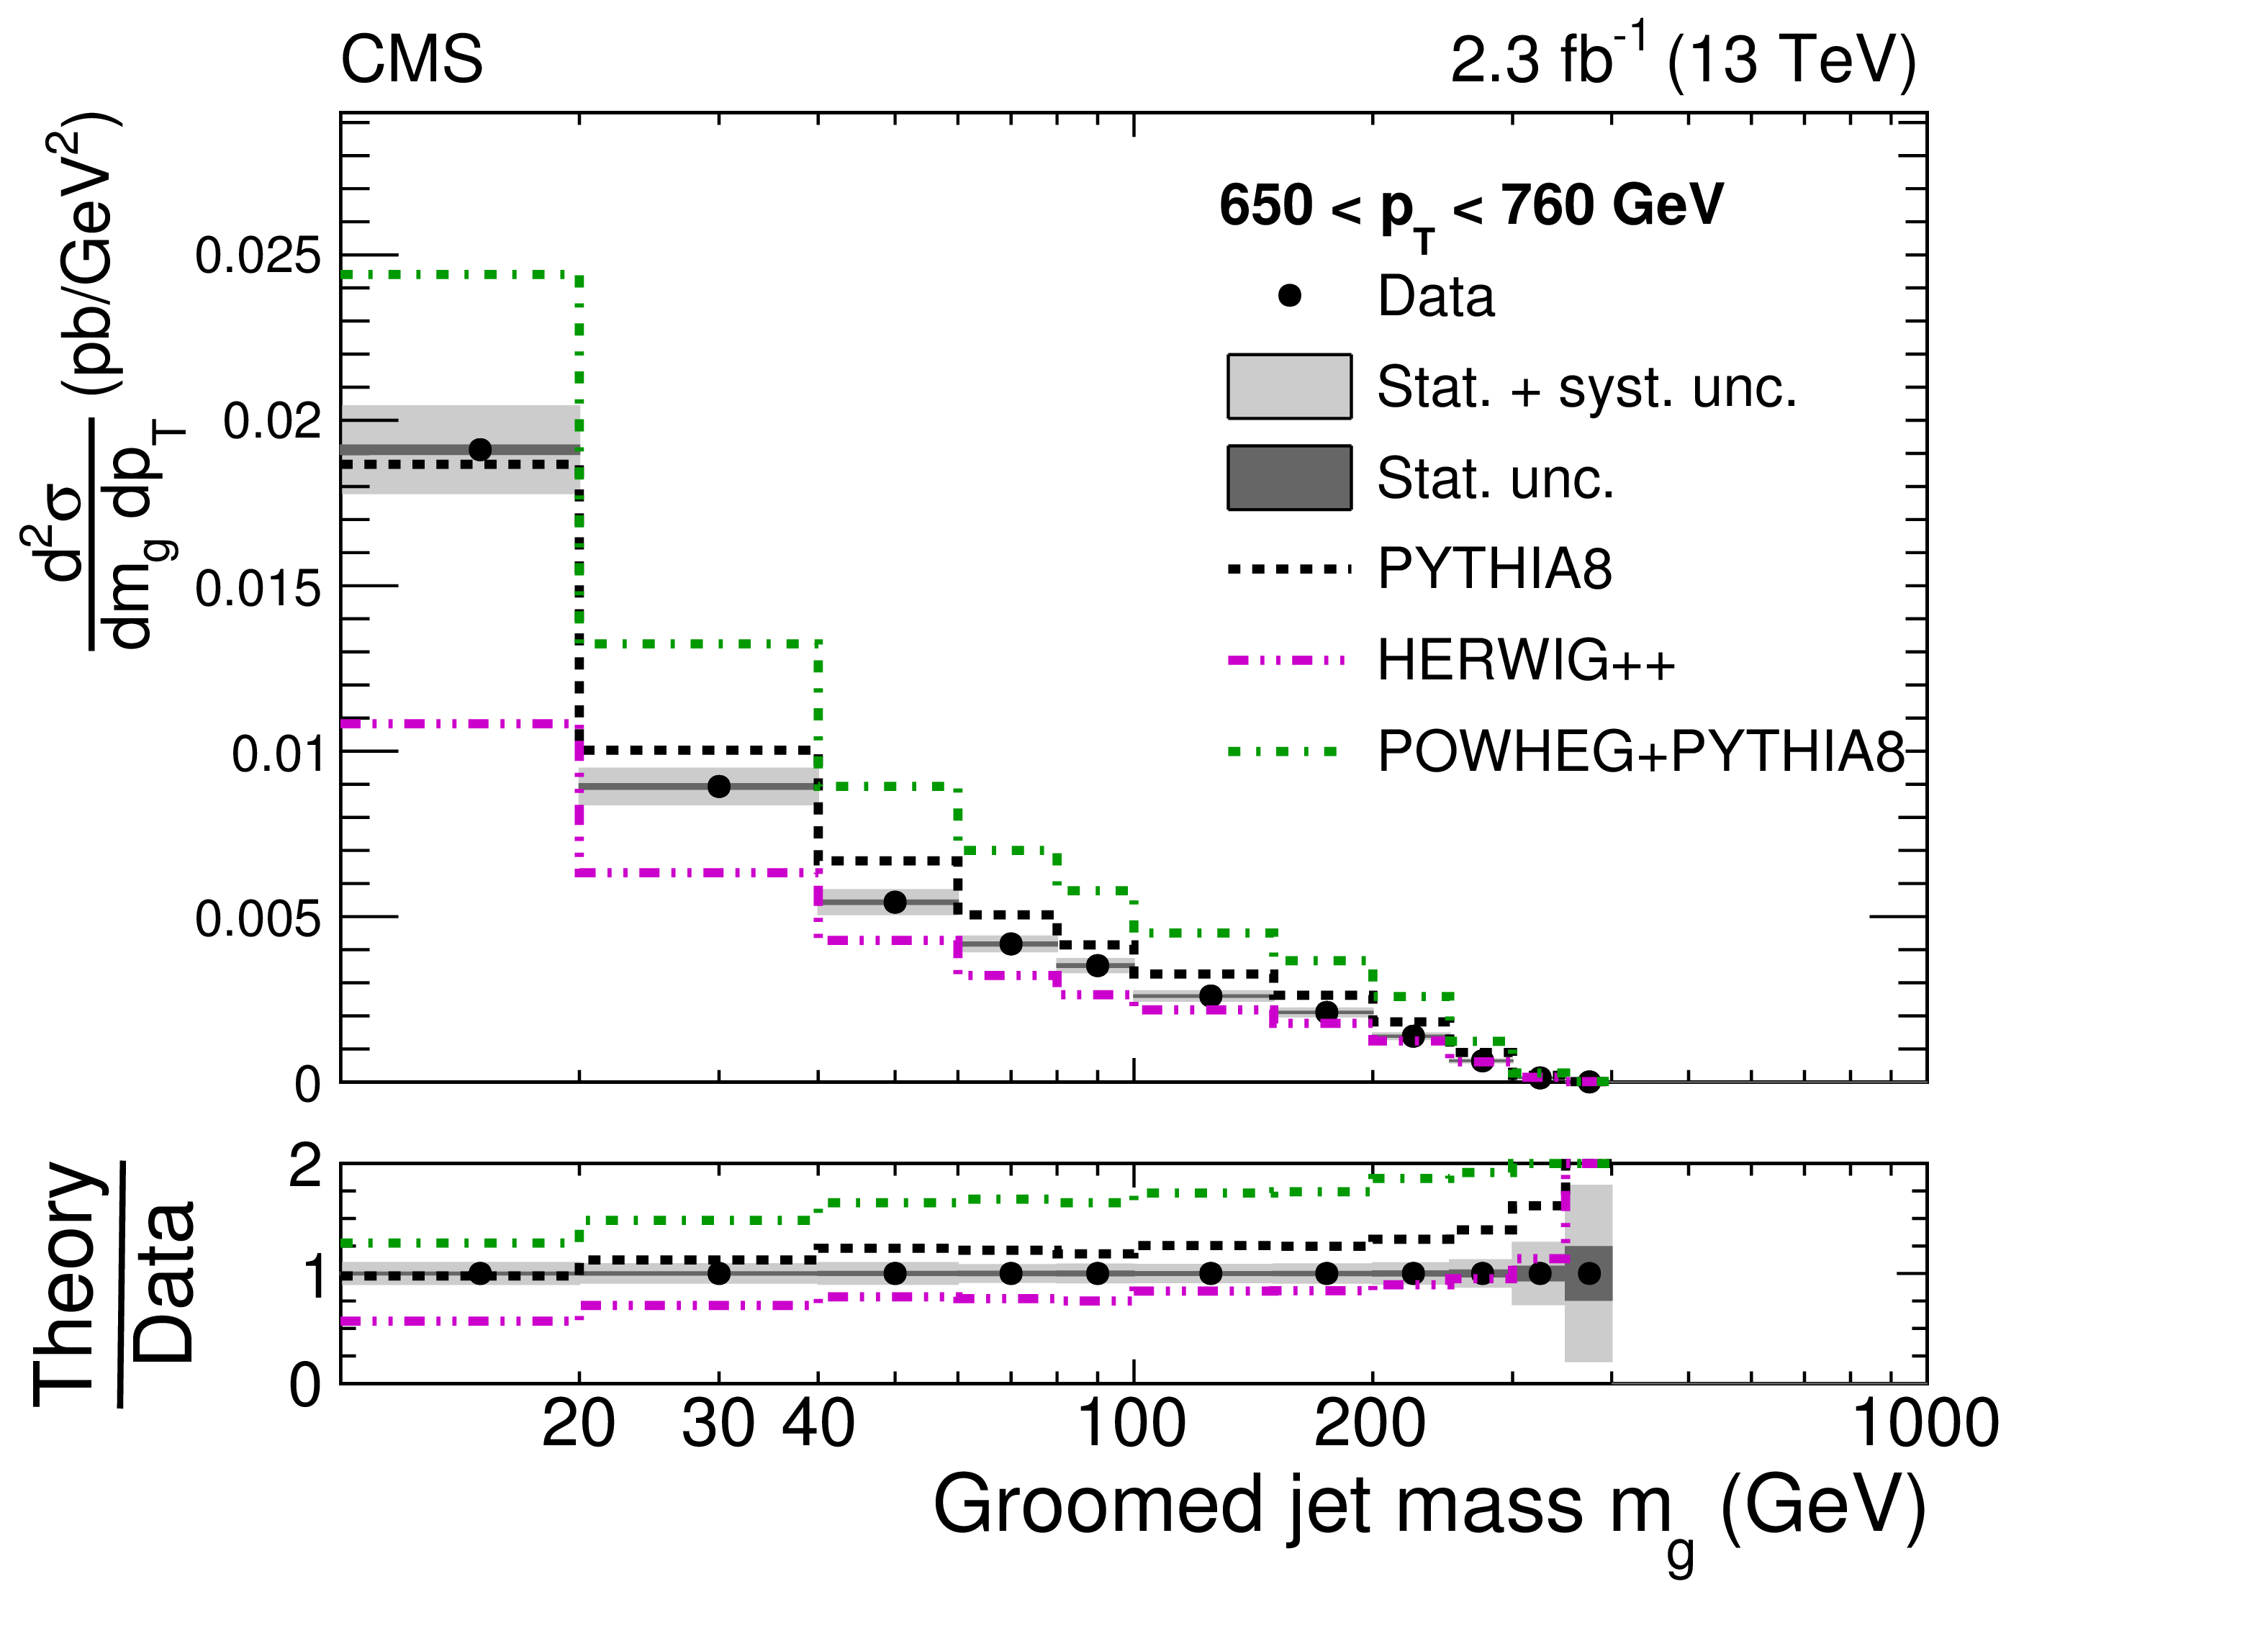
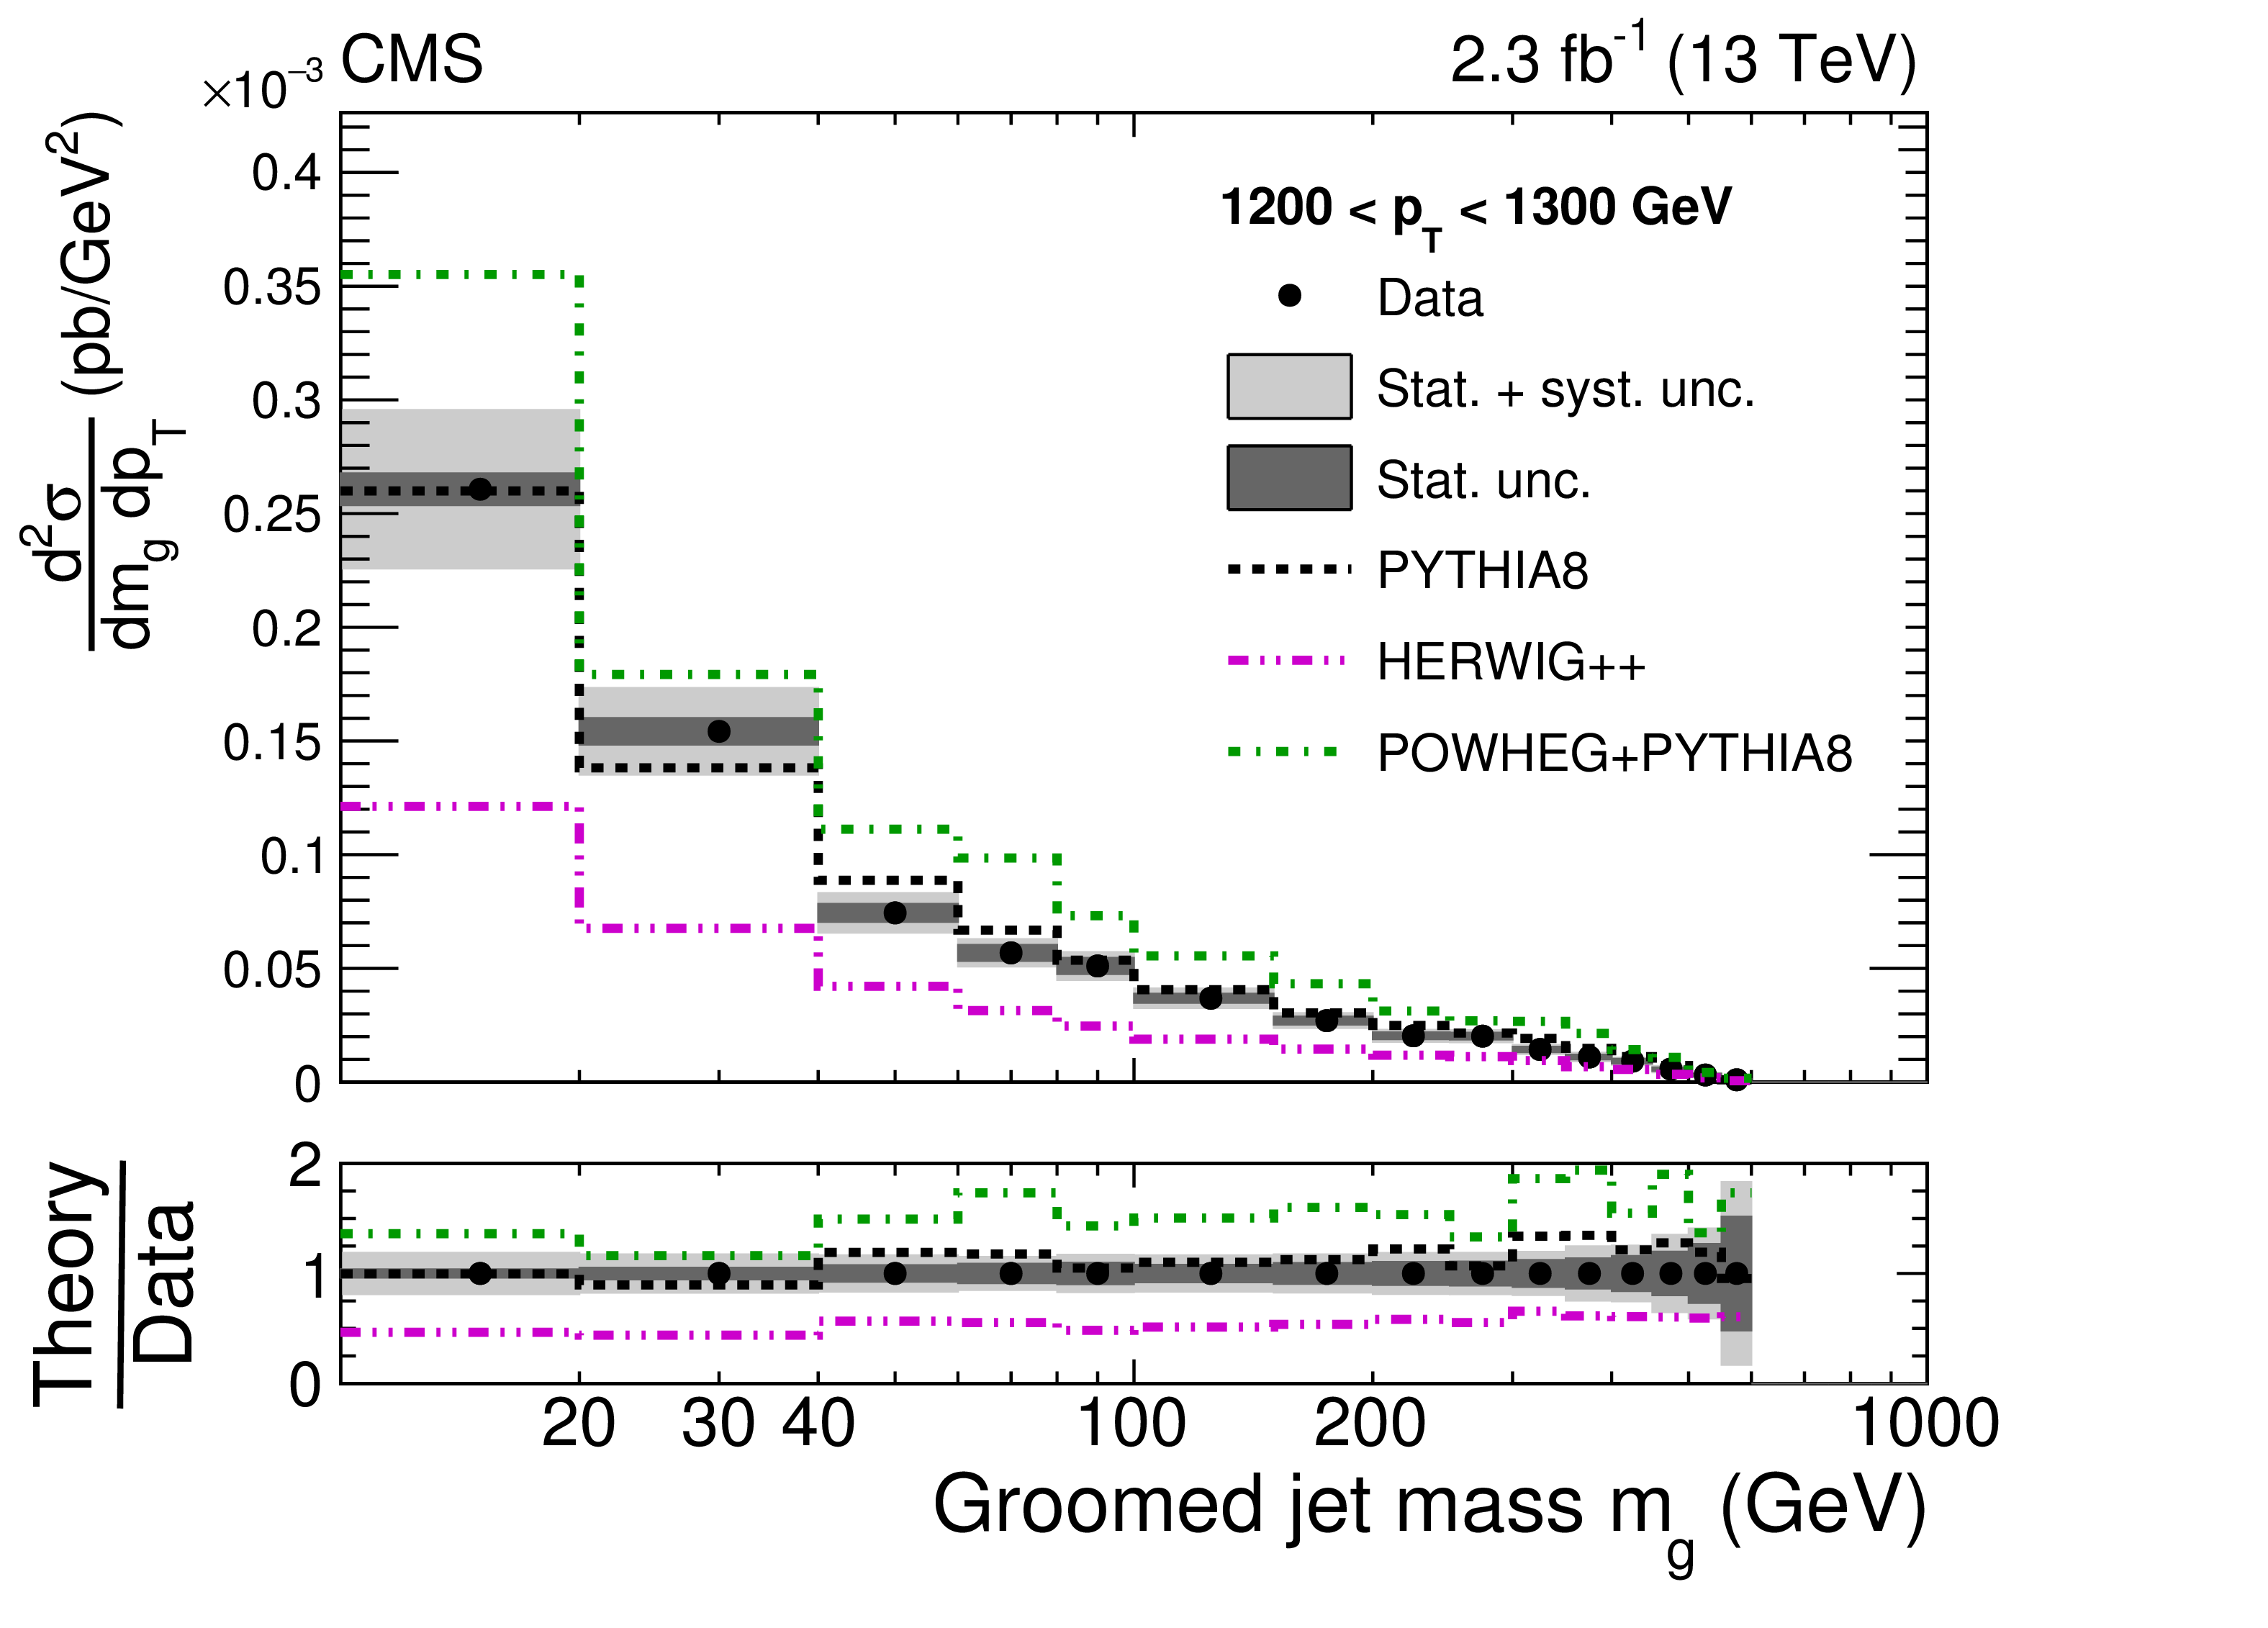
Figure 10:
Absolute cross section for groomed jets for two $ {p_{\mathrm {T}}} $ bins. The data are shown by the black points, with dark grey bands for the statistical uncertainty (Stat. unc.) and with light grey bands for the total uncertainty (Stat.+sys. unc., added in quadrature). The predictions from PYTHIA8, HERWIG++, and POWHEG+PYTHIA are shown with dashed black, dash-dot-dotted magenta, and dash-dotted green histograms, respectively, with no uncertainties shown. The MC simulations are normalized to the data over the entire $ {p_{\mathrm {T}}} $ range. |
png pdf |
Figure 10-a:
Absolute cross section for groomed jets for 650 $ < {p_{\mathrm {T}}} < $ 760 GeV. The data are shown by the black points, with dark grey bands for the statistical uncertainty (Stat. unc.) and with light grey bands for the total uncertainty (Stat.+sys. unc., added in quadrature). The predictions from PYTHIA8, HERWIG++, and POWHEG+PYTHIA are shown with dashed black, dash-dot-dotted magenta, and dash-dotted green histograms, respectively, with no uncertainties shown. The MC simulations are normalized to the data over the entire $ {p_{\mathrm {T}}} $ range. |
png pdf |
Figure 10-b:
Absolute cross section for groomed jets for 1200 $ < {p_{\mathrm {T}}} < $ 1300 GeV. The data are shown by the black points, with dark grey bands for the statistical uncertainty (Stat. unc.) and with light grey bands for the total uncertainty (Stat.+sys. unc., added in quadrature). The predictions from PYTHIA8, HERWIG++, and POWHEG+PYTHIA are shown with dashed black, dash-dot-dotted magenta, and dash-dotted green histograms, respectively, with no uncertainties shown. The MC simulations are normalized to the data over the entire $ {p_{\mathrm {T}}} $ range. |
png pdf |
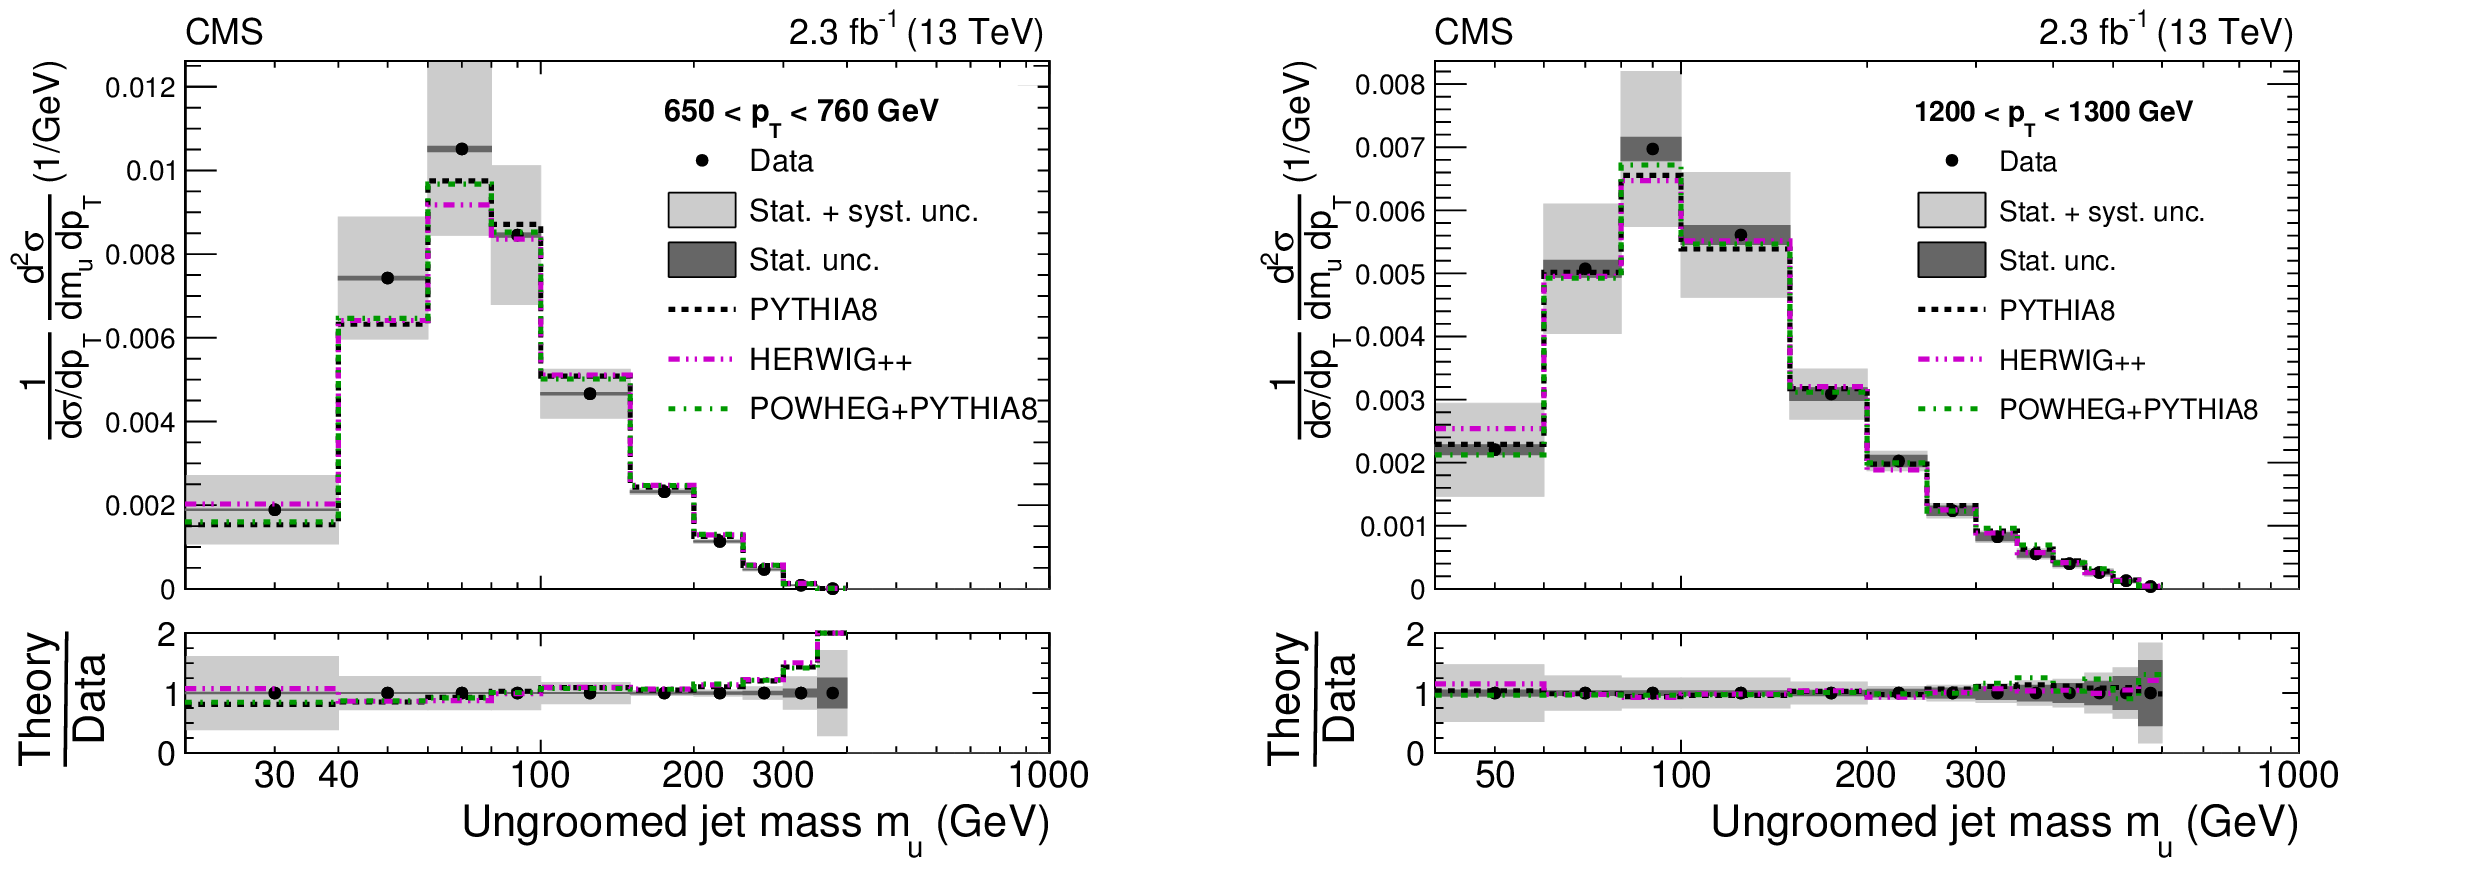
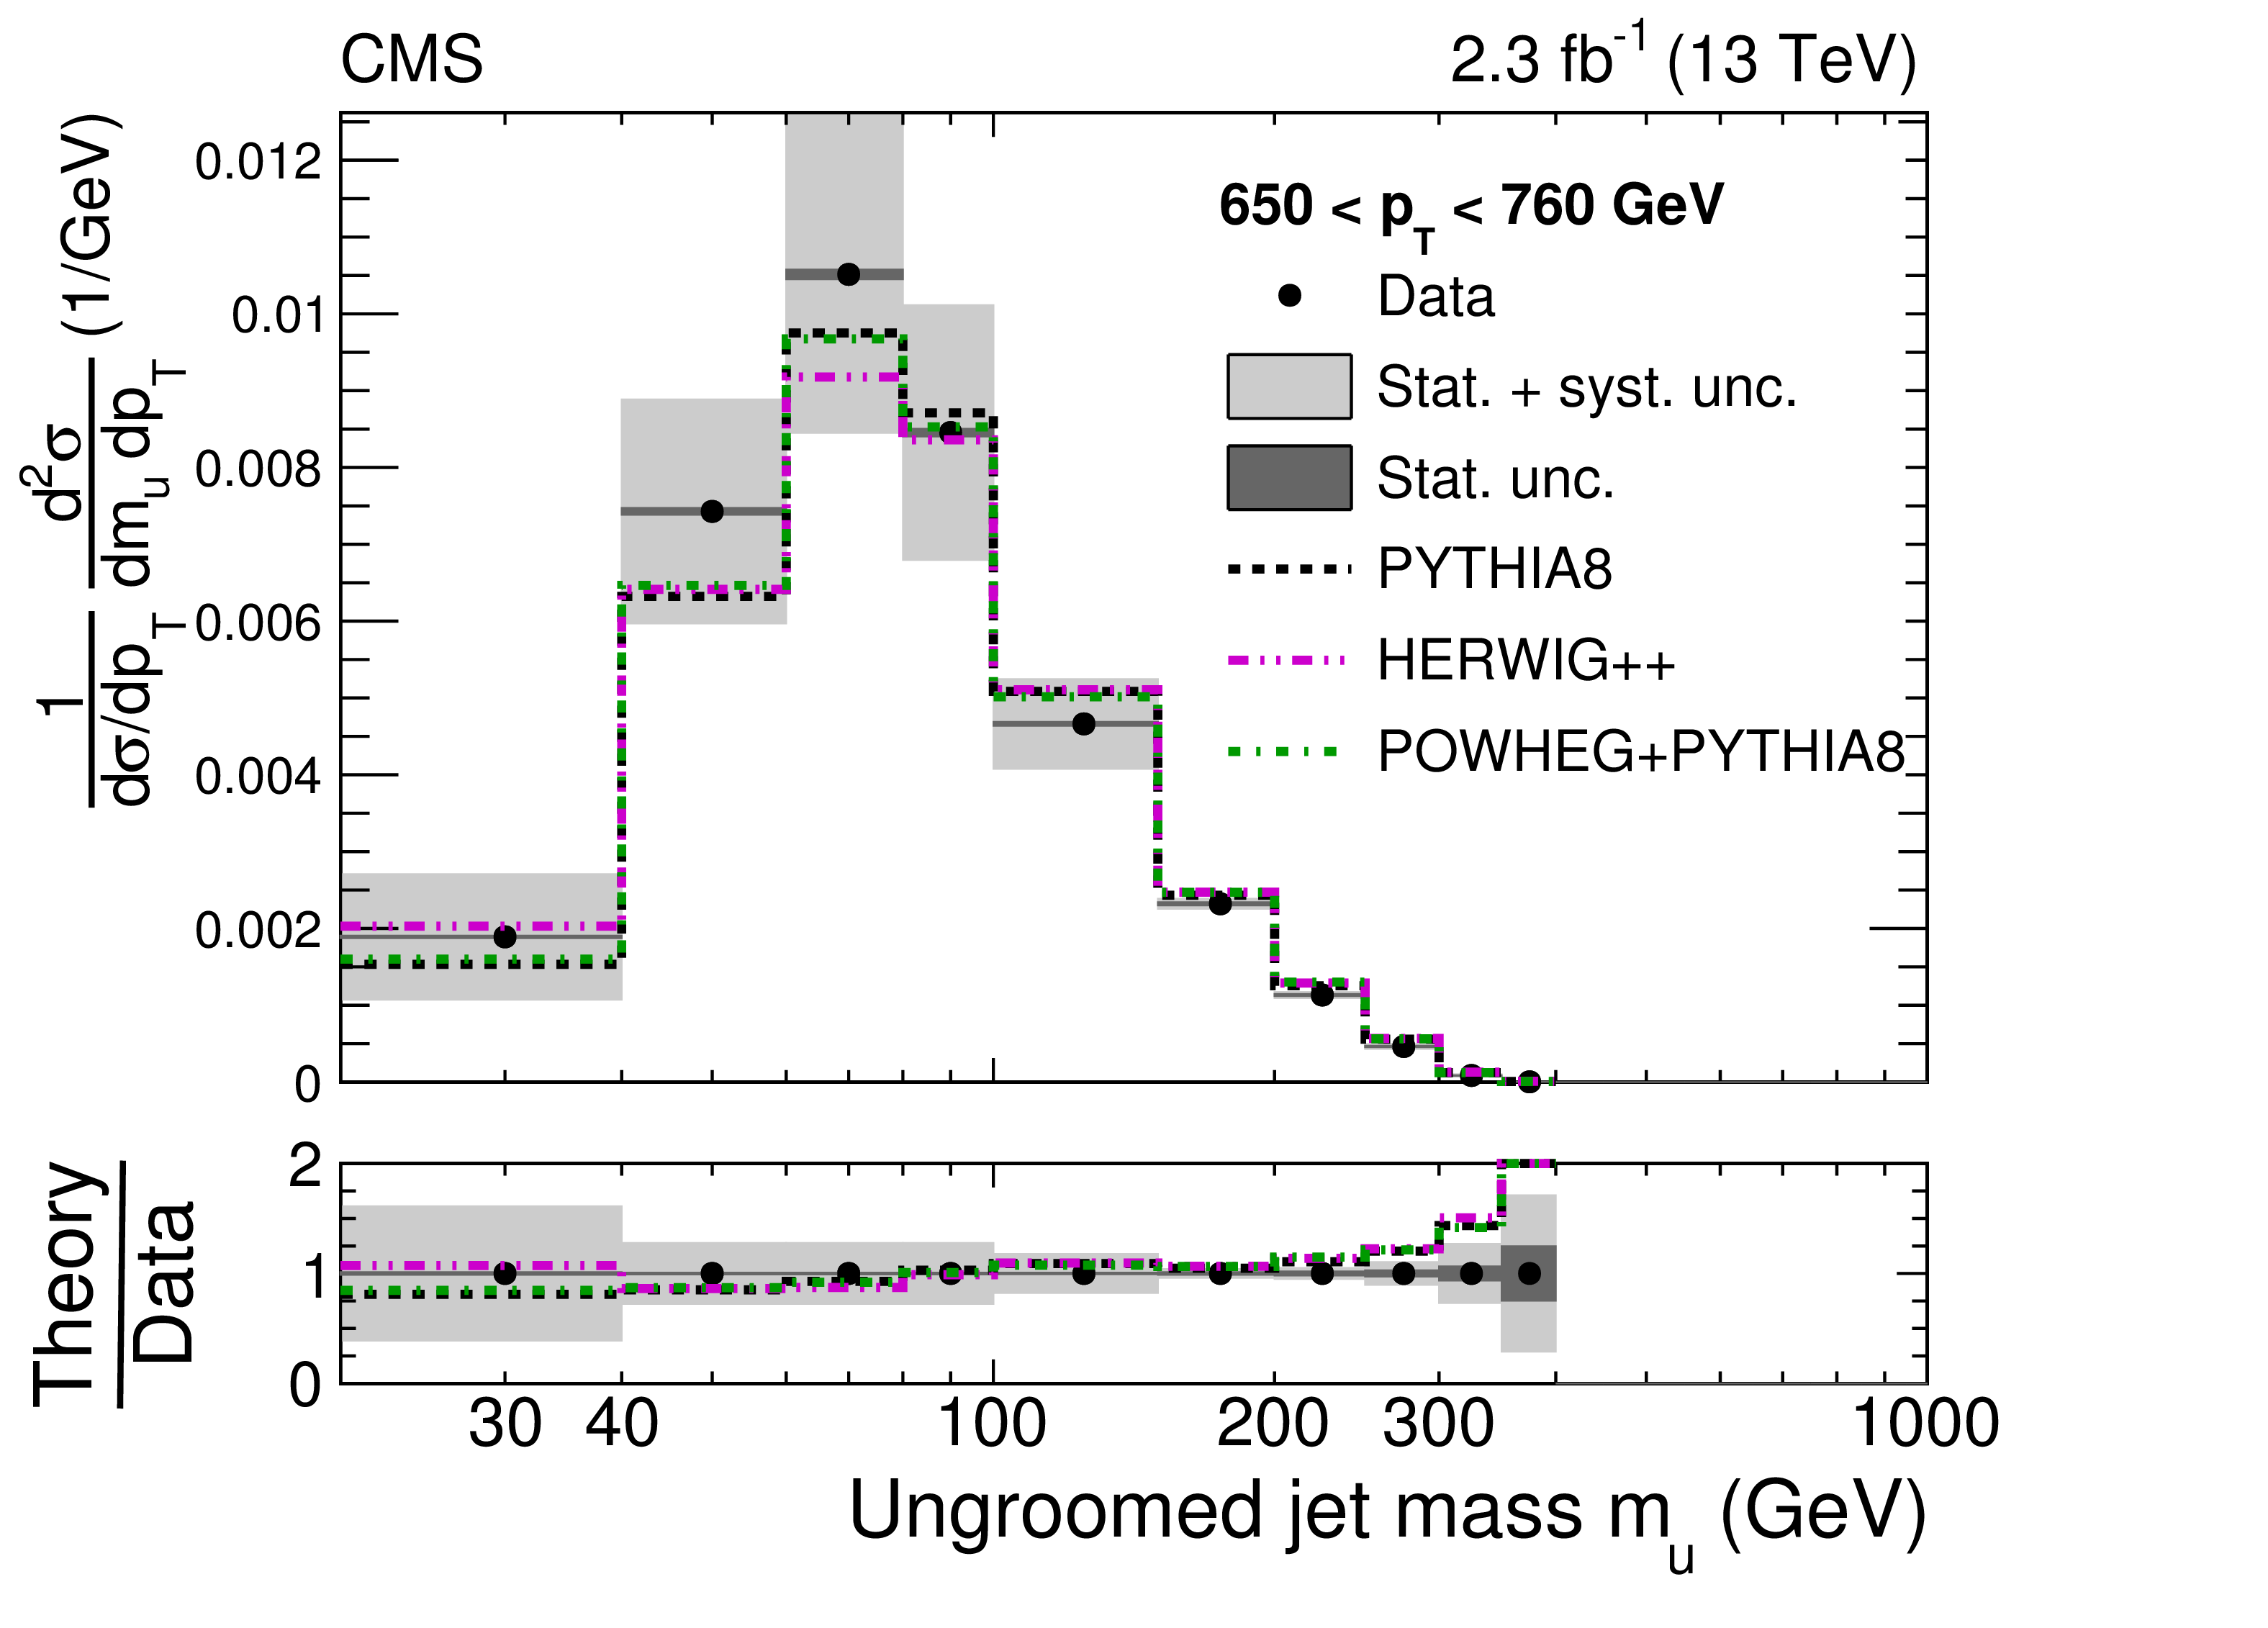
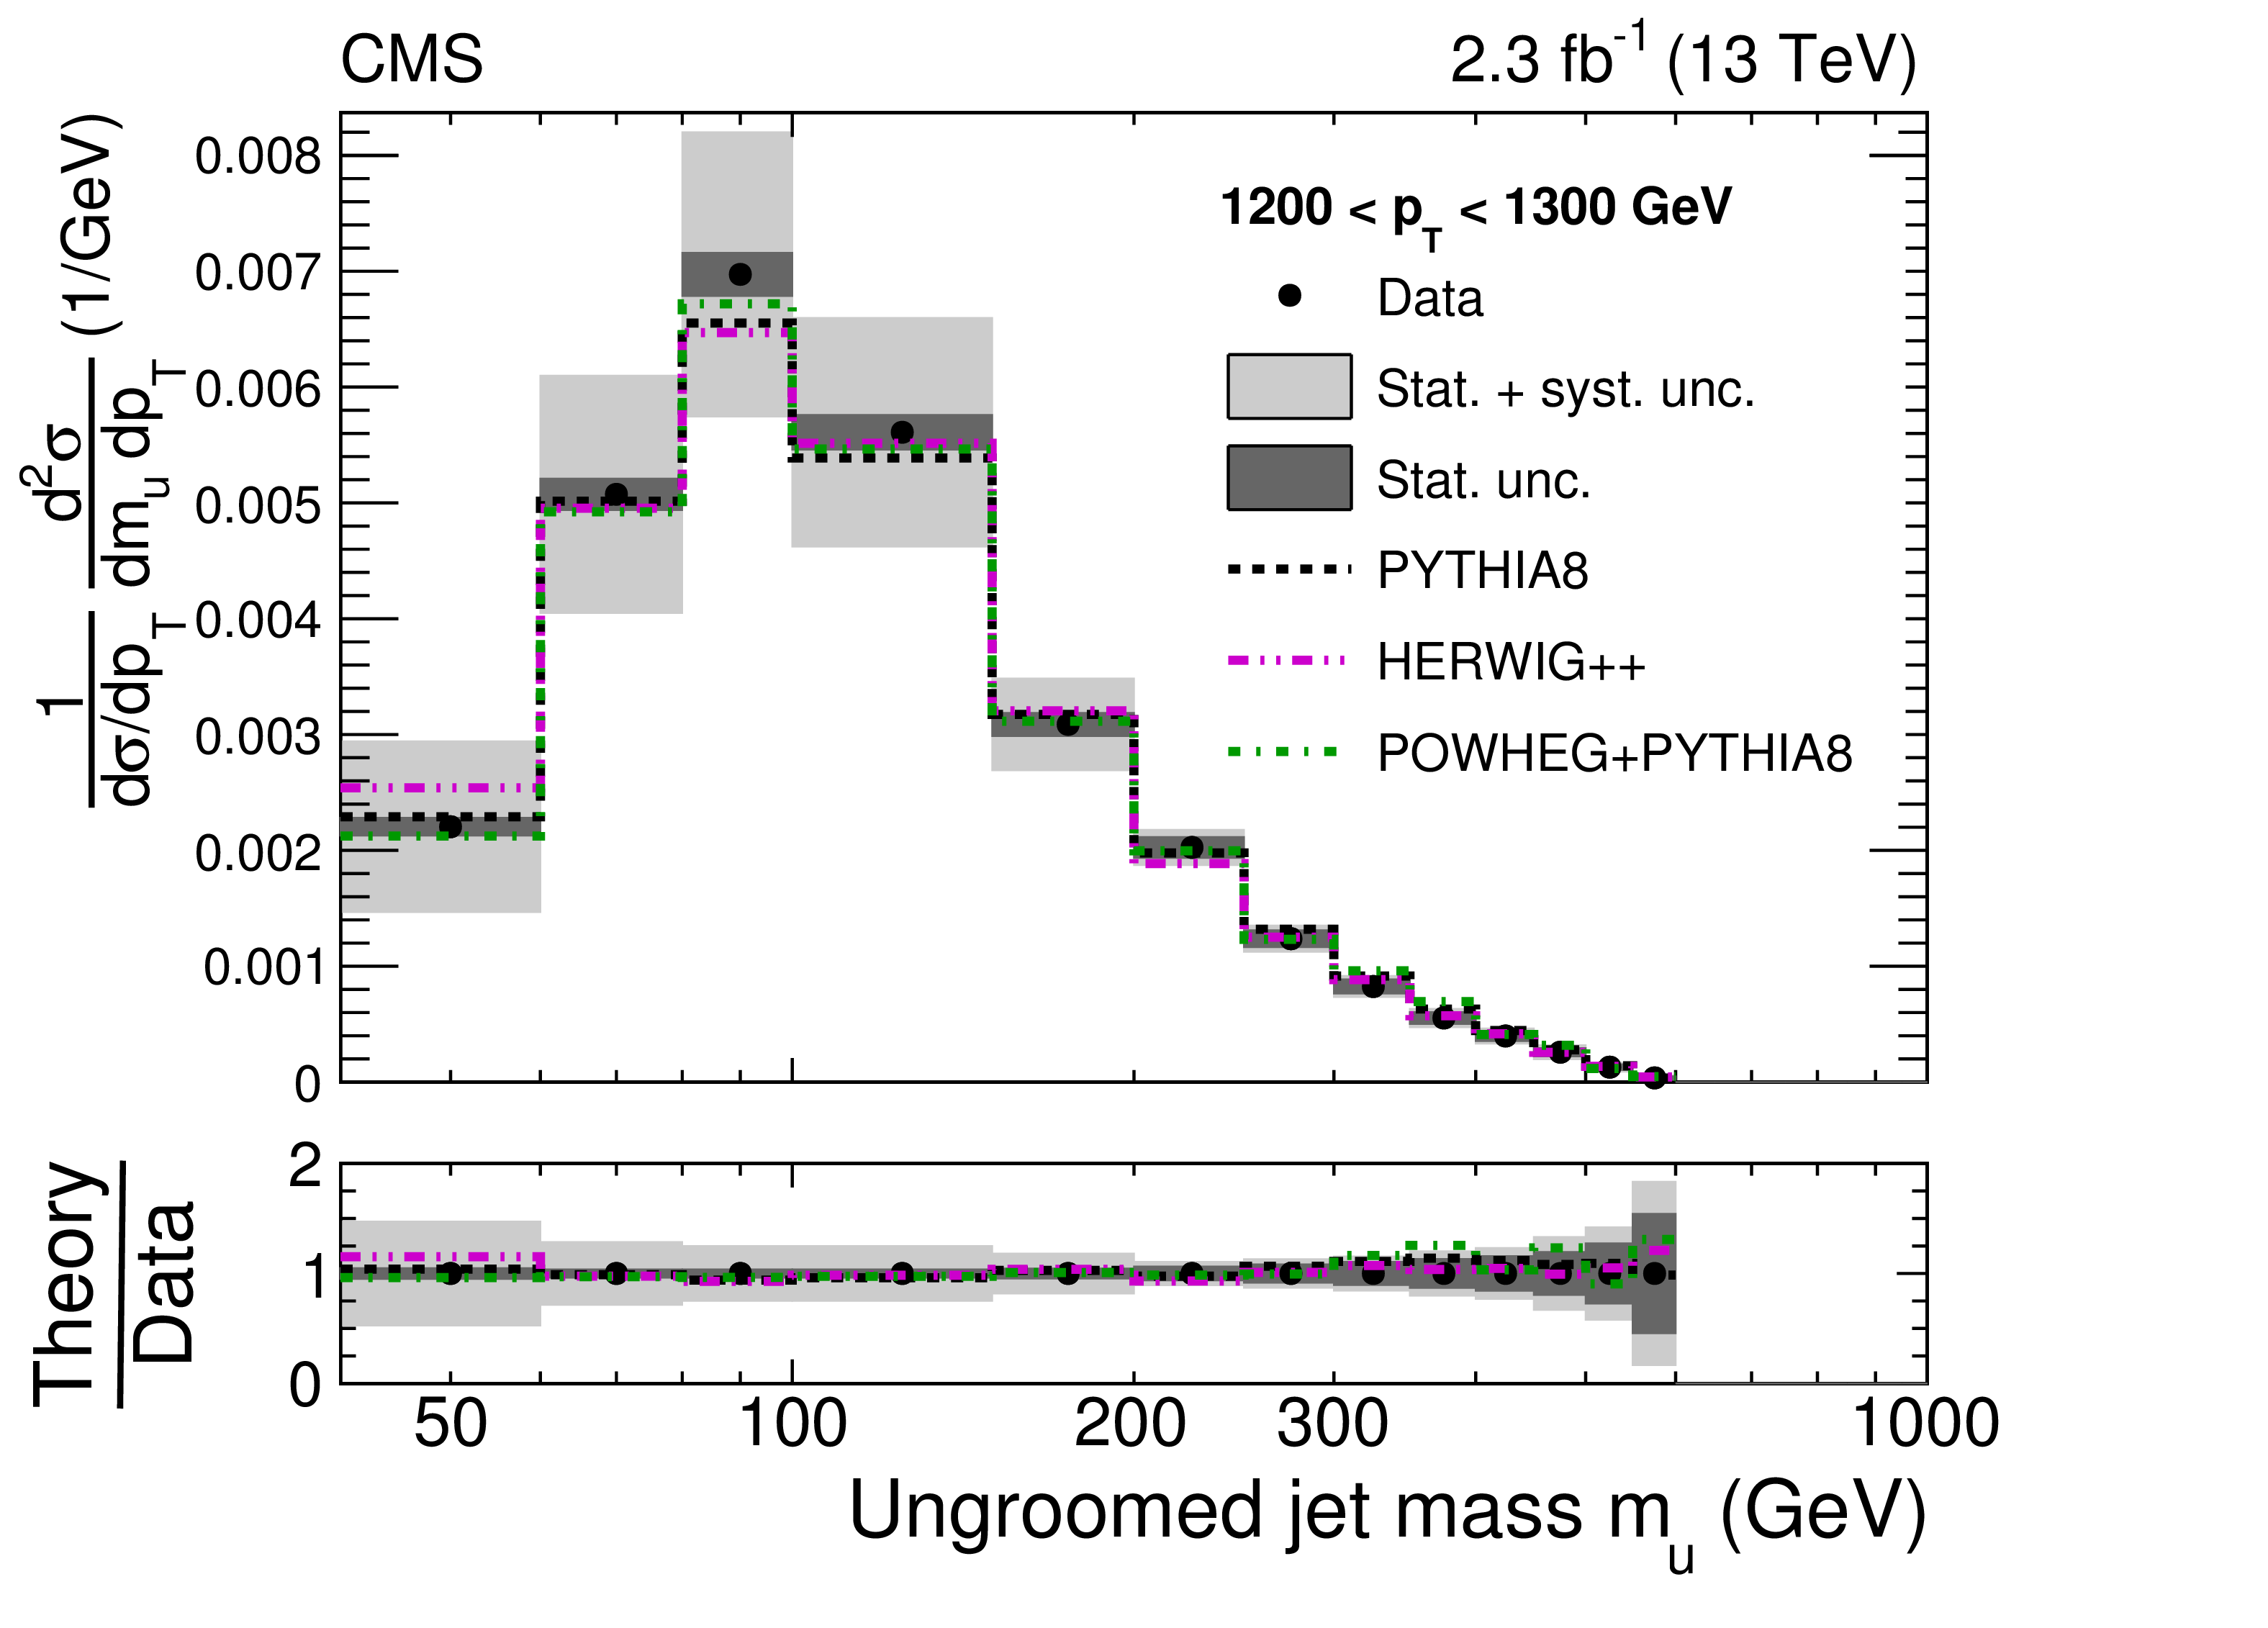
Figure 11:
Normalized cross section for the ungroomed jets for two $ {p_{\mathrm {T}}} $ bins. The data are shown by the black points, with dark grey bands for the statistical uncertainty (Stat. unc.) and with light grey bands for the total uncertainty (stat.+sys. unc., added in quadrature). The predictions from PYTHIA8, HERWIG++, and POWHEG+PYTHIA are shown with dashed black, dash-dot-dotted magenta, and dash-dotted green histograms, respectively, with no uncertainties shown. |
png pdf |
Figure 11-a:
Normalized cross section for the ungroomed jets for 650 $ < {p_{\mathrm {T}}} < $ 760 GeV. The data are shown by the black points, with dark grey bands for the statistical uncertainty (Stat. unc.) and with light grey bands for the total uncertainty (stat.+sys. unc., added in quadrature). The predictions from PYTHIA8, HERWIG++, and POWHEG+PYTHIA are shown with dashed black, dash-dot-dotted magenta, and dash-dotted green histograms, respectively, with no uncertainties shown. |
png pdf |
Figure 11-b:
Normalized cross section for the ungroomed jets for 1200 $ < {p_{\mathrm {T}}} < $ 1300 GeV. The data are shown by the black points, with dark grey bands for the statistical uncertainty (Stat. unc.) and with light grey bands for the total uncertainty (stat.+sys. unc., added in quadrature). The predictions from PYTHIA8, HERWIG++, and POWHEG+PYTHIA are shown with dashed black, dash-dot-dotted magenta, and dash-dotted green histograms, respectively, with no uncertainties shown. |

png pdf |
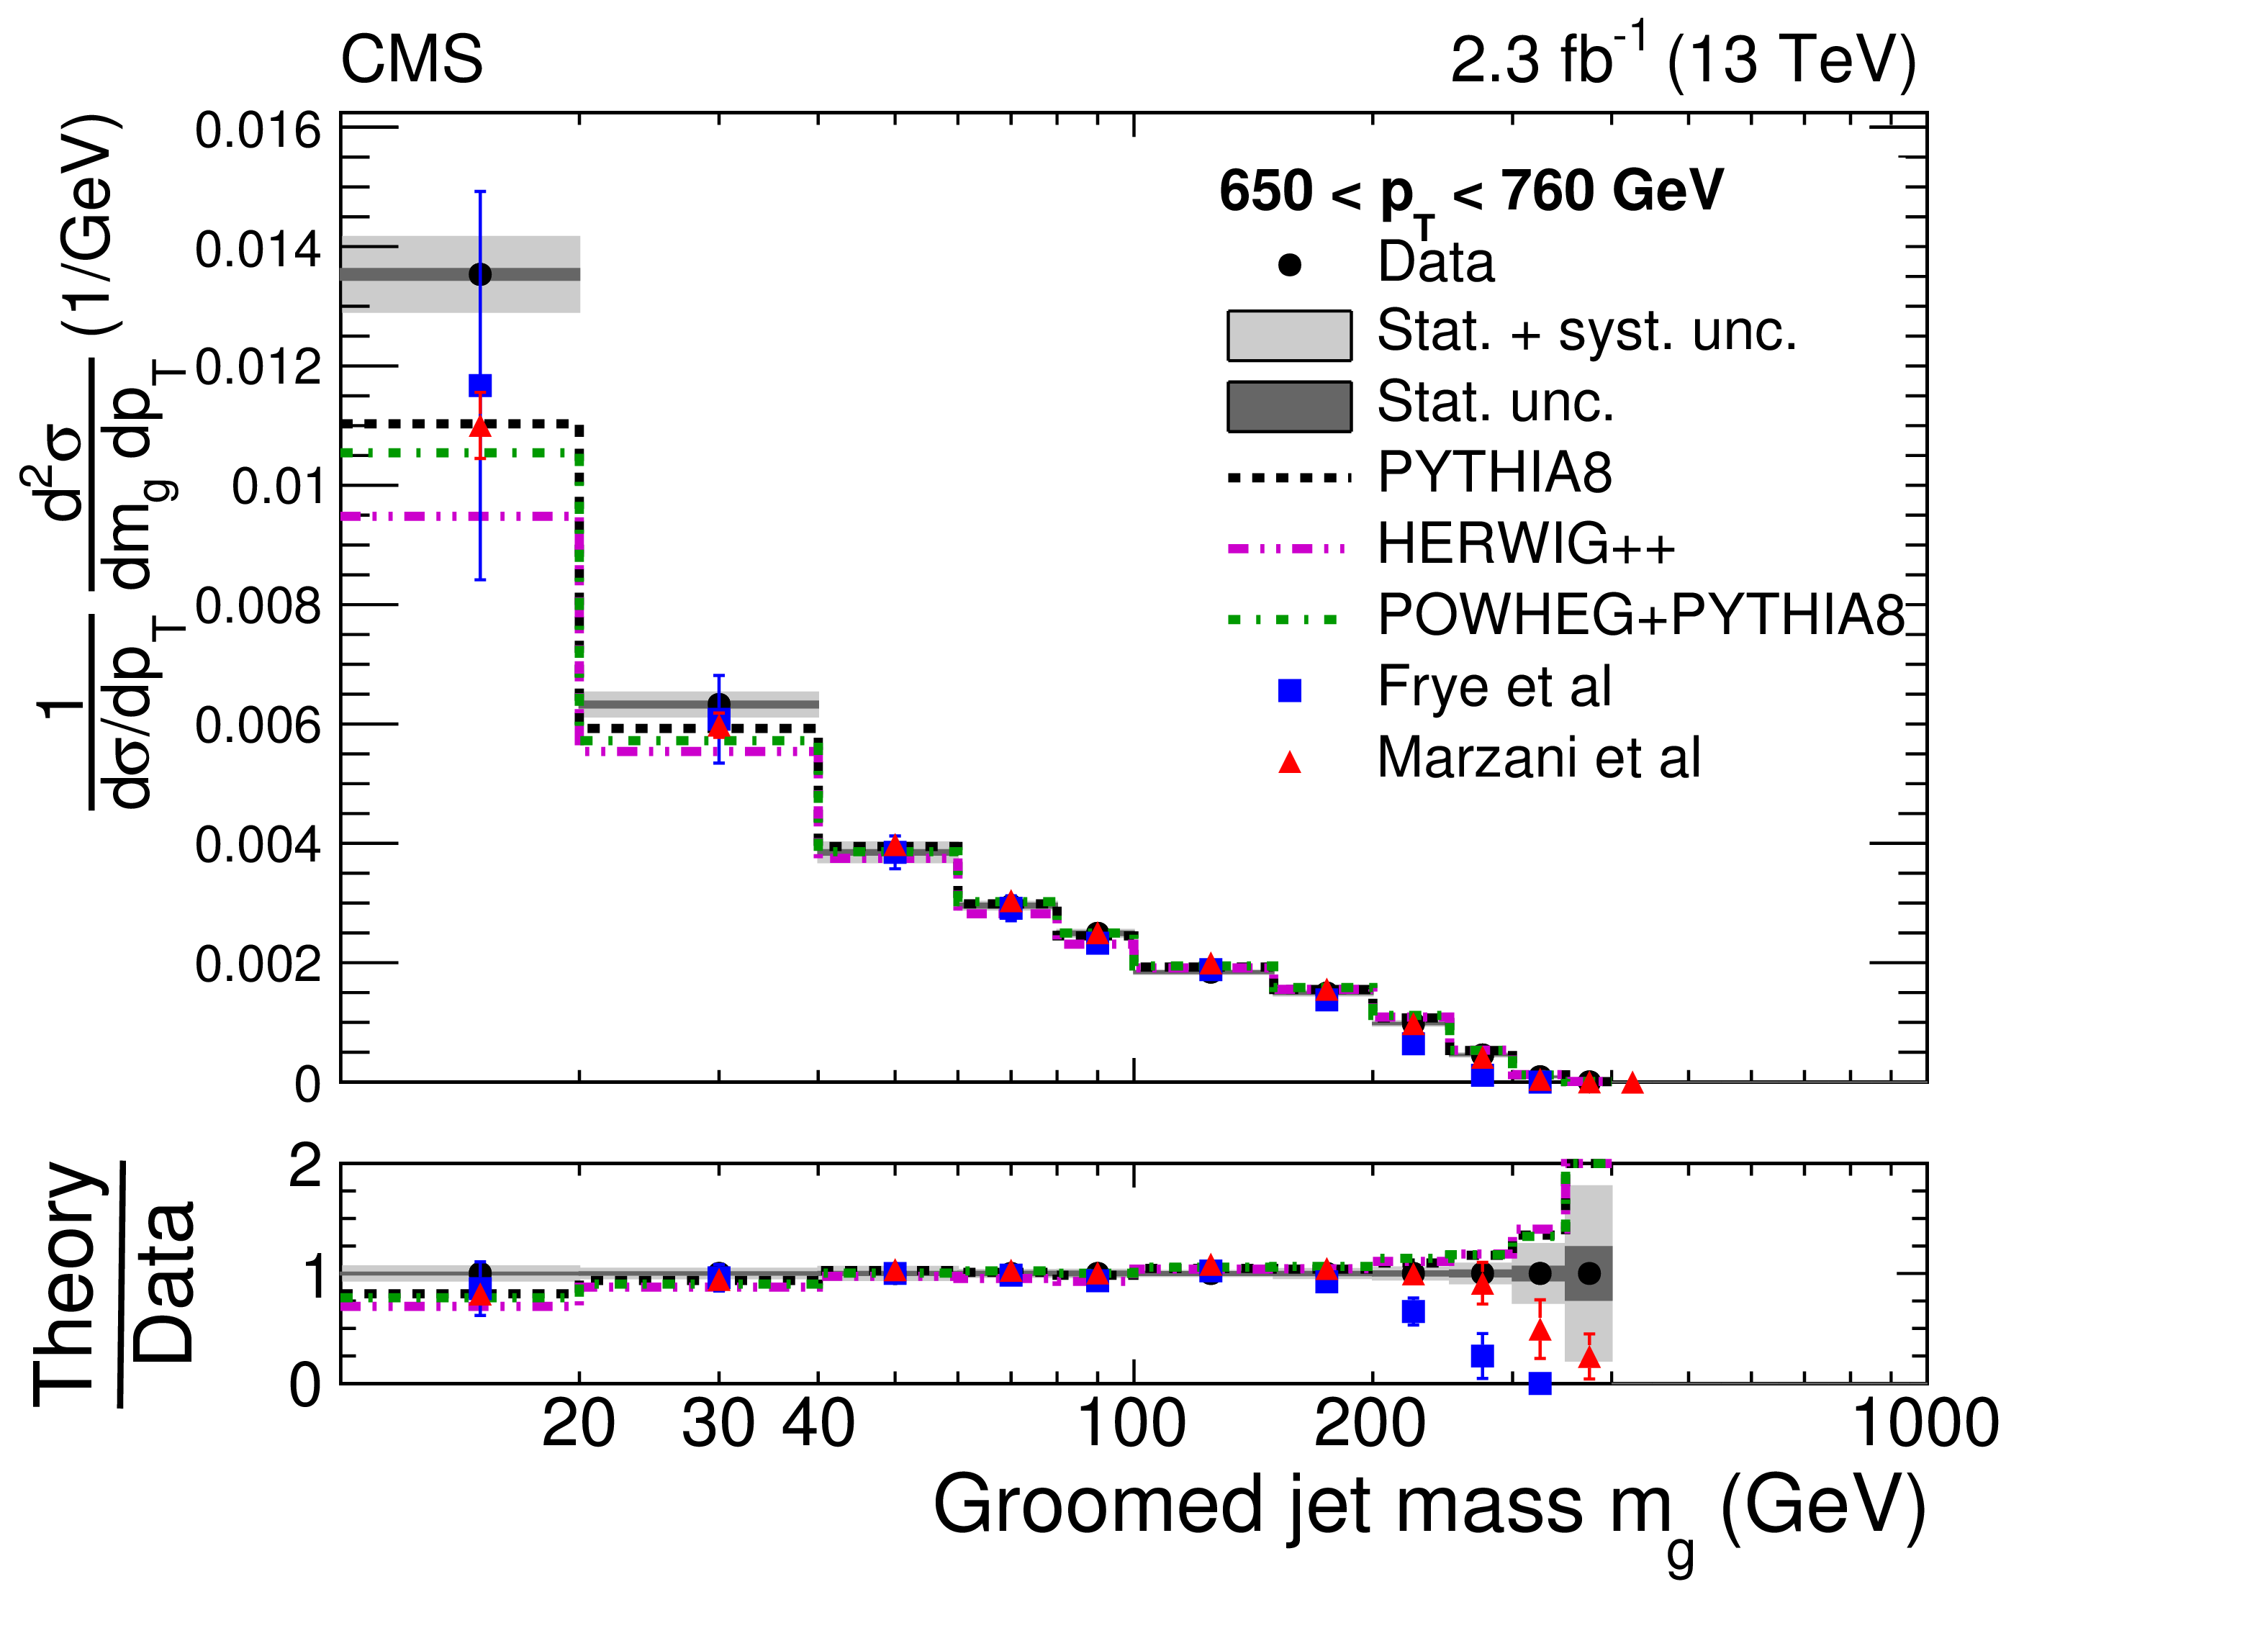
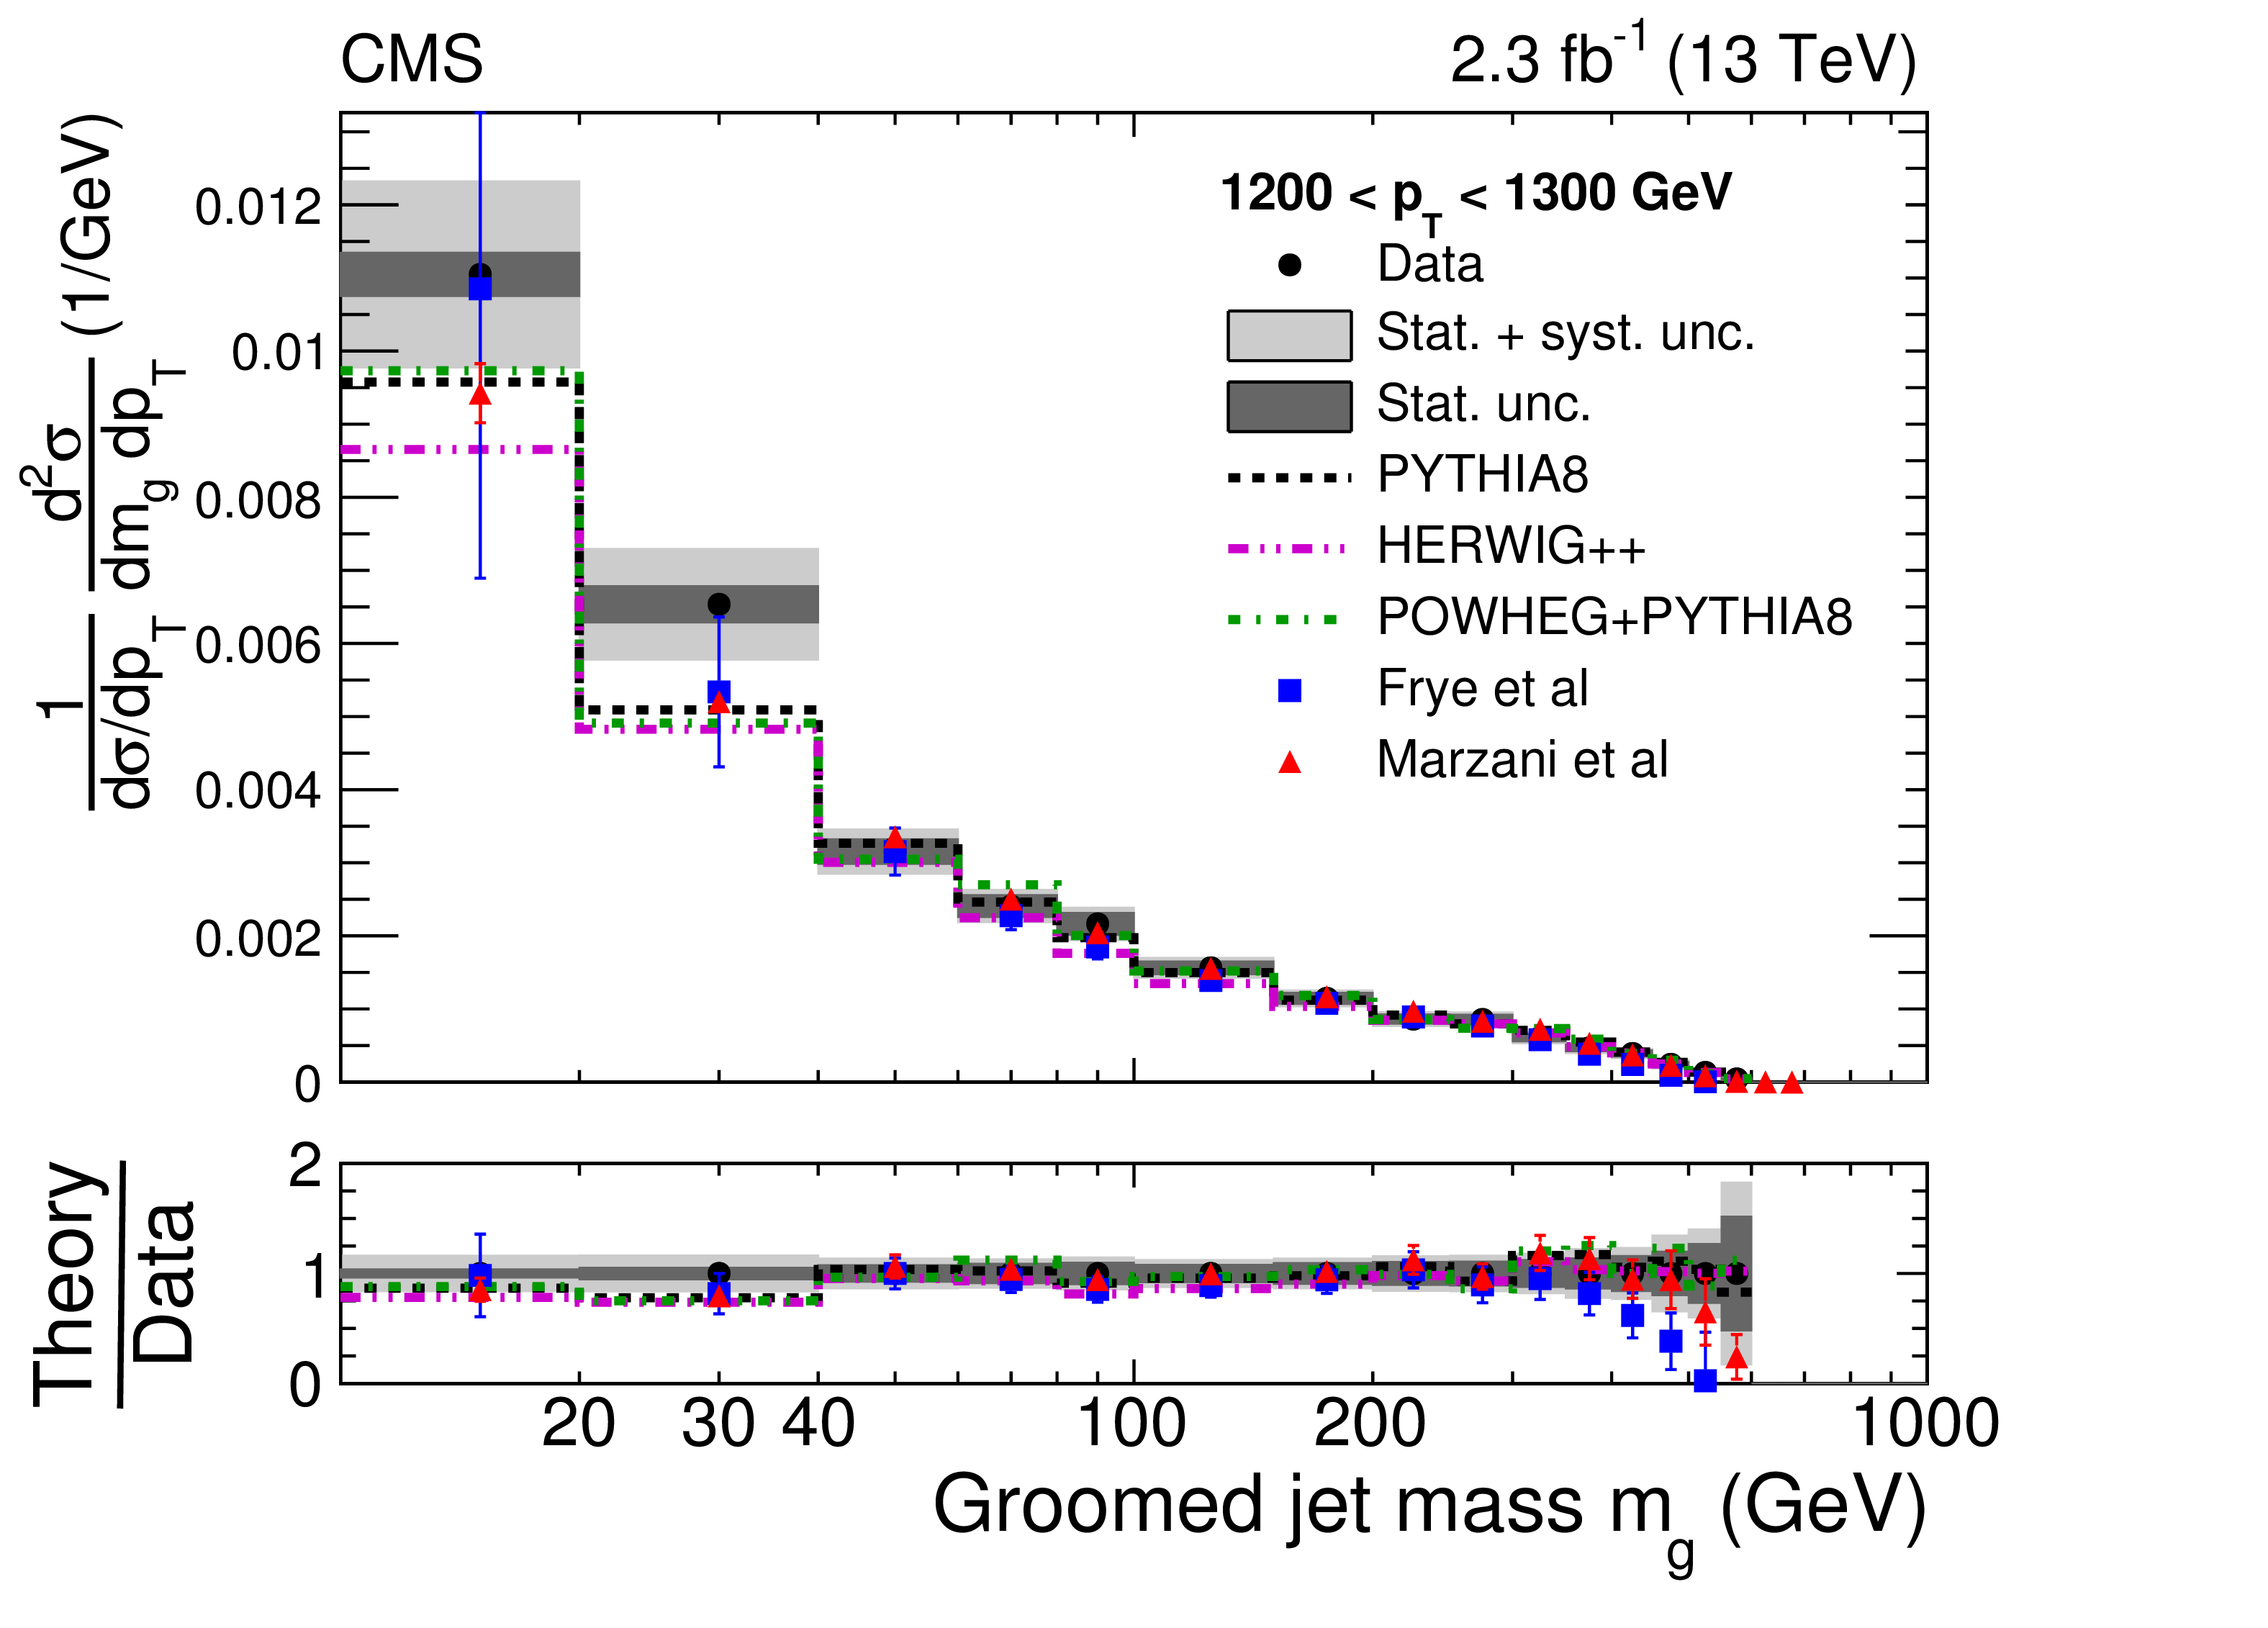
Figure 12:
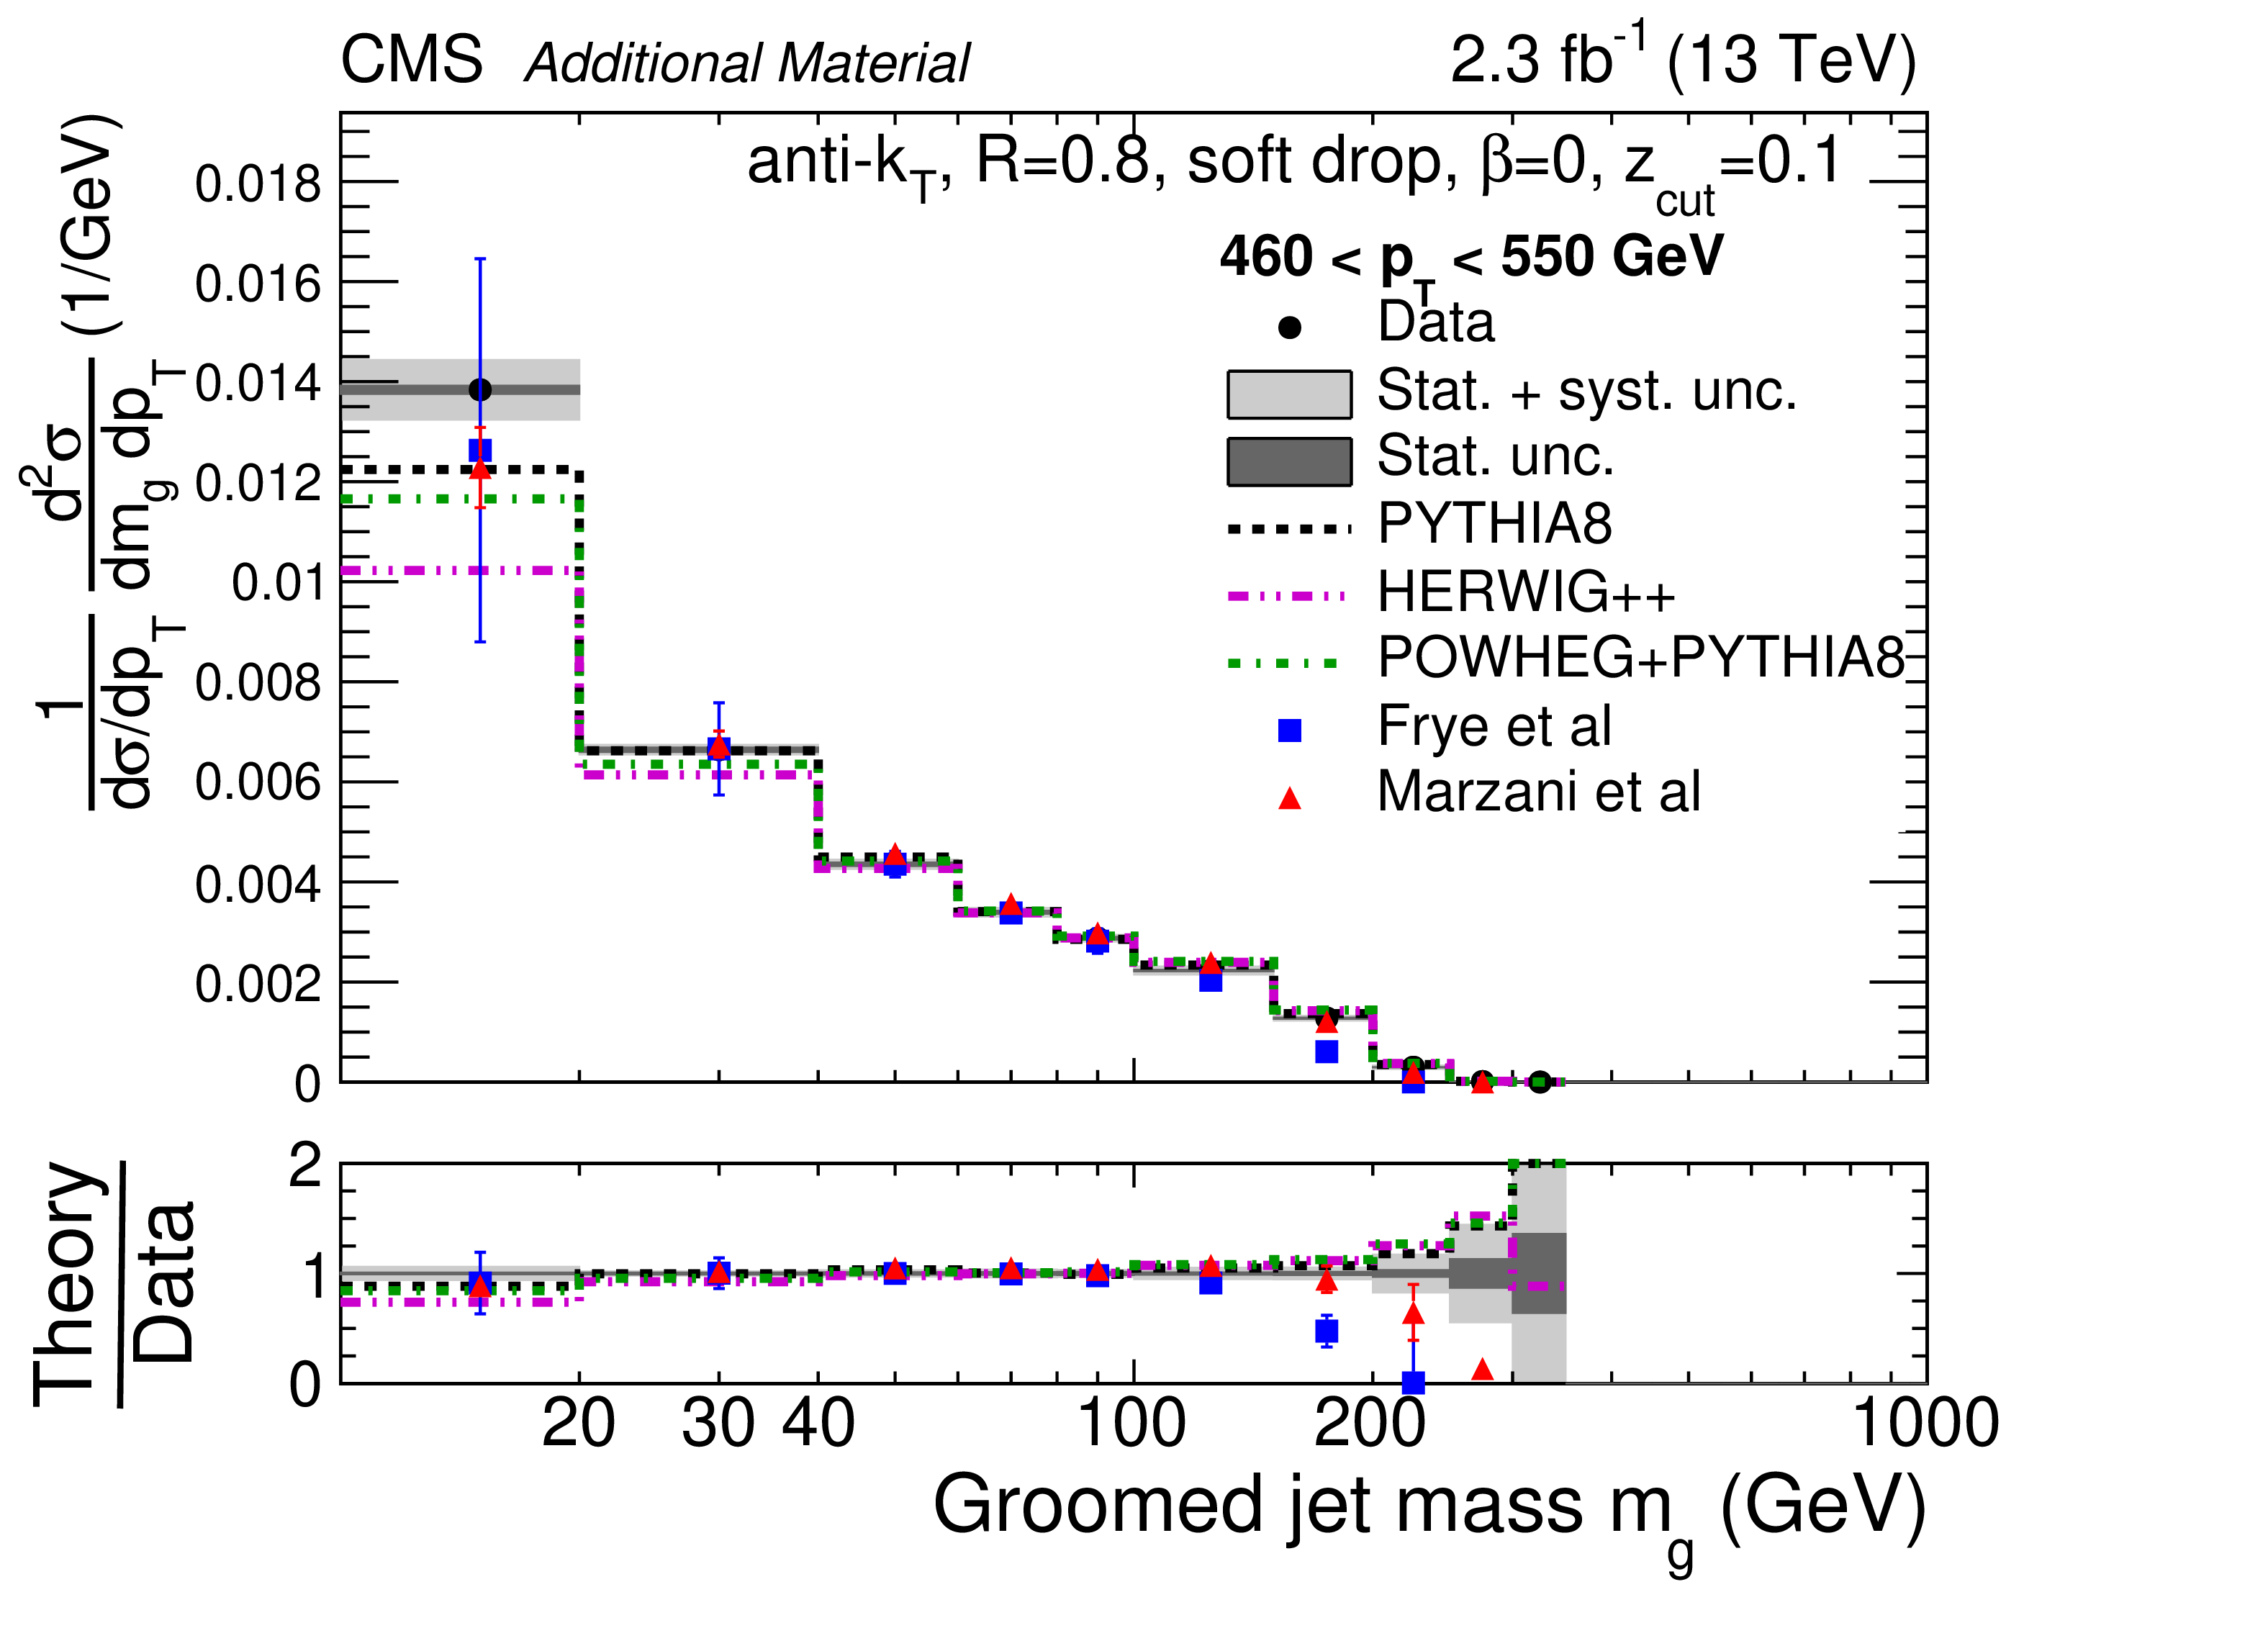
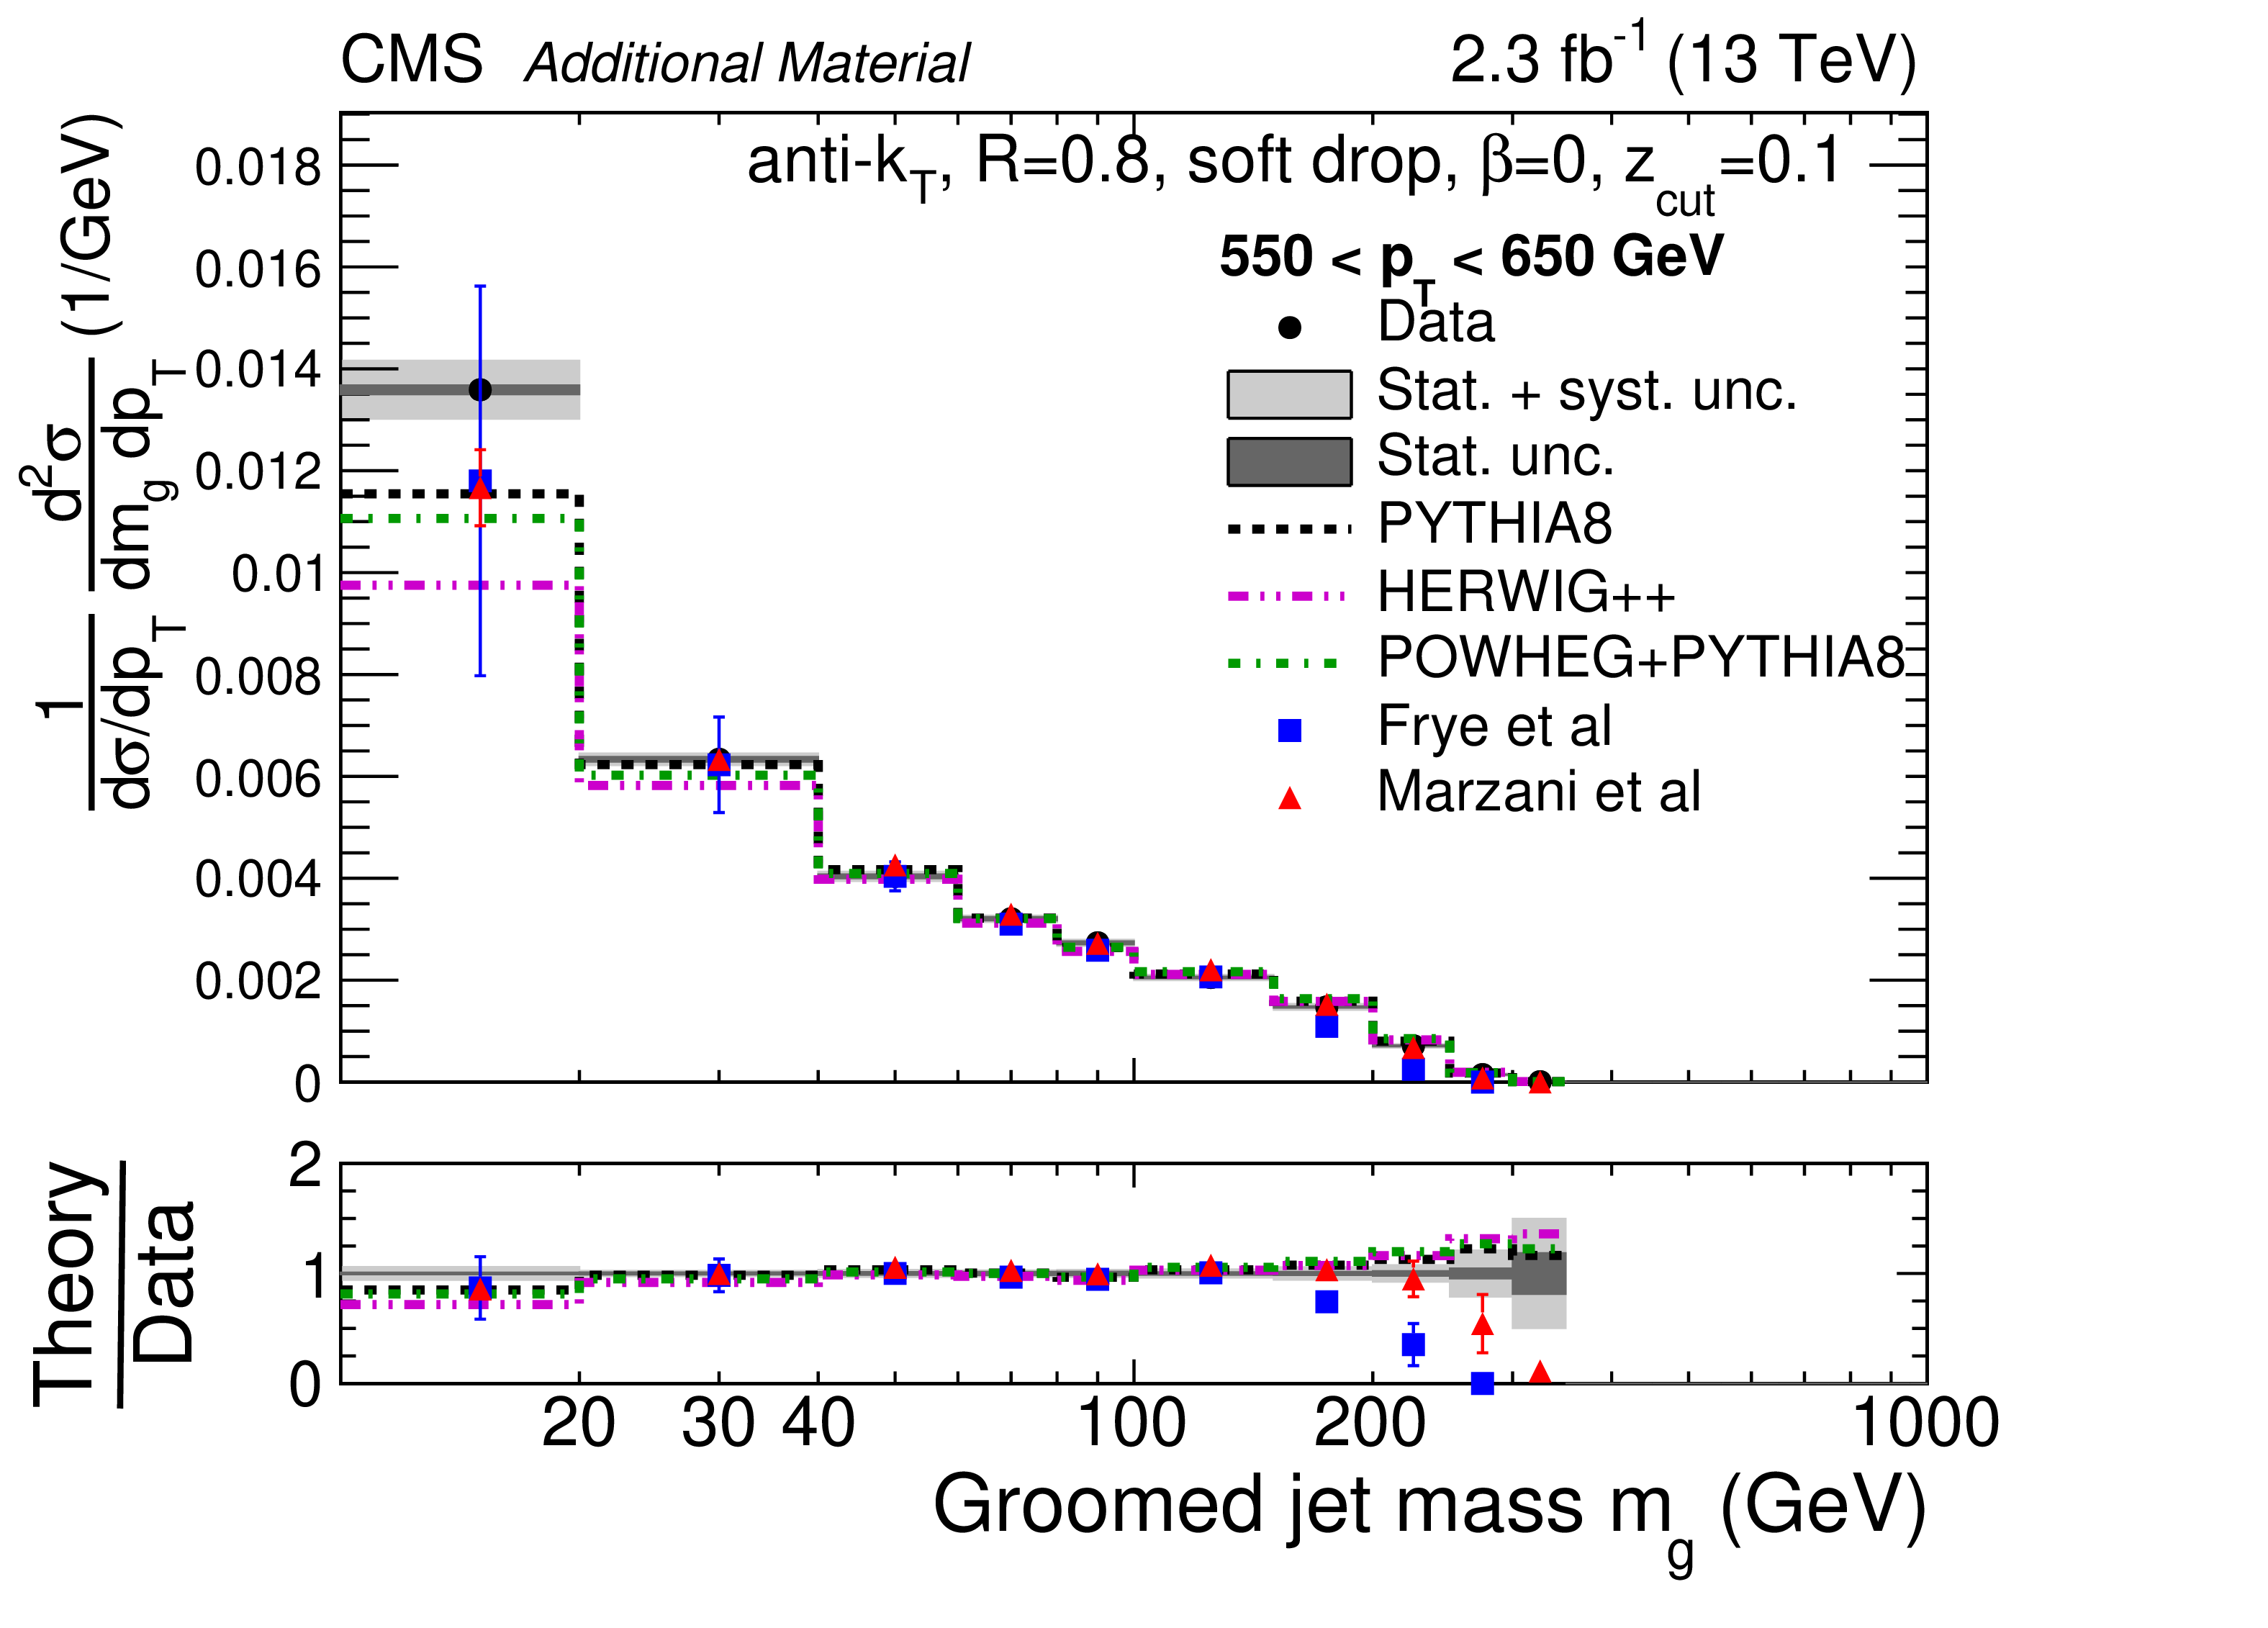
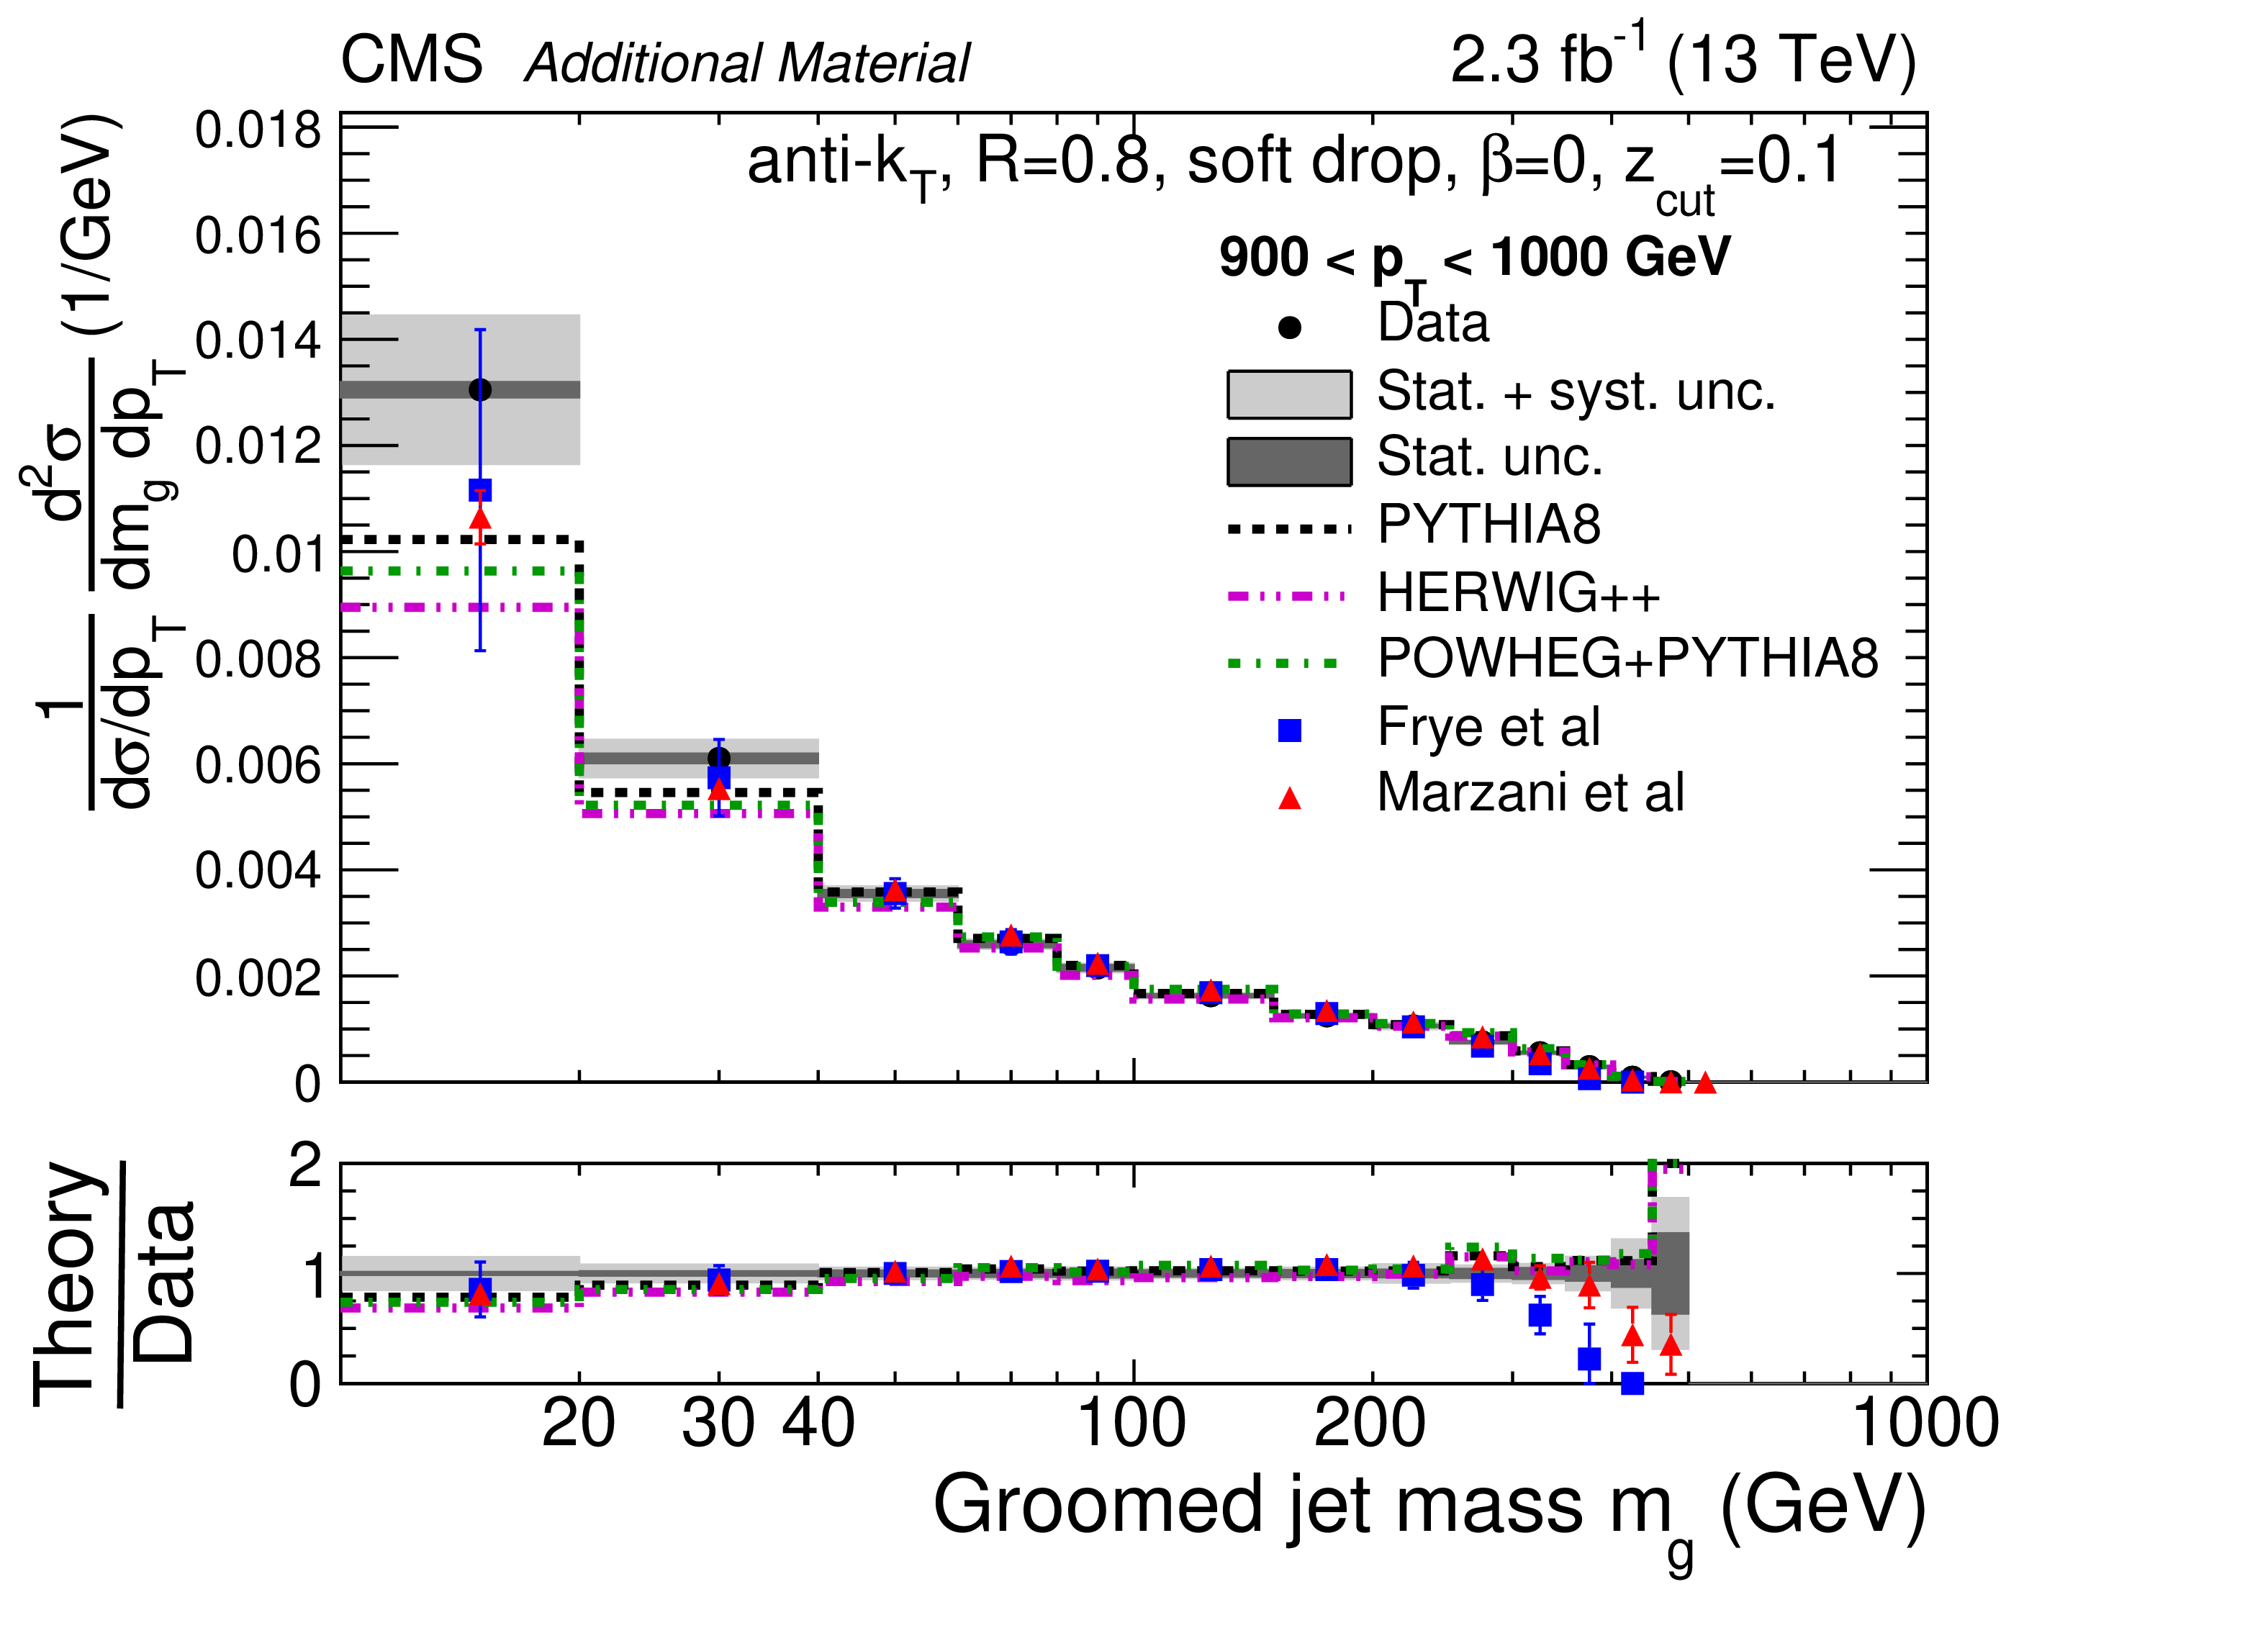
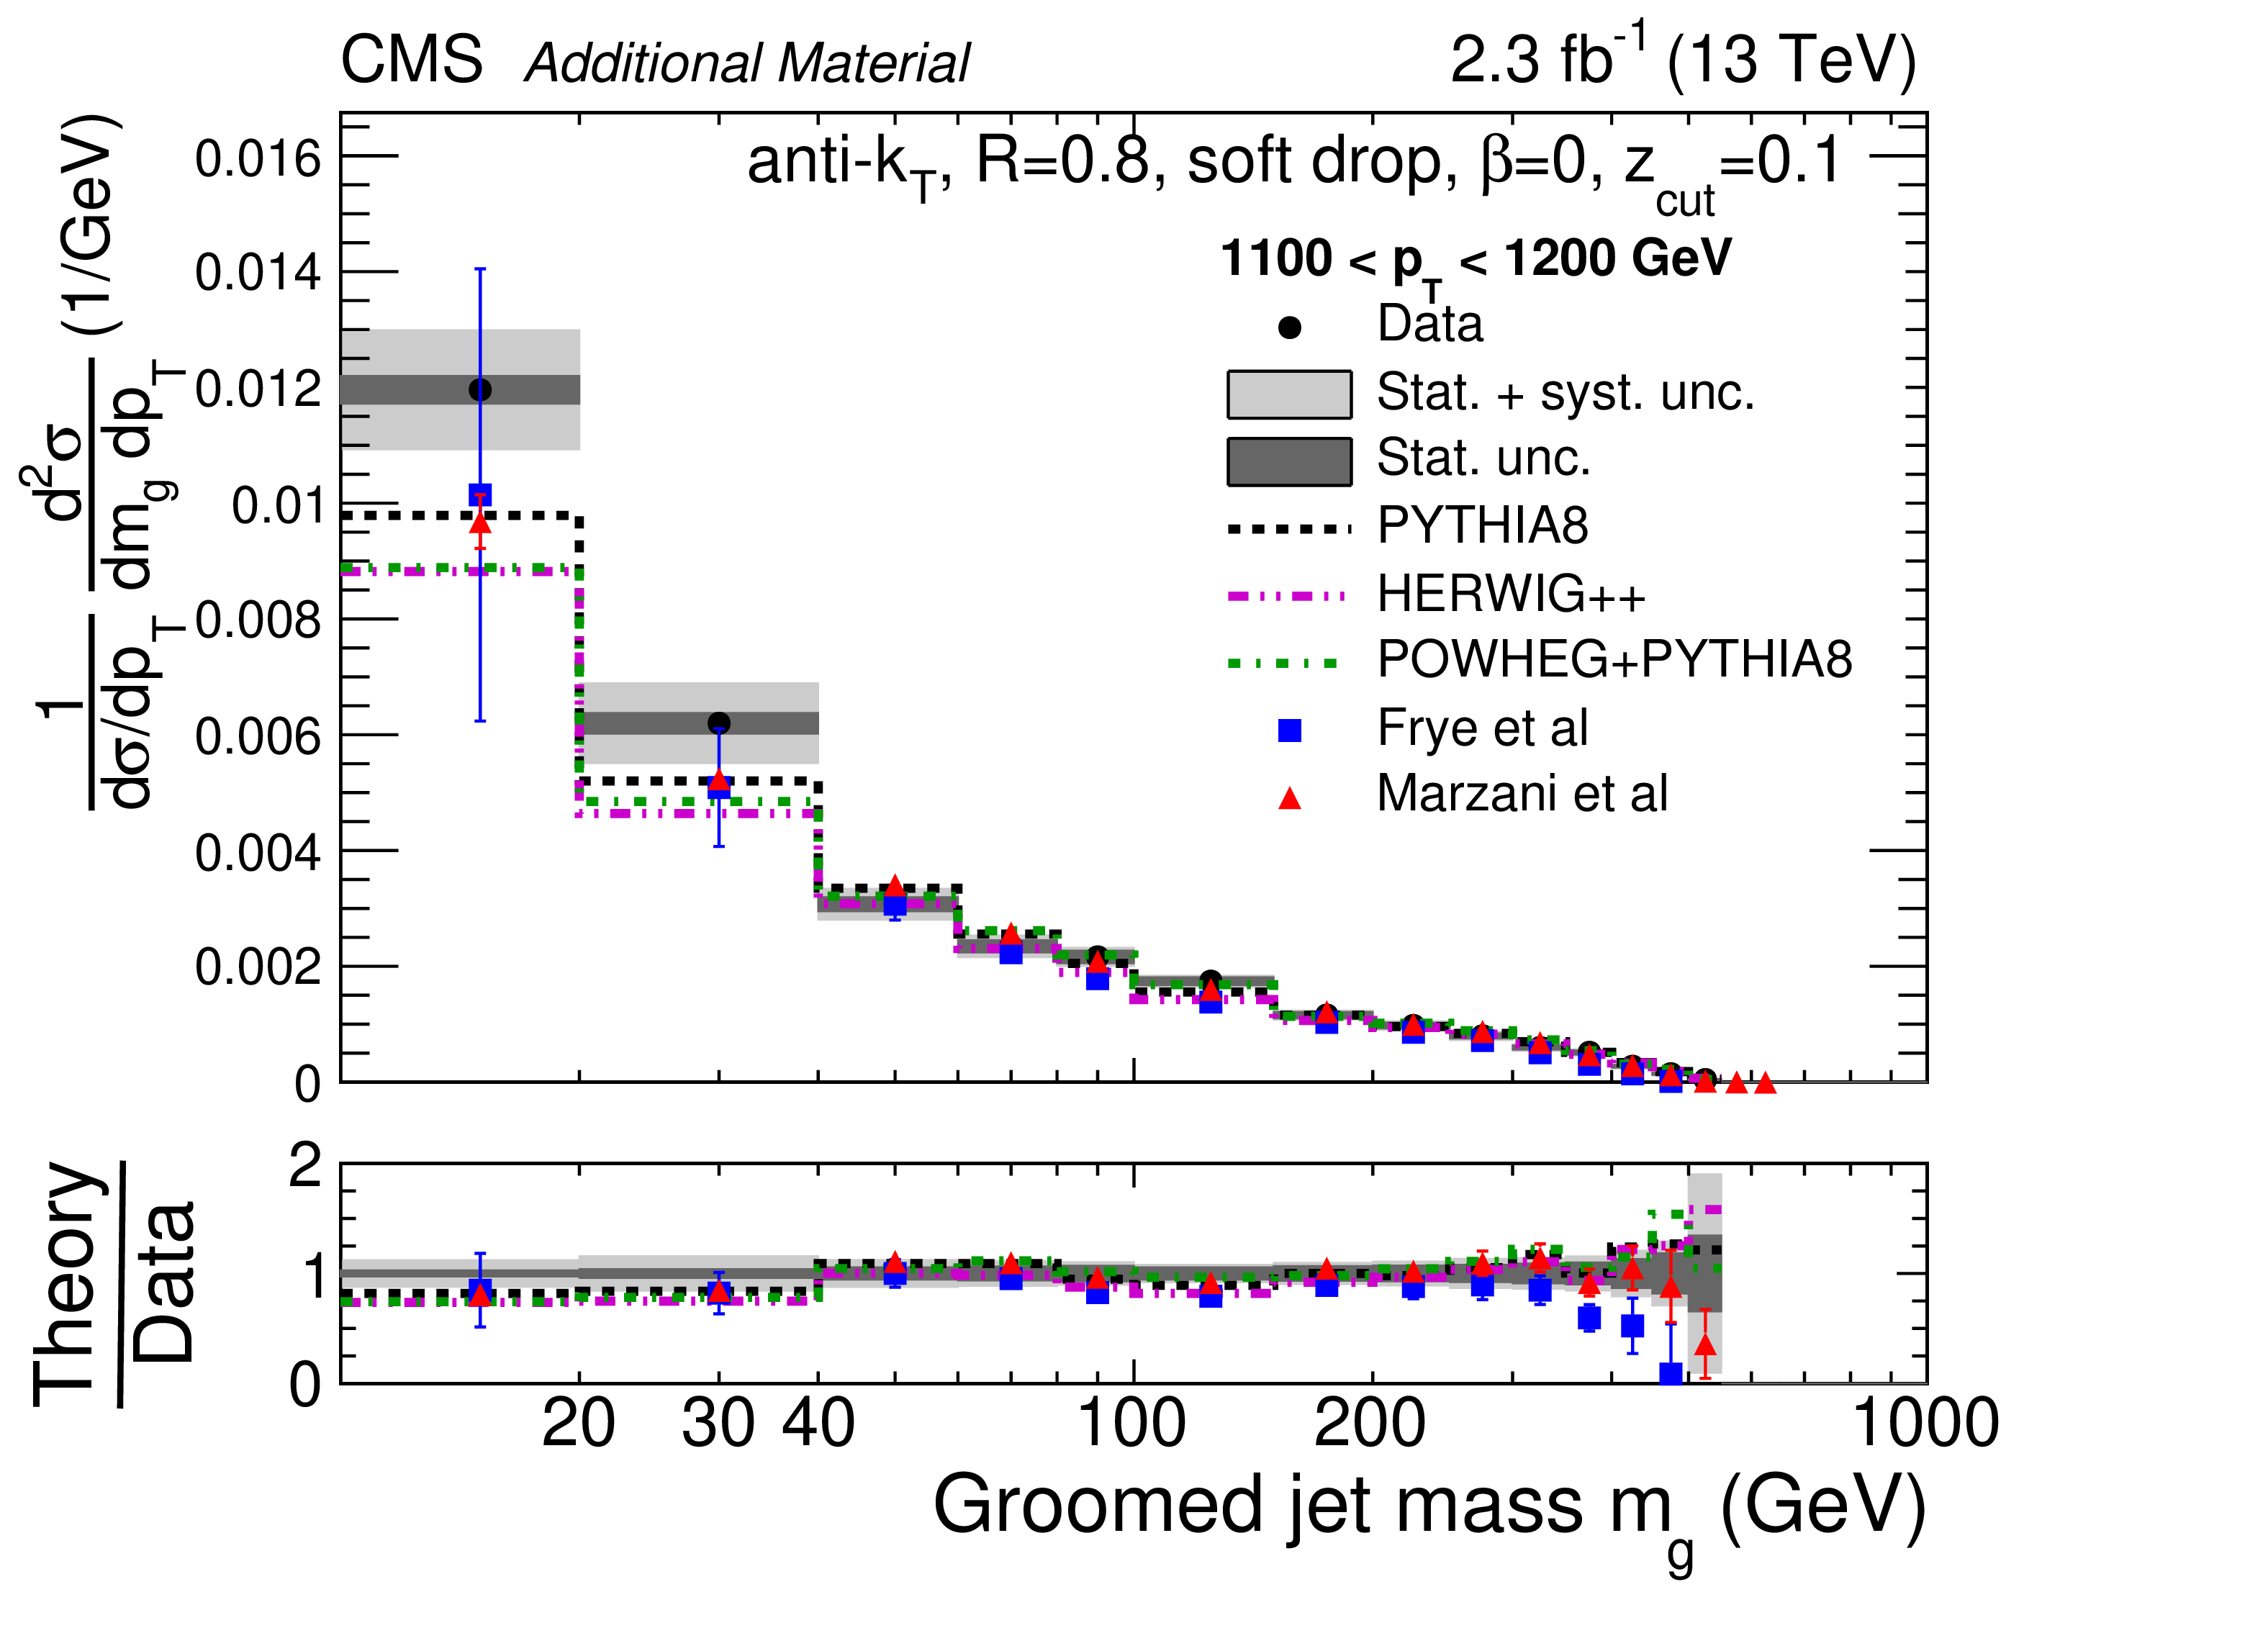
Normalized cross section for the groomed jets for two $ {p_{\mathrm {T}}} $ bins. The data are shown by the black points, with dark grey bands for the statistical uncertainty (Stat. unc.) and with light grey bands for the total uncertainty (stat.+sys. unc., added in quadrature). The predictions from PYTHIA8, HERWIG++, and POWHEG+PYTHIA are shown with dashed black, dash-dot-dotted magenta, and dash-dotted green histograms, respectively, with no uncertainties shown. The predictions from Ref. [17] (Frye et. al.) are shown with blue squares. The uncertainties include scale variations and an estimate of nonperturbative effects. The predictions from Ref. [18] (Marzani et. al.) are shown with red triangles. The uncertainties only include effects from scale variations, since nonperturbative corrections have been considered directly in the calculation. |
png pdf |
Figure 12-a:
Normalized cross section for the groomed jets for 650 $ < {p_{\mathrm {T}}} < $ 760 GeV. The data are shown by the black points, with dark grey bands for the statistical uncertainty (Stat. unc.) and with light grey bands for the total uncertainty (stat.+sys. unc., added in quadrature). The predictions from PYTHIA8, HERWIG++, and POWHEG+PYTHIA are shown with dashed black, dash-dot-dotted magenta, and dash-dotted green histograms, respectively, with no uncertainties shown. The predictions from Ref. [17] (Frye et. al.) are shown with blue squares. The uncertainties include scale variations and an estimate of nonperturbative effects. The predictions from Ref. [18] (Marzani et. al.) are shown with red triangles. The uncertainties only include effects from scale variations, since nonperturbative corrections have been considered directly in the calculation. |
png pdf |
Figure 12-b:
Normalized cross section for the groomed jets for 1200 $ < {p_{\mathrm {T}}} < $ 1300 GeV. The data are shown by the black points, with dark grey bands for the statistical uncertainty (Stat. unc.) and with light grey bands for the total uncertainty (stat.+sys. unc., added in quadrature). The predictions from PYTHIA8, HERWIG++, and POWHEG+PYTHIA are shown with dashed black, dash-dot-dotted magenta, and dash-dotted green histograms, respectively, with no uncertainties shown. The predictions from Ref. [17] (Frye et. al.) are shown with blue squares. The uncertainties include scale variations and an estimate of nonperturbative effects. The predictions from Ref. [18] (Marzani et. al.) are shown with red triangles. The uncertainties only include effects from scale variations, since nonperturbative corrections have been considered directly in the calculation. |
png pdf |
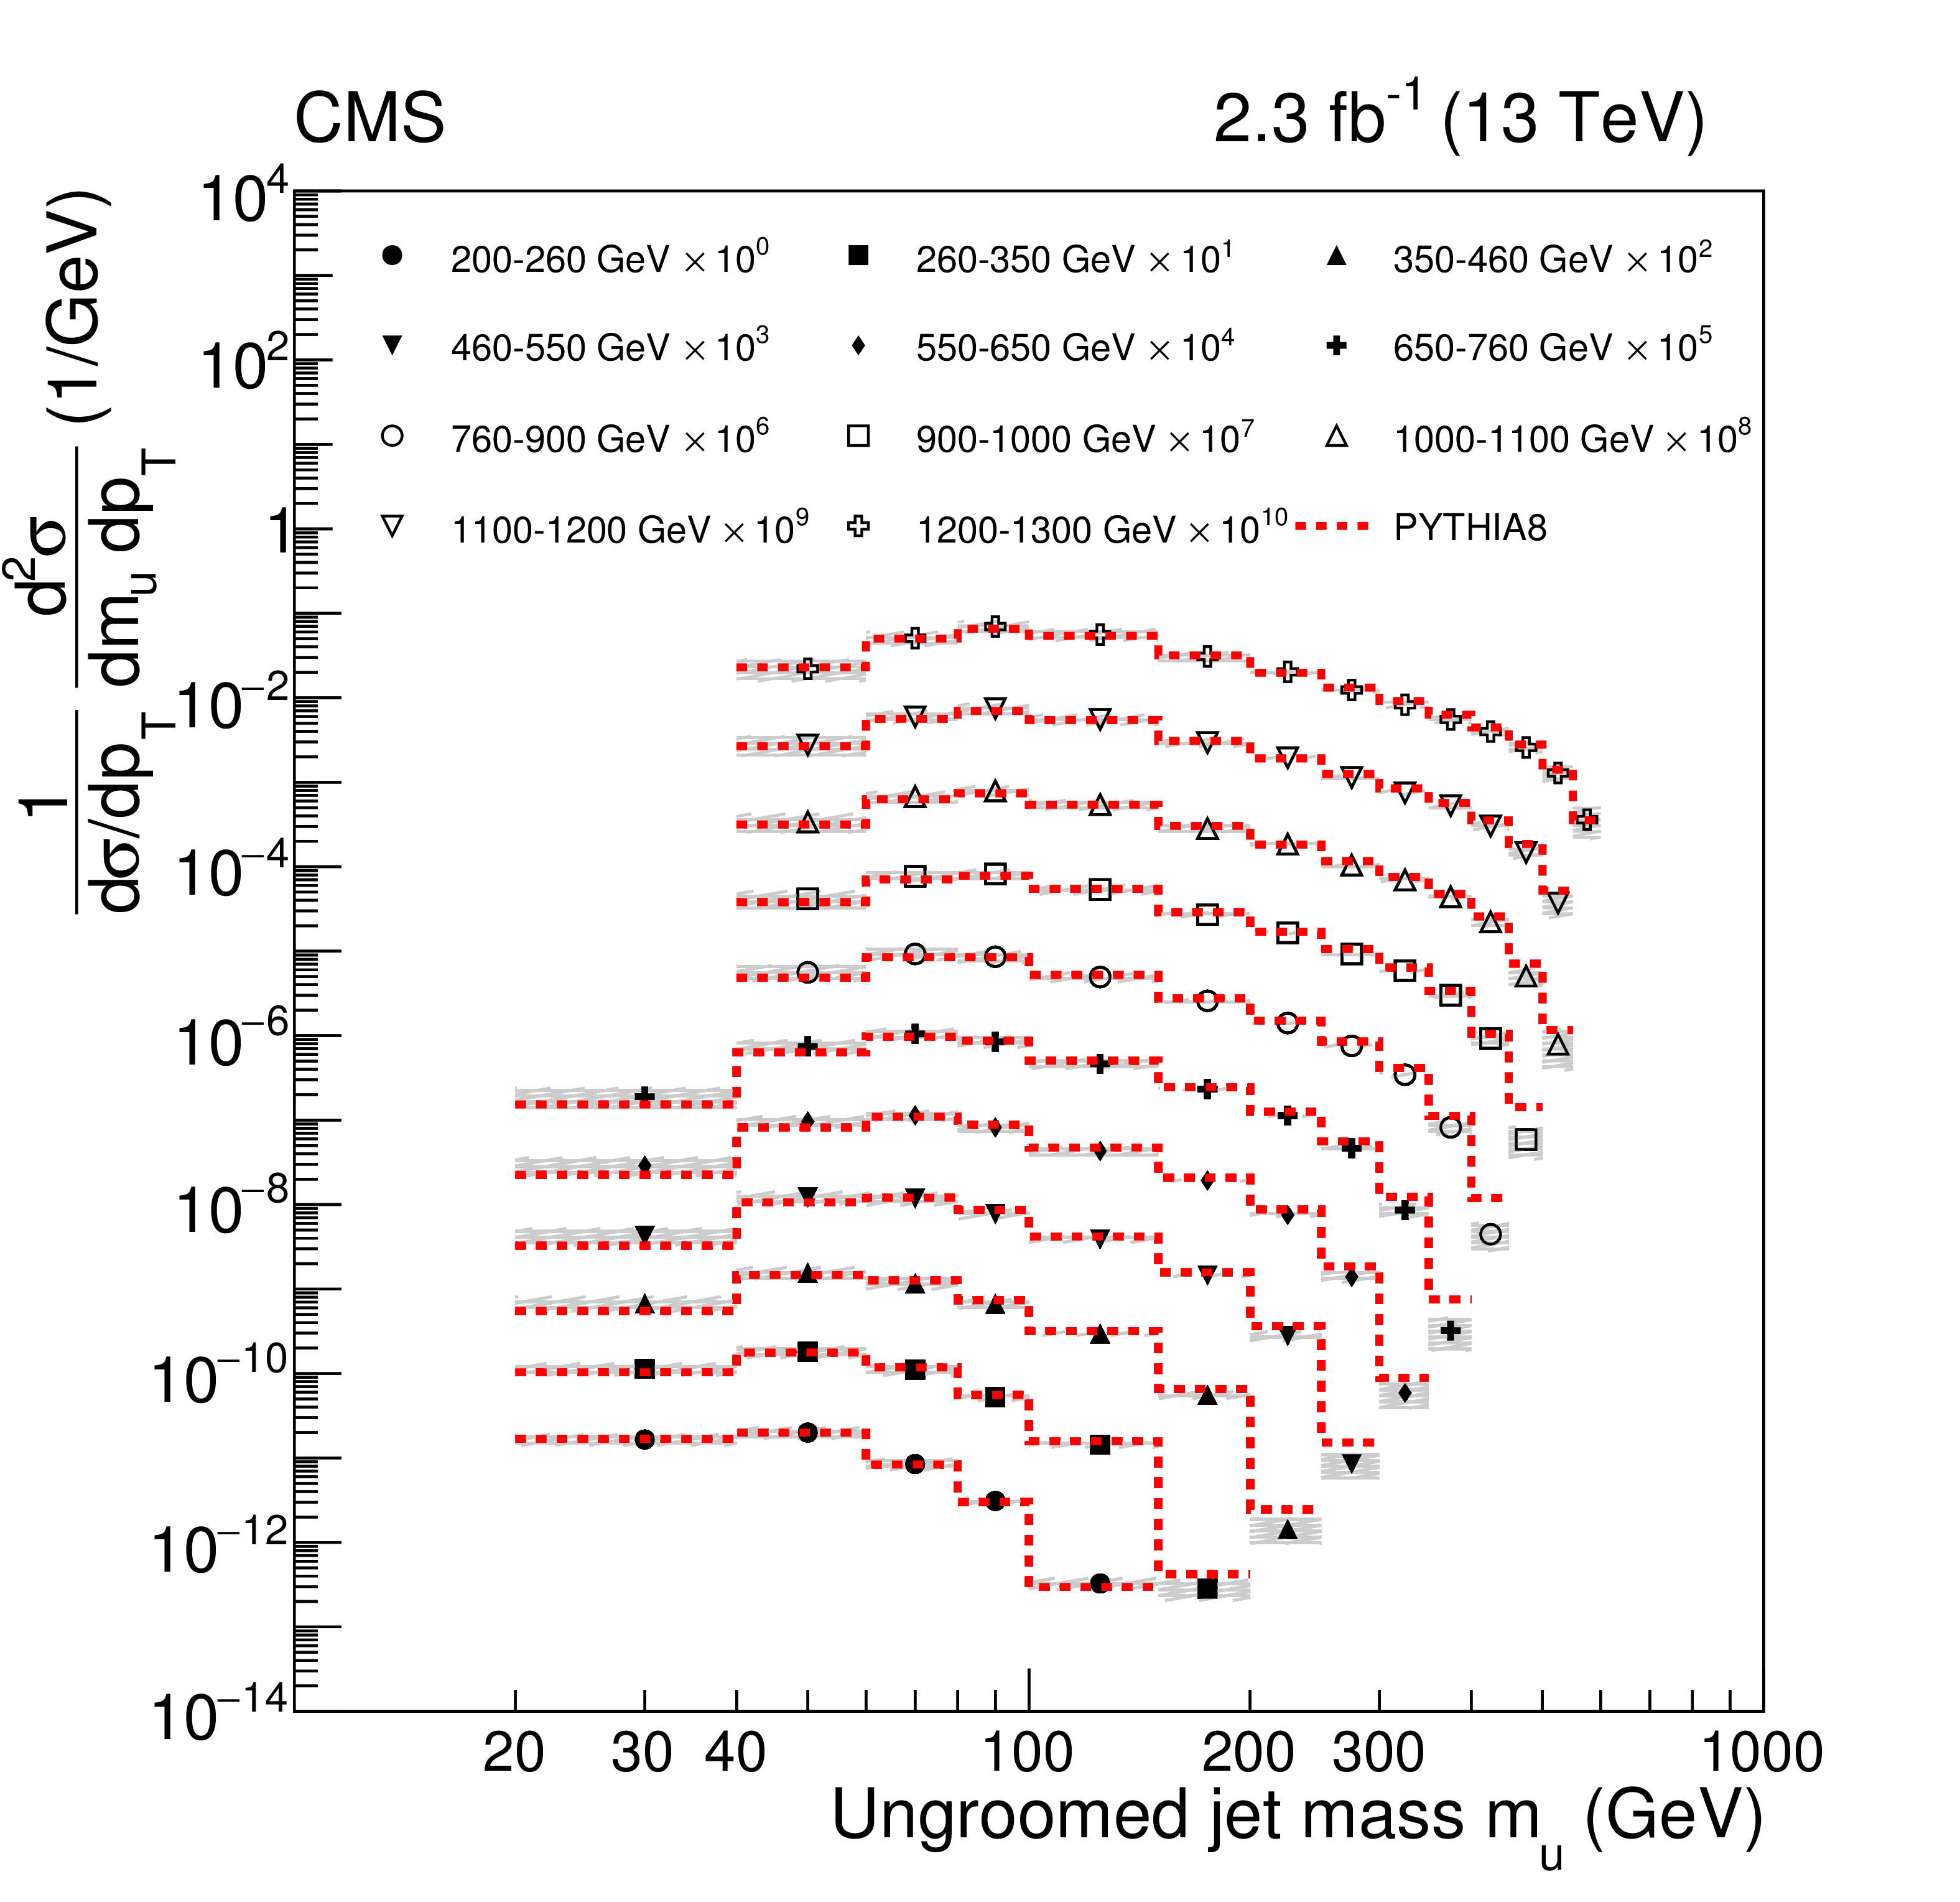
Figure 13:
Normalized cross section for ungroomed jets for all $ {p_{\mathrm {T}}} $ bins. Bins with total uncertainty larger than 60% are not shown. The data are shown with markers for each $ {p_{\mathrm {T}}} $ bin, scaled by a factor for better visibility. The total uncertainties (statistical added to systematic in quadrature) are shown with grey bands. The predictions from PYTHIA8 are shown as a dashed red line. |
png pdf |
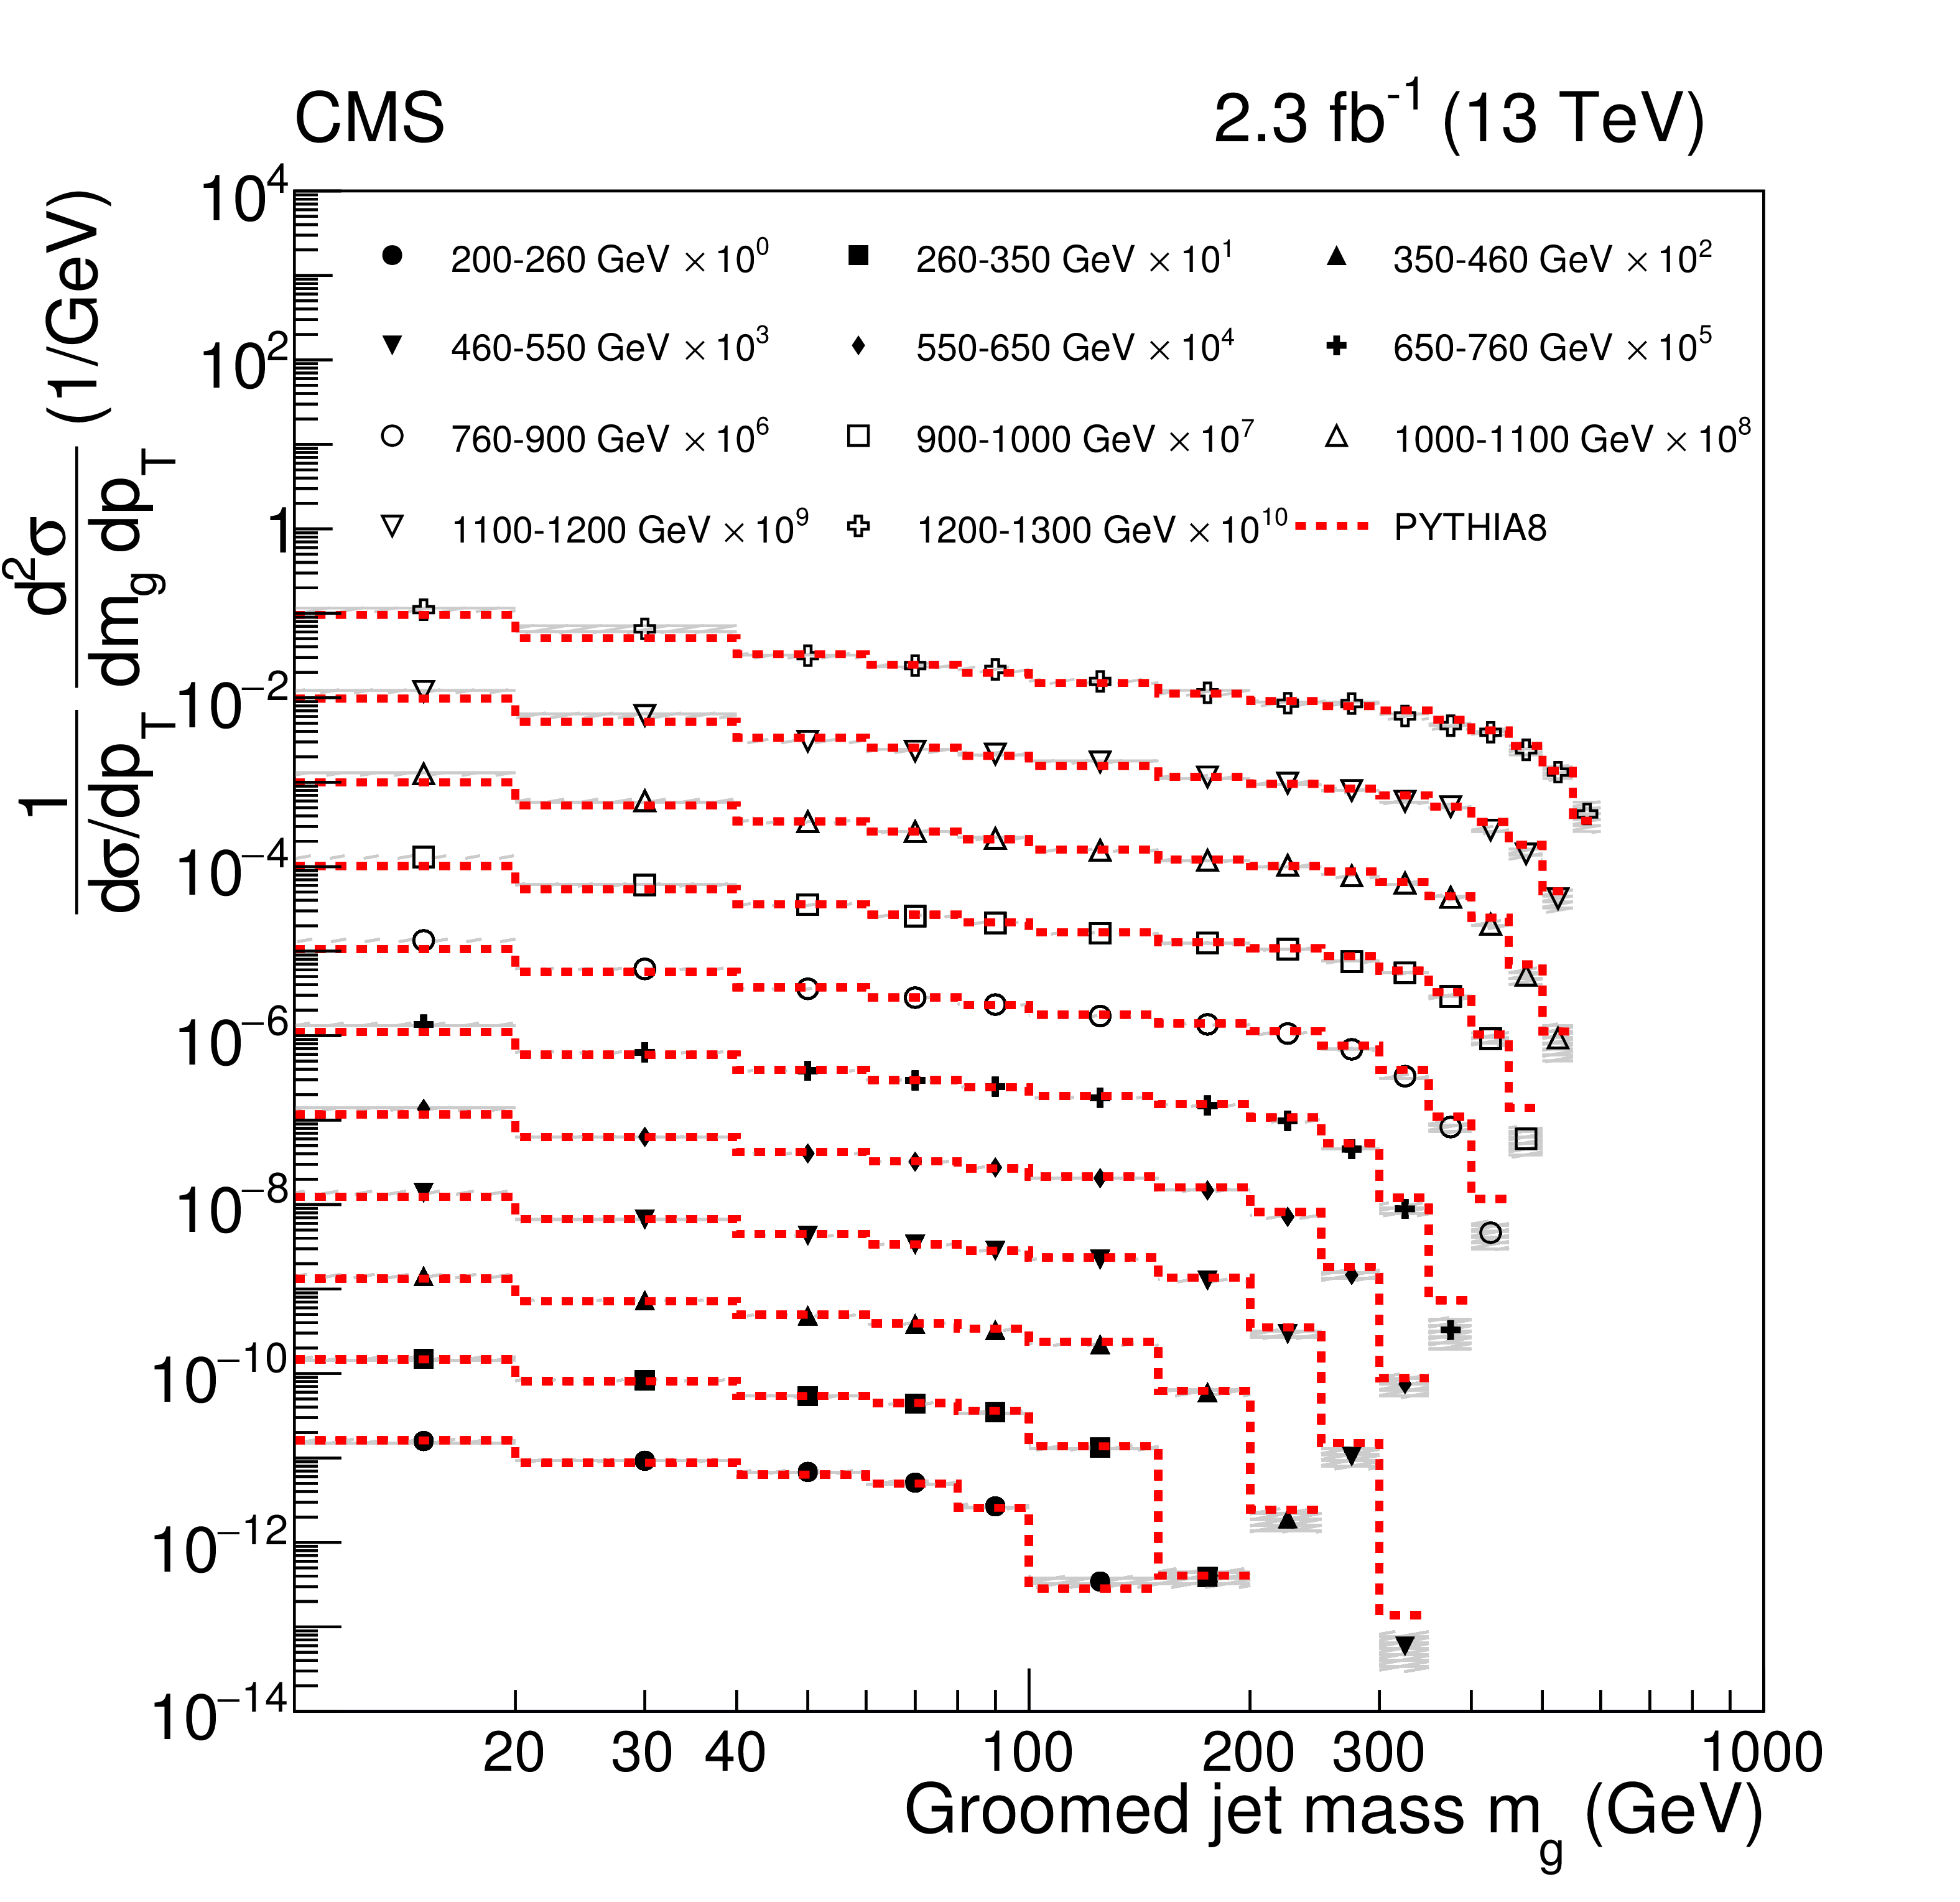
Figure 14:
Normalized cross section for groomed jets for all $ {p_{\mathrm {T}}} $ bins. Bins with total uncertainty larger than 60% are not shown. The data are shown with markers for each $ {p_{\mathrm {T}}} $ bin, scaled by a factor for better visibility. The total uncertainties (statistical added to systematic in quadrature) are shown with grey bands. The predictions from PYTHIA8 are shown as a dashed red line. |
| Tables | |
png pdf |
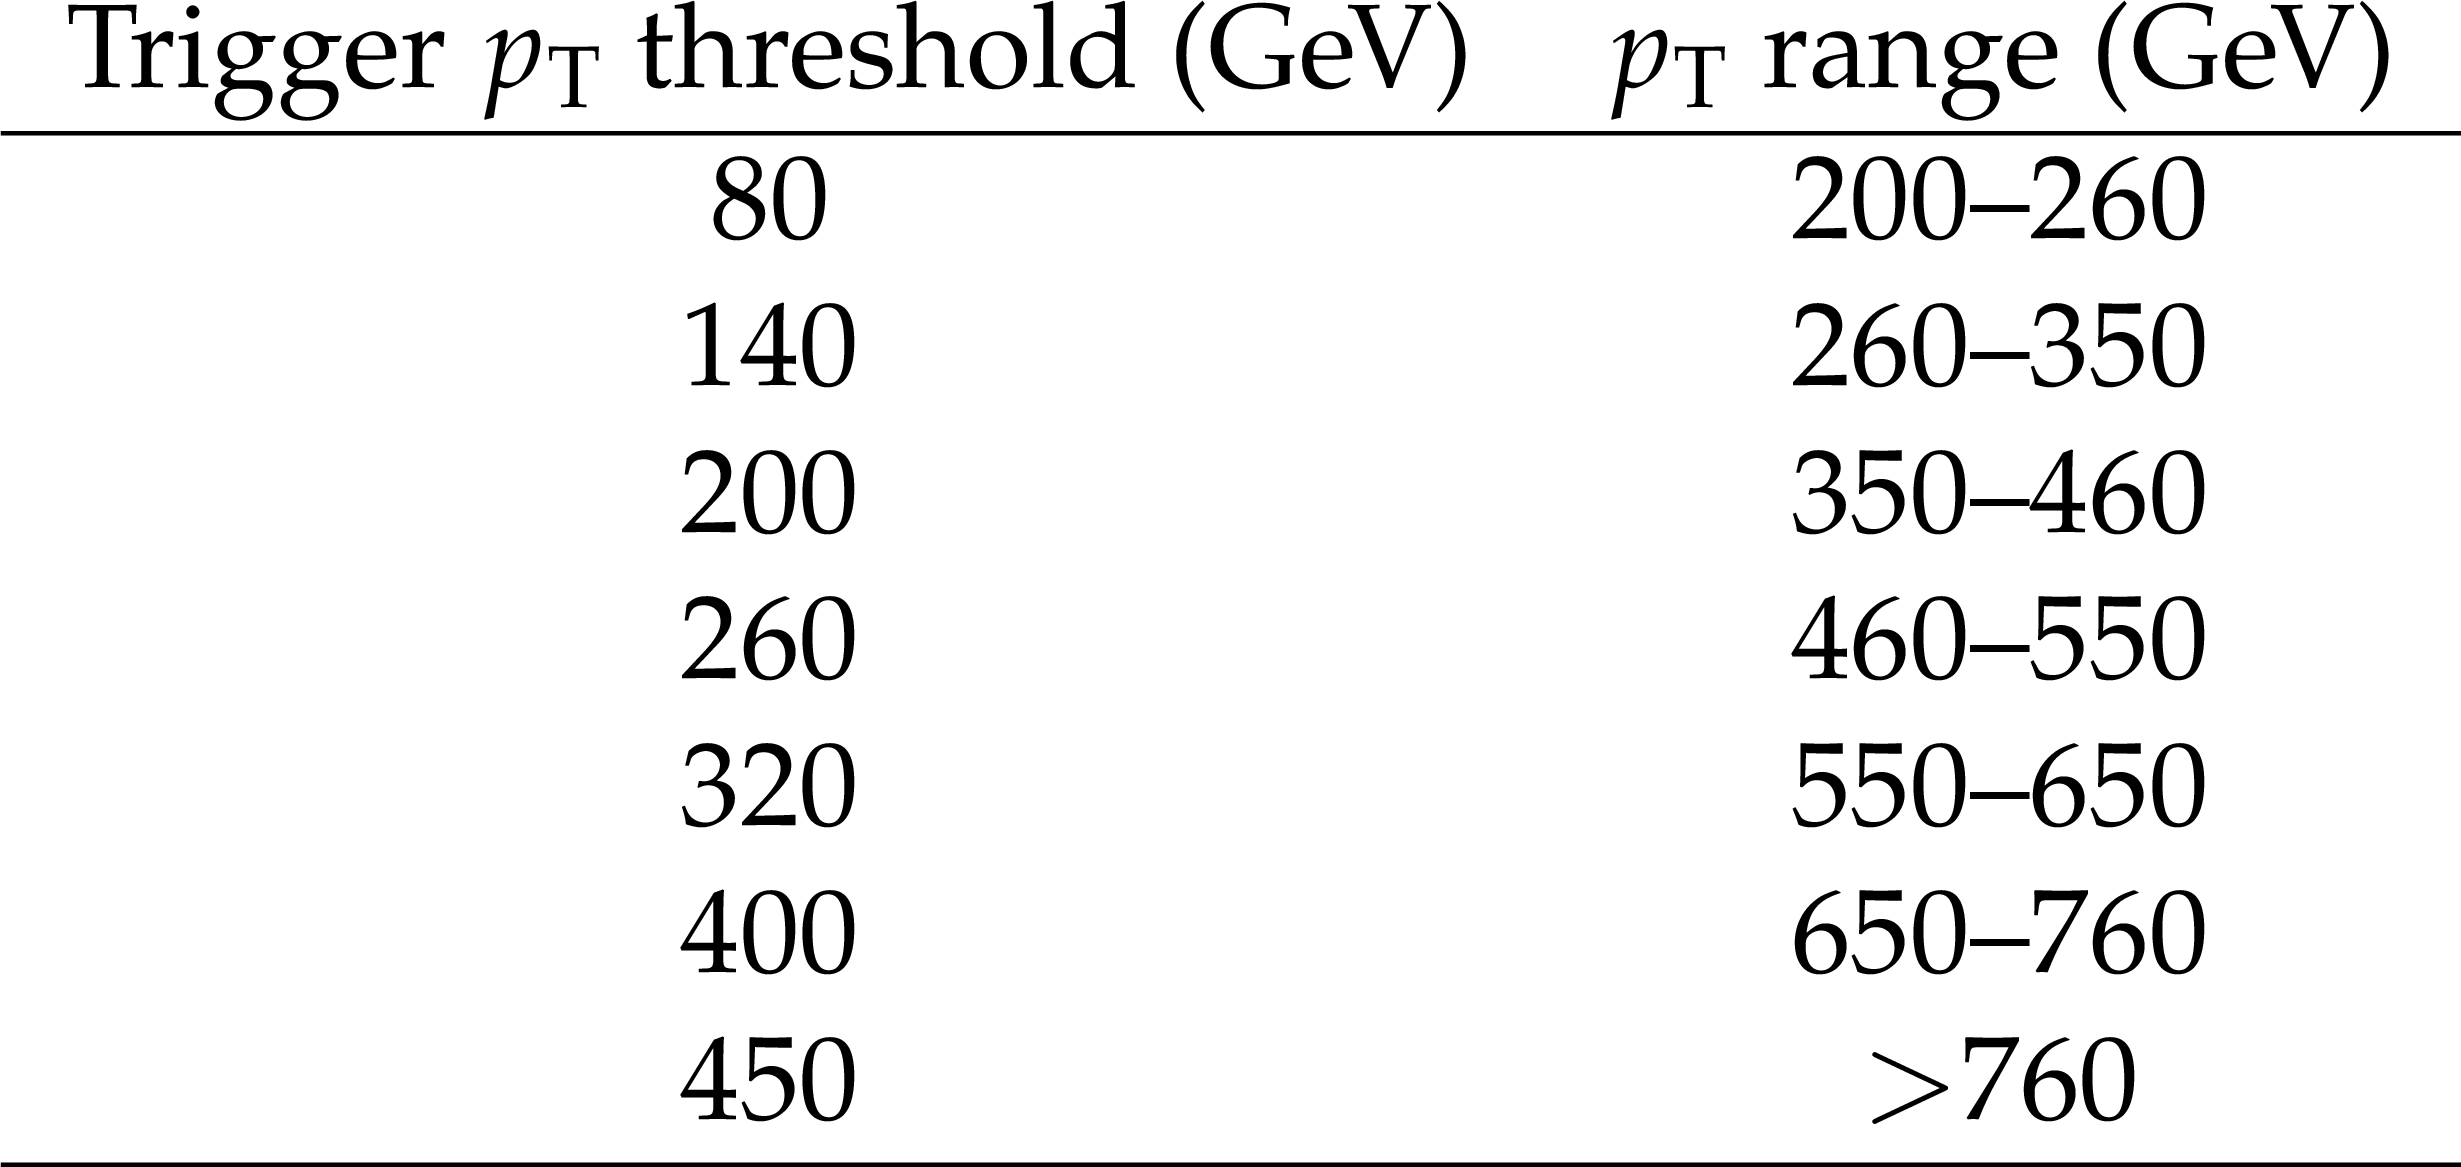
Table 1:
List of trigger thresholds used for each high-level trigger path. The ungroomed jet $ {p_{\mathrm {T}}} $ ranges are shown in the second column. Events are selected such that exactly one trigger is used for each $ {p_{\mathrm {T}}} $ bin. |
| Summary |
| The double-differential production cross section has been presented for dijet events in bins of ungroomed jet ${p_{\mathrm{T}}}$ as a function of jet mass, with and without a jet grooming algorithm applied. The grooming algorithm is observed to decrease the jet mass overall, and reduce the sensitivity of the observable to details of the physics modeling and pileup effects. The data are compared to various theoretical predictions, including new calculations using analytical resummation. Overall, in the normalized cross section, the theoretical predictions agree with the measured cross sections within the uncertainties for masses from 10 to 30% of the jet transverse momentum. |
| Additional Figures | |

png pdf |
Additional Figure 1:
Absolute cross section with respect to $ {p_{\mathrm {T}}} $. The data are shown by the black points, with dark grey bands for the statistical uncertainty (Stat. unc.) and with light grey bands for the total uncertainty (stat.+sys. unc., added in quadrature). The predictions from PYTHIA-8, HERWIG++, and POWHEG+PYTHIA are shown with dashed black, dash-dot-dotted magenta, and dash-dotted green histograms, respectively, with no uncertainties shown. |

png pdf |
Additional Figure 2:
Normalized cross section with respect to $\log{m}$ for ungroomed jets for all $ {p_{\mathrm {T}}} $ bins. Bins with statistical uncertainty larger than 60% are not shown. The data are shown with markers for each $ {p_{\mathrm {T}}} $ bin, scaled by a factor for better visibility. The total uncertainties (statistical added to systematic in quadrature) are shown with grey bands. The predictions from PYTHIA-8 are shown as a dashed red line. The derivative with respect to $\log{m}$ is approximated by multiplying the bin content by the bin center $m_c$. |
png pdf |
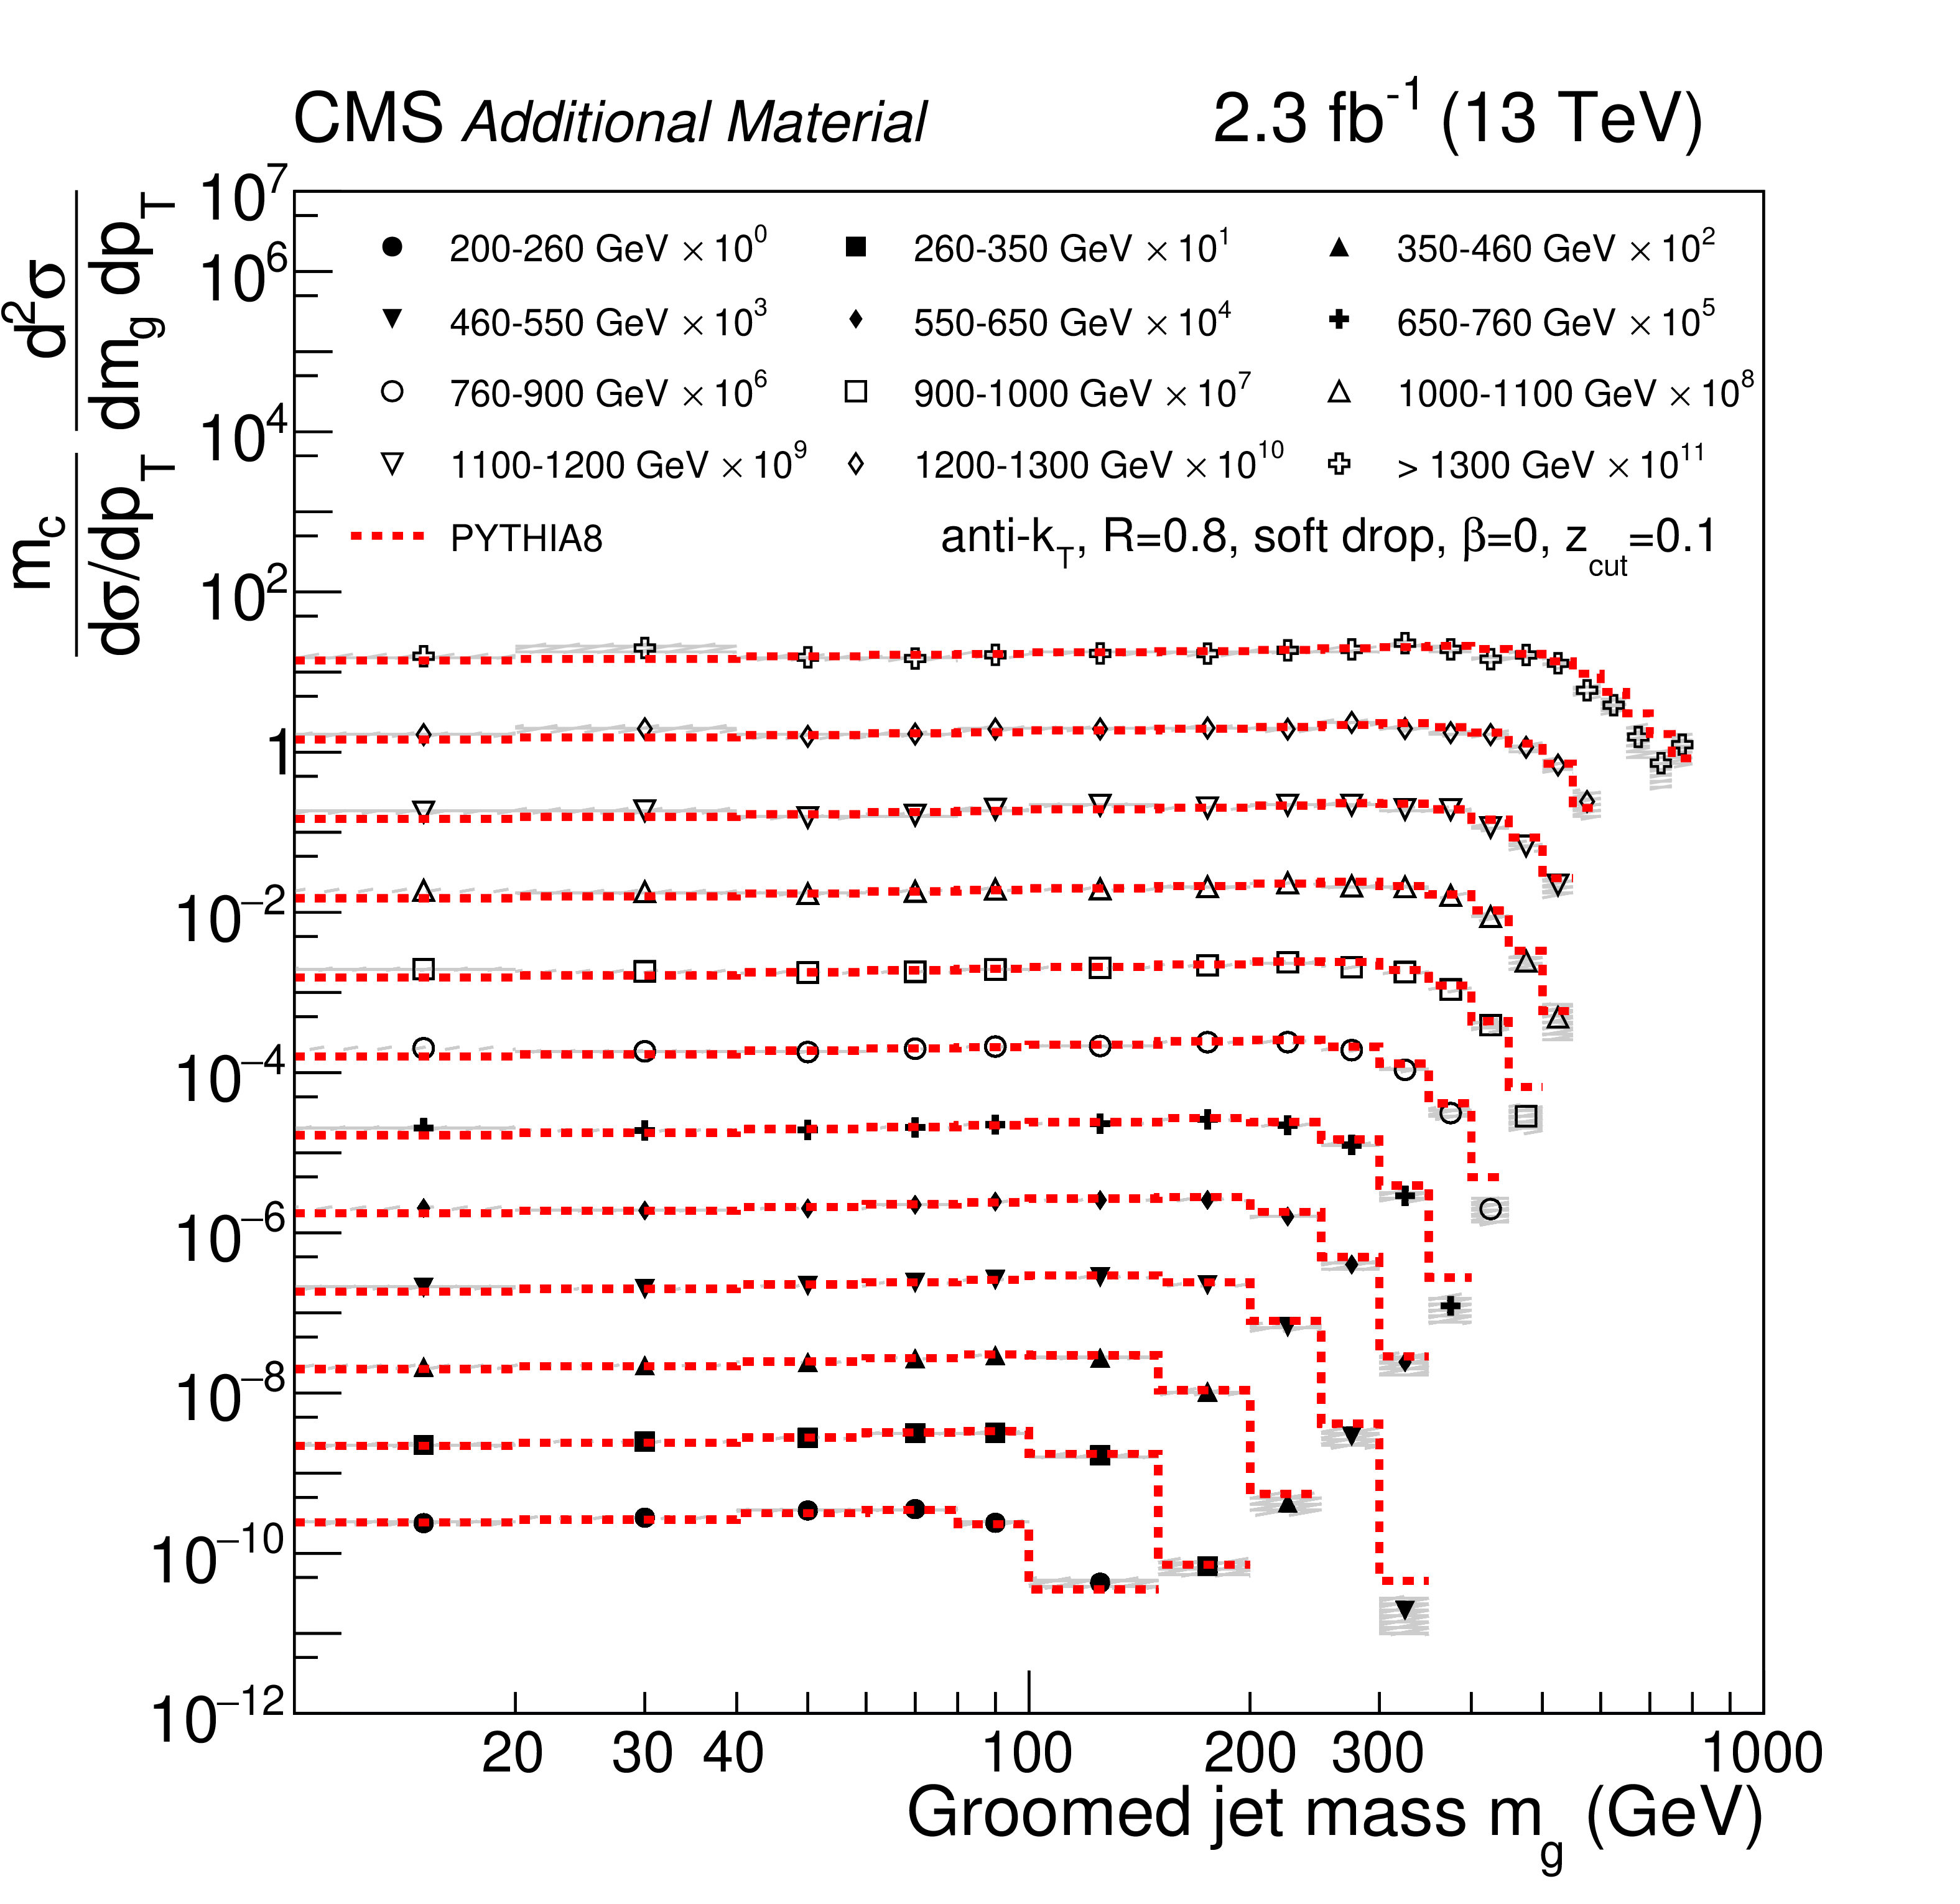
Additional Figure 3:
Normalized cross section with respect to $\log{m}$ for groomed jets for all $ {p_{\mathrm {T}}} $ bins. Bins with statistical uncertainty larger than 60% are not shown. The data are shown with markers for each $ {p_{\mathrm {T}}} $ bin, scaled by a factor for better visibility. The total uncertainties (statistical added to systematic in quadrature) are shown with grey bands. The predictions from PYTHIA-8 are shown as a dashed red line. The derivative with respect to $\log{m}$ is approximated by multiplying the bin content by the bin center $m_c$. |
png pdf |
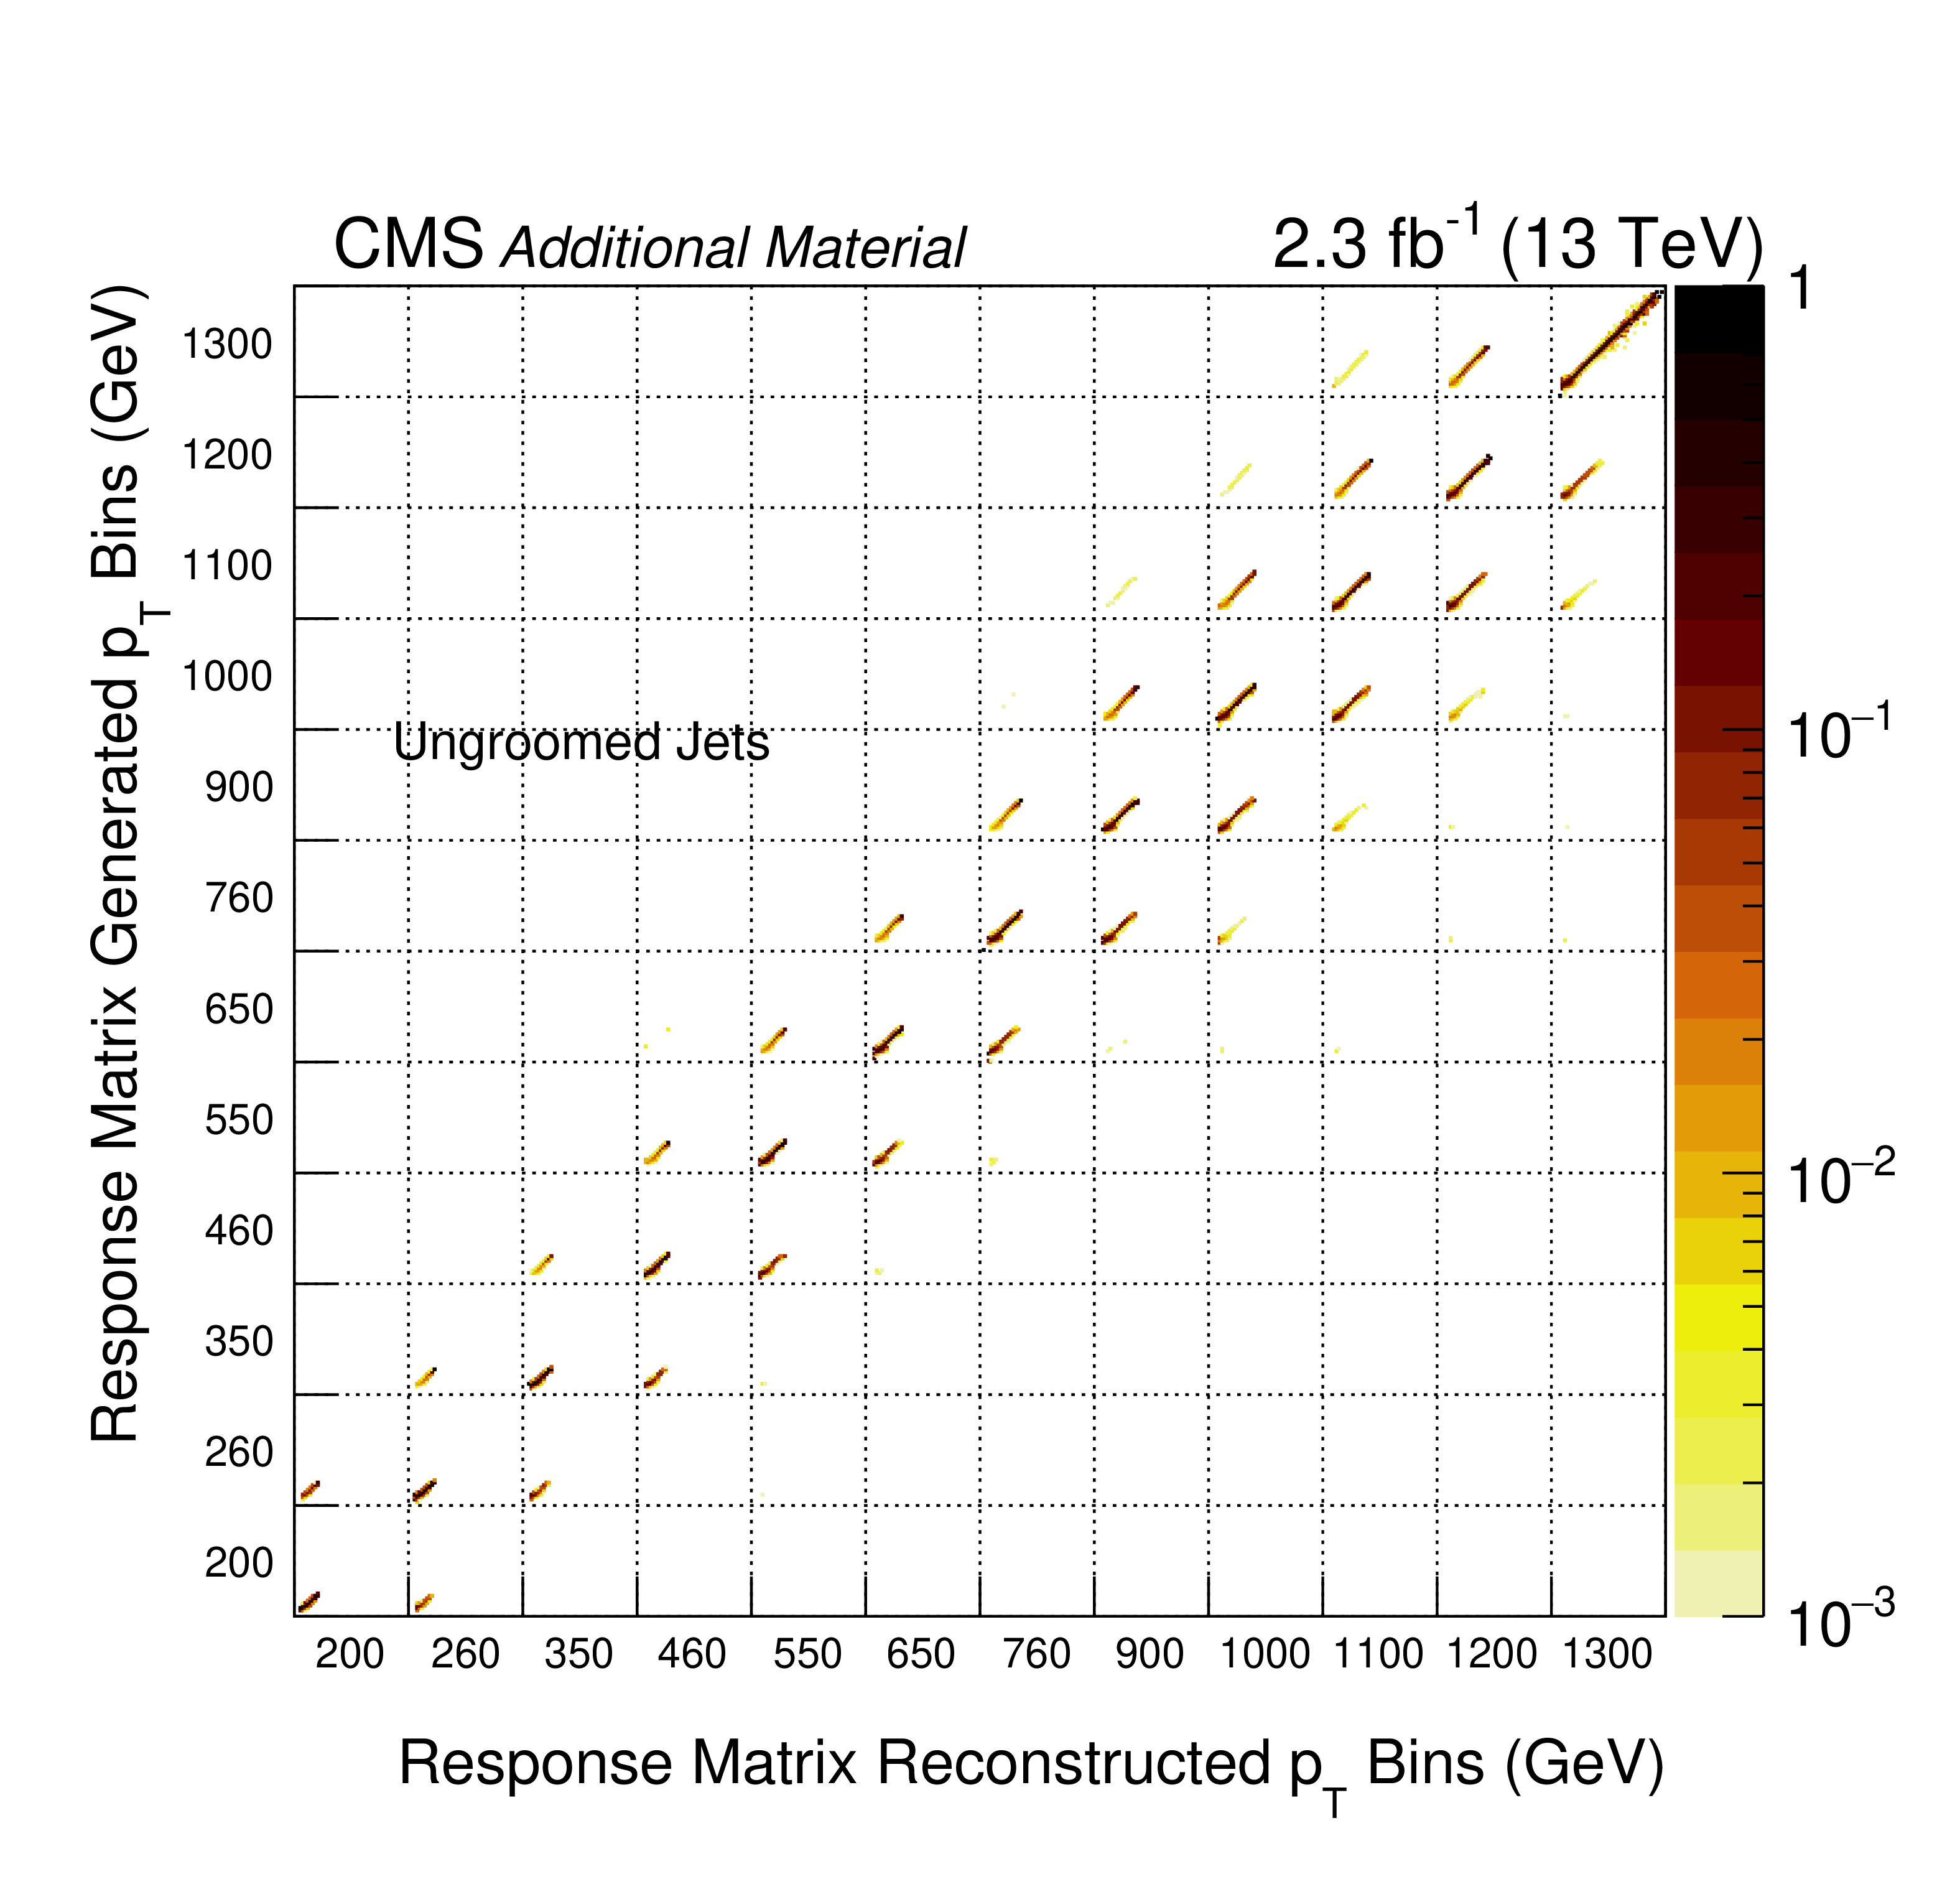
Additional Figure 4:
Response matrix for the ungroomed jets. The $x$ axis contains the bins in ungroomed reconstructed jet mass, grouped by reconstructed jet $ {p_{\mathrm {T}}} $. The $y$ axis contains the bins in ungroomed generated jet mass, grouped by generated jet $ {p_{\mathrm {T}}} $. Each column is normalized to unity. |
png pdf |
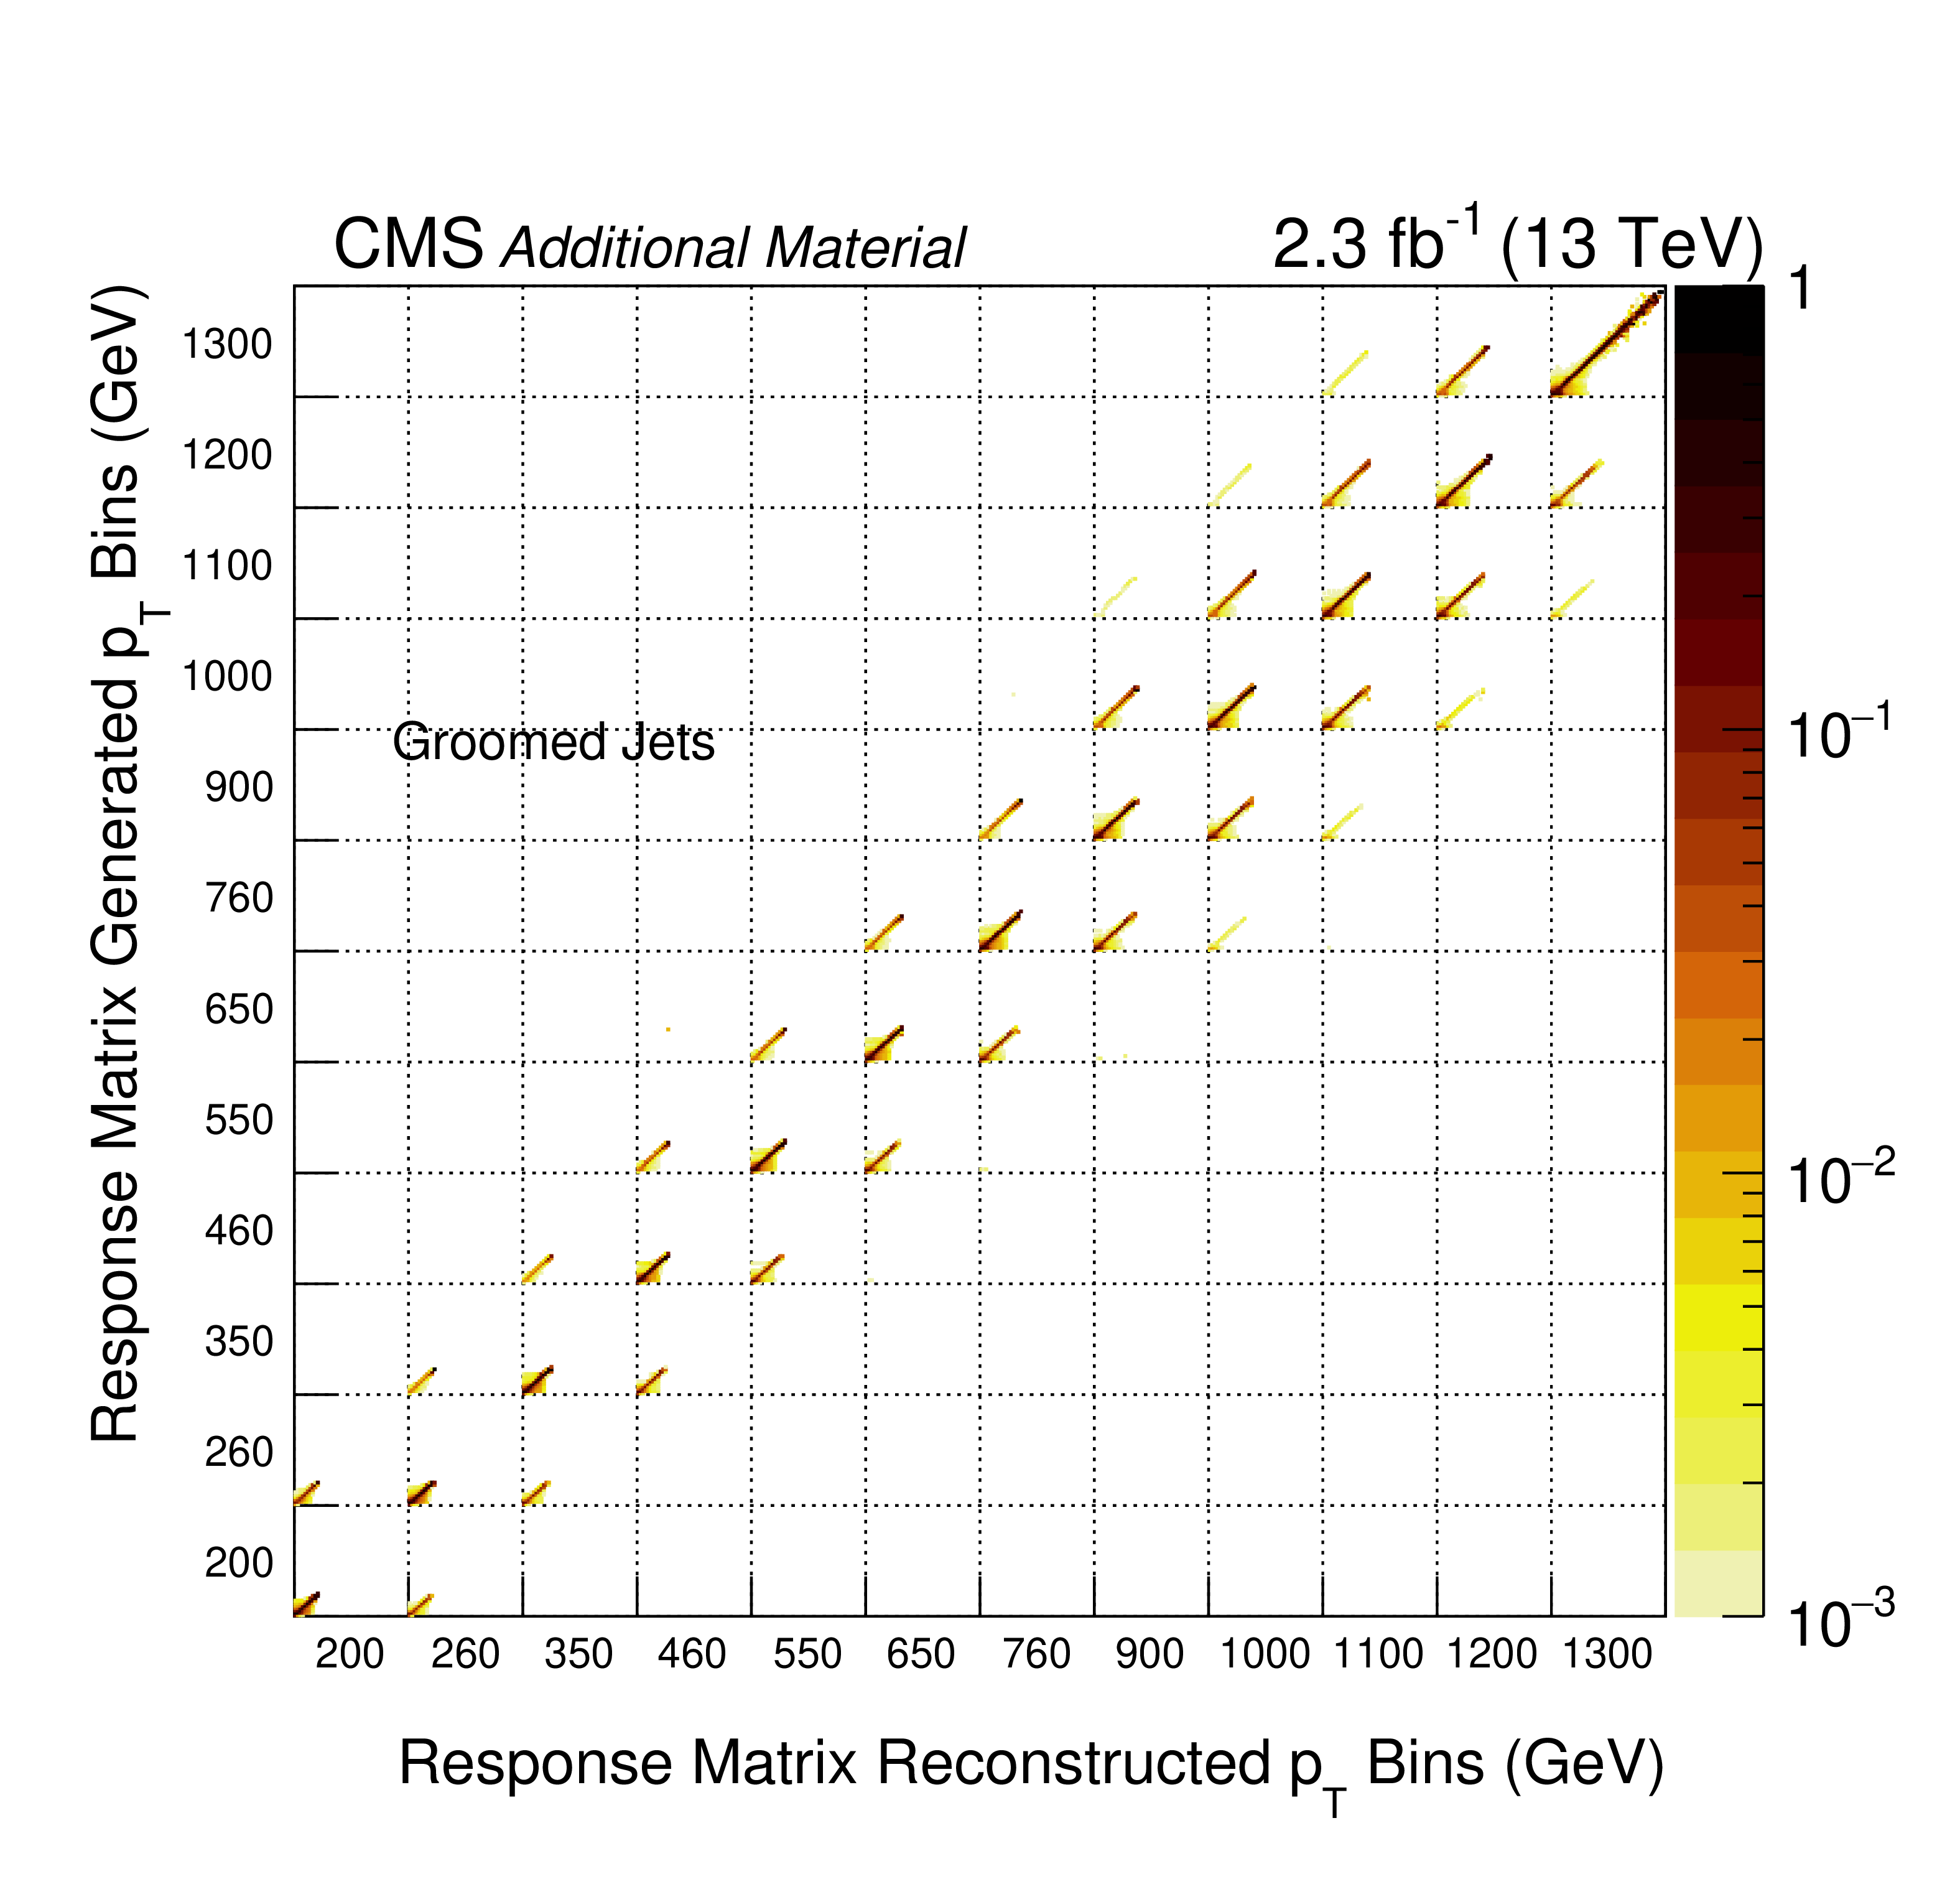
Additional Figure 5:
Response matrix for the groomed jets. The $x$ axis contains the bins in groomed reconstructed jet mass, grouped by reconstructed jet $ {p_{\mathrm {T}}} $. The $y$ axis contains the bins in groomed generated jet mass, grouped by generated jet $ {p_{\mathrm {T}}} $. Each column is normalized to unity. |

png pdf |
Additional Figure 6:
Covariance matrix for the ungroomed jets. The $x$ axis contains the bins in ungroomed reconstructed jet mass, grouped by reconstructed jet $ {p_{\mathrm {T}}} $. The $y$ axis contains the bins in ungroomed generated jet mass, grouped by generated jet $ {p_{\mathrm {T}}} $. |
png pdf |
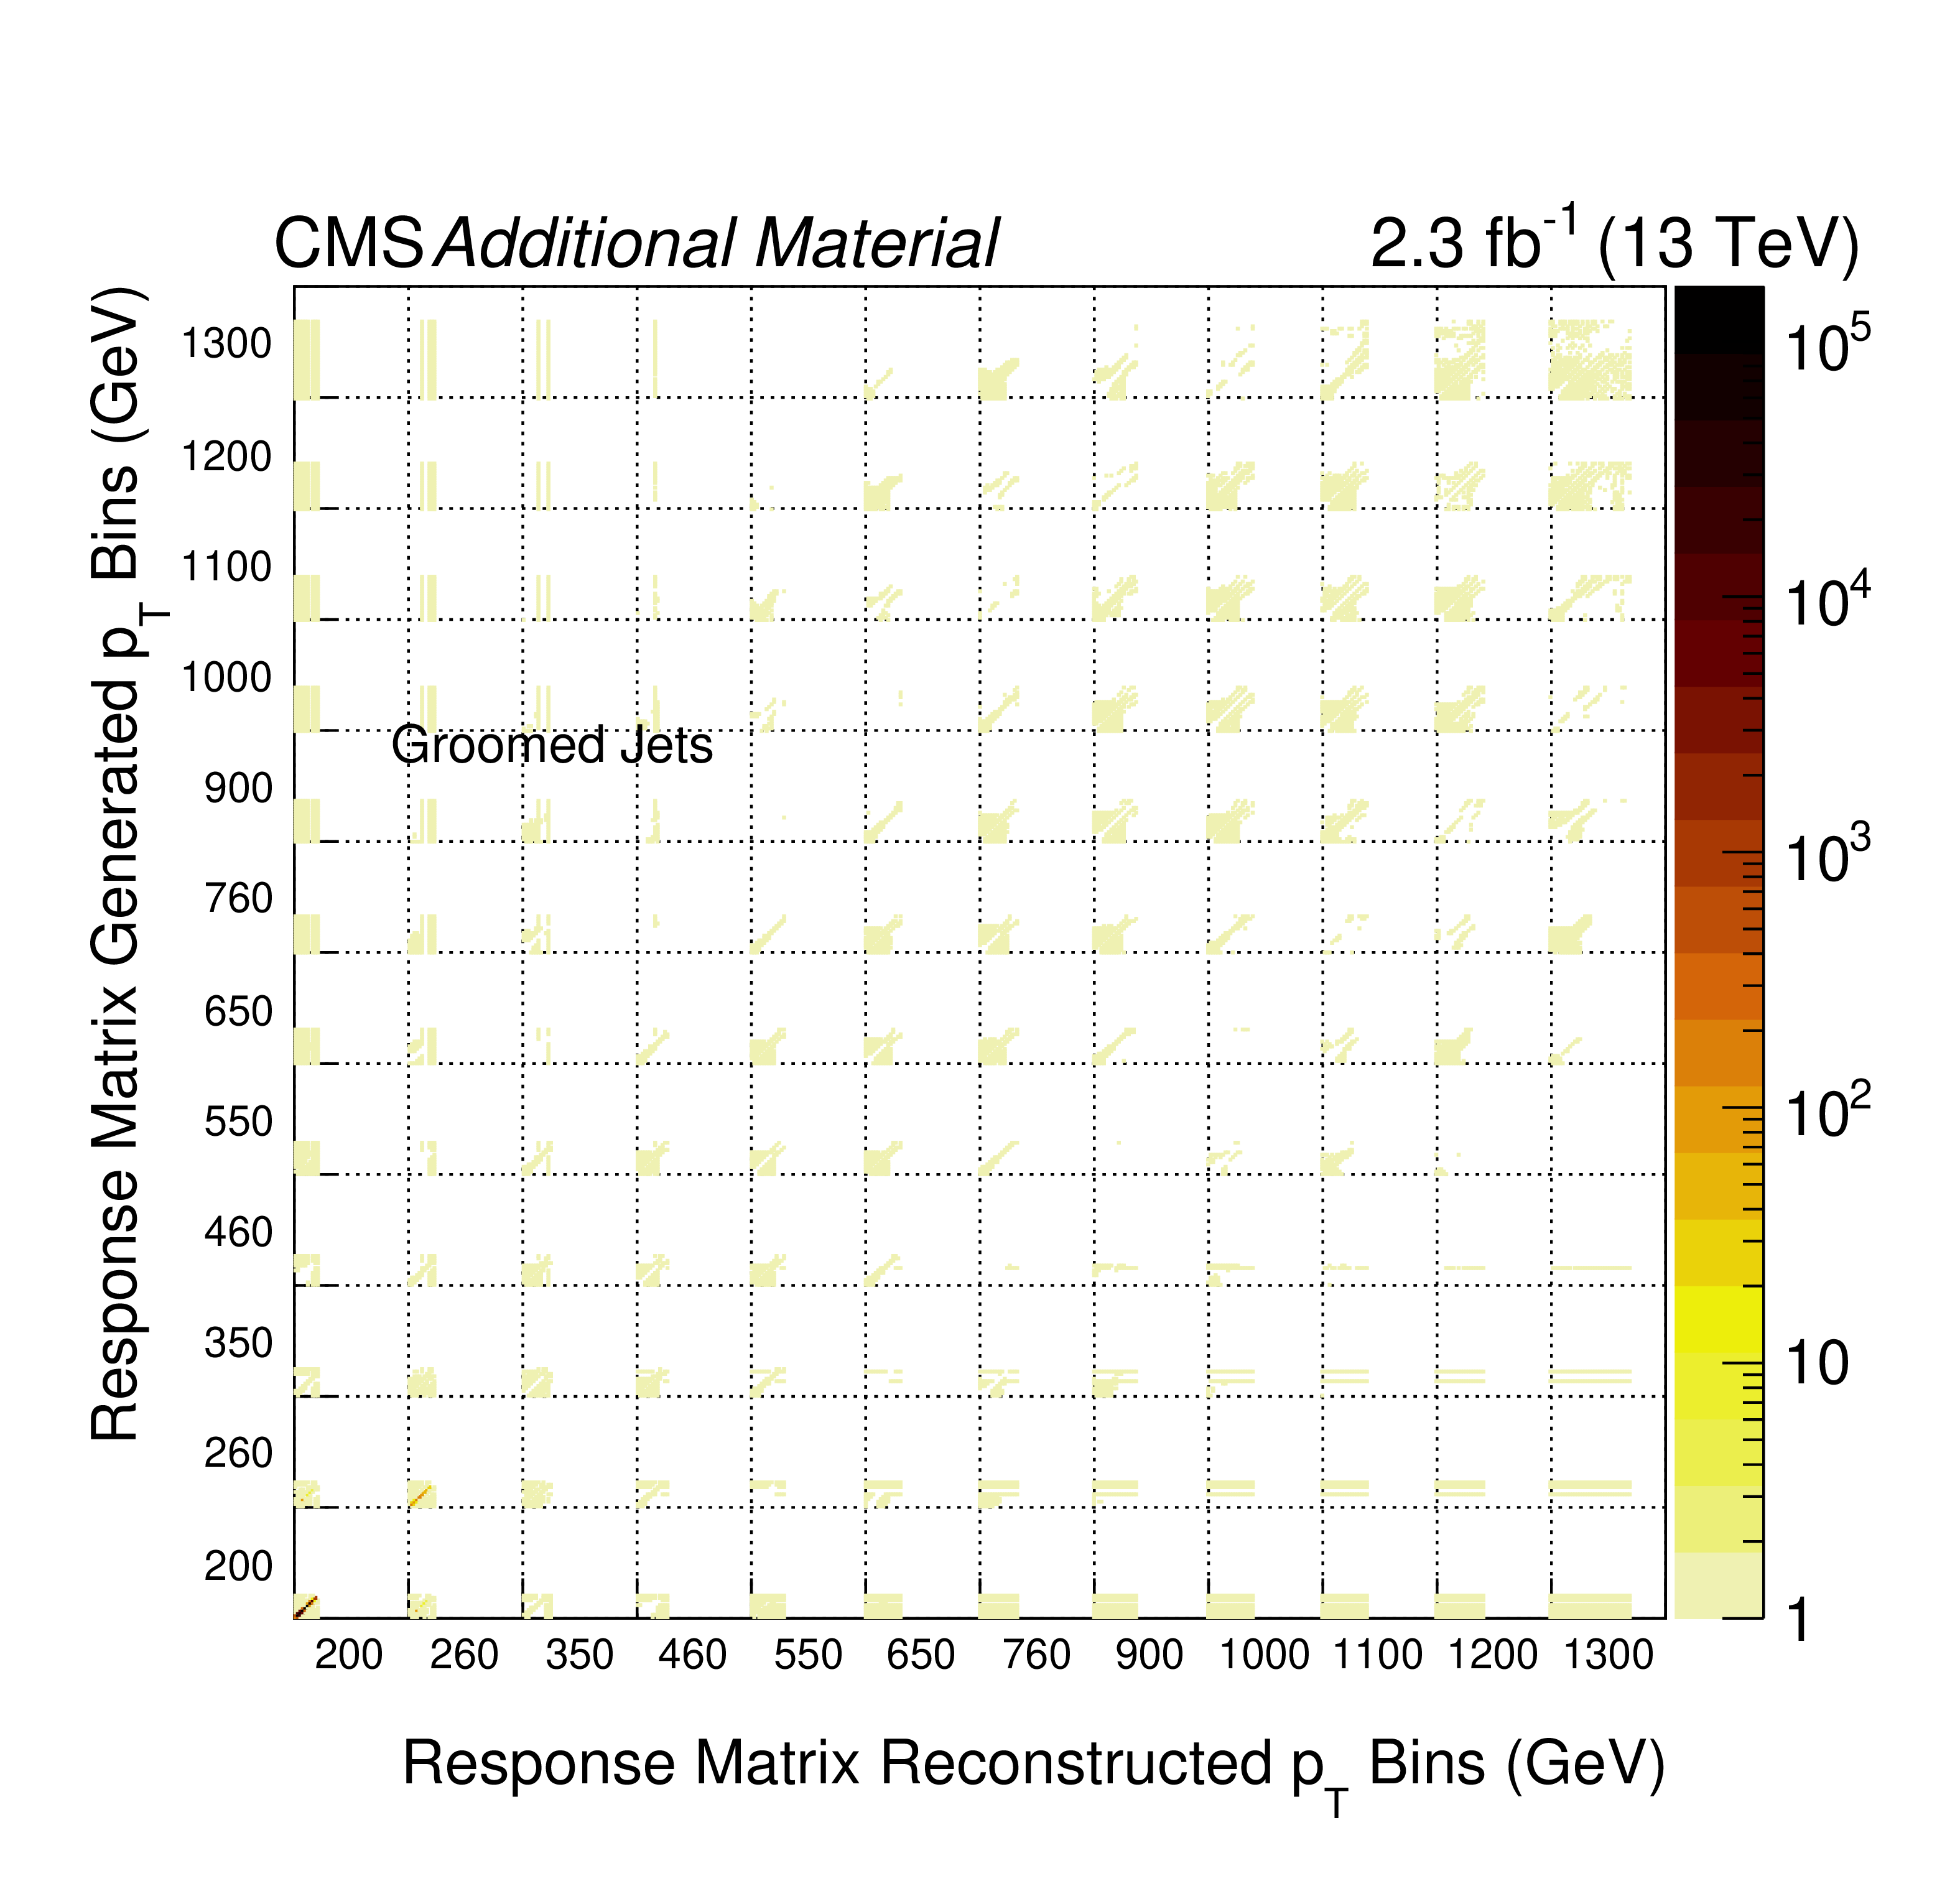
Additional Figure 7:
Covariance matrix for the groomed jets. The $x$ axis contains the bins in groomed reconstructed jet mass, grouped by reconstructed jet $ {p_{\mathrm {T}}} $. The $y$ axis contains the bins in groomed generated jet mass, grouped by generated jet $ {p_{\mathrm {T}}} $. |
png pdf |
Additional Figure 8:
Absolute cross section for ungroomed jets for 200 $ < {p_{\mathrm {T}}} < $ 260 GeV. The data are shown by the black points, with dark grey bands for the statistical uncertainty (Stat. unc.) and with light grey bands for the total uncertainty (Stat. + sys. unc., added in quadrature). The predictions from PYTHIA-8, HERWIG++, and POWHEG+PYTHIA are shown with dashed black, dash-dot-dotted magenta, and dash-dotted green histograms, respectively, with no uncertainties shown. The MC simulations are normalized to the data over the entire $ {p_{\mathrm {T}}} $ range. |
png pdf |
Additional Figure 9:
Absolute cross section for ungroomed jets for 260 $ < {p_{\mathrm {T}}} < $ 350 GeV. The data are shown by the black points, with dark grey bands for the statistical uncertainty (Stat. unc.) and with light grey bands for the total uncertainty (Stat. + sys. unc., added in quadrature). The predictions from PYTHIA-8, HERWIG++, and POWHEG+PYTHIA are shown with dashed black, dash-dot-dotted magenta, and dash-dotted green histograms, respectively, with no uncertainties shown. The MC simulations are normalized to the data over the entire $ {p_{\mathrm {T}}} $ range. |
png pdf |
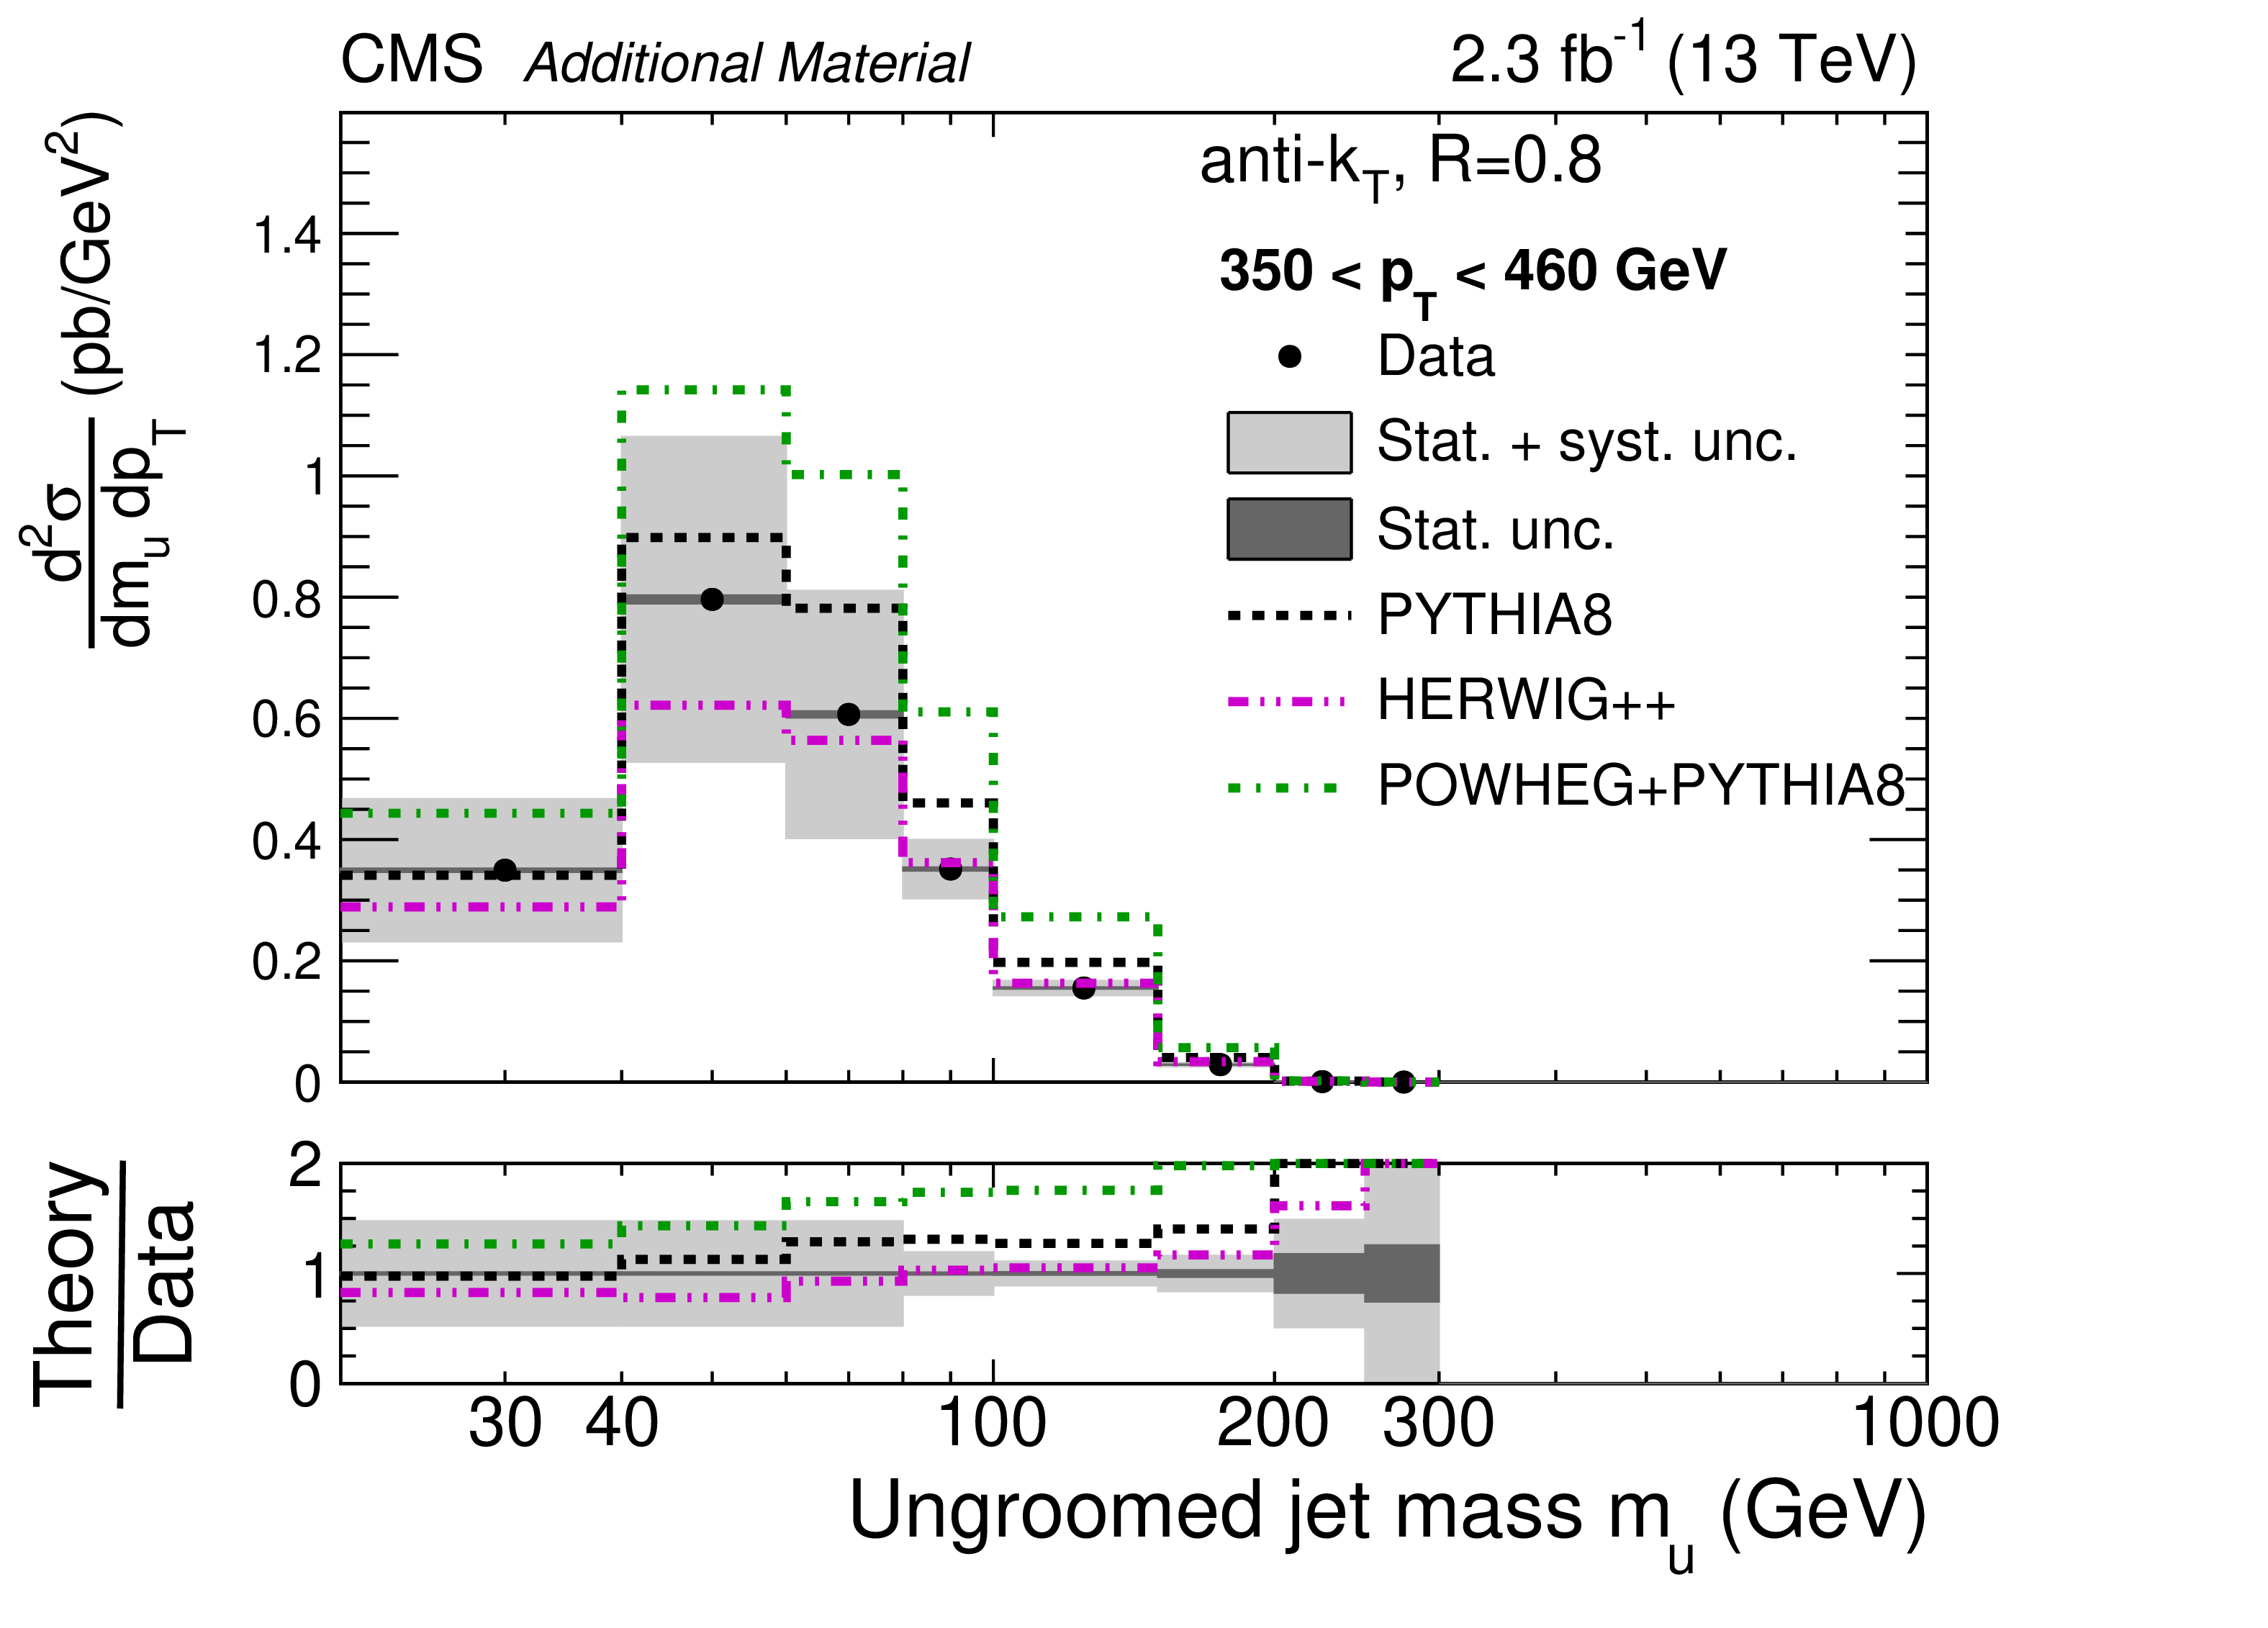
Additional Figure 10:
Absolute cross section for ungroomed jets for 350 $ < {p_{\mathrm {T}}} < $ 460 GeV. The data are shown by the black points, with dark grey bands for the statistical uncertainty (Stat. unc.) and with light grey bands for the total uncertainty (Stat. + sys. unc., added in quadrature). The predictions from PYTHIA-8, HERWIG++, and POWHEG+PYTHIA are shown with dashed black, dash-dot-dotted magenta, and dash-dotted green histograms, respectively, with no uncertainties shown. The MC simulations are normalized to the data over the entire $ {p_{\mathrm {T}}} $ range. |
png pdf |
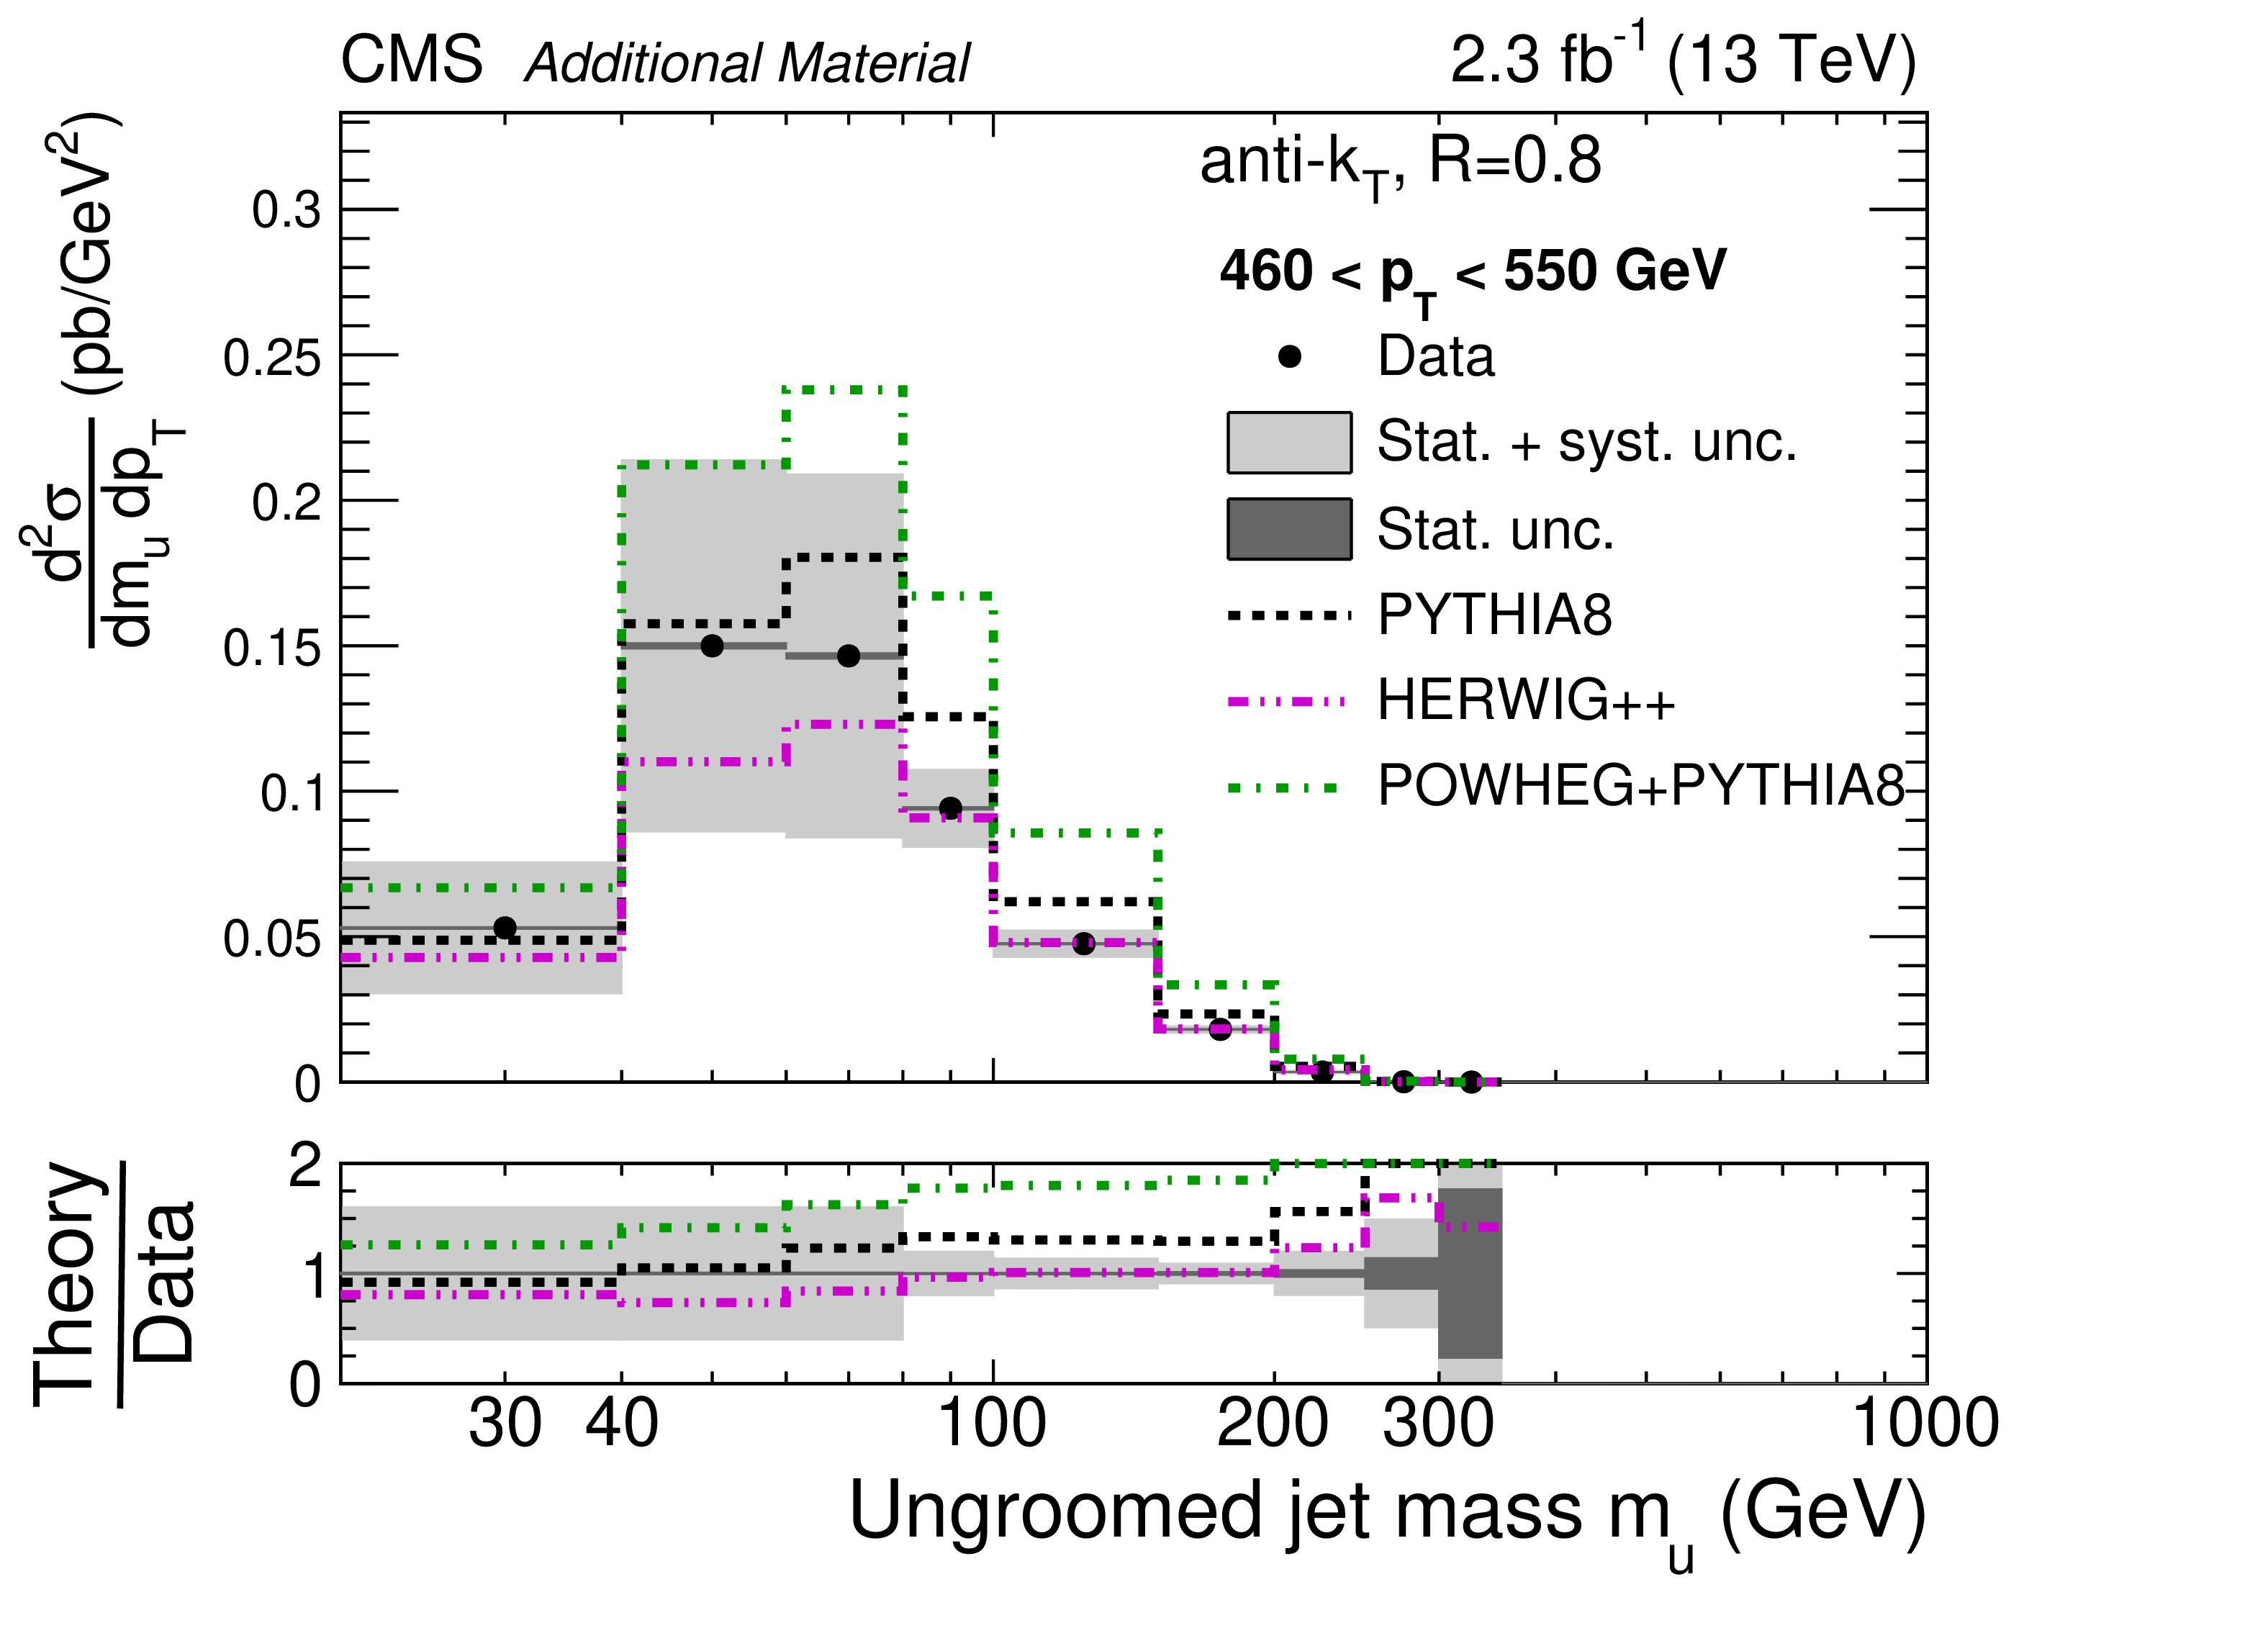
Additional Figure 11:
Absolute cross section for ungroomed jets for 460 $ < {p_{\mathrm {T}}} < $ 550 GeV. The data are shown by the black points, with dark grey bands for the statistical uncertainty (Stat. unc.) and with light grey bands for the total uncertainty (Stat. + sys. unc., added in quadrature). The predictions from PYTHIA-8, HERWIG++, and POWHEG+PYTHIA are shown with dashed black, dash-dot-dotted magenta, and dash-dotted green histograms, respectively, with no uncertainties shown. The MC simulations are normalized to the data over the entire $ {p_{\mathrm {T}}} $ range. |

png pdf |
Additional Figure 12:
Absolute cross section for ungroomed jets for 550 $ < {p_{\mathrm {T}}} < $ 650 GeV. The data are shown by the black points, with dark grey bands for the statistical uncertainty (Stat. unc.) and with light grey bands for the total uncertainty (Stat. + sys. unc., added in quadrature). The predictions from PYTHIA-8, HERWIG++, and POWHEG+PYTHIA are shown with dashed black, dash-dot-dotted magenta, and dash-dotted green histograms, respectively, with no uncertainties shown. The MC simulations are normalized to the data over the entire $ {p_{\mathrm {T}}} $ range. |
png pdf |
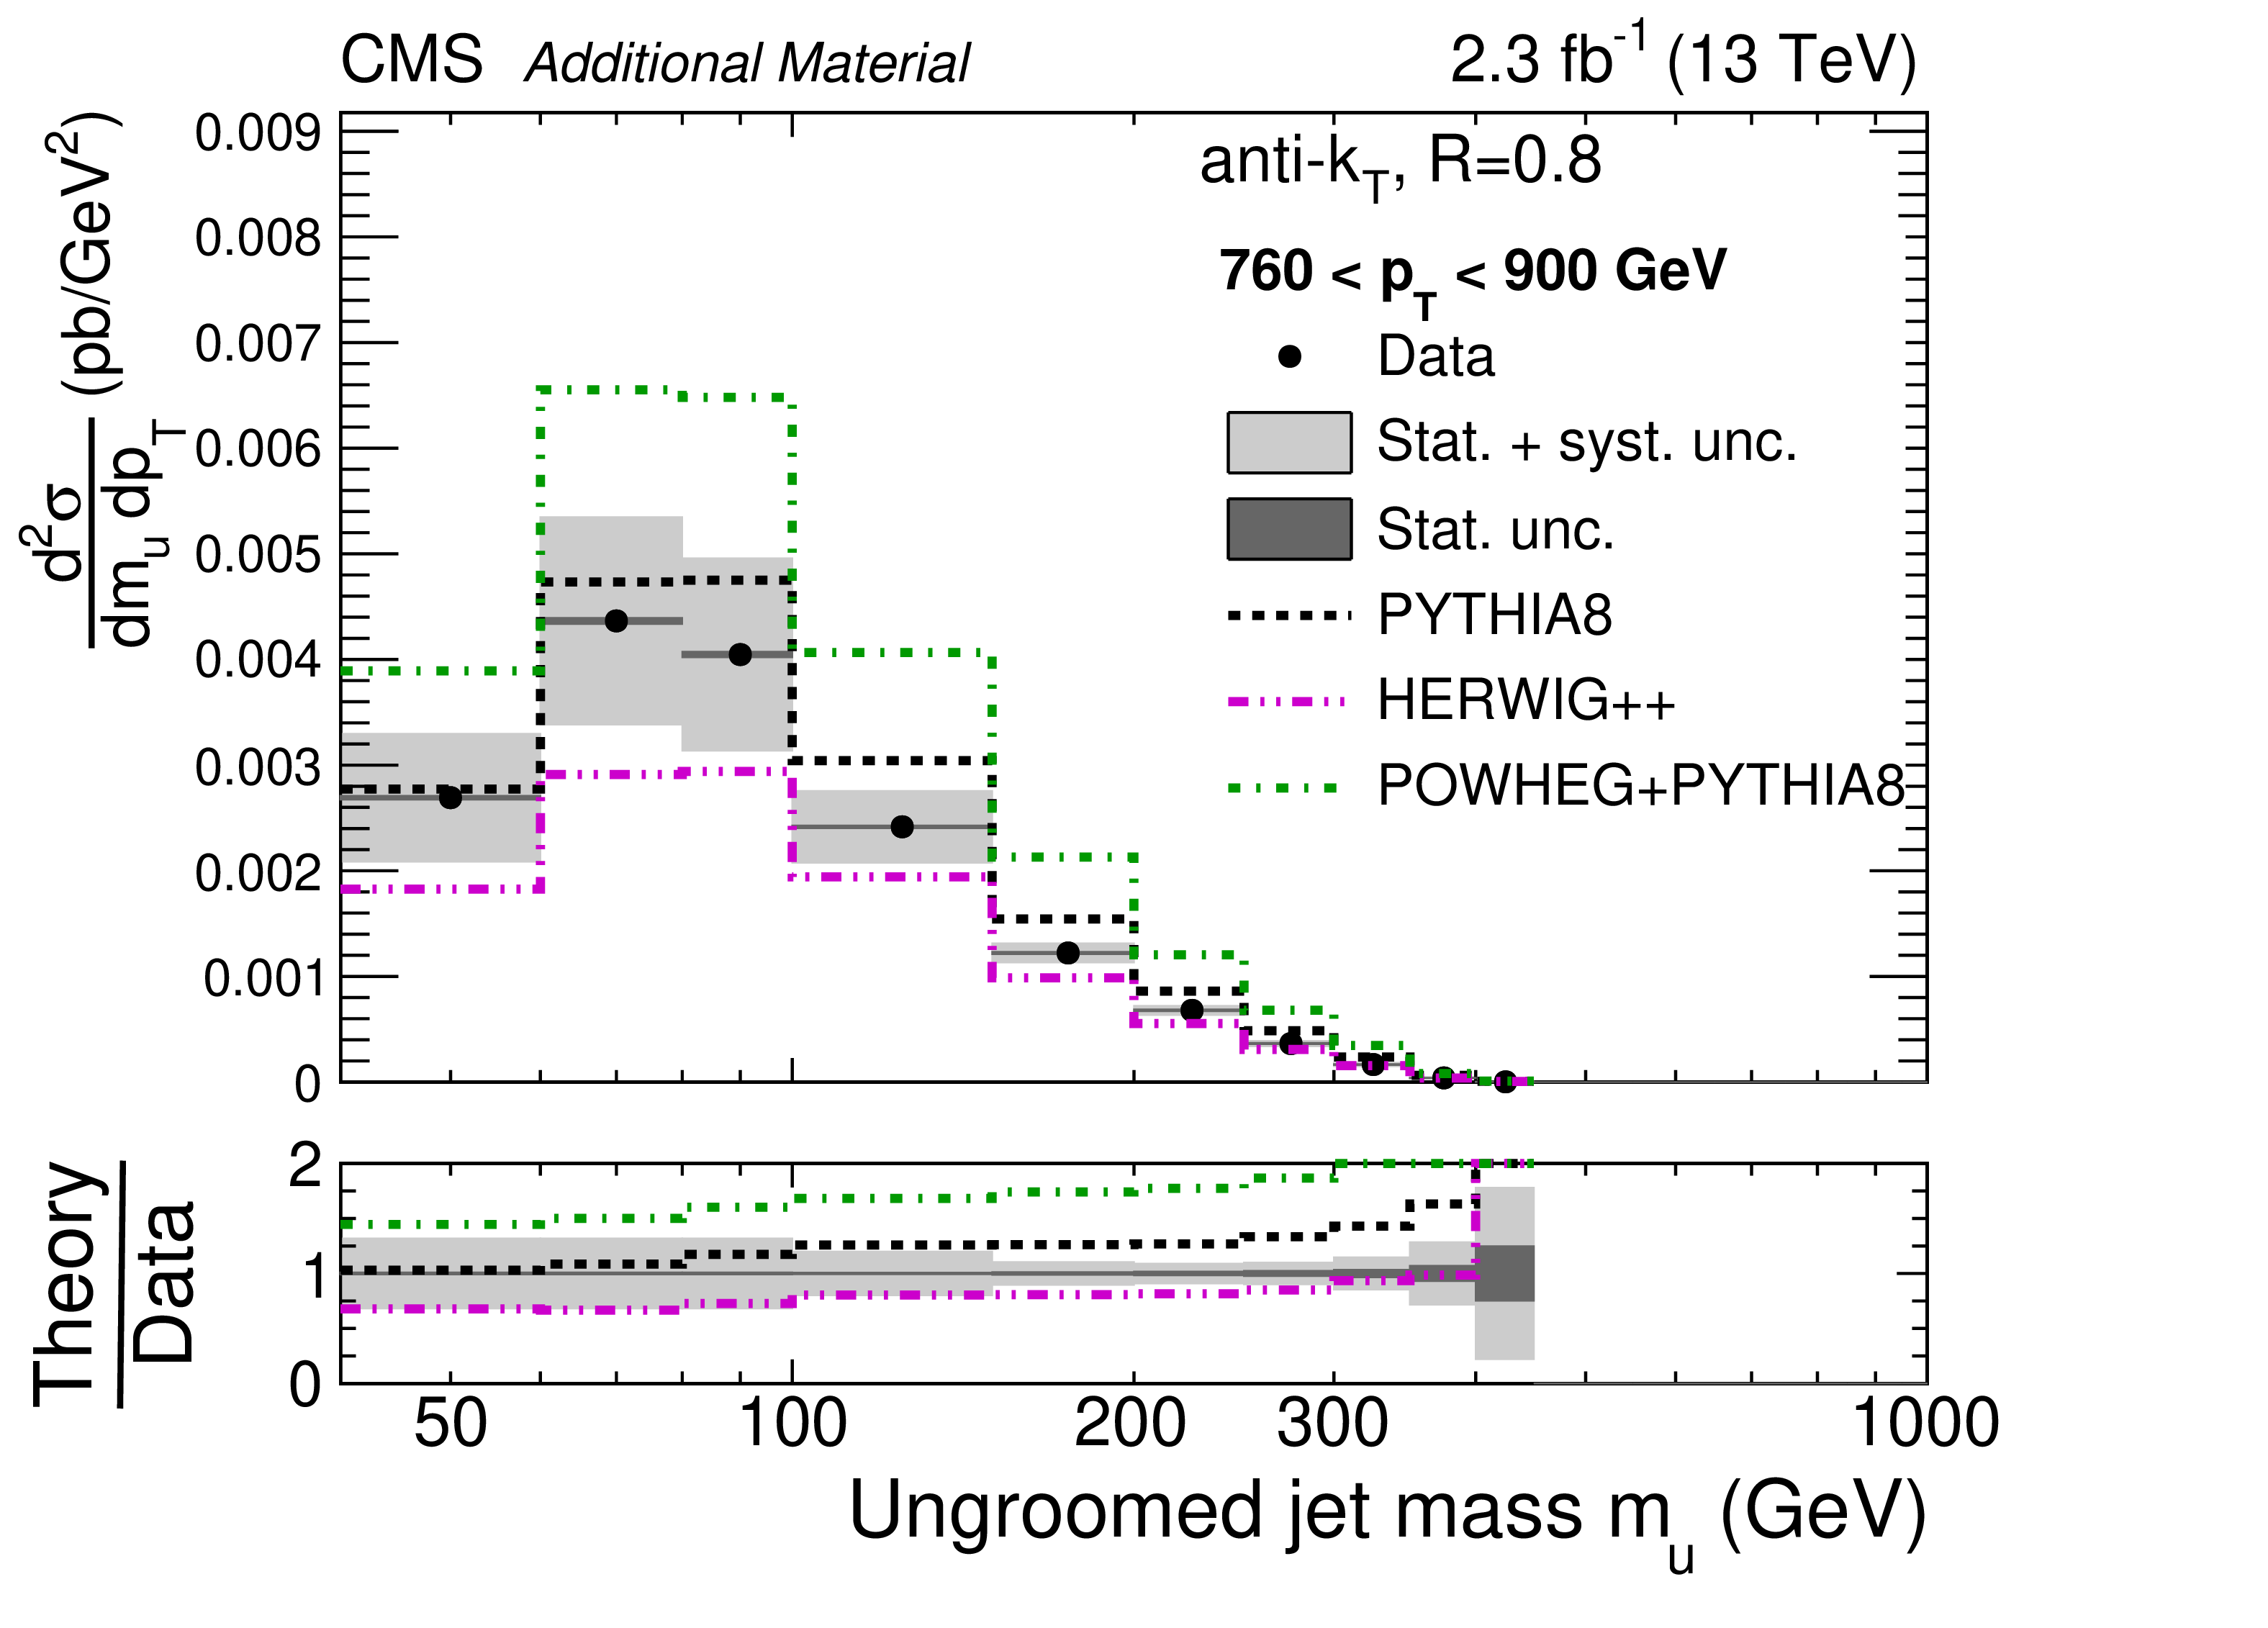
Additional Figure 13:
Absolute cross section for ungroomed jets for 760 $ < {p_{\mathrm {T}}} < $ 900 GeV. The data are shown by the black points, with dark grey bands for the statistical uncertainty (Stat. unc.) and with light grey bands for the total uncertainty (Stat. + sys. unc., added in quadrature). The predictions from PYTHIA-8, HERWIG++, and POWHEG+PYTHIA are shown with dashed black, dash-dot-dotted magenta, and dash-dotted green histograms, respectively, with no uncertainties shown. The MC simulations are normalized to the data over the entire $ {p_{\mathrm {T}}} $ range. |
png pdf |
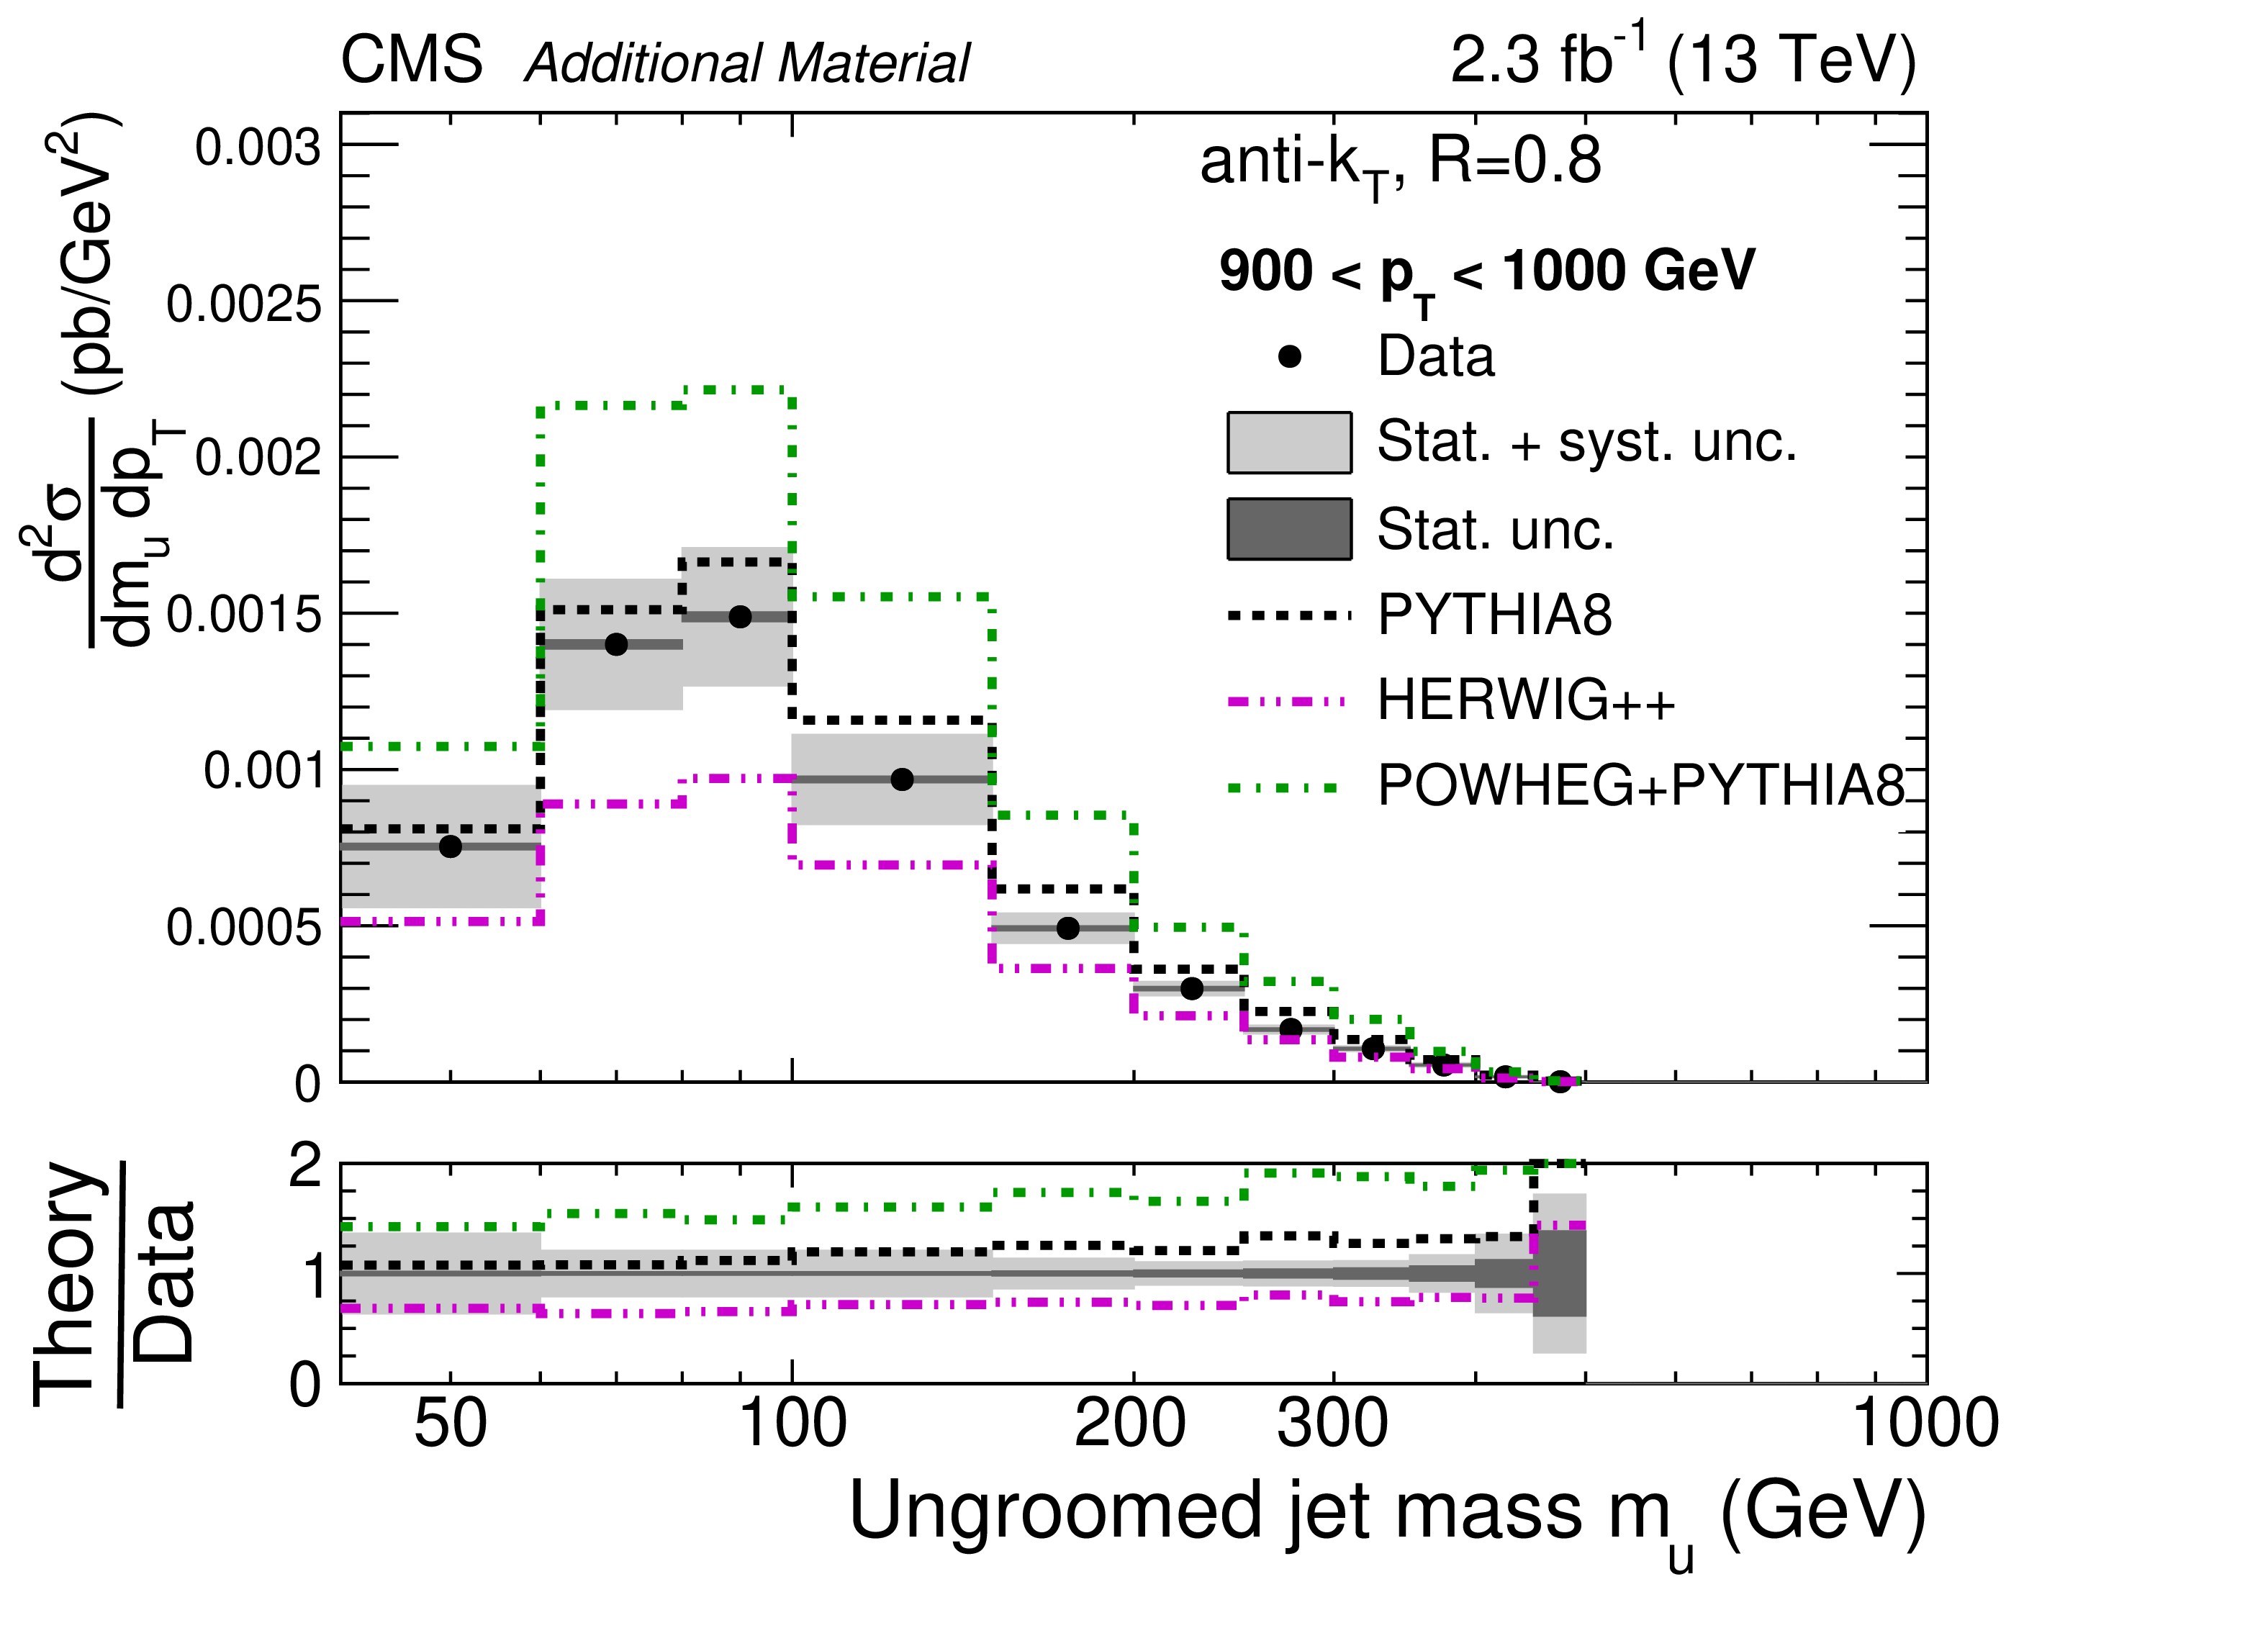
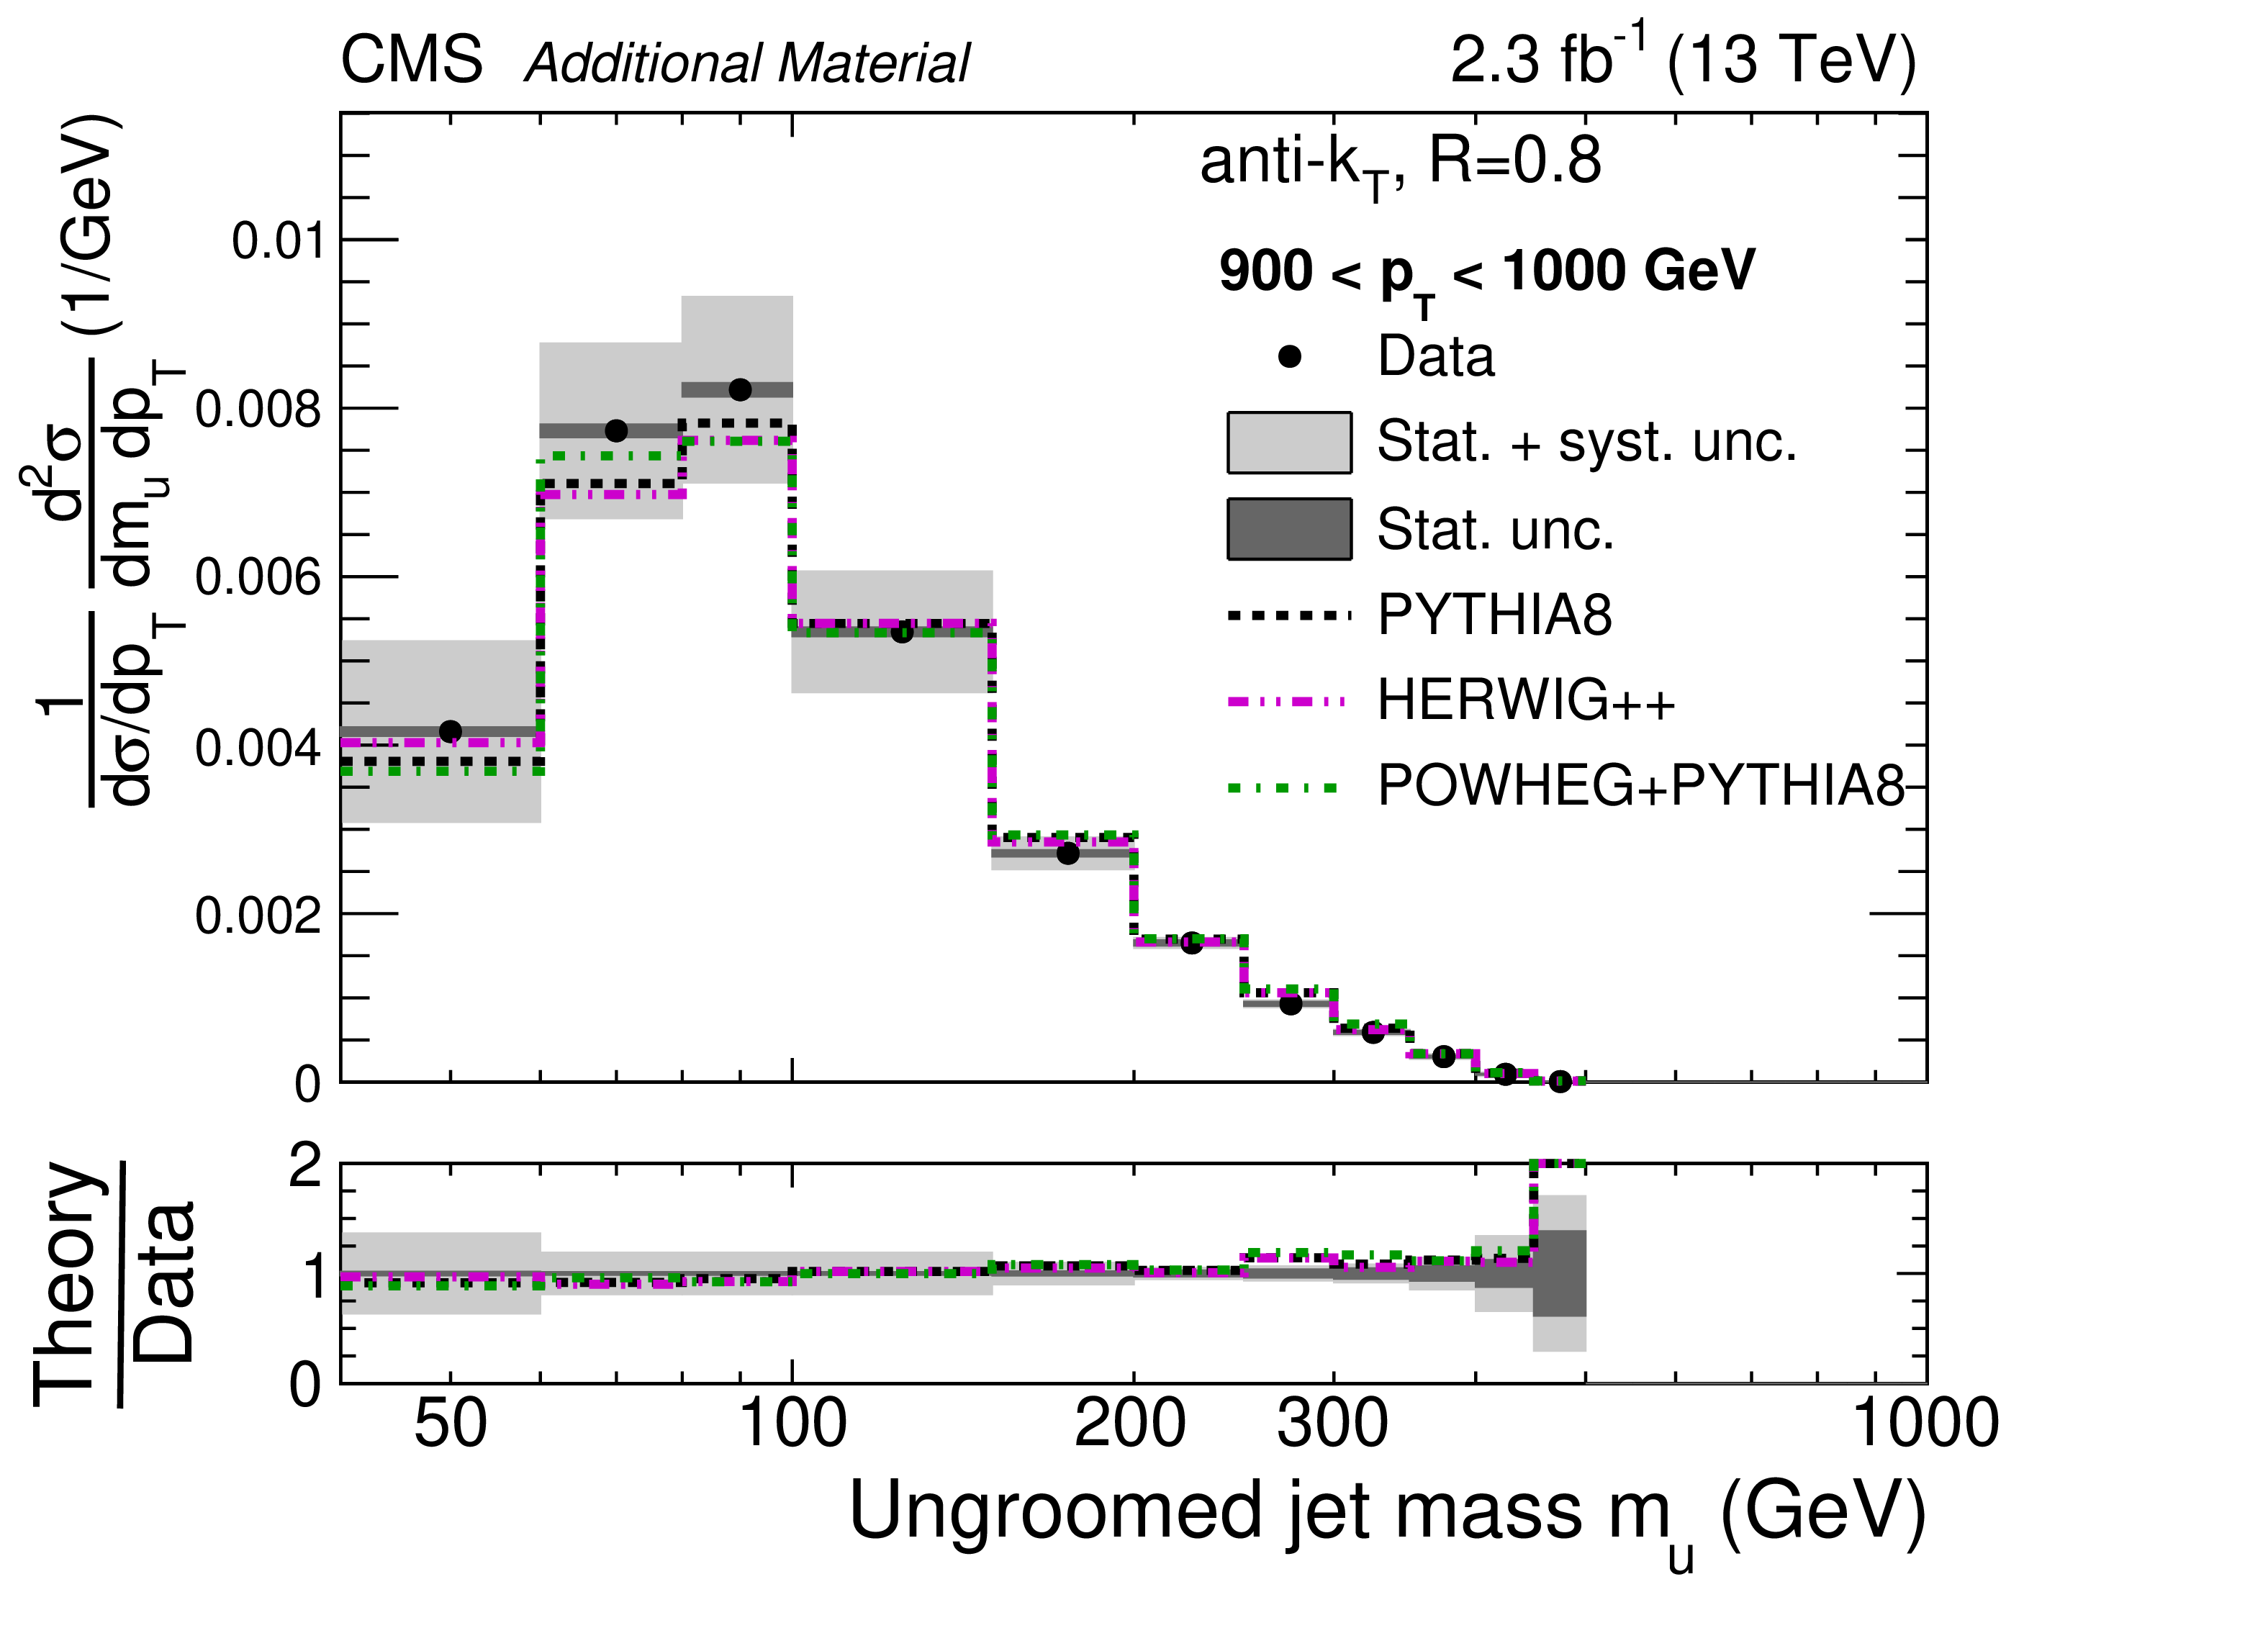
Additional Figure 14:
Absolute cross section for ungroomed jets for 900 $ < {p_{\mathrm {T}}} < $ 1000 GeV. The data are shown by the black points, with dark grey bands for the statistical uncertainty (Stat. unc.) and with light grey bands for the total uncertainty (Stat. + sys. unc., added in quadrature). The predictions from PYTHIA-8, HERWIG++, and POWHEG+PYTHIA are shown with dashed black, dash-dot-dotted magenta, and dash-dotted green histograms, respectively, with no uncertainties shown. The MC simulations are normalized to the data over the entire $ {p_{\mathrm {T}}} $ range. |
png pdf |
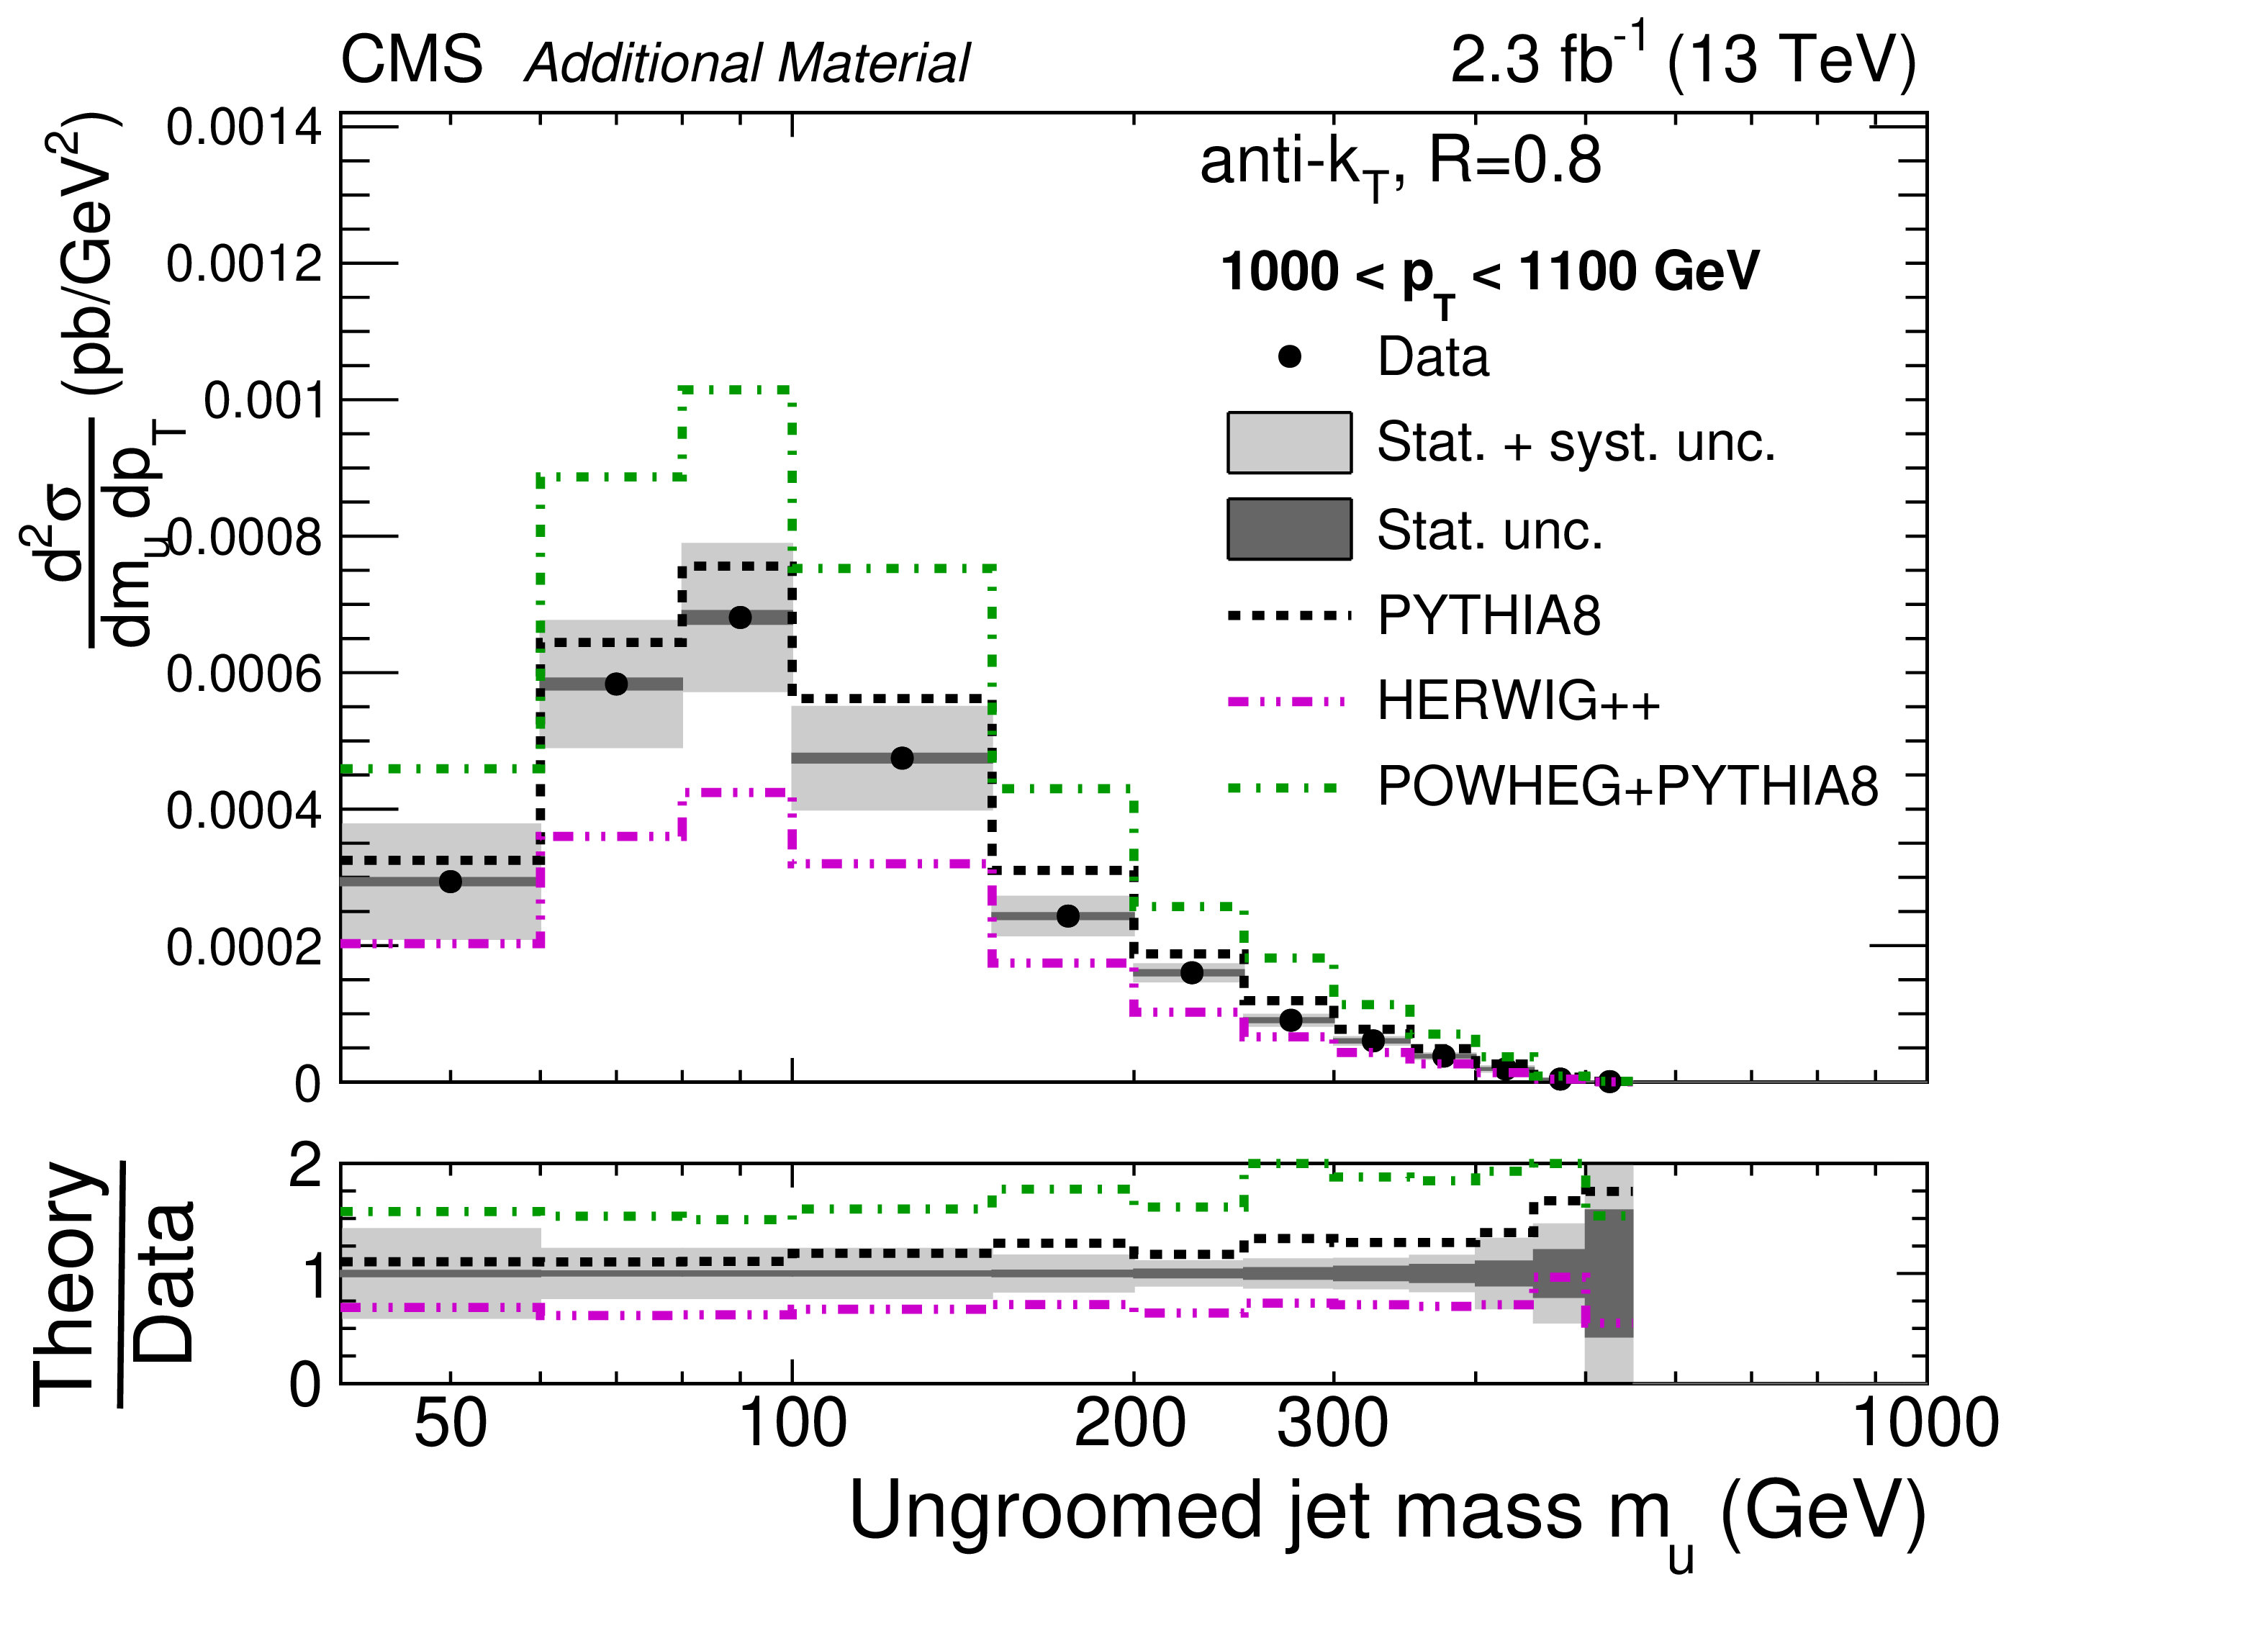
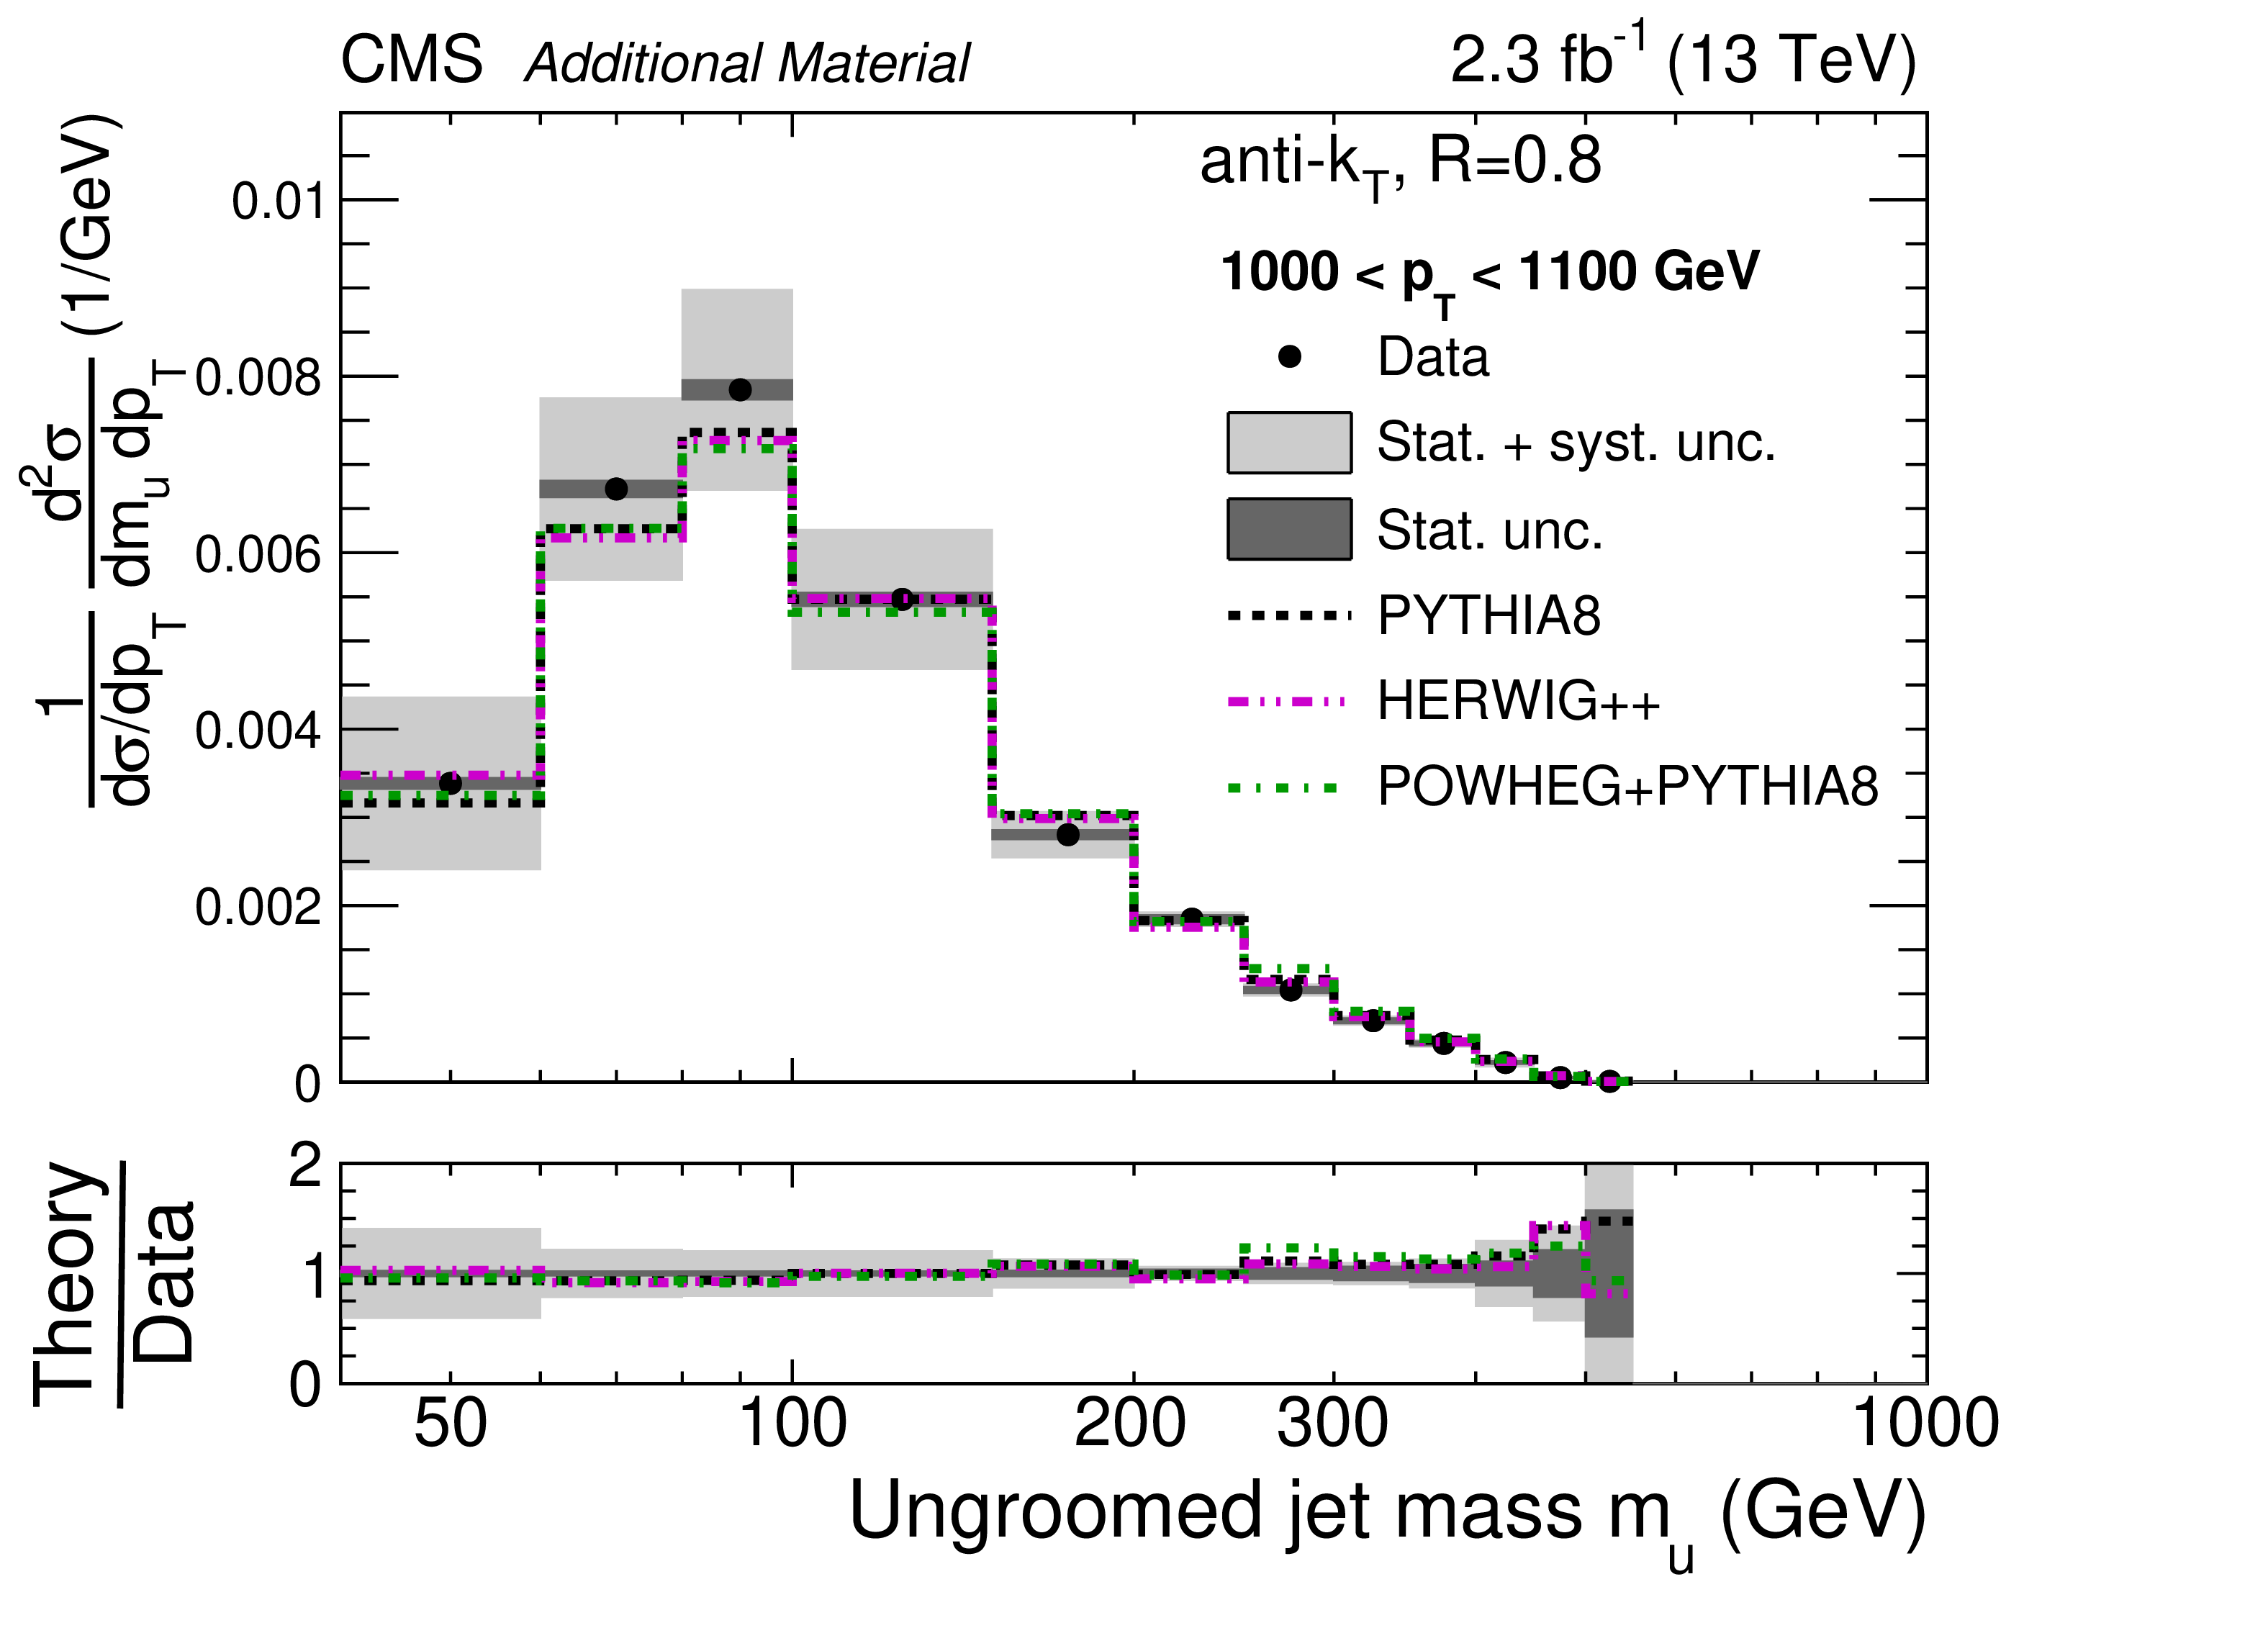
Additional Figure 15:
Absolute cross section for ungroomed jets for 1000 $ < {p_{\mathrm {T}}} < $ 1100 GeV. The data are shown by the black points, with dark grey bands for the statistical uncertainty (Stat. unc.) and with light grey bands for the total uncertainty (Stat. + sys. unc., added in quadrature). The predictions from PYTHIA-8, HERWIG++, and POWHEG+PYTHIA are shown with dashed black, dash-dot-dotted magenta, and dash-dotted green histograms, respectively, with no uncertainties shown. The MC simulations are normalized to the data over the entire $ {p_{\mathrm {T}}} $ range. |
png pdf |
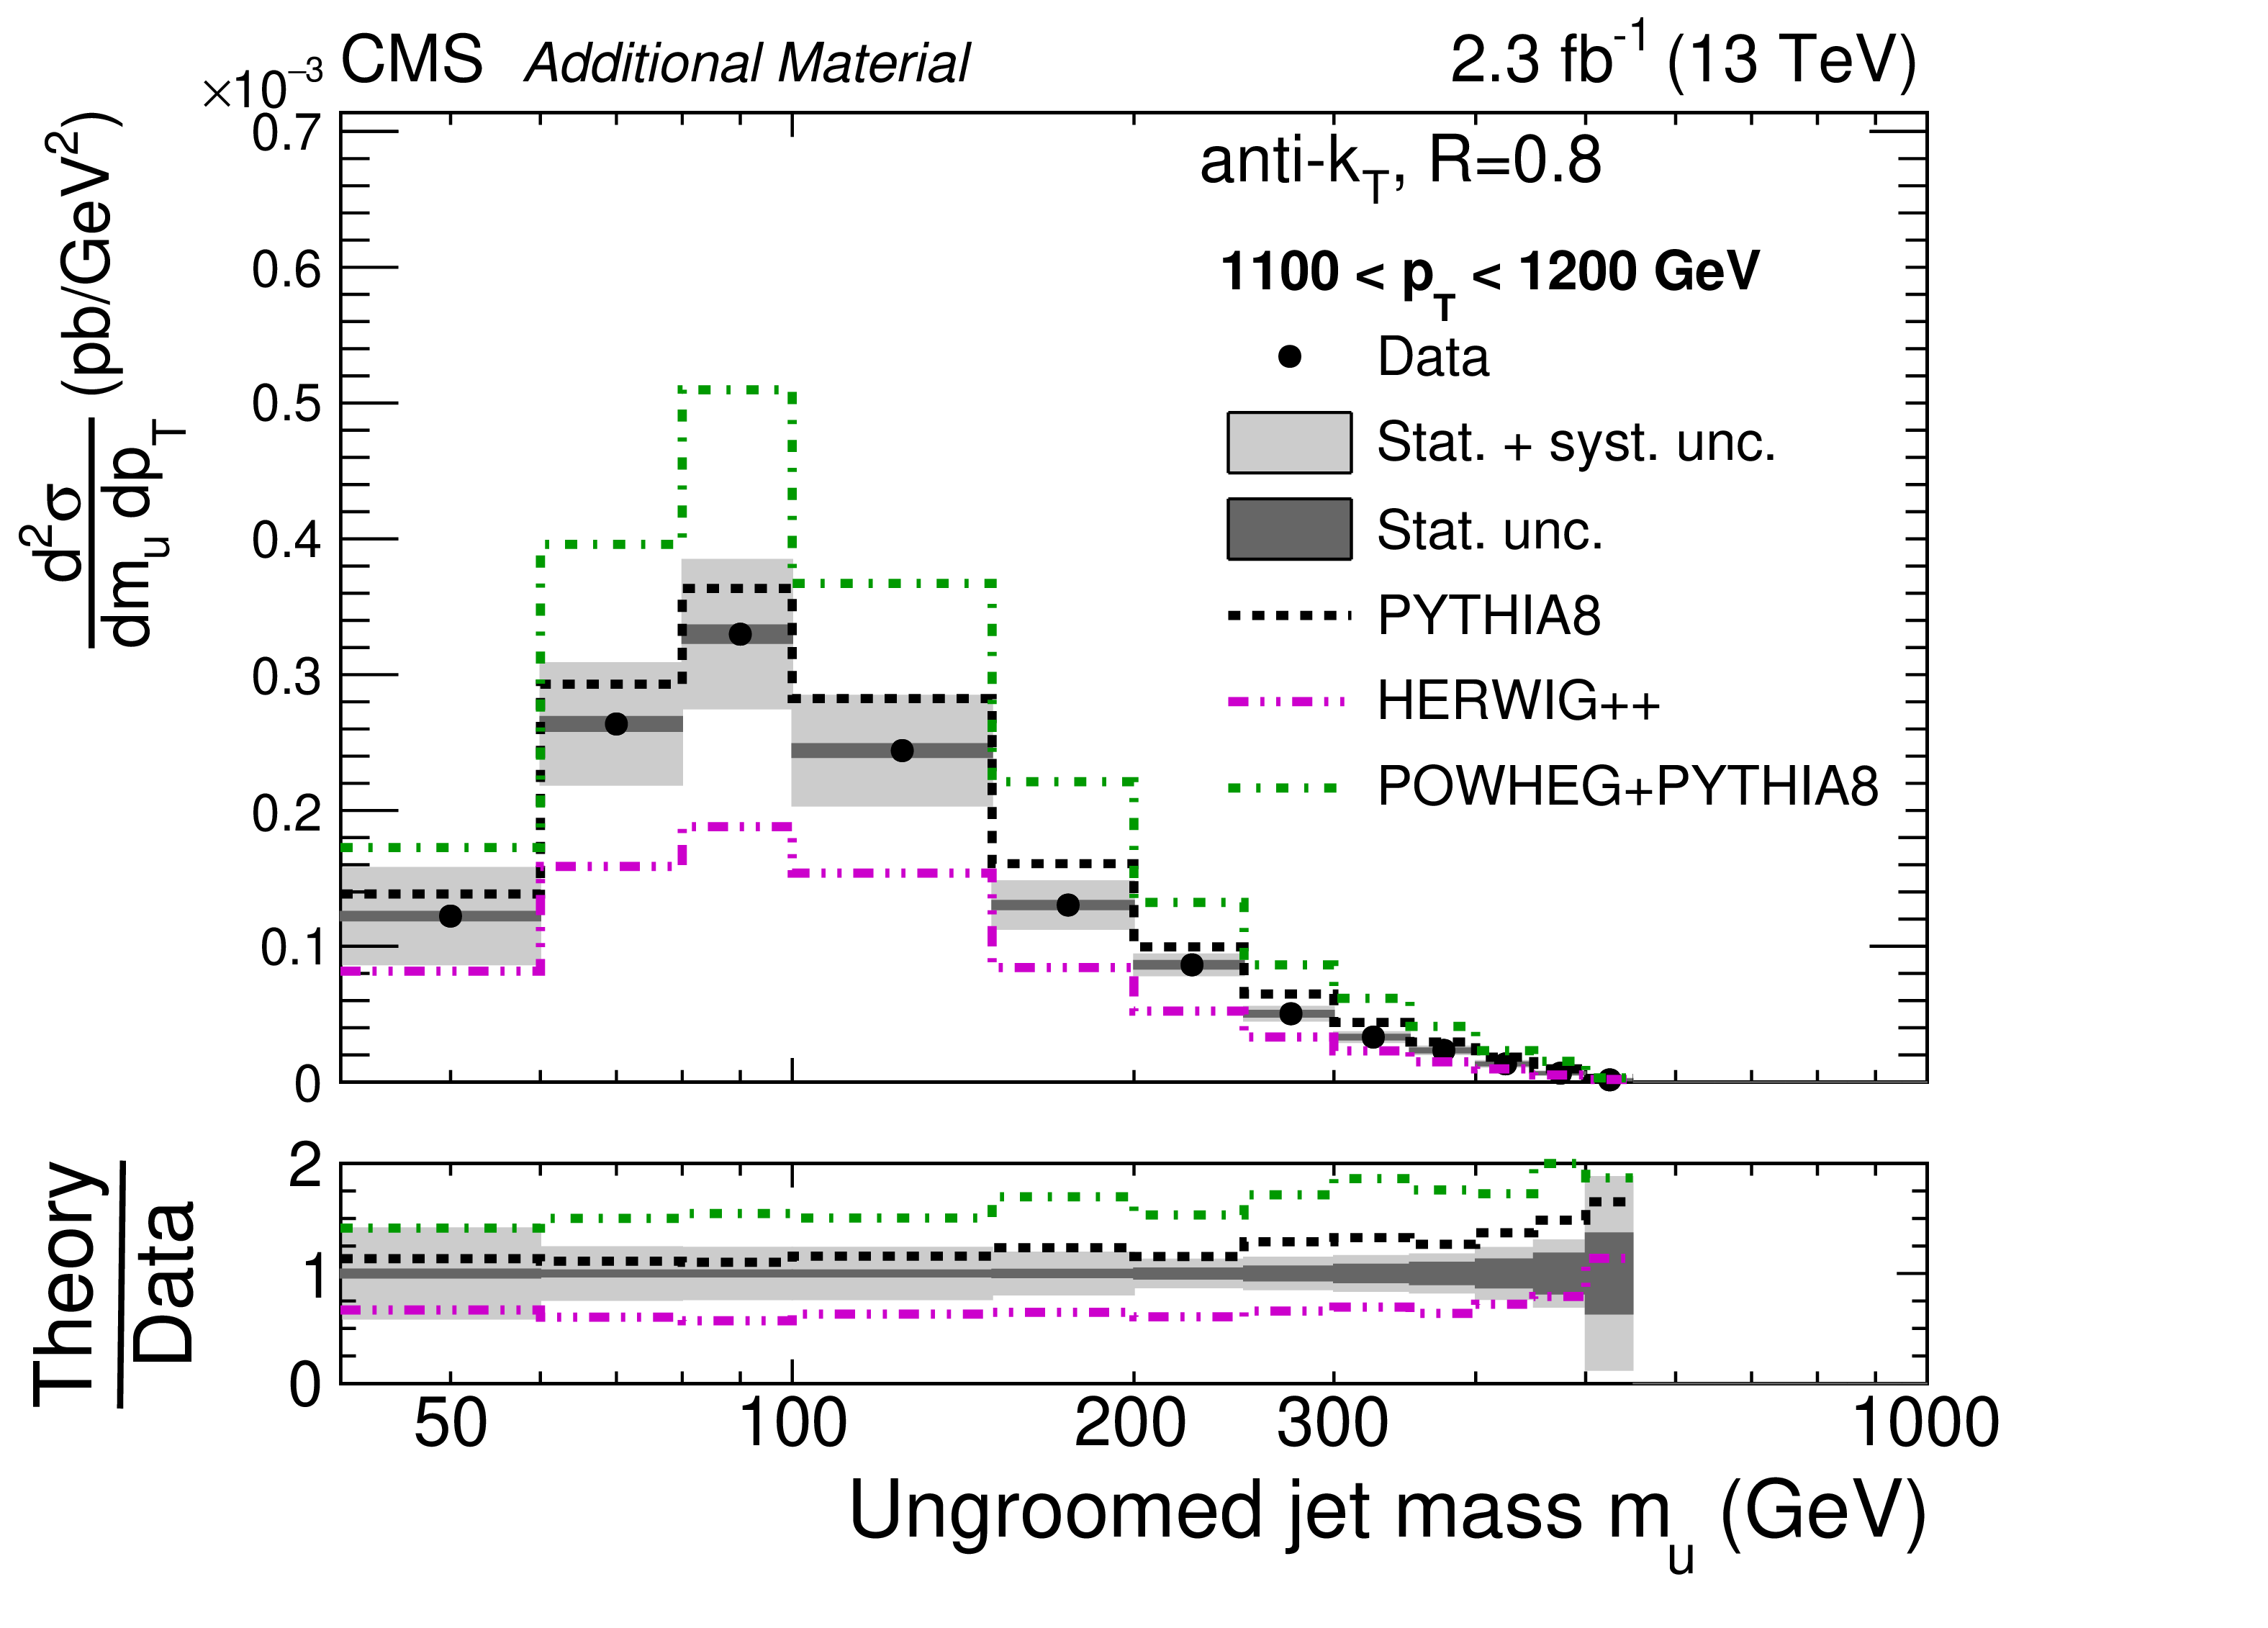
Additional Figure 16:
Absolute cross section for ungroomed jets for 1100 $ < {p_{\mathrm {T}}} < $ 1200 GeV. The data are shown by the black points, with dark grey bands for the statistical uncertainty (Stat. unc.) and with light grey bands for the total uncertainty (Stat. + sys. unc., added in quadrature). The predictions from PYTHIA-8, HERWIG++, and POWHEG+PYTHIA are shown with dashed black, dash-dot-dotted magenta, and dash-dotted green histograms, respectively, with no uncertainties shown. The MC simulations are normalized to the data over the entire $ {p_{\mathrm {T}}} $ range. |
png pdf |
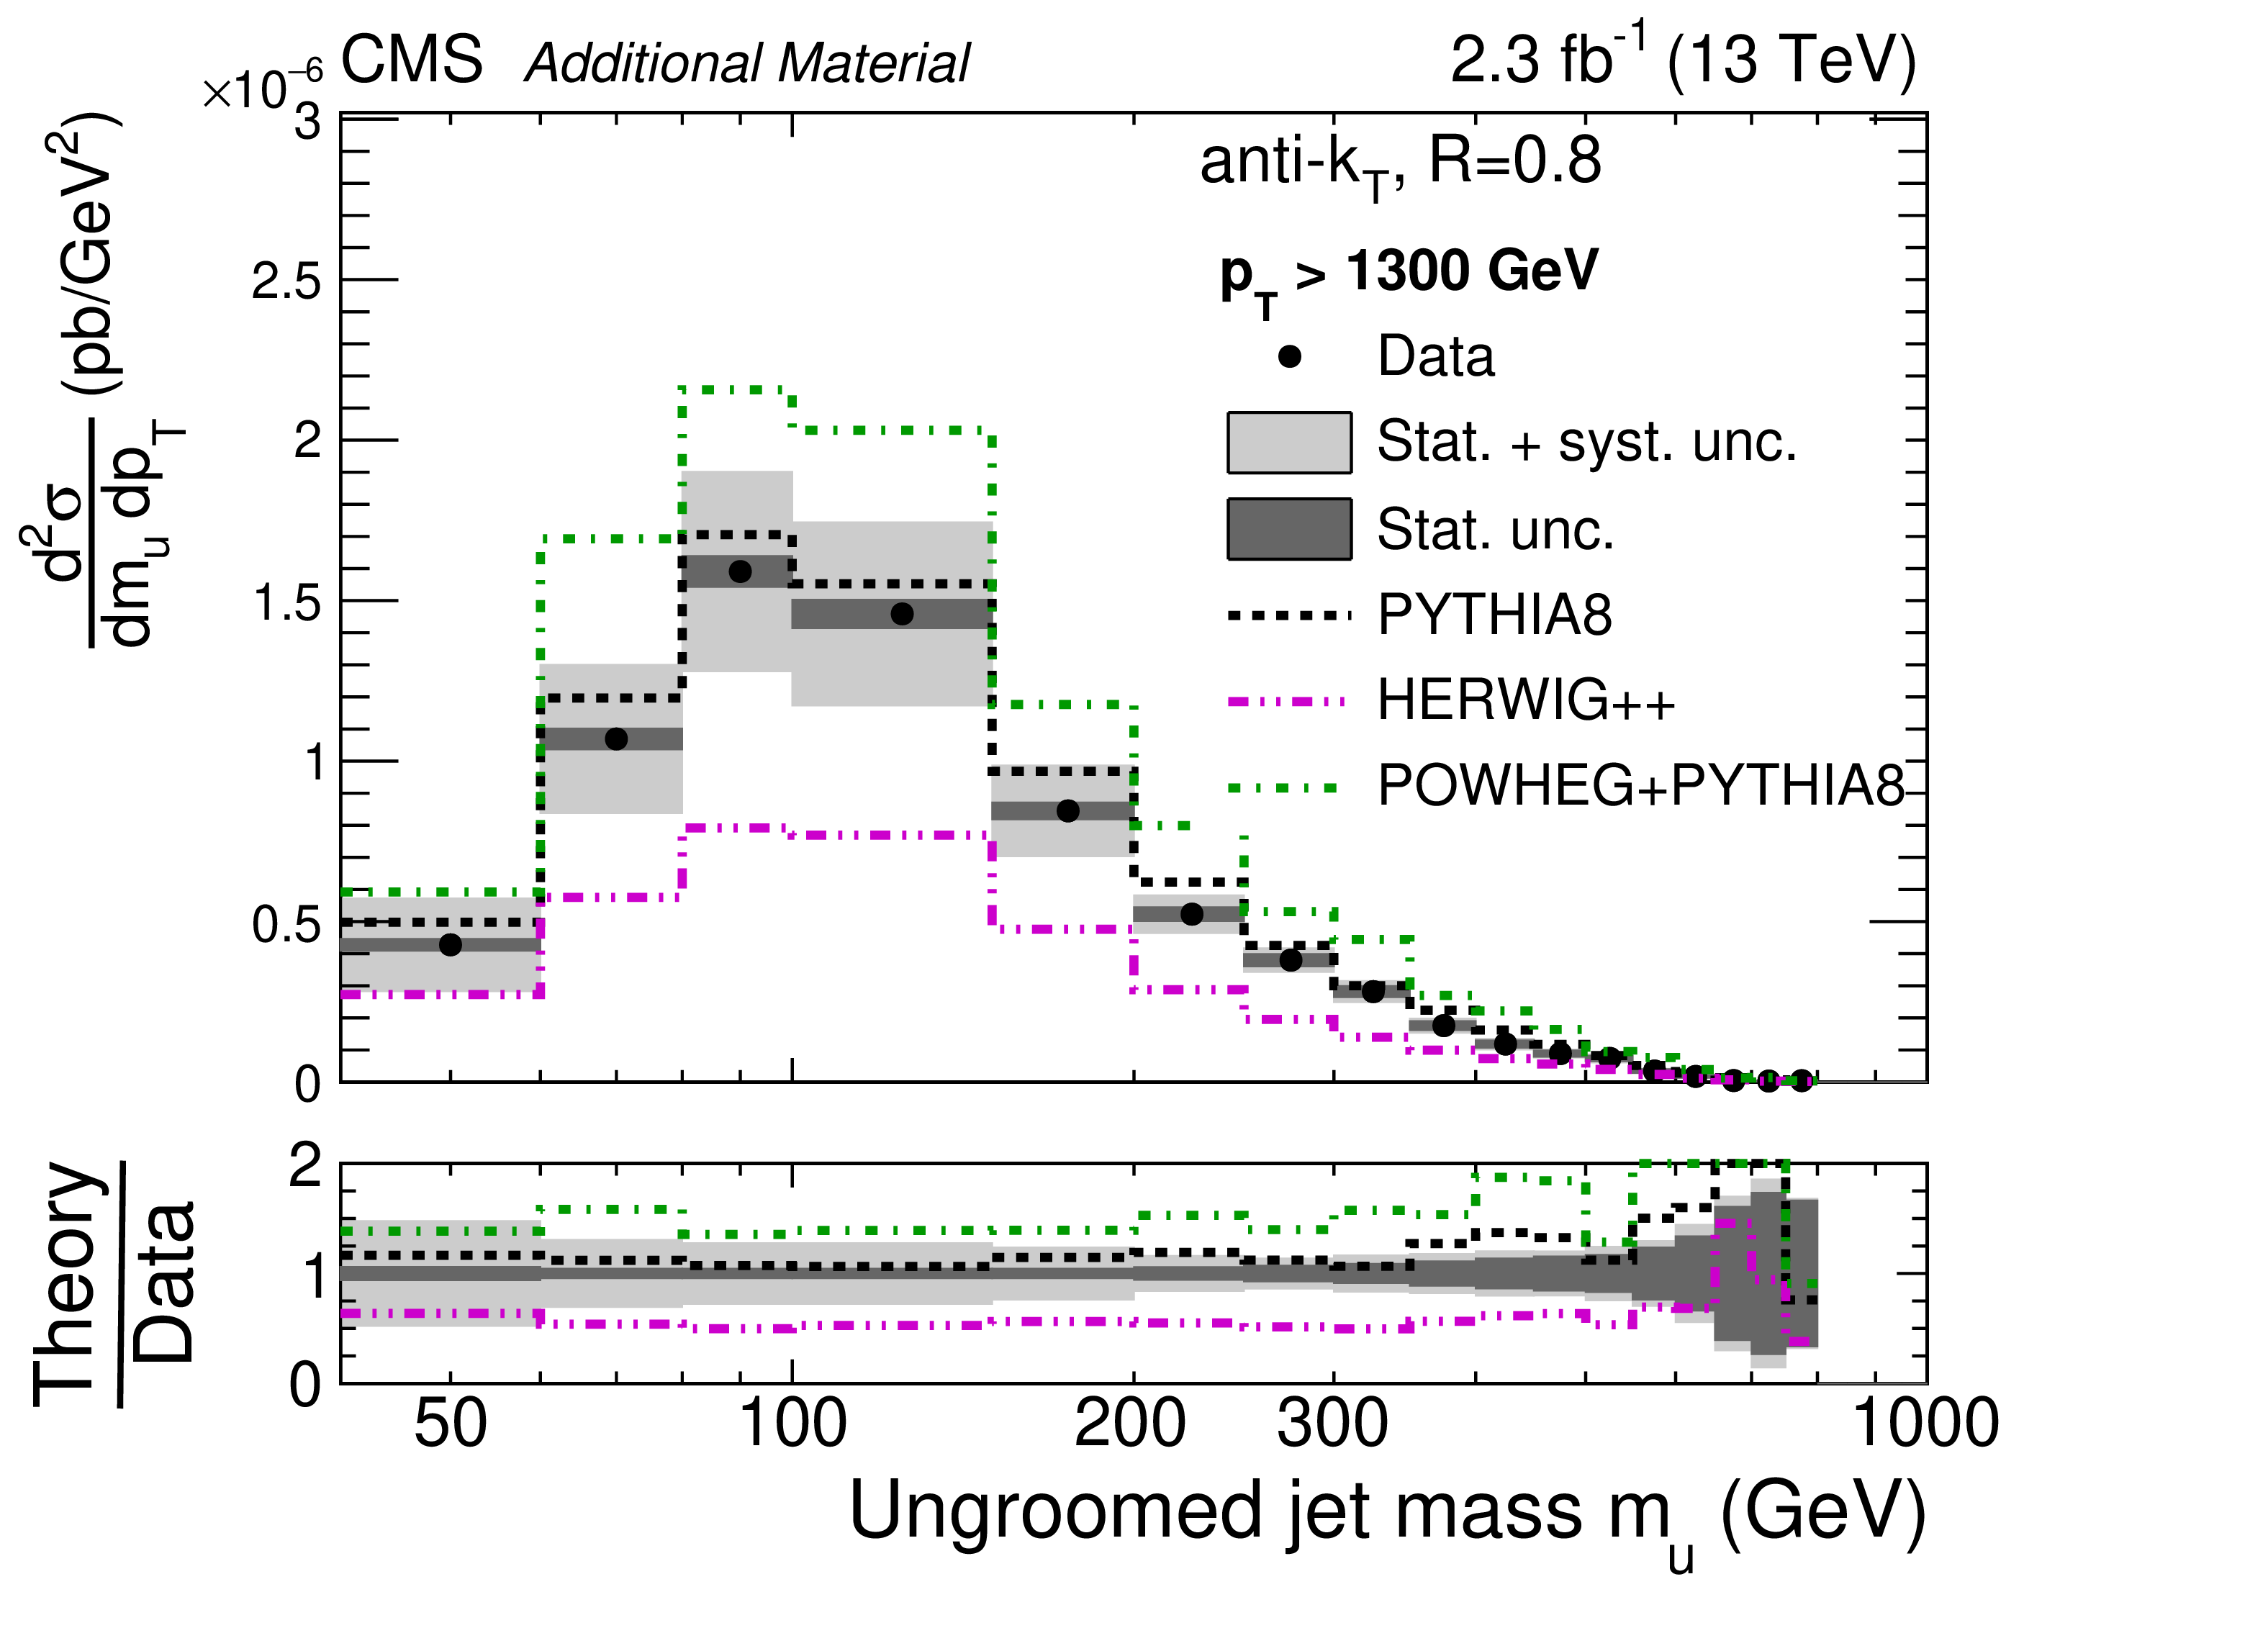
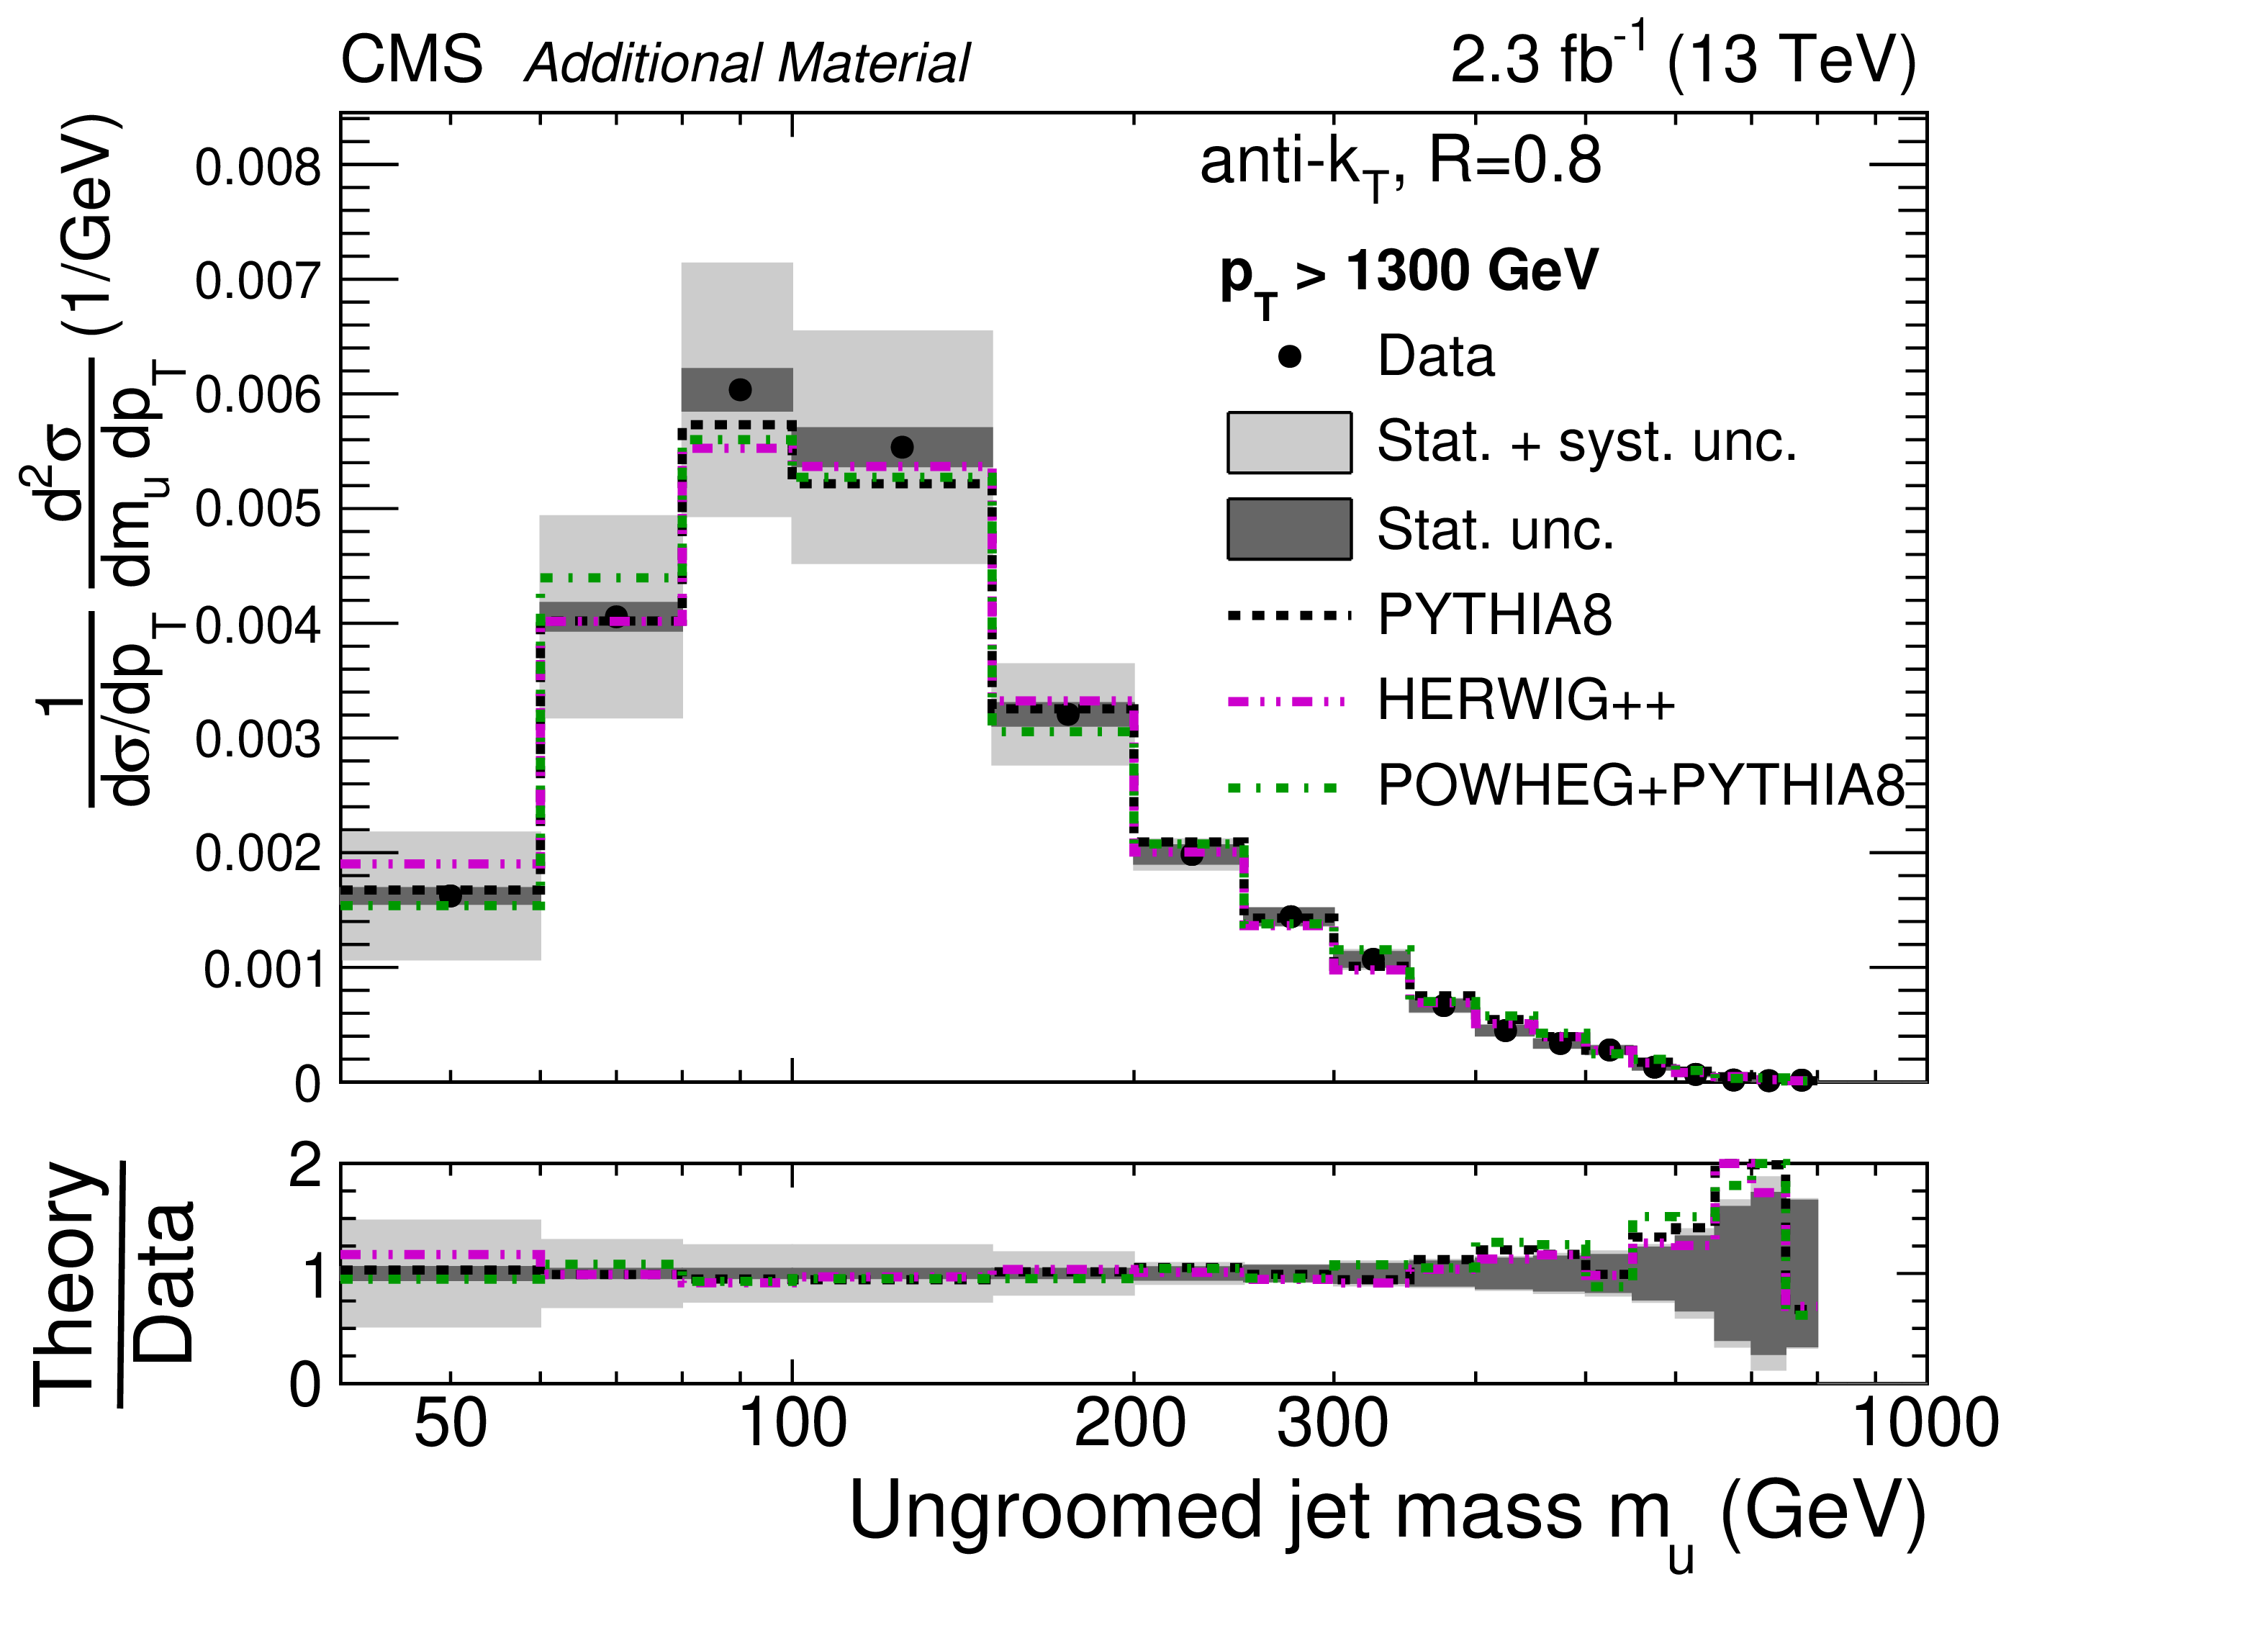
Additional Figure 17:
Absolute cross section for ungroomed jets for $ {p_{\mathrm {T}}} > $ 1300 GeV. The data are shown by the black points, with dark grey bands for the statistical uncertainty (Stat. unc.) and with light grey bands for the total uncertainty (Stat. + sys. unc., added in quadrature). The predictions from PYTHIA-8, HERWIG++, and POWHEG+PYTHIA are shown with dashed black, dash-dot-dotted magenta, and dash-dotted green histograms, respectively, with no uncertainties shown. The MC simulations are normalized to the data over the entire $ {p_{\mathrm {T}}} $ range. |
png pdf |
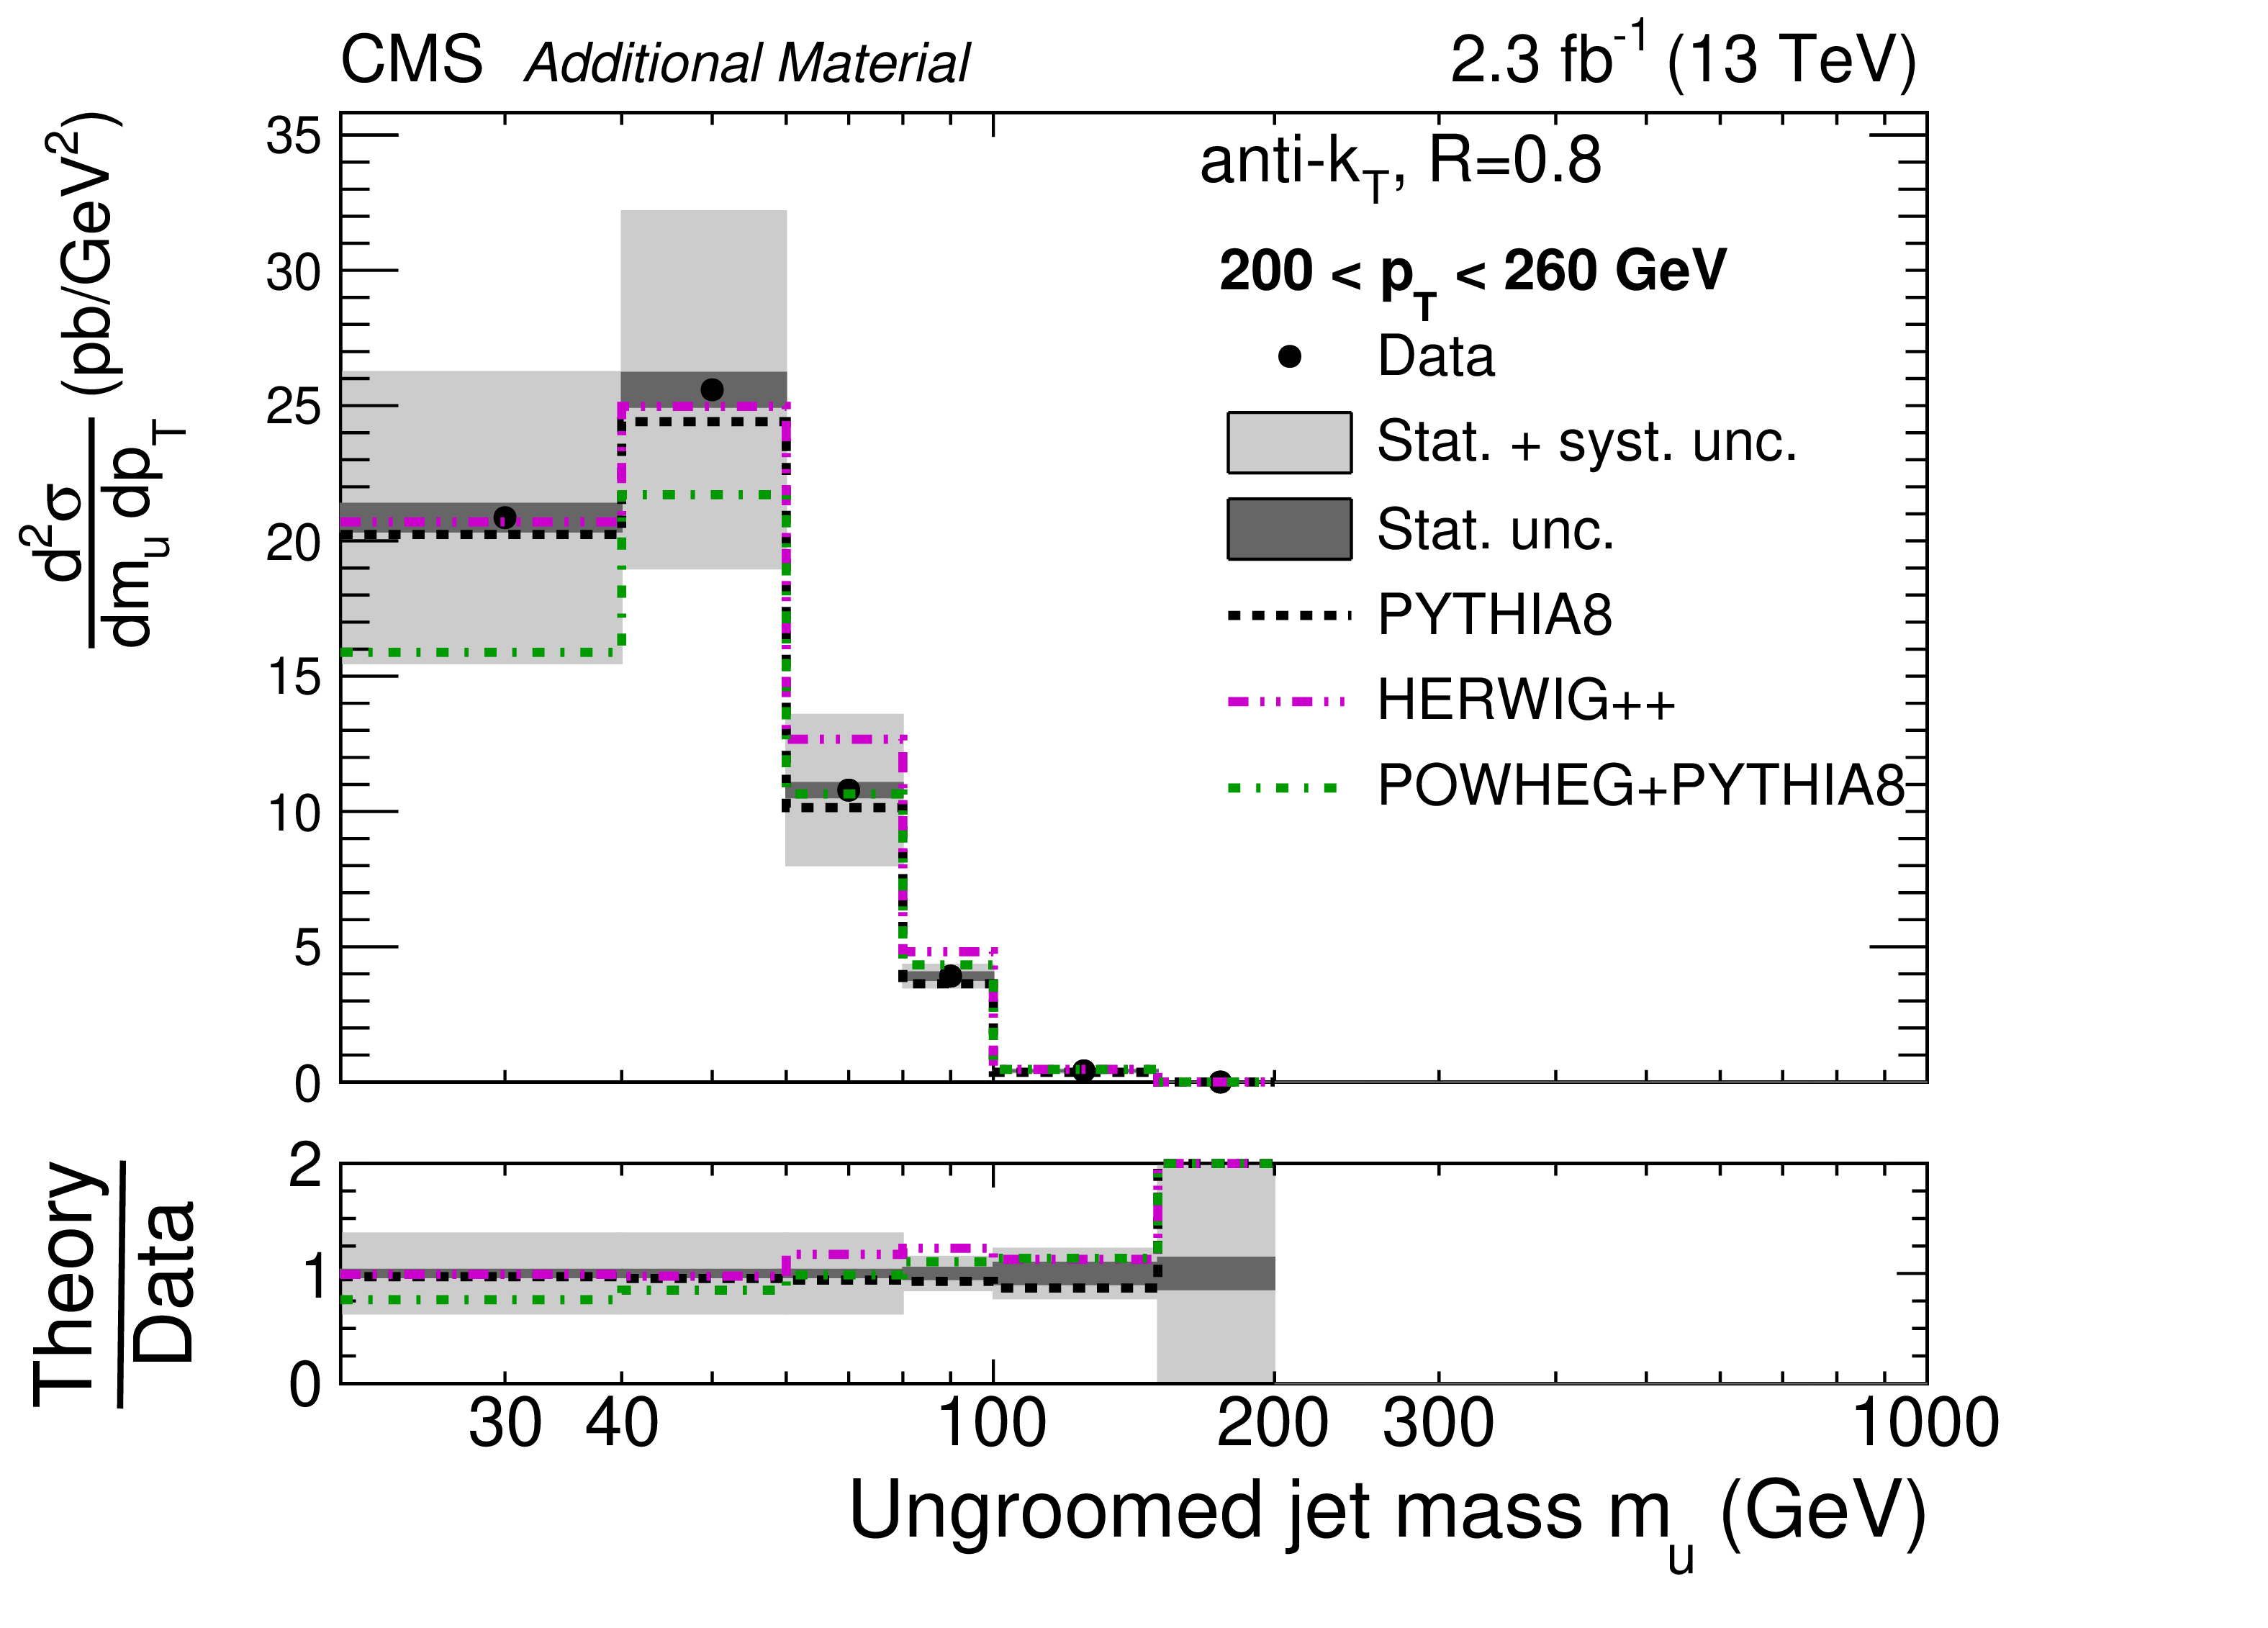
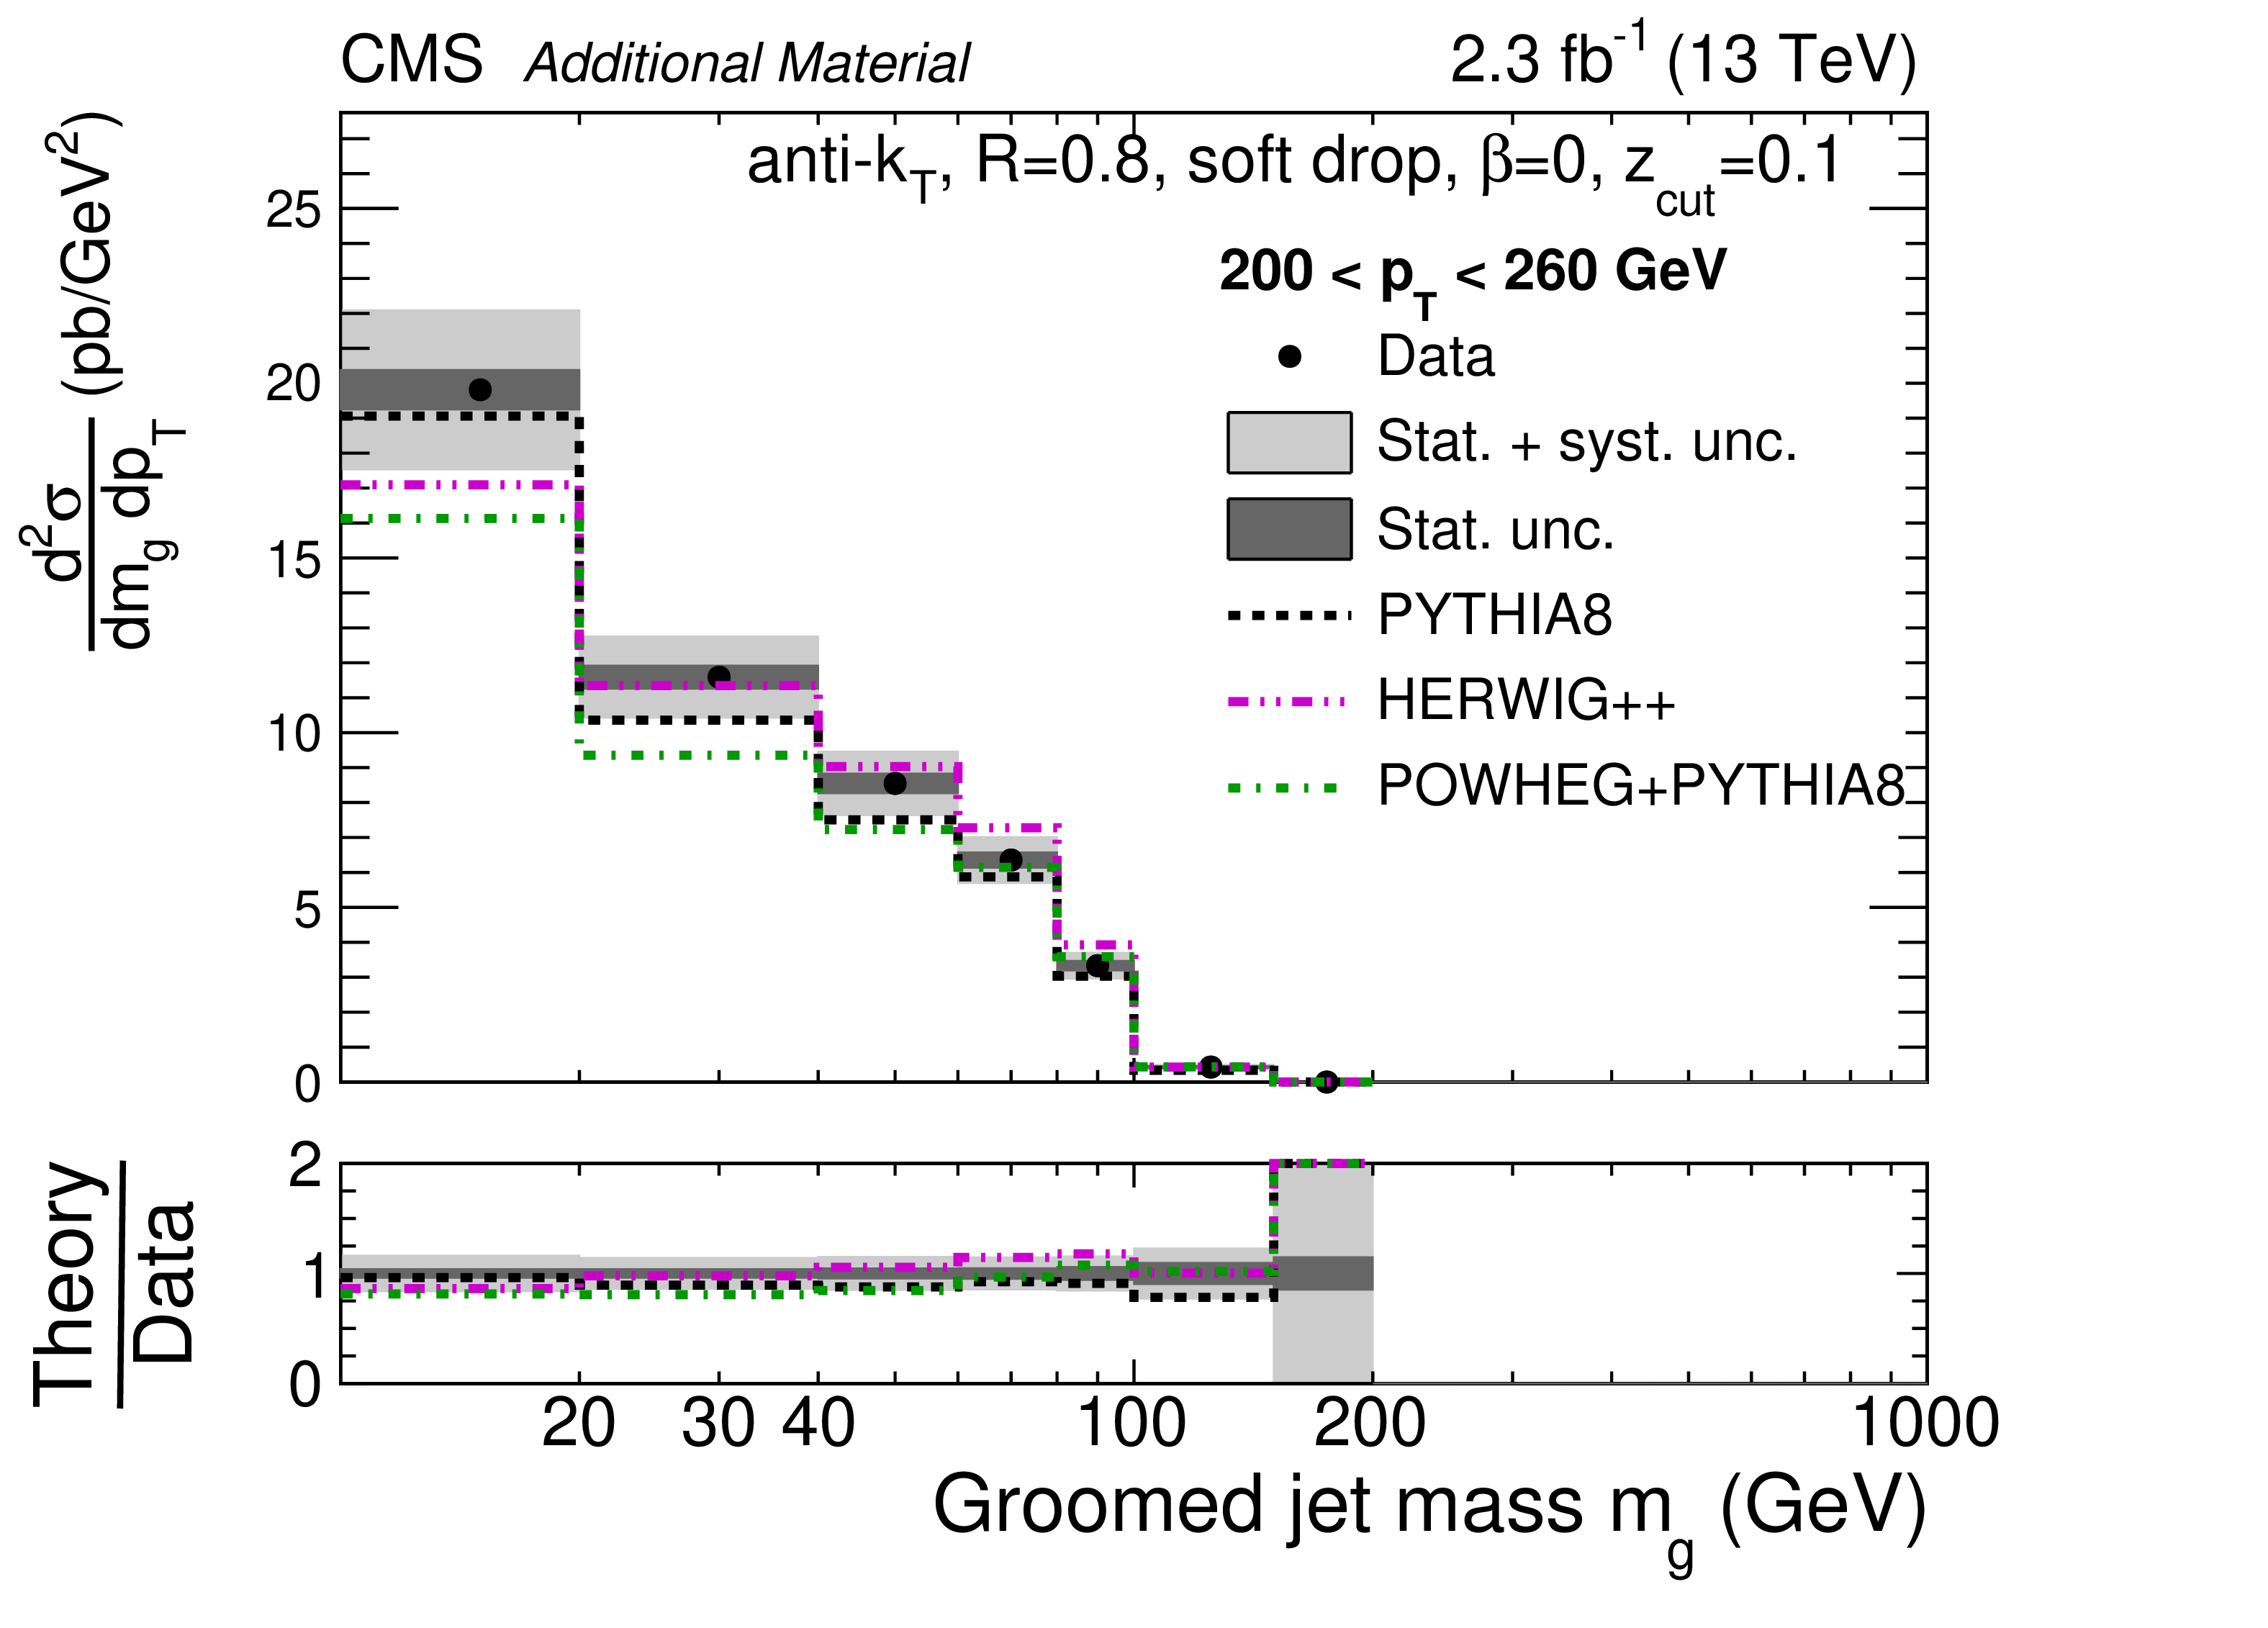
Additional Figure 18:
Absolute cross section for groomed jets for 200 $ < {p_{\mathrm {T}}} < $ 260 GeV. The data are shown by the black points, with dark grey bands for the statistical uncertainty (Stat. unc.) and with light grey bands for the total uncertainty (Stat.+sys. unc., added in quadrature). The predictions from PYTHIA-8, HERWIG++, and POWHEG+PYTHIA are shown with dashed black, dash-dot-dotted magenta, and dash-dotted green histograms, respectively, with no uncertainties shown. The MC simulations are normalized to the data over the entire $ {p_{\mathrm {T}}} $ range. |

png pdf |
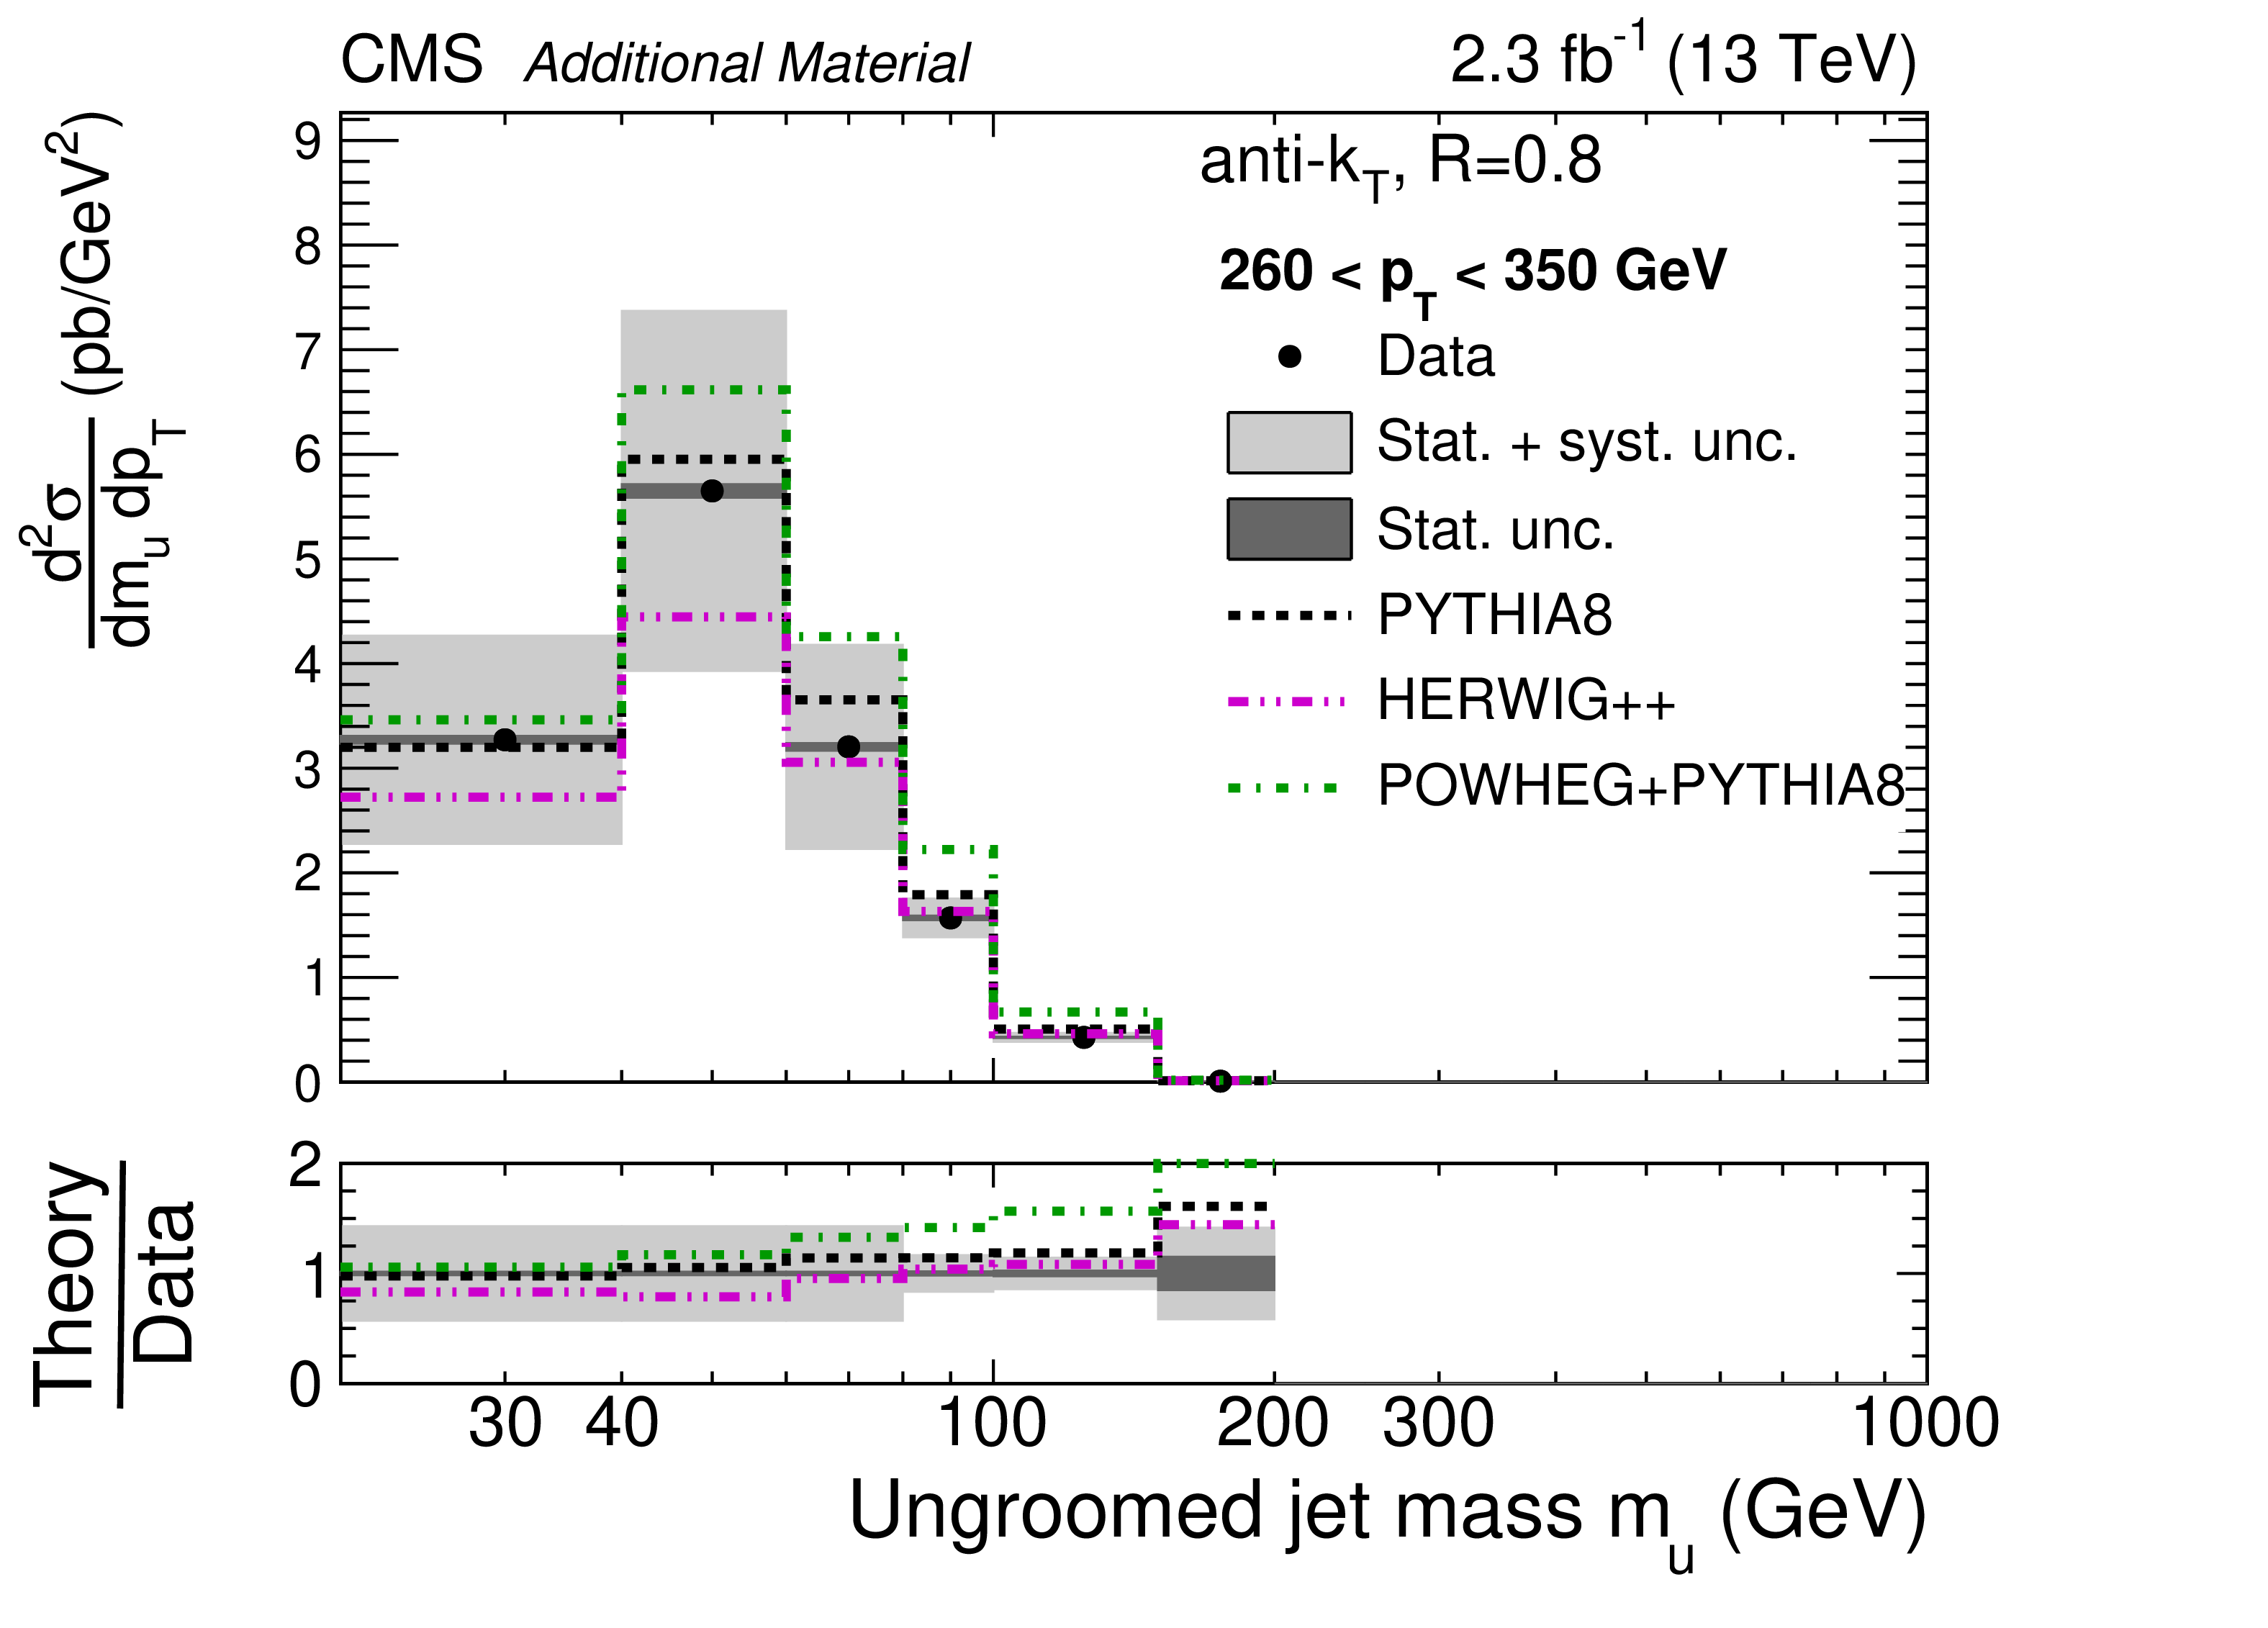
Additional Figure 19:
Absolute cross section for groomed jets for 260 $ < {p_{\mathrm {T}}} < $ 350 GeV. The data are shown by the black points, with dark grey bands for the statistical uncertainty (Stat. unc.) and with light grey bands for the total uncertainty (Stat.+sys. unc., added in quadrature). The predictions from PYTHIA-8, HERWIG++, and POWHEG+PYTHIA are shown with dashed black, dash-dot-dotted magenta, and dash-dotted green histograms, respectively, with no uncertainties shown. The MC simulations are normalized to the data over the entire $ {p_{\mathrm {T}}} $ range. |
png pdf |
Additional Figure 20:
Absolute cross section for groomed jets for 350 $ < {p_{\mathrm {T}}} < $ 460 GeV. The data are shown by the black points, with dark grey bands for the statistical uncertainty (Stat. unc.) and with light grey bands for the total uncertainty (Stat.+sys. unc., added in quadrature). The predictions from PYTHIA-8, HERWIG++, and POWHEG+PYTHIA are shown with dashed black, dash-dot-dotted magenta, and dash-dotted green histograms, respectively, with no uncertainties shown. The MC simulations are normalized to the data over the entire $ {p_{\mathrm {T}}} $ range. |
png pdf |
Additional Figure 21:
Absolute cross section for groomed jets for 460 $ < {p_{\mathrm {T}}} < $ 550 GeV. The data are shown by the black points, with dark grey bands for the statistical uncertainty (Stat. unc.) and with light grey bands for the total uncertainty (Stat.+sys. unc., added in quadrature). The predictions from PYTHIA-8, HERWIG++, and POWHEG+PYTHIA are shown with dashed black, dash-dot-dotted magenta, and dash-dotted green histograms, respectively, with no uncertainties shown. The MC simulations are normalized to the data over the entire $ {p_{\mathrm {T}}} $ range. |
png pdf |
Additional Figure 22:
Absolute cross section for groomed jets for 550 $ < {p_{\mathrm {T}}} < $ 650 GeV. The data are shown by the black points, with dark grey bands for the statistical uncertainty (Stat. unc.) and with light grey bands for the total uncertainty (Stat.+sys. unc., added in quadrature). The predictions from PYTHIA-8, HERWIG++, and POWHEG+PYTHIA are shown with dashed black, dash-dot-dotted magenta, and dash-dotted green histograms, respectively, with no uncertainties shown. The MC simulations are normalized to the data over the entire $ {p_{\mathrm {T}}} $ range. |
png pdf |
Additional Figure 23:
Absolute cross section for groomed jets for 760 $ < {p_{\mathrm {T}}} < $ 900 GeV. The data are shown by the black points, with dark grey bands for the statistical uncertainty (Stat. unc.) and with light grey bands for the total uncertainty (Stat.+sys. unc., added in quadrature). The predictions from PYTHIA-8, HERWIG++, and POWHEG+PYTHIA are shown with dashed black, dash-dot-dotted magenta, and dash-dotted green histograms, respectively, with no uncertainties shown. The MC simulations are normalized to the data over the entire $ {p_{\mathrm {T}}} $ range. |
png pdf |
Additional Figure 24:
Absolute cross section for groomed jets for 900 $ < {p_{\mathrm {T}}} < $ 1000 GeV. The data are shown by the black points, with dark grey bands for the statistical uncertainty (Stat. unc.) and with light grey bands for the total uncertainty (Stat.+sys. unc., added in quadrature). The predictions from PYTHIA-8, HERWIG++, and POWHEG+PYTHIA are shown with dashed black, dash-dot-dotted magenta, and dash-dotted green histograms, respectively, with no uncertainties shown. The MC simulations are normalized to the data over the entire $ {p_{\mathrm {T}}} $ range. |
png pdf |
Additional Figure 25:
Absolute cross section for groomed jets for 1000 $ < {p_{\mathrm {T}}} < $ 1100 GeV. The data are shown by the black points, with dark grey bands for the statistical uncertainty (Stat. unc.) and with light grey bands for the total uncertainty (Stat.+sys. unc., added in quadrature). The predictions from PYTHIA-8, HERWIG++, and POWHEG+PYTHIA are shown with dashed black, dash-dot-dotted magenta, and dash-dotted green histograms, respectively, with no uncertainties shown. The MC simulations are normalized to the data over the entire $ {p_{\mathrm {T}}} $ range. |
png pdf |
Additional Figure 26:
Absolute cross section for groomed jets for 1100 $ < {p_{\mathrm {T}}} < $ 1200 GeV. The data are shown by the black points, with dark grey bands for the statistical uncertainty (Stat. unc.) and with light grey bands for the total uncertainty (Stat.+sys. unc., added in quadrature). The predictions from PYTHIA-8, HERWIG++, and POWHEG+PYTHIA are shown with dashed black, dash-dot-dotted magenta, and dash-dotted green histograms, respectively, with no uncertainties shown. The MC simulations are normalized to the data over the entire $ {p_{\mathrm {T}}} $ range. |

png pdf |
Additional Figure 27:
Absolute cross section for groomed jets for $ {p_{\mathrm {T}}} > $ 1300 GeV. The data are shown by the black points, with dark grey bands for the statistical uncertainty (Stat. unc.) and with light grey bands for the total uncertainty (Stat.+sys. unc., added in quadrature). The predictions from PYTHIA-8, HERWIG++, and POWHEG+PYTHIA are shown with dashed black, dash-dot-dotted magenta, and dash-dotted green histograms, respectively, with no uncertainties shown. The MC simulations are normalized to the data over the entire $ {p_{\mathrm {T}}} $ range. |
png pdf |
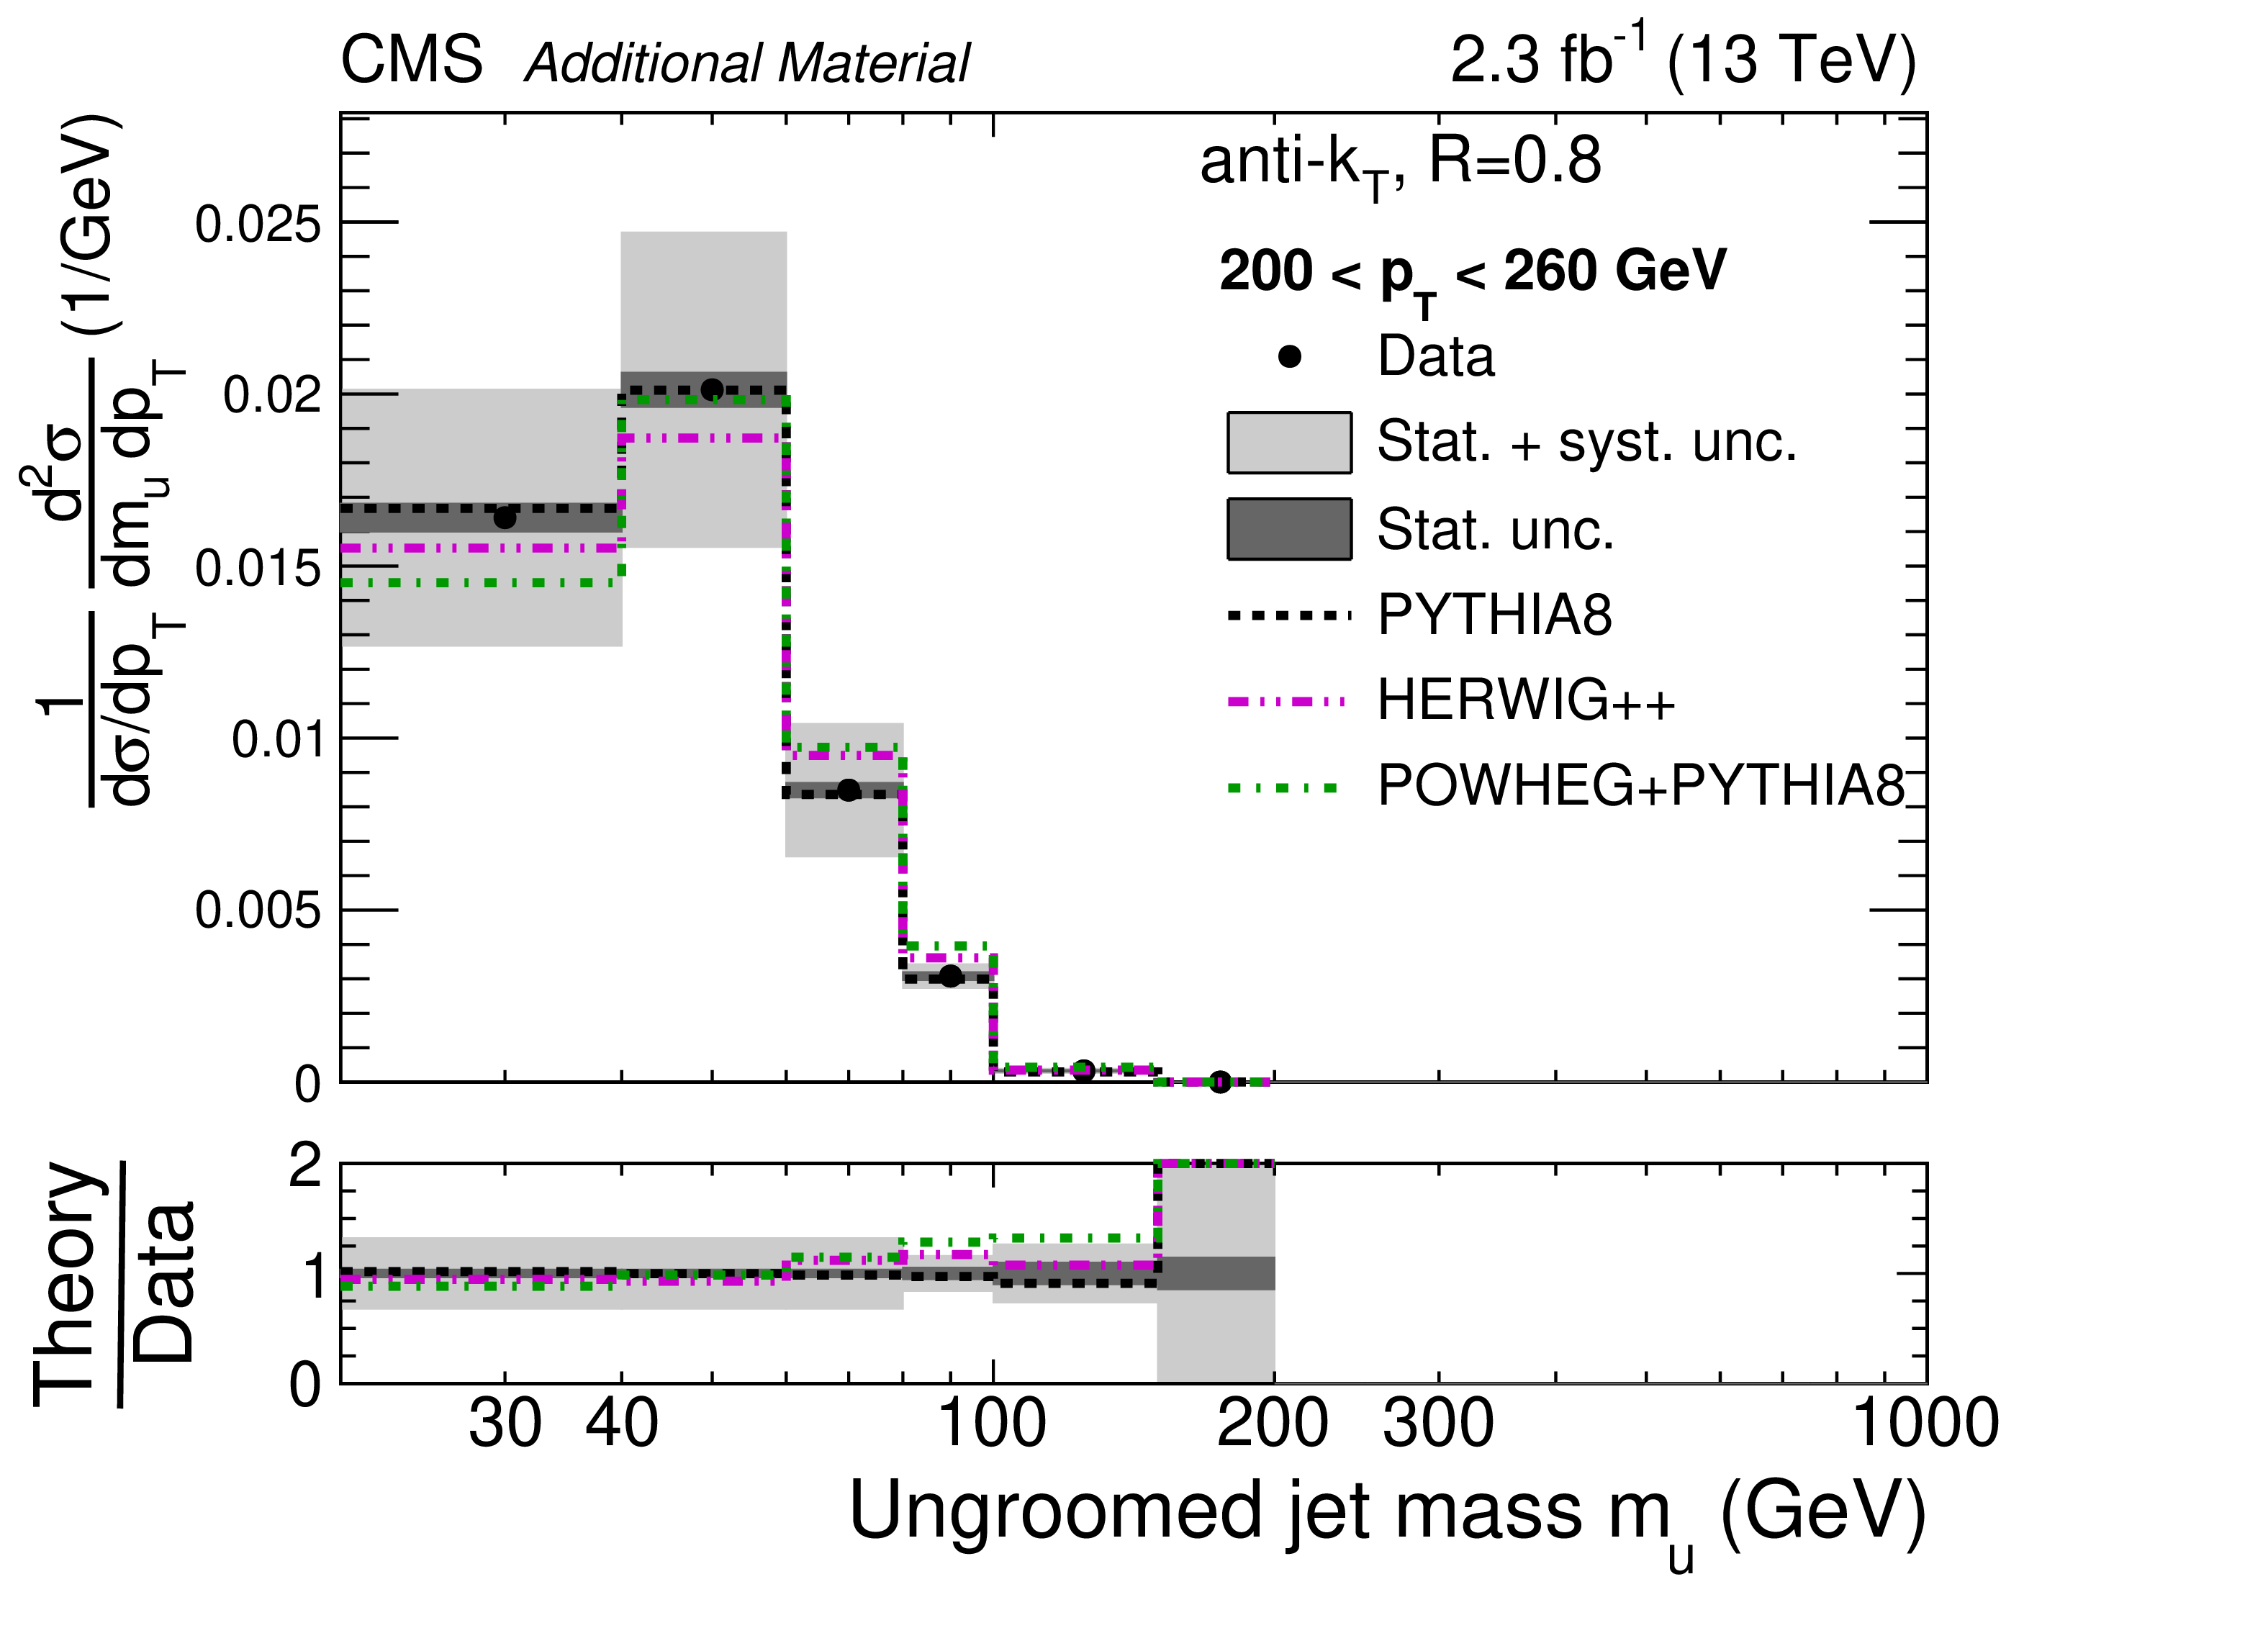
Additional Figure 28:
Normalized cross section for ungroomed jets for 200 $ < {p_{\mathrm {T}}} < $ 260 GeV. The data are shown by the black points, with dark grey bands for the statistical uncertainty (Stat. unc.) and with light grey bands for the total uncertainty (stat.+sys. unc., added in quadrature). The predictions from PYTHIA-8, HERWIG++, and POWHEG+PYTHIA are shown with dashed black, dash-dot-dotted magenta, and dash-dotted green histograms, respectively, with no uncertainties shown. |
png pdf |
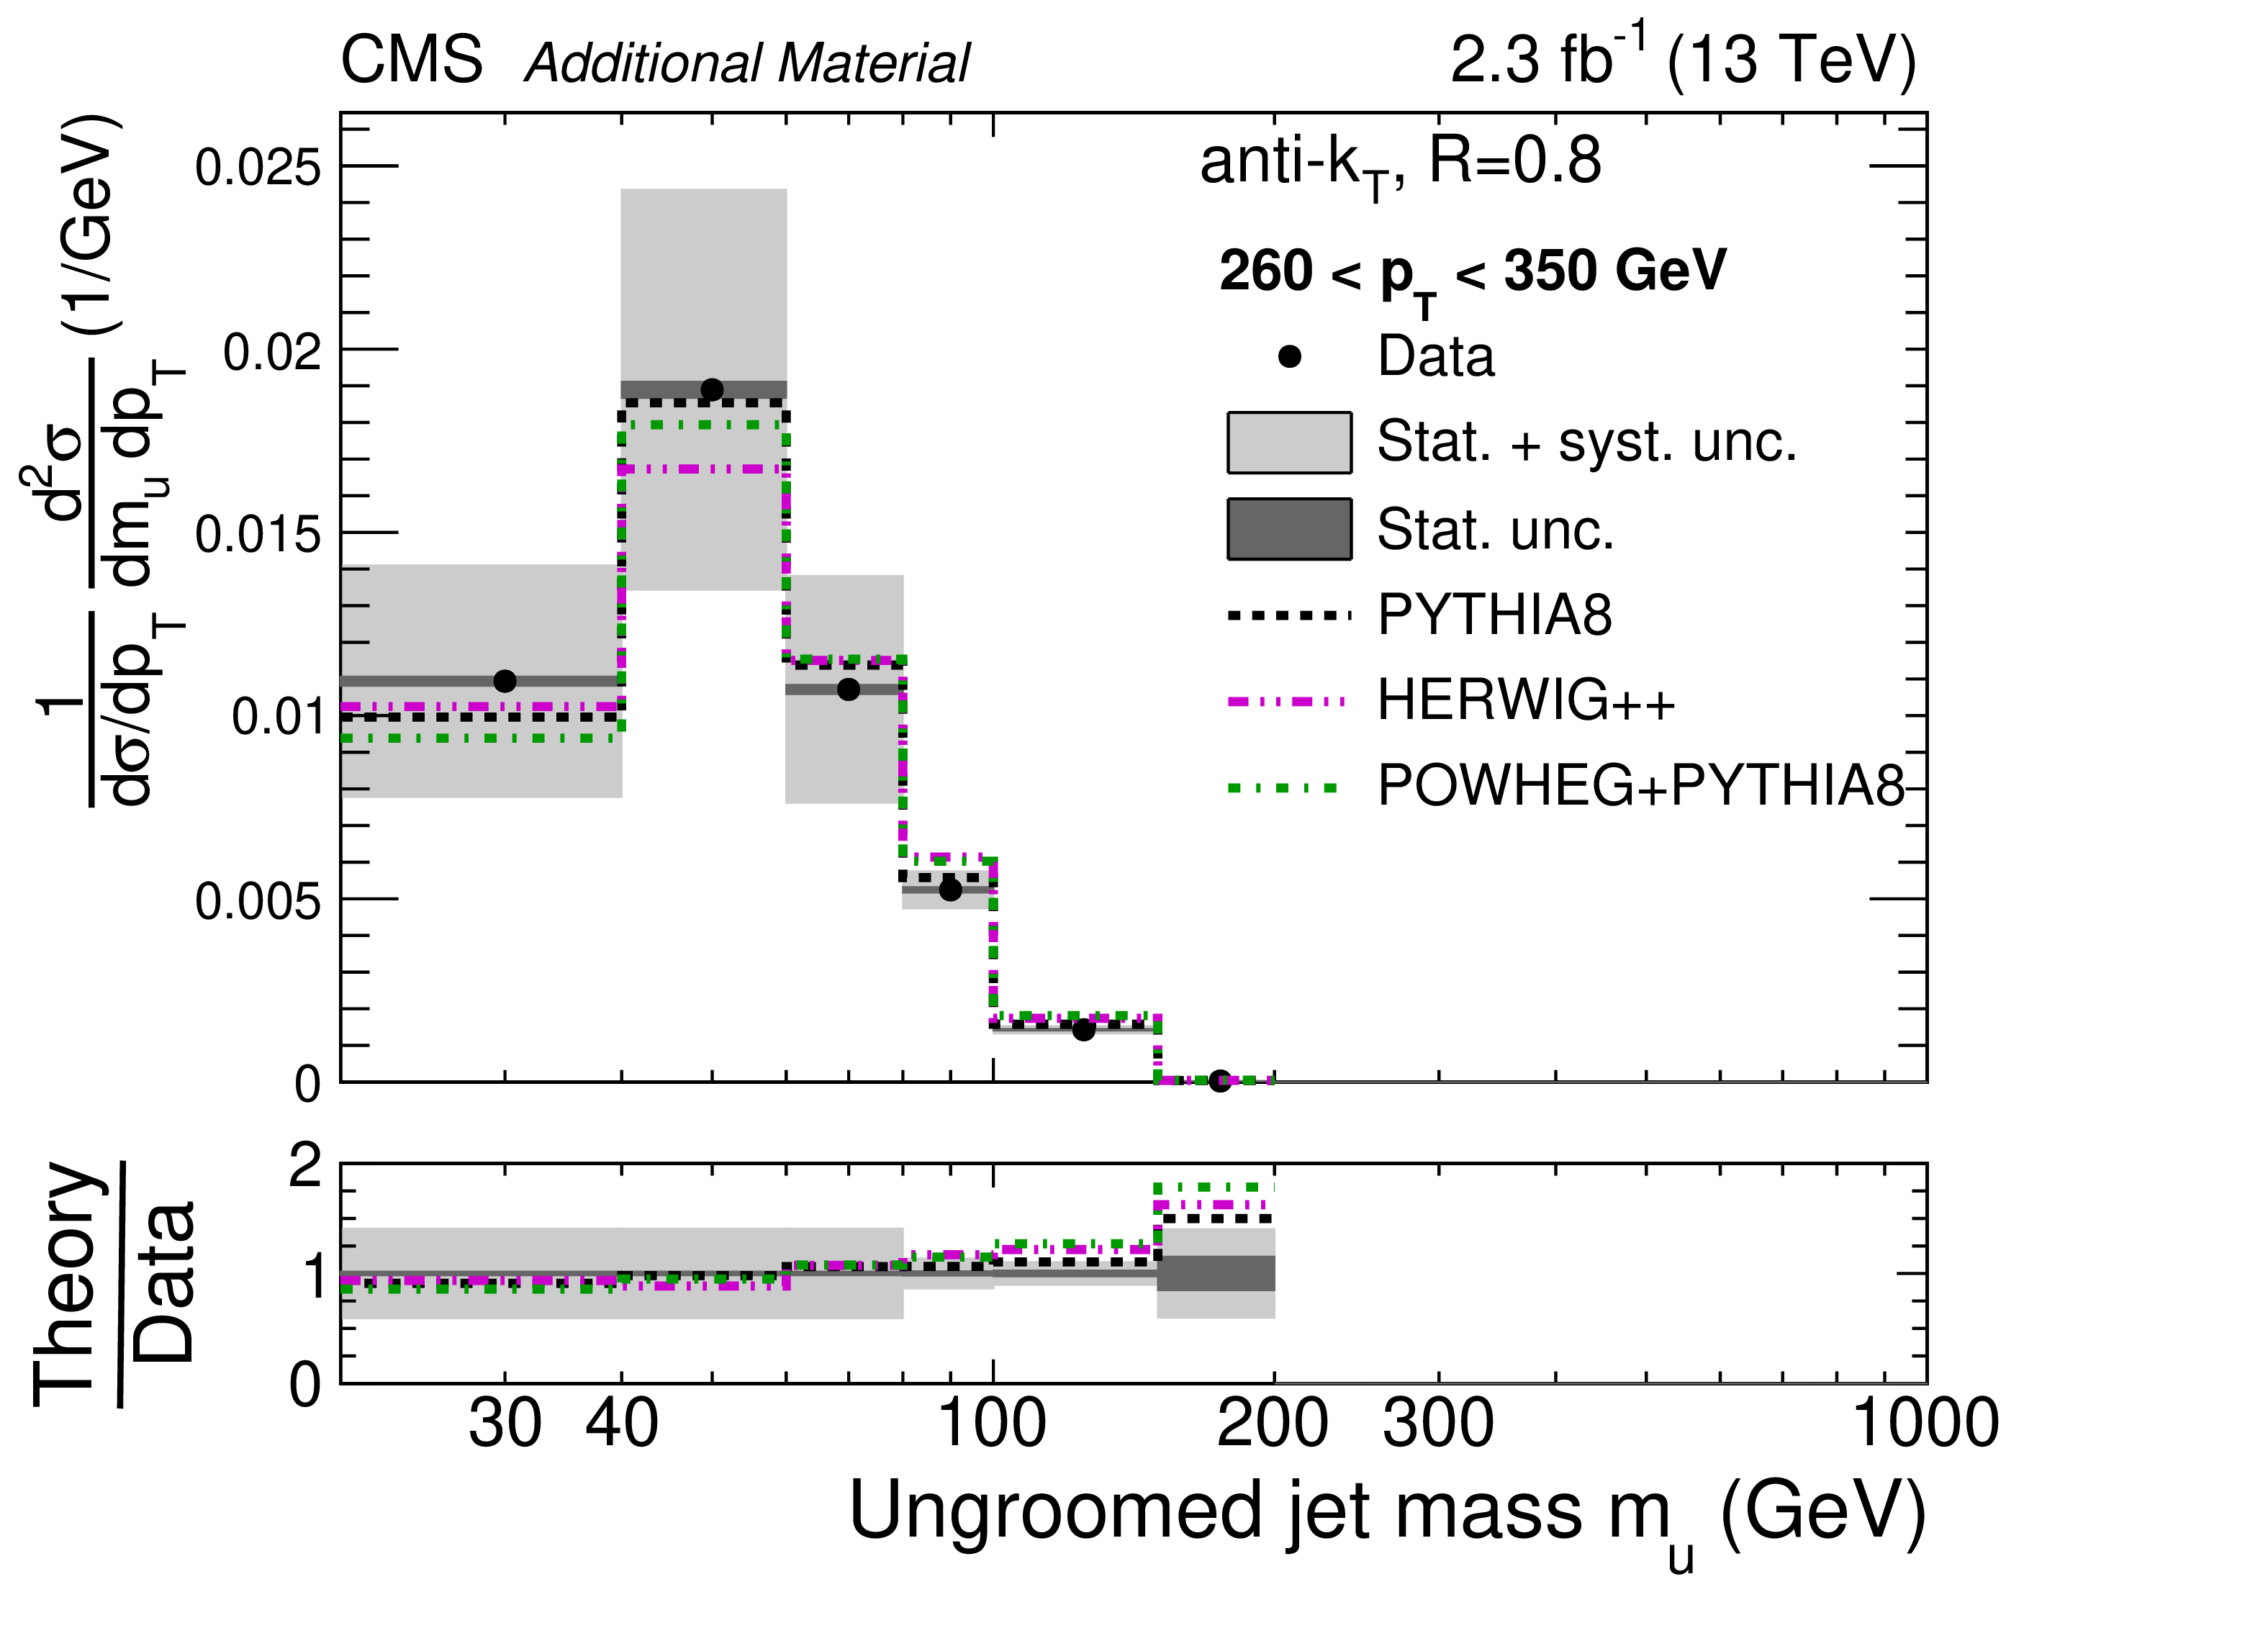
Additional Figure 29:
Normalized cross section for ungroomed jets for 260 $ < {p_{\mathrm {T}}} < $ 350 GeV. The data are shown by the black points, with dark grey bands for the statistical uncertainty (Stat. unc.) and with light grey bands for the total uncertainty (stat.+sys. unc., added in quadrature). The predictions from PYTHIA-8, HERWIG++, and POWHEG+PYTHIA are shown with dashed black, dash-dot-dotted magenta, and dash-dotted green histograms, respectively, with no uncertainties shown. |
png pdf |
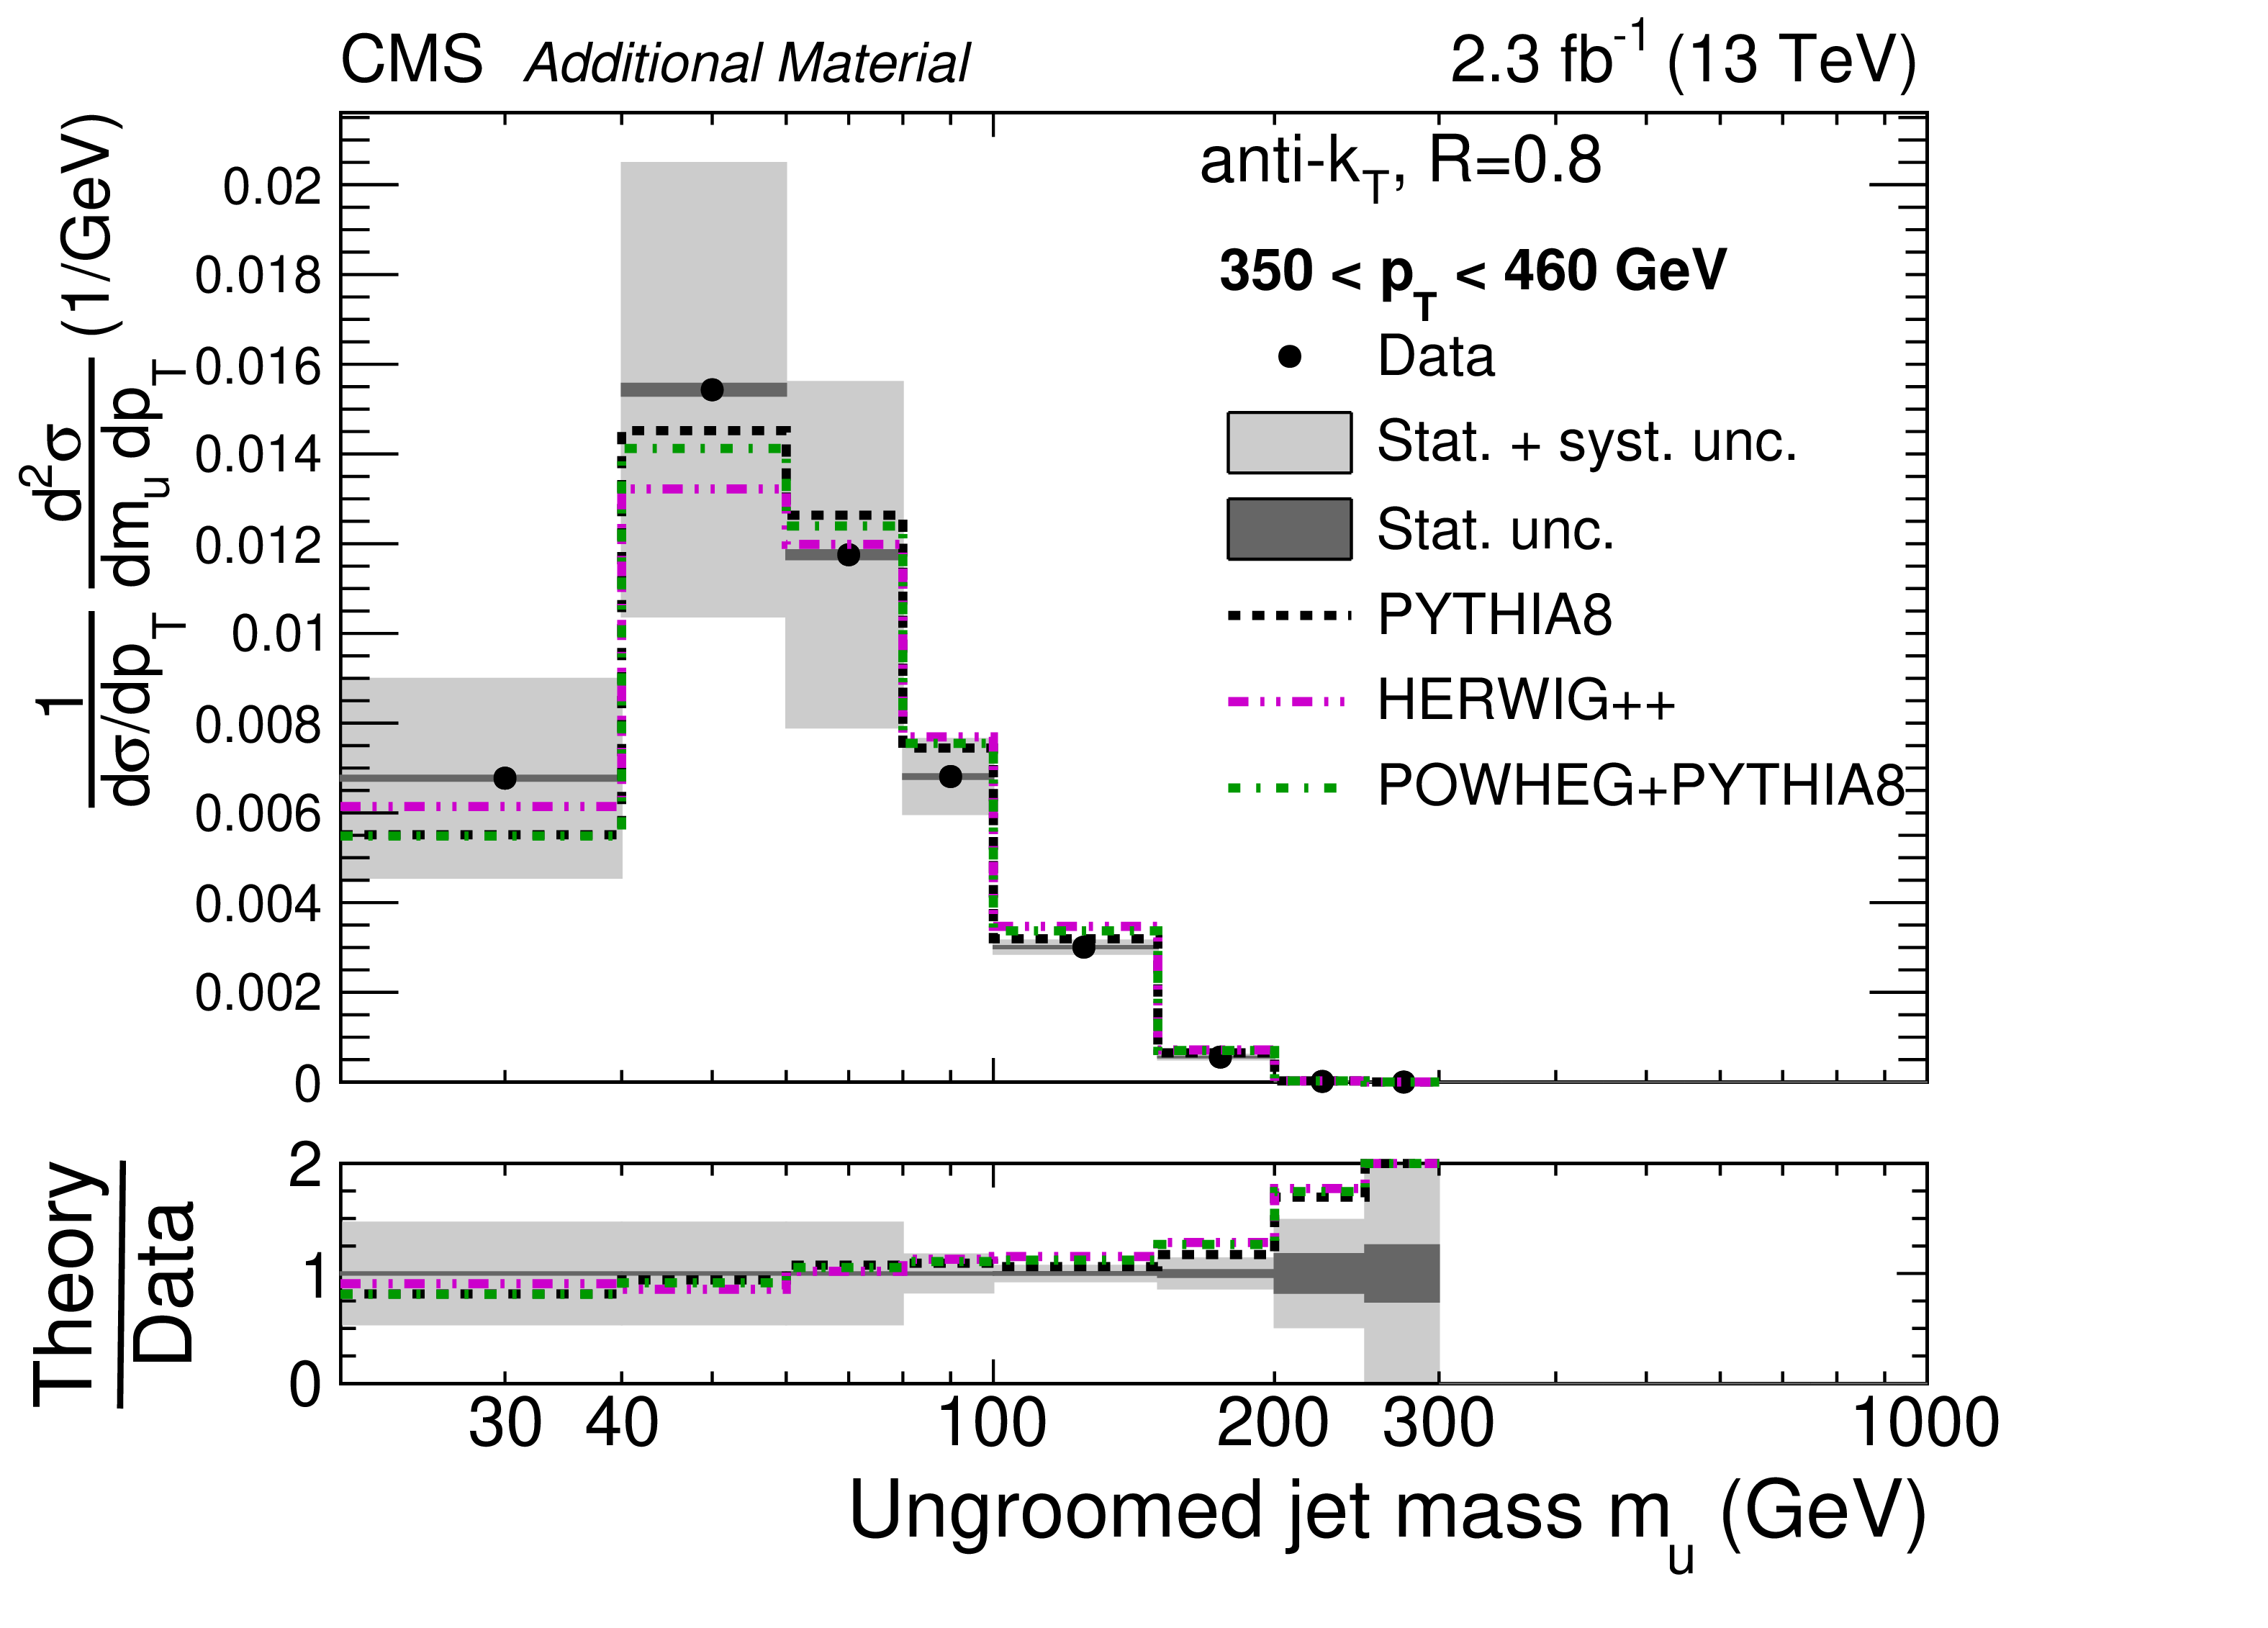
Additional Figure 30:
Normalized cross section for ungroomed jets for 350 $ < {p_{\mathrm {T}}} < $ 460 GeV. The data are shown by the black points, with dark grey bands for the statistical uncertainty (Stat. unc.) and with light grey bands for the total uncertainty (stat.+sys. unc., added in quadrature). The predictions from PYTHIA-8, HERWIG++, and POWHEG+PYTHIA are shown with dashed black, dash-dot-dotted magenta, and dash-dotted green histograms, respectively, with no uncertainties shown. |

png pdf |
Additional Figure 31:
Normalized cross section for ungroomed jets for 460 $ < {p_{\mathrm {T}}} < $ 550 GeV. The data are shown by the black points, with dark grey bands for the statistical uncertainty (Stat. unc.) and with light grey bands for the total uncertainty (stat.+sys. unc., added in quadrature). The predictions from PYTHIA-8, HERWIG++, and POWHEG+PYTHIA are shown with dashed black, dash-dot-dotted magenta, and dash-dotted green histograms, respectively, with no uncertainties shown. |
png pdf |
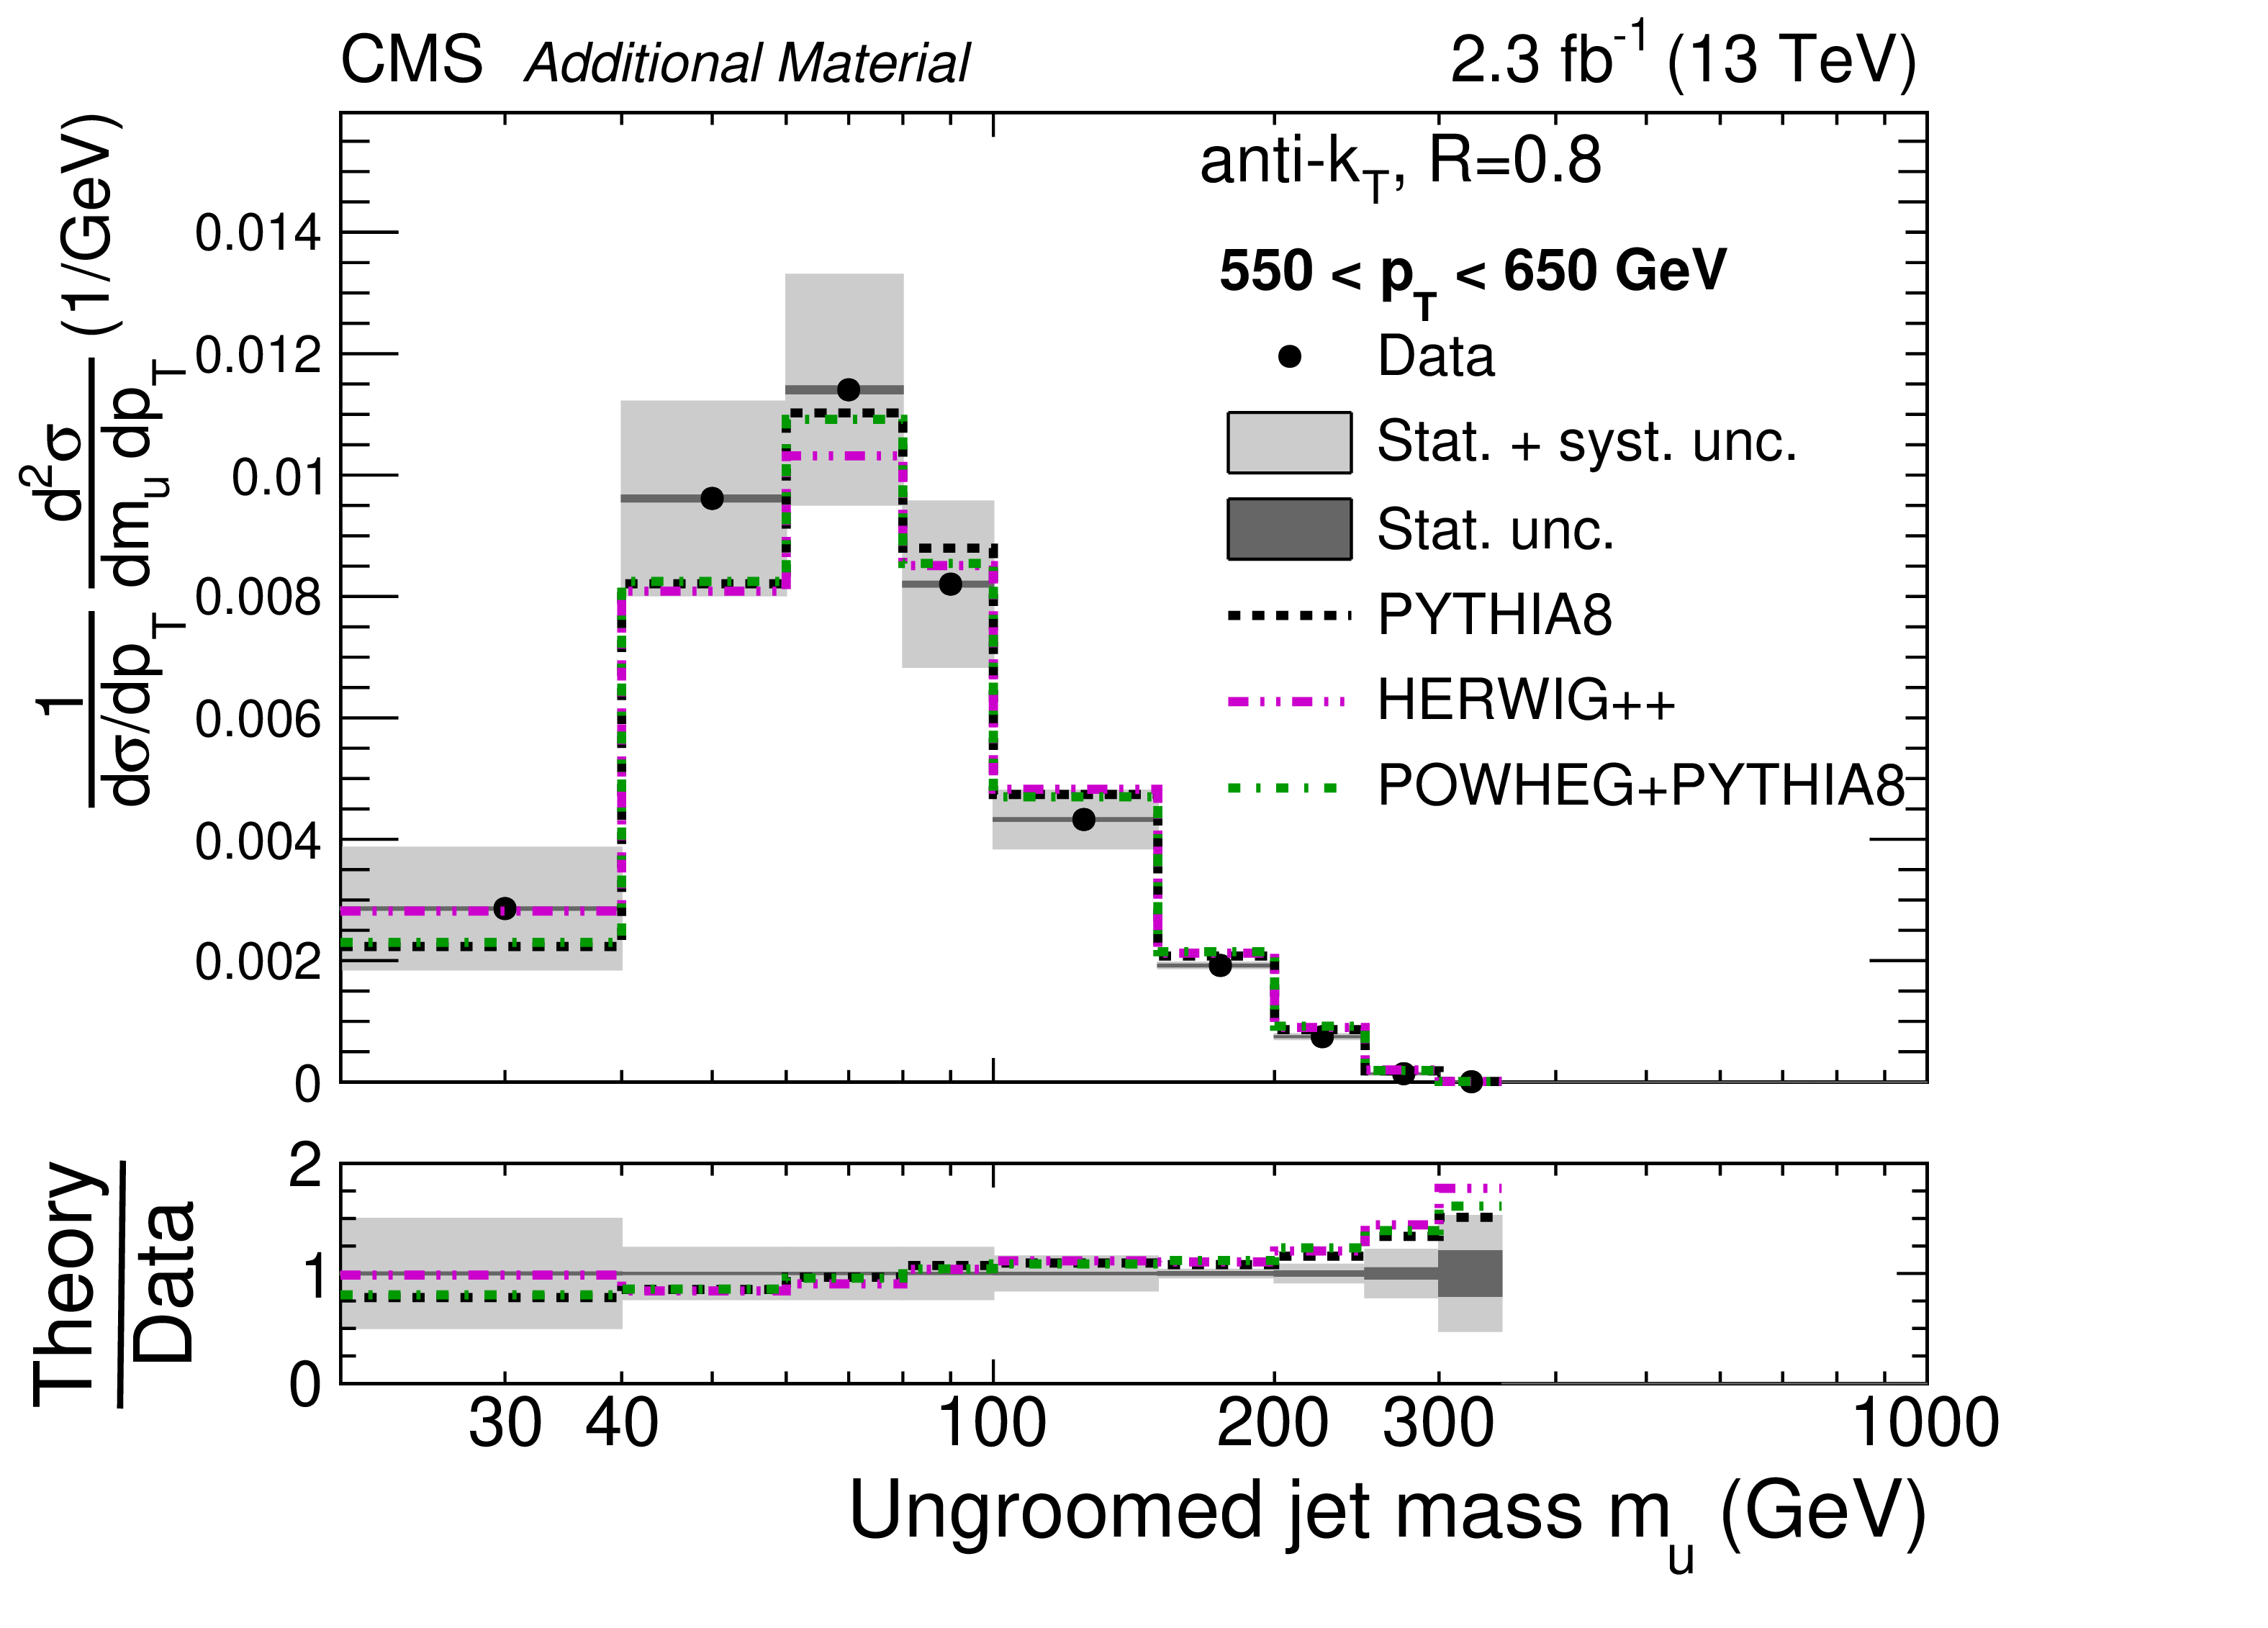
Additional Figure 32:
Normalized cross section for ungroomed jets for 550 $ < {p_{\mathrm {T}}} < $ 650 GeV. The data are shown by the black points, with dark grey bands for the statistical uncertainty (Stat. unc.) and with light grey bands for the total uncertainty (stat.+sys. unc., added in quadrature). The predictions from PYTHIA-8, HERWIG++, and POWHEG+PYTHIA are shown with dashed black, dash-dot-dotted magenta, and dash-dotted green histograms, respectively, with no uncertainties shown. |
png pdf |
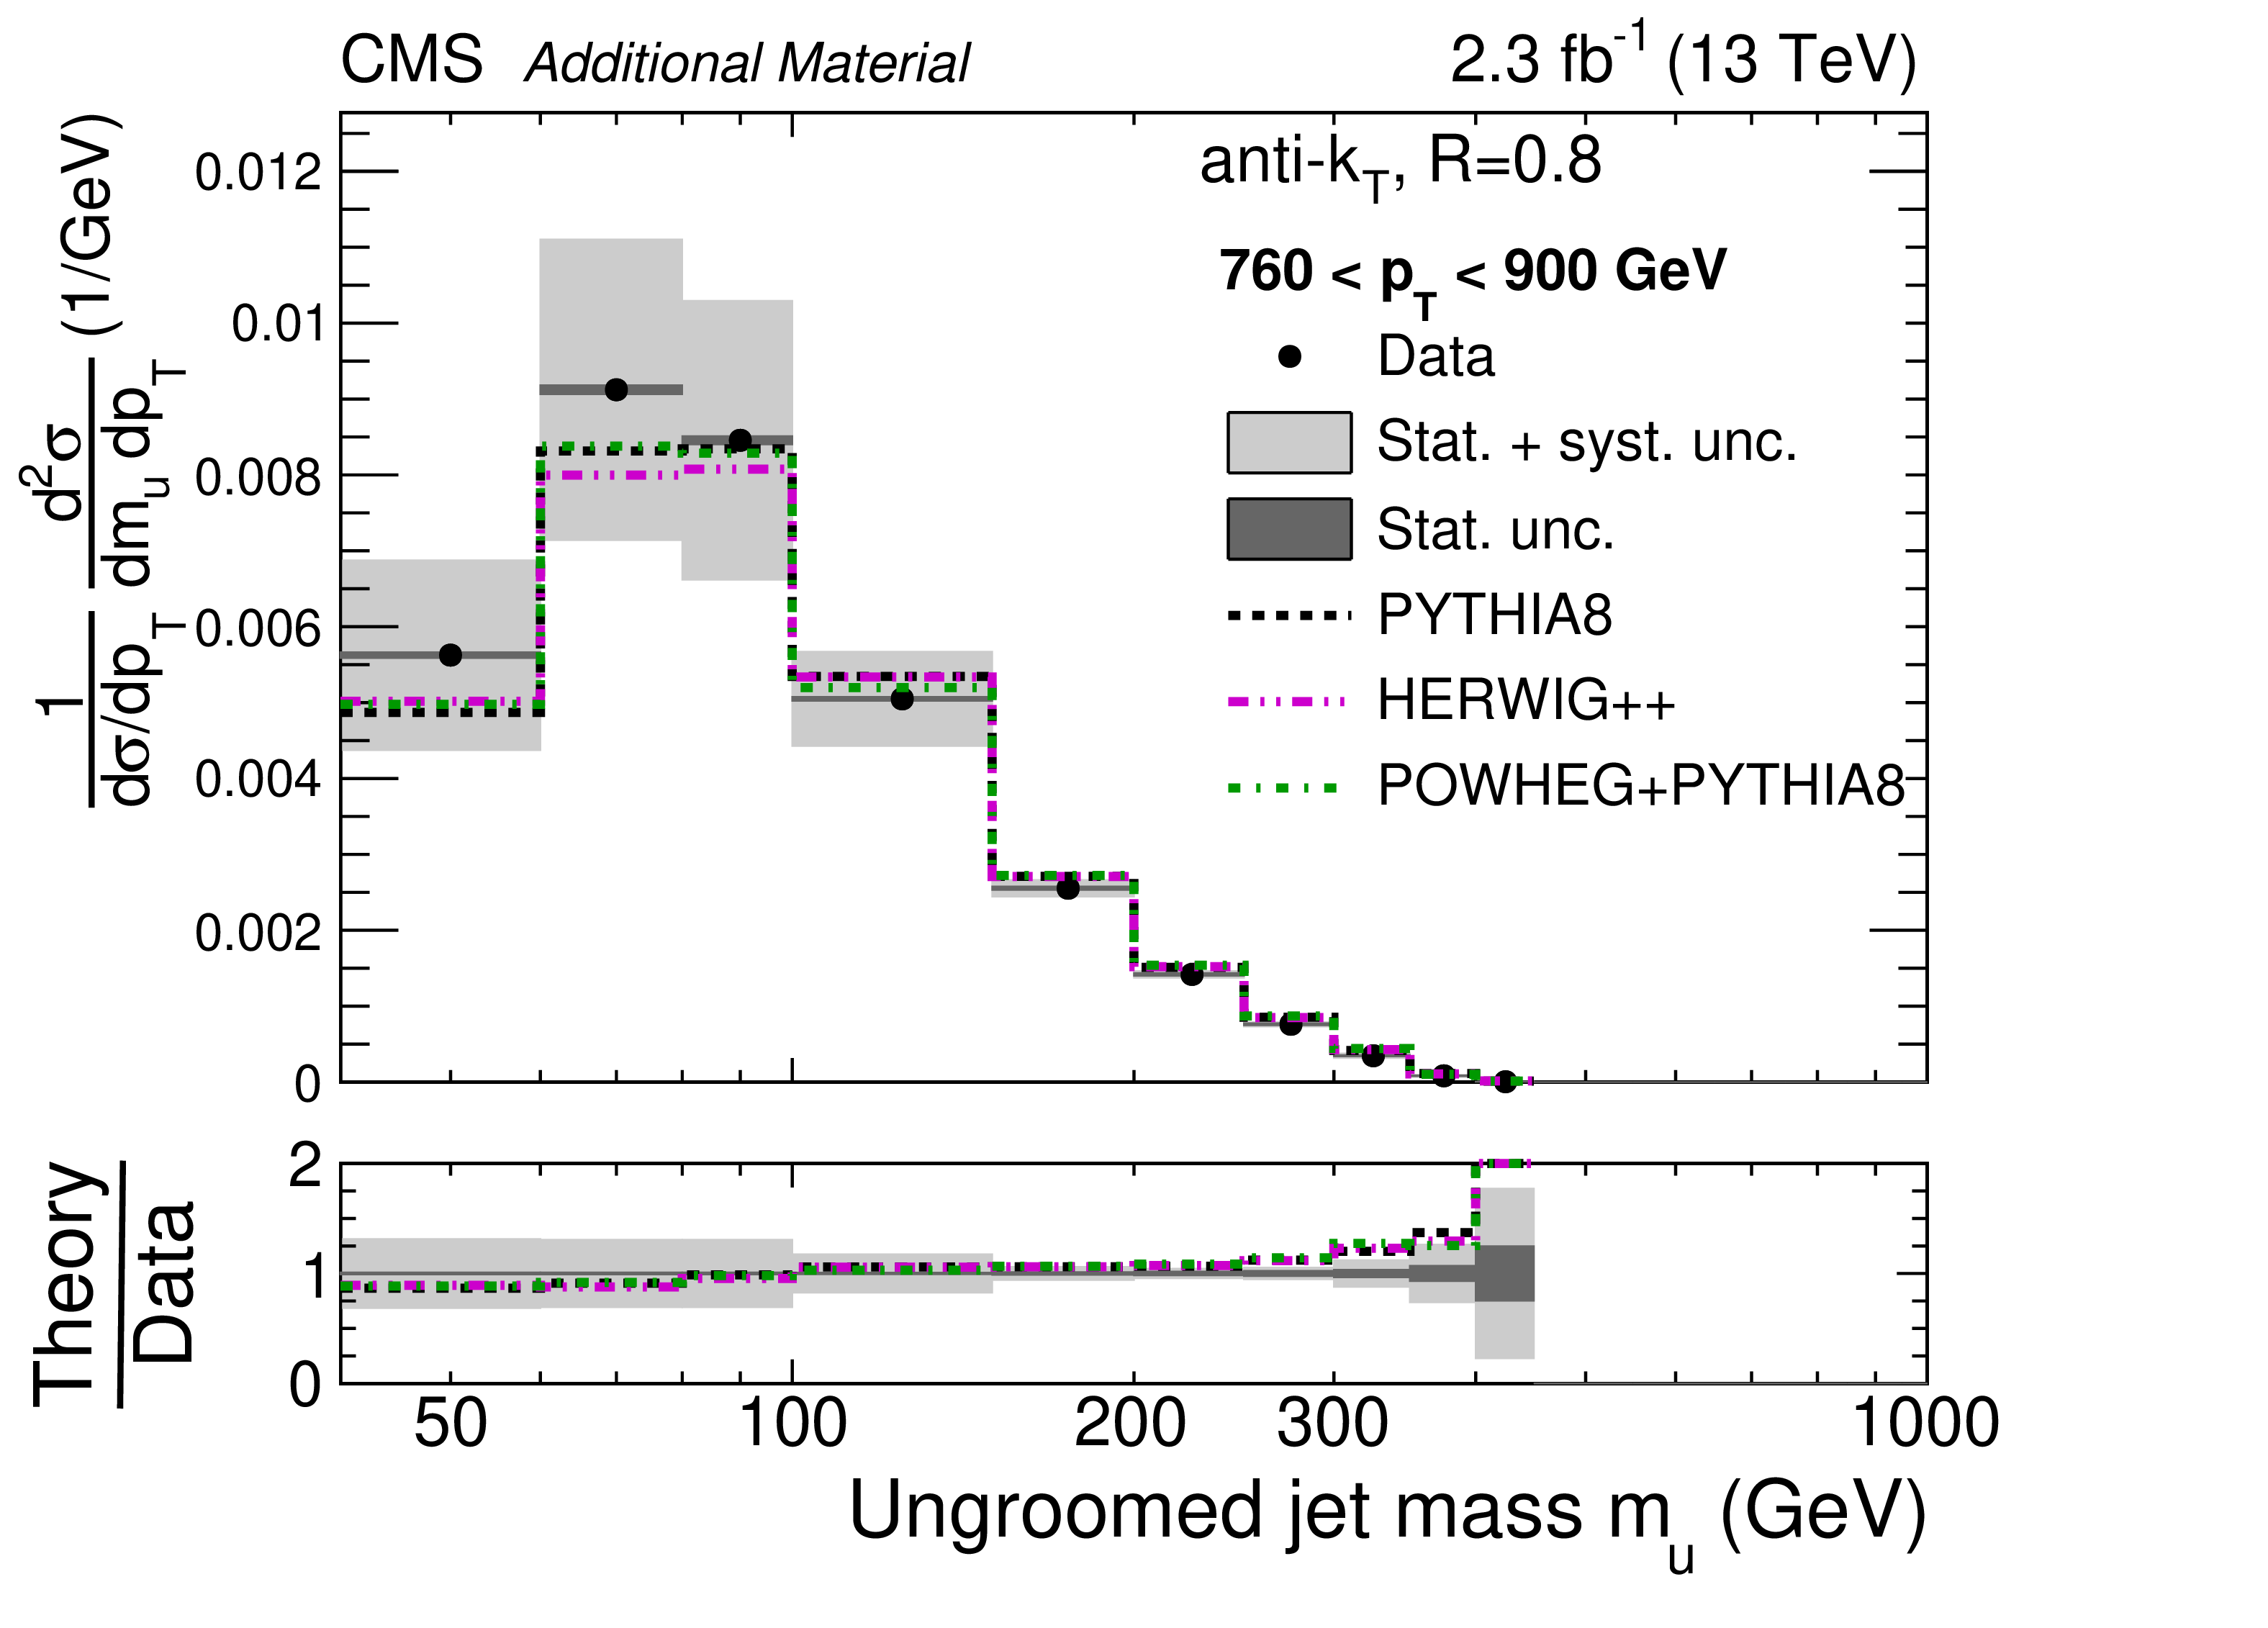
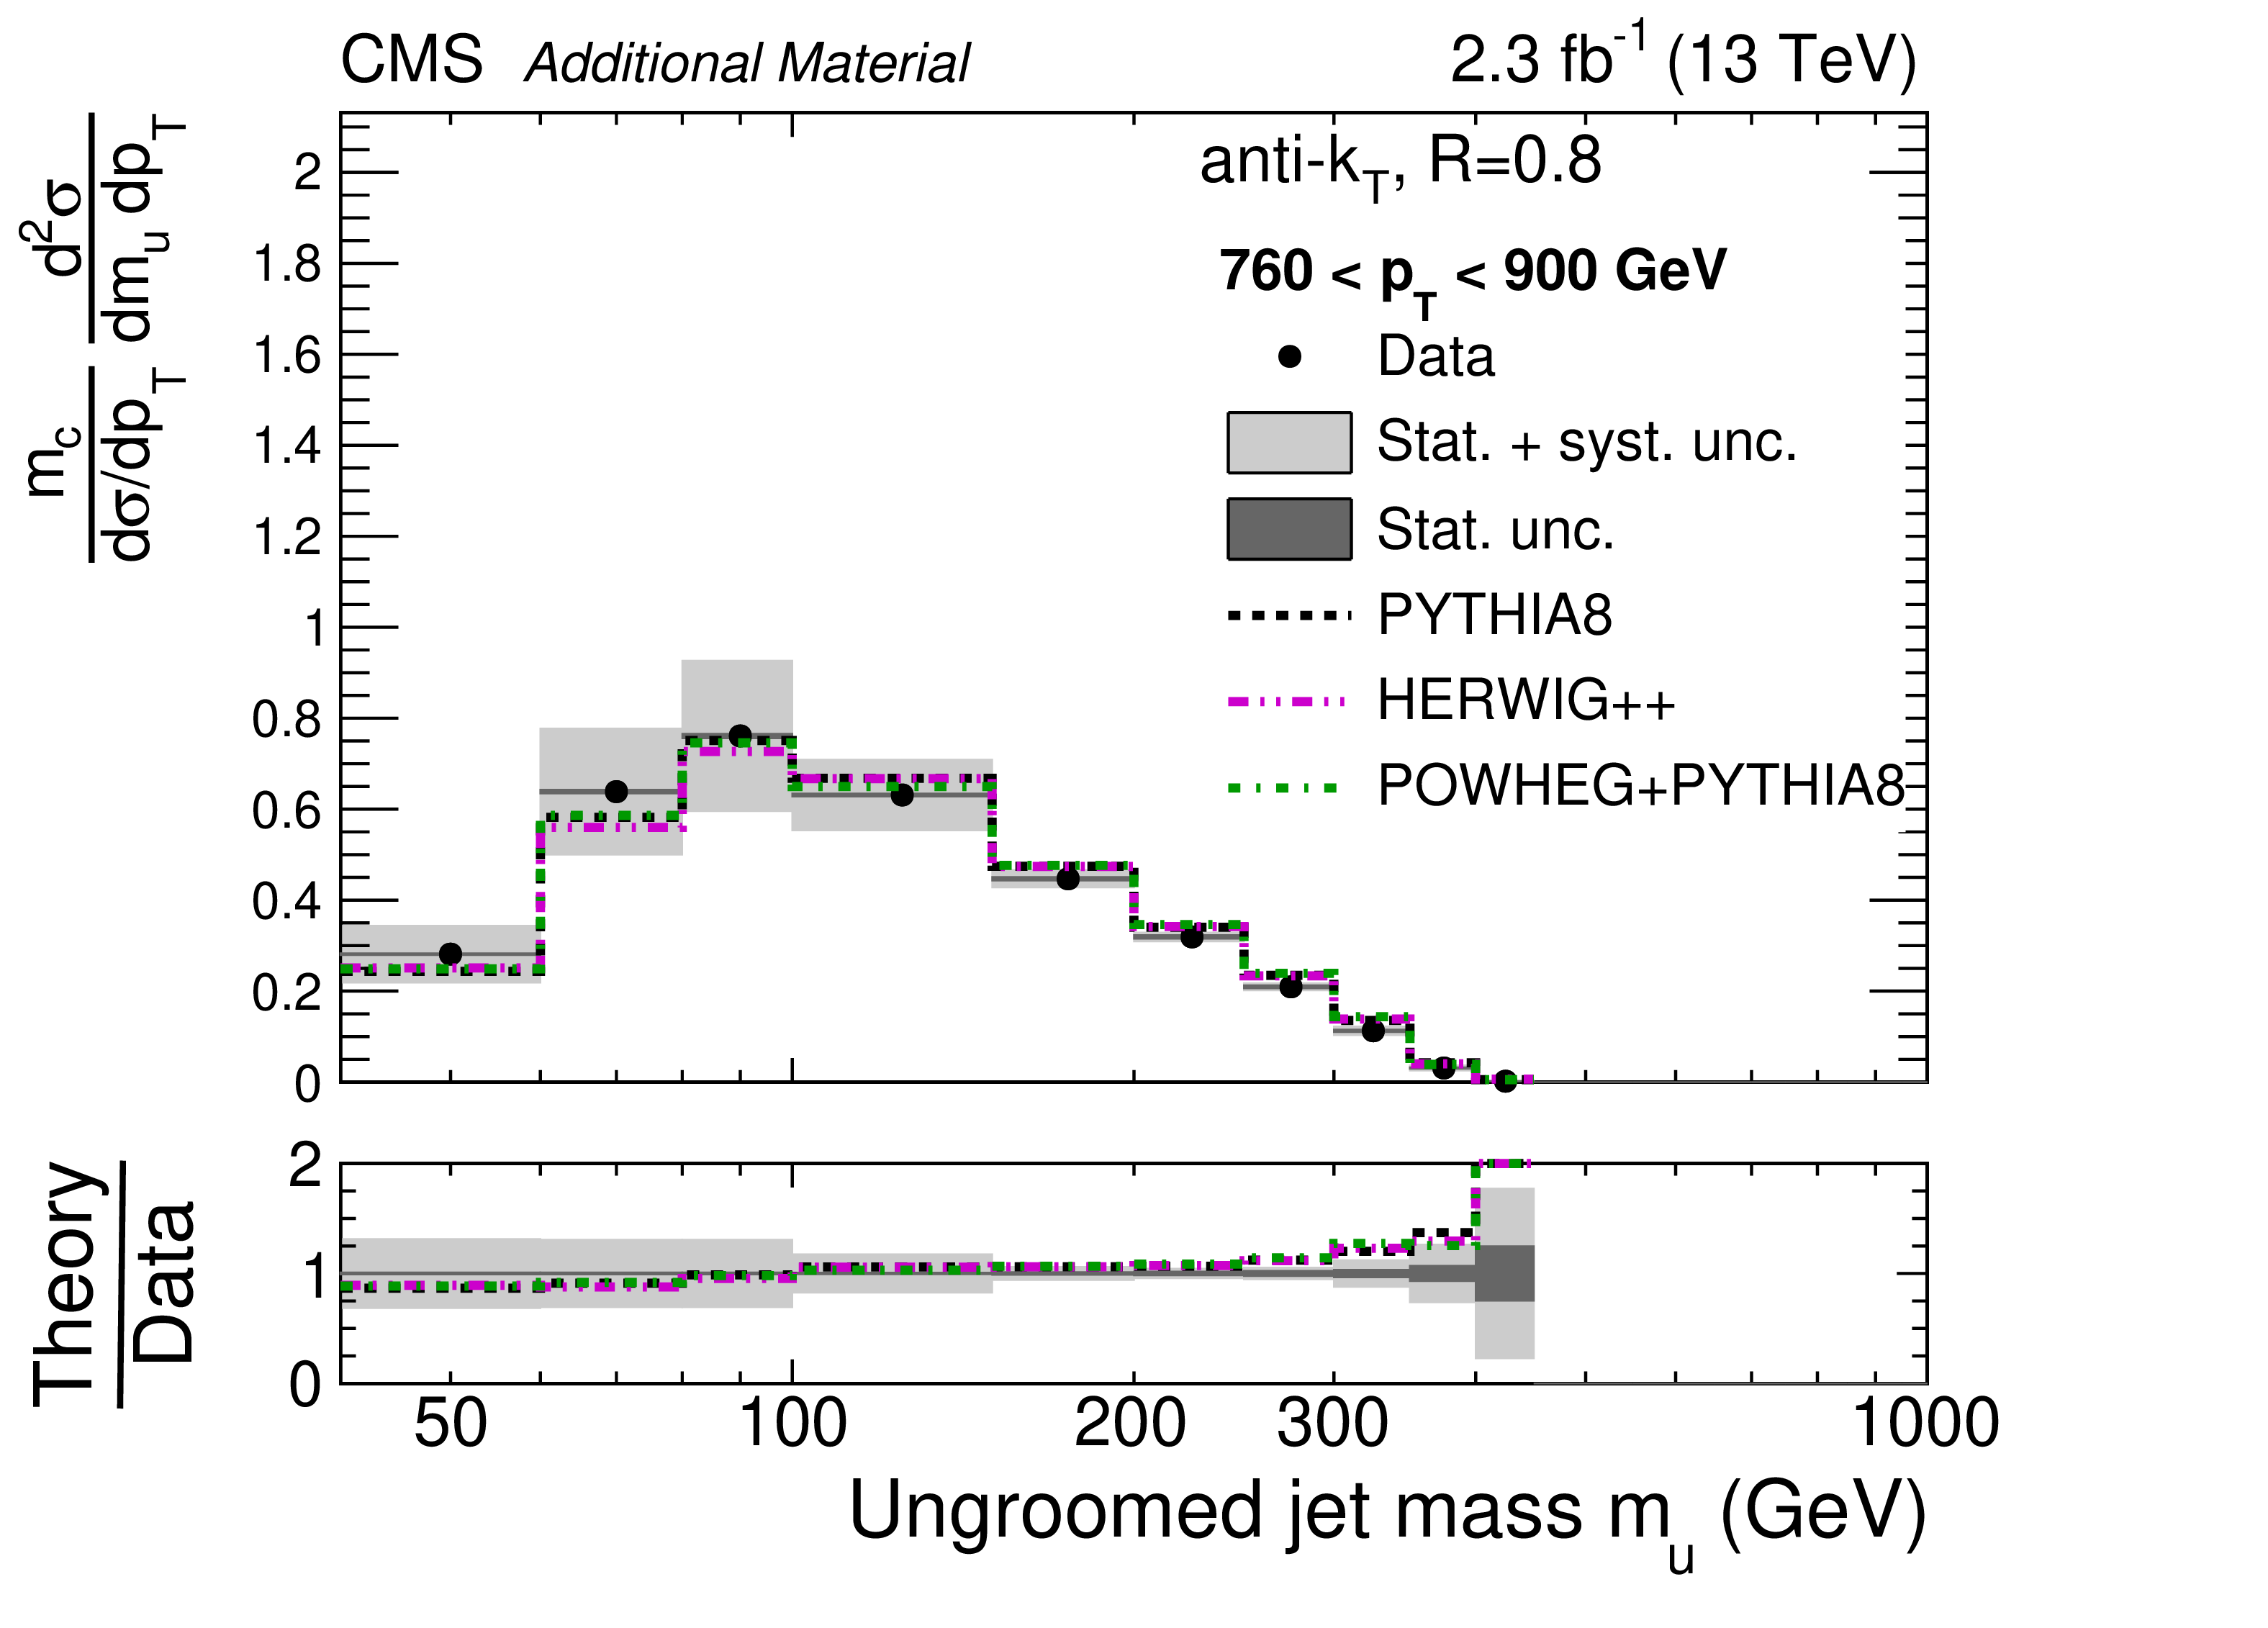
Additional Figure 33:
Normalized cross section for ungroomed jets for 760 $ < {p_{\mathrm {T}}} < $ 900 GeV. The data are shown by the black points, with dark grey bands for the statistical uncertainty (Stat. unc.) and with light grey bands for the total uncertainty (stat.+sys. unc., added in quadrature). The predictions from PYTHIA-8, HERWIG++, and POWHEG+PYTHIA are shown with dashed black, dash-dot-dotted magenta, and dash-dotted green histograms, respectively, with no uncertainties shown. |
png pdf |
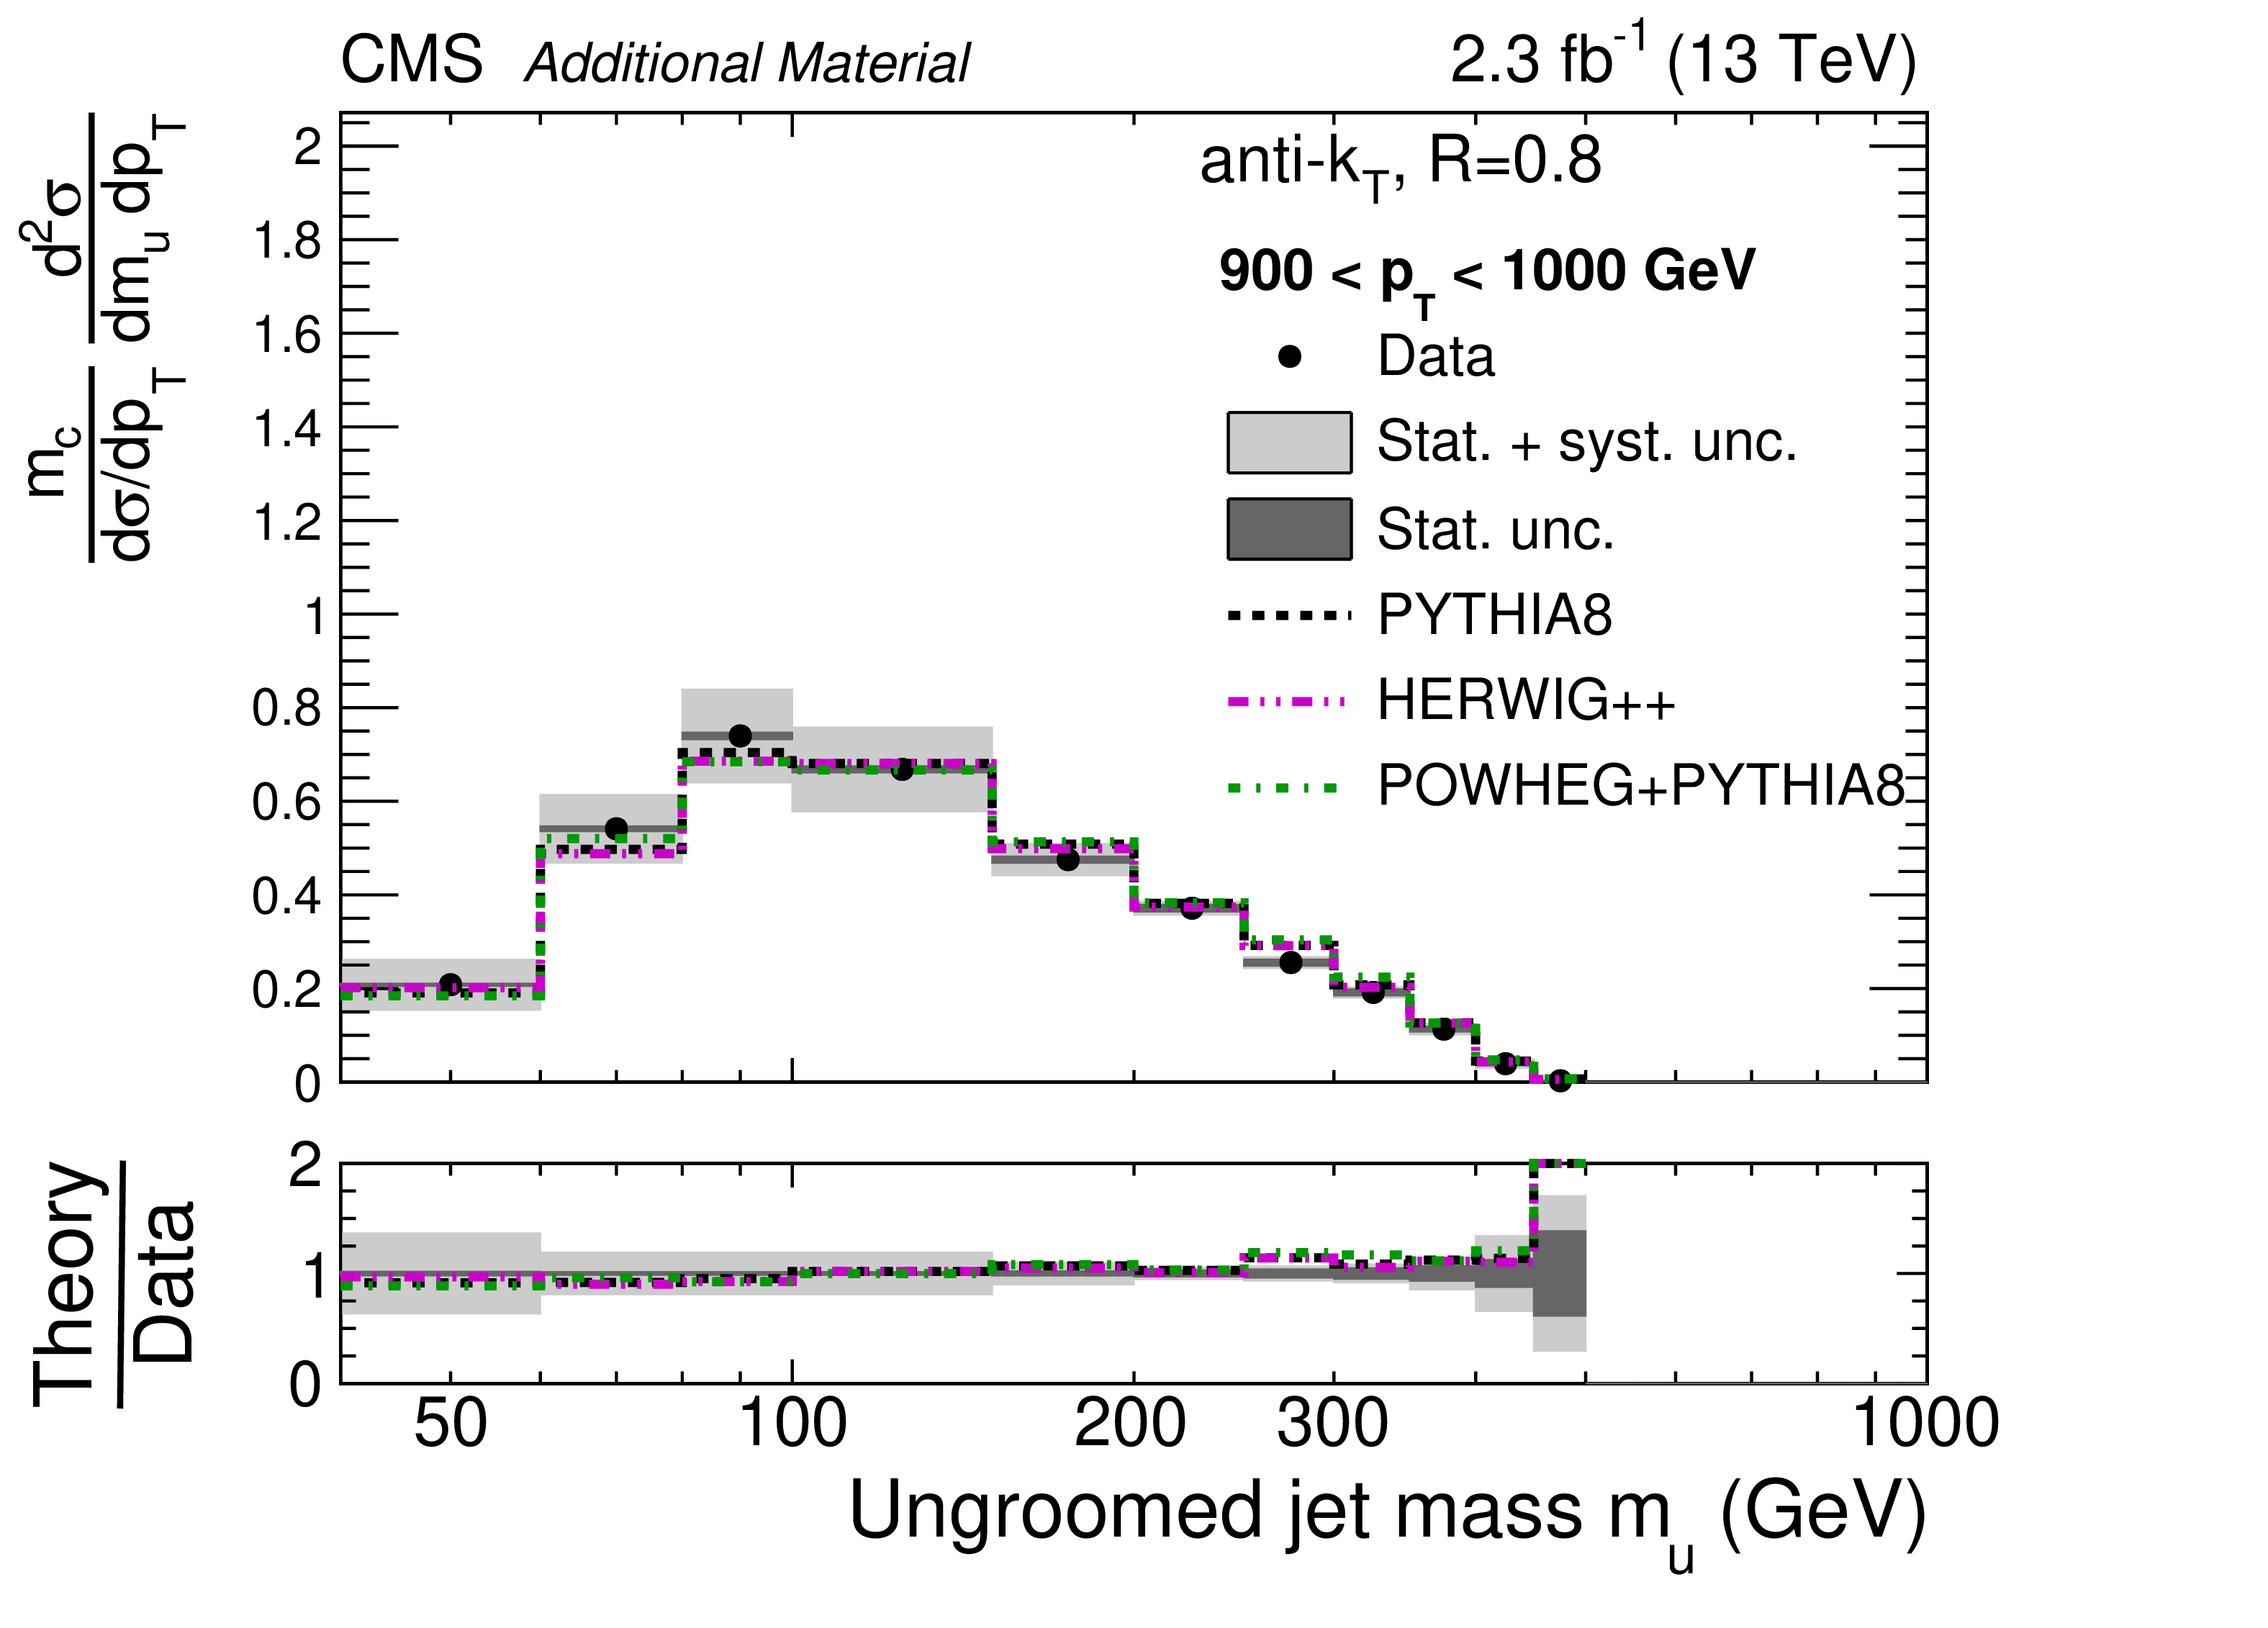
Additional Figure 34:
Normalized cross section for ungroomed jets for 900 $ < {p_{\mathrm {T}}} < $ 1000 GeV. The data are shown by the black points, with dark grey bands for the statistical uncertainty (Stat. unc.) and with light grey bands for the total uncertainty (stat.+sys. unc., added in quadrature). The predictions from PYTHIA-8, HERWIG++, and POWHEG+PYTHIA are shown with dashed black, dash-dot-dotted magenta, and dash-dotted green histograms, respectively, with no uncertainties shown. |
png pdf |
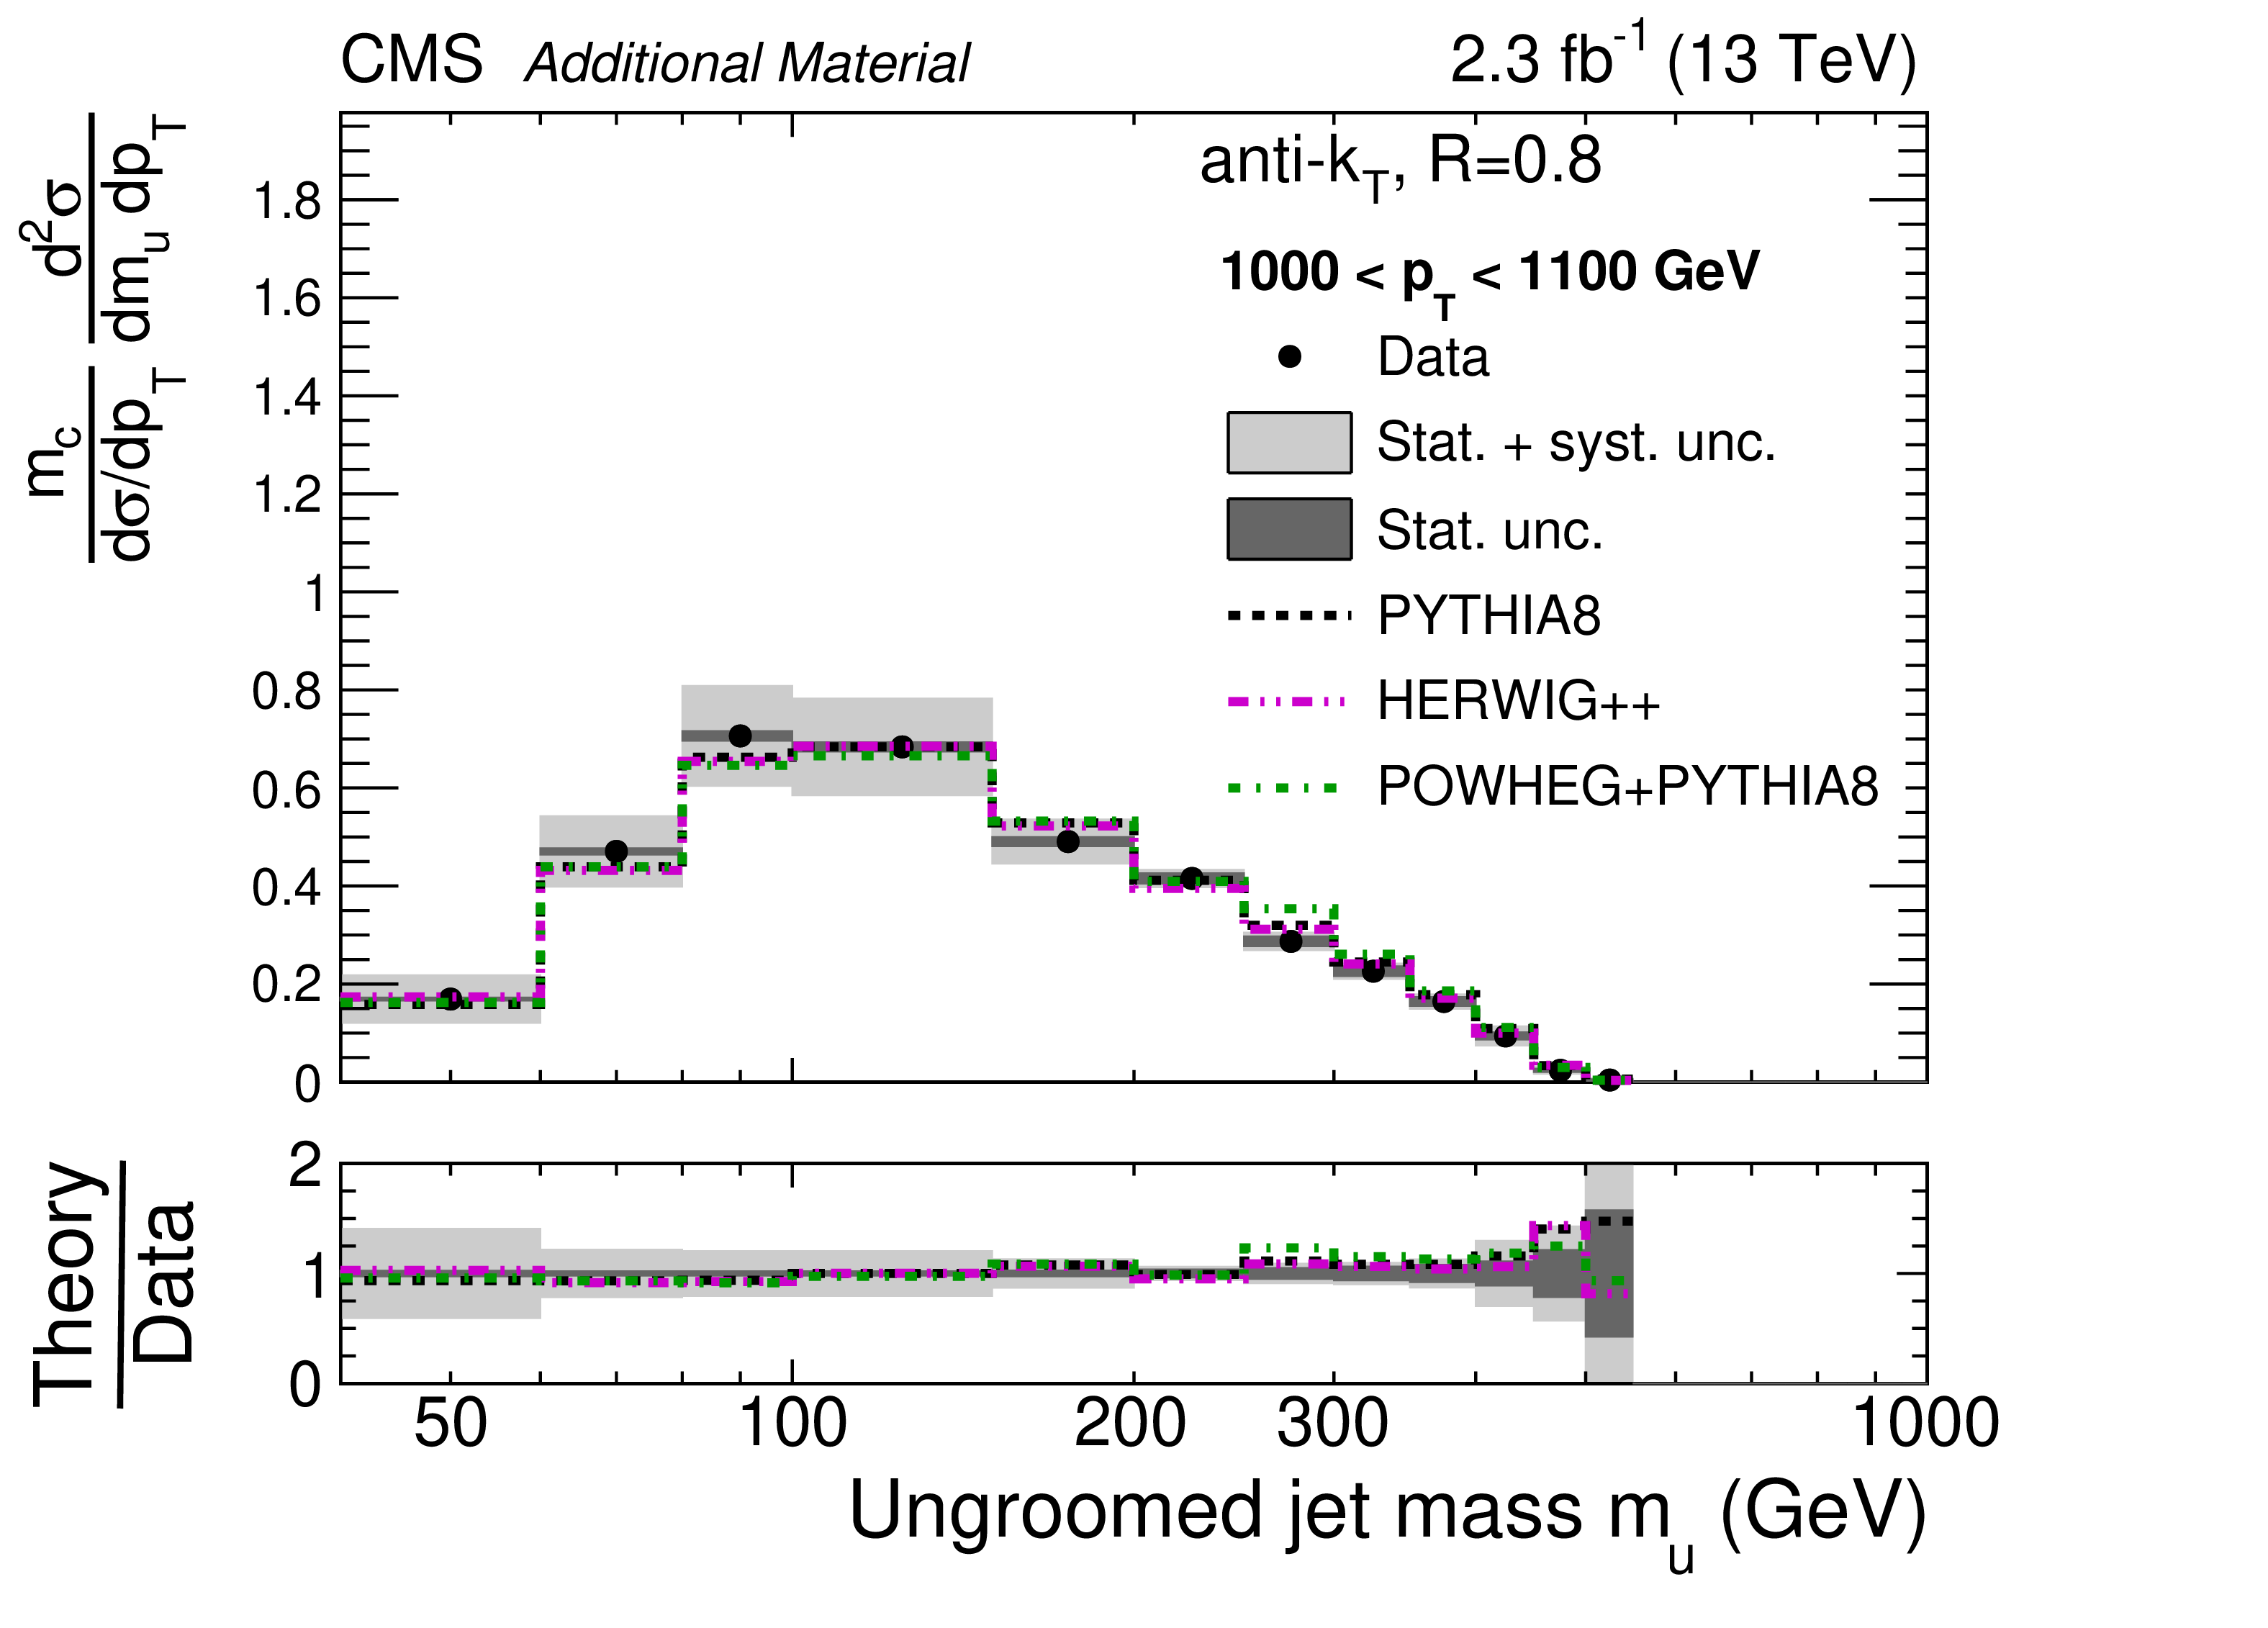
Additional Figure 35:
Normalized cross section for ungroomed jets for 1000 $ < {p_{\mathrm {T}}} < $ 1100 GeV. The data are shown by the black points, with dark grey bands for the statistical uncertainty (Stat. unc.) and with light grey bands for the total uncertainty (stat.+sys. unc., added in quadrature). The predictions from PYTHIA-8, HERWIG++, and POWHEG+PYTHIA are shown with dashed black, dash-dot-dotted magenta, and dash-dotted green histograms, respectively, with no uncertainties shown. |

png pdf |
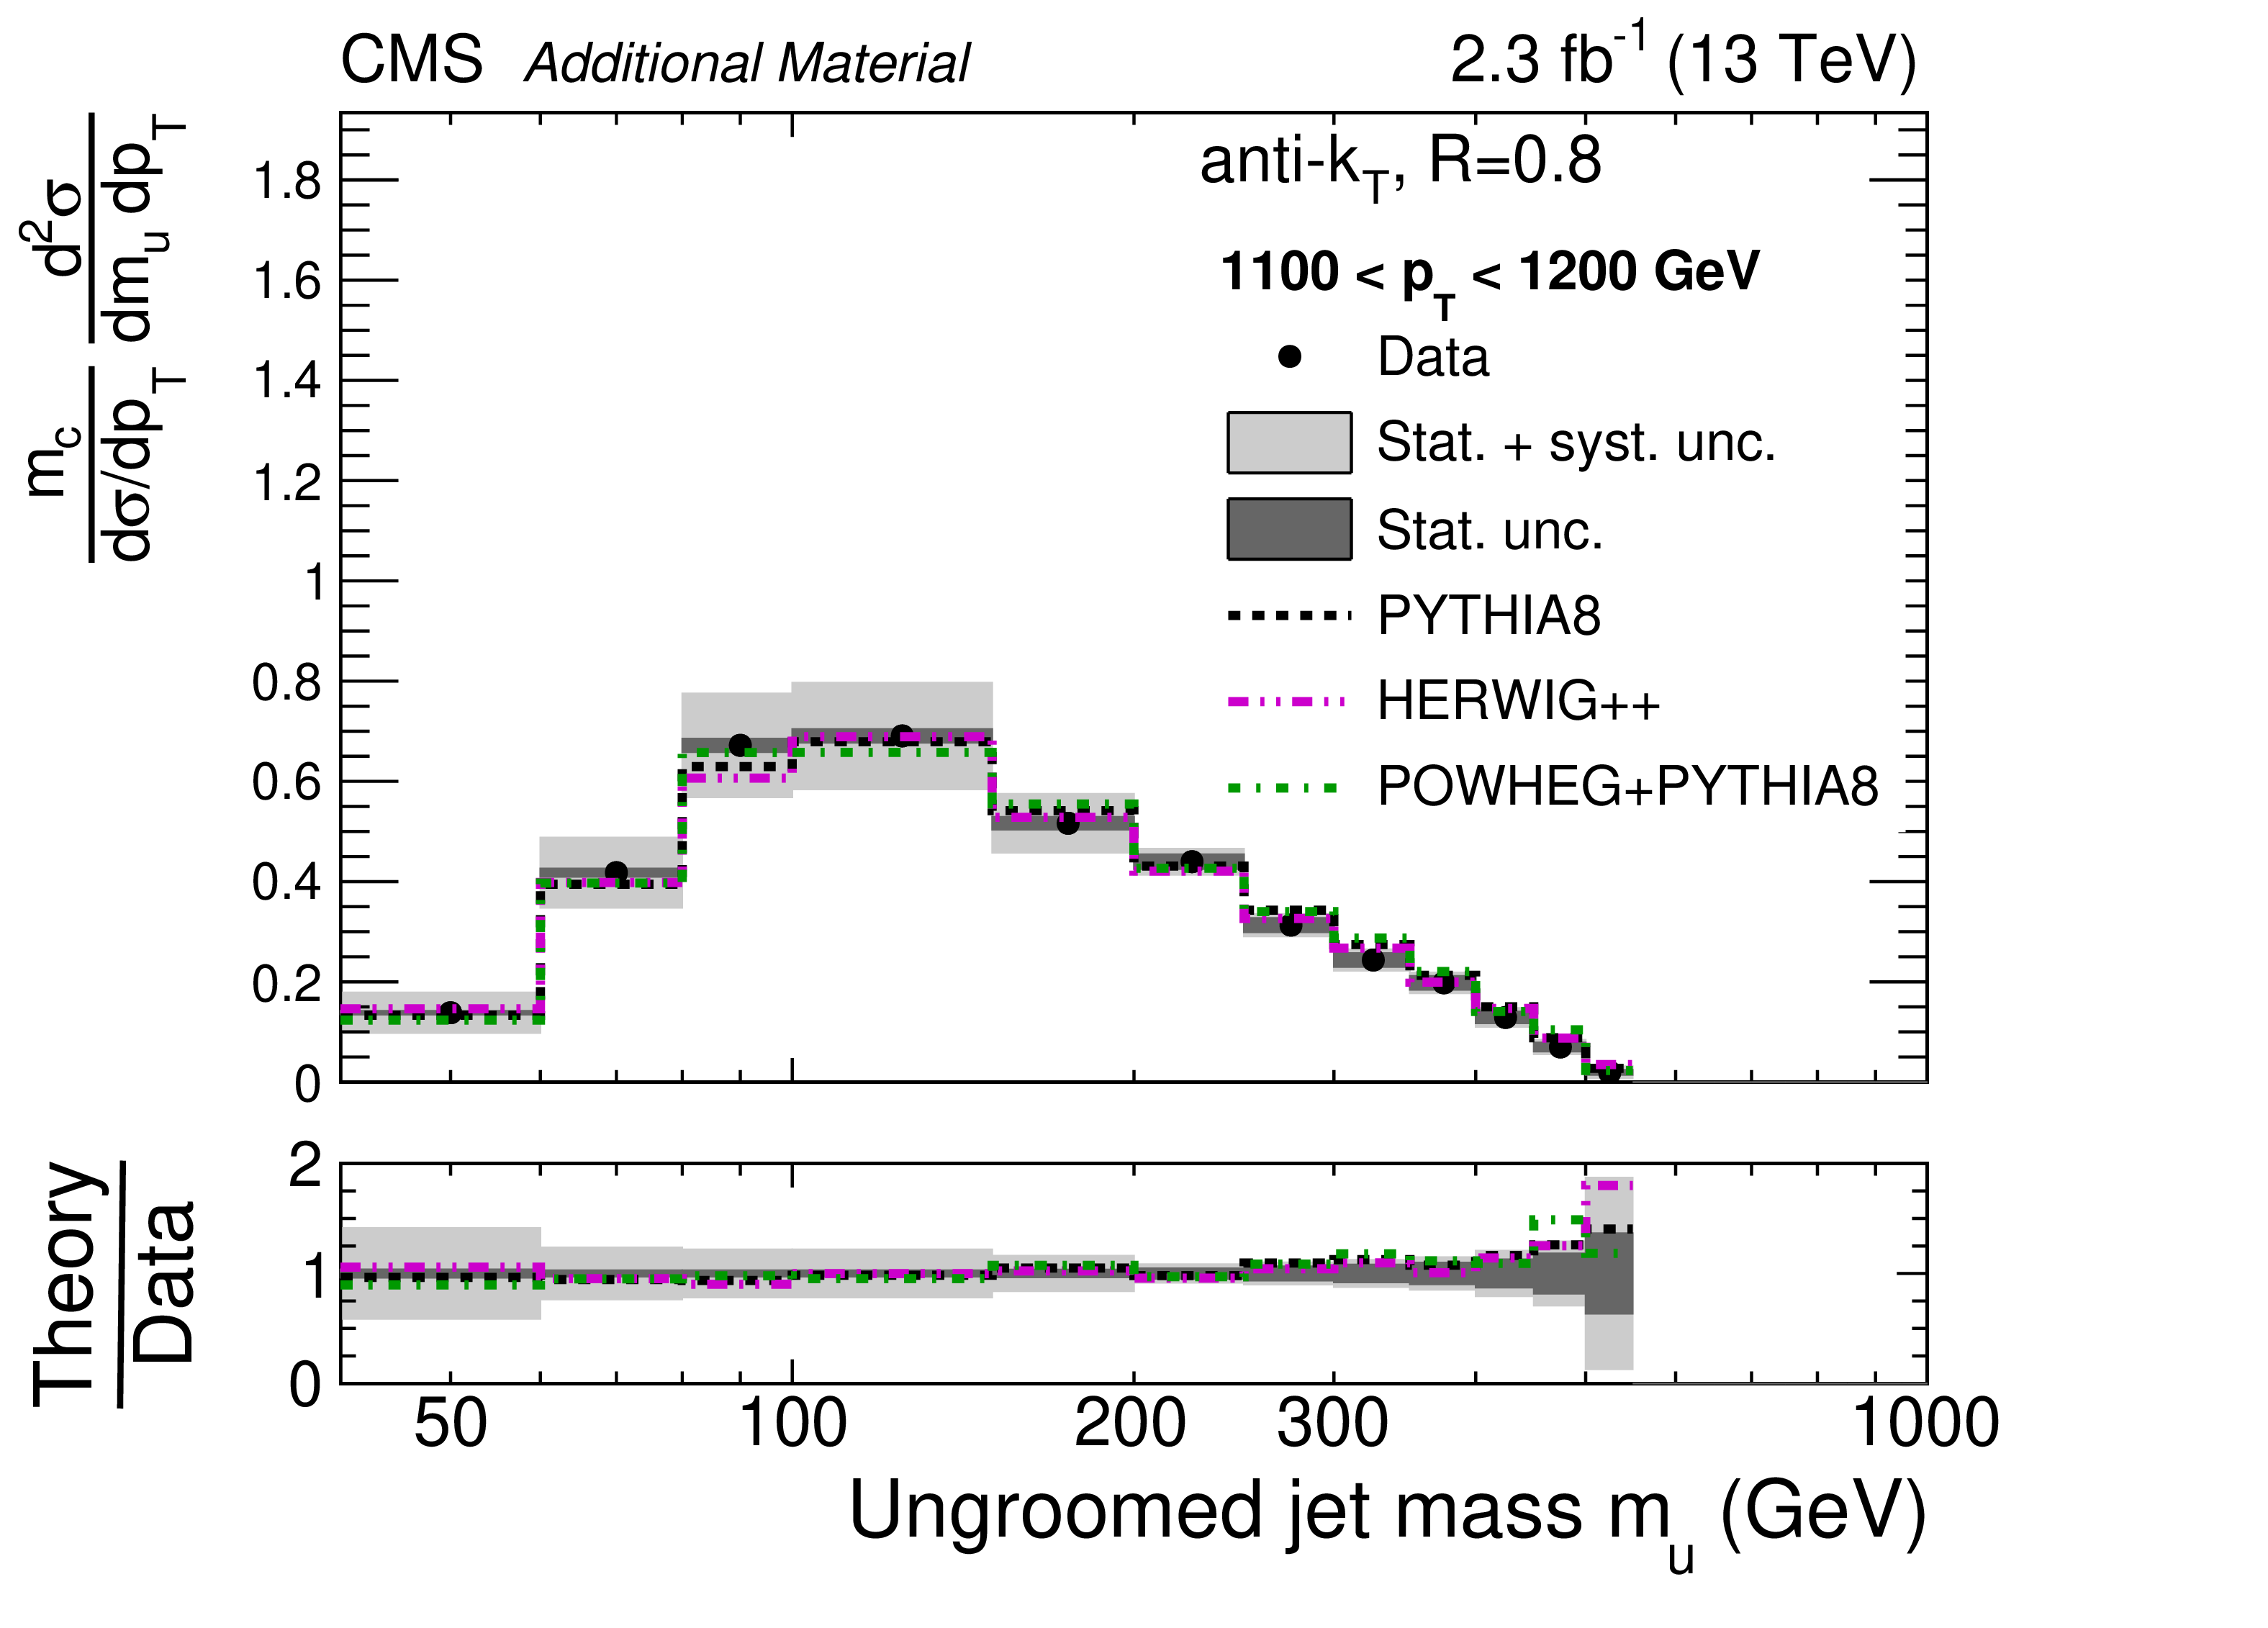
Additional Figure 36:
Normalized cross section for ungroomed jets for 1100 $ < {p_{\mathrm {T}}} < $ 1200 GeV. The data are shown by the black points, with dark grey bands for the statistical uncertainty (Stat. unc.) and with light grey bands for the total uncertainty (stat.+sys. unc., added in quadrature). The predictions from PYTHIA-8, HERWIG++, and POWHEG+PYTHIA are shown with dashed black, dash-dot-dotted magenta, and dash-dotted green histograms, respectively, with no uncertainties shown. |
png pdf |
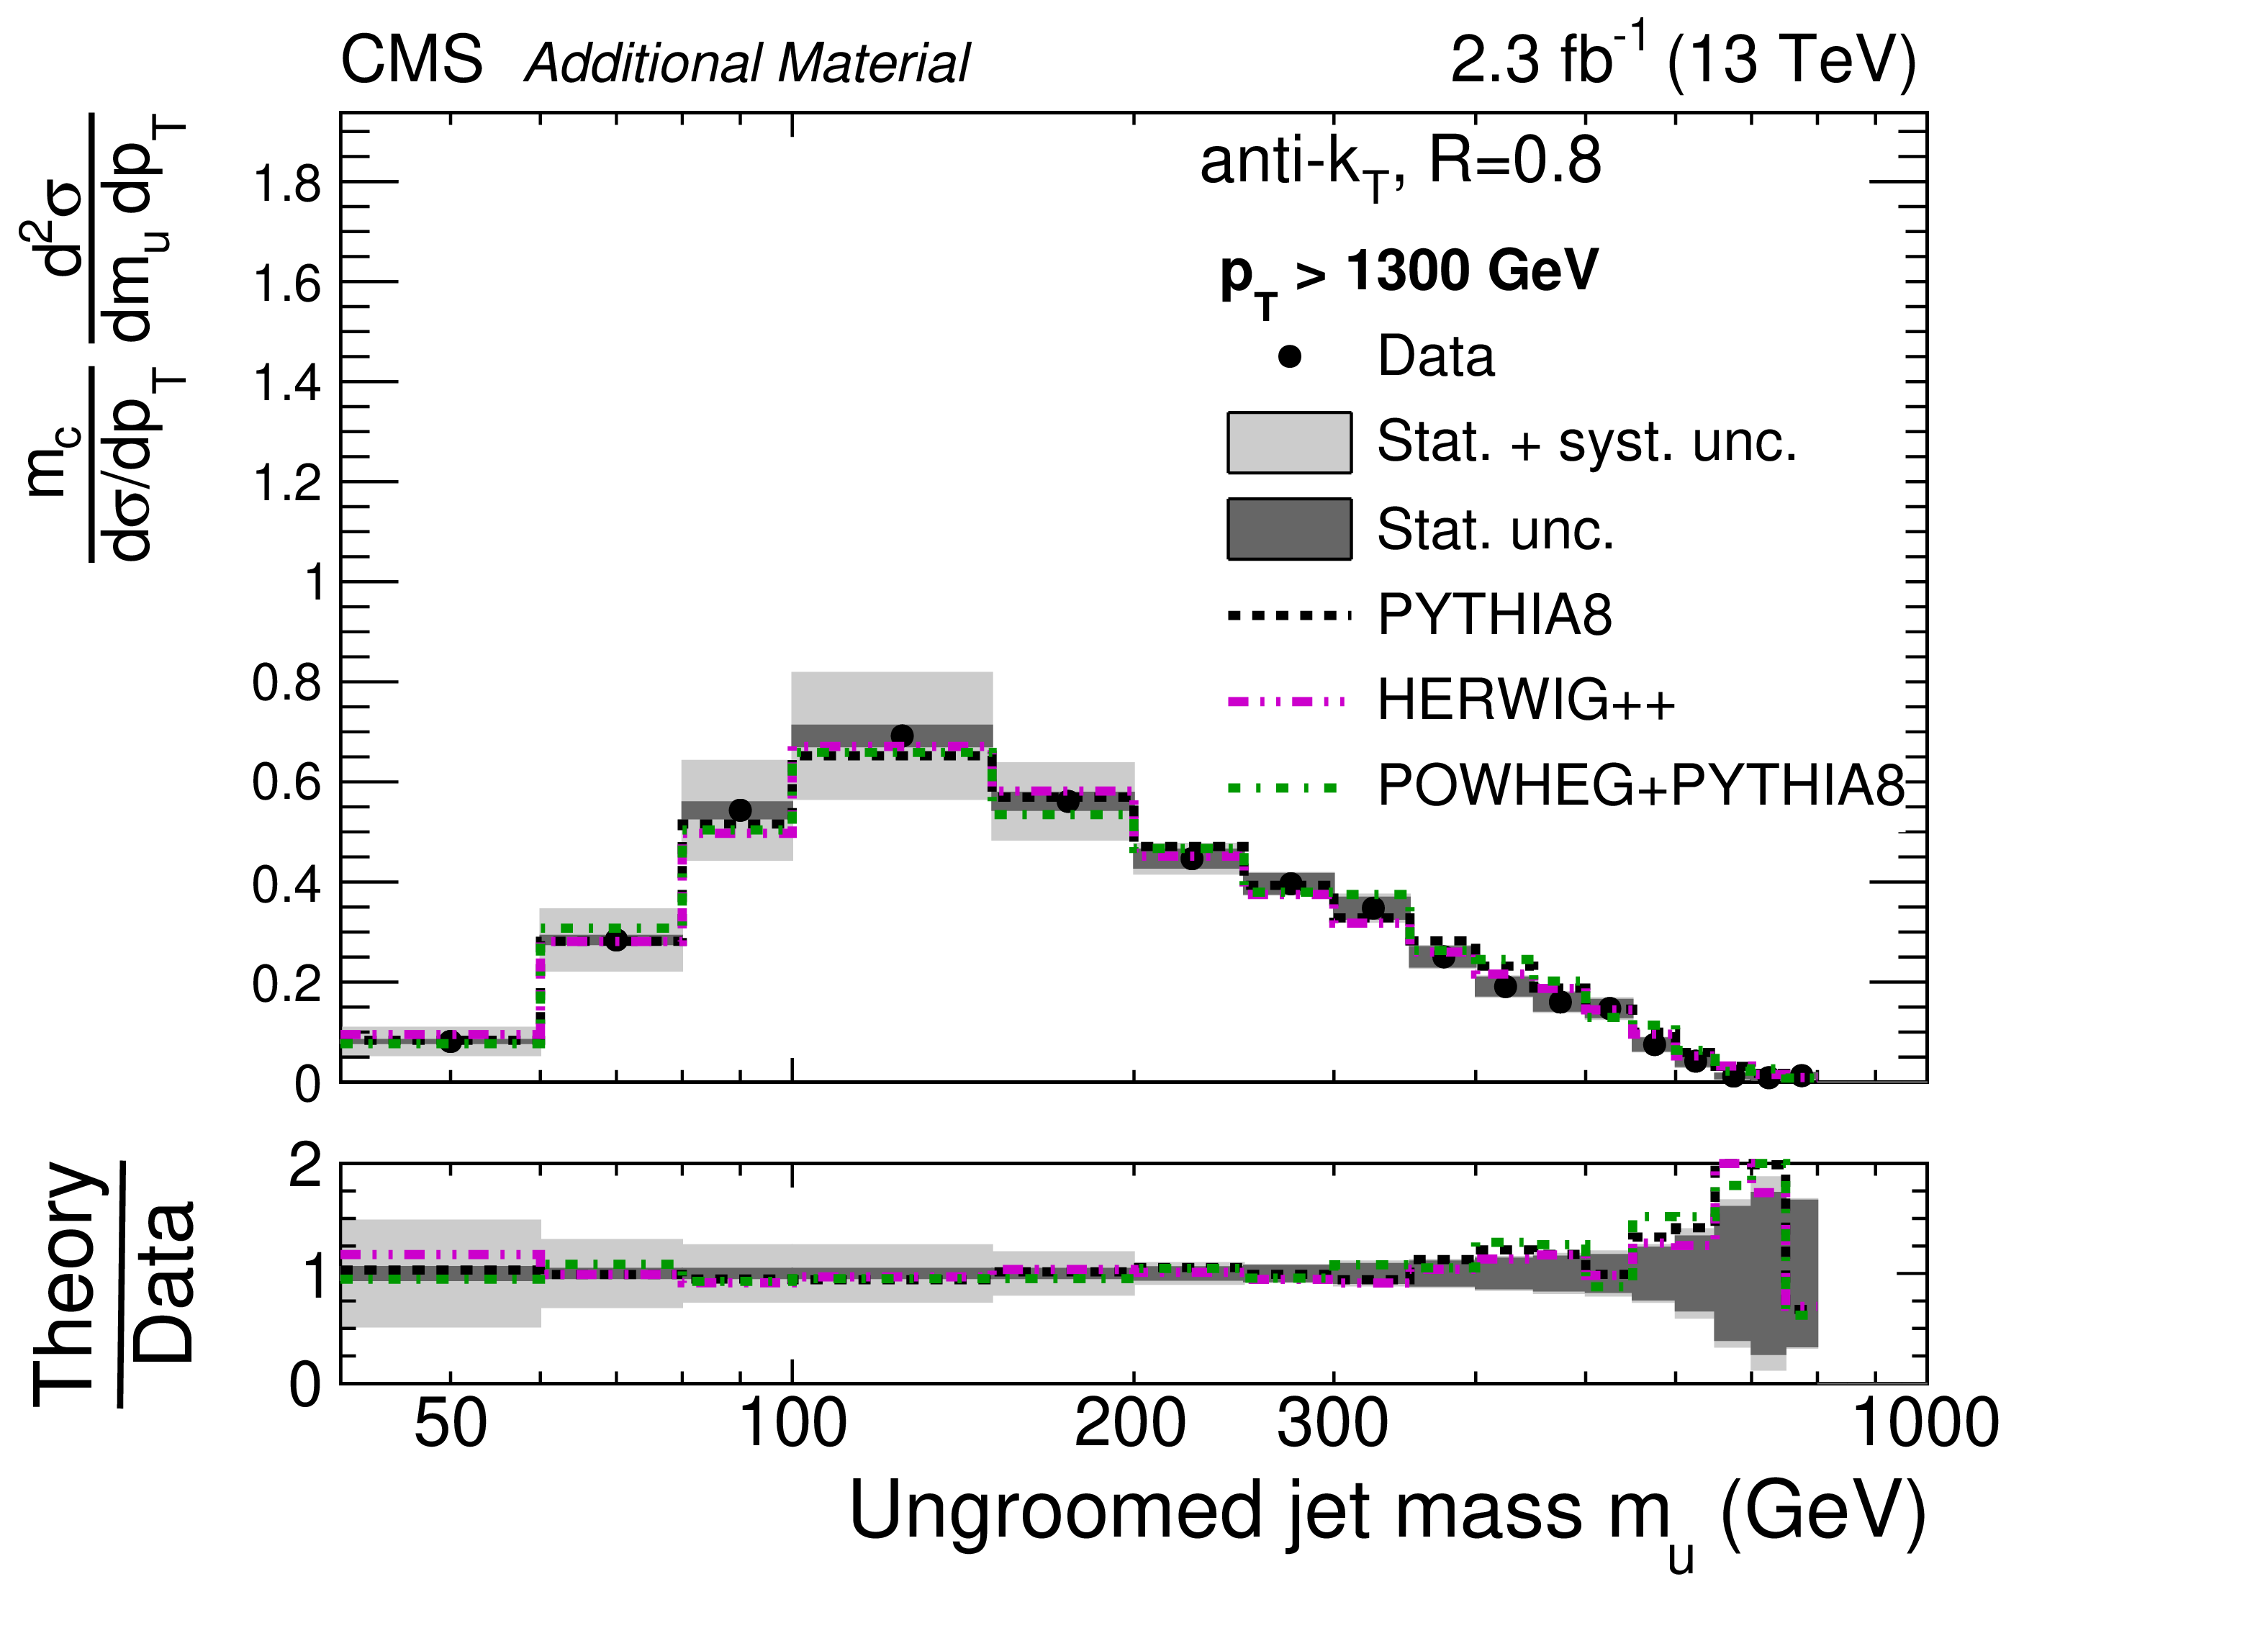
Additional Figure 37:
Normalized cross section for ungroomed jets for $ {p_{\mathrm {T}}} > $ 1300 GeV. The data are shown by the black points, with dark grey bands for the statistical uncertainty (Stat. unc.) and with light grey bands for the total uncertainty (stat.+sys. unc., added in quadrature). The predictions from PYTHIA-8, HERWIG++, and POWHEG+PYTHIA are shown with dashed black, dash-dot-dotted magenta, and dash-dotted green histograms, respectively, with no uncertainties shown. |

png pdf |
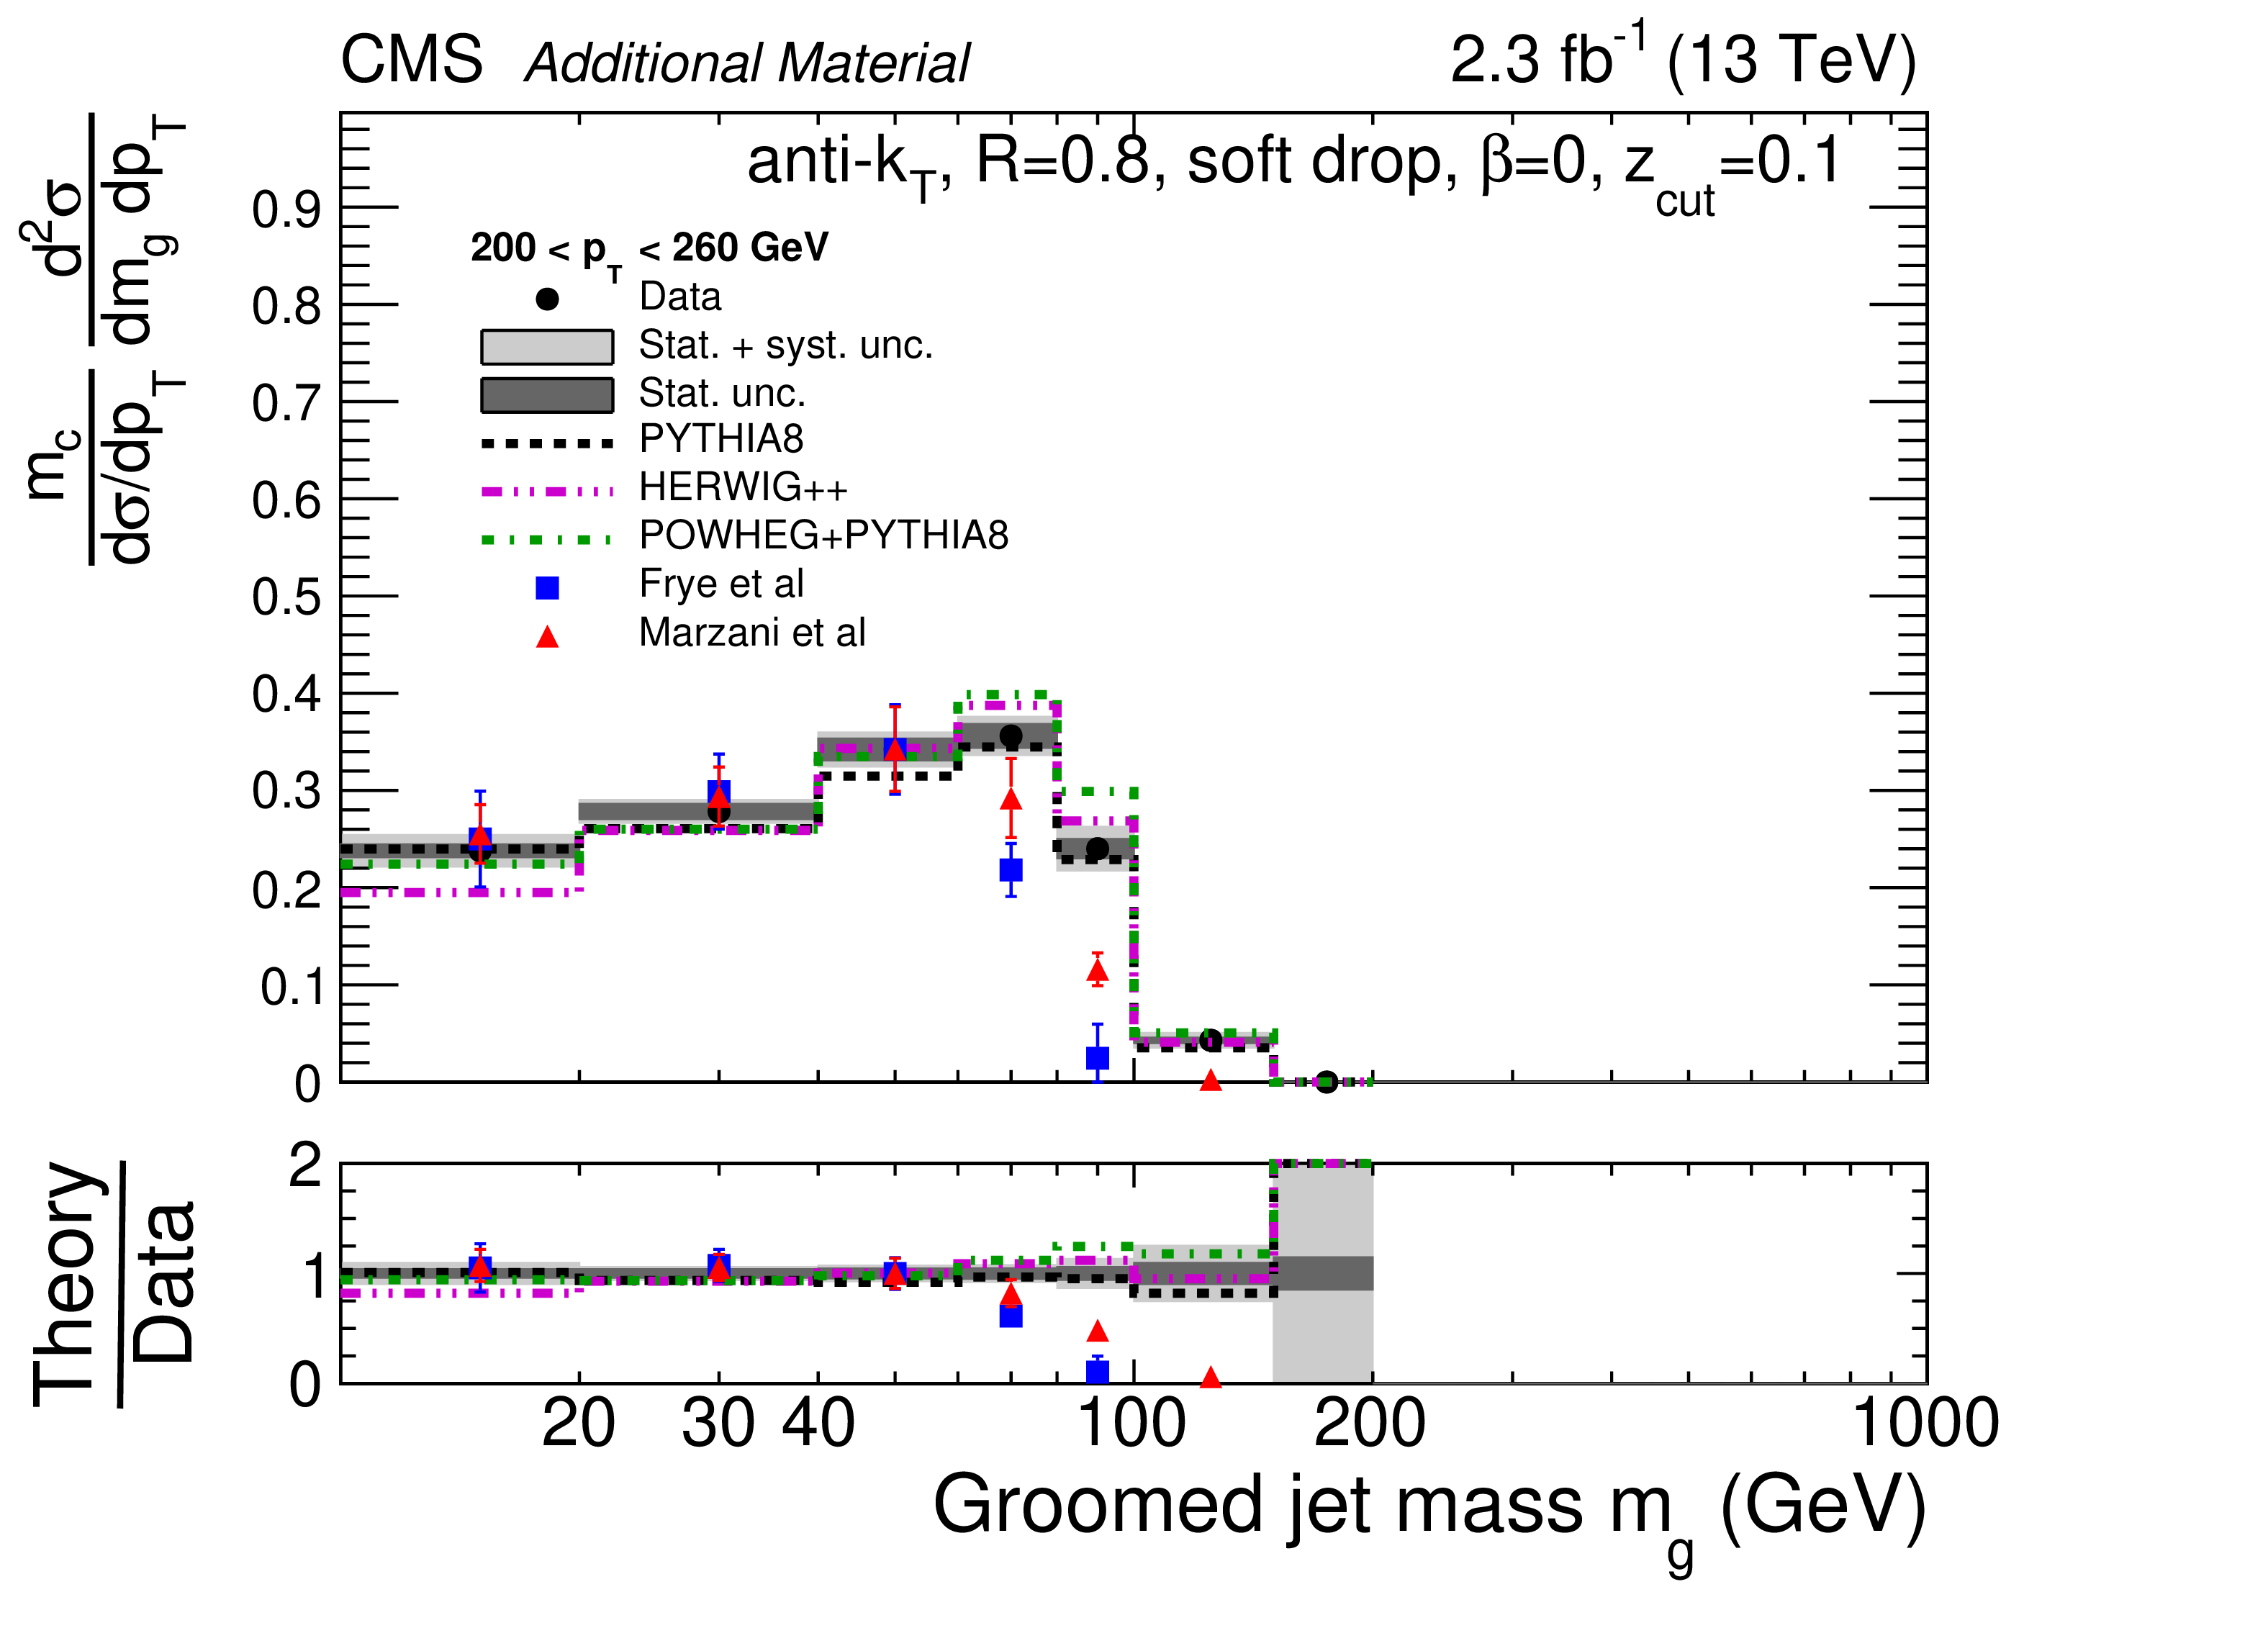
Additional Figure 38:
Normalized cross section for groomed jets for 200 $ < {p_{\mathrm {T}}} < $ 260 GeV. The data are shown by the black points, with dark grey bands for the statistical uncertainty (Stat. unc.) and with light grey bands for the total uncertainty (stat.+sys. unc., added in quadrature). The predictions from PYTHIA-8, HERWIG++, and POWHEG+PYTHIA are shown with dashed black, dash-dot-dotted magenta, and dash-dotted green histograms, respectively, with no uncertainties shown. The predictions from Ref. [1] (Frye et. al.) are shown with blue squares. The uncertainties include scale variations and an estimate of nonperturbative effects. The predictions from Ref. [2] (Marzani et. al.) are shown with red triangles. The uncertainties only include effects from scale variations, since nonperturbative corrections have been considered directly in the calculation. |

png pdf |
Additional Figure 39:
Normalized cross section for groomed jets for 260 $ < {p_{\mathrm {T}}} < $ 350 GeV. The data are shown by the black points, with dark grey bands for the statistical uncertainty (Stat. unc.) and with light grey bands for the total uncertainty (stat.+sys. unc., added in quadrature). The predictions from PYTHIA-8, HERWIG++, and POWHEG+PYTHIA are shown with dashed black, dash-dot-dotted magenta, and dash-dotted green histograms, respectively, with no uncertainties shown. The predictions from Ref. [1] (Frye et. al.) are shown with blue squares. The uncertainties include scale variations and an estimate of nonperturbative effects. The predictions from Ref. [2] (Marzani et. al.) are shown with red triangles. The uncertainties only include effects from scale variations, since nonperturbative corrections have been considered directly in the calculation. |
png pdf |
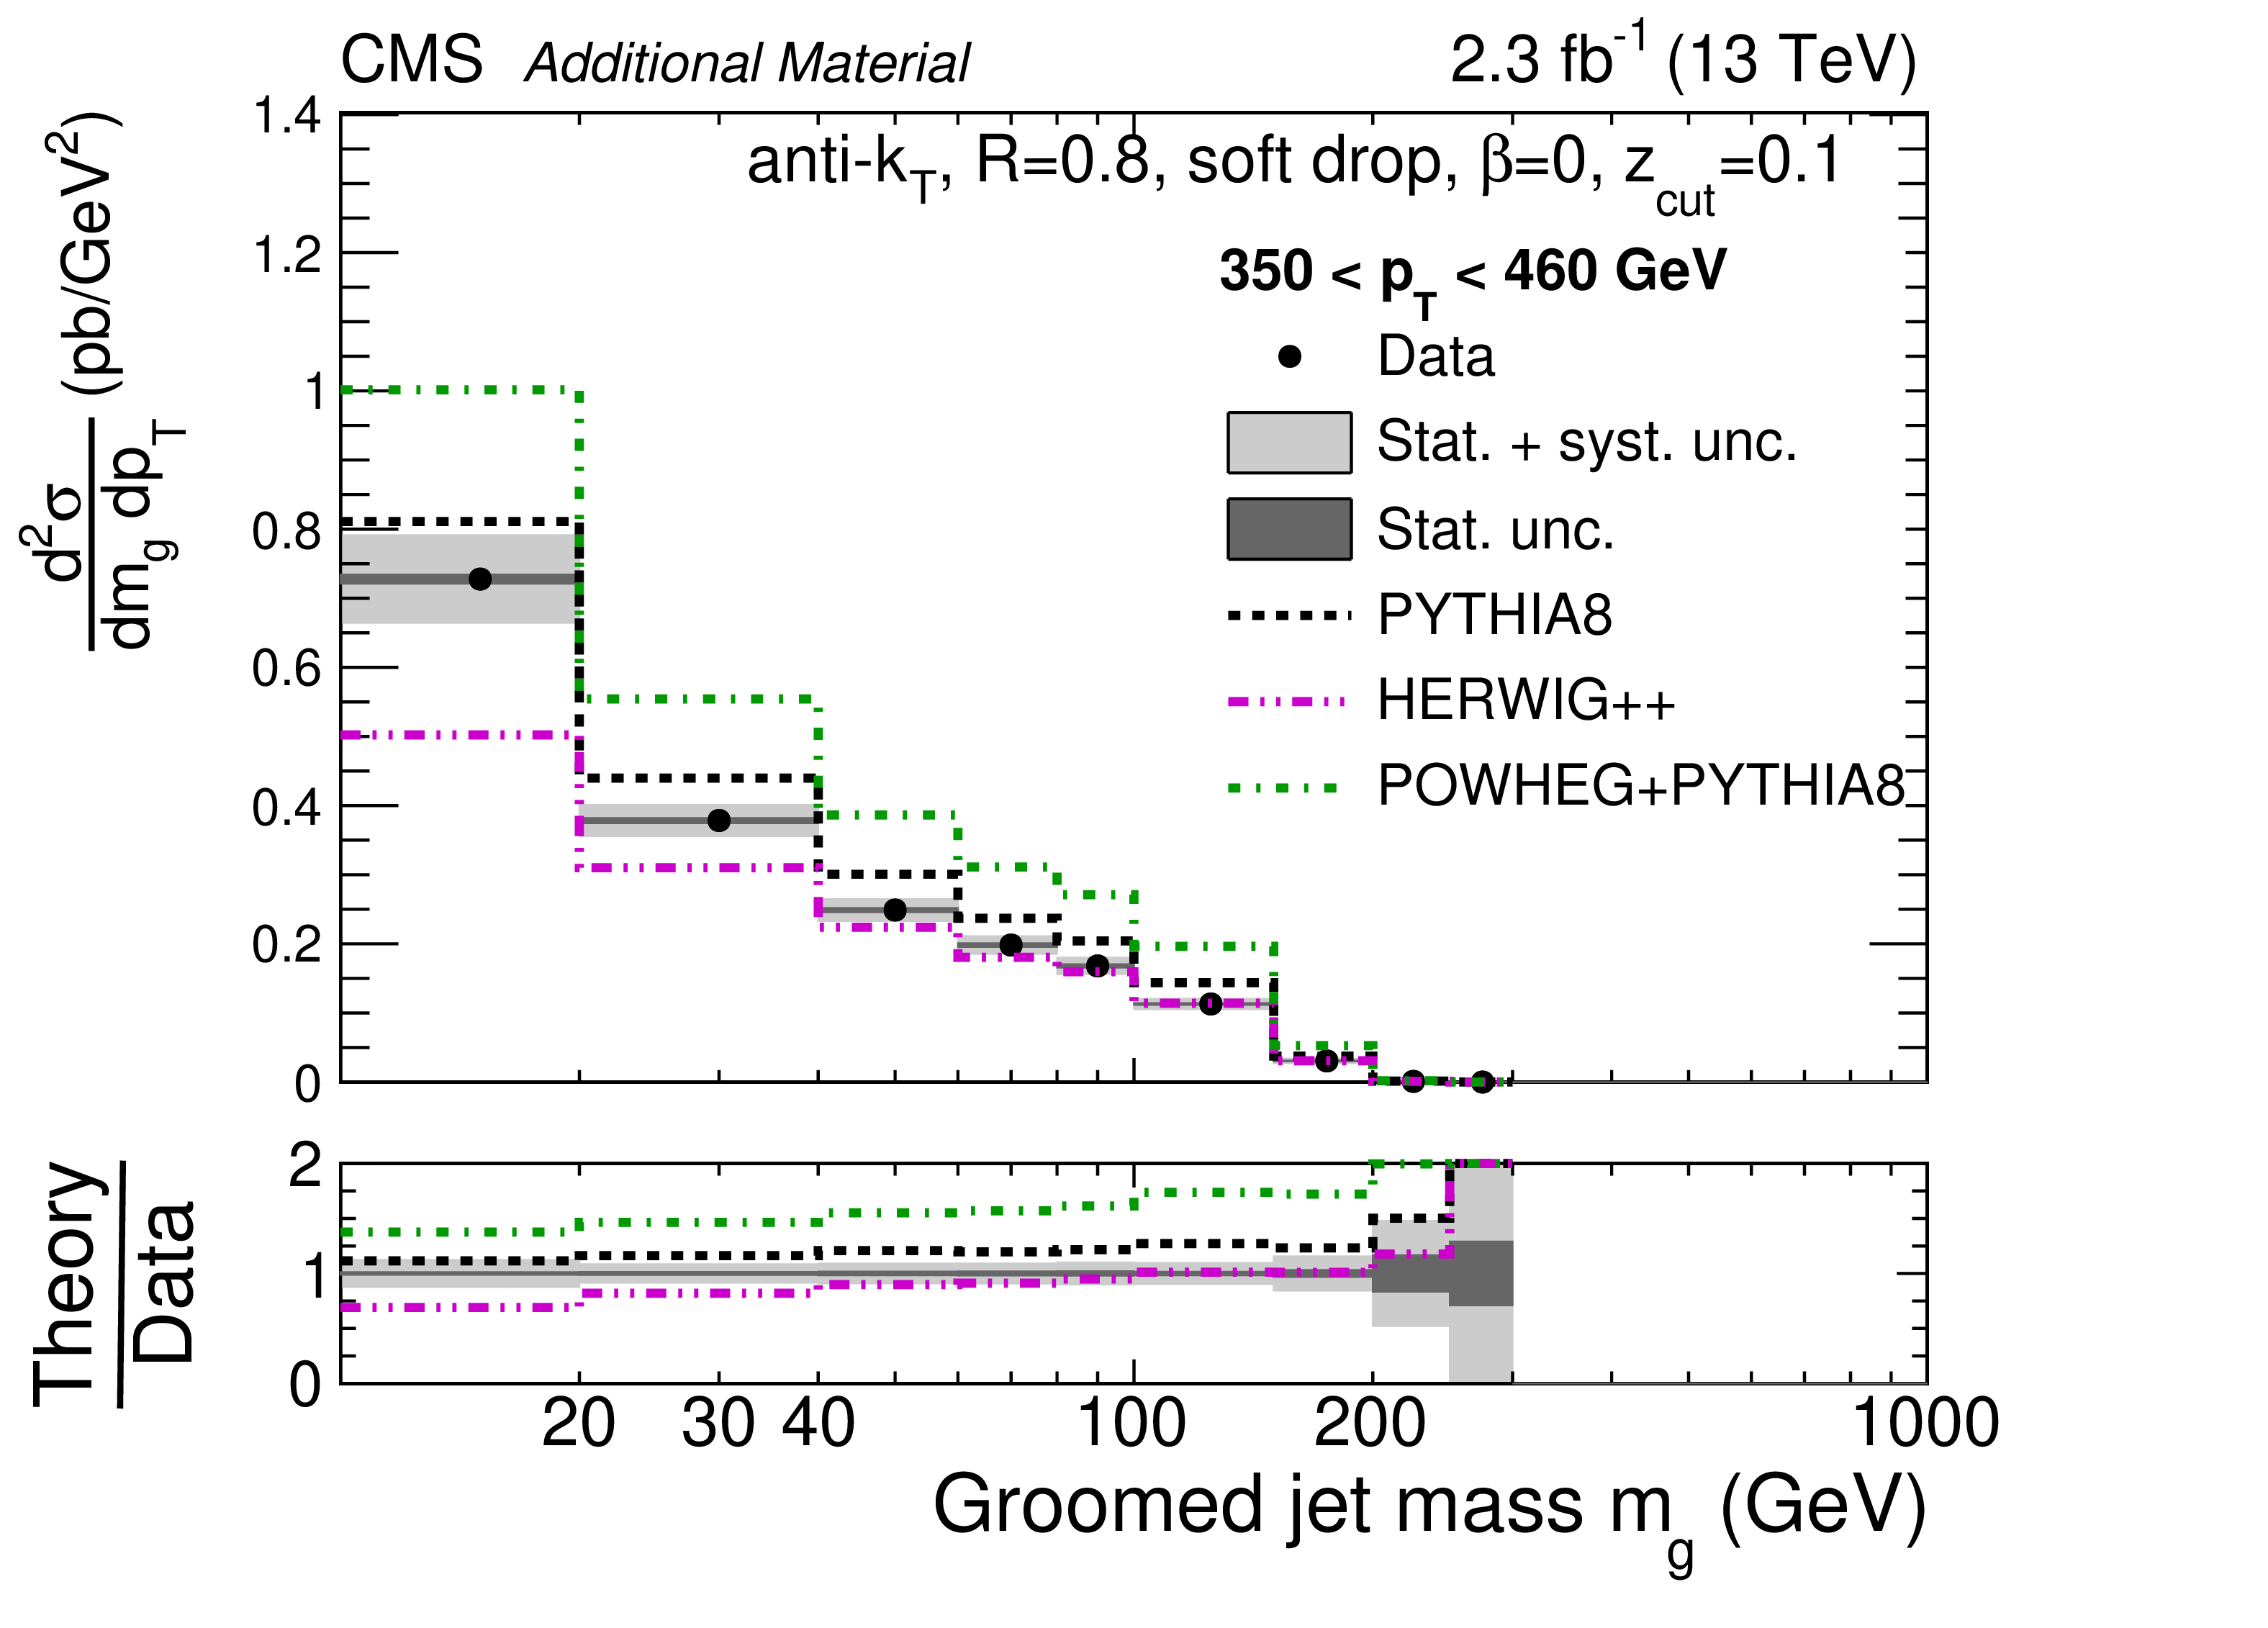
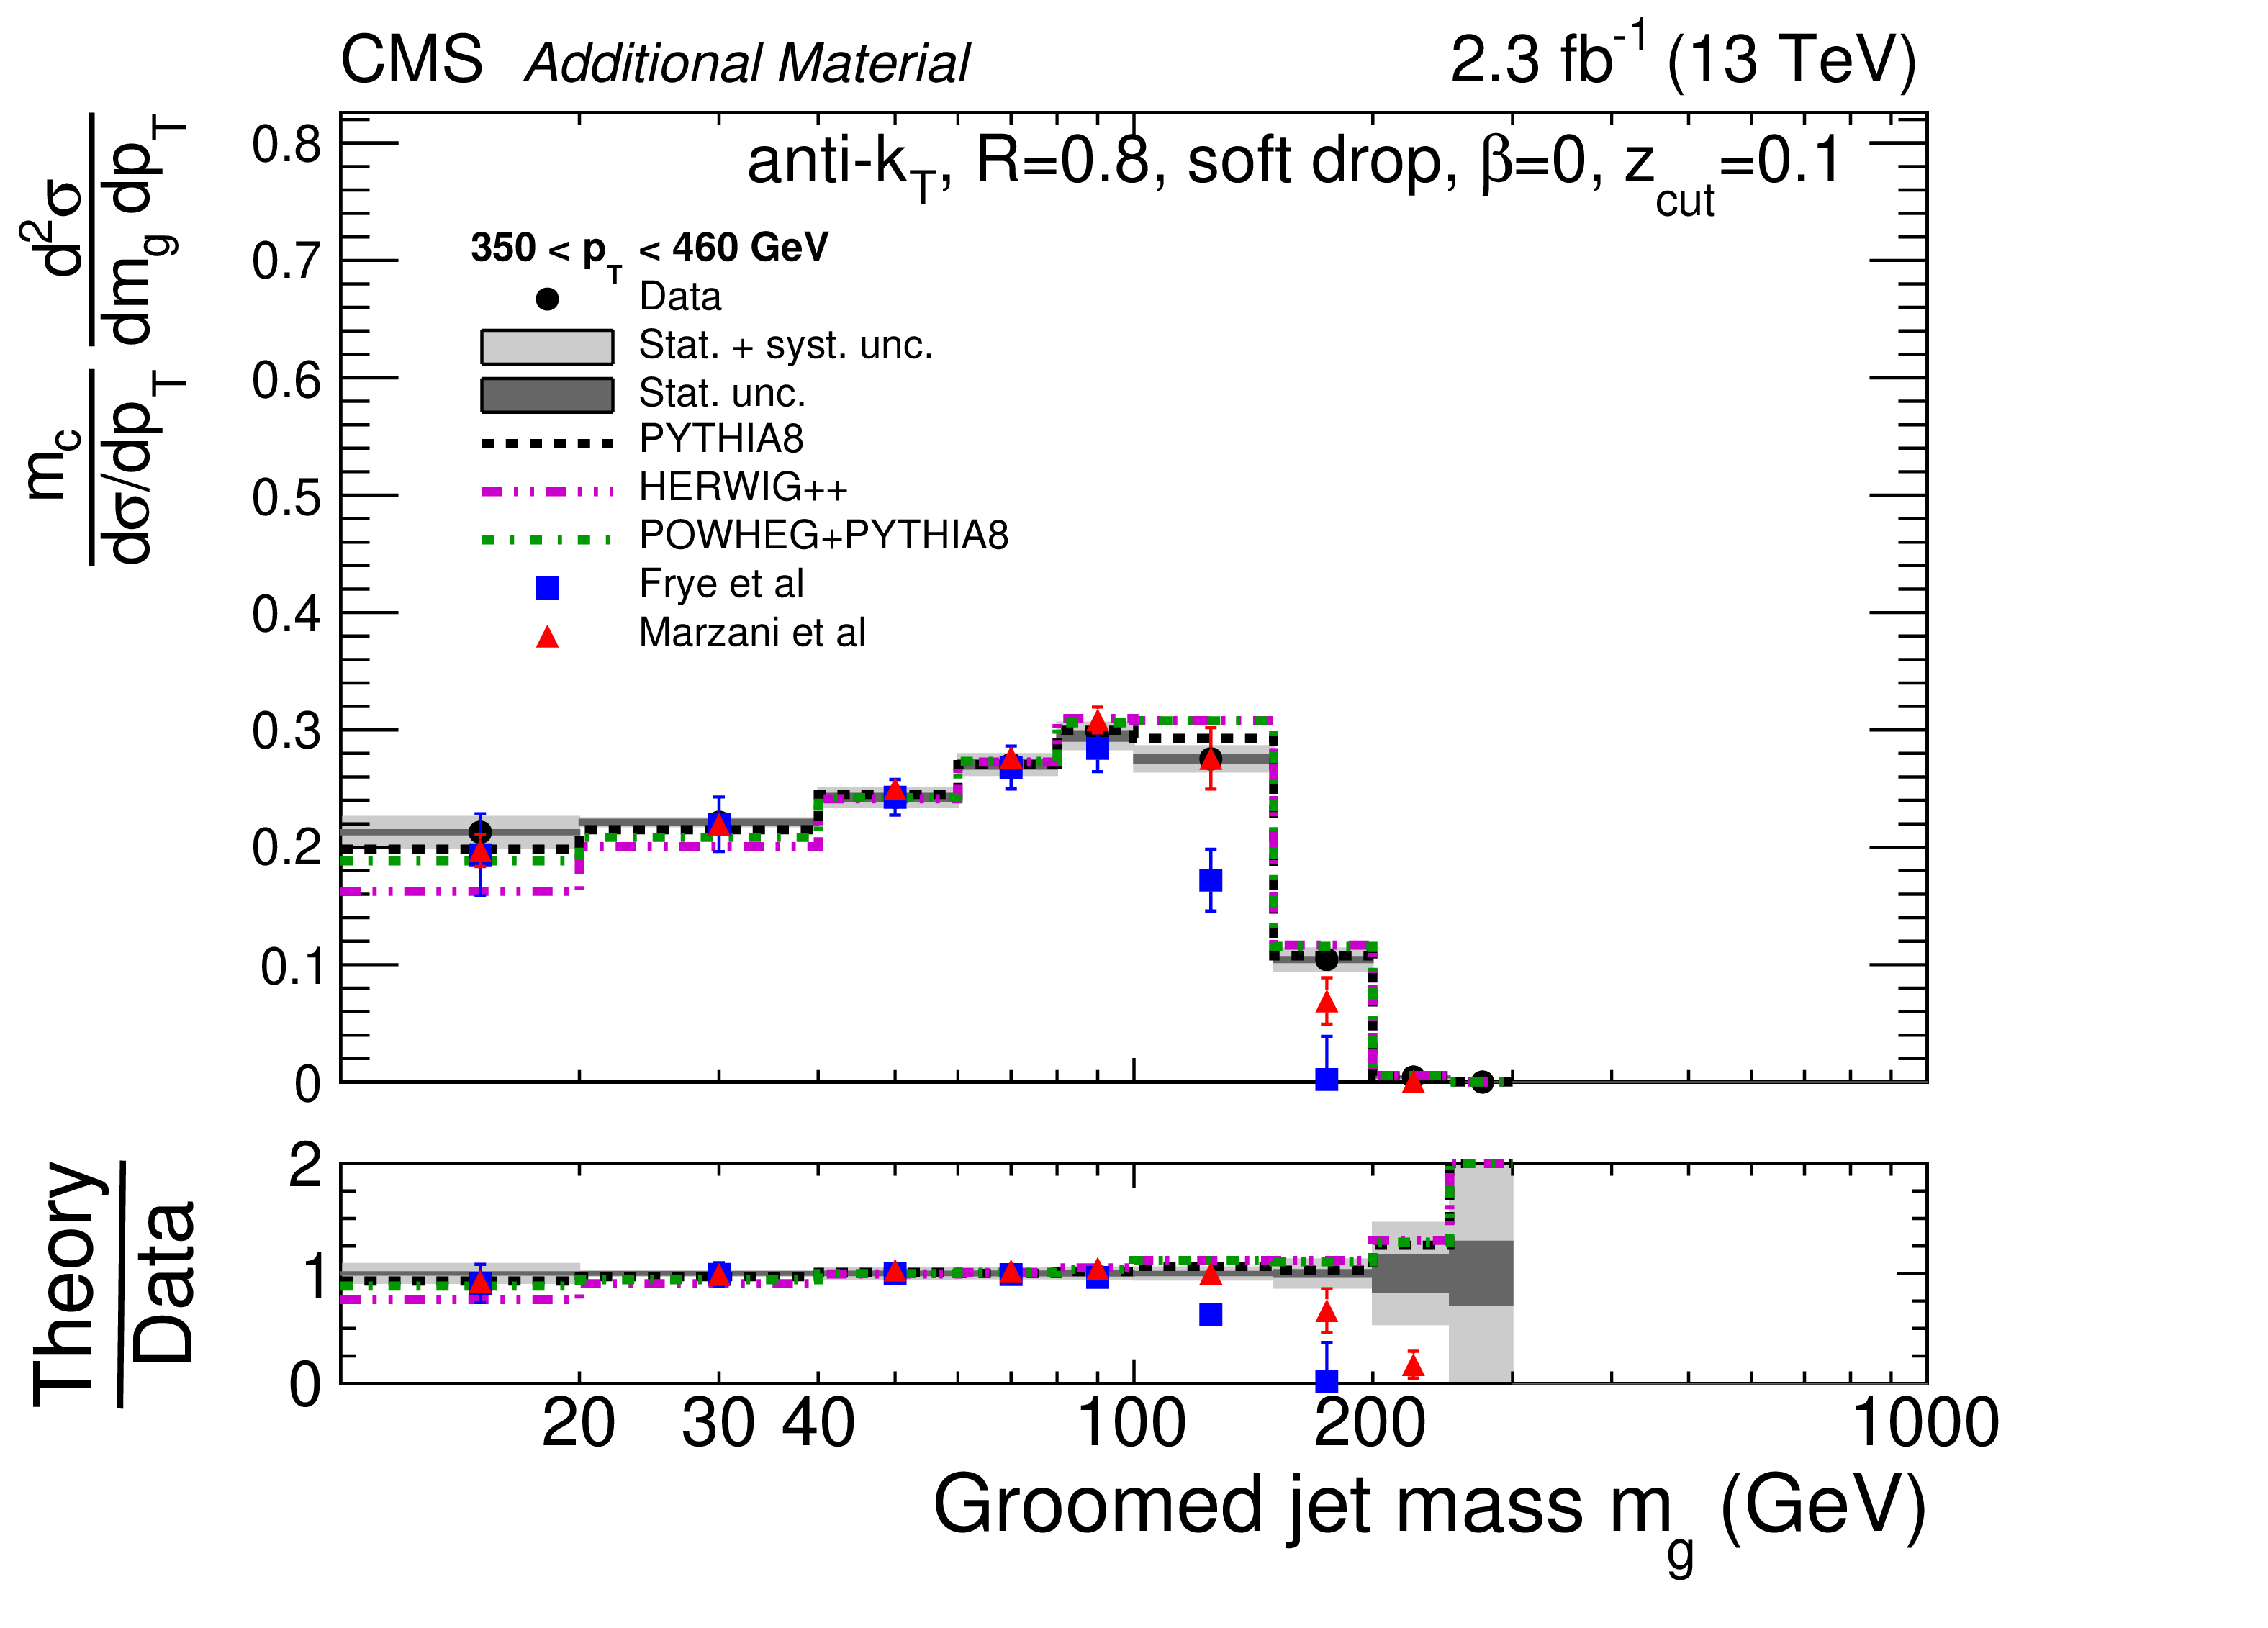
Additional Figure 40:
Normalized cross section for groomed jets for 350 $ < {p_{\mathrm {T}}} < $ 460 GeV. The data are shown by the black points, with dark grey bands for the statistical uncertainty (Stat. unc.) and with light grey bands for the total uncertainty (stat.+sys. unc., added in quadrature). The predictions from PYTHIA-8, HERWIG++, and POWHEG+PYTHIA are shown with dashed black, dash-dot-dotted magenta, and dash-dotted green histograms, respectively, with no uncertainties shown. The predictions from Ref. [1] (Frye et. al.) are shown with blue squares. The uncertainties include scale variations and an estimate of nonperturbative effects. The predictions from Ref. [2] (Marzani et. al.) are shown with red triangles. The uncertainties only include effects from scale variations, since nonperturbative corrections have been considered directly in the calculation. |
png pdf |
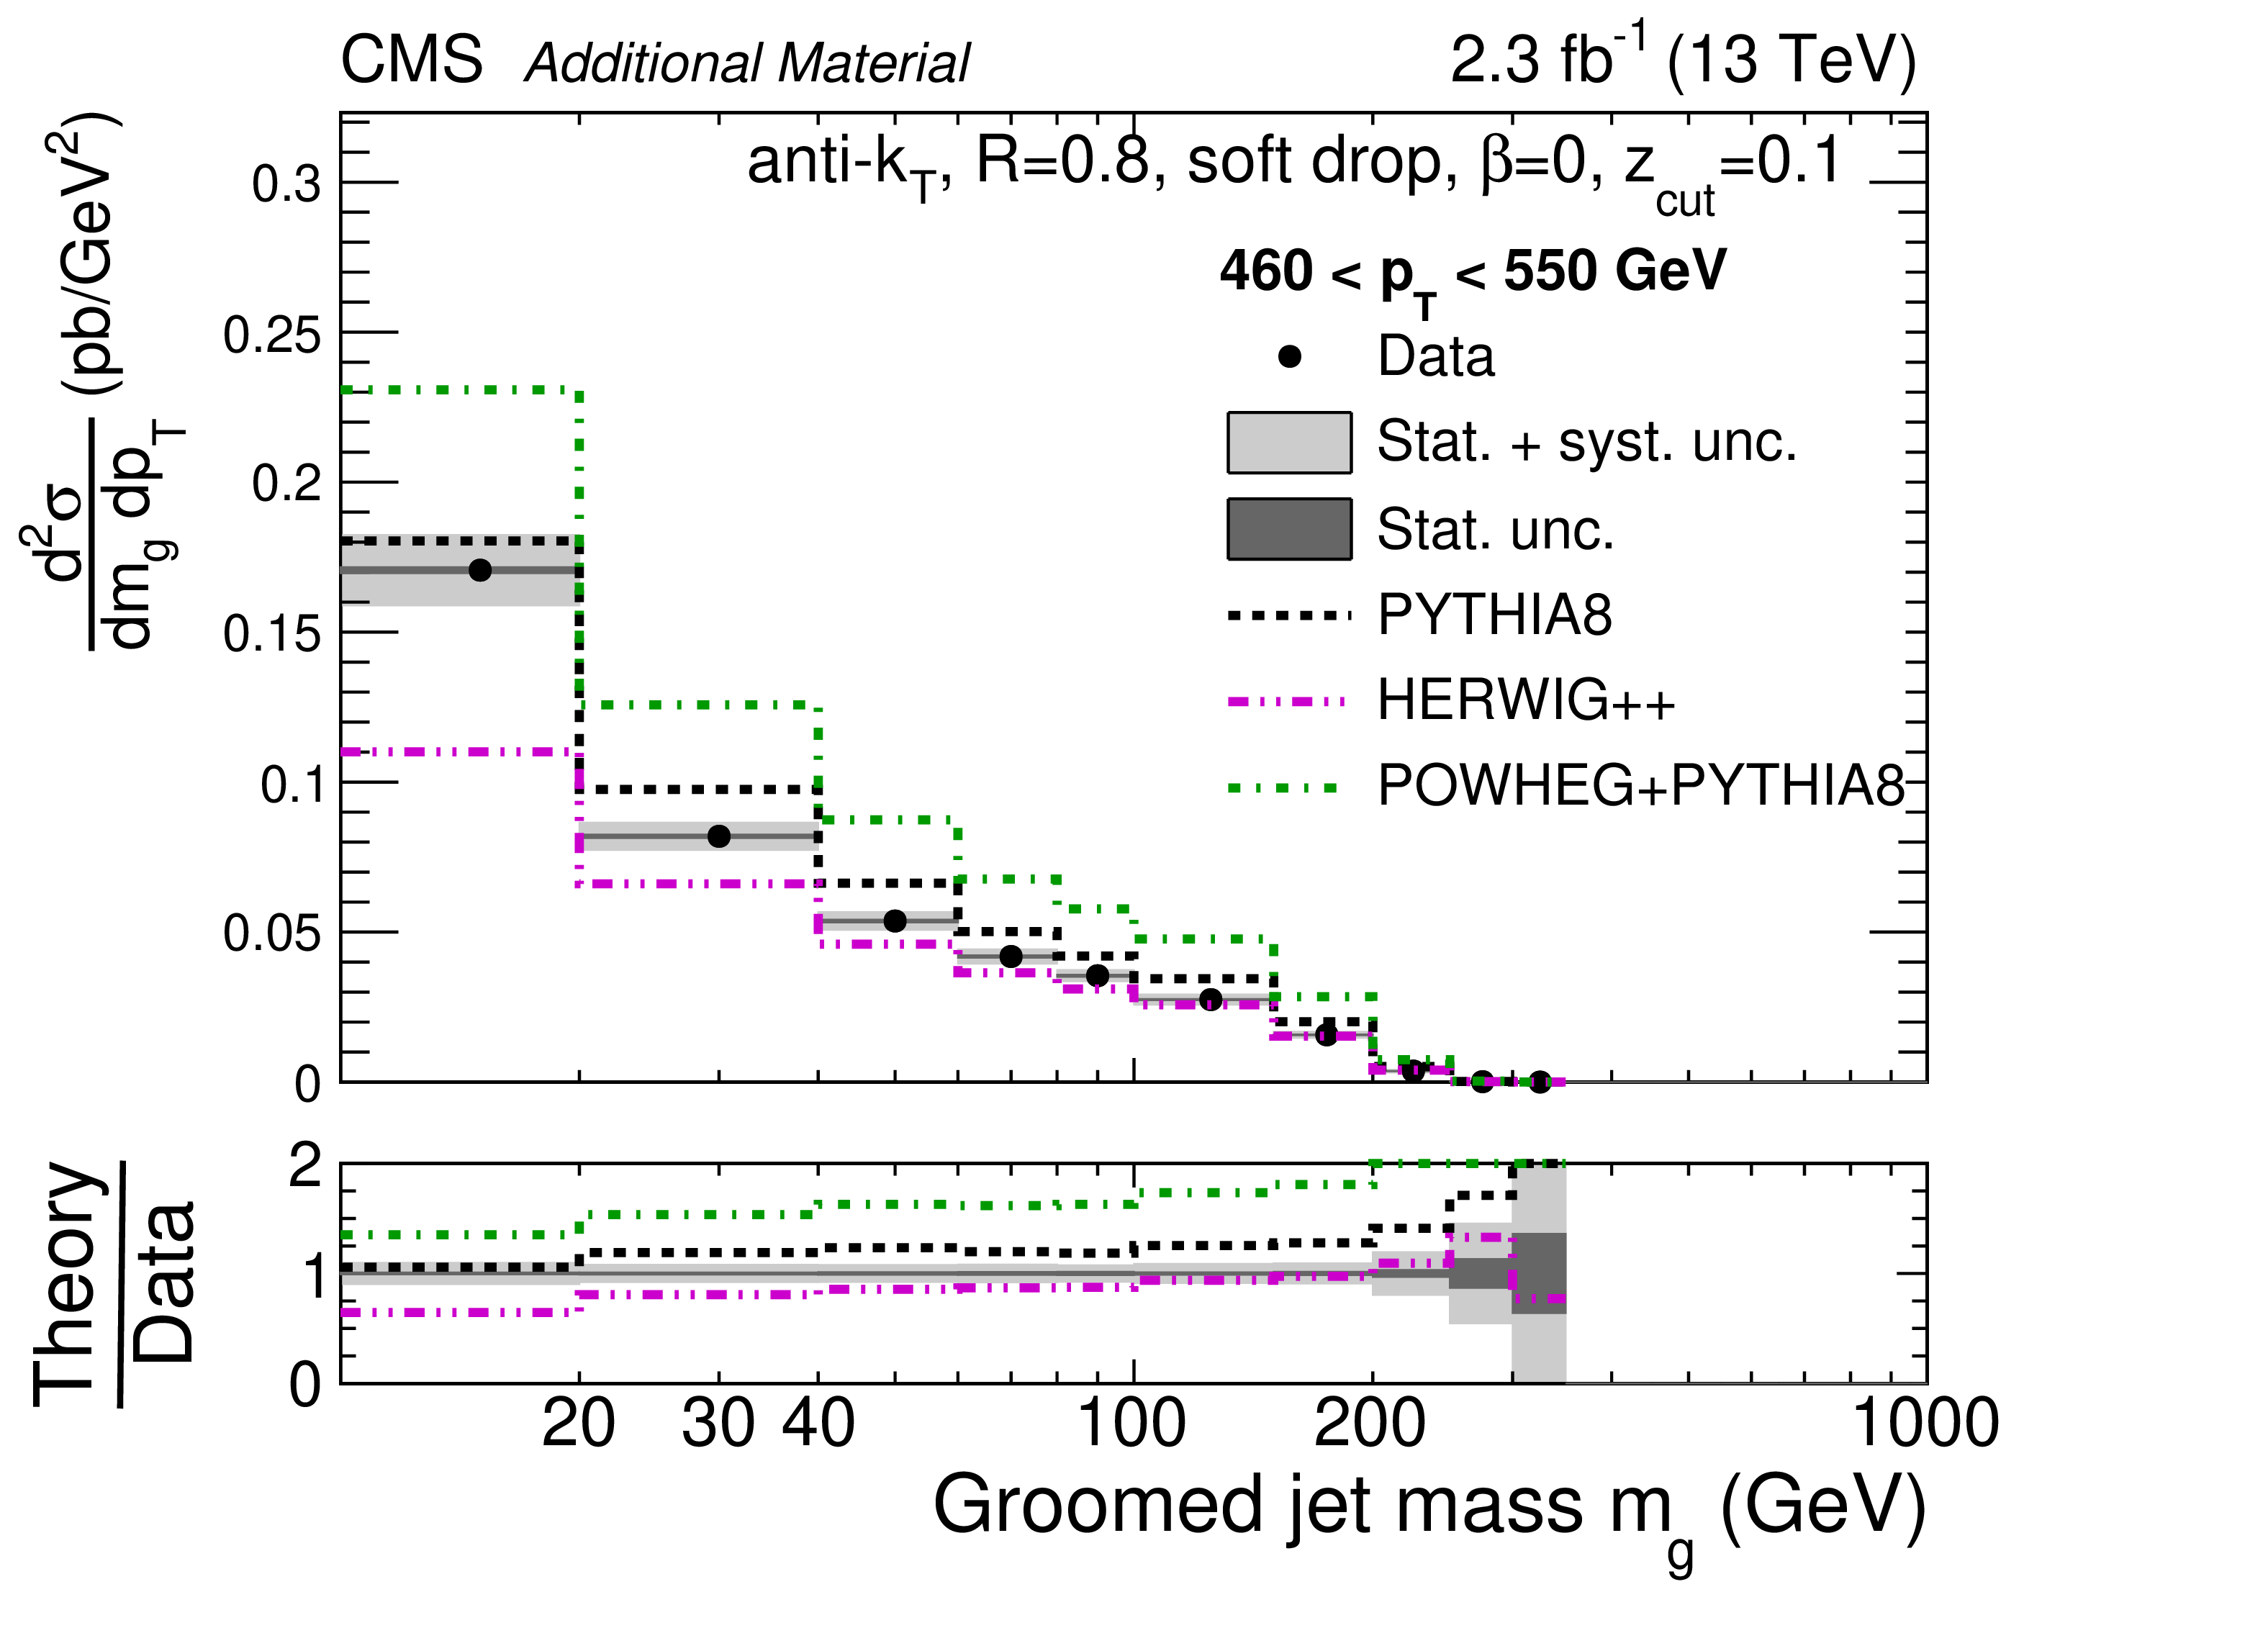
Additional Figure 41:
Normalized cross section for groomed jets for 460 $ < {p_{\mathrm {T}}} < $ 550 GeV. The data are shown by the black points, with dark grey bands for the statistical uncertainty (Stat. unc.) and with light grey bands for the total uncertainty (stat.+sys. unc., added in quadrature). The predictions from PYTHIA-8, HERWIG++, and POWHEG+PYTHIA are shown with dashed black, dash-dot-dotted magenta, and dash-dotted green histograms, respectively, with no uncertainties shown. The predictions from Ref. [1] (Frye et. al.) are shown with blue squares. The uncertainties include scale variations and an estimate of nonperturbative effects. The predictions from Ref. [2] (Marzani et. al.) are shown with red triangles. The uncertainties only include effects from scale variations, since nonperturbative corrections have been considered directly in the calculation. |
png pdf |
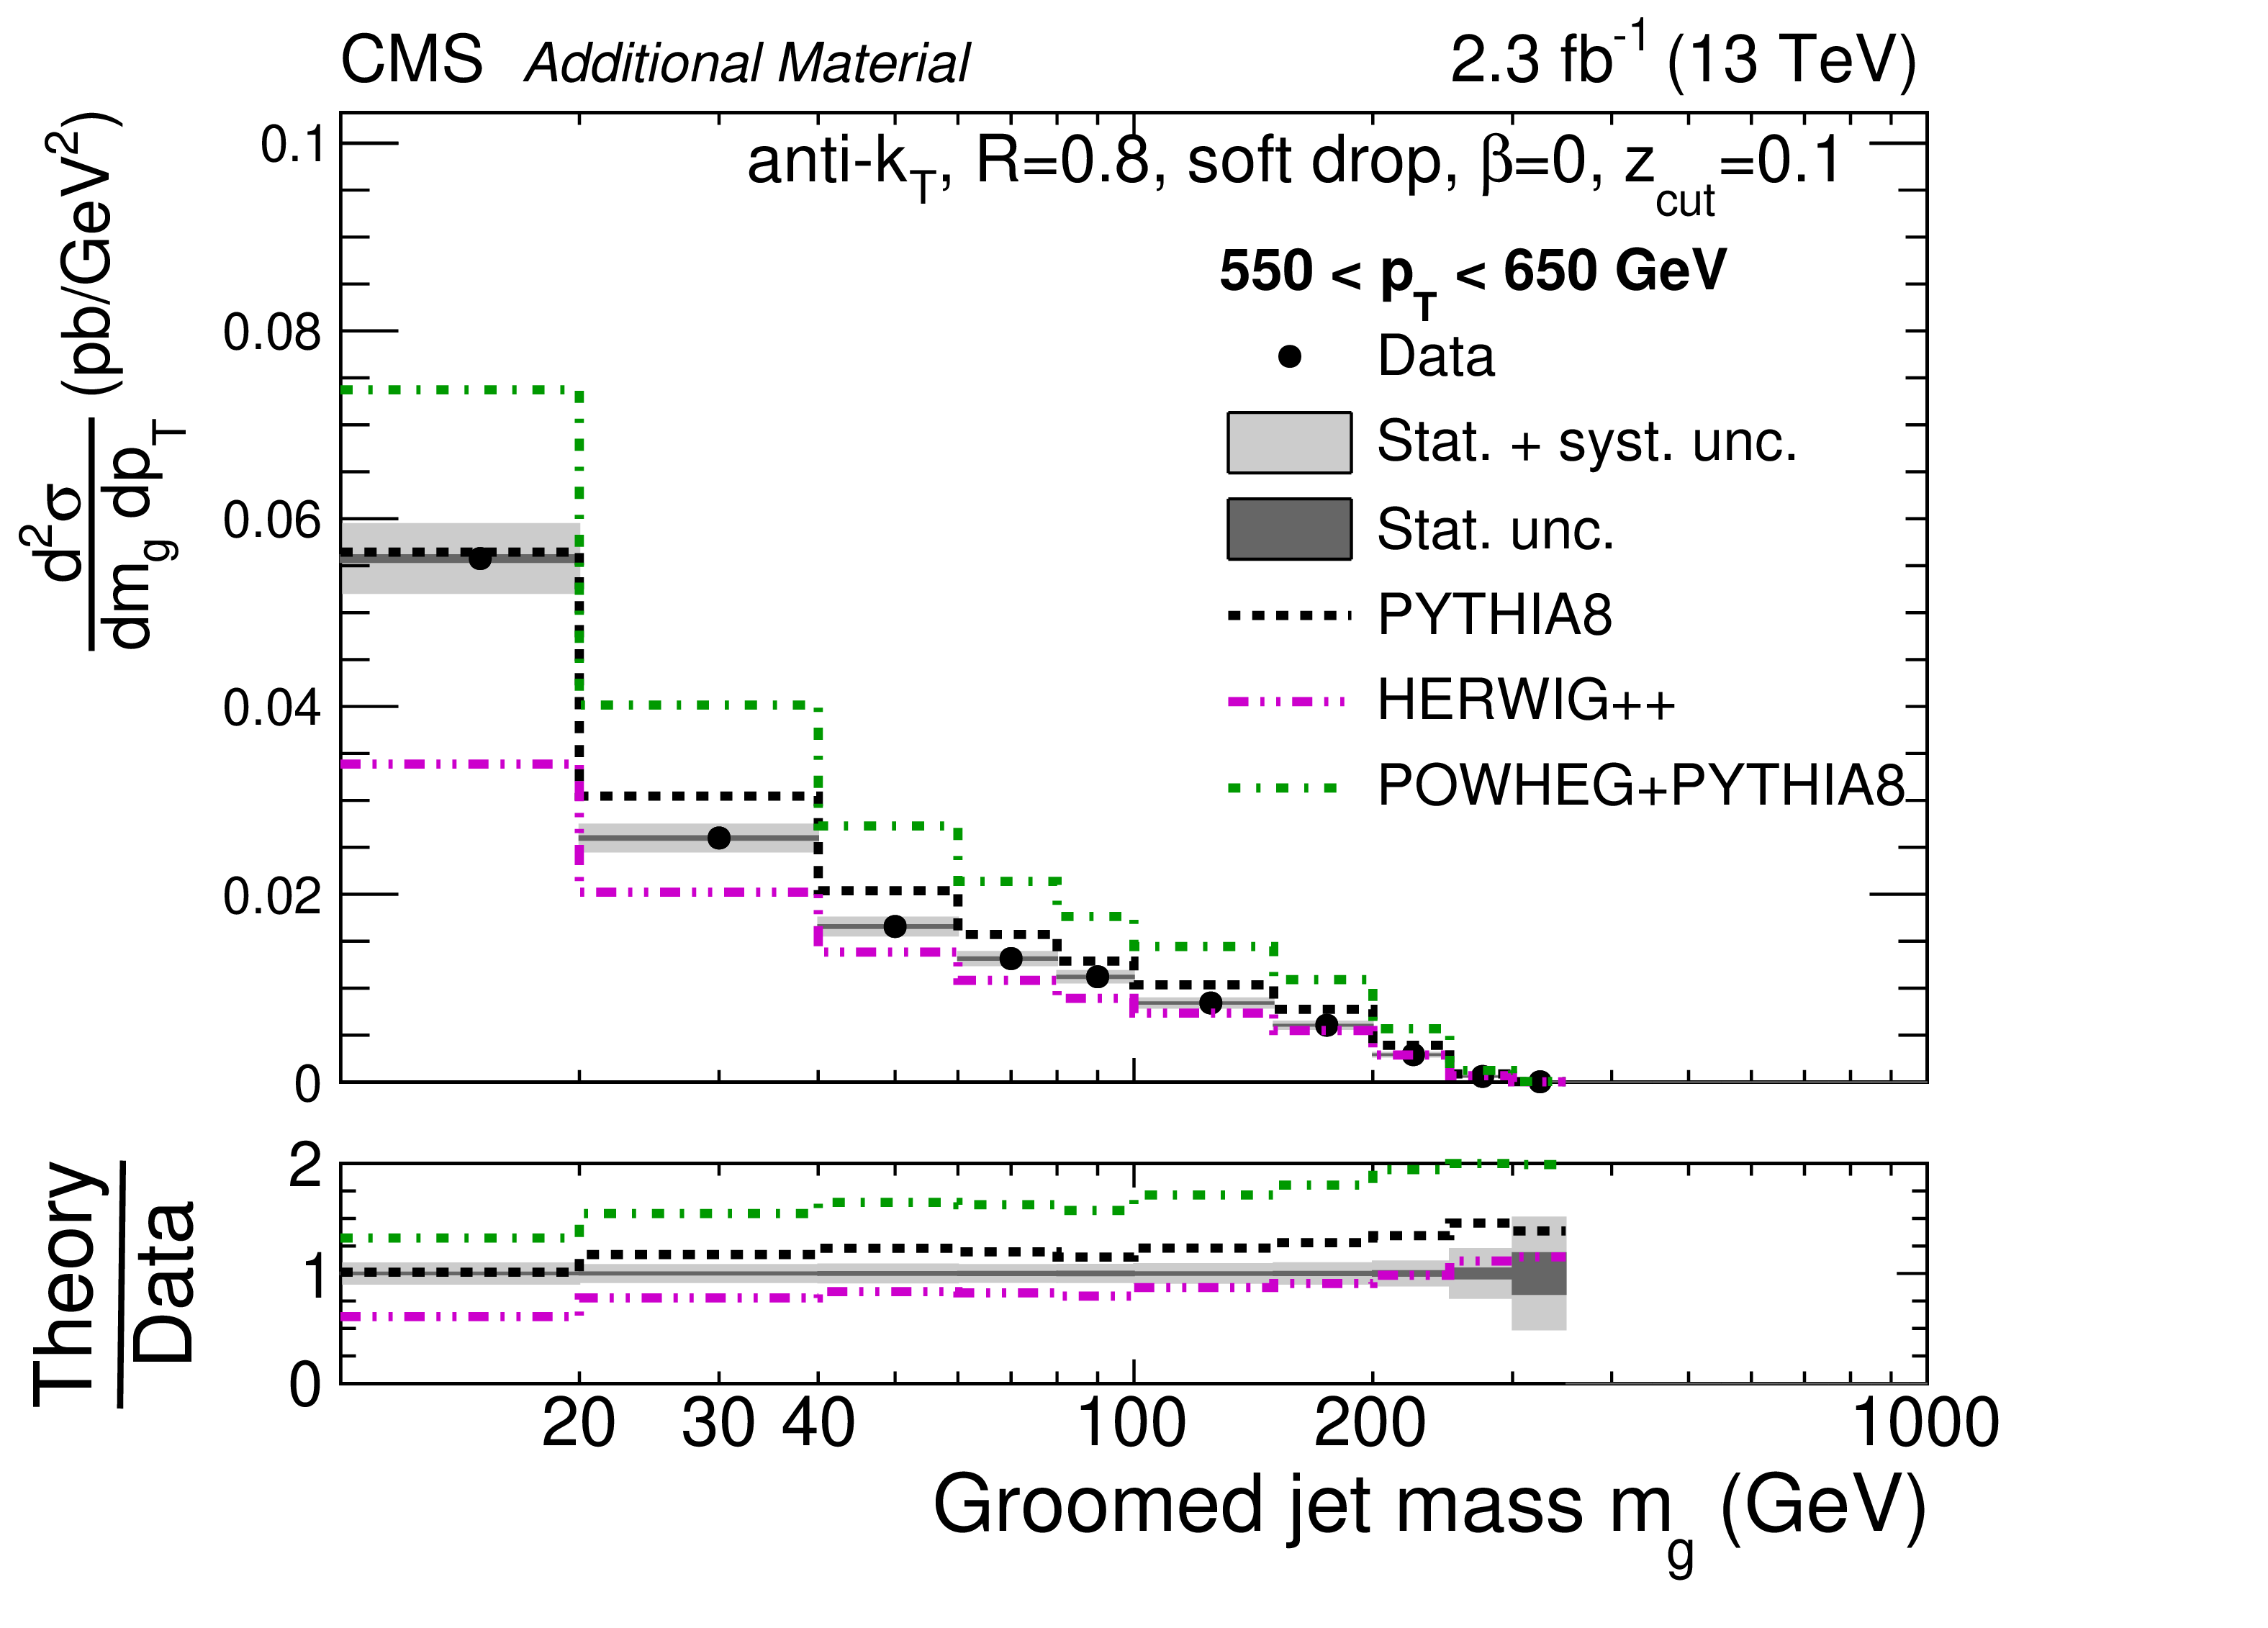
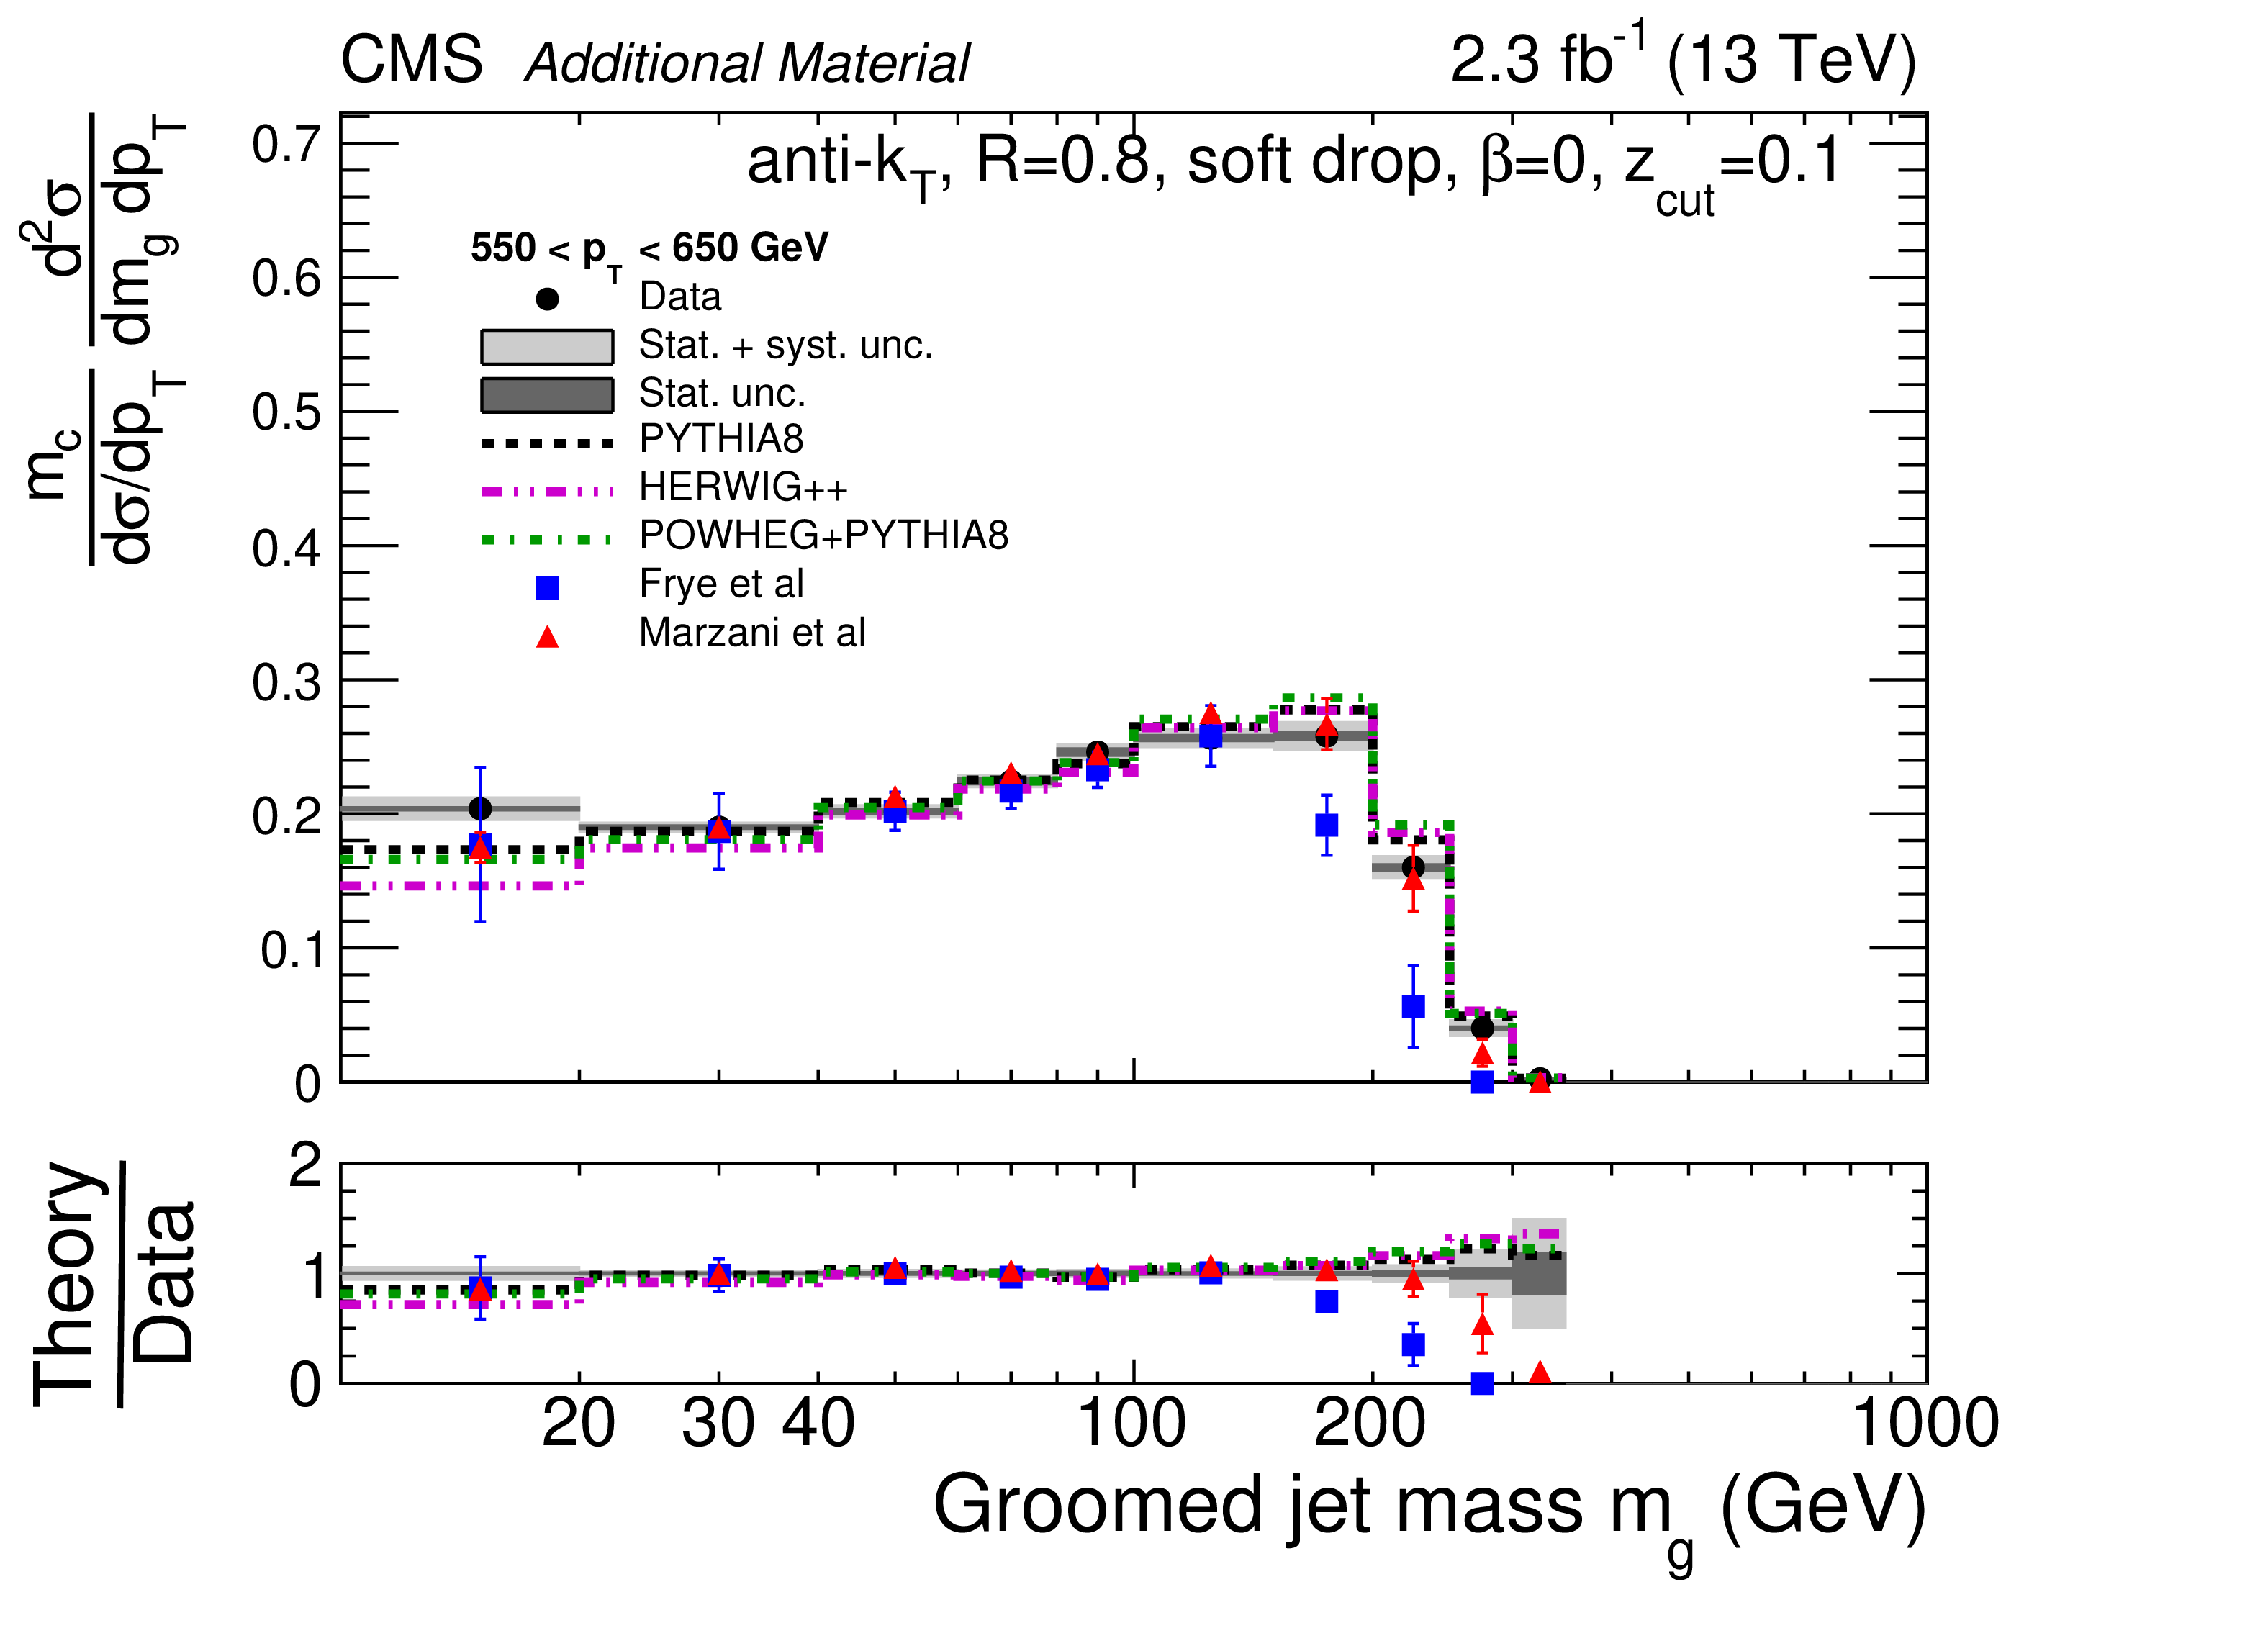
Additional Figure 42:
Normalized cross section for groomed jets for 550 $ < {p_{\mathrm {T}}} < $ 650 GeV. The data are shown by the black points, with dark grey bands for the statistical uncertainty (Stat. unc.) and with light grey bands for the total uncertainty (stat.+sys. unc., added in quadrature). The predictions from PYTHIA-8, HERWIG++, and POWHEG+PYTHIA are shown with dashed black, dash-dot-dotted magenta, and dash-dotted green histograms, respectively, with no uncertainties shown. The predictions from Ref. [1] (Frye et. al.) are shown with blue squares. The uncertainties include scale variations and an estimate of nonperturbative effects. The predictions from Ref. [2] (Marzani et. al.) are shown with red triangles. The uncertainties only include effects from scale variations, since nonperturbative corrections have been considered directly in the calculation. |

png pdf |
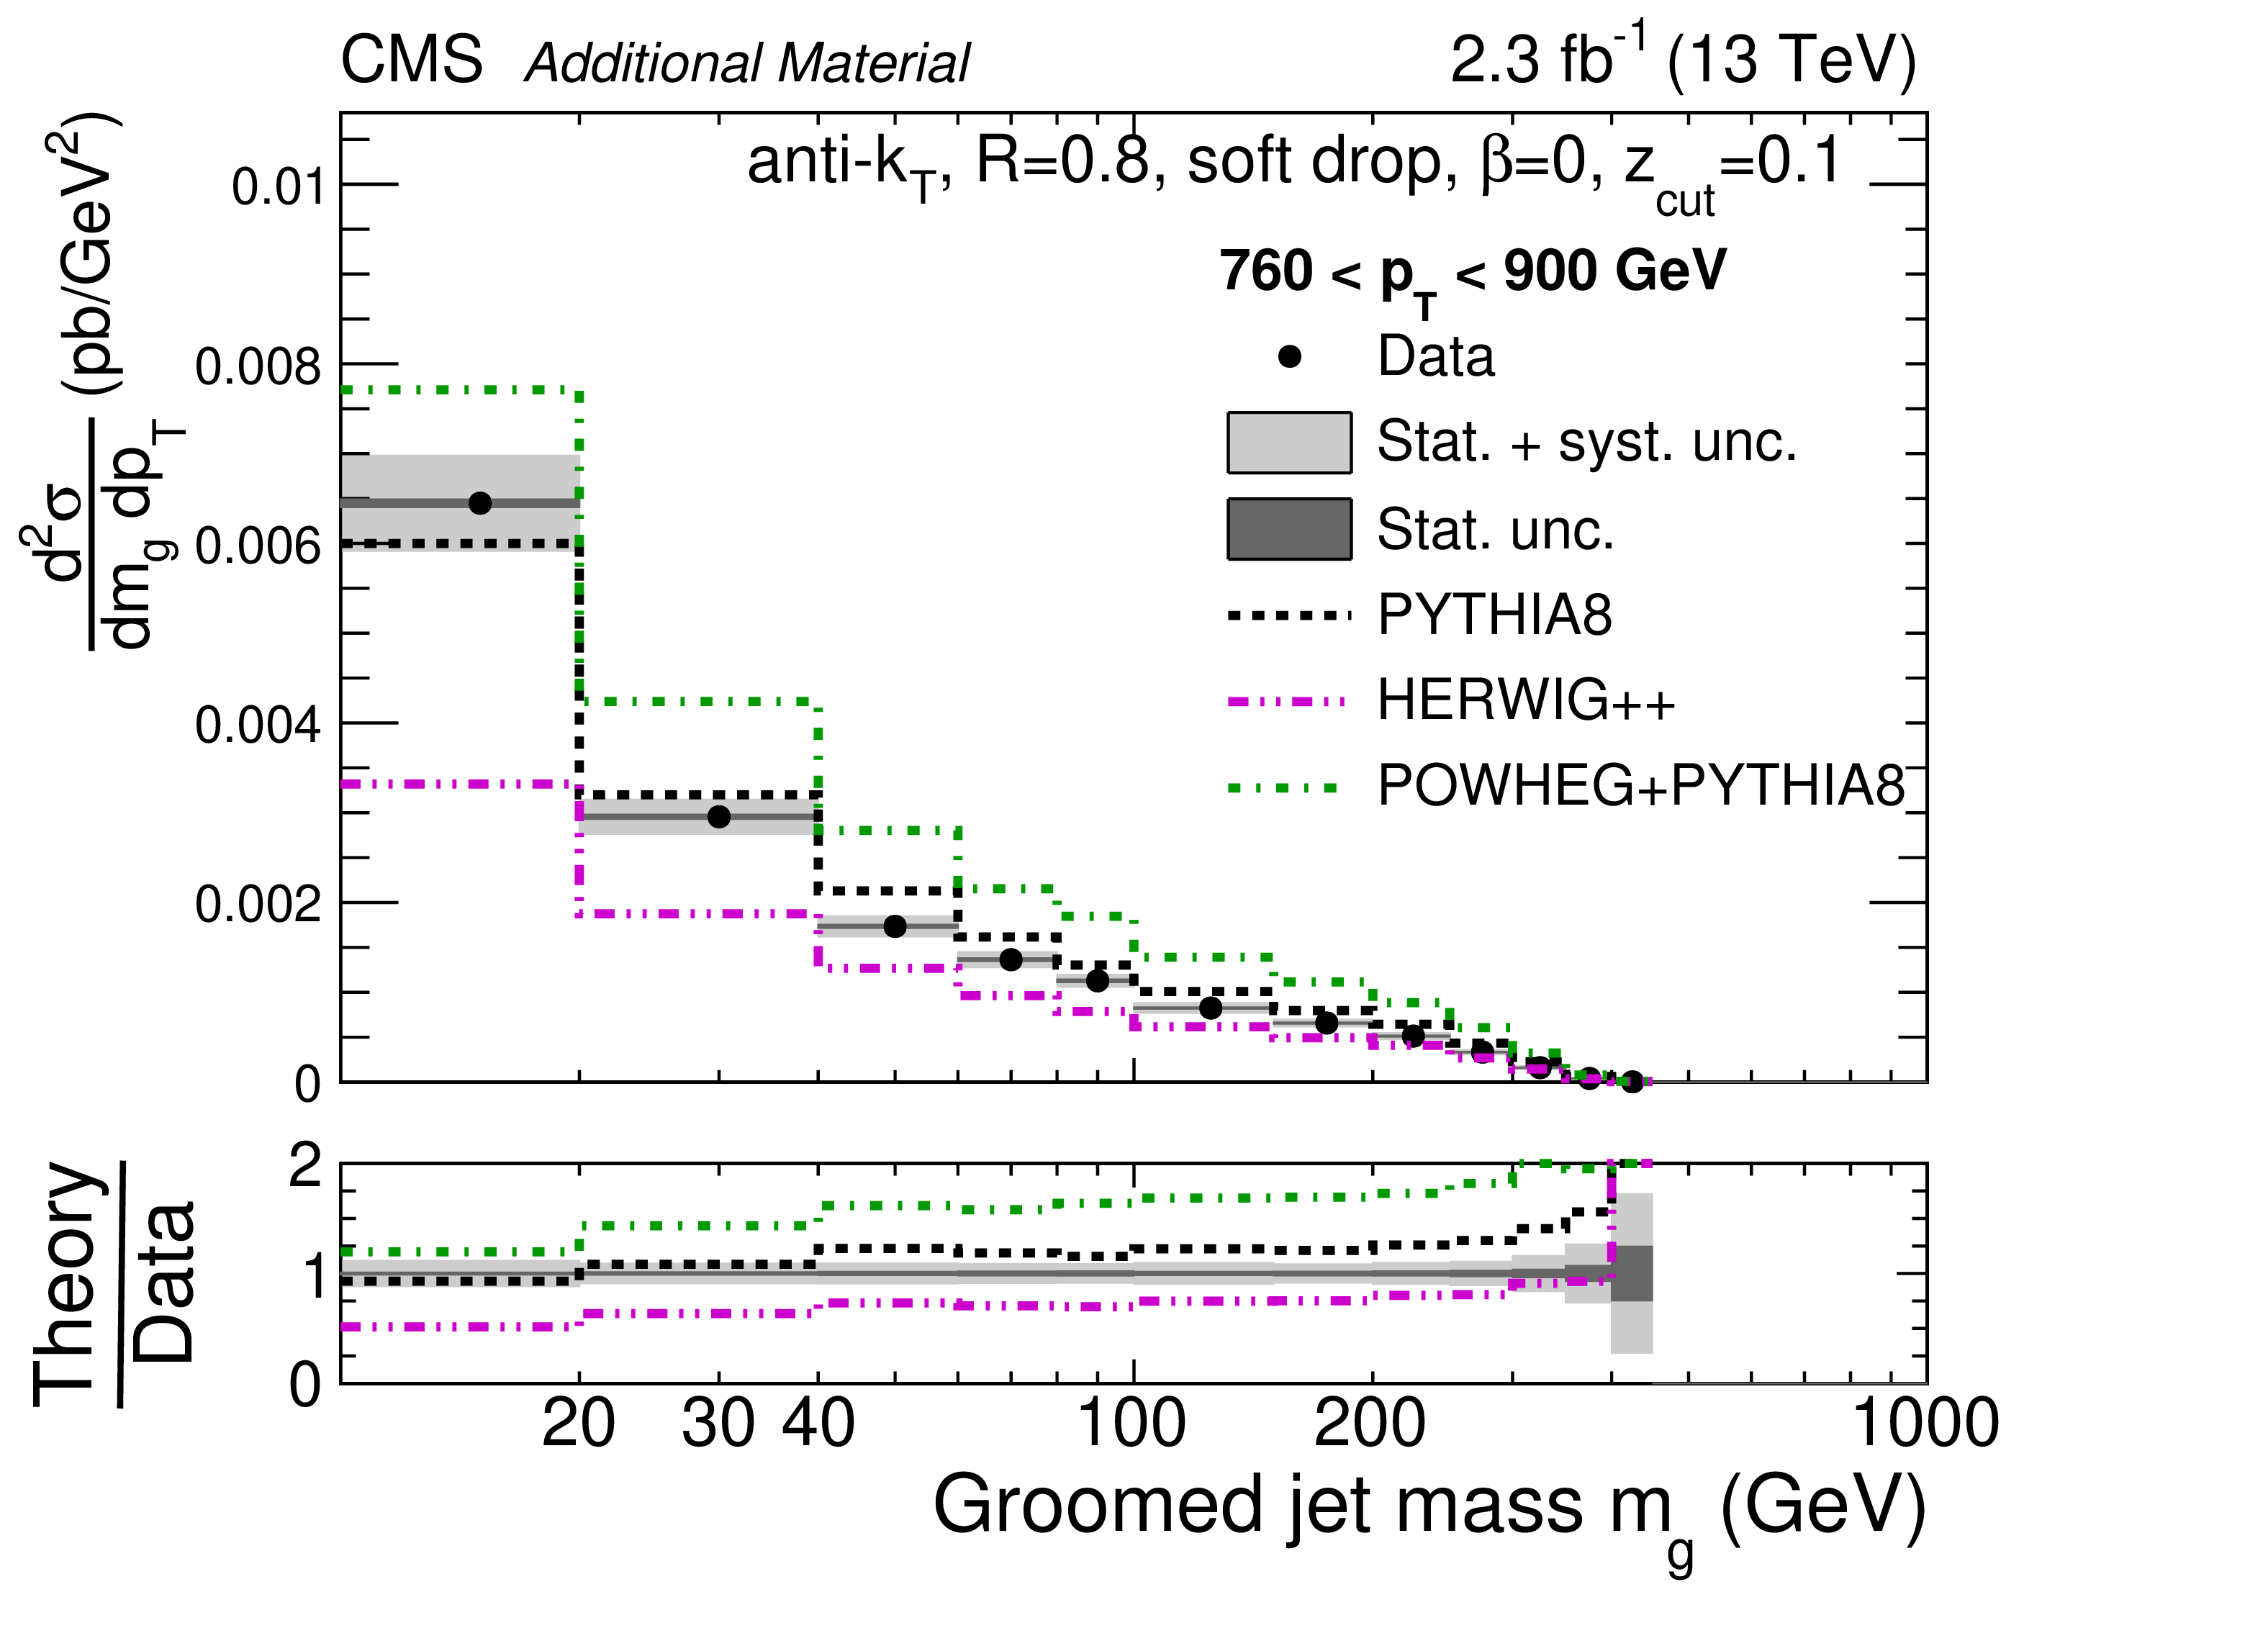
Additional Figure 43:
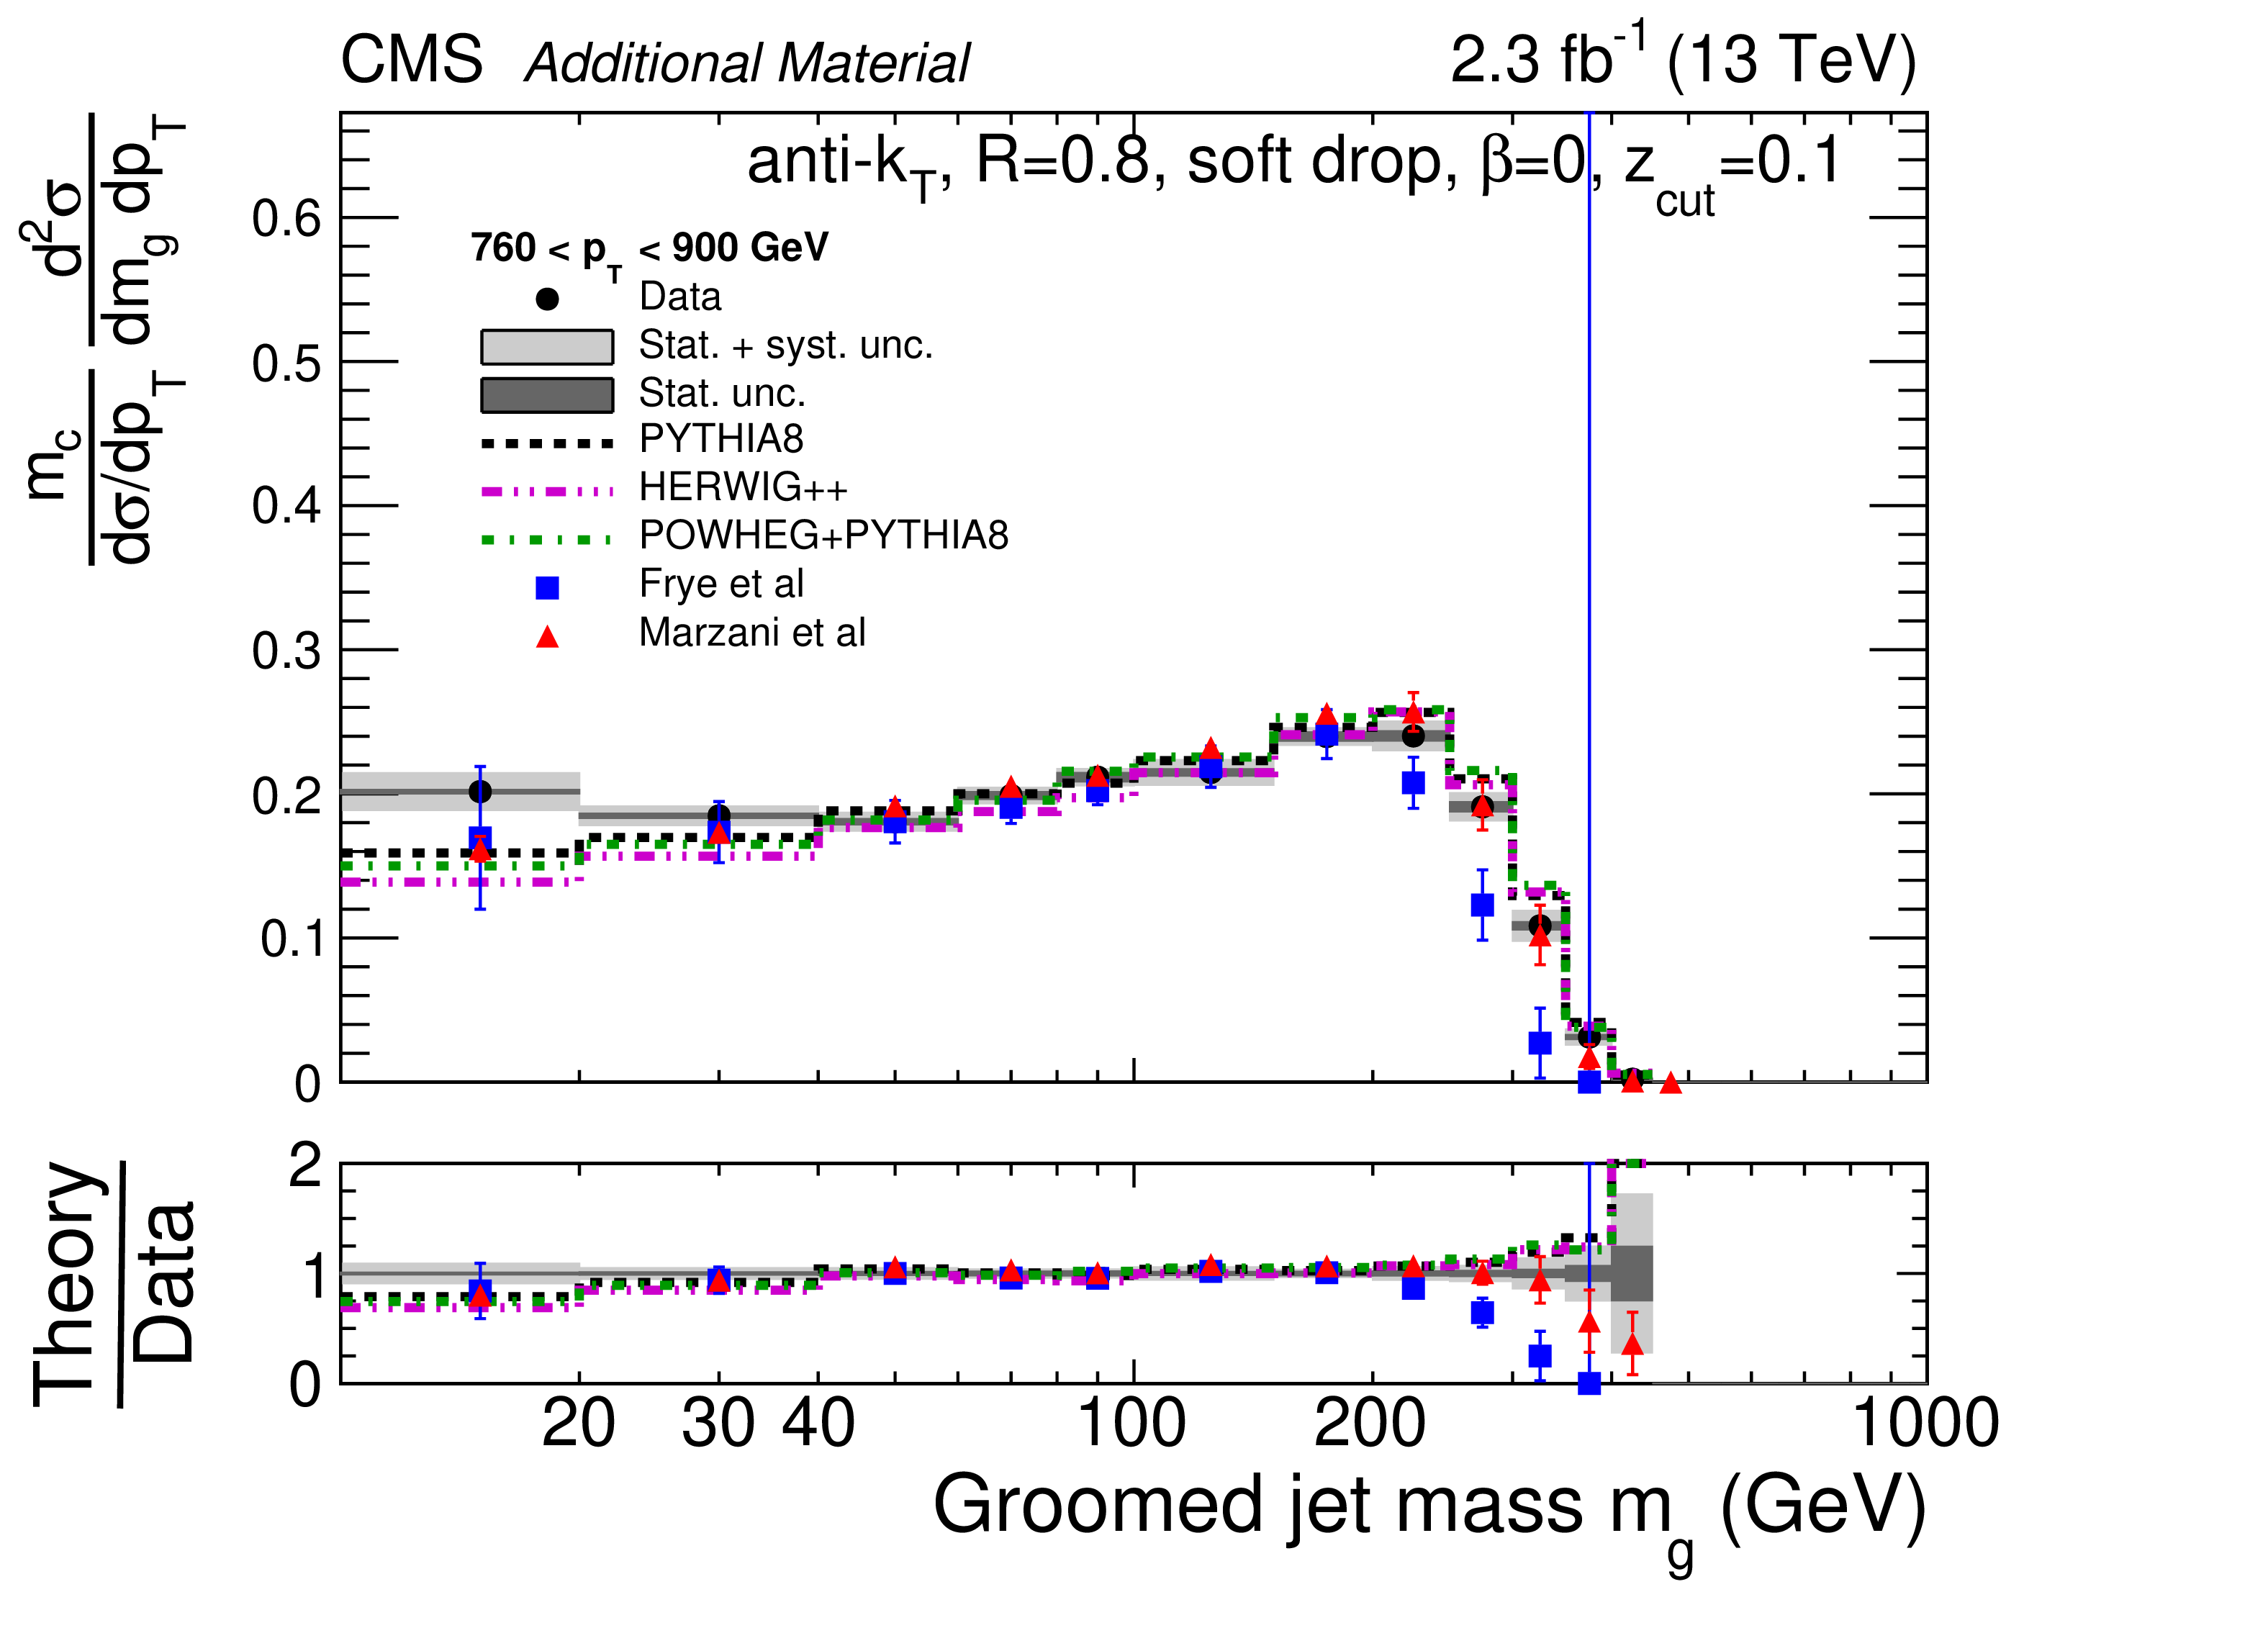
Normalized cross section for groomed jets for 760 $ < {p_{\mathrm {T}}} < $ 900 GeV. The data are shown by the black points, with dark grey bands for the statistical uncertainty (Stat. unc.) and with light grey bands for the total uncertainty (stat.+sys. unc., added in quadrature). The predictions from PYTHIA-8, HERWIG++, and POWHEG+PYTHIA are shown with dashed black, dash-dot-dotted magenta, and dash-dotted green histograms, respectively, with no uncertainties shown. The predictions from Ref. [1] (Frye et. al.) are shown with blue squares. The uncertainties include scale variations and an estimate of nonperturbative effects. The predictions from Ref. [2] (Marzani et. al.) are shown with red triangles. The uncertainties only include effects from scale variations, since nonperturbative corrections have been considered directly in the calculation. |
png pdf |
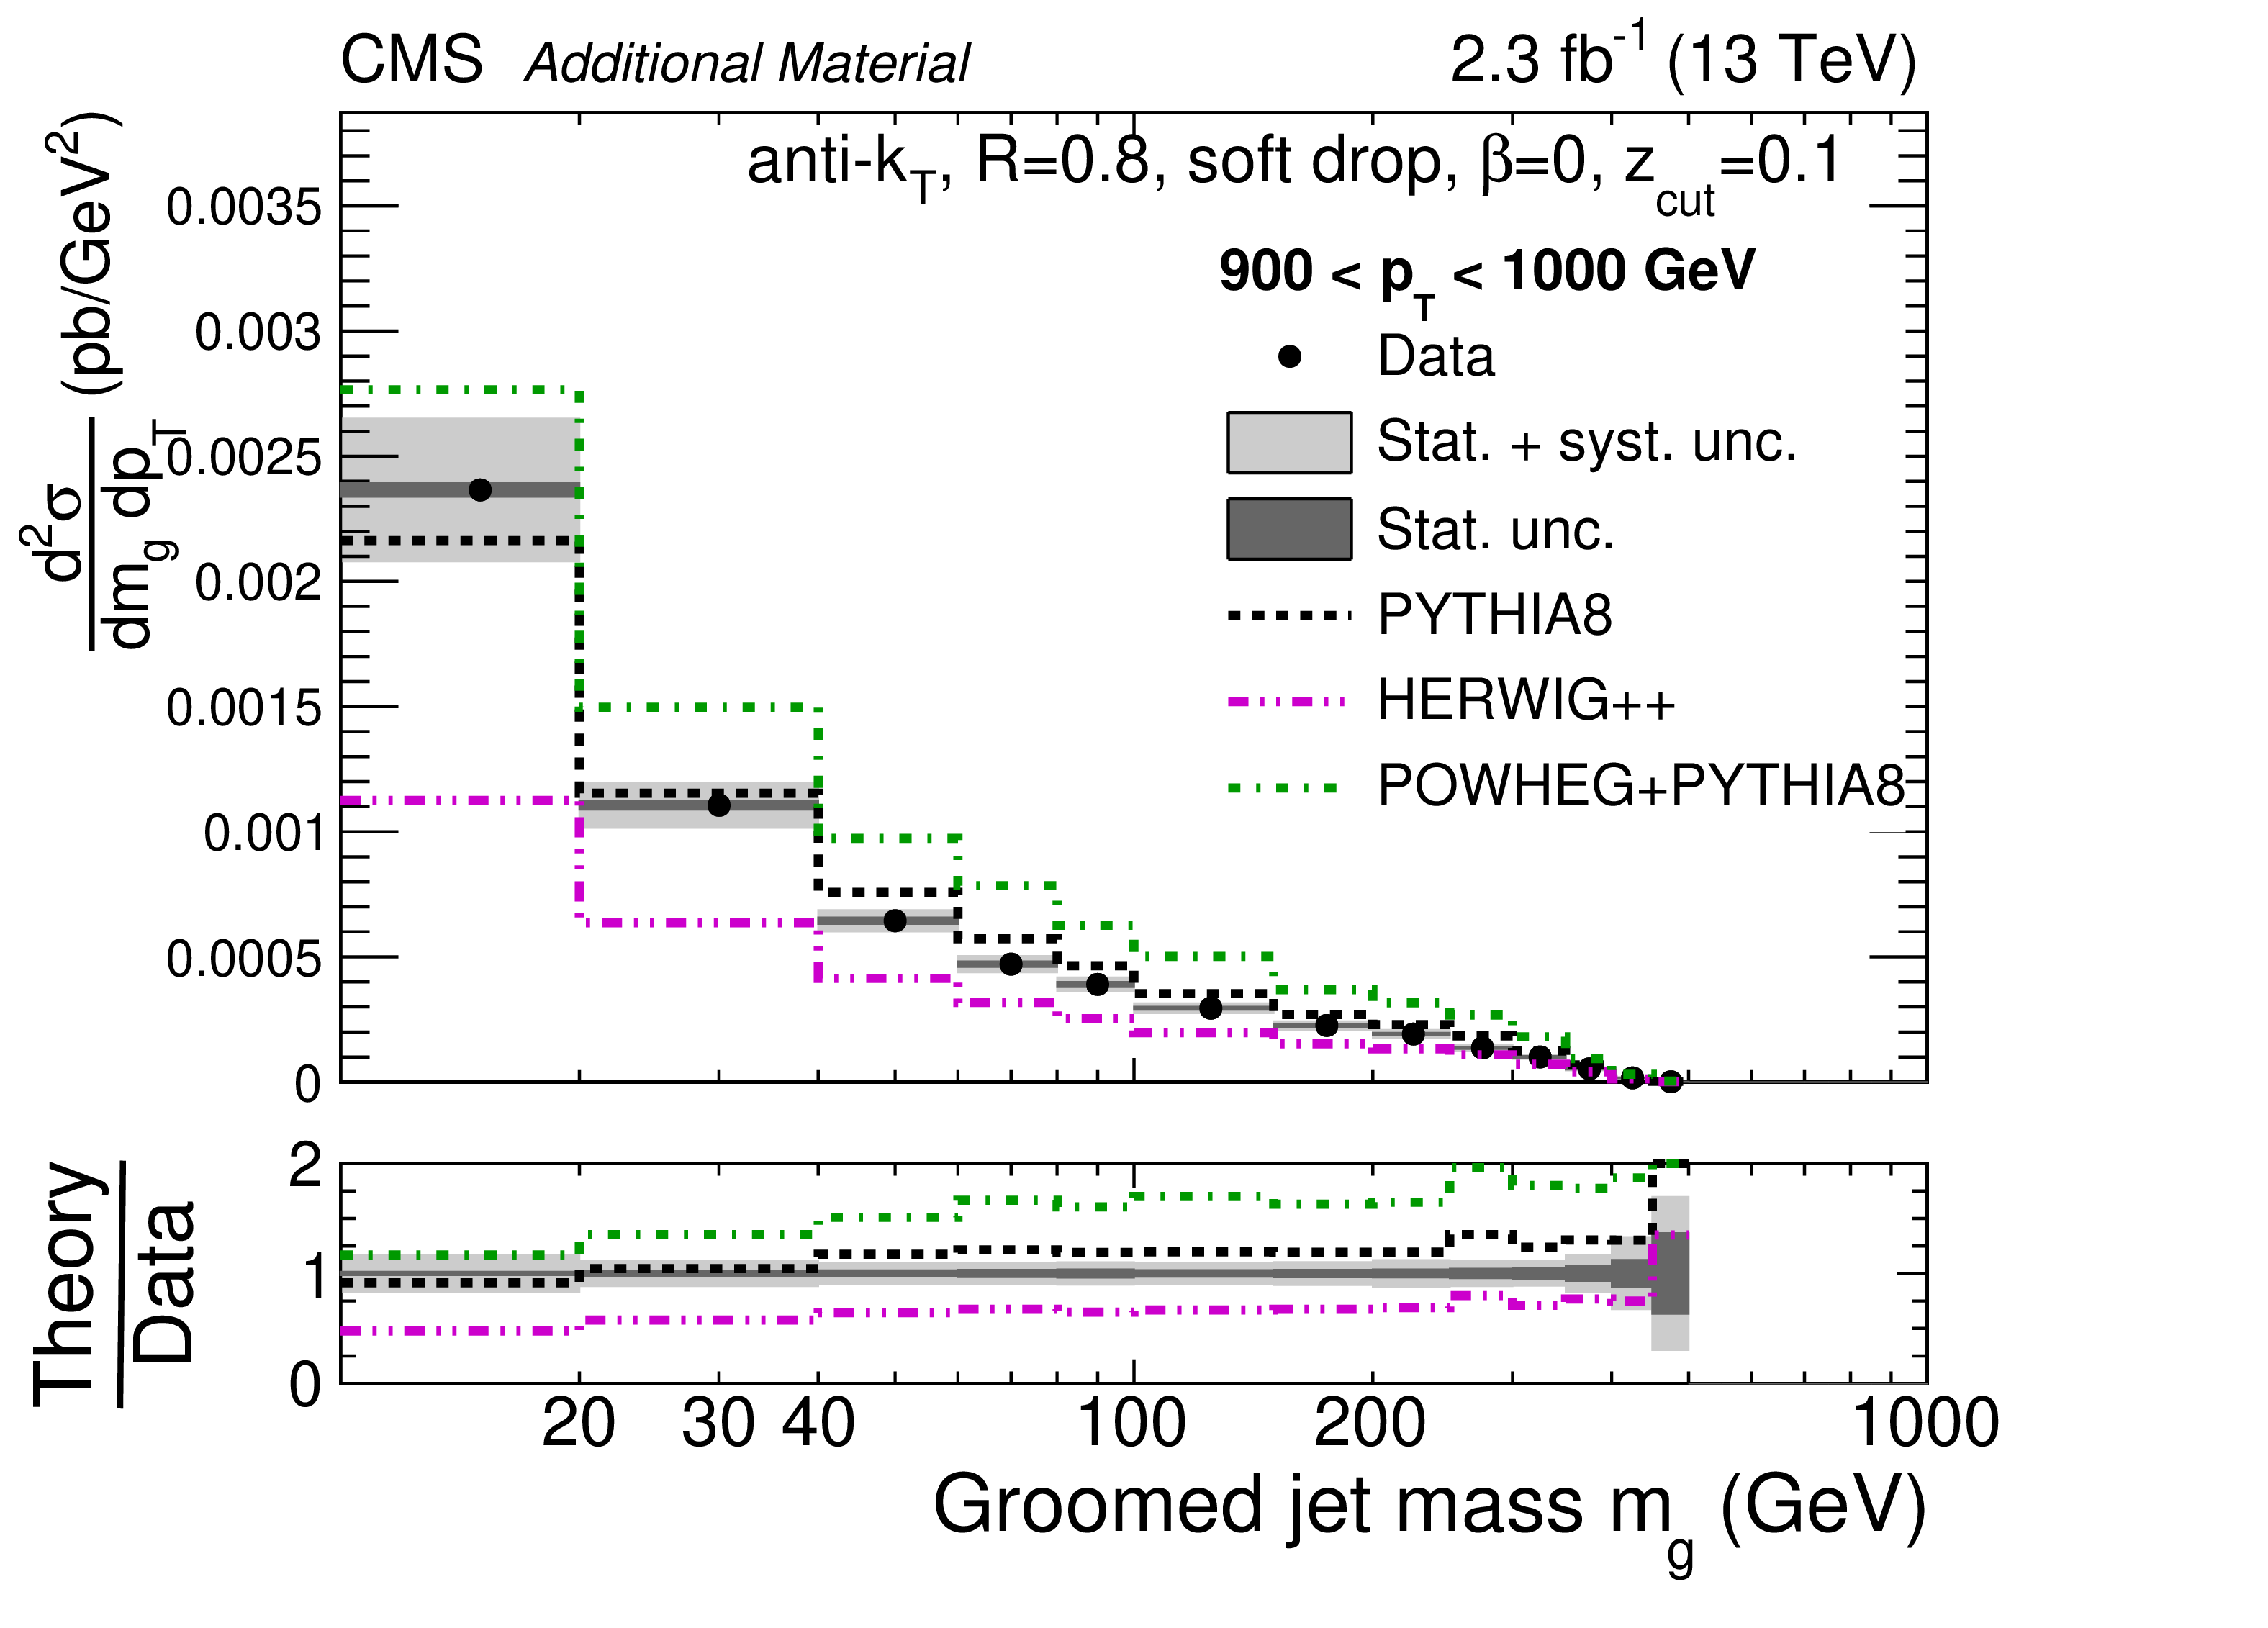
Additional Figure 44:
Normalized cross section for groomed jets for 900 $ < {p_{\mathrm {T}}} < $ 1000 GeV. The data are shown by the black points, with dark grey bands for the statistical uncertainty (Stat. unc.) and with light grey bands for the total uncertainty (stat.+sys. unc., added in quadrature). The predictions from PYTHIA-8, HERWIG++, and POWHEG+PYTHIA are shown with dashed black, dash-dot-dotted magenta, and dash-dotted green histograms, respectively, with no uncertainties shown. The predictions from Ref. [1] (Frye et. al.) are shown with blue squares. The uncertainties include scale variations and an estimate of nonperturbative effects. The predictions from Ref. [2] (Marzani et. al.) are shown with red triangles. The uncertainties only include effects from scale variations, since nonperturbative corrections have been considered directly in the calculation. |

png pdf |
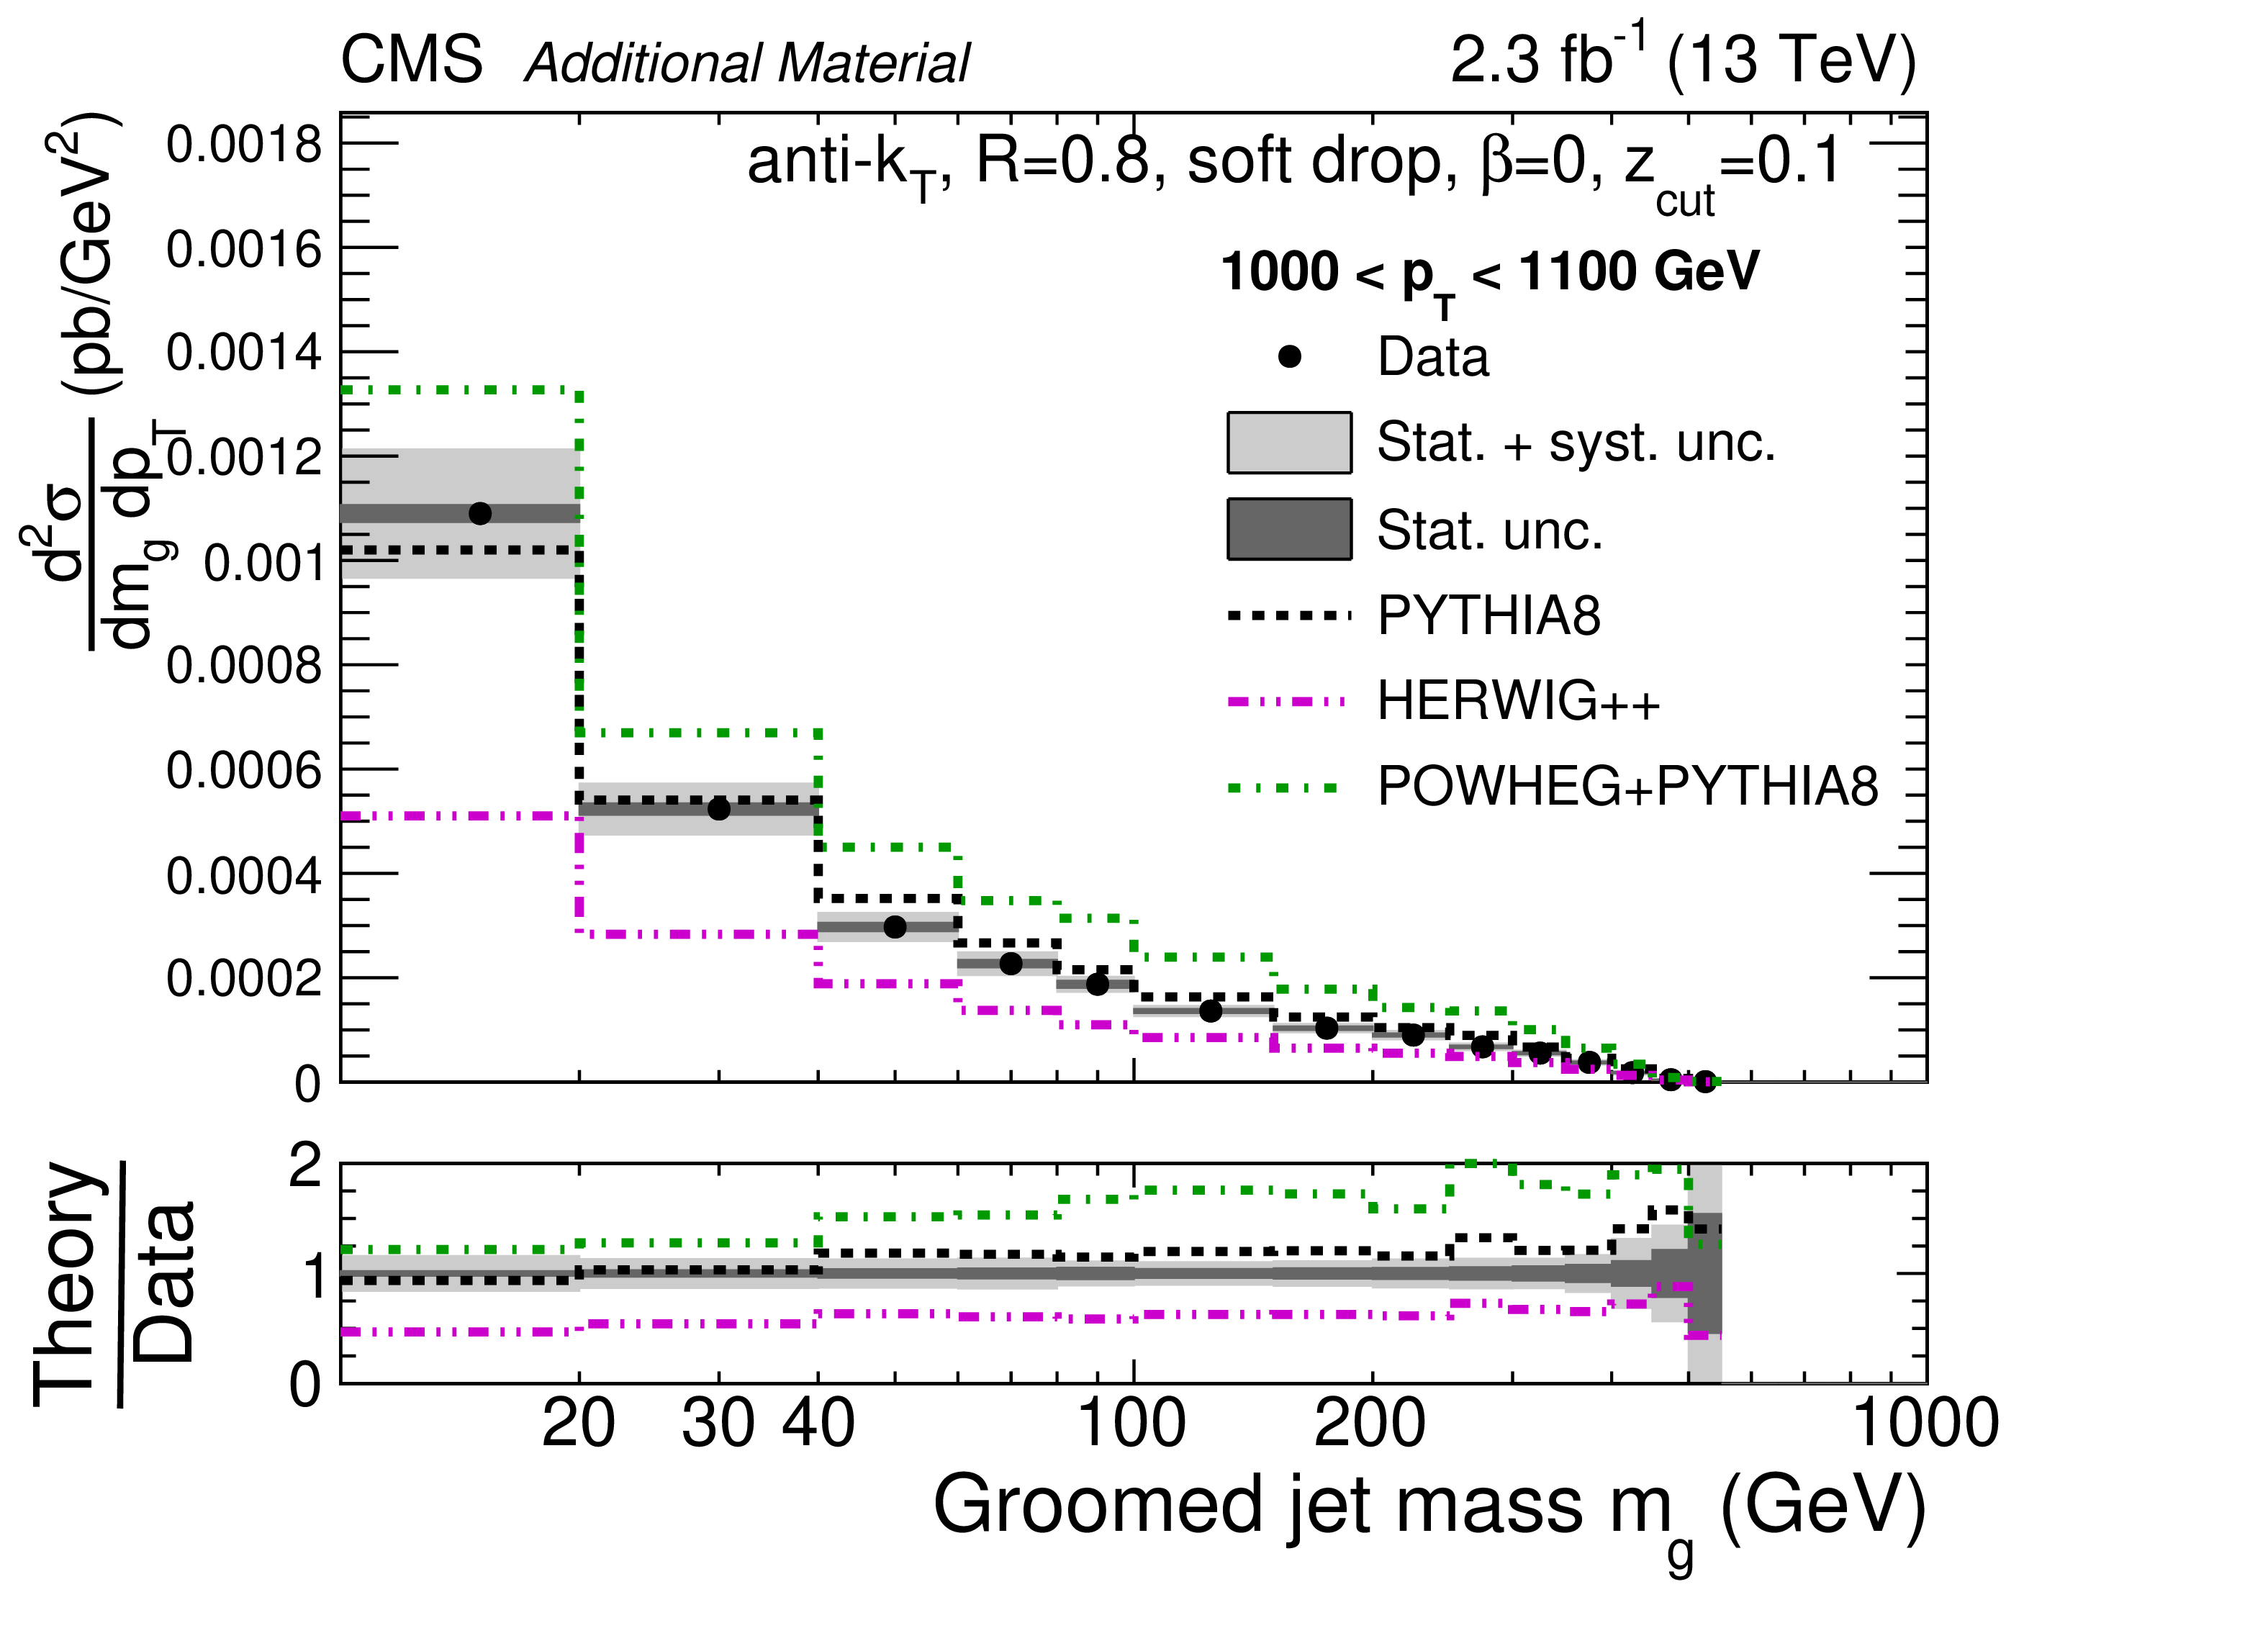
Additional Figure 45:
Normalized cross section for groomed jets for 1000 $ < {p_{\mathrm {T}}} < $ 1100 GeV. The data are shown by the black points, with dark grey bands for the statistical uncertainty (Stat. unc.) and with light grey bands for the total uncertainty (stat.+sys. unc., added in quadrature). The predictions from PYTHIA-8, HERWIG++, and POWHEG+PYTHIA are shown with dashed black, dash-dot-dotted magenta, and dash-dotted green histograms, respectively, with no uncertainties shown. The predictions from Ref. [1] (Frye et. al.) are shown with blue squares. The uncertainties include scale variations and an estimate of nonperturbative effects. The predictions from Ref. [2] (Marzani et. al.) are shown with red triangles. The uncertainties only include effects from scale variations, since nonperturbative corrections have been considered directly in the calculation. |
png pdf |
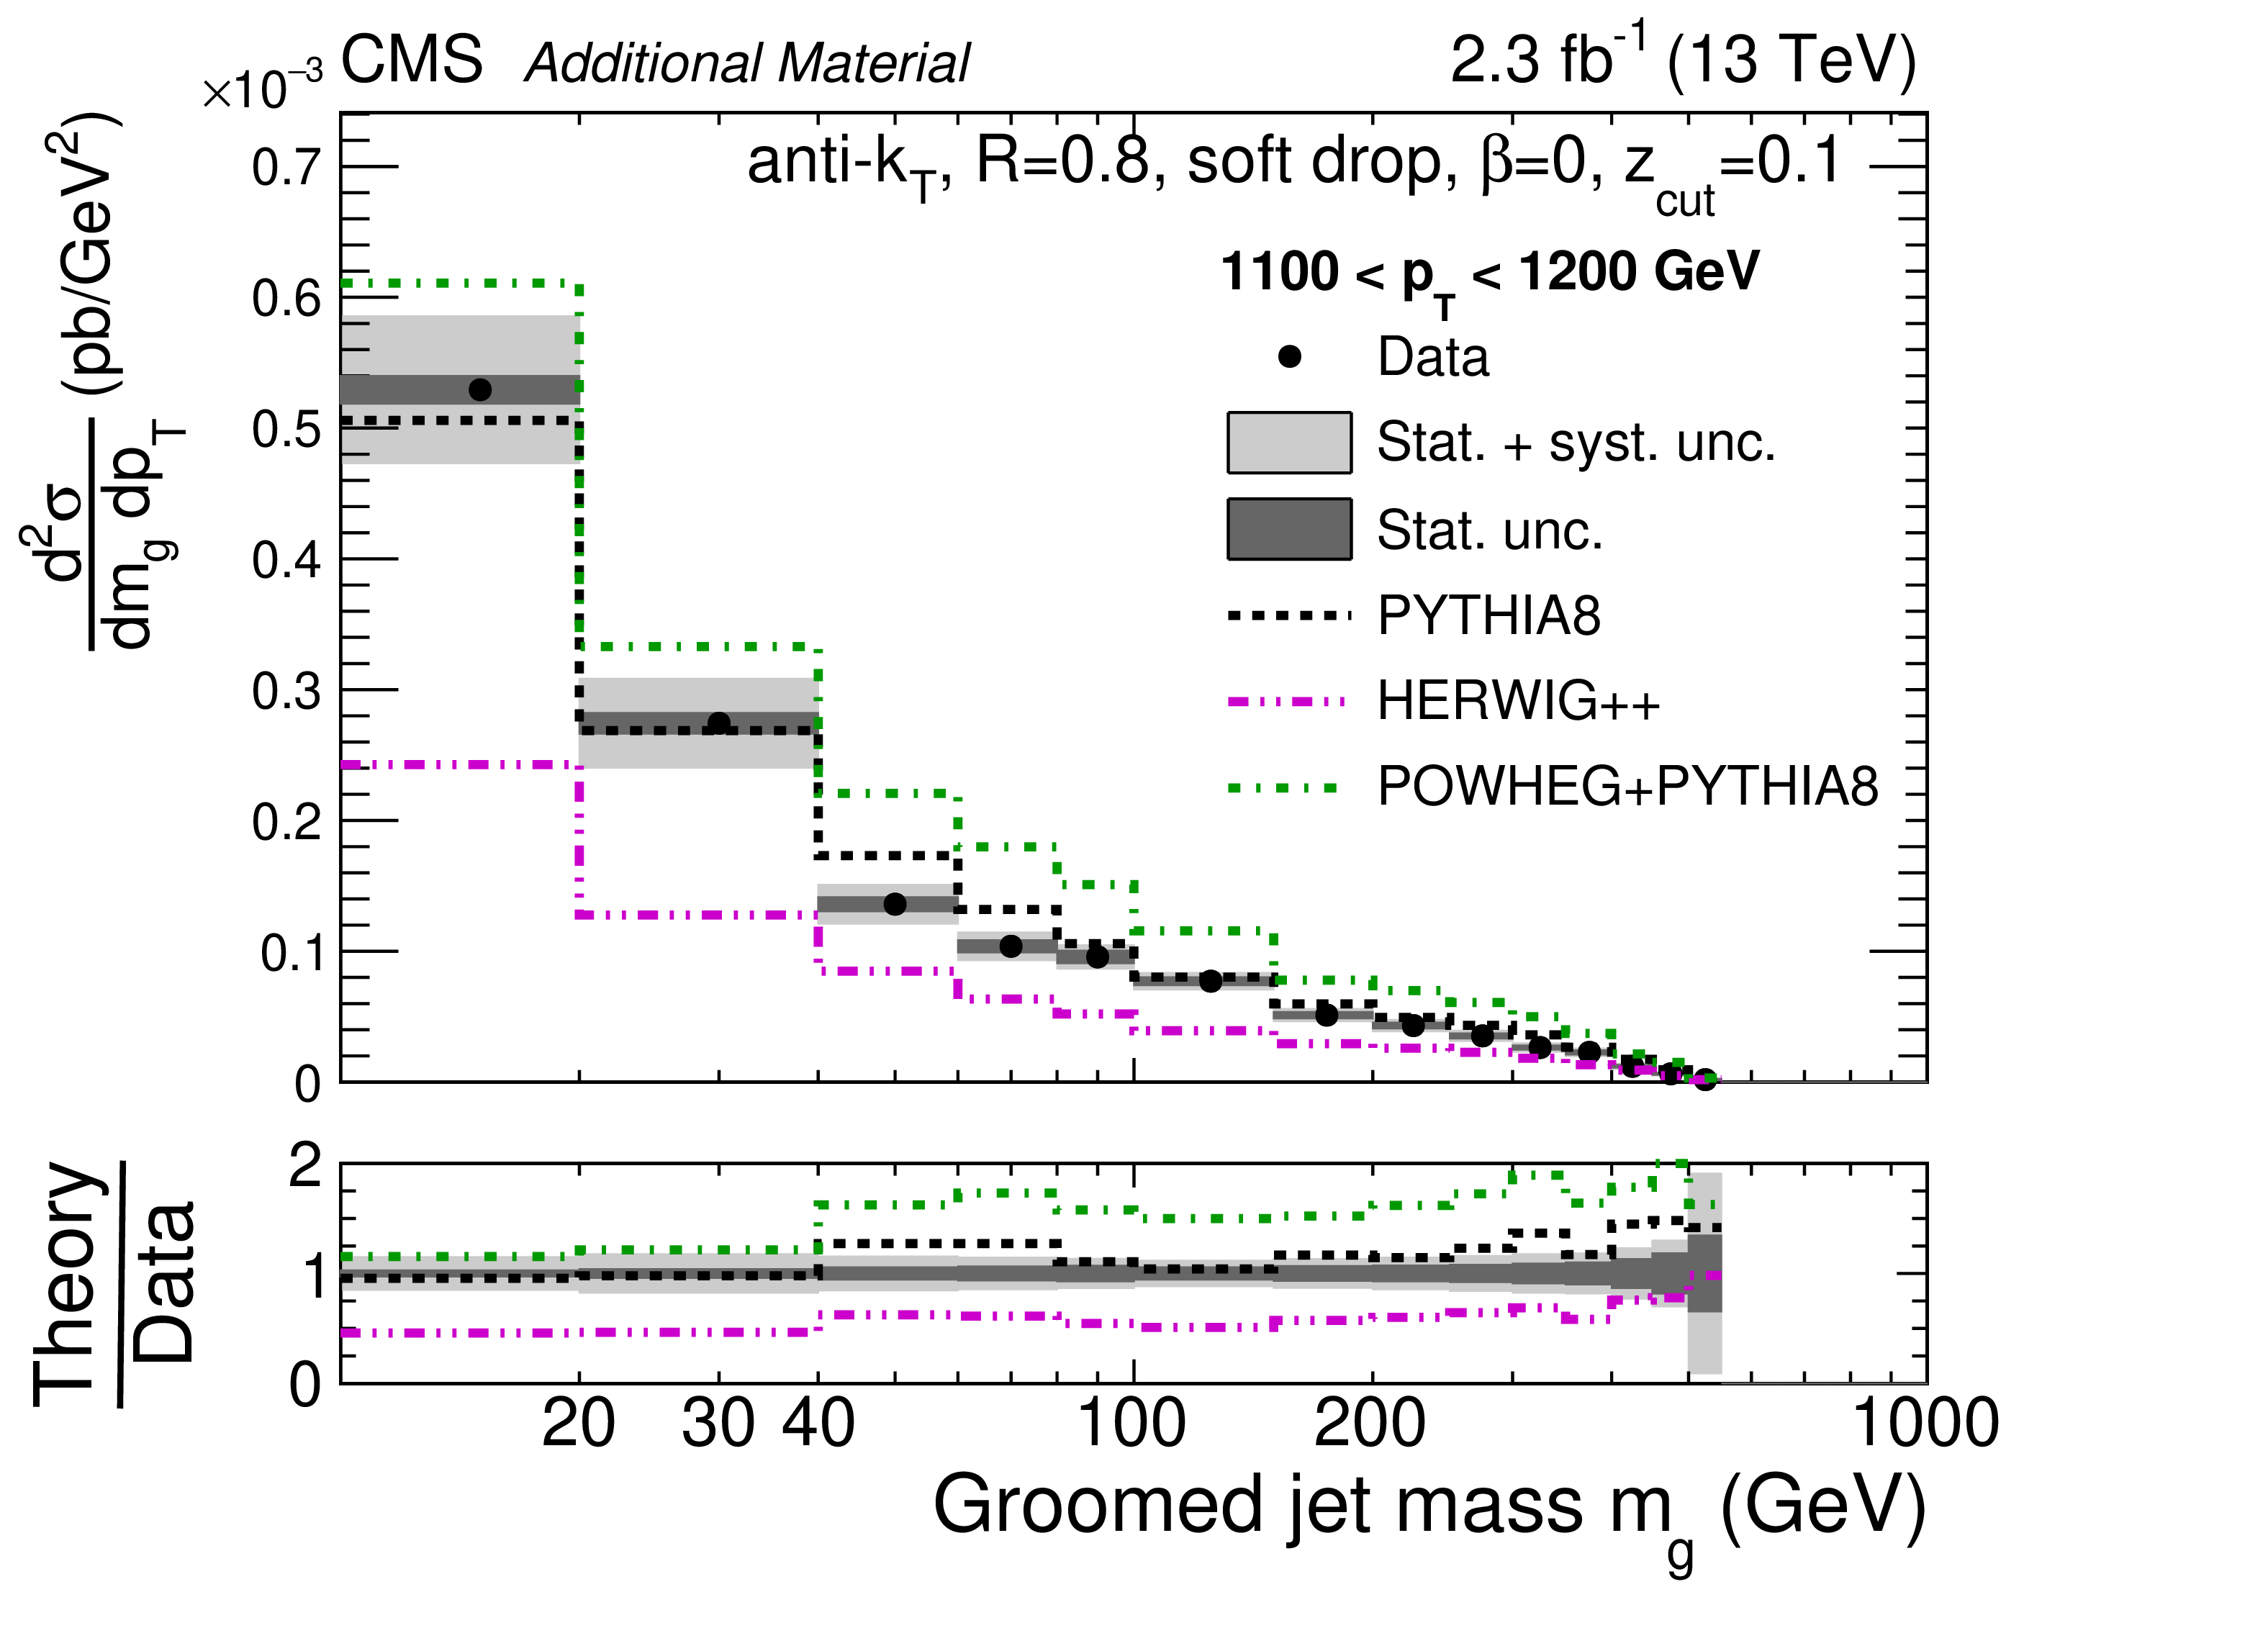
Additional Figure 46:
Normalized cross section for groomed jets for 1100 $ < {p_{\mathrm {T}}} < $ 1200 GeV. The data are shown by the black points, with dark grey bands for the statistical uncertainty (Stat. unc.) and with light grey bands for the total uncertainty (stat.+sys. unc., added in quadrature). The predictions from PYTHIA-8, HERWIG++, and POWHEG+PYTHIA are shown with dashed black, dash-dot-dotted magenta, and dash-dotted green histograms, respectively, with no uncertainties shown. The predictions from Ref. [1] (Frye et. al.) are shown with blue squares. The uncertainties include scale variations and an estimate of nonperturbative effects. The predictions from Ref. [2] (Marzani et. al.) are shown with red triangles. The uncertainties only include effects from scale variations, since nonperturbative corrections have been considered directly in the calculation. |
png pdf |
Additional Figure 47:
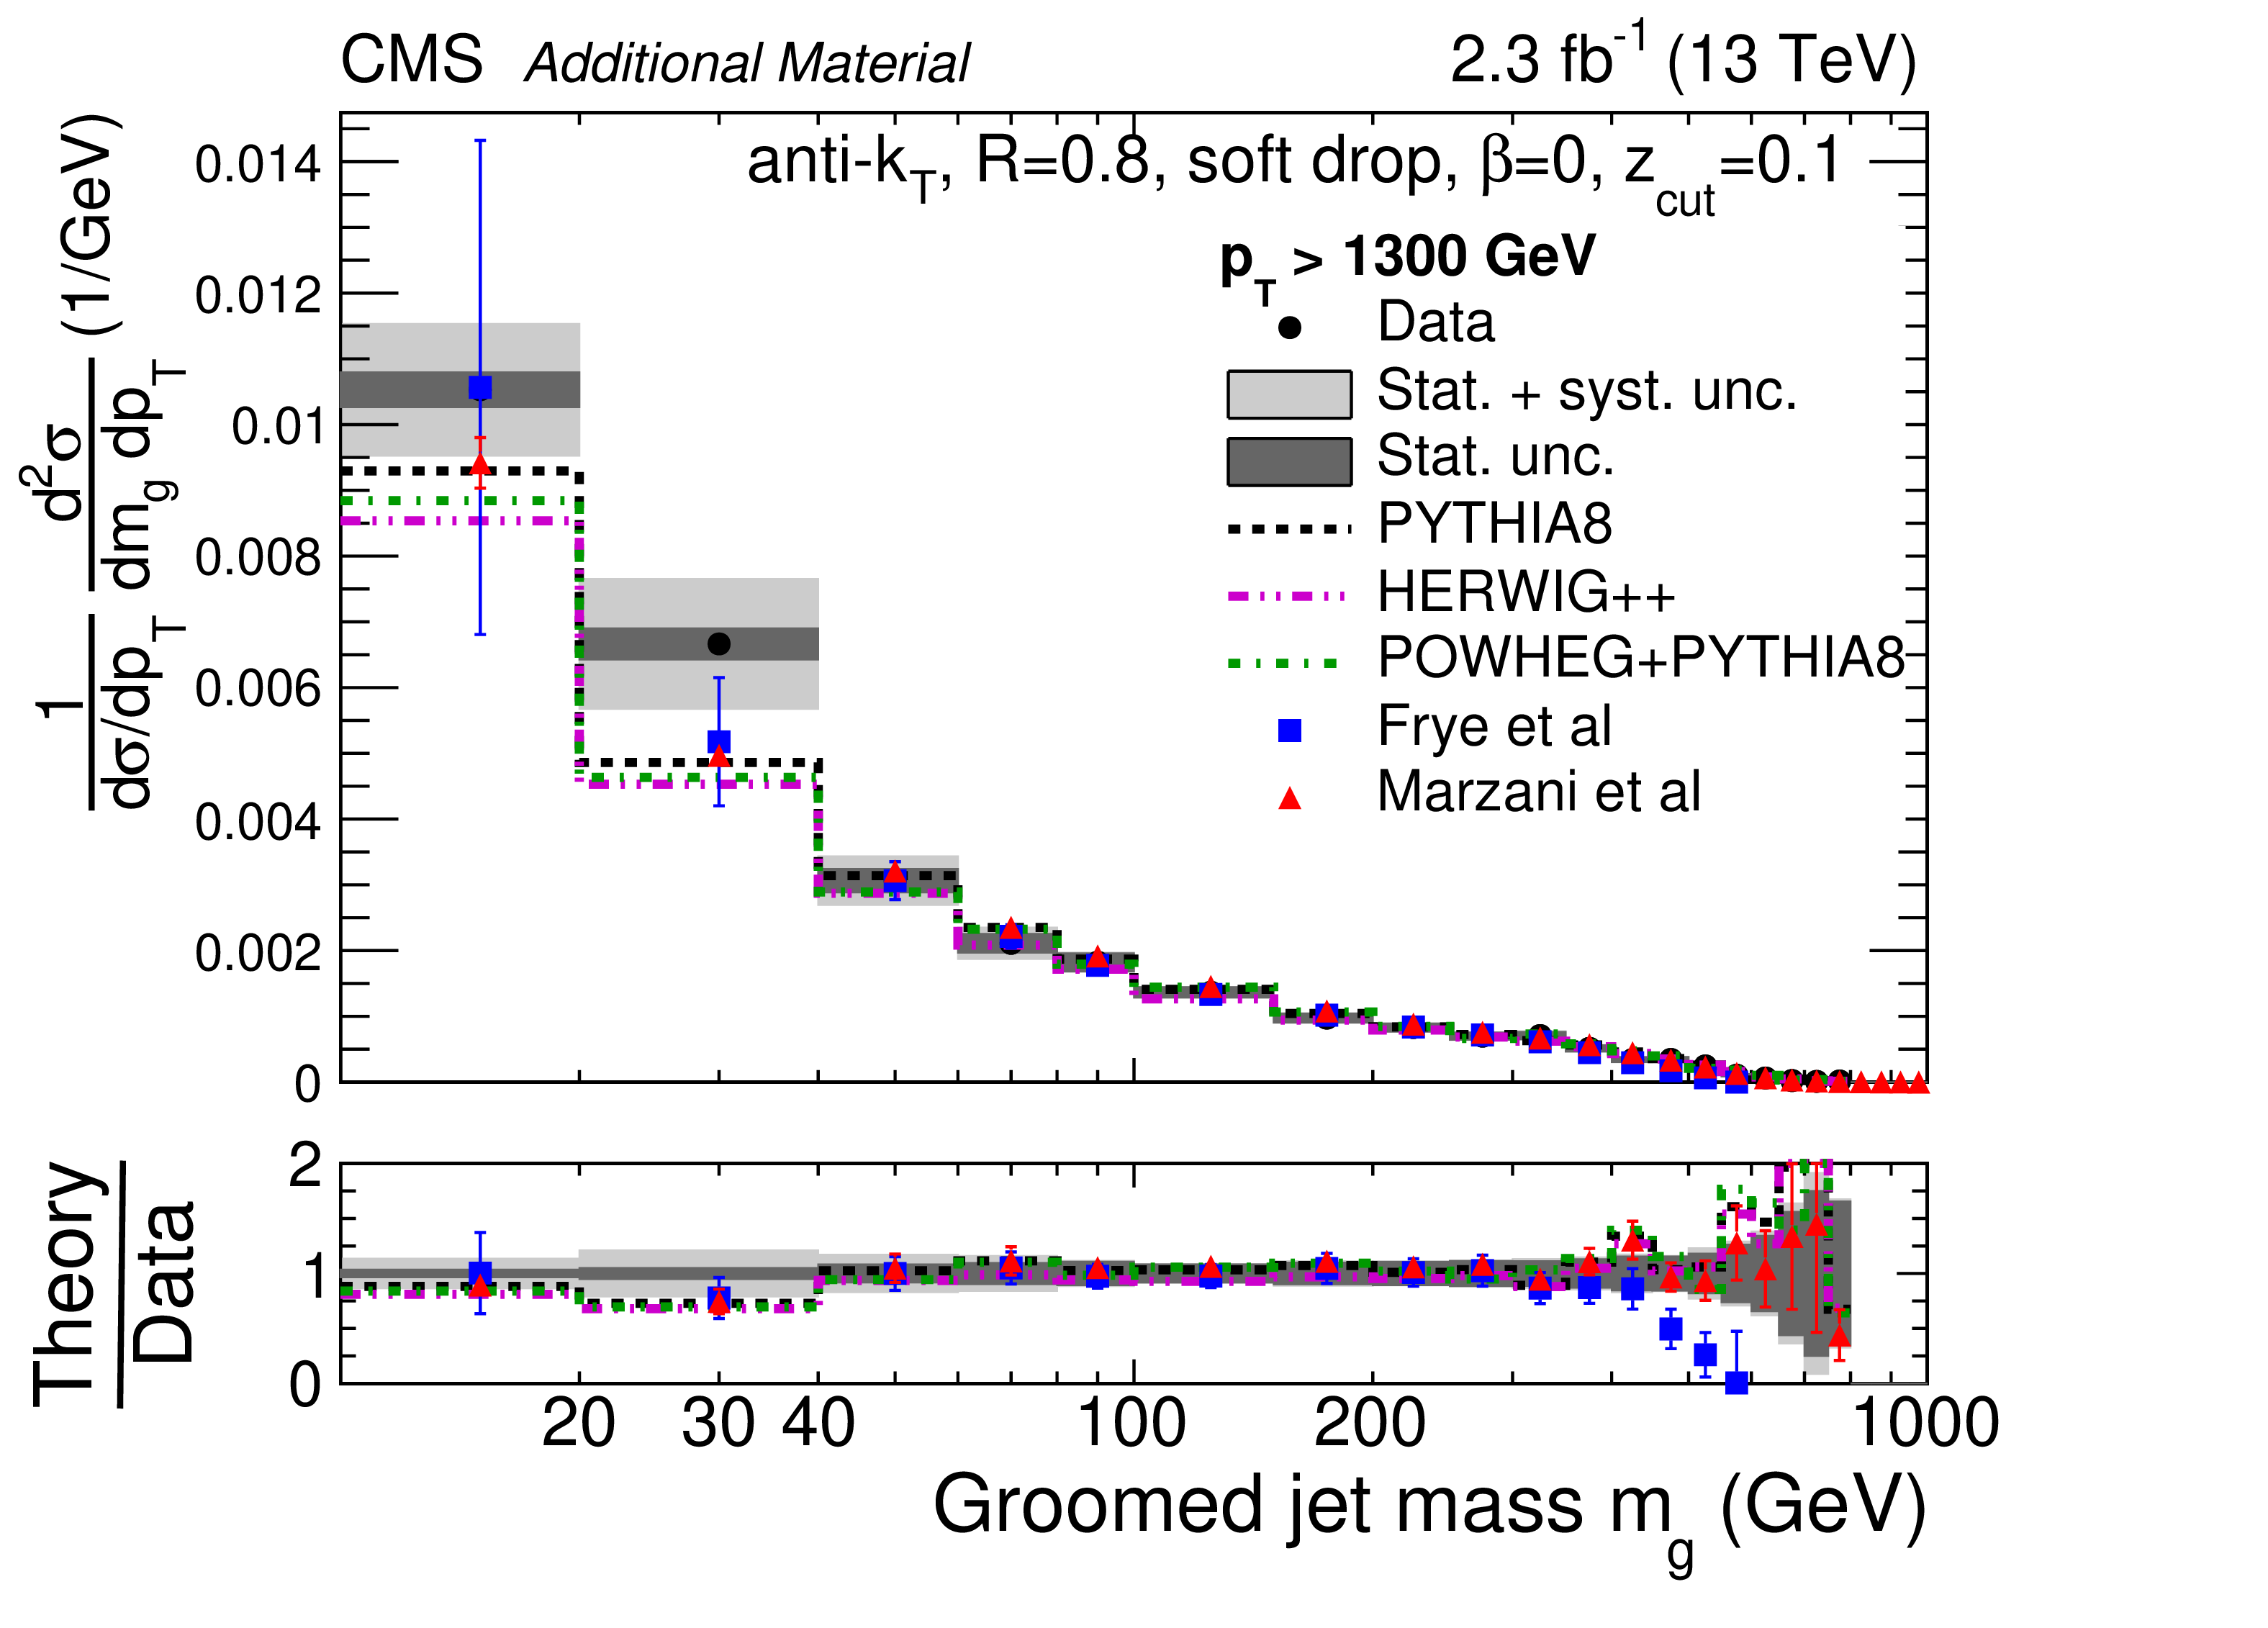
Normalized cross section for groomed jets for $ {p_{\mathrm {T}}} > $ 1300 GeV. The data are shown by the black points, with dark grey bands for the statistical uncertainty (Stat. unc.) and with light grey bands for the total uncertainty (stat.+sys. unc., added in quadrature). The predictions from PYTHIA-8, HERWIG++, and POWHEG+PYTHIA are shown with dashed black, dash-dot-dotted magenta, and dash-dotted green histograms, respectively, with no uncertainties shown. The predictions from Ref. [1] (Frye et. al.) are shown with blue squares. The uncertainties include scale variations and an estimate of nonperturbative effects. The predictions from Ref. [2] (Marzani et. al.) are shown with red triangles. The uncertainties only include effects from scale variations, since nonperturbative corrections have been considered directly in the calculation. |

png pdf |
Additional Figure 48:
Normalized cross section with respect to $\log{m}$ for ungroomed jets for 200 $ < {p_{\mathrm {T}}} < $ 260 GeV. The data are shown by the black points, with dark grey bands for the statistical uncertainty (Stat. unc.) and with light grey bands for the total uncertainty (stat.+sys. unc., added in quadrature). The predictions from PYTHIA-8, HERWIG++, and POWHEG+PYTHIA are shown with dashed black, dash-dot-dotted magenta, and dash-dotted green histograms, respectively, with no uncertainties shown. The derivative with respect to $\log{m}$ is approximated by multiplying the bin content by the bin center $m_c$. |
png pdf |
Additional Figure 49:
Normalized cross section with respect to $\log{m}$ for ungroomed jets for 260 $ < {p_{\mathrm {T}}} < $ 350 GeV. The data are shown by the black points, with dark grey bands for the statistical uncertainty (Stat. unc.) and with light grey bands for the total uncertainty (stat.+sys. unc., added in quadrature). The predictions from PYTHIA-8, HERWIG++, and POWHEG+PYTHIA are shown with dashed black, dash-dot-dotted magenta, and dash-dotted green histograms, respectively, with no uncertainties shown. The derivative with respect to $\log{m}$ is approximated by multiplying the bin content by the bin center $m_c$. |
png pdf |
Additional Figure 50:
Normalized cross section with respect to $\log{m}$ for ungroomed jets for 350 $ < {p_{\mathrm {T}}} < $ 460 GeV. The data are shown by the black points, with dark grey bands for the statistical uncertainty (Stat. unc.) and with light grey bands for the total uncertainty (stat.+sys. unc., added in quadrature). The predictions from PYTHIA-8, HERWIG++, and POWHEG+PYTHIA are shown with dashed black, dash-dot-dotted magenta, and dash-dotted green histograms, respectively, with no uncertainties shown. The derivative with respect to $\log{m}$ is approximated by multiplying the bin content by the bin center $m_c$. |

png pdf |
Additional Figure 51:
Normalized cross section with respect to $\log{m}$ for ungroomed jets for 460 $ < {p_{\mathrm {T}}} < $ 550 GeV. The data are shown by the black points, with dark grey bands for the statistical uncertainty (Stat. unc.) and with light grey bands for the total uncertainty (stat.+sys. unc., added in quadrature). The predictions from PYTHIA-8, HERWIG++, and POWHEG+PYTHIA are shown with dashed black, dash-dot-dotted magenta, and dash-dotted green histograms, respectively, with no uncertainties shown. The derivative with respect to $\log{m}$ is approximated by multiplying the bin content by the bin center $m_c$. |
png pdf |
Additional Figure 52:
Normalized cross section with respect to $\log{m}$ for ungroomed jets for 550 $ < {p_{\mathrm {T}}} < $ 650 GeV. The data are shown by the black points, with dark grey bands for the statistical uncertainty (Stat. unc.) and with light grey bands for the total uncertainty (stat.+sys. unc., added in quadrature). The predictions from PYTHIA-8, HERWIG++, and POWHEG+PYTHIA are shown with dashed black, dash-dot-dotted magenta, and dash-dotted green histograms, respectively, with no uncertainties shown. The derivative with respect to $\log{m}$ is approximated by multiplying the bin content by the bin center $m_c$. |
png pdf |
Additional Figure 53:
Normalized cross section with respect to $\log{m}$ for ungroomed jets for 760 $ < {p_{\mathrm {T}}} < $ 900 GeV. The data are shown by the black points, with dark grey bands for the statistical uncertainty (Stat. unc.) and with light grey bands for the total uncertainty (stat.+sys. unc., added in quadrature). The predictions from PYTHIA-8, HERWIG++, and POWHEG+PYTHIA are shown with dashed black, dash-dot-dotted magenta, and dash-dotted green histograms, respectively, with no uncertainties shown. The derivative with respect to $\log{m}$ is approximated by multiplying the bin content by the bin center $m_c$. |
png pdf |
Additional Figure 54:
Normalized cross section with respect to $\log{m}$ for ungroomed jets for 900 $ < {p_{\mathrm {T}}} < $ 1000 GeV. The data are shown by the black points, with dark grey bands for the statistical uncertainty (Stat. unc.) and with light grey bands for the total uncertainty (stat.+sys. unc., added in quadrature). The predictions from PYTHIA-8, HERWIG++, and POWHEG+PYTHIA are shown with dashed black, dash-dot-dotted magenta, and dash-dotted green histograms, respectively, with no uncertainties shown. The derivative with respect to $\log{m}$ is approximated by multiplying the bin content by the bin center $m_c$. |
png pdf |
Additional Figure 55:
Normalized cross section with respect to $\log{m}$ for ungroomed jets for 1000 $ < {p_{\mathrm {T}}} < $ 1100 GeV. The data are shown by the black points, with dark grey bands for the statistical uncertainty (Stat. unc.) and with light grey bands for the total uncertainty (stat.+sys. unc., added in quadrature). The predictions from PYTHIA-8, HERWIG++, and POWHEG+PYTHIA are shown with dashed black, dash-dot-dotted magenta, and dash-dotted green histograms, respectively, with no uncertainties shown. The derivative with respect to $\log{m}$ is approximated by multiplying the bin content by the bin center $m_c$. |
png pdf |
Additional Figure 56:
Normalized cross section with respect to $\log{m}$ for ungroomed jets for 1100 $ < {p_{\mathrm {T}}} < $ 1200 GeV. The data are shown by the black points, with dark grey bands for the statistical uncertainty (Stat. unc.) and with light grey bands for the total uncertainty (stat.+sys. unc., added in quadrature). The predictions from PYTHIA-8, HERWIG++, and POWHEG+PYTHIA are shown with dashed black, dash-dot-dotted magenta, and dash-dotted green histograms, respectively, with no uncertainties shown. The derivative with respect to $\log{m}$ is approximated by multiplying the bin content by the bin center $m_c$. |
png pdf |
Additional Figure 57:
Normalized cross section with respect to $\log{m}$ for ungroomed jets for $ {p_{\mathrm {T}}} > $ 1300 GeV. The data are shown by the black points, with dark grey bands for the statistical uncertainty (Stat. unc.) and with light grey bands for the total uncertainty (stat.+sys. unc., added in quadrature). The predictions from PYTHIA-8, HERWIG++, and POWHEG+PYTHIA are shown with dashed black, dash-dot-dotted magenta, and dash-dotted green histograms, respectively, with no uncertainties shown. The derivative with respect to $\log{m}$ is approximated by multiplying the bin content by the bin center $m_c$. |
png pdf |
Additional Figure 58:
Normalized cross section with respect to $\log{m}$ for groomed jets for 200 $ < {p_{\mathrm {T}}} < $ 260 GeV. The data are shown by the black points, with dark grey bands for the statistical uncertainty (Stat. unc.) and with light grey bands for the total uncertainty (stat.+sys. unc., added in quadrature). The predictions from PYTHIA-8, HERWIG++, and POWHEG+PYTHIA are shown with dashed black, dash-dot-dotted magenta, and dash-dotted green histograms, respectively, with no uncertainties shown. The predictions from Ref. [1] (Frye et. al.) are shown with blue squares. The uncertainties include scale variations and an estimate of nonperturbative effects. The predictions from Ref. [2] (Marzani et. al.) are shown with red triangles. The uncertainties only include effects from scale variations, since nonperturbative corrections have been considered directly in the calculation. The derivative with respect to $\log{m}$ is approximated by multiplying the bin content by the bin center $m_c$. |

png pdf |
Additional Figure 59:
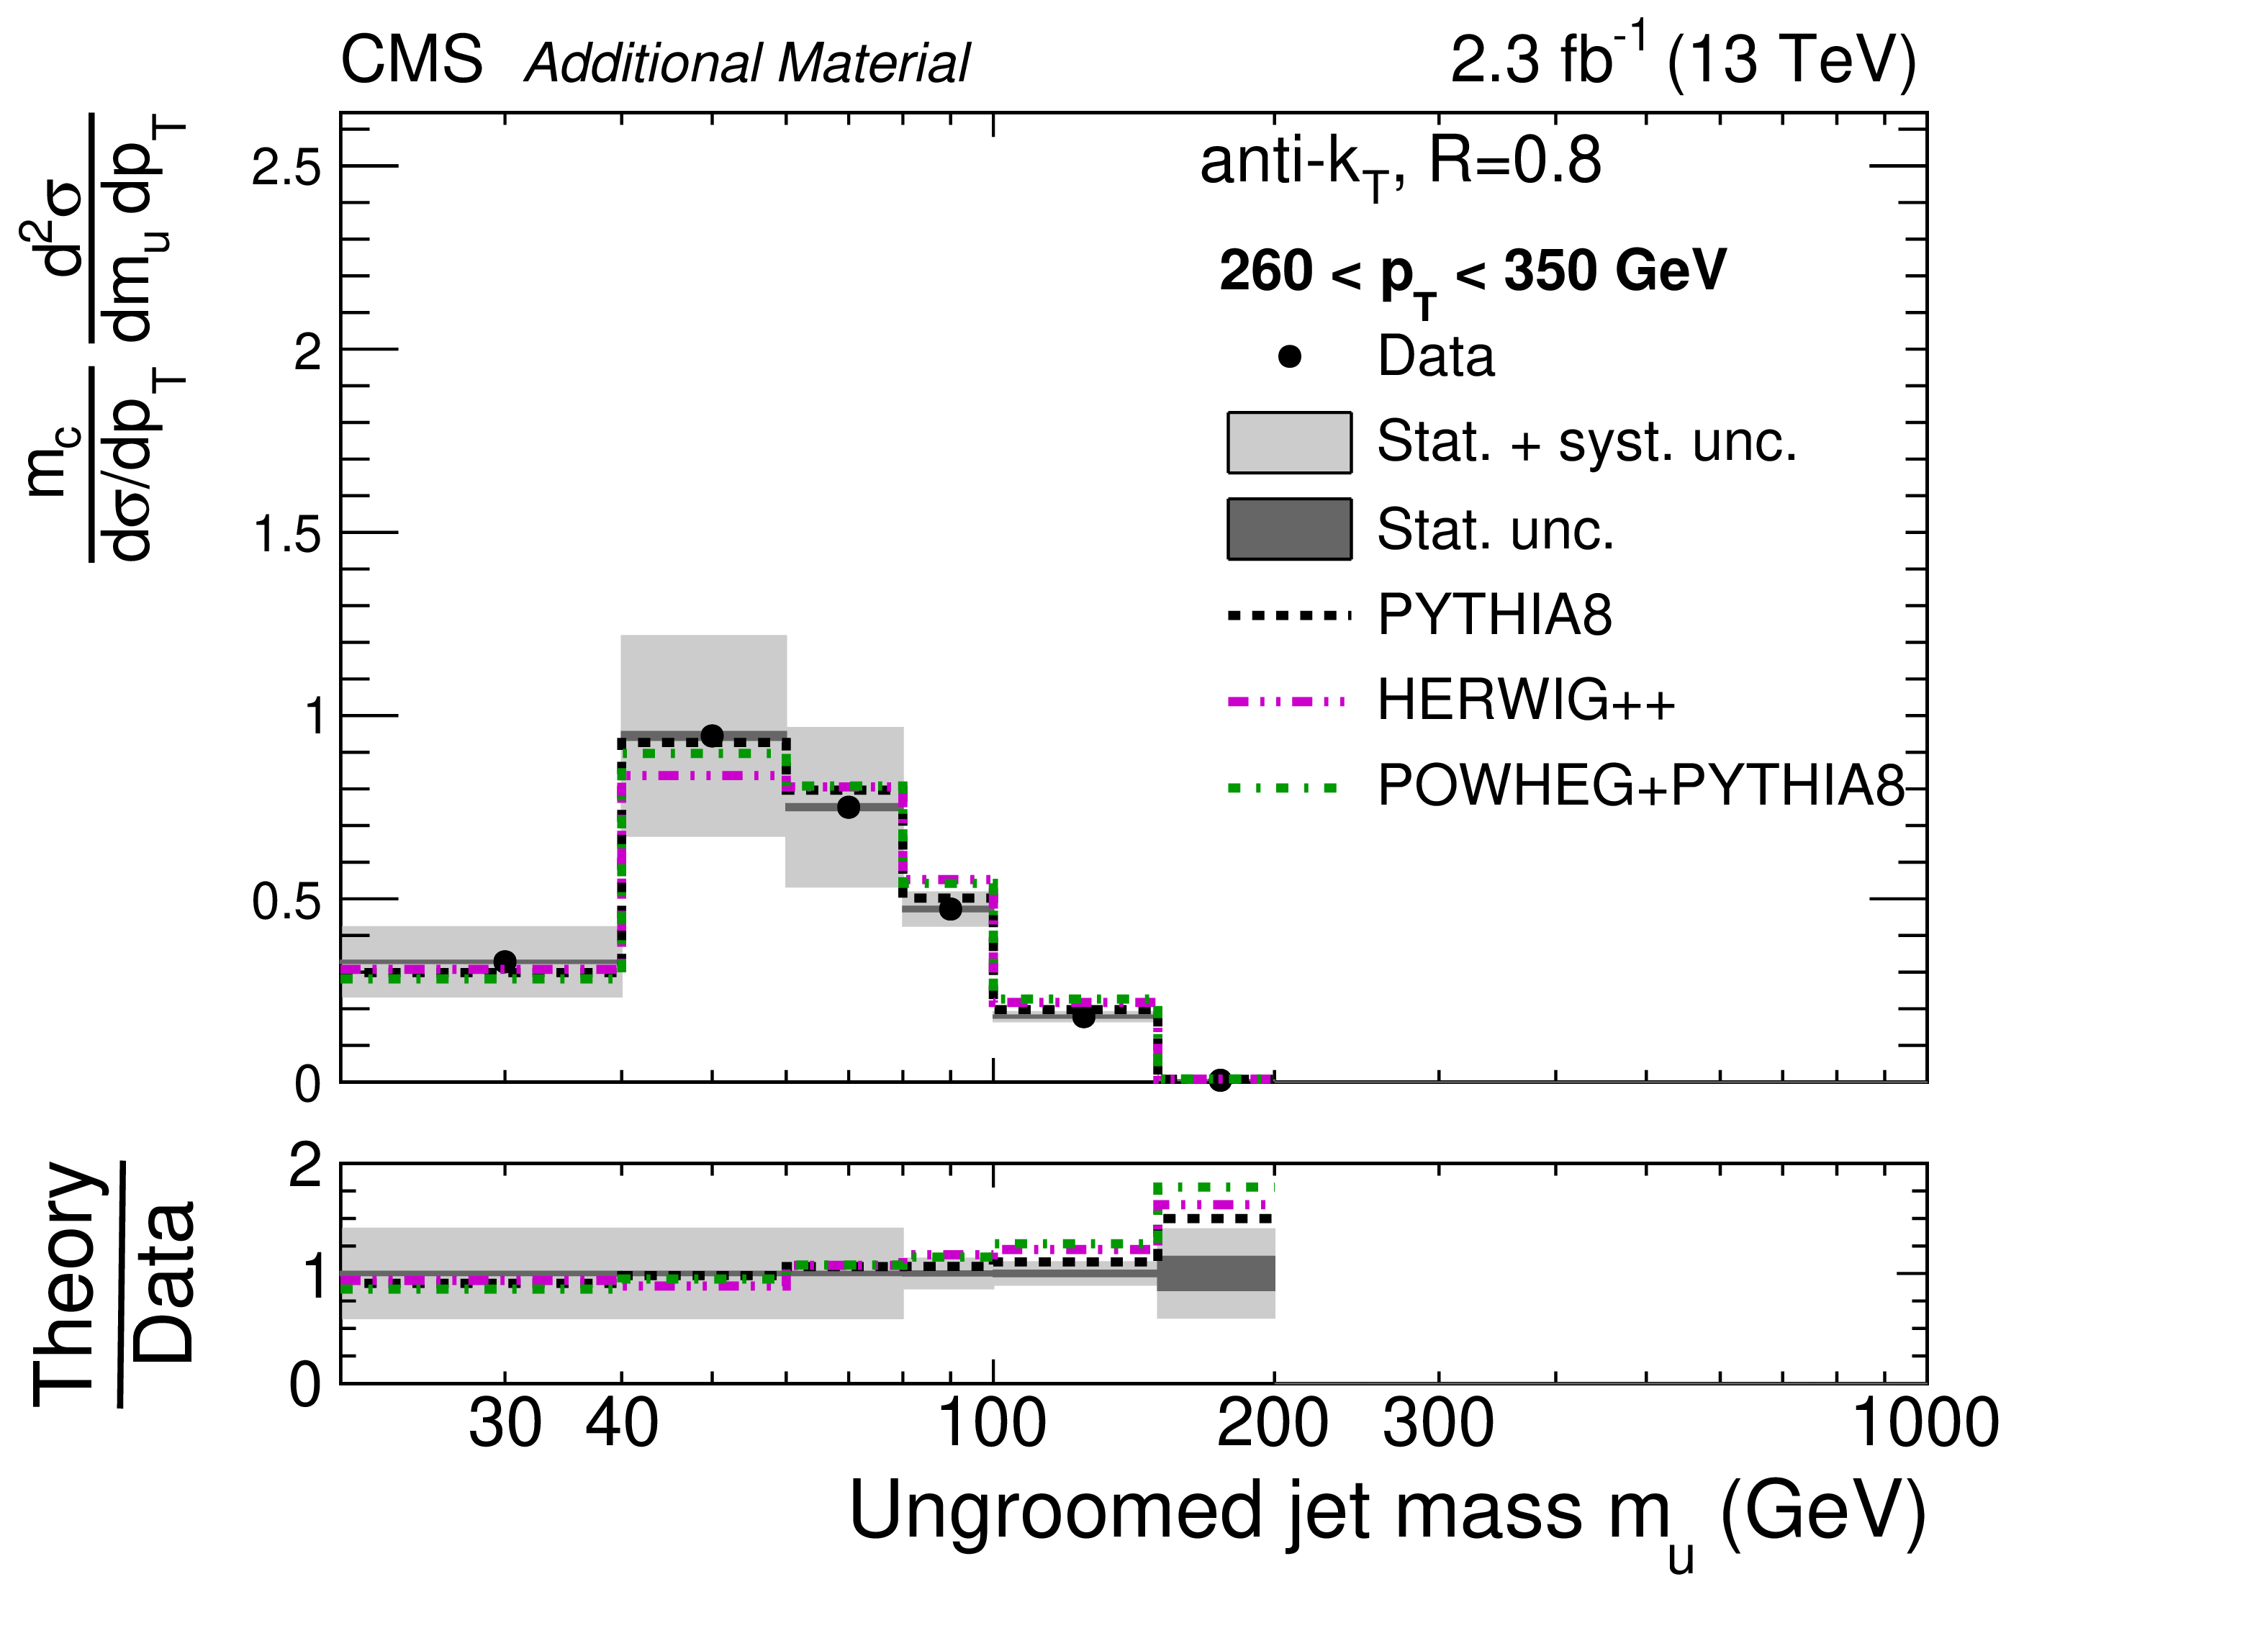
Normalized cross section with respect to $\log{m}$ for groomed jets for 260 $ < {p_{\mathrm {T}}} < $ 350 GeV. The data are shown by the black points, with dark grey bands for the statistical uncertainty (Stat. unc.) and with light grey bands for the total uncertainty (stat.+sys. unc., added in quadrature). The predictions from PYTHIA-8, HERWIG++, and POWHEG+PYTHIA are shown with dashed black, dash-dot-dotted magenta, and dash-dotted green histograms, respectively, with no uncertainties shown. The predictions from Ref. [1] (Frye et. al.) are shown with blue squares. The uncertainties include scale variations and an estimate of nonperturbative effects. The predictions from Ref. [2] (Marzani et. al.) are shown with red triangles. The uncertainties only include effects from scale variations, since nonperturbative corrections have been considered directly in the calculation. The derivative with respect to $\log{m}$ is approximated by multiplying the bin content by the bin center $m_c$. |
png pdf |
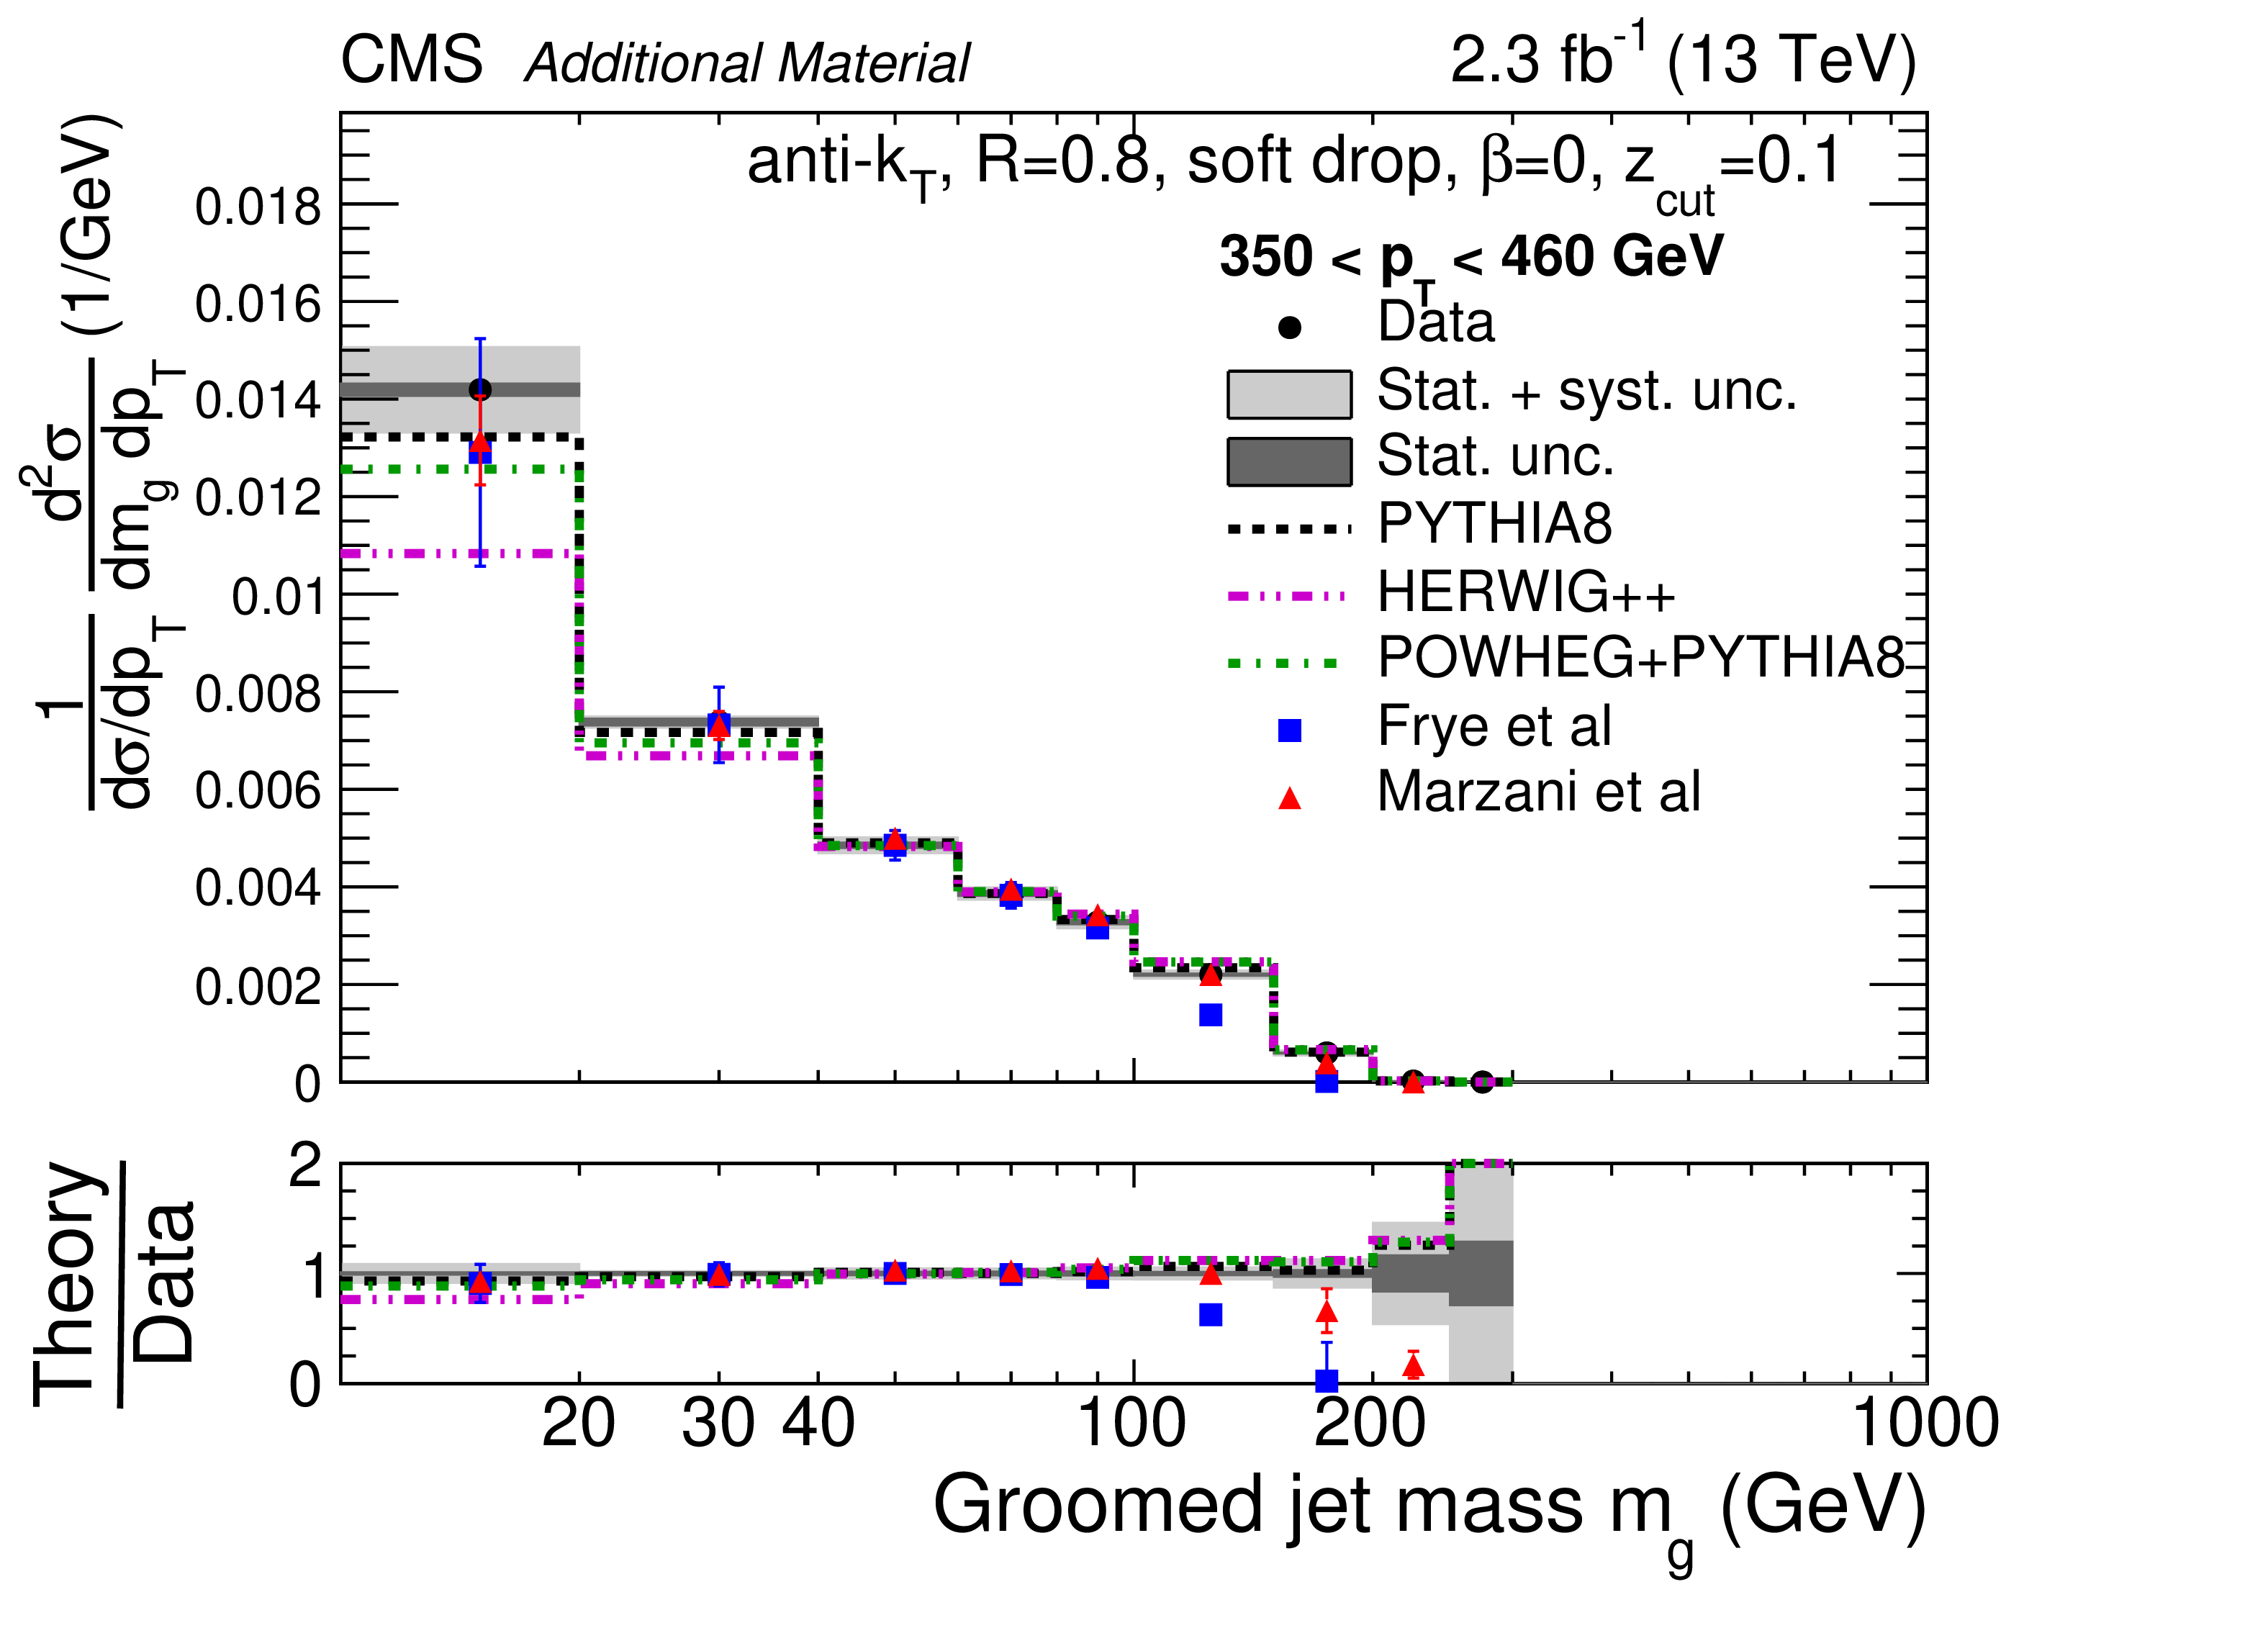
Additional Figure 60:
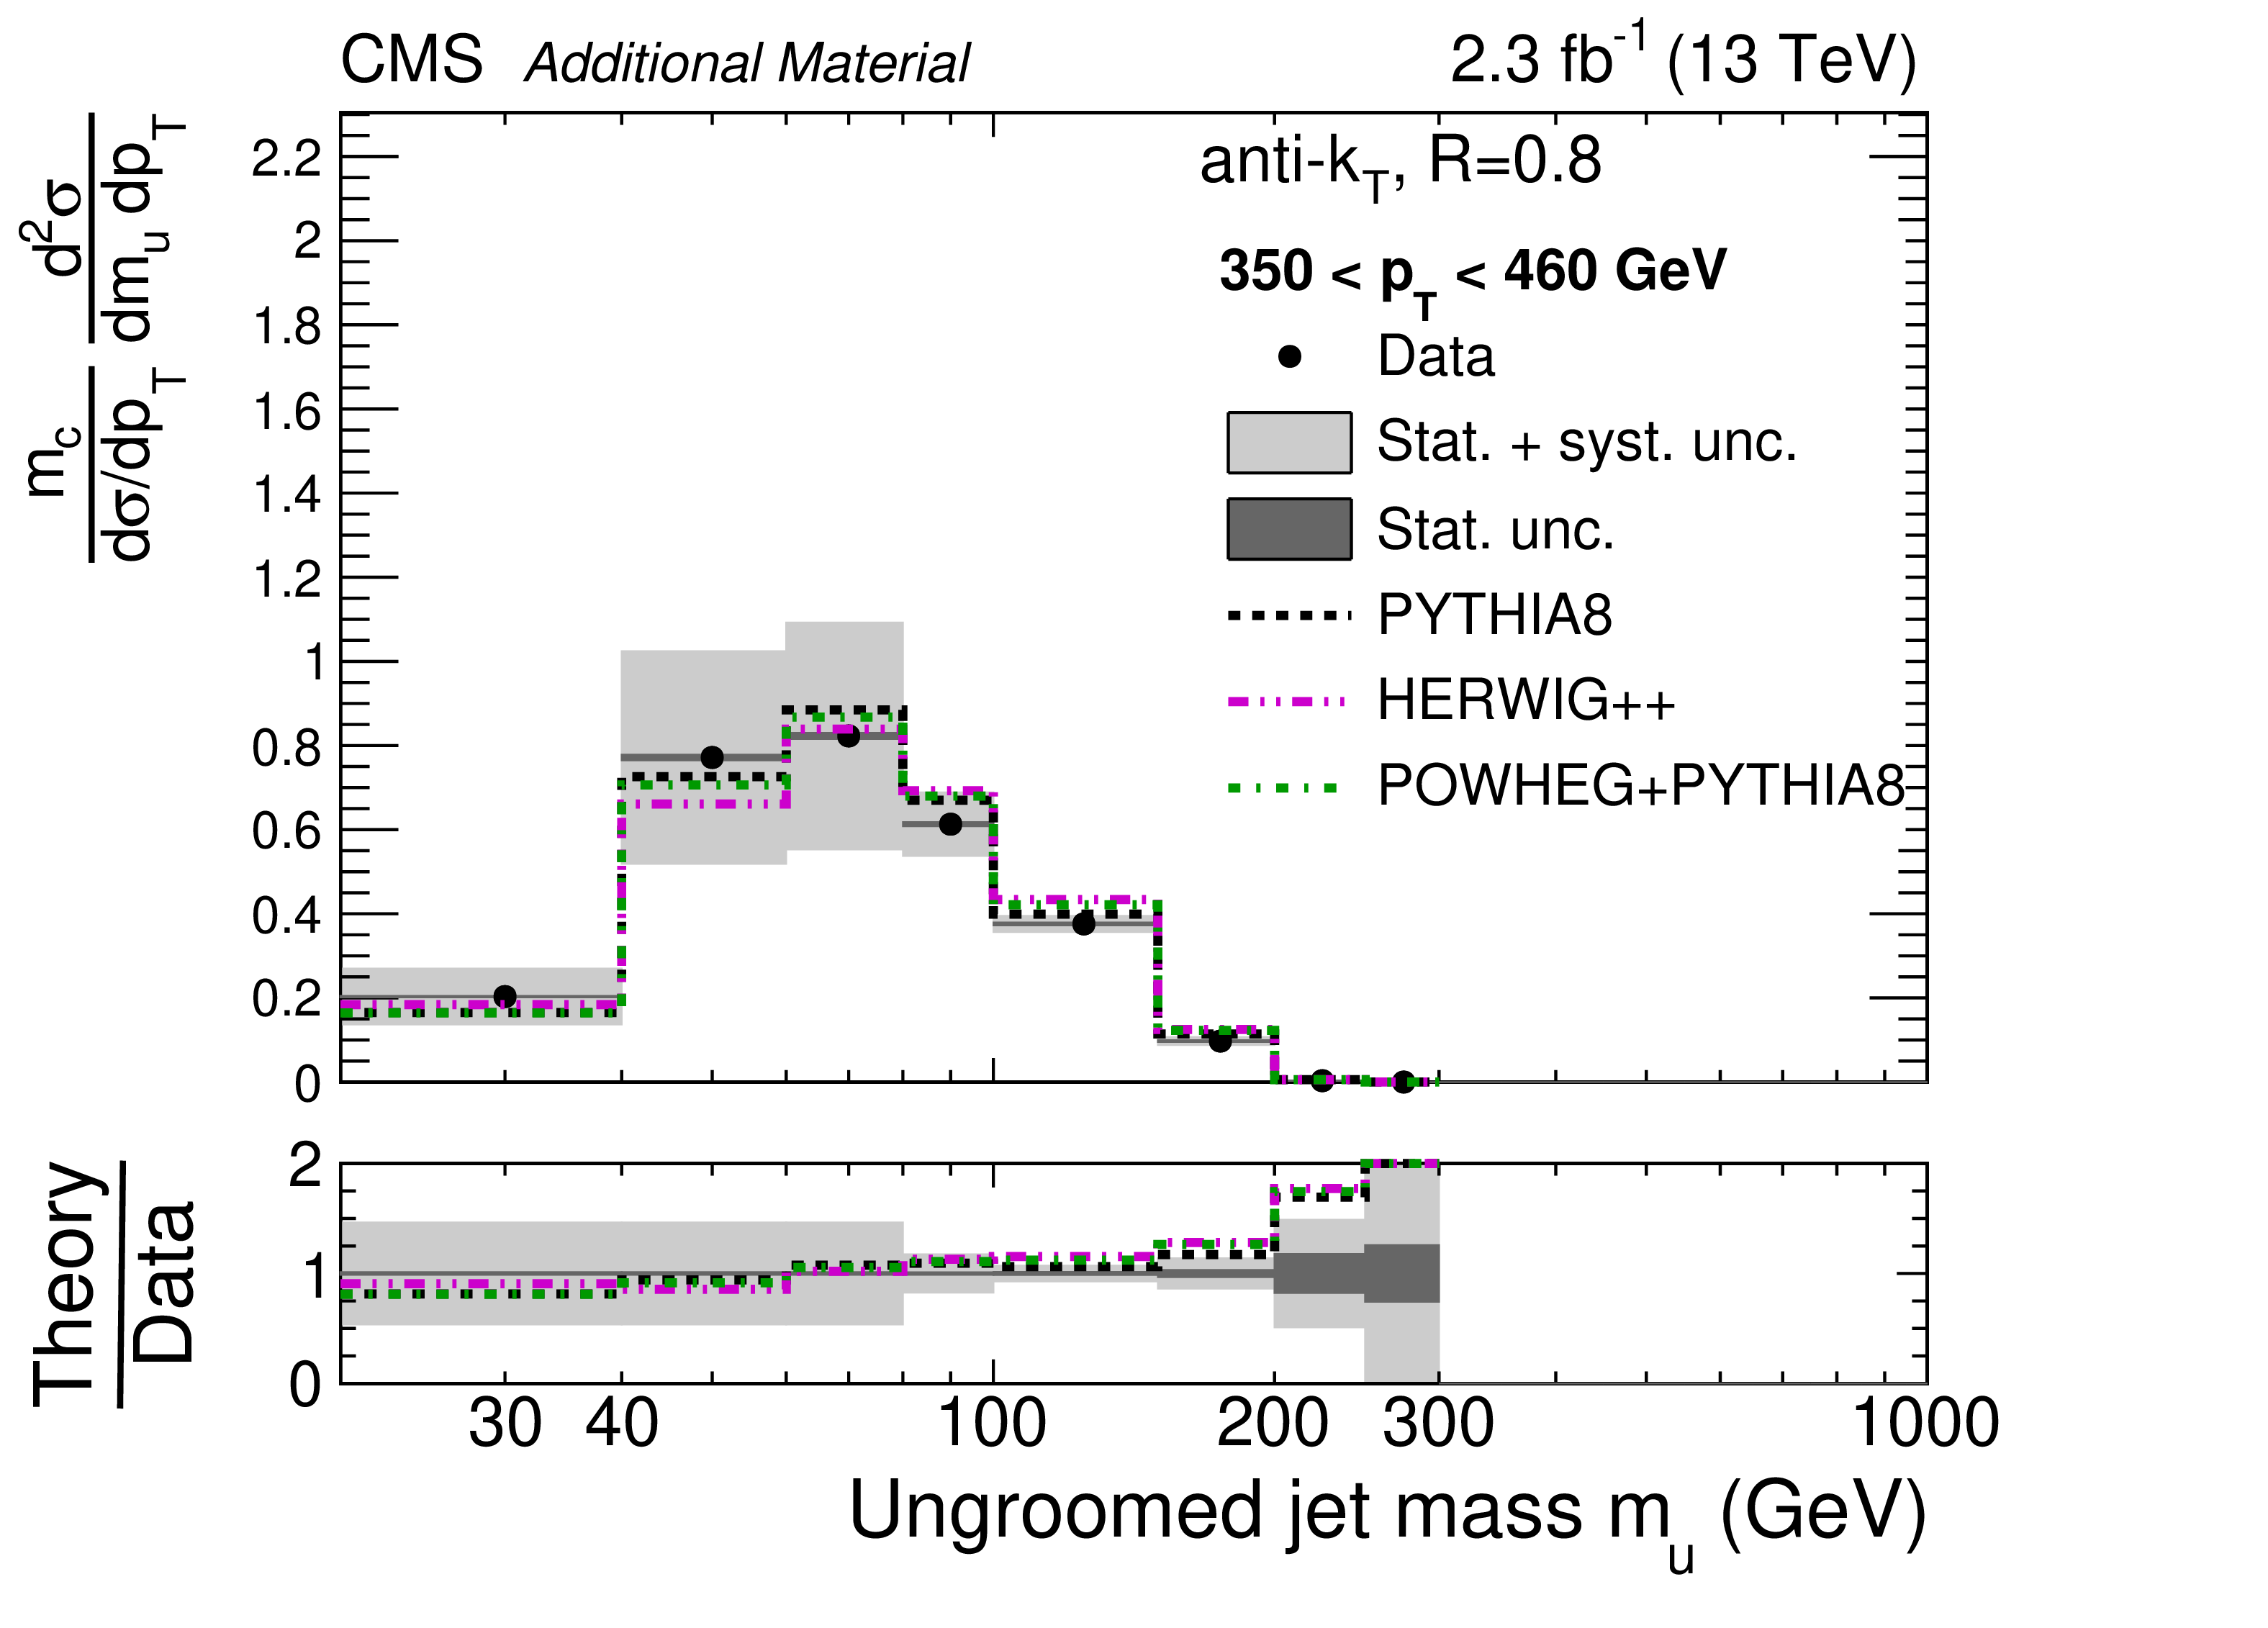
Normalized cross section with respect to $\log{m}$ for groomed jets for 350 $ < {p_{\mathrm {T}}} < $ 460 GeV. The data are shown by the black points, with dark grey bands for the statistical uncertainty (Stat. unc.) and with light grey bands for the total uncertainty (stat.+sys. unc., added in quadrature). The predictions from PYTHIA-8, HERWIG++, and POWHEG+PYTHIA are shown with dashed black, dash-dot-dotted magenta, and dash-dotted green histograms, respectively, with no uncertainties shown. The predictions from Ref. [1] (Frye et. al.) are shown with blue squares. The uncertainties include scale variations and an estimate of nonperturbative effects. The predictions from Ref. [2] (Marzani et. al.) are shown with red triangles. The uncertainties only include effects from scale variations, since nonperturbative corrections have been considered directly in the calculation. The derivative with respect to $\log{m}$ is approximated by multiplying the bin content by the bin center $m_c$. |

png pdf |
Additional Figure 61:
Normalized cross section with respect to $\log{m}$ for groomed jets for 460 $ < {p_{\mathrm {T}}} < $ 550 GeV. The data are shown by the black points, with dark grey bands for the statistical uncertainty (Stat. unc.) and with light grey bands for the total uncertainty (stat.+sys. unc., added in quadrature). The predictions from PYTHIA-8, HERWIG++, and POWHEG+PYTHIA are shown with dashed black, dash-dot-dotted magenta, and dash-dotted green histograms, respectively, with no uncertainties shown. The predictions from Ref. [1] (Frye et. al.) are shown with blue squares. The uncertainties include scale variations and an estimate of nonperturbative effects. The predictions from Ref. [2] (Marzani et. al.) are shown with red triangles. The uncertainties only include effects from scale variations, since nonperturbative corrections have been considered directly in the calculation. The derivative with respect to $\log{m}$ is approximated by multiplying the bin content by the bin center $m_c$. |
png pdf |
Additional Figure 62:
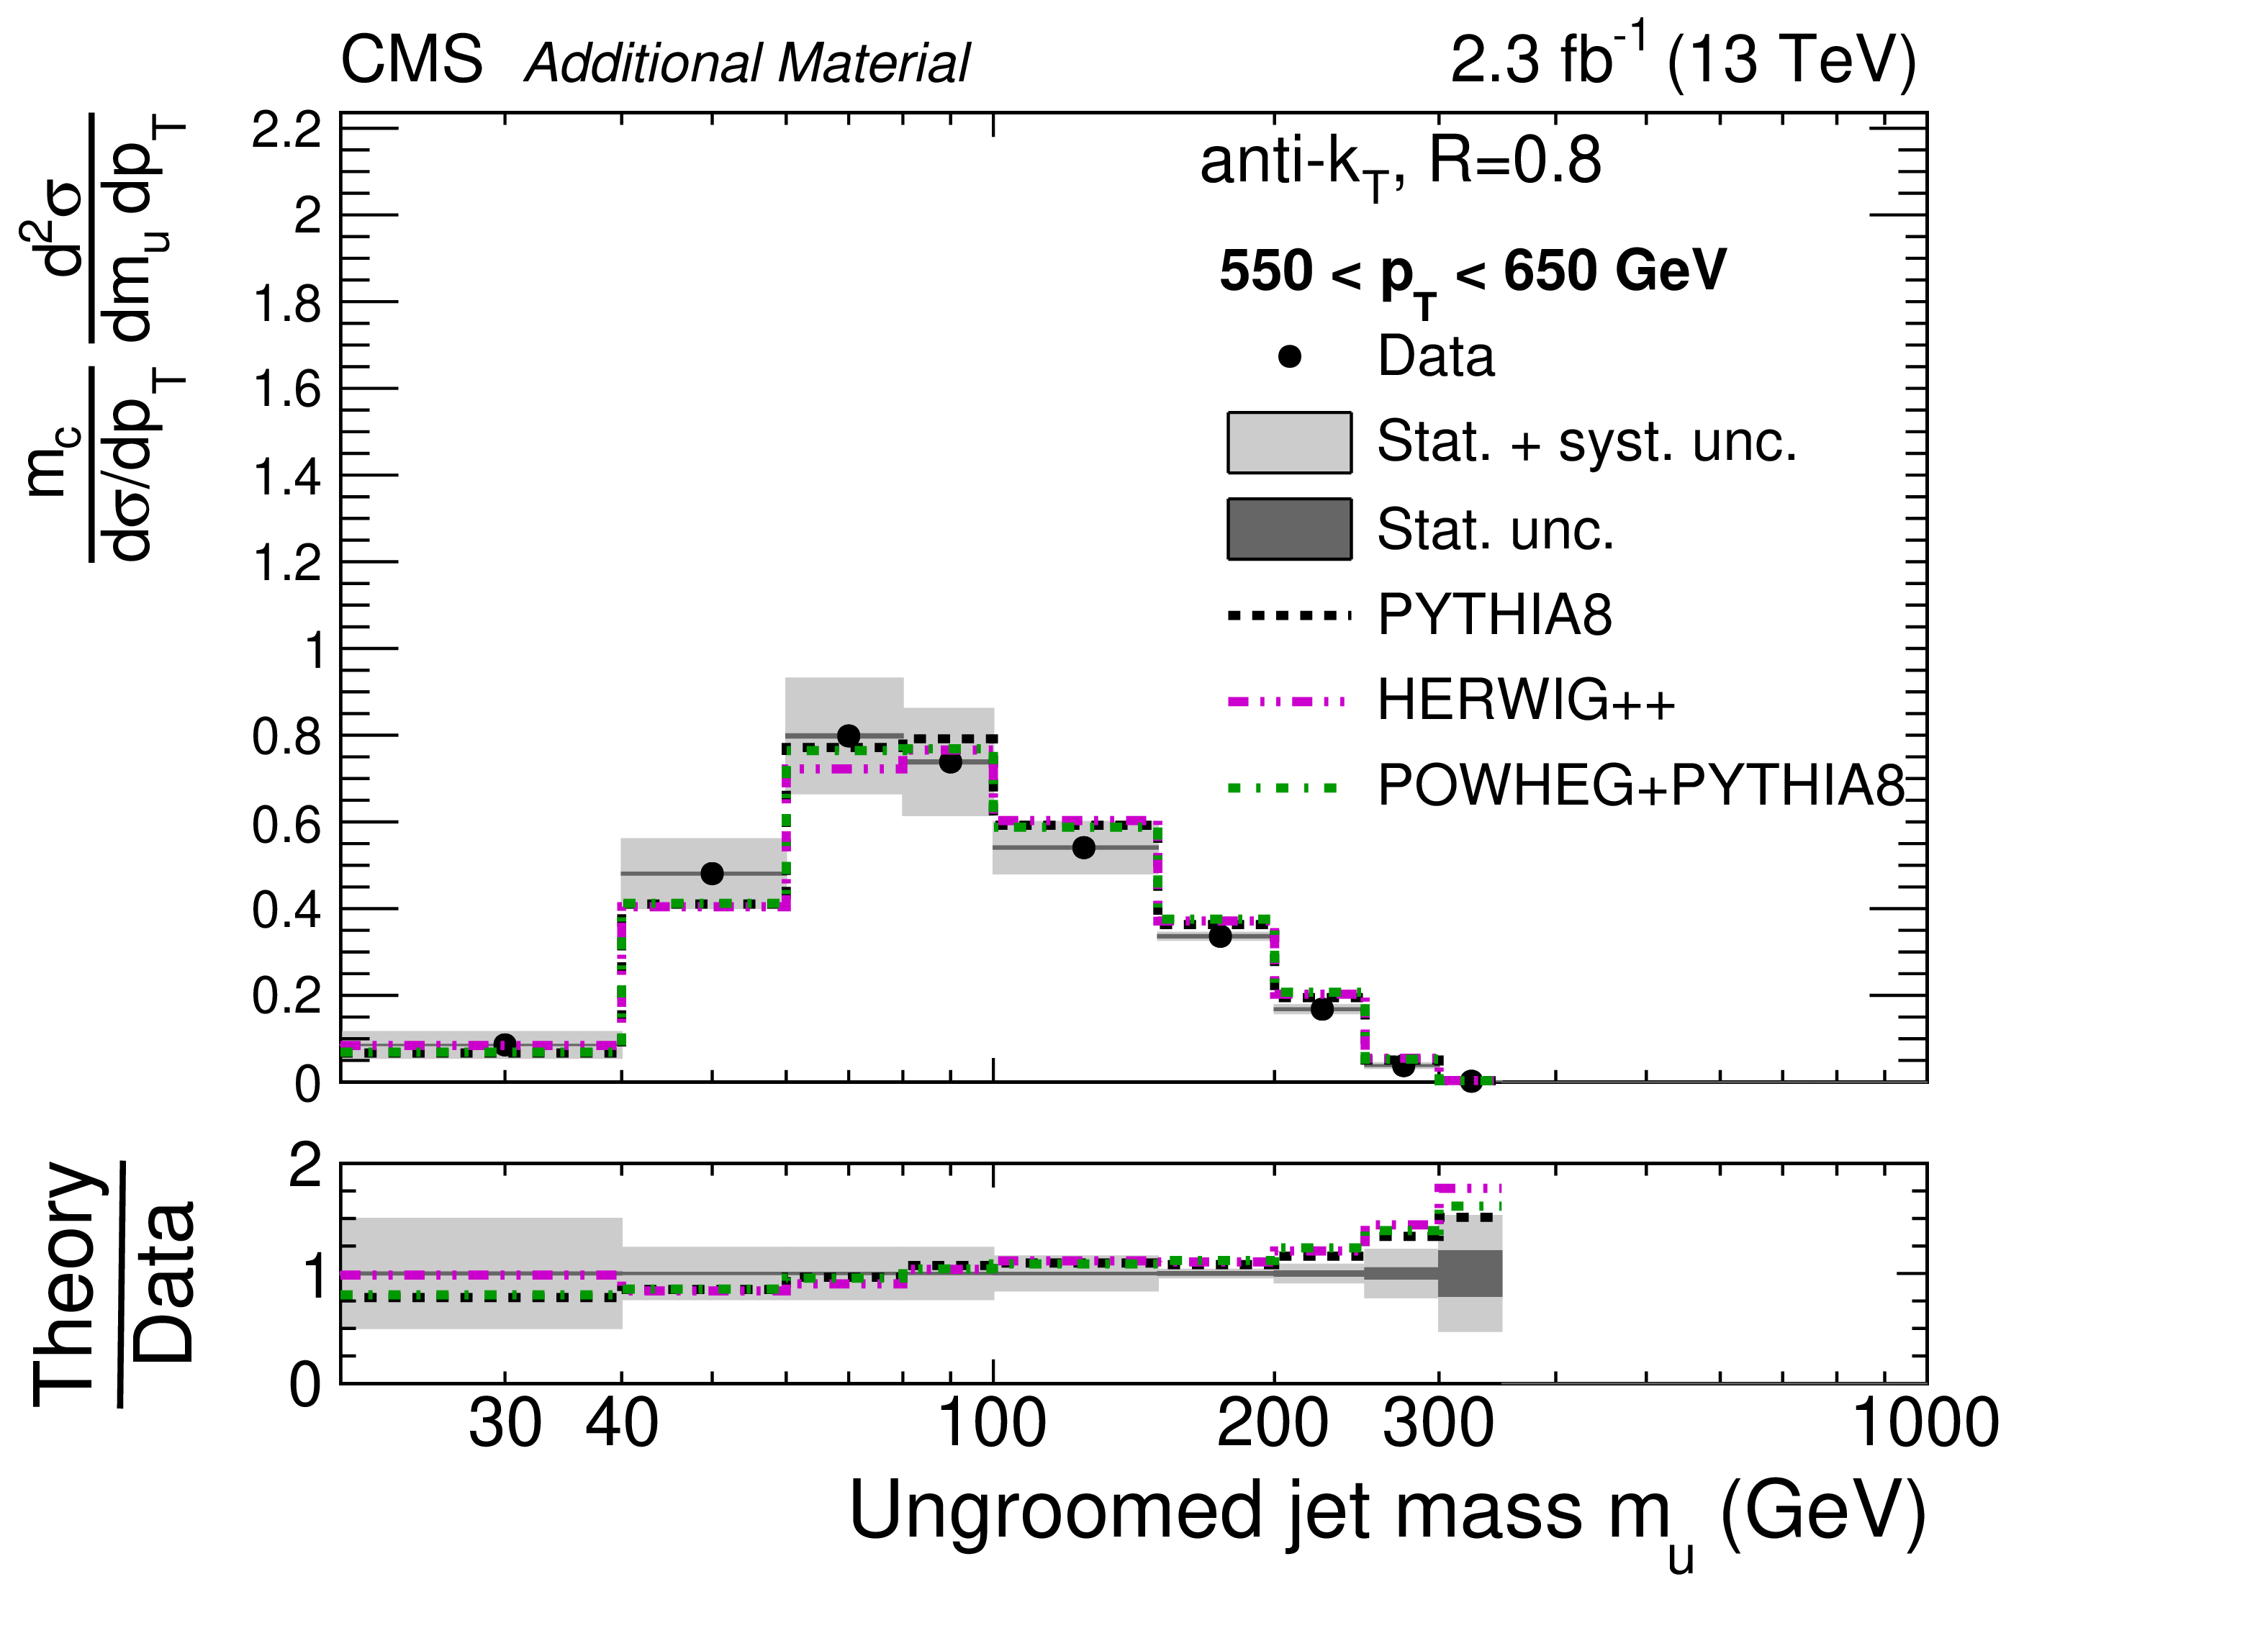
Normalized cross section with respect to $\log{m}$ for groomed jets for 550 $ < {p_{\mathrm {T}}} < $ 650 GeV. The data are shown by the black points, with dark grey bands for the statistical uncertainty (Stat. unc.) and with light grey bands for the total uncertainty (stat.+sys. unc., added in quadrature). The predictions from PYTHIA-8, HERWIG++, and POWHEG+PYTHIA are shown with dashed black, dash-dot-dotted magenta, and dash-dotted green histograms, respectively, with no uncertainties shown. The predictions from Ref. [1] (Frye et. al.) are shown with blue squares. The uncertainties include scale variations and an estimate of nonperturbative effects. The predictions from Ref. [2] (Marzani et. al.) are shown with red triangles. The uncertainties only include effects from scale variations, since nonperturbative corrections have been considered directly in the calculation. The derivative with respect to $\log{m}$ is approximated by multiplying the bin content by the bin center $m_c$. |
png pdf |
Additional Figure 63:
Normalized cross section with respect to $\log{m}$ for groomed jets for 760 $ < {p_{\mathrm {T}}} < $ 900 GeV. The data are shown by the black points, with dark grey bands for the statistical uncertainty (Stat. unc.) and with light grey bands for the total uncertainty (stat.+sys. unc., added in quadrature). The predictions from PYTHIA-8, HERWIG++, and POWHEG+PYTHIA are shown with dashed black, dash-dot-dotted magenta, and dash-dotted green histograms, respectively, with no uncertainties shown. The predictions from Ref. [1] (Frye et. al.) are shown with blue squares. The uncertainties include scale variations and an estimate of nonperturbative effects. The predictions from Ref. [2] (Marzani et. al.) are shown with red triangles. The uncertainties only include effects from scale variations, since nonperturbative corrections have been considered directly in the calculation. The derivative with respect to $\log{m}$ is approximated by multiplying the bin content by the bin center $m_c$. |
png pdf |
Additional Figure 64:
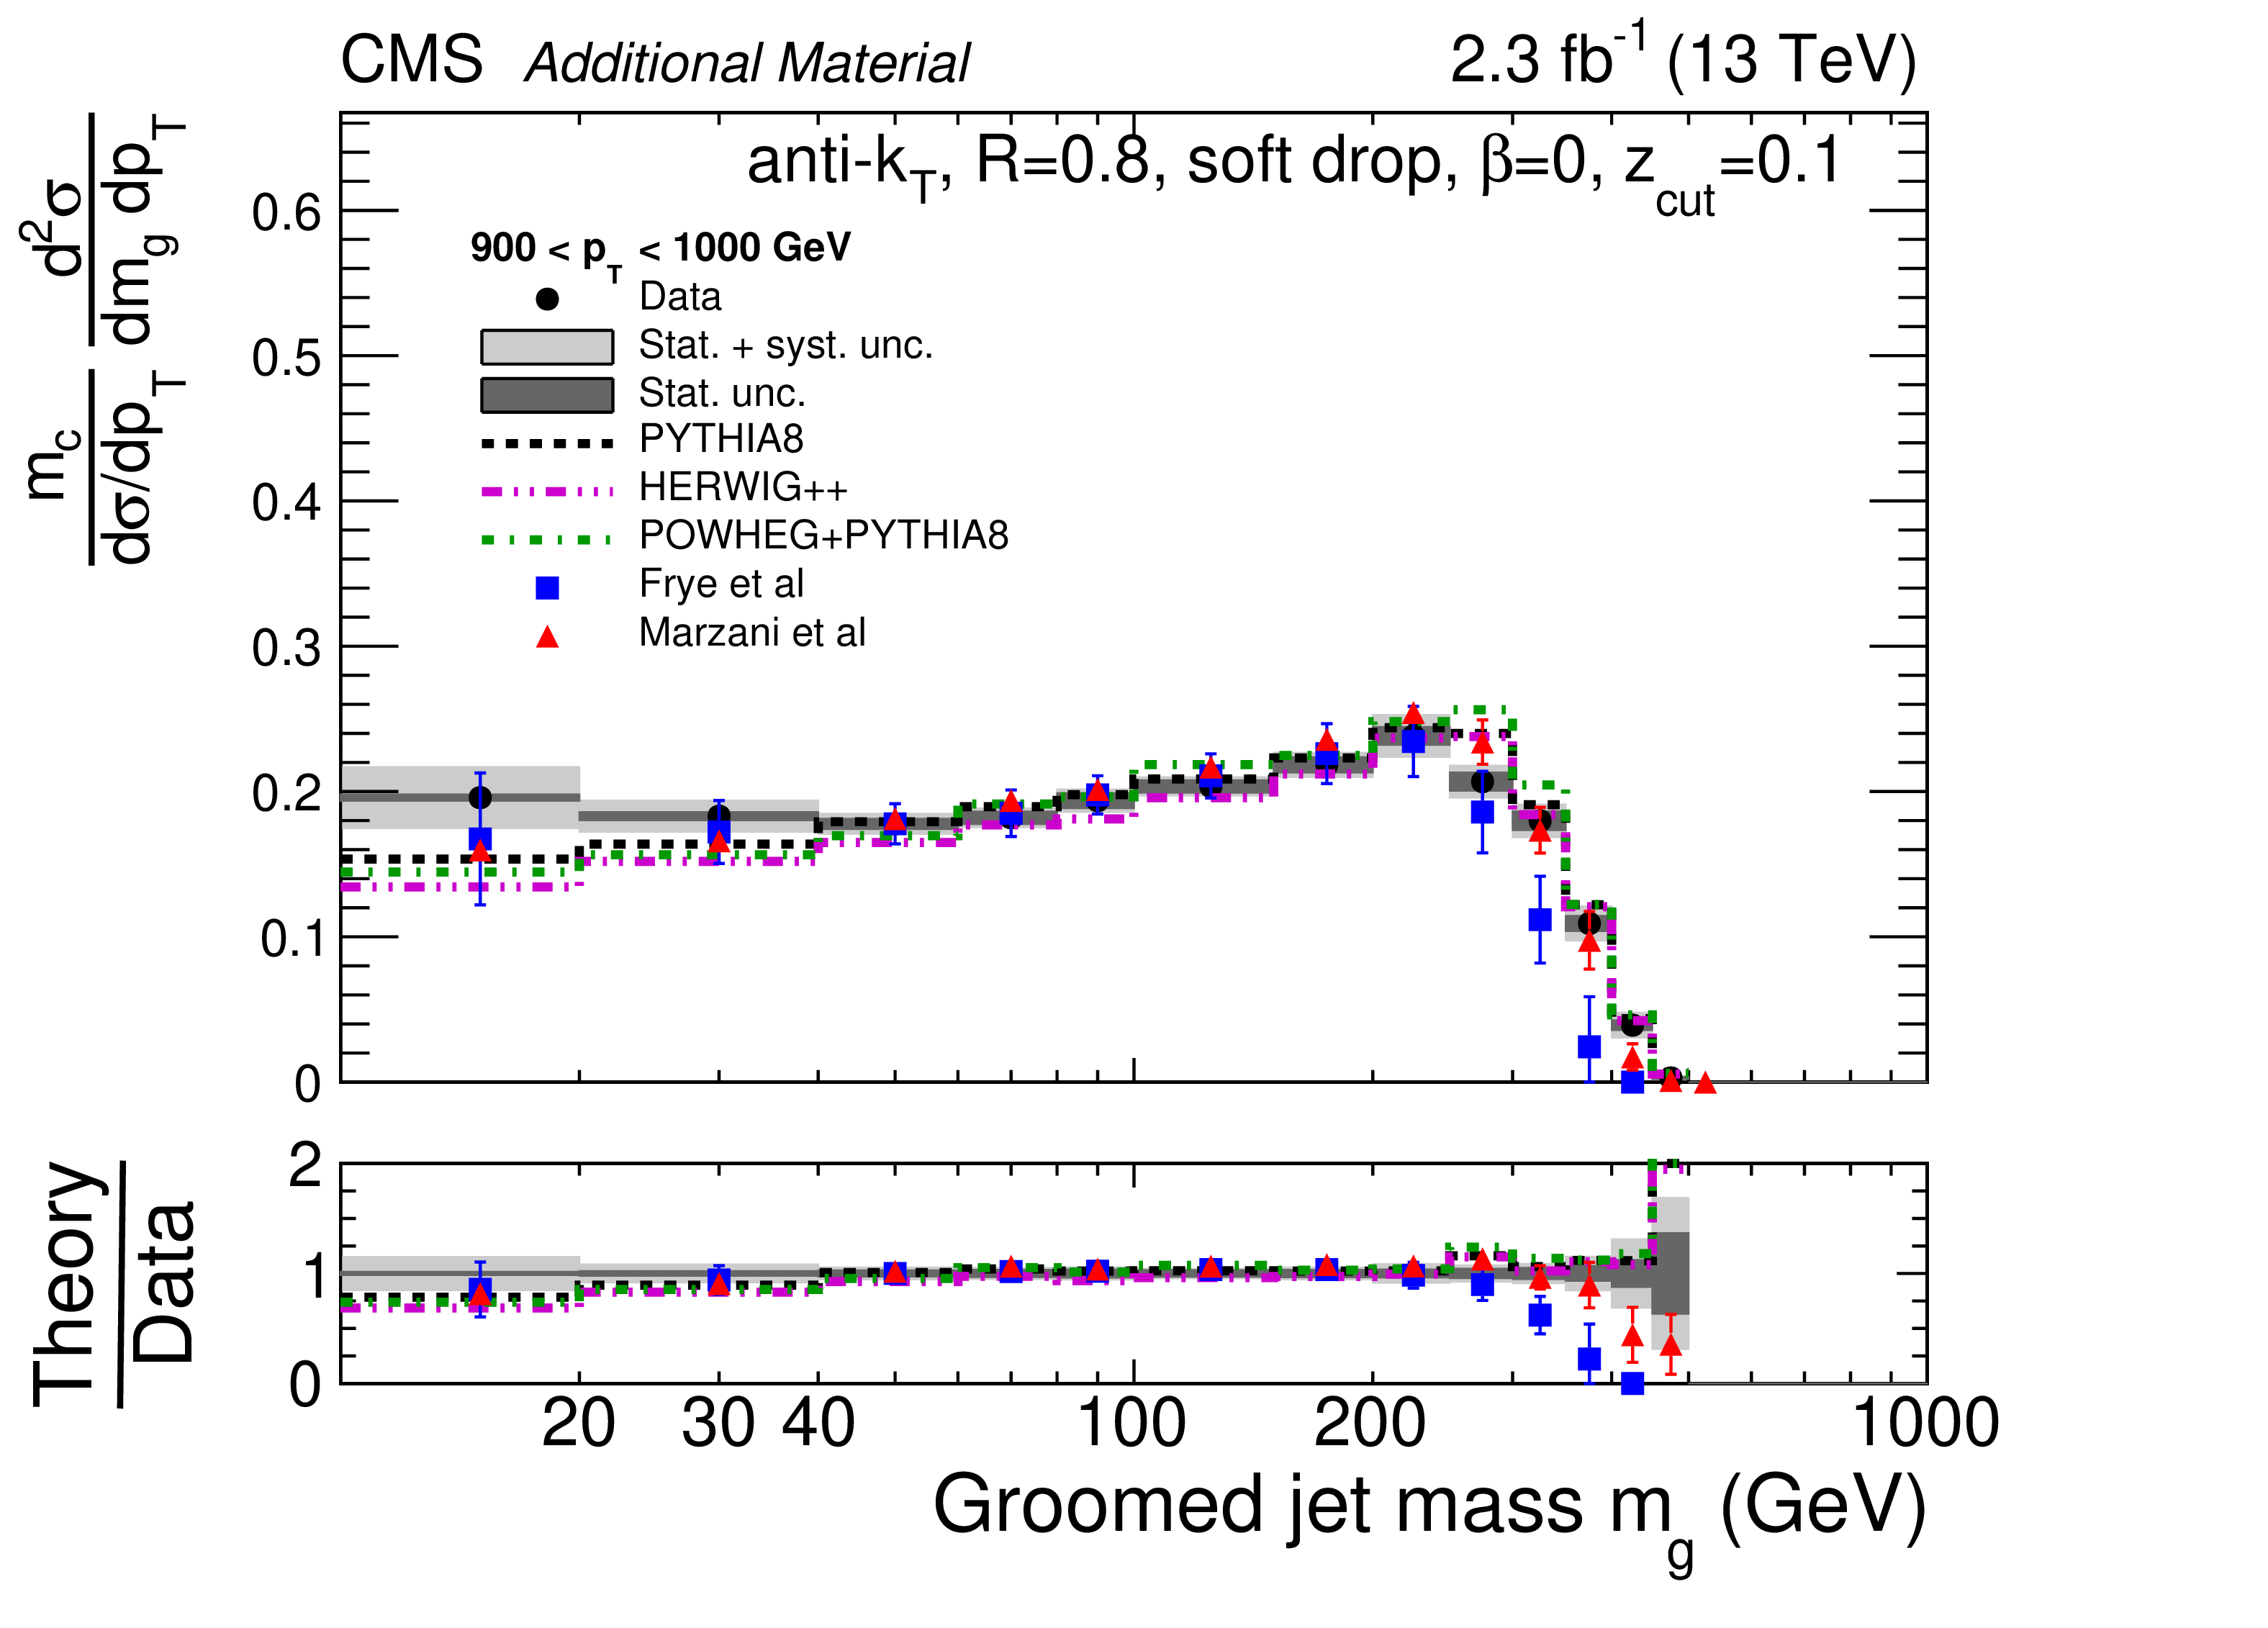
Normalized cross section with respect to $\log{m}$ for groomed jets for 900 $ < {p_{\mathrm {T}}} < $ 1000 GeV. The data are shown by the black points, with dark grey bands for the statistical uncertainty (Stat. unc.) and with light grey bands for the total uncertainty (stat.+sys. unc., added in quadrature). The predictions from PYTHIA-8, HERWIG++, and POWHEG+PYTHIA are shown with dashed black, dash-dot-dotted magenta, and dash-dotted green histograms, respectively, with no uncertainties shown. The predictions from Ref. [1] (Frye et. al.) are shown with blue squares. The uncertainties include scale variations and an estimate of nonperturbative effects. The predictions from Ref. [2] (Marzani et. al.) are shown with red triangles. The uncertainties only include effects from scale variations, since nonperturbative corrections have been considered directly in the calculation. The derivative with respect to $\log{m}$ is approximated by multiplying the bin content by the bin center $m_c$. |
png pdf |
Additional Figure 65:
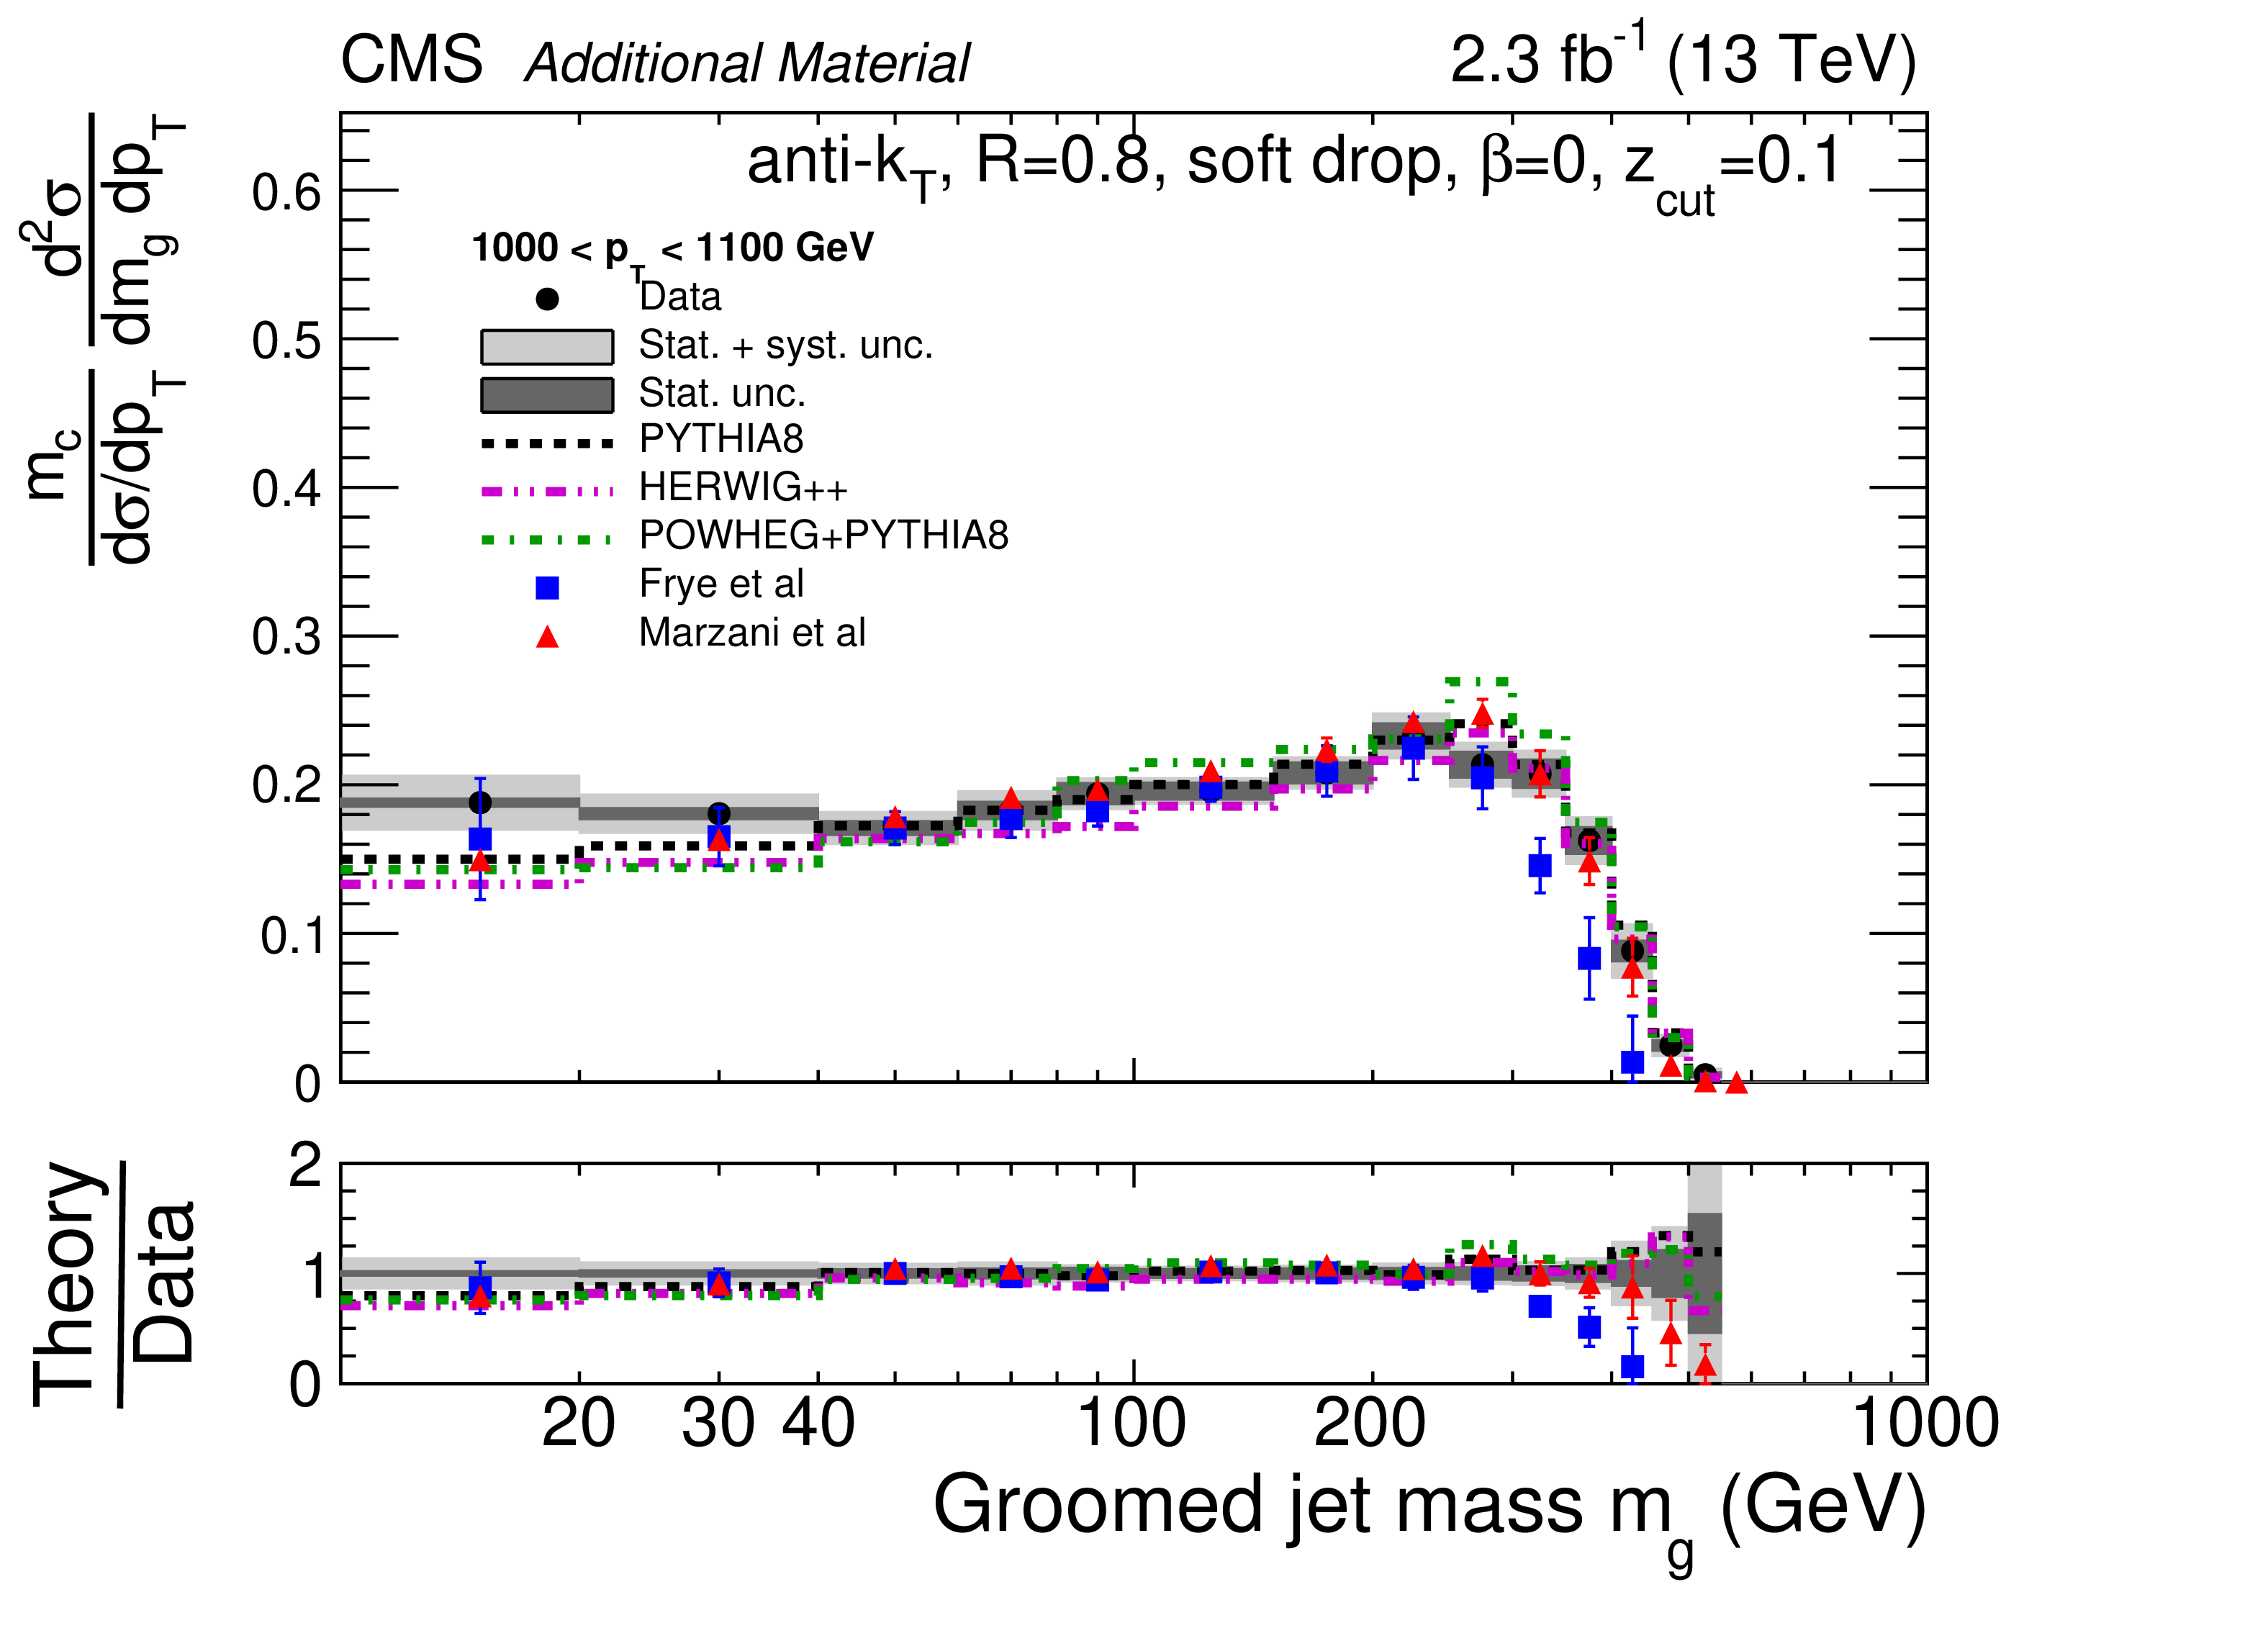
Normalized cross section with respect to $\log{m}$ for groomed jets for 1000 $ < {p_{\mathrm {T}}} < $ 1100 GeV. The data are shown by the black points, with dark grey bands for the statistical uncertainty (Stat. unc.) and with light grey bands for the total uncertainty (stat.+sys. unc., added in quadrature). The predictions from PYTHIA-8, HERWIG++, and POWHEG+PYTHIA are shown with dashed black, dash-dot-dotted magenta, and dash-dotted green histograms, respectively, with no uncertainties shown. The predictions from Ref. [1] (Frye et. al.) are shown with blue squares. The uncertainties include scale variations and an estimate of nonperturbative effects. The predictions from Ref. [2] (Marzani et. al.) are shown with red triangles. The uncertainties only include effects from scale variations, since nonperturbative corrections have been considered directly in the calculation. The derivative with respect to $\log{m}$ is approximated by multiplying the bin content by the bin center $m_c$. |
png pdf |
Additional Figure 66:
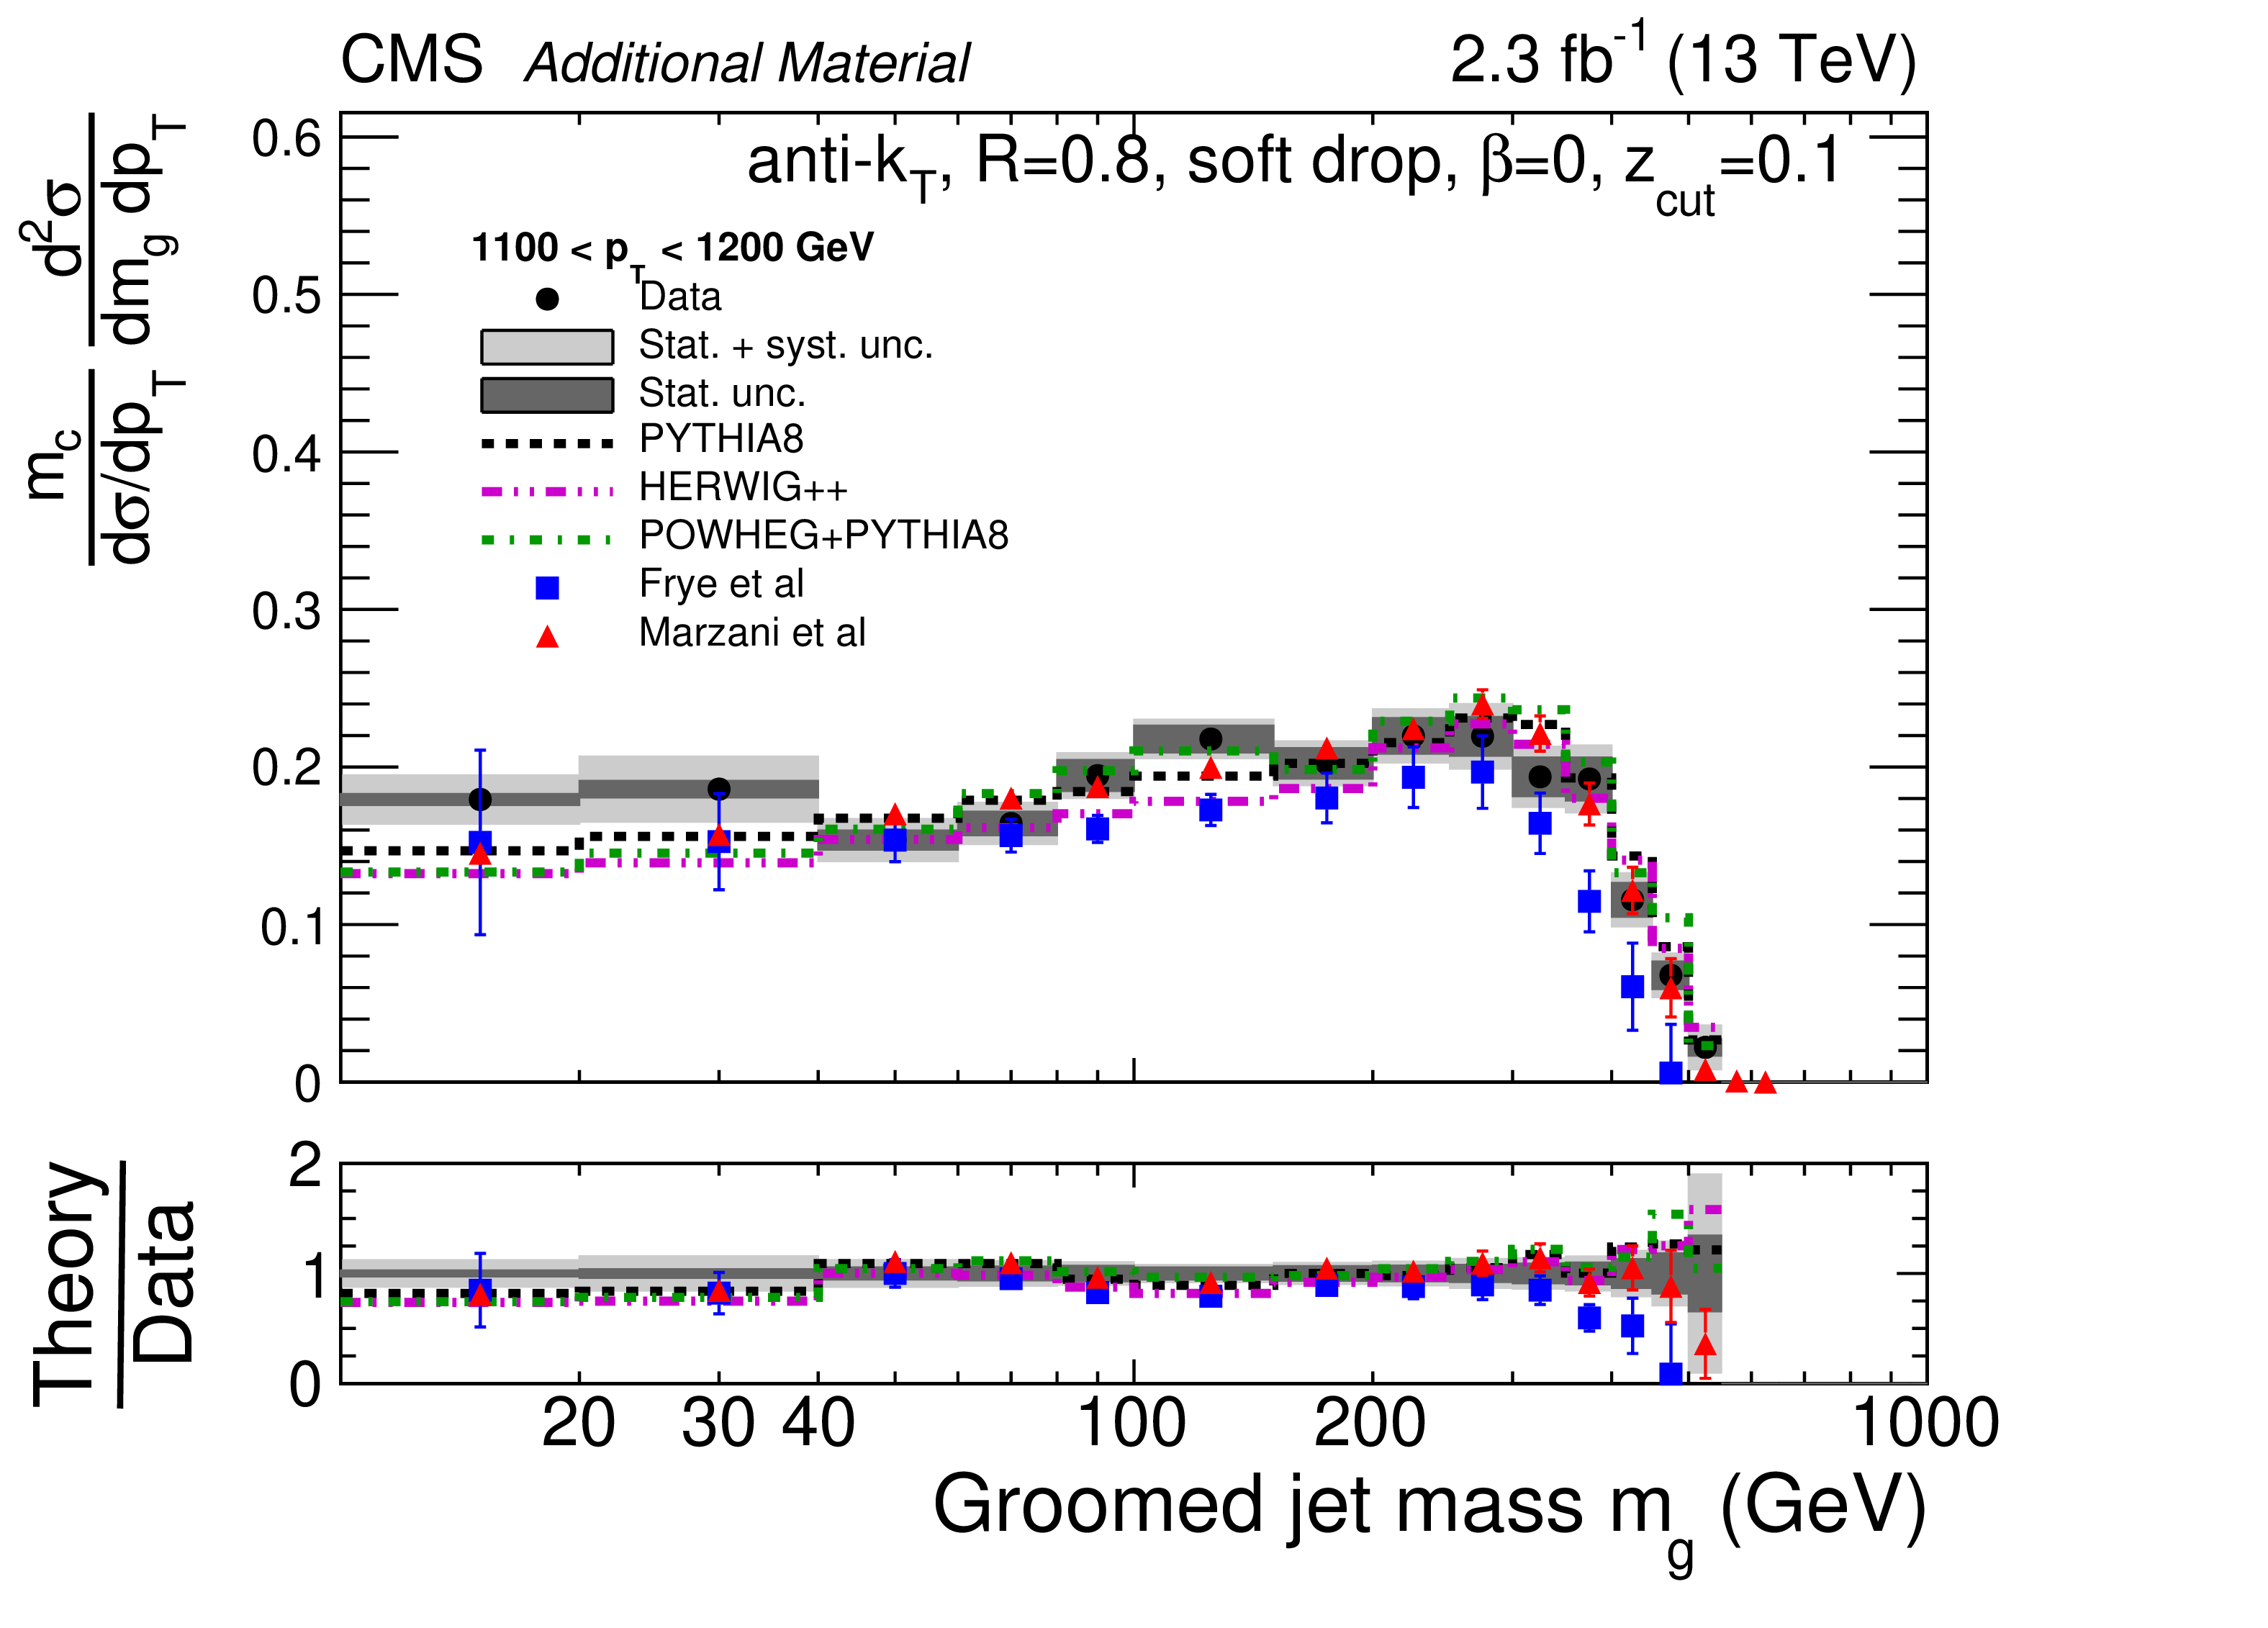
Normalized cross section with respect to $\log{m}$ for groomed jets for 1100 $ < {p_{\mathrm {T}}} < $ 1200 GeV. The data are shown by the black points, with dark grey bands for the statistical uncertainty (Stat. unc.) and with light grey bands for the total uncertainty (stat.+sys. unc., added in quadrature). The predictions from PYTHIA-8, HERWIG++, and POWHEG+PYTHIA are shown with dashed black, dash-dot-dotted magenta, and dash-dotted green histograms, respectively, with no uncertainties shown. The predictions from Ref. [1] (Frye et. al.) are shown with blue squares. The uncertainties include scale variations and an estimate of nonperturbative effects. The predictions from Ref. [2] (Marzani et. al.) are shown with red triangles. The uncertainties only include effects from scale variations, since nonperturbative corrections have been considered directly in the calculation. The derivative with respect to $\log{m}$ is approximated by multiplying the bin content by the bin center $m_c$. |
png pdf |
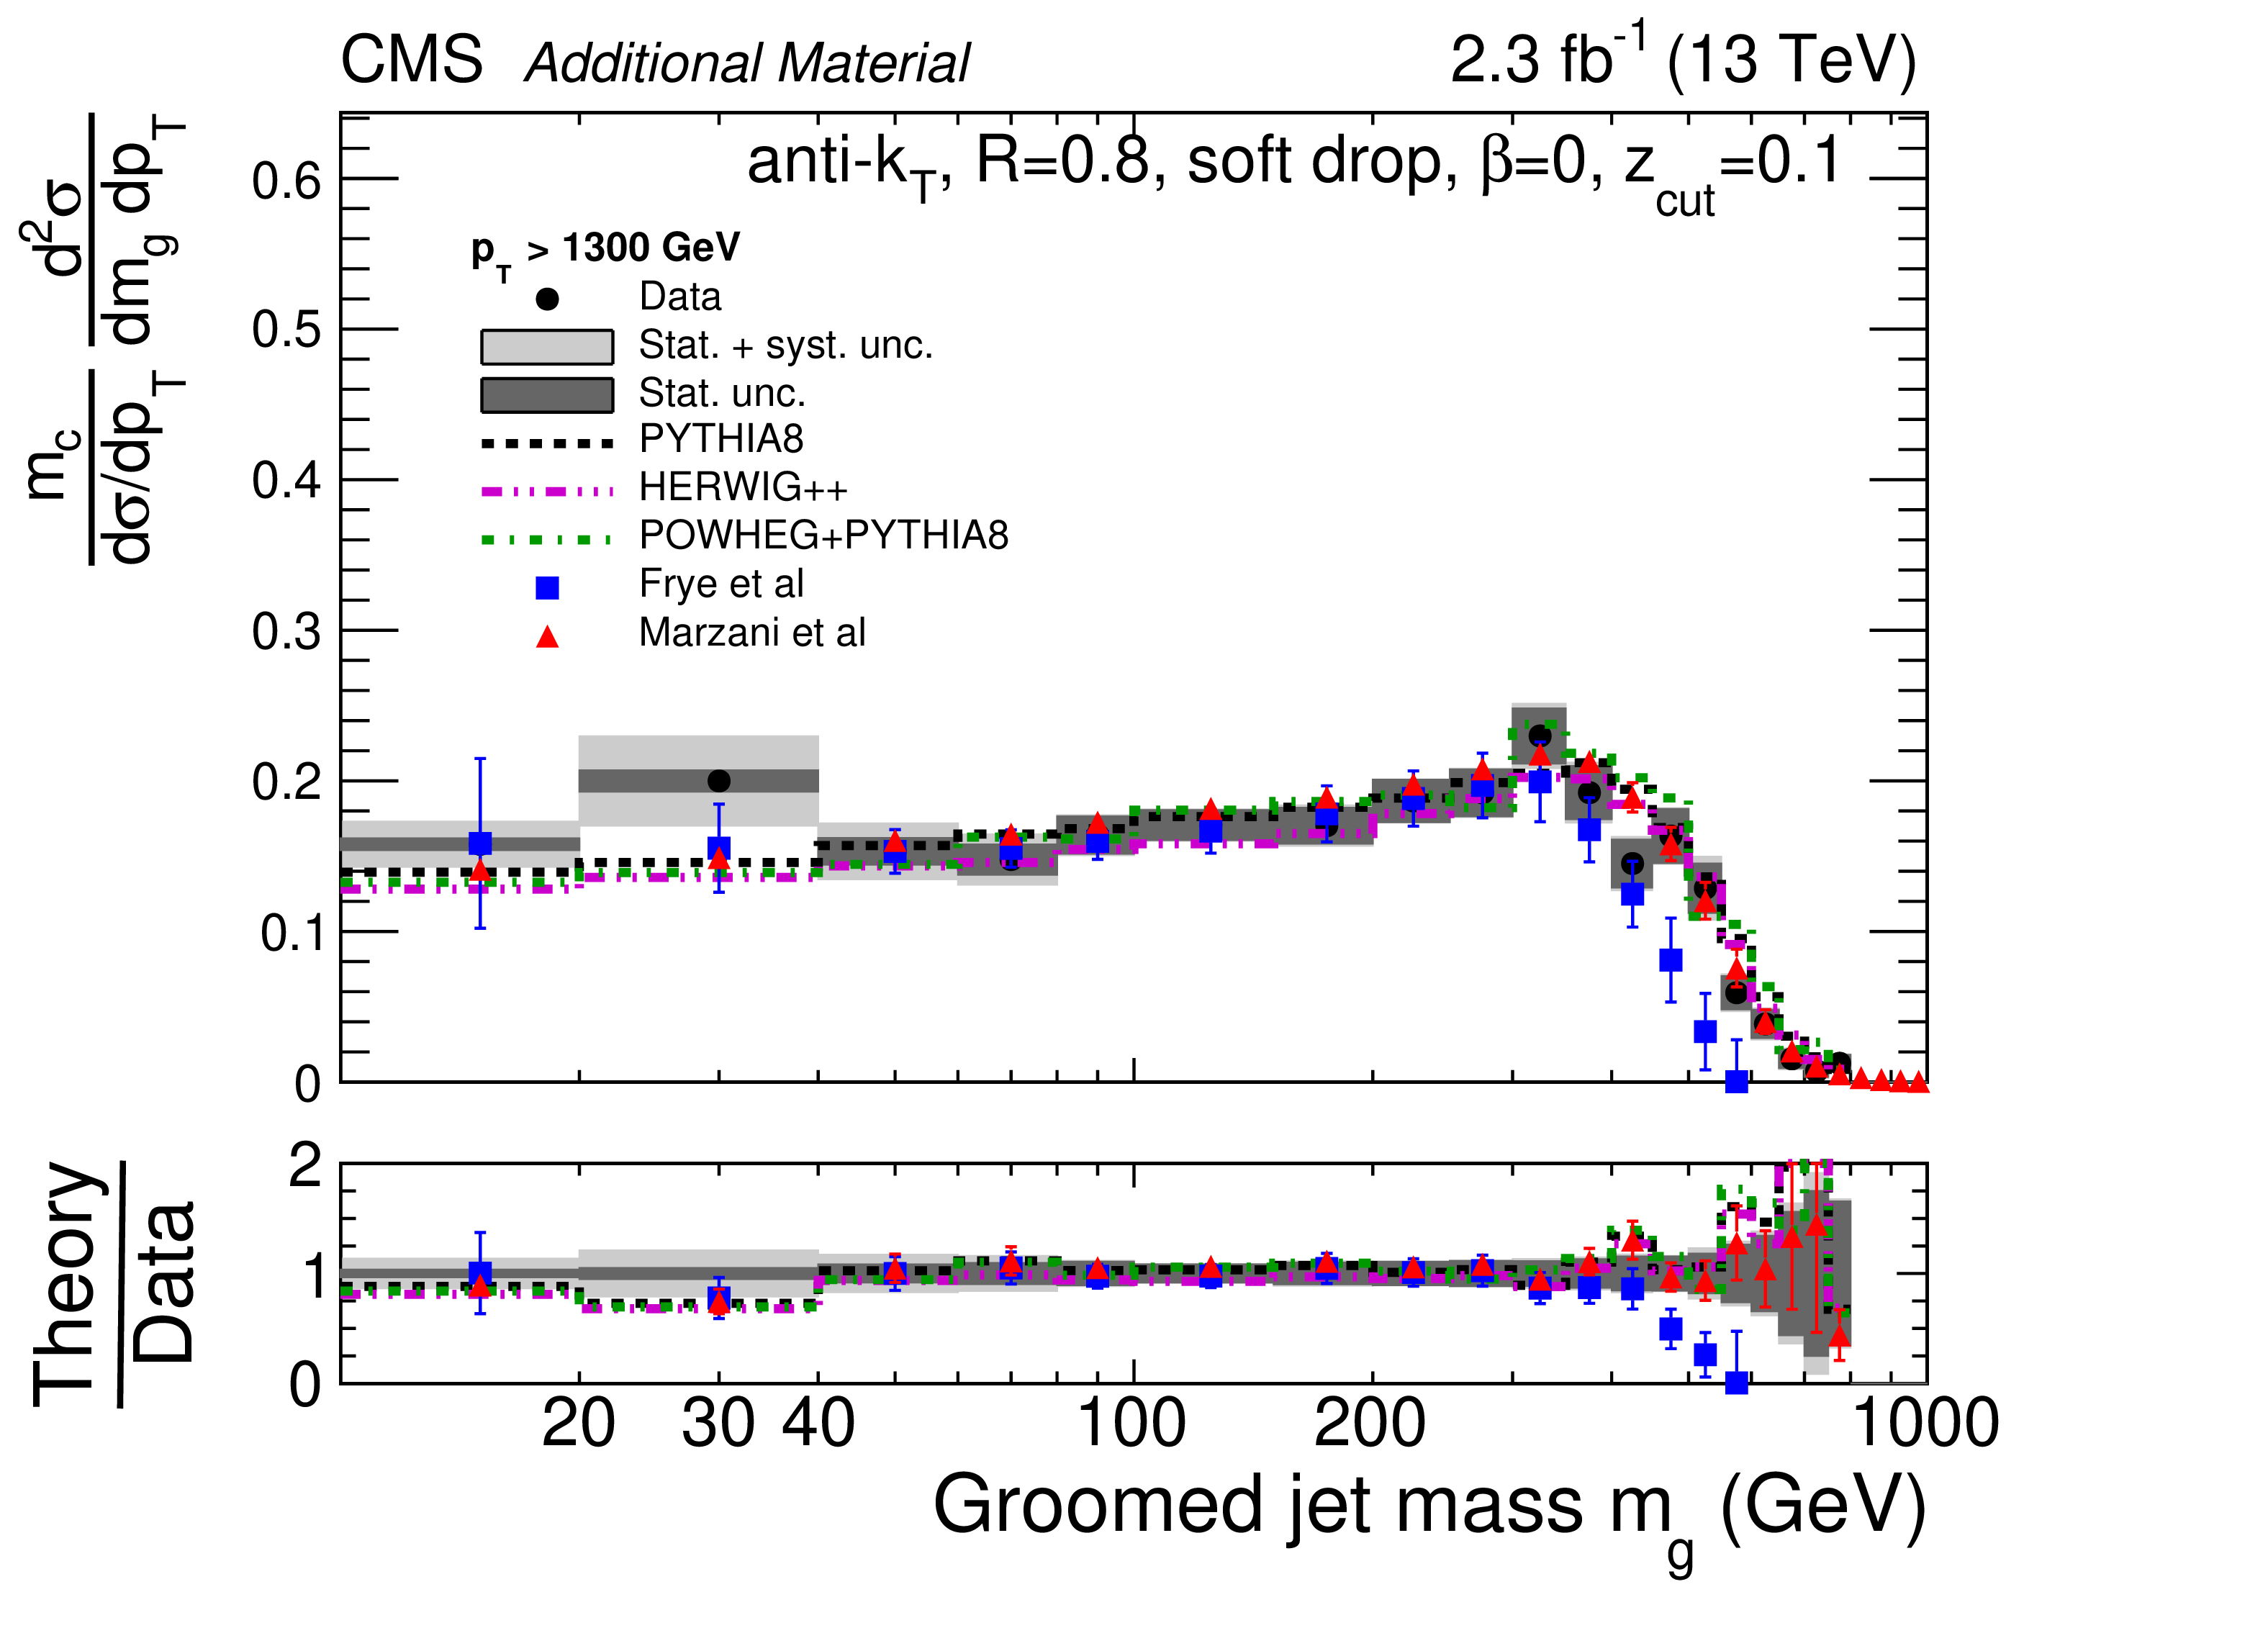
Additional Figure 67:
Normalized cross section with respect to $\log{m}$ for groomed jets for $ {p_{\mathrm {T}}} > $ 1300 GeV. The data are shown by the black points, with dark grey bands for the statistical uncertainty (Stat. unc.) and with light grey bands for the total uncertainty (stat.+sys. unc., added in quadrature). The predictions from PYTHIA-8, HERWIG++, and POWHEG+PYTHIA are shown with dashed black, dash-dot-dotted magenta, and dash-dotted green histograms, respectively, with no uncertainties shown. The predictions from Ref. [1] (Frye et. al.) are shown with blue squares. The uncertainties include scale variations and an estimate of nonperturbative effects. The predictions from Ref. [2] (Marzani et. al.) are shown with red triangles. The uncertainties only include effects from scale variations, since nonperturbative corrections have been considered directly in the calculation. The derivative with respect to $\log{m}$ is approximated by multiplying the bin content by the bin center $m_c$. |
| References | ||||
| 1 | S. Hoche | Introduction to parton-shower event generators | in Proceedings, Theoretical Advanced Study Institute in Elementary Particle Physics (TASI 2014): Boulder, Colorado, June 2014 | 1411.4085 |
| 2 | A. Buckley et al. | General-purpose event generators for LHC physics | PR 504 (2011) 145 | 1101.2599 |
| 3 | A. Abdesselam et al. | Boosted objects: A probe of beyond the standard model physics | EPJC 71 (2011) 1661 | 1012.5412 |
| 4 | A. Altheimer et al. | Boosted objects and jet substructure at the LHC. Report of BOOST2012, held at IFIC Valencia, 23rd-27th of July 2012 | EPJC 74 (2014) 2792 | 1311.2708 |
| 5 | D. Adams et al. | Towards an understanding of the correlations in jet substructure | EPJC 75 (2015) 409 | 1504.00679 |
| 6 | M. Dasgupta, A. Fregoso, S. Marzani, and G. P. Salam | Towards an understanding of jet substructure | JHEP 09 (2013) 029 | 1307.0007 |
| 7 | CMS Collaboration | Studies of jet mass in dijet and W/Z + jet events | JHEP 05 (2013) 090 | CMS-SMP-12-019 1303.4811 |
| 8 | M. Dasgupta and G. P. Salam | Resummation of nonglobal QCD observables | PLB 512 (2001) 323 | hep-ph/0104277 |
| 9 | S. Catani, L. Trentadue, G. Turnock, and B. R. Webber | Resummation of large logarithms in $ \mathrm{e^{+}e^{-}} $ event shape distributions | NPB 407 (1993) 3 | |
| 10 | A. Banfi, G. P. Salam, and G. Zanderighi | Semi-numerical resummation of event shapes | JHEP 01 (2002) 018 | hep-ph/0112156 |
| 11 | A. Banfi, G. P. Salam, and G. Zanderighi | Phenomenology of event shapes at hadron colliders | JHEP 06 (2010) 038 | 1001.4082 |
| 12 | A. J. Larkoski, S. Marzani, G. Soyez, and J. Thaler | Soft Drop | JHEP 05 (2014) 146 | 1402.2657 |
| 13 | M. Dasgupta, A. Fregoso, S. Marzani, and A. Powling | Jet substructure with analytical methods | EPJC 73 (2013) 2623 | 1307.0013 |
| 14 | M. Dasgupta, A. Powling, and A. Siodmok | On jet substructure methods for signal jets | JHEP 08 (2015) 079 | 1503.01088 |
| 15 | A. J. Larkoski, I. Moult, and D. Neill | Non-global logarithms, factorization, and the soft substructure of jets | JHEP 09 (2015) 143 | 1501.04596 |
| 16 | J. M. Butterworth, A. R. Davison, M. Rubin, and G. P. Salam | Jet substructure as a new Higgs search channel at the LHC | PRL 100 (2008) 242001 | 0802.2470 |
| 17 | C. Frye, A. J. Larkoski, M. D. Schwartz, and K. Yan | Factorization for groomed jet substructure beyond the next-to-leading logarithm | JHEP 07 (2016) 064 | 1603.09338 |
| 18 | S. Marzani, L. Schunk, and G. Soyez | A study of jet mass distributions with grooming | JHEP 07 (2017) 132 | 1704.02210 |
| 19 | ATLAS Collaboration | A measurement of the soft-drop jet mass in pp collisions at $ \sqrt{s} = $ 13 TeV with the ATLAS detector | Submitted to PRL (2017) | 1711.08341 |
| 20 | T. Sjostrand et al. | An Introduction to PYTHIA 8.2 | CPC 191 (2015) 159 | 1410.3012 |
| 21 | CMS Collaboration | Event generator tunes obtained from underlying event and multiparton scattering measurements | EPJC 76 (2016) 155 | CMS-GEN-14-001 1512.00815 |
| 22 | NNPDF Collaboration | Parton distributions for the LHC Run II | JHEP 04 (2015) 040 | 1410.8849 |
| 23 | A. Buckley et al. | LHAPDF6: parton density access in the LHC precision era | EPJC 75 (2015) 132 | 1412.7420 |
| 24 | J. Butterworth et al. | PDF4LHC recommendations for LHC Run II | JPG 43 (2016) 023001 | 1510.03865 |
| 25 | M. Bahr et al. | Herwig++ physics and manual | EPJC 58 (2008) 639 | 0803.0883 |
| 26 | P. Nason | A new method for combining NLO QCD with shower Monte Carlo algorithms | JHEP 11 (2004) 040 | hep-ph/0409146 |
| 27 | S. Frixione, P. Nason, and C. Oleari | Matching NLO QCD computations with parton shower simulations: the POWHEG method | JHEP 11 (2007) 070 | 0709.2092 |
| 28 | S. Alioli, P. Nason, C. Oleari, and E. Re | A general framework for implementing NLO calculations in shower Monte Carlo programs: the POWHEG BOX | JHEP 06 (2010) 043 | 1002.2581 |
| 29 | S. Alioli et al. | Jet pair production in POWHEG | JHEP 04 (2011) 081 | 1012.3380 |
| 30 | J. Alwall et al. | The automated computation of tree-level and next-to-leading order differential cross sections, and their matching to parton shower simulations | JHEP 07 (2014) 079 | 1405.0301 |
| 31 | Z. Nagy | Next-to-leading order calculation of three jet observables in hadron-hadron collision | PRD 68 (2003) 094002 | hep-ph/0307268 |
| 32 | S. Dulat et al. | New parton distribution functions from a global analysis of quantum chromodynamics | PRD 93 (2016) 033006 | 1506.07443 |
| 33 | CMS Collaboration | The CMS experiment at the CERN LHC | JINST 3 (2008) S08004 | CMS-00-001 |
| 34 | CMS Collaboration | The CMS trigger system | JINST 12 (2017) P01020 | CMS-TRG-12-001 1609.02366 |
| 35 | CMS Collaboration | Particle-flow reconstruction and global event description with the CMS detector | JINST 12 (2017) P10003 | CMS-PRF-14-001 1706.04965 |
| 36 | CMS Collaboration | Pileup removal algorithms | CMS-PAS-JME-14-001 | CMS-PAS-JME-14-001 |
| 37 | M. Cacciari, G. P. Salam, and G. Soyez | The anti-$ {k_{\mathrm{T}}} $ jet clustering algorithm | JHEP 04 (2008) 063 | 0802.1189 |
| 38 | M. Cacciari, G. P. Salam, and G. Soyez | FastJet user manual | EPJC 72 (2012) 1896 | 1111.6097 |
| 39 | Y. L. Dokshitzer, G. D. Leder, S. Moretti, and B. R. Webber | Better jet clustering algorithms | JHEP 08 (1997) 001 | hep-ph/9707323 |
| 40 | M. Wobisch and T. Wengler | Hadronization corrections to jet cross sections in deep-inelastic scattering | in Monte Carlo generators for HERA physics. Proceedings, Workshop, Hamburg, Germany, 1998-1999, p. 270 1998 | hep-ph/9907280 |
| 41 | M. Cacciari and G. P. Salam | Pileup subtraction using jet areas | PLB 659 (2008) 119 | 0707.1378 |
| 42 | CMS Collaboration | Jet energy scale and resolution in the CMS experiment in pp collisions at 8 TeV | JINST 12 (2017) P02014 | CMS-JME-13-004 1607.03663 |
| 43 | CMS Collaboration | Search for massive resonances decaying into WW, WZ or ZZ bosons in proton-proton collisions at $ \sqrt{s} = $ 13 TeV | JHEP 03 (2017) 162 | CMS-B2G-16-004 1612.09159 |
| 44 | CMS Collaboration | Identification techniques for highly boosted W bosons that decay into hadrons | JHEP 12 (2014) 017 | CMS-JME-13-006 1410.4227 |
| 45 | CMS Collaboration | Measurement of the double-differential inclusive jet cross section in proton-proton collisions at $ \sqrt{s} = $ 13 TeV | EPJC 76 (2016) 451 | CMS-SMP-15-007 1605.04436 |
| 46 | CMS Collaboration | Jet algorithms performance in 13 TeV data | CMS-PAS-JME-16-003 | CMS-PAS-JME-16-003 |
| 47 | G. D'Agostini | A multidimensional unfolding method based on Bayes' theorem | NIMA 362 (1995) 487 | |
| 48 | W. H. Richardson | Bayesian-based iterative method of image restoration | J. Opt. Soc. Am. 62 (1972) 55 | |
| 49 | L. B. Lucy | An iterative technique for the rectification of observed distributions | Astron. J. 79 (1974) 745 | |
| 50 | J. Tukey, J. Kiefer, and B. Owen | Abstracts of papers | Ann. Math. Statis. 29 (1958) 614 | |
| 51 | M. H. Quenouille | Approximate tests of correlation in time-series | J. Royal Stat. Soc. B 11 (1949) 68 | |
| 52 | CMS Collaboration | Determination of jet energy calibration and transverse momentum resolution in CMS | JINST 6 (2011) P11002 | CMS-JME-10-011 1107.4277 |
| 53 | CMS Collaboration | CMS luminosity measurement for the 2015 data taking period | CMS-PAS-LUM-15-001 | CMS-PAS-LUM-15-001 |
|
|
Compact Muon Solenoid LHC, CERN |
|

|

|

|

|

|