

Compact Muon Solenoid
LHC, CERN
| CMS-B2G-16-004 ; CERN-EP/2016-296 | ||
| Search for massive resonances decaying into WW, WZ or ZZ bosons in proton-proton collisions at $\sqrt{s} = $ 13 TeV | ||
| CMS Collaboration | ||
| 29 December 2016 | ||
| JHEP 03 (2017) 162 | ||
| Abstract: A search is presented for new massive resonances decaying to WW, WZ or ZZ bosons in $\ell\nu\mathrm{q\bar{q}}$ and $\mathrm{q\bar{q}}\mathrm{q\bar{q}}$ final states. Results are based on data corresponding to an integrated luminosity of 2.3-2.7 fb$^{-1}$ recorded in proton-proton collisions at $\sqrt{s} = $ 13 TeV with the CMS detector at the LHC. Decays of spin-1 and spin-2 resonances into two vector bosons are sought in the mass range 0.6-4.0 TeV. No significant excess over the standard model background is observed. Combining the results of the $\ell\nu\mathrm{q\bar{q}}$ and $\mathrm{q\bar{q}}\mathrm{q\bar{q}}$ final states, cross section and mass exclusion limits are set for models that predict heavy spin-1 and spin-2 resonances. This is the first search for a narrow-width spin-2 resonance at $\sqrt{s} = $ 13 TeV. | ||
| Links: e-print arXiv:1612.09159 [hep-ex] (PDF) ; CDS record ; inSPIRE record ; CADI line (restricted) ; | ||
| Figures | |
png pdf |
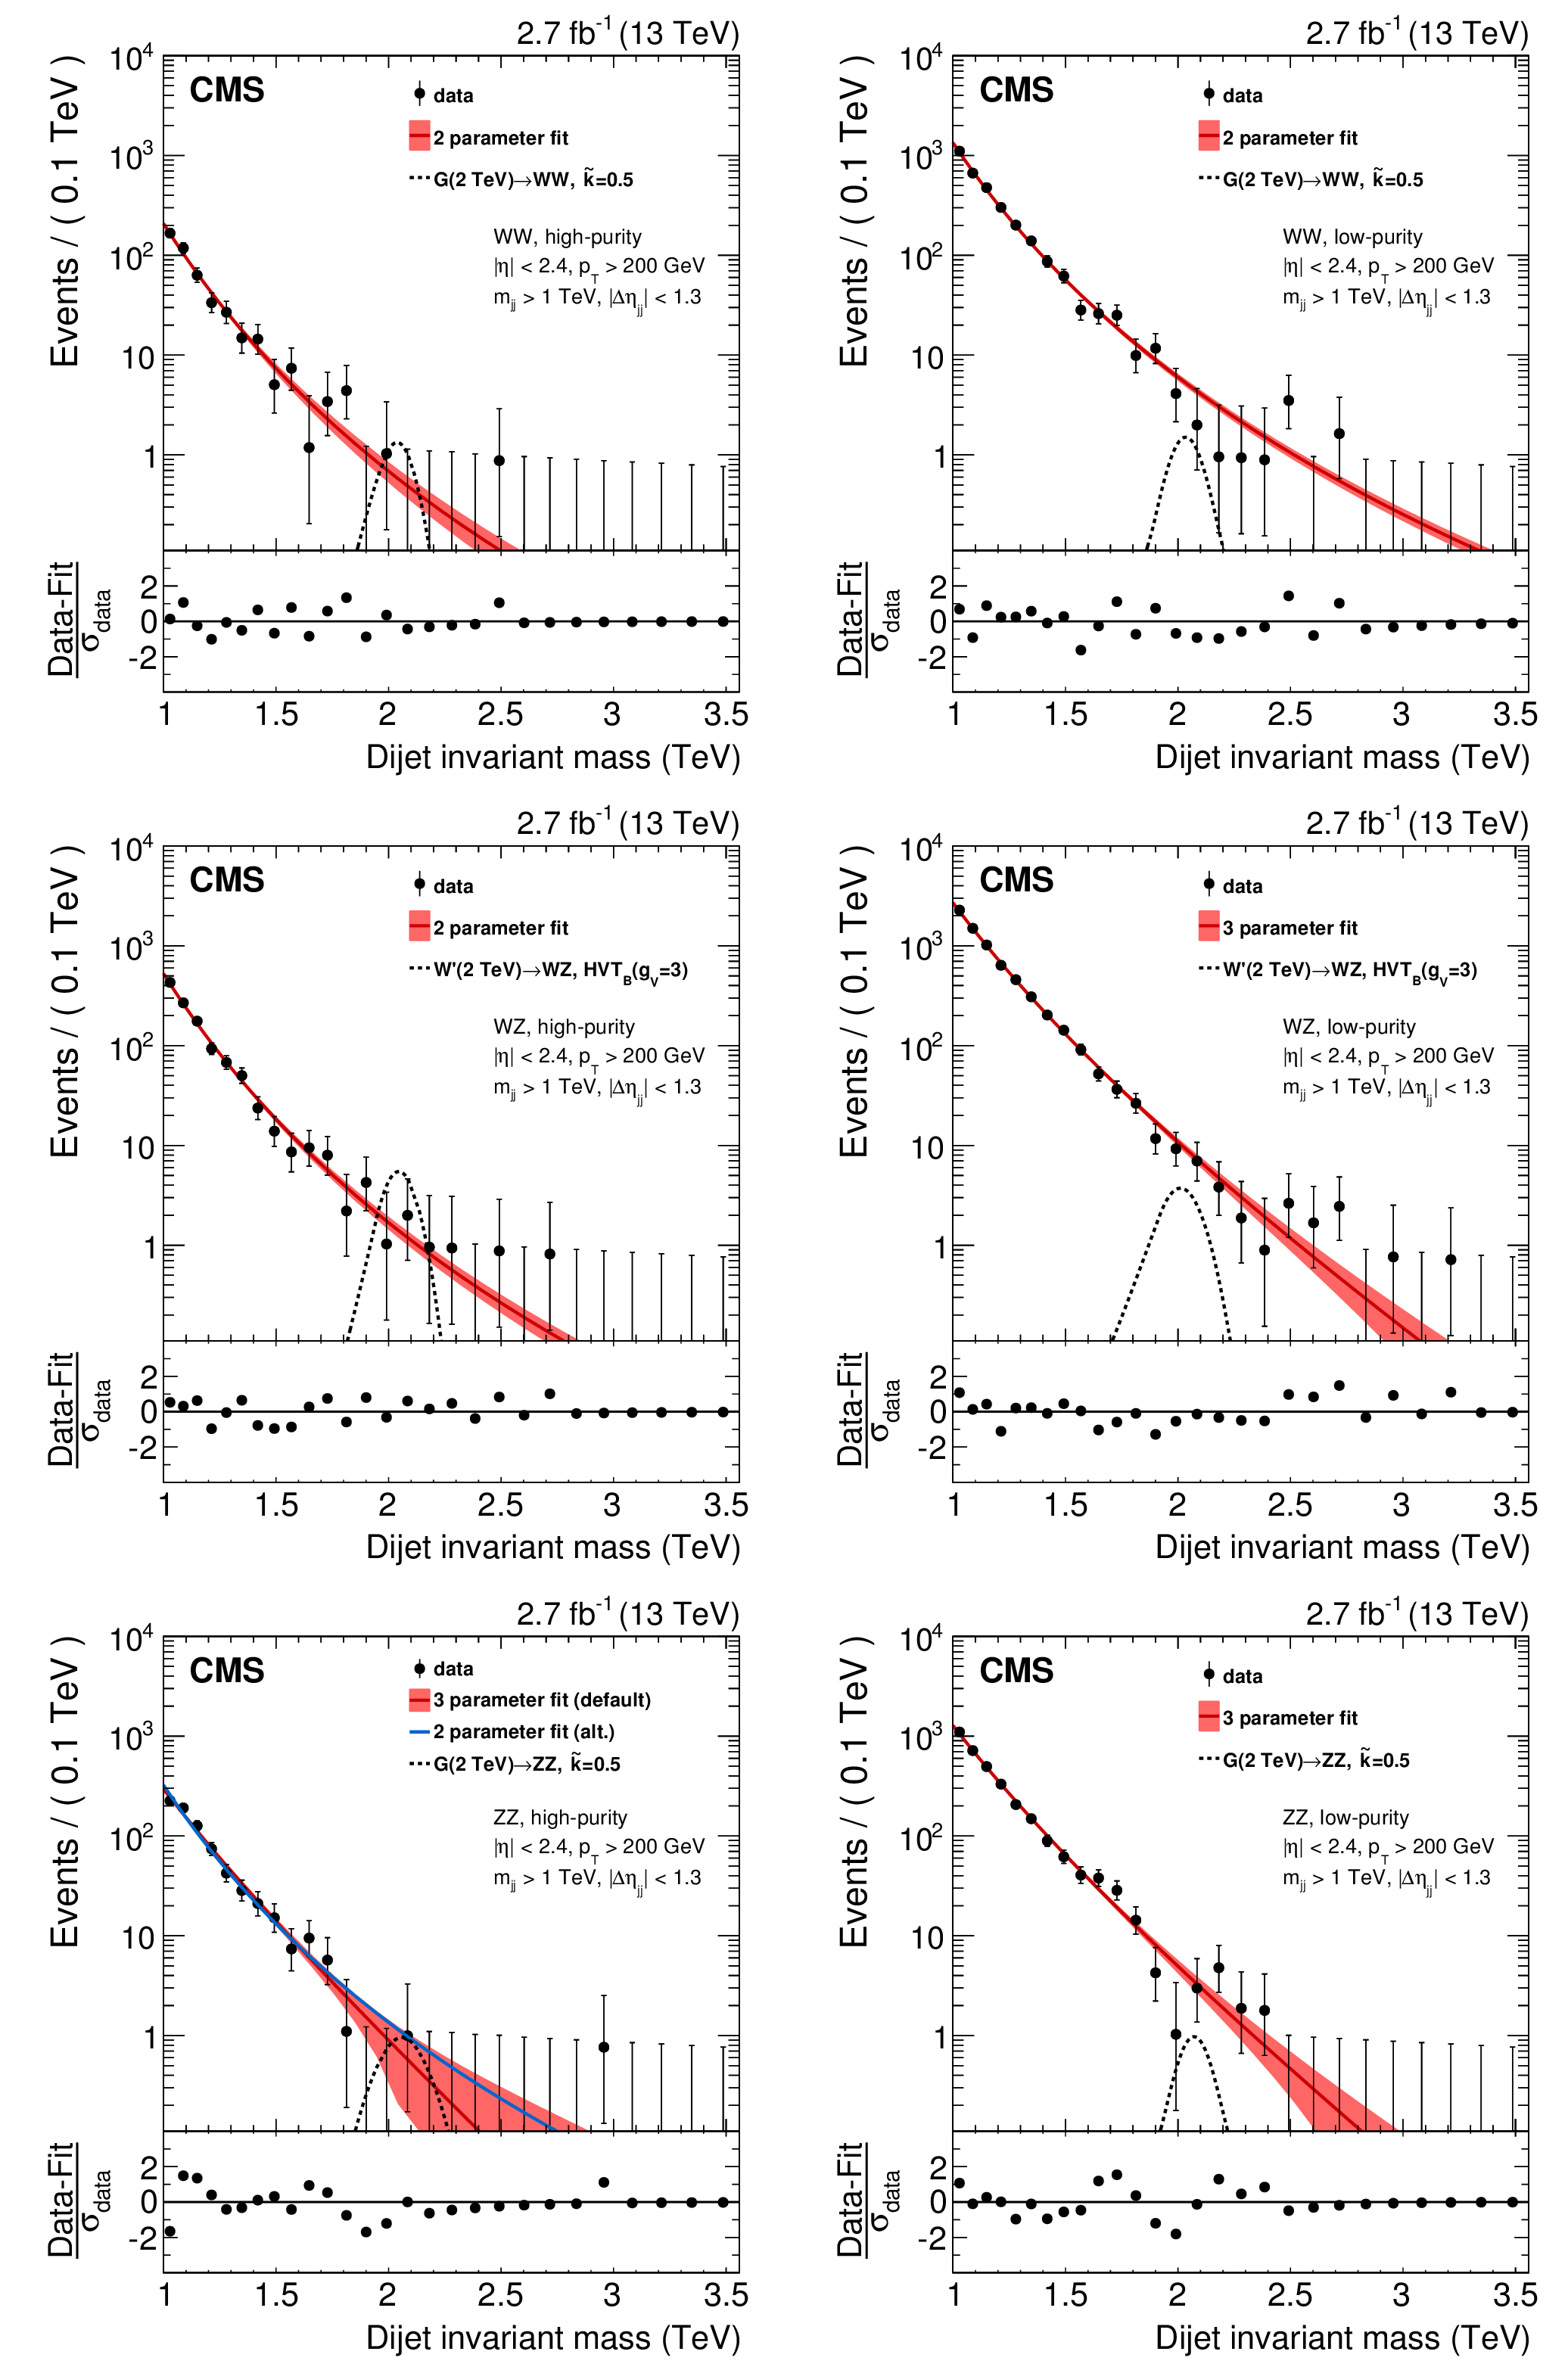
Figure 1:
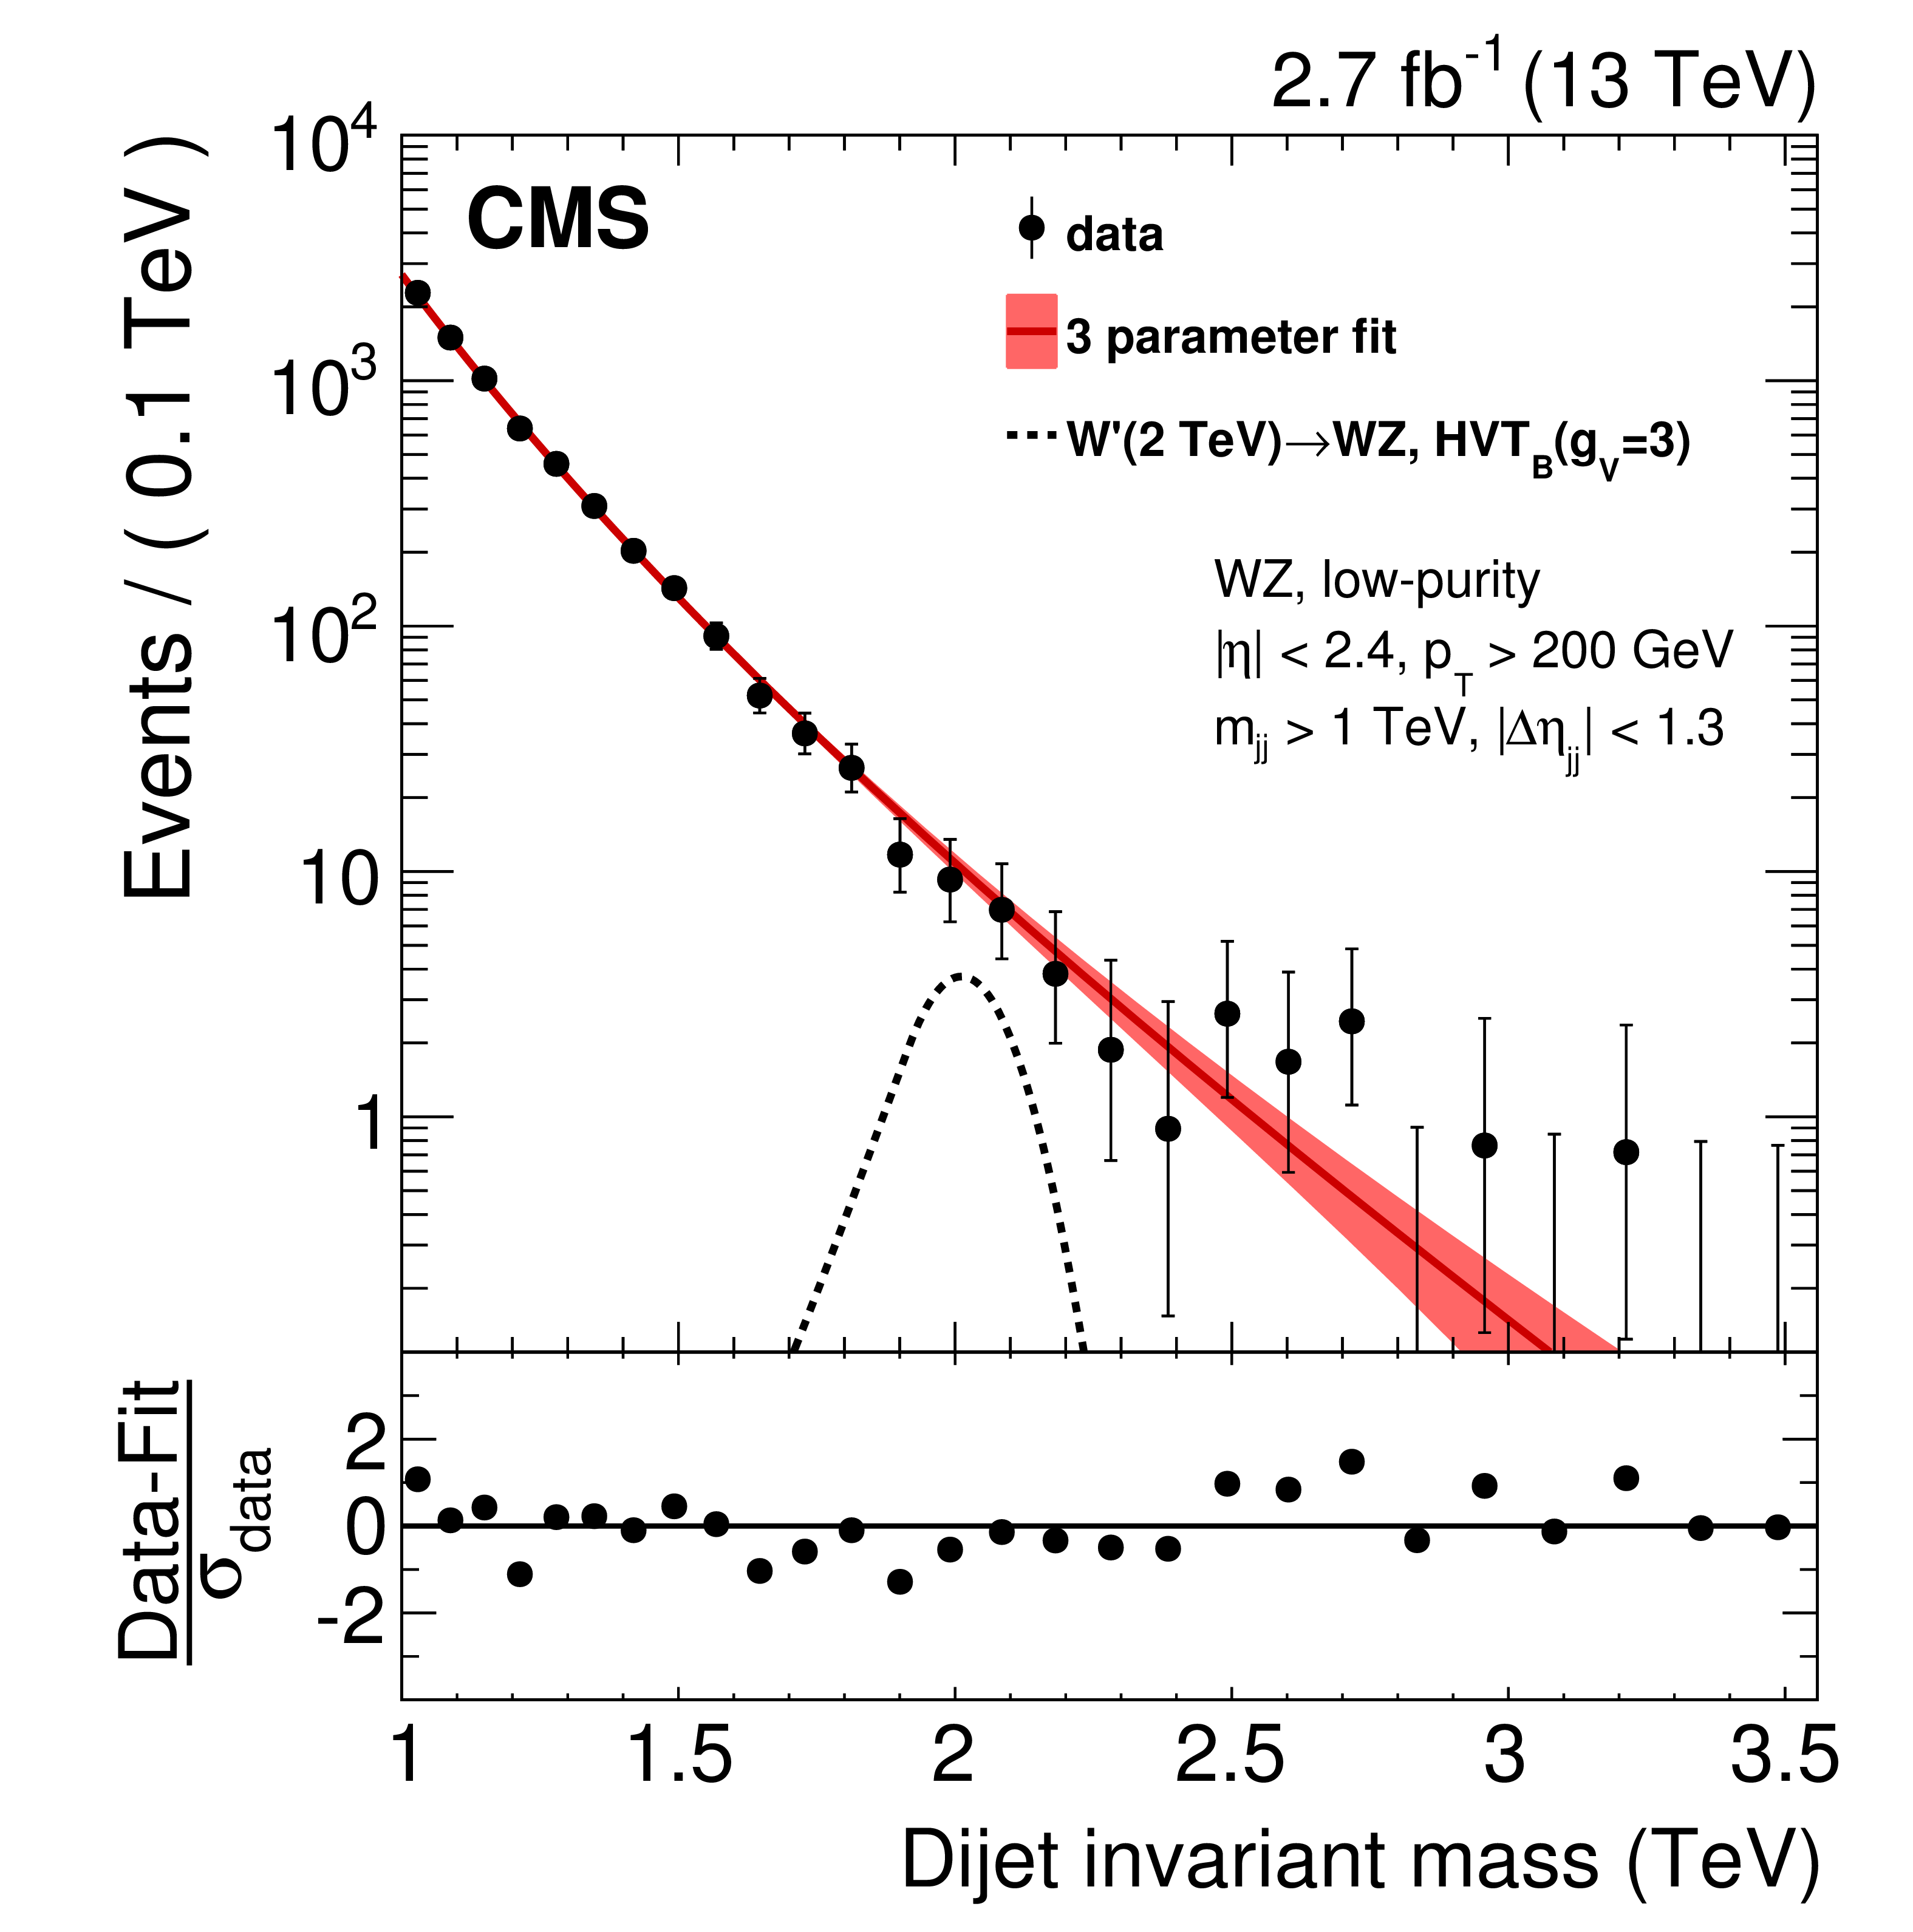
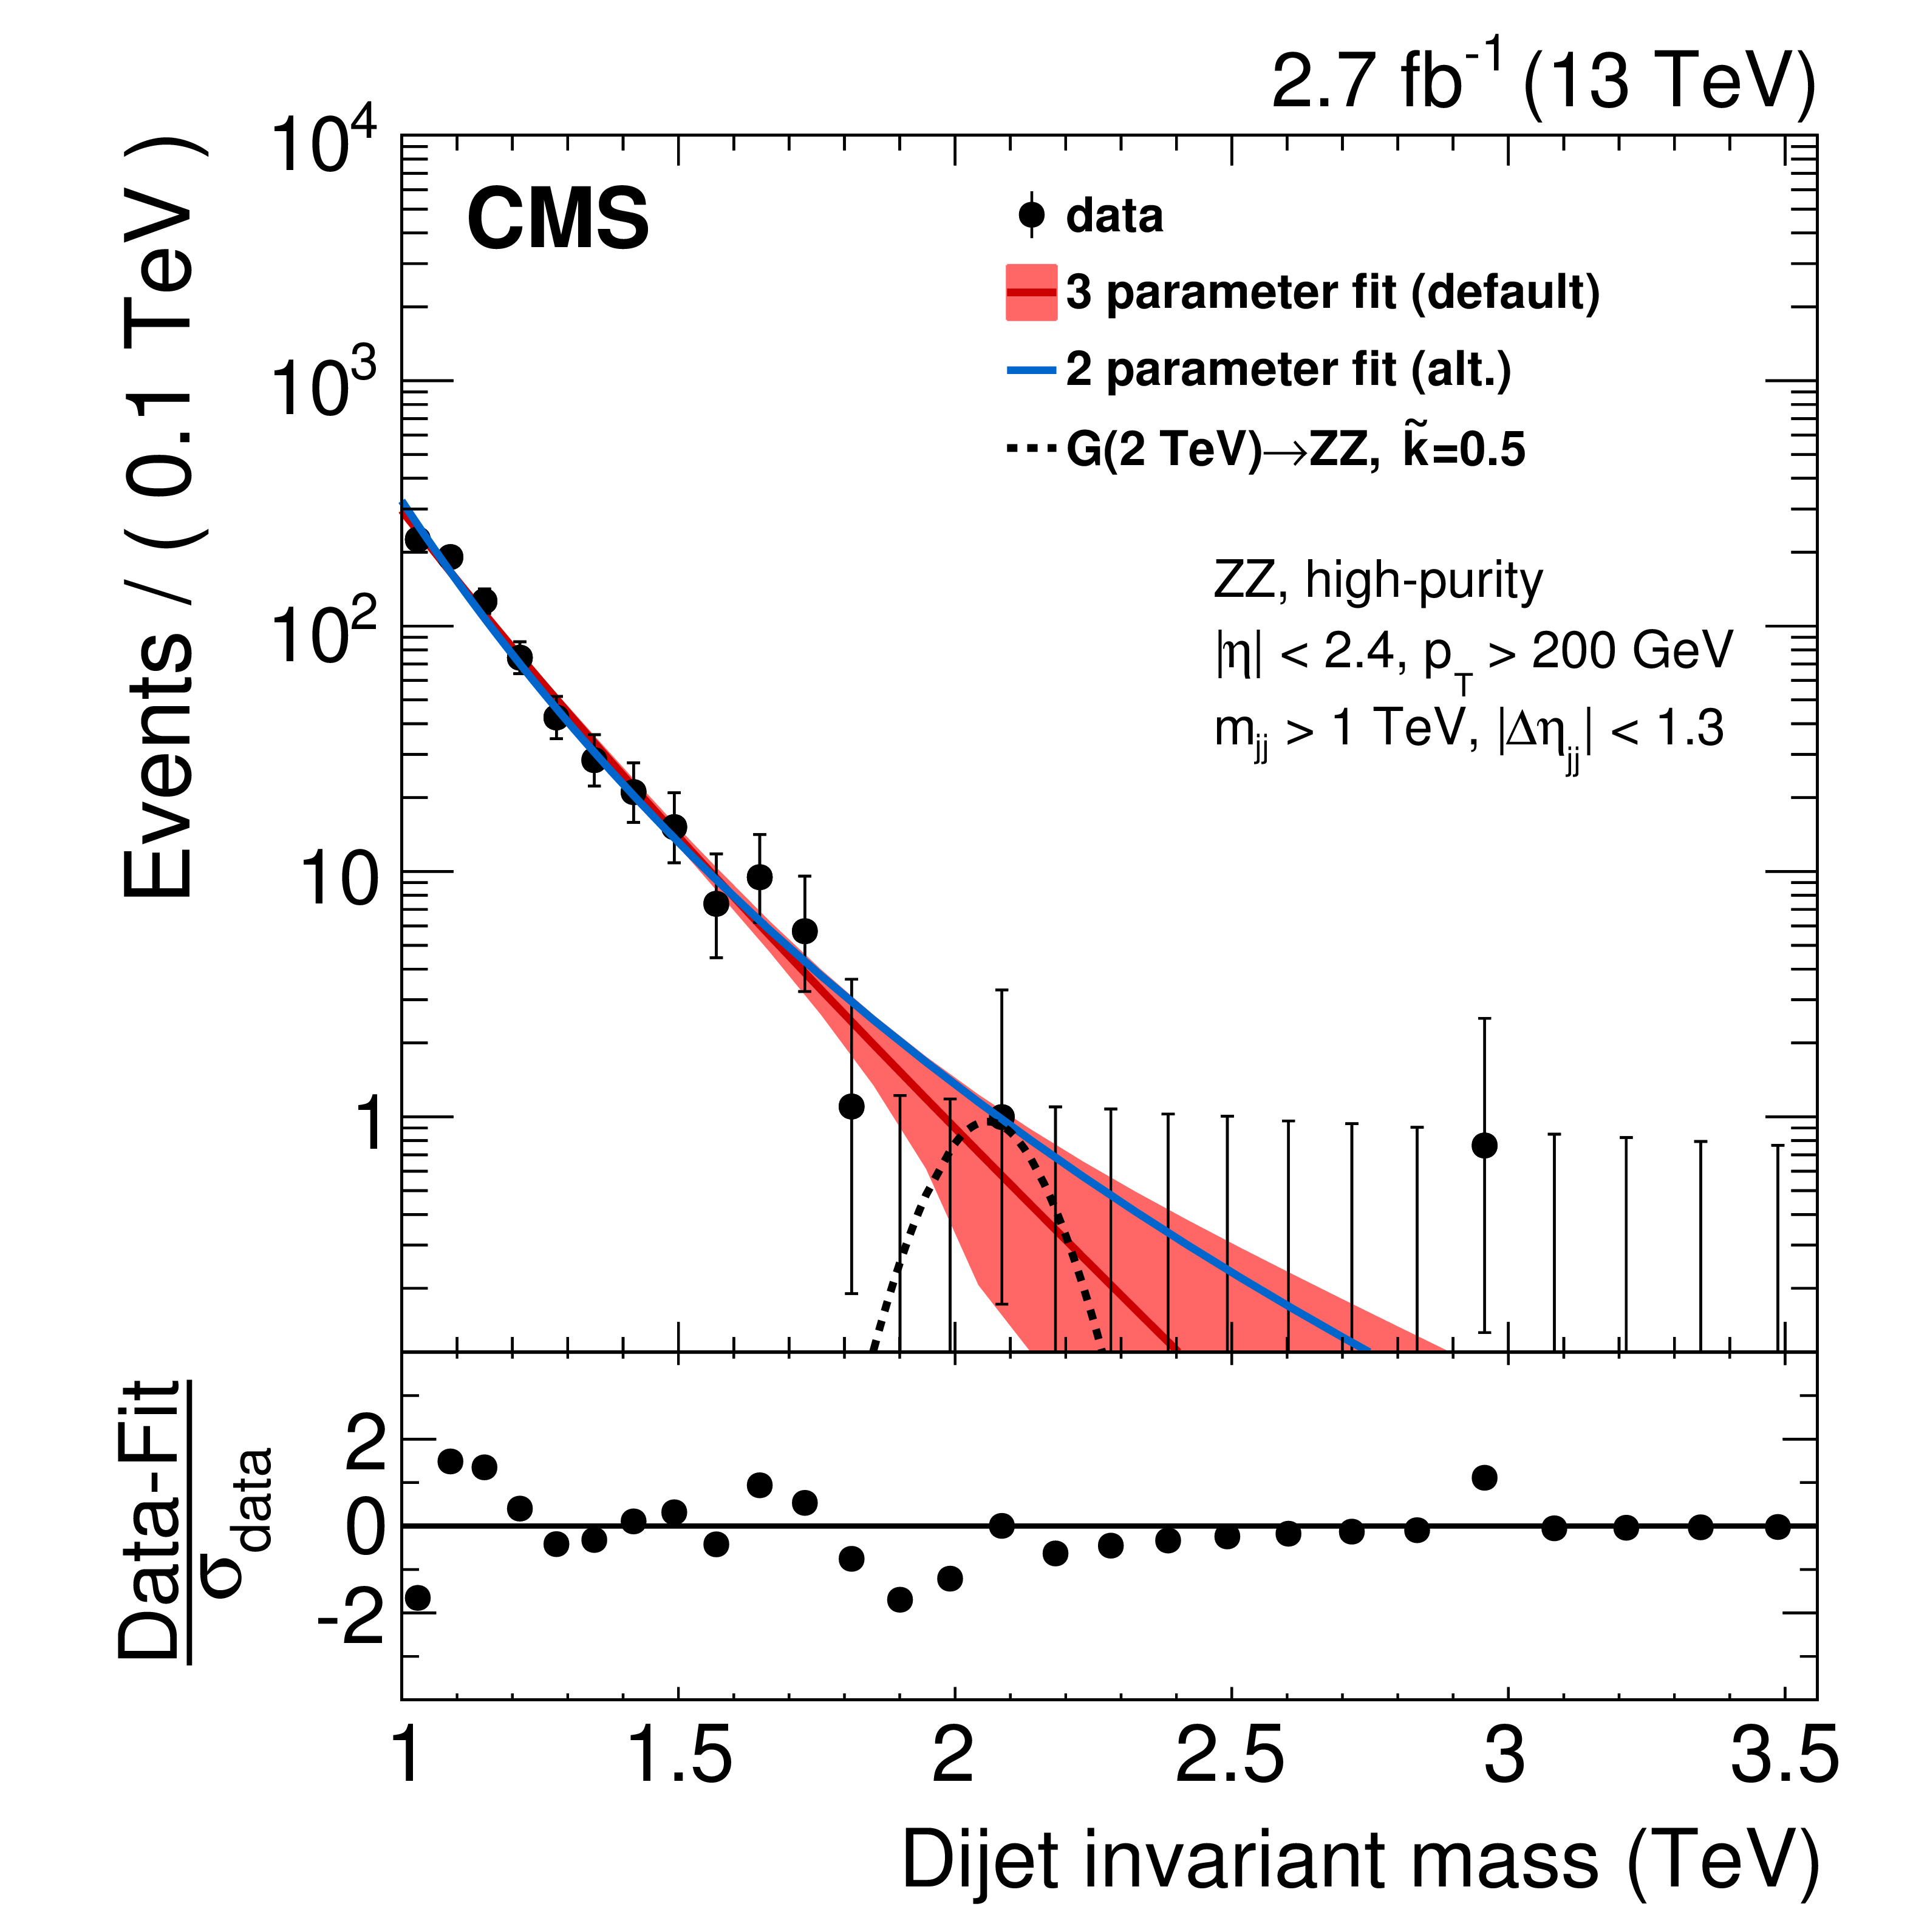
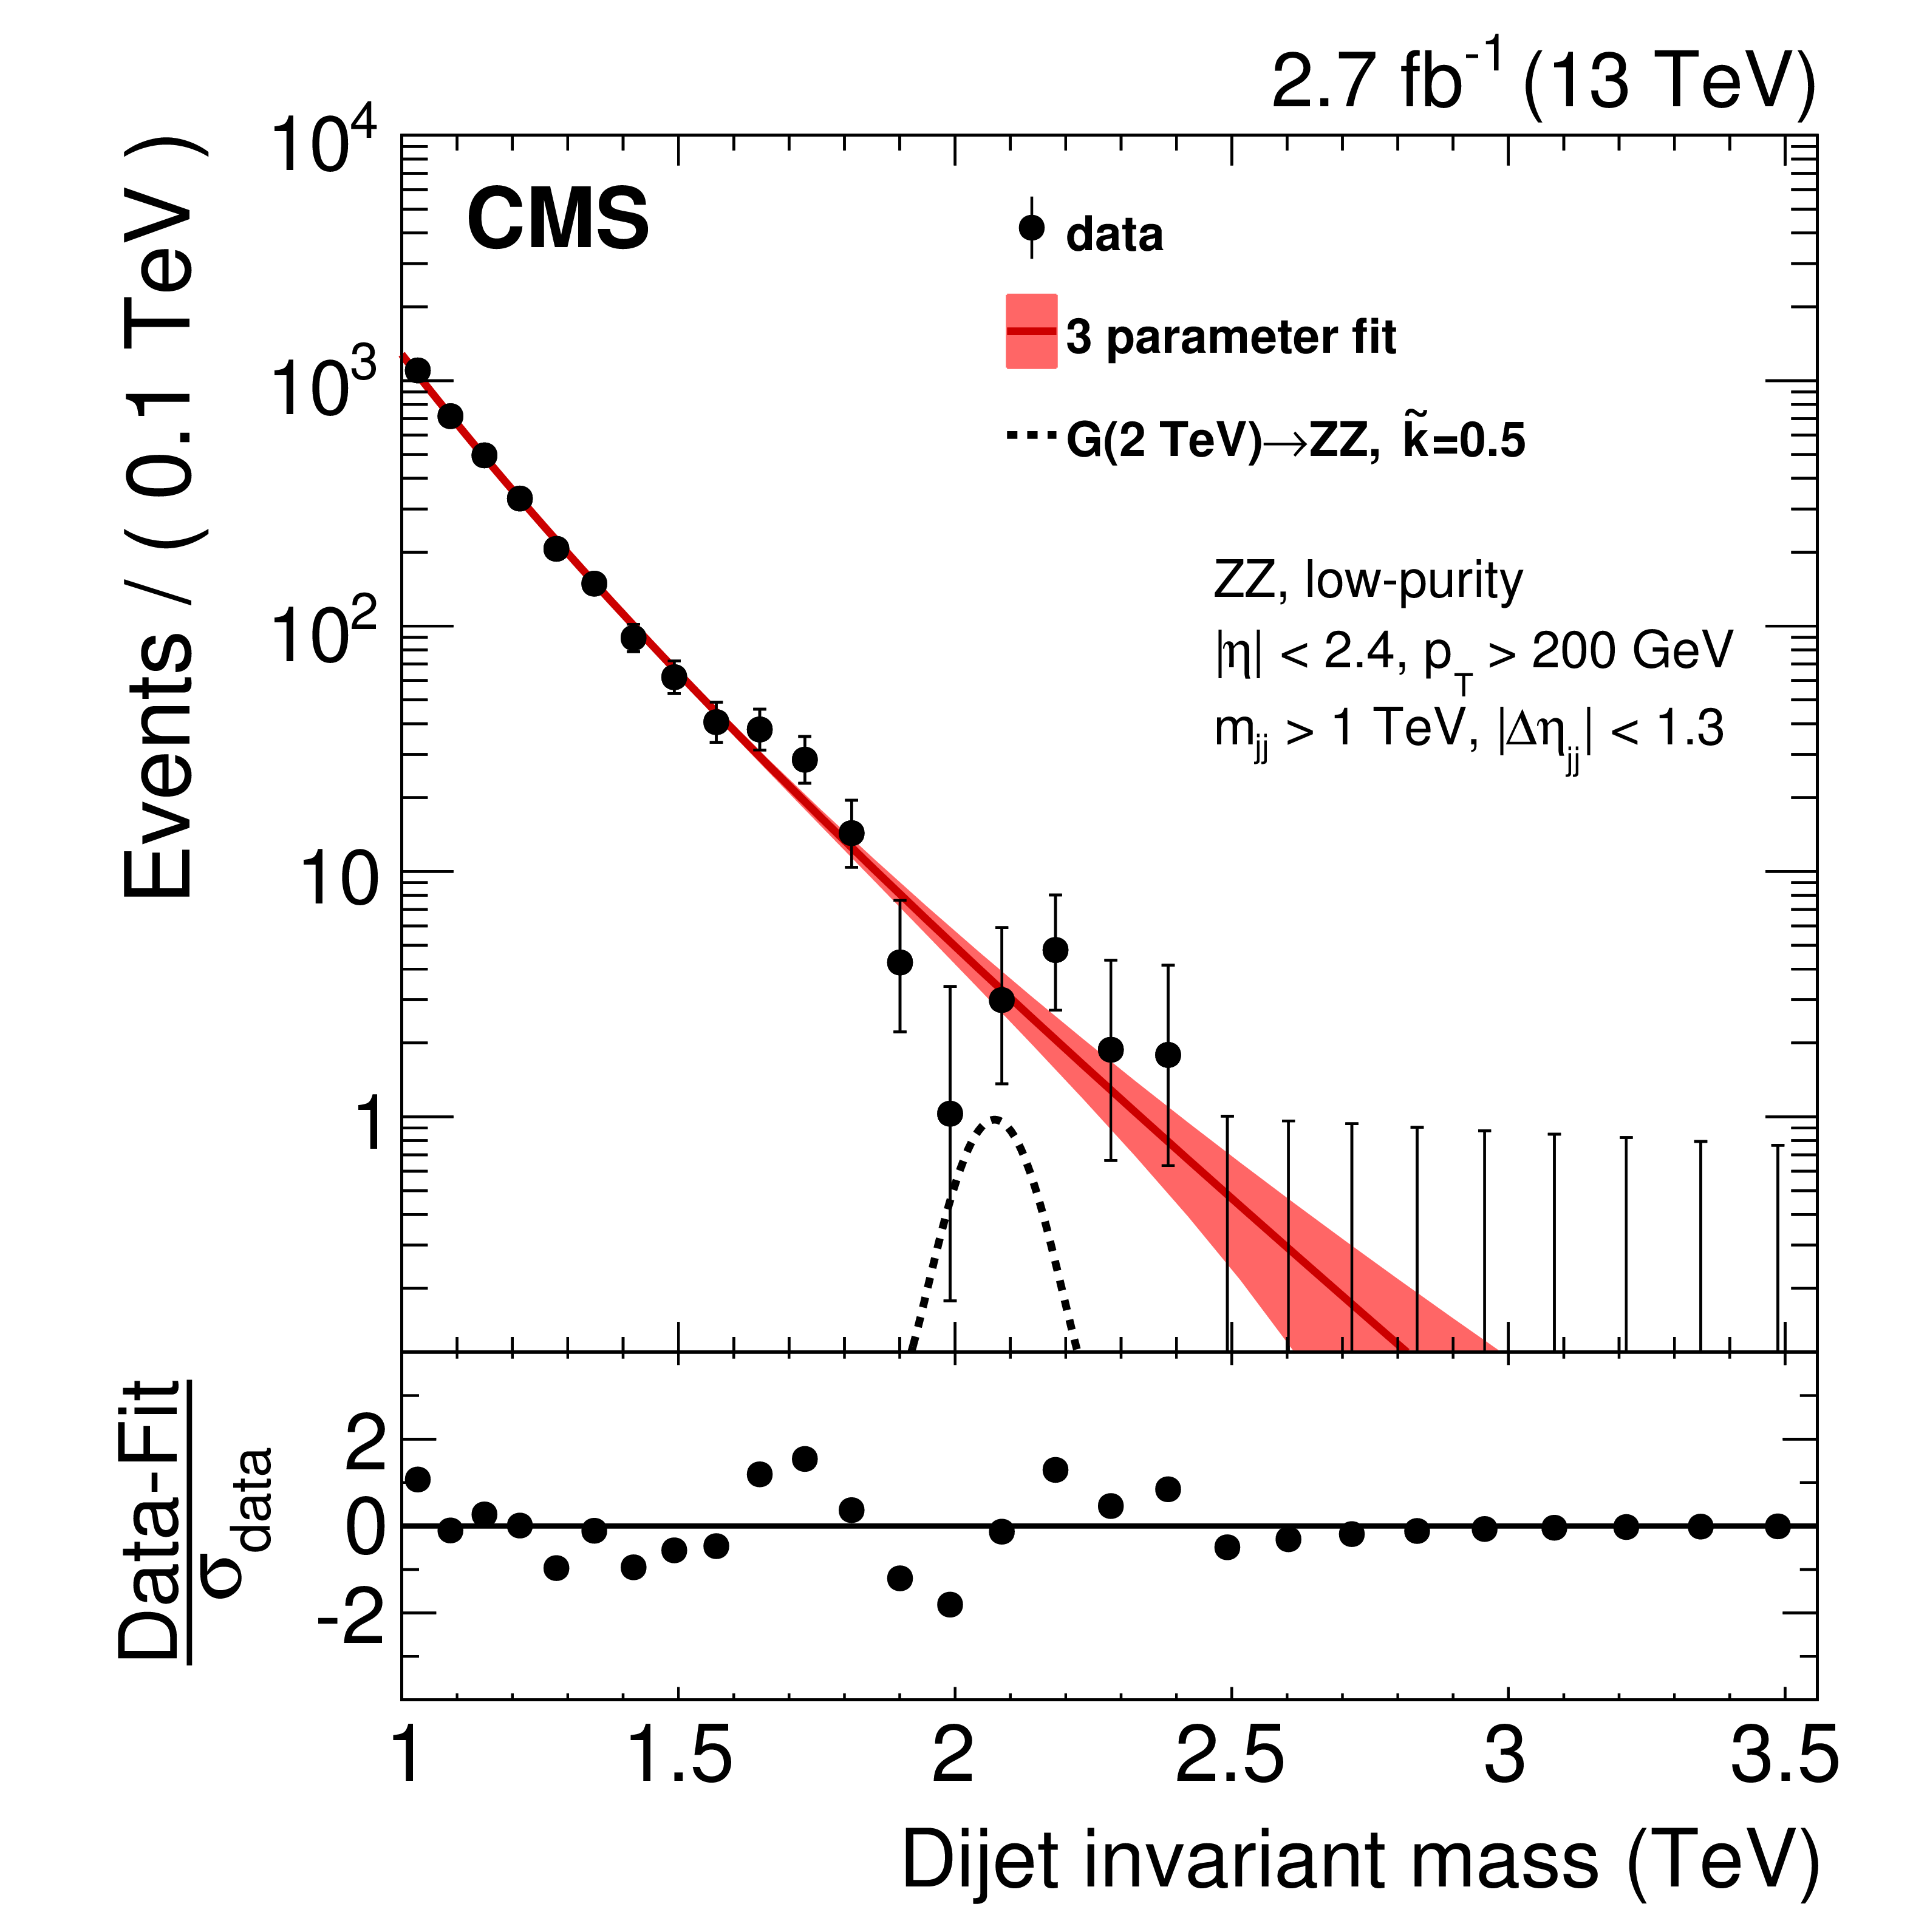
Final ${m_\mathrm {jj}}$ distributions for the dijet analysis in six signal regions. The high-purity (on the left) and the low-purity (on the right) categories are shown for the WW (top row), WZ (central row), and ZZ (bottom row) ${m_{\text {jet}}}$ regions. The solid curve represents a background-only fit to the data distribution, where the filled red area corresponds to the $\pm $1 standard deviation statistical uncertainties of the fit. The data are represented by the black points. For the ZZ high-purity category (bottom left), we also show the background-only fit using the two-parameter functional form (blue solid line), for comparison. Signal benchmarks for a mass of 2 TeV are also shown with black dashed lines. In the lower panel of each plot, the bin-by-bin fit residuals, $(N_\text {data} - N_\text {fit})/\sigma _\text {data}$, are shown. |
png pdf |
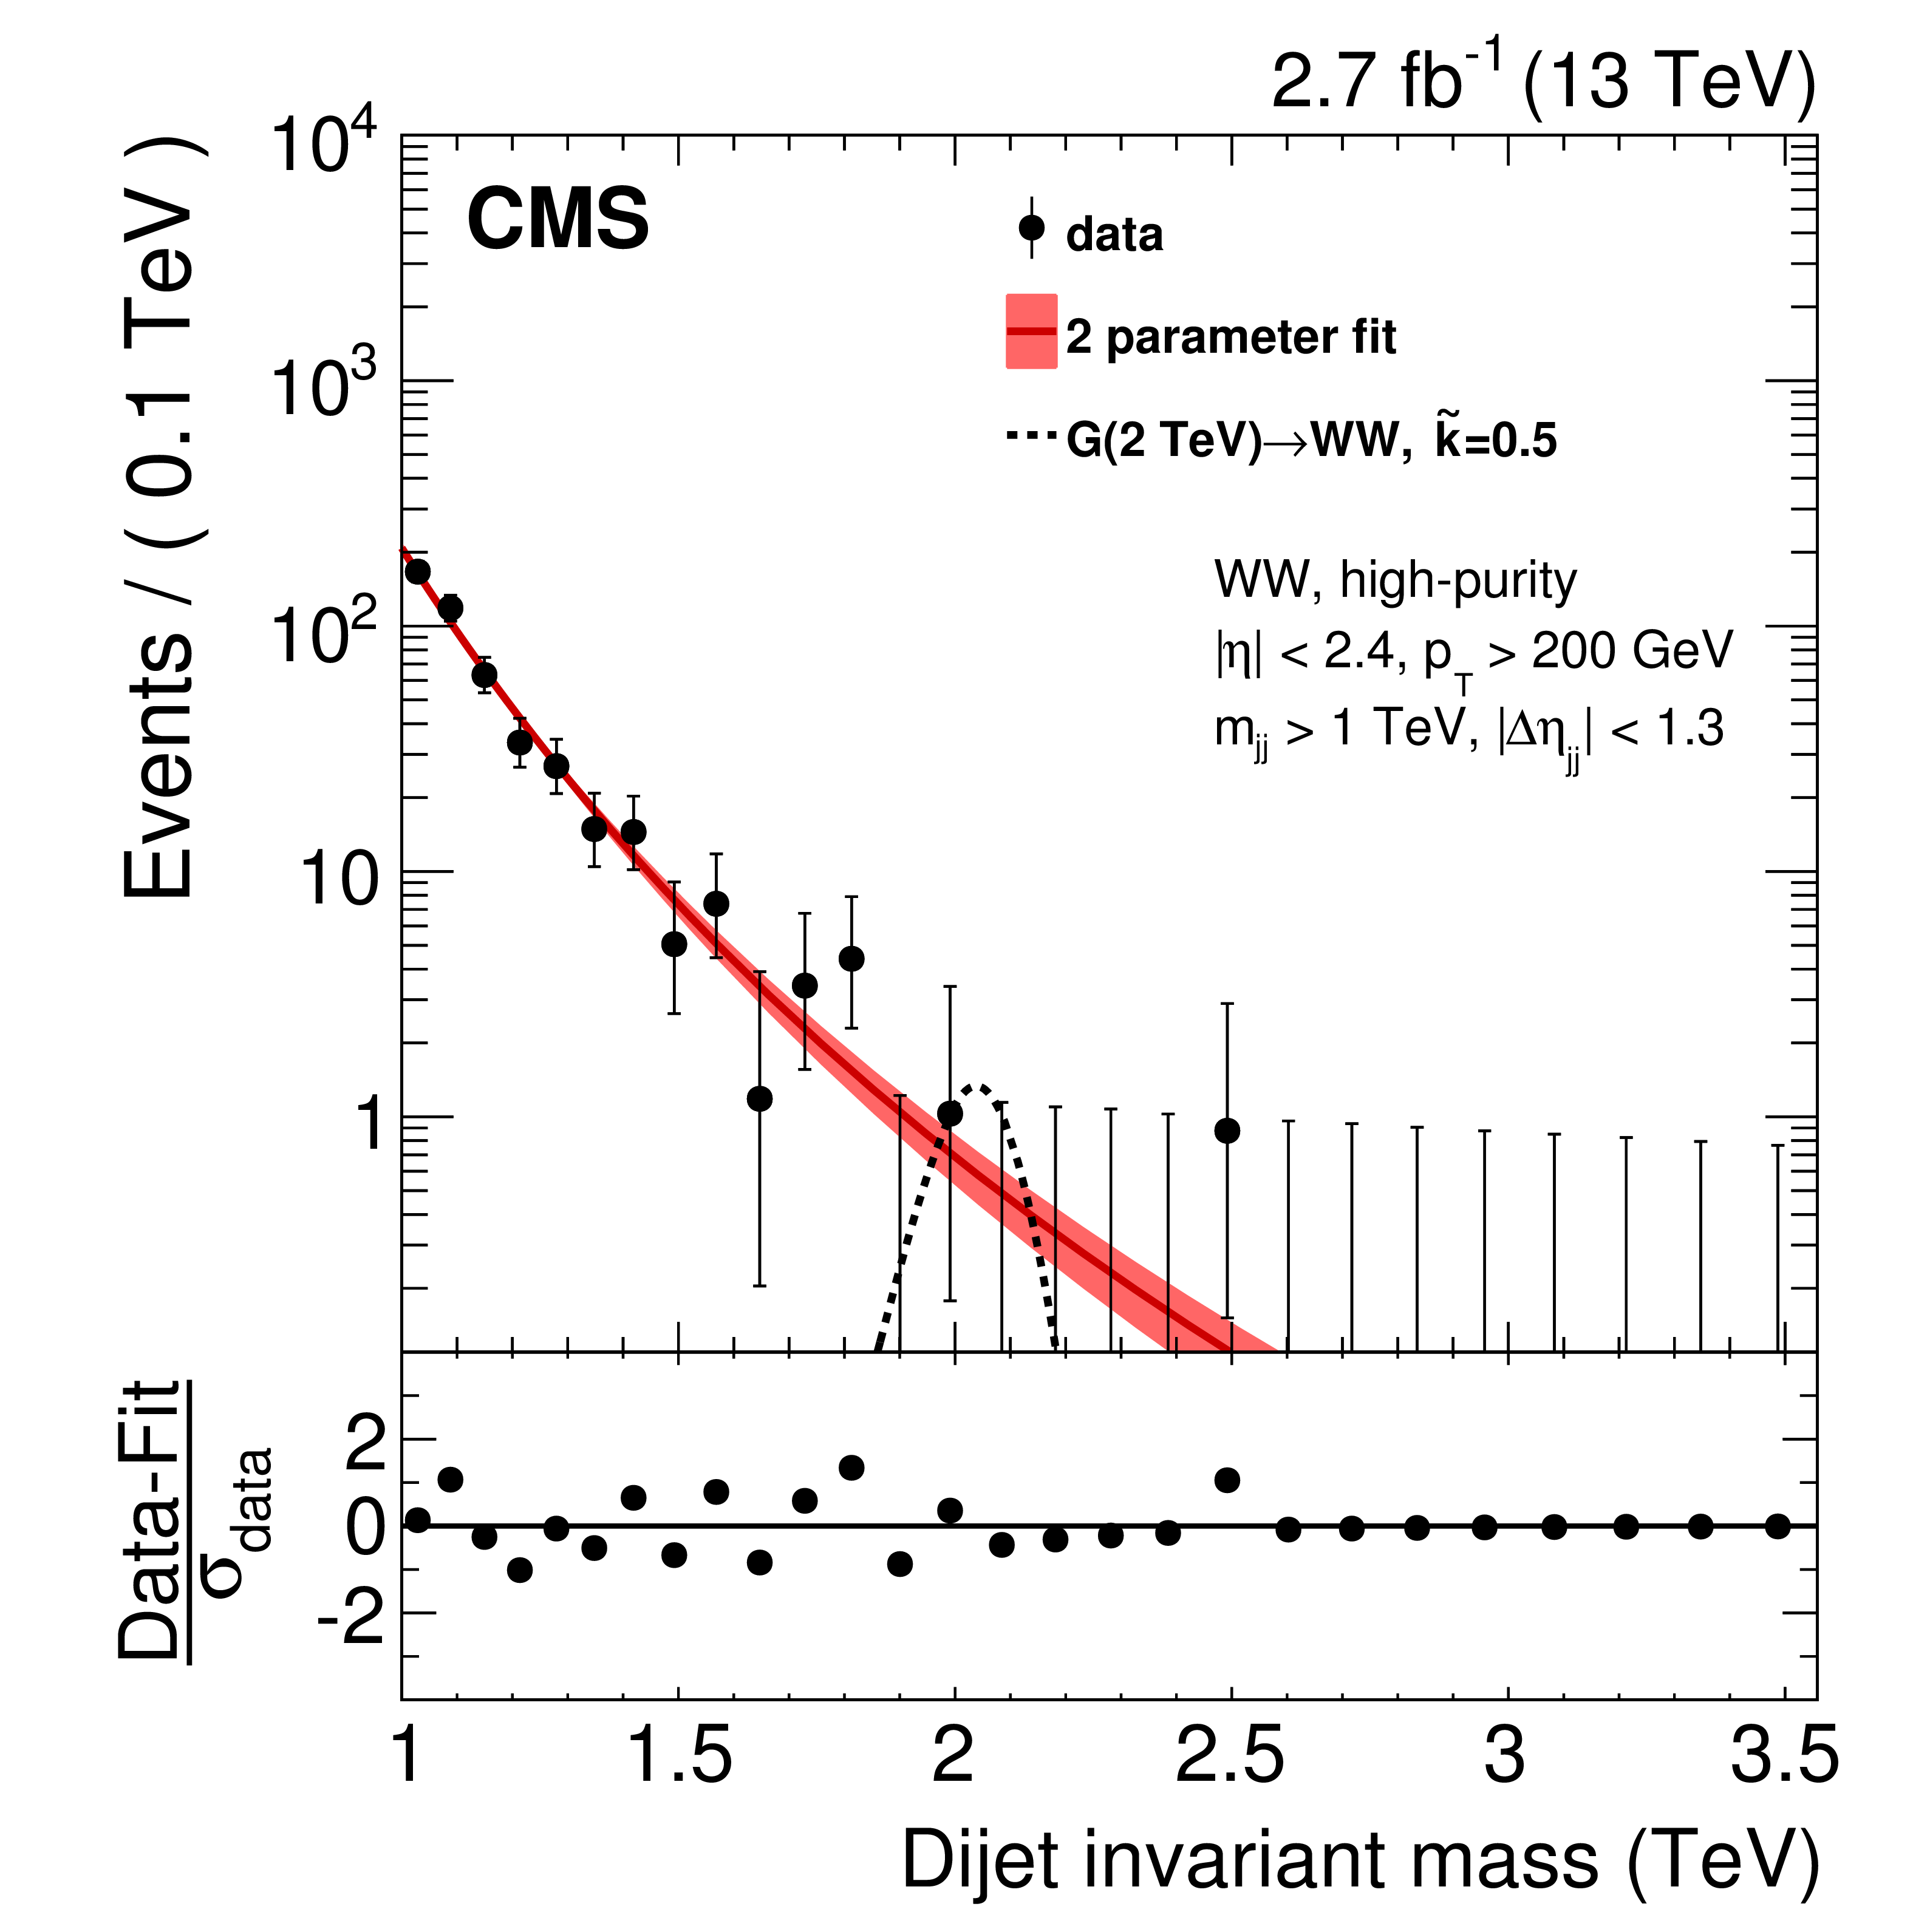
Figure 1-a:
Final ${m_\mathrm {jj}}$ distributions for the dijet analysis: high-purity category for the WW ${m_{\text {jet}}}$ region. The solid curve represents a background-only fit to the data distribution, where the filled red area corresponds to the $\pm $1 standard deviation statistical uncertainties of the fit. The data are represented by the black points. Signal benchmark for a mass of 2 TeV is also shown with black dashed lines. In the lower panel, the bin-by-bin fit residuals, $(N_\text {data} - N_\text {fit})/\sigma _\text {data}$, are shown. |
png pdf |
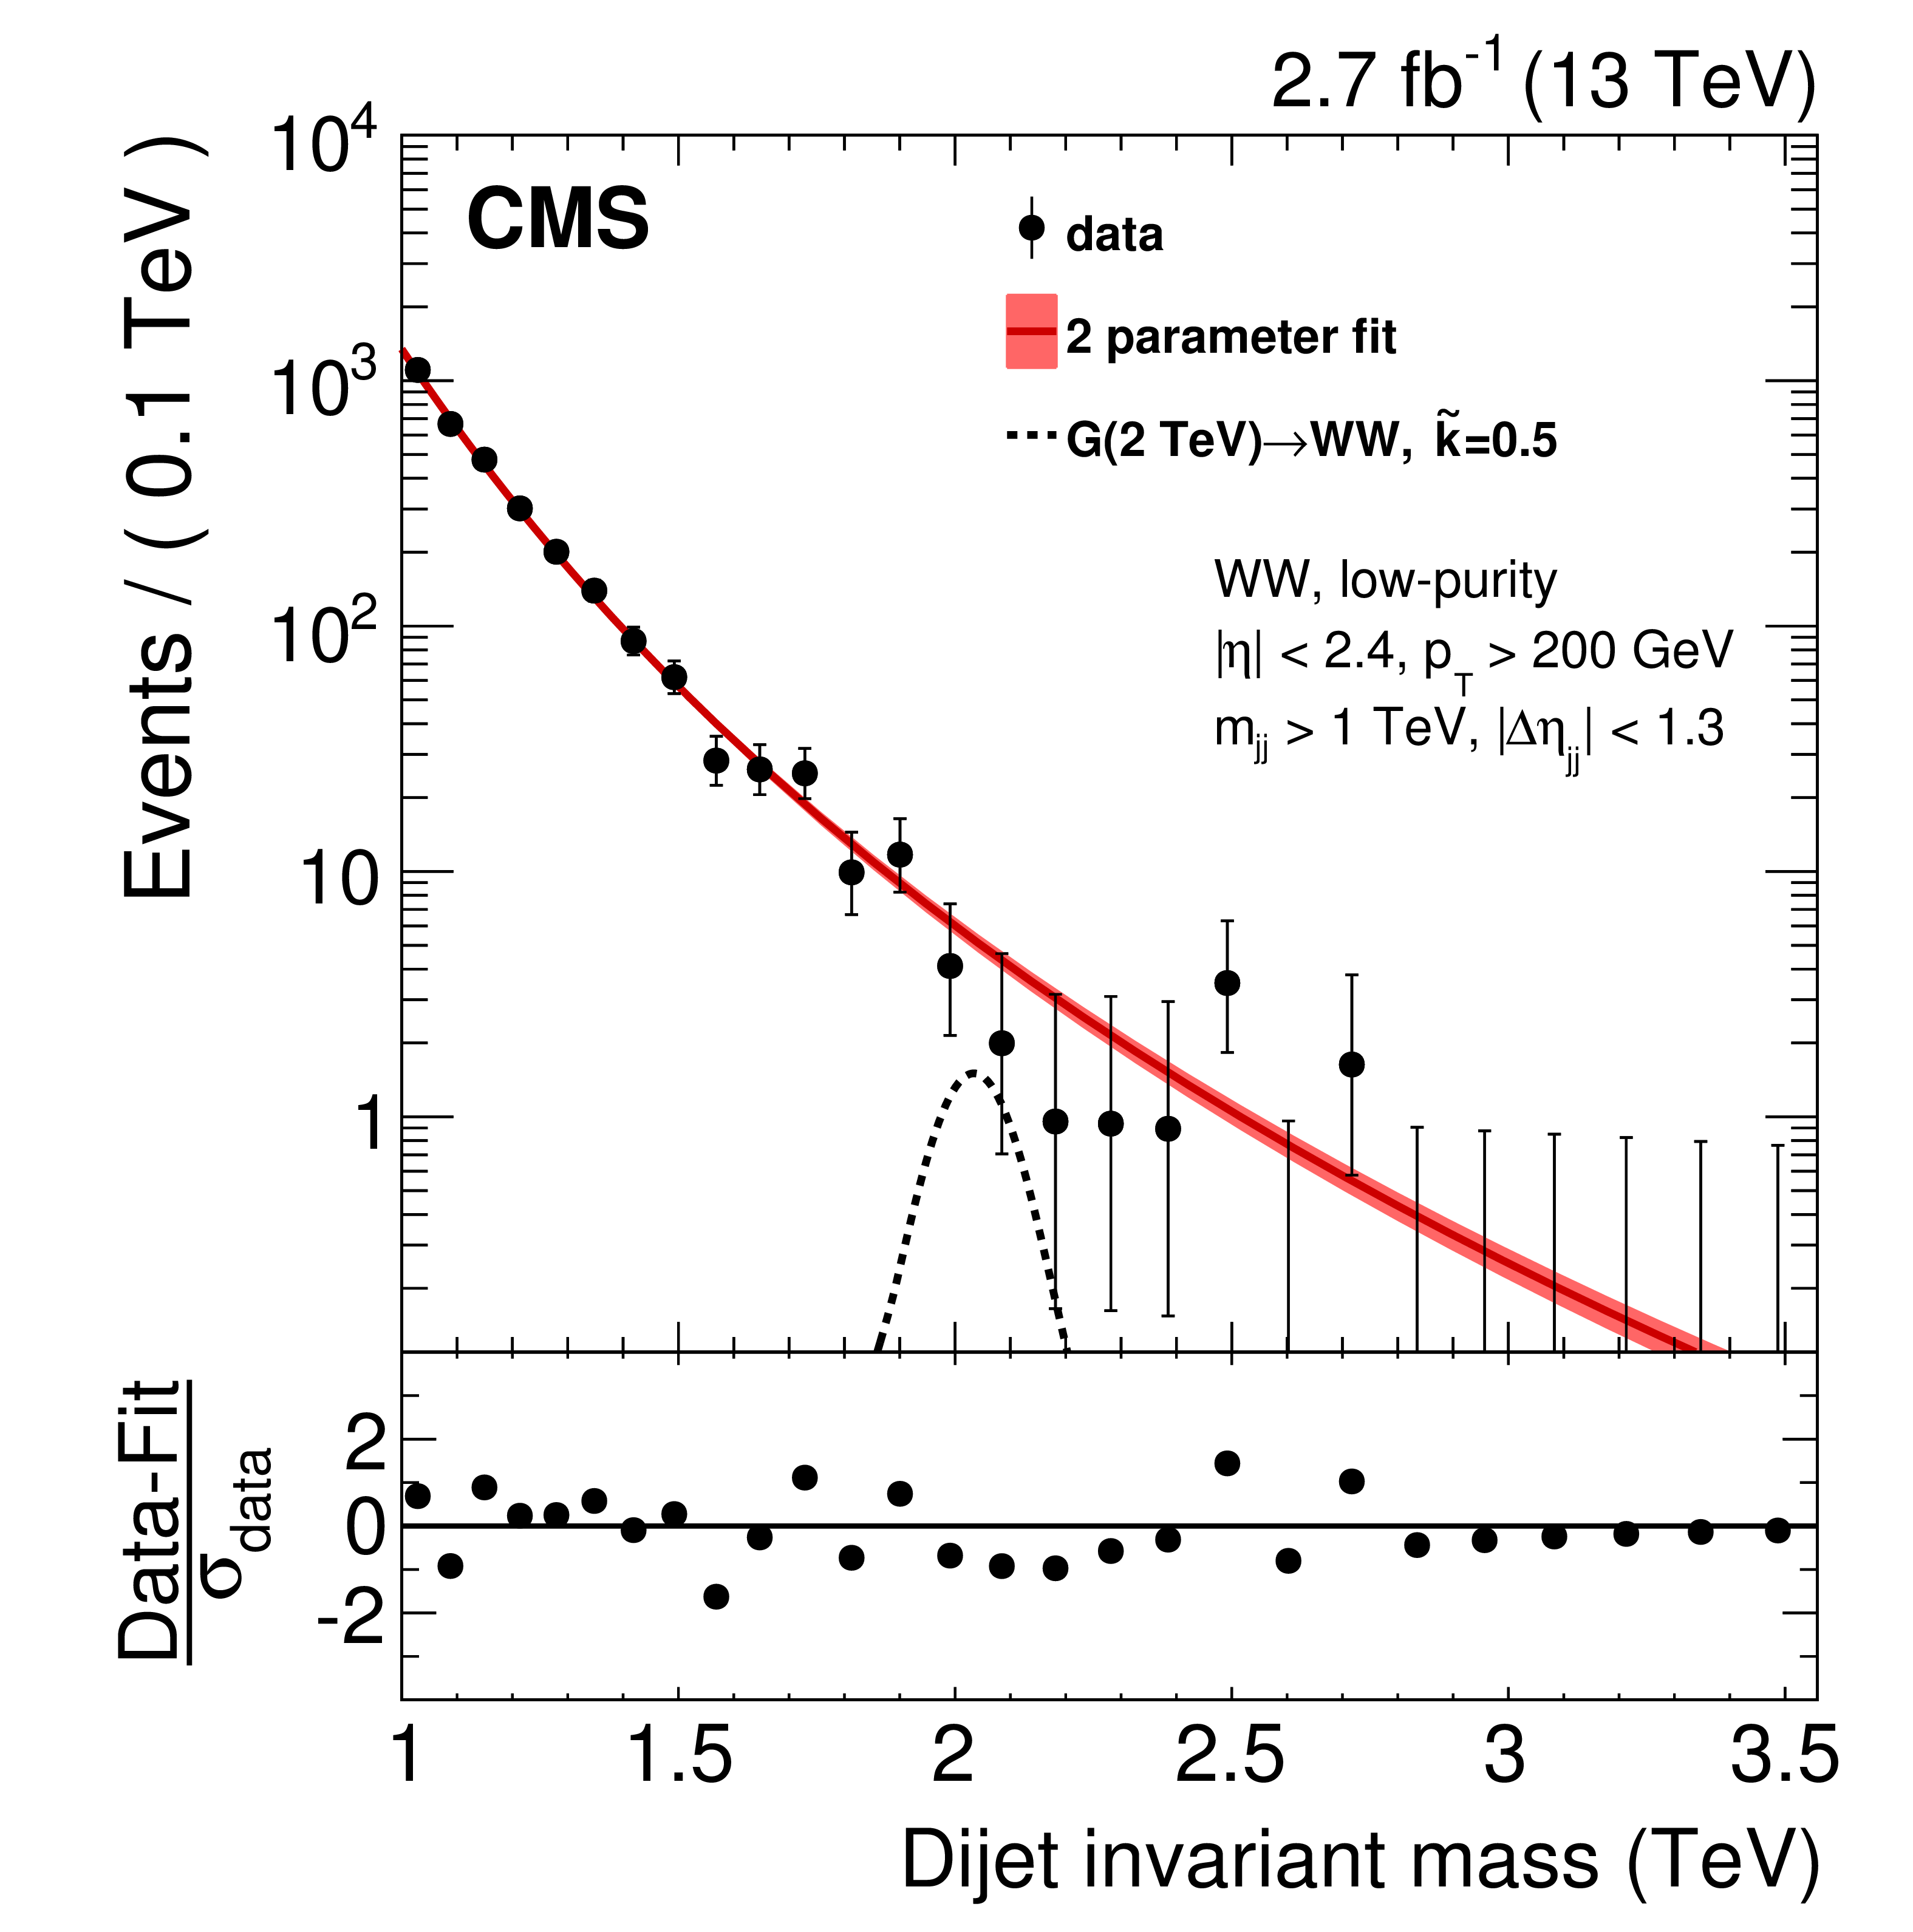
Figure 1-b:
Final ${m_\mathrm {jj}}$ distributions for the dijet analysis: low-purity category for the WW ${m_{\text {jet}}}$ region. The solid curve represents a background-only fit to the data distribution, where the filled red area corresponds to the $\pm $1 standard deviation statistical uncertainties of the fit. The data are represented by the black points. Signal benchmark for a mass of 2 TeV is also shown with black dashed lines. In the lower panel, the bin-by-bin fit residuals, $(N_\text {data} - N_\text {fit})/\sigma _\text {data}$, are shown. |
png pdf |
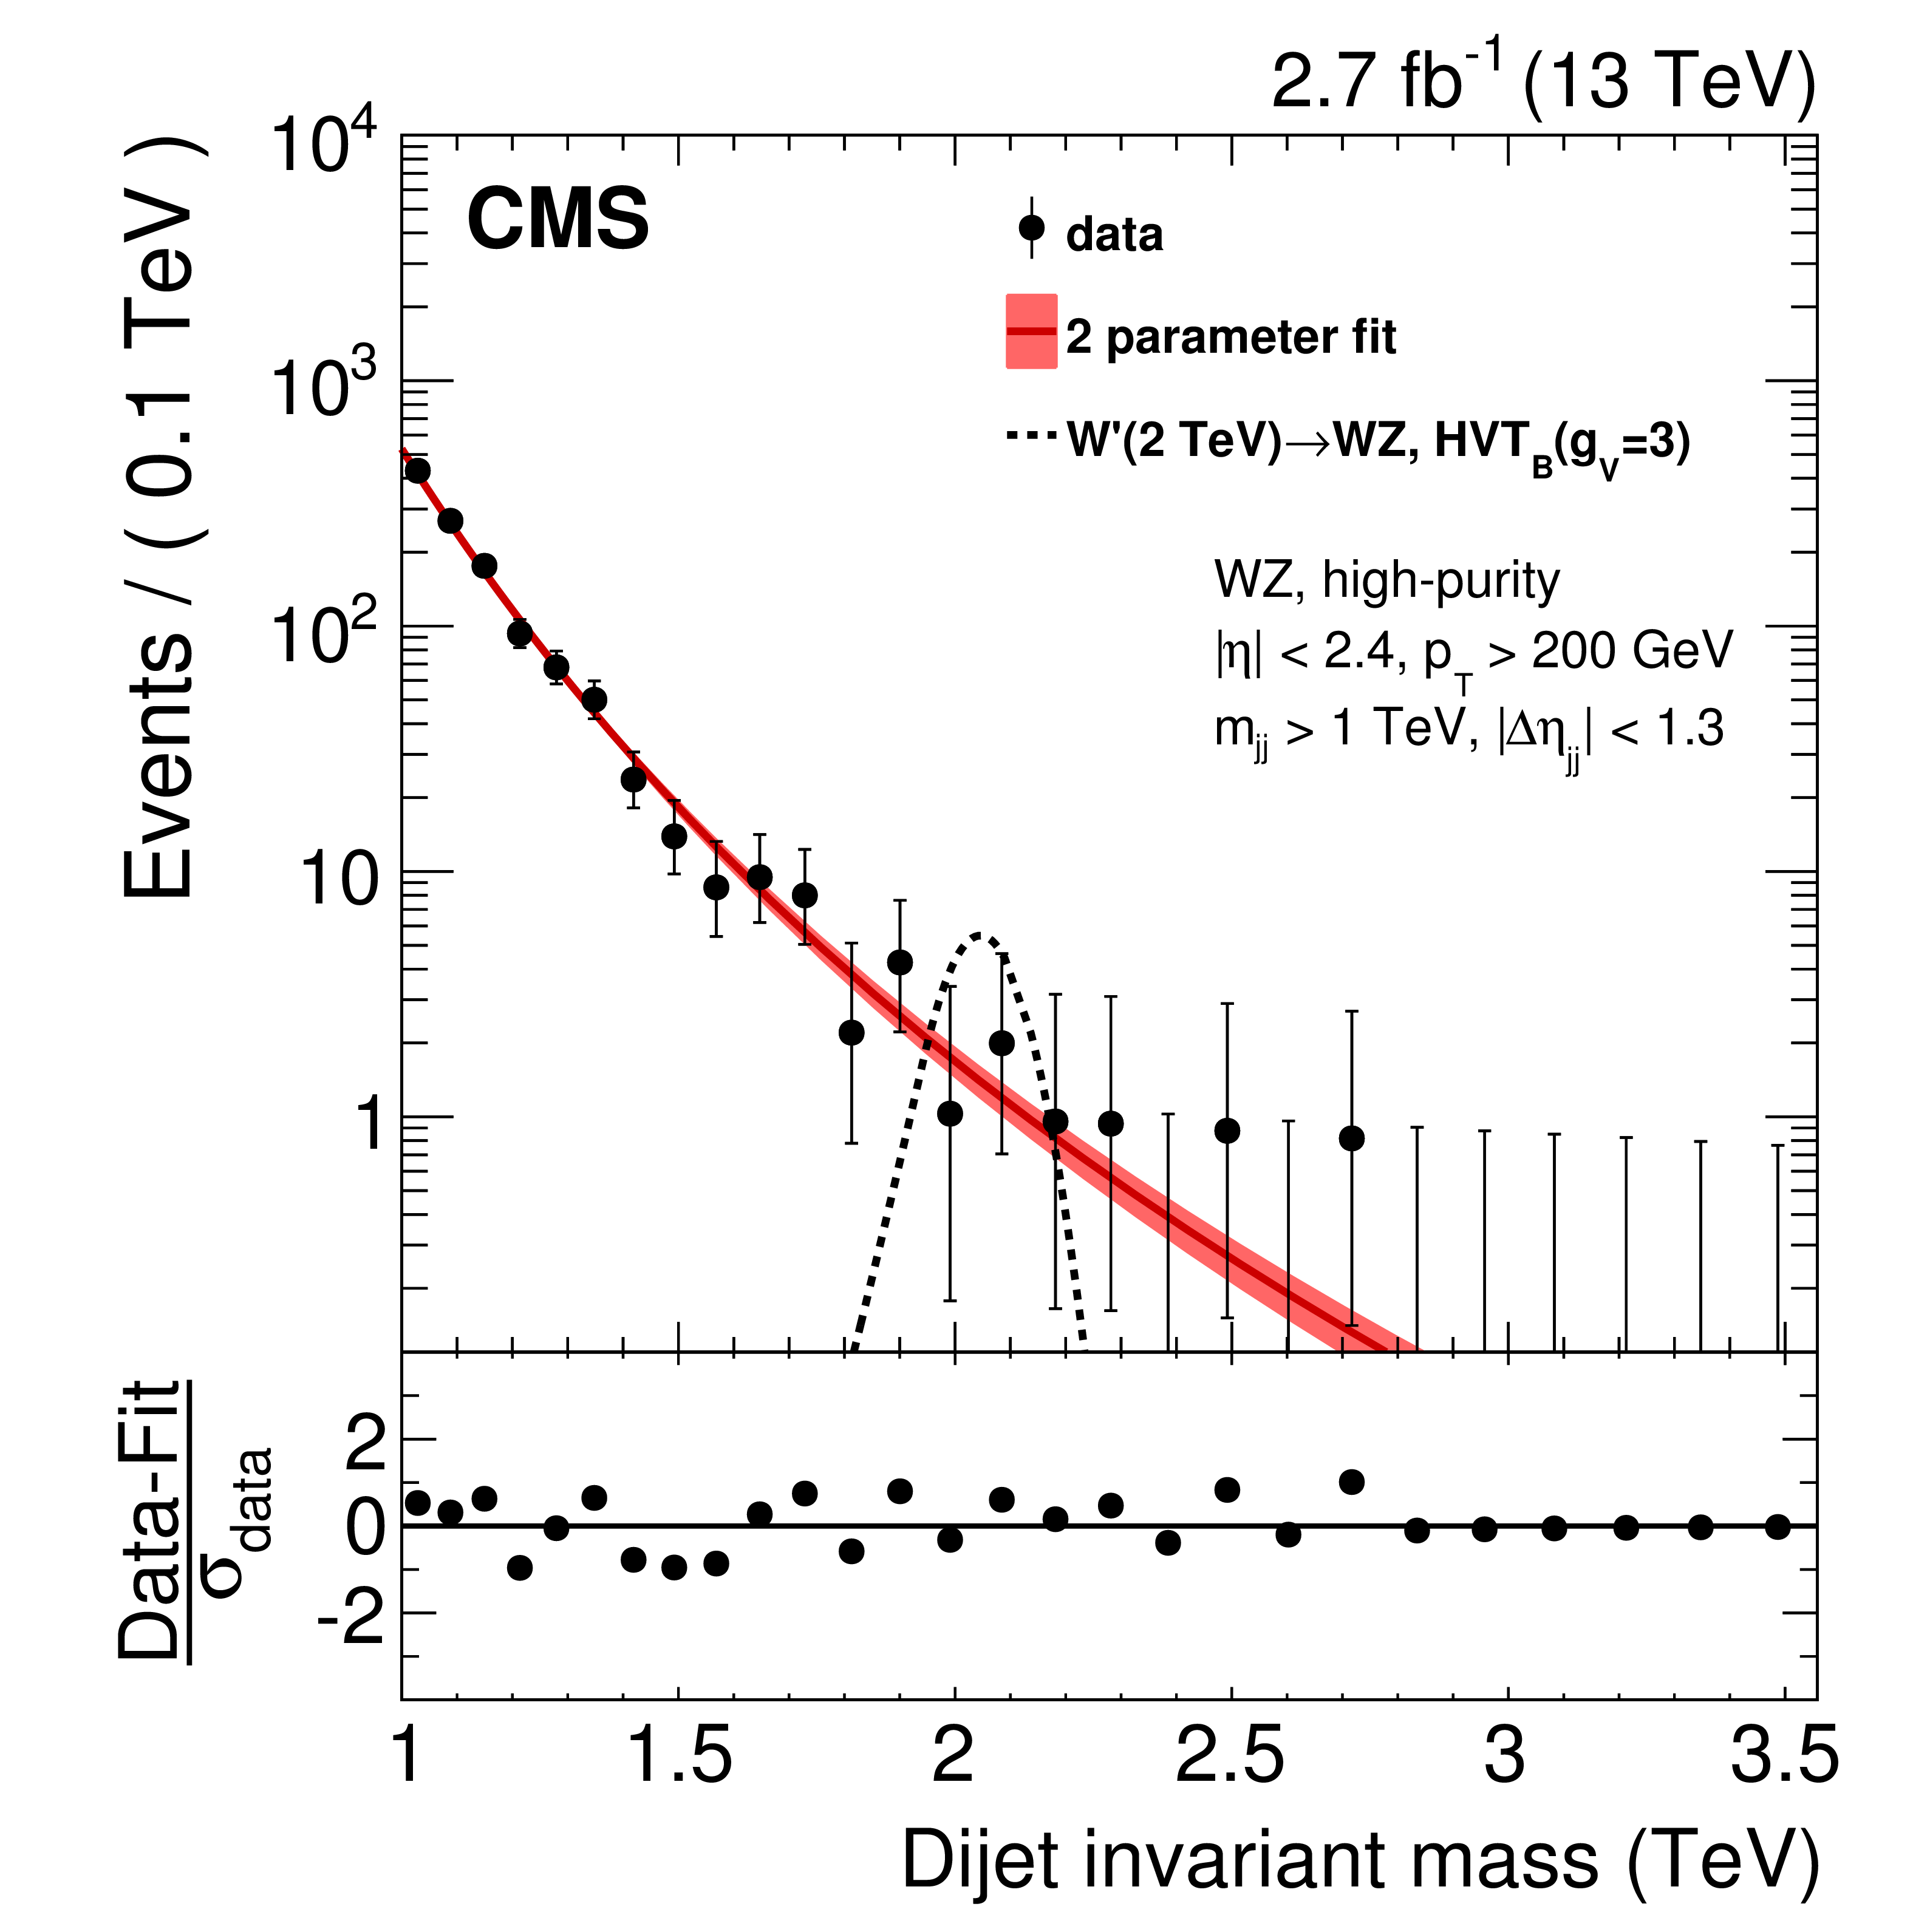
Figure 1-c:
Final ${m_\mathrm {jj}}$ distributions for the dijet analysis: high-purity category for the WZ ${m_{\text {jet}}}$ region. The solid curve represents a background-only fit to the data distribution, where the filled red area corresponds to the $\pm $1 standard deviation statistical uncertainties of the fit. The data are represented by the black points. Signal benchmark for a mass of 2 TeV is also shown with black dashed lines. In the lower panel, the bin-by-bin fit residuals, $(N_\text {data} - N_\text {fit})/\sigma _\text {data}$, are shown. |
png pdf |
Figure 1-d:
Final ${m_\mathrm {jj}}$ distributions for the dijet analysis: low-purity category for the WZ ${m_{\text {jet}}}$ region. The solid curve represents a background-only fit to the data distribution, where the filled red area corresponds to the $\pm $1 standard deviation statistical uncertainties of the fit. The data are represented by the black points. Signal benchmark for a mass of 2 TeV is also shown with black dashed lines. In the lower panel, the bin-by-bin fit residuals, $(N_\text {data} - N_\text {fit})/\sigma _\text {data}$, are shown. |
png pdf |
Figure 1-e:
Final ${m_\mathrm {jj}}$ distributions for the dijet analysis: high-purity category for the ZZ ${m_{\text {jet}}}$ region. The solid curve represents a background-only fit to the data distribution, where the filled red area corresponds to the $\pm $1 standard deviation statistical uncertainties of the fit. The data are represented by the black points. We also show the background-only fit using the two-parameter functional form (blue solid line), for comparison. Signal benchmark for a mass of 2 TeV is also shown with black dashed lines. In the lower panel, the bin-by-bin fit residuals, $(N_\text {data} - N_\text {fit})/\sigma _\text {data}$, are shown. |
png pdf |
Figure 1-f:
Final ${m_\mathrm {jj}}$ distributions for the dijet analysis: low-purity category for the ZZ ${m_{\text {jet}}}$ region. The solid curve represents a background-only fit to the data distribution, where the filled red area corresponds to the $\pm $1 standard deviation statistical uncertainties of the fit. The data are represented by the black points. Signal benchmark for a mass of 2 TeV is also shown with black dashed lines. In the lower panel, the bin-by-bin fit residuals, $(N_\text {data} - N_\text {fit})/\sigma _\text {data}$, are shown. |
png pdf |
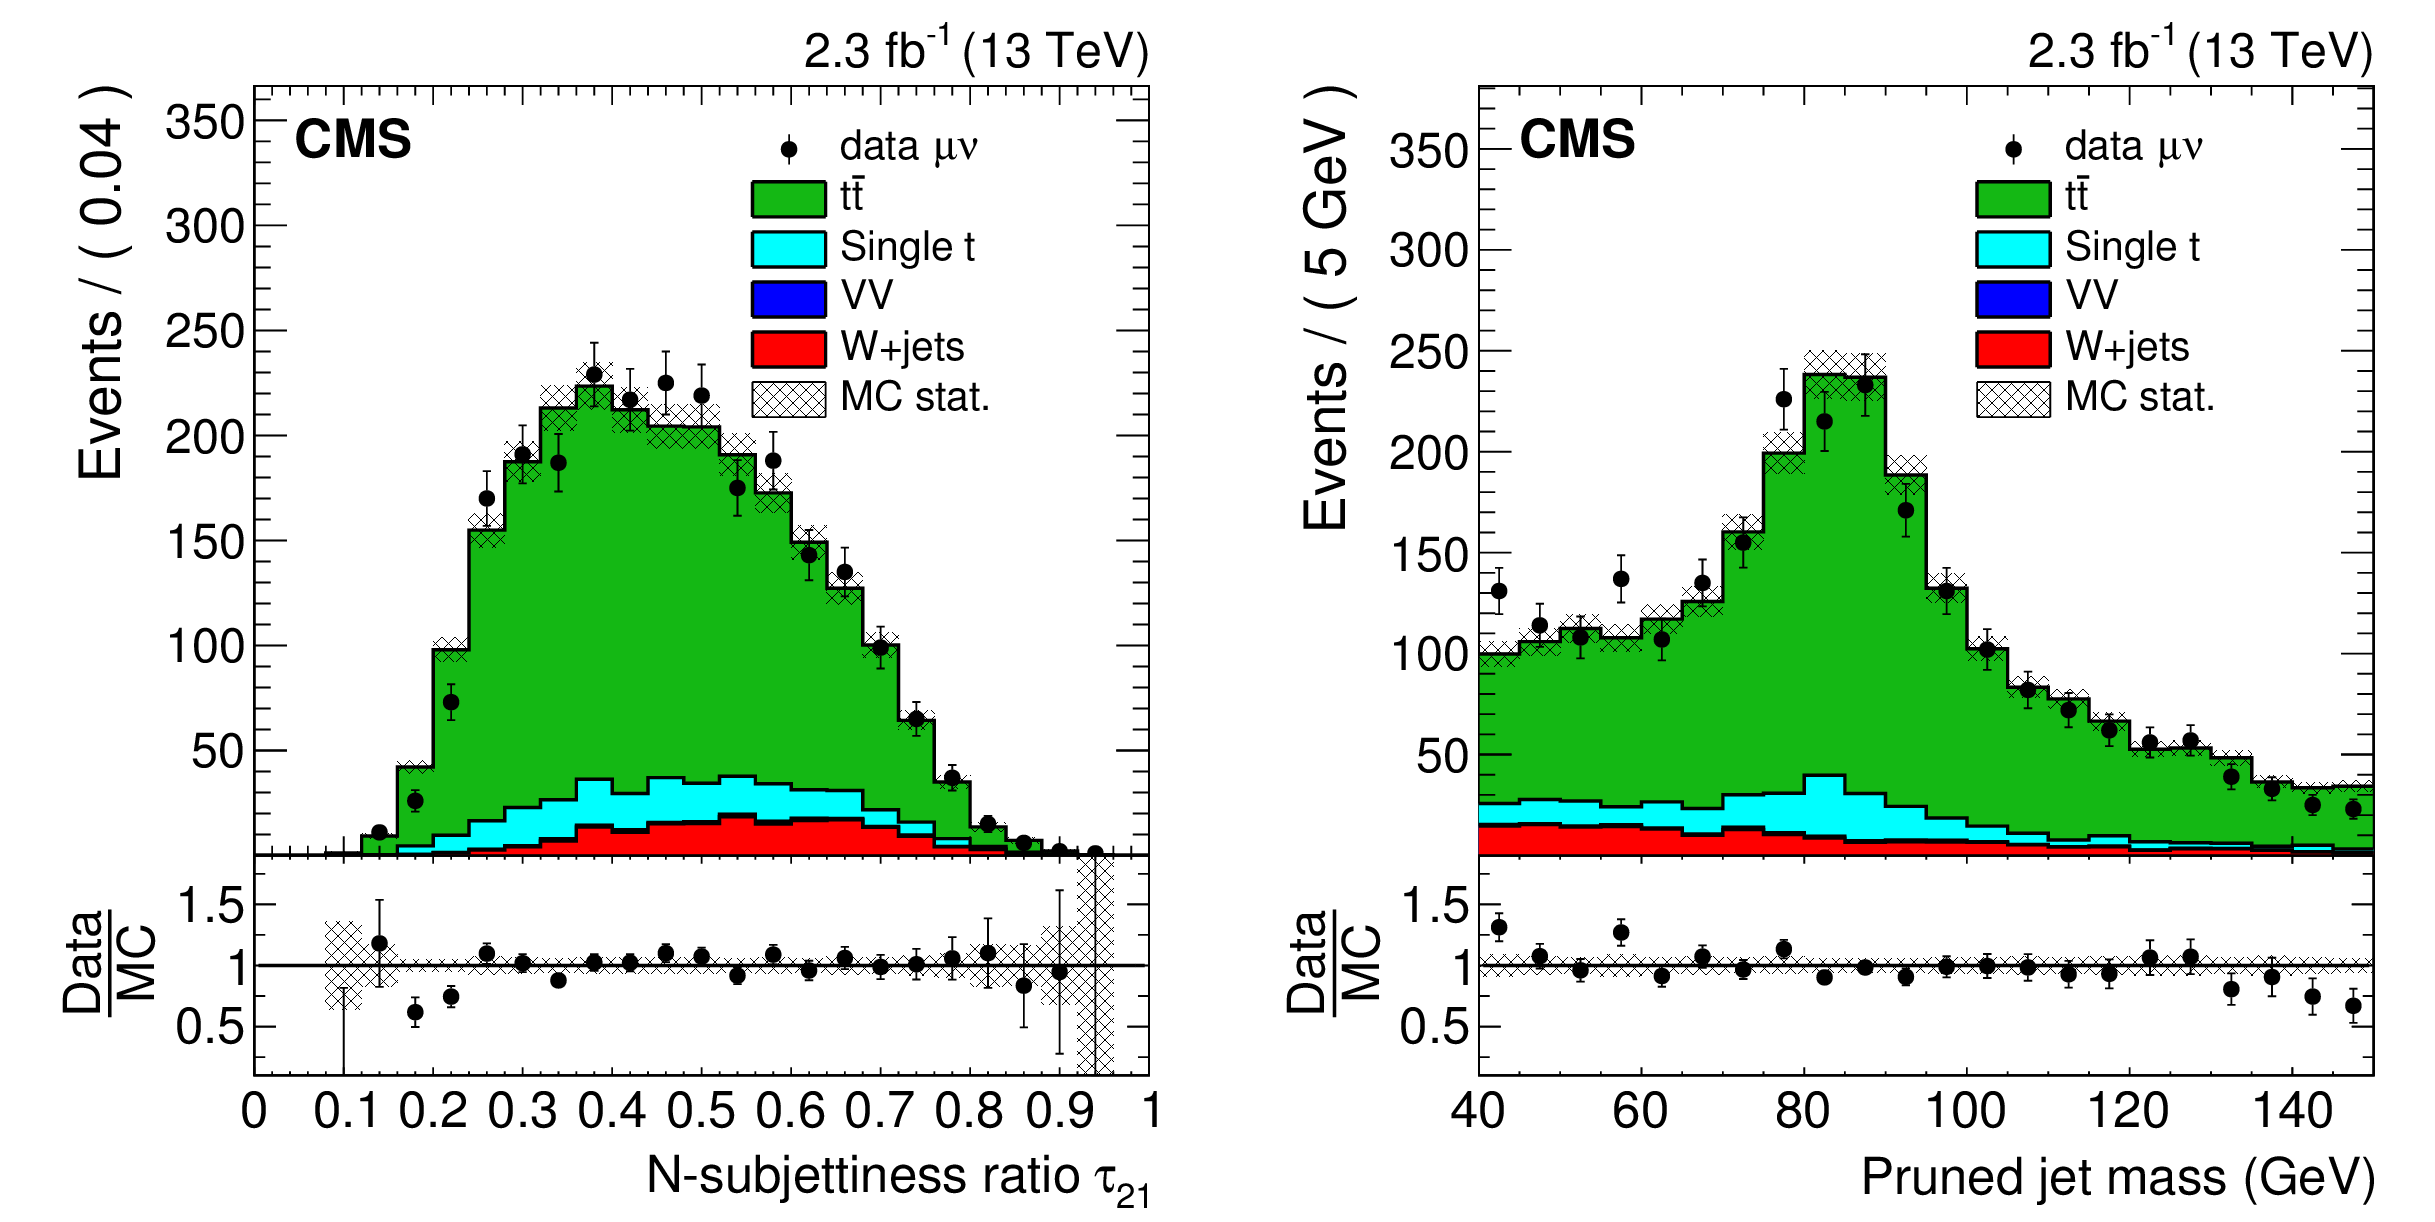
Figure 2:
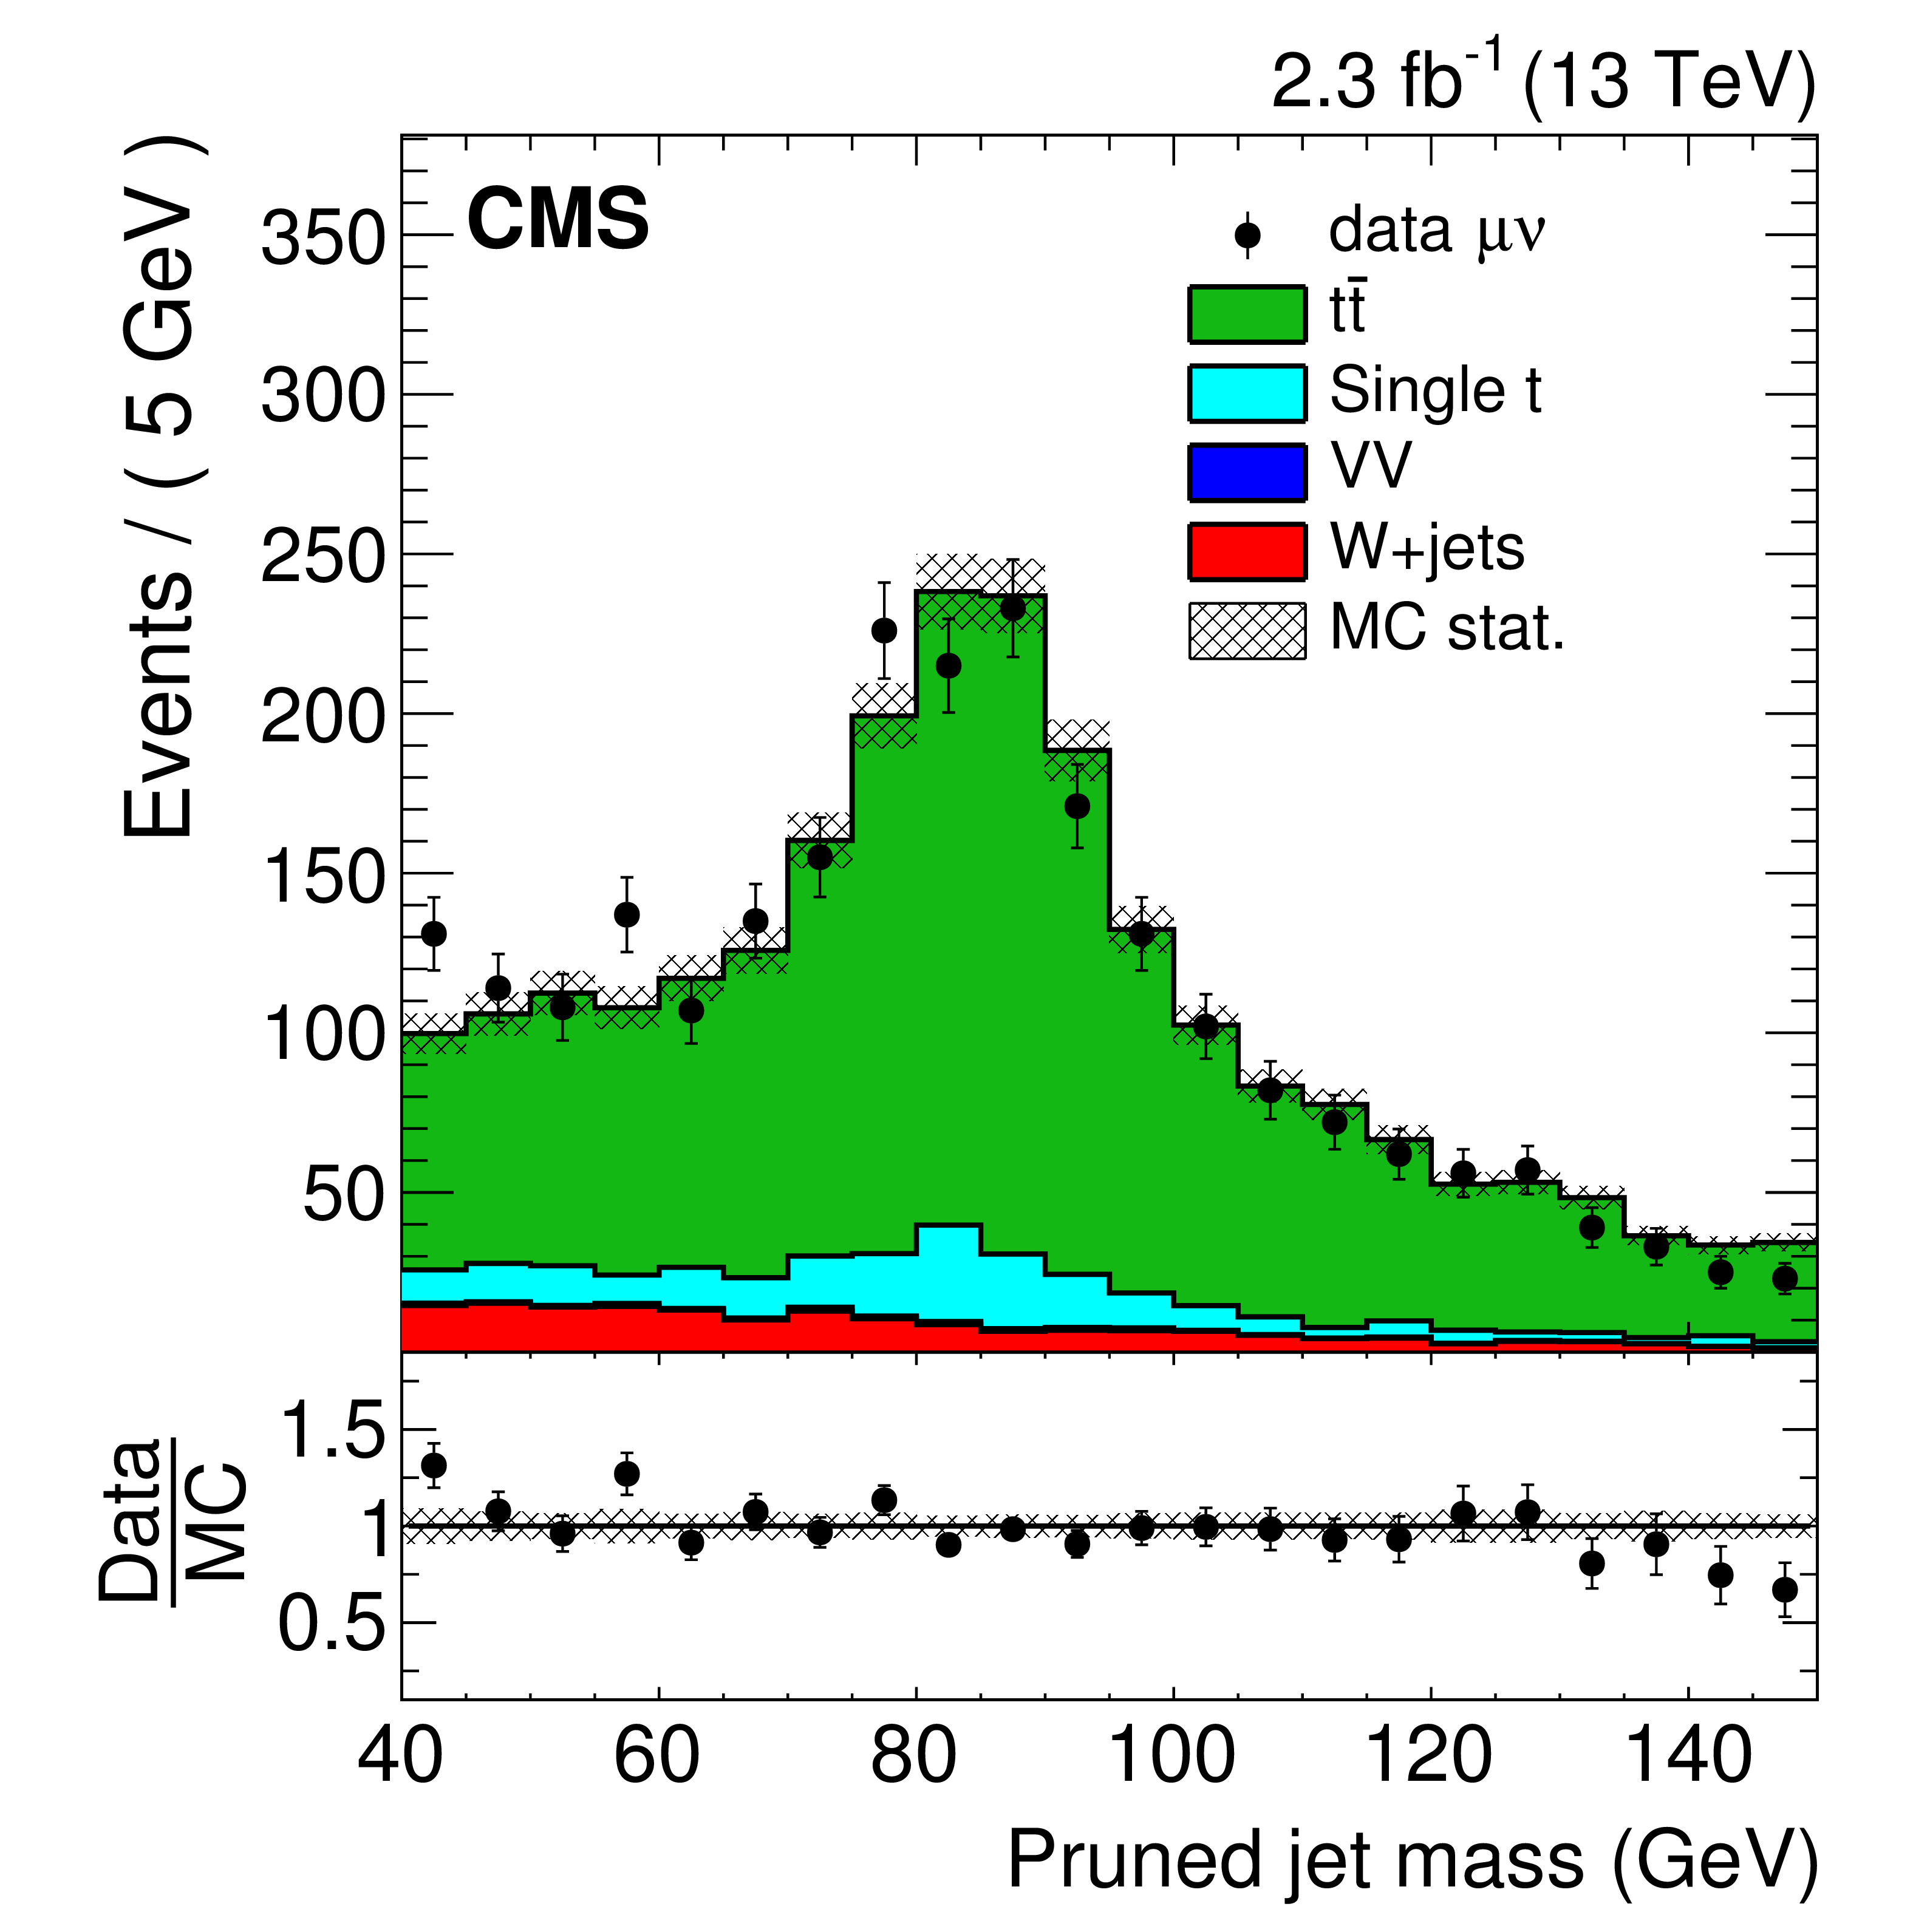
Distributions in $N$-subjettiness ratio $ {\tau _{21}}$ (left) and pruned $ {m_{\text {jet}}}$ (right) from the top quark enriched control sample in the muon channel. The ${\mathrm{ t } \mathrm{ \bar{t} } }$ background is rescaled such that the total number of background events matches the number of events in data. In the lower panel of each plot, the ratio between data and simulation is shown together with the statistical uncertainty in the simulation normalized by its central value. |

png pdf |
Figure 2-a:
Distribution in $N$-subjettiness ratio $ {\tau _{21}}$ from the top quark enriched control sample in the muon channel. The ${\mathrm{ t } \mathrm{ \bar{t} } }$ background is rescaled such that the total number of background events matches the number of events in data. In the lower panel, the ratio between data and simulation is shown together with the statistical uncertainty in the simulation normalized by its central value. |
png pdf |
Figure 2-b:
Distribution in $pruned $ {m_{\text {jet}}}$ from the top quark enriched control sample in the muon channel. The ${\mathrm{ t } \mathrm{ \bar{t} } }$ background is rescaled such that the total number of background events matches the number of events in data. In the lower panel, the ratio between data and simulation is shown together with the statistical uncertainty in the simulation normalized by its central value. |
png pdf |
Figure 3:
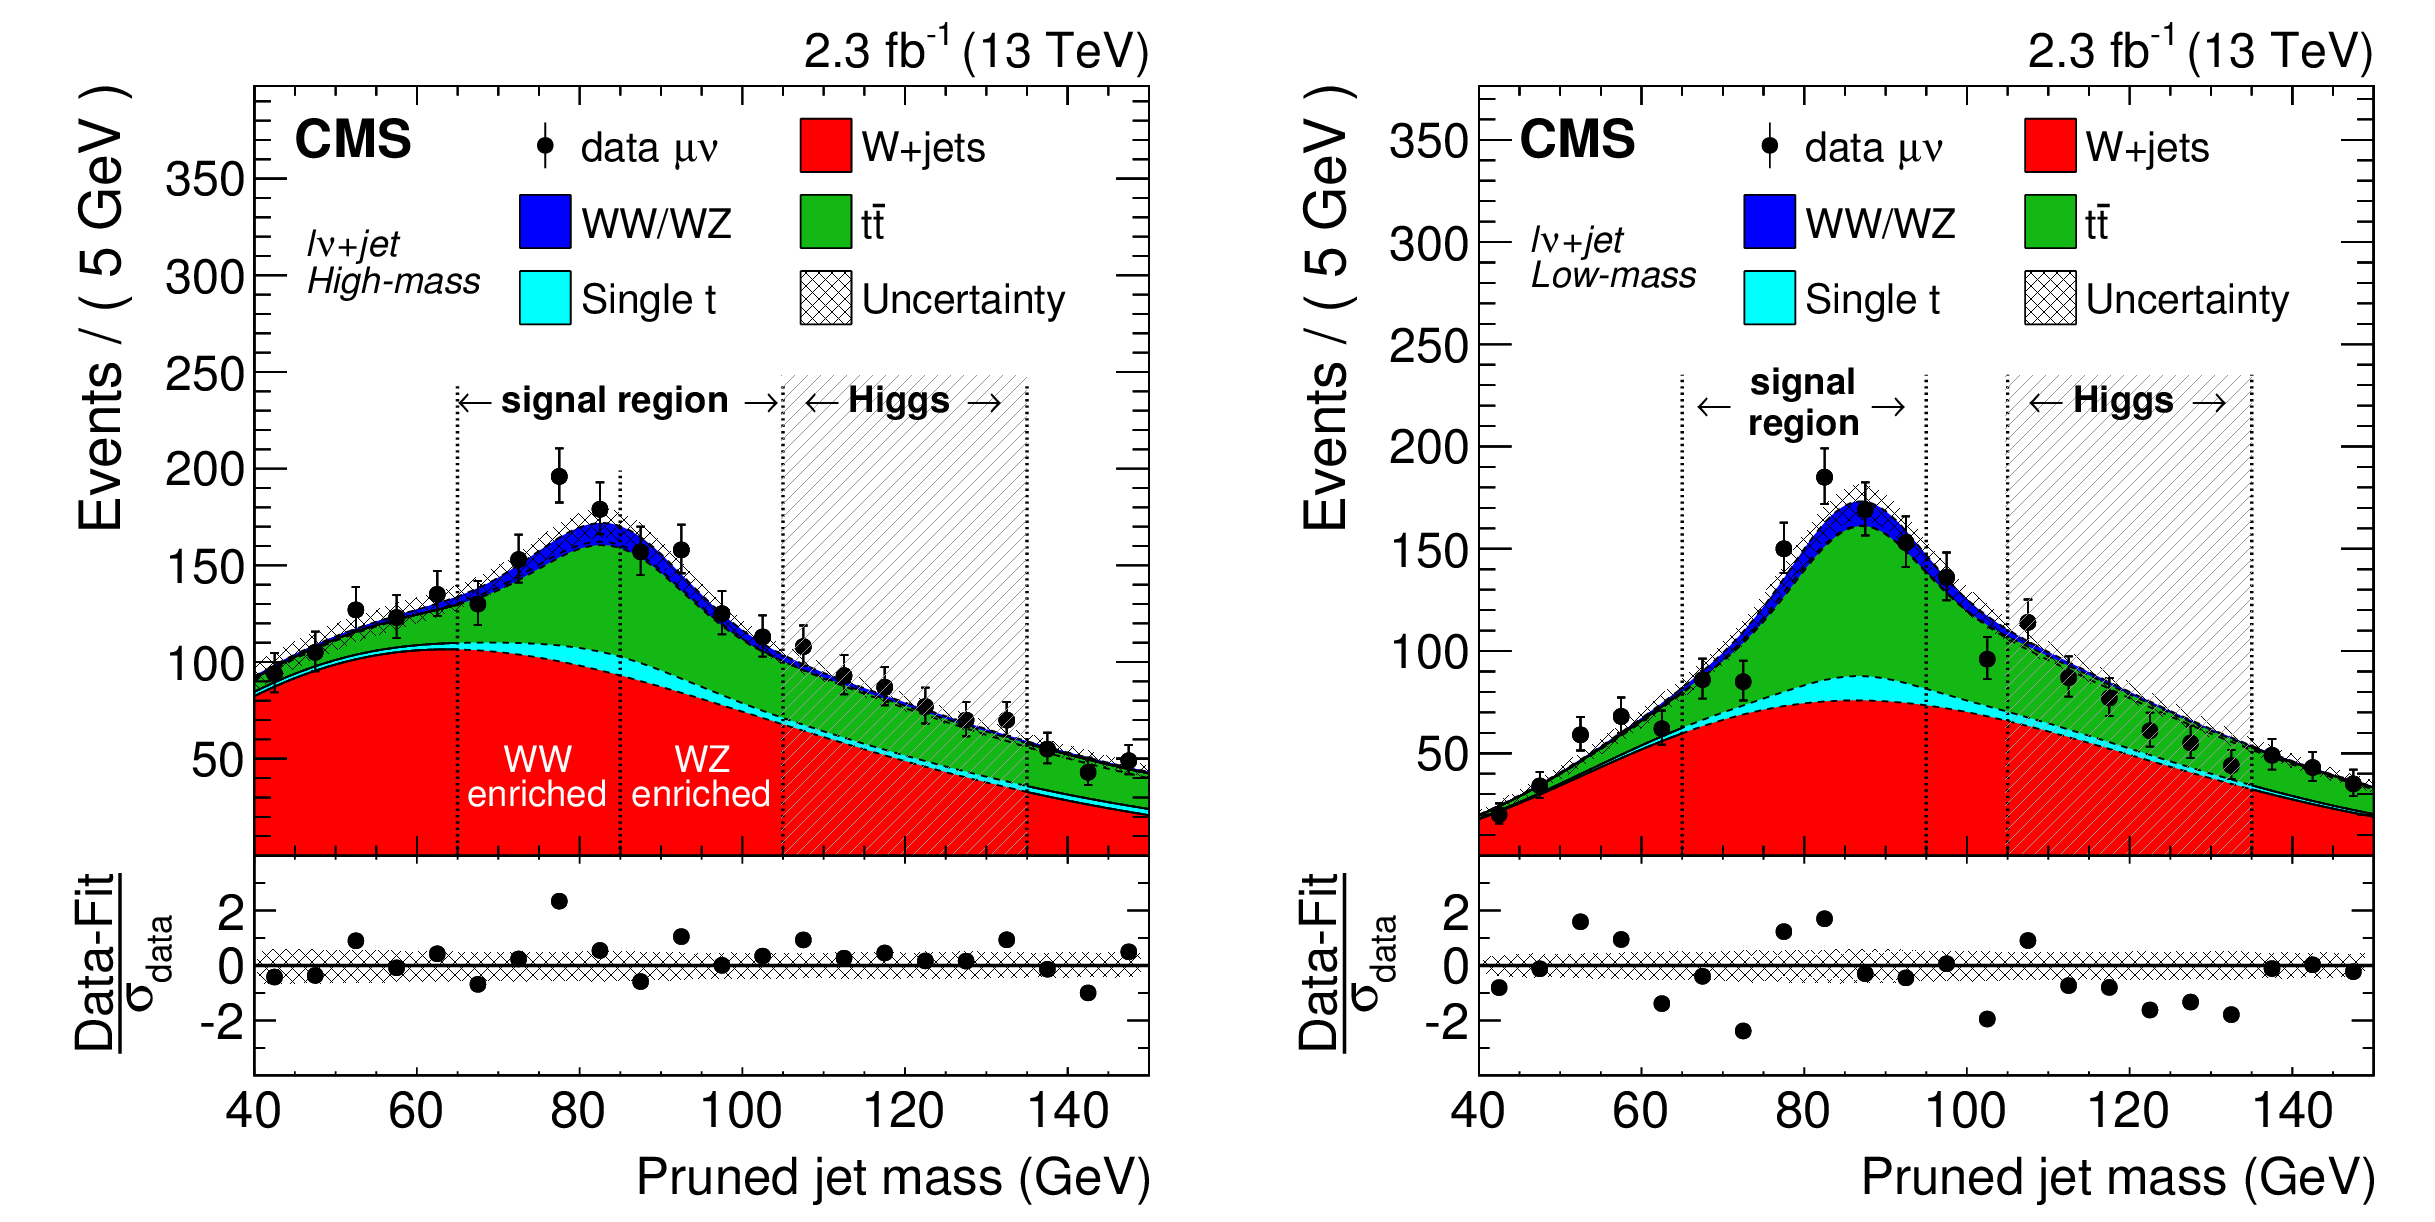
Distributions of the pruned jet mass $ {m_{\text {jet}}}$ in the ${\ell \nu }$+jet high-mass (left) and low-mass (right) analyses in the muon channel. All selections are applied except the requirement on $ {m_{\text {jet}}}$ signal window. Data are shown as black points. The signal regions and $ {m_{\text {jet}}}$ categories of the analyses are indicated by the vertical dotted lines. The shaded $ {m_{\text {jet}}}$ region 105 -135 GeV is not used in these analyses. In the lower panel of each plot, the bin-by-bin fit residuals, $(N_\text {data}- N_\text {fit})/\sigma _\text {data}$, are shown together with the uncertainty band of the fit normalized by the statistical uncertainty of data points, $\sigma _\text {data}$. |
png pdf |
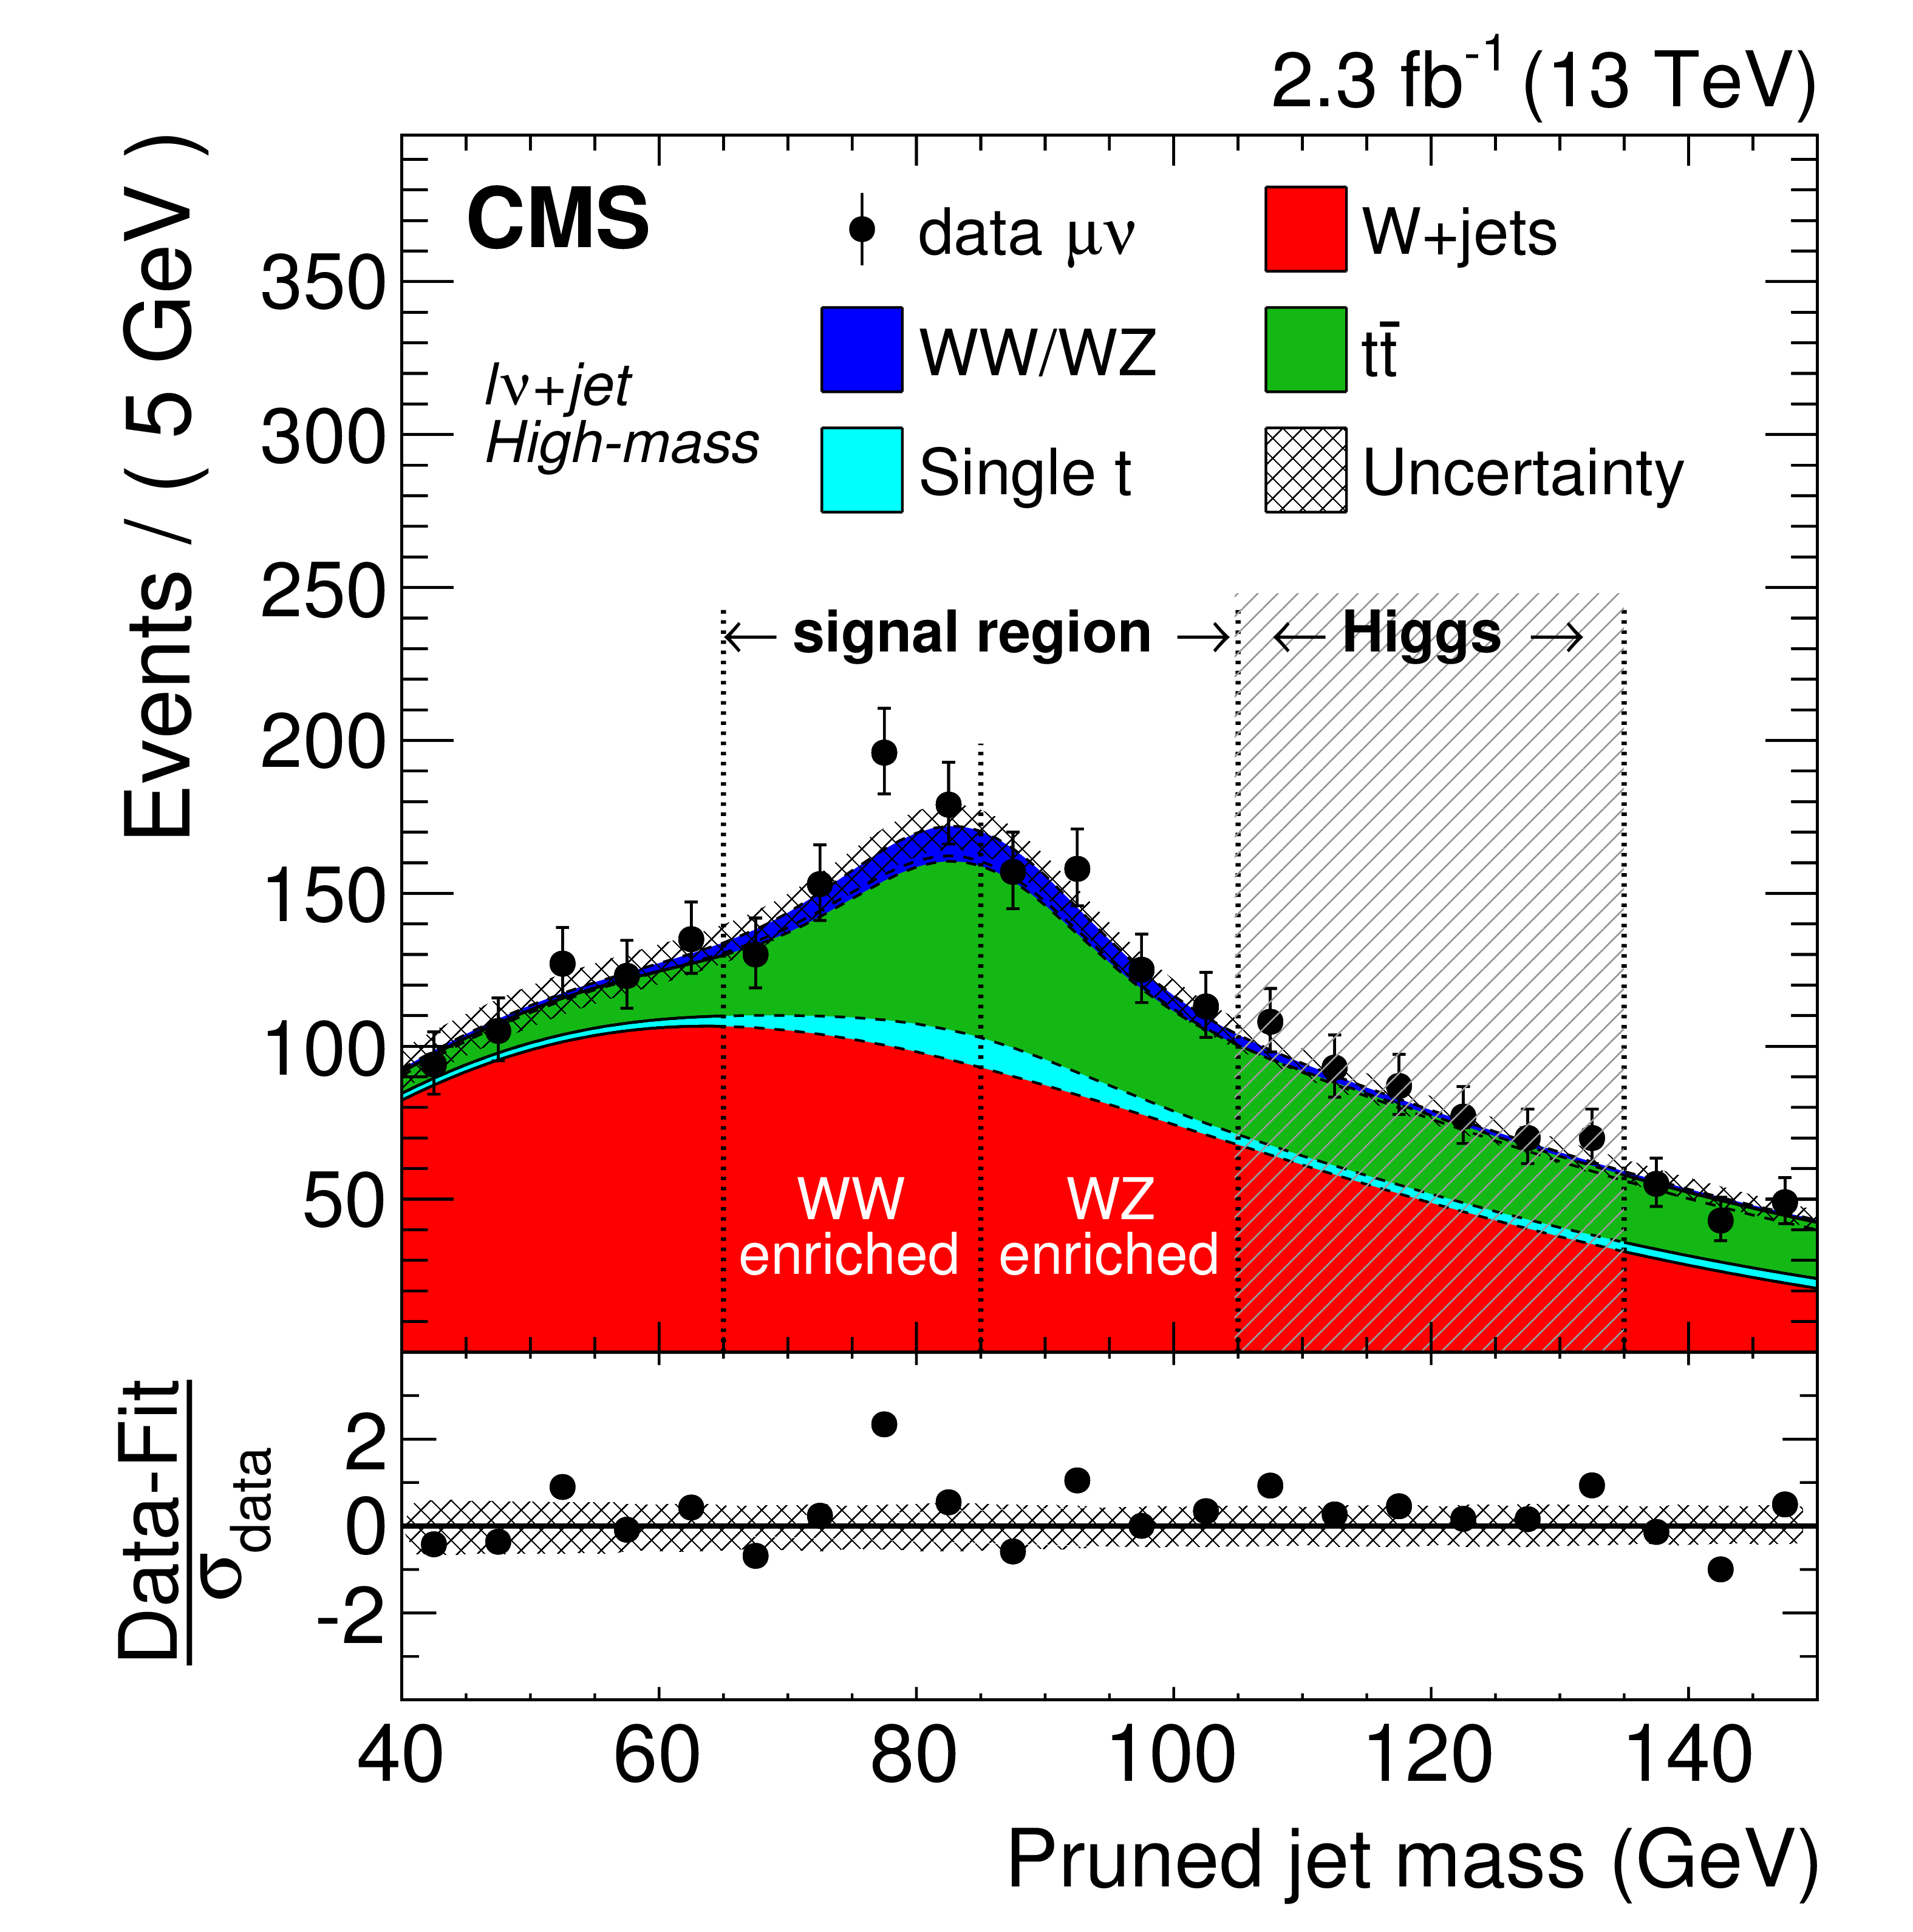
Figure 3-a:
Distribution of the pruned jet mass $ {m_{\text {jet}}}$ in the ${\ell \nu }$+jet high-mass analysis in the muon channel. All selections are applied except the requirement on $ {m_{\text {jet}}}$ signal window. Data are shown as black points. The signal regions and $ {m_{\text {jet}}}$ categories of the analyses are indicated by the vertical dotted lines. The shaded $ {m_{\text {jet}}}$ region 105 -135 GeV is not used in these analyses. In the lower panel, the bin-by-bin fit residuals, $(N_\text {data}- N_\text {fit})/\sigma _\text {data}$, are shown together with the uncertainty band of the fit normalized by the statistical uncertainty of data points, $\sigma _\text {data}$. |
png pdf |
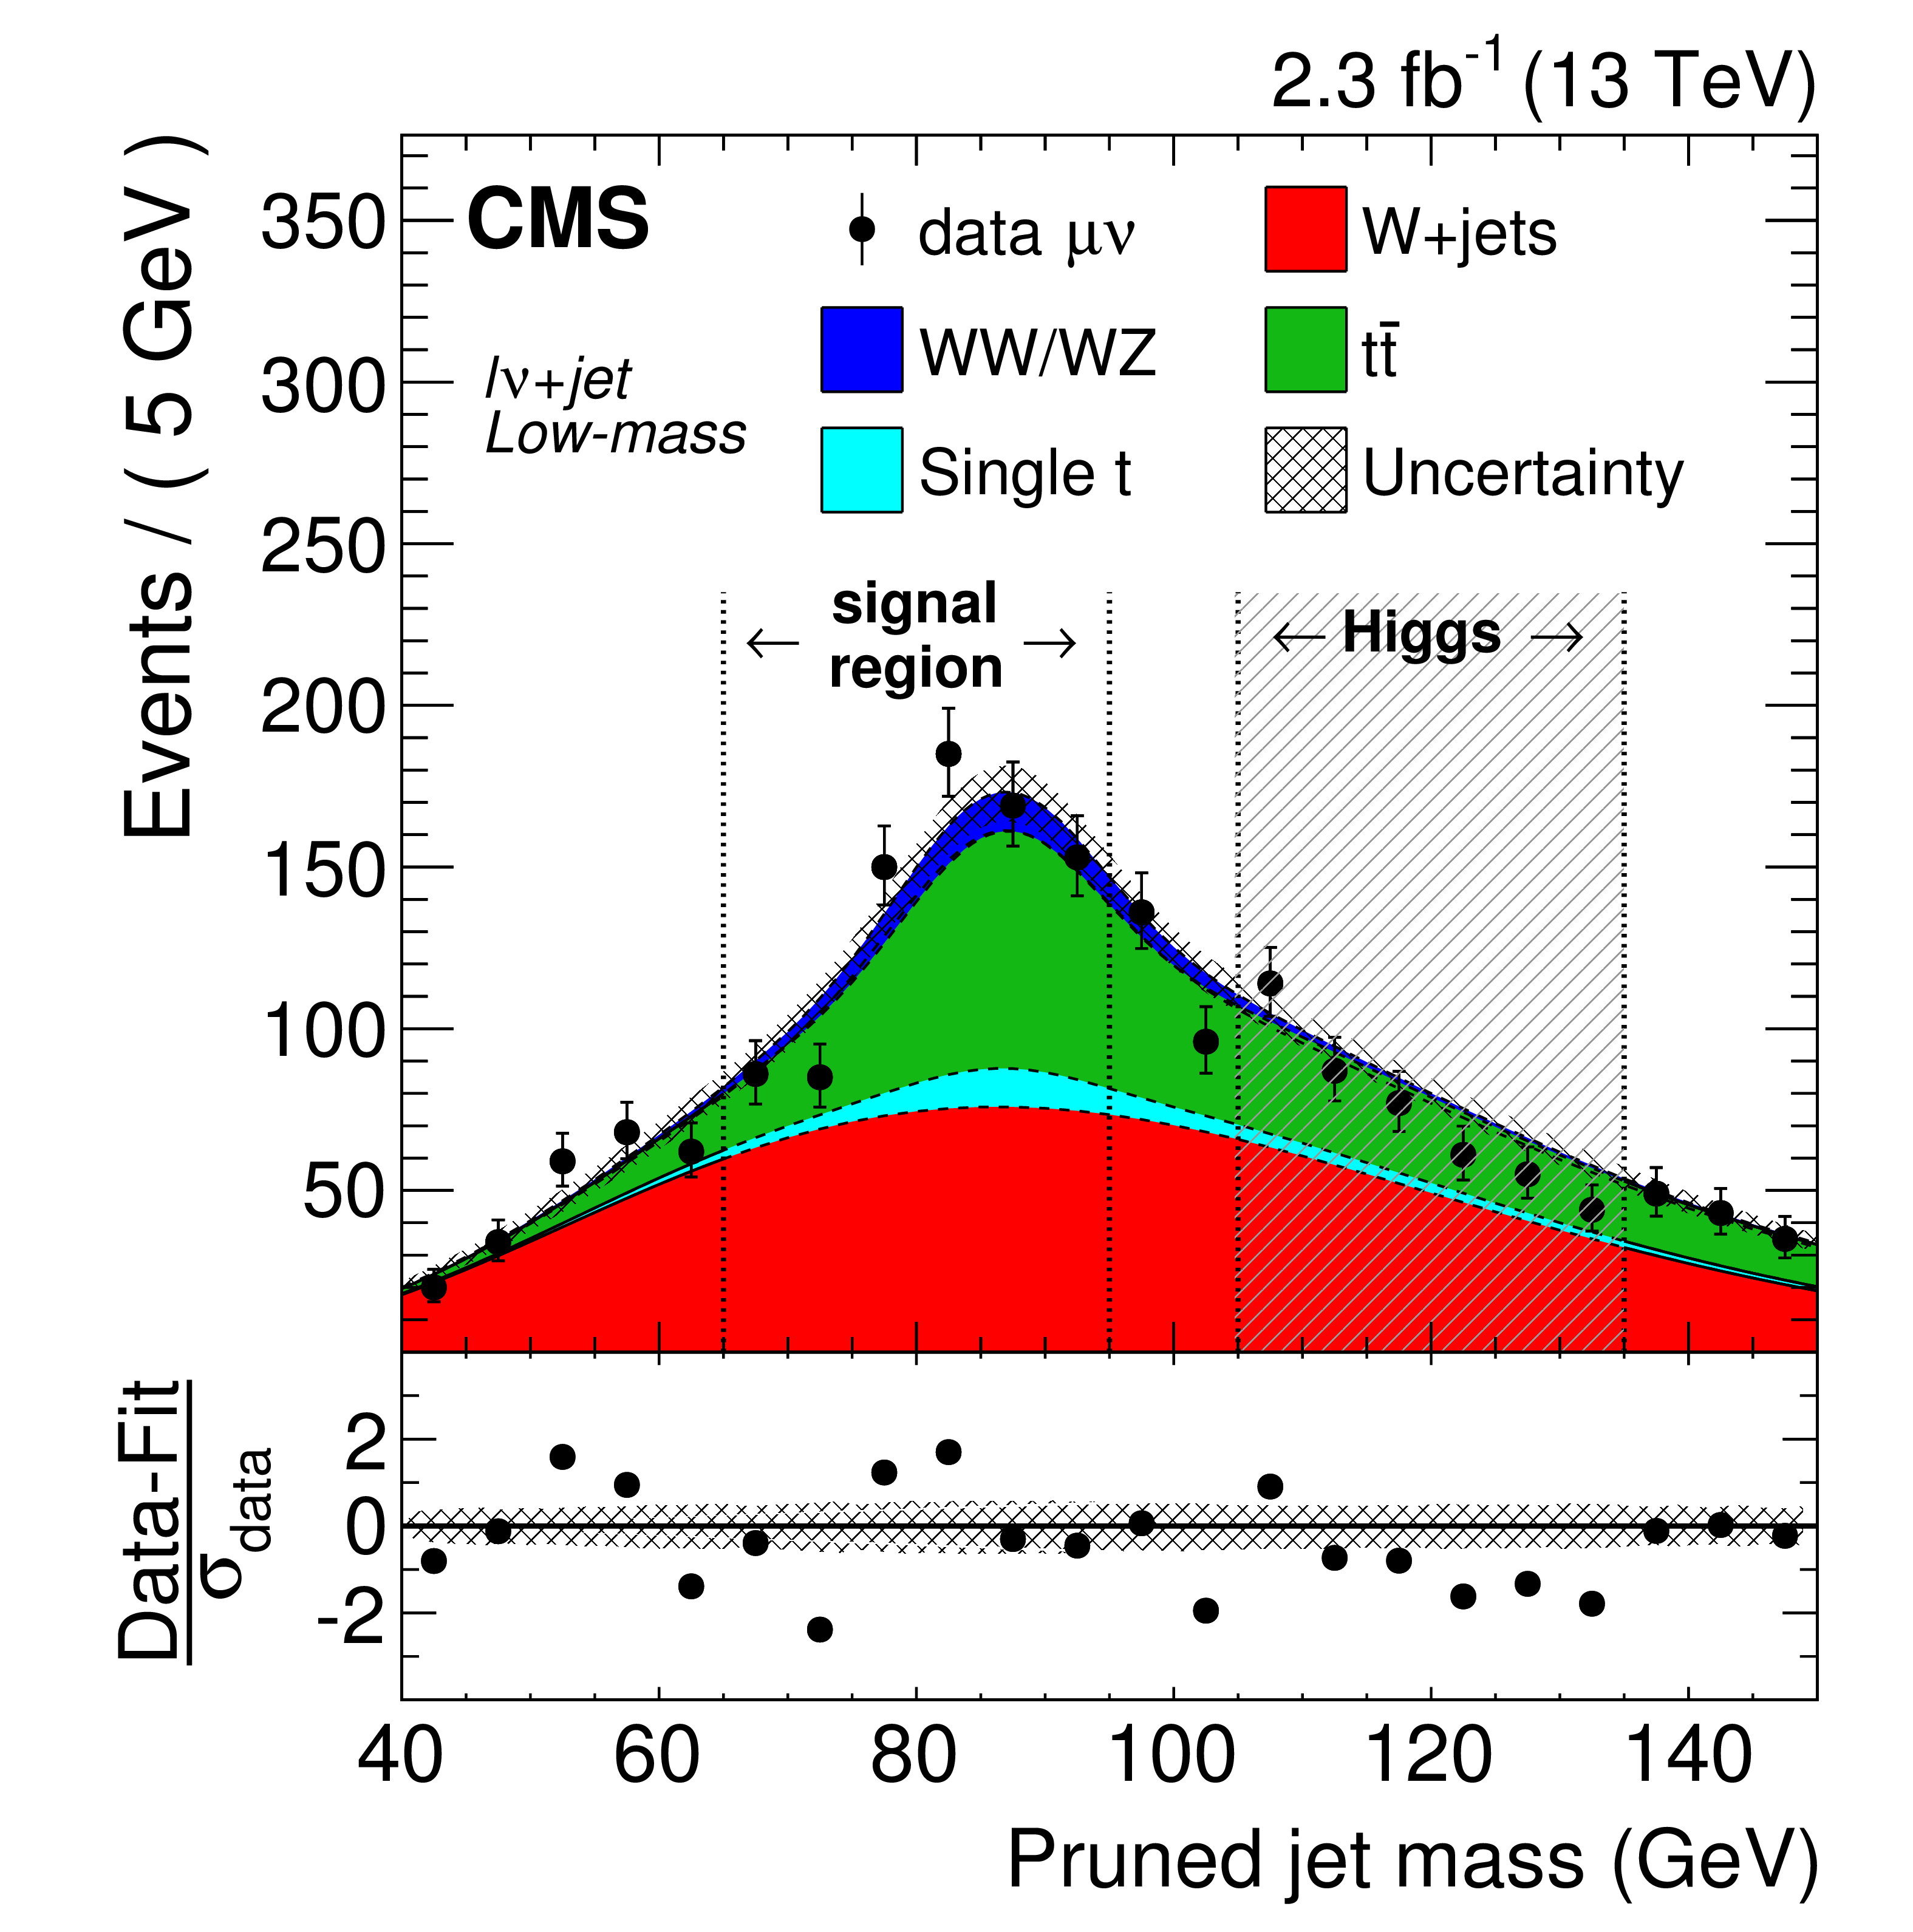
Figure 3-b:
Distribution of the pruned jet mass $ {m_{\text {jet}}}$ in the ${\ell \nu }$+jet low-mass analysis in the muon channel. All selections are applied except the requirement on $ {m_{\text {jet}}}$ signal window. Data are shown as black points. The signal regions and $ {m_{\text {jet}}}$ categories of the analyses are indicated by the vertical dotted lines. The shaded $ {m_{\text {jet}}}$ region 105 -135 GeV is not used in these analyses. In the lower panel, the bin-by-bin fit residuals, $(N_\text {data}- N_\text {fit})/\sigma _\text {data}$, are shown together with the uncertainty band of the fit normalized by the statistical uncertainty of data points, $\sigma _\text {data}$. |
png pdf |
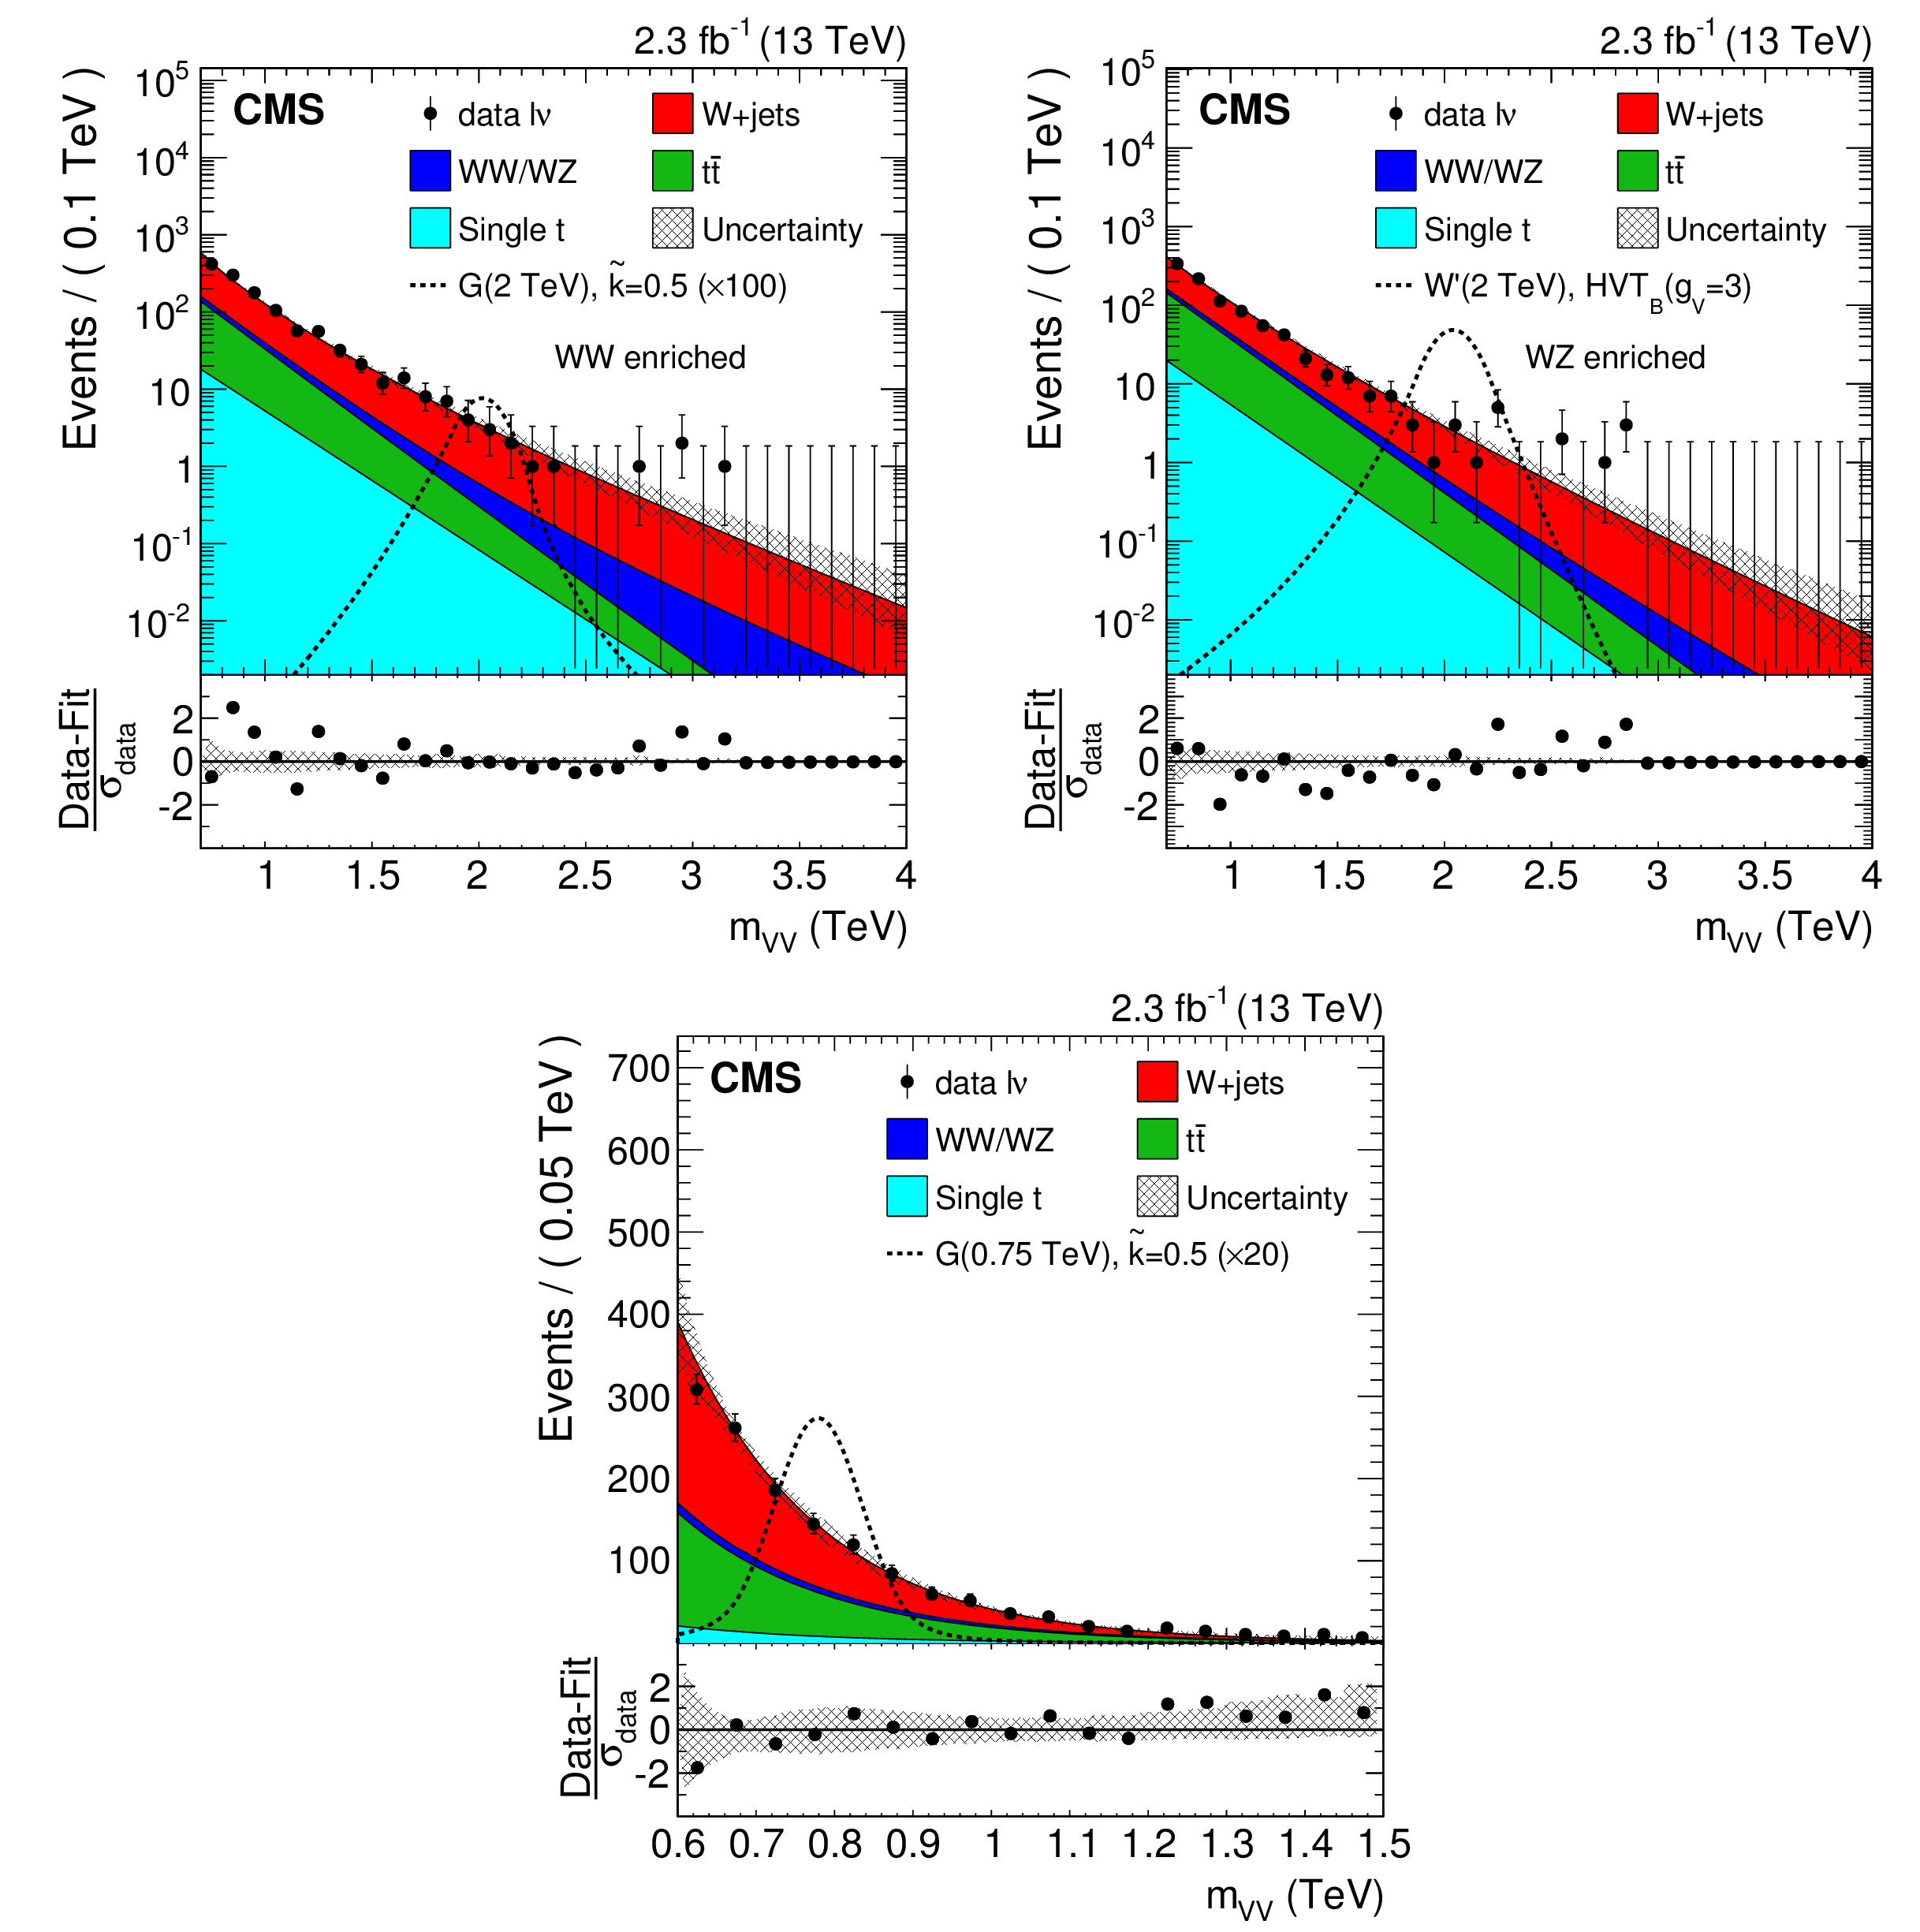
Figure 4:
(Upper plots) Final $ {m_{ {\mathrm {V}} {\mathrm {V}} }} $ distributions for data and expected backgrounds in the high-mass analysis obtained from the combined muon and electron channels in the WW-enriched (left) and WZ-enriched (right) signal regions. (Lower plot) Final $ {m_{ {\mathrm {V}} {\mathrm {V}} }} $ distributions for data and expected backgrounds in the signal region of the low-mass analysis obtained from the combined muon and electron channels. In each plot the solid curve represents the background estimation provided by the $\alpha $ ratio method. The hatched band includes both statistical and systematic uncertainties. The data are shown as black points. Signal benchmarks for a mass of 2 TeV (0.75 TeV) are also shown with black dashed lines for the upper (lower) plots. In the lower panel of each plot are the bin-by-bin fit residuals, ($N_\text {data}- N_\text {fit}$)/$\sigma _\text {data}$, shown together with the uncertainty band of the fit normalized by the statistical uncertainty of data, $\sigma _\text {data}$. |
png pdf |
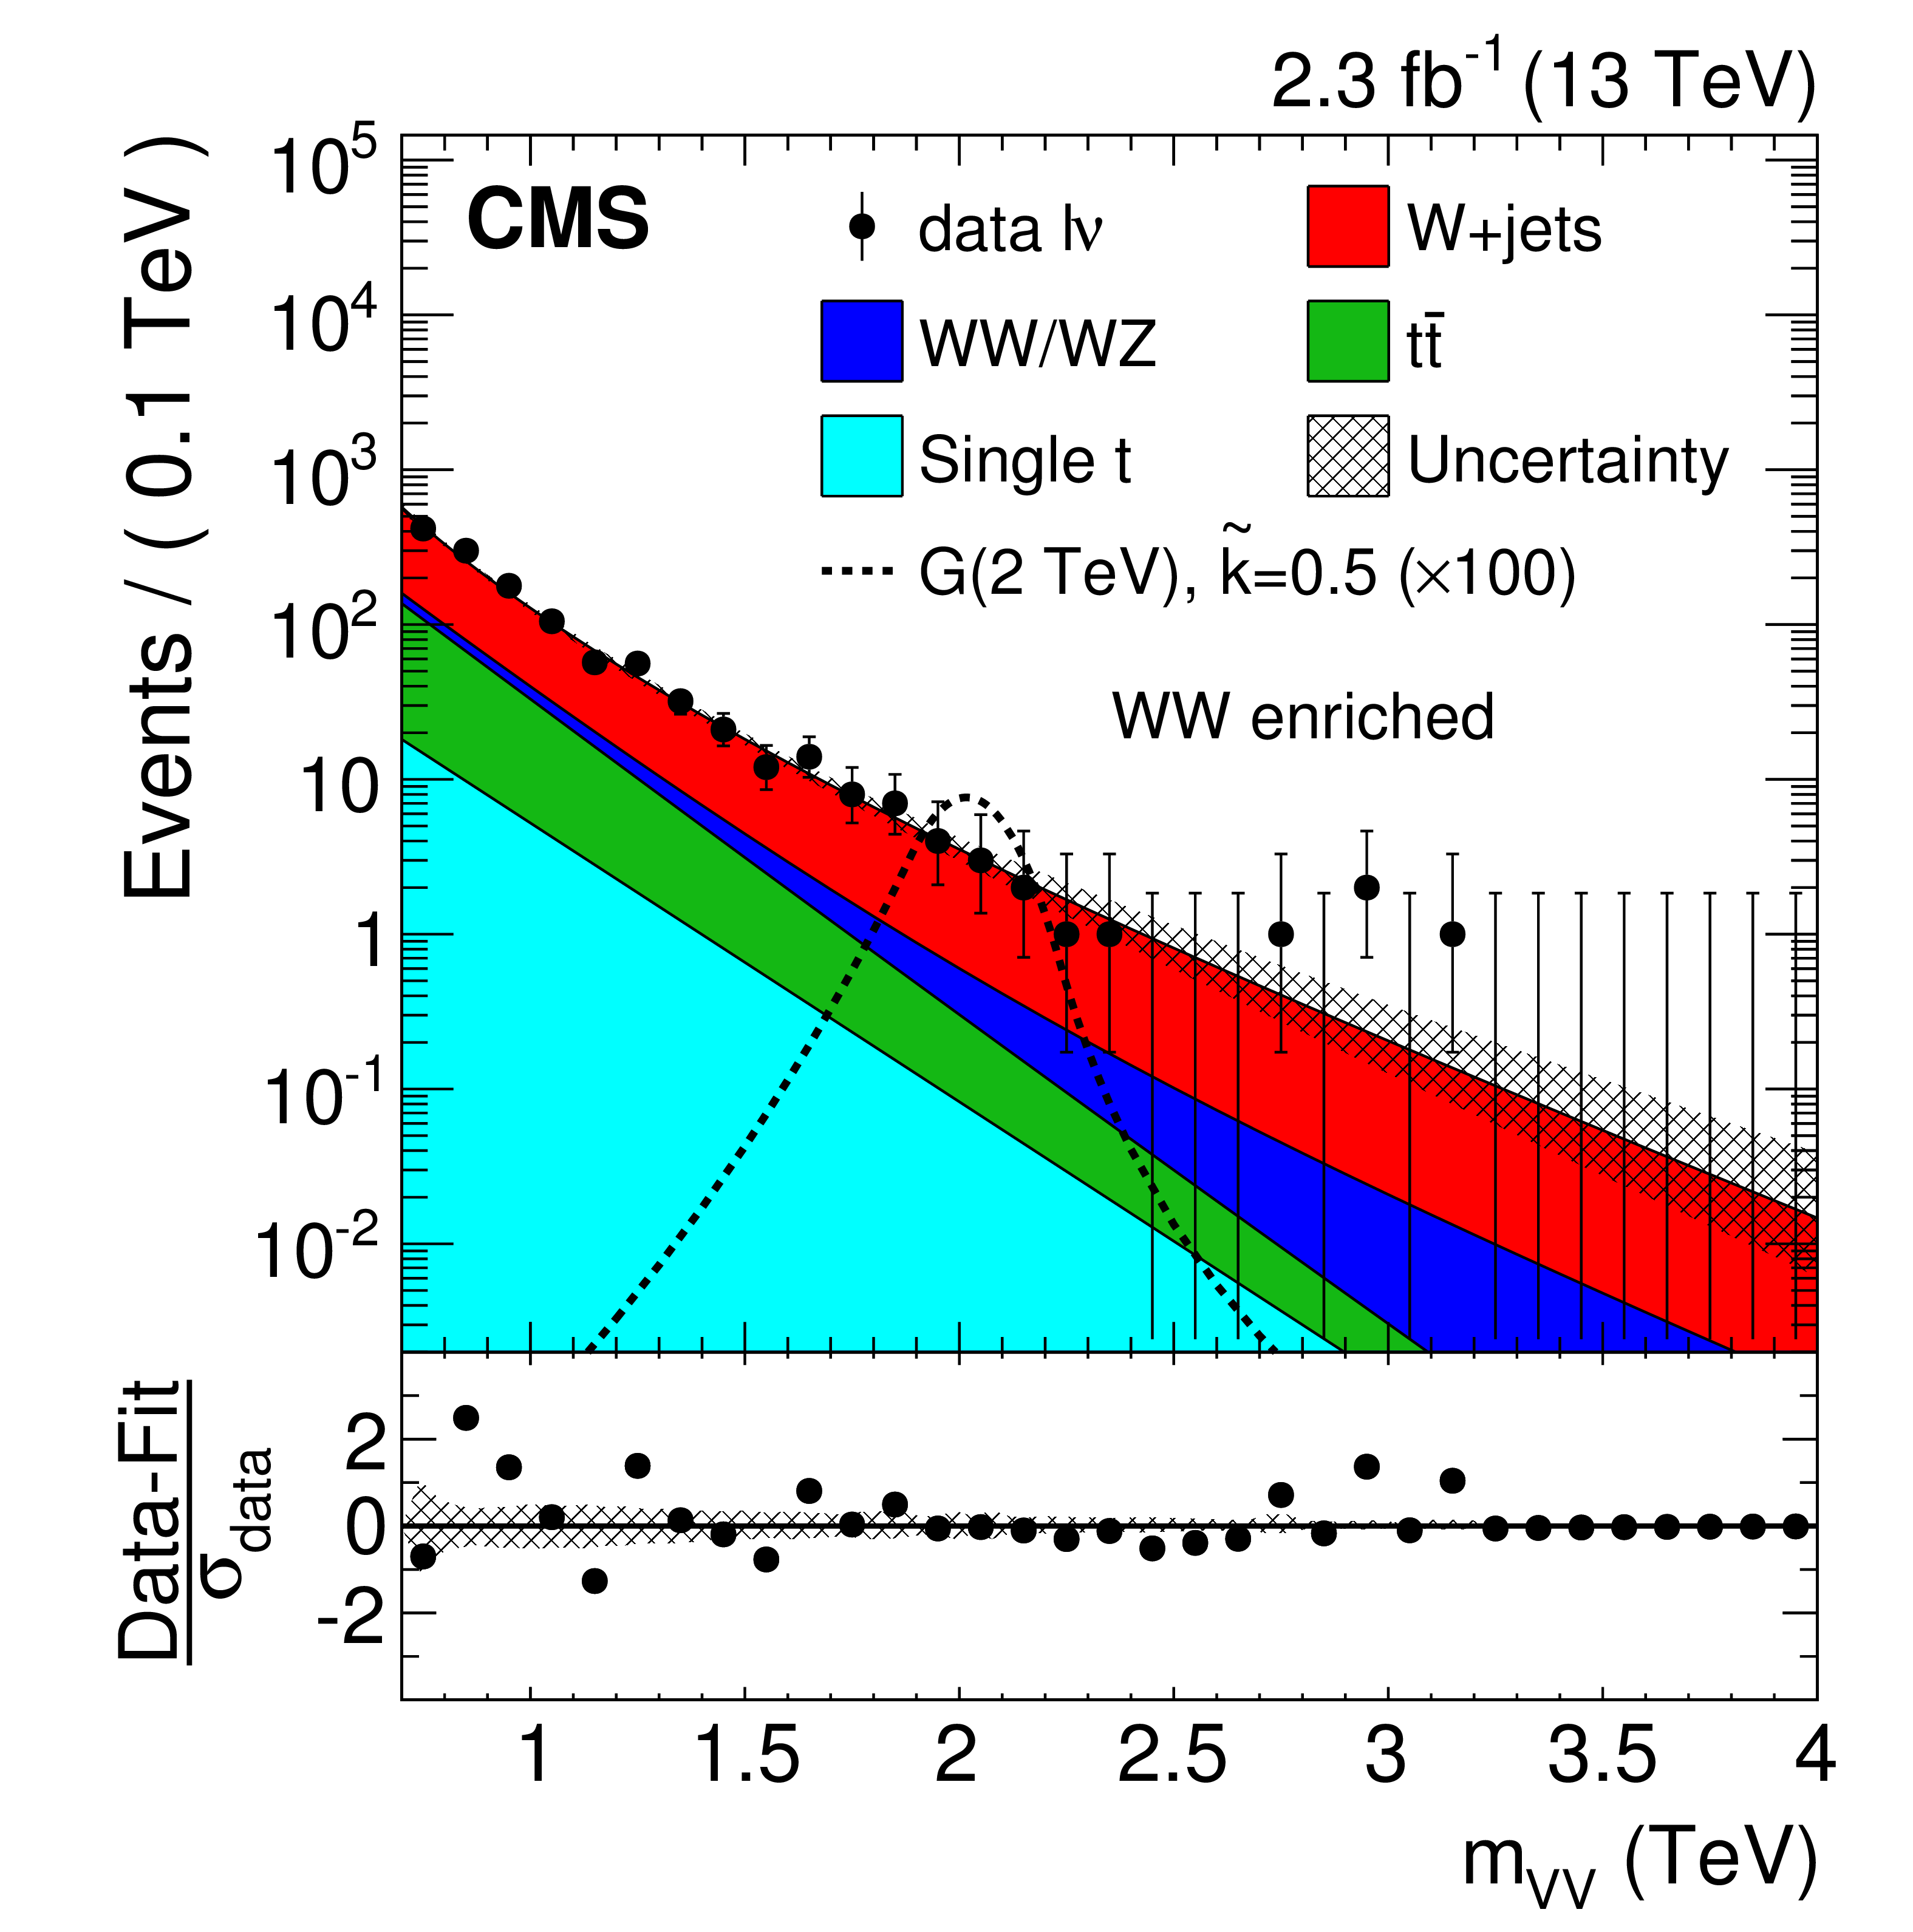
Figure 4-a:
Final $ {m_{ {\mathrm {V}} {\mathrm {V}} }} $ distribution for data and expected backgrounds in the high-mass analysis obtained from the combined muon and electron channels in the WW-enriched signal region. The solid curve represents the background estimation provided by the $\alpha $ ratio method. The hatched band includes both statistical and systematic uncertainties. The data are shown as black points. Signal benchmarks for a mass of 2 TeV (0.75 TeV) are also shown with black dashed lines for the upper (lower) plots. In the lower panel are the bin-by-bin fit residuals, ($N_\text {data}- N_\text {fit}$)/$\sigma _\text {data}$, shown together with the uncertainty band of the fit normalized by the statistical uncertainty of data, $\sigma _\text {data}$. |
png pdf |
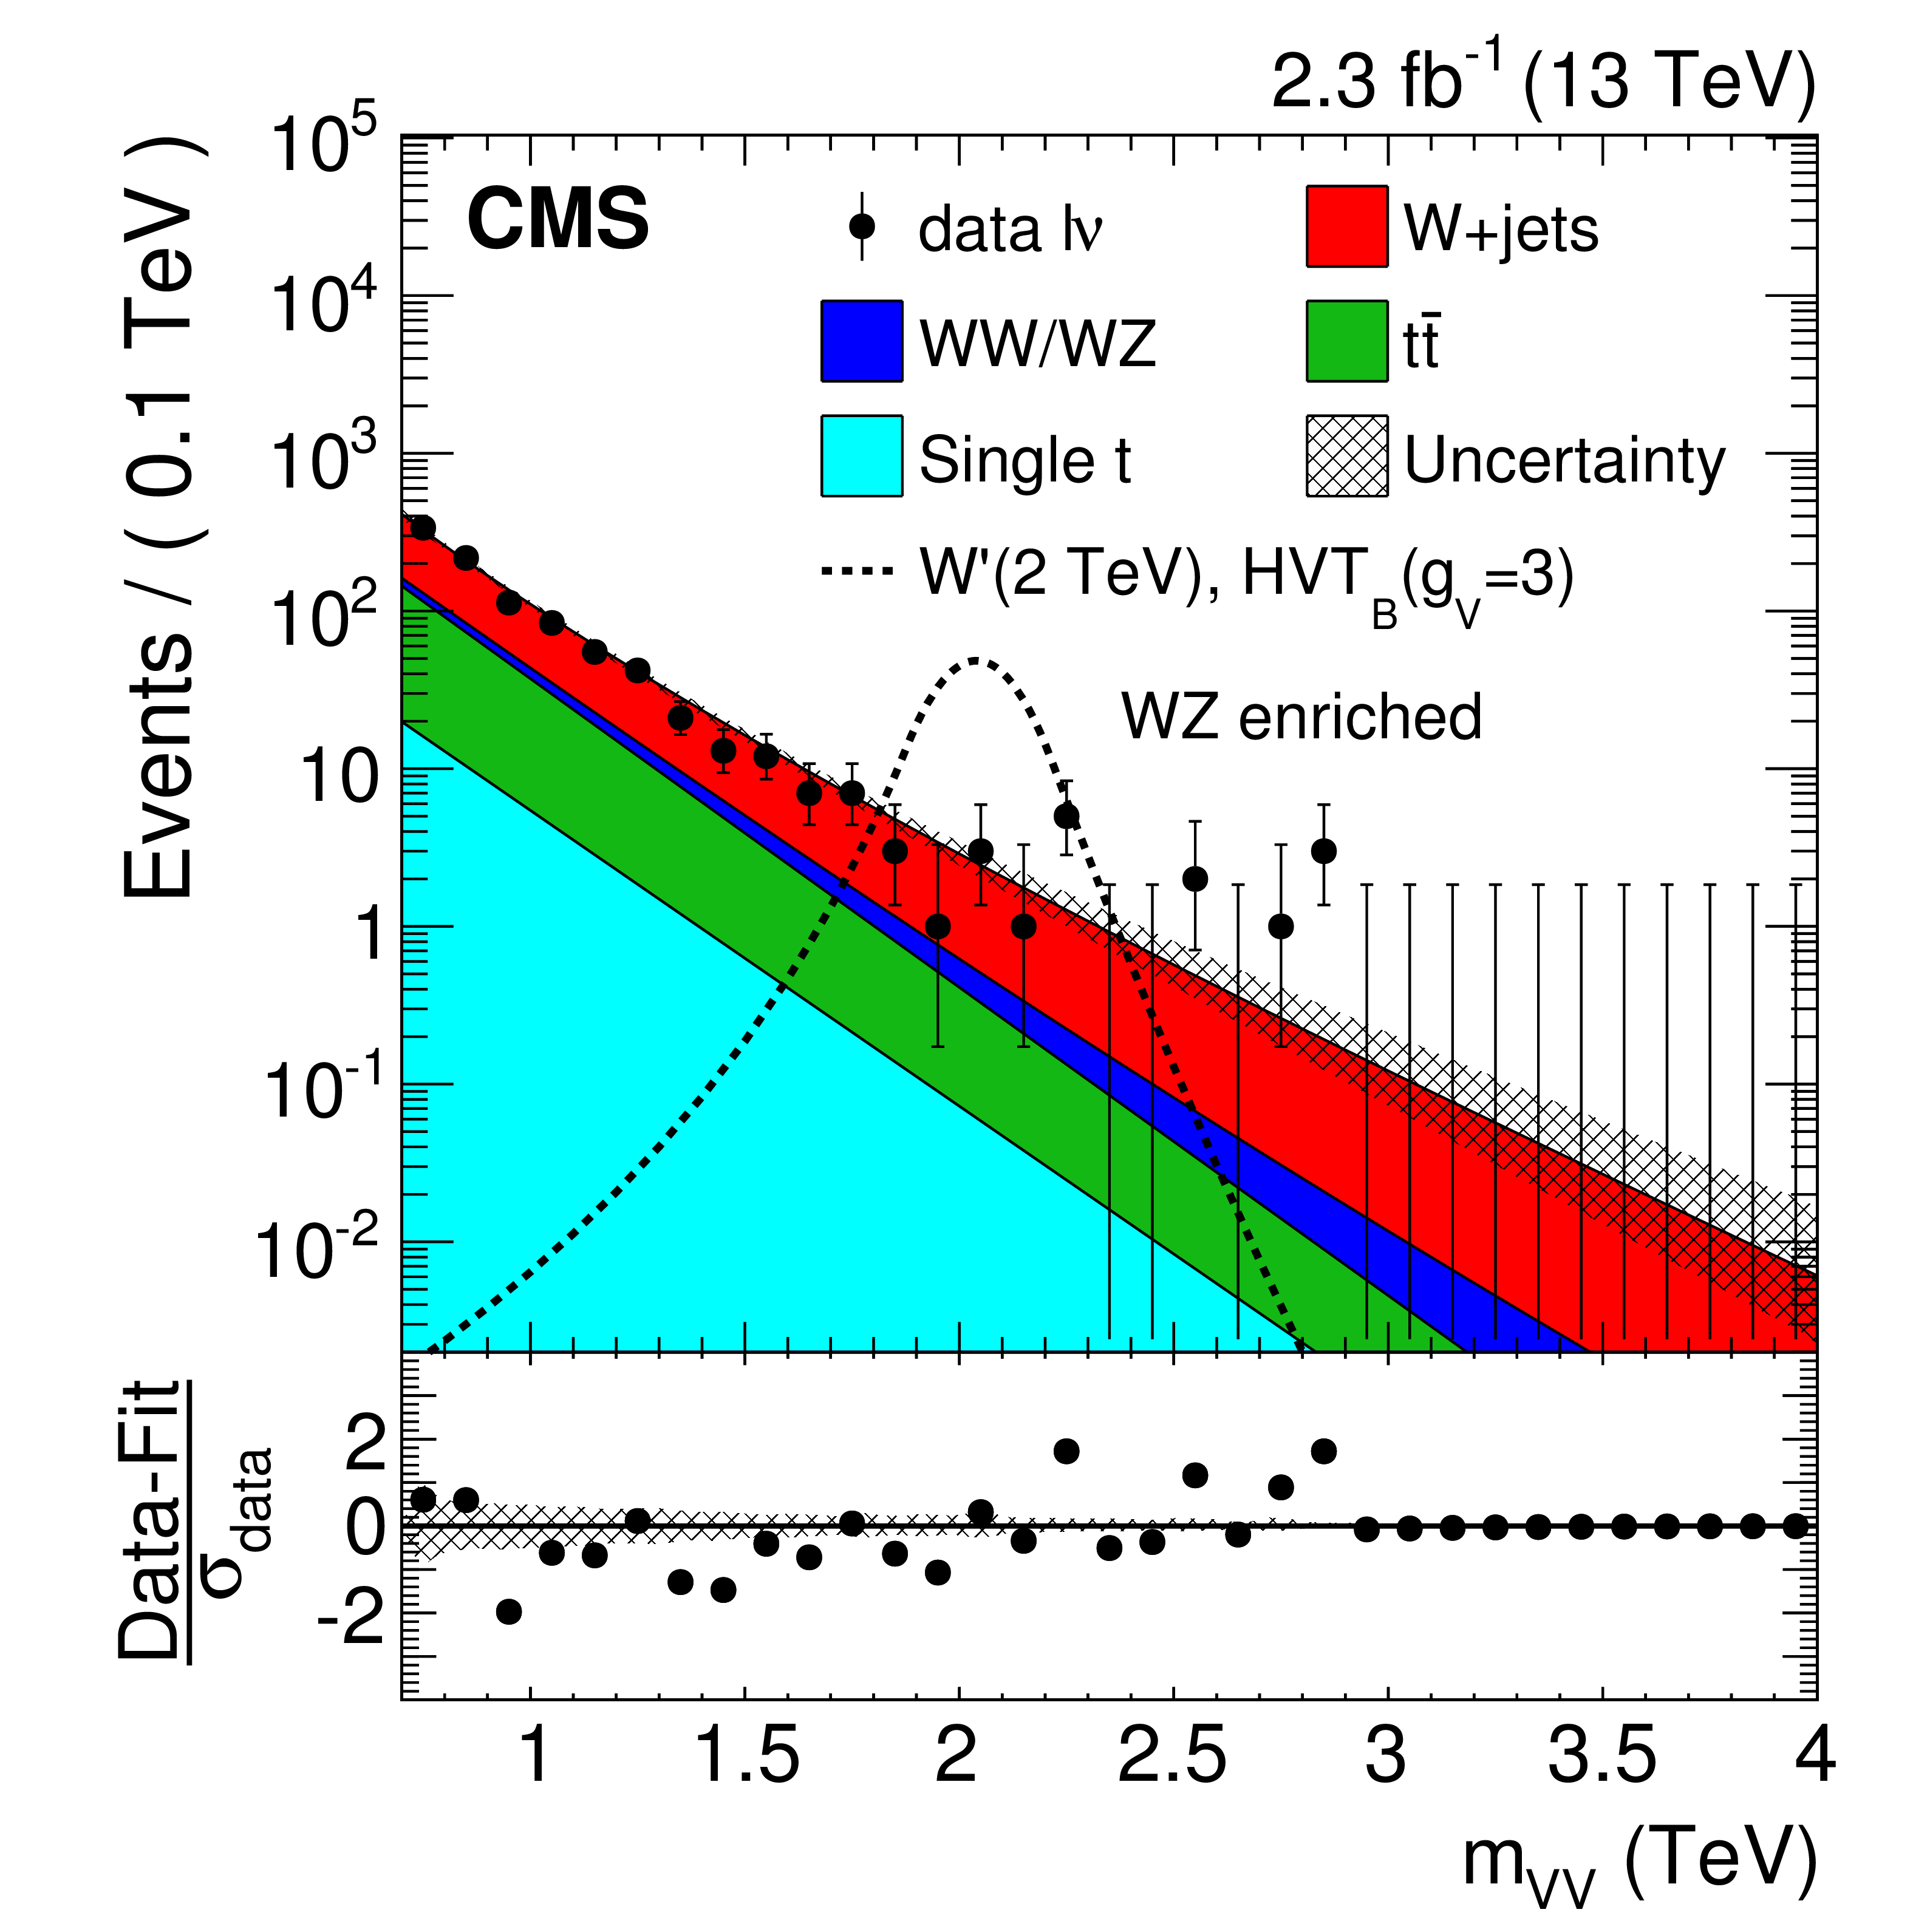
Figure 4-b:
Final $ {m_{ {\mathrm {V}} {\mathrm {V}} }} $ distribution for data and expected backgrounds in the high-mass analysis obtained from the combined muon and electron channels in the WZ-enriched signal region. The solid curve represents the background estimation provided by the $\alpha $ ratio method. The hatched band includes both statistical and systematic uncertainties. The data are shown as black points. Signal benchmarks for a mass of 2 TeV (0.75 TeV) are also shown with black dashed lines for the upper (lower) plots. In the lower panel are the bin-by-bin fit residuals, ($N_\text {data}- N_\text {fit}$)/$\sigma _\text {data}$, shown together with the uncertainty band of the fit normalized by the statistical uncertainty of data, $\sigma _\text {data}$. |
png pdf |
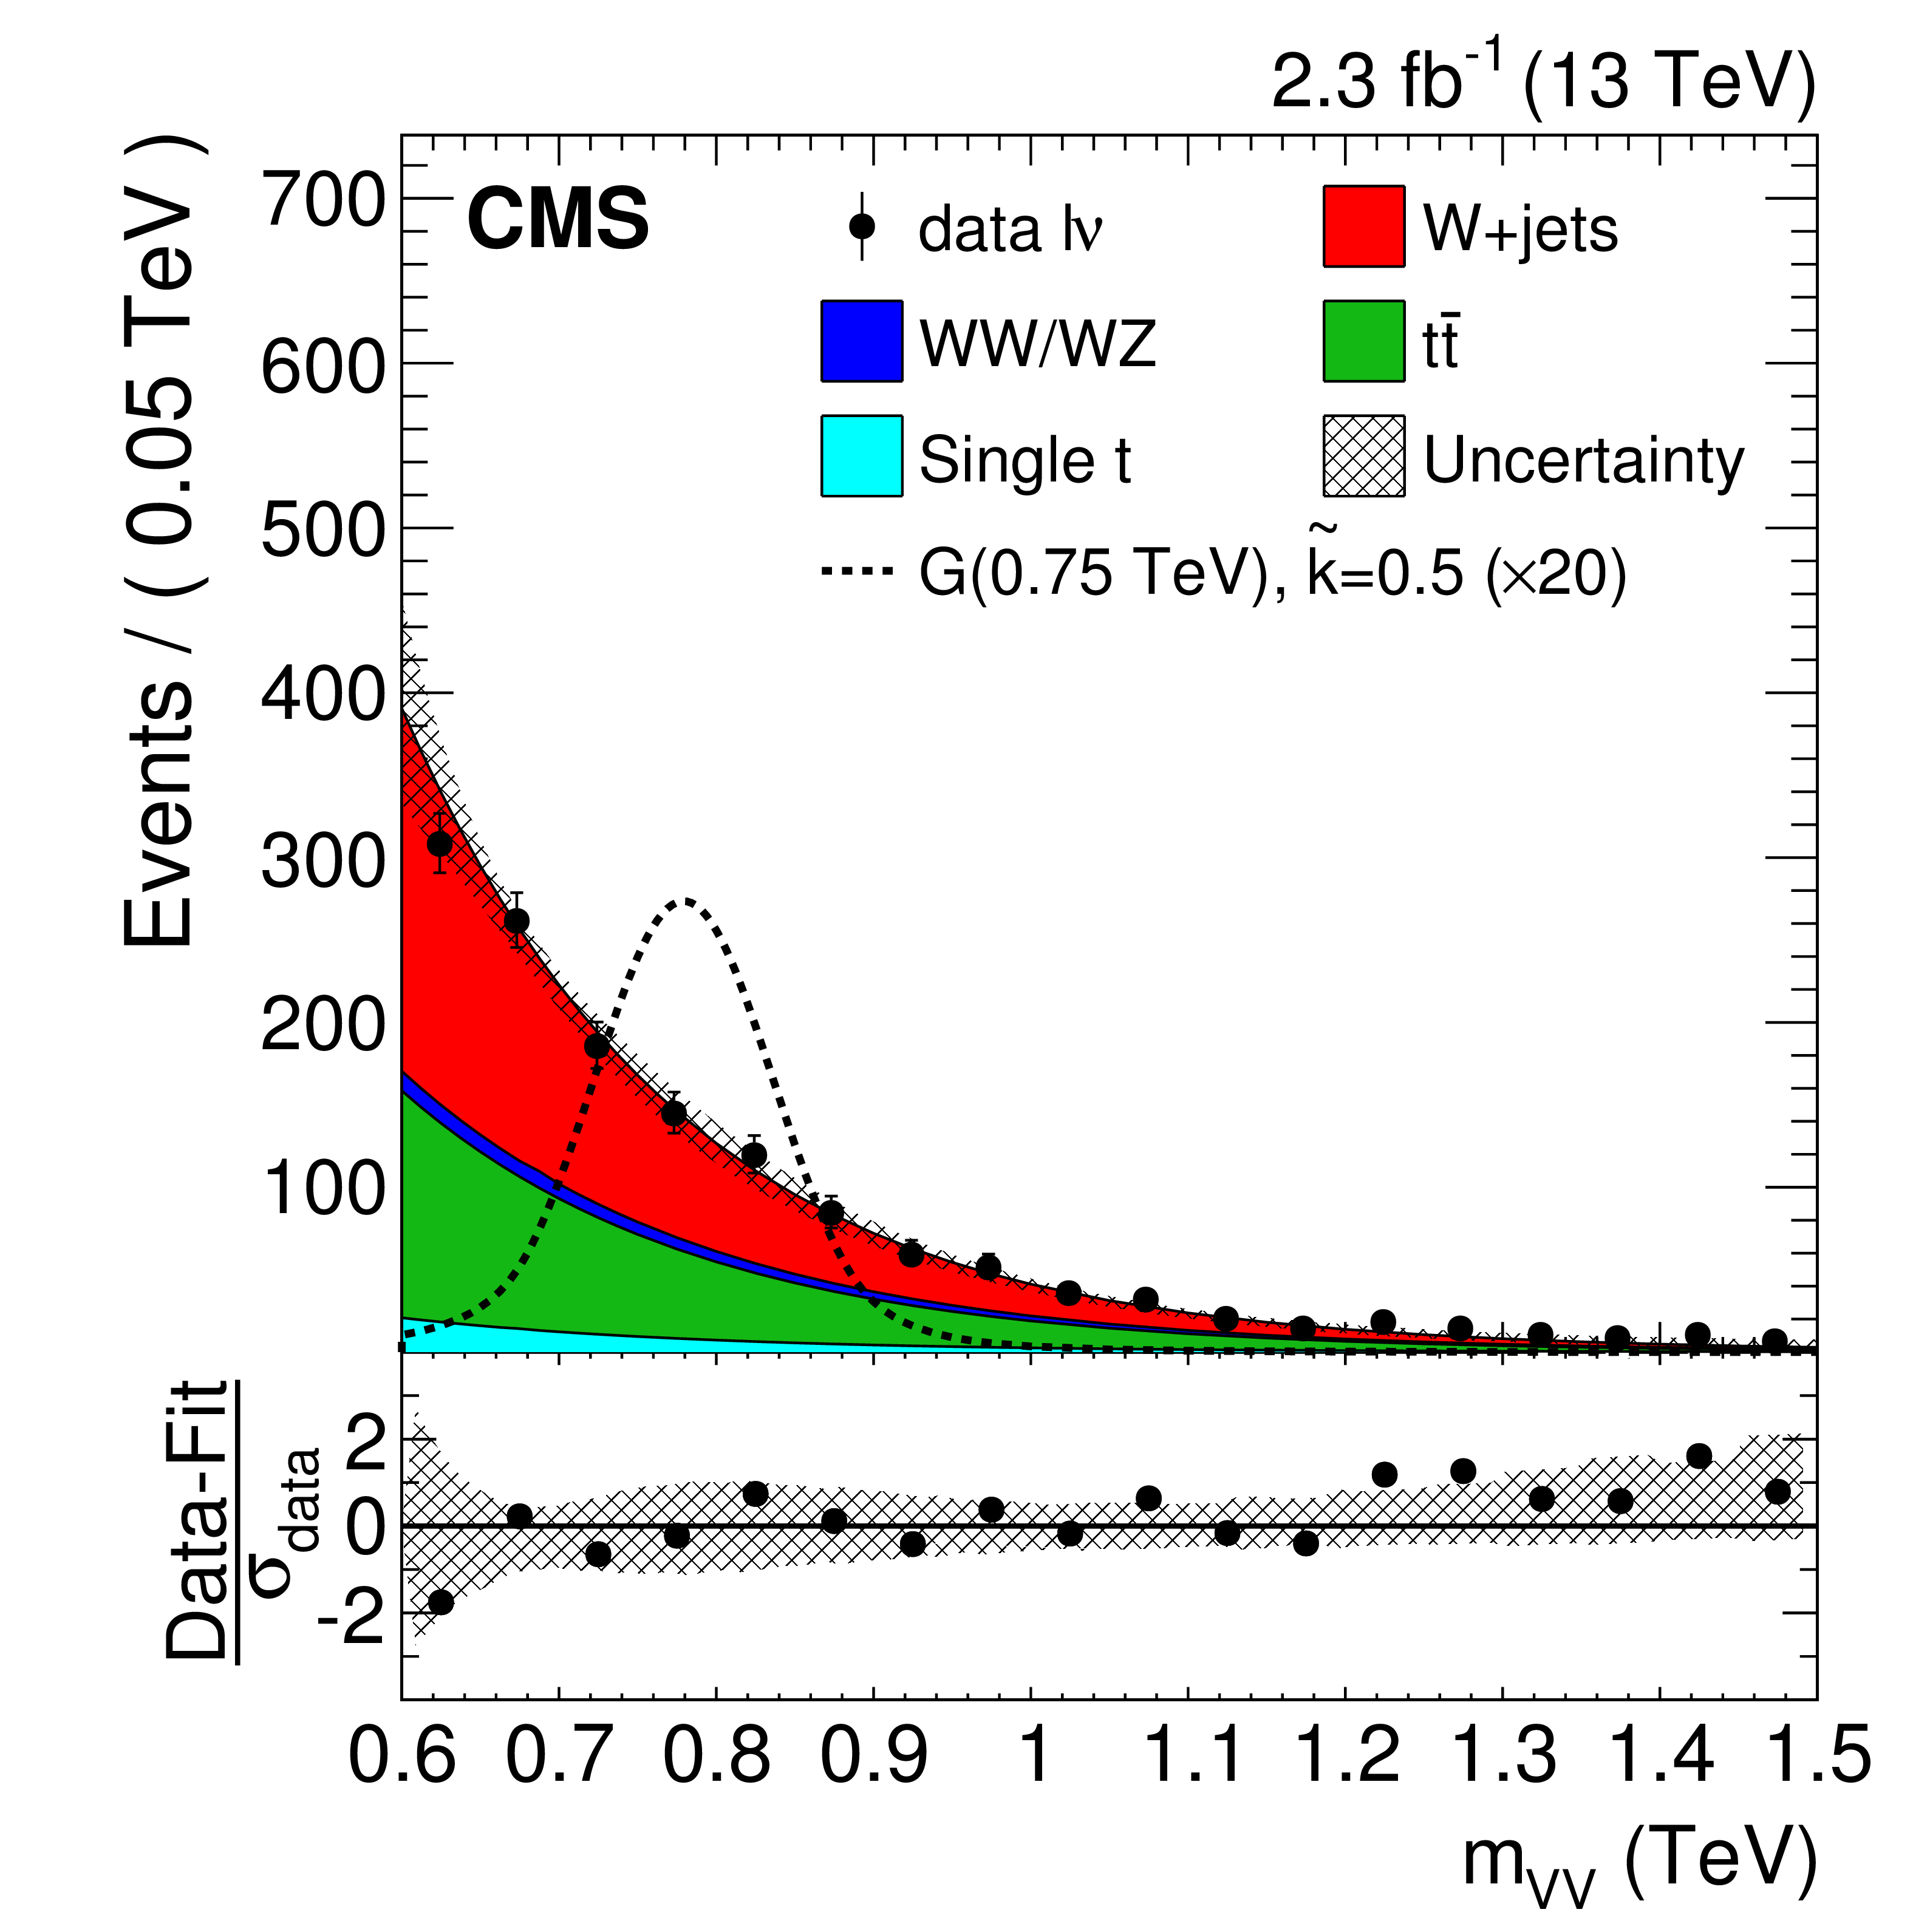
Figure 4-c:
Final $ {m_{ {\mathrm {V}} {\mathrm {V}} }} $ distribution for data and expected backgrounds in the signal region of the low-mass analysis obtained from the combined muon and electron channels. The solid curve represents the background estimation provided by the $\alpha $ ratio method. The hatched band includes both statistical and systematic uncertainties. The data are shown as black points. Signal benchmarks for a mass of 2 TeV (0.75 TeV) are also shown with black dashed lines for the upper (lower) plots. In the lower panel are the bin-by-bin fit residuals, ($N_\text {data}- N_\text {fit}$)/$\sigma _\text {data}$, shown together with the uncertainty band of the fit normalized by the statistical uncertainty of data, $\sigma _\text {data}$. |
png pdf |
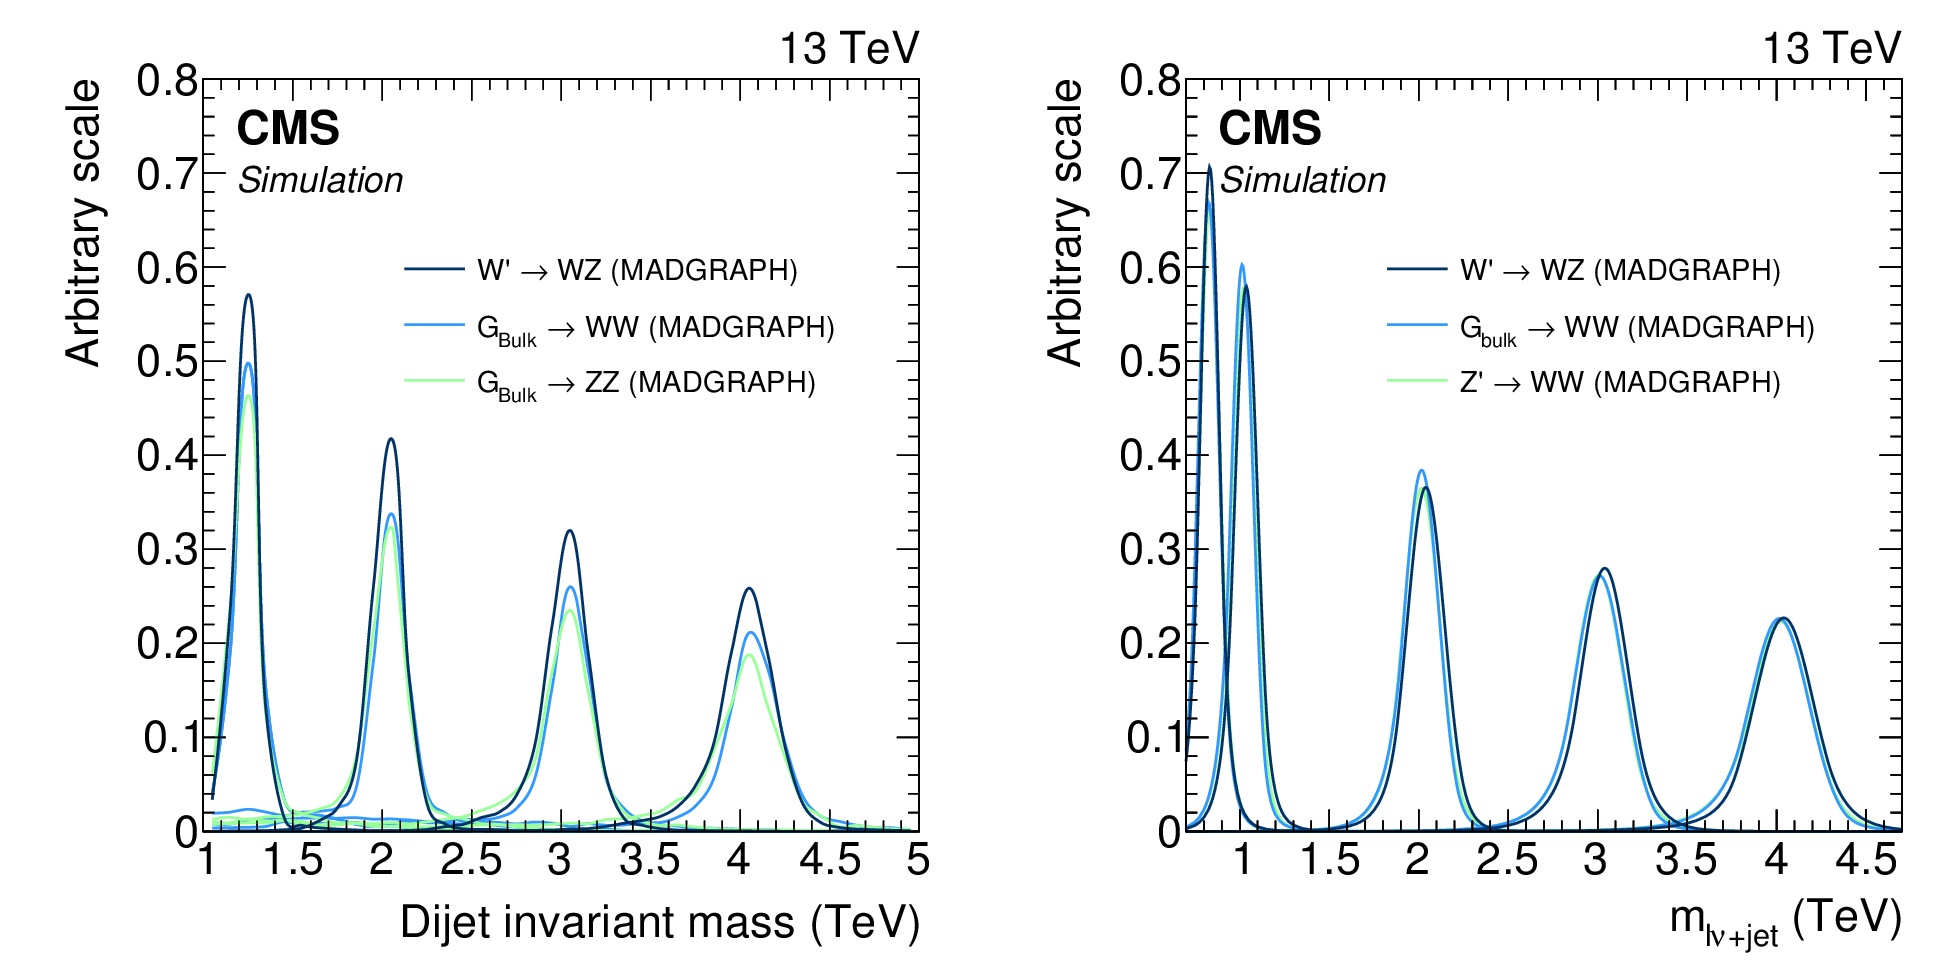
Figure 5:
Dijet invariant mass (left) and $m_{\ell \nu +{\rm jet}}$ (right) distributions expected for different signal mass hypotheses. |
png pdf |
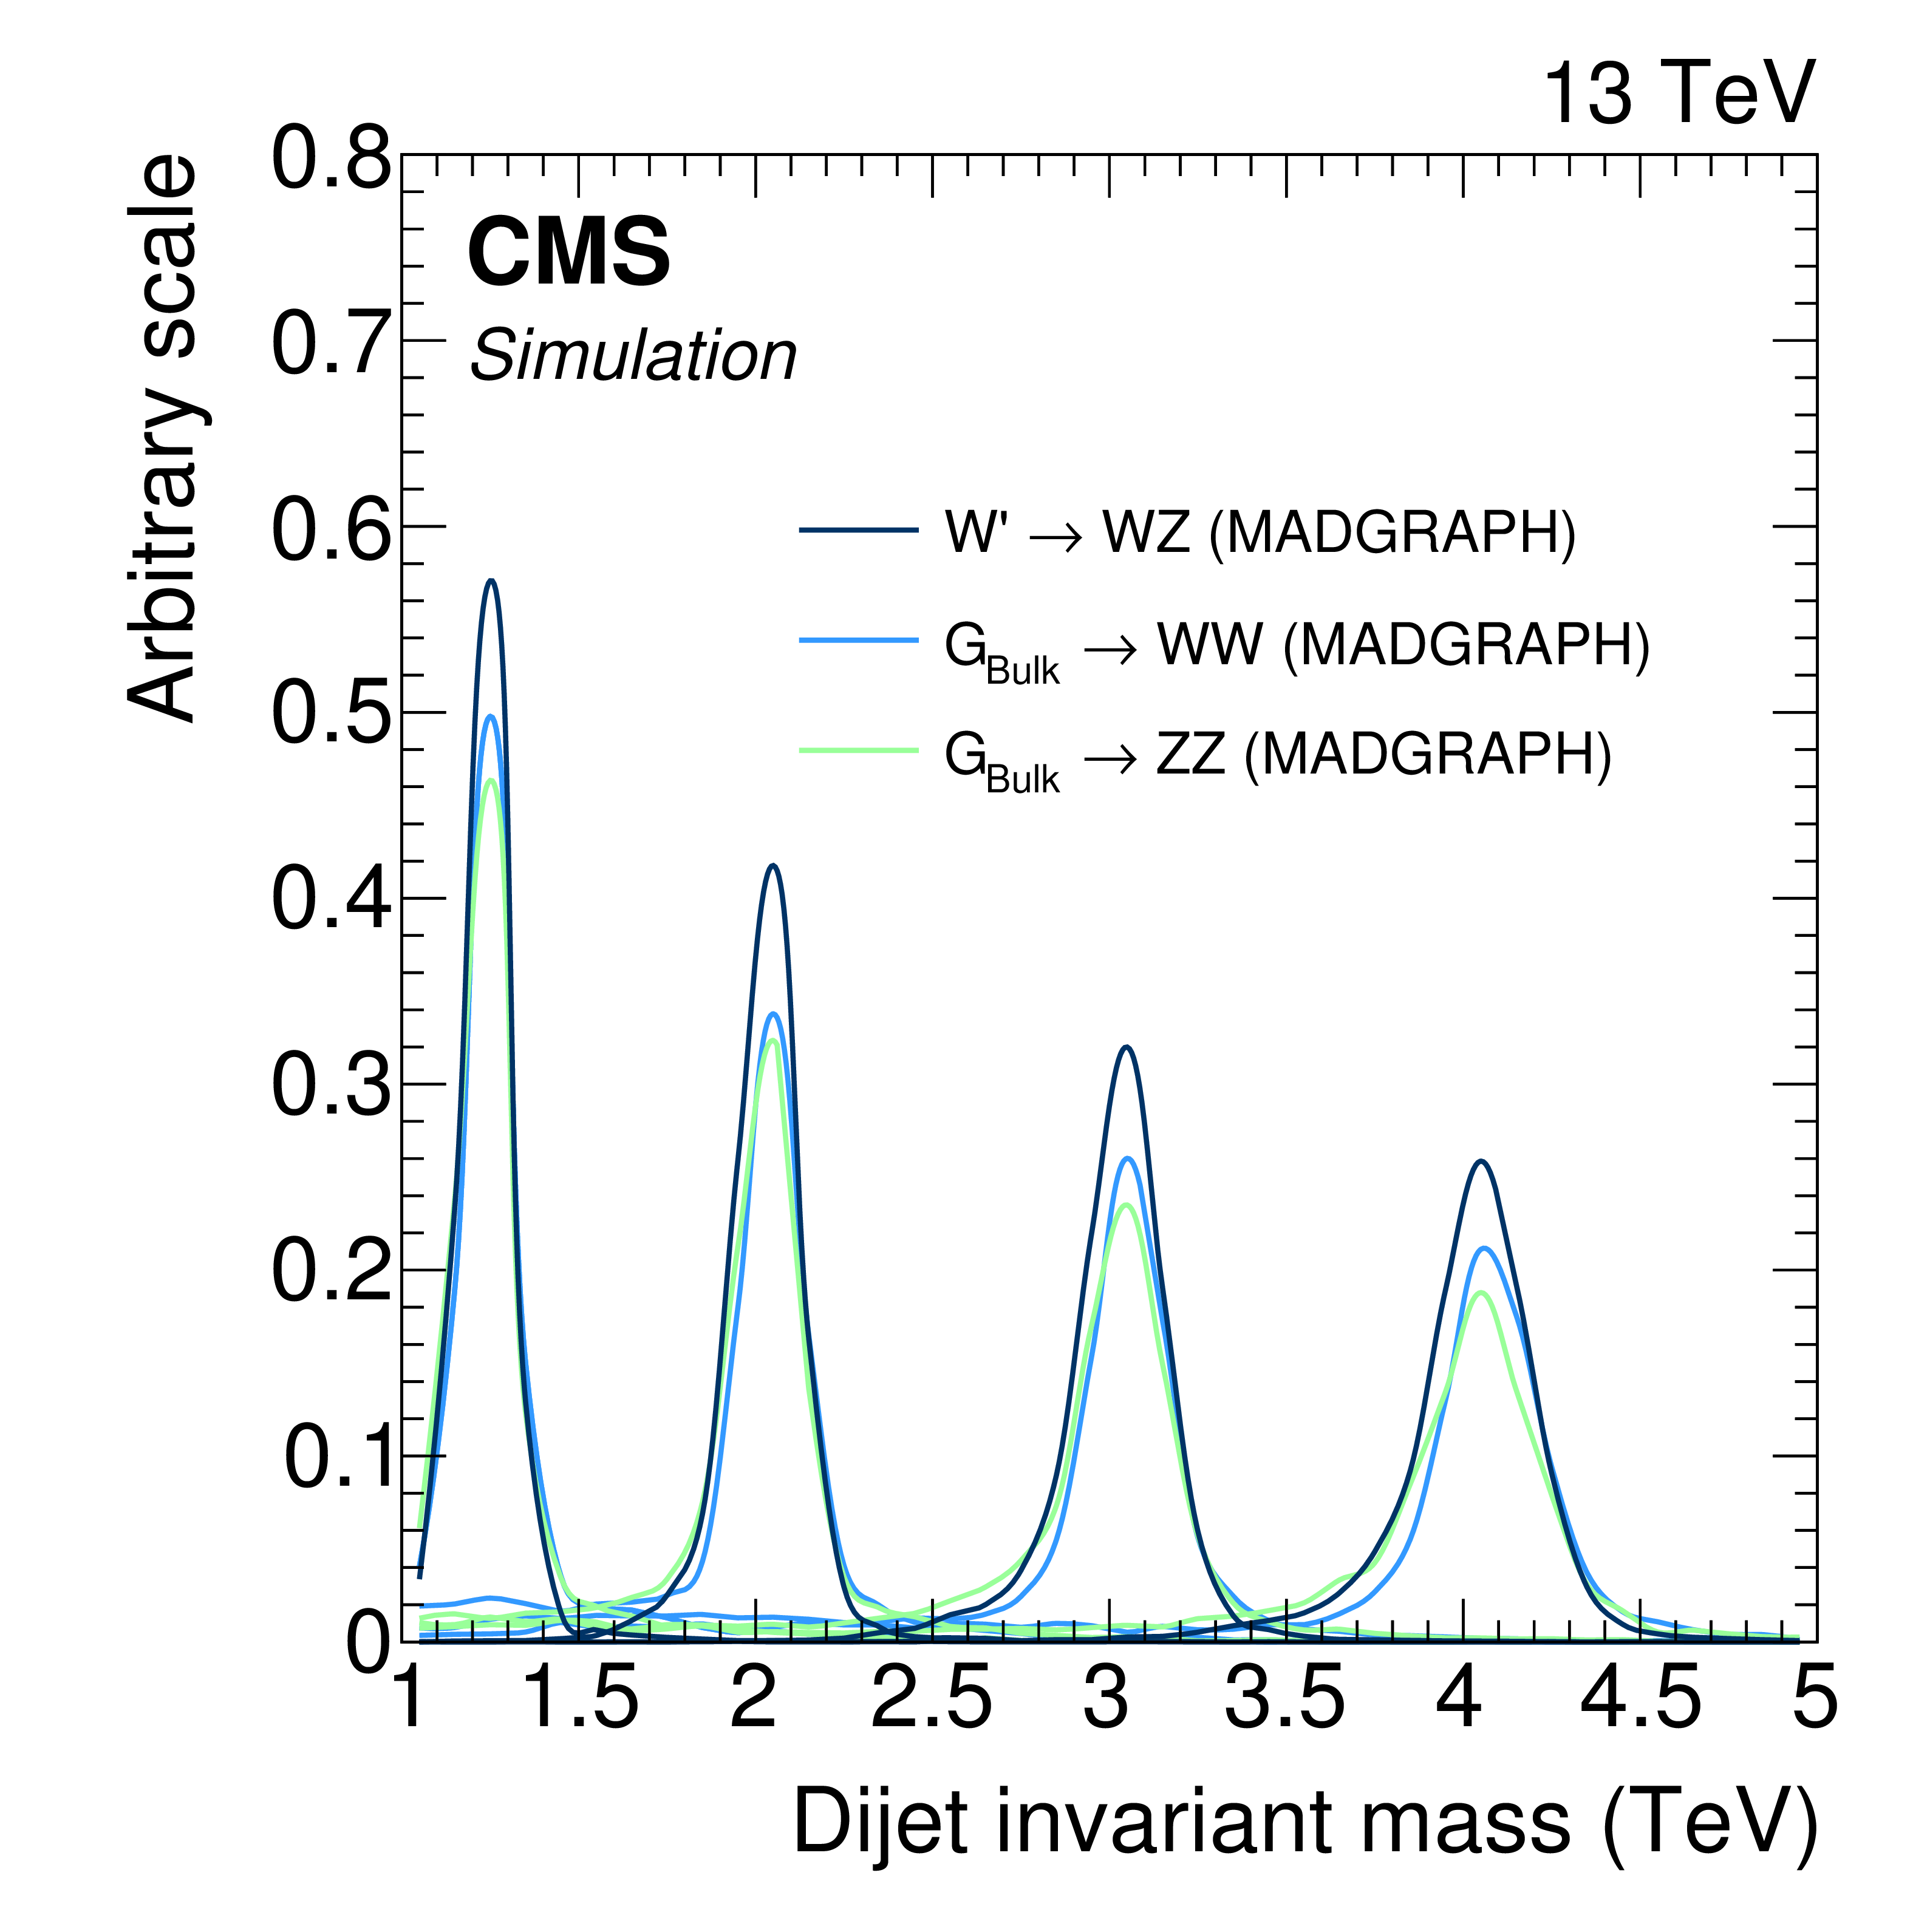
Figure 5-a:
Dijet invariant mass distribution expected for different signal mass hypotheses. |

png pdf |
Figure 5-b:
$m_{\ell \nu +{\rm jet}}$ distribution expected for different signal mass hypotheses. |

png pdf |
Figure 6:
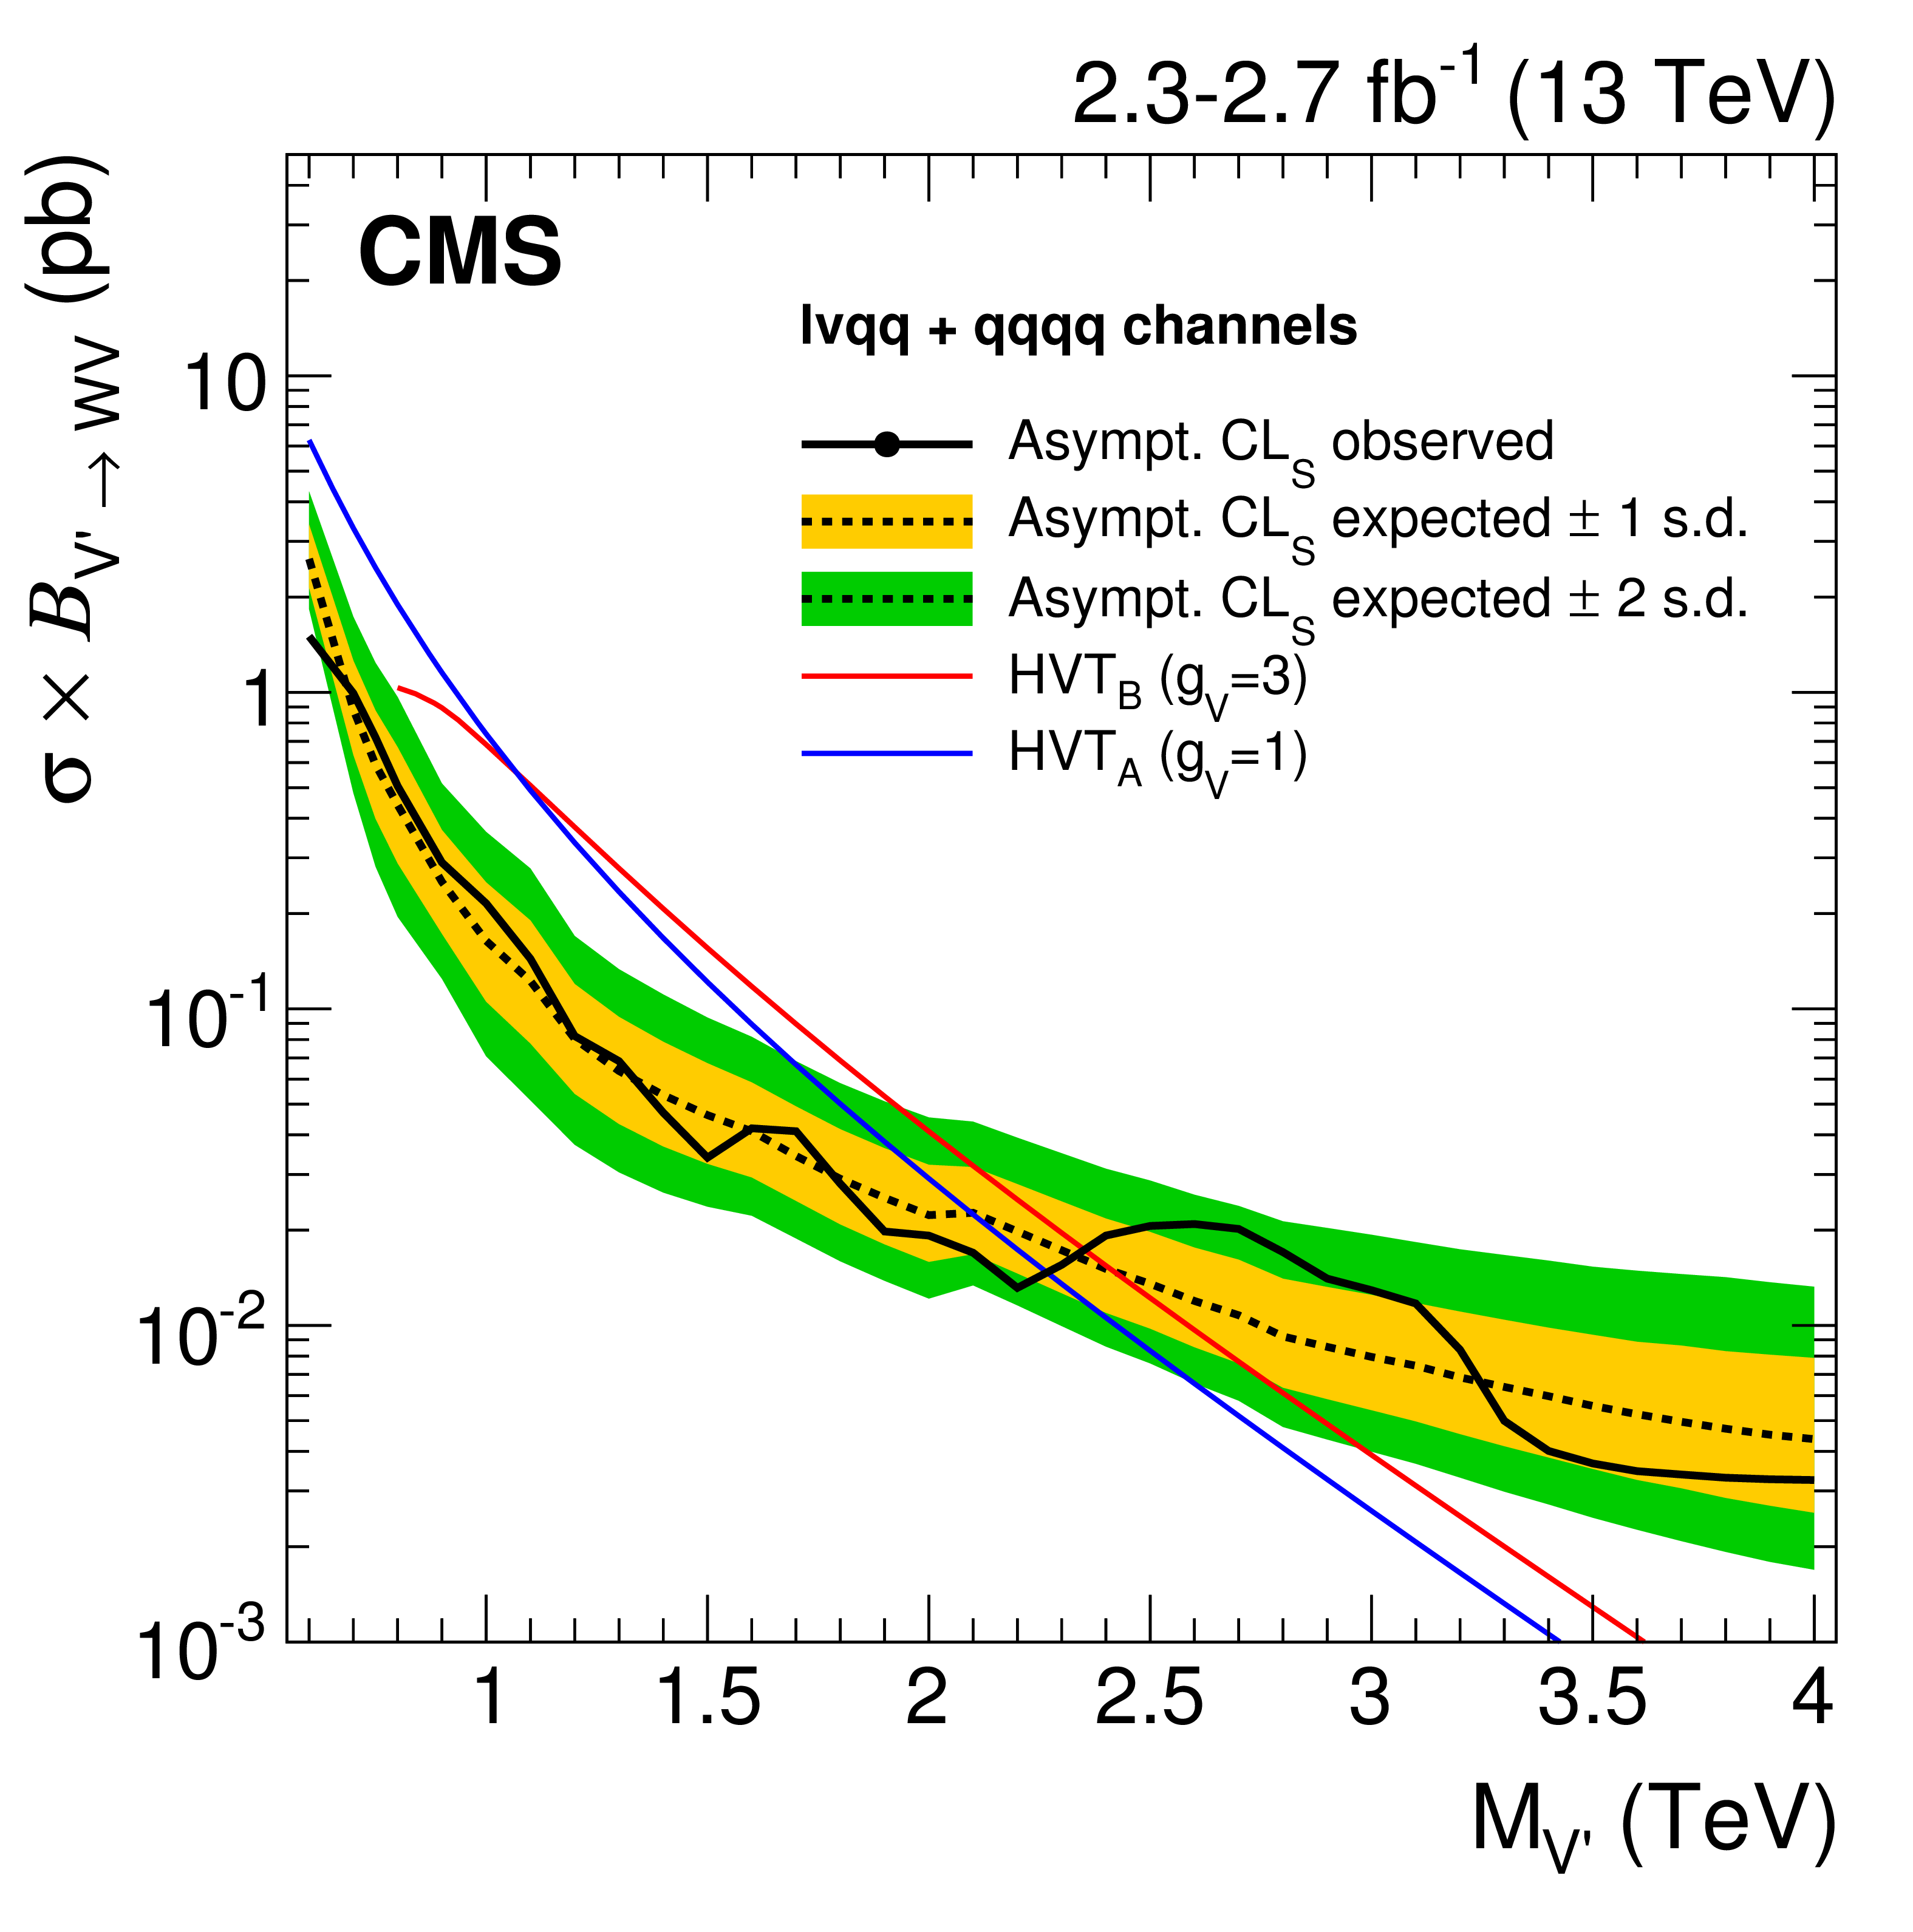
Observed (black solid) and expected (black dashed) 95% CL upper limits on the production of a narrow-width resonance decaying to a pair of vector bosons for different signal hypotheses. In the upper plots, limits are set in the context of a spin-1 neutral Z' (left) and charged W' (right) resonances, and compared with the prediction of the HVT Models A and B. In the lower left plot, limits are set in the same model under the triplet hypothesis (W' and Z'). In the lower right plot, limits are set in the context of a bulk graviton with $ {k/\overline {M}_\mathrm {Pl}} =$ 0.5 and compared with the prediction. For $\mathrm {G}_\text {bulk}$, Z' and triplet signals (W' signal) with masses <0.8 TeV (<0.75 TeV), the limits are obtained from the low-mass ${\ell \nu }$+jet channel, while for the higher masses they are obtained from the high-mass ${\ell \nu }$+jet and dijet channels. |
png pdf |
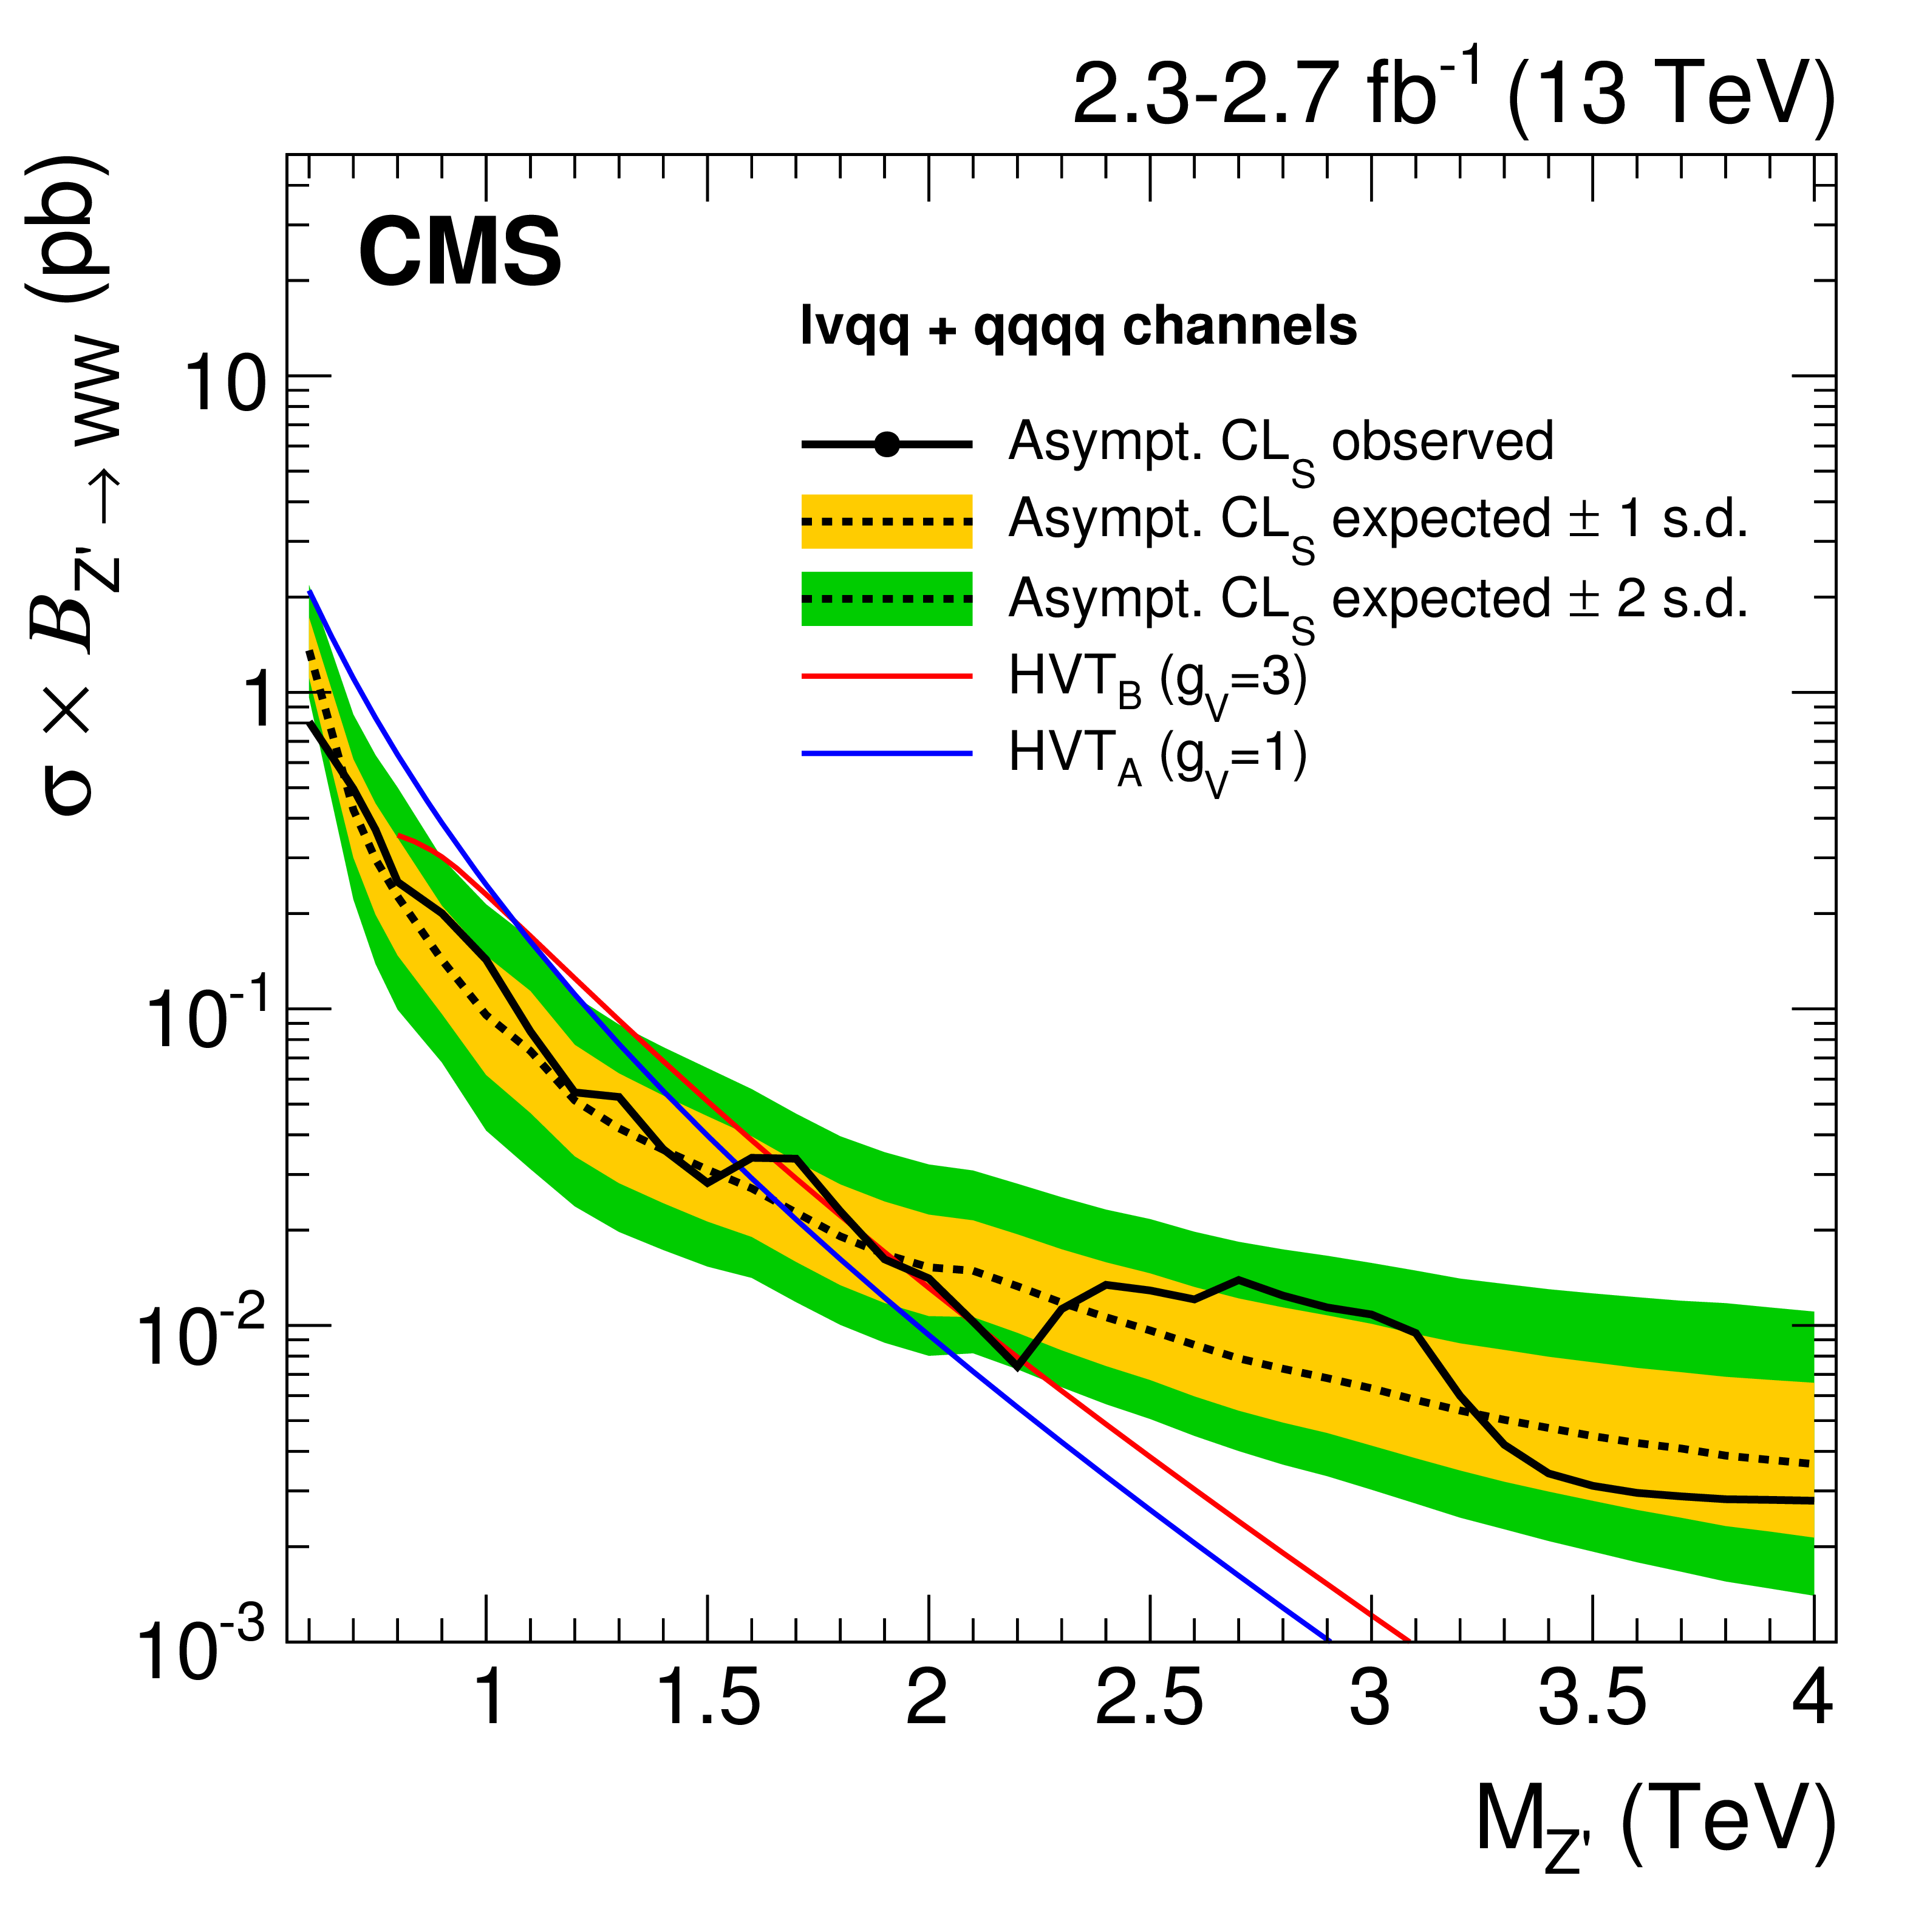
Figure 6-a:
Observed (black solid) and expected (black dashed) 95% CL upper limits on the production of a narrow-width resonance decaying to a pair of vector bosons in the context of a spin-1 neutral Z' resonance, compared with the prediction of the HVT Models A and B. |
png pdf |
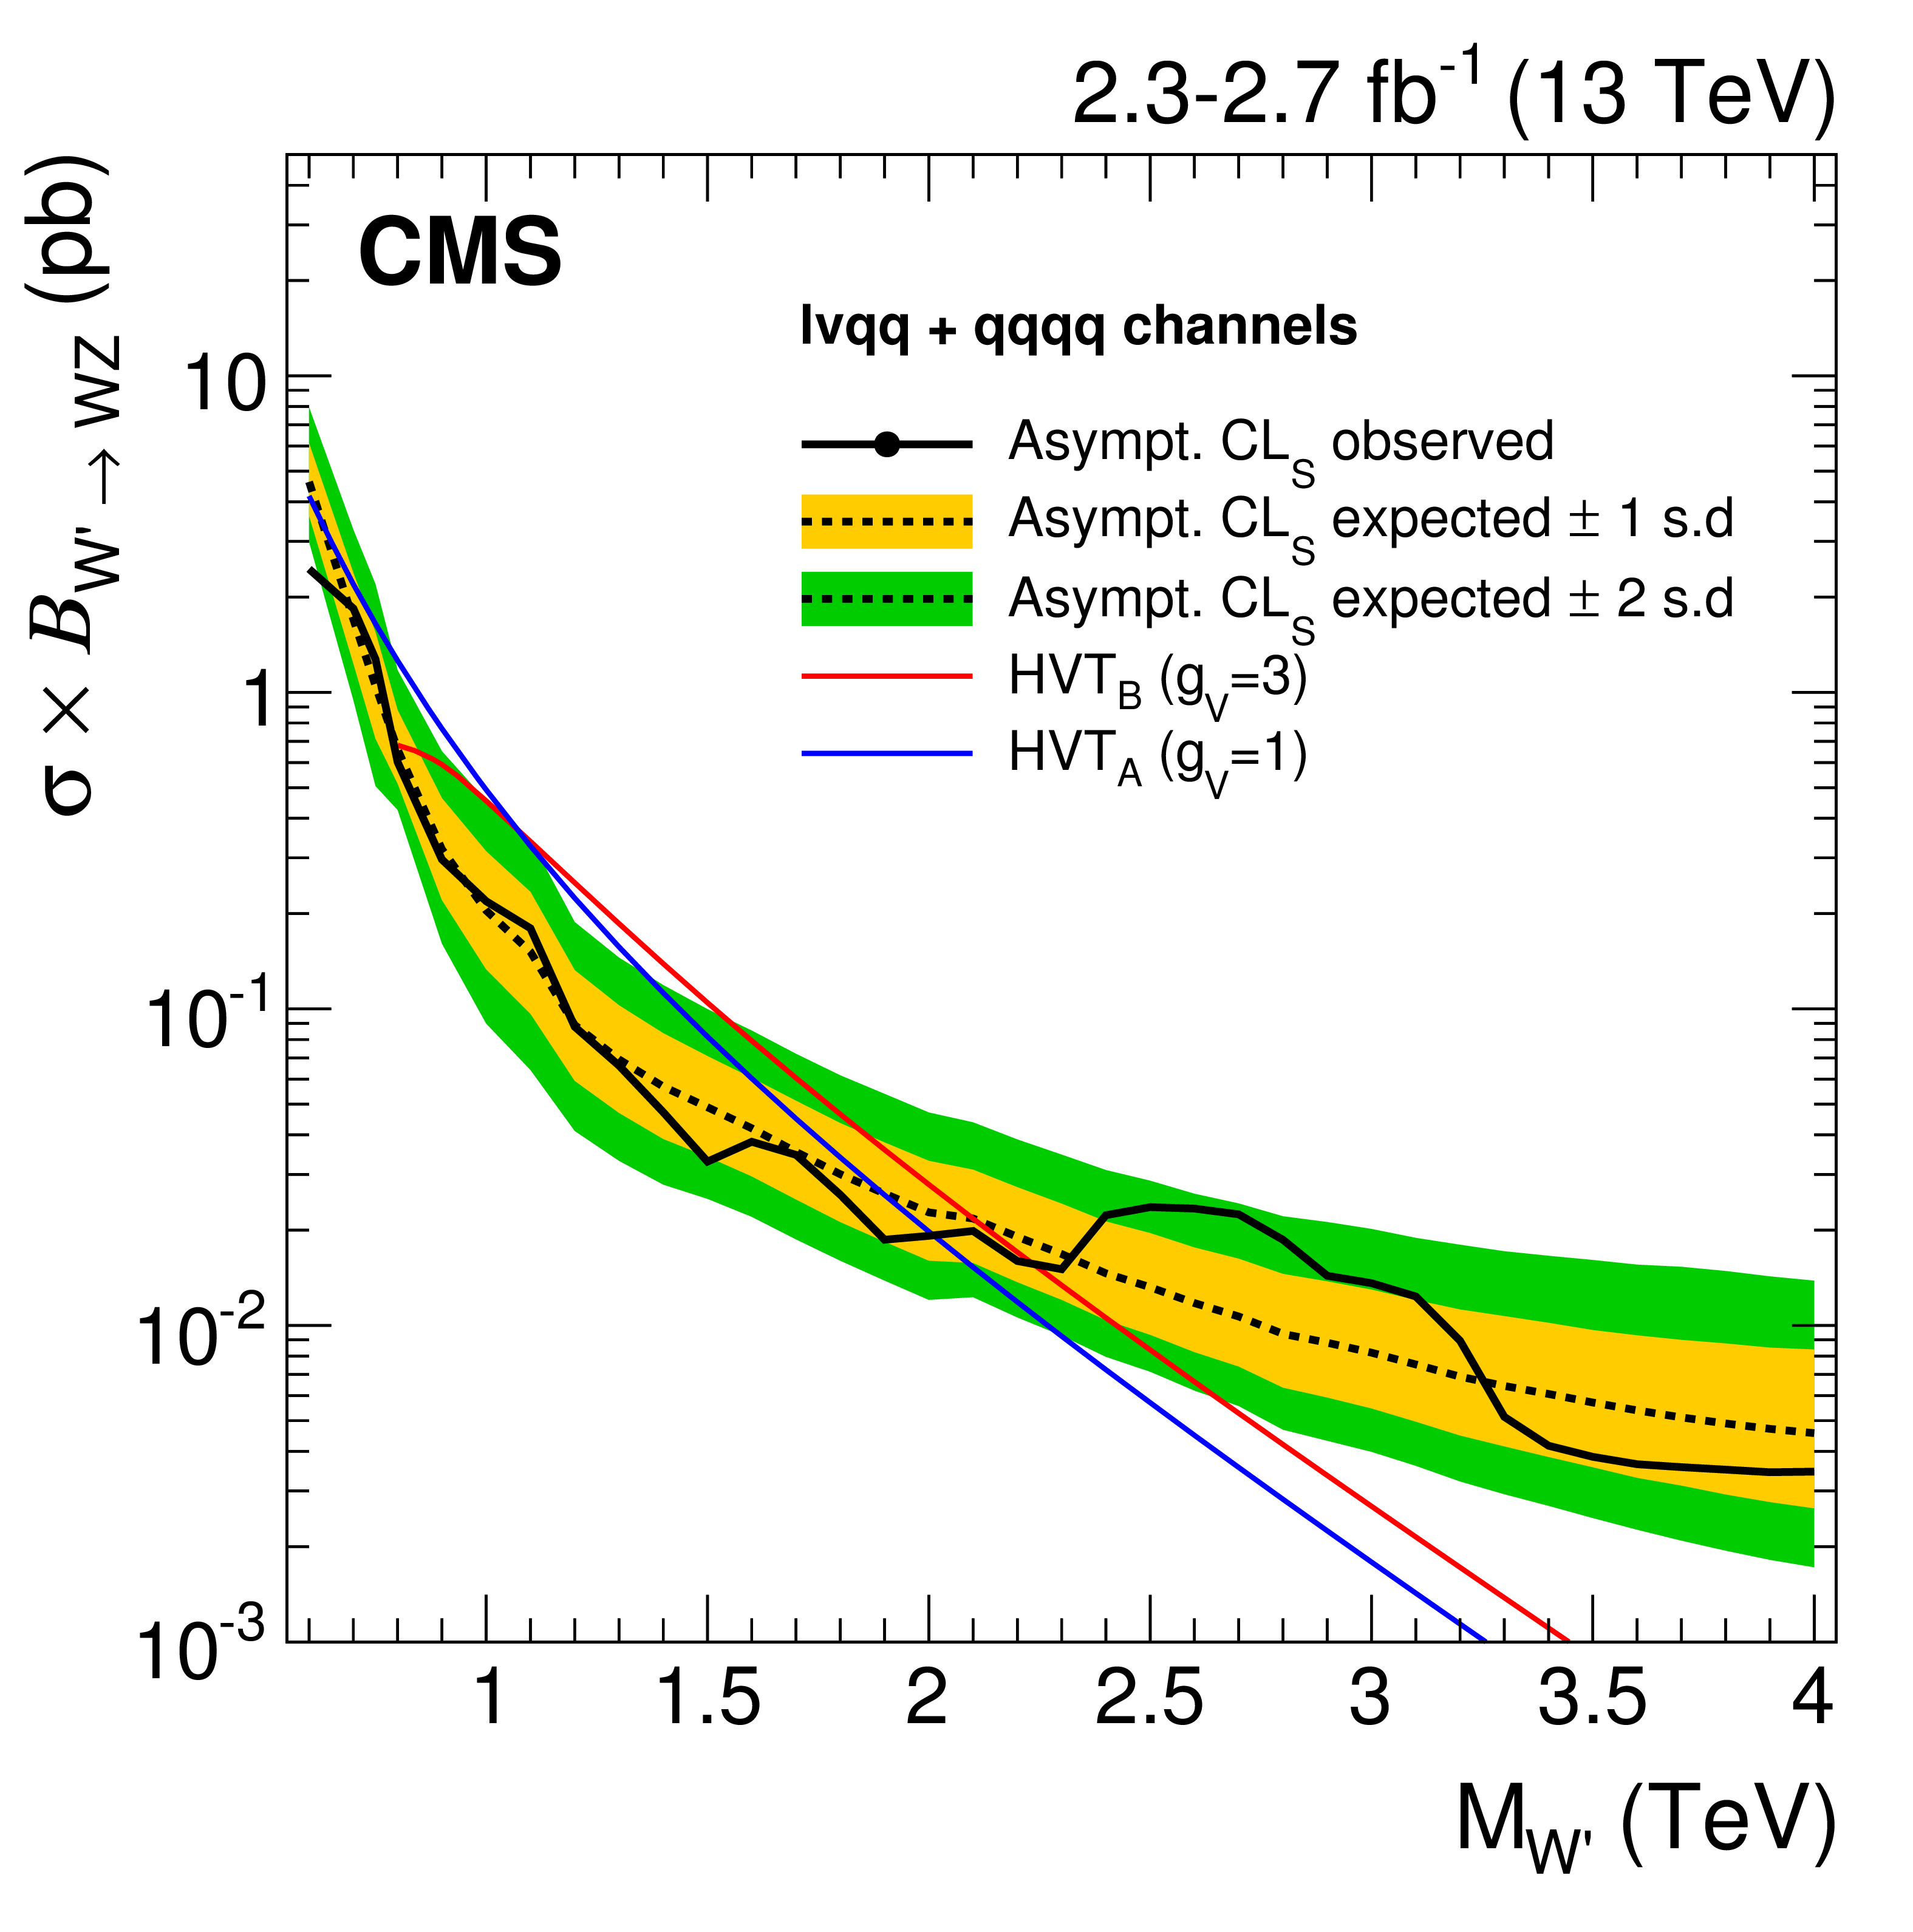
Figure 6-b:
Observed (black solid) and expected (black dashed) 95% CL upper limits on the production of a narrow-width resonance decaying to a pair of vector bosons in the context of a spin-1 charged W' resonance, compared with the prediction of the HVT Models A and B. |
png pdf |
Figure 6-c:
Observed (black solid) and expected (black dashed) 95% CL upper limits on the production of a narrow-width resonance decaying to a pair of vector bosons for the HVT Models A and B under the triplet hypothesis (W' and Z'). |

png pdf |
Figure 6-d:
Observed (black solid) and expected (black dashed) 95% CL upper limits on the production of a narrow-width resonance decaying to a pair of vector bosons in the context of a bulk graviton with $ {k/\overline {M}_\mathrm {Pl}} =$ 0.5 and compared with the prediction. . |
png pdf |
Figure 7:
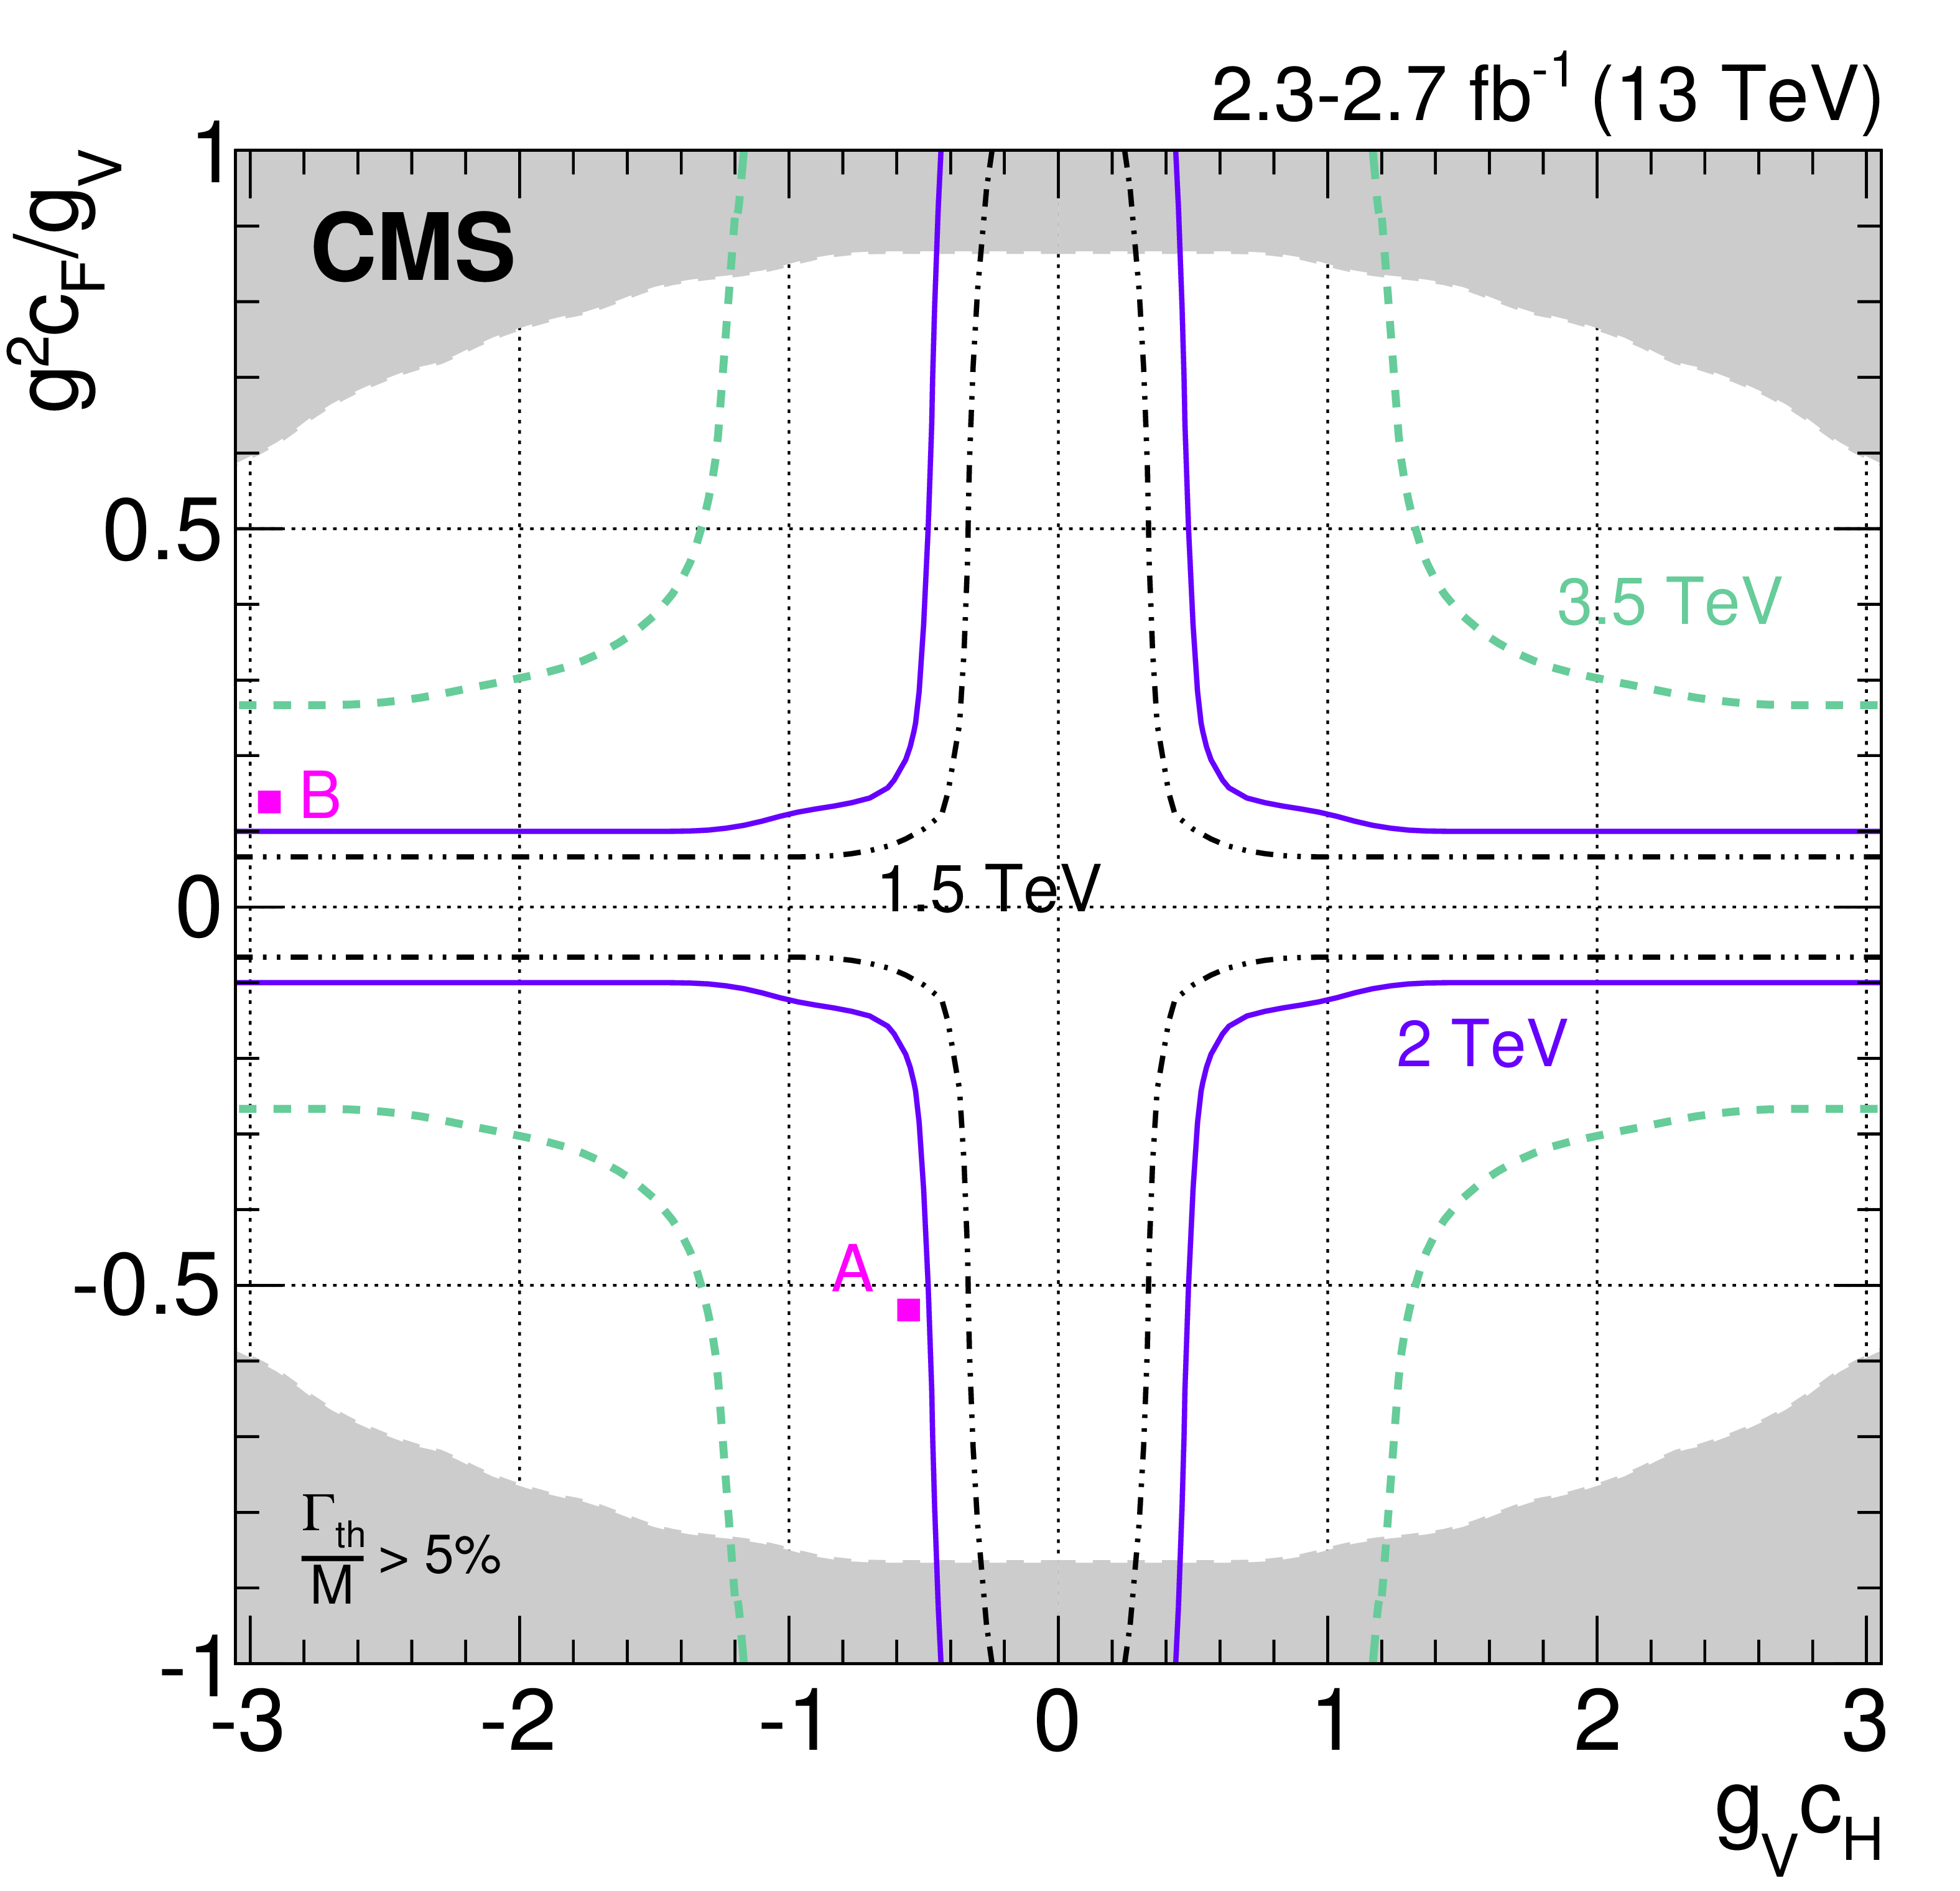
Exclusion regions in the plane of the HVT couplings ($g^2c_\mathrm {F}/g_{ {\mathrm {V}}},g_{ {\mathrm {V}}}c_\mathrm {H}$) for three resonance masses, 1.5, 2.0, and 3.5 TeV . Model points A and B of the benchmarks used in the analysis are also shown. The solid, dashed, and dashed-dotted lines represent the boundaries of the regions excluded by this search for different resonance masses (the region outside these lines is excluded). The areas indicated by the solid shading correspond to regions where the resonance width is predicted to be more than 5% of the resonance mass and the narrow-resonance assumption is not satisfied. |
png pdf |
Figure 8:
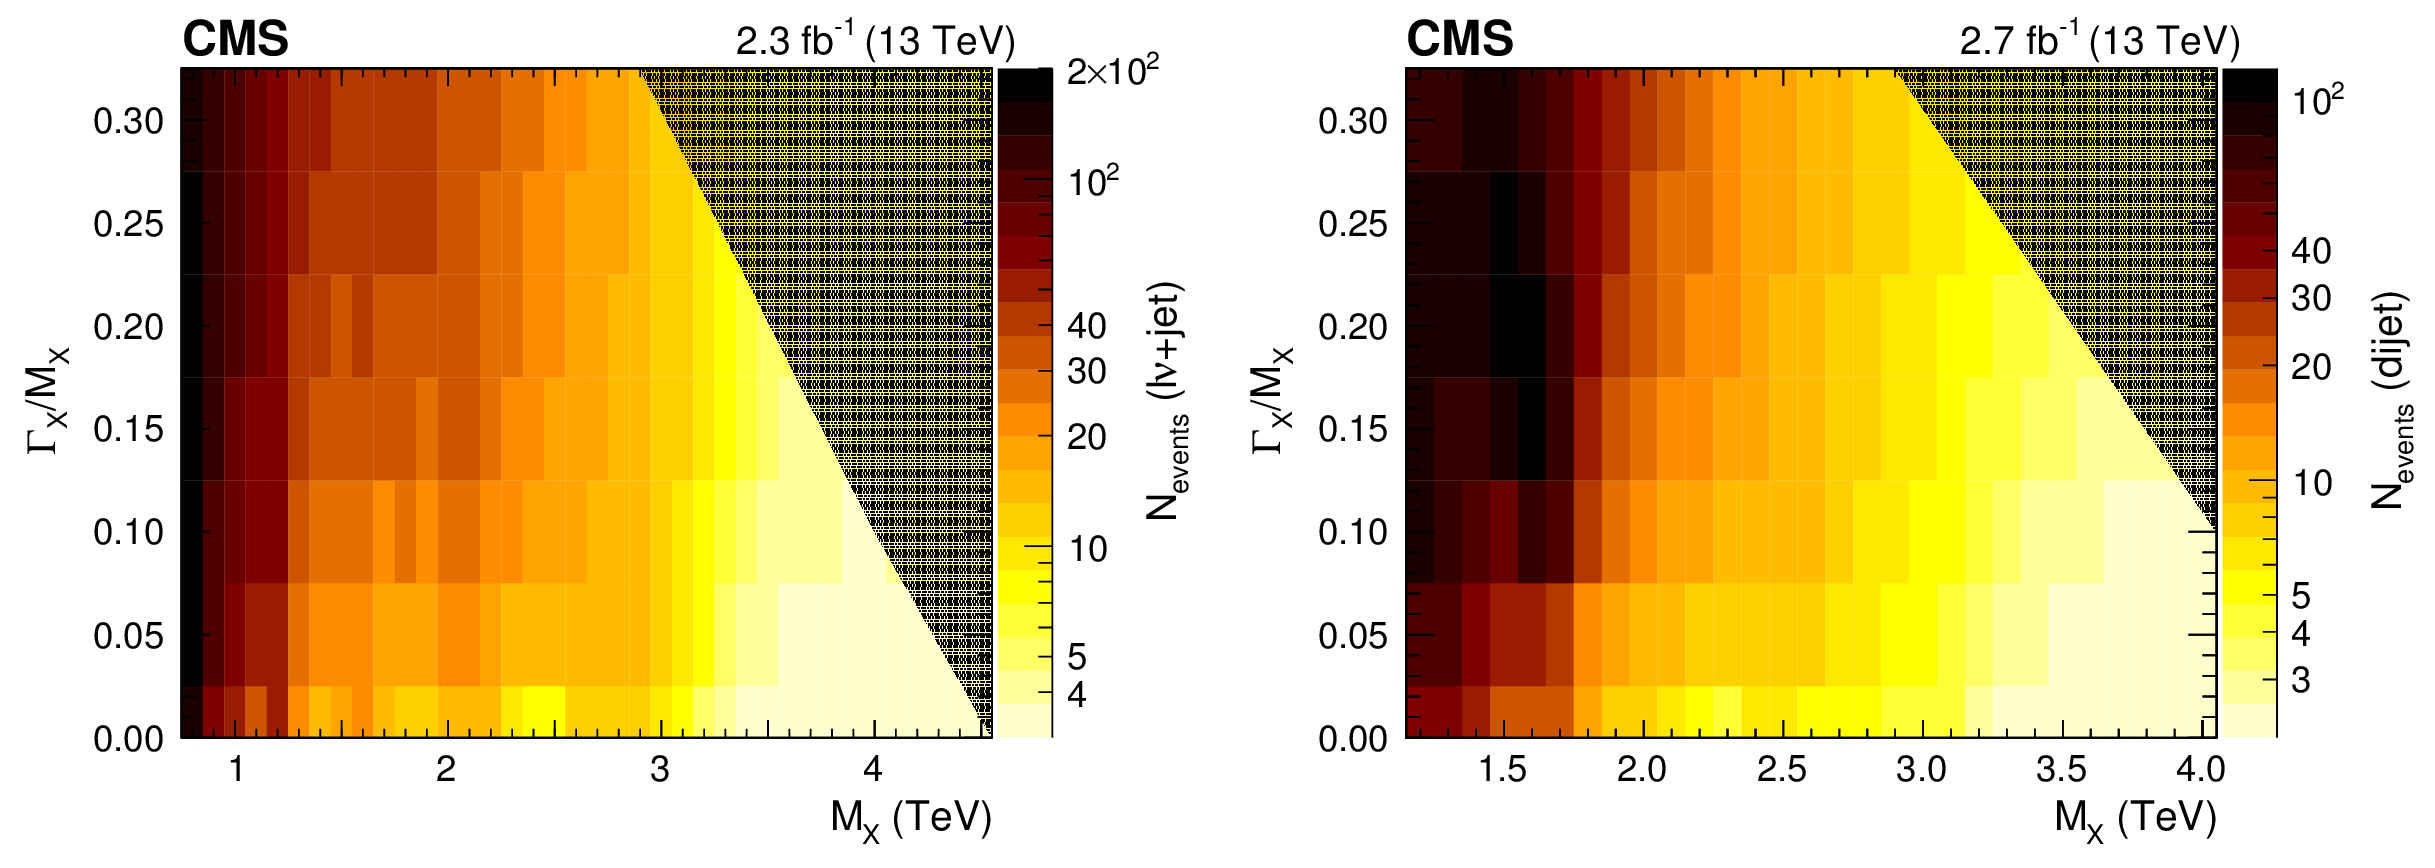
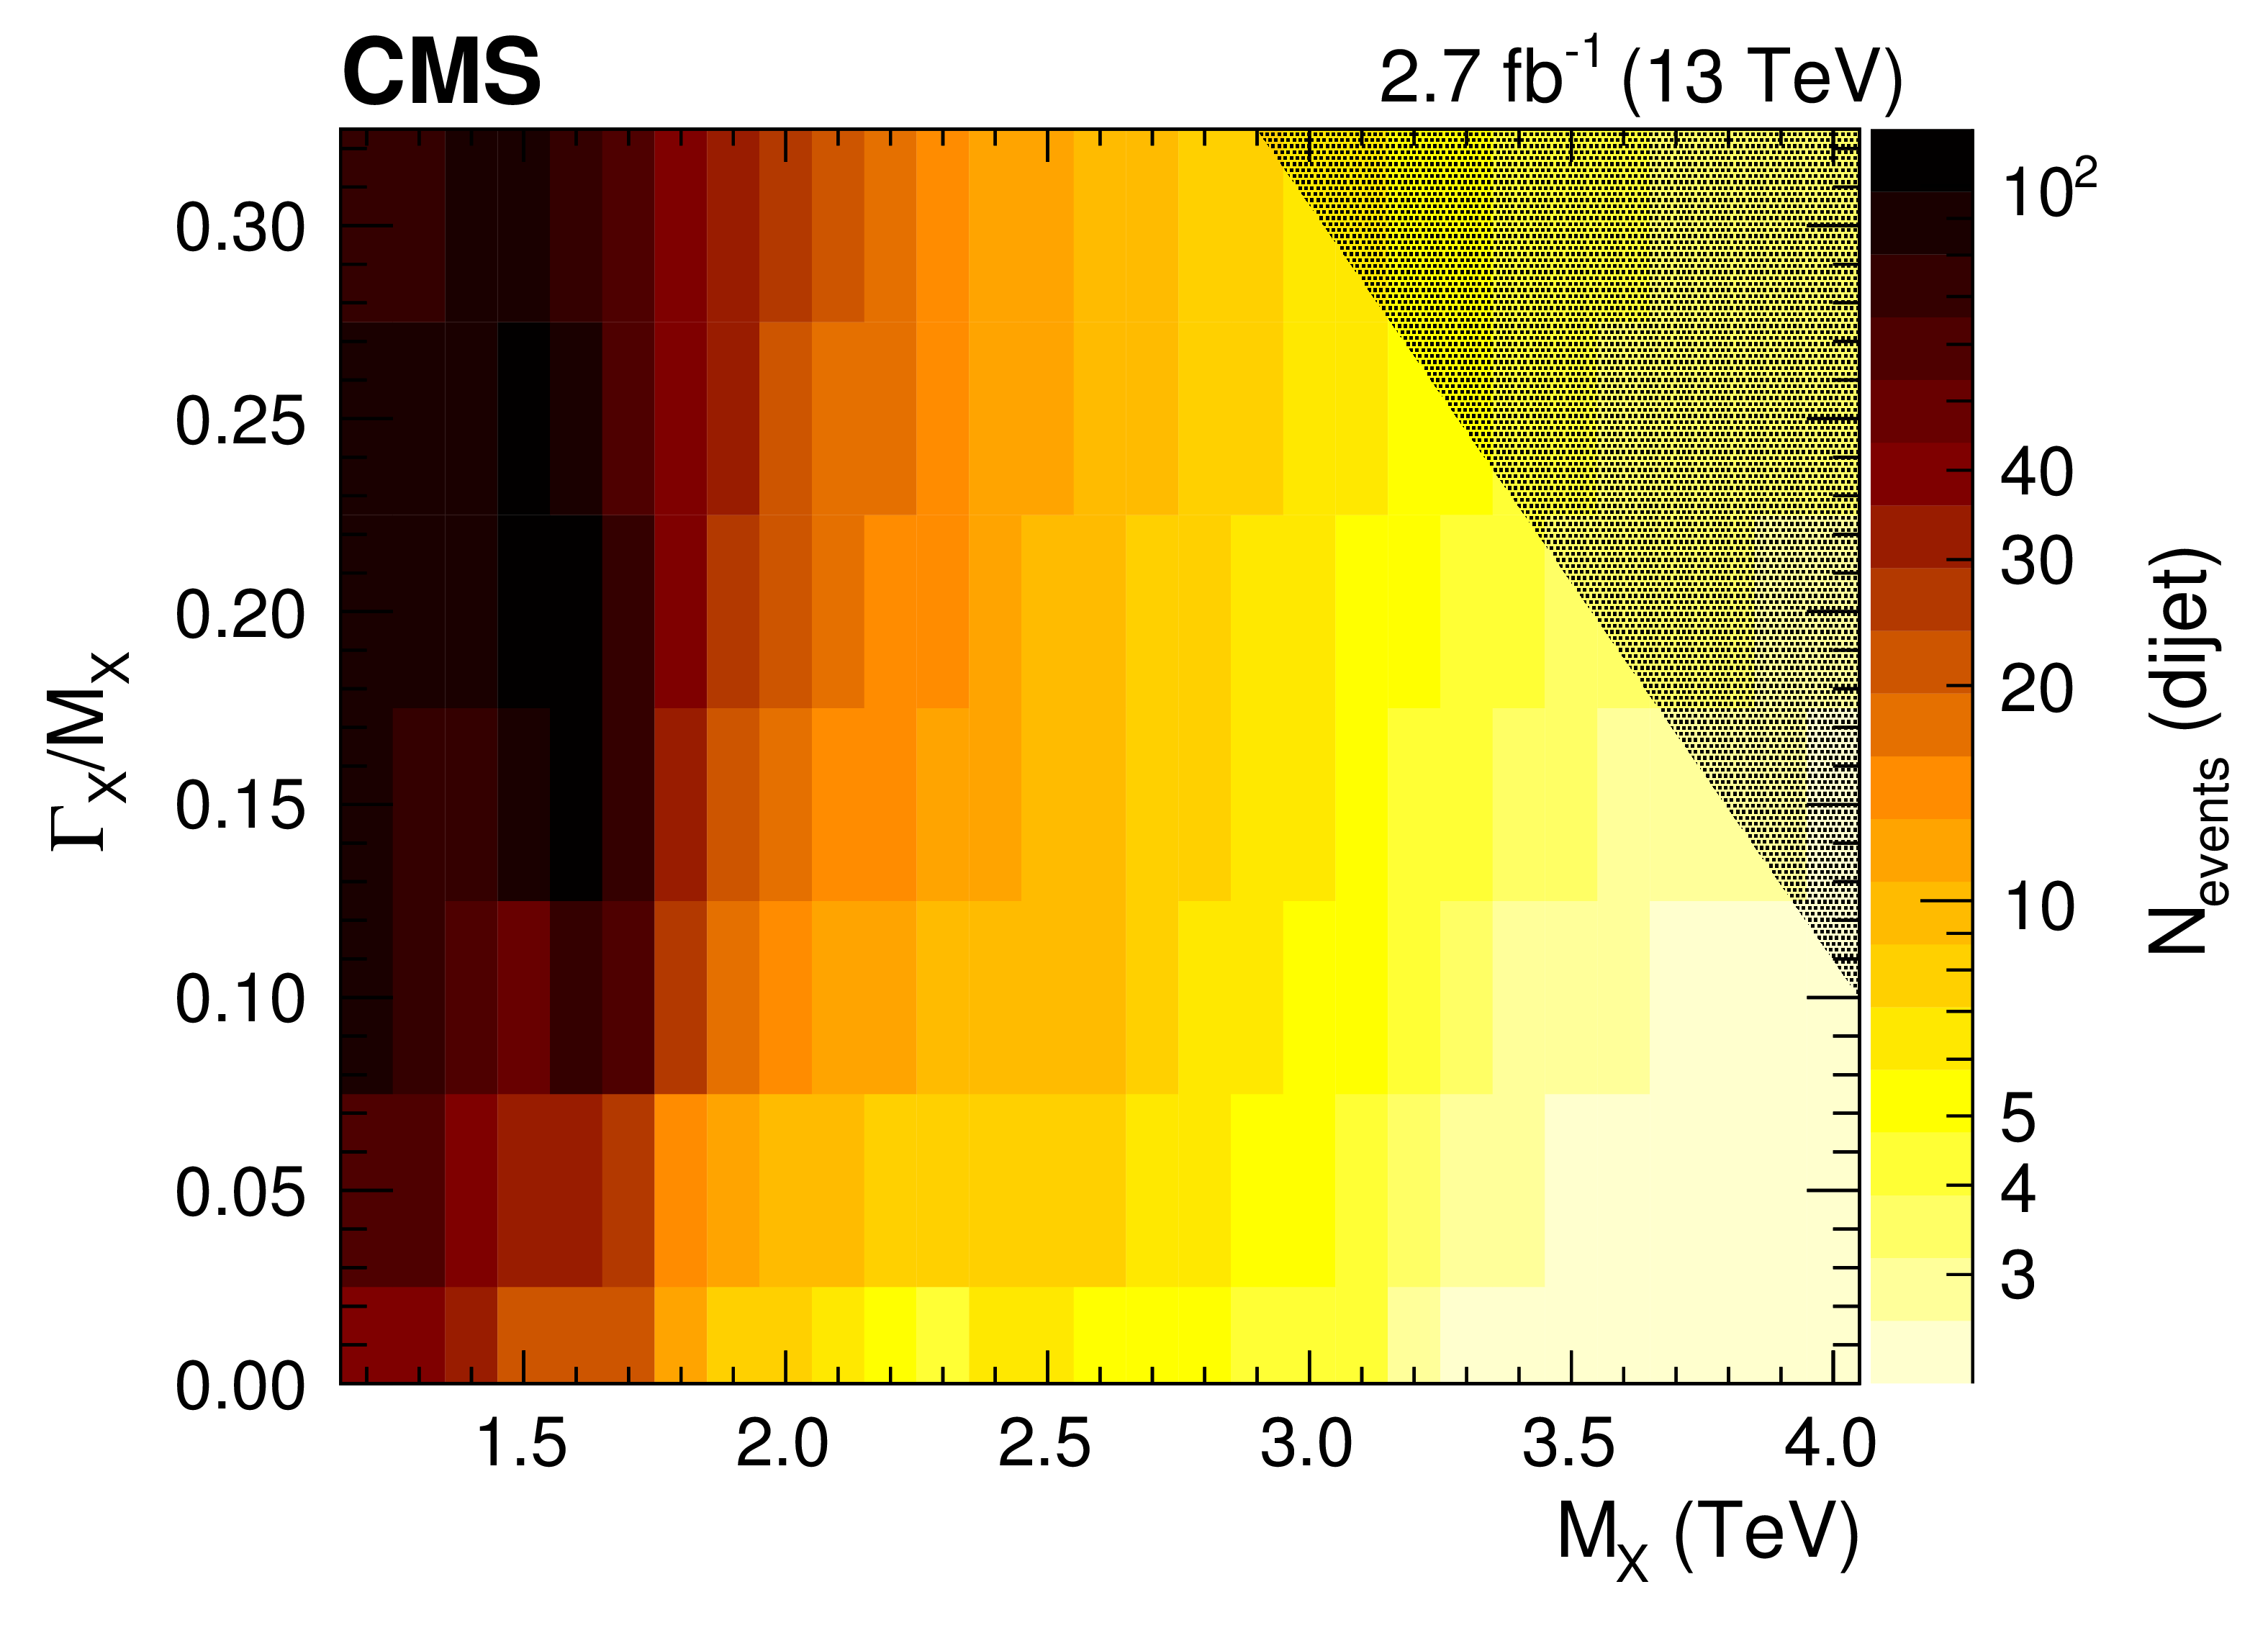
Observed exclusion limits at 95% CL on the number of events for a $\mathrm{ W } {\mathrm {V}}\to {\ell \nu }$+jet (left) and a $ {\mathrm {V}} {\mathrm {V}}\to \text {dijet}$ (right) resonance, as a function of its mass and normalized width. The dark shaded area denotes the kinematic regime where the limit is valid only for the quark-antiquark annihilation processes. |

png pdf |
Figure 8-a:
Observed exclusion limits at 95% CL on the number of events for a $\mathrm{ W } {\mathrm {V}}\to {\ell \nu }$+jet (left) and a $ {\mathrm {V}} {\mathrm {V}}\to \text {dijet}$ (right) resonance, as a function of its mass and normalized width. The dark shaded area denotes the kinematic regime where the limit is valid only for the quark-antiquark annihilation processes. |
png pdf |
Figure 8-b:
Observed exclusion limits at 95% CL on the number of events for a $\mathrm{ W } {\mathrm {V}}\to {\ell \nu }$+jet (left) and a $ {\mathrm {V}} {\mathrm {V}}\to \text {dijet}$ (right) resonance, as a function of its mass and normalized width. The dark shaded area denotes the kinematic regime where the limit is valid only for the quark-antiquark annihilation processes. |
| Tables | |

png pdf |
Table 1:
Data-to-simulation scale factors for the efficiency of the ${\tau _{21}}$ selection used in the analyses, as extracted from top quark enriched data and from simulation. |

png pdf |
Table 2:
The W jet mass peak position and resolution, as extracted from top quark enriched data and from simulation. These results are used to apply corrections in the V tagging procedure. |
png pdf |
Table 3:
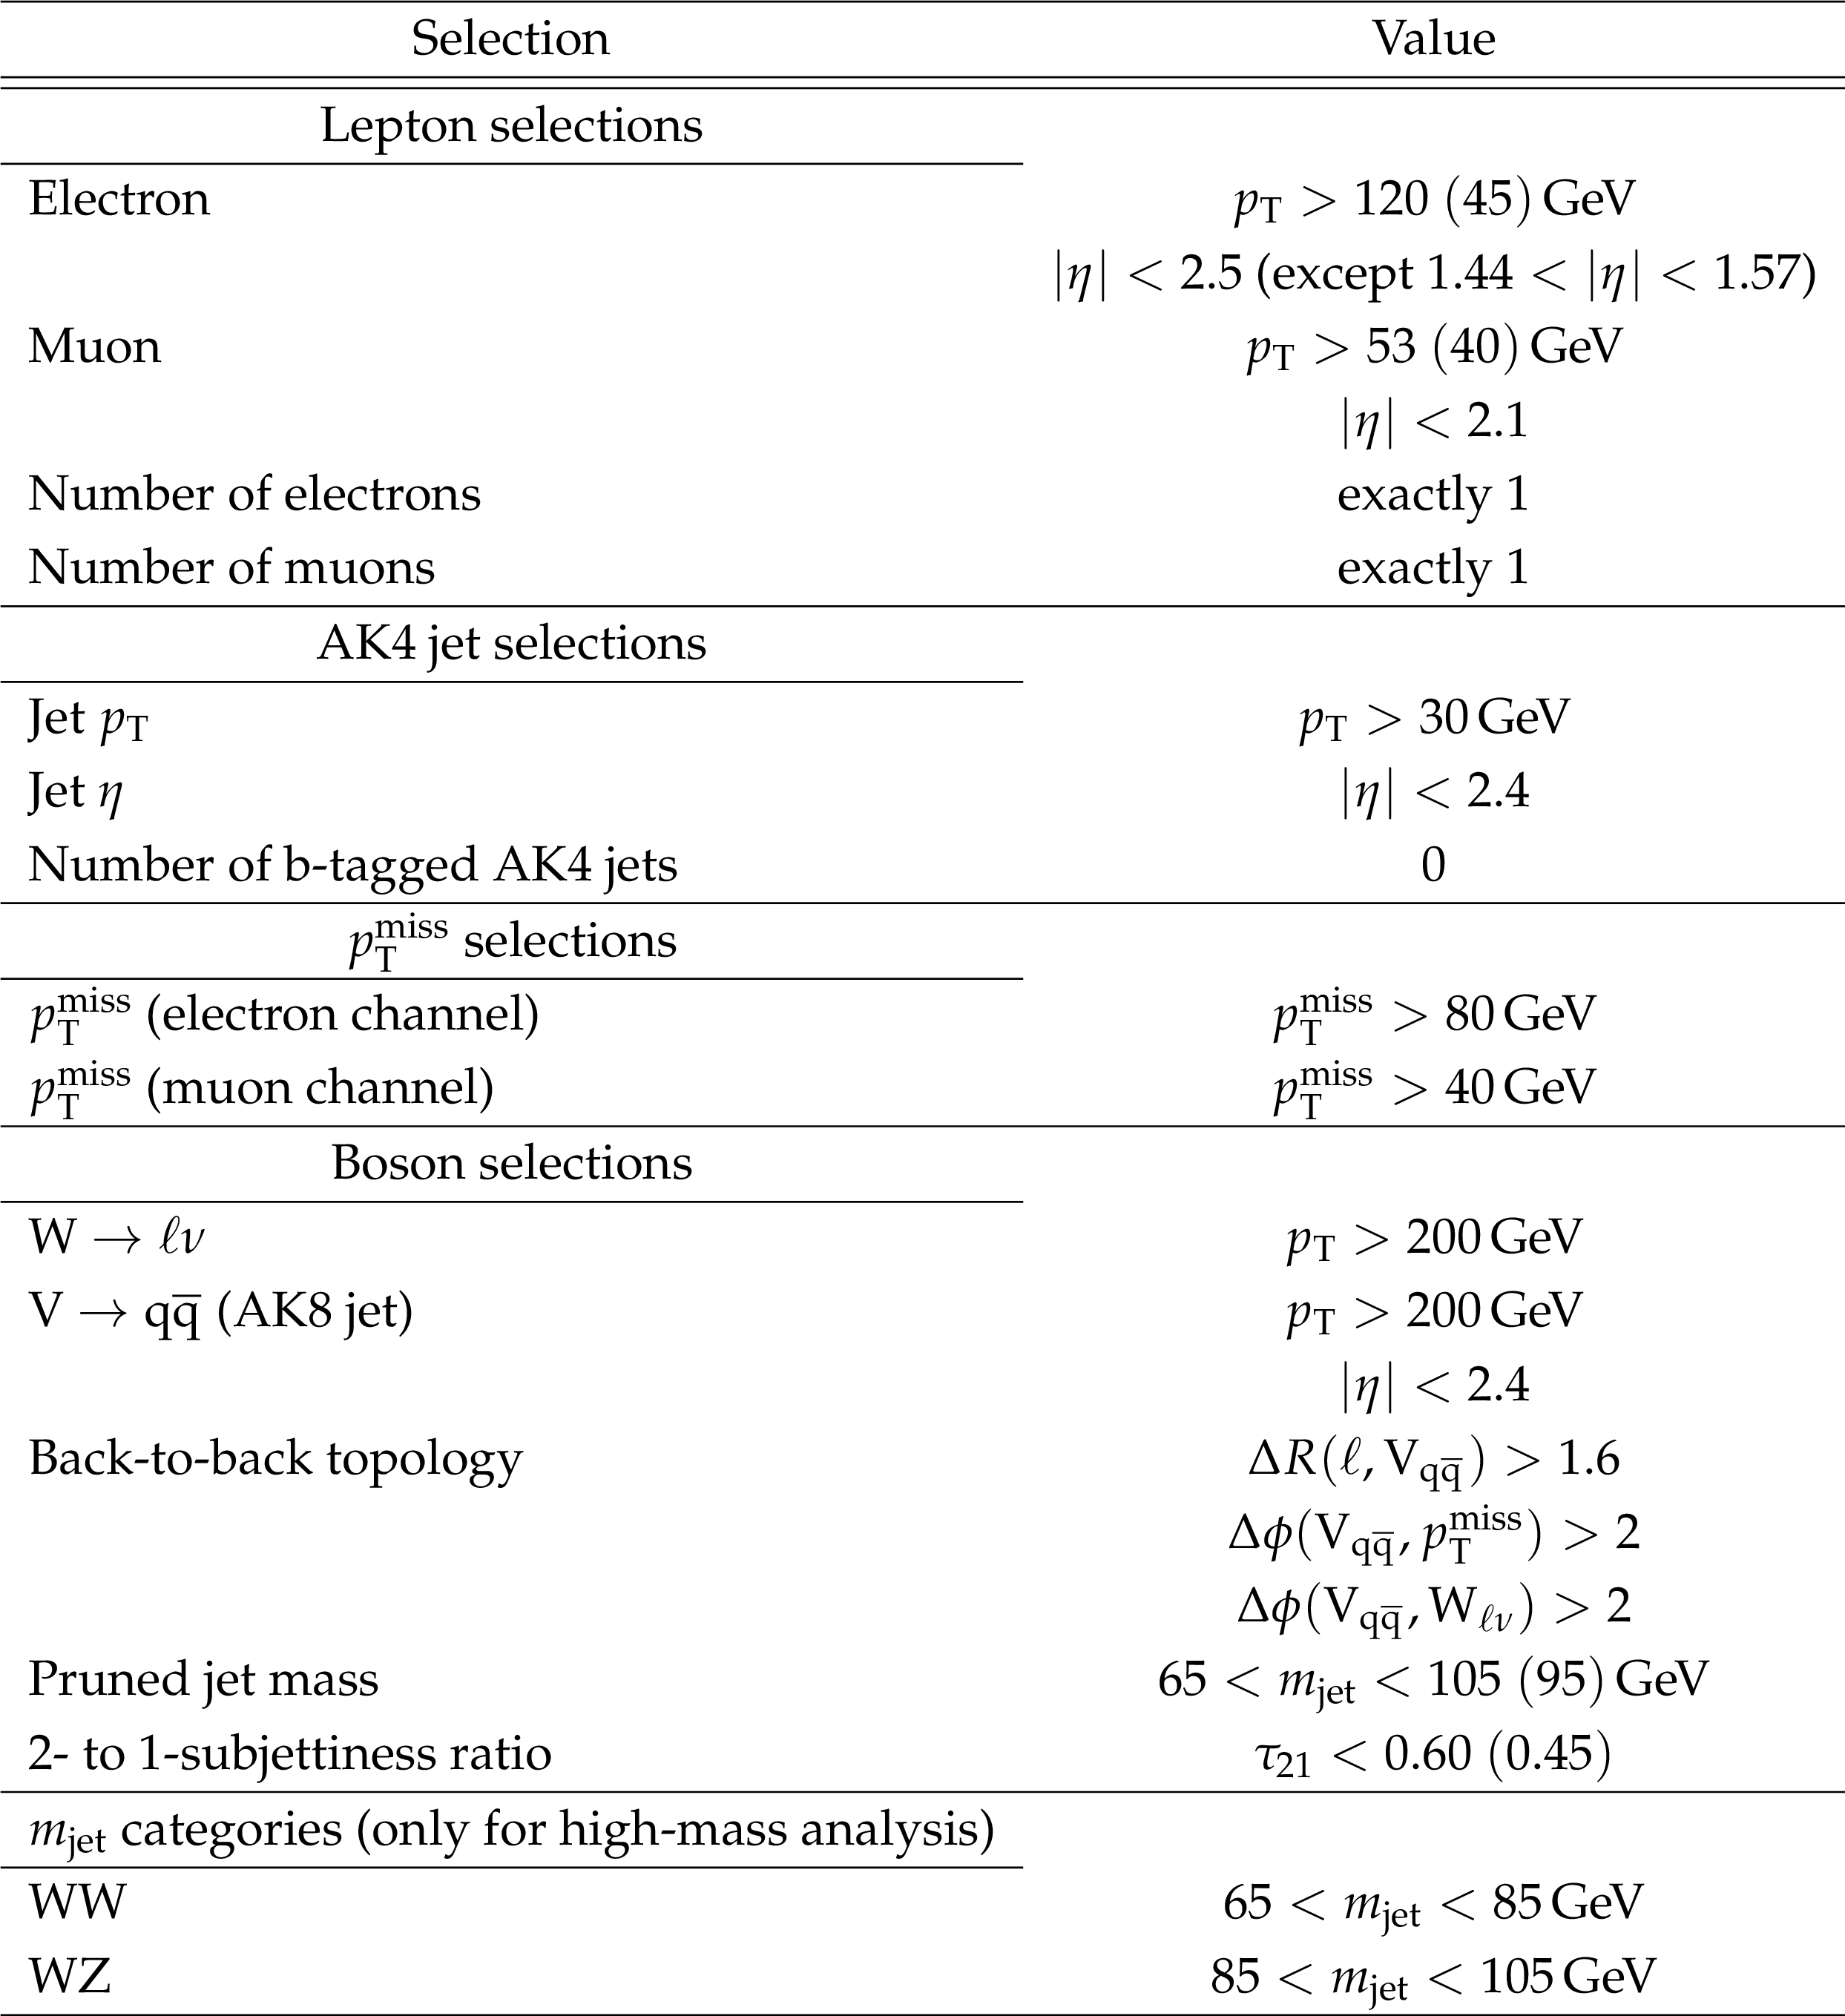
Summary of the final selections and categories for the ${\ell \nu }$+jet channel. The values indicated in parentheses correspond to the low-mass analysis. |

png pdf |
Table 4:
Summary of the final selections and categories for the dijet analyses. |

png pdf |
Table 5:
Data-to-simulation scale factors for ${\mathrm{ t } \mathrm{ \bar{t} } }$ and single top quark background processes, extracted from the comparison between data and simulation in the top quark enriched control sample. |
png pdf |
Table 6:
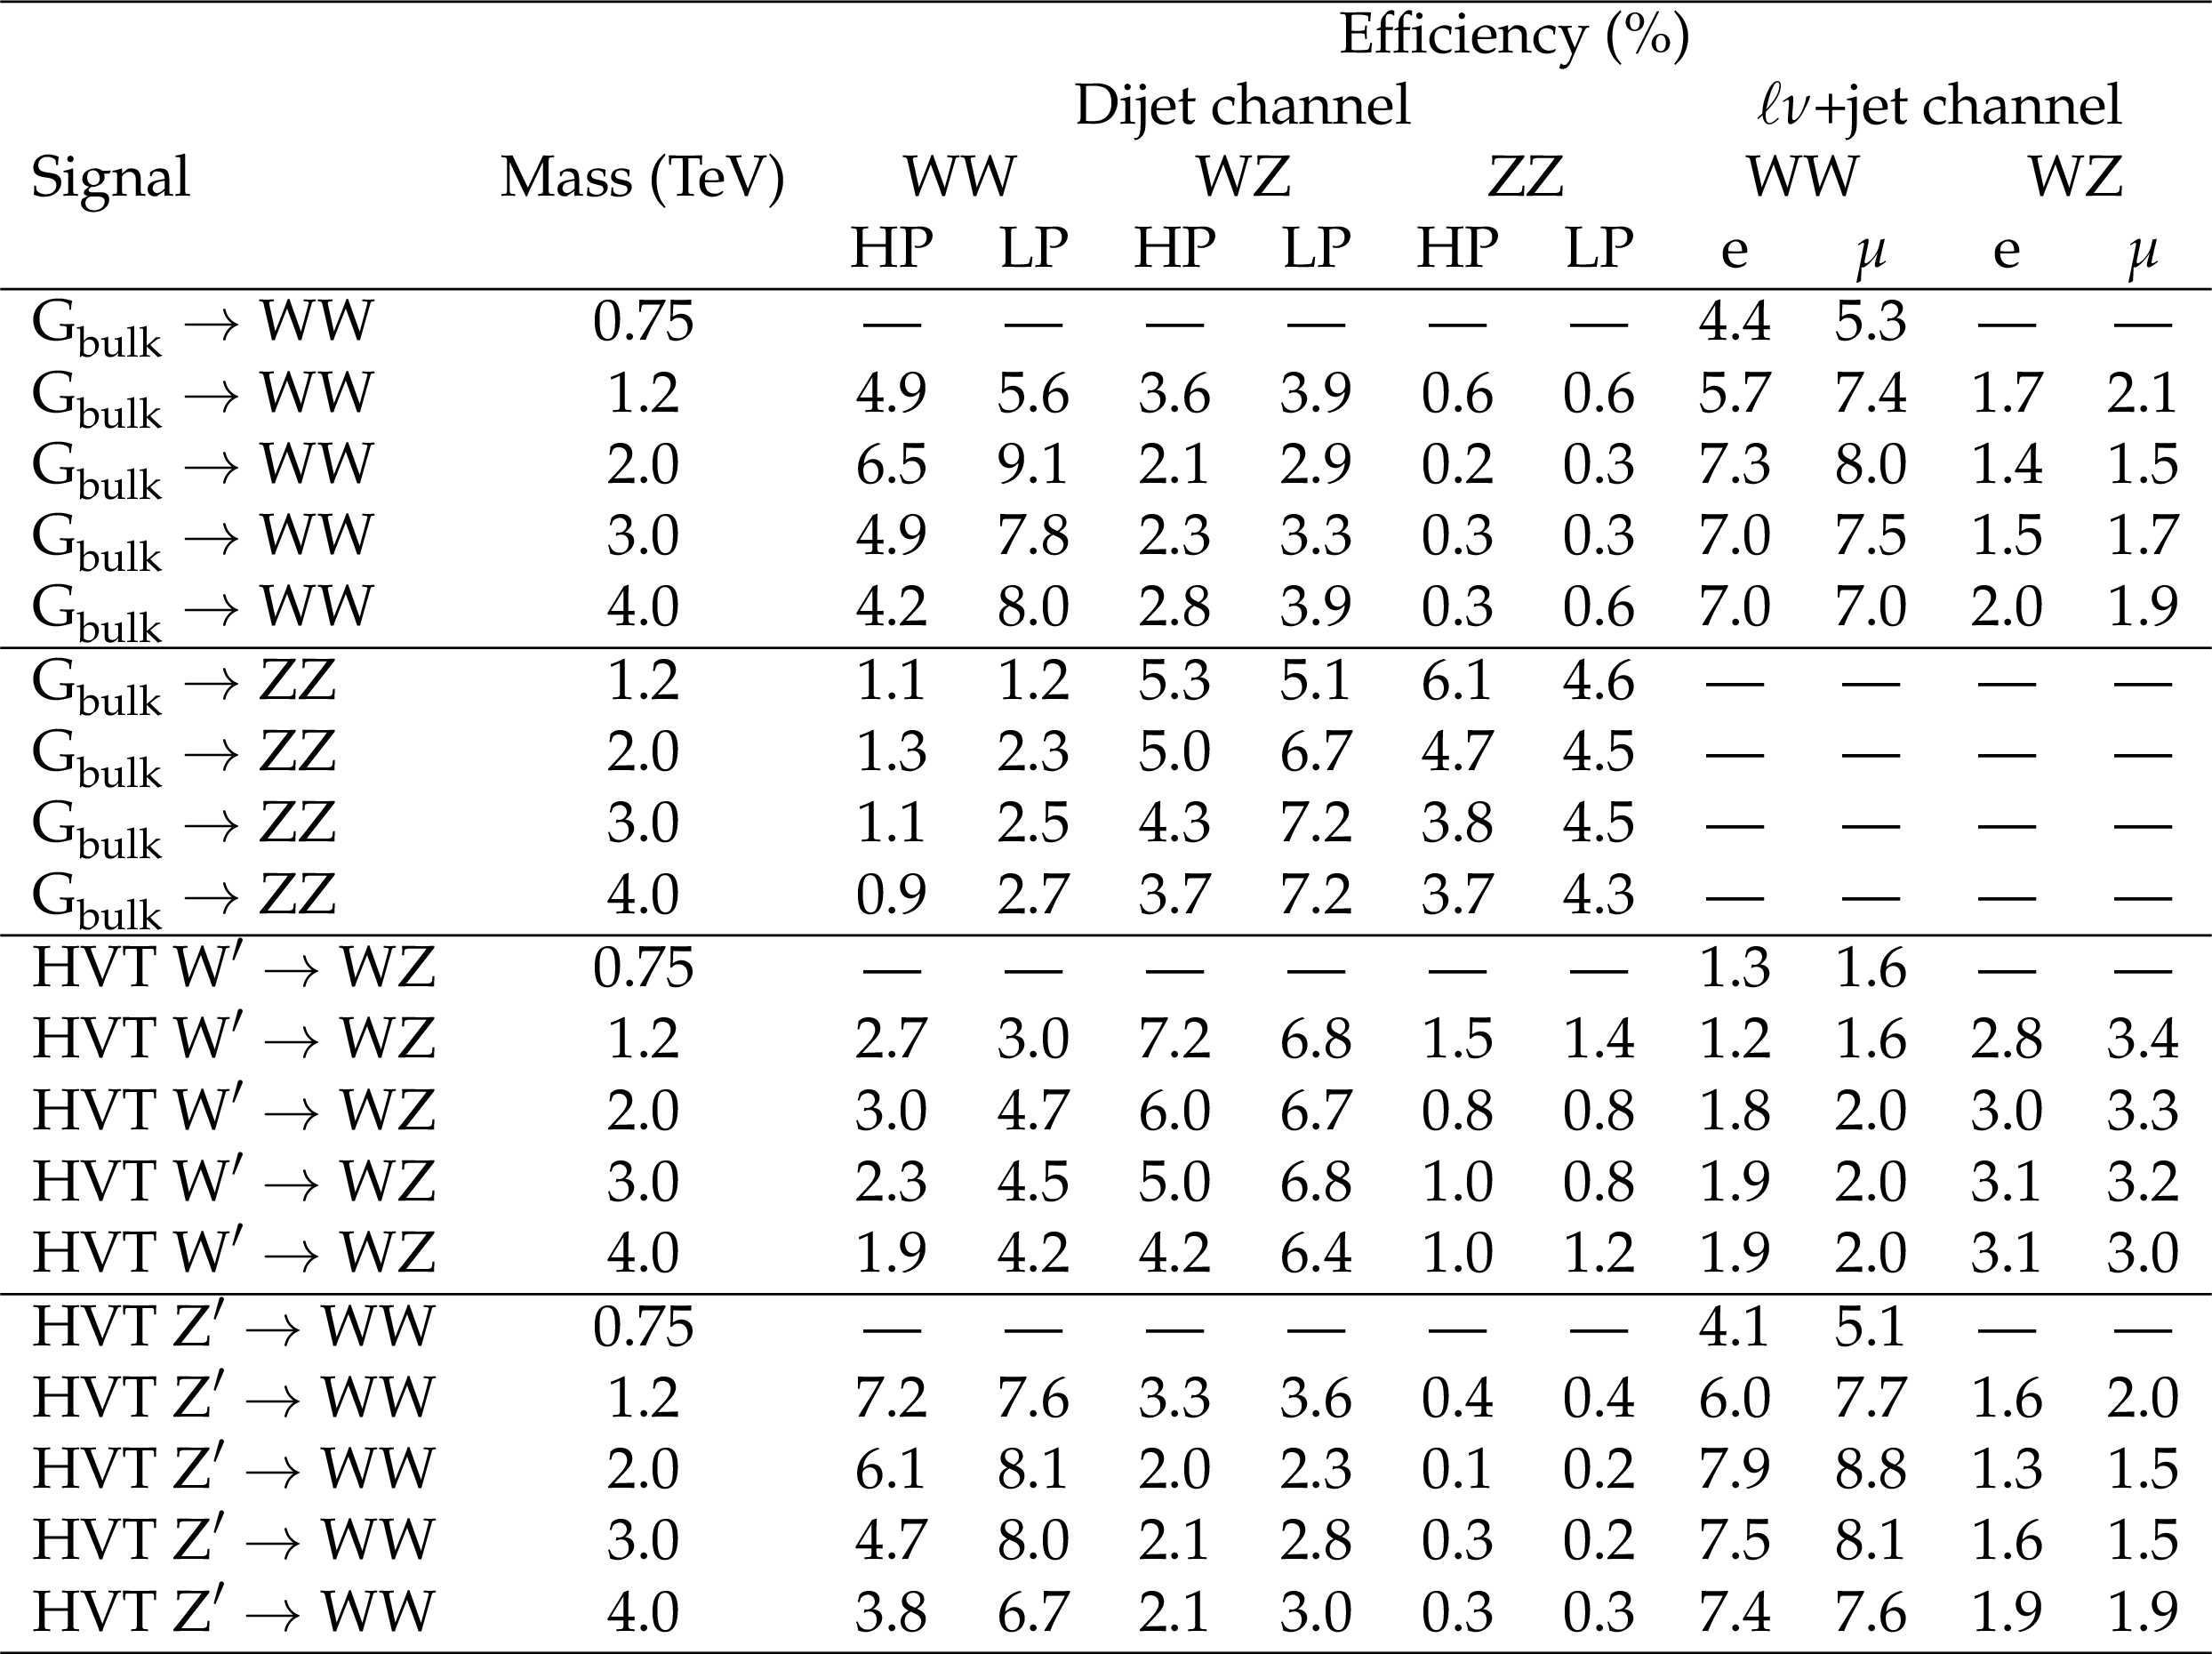
Summary of signal efficiencies for all analysis channels and all signal models. The quoted efficiencies are in percent, and include the branching fractions of the two vector bosons to the final state of the analysis channel, effects from detector acceptance, as well as reconstruction and selection efficiencies. Values are not indicated for categories and masses where the analysis channel has no sensitivity. |
png pdf |
Table 7:
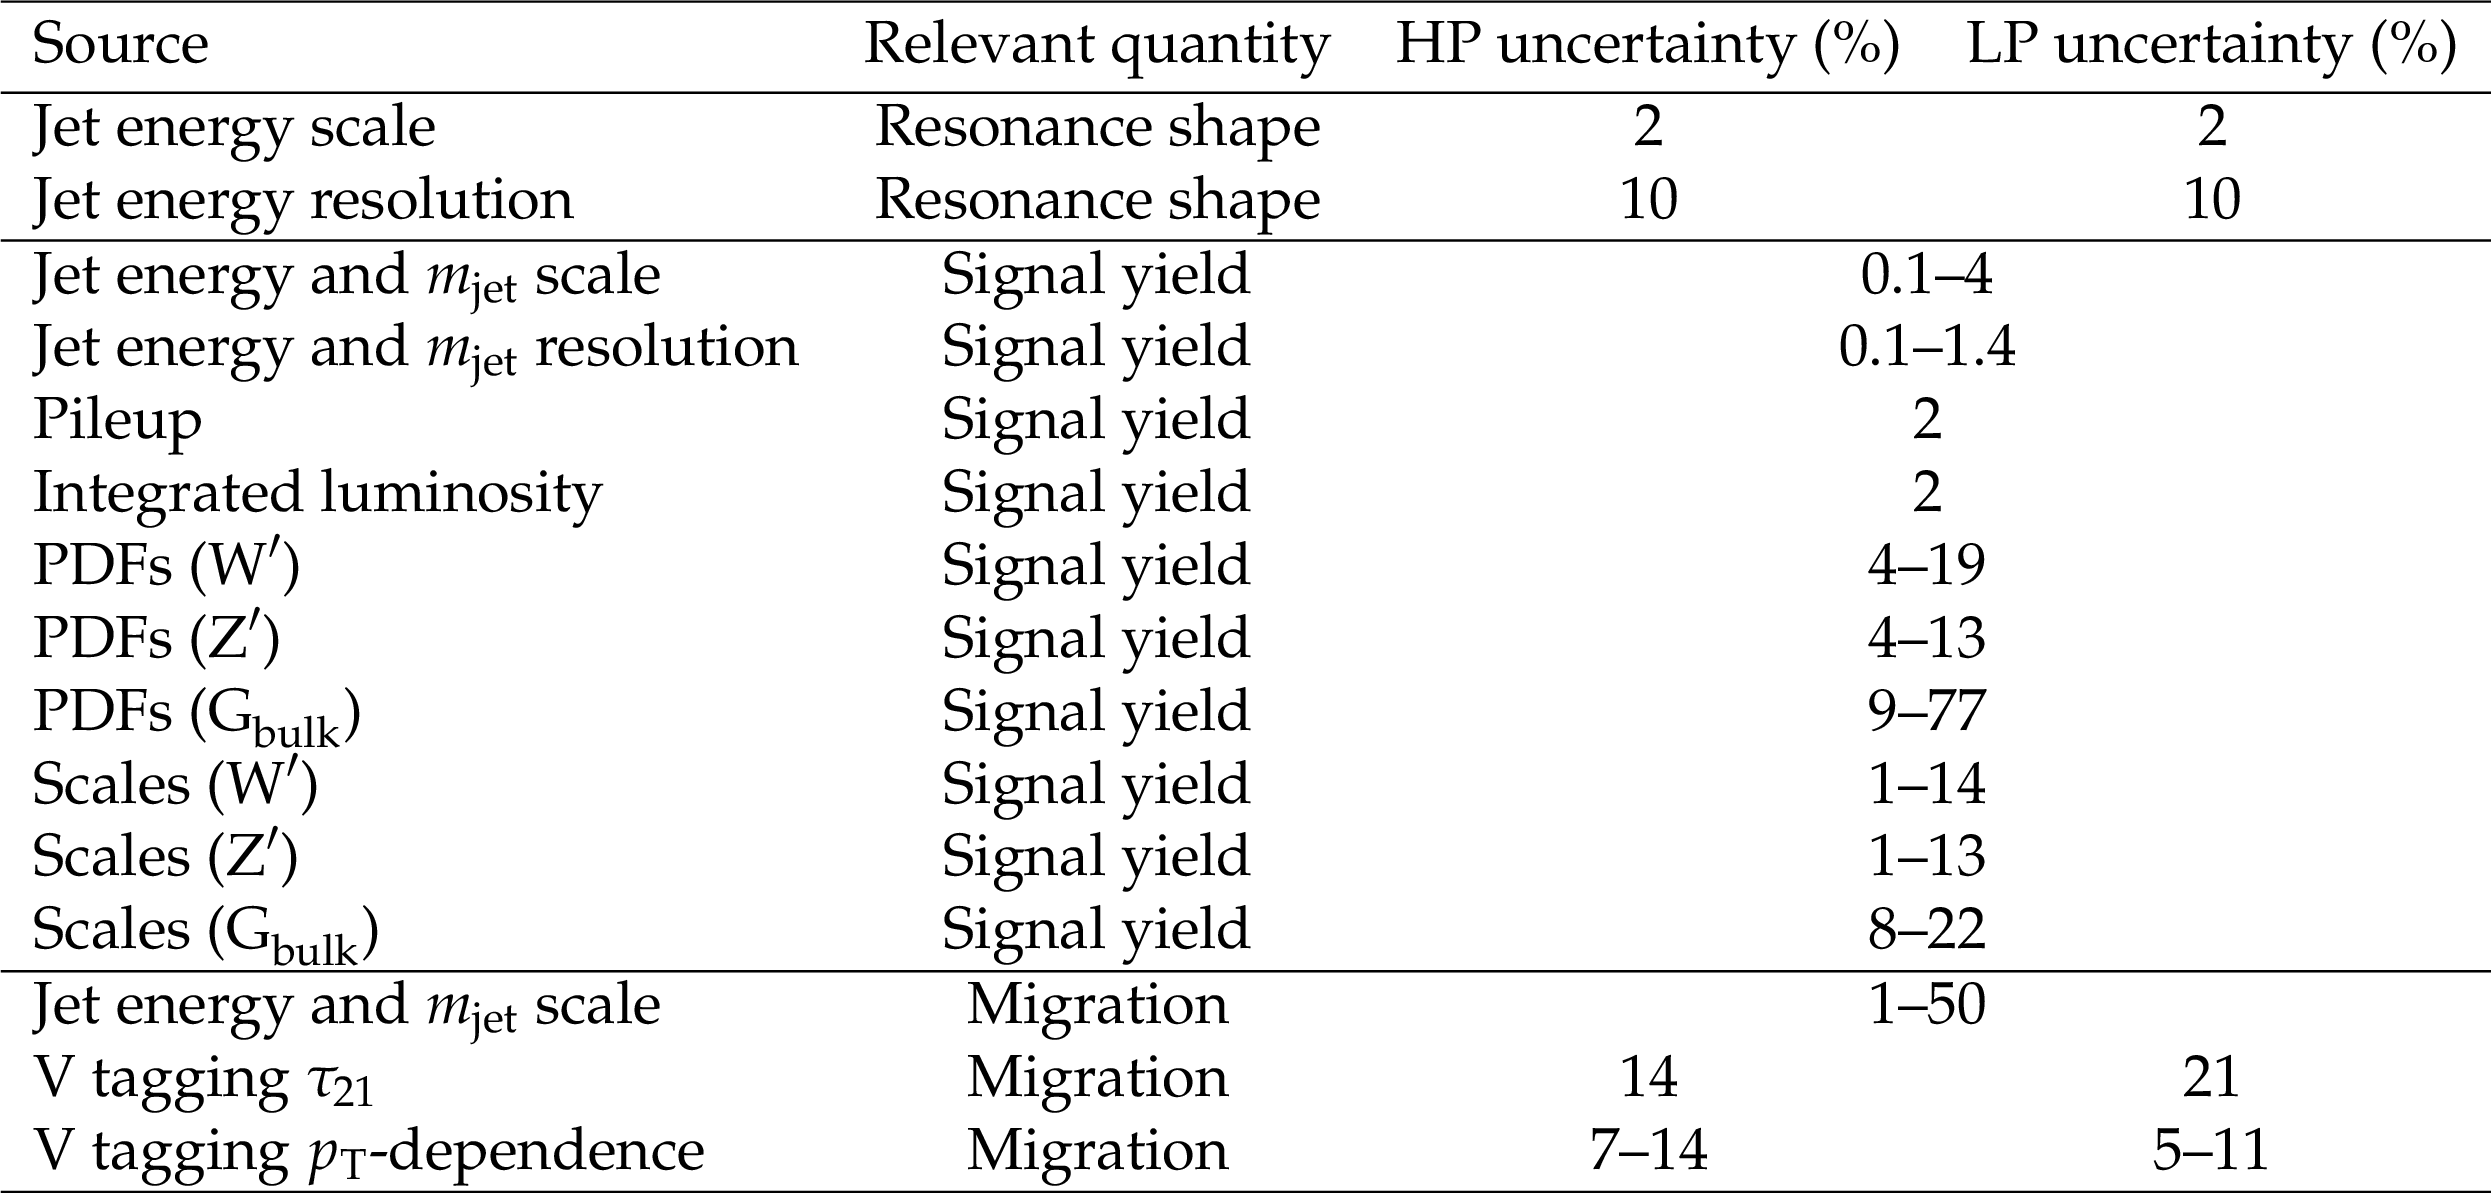
Summary of the systematic uncertainties in the contribution from signal in the dijet analysis and their impact on the event yield in the signal region and on the reconstructed distribution in ${m_{ {\mathrm {V}} {\mathrm {V}} }}$ (mean and width). The last three uncertainties result in migrations between event categories, but do not affect the overall signal efficiency. |
png pdf |
Table 8:
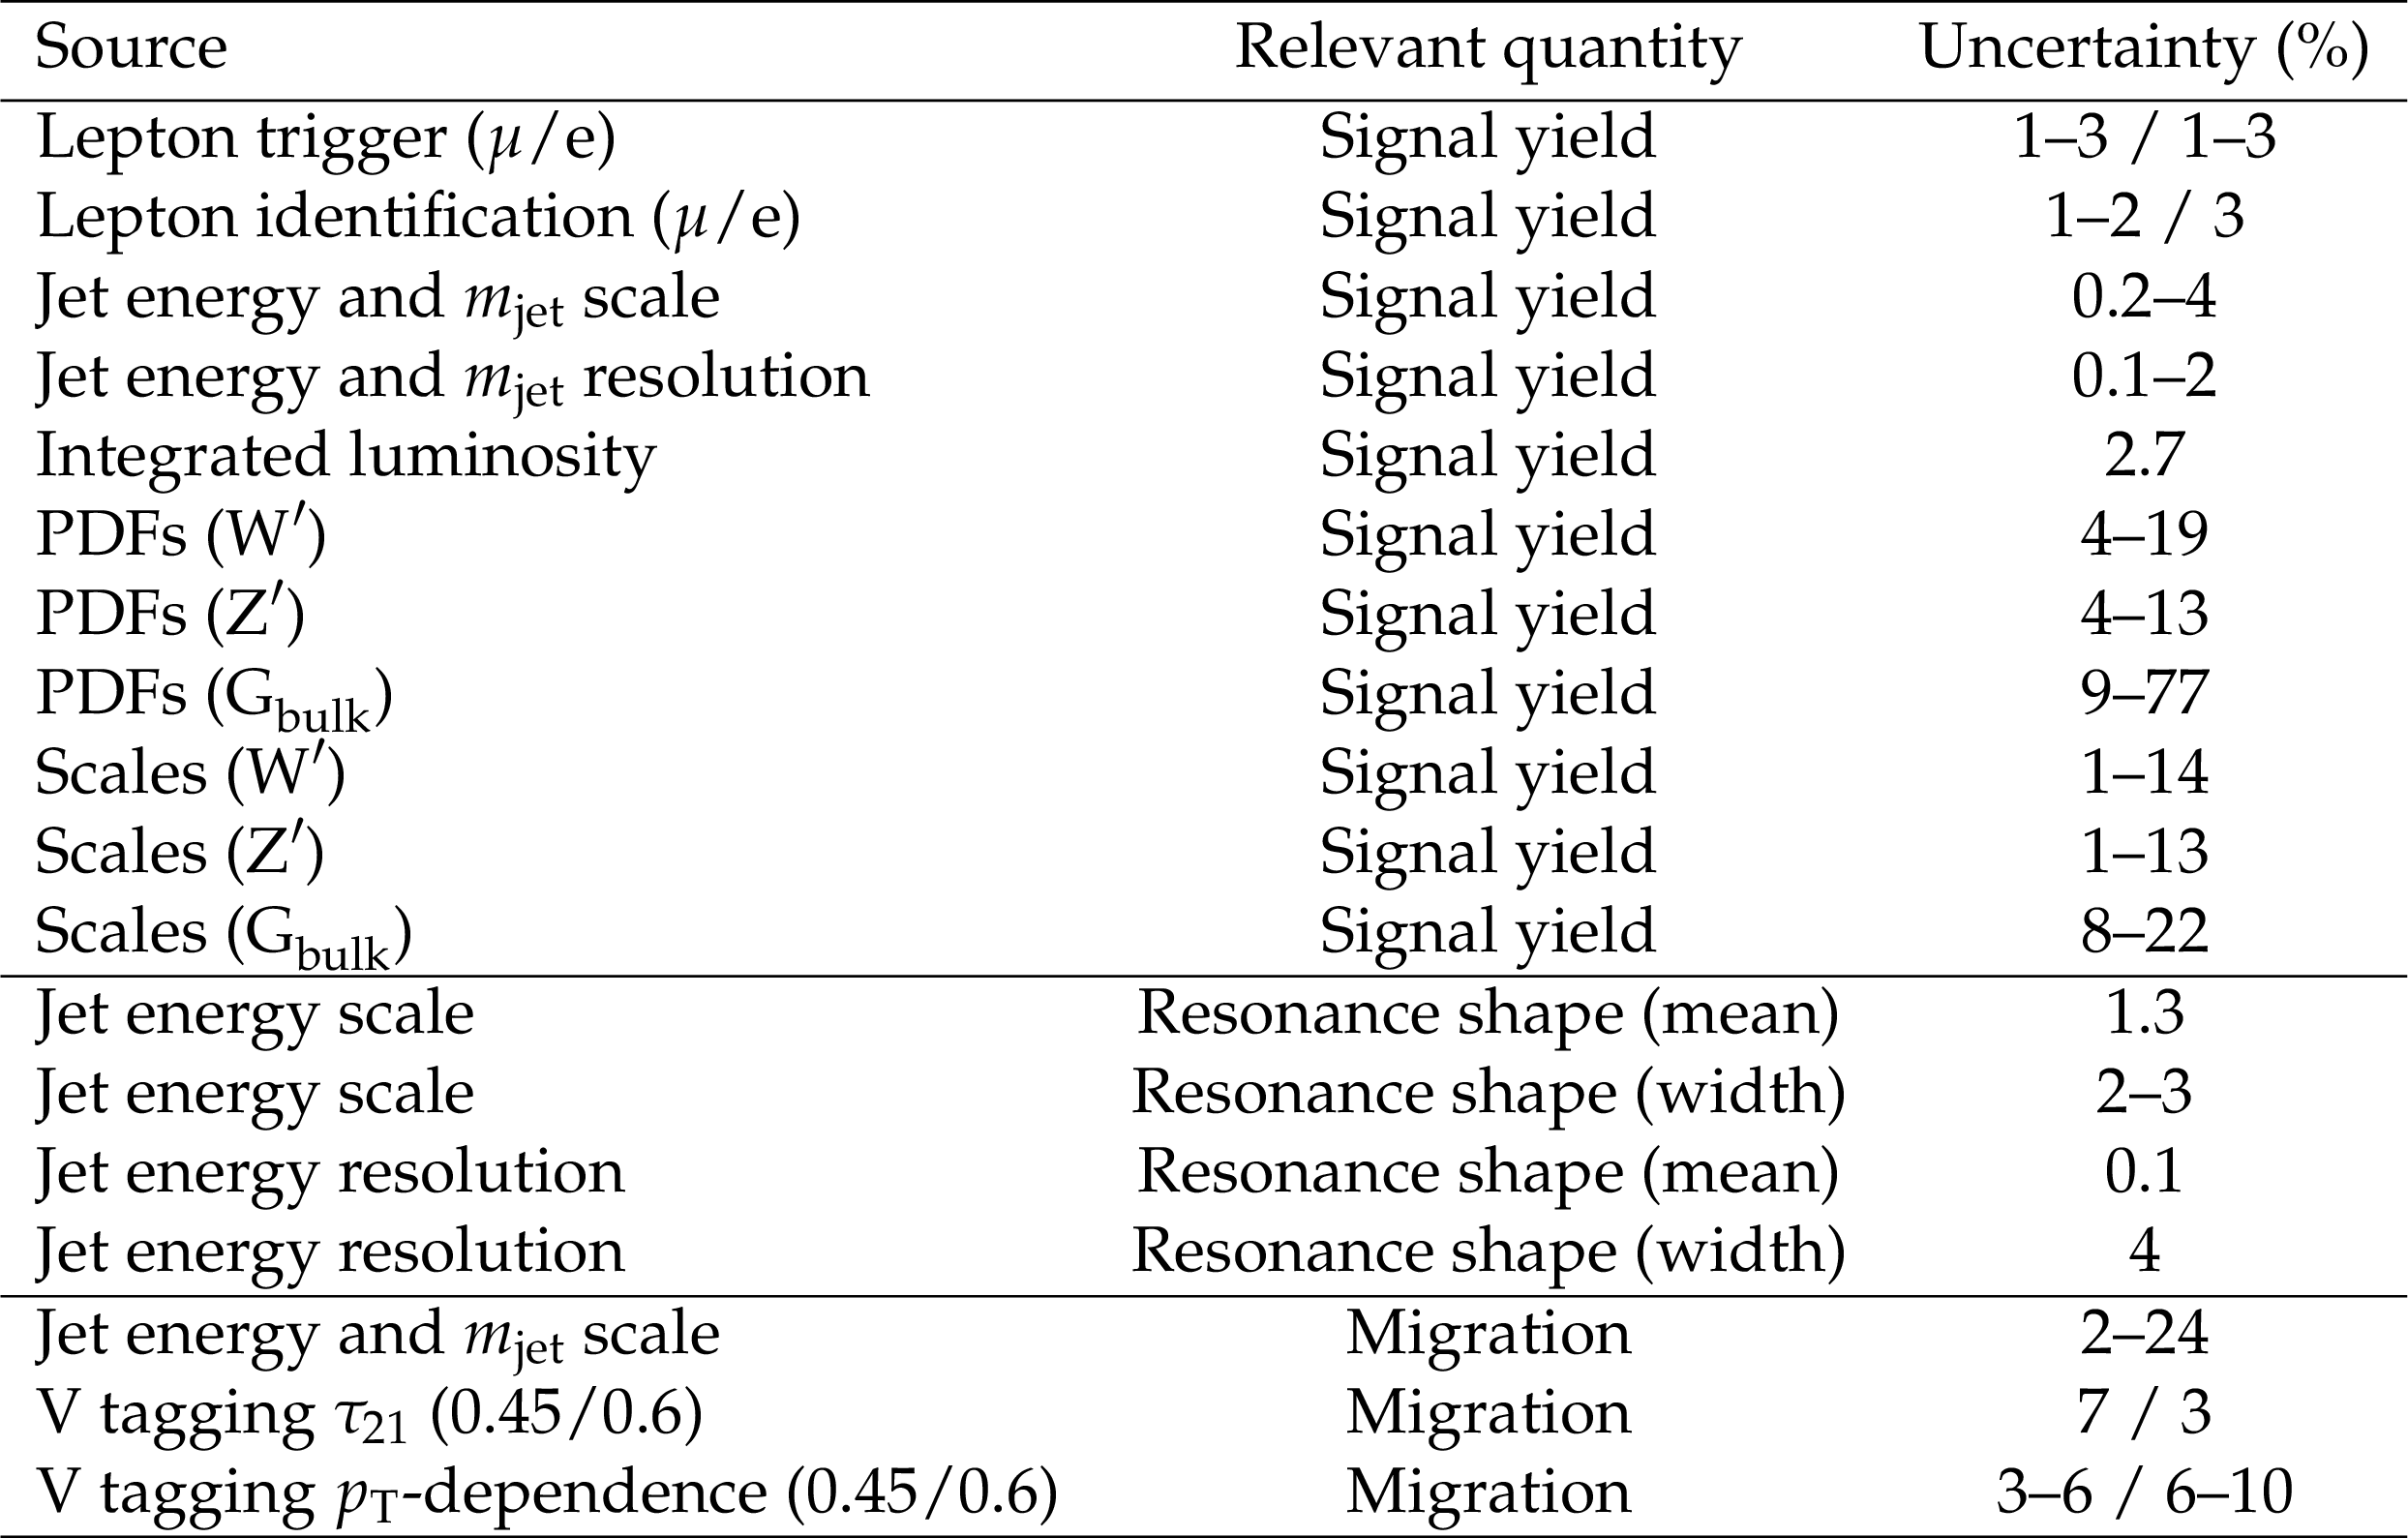
Summary of the signal systematic uncertainties for the ${\ell \nu }$+jet analyses and their impact on the event yield in the signal region and on the reconstructed ${m_{ {\mathrm {V}} {\mathrm {V}} }}$ shape (mean and width) for both muon and electron channels. The last three uncertainties result in migrations between event categories, but do not affect the overall signal efficiency. The correlations among different categories are taken into account. |
png pdf |
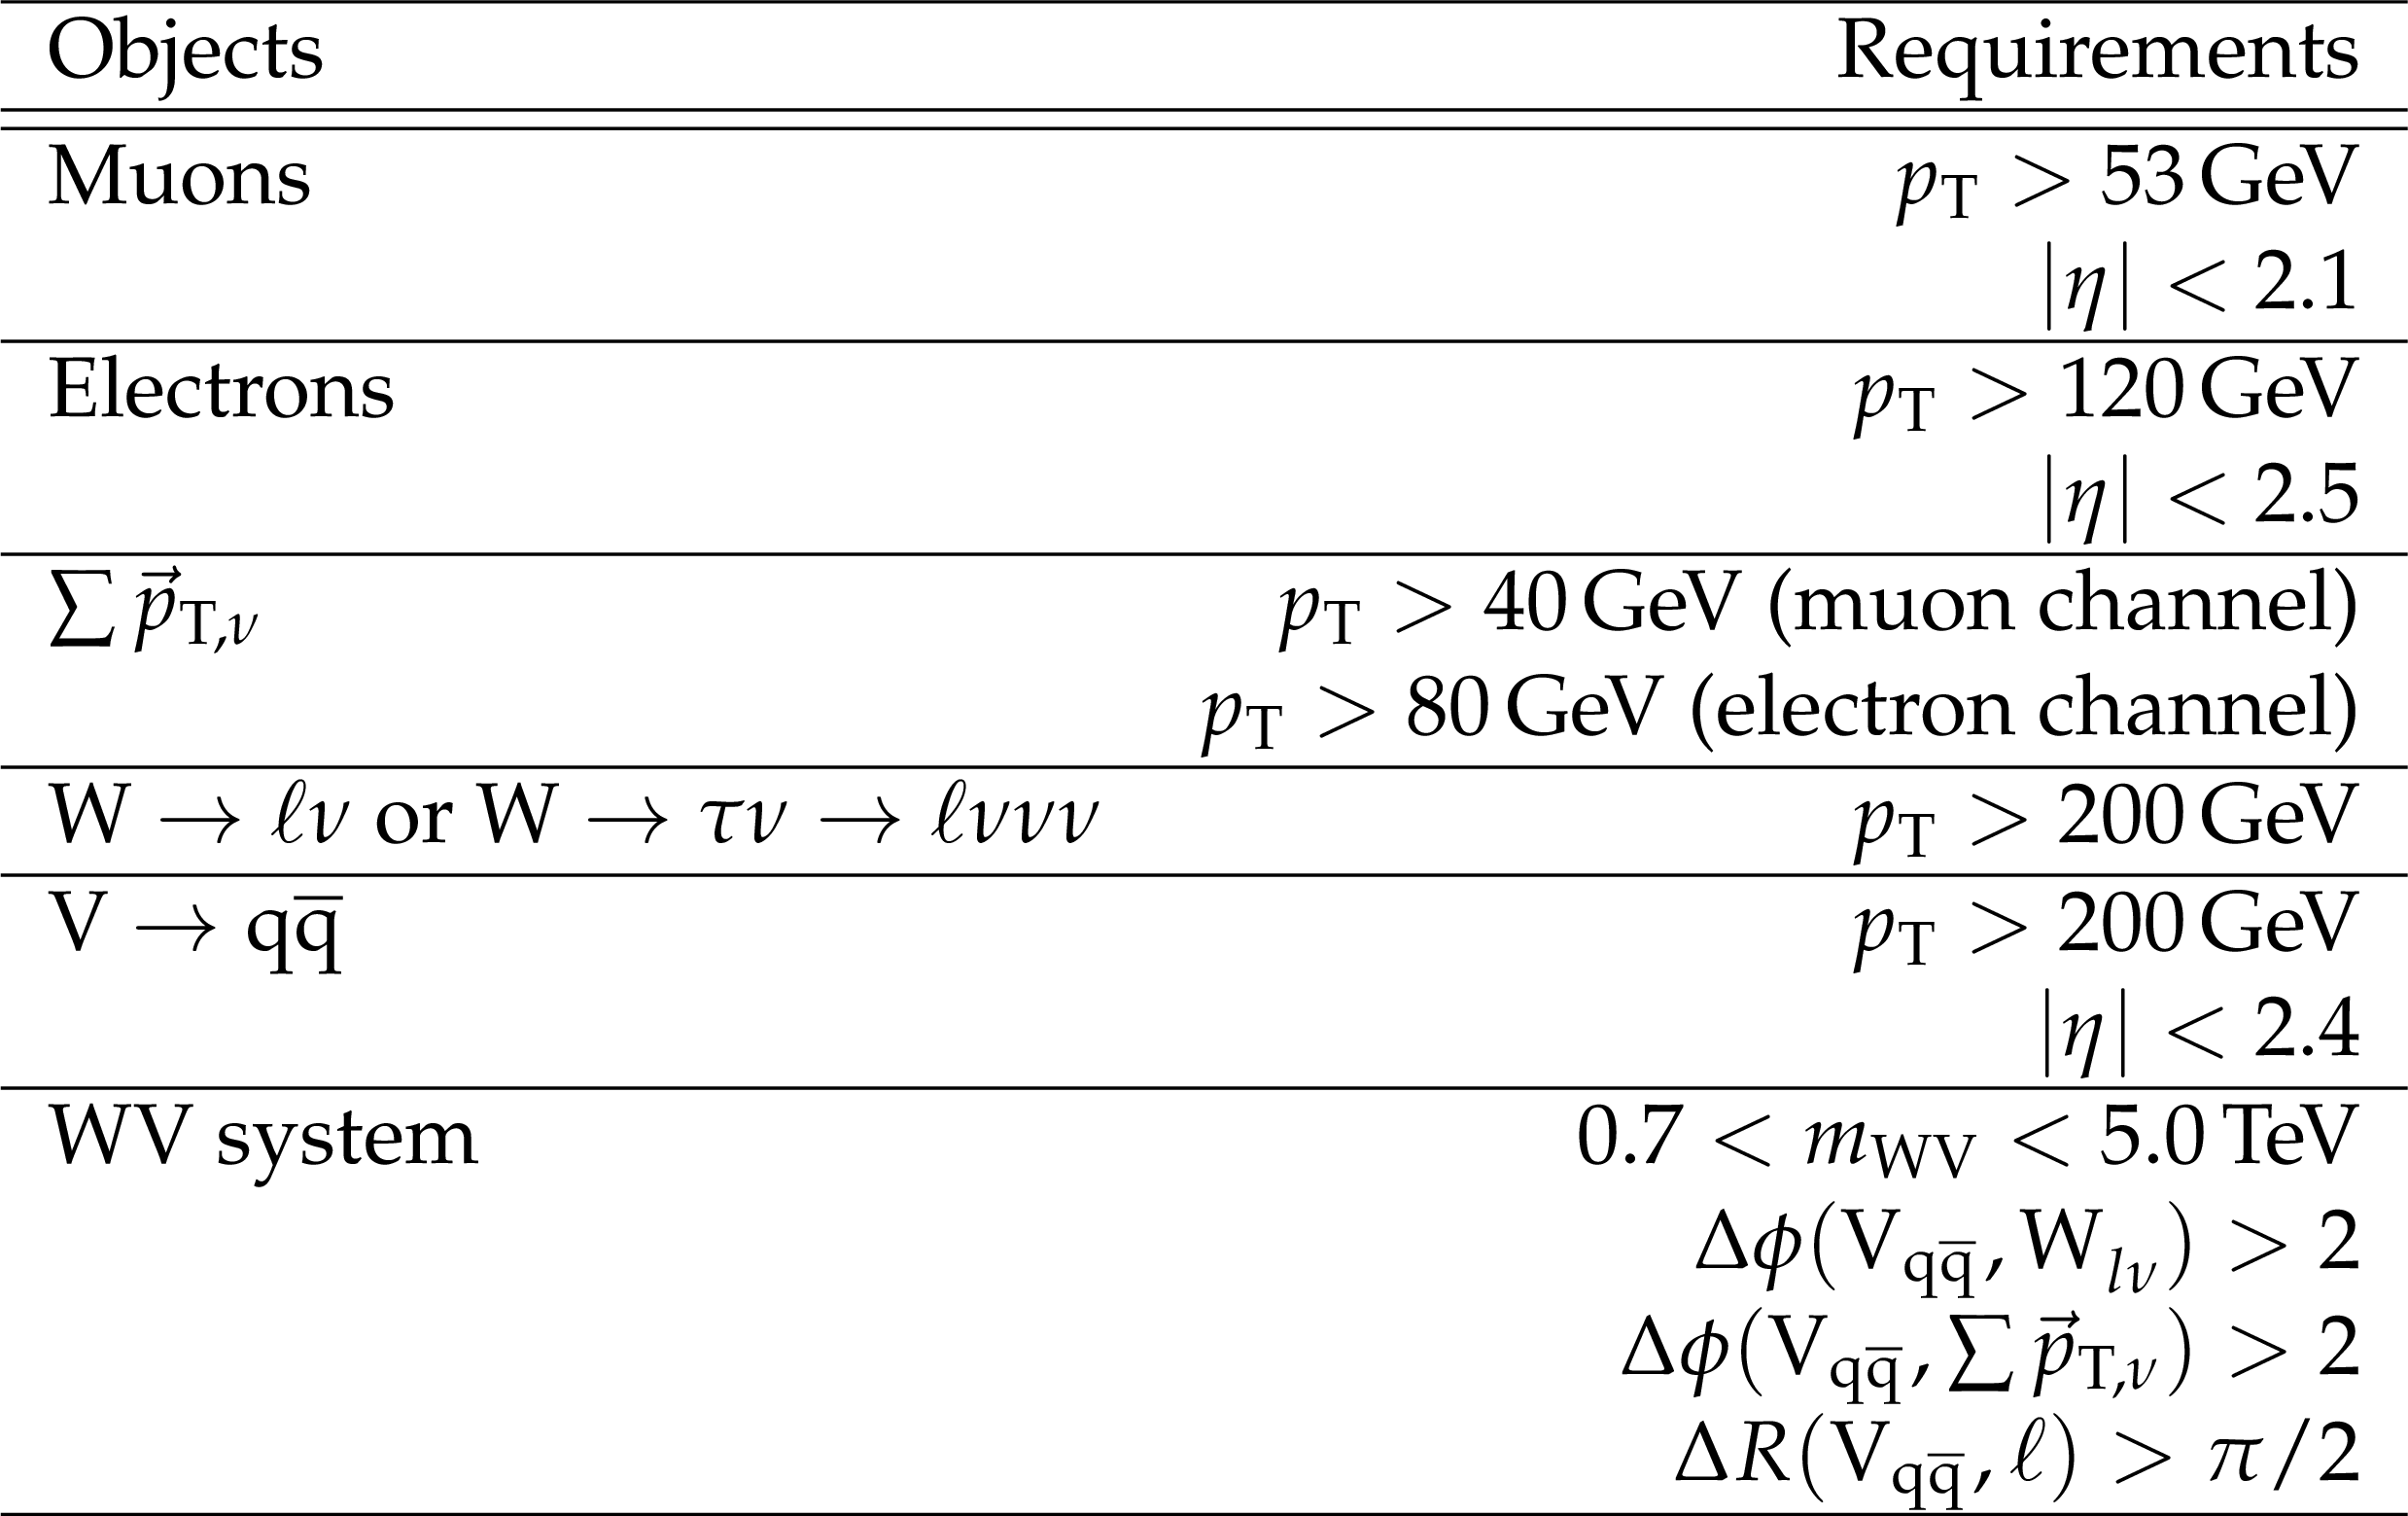
Table 9:
Generator-level requirements for the ${\ell \nu }$+jet analysis, to be used for the computation of the efficiency parametrization. The vector sum of the transverse neutrino momenta $\vec{p}_{\mathrm {T},\nu }$ is taken over all the neutrinos in the final state, coming either from $\mathrm{ W } \to \ell \nu $ or $\mathrm{W} \to \tau \nu \to \ell \nu \nu \nu $ decays with $\ell =\mu $ or e. |

png pdf |
Table 10:
Generator-level requirements for the dijet analysis, to be used for the computation of the efficiency parametrization. |

png pdf |
Table 11:
Reconstruction and identification efficiency for the (upper table) $\mathrm{ W } \to \mu \nu $ and $\mathrm{ W } \to \tau \nu \to \mu \nu \nu \nu $, and (lower table) $\mathrm{ W } \to \mathrm{ e } \nu $ and $\mathrm{ W } \to \tau \nu \to \mathrm{ e } \nu \nu \nu $ decays as function of generated $ {p_{\mathrm {T}}} ^\mathrm{ W } $ and $ {| \eta _\mathrm{ W } | }$. Uncertainties in the efficiencies are included in the generic limit calculation as discussed in the text. |
png pdf |
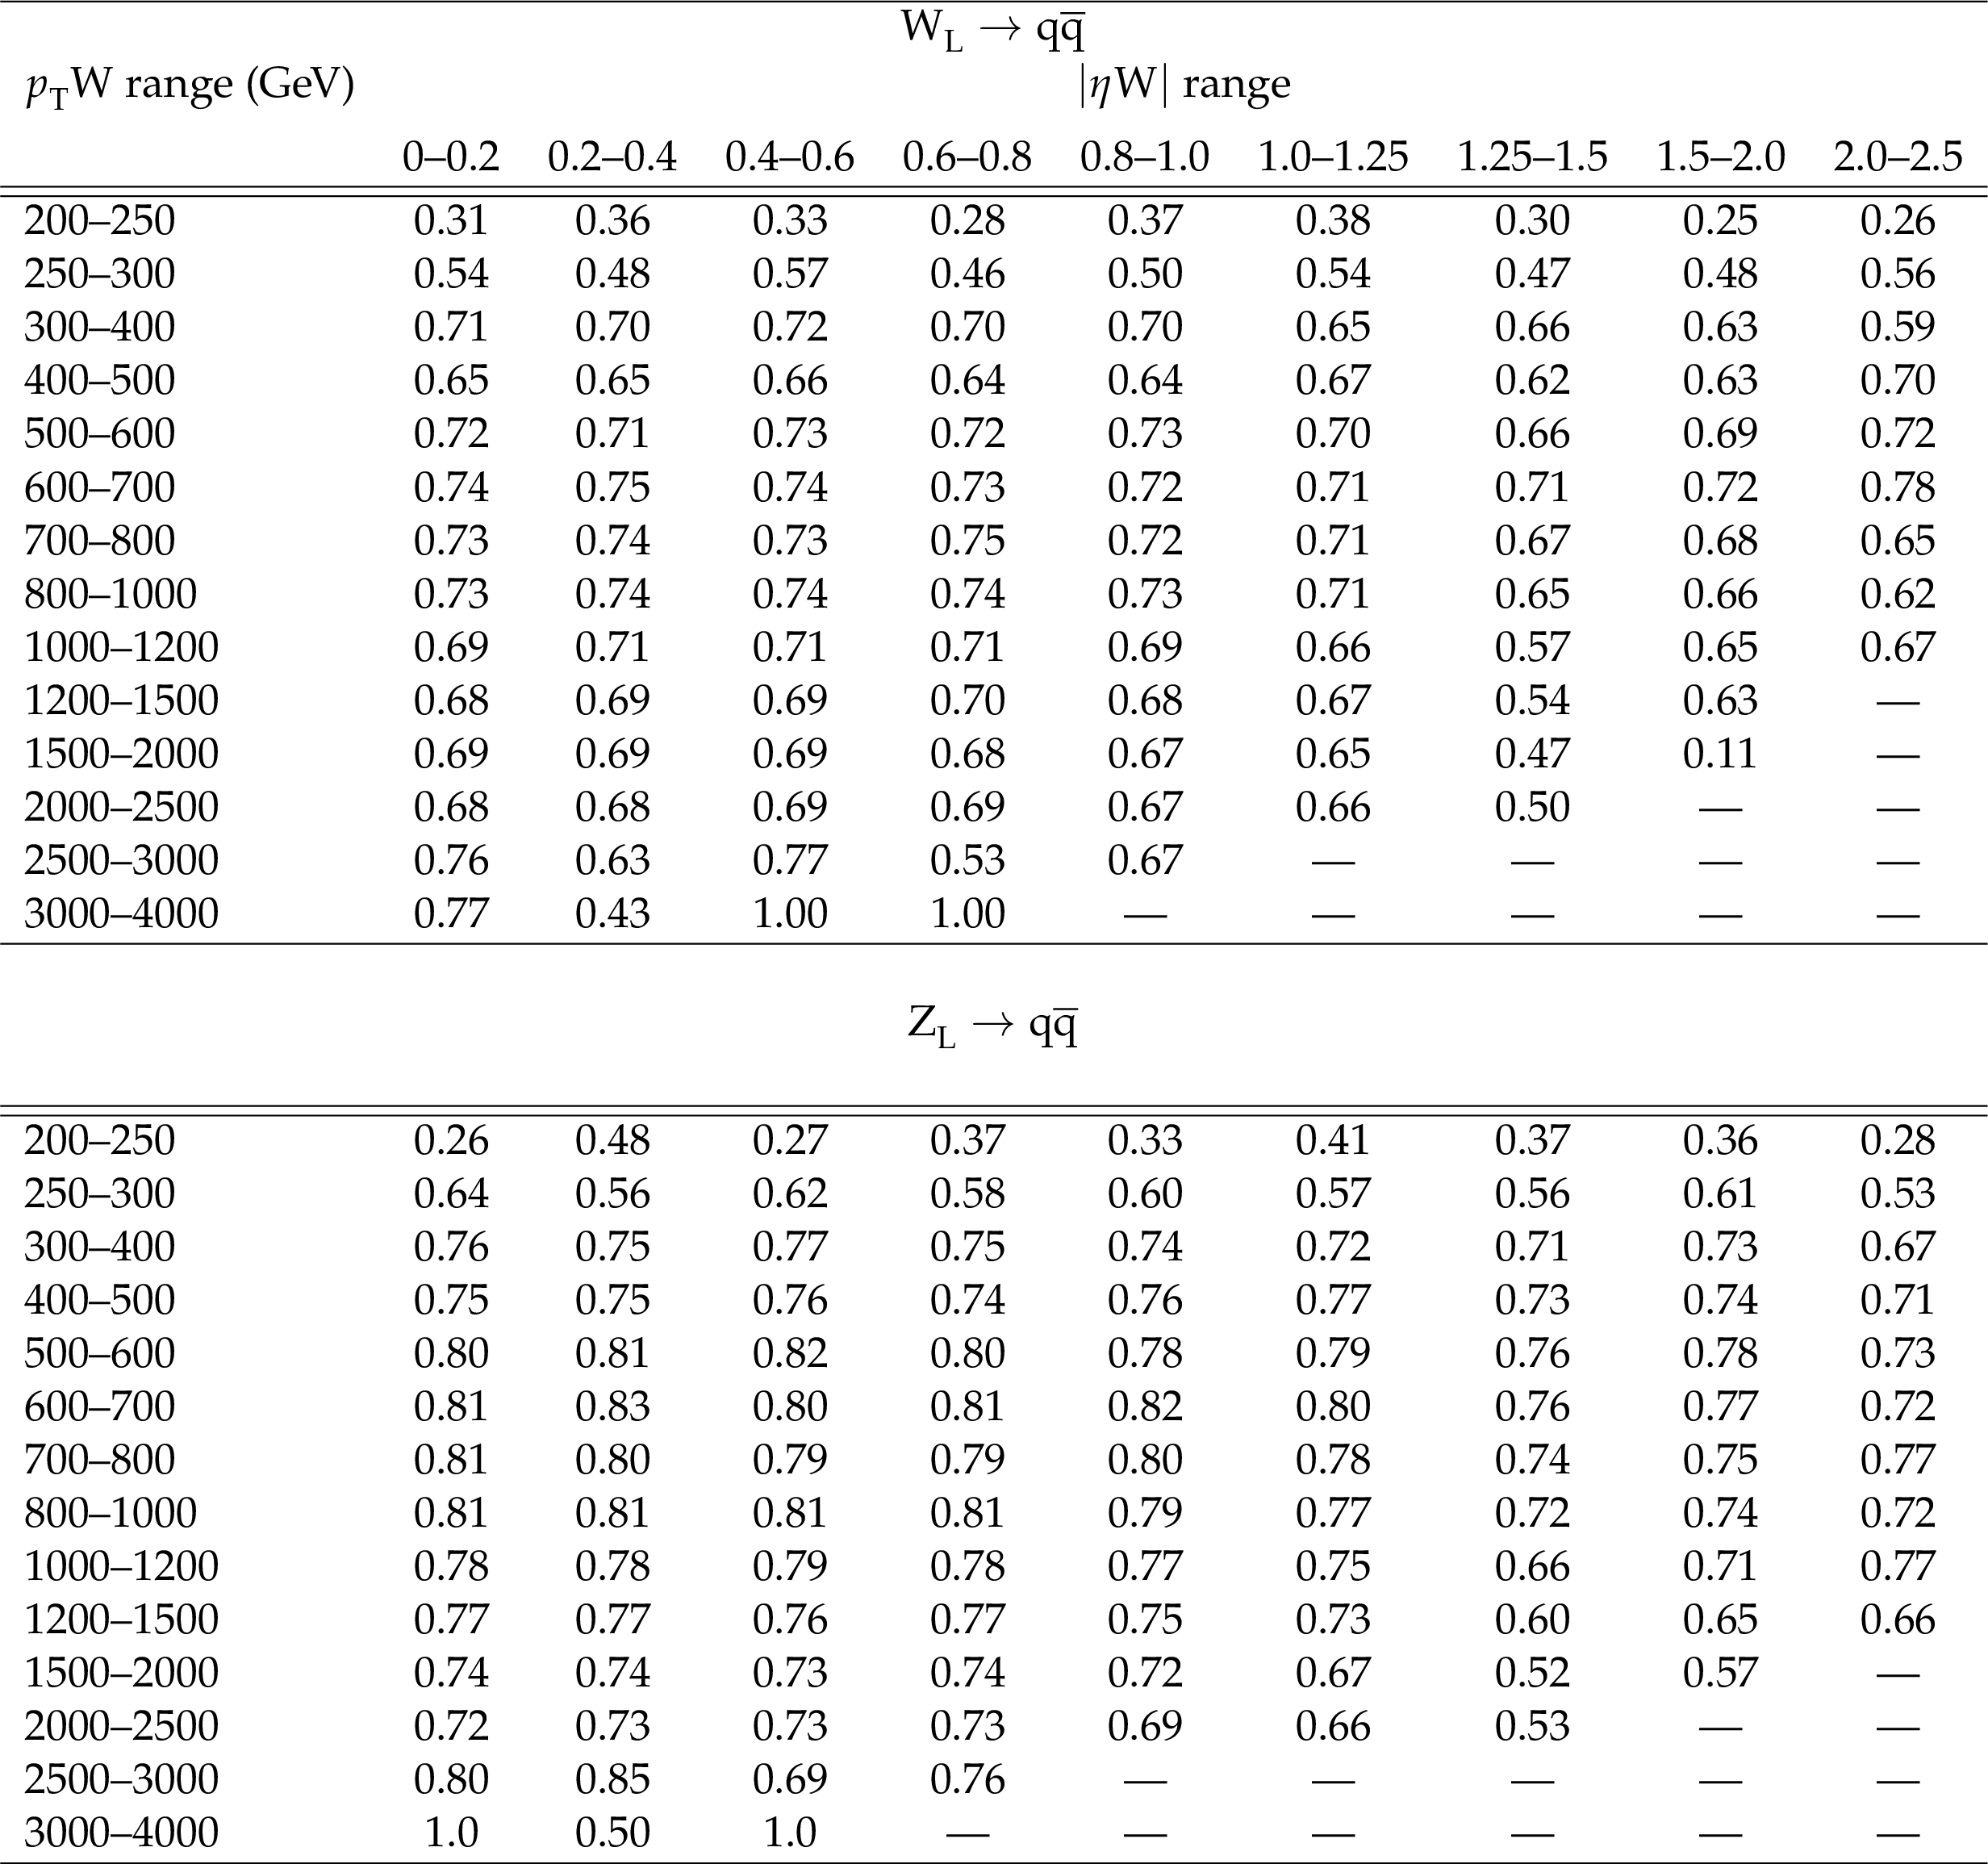
Table 12:
Reconstruction and identification efficiency for the (upper table) $\mathrm{ W } _{\text {L}}\to {\mathrm{ q } \mathrm{ \bar{q} } } $ and (lower table) $\mathrm{ Z } _{\text {L}}\to {\mathrm{ q } \mathrm{ \bar{q} } } $ decay as a function of generated $ {p_{\mathrm {T}}} ^ {\mathrm {V}} $ and $ {| \eta _ {\mathrm {V}} | }$ applying the V tagging requirements used in the ${\ell \nu }$+jet analysis ($ {\tau _{21}}<$ 0.6). Uncertainties in the efficiencies are included in the generic limit calculation as discussed in the text. |

png pdf |
Table 13:
Reconstruction and identification efficiency for the (upper table) $\mathrm{ W } _{\text {L}}\to {\mathrm{ q } \mathrm{ \bar{q} } } $ and (lower table) $\mathrm{ Z } _{\text {L}}\to {\mathrm{ q } \mathrm{ \bar{q} } } $ decays as a function of generated $ {p_{\mathrm {T}}} ^ {\mathrm {V}} $ and $ {| \eta _ {\mathrm {V}} | }$ applying the V tagging requirements used in the dijet analysis ($ {\tau _{21}}<$ 0.45). Uncertainties in the efficiencies are included in the generic limit calculation as discussed in the text. |
png pdf |
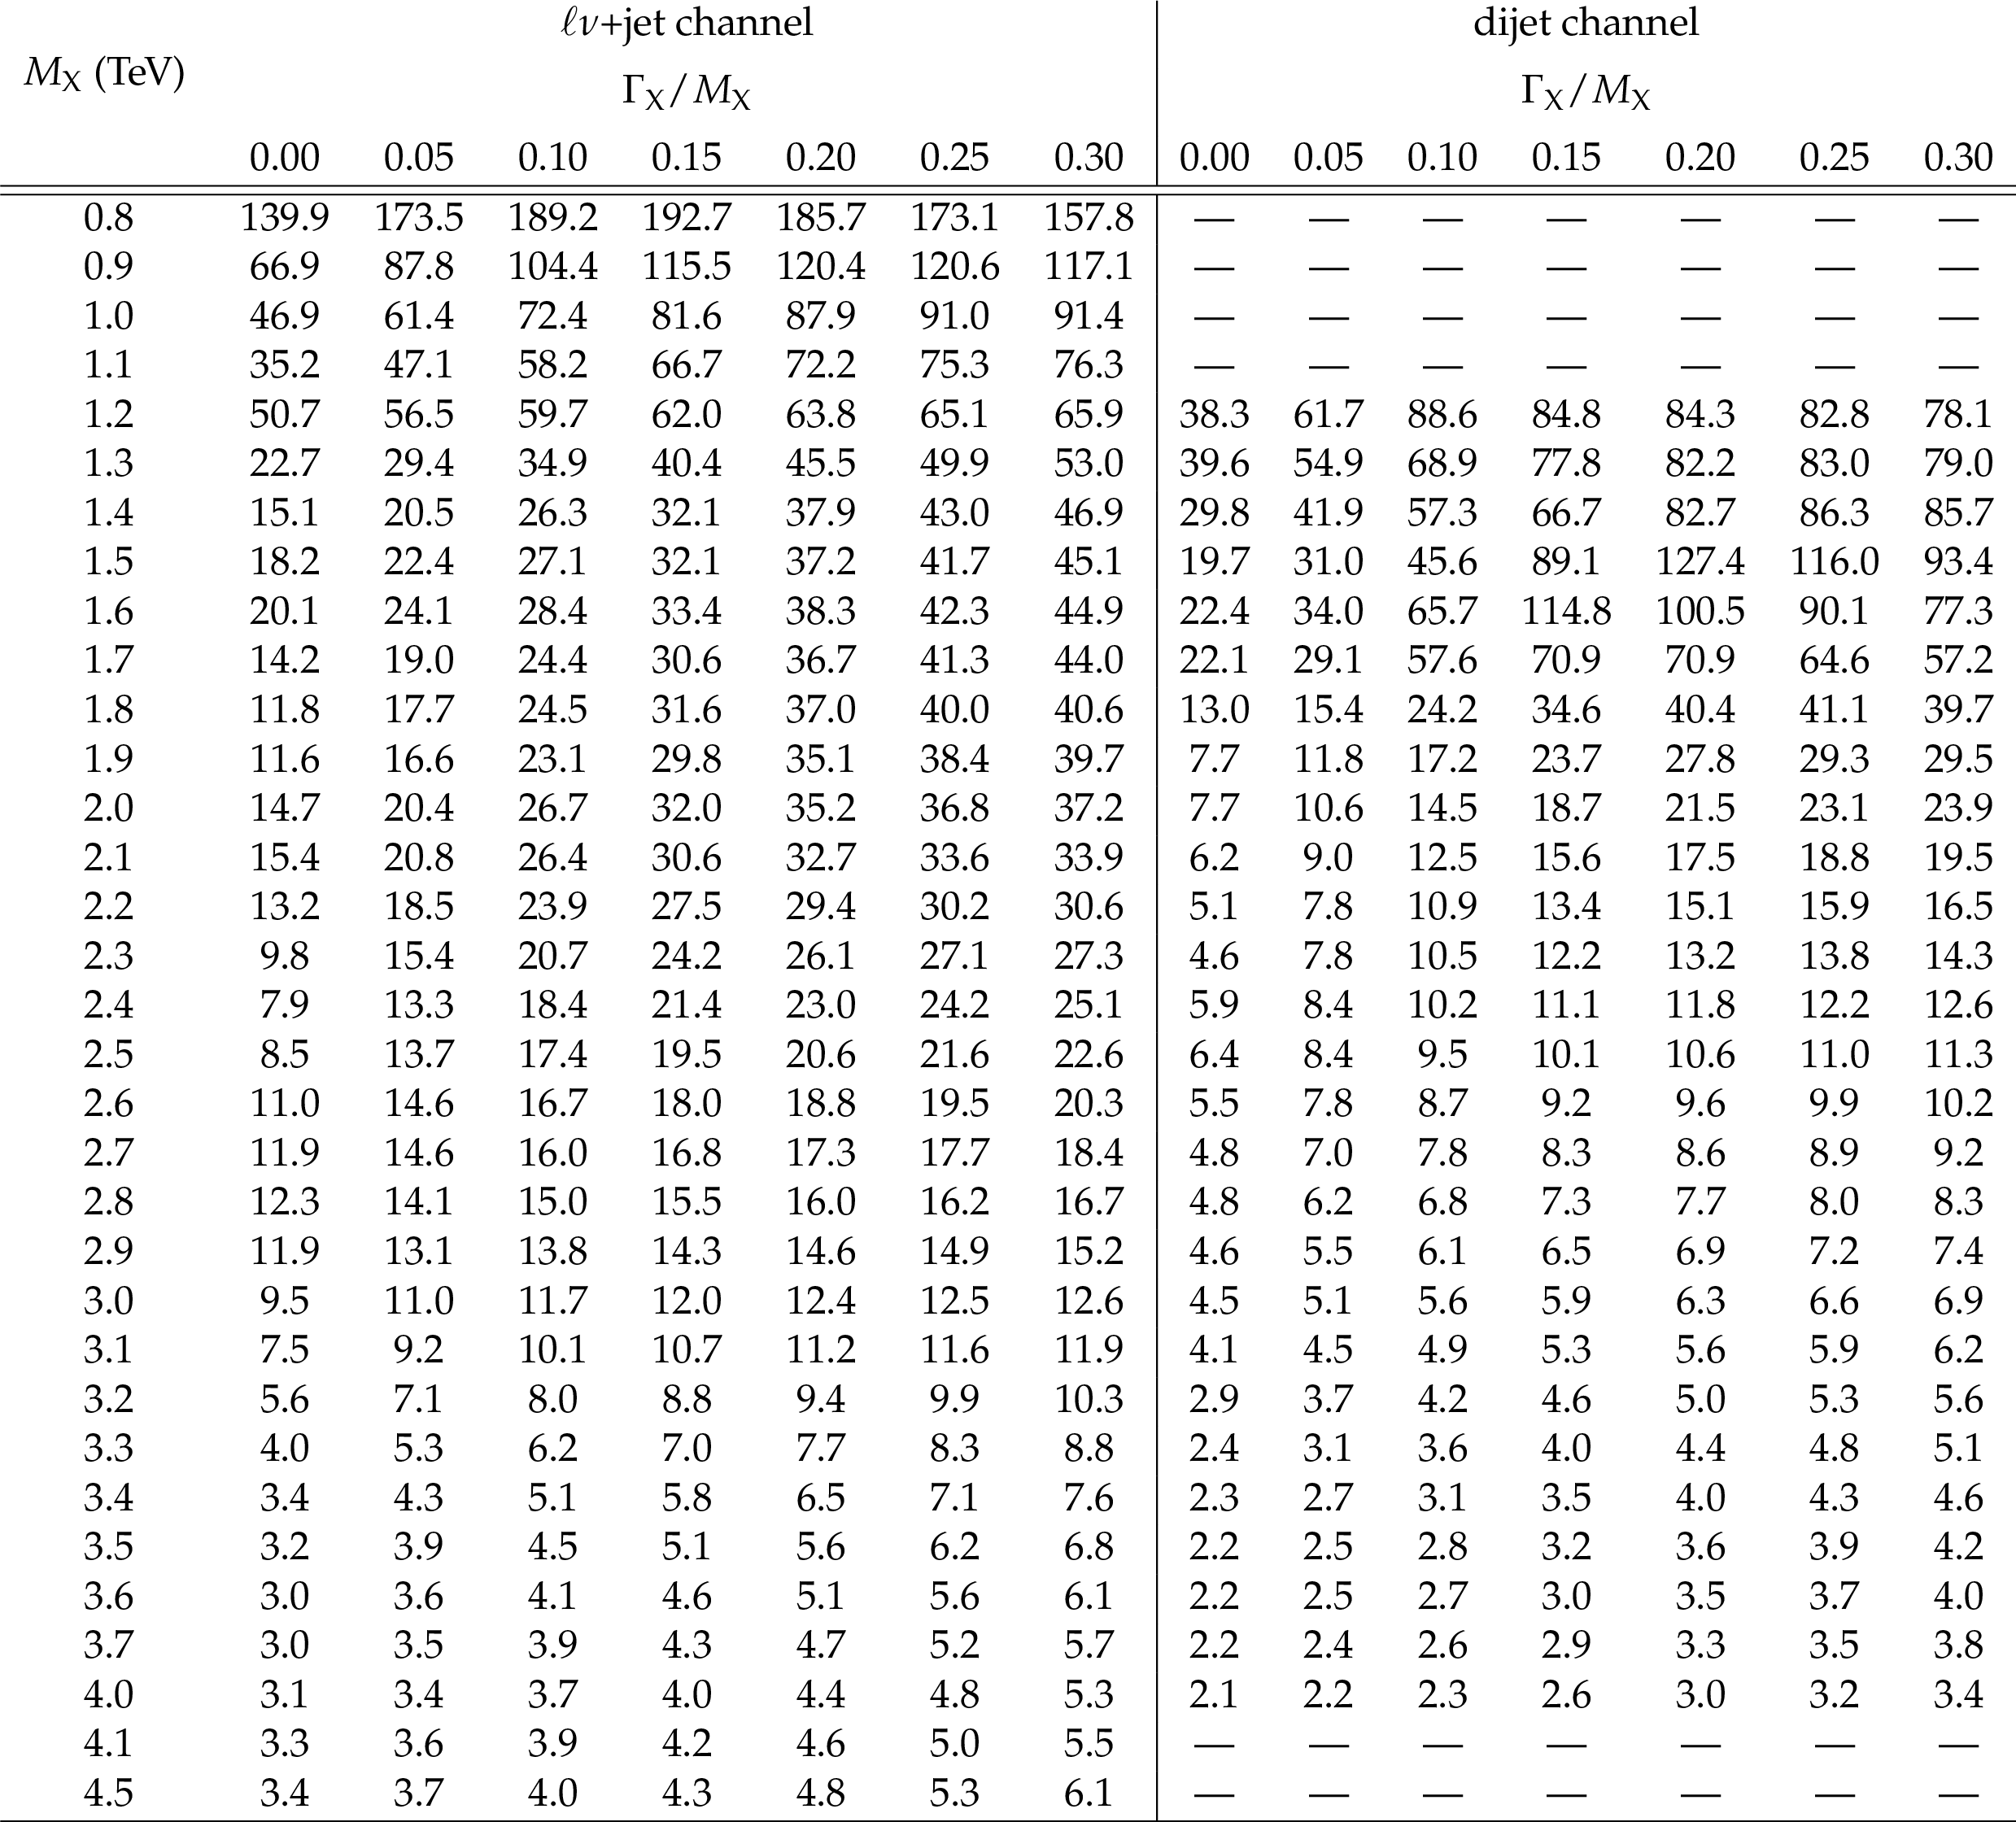
Table 14:
Simplified limits on the number of visible events from generic resonances decaying to pairs of V bosons in the ${\ell \nu }$+jet (left) and dijet (right) channels as a function of resonance mass, $M_\mathrm {X}$, and normalized width, $\Gamma _\mathrm {X}/M_\mathrm {X}$. Shown are limits on the visible number of events at 95% CL using the asymptotic $\mathrm {CL_S}$ approach. Results with $\Gamma _\mathrm {X}/M_\mathrm {X}=$ 0 are obtained using the resolution function only. |
| Summary |
| A search has been presented for new resonances decaying to WW, ZZ, or WZ boson pairs in which at least one of the bosons decays into quarks. The final states involve dijet and ${\ell \nu}$+jet events with $\ell=\mu $ or e. The results include the $\mathrm{ W }\to\tau\nu$ contribution with subsequent decay $\tau\to\ell\nu\bar{\nu}$. The W and Z bosons that decay to quarks are selected by requiring a jet with mass compatible with the W or Z boson mass, respectively. Additional information from jet substructure is used to suppress background from W+jets and multijet processes. No evidence for a signal is found. In particular, the excesses at a resonance mass of 2 TeV observed in previous searches are not confirmed. The result is interpreted as an upper limit on the production cross section of a narrow-width resonance as a function its mass, in the context of the bulk graviton model (with decays to WW or ZZ), heavy vector-triplet Models A and B, and W' and Z' singlet models. The upper limits are based on the statistical combination of the two channels. For the heavy vector-triplet, we exclude W' and Z' resonances with respective masses <2.0 and <1.6 TeV for Model A, <2.2 and <1.7 TeV for Model B. Under the triplet hypothesis, spin-1 resonances with masses below 2.3 and 2.4 TeV are excluded for heavy vector-triplet Model A and B, respectively. In the narrow-width bulk graviton model, cross sections are excluded in the range of 3-1200 fb. This is the first search for a narrow-width bulk graviton with $\tilde{k} = $ 0.5 at $\sqrt{s} =$ 13 TeV. Tabulated efficiencies for the reconstruction of the vector bosons within the kinematic acceptance of the analysis are also provided, allowing for a reintepretation of the exclusion limits in a generic phenomenological model. |
| References | ||||
| 1 | K. Agashe, H. Davoudiasl, G. Perez, and A. Soni | Warped gravitons at the LHC and beyond | PRD 76 (2007) 036006 | hep-ph/0701186 |
| 2 | A. L. Fitzpatrick, J. Kaplan, L. Randall, and L.-T. Wang | Searching for the Kaluza-Klein graviton in bulk RS models | JHEP 09 (2007) 013 | hep-ph/0701150 |
| 3 | O. Antipin, D. Atwood, and A. Soni | Search for RS gravitons via $ \mathrm{ W }_L\mathrm{ W }_L $ decays | PLB 666 (2008) 155 | 0711.3175 |
| 4 | L. Randall and R. Sundrum | A Large Mass Hierarchy from a Small Extra Dimension | PRL 83 (1999) 3370 | hep-ph/9905221 |
| 5 | L. Randall and R. Sundrum | An Alternative to Compactification | PRL 83 (1999) 4690 | hep-th/9906064 |
| 6 | D. Pappadopulo, A. Thamm, R. Torre, and A. Wulzer | Heavy vector triplets: bridging theory and data | JHEP 09 (2014) 060 | 1402.4431 |
| 7 | G. Altarelli, B. Mele, and M. Ruiz-Altaba | Searching for new heavy vector bosons in $ \rm p\bar{p} $ colliders | Z. Phys. C 45 (1989) 109 | |
| 8 | ATLAS Collaboration | Search for new resonances decaying to a W or Z boson and a Higgs boson in the $ \ell^+\ell^-\mathrm{ b \bar{b} } $, $ \ell\nu\mathrm{ b \bar{b} } $, and $ \nu\bar{\nu}\mathrm{ b \bar{b} } $ channels with $ pp $ collisions at $ \sqrt{s} = 13 $ TeV with the ATLAS detector | PLB 765 (2017) 32 | 1607.05621 |
| 9 | ATLAS Collaboration | Searches for heavy diboson resonances in pp collisions at $ \sqrt{s}=13 $ TeV with the ATLAS detector | JHEP 09 (2016) 173 | 1606.04833 |
| 10 | CMS Collaboration | Search for new resonances decaying via WZ to leptons in proton-proton collisions at $ \sqrt s = $ 8 TeV | PLB 740 (2015) 83 | CMS-EXO-12-025 1407.3476 |
| 11 | CMS Collaboration | Search for massive resonances decaying into pairs of boosted bosons in semi-leptonic final states at $ \sqrt{s} = $ 8 TeV | JHEP 08 (2014) 174 | CMS-EXO-13-009 1405.3447 |
| 12 | CMS Collaboration | Search for massive resonances in dijet systems containing jets tagged as W or Z boson decays in $ pp $ collisions at $ \sqrt{s} $ = 8 TeV | JHEP 08 (2014) 173 | CMS-EXO-12-024 1405.1994 |
| 13 | CMS Collaboration | Search for massive WH resonances decaying into the $ \ell \nu \mathrm{b} \overline{\mathrm{b}} $ final state at $ \sqrt{s}=8 $ $ \text {TeV} $ | EPJC 76 (2016) 237 | CMS-EXO-14-010 1601.06431 |
| 14 | CMS Collaboration | Search for a massive resonance decaying into a Higgs boson and a W or Z boson in hadronic final states in proton-proton collisions at $ \sqrt{s}=8 $ TeV | JHEP 02 (2016) 145 | CMS-EXO-14-009 1506.01443 |
| 15 | CMS Collaboration | Search for narrow high-mass resonances in proton-proton collisions at $ \sqrt{s} $ = 8 TeV decaying to a Z and a Higgs boson | PLB 748 (2015) 255 | CMS-EXO-13-007 1502.04994 |
| 16 | ATLAS Collaboration | Search for high-mass diboson resonances with boson-tagged jets in proton-proton collisions at $ \sqrt{s}=8 $ TeV with the ATLAS detector | JHEP 12 (2015) 055 | 1506.00962 |
| 17 | ATLAS Collaboration | Search for production of WW/WZ resonances decaying to a lepton, neutrino and jets in $ pp $ collisions at $ \sqrt{s}=8 $ TeV with the ATLAS detector | EPJC 75 (2015) 209, , [Erratum: \DOI10.1140/epjc/s10052-015-3593-4] | 1503.04677 |
| 18 | ATLAS Collaboration | Search for WZ resonances in the fully leptonic channel using $ pp $ collisions at $ \sqrt{s} $ = 8 TeV with the ATLAS detector | PLB 737 (2014) 223 | 1406.4456 |
| 19 | ATLAS Collaboration | Search for a new resonance decaying to a W or Z boson and a Higgs boson in the $ \ell\ell / \ell\nu / \nu\nu + \mathrm{ b \bar{b} } $ final states with the ATLAS detector | EPJC 75 (2015) 263 | 1503.08089 |
| 20 | CMS Collaboration | V Tagging Observables and Correlations | CMS-PAS-JME-14-002 | CMS-PAS-JME-14-002 |
| 21 | CMS Collaboration | Identification techniques for highly boosted W bosons that decay into hadrons | JHEP 12 (2014) 017 | CMS-JME-13-006 1410.4227 |
| 22 | CMS Collaboration | Particle-flow event reconstruction in CMS and performance for jets, taus, and MET | CDS | |
| 23 | CMS Collaboration | Commissioning of the particle-flow event reconstruction with the first LHC collisions recorded in the CMS detector | CDS | |
| 24 | CMS Collaboration | The CMS experiment at the CERN LHC | JINST 3 (2008) S08004 | CMS-00-001 |
| 25 | J. Alwall et al. | The automated computation of tree-level and next-to-leading order differential cross sections, and their matching to parton shower simulations | JHEP 07 (2014) 079 | 1405.0301 |
| 26 | P. Nason | A new method for combining NLO QCD with shower Monte Carlo algorithms | JHEP 11 (2004) 040 | hep-ph/0409146 |
| 27 | S. Frixione, P. Nason, and C. Oleari | Matching NLO QCD computations with Parton Shower simulations: the POWHEG method | JHEP 11 (2007) 070 | 0709.2092 |
| 28 | S. Alioli, P. Nason, C. Oleari, and E. Re | A general framework for implementing NLO calculations in shower Monte Carlo programs: the POWHEG BOX | JHEP 06 (2010) 043 | 1002.2581 |
| 29 | S. Alioli, P. Nason, C. Oleari, and E. Re | NLO single-top production matched with shower in POWHEG: $ s $- and $ t $-channel contributions | JHEP 09 (2009) 111, , [Erratum: \DOI10.1007/JHEP02(2010)011] | 0907.4076 |
| 30 | E. Re | Single-top Wt-channel production matched with parton showers using the POWHEG method | EPJC 71 (2011) 1547 | 1009.2450 |
| 31 | S. Alioli, S.-O. Moch, and P. Uwer | Hadronic top-quark pair-production with one jet and parton showering | JHEP 01 (2012) 137 | 1110.5251 |
| 32 | T. Sj\"ostrand, S. Mrenna, and P. Z. Skands | PYTHIA 6.4 physics and manual | JHEP 05 (2006) 026 | hep-ph/0603175 |
| 33 | T. Sj\"ostrand, S. Mrenna, and P. Z. Skands | A brief introduction to PYTHIA 8.1 | CPC 178 (2008) 852 | 0710.3820 |
| 34 | P. Skands, S. Carrazza, and J. Rojo | Tuning PYTHIA 8.1: the Monash 2013 tune | EPJC 74 (2014) 3024 | 1404.5630 |
| 35 | CMS Collaboration | Event generator tunes obtained from underlying event and multiparton scattering measurements | EPJC 76 (2016) 155 | CMS-GEN-14-001 1512.00815 |
| 36 | R. D. Ball et al. | Impact of heavy quark masses on parton distributions and LHC phenomenology | Nucl. Phys. B 849 (2011) 296 | 1101.1300 |
| 37 | GEANT4 Collaboration | GEANT4---a simulation toolkit | NIMA 506 (2003) 250 | |
| 38 | J. M. Campbell, R. K. Ellis, and D. L. Rainwater | Next-to-leading order QCD predictions for $ W $ + 2 jet and $ Z $ + 2 jet production at the CERN LHC | PRD 68 (2003) 094021 | hep-ph/0308195 |
| 39 | J. M. Campbell, R. K. Ellis, and C. Williams | Vector boson pair production at the LHC | JHEP 07 (2011) 018 | 1105.0020 |
| 40 | J. M. Campbell and R. K. Ellis | Top-quark processes at NLO in production and decay | JPG 42 (2015) 015005 | 1204.1513 |
| 41 | J. M. Campbell, R. K. Ellis, and F. Tramontano | Single top production and decay at next-to-leading order | PRD 70 (2004) 094012 | hep-ph/0408158 |
| 42 | Y. Li and F. Petriello | Combining QCD and electroweak corrections to dilepton production in FEWZ | PRD 86 (2012) 094034 | 1208.5967 |
| 43 | CMS Collaboration | Measurements of inclusive W and Z cross sections in pp collisions at $ \sqrt{s}=7 $ TeV | JHEP 01 (2011) 080 | CMS-EWK-10-002 1012.2466 |
| 44 | CMS Collaboration | Identification of b quark jets at the CMS Experiment in the LHC Run 2 | CMS-PAS-BTV-15-001 | CMS-PAS-BTV-15-001 |
| 45 | CMS Collaboration | CMS Luminosity Measurement for the 2015 Data Taking Period | CMS-PAS-LUM-15-001 | CMS-PAS-LUM-15-001 |
| 46 | CMS Collaboration | Description and performance of track and primary-vertex reconstruction with the CMS tracker | JINST 9 (2014) P10009 | CMS-TRK-11-001 1405.6569 |
| 47 | M. Cacciari, G. P. Salam, and G. Soyez | FastJet user manual | EPJC 72 (2012) 1896 | 1111.6097 |
| 48 | M. Cacciari, G. P. Salam, and G. Soyez | The anti-$ k_t $ jet clustering algorithm | JHEP 04 (2008) 063 | 0802.1189 |
| 49 | CMS Collaboration | Identification of b-quark jets with the CMS experiment | JINST 8 (2013) P04013 | CMS-BTV-12-001 1211.4462 |
| 50 | CMS Collaboration | Determination of Jet Energy Calibration and Transverse Momentum Resolution in CMS | JINST 6 (2011) P11002 | CMS-JME-10-011 1107.4277 |
| 51 | CMS Collaboration | Performance of CMS muon reconstruction in pp collision events at $ \sqrt{s}=7 $ TeV | JINST 7 (2012) P10002 | CMS-MUO-10-004 1206.4071 |
| 52 | CMS Collaboration | Performance of electron reconstruction and selection with the CMS detector in proton-proton collisions at $ \sqrt{s}=8 $ TeV | JINST 10 (2015) P06005 | CMS-EGM-13-001 1502.02701 |
| 53 | CMS Collaboration | Search for leptonic decays of W' bosons in pp collisions at $ \sqrt{s}=7 $ TeV | JHEP 08 (2012) 023 | CMS-EXO-11-024 1204.4764 |
| 54 | CMS Collaboration | Missing transverse energy performance of the CMS detector | JINST 6 (2011) P09001 | CMS-JME-10-009 1106.5048 |
| 55 | CMS Collaboration | Performance of the CMS missing transverse momentum reconstruction in pp data at $ \sqrt{s} $ = 8 TeV | JINST 10 (2015) P02006 | CMS-JME-13-003 1411.0511 |
| 56 | CMS Collaboration | Studies of jet mass in dijet and W/Z + jet events | JHEP 05 (2013) 090 | CMS-SMP-12-019 1303.4811 |
| 57 | S. D. Ellis, C. K. Vermilion, and J. R. Walsh | Techniques for improved heavy particle searches with jet substructure | PRD 80 (2009) 051501 | 0903.5081 |
| 58 | S. D. Ellis, C. K. Vermilion, and J. R. Walsh | Recombination Algorithms and Jet Substructure: Pruning as a Tool for Heavy Particle Searches | PRD 81 (2010) 094023 | 0912.0033 |
| 59 | D. Krohn, J. Thaler, and L.-T. Wang | Jet Trimming | JHEP 02 (2010) 084 | 0912.1342 |
| 60 | S. Catani, Y. L. Dokshitzer, M. H. Seymour, and B. R. Webber | Longitudinally invariant $ k_t $ clustering algorithms for hadron hadron collisions | Nucl. Phys. B 406 (1993) 187 | |
| 61 | Y. L. Dokshitzer, G. D. Leder, S. Moretti, and B. R. Webber | Better jet clustering algorithms | JHEP 08 (1997) 001 | hep-ph/9707323 |
| 62 | J. Thaler and K. Van Tilburg | Identifying boosted objects with N-subjettiness | JHEP 03 (2011) 015 | 1011.2268 |
| 63 | S. D. Ellis and D. E. Soper | Successive combination jet algorithm for hadron collisions | PRD 48 (1993) 3160 | hep-ph/9305266 |
| 64 | M. B\"ahr et al. | Herwig++ physics and manual | EPJC 58 (2008) 639 | 0803.0883 |
| 65 | Particle Data Group Collaboration | Review of Particle Physics | CPC 38 (2014) 090001 | |
| 66 | CMS Collaboration | Search for heavy resonances decaying into a vector boson and a Higgs boson in final states with charged leptons, neutrinos, and b quarks | Submitted to PLB | CMS-B2G-16-003 1610.08066 |
| 67 | M. J. Oreglia | PhD thesis, Stanford University, 1980 SLAC Report SLAC-R-236 | ||
| 68 | M. Cacciari et al. | The $ \mathrm{ t \bar{t} } $ cross-section at 1.8 TeV and 1.96 TeV: a study of the systematics due to parton densities and scale dependence | JHEP 04 (2004) 068 | hep-ph/0303085 |
| 69 | S. Catani, D. de Florian, M. Grazzini, and P. Nason | Soft gluon resummation for Higgs boson production at hadron colliders | JHEP 07 (2003) 028 | hep-ph/0306211 |
| 70 | G. Cowan, K. Cranmer, E. Gross, and O. Vitells | Asymptotic formulae for likelihood-based tests of new physics | EPJC 71 (2011) 1554, , [Erratum: \DOI10.1140/epjc/s10052-013-2501-z] | 1007.1727 |
| 71 | A. L. Read | Presentation of search results: The $ {CL_S} $ technique | JPG 28 (2002) 2693 | |
| 72 | T. Junk | Confidence level computation for combining searches with small statistics | NIMA 434 (1999) 435 | hep-ex/9902006 |
| 73 | ATLAS and CMS Collaborations | Combined Measurement of the Higgs Boson Mass in pp Collisions at $ \sqrt{s}=7 $ and 8 TeV with the ATLAS and CMS Experiments | PRL 114 (2015) 191803 | 1503.07589 |
|
|
Compact Muon Solenoid LHC, CERN |
|

|

|

|

|

|