

Compact Muon Solenoid
LHC, CERN
| CMS-SMP-17-001 ; CERN-EP-2018-320 | ||
| Measurement of the differential Drell-Yan cross section in proton-proton collisions at $\sqrt{s} = $ 13 TeV | ||
| CMS Collaboration | ||
| 27 December 2018 | ||
| JHEP 12 (2019) 059 | ||
| Abstract: Measurements of the differential cross section for the Drell-Yan process, based on proton-proton collision data at a centre-of-mass energy of 13 TeV, collected by the CMS experiment, are presented. The data correspond to an integrated luminosity of 2.8 (2.3) fb$^{-1}$ in the dimuon (dielectron) channel. The total and fiducial cross section measurements are presented as a function of dilepton invariant mass in the range 15 to 3000 GeV, and compared with the perturbative predictions of the standard model. The measured differential cross sections are in good agreement with the theoretical calculations. | ||
| Links: e-print arXiv:1812.10529 [hep-ex] (PDF) ; CDS record ; inSPIRE record ; HepData record ; CADI line (restricted) ; | ||
| Figures | |
png pdf |
Figure 1:
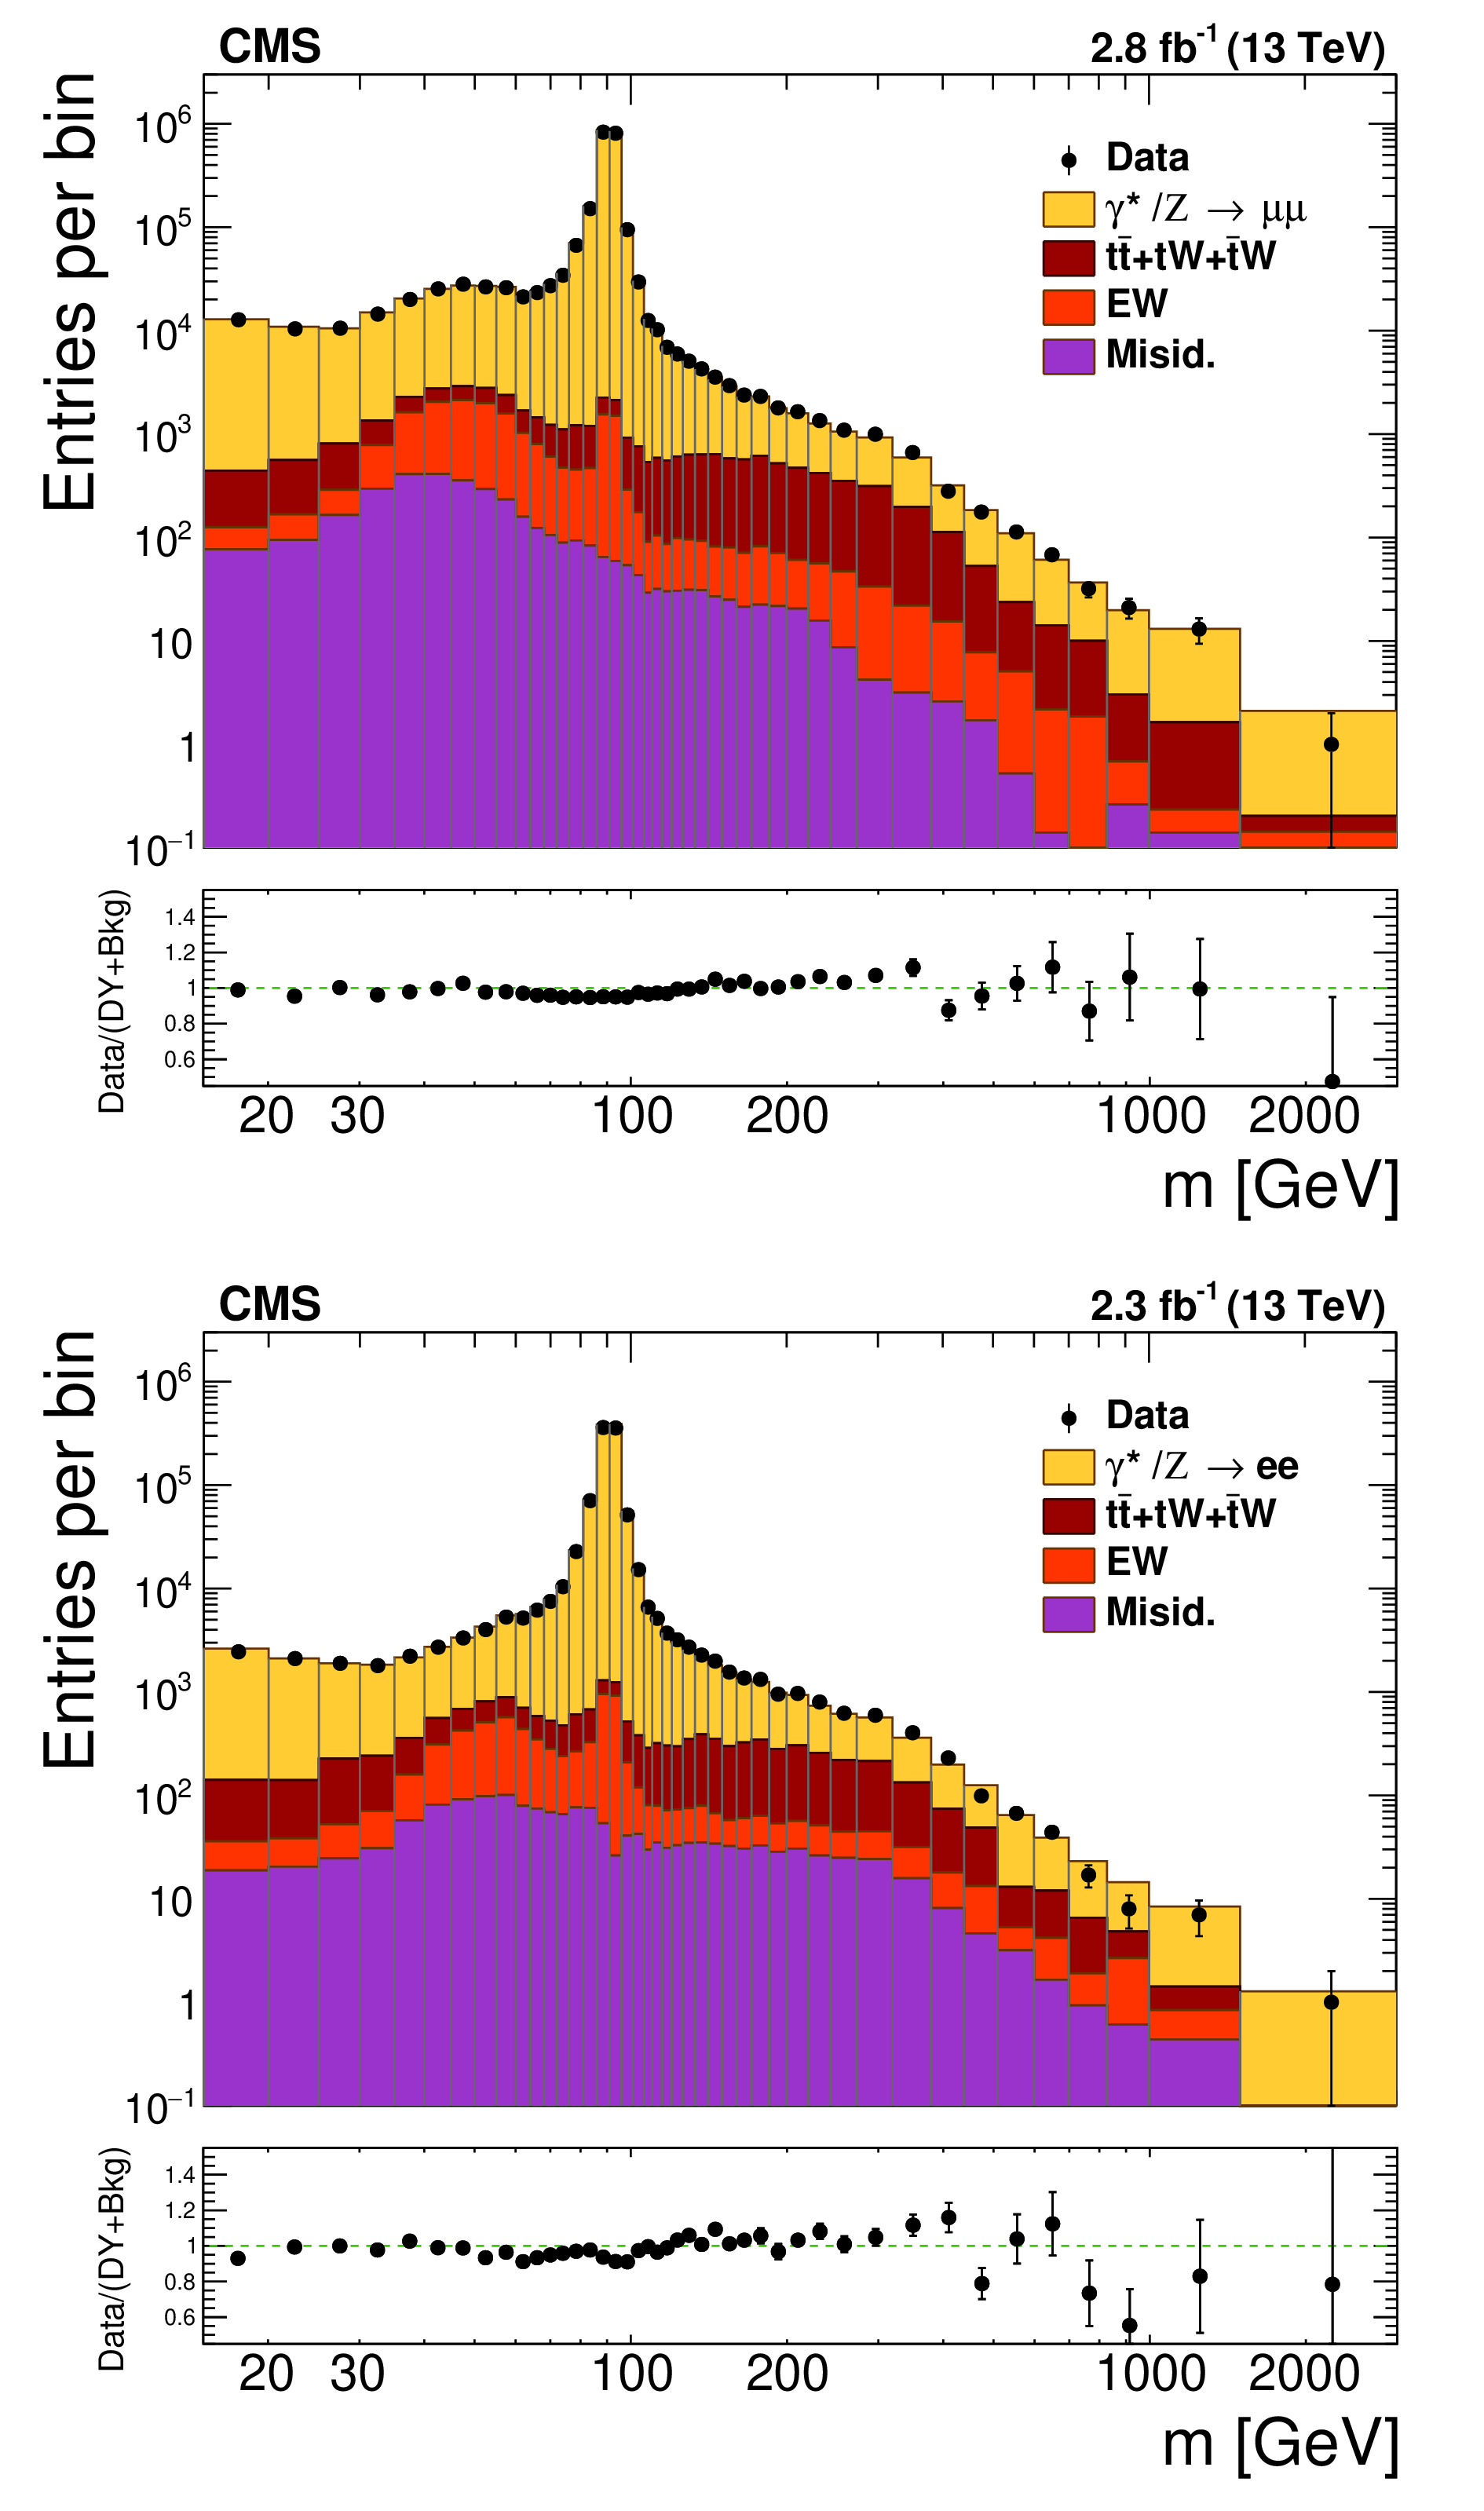
The observed dimuon (top) and dielectron (bottom) invariant mass spectra within the detector acceptance. The "EW'' label indicates the contributions from the DY production of $\tau ^+\tau ^-$, WW, WZ, and ZZ processes. The "Misid.'' label corresponds W+jets and QCD multijet backgrounds. Each MC process is normalised using the most accurate theoretical cross section value available. The error bars on the data points represent the statistical uncertainty only. |
png pdf |
Figure 1-a:
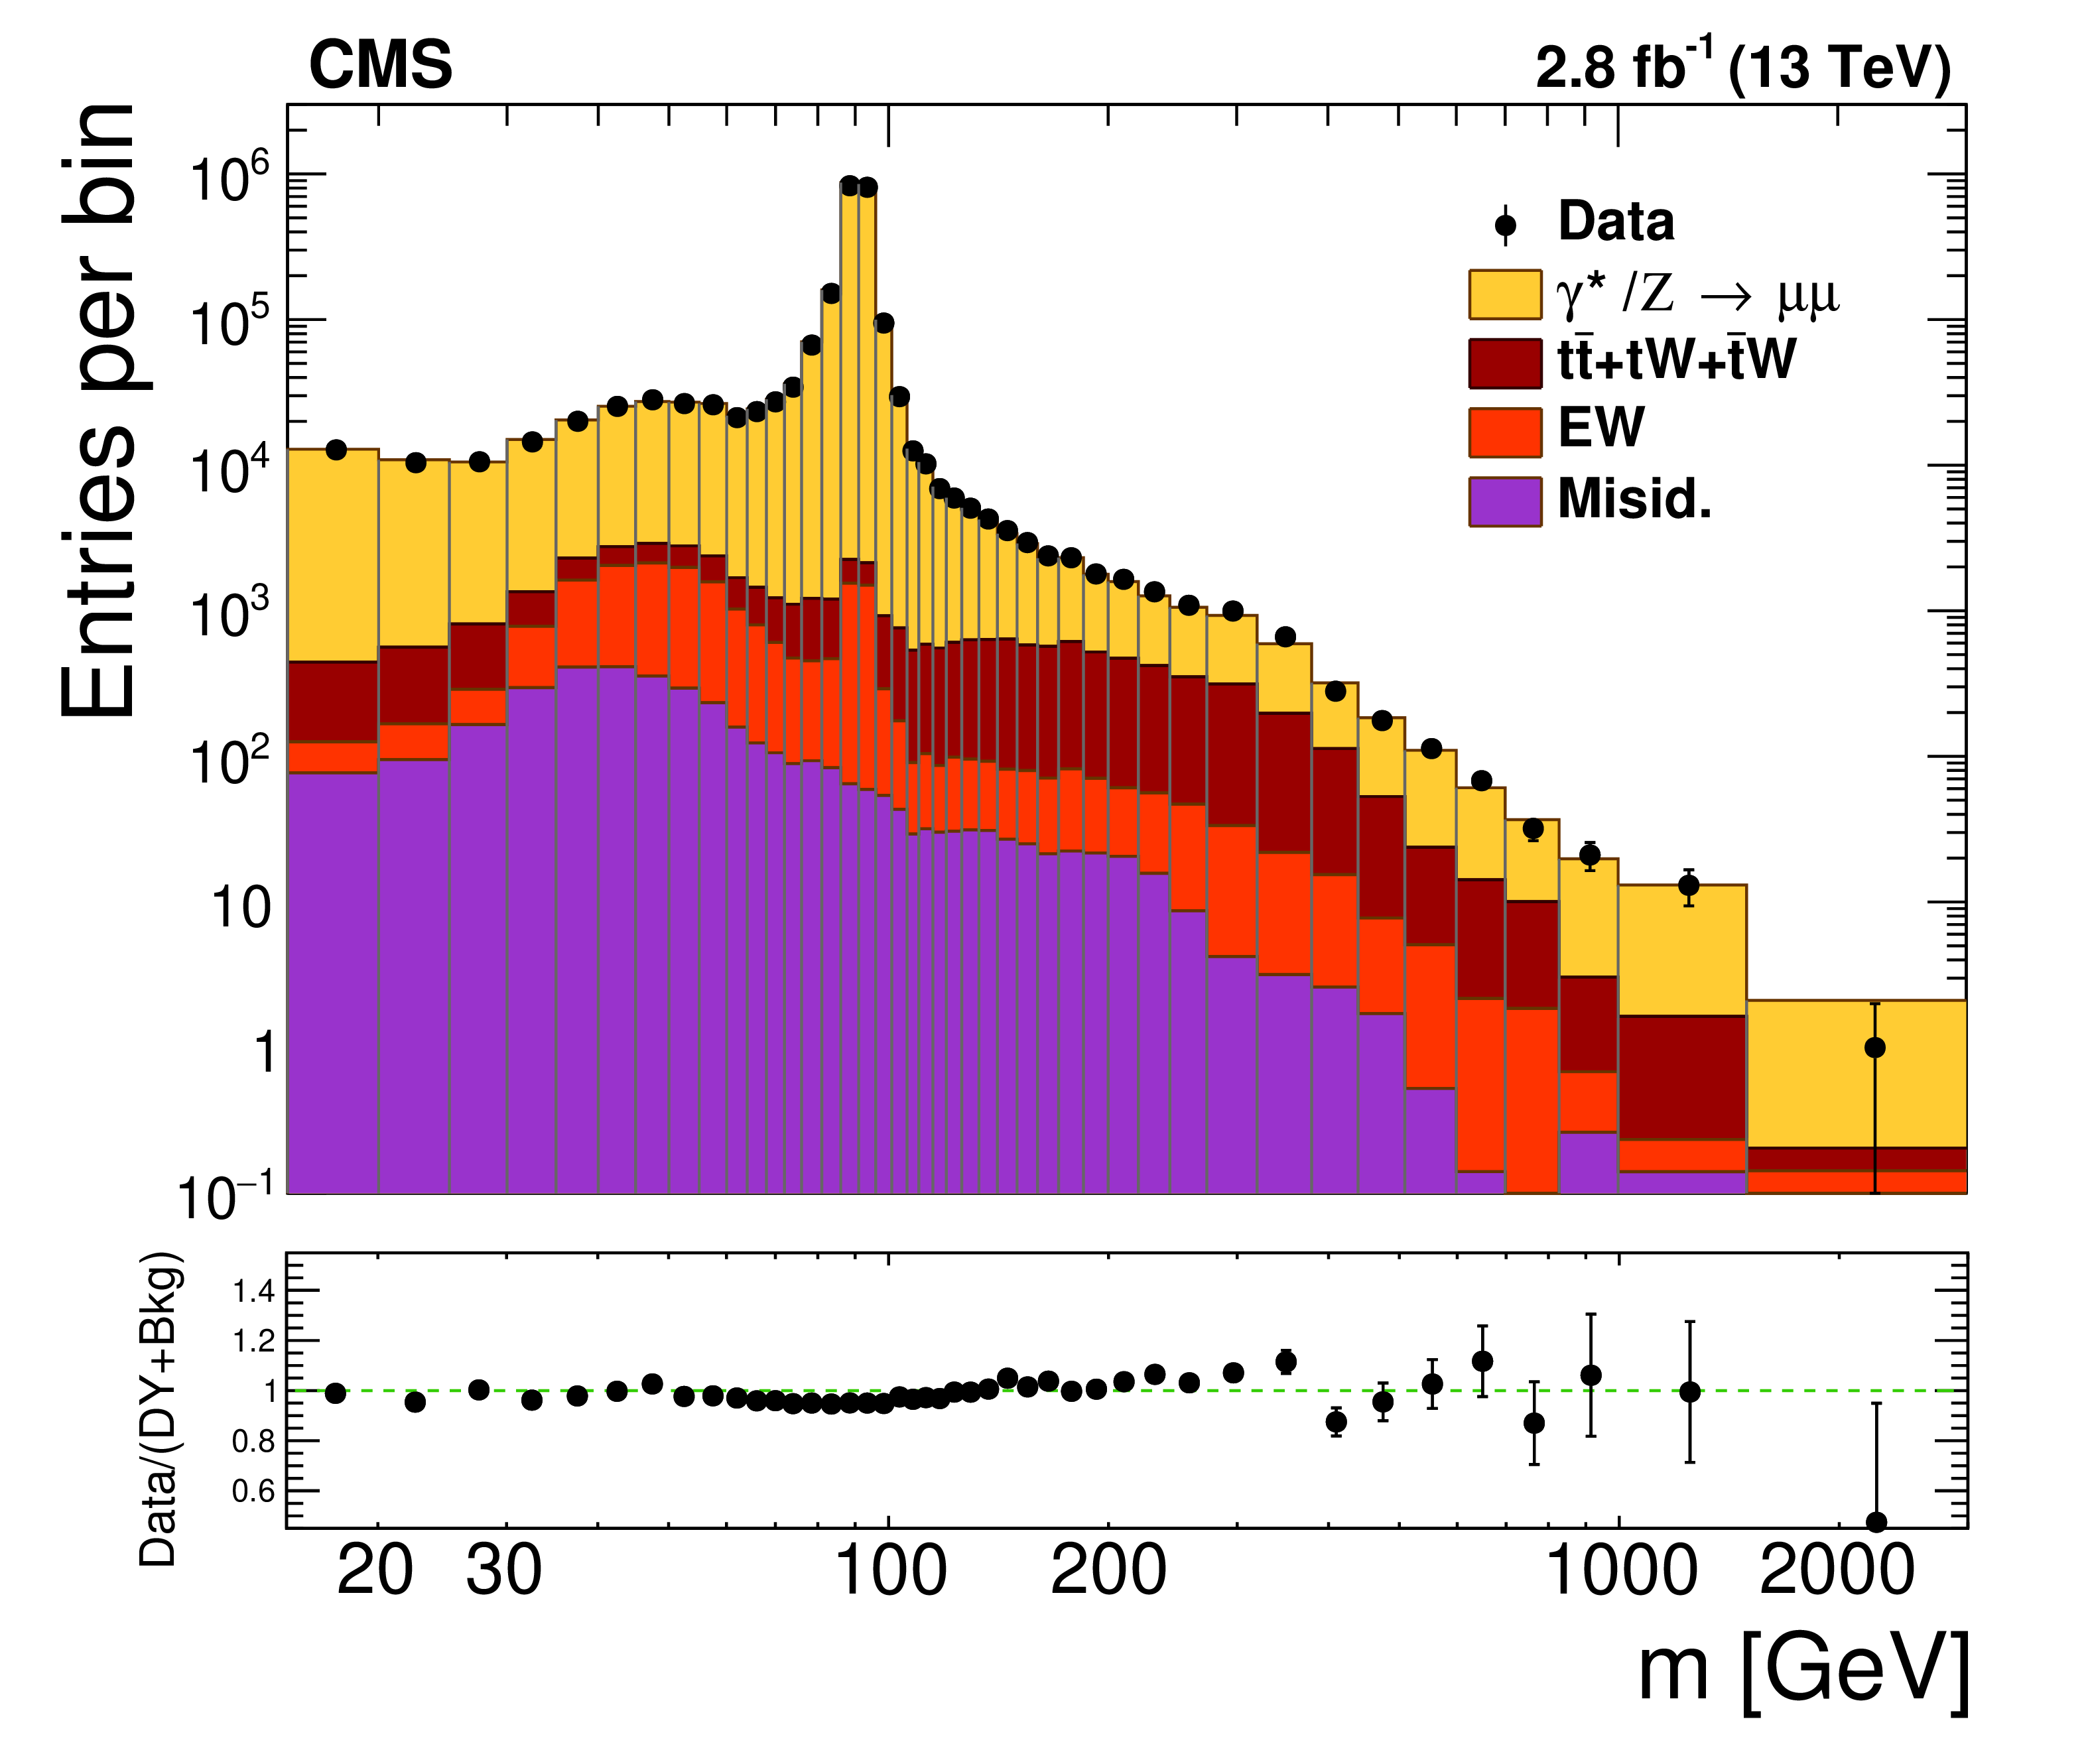
The observed dimuon invariant mass spectrum within the detector acceptance. The "EW'' label indicates the contributions from the DY production of $\tau ^+\tau ^-$, WW, WZ, and ZZ processes. The "Misid.'' label corresponds W+jets and QCD multijet backgrounds. Each MC process is normalised using the most accurate theoretical cross section value available. The error bars on the data points represent the statistical uncertainty only. |

png pdf |
Figure 1-b:
The observed dielectron invariant mass spectrum within the detector acceptance. The "EW'' label indicates the contributions from the DY production of $\tau ^+\tau ^-$, WW, WZ, and ZZ processes. The "Misid.'' label corresponds W+jets and QCD multijet backgrounds. Each MC process is normalised using the most accurate theoretical cross section value available. The error bars on the data points represent the statistical uncertainty only. |
png pdf |
Figure 2:
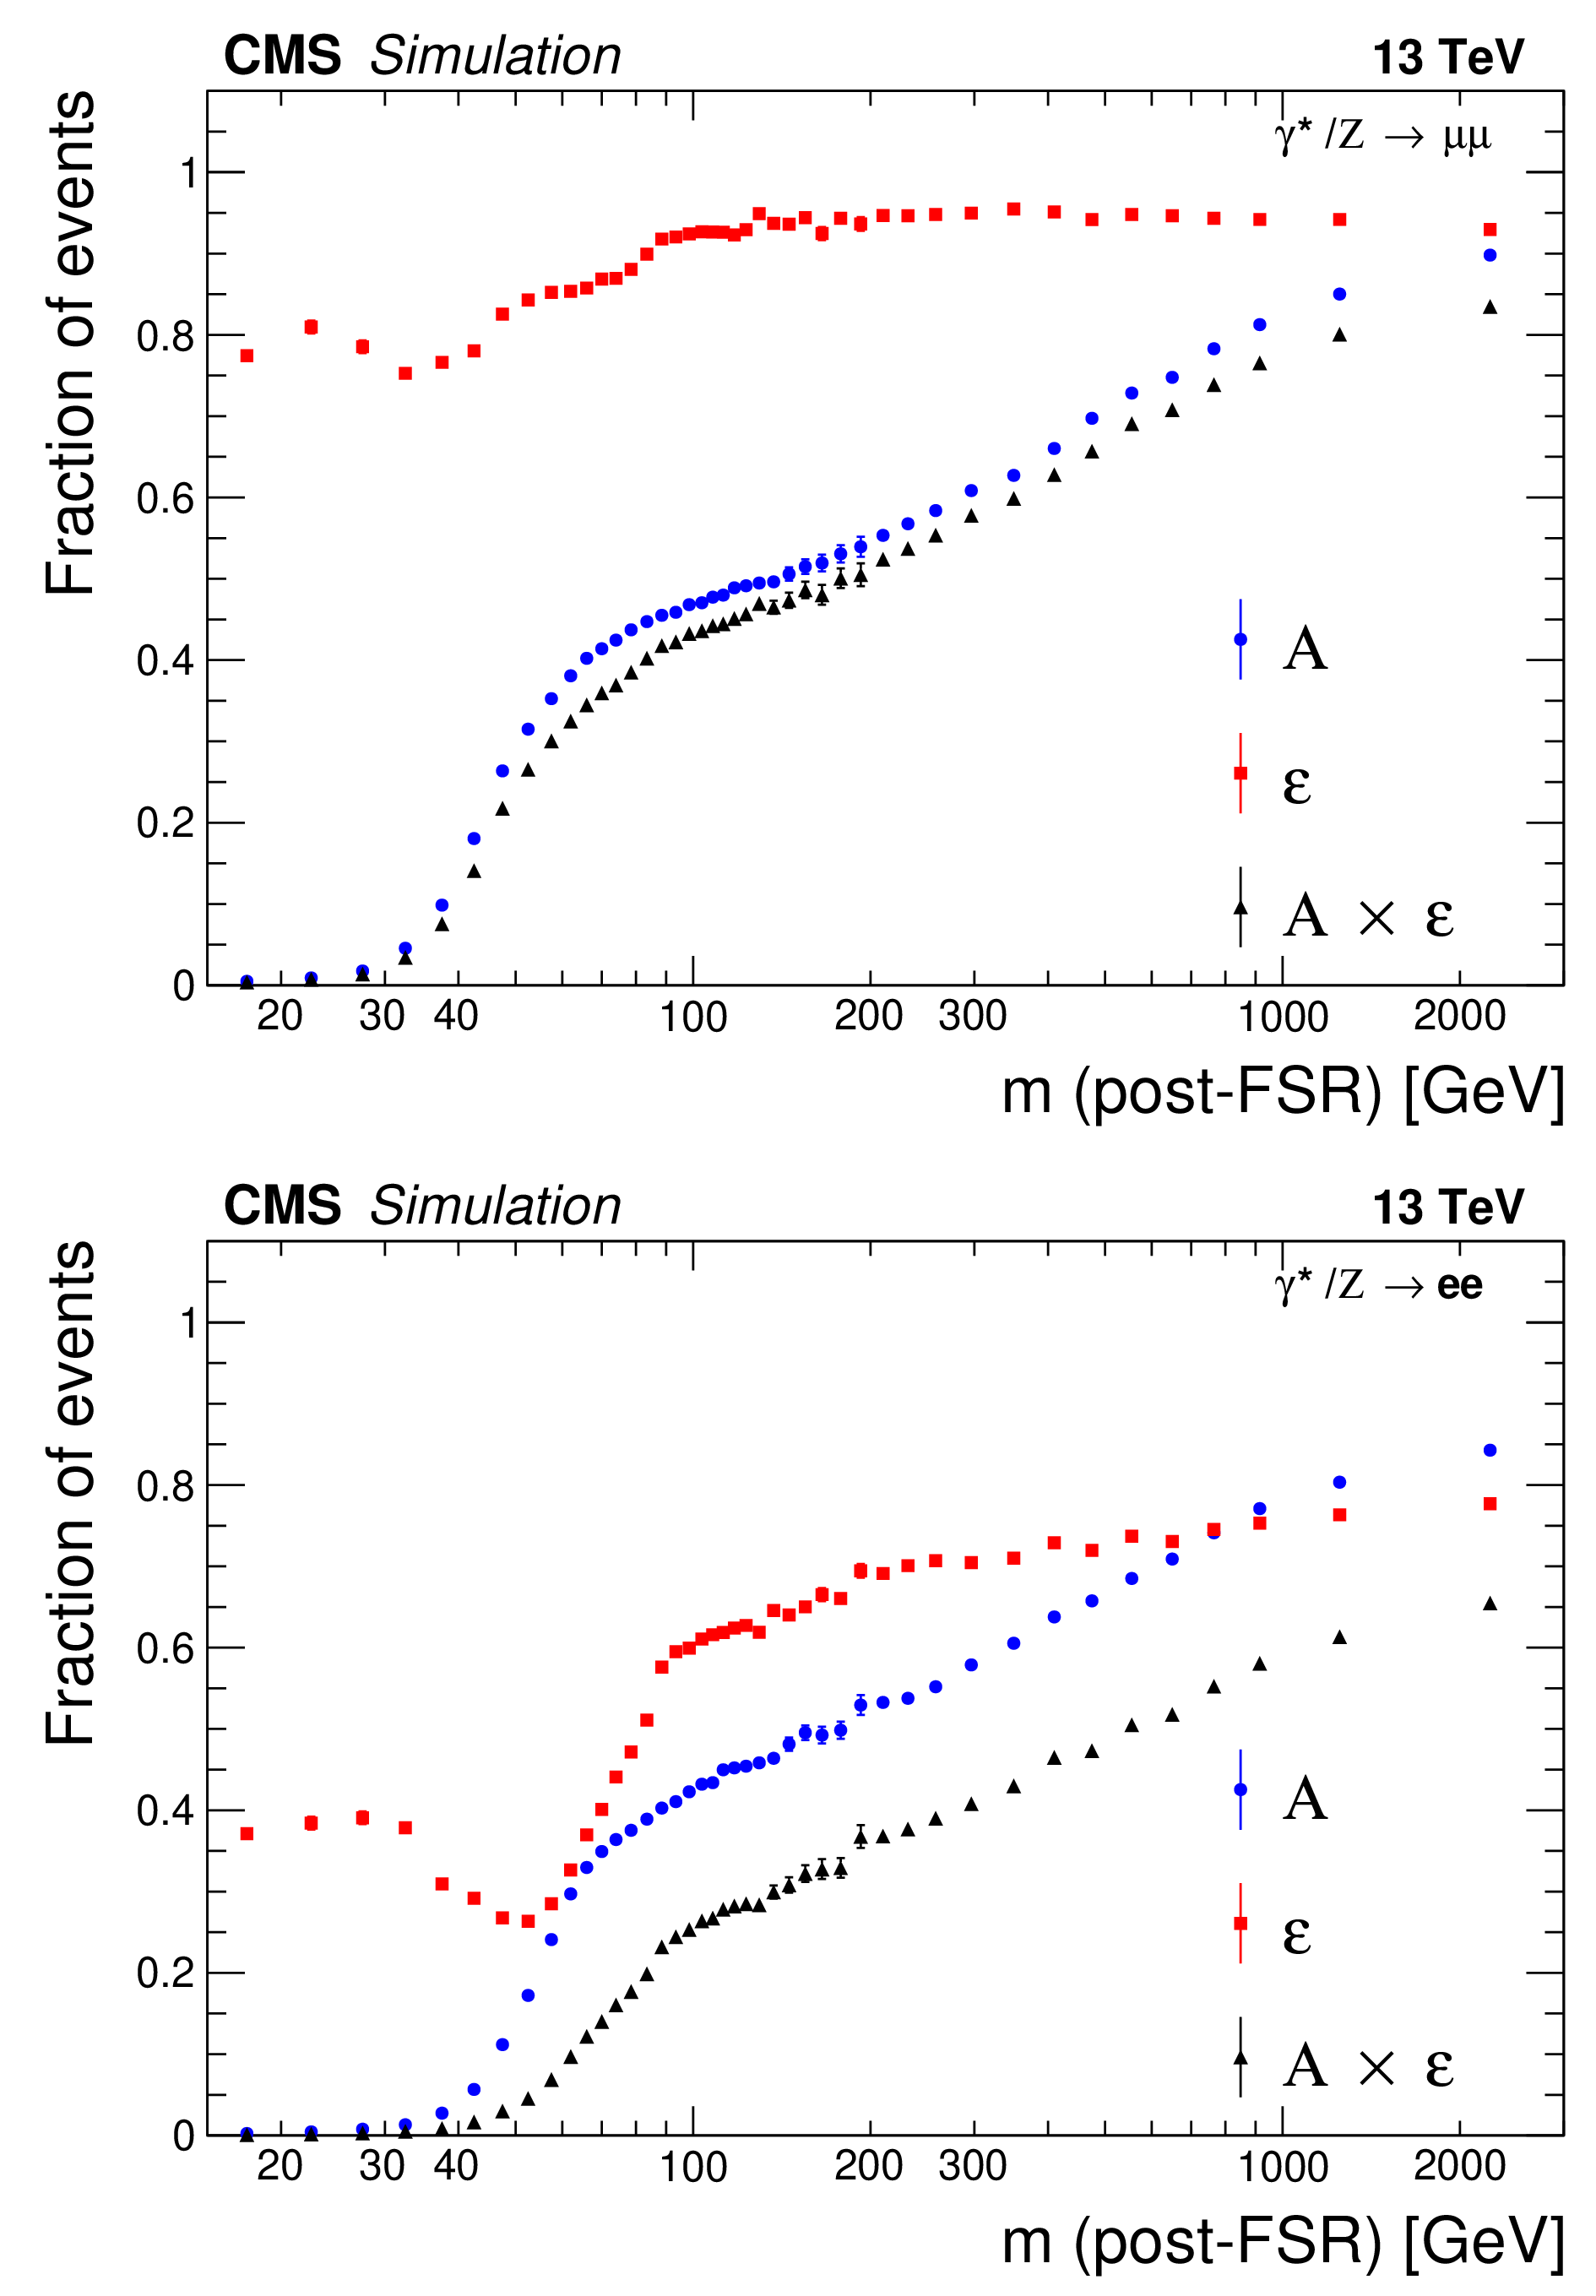
The signal acceptance (A), efficiency ($\varepsilon $) and their product for each invariant mass bin in the dimuon (top) and dielectron (bottom) channels, calculated from simulation. The error bars on the data points represent the statistical uncertainty only. |
png pdf |
Figure 2-a:
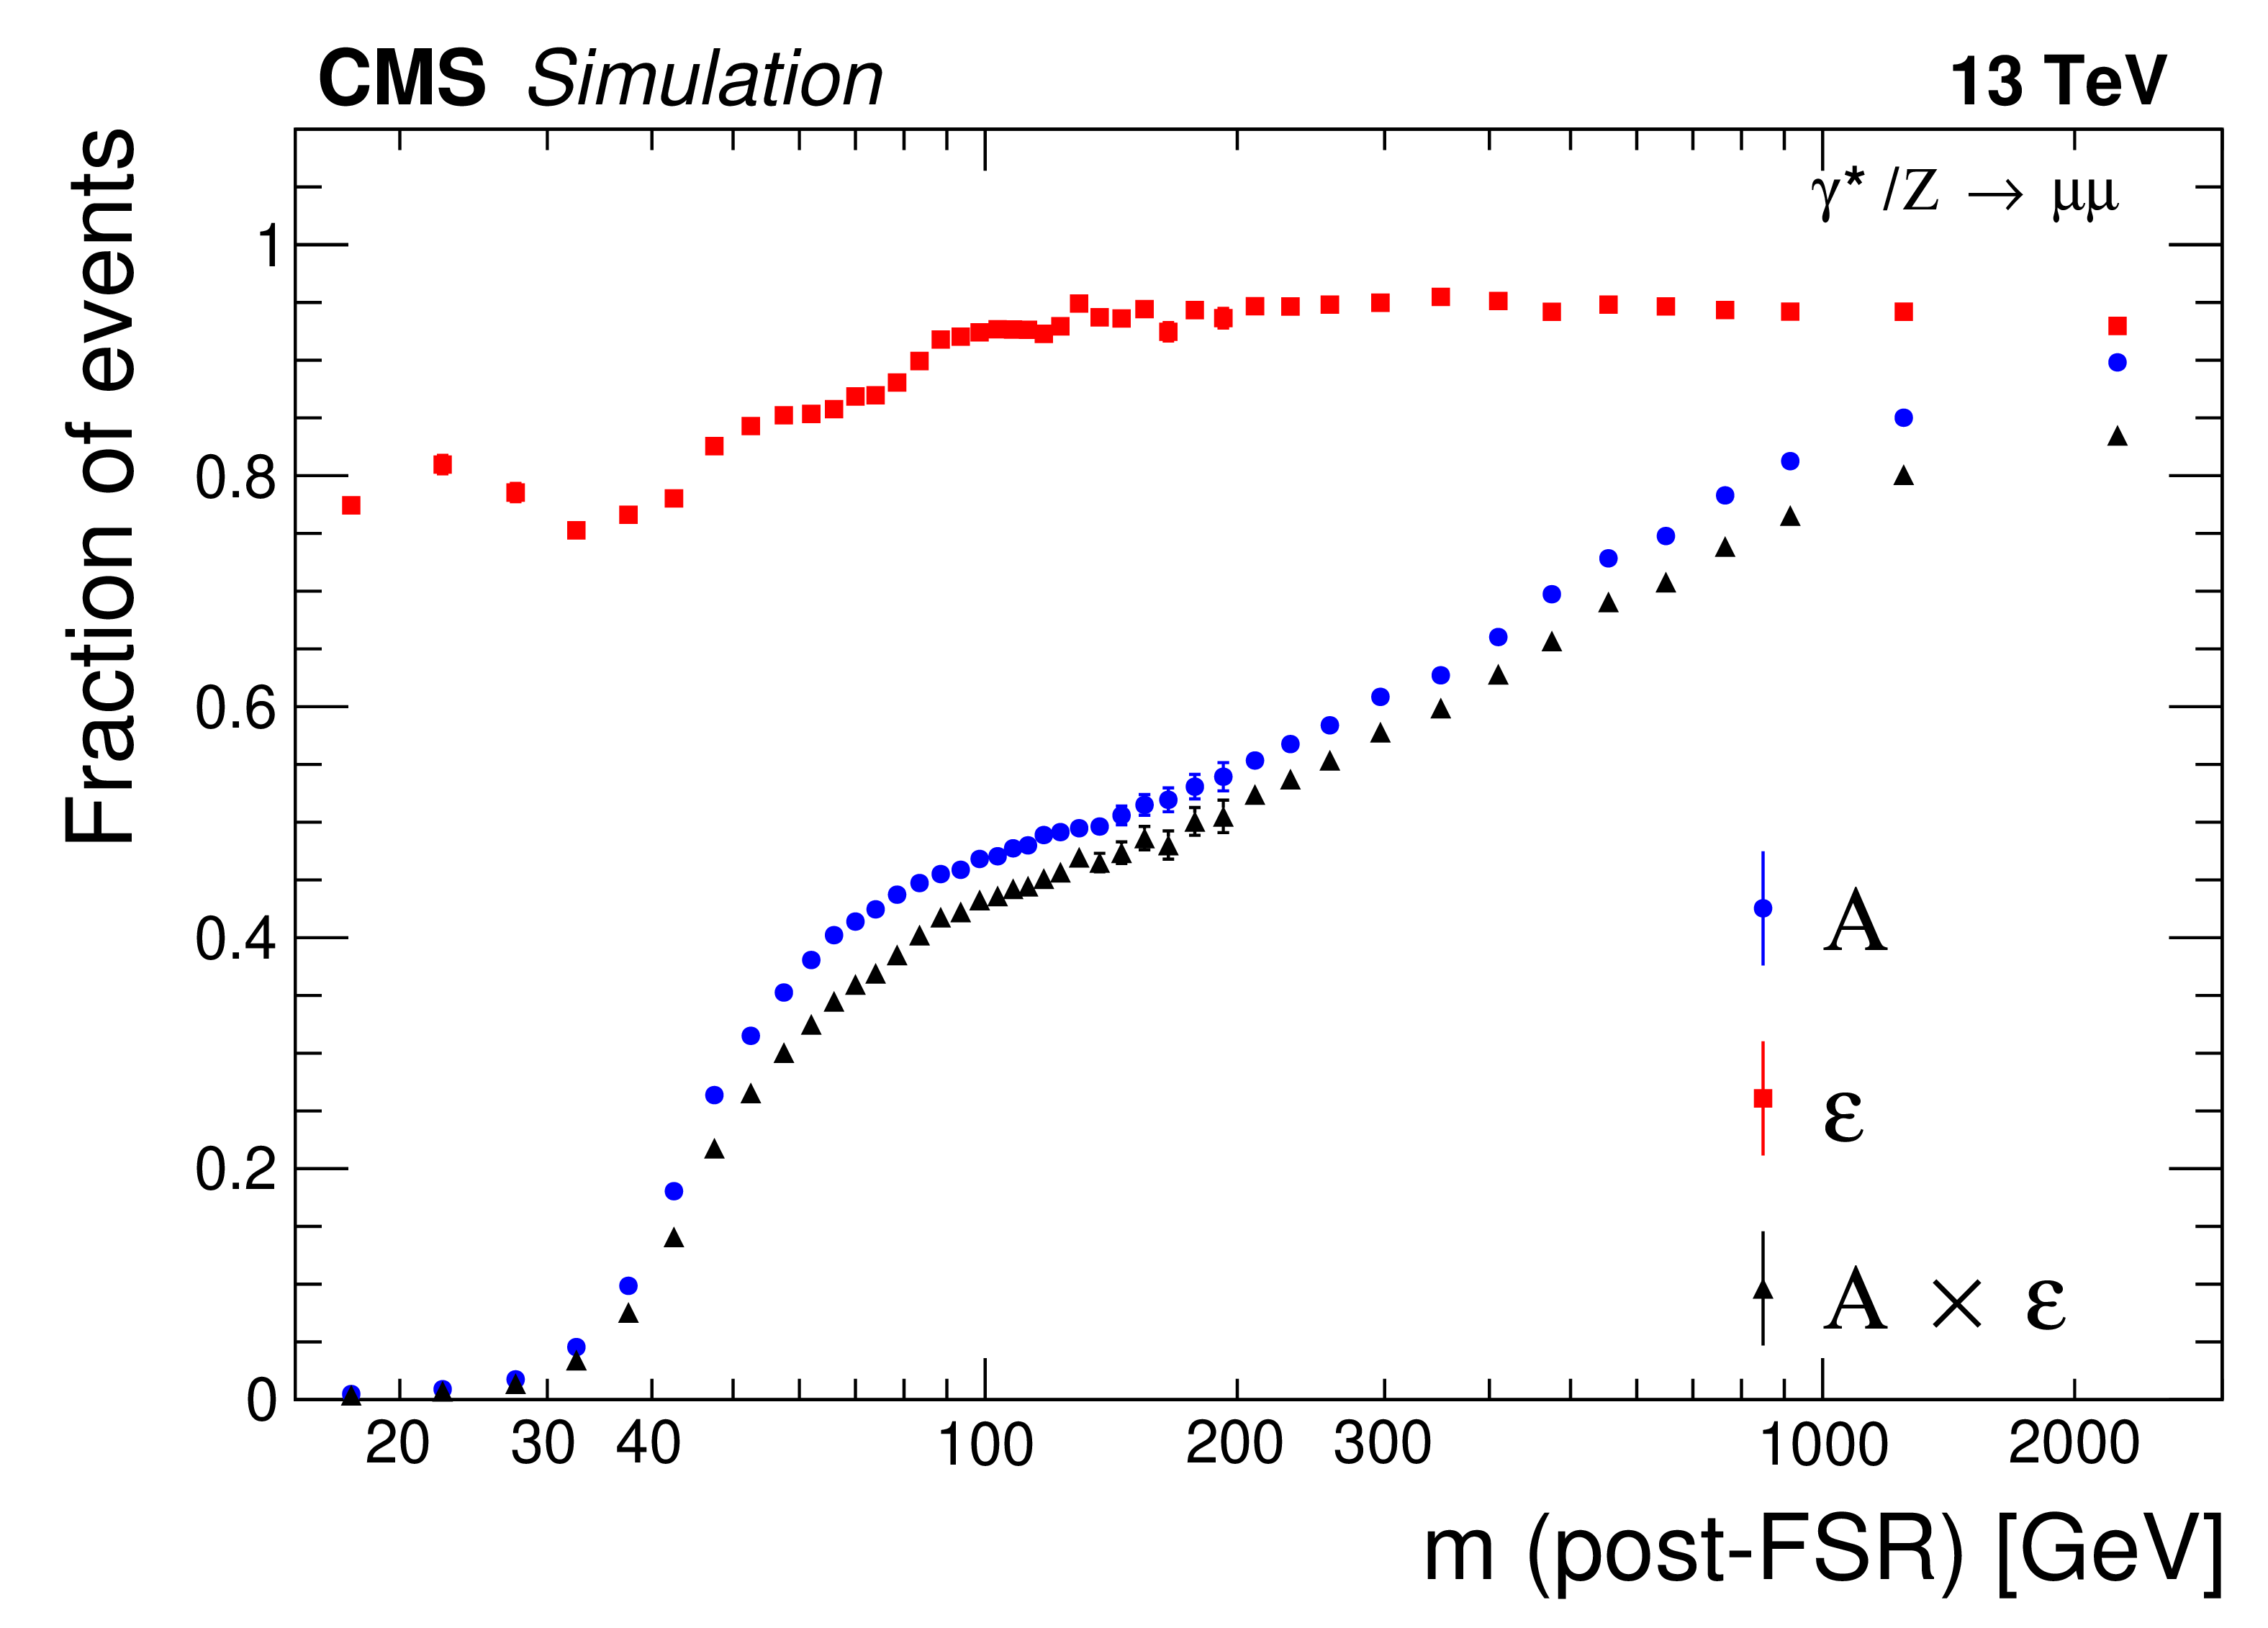
The signal acceptance (A), efficiency ($\varepsilon $) and their product for each invariant mass bin in the dimuon channel, calculated from simulation. The error bars on the data points represent the statistical uncertainty only. |
png pdf |
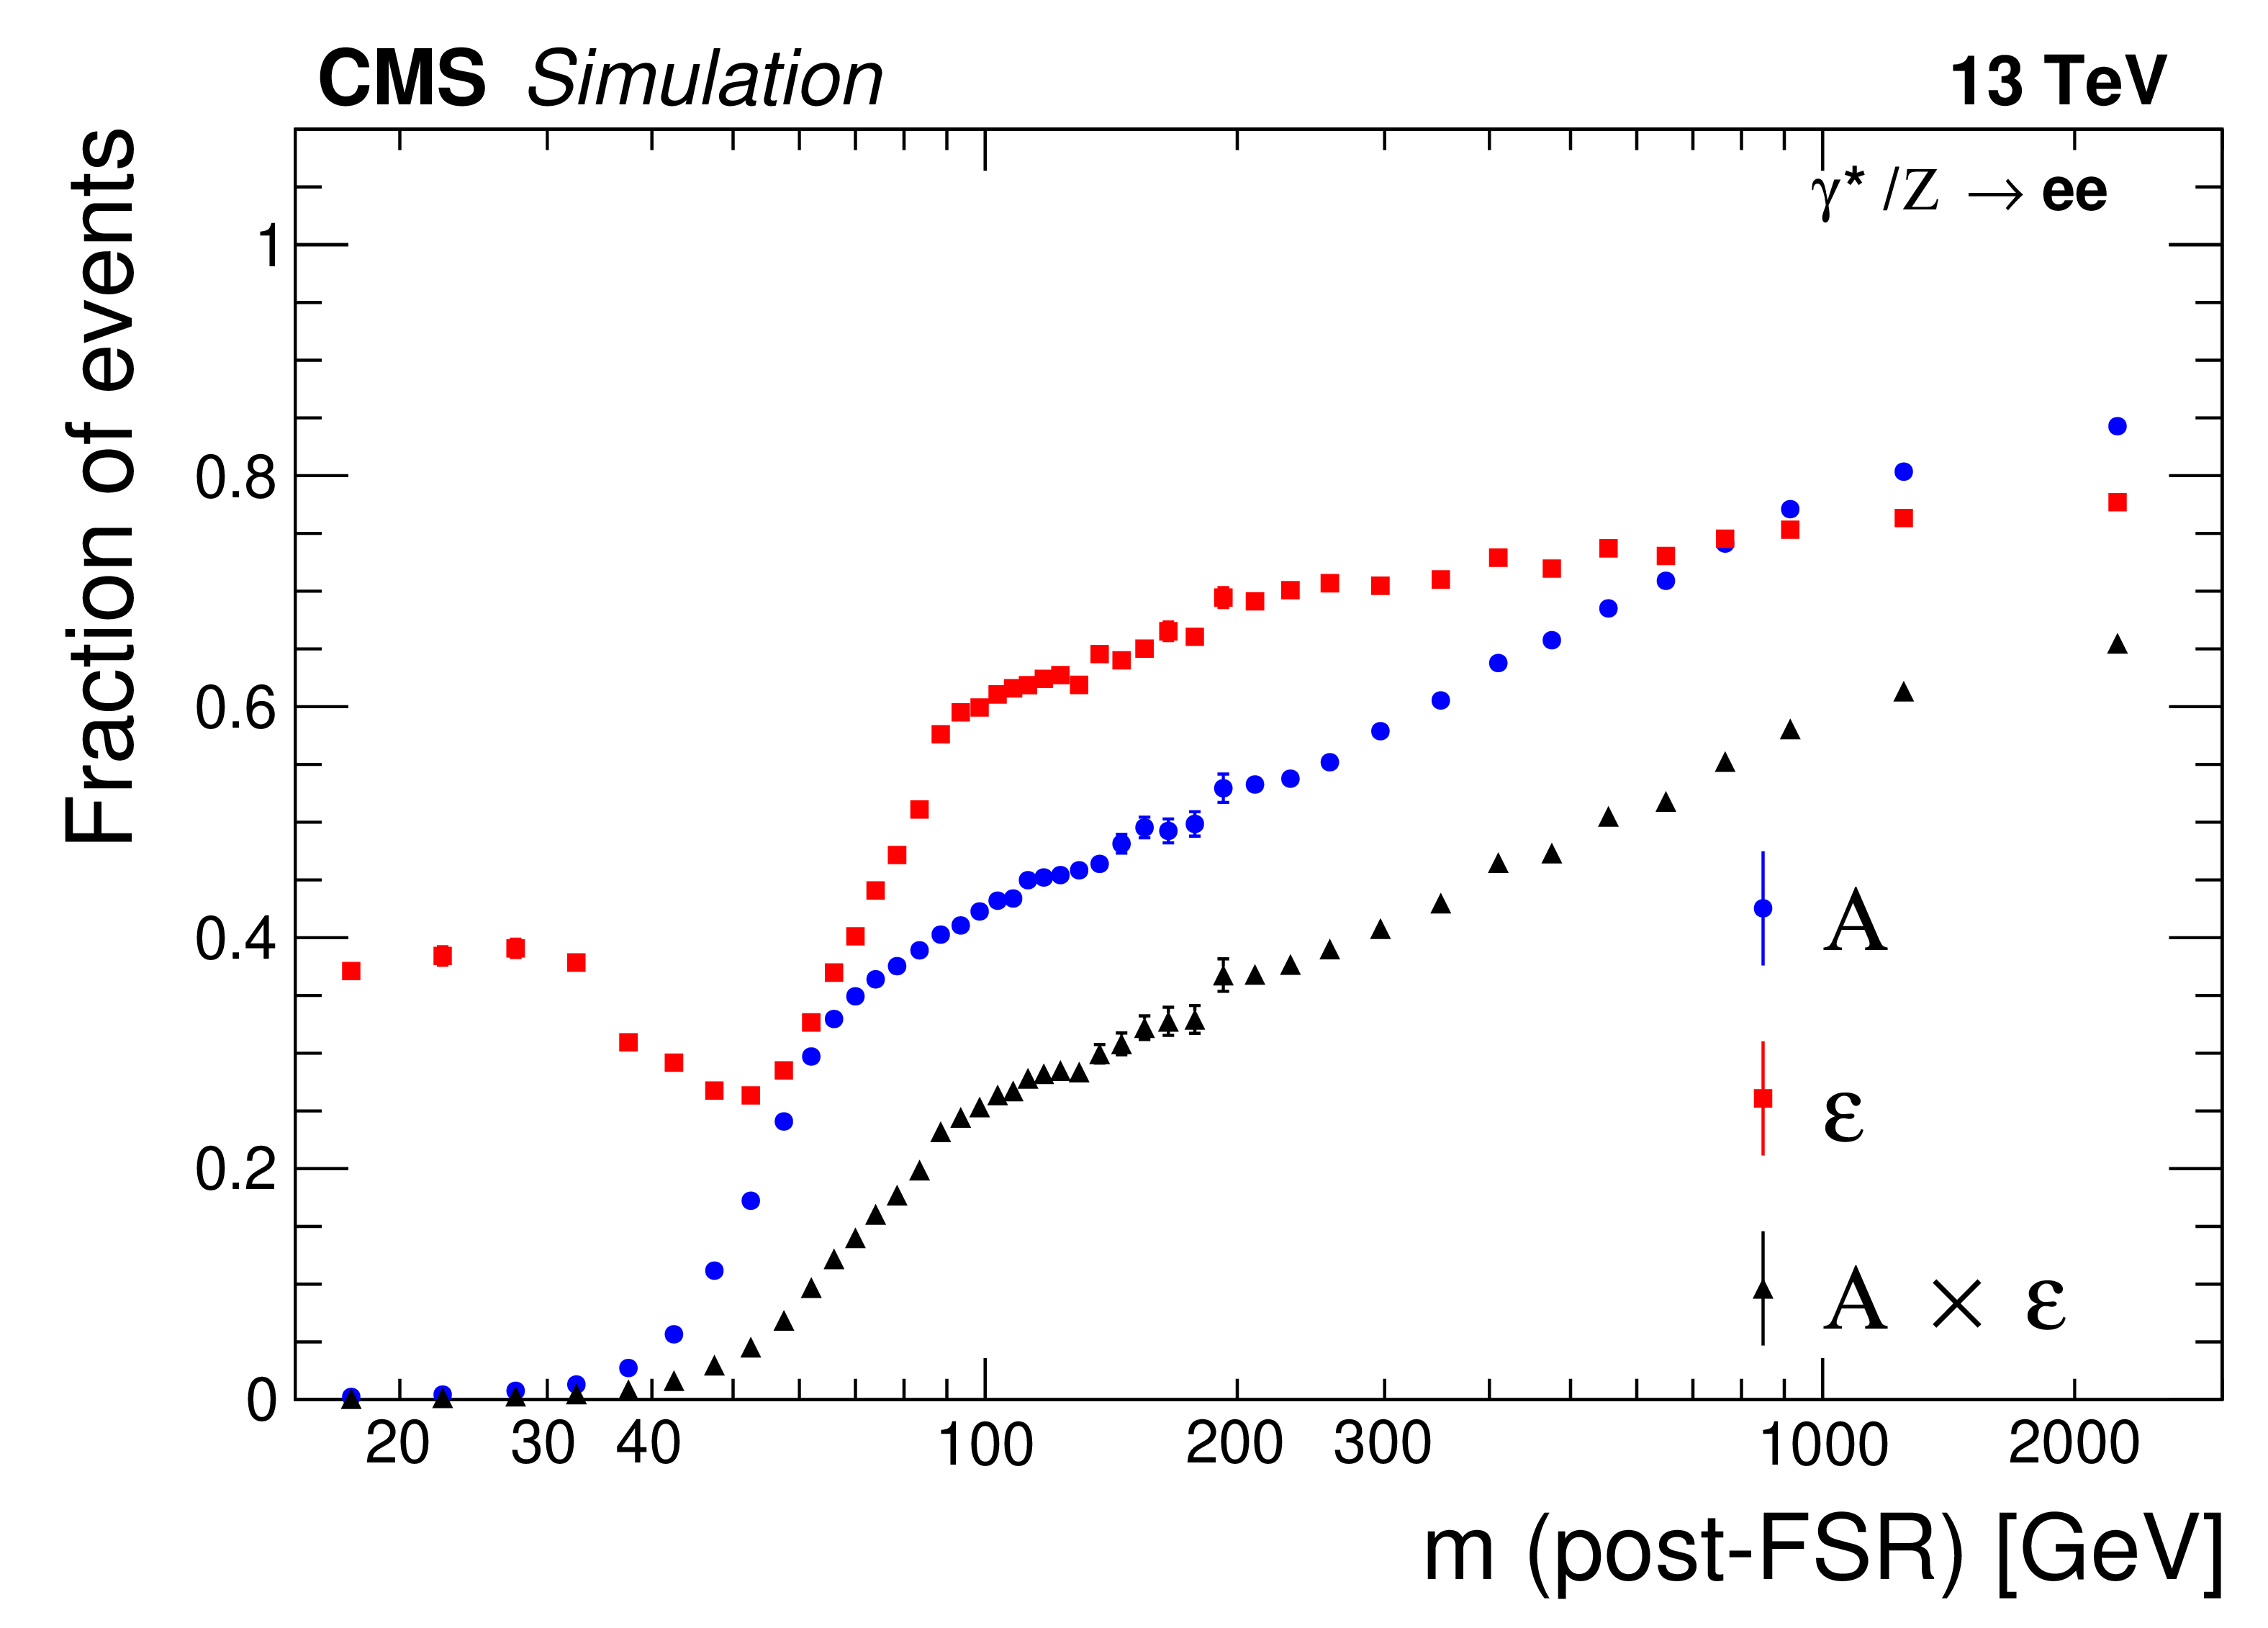
Figure 2-b:
The signal acceptance (A), efficiency ($\varepsilon $) and their product for each invariant mass bin in the dielectron channel, calculated from simulation. The error bars on the data points represent the statistical uncertainty only. |
png pdf |
Figure 3:
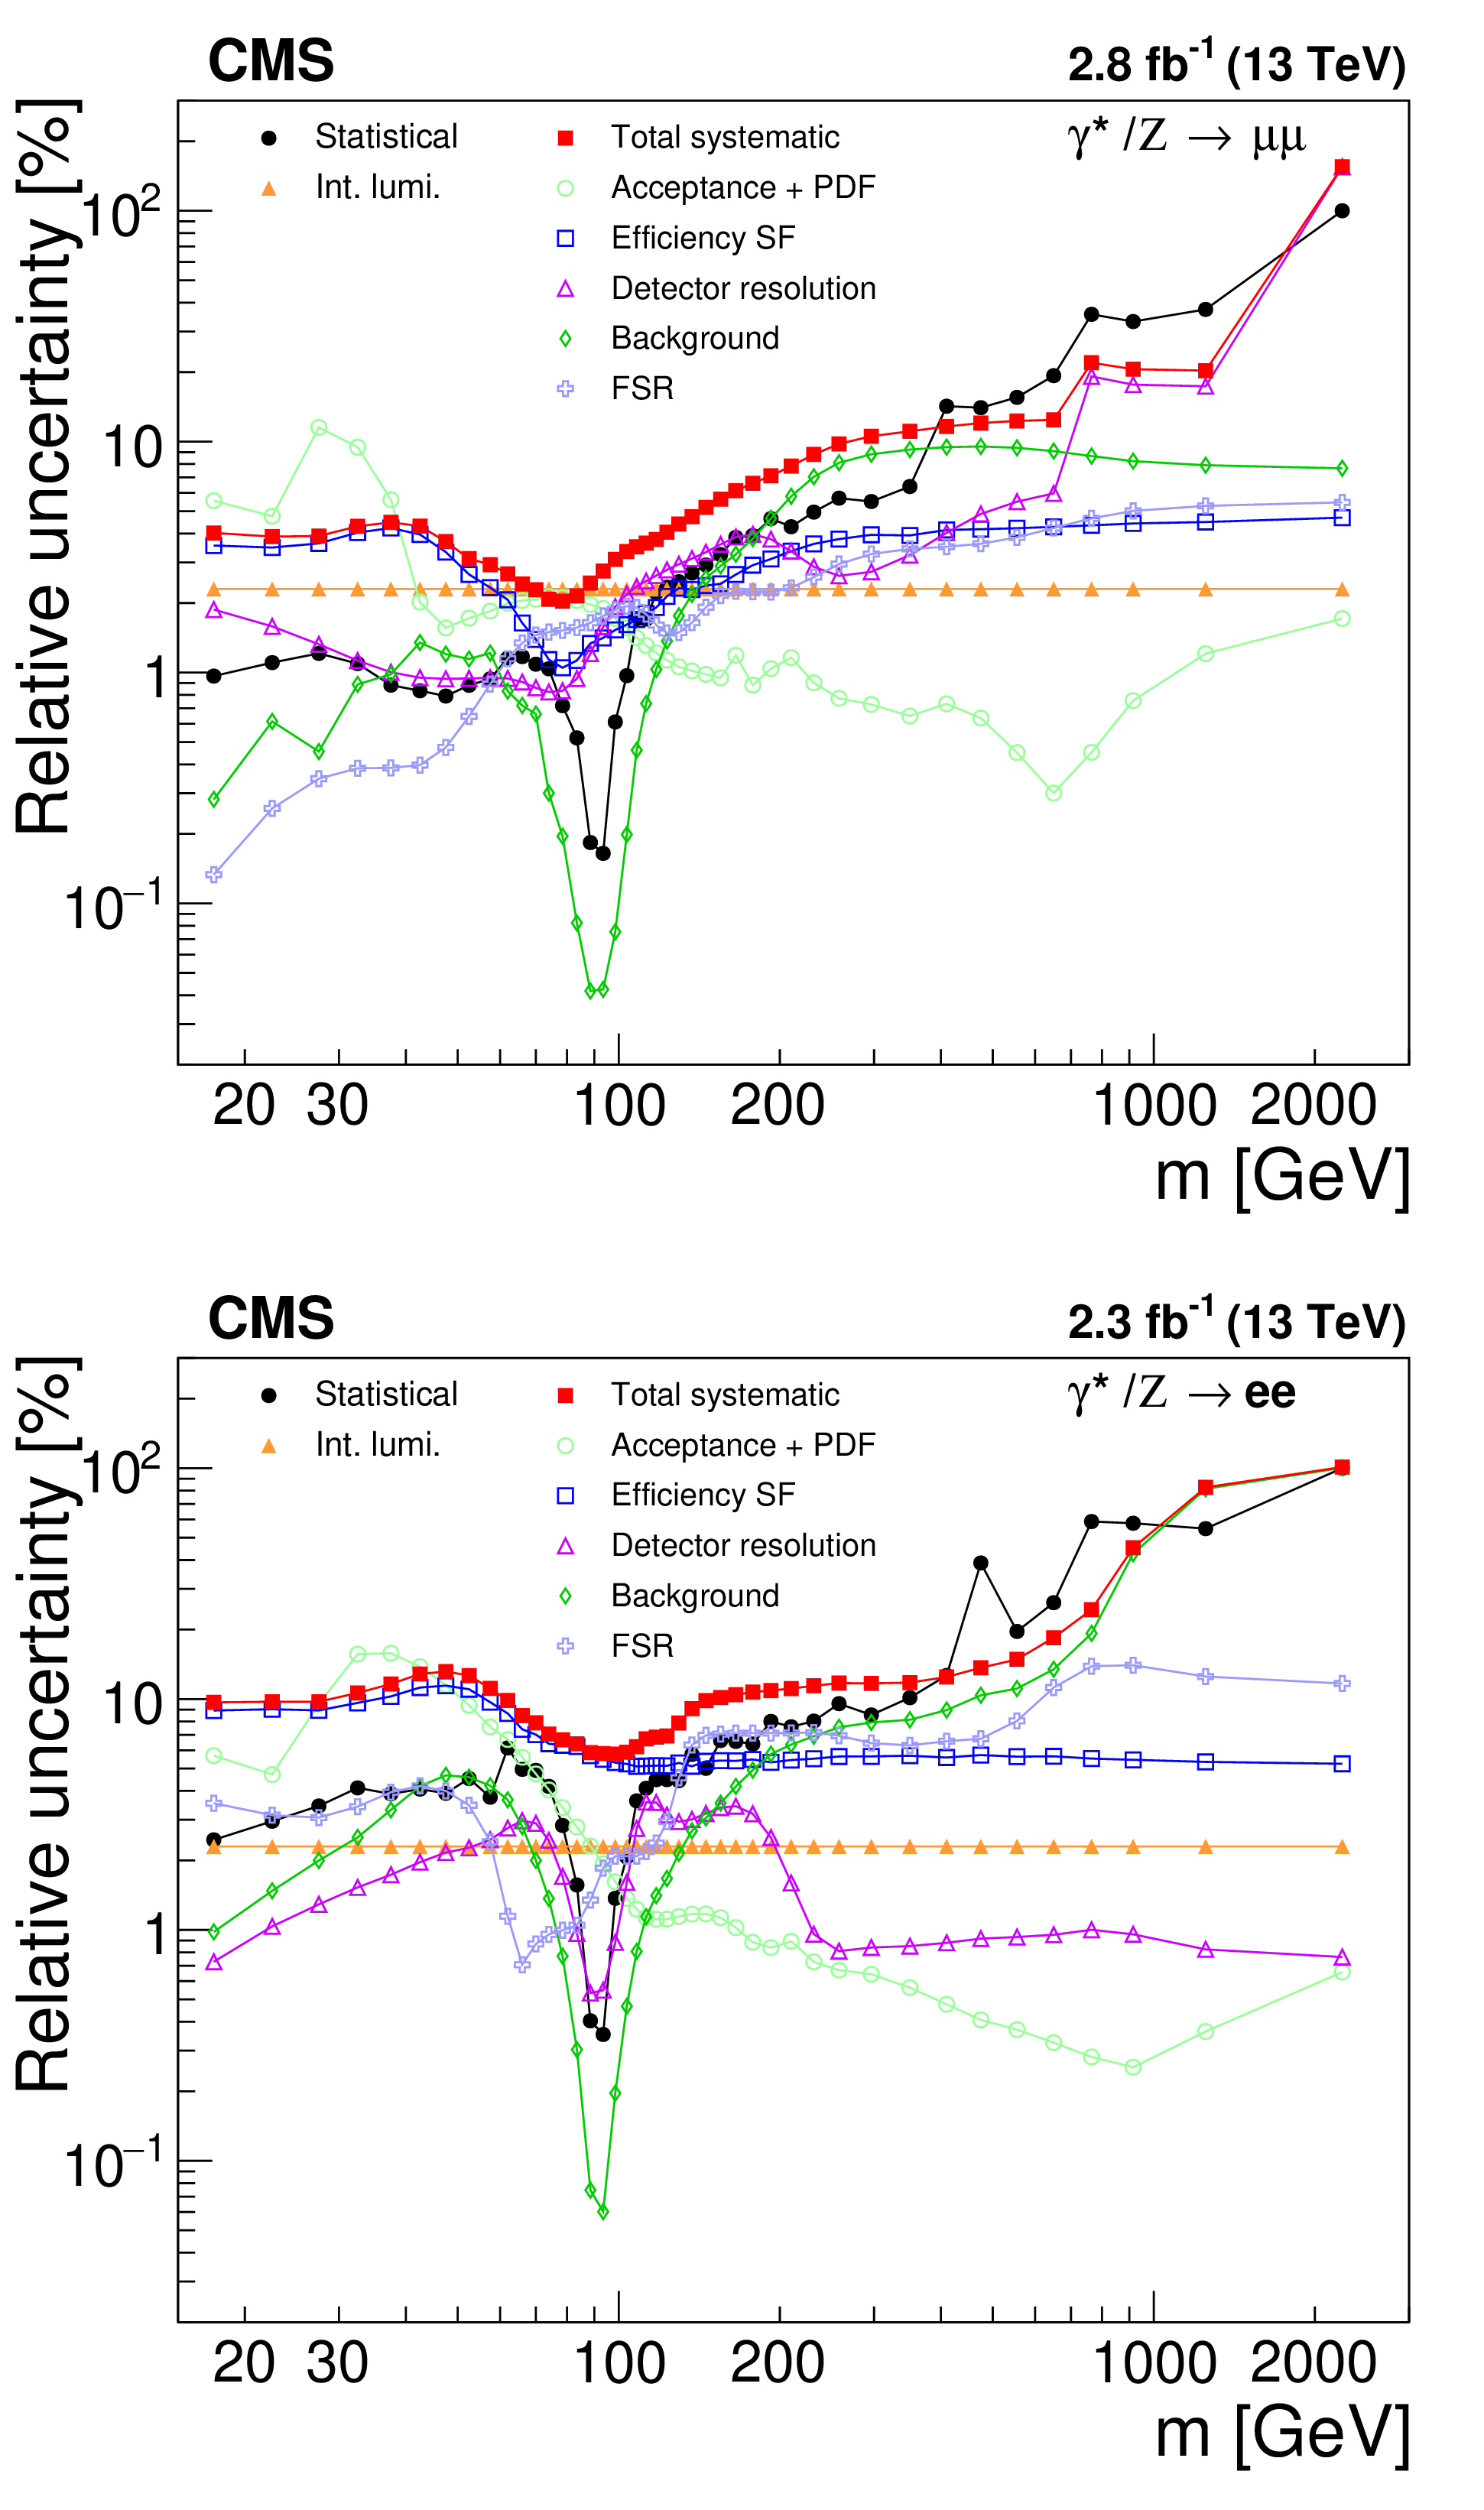
Summary of the systematic uncertainties on the differential cross section measurement $ {\mathrm {d}}\sigma / {\mathrm {d}}{m}$ [pb/GeV] in the dimuon (upper) and dielectron (lower) channels. The "Total systematic'' is a quadratic sum of all systematic uncertainty sources except for the "Acceptance + PDF''. |
png pdf |
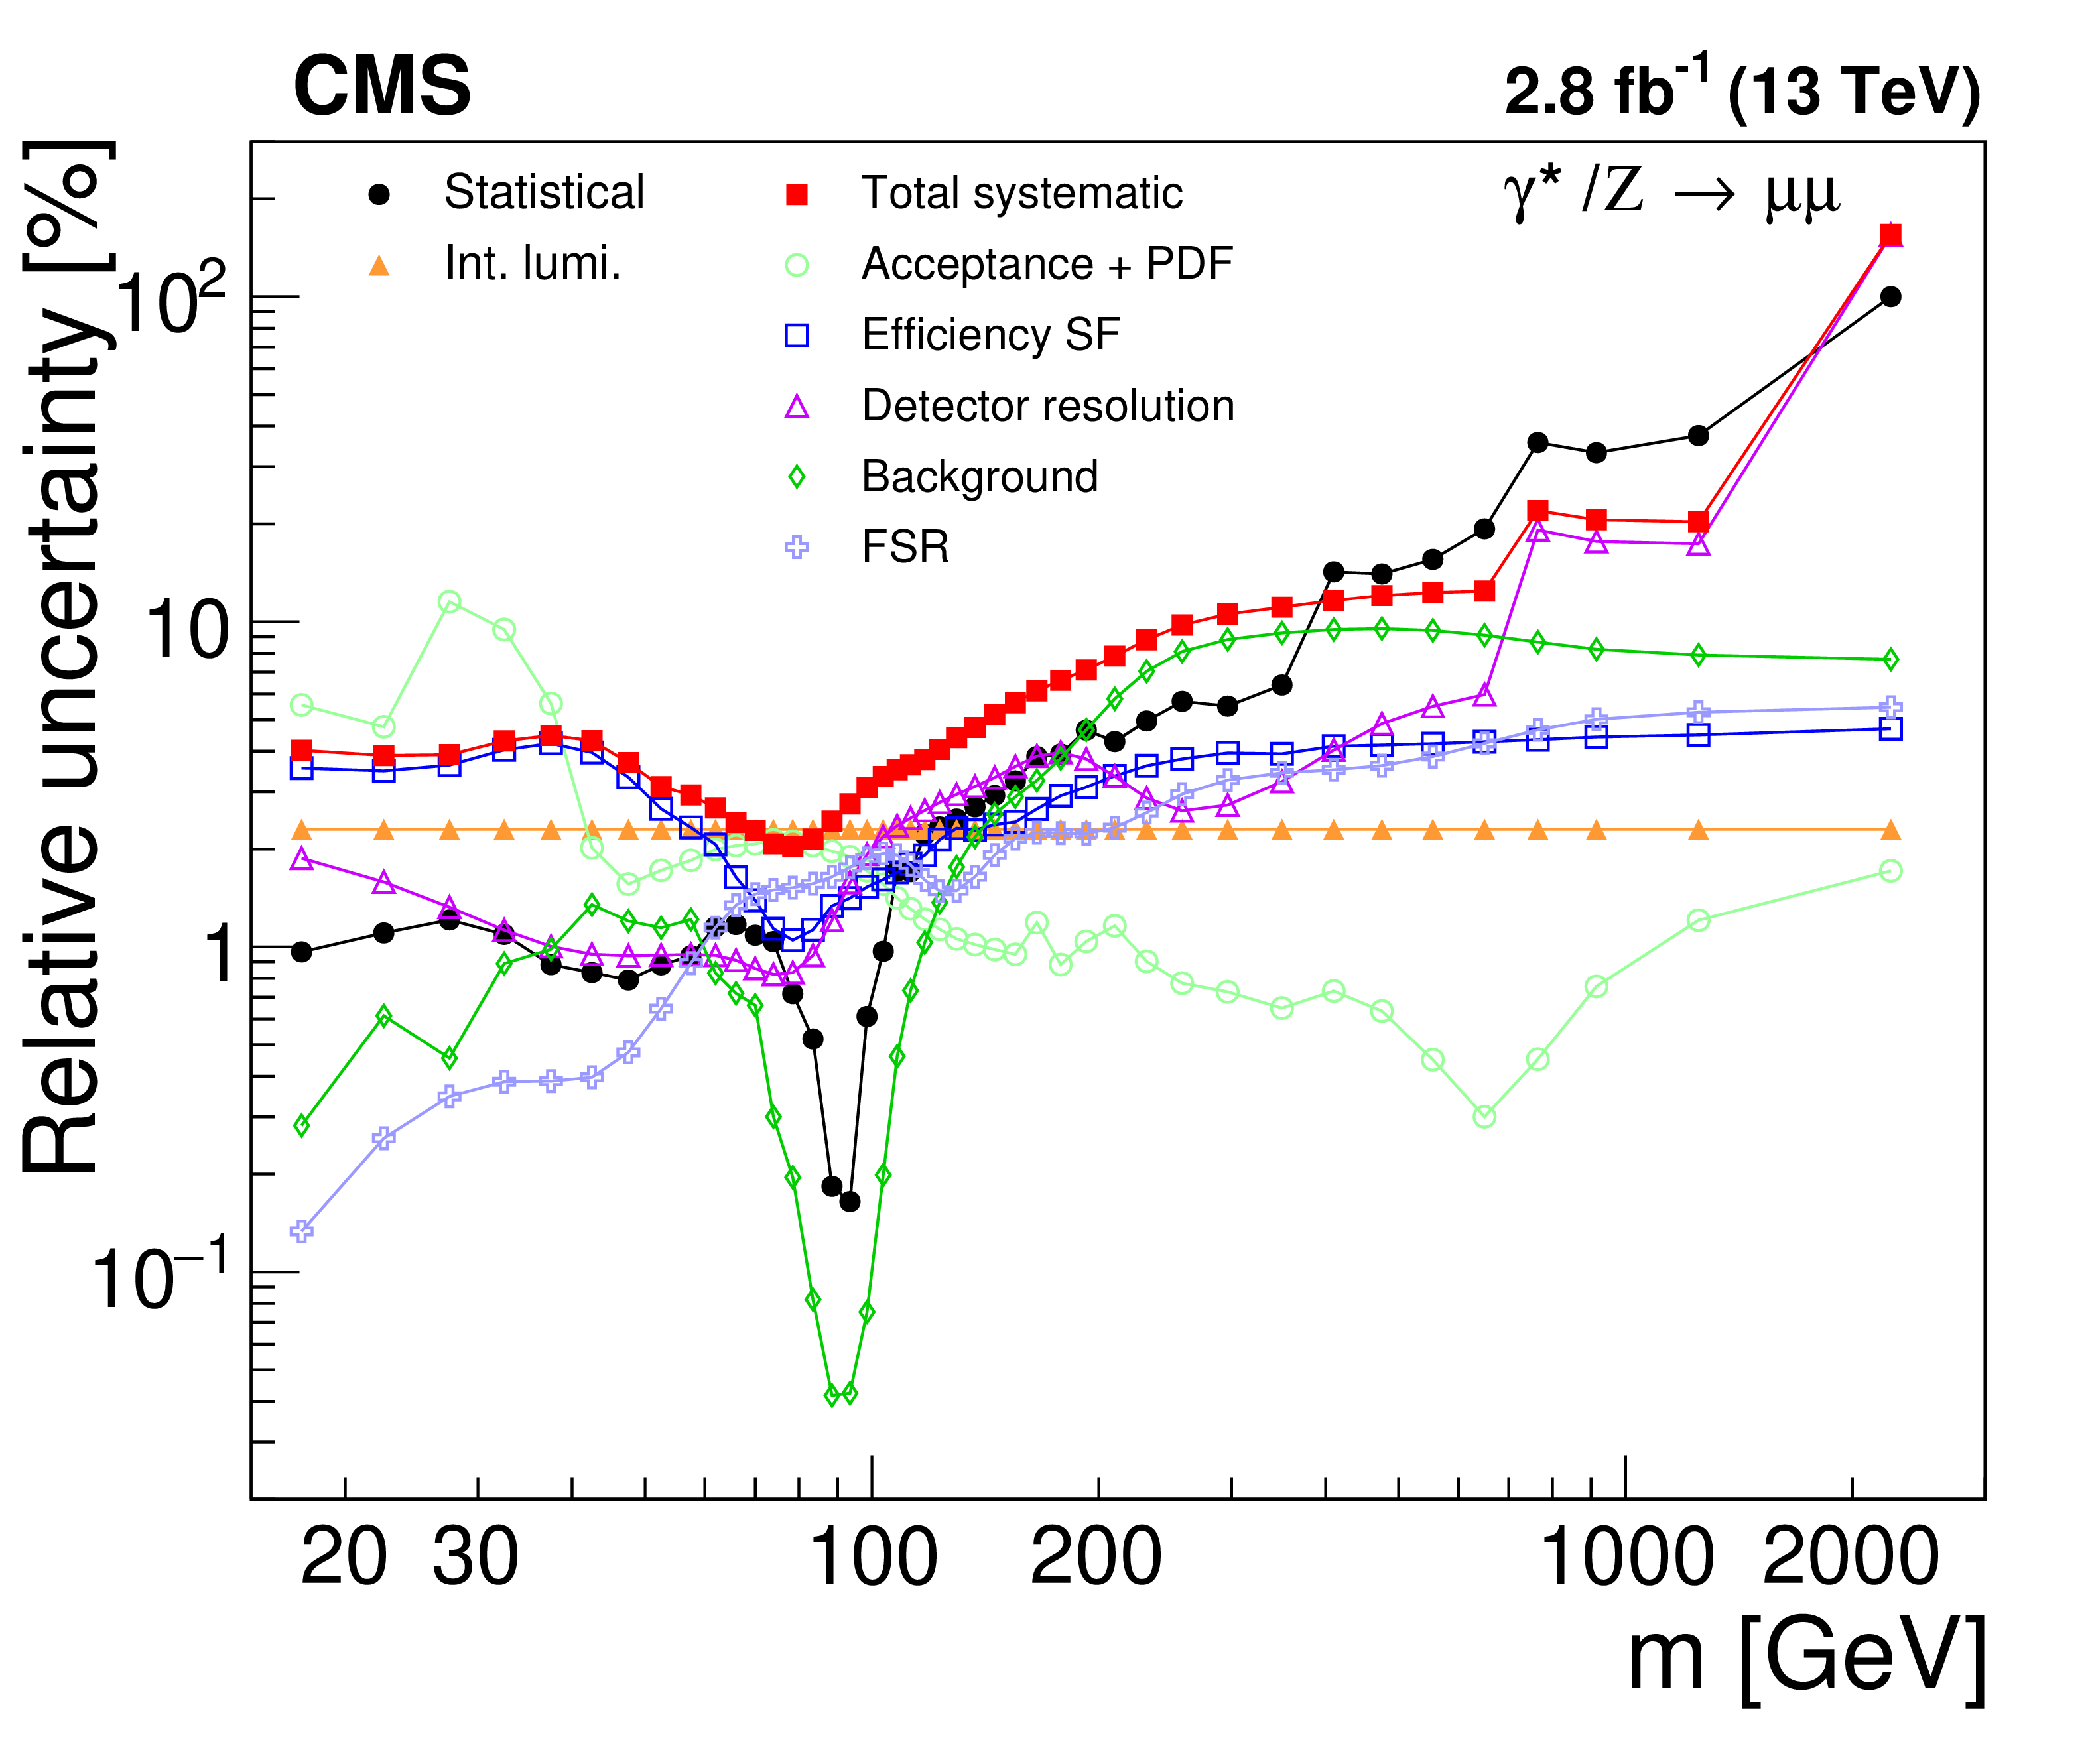
Figure 3-a:
Summary of the systematic uncertainties on the differential cross section measurement $ {\mathrm {d}}\sigma / {\mathrm {d}}{m}$ [pb/GeV] in the dimuon channel. The "Total systematic'' is a quadratic sum of all systematic uncertainty sources except for the "Acceptance + PDF''. |
png pdf |
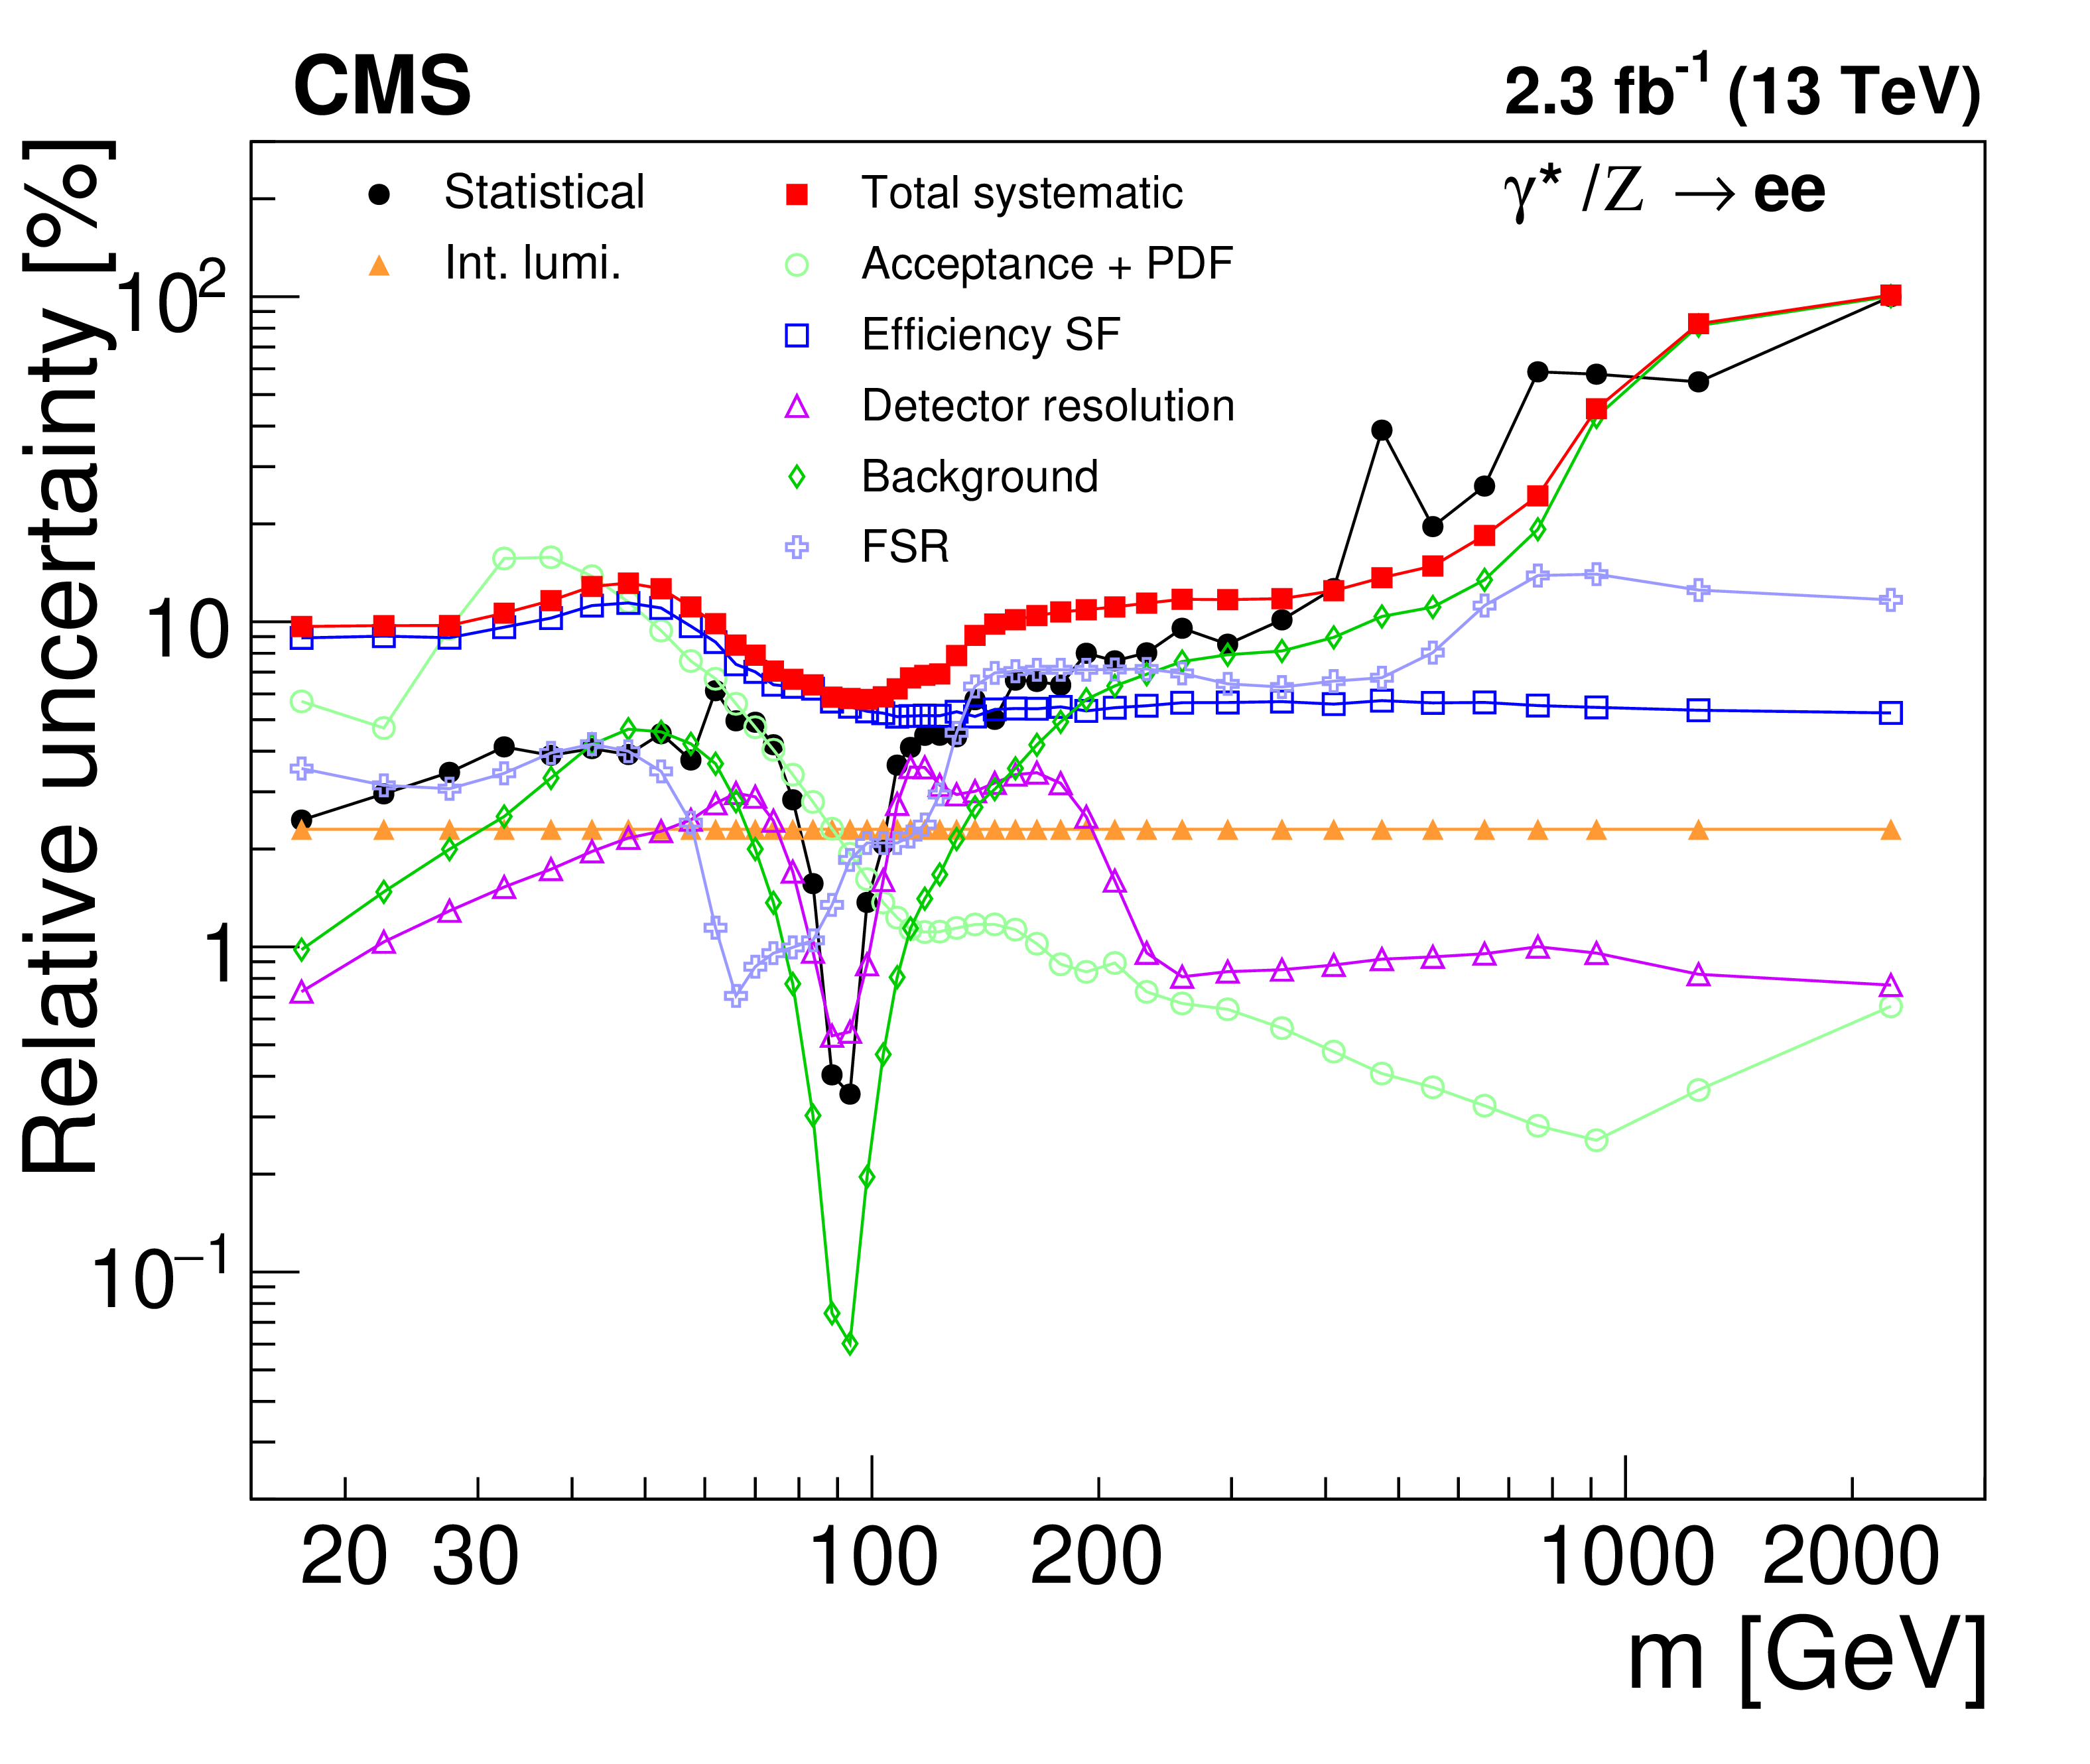
Figure 3-b:
Summary of the systematic uncertainties on the differential cross section measurement $ {\mathrm {d}}\sigma / {\mathrm {d}}{m}$ [pb/GeV] in the dielectron channel. The "Total systematic'' is a quadratic sum of all systematic uncertainty sources except for the "Acceptance + PDF''. |
png pdf |
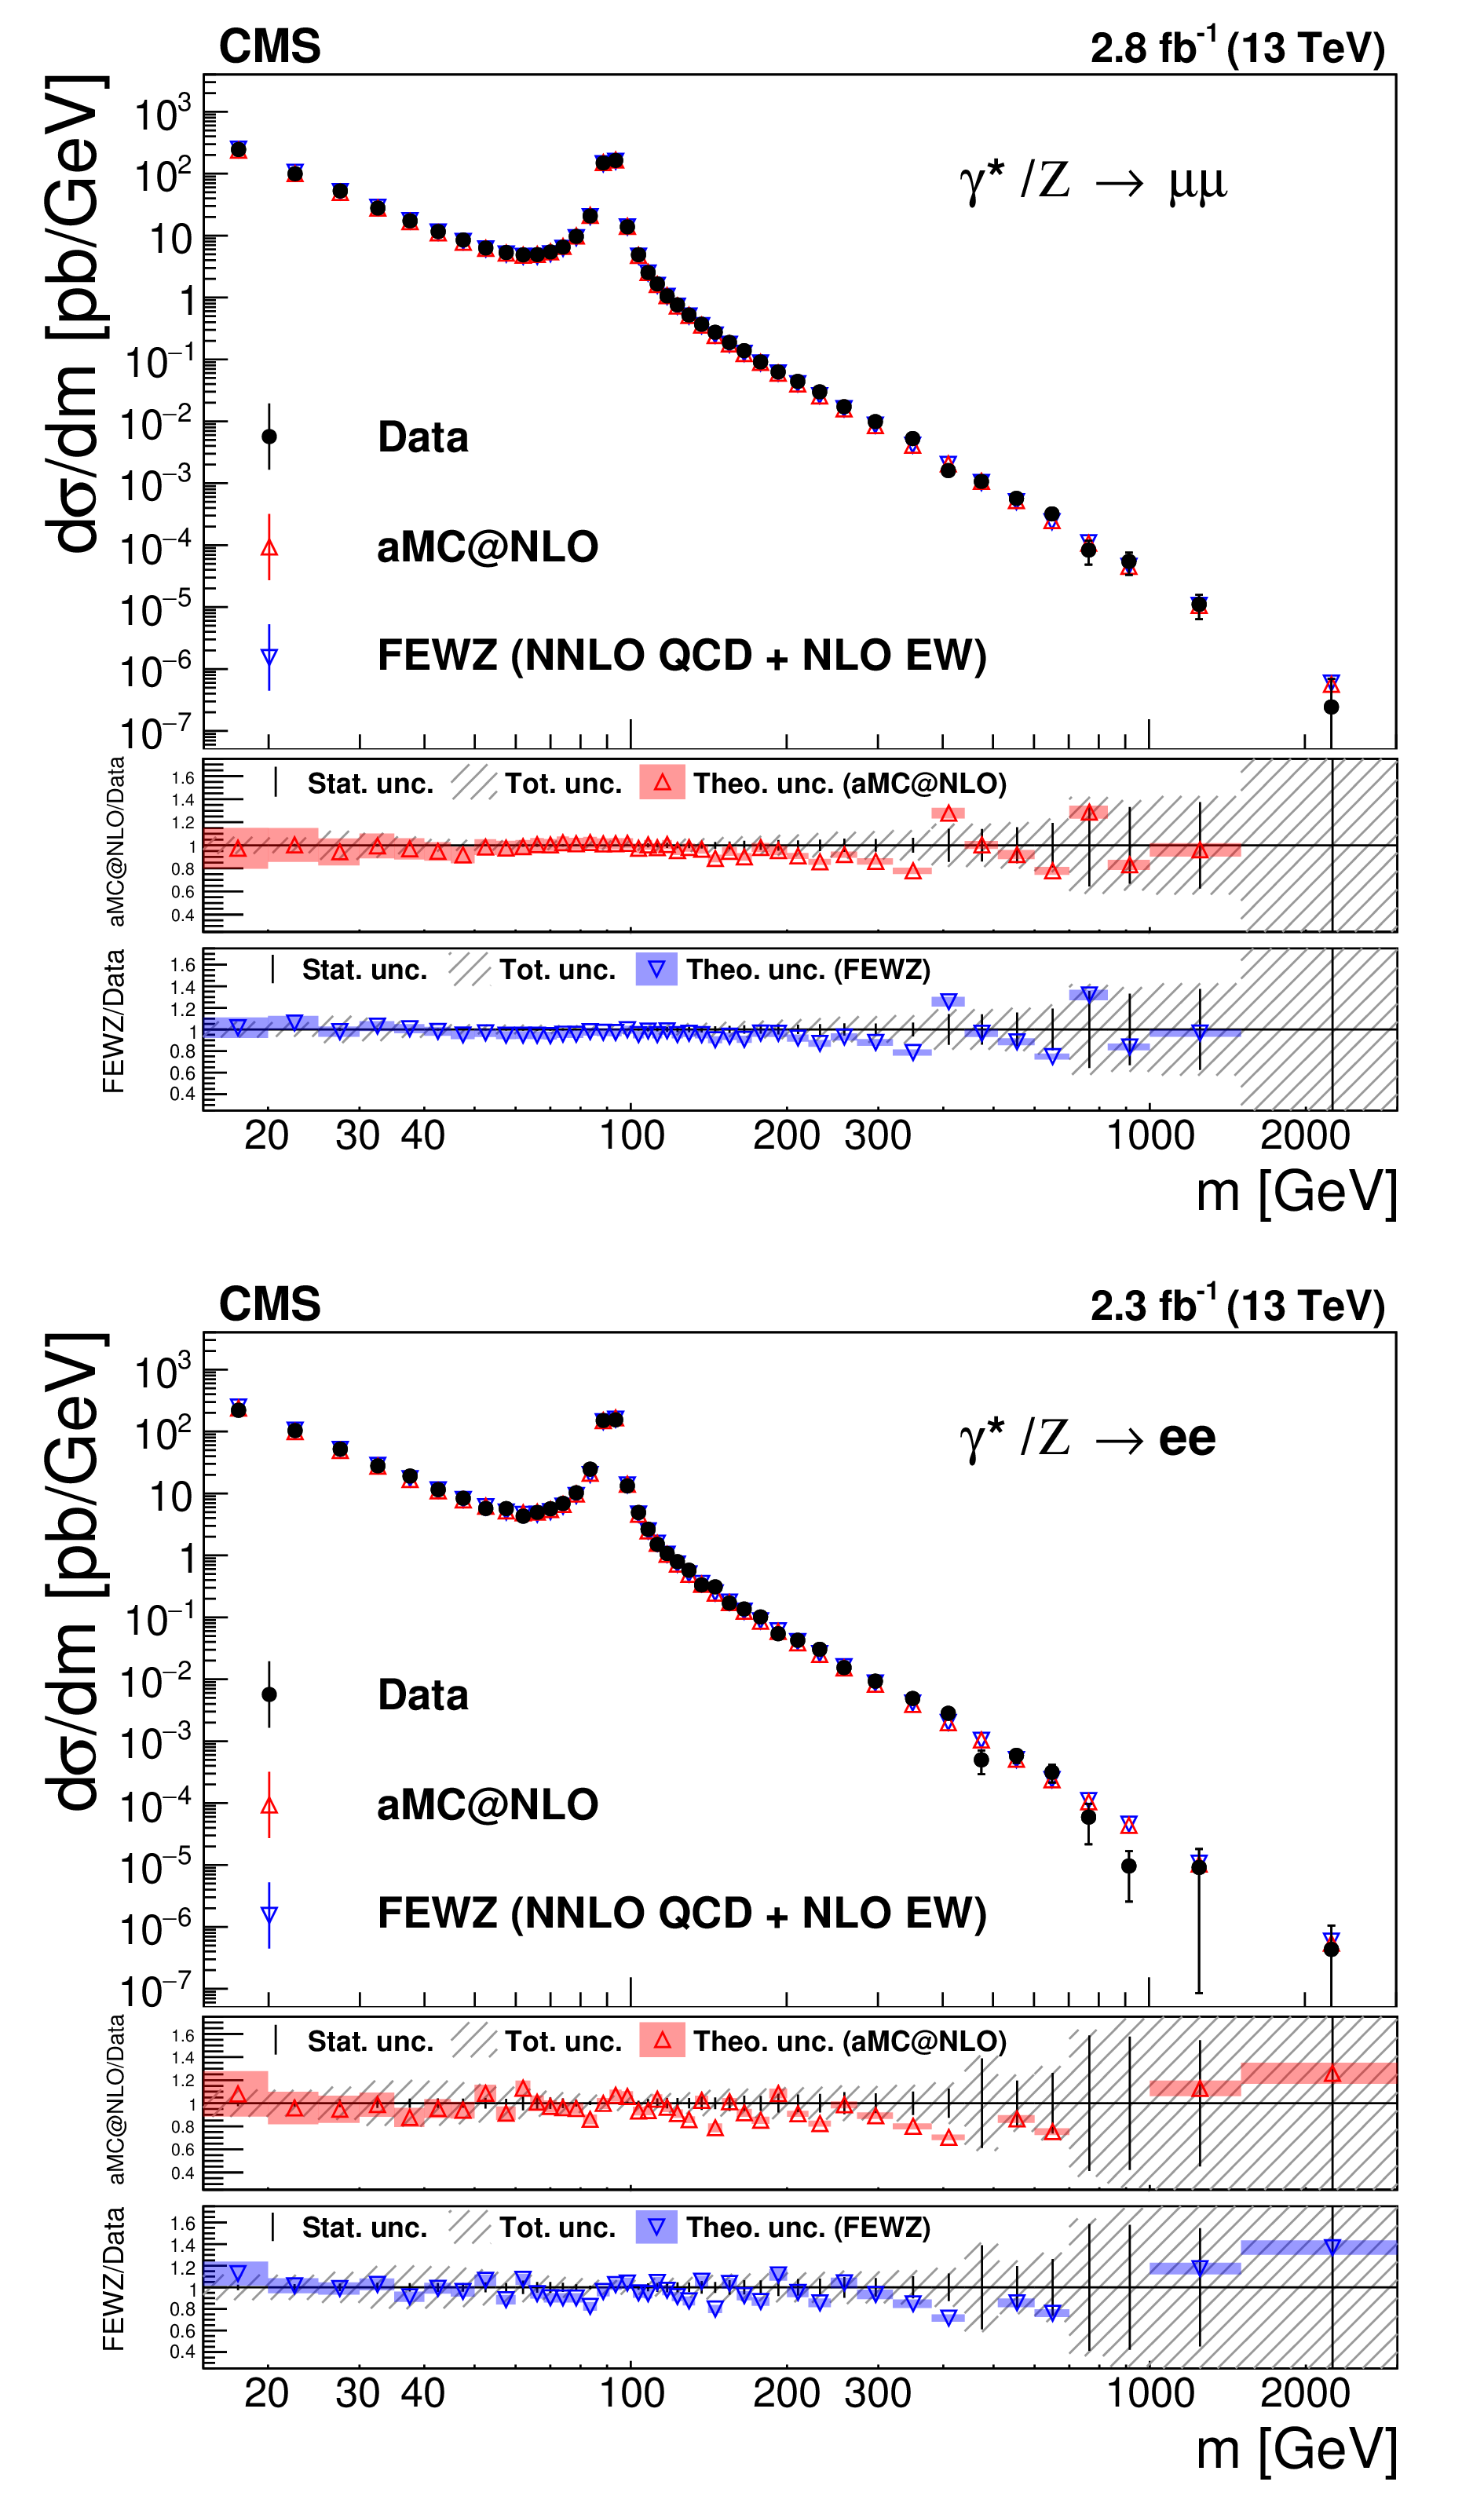
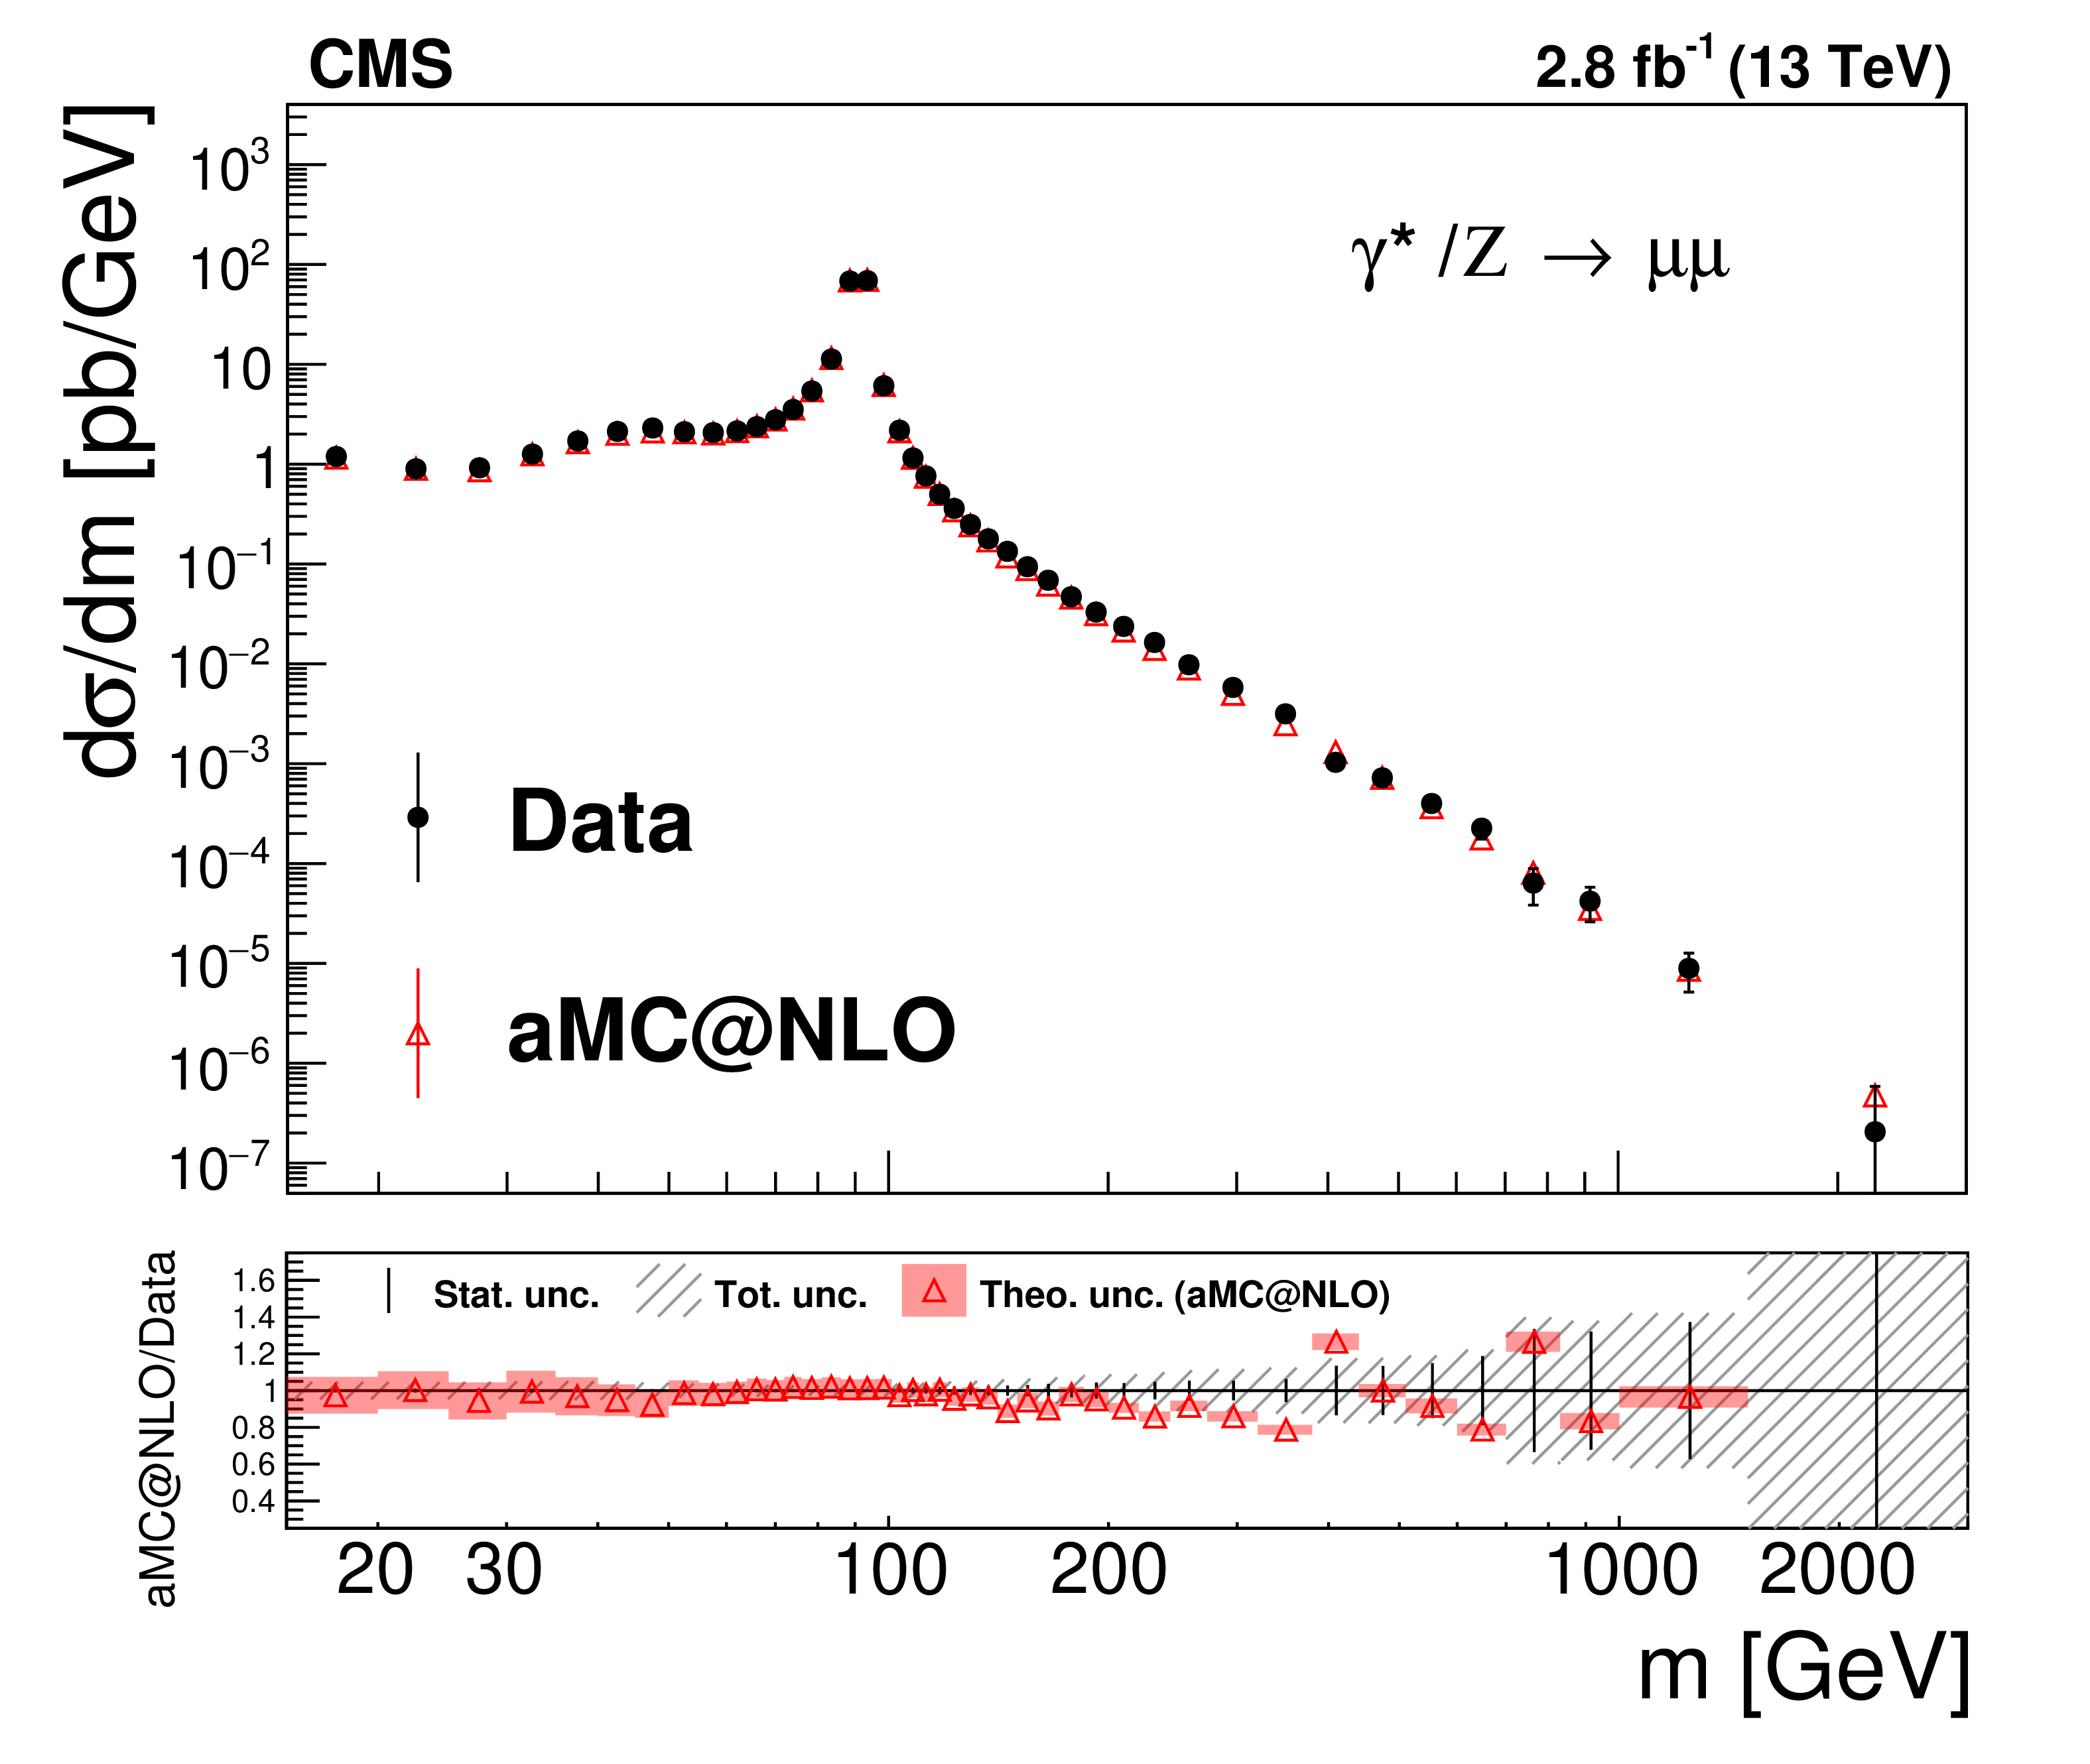
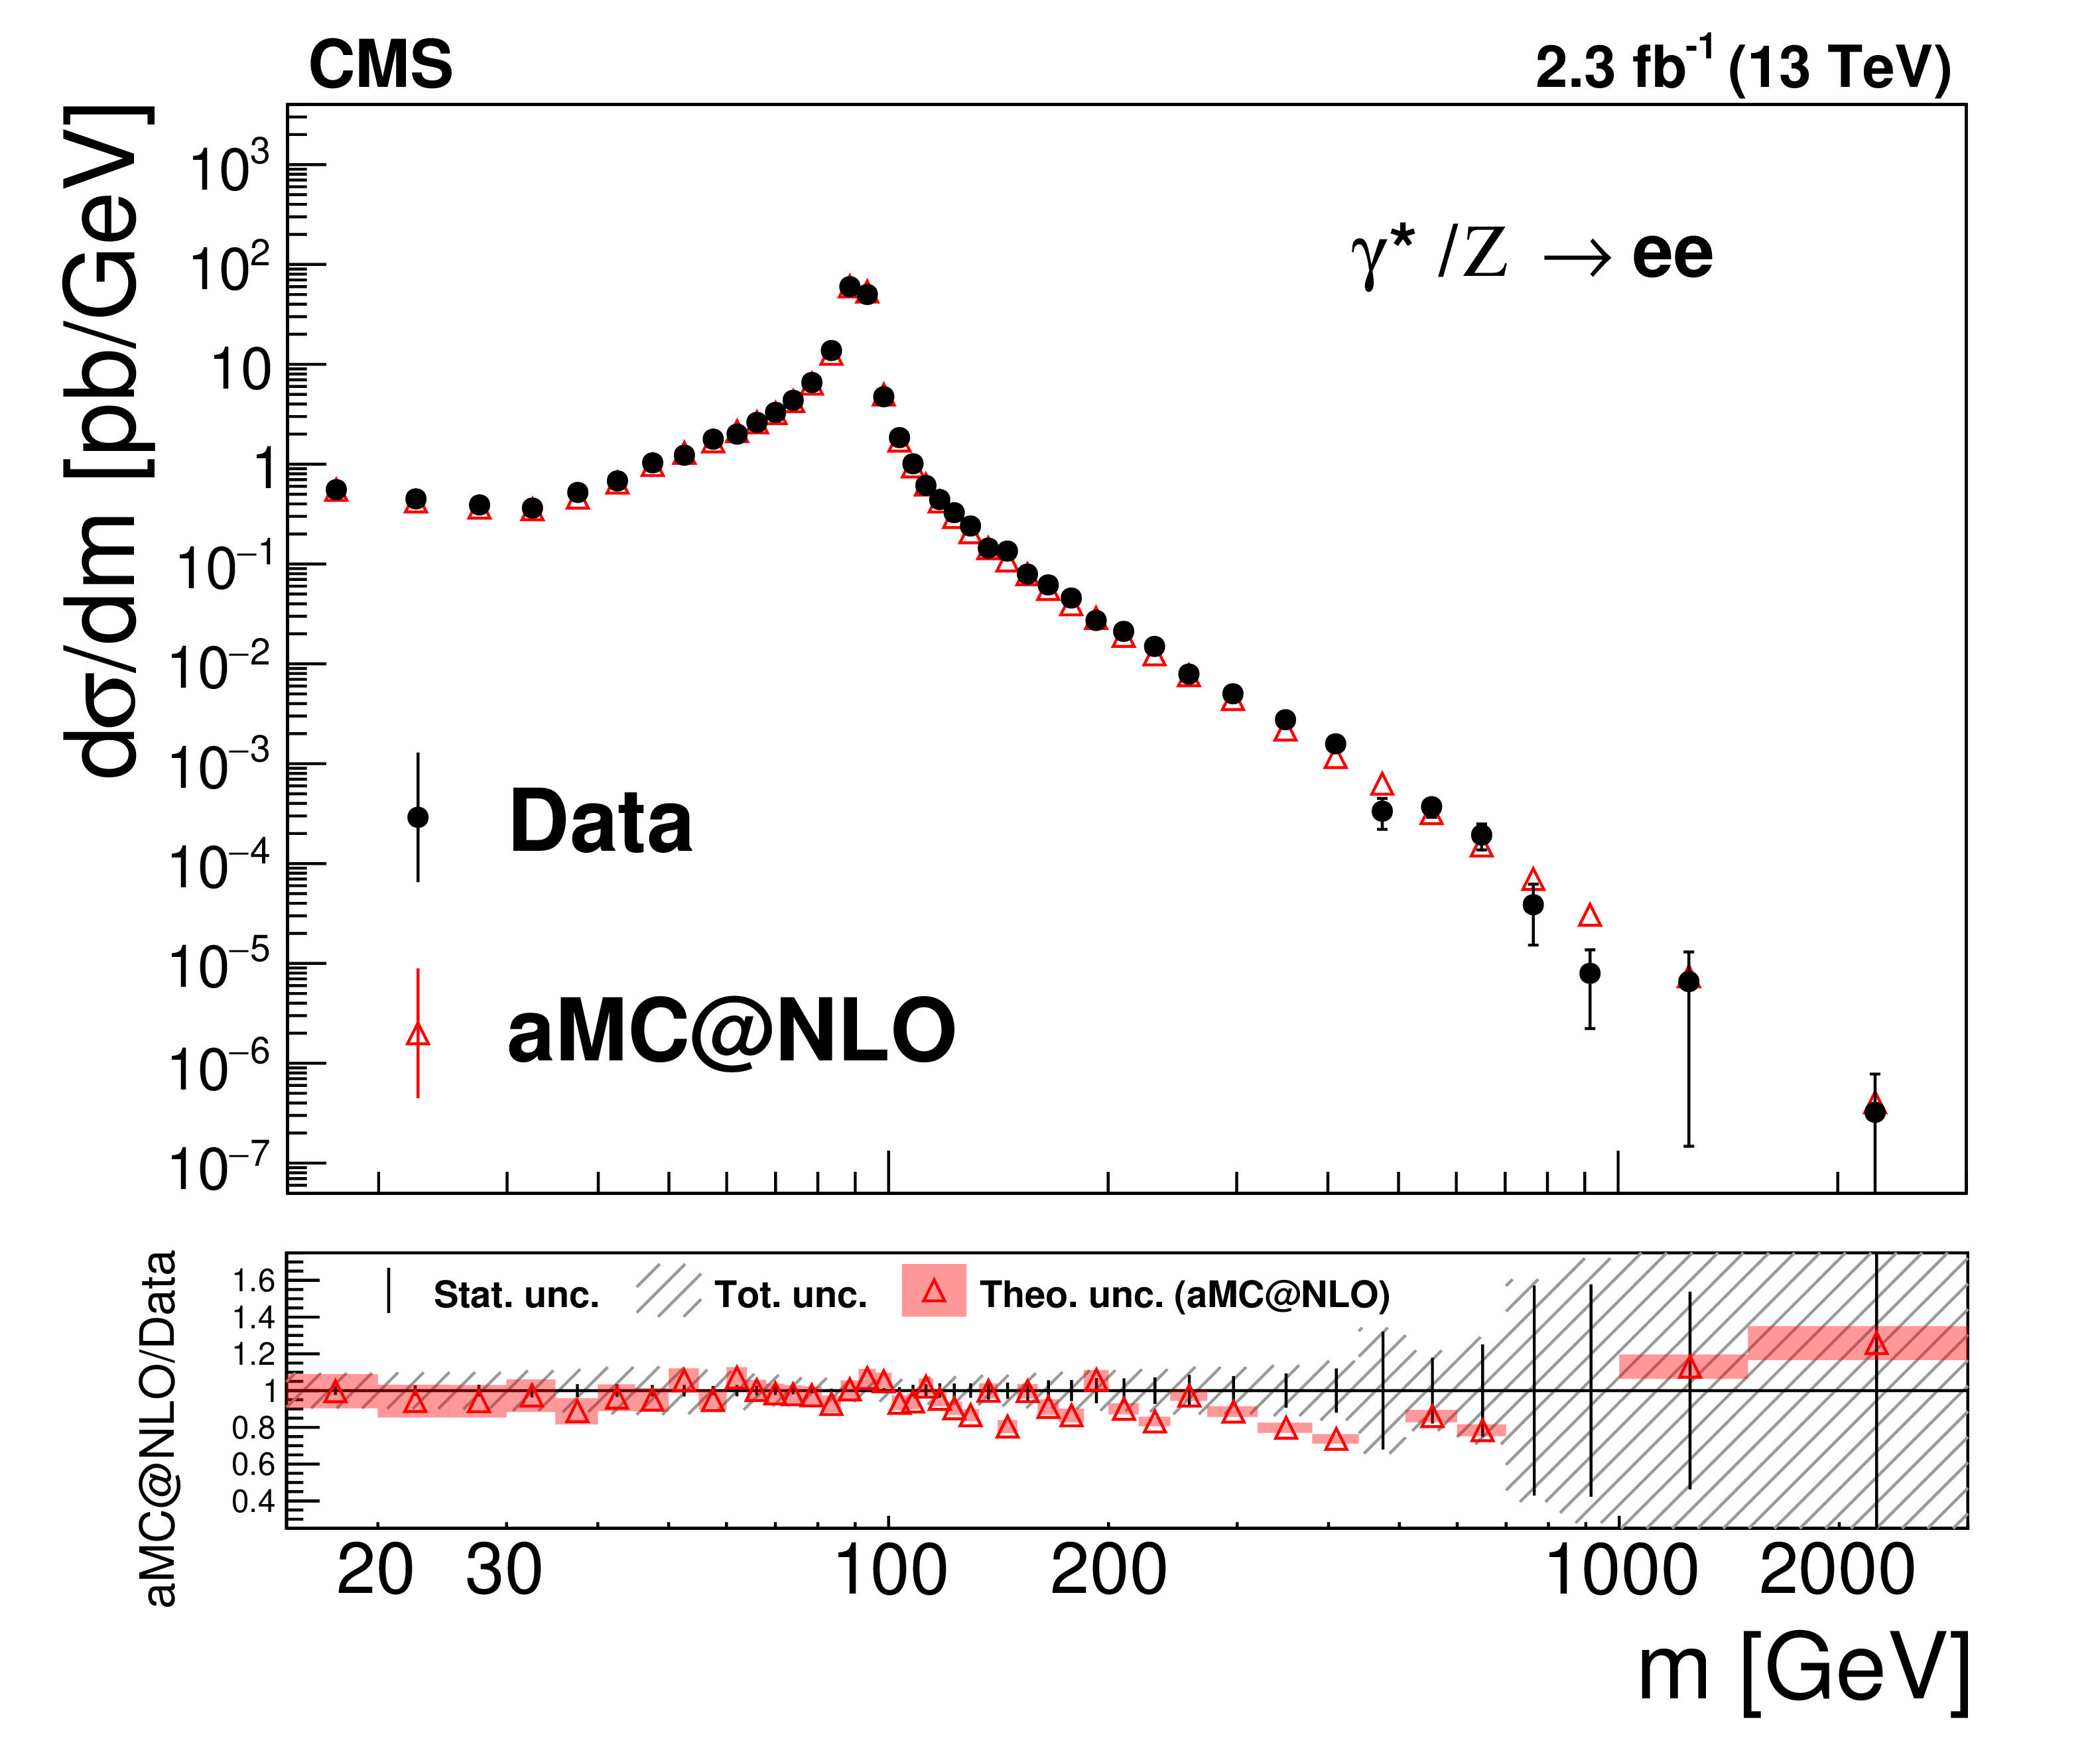
Figure 4:
The differential cross section as a function of the dimuon (upper) and dielectron (lower) invariant mass, measured in the full phase space, with FSR correction applied. The spectra are compared with the NNLO theoretical prediction of FEWZ (blue) and the NLO prediction of MadGraph 5_aMC@NLO (red). The NNPDF3.0 PDF set is used in both cases. In the middle and lower panels, the coloured bands denote the theoretical uncertainty and the hatched bands denote the total uncertainty, which is the combination of statistical, systematic, and integrated luminosity components. |
png pdf |
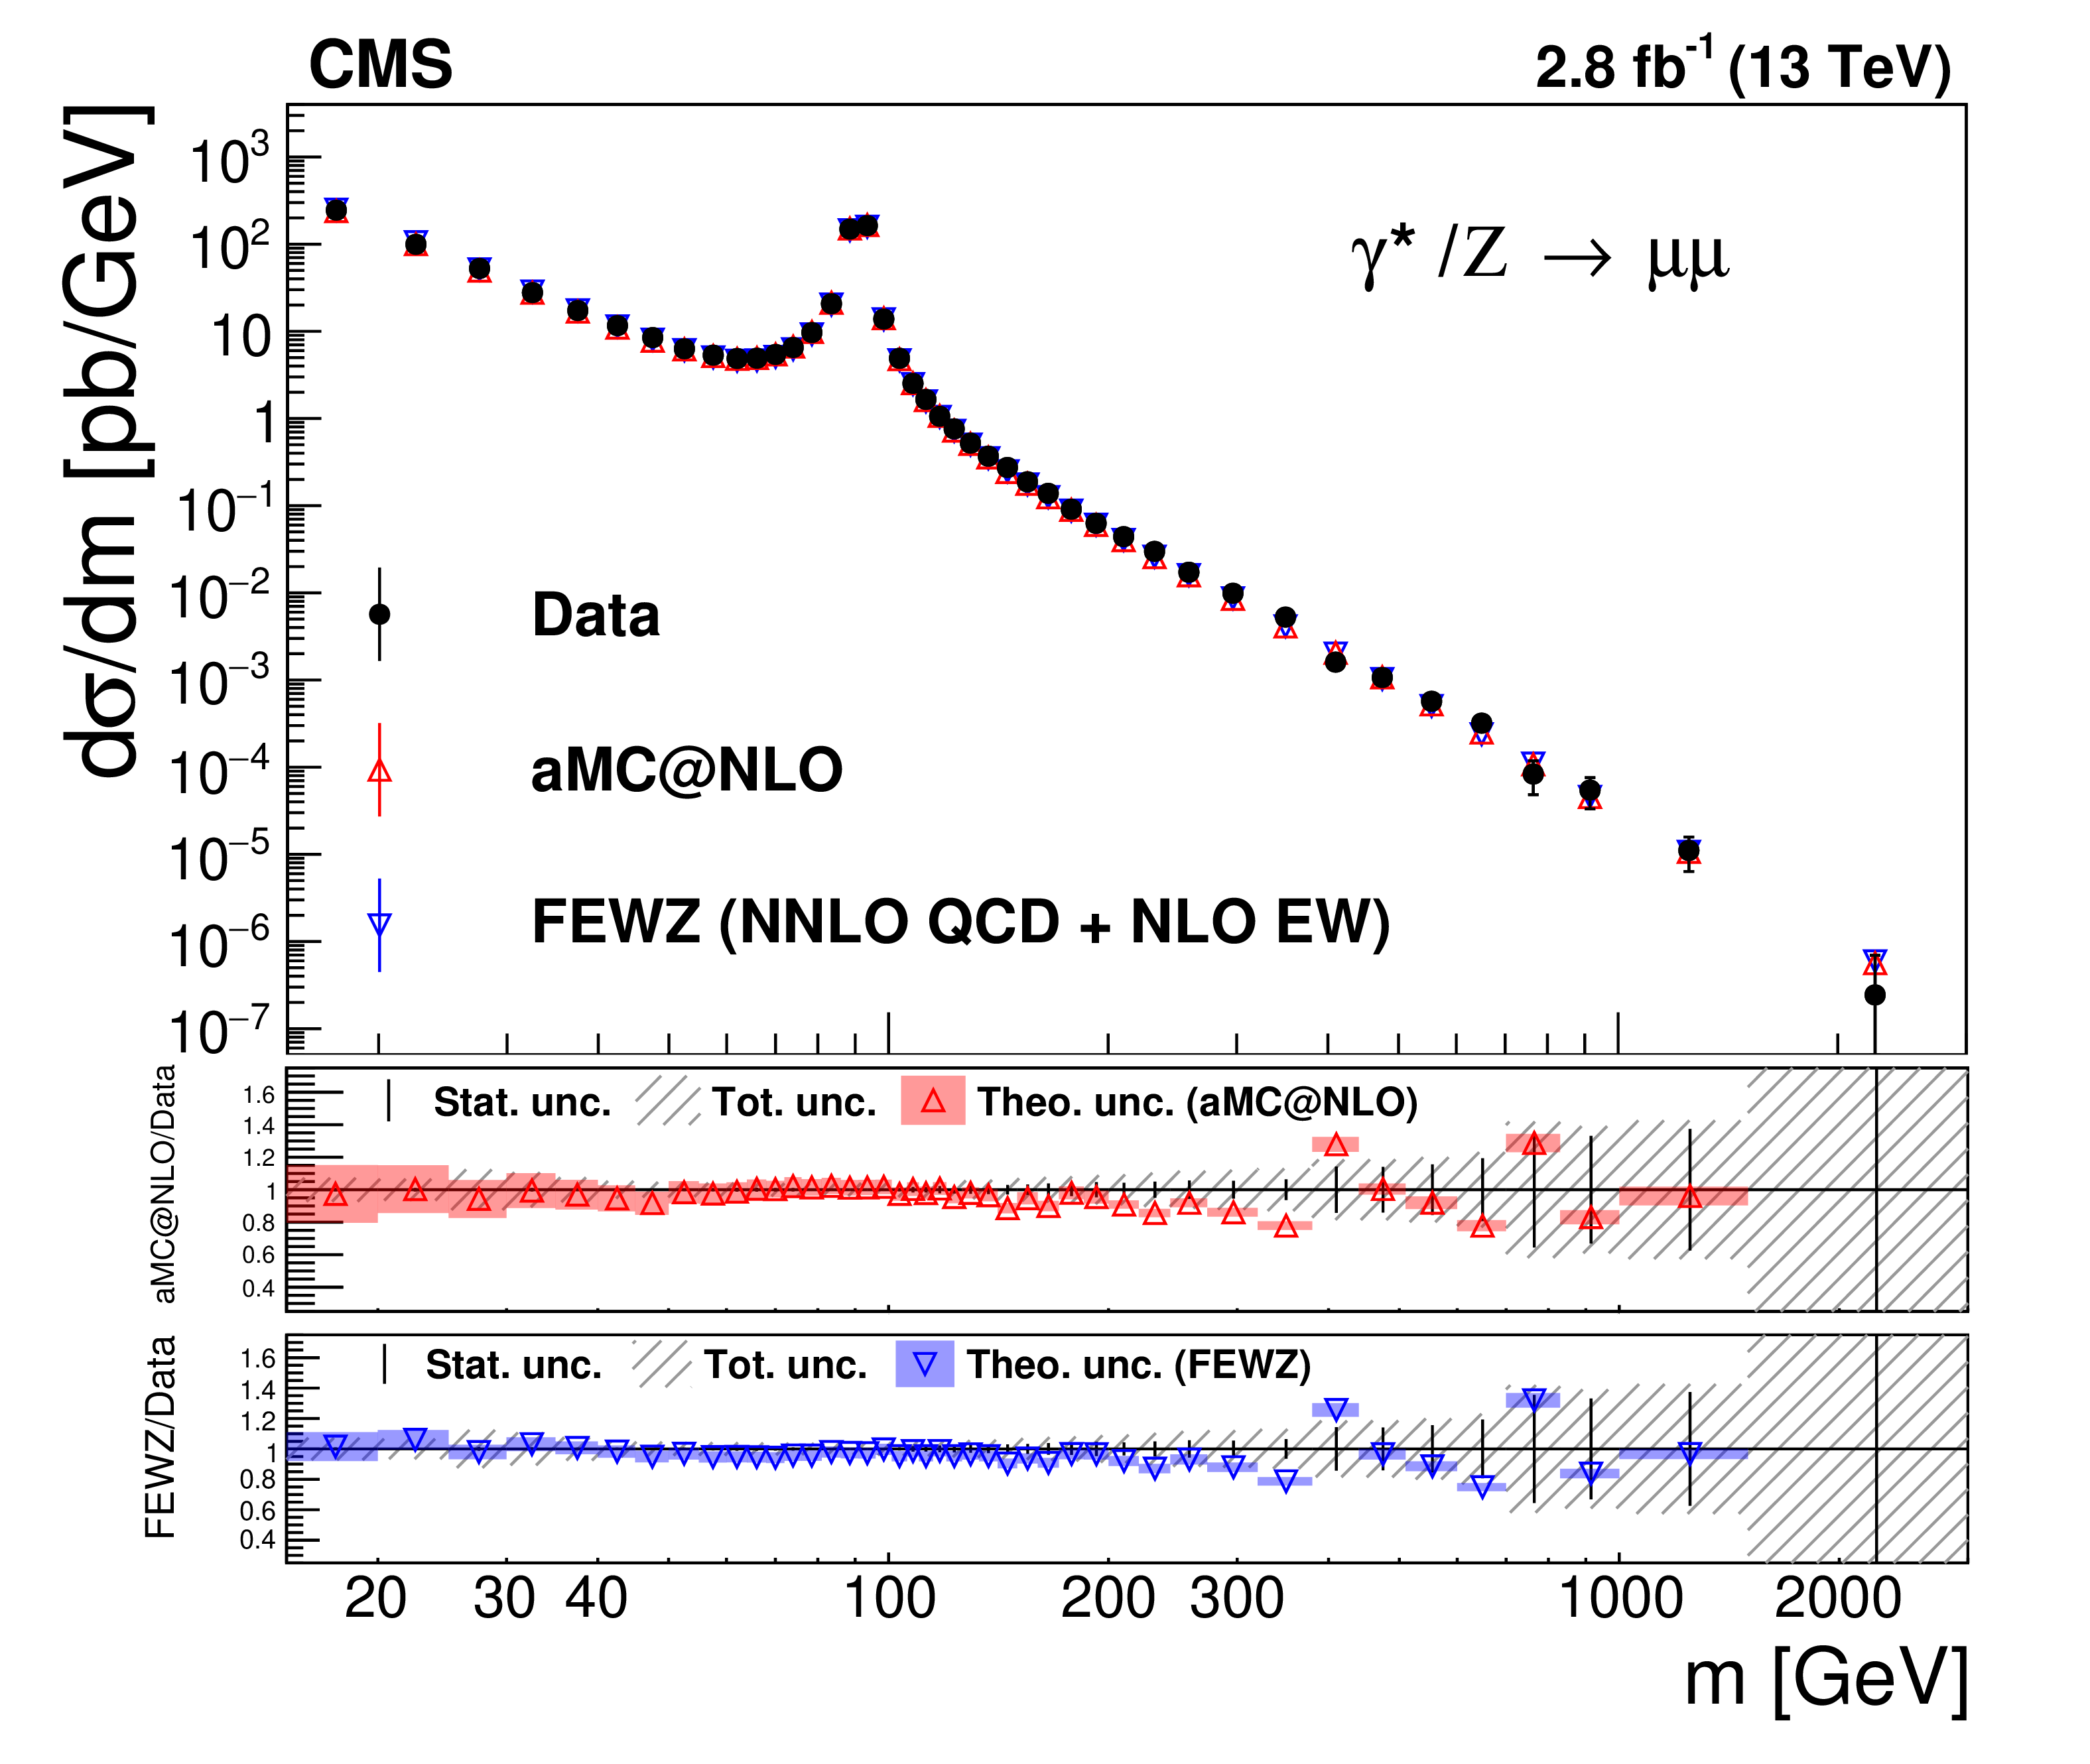
Figure 4-a:
The differential cross section as a function of the dimuon invariant mass, measured in the full phase space, with FSR correction applied. The spectra are compared with the NNLO theoretical prediction of FEWZ (blue) and the NLO prediction of MadGraph 5_aMC@NLO (red). The NNPDF3.0 PDF set is used in both cases. In the middle and lower panels, the coloured bands denote the theoretical uncertainty and the hatched bands denote the total uncertainty, which is the combination of statistical, systematic, and integrated luminosity components. |
png pdf |
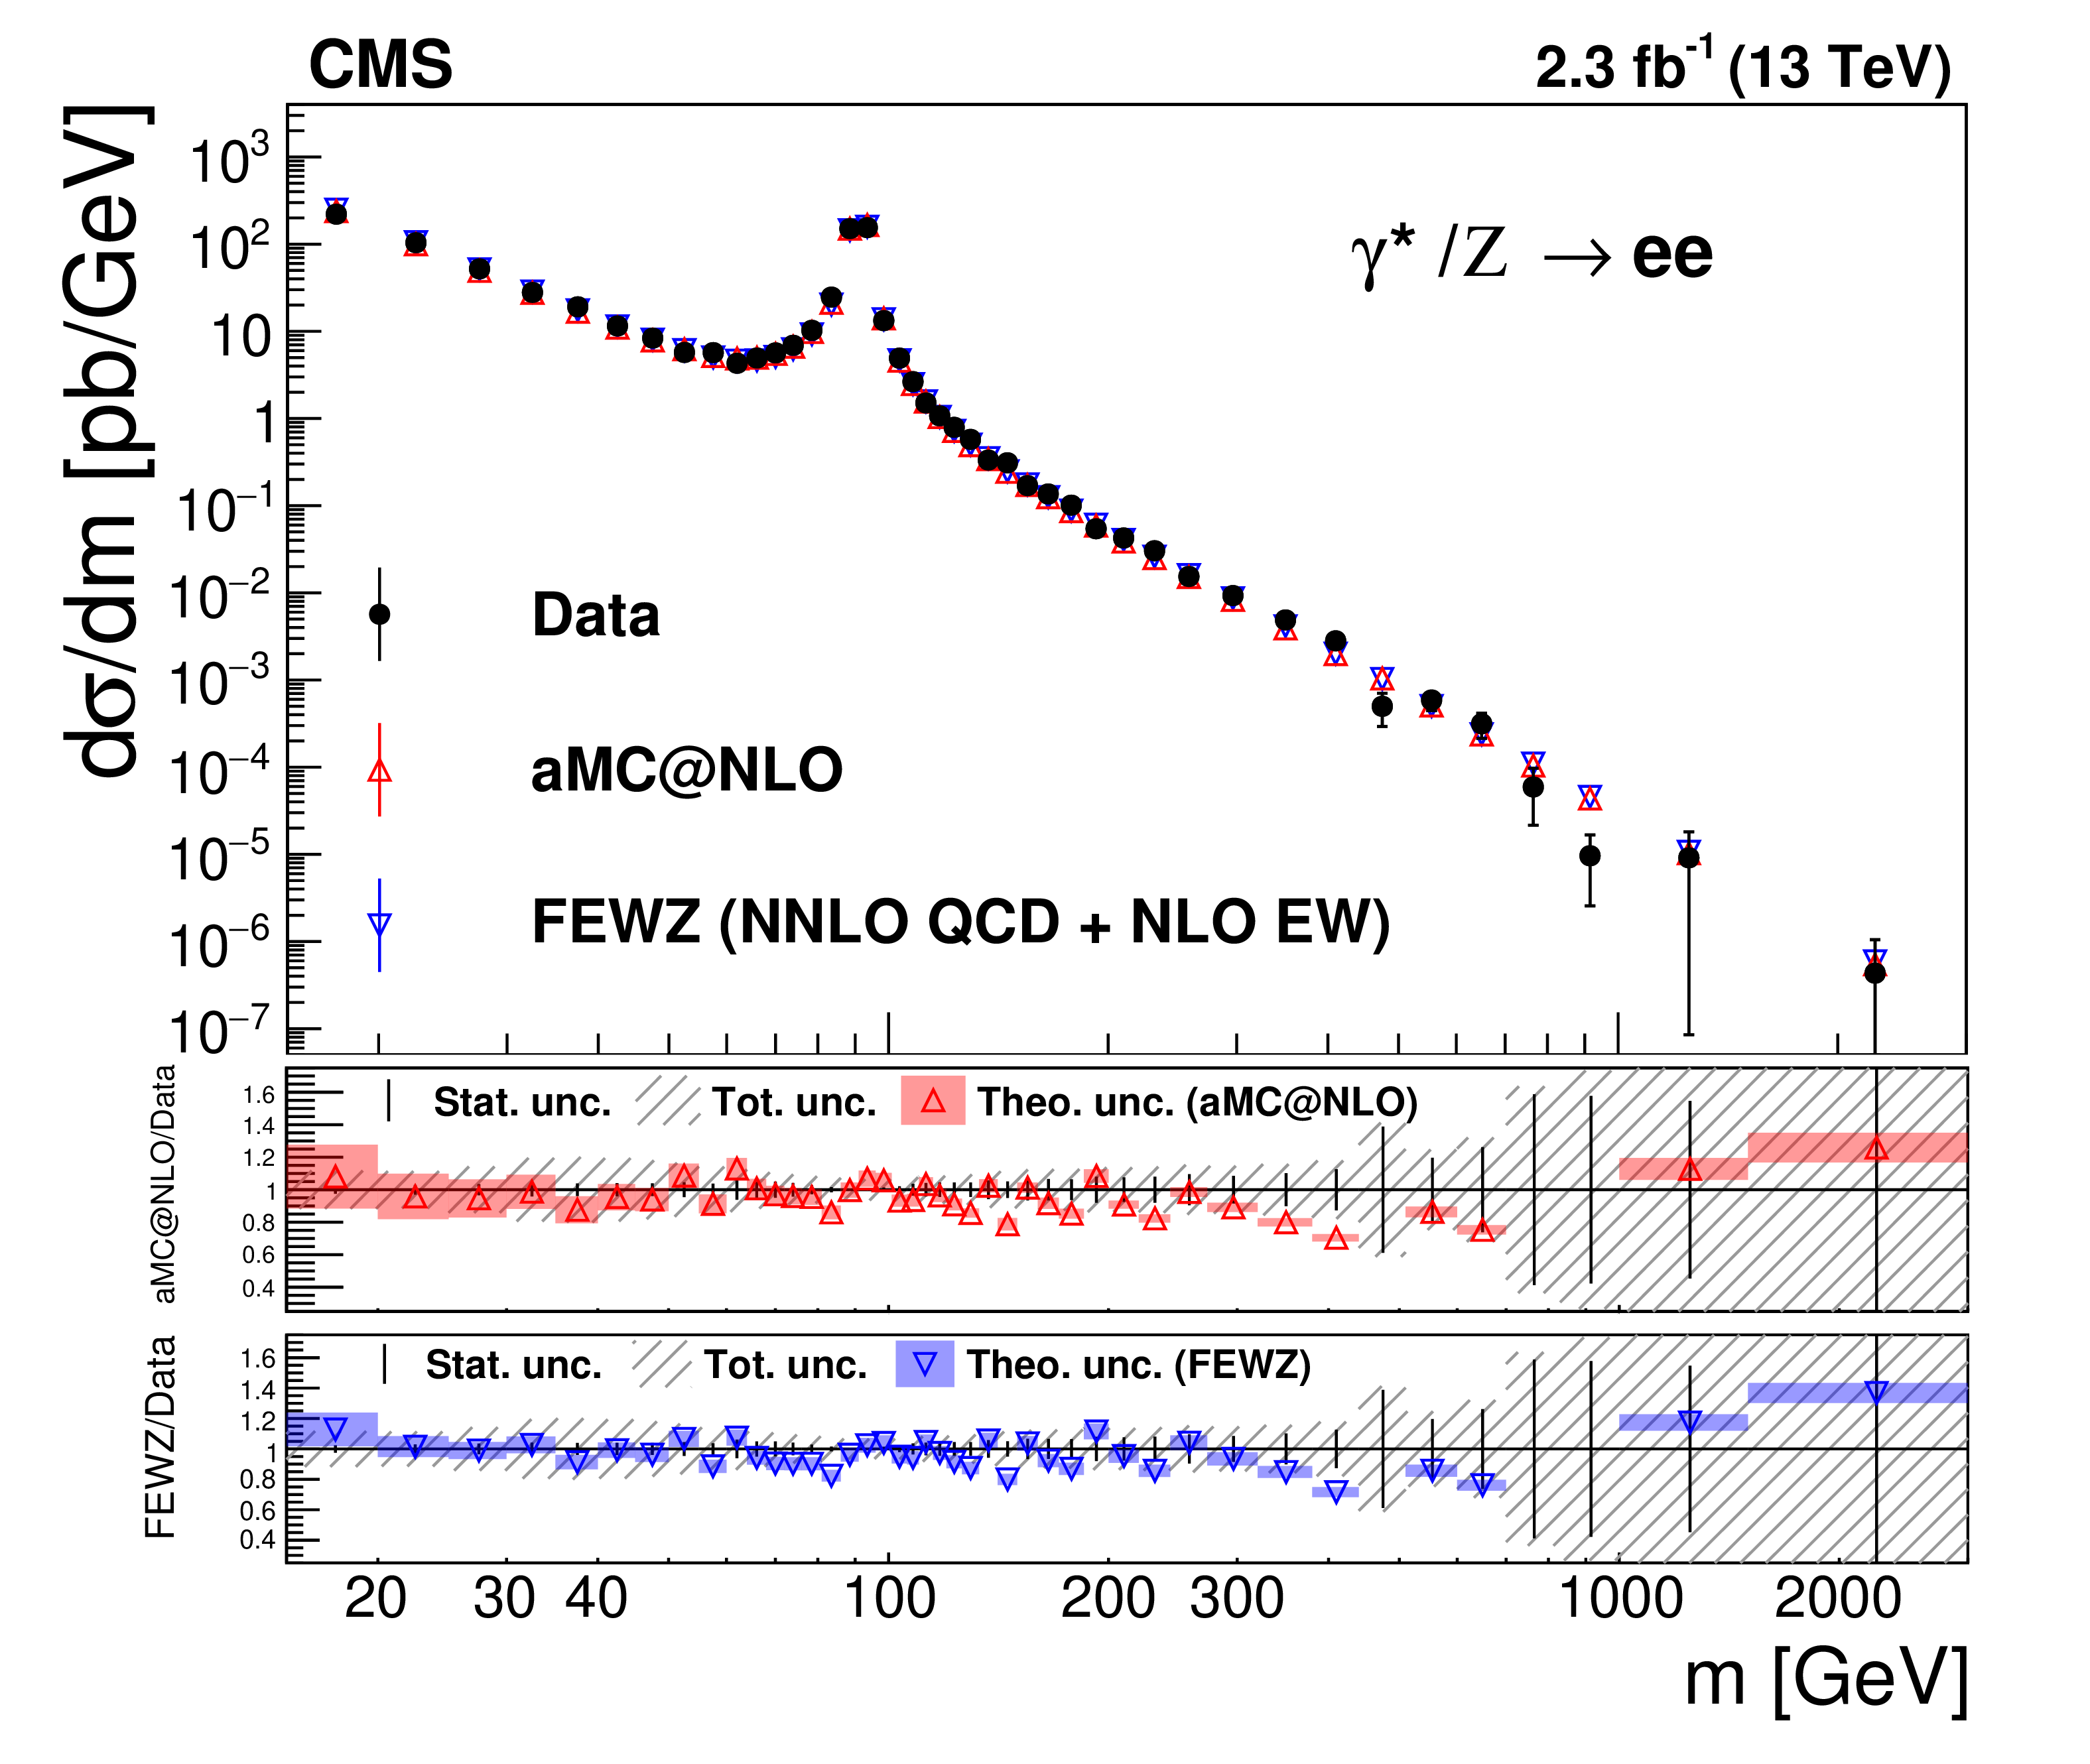
Figure 4-b:
The differential cross section as a function of the dielectron invariant mass, measured in the full phase space, with FSR correction applied. The spectra are compared with the NNLO theoretical prediction of FEWZ (blue) and the NLO prediction of MadGraph 5_aMC@NLO (red). The NNPDF3.0 PDF set is used in both cases. In the middle and lower panels, the coloured bands denote the theoretical uncertainty and the hatched bands denote the total uncertainty, which is the combination of statistical, systematic, and integrated luminosity components. |
png pdf |
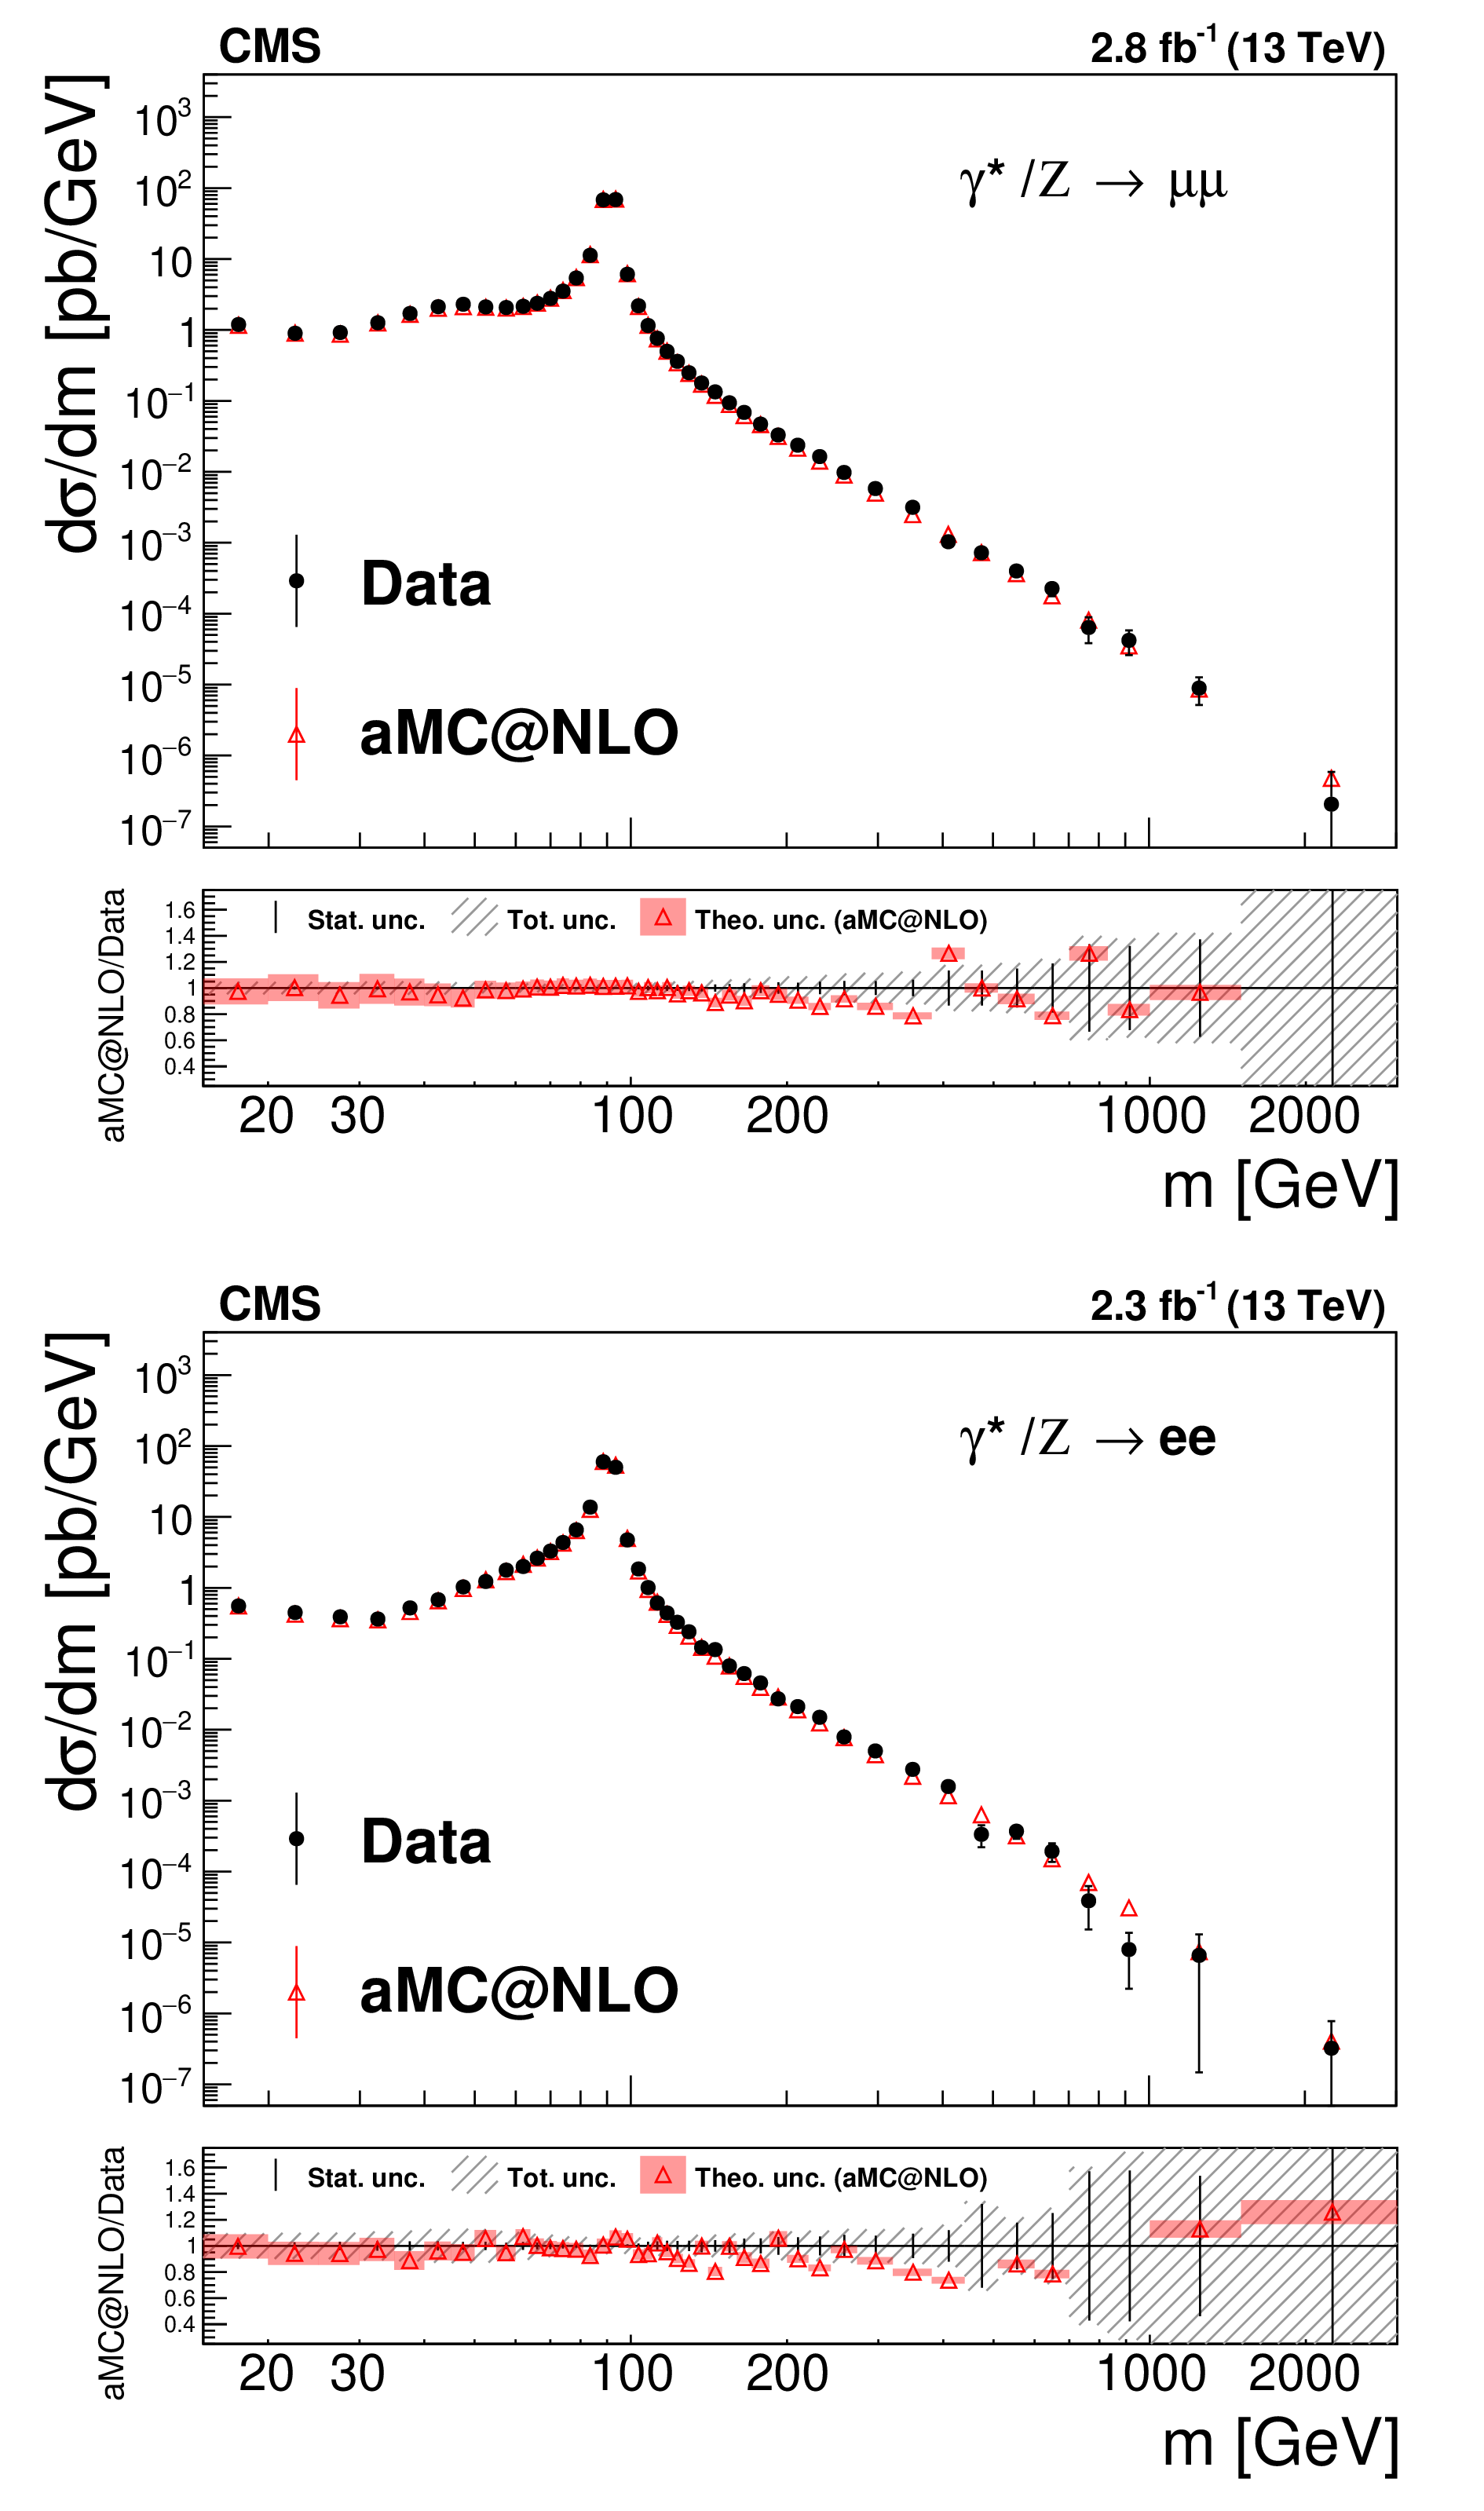
Figure 5:
Comparison between the measured fiducial cross section (with no FSR correction applied) and the NLO theoretical prediction using MadGraph 5_aMC@NLO in the dimuon (upper) and dielectron (lower) channels. In the bottom panels, the red band represents the theoretical uncertainty and the hatched band represents the total uncertainty, which is the combination of the statistical, systematic, and integrated luminosity components. |
png pdf |
Figure 5-a:
Comparison between the measured fiducial cross section (with no FSR correction applied) and the NLO theoretical prediction using MadGraph 5_aMC@NLO in the dimuon channel. In the bottom panel, the red band represents the theoretical uncertainty and the hatched band represents the total uncertainty, which is the combination of the statistical, systematic, and integrated luminosity components. |
png pdf |
Figure 5-b:
Comparison between the measured fiducial cross section (with no FSR correction applied) and the NLO theoretical prediction using MadGraph 5_aMC@NLO in the dielectron channel. In the bottom panel, the red band represents the theoretical uncertainty and the hatched band represents the total uncertainty, which is the combination of the statistical, systematic, and integrated luminosity components. |
png pdf |
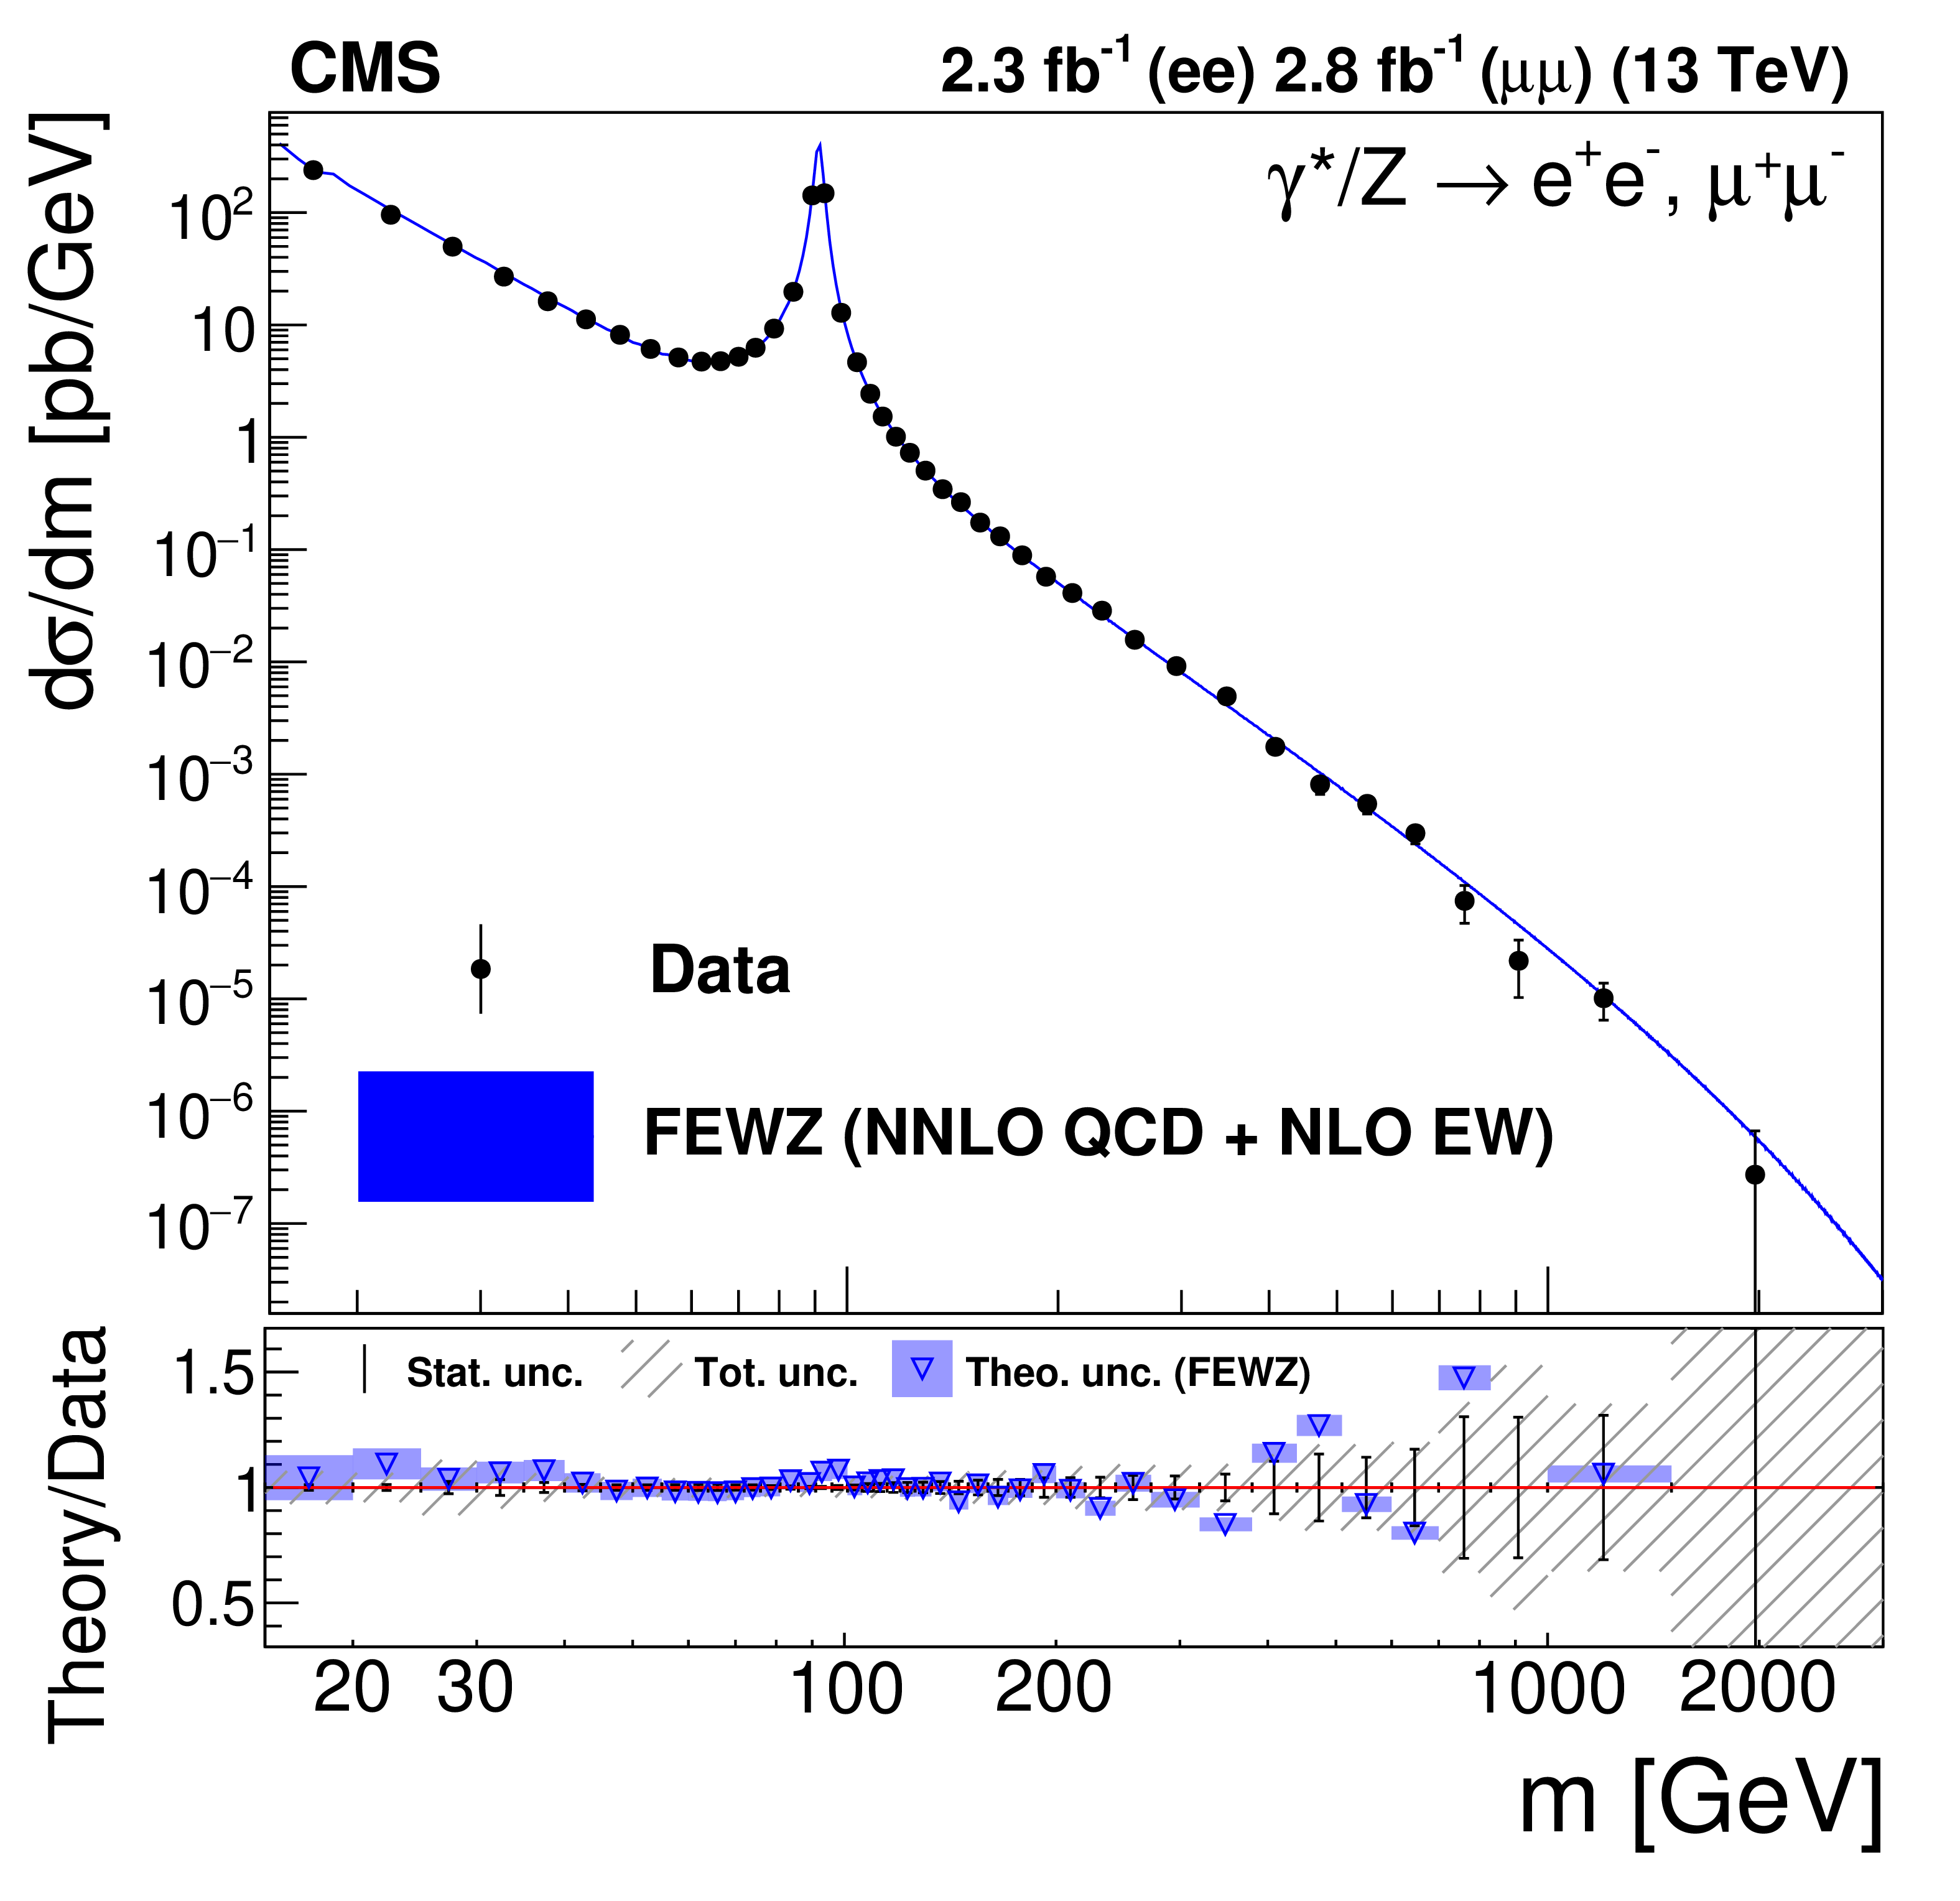
Figure 6:
The differential DY cross section measured for the combination of the two channels and as predicted by the NNLO theoretical calculation of FEWZ in the full phase space. The ratio between the data and the theoretical prediction is presented in the bottom panel. The coloured boxes represent the theoretical uncertainties. |
png pdf |
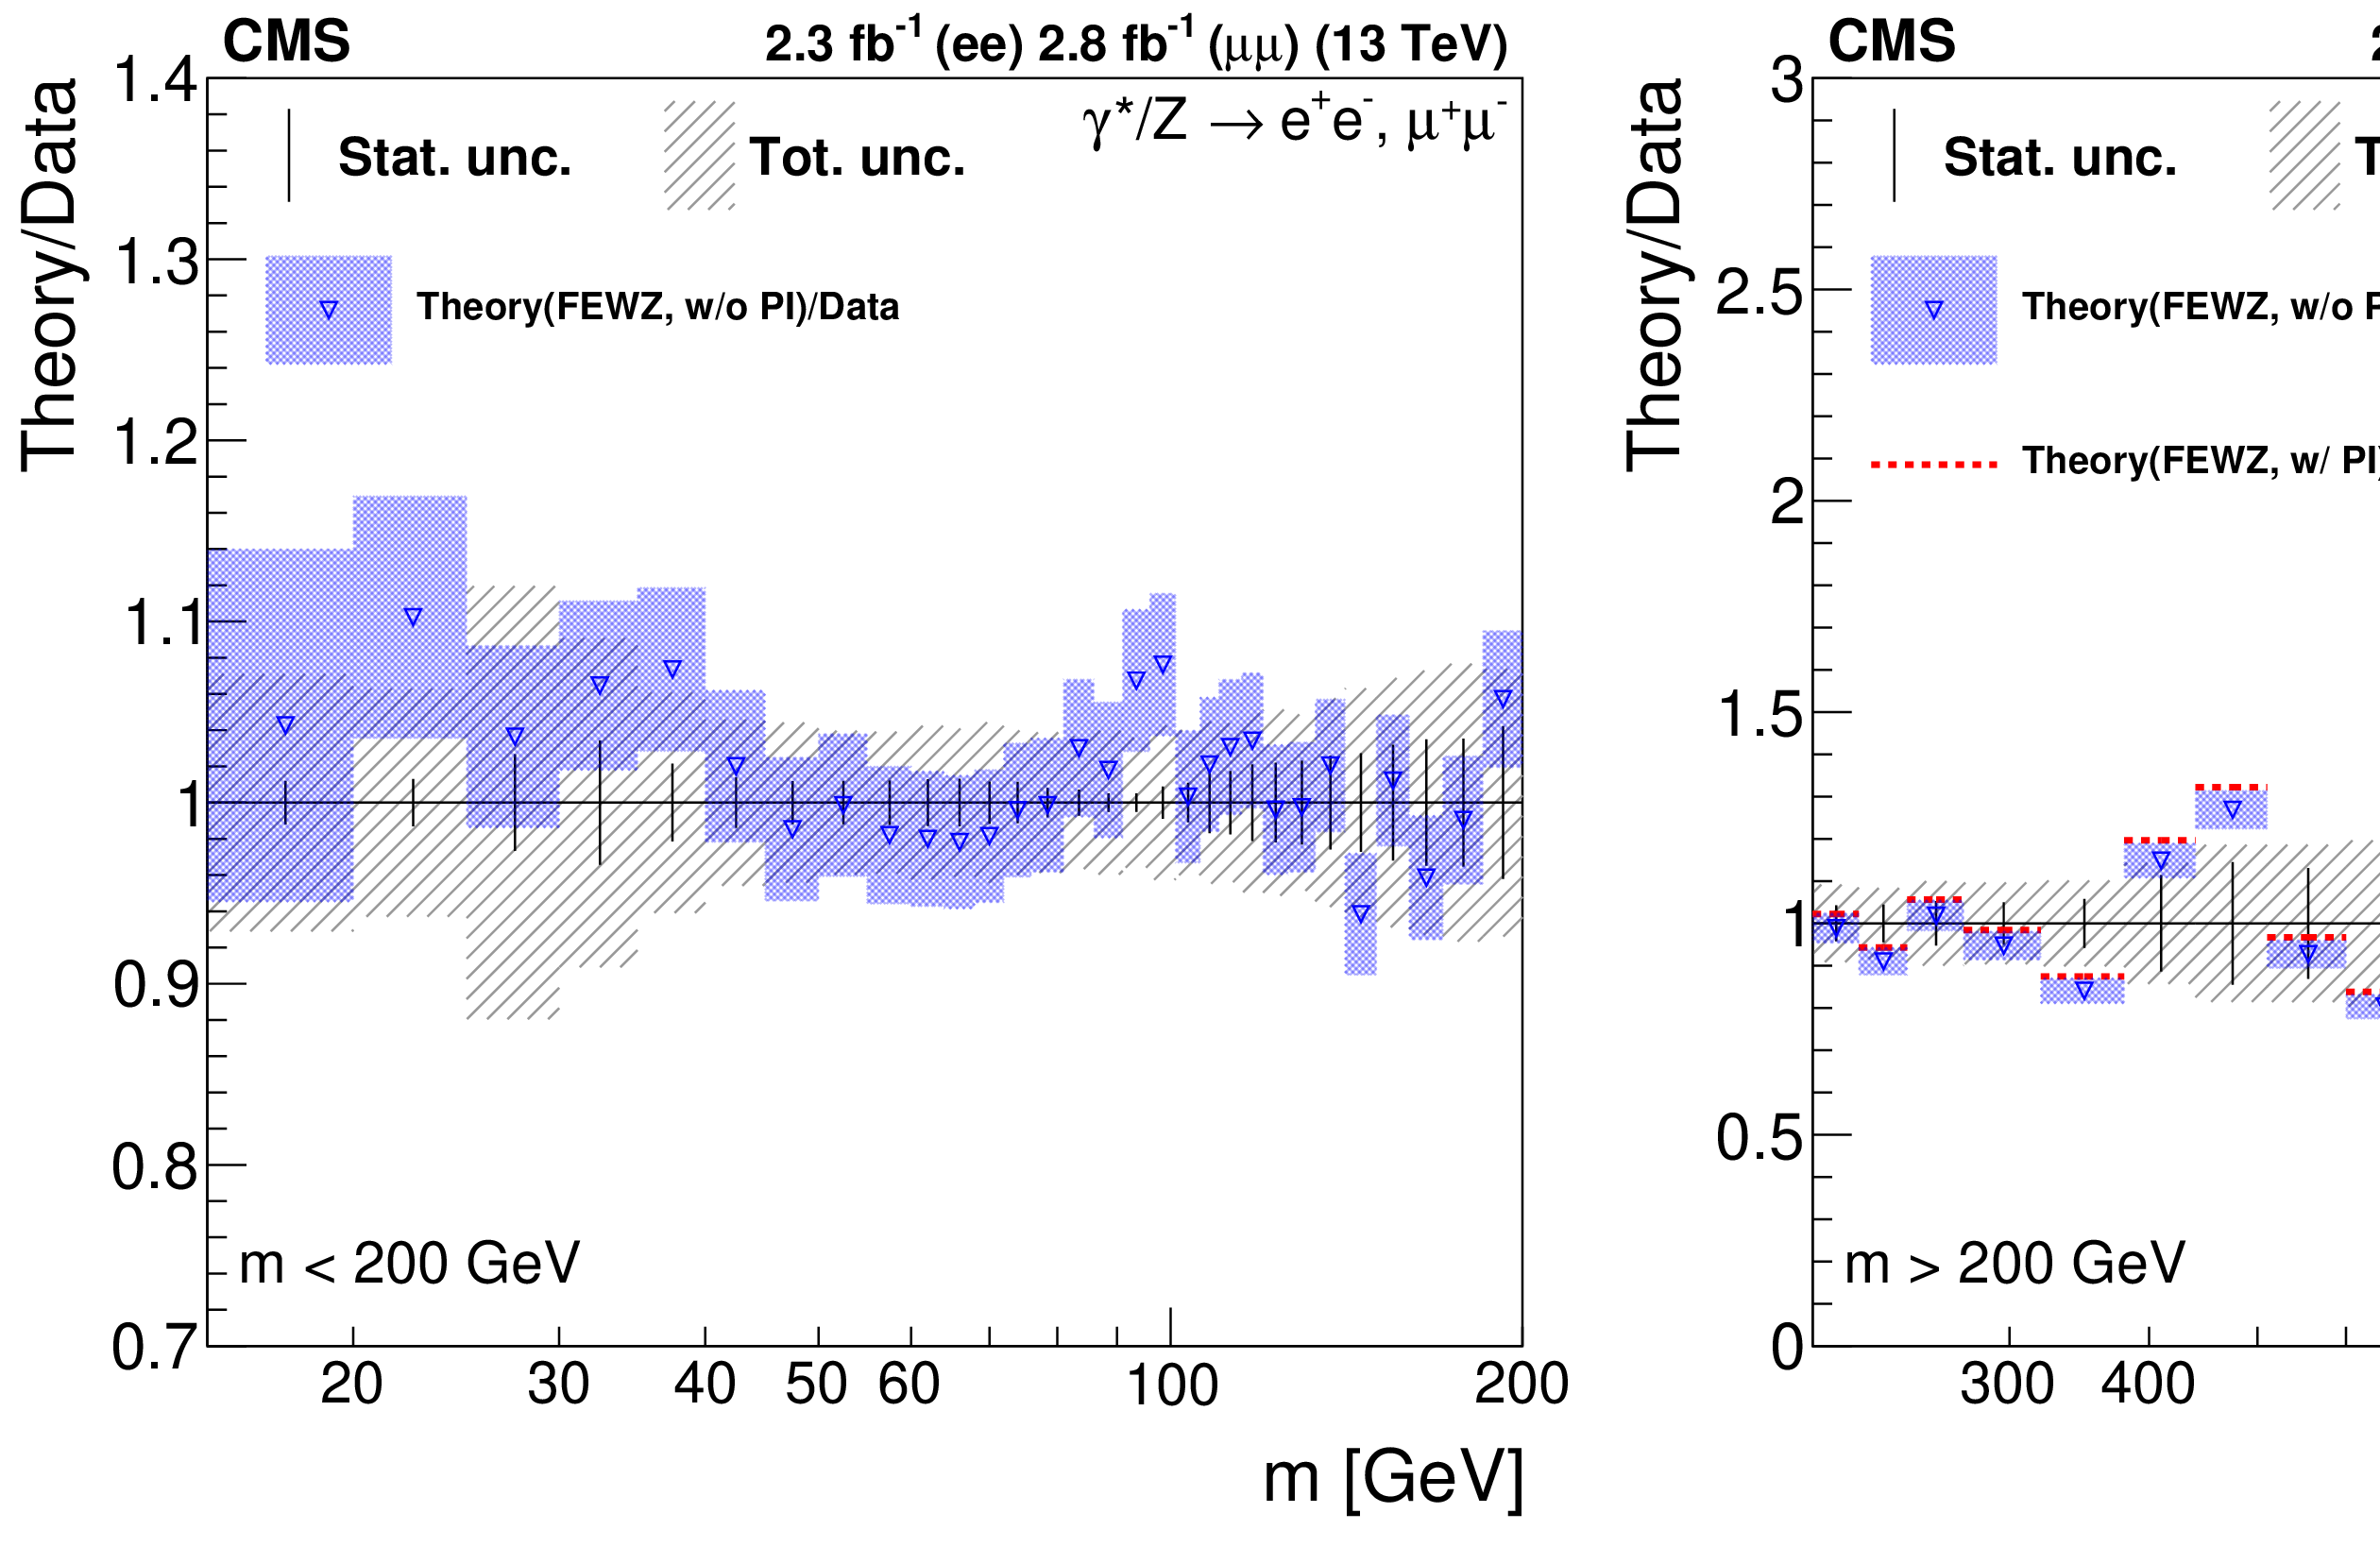
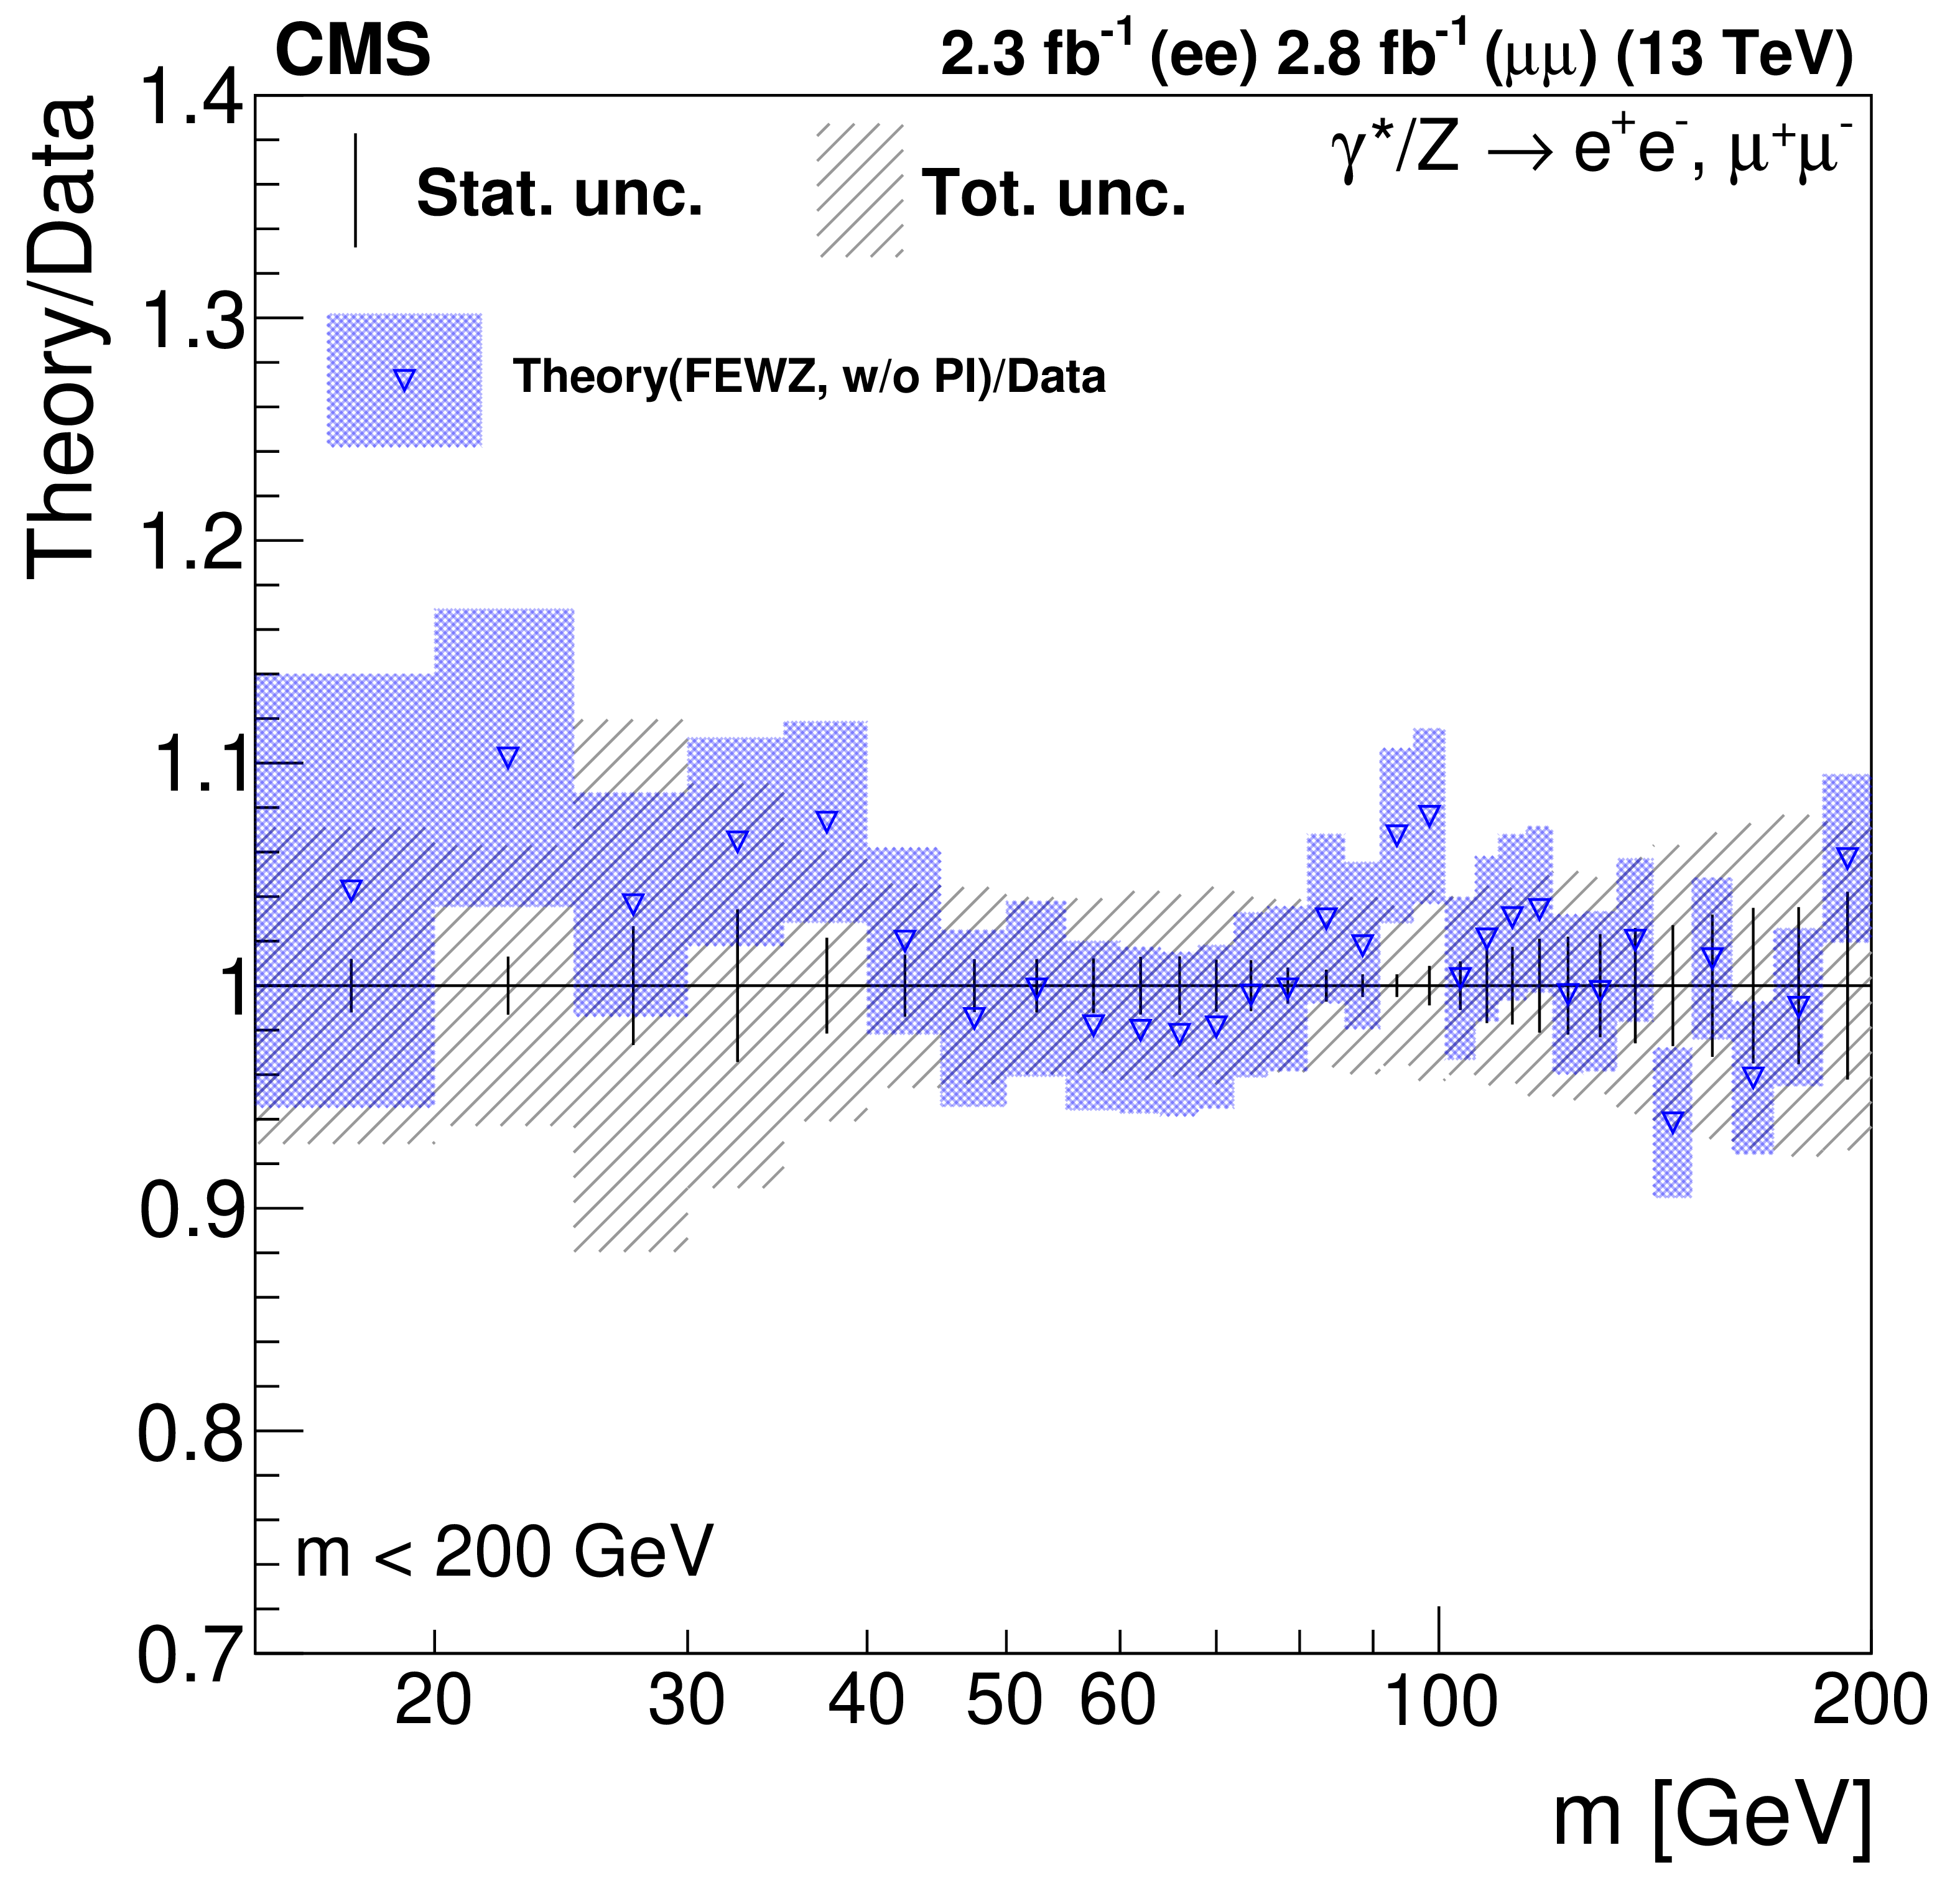
Figure 7:
Magnified view of the ratio of the NNLO theoretical prediction from FEWZ to data for the combined differential cross sections in two different mass ranges: $m < $ 200 GeV (top) and $m > $ 200 GeV (bottom). The blue bands represent the theoretical uncertainty on the ratio. The bottom plot also shows the ratio with the photon-induced contribution (red dashed lines), which has a sizeable effect in the high-mass region. |
png pdf |
Figure 7-a:
Magnified view of the ratio of the NNLO theoretical prediction from FEWZ to data for the combined differential cross sections in the $m < $ 200 GeV mass range. The blue bands represent the theoretical uncertainty on the ratio. The bottom plot also shows the ratio with the photon-induced contribution (red dashed lines), which has a sizeable effect in the high-mass region. |

png pdf |
Figure 7-b:
Magnified view of the ratio of the NNLO theoretical prediction from FEWZ to data for the combined differential cross sections in the $m > $ 200 GeV mass range. The blue bands represent the theoretical uncertainty on the ratio. The bottom plot also shows the ratio with the photon-induced contribution (red dashed lines), which has a sizeable effect in the high-mass region. |
| Tables | |
png pdf |
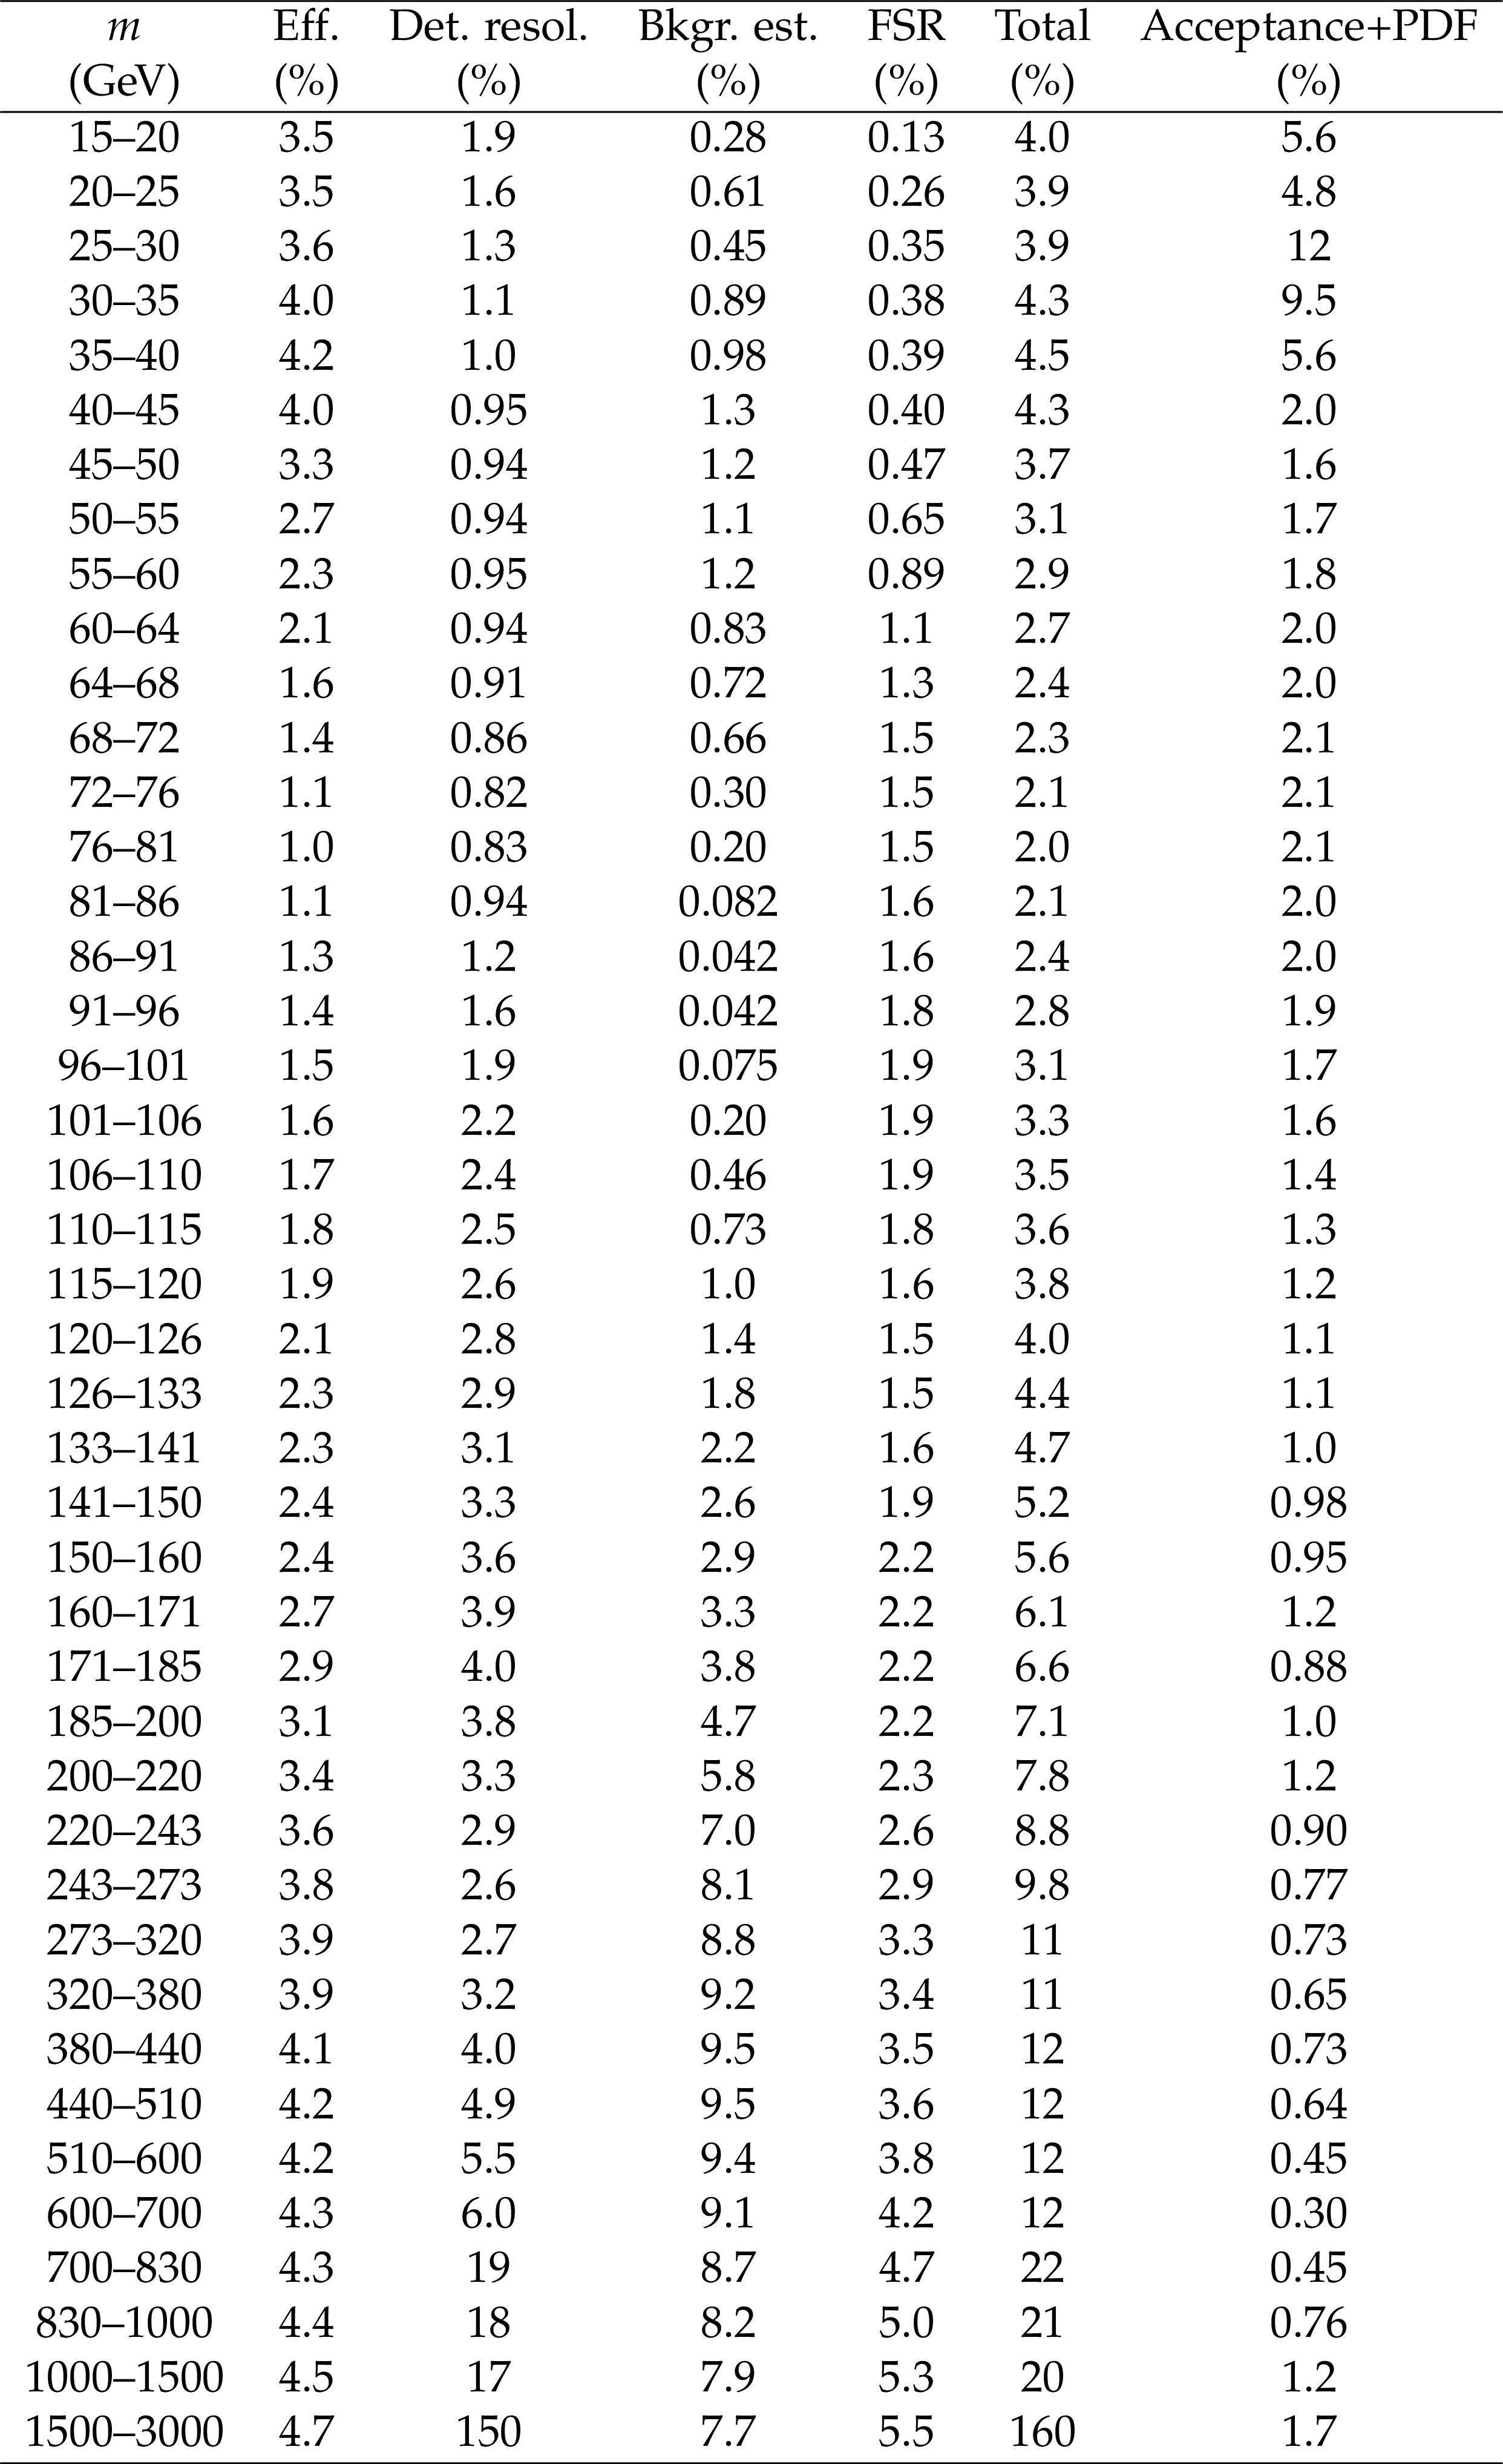
Table 1:
Summary of the systematic uncertainties (%) for the $ {\mathrm {d}}\sigma / {\mathrm {d}}{m}$ (pb/GeV) measurement in the dimuon channel. The column labelled "Total'' corresponds to the quadratic sum of all the experimental sources, except for that Acceptance+PDF. |
png pdf |
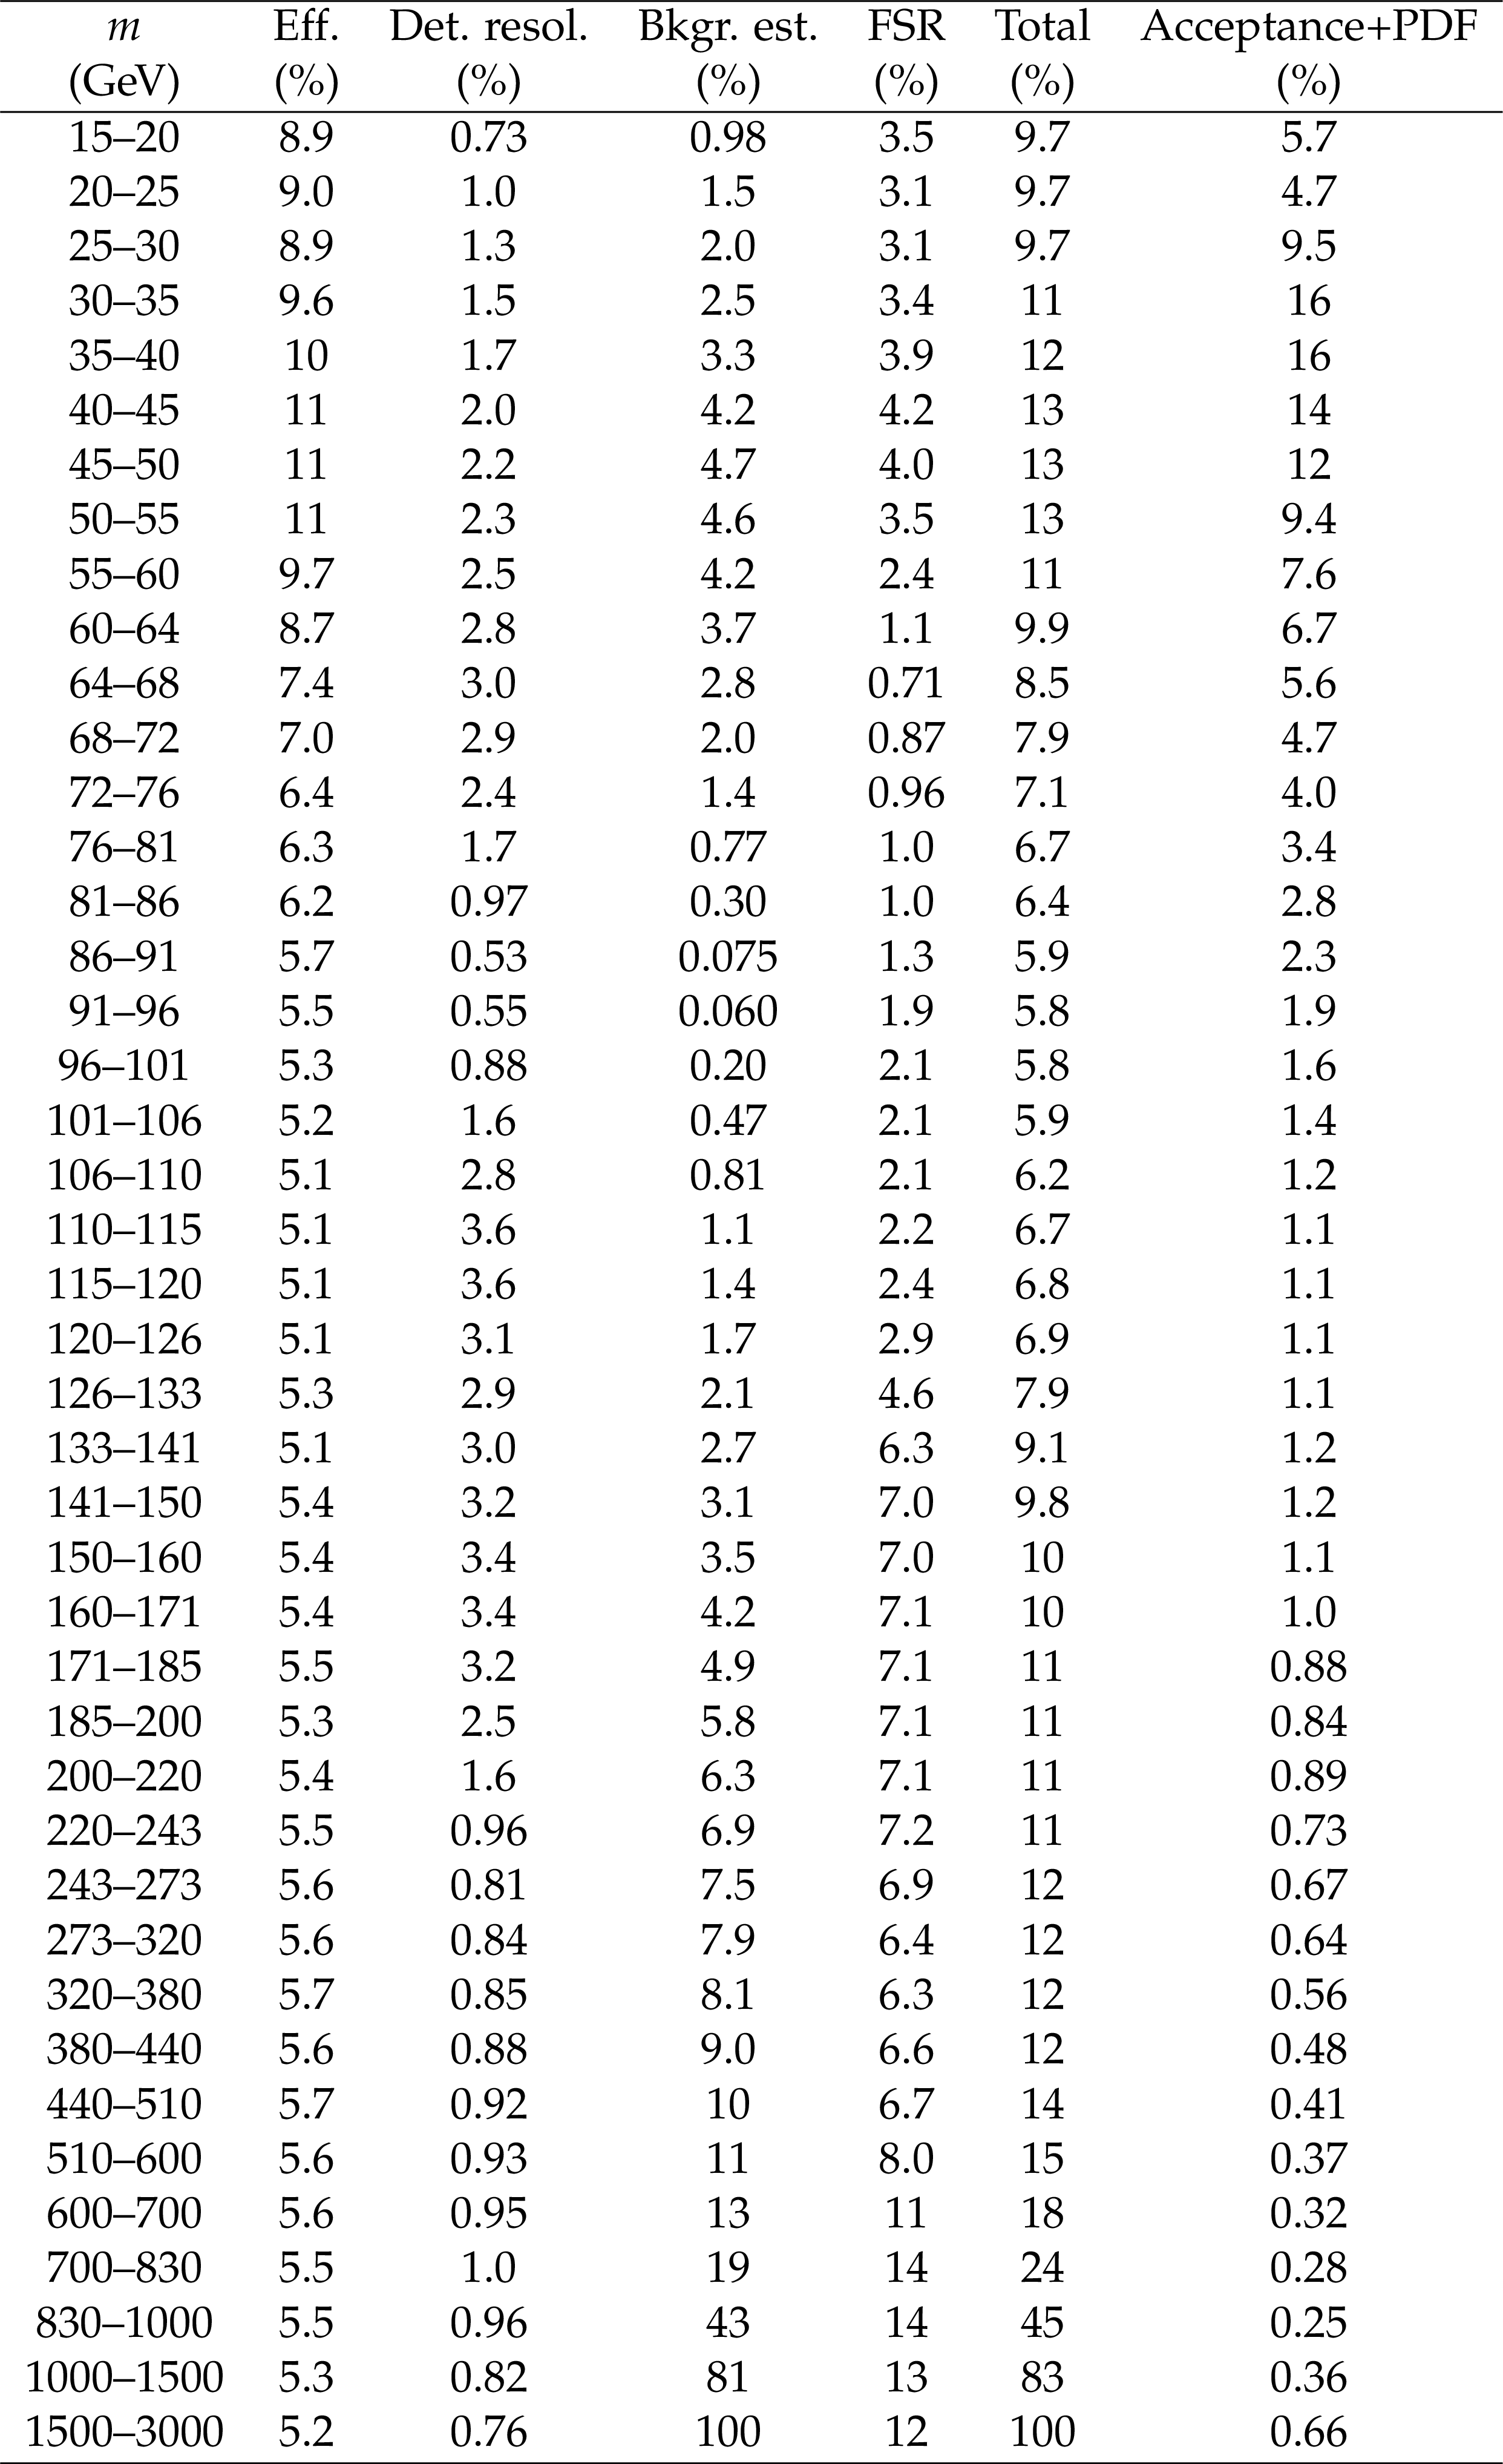
Table 2:
Summary of the systematic uncertainties (%) for the $ {\mathrm {d}}\sigma / {\mathrm {d}}{m}$ (pb/GeV) measurement in the dielectron channel. The column labelled "Total'' corresponds to the quadratic sum of all the experimental sources, except for that Acceptance+PDF. |

png pdf |
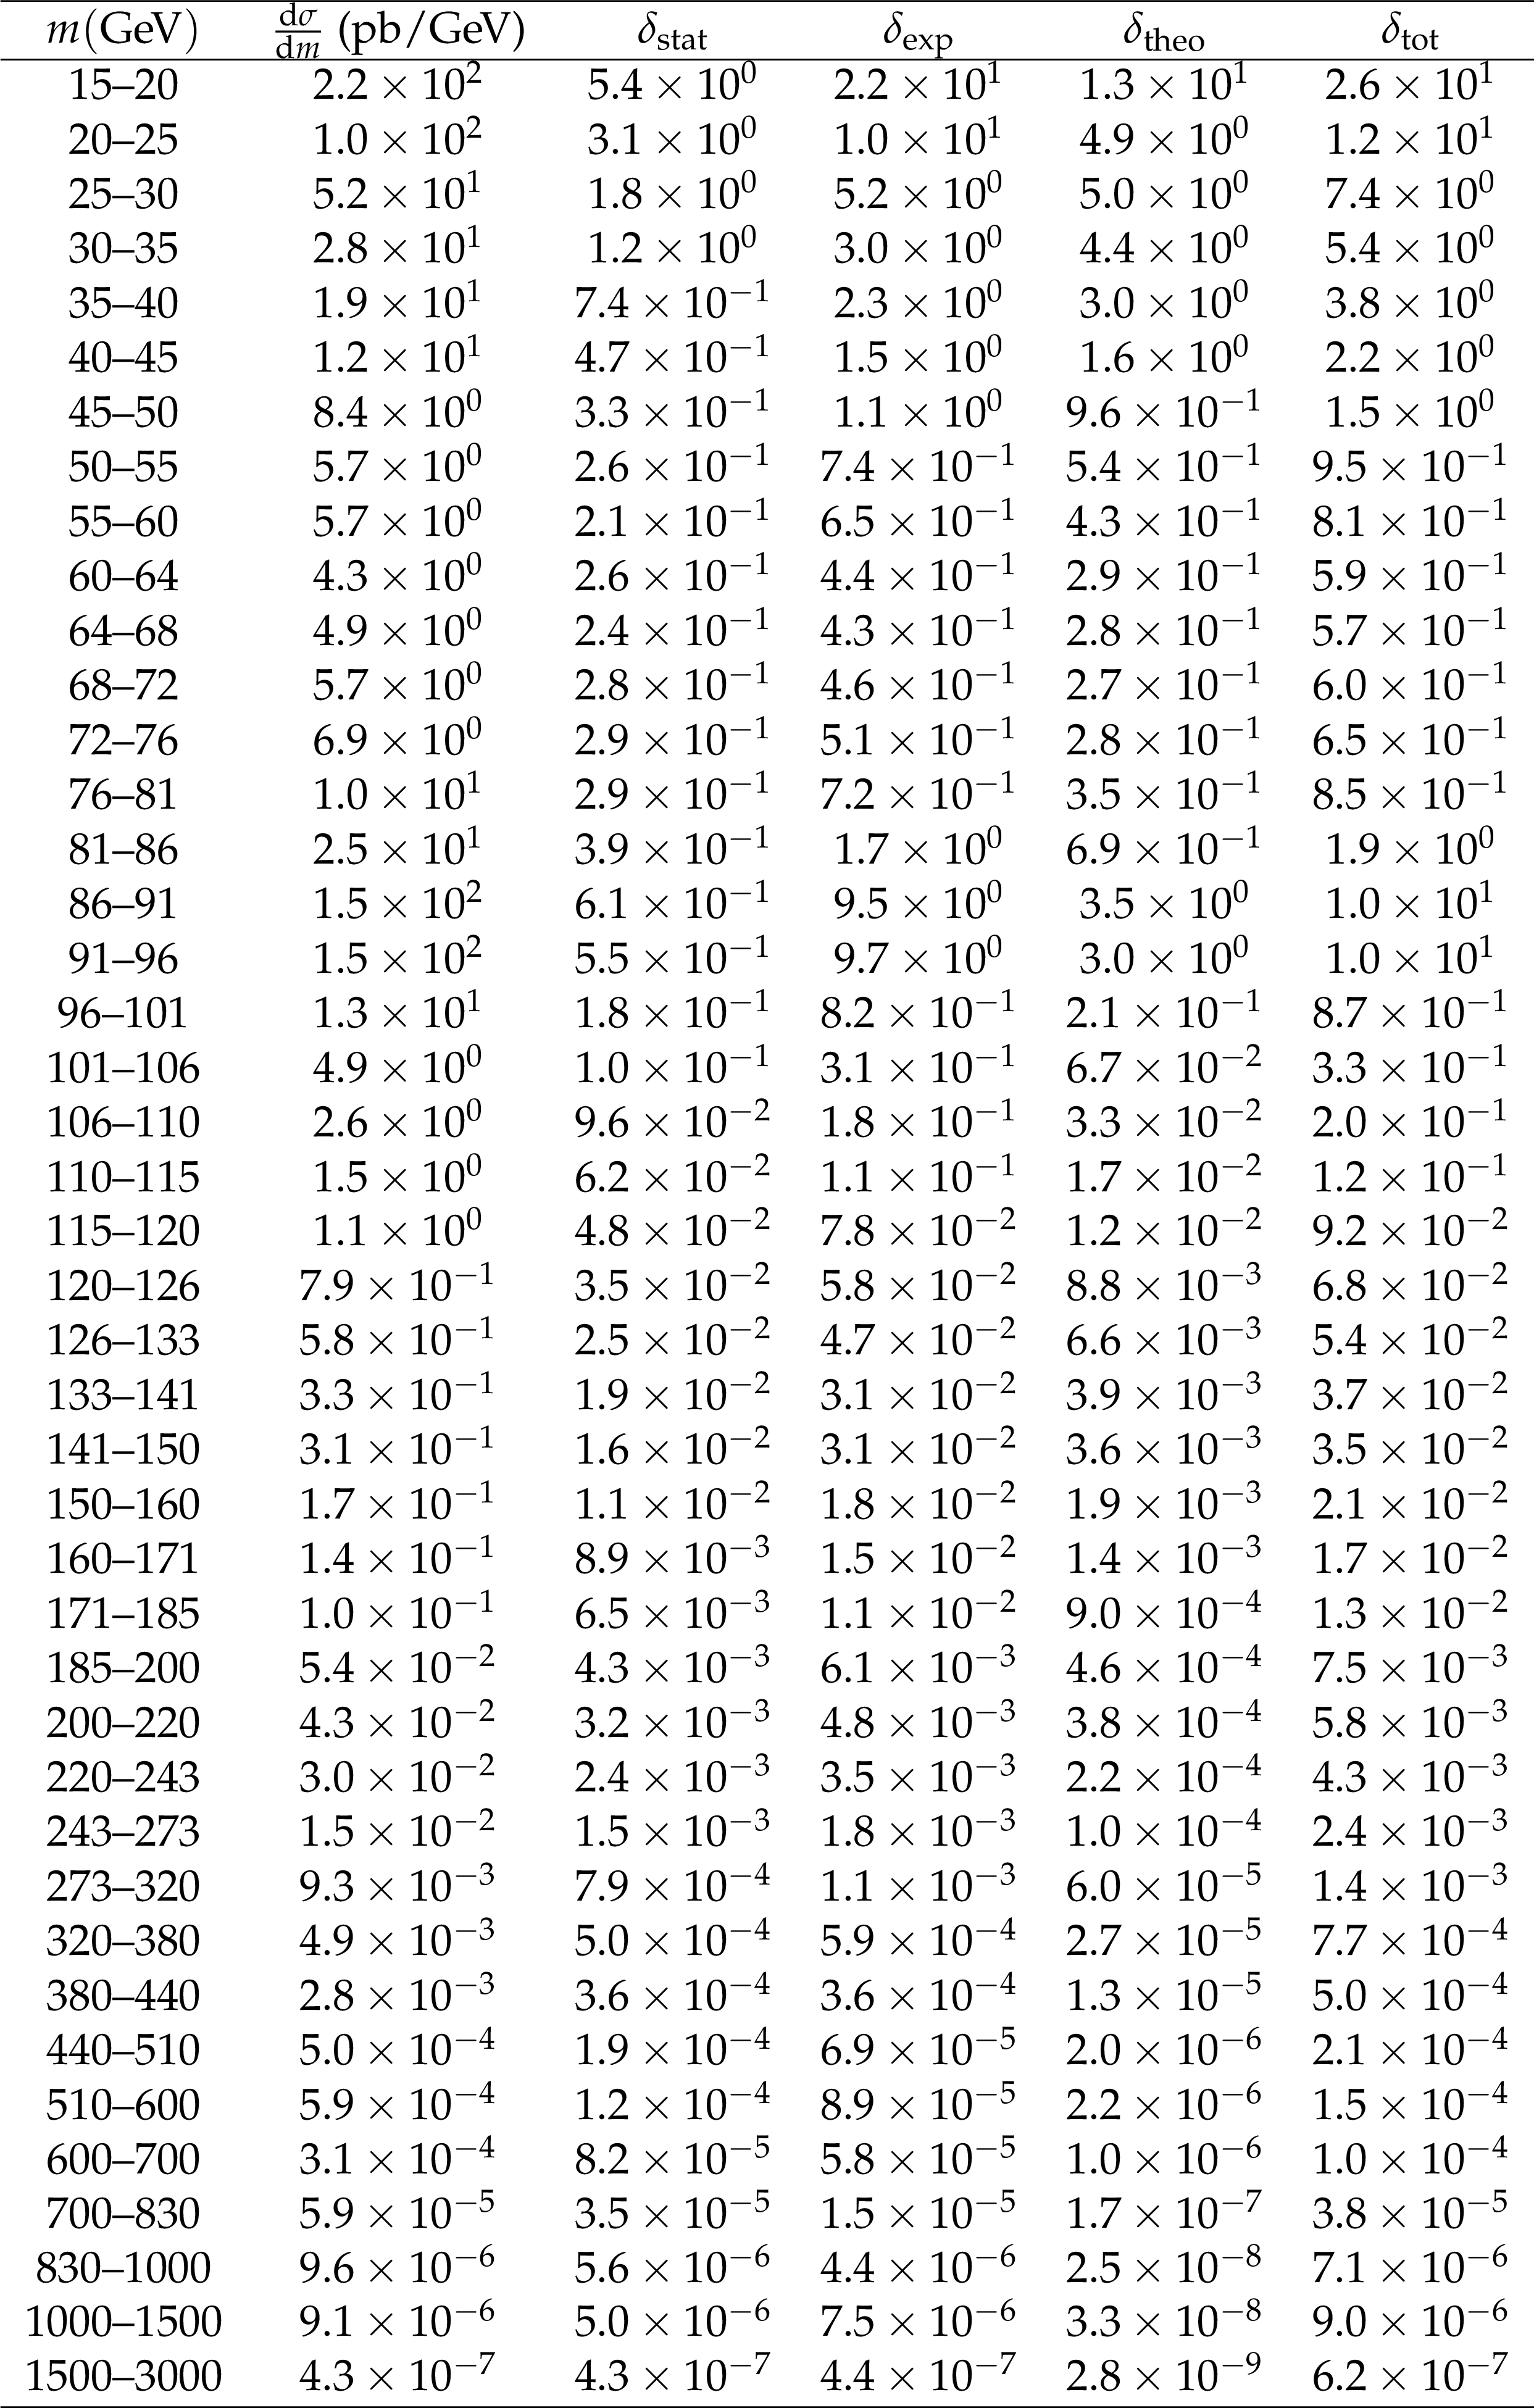
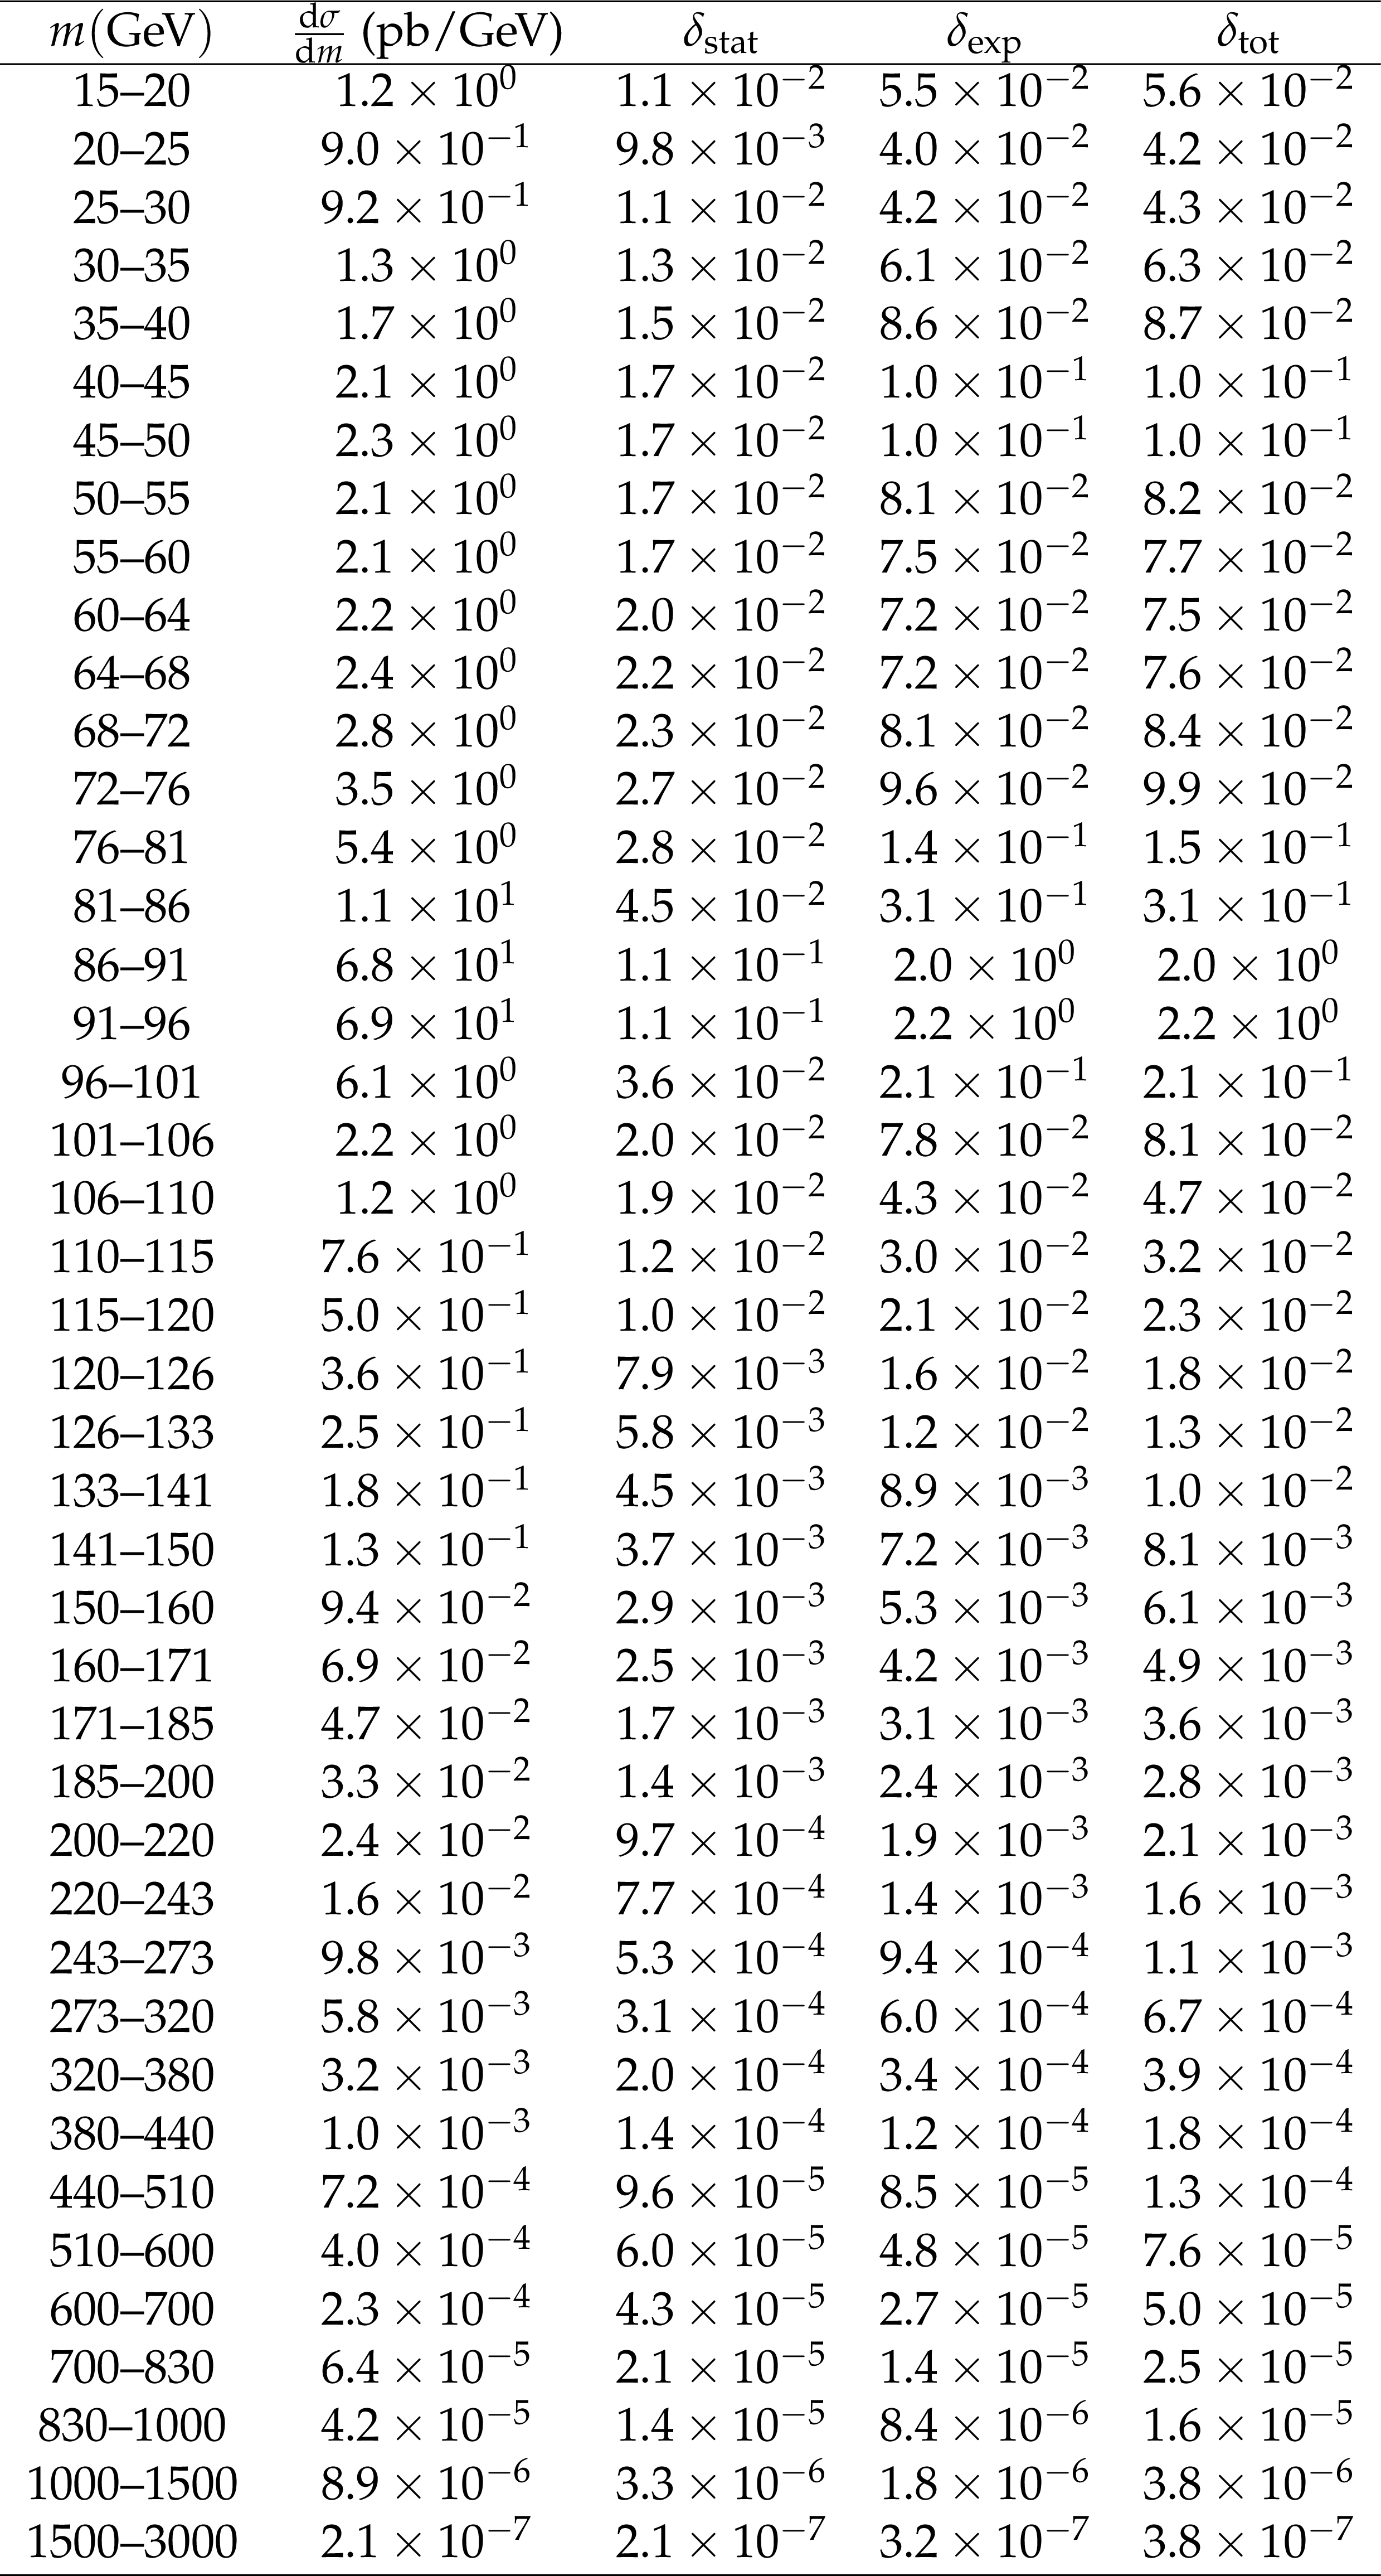
Table 3:
Summary of the measured values of $ {\mathrm {d}}\sigma / {\mathrm {d}}{m}$ (pb/GeV) in the dimuon channel with the statistical ($\delta _{\text {stat}}$), experimental ($\delta _{\text {exp}}$) and theoretical ($\delta _{\text {theo}}$) uncertainties, respectively. Here, $\delta _{\text {tot}}$ is the quadratic sum of the three components. |
png pdf |
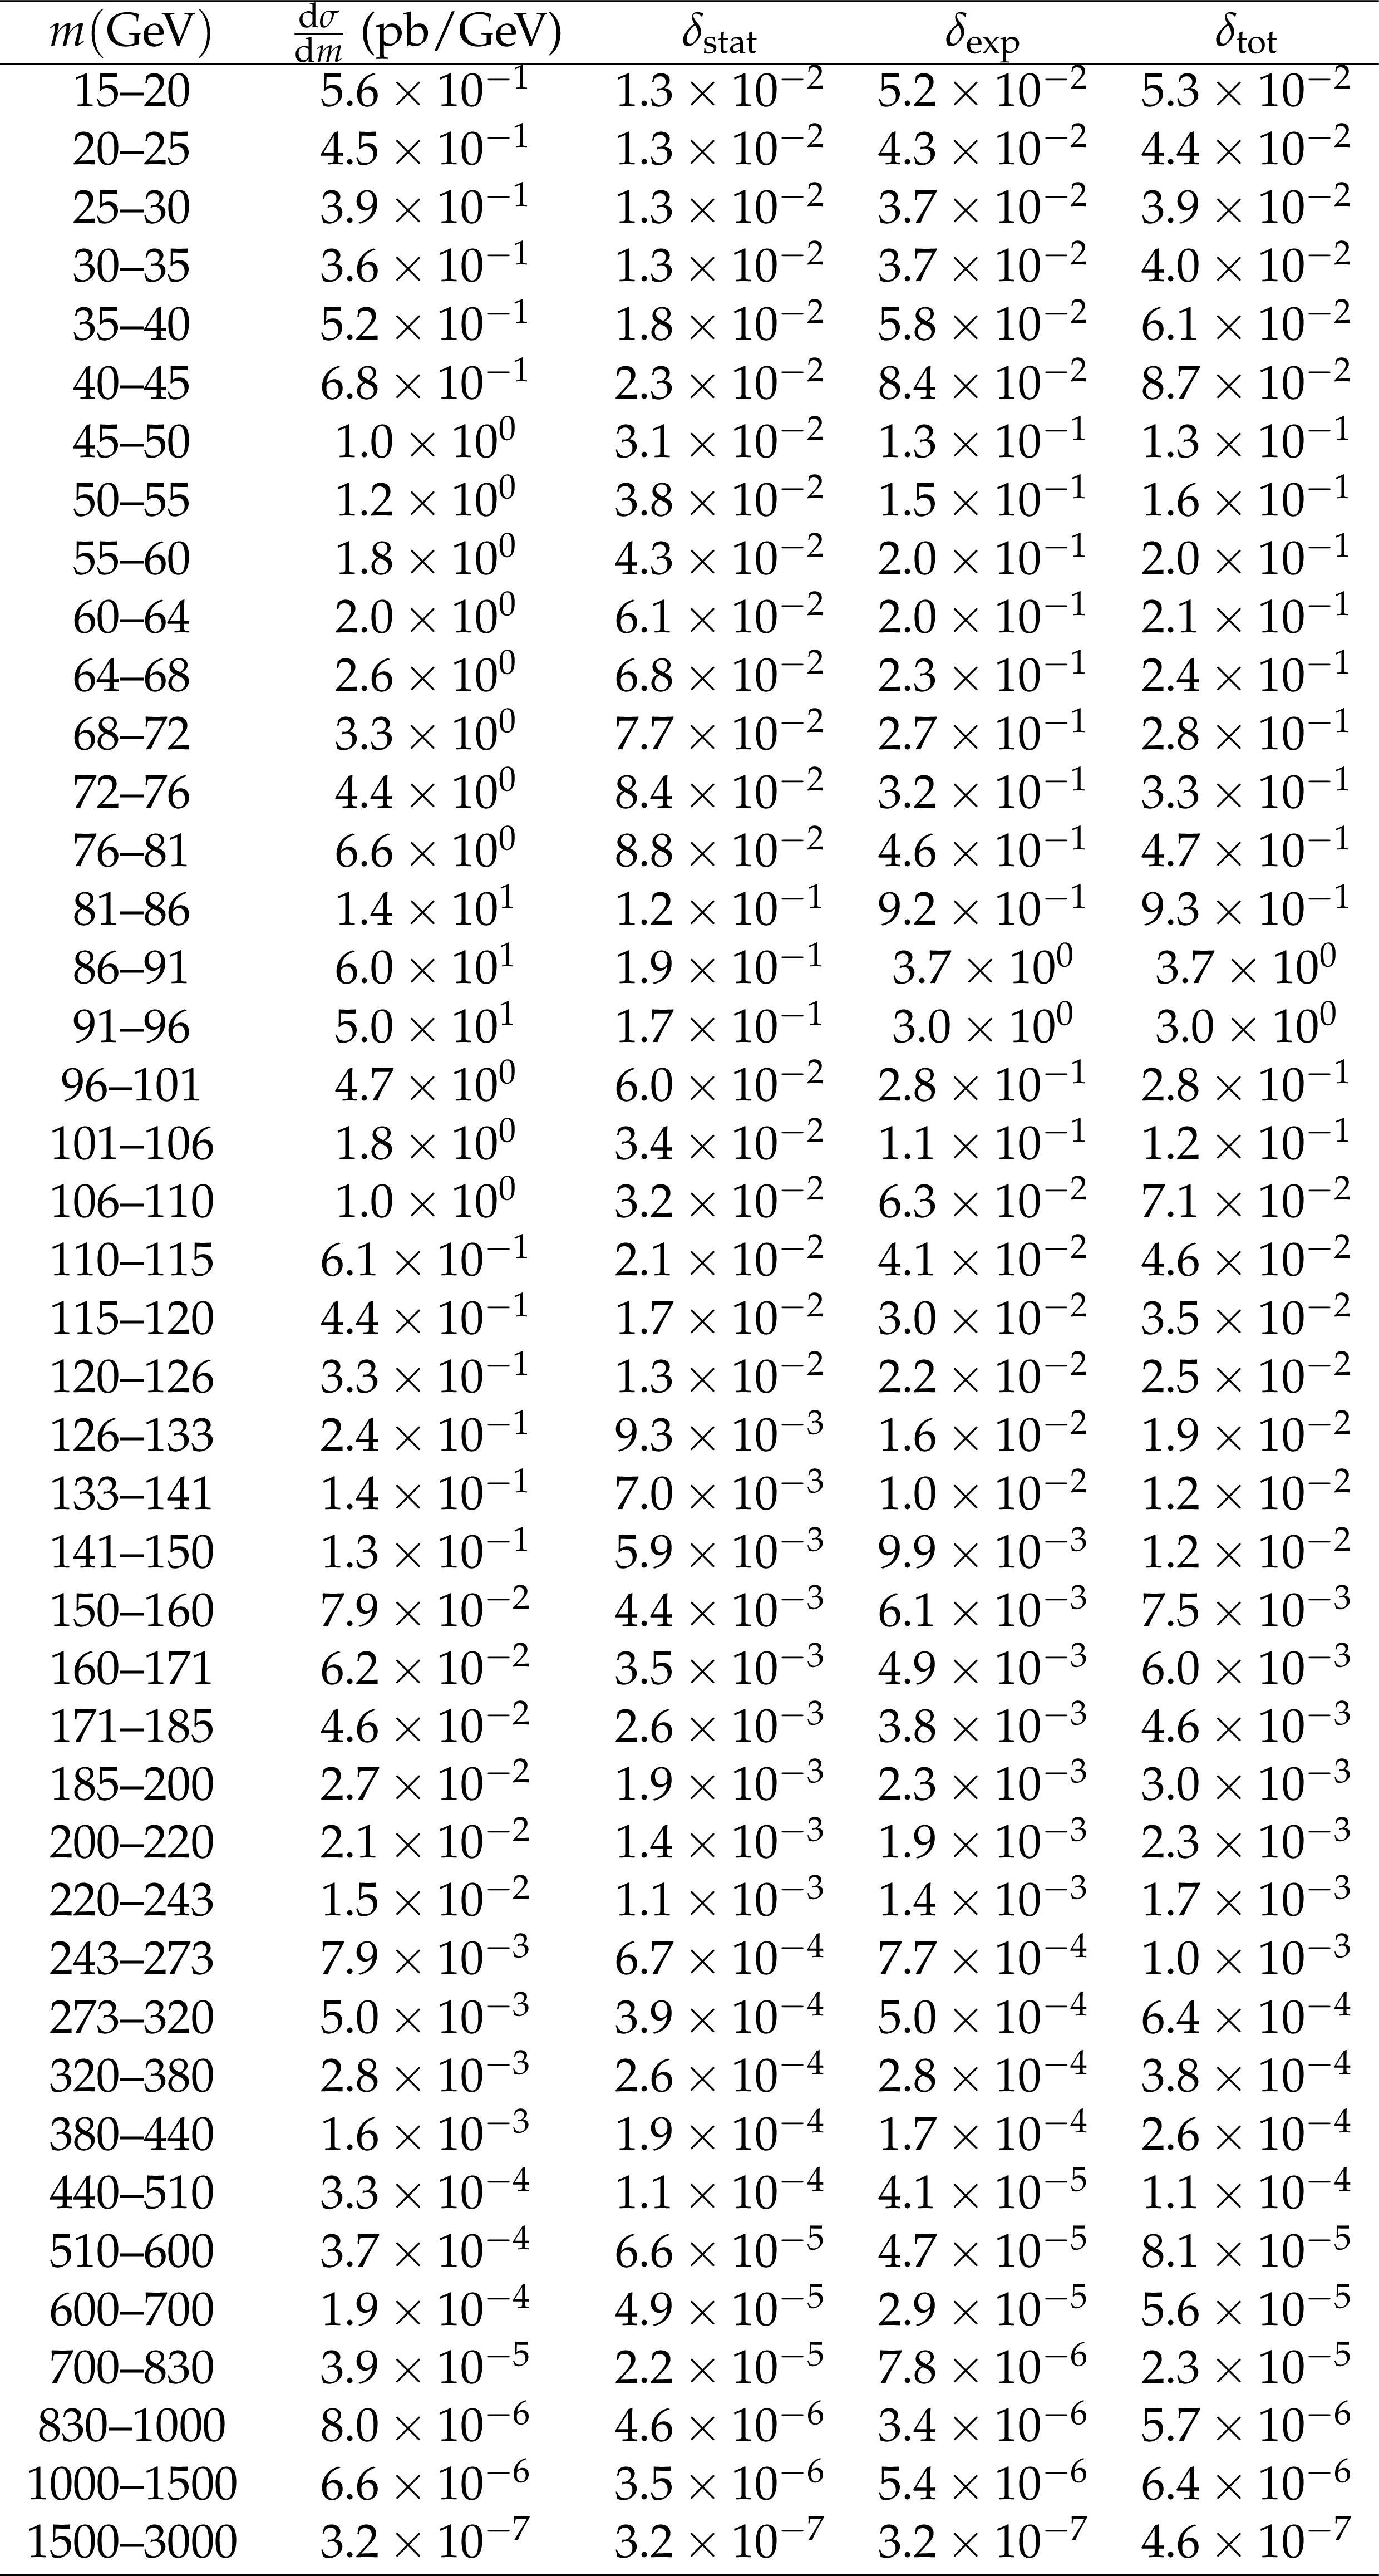
Table 4:
Summary of the measured values of $ {\mathrm {d}}\sigma / {\mathrm {d}}{m}$ (pb/GeV) in the dielectron channel with the statistical ($\delta _{\text {stat}}$), experimental ($\delta _{\text {exp}}$) and theoretical ($\delta _{\text {theo}}$) uncertainties, respectively. Here, $\delta _{\text {tot}}$ is the quadratic sum of the three components. |
png pdf |
Table 5:
Summary of the measured values of fiducial $ {\mathrm {d}}\sigma / {\mathrm {d}}{m}$ (pb/GeV) (with no FSR correction applied) in the dimuon channel with the statistical ($\delta _{\text {stat}}$) and experimental ($\delta _{\text {exp}}$) uncertainties shown separately. Here, $\delta _{\text {tot}}$ is the quadratic sum of the two components. |
png pdf |
Table 6:
Summary of the measured values of fiducial $ {\mathrm {d}}\sigma / {\mathrm {d}}{m}$ (pb/GeV) (with no FSR correction applied) in the dielectron channel with the statistical ($\delta _{\text {stat}}$) and experimental ($\delta _{\text {exp}}$) uncertainties shown separately. Here, $\delta _{\text {tot}}$ is the quadratic sum of the two components. |
png pdf |
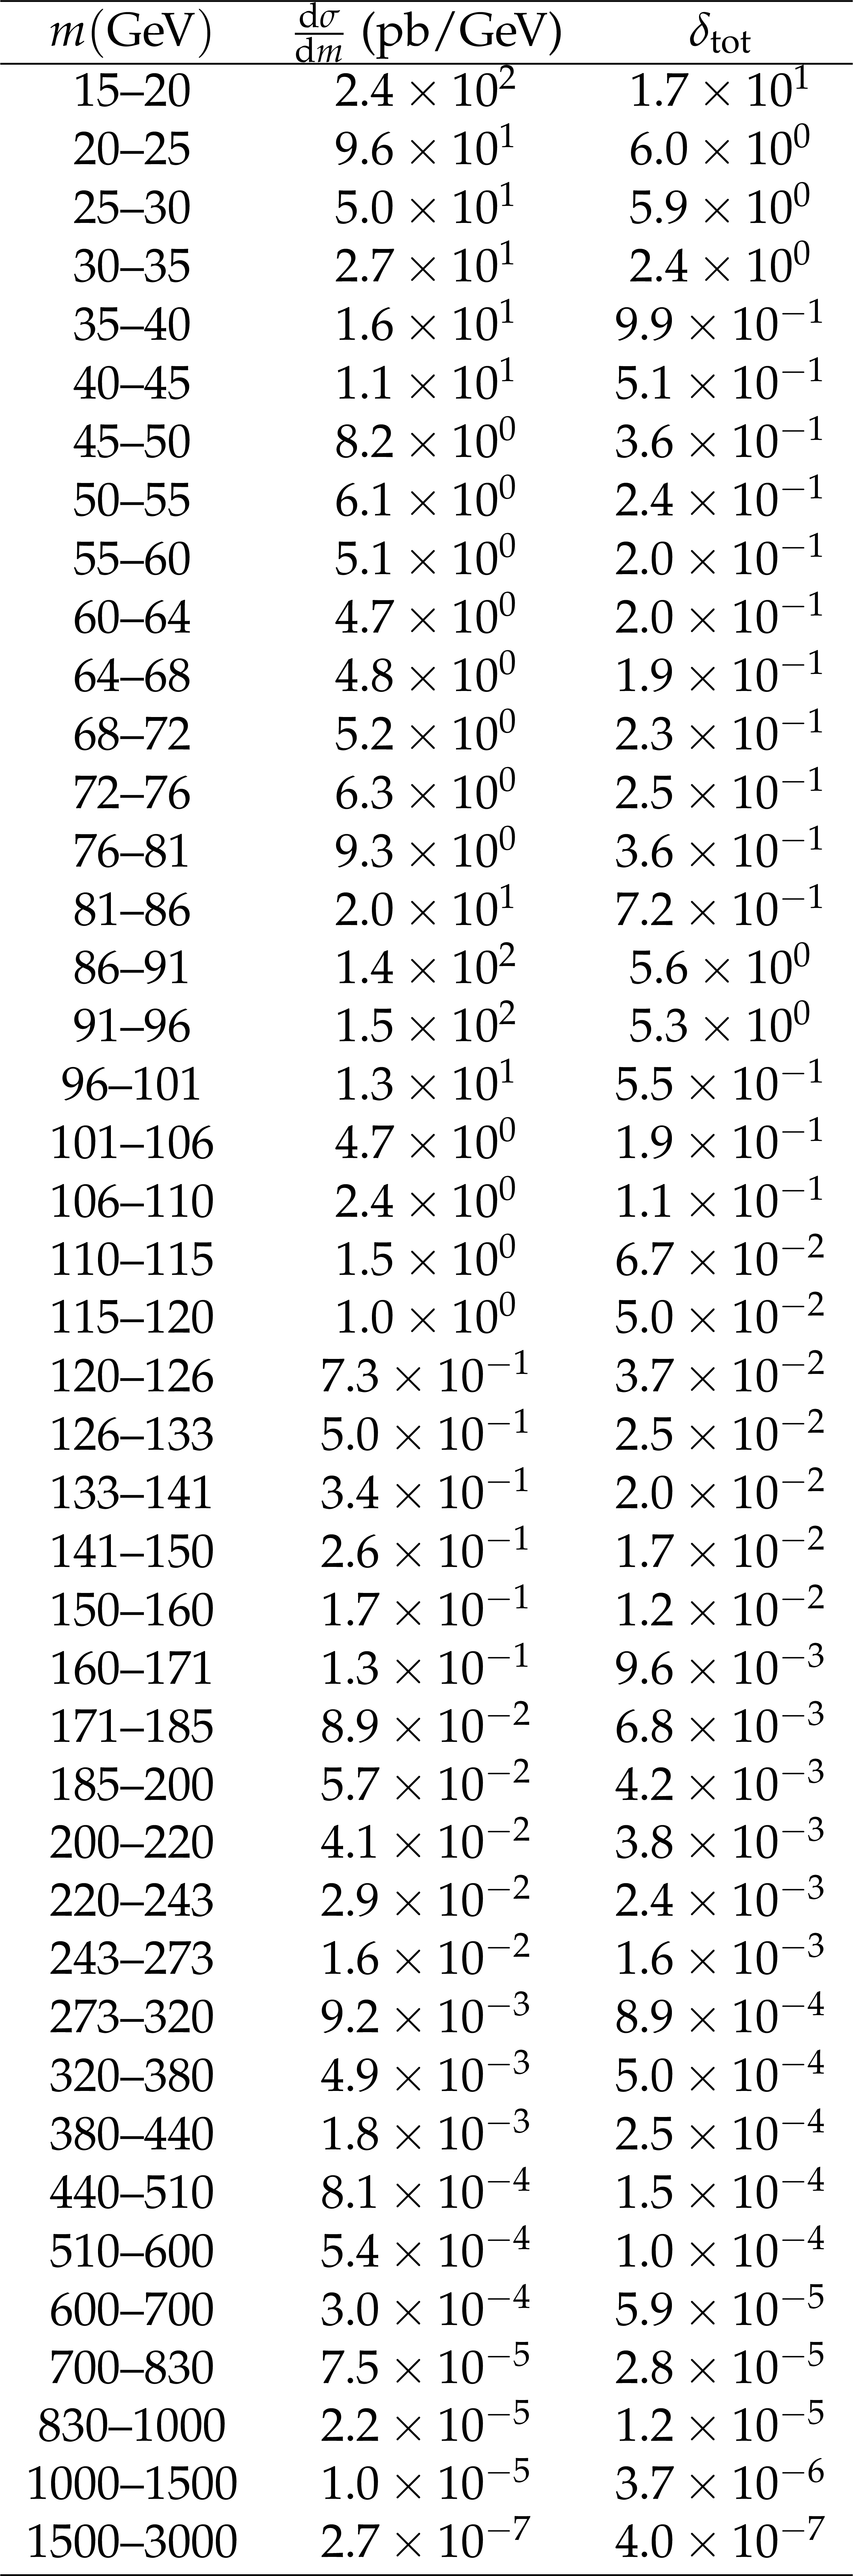
Table 7:
Summary of the combined values of $ {\mathrm {d}}\sigma / {\mathrm {d}}{m}$ (pb/GeV) using the results from both the dimuon and dielectron channels. Here, $\delta _{\text {tot}}$ is the quadratic sum of the statistical, experimental and theoretical uncertainties. |
| Summary |
| This paper presents measurements of the total and fiducial Drell-Yan differential cross sections ${\mathrm{d}}\sigma / {\mathrm{d}}{m}$ in the dimuon and the dielectron channels as well as their combination, in the dilepton invariant mass range 15 $ < m < $ 3000 GeV, using data collected by the CMS experiment, in proton-proton collisions at a centre-of-mass energy of 13 TeV, corresponding to an integrated luminosity of up to 2.8 fb$^{-1}$. The data are corrected for detector resolution effects, the differences in the efficiency between data and Monte Carlo simulation, and the acceptance. Additionally the final-state photon radiation effects, which are most pronounced below the Z boson peak, are included. The results are in good agreement with the theoretical predictions of the standard model. |
| References | ||||
| 1 | R. Hamberg, W. L. van Neerven, and T. Matsuura | A complete calculation of the order $ \alpha^2_s $ correction to the Drell--Yan k-factor | NPB 359 (1991) 343 | |
| 2 | S. Catani et al. | Vector boson production at hadron colliders: A fully exclusive QCD calculation at next-to-next-to-leading order | PRL 103 (2009) 082001 | 0903.2120 |
| 3 | S. Catani and M. Grazzini | Next-to-next-to-leading-order subtraction formalism in hadron collisions and its application to Higgs-boson production at the Large Hadron Collider | PRL 98 (2007) 222002 | hep-ph/0703012 |
| 4 | K. Melnikov and F. Petriello | Electroweak gauge boson production at hadron colliders through O($ \alpha_s^2 $) | PRD 74 (2006) 114017 | hep-ph/0609070 |
| 5 | ATLAS Collaboration | Measurement of the high-mass Drell--Yan differential cross-section in pp collisions at $ \sqrt{s} = $ 7 TeV with the ATLAS detector | PLB 725 (2013) 223 | 1305.4192 |
| 6 | ATLAS Collaboration | Measurement of the low-mass Drell--Yan differential cross section at $ \sqrt{s}= $ 7 TeV using the ATLAS detector | JHEP 06 (2014) 112 | 1404.1212 |
| 7 | ATLAS Collaboration | Measurement of the double-differential high-mass Drell--Yan cross section in pp collisions at $ \sqrt{s}= $ 8 TeV with the ATLAS detector | JHEP 08 (2016) 009 | 1606.01736 |
| 8 | CMS Collaboration | Measurement of the Drell--Yan cross section in pp collisions at $ \sqrt s= $ 7 TeV | JHEP 10 (2011) 007 | CMS-EWK-10-007 1108.0566 |
| 9 | CMS Collaboration | Measurement of the differential and double-differential Drell--Yan cross sections in proton-proton collisions at $ \sqrt{s} = $ 7 TeV | JHEP 12 (2013) 030 | CMS-SMP-13-003 1310.7291 |
| 10 | CMS Collaboration | Measurement of differential and double-differential Drell--Yan cross sections in proton-proton collisions at $ \sqrt{s} = $ 8 TeV | EPJC 75 (2015) 147 | CMS-SMP-14-003 1412.1115 |
| 11 | ATLAS Collaboration | Measurement of $ W^{\pm} $ and $ Z $-boson production cross sections in pp collisions at $ \sqrt{s}= $ 13 TeV with the ATLAS detector | PLB 759 (2016) 601 | 1603.09222 |
| 12 | CMS Collaboration | Performance of electron reconstruction and selection with the CMS detector in proton-proton collisions at $ \sqrt{s} = $ 8 TeV | JINST 10 (2015) P06005 | CMS-EGM-13-001 1502.02701 |
| 13 | CMS Collaboration | Performance of the CMS muon detector and muon reconstruction with proton-proton collisions at $ \sqrt{s} = $ 13 TeV | JINST 13 (2018) P06015 | CMS-MUO-16-001 1804.04528 |
| 14 | CMS Collaboration | The CMS trigger system | JINST 12 (2017) P01020 | CMS-TRG-12-001 1609.02366 |
| 15 | CMS Collaboration | The CMS experiment at the CERN LHC | JINST 3 (2008) S08004 | CMS-00-001 |
| 16 | J. Alwall et al. | The automated computation of tree-level and next-to-leading order differential cross sections, and their matching to parton shower simulations | JHEP 07 (2014) 079 | 1405.0301 |
| 17 | P. Nason | A new method for combining NLO QCD with shower Monte Carlo algorithms | JHEP 11 (2004) 040 | hep-ph/0409146 |
| 18 | S. Frixione, P. Nason, and C. Oleari | Matching NLO QCD computations with parton shower simulations: the POWHEG method | JHEP 11 (2007) 070 | 0709.2092 |
| 19 | S. Alioli, P. Nason, C. Oleari, and E. Re | A general framework for implementing NLO calculations in shower Monte Carlo programs: the POWHEG BOX | JHEP 06 (2010) 043 | 1002.2581 |
| 20 | S. Frixione, P. Nason, and G. Ridolfi | A positive-weight next-to-leading-order Monte Carlo for heavy flavour hadroproduction | JHEP 09 (2007) 126 | 0707.3088 |
| 21 | E. Re | Single-top Wt-channel production matched with parton showers using the POWHEG method | EPJC 71 (2011) 1547 | 1009.2450 |
| 22 | T. Sjostrand et al. | An introduction to PYTHIA 8.2 | CPC 191 (2015) 159 | 1410.3012 |
| 23 | NNPDF Collaboration | A first unbiased global NLO determination of parton distributions and their uncertainties | NPB 838 (2010) 136 | 1002.4407 |
| 24 | NNPDF Collaboration | Parton distributions for the LHC Run II | JHEP 04 (2015) 040 | 1410.8849 |
| 25 | CMS Collaboration | Event generator tunes obtained from underlying event and multiparton scattering measurements | EPJC 76 (2016) 155 | CMS-GEN-14-001 1512.00815 |
| 26 | R. Frederix and S. Frixione | Merging meets matching in MC@NLO | JHEP 12 (2012) 061 | 1209.6215 |
| 27 | M. Czakon and A. Mitov | Top++: A program for the calculation of the top-pair cross-section at hadron colliders | CPC 185 (2014) 2930 | 1112.5675 |
| 28 | J. M. Campbell, R. K. Ellis, and C. Williams | Vector boson pair production at the LHC | JHEP 07 (2011) 018 | 1105.0020 |
| 29 | T. Melia, P. Nason, R. Rontsch, and G. Zanderighi | WW, WZ and ZZ production in the POWHEG BOX | JHEP 11 (2011) 078 | 1107.5051 |
| 30 | GEANT4 Collaboration | GEANT4 --- a simulation toolkit | NIMA 506 (2003) 250 | |
| 31 | CMS Collaboration | Particle-flow reconstruction and global event description with the CMS detector | JINST 12 (2017) P10003 | CMS-PRF-14-001 1706.04965 |
| 32 | CMS Collaboration | Energy calibration and resolution of the CMS electromagnetic calorimeter in $ {\mathrm{p}}{\mathrm{p}} $ collisions at $ \sqrt{s} = $ 7 TeV | JINST 8 (2013) P09009 | CMS-EGM-11-001 1306.2016 |
| 33 | A. Bodek et al. | Extracting muon momentum scale corrections for hadron collider experiments | EPJC 72 (2012) 2194 | 1208.3710 |
| 34 | CMS Collaboration | Search for physics beyond the standard model in dilepton mass spectra in proton-proton collisions at $ \sqrt{s} = $ 8 TeV | JHEP 04 (2015) 025 | CMS-EXO-12-061 1412.6302 |
| 35 | R. Gavin, Y. Li, F. Petriello, and S. Quackenbush | FEWZ 2.0: A code for hadronic Z production at next-to-next-to-leading order | CPC 182 (2011) 2388 | 1011.3540 |
| 36 | Y. Li and F. Petriello | Combining QCD and electroweak corrections to dilepton production in the framework of the FEWZ simulation code | PRD 86 (2012) 094034 | 1208.5967 |
| 37 | A. V. Manohar, P. Nason, G. P. Salam, and G. Zanderighi | The photon content of the proton | JHEP 12 (2017) 046 | 1708.01256 |
| 38 | D. Bourilkov | Photon-induced background for dilepton searches and measurements in pp collisions at 13 TeV | 1606.00523 | |
| 39 | D. Bourilkov | Exploring the LHC landscape with dileptons | 1609.08994 | |
| 40 | G. D'Agostini | A multidimensional unfolding method based on Bayes' theorem | NIMA 362 (1995) 487 | |
| 41 | CMS Collaboration | Measurement of the inclusive W and Z production cross sections in pp collisions at $ \sqrt{s}= $ 7 TeV with the CMS experiment | JHEP 10 (2011) 132 | CMS-EWK-10-005 1107.4789 |
| 42 | P. Golonka and Z. Was | PHOTOS Monte Carlo: a precision tool for QED corrections in Z and W decays | EPJC 45 (2006) 97 | hep-ph/0506026 |
| 43 | CMS Collaboration | CMS luminosity measurement for the 2015 data taking period | CMS-PAS-LUM-15-001 | |
| 44 | A. Valassi | Combining correlated measurements of several different physical quantities | NIMA 500 (2003) 391 | |
| 45 | G. D. Lafferty and T. R. Wyatt | Where to stick your data points: The treatment of measurements within wide bins | NIMA 355 (1995) 541 | |
|
|
Compact Muon Solenoid LHC, CERN |
|

|

|

|

|

|