

Compact Muon Solenoid
LHC, CERN
| CMS-SMP-17-009 ; CERN-EP-2018-344 | ||
| Azimuthal separation in nearly back-to-back jet topologies in inclusive 2- and 3-jet events in pp collisions at $\sqrt{s} = $ 13 TeV | ||
| CMS Collaboration | ||
| 12 February 2019 | ||
| Eur. Phys. J. C 79 (2019) 773 | ||
| Abstract: A measurement for inclusive 2- and 3-jet events of the azimuthal correlation between the two jets with the largest transverse momenta, ${\Delta\phi_{12}}$, is presented. The measurement considers events where the two leading jets are nearly collinear ("back-to-back") in the transverse plane and is performed for several ranges of the leading jet transverse momentum. Proton-proton collision data collected with the CMS experiment at a center-of-mass energy of 13 TeV and corresponding to an integrated luminosity of 35.9 fb$^{-1}$ are used. Predictions based on calculations using matrix elements at leading-order and next-to-leading-order accuracy in perturbative quantum chromodynamics supplemented with leading-log parton showers and hadronization are generally in agreement with the measurements. Discrepancies between the measurement and theoretical predictions are as large as 15%, mainly in the region 177$^\circ$ $< {\Delta\phi_{12}} <$ 180$^\circ$. The 2- and 3-jet measurements are not simultaneously described by any of models. | ||
| Links: e-print arXiv:1902.04374 [hep-ex] (PDF) ; CDS record ; inSPIRE record ; HepData record ; CADI line (restricted) ; | ||
| Figures | |

png pdf |
Figure 1:
Normalized inclusive 2-jet distributions as a function of the azimuthal separation of the two leading jets ${\Delta \phi _{12}}$ for different ${{p_{\mathrm {T}}} ^{\text {max}}}$ regions (left and right). The data are represented by the markers and the theory by histograms. Overlaid with the data are predictions from the HERWIG++ event generator (solid lines) and PH-2J + PYTHIA 8 (dotted lines). The total experimental uncertainty is depicted as error bars on the predictions. |

png pdf |
Figure 1-a:
Normalized inclusive 2-jet distributions as a function of the azimuthal separation of the two leading jets ${\Delta \phi _{12}}$ for different ${{p_{\mathrm {T}}} ^{\text {max}}}$ regions. The data are represented by the markers and the theory by histograms. Overlaid with the data are predictions from the HERWIG++ event generator (solid lines) and PH-2J + PYTHIA 8 (dotted lines). The total experimental uncertainty is depicted as error bars on the predictions. |

png pdf |
Figure 1-b:
Normalized inclusive 2-jet distributions as a function of the azimuthal separation of the two leading jets ${\Delta \phi _{12}}$ for different ${{p_{\mathrm {T}}} ^{\text {max}}}$ regions. The data are represented by the markers and the theory by histograms. Overlaid with the data are predictions from the HERWIG++ event generator (solid lines) and PH-2J + PYTHIA 8 (dotted lines). The total experimental uncertainty is depicted as error bars on the predictions. |

png pdf |
Figure 2:
Ratios of the normalized inclusive 2-jet distributions for the PYTHIA 8, HERWIG++, and MadGraph + PYTHIA 8 predictions to data as a function of the azimuthal separation of the two leading jets ${\Delta \phi _{12}}$, for all the ${{p_{\mathrm {T}}} ^{\text {max}}}$ regions. The solid band indicates the total experimental uncertainty and the error bars on the MC points represent the statistical uncertainty of the simulated data. |
png pdf |
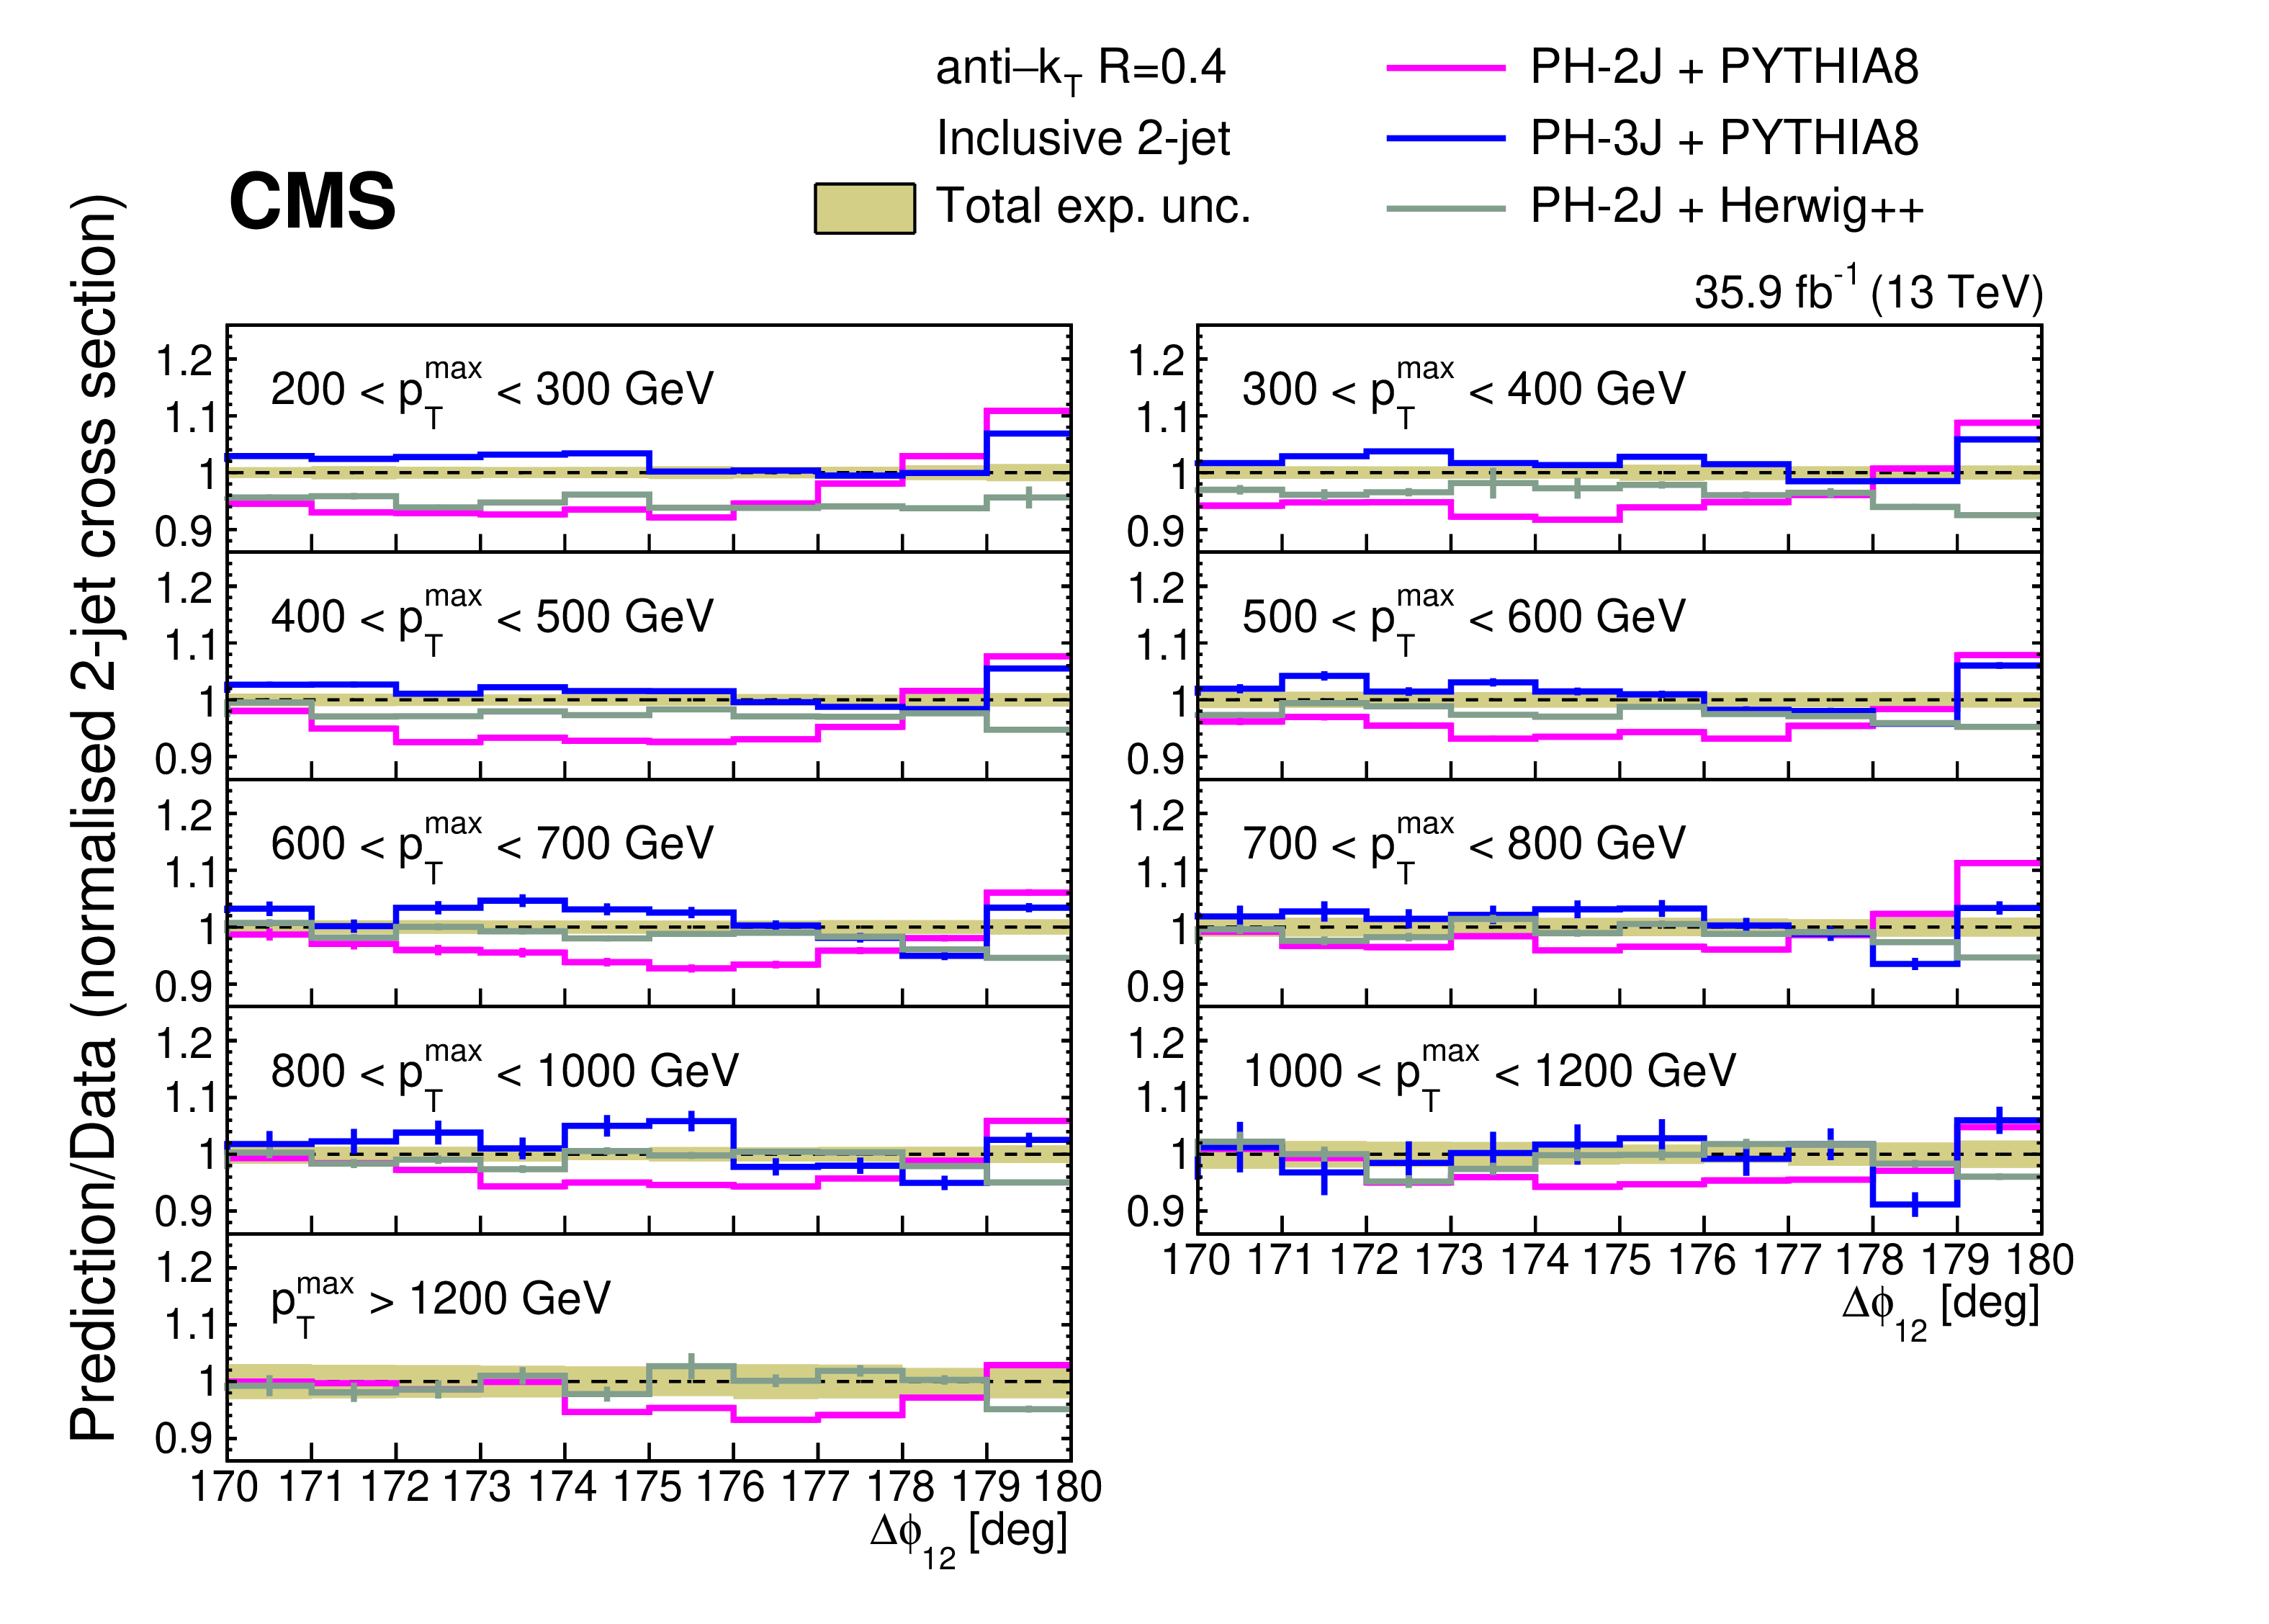
Figure 3:
Ratios of the normalized inclusive 2-jet distributions for the PH-2J + PYTHIA 8, PH-3J + PYTHIA 8, and PH-2J + HERWIG++ predictions to data as a function of the azimuthal separation of the two leading jets ${\Delta \phi _{12}}$, for all the ${{p_{\mathrm {T}}} ^{\text {max}}}$ regions. The solid band indicates the total experimental uncertainty and the error bars on the MC points represent the statistical uncertainty of the simulated data. The PH-3J prediction is not shown for the highest bin in ${{p_{\mathrm {T}}} ^{\text {max}}}$ because of the large statistical fluctuations. |

png pdf |
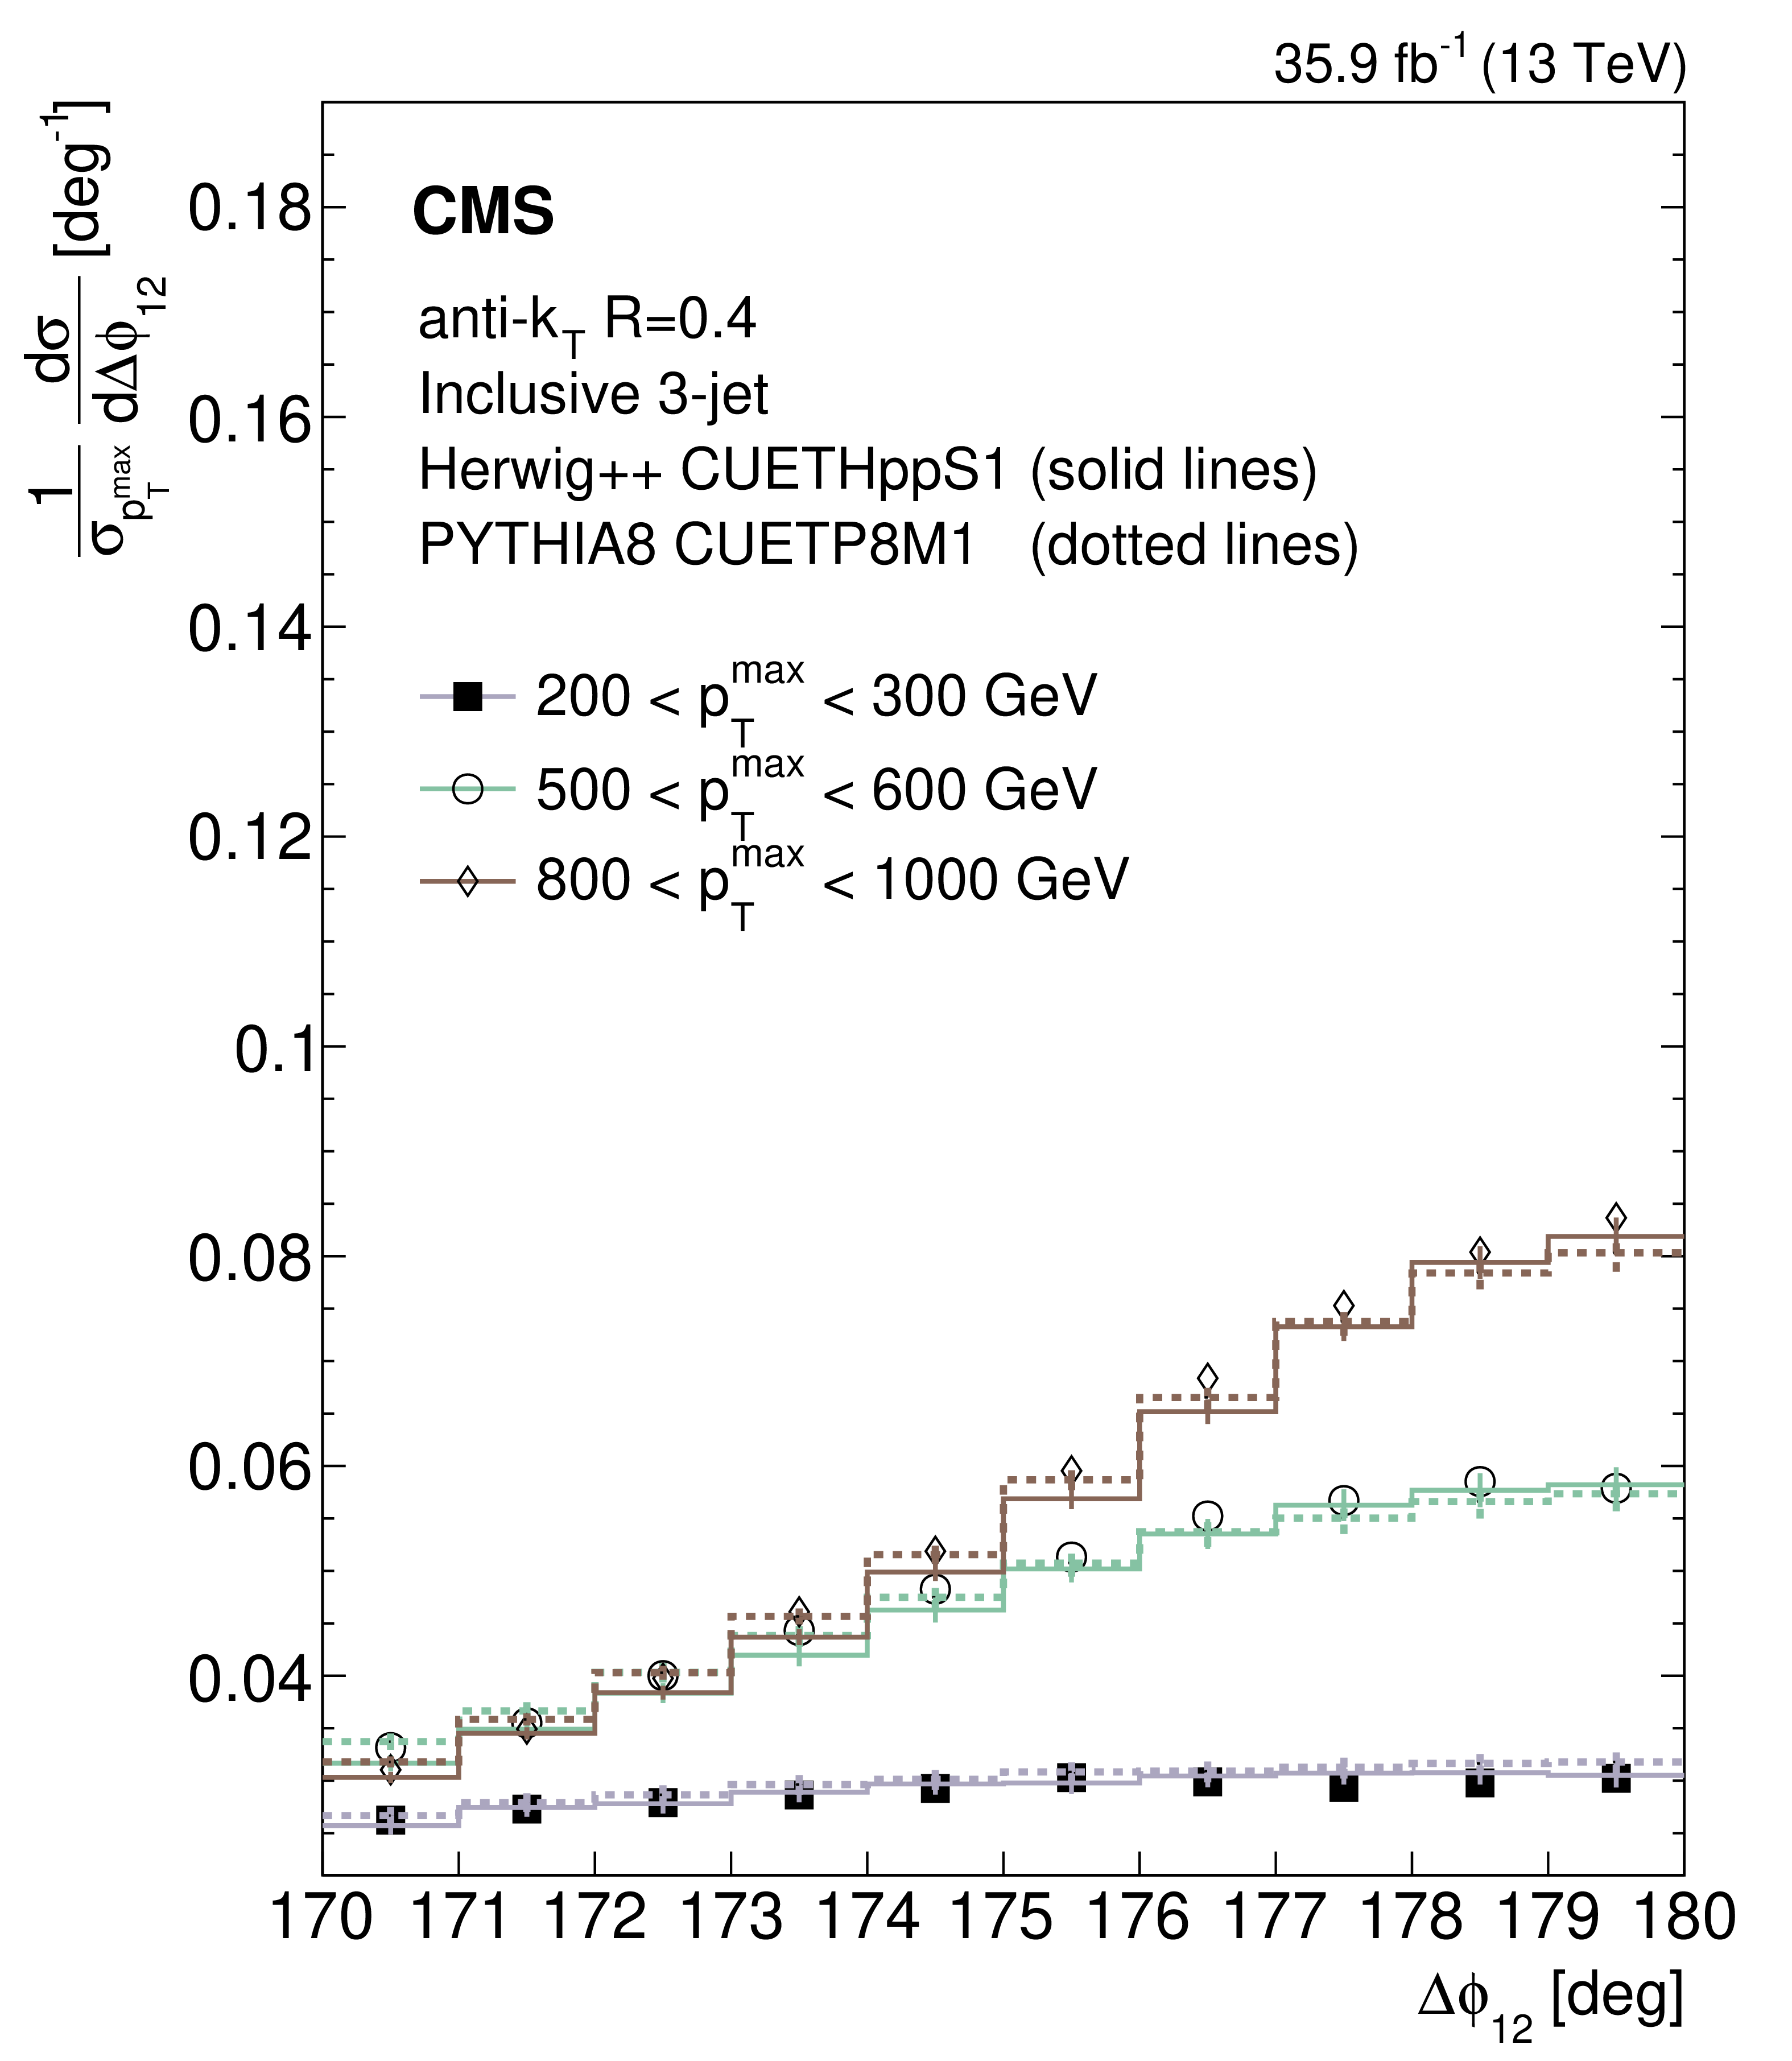
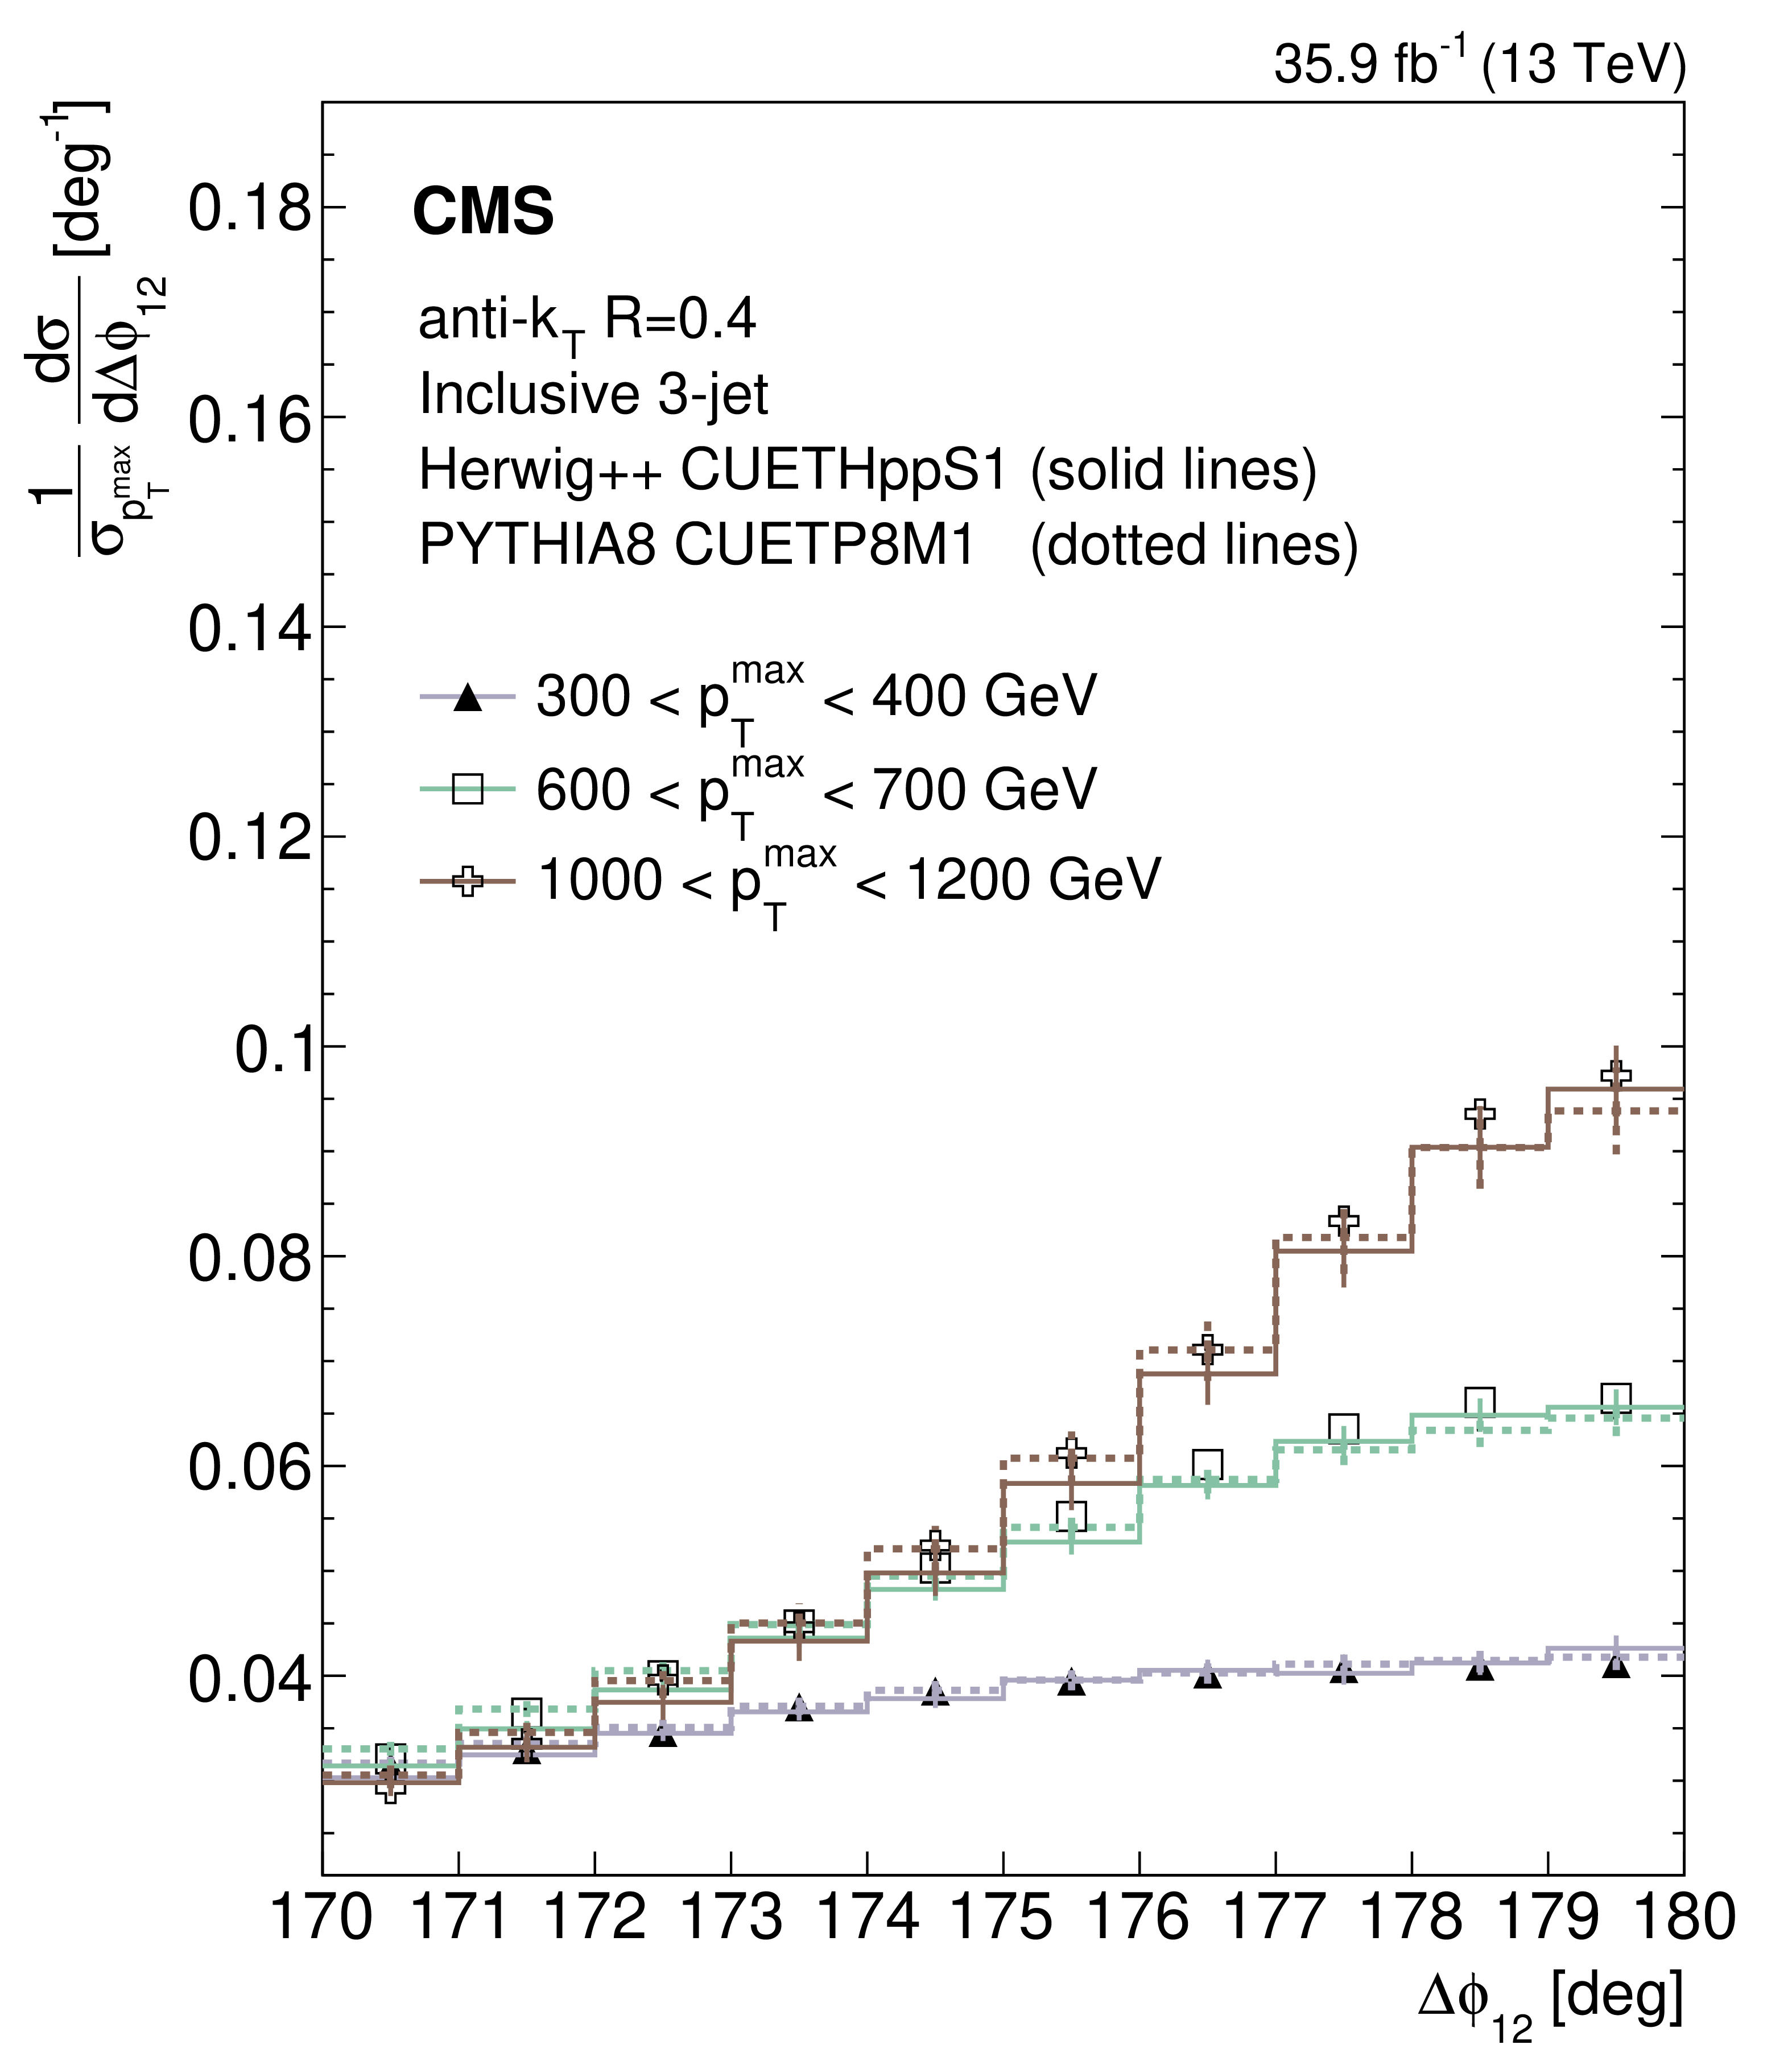
Figure 4:
Normalized inclusive 3-jet distributions as a function of the azimuthal separation of the two leading jets ${\Delta \phi _{12}}$ for different ${{p_{\mathrm {T}}} ^{\text {max}}}$ regions (left and right). The data are represented by the markers and the theory by histograms. Overlaid with the data are predictions from the HERWIG++ event generator (solid lines) and PH-2J + PYTHIA 8 (dotted lines). The total experimental uncertainty is depicted as error bars on the predictions. |
png pdf |
Figure 4-a:
Normalized inclusive 3-jet distributions as a function of the azimuthal separation of the two leading jets ${\Delta \phi _{12}}$ for different ${{p_{\mathrm {T}}} ^{\text {max}}}$ regions. The data are represented by the markers and the theory by histograms. Overlaid with the data are predictions from the HERWIG++ event generator (solid lines) and PH-2J + PYTHIA 8 (dotted lines). The total experimental uncertainty is depicted as error bars on the predictions. |
png pdf |
Figure 4-b:
Normalized inclusive 3-jet distributions as a function of the azimuthal separation of the two leading jets ${\Delta \phi _{12}}$ for different ${{p_{\mathrm {T}}} ^{\text {max}}}$ regions. The data are represented by the markers and the theory by histograms. Overlaid with the data are predictions from the HERWIG++ event generator (solid lines) and PH-2J + PYTHIA 8 (dotted lines). The total experimental uncertainty is depicted as error bars on the predictions. |

png pdf |
Figure 5:
Ratios of the normalized inclusive 3-jet distributions for the PYTHIA 8, HERWIG++, and MadGraph + PYTHIA 8 predictions to data as a function of the azimuthal separation of the two leading jets ${\Delta \phi _{12}}$, for all the ${{p_{\mathrm {T}}} ^{\text {max}}}$ regions. The solid band indicates the total experimental uncertainty and the error bars on the MC points represent the statistical uncertainty of the simulated data. |

png pdf |
Figure 6:
Ratios of the normalized inclusive 3-jet distributions for the PH-2J + PYTHIA 8, PH-3J + PYTHIA 8, and PH-2J + HERWIG++ predictions to data as a function of the azimuthal separation of the two leading jets ${\Delta \phi _{12}}$, for all ${{p_{\mathrm {T}}} ^{\text {max}}}$ regions. The solid band indicates the total experimental uncertainty and the error bars on the MC points represent the statistical uncertainty of the simulated data. The PH-3J prediction is not shown for the highest bin in ${{p_{\mathrm {T}}} ^{\text {max}}}$ because of the large statistical fluctuations. |

png pdf |
Figure 7:
Ratios of the normalized inclusive 2-jet distributions for the PH-2J + PYTHIA 8 predictions to data as a function of the azimuthal separation of the two leading jets ${\Delta \phi _{12}}$, for all ${{p_{\mathrm {T}}} ^{\text {max}}}$ regions. The solid beige band indicates the total experimental uncertainty and the hatched band represents the total theoretical uncertainty. |
png pdf |
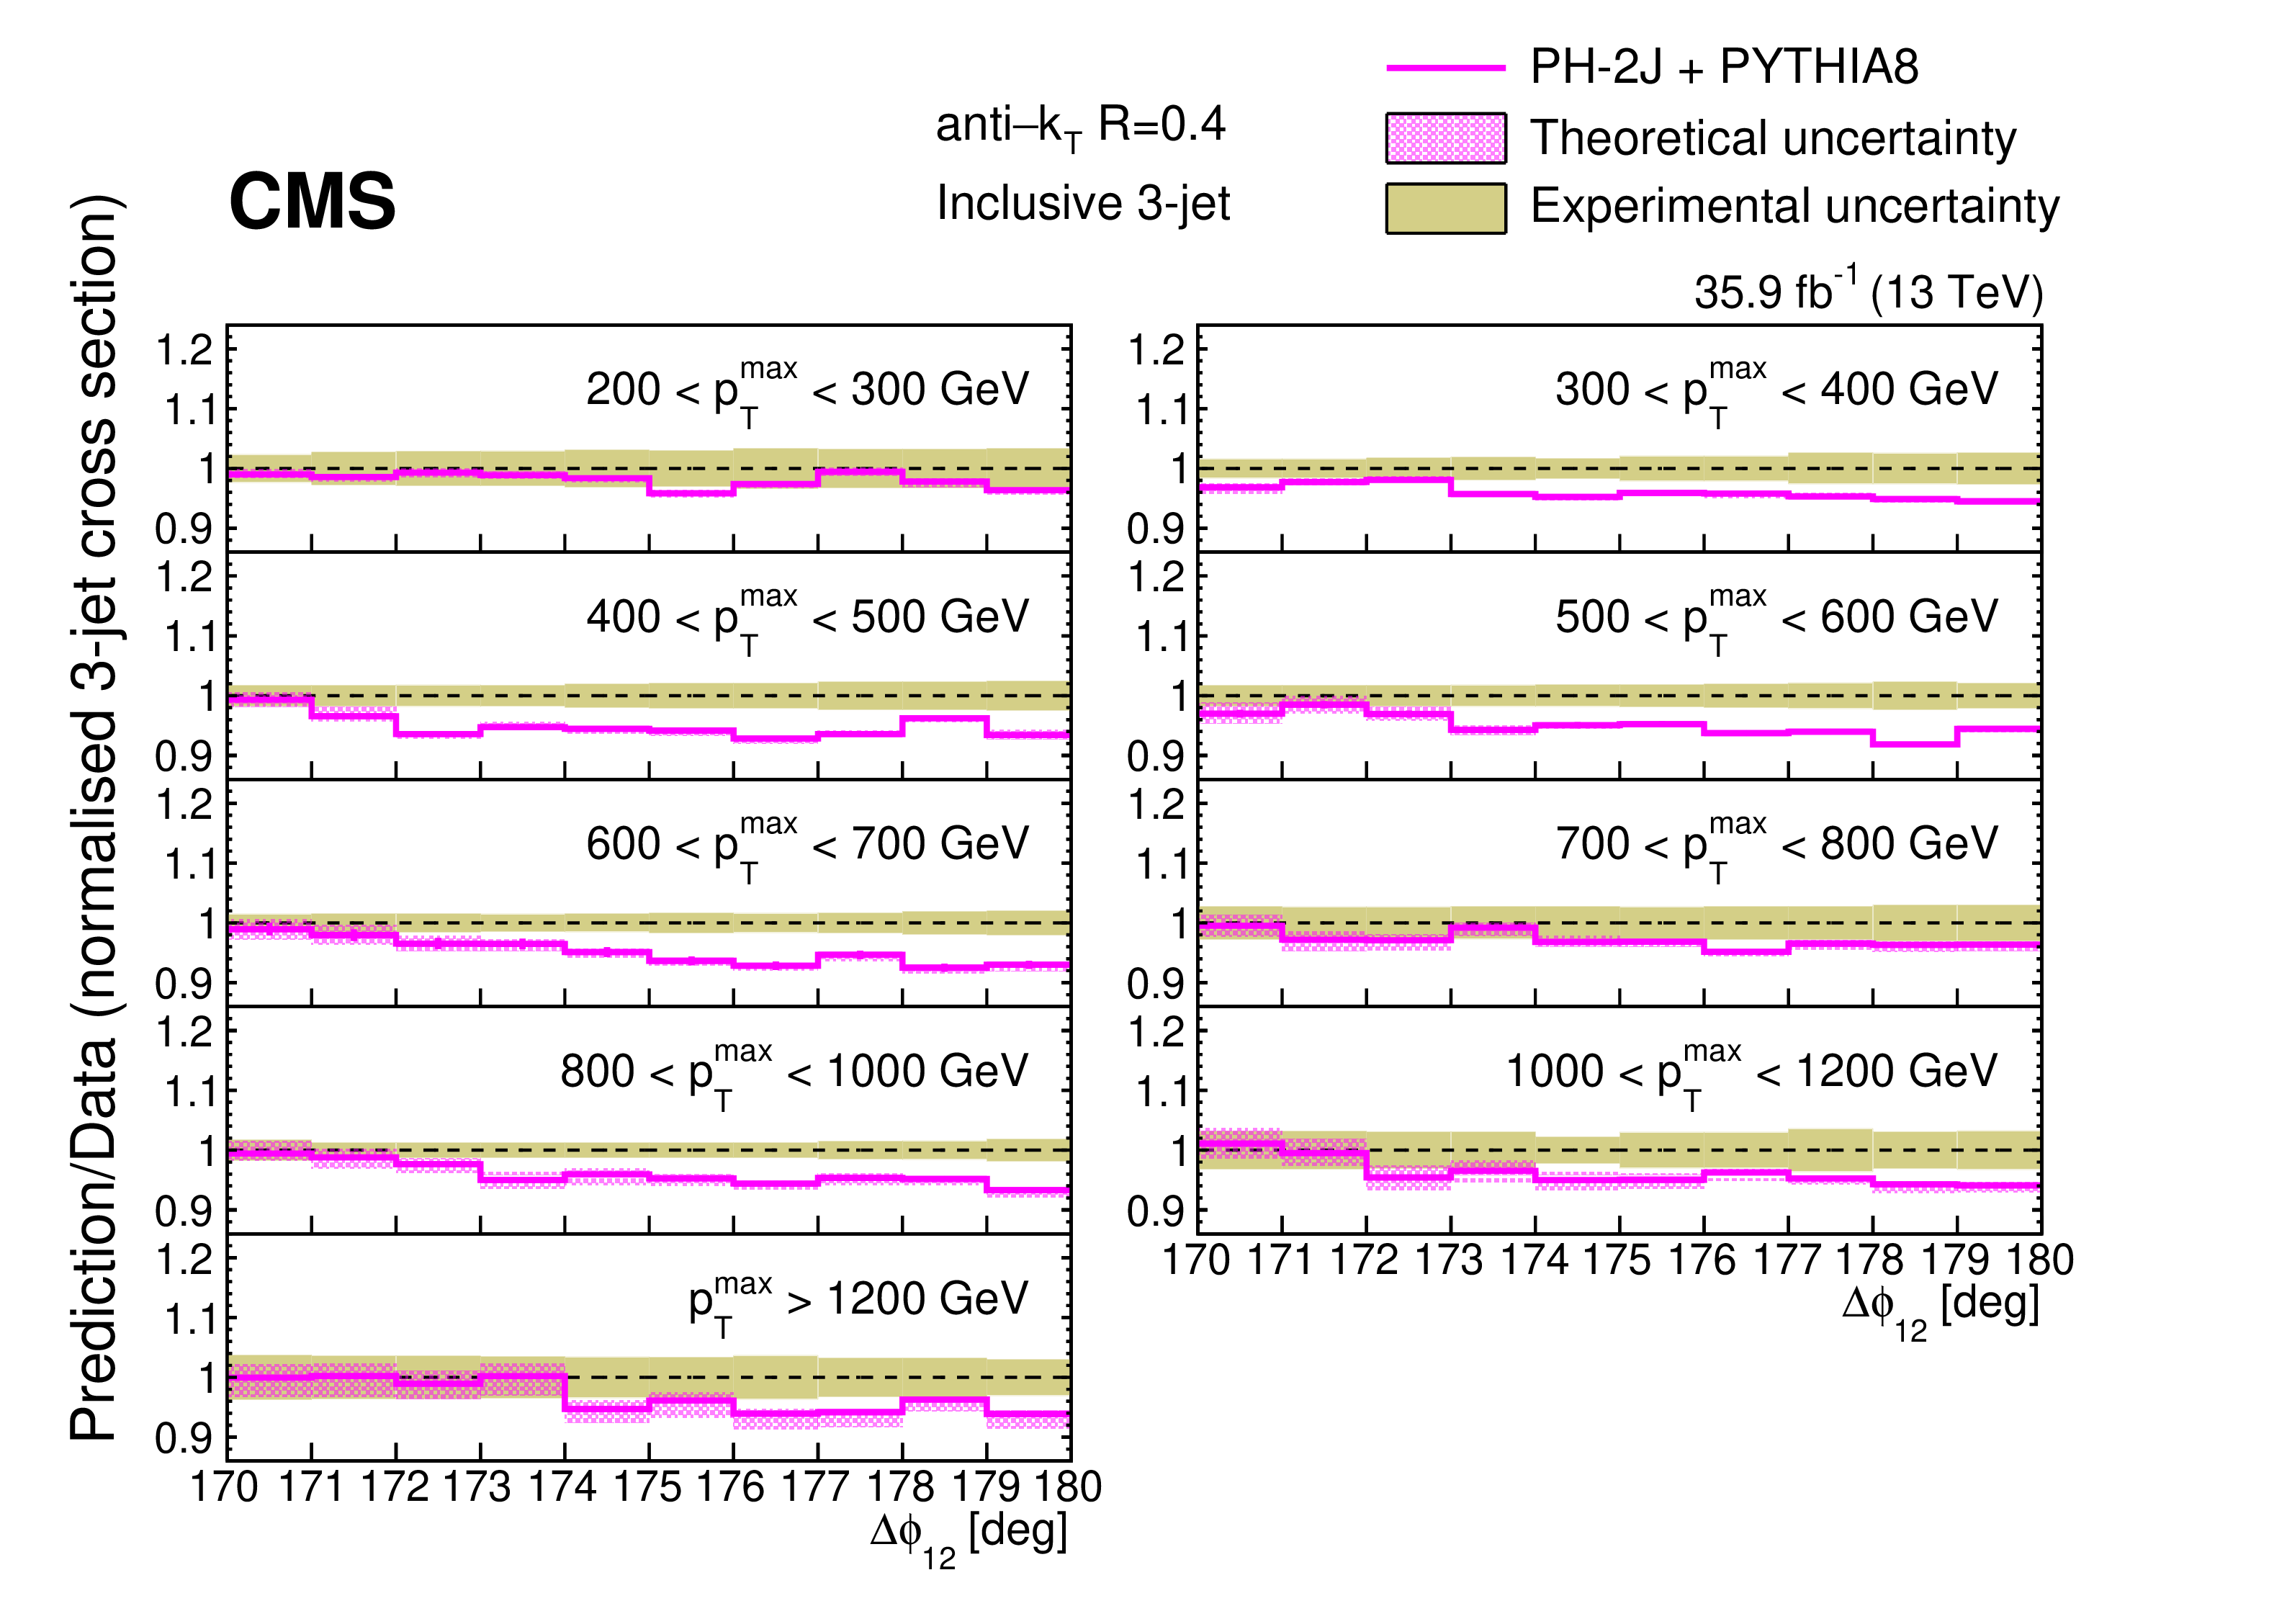
Figure 8:
Ratios of the normalized inclusive 3-jet distributions for the PH-2J + PYTHIA 8 predictions to data as a function of the azimuthal separation of the two leading jets ${\Delta \phi _{12}}$, for all ${{p_{\mathrm {T}}} ^{\text {max}}}$ regions. The solid beige band indicates the total experimental uncertainty, the hatched band represents the total theoretical uncertainty. |
| Tables | |
png pdf |
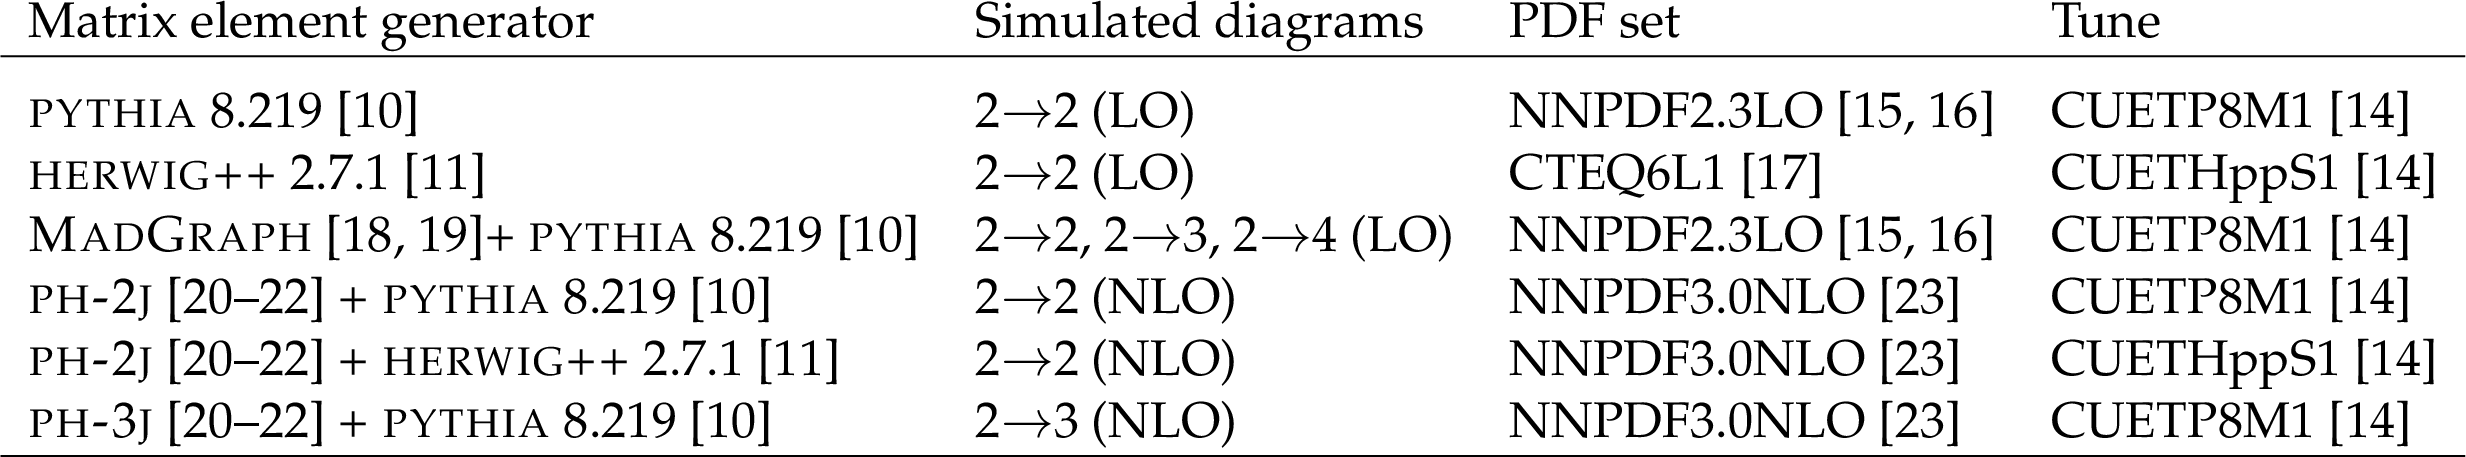
Table 1:
Monte Carlo event generators, parton densities, and underlying event tunes used for comparison with measurements. |
png pdf |
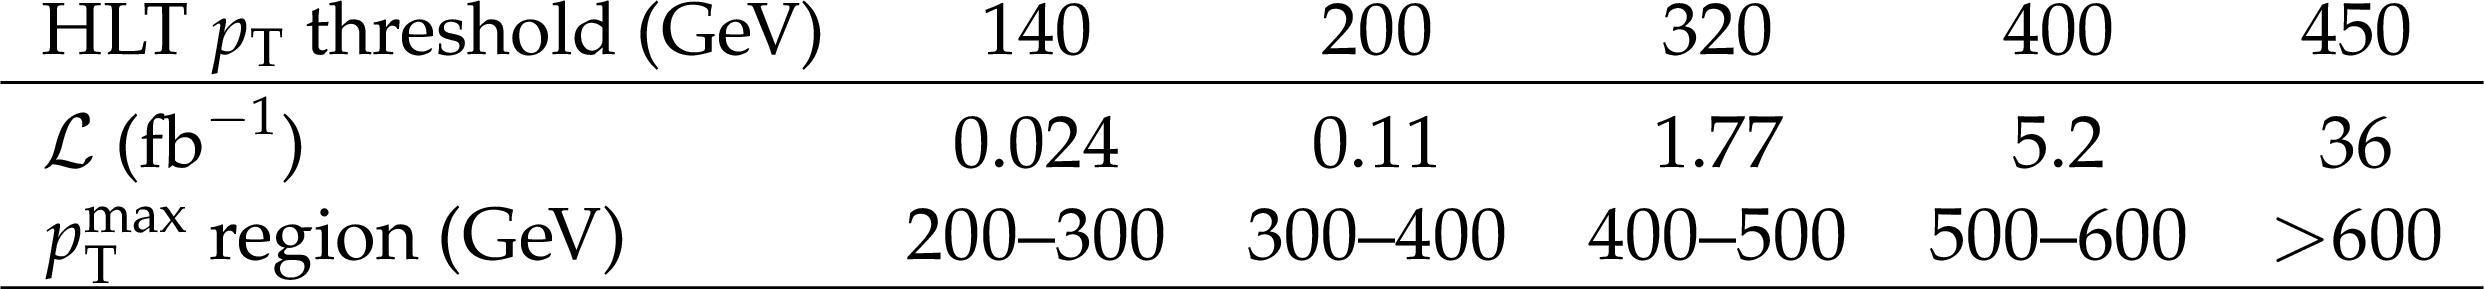
Table 2:
The integrated luminosity for each trigger sample in the analysis, and trigger used for each ${{p_{\mathrm {T}}} ^{\text {max}}}$ range. |
| Summary |
|
Measurements of the normalized inclusive 2- and 3-jet distributions as a function of the azimuthal separation ${\Delta\phi_{12}}$ between the two jets with the highest transverse momentum ${p_{\mathrm{T}}}$, in the collinear back-to-back region, are presented for several ${p_{\mathrm{T}}^{\mathrm{max}}}$ ranges of the leading jet. The measurements are performed using data collected with the CMS experiment at the LHC, corresponding to an integrated luminosity of 35.9 fb$^{-1}$ of pp collisions at a center-of-mass energy of $13 TeV$. The measured ${\Delta\phi_{12}}$ distributions generally agree with predictions from PYTHIA 8, HERWIG++, MadGraph + PYTHIA 8, PH-2J + HERWIG++, and POWHEG (PH-2J and PH-3J) matched to PYTHIA 8. Discrepancies between the measurement and theoretical predictions are as large as 15%, mainly in the region 177$^\circ$ $< {\Delta\phi_{12}} <$ 180$^\circ$. The predictions agree better with the measurements for larger ${p_{\mathrm{T}}^{\mathrm{max}}}$ and smaller ${\Delta\phi_{12}}$, where the contribution of resummation effects becomes smaller. The 2- and 3-jet measurements are not simultaneously described by any of models. The tree-level multijet event generator MadGraph in combination with PYTHIA 8 for showering, hadronization, and multiparton interactions, shows deviations from the measured ${\Delta\phi_{12}}$ for the inclusive 2-jet case, and even larger deviations for the 3-jet case. The PYTHIA 8 and HERWIG++ predictions show deviations (up to 10%) for the 2-jet inclusive distributions, whereas their predictions are in reasonable agreement with the inclusive 3-jet distributions. The next-to-leading-order PH-2J + PYTHIA 8 prediction does not describe the data and a different trend compared to PYTHIA 8 and HERWIG++ towards ${\Delta\phi_{12}} =$ 180$^{\circ}$ is observed. The PH-3J + PYTHIA 8 predictions agree with the measurements except for the last bin in the low ${p_{\mathrm{T}}^{\mathrm{max}}}$ intervals. The PH-2J + HERWIG++ prediction agrees well with the measurement in the highest ${p_{\mathrm{T}}^{\mathrm{max}}}$ ranges. For the inclusive 3-jet case, PH-2J + PYTHIA 8 performs similarly to PYTHIA 8 and HERWIG++ in the whole ${\Delta\phi_{12}}$ range for high ${p_{\mathrm{T}}^{\mathrm{max}}}$ intervals. MadGraph + PYTHIA 8, PH-3J + PYTHIA 8, and PH-2J + HERWIG++ show deviations from the measurements of up to 15%. The measurement of correlations for collinear back-to-back dijet configurations probes the multiple scales involved in the event and, therefore, the differences observed between predictions and the measurements illustrate the importance of improving the models of soft parton radiation accompanying the hard process. |
| References | ||||
| 1 | D0 Collaboration | Measurement of dijet azimuthal decorrelations at central rapidities in $ \mathrm{p}\overline{\mathrm{p}} $ collisions at $ \sqrt{s}=$ 1.96 TeV | PRL 94 (2005) 221801 | hep-ex/0409040 |
| 2 | D0 Collaboration | Measurement of the combined rapidity and $ {p_{\mathrm{T}}} $ dependence of dijet azimuthal decorrelations in $ \mathrm{p}\overline{\mathrm{p}} $ collisions at $ \sqrt{s}=$ 1.96 TeV | PLB 721 (2013) 212 | 1212.1842 |
| 3 | ATLAS Collaboration | Measurement of dijet azimuthal decorrelations in $ \mathrm{p}\mathrm{p} $ collisions at $ \sqrt{s}=$ 7 TeV | PRL 106 (2011) 172002 | 1102.2696 |
| 4 | CMS Collaboration | Dijet azimuthal decorrelations in $ \mathrm{p}\mathrm{p} $ collisions at $ \sqrt{s}=$ 7 TeV | PRL 106 (2011) 122003 | CMS-QCD-10-026 1101.5029 |
| 5 | CMS Collaboration | Measurement of dijet azimuthal decorrelation in pp collisions at $ \sqrt{s}=$ 8 TeV | EPJC 76 (2016) 536 | CMS-SMP-14-015 1602.04384 |
| 6 | CMS Collaboration | Azimuthal correlations for inclusive 2-jet, 3-jet, and 4-jet events in pp collisions at $ \sqrt{s}= $ 13 TeV | EPJC 78 (2018) 566 | CMS-SMP-16-014 1712.05471 |
| 7 | S. Catani, M. Grazzini, and H. Sargsyan | Azimuthal asymmetries in QCD hard scattering: infrared safe but divergent | JHEP 06 (2017) 017 | 1703.08468 |
| 8 | S. Catani, M. Grazzini, and A. Torre | Transverse-momentum resummation for heavy-quark hadroproduction | NPB 890 (2014) 518 | 1408.4564 |
| 9 | CMS Collaboration | The CMS experiment at the CERN LHC | JINST 03 (2008) S08004 | CMS-00-001 |
| 10 | T. Sjostrand et al. | An introduction to PYTHIA 8.2 | CPC 191 (2015) 159 | 1410.3012 |
| 11 | M. Bahr et al. | Herwig++ physics and manual | EPJC 58 (2008) 639 | 0803.0883 |
| 12 | B. Andersson | The Lund model | Camb. Monogr. Part. Phys. NP Cosmol. 7 (1997) 1 | |
| 13 | B. R. Webber | A QCD model for jet fragmentation including soft gluon interference | NPB 238 (1984) 492 | |
| 14 | CMS Collaboration | Event generator tunes obtained from underlying event and multiparton scattering measurements | EPJC 76 (2016) 155 | CMS-GEN-14-001 1512.00815 |
| 15 | NNPDF Collaboration | Parton distributions with QED corrections | NPB 877 (2013) 290 | 1308.0598 |
| 16 | NNPDF Collaboration | Unbiased global determination of parton distributions and their uncertainties at NNLO and at LO | NPB 855 (2012) 153 | 1107.2652 |
| 17 | J. Pumplin et al. | New generation of parton distributions with uncertainties from global QCD analysis | JHEP 07 (2002) 012 | hep-ph/0201195 |
| 18 | J. Alwall et al. | The automated computation of tree-level and next-to-leading order differential cross sections, and their matching to parton shower simulations | JHEP 07 (2014) 079 | 1405.0301 |
| 19 | J. Alwall et al. | Comparative study of various algorithms for the merging of parton showers and matrix elements in hadronic collisions | EPJC 53 (2008) 473 | 0706.2569 |
| 20 | P. Nason | A new method for combining NLO QCD with shower Monte Carlo algorithms | JHEP 11 (2004) 040 | hep-ph/0409146 |
| 21 | S. Frixione, P. Nason, and C. Oleari | Matching NLO QCD computations with parton shower simulations: the POWHEG method | JHEP 11 (2007) 070 | 0709.2092 |
| 22 | S. Alioli, P. Nason, C. Oleari, and E. Re | A general framework for implementing NLO calculations in shower Monte Carlo programs: the POWHEG BOX | JHEP 06 (2010) 043 | 1002.2581 |
| 23 | NNPDF Collaboration | Parton distributions for the LHC Run II | JHEP 04 (2015) 040 | 1410.8849 |
| 24 | S. Alioli et al. | Jet pair production in POWHEG | JHEP 11 (2011) 081 | 1012.3380 |
| 25 | A. Kardos, P. Nason, and C. Oleari | Three-jet production in POWHEG | JHEP 04 (2014) 043 | 1402.4001 |
| 26 | K. Hamilton, P. Nason, C. Oleari, and G. Zanderighi | Merging H/W/Z + 0 and 1 jet at NLO with no merging scale: a path to parton shower + NNLO matching | JHEP 05 (2013) 082 | 1212.4504 |
| 27 | K. Hamilton, P. Nason, and G. Zanderighi | MINLO: multi-scale improved NLO | JHEP 10 (2012) 155 | 1206.3572 |
| 28 | GEANT4 Collaboration | GEANT4--a simulation toolkit | NIMA 506 (2003) 250 | |
| 29 | CMS Collaboration | The CMS high level trigger | EPJC 46 (2006) 605 | hep-ex/0512077 |
| 30 | CMS Collaboration | The CMS trigger system | JINST 12 (2017) P01020 | CMS-TRG-12-001 1609.02366 |
| 31 | CMS Collaboration | Particle-flow reconstruction and global event description with the CMS detector | JINST 12 (2017) P10003 | CMS-PRF-14-001 1706.04965 |
| 32 | M. Cacciari, G. P. Salam, and G. Soyez | The anti-$ {k_{\mathrm{T}}} $ jet clustering algorithm | JHEP 04 (2008) 063 | 0802.1189 |
| 33 | M. Cacciari, G. P. Salam, and G. Soyez | FastJet user manual | EPJC 72 (2012) 1896 | 1111.6097 |
| 34 | CMS Collaboration | Jet energy scale and resolution in the CMS experiment in pp collisions at 8 TeV | JINST 12 (2017) P02014 | CMS-JME-13-004 1607.03663 |
| 35 | M. Cacciari and G. P. Salam | Pileup subtraction using jet areas | PLB 659 (2008) 119 | 0707.1378 |
| 36 | CMS Collaboration | Pileup Jet Identification | CMS-PAS-JME-13-005 | CMS-PAS-JME-13-005 |
| 37 | G. D'Agostini | A multidimensional unfolding method based on Bayes' theorem | NIMA 362 (1995) 487 | |
| 38 | T. Adye | Unfolding algorithms and tests using RooUnfold | 1105.1160 | |
| 39 | S. Schmitt | TUnfold: an algorithm for correcting migration effects in high energy physics | JINST 7 (2012) T10003 | 1205.6201 |
| 40 | S. Schmitt | Data unfolding methods in high energy physics | EPJWeb Conf. 137 (2017) 11008 | 1611.01927 |
| 41 | H.-L. Lai et al. | Uncertainty induced by QCD coupling in the CTEQ global analysis of parton distributions | PRD 82 (2010) 054021 | 1004.4624 |
|
|
Compact Muon Solenoid LHC, CERN |
|

|

|

|

|

|