

Compact Muon Solenoid
LHC, CERN
| CMS-SMP-16-014 ; CERN-EP-2017-290 | ||
| Azimuthal correlations for inclusive 2-jet, 3-jet, and 4-jet events in pp collisions at $\sqrt{s}= $ 13 TeV | ||
| CMS Collaboration | ||
| 14 December 2017 | ||
| Eur. Phys. J. C 78 (2018) 566 | ||
| Abstract: Azimuthal correlations between the two jets with the largest transverse momenta $ {p_{\mathrm{T}}} $ in inclusive 2-, 3-, and 4-jet events are presented for several regions of the leading jet $ {p_{\mathrm{T}}} $ up to 4 TeV. For 3- and 4-jet scenarios, measurements of the minimum azimuthal angles between any two of the three or four leading $ {p_{\mathrm{T}}} $ jets are also presented. The analysis is based on data from proton-proton collisions collected by the CMS Collaboration at a centre-of-mass energy of 13 TeV, corresponding to an integrated luminosity of 35.9 fb$^{-1}$. Calculations based on leading-order matrix elements supplemented with parton showering and hadronization do not fully describe the data, so next-to-leading-order calculations matched with parton shower and hadronization models are needed to better describe the measured distributions. Furthermore, we show that azimuthal jet correlations are sensitive to details of the parton showering, hadronization, and multiparton interactions. A next-to-leading-order calculation matched with parton showers in the MC@NLO method, as implemented in HERWIG 7, gives a better overall description of the measurements than the POWHEG method. | ||
| Links: e-print arXiv:1712.05471 [hep-ex] (PDF) ; CDS record ; inSPIRE record ; HepData record ; CADI line (restricted) ; | ||
| Figures | |
png pdf |
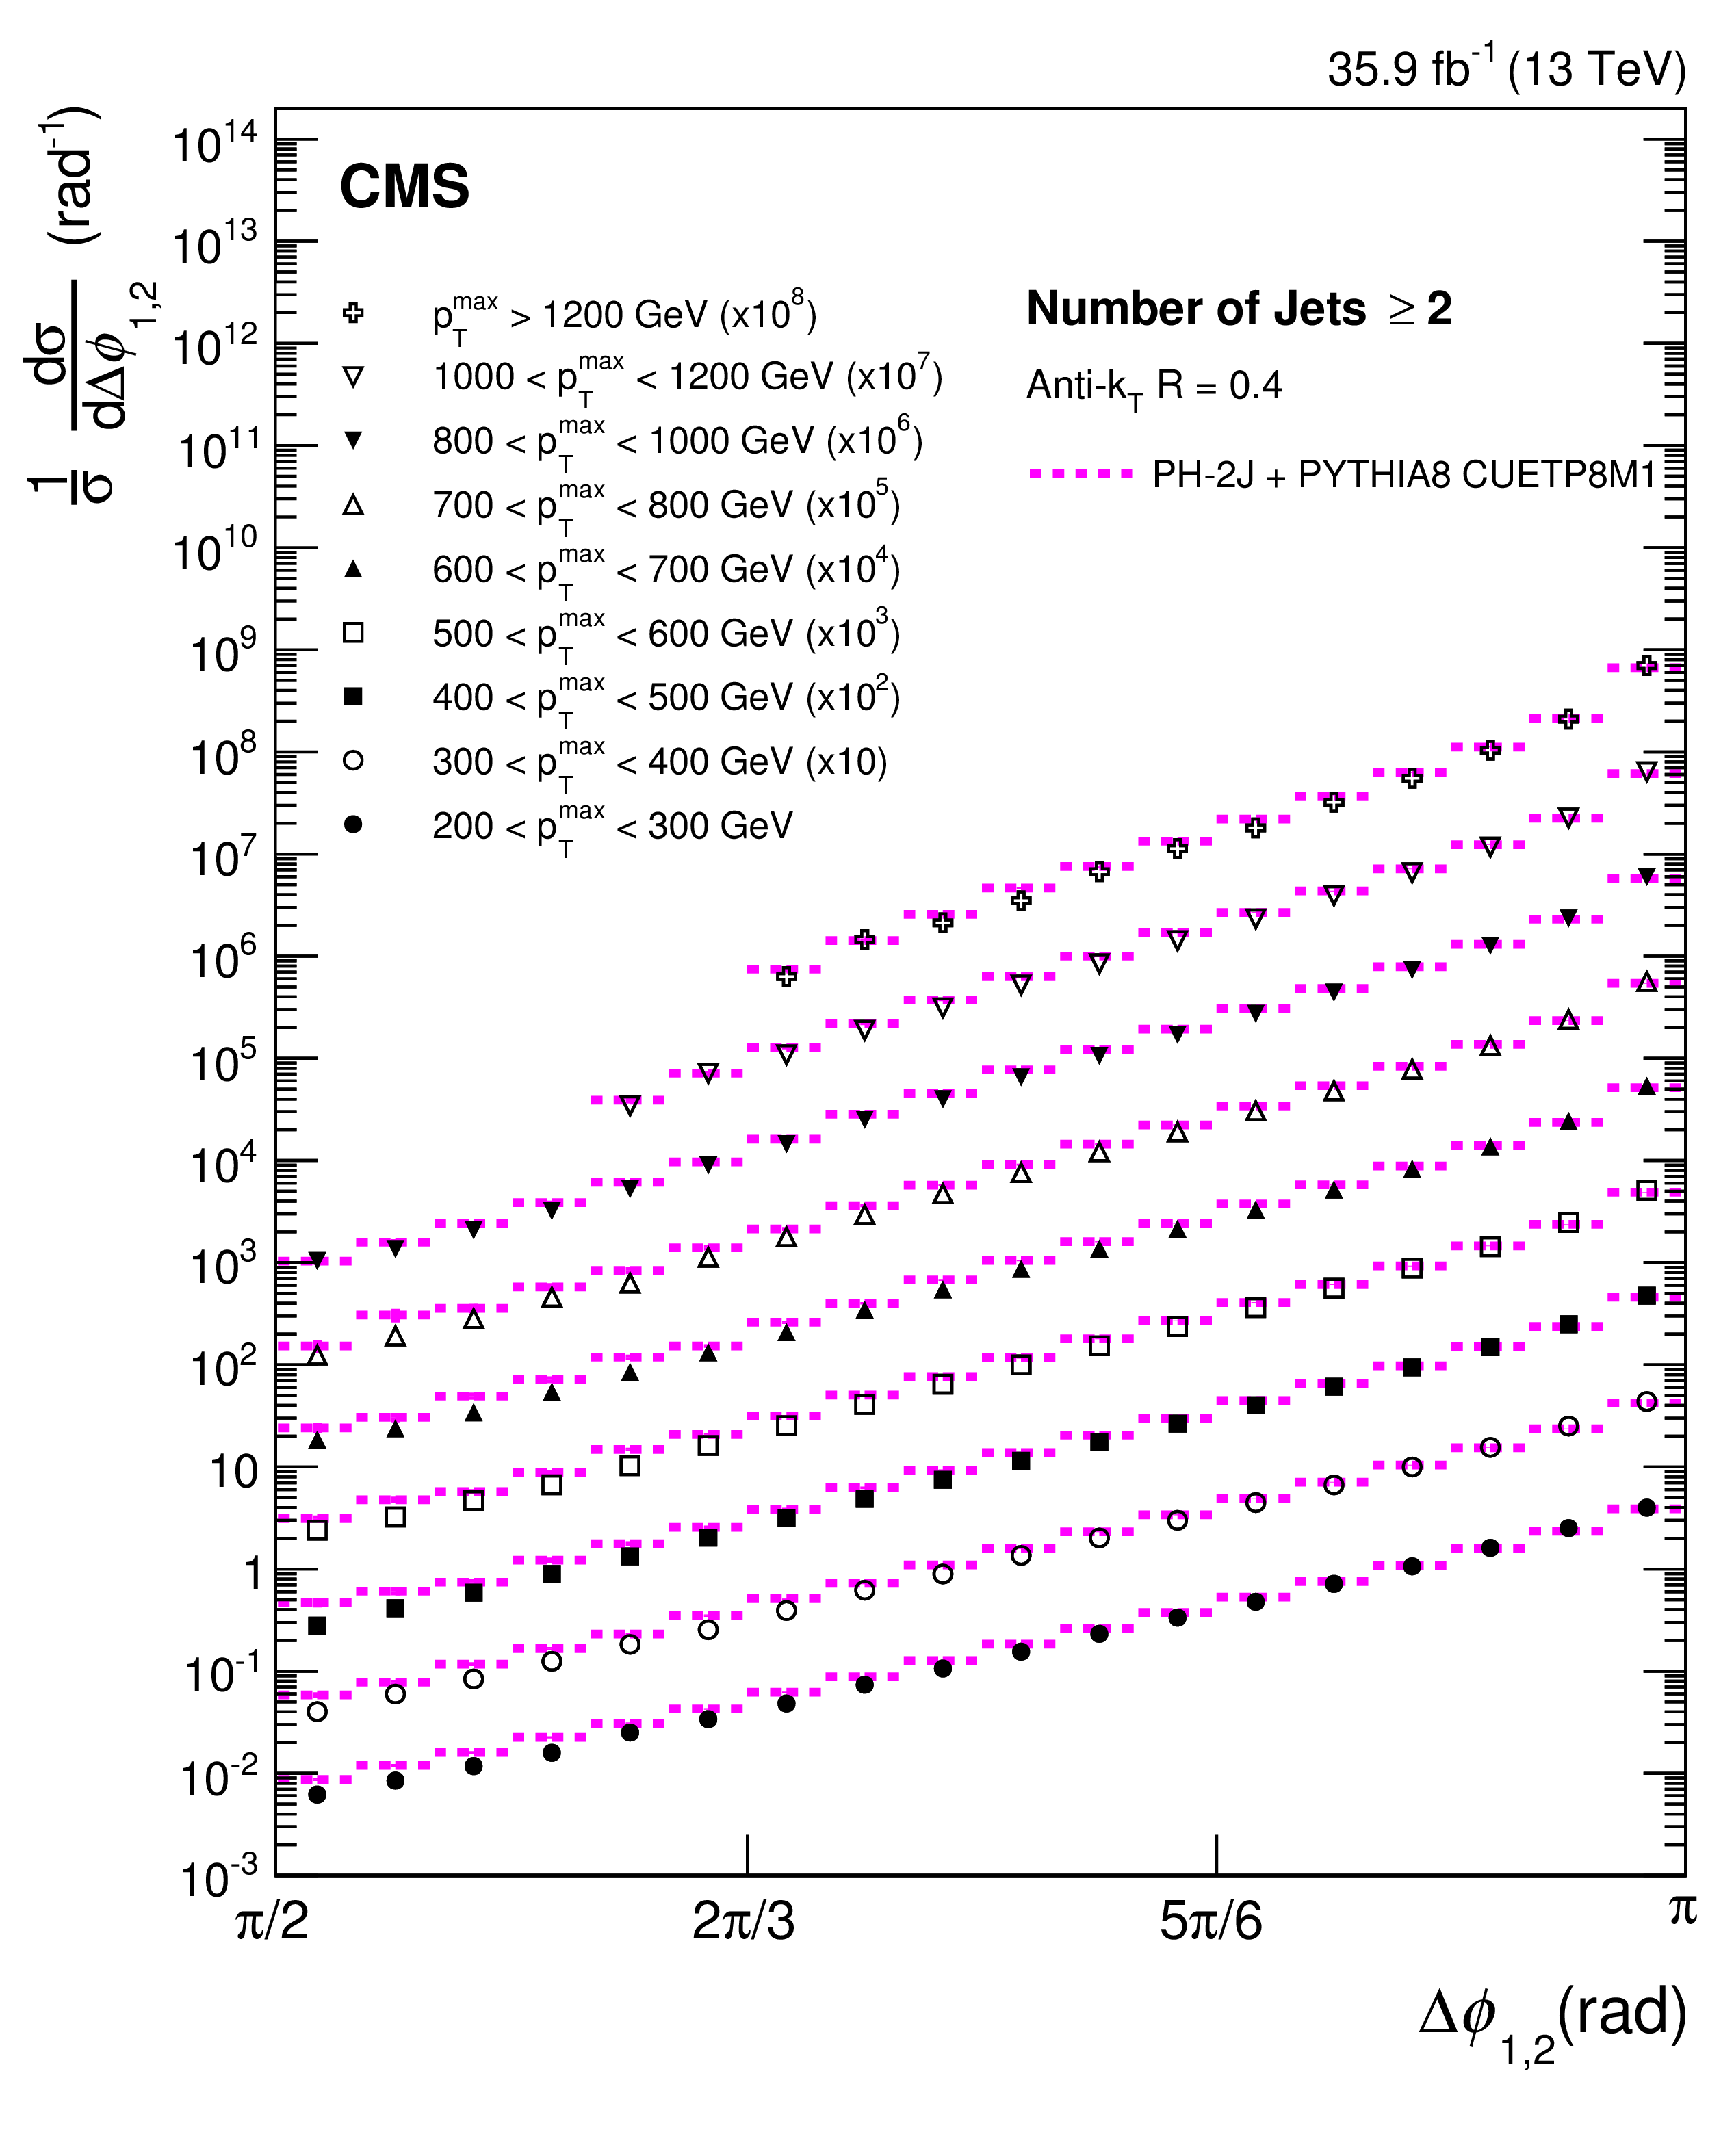
Figure 1:
Normalized inclusive 2-jet cross section differential in $ {\Delta \phi _\text {1,2}} $ for nine $ {{p_{\mathrm {T}}} ^{\text {max}}} $ regions, scaled by multiplicative factors for presentation purposes. The size of the data symbol includes both statistical and systematic uncertainties. The data points are overlaid with the predictions from the PH-2J + PYTHIA 8 event generator. |

png pdf |
Figure 2:
Normalized inclusive 3-jet cross section differential in $ {\Delta \phi _\text {1,2}} $ for eight $ {{p_{\mathrm {T}}} ^{\text {max}}} $ regions, scaled by multiplicative factors for presentation purposes. The size of the data symbol includes both statistical and systematic uncertainties. The data points are overlaid with the predictions from the PH-2J + PYTHIA 8 event generator. |

png pdf |
Figure 3:
Normalized inclusive 4-jet cross section differential in $ {\Delta \phi _\text {1,2}} $ for eight $ {{p_{\mathrm {T}}} ^{\text {max}}} $ regions, scaled by multiplicative factors for presentation purposes. The size of the data symbol includes both statistical and systematic uncertainties. The data points are overlaid with the predictions from the PH-2J + PYTHIA 8 event generator. |

png pdf |
Figure 4:
Ratios of PYTHIA 8, HERWIG++, and MadGraph + PYTHIA 8 predictions to the normalized inclusive 2-jet cross section differential in $ {\Delta \phi _\text {1,2}} $, for all $ {{p_{\mathrm {T}}} ^{\text {max}}} $ regions. The solid band indicates the total experimental uncertainty and the vertical bars on the points represent the statistical uncertainties in the simulated data. |

png pdf |
Figure 5:
Ratios of PYTHIA 8, HERWIG++, and MadGraph + PYTHIA 8 predictions to the normalized inclusive 3-jet cross section differential in $ {\Delta \phi _\text {1,2}} $, for all $ {{p_{\mathrm {T}}} ^{\text {max}}} $ regions. The solid band indicates the total experimental uncertainty and the vertical bars on the points represent the statistical uncertainties in the simulated data. |

png pdf |
Figure 6:
Ratios of PYTHIA 8, HERWIG++, and MadGraph + PYTHIA 8 predictions to the normalized inclusive 4-jet cross section differential in $ {\Delta \phi _\text {1,2}} $, for all $ {{p_{\mathrm {T}}} ^{\text {max}}} $ regions. The solid band indicates the total experimental uncertainty and the vertical bars on the points represent the statistical uncertainties in the simulated data. |

png pdf |
Figure 7:
Ratios of PH-2J + PYTHIA 8, PH-2J + HERWIG++, PH-2J + PYTHIA 8, and HERWIG 7 predictions to the normalized inclusive 2-jet cross section differential in $ {\Delta \phi _\text {1,2}} $, for all $ {{p_{\mathrm {T}}} ^{\text {max}}} $ regions. The solid band indicates the total experimental uncertainty and the vertical bars on the points represent the statistical uncertainties in the simulated data. |

png pdf |
Figure 8:
Ratios of PH-2J + PYTHIA 8, PH-2J + HERWIG++, PH-2J + PYTHIA 8, and HERWIG 7 predictions to the normalized inclusive 3-jet cross section differential in $ {\Delta \phi _\text {1,2}} $, for all $ {{p_{\mathrm {T}}} ^{\text {max}}} $ regions. The solid band indicates the total experimental uncertainty and the vertical bars on the points represent the statistical uncertainties in the simulated data. |

png pdf |
Figure 9:
Ratios of PH-2J + PYTHIA 8, PH-2J + HERWIG++, PH-2J + PYTHIA 8, and HERWIG 7 predictions to the normalized inclusive 4-jet cross section differential in $ {\Delta \phi _\text {1,2}} $, for all $ {{p_{\mathrm {T}}} ^{\text {max}}} $ regions. The solid band indicates the total experimental uncertainty and the vertical bars on the points represent the statistical uncertainties in the simulated data. |

png pdf |
Figure 10:
Normalized inclusive 3-jet cross section differential in $ {\Delta \phi _\text {2j}^\text {min}} $ for eight $ {{p_{\mathrm {T}}} ^{\text {max}}} $ regions, scaled by multiplicative factors for presentation purposes. The size of the data symbol includes both statistical and systematic uncertainties. The data points are overlaid with the predictions from the PH-2J + PYTHIA 8 event generator. |

png pdf |
Figure 11:
Normalized inclusive 4-jet cross section differential in $ {\Delta \phi _\text {2j}^\text {min}} $ for eight $ {{p_{\mathrm {T}}} ^{\text {max}}} $ regions, scaled by multiplicative factors for presentation purposes. The size of the data symbol includes both statistical and systematic uncertainties. The data points are overlaid with the predictions from the PH-2J + PYTHIA 8 event generator. |

png pdf |
Figure 12:
Ratios of PYTHIA 8, HERWIG++, and MadGraph + PYTHIA 8 predictions to the normalized inclusive 3-jet cross section differential in $ {\Delta \phi _\text {2j}^\text {min}} $, for all $ {{p_{\mathrm {T}}} ^{\text {max}}} $ regions. The solid band indicates the total experimental uncertainty and the vertical bars on the points represent the statistical uncertainties in the simulated data. |

png pdf |
Figure 13:
Ratios of PYTHIA 8, HERWIG++, and MadGraph + PYTHIA 8 predictions to the normalized inclusive 4-jet cross section differential in $ {\Delta \phi _\text {2j}^\text {min}} $, for all $ {{p_{\mathrm {T}}} ^{\text {max}}} $ regions. The solid band indicates the total experimental uncertainty and the vertical bars on the points represent the statistical uncertainties in the simulated data. |

png pdf |
Figure 14:
Ratios of PH-2J + PYTHIA 8, PH-2J + HERWIG++, PH-2J + PYTHIA 8, and HERWIG 7 predictions to the normalized inclusive 3-jet cross section differential in $ {\Delta \phi _\text {2j}^\text {min}} $, for all $ {{p_{\mathrm {T}}} ^{\text {max}}} $ regions. The solid band indicates the total experimental uncertainty and the vertical bars on the points represent the statistical uncertainties of the simulated data. |

png pdf |
Figure 15:
Ratios of PH-2J + PYTHIA 8, PH-2J + HERWIG++, PH-2J + PYTHIA 8, and HERWIG 7 predictions to the normalized inclusive 4-jet cross section differential in $ {\Delta \phi _\text {2j}^\text {min}} $, for all $ {{p_{\mathrm {T}}} ^{\text {max}}} $ regions. The solid band indicates the total experimental uncertainty and the vertical bars on the points represent the statistical uncertainties of the simulated data. |
| Tables | |

png pdf |
Table 1:
Monte Carlo event generators used for comparison in this analysis. Version of the generators, PDF set, underlying event tune, and corresponding references are listed. |

png pdf |
Table 2:
The integrated luminosity for each trigger sample considered in this analysis. |
| Summary |
|
Measurements of the normalized inclusive 2-, 3-, and 4-jet cross sections differential in the azimuthal angular separation $ {\Delta\phi_\text{1,2}} $ and of the normalized inclusive 3- and 4-jet cross sections differential in the minimum azimuthal angular separation between any two jets $ {\Delta\phi_\text{2j}^\text{min}} $ are presented for several regions of the leading-jet transverse momentum $ {p_{\mathrm{T}}}^{\text{max}} $. The measurements are performed using data collected during 2016 with the CMS detector at the CERN LHC corresponding to an integrated luminosity of 35.9 fb$^{-1}$ of proton-proton collisions at $\sqrt{s} = $ 13 TeV. The measured distributions in $ {\Delta\phi_\text{1,2}} $ and $ {\Delta\phi_\text{2j}^\text{min}} $ are compared with predictions from PYTHIA 8, HERWIG++, MadGraph + PYTHIA 8, PH-2J matched to PYTHIA 8 and HERWIG++, PH-3J + PYTHIA 8, and HERWIG 7 event generators. The leading order (LO) PYTHIA 8 dijet event generator exhibits small deviations from the $ {\Delta\phi_\text{1,2}} $ measurements but shows significant deviations at low-$ {p_{\mathrm{T}}} $ in the $ {\Delta\phi_\text{2j}^\text{min}} $ distributions. The HERWIG++ event generator exhibits the largest deviations of any of the generators for the $ {\Delta\phi_\text{1,2}} $ measurements, but provides a reasonable description of the $ {\Delta\phi_\text{2j}^\text{min}} $ distributions. The tree-level multijet event generator MadGraph in combination with PYTHIA 8 for showering, hadronization, and multiparton interactions provides a good overall description of the measurements, except for the $ {\Delta\phi_\text{2j}^\text{min}} $ distributions in the 4-jet case, where the generator deviates from the measurement mainly at high $ {{p_{\mathrm {T}}} ^{\text {max}}} $. The dijet next-to-leading order (NLO) PH-2J event generator deviates from the $ {\Delta\phi_\text{1,2}} $ measurements, but provides a good description of the $ {\Delta\phi_\text{2j}^\text{min}} $ observable. The predictions from the three-jet NLO PH-3J event generator exhibit large deviations from the measurements and describe the considered multijet observables in a less accurate way than the predictions from PH-2J. Parton shower contributions are responsible for the different behaviour of the PH-2J and PH-3J predictions. Finally, predictions from the dijet NLO HERWIG 7 event generator matched to parton shower contributions with the MC@NLO method provide a very good description of the $ {\Delta\phi_\text{1,2}} $ measurements, showing improvement in comparison to HERWIG++. All these observations emphasize the need to improve predictions for multijet production. Similar observations, for the inclusive 2-jet cross sections differential in $ {\Delta\phi_\text{1,2}} $, were reported previously by CMS [5] at a different centre-of-mass energy of 8 TeV. The extension of $ {\Delta\phi_\text{1,2}} $ correlations, and the measurement of the $ {\Delta\phi_\text{2j}^\text{min}} $ distributions in inclusive 3- and 4-jet topologies are novel measurements of the present analysis. |
| References | ||||
| 1 | D0 Collaboration | Measurement of dijet azimuthal decorrelations at central rapidities in $ \mathrm{p}\overline{\mathrm{p}} $ collisions at $ \sqrt{s} = $ 1.96 TeV | PRL 94 (2005) 221801 | hep-ex/0409040 |
| 2 | D0 Collaboration | Measurement of the combined rapidity and $ p_\mathrm{T} $ dependence of dijet azimuthal decorrelations in $ \mathrm{p}\overline{\mathrm{p}} $ collisions at $ \sqrt{s} = $ 1.96 TeV | PLB 721 (2013) 212 | 1212.1842 |
| 3 | ATLAS Collaboration | Measurement of dijet azimuthal decorrelations in $ \mathrm{p}\mathrm{p} $ collisions at $ \sqrt{s} = $ 7 TeV | PRL 106 (2011) 172002 | 1102.2696 |
| 4 | CMS Collaboration | Dijet azimuthal decorrelations in $ \mathrm{p}\mathrm{p} $ collisions at $ \sqrt{s} = $ 7 TeV | PRL 106 (2011) 122003 | CMS-QCD-10-026 1101.5029 |
| 5 | CMS Collaboration | Measurement of dijet azimuthal decorrelation in pp collisions at $ \sqrt{s} = $ 8 TeV | EPJC 76 (2016) 536 | CMS-SMP-14-015 1602.04384 |
| 6 | ATLAS Collaboration | Measurement of three-jet production cross-sections in pp collisions at 7 TeV centre-of-mass energy using the ATLAS detector | EPJC 75 (2015) 228 | 1411.1855 |
| 7 | ATLAS Collaboration | Measurement of four-jet differential cross sections in $ \sqrt{s} = $ 8 TeV proton-proton collisions using the ATLAS detector | JHEP 12 (2015) 105 | 1509.07335 |
| 8 | CMS Collaboration | The CMS experiment at the CERN LHC | JINST 3 (2008) S08004 | CMS-00-001 |
| 9 | T. Sjostrand et al. | An introduction to PYTHIA 8.2 | CPC 191 (2015) 159 | 1410.3012 |
| 10 | M. Bahr et al. | Herwig++ physics and manual | EPJC 58 (2008) 639 | 0803.0883 |
| 11 | B. Andersson | The Lund model | Camb. Monogr. Part. Phys. NP Cosmol. 7 (1997) 1 | |
| 12 | B. R. Webber | A QCD model for jet fragmentation including soft gluon interference | NPB 238 (1984) 492 | |
| 13 | CMS Collaboration | Event generator tunes obtained from underlying event and multiparton scattering measurements | EPJC 76 (2016) 155 | CMS-GEN-14-001 1512.00815 |
| 14 | NNPDF Collaboration | Parton distributions with QED corrections | NPB 877 (2013) 290 | 1308.0598 |
| 15 | NNPDF Collaboration | Unbiased global determination of parton distributions and their uncertainties at NNLO and at LO | NPB 855 (2012) 153 | 1107.2652 |
| 16 | J. Pumplin et al. | New generation of parton distributions with uncertainties from global QCD analysis | JHEP 07 (2002) 012 | hep-ph/0201195 |
| 17 | J. Alwall et al. | The automated computation of tree-level and next-to-leading order differential cross sections, and their matching to parton shower simulations | JHEP 07 (2014) 079 | 1405.0301 |
| 18 | J. Alwall et al. | Comparative study of various algorithms for the merging of parton showers and matrix elements in hadronic collisions | EPJC 53 (2008) 473 | 0706.2569 |
| 19 | S. Mrenna and P. Richardson | Matching matrix elements and parton showers with HERWIG and PYTHIA | JHEP 05 (2004) 040 | hep-ph/0312274 |
| 20 | S. Frixione, P. Nason, and C. Oleari | Matching NLO QCD computations with parton shower simulations: the POWHEG method | JHEP 11 (2007) 070 | 0709.2092 |
| 21 | S. Alioli, P. Nason, C. Oleari, and E. Re | A general framework for implementing NLO calculations in shower Monte Carlo programs: the POWHEG BOX | JHEP 06 (2010) 043 | 1002.2581 |
| 22 | P. Nason | A new method for combining NLO QCD with shower Monte Carlo algorithms | JHEP 11 (2004) 040 | hep-ph/0409146 |
| 23 | J. Bellm et al. | Herwig 7.0/Herwig++ 3.0 release note | EPJC 76 (2016) 196 | 1512.01178 |
| 24 | S. Frixione and B. R. Webber | Matching NLO QCD computations and parton shower simulations | JHEP 06 (2002) 029 | hep-ph/0204244 |
| 25 | R. Frederix and S. Frixione | Merging meets matching in MC@NLO | JHEP 12 (2012) 061 | 1209.6215 |
| 26 | S. Alioli et al. | Jet pair production in POWHEG | JHEP 11 (2011) 081 | 1012.3380 |
| 27 | A. Kardos, P. Nason, and C. Oleari | Three-jet production in POWHEG | JHEP 04 (2014) 043 | 1402.4001 |
| 28 | NNPDF Collaboration | Parton distributions for the LHC Run II | JHEP 04 (2015) 040 | 1410.8849 |
| 29 | L. A. Harland-Lang, A. D. Martin, P. Motylinski, and R. S. Thorne | Parton distributions in the LHC era: MMHT 2014 PDFs | EPJC 75 (2015) 204 | 1412.3989 |
| 30 | CMS Collaboration | The CMS high level trigger | EPJC 46 (2006) 605 | hep-ex/0512077 |
| 31 | CMS Collaboration | The CMS trigger system | JINST 12 (2017) P01020 | CMS-TRG-12-001 1609.02366 |
| 32 | CMS Collaboration | Particle-flow reconstruction and global event description with the CMS detector | JINST 12 (2017) P10003 | CMS-PRF-14-001 1706.04965 |
| 33 | M. Cacciari, G. P. Salam, and G. Soyez | The anti-$ k_t $ jet clustering algorithm | JHEP 04 (2008) 063 | 0802.1189 |
| 34 | M. Cacciari, G. P. Salam, and G. Soyez | FastJet user manual | EPJC 72 (2012) 1896 | 1111.6097 |
| 35 | CMS Collaboration | Jet energy scale and resolution in the CMS experiment in pp collisions at 8 TeV | JINST 12 (2017) 02014 | CMS-JME-13-004 1607.03663 |
| 36 | GEANT4 Collaboration | GEANT4---a simulation toolkit | NIMA 506 (2003) 250 | |
| 37 | CMS Collaboration | Description and performance of track and primary-vertex reconstruction with the CMS tracker | JINST 9 (2014) P10009 | CMS-TRK-11-001 1405.6569 |
| 38 | CMS Collaboration | Jet algorithms performance in 13 TeV data | CMS-PAS-JME-16-003 | CMS-PAS-JME-16-003 |
| 39 | T. Adye | Unfolding algorithms and tests using RooUnfold | in PHYSTAT 2011 Workshop on Statistical Issues Related to Discovery Claims in Search Experiments and Unfolding, H. Prosper and L. Lyons, eds., p. 313 Geneva, Switzerland | 1105.1160 |
| 40 | M. H. Seymour and A. Siodmok | Constraining MPI models using $ \sigma_{\text{eff}} $ and recent Tevatron and LHC underlying event data | JHEP 10 (2013) 113 | 1307.5015 |
|
|
Compact Muon Solenoid LHC, CERN |
|

|

|

|

|

|