

Compact Muon Solenoid
LHC, CERN
| CMS-SUS-16-035 ; CERN-EP-2017-071 | ||
| Search for physics beyond the standard model in events with two leptons of same sign, missing transverse momentum, and jets in proton-proton collisions at $ \sqrt{s} = $ 13 TeV | ||
| CMS Collaboration | ||
| 24 April 2017 | ||
| Eur. Phys. J. C 77 (2017) 578 | ||
| Abstract: A data sample of events from proton-proton collisions with two isolated same-sign leptons, missing transverse momentum, and jets is studied in a search for signatures of new physics phenomena by the CMS Collaboration at the LHC. The data correspond to an integrated luminosity of 35.9 fb$^{-1}$, and a center-of-mass energy of 13 TeV. The properties of the events are consistent with expectations from standard model processes, and no excess yield is observed. Exclusion limits at 95% confidence level are set on cross sections for the pair production of gluinos, squarks, and same-sign top quarks, as well as top-quark associated production of a heavy scalar or pseudoscalar boson decaying to top quarks, and on the standard model production of events with four top quarks. The observed lower mass limits are as high as 1500 GeV for gluinos, 830 GeV for bottom squarks. The excluded mass range for heavy (pseudo)scalar bosons is 350-360 (350-410) GeV. Additionally, model-independent limits in several topological regions are provided, allowing for further interpretations of the results. | ||
| Links: e-print arXiv:1704.07323 [hep-ex] (PDF) ; CDS record ; inSPIRE record ; CADI line (restricted) ; | ||
| Figures & Tables | Summary | Additional Figures & Tables | References | CMS Publications |
|---|
|
Additional information on efficiencies needed for reinterpretation of these results are available here
Additional technical material for CMS speakers can be found here |
| Figures | |
png pdf |
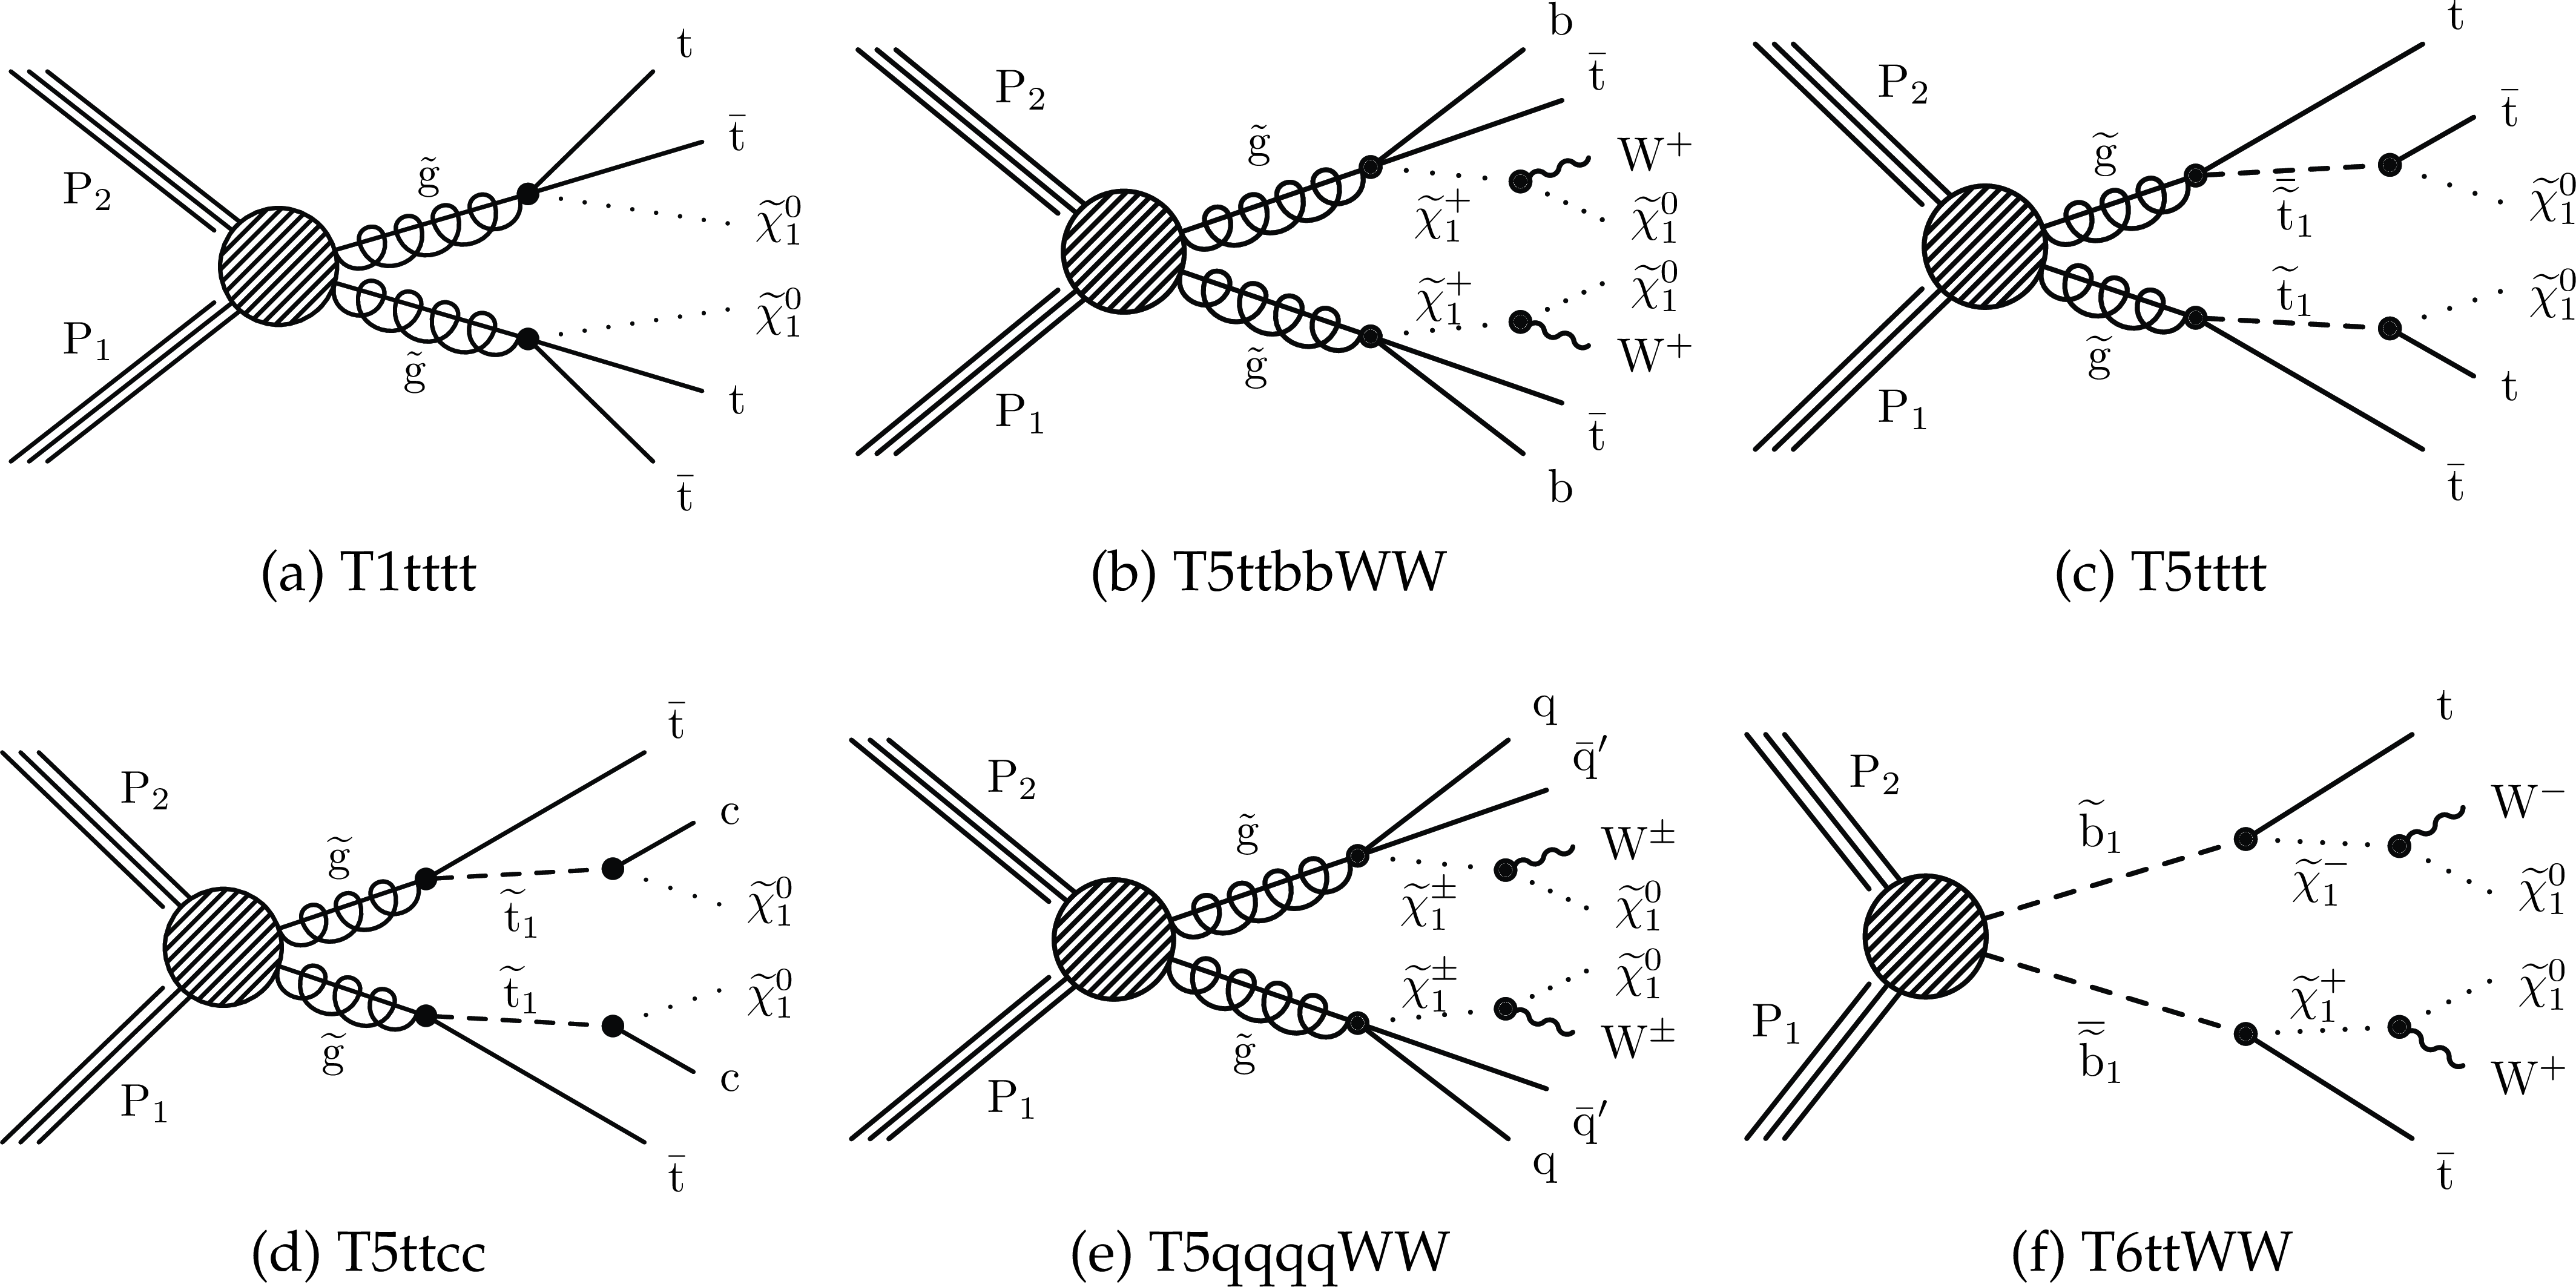
Figure 1:
Diagrams illustrating the simplified SUSY models considered in this analysis. |

png pdf |
Figure 2:
Diagrams for scalar (pseudoscalar) boson production in association with top quarks. |

png pdf |
Figure 3:
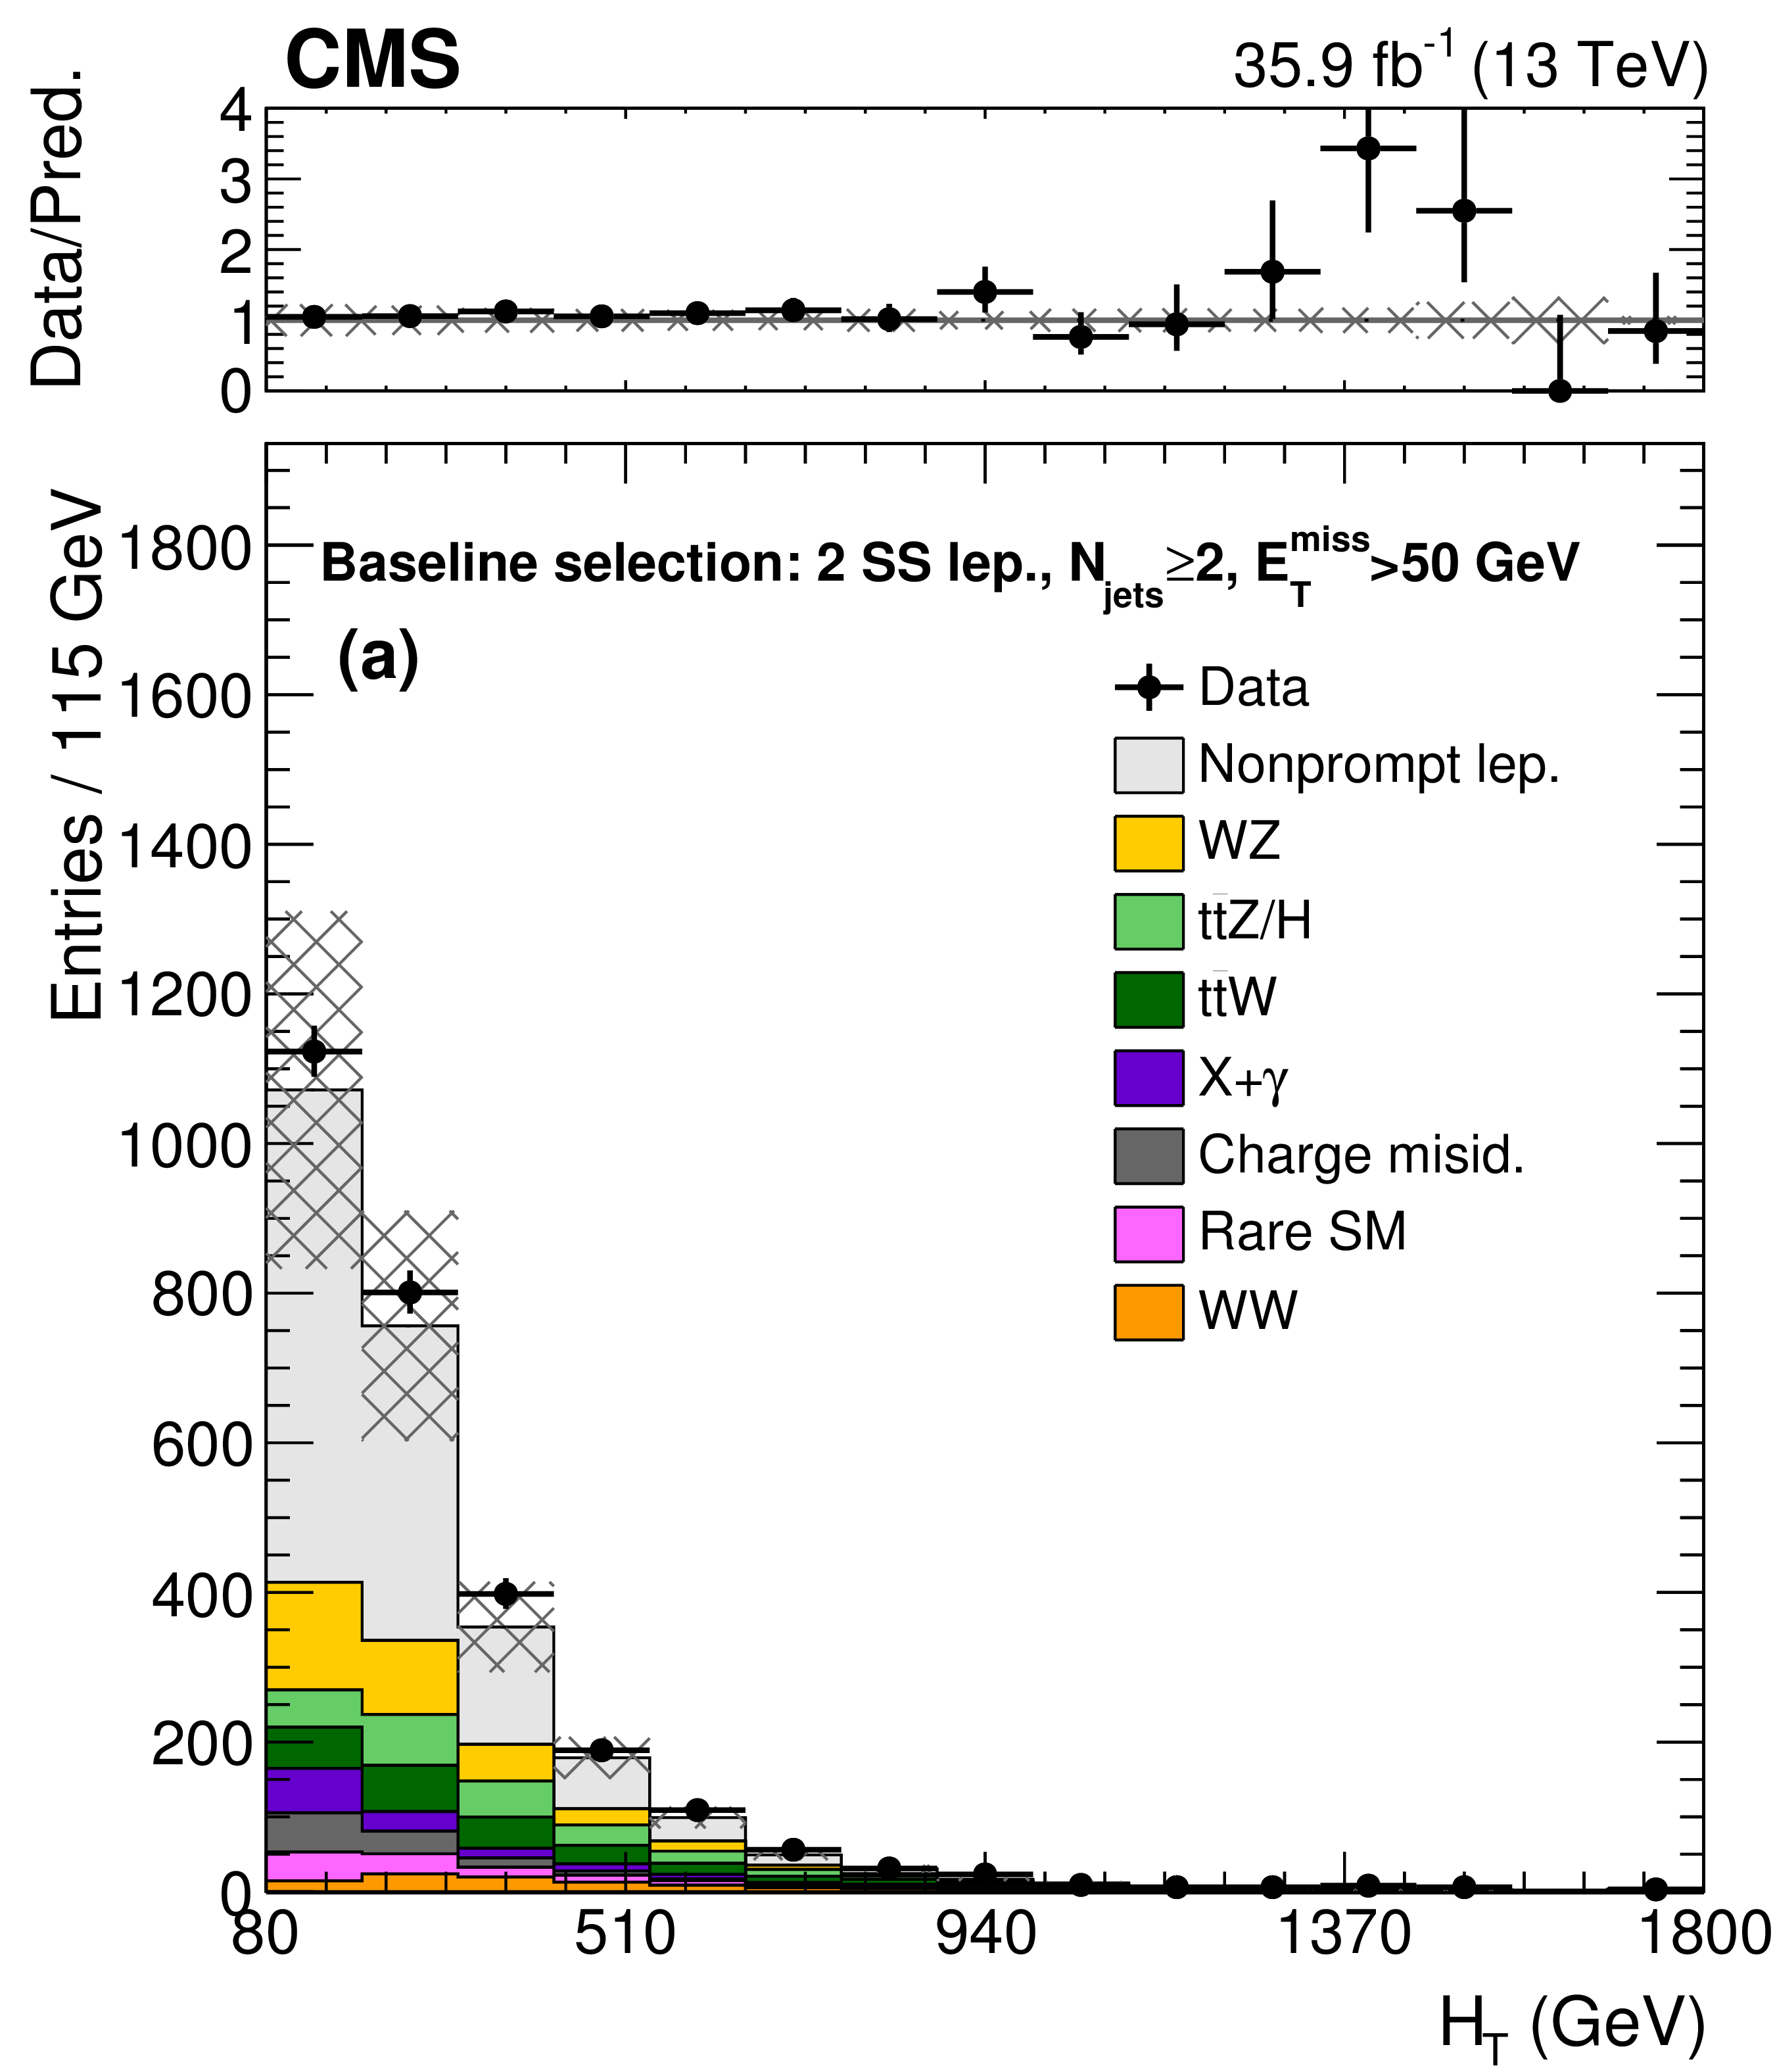
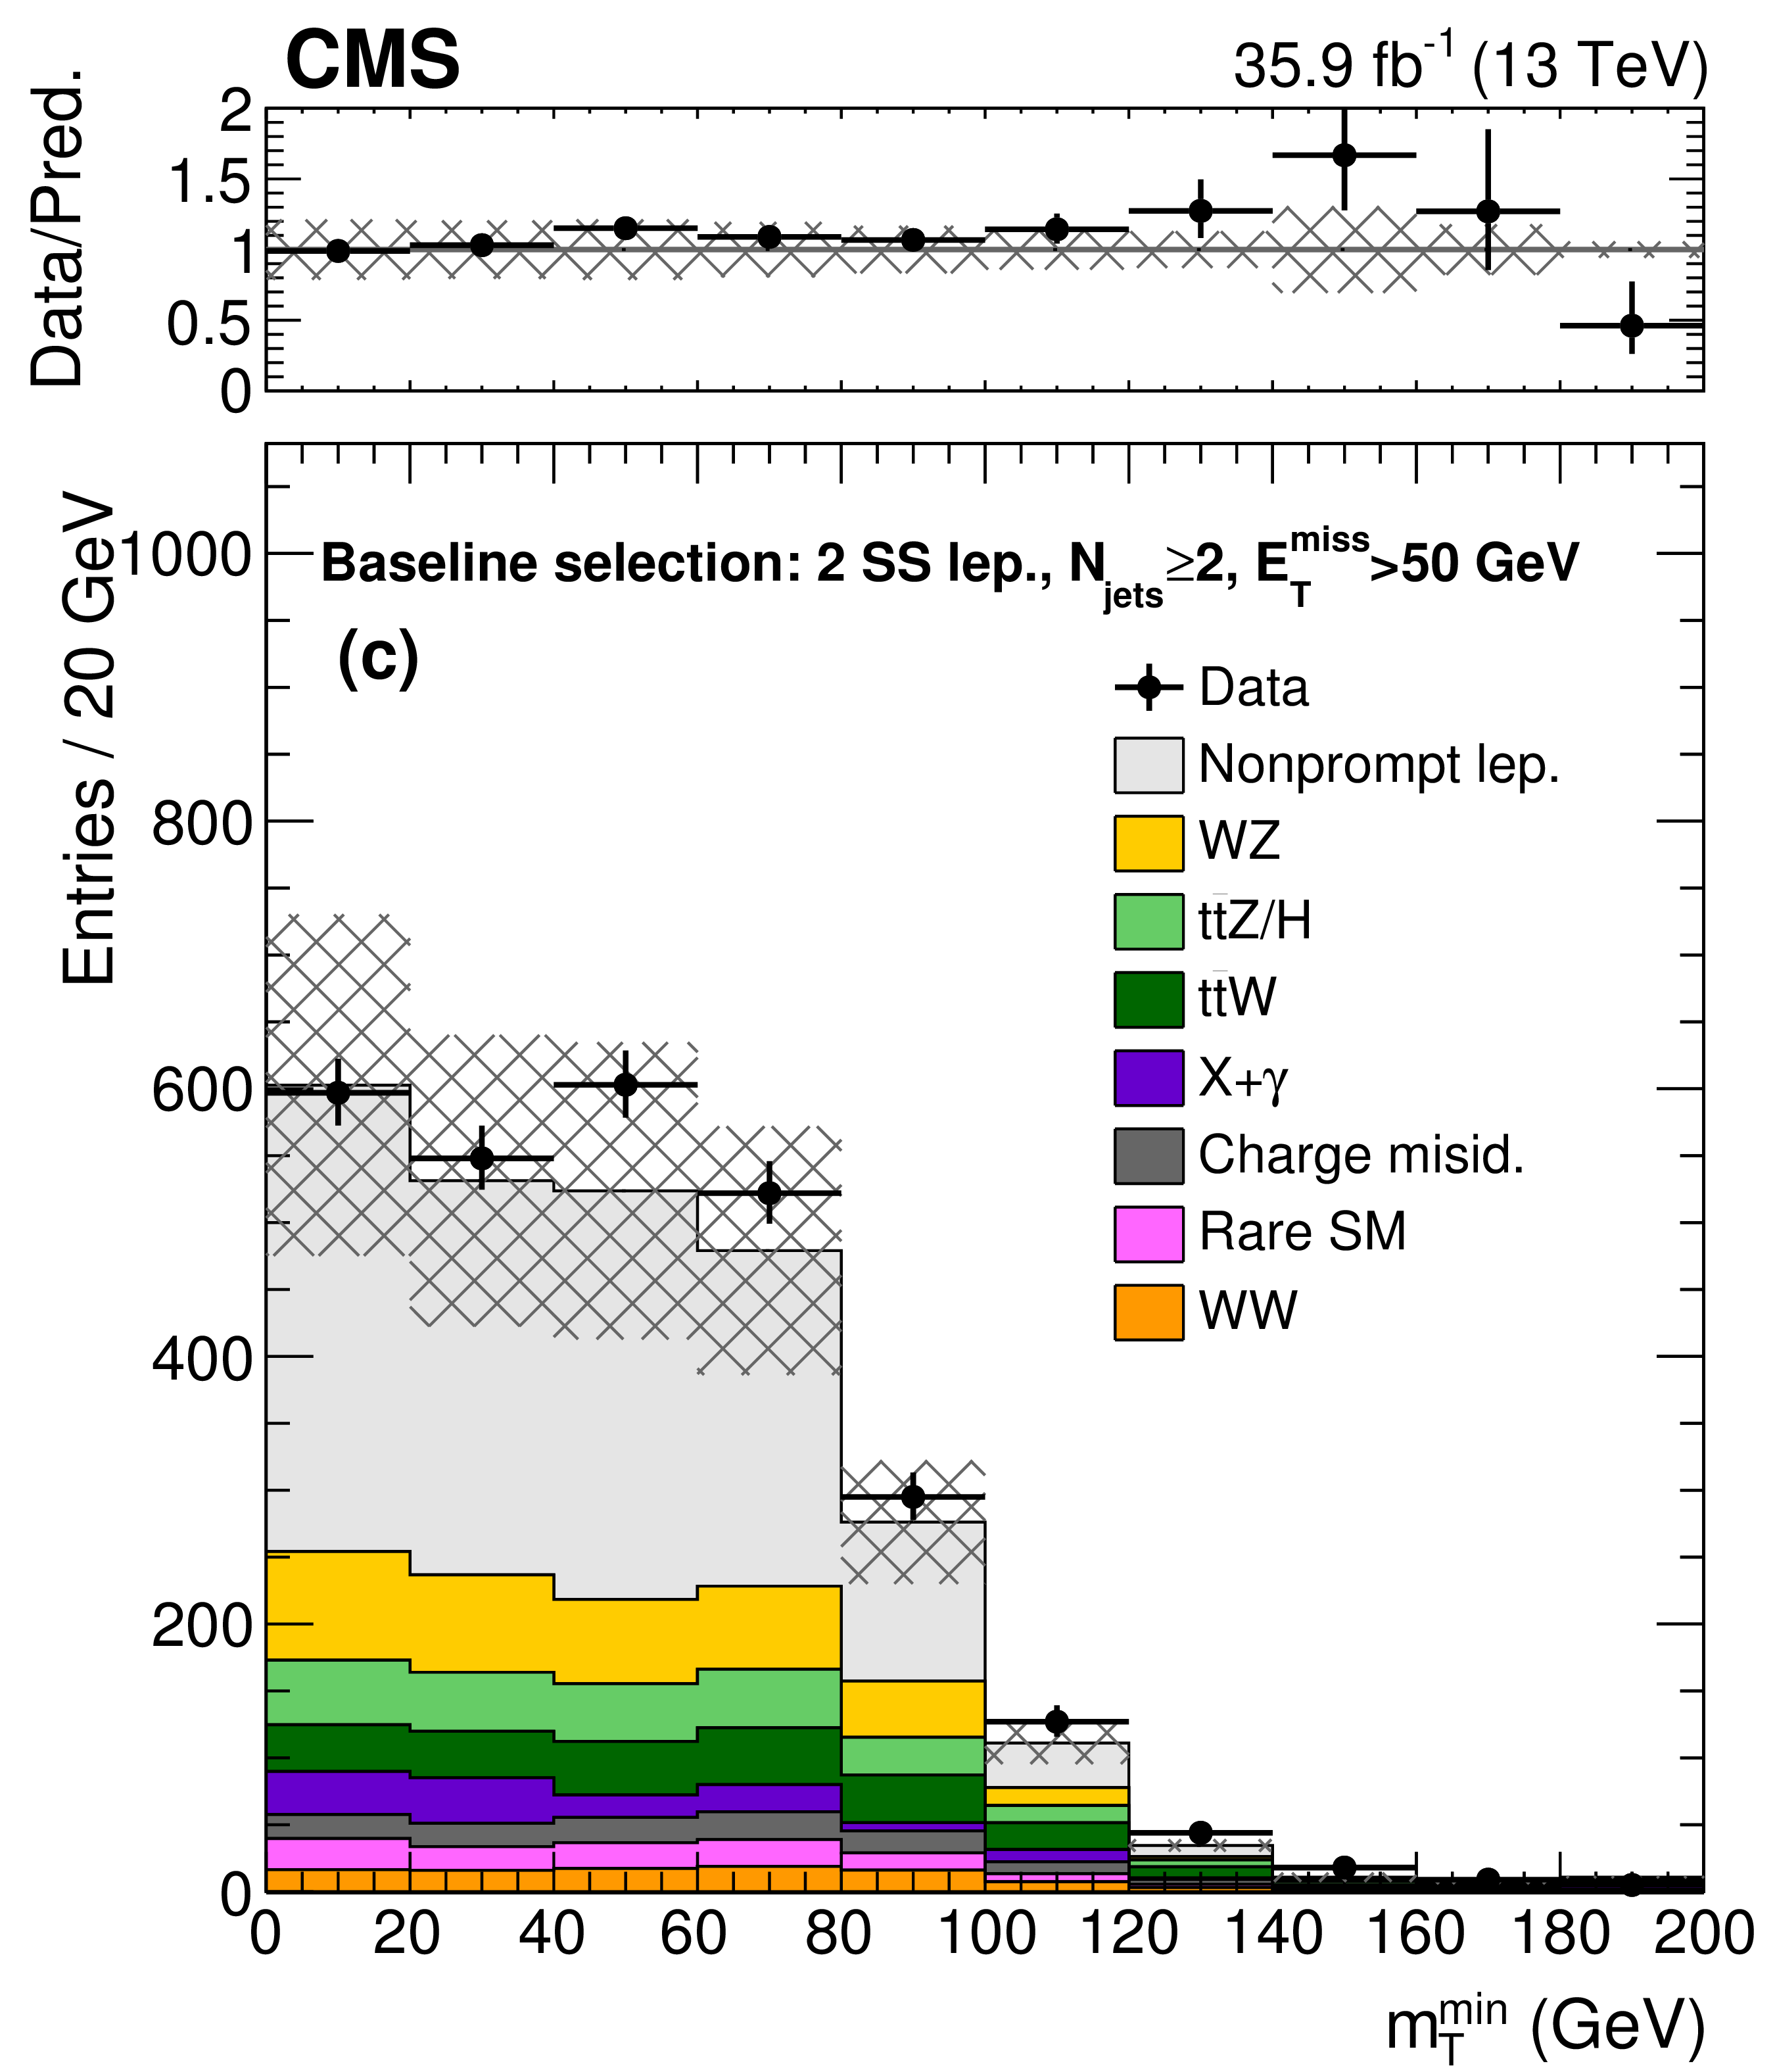
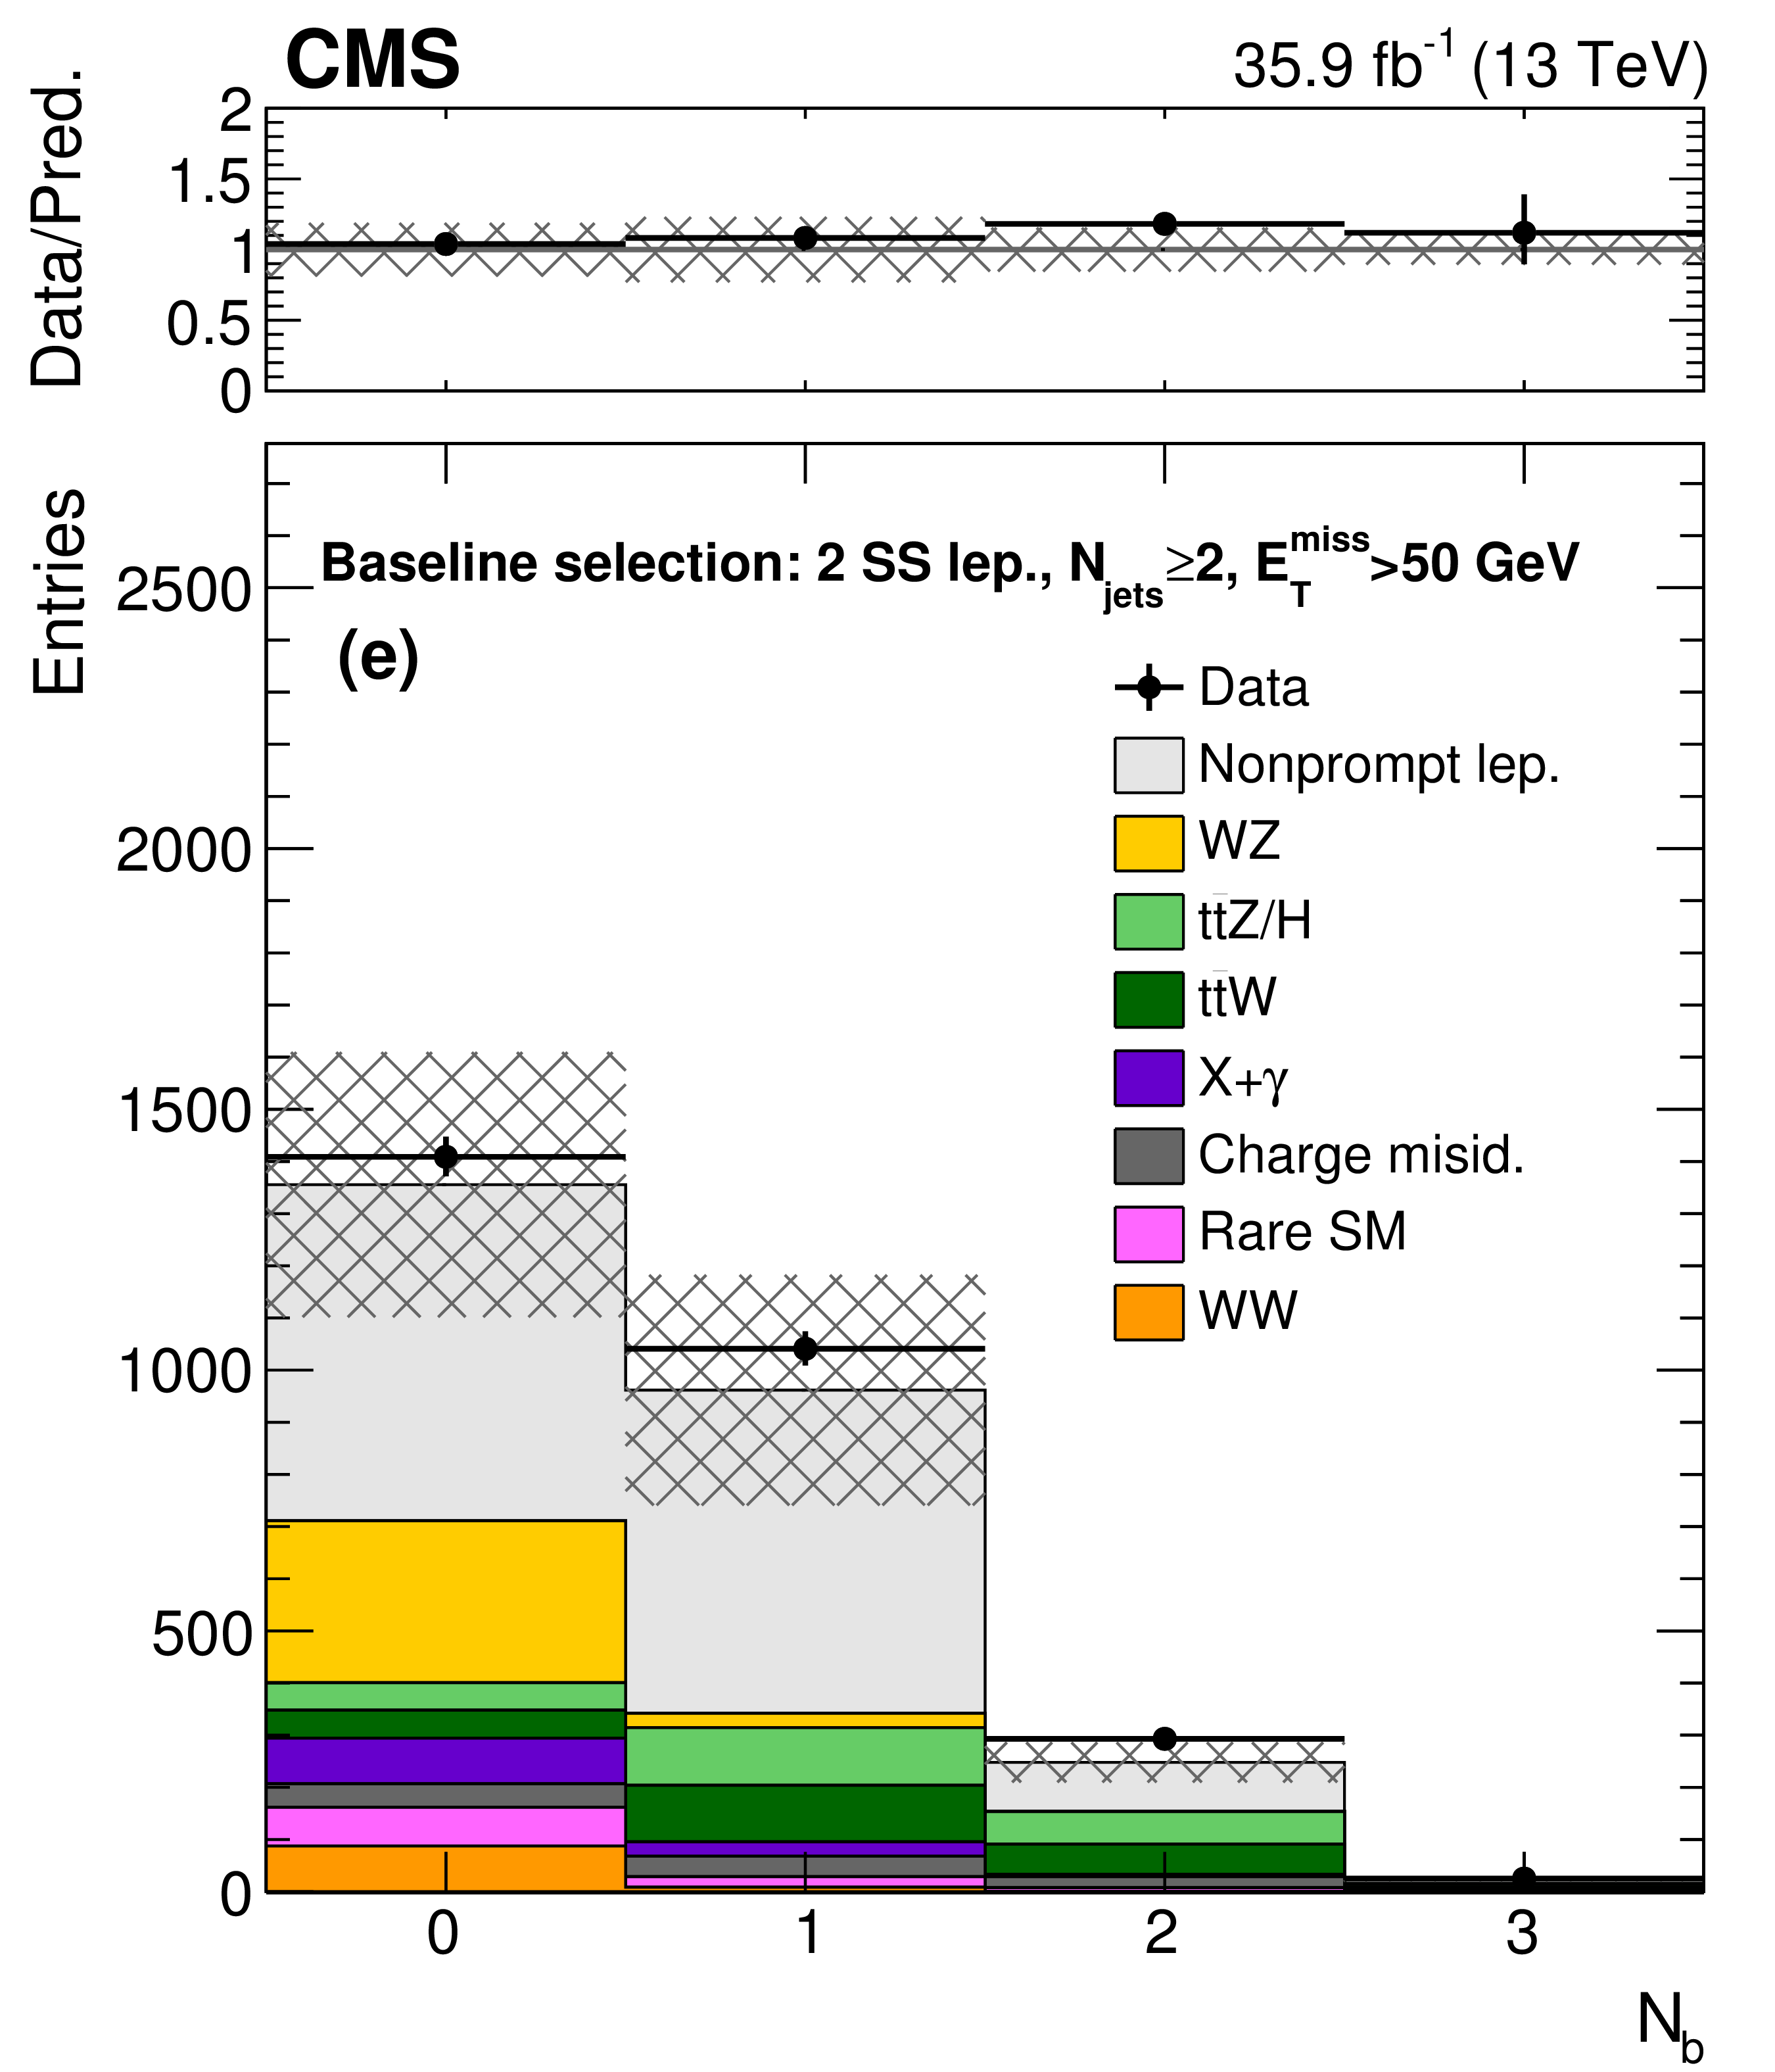
Distributions of the main analysis variables: $ {H_{\mathrm {T}}}$ (a), ${E_{\mathrm {T}}^{\text {miss}}}$ (b), ${m_\mathrm {T}^{\text {min}}}$ (c), ${N_\text {jets}}$ (d), and ${N_{\mathrm{ b } }}$ (e), after the baseline selection requiring a pair of SS leptons, two jets, and $ {E_{\mathrm {T}}^{\text {miss}}} > $ 50 GeV. The last bin includes the overflow events and the hatched area represents the total uncertainty in the background prediction. The upper panels show the ratio of the observed event yield to the background prediction. |
png pdf |
Figure 3-a:
Distribution of the $ {H_{\mathrm {T}}}$ analysis variable, after the baseline selection requiring a pair of SS leptons, two jets, and $ {E_{\mathrm {T}}^{\text {miss}}} > $ 50 GeV. The last bin includes the overflow events and the hatched area represents the total uncertainty in the background prediction. The upper panel shows the ratio of the observed event yield to the background prediction. |

png pdf |
Figure 3-b:
Distribution of the ${E_{\mathrm {T}}^{\text {miss}}}$ analysis variable, after the baseline selection requiring a pair of SS leptons, two jets, and $ {E_{\mathrm {T}}^{\text {miss}}} > $ 50 GeV. The last bin includes the overflow events and the hatched area represents the total uncertainty in the background prediction. The upper panel shows the ratio of the observed event yield to the background prediction. |
png pdf |
Figure 3-c:
Distribution of the ${m_\mathrm {T}^{\text {min}}}$ analysis variable, after the baseline selection requiring a pair of SS leptons, two jets, and $ {E_{\mathrm {T}}^{\text {miss}}} > $ 50 GeV. The last bin includes the overflow events and the hatched area represents the total uncertainty in the background prediction. The upper panel shows the ratio of the observed event yield to the background prediction. |

png pdf |
Figure 3-d:
Distribution of the ${N_\text {jets}}$ analysis variable, after the baseline selection requiring a pair of SS leptons, two jets, and $ {E_{\mathrm {T}}^{\text {miss}}} > $ 50 GeV. The last bin includes the overflow events and the hatched area represents the total uncertainty in the background prediction. The upper panel shows the ratio of the observed event yield to the background prediction. |
png pdf |
Figure 3-e:
Distribution of the ${N_{\mathrm{ b } }}$ analysis variable, after the baseline selection requiring a pair of SS leptons, two jets, and $ {E_{\mathrm {T}}^{\text {miss}}} > $ 50 GeV. The last bin includes the overflow events and the hatched area represents the total uncertainty in the background prediction. The upper panel shows the ratio of the observed event yield to the background prediction. |
png pdf |
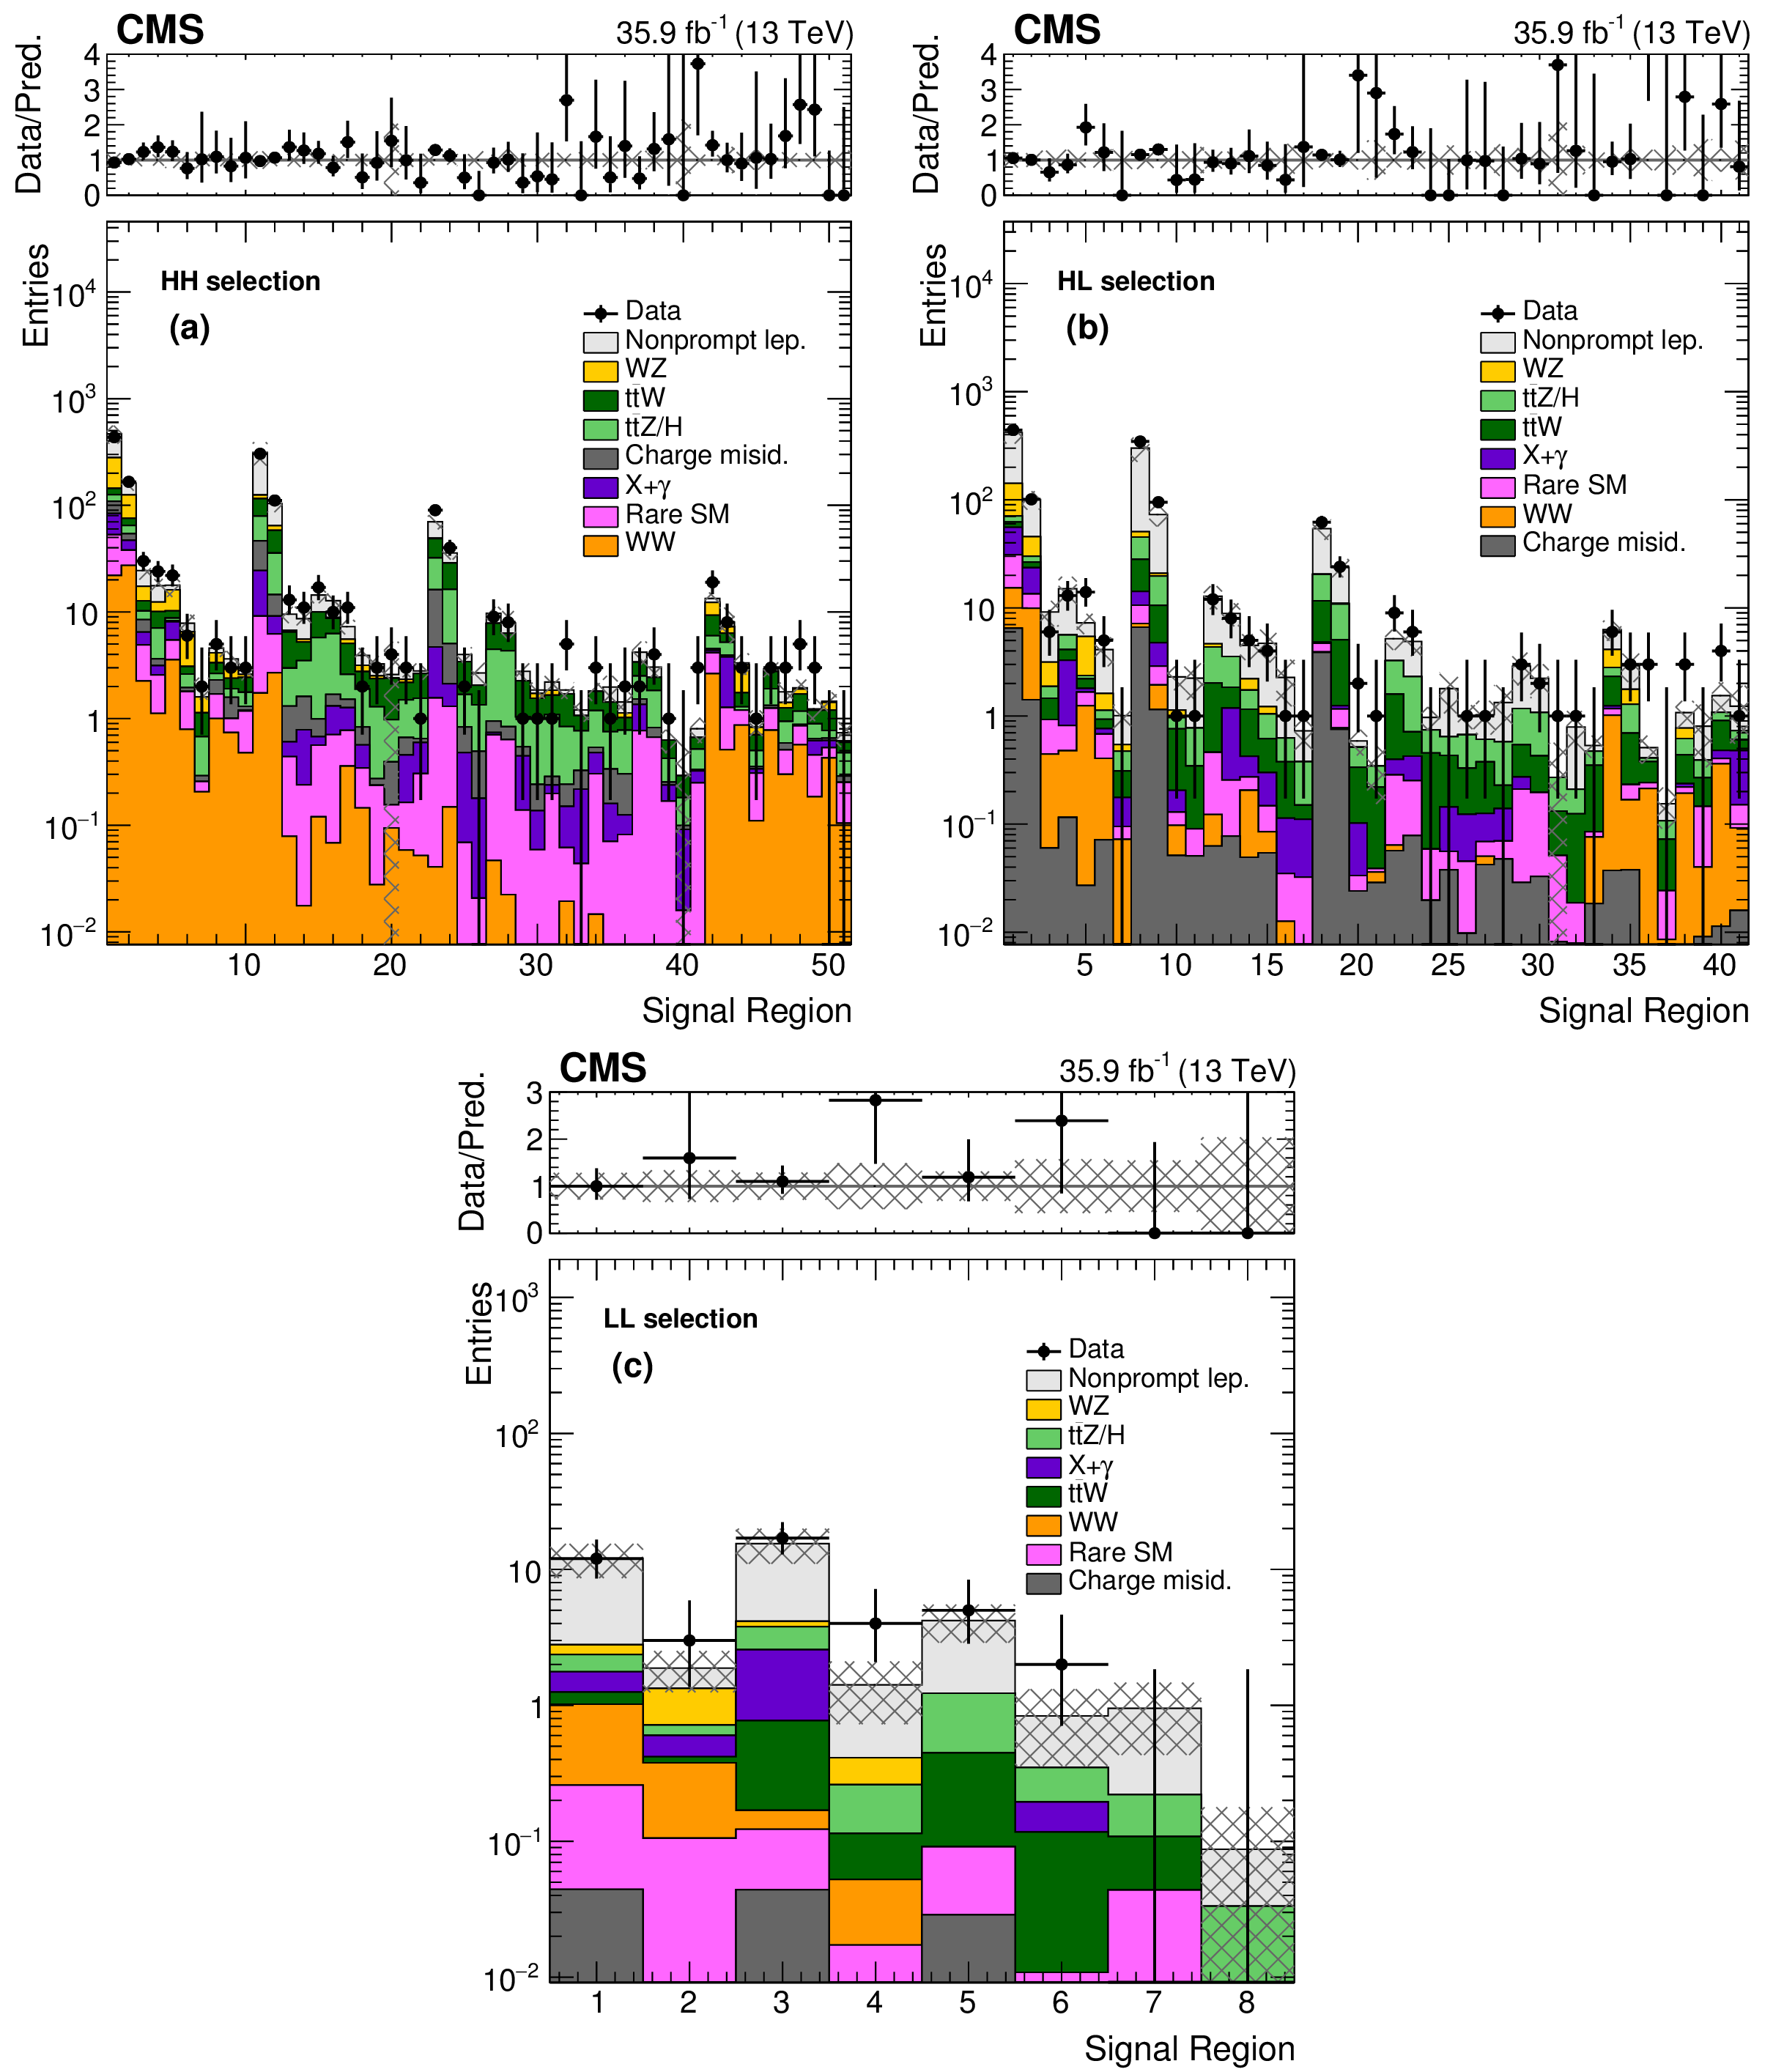
Figure 4:
Event yields in the HH(a), HL(b), and LL(c) signal regions. The hatched area represents the total uncertainty in the background prediction. The upper panels show the ratio of the observed event yield to the background prediction. |
png pdf |
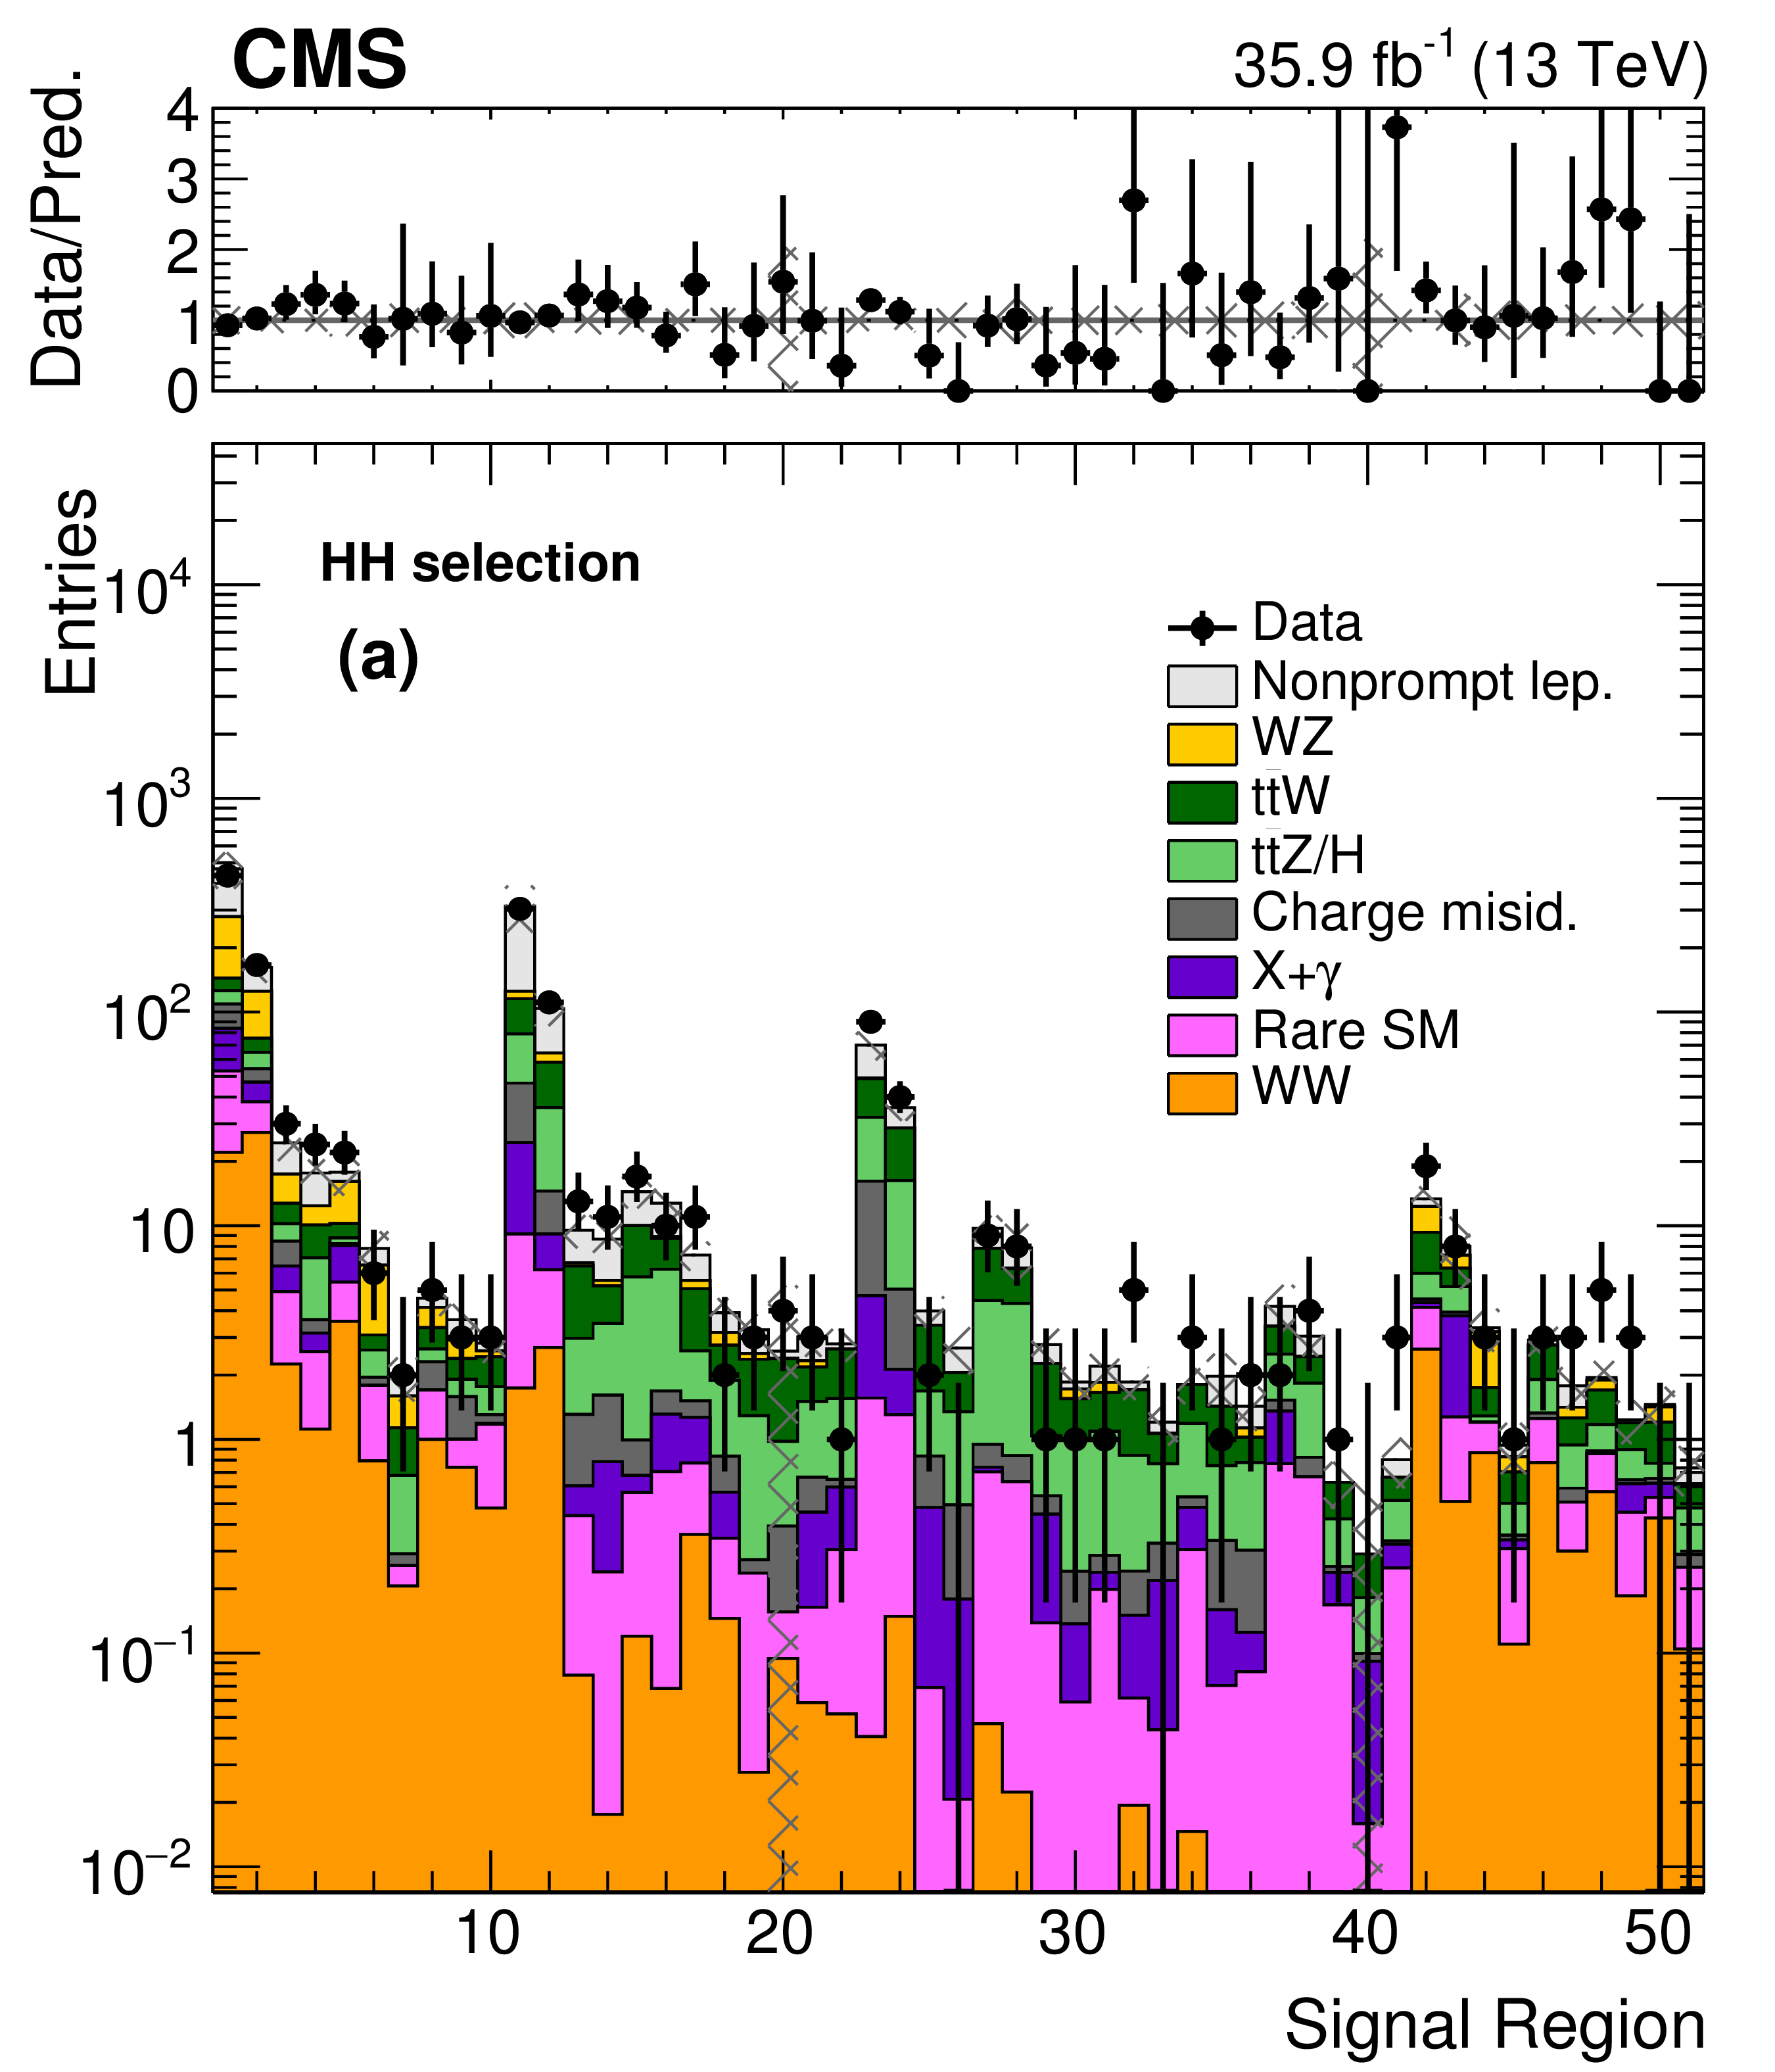
Figure 4-a:
Event yield in the HH signal regions. The hatched area represents the total uncertainty in the background prediction. The upper panel shows the ratio of the observed event yield to the background prediction. |
png pdf |
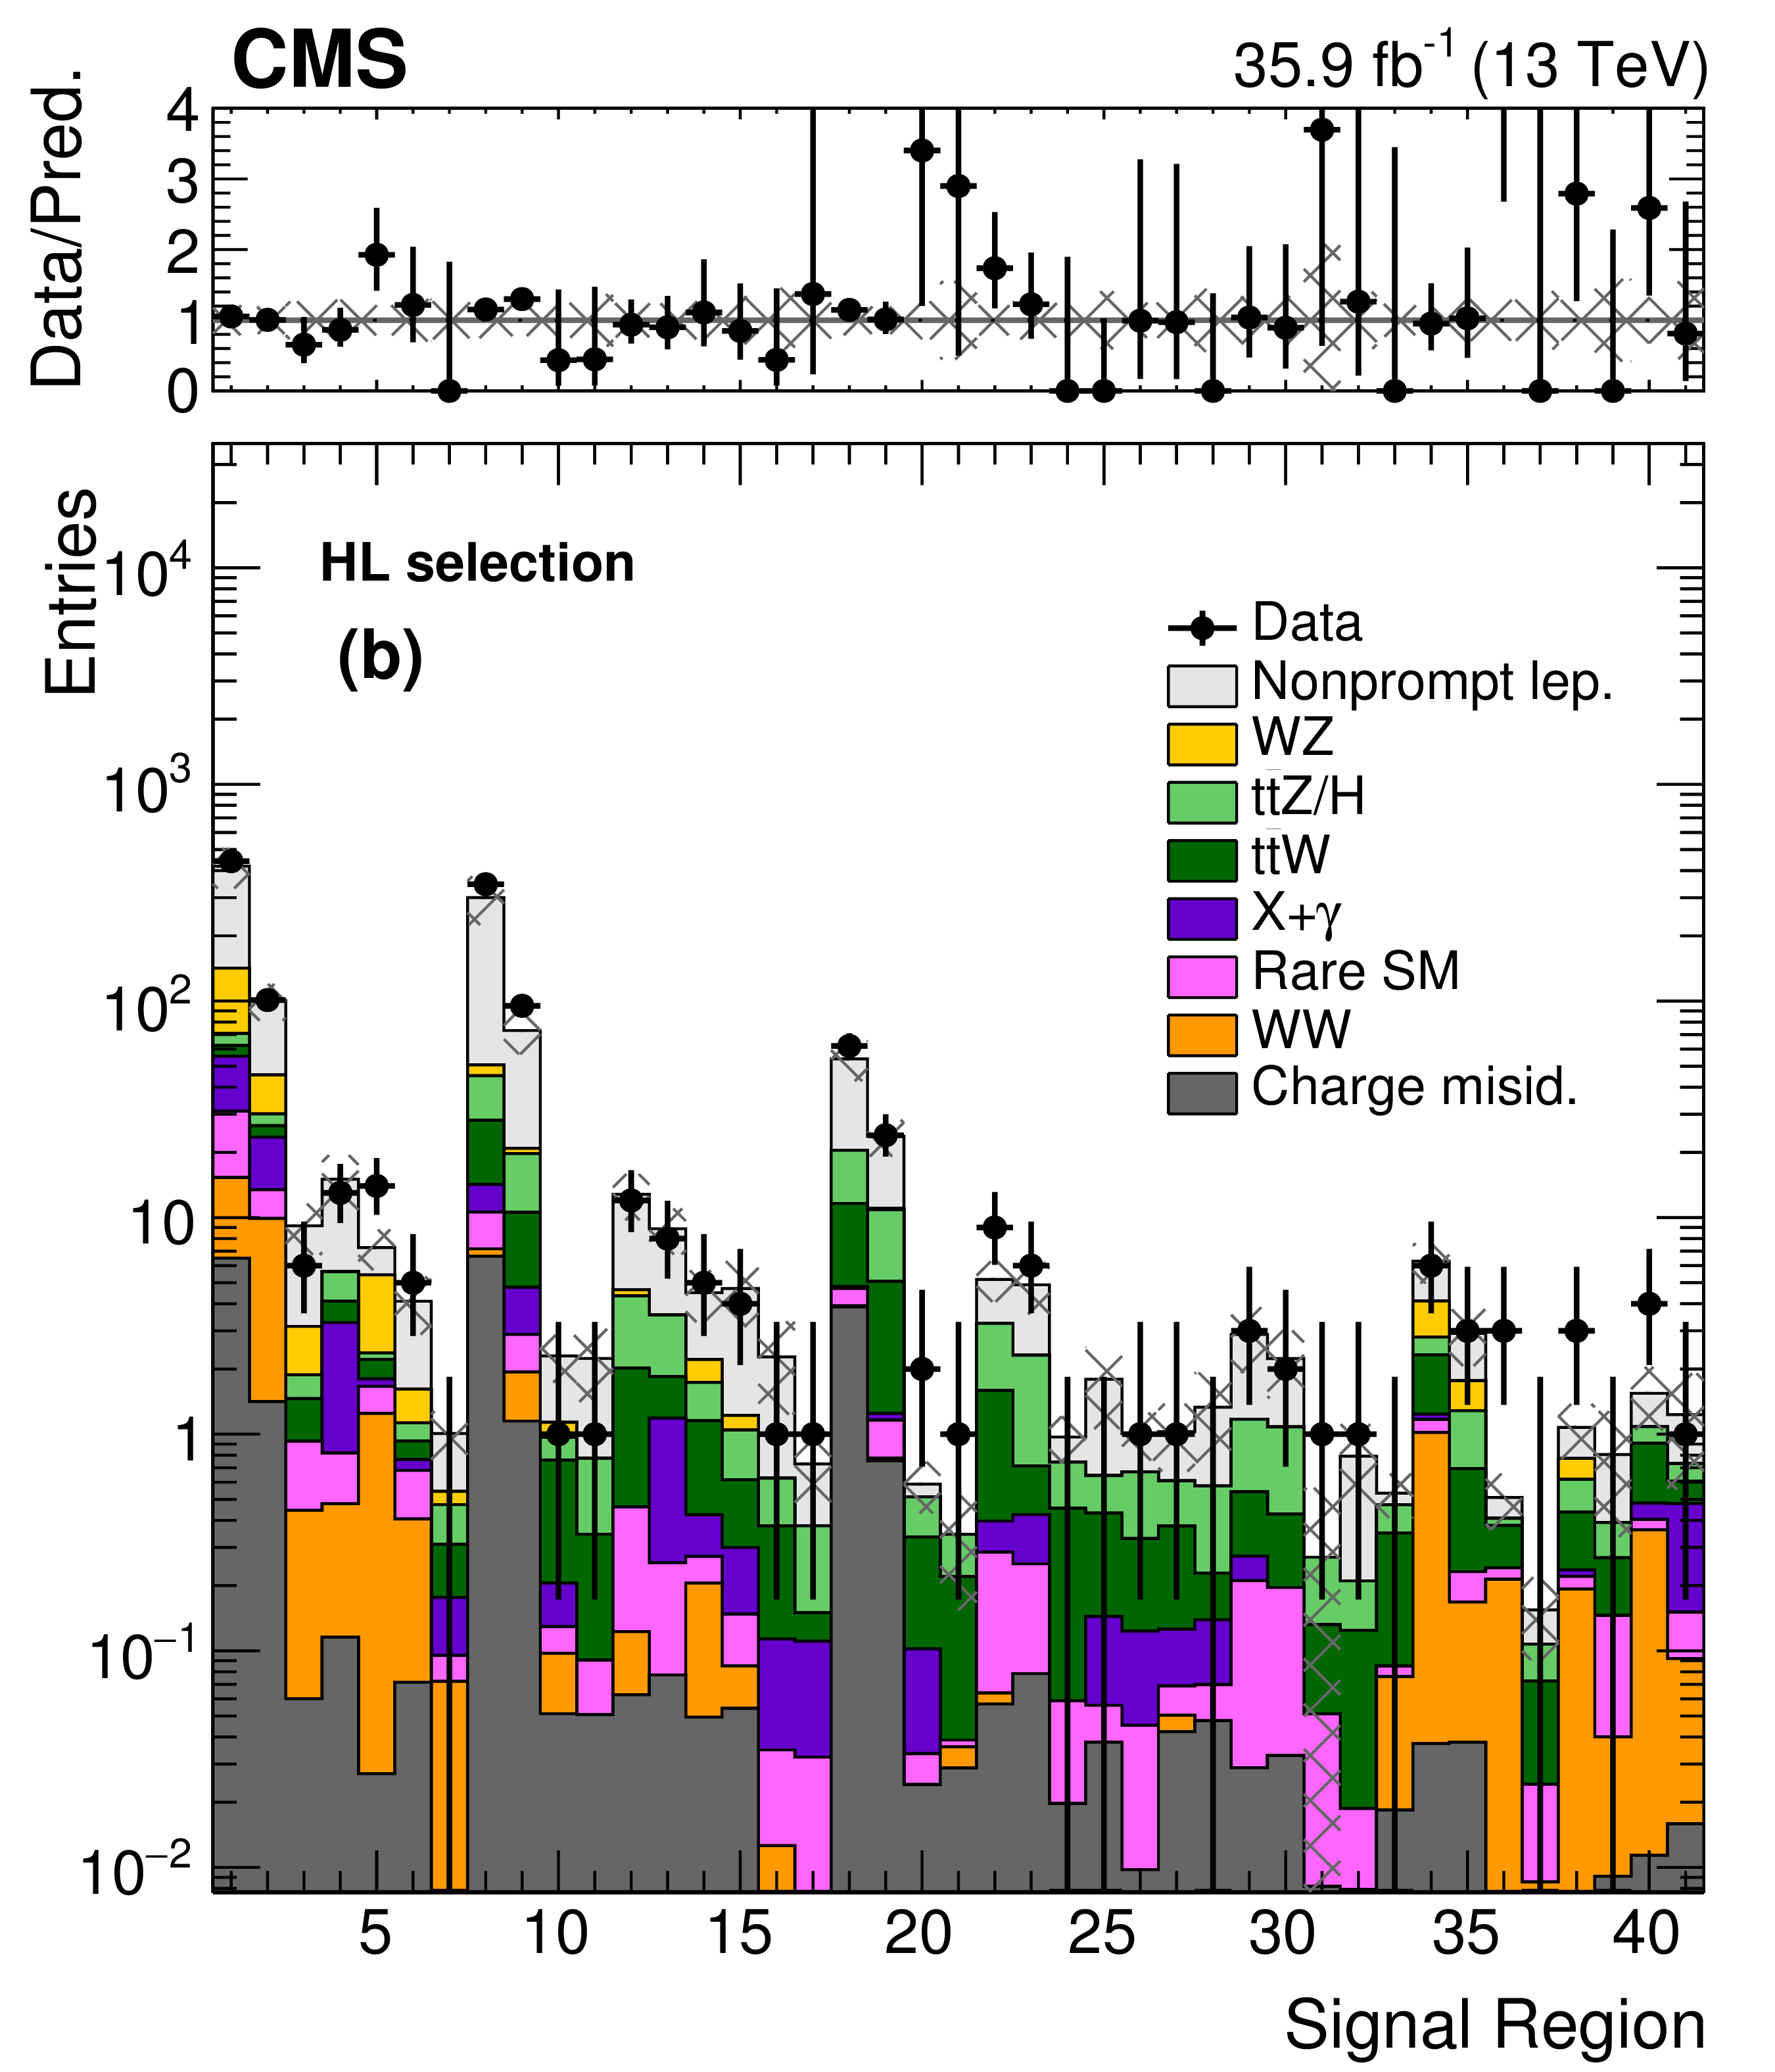
Figure 4-b:
Event yield in the HL signal regions. The hatched area represents the total uncertainty in the background prediction. The upper panel shows the ratio of the observed event yield to the background prediction. |
png pdf |
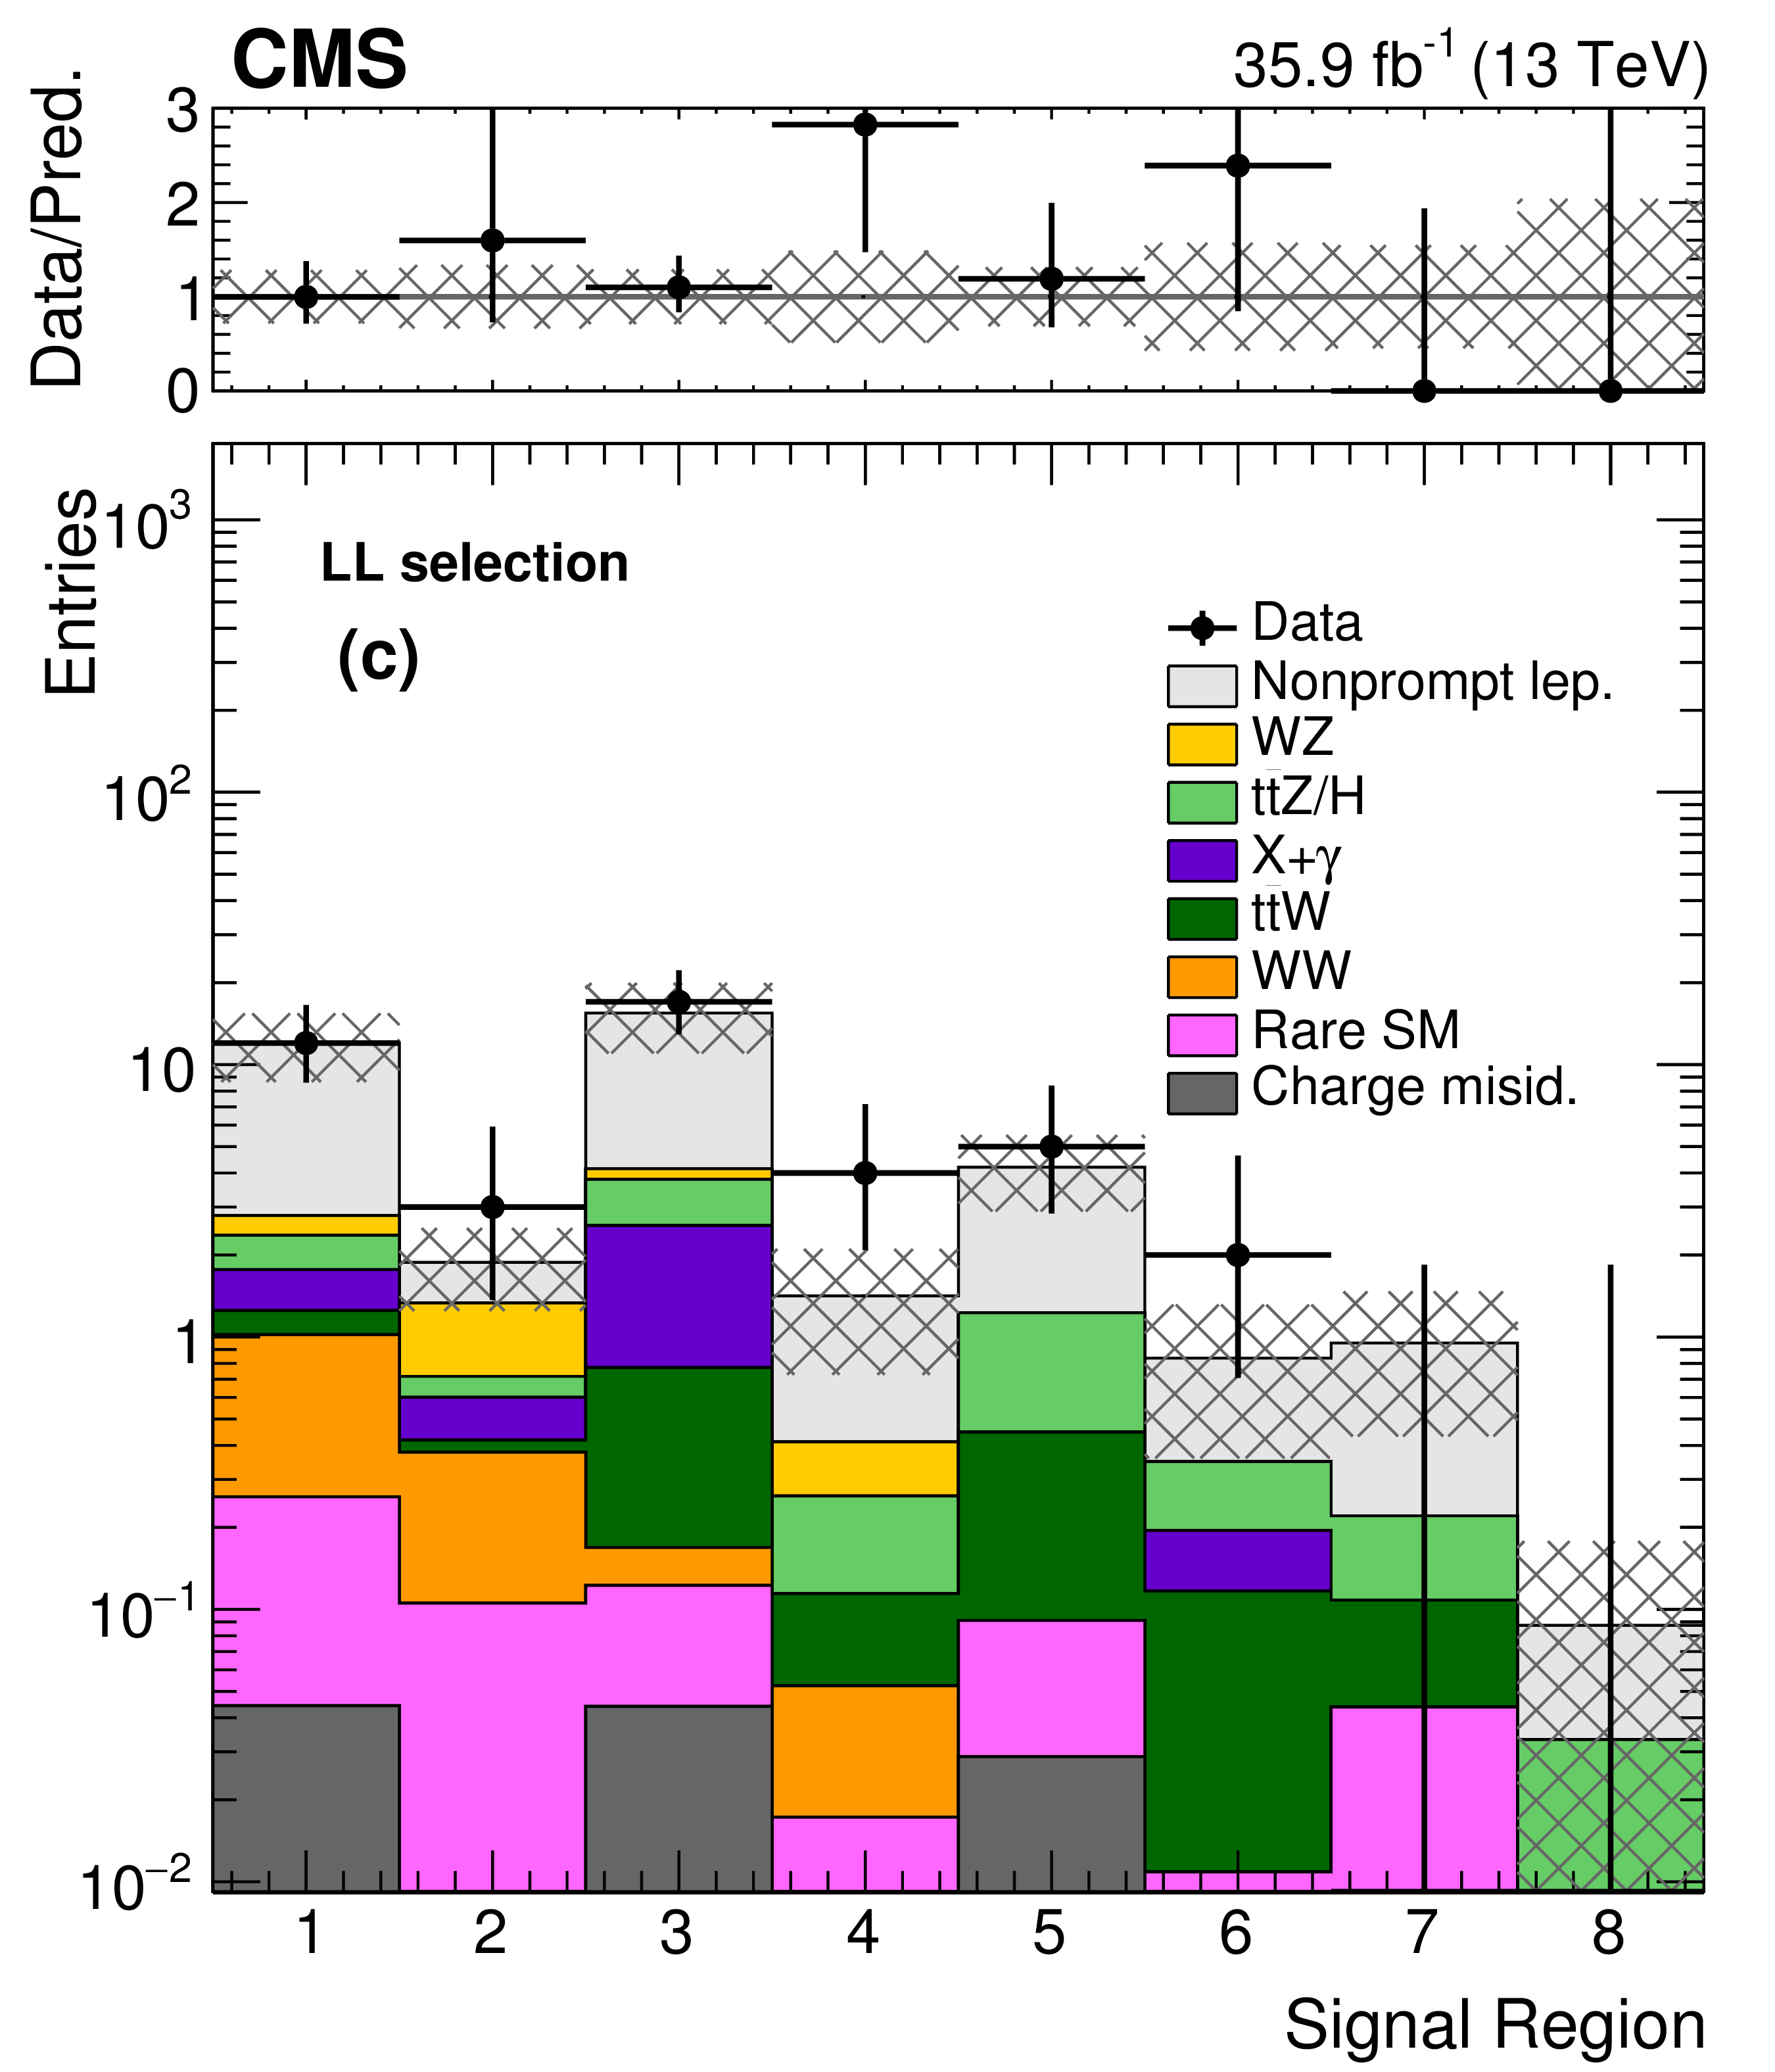
Figure 4-c:
Event yield in the LL signal regions. The hatched area represents the total uncertainty in the background prediction. The upper panel shows the ratio of the observed event yield to the background prediction. |
png pdf |
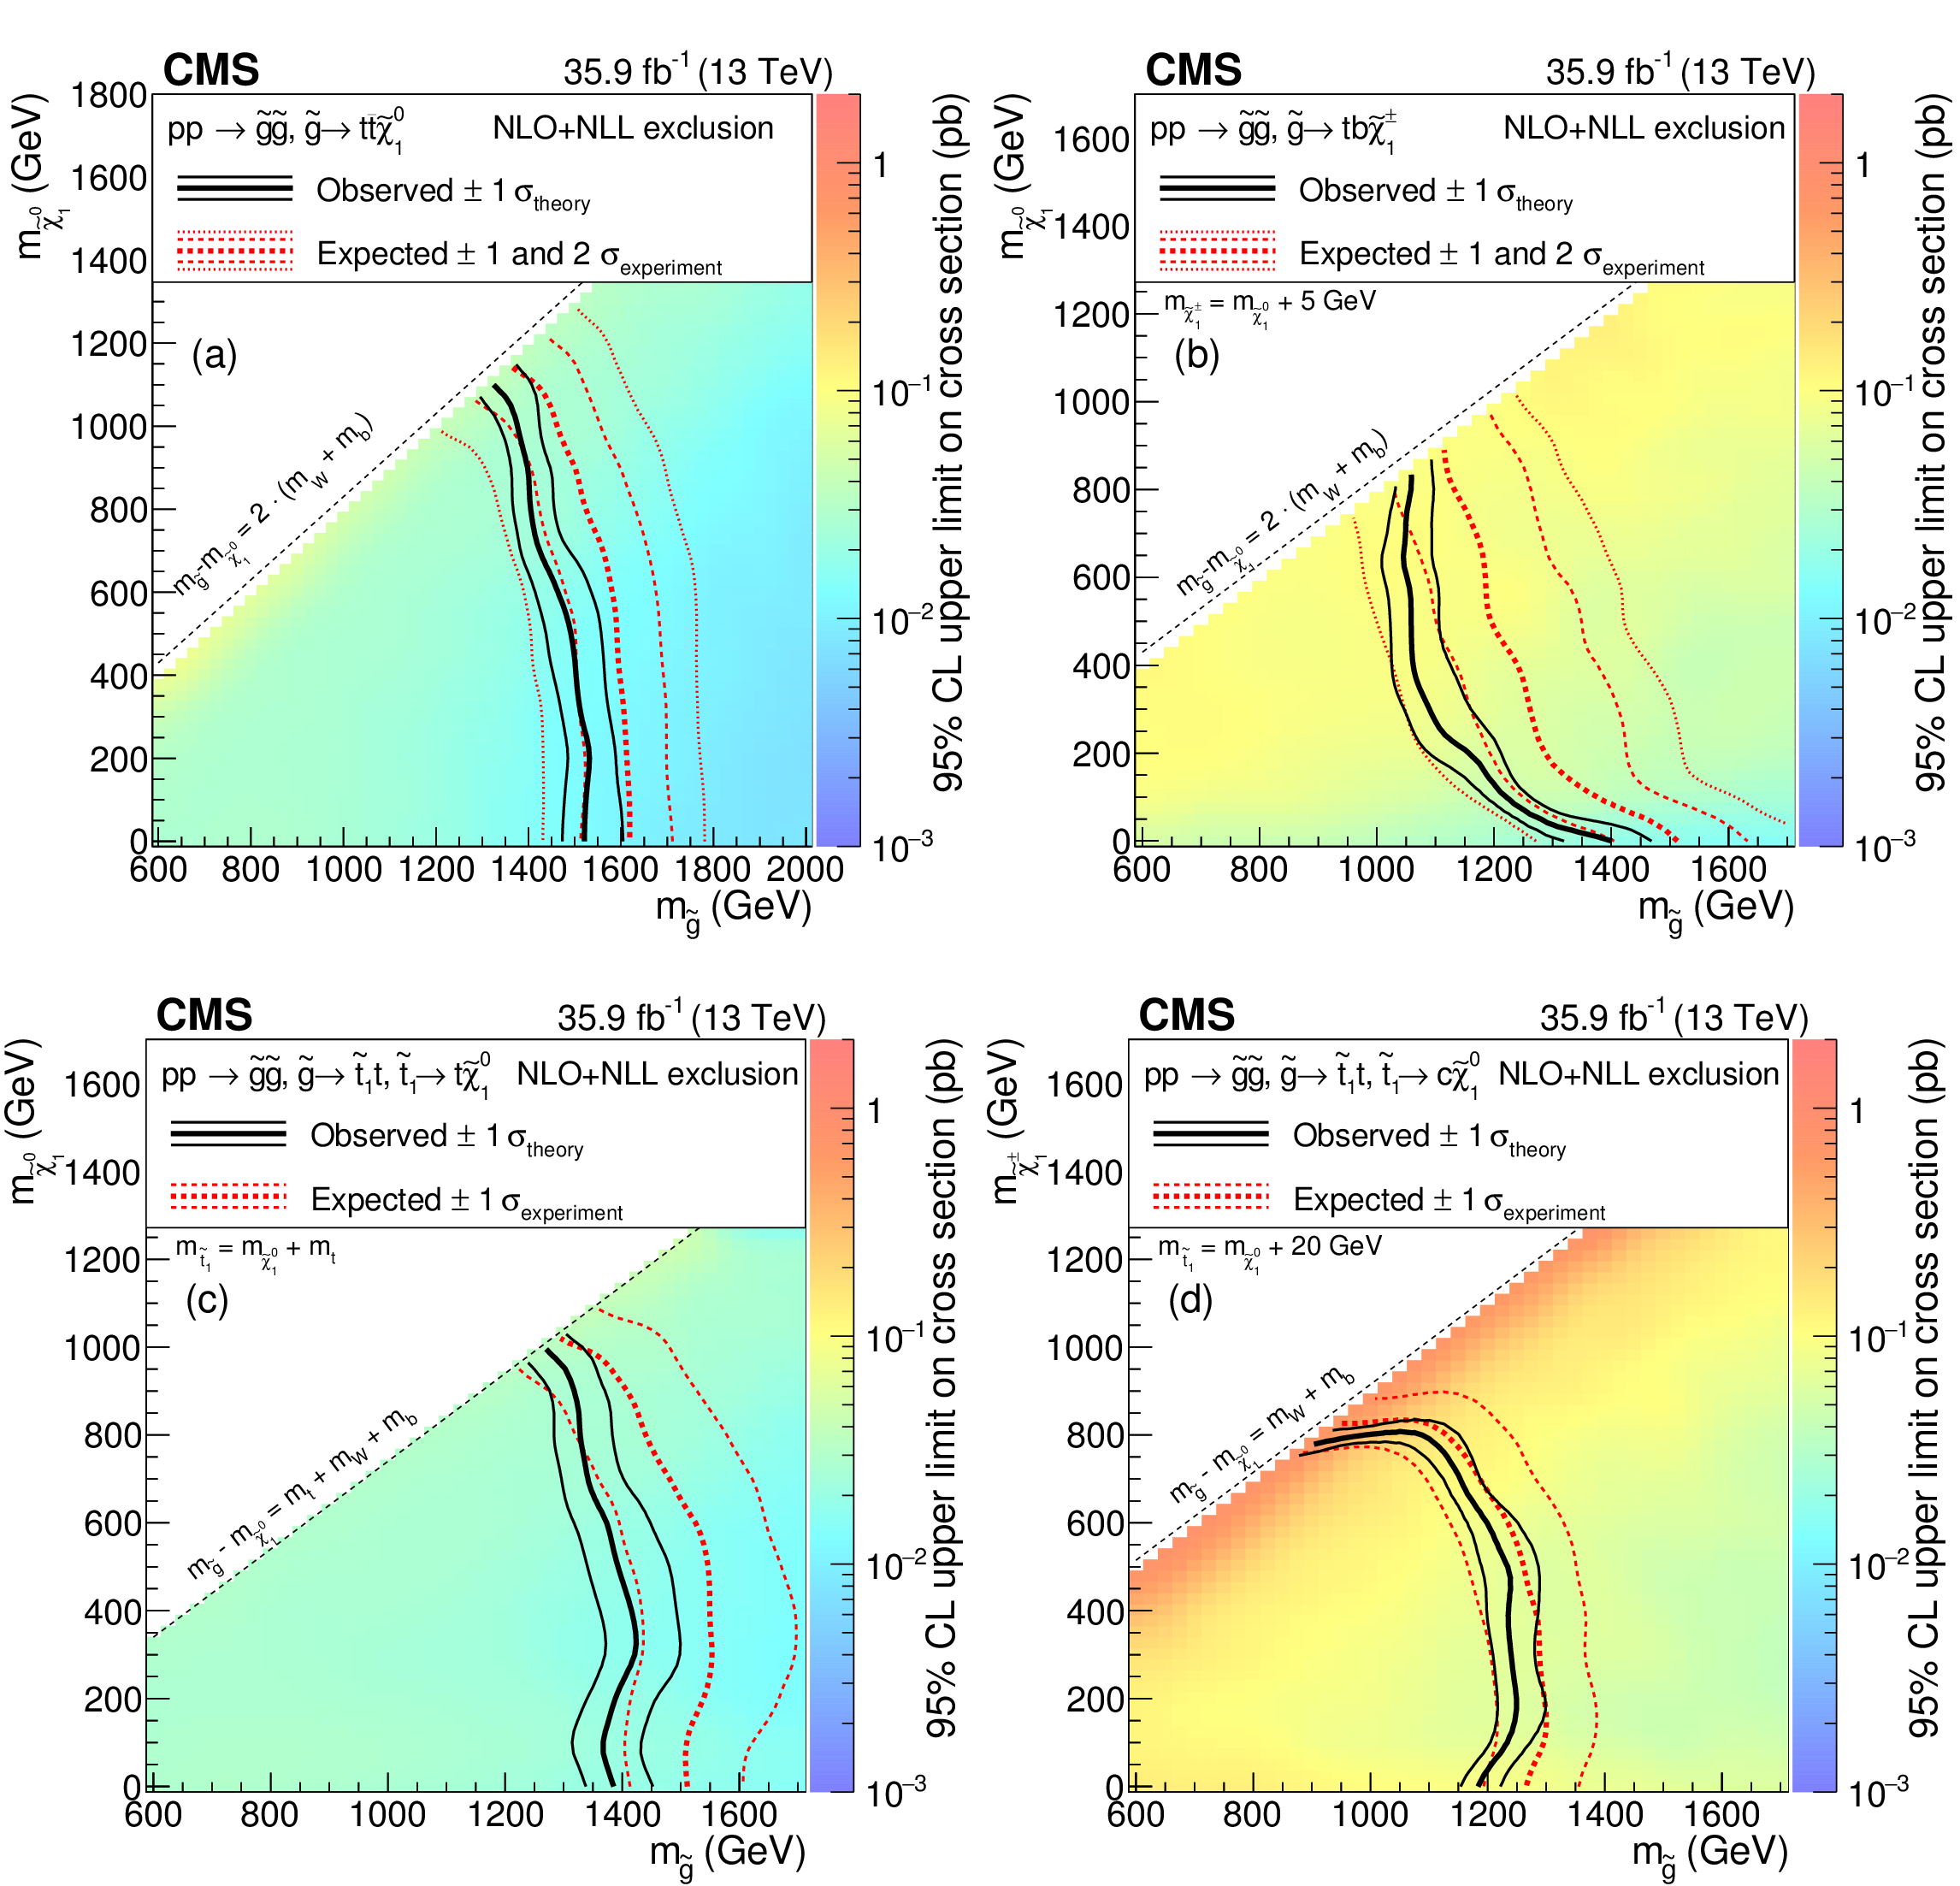
Figure 5:
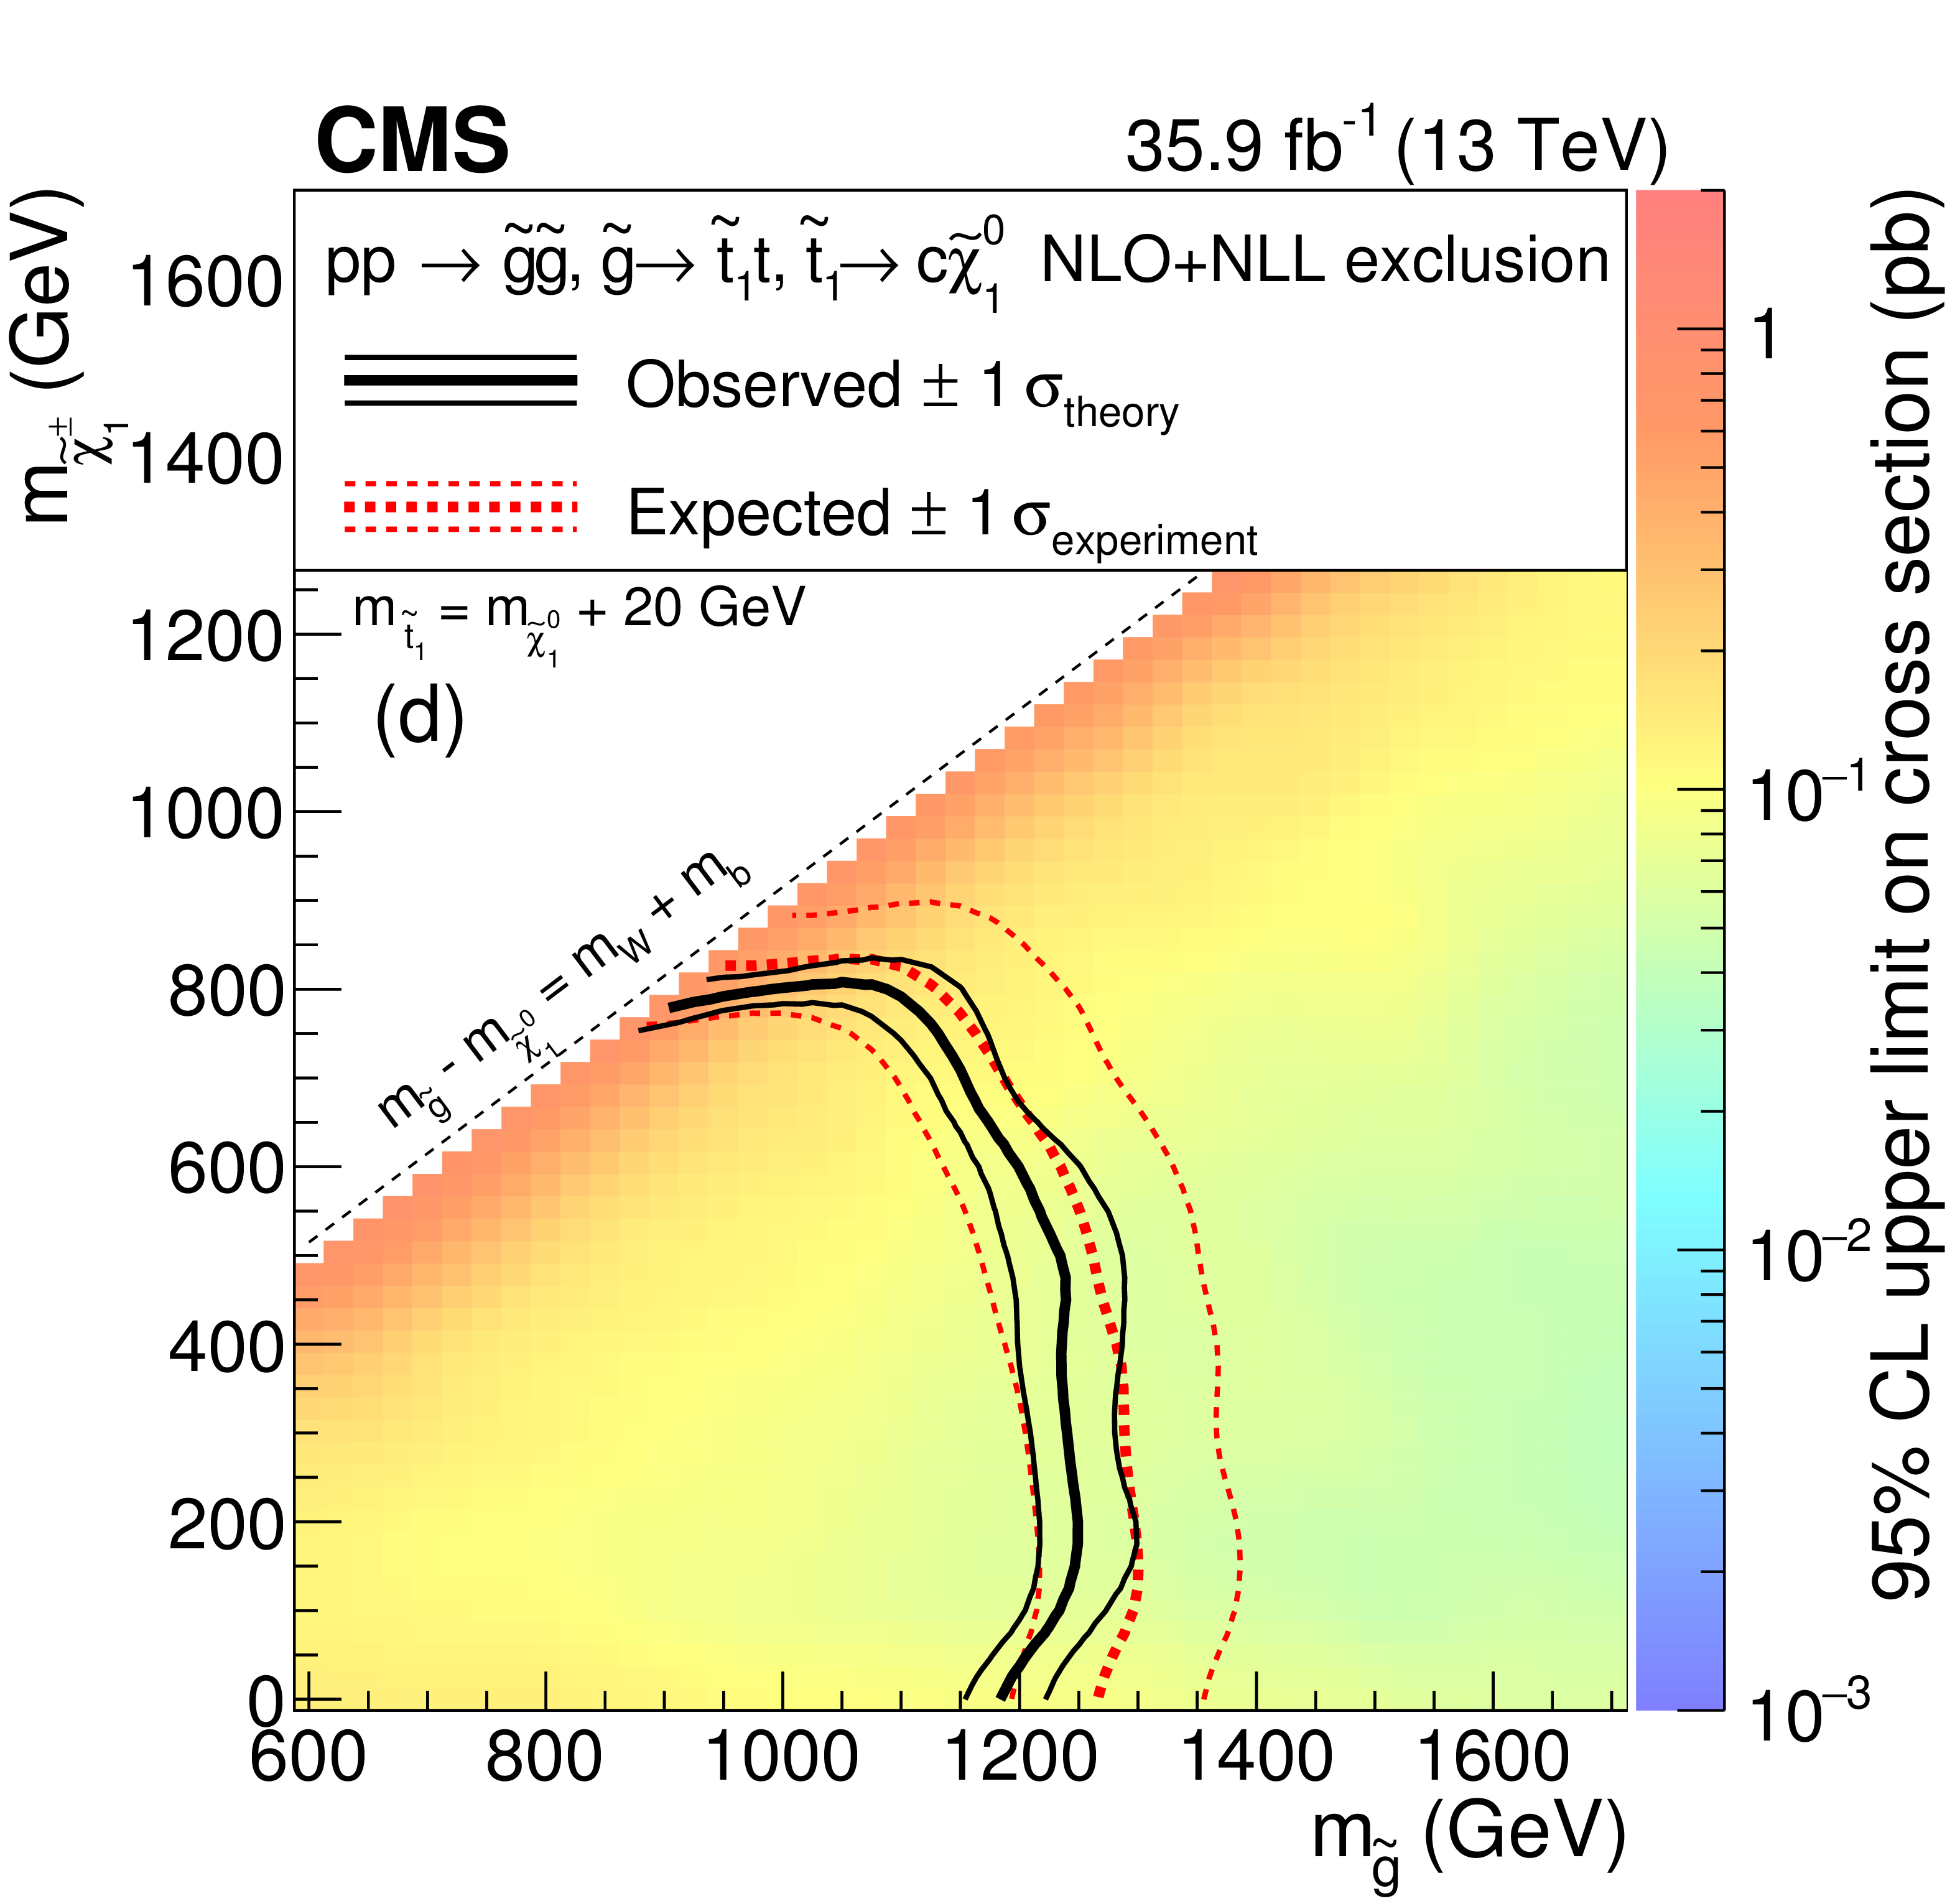
Exclusion regions at 95% CL in the $m_{\tilde{\chi}^0_1 }$ versus $m_{\tilde{\mathrm{g}} }$ plane for the T1tttt (a) and T5ttbbWW (b) models, with off-shell third-generation squarks, and the T5tttt (c) and T5ttcc (d) models, with on-shell third-generation squarks. For the T5ttbbWW model, $m_{\tilde{\chi}^{\pm}_1 } = m_{\tilde{\chi}^0_1 } +$ 5 GeV, for the T5tttt model, $m_{\tilde{ \mathrm{ t } } } - m_{\tilde{\chi}^0_1 } = m_{\mathrm{ t } }$, and for the T5ttcc model, $m_{\tilde{ \mathrm{ t } } } - m_{\tilde{\chi}^0_1 } = $ 20 GeV and the decay proceeds through $\tilde{ \mathrm{ t } } \to \mathrm{c} \tilde{\chi}^0_1 $. The right-hand side color scale indicates the excluded cross section values for a given point in the SUSY particle mass plane. The solid, black curves represent the observed exclusion limits assuming the NLO+NLL cross sections [46,47,48,49,50,51] (thick line), or their variations of $\pm $1 standard deviation (thin lines). The dashed, red curves show the expected limits with the corresponding $\pm $1 and $\pm $2 standard deviation experimental uncertainties. Excluded regions are to the left and below the limit curves. |
png pdf root |
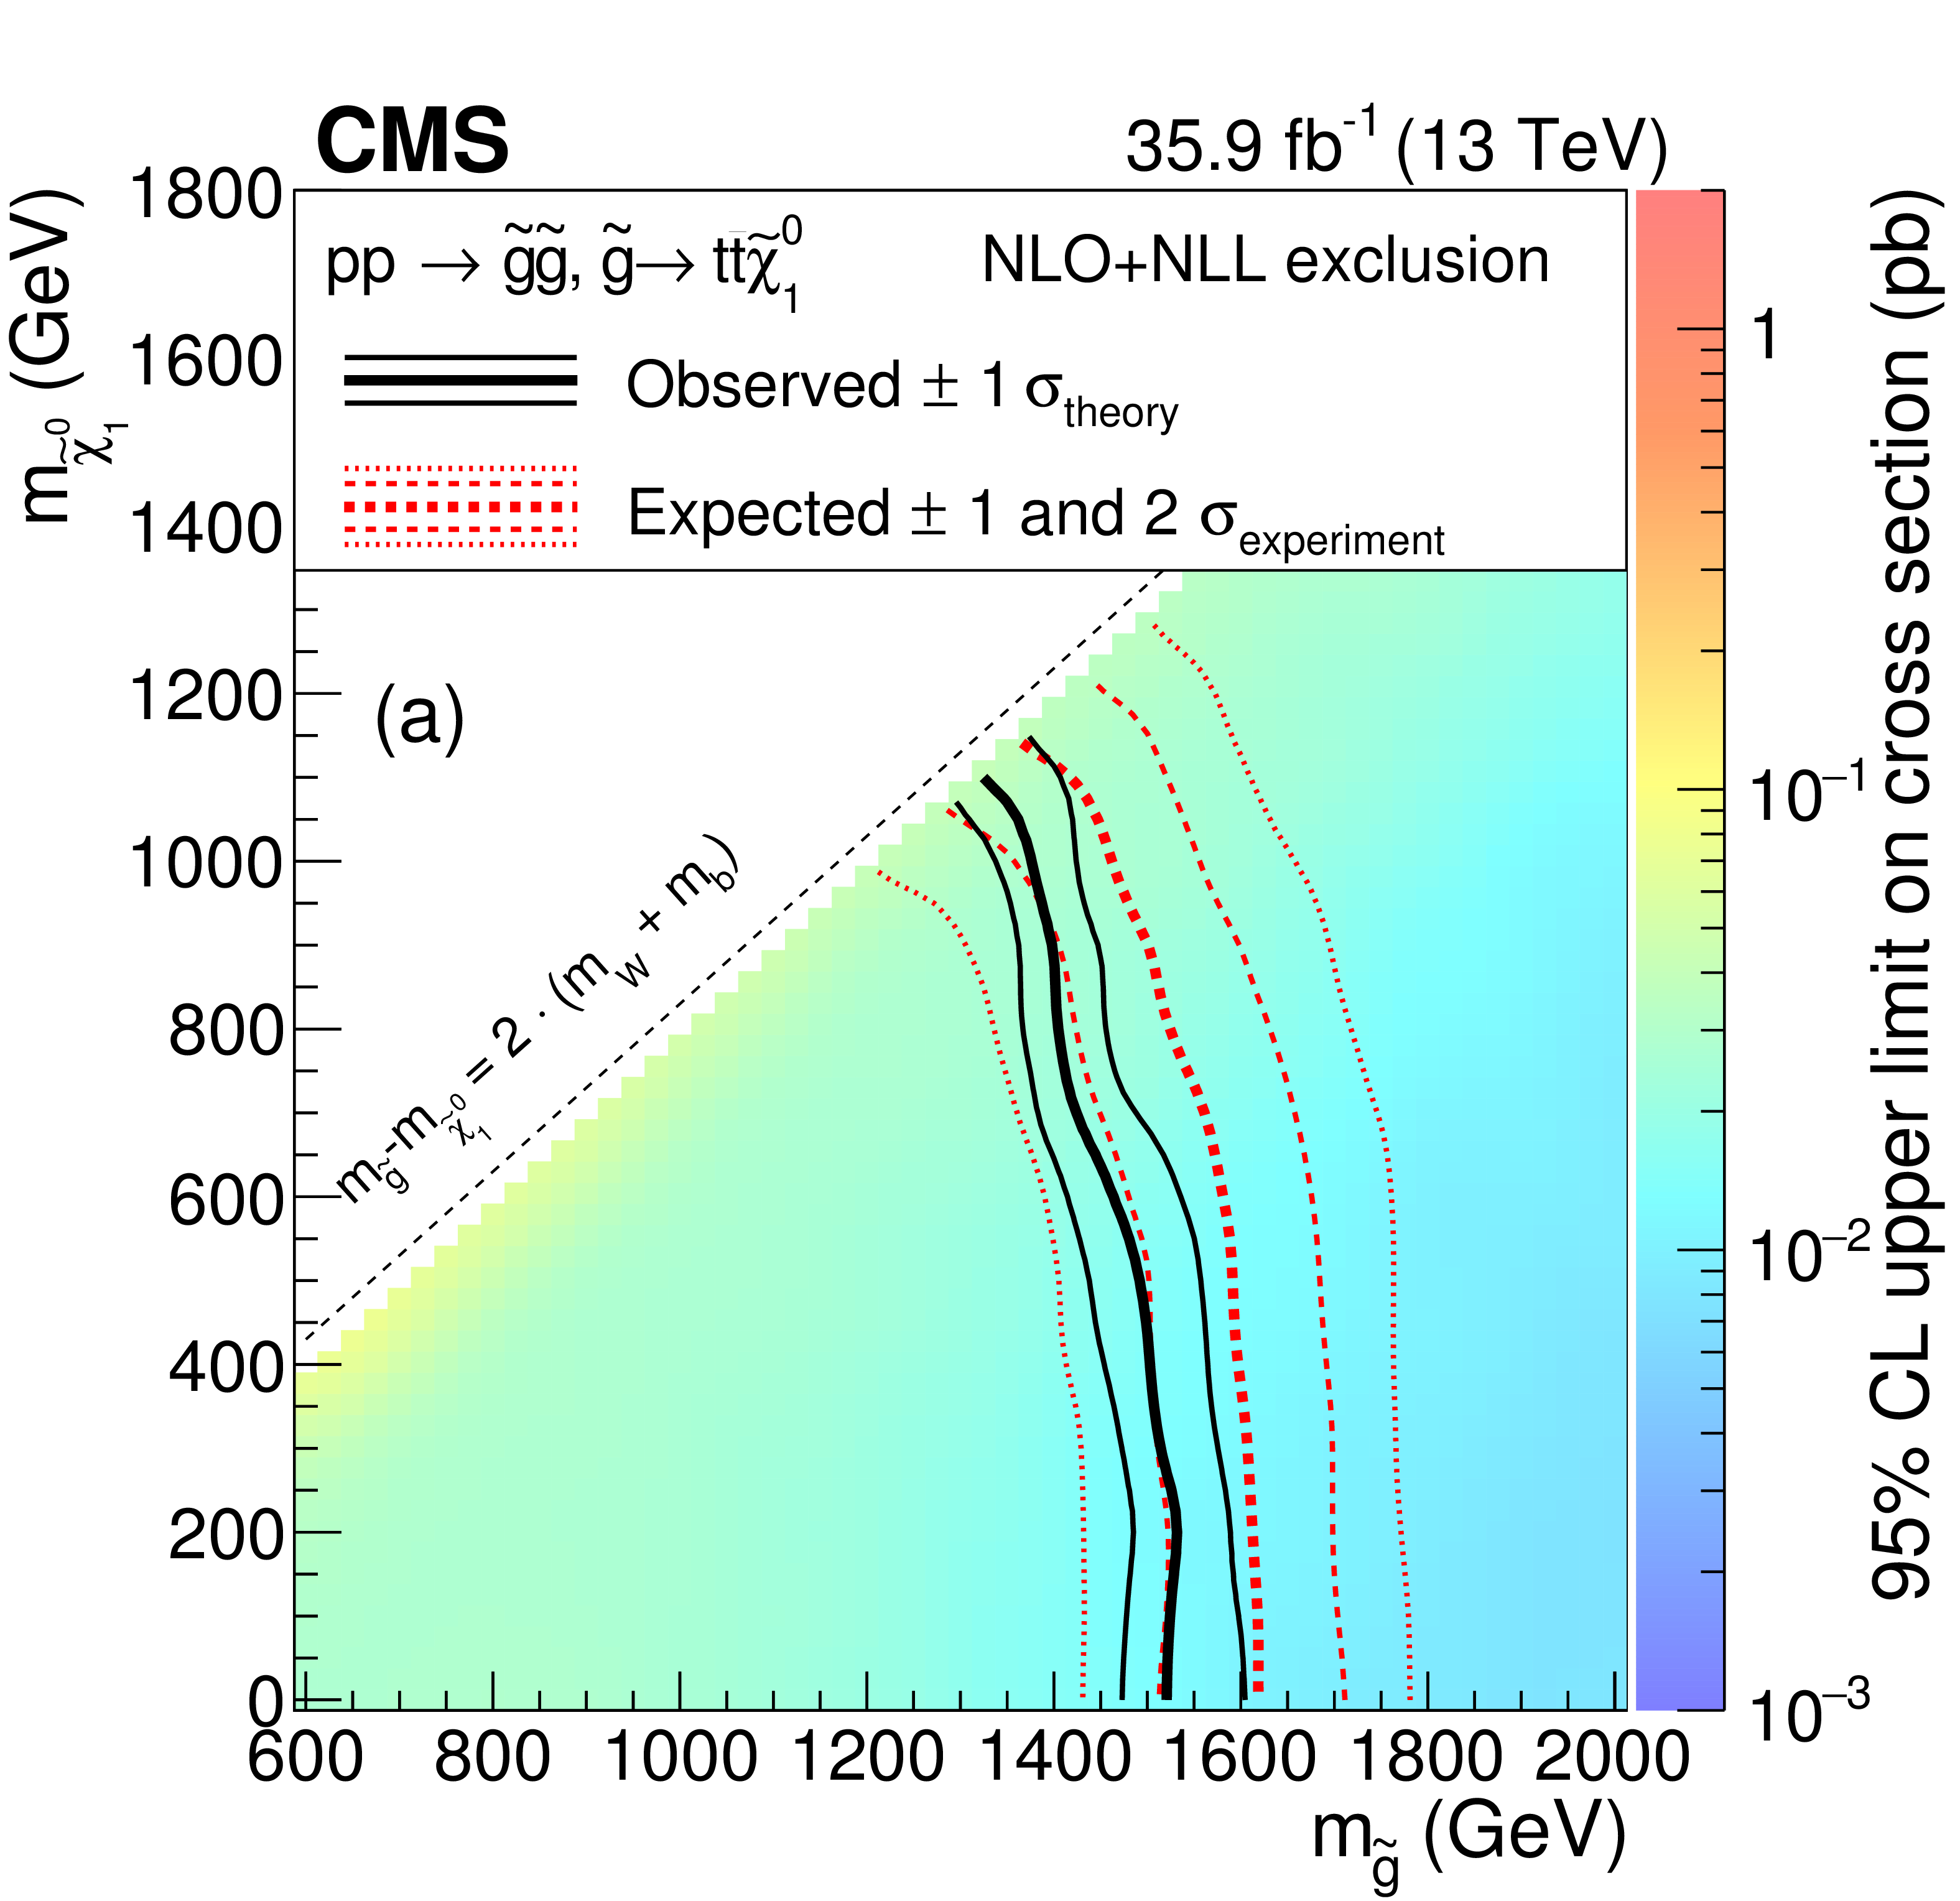
Figure 5-a:
Exclusion regions at 95% CL in the $m_{\tilde{\chi}^0_1 }$ versus $m_{\tilde{\mathrm{g}} }$ plane for the T1tttt model, with off-shell third-generation squarks. The right-hand side color scale indicates the excluded cross section values for a given point in the SUSY particle mass plane. The solid, black curves represent the observed exclusion limits assuming the NLO+NLL cross sections (thick line), or their variations of $\pm $1 standard deviation (thin lines). The dashed, red curves show the expected limits with the corresponding $\pm $1 and $\pm $2 standard deviation experimental uncertainties. Excluded regions are to the left and below the limit curves. |
png pdf root |
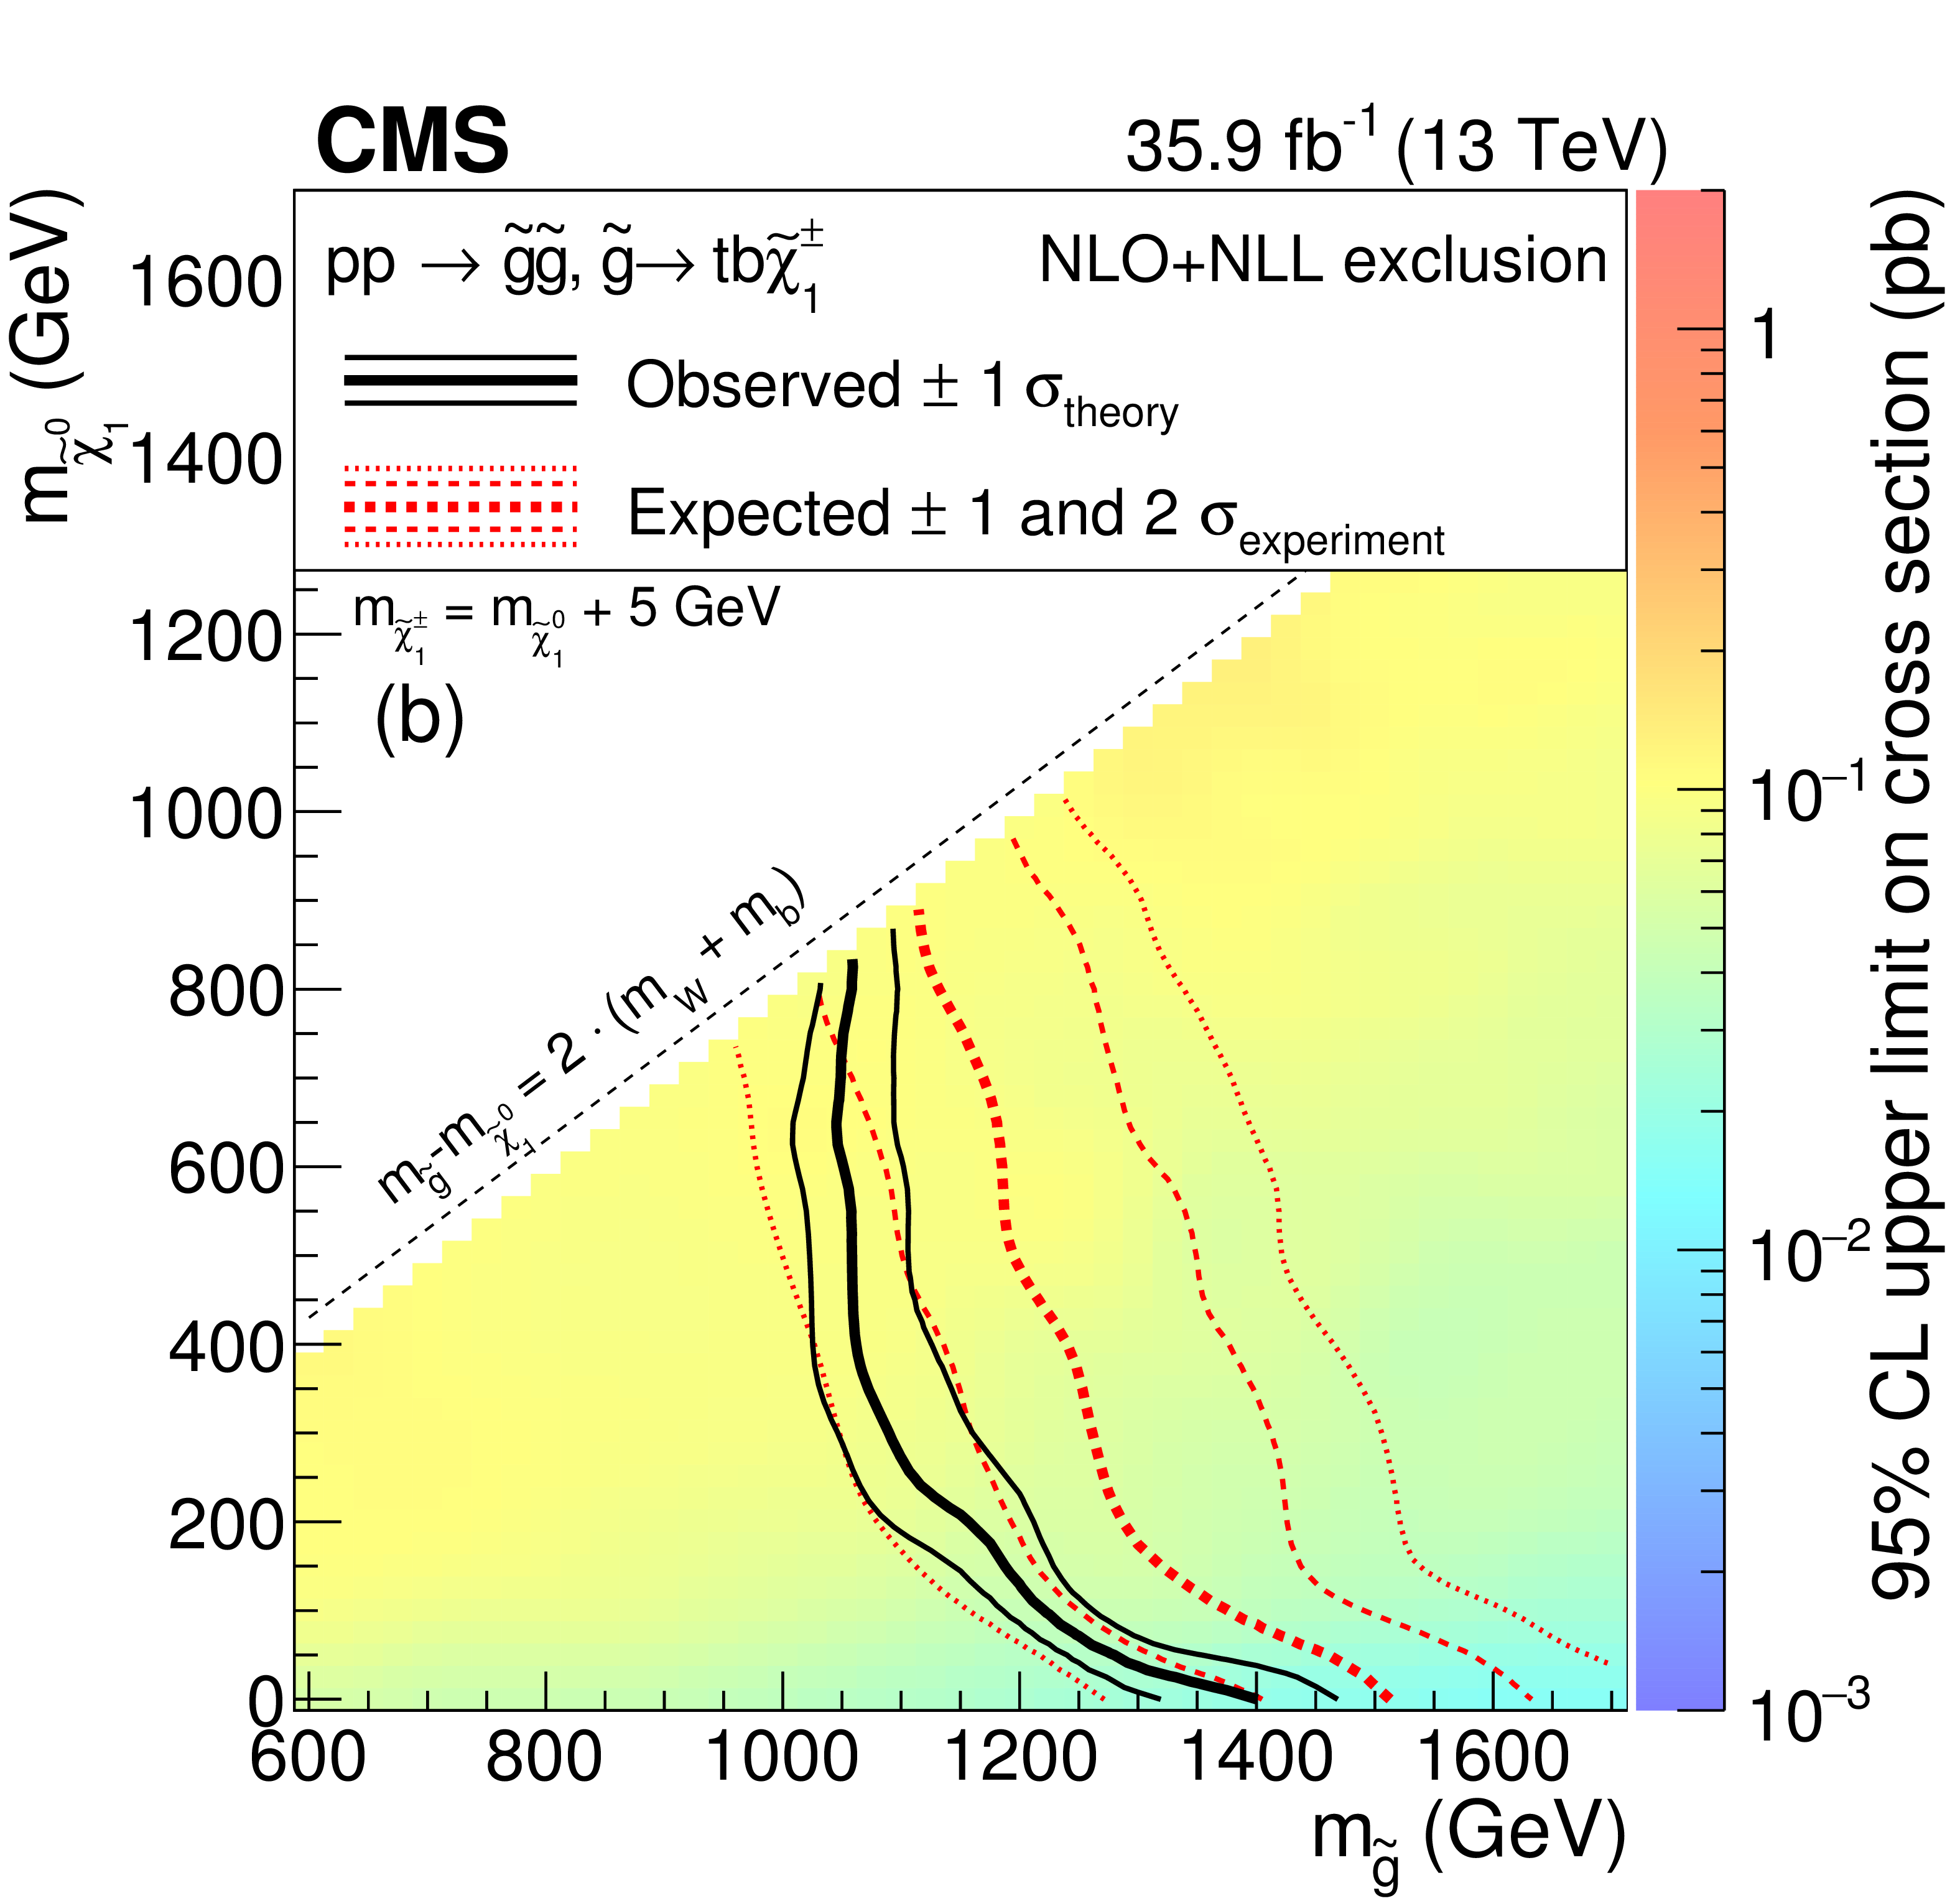
Figure 5-b:
Exclusion regions at 95% CL in the $m_{\tilde{\chi}^0_1 }$ versus $m_{\tilde{\mathrm{g}} }$ plane for the T5ttbbWW model, with off-shell third-generation squarks, with $m_{\tilde{\chi}^{\pm}_1 } = m_{\tilde{\chi}^0_1 } +$ 5 GeV. The right-hand side color scale indicates the excluded cross section values for a given point in the SUSY particle mass plane. The solid, black curves represent the observed exclusion limits assuming the NLO+NLL cross sections (thick line), or their variations of $\pm $1 standard deviation (thin lines). The dashed, red curves show the expected limits with the corresponding $\pm $1 and $\pm $2 standard deviation experimental uncertainties. Excluded regions are to the left and below the limit curves. |
png pdf root |
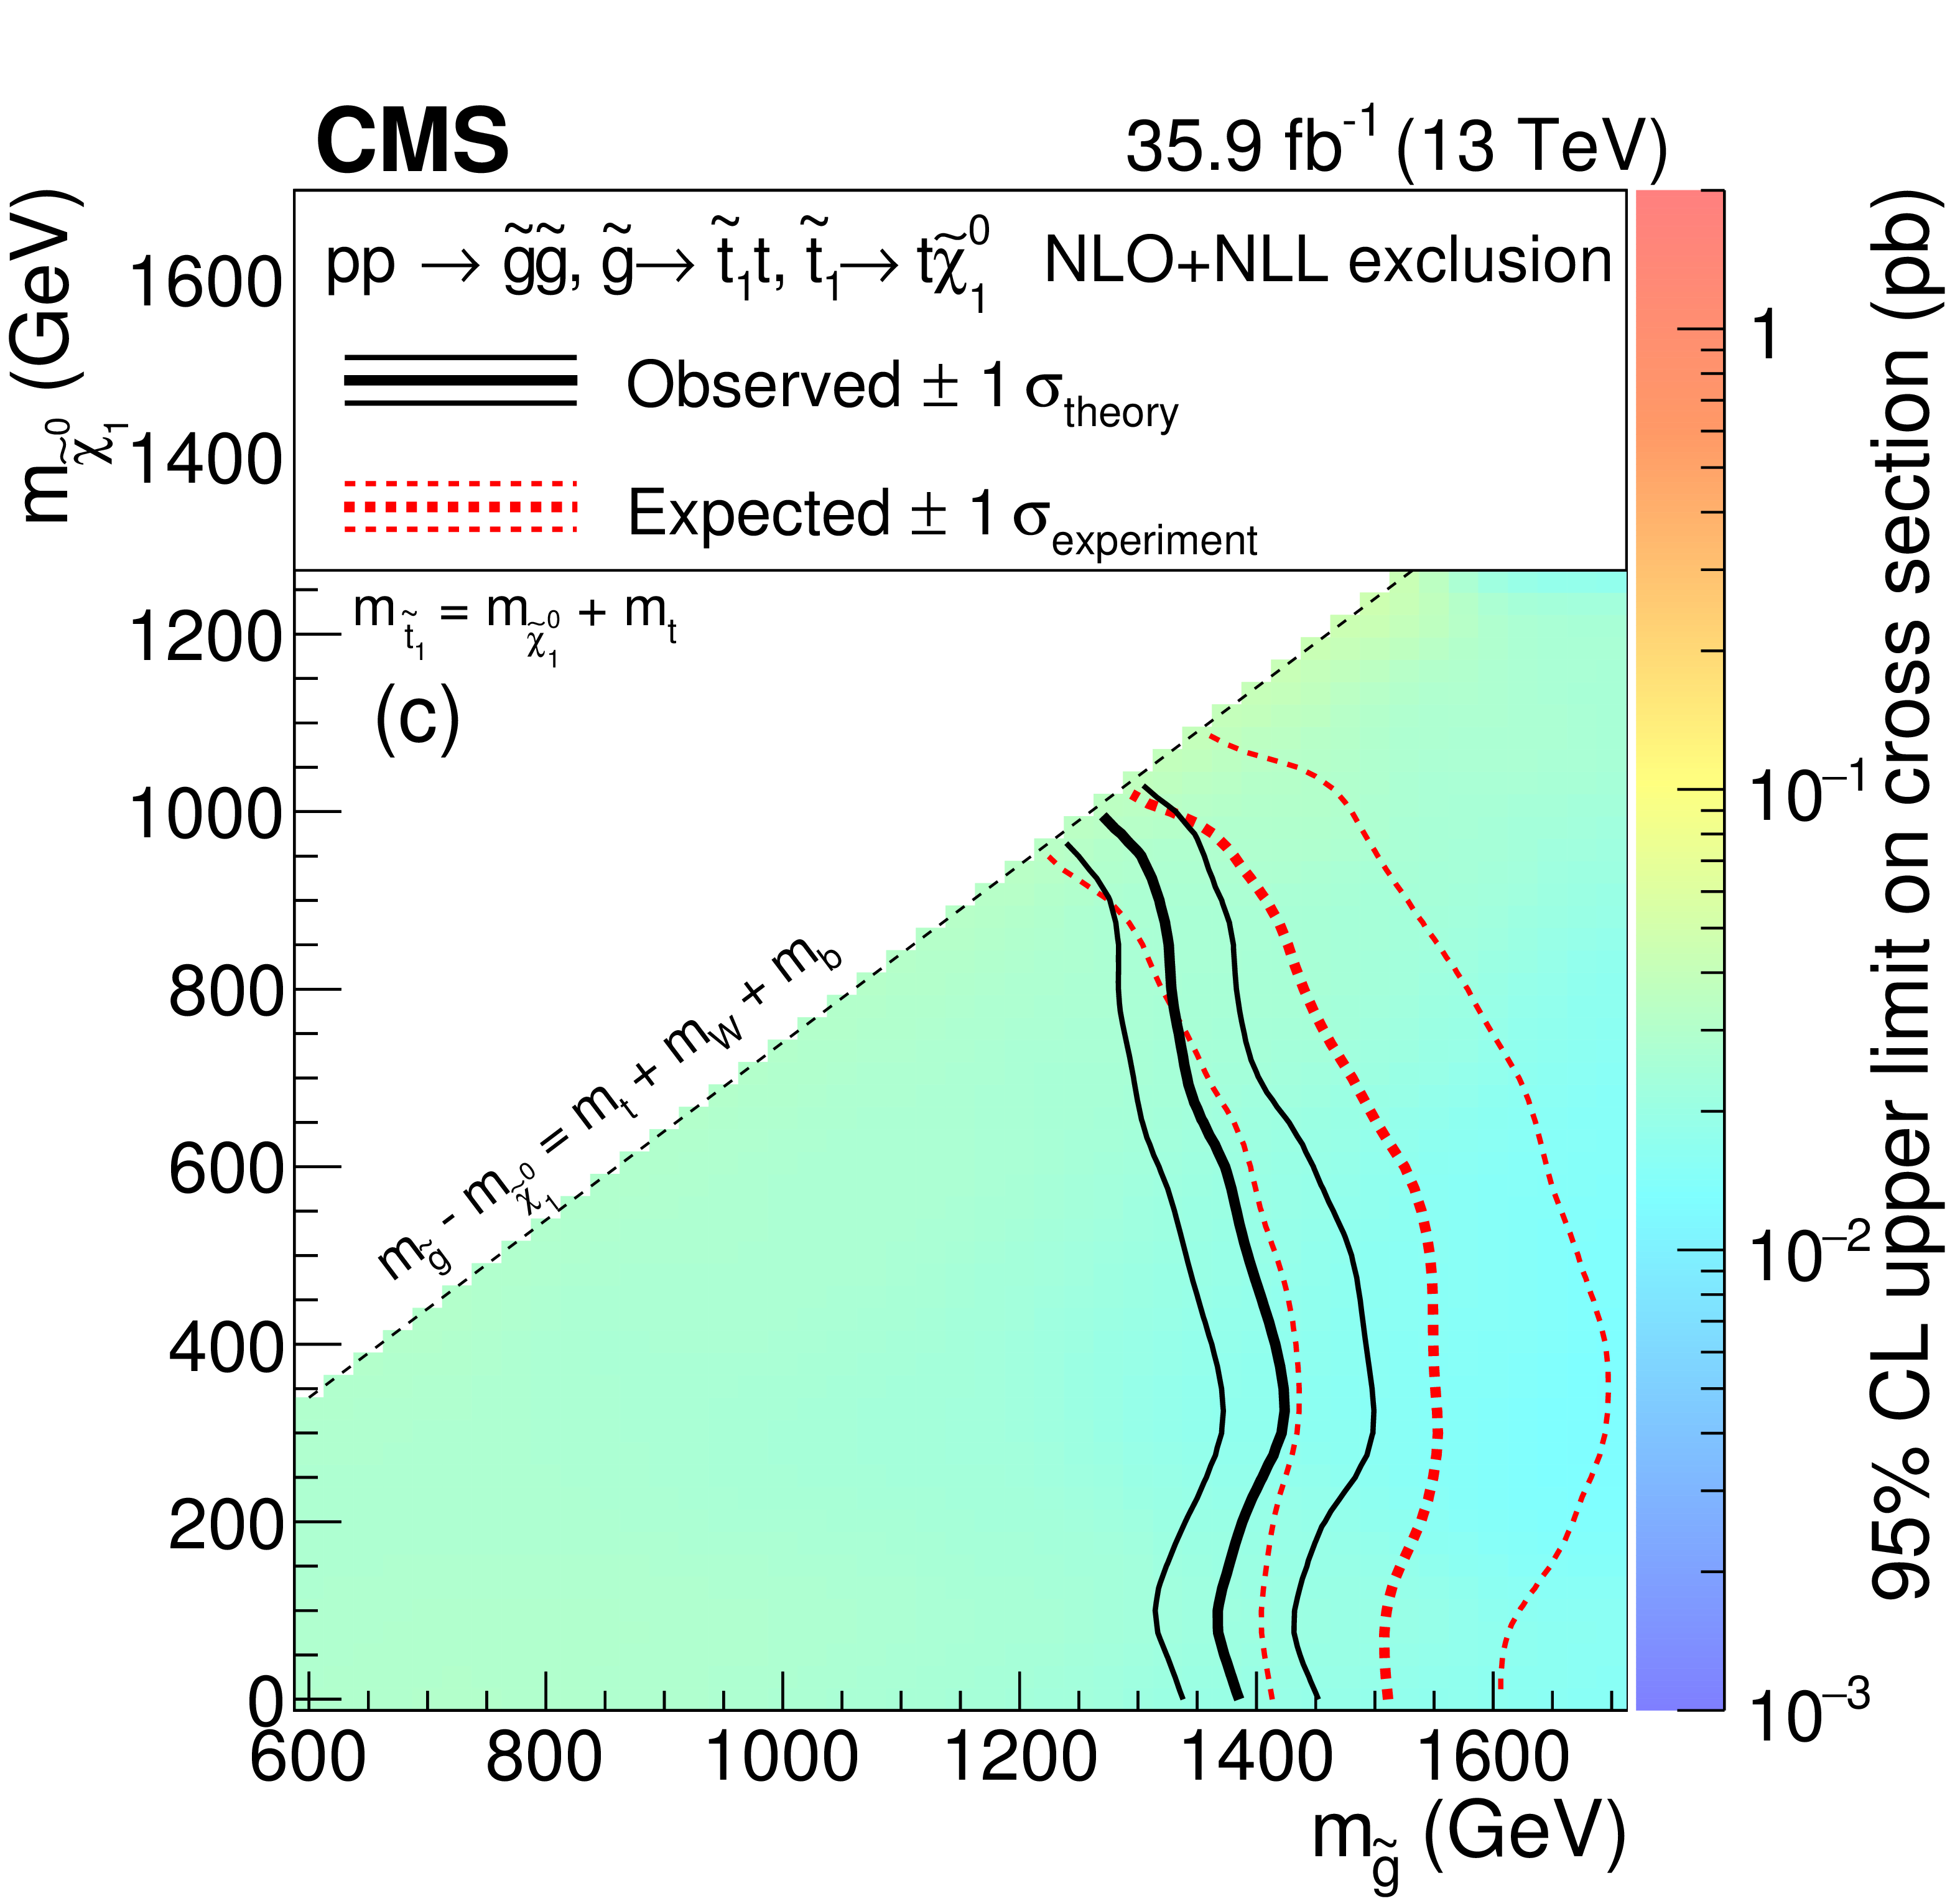
Figure 5-c:
Exclusion regions at 95% CL in the $m_{\tilde{\chi}^0_1 }$ versus $m_{\tilde{\mathrm{g}} }$ plane for the T5tttt model, with on-shell third-generation squarks, with $m_{\tilde{ \mathrm{ t } } } - m_{\tilde{\chi}^0_1 } = m_{\mathrm{ t } }$. The right-hand side color scale indicates the excluded cross section values for a given point in the SUSY particle mass plane. The solid, black curves represent the observed exclusion limits assuming the NLO+NLL cross sections (thick line), or their variations of $\pm $1 standard deviation (thin lines). The dashed, red curves show the expected limits with the corresponding $\pm $1 and $\pm $2 standard deviation experimental uncertainties. Excluded regions are to the left and below the limit curves. |
png pdf root |
Figure 5-d:
Exclusion regions at 95% CL in the $m_{\tilde{\chi}^0_1 }$ versus $m_{\tilde{\mathrm{g}} }$ plane for the T5ttcc model, with on-shell third-generation squarks, $m_{\tilde{ \mathrm{ t } } } - m_{\tilde{\chi}^0_1 } = $ 20 GeV. The decay proceeds through $\tilde{ \mathrm{ t } } \to \mathrm{c} \tilde{\chi}^0_1 $. The right-hand side color scale indicates the excluded cross section values for a given point in the SUSY particle mass plane. The solid, black curves represent the observed exclusion limits assuming the NLO+NLL cross sections (thick line), or their variations of $\pm $1 standard deviation (thin lines). The dashed, red curves show the expected limits with the corresponding $\pm $1 and $\pm $2 standard deviation experimental uncertainties. Excluded regions are to the left and below the limit curves. |

png pdf |
Figure 6:
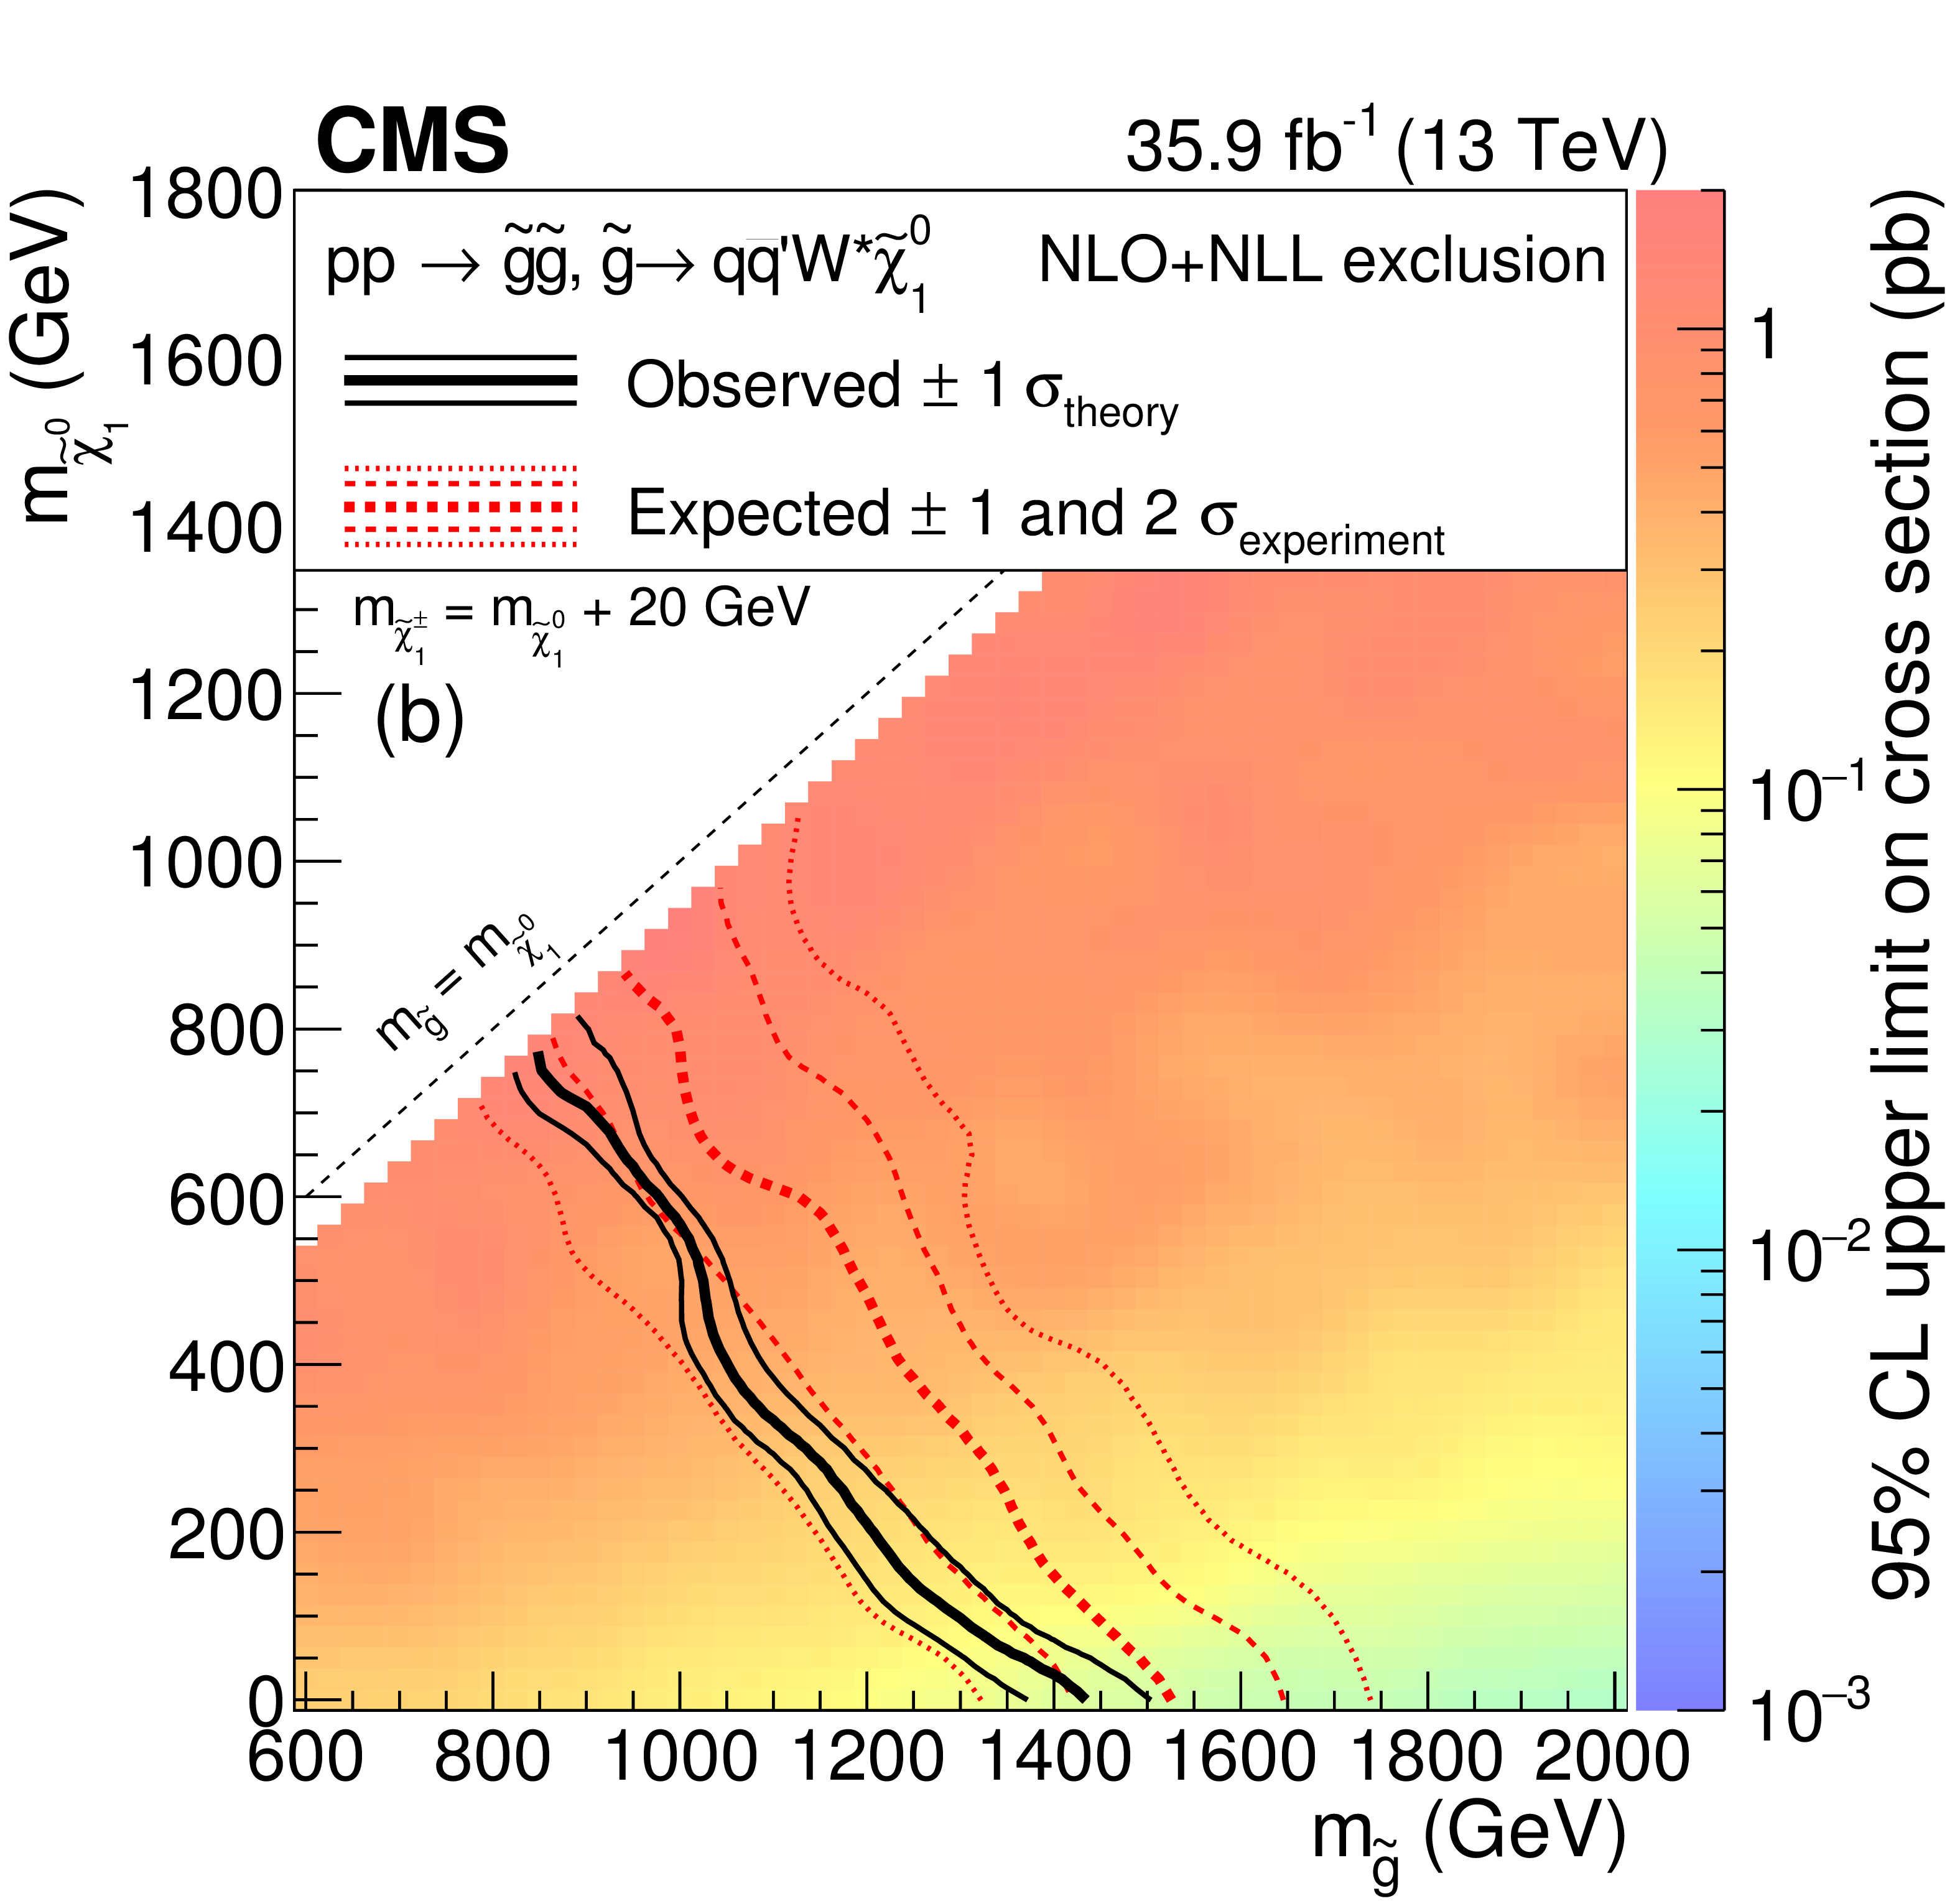
Exclusion regions at 95% CL in the plane of $m_{\tilde{\chi}^0_1 }$ versus $m_{\tilde{\mathrm{g}} }$ for the T5qqqqWW model with $m_{\tilde{\chi}^{\pm}_1 }=0.5(m_{\tilde{\mathrm{g}} } + m_{\tilde{\chi}^0_1 })$ (a) and with $m_{\tilde{\chi}^{\pm}_1 } = m_{\tilde{\chi}^0_1 } + $ 20 GeV (b). The notations are as in Fig. 5. |

png pdf root |
Figure 6-a:
Exclusion regions at 95% CL in the plane of $m_{\tilde{\chi}^0_1 }$ versus $m_{\tilde{\mathrm{g}} }$ for the T5qqqqWW model with $m_{\tilde{\chi}^{\pm}_1 }=0.5(m_{\tilde{\mathrm{g}} } + m_{\tilde{\chi}^0_1 })$. The notations are as in Fig. 5. |
png pdf root |
Figure 6-b:
Exclusion regions at 95% CL in the plane of $m_{\tilde{\chi}^0_1 }$ versus $m_{\tilde{\mathrm{g}} }$ for the T5qqqqWW model with $m_{\tilde{\chi}^{\pm}_1 } = m_{\tilde{\chi}^0_1 } + $ 20 GeV. The notations are as in Fig. 5. |
png pdf root |
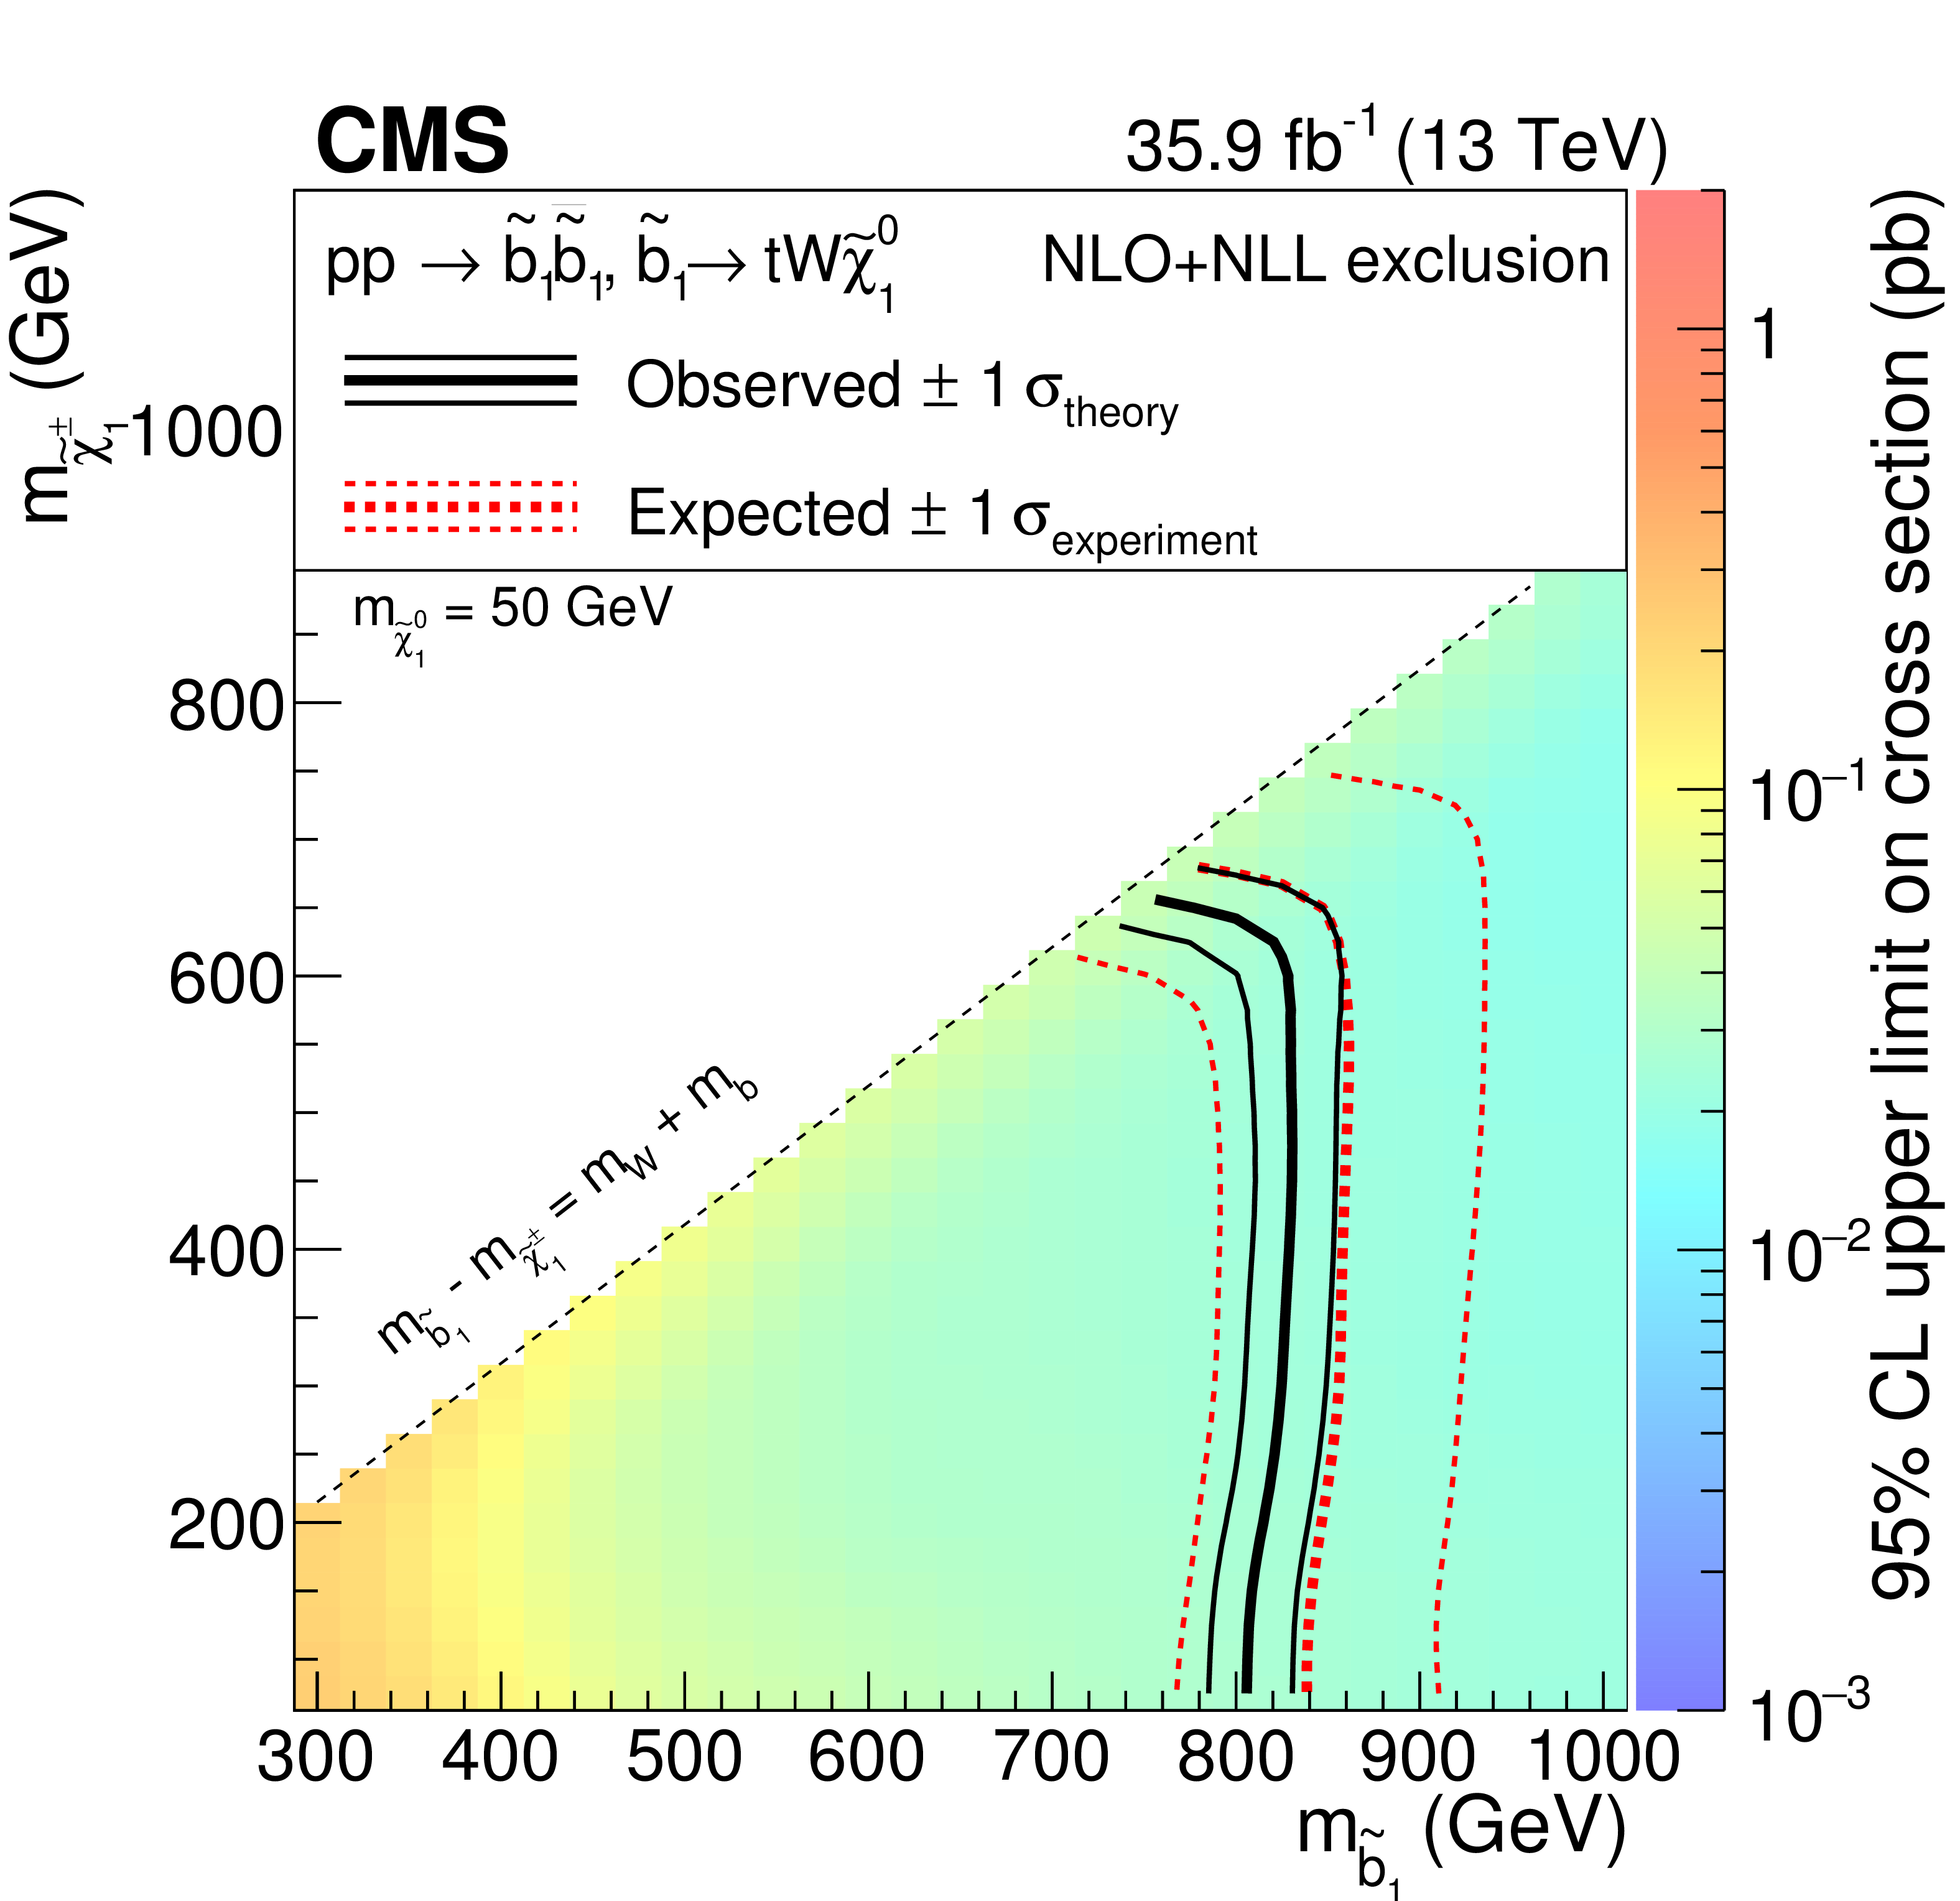
Figure 7:
Exclusion regions at 95% CL in the plane of $m_{\tilde{\chi}^{\pm}_1 }$ versus $m_{\tilde{ \mathrm{ b } } }$ for the T6ttWW model with $m_{\tilde{\chi}^0_1 }=$ 50 GeV. The notations are as in Fig. 5. |

png pdf |
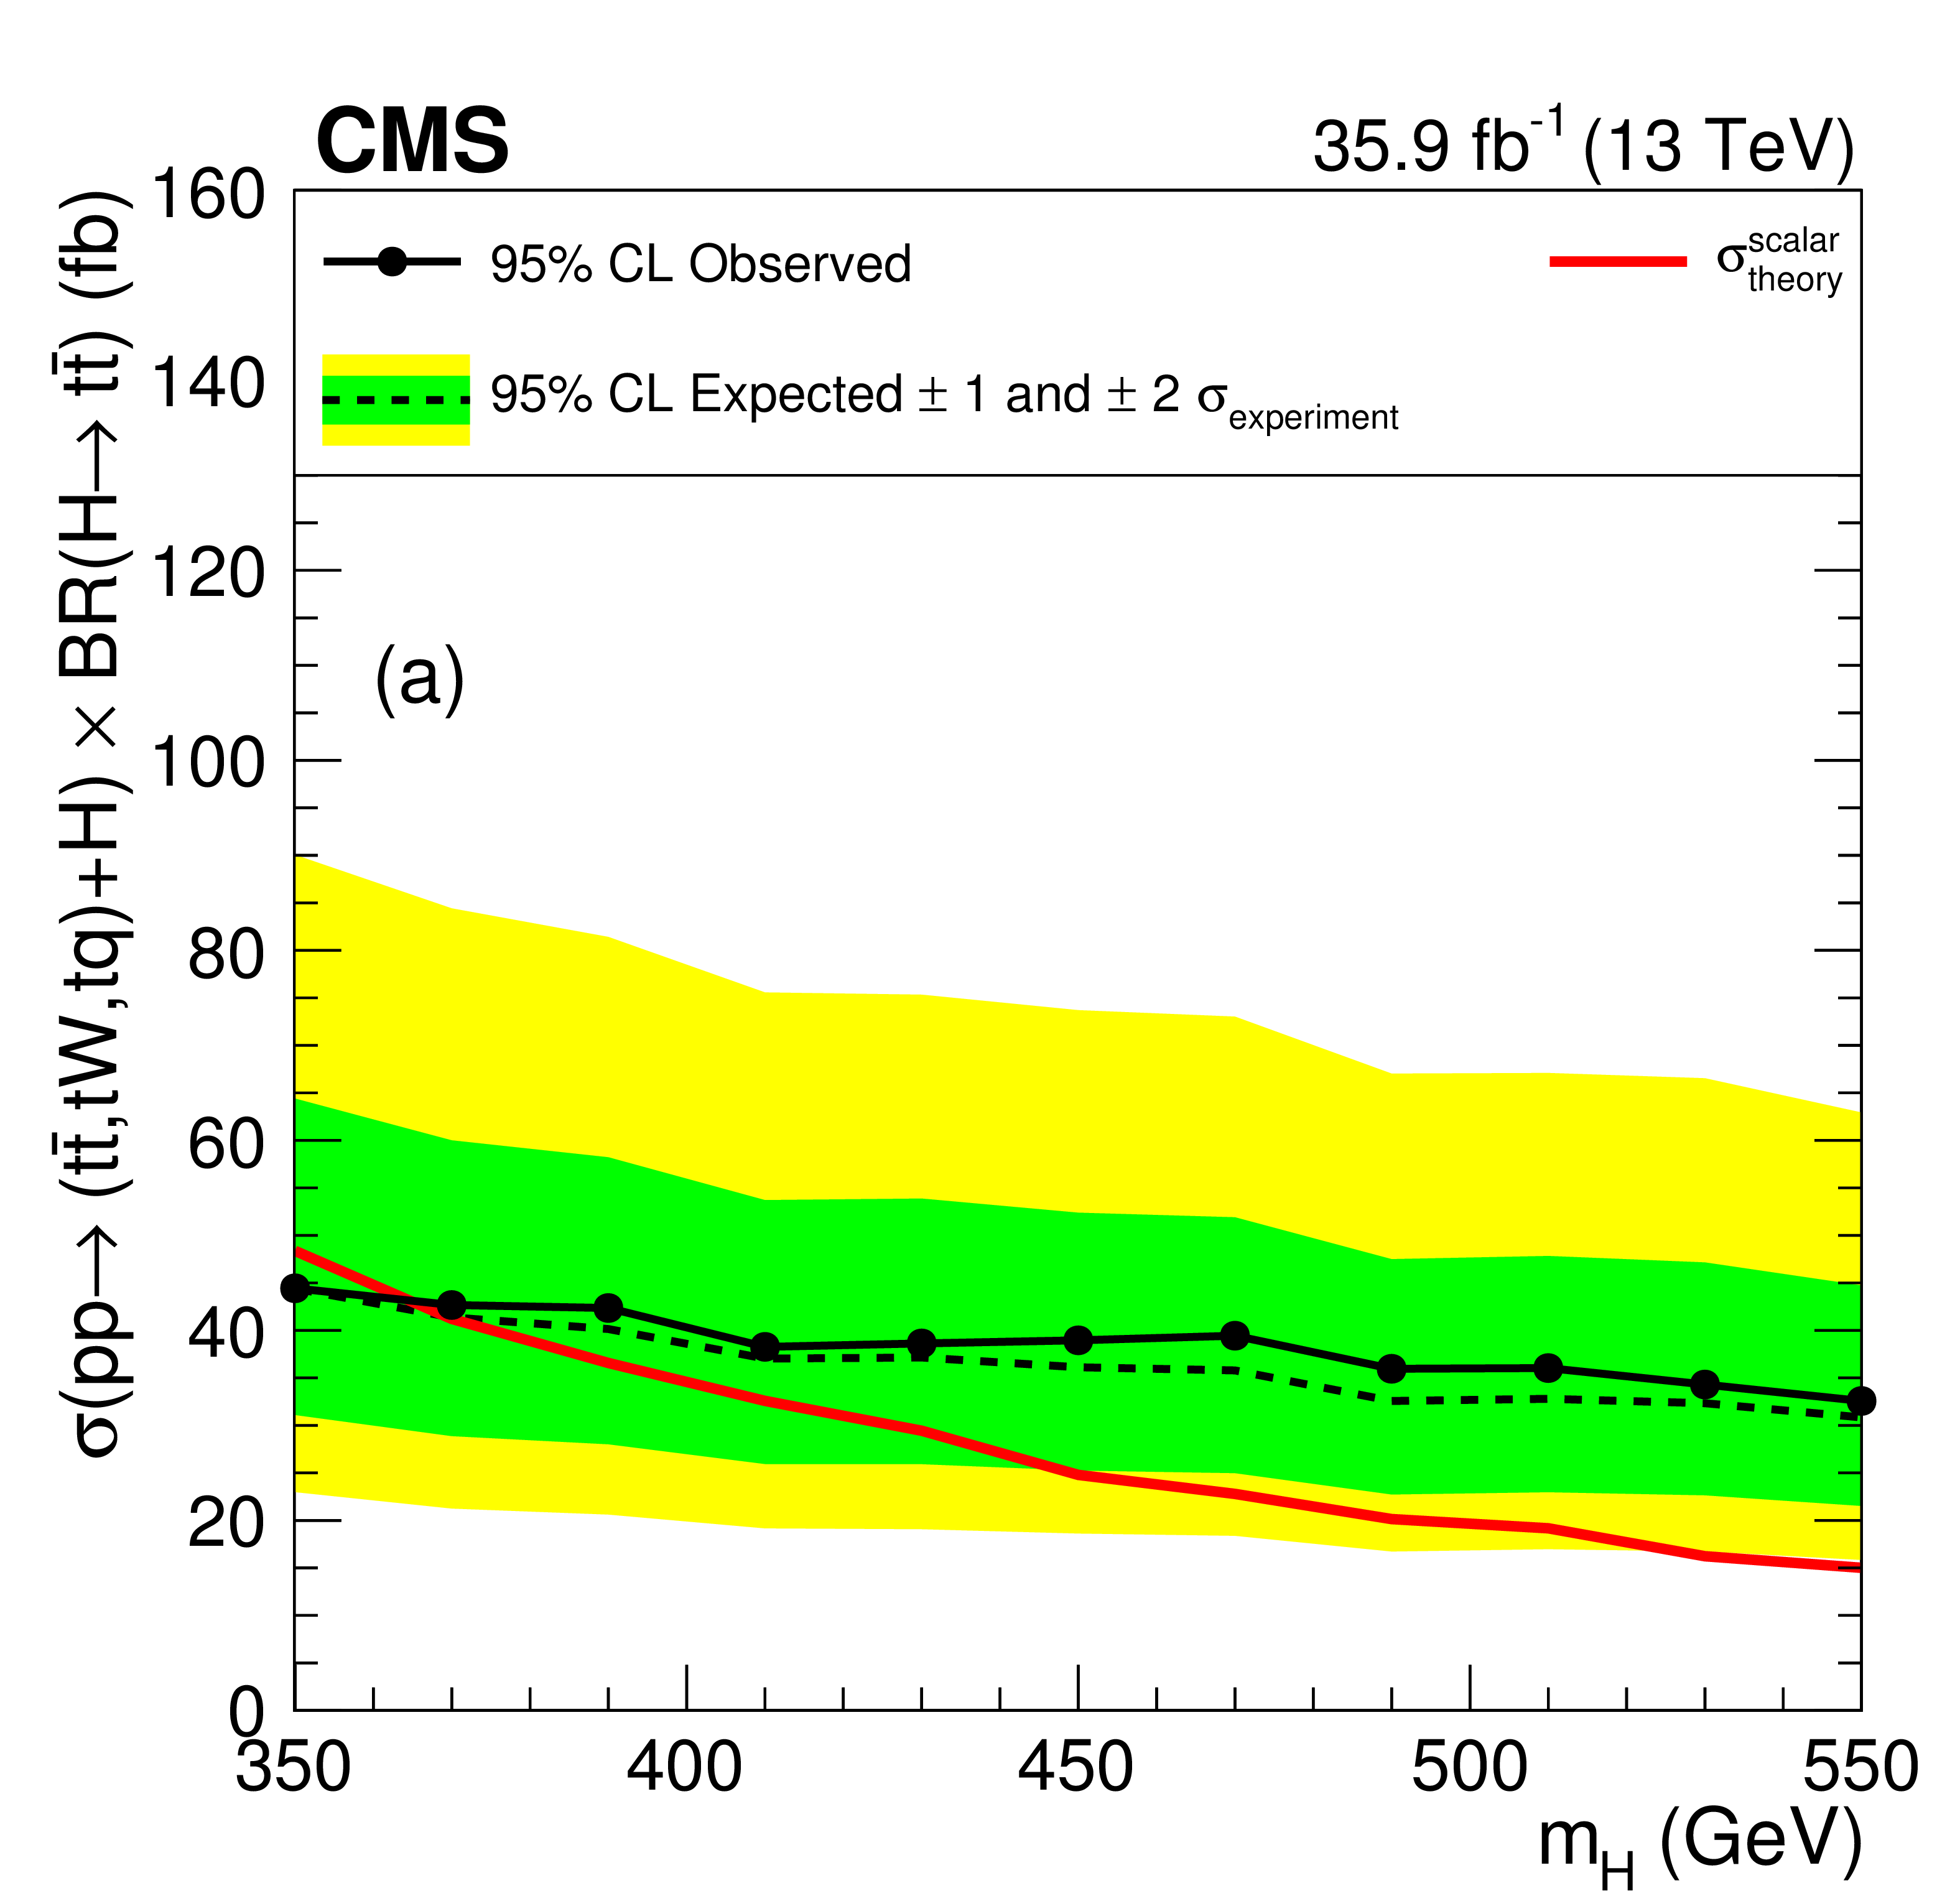
Figure 8:
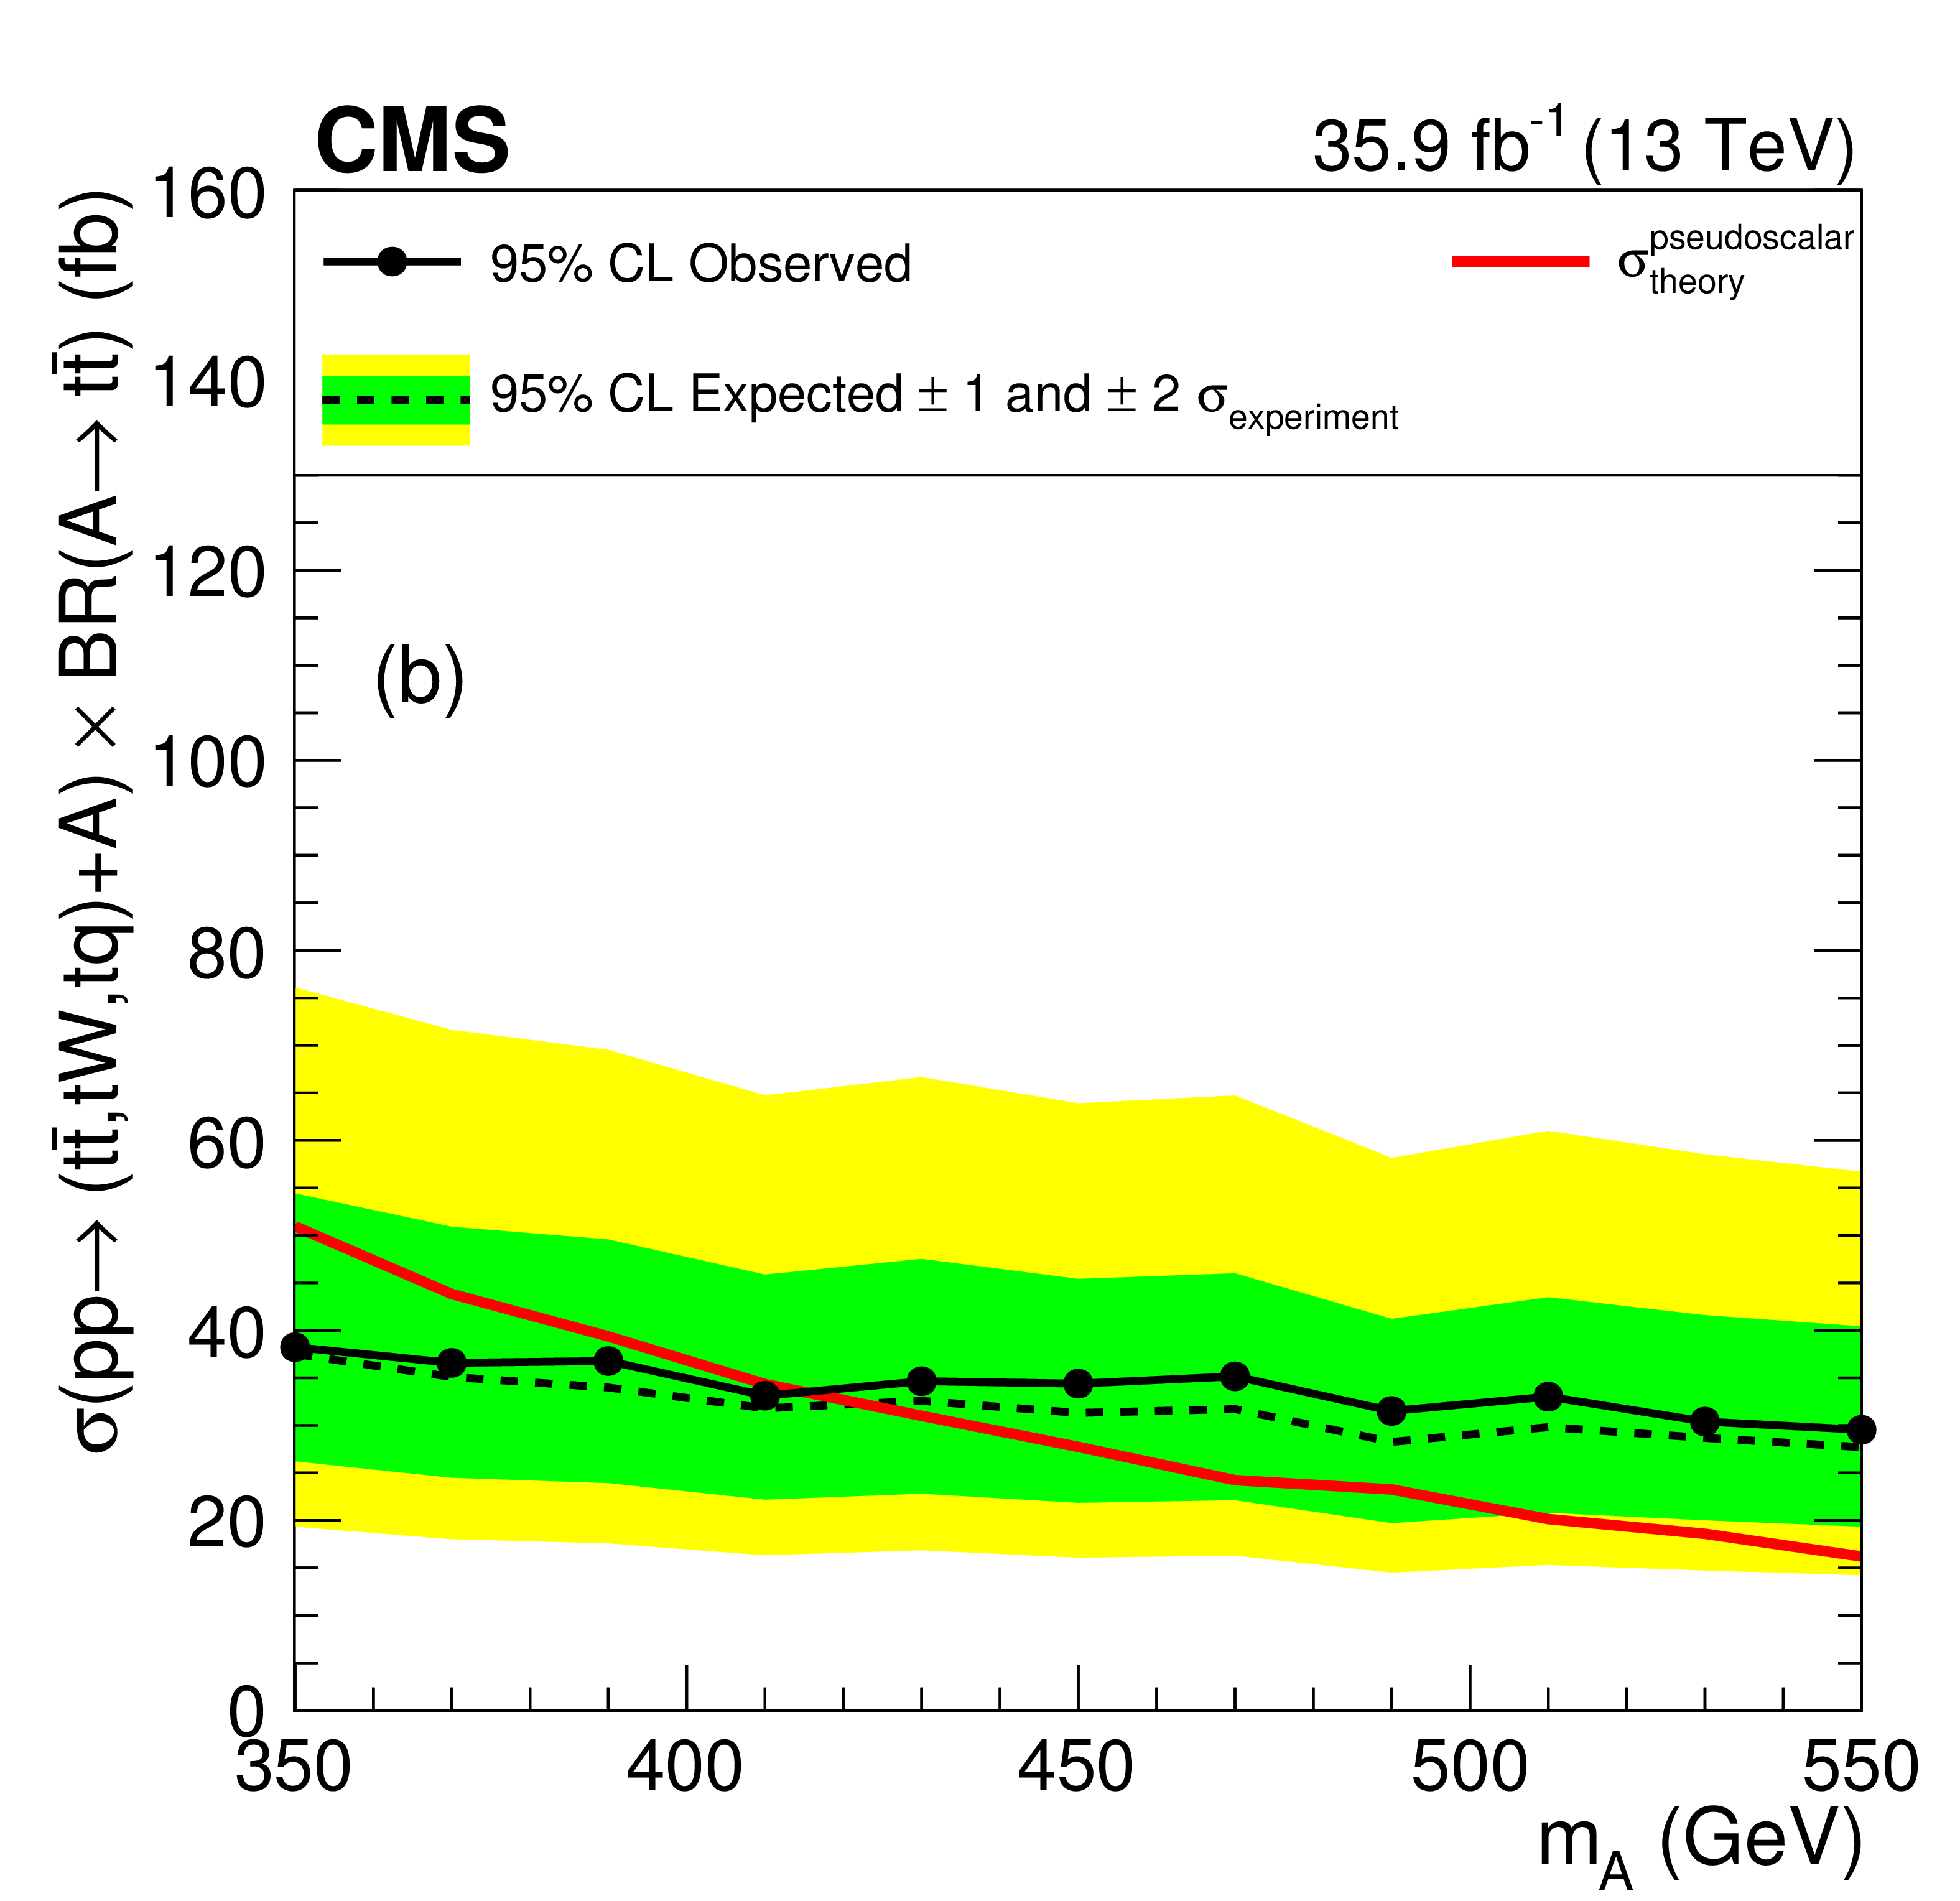
Limits at 95% CL on the production cross section for heavy scalar (a) and pseudoscalar (b) boson in association to one or two top quarks, followed by its decay to top quarks, as a function of the (pseudo)scalar mass. The red line corresponds to the theoretical cross section in the (pseudo)scalar model. |
png pdf root |
Figure 8-a:
Limits at 95% CL on the production cross section for heavy scalar boson in association to one or two top quarks, followed by its decay to top quarks, as a function of the scalar mass. The red line corresponds to the theoretical cross section in the scalar model. |
png pdf root |
Figure 8-b:
Limits at 95% CL on the production cross section for heavy pseudoscalar boson in association to one or two top quarks, followed by its decay to top quarks, as a function of the pseudoscalar mass. The red line corresponds to the theoretical cross section in the pseudoscalar model. |
png pdf |
Figure 9:
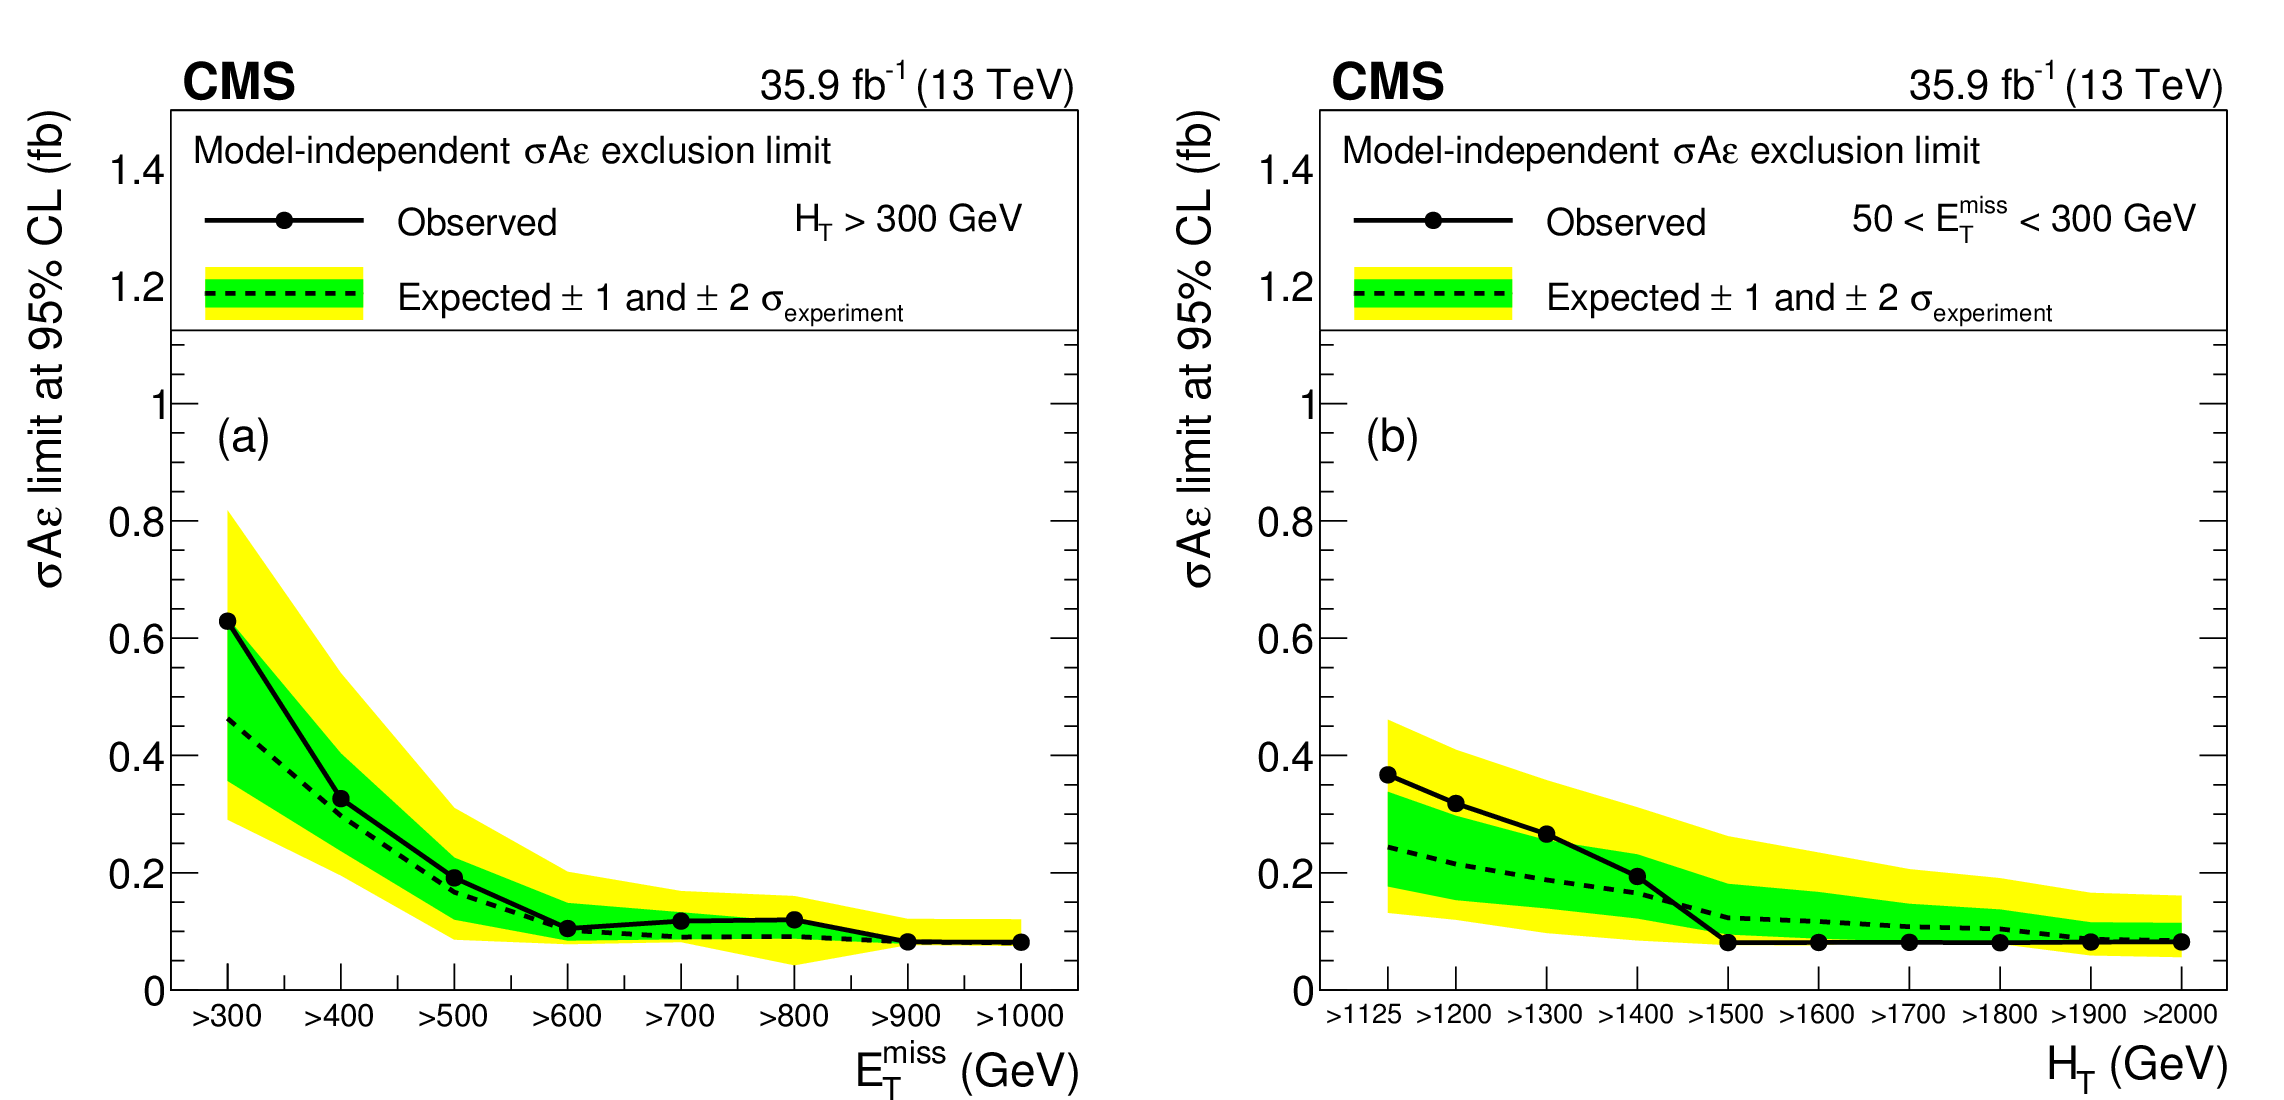
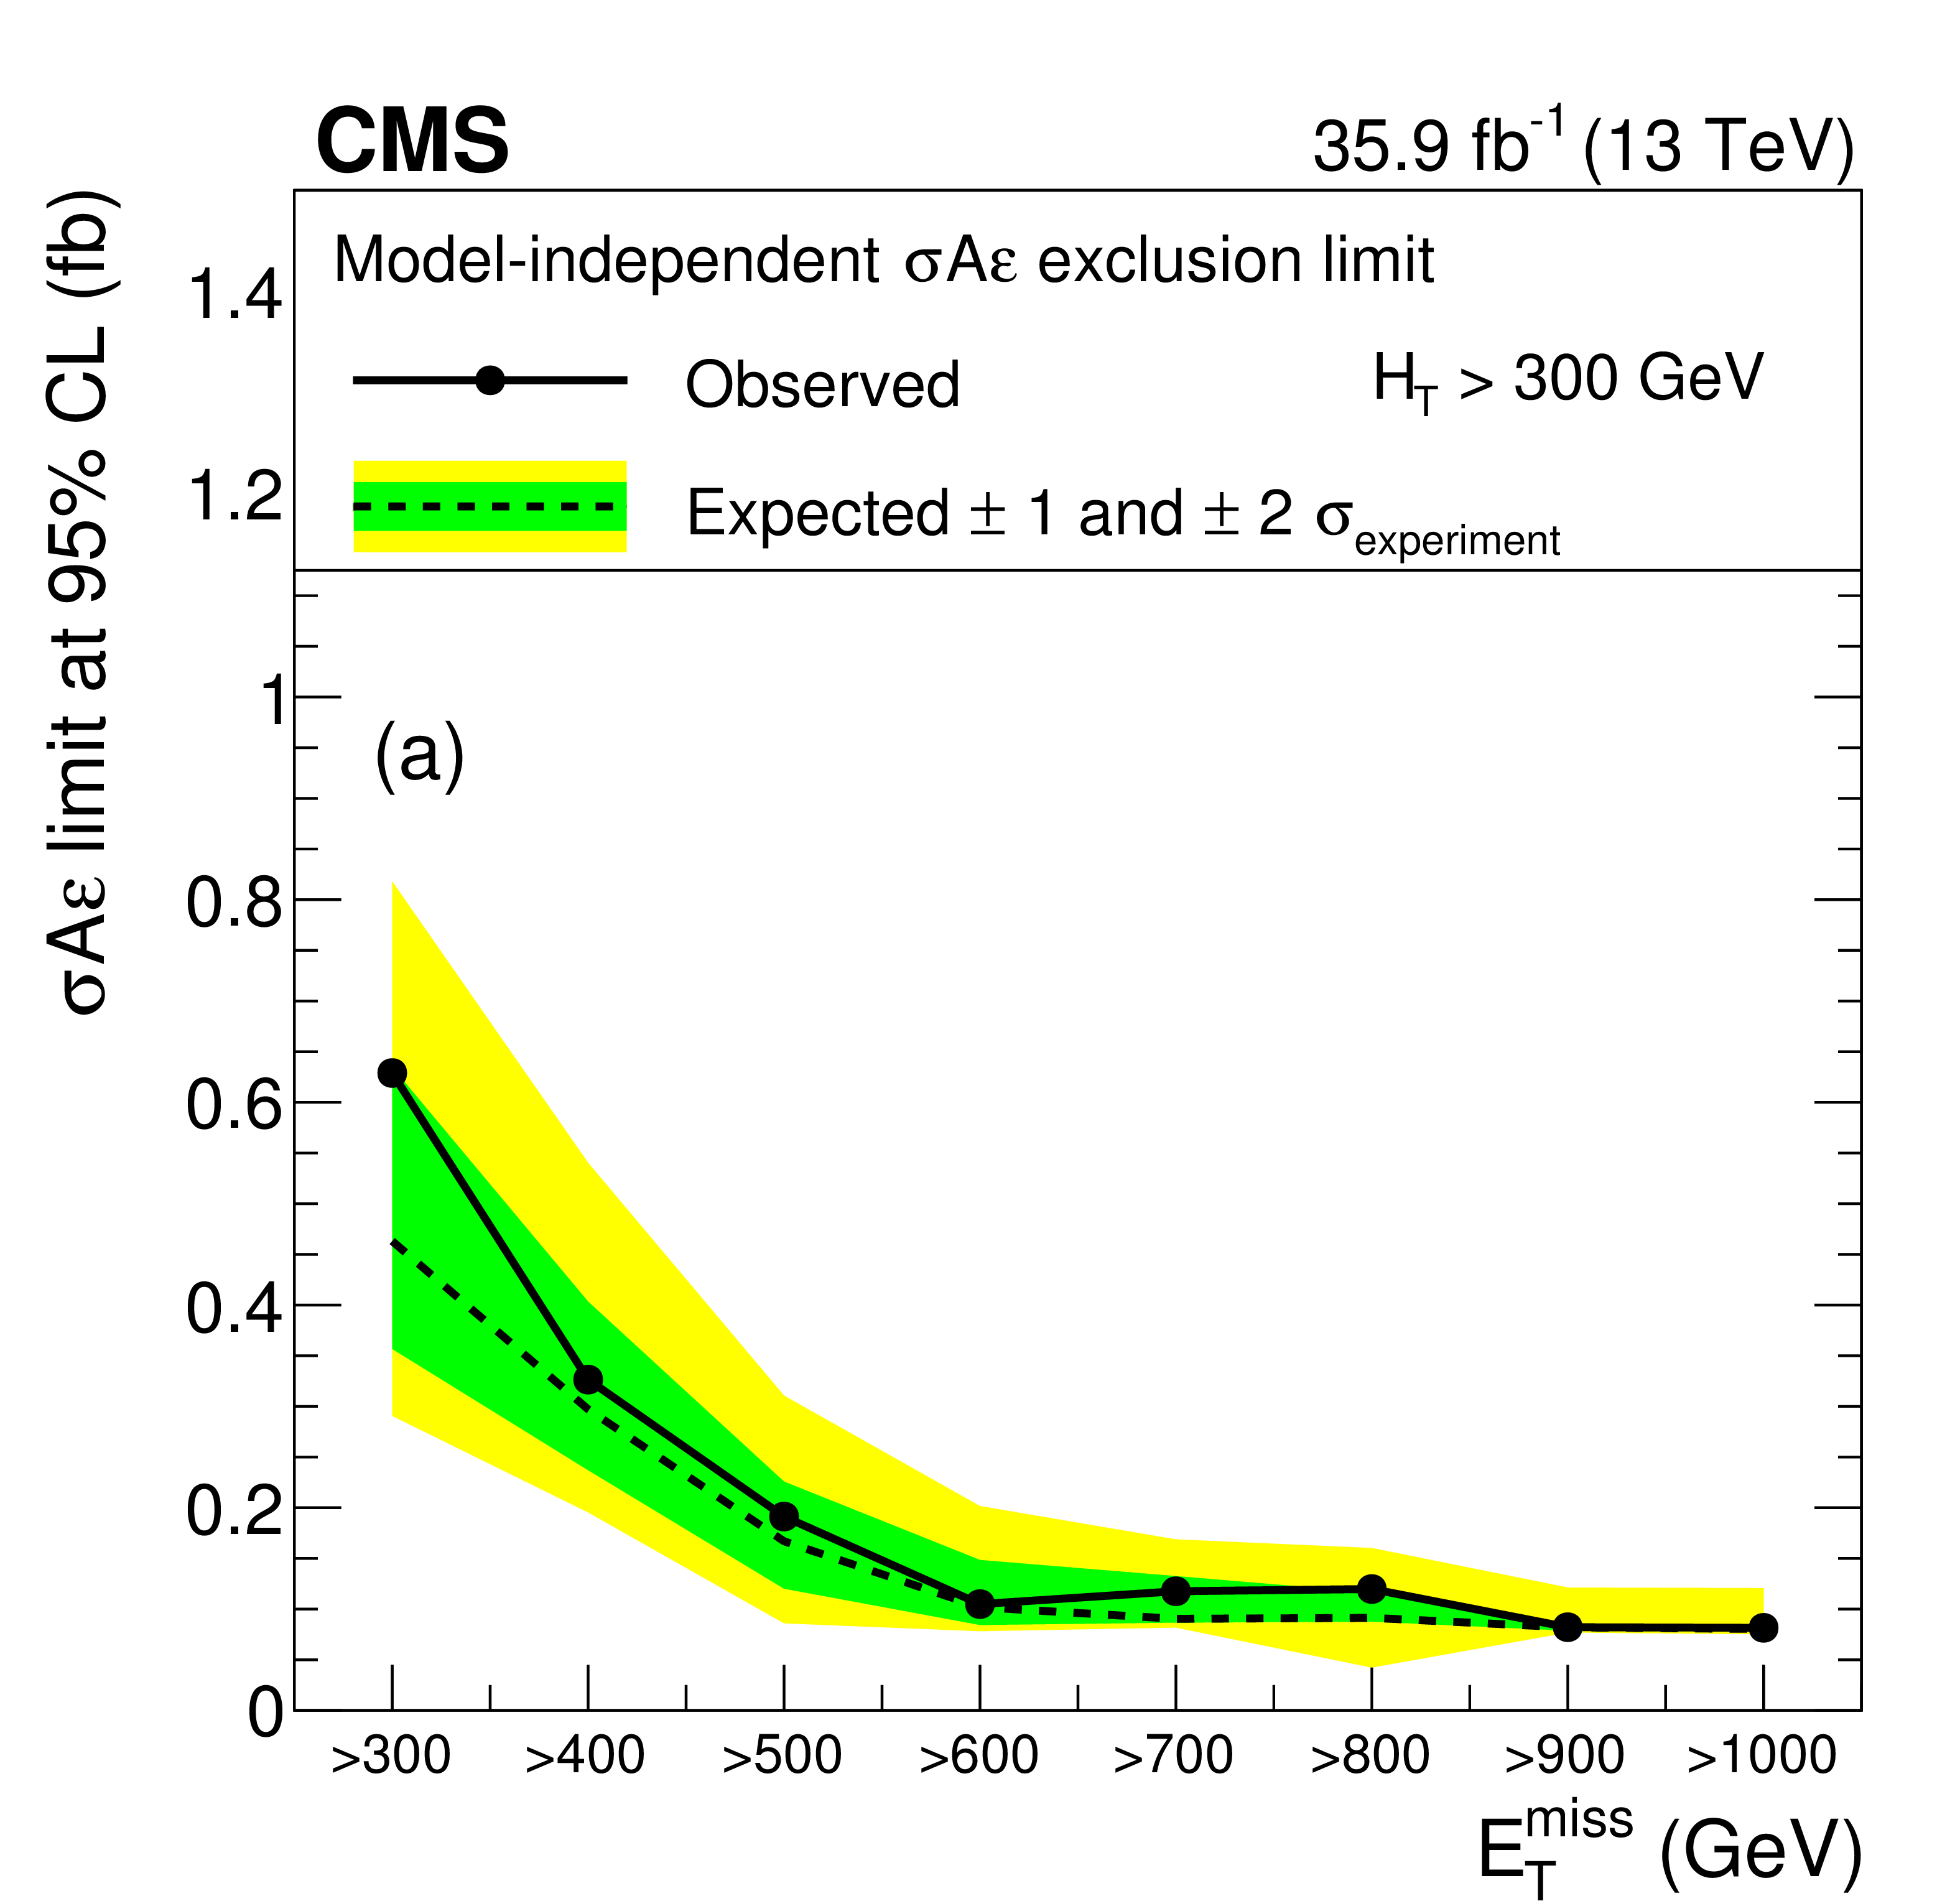
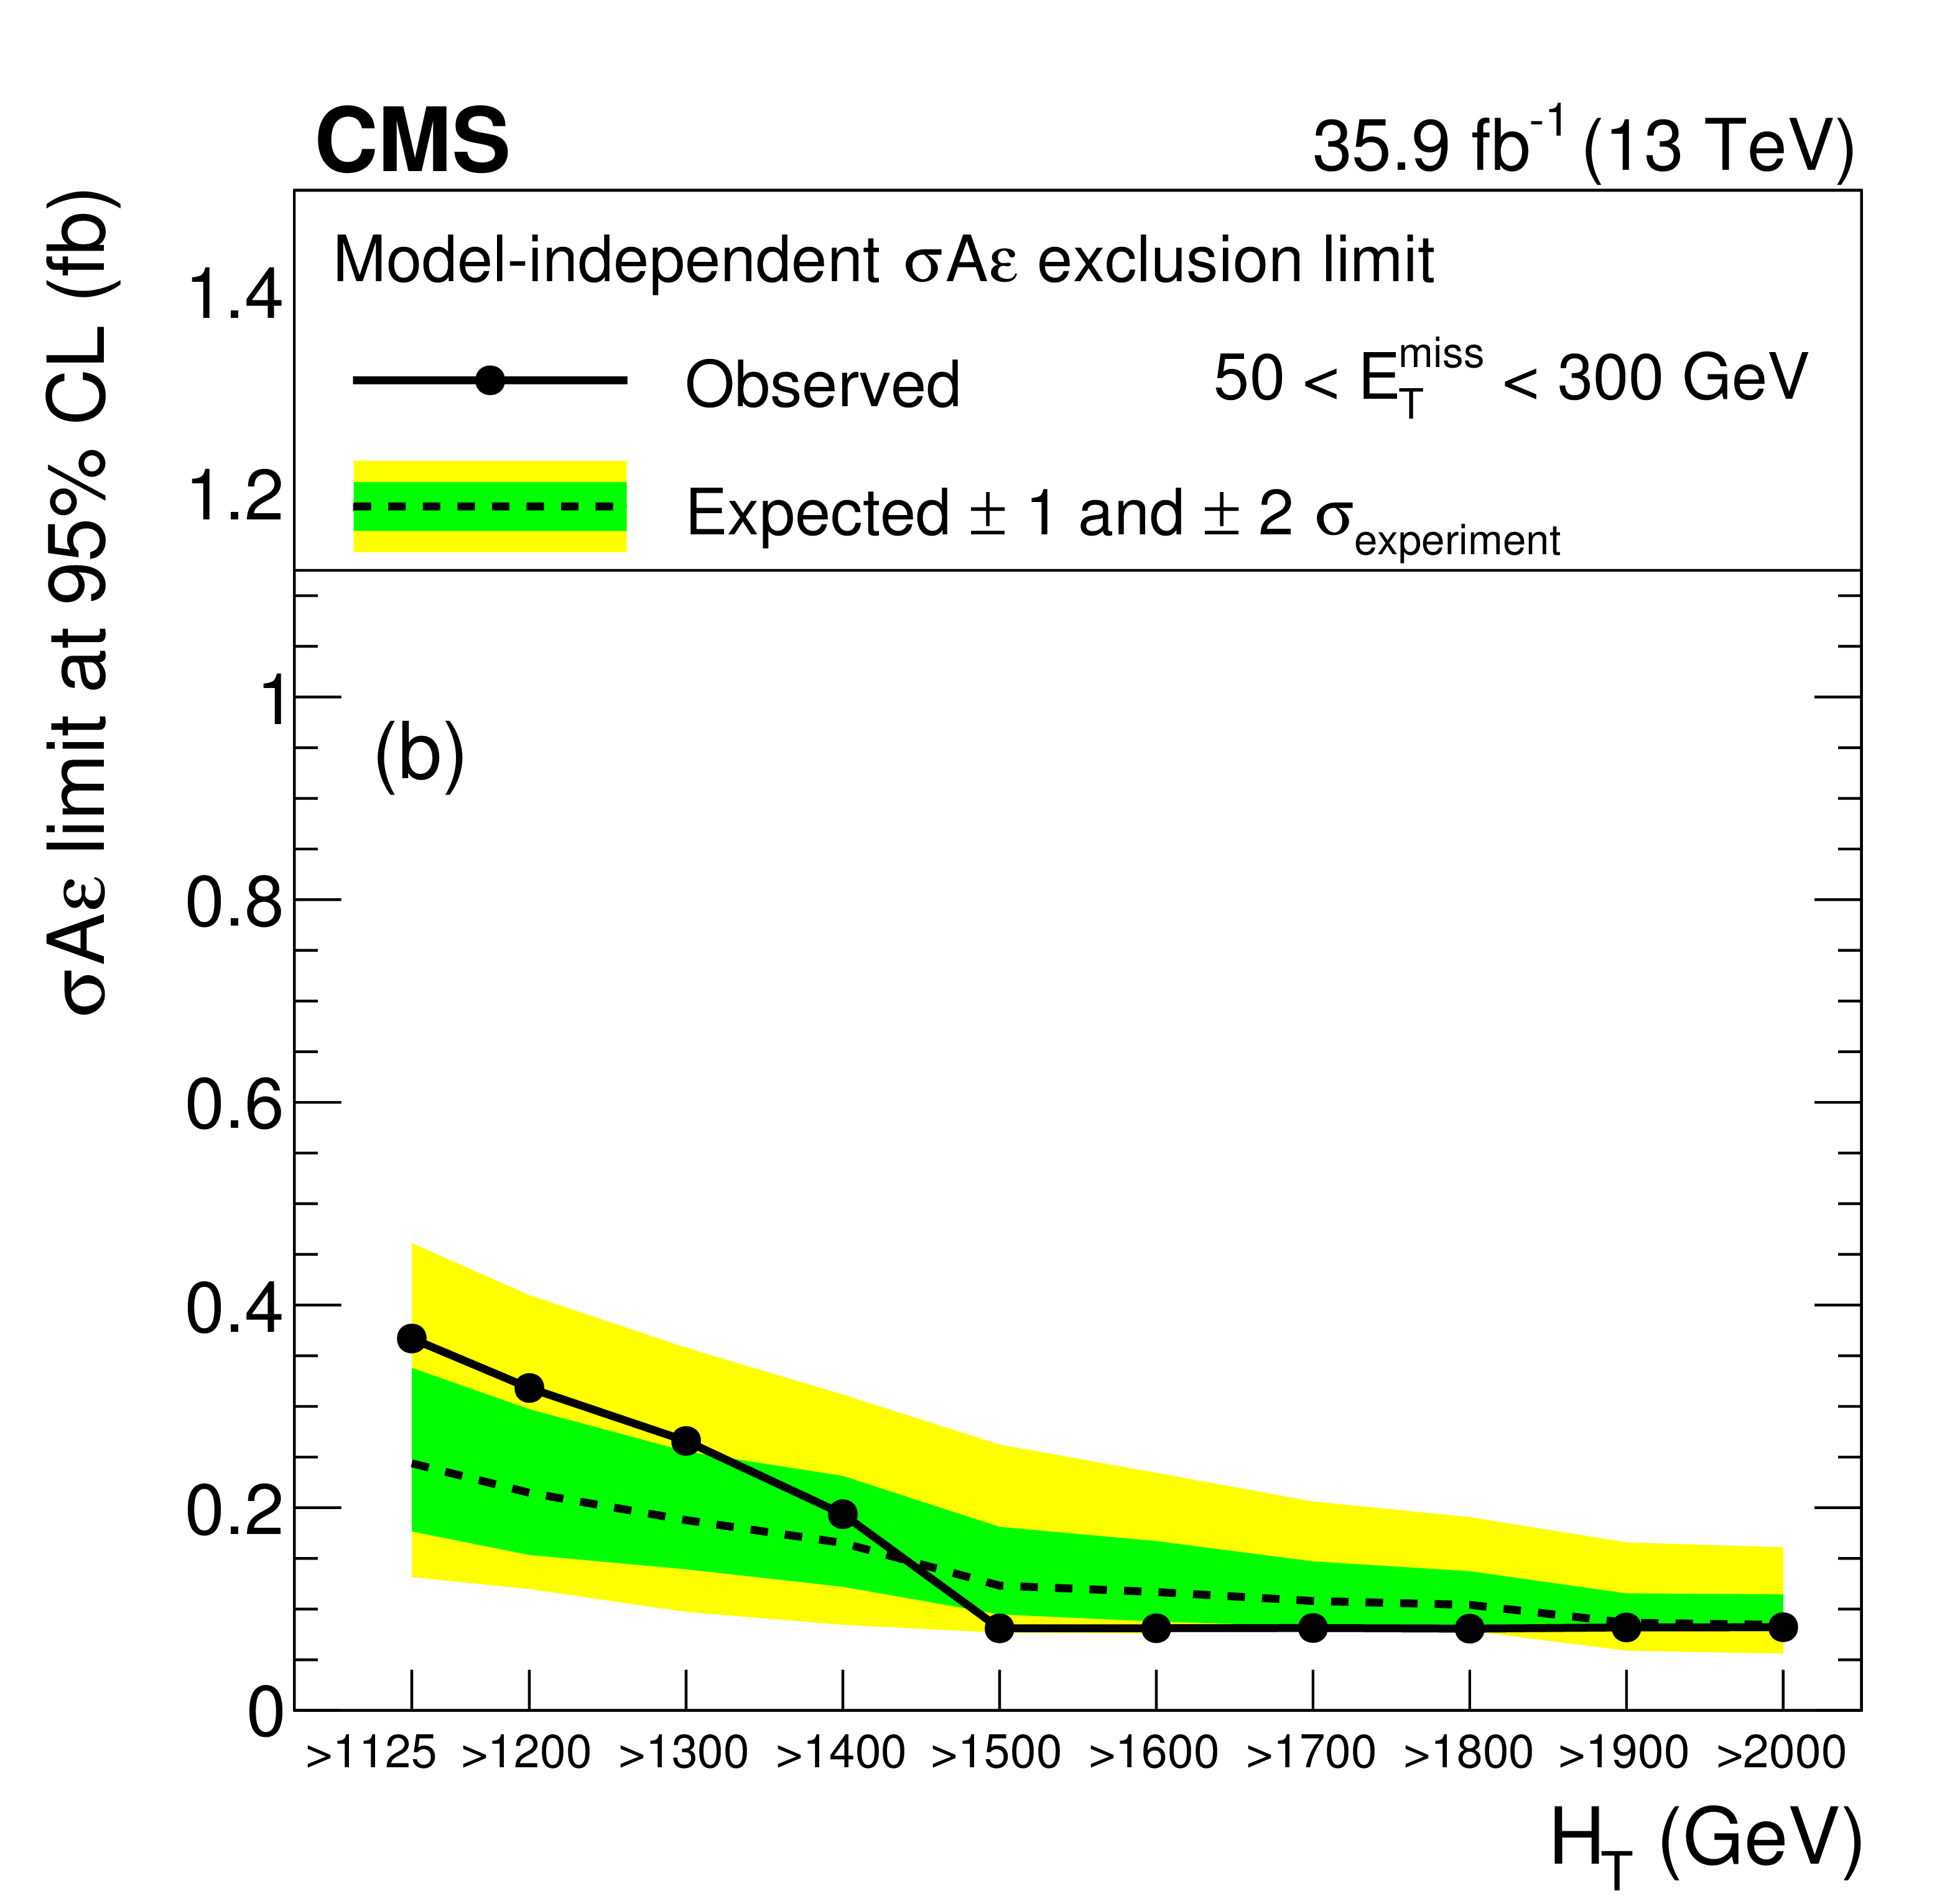
Limits on the product of cross section, detector acceptance, and selection efficiency, $\sigma \mathcal {A} \epsilon $, for the production of an SS dilepton pair as a function of ${E_{\mathrm {T}}^{\text {miss}}}$ (a) and of ${H_{\mathrm {T}}}$ (b). |
png pdf root |
Figure 9-a:
Limits on the product of cross section, detector acceptance, and selection efficiency, $\sigma \mathcal {A} \epsilon $, for the production of an SS dilepton pair as a function of ${E_{\mathrm {T}}^{\text {miss}}}$. |
png pdf root |
Figure 9-b:
Limits on the product of cross section, detector acceptance, and selection efficiency, $\sigma \mathcal {A} \epsilon $, for the production of an SS dilepton pair as a function of ${H_{\mathrm {T}}}$. |
png pdf root |
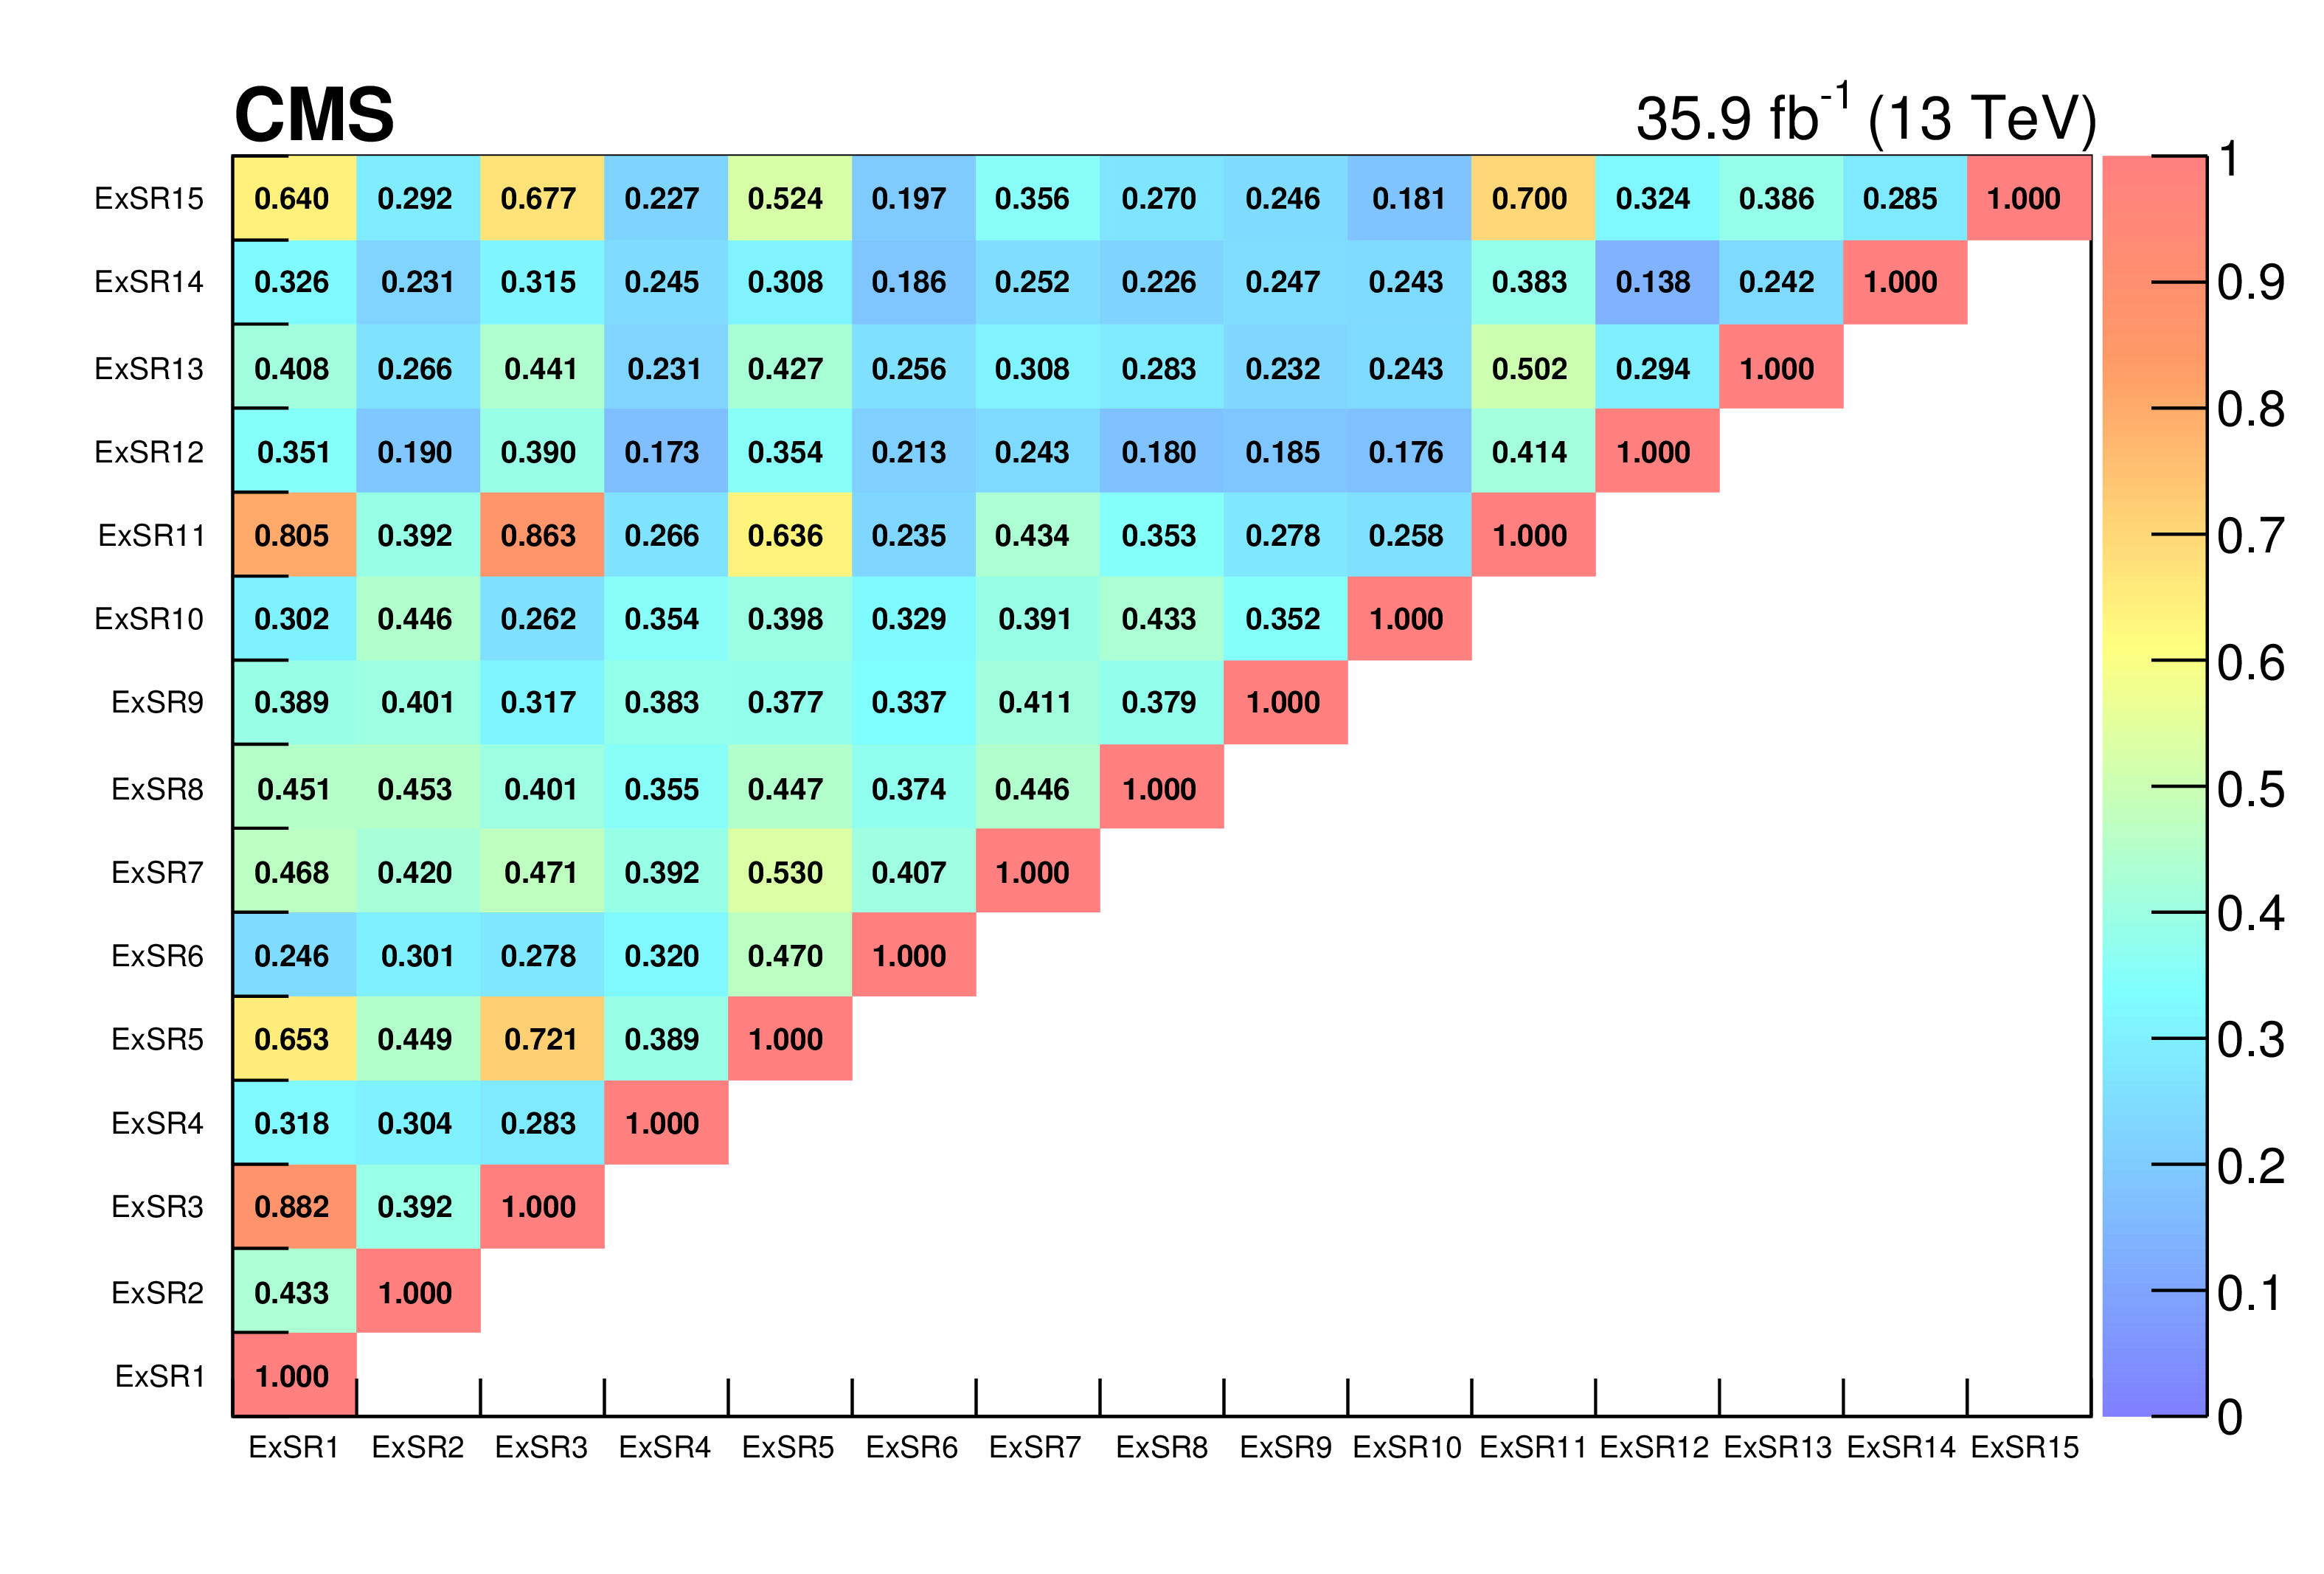
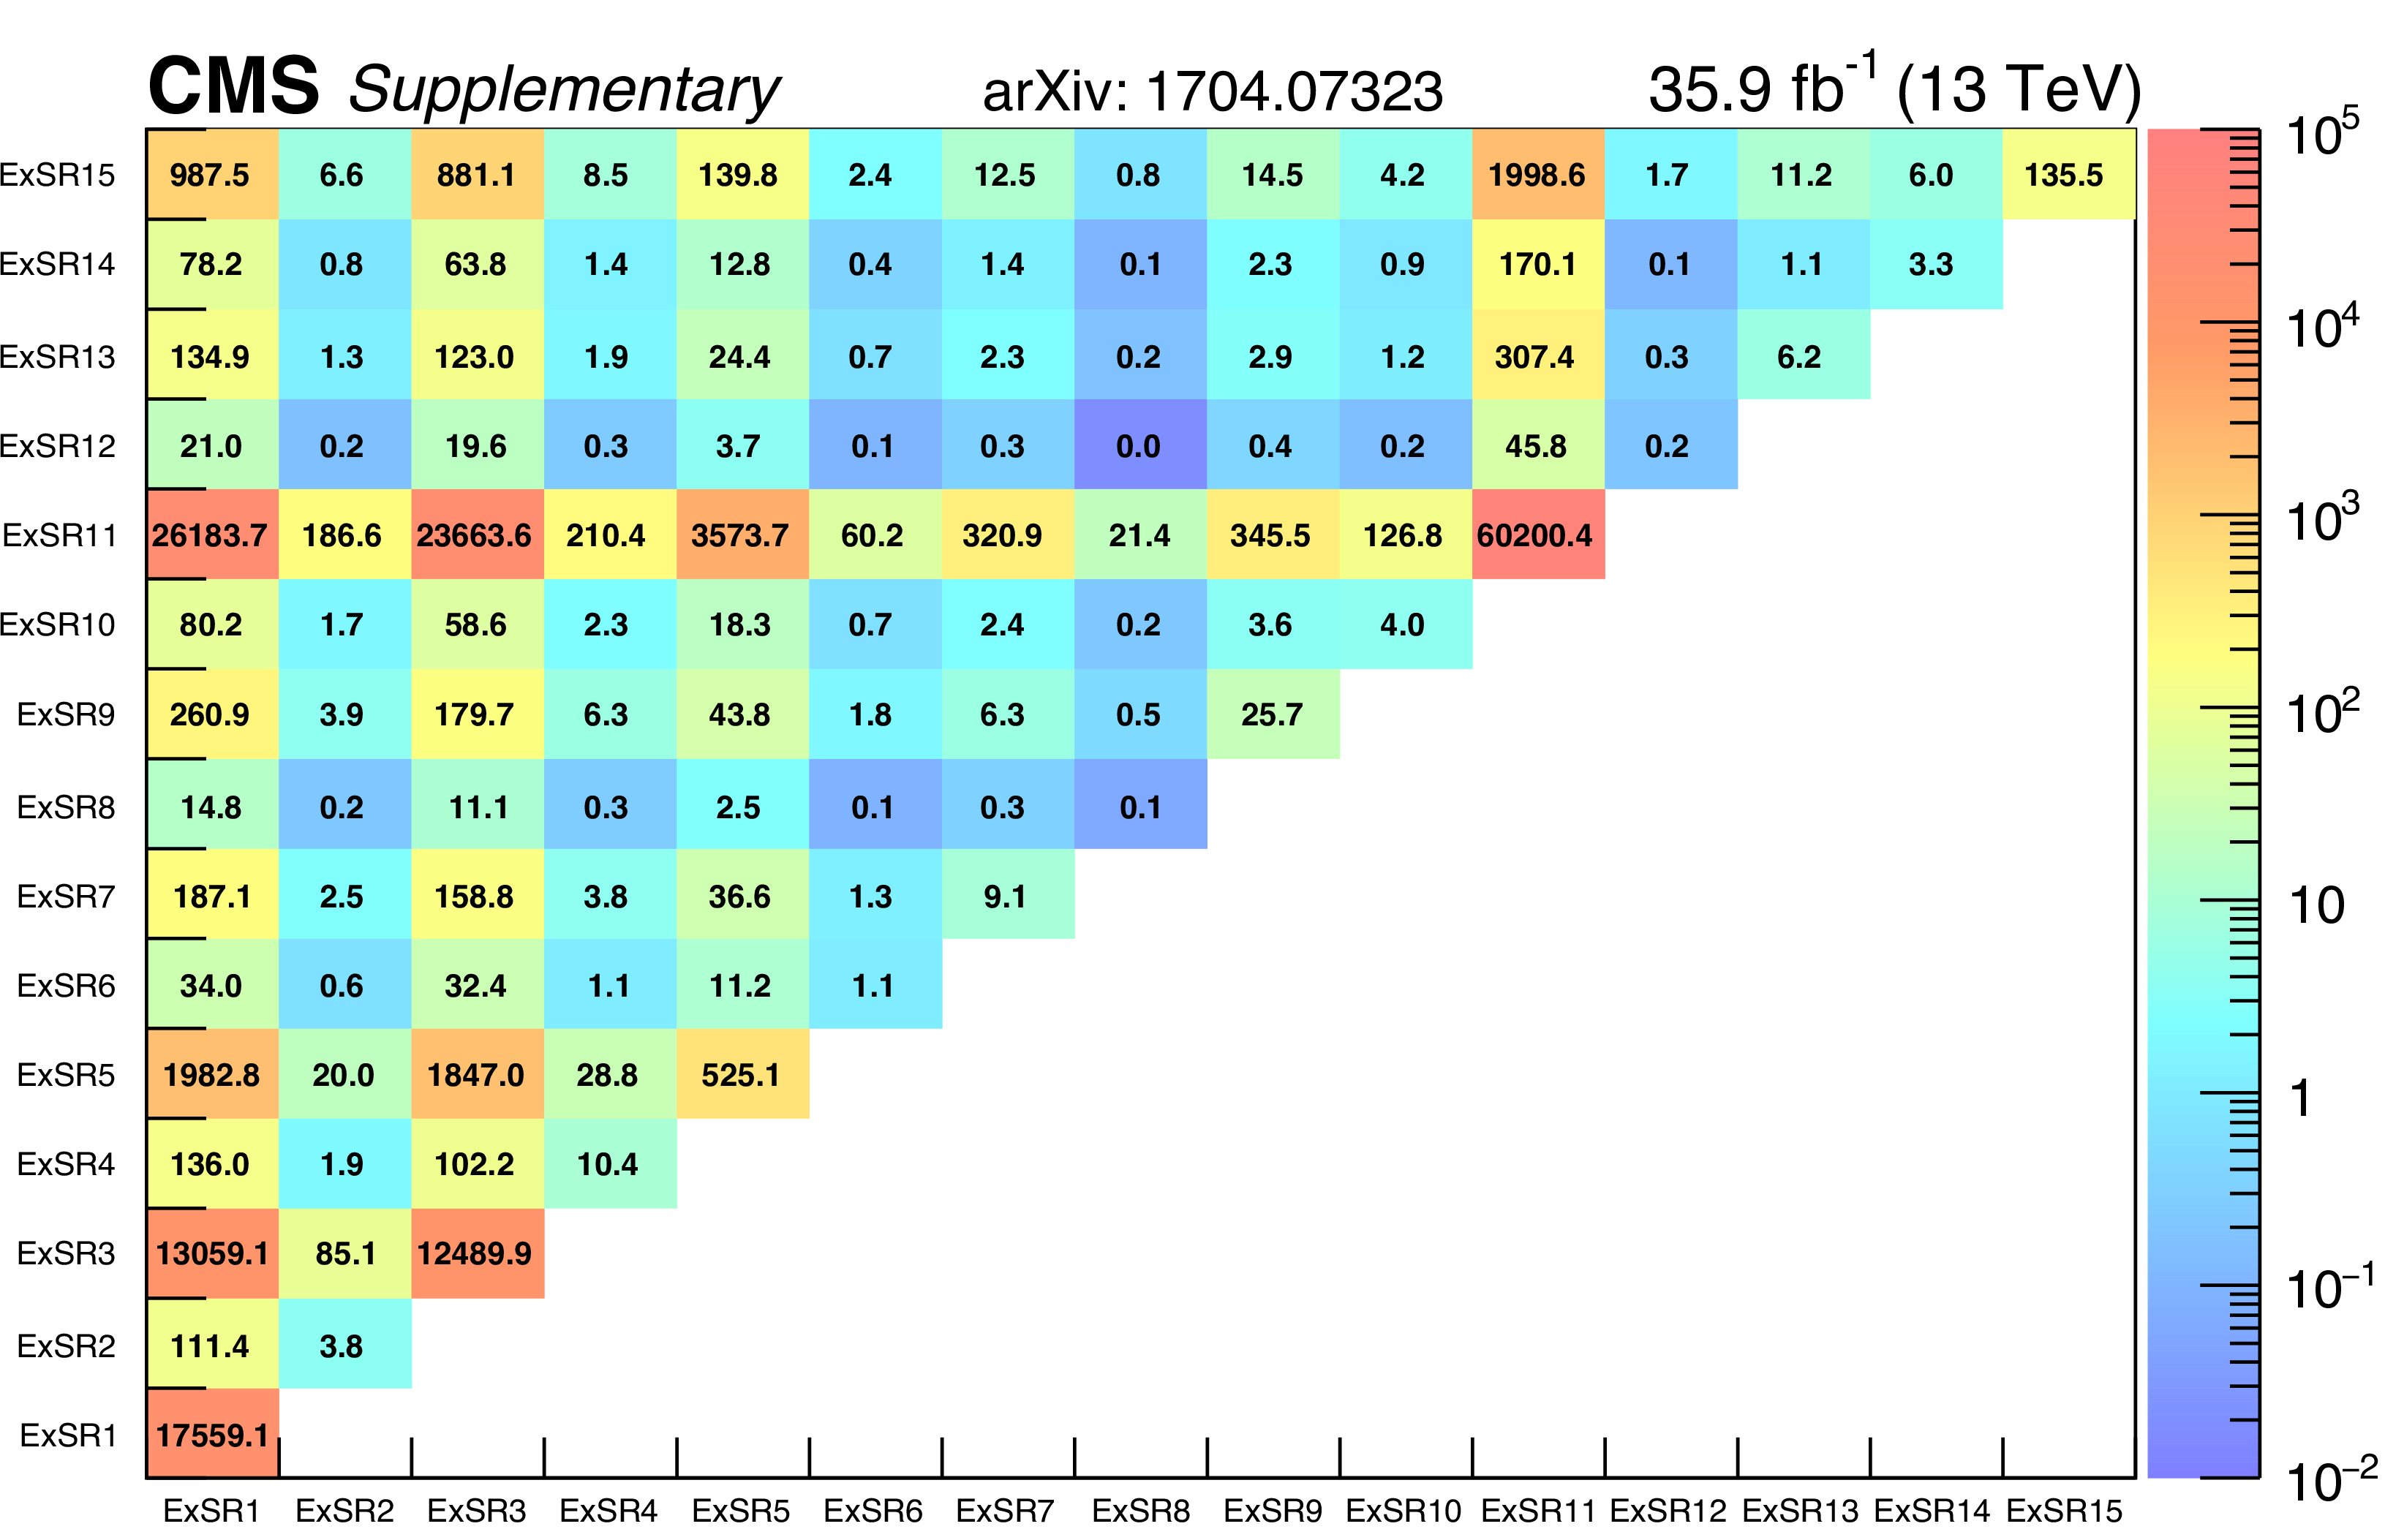
Figure 10:
Correlations between the background predictions in the 15 exclusive regions. |
| Tables | |
png pdf |
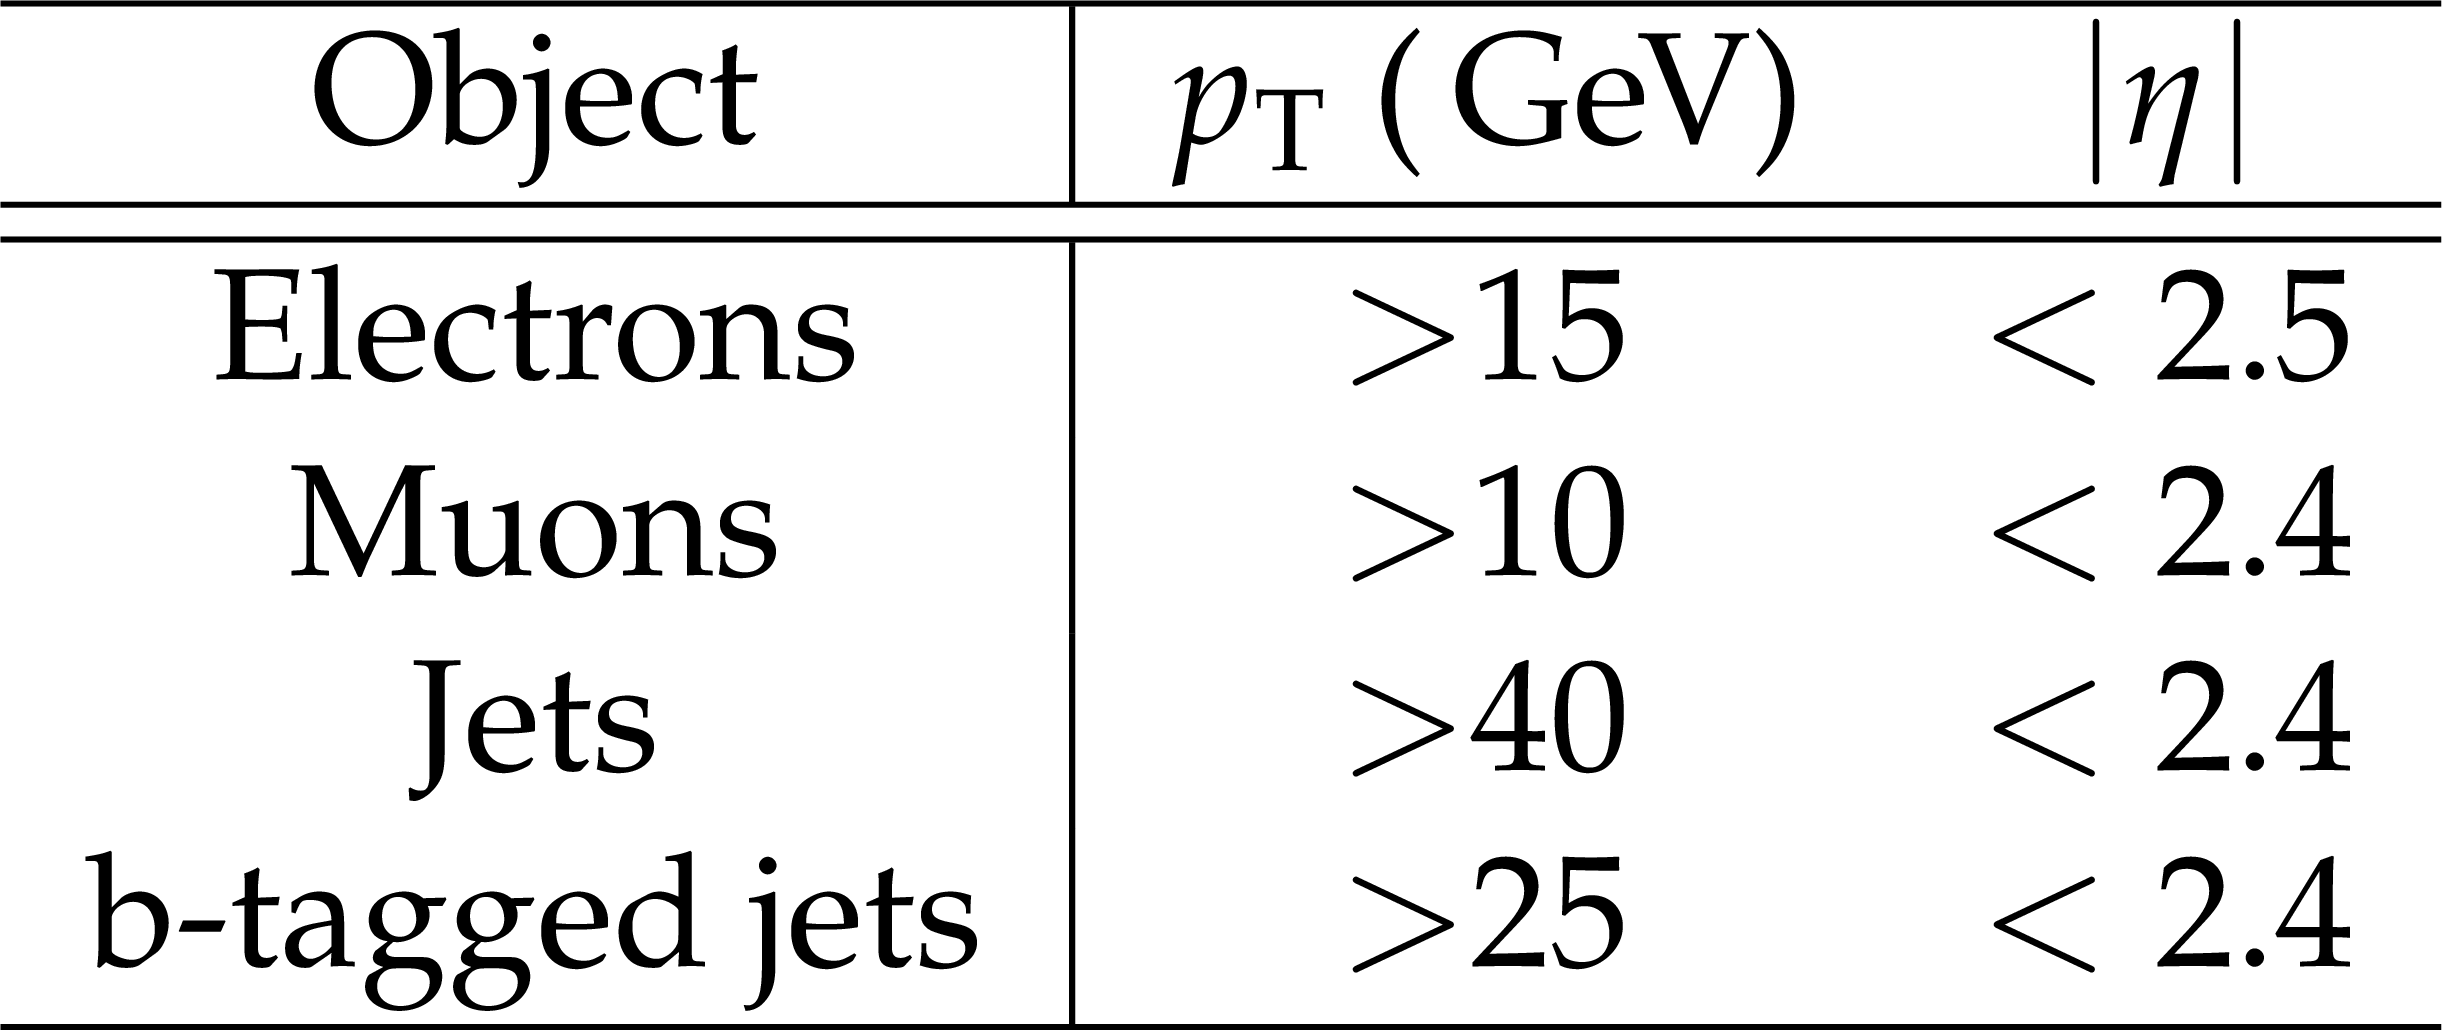
Table 1:
Kinematic requirements for leptons and jets. Note that the ${p_{\mathrm {T}}}$ thresholds to count jets and b-tagged jets are different. |
png pdf |
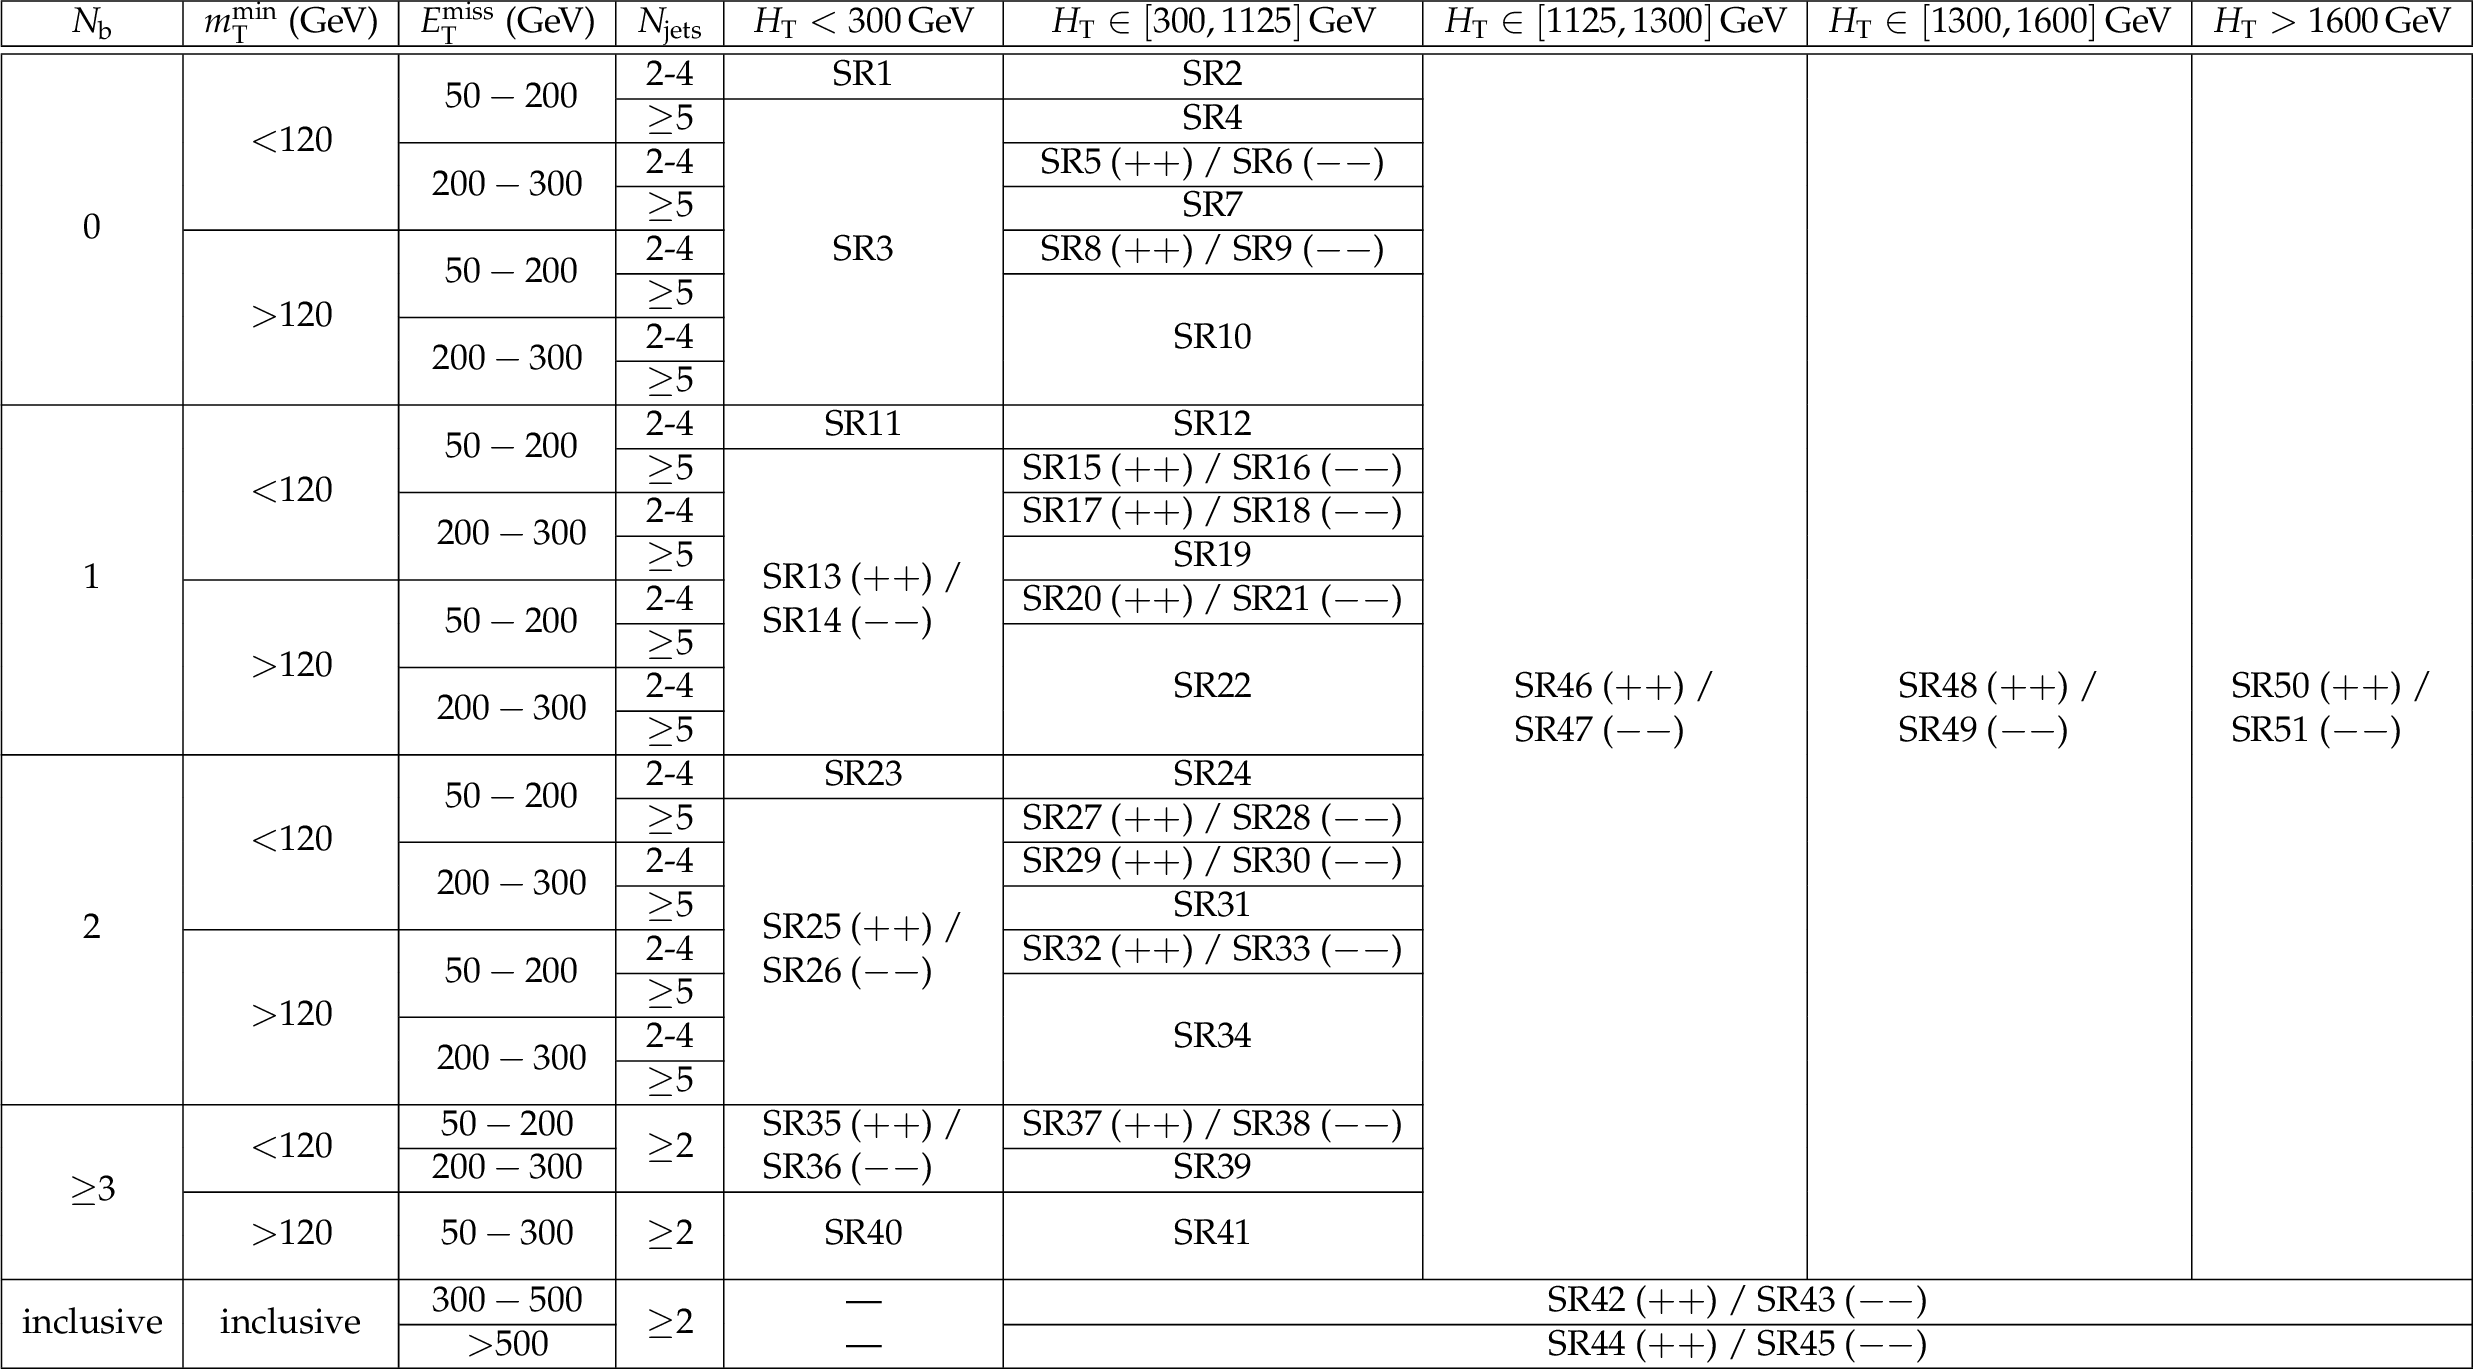
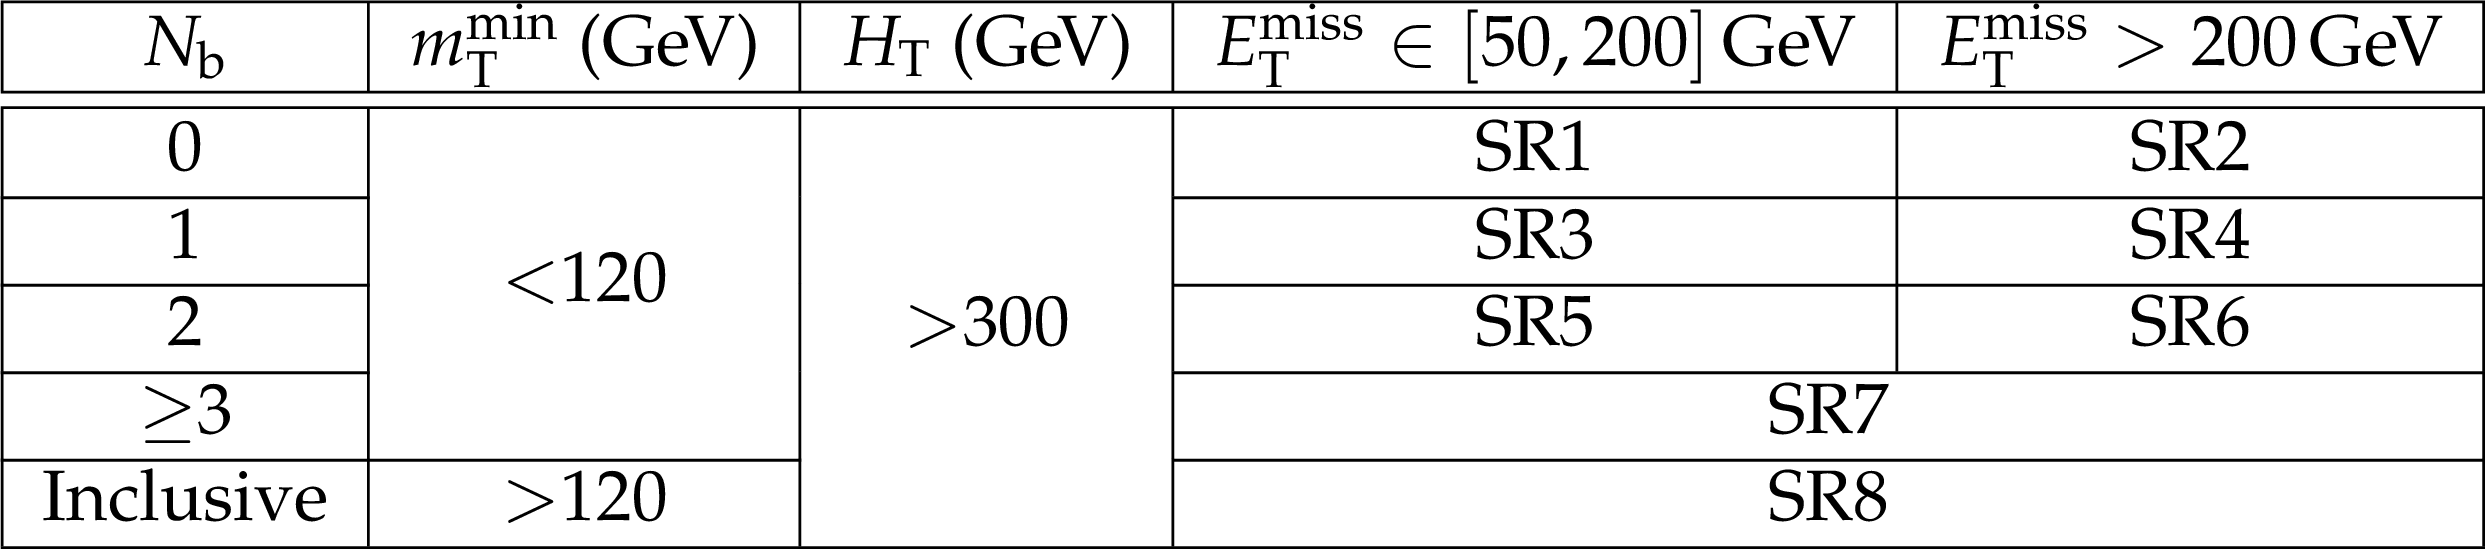
Table 2:
Signal region definitions for the HH selection. Regions split by charge are indicated with ($++$) and ($--$). |
png pdf |
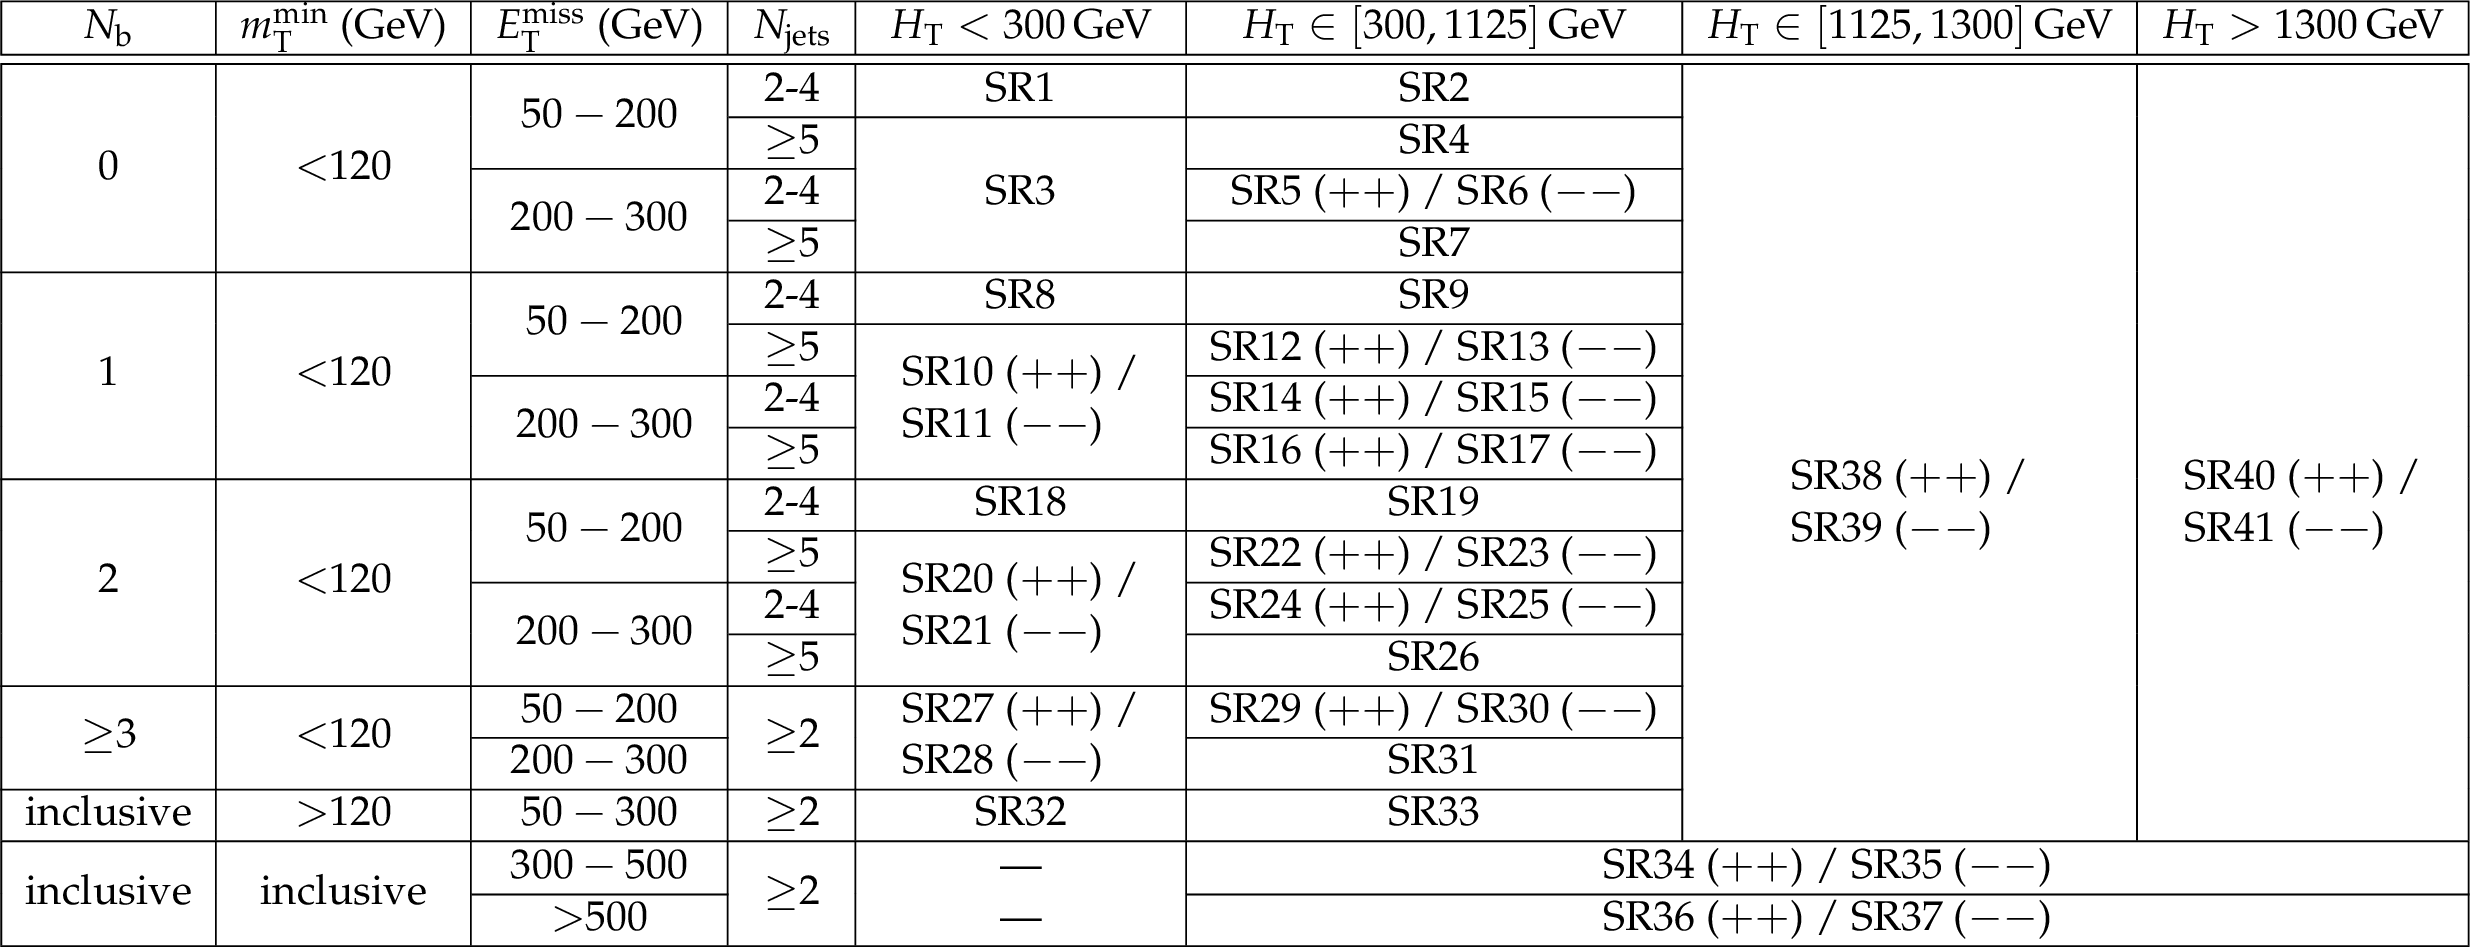
Table 3:
Signal region definitions for the HL selection. Regions split by charge are indicated with ($++$) and ($--$). |
png pdf |
Table 4:
Signal region definitions for the LL selection. All SRs in this category require $ {N_\text {jets}} \geq $ 2. |
png pdf |
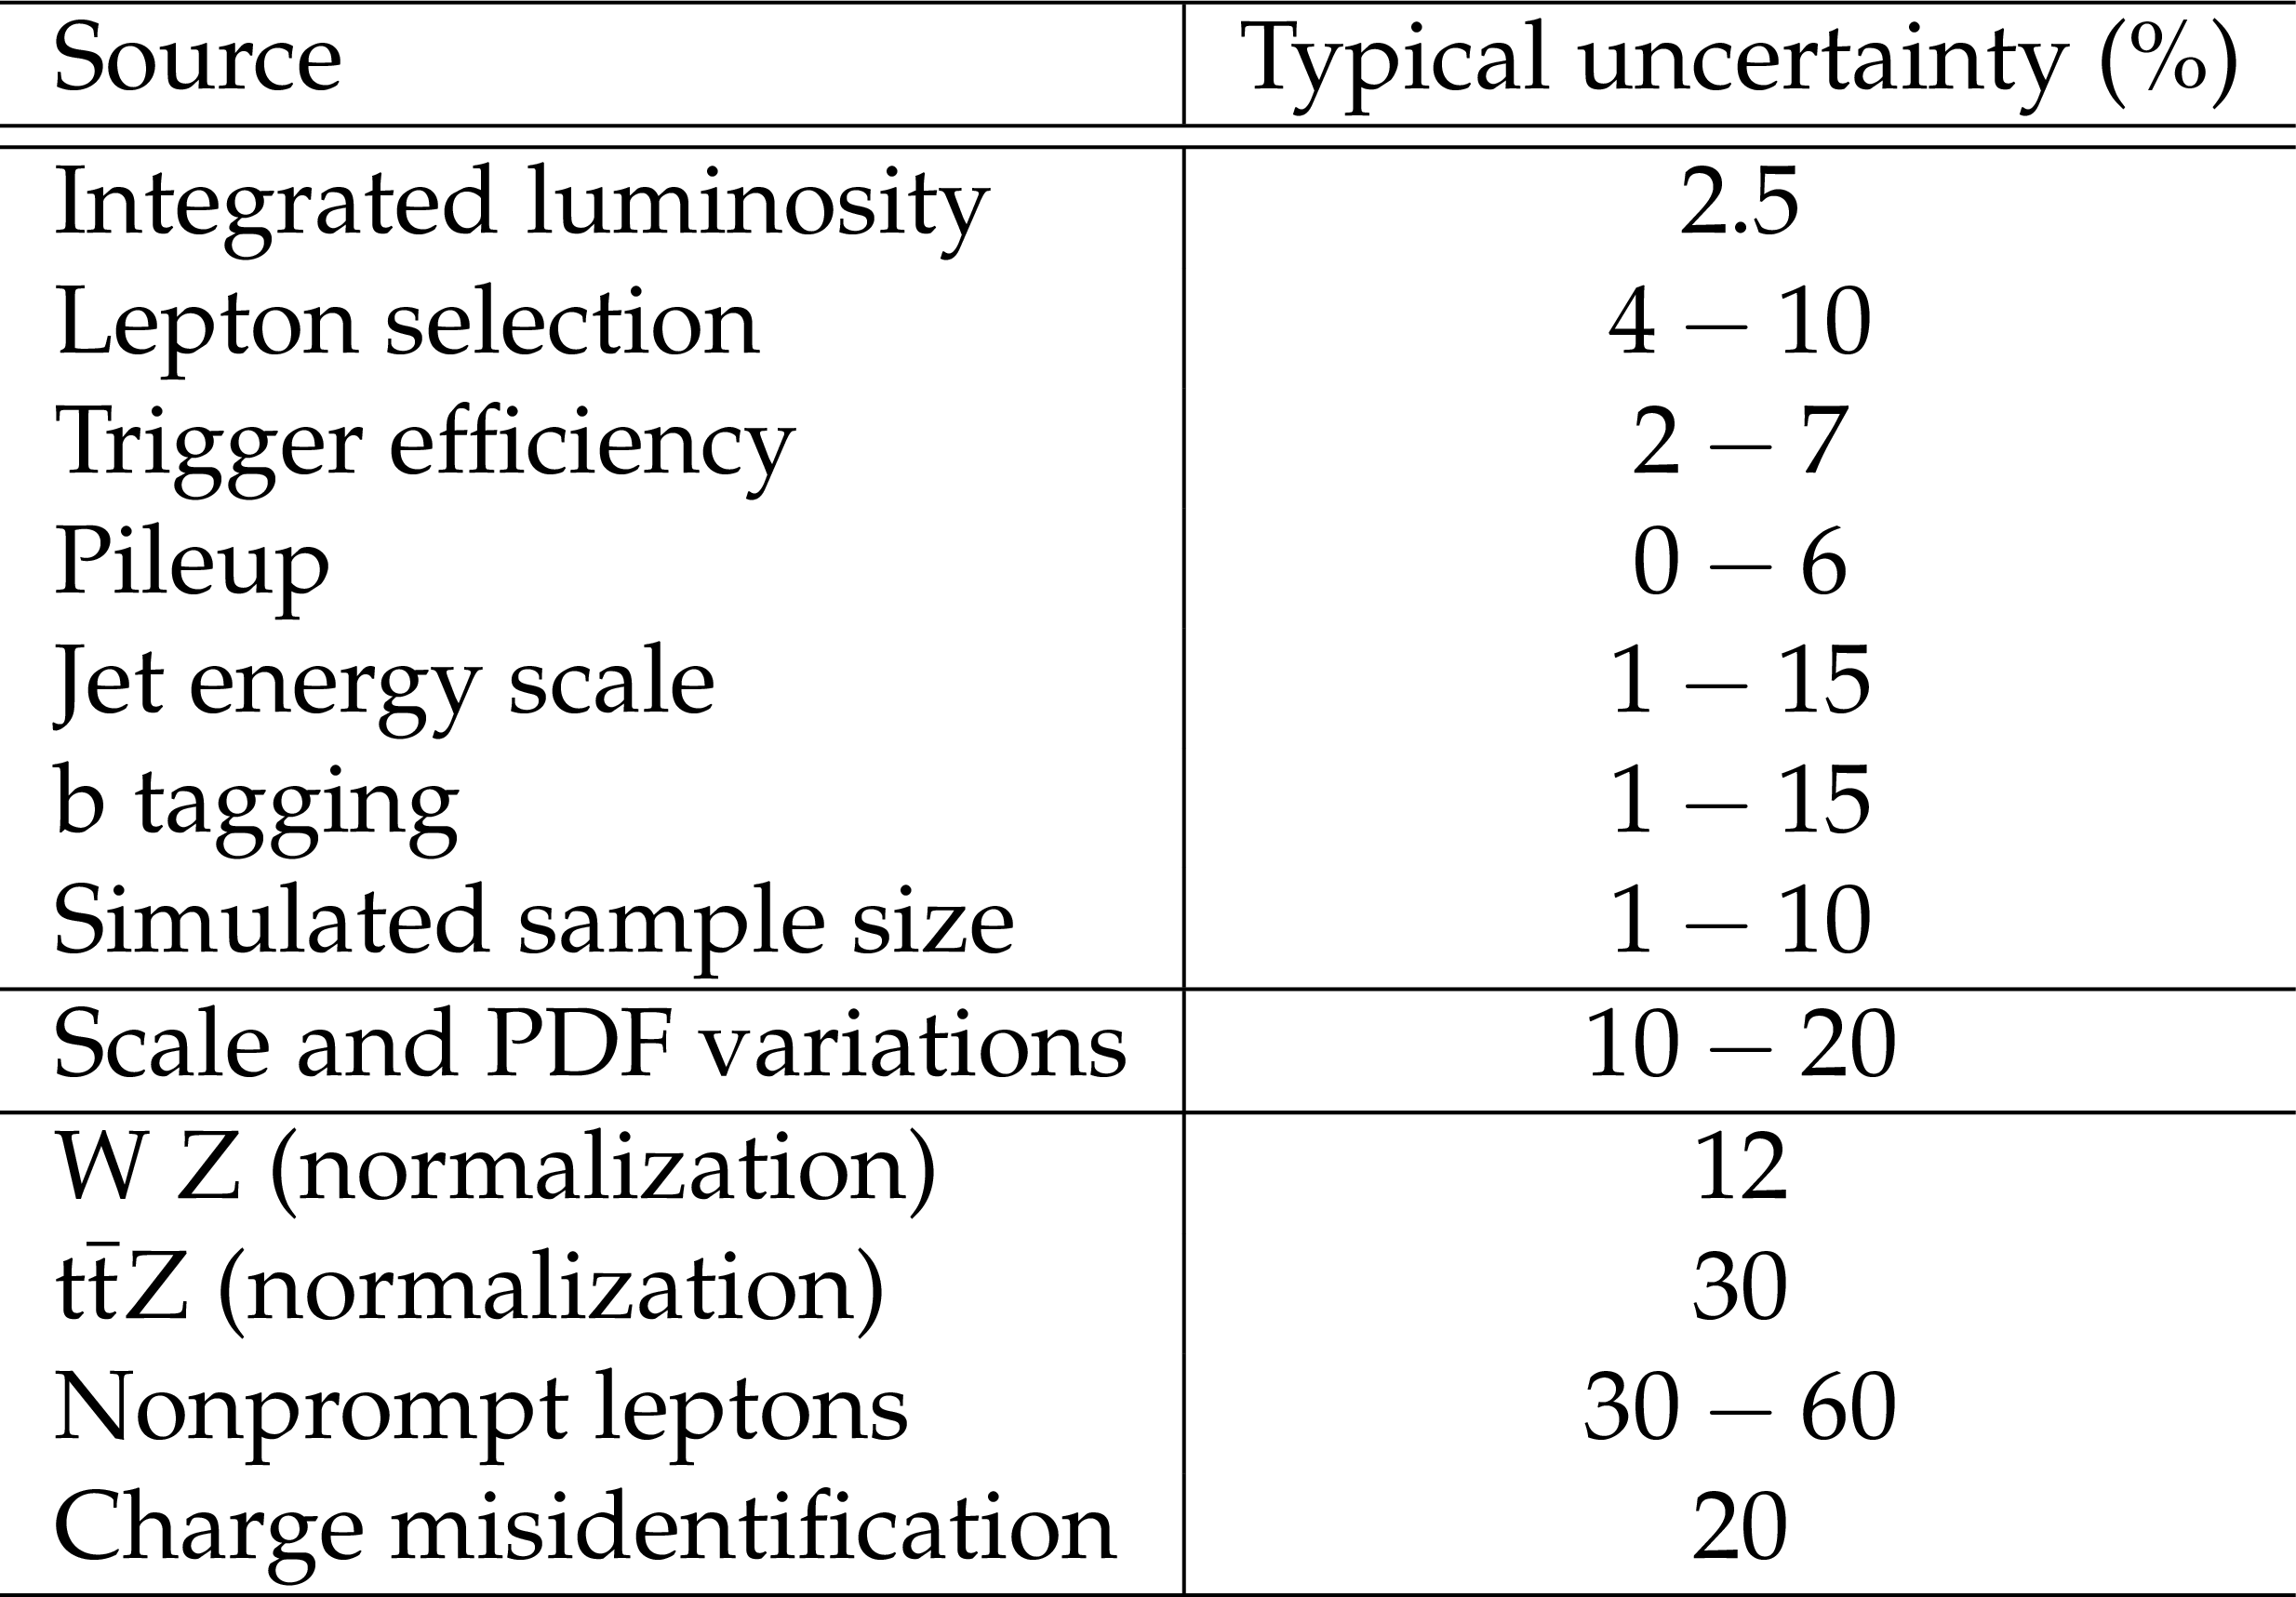
Table 5:
Summary of the sources of uncertainty and their effect on the yields of different processes in the SRs. The first two groups list experimental and theoretical uncertainties assigned to processes estimated using simulation, while the last group lists uncertainties assigned to processes whose yield is estimated from data. The uncertainties in the first group also apply to signal samples. Reported values are representative for the most relevant signal regions. |
png pdf |
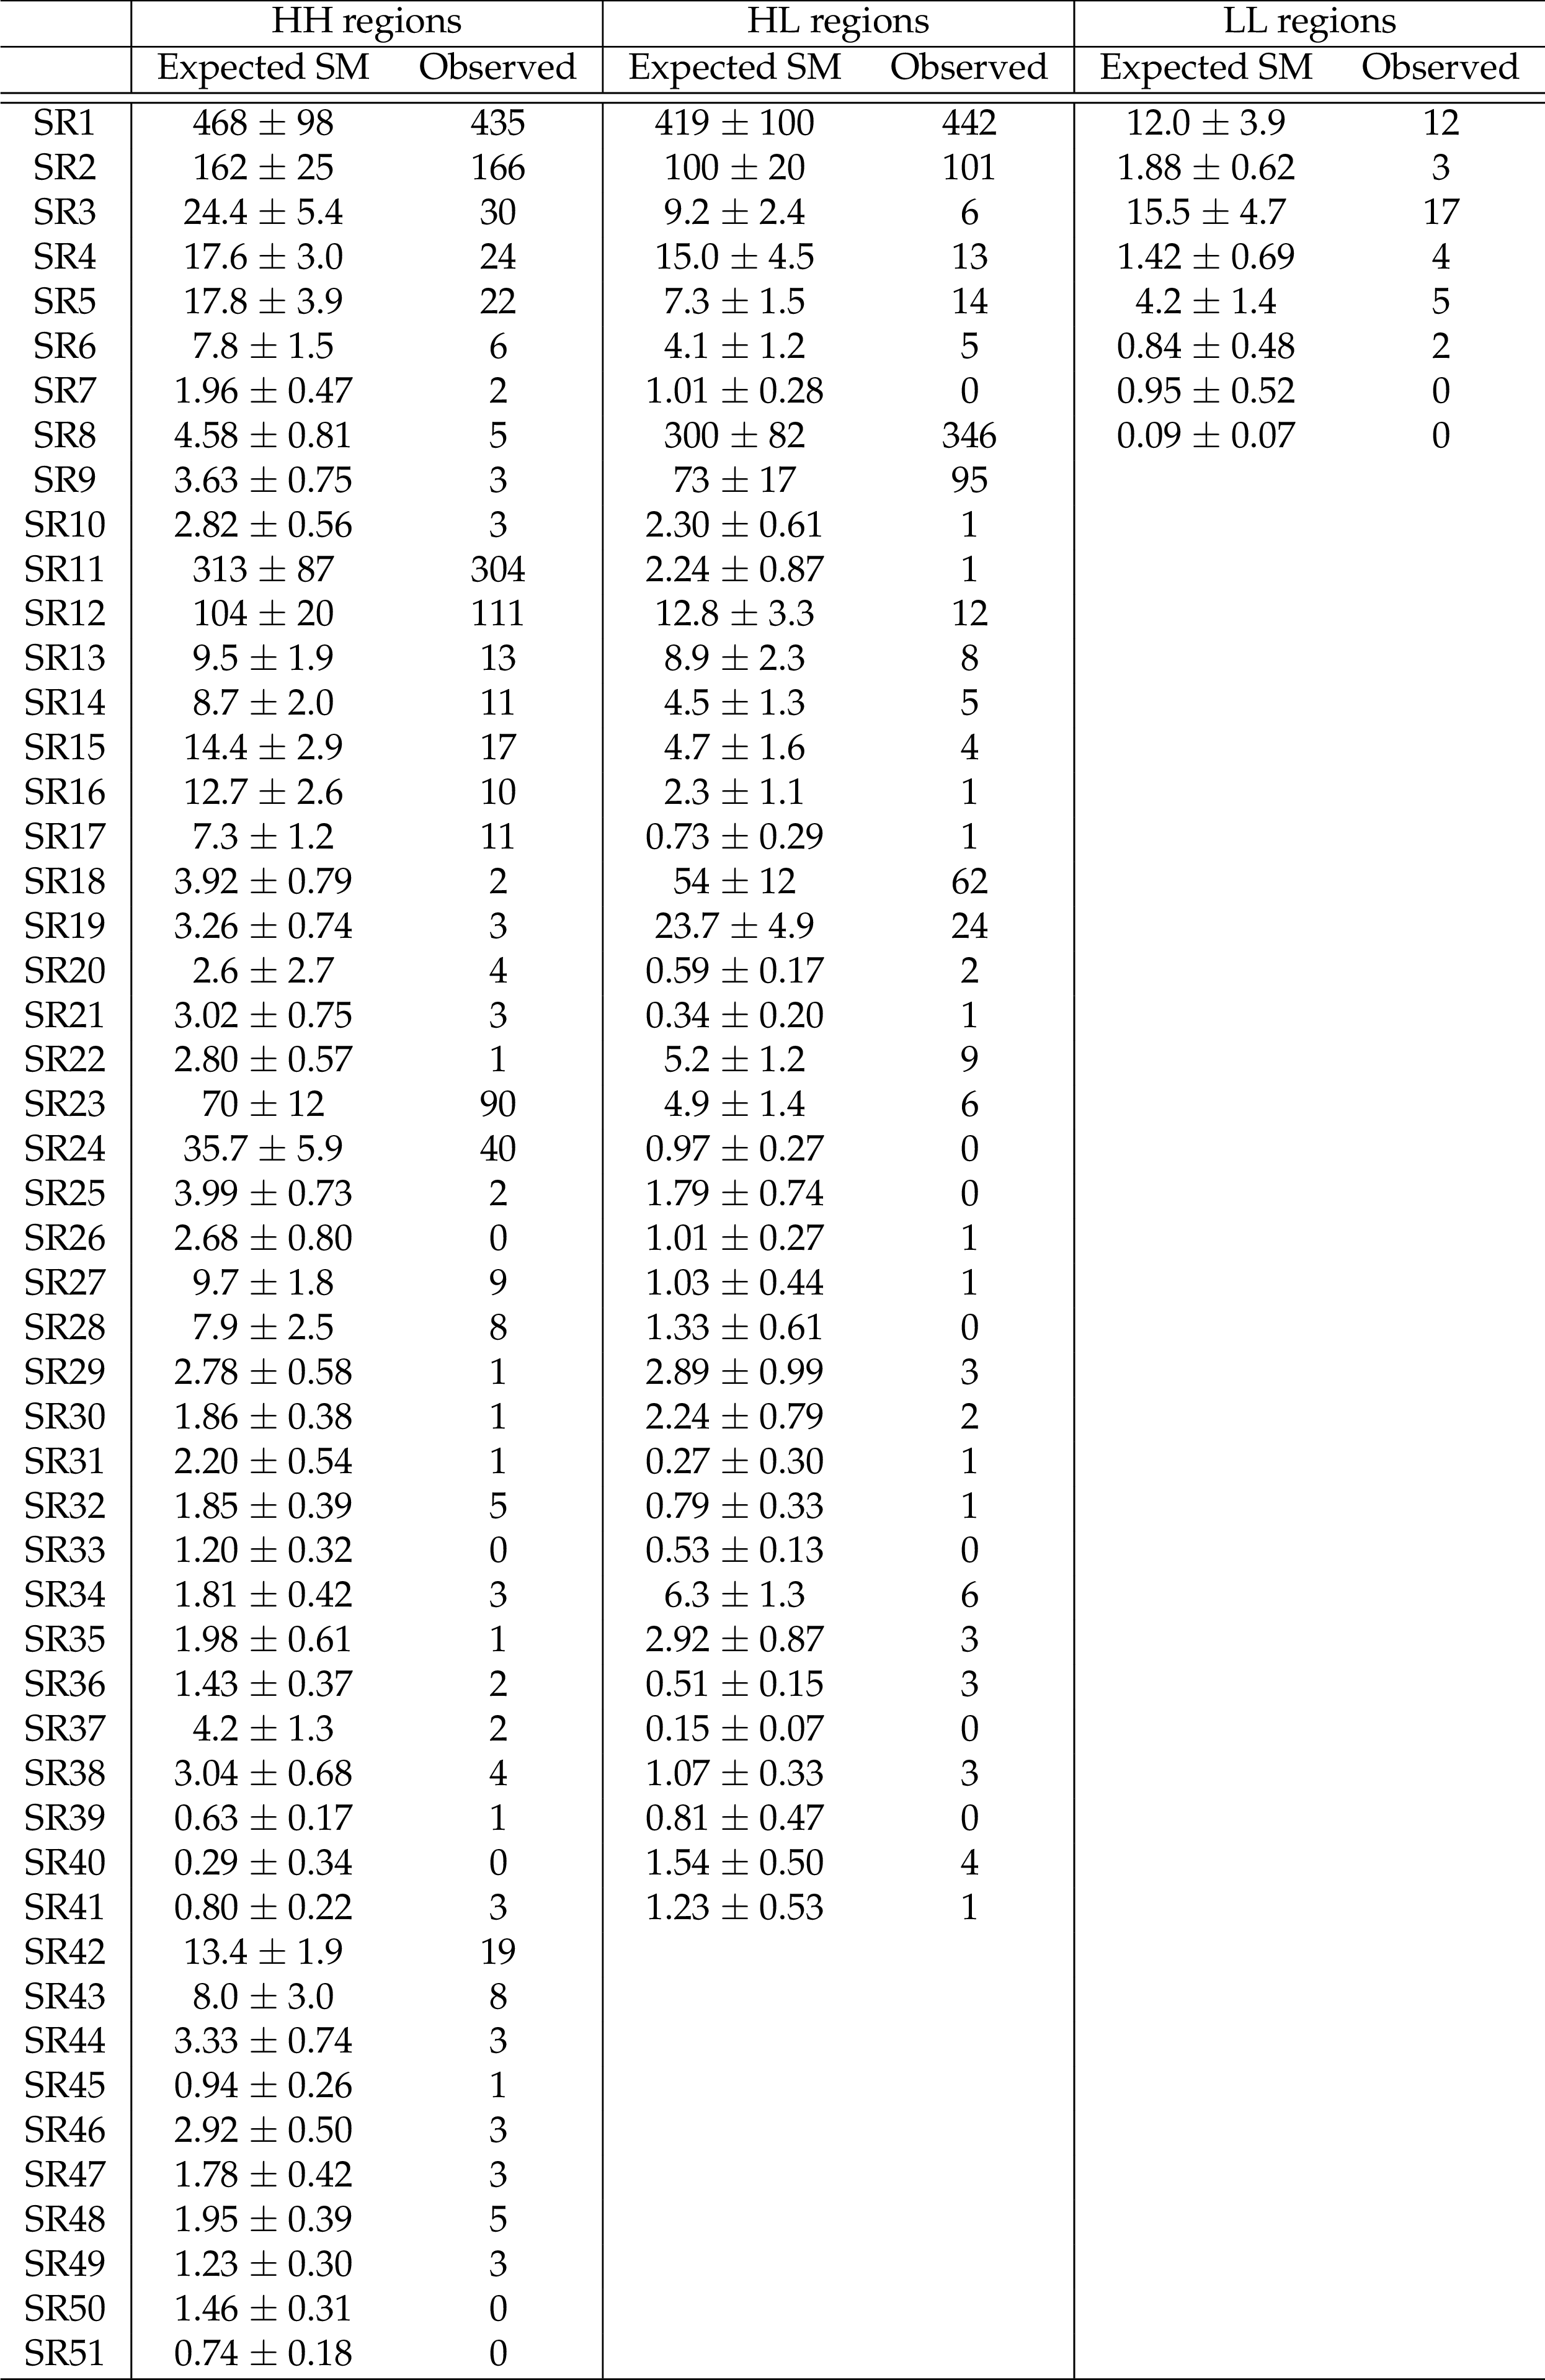
Table 6:
Number of expected background and observed events in different SRs in this analysis. |

png pdf |
Table 7:
Inclusive SR definitions, expected background yields, and observed yields, as well the observed 95% CL upper limits on the number of signal events contributing to each region. No uncertainty in the signal acceptance is assumed in calculating these limits. A dash ($-$) means that the selection is not applied. |
png pdf |
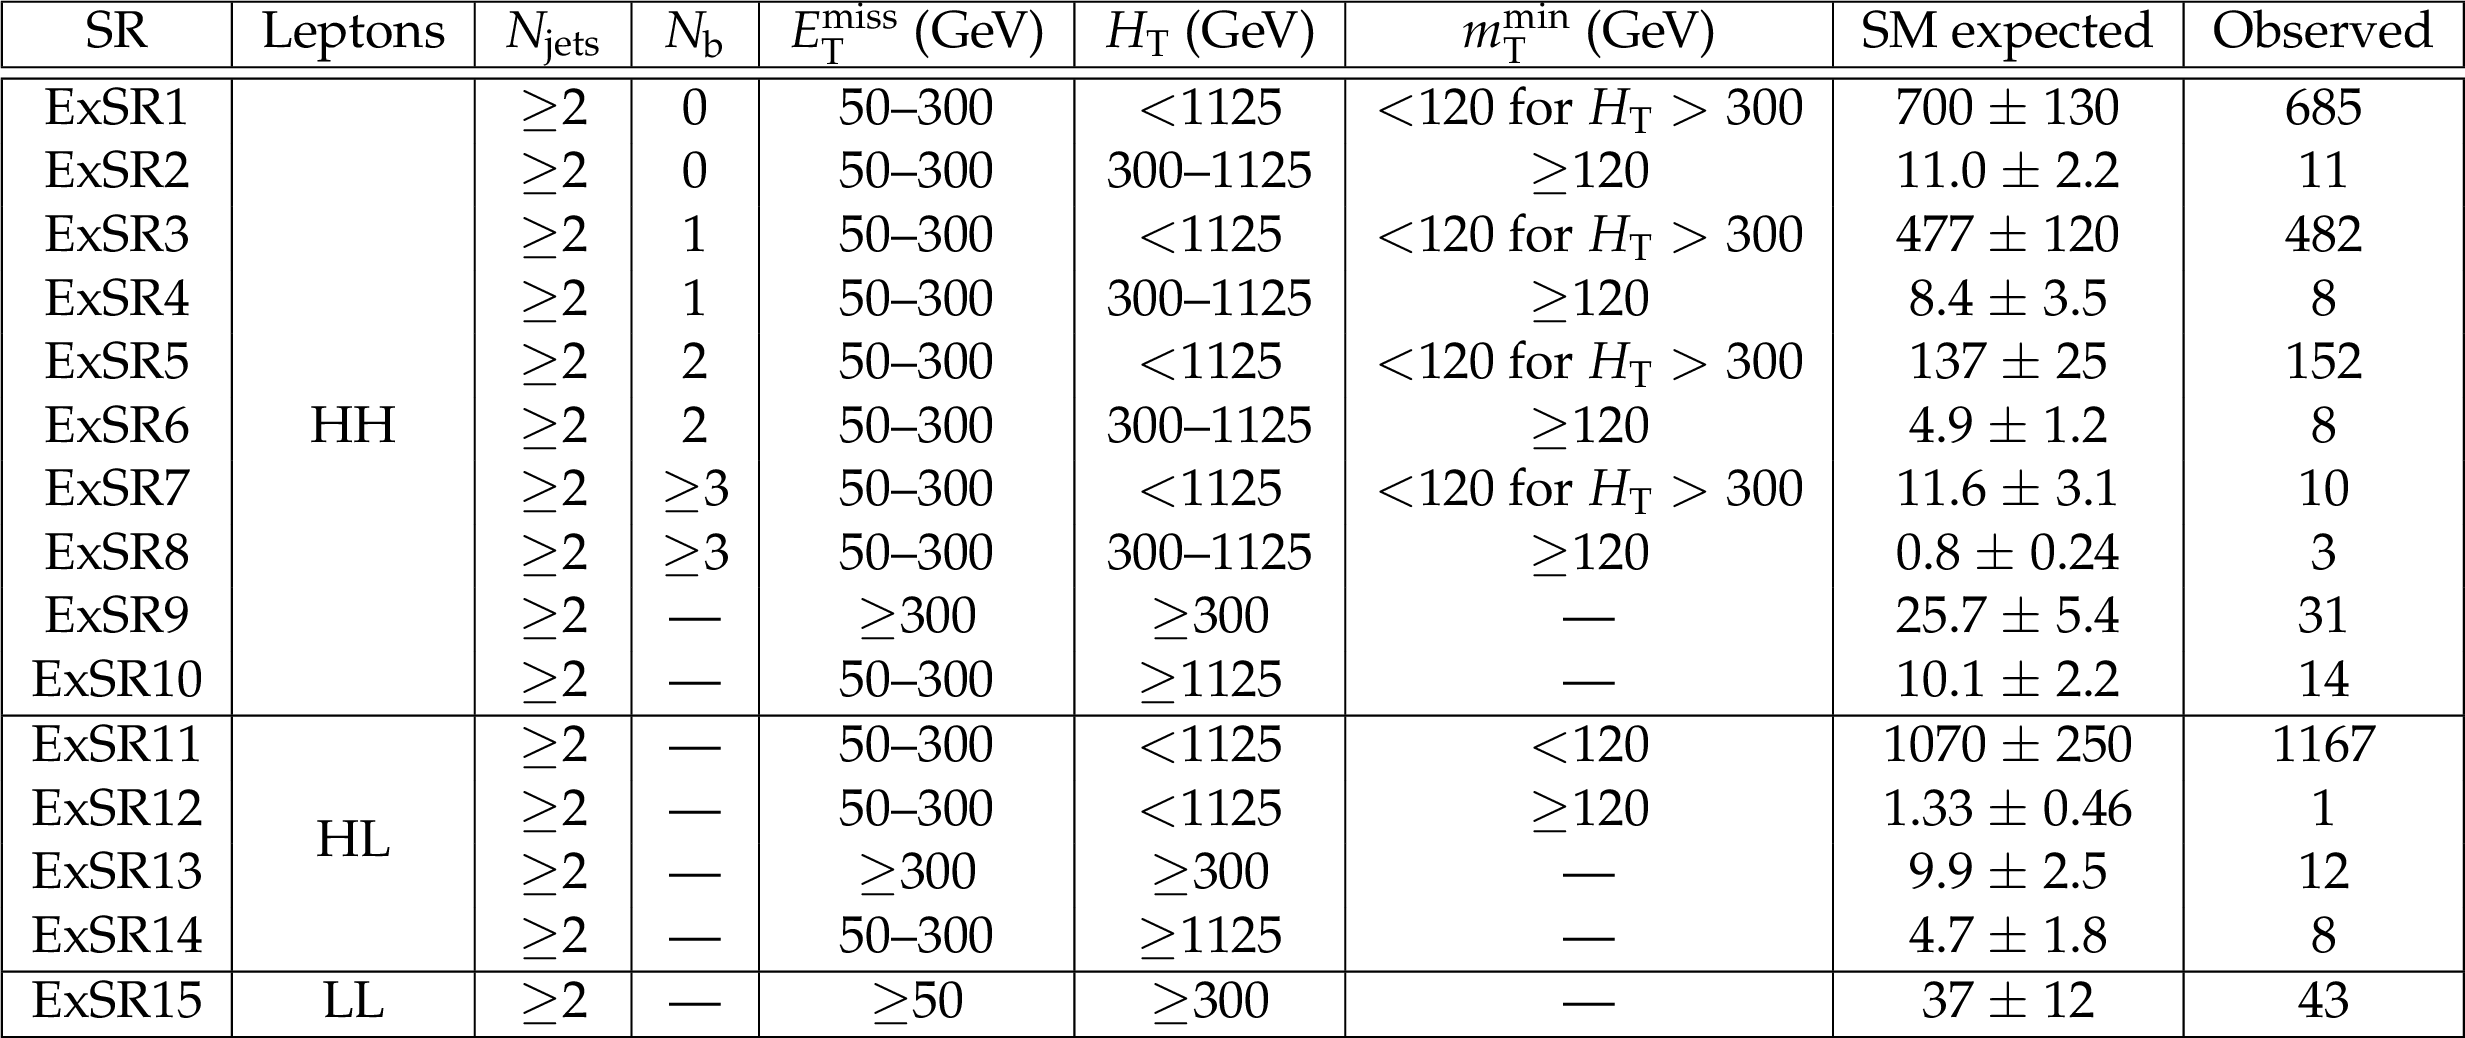
Table 8:
Exclusive SR definitions, expected background yields, and observed yields. A dash ($-$) means that the selection is not applied. |
| Summary |
| A sample of same-sign dilepton events produced in proton-proton collisions at 13 TeV, corresponding to an integrated luminosity of 35.9 fb$^{-1}$, has been studied to search for manifestations of physics beyond the standard model. The data are found to be consistent with the standard model expectations, and no excess event yield is observed. The results are interpreted as limits at 95% confidence level on cross sections for the production of new particles in simplified supersymmetric models. Using calculations for these cross sections as functions of particle masses, the limits are turned into lower mass limits that are as high as 1500 GeV for gluinos and 830 GeV for bottom squarks, depending on the details of the model. Limits are also provided on the production of heavy scalar (excluding the mass range 350-360 GeV) and pseudoscalar (350-410 GeV) bosons decaying to top quarks in the context of two Higgs doublet models, as well as on same-sign top quark pair production, and the standard model production of four top quarks. Finally, to facilitate further interpretations of the search, model-independent limits are provided as a function of $H_{\mathrm{T}}$ and $E_{\mathrm{T}}^{\text{miss}}$, together with the background prediction and data yields in a smaller set of signal regions. |
| Additional Figures | |
png pdf |
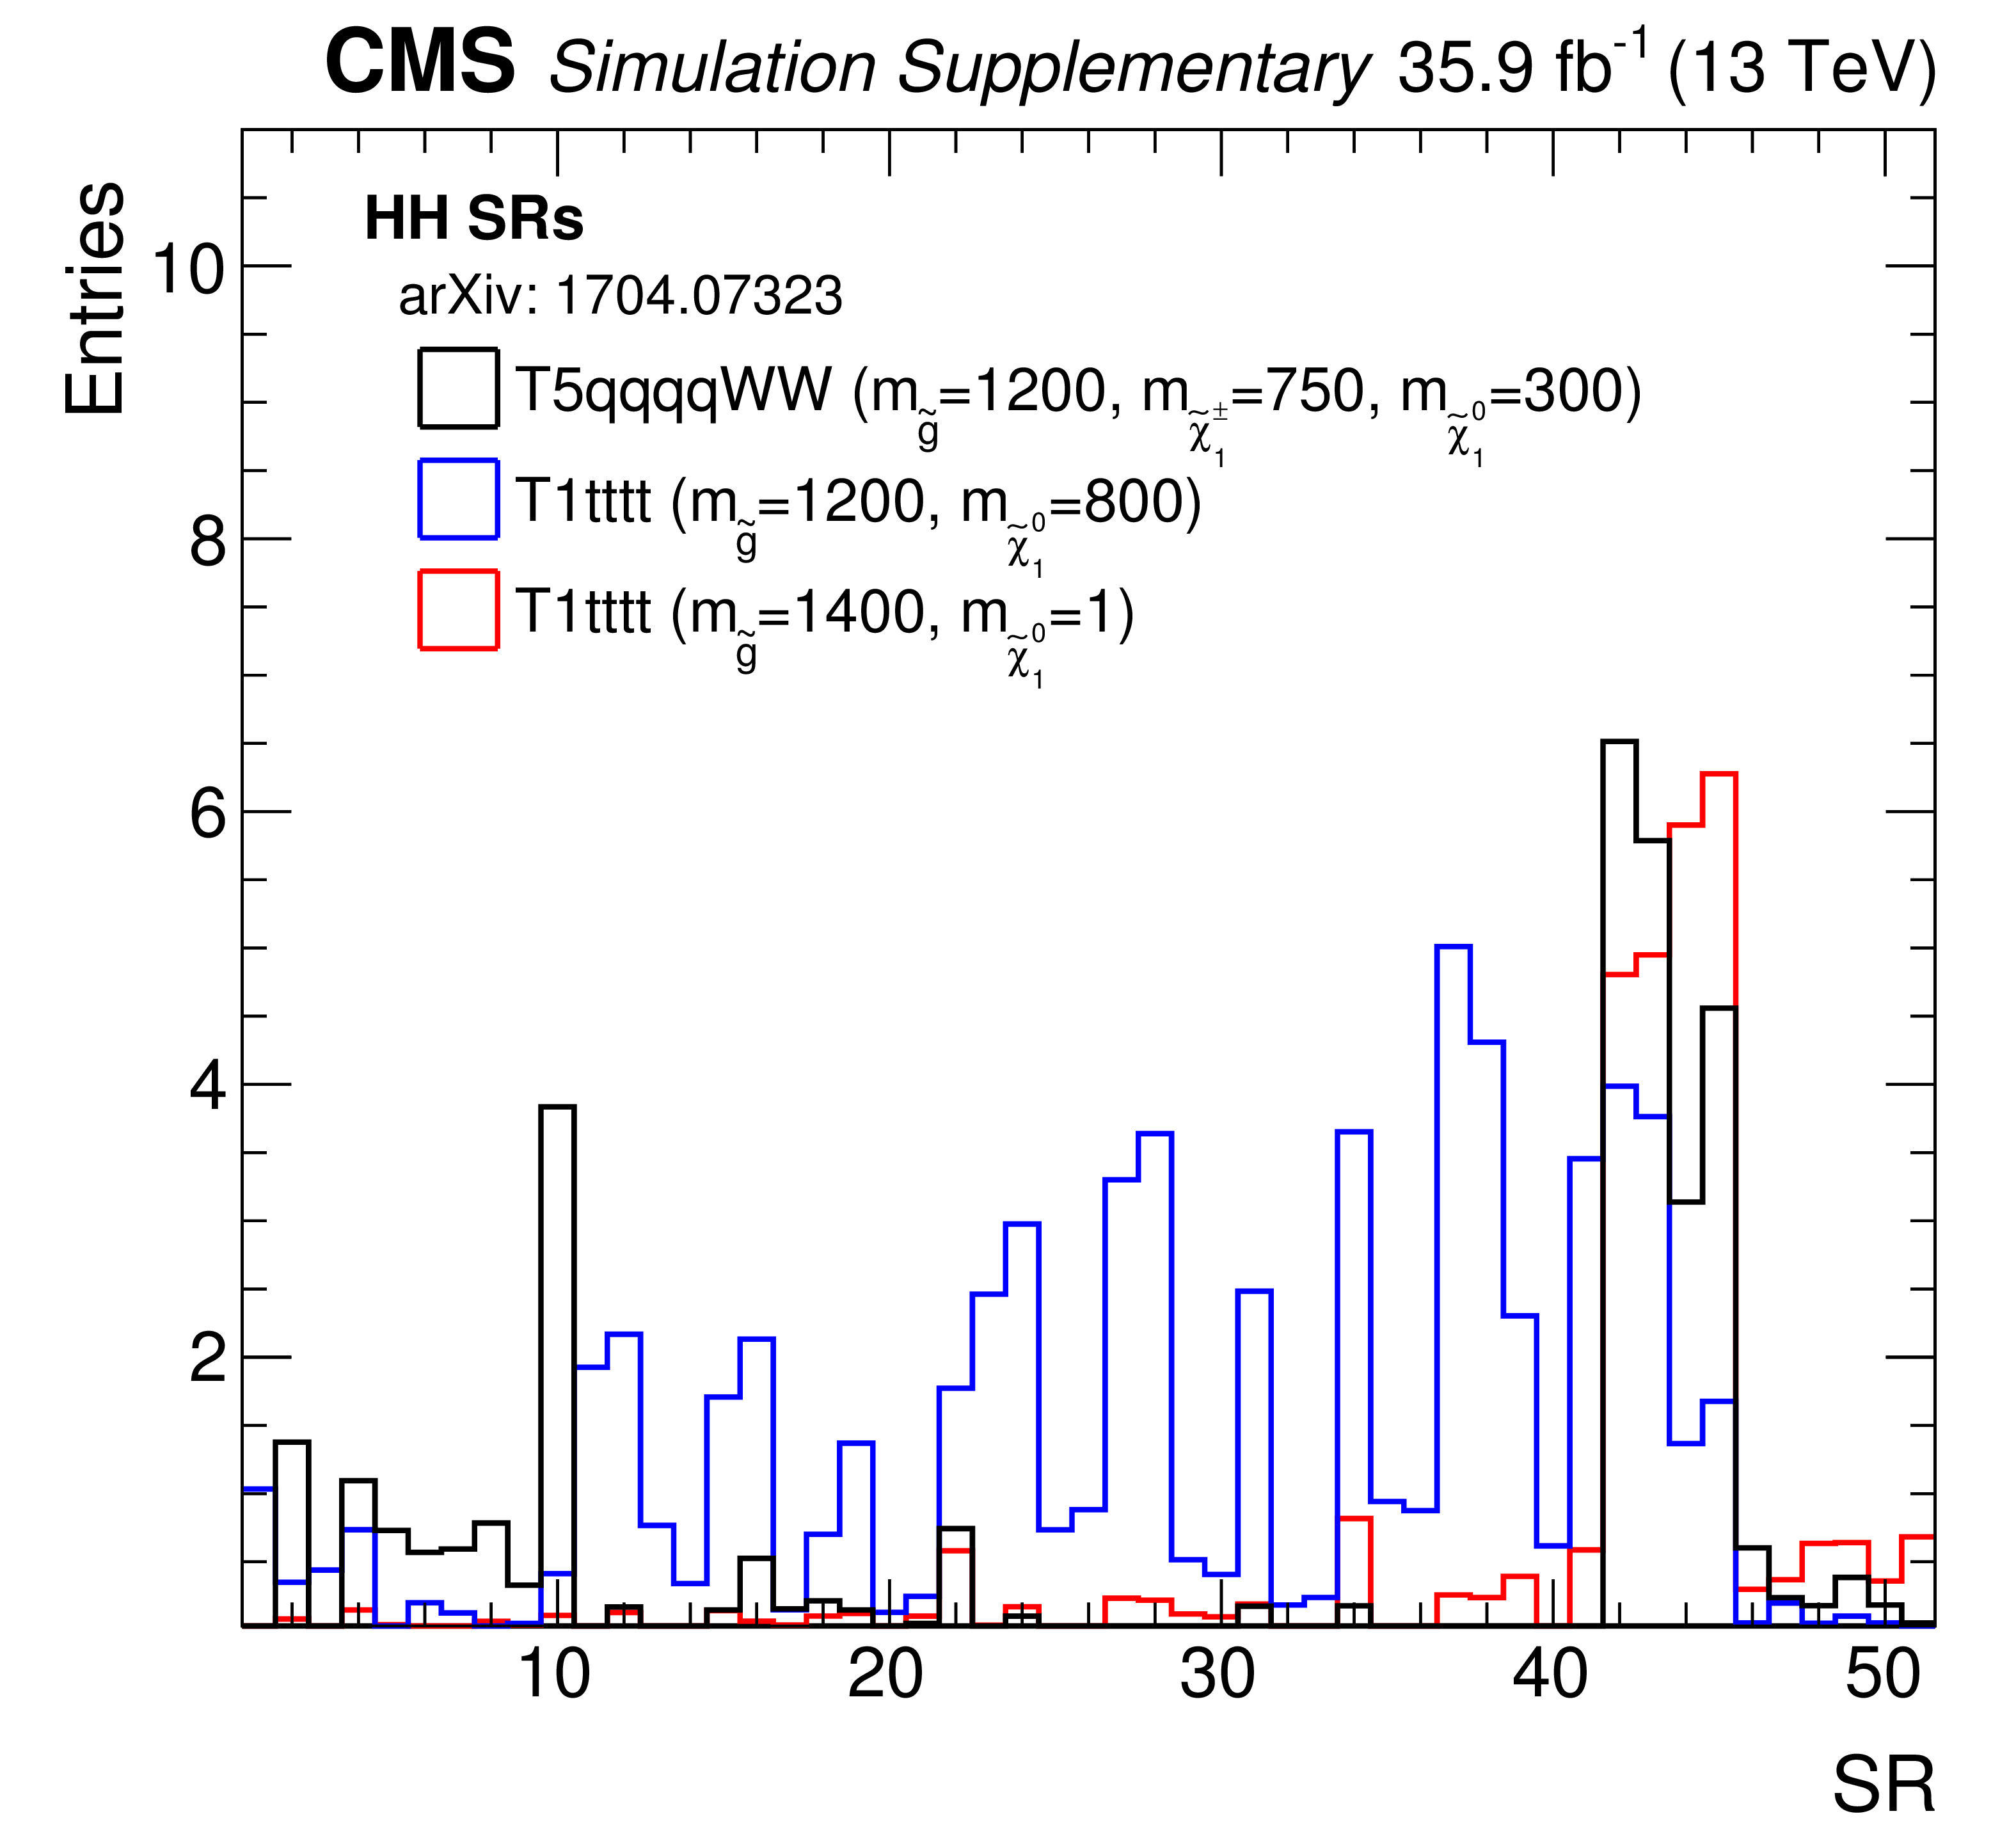
Additional Figure 1:
Event yields in the HH search regions for a few SUSY signal models. |
png pdf |
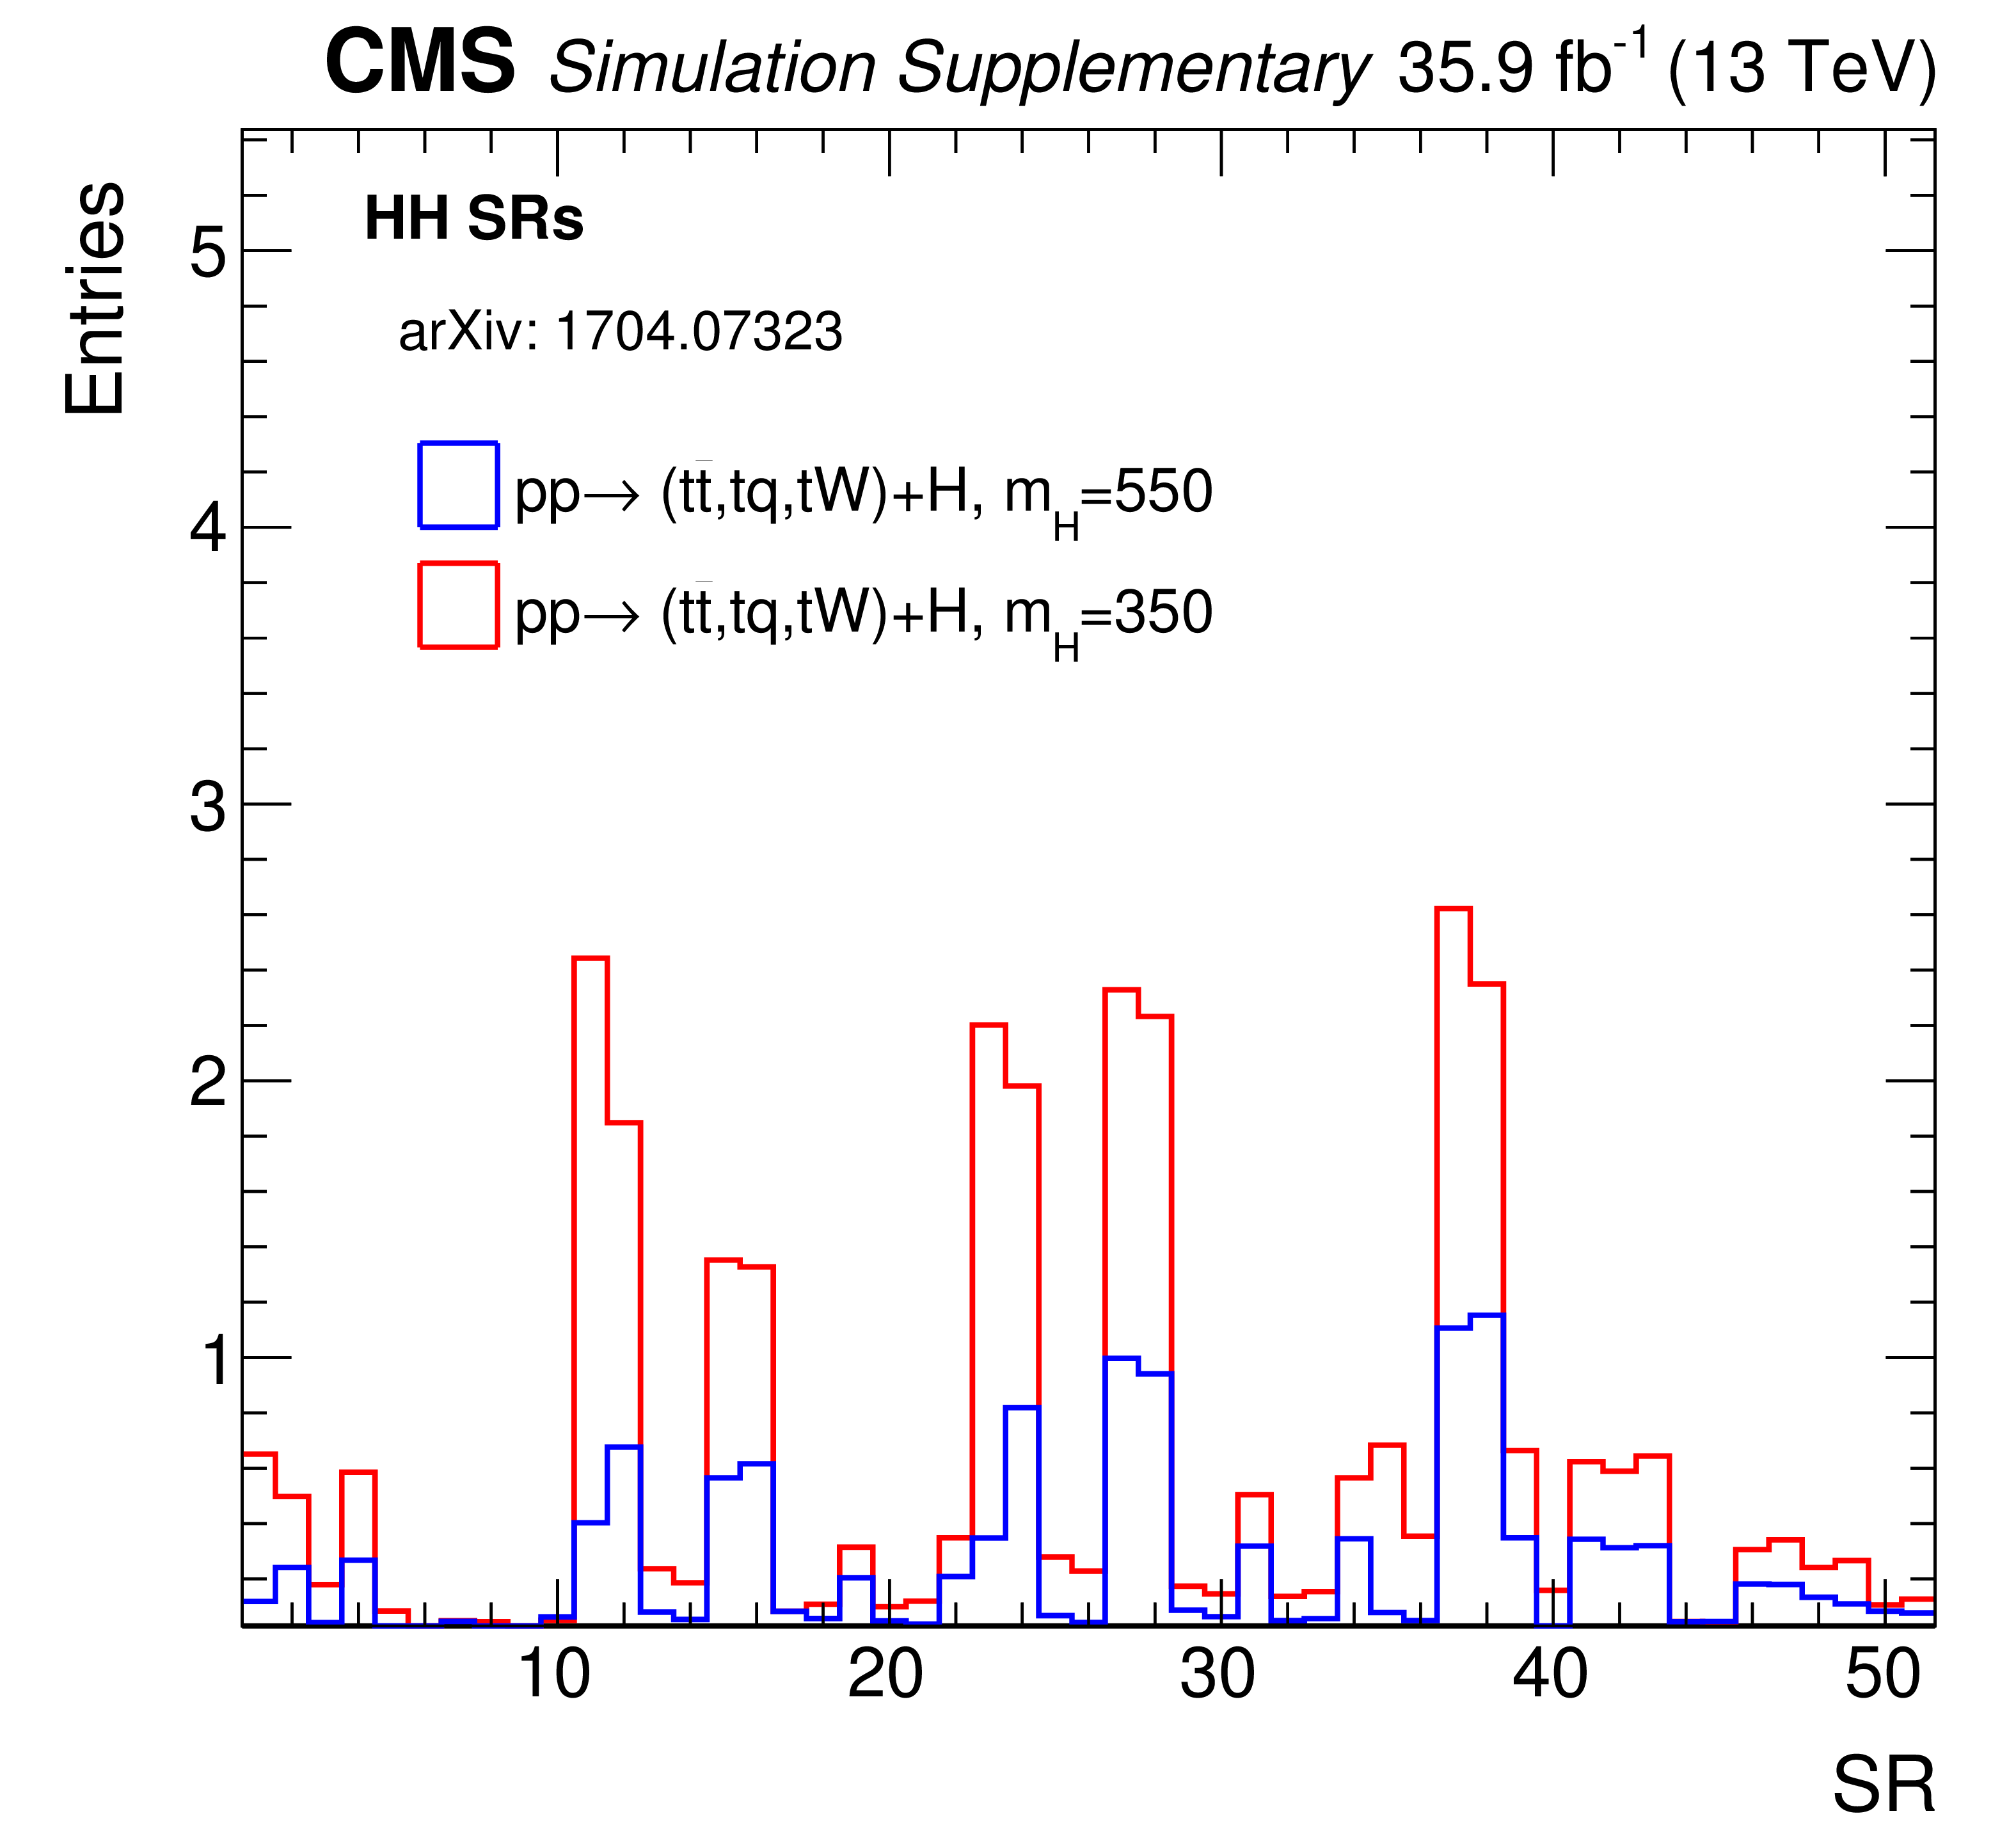
Additional Figure 2:
Event yields in the HH search regions for a low and high mass point for production of a heavy scalar boson in association to one or two top quarks, followed by its decay to top quarks. |

png pdf |
Additional Figure 3:
Distribution of the leading lepton $ {p_{\mathrm {T}}} $ after the baseline selection, where the last bin includes the overflow. The hatched area represents the total uncertainty in the background prediction. The upper panels show the ratio of the observed event yield and the background prediction. |
png pdf |
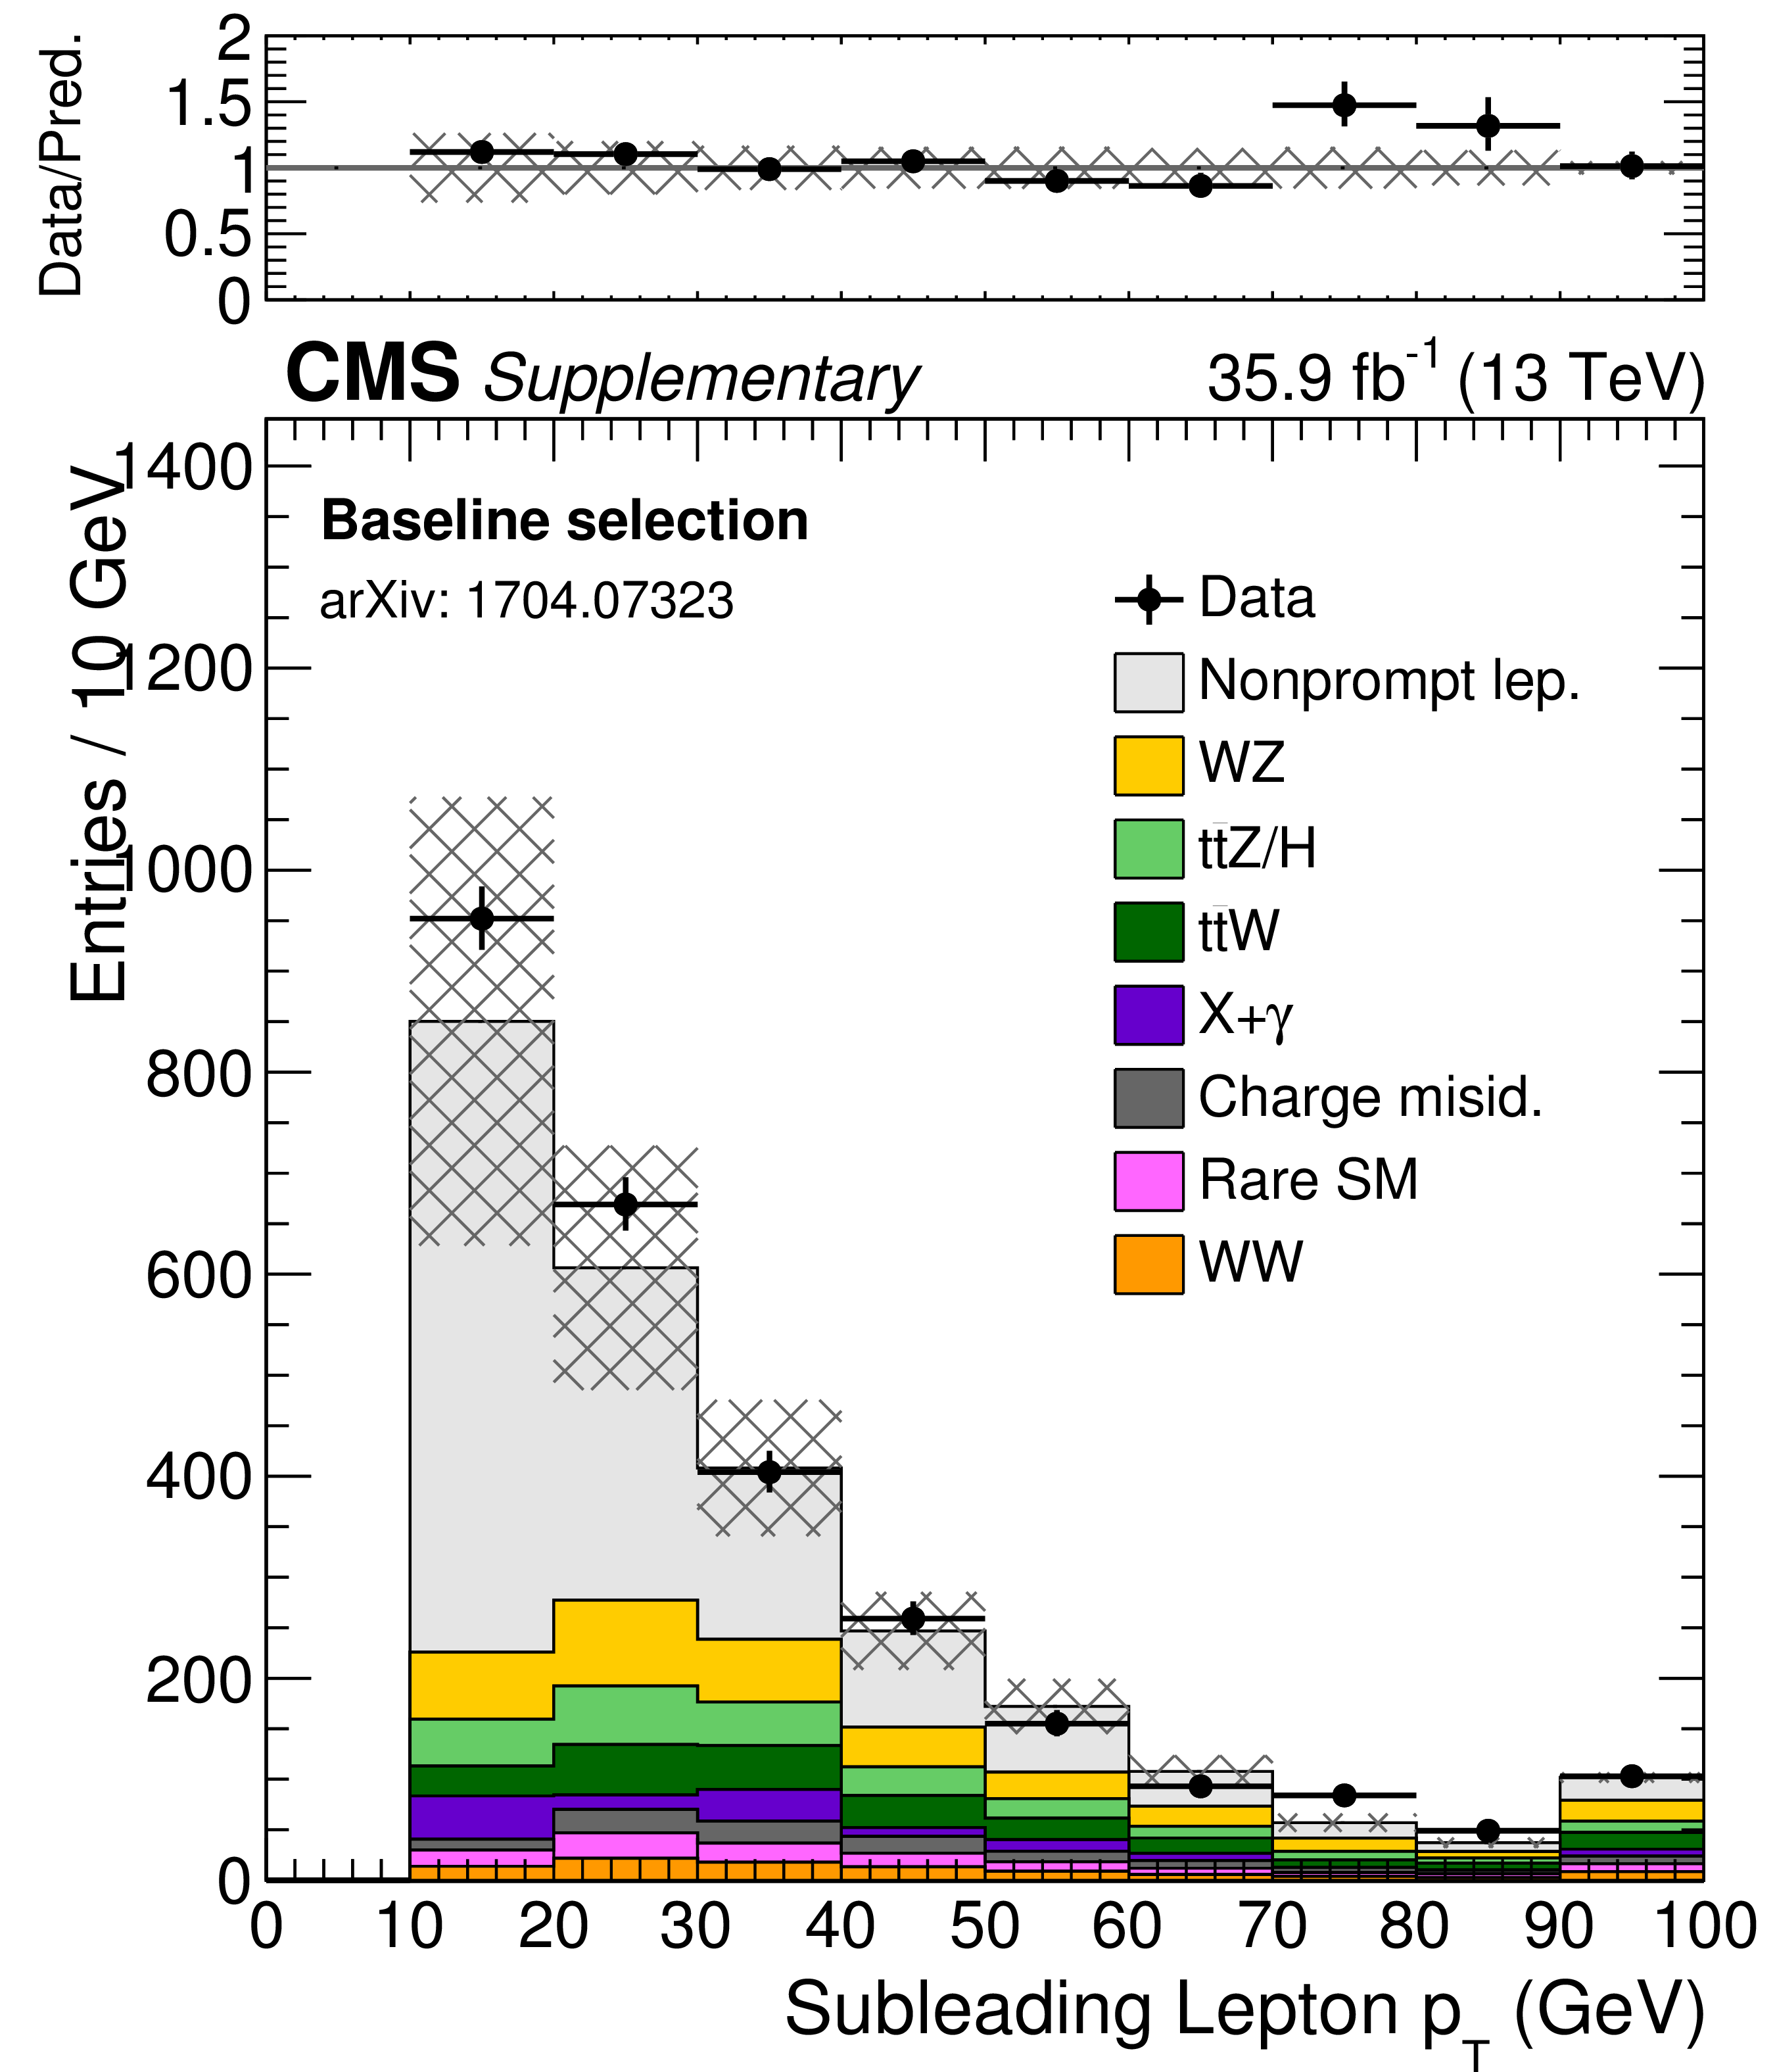
Additional Figure 4:
Distribution of the subleading lepton $ {p_{\mathrm {T}}} $ after the baseline selection, where the last bin includes the overflow. The hatched area represents the total uncertainty in the background prediction. The upper panels show the ratio of the observed event yield and the background prediction. |
png pdf |
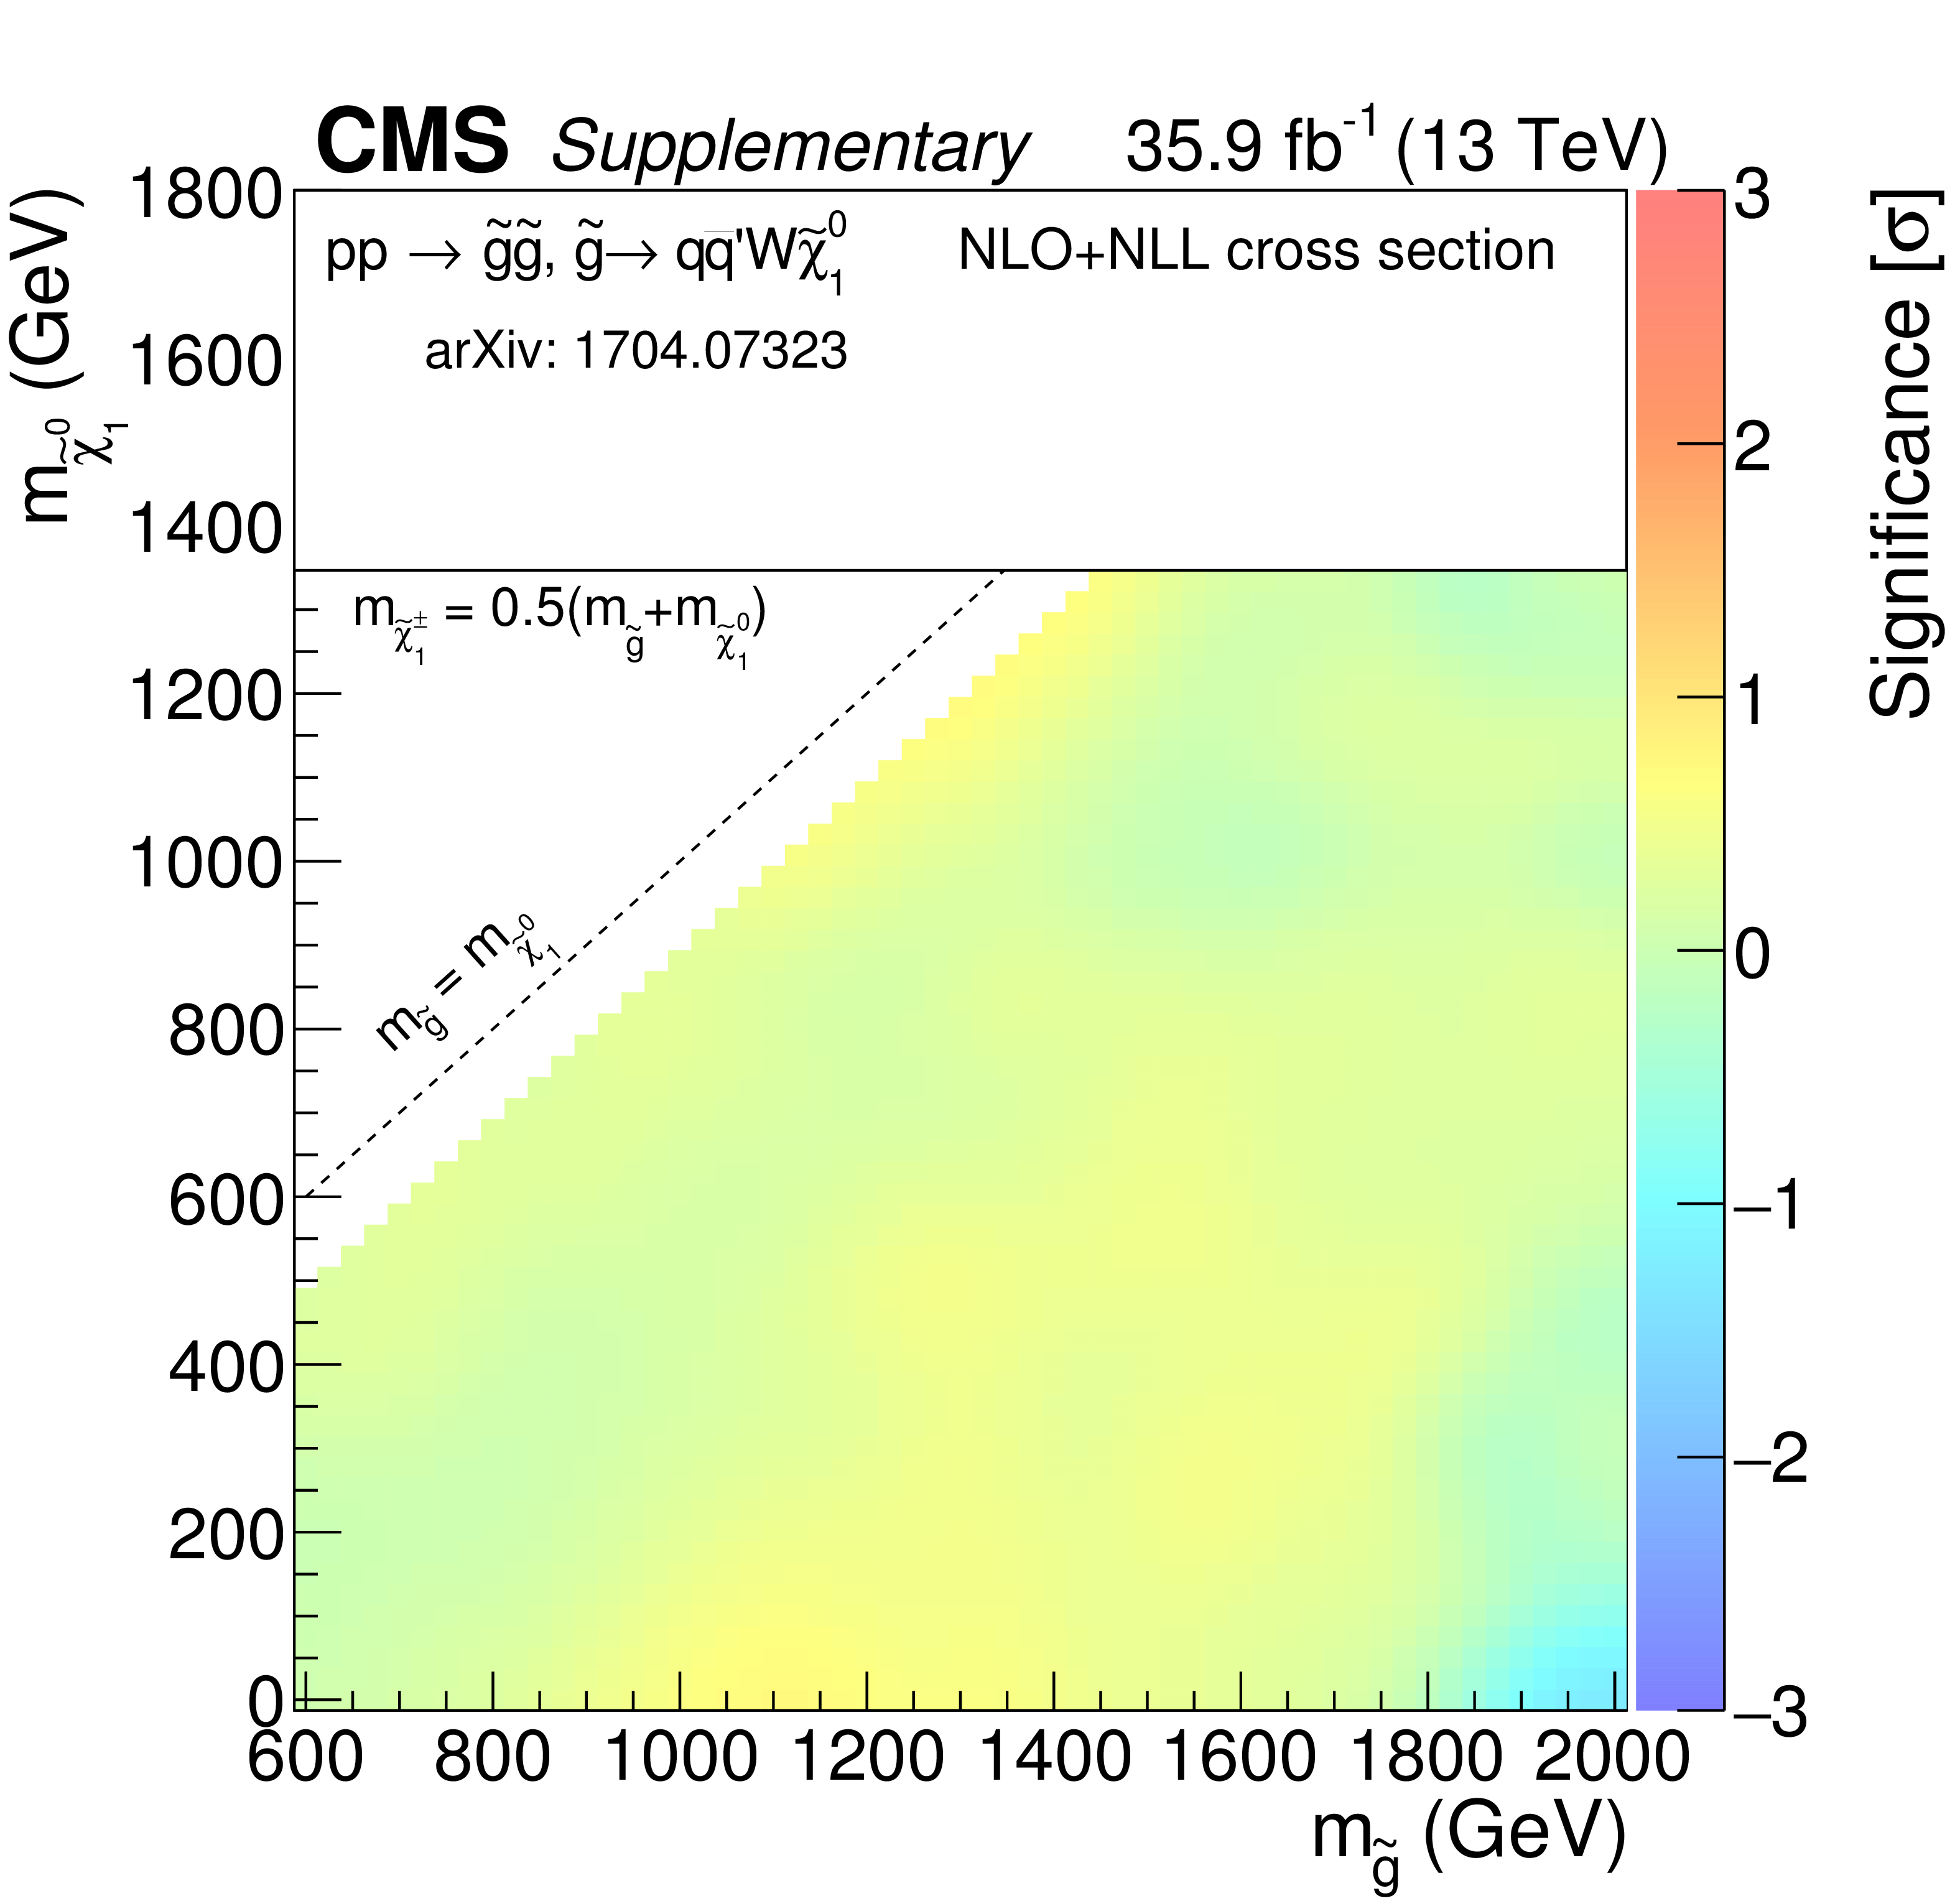
Additional Figure 5:
Observed significance at 95% CL in the $m_{\tilde{\chi}^0_1 }$ versus $m_{\tilde{ \mathrm{g} } }$ plane for the T5qqqqWW model with $m_{\tilde{\chi}^{\pm}_1 }=0.5(m_{\tilde{ \mathrm{g} } } + m_{\tilde{\chi}^0_1 })$. |

png pdf |
Additional Figure 6:
Observed significance at 95% CL in the $m_{\tilde{\chi}^0_1 }$ versus $m_{\tilde{ \mathrm{g} } }$ plane for the T5qqqqWW model with $m_{\tilde{\chi}^{\pm}_1 }=m_{\tilde{\chi}^0_1 } $ + 20 GeV. |
png pdf |
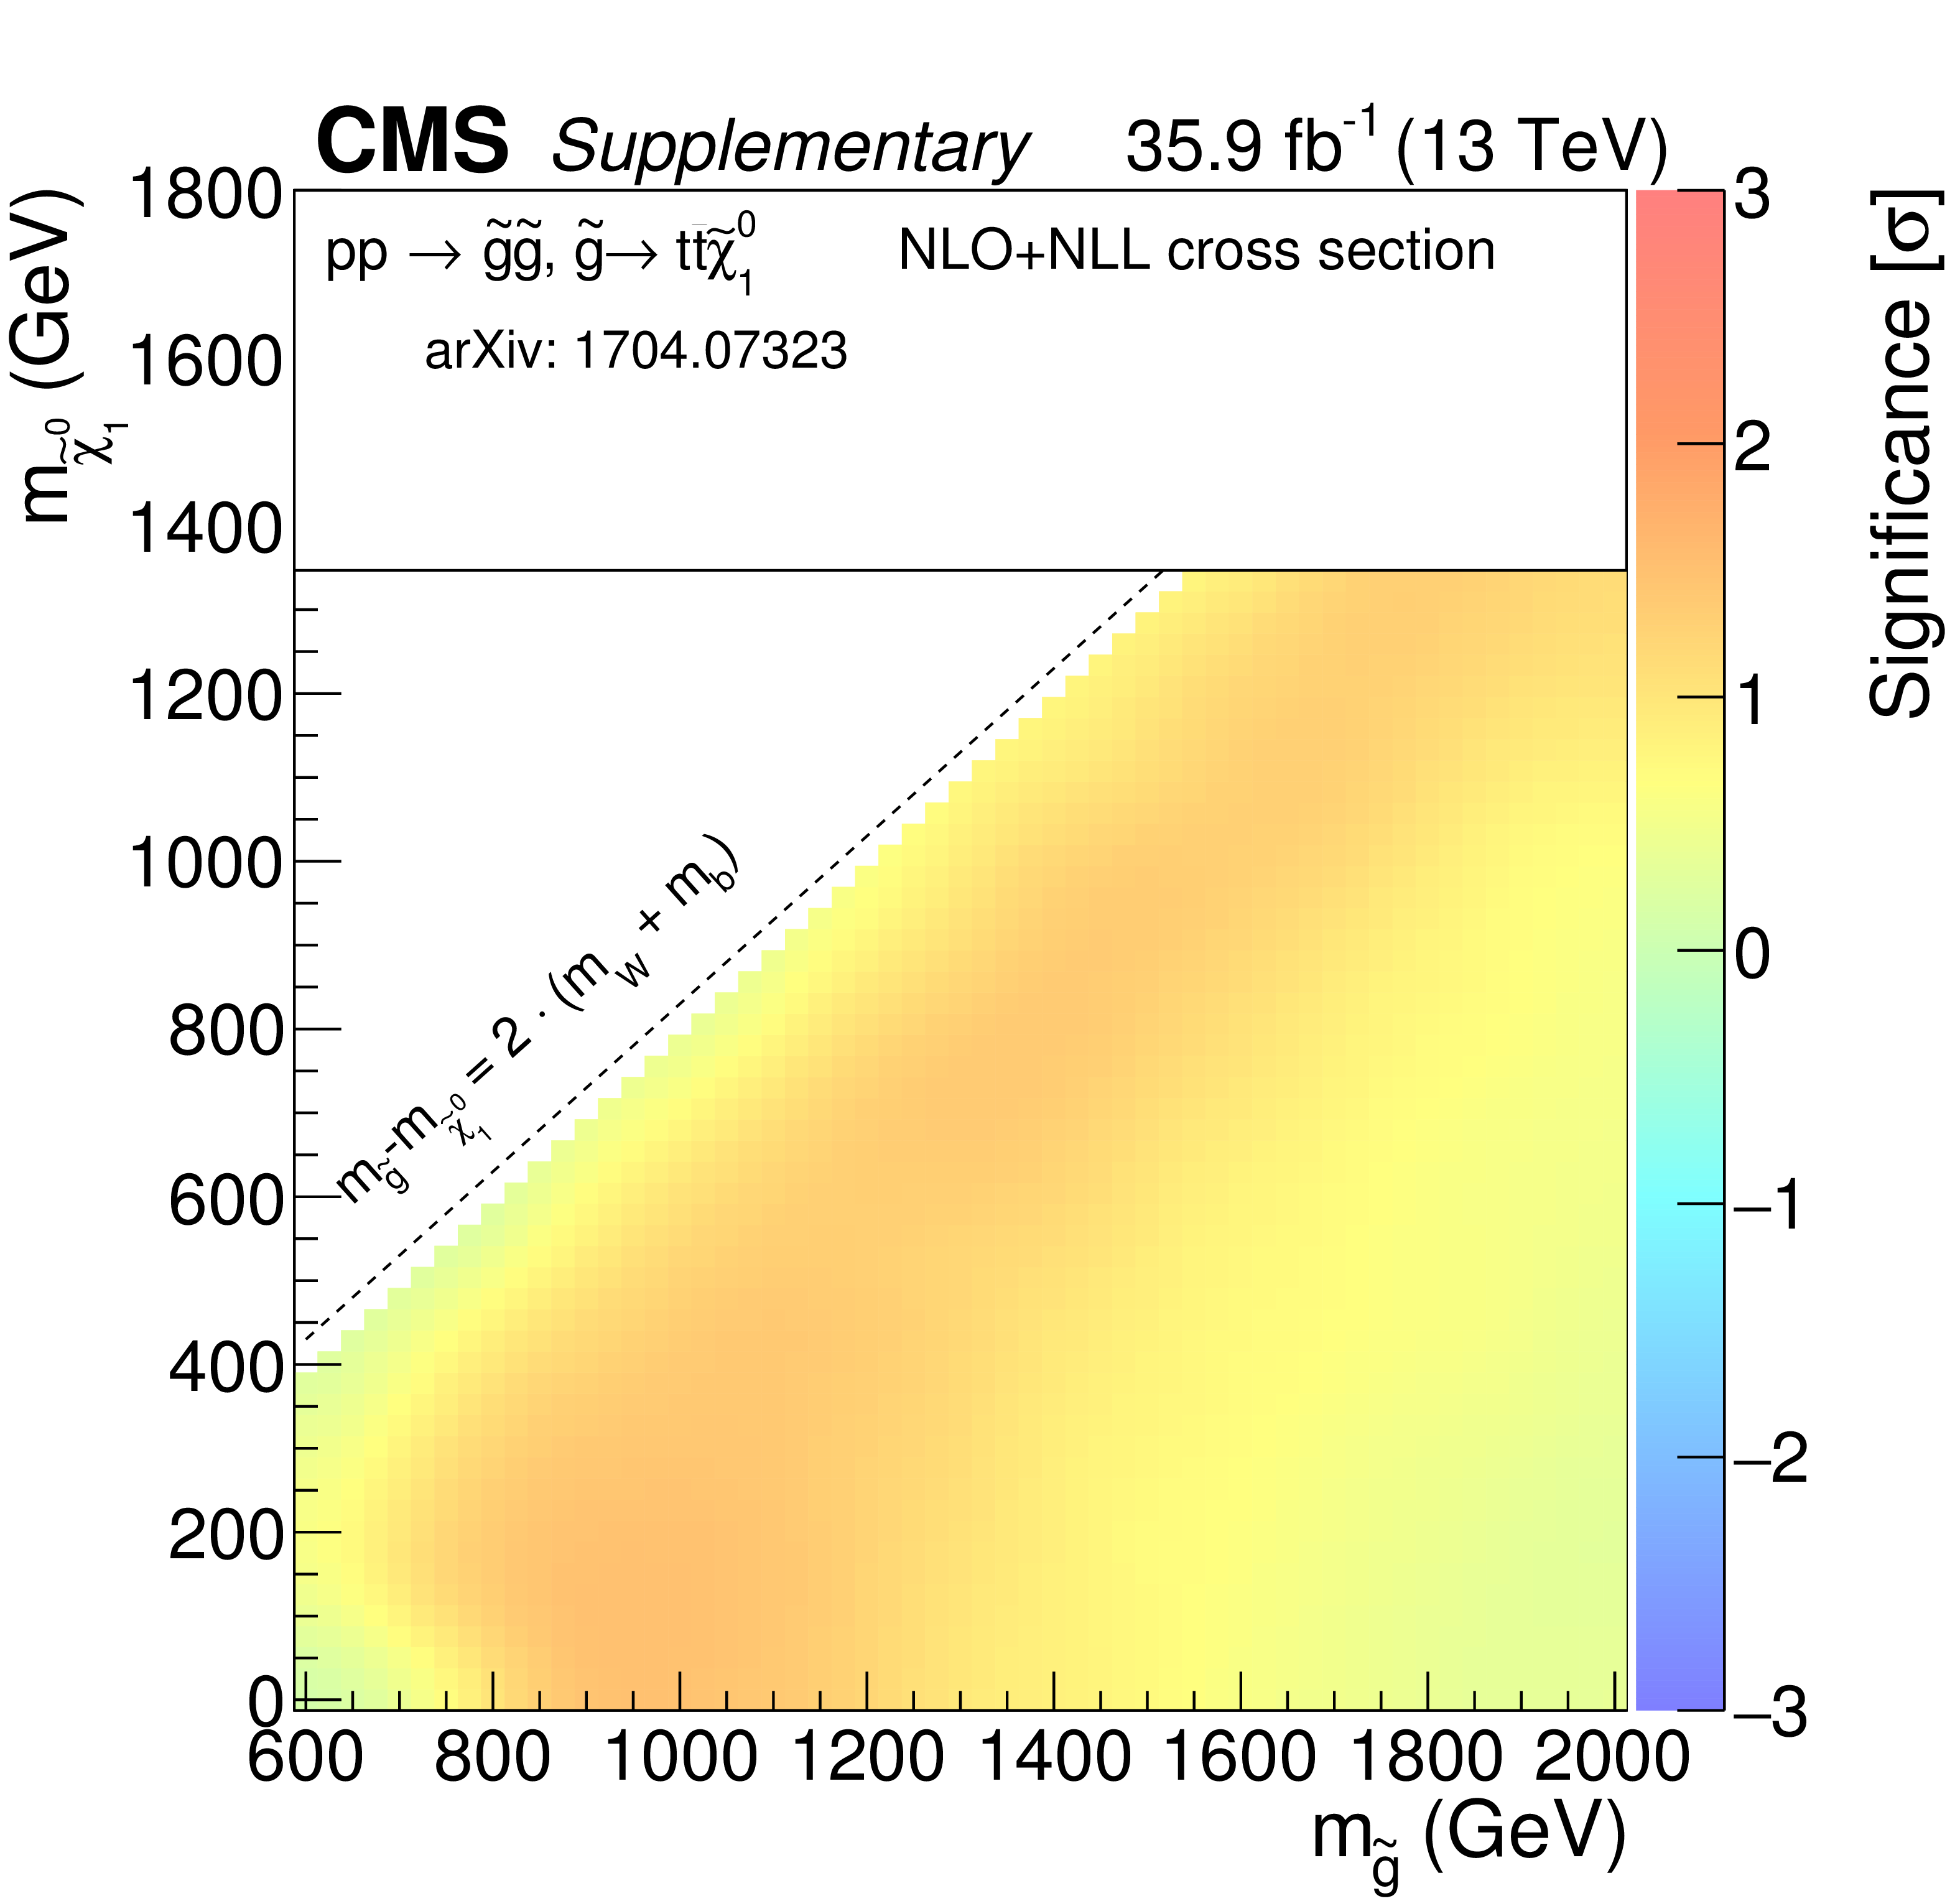
Additional Figure 7:
Observed significance at 95% CL in the $m_{\tilde{\chi}^0_1 }$ versus $m_{\tilde{ \mathrm{g} } }$ plane for the T1tttt model. |
png pdf |
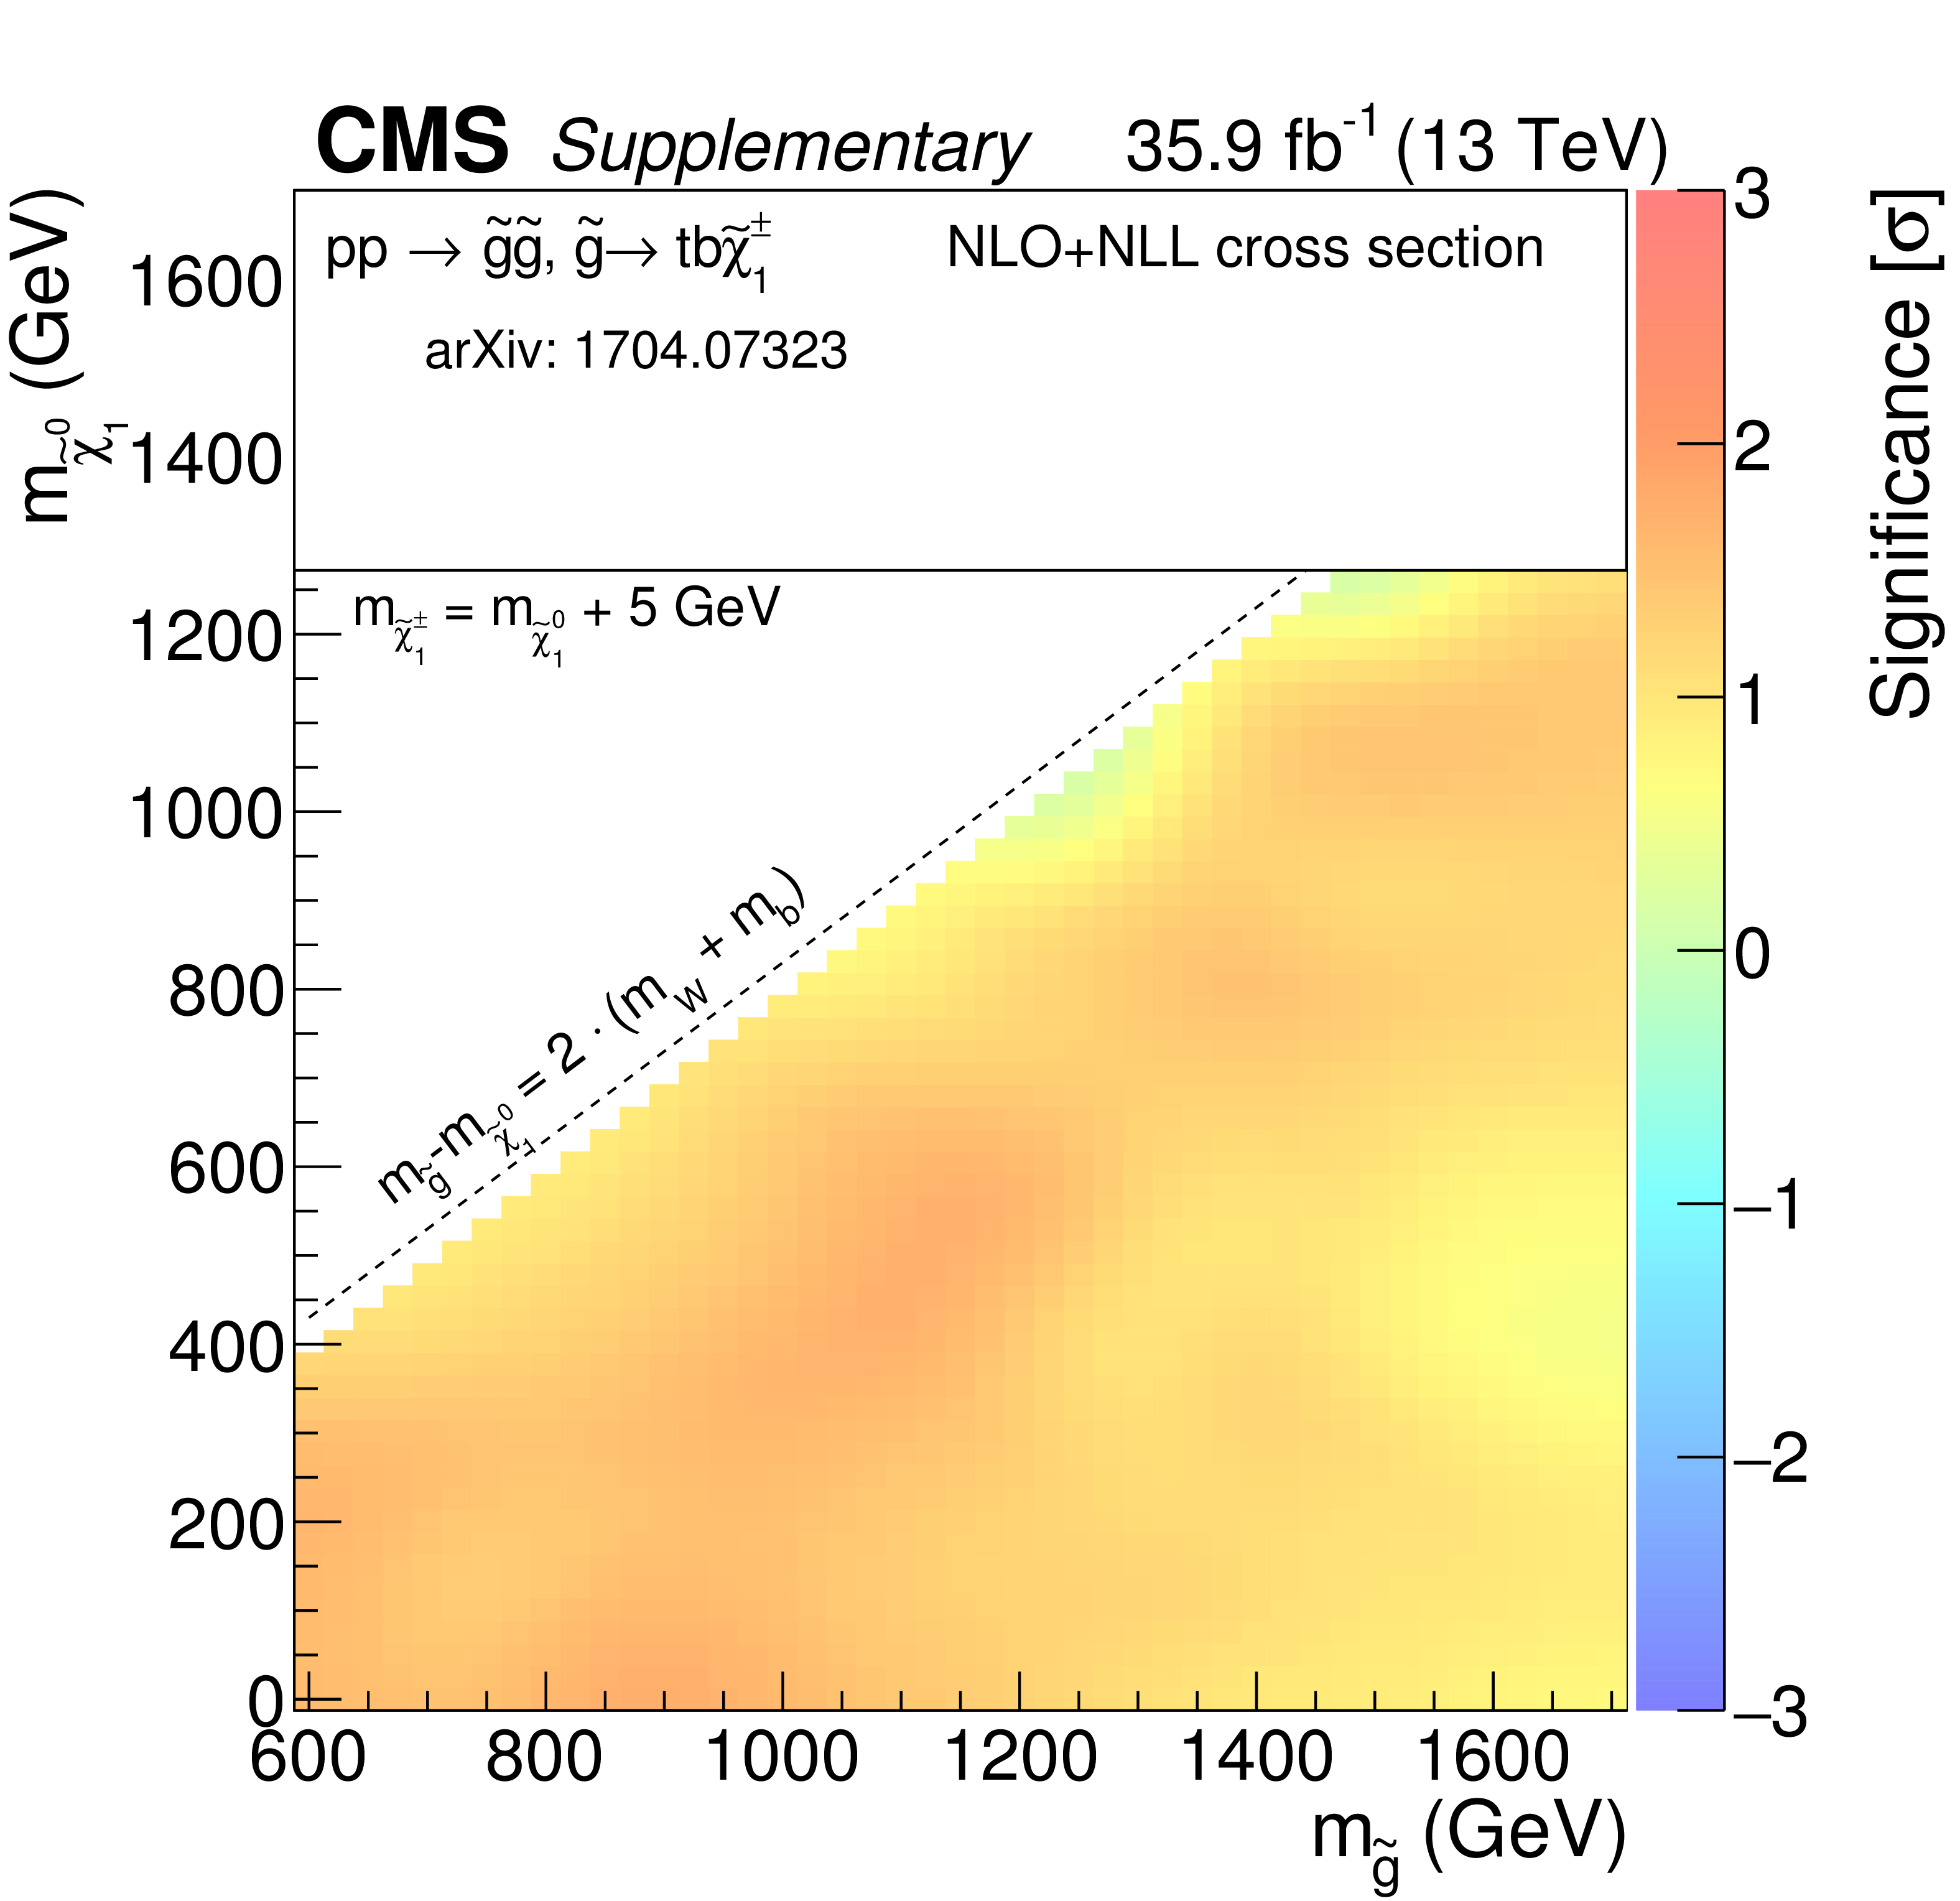
Additional Figure 8:
Observed significance at 95% CL in the $m_{\tilde{\chi}^0_1 }$ versus $m_{\tilde{ \mathrm{g} } }$ plane for the T5ttbbWW model. |
png pdf |
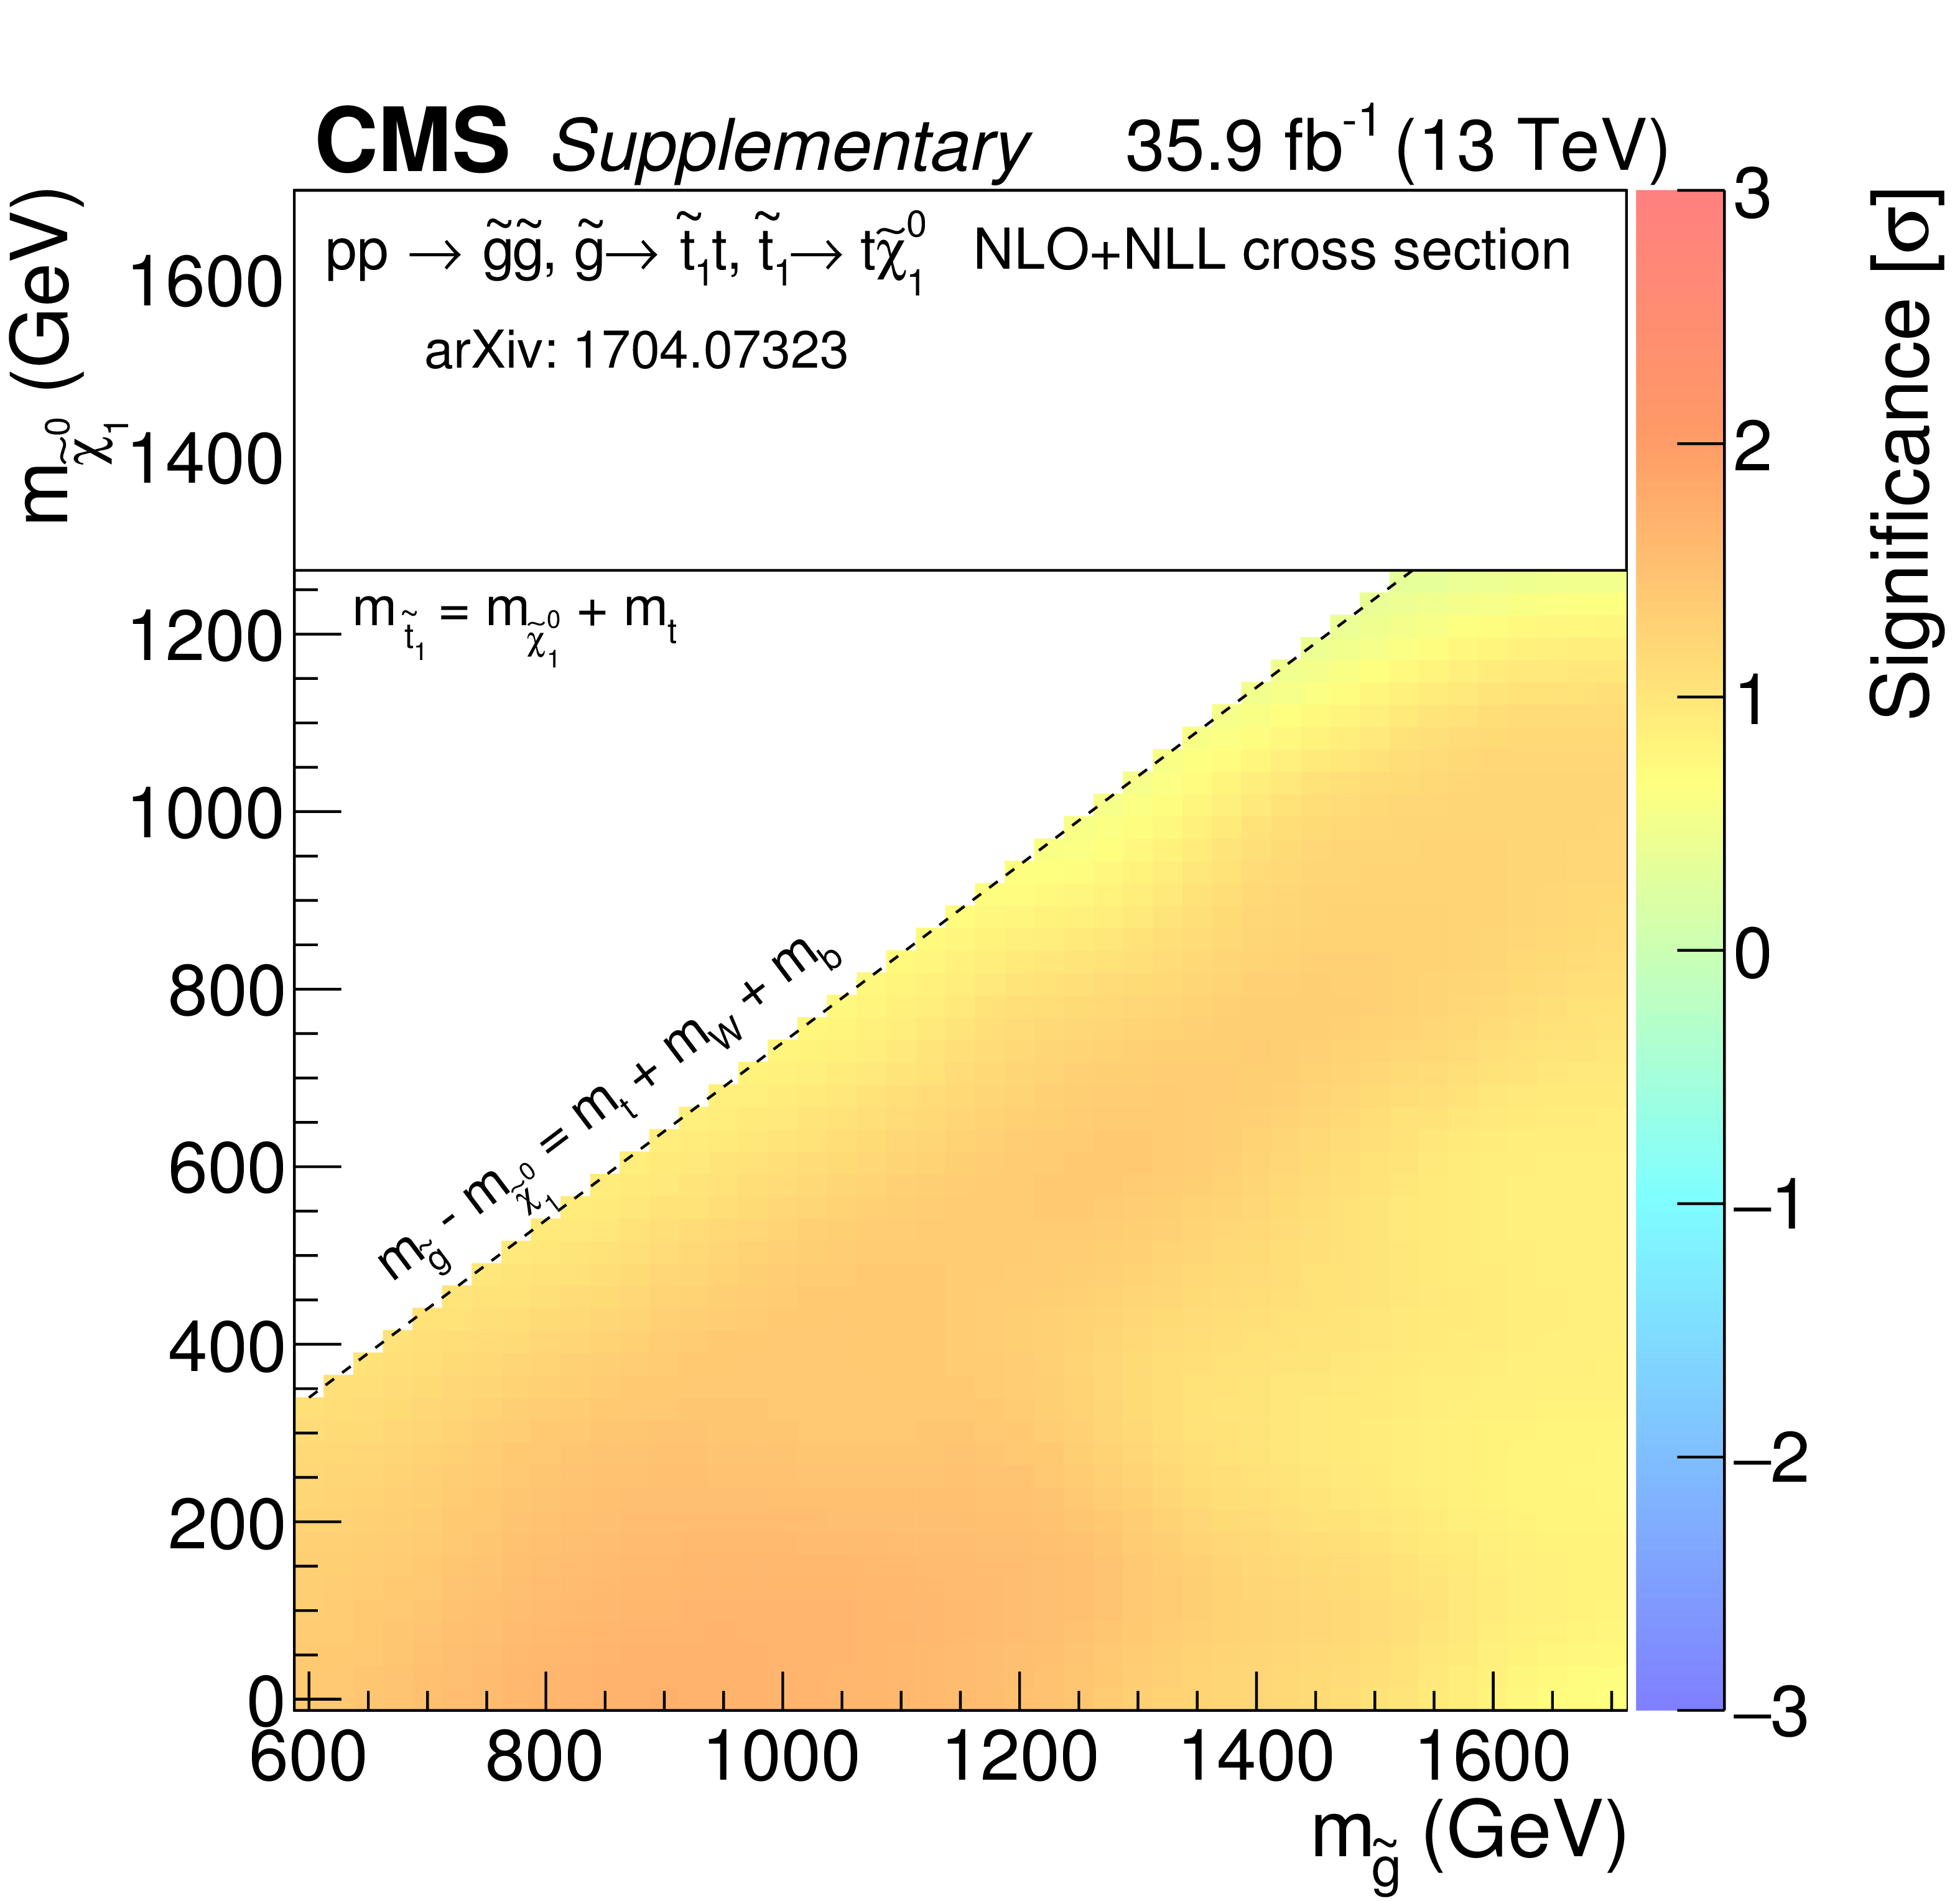
Additional Figure 9:
Observed significance at 95% CL in the $m_{\tilde{\chi}^0_1 }$ versus $m_{\tilde{ \mathrm{g} } }$ plane for the T5tttt model. |

png pdf |
Additional Figure 10:
Observed significance at 95% CL in the $m_{\tilde{\chi}^0_1 }$ versus $m_{\tilde{ \mathrm{g} } }$ plane for the T5ttcc model. |
png pdf |
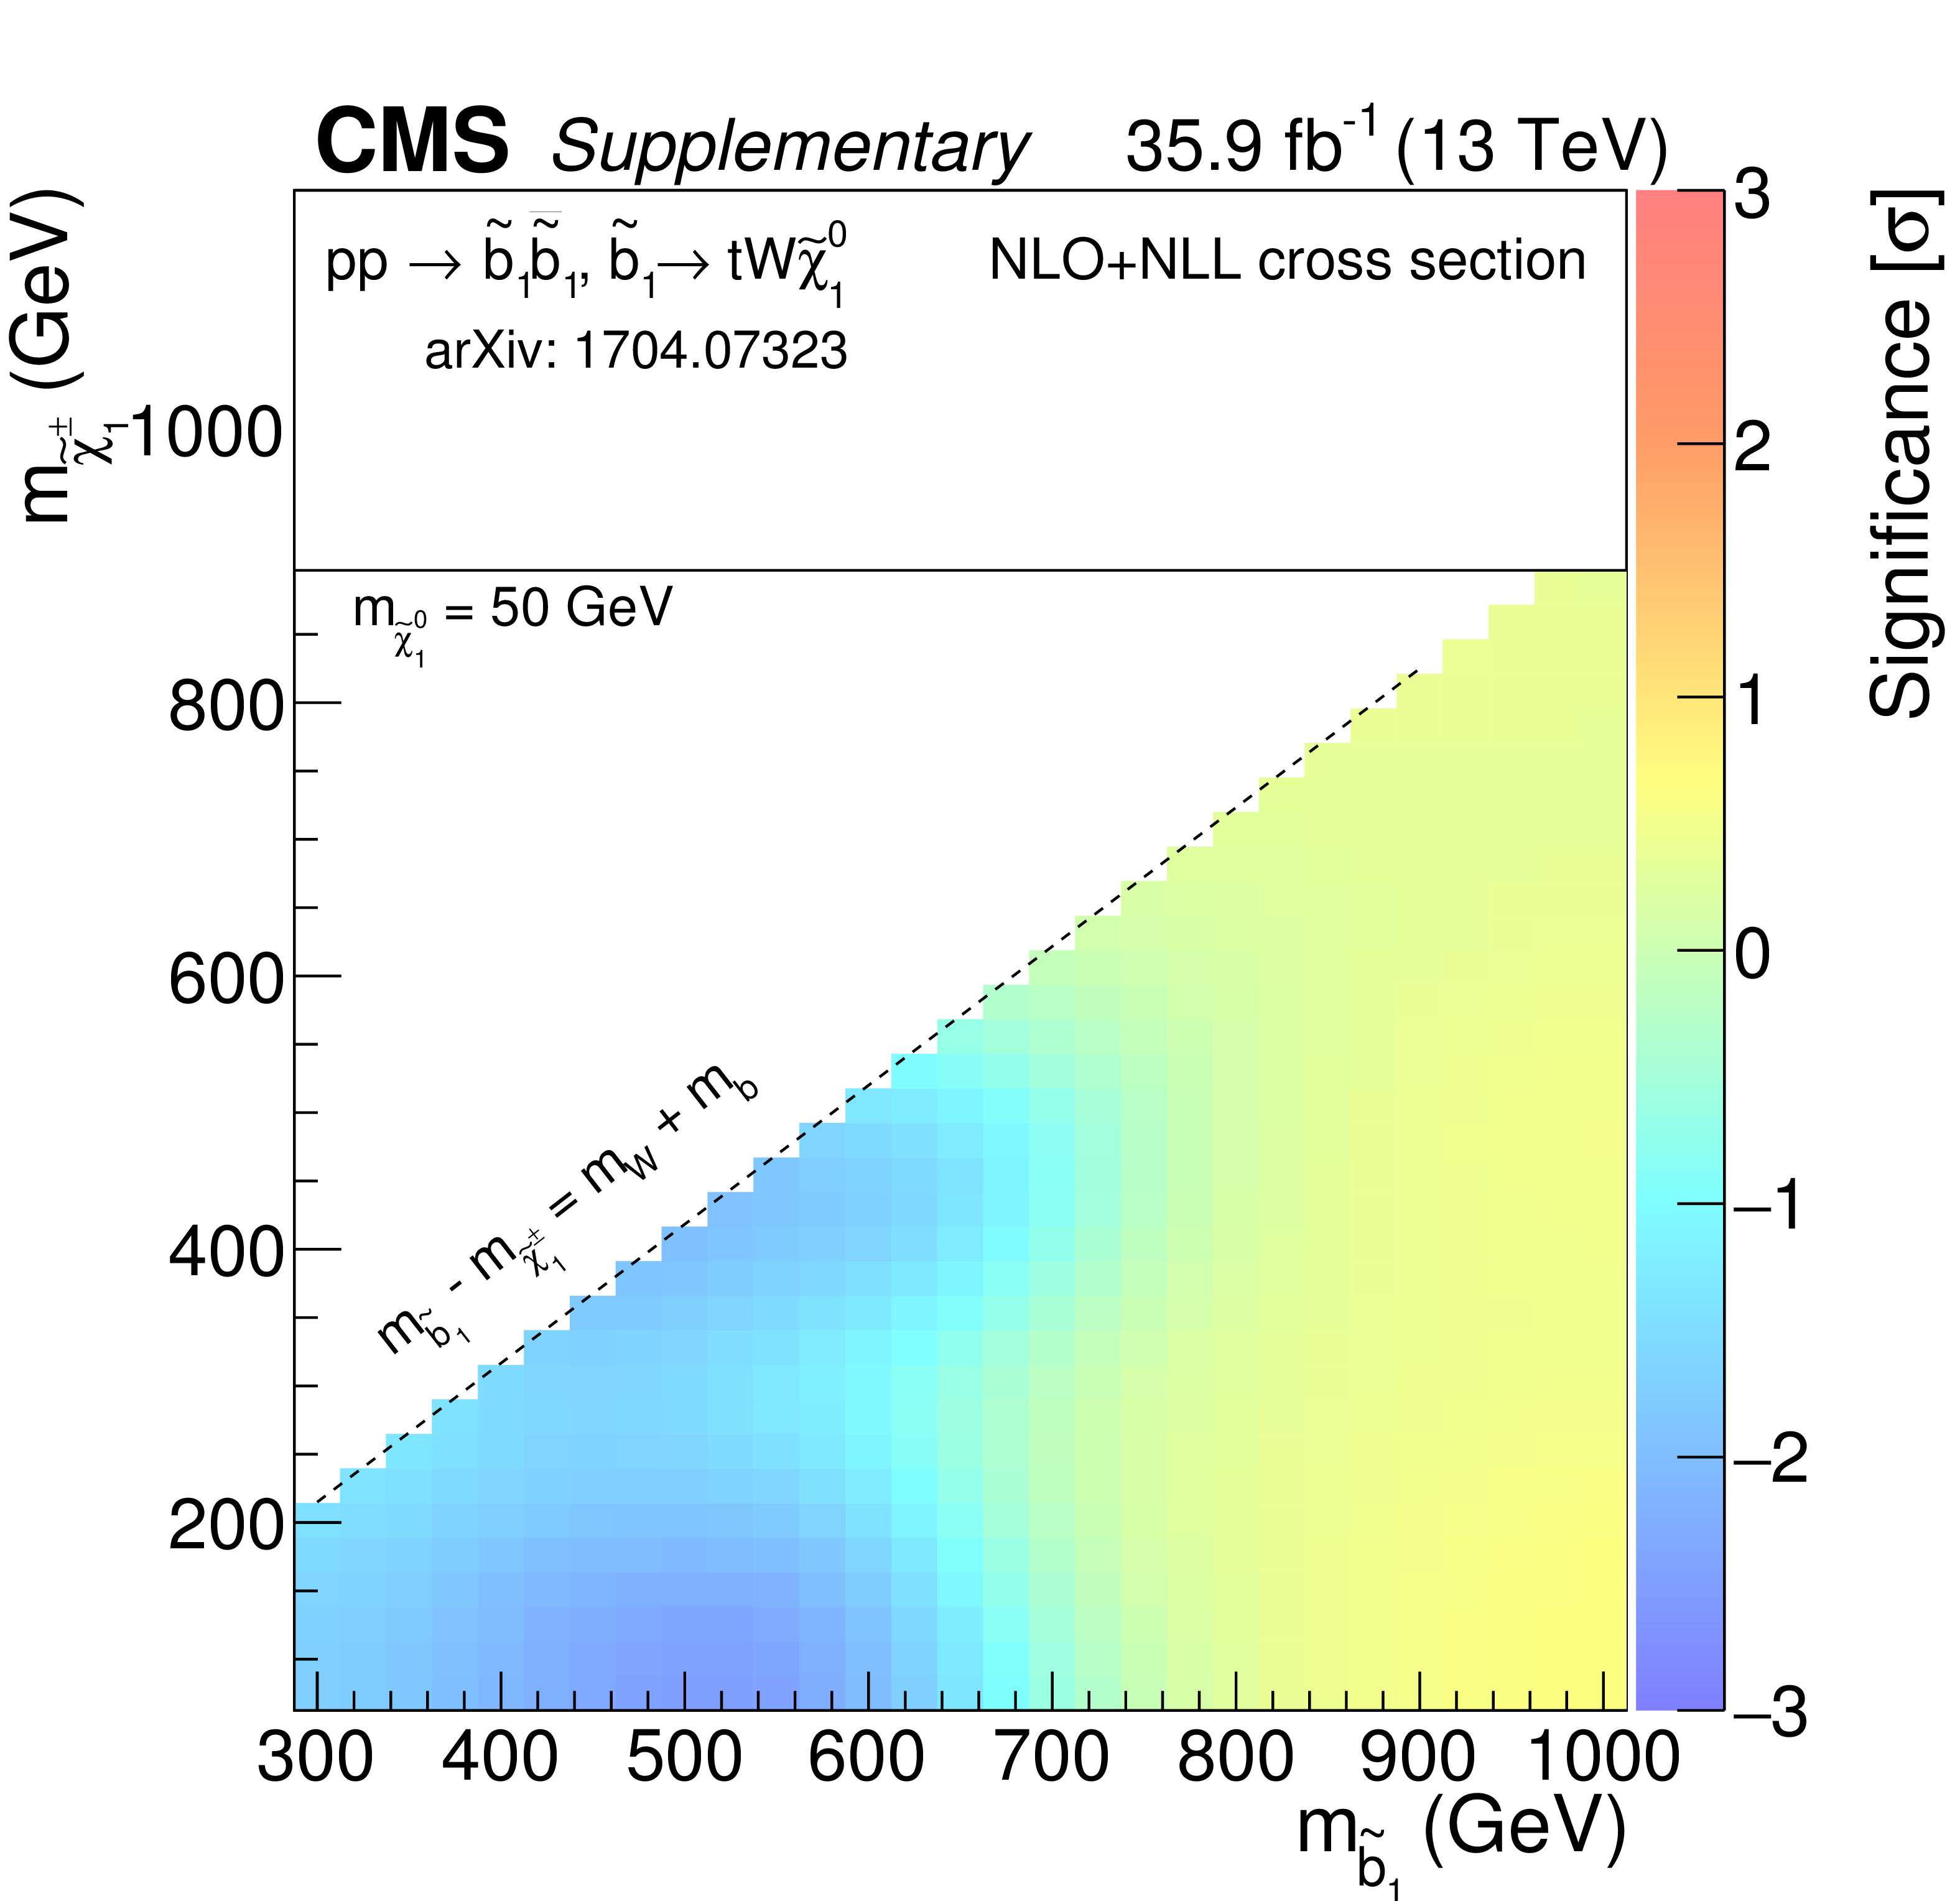
Additional Figure 11:
Observed significance at 95% CL in the $m_{\tilde{\chi}^{\pm}_1 }$ versus $m_{\tilde{ \mathrm{ b } } }$ plane for the T6ttWW model with $m_{\tilde{\chi}^0_1 }= $ 50 GeV. |
png pdf |
Additional Figure 12:
Covariances of the background predictions in the 15 exclusive regions. |
| Additional Tables | |
png pdf |
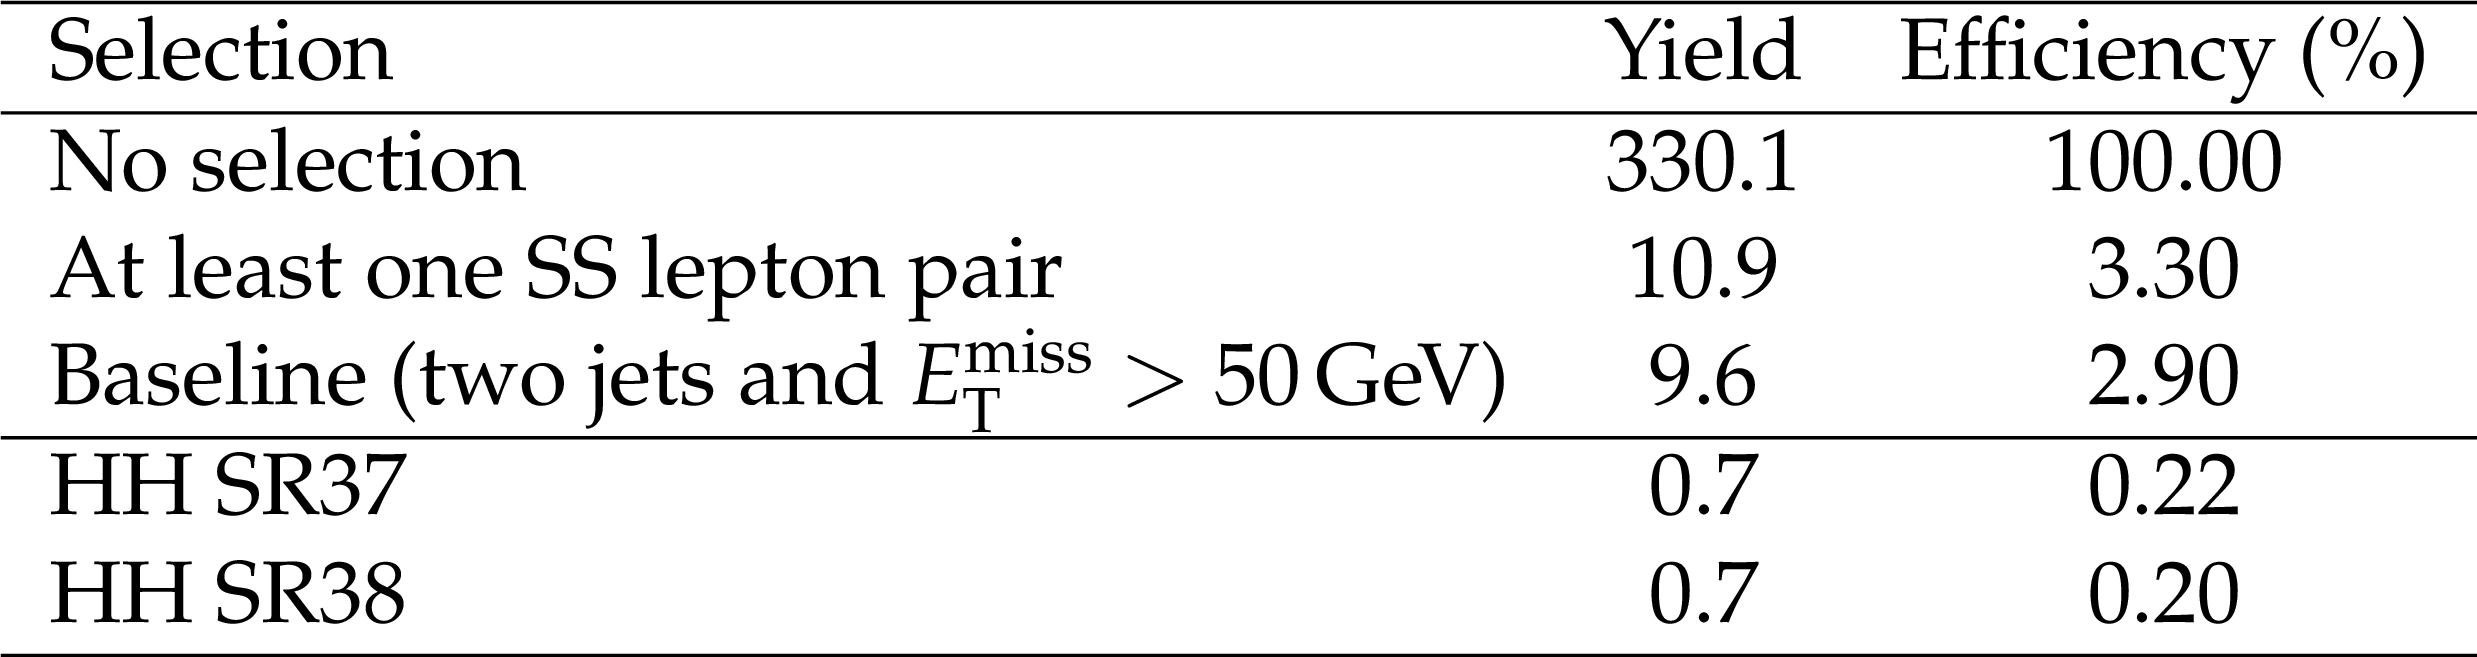
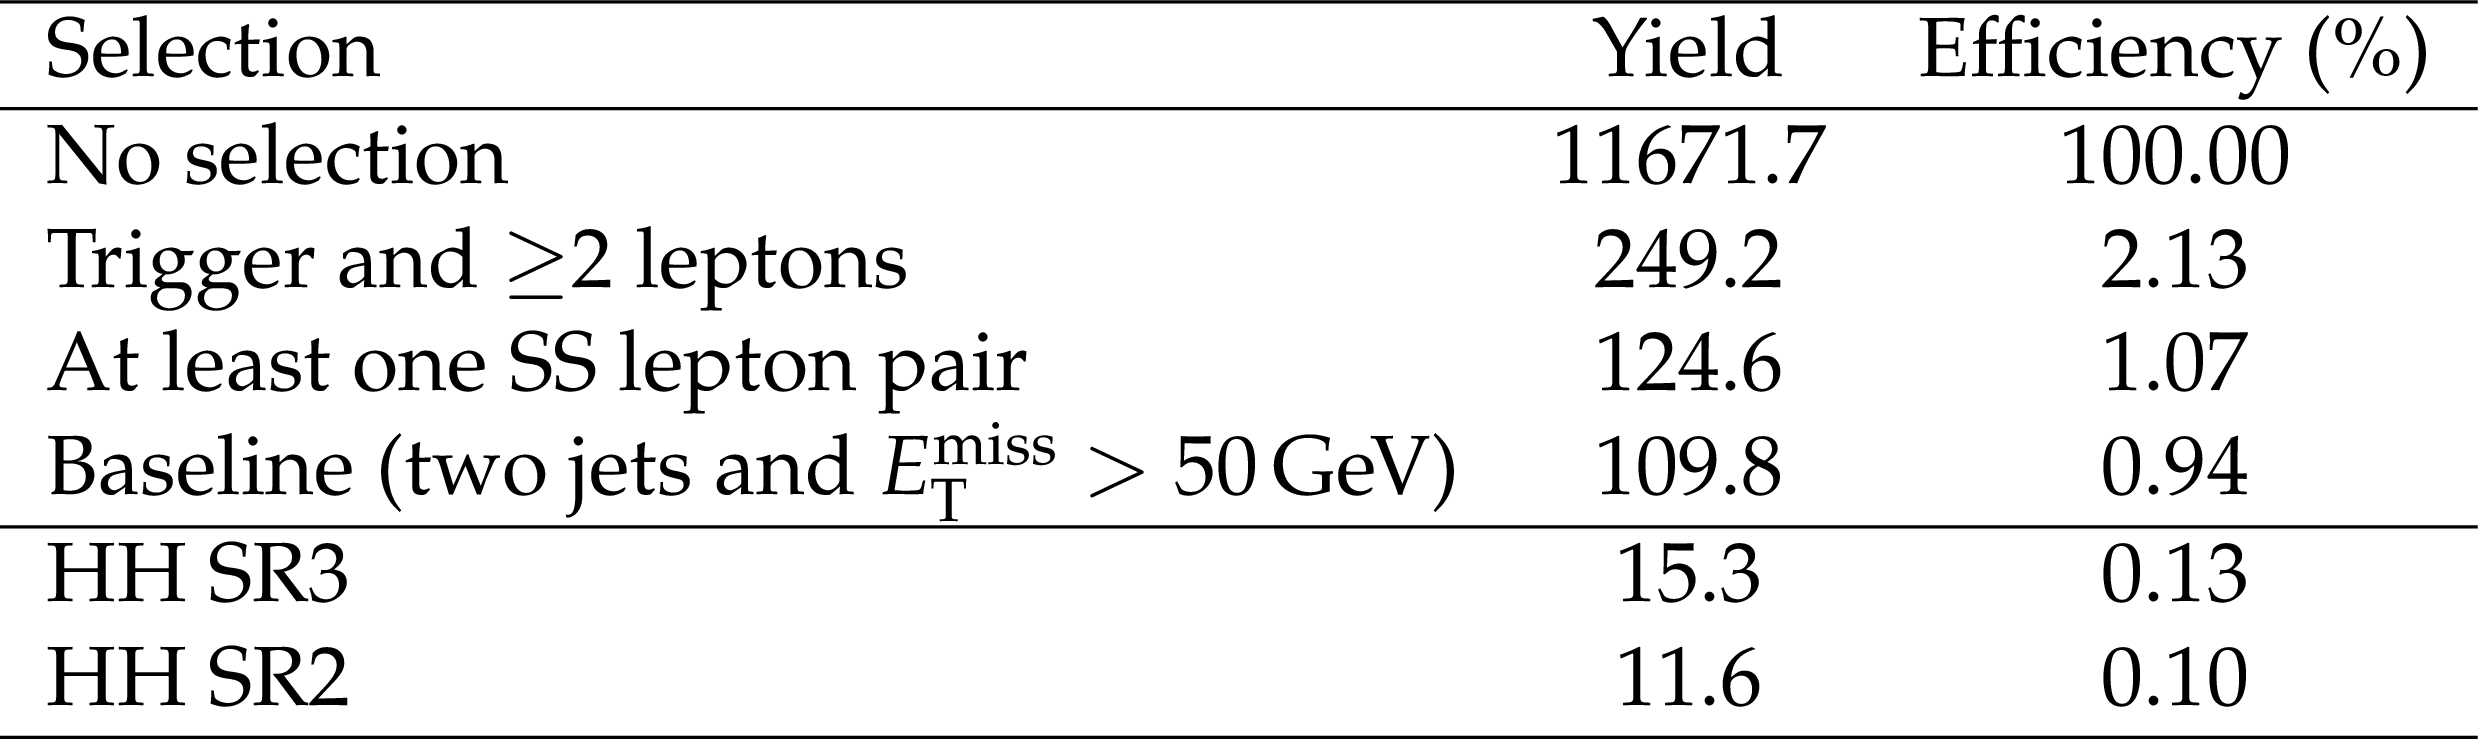
Additional Table 1:
Cut flow table for ${\mathrm{ t } {}\mathrm{ \bar{t} } } {\mathrm{ t } {}\mathrm{ \bar{t} } } $, at 35.9 fb$^{-1}$. The last two lines correspond to the most populated search regions The assumed cross section for this model is 9.2 pb. |
png pdf |
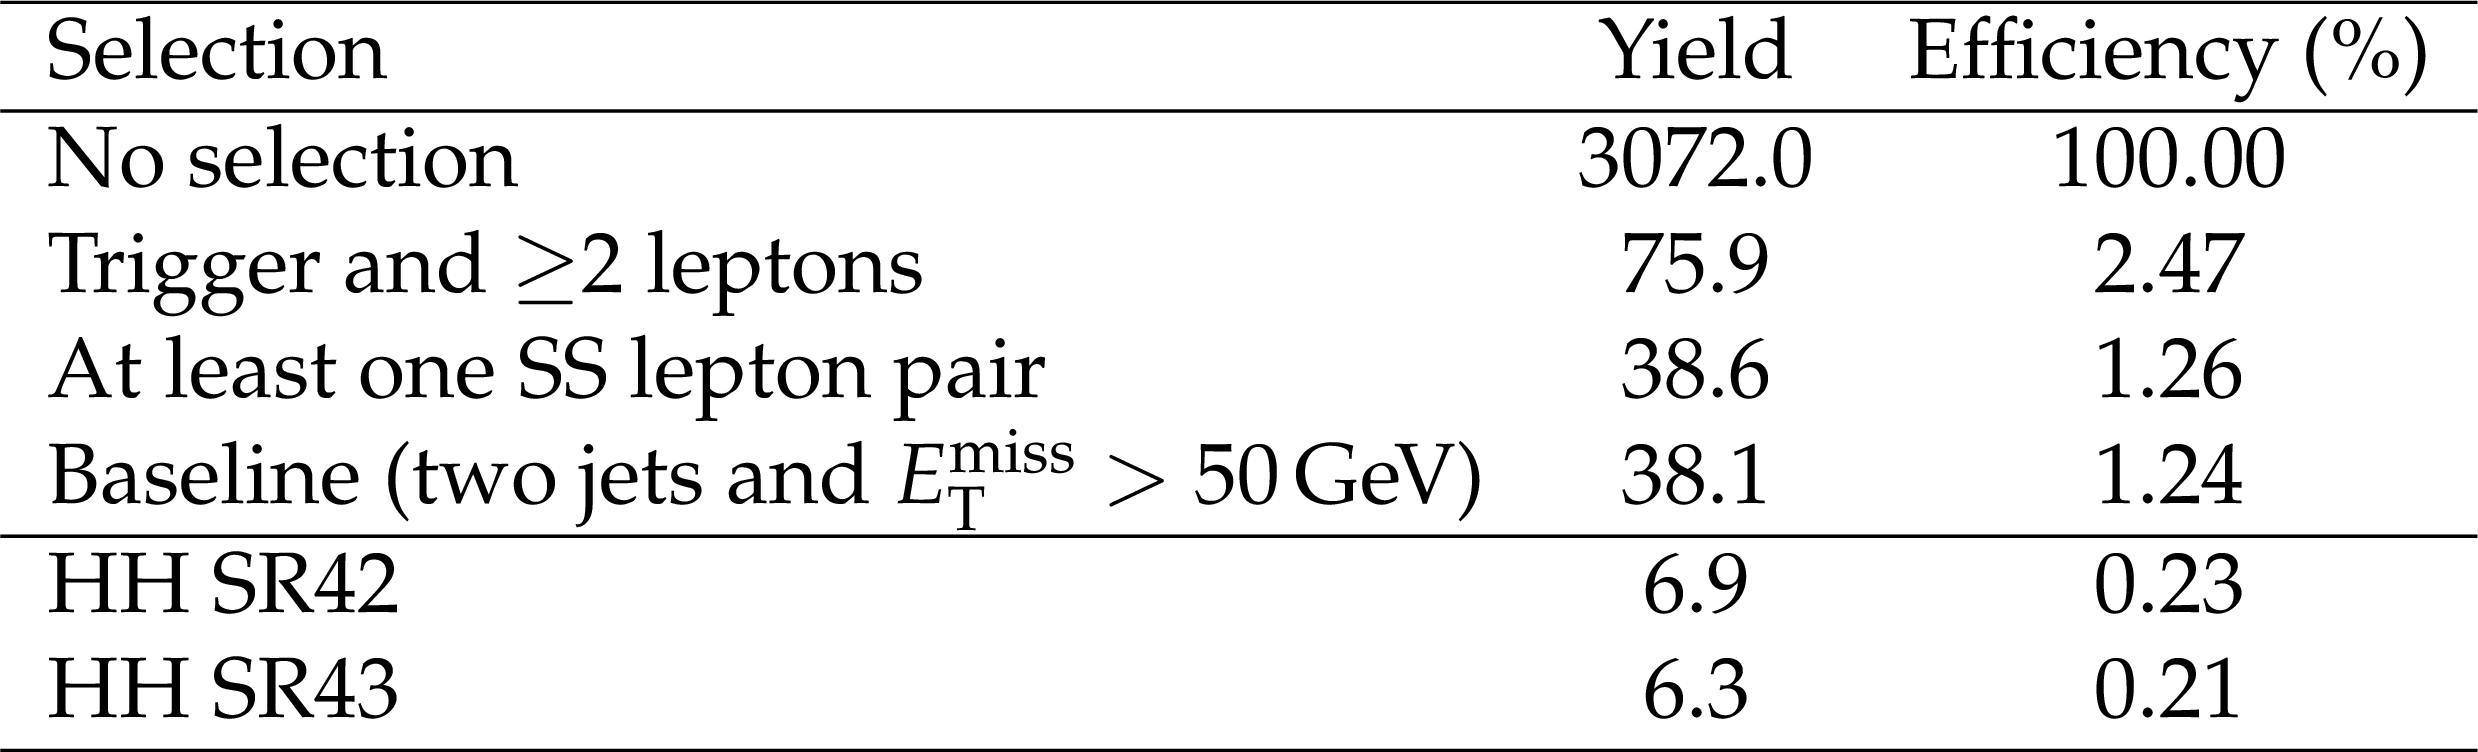
Additional Table 2:
Cut flow table for the T1tttt model assuming gluino and LSP masses equal to 1400 and 1000 GeV, respectively, at 35.9 fb$^{-1}$. The last two lines correspond to the most populated search regions. The assumed cross section for this model is 0.0253 pb. |
png pdf |
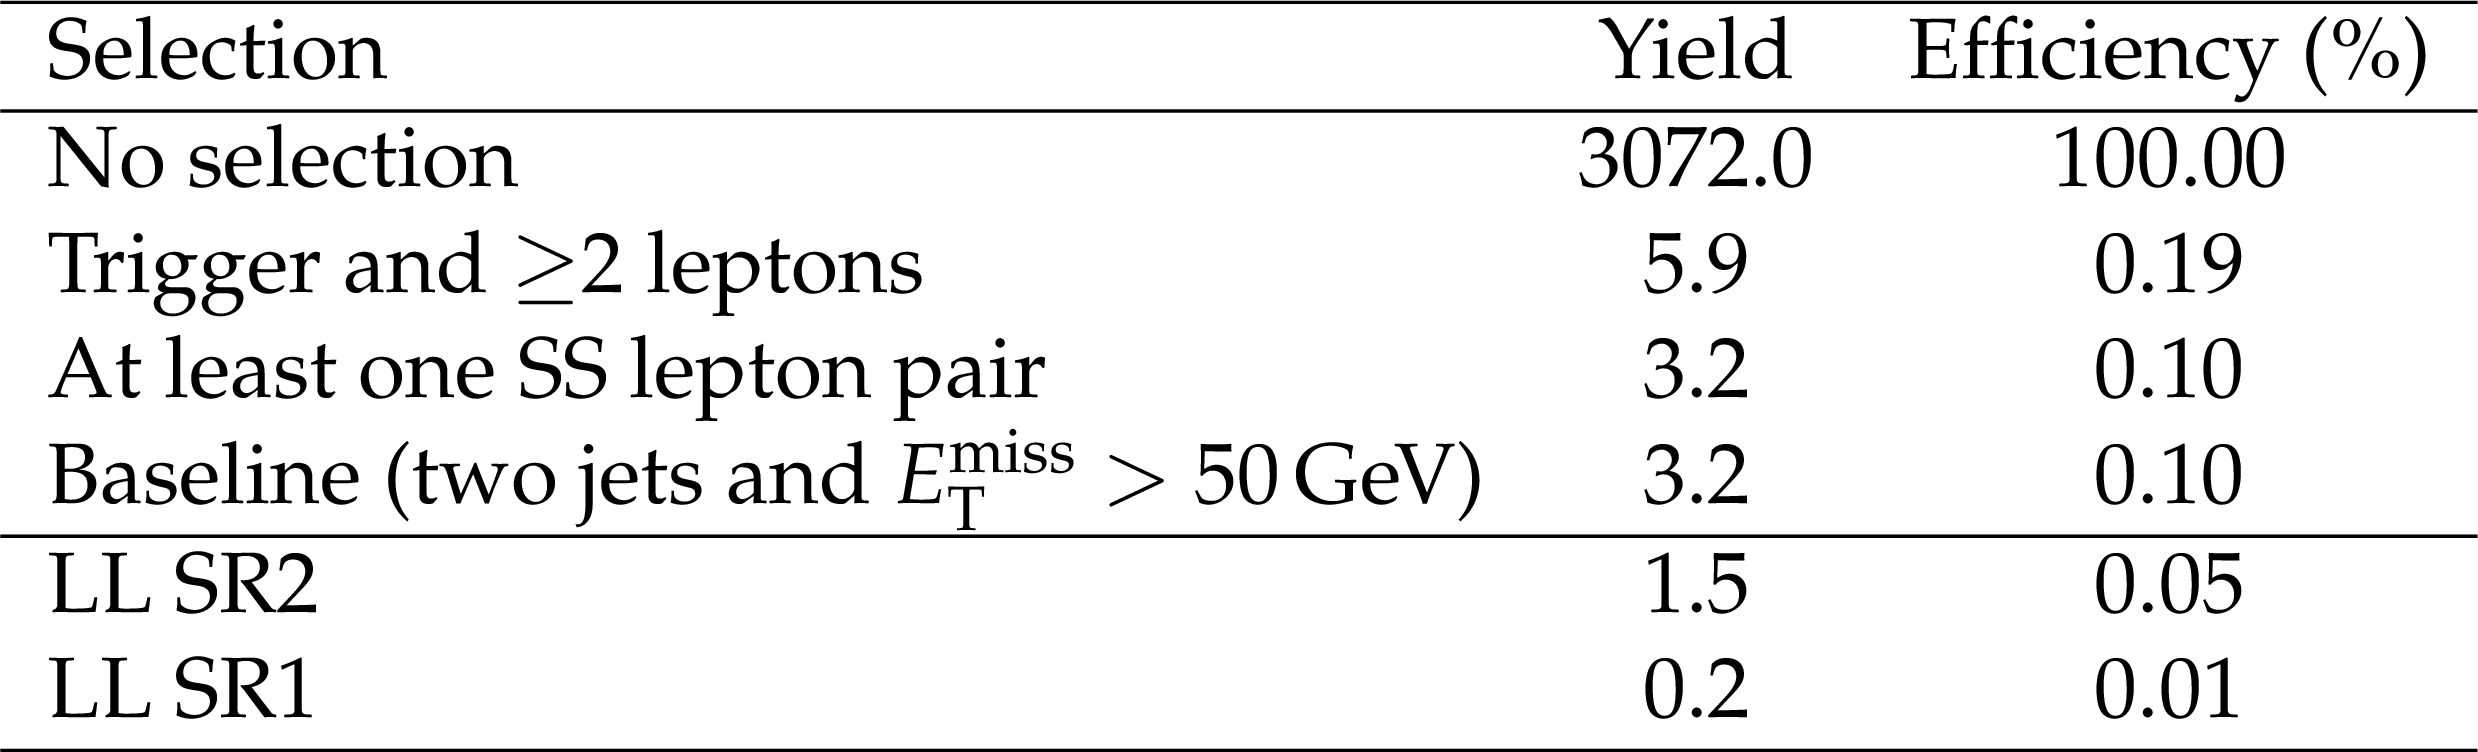
Additional Table 3:
Cut flow table for the T1tttt model assuming gluino and LSP masses equal to 1500 and 200 GeV, respectively, at 35.9 fb$^{-1}$. The last two lines correspond to the most populated search regions. The assumed cross section for this model is 0.0142 pb. |
png pdf |
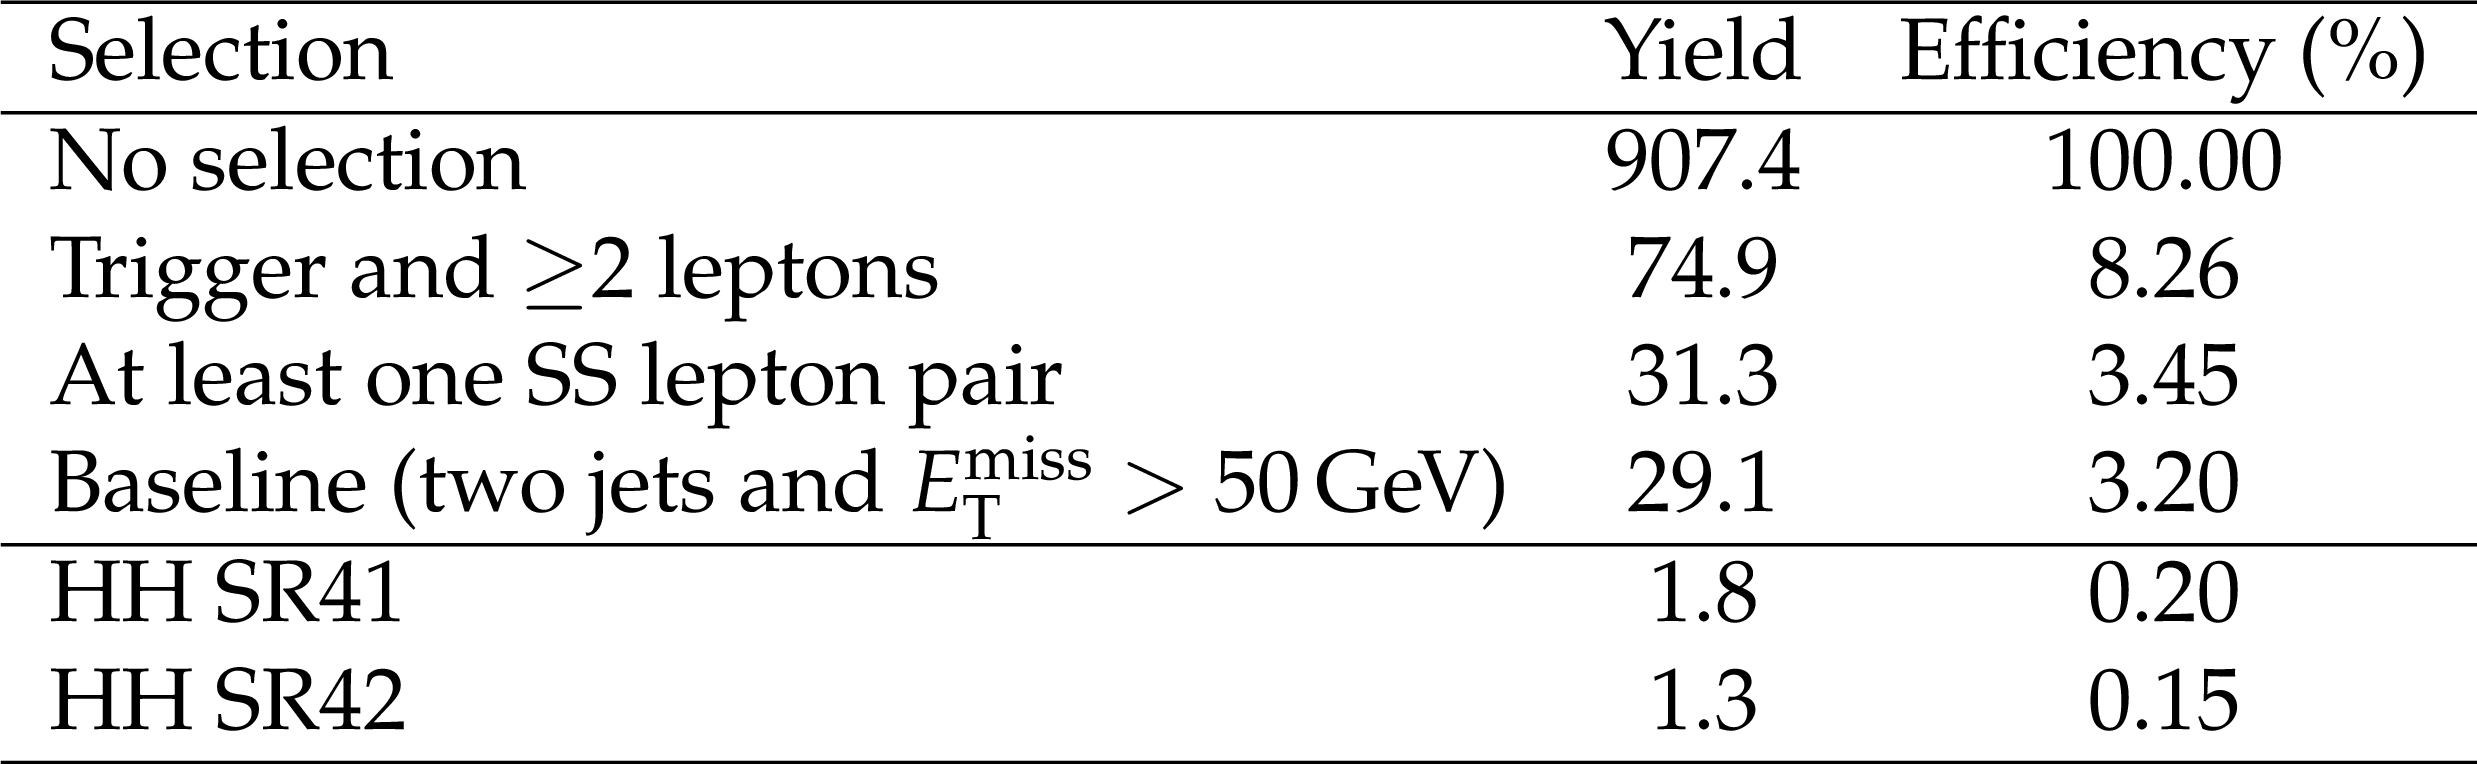
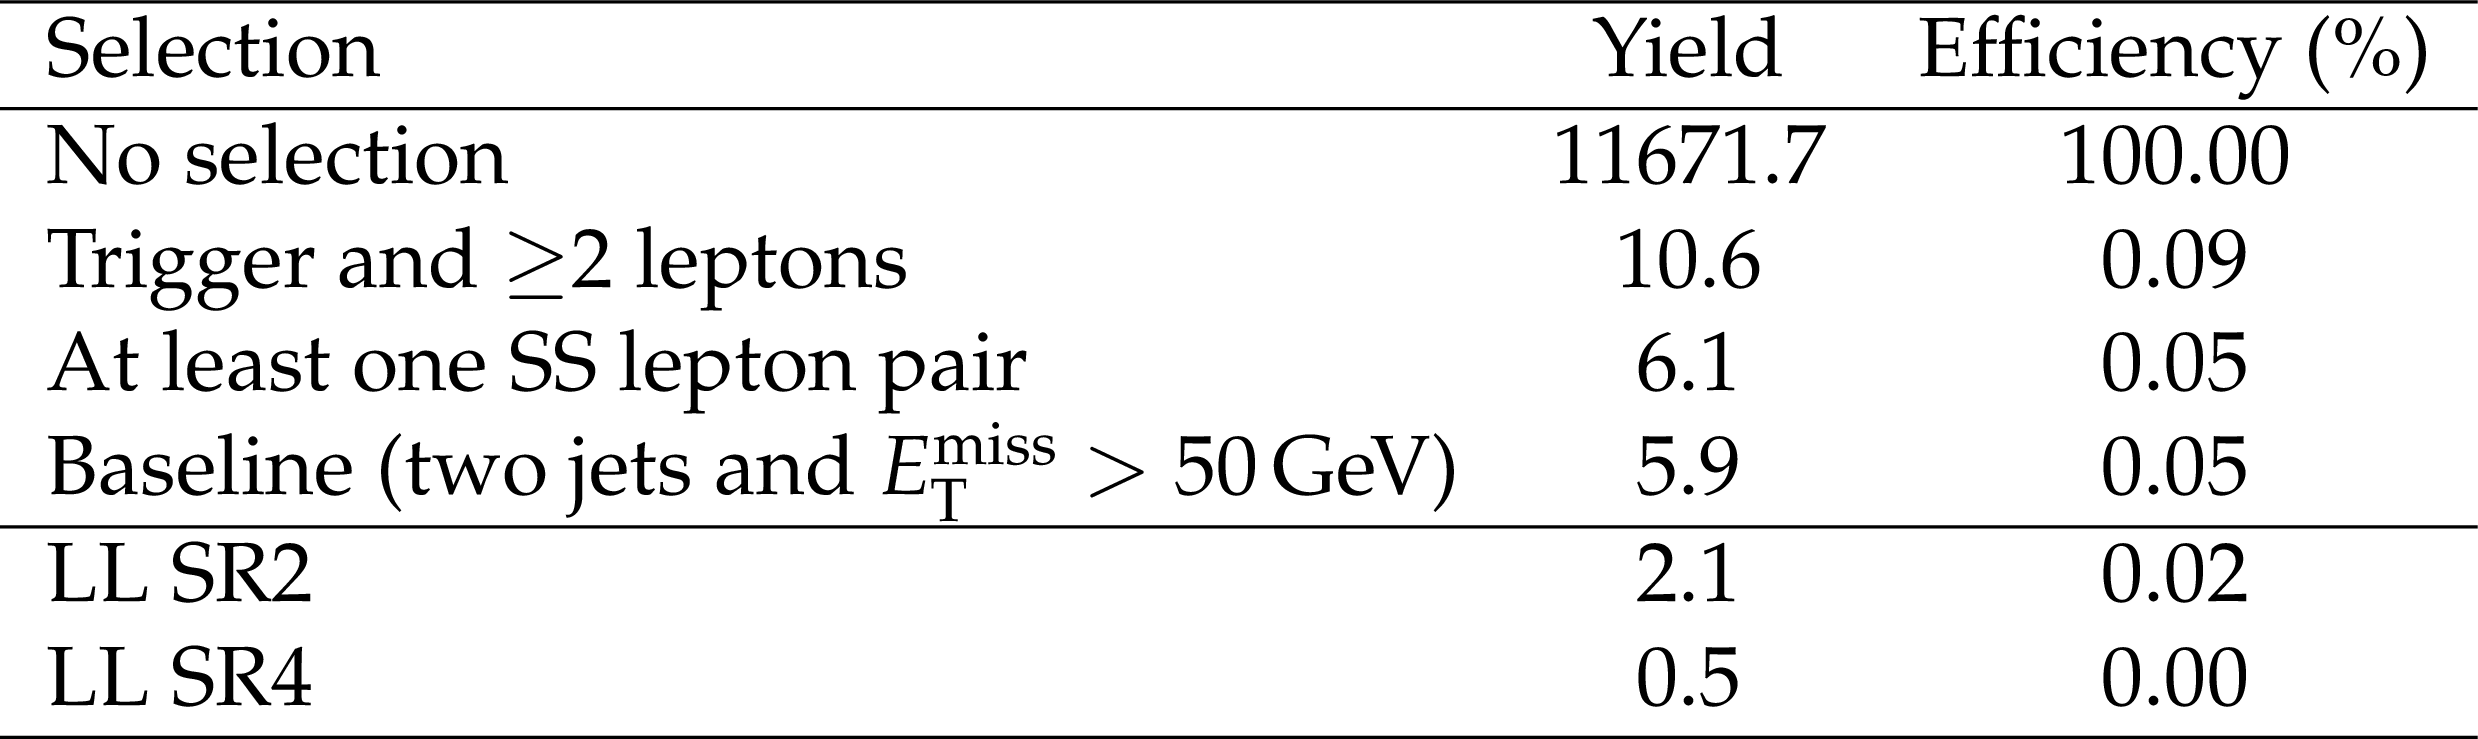
Additional Table 4:
Cut flow table for the T5qqqqWW model with $m_{ \tilde{\chi}^{\pm}_1 } = 0.5(m_{ \tilde{ \mathrm{g} } } + m_{ \tilde{\chi}^0_1 })$ assuming gluino and LSP masses equal to 1000 and 700 GeV, respectively, at 35.9 fb$^{-1}$. The last two lines correspond to the most populated search regions. The assumed cross section for this model is 0.3254 pb. |
png pdf |
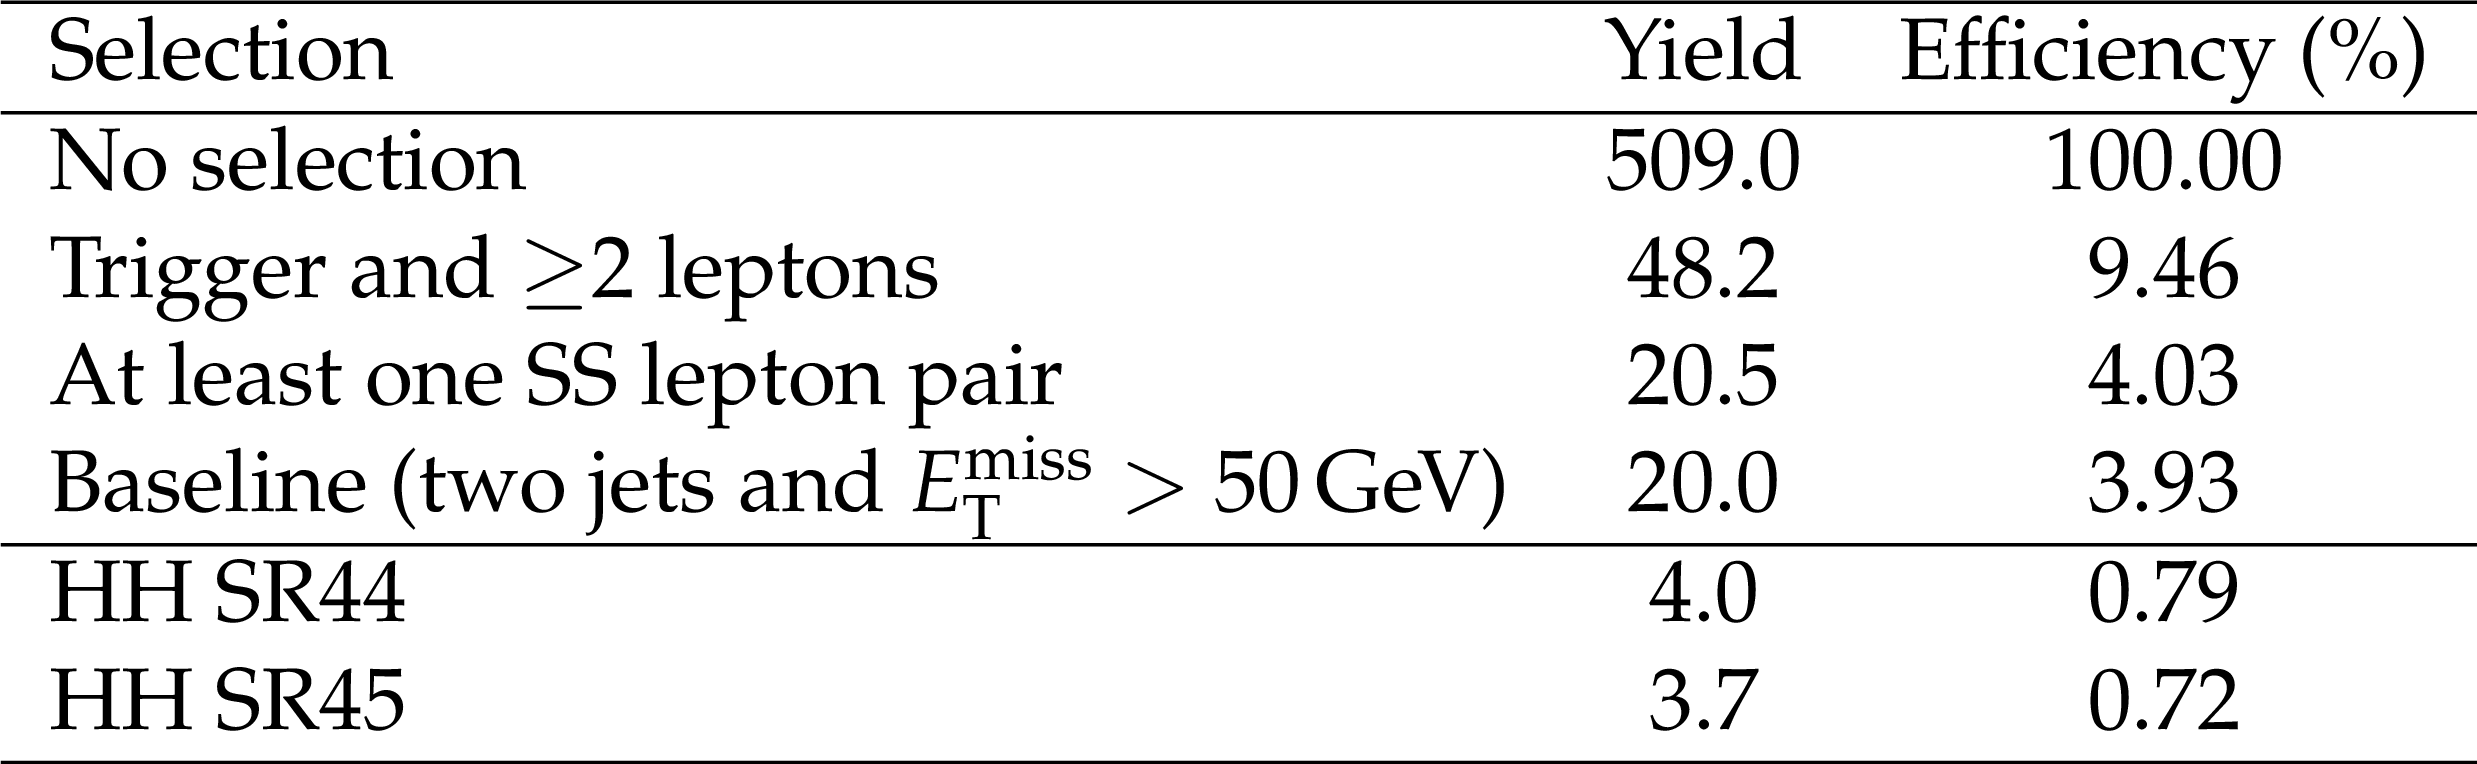
Additional Table 5:
Cut flow table for the T5qqqqWW model with $m_{ \tilde{\chi}^{\pm}_1 } = 0.5(m_{ \tilde{ \mathrm{g} } } + m_{ \tilde{\chi}^0_1 })$ assuming gluino and LSP masses equal to 1200 and 400 GeV, respectively, at 35.9 fb$^{-1}$. The last two lines correspond to the most populated search regions. The assumed cross section for this model is 0.0856 pb. |
png pdf |
Additional Table 6:
Cut flow table for the T5qqqqWW model with $m_{ \tilde{\chi}^{\pm}_1 } = m_{ \tilde{\chi}^0_1 }$ + 20 GeV assuming gluino and LSP masses equal to 1200 and 400 GeV, respectively, at 35.9 fb$^{-1}$. The last two lines correspond to the most populated search regions. The assumed cross section for this model is 0.0856 pb. |
png pdf |
Additional Table 7:
Cut flow table for the T5qqqqWW model with $m_{ \tilde{\chi}^{\pm}_1 } = m_{ \tilde{\chi}^0_1 }$ + 20 GeV assuming gluino and LSP masses equal to 1000 and 700 GeV, respectively, at 35.9 fb$^{-1}$. The last two lines correspond to the most populated search regions. The assumed cross section for this model is 0.3254 pb. |
| References | ||||
| 1 | R. M. Barnett, J. F. Gunion, and H. E. Haber | Discovering supersymmetry with like-sign dileptons | PLB 315 (1993) 349 | hep-ph/9306204 |
| 2 | M. Guchait and D. P. Roy | Like-sign dilepton signature for gluino production at CERN LHC including top quark and Higgs boson effects | PRD 52 (1995) 133 | hep-ph/9412329 |
| 3 | Y. Bai and Z. Han | Top-antitop and top-top resonances in the dilepton channel at the CERN LHC | JHEP 04 (2009) 056 | 0809.4487 |
| 4 | E. L. Berger et al. | Top Quark Forward-Backward Asymmetry and Same-Sign Top Quark Pairs | PRL 106 (2011) 201801 | 1101.5625 |
| 5 | T. Plehn and T. M. P. Tait | Seeking Sgluons | JPG 36 (2009) 075001 | 0810.3919 |
| 6 | S. Calvet, B. Fuks, P. Gris, and L. Valery | Searching for sgluons in multitop events at a center-of-mass energy of 8 TeV | JHEP 04 (2013) 043 | 1212.3360 |
| 7 | K. J. F. Gaemers and F. Hoogeveen | Higgs production and decay into heavy flavors with the gluon fusion mechanism | PLB 146 (1984) 347 | |
| 8 | G. C. Branco et al. | Theory and phenomenology of two-Higgs-doublet models | PR 516 (2012) 1 | 1106.0034 |
| 9 | F. M. L. Almeida, Jr. et al. | Same-sign dileptons as a signature for heavy Majorana neutrinos in hadron-hadron collisions | PLB 400 (1997) 331 | hep-ph/9703441 |
| 10 | R. Contino and G. Servant | Discovering the top partners at the LHC using same-sign dilepton final states | JHEP 06 (2008) 026 | 0801.1679 |
| 11 | P. Ramond | Dual theory for free fermions | PRD 3 (1971) 2415 | |
| 12 | Y. A. Gol'fand and E. P. Likhtman | Extension of the algebra of Poincar$ e $ group generators and violation of P invariance | JEPTL 13 (1971)323 | |
| 13 | A. Neveu and J. H. Schwarz | Factorizable dual model of pions | Nucl. Phys. B 31 (1971) 86 | |
| 14 | D. V. Volkov and V. P. Akulov | Possible universal neutrino interaction | JEPTL 16 (1972)438 | |
| 15 | J. Wess and B. Zumino | A lagrangian model invariant under supergauge transformations | PLB 49 (1974) 52 | |
| 16 | J. Wess and B. Zumino | Supergauge transformations in four-dimensions | Nucl. Phys. B 70 (1974) 39 | |
| 17 | P. Fayet | Supergauge invariant extension of the Higgs mechanism and a model for the electron and its neutrino | Nucl. Phys. B 90 (1975) 104 | |
| 18 | H. P. Nilles | Supersymmetry, supergravity and particle physics | PR 110 (1984) 1 | |
| 19 | S. P. Martin | A supersymmetry primer | in Perspectives on Supersymmetry II, G. L. Kane, ed., p. 1 World Scientific, 2010 Adv. Ser. Direct. High Energy Phys., vol. 21 | |
| 20 | G. R. Farrar and P. Fayet | Phenomenology of the production, decay, and detection of new hadronic states associated with supersymmetry | PLB 76 (1978) 575 | |
| 21 | D. Dicus, A. Stange, and S. Willenbrock | Higgs decay to top quarks at hadron colliders | PLB 333 (1994) 126 | hep-ph/9404359 |
| 22 | N. Craig et al. | The hunt for the rest of the Higgs bosons | JHEP 06 (2015) 137 | 1504.04630 |
| 23 | N. Craig et al. | Heavy Higgs bosons at low $ \tan \beta $: from the LHC to 100 TeV | JHEP 01 (2017) 018 | 1605.08744 |
| 24 | CMS Collaboration | Search for new physics in same-sign dilepton events in proton-proton collisions at $ \sqrt{s} = $ 13 TeV | EPJC 76 (2016) 439 | CMS-SUS-15-008 1605.03171 |
| 25 | ATLAS Collaboration | Search for Gluinos in Events with Two Same-Sign Leptons, Jets and Missing Transverse Momentum with the ATLAS Detector in $ pp $ Collisions at $ \sqrt{s} = $ 7 TeV | PRL 108 (2012) 241802 | 1203.5763 |
| 26 | ATLAS Collaboration | Search for supersymmetry at $ \sqrt{s} = $ 8 TeV in final states with jets and two same-sign leptons or three leptons with the ATLAS detector | JHEP 06 (2014) 035 | 1404.2500 |
| 27 | ATLAS Collaboration | Search for supersymmetry at $ \sqrt{s} = $ 13 TeV in final states with jets and two same-sign leptons or three leptons with the ATLAS detector | EPJC 76 (2016) 259 | 1602.09058 |
| 28 | CMS Collaboration | Search for new physics with same-sign isolated dilepton events with jets and missing transverse energy at the LHC | JHEP 06 (2011) 077 | CMS-SUS-10-004 1104.3168 |
| 29 | CMS Collaboration | Search for new physics in events with same-sign dileptons and b-tagged jets in pp collisions at $ \sqrt{s} = $ 7 TeV | JHEP 08 (2012) 110 | CMS-SUS-11-020 1205.3933 |
| 30 | CMS Collaboration | Search for New Physics with Same-Sign Isolated Dilepton Events with Jets and Missing Transverse Energy | PRL 109 (2012) 071803 | CMS-SUS-11-010 1205.6615 |
| 31 | CMS Collaboration | Search for new physics in events with same-sign dileptons and b jets in pp collisions at $ \sqrt{s} = $ 8 TeV | JHEP 03 (2013) 037 | CMS-SUS-12-017 1212.6194 |
| 32 | CMS Collaboration | Search for new physics in events with same-sign dileptons and jets in pp collisions at 8 TeV | JHEP 01 (2014) 163 | CMS-SUS-13-013 1311.6736 |
| 33 | J. Alwall et al. | The automated computation of tree-level and next-to-leading order differential cross sections, and their matching to parton shower simulations | JHEP 07 (2014) 079 | 1405.0301 |
| 34 | J. Alwall et al. | Comparative study of various algorithms for the merging of parton showers and matrix elements in hadronic collisions | EPJC 53 (2008) 473 | 0706.2569 |
| 35 | R. Frederix and S. Frixione | Merging meets matching in MC@NLO | JHEP 12 (2012) 061 | 1209.6215 |
| 36 | T. Melia, P. Nason, R. Rontsch, and G. Zanderighi | W$ ^+ $W$ ^- $, WZ and ZZ production in the POWHEG BOX | JHEP 11 (2011) 078 | 1107.5051 |
| 37 | P. Nason and G. Zanderighi | W$ ^+ $W$ ^- $, WZ and ZZ production in the POWHEG BOX V2 | EPJC 74 (2014) 2702 | 1311.1365 |
| 38 | NNPDF Collaboration | Parton distributions for the LHC Run II | JHEP 04 (2015) 040 | 1410.8849 |
| 39 | T. Sjostrand, S. Mrenna, and P. Z. Skands | A brief introduction to PYTHIA 8.1 | CPC 178 (2008) 852 | 0710.3820 |
| 40 | P. Skands, S. Carrazza, and J. Rojo | Tuning PYTHIA 8.1: the Monash 2013 tune | EPJC 74 (2014) 3024 | 1404.5630 |
| 41 | CMS Collaboration | Event generator tunes obtained from underlying event and multiparton scattering measurements | EPJC 76 (2016) 155 | CMS-GEN-14-001 1512.00815 |
| 42 | GEANT4 Collaboration | GEANT4 --- a simulation toolkit | NIMA 506 (2003) 250 | |
| 43 | S. Abdullin et al. | The fast simulation of the CMS detector at LHC | J. Phys. Conf. Ser. 331 (2011) 032049 | |
| 44 | D. Alves et al. | Simplified models for LHC new physics searches | JPG 39 (2012) 105005 | 1105.2838 |
| 45 | CMS Collaboration | Interpretation of searches for supersymmetry with simplified models | PRD 88 (2013) 052017 | CMS-SUS-11-016 1301.2175 |
| 46 | W. Beenakker, R. Hopker, M. Spira, and P. M. Zerwas | Squark and gluino production at hadron colliders | Nucl. Phys. B 492 (1997) 51 | hep-ph/9610490 |
| 47 | A. Kulesza and L. Motyka | Threshold resummation for squark-antisquark and gluino-pair production at the LHC | PRL 102 (2009) 111802 | 0807.2405 |
| 48 | A. Kulesza and L. Motyka | Soft gluon resummation for the production of gluino-gluino and squark-antisquark pairs at the LHC | PRD 80 (2009) 095004 | 0905.4749 |
| 49 | W. Beenakker et al. | Soft-gluon resummation for squark and gluino hadroproduction | JHEP 12 (2009) 041 | 0909.4418 |
| 50 | W. Beenakker et al. | Squark and gluino hadroproduction | Int. J. Mod. Phys. A 26 (2011) 2637 | 1105.1110 |
| 51 | C. Borschensky et al. | Squark and gluino production cross sections in pp collisions at $ \sqrt{s} = $ 13, 14, 33 and 100 TeV | EPJC 74 (2014) 3174 | 1407.5066 |
| 52 | CMS Collaboration | The CMS experiment at the CERN LHC | JINST 3 (2008) S08004 | CMS-00-001 |
| 53 | CMS Collaboration | The CMS trigger system | JINST 12 (2017) P01020 | CMS-TRG-12-001 1609.02366 |
| 54 | CMS Collaboration | Particle-flow event reconstruction in CMS and performance for jets, taus, and $ E_{\mathrm{T}}^{\text{miss}} $ | CDS | |
| 55 | CMS Collaboration | Commissioning of the particle-flow event reconstruction with the first LHC collisions recorded in the CMS detector | CDS | |
| 56 | CMS Collaboration | Performance of electron reconstruction and selection with the CMS detector in proton-proton collisions at $ \sqrt{s} = $ 8 TeV | JINST 10 (2015) P06005 | CMS-EGM-13-001 1502.02701 |
| 57 | CMS Collaboration | Performance of CMS muon reconstruction in pp collision events at $ \sqrt{s} = $ 7 TeV | JINST 7 (2012) P10002 | CMS-MUO-10-004 1206.4071 |
| 58 | M. Cacciari, G. P. Salam, and G. Soyez | The anti-$ k_t $ jet clustering algorithm | JHEP 04 (2008) 063 | 0802.1189 |
| 59 | M. Cacciari, G. P. Salam, and G. Soyez | FastJet user manual | EPJC 72 (2012) 1896 | 1111.6097 |
| 60 | CMS Collaboration | Determination of jet energy calibration and transverse momentum resolution in CMS | JINST 6 (2011) P11002 | CMS-JME-10-011 1107.4277 |
| 61 | CMS Collaboration | Jet energy scale and resolution in the CMS experiment in pp collisions at 8 TeV | JINST 12 (2016) P02014 | CMS-JME-13-004 1607.03663 |
| 62 | CMS Collaboration | Identification of b quark jets at the CMS experiment in the LHC Run2 | CDS | |
| 63 | CMS Collaboration | Performance of missing energy reconstruction in 13 TeV pp collision data using the CMS detector | CDS | |
| 64 | CMS Collaboration | Performance of the CMS missing transverse momentum reconstruction in pp data at $ \sqrt{s} = $ 8 TeV | JINST 10 (2015) P02006 | CMS-JME-13-003 1411.0511 |
| 65 | ATLAS Collaboration | Search for anomalous production of prompt same-sign lepton pairs and pair-produced doubly charged Higgs bosons with $ \sqrt{s} = $ 8 TeV $ pp $ collisions using the ATLAS detector | JHEP 03 (2015) 041 | 1412.0237 |
| 66 | CMS Collaboration | CMS Luminosity Measurements for the 2016 Data Taking Period | CDS | |
| 67 | T. Junk | Confidence level computation for combining searches with small statistics | NIMA 434 (1999) 435 | hep-ex/9902006 |
| 68 | A. L. Read | Presentation of search results: the $ CL_S $ technique | JPG 28 (2002) 2693 | |
| 69 | ATLAS and CMS Collaborations | Procedure for the LHC Higgs boson search combination in summer 2011 | ATL-PHYS-PUB-2011-011, CMS NOTE-2011/005 | |
| 70 | G. Cowan, K. Cranmer, E. Gross, and O. Vitells | Asymptotic formulae for likelihood-based tests of new physics | EPJC 71 (2011) 1554 | 1007.1727 |
| 71 | CMS Collaboration | Search for standard model production of four top quarks in proton-proton collisions at $ \sqrt{s} = $ 13 TeV | Submitted to PLB | CMS-TOP-16-016 1702.06164 |
| 72 | CMS Collaboration | Simplified likelihood for the re-interpretation of public CMS results | CDS | |
|
|
Compact Muon Solenoid LHC, CERN |
|

|

|

|

|

|