

Compact Muon Solenoid
LHC, CERN
| CMS-SUS-16-047 ; CERN-EP-2017-130 | ||
| Search for supersymmetry in events with at least one photon, missing transverse momentum, and large transverse event activity in proton-proton collisions at $ \sqrt{s} = $ 13 TeV | ||
| CMS Collaboration | ||
| 19 July 2017 | ||
| JHEP 12 (2017) 142 | ||
| Abstract: A search for physics beyond the standard model in final states with at least one photon, large transverse momentum imbalance, and large total transverse event activity is presented. Such topologies can be produced in gauge-mediated supersymmetry models in which pair-produced gluinos or squarks decay to photons and gravitinos via short-lived neutralinos. The data sample corresponds to an integrated luminosity of 35.9 fb$^{-1}$ of proton-proton collisions at $ \sqrt{s} = $ 13 TeV recorded by the CMS experiment at the LHC in 2016. No significant excess of events above the expected standard model background is observed. The data are interpreted in simplified models of gluino and squark pair production, in which gluinos or squarks decay via neutralinos to photons. Gluino masses of up to 1.50-2.00 TeV and squark masses up to 1.30-1.65 TeV are excluded at 95% confidence level, depending on the neutralino mass and branching fraction. | ||
| Links: e-print arXiv:1707.06193 [hep-ex] (PDF) ; CDS record ; inSPIRE record ; HepData record ; CADI line (restricted) ; | ||
| Figures & Tables | Summary | Additional Figures | References | CMS Publications |
|---|
|
Additional information on efficiencies needed for reinterpretation of these results are available here.
Additional technical material for CMS speakers can be found here. |
| Figures | |
png pdf |
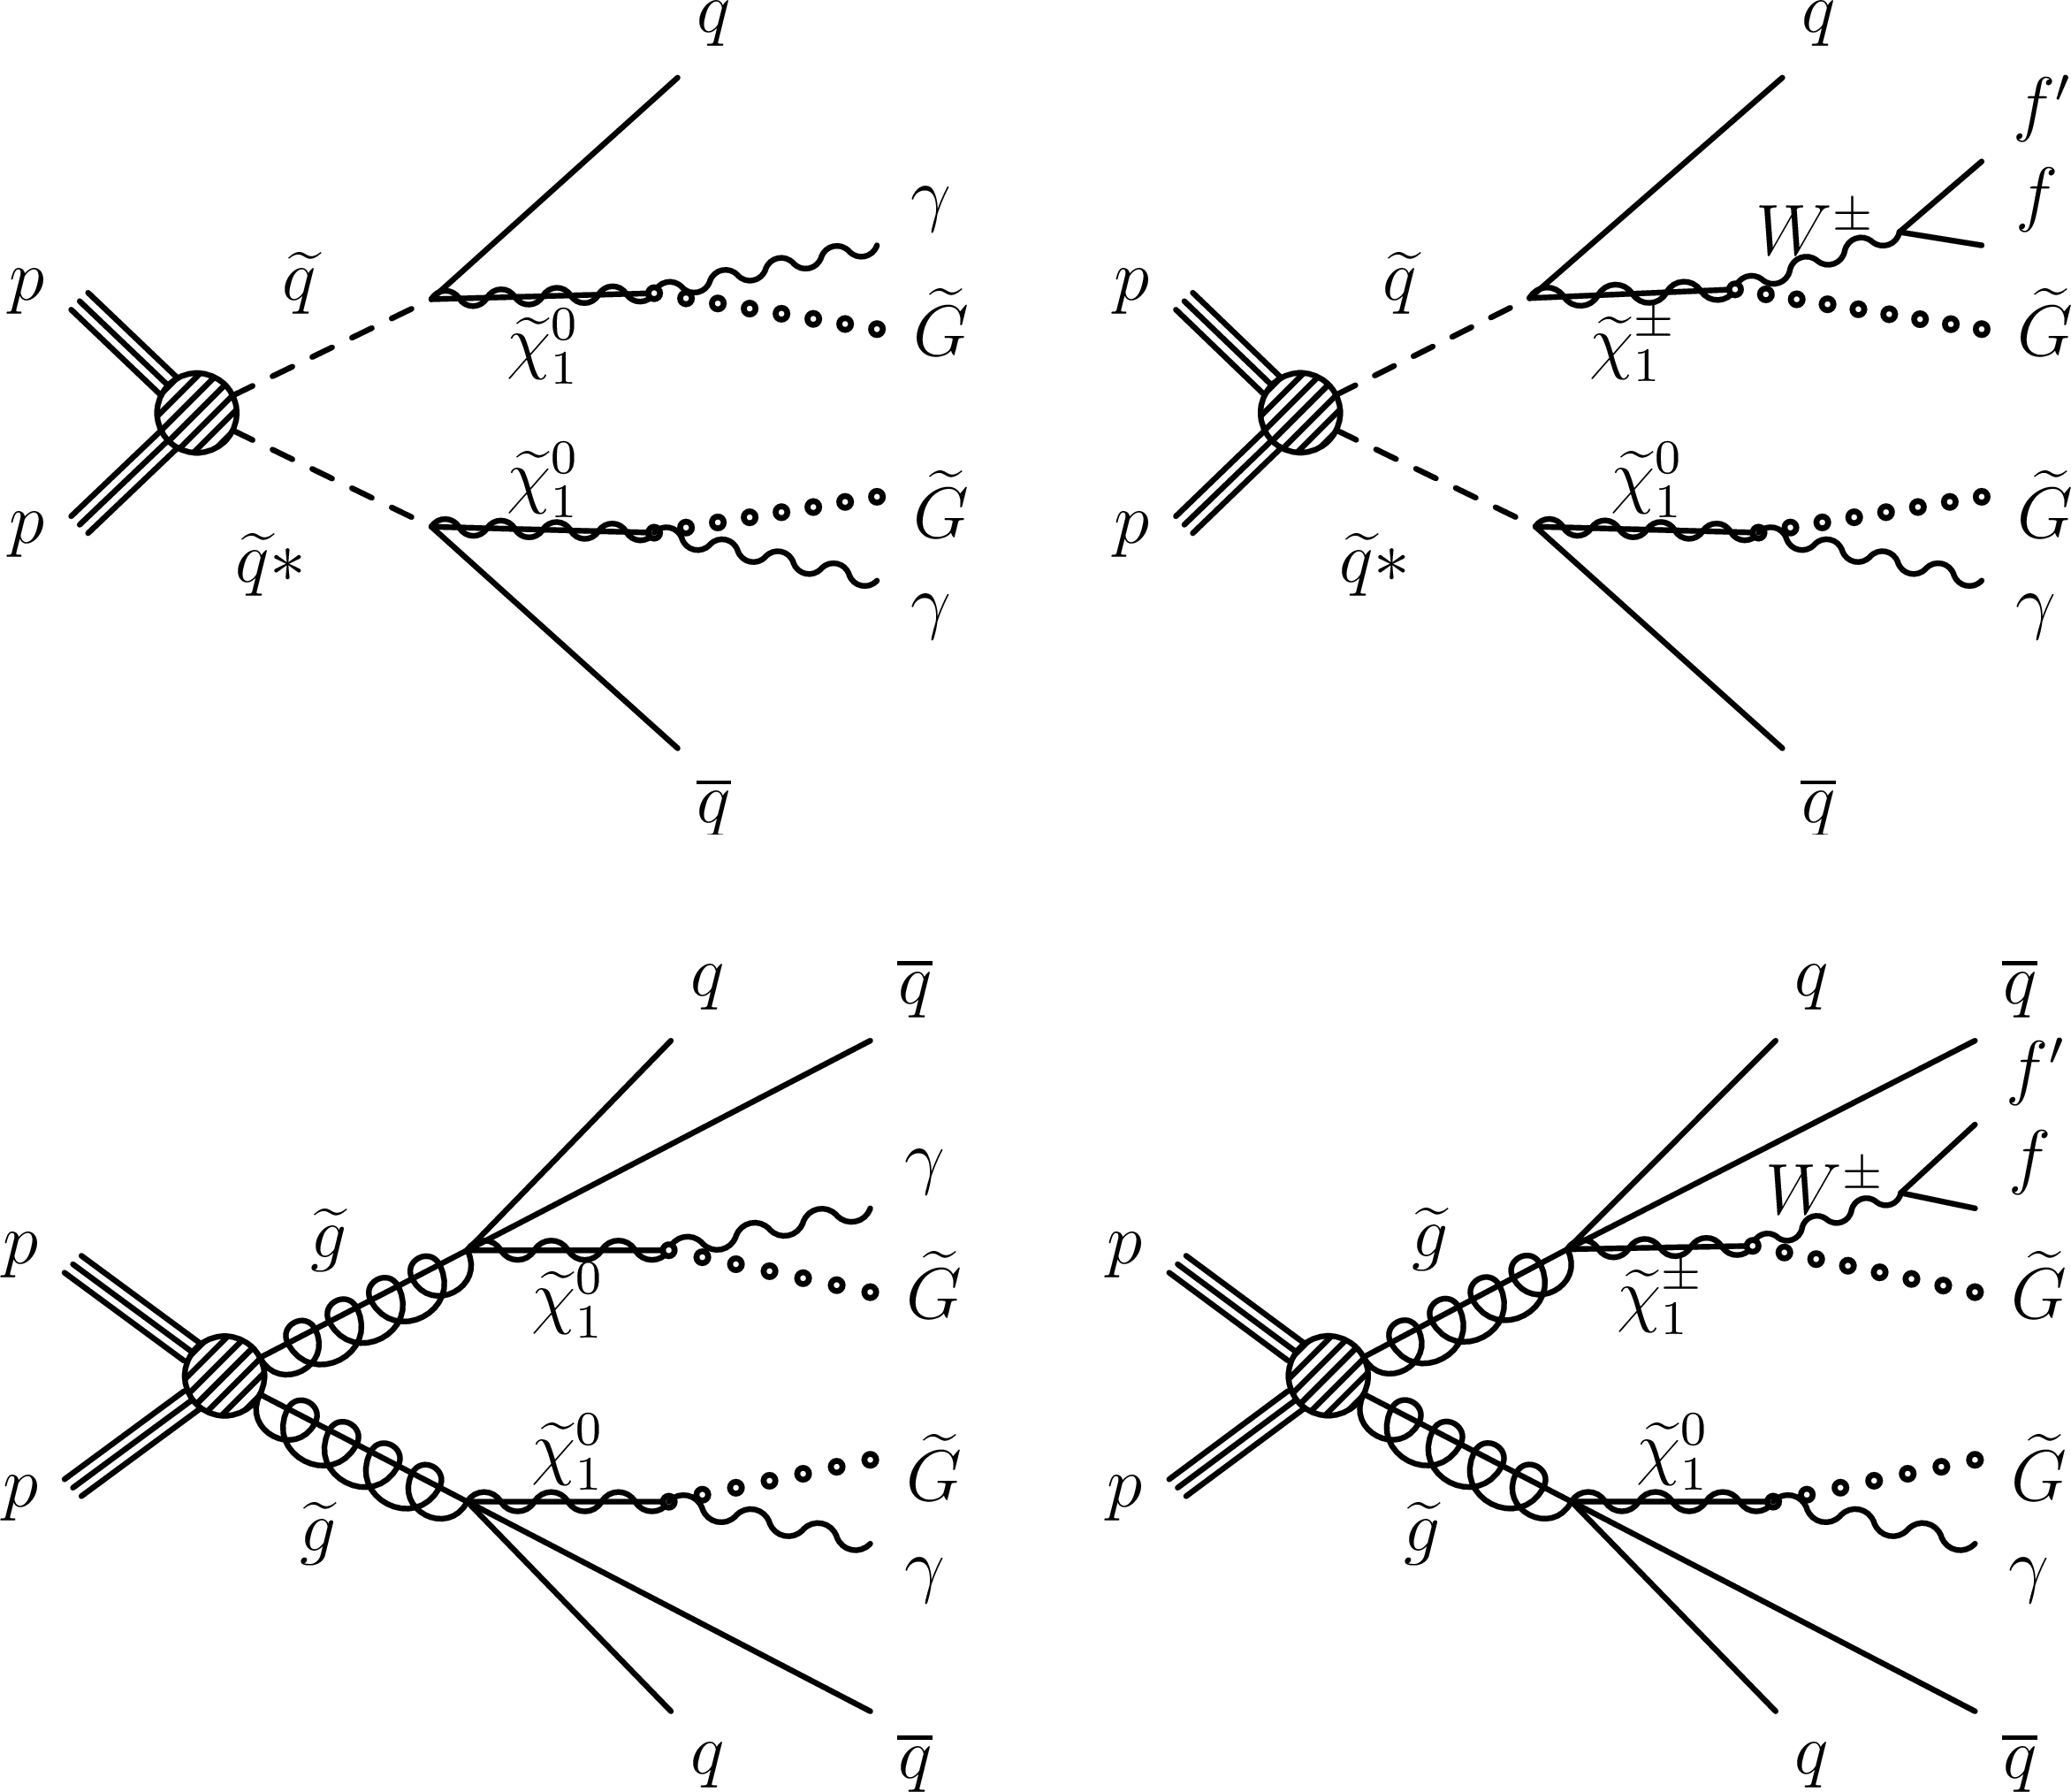
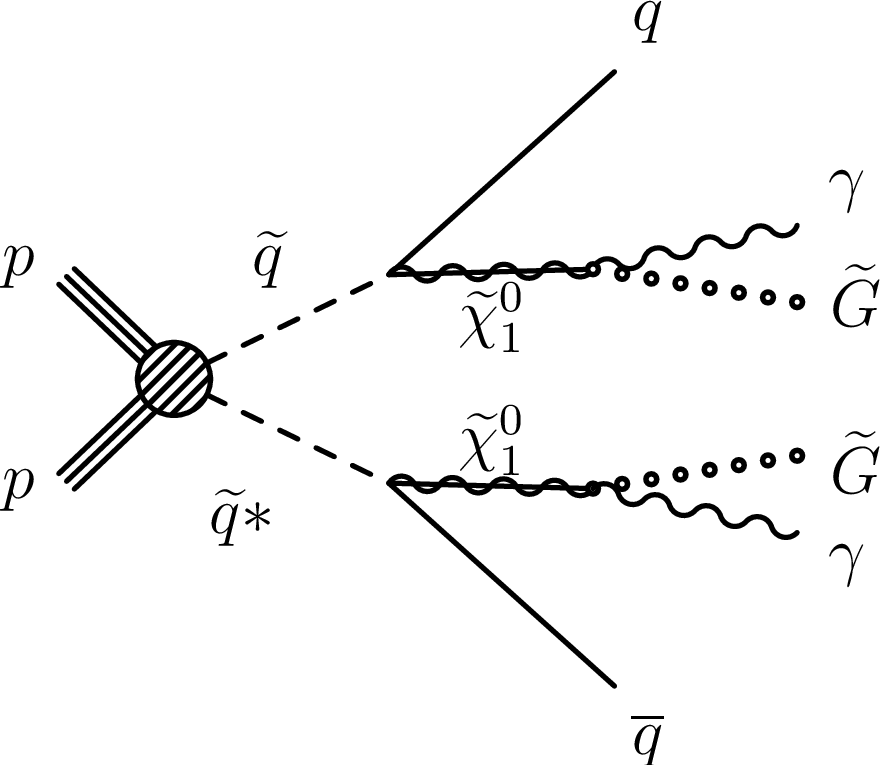
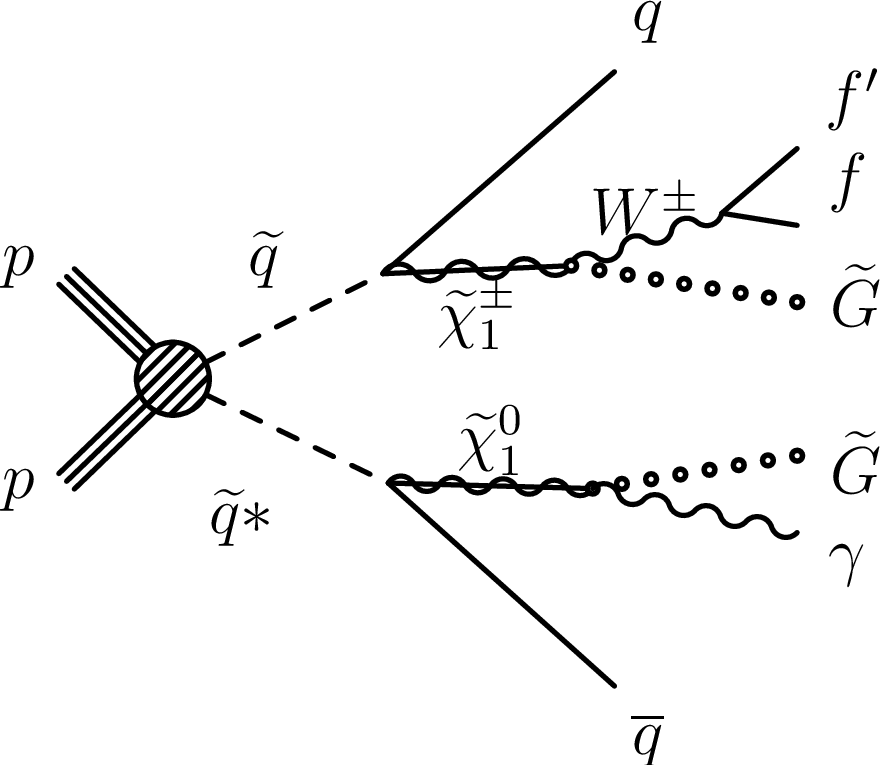
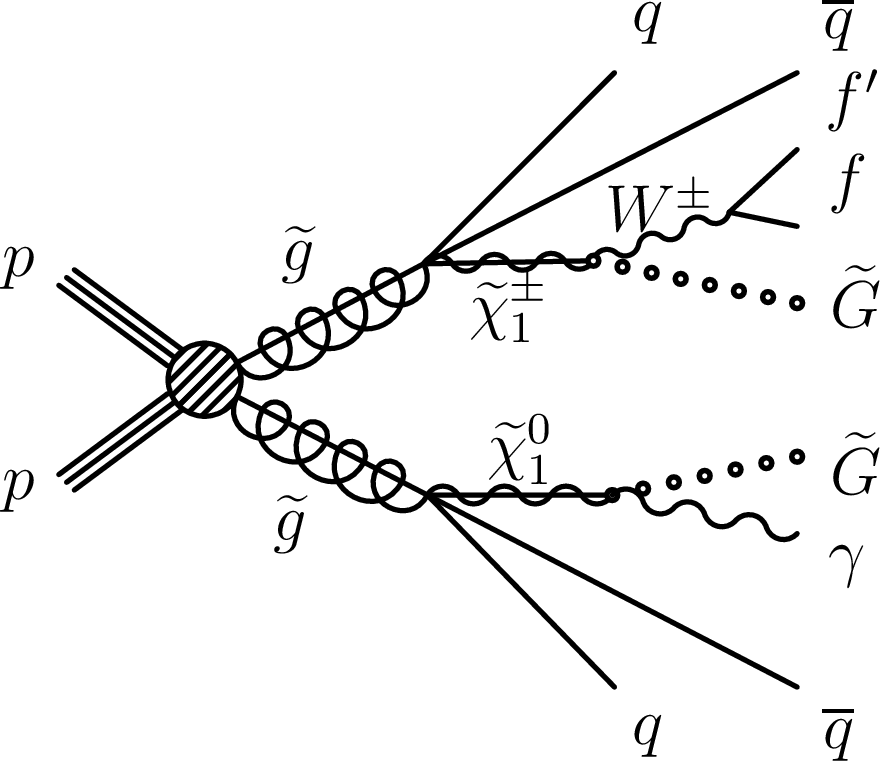
Figure 1:
Representative Feynman-like diagrams for the simulated signal processes: T6gg (top left), T6Wg (top right), T5gg (bottom left), and T5Wg (bottom right). |
png pdf |
Figure 1-a:
Representative Feynman-like diagram for the simulated T6gg signal process. |
png pdf |
Figure 1-b:
Representative Feynman-like diagram for the simulated T6Wg signal process. |
png pdf |
Figure 1-c:
Representative Feynman-like diagram for the simulated T5gg signal process. |
png pdf |
Figure 1-d:
Representative Feynman-like diagram for the simulated T5Wg signal process. |
png pdf |
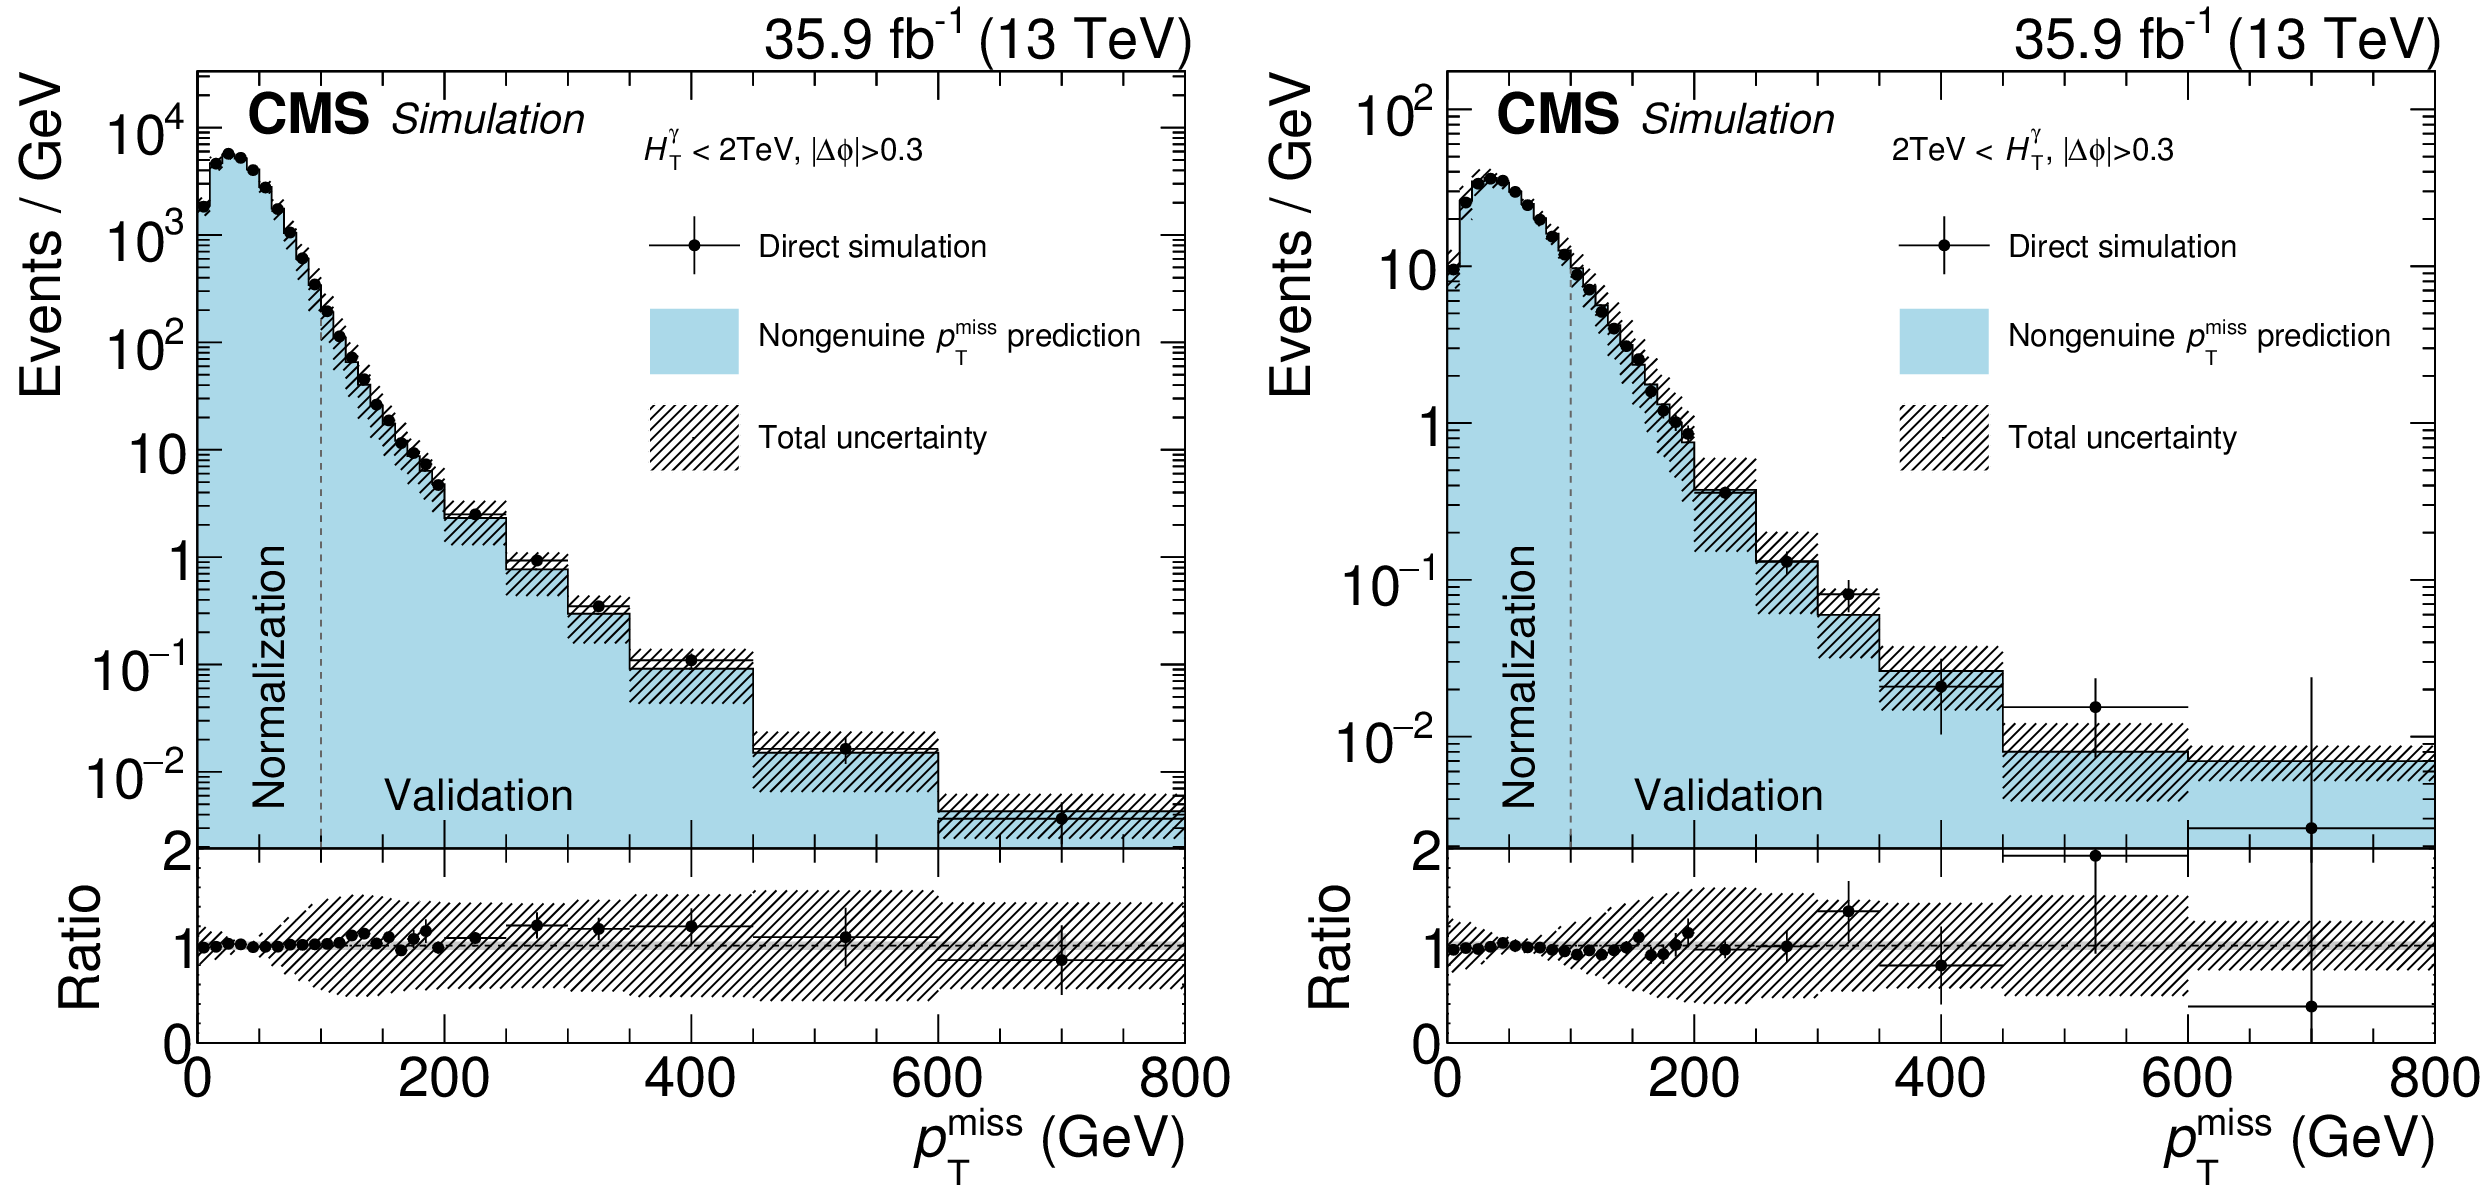
Figure 2:
Validation of the nongenuine ${ {p_{\mathrm {T}}} ^\text {miss}}$ background estimation method with ${\gamma }$+jet and multijet simulations. The direct simulation results are shown as black dots, while the prediction using the jet CR is shown as light blue histogram. The total uncertainty of the prediction is presented as shaded area. The bottom panel shows the ratio of the direct simulation to the prediction. The low- (high-) ${H_\mathrm {T}^{\gamma }}$ selection is shown on the left (right). The number of events corresponds to the expectation in data for an integrated luminosity of 35.9 fb$^{-1}$. The rightmost bin includes all events with $ { {p_{\mathrm {T}}} ^\text {miss}} > $ 600 GeV. |

png pdf |
Figure 2-a:
Validation of the nongenuine ${ {p_{\mathrm {T}}} ^\text {miss}}$ background estimation method with ${\gamma }$+jet and multijet simulations. The direct simulation results are shown as black dots, while the prediction using the jet CR is shown as light blue histogram. The total uncertainty of the prediction is presented as shaded area. The bottom panel shows the ratio of the direct simulation to the prediction. The low-${H_\mathrm {T}^{\gamma }}$ selection is shown. The number of events corresponds to the expectation in data for an integrated luminosity of 35.9 fb$^{-1}$. The rightmost bin includes all events with $ { {p_{\mathrm {T}}} ^\text {miss}} > $ 600 GeV. |

png pdf |
Figure 2-b:
Validation of the nongenuine ${ {p_{\mathrm {T}}} ^\text {miss}}$ background estimation method with ${\gamma }$+jet and multijet simulations. The direct simulation results are shown as black dots, while the prediction using the jet CR is shown as light blue histogram. The total uncertainty of the prediction is presented as shaded area. The bottom panel shows the ratio of the direct simulation to the prediction. The high-${H_\mathrm {T}^{\gamma }}$ selection is shown. The number of events corresponds to the expectation in data for an integrated luminosity of 35.9 fb$^{-1}$. The rightmost bin includes all events with $ { {p_{\mathrm {T}}} ^\text {miss}} > $ 600 GeV. |

png pdf |
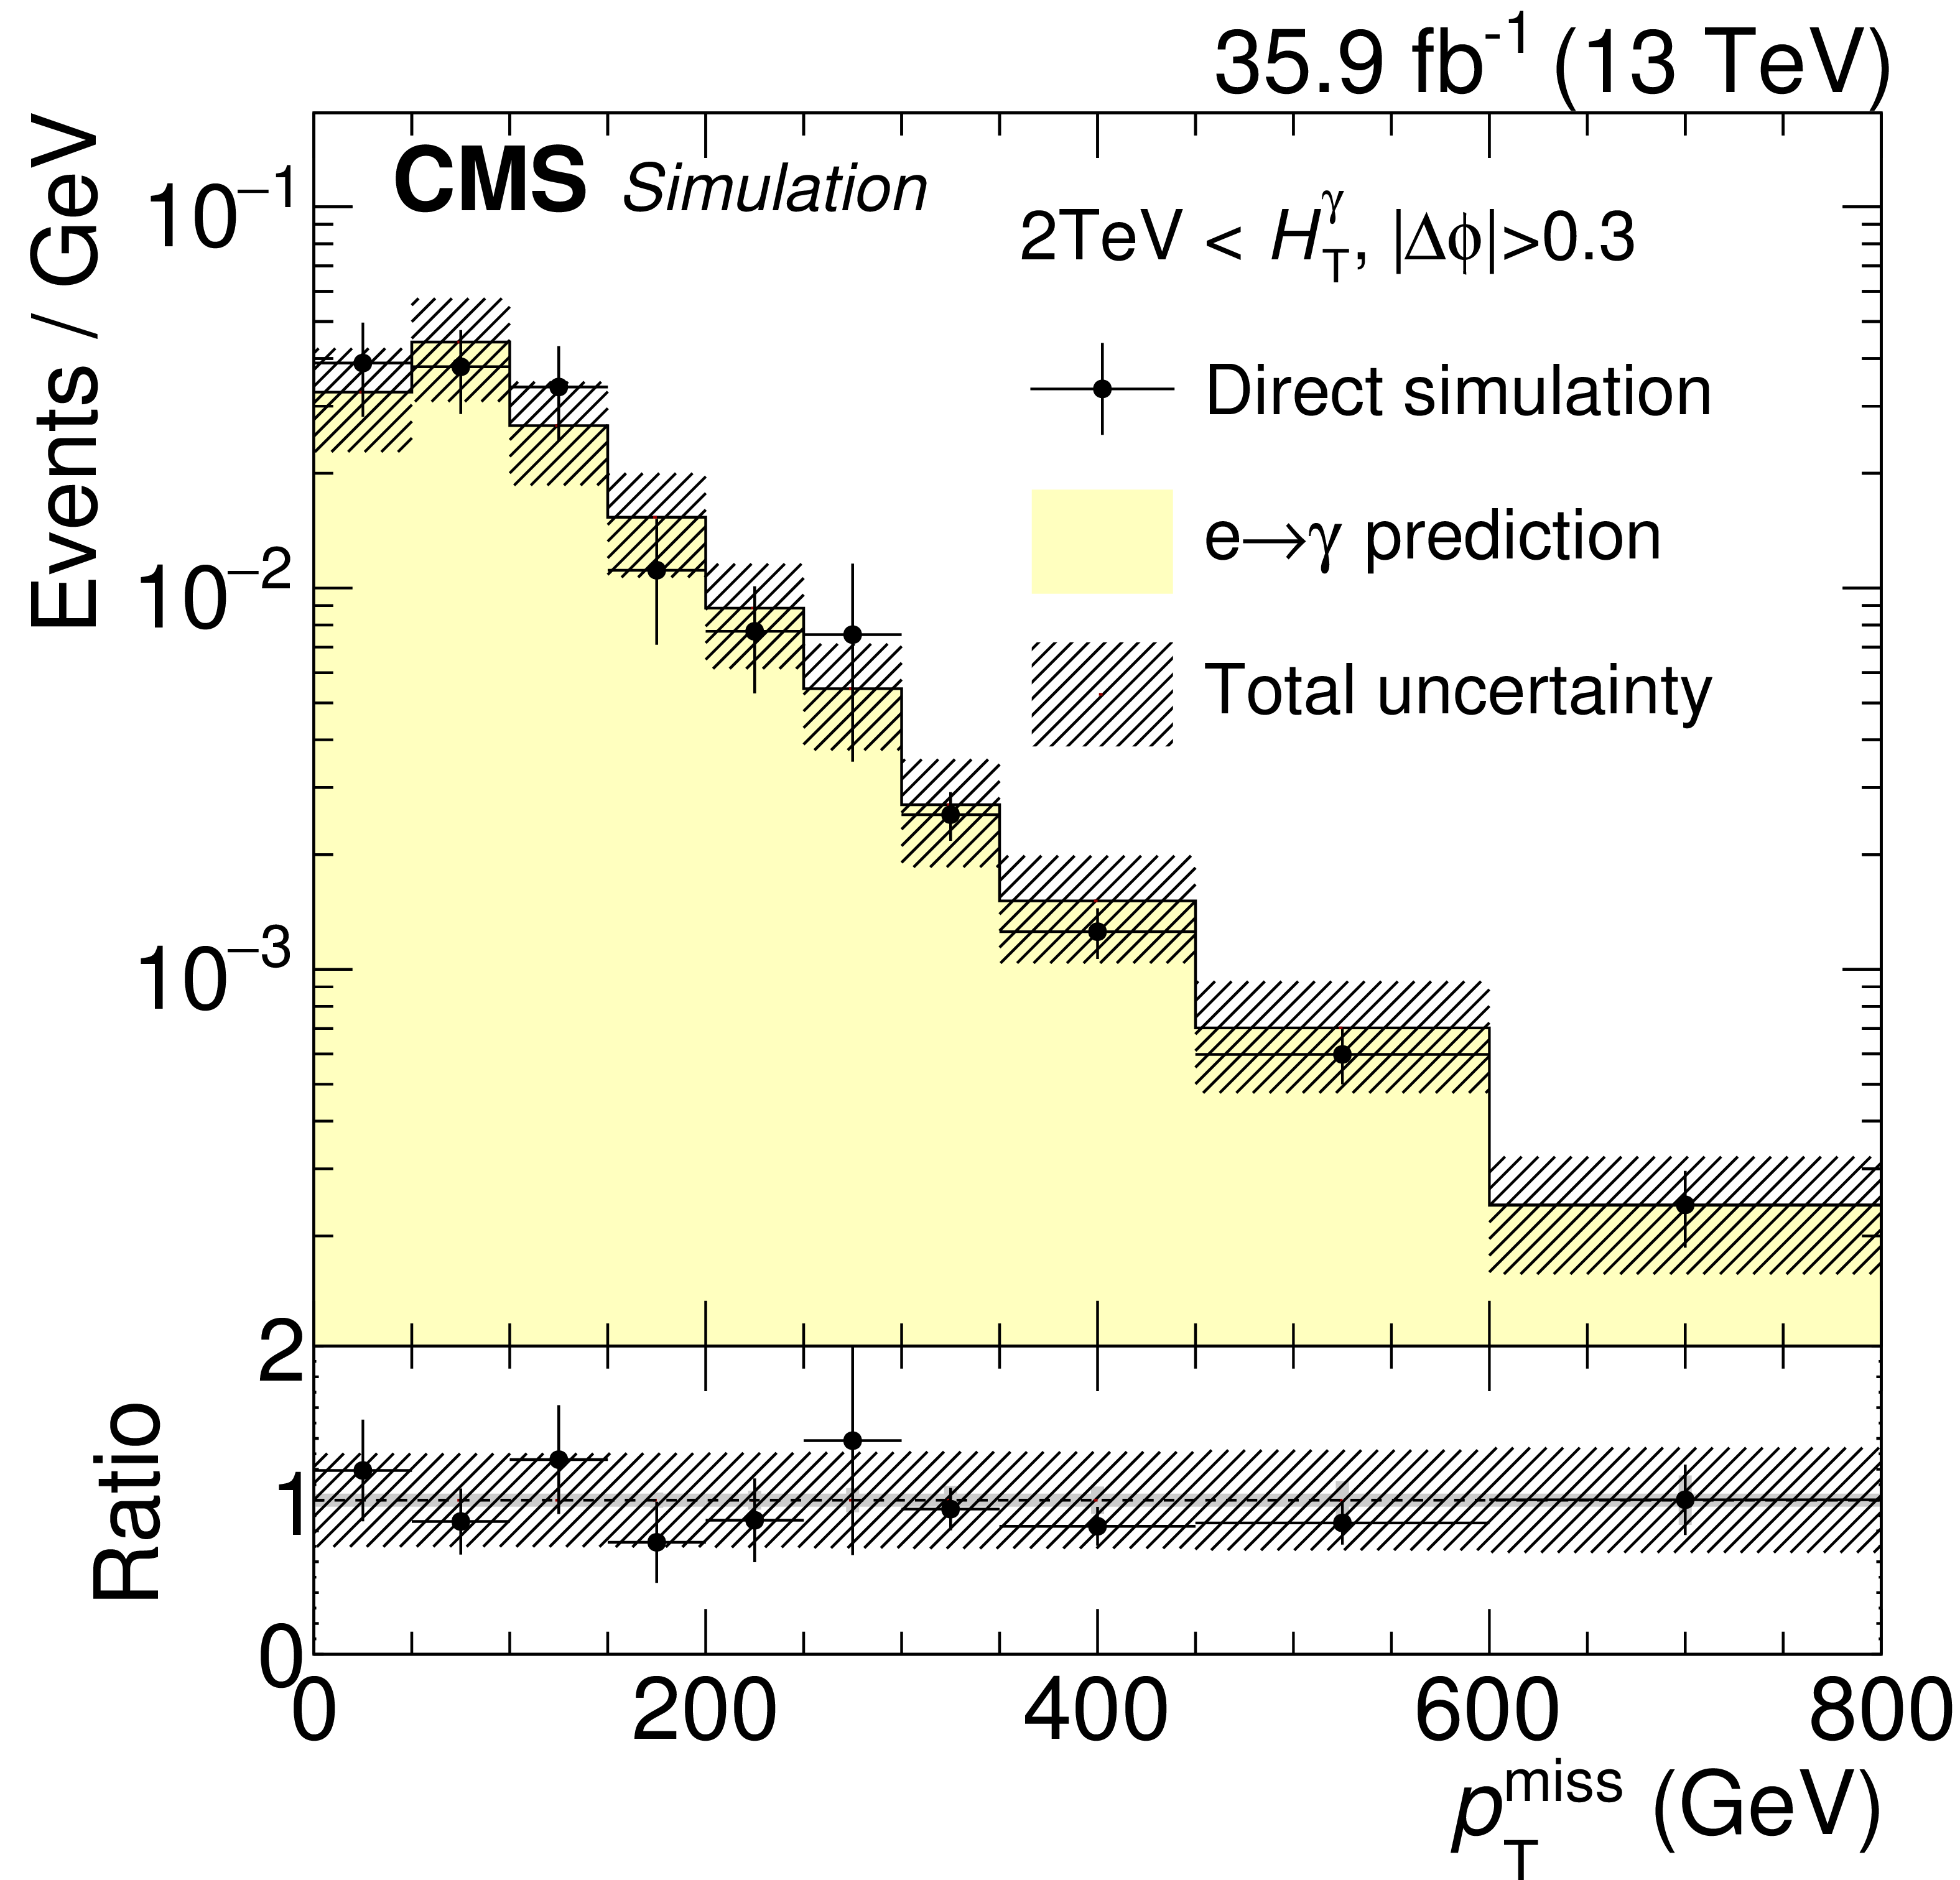
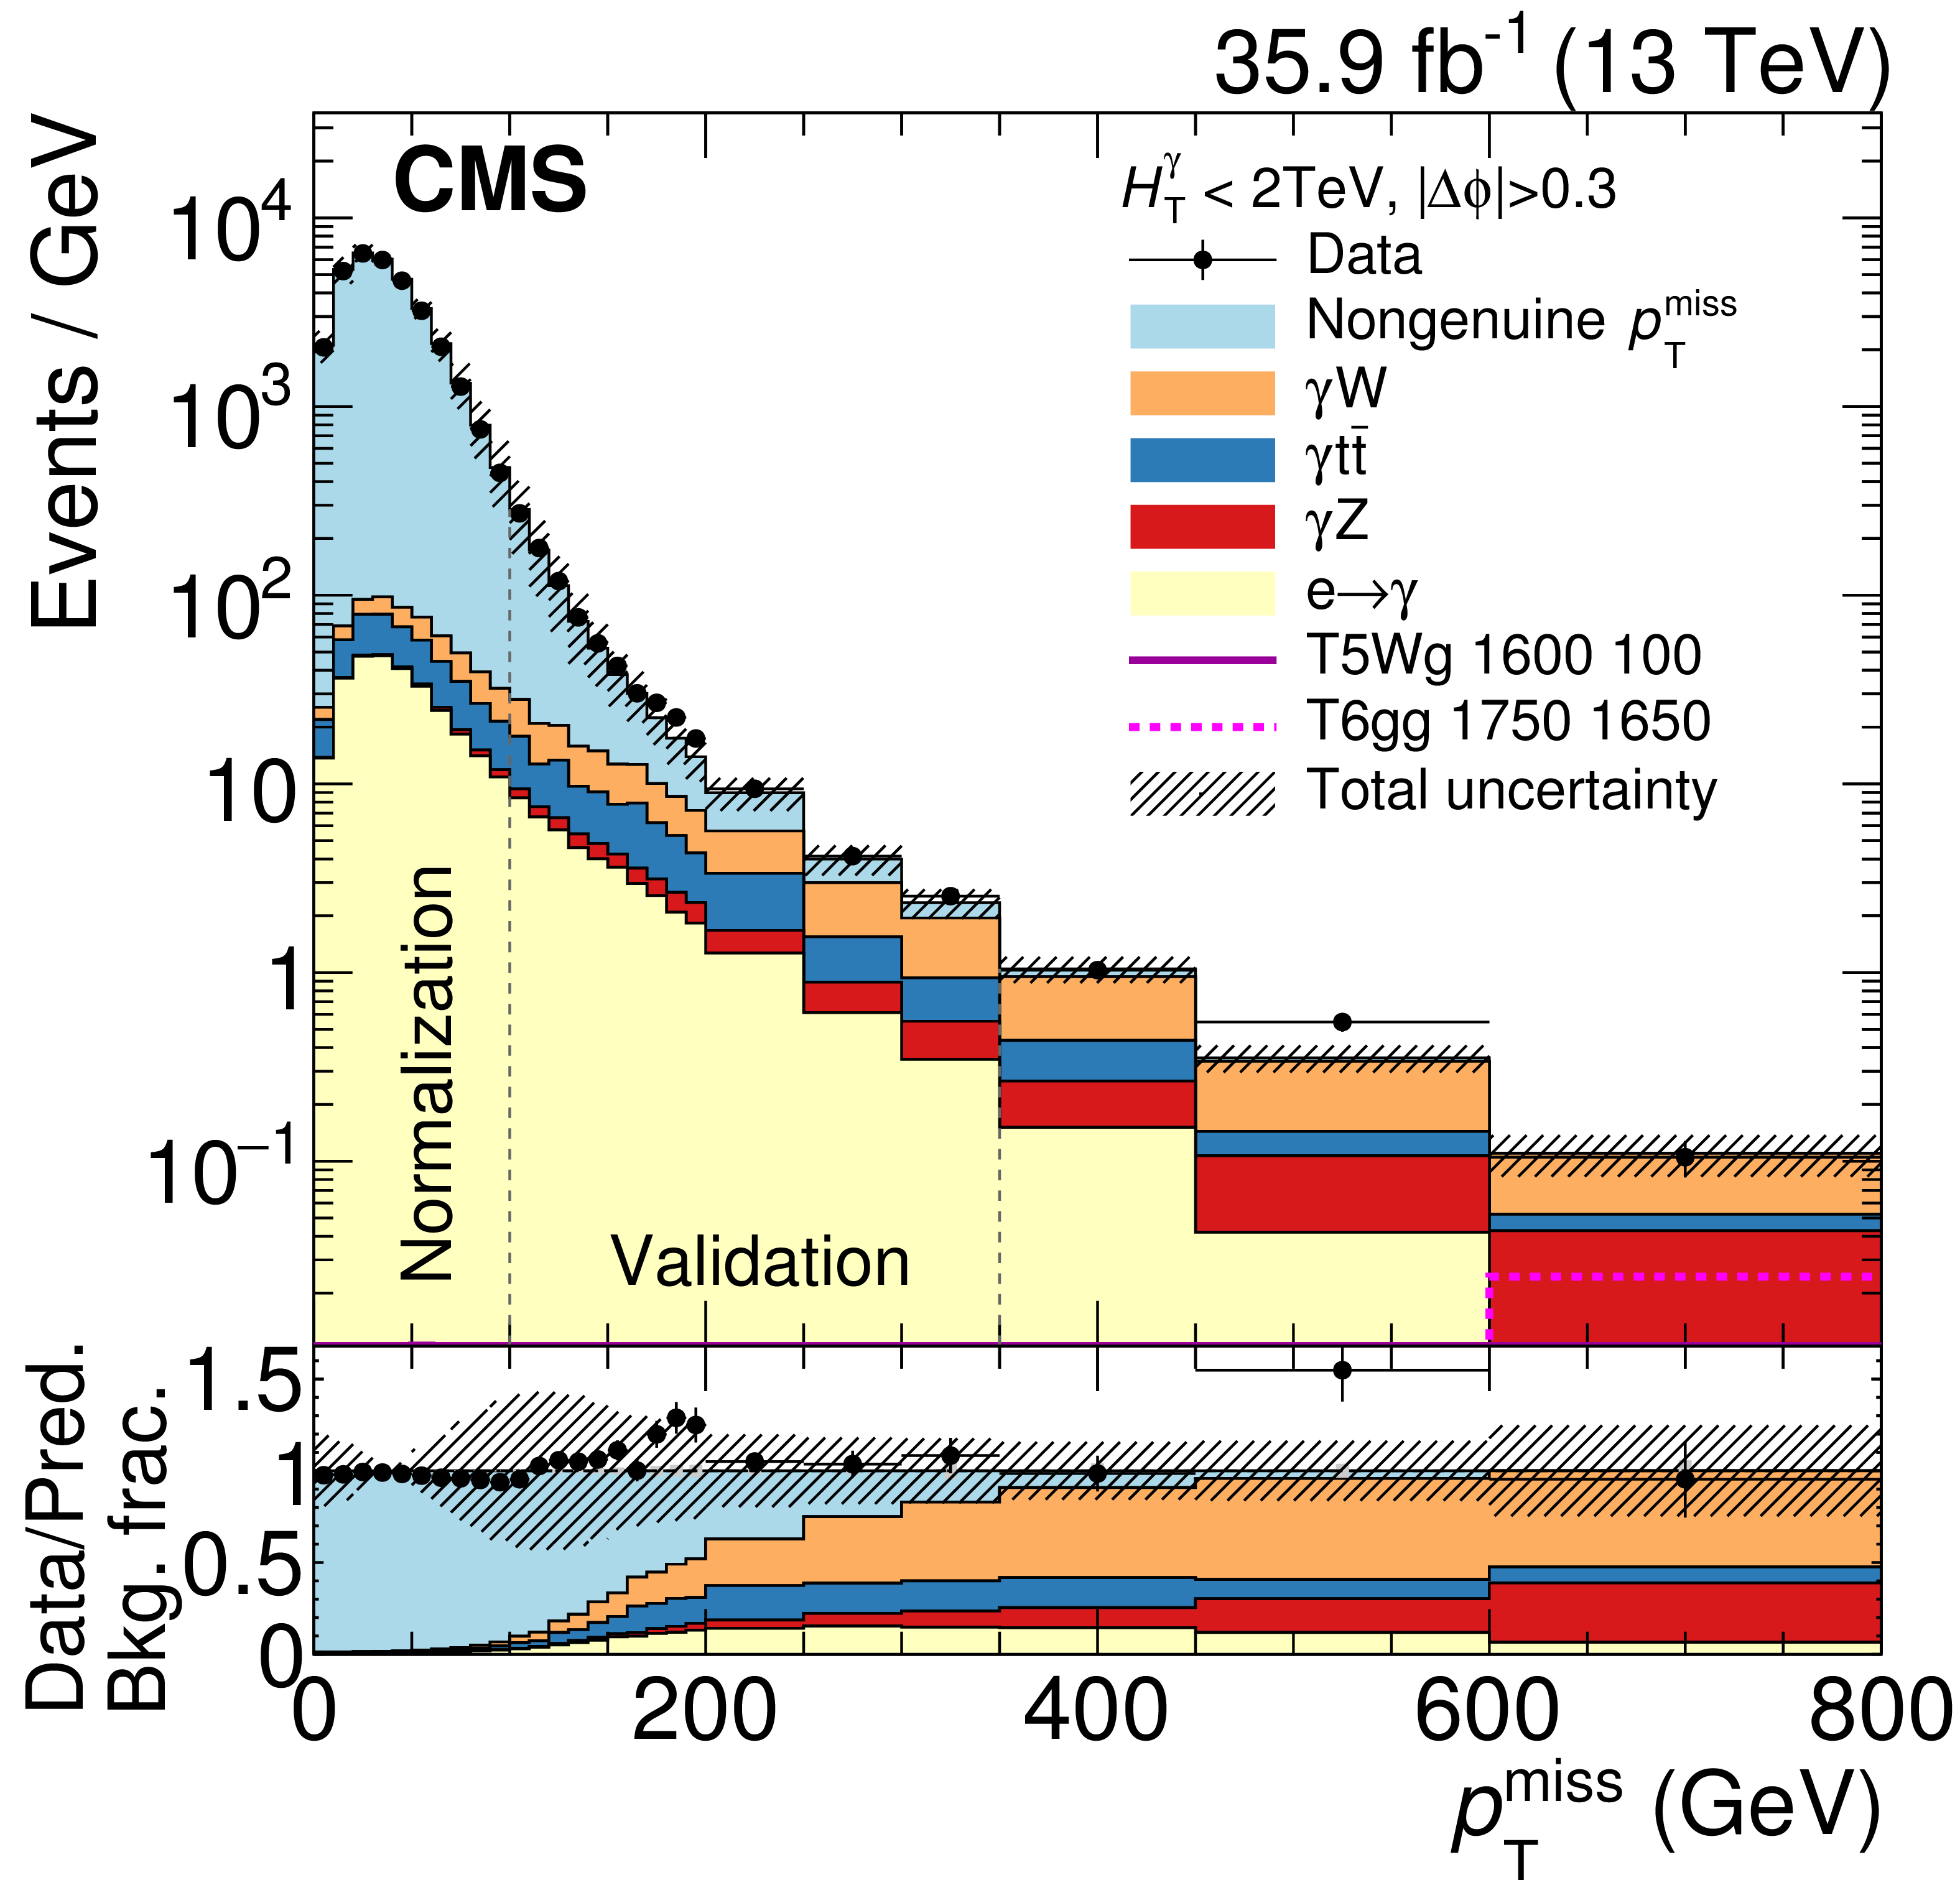
Figure 3:
Validation of the background estimation method for electrons misreconstructed as photons using W+jets and $ {\mathrm{ t } {}\mathrm{ \bar{t} } } $ simulation. The low- (high-) $ {H_\mathrm {T}^{\gamma }} $ selection is shown on the left (right). The number of events corresponds to the expectation in data for an integrated luminosity of 35.9 fb$^{-1}$. The rightmost bin includes all events with $ { {p_{\mathrm {T}}} ^\text {miss}} > $ 600 GeV. |

png pdf |
Figure 3-a:
Validation of the background estimation method for electrons misreconstructed as photons using W+jets and $ {\mathrm{ t } {}\mathrm{ \bar{t} } } $ simulation. The low-$ {H_\mathrm {T}^{\gamma }} $ selection is shown. The number of events corresponds to the expectation in data for an integrated luminosity of 35.9 fb$^{-1}$. The rightmost bin includes all events with $ { {p_{\mathrm {T}}} ^\text {miss}} > $ 600 GeV. |
png pdf |
Figure 3-b:
Validation of the background estimation method for electrons misreconstructed as photons using W+jets and $ {\mathrm{ t } {}\mathrm{ \bar{t} } } $ simulation. The high-$ {H_\mathrm {T}^{\gamma }} $ selection is shown. The number of events corresponds to the expectation in data for an integrated luminosity of 35.9 fb$^{-1}$. The rightmost bin includes all events with $ { {p_{\mathrm {T}}} ^\text {miss}} > $ 600 GeV. |
png pdf |
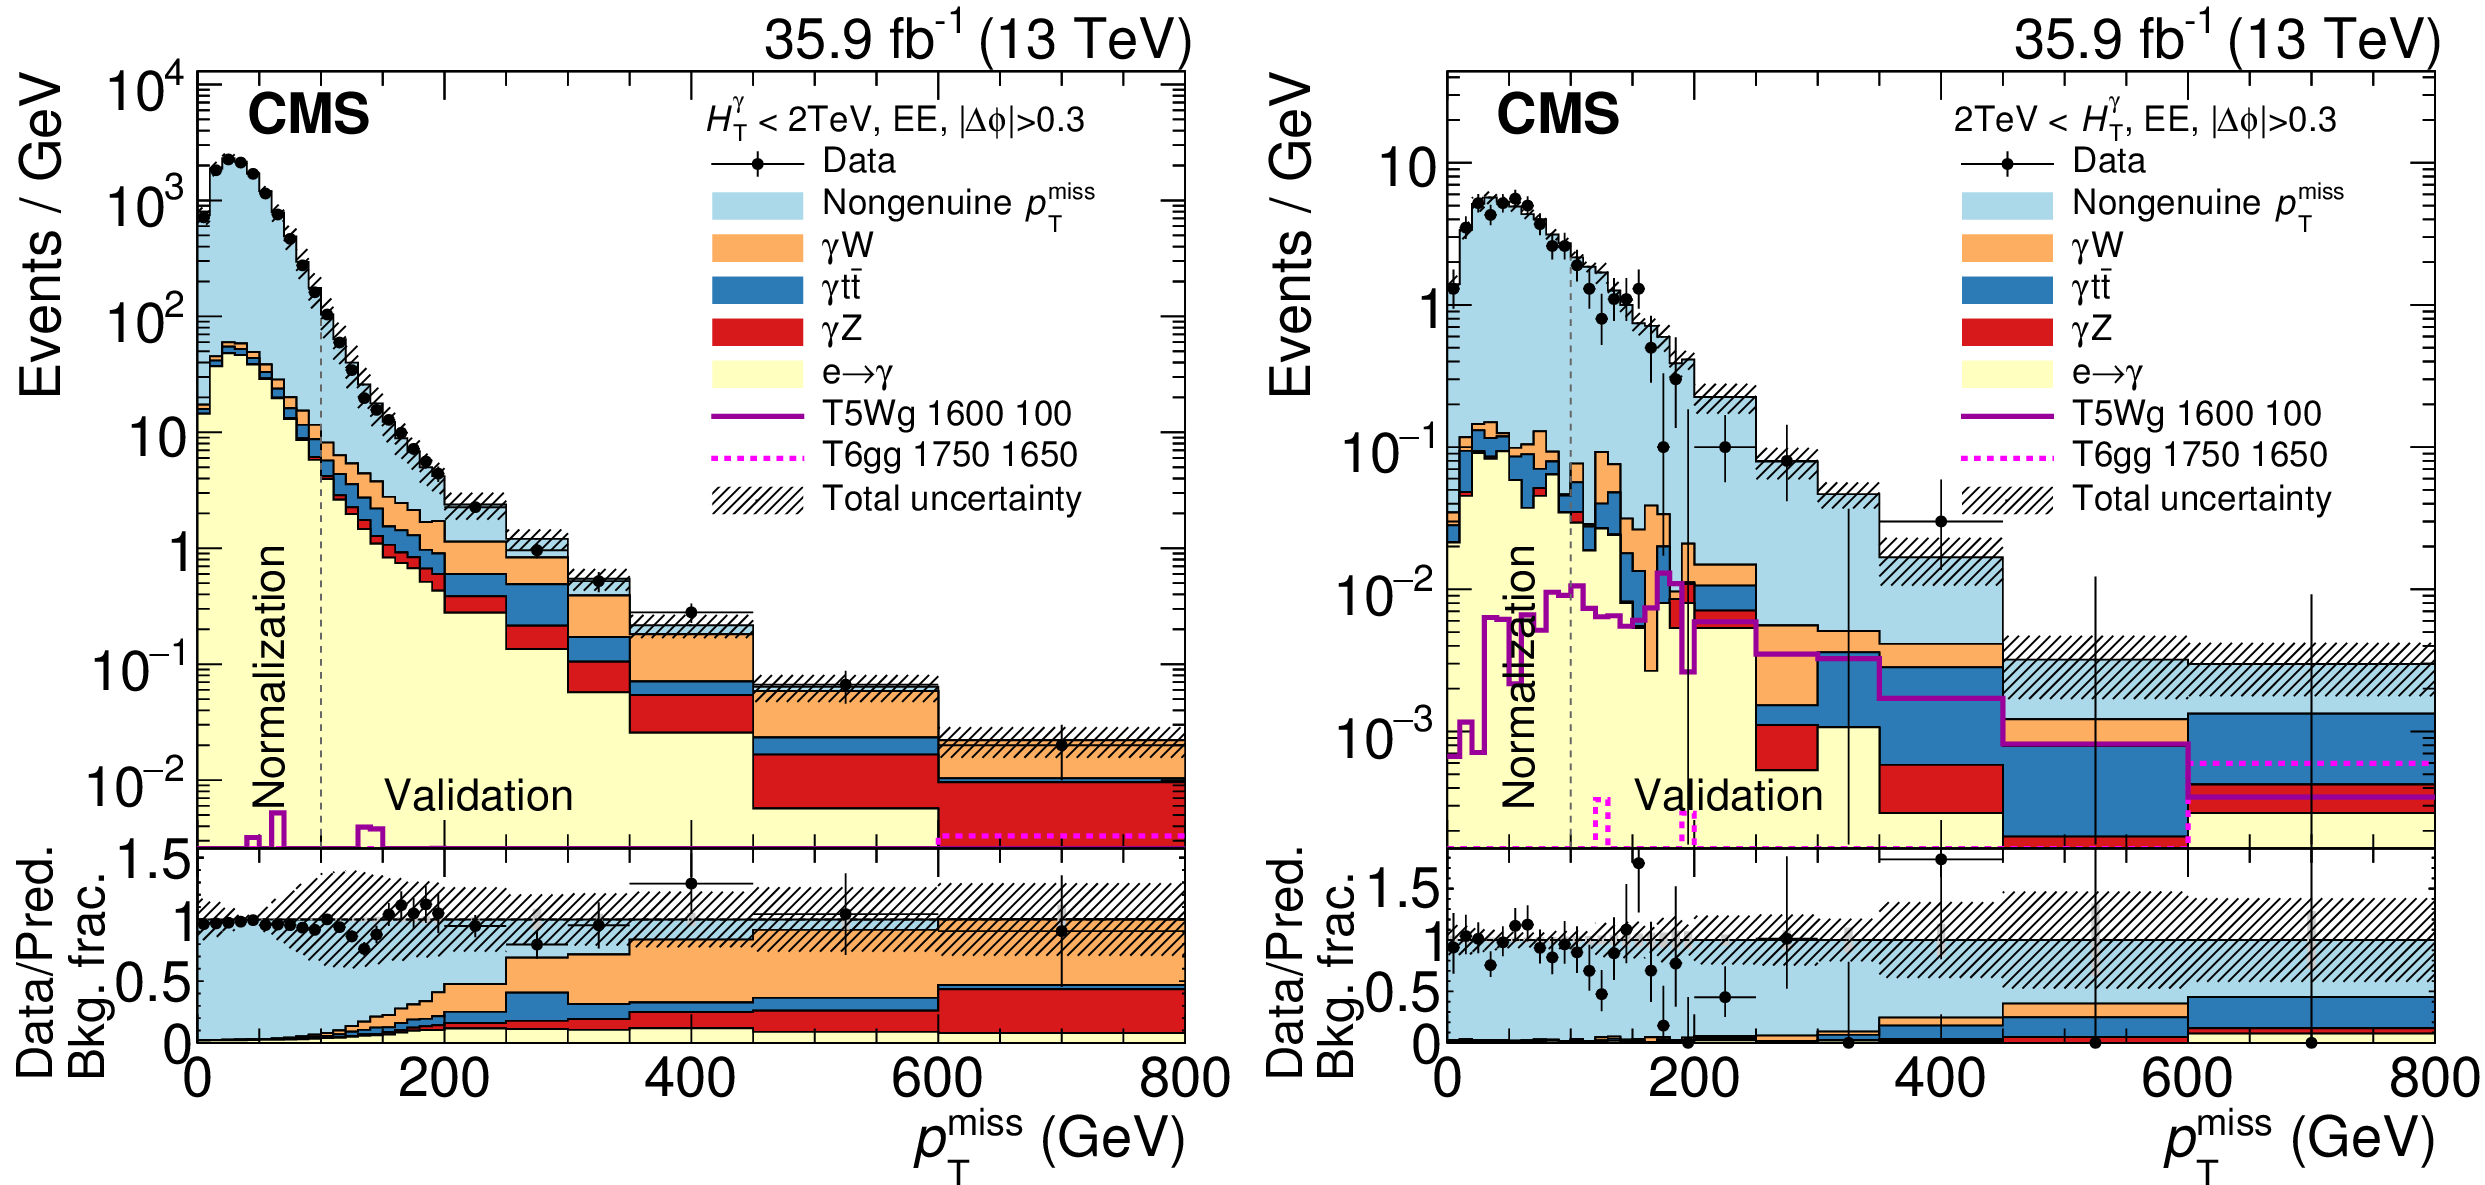
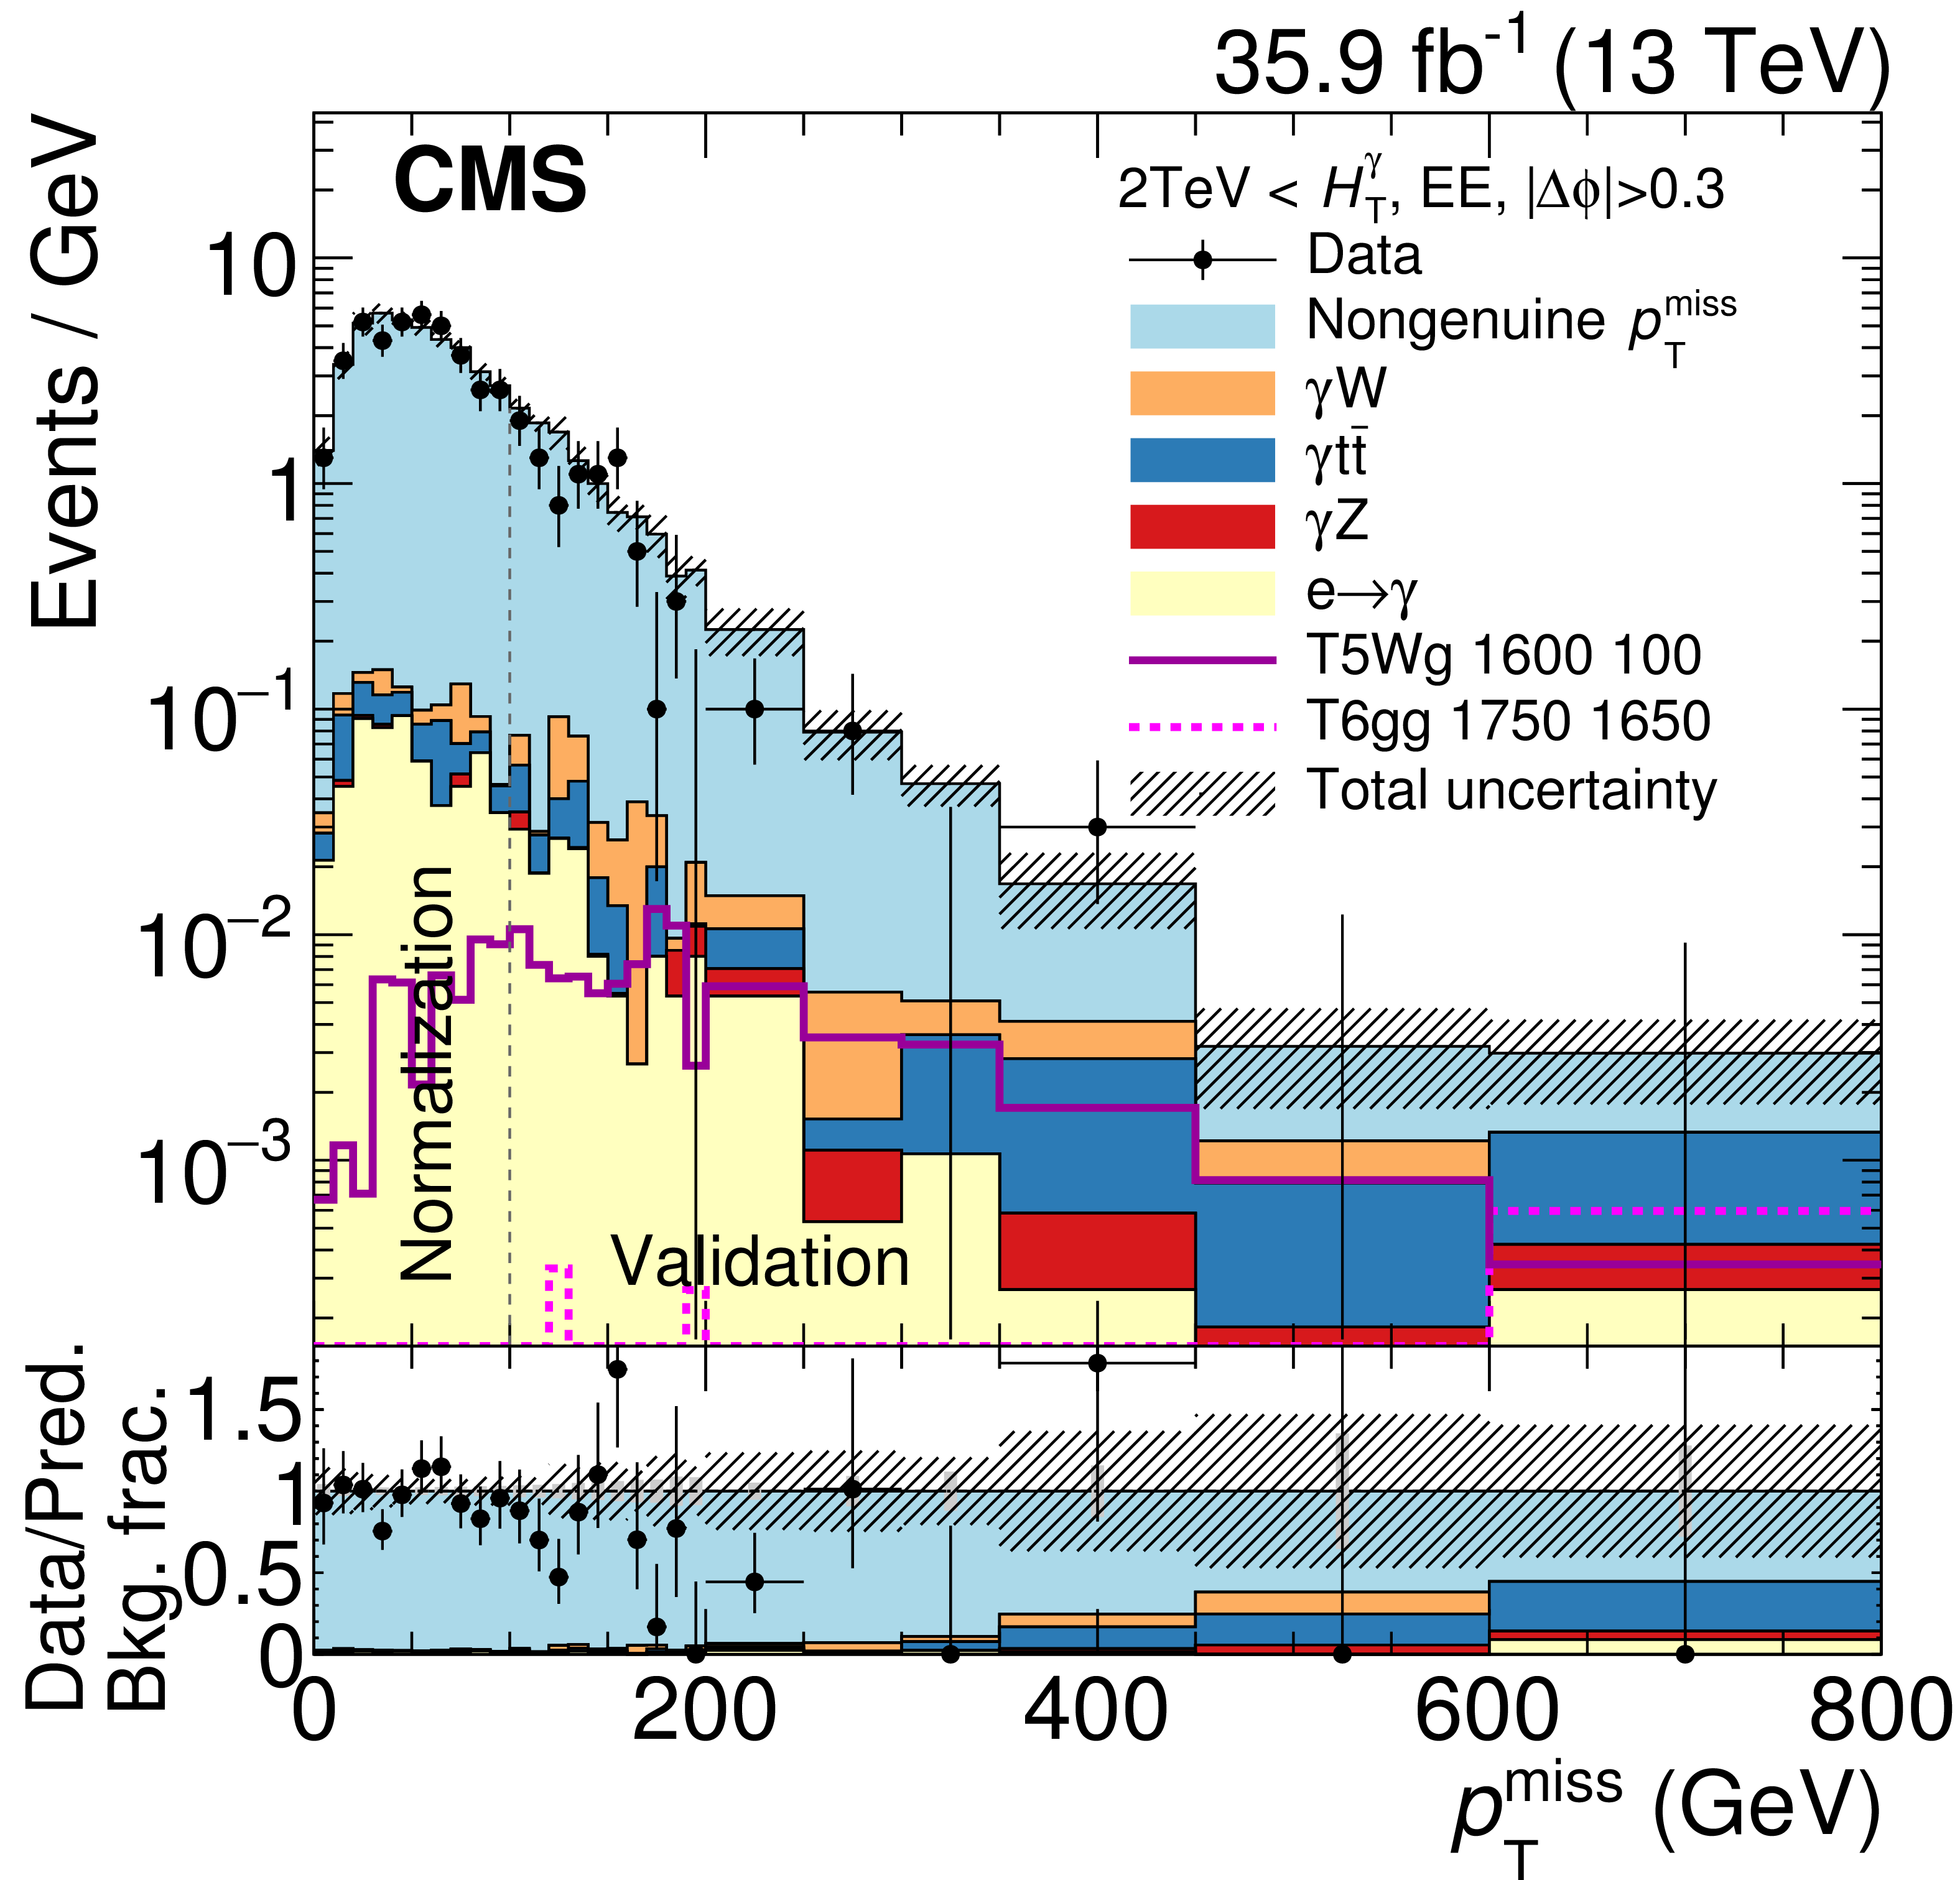
Figure 4:
Validation of the background estimation methods with photons reconstructed in the EE. The expectation for the T5Wg signal scenario with a gluino mass of 1600 GeV and a gaugino mass of 100 GeV and the T6gg signal scenario with a squark mass of 1750 GeV and a neutralino mass of 1650 GeV are shown. The low- (high-) $ {H_\mathrm {T}^{\gamma }} $ selection is shown on the left (right). Below the $ { {p_{\mathrm {T}}} ^\text {miss}} $ distributions, the data divided by the background prediction are shown as black dots, and the relative background components are shown as coloured areas. The rightmost bin includes all events with $ { {p_{\mathrm {T}}} ^\text {miss}} > $ 600 GeV. |

png pdf |
Figure 4-a:
Validation of the background estimation methods with photons reconstructed in the EE. The expectation for the T5Wg signal scenario with a gluino mass of 1600 GeV and a gaugino mass of 100 GeV and the T6gg signal scenario with a squark mass of 1750 GeV and a neutralino mass of 1650 GeV are shown. The low- $ {H_\mathrm {T}^{\gamma }} $ selection is shown. Below the $ { {p_{\mathrm {T}}} ^\text {miss}} $ distributions, the data divided by the background prediction are shown as black dots, and the relative background components are shown as coloured areas. The rightmost bin includes all events with $ { {p_{\mathrm {T}}} ^\text {miss}} > $ 600 GeV. |
png pdf |
Figure 4-b:
Validation of the background estimation methods with photons reconstructed in the EE. The expectation for the T5Wg signal scenario with a gluino mass of 1600 GeV and a gaugino mass of 100 GeV and the T6gg signal scenario with a squark mass of 1750 GeV and a neutralino mass of 1650 GeV are shown. The high- $ {H_\mathrm {T}^{\gamma }} $ selection is shown. Below the $ { {p_{\mathrm {T}}} ^\text {miss}} $ distributions, the data divided by the background prediction are shown as black dots, and the relative background components are shown as coloured areas. The rightmost bin includes all events with $ { {p_{\mathrm {T}}} ^\text {miss}} > $ 600 GeV. |
png pdf |
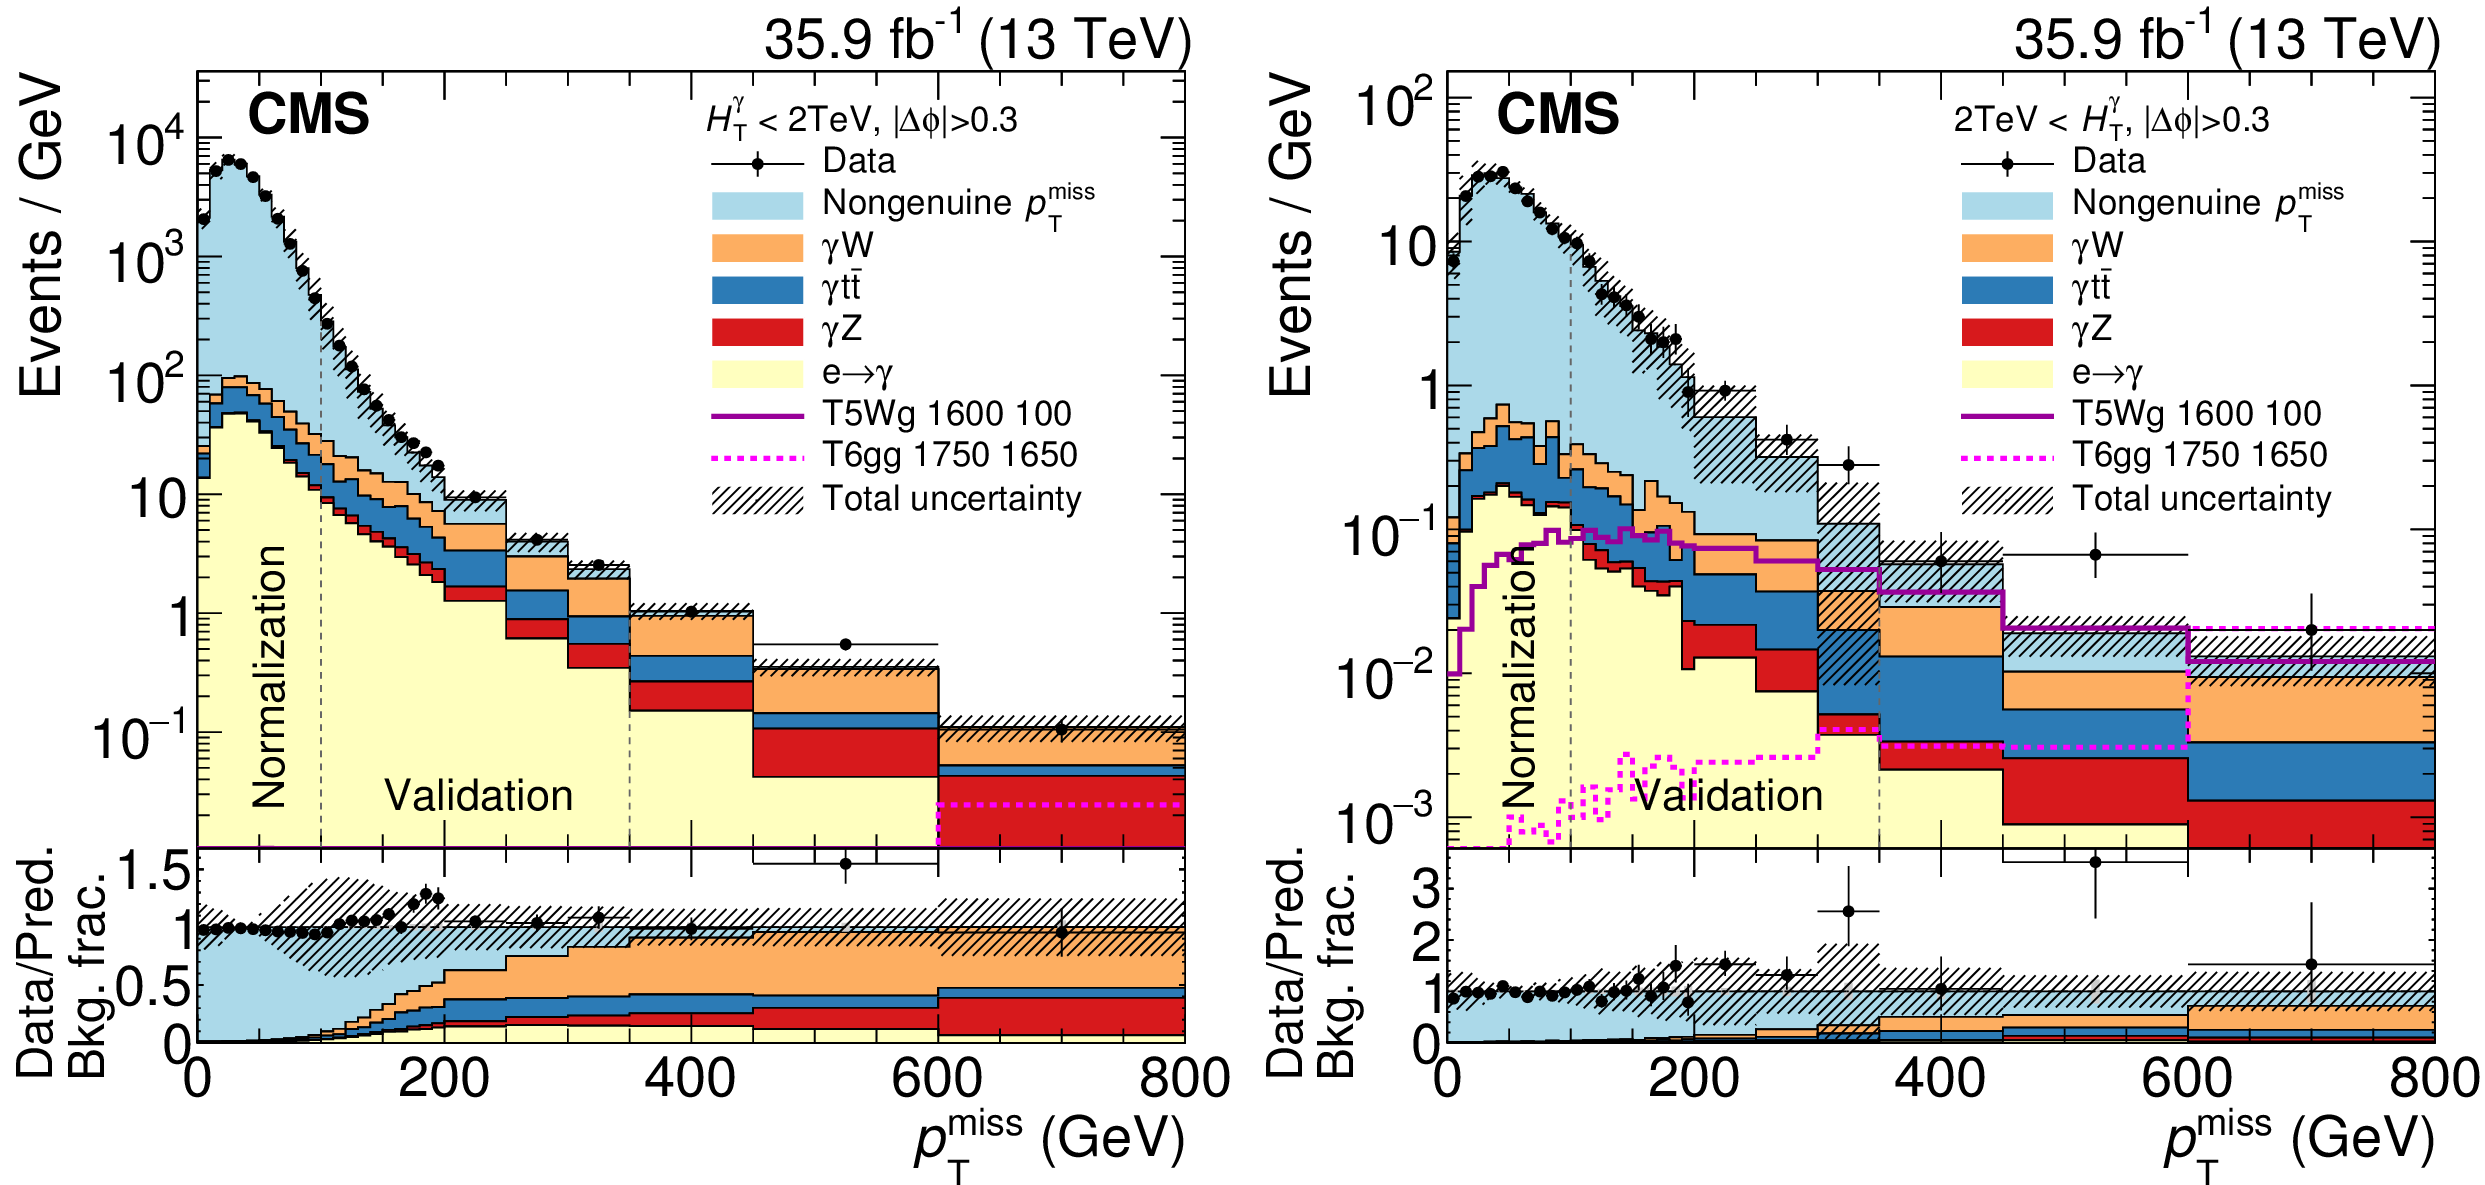
Figure 5:
Observed data compared to the background prediction. The expectation for the T5Wg signal scenario with a gluino mass of 1600 GeV and a gaugino mass of 100 GeV and the T6gg signal scenario with a squark mass of 1750 GeV and a neutralino mass of 1650 GeV are shown. The low- (high-) $ {H_\mathrm {T}^{\gamma }} $ selection is shown on the left (right). Below the $ { {p_{\mathrm {T}}} ^\text {miss}} $ distributions, the data divided by the background prediction are shown as black dots, and the relative background components are shown as coloured areas. The last three bins in each plot correspond to the search regions. The rightmost bin includes all events with $ { {p_{\mathrm {T}}} ^\text {miss}} > $ 600 GeV. |
png pdf |
Figure 5-a:
Observed data compared to the background prediction. The expectation for the T5Wg signal scenario with a gluino mass of 1600 GeV and a gaugino mass of 100 GeV and the T6gg signal scenario with a squark mass of 1750 GeV and a neutralino mass of 1650 GeV are shown. The low- $ {H_\mathrm {T}^{\gamma }} $ selection is shown. Below the $ { {p_{\mathrm {T}}} ^\text {miss}} $ distributions, the data divided by the background prediction are shown as black dots, and the relative background components are shown as coloured areas. The last three bins in each plot correspond to the search regions. The rightmost bin includes all events with $ { {p_{\mathrm {T}}} ^\text {miss}} > $ 600 GeV. |

png pdf |
Figure 5-b:
Observed data compared to the background prediction. The expectation for the T5Wg signal scenario with a gluino mass of 1600 GeV and a gaugino mass of 100 GeV and the T6gg signal scenario with a squark mass of 1750 GeV and a neutralino mass of 1650 GeV are shown. The high- $ {H_\mathrm {T}^{\gamma }} $ selection is shown. Below the $ { {p_{\mathrm {T}}} ^\text {miss}} $ distributions, the data divided by the background prediction are shown as black dots, and the relative background components are shown as coloured areas. The last three bins in each plot correspond to the search regions. The rightmost bin includes all events with $ { {p_{\mathrm {T}}} ^\text {miss}} > $ 600 GeV. |
png pdf |
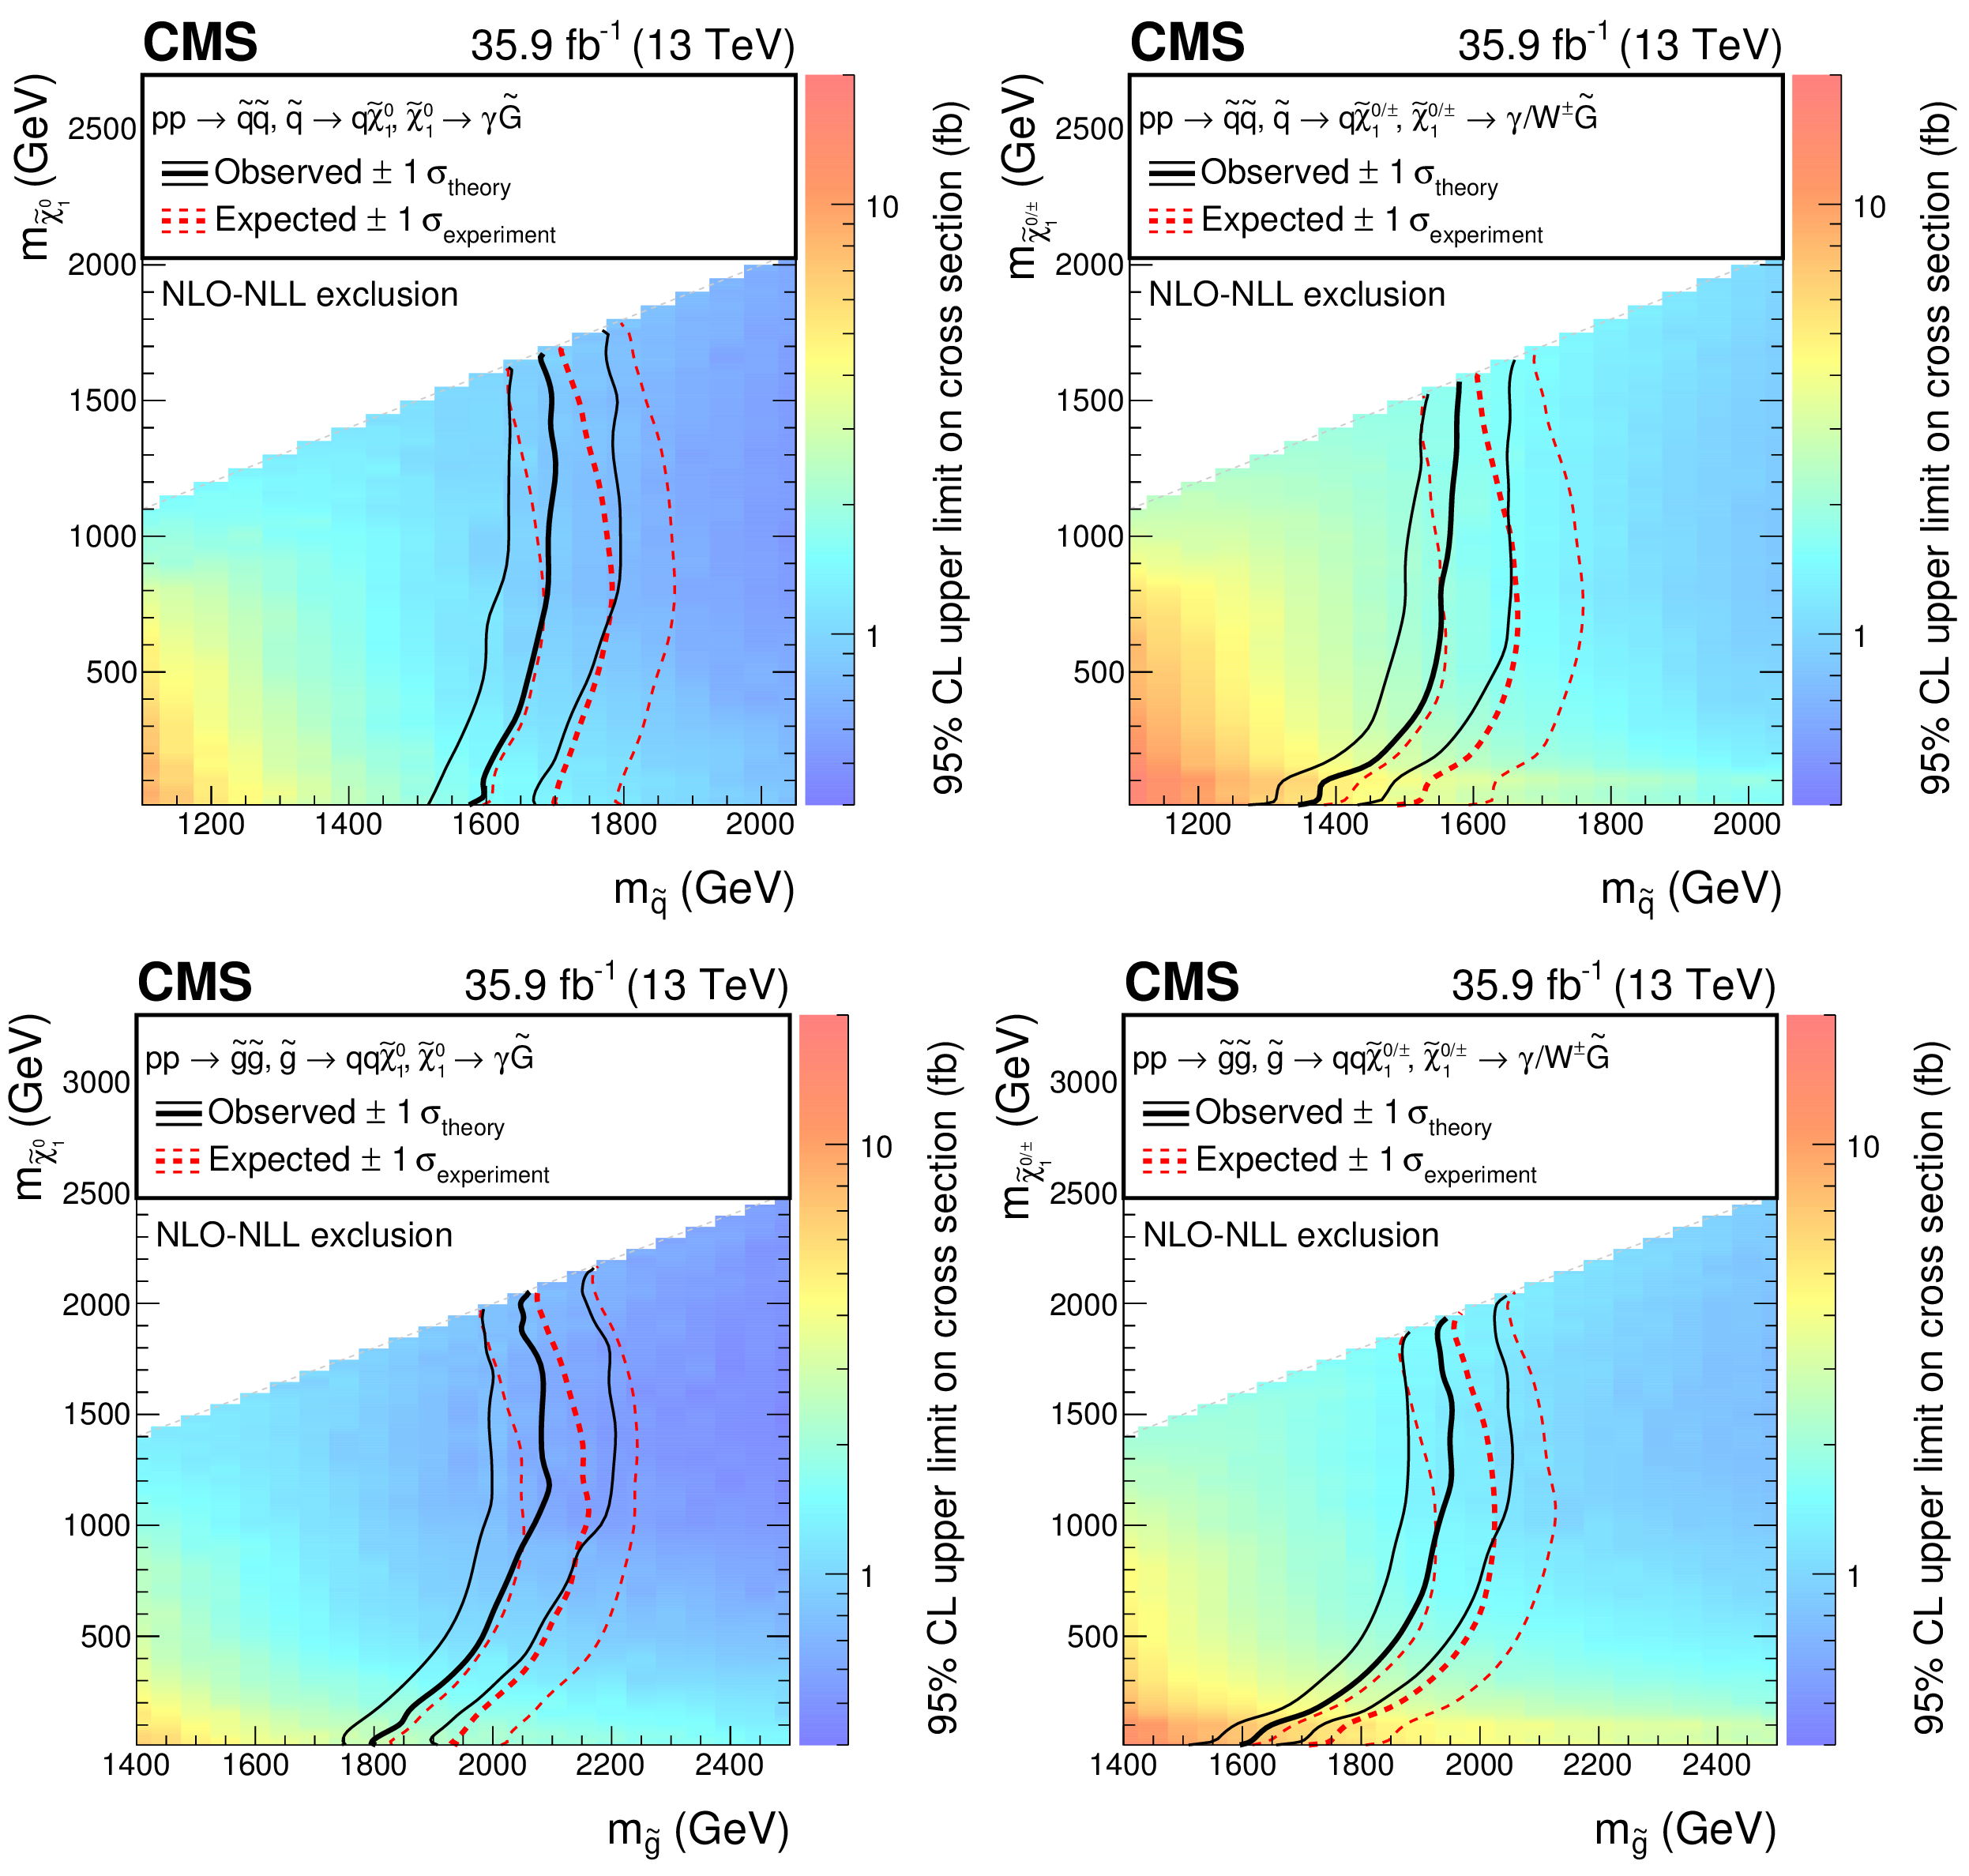
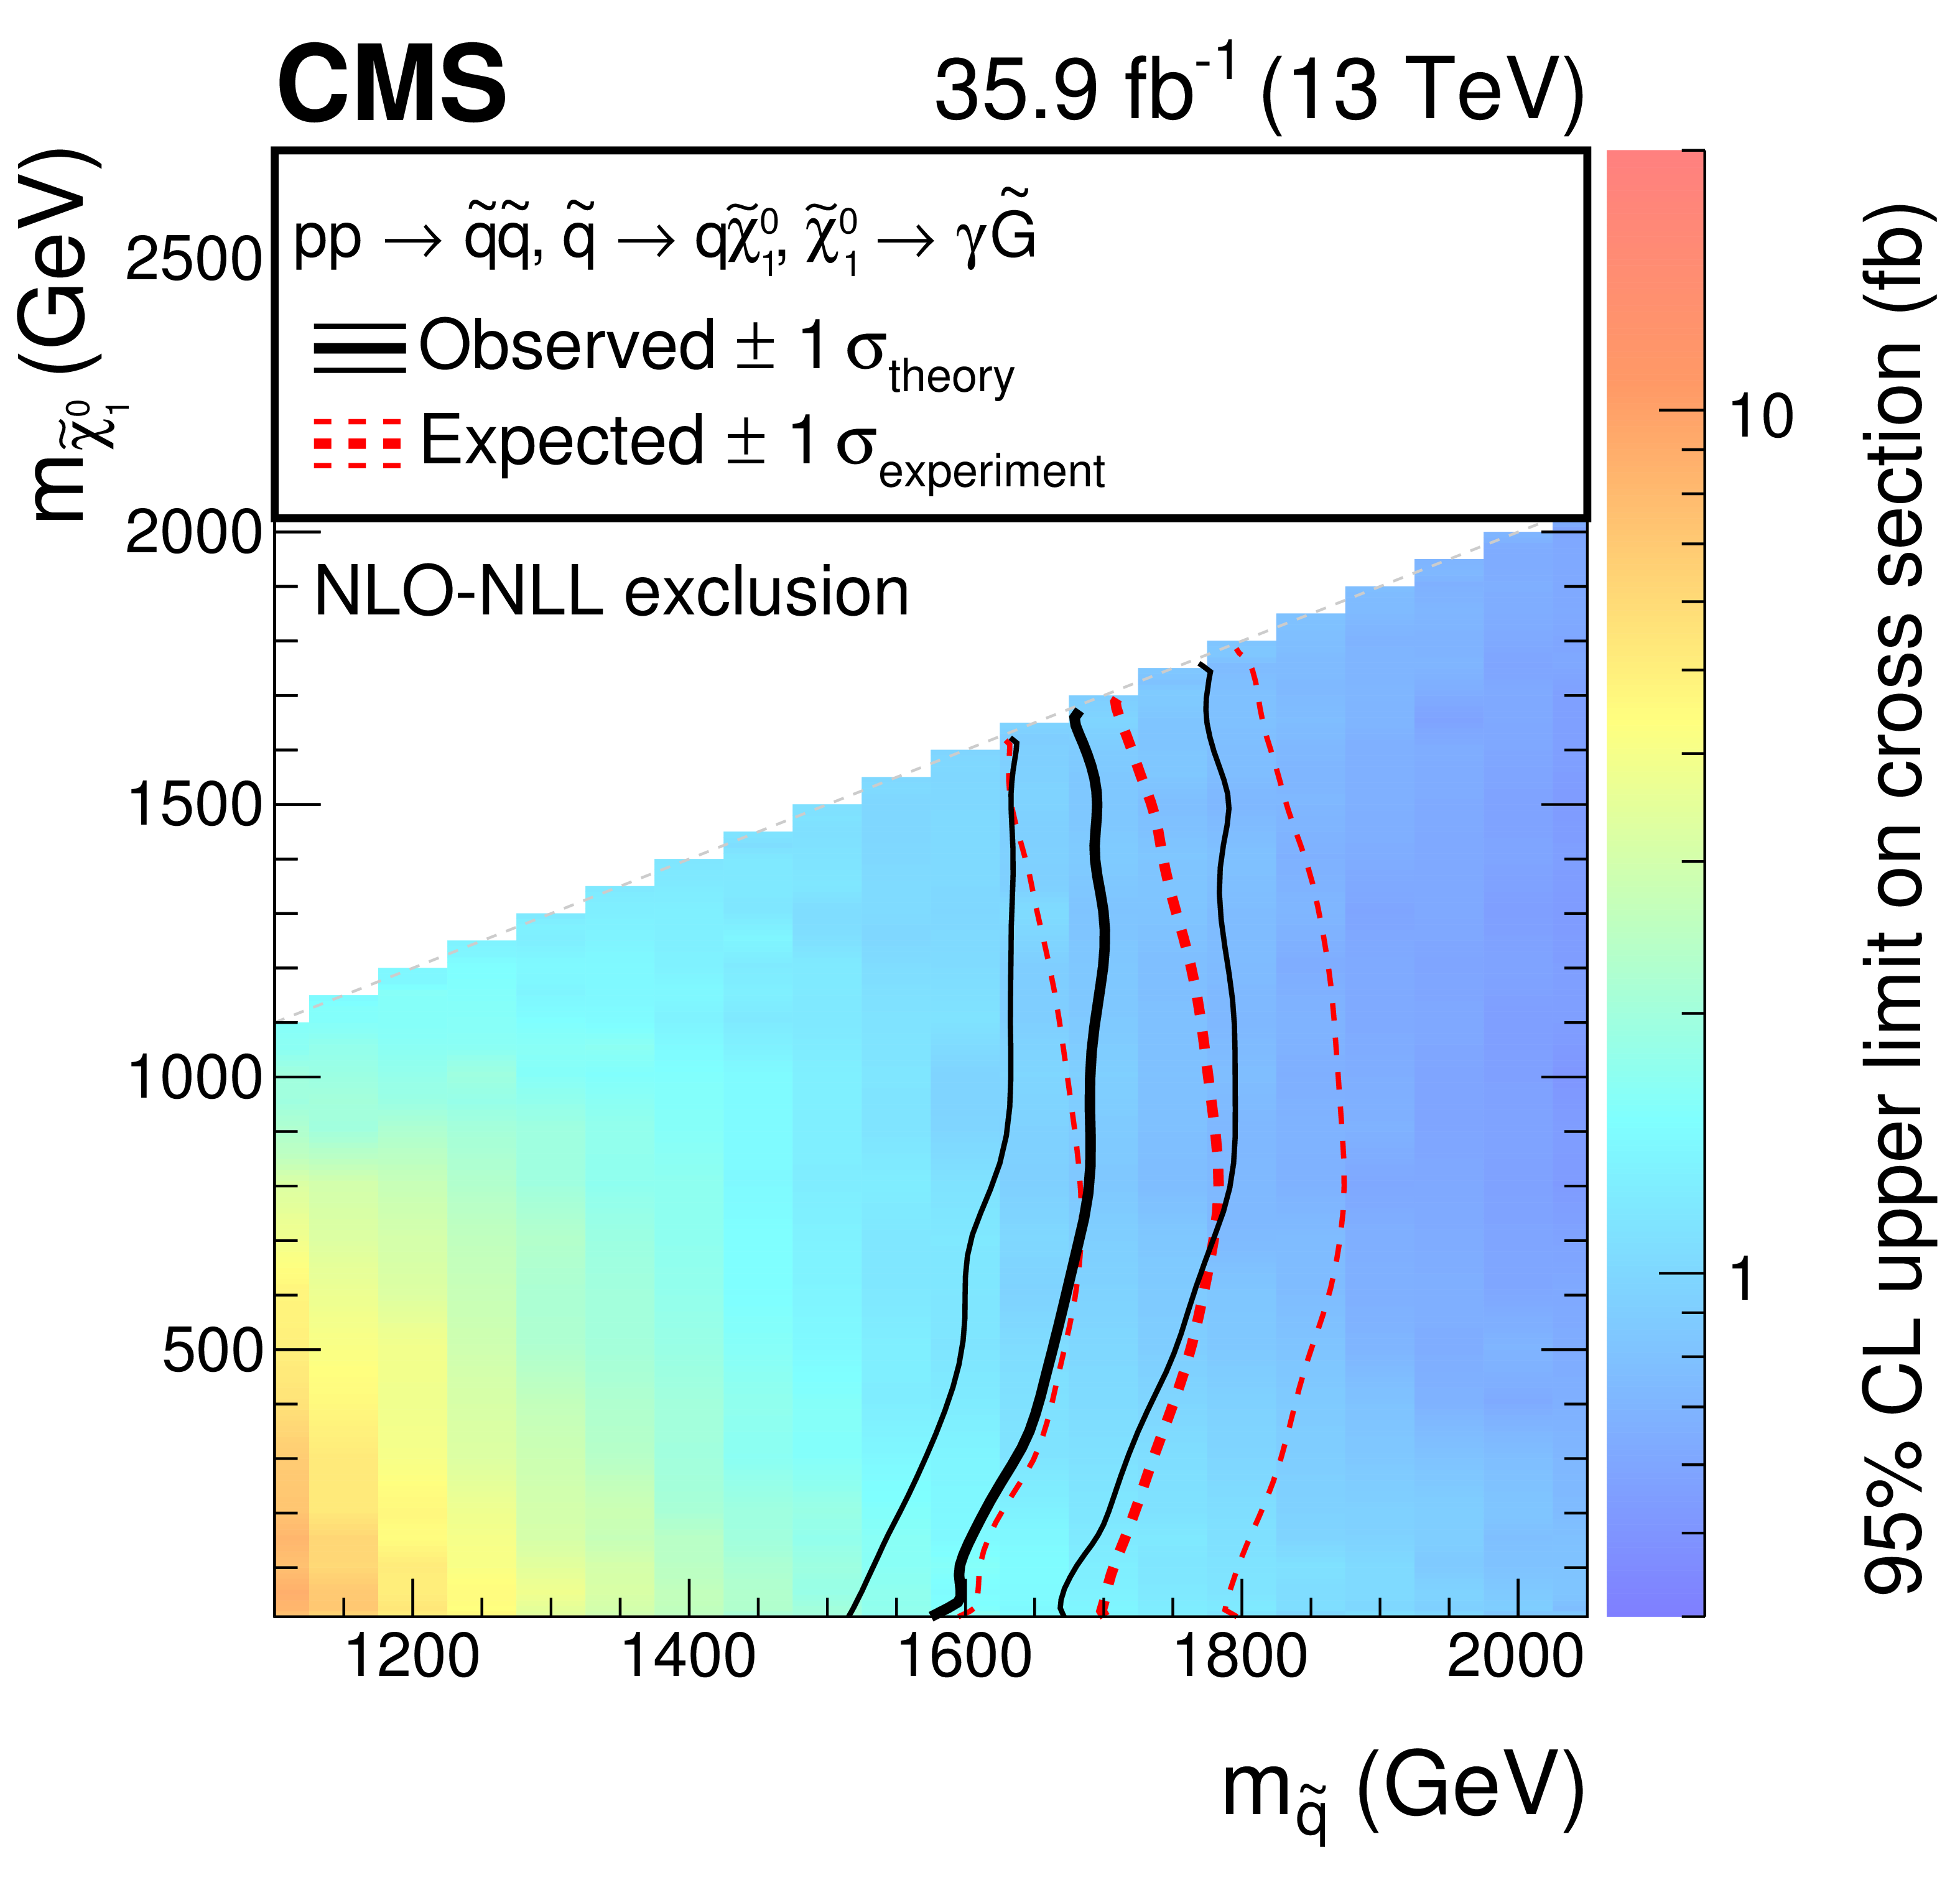
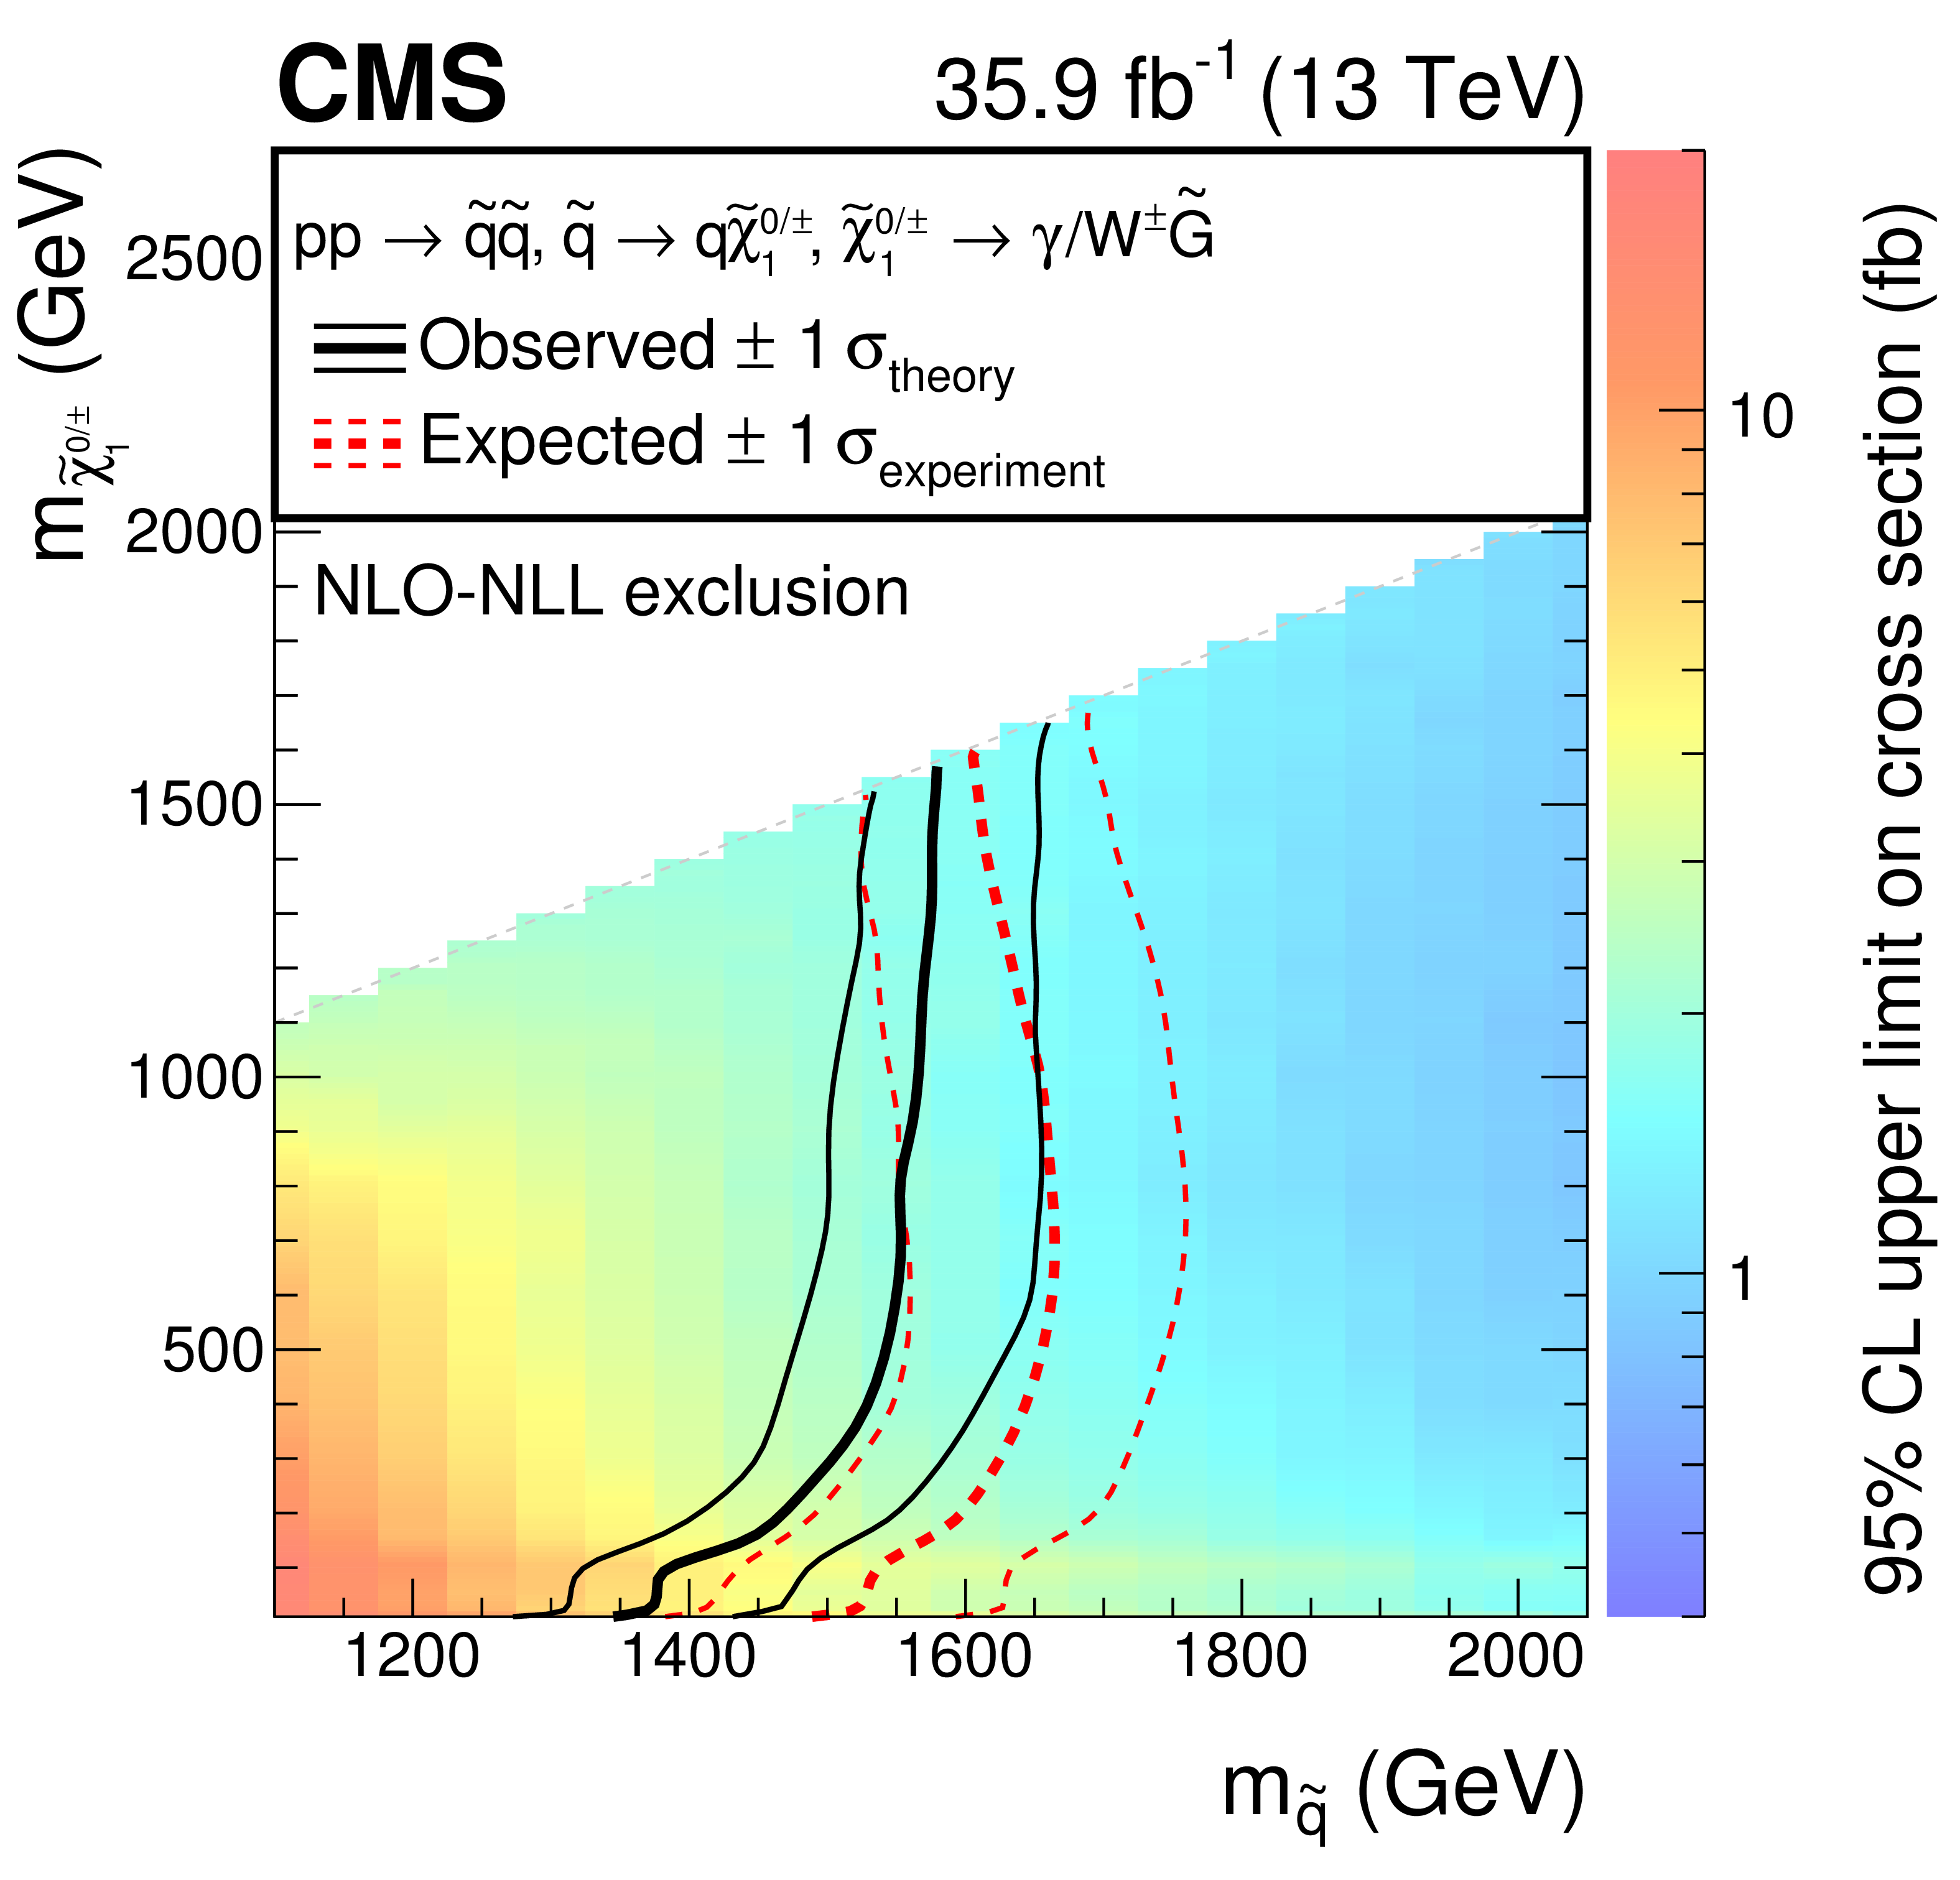
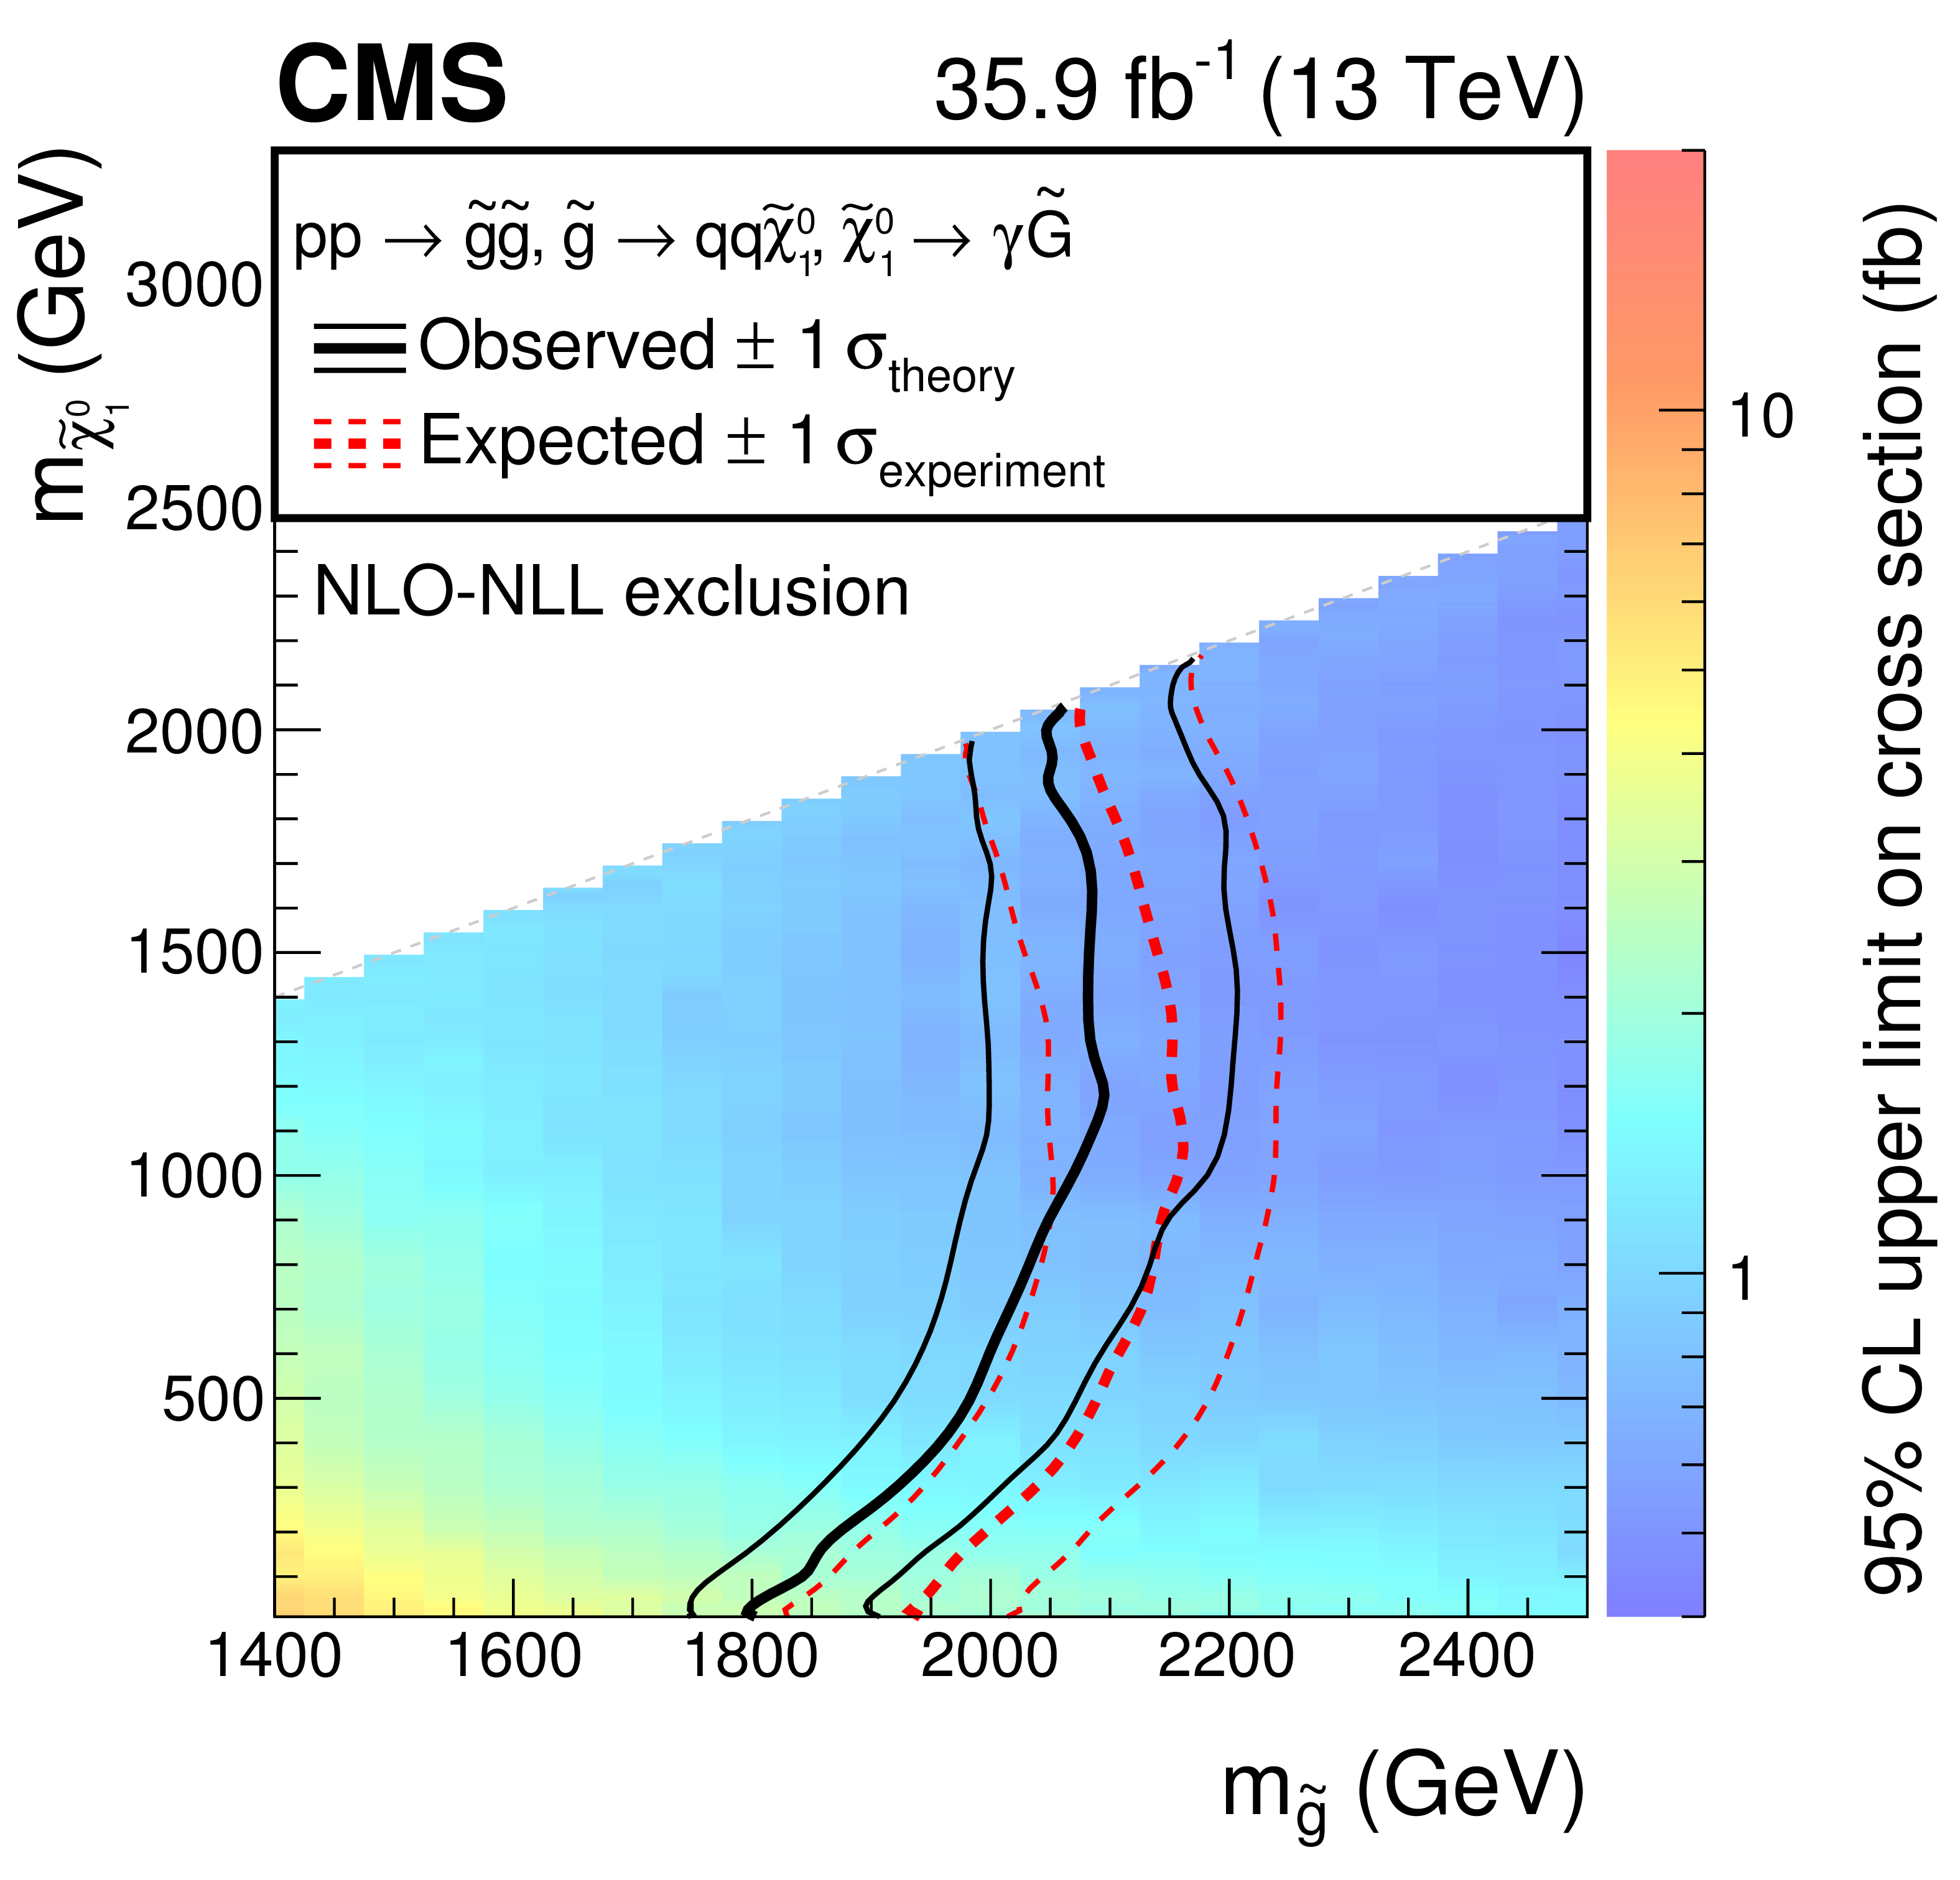
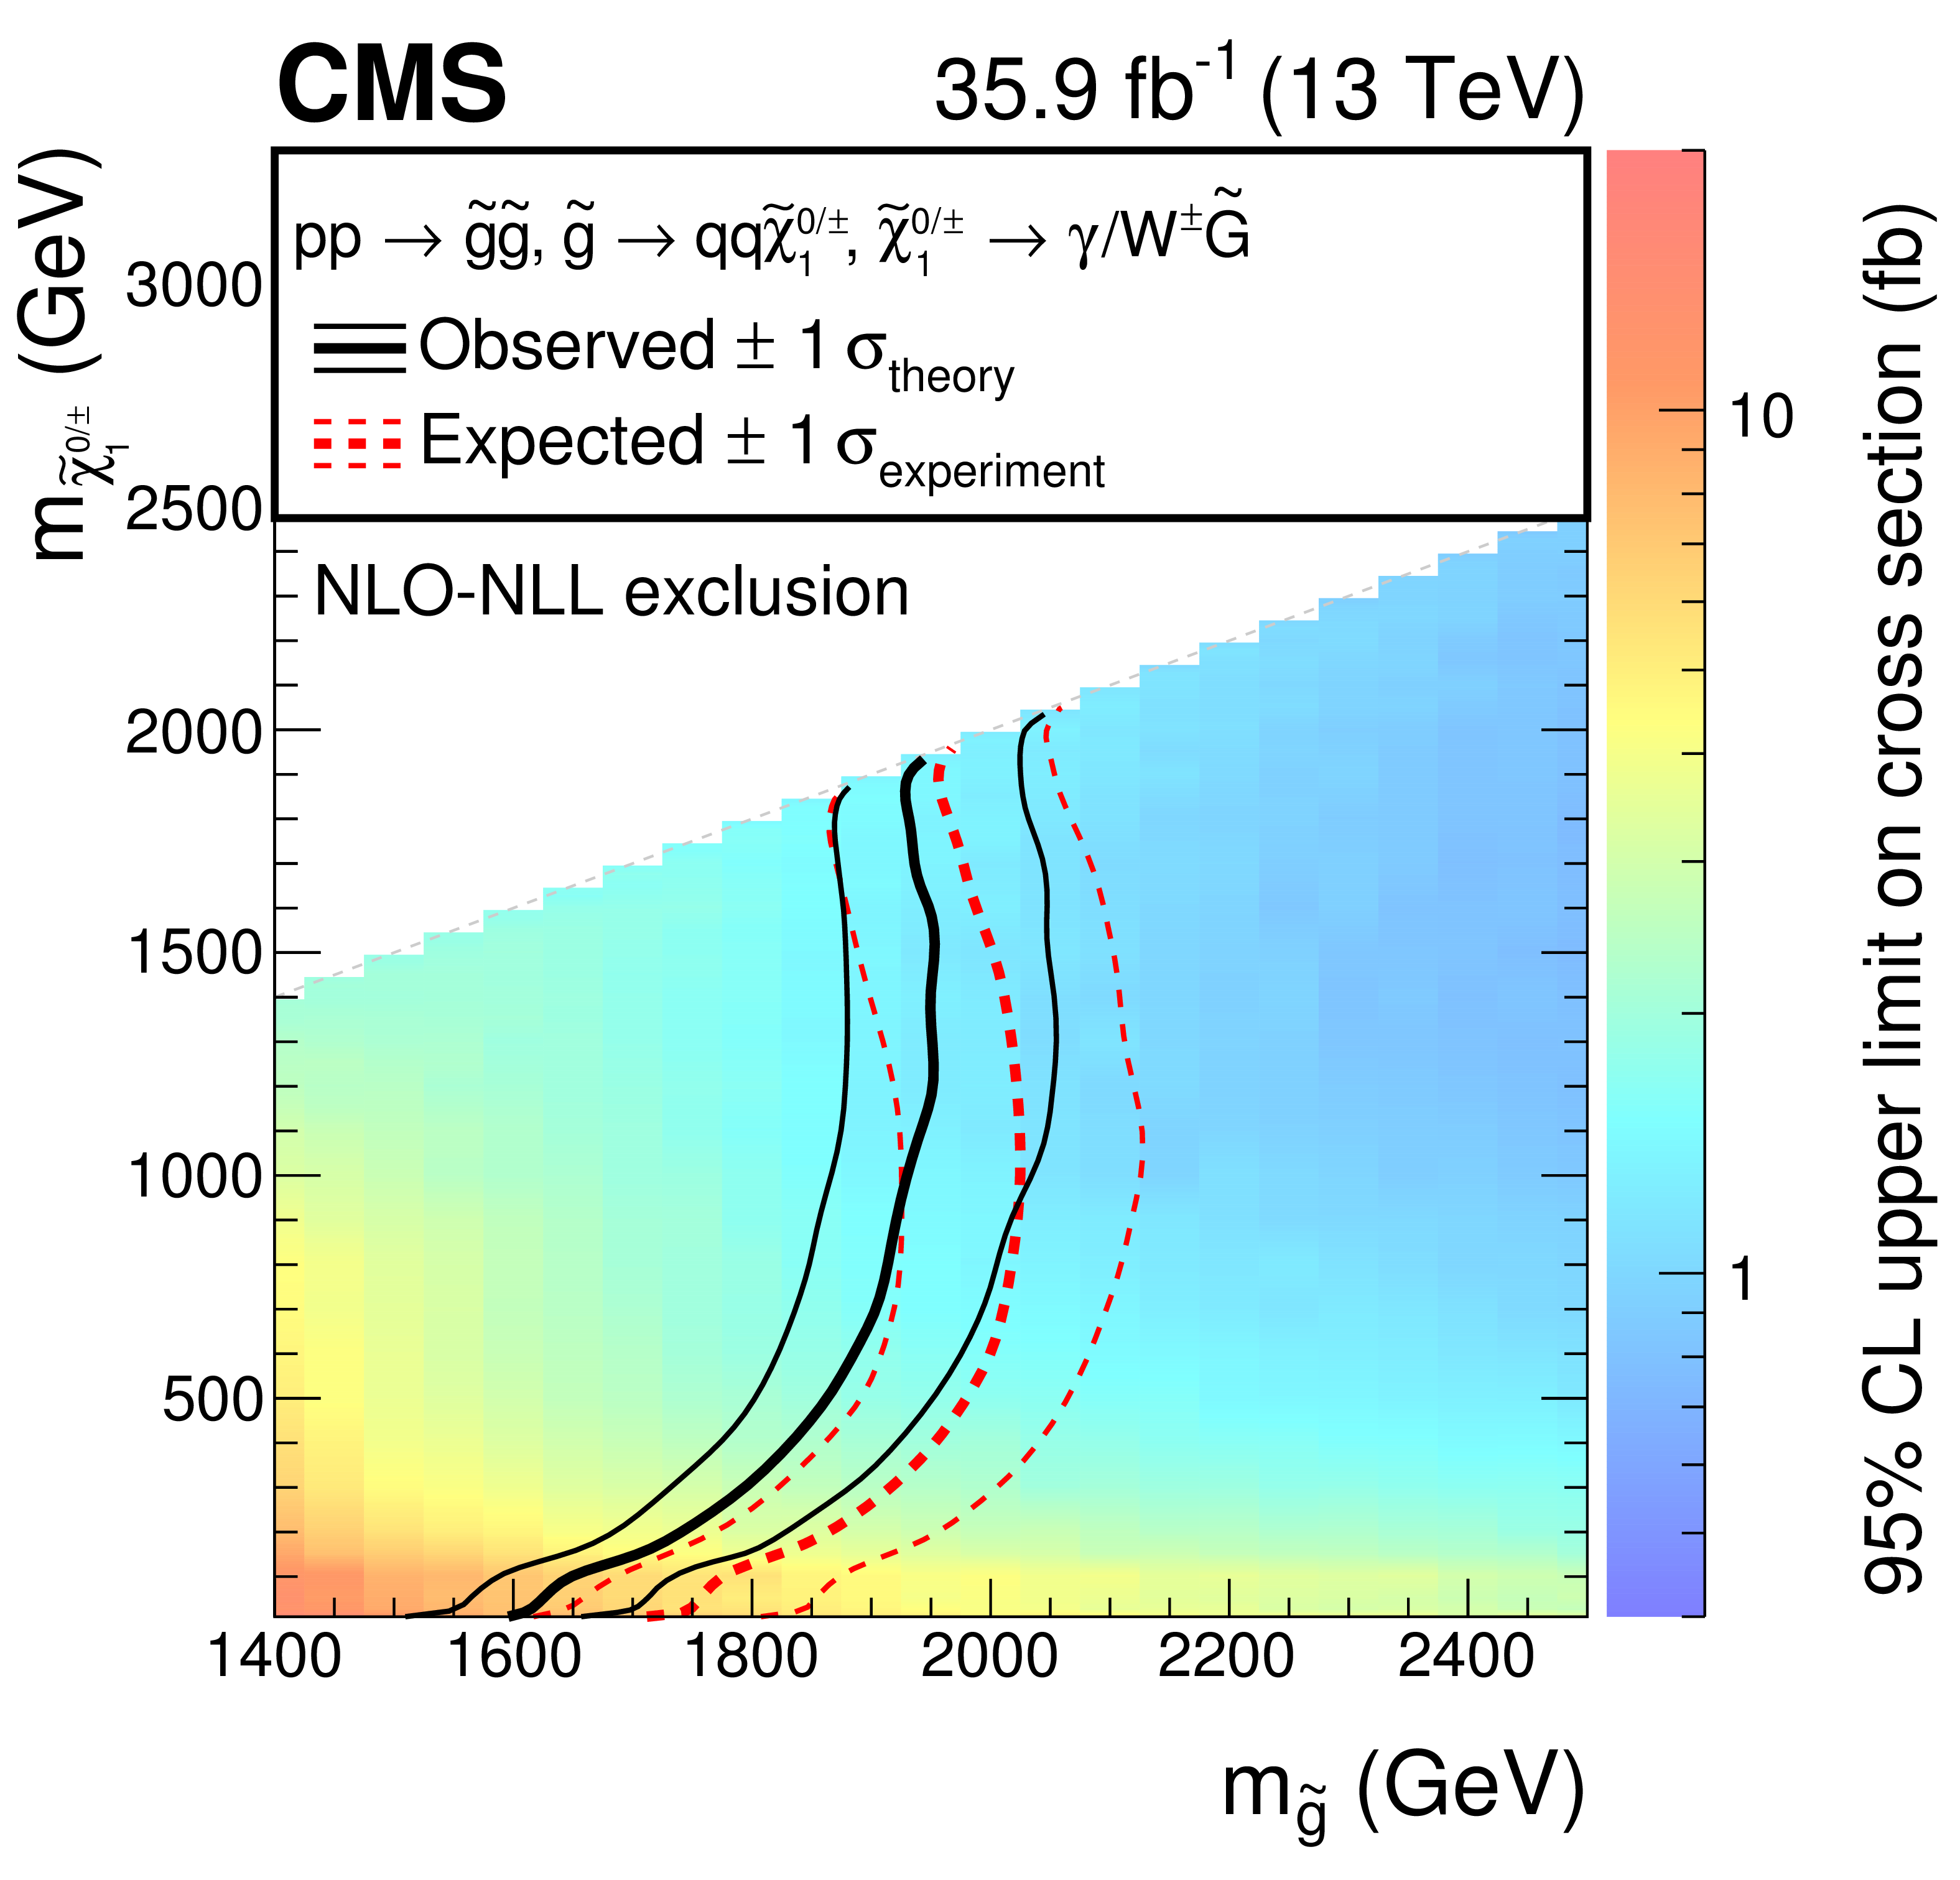
Figure 6:
Exclusion limits at 95% CL for the T6gg (top left), T6Wg (top right), T5gg (bottom left) and T5Wg (bottom right) models. The solid black curve represents the observed exclusion contour and the uncertainty due to the signal cross section. The red dashed curves represent the expected exclusion contours and the experimental uncertainties. |
png pdf root |
Figure 6-a:
Exclusion limits at 95% CL for the T6gg model. The solid black curve represents the observed exclusion contour and the uncertainty due to the signal cross section. The red dashed curves represent the expected exclusion contours and the experimental uncertainties. |
png pdf root |
Figure 6-b:
Exclusion limits at 95% CL for the T6Wg model. The solid black curve represents the observed exclusion contour and the uncertainty due to the signal cross section. The red dashed curves represent the expected exclusion contours and the experimental uncertainties. |
png pdf root |
Figure 6-c:
Exclusion limits at 95% CL for the T5gg model. The solid black curve represents the observed exclusion contour and the uncertainty due to the signal cross section. The red dashed curves represent the expected exclusion contours and the experimental uncertainties. |
png pdf root |
Figure 6-d:
Exclusion limits at 95% CL for the T5Wg model. The solid black curve represents the observed exclusion contour and the uncertainty due to the signal cross section. The red dashed curves represent the expected exclusion contours and the experimental uncertainties. |
| Tables | |
png pdf |
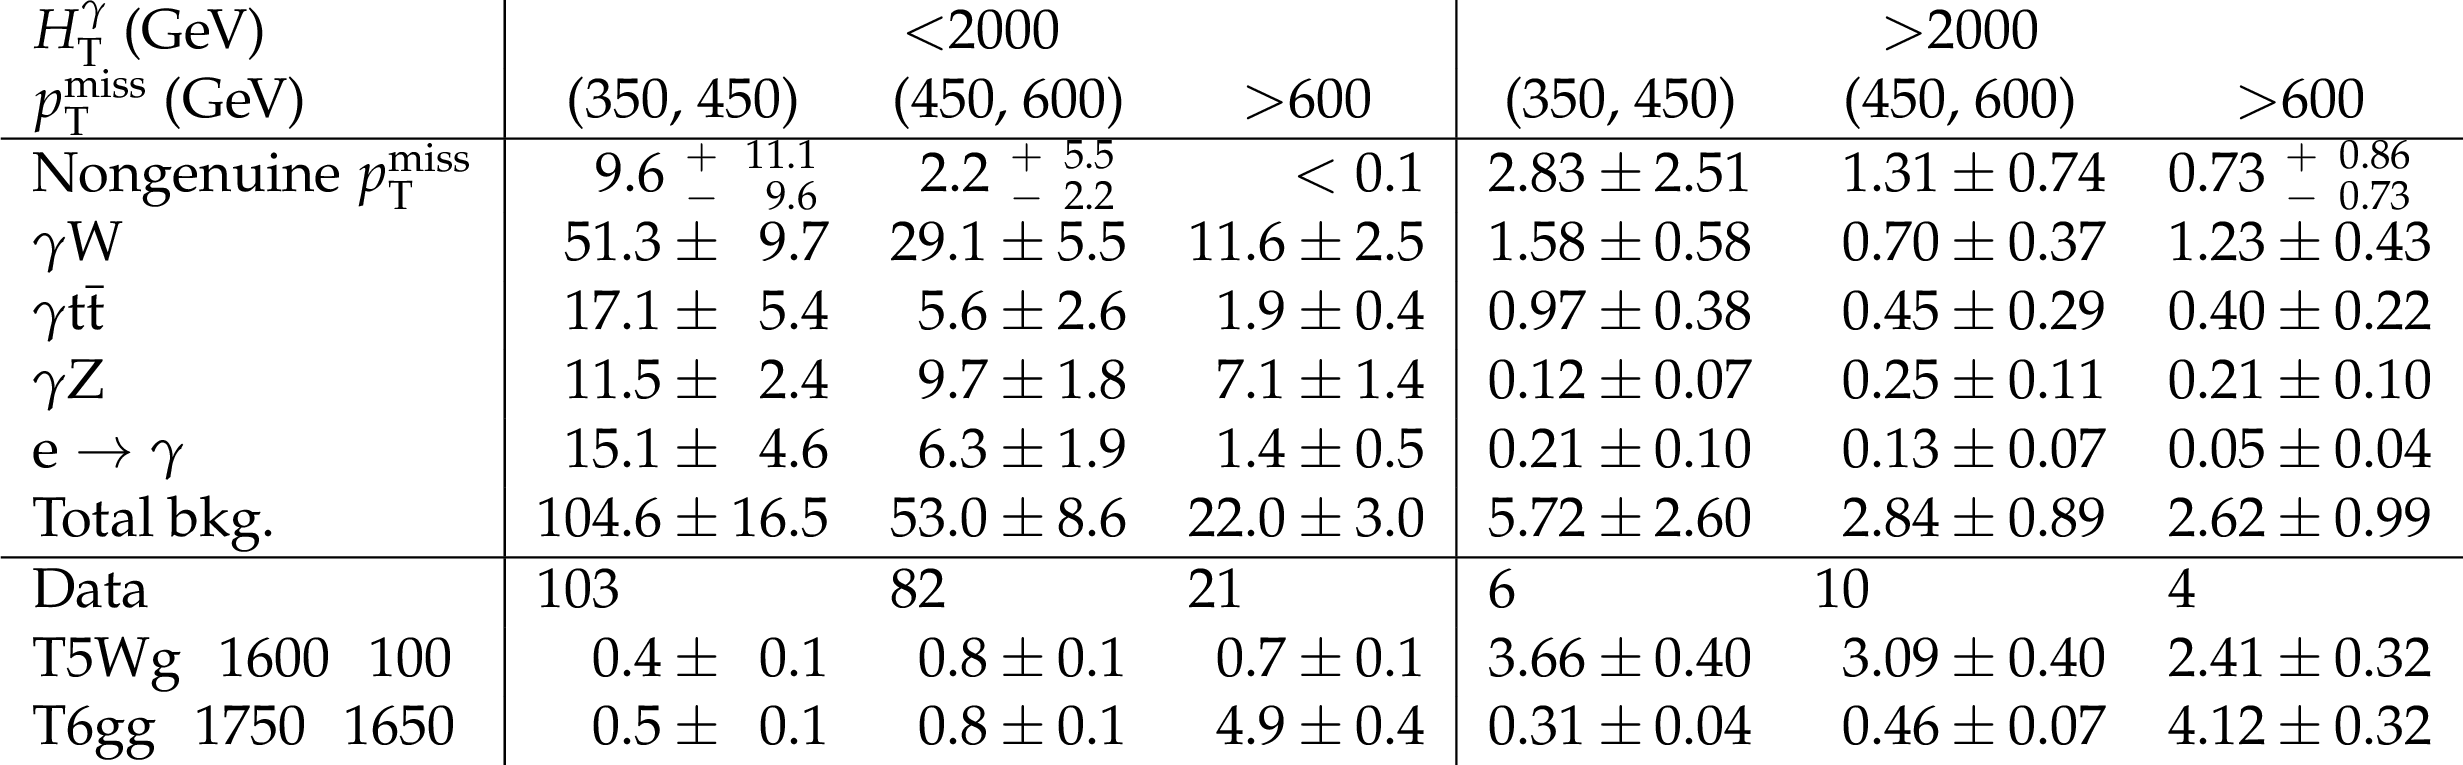
Table 1:
Observed data compared to the background prediction and the expected signal yields for two signal scenarios. The expectations are given for the T5Wg signal scenario with a gluino mass of 1600 GeV and a gaugino mass of 100 GeV and the T6gg signal scenario with a squark mass of 1750 GeV and a neutralino mass of 1650 GeV. The quadratic sum of statistical and systematical uncertainties is given. Only experimental uncertainties for the signal model are stated. |
png pdf |
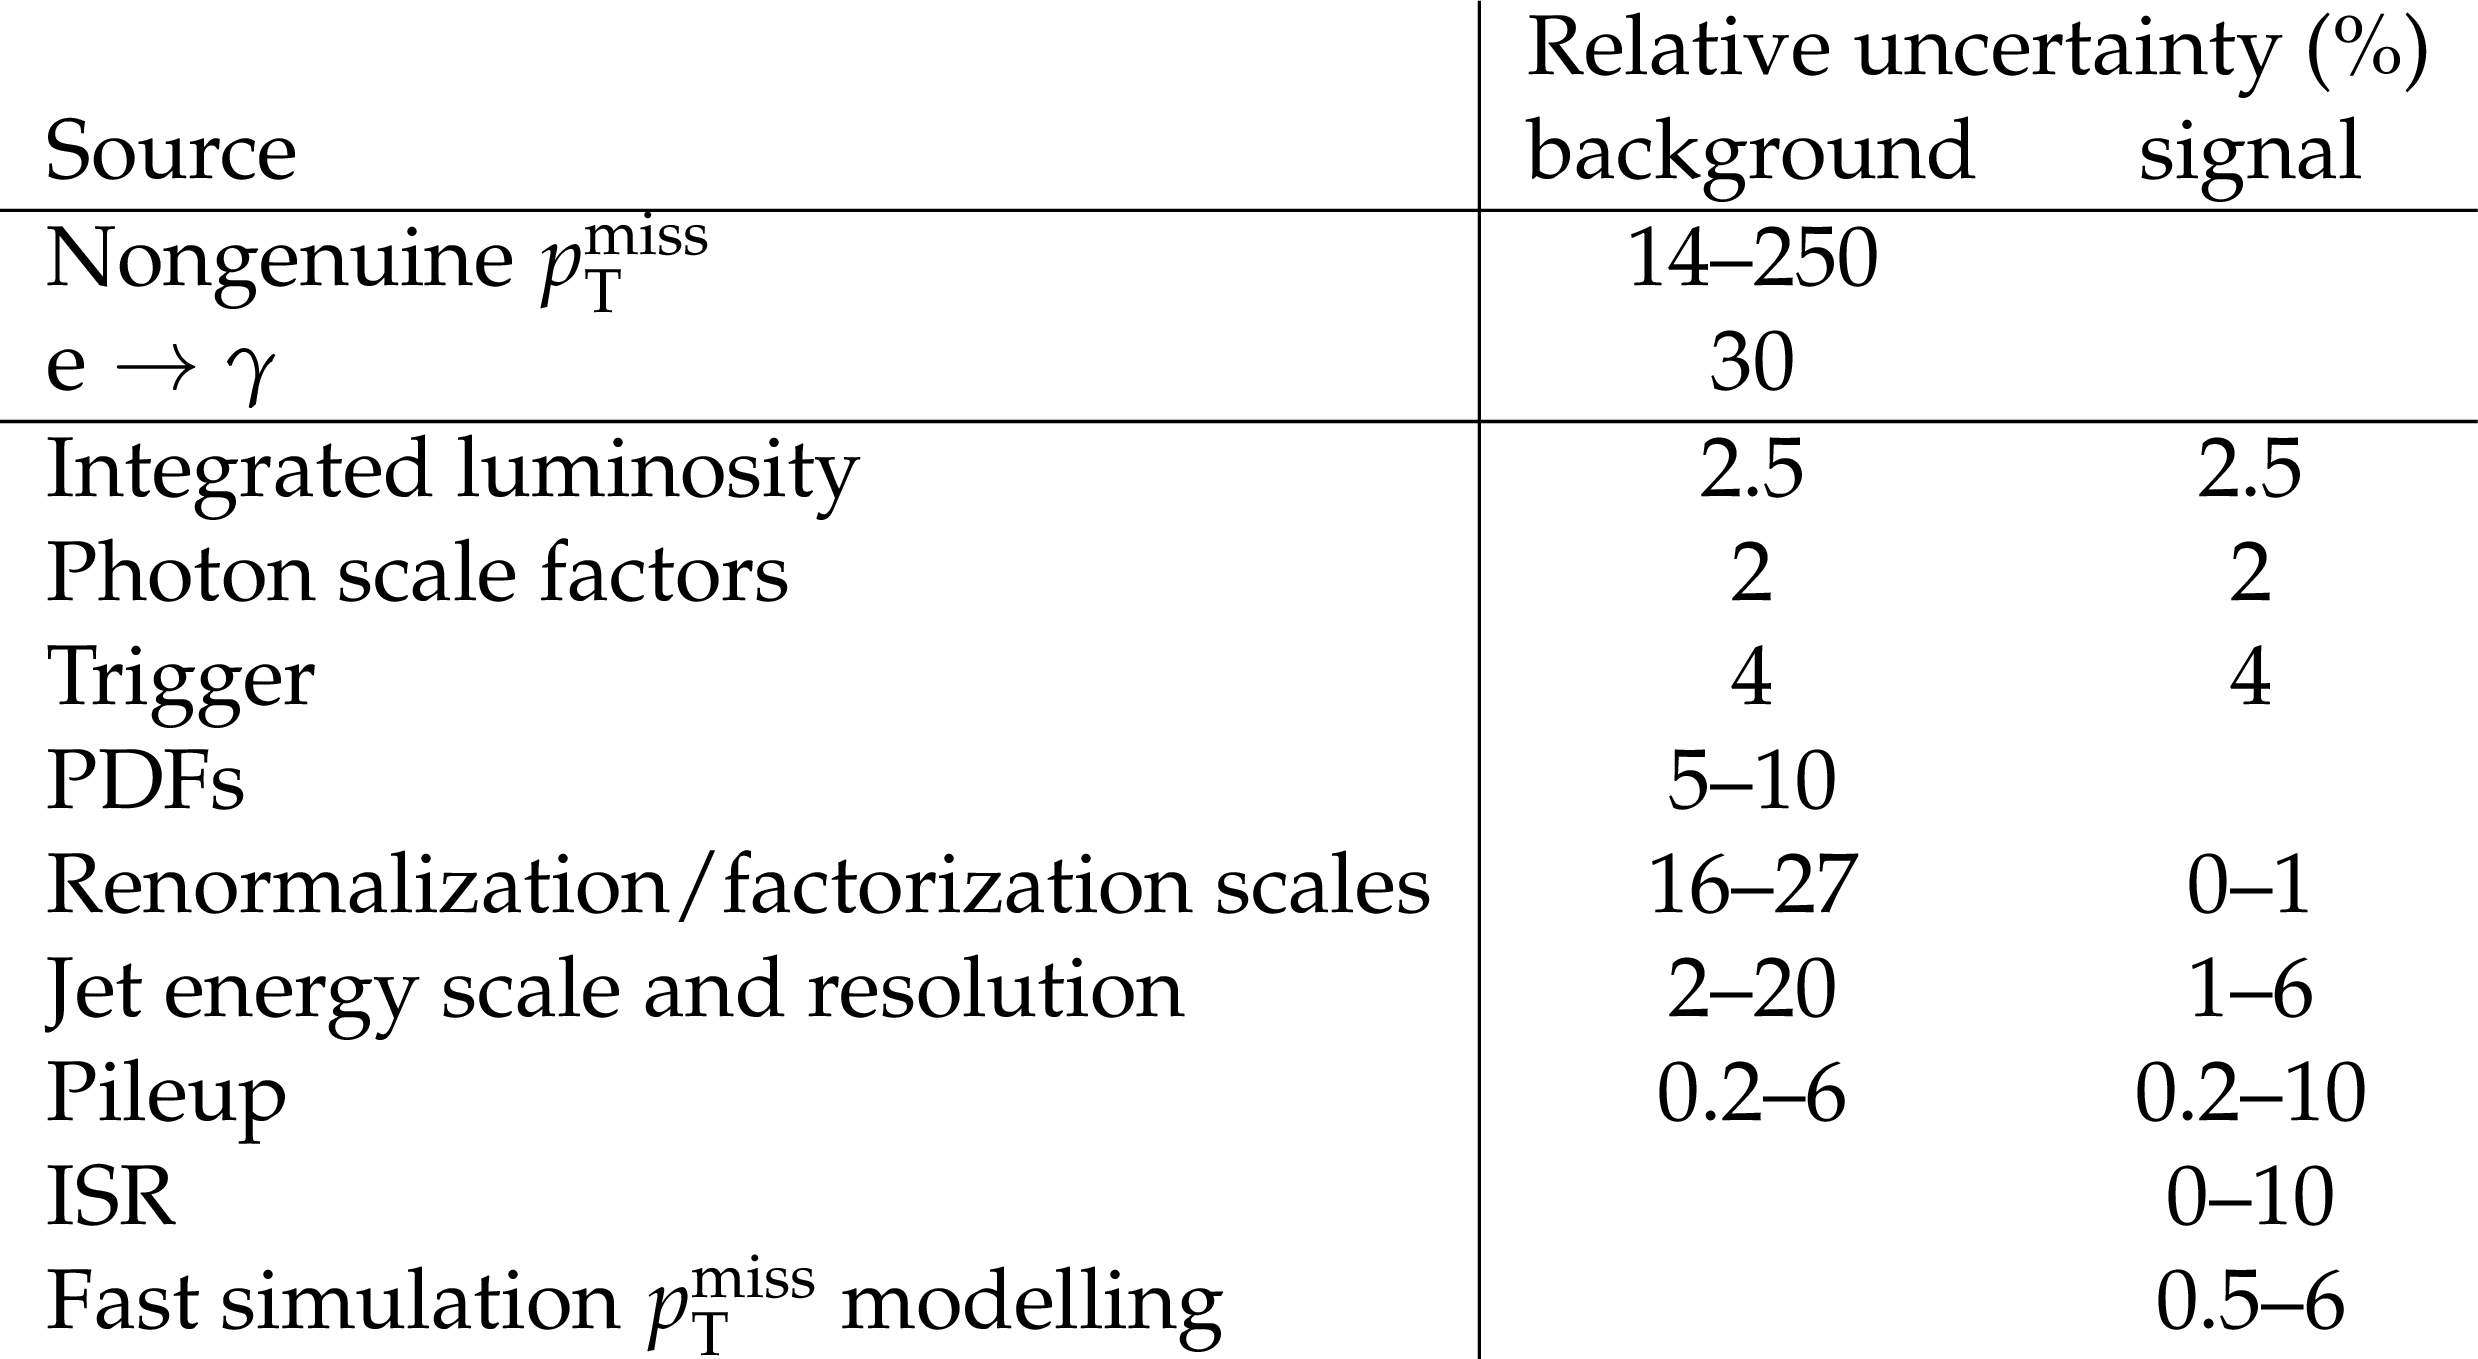
Table 2:
Systematic uncertainties for background determined from control samples in data (first two rows) and simulation (all other rows). If two values are given, the first one is for simulated SM backgrounds, while the latter is for simulated signal. The PDF and scale uncertainties for the signal simulation affect the shape only, as the uncertainty in the rate is already considered in the overall cross section uncertainty [35]. |
| Summary |
| A search for physics beyond the standard model (SM) in final states with at least one photon, large missing transverse momentum, and large total transverse event activity has been presented using data corresponding to an integrated luminosity of 35.9 fb$^{-1}$ of proton-proton collisions at $ \sqrt{s} = $ 13 TeV recorded by the CMS experiment at the LHC in 2016. The SM background is estimated from data and simulation, and is validated in several control regions. No significant signs of new physics beyond the SM are found, and the data are interpreted in simplified models motivated by gauge-mediated supersymmetry breaking. Gluino masses up to 1.50-2.00 TeV and squark masses up to 1.30-1.65 TeV are excluded at 95% confidence level, depending on the neutralino mass and mixture. |
| Additional Figures | |
png pdf root |
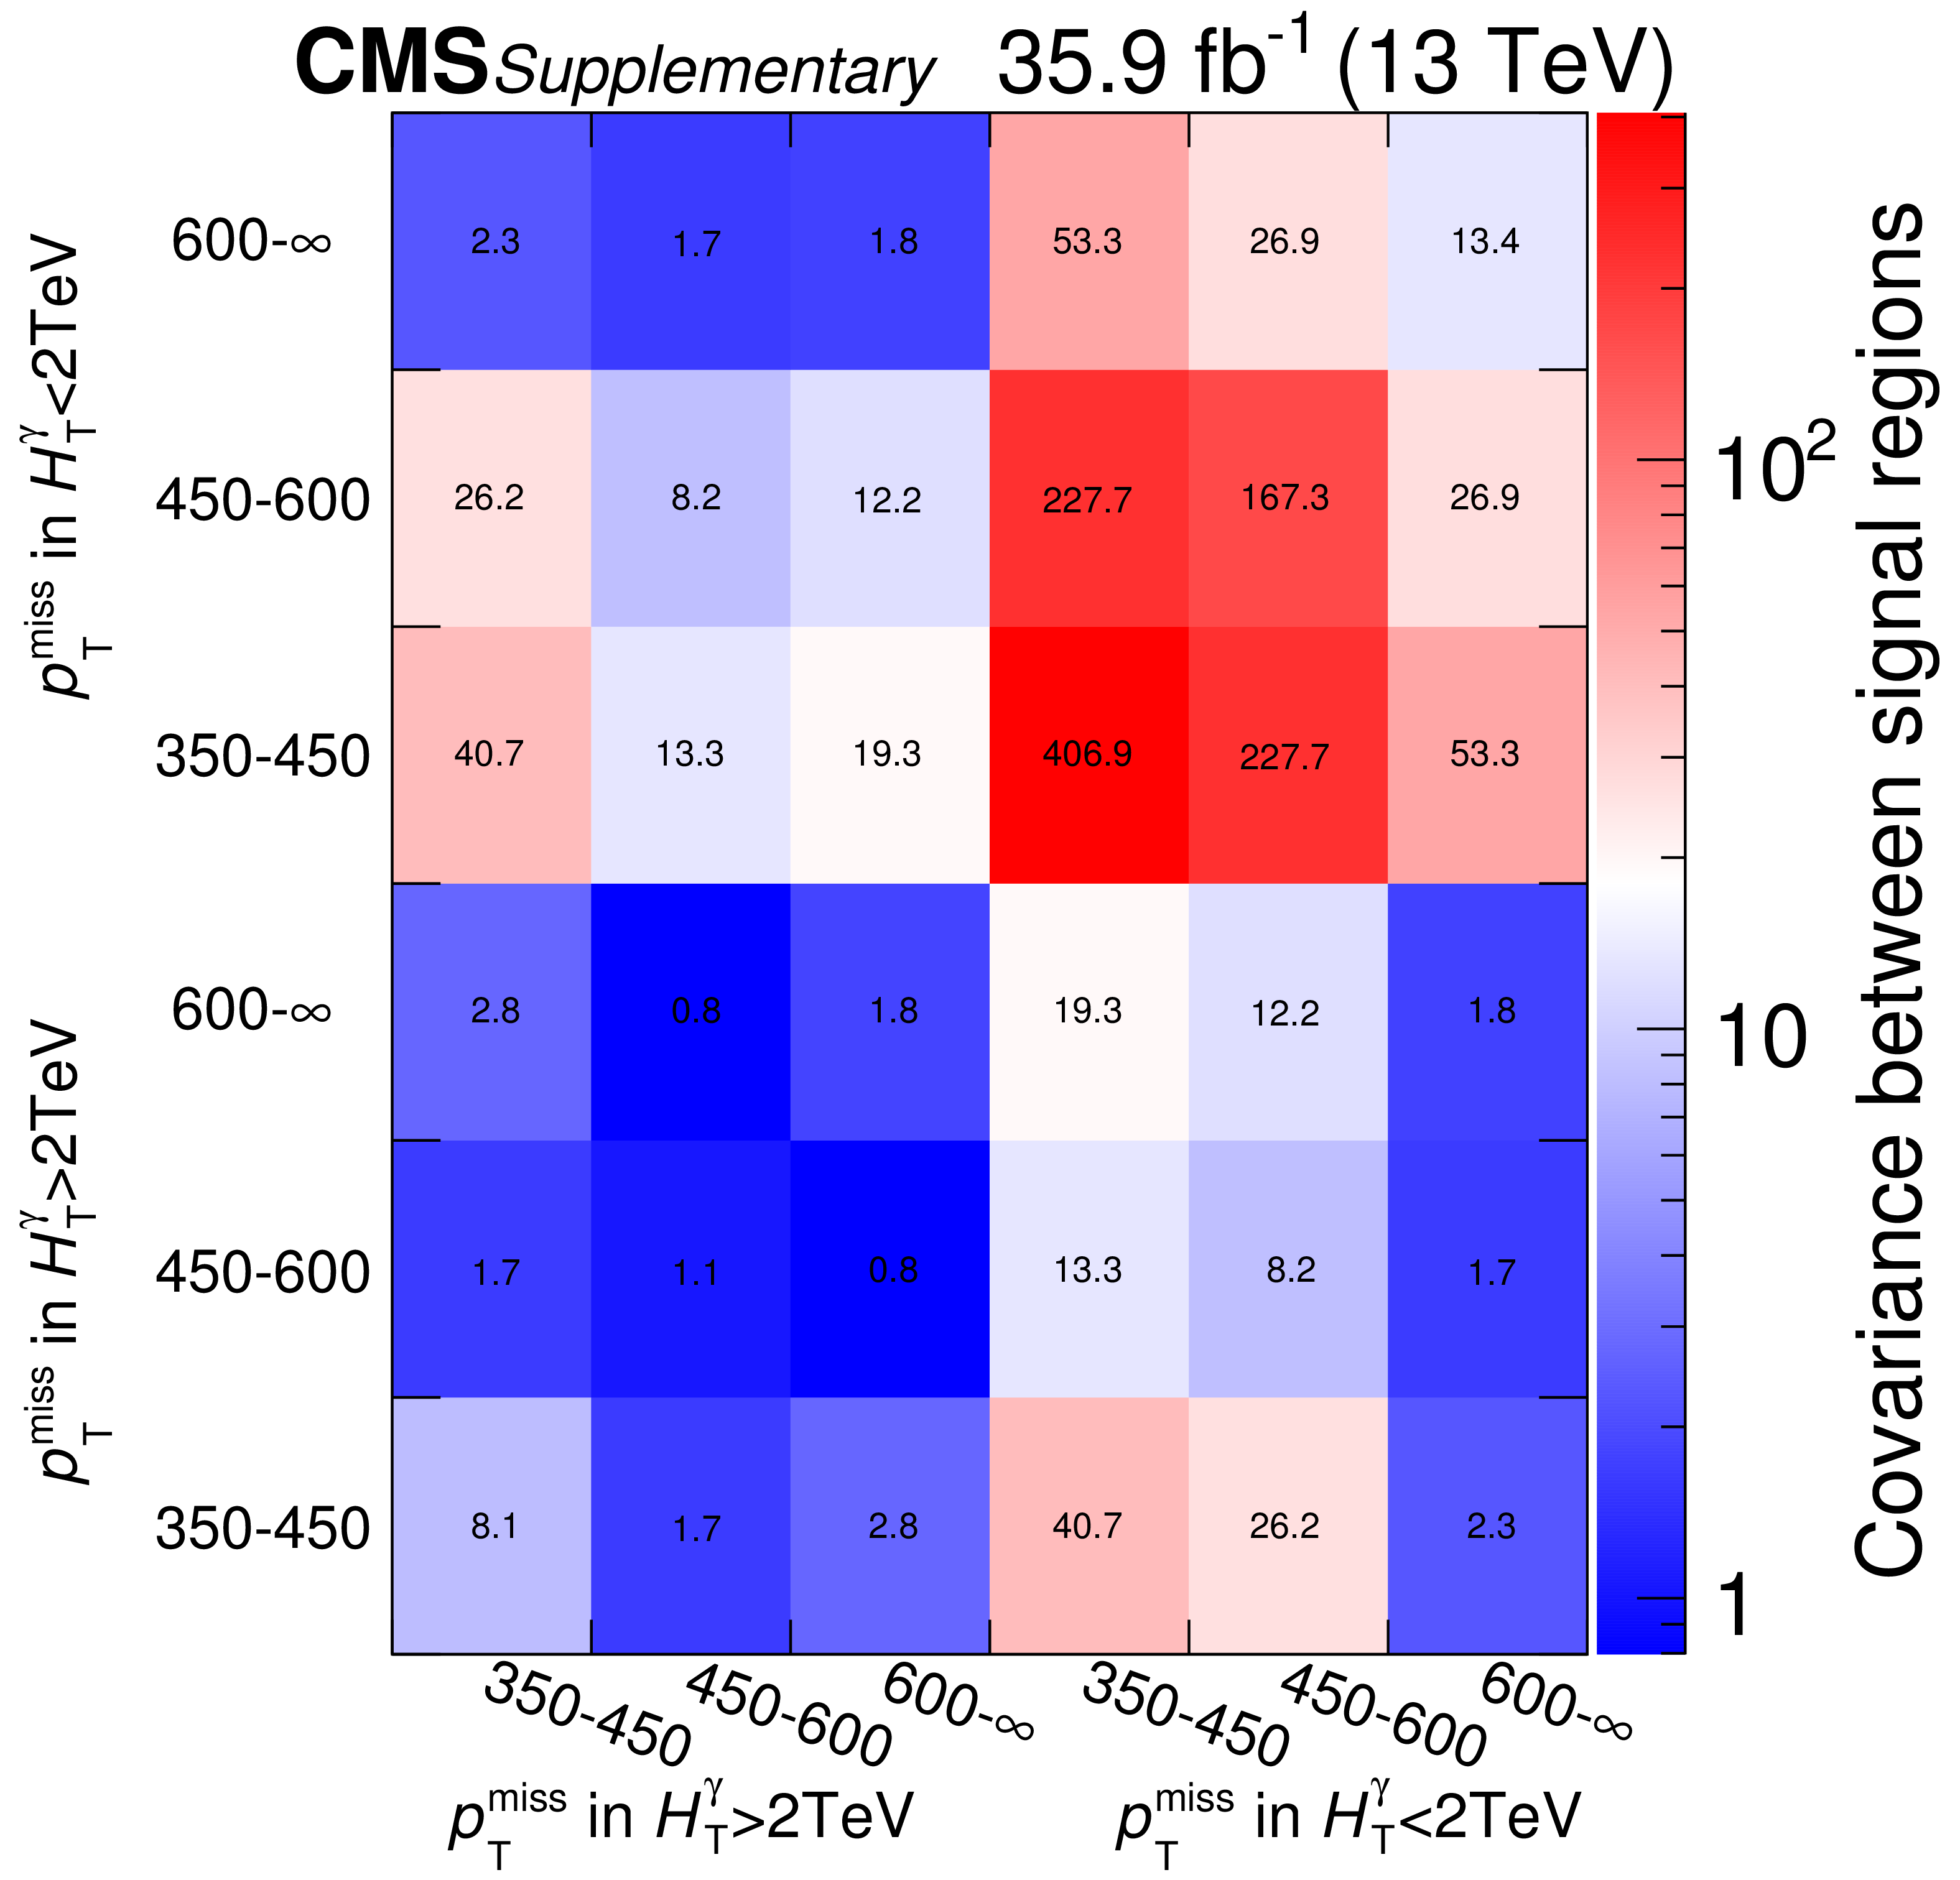
Additional Figure 1:
Covariance between the search regions. |
png pdf root |
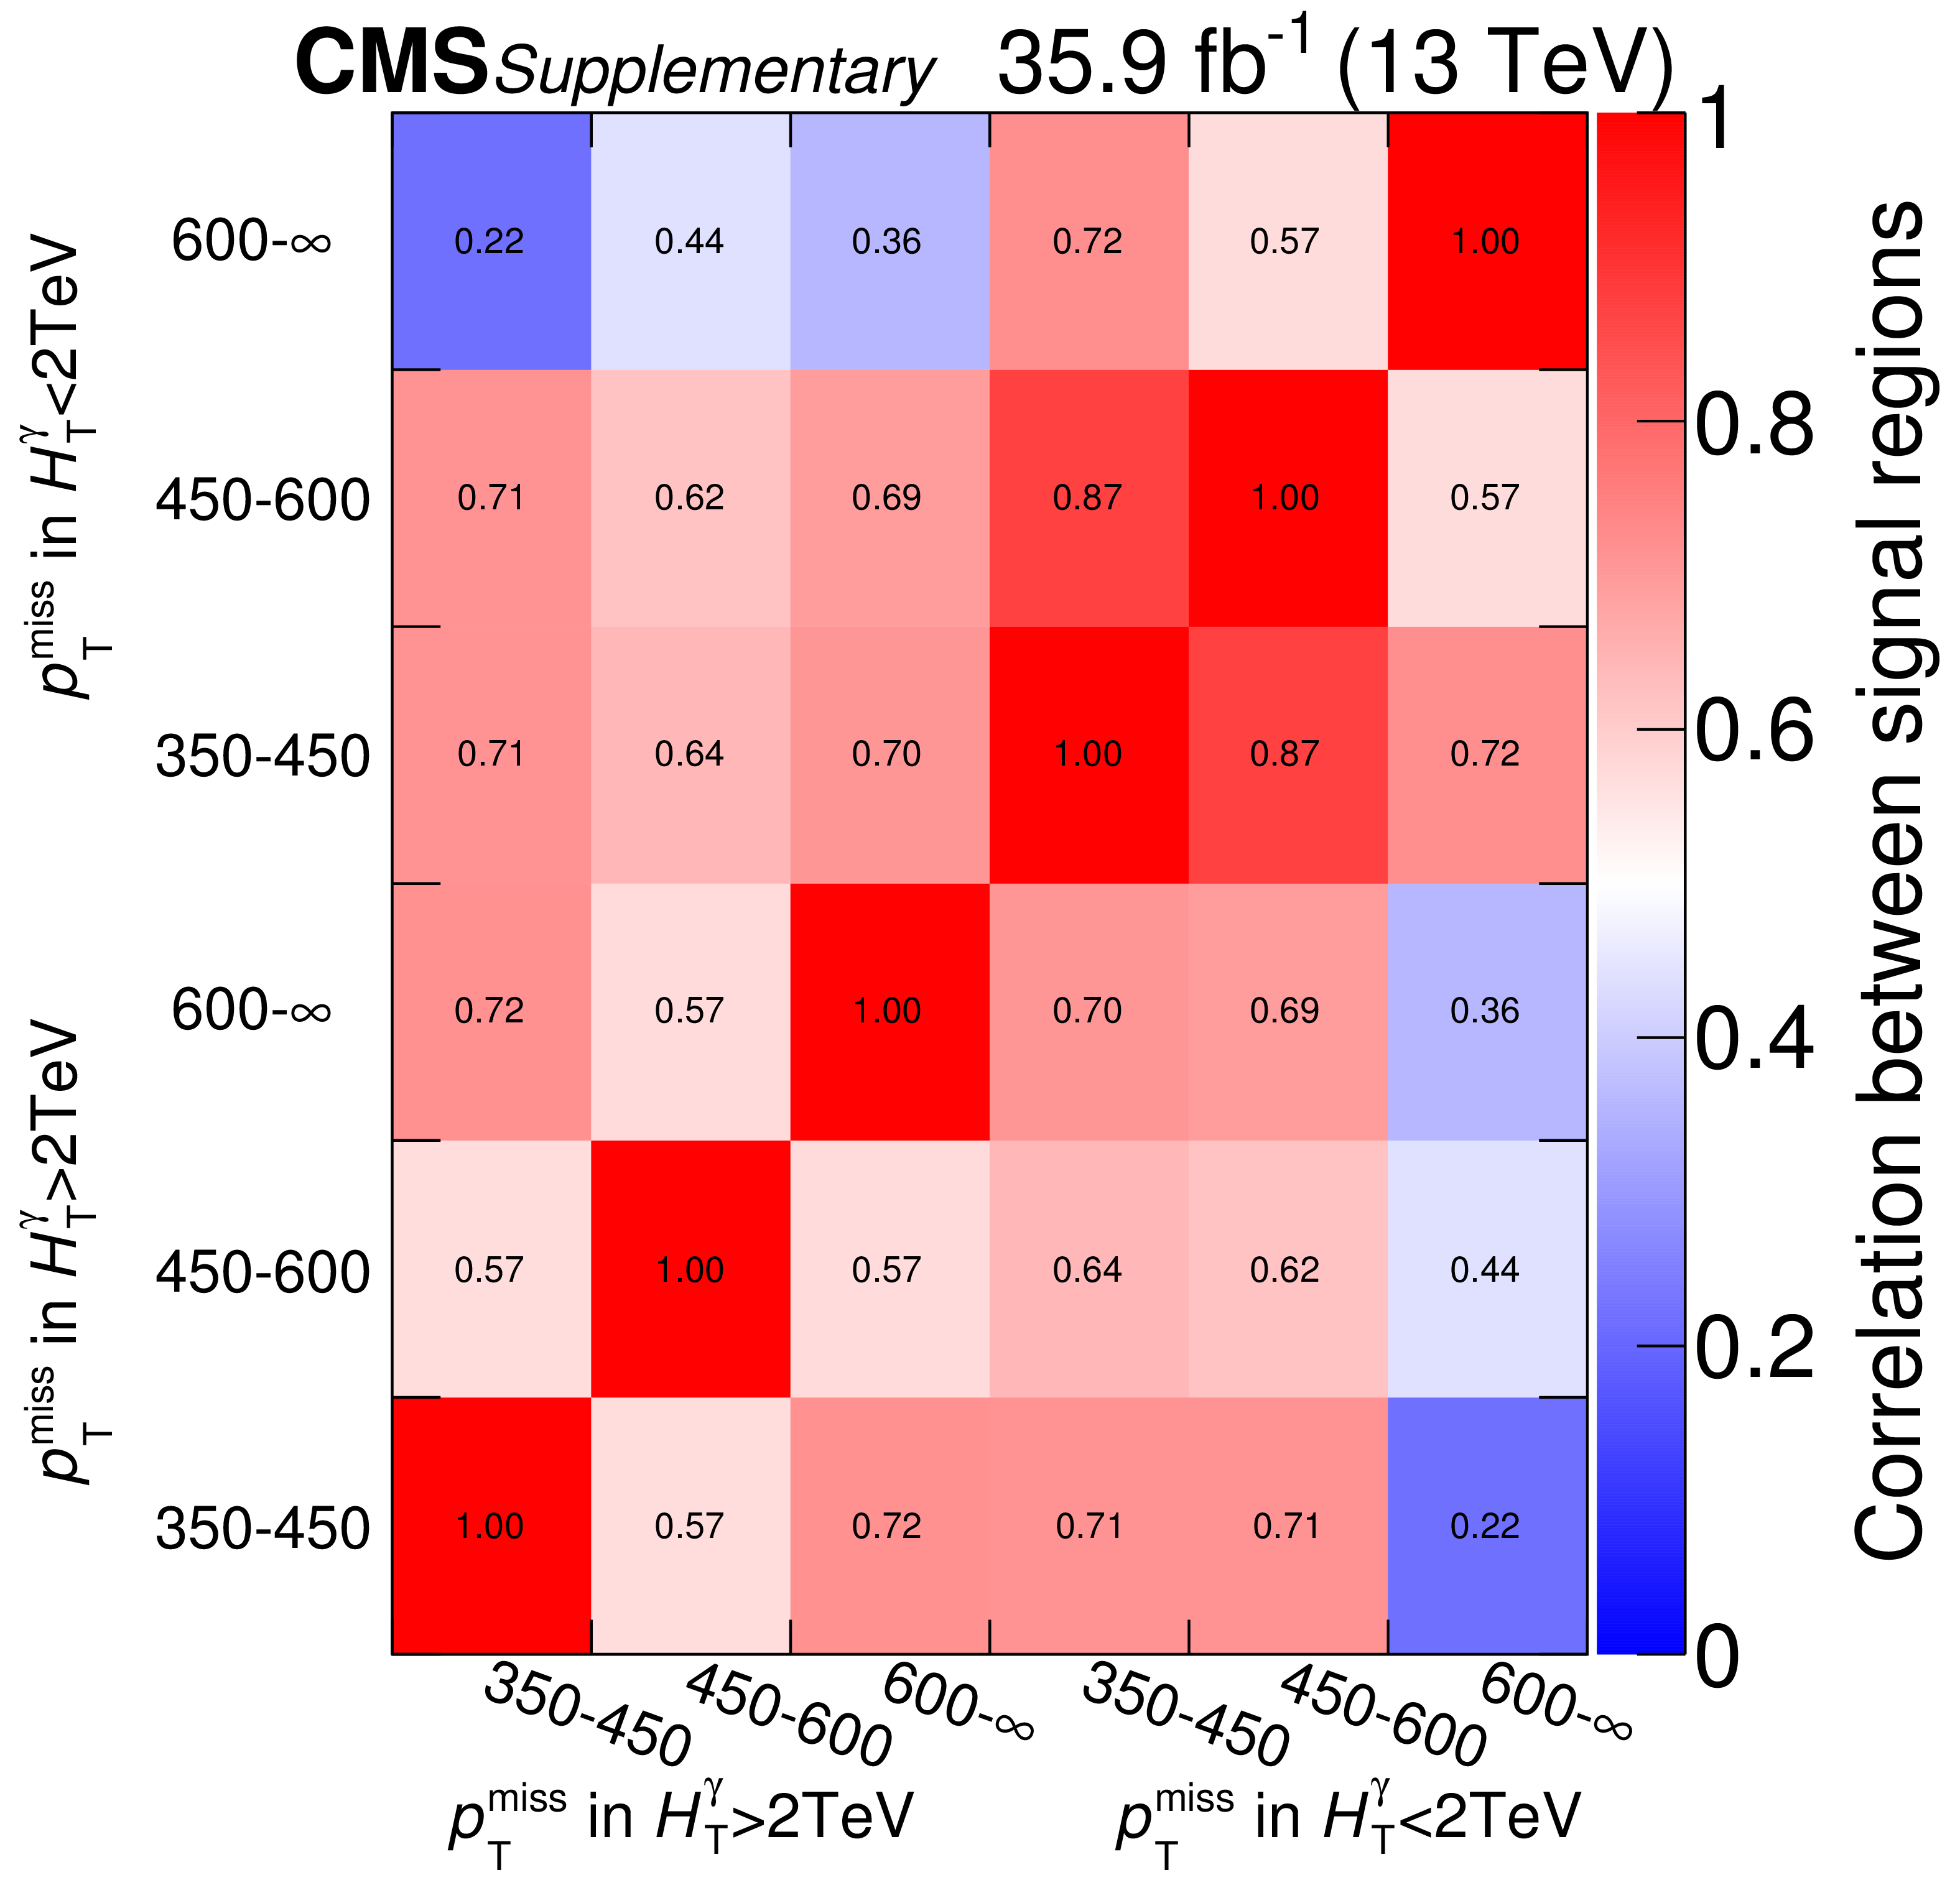
Additional Figure 2:
Correlation between the search regions. |

png pdf root |
Additional Figure 3:
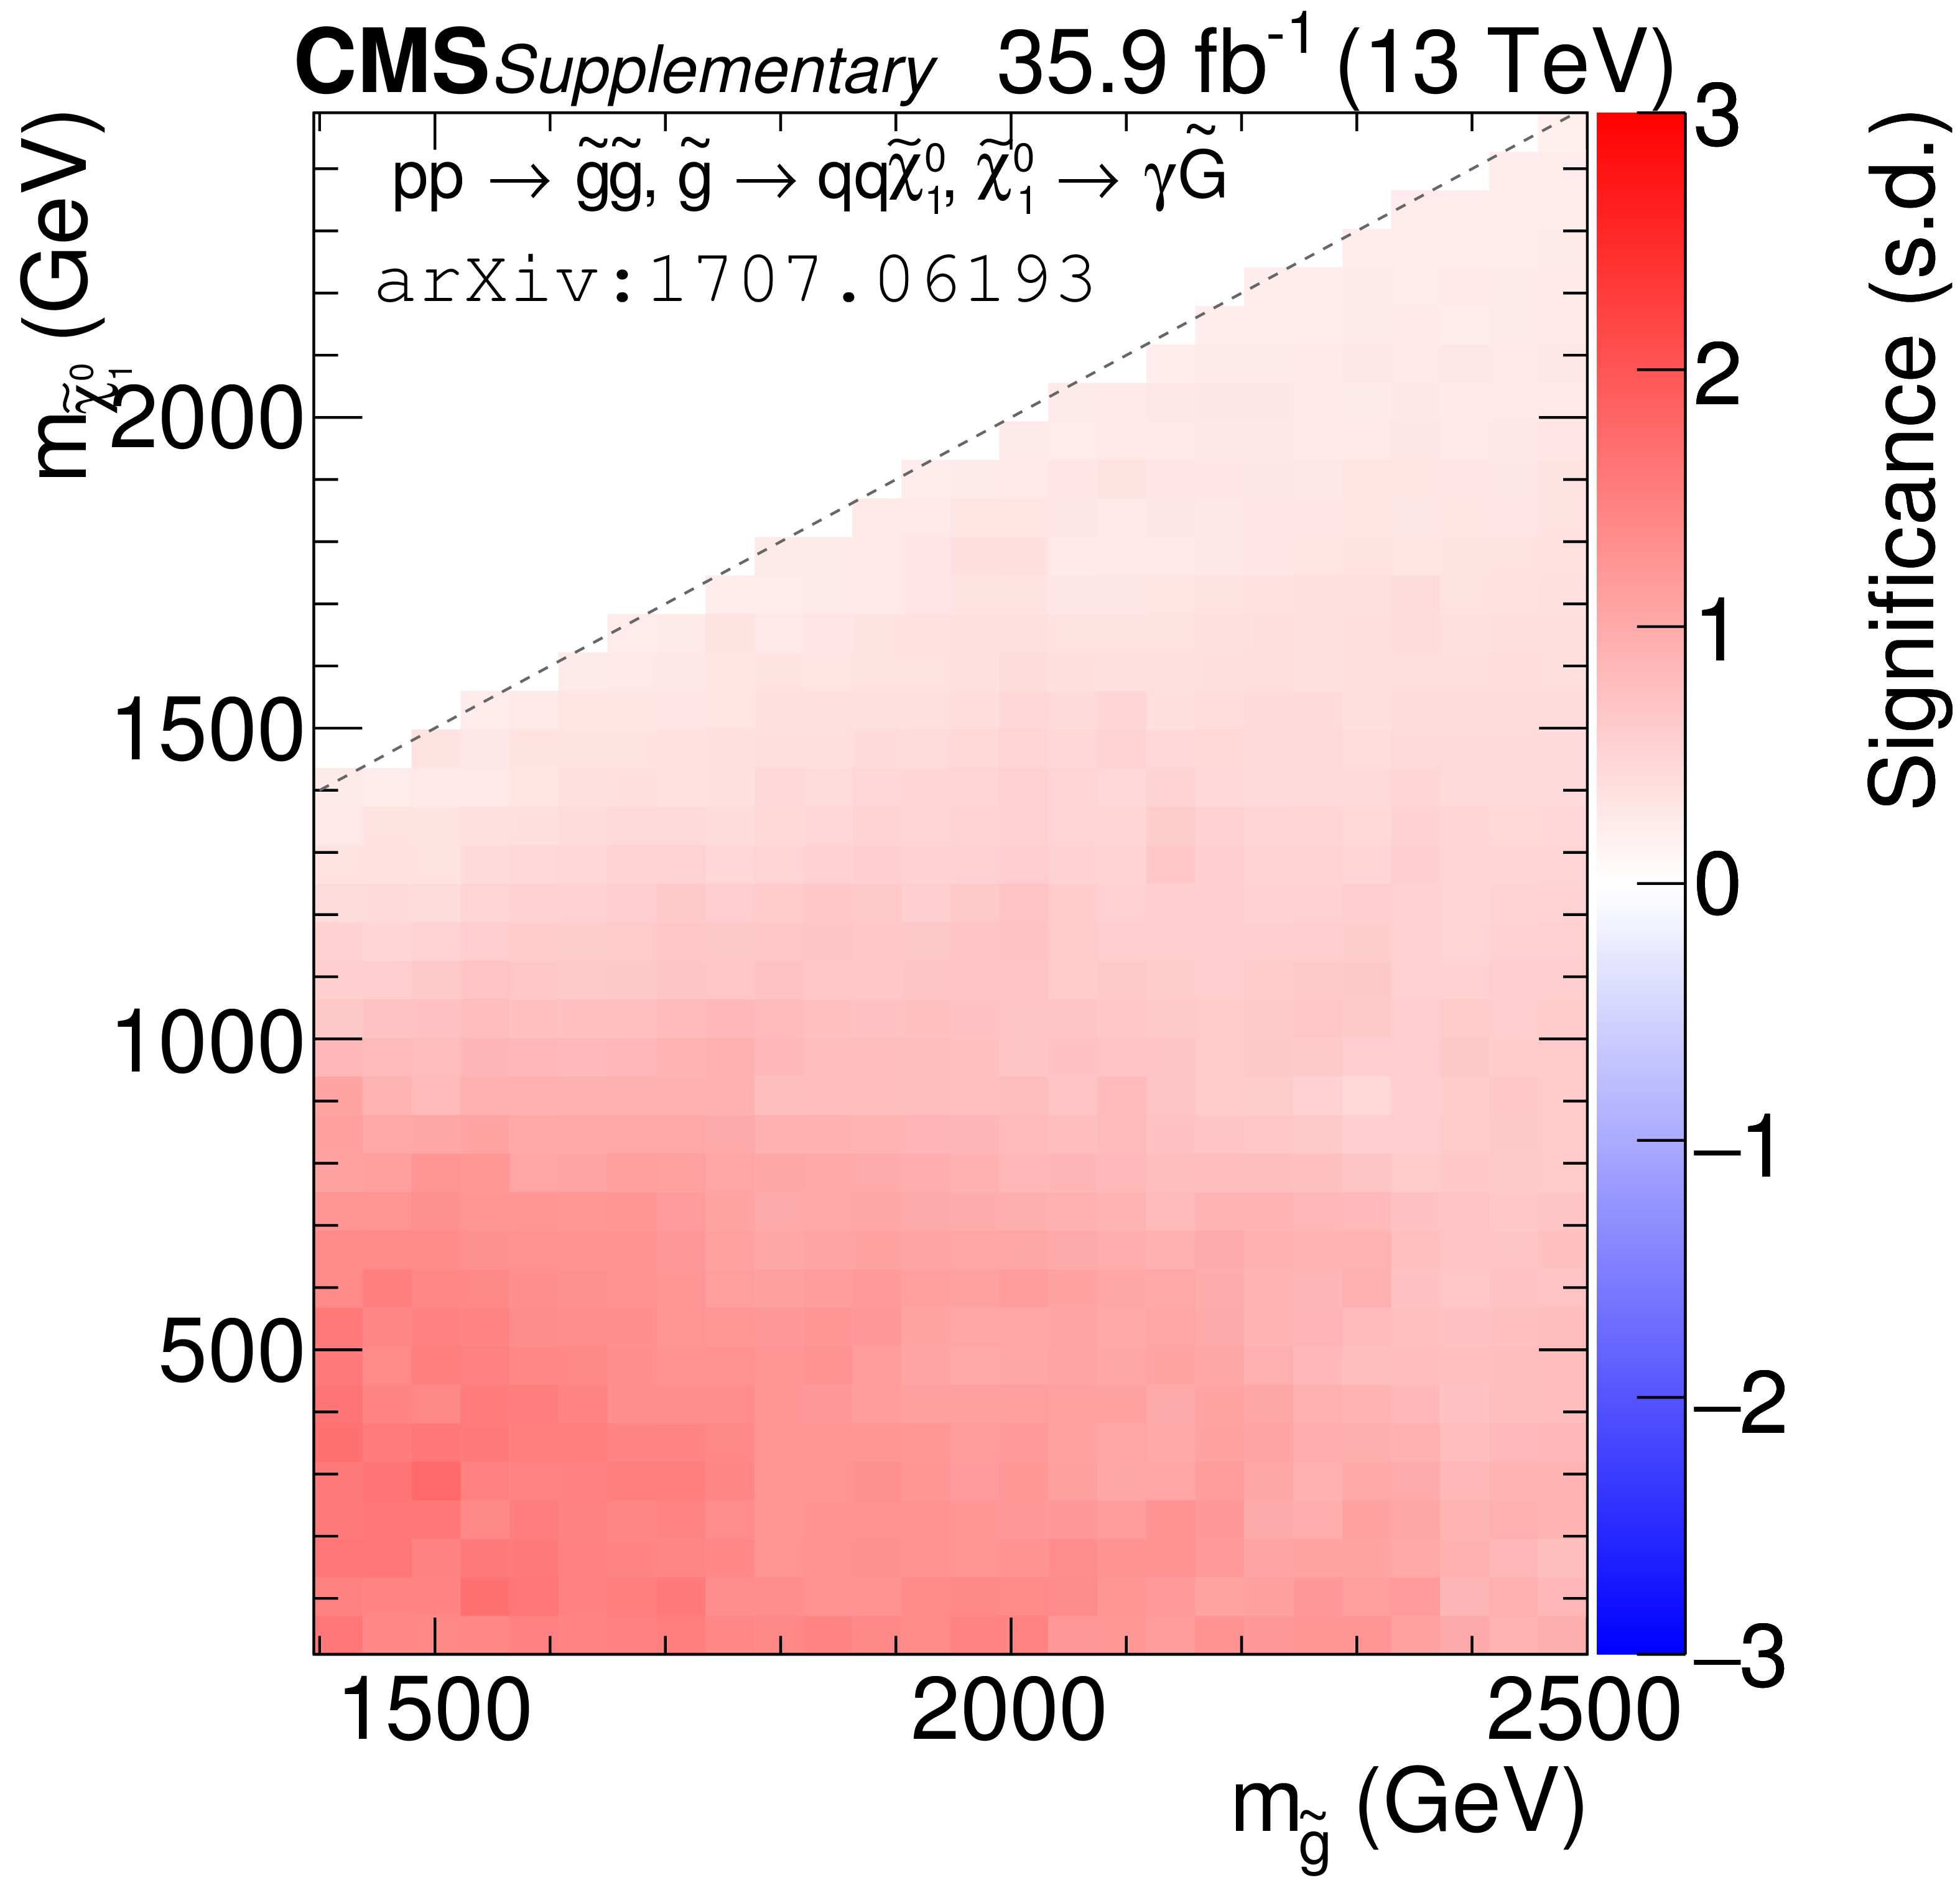
Observed significance for T6gg model. |
png pdf root |
Additional Figure 4:
Observed significance for T6Wg model. |
png pdf root |
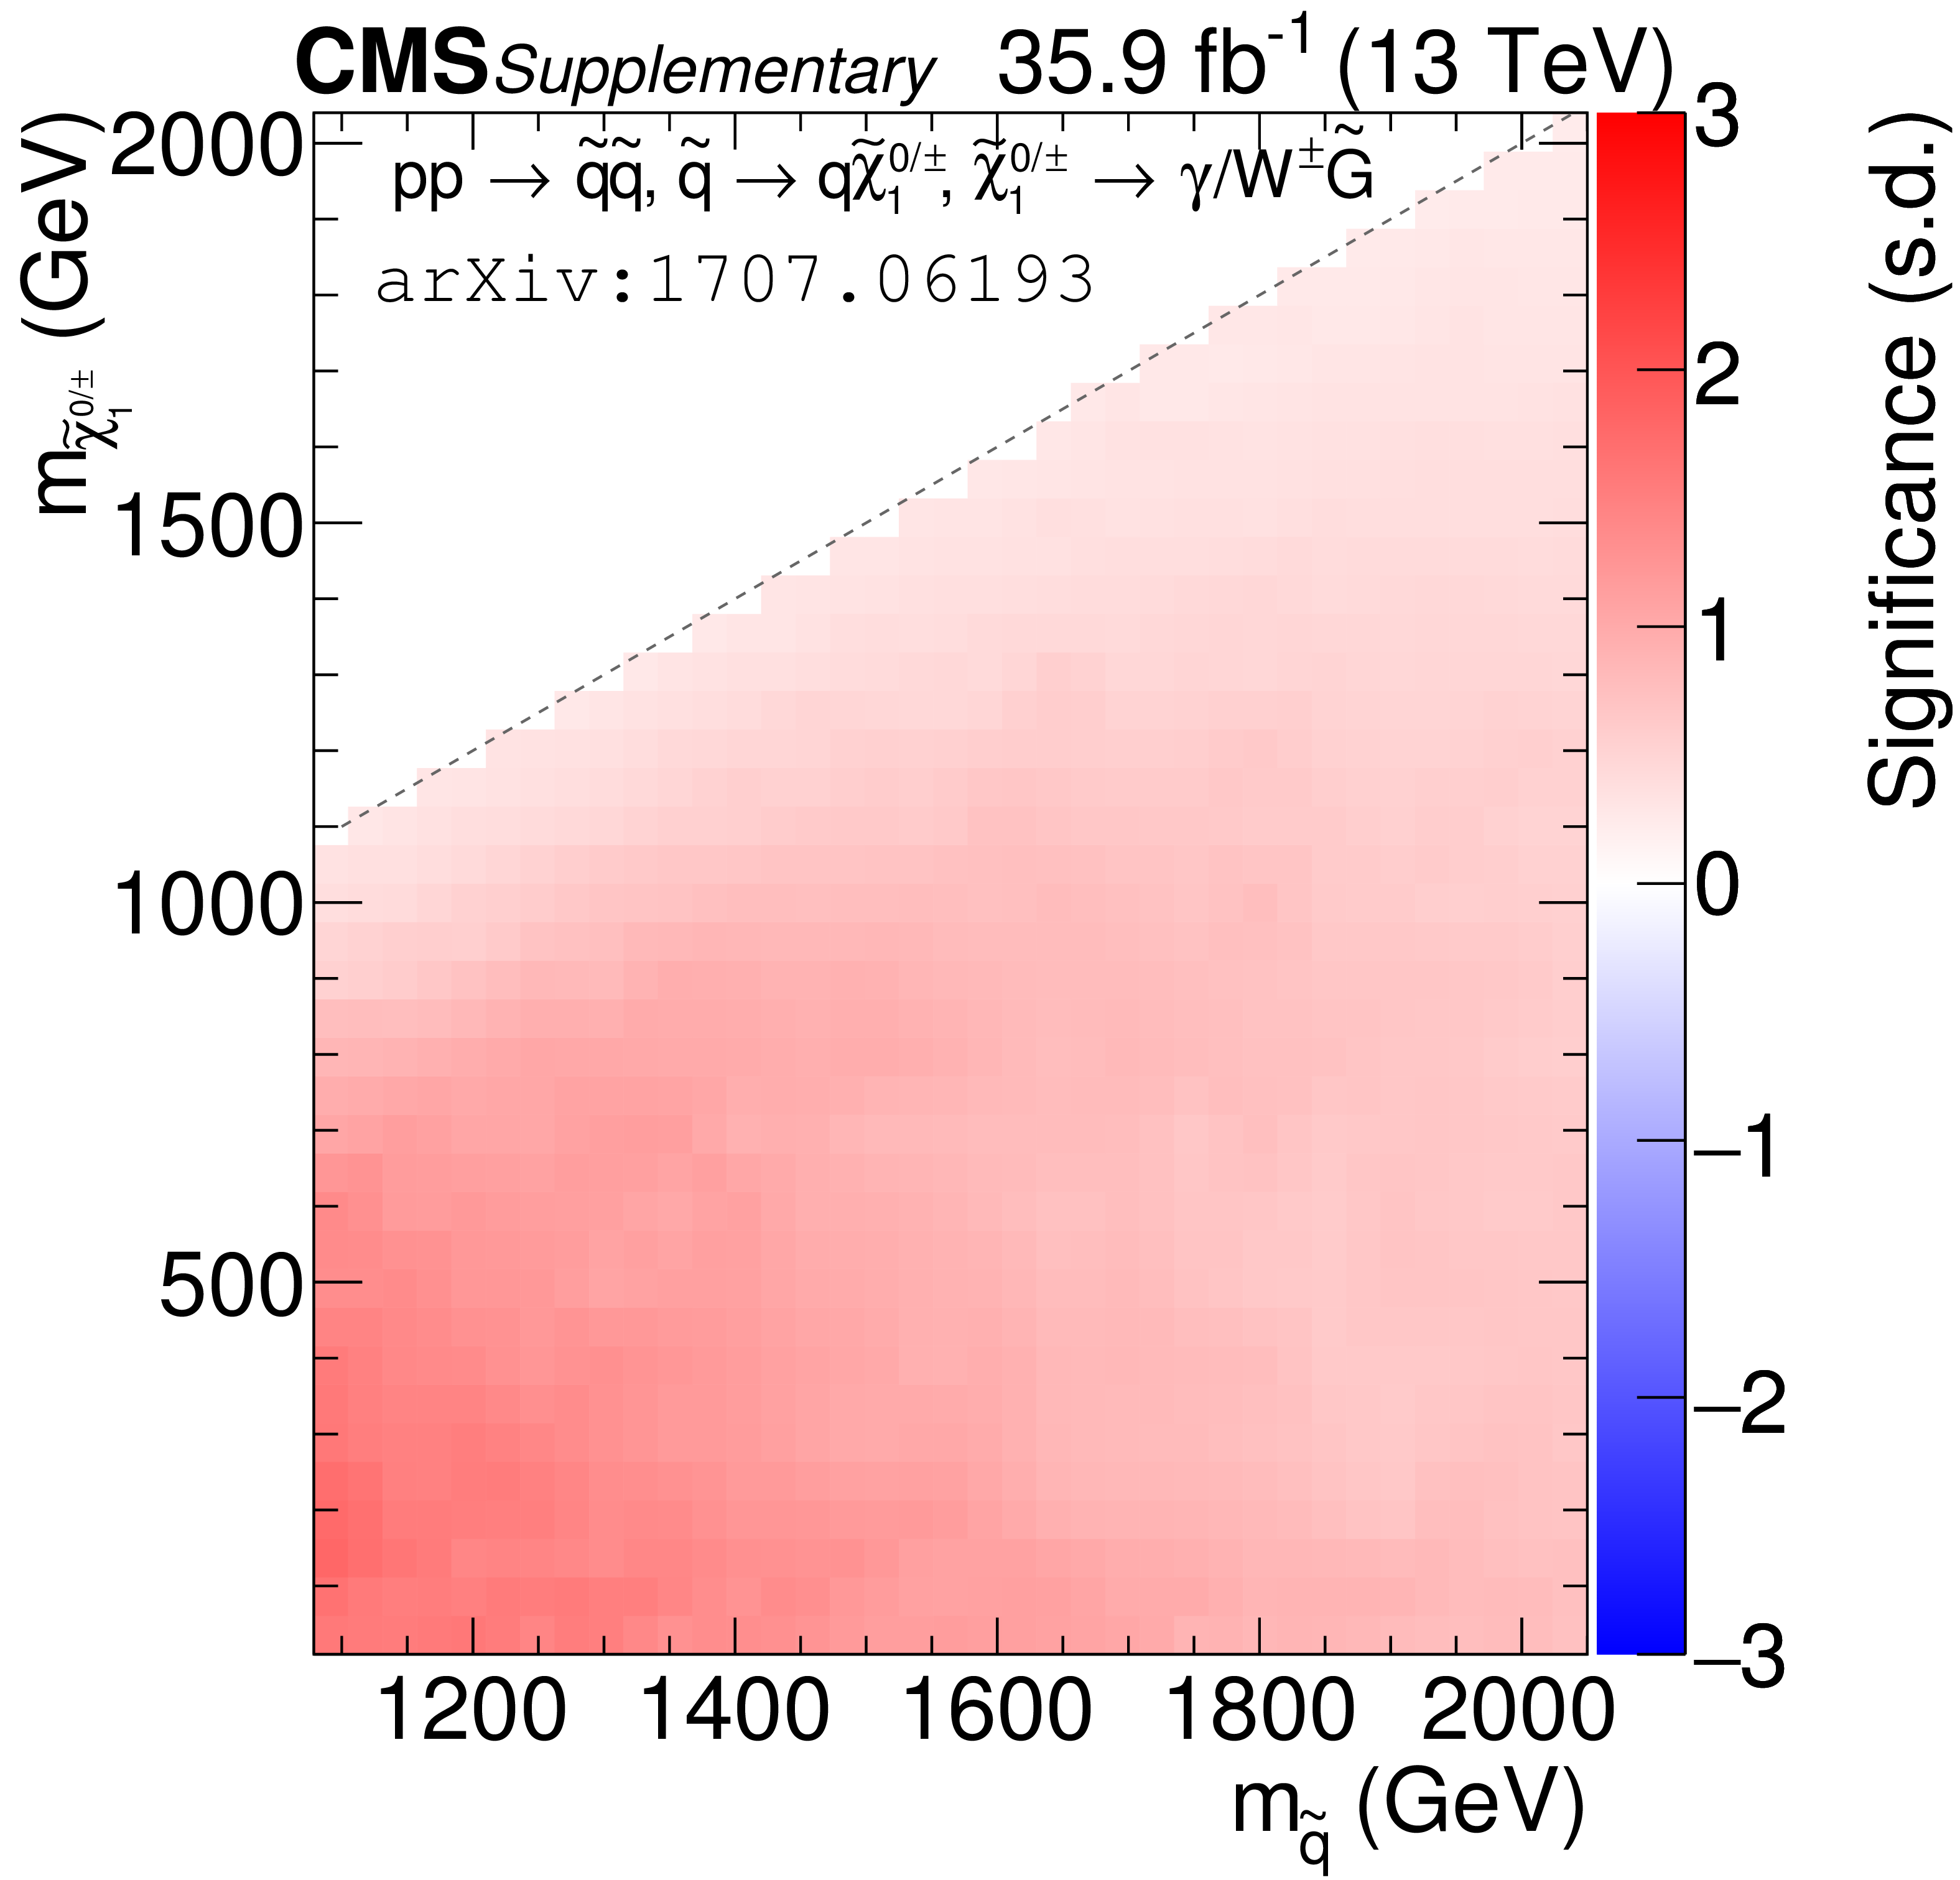
Additional Figure 5:
Observed significance for T5gg model. |
png pdf root |
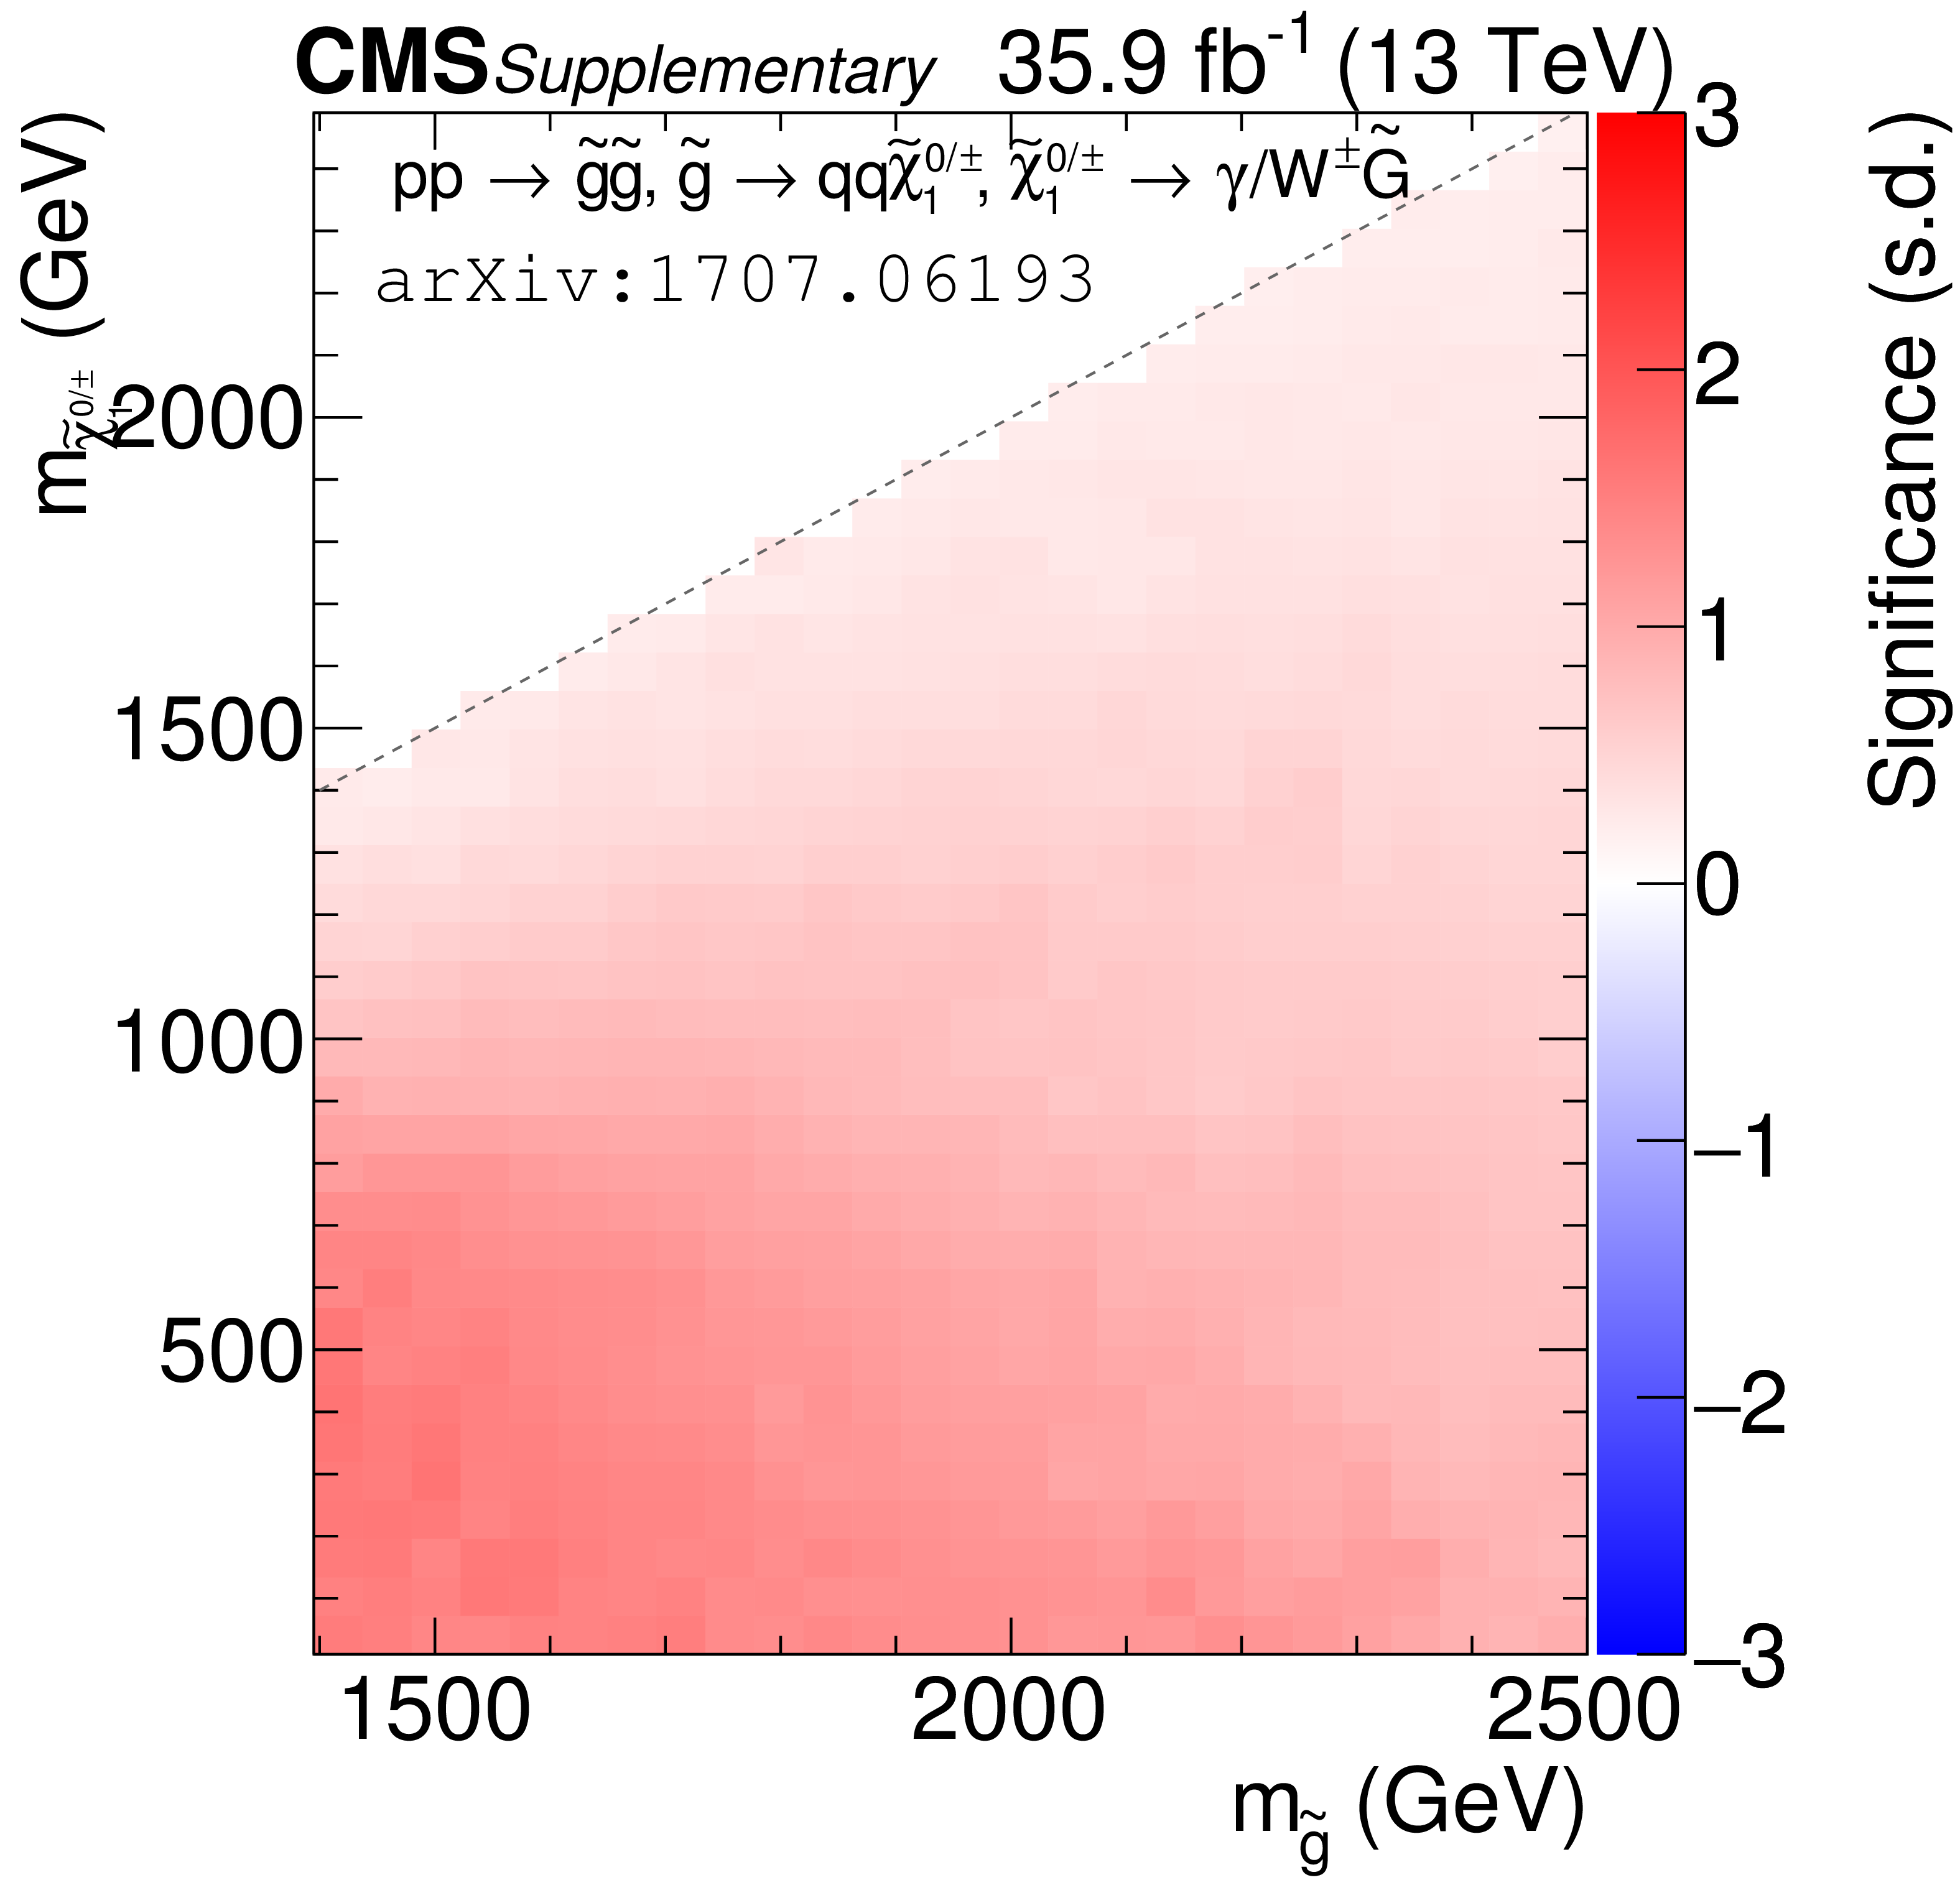
Additional Figure 6:
Observed significance for T5Wg model. |
png pdf root |
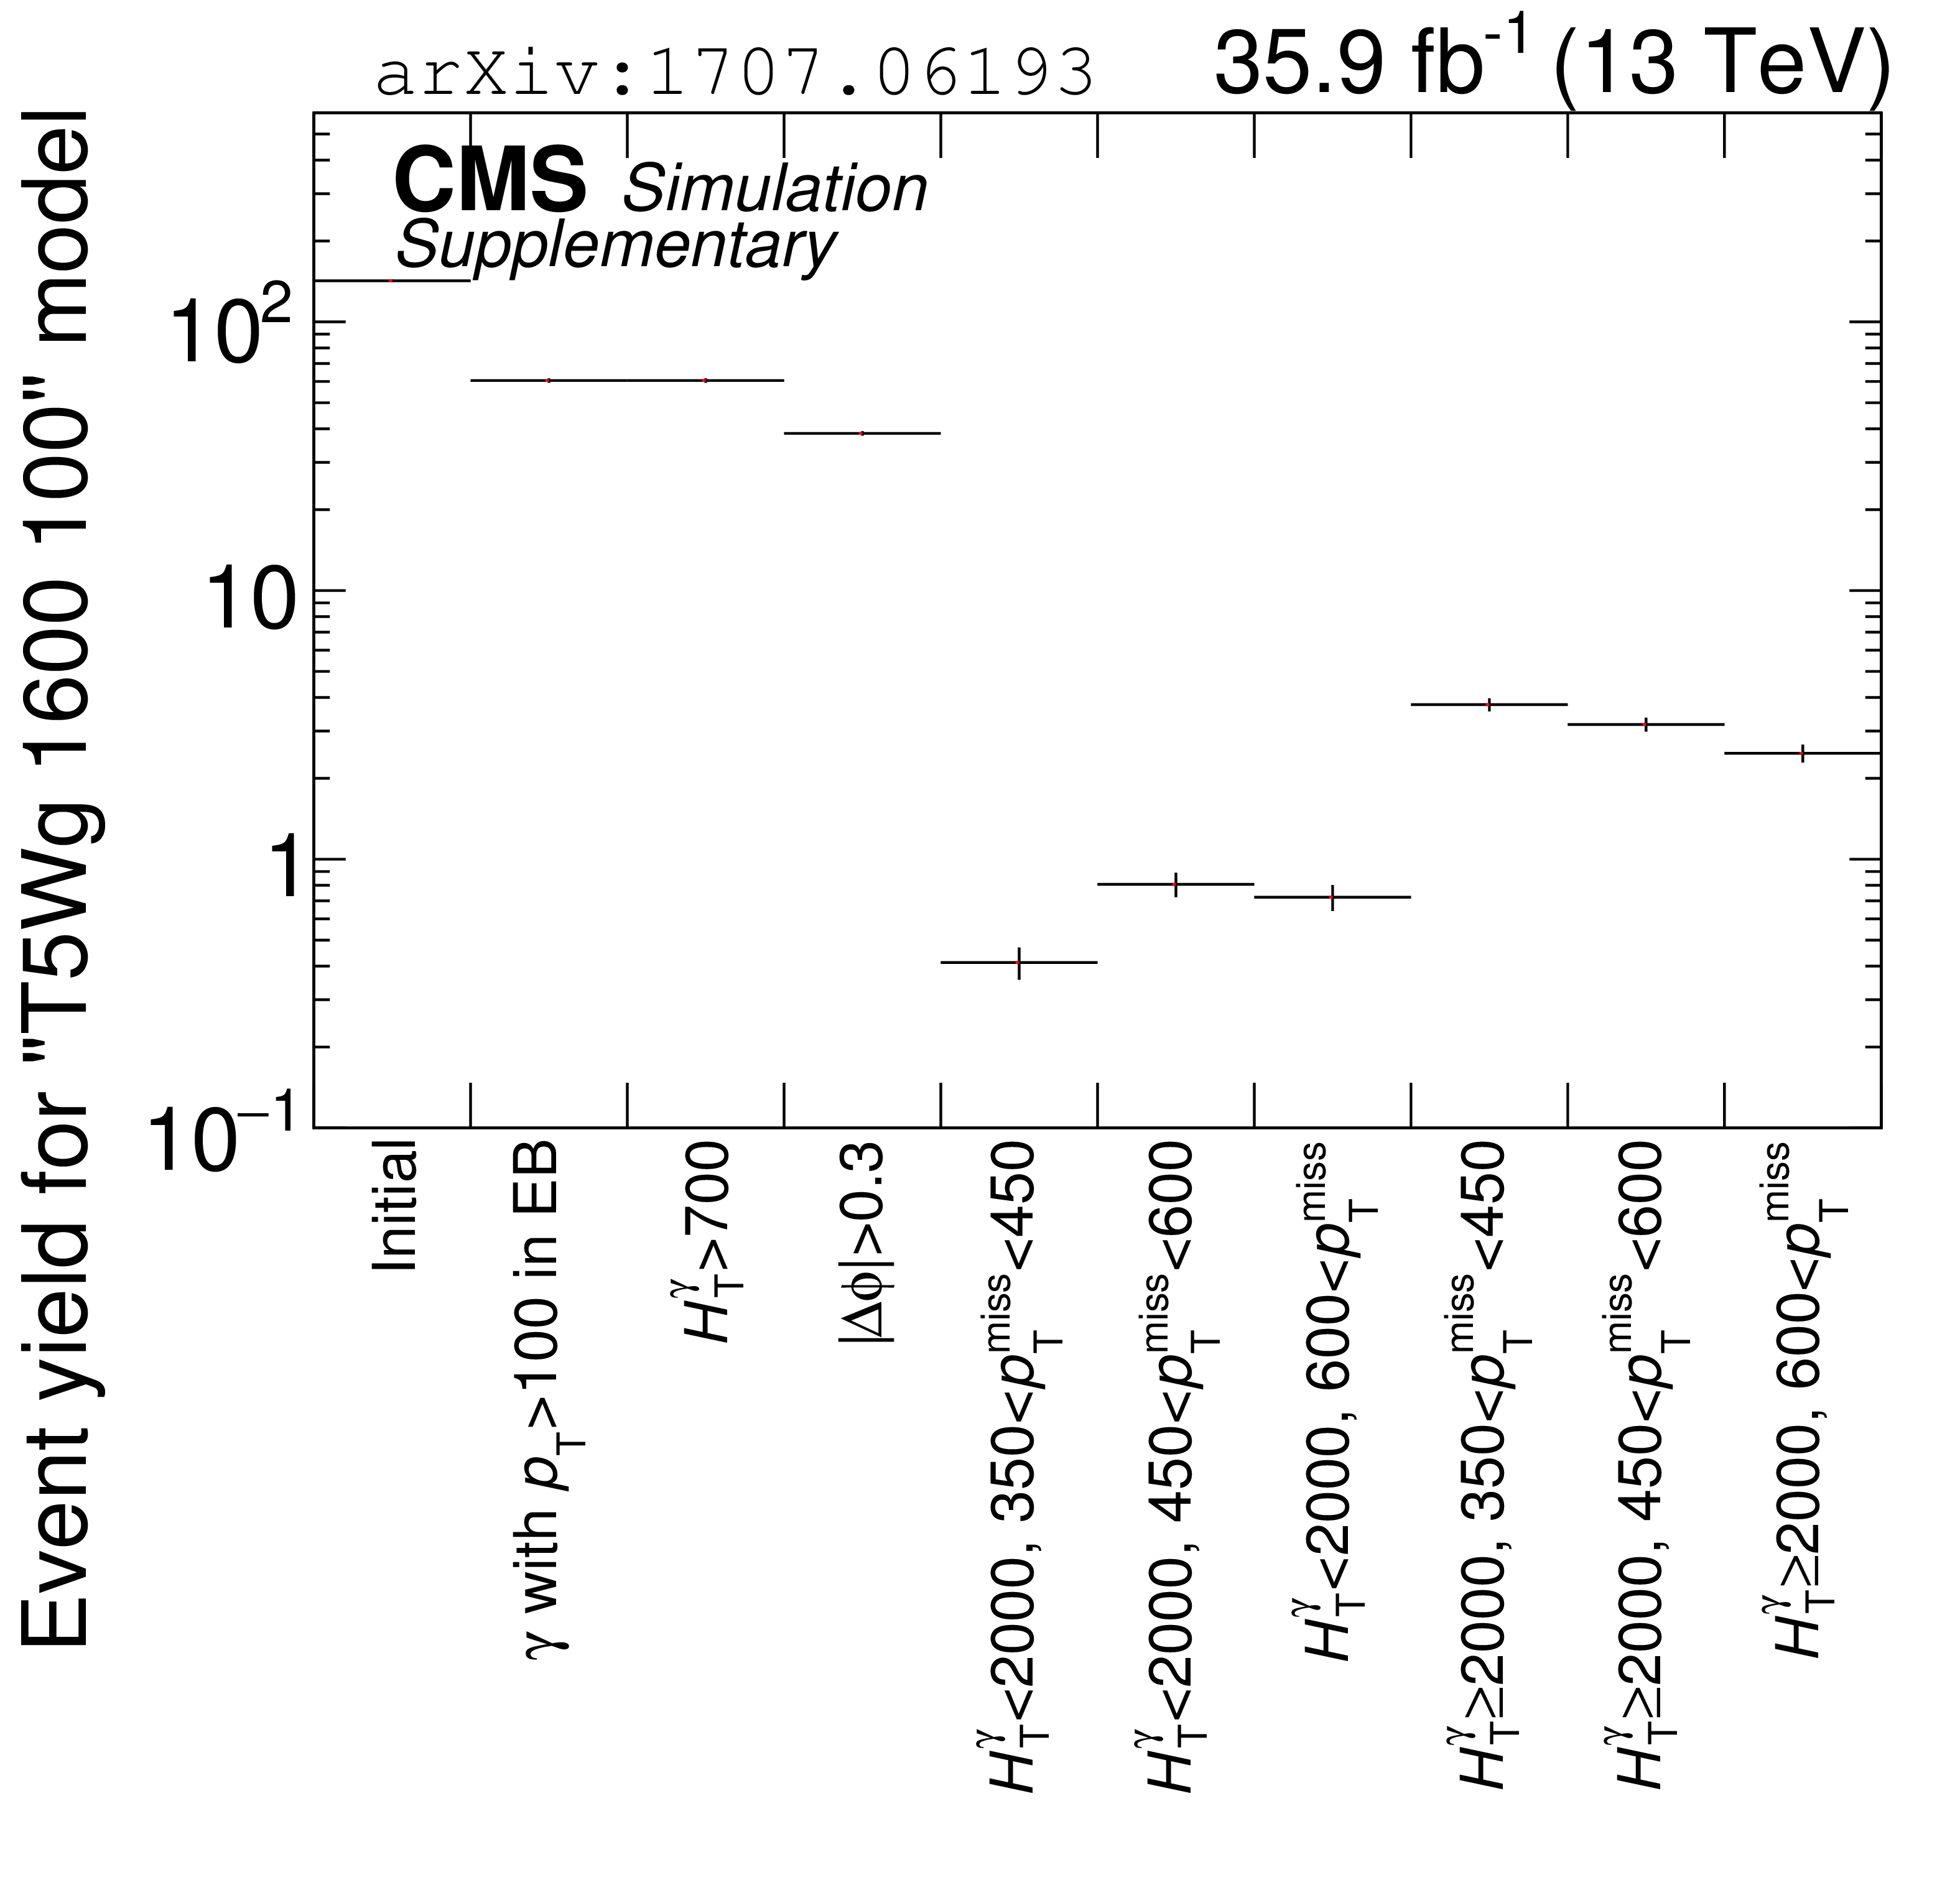
Additional Figure 7:
Signal yield after several analysis cuts for the T6Wg model with a gluino mass of 1600 GeV and a gaugino mass of 100 GeV. The number of events which would have been produced in the collisions is given in the first bin. The second bin contains events, in which a reconstructed photon with the criteria defined in the analysis is reconstructed. The third bin contains events which have $ {EM {H_{\mathrm {T}}} } > $ 700 GeV in addition to a photon. In nearly all events of this model, ${EM {H_{\mathrm {T}}} }$ exceeds 700 GeV. The fourth bin contains events with a reconstructed photon, $ {EM {H_{\mathrm {T}}} } > $ 700 GeV, and $|\Delta \phi (\pm { {p_{\mathrm {T}}} ^\text {miss}}, {p_{\mathrm {T}}} ^{\gamma })|> $ 0.3. The last six bins are the event yields in the search regions. |
png pdf |
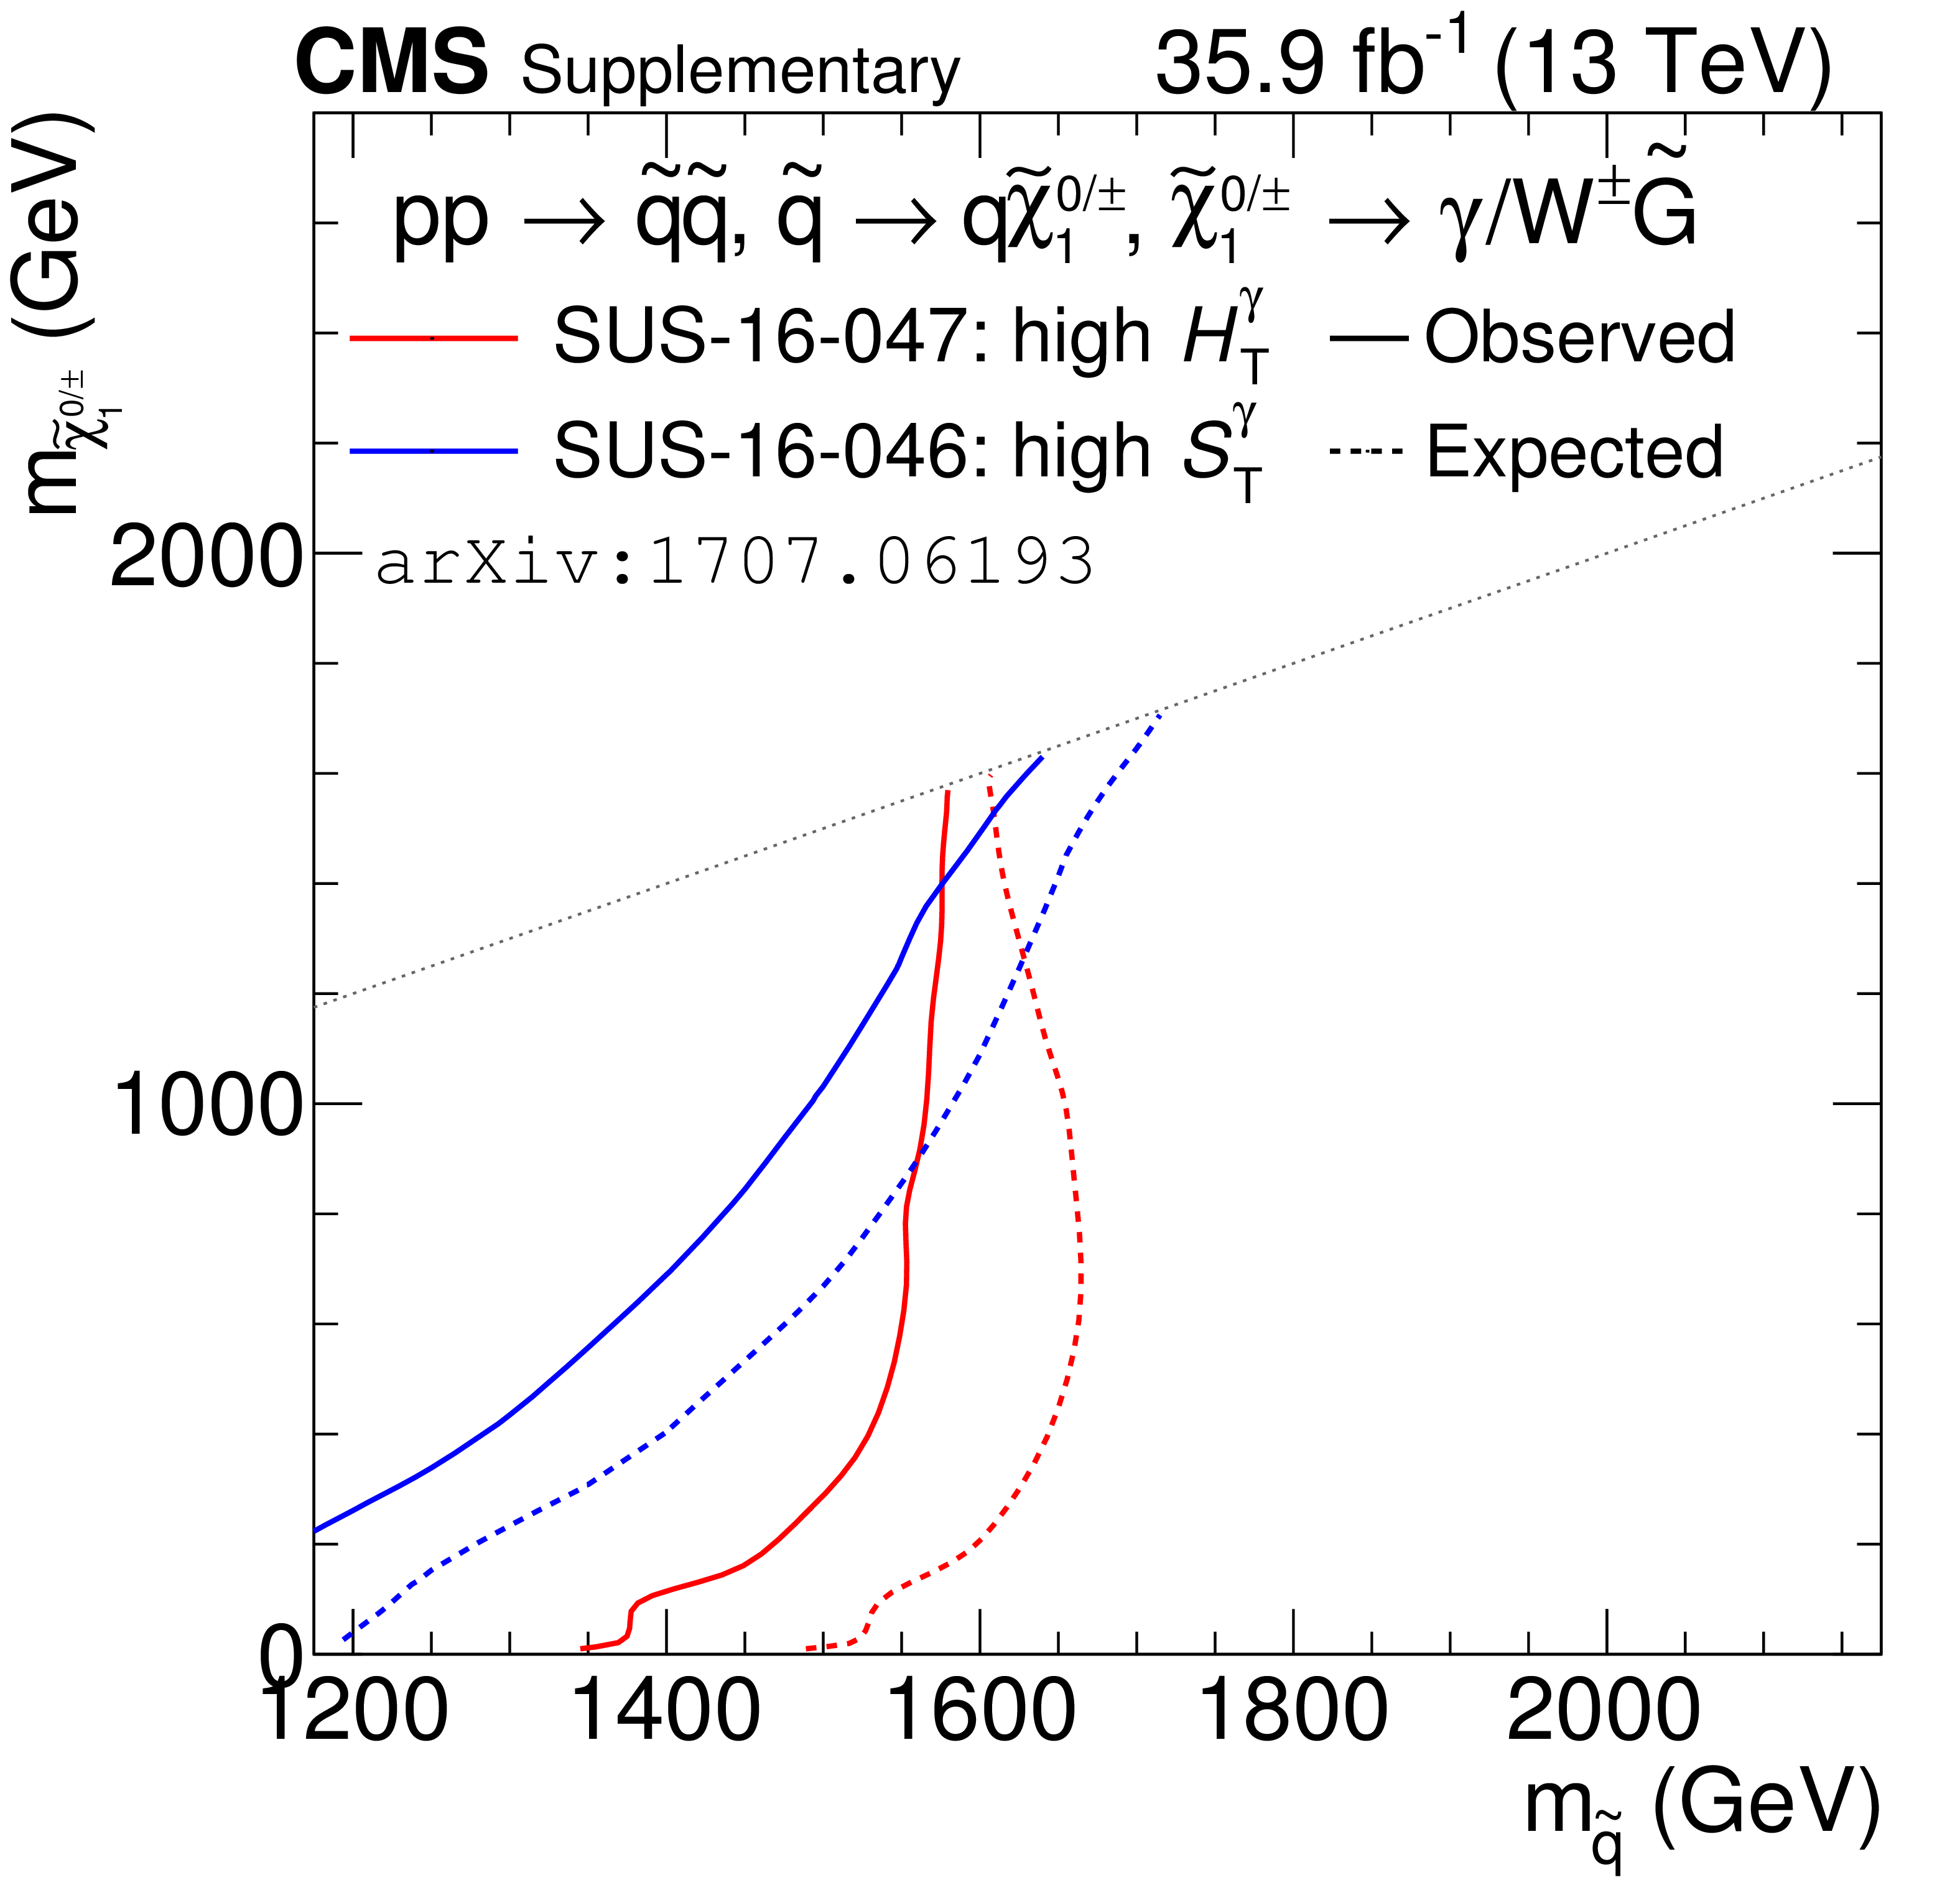
Additional Figure 8:
Observed and expected exclusion contours for SUS-16-047 (this analysis) and SUS-16-046 for the T6gg model. |
png pdf |
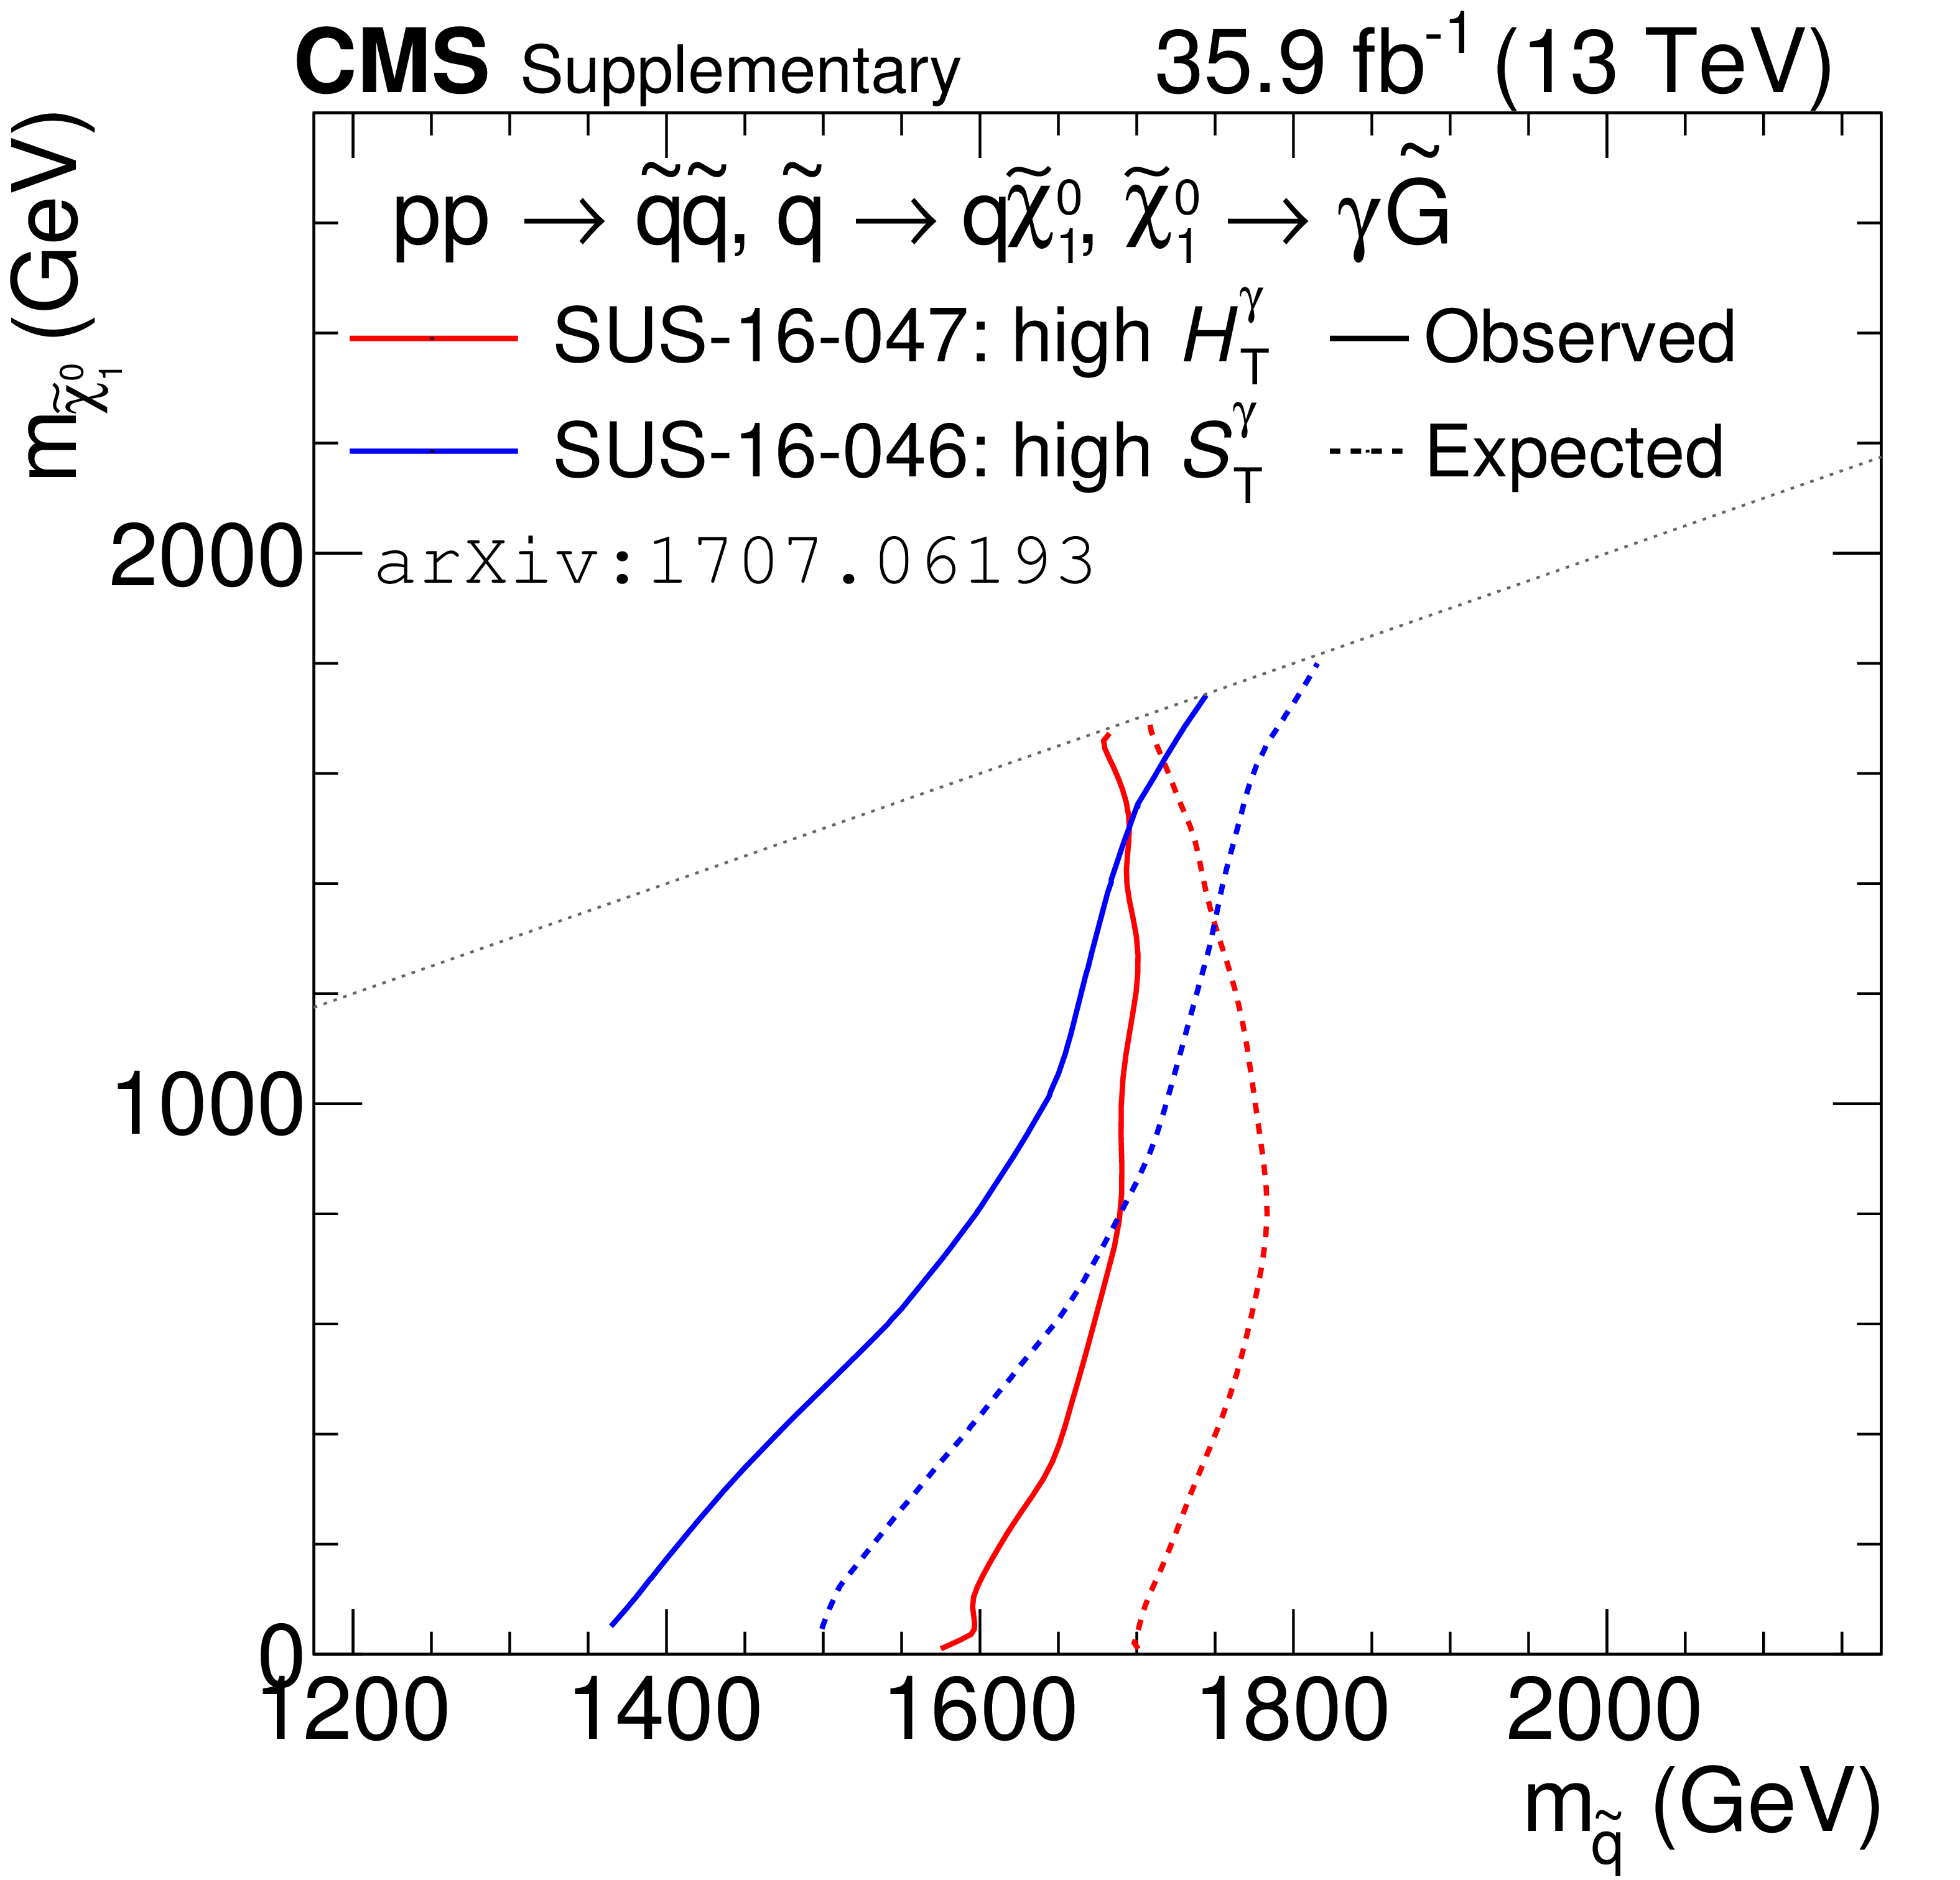
Additional Figure 9:
Observed and expected exclusion contours for SUS-16-047 (this analysis) and SUS-16-046 for the T6Wg model. |
png pdf |
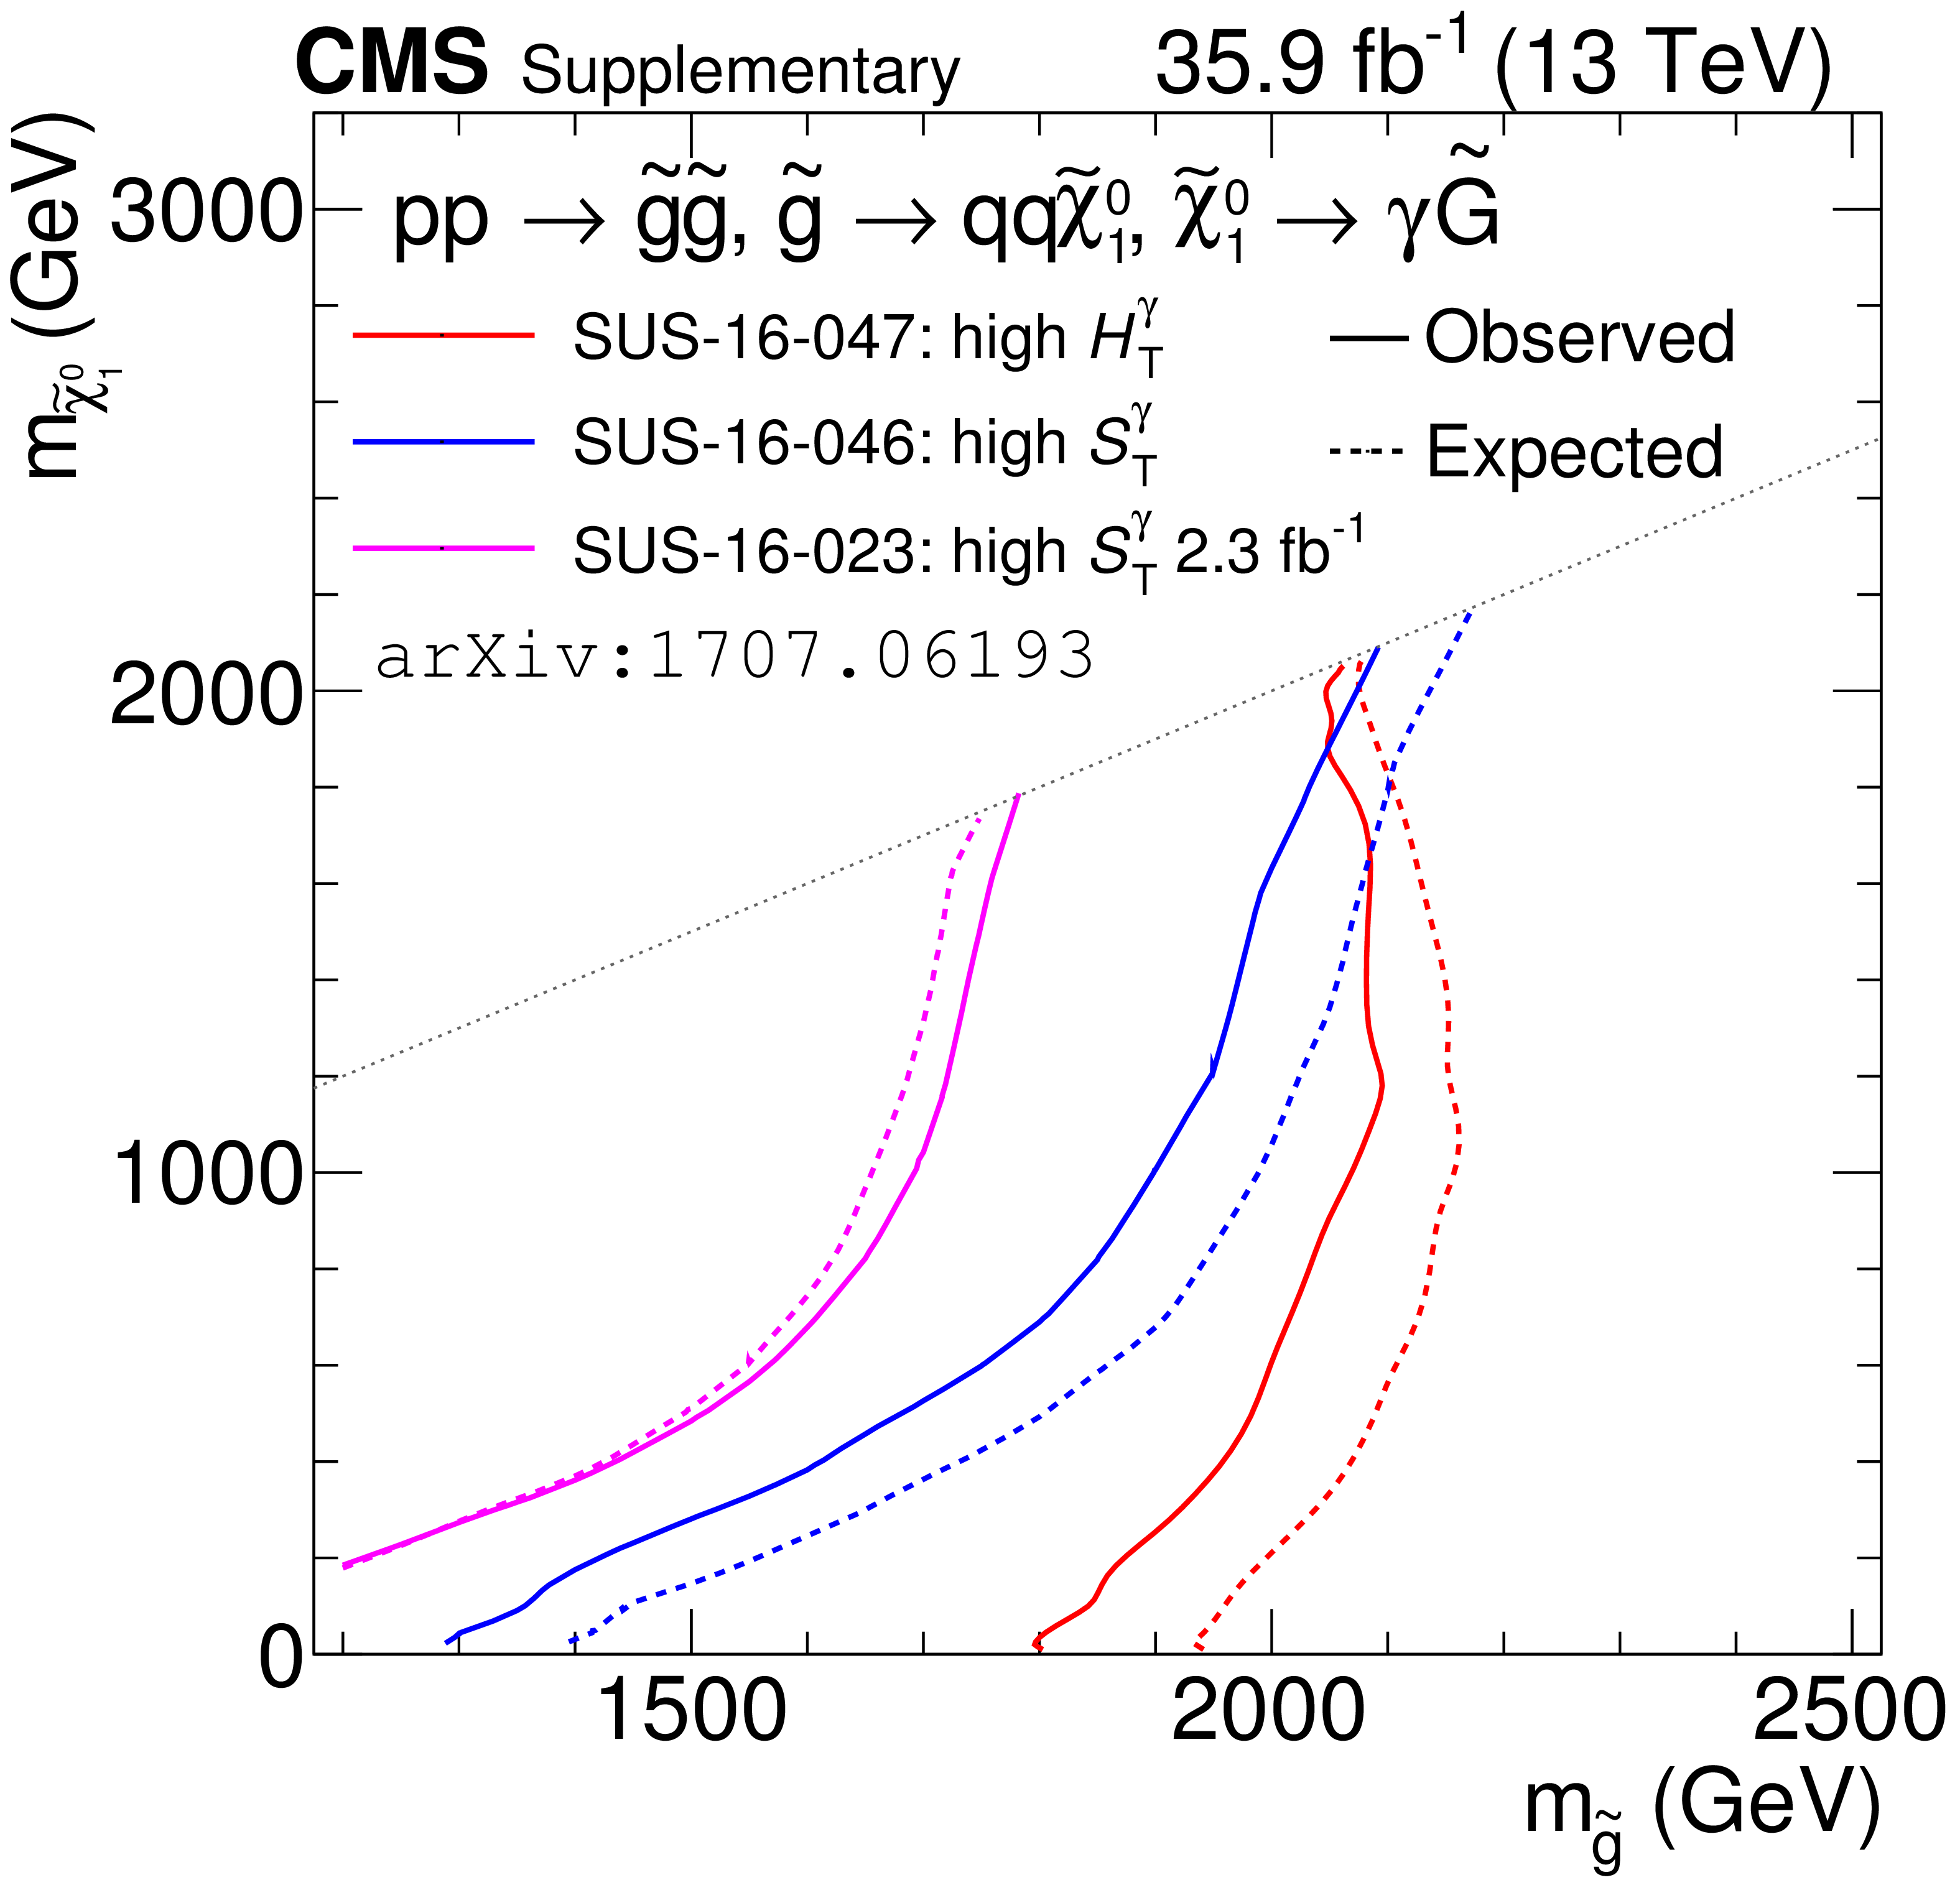
Additional Figure 10:
Observed and expected exclusion contours for SUS-16-047 (this analysis), SUS-16-046, and SUS-16-023 for the T5gg model. |
png pdf |
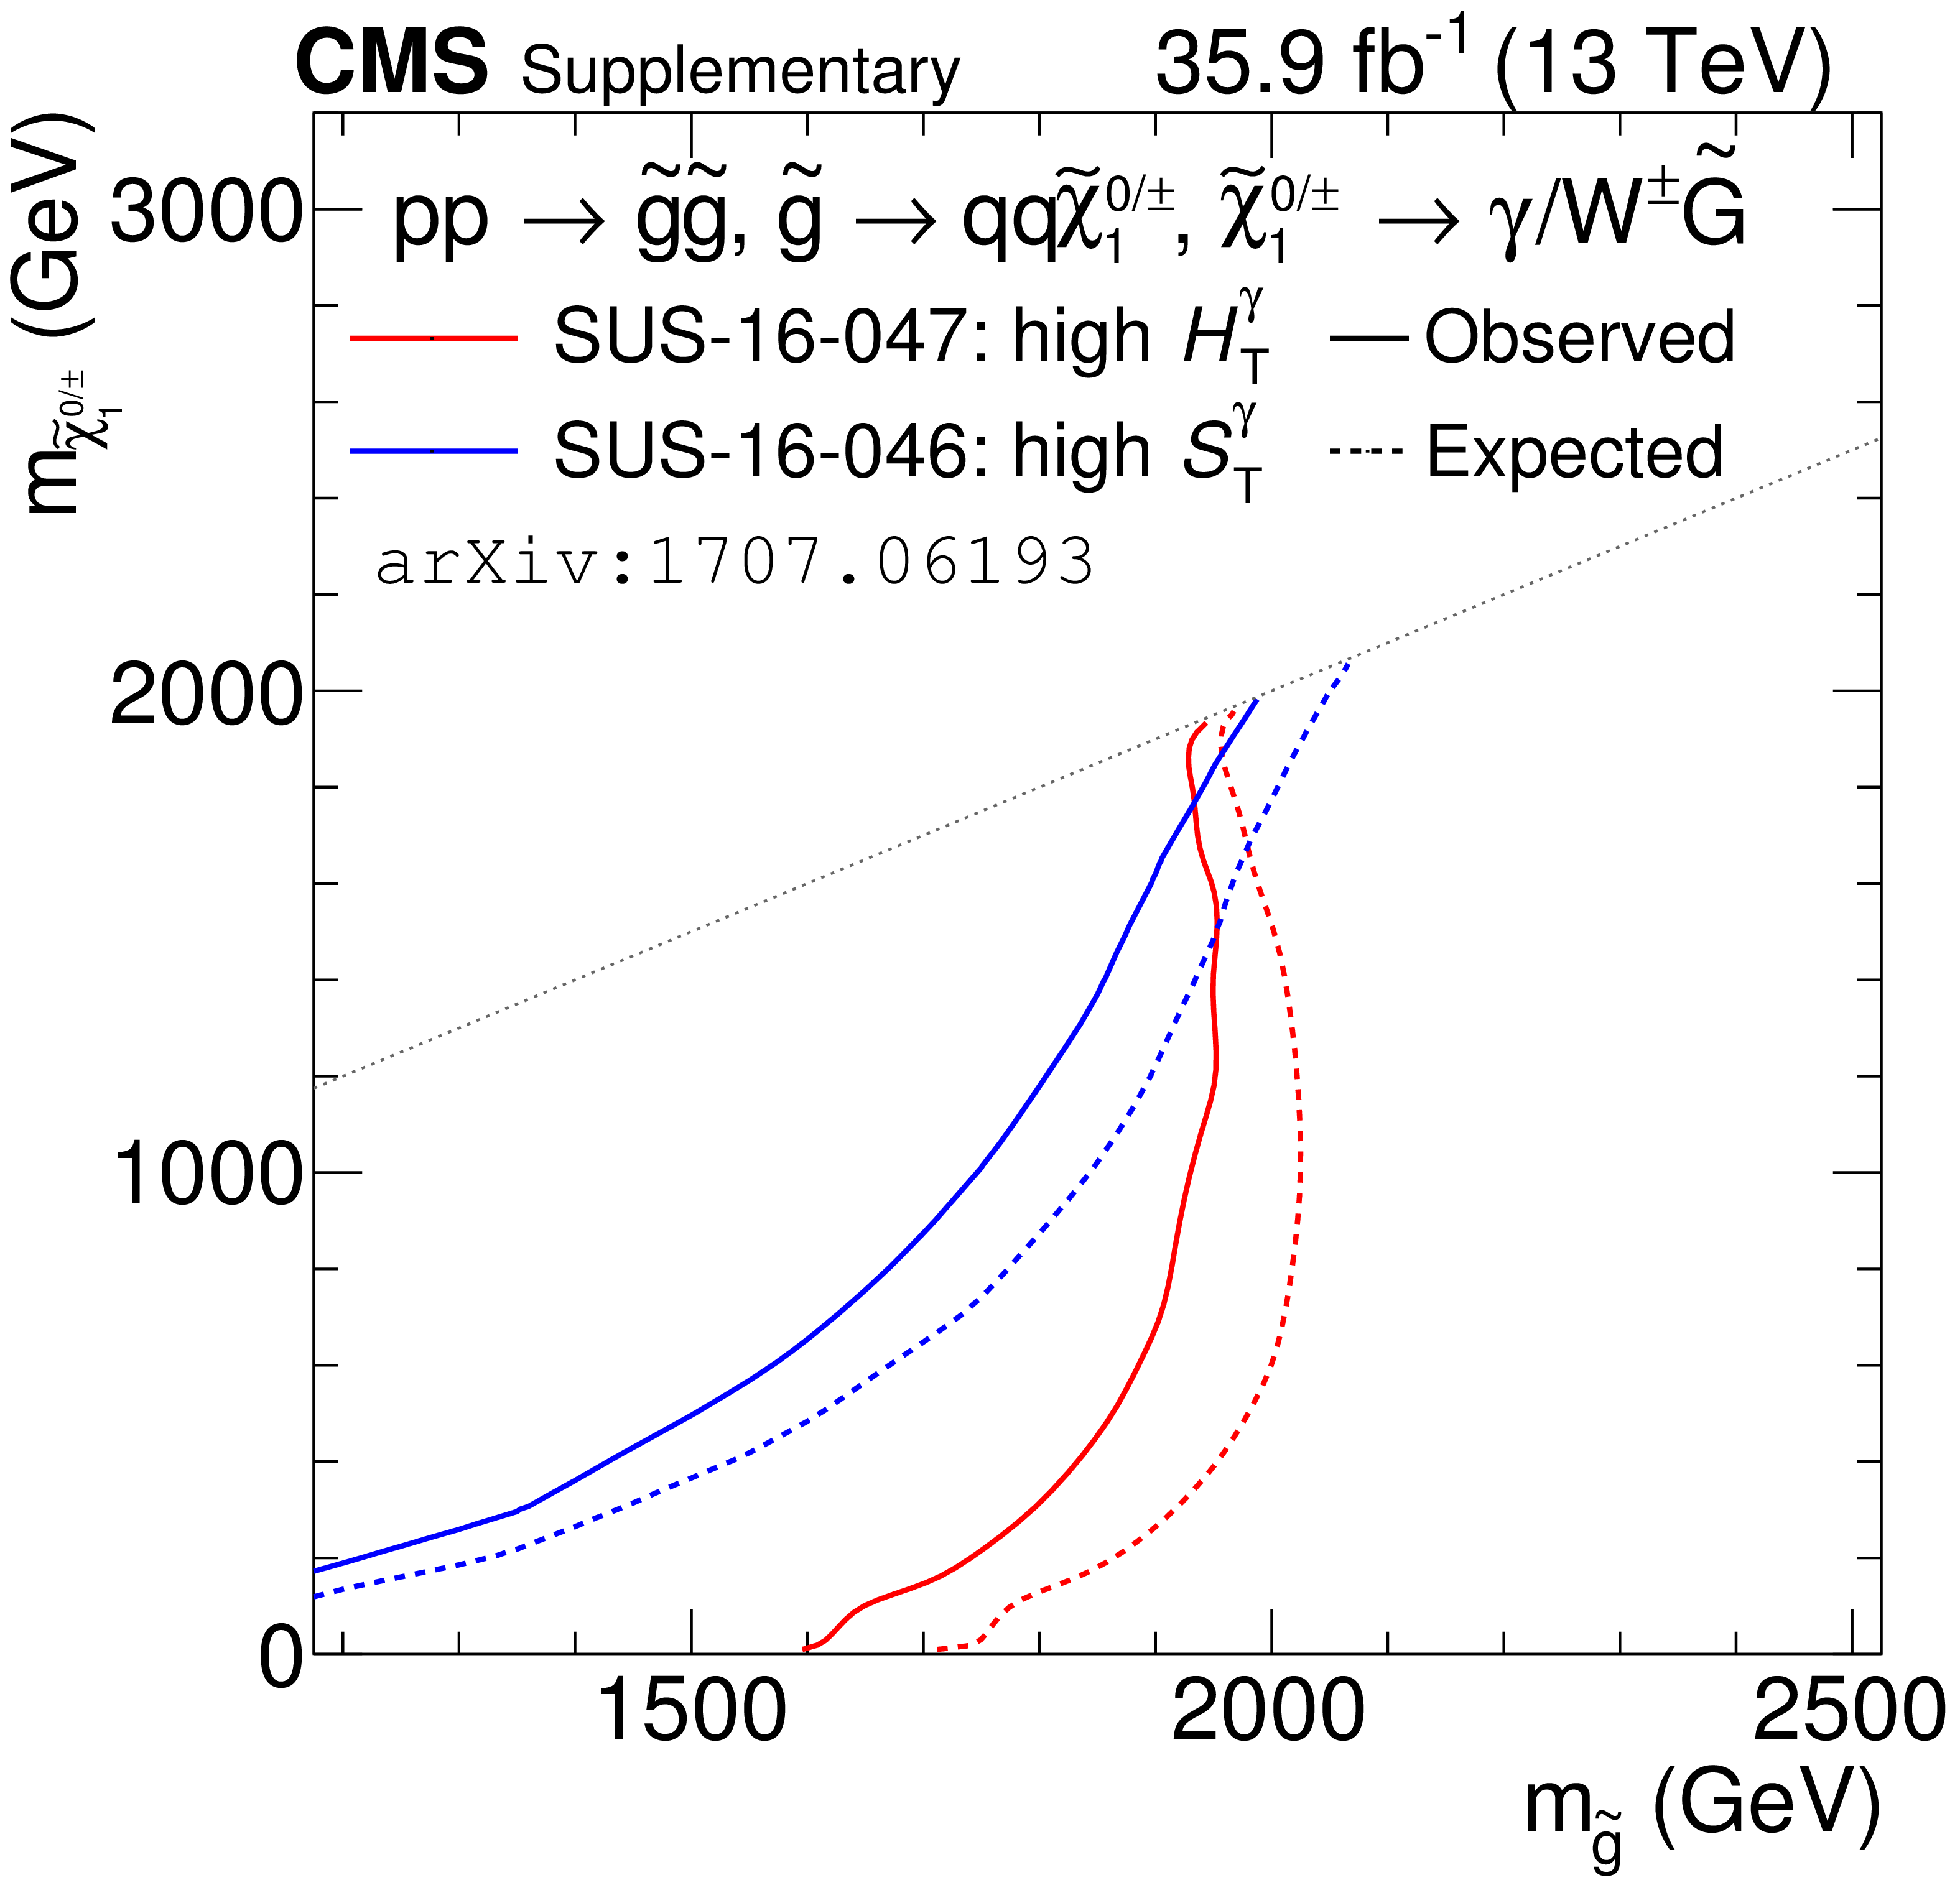
Additional Figure 11:
Observed and expected exclusion contours for SUS-16-047 (this analysis) and SUS-16-046 for the T5Wg model. |
| References | ||||
| 1 | R. Barbieri and G. F. Giudice | Upper bounds on supersymmetric particle masses | NPB 306 (1988) 63 | |
| 2 | P. Ramond | Dual theory for free fermions | PRD 3 (1971) 2415 | |
| 3 | Y. A. Gol'fand and E. P. Likhtman | Extension of the algebra of Poincar$ \'e $ group generators and violation of P invariance | JEPTL 13 (1971)323 | |
| 4 | S. Ferrara and B. Zumino | Supergauge invariant yang-mills theories | NPB 79 (1974) 413 | |
| 5 | J. Wess and B. Zumino | Supergauge transformations in four-dimensions | NPB 70 (1974) 39 | |
| 6 | A. H. Chamseddine, R. L. Arnowitt, and P. Nath | Locally supersymmetric grand unification | PRL 49 (1982) 970 | |
| 7 | R. Barbieri, S. Ferrara, and C. A. Savoy | Gauge models with spontaneously broken local supersymmetry | PLB 119 (1982) 343 | |
| 8 | L. J. Hall, J. D. Lykken, and S. Weinberg | Supergravity as the messenger of supersymmetry breaking | PRD 27 (1983) 2359 | |
| 9 | P. Fayet | Mixing between gravitational and weak interactions through the massive gravitino | PLB 70 (1977) 461 | |
| 10 | H. Baer, M. Brhlik, C.-h. Chen, and X. Tata | Signals for the minimal gauge-mediated supersymmetry breaking model at the Fermilab Tevatron collider | PRD 55 (1997) 4463 | hep-ph/9610358 |
| 11 | H. Baer, P. G. Mercadante, X. Tata, and Y. Wang | Reach of Fermilab Tevatron upgrades in gauge-mediated supersymmetry breaking models | PRD 60 (1999) 055001 | hep-ph/9903333 |
| 12 | S. Dimopoulos, S. Thomas, and J. D. Wells | Sparticle spectroscopy and electroweak symmetry breaking with gauge-mediated supersymmetry breaking | NPB 488 (1997) 39 | hep-ph/9609434 |
| 13 | J. Ellis, J. L. Lopez, and D. V. Nanopoulos | Analysis of LEP constraints on supersymmetric models with a light gravitino | PLB 394 (1997) 354 | hep-ph/9610470 |
| 14 | M. Dine, A. E. Nelson, Y. Nir, and Y. Shirman | New tools for low energy dynamical supersymmetry breaking | PRD 53 (1996) 2658 | hep-ph/9507378 |
| 15 | G. F. Giudice and R. Rattazzi | Gauge-mediated supersymmetry breaking | in Perspectives on Supersymmetry, p. 355 World Scientific, Singapore | |
| 16 | P. Grajek, A. Mariotti, and D. Redigolo | Phenomenology of general gauge mediation in light of a 125 GeV Higgs | JHEP 07 (2013) 109 | 1303.0870 |
| 17 | G. R. Farrar and P. Fayet | Phenomenology of the production, decay, and detection of new hadronic states associated with supersymmetry | PLB 76 (1978) 575 | |
| 18 | R. Barbier et al. | $ R $-parity-violating supersymmetry | Phys. Rep. 420 (2005) 1 | hep-ph/0406039 |
| 19 | J. T. Ruderman and D. Shih | General neutralino NLSPs at the early LHC | JHEP 08 (2012) 159 | 1103.6083 |
| 20 | CMS Collaboration | Search for supersymmetry with photons in pp collisions at $ \sqrt{s} = $ 8 TeV | PRD 92 (2015) 072006 | CMS-SUS-14-004 1507.02898 |
| 21 | CMS Collaboration | Search for supersymmetry in electroweak production with photons and large missing transverse energy in pp collisions at $ \sqrt{s} = $ 8 TeV | PLB 759 (2016) 479 | CMS-SUS-14-016 1602.08772 |
| 22 | CMS Collaboration | Search for supersymmetry in events with photons and missing transverse energy in pp collisions at 13 TeV | PLB 769 (2017) 391 | CMS-SUS-15-012 1611.06604 |
| 23 | ATLAS Collaboration | Search for photonic signatures of gauge-mediated supersymmetry in 8 TeV pp collisions with the ATLAS detector | PRD 92 (2015) 072001 | 1507.05493 |
| 24 | ATLAS Collaboration | Search for supersymmetry in a final state containing two photons and missing transverse momentum in $ \sqrt{s} = $ 13 TeV pp collisions at the LHC using the ATLAS detector | EPJC 76 (2016) 517 | 1606.09150 |
| 25 | CMS Collaboration | Jet energy scale and resolution in the CMS experiment in pp collisions at 8 TeV | JINST 12 (2017) P02014 | CMS-JME-13-004 1607.03663 |
| 26 | CMS Collaboration | The CMS experiment at the CERN LHC | JINST 3 (2008) S08004 | CMS-00-001 |
| 27 | CMS Collaboration | Particle-flow reconstruction and global event description with the CMS detector | Submitted to JINST | CMS-PRF-14-001 1706.04965 |
| 28 | M. Cacciari, G. P. Salam, and G. Soyez | The anti-$ k_t $ jet clustering algorithm | JHEP 04 (2008) 063 | 0802.1189 |
| 29 | M. Cacciari, G. P. Salam, and G. Soyez | Fastjet user manual | EPJC 72 (2012) 1896 | 1111.6097 |
| 30 | M. Cacciari and G. P. Salam | Pileup subtraction using jet areas | PLB 659 (2008) 119 | 0707.1378 |
| 31 | J. Alwall et al. | The automated computation of tree-level and next-to-leading order differential cross sections, and their matching to parton shower simulations | JHEP 07 (2014) 079 | 1405.0301 |
| 32 | NNPDF Collaboration | Parton distributions for the LHC Run II | JHEP 04 (2015) 040 | 1410.8849 |
| 33 | T. Sjostrand, S. Mrenna, and P. Z. Skands | A brief introduction to PYTHIA 8.1 | CPC 178 (2008) 852 | 0710.3820 |
| 34 | CMS Collaboration | Event generator tunes obtained from underlying event and multiparton scattering measurements | EPJC 76 (2016) 155 | CMS-GEN-14-001 1512.00815 |
| 35 | C. Borschensky et al. | Squark and gluino production cross sections in pp collisions at $ \sqrt{s} = 13, 14, 33 $ and 100 TeV | EPJC 74 (2014) 3174 | 1407.5066 |
| 36 | LHC New Physics Working Group | Simplified models for LHC new physics searches | JPG 39 (2012) 105005 | 1105.2838 |
| 37 | CMS Collaboration | Interpretation of searches for supersymmetry with simplified models | PRD 88 (2013) 052017 | CMS-SUS-11-016 1301.2175 |
| 38 | GEANT4 Collaboration | GEANT4---a simulation toolkit | NIMA 506 (2003) 250 | |
| 39 | CMS CollaborationS. Abdullin, et al. | The fast simulation of the CMS detector at LHC | in Int'l. Conf. on High Energy and Nuclear Physics Taipei, Taiwan, October, 2011 [J. Phys. Conf. Ser. 331 (2011) 032049] | |
| 40 | CMS Collaboration, S. Sekmen | Recent developments in CMS fast simulation | in Proceedings, 38th International Conference on High Energy Physics (ICHEP 2016), p. 181 Chicago, Illinois, USA, August, 2016 [PoS(ICHEP2016)181] | 1701.03850 |
| 41 | CMS Collaboration | The CMS trigger system | JINST 12 (2017) P01020 | CMS-TRG-12-001 1609.02366 |
| 42 | CMS Collaboration | Performance of missing energy reconstruction in 13 TeV pp collision data using the CMS detector | CMS-PAS-JME-16-004 | CMS-PAS-JME-16-004 |
| 43 | J. Butterworth et al. | PDF4LHC recommendations for LHC Run II | JPG 43 (2016) 023001 | 1510.03865 |
| 44 | CMS Collaboration | CMS luminosity measurements for the 2016 data taking period | CMS-PAS-LUM-17-001 | CMS-PAS-LUM-17-001 |
| 45 | T. Junk | Confidence level computation for combining searches with small statistics | NIMA 434 (1999) 435 | hep-ex/9902006 |
| 46 | A. L. Read | Presentation of search results: the $ CL_s $ technique | JPG 28 (2002) 2693 | |
| 47 | ATLAS and CMS Collaborations | Procedure for the LHC Higgs boson search combination in Summer 2011 | CMS-NOTE-2011-005 | |
| 48 | G. Cowan, K. Cranmer, E. Gross, and O. Vitells | Asymptotic formulae for likelihood-based tests of new physics | EPJC 71 (2011) 1554 | 1007.1727 |
|
|
Compact Muon Solenoid LHC, CERN |
|

|

|

|

|

|