

Compact Muon Solenoid
LHC, CERN
| CMS-SUS-18-007 ; CERN-EP-2019-171 | ||
| Search for supersymmetry using Higgs boson to diphoton decays at $\sqrt{s} = $ 13 TeV | ||
| CMS Collaboration | ||
| 23 August 2019 | ||
| JHEP 11 (2019) 109 | ||
| Abstract: A search for supersymmetry (SUSY) is presented where at least one Higgs boson is produced and decays to two photons in the decay chains of pair-produced SUSY particles. Two complementary analysis strategies are pursued: one focused on strong SUSY production and the other focused on electroweak SUSY production. The presence of charged leptons, additional Higgs boson candidates, and various kinematic variables are used to categorize events into search regions that are sensitive to different SUSY scenarios. The results are based on data from proton-proton collisions at the Large Hadron Collider at a center-of-mass energy of 13 TeV collected by the CMS experiment, corresponding to an integrated luminosity of 77.5 fb$^{-1}$. No statistically significant excess of events is observed relative to the standard model expectations. We exclude bottom squark pair production for bottom squark masses below 530 GeV and a lightest SUSY particle mass of 1 GeV; wino-like chargino-neutralino production for chargino and neutralino masses below 235 GeV with a gravitino mass of 1 GeV; and higgsino-like chargino-neutralino production in the case where the neutralino decays exclusively to a Higgs boson and a gravitino for neutralino masses below 290 GeV. | ||
| Links: e-print arXiv:1908.08500 [hep-ex] (PDF) ; CDS record ; inSPIRE record ; CADI line (restricted) ; | ||
| Additional information on efficiencies needed for reinterpretation of these results are available here. Additional technical material for CMS speakers can be found here. |
| Figures | |

png pdf |
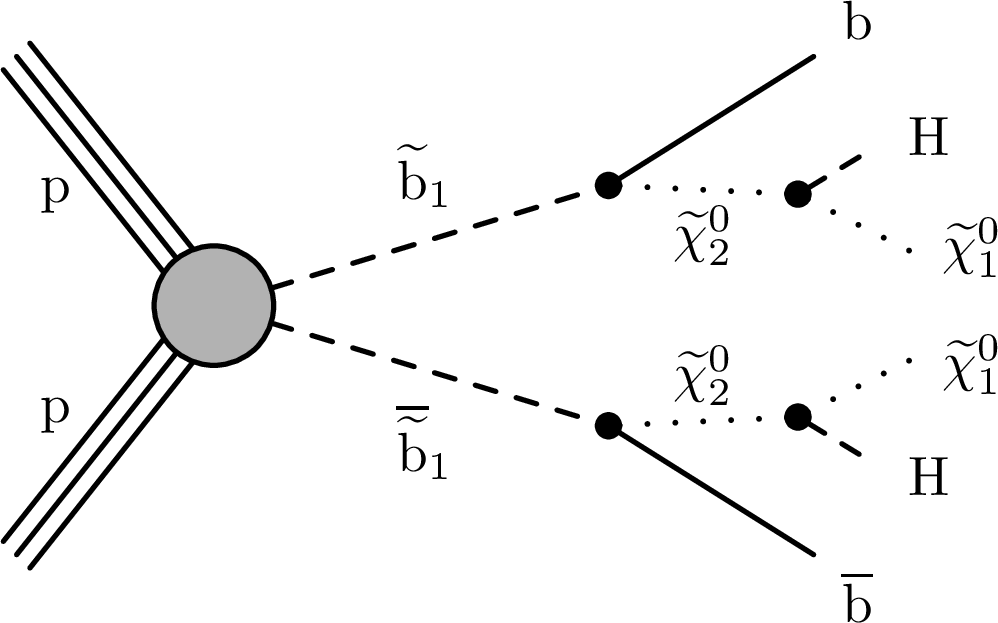
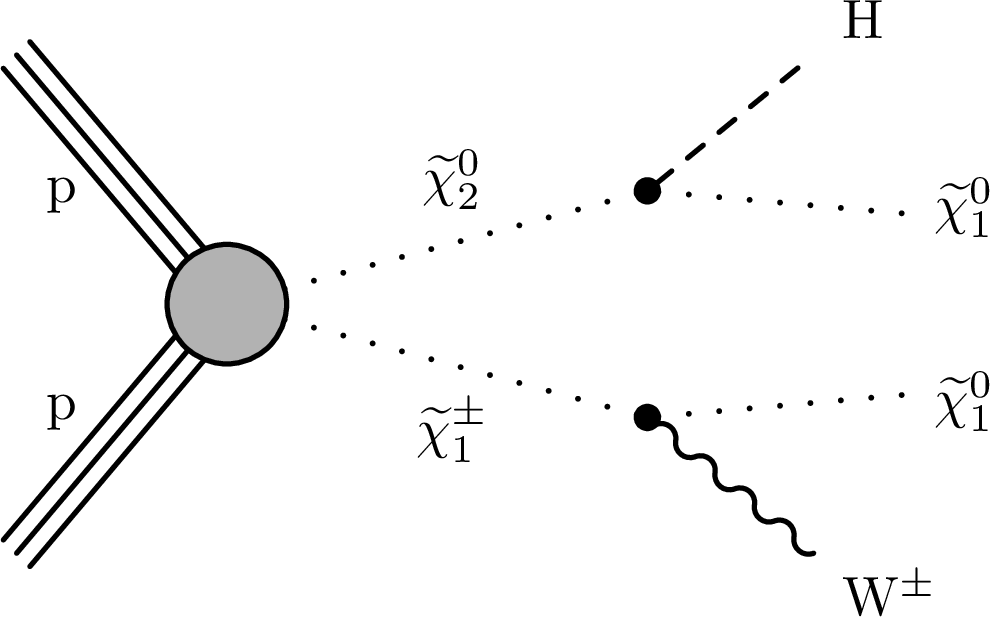
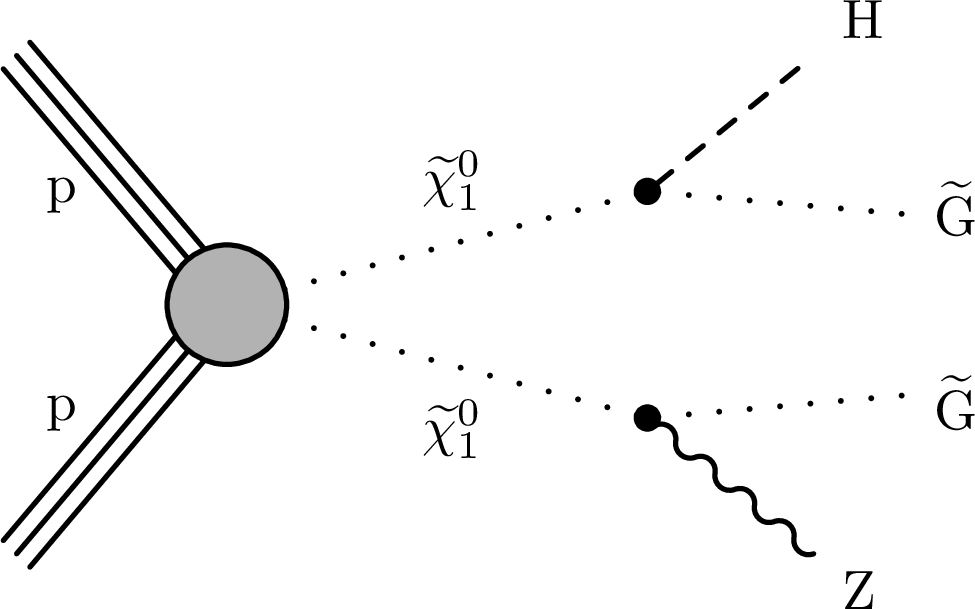
Figure 1:
Diagrams displaying the simplified models that are being considered. Upper left: bottom squark pair production; upper right: wino-like chargino-neutralino production; lower: the two relevant decay modes for higgsino-like neutralino pair production in the GMSB scenario. |
png pdf |
Figure 1-a:
Diagram displaying the simplified model for bottom squark pair production. |
png pdf |
Figure 1-b:
Diagram displaying the simplified model for wino-like chargino-neutralino production. |

png pdf |
Figure 1-c:
Diagram displaying the simplified model for higgsino-like neutralino pair production in the GMSB scenario. |
png pdf |
Figure 1-d:
Diagram displaying the simplified model for higgsino-like neutralino pair production in the GMSB scenario. |

png pdf |
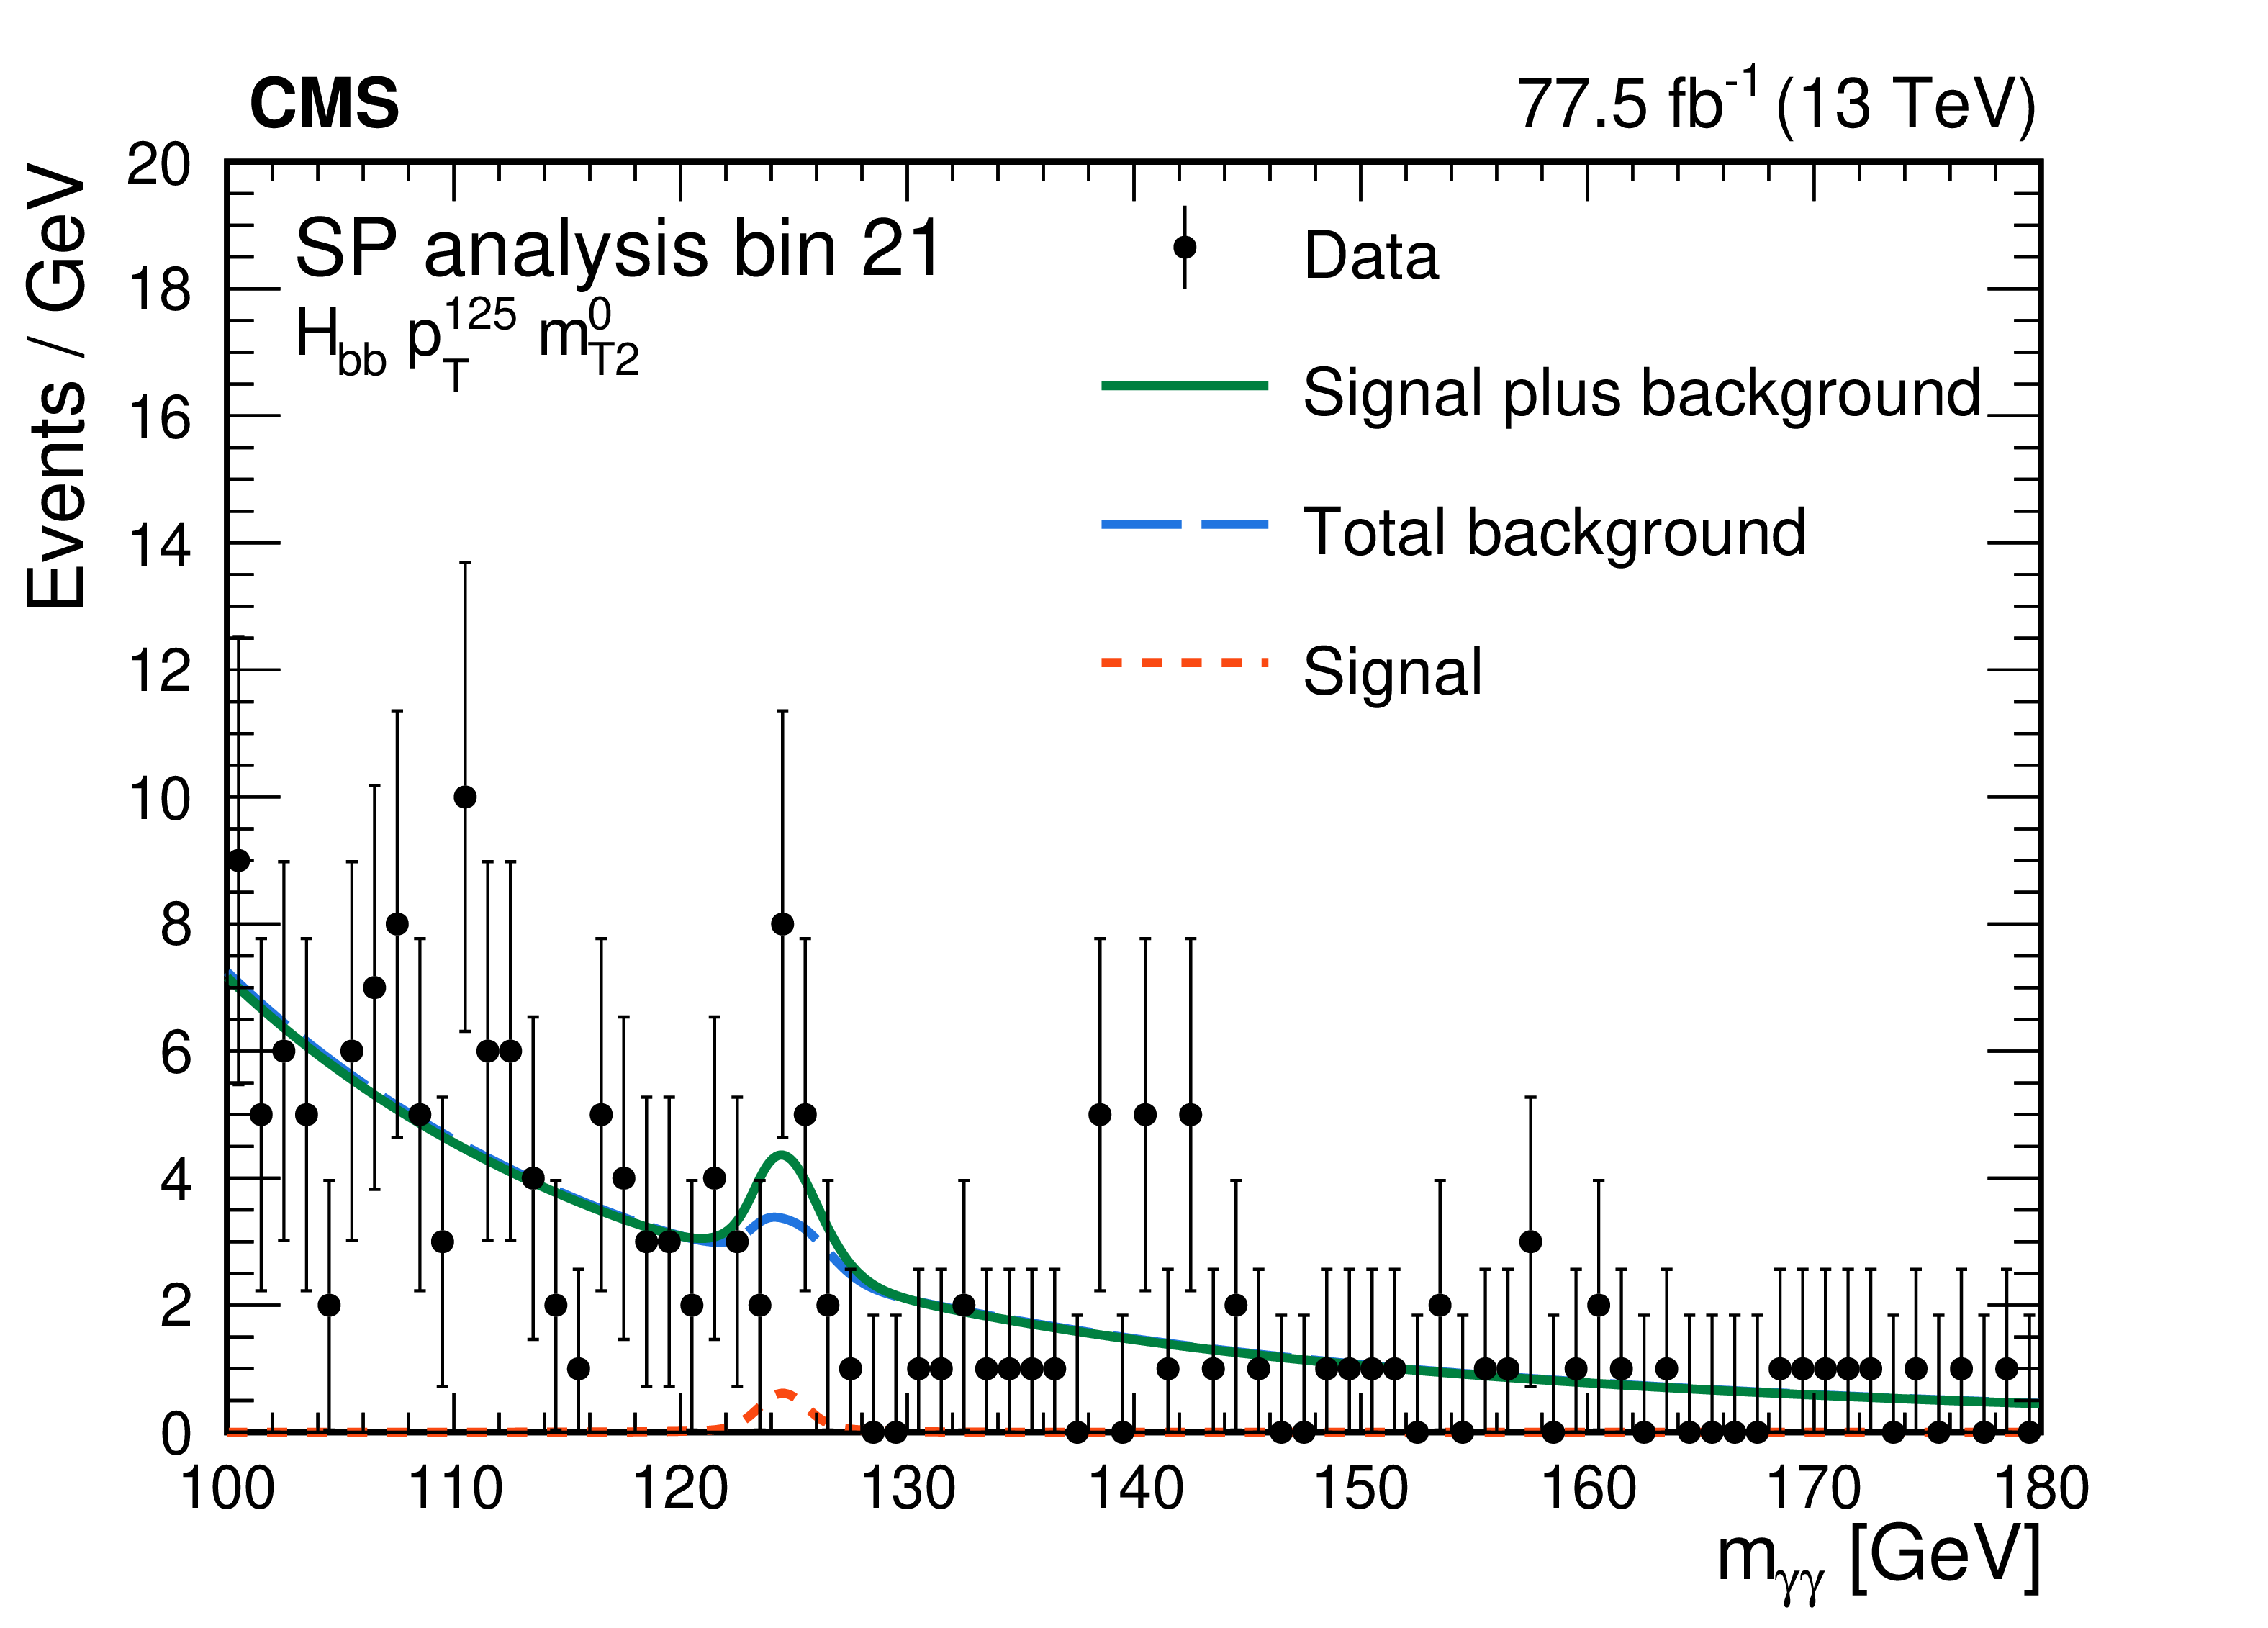
Figure 2:
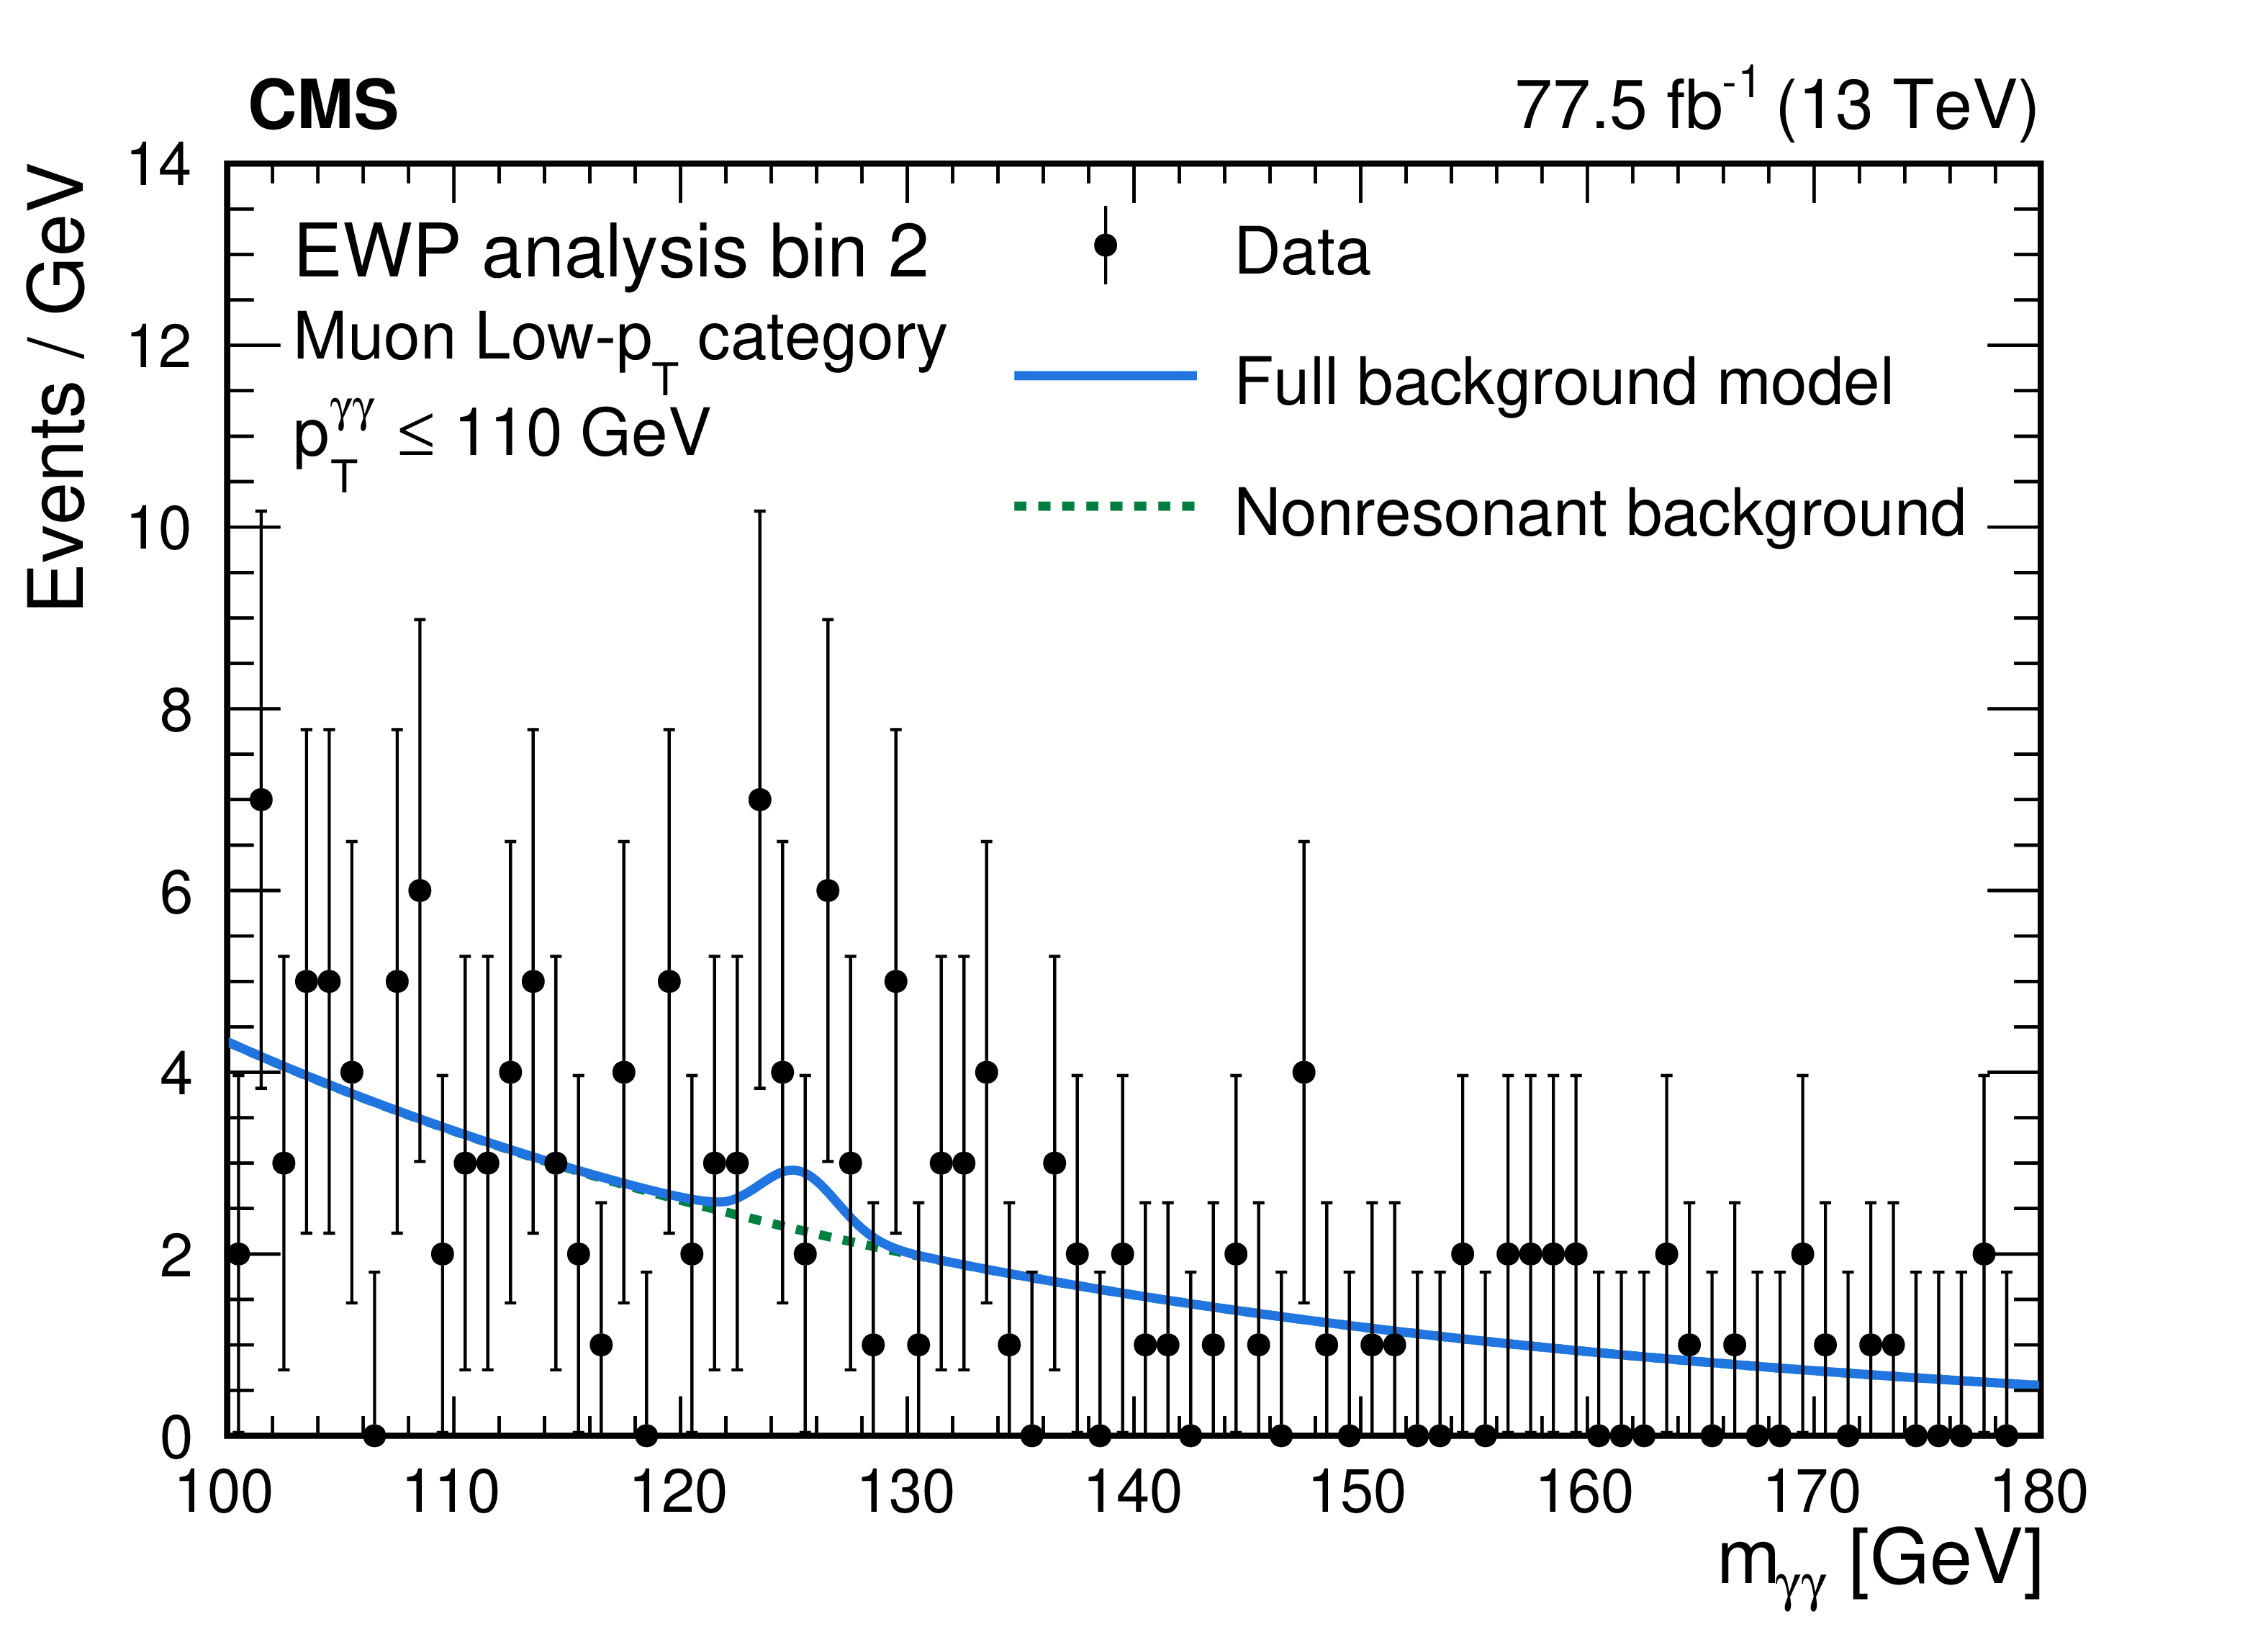
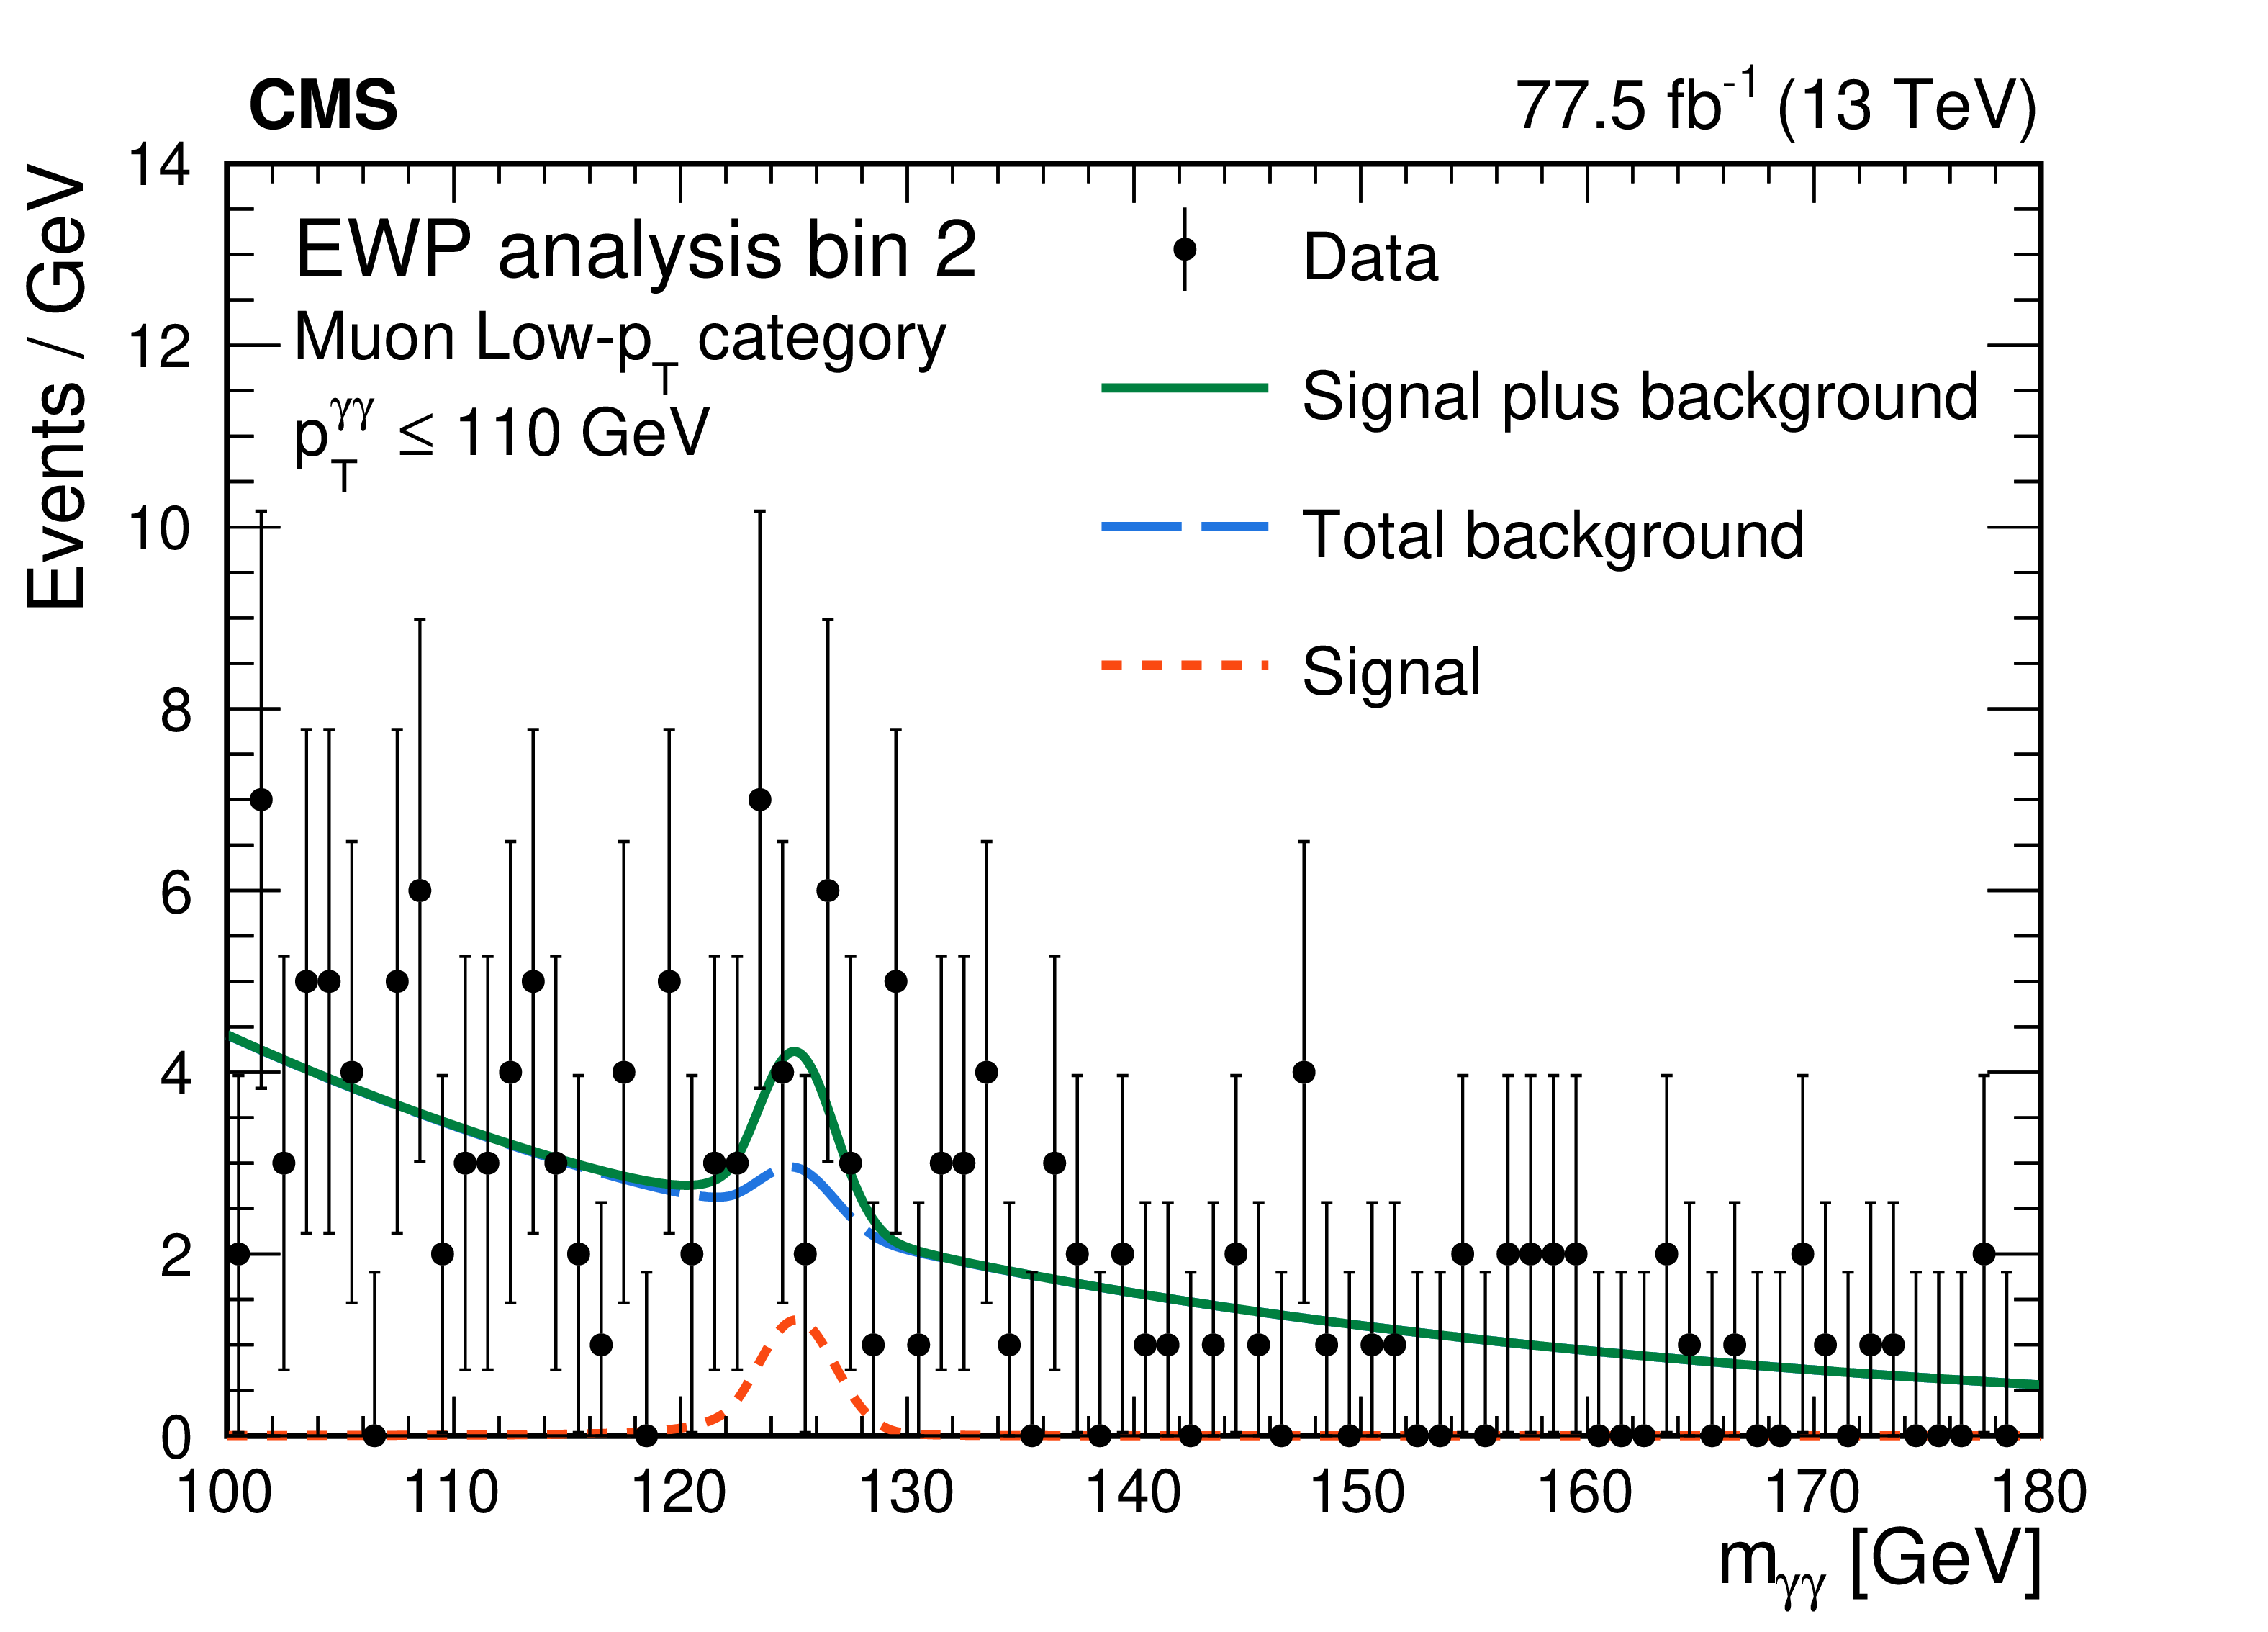
The diphoton mass distribution for two example search bin is shown with the background-only fit (left) and the signal-plus-background fit (right) to illustrate the signal extraction procedure. The search region bins shown corresponds to the $\mathrm{H} \mathrm{b} \mathrm{\bar{b}} {p_{\mathrm {T}}} ^{125}, {m_{\mathrm {T2}}} ^{0} $ category, bin 21, of the SP analysis (upper) and the Muon Low-$ {p_{\mathrm {T}}} $ category, bin 2, of the EWP analysis (lower). |

png pdf |
Figure 2-a:
The diphoton mass distribution for two example search bin is shown with the background-only fit to illustrate the signal extraction procedure. The search region bins shown corresponds to the $\mathrm{H} \mathrm{b} \mathrm{\bar{b}} {p_{\mathrm {T}}} ^{125}, {m_{\mathrm {T2}}} ^{0} $ category, bin 21, of the SP analysis. |
png pdf |
Figure 2-b:
The diphoton mass distribution for two example search bin is shown with the signal-plus-background fit to illustrate the signal extraction procedure. The search region bins shown corresponds to the $\mathrm{H} \mathrm{b} \mathrm{\bar{b}} {p_{\mathrm {T}}} ^{125}, {m_{\mathrm {T2}}} ^{0} $ category, bin 21, of the SP analysis. |
png pdf |
Figure 2-c:
The diphoton mass distribution for two example search bin is shown with the background-only fit to illustrate the signal extraction procedure. |
png pdf |
Figure 2-d:
The diphoton mass distribution for two example search bin is shown with the signal-plus-background fit to illustrate the signal extraction procedure. The search region bins shown corresponds to the Muon Low-$ {p_{\mathrm {T}}} $ category, bin 2, of the EWP analysis. |
png pdf root |
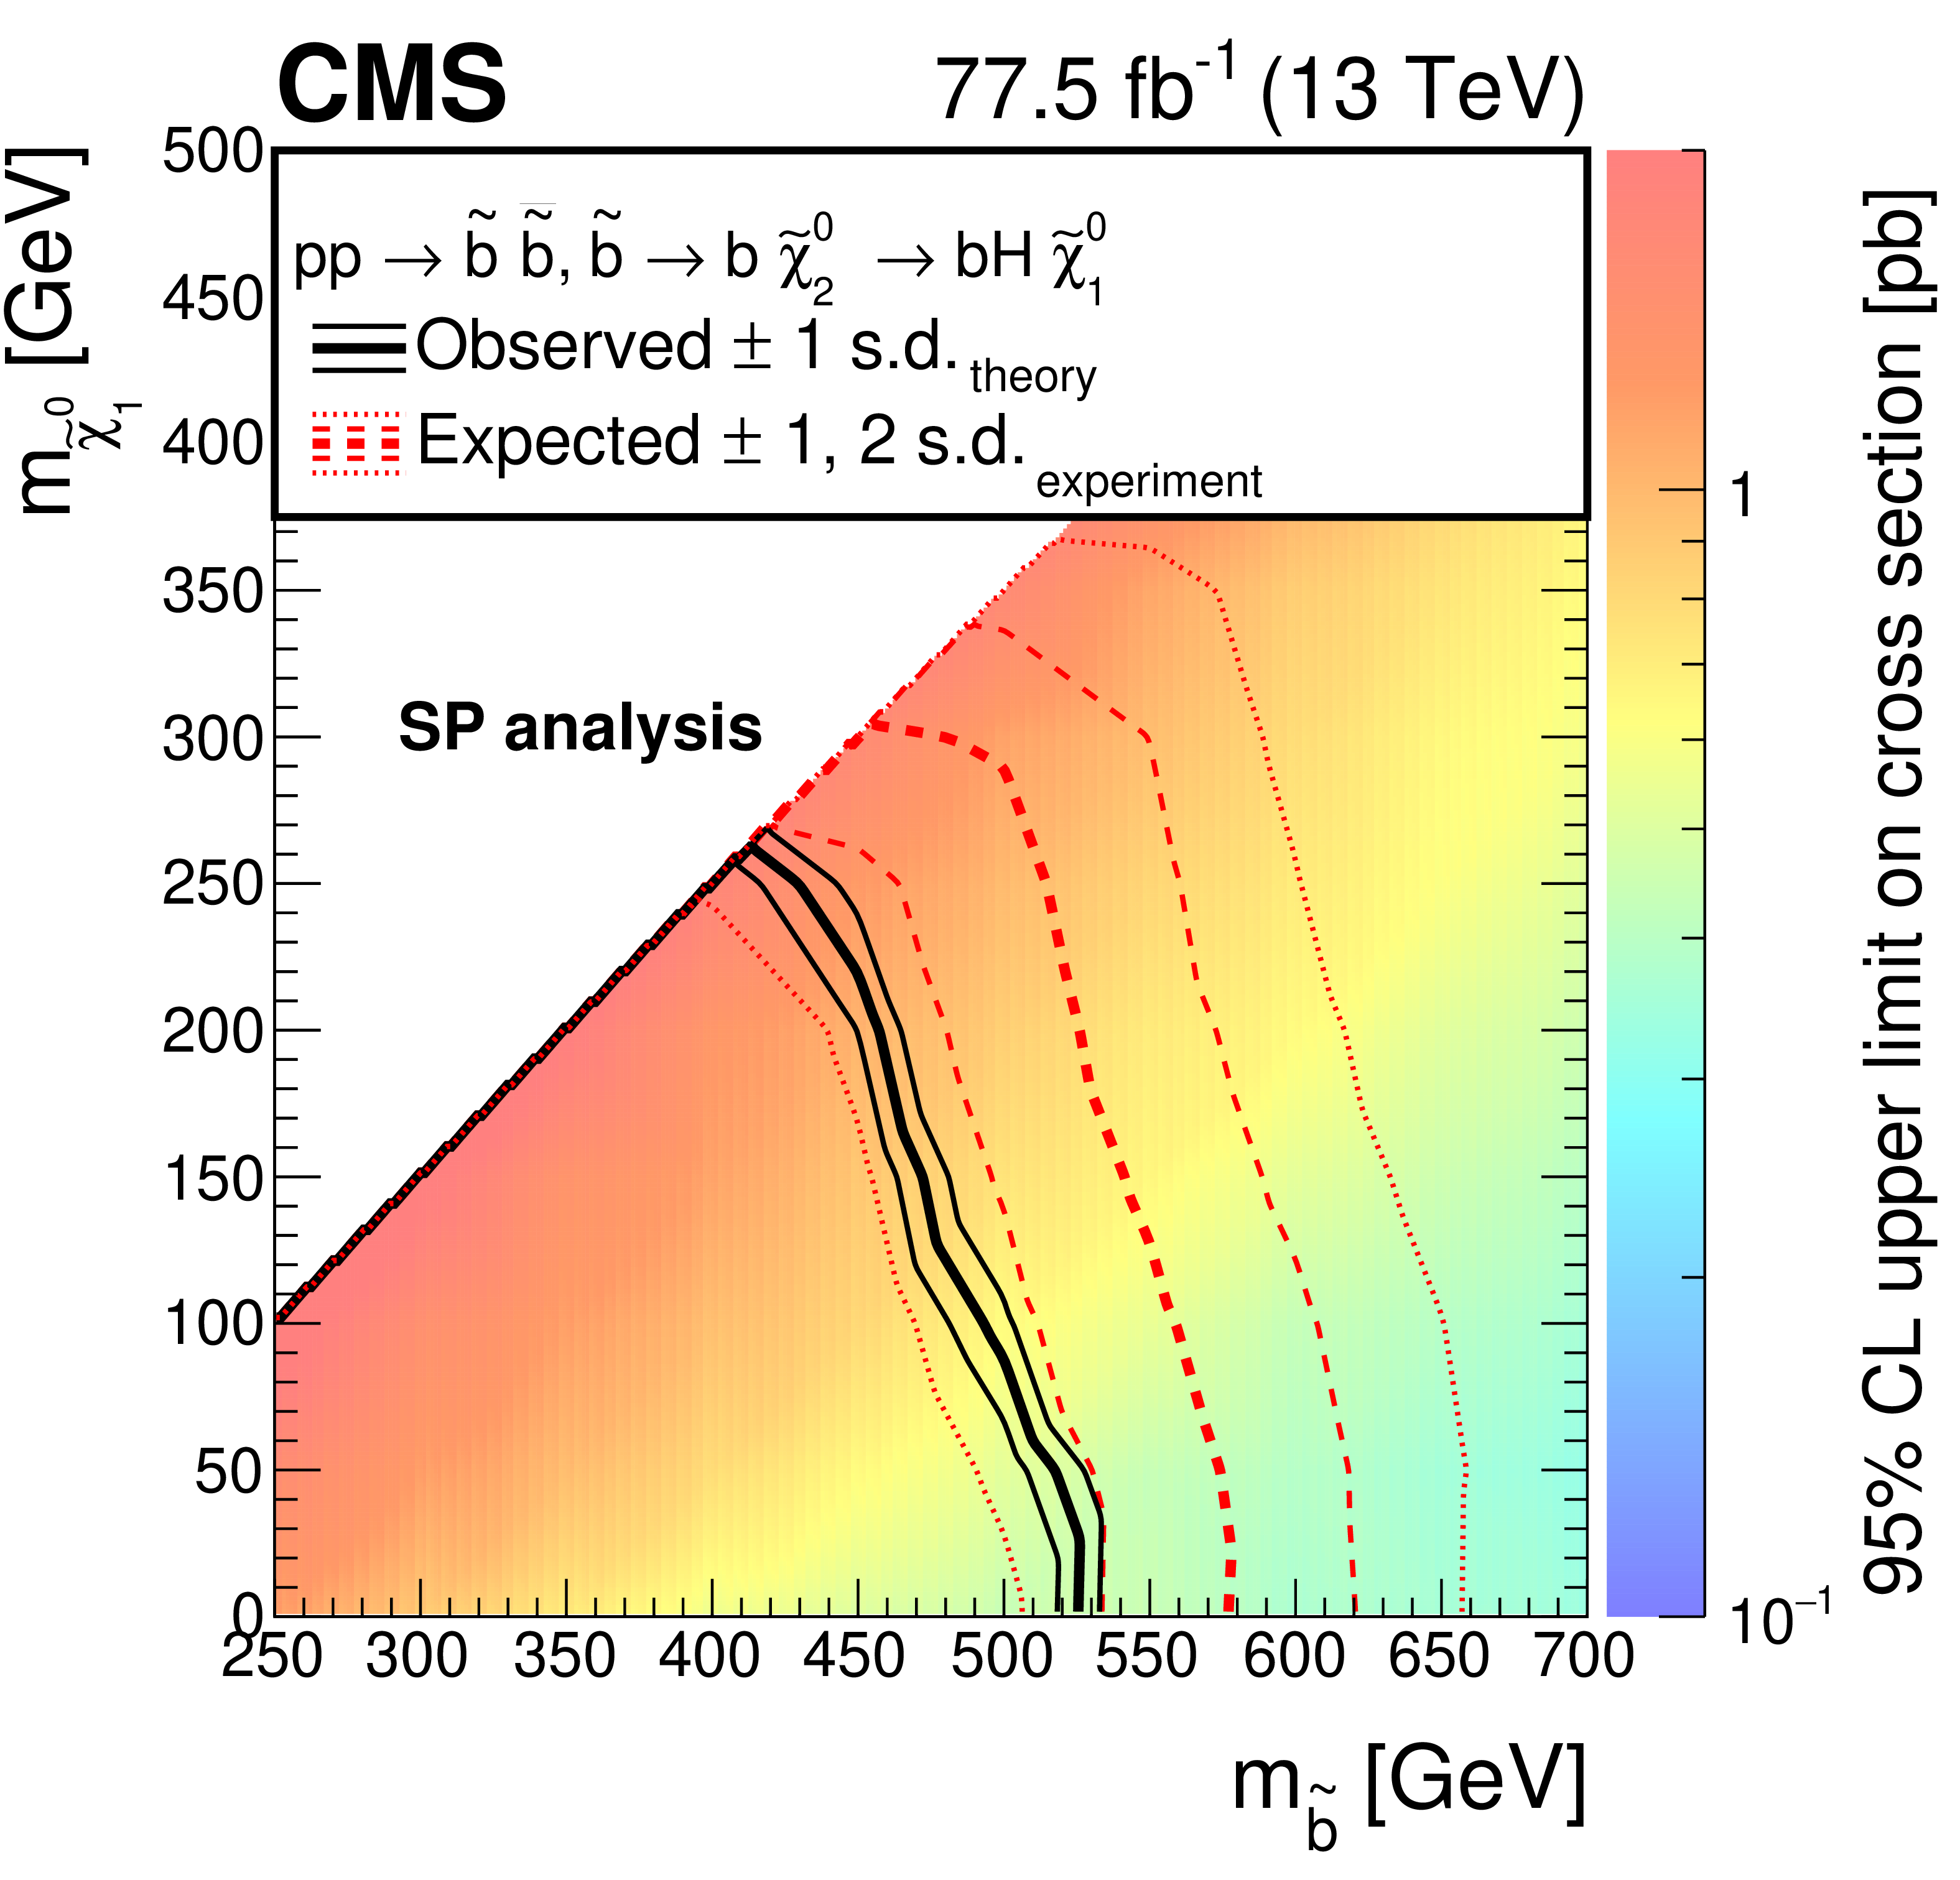
Figure 3:
The observed 95% CL upper limits on the bottom squark pair production cross section are shown for the SP analysis. The bold and light solid black contours represent the observed exclusion region and the $\pm $1 standard deviation (s.d.) band, including both experimental and theoretical uncertainties. The analogous red dotted contours represent the expected exclusion region and its $\pm $1 and $\pm $2 s.d. bands. |
png pdf root |
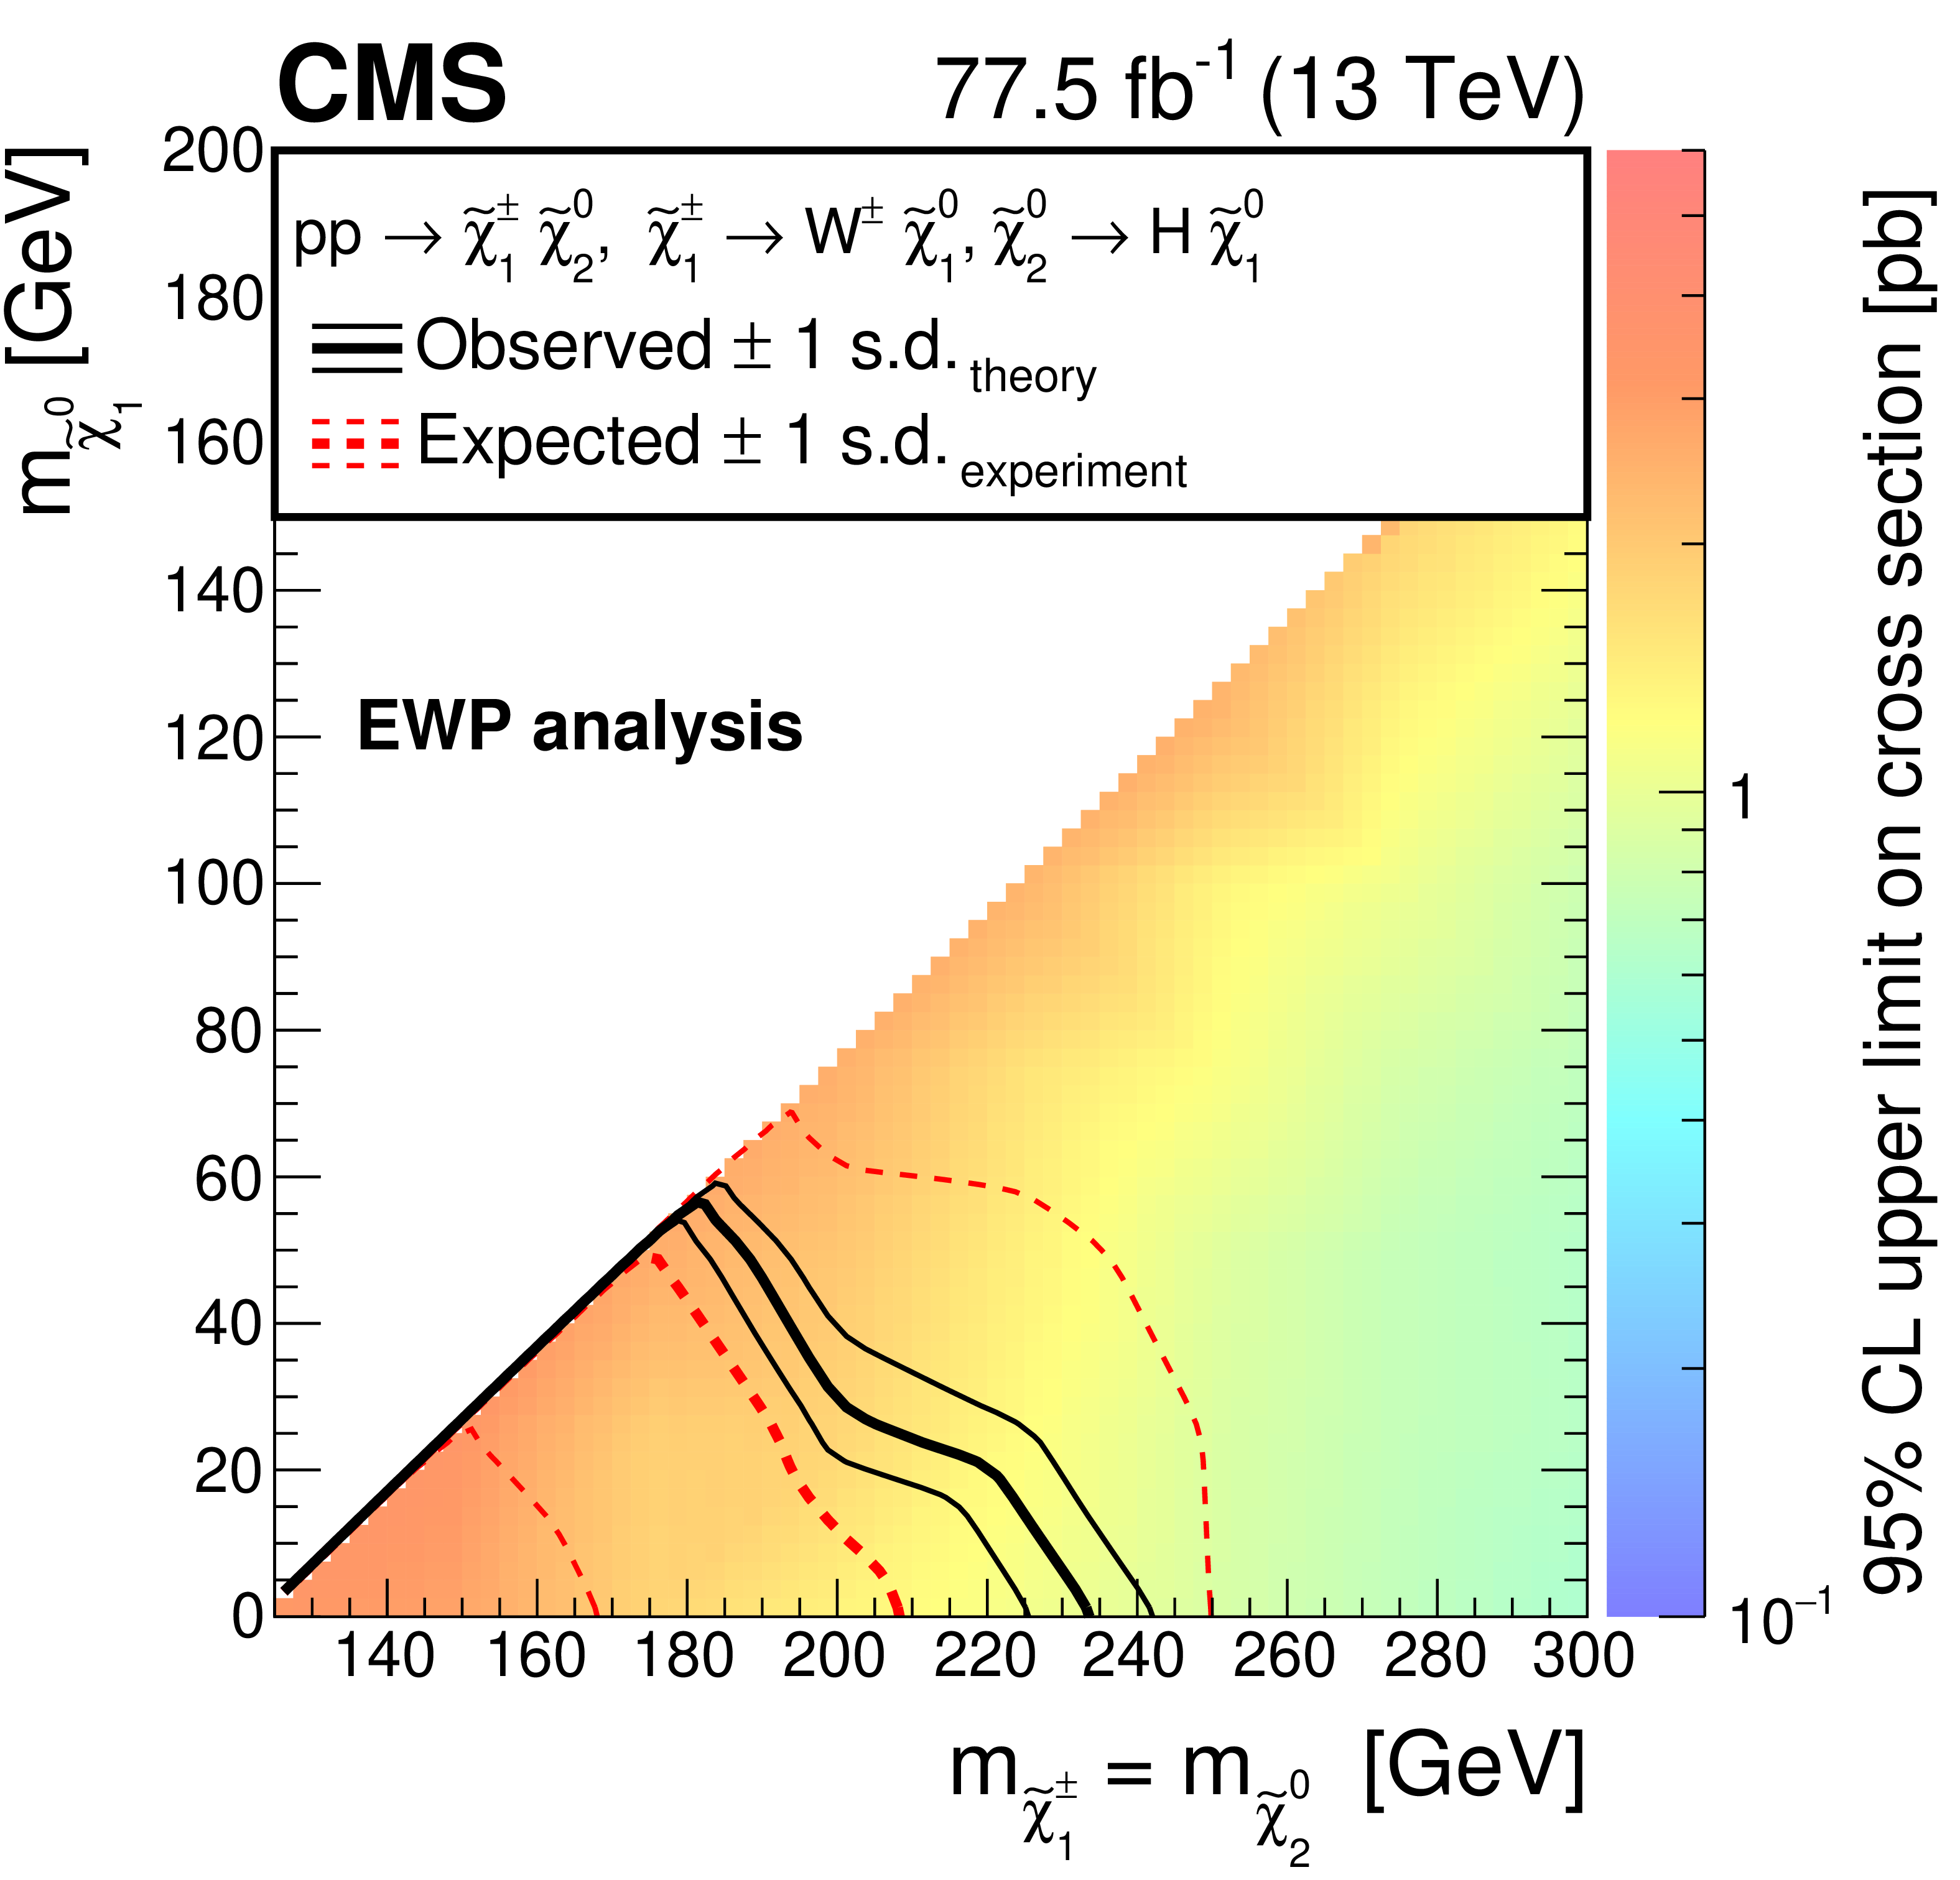
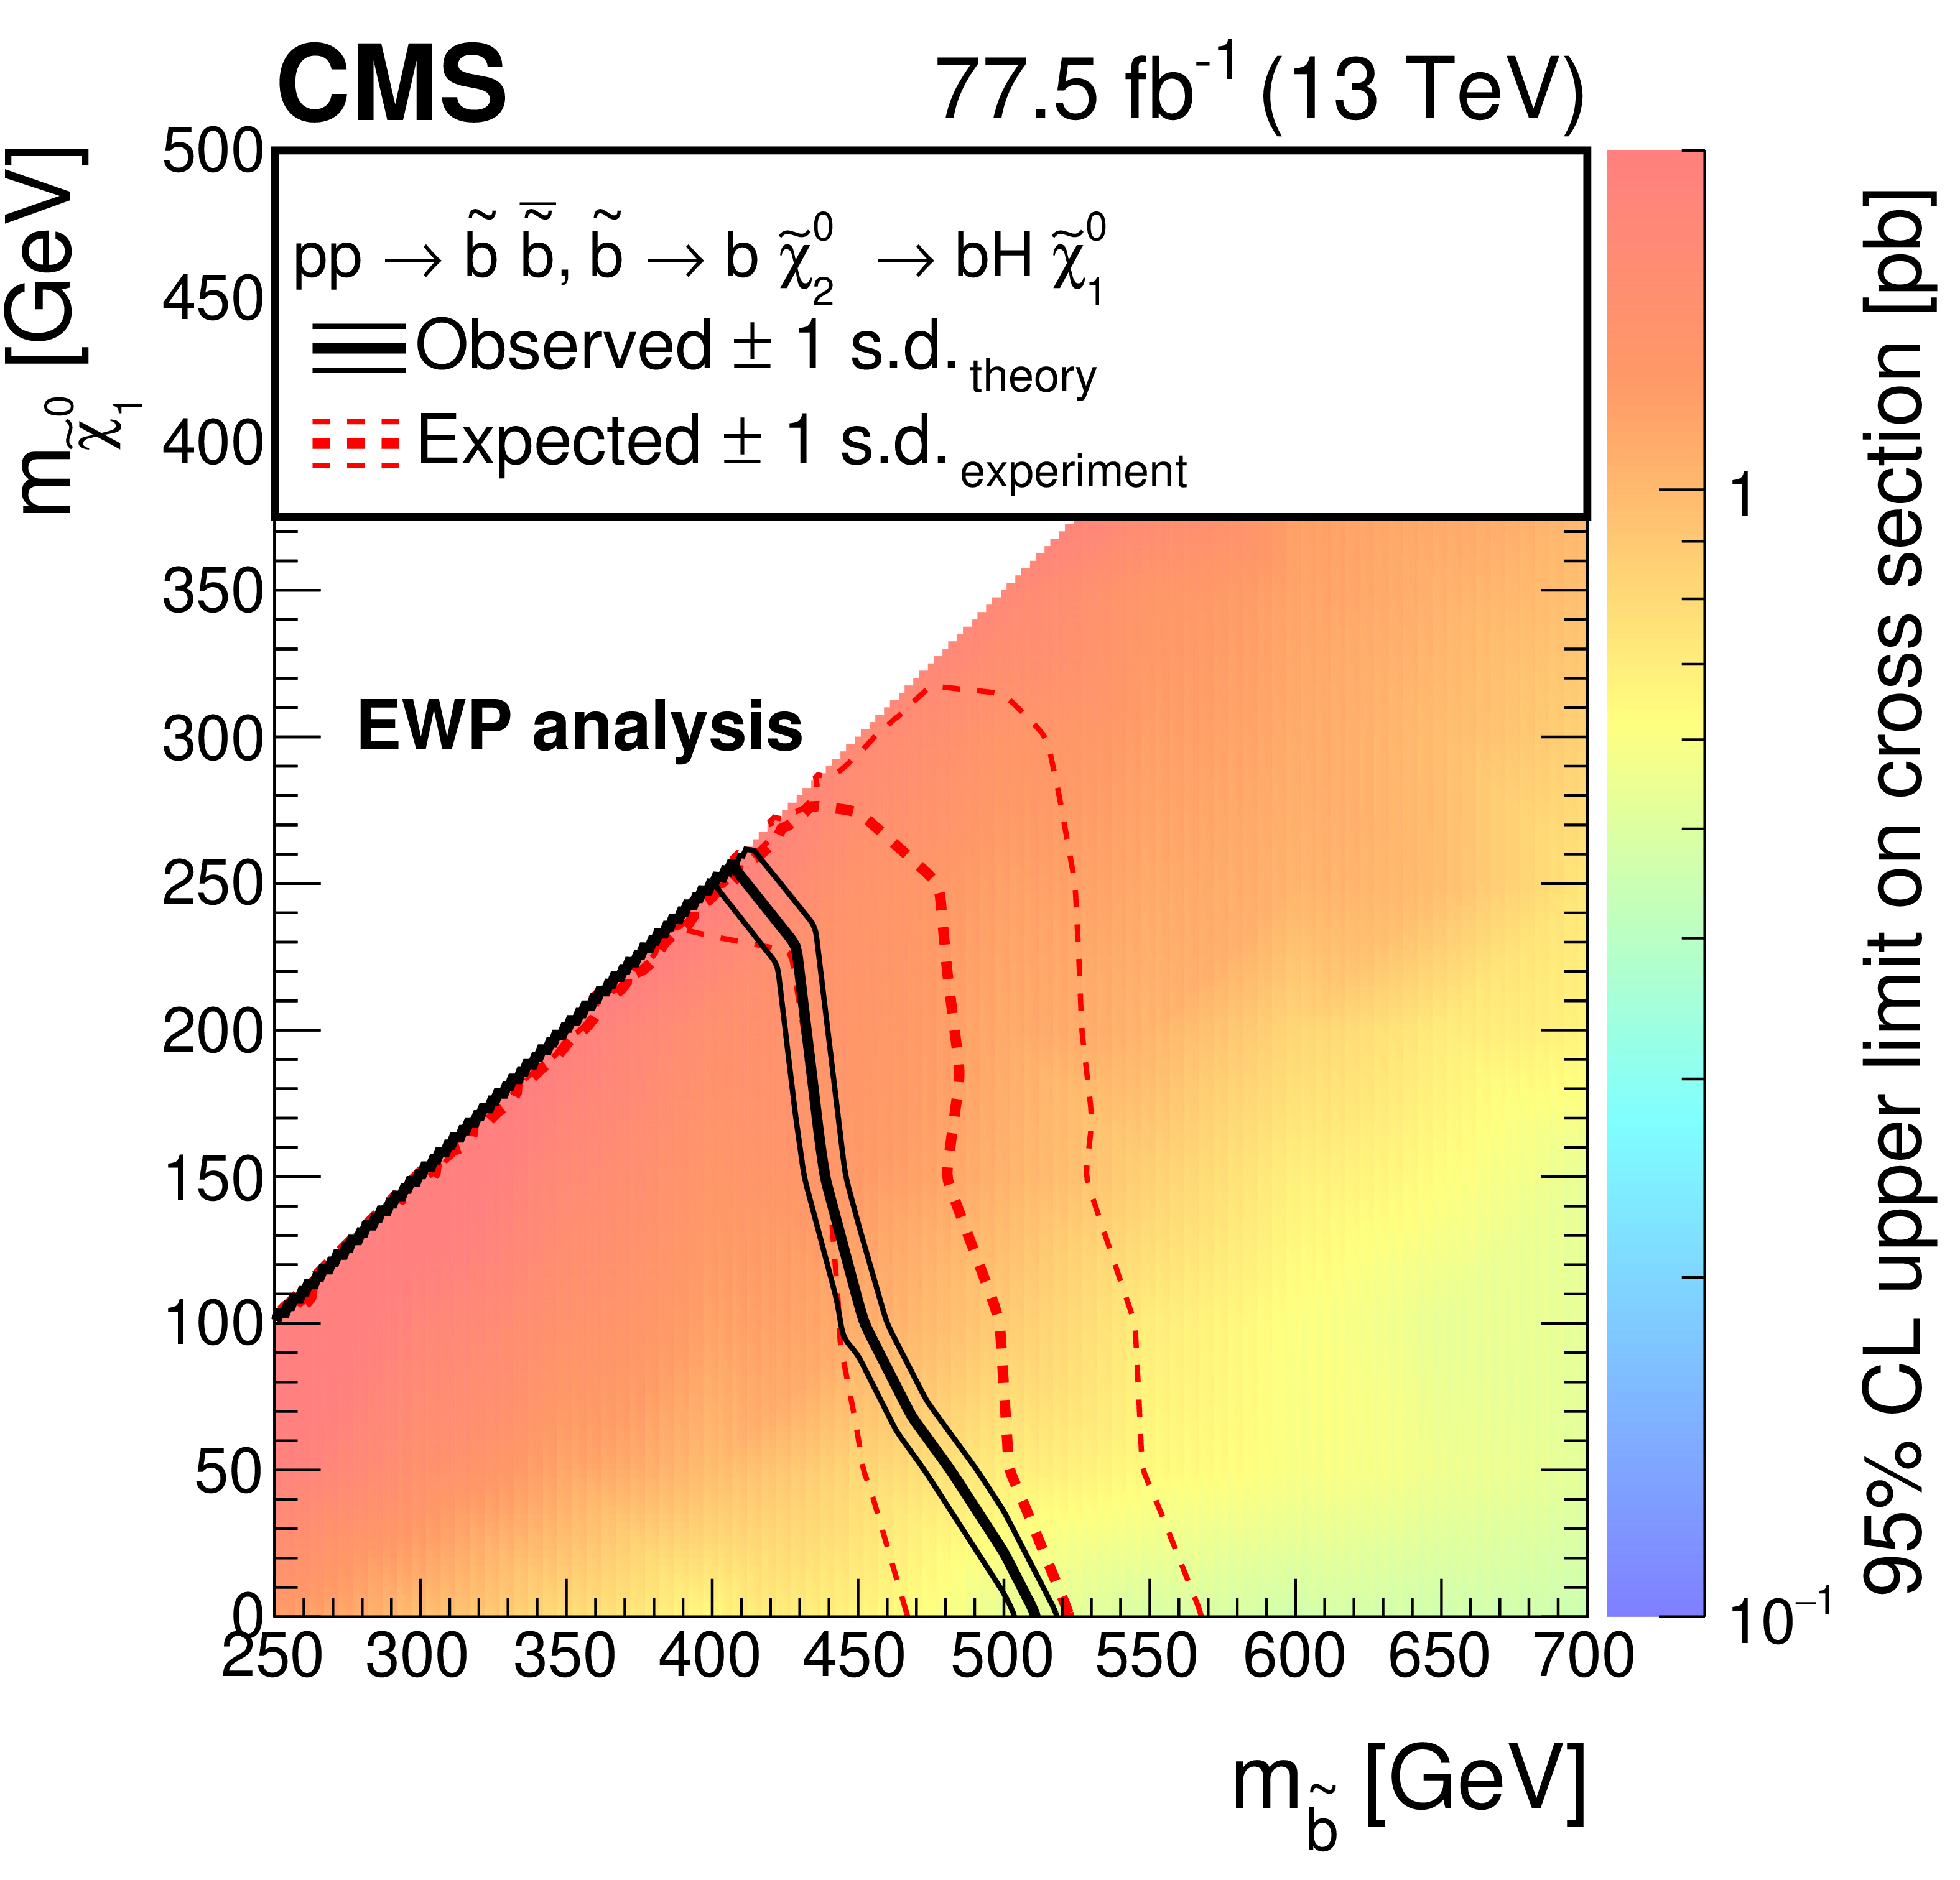
Figure 4:
The observed 95% CL upper limits on the wino-like chargino-neutralino production cross section are shown for the EWP analysis. The bold and light black contours represent the observed exclusion region and the $\pm $1 standard deviation (s.d.) band, including both experimental and theoretical uncertainties. The analogous red dotted contours represent the expected exclusion region and its $\pm $1 s.d. band. |
png pdf |
Figure 5:
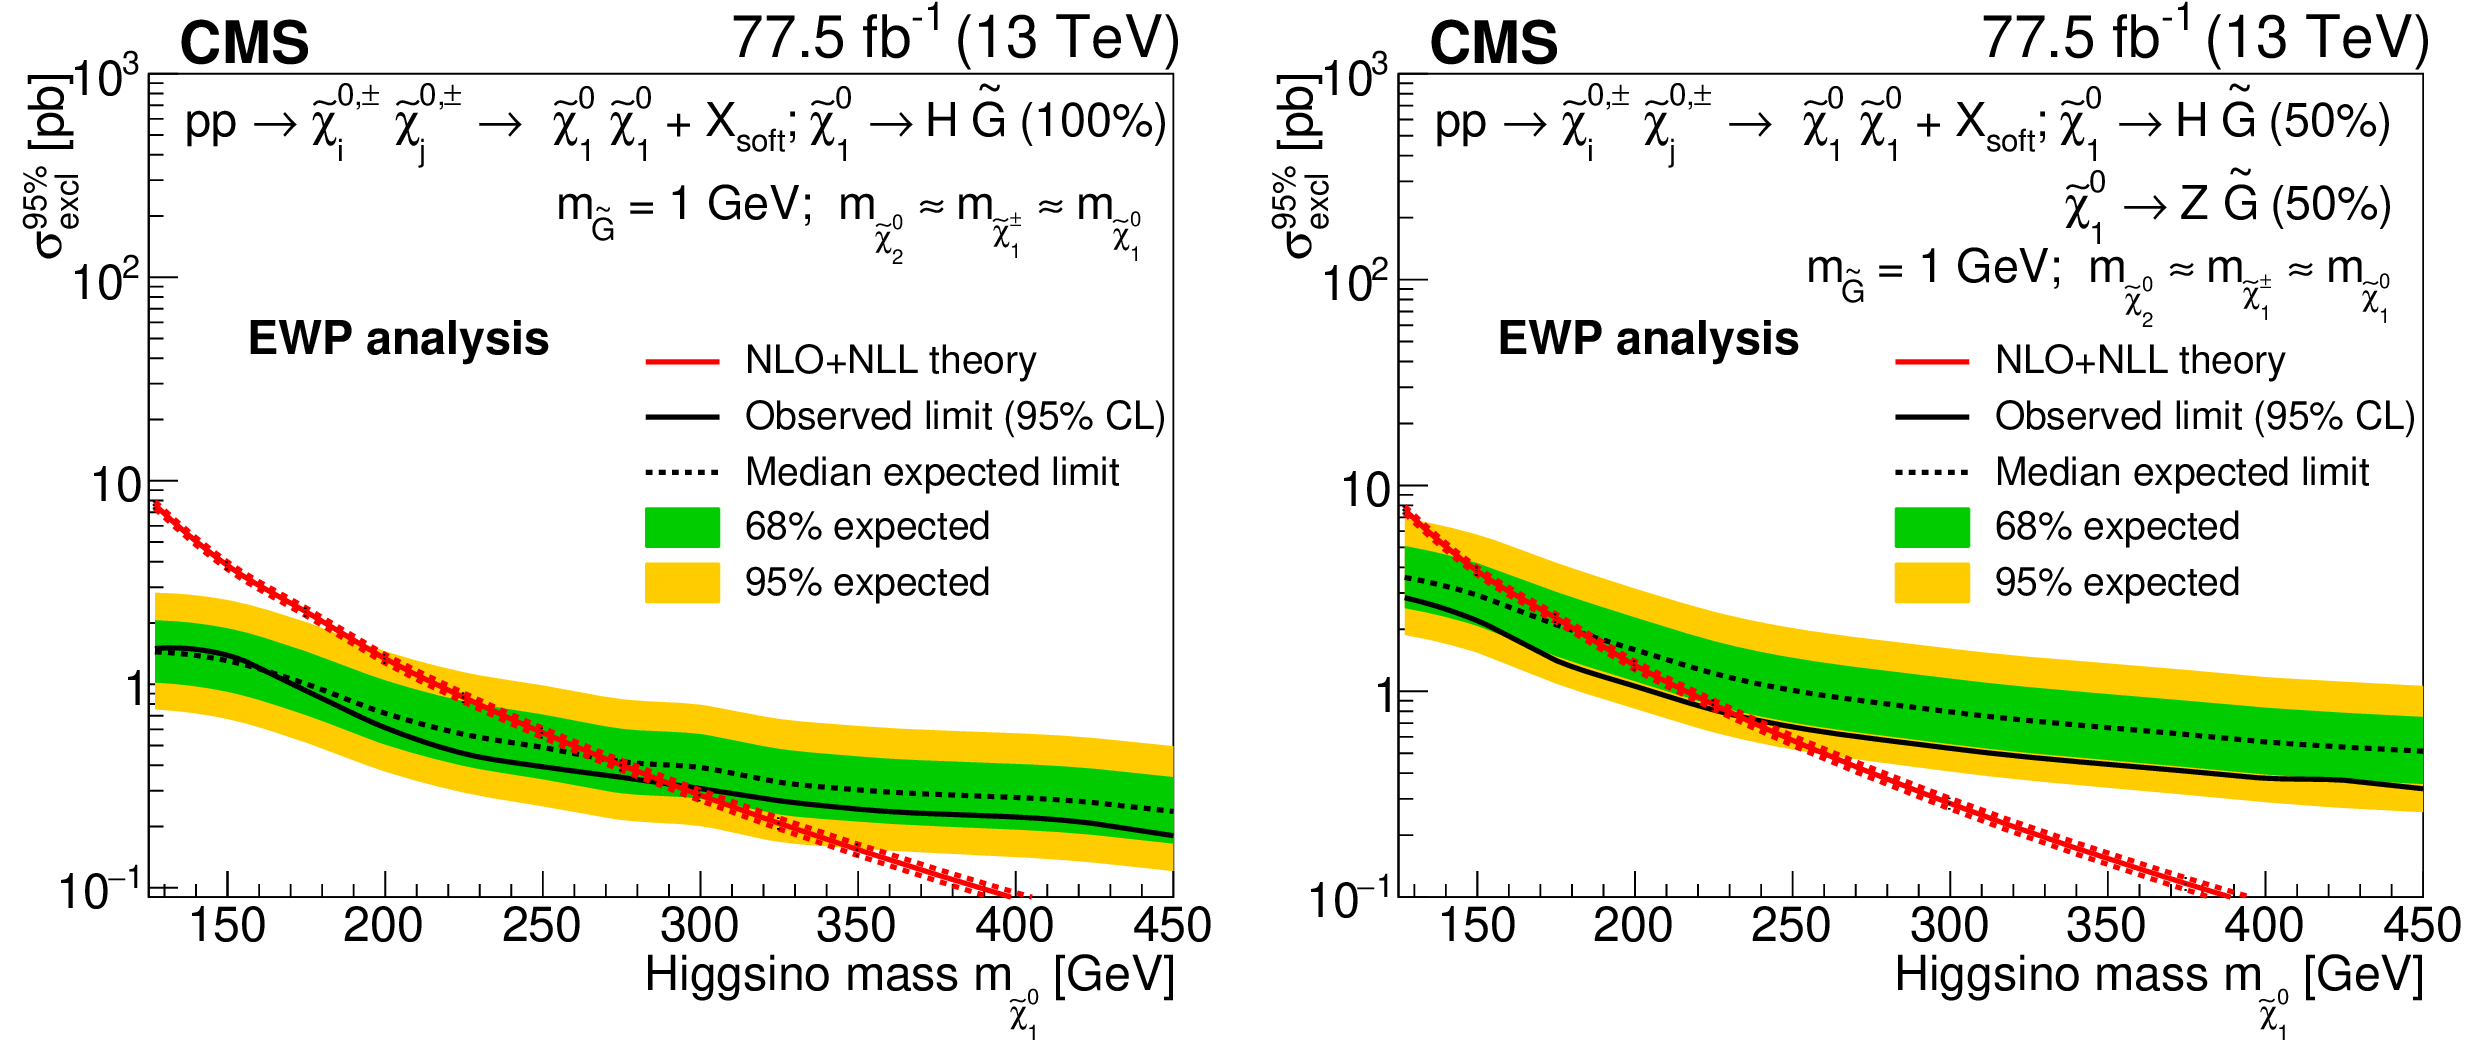
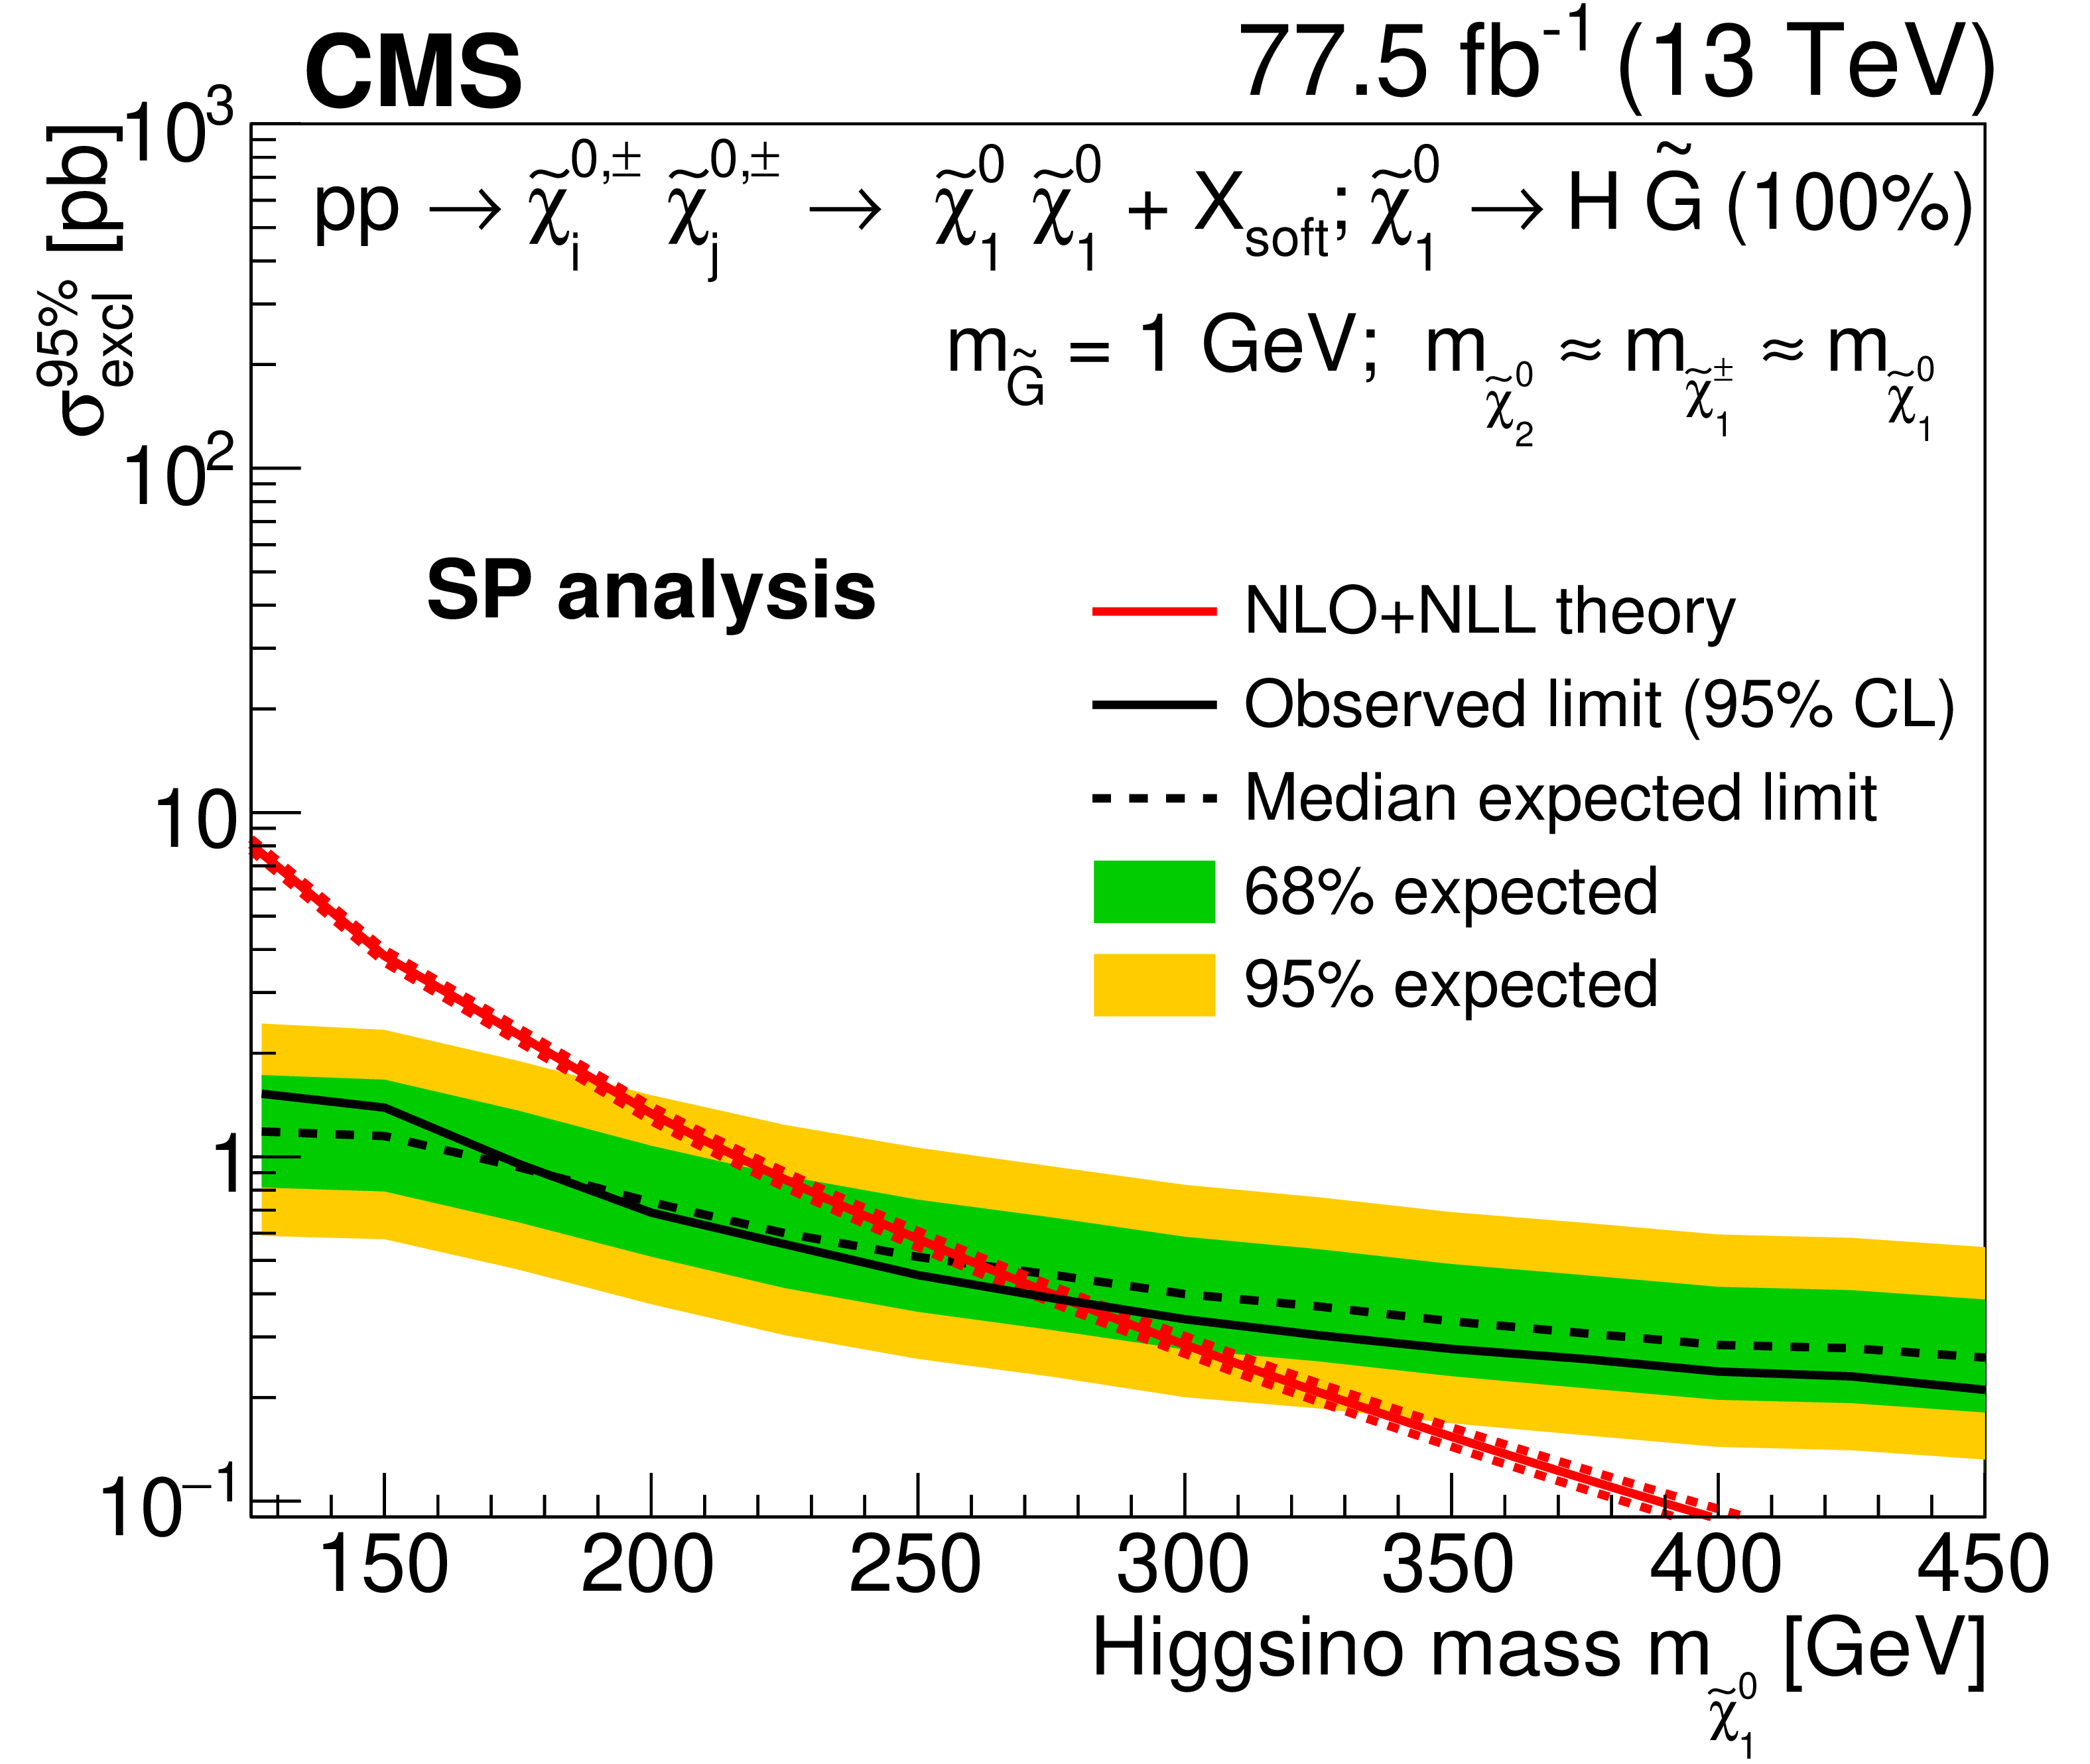
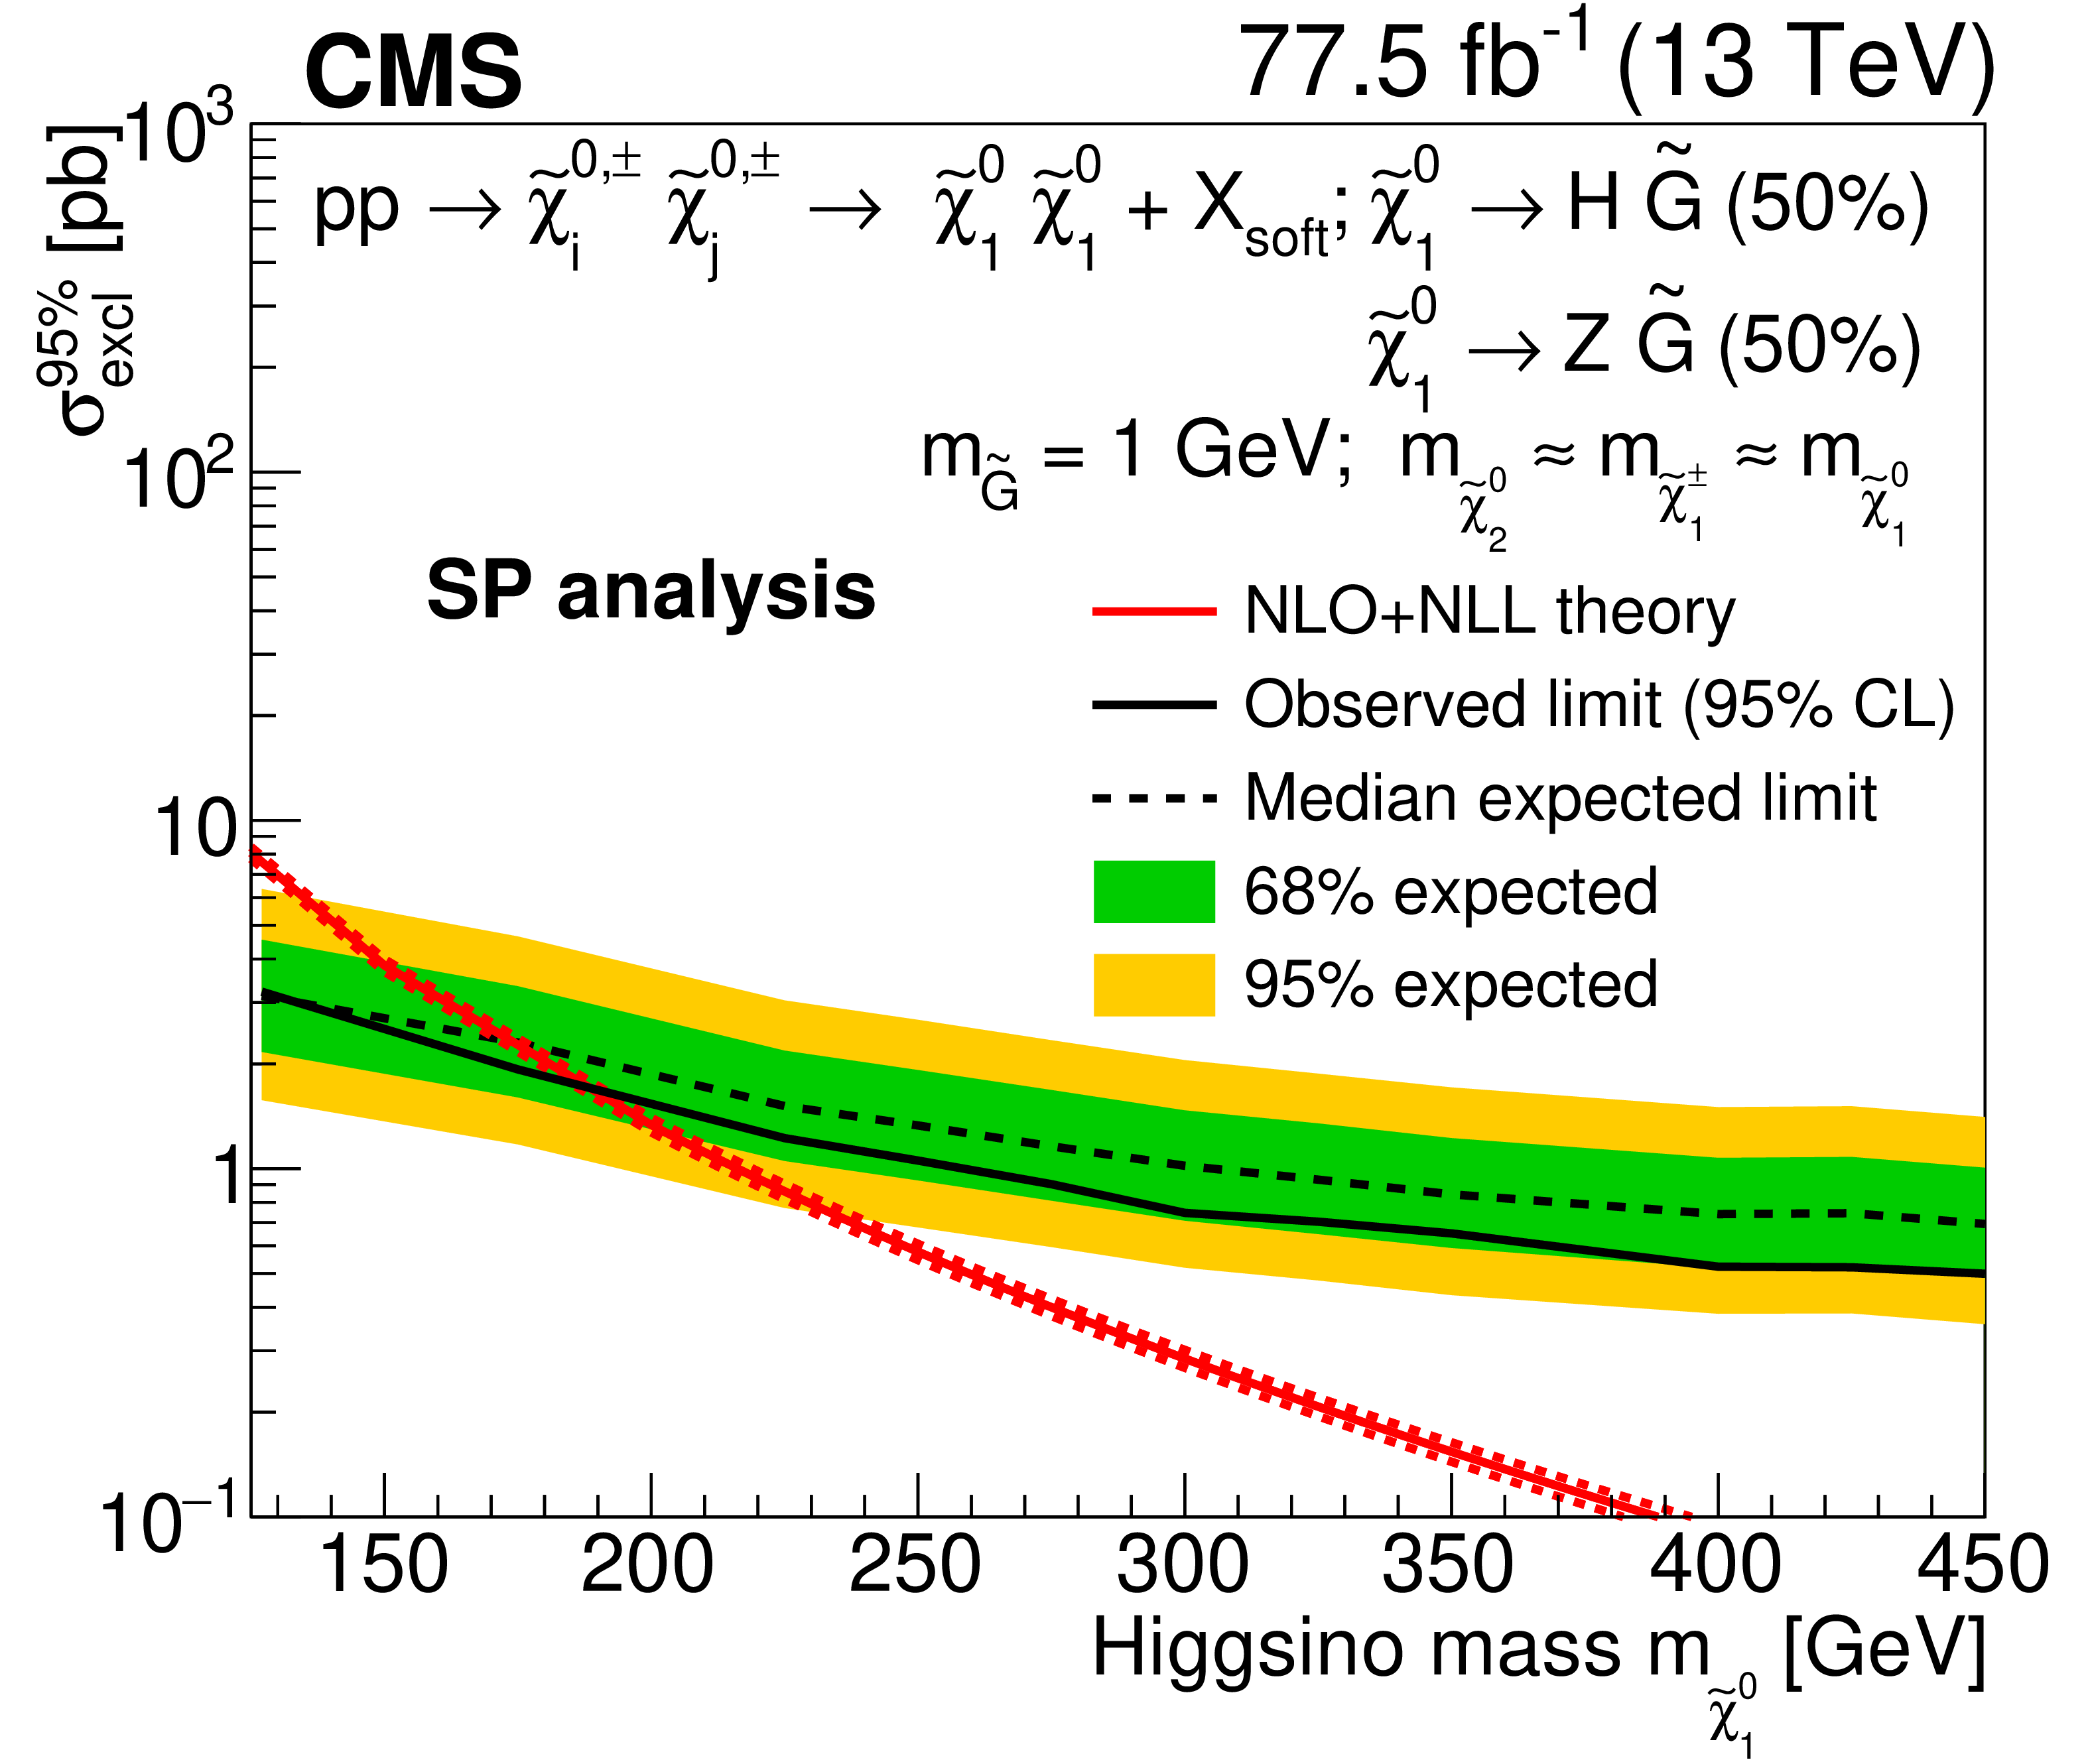
The observed 95% CL upper limits on the production cross section for higgsino-like chargino-neutralino production are shown for the EWP analysis. We present limits in the scenario where the branching fraction of $\tilde{\chi}^0_1 \to \mathrm{H} \tilde{\mathrm{G}} $ decay is 100% (left plot), and where the $\tilde{\chi}^0_1 \to \mathrm{H} \tilde{\mathrm{G}} $ and $\tilde{\chi}^0_1 \to \mathrm{Z} \tilde{\mathrm{G}} $ decays are each 50% (right plot). The dotted and solid black curves represent the expected and observed exclusion region, and the green dark and yellow light bands represent the $\pm $1 and $\pm $2 standard deviation regions, respectively. The red solid and dotted lines show the theoretical production cross section and its uncertainty band. |
png pdf root |
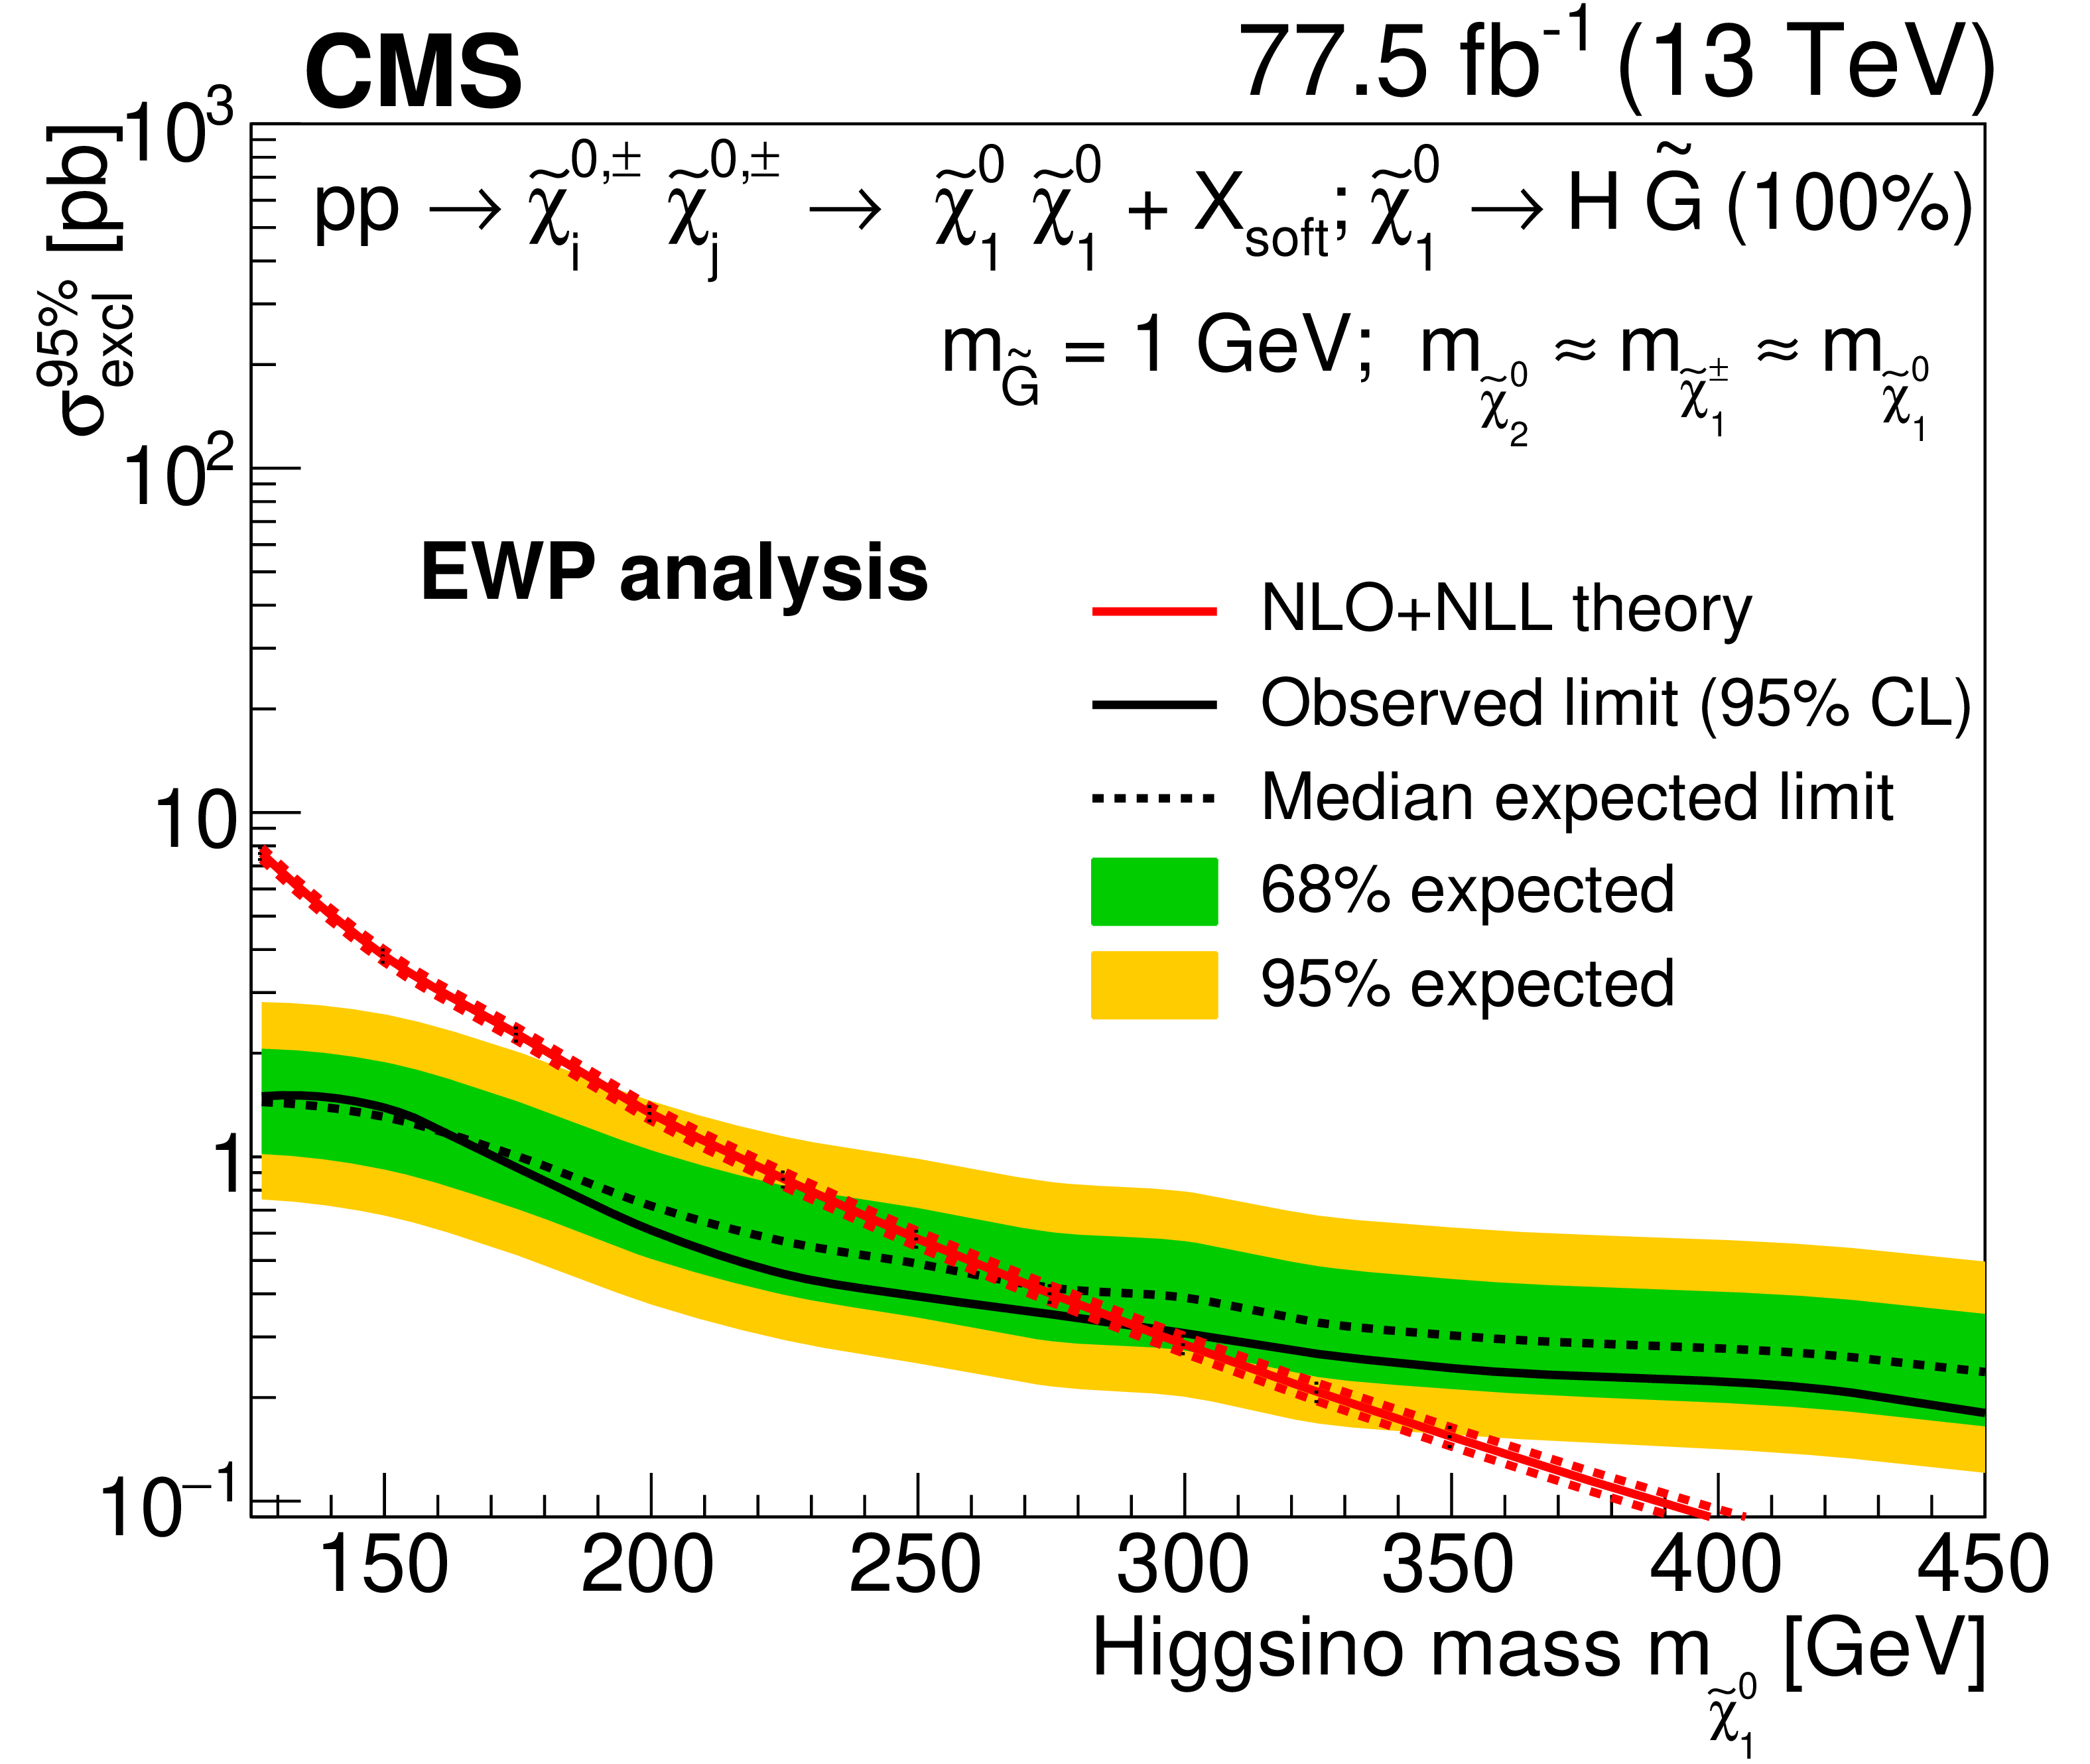
Figure 5-a:
The observed 95% CL upper limits on the production cross section for higgsino-like chargino-neutralino production are shown for the EWP analysis. We present limits in the scenario where the branching fraction of $\tilde{\chi}^0_1 \to \mathrm{H} \tilde{\mathrm{G}} $ decay is 100%. The dotted and solid black curves represent the expected and observed exclusion region, and the green dark and yellow light bands represent the $\pm $1 and $\pm $2 standard deviation regions, respectively. The red solid and dotted lines show the theoretical production cross section and its uncertainty band. |
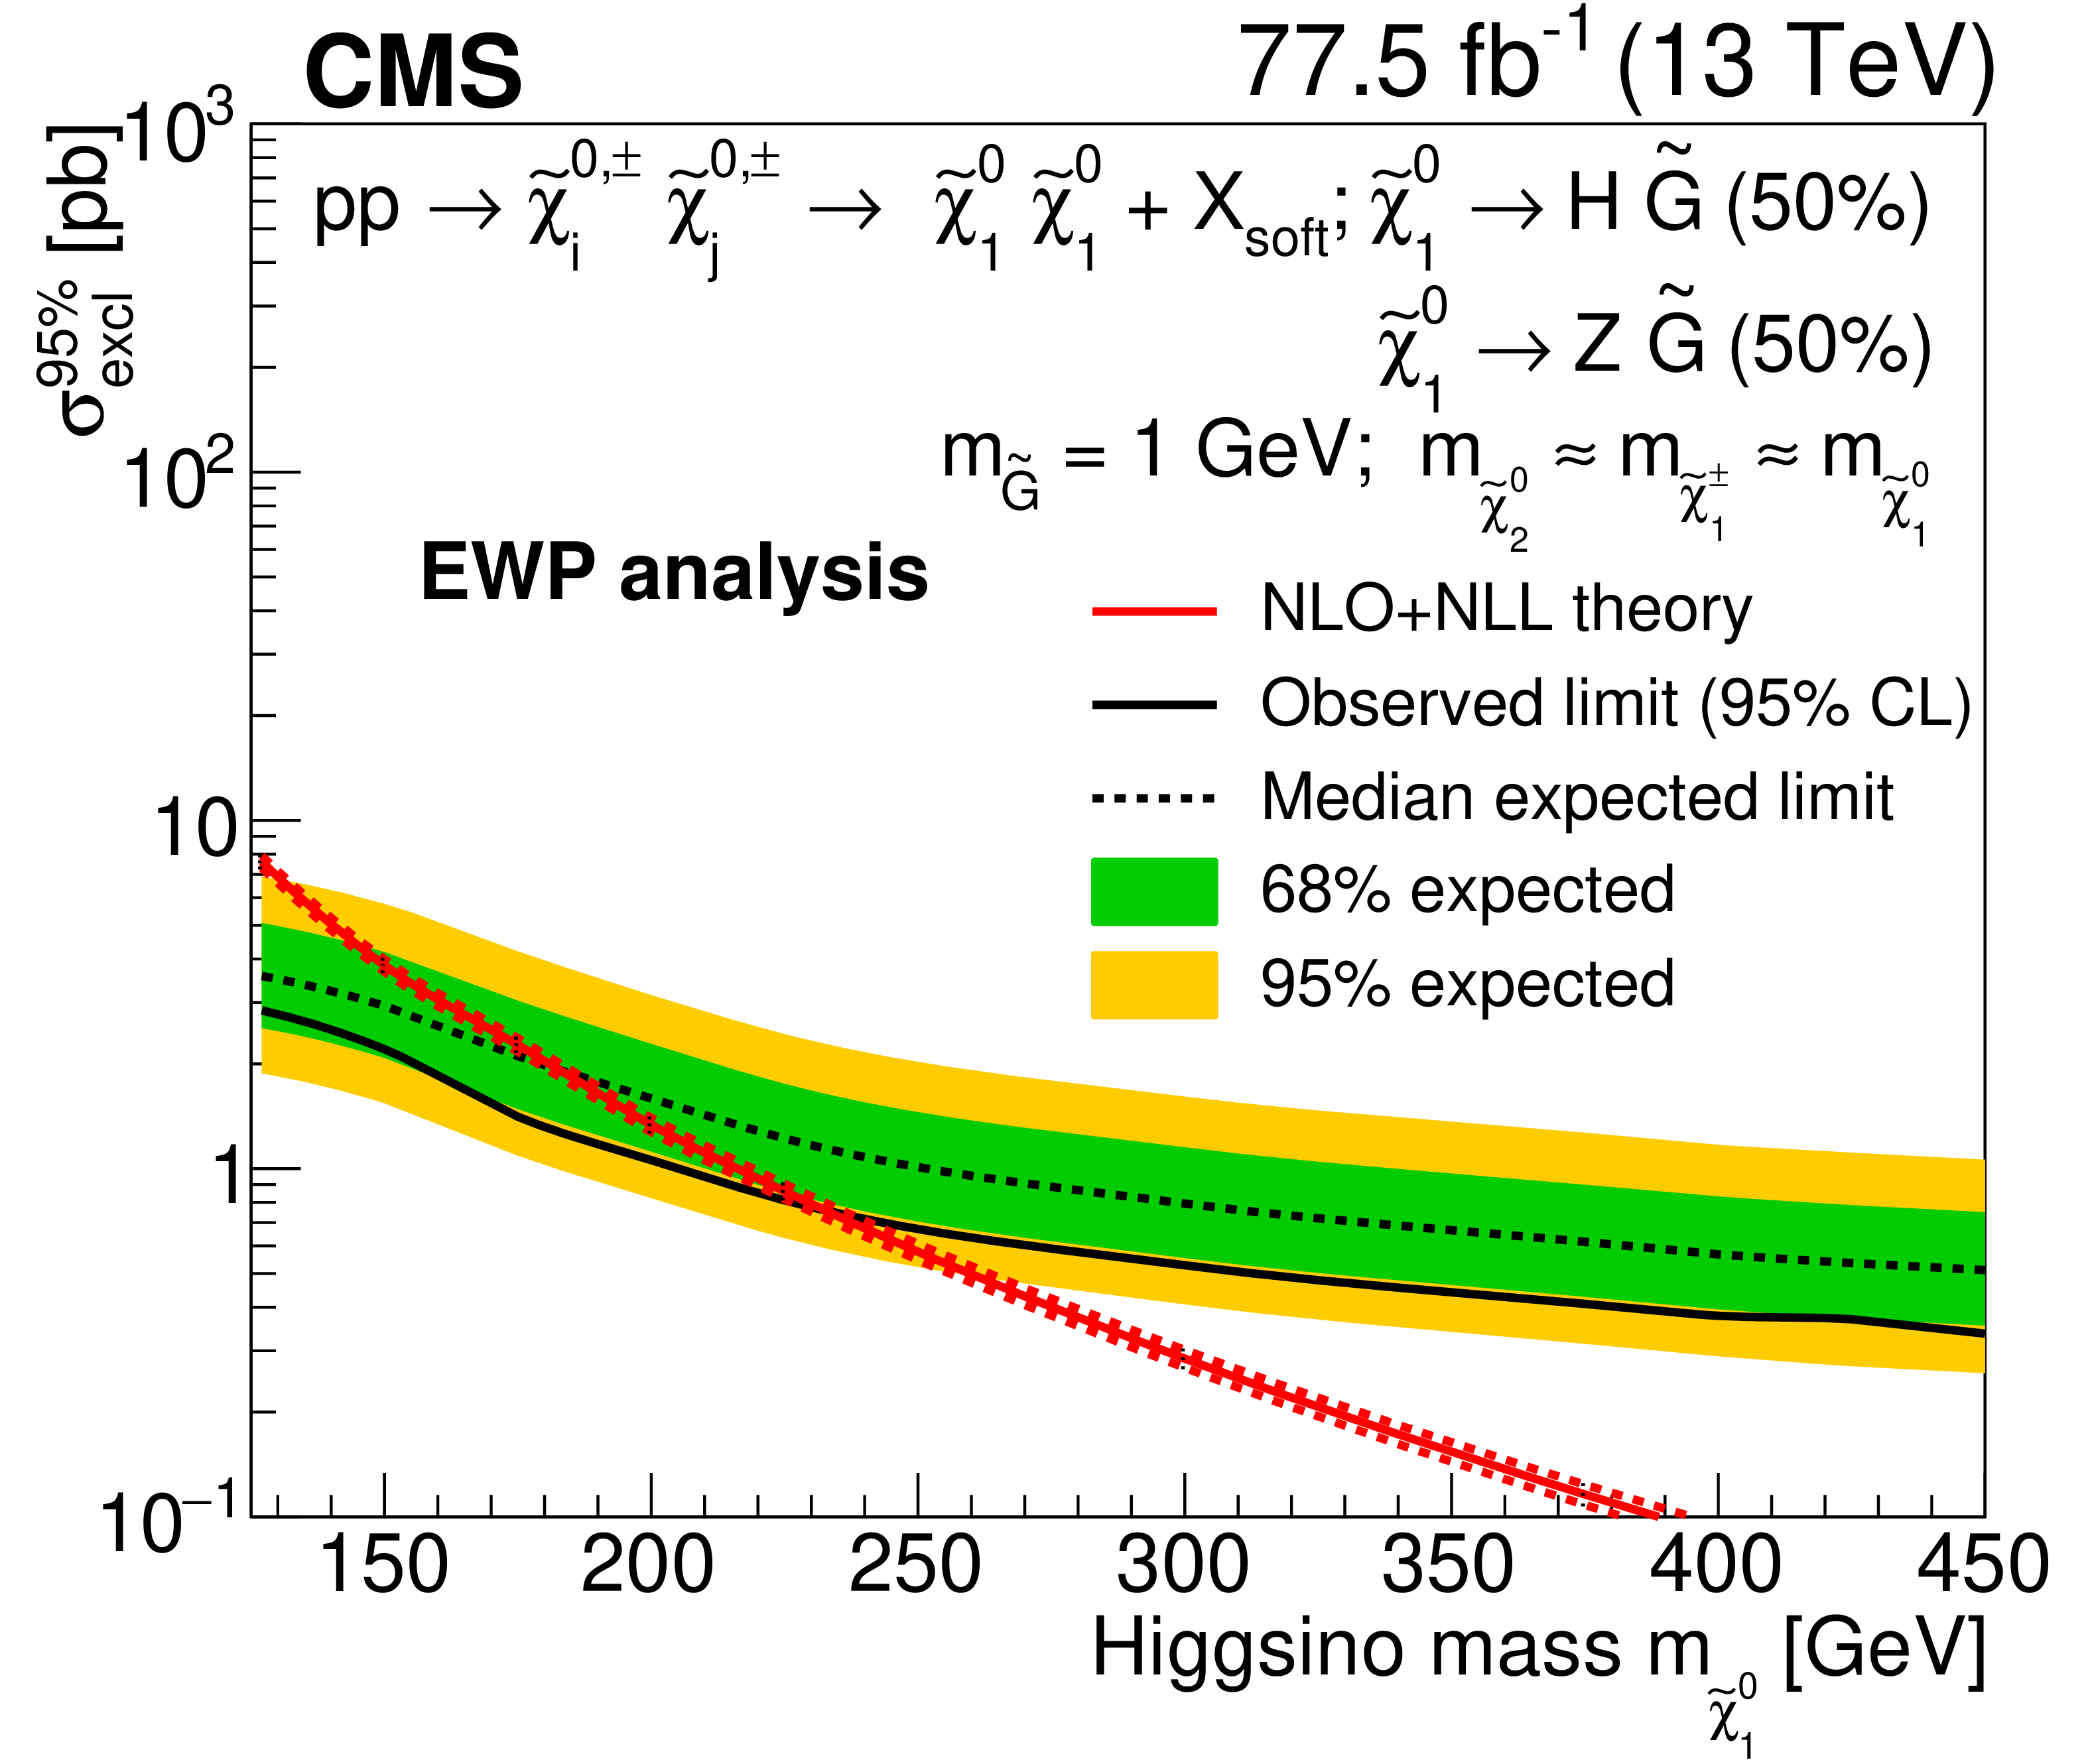
png pdf root |
Figure 5-b:
The observed 95% CL upper limits on the production cross section for higgsino-like chargino-neutralino production are shown for the EWP analysis. We present limits in the scenario where the $\tilde{\chi}^0_1 \to \mathrm{H} \tilde{\mathrm{G}} $ and $\tilde{\chi}^0_1 \to \mathrm{Z} \tilde{\mathrm{G}} $ decays are each 50%. The dotted and solid black curves represent the expected and observed exclusion region, and the green dark and yellow light bands represent the $\pm $1 and $\pm $2 standard deviation regions, respectively. The red solid and dotted lines show the theoretical production cross section and its uncertainty band. |
png pdf |
Figure 6:
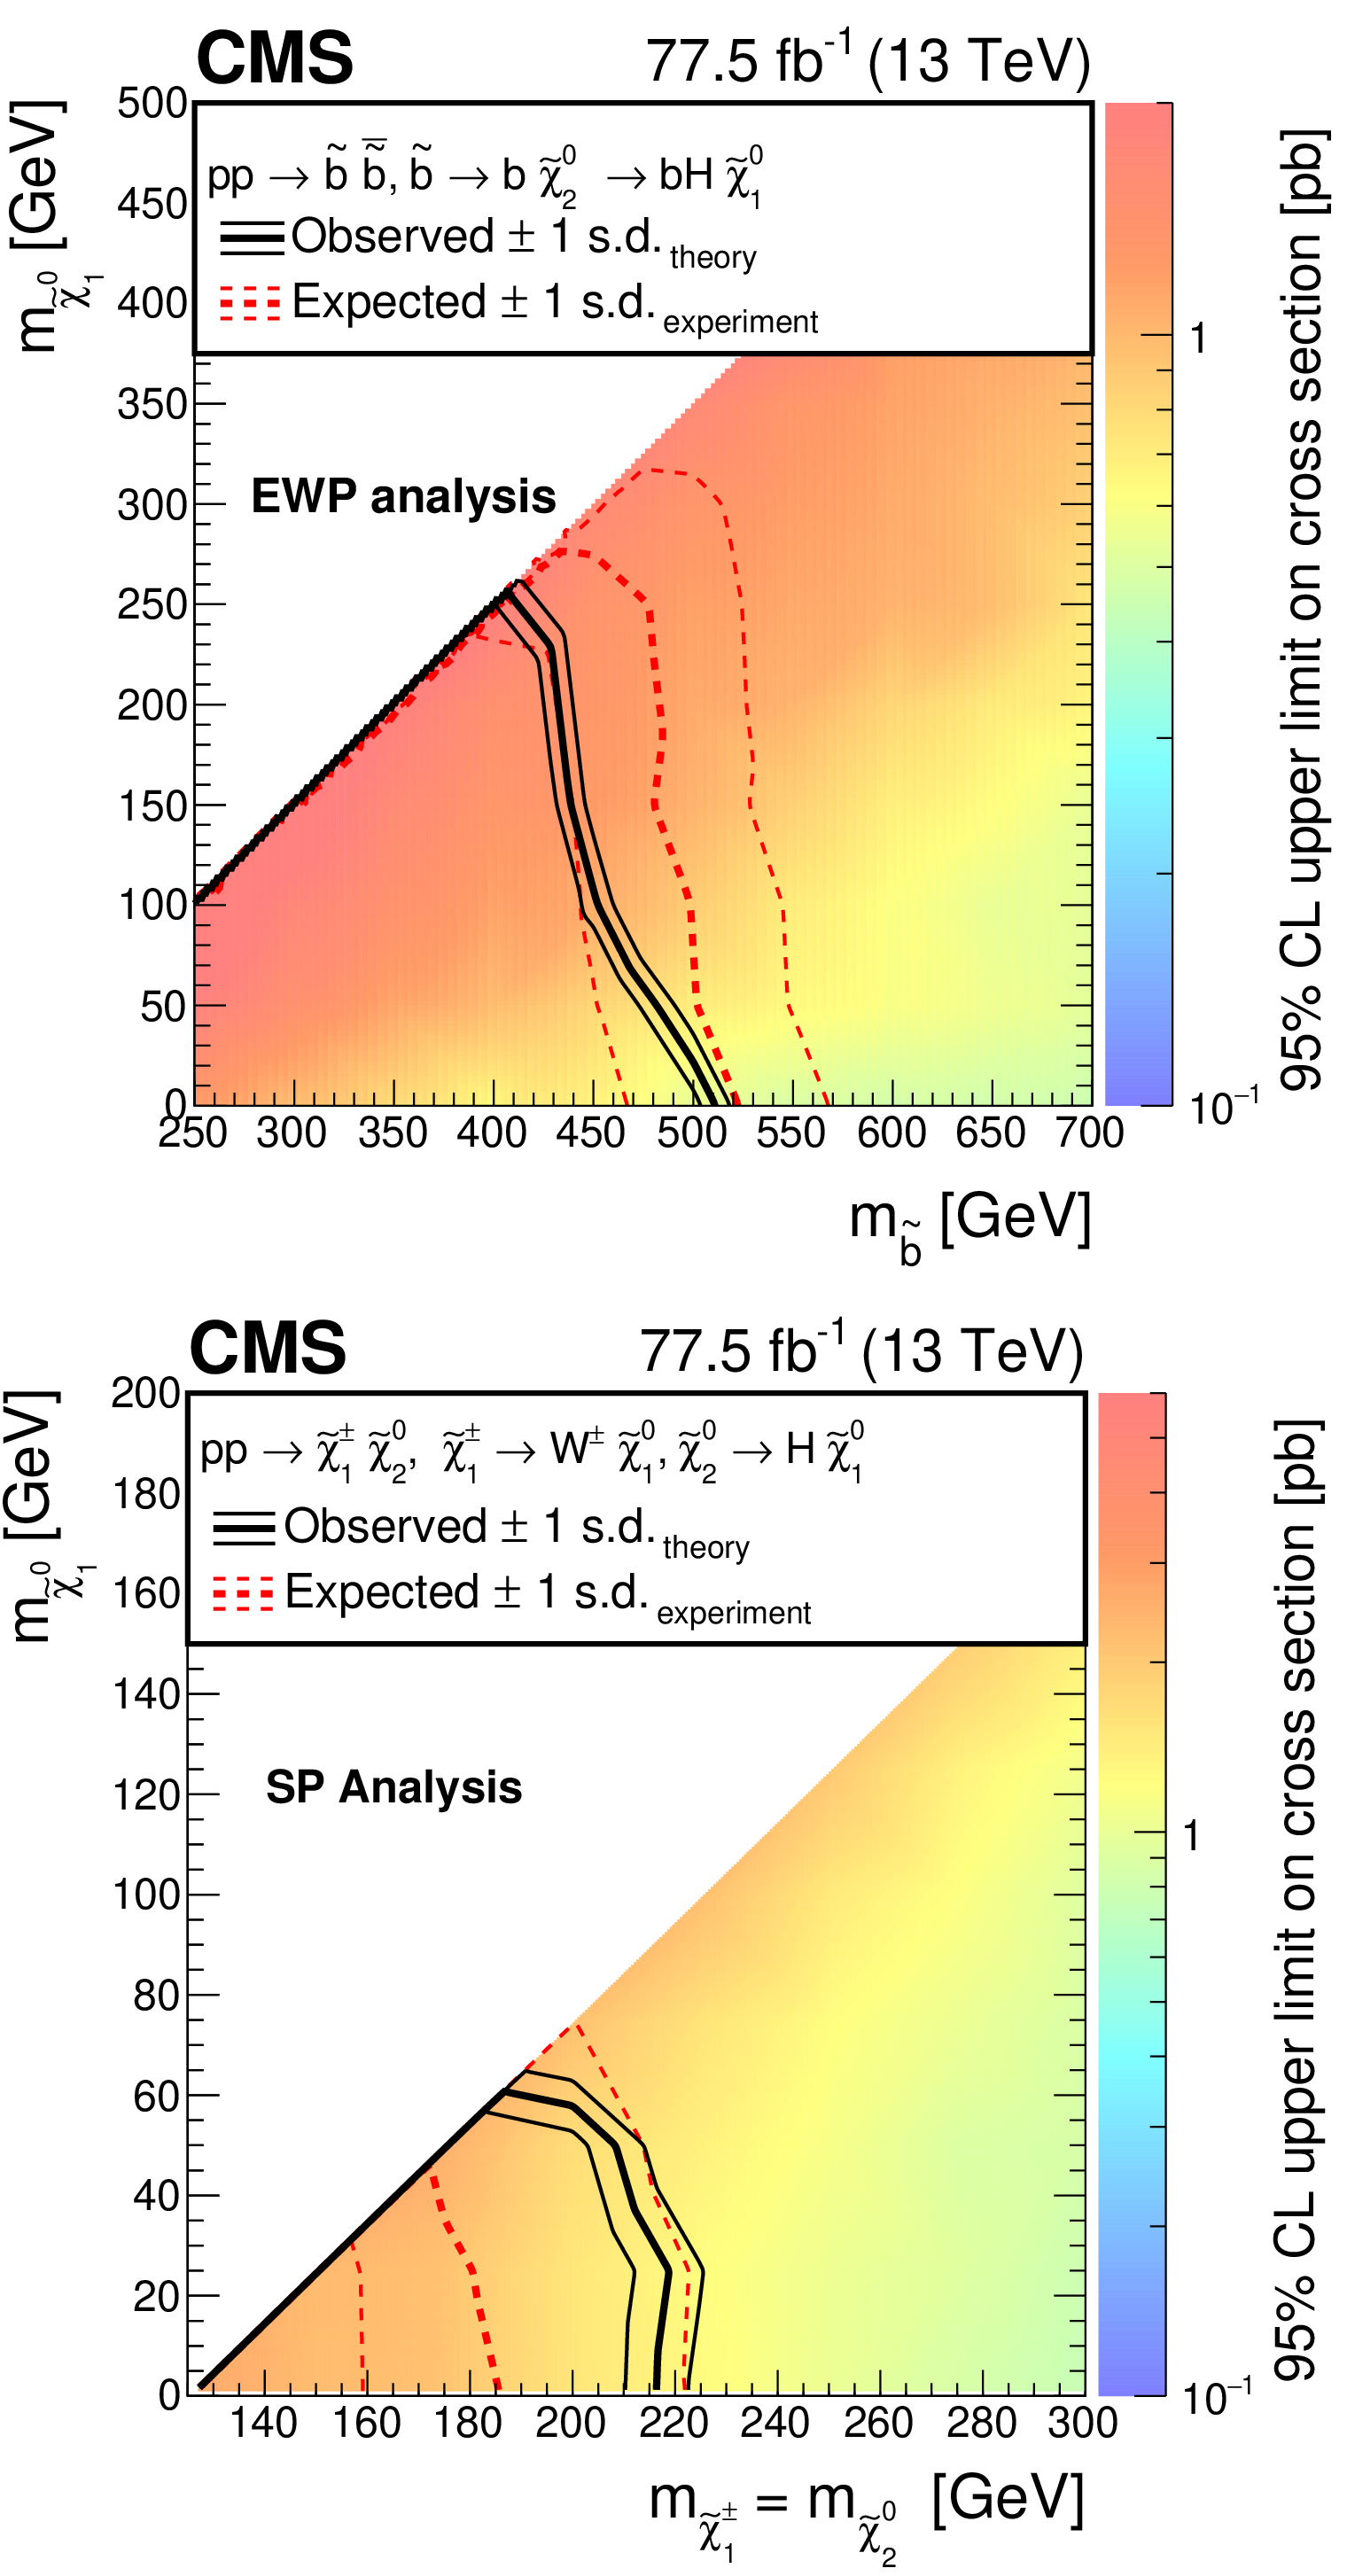
The observed 95% CL upper limits on the bottom squark pair production cross section for the EWP analysis (upper plot), and on the wino-like chargino-neutralino production cross section for the SP analysis (lower plot), are shown. The bold and light solid black contours represent the observed exclusion region and the $\pm $1 standard deviation (s.d.) band, including both experimental and theoretical uncertainties. The analogous red dotted contours represent the expected exclusion region and its $\pm $1 s.d. band. |
png pdf root |
Figure 6-a:
The observed 95% CL upper limits on the bottom squark pair production cross section for the EWP analysis, are shown. The bold and light solid black contours represent the observed exclusion region and the $\pm $1 standard deviation (s.d.) band, including both experimental and theoretical uncertainties. The analogous red dotted contours represent the expected exclusion region and its $\pm $1 s.d. band. |

png pdf root |
Figure 6-b:
The observed 95% CL upper limits on the wino-like chargino-neutralino production cross section for the SP analysis, are shown. The bold and light solid black contours represent the observed exclusion region and the $\pm $1 standard deviation (s.d.) band, including both experimental and theoretical uncertainties. The analogous red dotted contours represent the expected exclusion region and its $\pm $1 s.d. band. |

png pdf |
Figure 7:
The observed 95% CL upper limits on the production cross section for higgsino-like chargino-neutralino production are shown for the SP analysis. The charginos and neutralinos undergo several cascade decays producing either Higgs bosons (left plot), or a Higgs boson and a $\mathrm{Z} $ boson (right plot). We present limits in the scenario where the branching fraction of $\tilde{\chi}^0_1 \to \mathrm{H} \tilde{\mathrm{G}} $ decay is 100% (left plot), and where the $\tilde{\chi}^0_1 \to \mathrm{H} \tilde{\mathrm{G}} $ and $\tilde{\chi}^0_1 \to \mathrm{Z} \tilde{\mathrm{G}} $ decays are each 50% (right plot). The dotted and solid black curves represent the expected and observed exclusion region, and the green dark and yellow light bands represent the $\pm $1 and $\pm $2 standard deviation regions, respectively. The red solid and dotted lines show the theoretical production cross section and its uncertainty band. |
png pdf root |
Figure 7-a:
The observed 95% CL upper limits on the production cross section for higgsino-like chargino-neutralino production are shown for the SP analysis. The charginos and neutralinos undergo several cascade decays producing Higgs bosons. We present limits in the scenario where the branching fraction of $\tilde{\chi}^0_1 \to \mathrm{H} \tilde{\mathrm{G}} $ decay is 100%. The dotted and solid black curves represent the expected and observed exclusion region, and the green dark and yellow light bands represent the $\pm $1 and $\pm $2 standard deviation regions, respectively. The red solid and dotted lines show the theoretical production cross section and its uncertainty band. |
png pdf root |
Figure 7-b:
The observed 95% CL upper limits on the production cross section for higgsino-like chargino-neutralino production are shown for the SP analysis. The charginos and neutralinos undergo several cascade decays producing a Higgs boson and a $\mathrm{Z} $ boson. We present limits in the scenario where the $\tilde{\chi}^0_1 \to \mathrm{H} \tilde{\mathrm{G}} $ and $\tilde{\chi}^0_1 \to \mathrm{Z} \tilde{\mathrm{G}} $ decays are each 50%. The dotted and solid black curves represent the expected and observed exclusion region, and the green dark and yellow light bands represent the $\pm $1 and $\pm $2 standard deviation regions, respectively. The red solid and dotted lines show the theoretical production cross section and its uncertainty band. |
| Tables | |
png pdf |
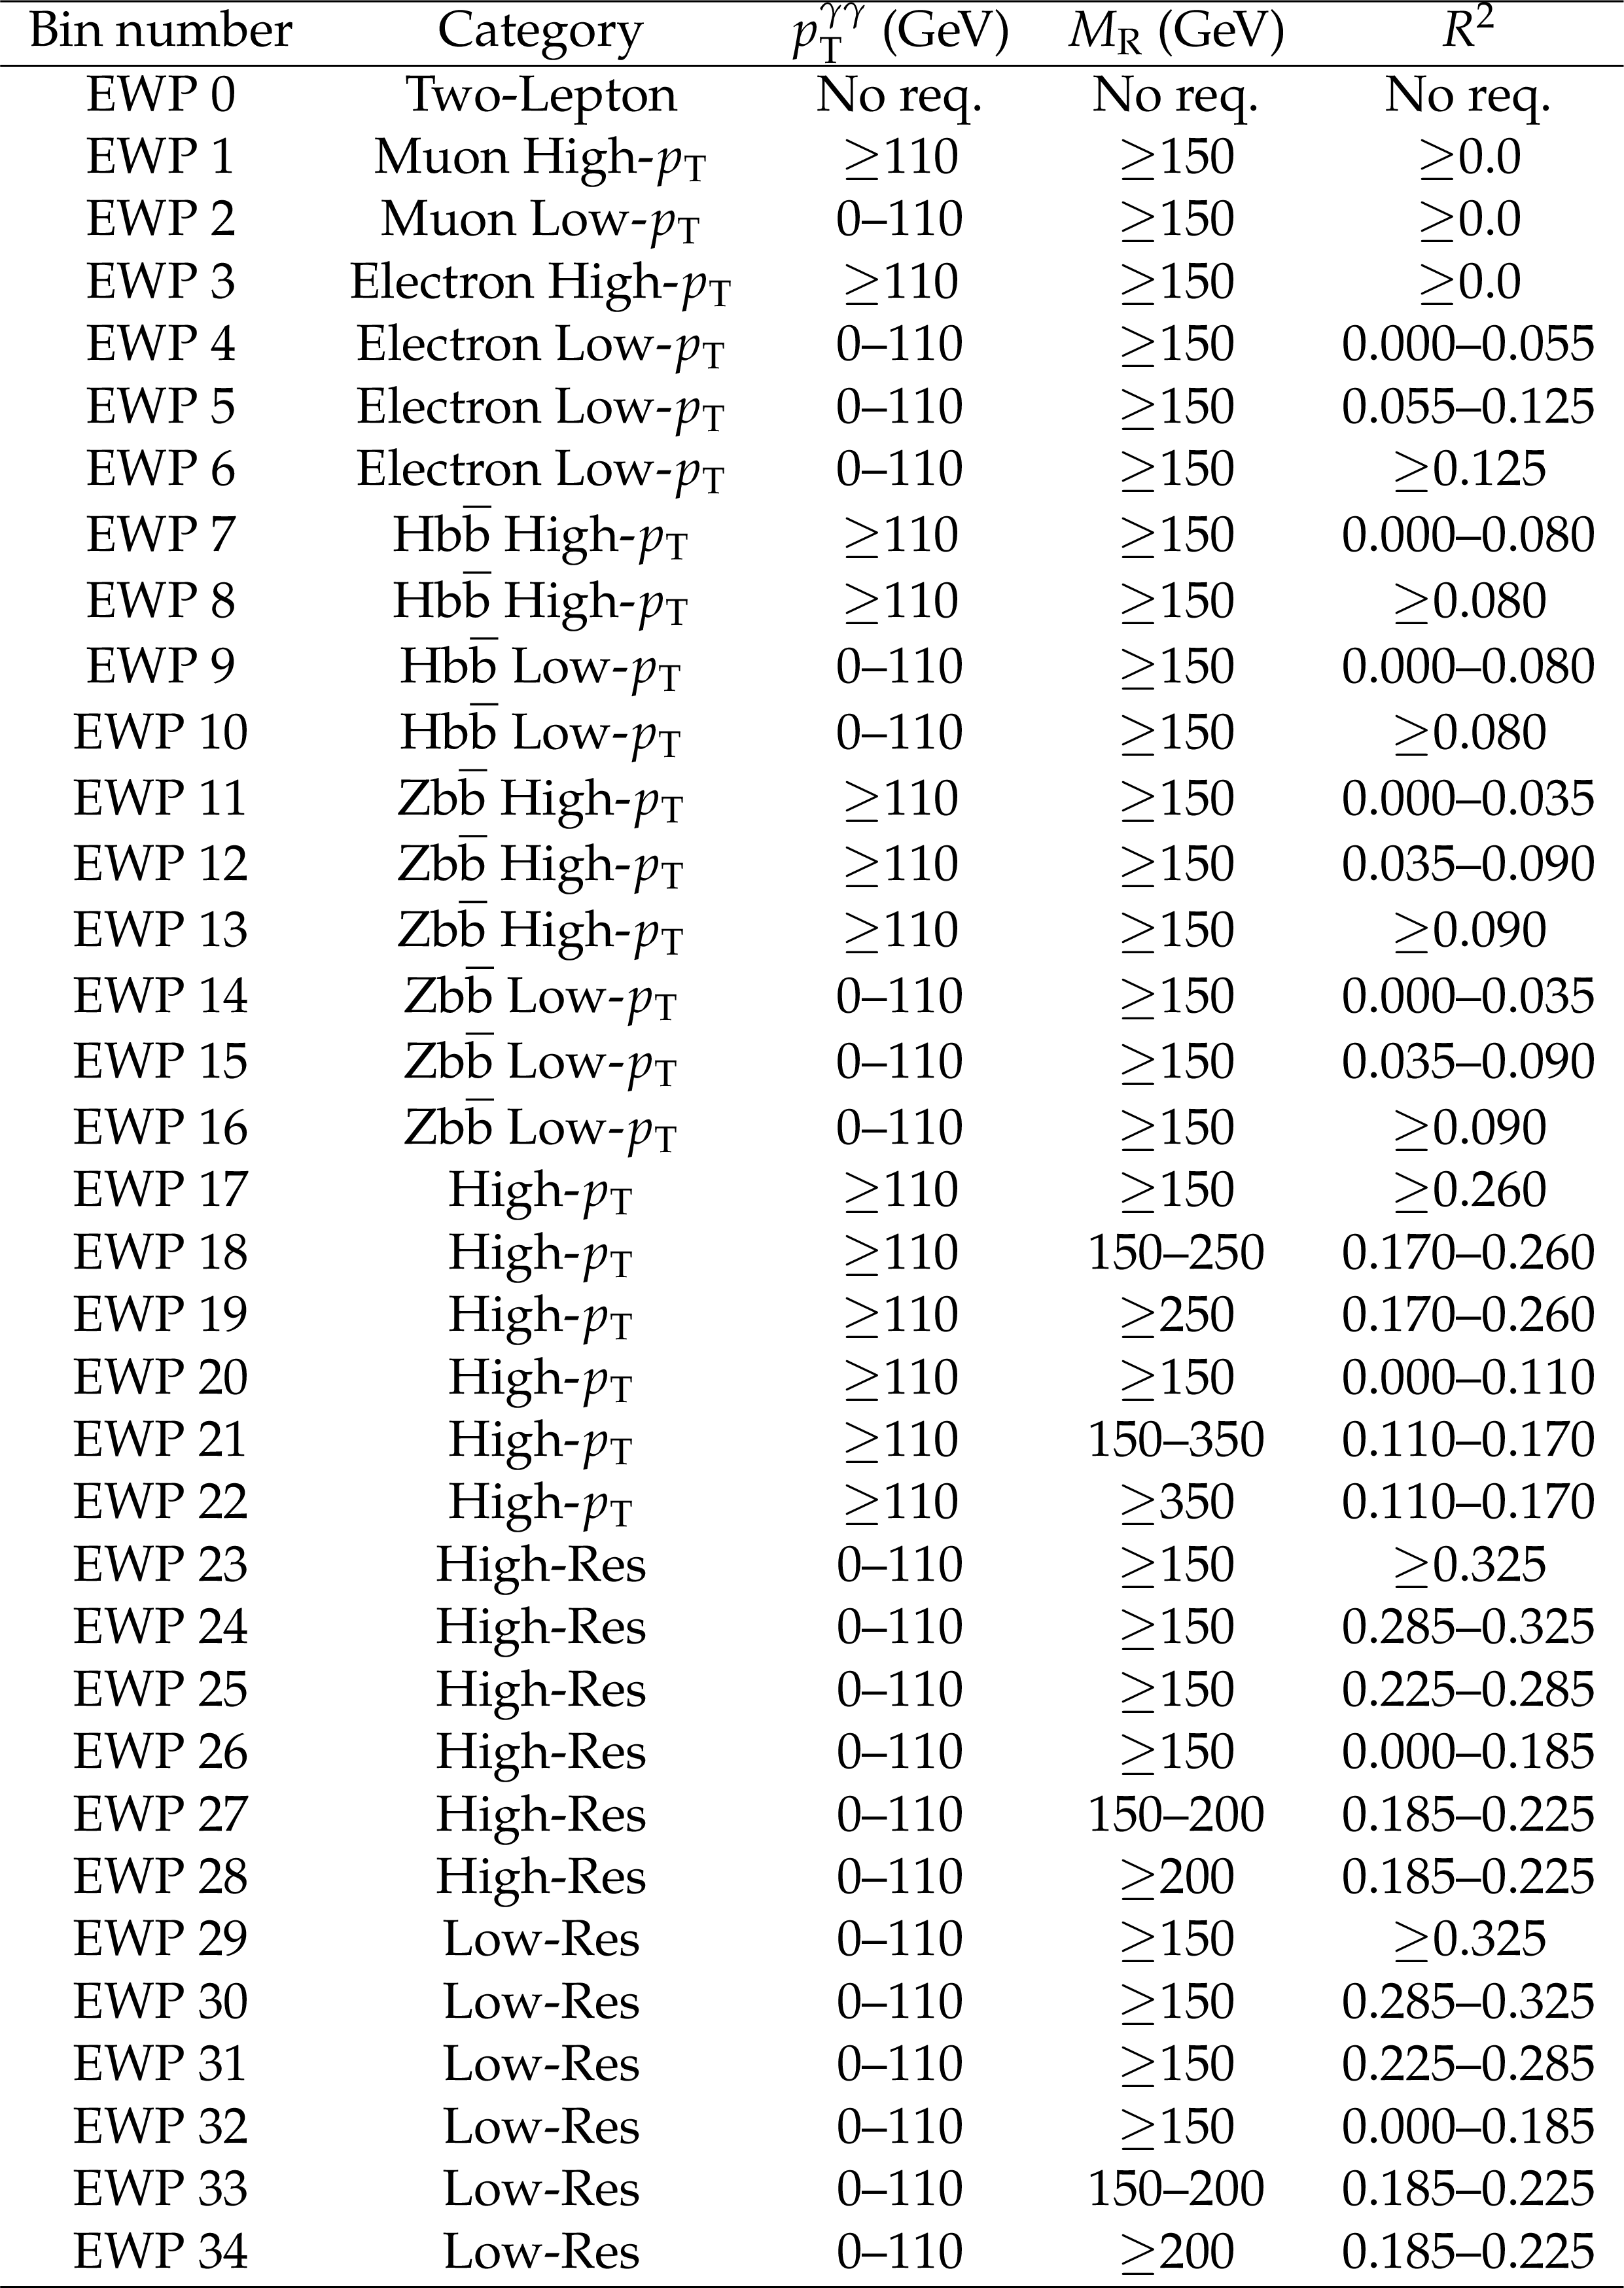
Table 1:
A summary of the search region bins used in the EWP analysis. Events are separated into categories based on the number of leptons, the presence of $ {\mathrm{H} \to \mathrm{b} \mathrm{\bar{b}}} $ candidates, the $ {p_{\mathrm {T}}} $ of the $ {\mathrm{H} \to \gamma \gamma} $ candidate, and the estimated diphoton mass resolution. The High-Res and Low-Res categories are defined by the estimated diphoton resolution mass $\sigma _{m}/m$ being smaller or larger than 0.85%, respectively. For the Two-Lepton category, "No req.'' means that no requirements are placed on the given observables. |
png pdf |
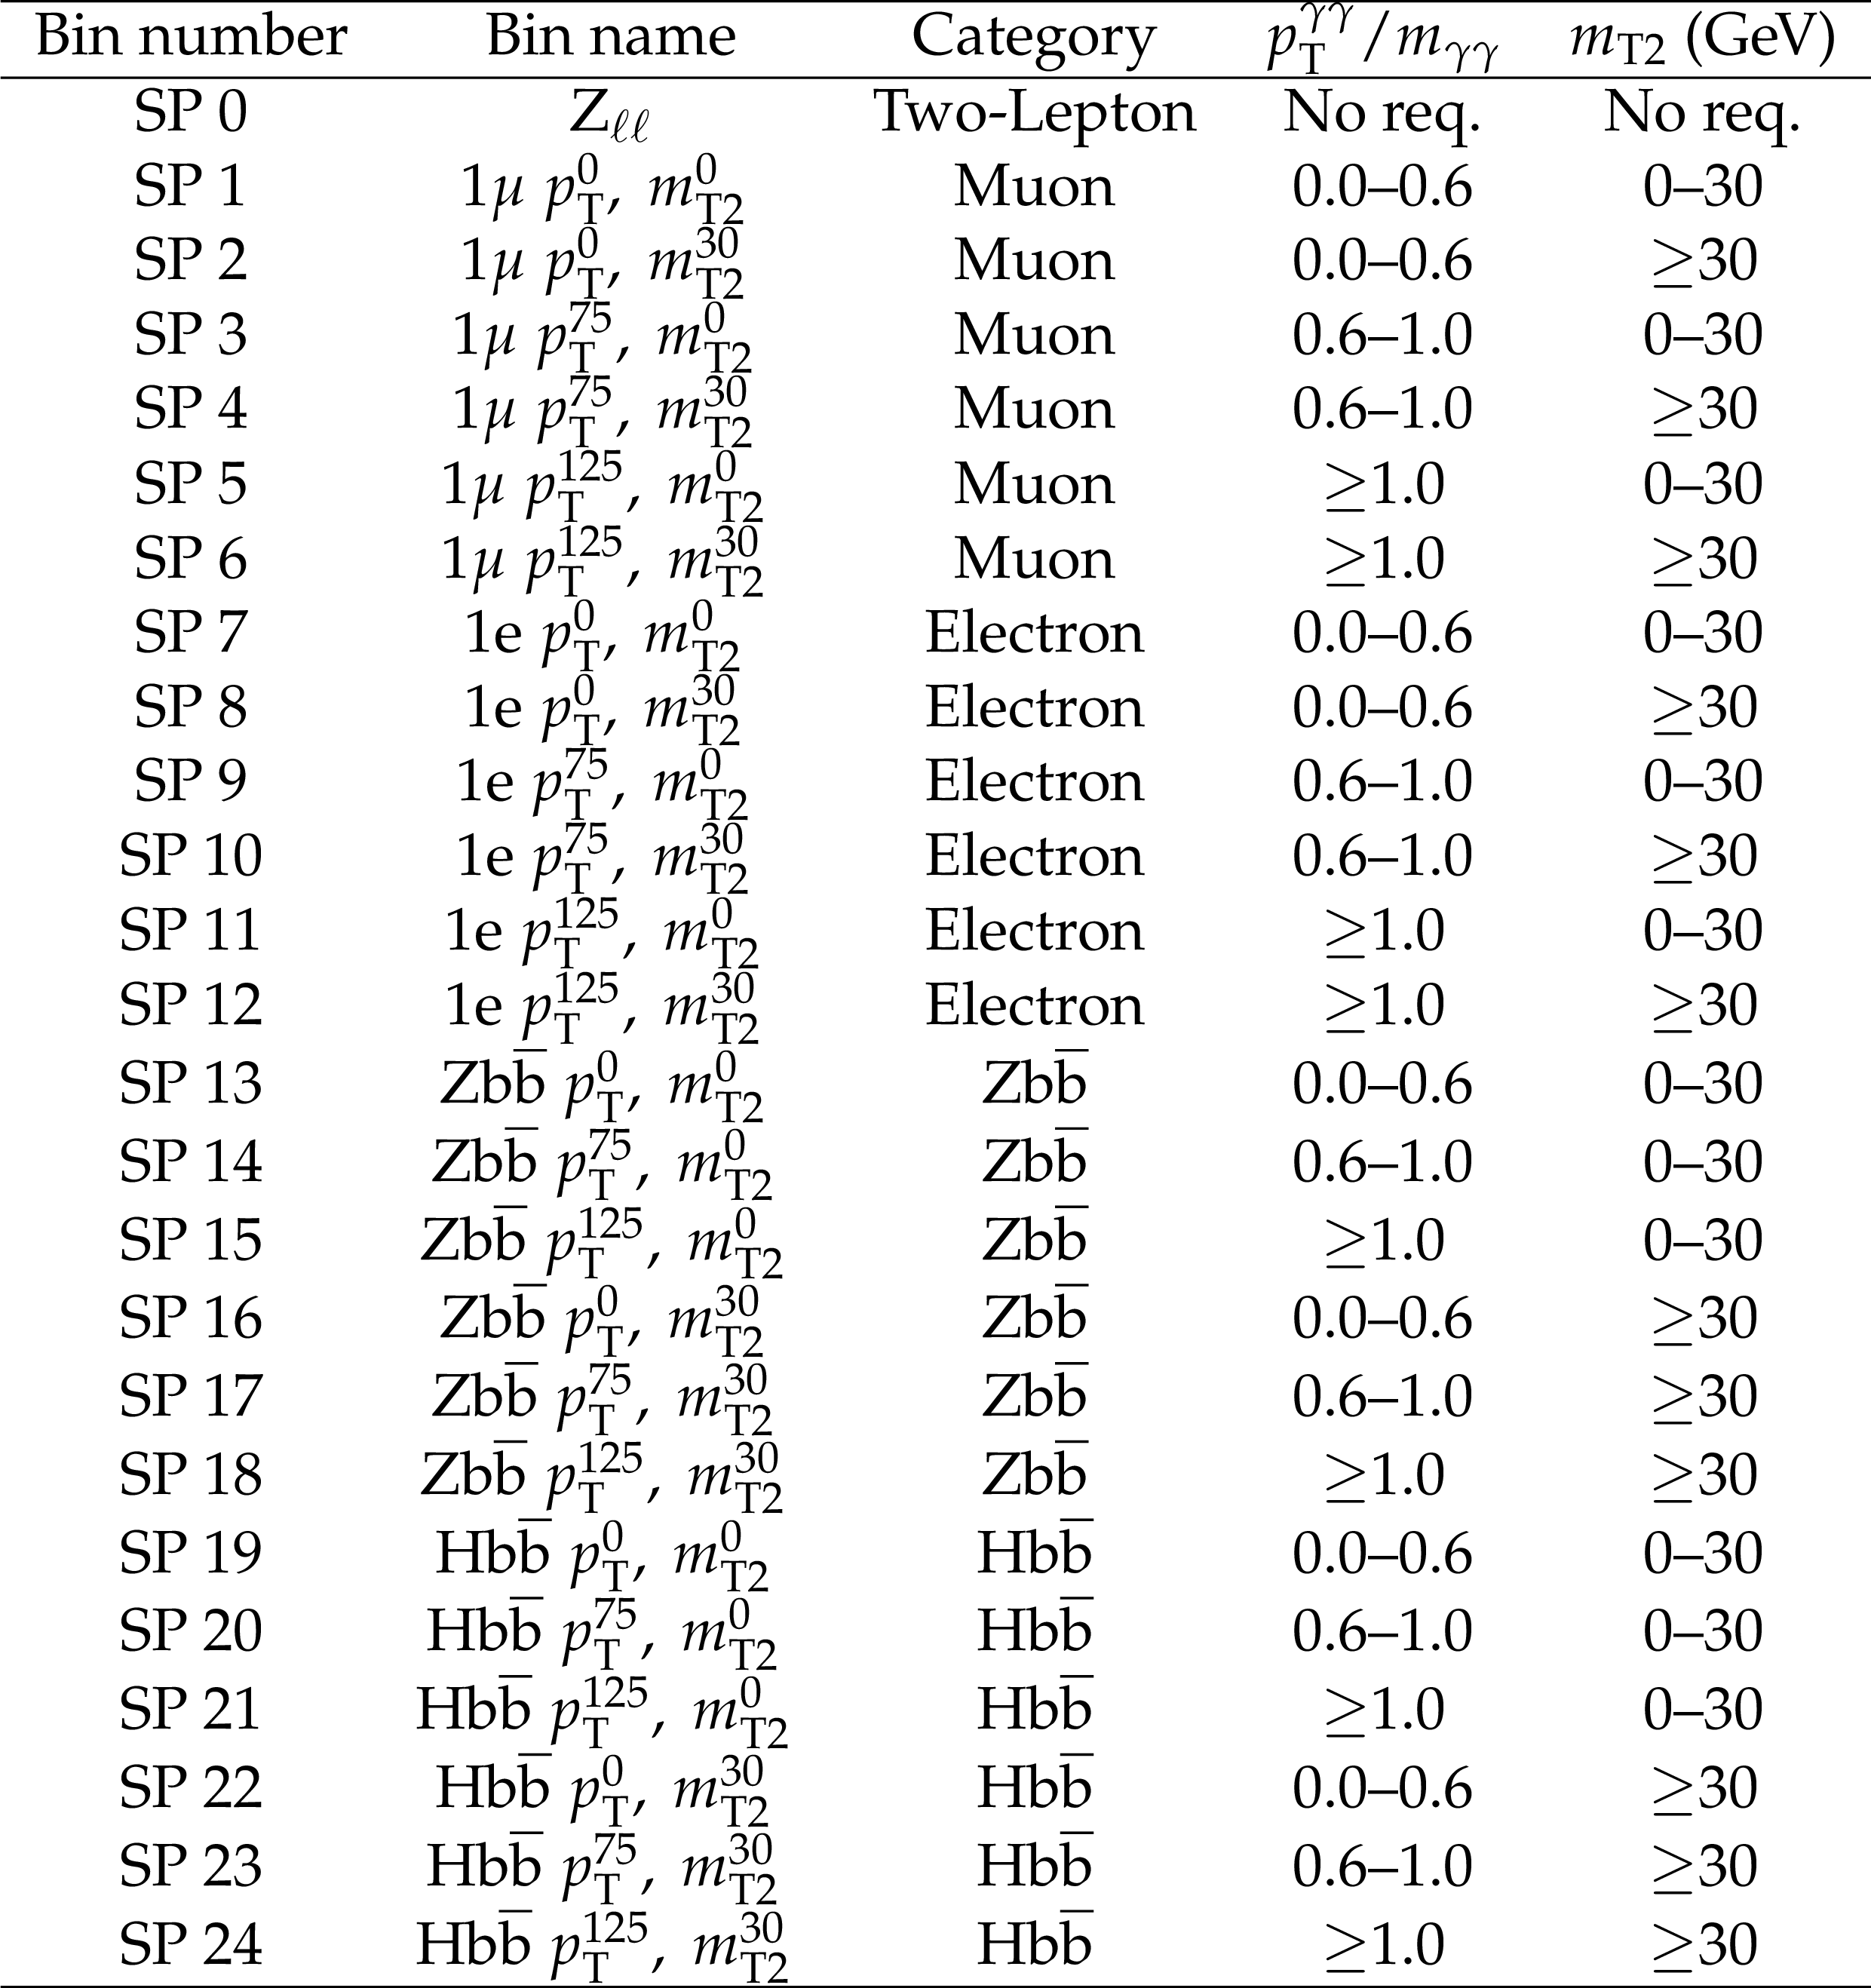
Table 2:
A summary of the search region bins in the leptonic and Higgs boson categories used in the SP analysis, along with the requirements on ${{p_{\mathrm {T}}} ^{\gamma \gamma} / m_{\gamma \gamma}}$ and ${m_{\mathrm {T2}}}$. There are no explicit requirements on the number of jets or b-tagged jets for these categories. For the Two-Lepton category, "No req.'' means that no requirements are placed on the given observables. |
png pdf |
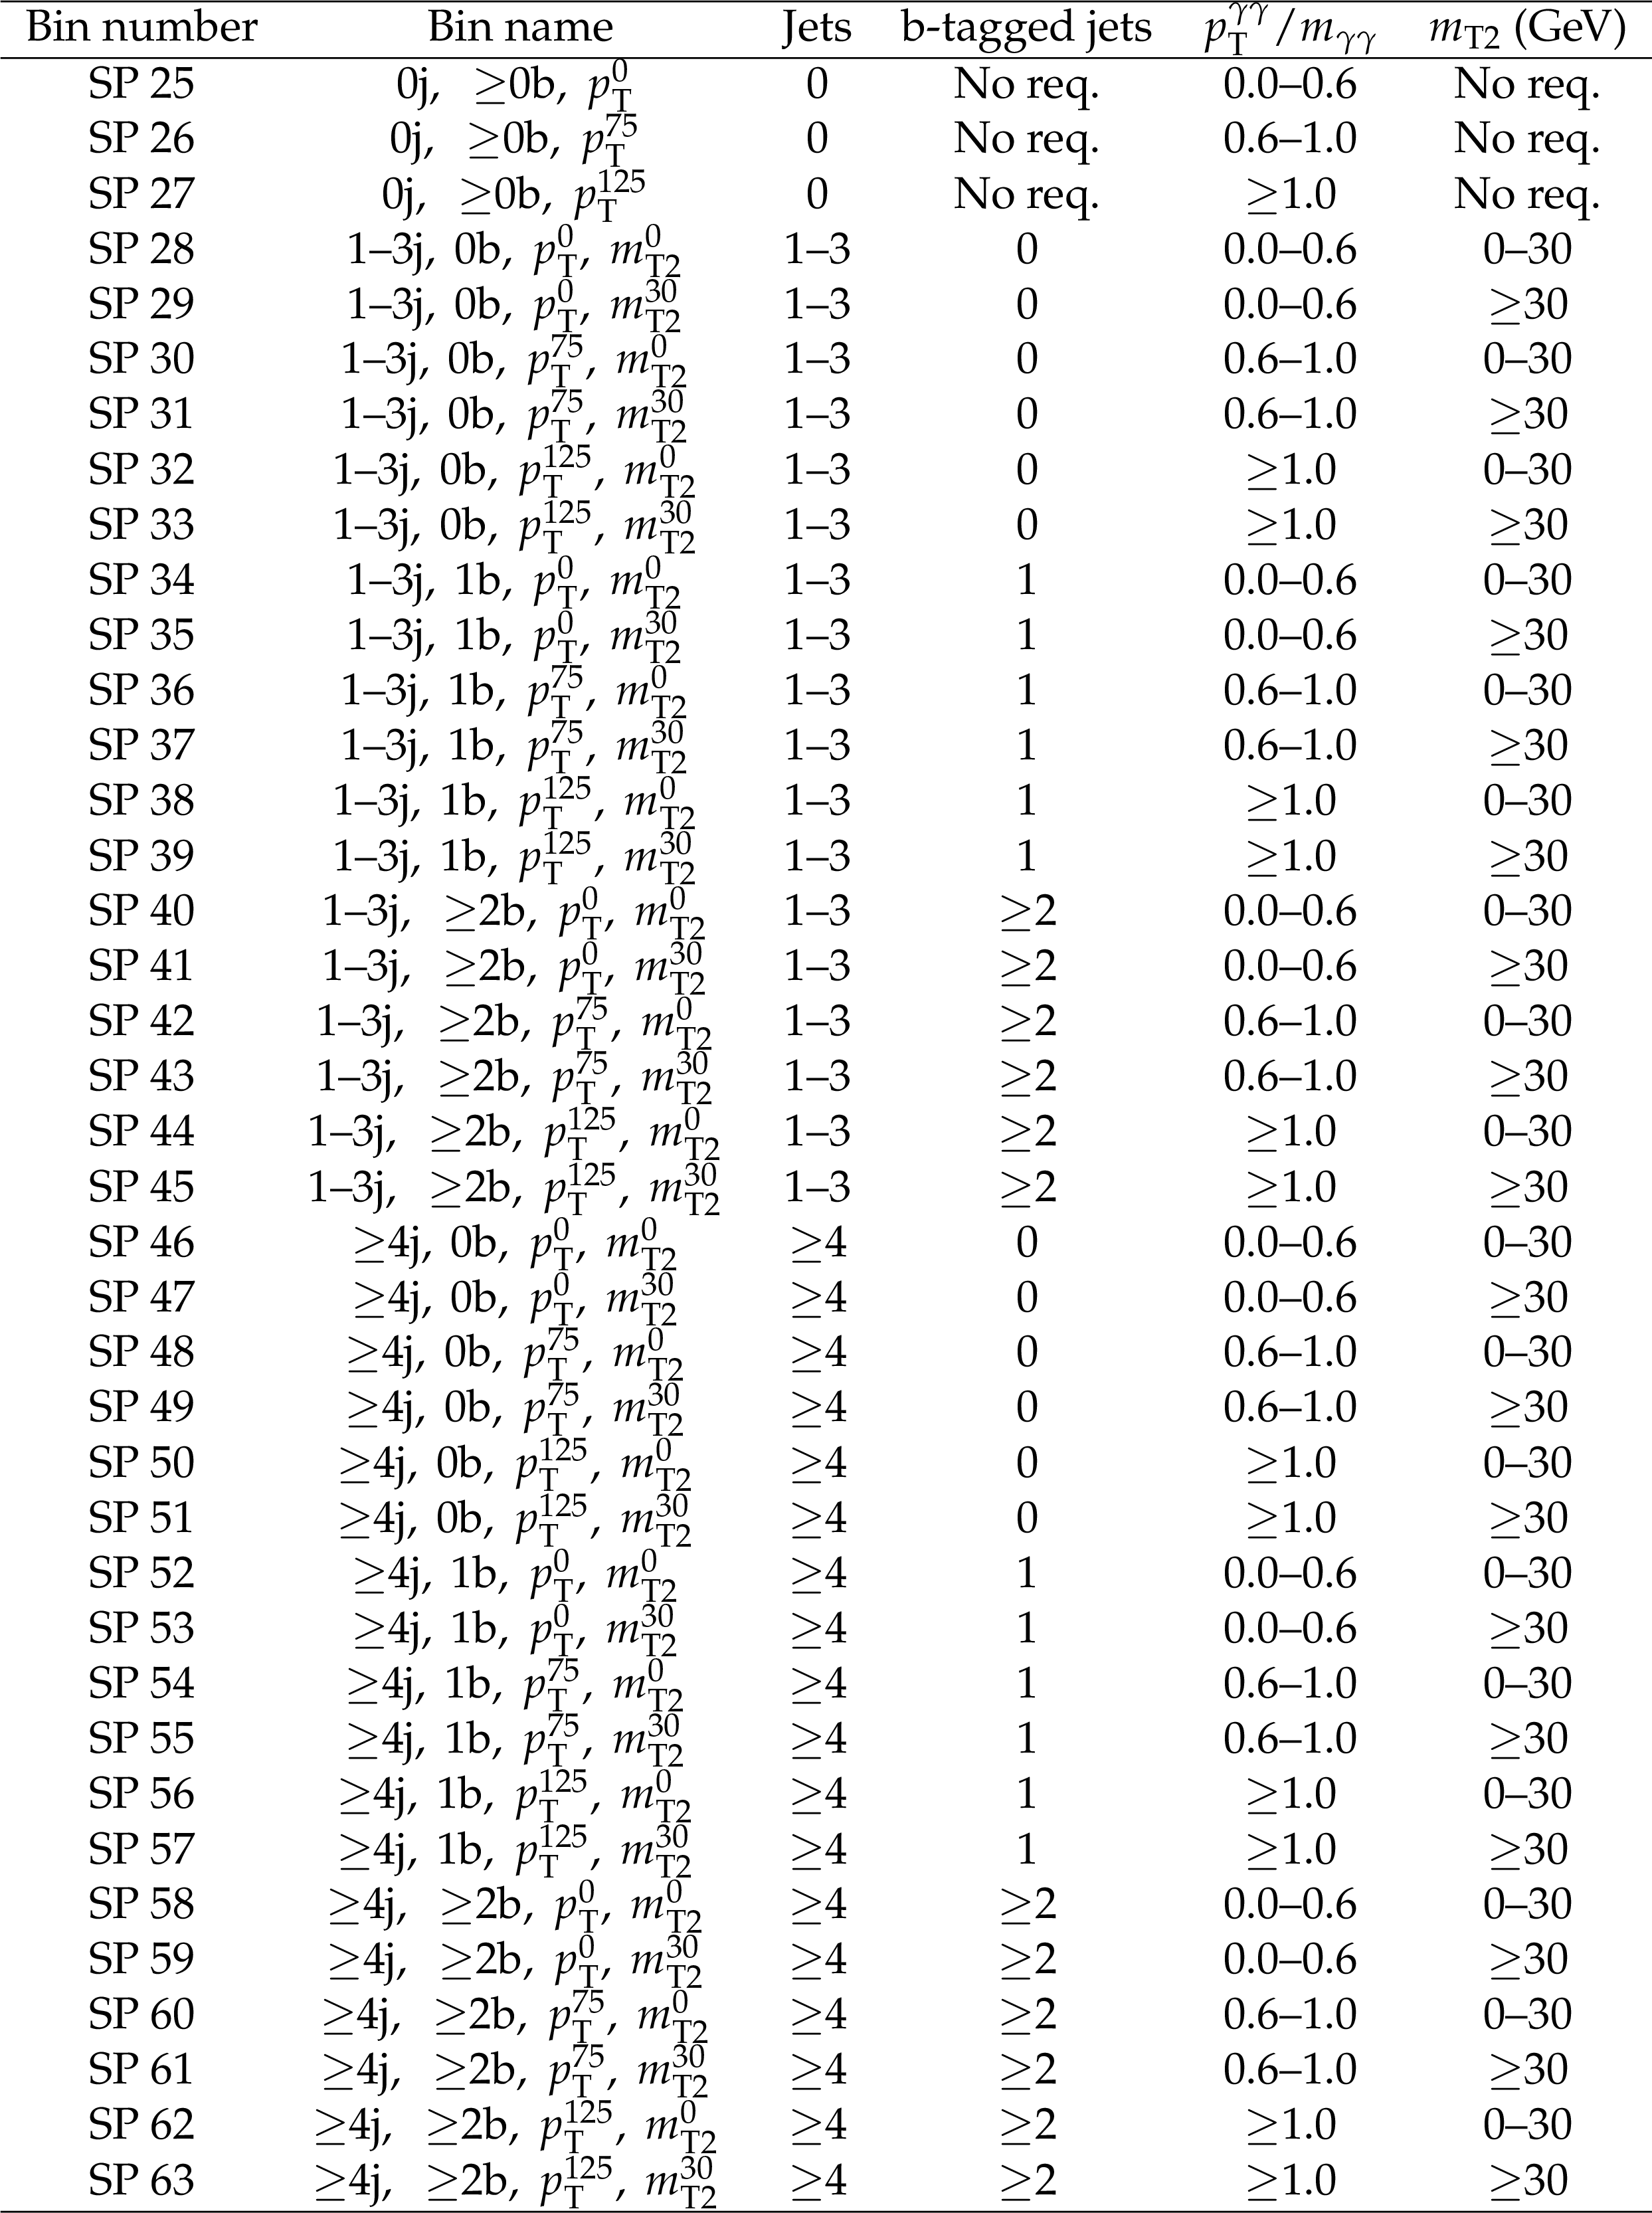
Table 3:
A summary of the search region bins in the leptonic and Higgs boson categories used in the SP analysis, along with the requirements on ${{p_{\mathrm {T}}} ^{\gamma \gamma} / m_{\gamma \gamma}}$ and ${m_{\mathrm {T2}}}$. "No req.'' means that no requirements are placed on the given observables. |

png pdf |
Table 4:
Summary of systematic uncertainties on the SM Higgs boson background and signal yield predictions, and the size of their effect on the signal yield. |
png pdf |
Table 5:
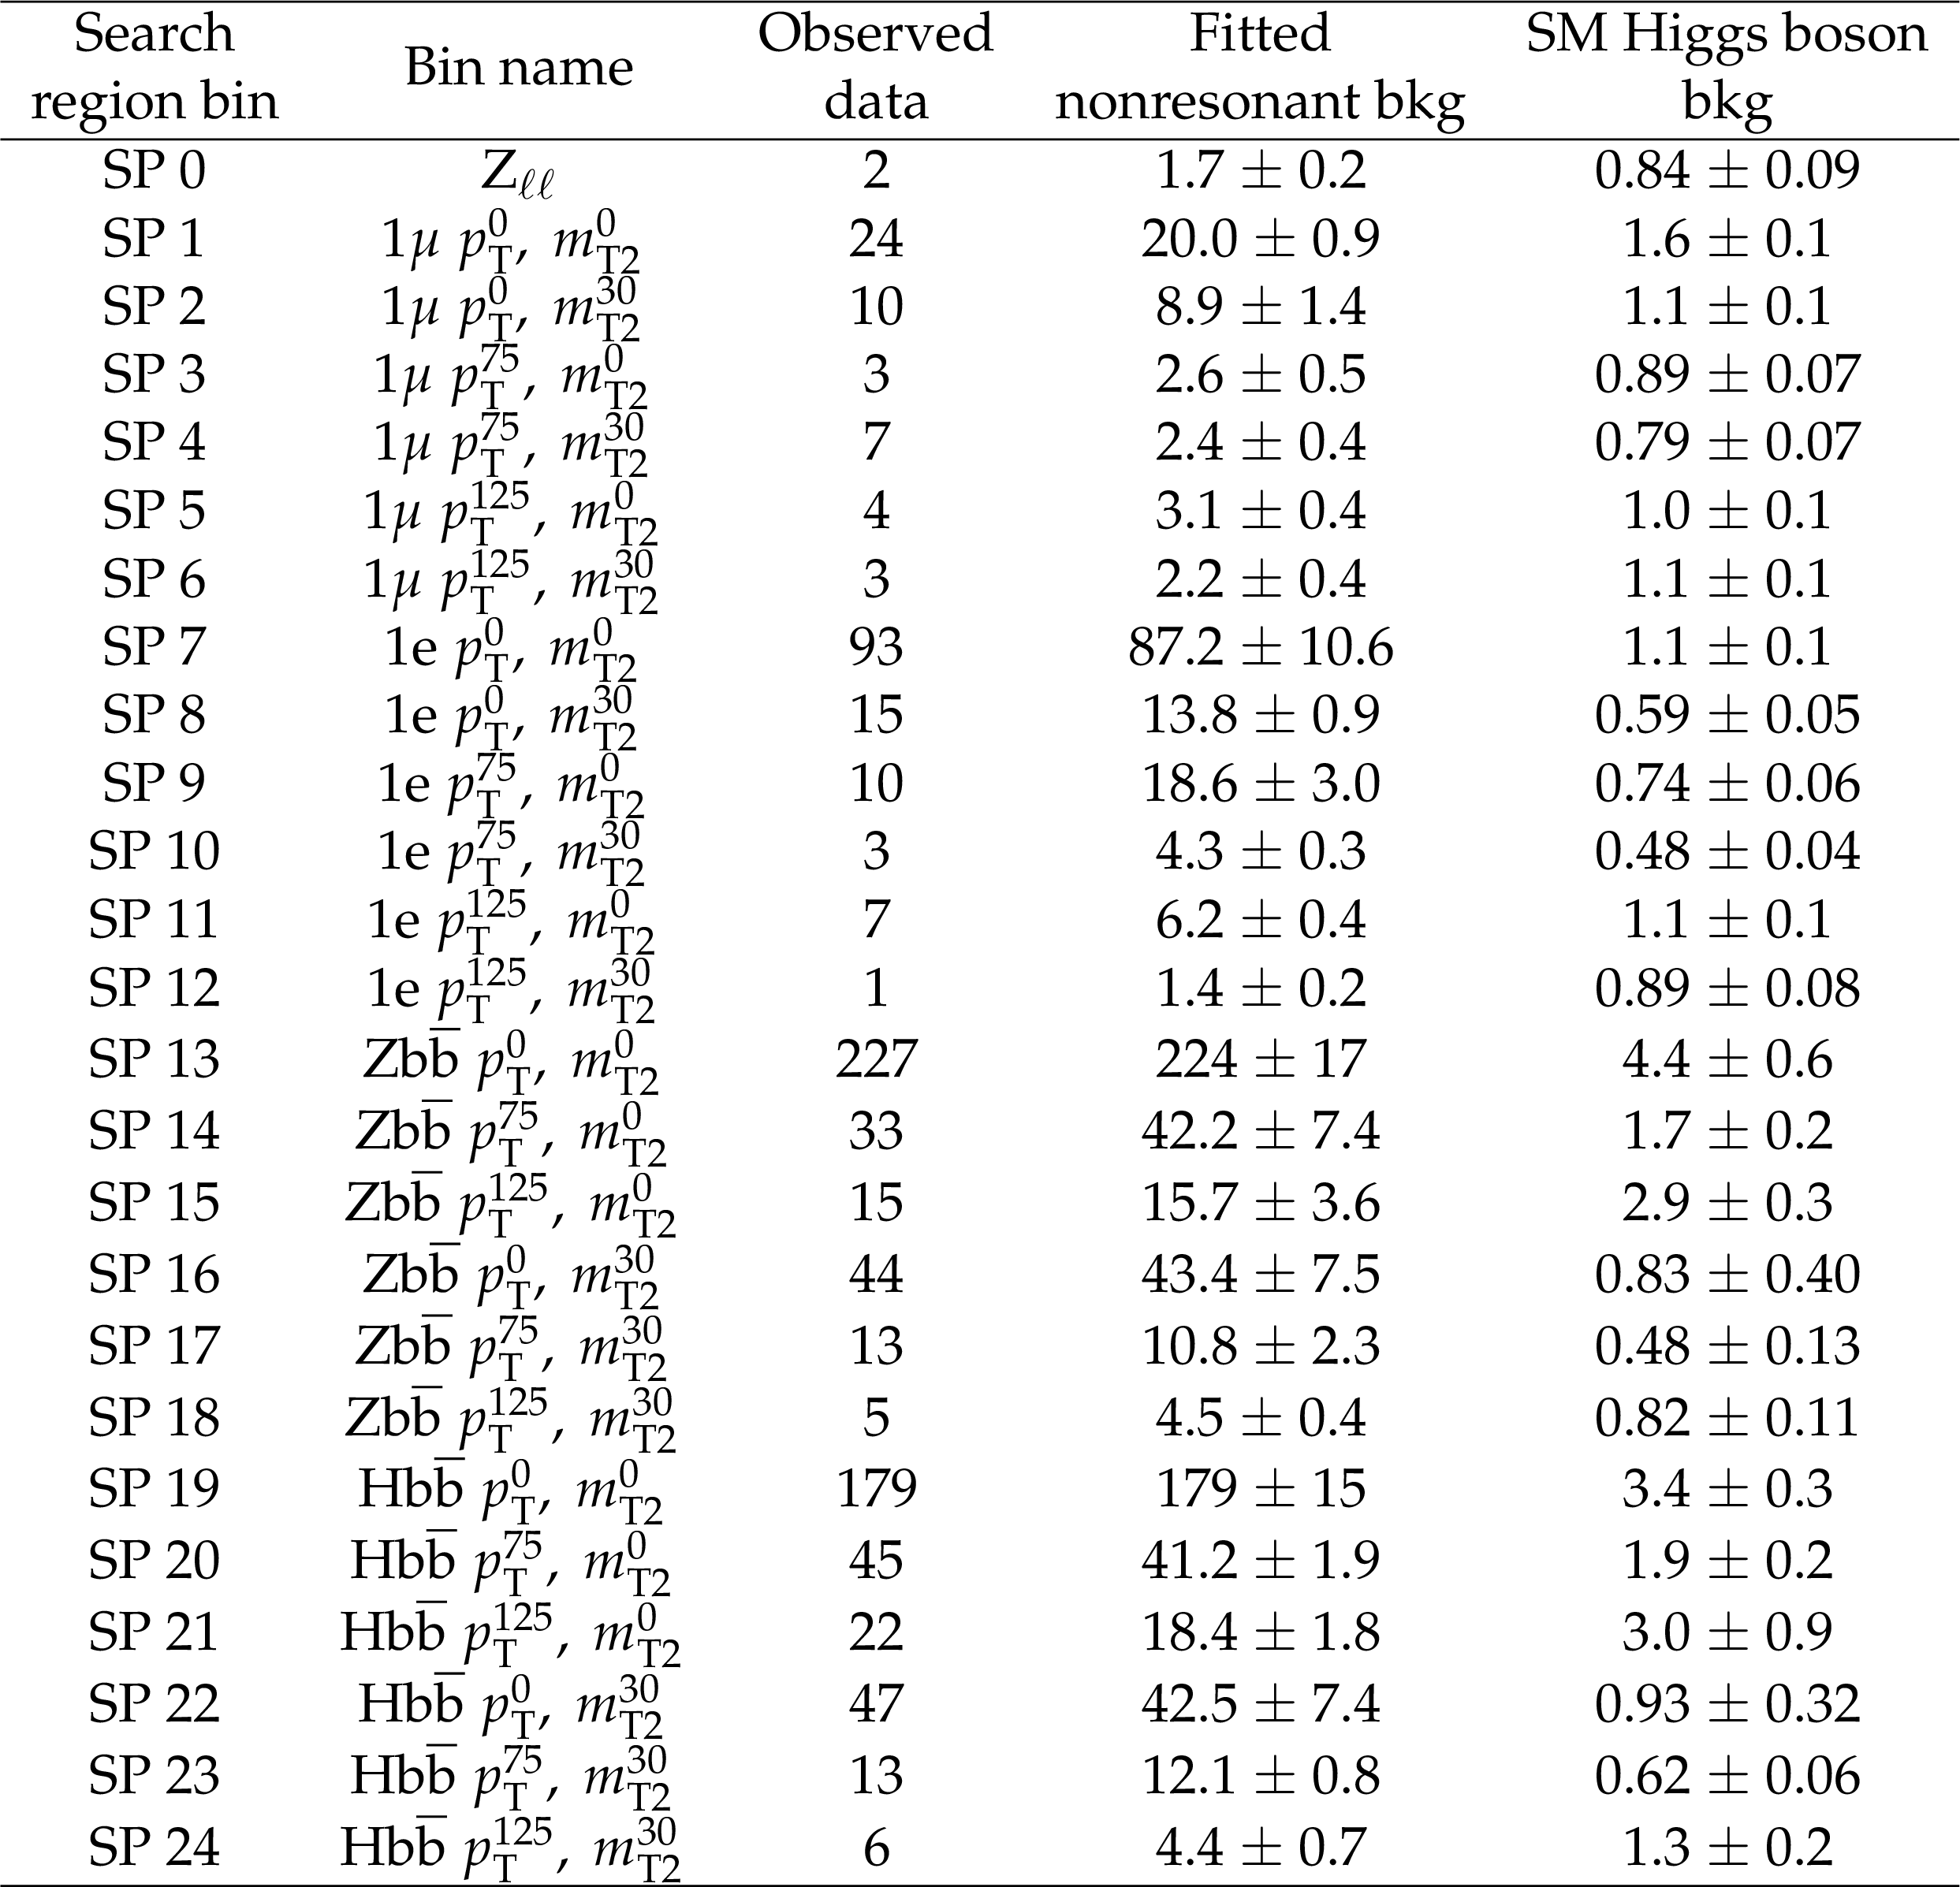
The observed data, fitted nonresonant background yields, and SM Higgs boson background yields within the mass window between 122 and 129 GeV are shown for each search region bin in the $\mathrm{H} \mathrm{b} \mathrm{\bar{b}} $, $\mathrm{Z} \mathrm{b} \mathrm{\bar{b}} $, and leptonic categories of the SP analysis. The uncertainties quoted are the fit uncertainties, which include the impact of all systematic uncertainties. The bin names give a short-form description of the search region bin definition which are given in full in Table 2. The labels $ {p_{\mathrm {T}}} ^{0}$, $ {p_{\mathrm {T}}} ^{75}$, and $ {p_{\mathrm {T}}} ^{125}$ refer to bins defined by the requirement that ${{p_{\mathrm {T}}} ^{\gamma \gamma} / m_{\gamma \gamma}}$ is less than 0.6, between 0.6 and 1.0, and greater than 1.0, respectively. The labels $ {m_{\mathrm {T2}}} ^{0}$ and $ {m_{\mathrm {T2}}} ^{30}$ refer to bins defined by the requirement that ${m_{\mathrm {T2}}}$ is less than and greater than 30 GeV, respectively. |
png pdf |
Table 6:
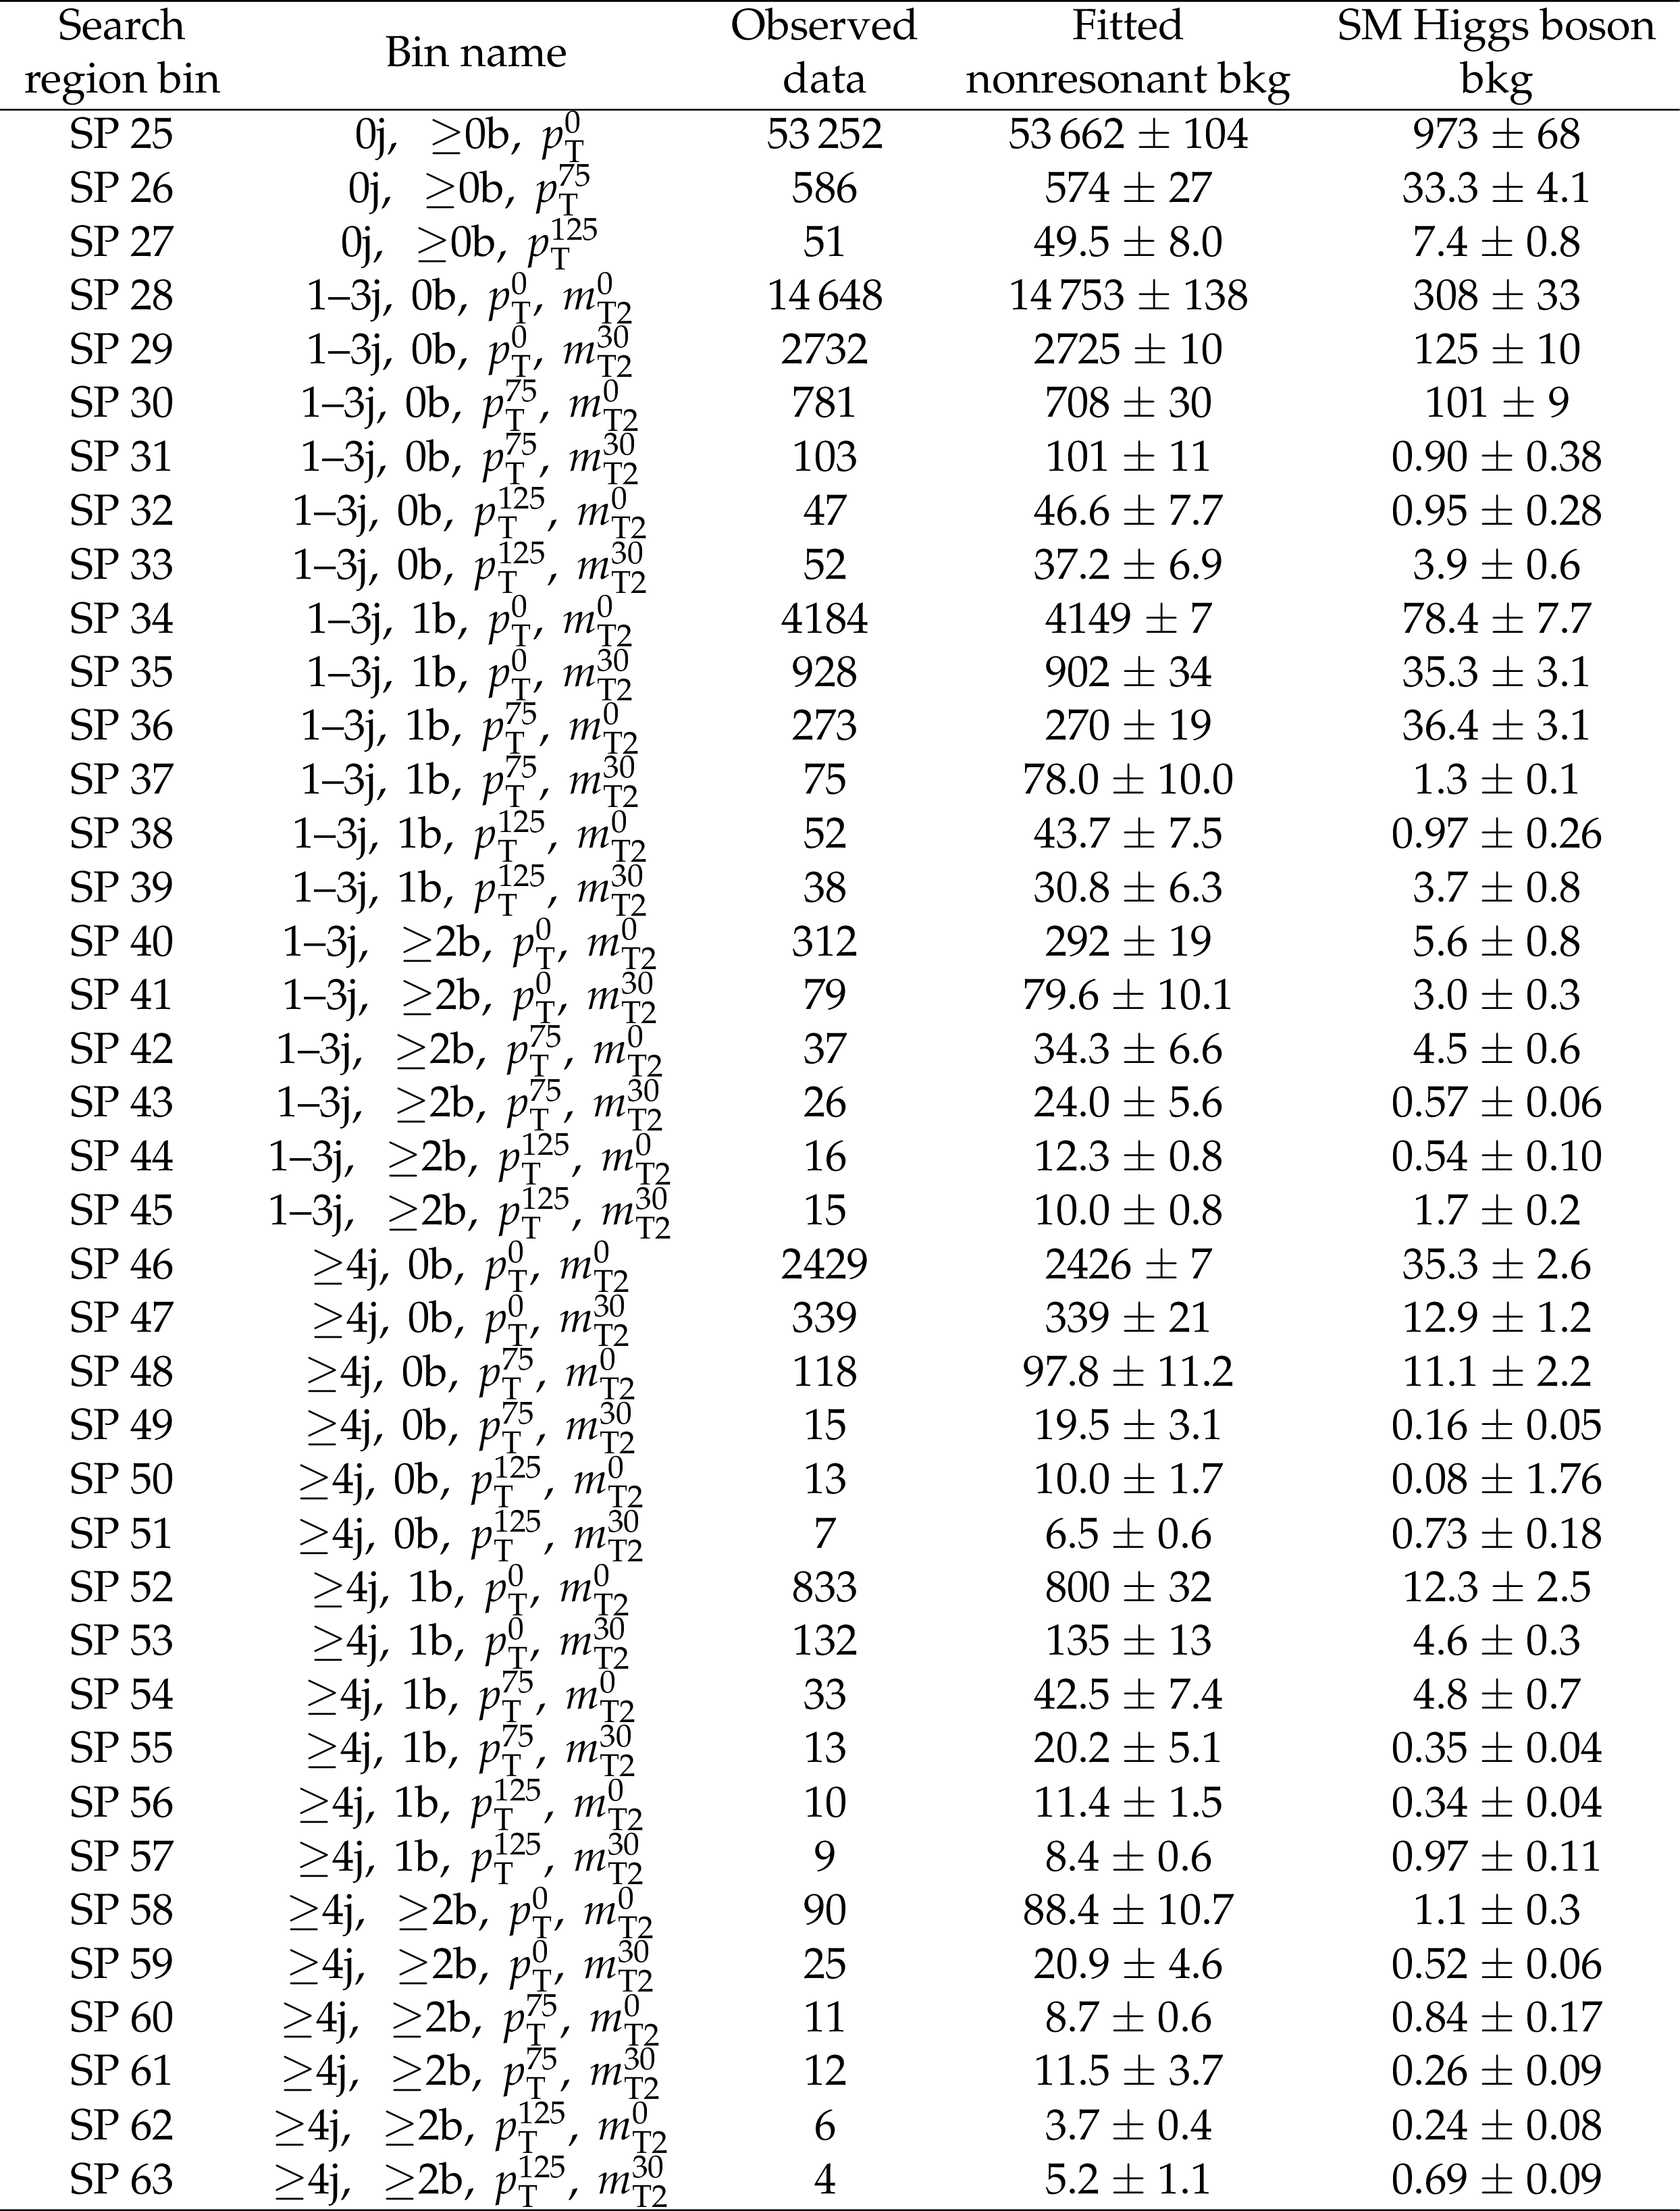
The observed data, fitted nonresonant background yields, and SM Higgs boson background yields within the mass window between 122 and 129 GeV are shown for each search region bin in the all-hadronic categories of the SP analysis. The uncertainties quoted are the fit uncertainties, which include the impact of all systematic uncertainties. The bin names give a short-form description of the search region bin definition which are given in full in Table 3. The labels $ {p_{\mathrm {T}}} ^{0}$, $ {p_{\mathrm {T}}} ^{75}$, and $ {p_{\mathrm {T}}} ^{125}$ refer to bins defined by the requirement that ${{p_{\mathrm {T}}} ^{\gamma \gamma} / m_{\gamma \gamma}}$ is less than 0.6, between 0.6 and 1.0, and greater than 1.0, respectively. The labels $ {m_{\mathrm {T2}}} ^{0}$ and $ {m_{\mathrm {T2}}} ^{30}$ refer to bins defined by the requirement that ${m_{\mathrm {T2}}}$ is less than and greater than 30 GeV, respectively. |
png pdf |
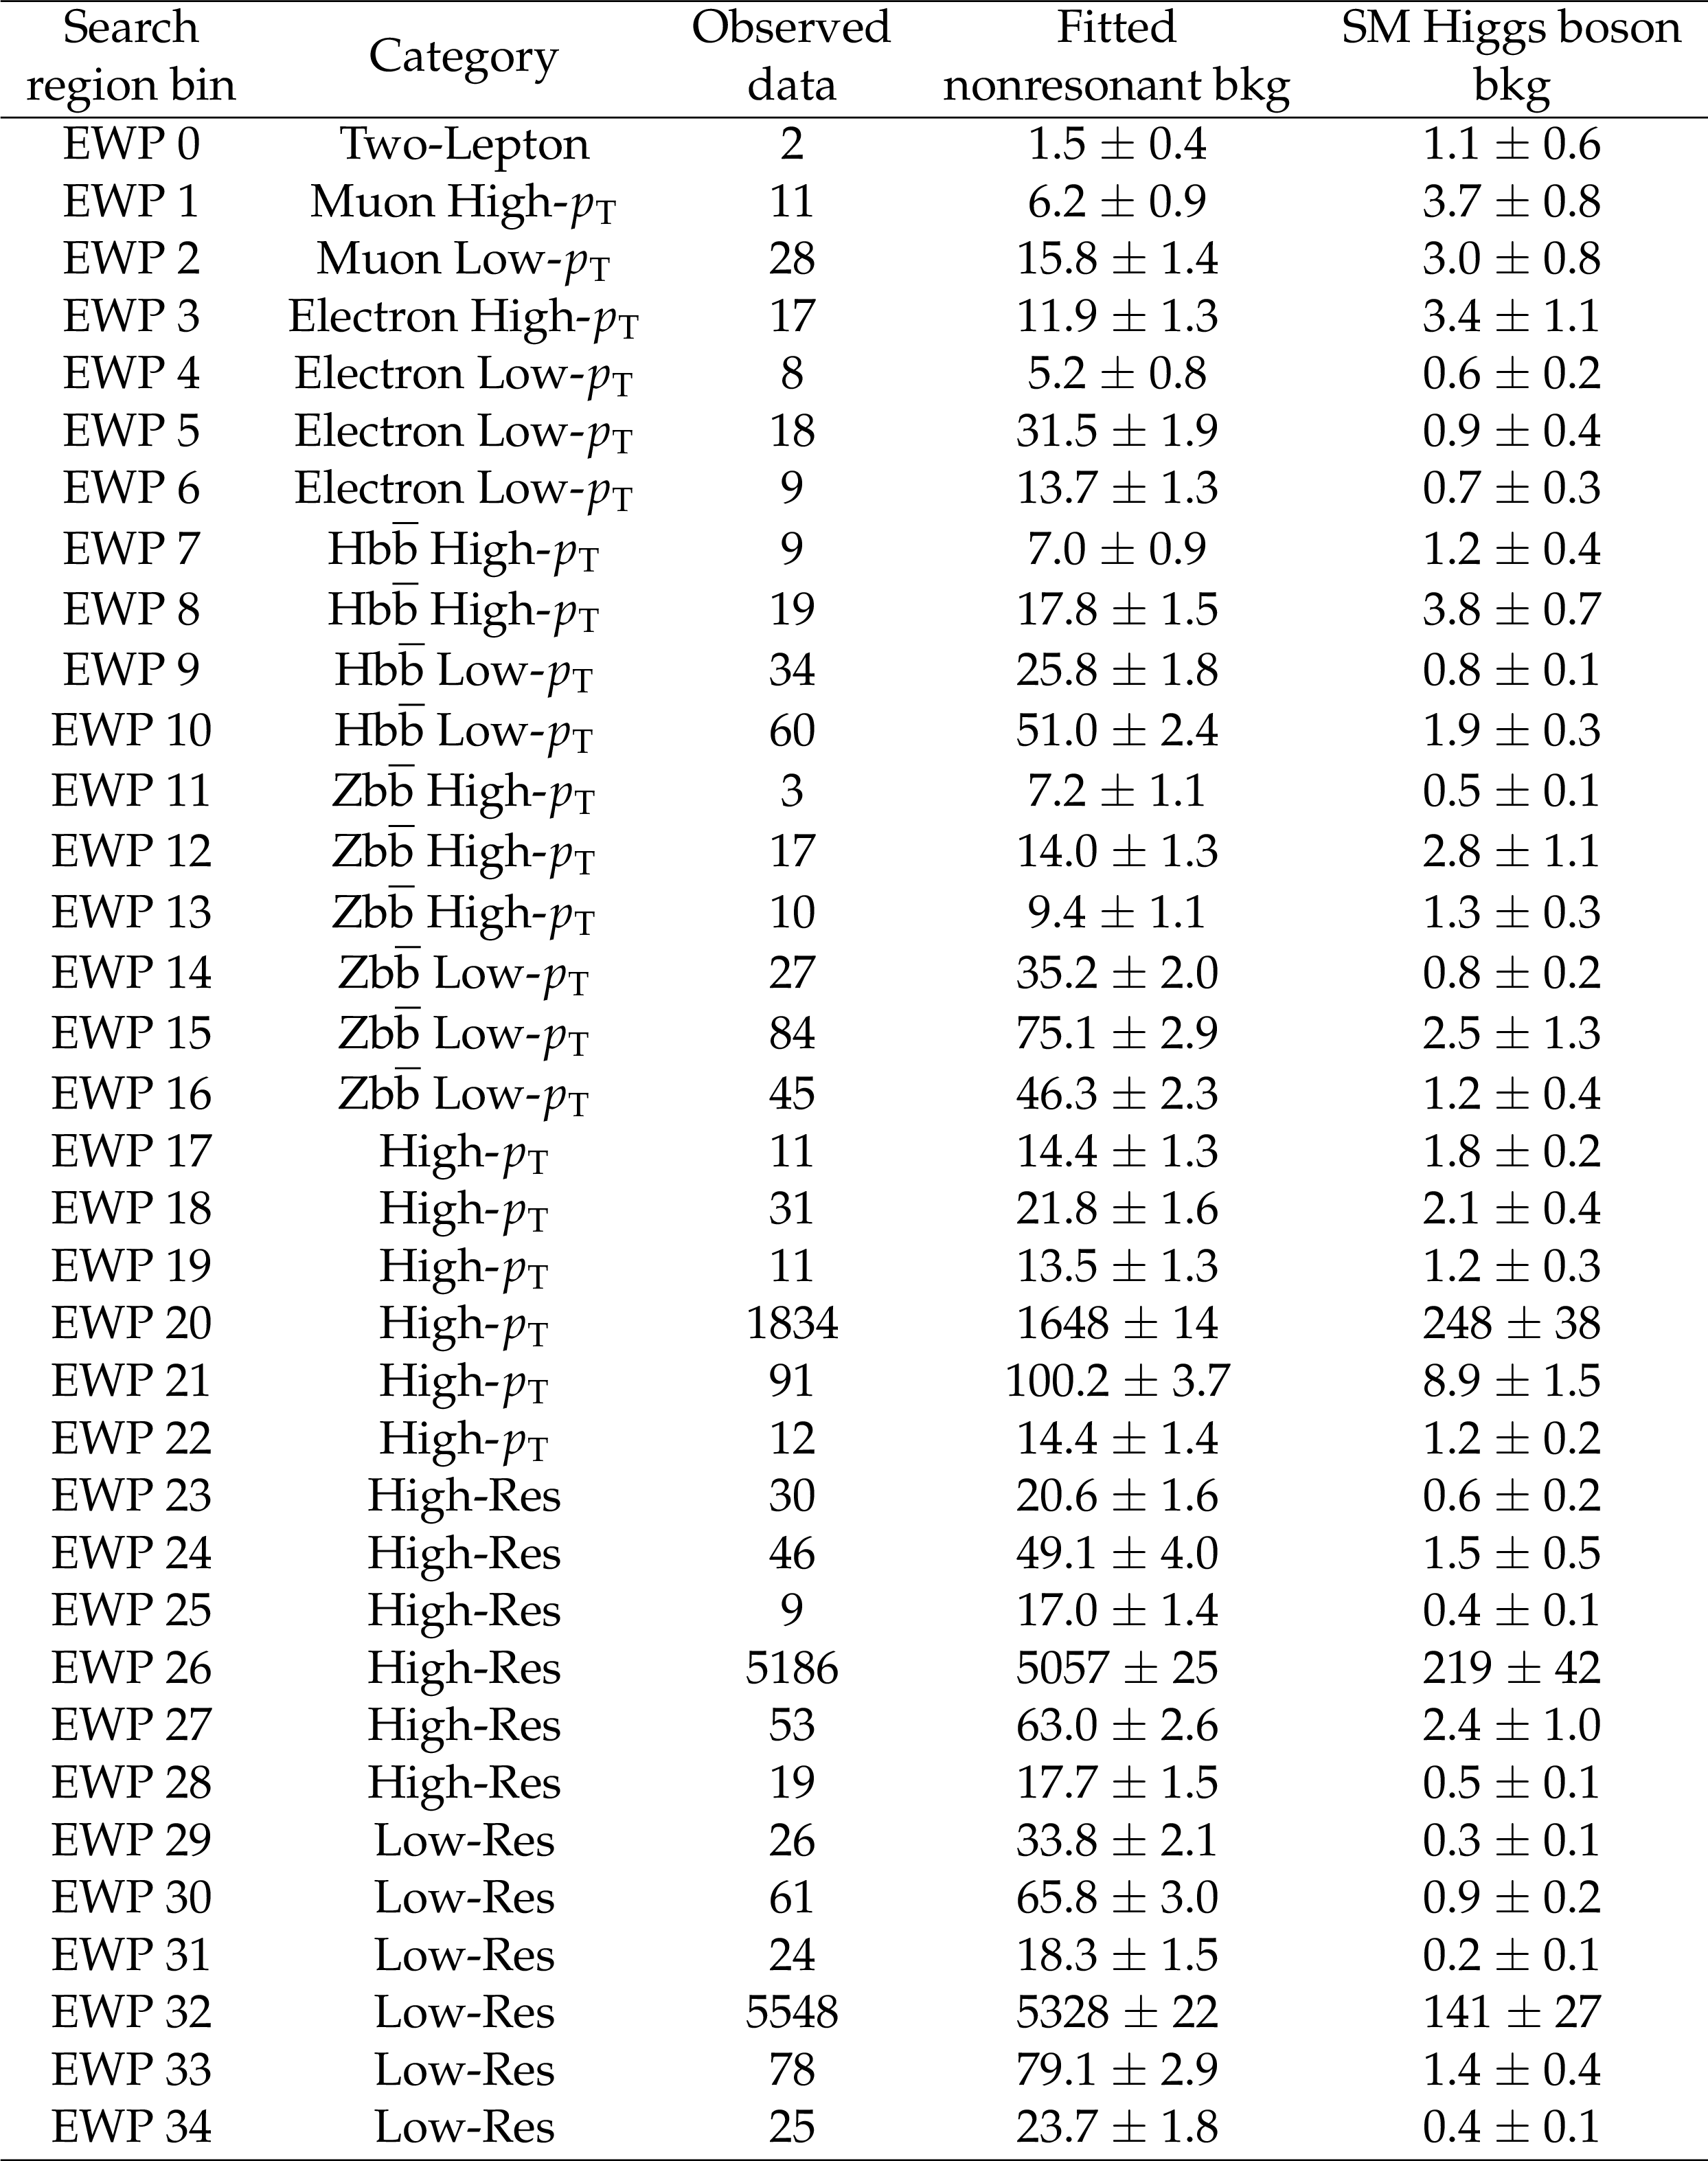
Table 7:
The observed data, fitted nonresonant background yields, and SM Higgs boson background yields within the mass window between 122 and 129 GeV are shown for each search region bin of the EWP analysis. The uncertainties quoted are the fit uncertainties, which include the impact of all systematic uncertainties. |
png pdf |
Table 8:
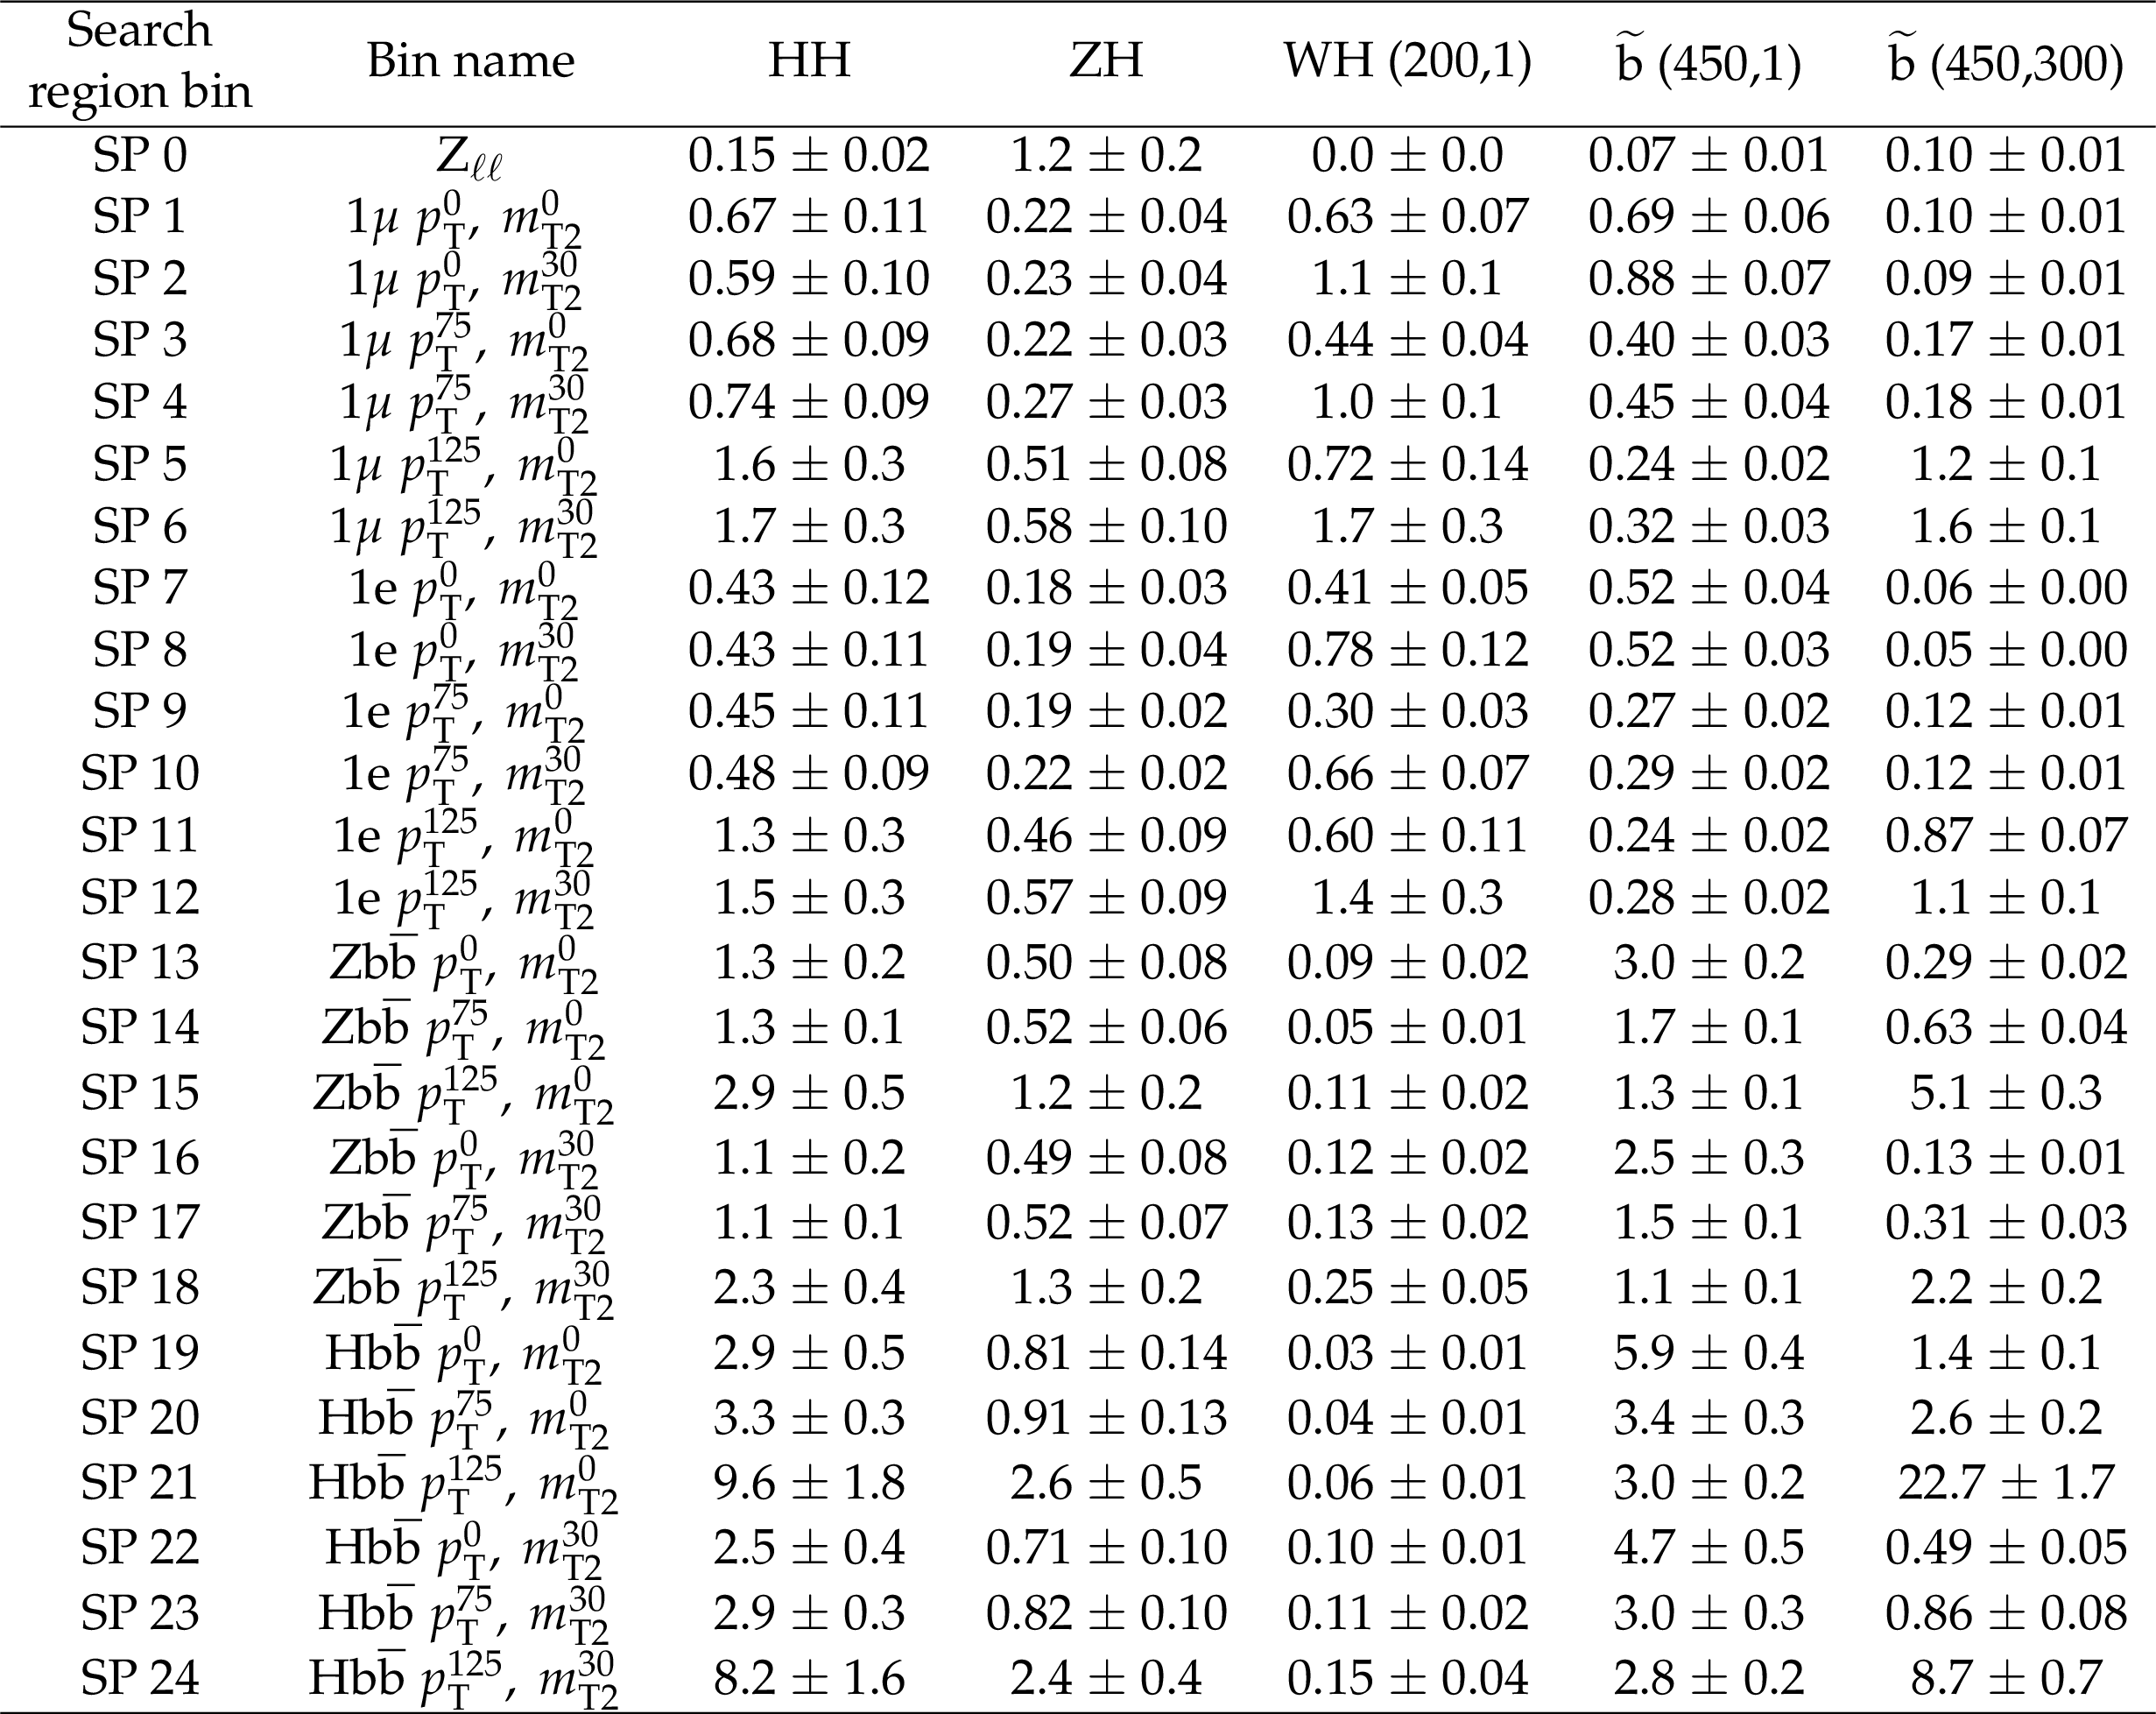
The expected signal yields for the SUSY simplified model signals considered are shown for each search region bin in the $\mathrm{H} \mathrm{b} \mathrm{\bar{b}} $, $\mathrm{Z} \mathrm{b} \mathrm{\bar{b}} $, and leptonic categories of the SP analysis. The bin names give a short-form description of the search region bin definition which are given in full in Table 2. The labels $ {p_{\mathrm {T}}} ^{0}$, $ {p_{\mathrm {T}}} ^{75}$, and $ {p_{\mathrm {T}}} ^{125}$ refer to bins defined by the requirement that ${{p_{\mathrm {T}}} ^{\gamma \gamma} / m_{\gamma \gamma}}$ is less than 0.6, between 0.6 and 1.0, and greater than 1.0, respectively. The labels $ {m_{\mathrm {T2}}} ^{0}$ and $ {m_{\mathrm {T2}}} ^{30}$ refer to bins defined by the requirement that ${m_{\mathrm {T2}}}$ is less than and greater than 30 GeV, respectively. The labels $\mathrm{H} \mathrm{H} $ and $\mathrm{Z} \mathrm{H} $ refer to the signal models for higgsino-like chargino and neutralino production where the branching fractions of the decays $\tilde{\chi}^0_1 \to \mathrm{H} \tilde{\mathrm{G}} $ and $\tilde{\chi}^0_1 \to \mathrm{Z} \tilde{\mathrm{G}} $ are 100% and 0%, and 50% and 50%, respectively. For the above two scenarios, the mass of the chargino and next-to-lightest neutralino is 175 GeV, while the LSP mass is 45 GeV. The label $\mathrm{W} \mathrm{H} $ (200,1) refers to the signal model for wino-like chargino and neutralino production, where the mass of the chargino and next-to-lightest neutralino is 200 GeV and the LSP mass is 1 GeV. The labels $\tilde{\mathrm{b}} (450,1) $ and $\tilde{\mathrm{b}} (450,300)$ refer to the signal models for bottom squark pair production where the bottom squark mass is 450 GeV and the LSP mass is 1 and 300 GeV, respectively. |
png pdf |
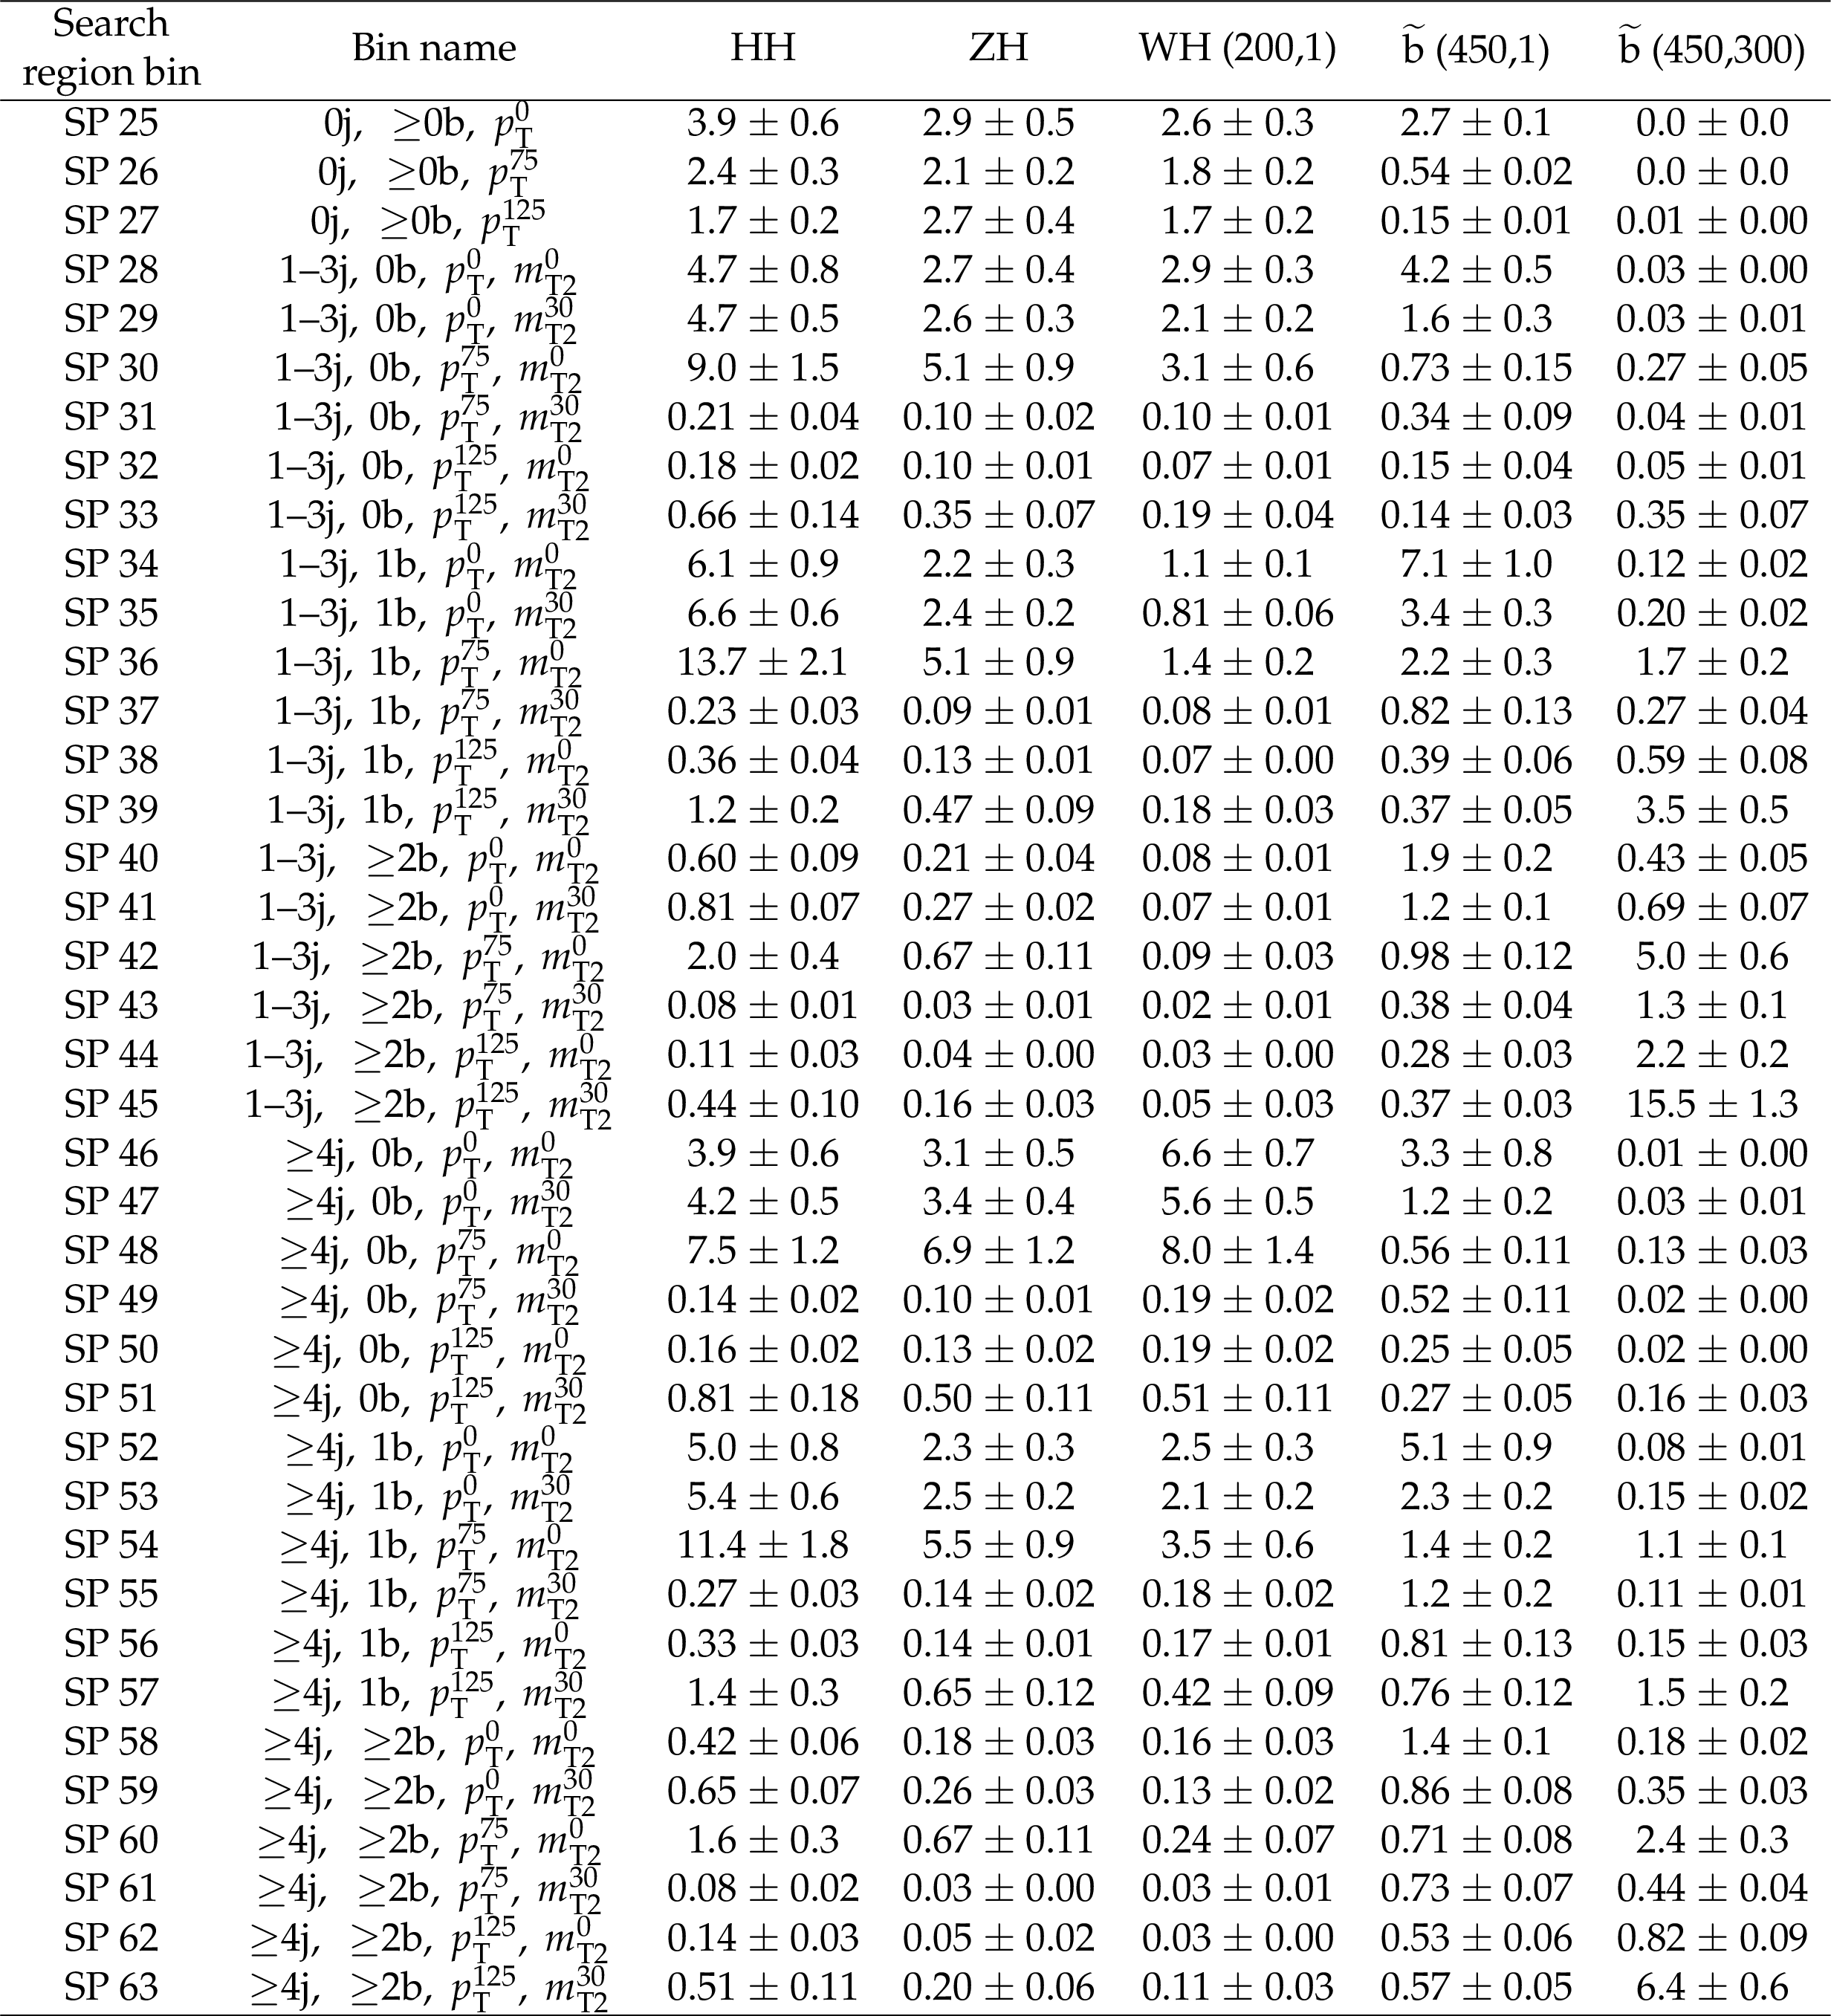
Table 9:
The expected signal yields for the SUSY simplified model signals considered are shown for each search region bin in the all-hadronic categories of the SP analysis. The bin names give a short-form description of the search region bin definition which are given in full in Table 3. The labels $ {p_{\mathrm {T}}} ^{0}$, $ {p_{\mathrm {T}}} ^{75}$, and $ {p_{\mathrm {T}}} ^{125}$ refer to bins defined by the requirement that ${{p_{\mathrm {T}}} ^{\gamma \gamma} / m_{\gamma \gamma}}$ is less than 0.6, between 0.6 and 1.0, and greater than 1.0, respectively. The labels $ {m_{\mathrm {T2}}} ^{0}$ and $ {m_{\mathrm {T2}}} ^{30}$ refer to bins defined by the requirement that ${m_{\mathrm {T2}}}$ is less than and greater than 30 GeV, respectively. The labels for the different signal models are explained in detail in the caption of Table 8. |
png pdf |
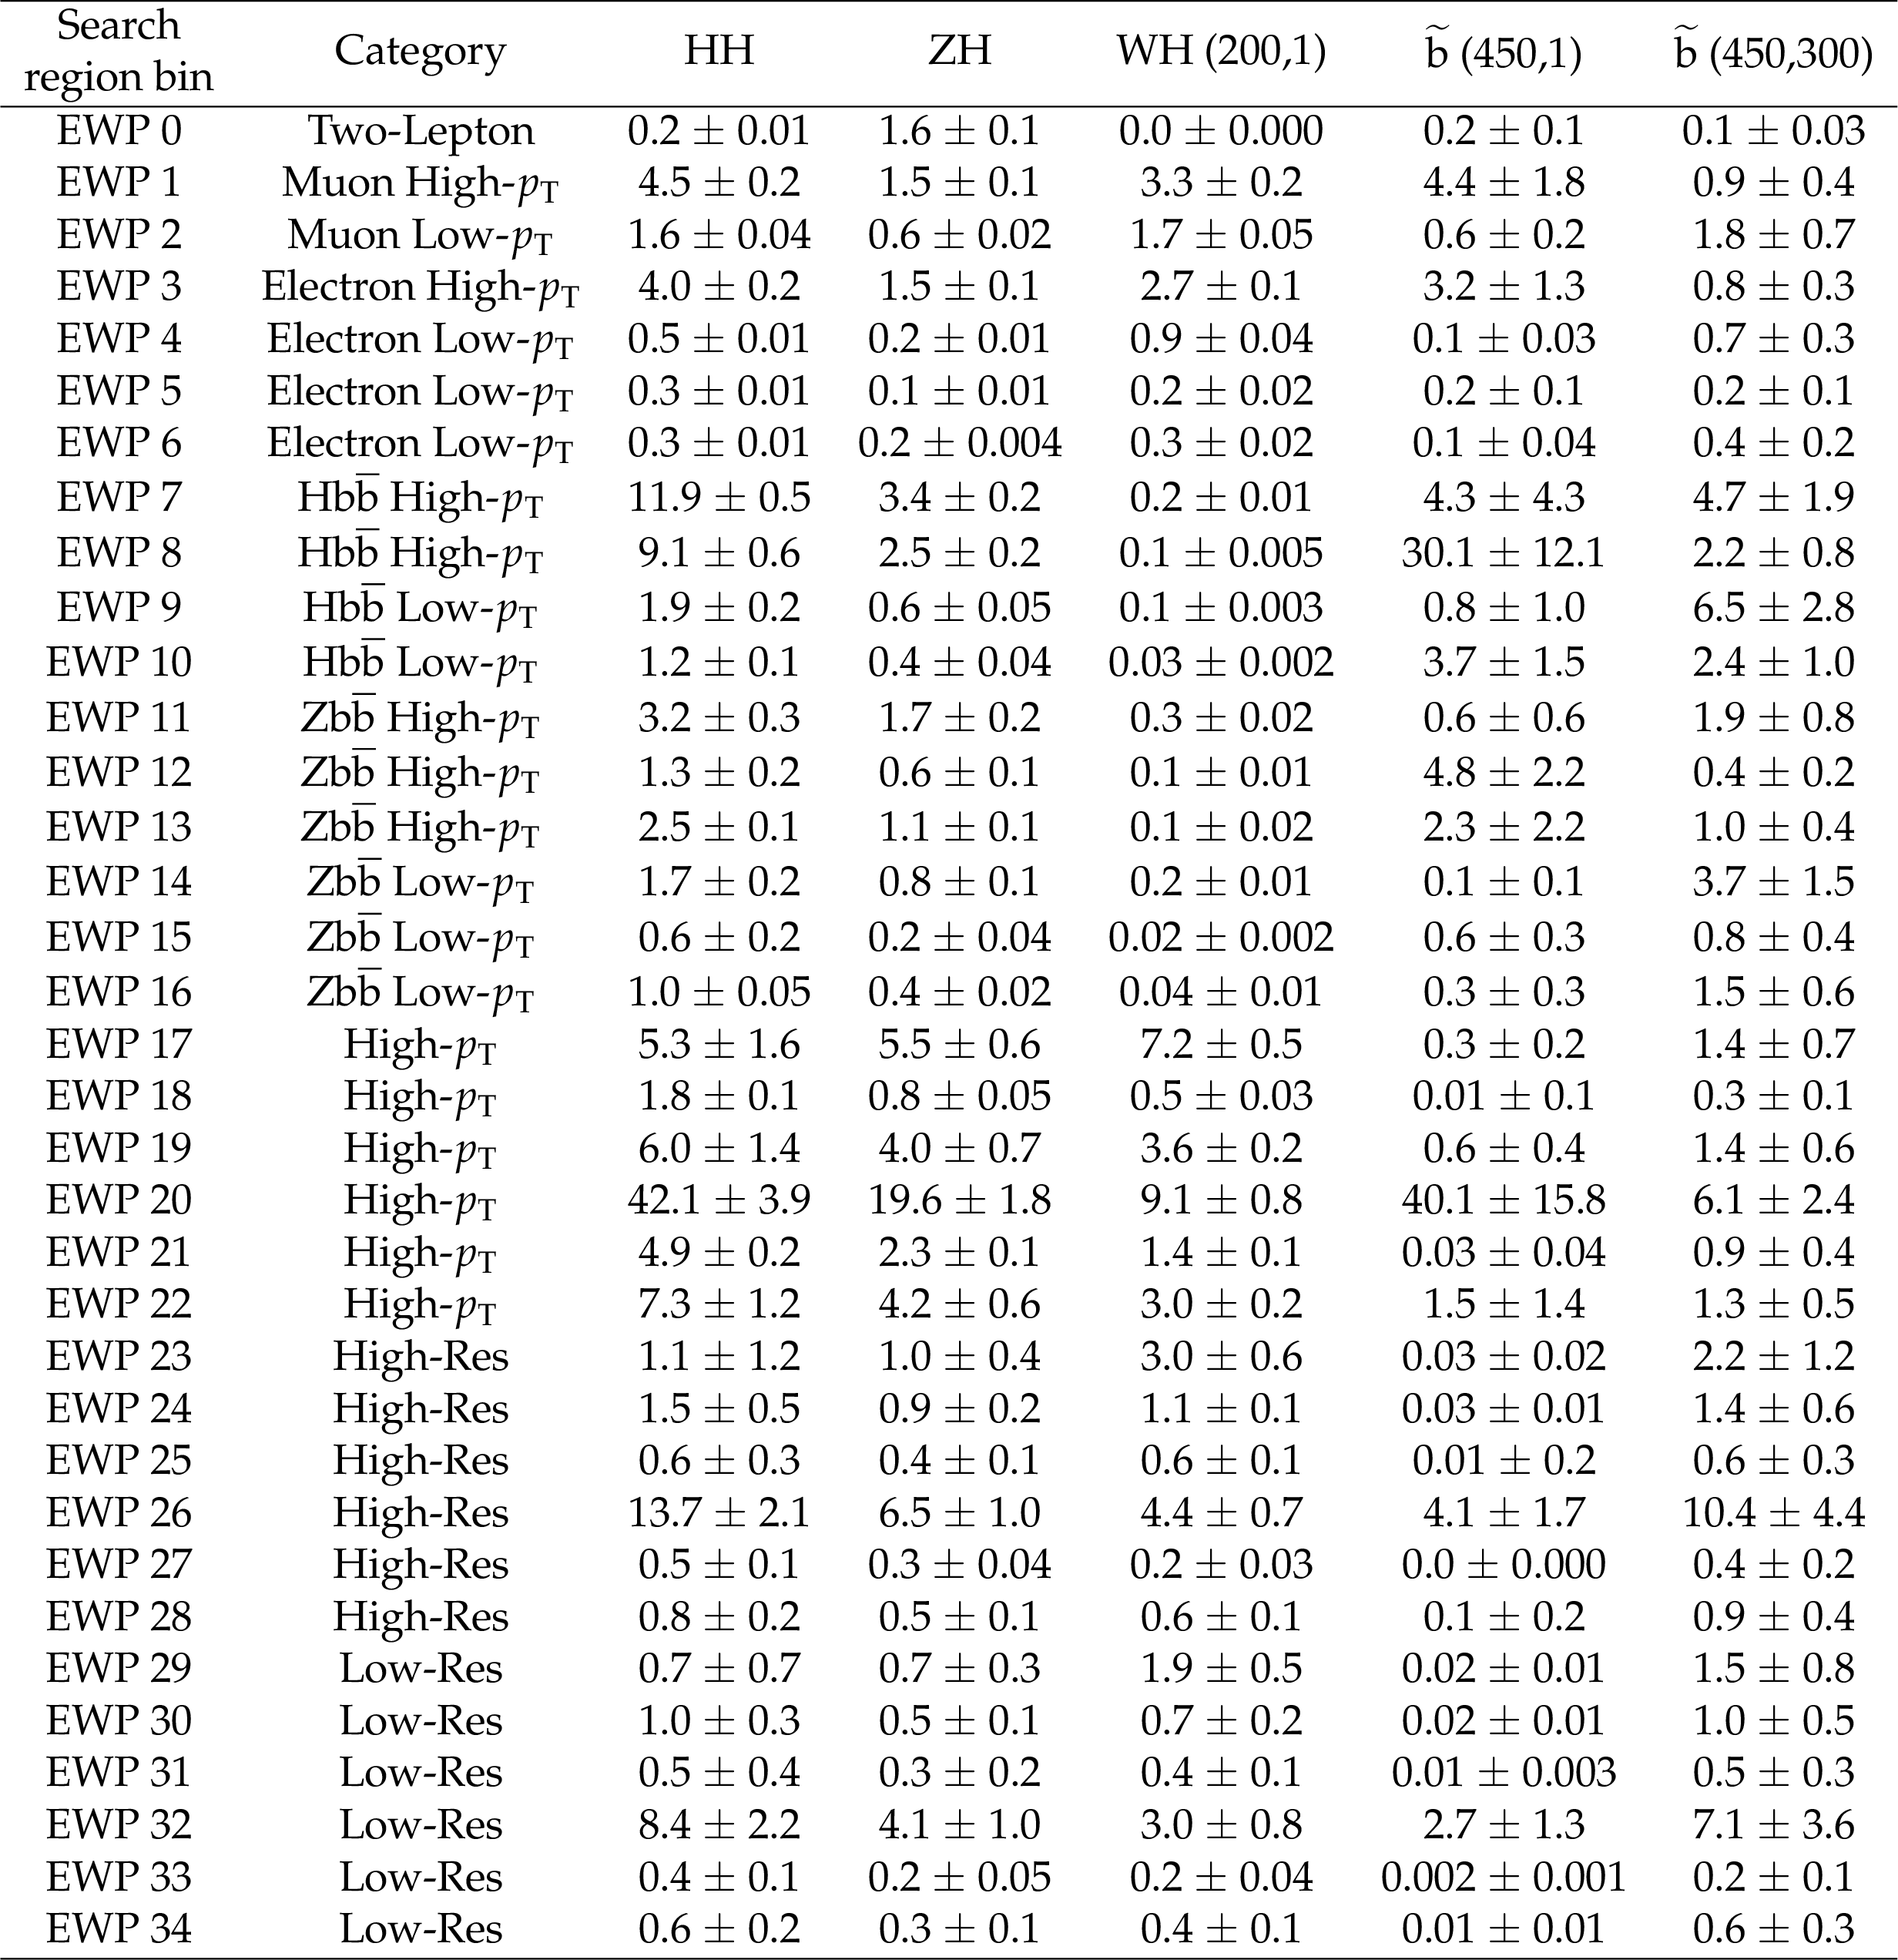
Table 10:
The expected signal yields for the SUSY simplified model signals considered are shown for each search region bin of the EWP analysis. The category that each search region bin belongs to is also indicated in the table. The search region bins definitions are summarized in Table 1. The labels for the different signal models are explained in detail in the caption of Table 8. |
| Summary |
|
We have presented a search for supersymmetry (SUSY) in the final state with a Higgs boson (H) decaying to a photon pair, using data collected with the CMS detector at the LHC in 2016 and 2017, corresponding to 77.5 fb$^{-1}$ of integrated luminosity. To improve the sensitivity over previously published results, we pursue two complementary strategies that are optimized for strong and electroweak SUSY production, respectively. Photon pairs in the central region of the detector are used to reconstruct Higgs boson candidates. Charged leptons and b jets are used to tag the decay products of an additional boson, while kinematic quantities such as $m_{\mathrm{T2}}$ and the razor variables ${M_{\mathrm{R}}}$ and ${R^2} $ are used to suppress standard model backgrounds. Data driven fits determine the shape of the nonresonant background. The resonant background from standard model Higgs boson production is estimated from simulation. The results are interpreted in terms of exclusion limits on the production cross section of simplified models of bottom squark pair production and chargino-neutralino production. As a result of the improvements in the event categorization and the larger data set, we extend the mass limits over the previous best results [8,9] by about 100 GeV for bottom squark pair production and about 50 GeV for chargino-neutralino production. We exclude bottom squark pair production for bottom squark masses below 530 GeV for a lightest SUSY particle (LSP) mass of 1 GeV; wino-like chargino-neutralino production, for chargino and neutralino masses of up to 235 GeV and an LSP mass of 1 GeV; and higgsino-like chargino-neutralino production, for chargino and neutralino masses of up to 290 and 230 GeV for the cases where the branching fraction of the lightest neutralino $\tilde{\chi}^0_1\to \mathrm{H}\tilde{\mathrm{G}}$ decay is 100%, and where the branching fractions of the $\tilde{\chi}^0_1\to\mathrm{H}\tilde{\mathrm{G}}$ and $\tilde{\chi}^0_1\to\mathrm{Z}\tilde{\mathrm{G}}$ decays are both 50%, respectively. |
| An example code snippet to compute the variables MR and R^2 is provided at this link. Please see the function ComputeRazorVariables which takes as input TLorentzVector objects for the four-momenta of the two photons from the Higgs decay, a vector of TLorentzVector objects of all jets in the event with transverse momentum larger than 30 GeV, and a TLorentzVector for the missing transverse energy. The variables MR and Rsq are computed and passed by reference. |
| References | ||||
| 1 | M. Monaco, M. Pierini, A. Romanino, and M. Spinrath | Phenomenology of minimal unified tree level gauge mediation at the LHC | JHEP 07 (2013) 078 | 1302.1305 |
| 2 | J. Duarte et al. | Squark-mediated Higgs+jets production at the LHC | 1703.06544 | |
| 3 | S. Dimopoulos and H. Georgi | Softly broken supersymmetry and SU(5) | NPB 193 (1981) 150 | |
| 4 | S. Dimopoulos, M. Dine, S. Raby, and S. D. Thomas | Experimental signatures of low-energy gauge mediated supersymmetry breaking | PRL 76 (1996) 3494 | hep-ph/9601367 |
| 5 | K. T. Matchev and S. D. Thomas | Higgs and $ Z $ boson signatures of supersymmetry | PRD 62 (2000) 077702 | hep-ph/9908482 |
| 6 | ATLAS Collaboration | Search for direct pair production of a chargino and a neutralino decaying to the 125 GeV Higgs boson in $ \sqrt{s} = $ 8 TeV pp collisions with the ATLAS detector | EPJC 75 (2015) 208 | 1501.07110 |
| 7 | CMS Collaboration | Searches for electroweak neutralino and chargino production in channels with Higgs, Z, and W bosons in pp collisions at 8 TeV | PRD 90 (2014) 092007 | CMS-SUS-14-002 1409.3168 |
| 8 | CMS Collaboration | Search for supersymmetry with Higgs boson to diphoton decays using the razor variables at $ \sqrt{s} = $ 13 TeV | PLB 779 (2018) 166 | CMS-SUS-16-045 1709.00384 |
| 9 | ATLAS Collaboration | Search for chargino and neutralino production in final states with a Higgs boson and missing transverse momentum at $ \sqrt{s} = $ 13 TeV with the ATLAS detector | Submitted to: PRD | 1812.09432 |
| 10 | CMS Collaboration | The CMS trigger system | JINST 12 (2017) P01020 | CMS-TRG-12-001 1609.02366 |
| 11 | CMS Collaboration | The CMS experiment at the CERN LHC | JINST 3 (2008) S08004 | CMS-00-001 |
| 12 | J. Alwall et al. | The automated computation of tree-level and next-to-leading order differential cross sections, and their matching to parton shower simulations | JHEP 07 (2014) 079 | 1405.0301 |
| 13 | ATLAS and CMS Collaborations | Combined measurement of the Higgs boson mass in pp collisions at $ \sqrt{s}= $ 7 and 8 TeV with the ATLAS and CMS experiments | PRL 114 (2015) 191803 | 1503.07589 |
| 14 | CMS Collaboration | Measurements of properties of the Higgs boson decaying into the four-lepton final state in pp collisions at $ \sqrt{s}= $ 13 TeV | JHEP 11 (2017) 047 | CMS-HIG-16-041 1706.09936 |
| 15 | D. de Florian et al. | Handbook of LHC Higgs cross sections: 4. deciphering the nature of the Higgs sector | CERN-2017-002-M | 1610.07922 |
| 16 | R. Frederix and S. Frixione | Merging meets matching in MC@NLO | JHEP 12 (2012) 061 | 1209.6215 |
| 17 | J. Alwall et al. | Comparative study of various algorithms for the merging of parton showers and matrix elements in hadronic collisions | EPJC 53 (2008) 473 | 0706.2569 |
| 18 | T. Sjostrand et al. | An Introduction to PYTHIA 8.2 | CPC 191 (2015) 159 | 1410.3012 |
| 19 | P. Skands, S. Carrazza, and J. Rojo | Tuning PYTHIA 8.1: the Monash 2013 tune | EPJC 74 (2014) 3024 | |
| 20 | CMS Collaboration | Extraction and validation of a new set of CMS PYTHIA8 tunes from underlying-event measurements | Submitted to EPJC | CMS-GEN-17-001 1903.12179 |
| 21 | NNPDF Collaboration | Parton distributions for the LHC Run II | JHEP 04 (2015) 040 | 1410.8849 |
| 22 | NNPDF Collaboration | Parton distributions from high-precision collider data | EPJC 77 (2017) 663 | 1706.00428 |
| 23 | GEANT4 Collaboration | GEANT4---a simulation toolkit | NIMA 506 (2003) 250 | |
| 24 | S. Abdullin et al. | The fast simulation of the CMS detector at LHC | J. Phys. Conf. Ser. 331 (2011) 032049 | |
| 25 | A. Giammanco | The fast simulation of the CMS experiment | J. Phys. Conf. Ser. 513 (2014) 022012 | |
| 26 | CMS Collaboration | Particle-flow reconstruction and global event description with the CMS detector | JINST 12 (2017) P10003 | CMS-PRF-14-001 1706.04965 |
| 27 | M. Cacciari and G. P. Salam | Pileup subtraction using jet areas | PLB 659 (2008) 119 | 0707.1378 |
| 28 | M. Cacciari, G. P. Salam, and G. Soyez | The anti-$ {k_{\mathrm{T}}} $ jet clustering algorithm | JHEP 04 (2008) 063 | 0802.1189 |
| 29 | M. Cacciari, G. P. Salam, and G. Soyez | FastJet user manual | EPJC 72 (2012) 1896 | 1111.6097 |
| 30 | CMS Collaboration | Jet energy scale and resolution in the CMS experiment in pp collisions at 8 TeV | JINST 12 (2017) P02014 | CMS-JME-13-004 1607.03663 |
| 31 | CMS Collaboration | Identification of b-quark jets with the CMS experiment | JINST 8 (2013) P04013 | CMS-BTV-12-001 1211.4462 |
| 32 | CMS Collaboration | Missing transverse energy performance of the CMS detector | JINST 6 (2011) P09001 | CMS-JME-10-009 1106.5048 |
| 33 | C. Rogan | Kinematical variables towards new dynamics at the LHC | 1006.2727 | |
| 34 | CMS Collaboration | Inclusive search for supersymmetry using razor variables in pp collisions at $ \sqrt s= $ 13 TeV | PRD 95 (2017) 012003 | CMS-SUS-15-004 1609.07658 |
| 35 | CMS Collaboration | Search for new physics with the $ M_{\mathrm{T2}} $ variable in all-jets final states produced in pp collisions at $ \sqrt{s}= $ 13 TeV | JHEP 10 (2016) 006 | CMS-SUS-15-003 1603.04053 |
| 36 | C. G. Lester and D. J. Summers | Measuring masses of semi-invisibly decaying particles pair produced at hadron colliders | PLB 463 (1999) 99 | hep-ph/9906349 |
| 37 | H. Akaike | A new look at the statistical model identification | IEEE Transactions on Automatic Control 19-6 (1974) 716 | |
| 38 | P. D. Dauncey, M. Kenzie, N. Wardle, and G. J. Davies | Handling uncertainties in background shapes | JINST 10 (2015) P04015 | 1408.6865 |
| 39 | A. Kalogeropoulos and J. Alwall | The SysCalc code: A tool to derive theoretical systematic uncertainties | 1801.08401 | |
| 40 | J. Butterworth et al. | PDF4LHC recommendations for LHC Run II | JPG 43 (2016) 023001 | 1510.03865 |
| 41 | W. Beenakker, R. Hopker, M. Spira, and P. M. Zerwas | Squark and gluino production at hadron colliders | NPB 492 (1997) 51 | hep-ph/9610490 |
| 42 | A. Kulesza and L. Motyka | Threshold resummation for squark-antisquark and gluino-pair production at the LHC | PRL 102 (2009) 111802 | 0807.2405 |
| 43 | A. Kulesza and L. Motyka | Soft gluon resummation for the production of gluino-gluino and squark-antisquark pairs at the LHC | PRD 80 (2009) 095004 | 0905.4749 |
| 44 | W. Beenakker et al. | Soft-gluon resummation for squark and gluino hadroproduction | JHEP 12 (2009) 041 | 0909.4418 |
| 45 | W. Beenakker et al. | Squark and gluino hadroproduction | Int. J. Mod. Phys. A 26 (2011) 2637 | 1105.1110 |
| 46 | C. Borschensky et al. | Squark and gluino production cross sections in $ pp $ collisions at $ \sqrt{s} = $ 13, 14, 33 and 100 TeV | EPJC 74 (2014) 3174 | 1407.5066 |
| 47 | W. Beenakker et al. | Production of charginos, neutralinos, and sleptons at hadron colliders | PRL 83 (1999) 3780 | hep-ph/9906298 |
| 48 | B. Fuks, M. Klasen, D. R. Lamprea, and M. Rothering | Gaugino production in proton-proton collisions at a center-of-mass energy of 8 TeV | JHEP 10 (2012) 081 | 1207.2159 |
| 49 | B. Fuks, M. Klasen, D. R. Lamprea, and M. Rothering | Precision predictions for electroweak superpartner production at hadron colliders with Resummino | EPJC 73 (2013) 2480 | 1304.0790 |
| 50 | P. Z. Skands and Others | SUSY Les Houches accord: interfacing SUSY spectrum calculators, decay packages, and event generators | JHEP 07 (2004) 036 | Hep-Ph/0311123 |
| 51 | T. Junk | Confidence level computation for combining searches with small statistics | NIMA 434 (1999) 435 | hep-ex/9902006 |
| 52 | A. L. Read | Presentation of search results: The $ CL_{s} $ technique | JPG 28 (2002) 2693 | |
| 53 | ATLAS and CMS Collaborations | Procedure for the LHC Higgs boson search combination in summer 2011 | CMS-NOTE-2011-005 | |
| 54 | G. Cowan, K. Cranmer, E. Gross, and O. Vitells | Asymptotic formulae for likelihood-based tests of new physics | EPJC 71 (2011) 1554 | 1007.1727 |
|
|
Compact Muon Solenoid LHC, CERN |
|

|

|

|

|

|