

Compact Muon Solenoid
LHC, CERN
| CMS-SUS-15-004 ; CERN-EP-2016-214 | ||
| Inclusive search for supersymmetry using razor variables in pp collisions at $ \sqrt{s} = $ 13 TeV | ||
| CMS Collaboration | ||
| 24 September 2016 | ||
| Phys. Rev. D 95 (2017) 012003 | ||
| Abstract: An inclusive search for supersymmetry using razor variables is performed in events with four or more jets and no more than one lepton. The results are based on a sample of proton-proton collisions corresponding to an integrated luminosity of 2.3 fb$^{-1}$ collected with the CMS experiment at a center-of-mass energy of $ \sqrt{s} = $ 13 TeV. No significant excess over the background prediction is observed in data, and 95% confidence level exclusion limits are placed on the masses of new heavy particles in a variety of simplified models. Assuming that pair-produced gluinos decay only via three-body processes involving third-generation quarks plus a neutralino, and that the neutralino is the lightest supersymmetric particle with a mass of 200 GeV, gluino masses below 1.6 TeV are excluded for any branching fractions for the individual gluino decay modes. For some specific decay mode scenarios, gluino masses up to 1.65 TeV are excluded. For decays to first- and second-generation quarks and a neutralino with a mass of 200 GeV, gluinos with masses up to 1.4 TeV are excluded. Pair production of top squarks decaying to a top quark and a neutralino with a mass of 100 GeV is excluded for top squark masses up to 750 GeV. | ||
| Links: e-print arXiv:1609.07658 [hep-ex] (PDF) ; CDS record ; inSPIRE record ; CADI line (restricted) ; | ||
| Figures | |

png pdf |
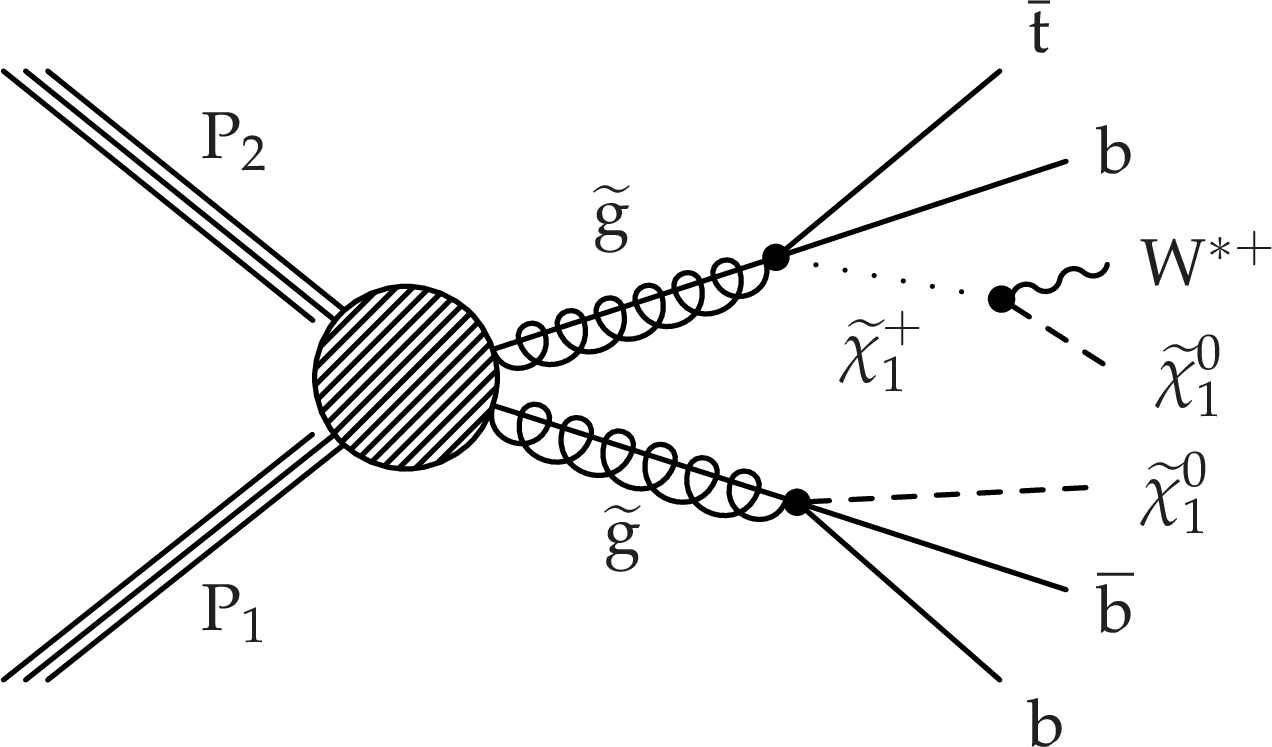
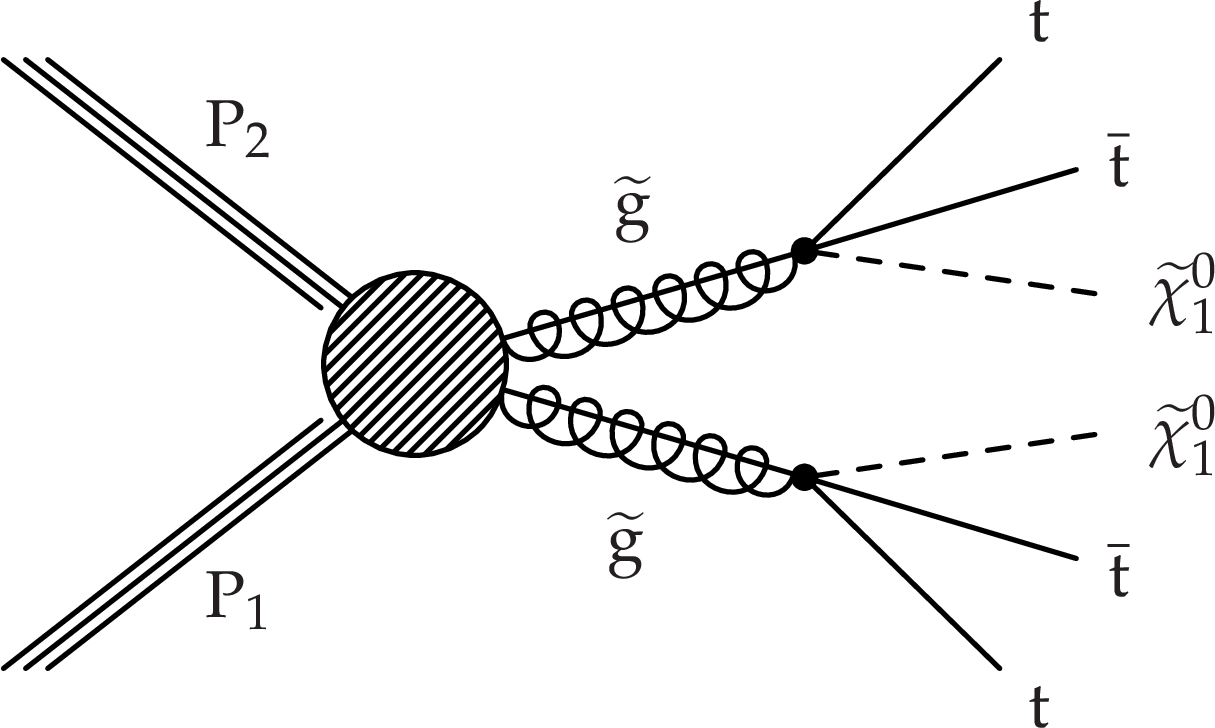
Figure 1:
Diagrams displaying the distinct event topologies of gluino (all but last) and top squark (last) pair production considered in this paper. Diagrams corresponding to charge conjugate decay modes are implied. The symbol $\mathrm{ W } ^*$ is used to denote a virtual W boson. |

png pdf |
Figure 1-a:
Diagram displaying an event topology of gluino pair production considered in this paper. The symbol $\mathrm{ W } ^*$ is used to denote a virtual W boson. |
png pdf |
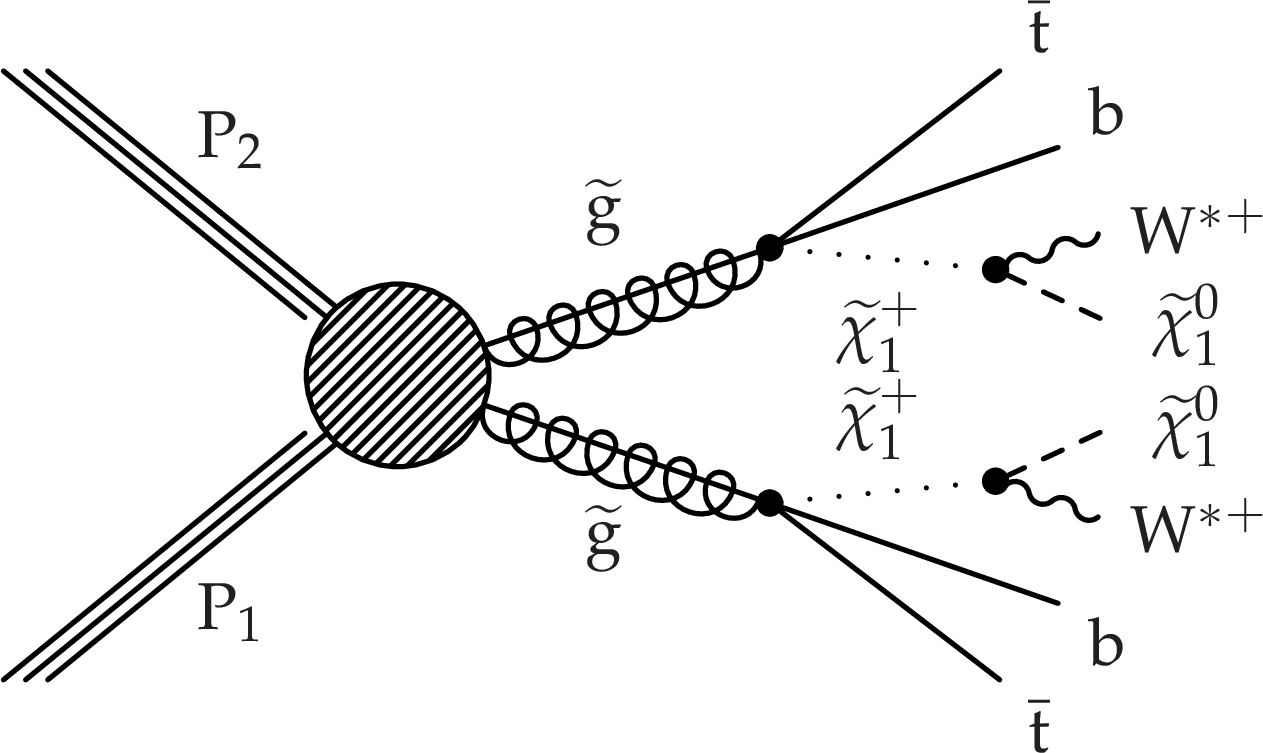
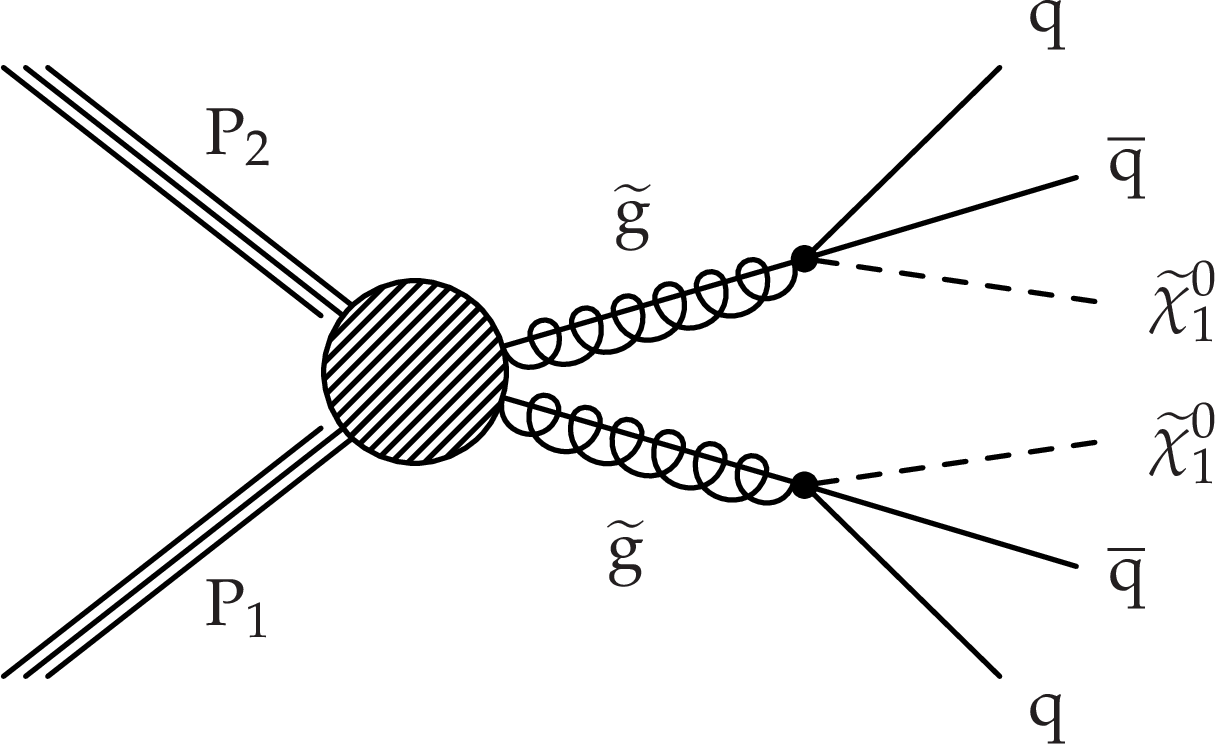
Figure 1-b:
Diagram displaying an event topology of gluino pair production considered in this paper. The symbol $\mathrm{ W } ^*$ is used to denote a virtual W boson. |
png pdf |
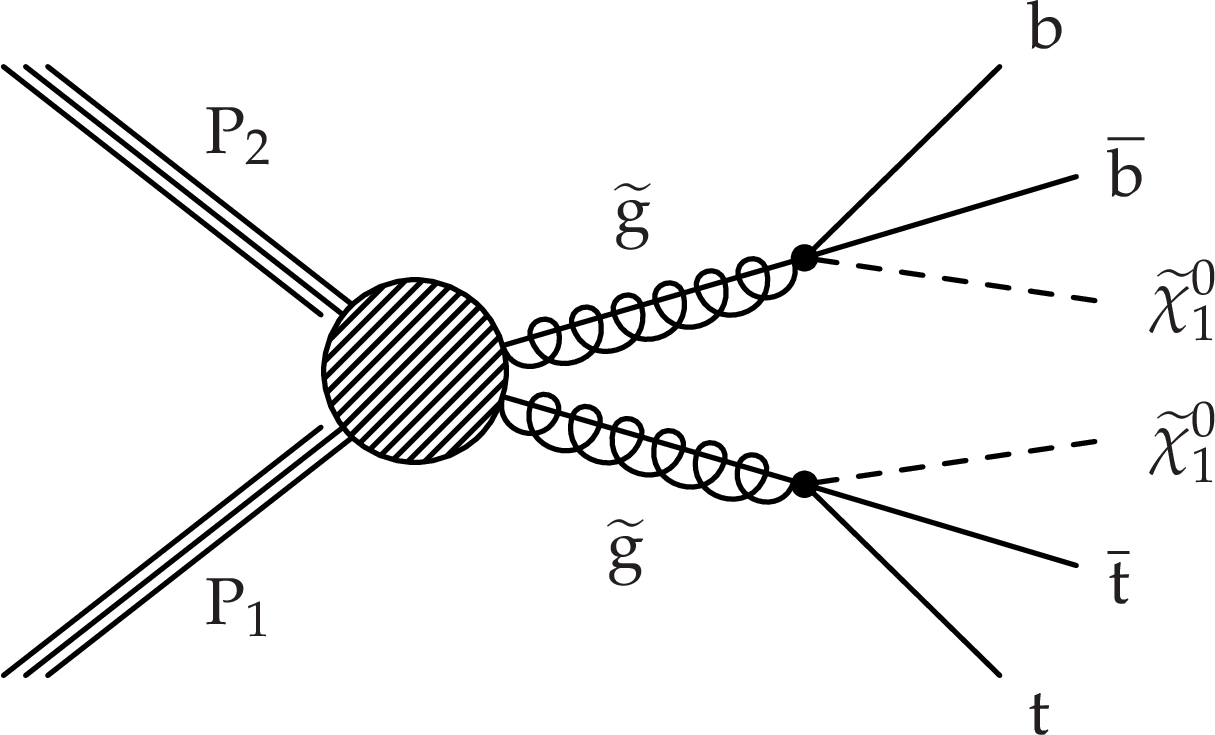
Figure 1-c:
Diagram displaying an event topology of gluino pair production considered in this paper. The symbol $\mathrm{ W } ^*$ is used to denote a virtual W boson. |
png pdf |
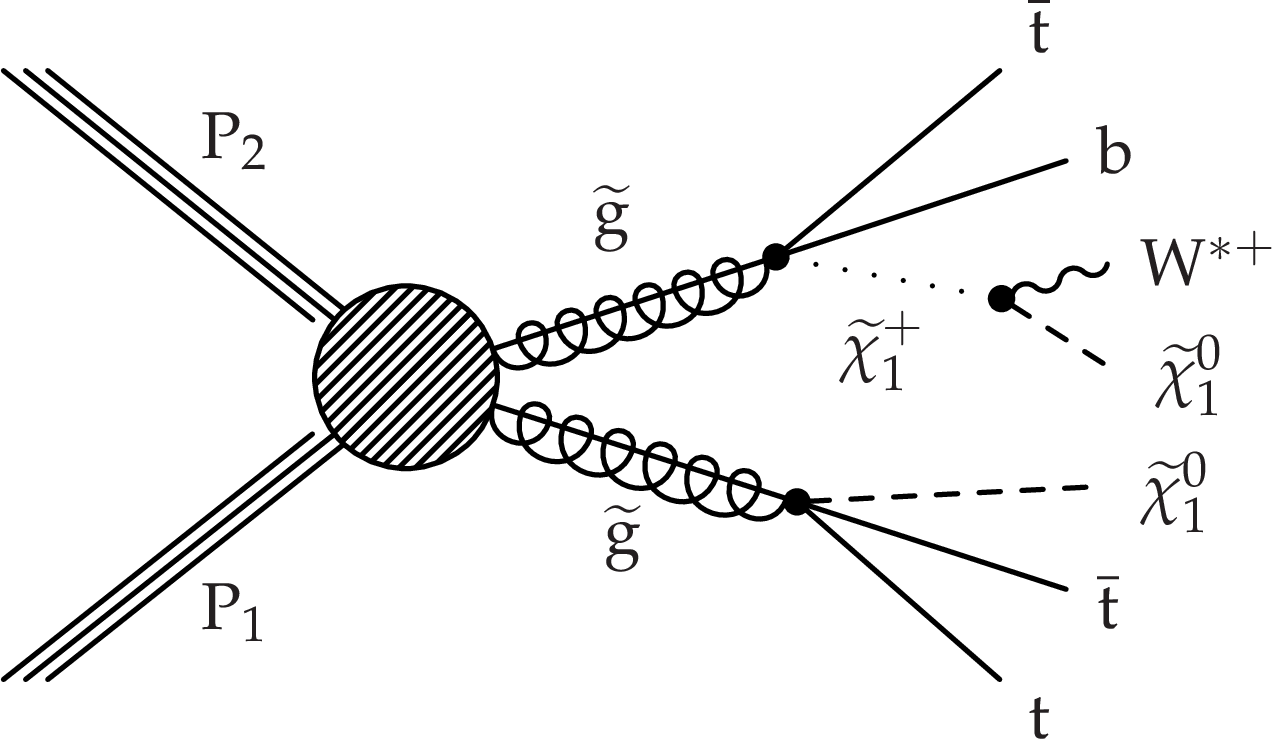
Figure 1-d:
Diagram displaying an event topology of gluino pair production considered in this paper. |
png pdf |
Figure 1-e:
Diagram displaying an event topology of gluino pair production considered in this paper. The symbol $\mathrm{ W } ^*$ is used to denote a virtual W boson. |
png pdf |
Figure 1-f:
Diagram displaying an event topology of gluino pair production considered in this paper. |
png pdf |
Figure 1-g:
Diagram displaying an event topology of gluino pair production considered in this paper. |
png pdf |
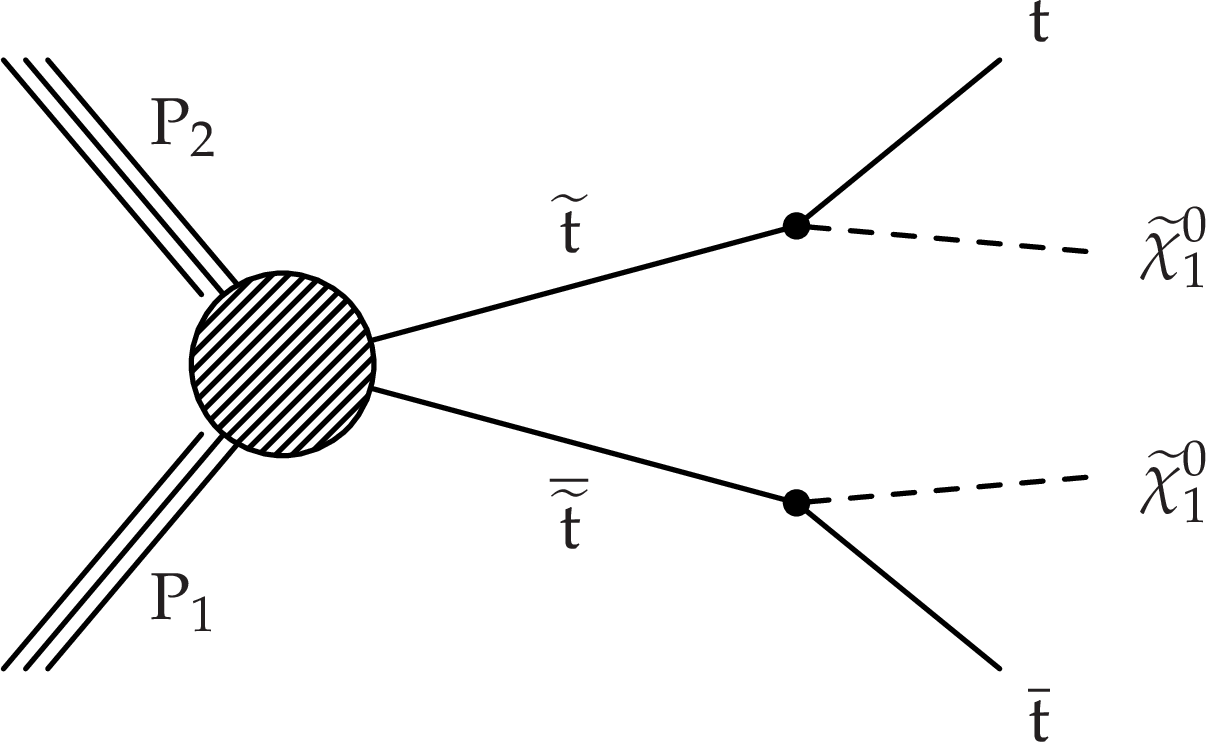
Figure 1-h:
Diagrams displaying an event topologies of top squark pair production considered in this paper. |
png pdf |
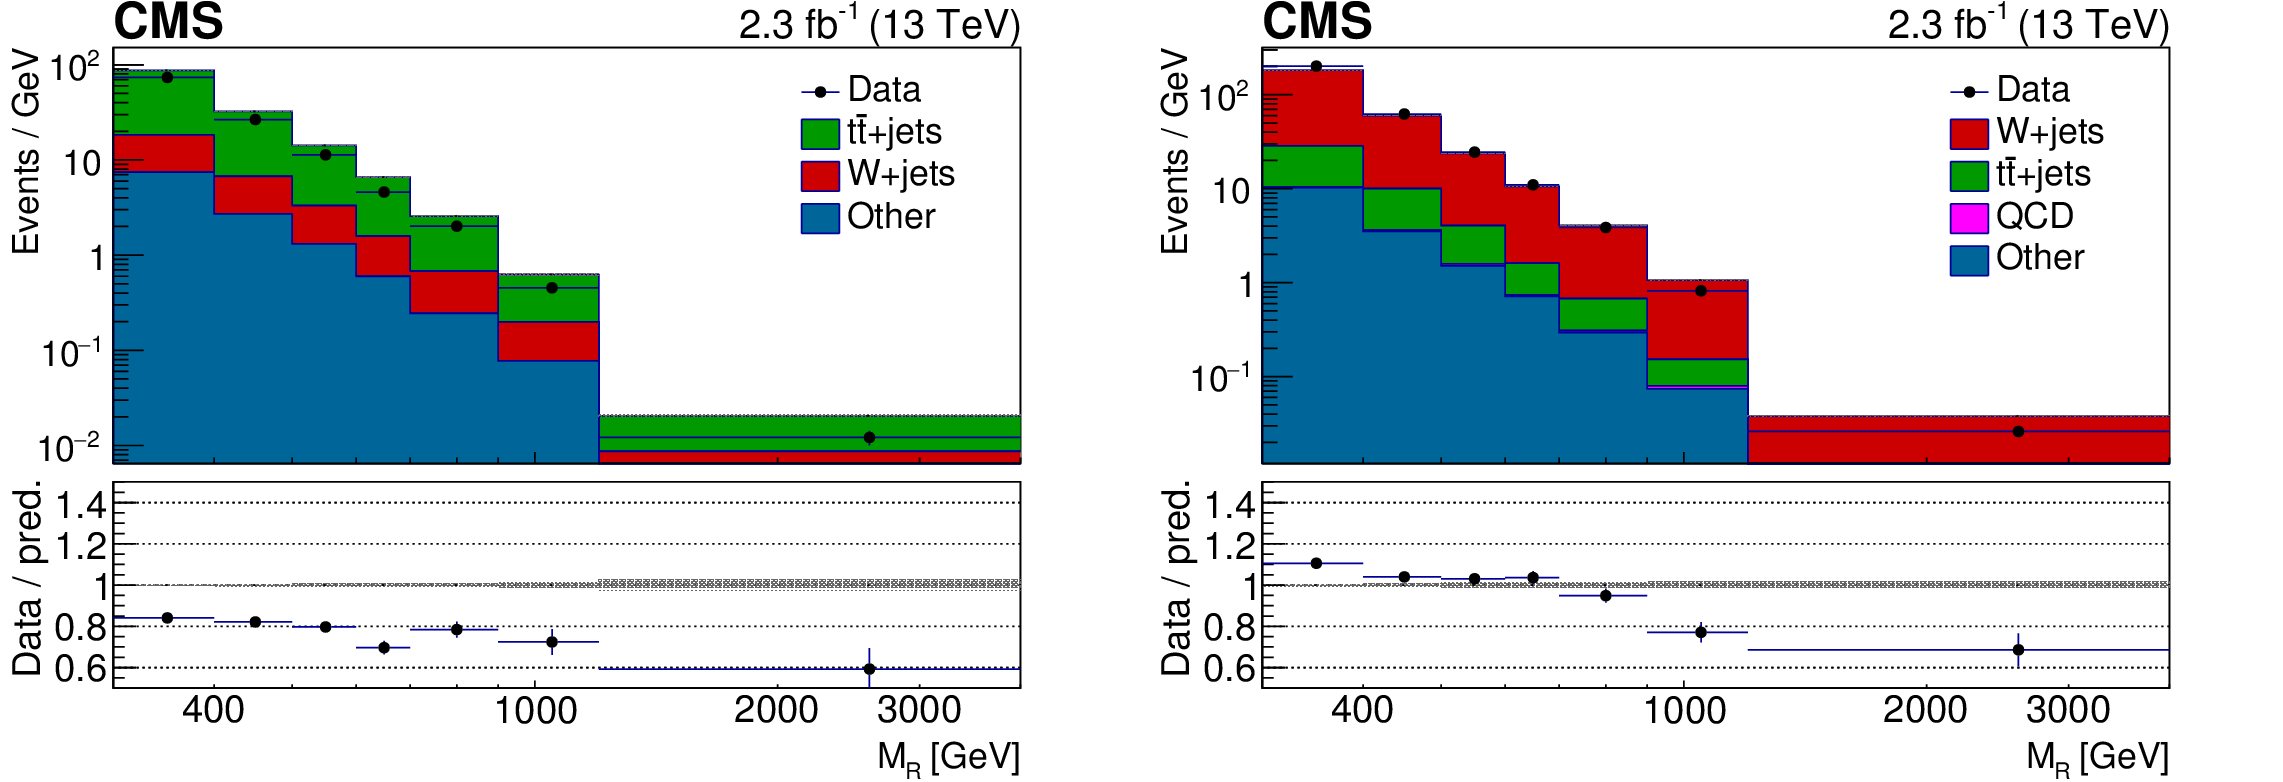
Figure 2:
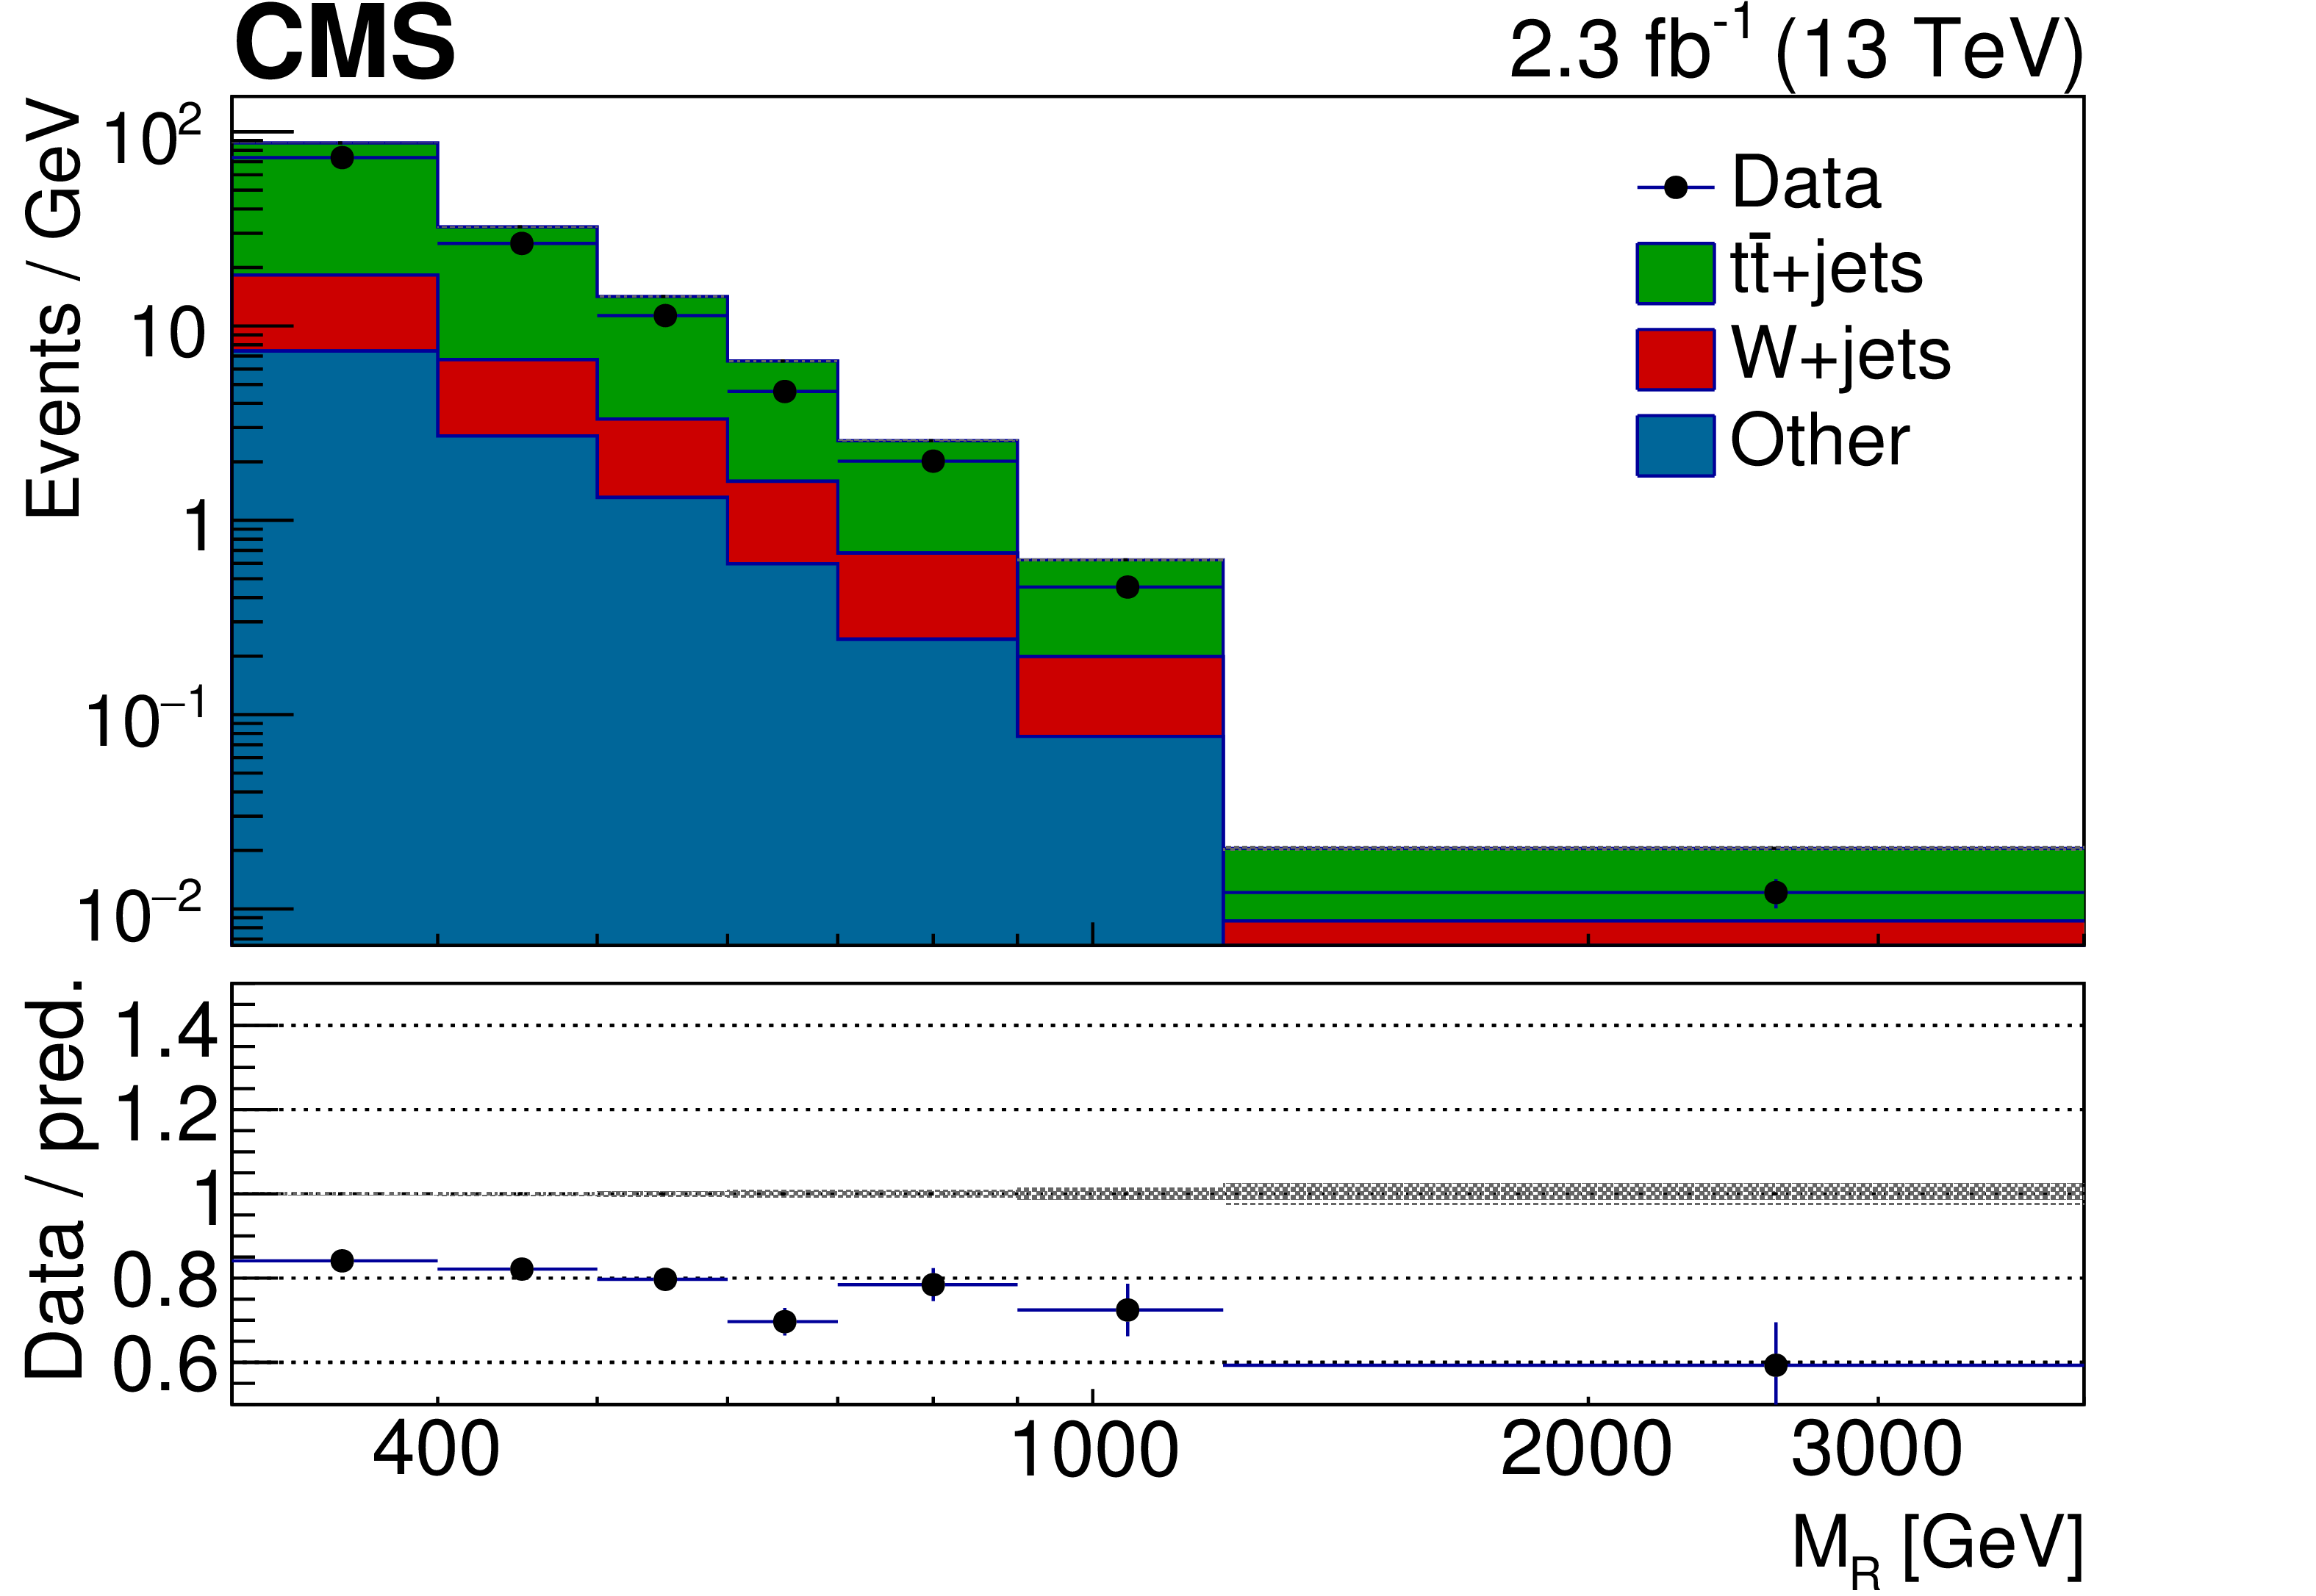
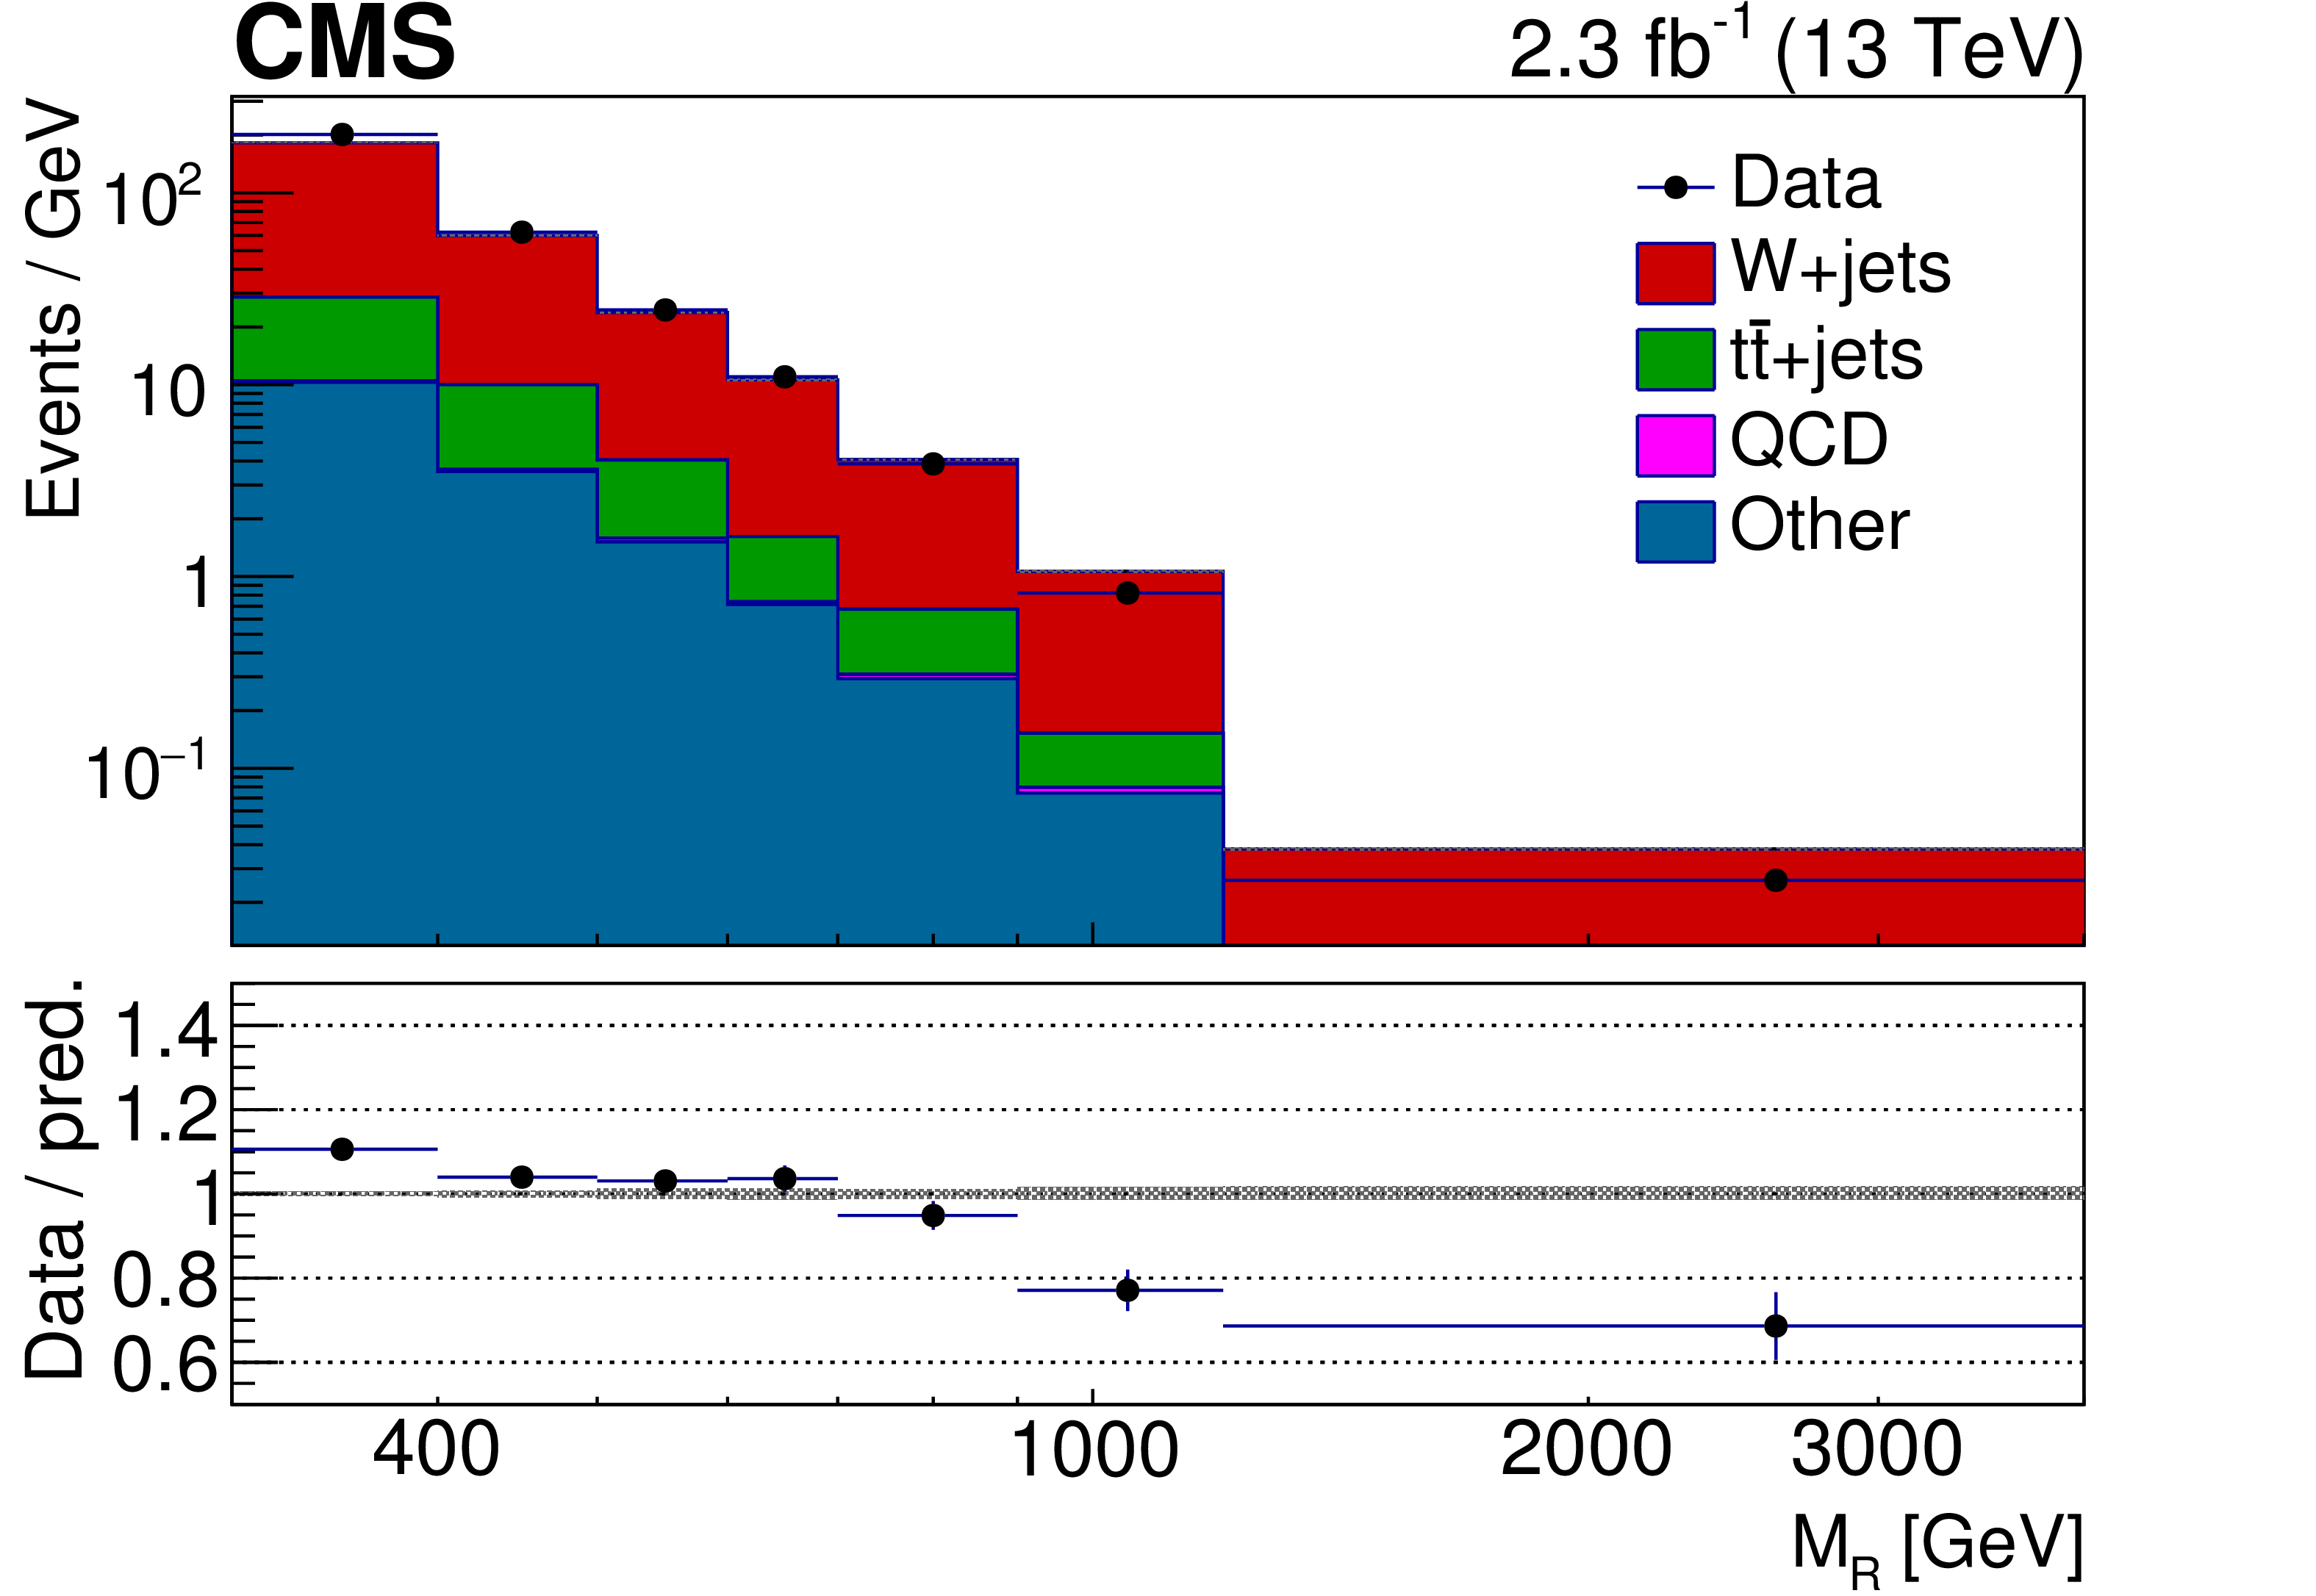
The $ {M_\mathrm {R}} $ distributions for events in the ${\mathrm{ t } \mathrm{ \bar{t} } } $ (left ) and $\mathrm{ W } (\ell \nu )$+jets (right ) control regions are shown, comparing data with the MC prediction. The ratio of data to the background prediction is shown on the bottom panel, with the statistical uncertainty expressed through the data point error bars and the systematic uncertainty of the background prediction represented by the shaded region. In the right-hand plot, the ${\mathrm{ t } \mathrm{ \bar{t} } } $ MC events have been reweighted according to the corrections derived in the ${\mathrm{ t } \mathrm{ \bar{t} } } $-enhanced control region. |
png pdf |
Figure 2-a:
The $ {M_\mathrm {R}} $ distribution for events in the ${\mathrm{ t } \mathrm{ \bar{t} } } $ control region is shown, comparing data with the MC prediction. The ratio of data to the background prediction is shown on the bottom panel, with the statistical uncertainty expressed through the data point error bars and the systematic uncertainty of the background prediction represented by the shaded region. In the right-hand plot, the ${\mathrm{ t } \mathrm{ \bar{t} } } $ MC events have been reweighted according to the corrections derived in the ${\mathrm{ t } \mathrm{ \bar{t} } } $-enhanced control region. |
png pdf |
Figure 2-b:
The $ {M_\mathrm {R}} $ distribution for events in the $\mathrm{ W } (\ell \nu )$+jets control region is shown, comparing data with the MC prediction. The ratio of data to the background prediction is shown on the bottom panel, with the statistical uncertainty expressed through the data point error bars and the systematic uncertainty of the background prediction represented by the shaded region. In the right-hand plot, the ${\mathrm{ t } \mathrm{ \bar{t} } } $ MC events have been reweighted according to the corrections derived in the ${\mathrm{ t } \mathrm{ \bar{t} } } $-enhanced control region. |
png pdf |
Figure 3:
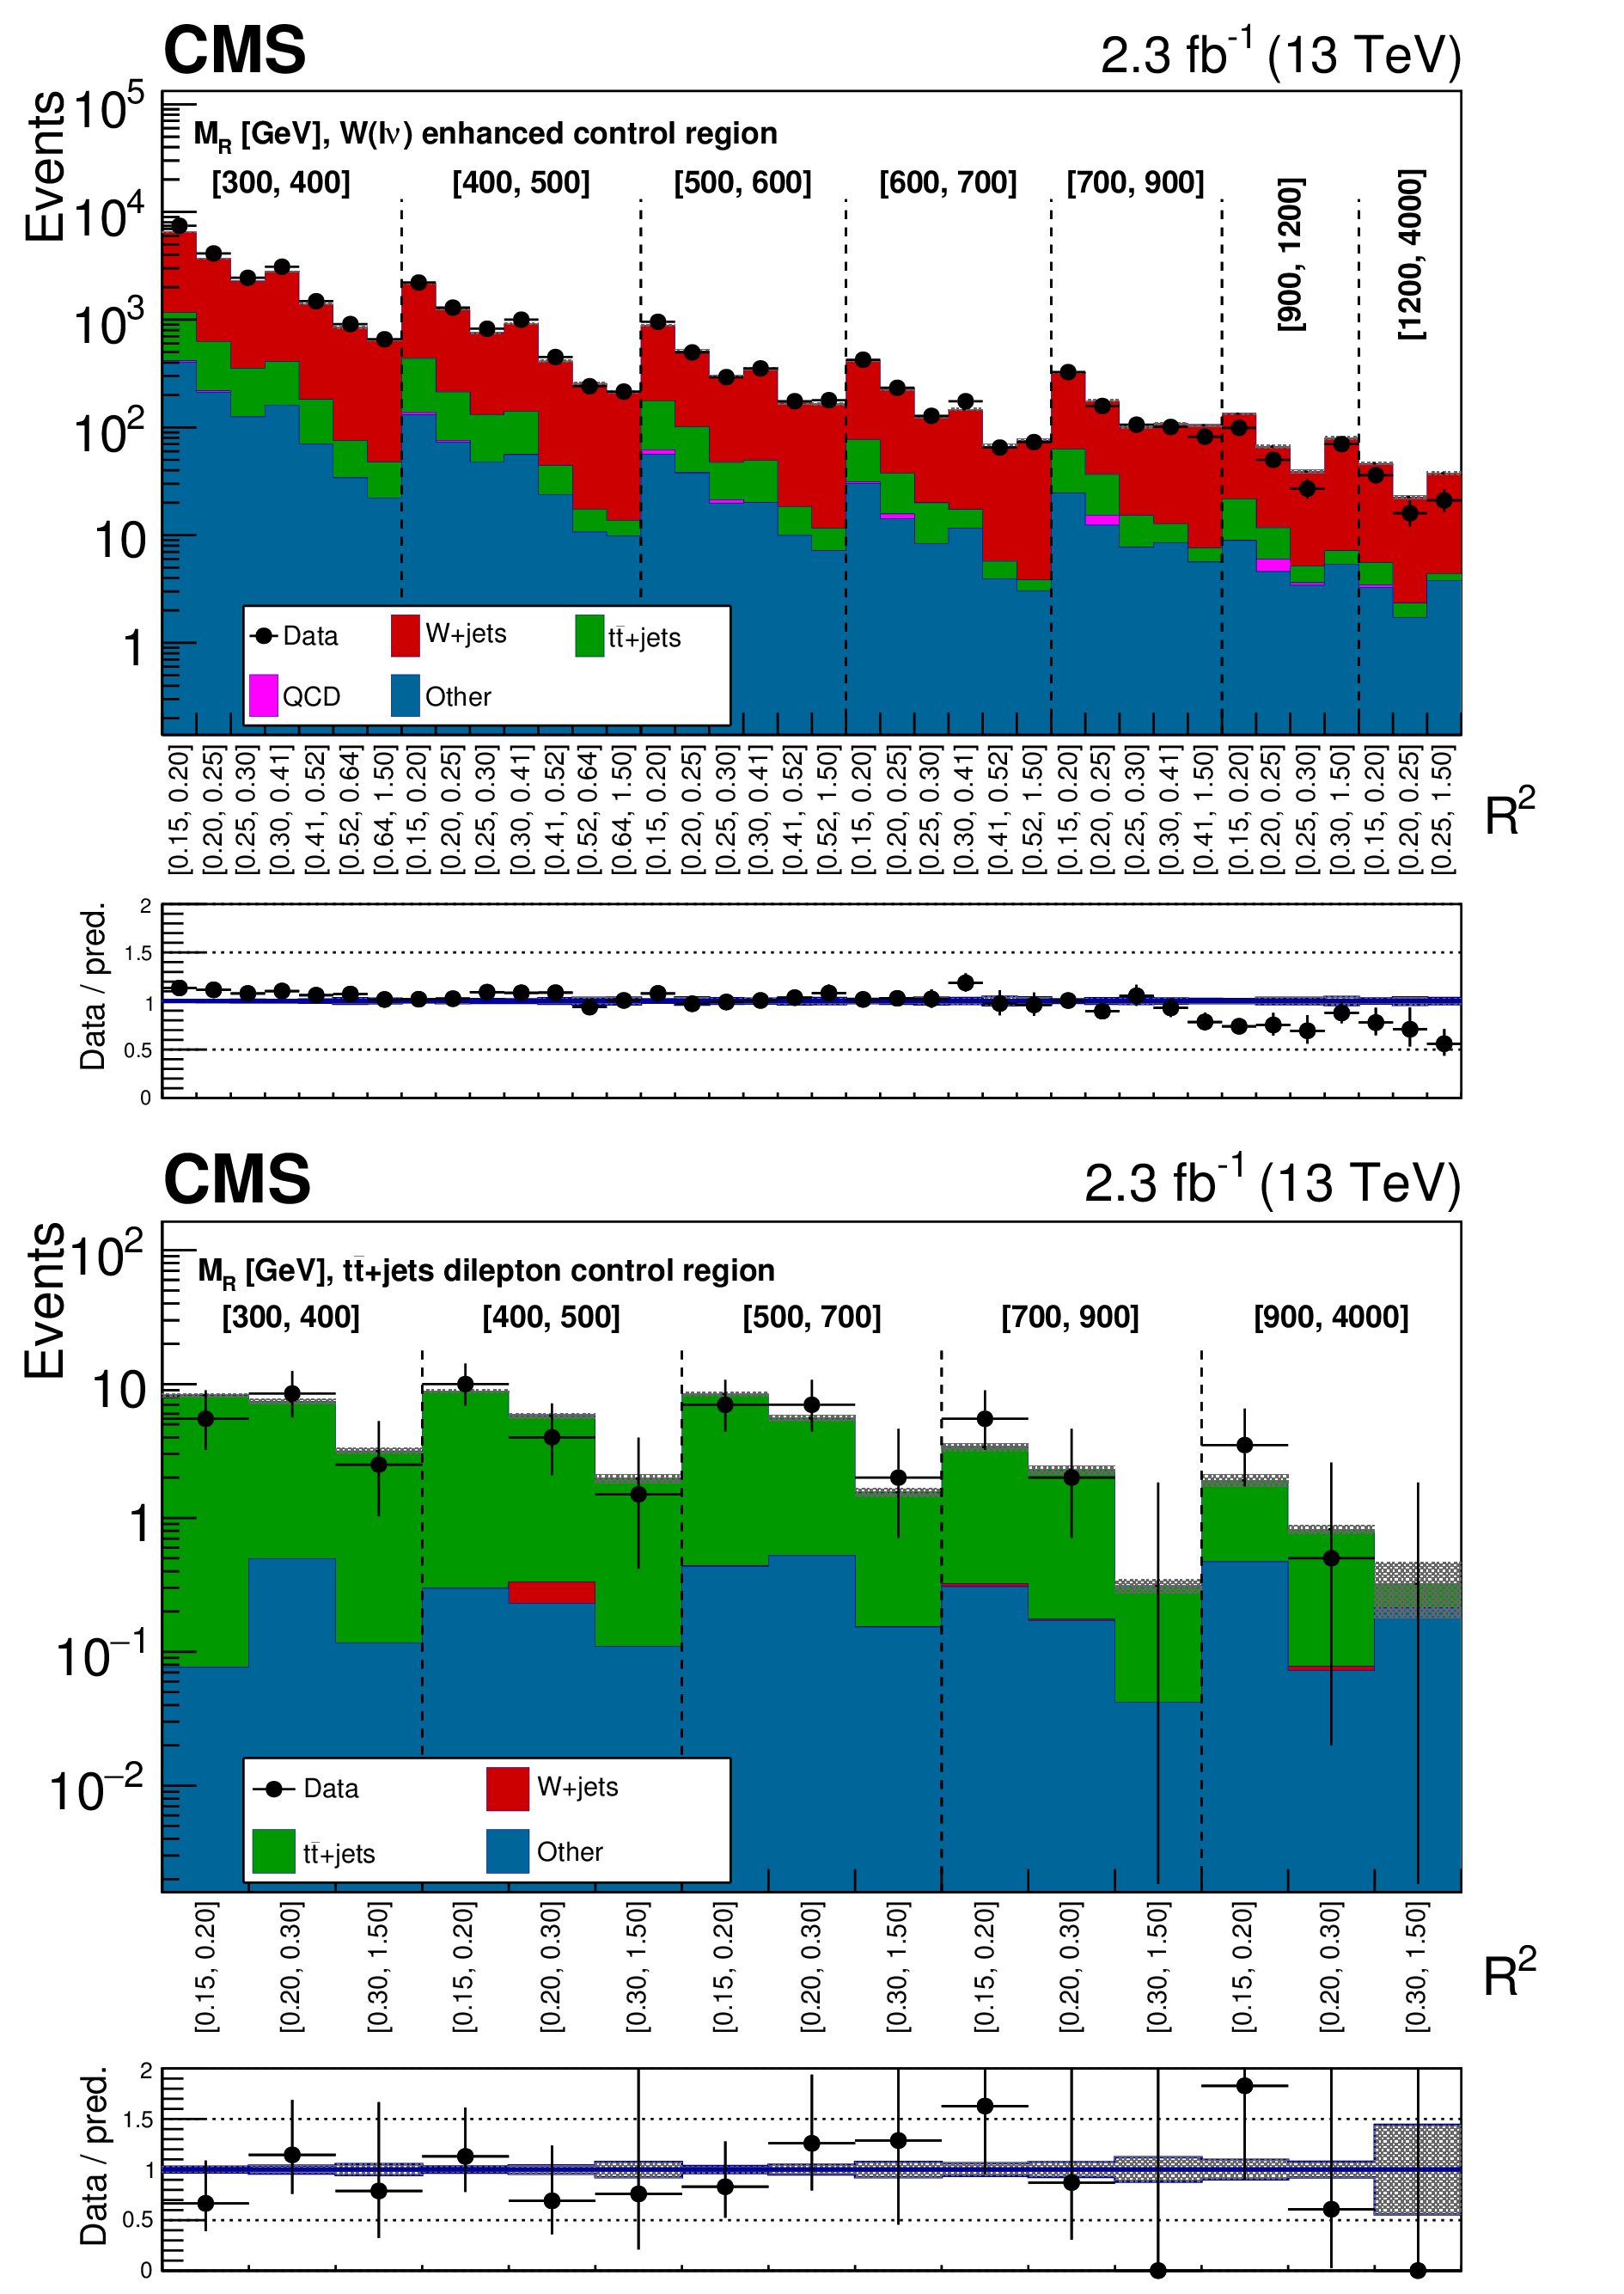
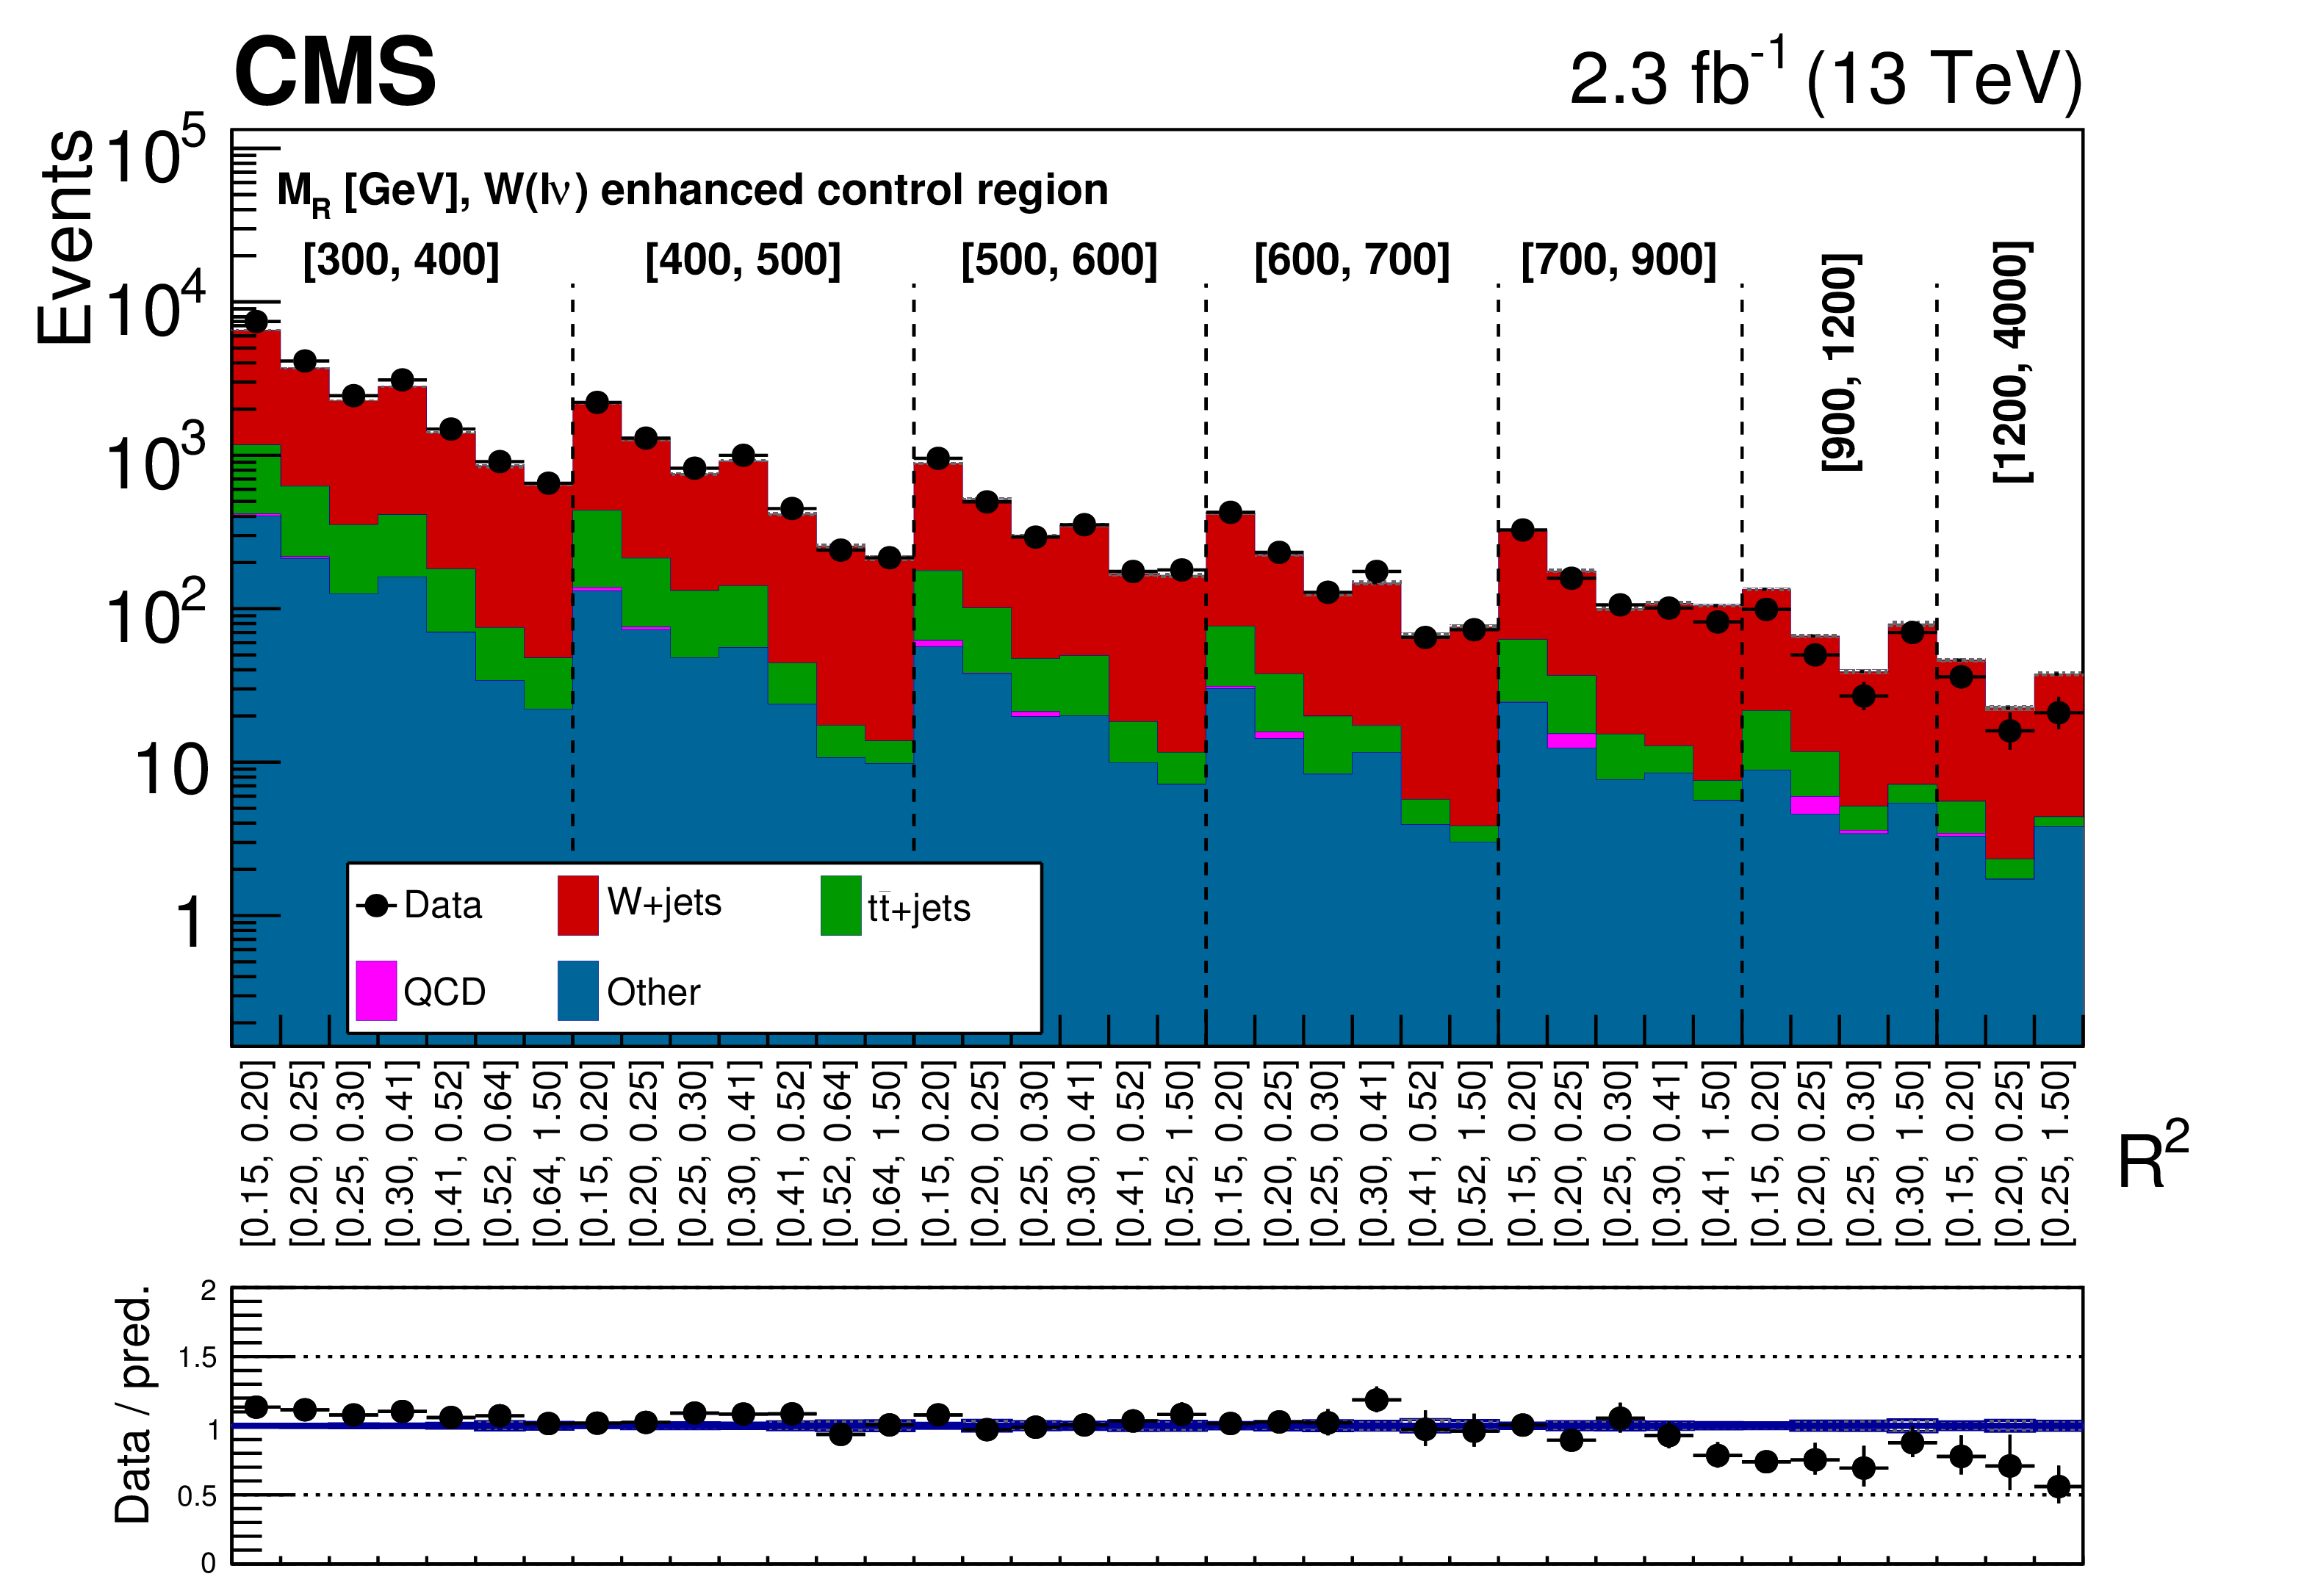
The two-dimensional $ {M_\mathrm {R}} $-$ {\mathrm {R}^2} $ distribution for the $\mathrm{ W } (\ell \nu )$+jets enhanced (upper) and the ${\mathrm{ t } \mathrm{ \bar{t} } } $ dilepton (lower) control regions is shown, comparing data with the MC prediction. The ${\mathrm{ t } \mathrm{ \bar{t} } } $ MC events have been reweighted according to the correction factors derived in the ${\mathrm{ t } \mathrm{ \bar{t} } } $-enhanced control region. The two-dimensional $ {M_\mathrm {R}} $-$ {\mathrm {R}^2} $ distribution is shown in a one dimensional representation, with each $ {M_\mathrm {R}} $ bin marked by the dashed lines and labeled near the top, and each $ {\mathrm {R}^2} $ bin labeled below. The bottom panel shows the ratio of data to the background prediction, with uncertainties displayed as in Fig. 2. |
png pdf |
Figure 3-a:
The two-dimensional $ {M_\mathrm {R}} $-$ {\mathrm {R}^2} $ distribution for the $\mathrm{ W } (\ell \nu )$+jets enhanced control region is shown, comparing data with the MC prediction. The ${\mathrm{ t } \mathrm{ \bar{t} } } $ MC events have been reweighted according to the correction factors derived in the ${\mathrm{ t } \mathrm{ \bar{t} } } $-enhanced control region. The two-dimensional $ {M_\mathrm {R}} $-$ {\mathrm {R}^2} $ distribution is shown in a one dimensional representation, with each $ {M_\mathrm {R}} $ bin marked by the dashed lines and labeled near the top, and each $ {\mathrm {R}^2} $ bin labeled below. The bottom panel shows the ratio of data to the background prediction, with uncertainties displayed as in Fig. 2. |

png pdf |
Figure 3-b:
The two-dimensional $ {M_\mathrm {R}} $-$ {\mathrm {R}^2} $ distribution for the ${\mathrm{ t } \mathrm{ \bar{t} } } $ dilepton (lower) control regions is shown, comparing data with the MC prediction. The ${\mathrm{ t } \mathrm{ \bar{t} } } $ MC events have been reweighted according to the correction factors derived in the ${\mathrm{ t } \mathrm{ \bar{t} } } $-enhanced control region. The two-dimensional $ {M_\mathrm {R}} $-$ {\mathrm {R}^2} $ distribution is shown in a one dimensional representation, with each $ {M_\mathrm {R}} $ bin marked by the dashed lines and labeled near the top, and each $ {\mathrm {R}^2} $ bin labeled below. The bottom panel shows the ratio of data to the background prediction, with uncertainties displayed as in Fig. 2. |
png pdf |
Figure 4:
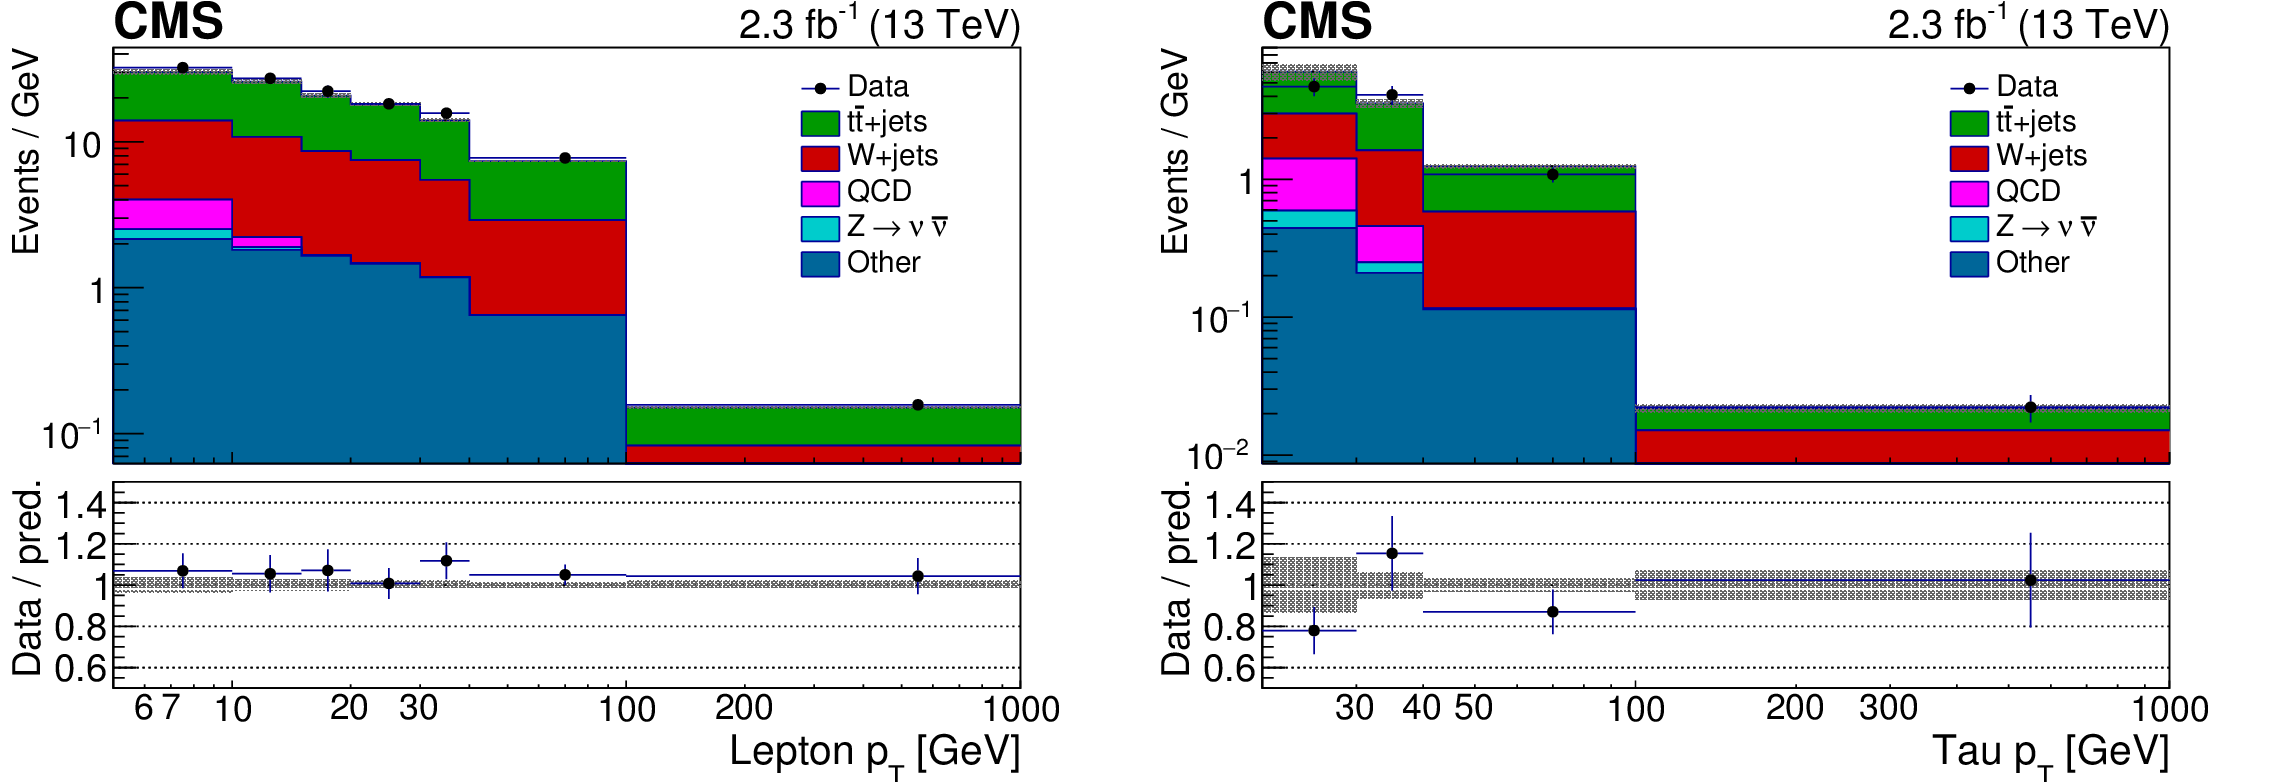
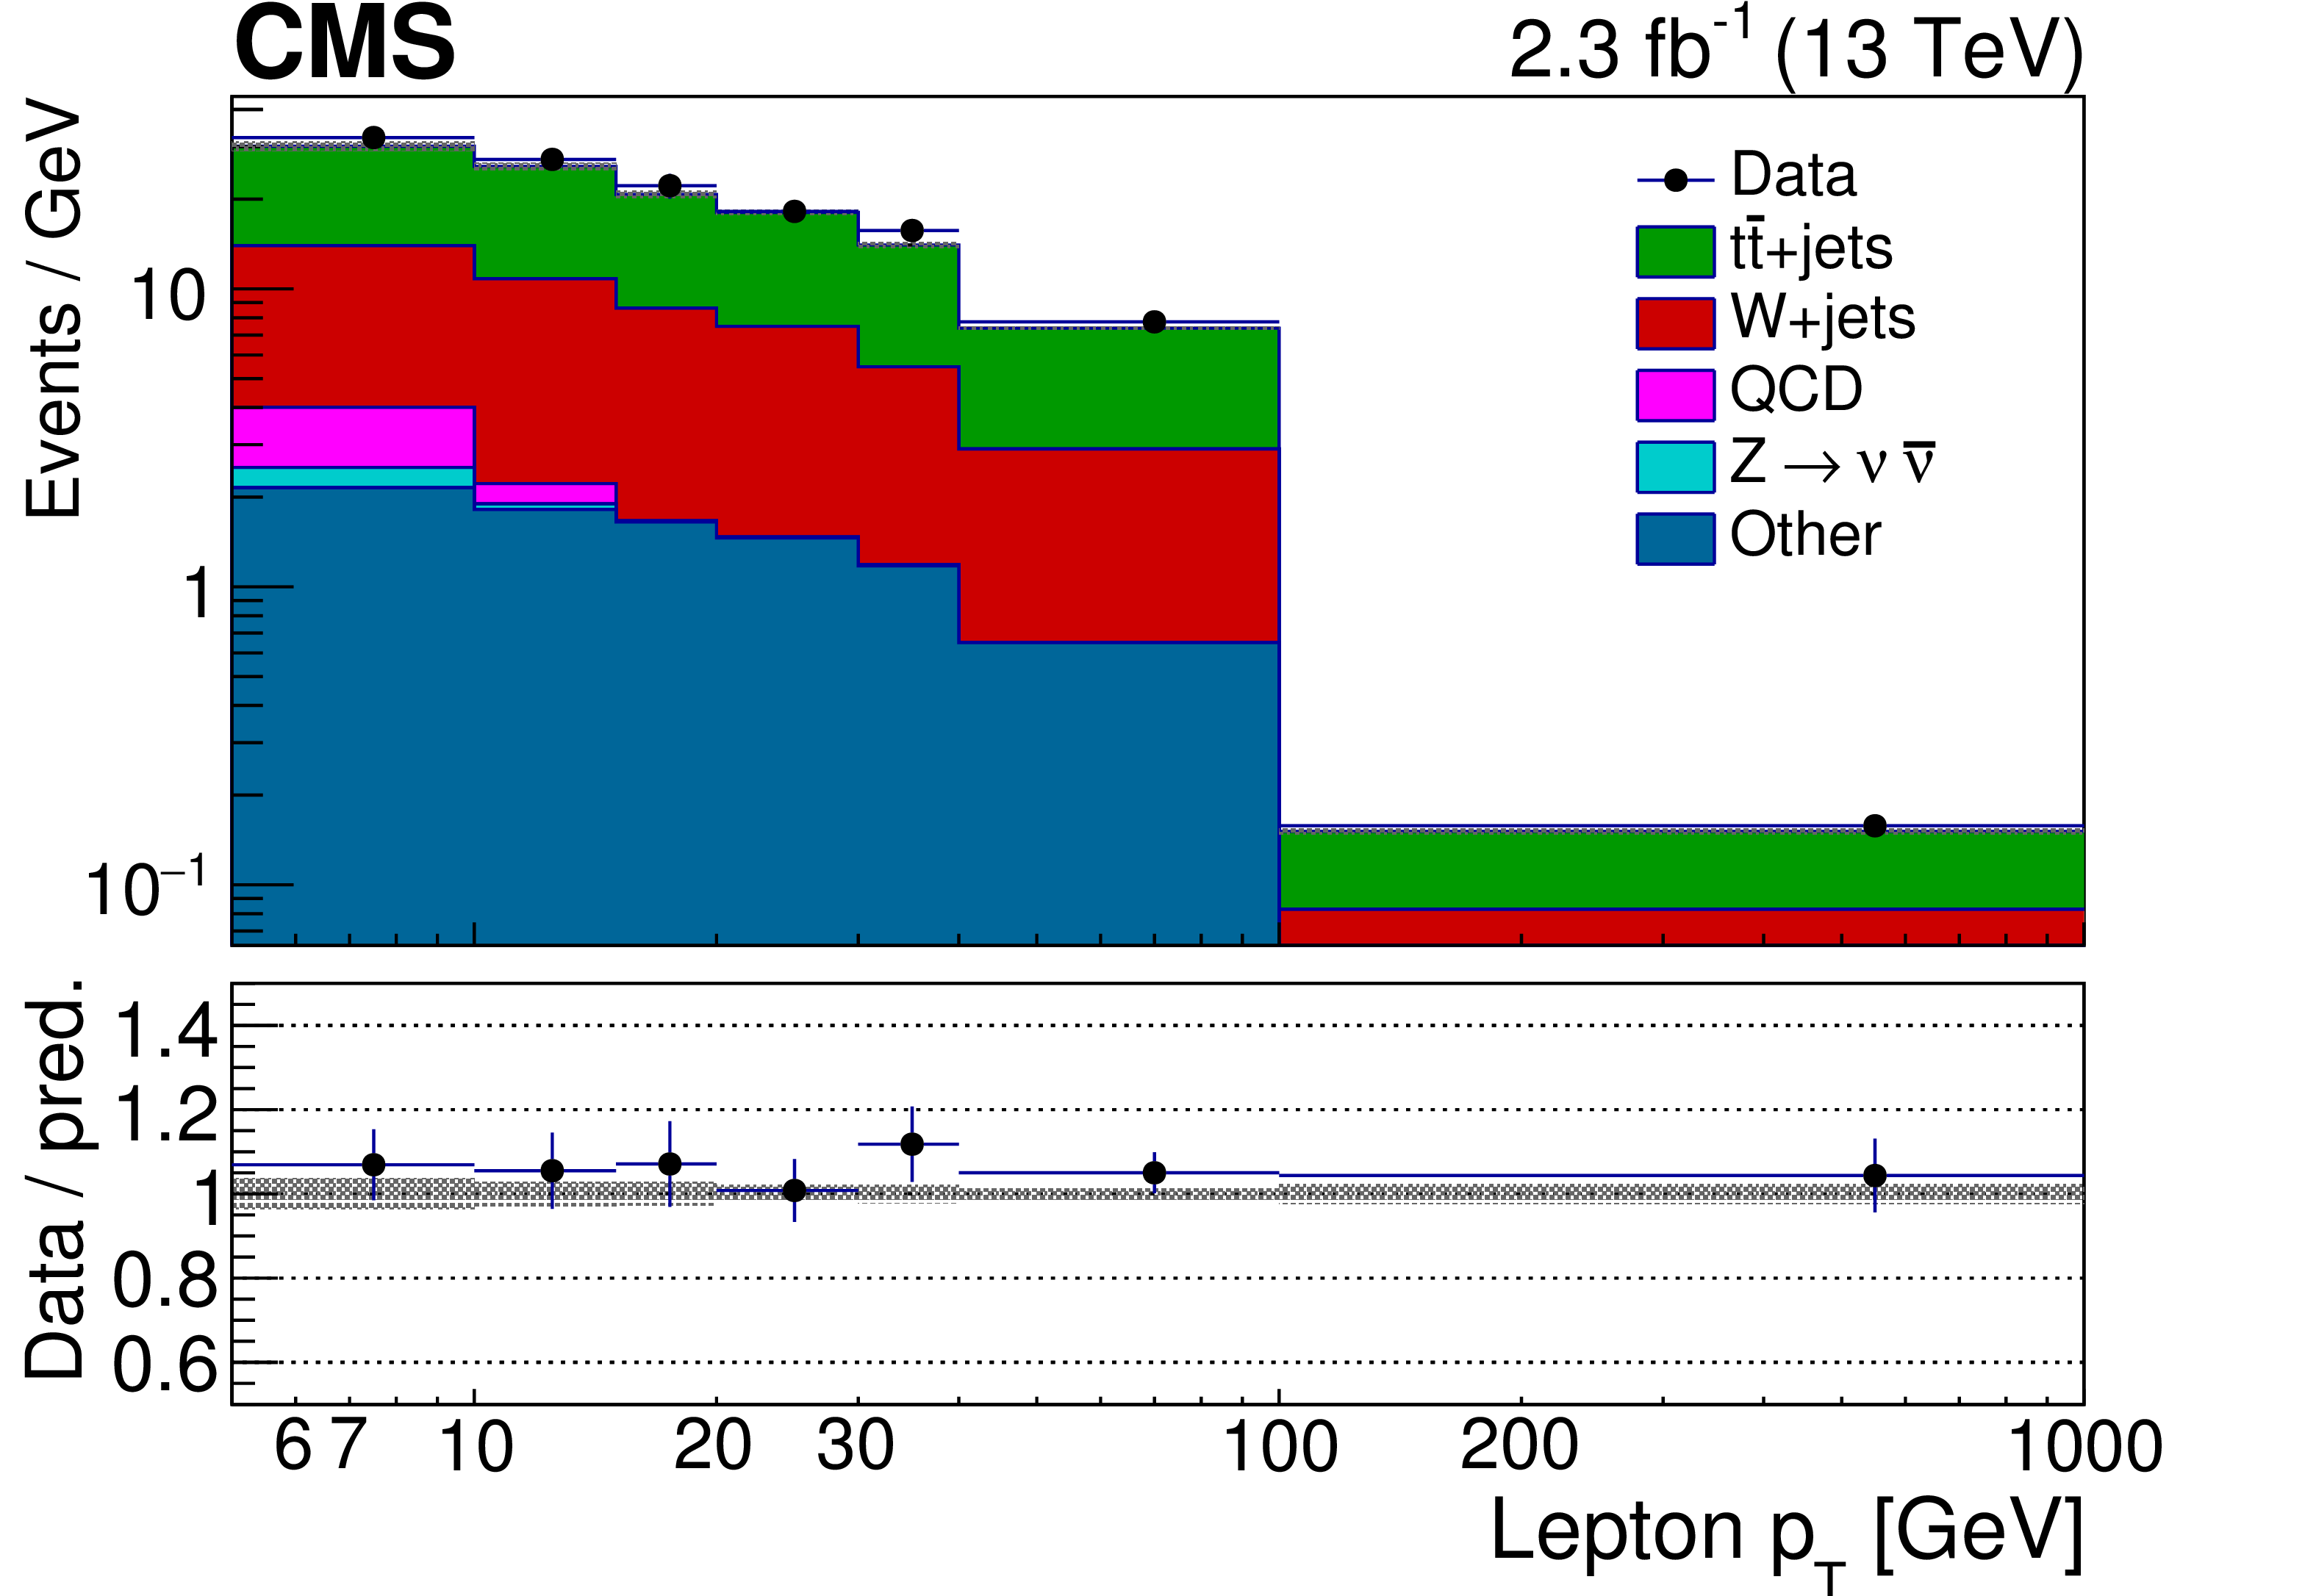
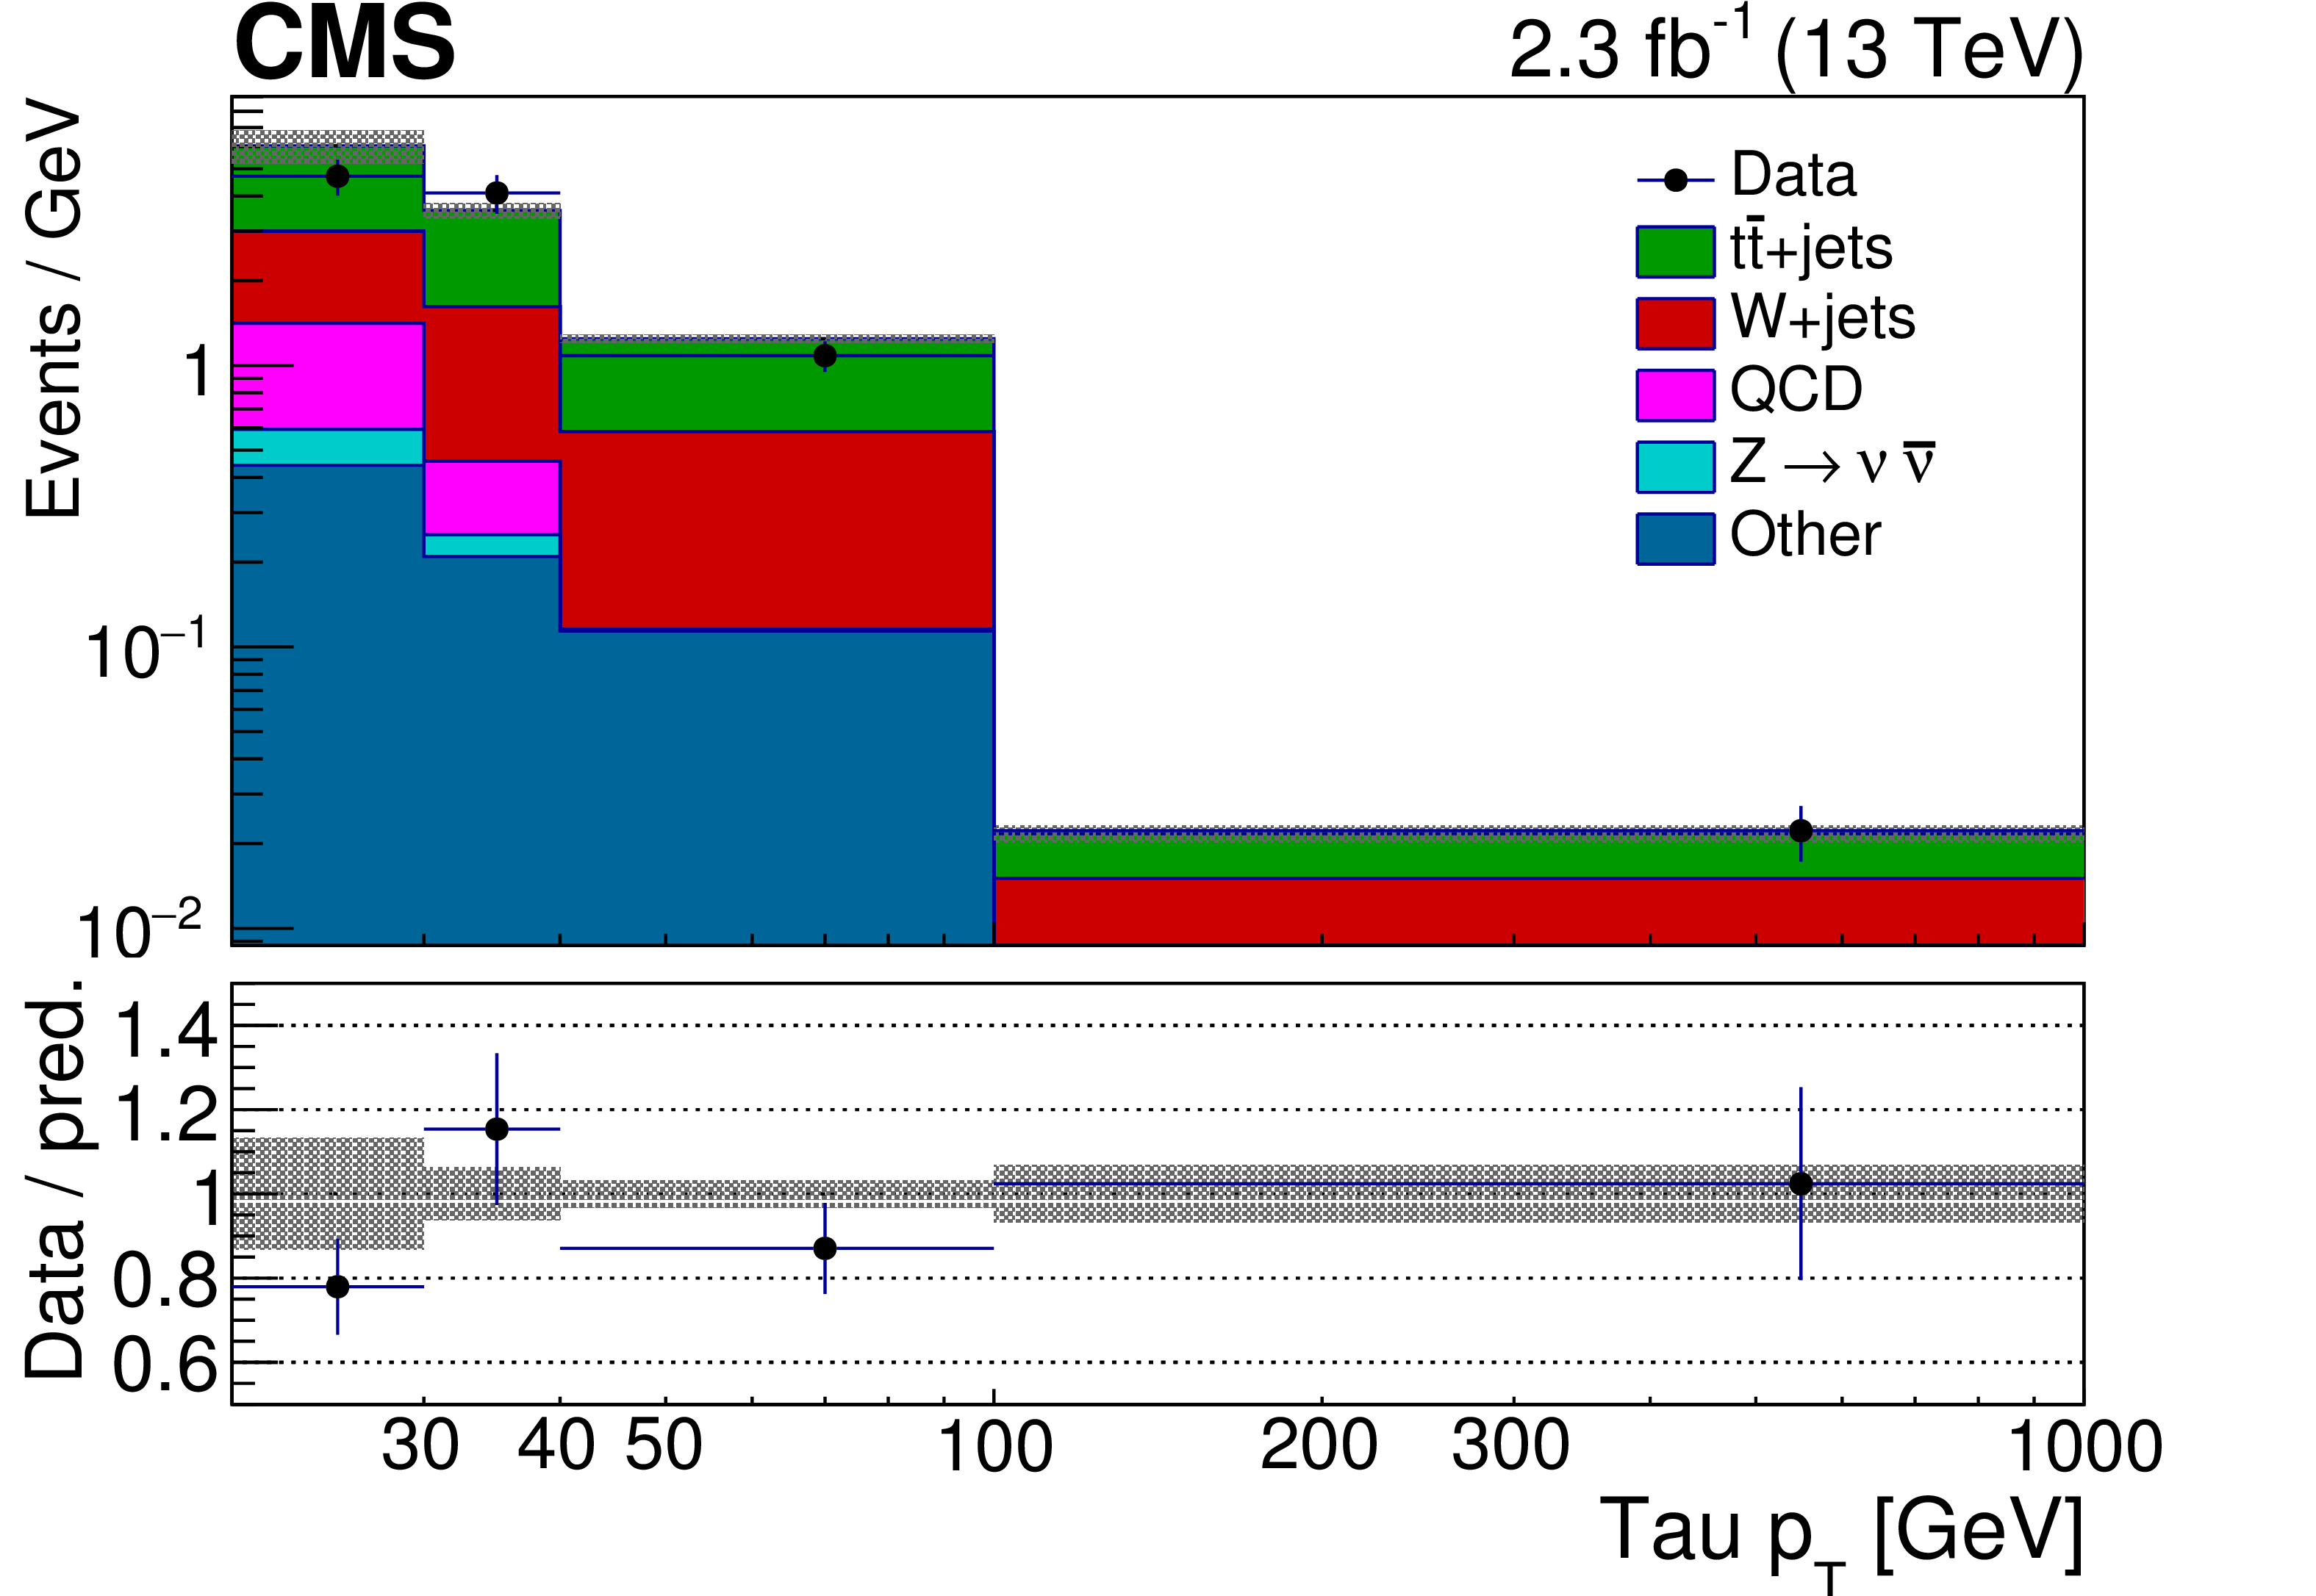
The $ {p_{\mathrm {T}}} $ distribution of the veto electron or muon (left ) and the veto $ {\tau _{\mathrm {h}}}$ (right ) is shown for events in the veto lepton control regions, comparing data with the MC prediction. The ${\mathrm{ t } \mathrm{ \bar{t} } } $ and $\mathrm{ W } (\ell \nu )$+jets MC events have been reweighted according to the correction factors derived in the ${\mathrm{ t } \mathrm{ \bar{t} } } $ enhanced and $\mathrm{ W } (\ell \nu )$+jets enhanced control regions, respectively. The bottom panel shows the ratio of data to the background prediction, with uncertainties displayed as in Fig. 2. |
png pdf |
Figure 4-a:
The $ {p_{\mathrm {T}}} $ distribution of the veto electron or muon is shown for events in the veto lepton control regions, comparing data with the MC prediction. The ${\mathrm{ t } \mathrm{ \bar{t} } } $ and $\mathrm{ W } (\ell \nu )$+jets MC events have been reweighted according to the correction factors derived in the ${\mathrm{ t } \mathrm{ \bar{t} } } $ enhanced and $\mathrm{ W } (\ell \nu )$+jets enhanced control regions, respectively. The bottom panel shows the ratio of data to the background prediction, with uncertainties displayed as in Fig. 2. |
png pdf |
Figure 4-b:
The $ {p_{\mathrm {T}}} $ distribution of the veto $ {\tau _{\mathrm {h}}}$ is shown for events in the veto lepton control regions, comparing data with the MC prediction. The ${\mathrm{ t } \mathrm{ \bar{t} } } $ and $\mathrm{ W } (\ell \nu )$+jets MC events have been reweighted according to the correction factors derived in the ${\mathrm{ t } \mathrm{ \bar{t} } } $ enhanced and $\mathrm{ W } (\ell \nu )$+jets enhanced control regions, respectively. The bottom panel shows the ratio of data to the background prediction, with uncertainties displayed as in Fig. 2. |

png pdf |
Figure 5:
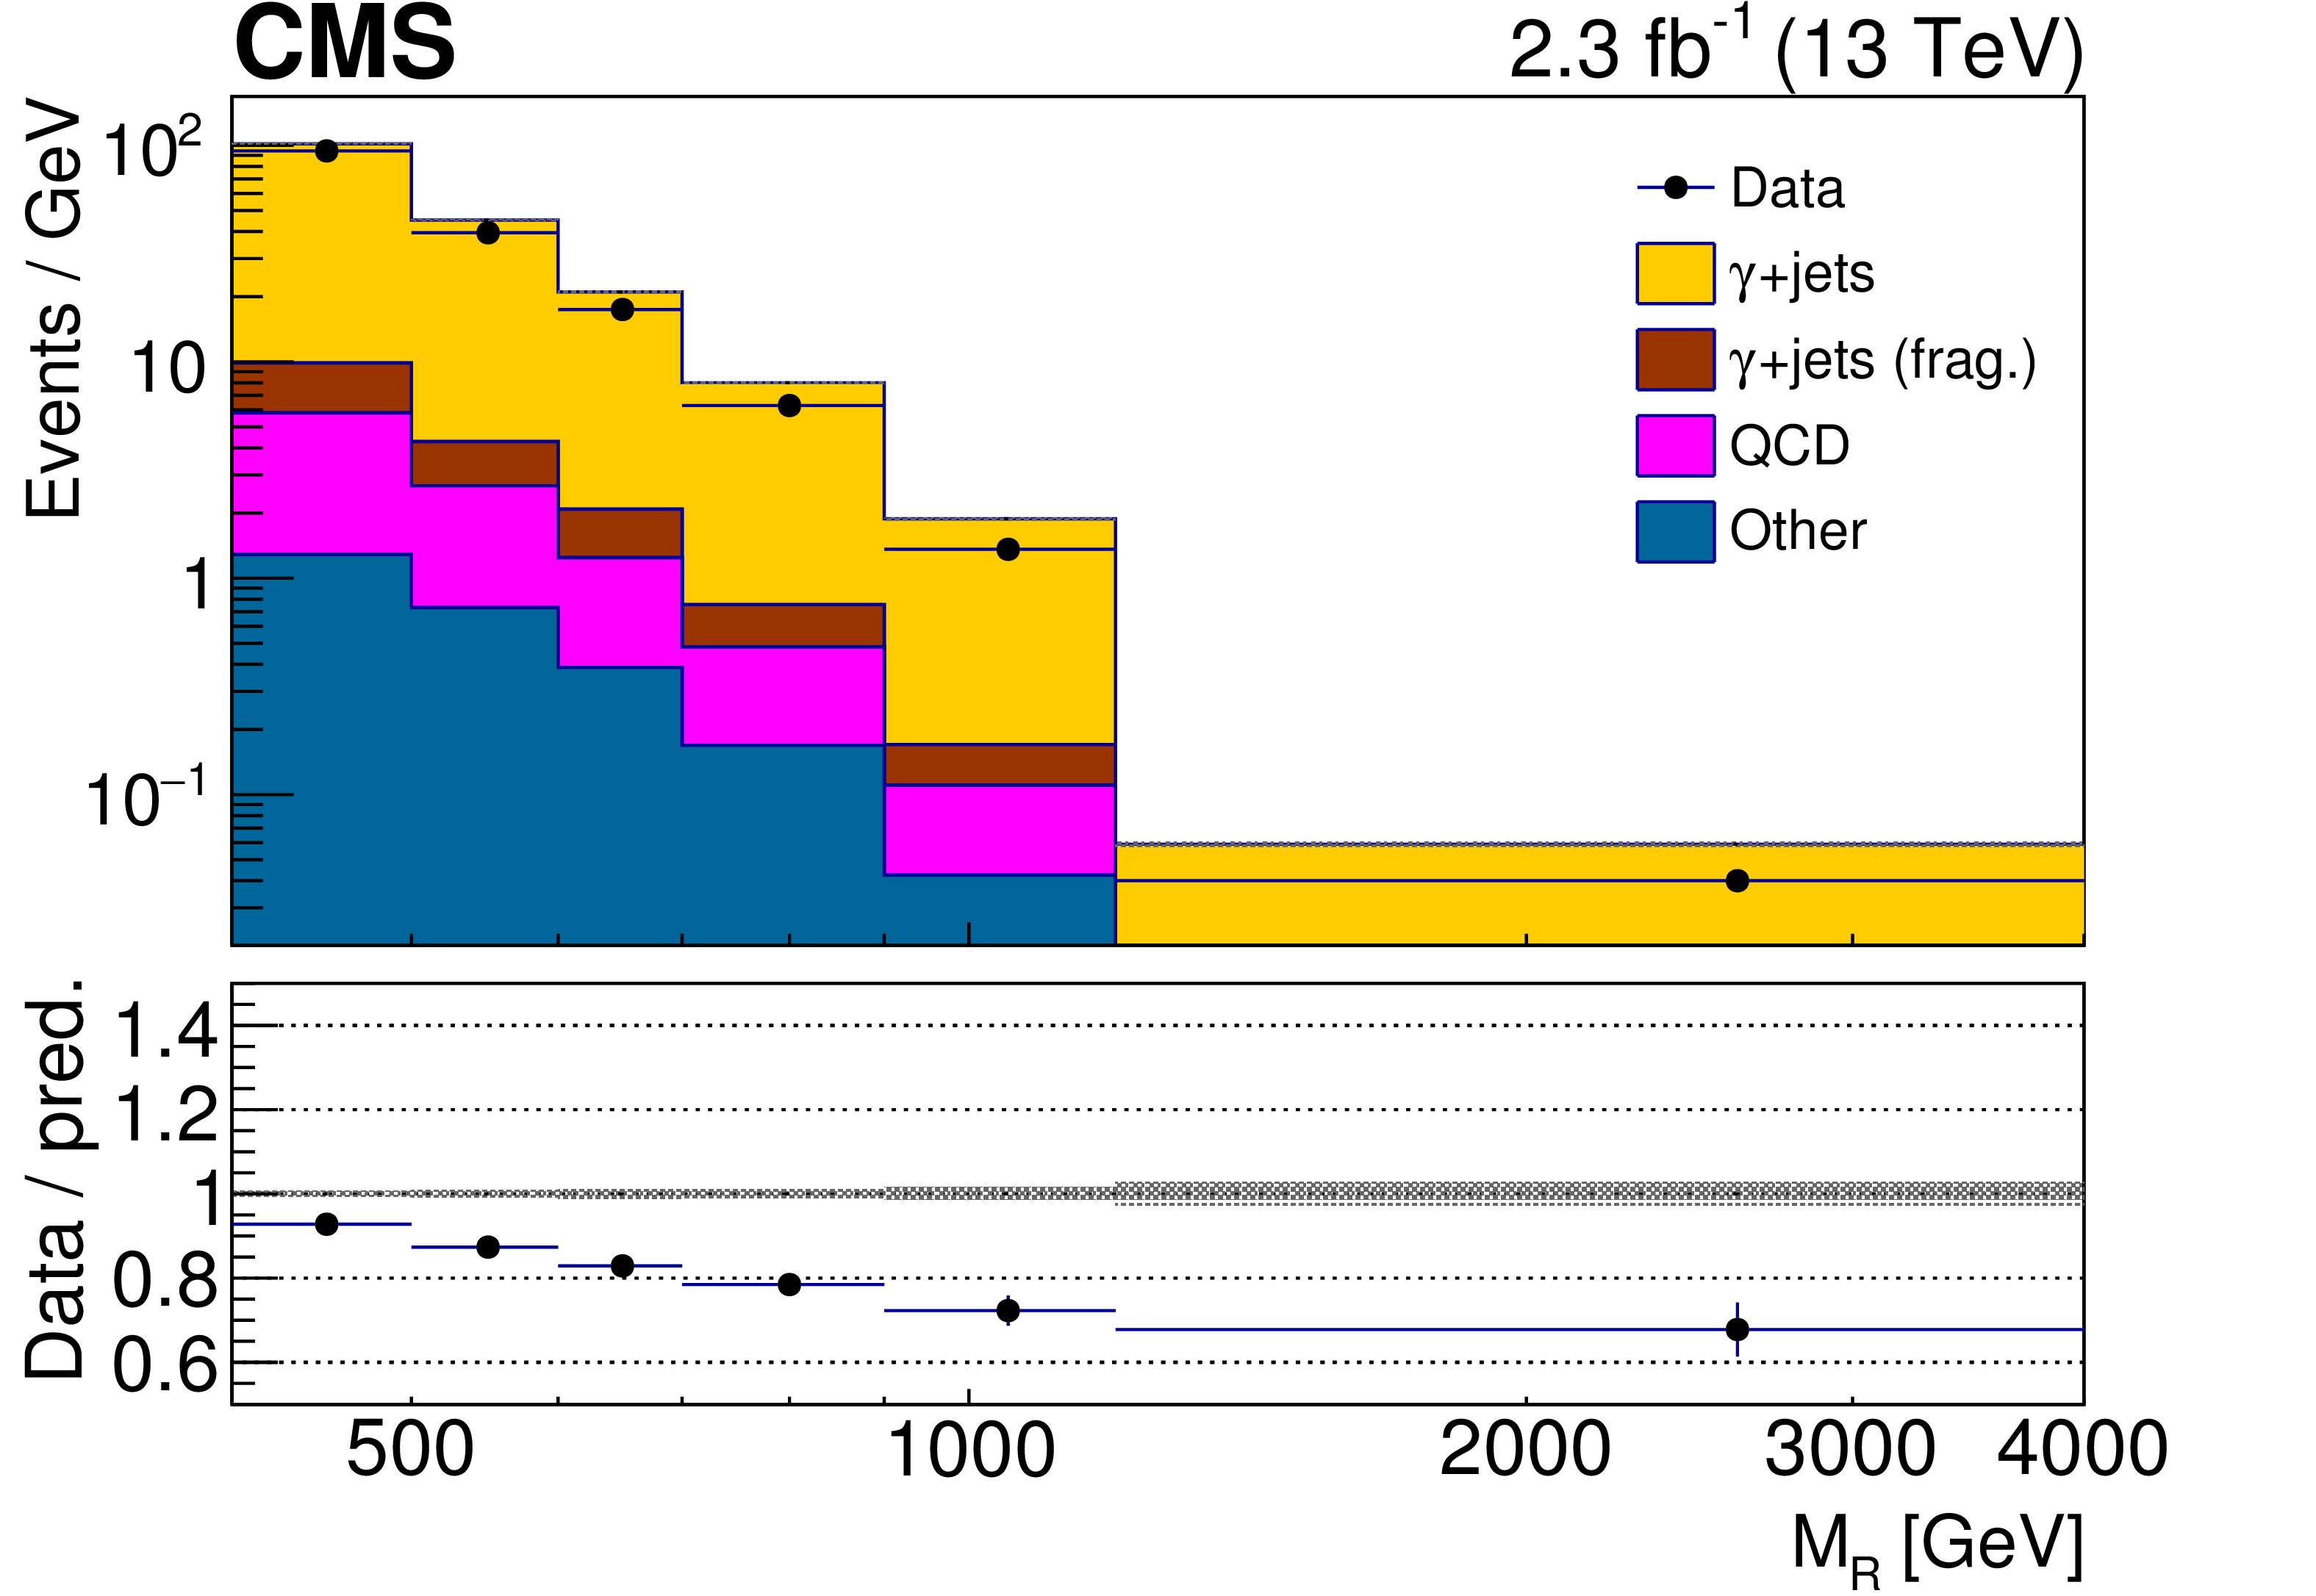
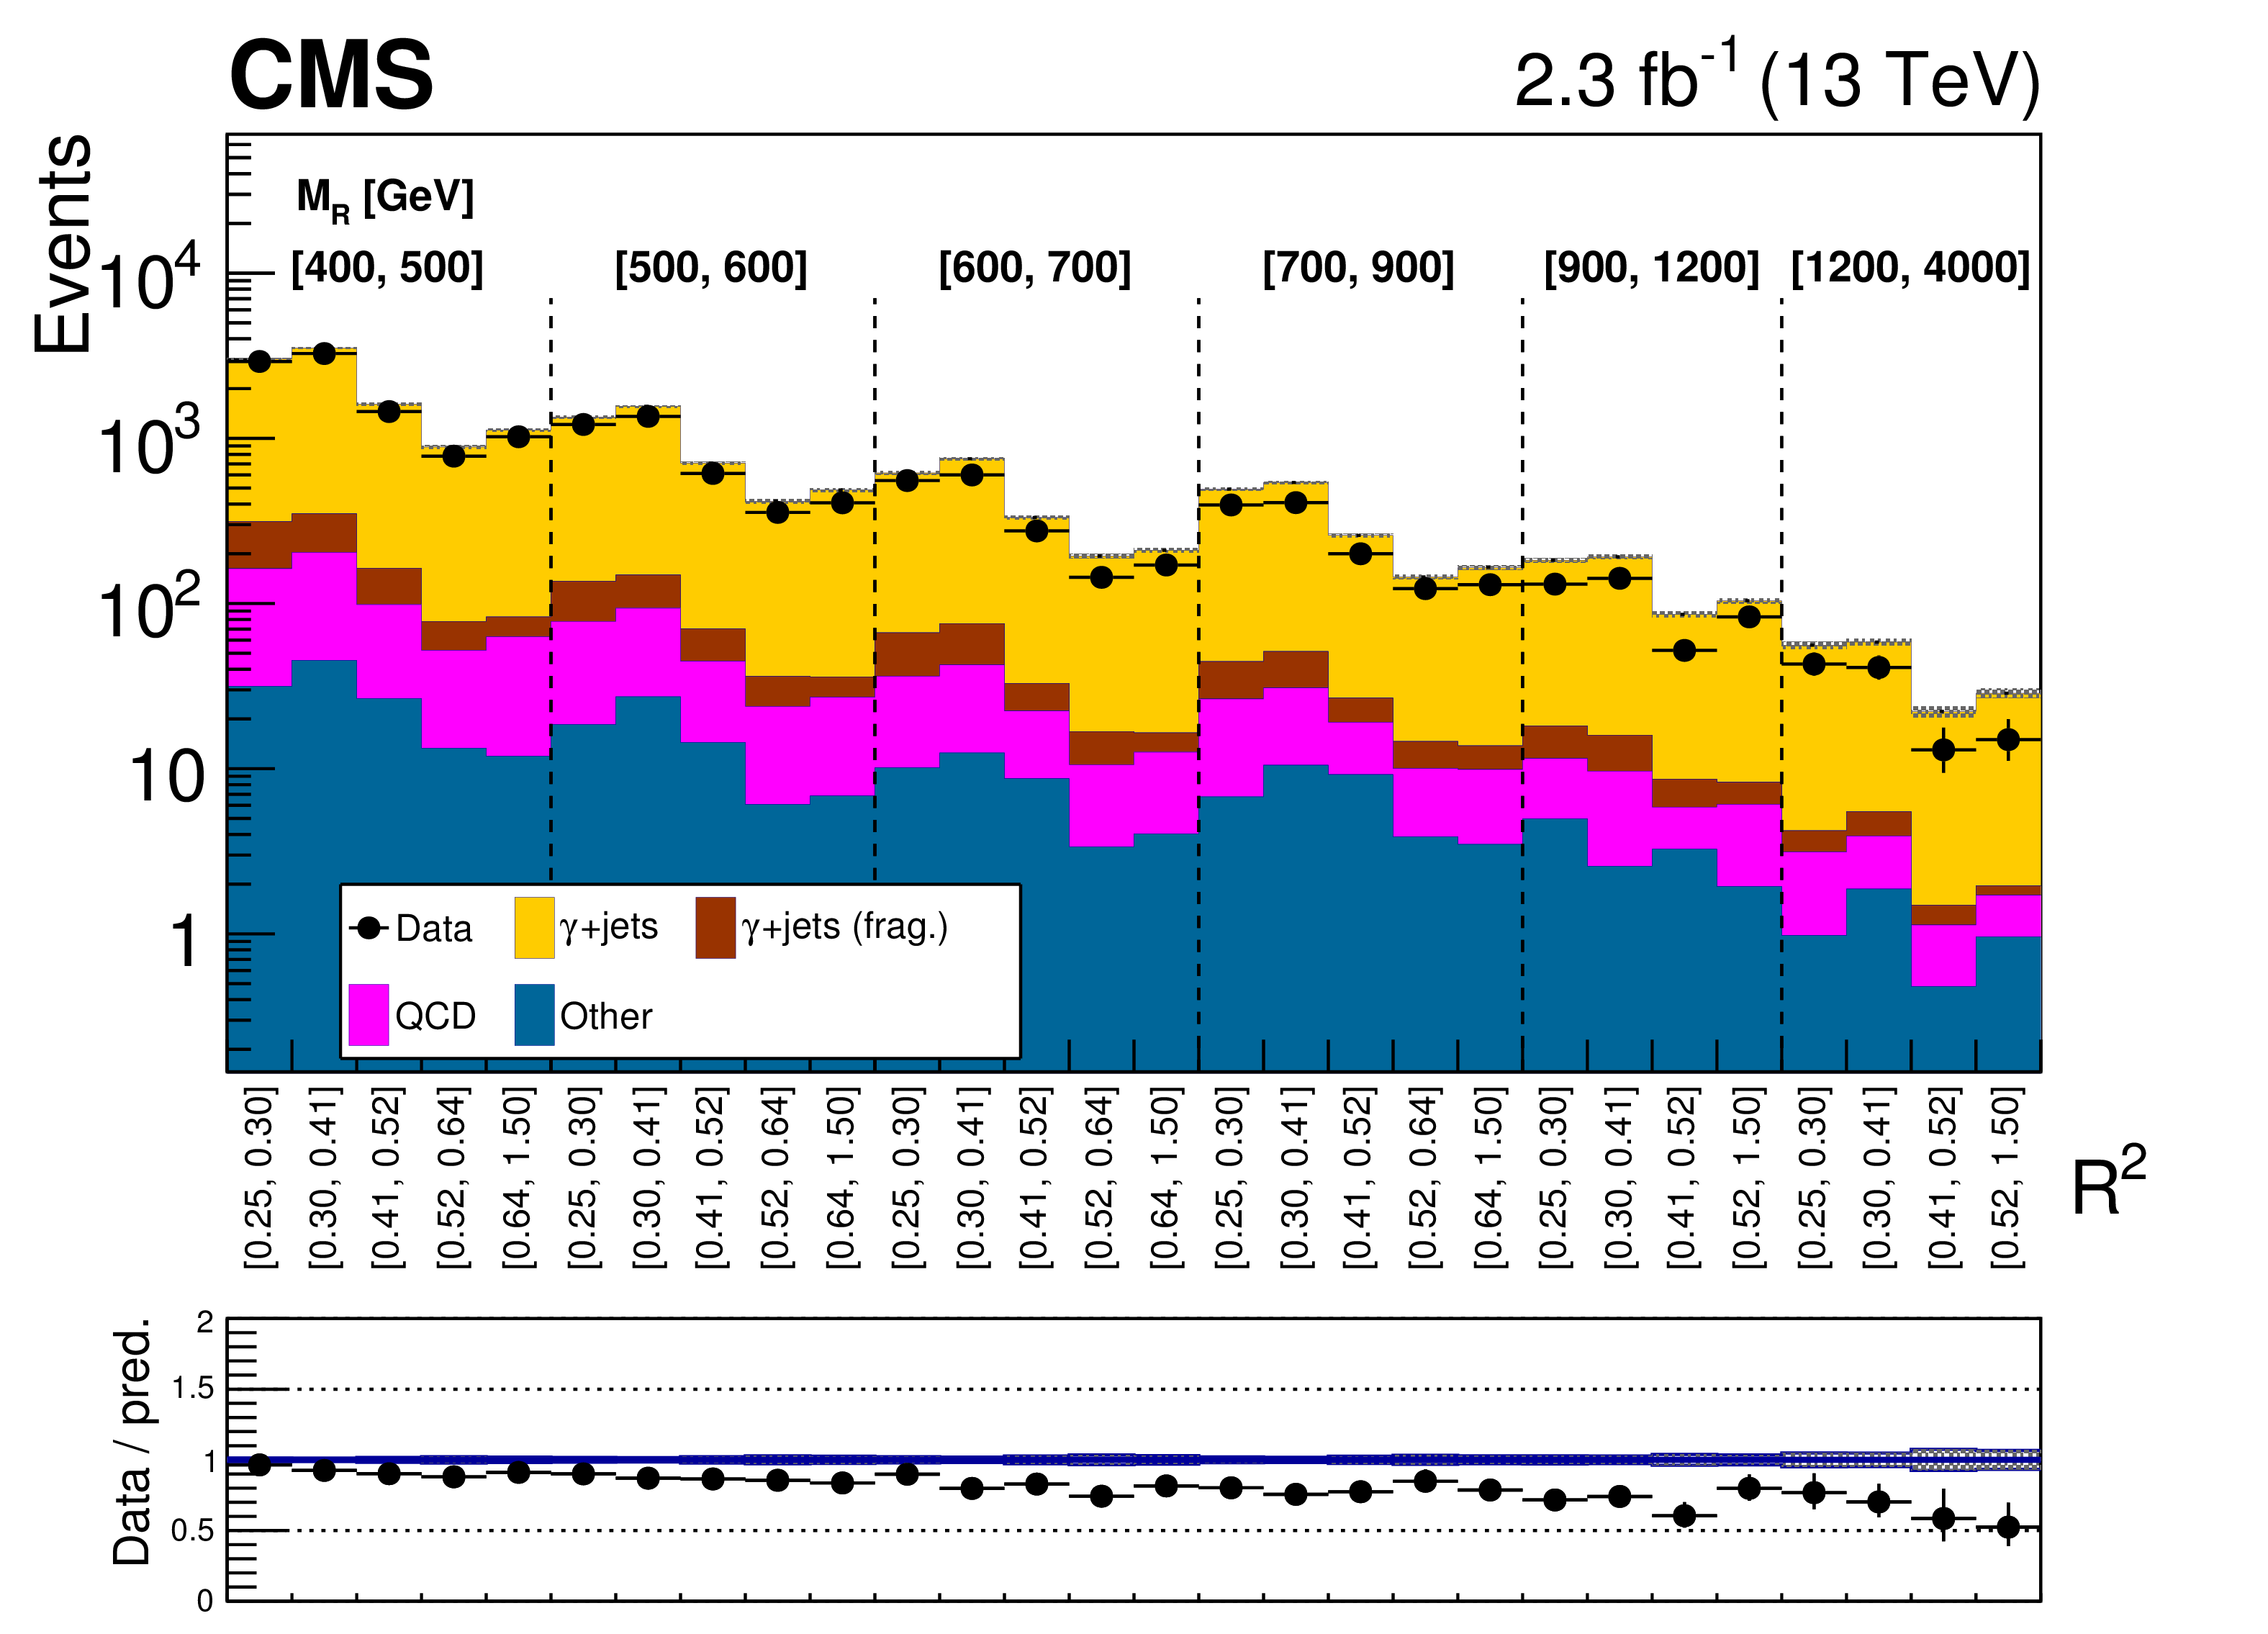
The one-dimensional distribution of $ {M_\mathrm {R}} $ in the $\gamma $+jets control region (above) and the two-dimensional $ {M_\mathrm {R}} $-$ {\mathrm {R}^2} $ distribution in the $\gamma $+jets control region (below) are shown. The two-dimensional $ {M_\mathrm {R}} $-$ {\mathrm {R}^2} $ distribution is shown in a one-dimensional representation as in Fig. 2. The bottom panel shows the ratio of data to the background prediction, with uncertainties displayed as in Fig. 2. |
png pdf |
Figure 5-a:
The one-dimensional distribution of $ {M_\mathrm {R}} $ in the $\gamma $+jets control region is shown. The bottom panel shows the ratio of data to the background prediction, with uncertainties displayed as in Fig. 2. |
png pdf |
Figure 5-b:
The two-dimensional $ {M_\mathrm {R}} $-$ {\mathrm {R}^2} $ distribution in the $\gamma $+jets control region is shown, in a one-dimensional representation as in Fig. 2. The bottom panel shows the ratio of data to the background prediction, with uncertainties displayed as in Fig. 2. |
png pdf |
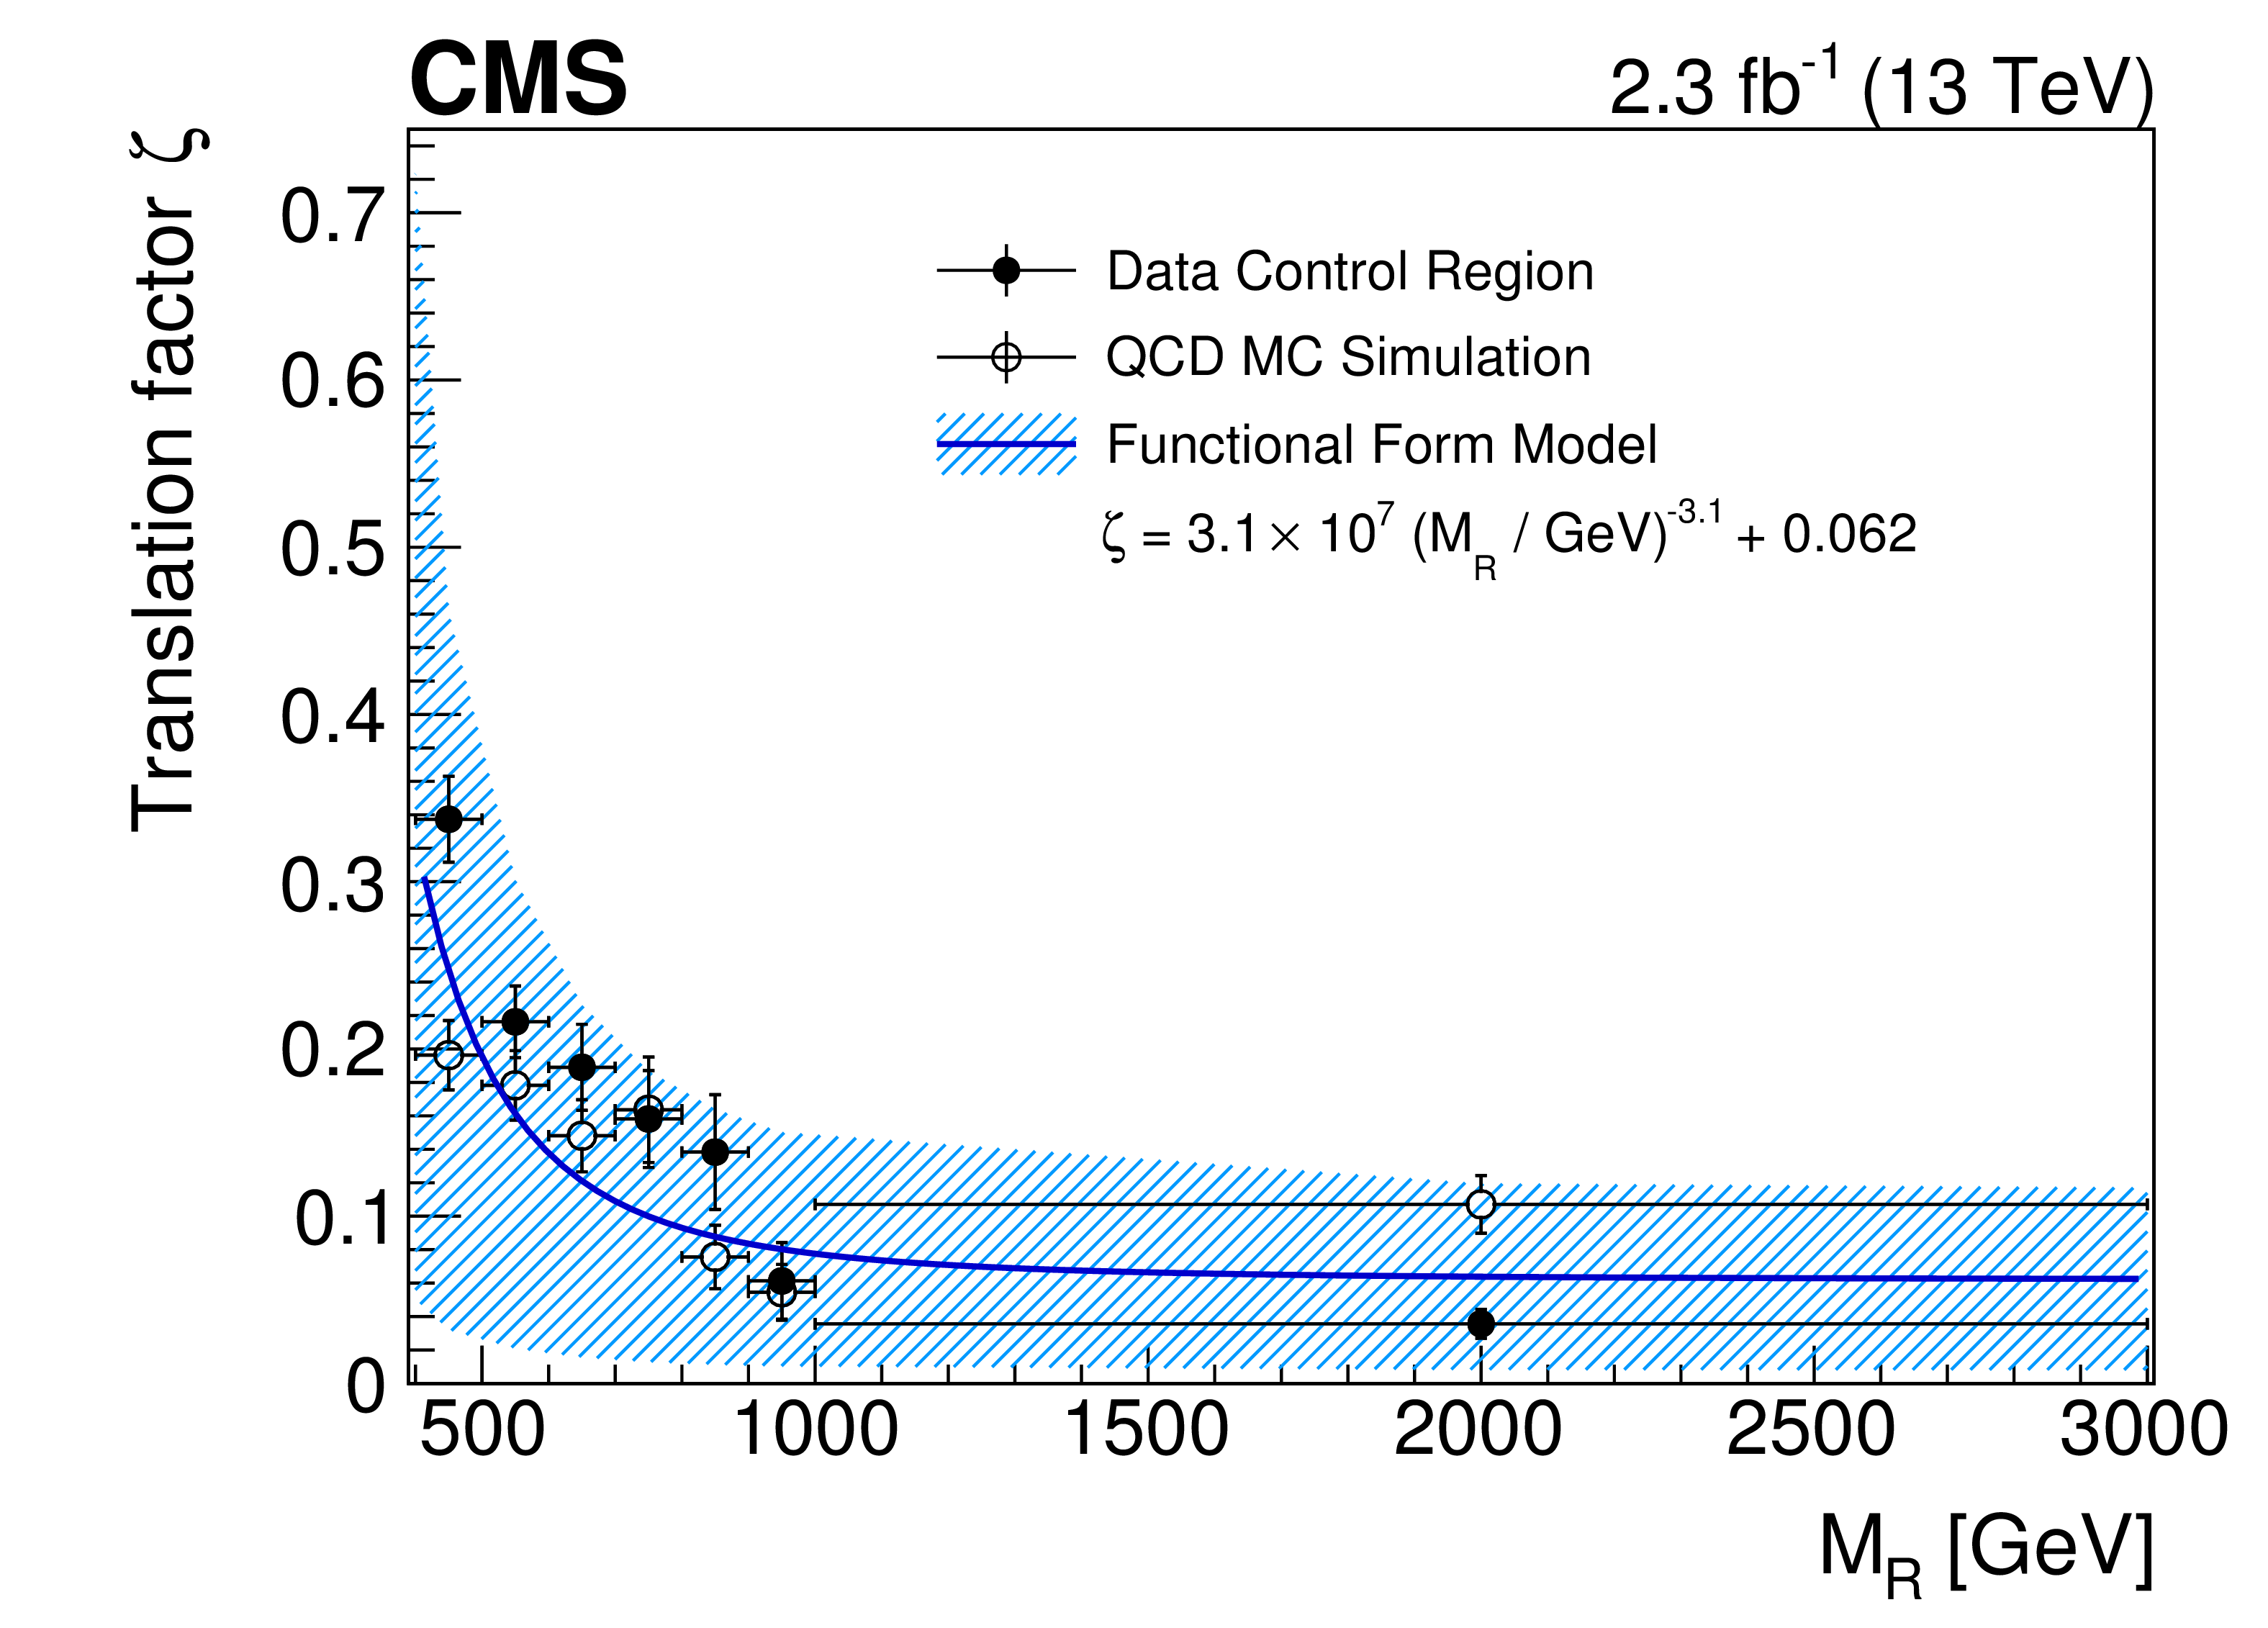
Figure 6:
The translation factor $\zeta $ is shown as a function of $ {M_\mathrm {R}} $. The curve shows the functional form used to model the $ {M_\mathrm {R}} $ dependence, and the open circle and black dot data points are the values of $\zeta $ measured in the low-$ {\mathrm {R}^2} $ data control region and the QCD MC simulation, respectively. The hashed region indicates the size of the systematic uncertainty in $\zeta $. |
png pdf |
Figure 7:
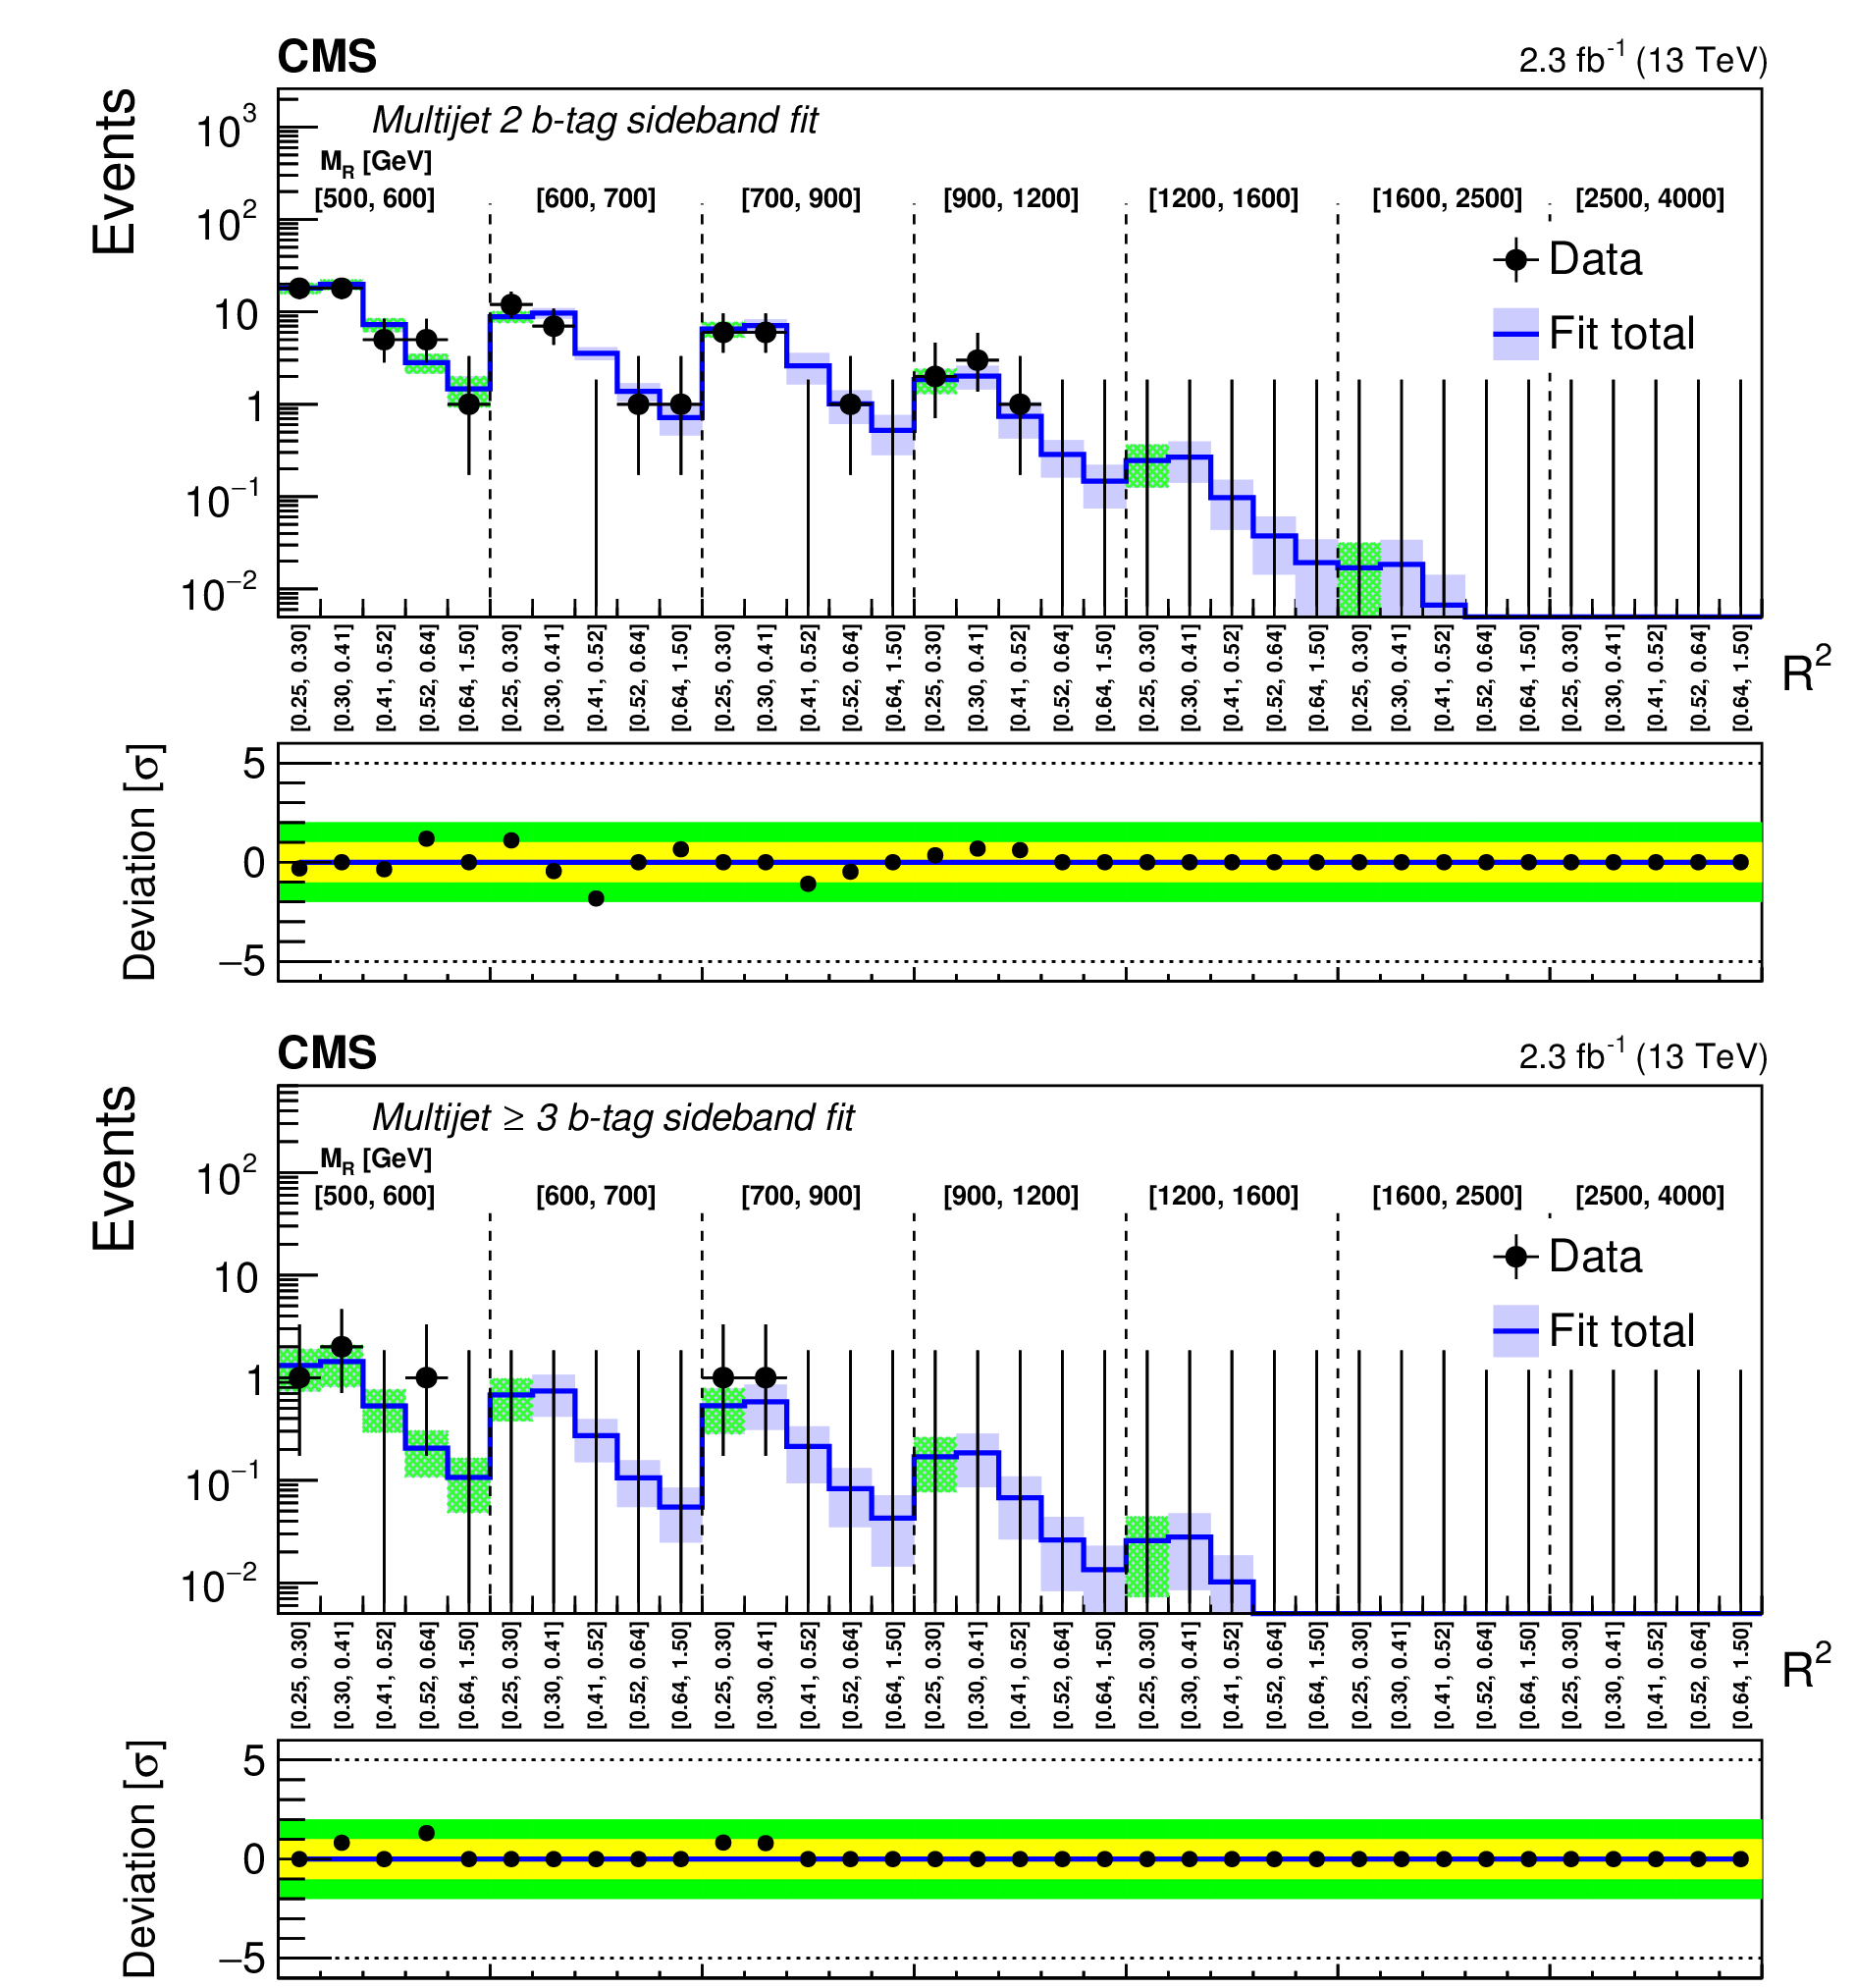
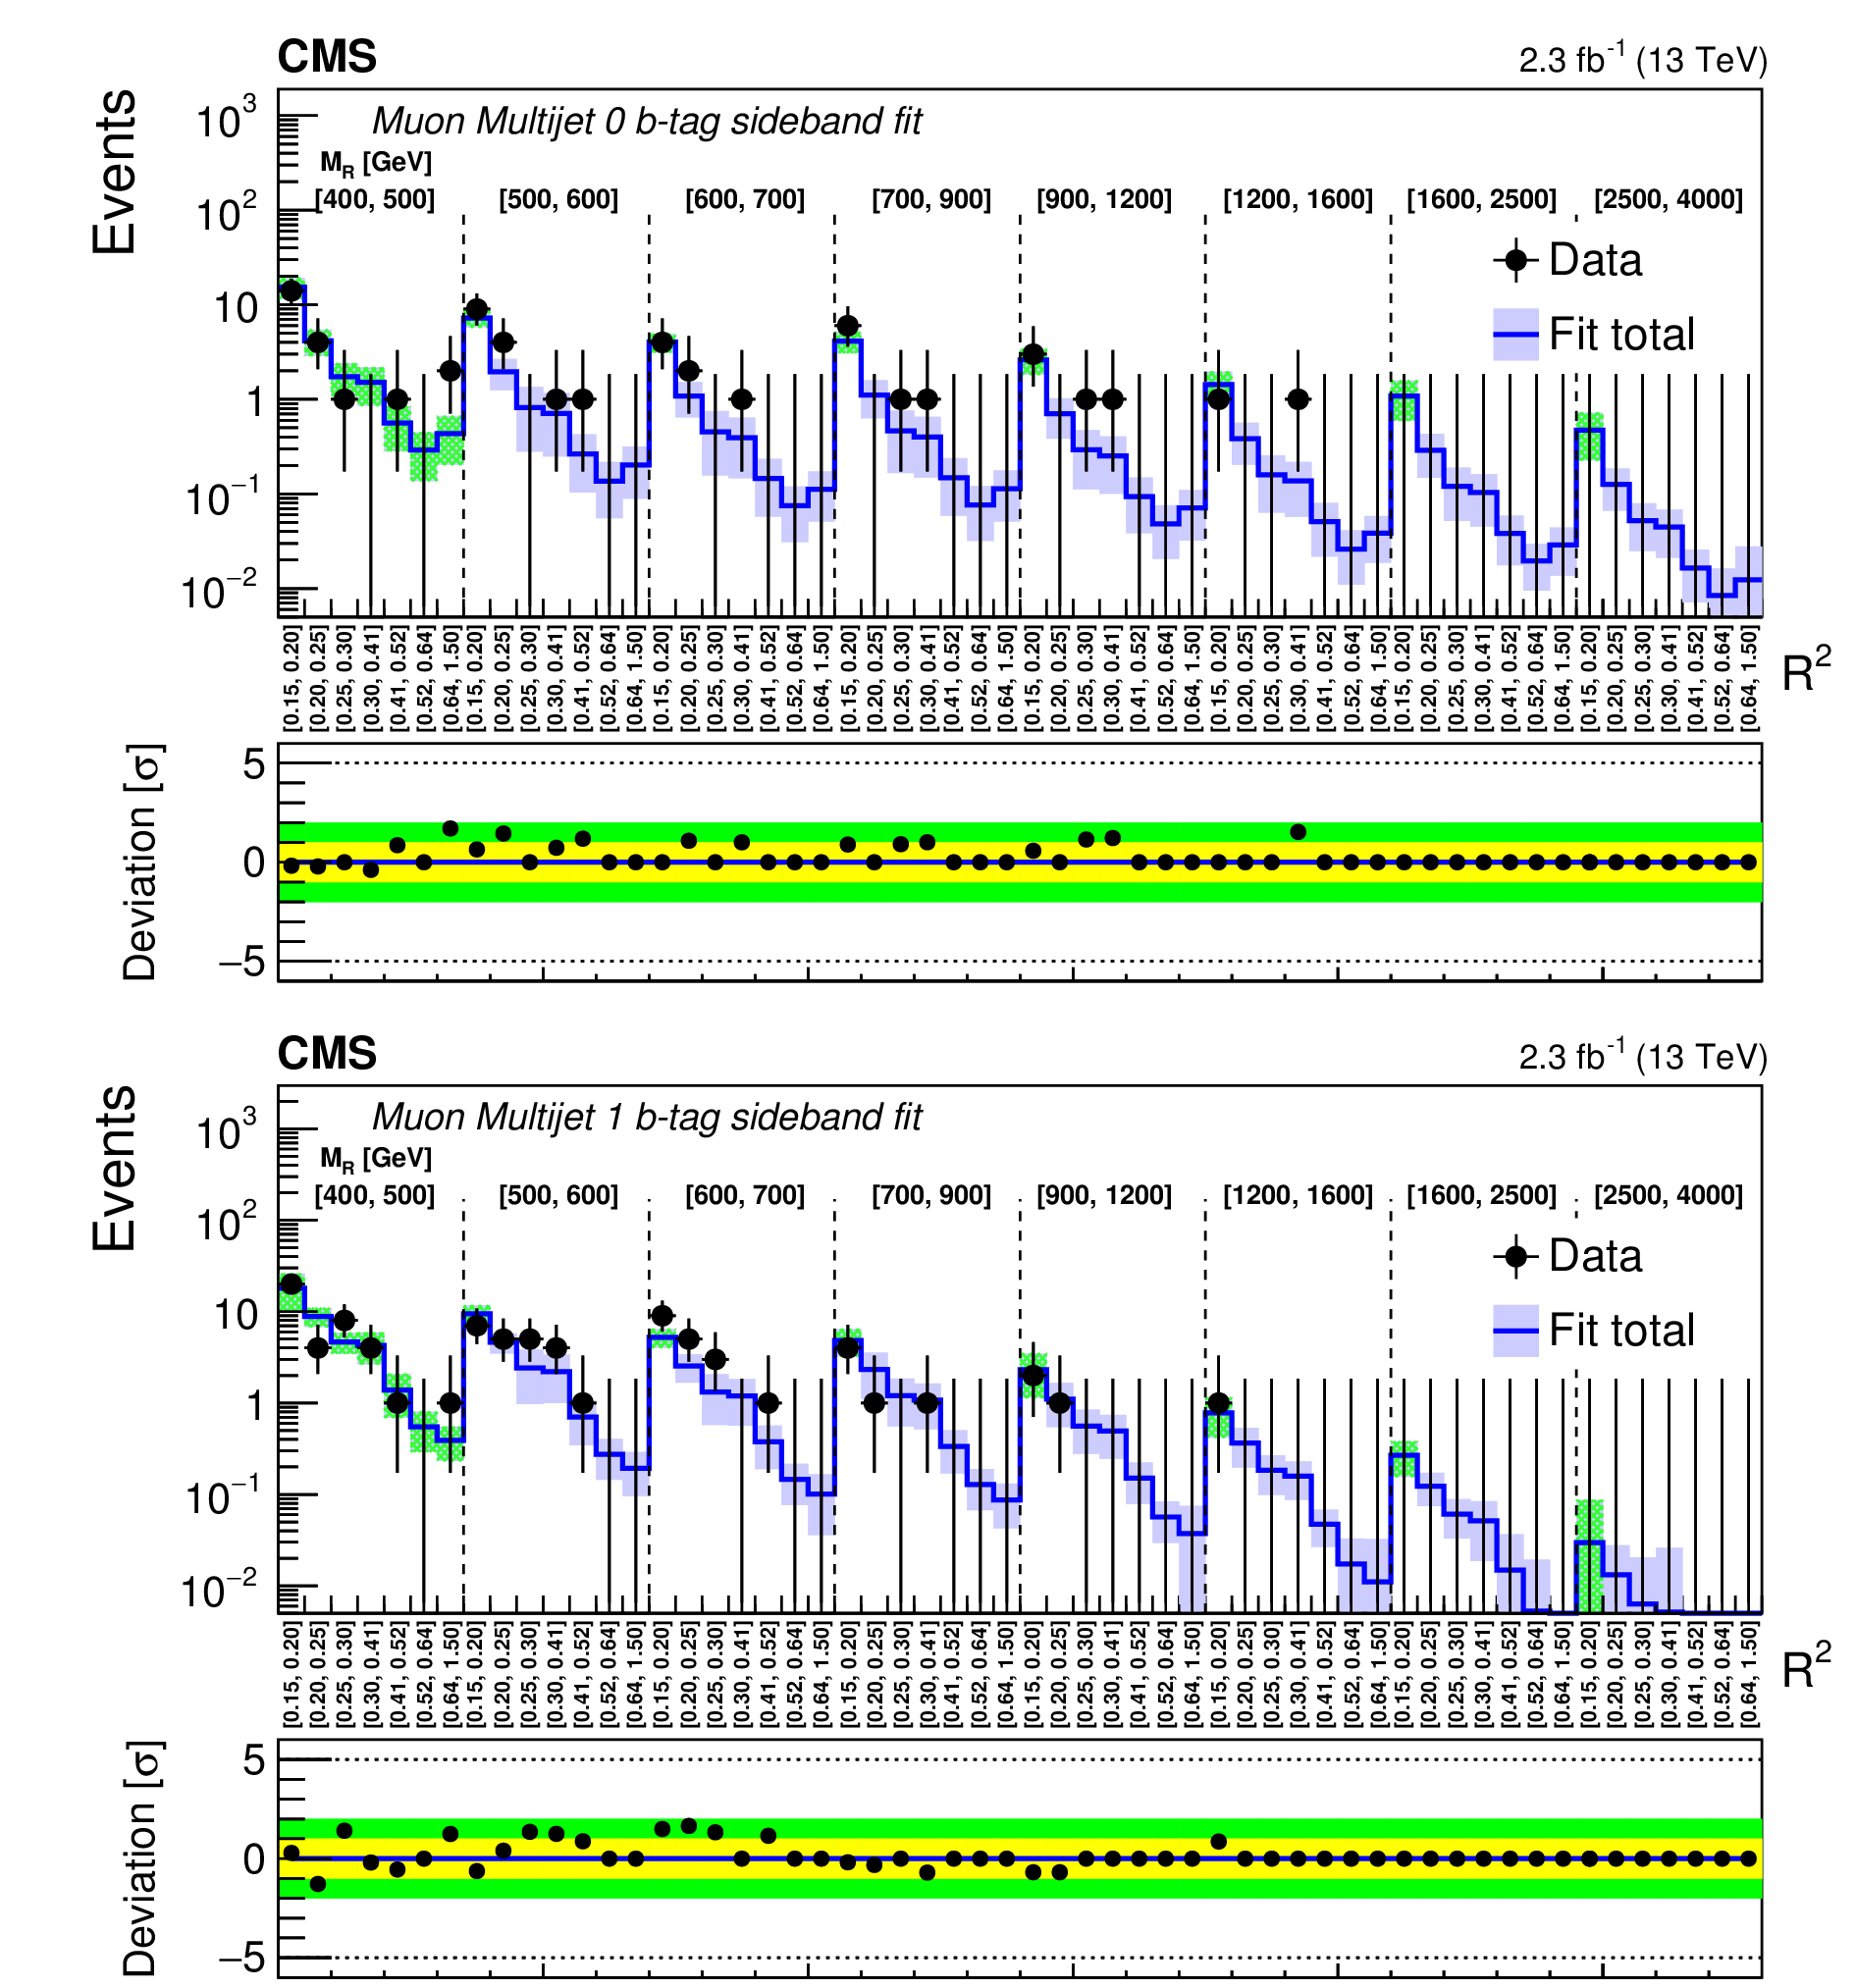
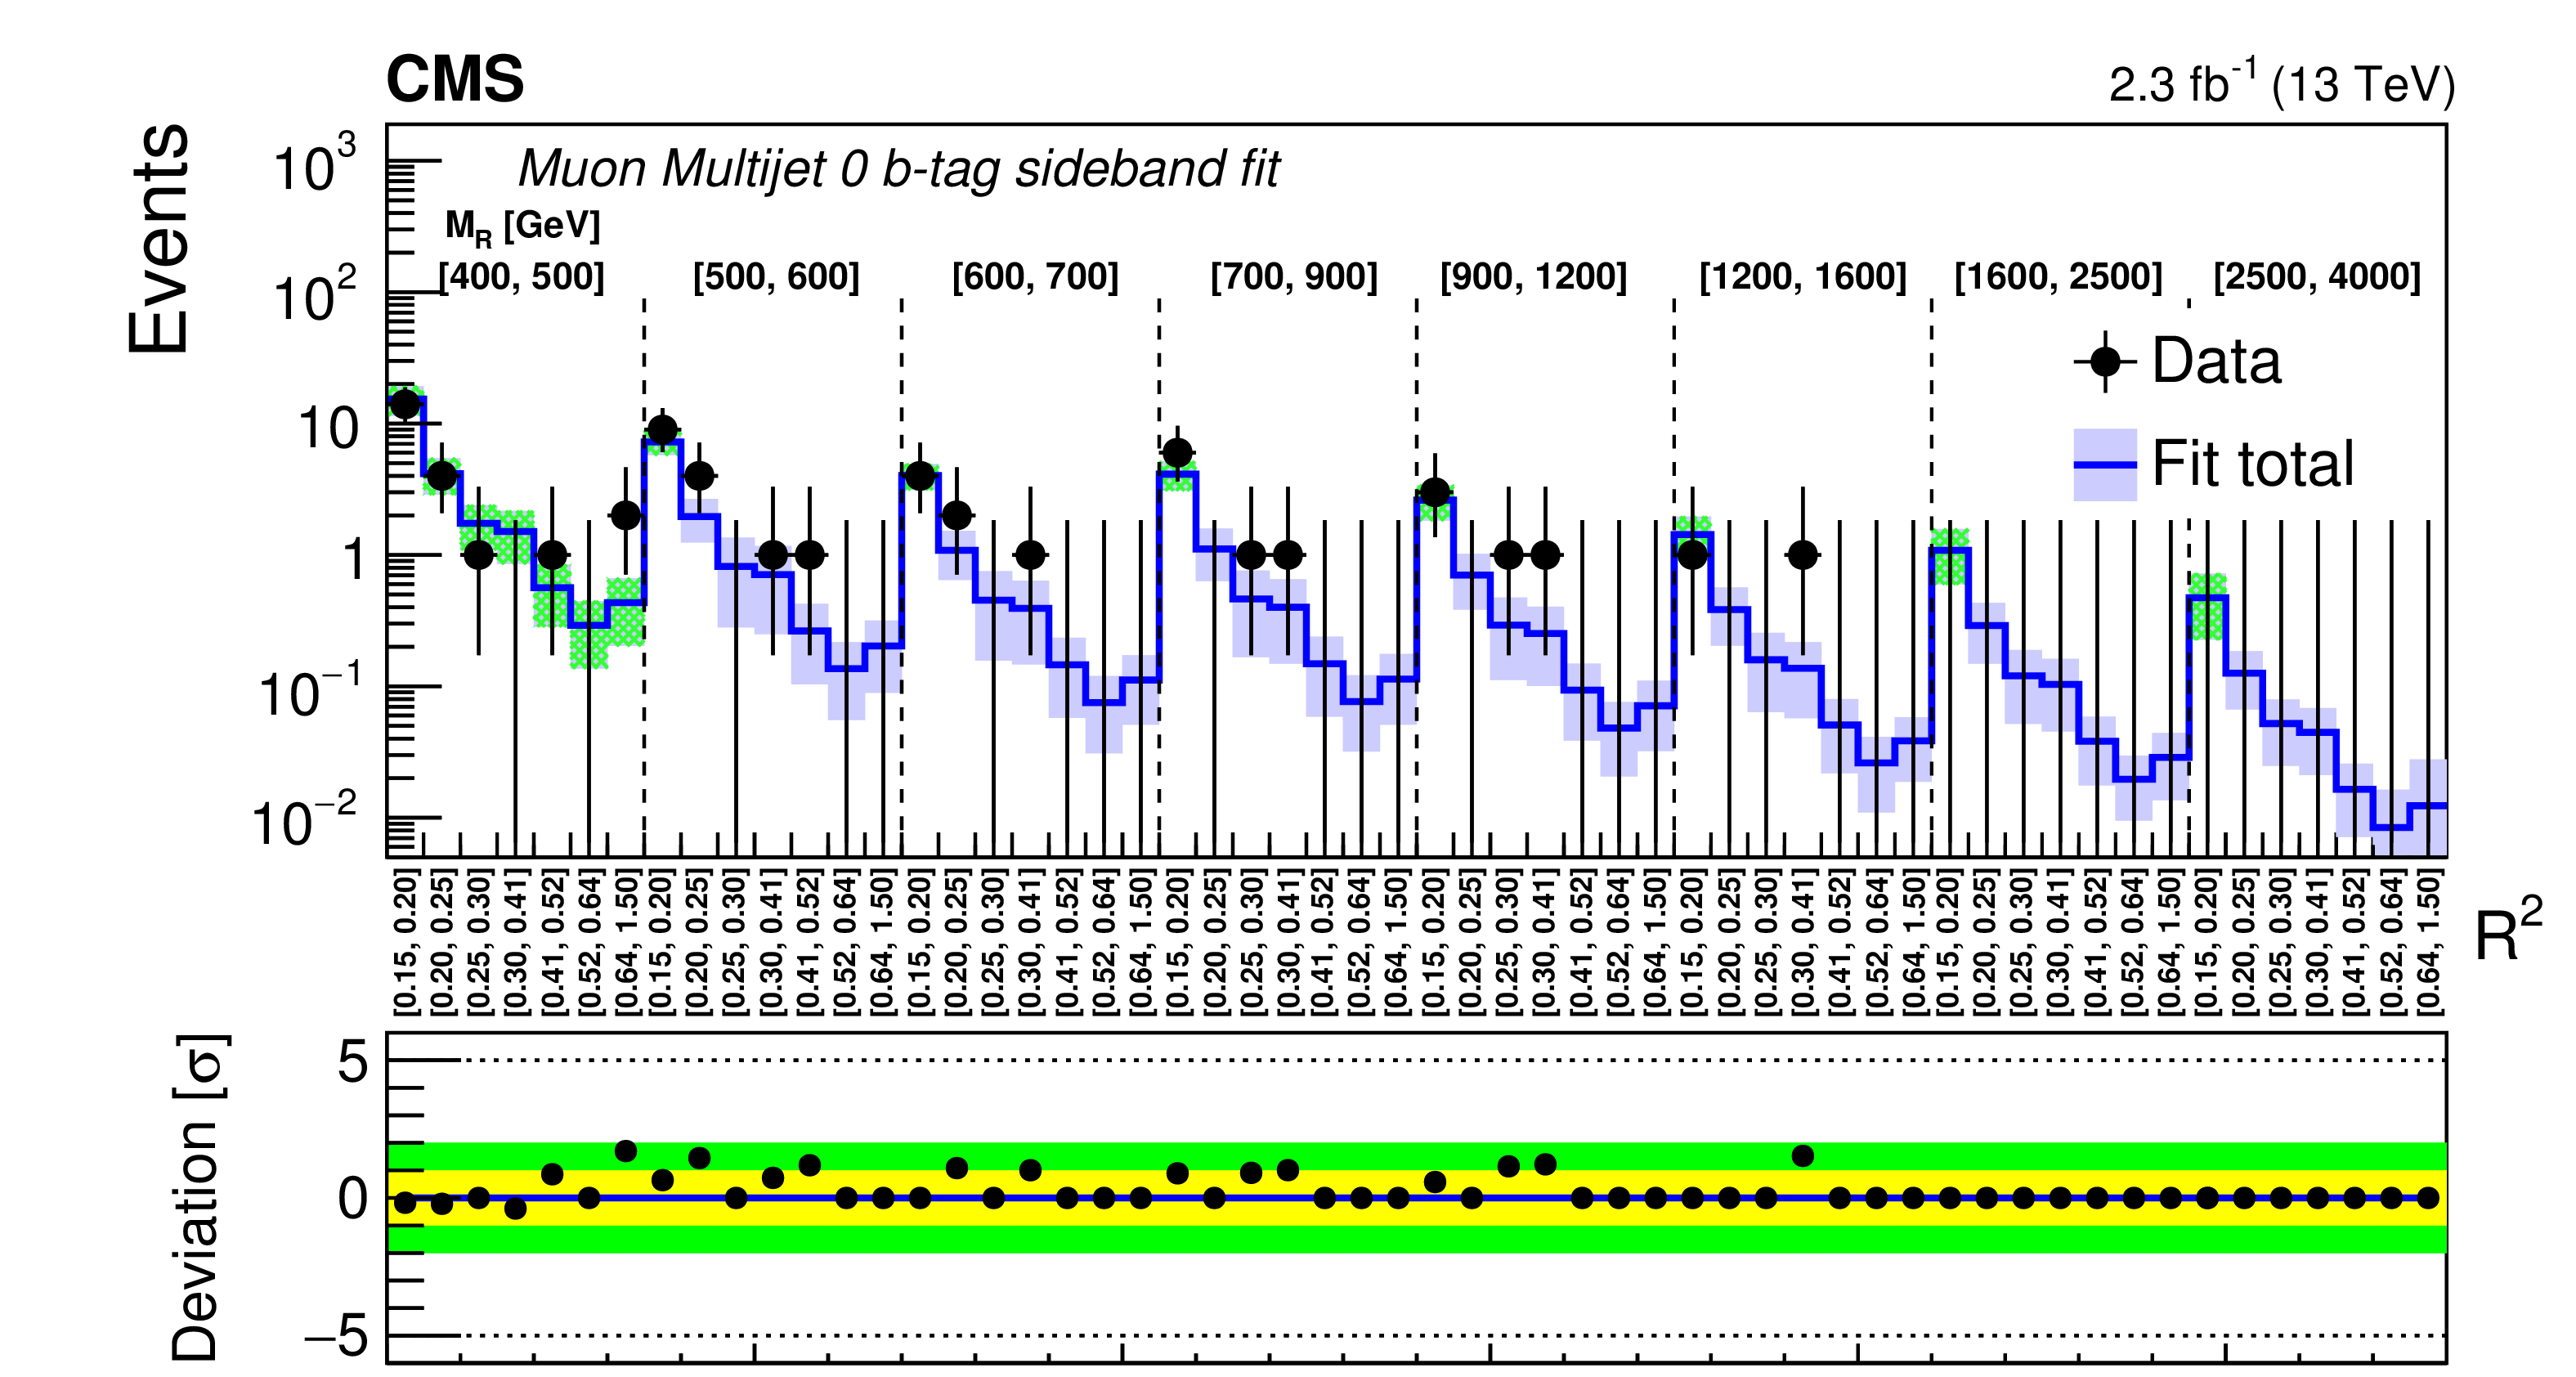
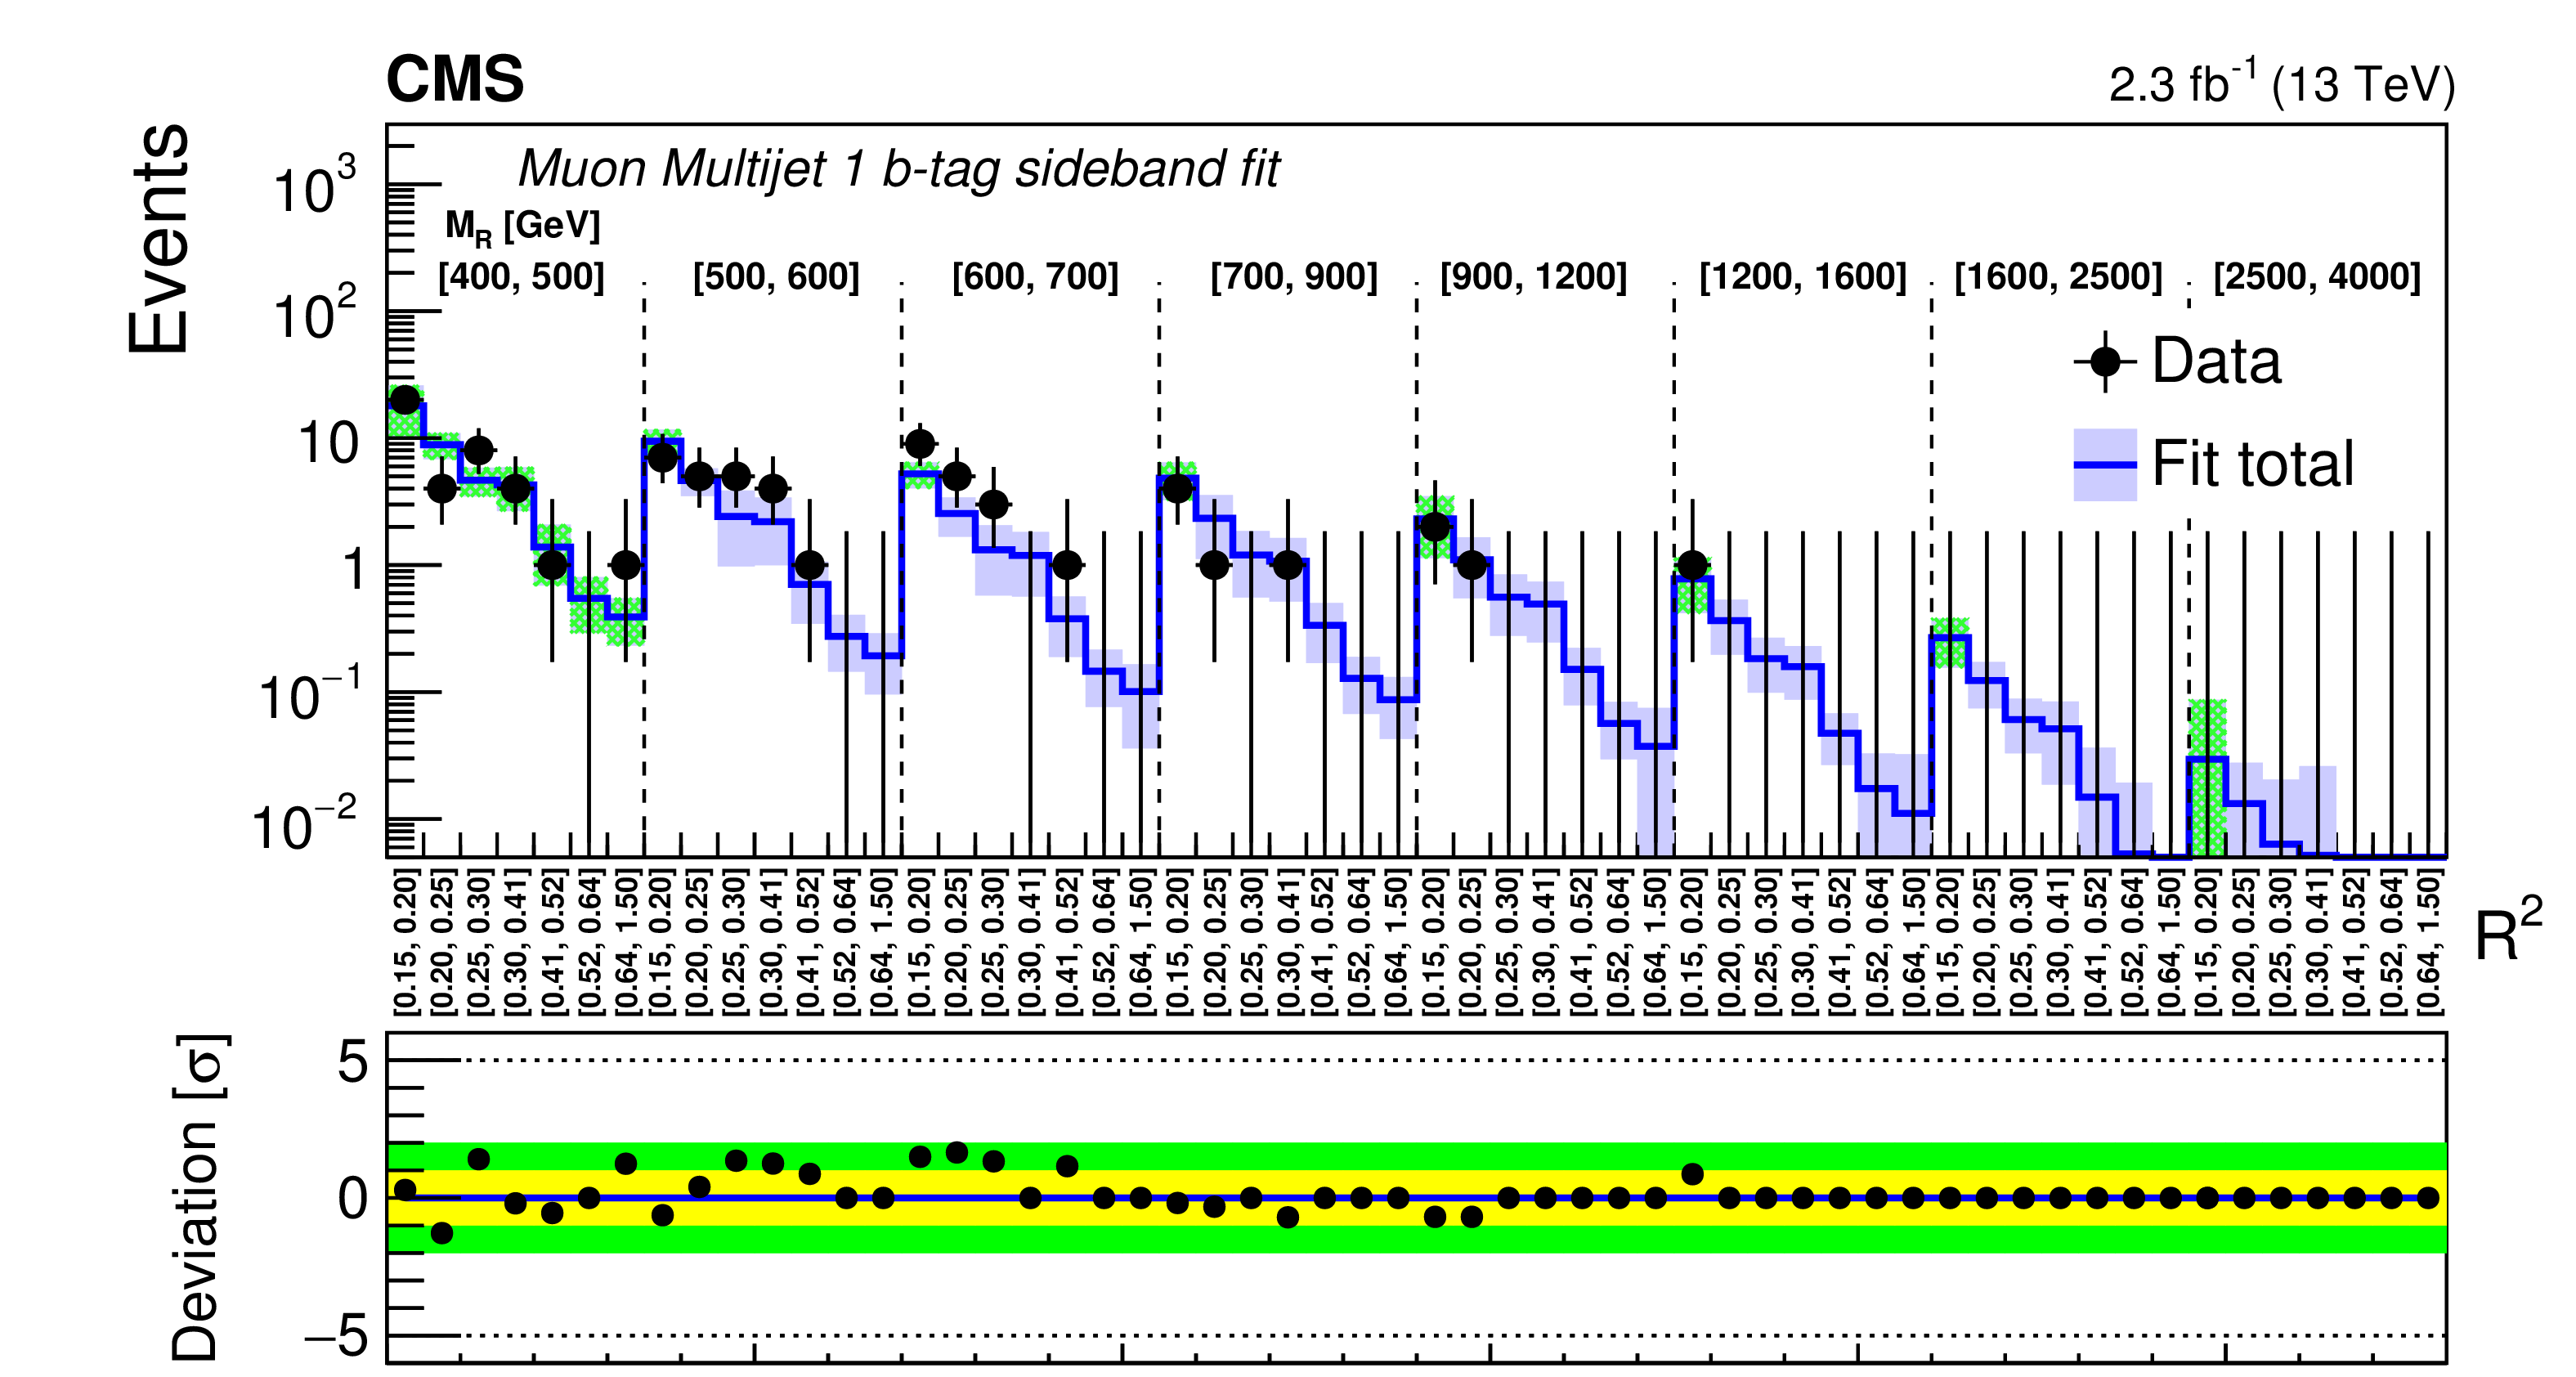
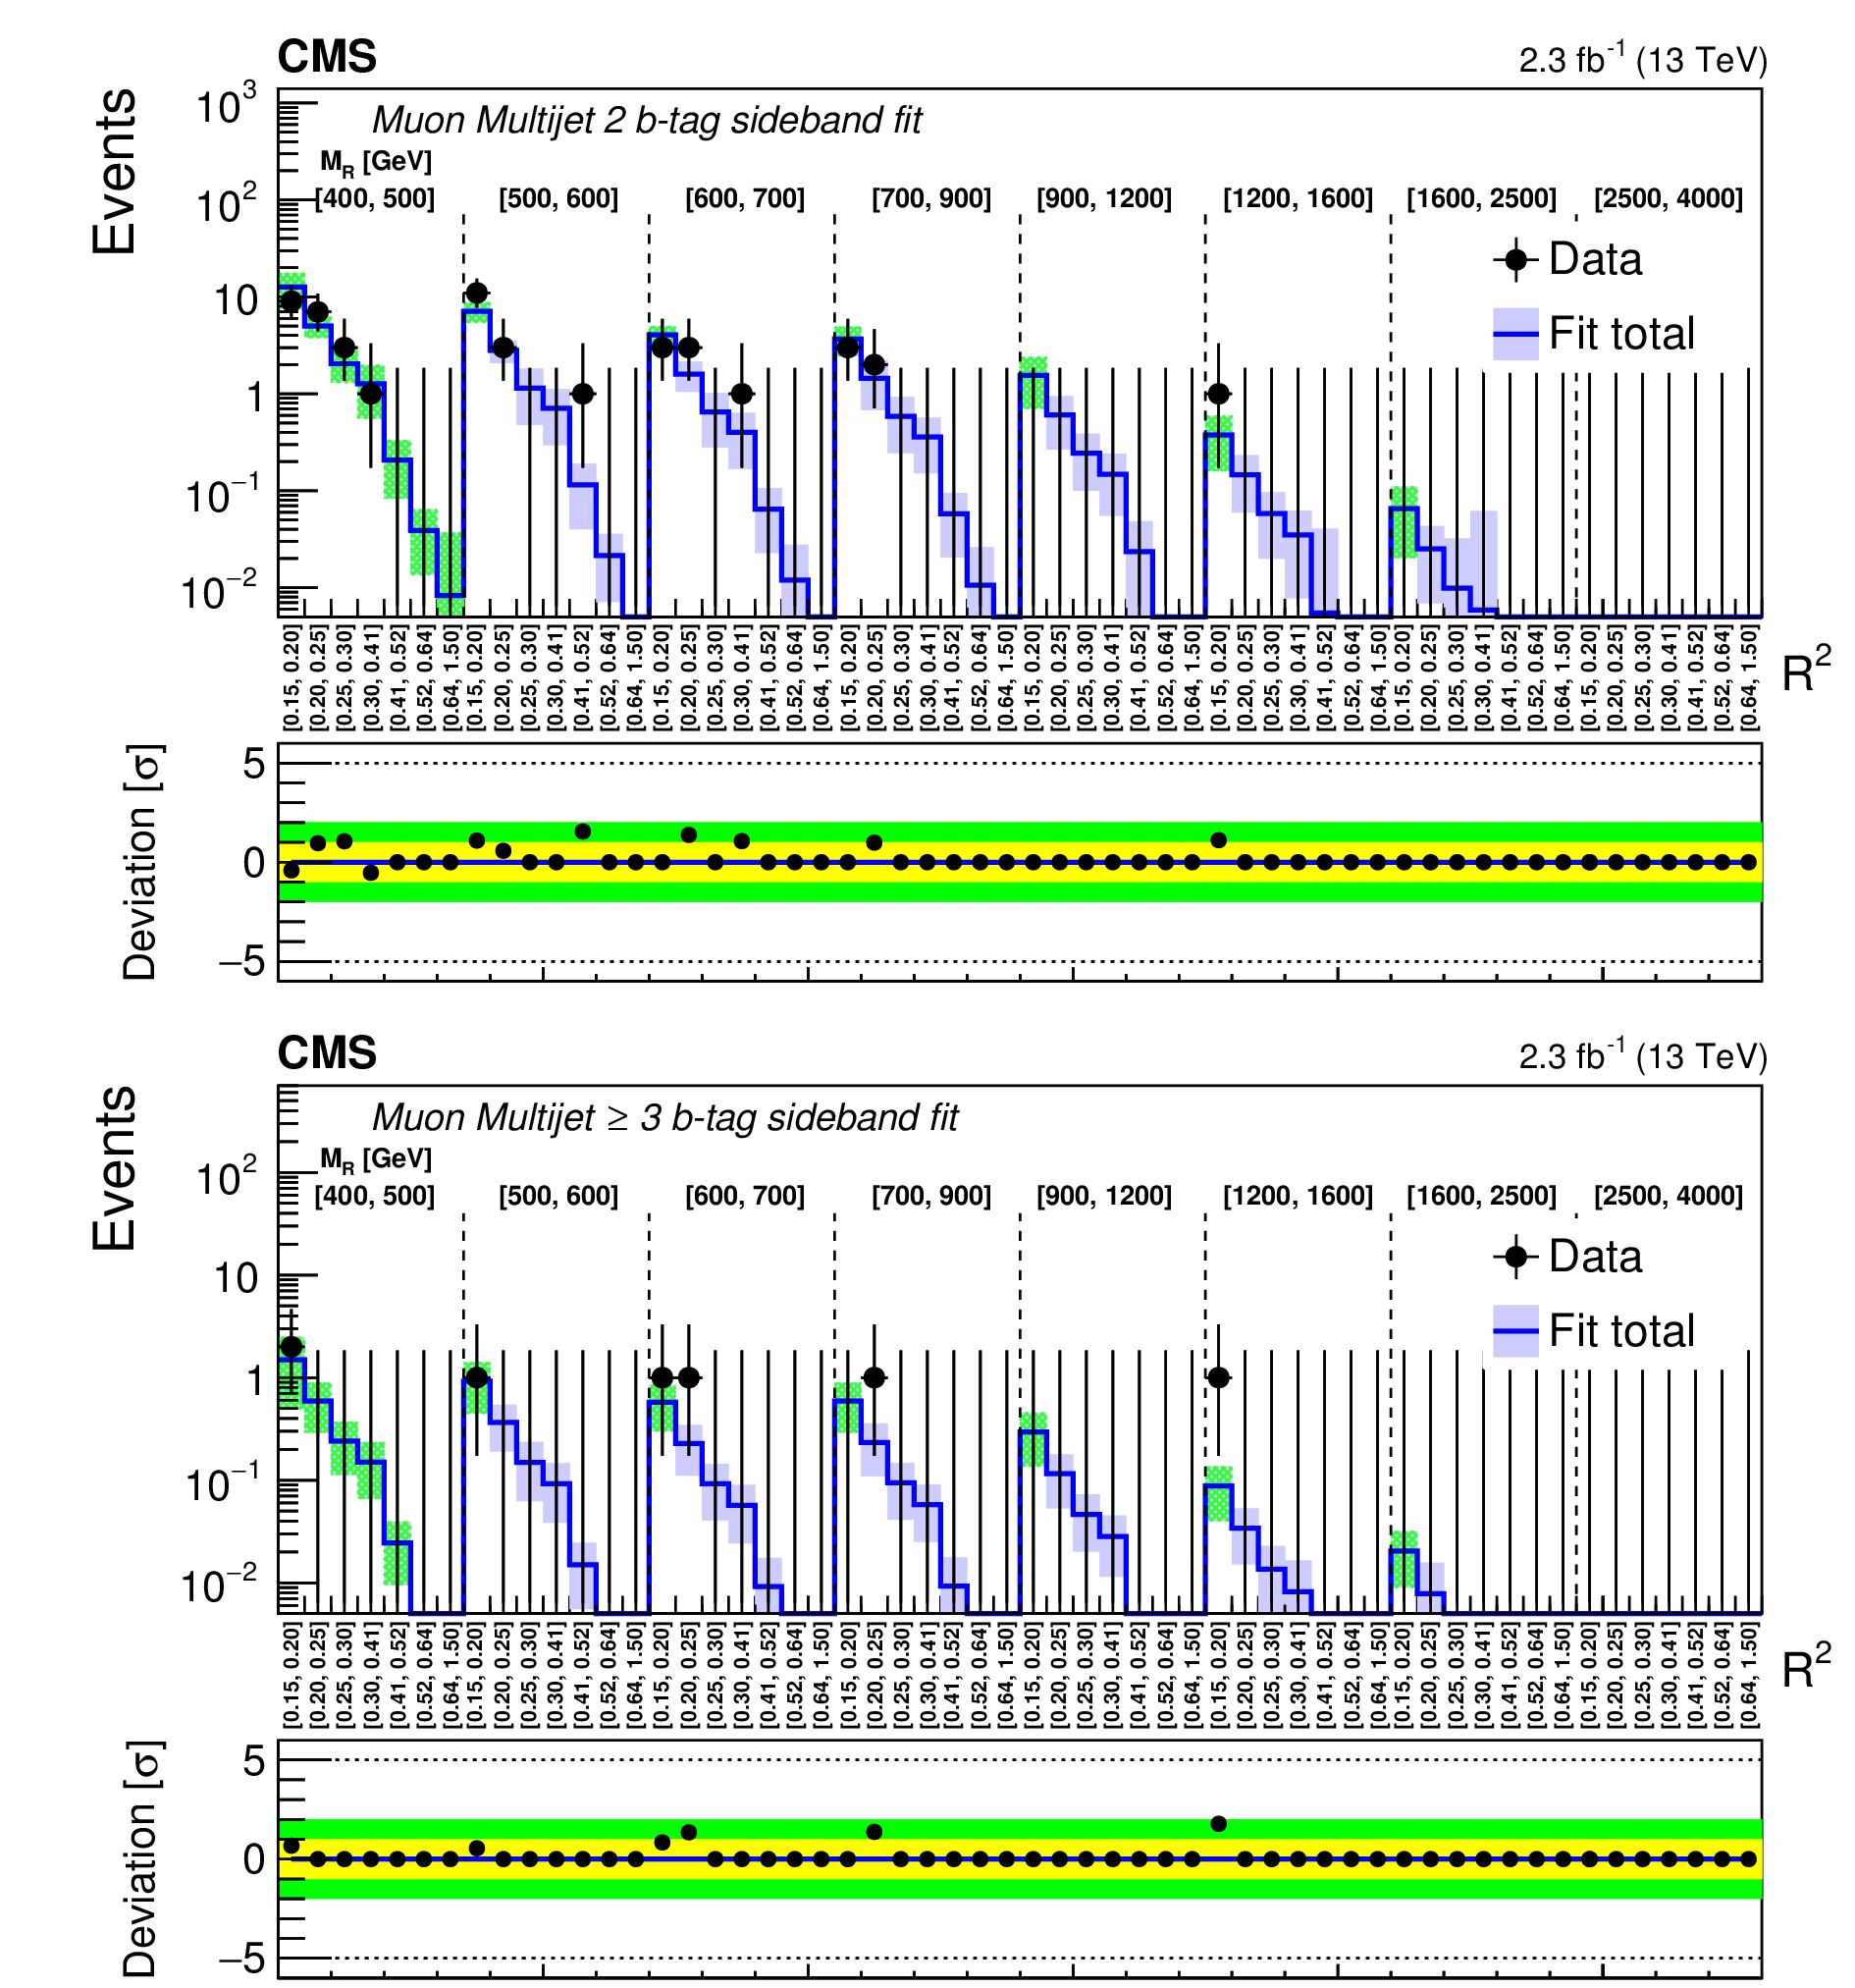
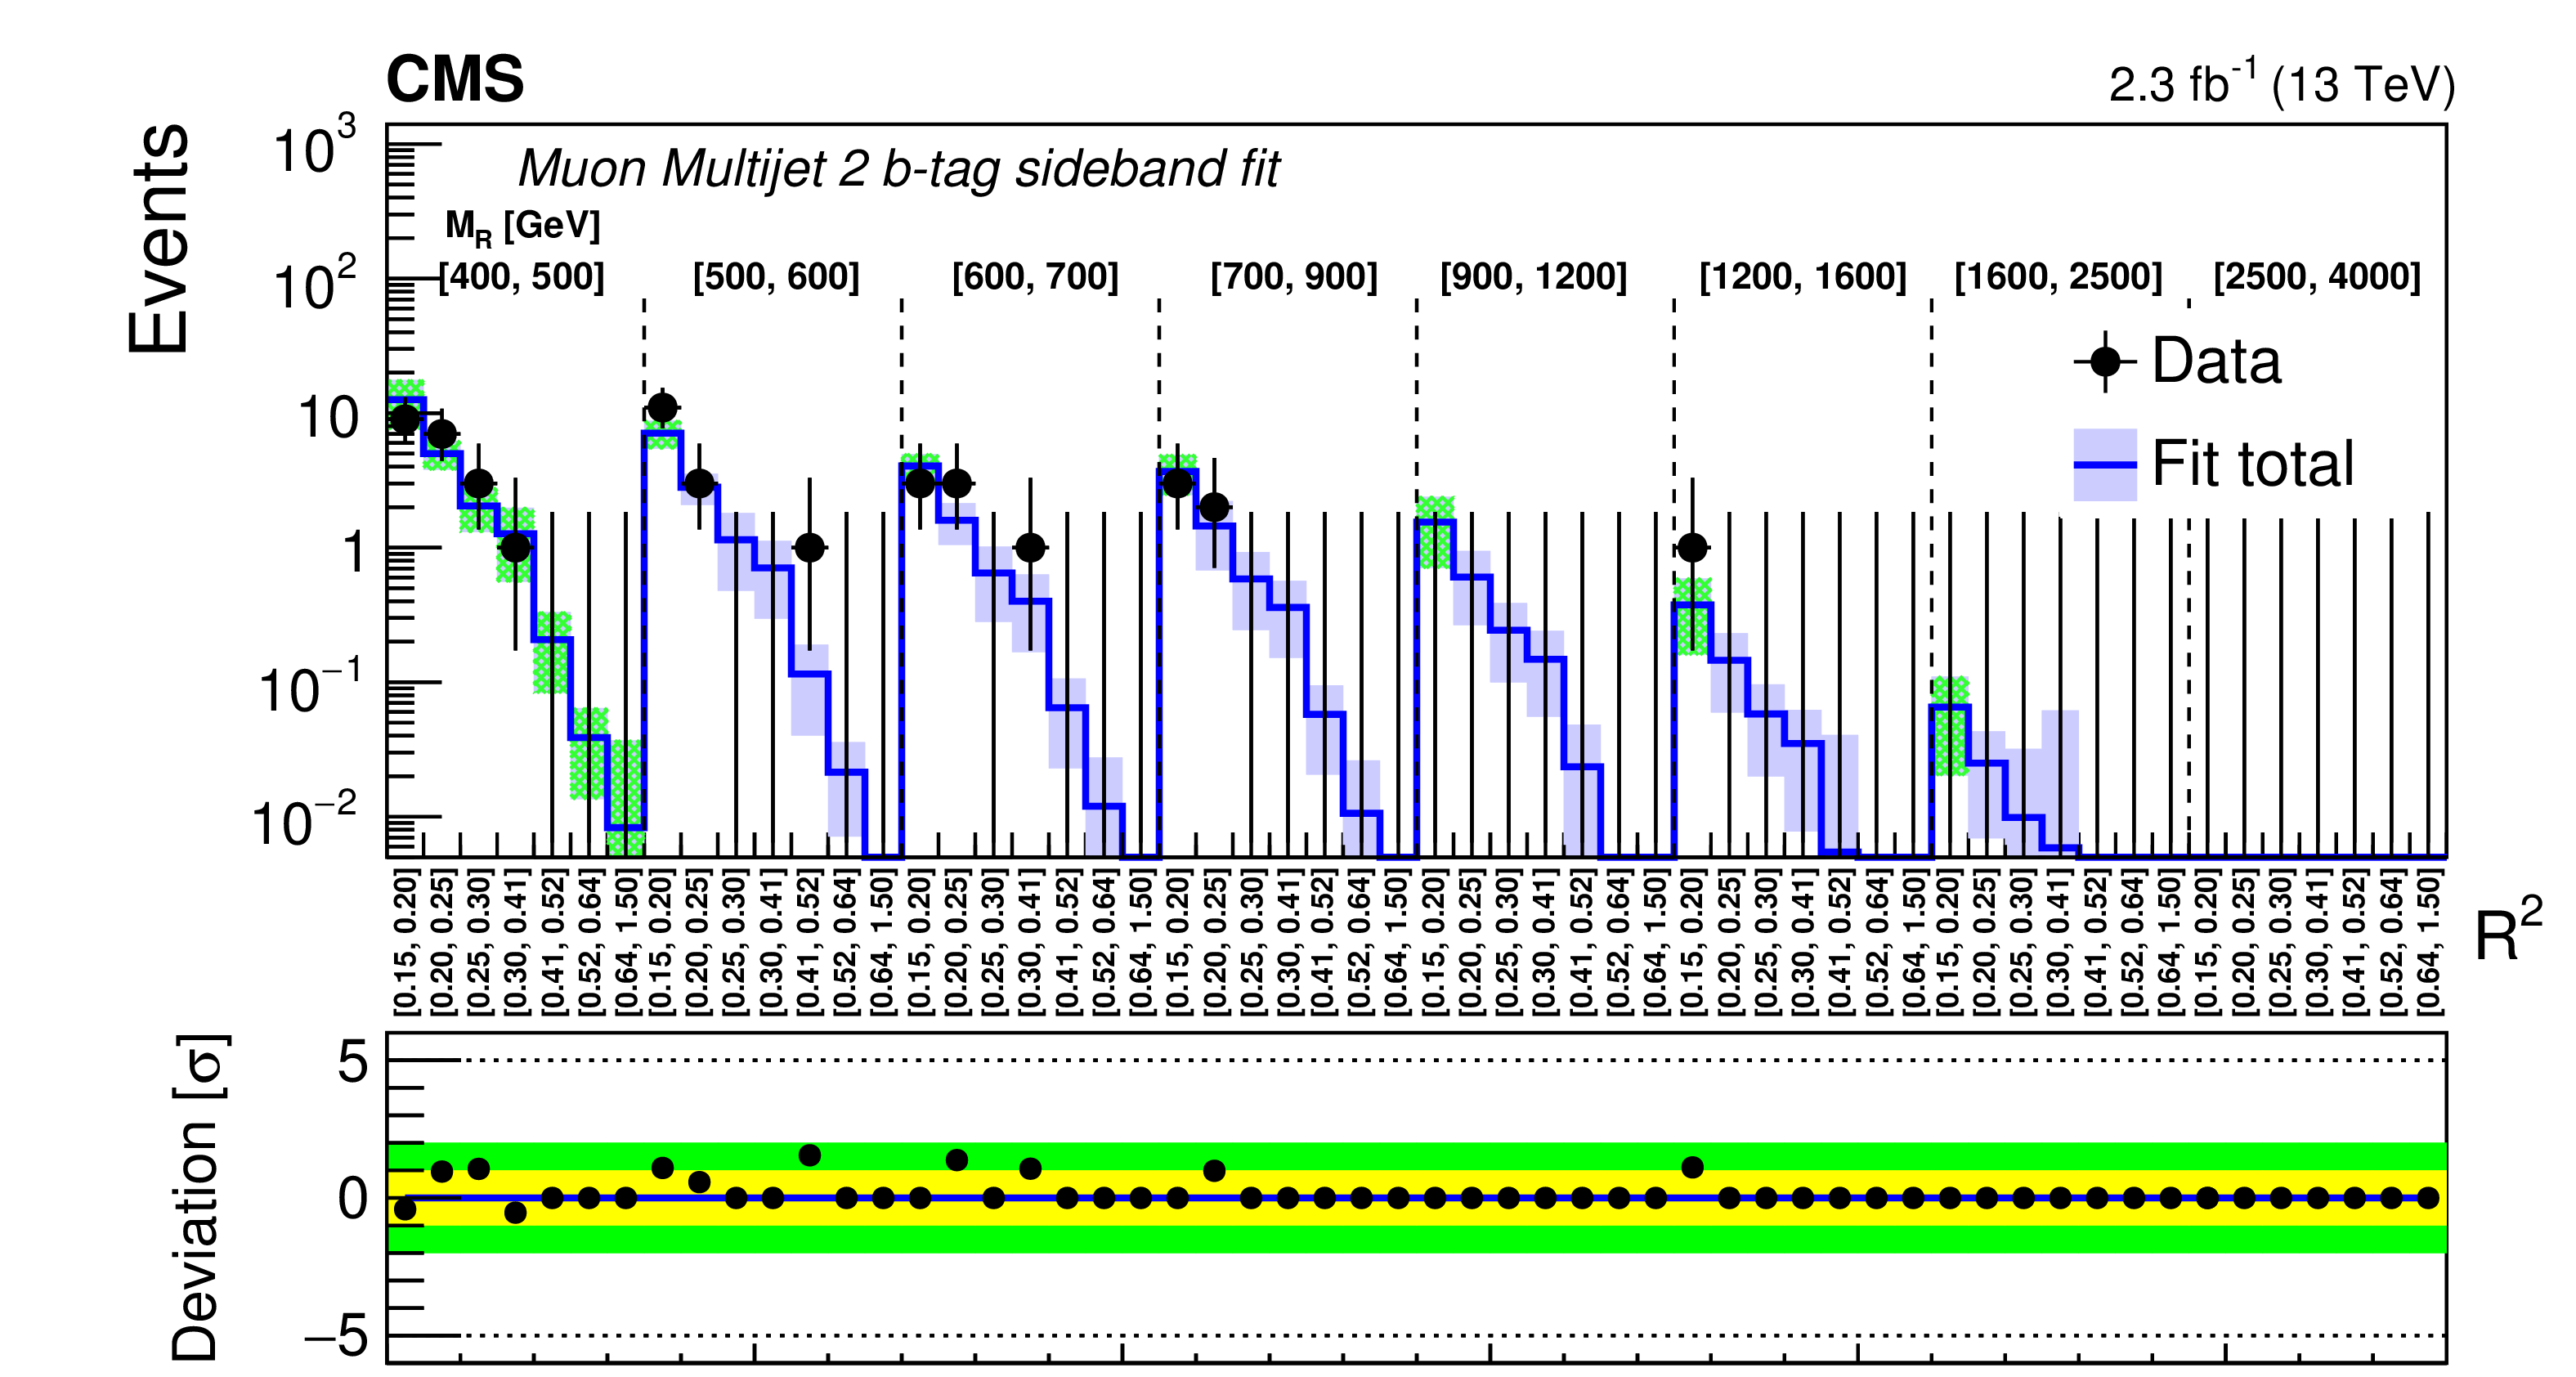
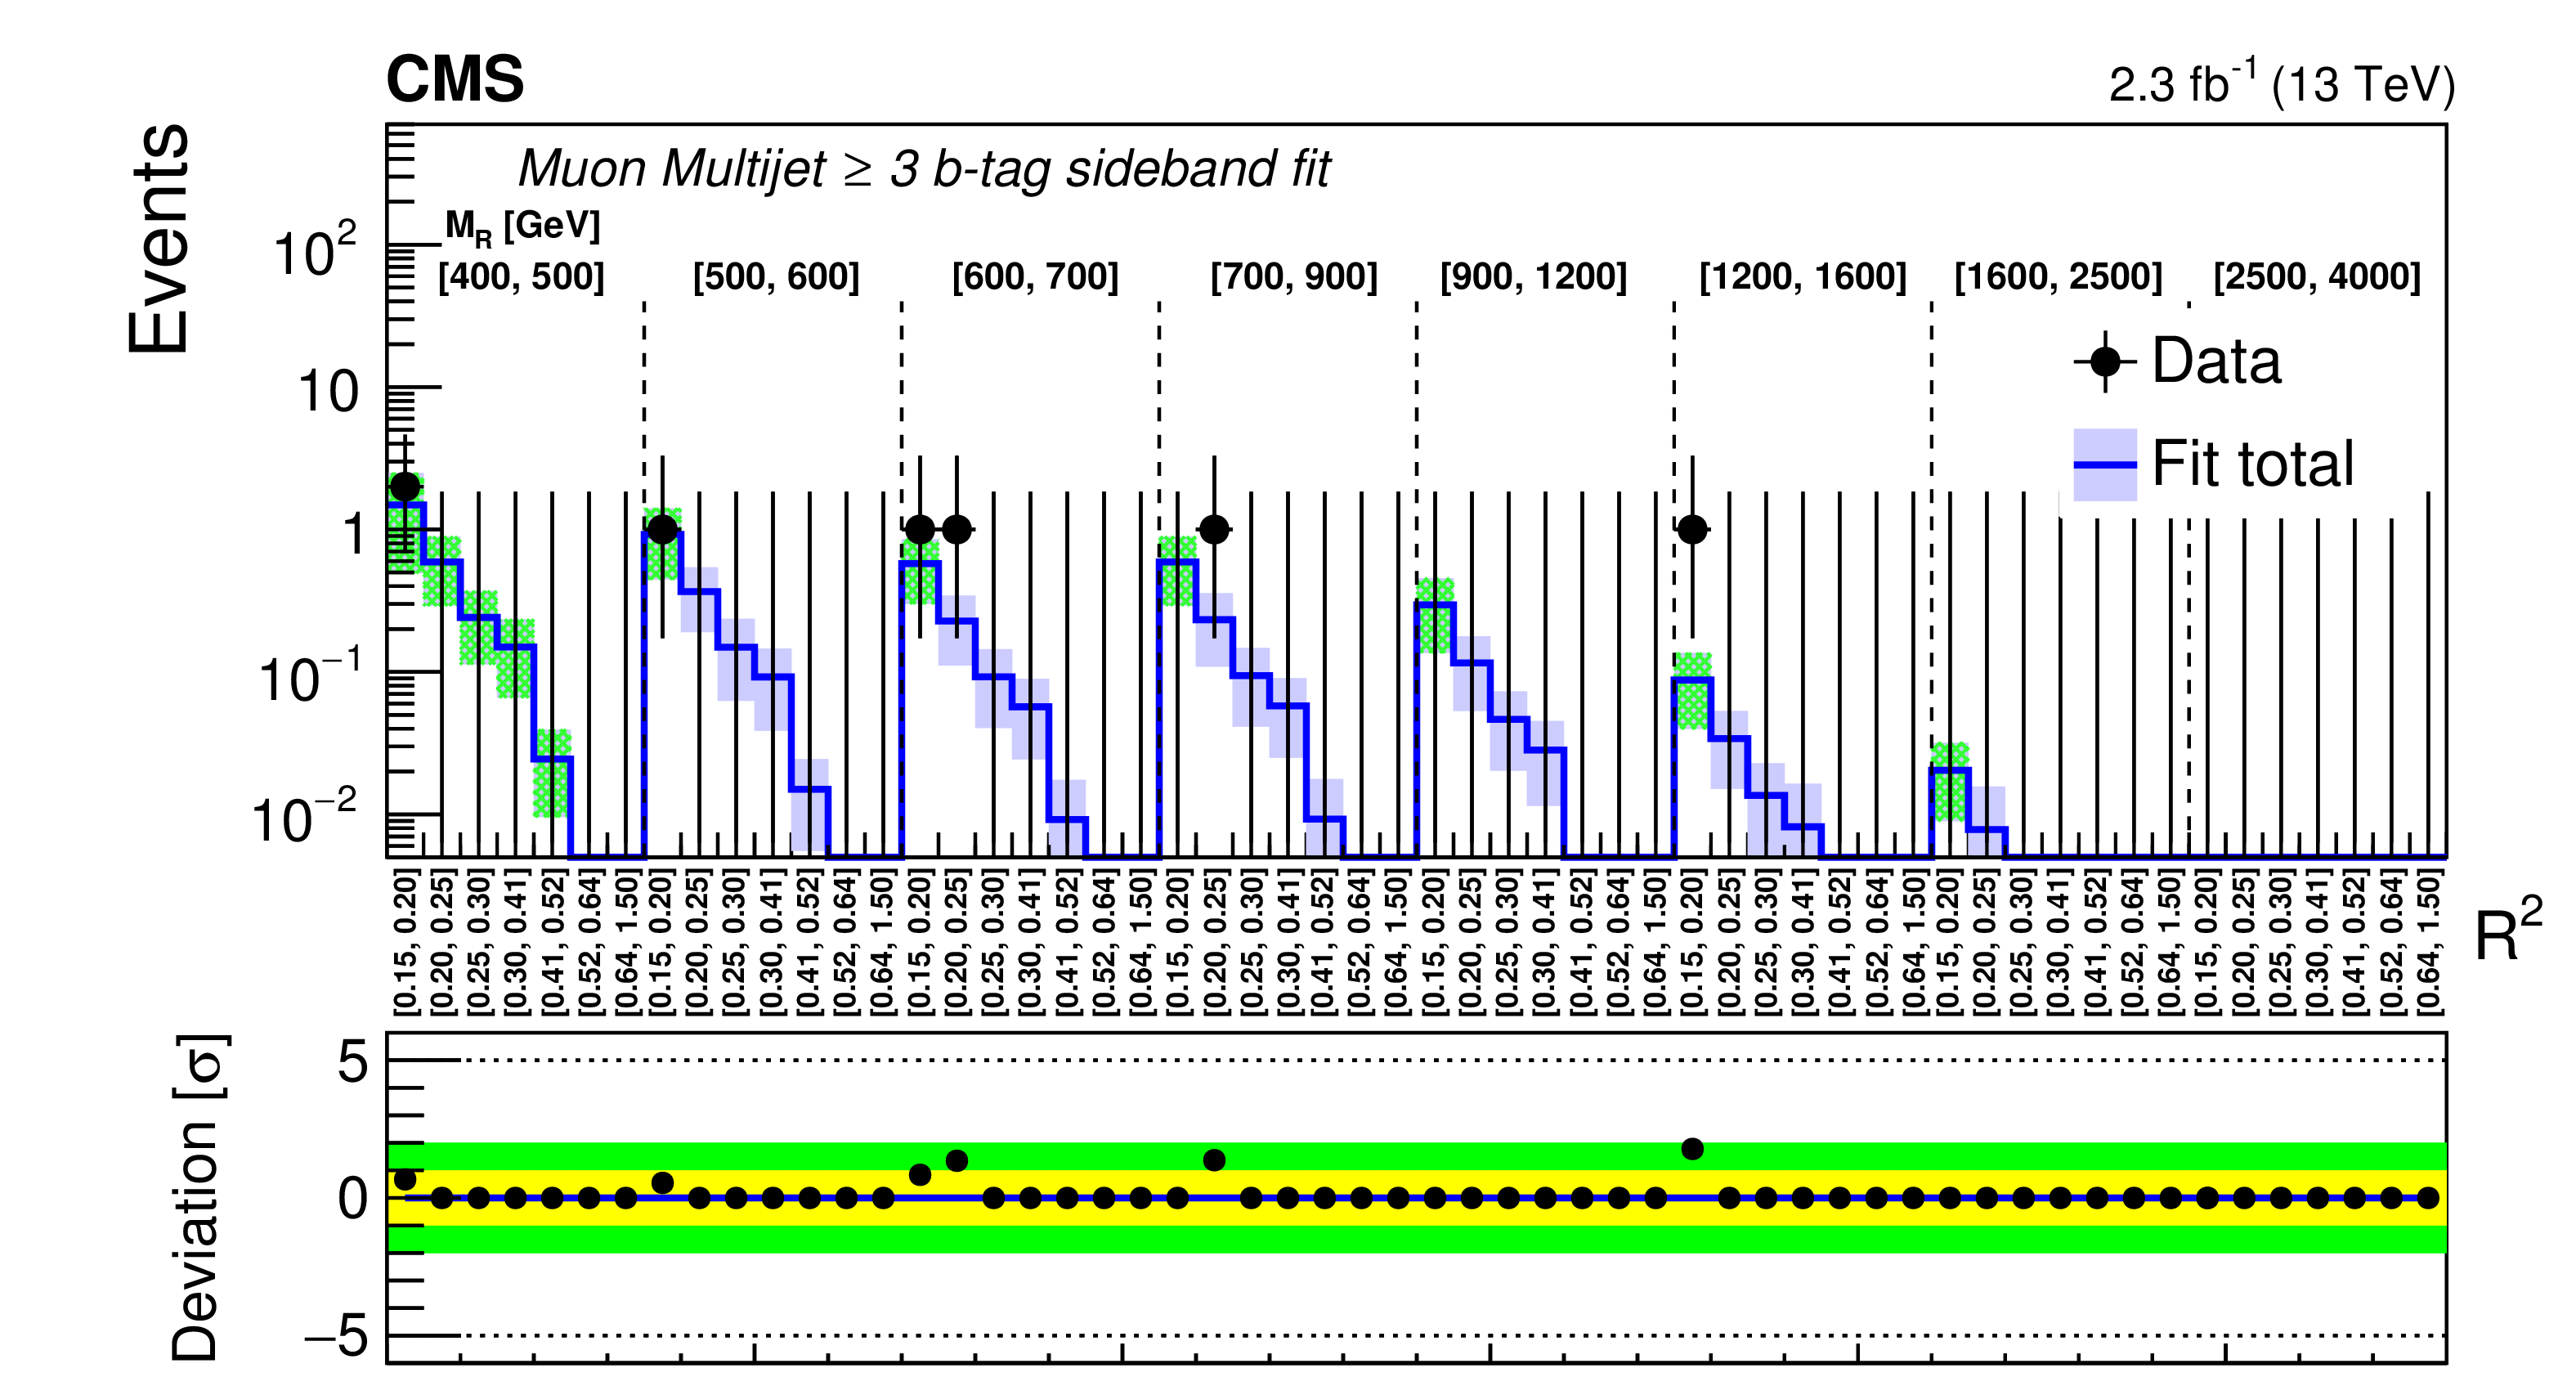
Comparison of the sideband fit background prediction with the observed data in bins of $ {M_\mathrm {R}} $ and $ {\mathrm {R}^2} $ variables in the Multijet category for the 2b-tag (upper) and ${\geq }$3b-tag (lower) bins. Vertical dashed lines denote the boundaries of different $ {M_\mathrm {R}} $ bins. On the upper panels, the colored bands represent the systematic uncertainties in the background prediction, and the uncertainty bands for the sideband bins are shown in green. On the bottom panels, the deviations between the observed data and the background prediction are plotted in units of standard deviation ($\sigma $), taking into account both statistical and systematic uncertainties. The green and yellow horizontal bands show the boundaries of $1$ and $2\sigma $. |

png pdf |
Figure 7-a:
Comparison of the sideband fit background prediction with the observed data in bins of $ {M_\mathrm {R}} $ and $ {\mathrm {R}^2} $ variables in the Multijet category for the 2b-tag bin. Vertical dashed lines denote the boundaries of different $ {M_\mathrm {R}} $ bins. On the upper panel, the colored bands represent the systematic uncertainties in the background prediction, and the uncertainty bands for the sideband bins are shown in green. On the bottom panel, the deviations between the observed data and the background prediction are plotted in units of standard deviation ($\sigma $), taking into account both statistical and systematic uncertainties. The green and yellow horizontal bands show the boundaries of $1$ and $2\sigma $. |
png pdf |
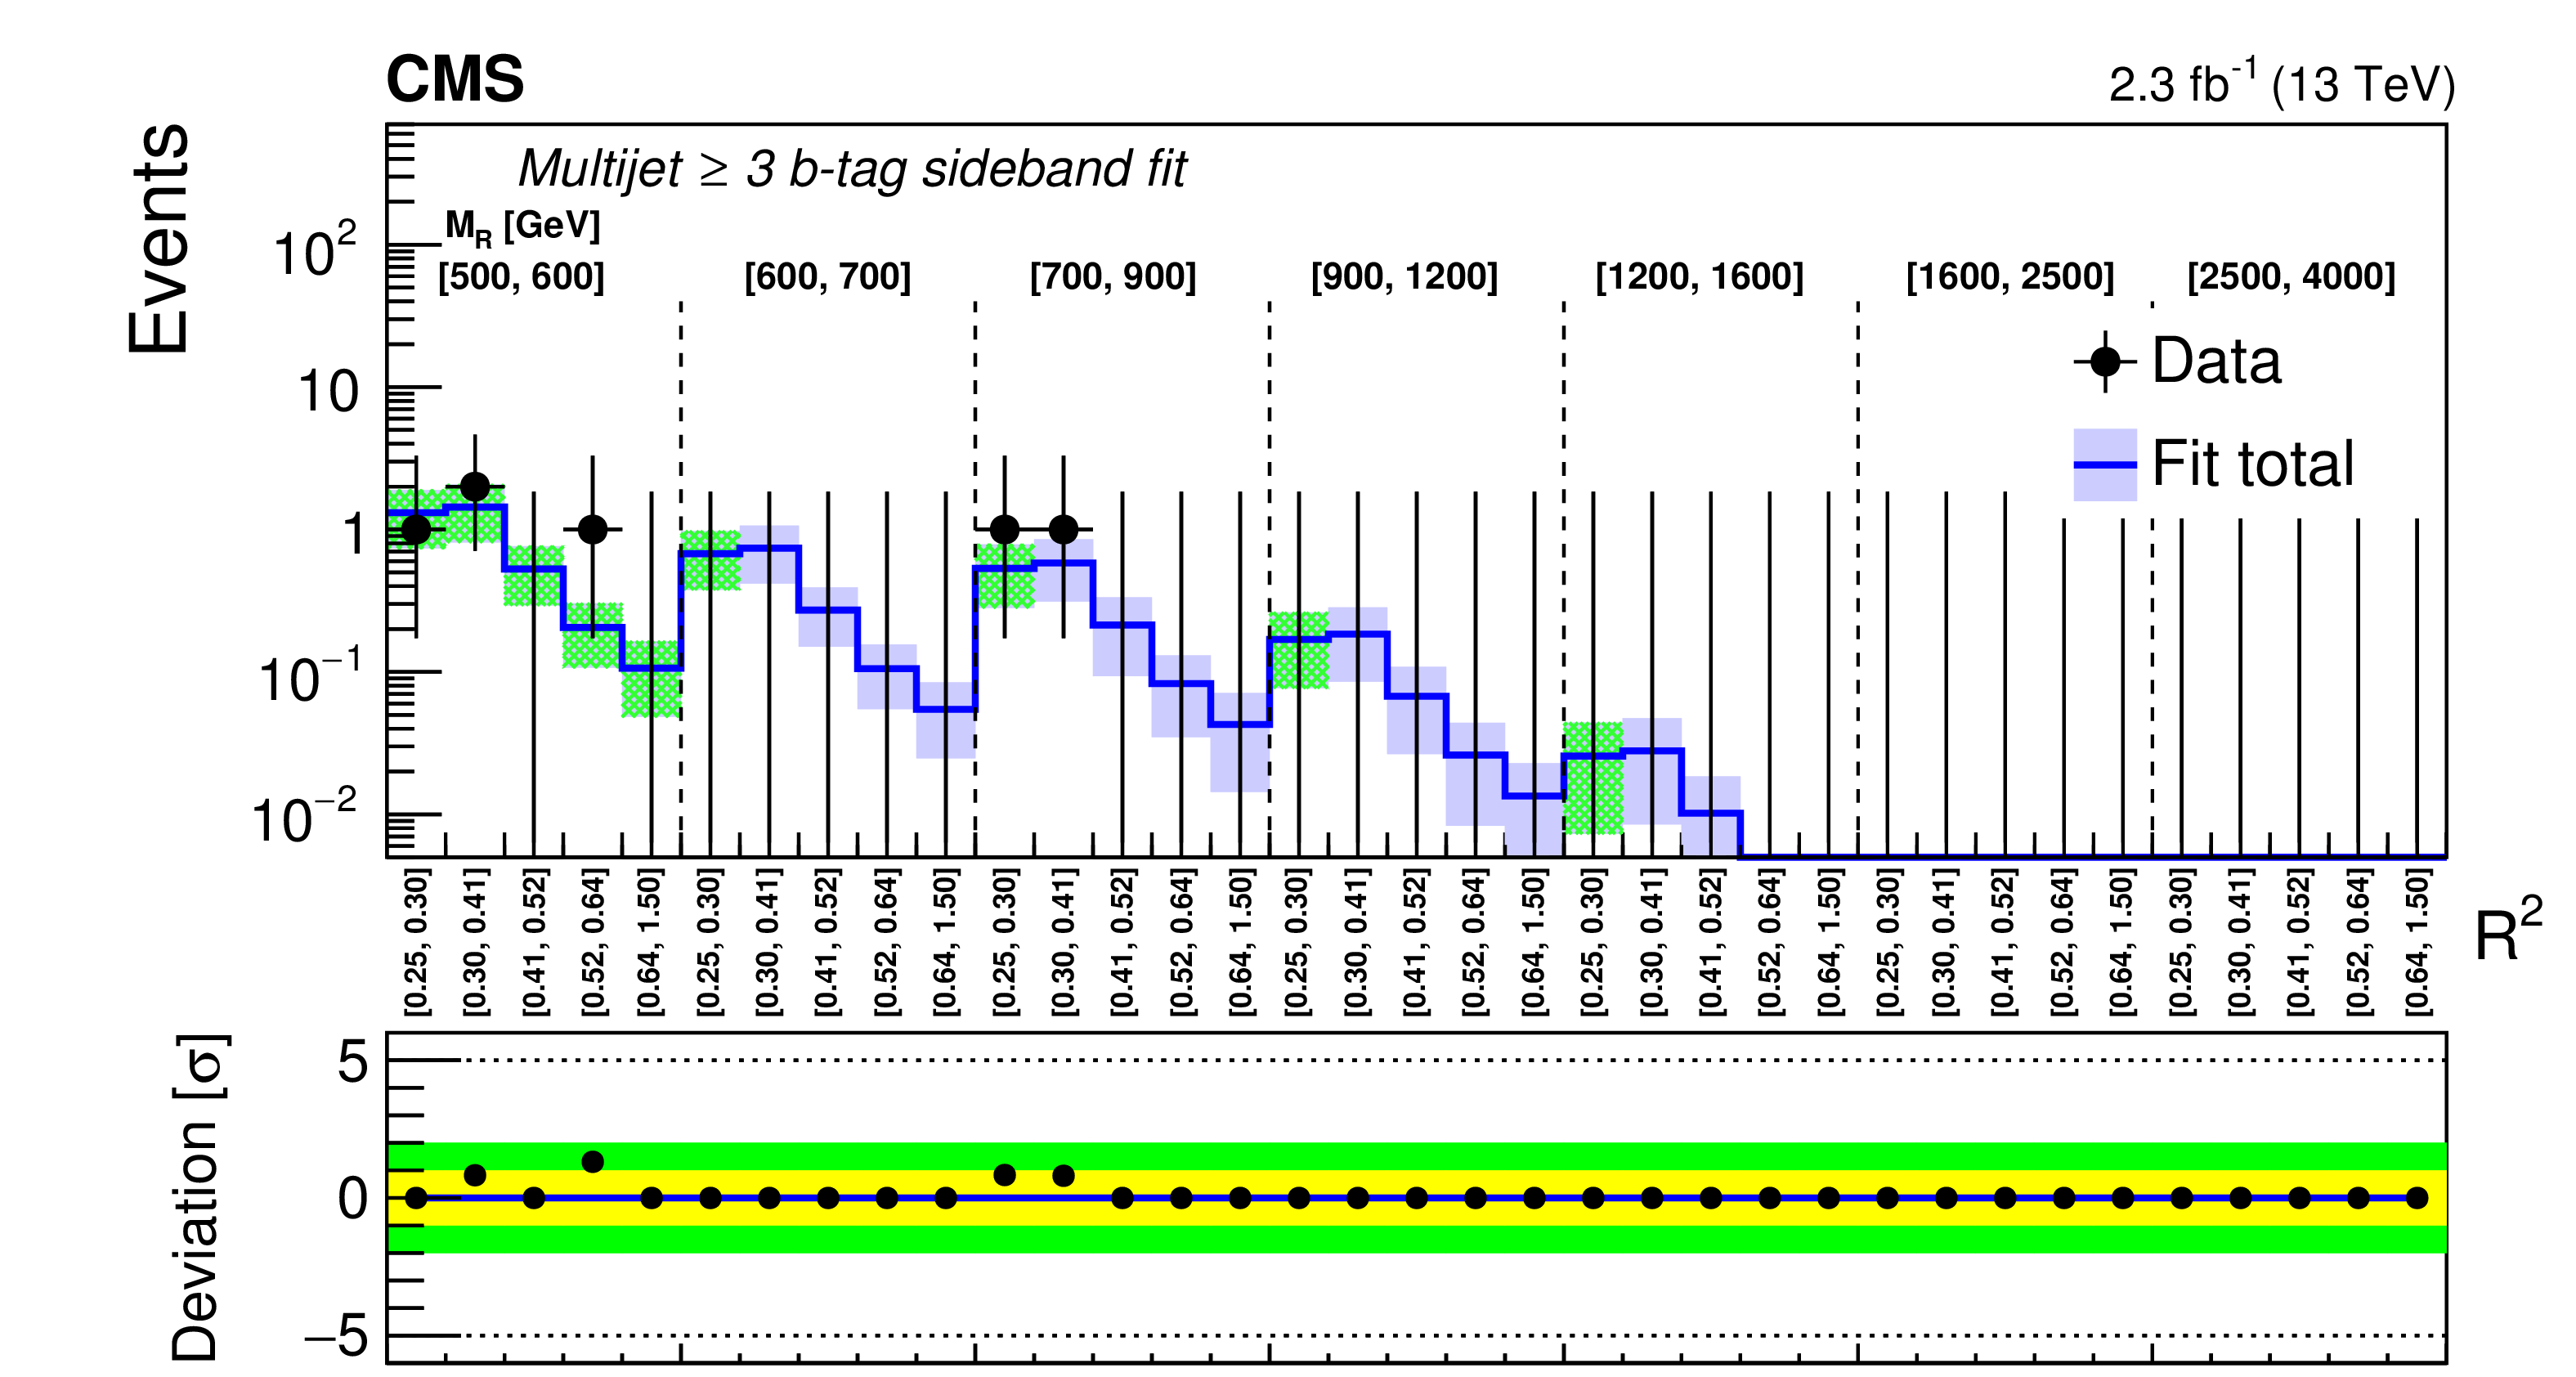
Figure 7-b:
Comparison of the sideband fit background prediction with the observed data in bins of $ {M_\mathrm {R}} $ and $ {\mathrm {R}^2} $ variables in the Multijet category for the ${\geq }$3b-tag bin. Vertical dashed lines denote the boundaries of different $ {M_\mathrm {R}} $ bins. On the upper panel, the colored bands represent the systematic uncertainties in the background prediction, and the uncertainty bands for the sideband bins are shown in green. On the bottom panel, the deviations between the observed data and the background prediction are plotted in units of standard deviation ($\sigma $), taking into account both statistical and systematic uncertainties. The green and yellow horizontal bands show the boundaries of $1$ and $2\sigma $. |
png pdf |
Figure 8:
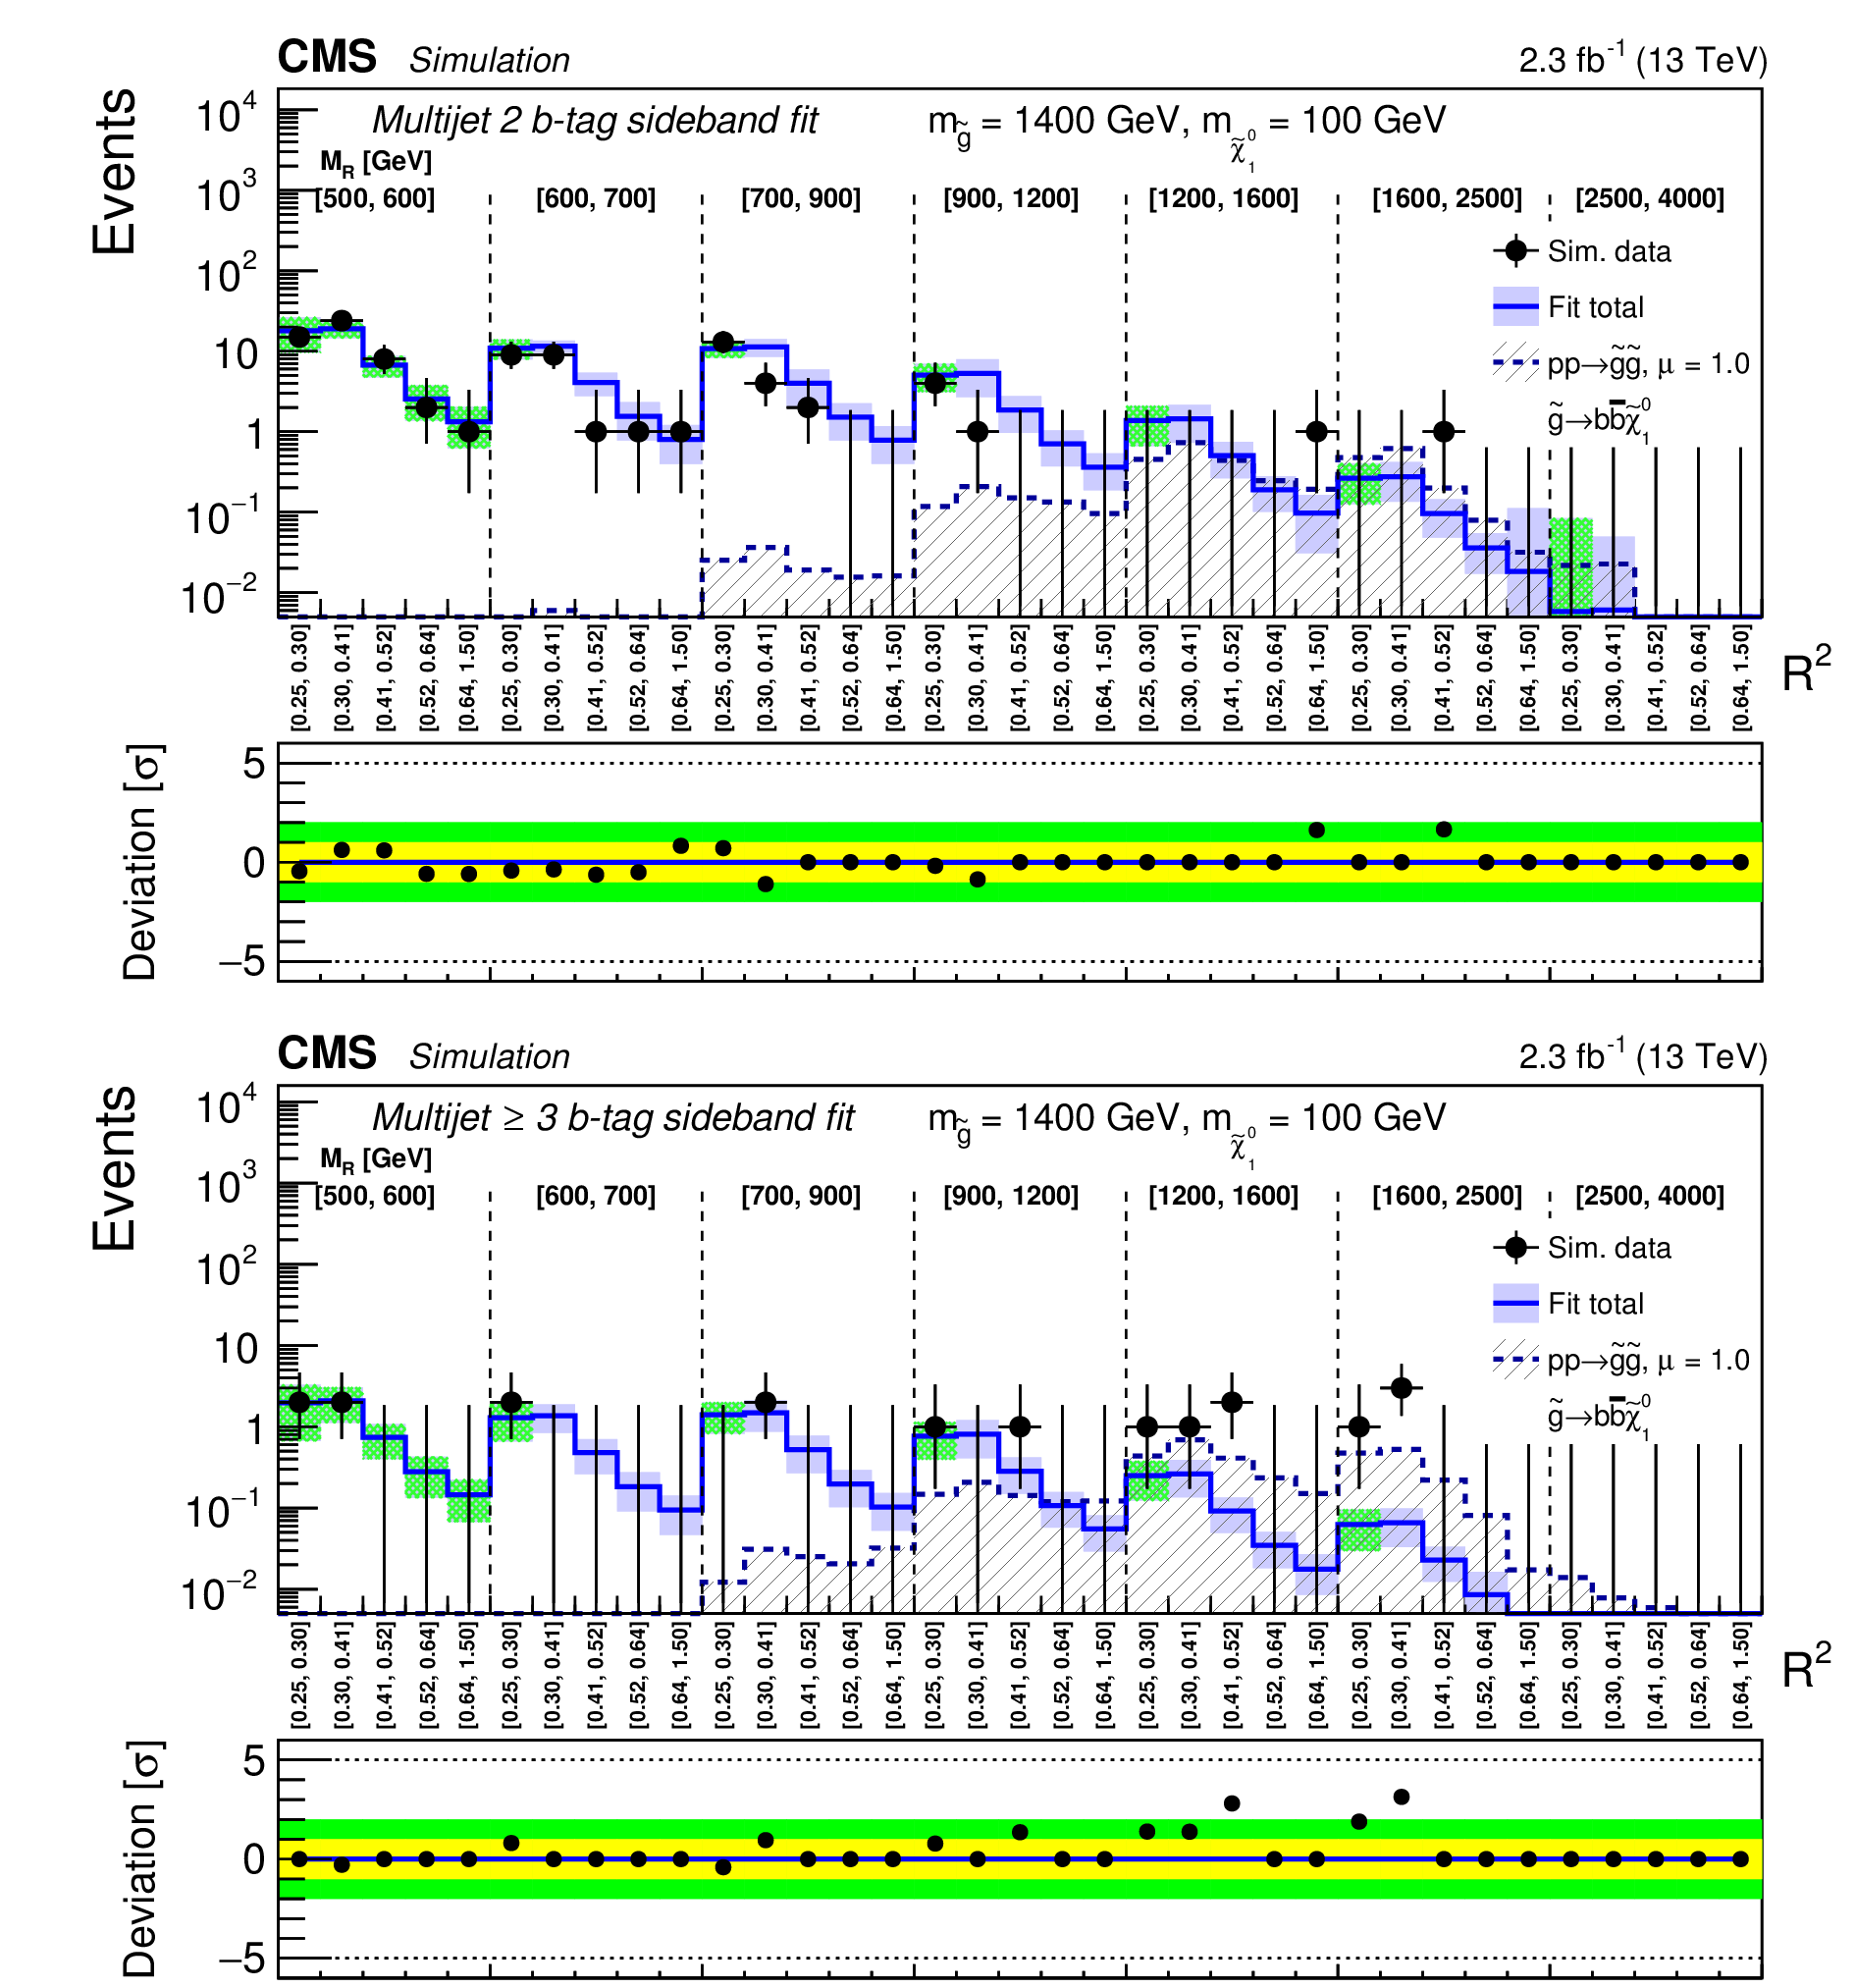
The result of the background-only fit performed in the sideband of the 2b-tag (upper) and ${\geq }$3b-tag (lower) bins of the Multijet category on a signal-plus-background pseudo-data set assuming a gluino pair production simplified model signal, where gluinos decay with a 100% branching fraction to a $ {\mathrm{ b \bar{b} } } $ pair and the LSP, with $m_{\tilde{\gamma} } = 1.4 TeV $ and $m_{\tilde{\chi}^{0}_{1}}= $ 100 GeV, at nominal signal strength. A detailed explanation of the figure format is given in the caption of Fig. 7. |

png pdf |
Figure 8-a:
The result of the background-only fit performed in the sideband of the 2b-tag bin of the Multijet category on a signal-plus-background pseudo-data set assuming a gluino pair production simplified model signal, where gluinos decay with a 100% branching fraction to a $ {\mathrm{ b \bar{b} } } $ pair and the LSP, with $m_{\tilde{\gamma} } = 1.4 TeV $ and $m_{\tilde{\chi}^{0}_{1}}= $ 100 GeV, at nominal signal strength. A detailed explanation of the figure format is given in the caption of Fig. 7. |

png pdf |
Figure 8-b:
The result of the background-only fit performed in the sideband of the ${\geq }$3b-tag bin of the Multijet category on a signal-plus-background pseudo-data set assuming a gluino pair production simplified model signal, where gluinos decay with a 100% branching fraction to a $ {\mathrm{ b \bar{b} } } $ pair and the LSP, with $m_{\tilde{\gamma} } = 1.4 TeV $ and $m_{\tilde{\chi}^{0}_{1}}= $ 100 GeV, at nominal signal strength. A detailed explanation of the figure format is given in the caption of Fig. 7. |
png pdf |
Figure 9:
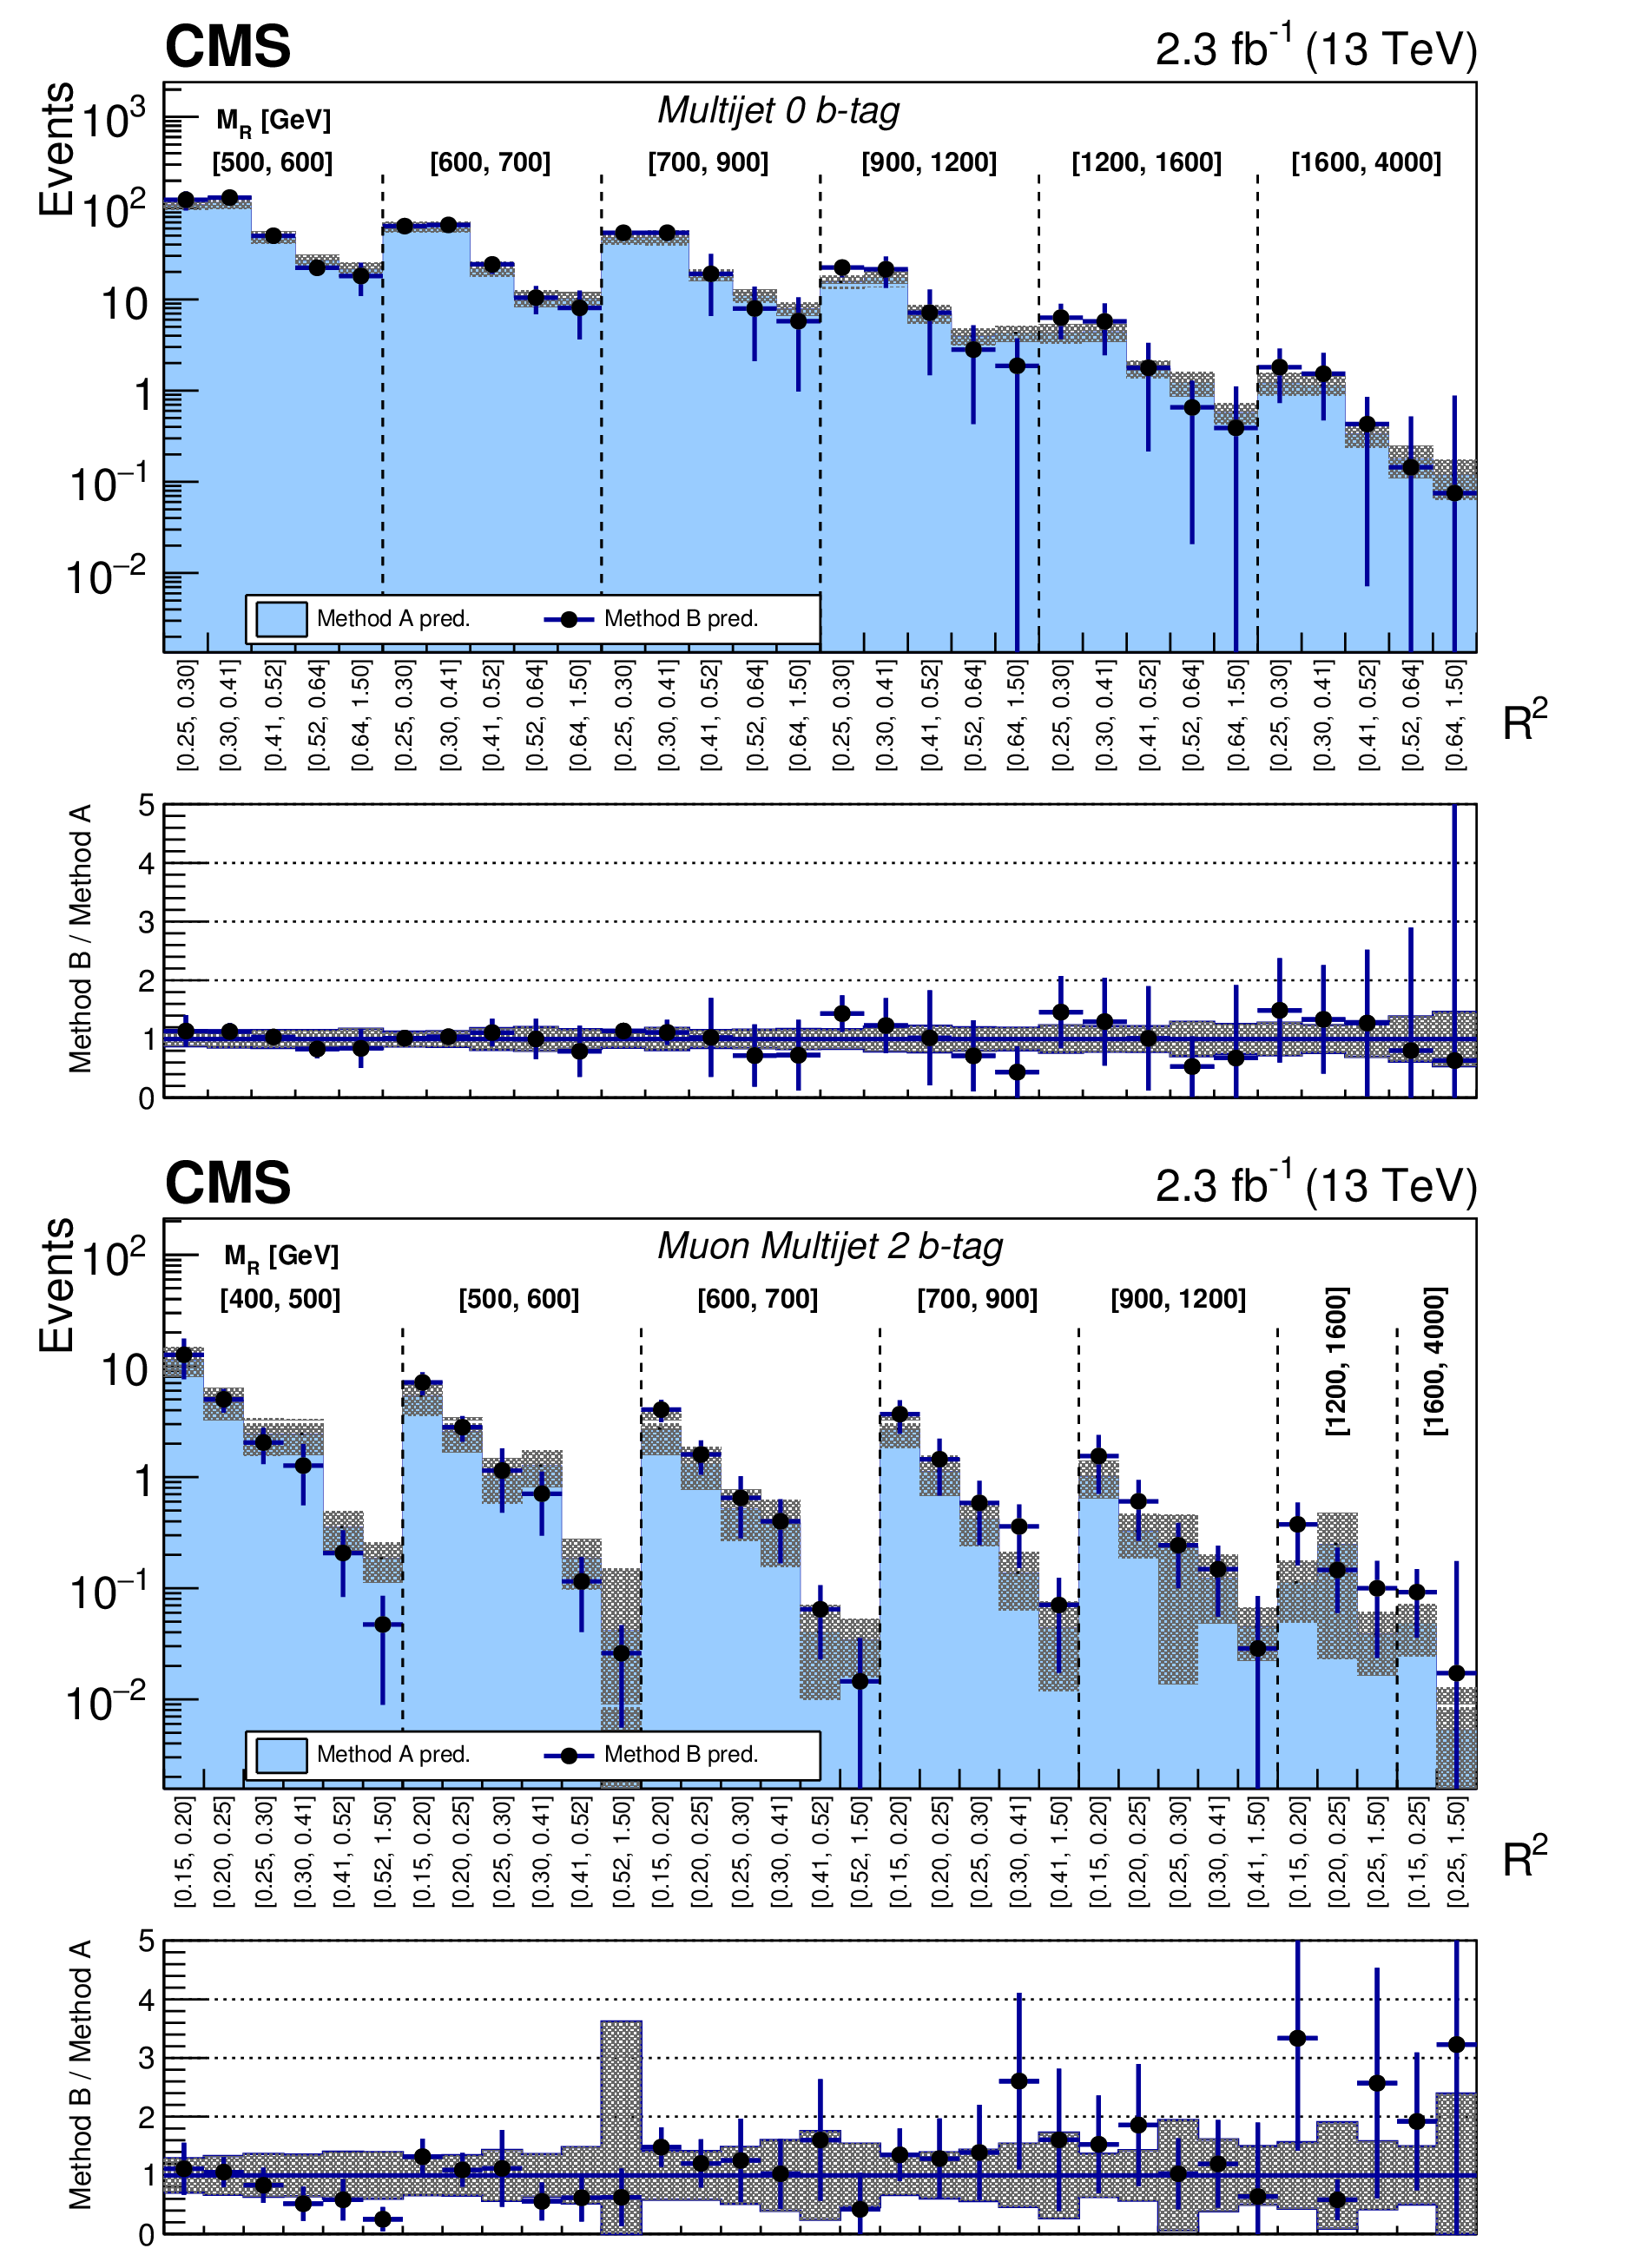
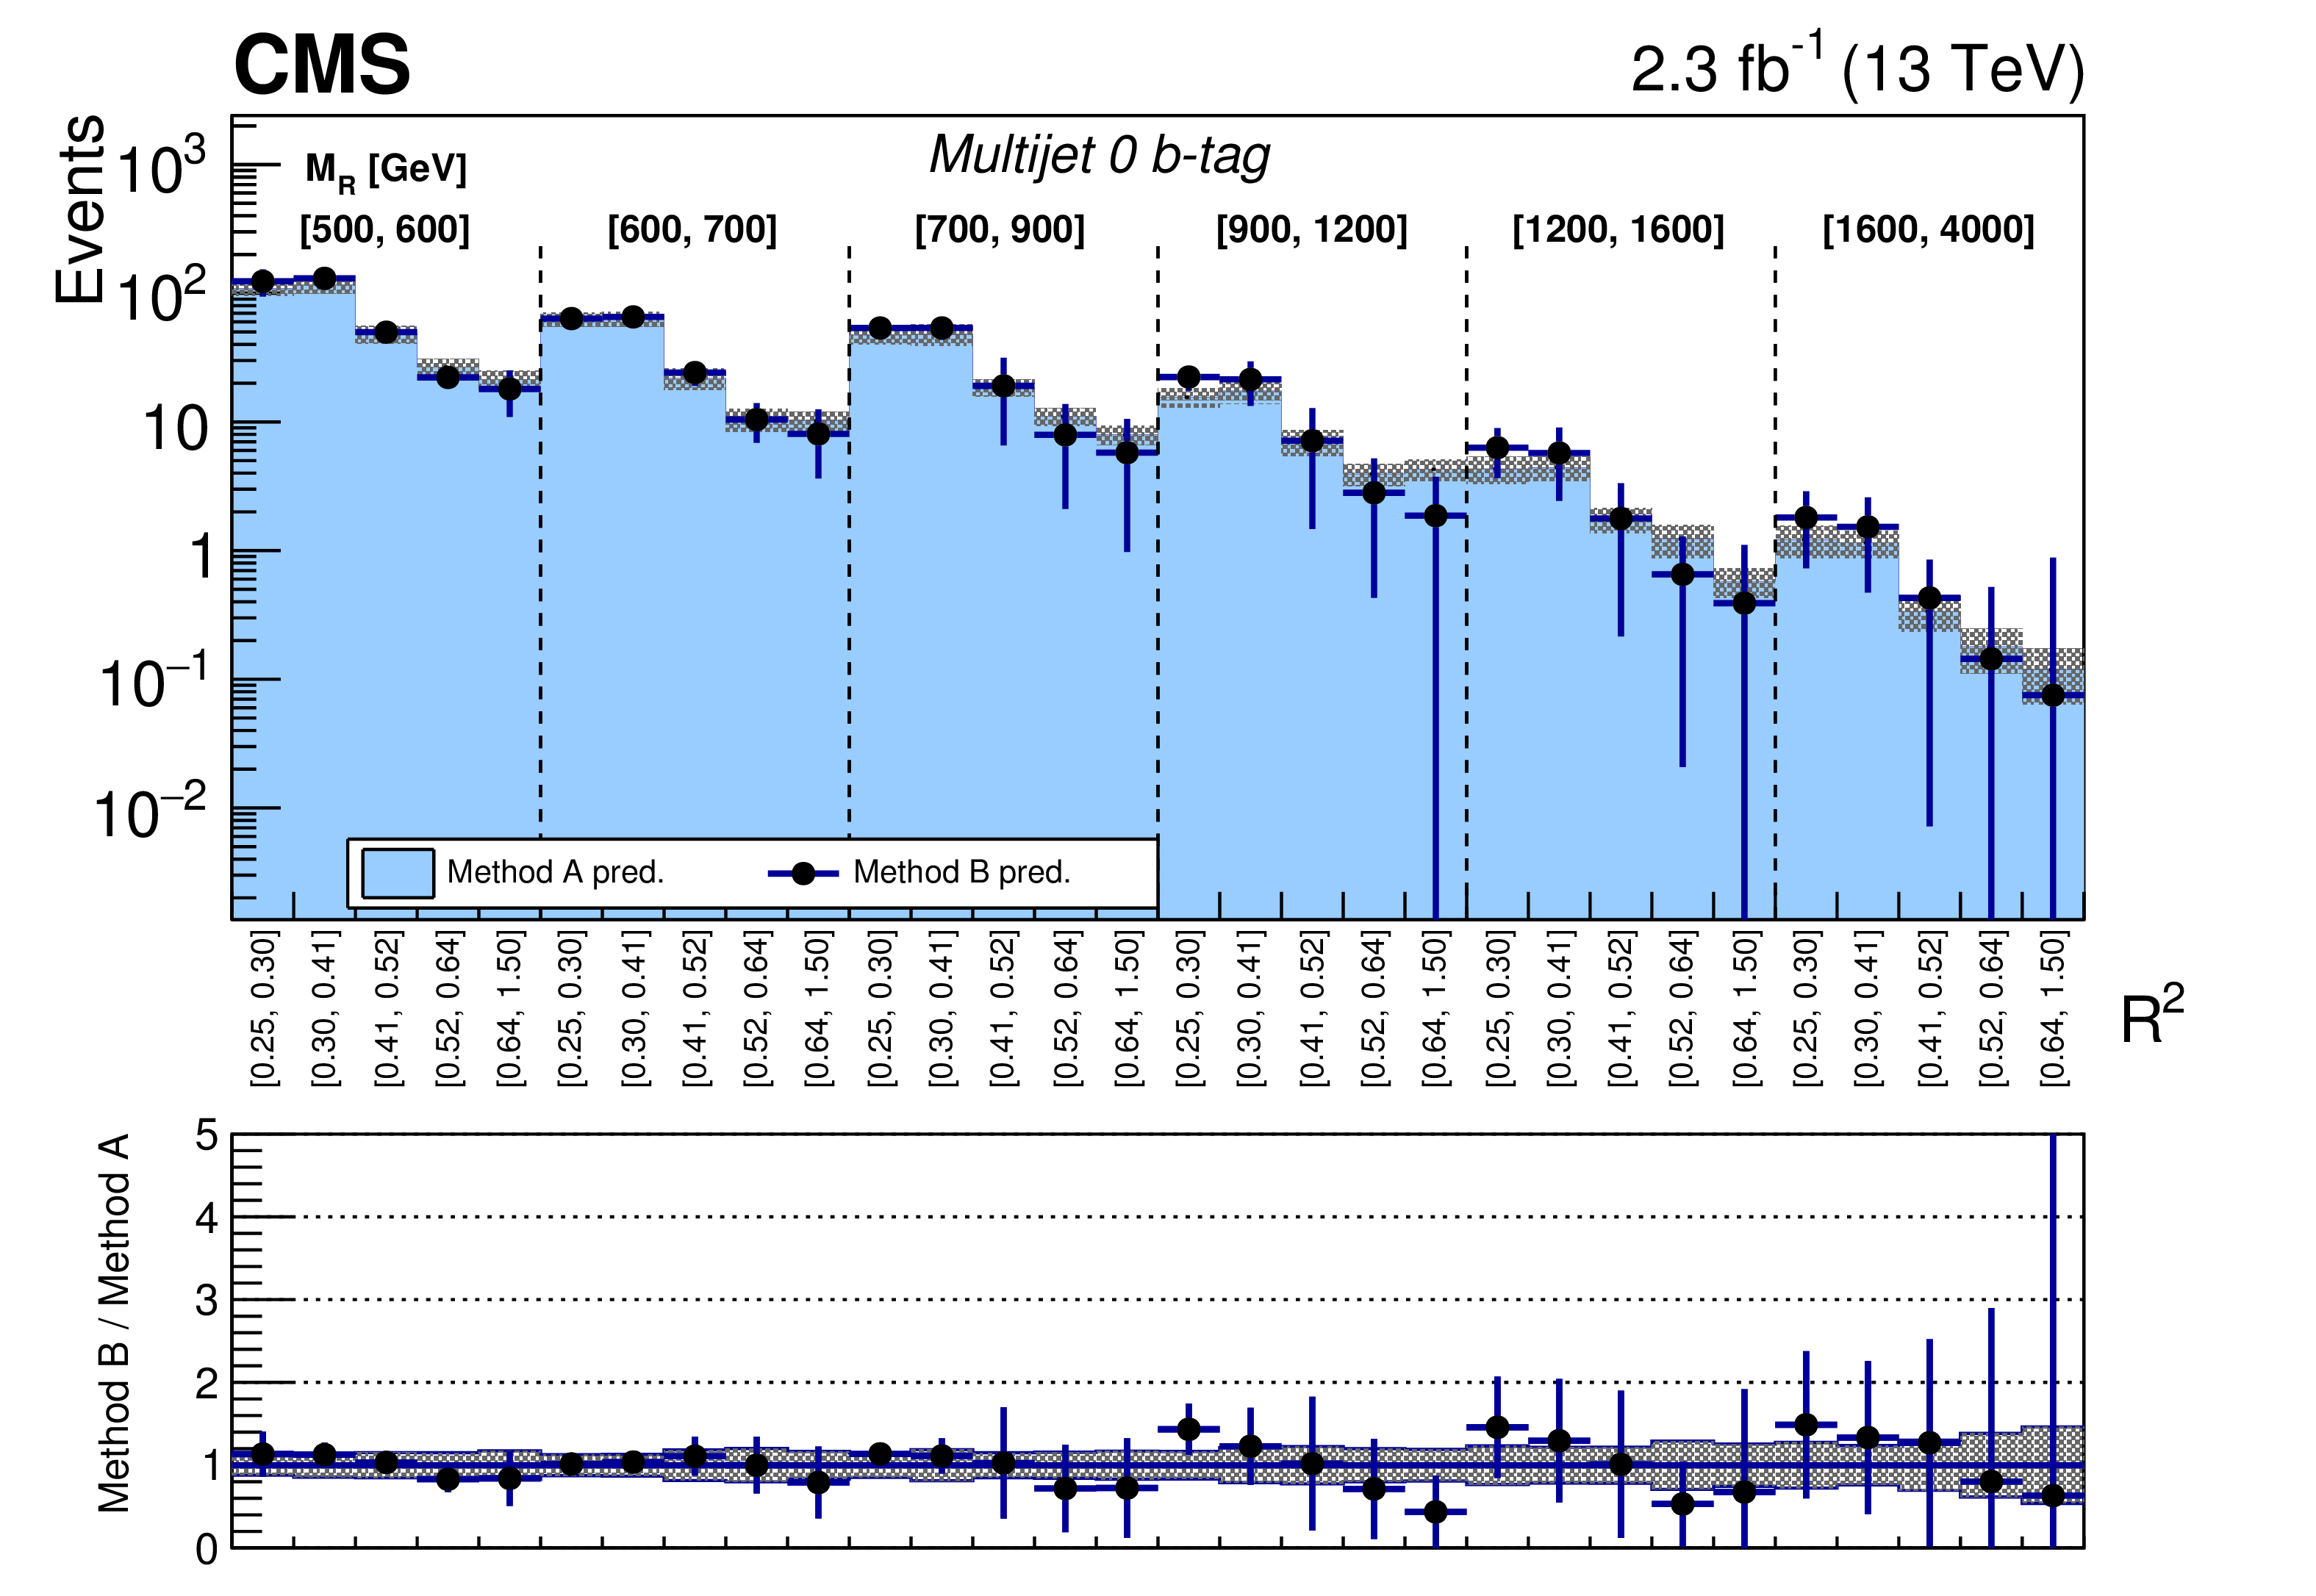
Comparisons of the two alternative background predictions for the $ {M_\mathrm {R}} $-$ {\mathrm {R}^2} $ distribution for the 0b-tag bin of the Multijet category (upper) and the 2b-tag bin of the Muon Multijet category (lower). The two-dimensional $ {M_\mathrm {R}} $-$ {\mathrm {R}^2} $ distribution is shown in a one dimensional representation, with each $ {M_\mathrm {R}} $ bin marked by the dashed lines and labeled near the top and each $ {\mathrm {R}^2} $ bin labeled below. The ratios of the method B fit-based predictions to the method A simulation-assisted predictions are shown on the bottom panels. The method B uncertainty is represented by the error bars on the data points and the method A uncertainty is represented by the shaded region. |
png pdf |
Figure 9-a:
Comparison of the two alternative background predictions for the $ {M_\mathrm {R}} $-$ {\mathrm {R}^2} $ distribution for the 0b-tag bin of the Multijet category. The two-dimensional $ {M_\mathrm {R}} $-$ {\mathrm {R}^2} $ distribution is shown in a one dimensional representation, with each $ {M_\mathrm {R}} $ bin marked by the dashed lines and labeled near the top and each $ {\mathrm {R}^2} $ bin labeled below. The ratio of the method B fit-based predictions to the method A simulation-assisted predictions is shown on the bottom panel. The method B uncertainty is represented by the error bars on the data points and the method A uncertainty is represented by the shaded region. |

png pdf |
Figure 9-b:
Comparison of the two alternative background predictions for the $ {M_\mathrm {R}} $-$ {\mathrm {R}^2} $ distribution for the 2b-tag bin of the Muon Multijet category. The two-dimensional $ {M_\mathrm {R}} $-$ {\mathrm {R}^2} $ distribution is shown in a one dimensional representation, with each $ {M_\mathrm {R}} $ bin marked by the dashed lines and labeled near the top and each $ {\mathrm {R}^2} $ bin labeled below. The ratio of the method B fit-based predictions to the method A simulation-assisted predictions is shown on the bottom panel. The method B uncertainty is represented by the error bars on the data points and the method A uncertainty is represented by the shaded region. |
png pdf |
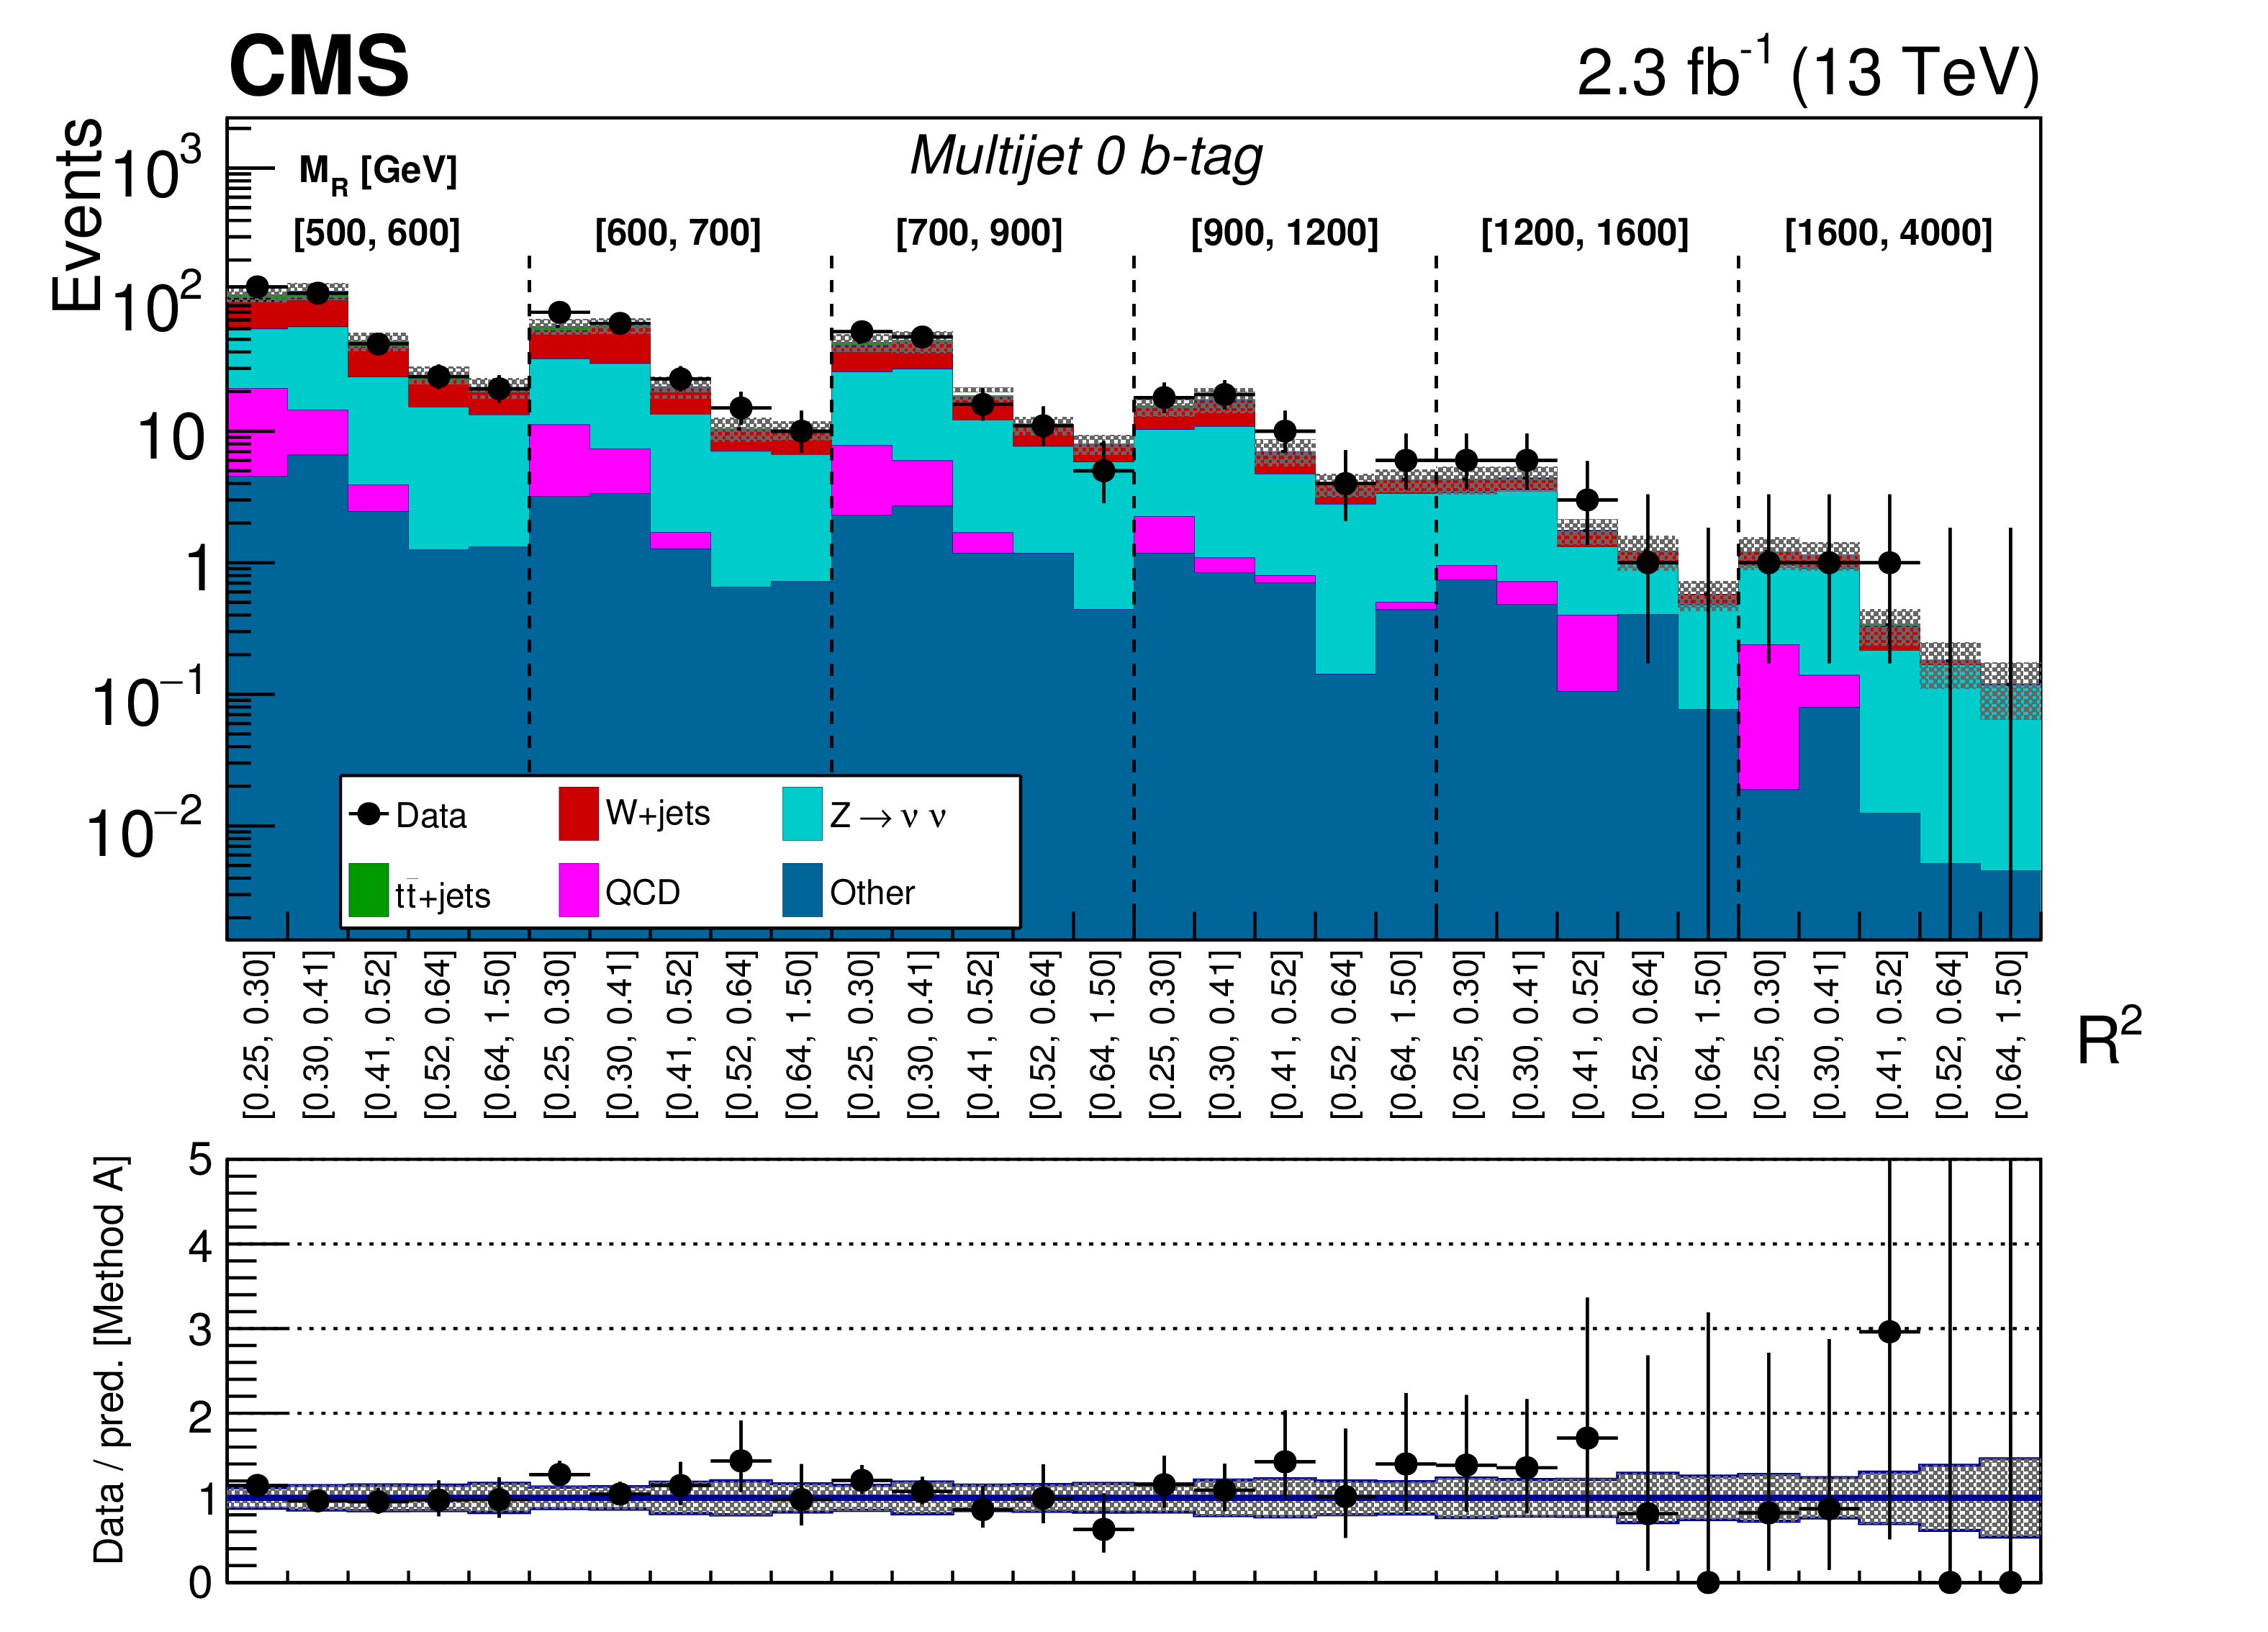
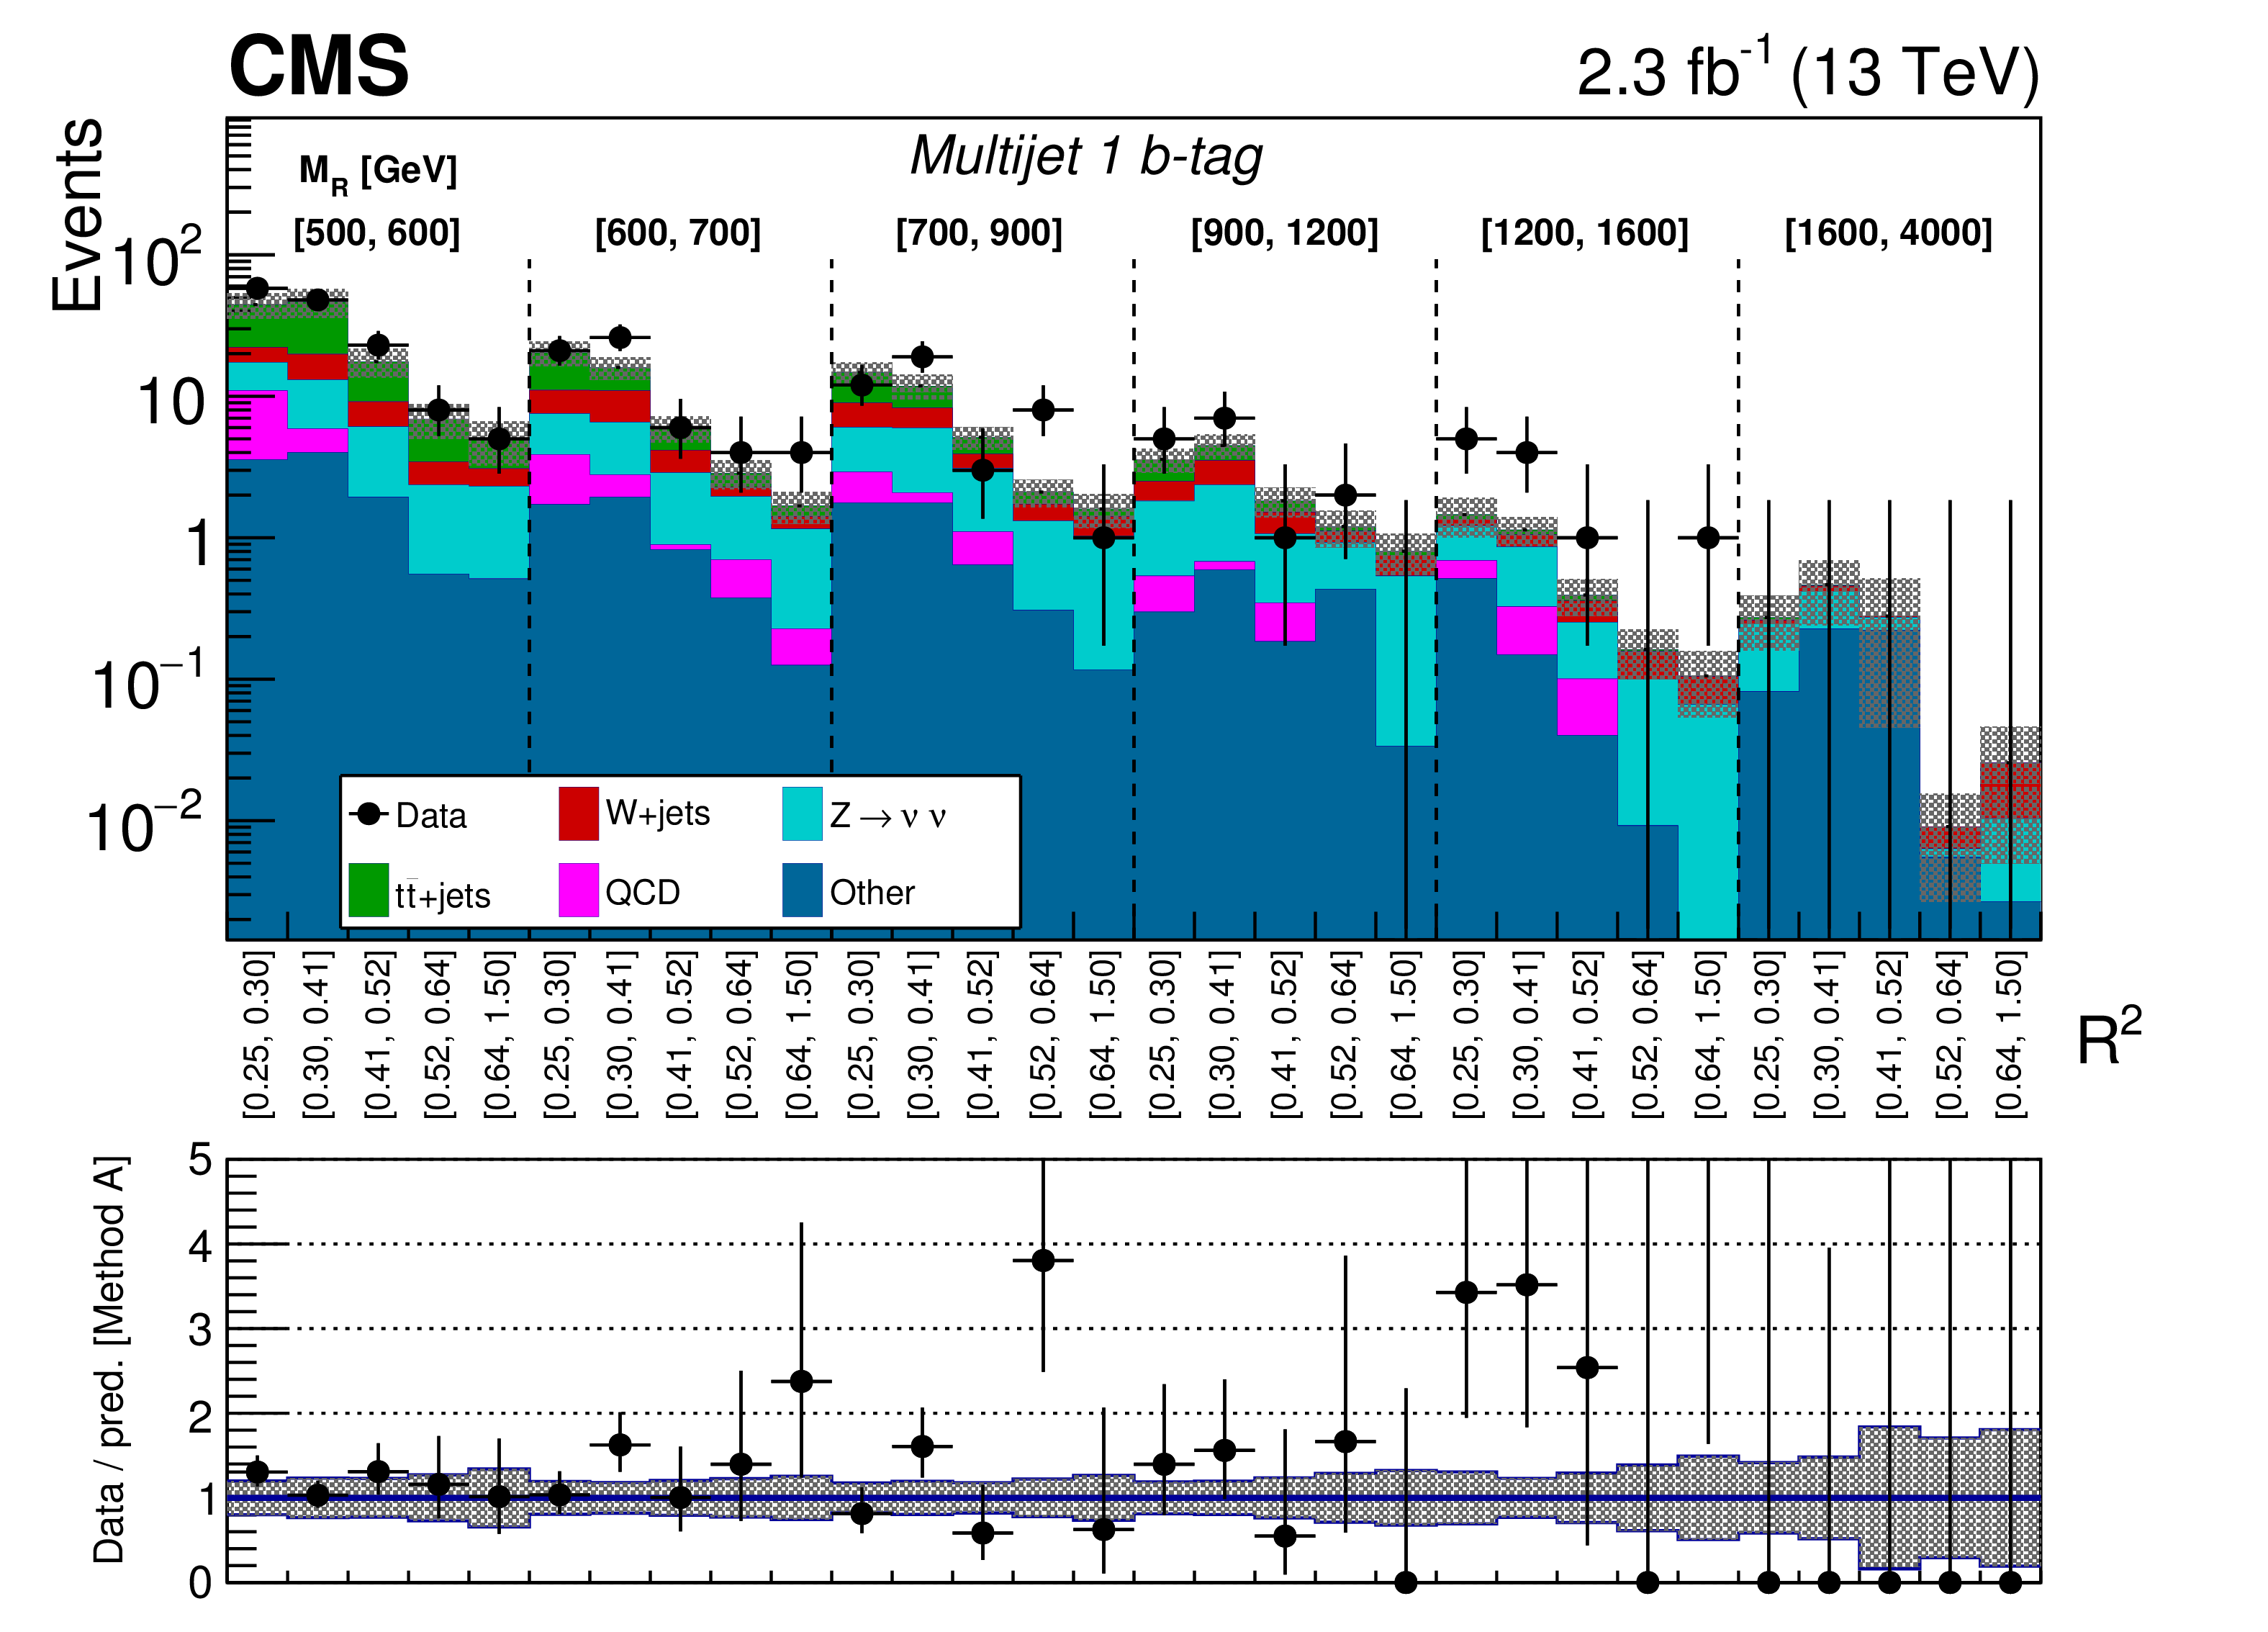
Figure 10:
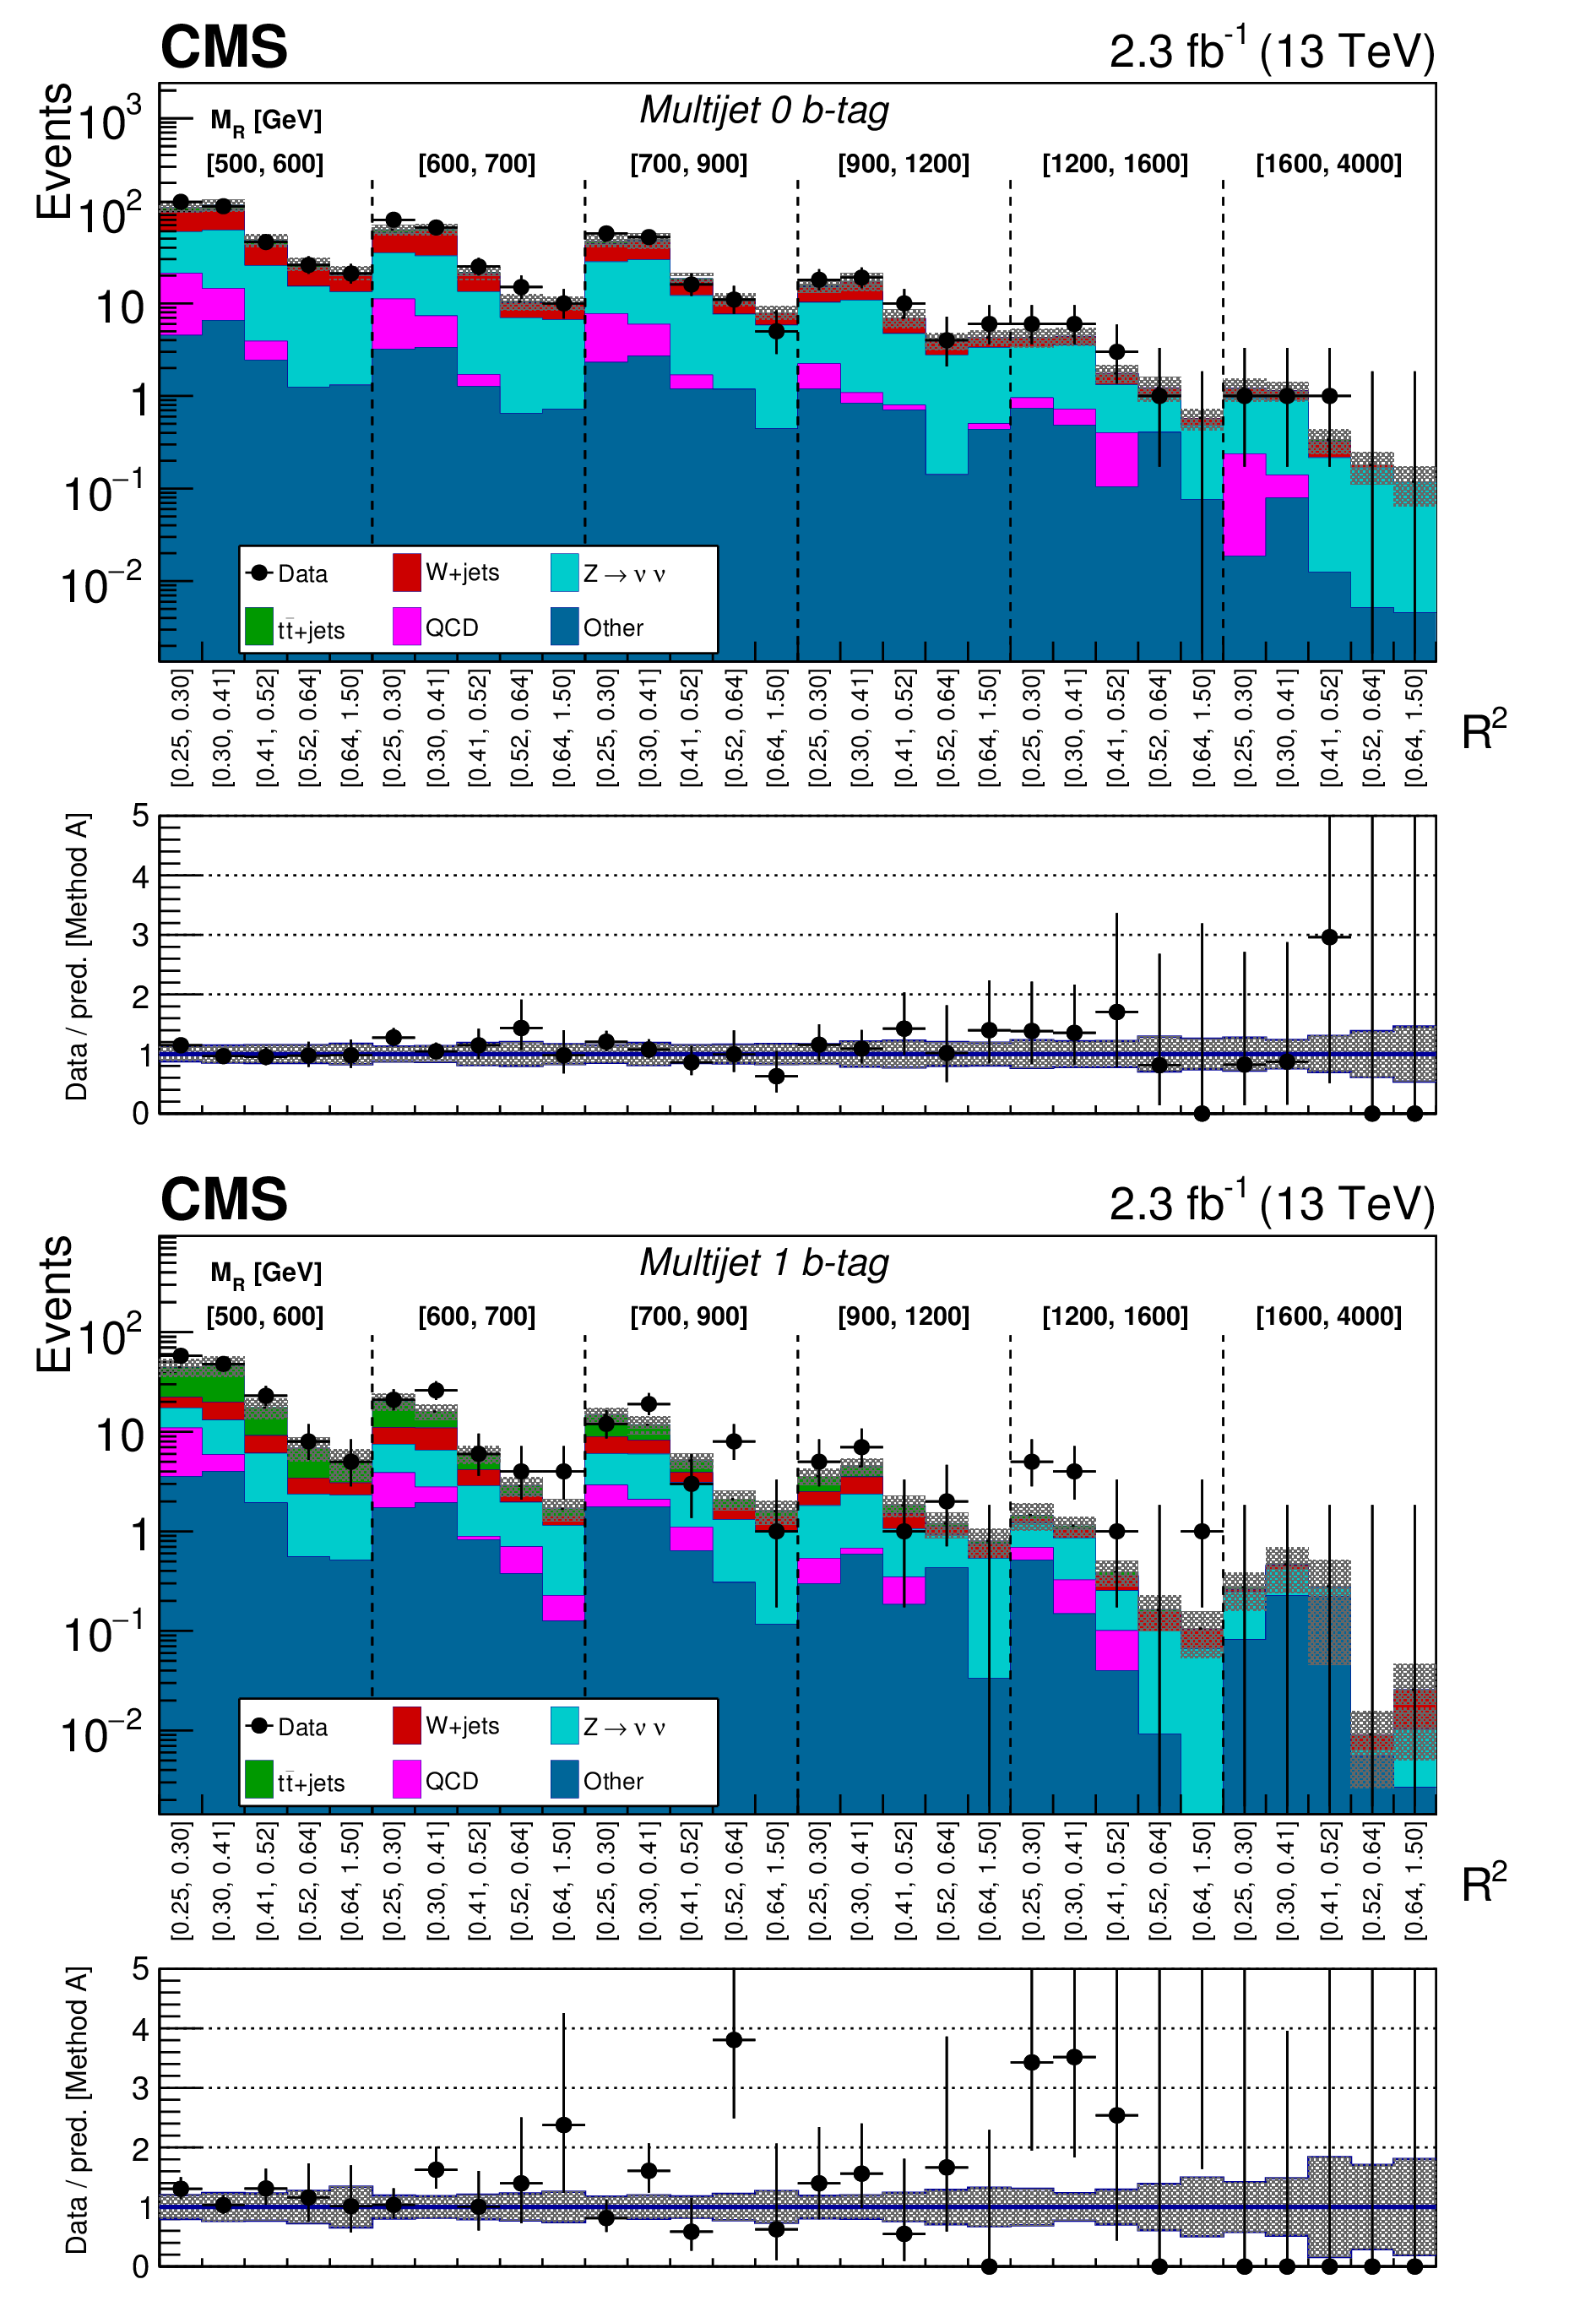
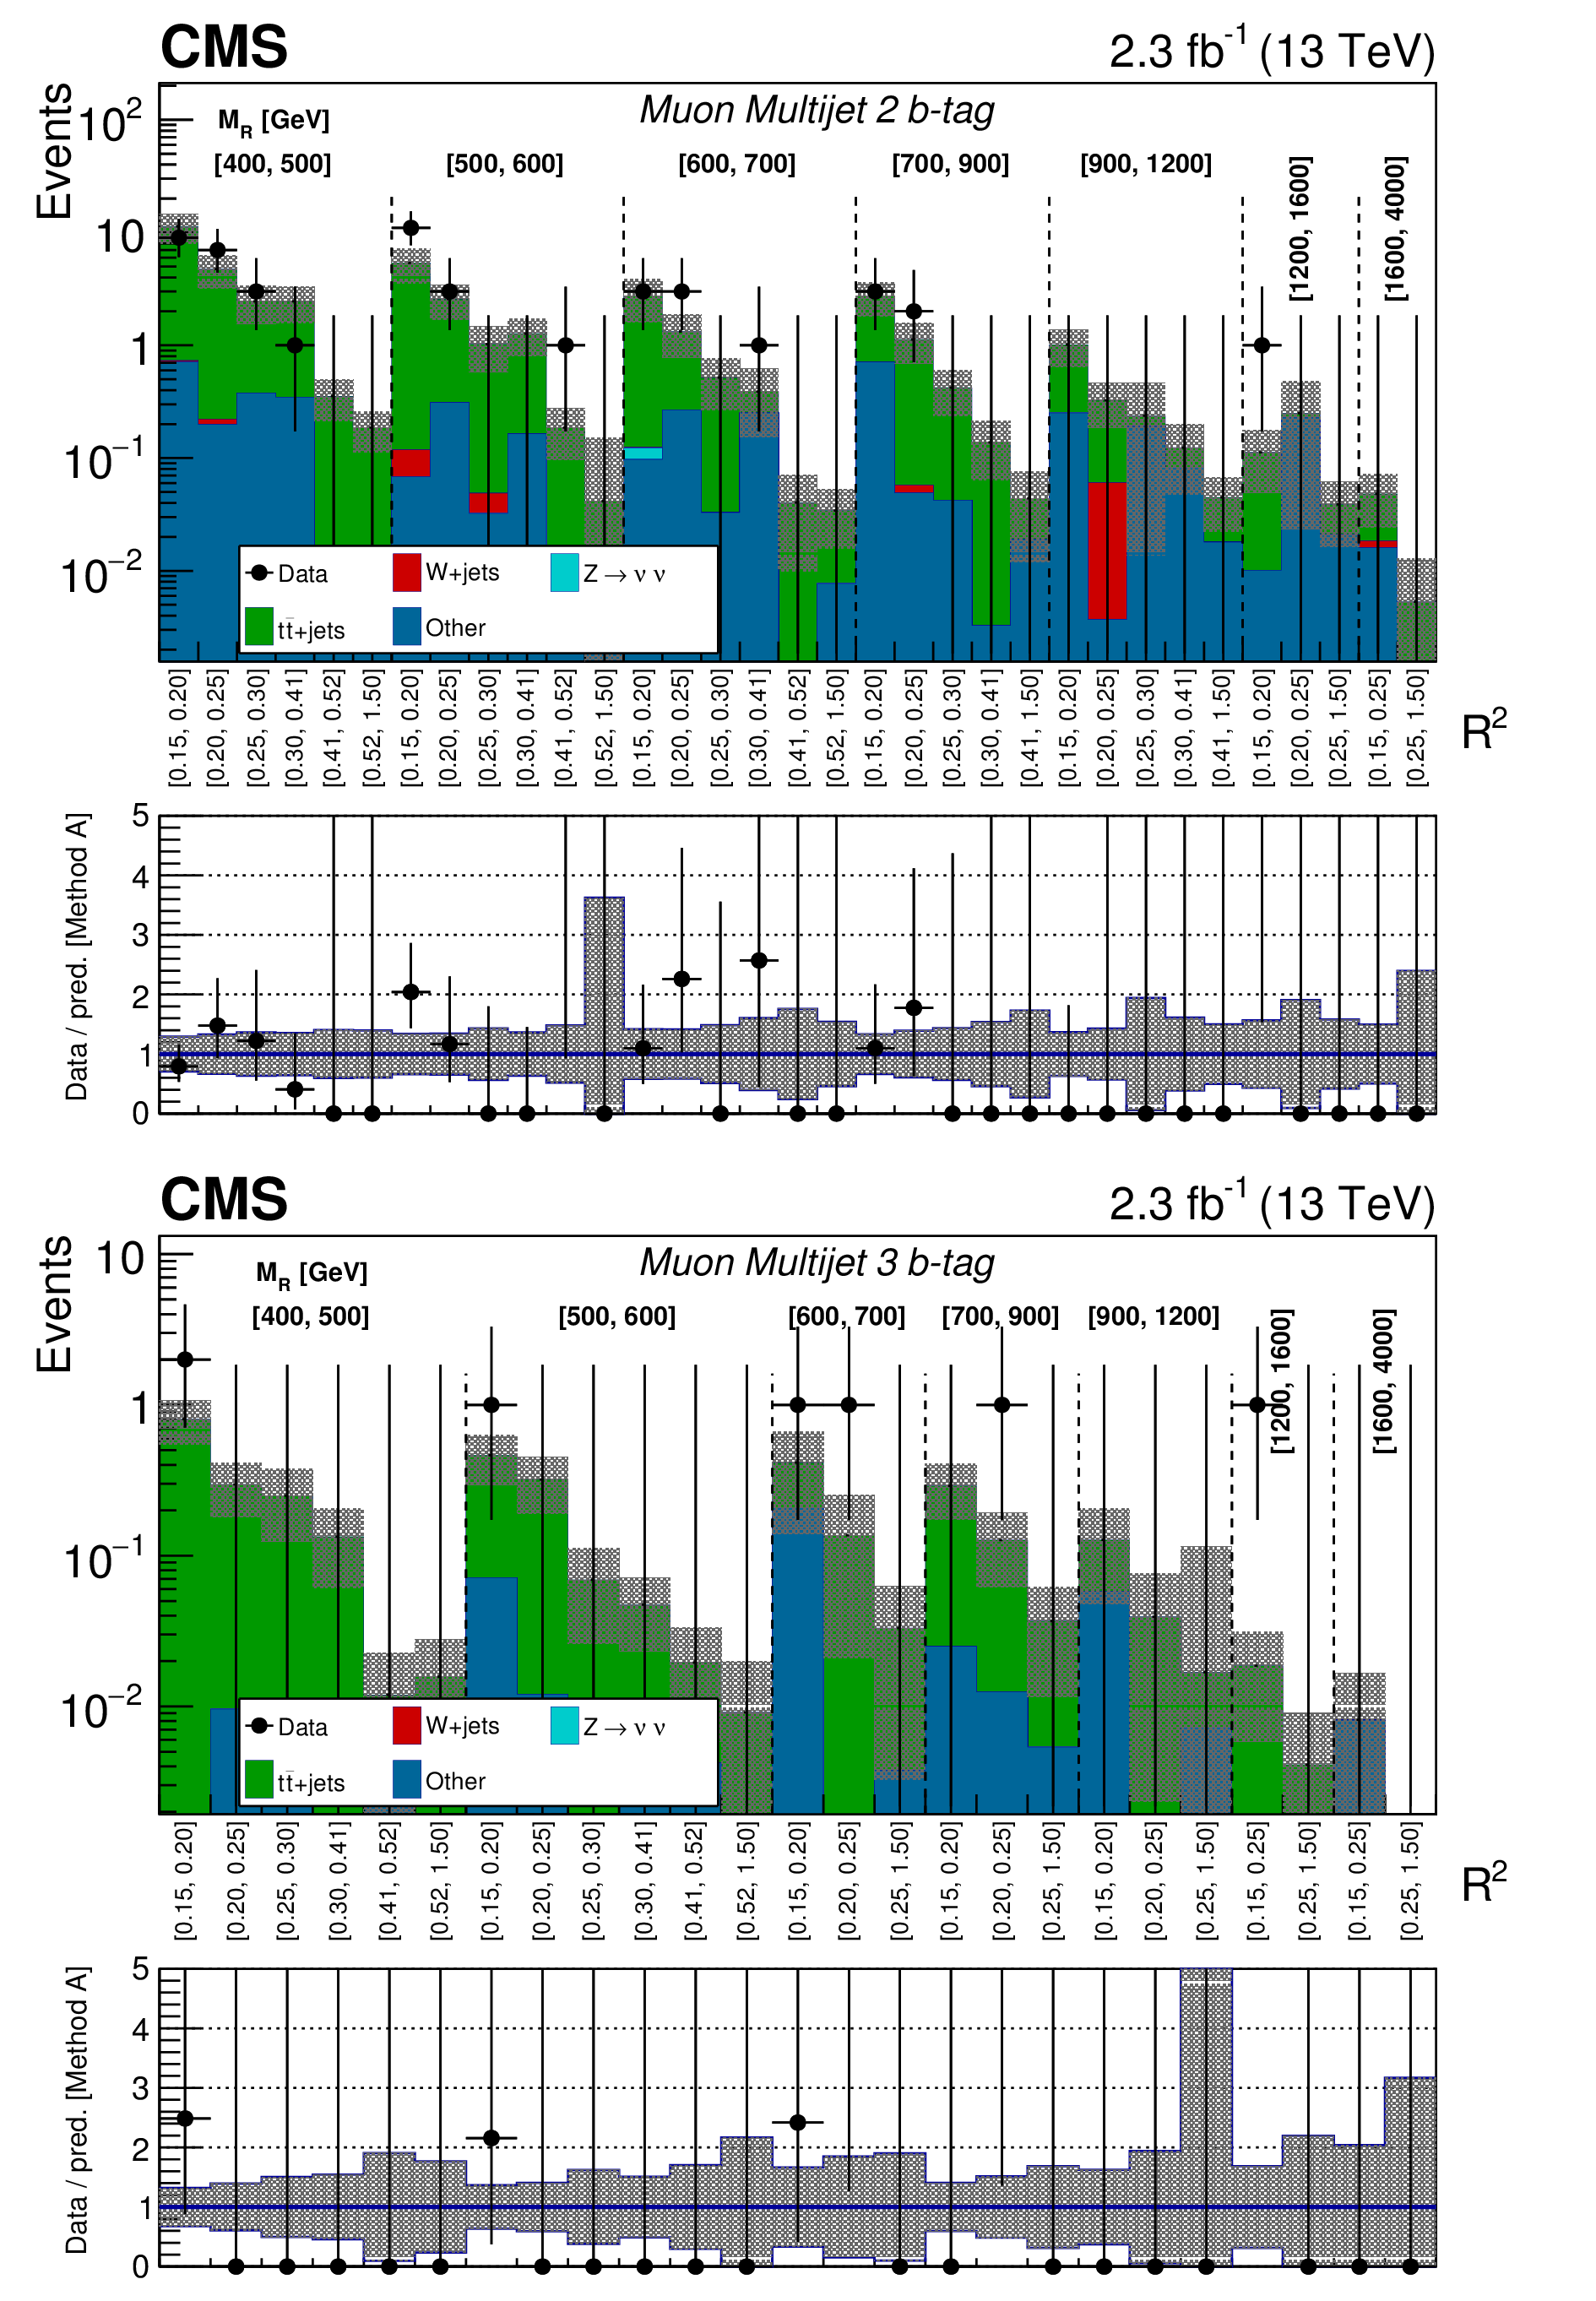
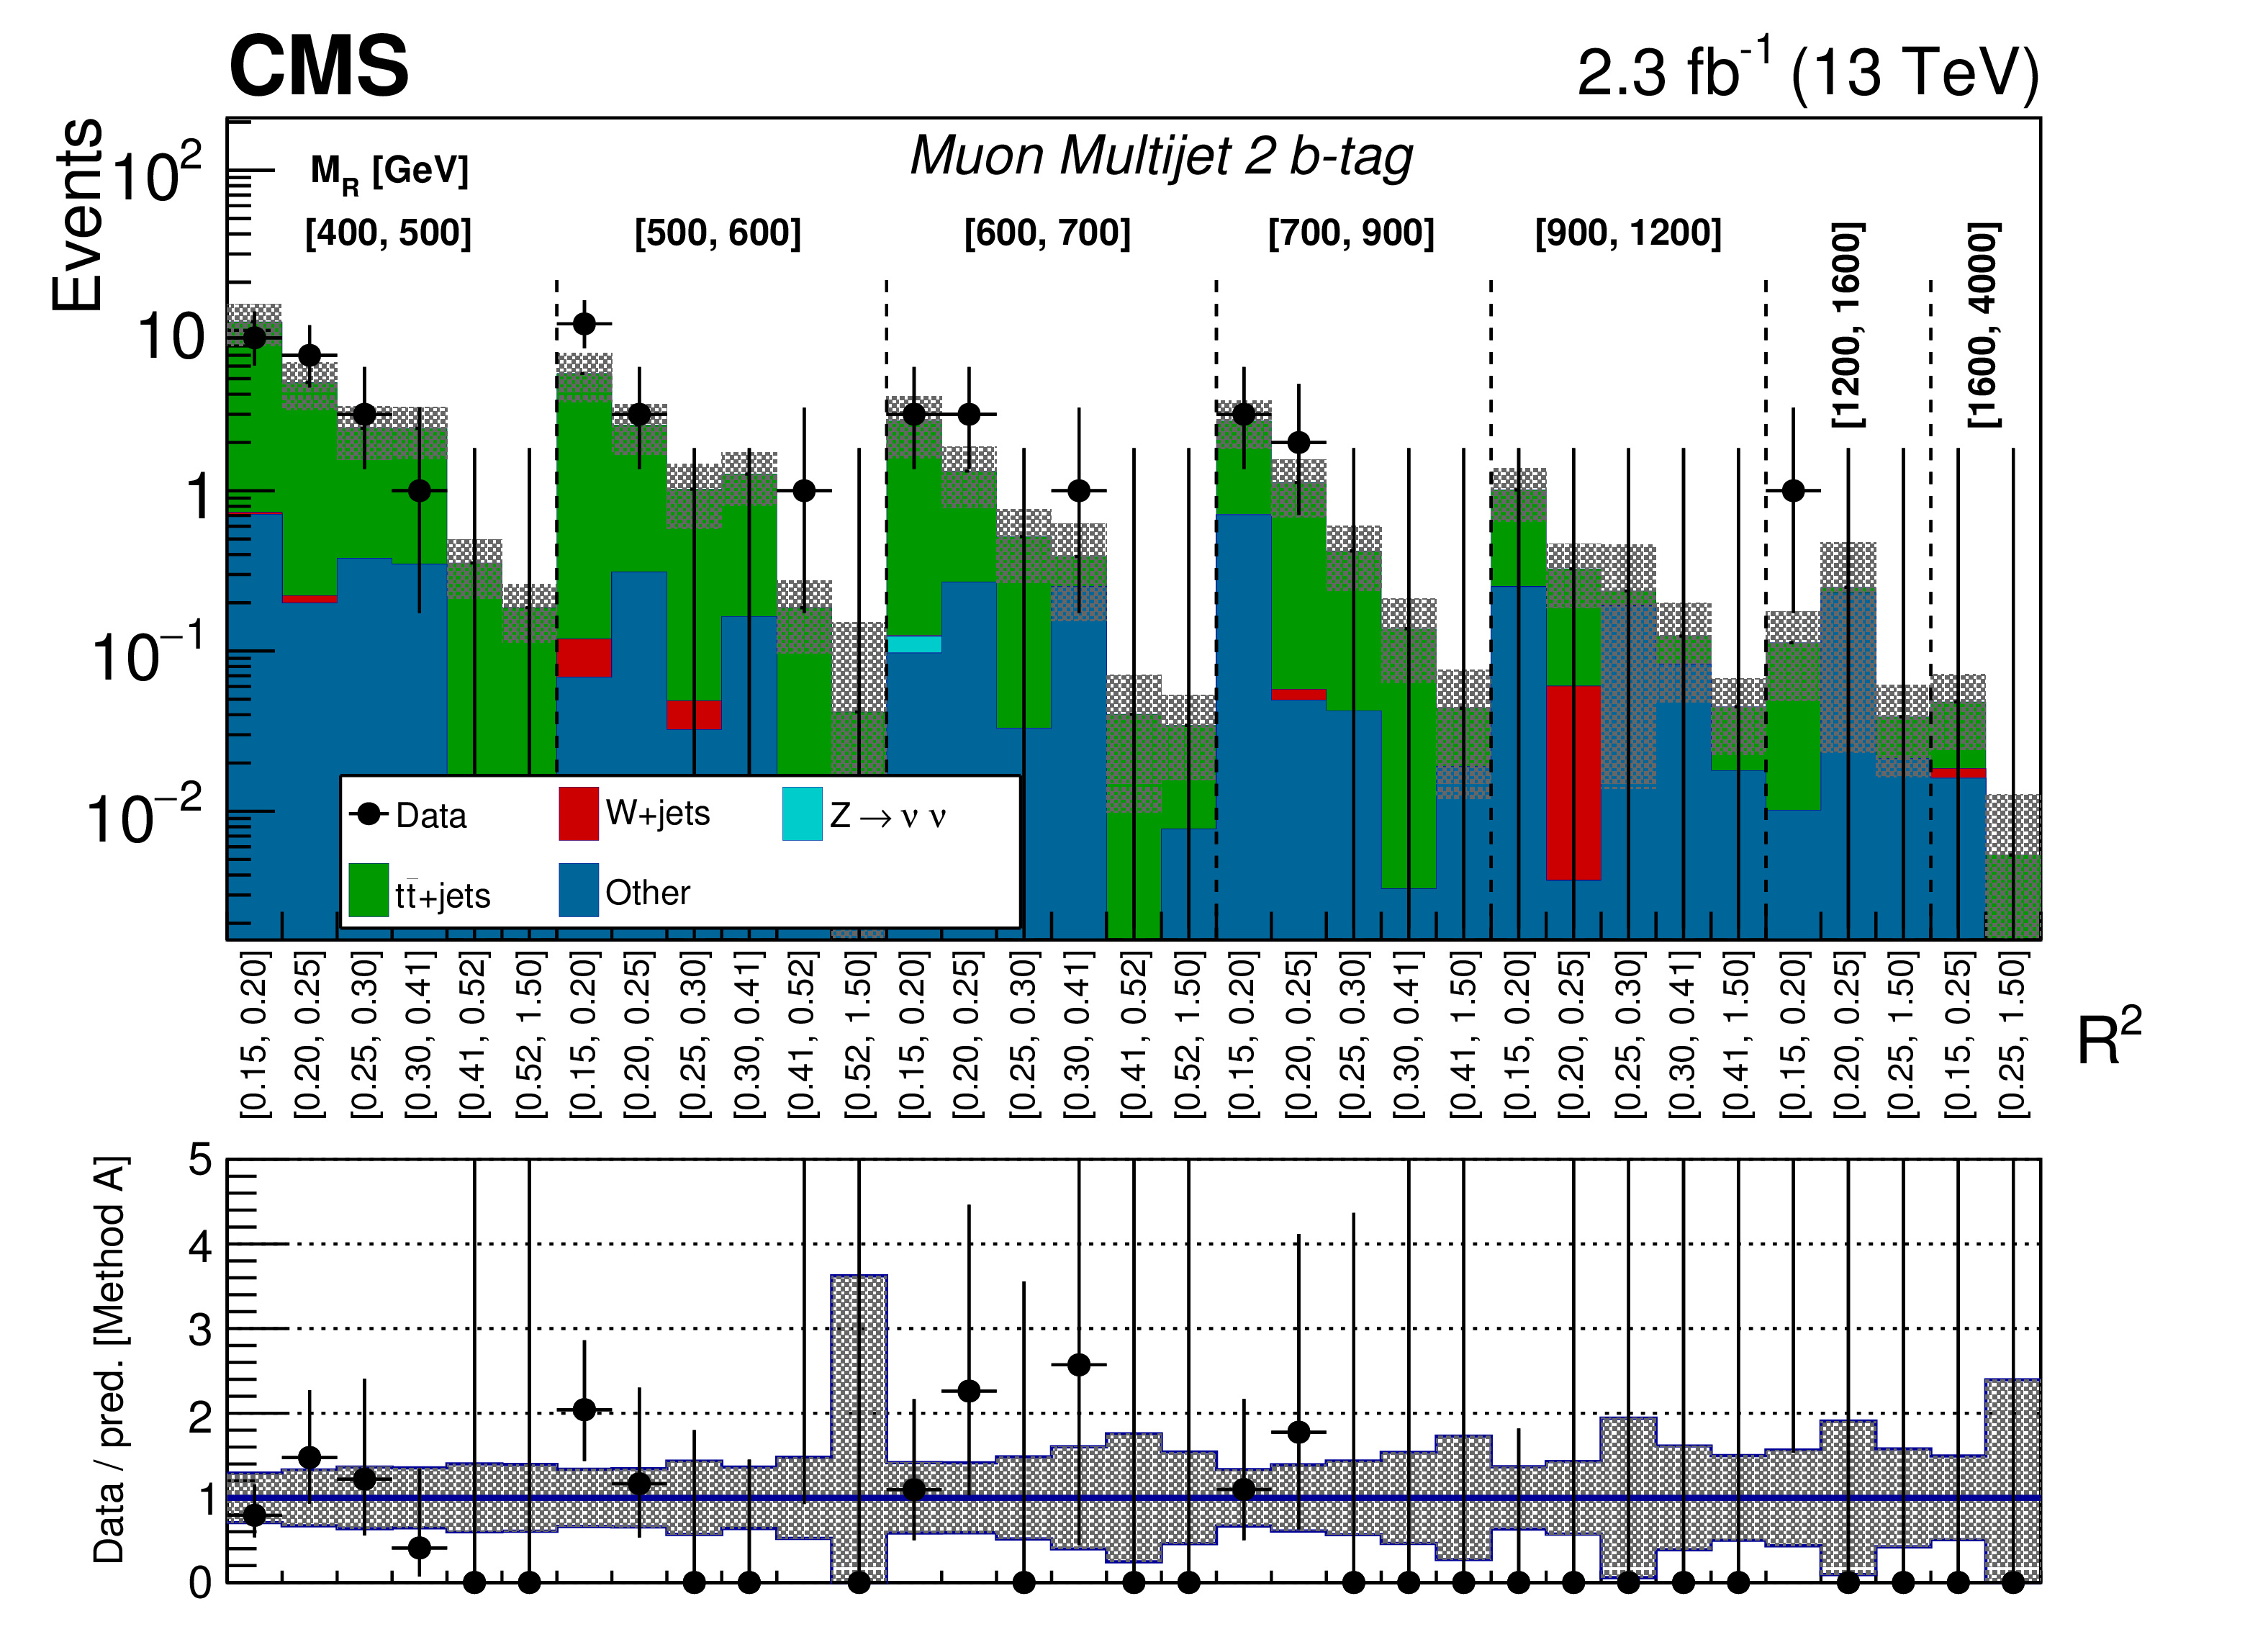
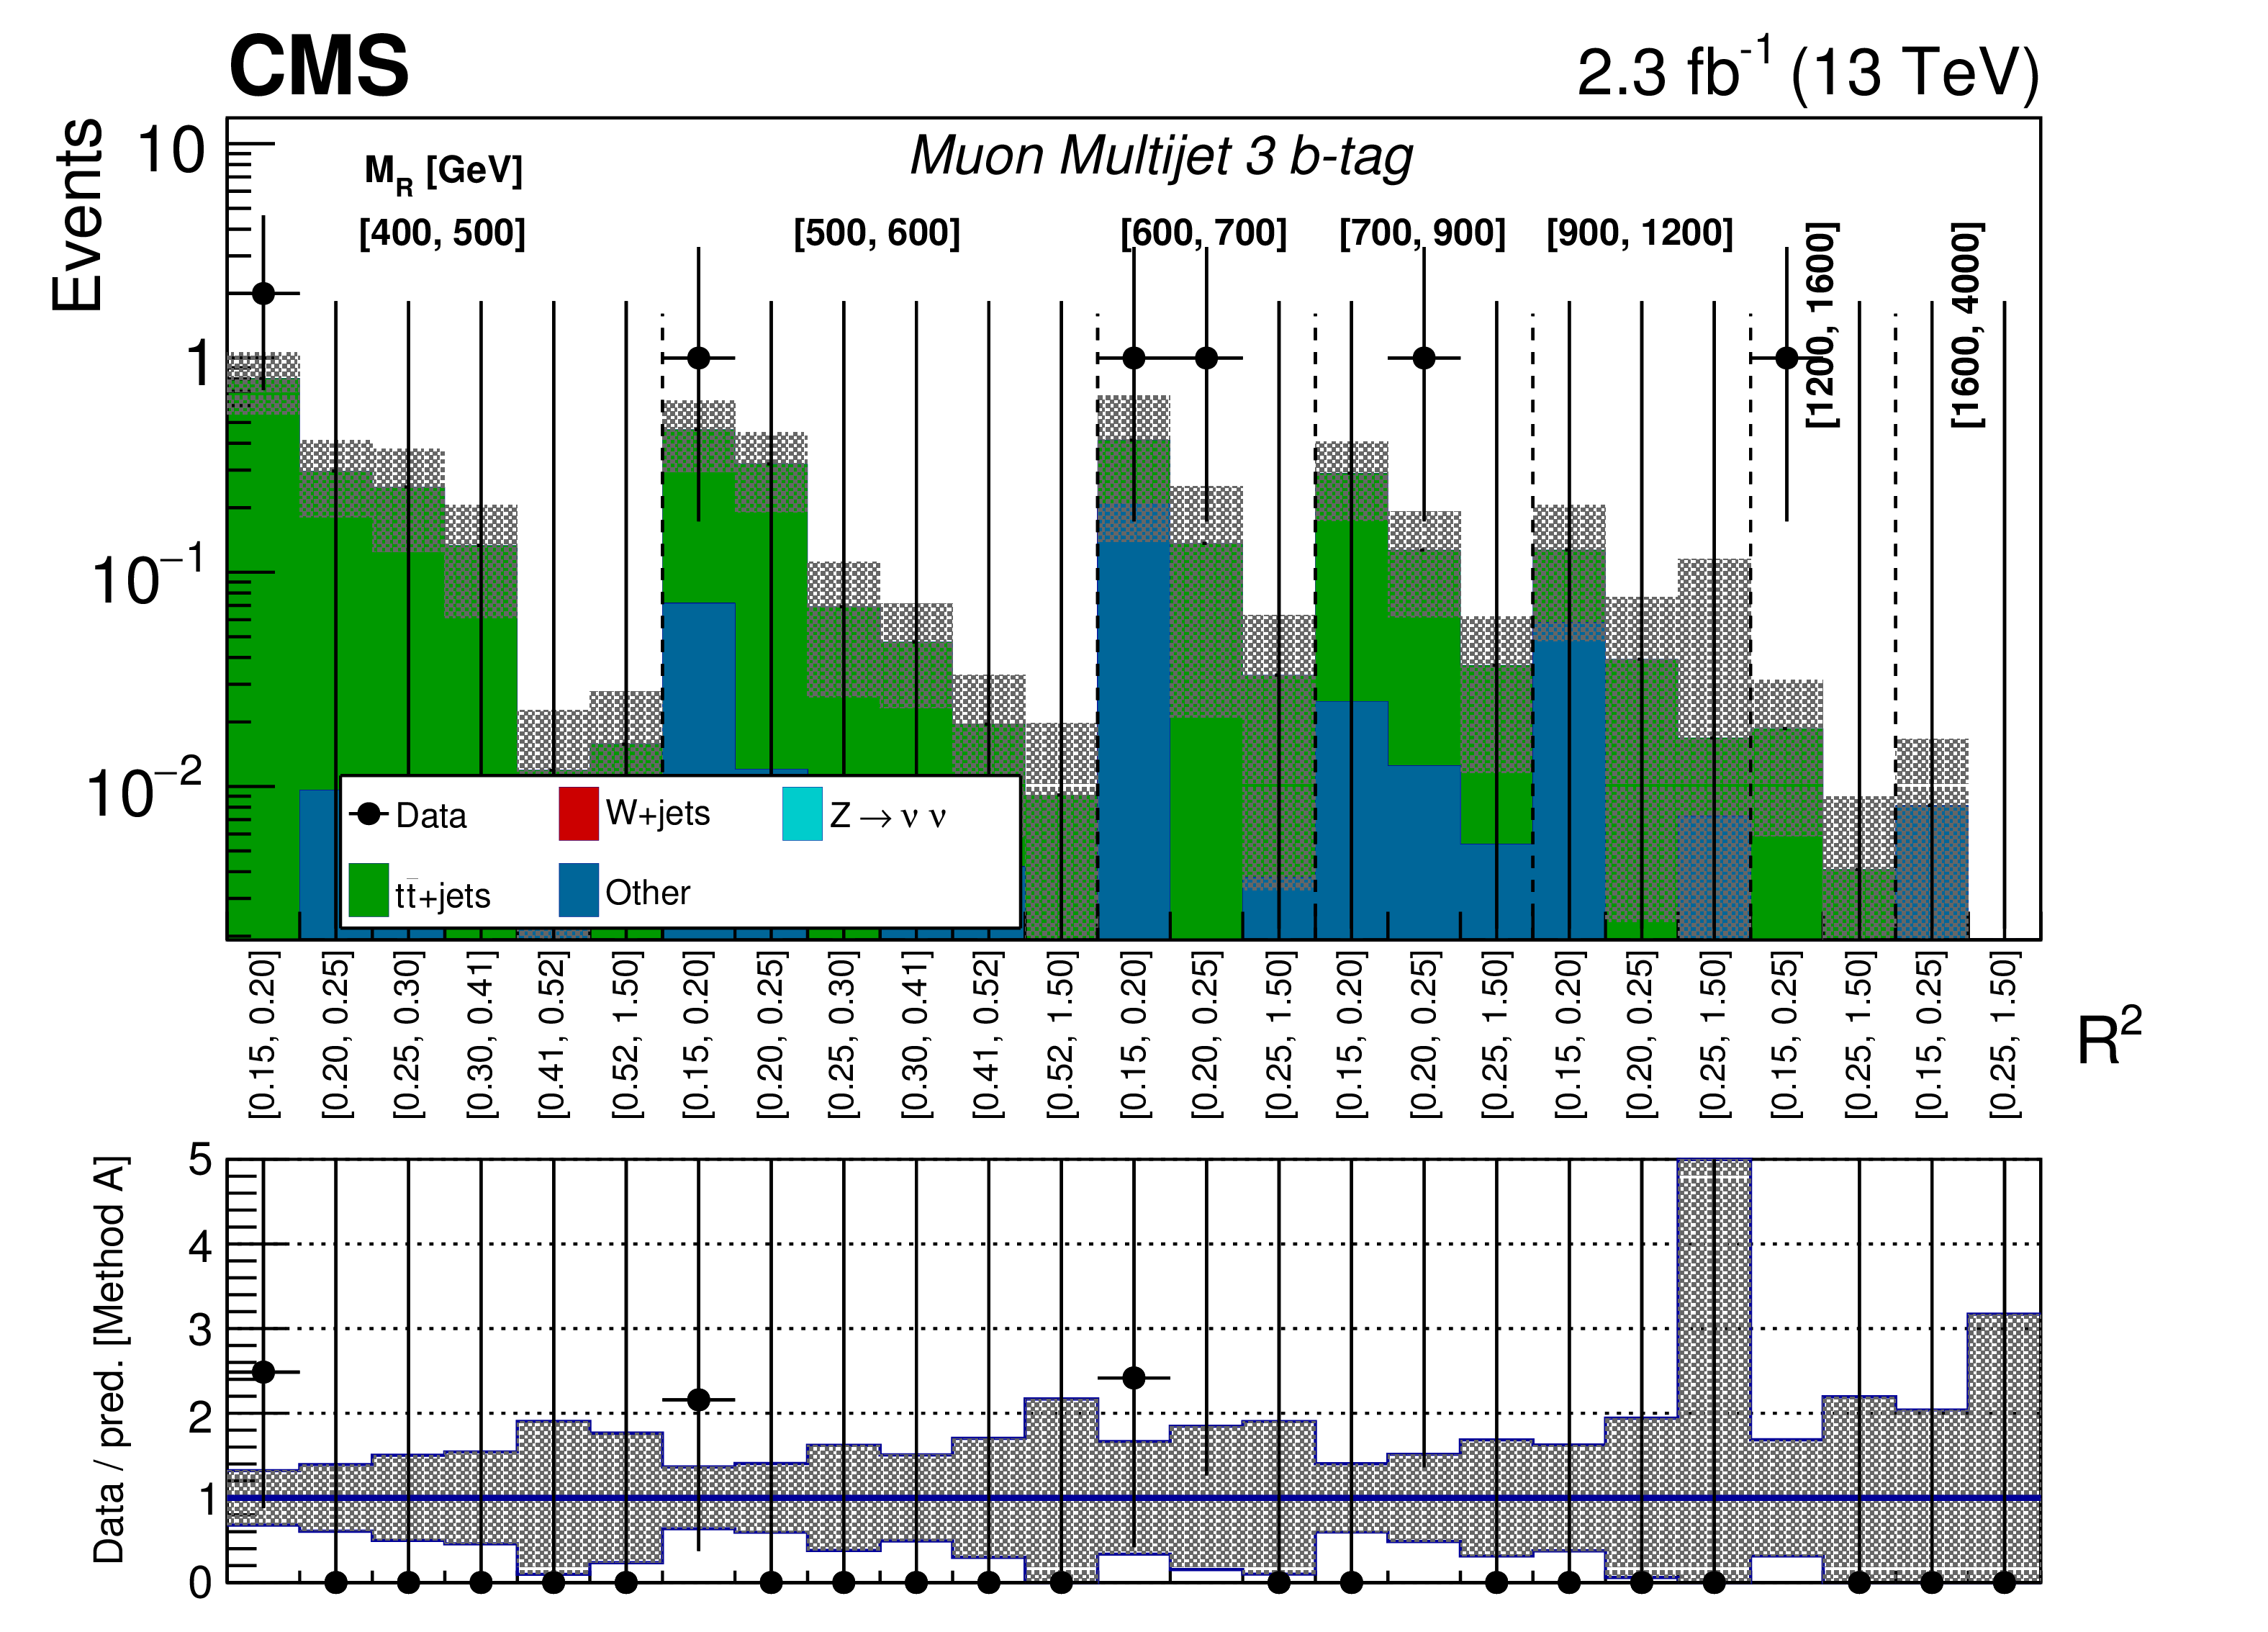
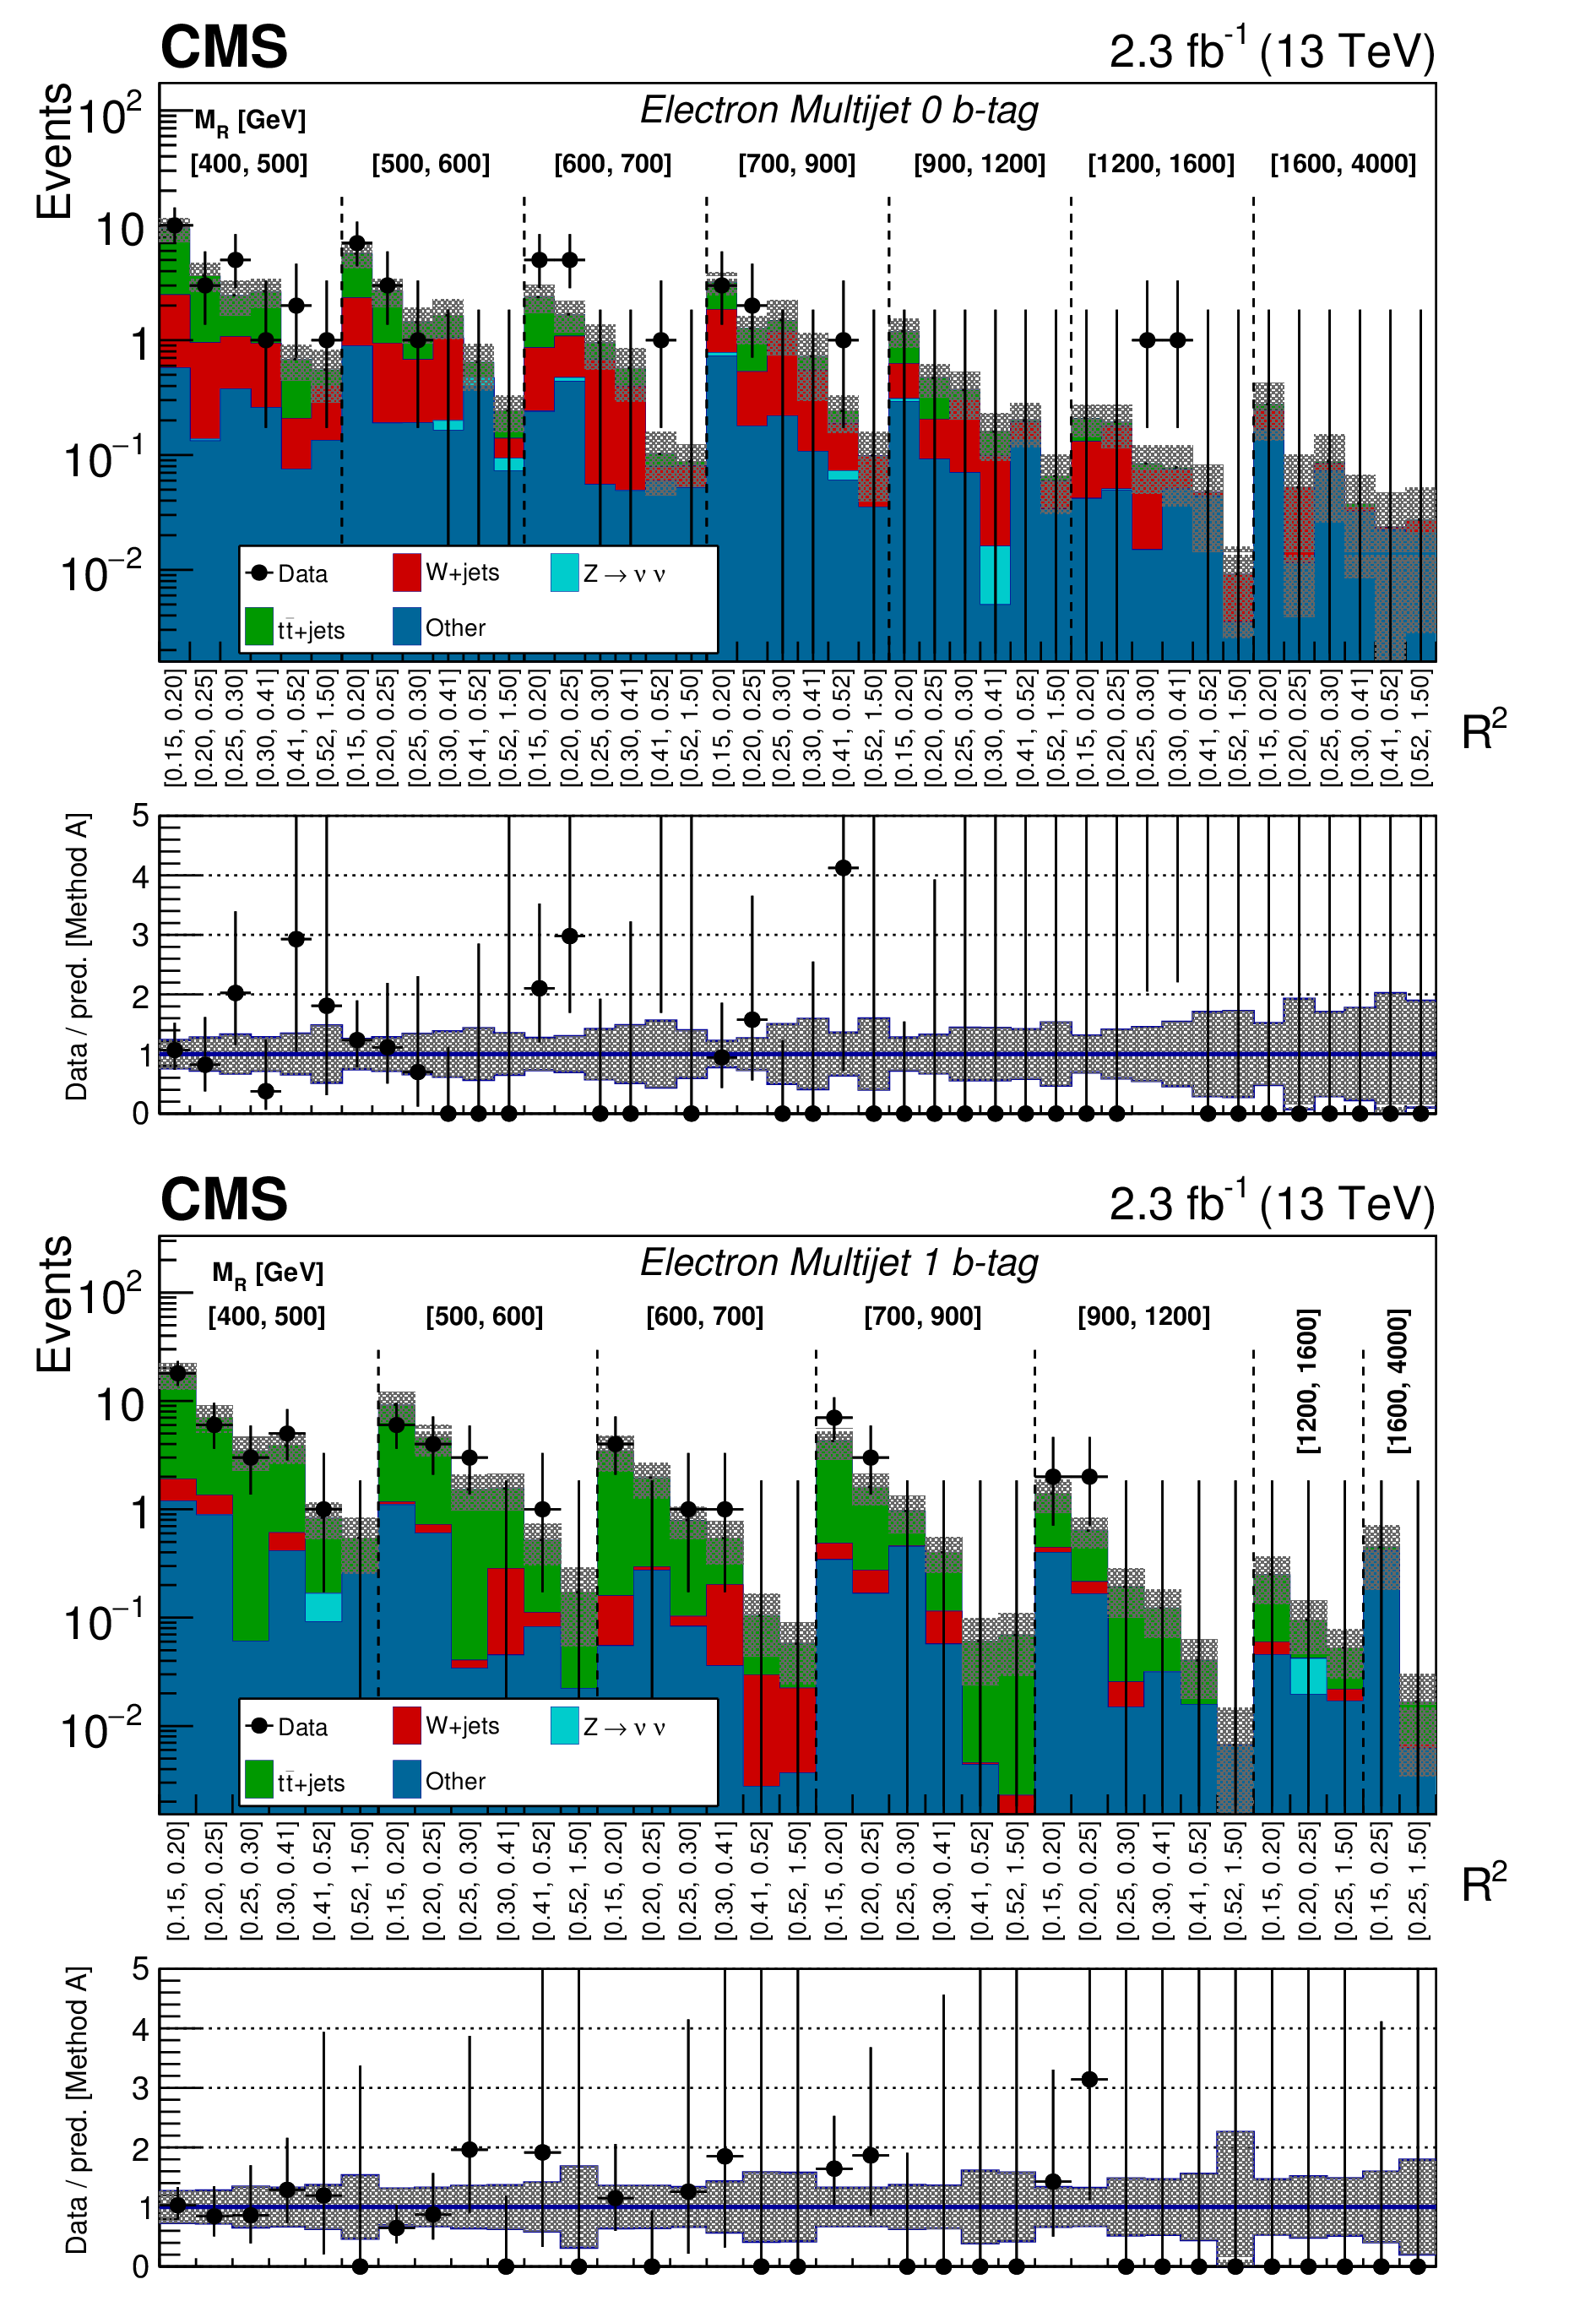
The $ {M_\mathrm {R}} $-$ {\mathrm {R}^2} $ distribution observed in data is shown along with the background prediction obtained from method A for the Multijet event category in the 0b-tag (upper) and 1b-tag (lower) bins. The two-dimensional $ {M_\mathrm {R}} $-$ {\mathrm {R}^2} $ distribution is shown in a one-dimensional representation, with each $ {M_\mathrm {R}} $ bin marked by the dashed lines and labeled near the top, and each $ {\mathrm {R}^2} $ bin labeled below. The ratio of data to the background prediction is shown on the bottom panels, with the statistical uncertainty expressed through the data point error bars and the systematic uncertainty of the background prediction represented by the shaded region. |
png pdf |
Figure 10-a:
The $ {M_\mathrm {R}} $-$ {\mathrm {R}^2} $ distribution observed in data is shown along with the background prediction obtained from method A for the Multijet event category in the 0b-tag bin. The two-dimensional $ {M_\mathrm {R}} $-$ {\mathrm {R}^2} $ distribution is shown in a one-dimensional representation, with each $ {M_\mathrm {R}} $ bin marked by the dashed lines and labeled near the top, and each $ {\mathrm {R}^2} $ bin labeled below. The ratio of data to the background prediction is shown on the bottom panels, with the statistical uncertainty expressed through the data point error bars and the systematic uncertainty of the background prediction represented by the shaded region. |
png pdf |
Figure 10-b:
The $ {M_\mathrm {R}} $-$ {\mathrm {R}^2} $ distribution observed in data is shown along with the background prediction obtained from method A for the Multijet event category in the 1b-tag bin. The two-dimensional $ {M_\mathrm {R}} $-$ {\mathrm {R}^2} $ distribution is shown in a one-dimensional representation, with each $ {M_\mathrm {R}} $ bin marked by the dashed lines and labeled near the top, and each $ {\mathrm {R}^2} $ bin labeled below. The ratio of data to the background prediction is shown on the bottom panels, with the statistical uncertainty expressed through the data point error bars and the systematic uncertainty of the background prediction represented by the shaded region. |
png pdf |
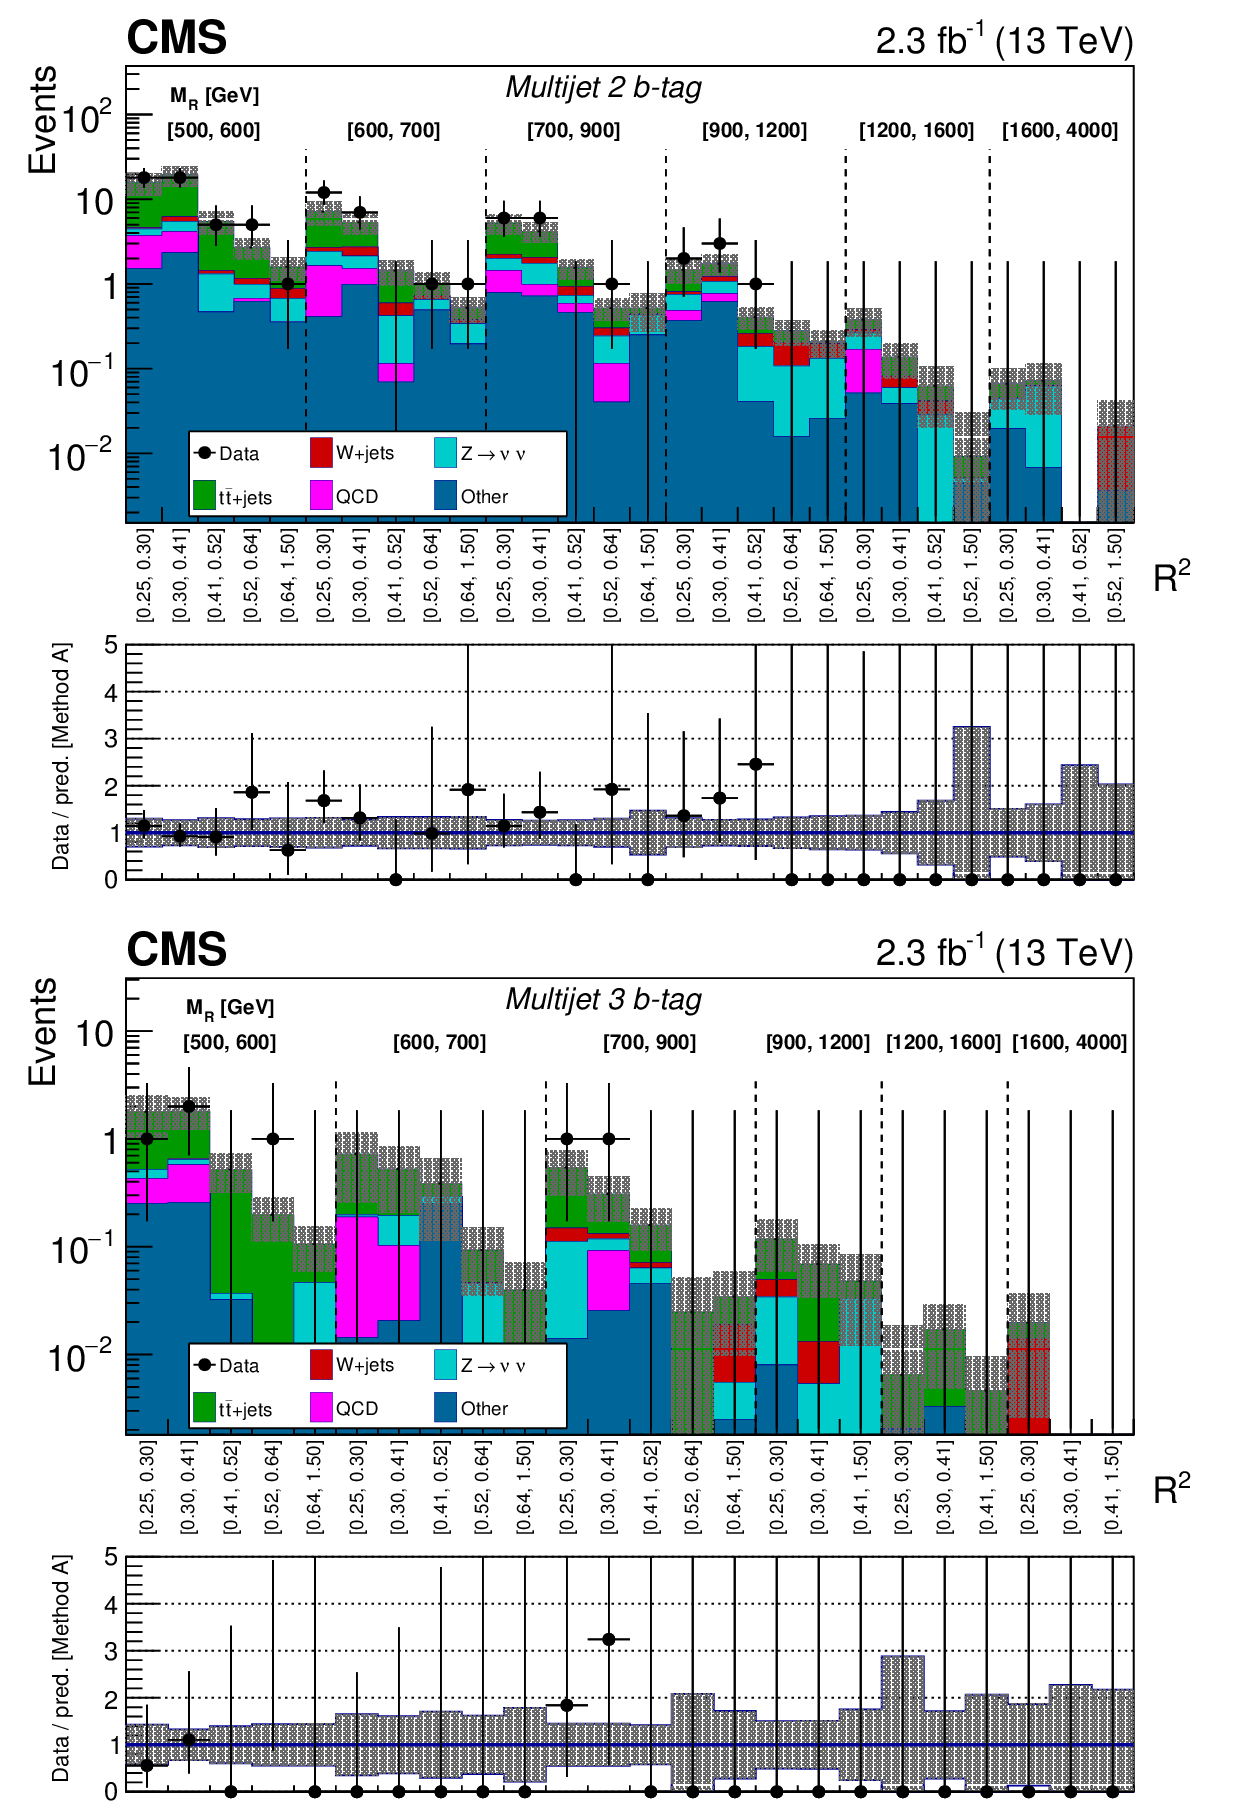
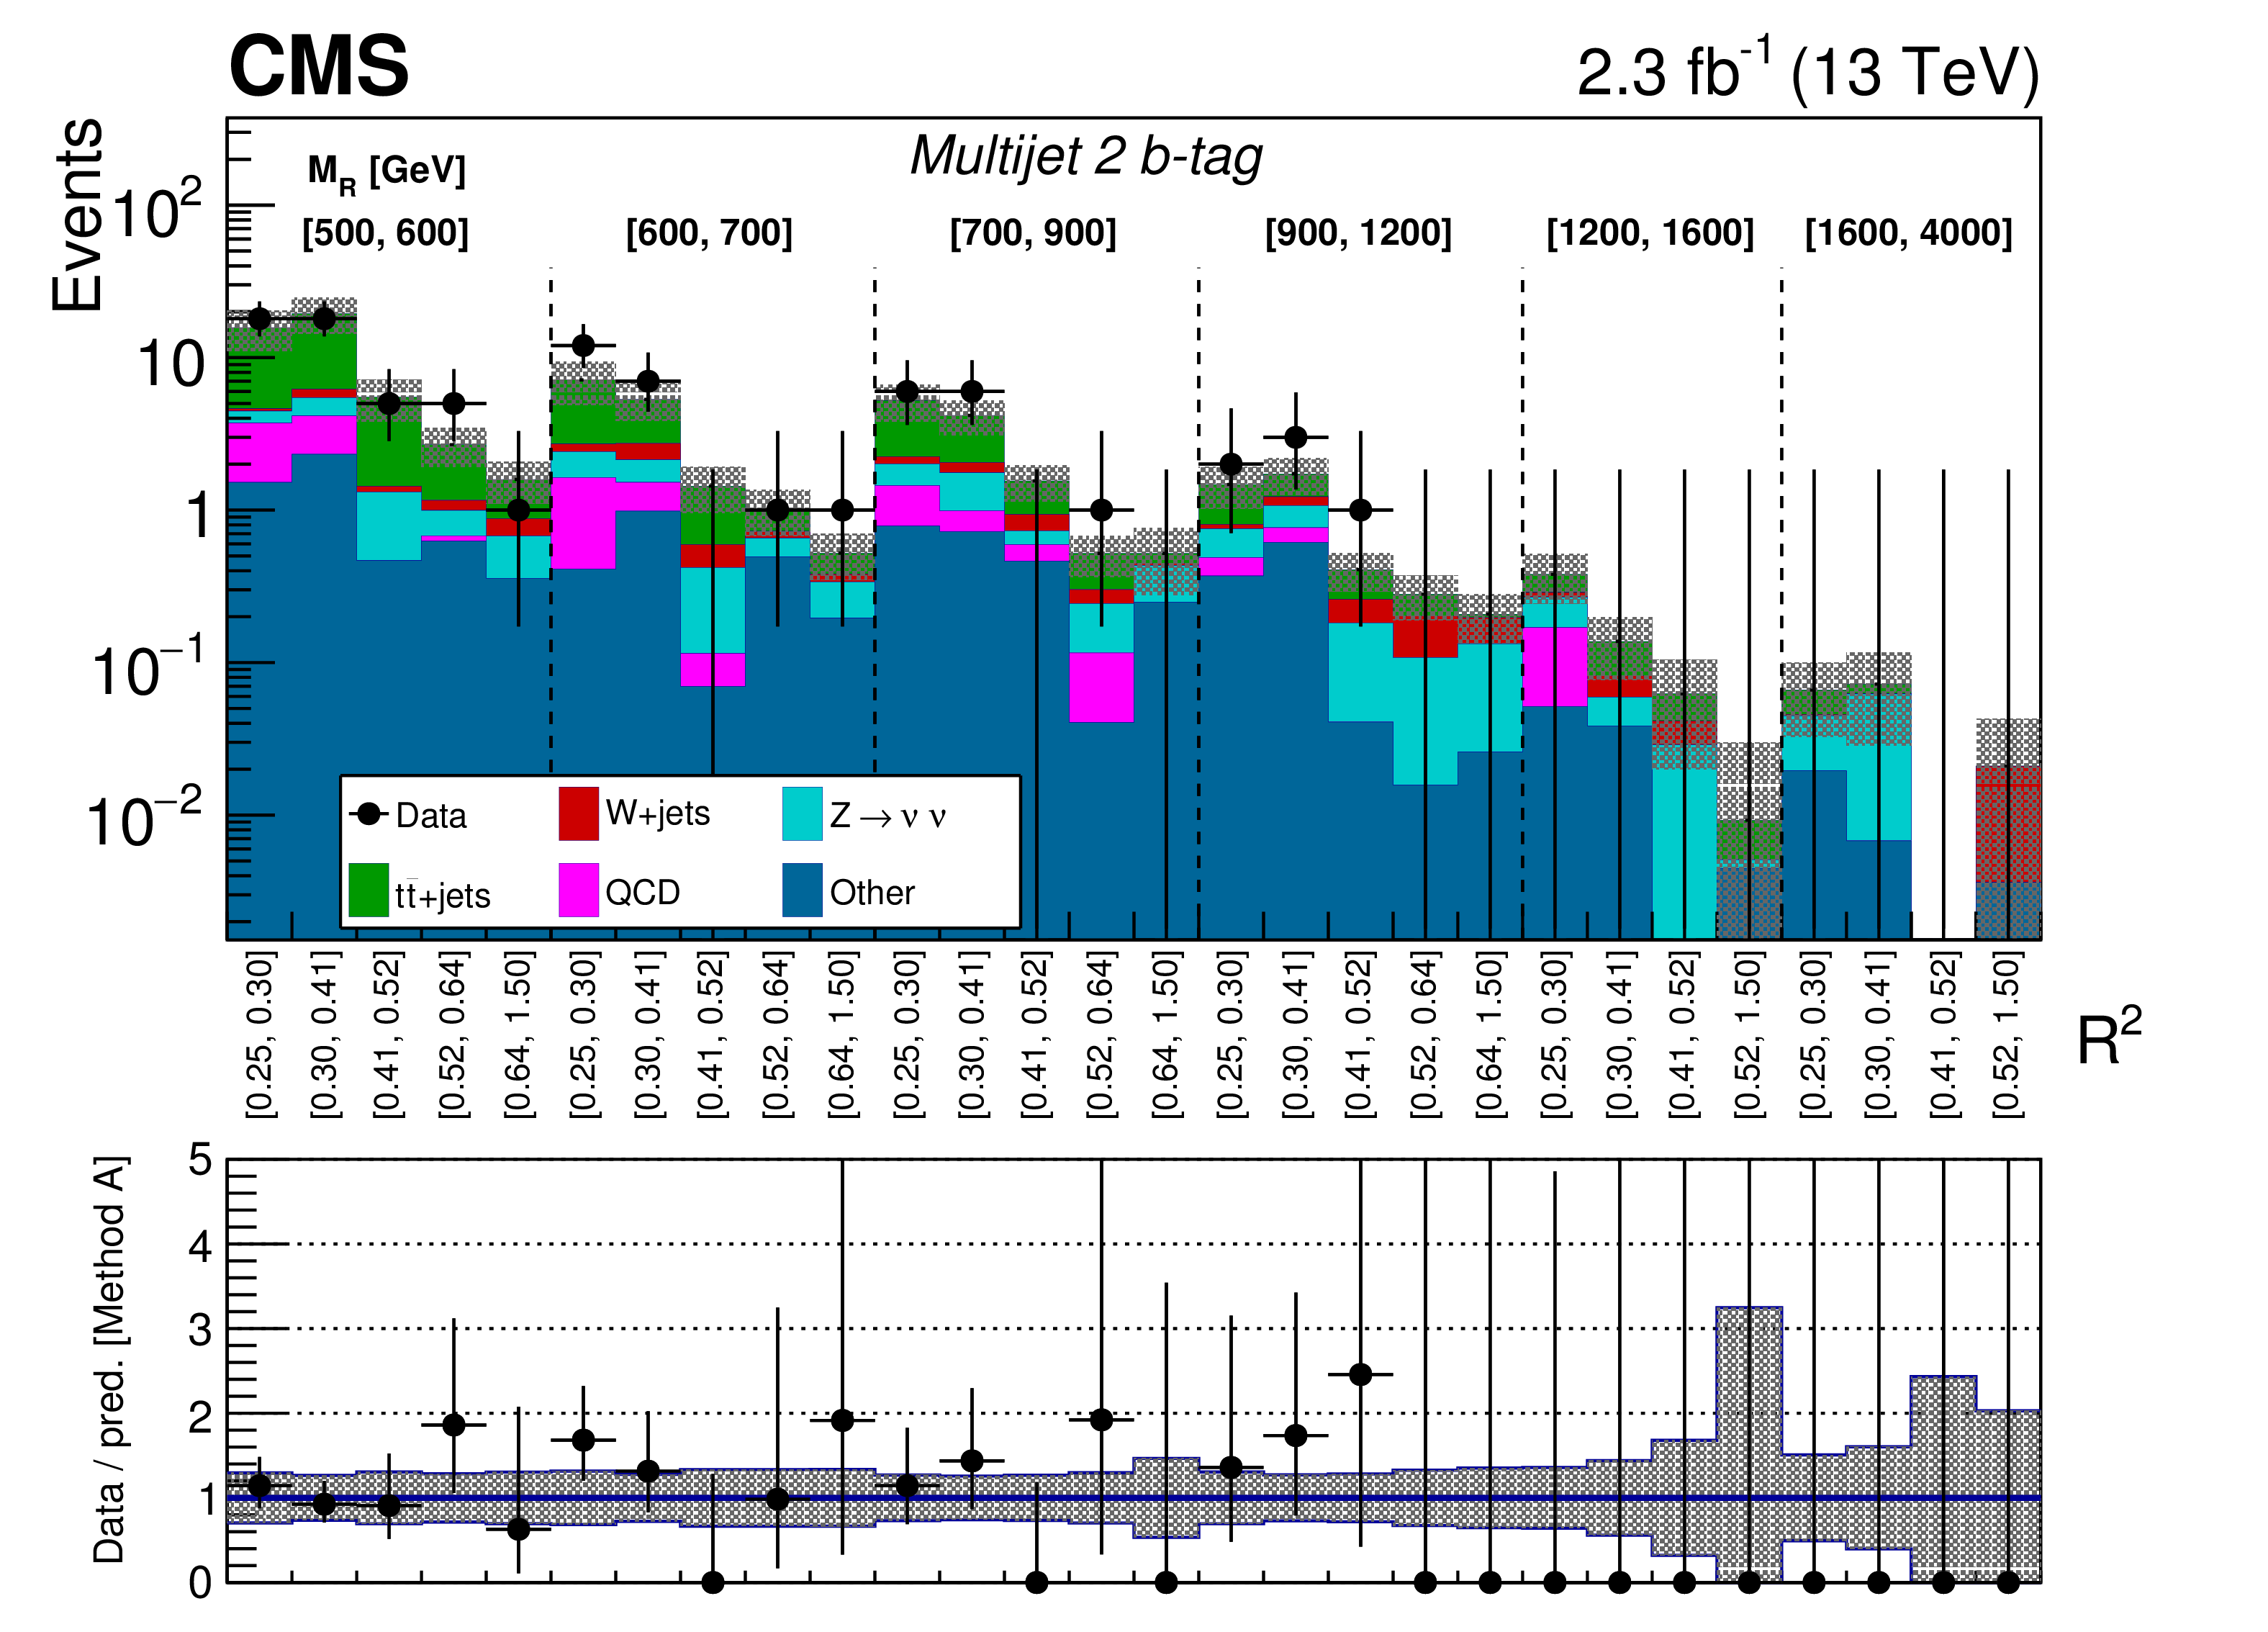
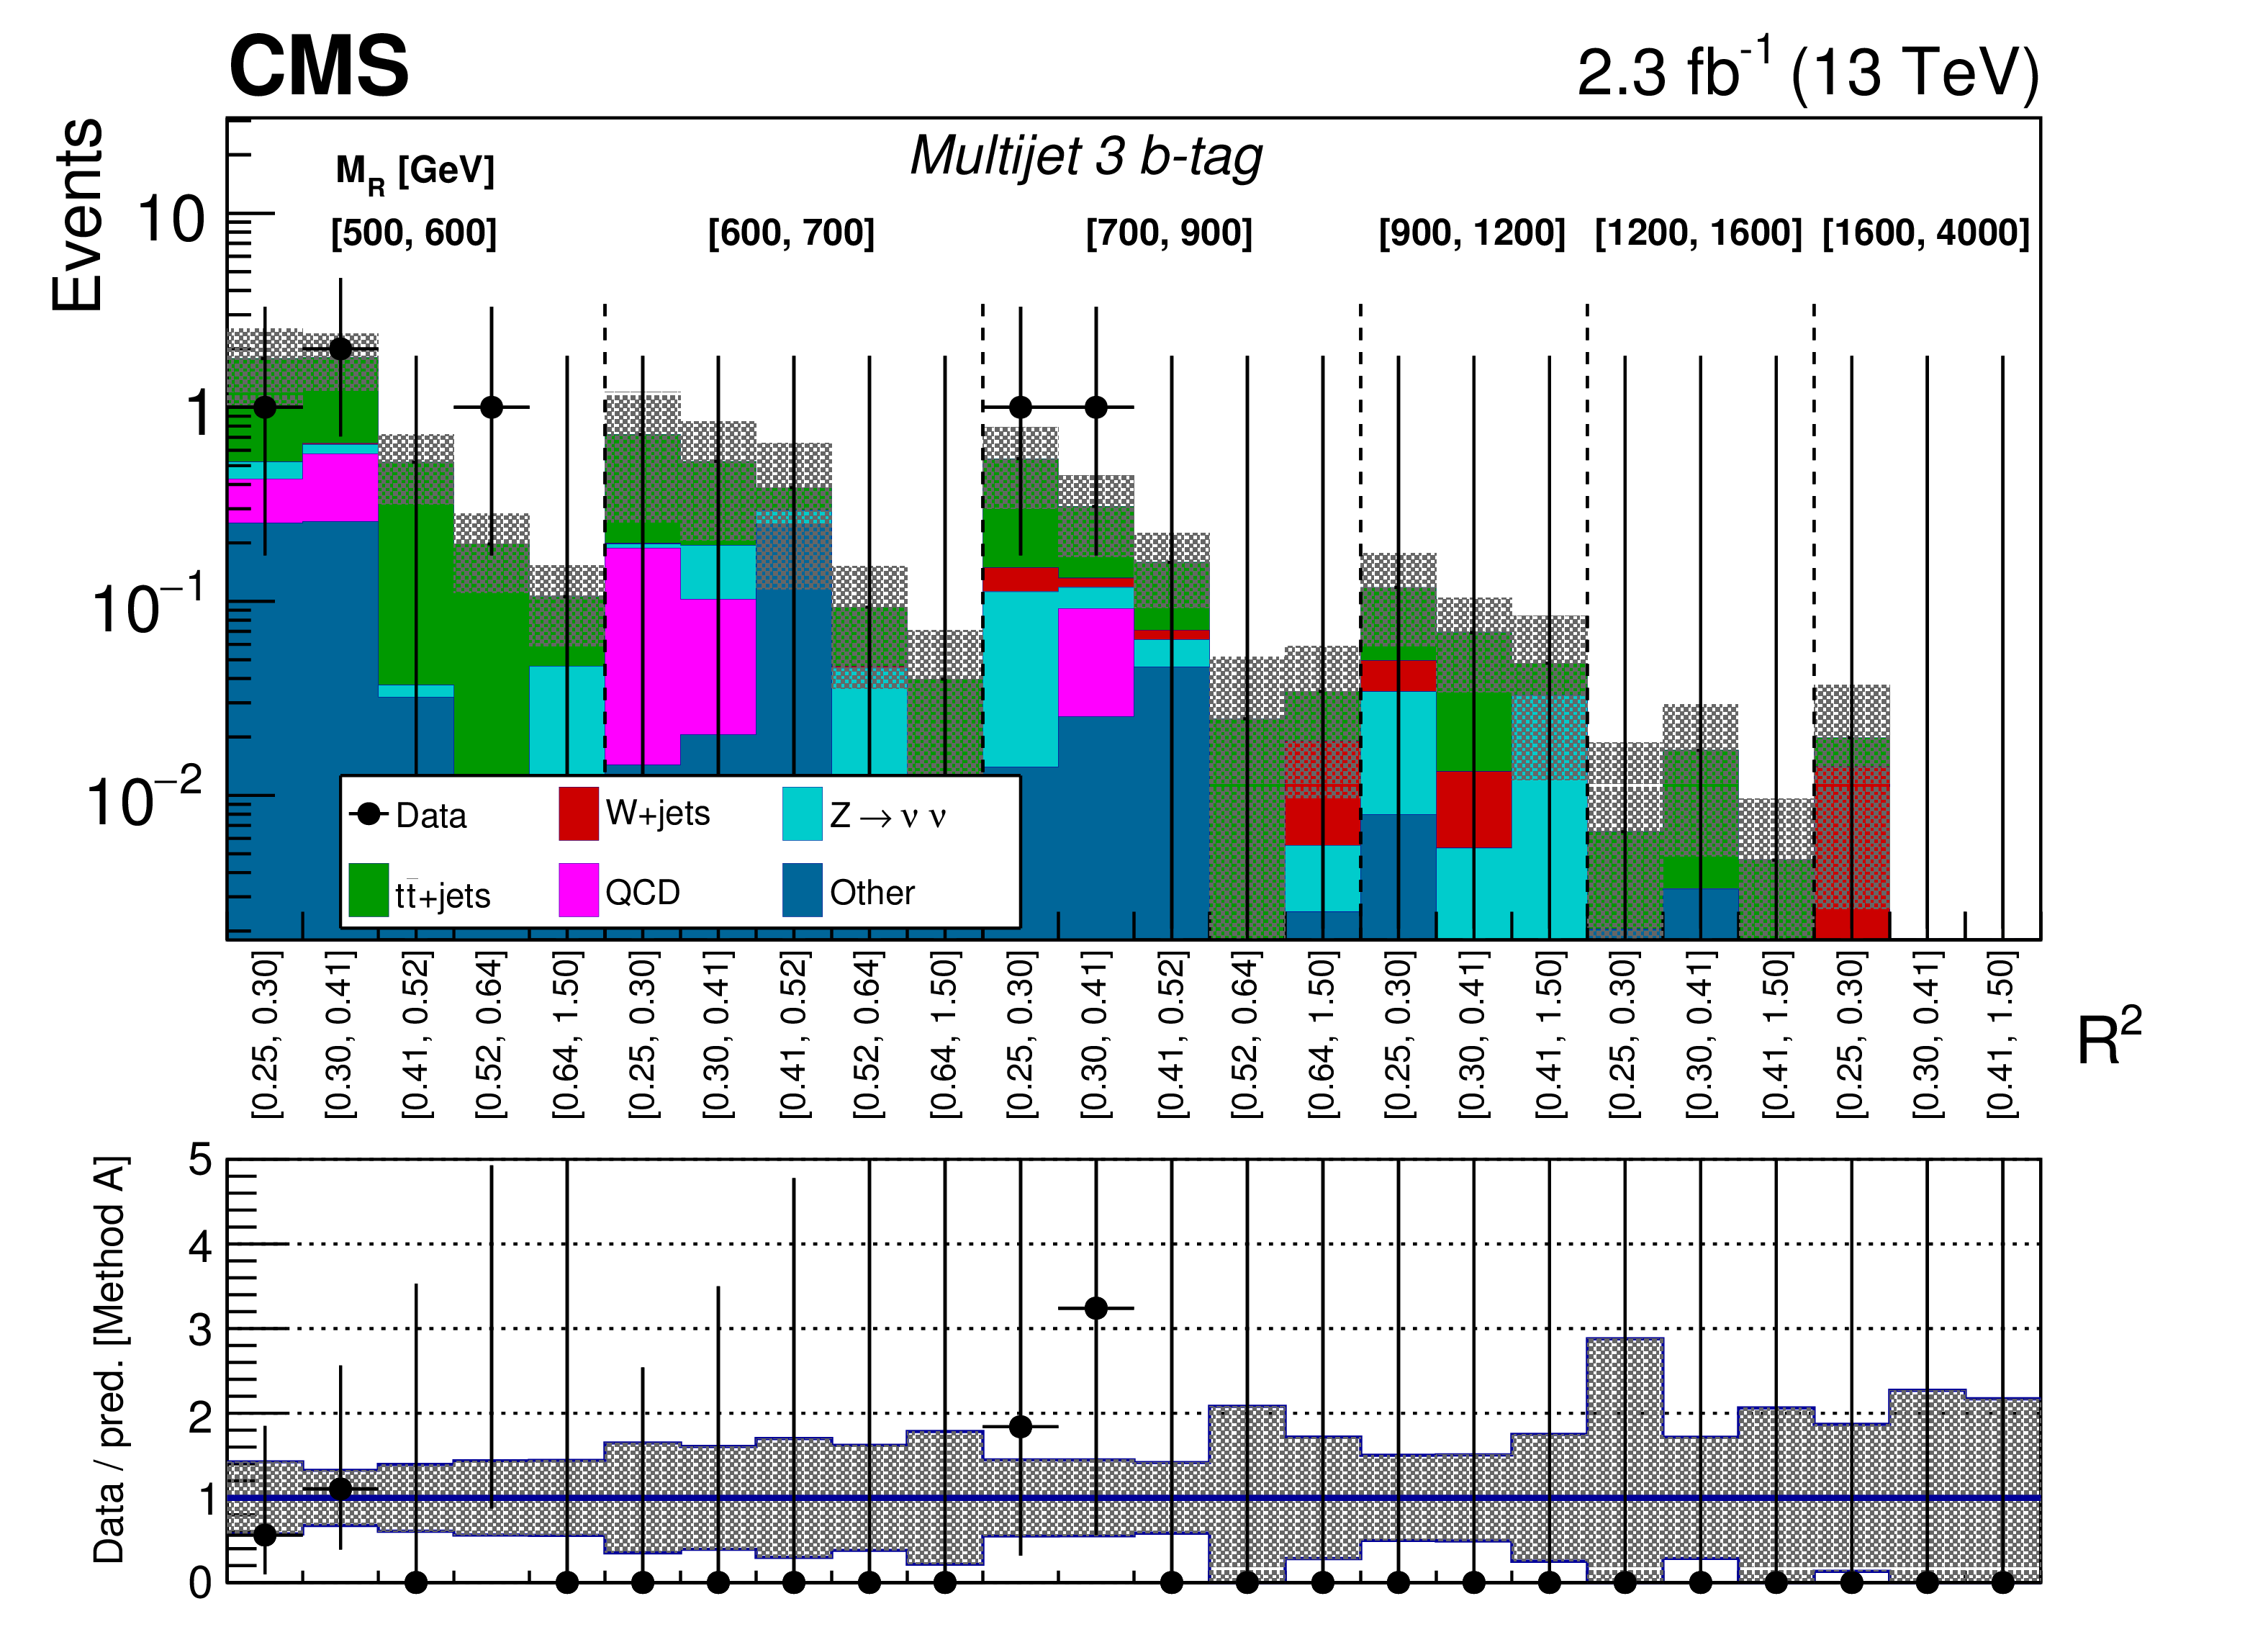
Figure 11:
The $ {M_\mathrm {R}} $-$ {\mathrm {R}^2} $ distribution observed in data is shown along with the background prediction obtained from method A for the Multijet event category in the 2b-tag (upper) and ${\geq }$3b-tag (lower) bins. A detailed explanation of the panels is given in the caption of Fig. 10. |
png pdf |
Figure 11-a:
The $ {M_\mathrm {R}} $-$ {\mathrm {R}^2} $ distribution observed in data is shown along with the background prediction obtained from method A for the Multijet event category in the 2b-tag bin. A detailed explanation of the panels is given in the caption of Fig. 10. |
png pdf |
Figure 11-b:
The $ {M_\mathrm {R}} $-$ {\mathrm {R}^2} $ distribution observed in data is shown along with the background prediction obtained from method A for the Multijet event category in the ${\geq }$3b-tag bin. A detailed explanation of the panels is given in the caption of Fig. 10. |
png pdf |
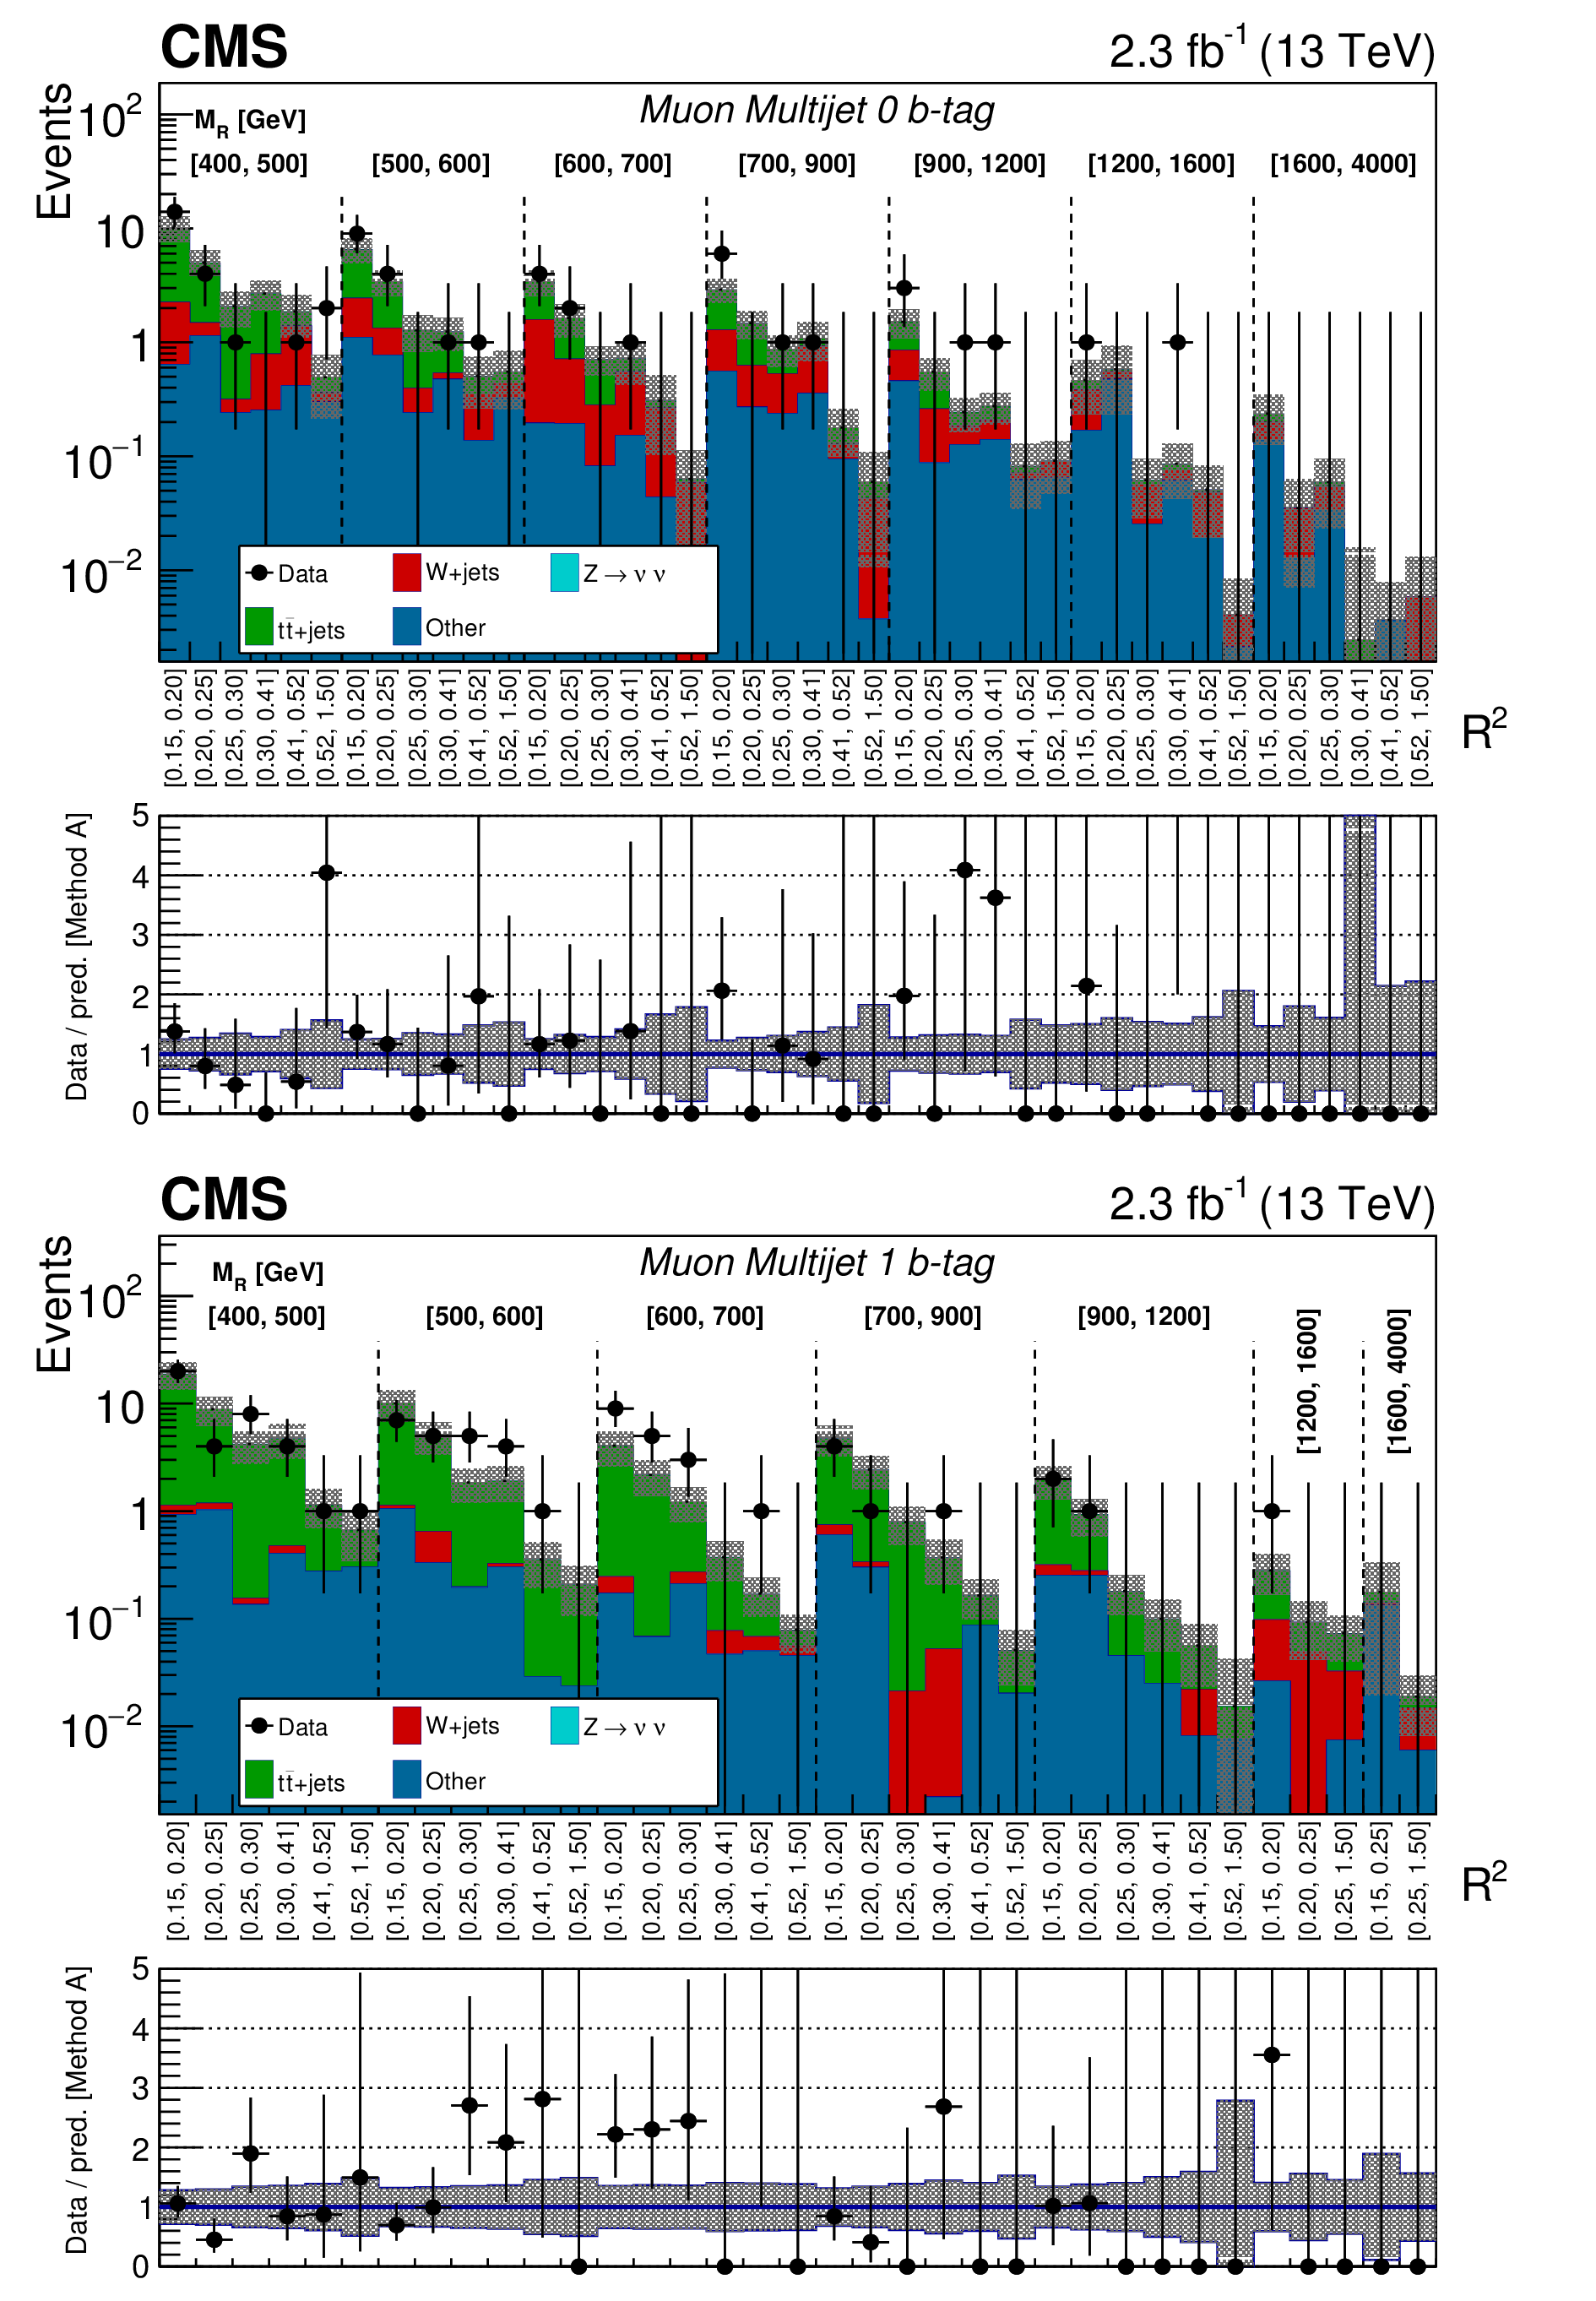
Figure 12:
The $ {M_\mathrm {R}} $-$ {\mathrm {R}^2} $ distribution observed in data is shown along with the background prediction obtained from method A for the Muon Multijet event category in the 0b-tag (upper) and 1b-tag (lower) bins. A detailed explanation of the panels is given in the caption of Fig. 10. |
png pdf |
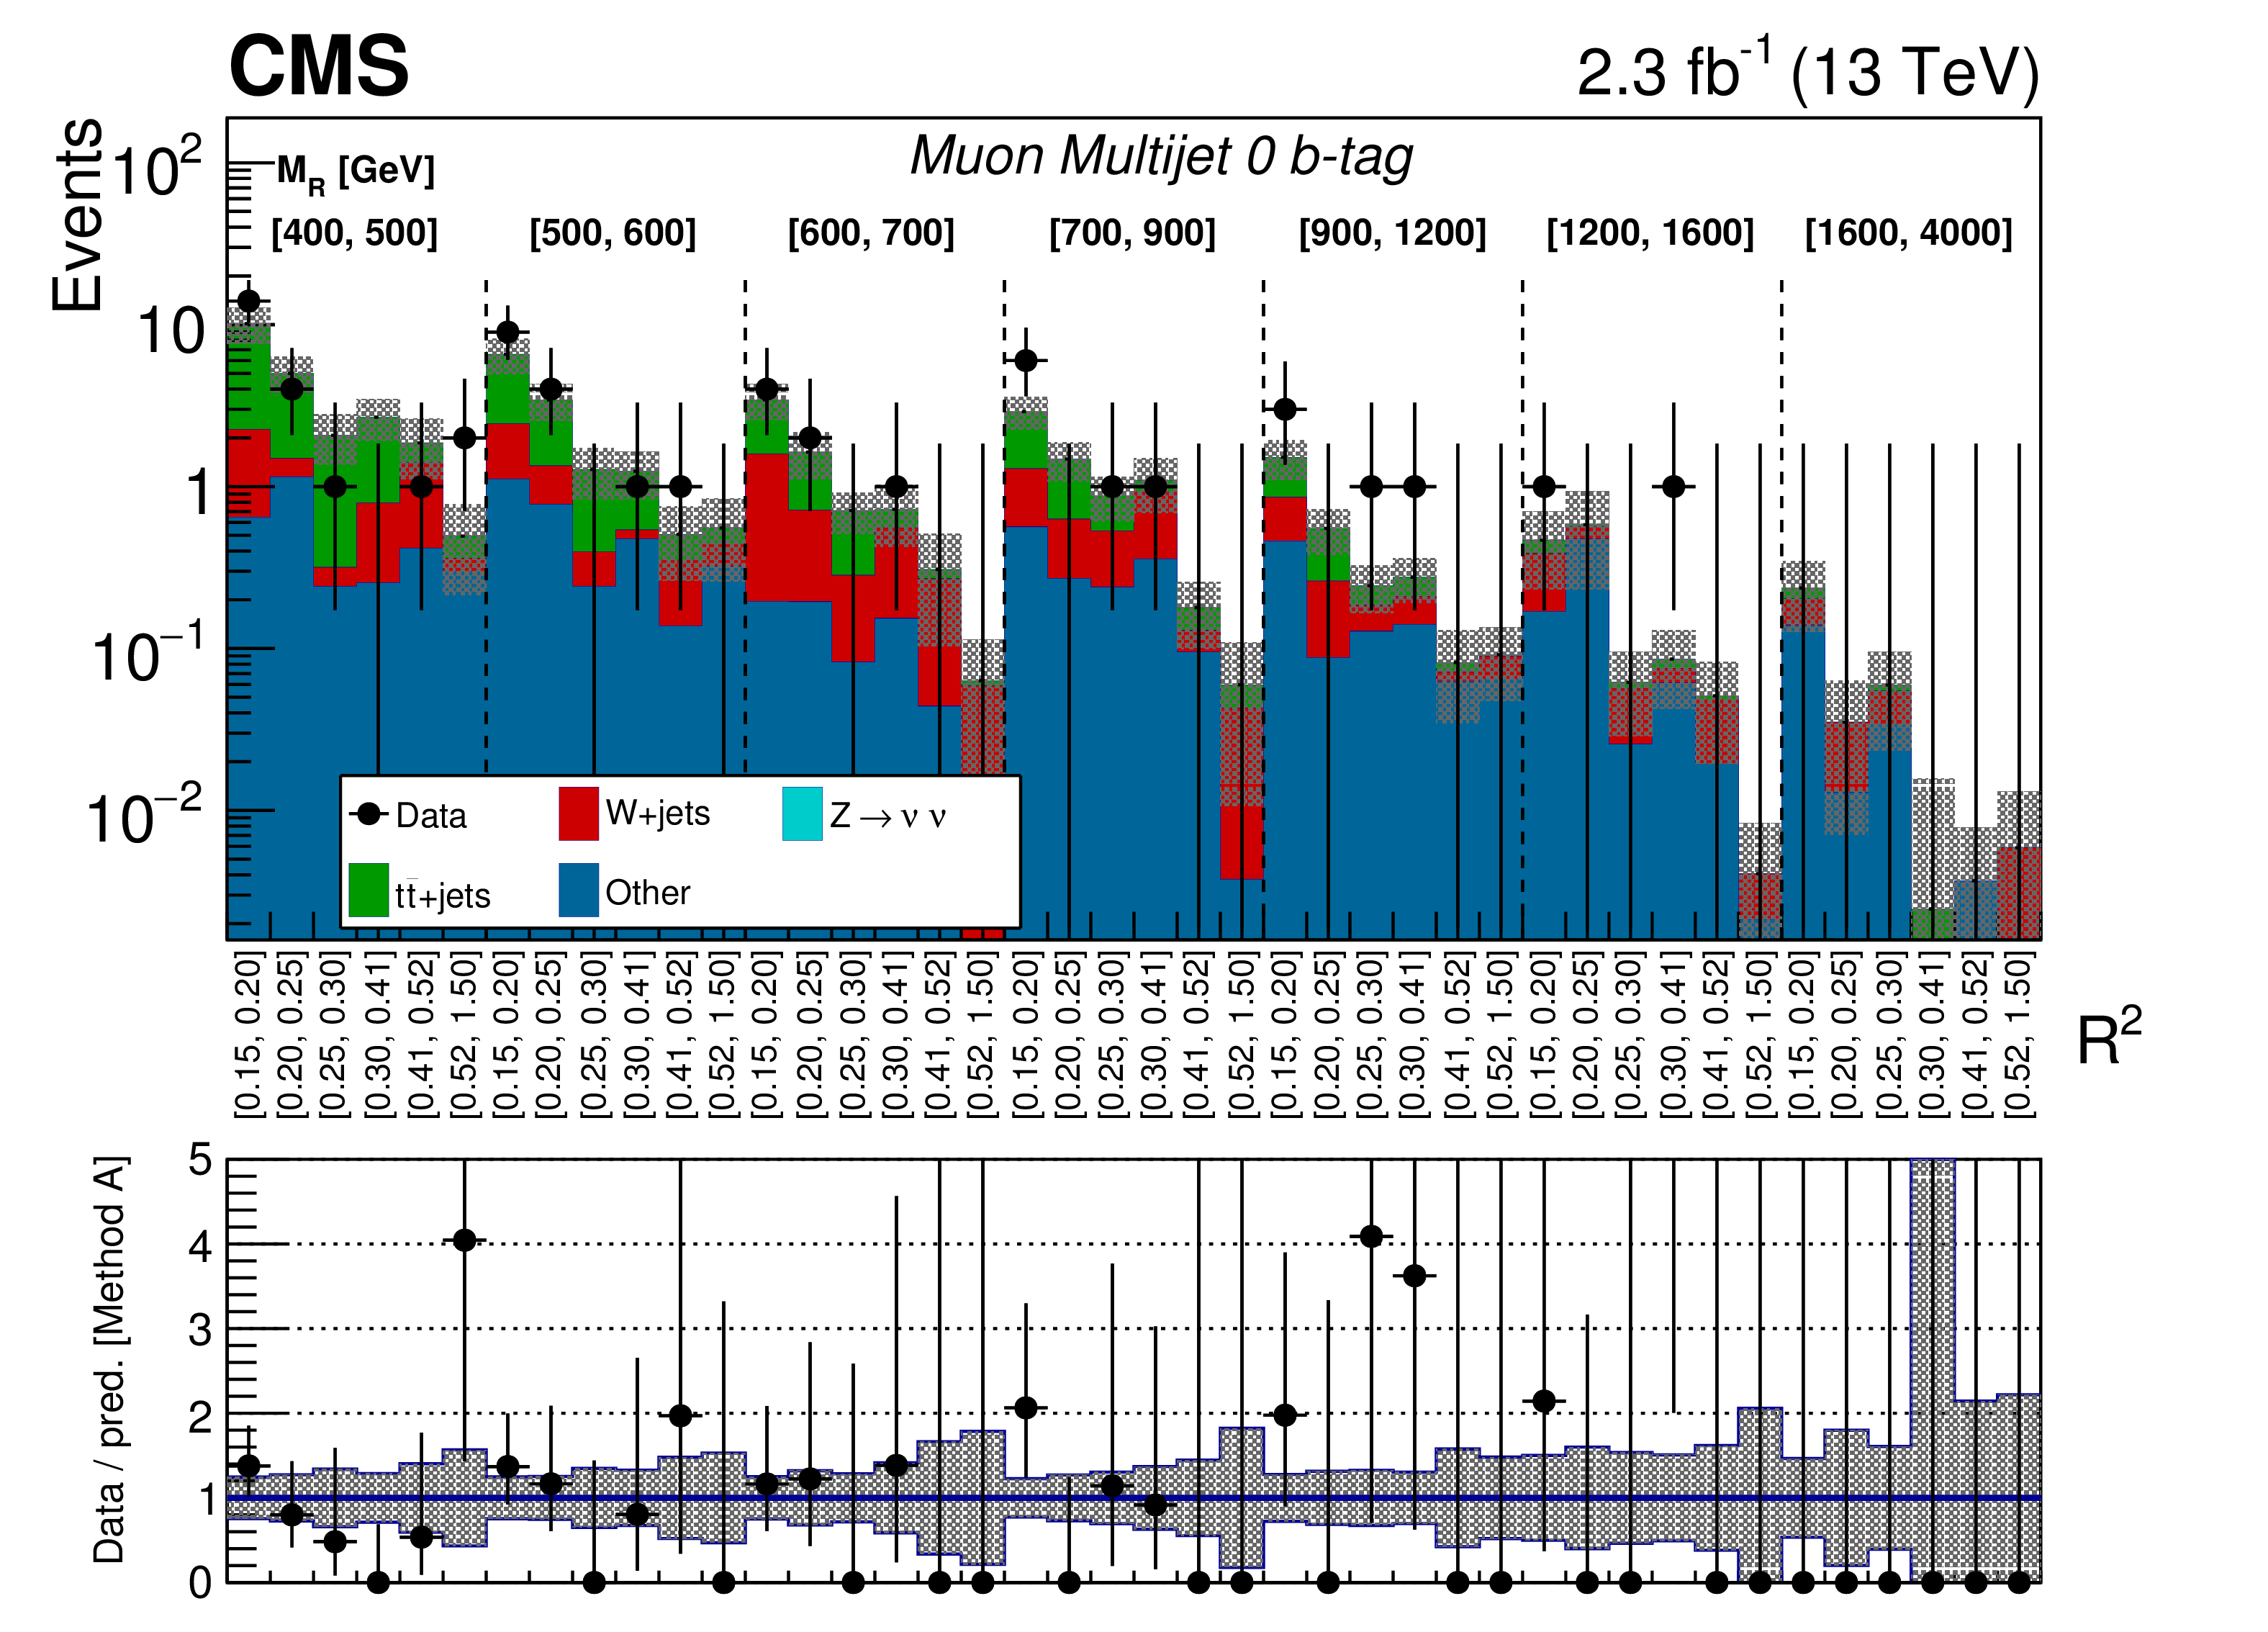
Figure 12-a:
The $ {M_\mathrm {R}} $-$ {\mathrm {R}^2} $ distribution observed in data is shown along with the background prediction obtained from method A for the Muon Multijet event category in the 0b-tag bin. A detailed explanation of the panels is given in the caption of Fig. 10. |
png pdf |
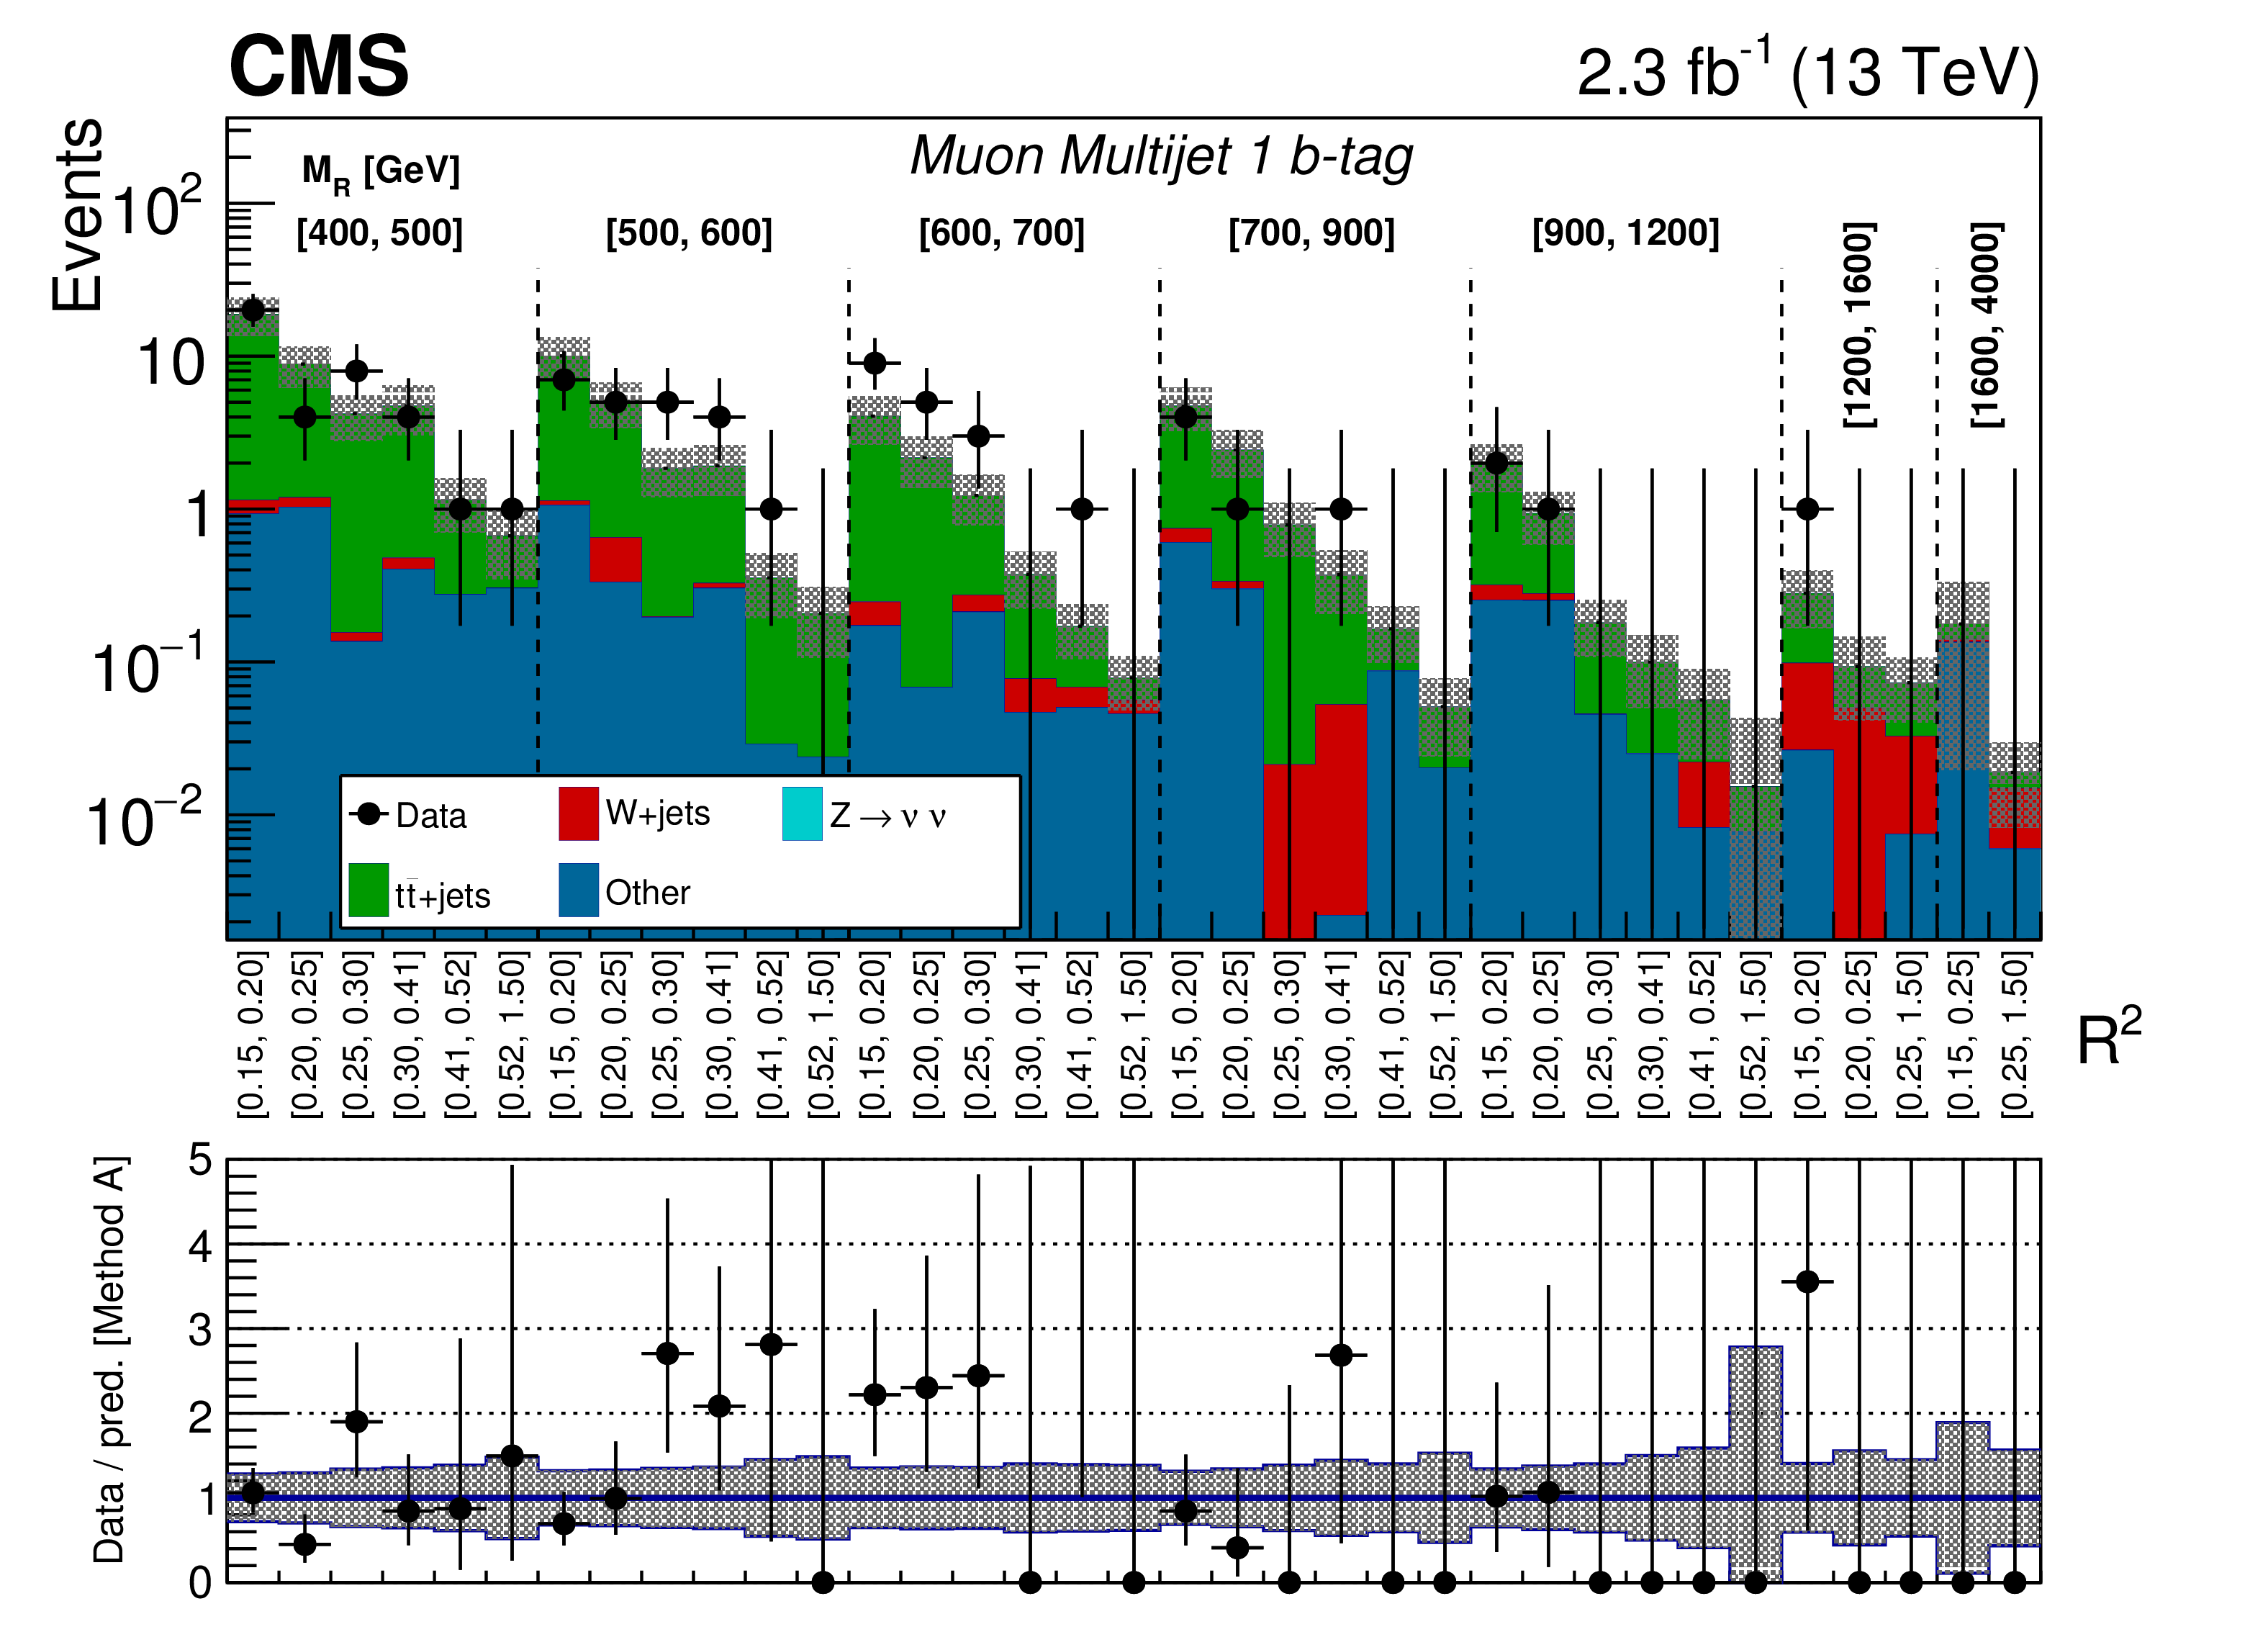
Figure 12-b:
The $ {M_\mathrm {R}} $-$ {\mathrm {R}^2} $ distribution observed in data is shown along with the background prediction obtained from method A for the Muon Multijet event category in the 1b-tag bin. A detailed explanation of the panels is given in the caption of Fig. 10. |
png pdf |
Figure 13:
The $ {M_\mathrm {R}} $-$ {\mathrm {R}^2} $ distribution observed in data is shown along with the background prediction obtained from method A for the Muon Multijet event category in the 2b-tag (upper) and ${\geq }$3b-tag (lower) bins. A detailed explanation of the panels is given in the caption of Fig. 10. |
png pdf |
Figure 13-a:
The $ {M_\mathrm {R}} $-$ {\mathrm {R}^2} $ distribution observed in data is shown along with the background prediction obtained from method A for the Muon Multijet event category in the 2b-tag bin. A detailed explanation of the panels is given in the caption of Fig. 10. |
png pdf |
Figure 13-b:
The $ {M_\mathrm {R}} $-$ {\mathrm {R}^2} $ distribution observed in data is shown along with the background prediction obtained from method A for the Muon Multijet event category in the ${\geq }$3b-tag bin. A detailed explanation of the panels is given in the caption of Fig. 10. |
png pdf |
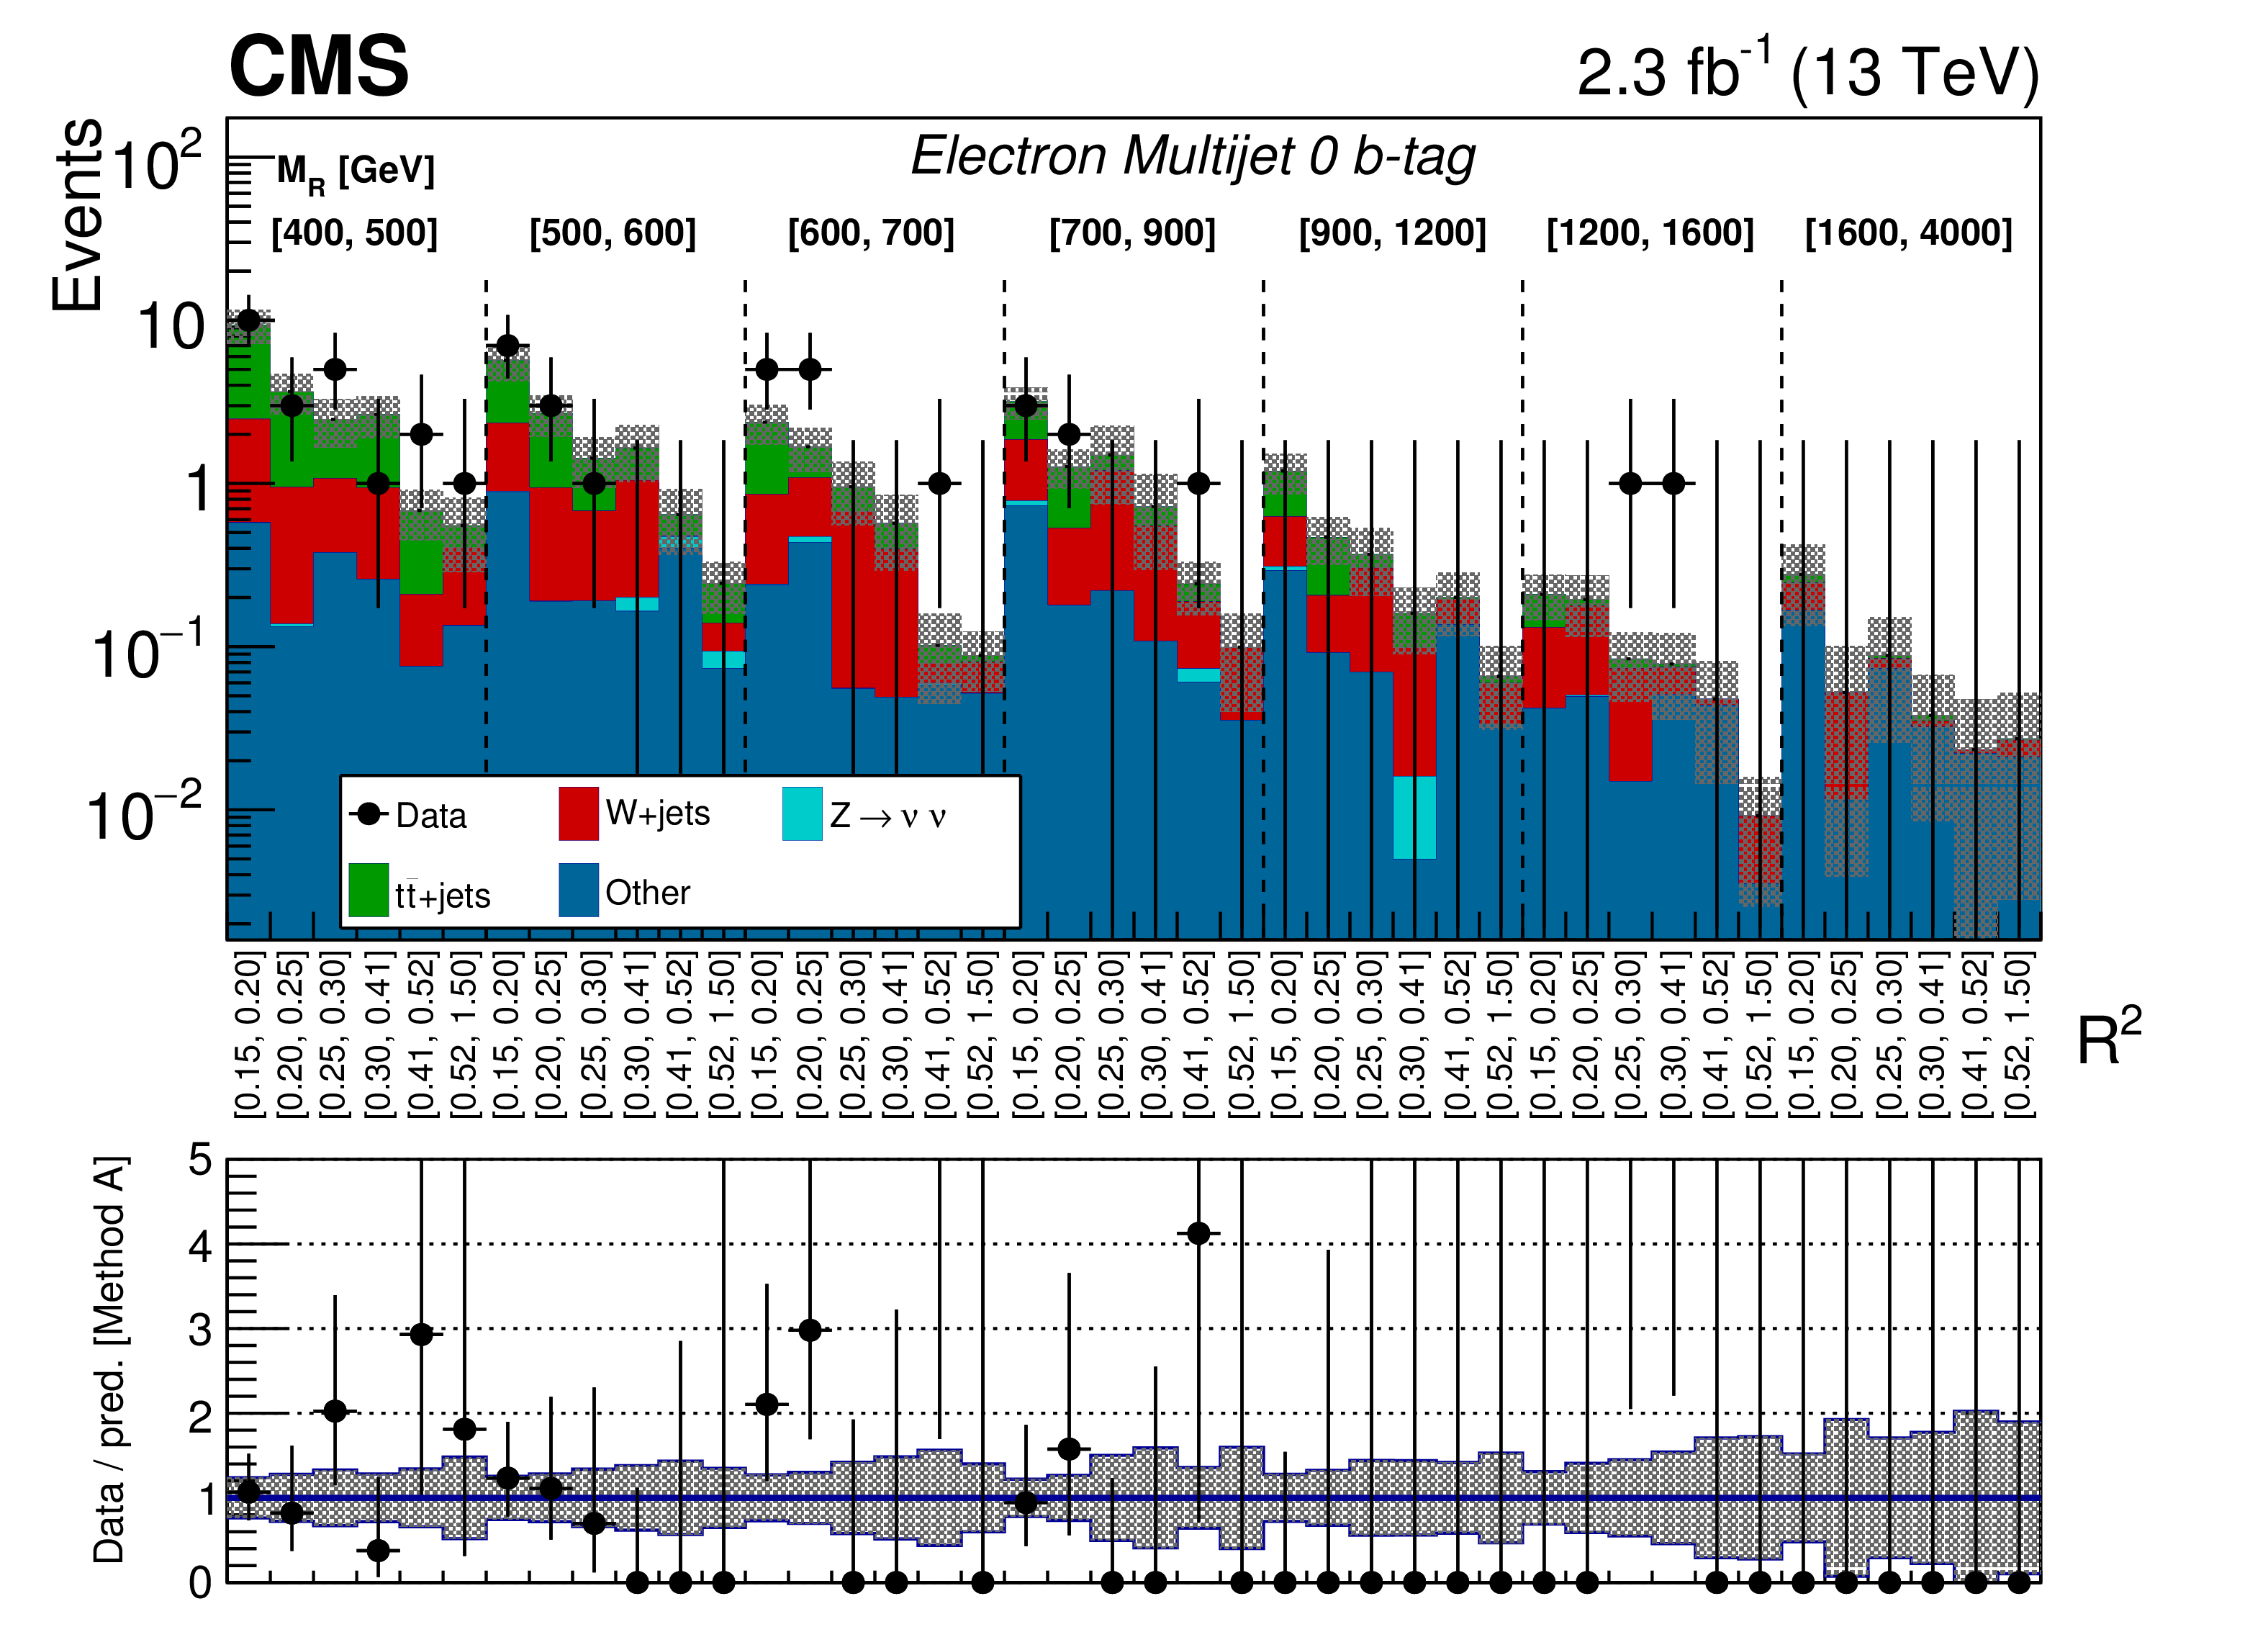
Figure 14:
The $ {M_\mathrm {R}} $-$ {\mathrm {R}^2} $ distribution observed in data is shown along with the background prediction obtained from method A for the Electron Multijet event category in the 0b-tag (upper) and 1b-tag (lower) bins. A detailed explanation of the panels is given in the caption of Fig. 10. |
png pdf |
Figure 14-a:
The $ {M_\mathrm {R}} $-$ {\mathrm {R}^2} $ distribution observed in data is shown along with the background prediction obtained from method A for the Electron Multijet event category in the 0b-tag bin. A detailed explanation of the panels is given in the caption of Fig. 10. |
png pdf |
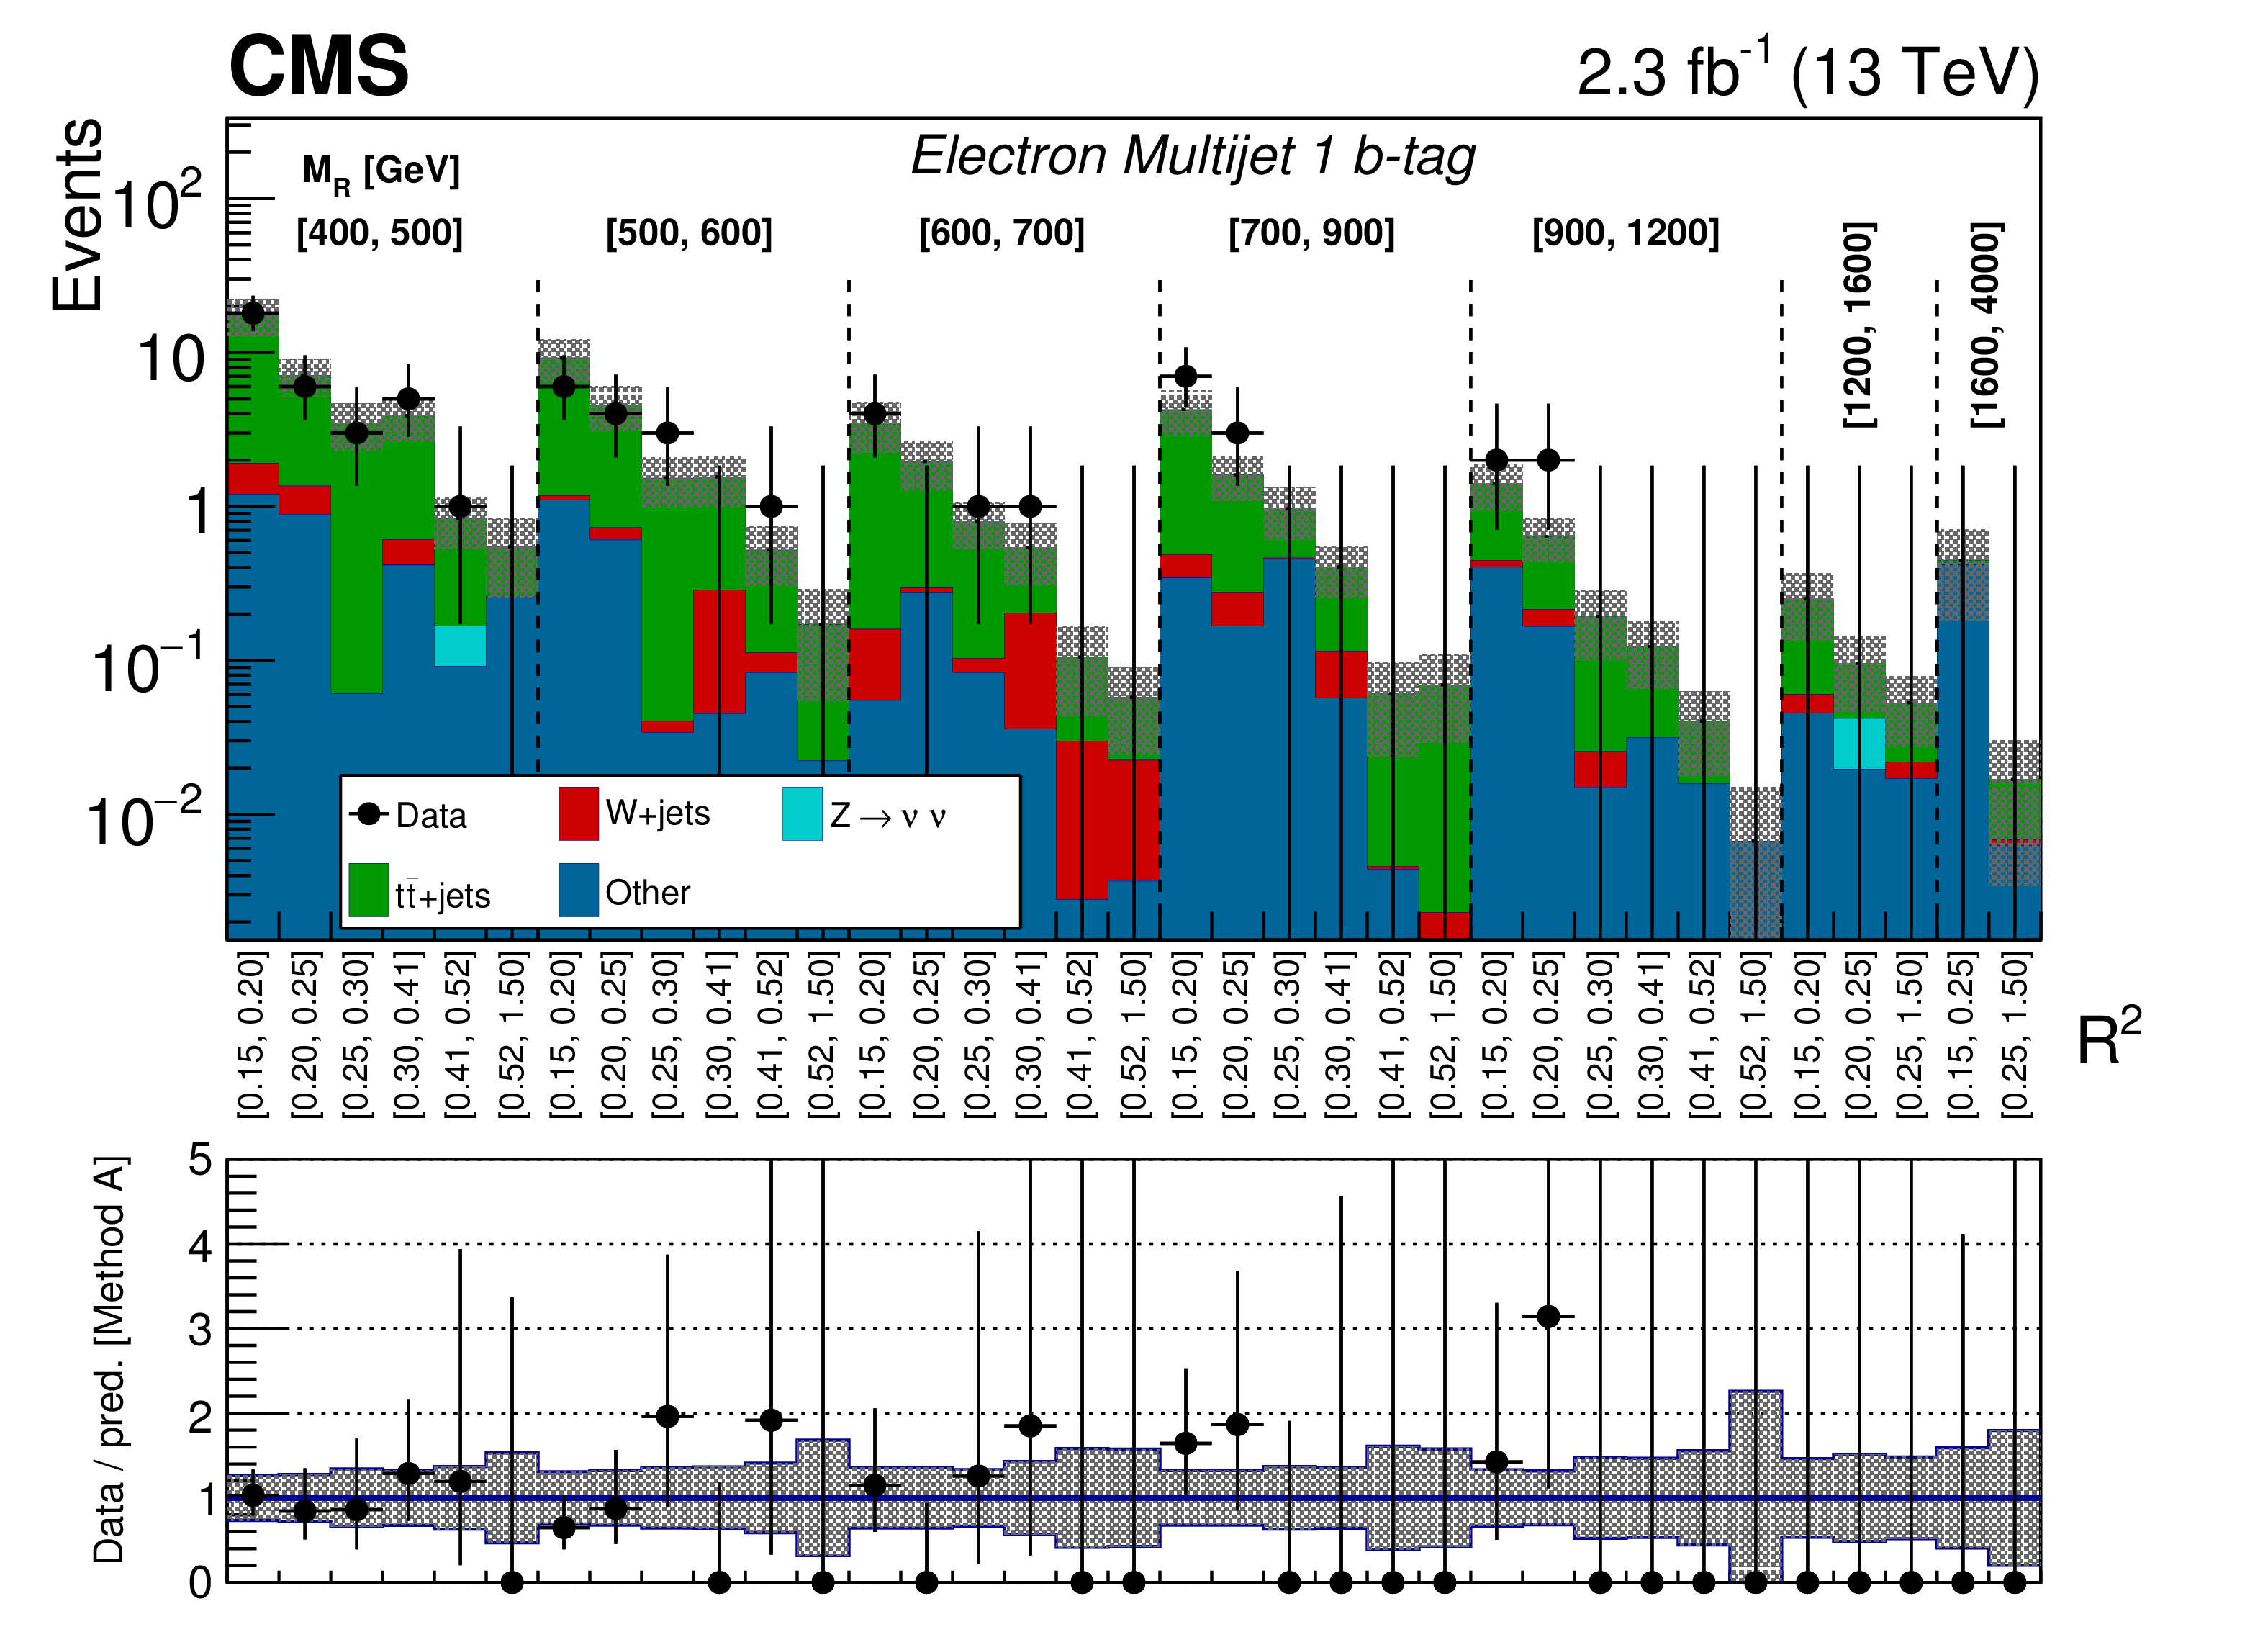
Figure 14-b:
The $ {M_\mathrm {R}} $-$ {\mathrm {R}^2} $ distribution observed in data is shown along with the background prediction obtained from method A for the Electron Multijet event category in the 1b-tag bin. A detailed explanation of the panels is given in the caption of Fig. 10. |

png pdf |
Figure 15:
The $ {M_\mathrm {R}} $-$ {\mathrm {R}^2} $ distribution observed in data is shown along with the background prediction obtained from method A for the Electron Multijet event category in the 2b-tag (upper) and ${\geq }$3b-tag (lower) bins. A detailed explanation of the panels is given in the caption of Fig. 10. |
png pdf |
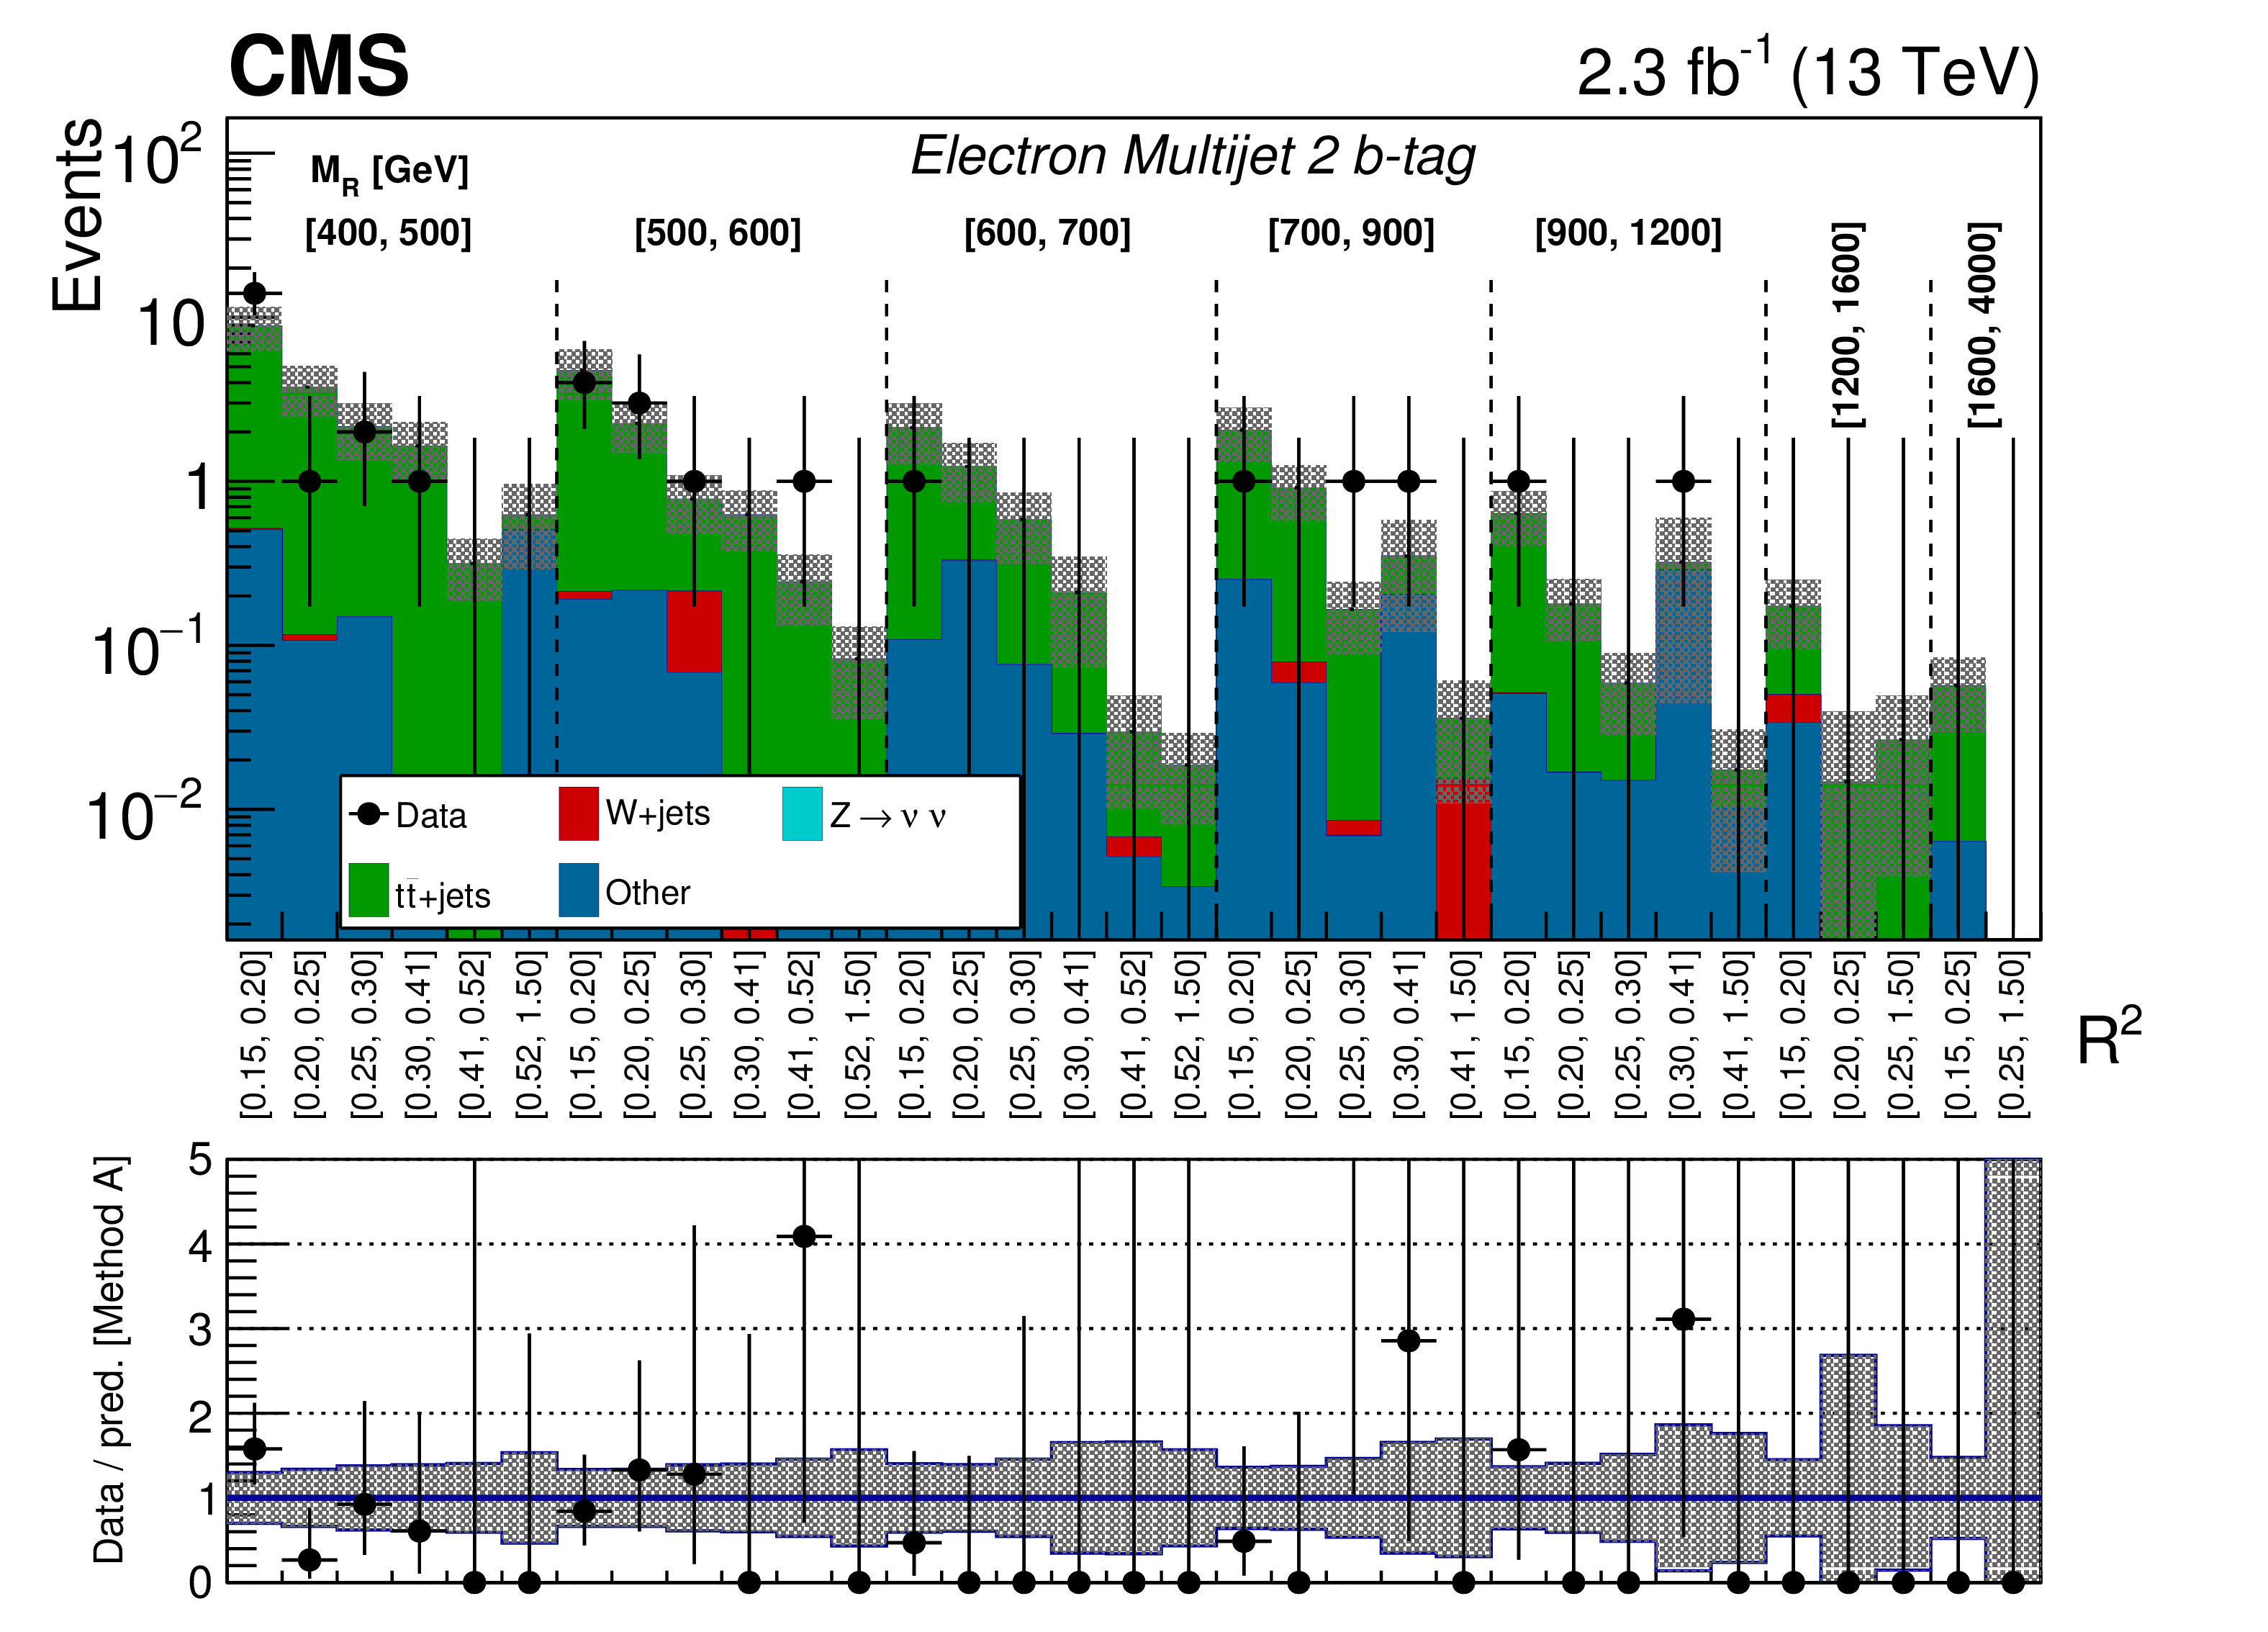
Figure 15-a:
The $ {M_\mathrm {R}} $-$ {\mathrm {R}^2} $ distribution observed in data is shown along with the background prediction obtained from method A for the Electron Multijet event category in the 2b-tag bin. A detailed explanation of the panels is given in the caption of Fig. 10. |
png pdf |
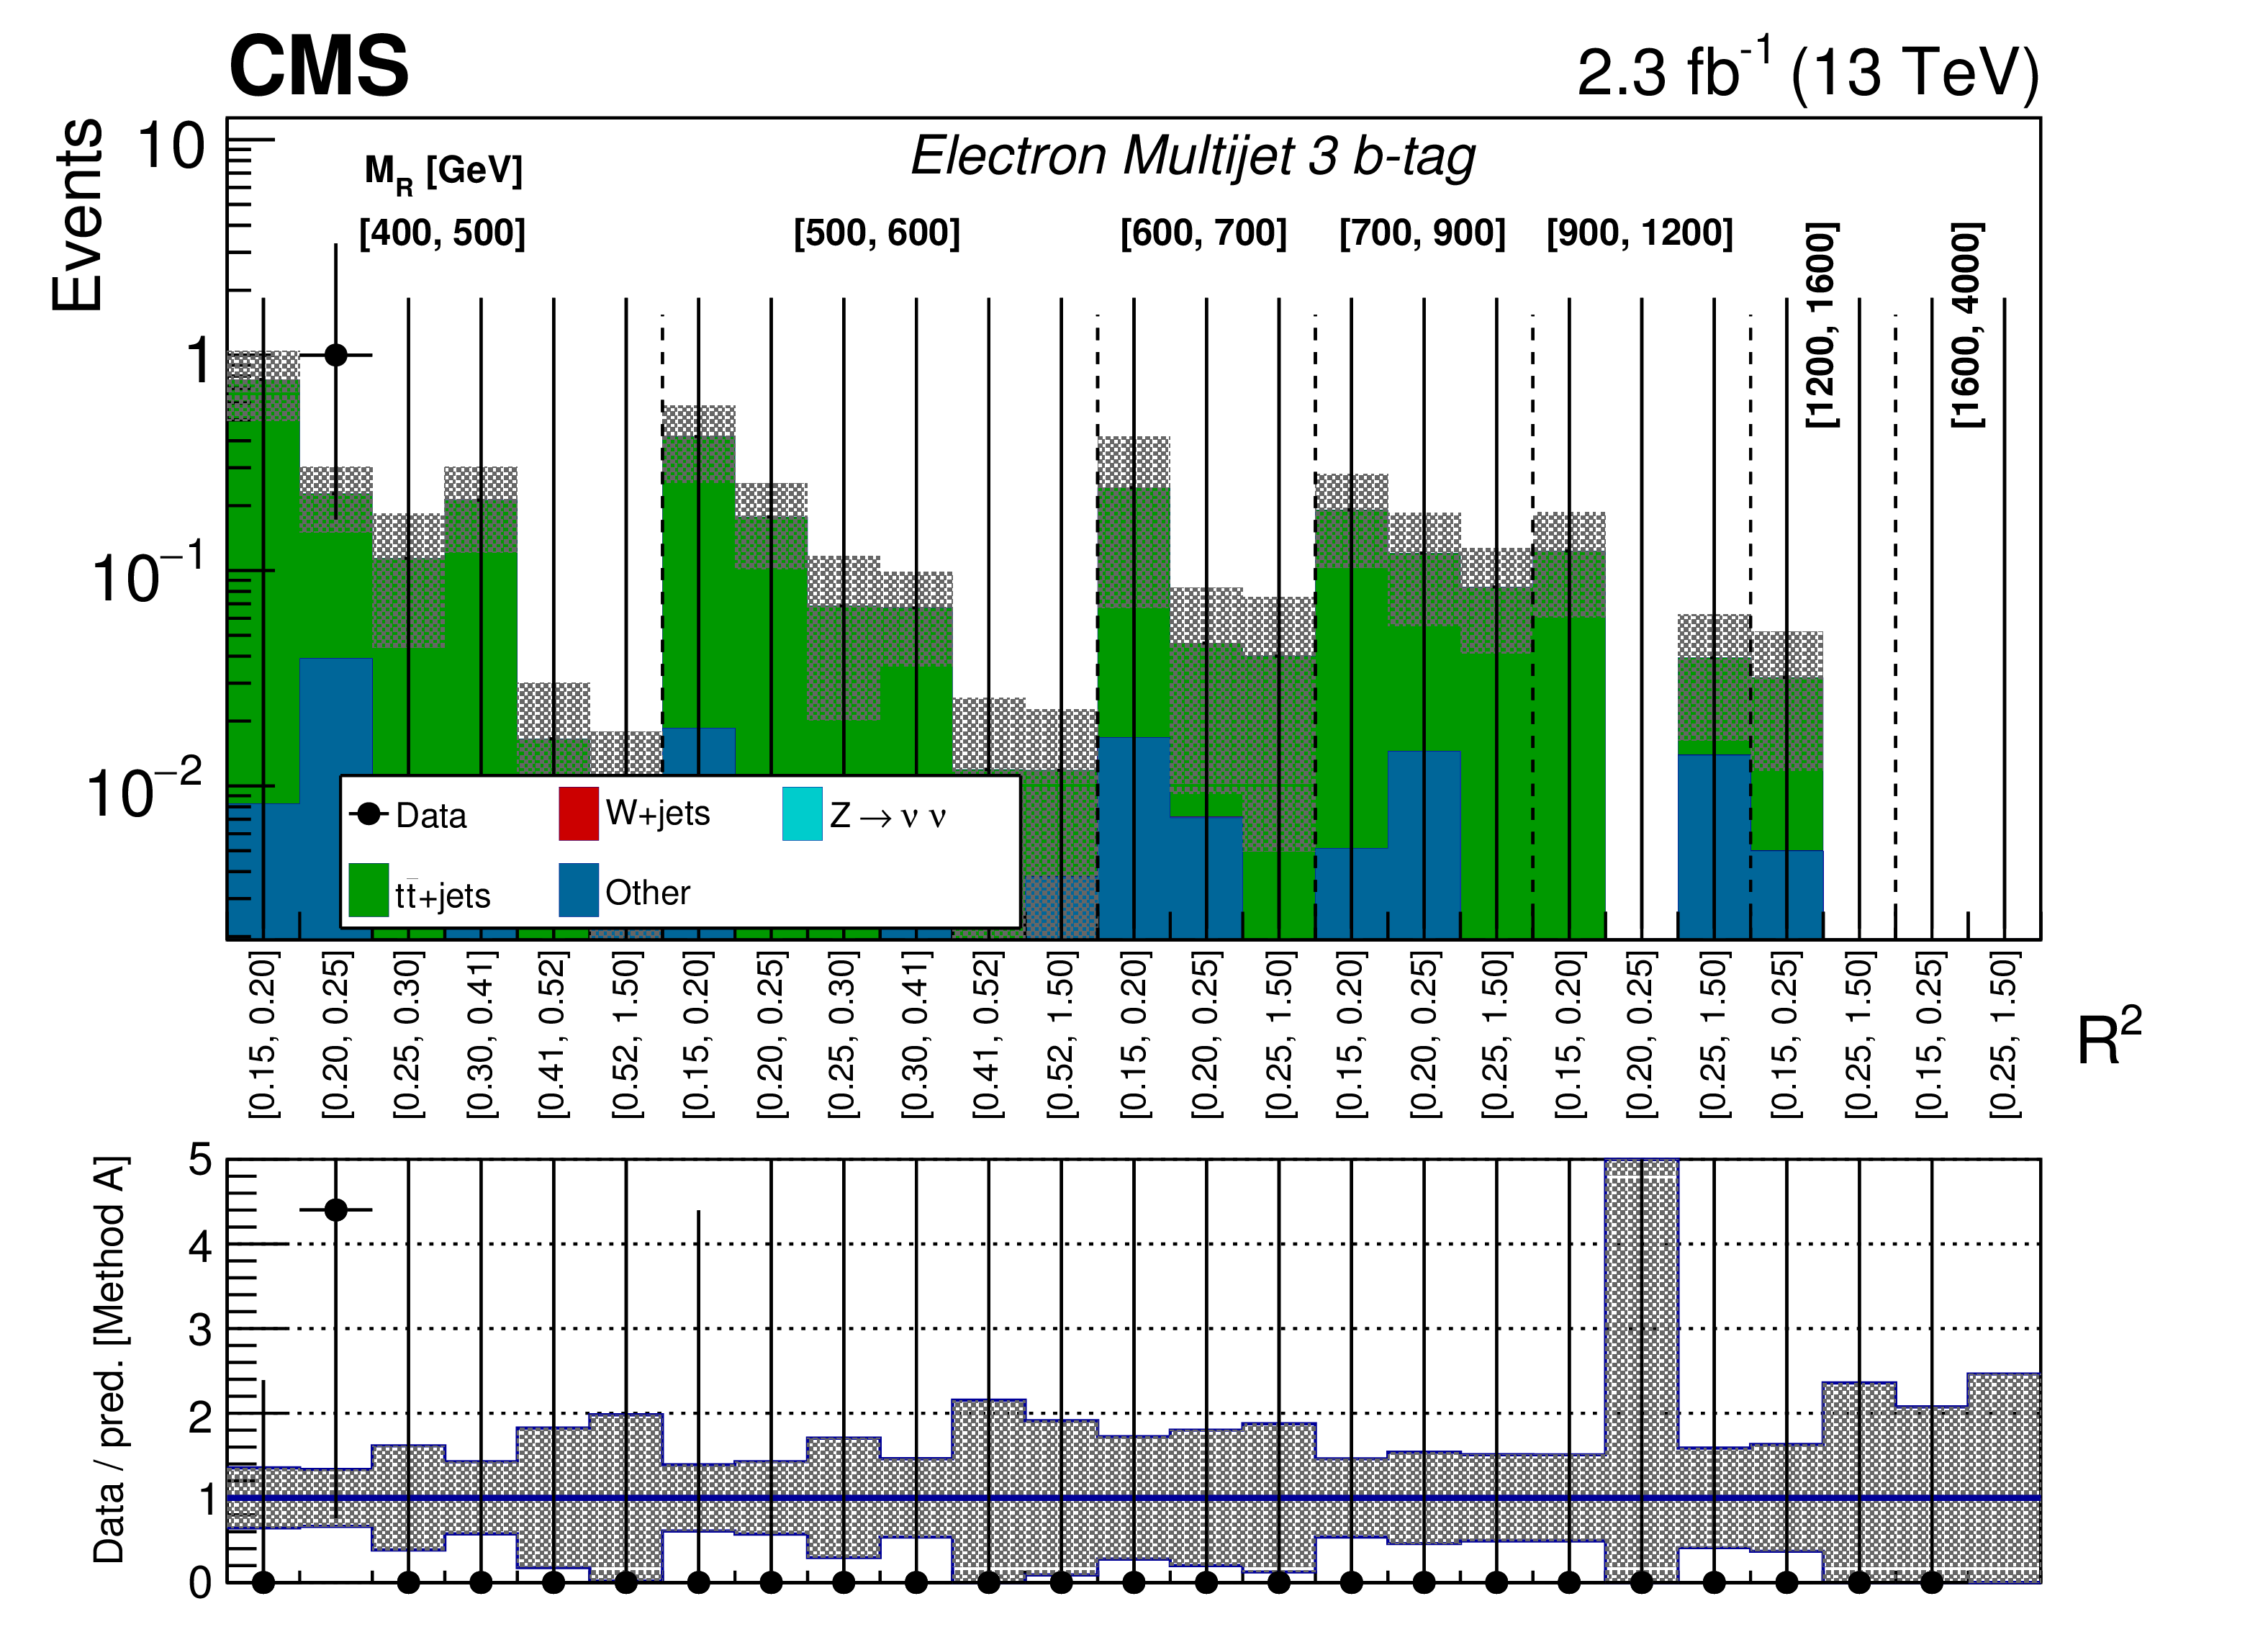
Figure 15-b:
The $ {M_\mathrm {R}} $-$ {\mathrm {R}^2} $ distribution observed in data is shown along with the background prediction obtained from method A for the Electron Multijet event category in the ${\geq }$3b-tag bin. A detailed explanation of the panels is given in the caption of Fig. 10. |

png pdf |
Figure 16:
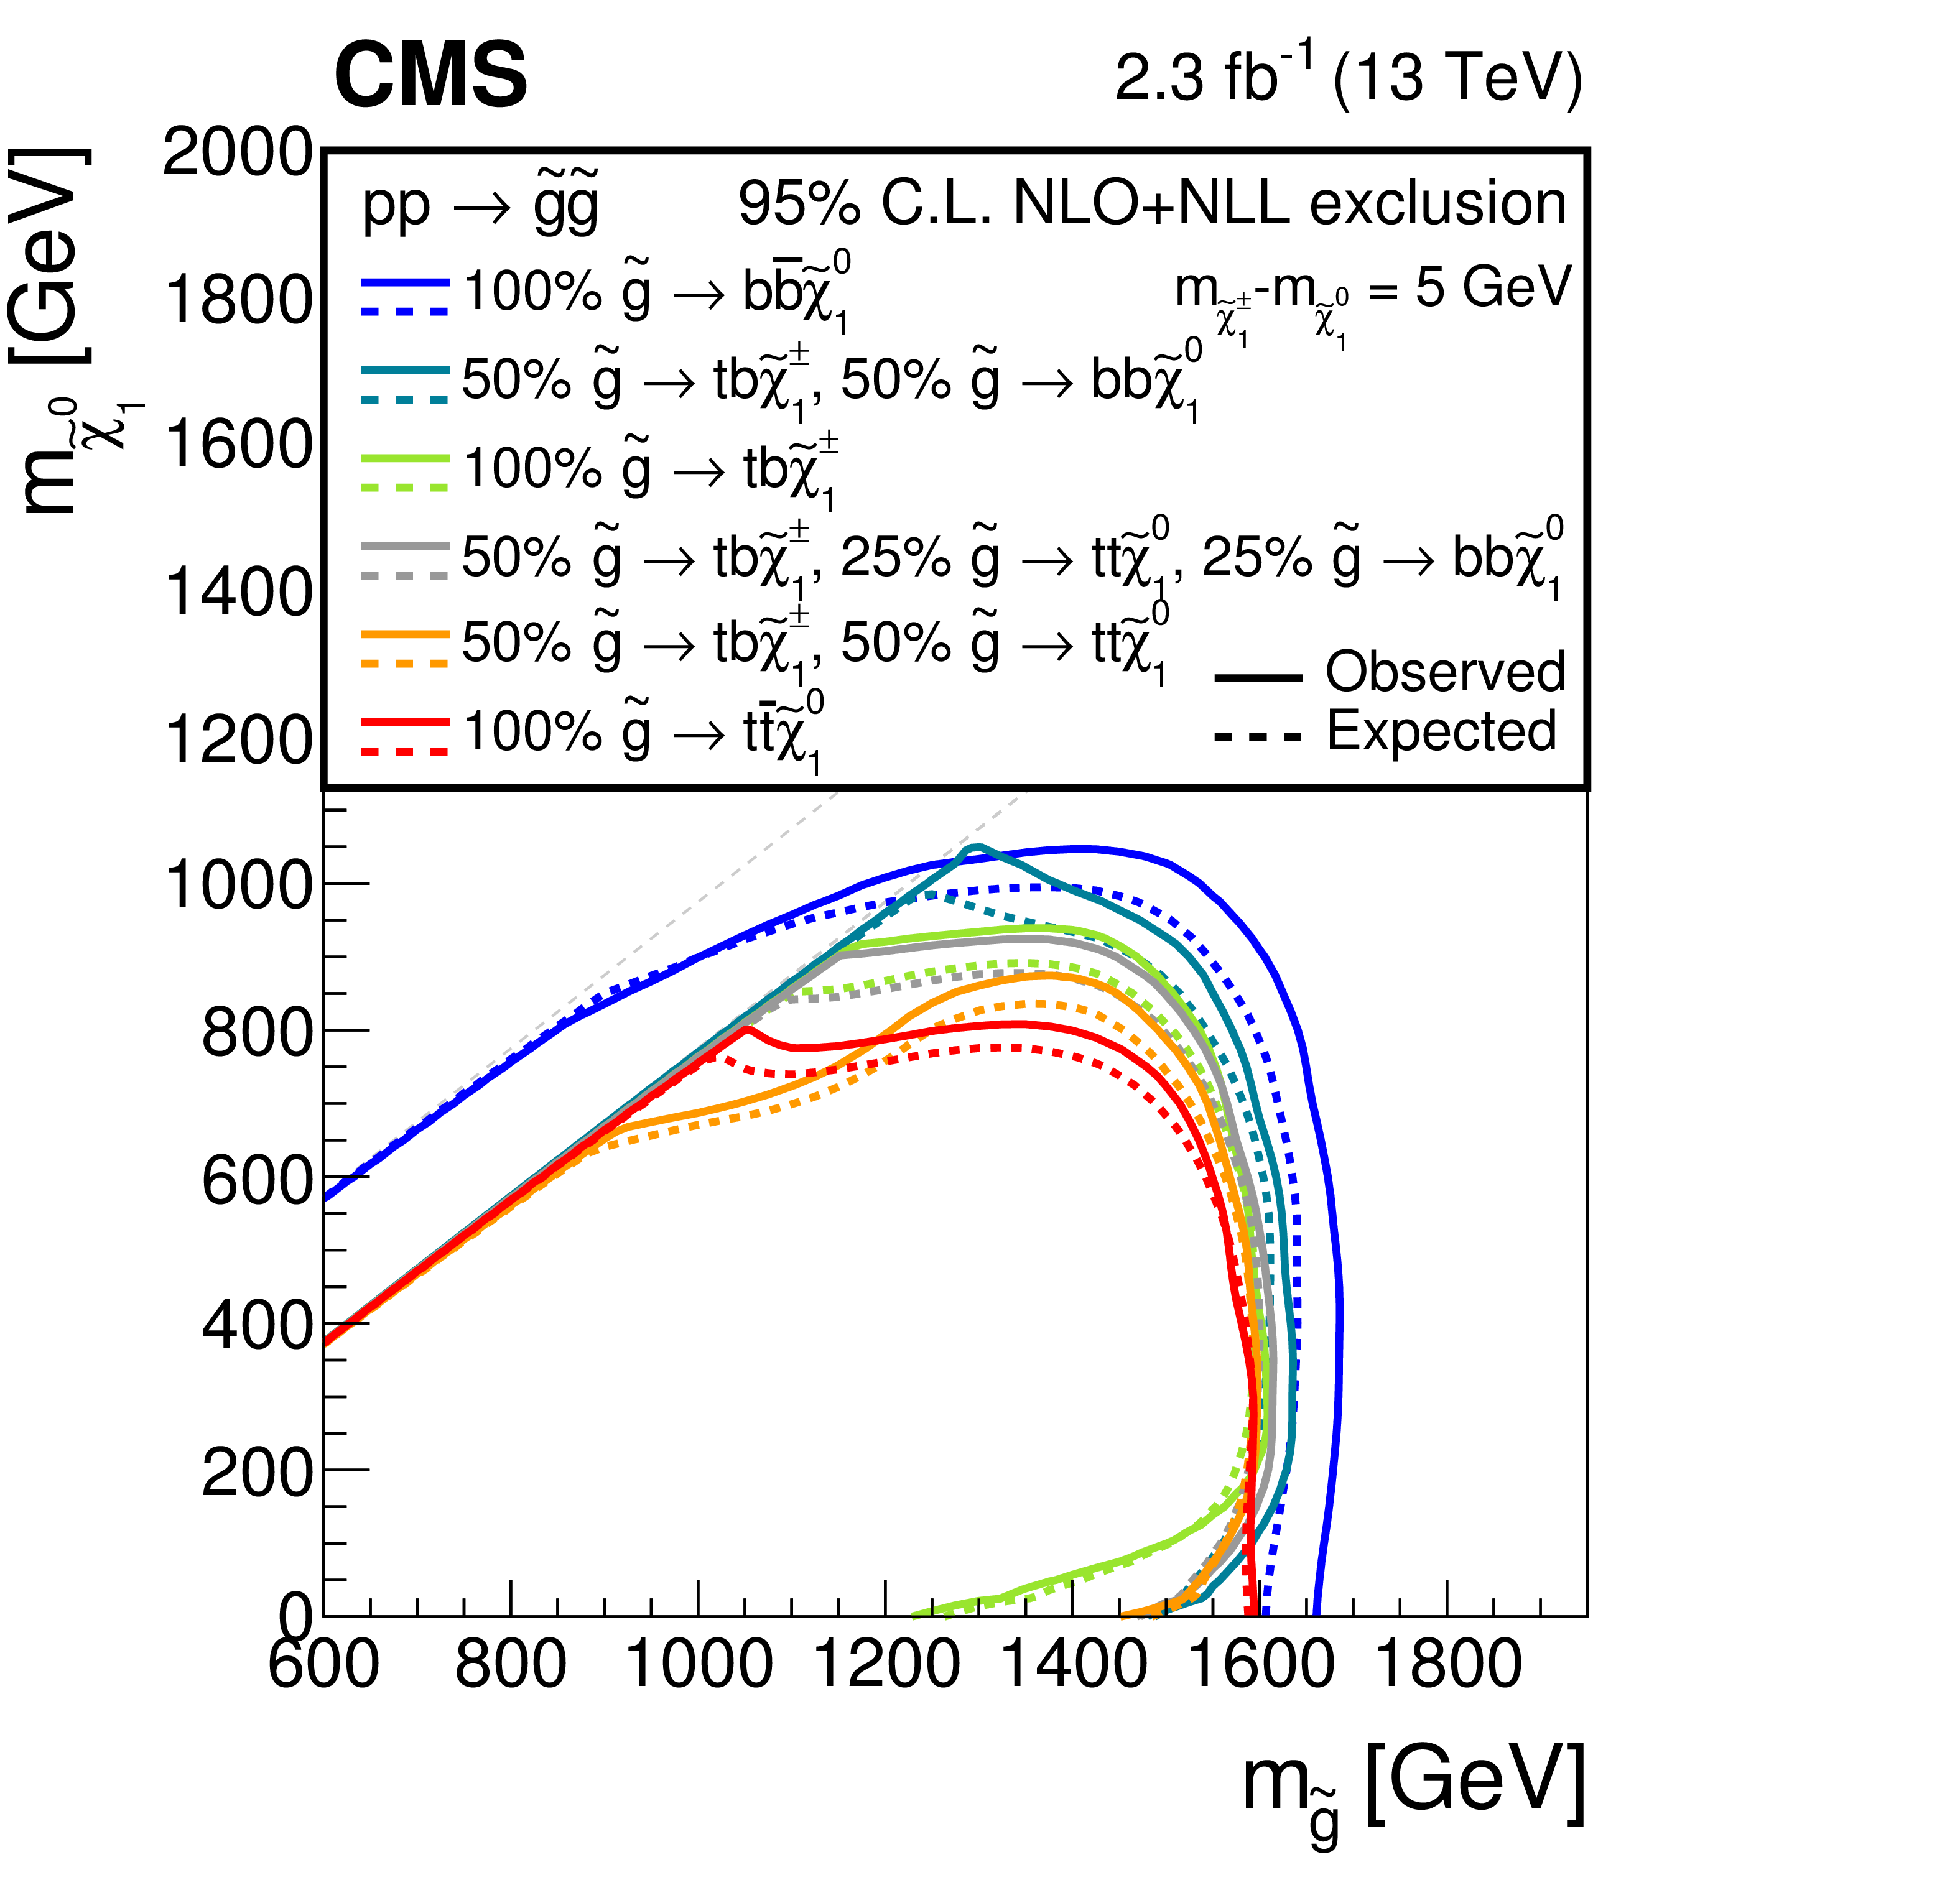
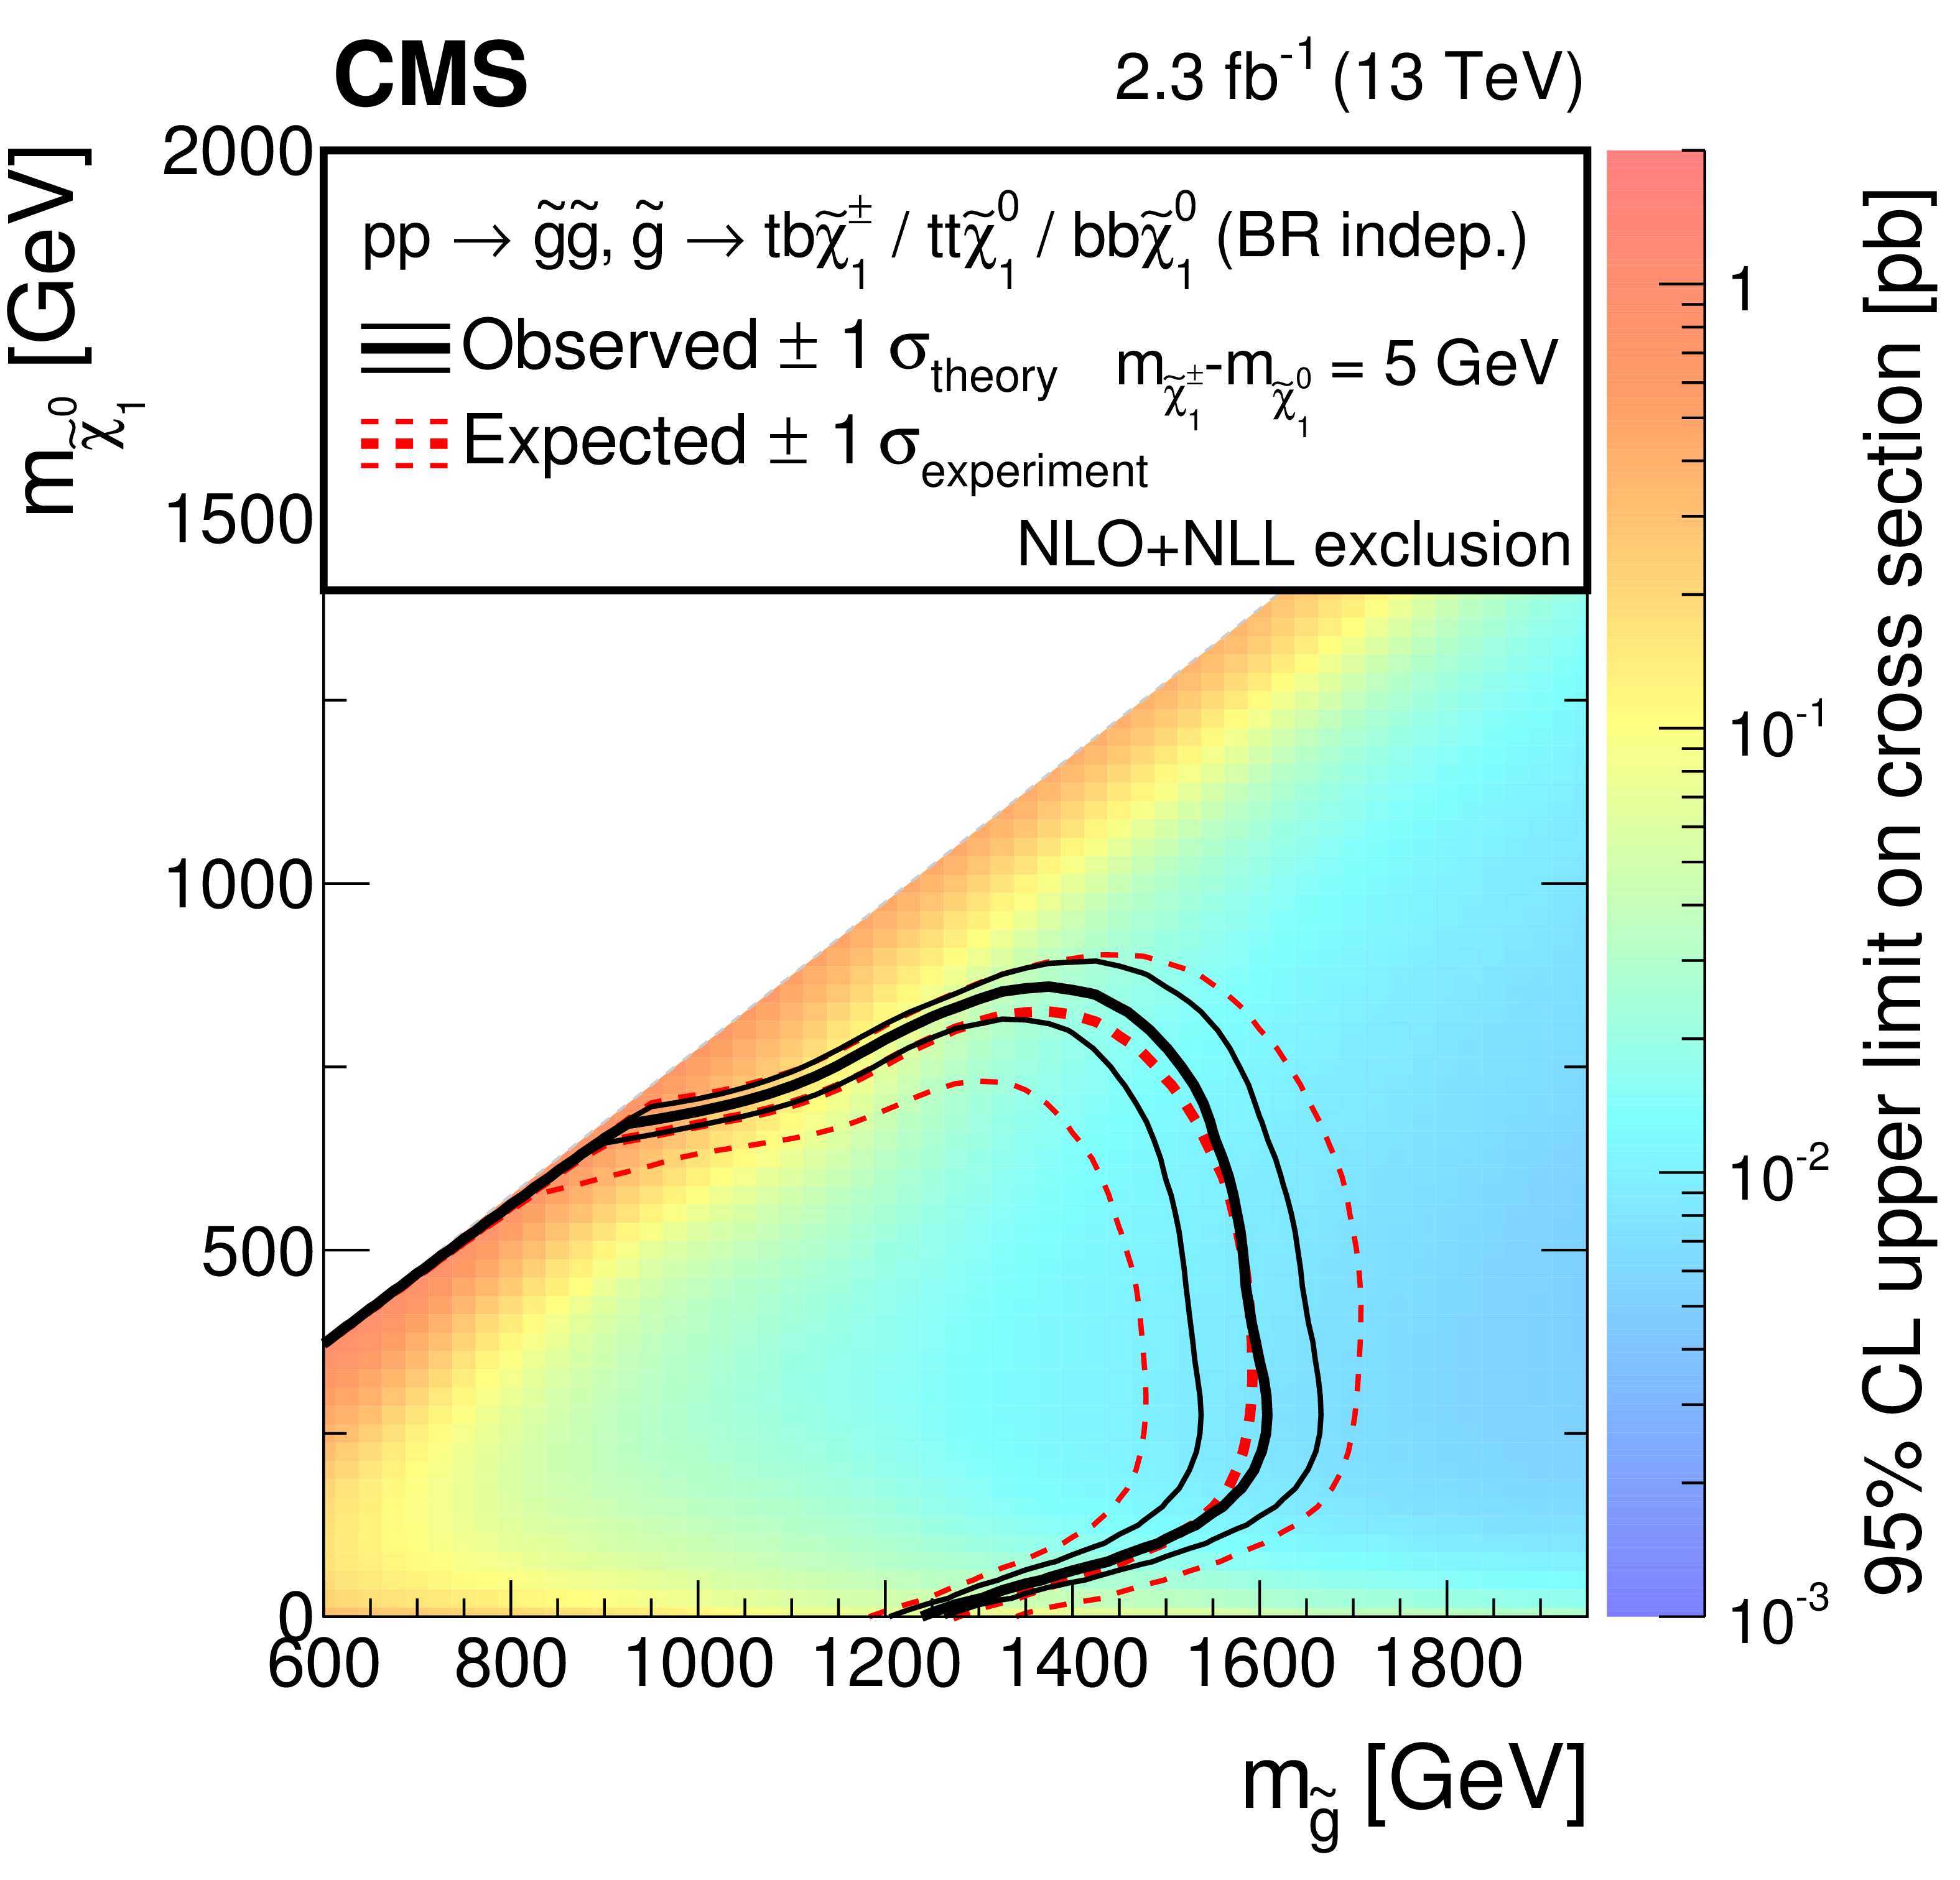
(Left) the expected and observed 95% confidence level (CL ) upper limits on the production cross section for gluino pair production decaying to third-generation quarks under various assumptions of the branching fractions. The two gray dashed diagonal lines correspond to $ {| m_{\tilde{\gamma} }-m_{\tilde{\chi}^{0}_{1} } | } = 25 GeV $, which is where the scan ends for the $\tilde{\gamma} \rightarrow {\mathrm{ b \bar{b} } } \tilde{\chi}^{0}_{1} $ decay mode, and $ {| m_{\tilde{\gamma} }-m_{\tilde{\chi}^{0}_{1} } | } = 225 GeV $, which is where the scan ends for the remaining modes due to a technical limitation inherent in the event generator. For $ {| m_{\tilde{\gamma} }-m_{\tilde{\chi}^{0}_{1} } | } < 225 GeV $, we only consider the $\tilde{\gamma} \rightarrow {\mathrm{ b \bar{b} } } \tilde{\chi}^{0}_{1} $ decay mode. (Right) the analogous upper limits on the gluino pair production cross section valid for any values of the gluino decay branching fractions. |
png pdf |
Figure 16-a:
The expected and observed 95% confidence level (CL ) upper limits on the production cross section for gluino pair production decaying to third-generation quarks under various assumptions of the branching fractions. The two gray dashed diagonal lines correspond to $ {| m_{\tilde{\gamma} }-m_{\tilde{\chi}^{0}_{1} } | } = 25 GeV $, which is where the scan ends for the $\tilde{\gamma} \rightarrow {\mathrm{ b \bar{b} } } \tilde{\chi}^{0}_{1} $ decay mode, and $ {| m_{\tilde{\gamma} }-m_{\tilde{\chi}^{0}_{1} } | } = 225 GeV $, which is where the scan ends for the remaining modes due to a technical limitation inherent in the event generator. For $ {| m_{\tilde{\gamma} }-m_{\tilde{\chi}^{0}_{1} } | } < 225 GeV $, we only consider the $\tilde{\gamma} \rightarrow {\mathrm{ b \bar{b} } } \tilde{\chi}^{0}_{1} $ decay mode. |
png pdf |
Figure 16-b:
The analogous upper limits on the gluino pair production cross section valid for any values of the gluino decay branching fractions. |
png pdf |
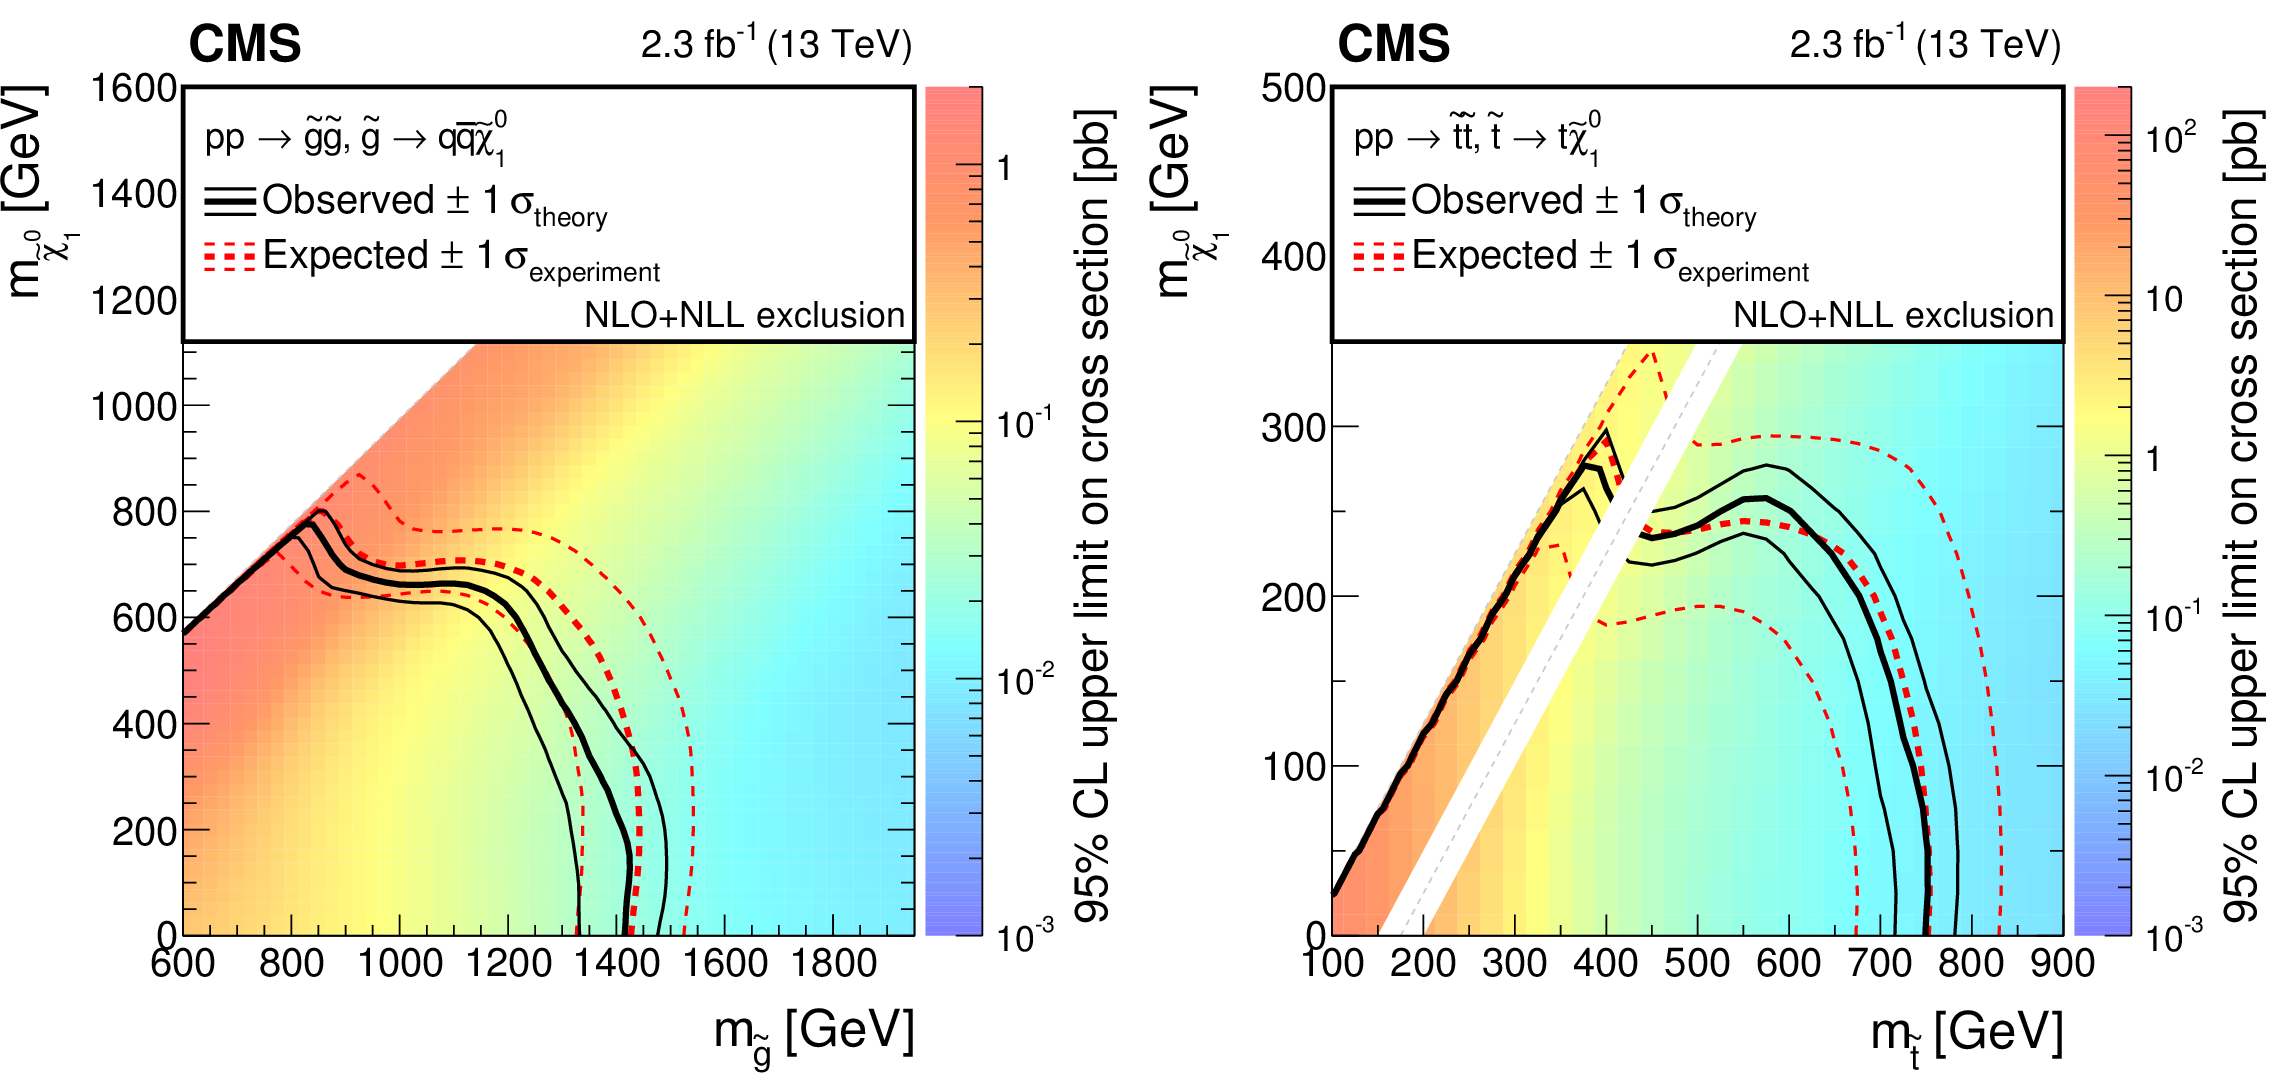
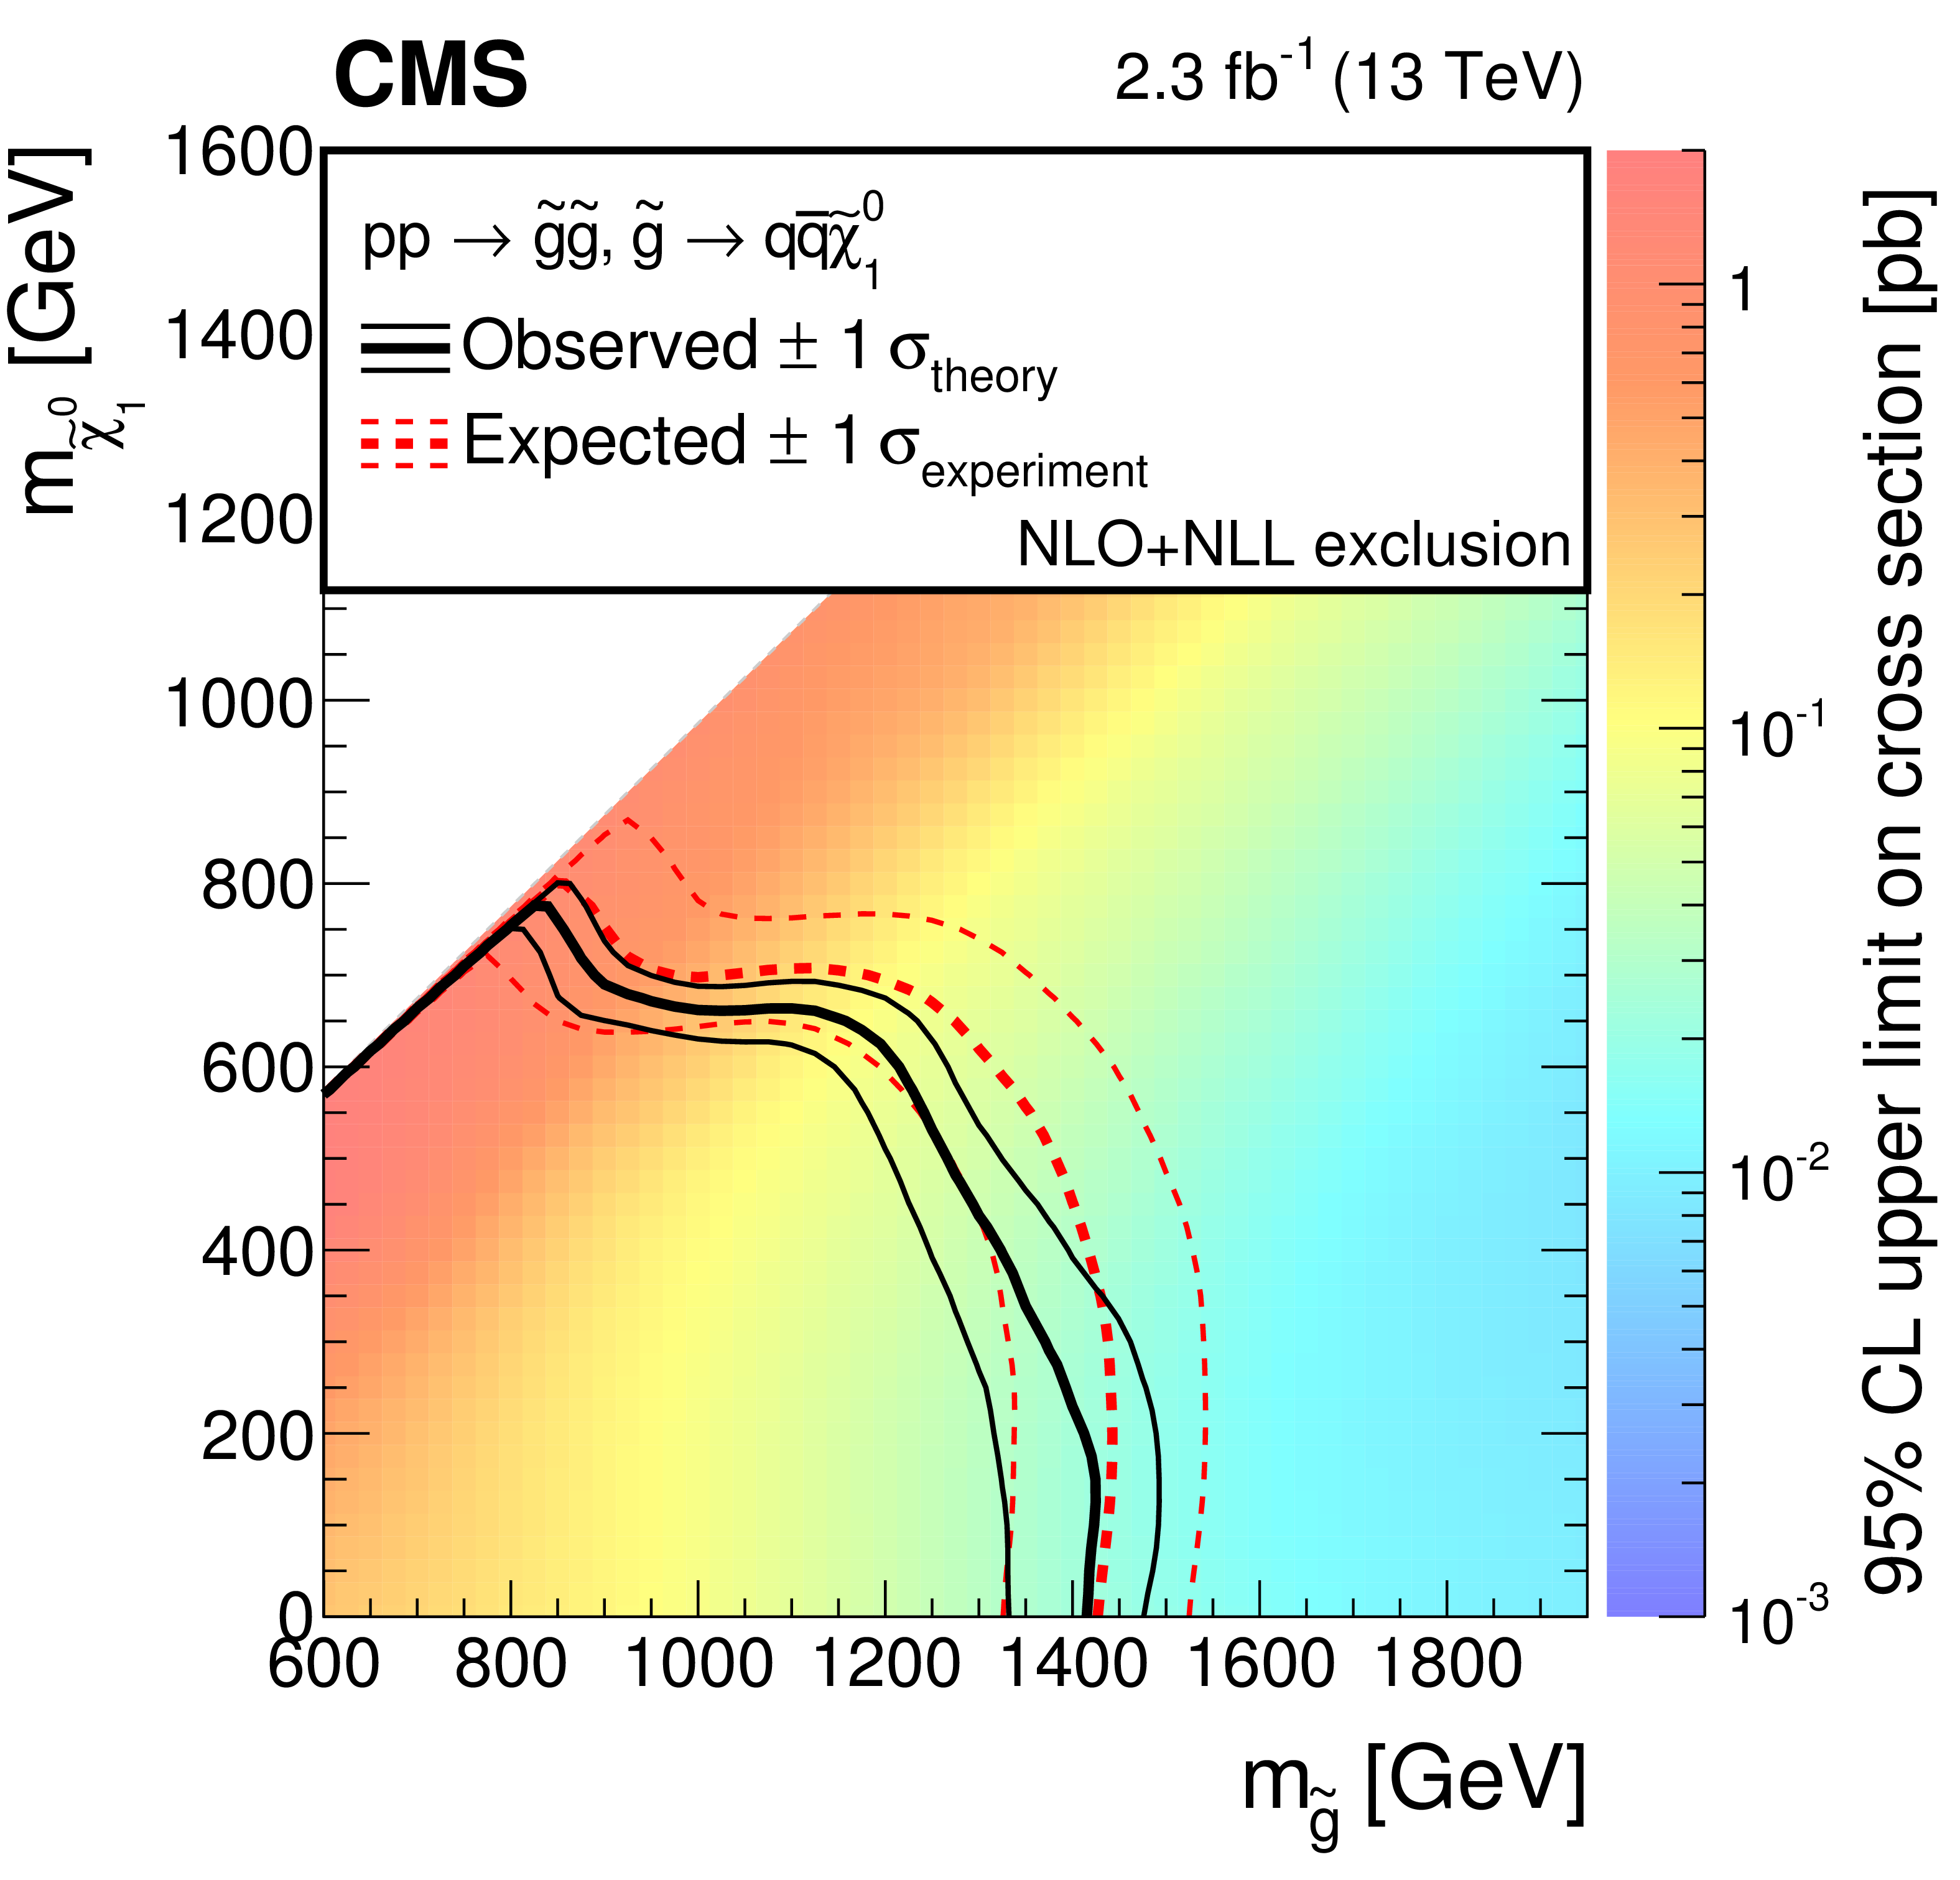
Figure 17:
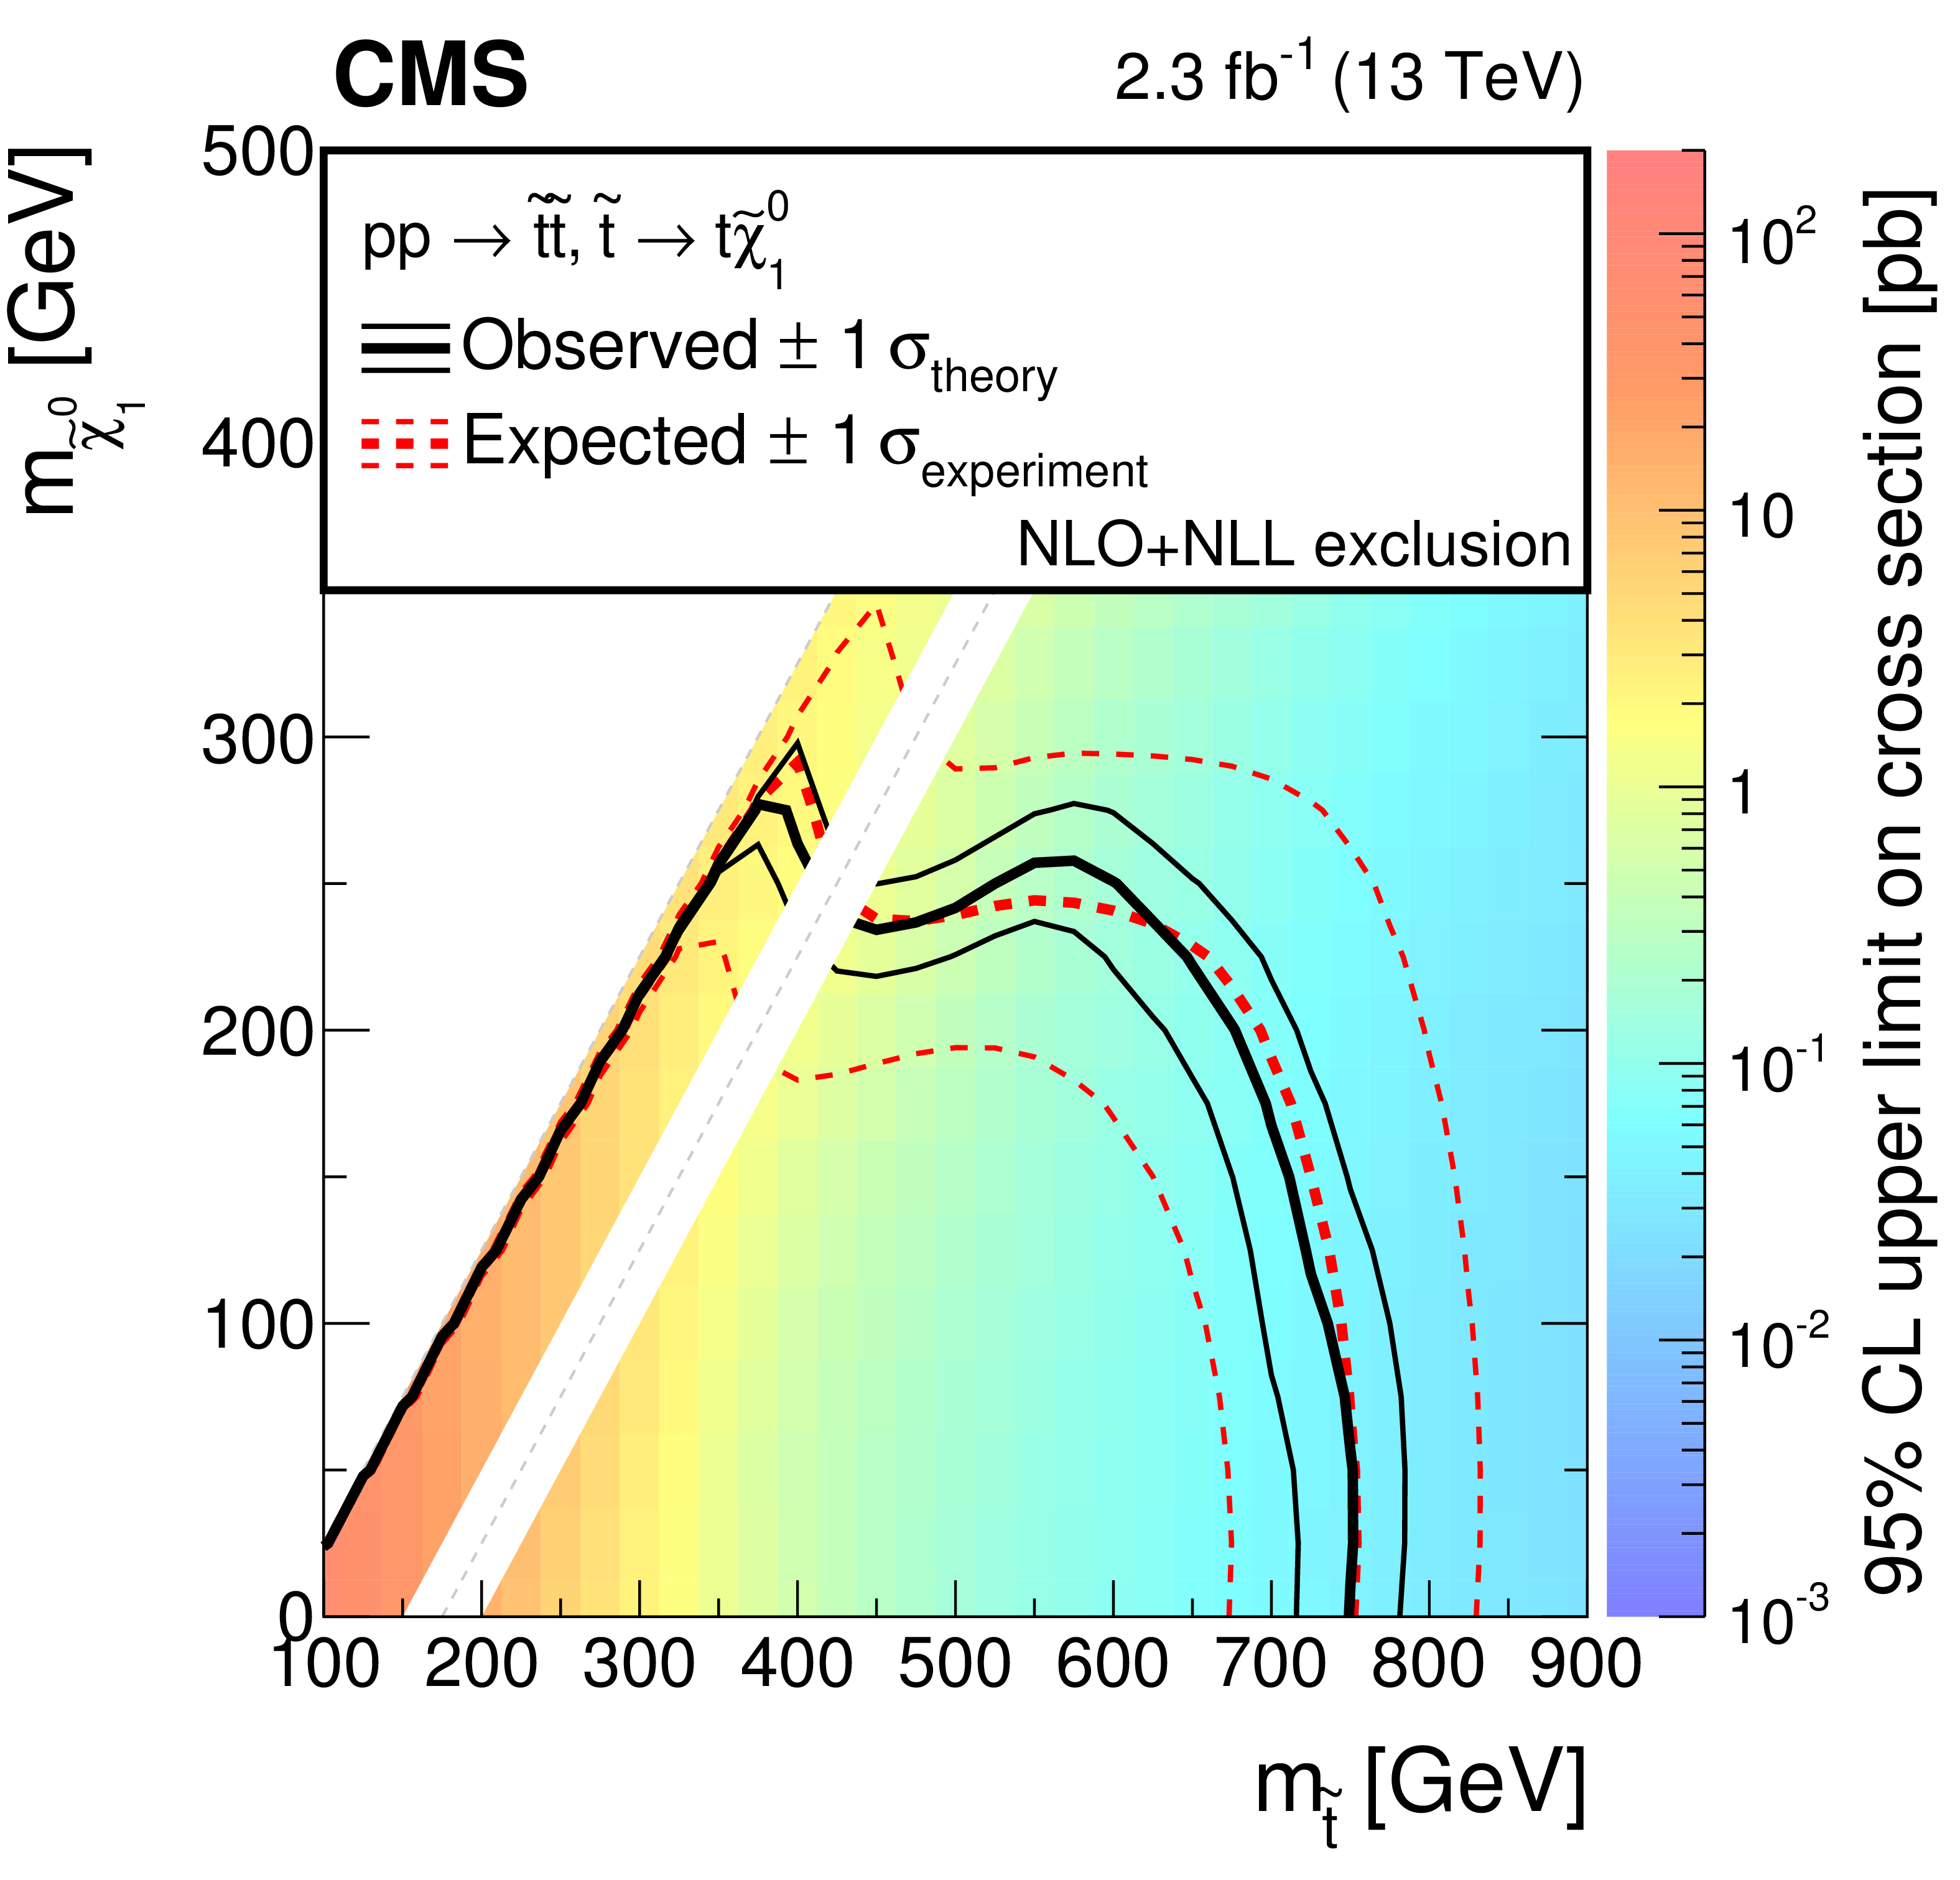
Expected and observed 95% confidence level (CL ) upper limits on the production cross section for (left) gluino pair production decaying to two light-flavored quarks and the LSP and (right) top squark pair production decaying to a top quark and the LSP. The white diagonal band in the right plot corresponds to the region $ {| m_{\tilde{ \mathrm{ t } } }-m_{\mathrm{ t } }-m_{\tilde{\chi}^{0}_{1} } | } < 25 GeV $, where the signal efficiency is a strong function of $m_{\tilde{ \mathrm{ t } } }-m_{\tilde{\chi}^{0}_{1} }$, and as a result the precise determination of the cross section upper limit is uncertain because of the finite granularity of the available MC samples in this region of the ($m_{\tilde{ \mathrm{ t } } }$, $m_{\tilde{\chi}^{0}_{1} }$) plane. |
png pdf |
Figure 17-a:
Expected and observed 95% confidence level (CL ) upper limits on the production cross section for gluino pair production decaying to two light-flavored quarks and the LSP. The white diagonal band in the right plot corresponds to the region $ {| m_{\tilde{ \mathrm{ t } } }-m_{\mathrm{ t } }-m_{\tilde{\chi}^{0}_{1} } | } < 25 GeV $, where the signal efficiency is a strong function of $m_{\tilde{ \mathrm{ t } } }-m_{\tilde{\chi}^{0}_{1} }$, and as a result the precise determination of the cross section upper limit is uncertain because of the finite granularity of the available MC samples in this region of the ($m_{\tilde{ \mathrm{ t } } }$, $m_{\tilde{\chi}^{0}_{1} }$) plane. |
png pdf |
Figure 17-b:
Expected and observed 95% confidence level (CL ) upper limits on the production cross section for top squark pair production decaying to a top quark and the LSP. The white diagonal band in the right plot corresponds to the region $ {| m_{\tilde{ \mathrm{ t } } }-m_{\mathrm{ t } }-m_{\tilde{\chi}^{0}_{1} } | } < 25 GeV $, where the signal efficiency is a strong function of $m_{\tilde{ \mathrm{ t } } }-m_{\tilde{\chi}^{0}_{1} }$, and as a result the precise determination of the cross section upper limit is uncertain because of the finite granularity of the available MC samples in this region of the ($m_{\tilde{ \mathrm{ t } } }$, $m_{\tilde{\chi}^{0}_{1} }$) plane. |
png pdf |
Figure 18:
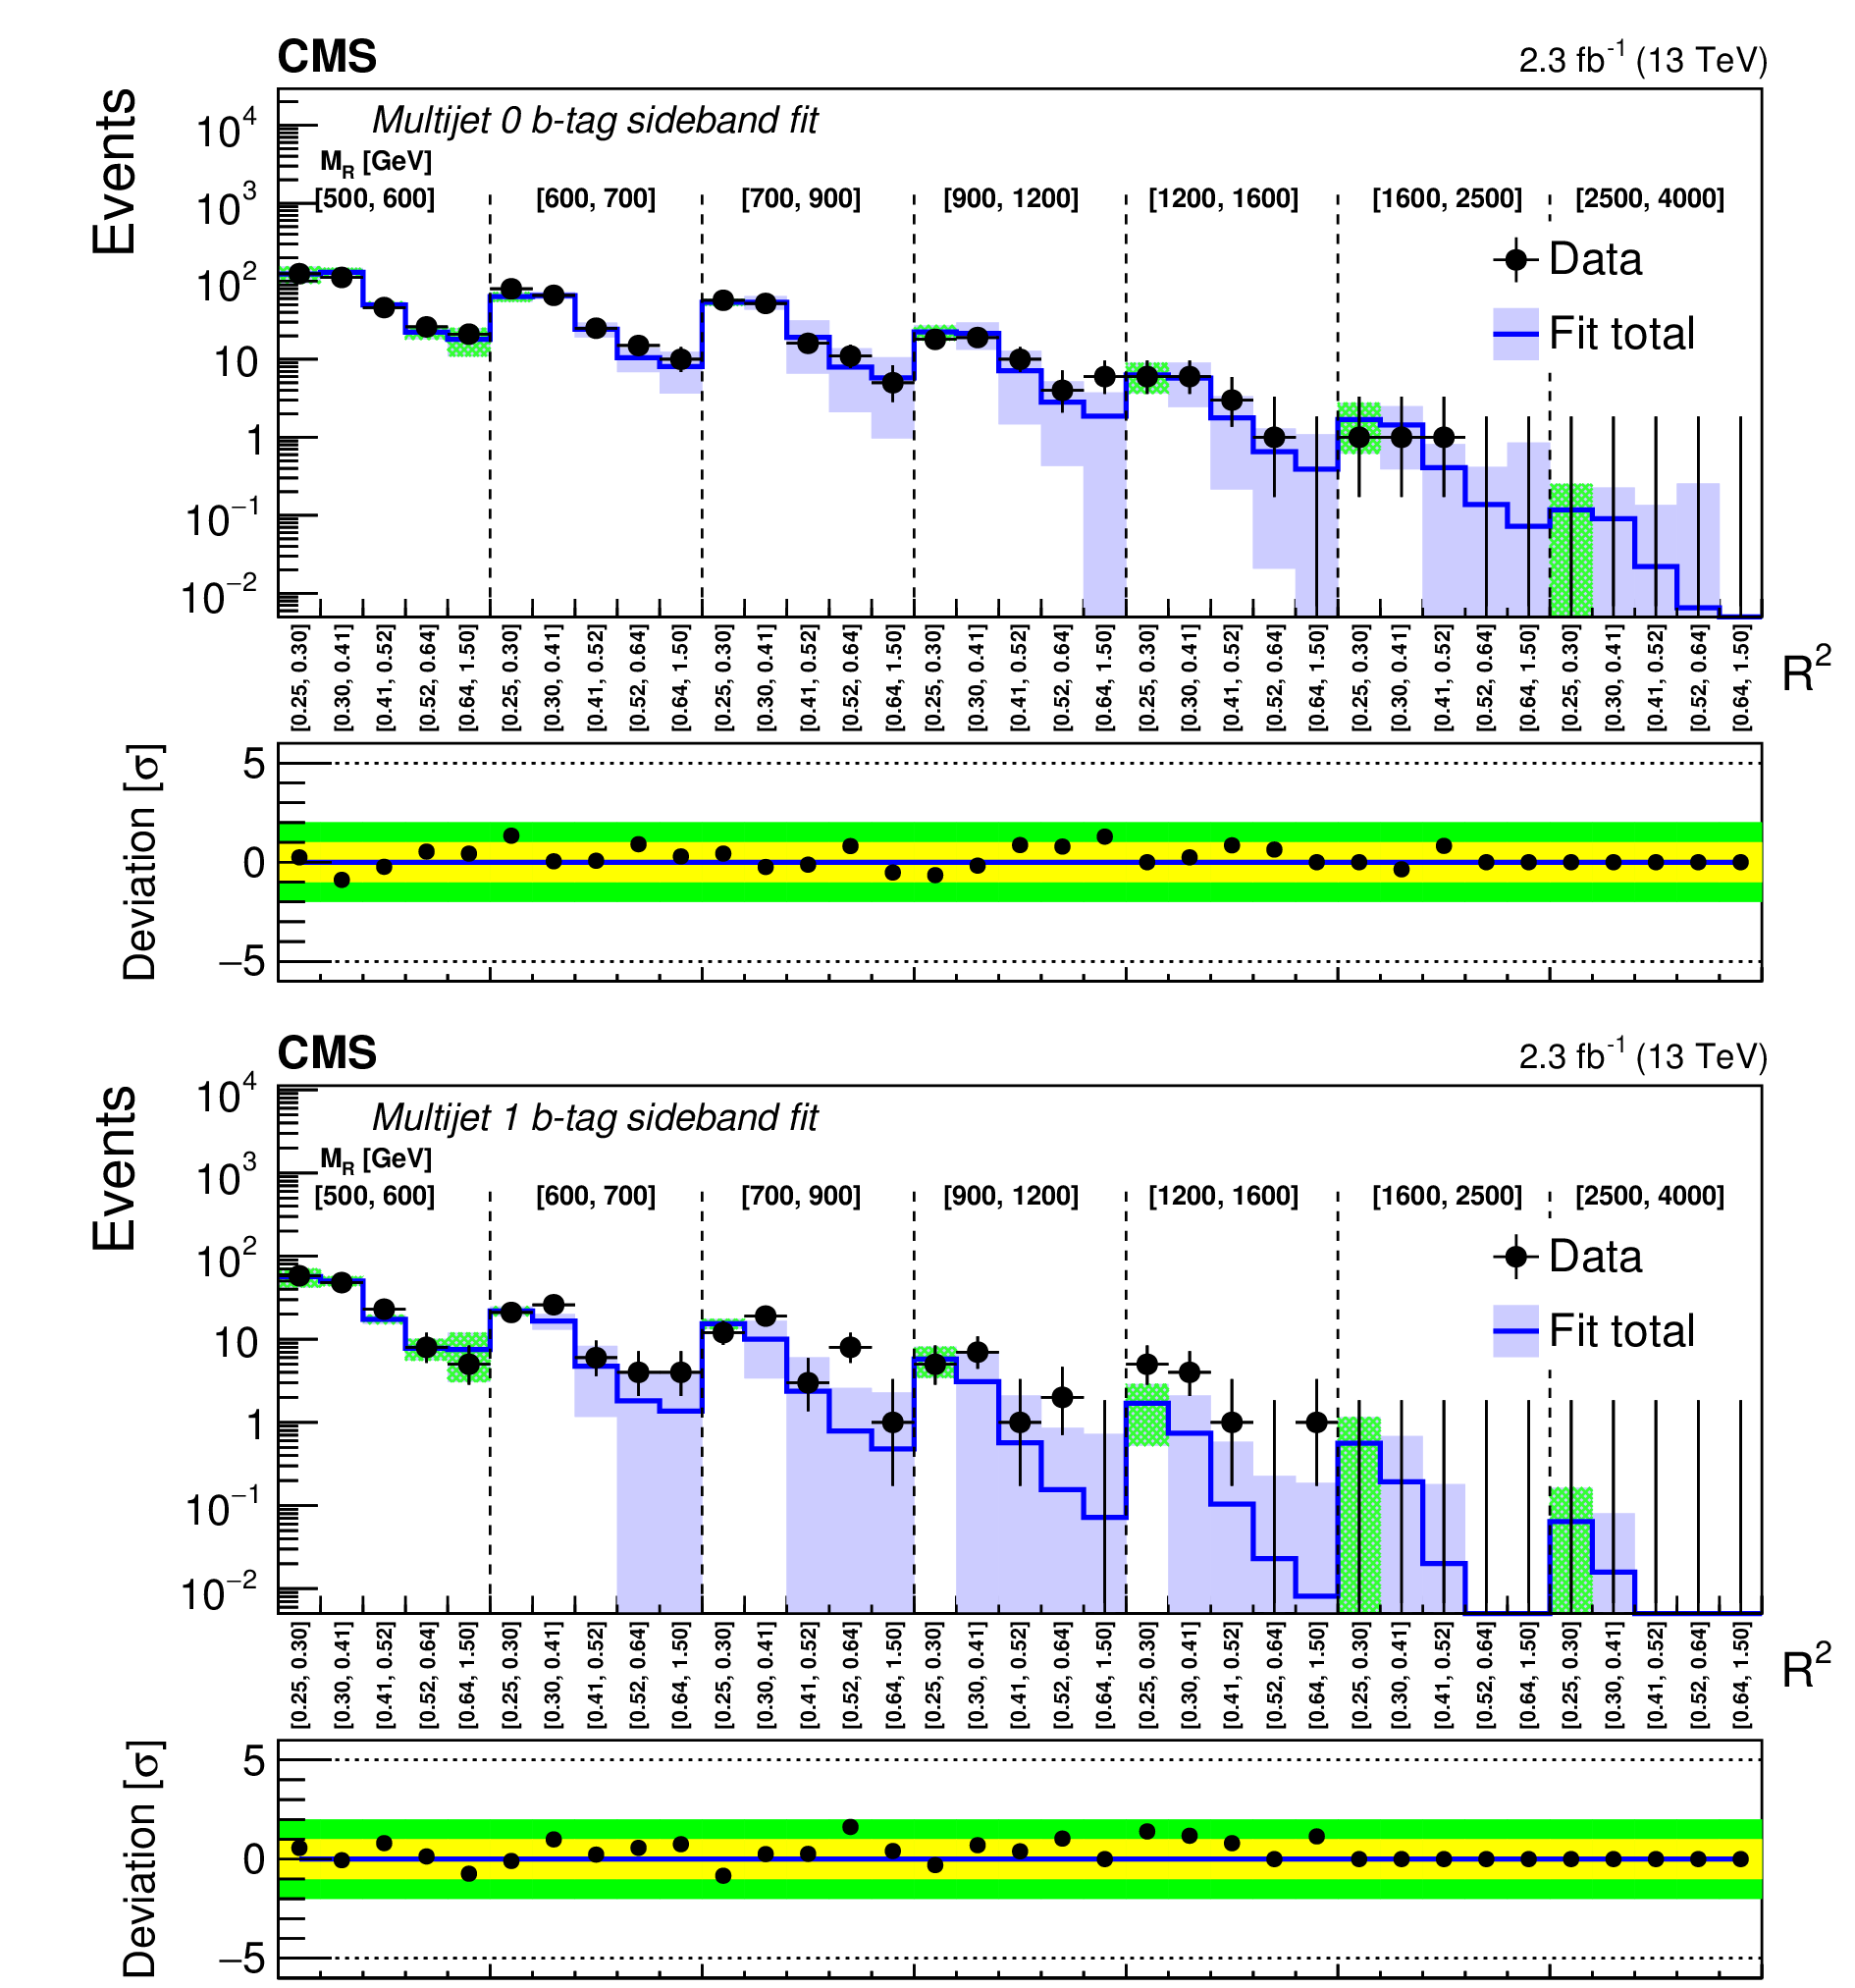
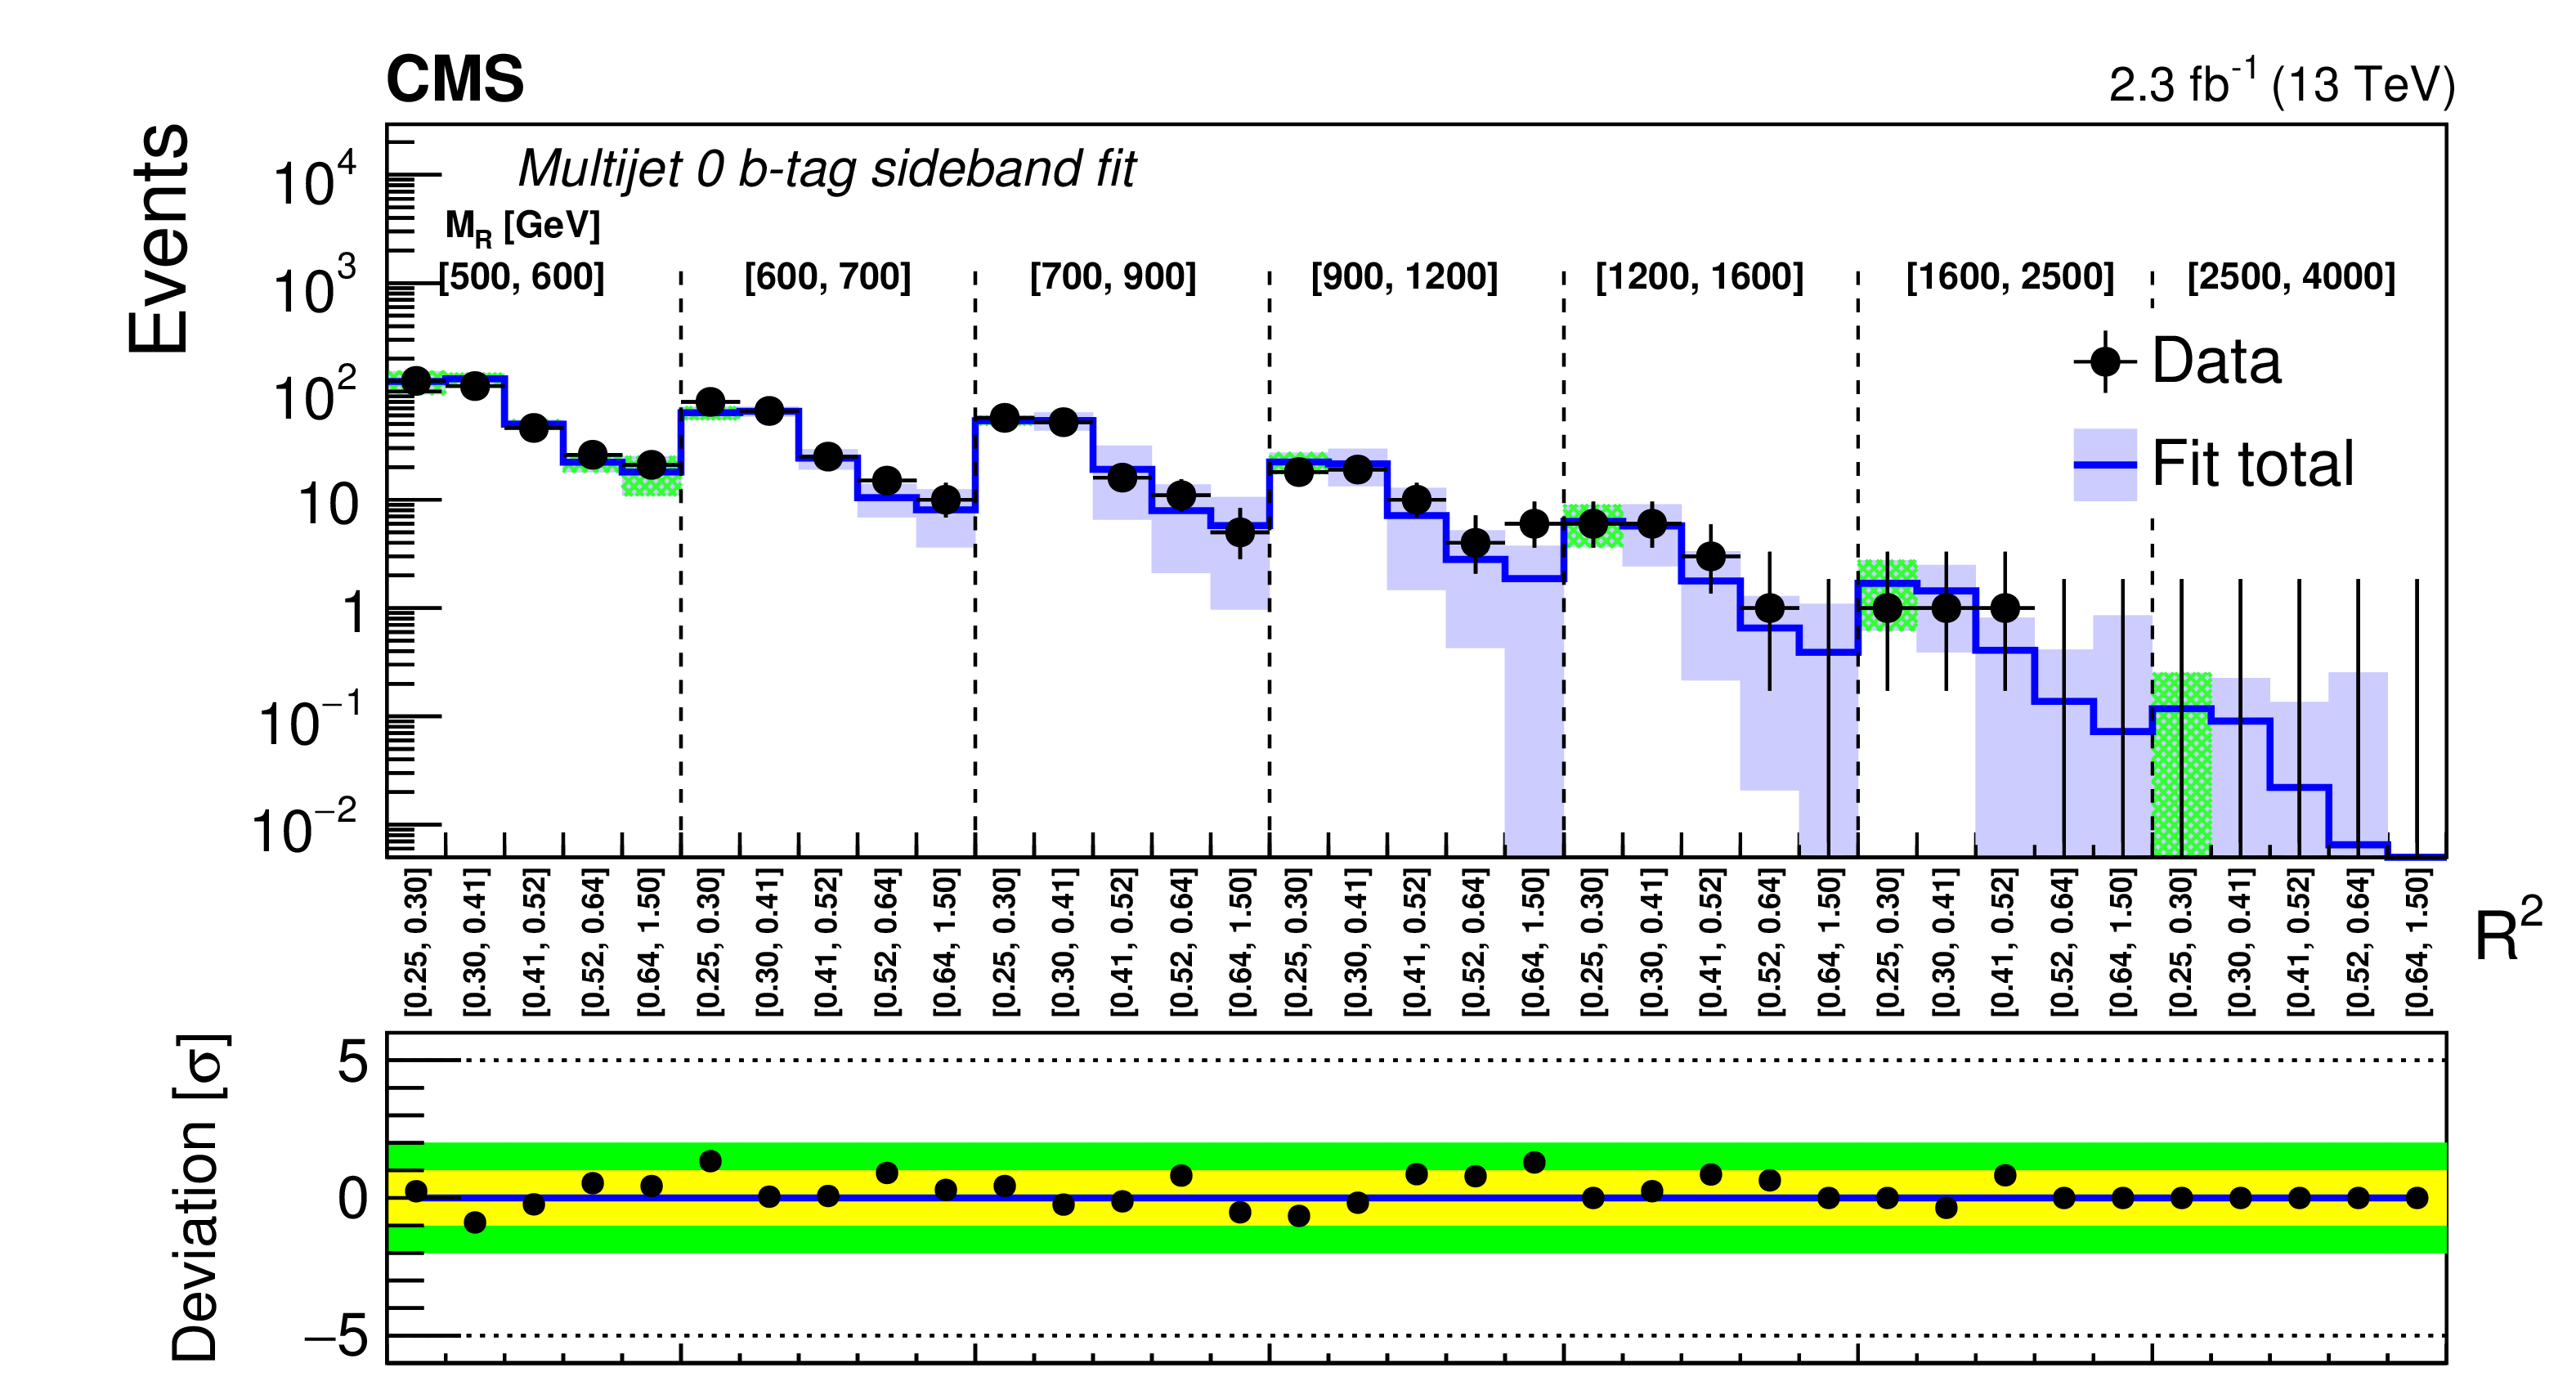
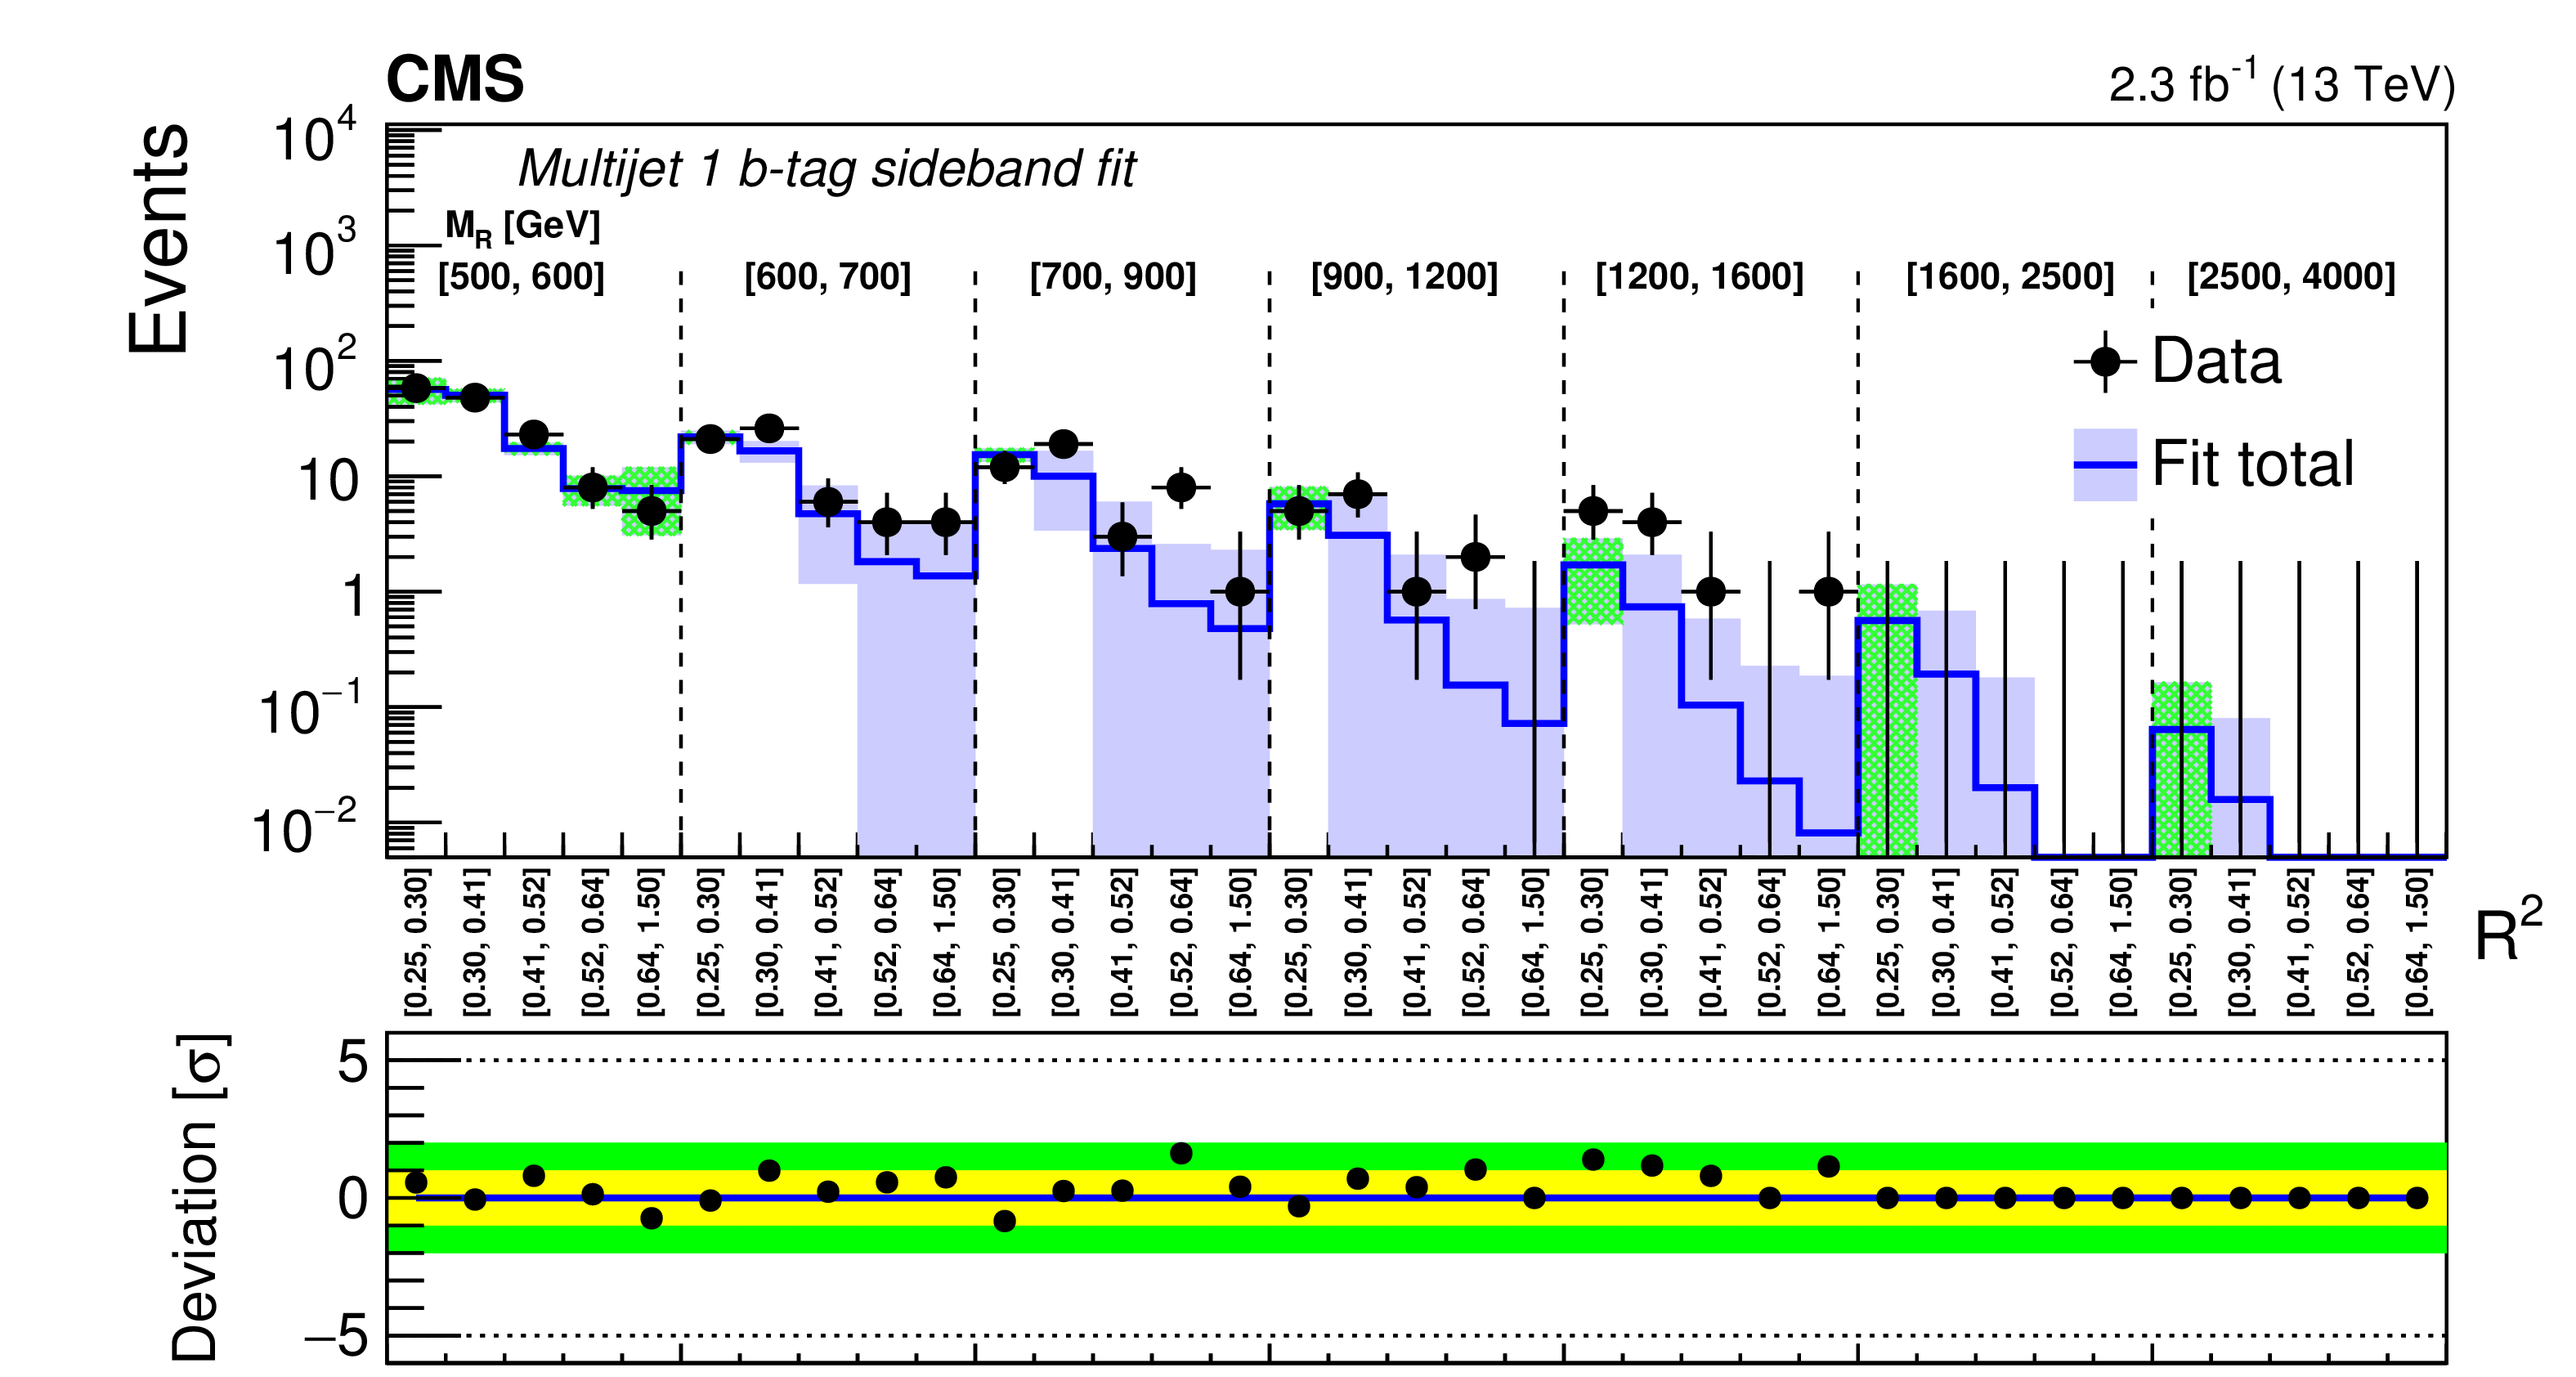
Comparison of the predicted background with the observed data in bins of $ {M_\mathrm {R}} $ and $ {\mathrm {R}^2} $ variables in the Multijet category for the 0b-tag (upper) and 1b-tag (lower) bins. A detailed explanation of the panels is given in the caption of Fig. 7. |
png pdf |
Figure 18-a:
Comparison of the predicted background with the observed data in bins of $ {M_\mathrm {R}} $ and $ {\mathrm {R}^2} $ variables in the Multijet category for the 0b-tag bin. A detailed explanation of the panels is given in the caption of Fig. 7. |
png pdf |
Figure 18-b:
Comparison of the predicted background with the observed data in bins of $ {M_\mathrm {R}} $ and $ {\mathrm {R}^2} $ variables in the Multijet category for the 1b-tag bin. A detailed explanation of the panels is given in the caption of Fig. 7. |
png pdf |
Figure 19:
Comparison of the predicted background with the observed data in bins of $ {M_\mathrm {R}} $ and $ {\mathrm {R}^2} $ variables in the Muon Multijet category for the 0b-tag (upper) and 1b-tag (lower) bins. A detailed explanation of the panels is given in the caption of Fig. 7. |
png pdf |
Figure 19-a:
Comparison of the predicted background with the observed data in bins of $ {M_\mathrm {R}} $ and $ {\mathrm {R}^2} $ variables in the Muon Multijet category for the 1b-tag bin. A detailed explanation of the panels is given in the caption of Fig. 7. |
png pdf |
Figure 19-b:
Comparison of the predicted background with the observed data in bins of $ {M_\mathrm {R}} $ and $ {\mathrm {R}^2} $ variables in the Muon Multijet category for the 1b-tag bin. A detailed explanation of the panels is given in the caption of Fig. 7. |
png pdf |
Figure 20:
Comparison of the predicted background with the observed data in bins of $ {M_\mathrm {R}} $ and $ {\mathrm {R}^2} $ variables in the Muon Multijet category for the 2b-tag (upper) and ${\geq }$3b-tag (lower) bins. A detailed explanation of the panels is given in the caption of Fig. 7. |
png pdf |
Figure 20-a:
Comparison of the predicted background with the observed data in bins of $ {M_\mathrm {R}} $ and $ {\mathrm {R}^2} $ variables in the Muon Multijet category for the 2b-tag bin. A detailed explanation of the panels is given in the caption of Fig. 7. |
png pdf |
Figure 20-b:
Comparison of the predicted background with the observed data in bins of $ {M_\mathrm {R}} $ and $ {\mathrm {R}^2} $ variables in the Muon Multijet category for the ${\geq }$3b-tag bin. A detailed explanation of the panels is given in the caption of Fig. 7. |
png pdf |
Figure 21:
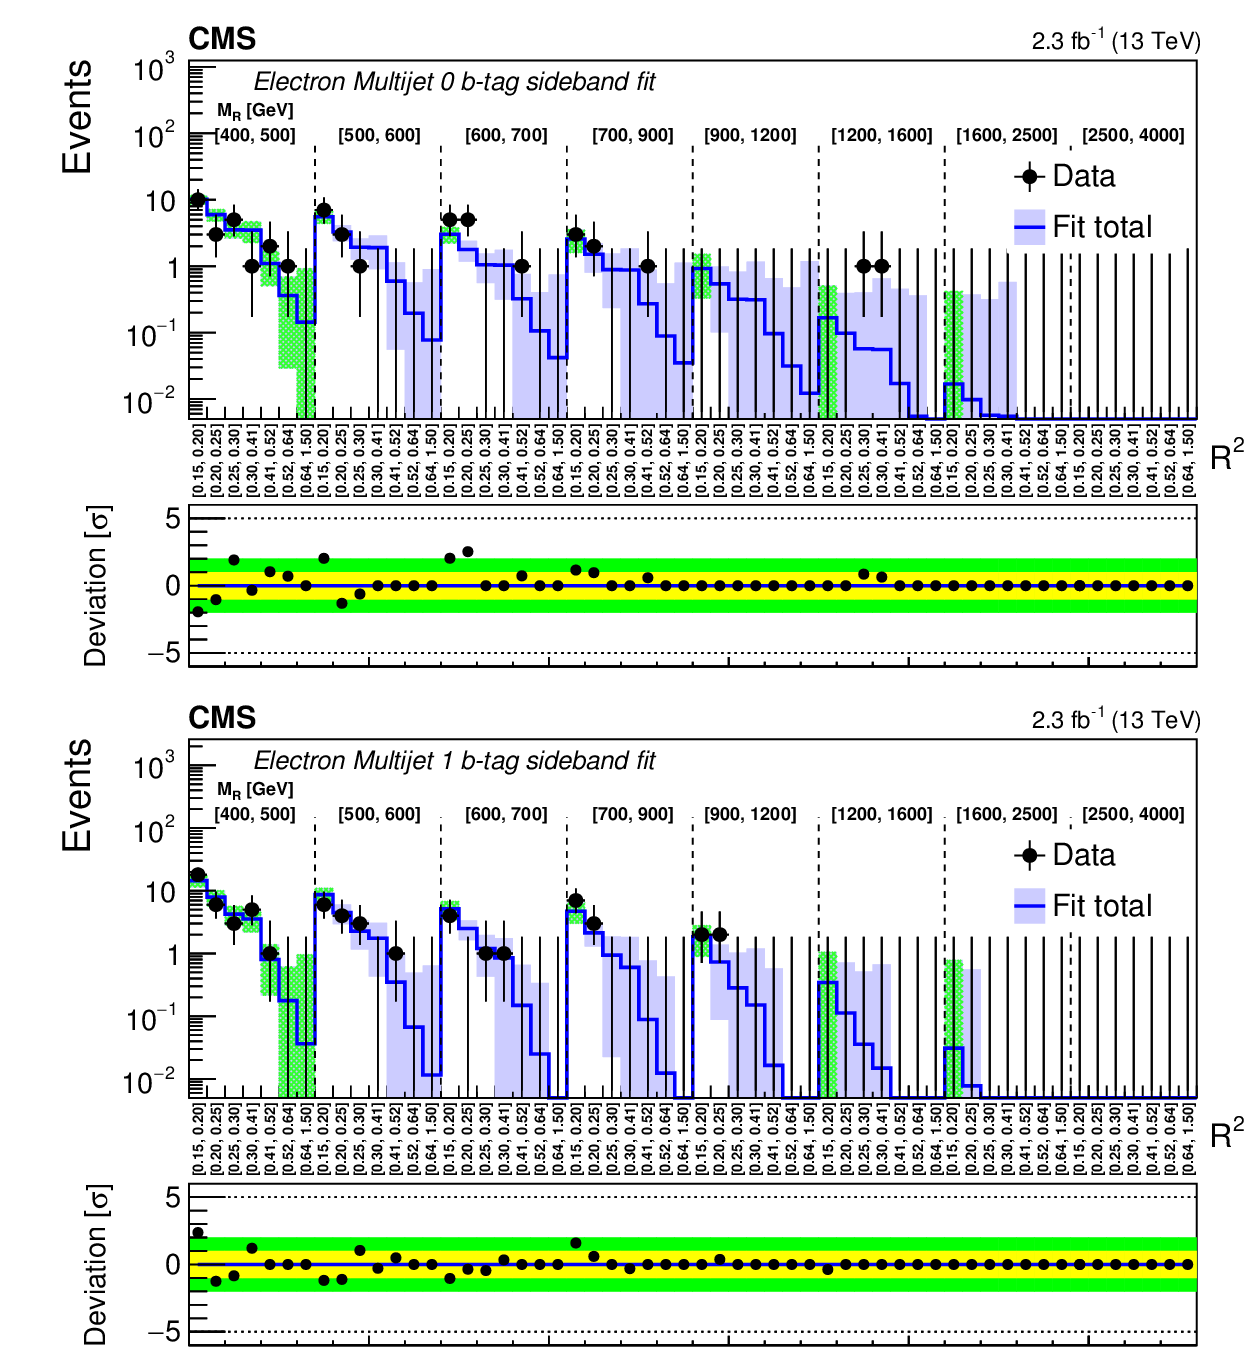
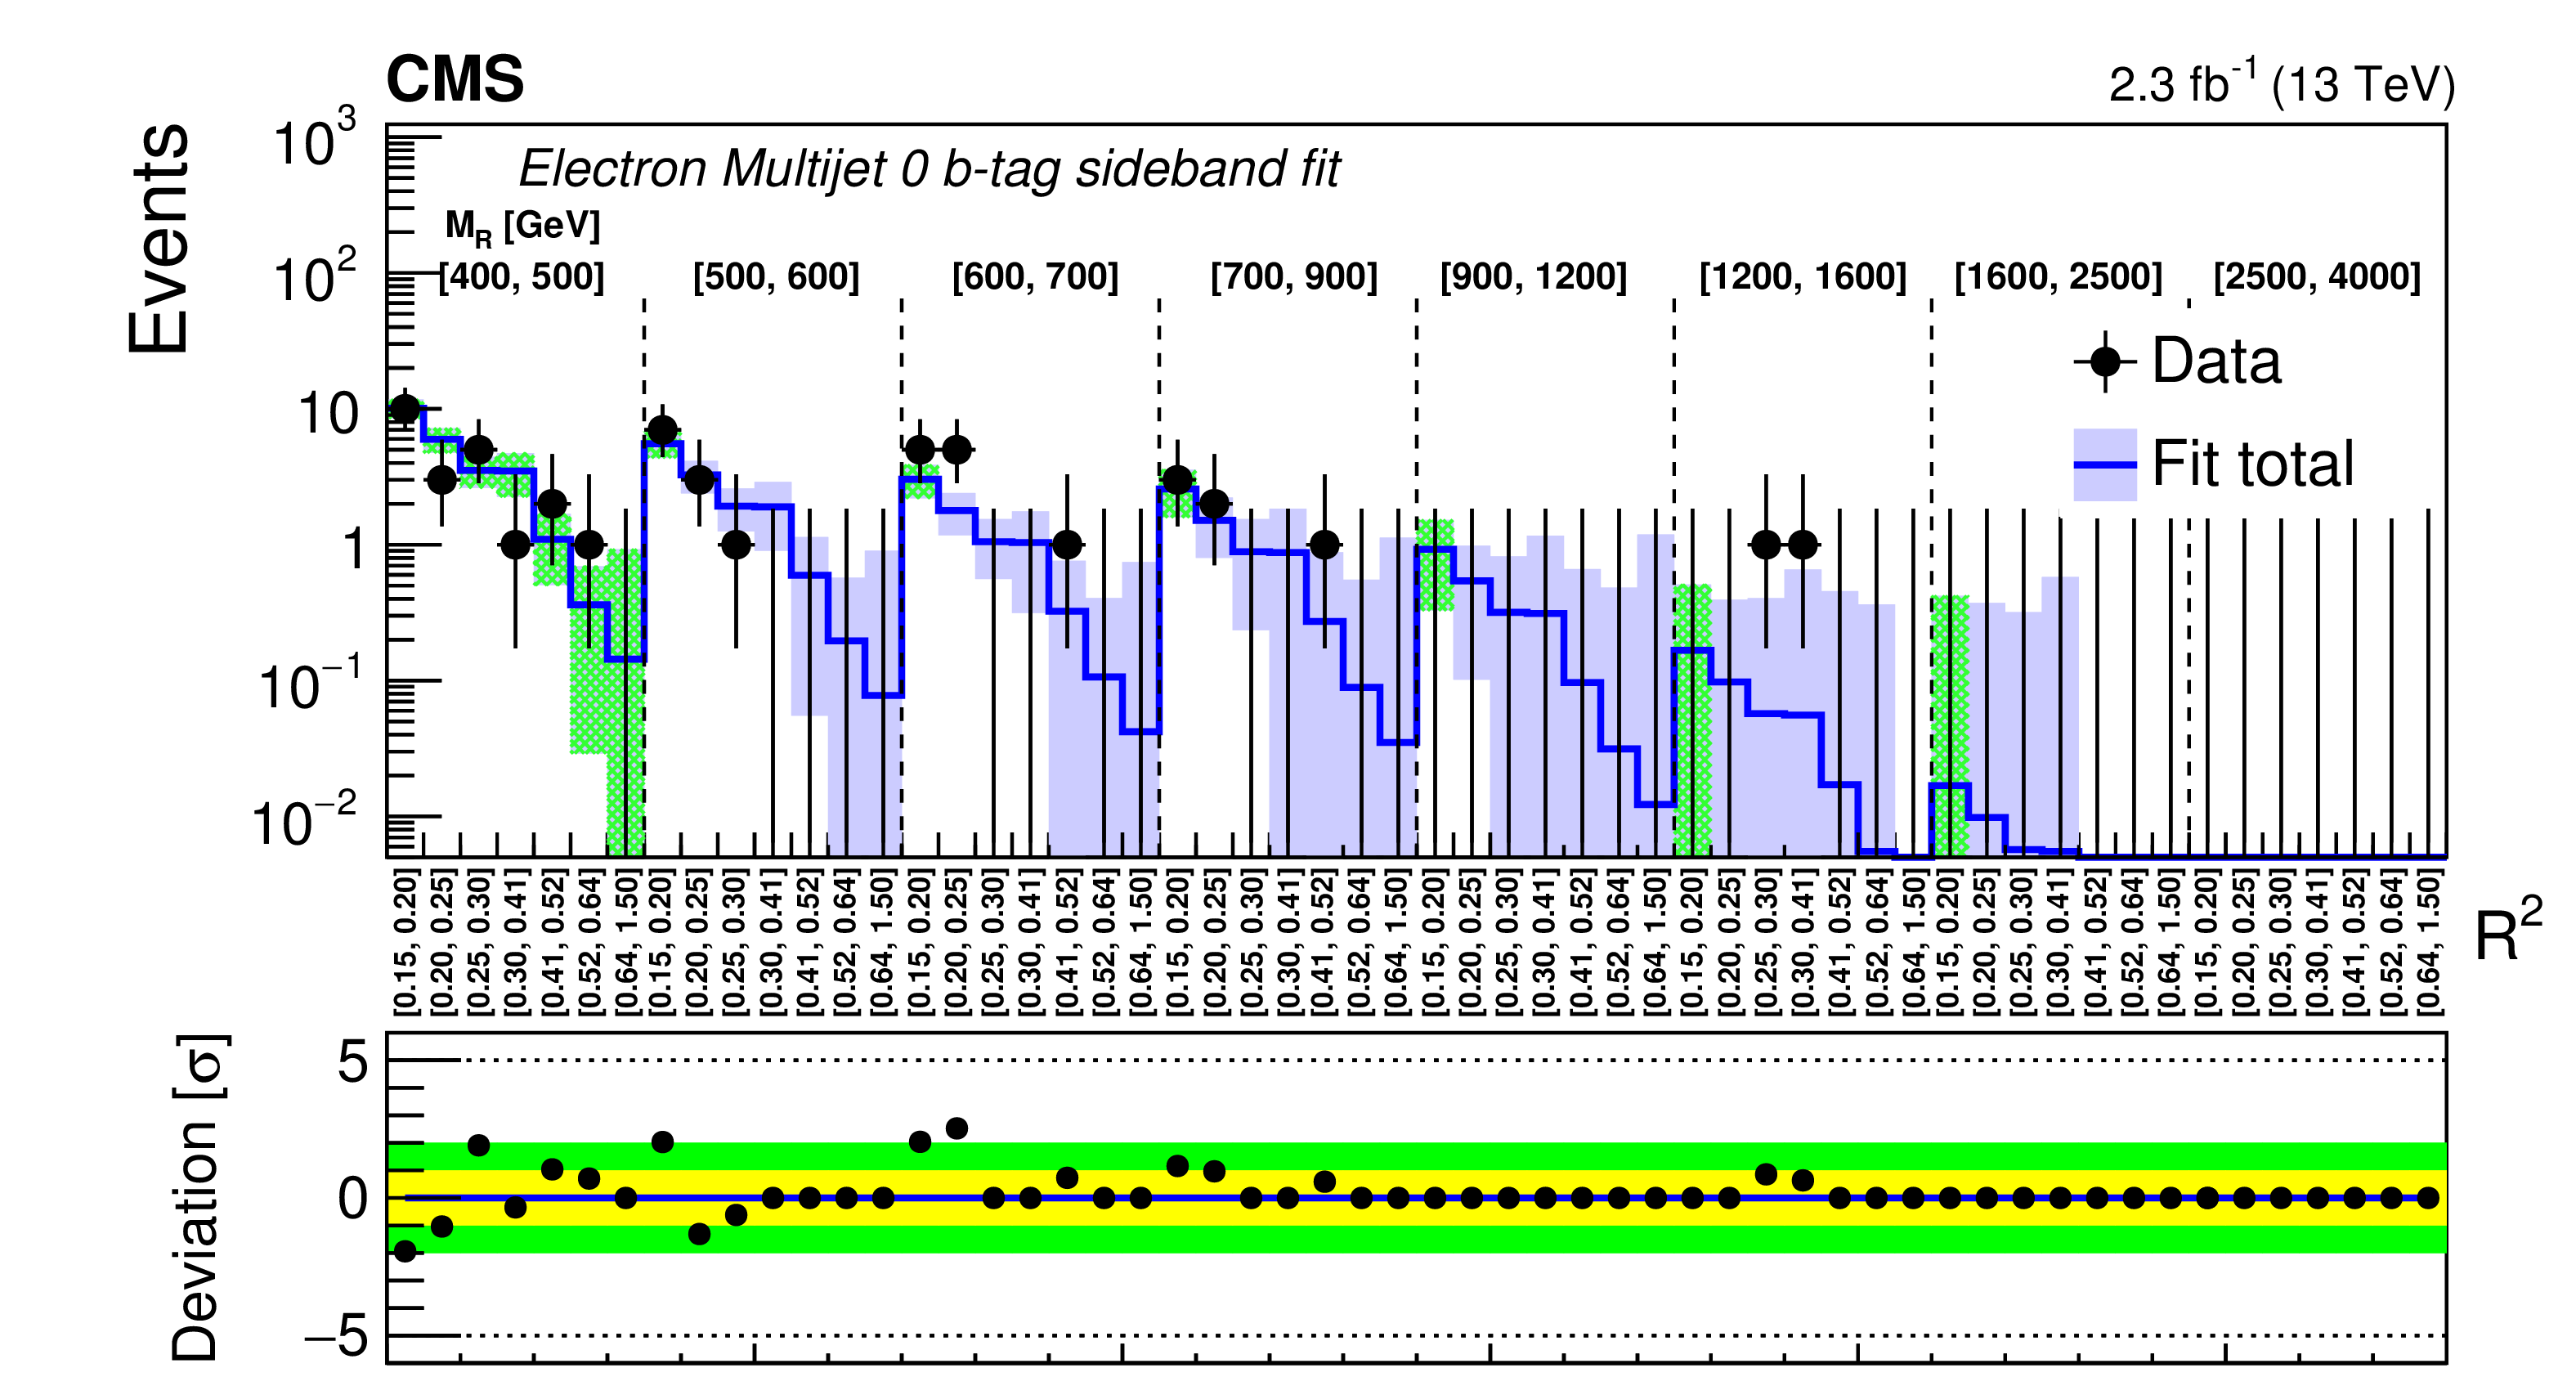
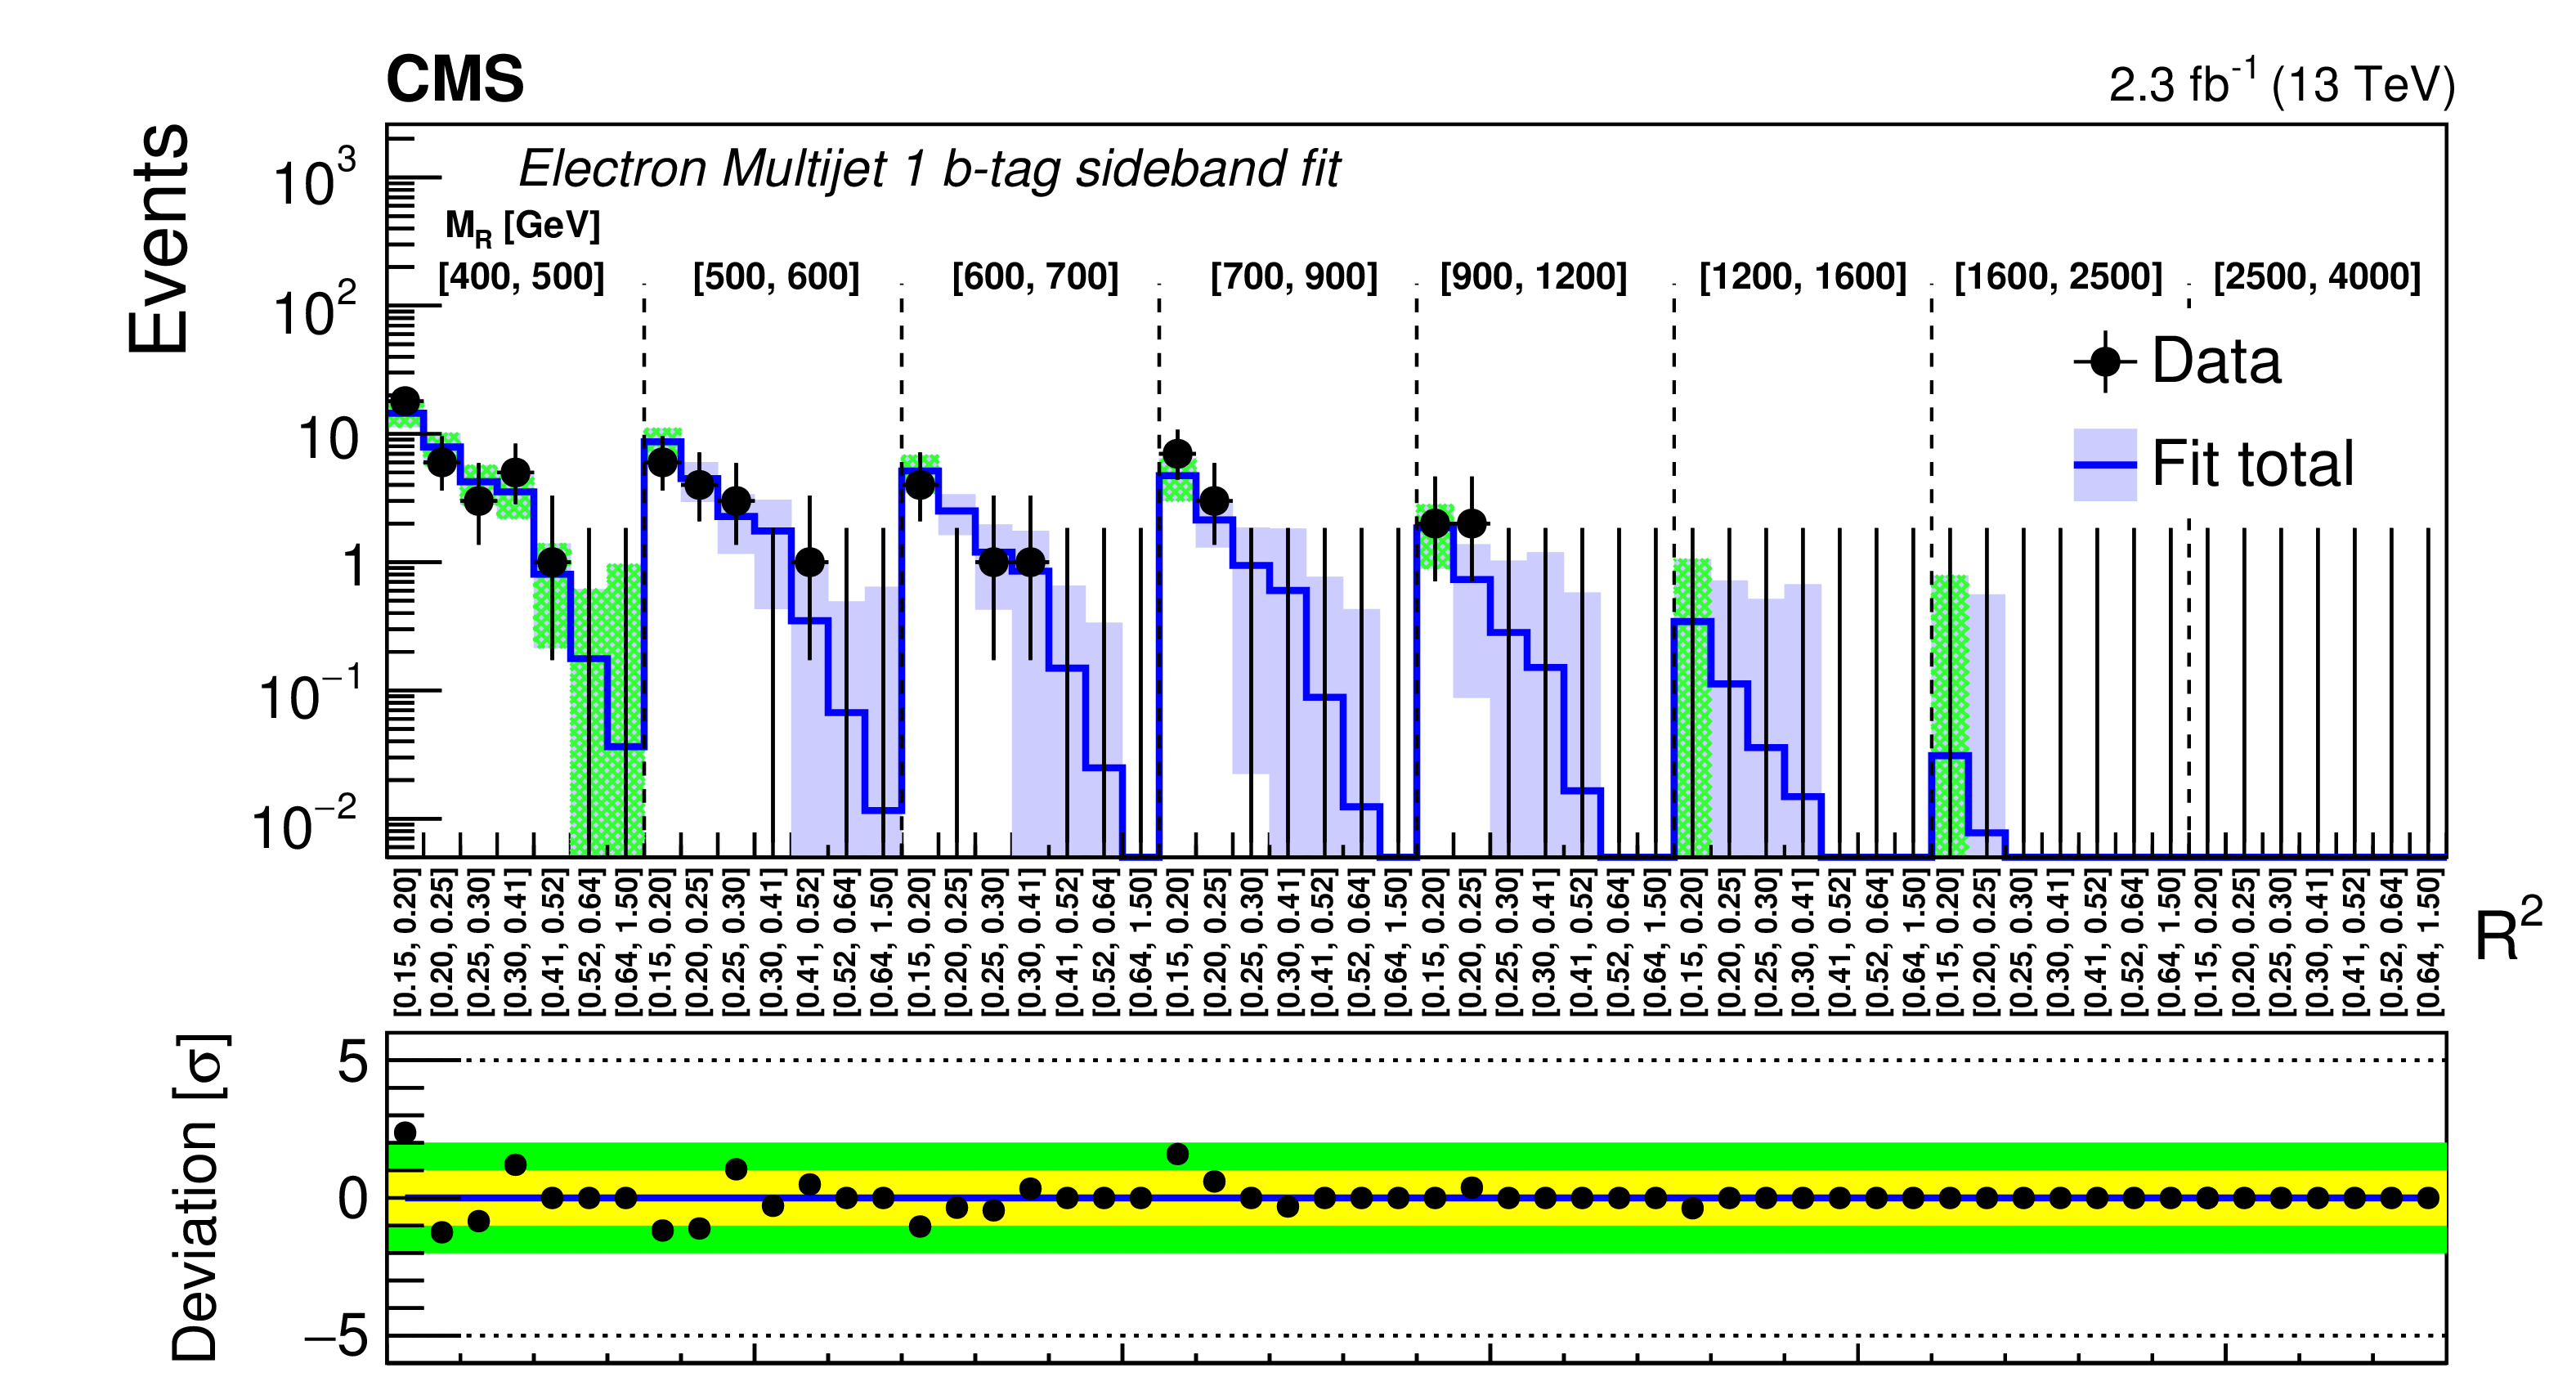
Comparison of the predicted background with the observed data in bins of $ {M_\mathrm {R}} $ and $ {\mathrm {R}^2} $ variables in the Electron Multijet category for the 0b-tag (upper) and 1b-tag (lower) bins. A detailed explanation of the panels is given in the caption of Fig. 7. |
png pdf |
Figure 21-a:
Comparison of the predicted background with the observed data in bins of $ {M_\mathrm {R}} $ and $ {\mathrm {R}^2} $ variables in the Electron Multijet category for the 0b-tag bin. A detailed explanation of the panels is given in the caption of Fig. 7. |
png pdf |
Figure 21-b:
Comparison of the predicted background with the observed data in bins of $ {M_\mathrm {R}} $ and $ {\mathrm {R}^2} $ variables in the Electron Multijet category for the 1b-tag bin. A detailed explanation of the panels is given in the caption of Fig. 7. |
png pdf |
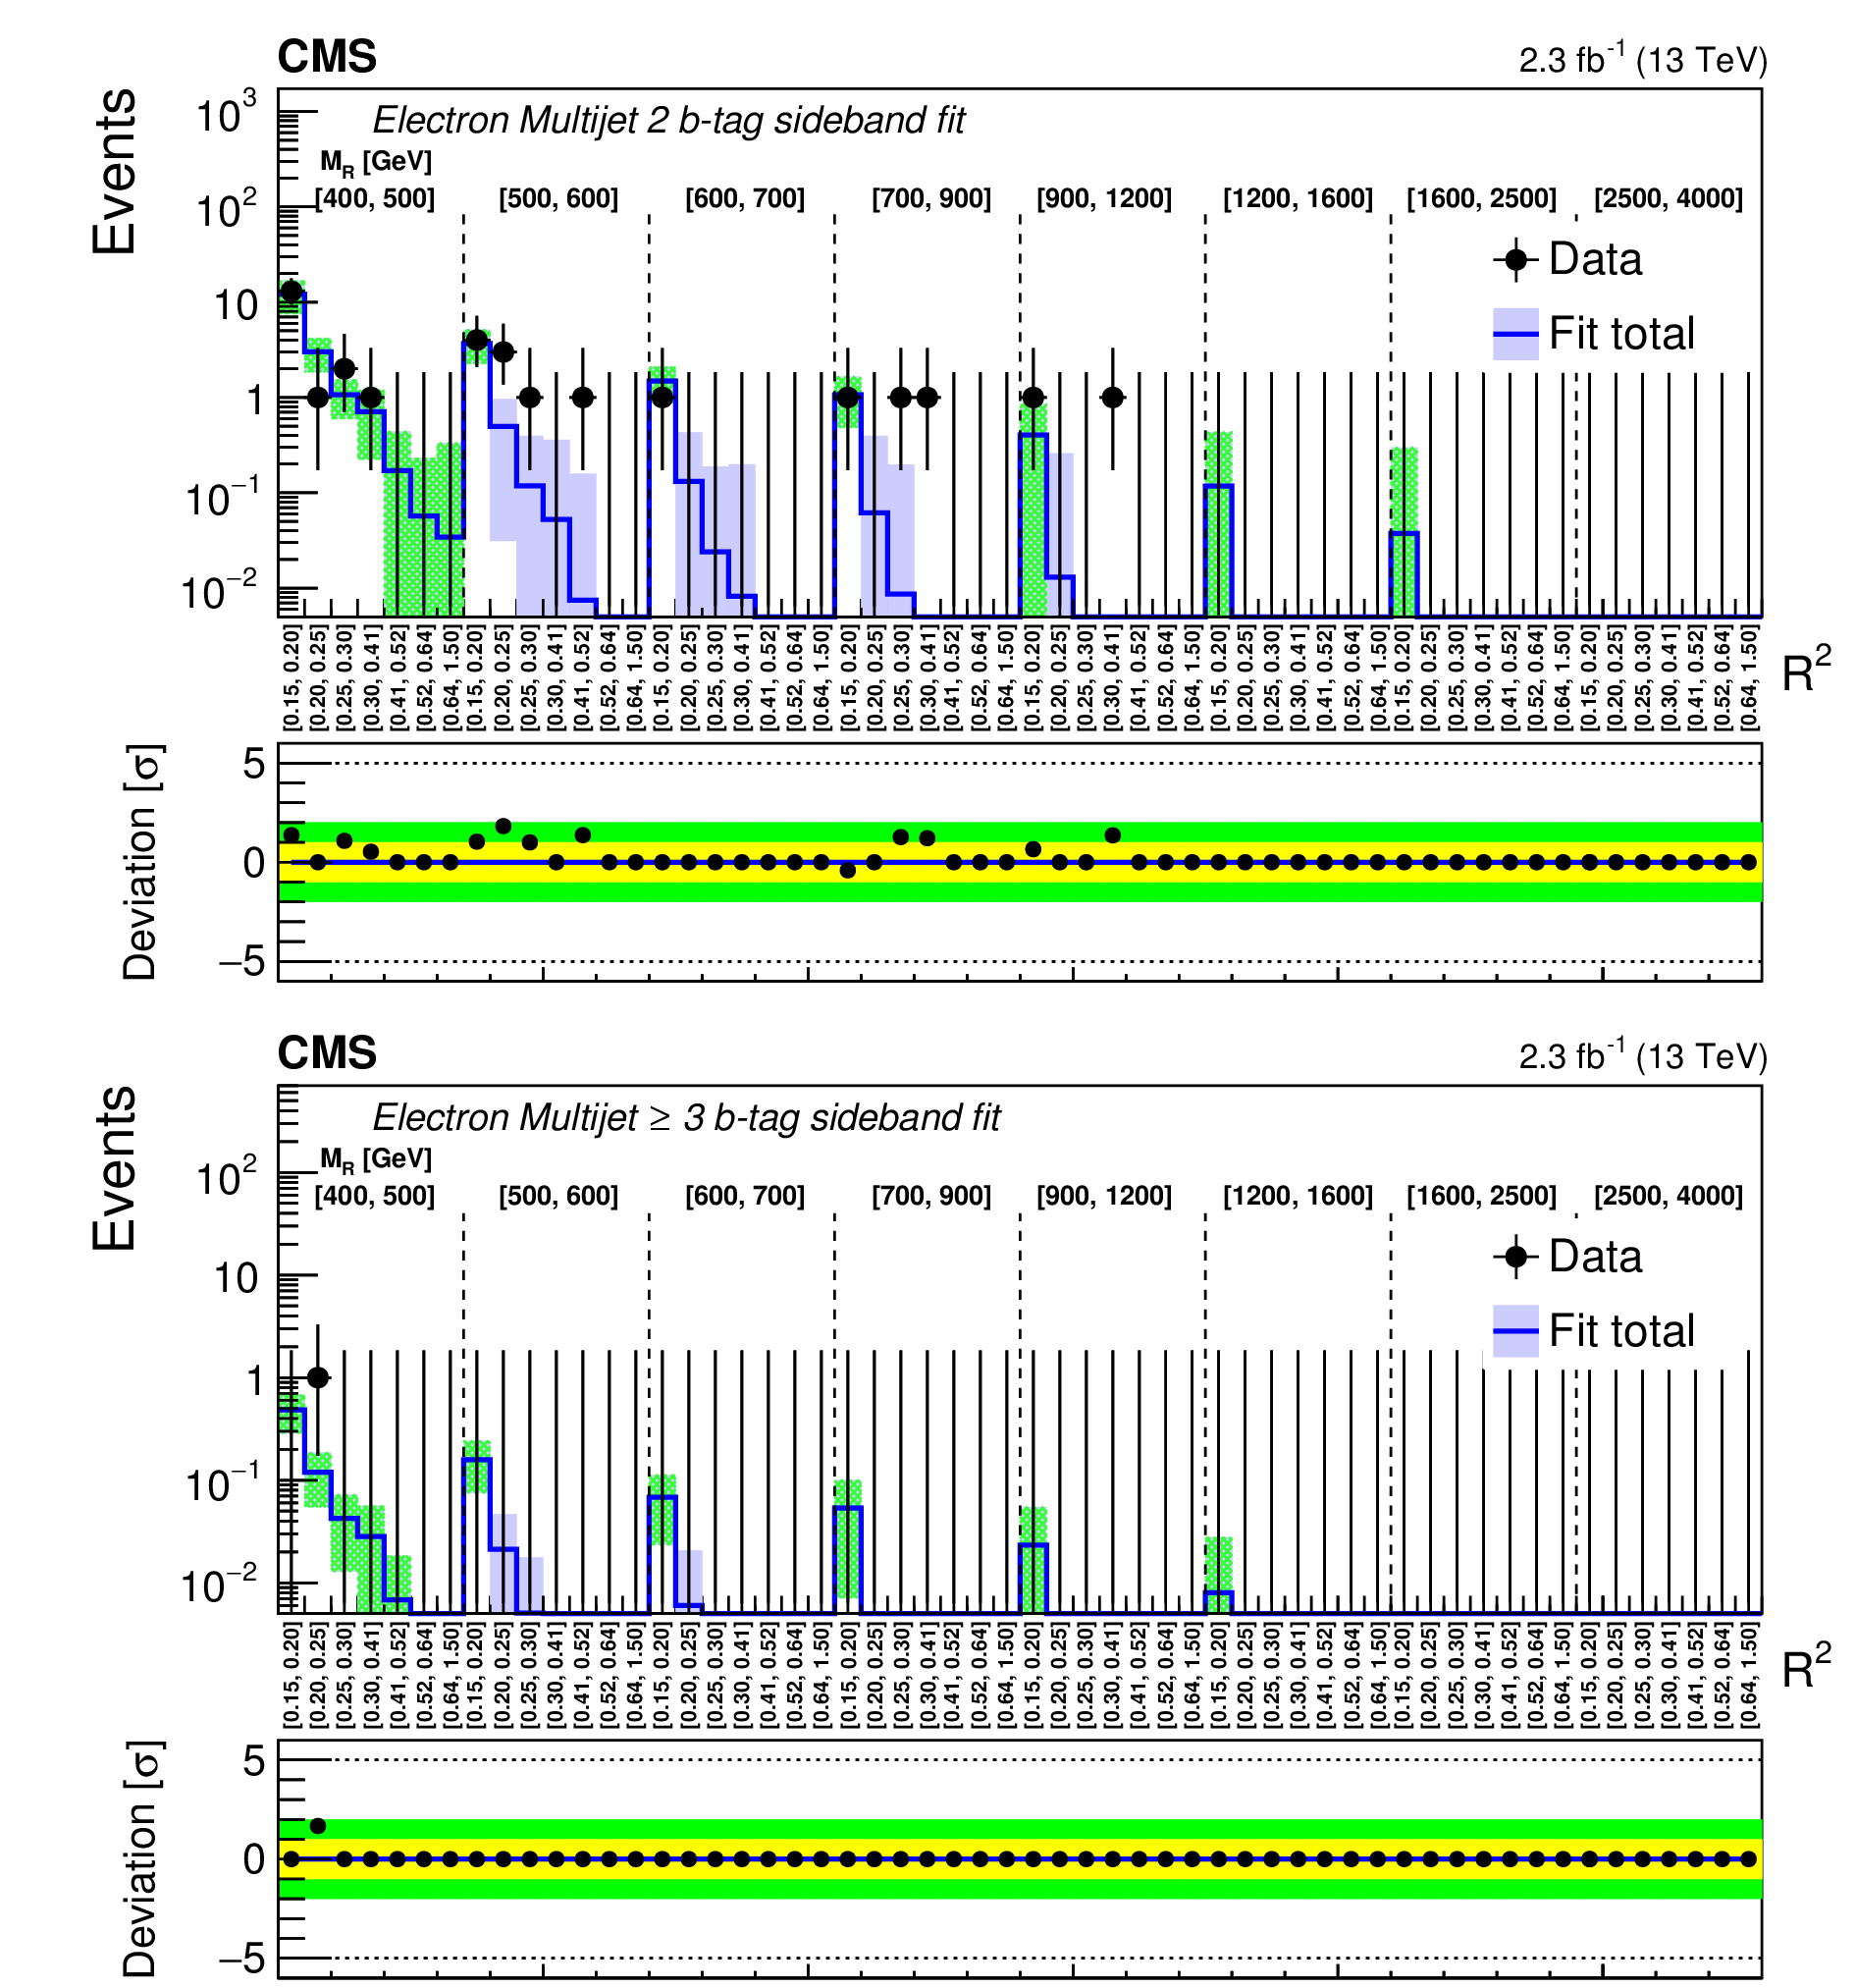
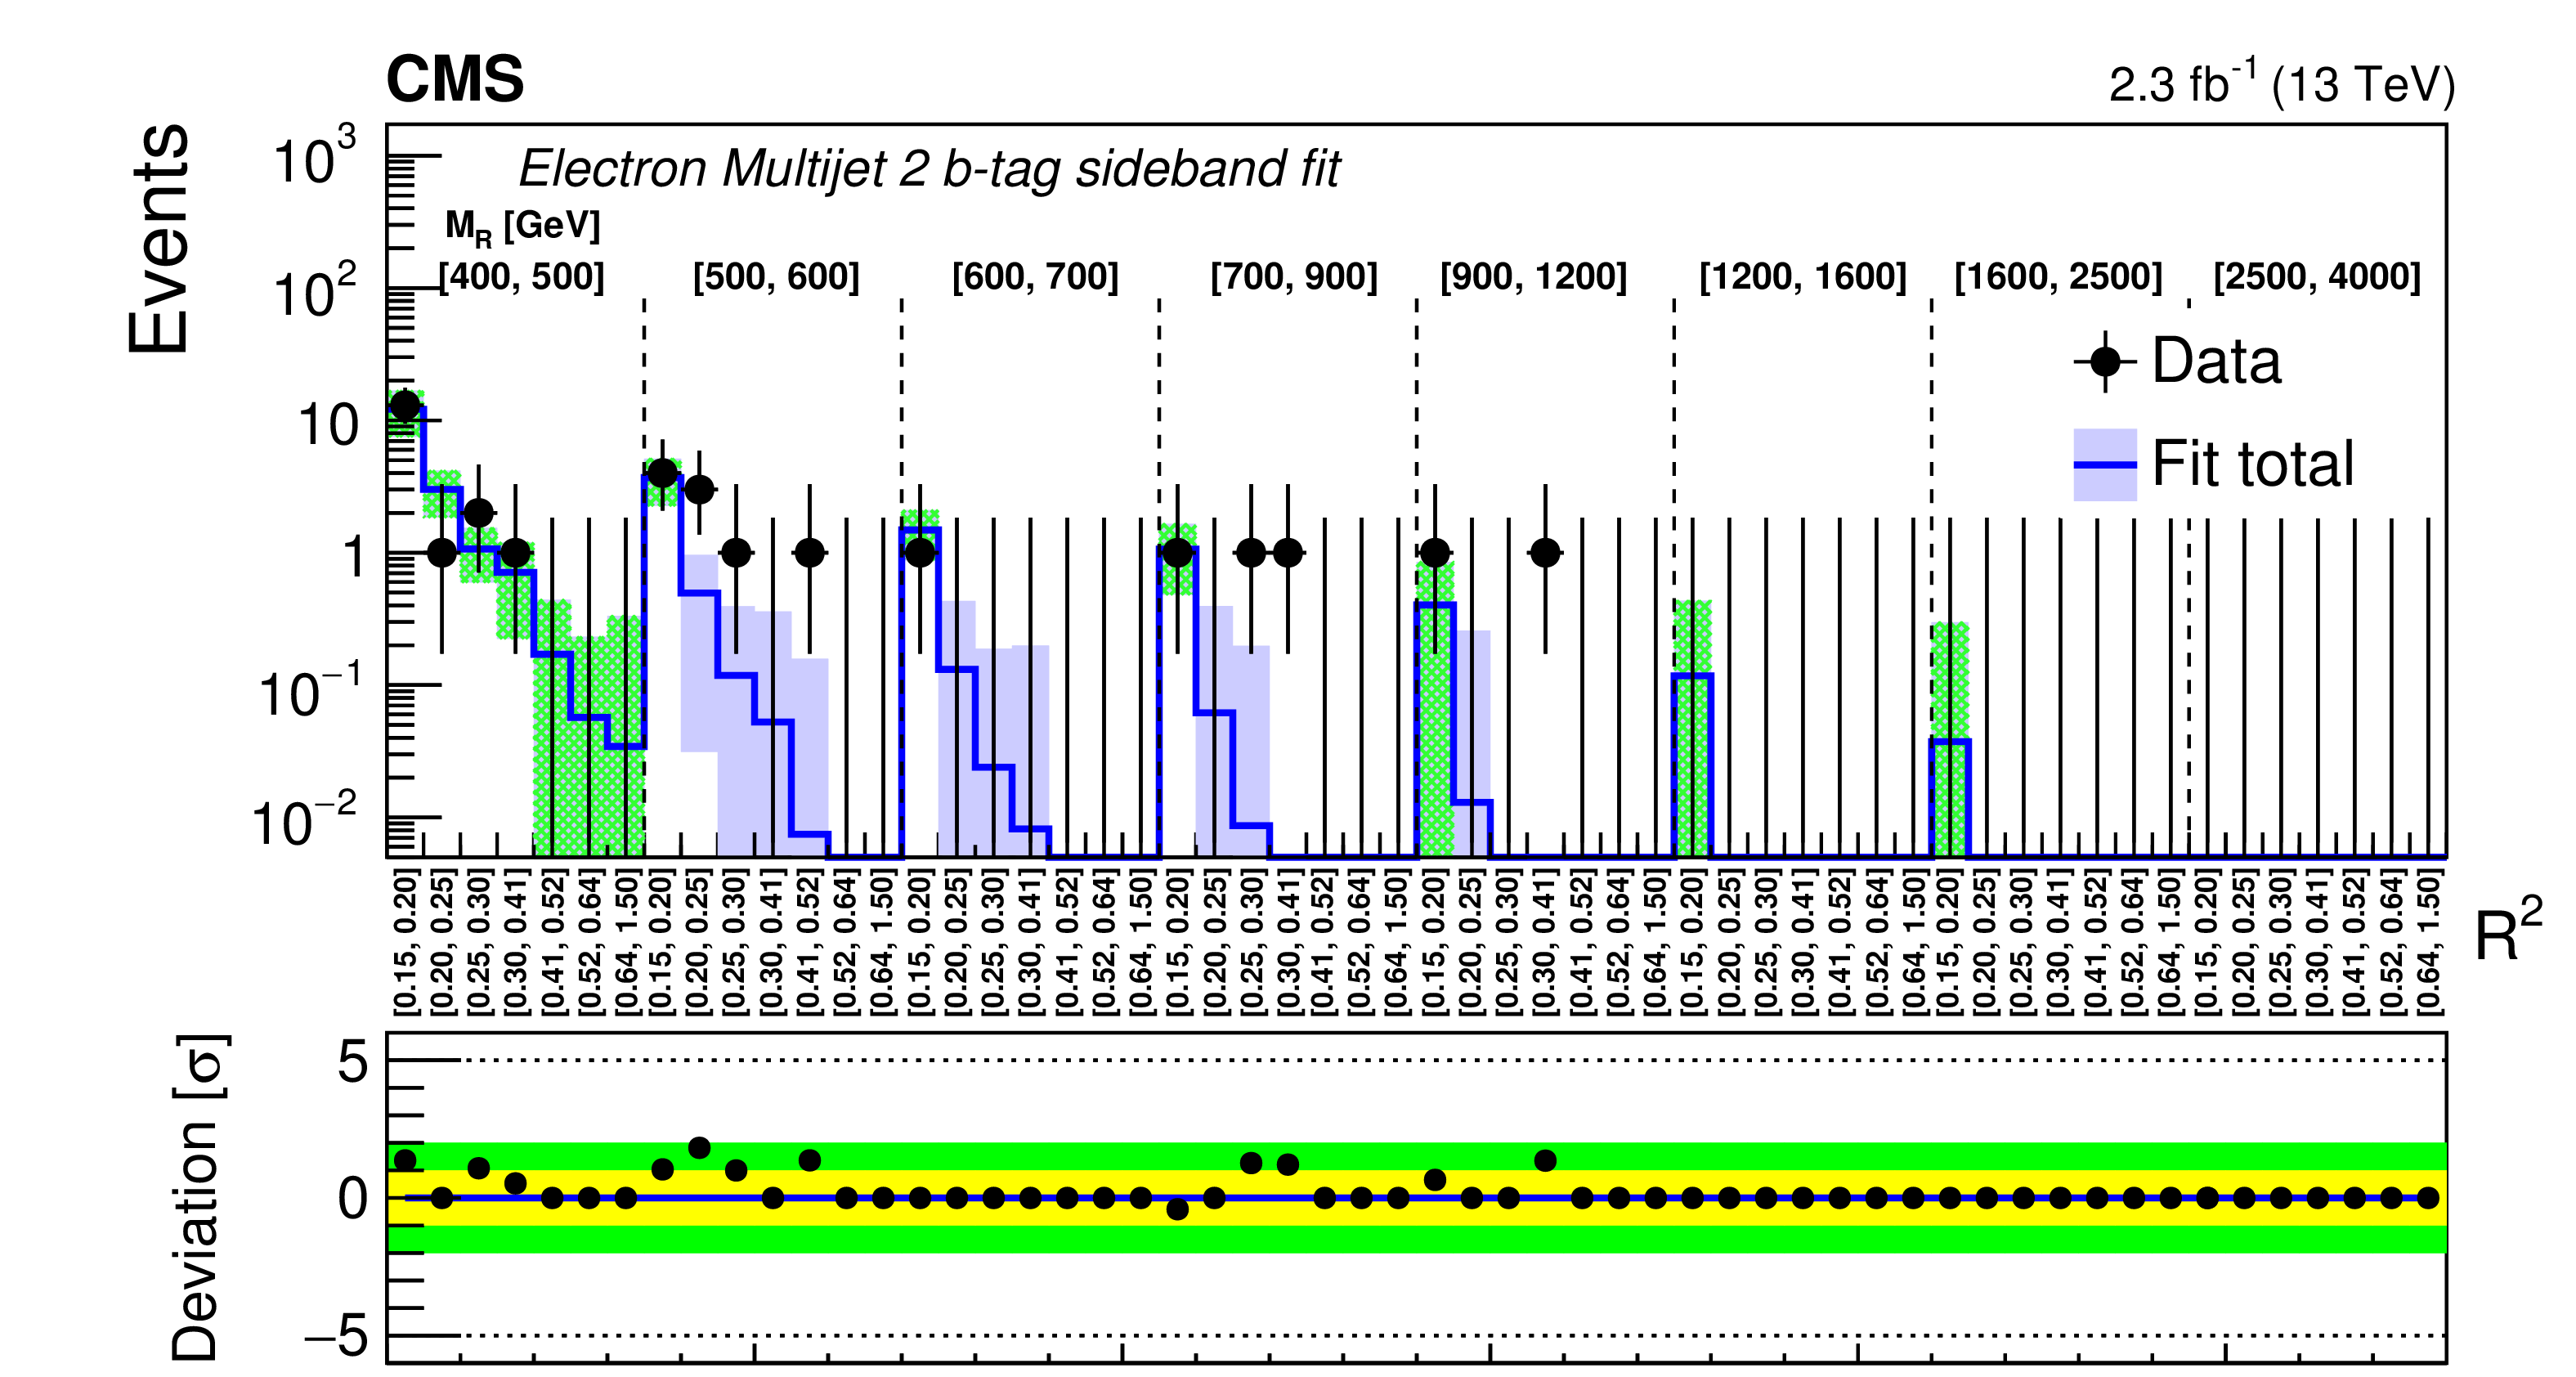
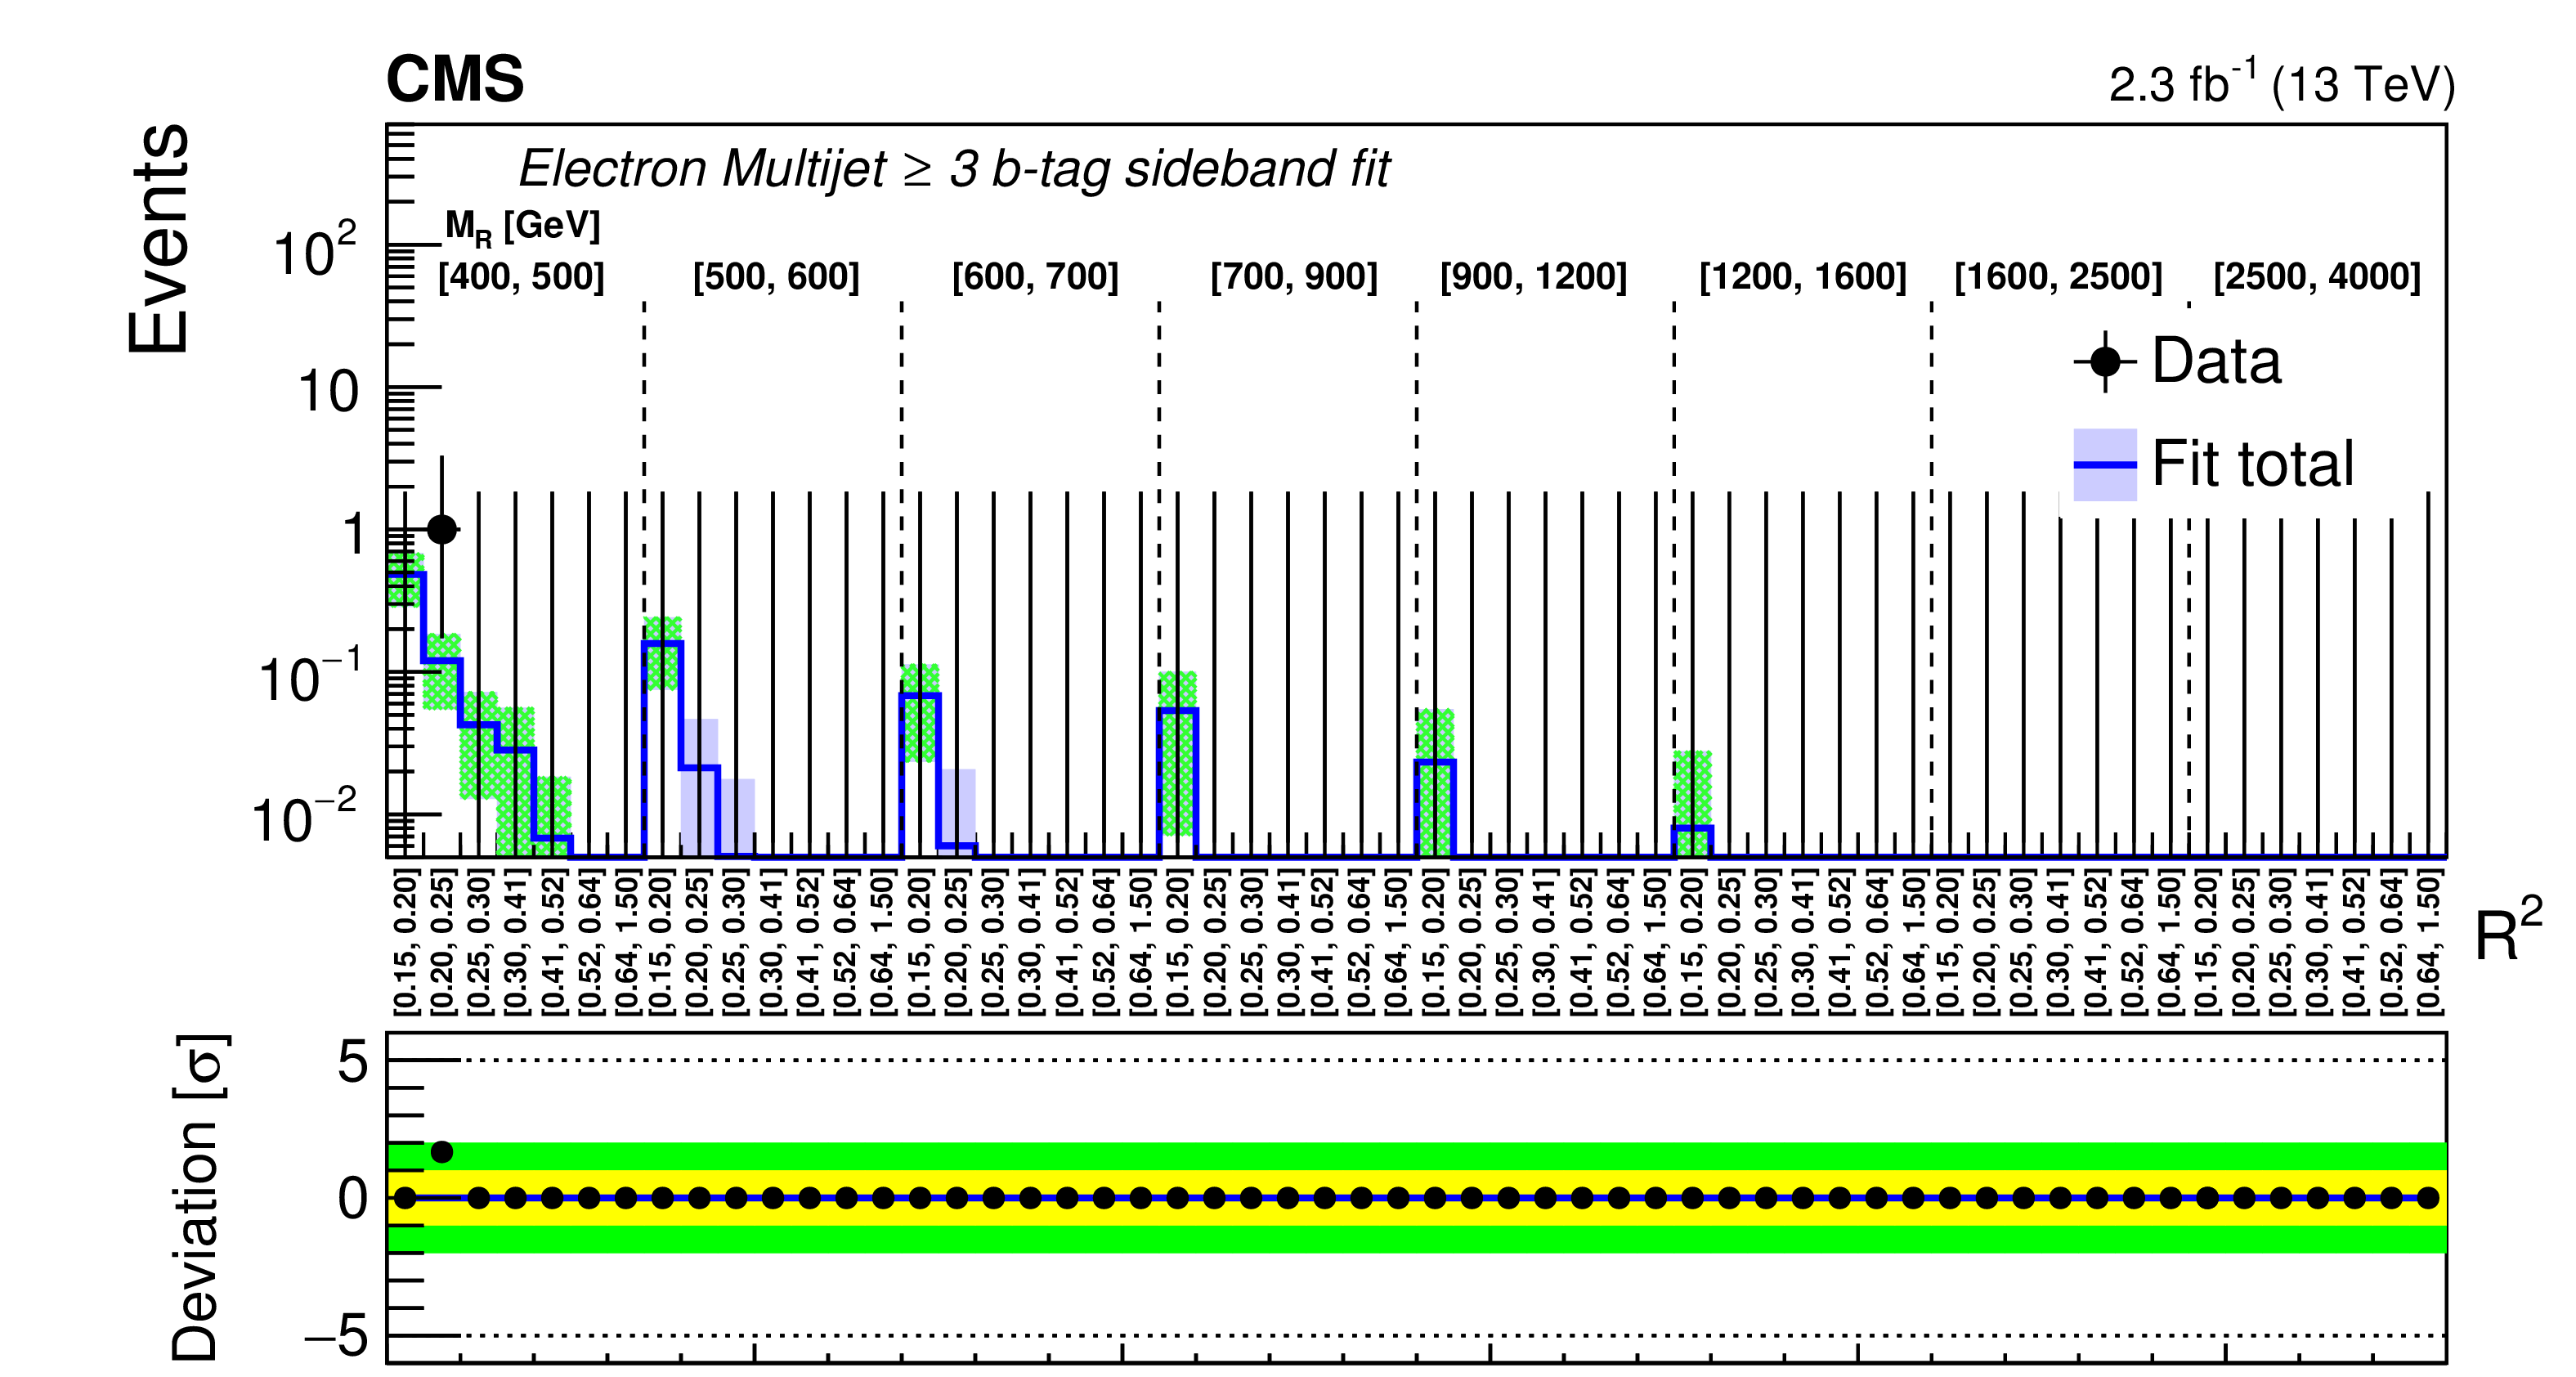
Figure 22:
Comparison of the predicted background with the observed data in bins of $ {M_\mathrm {R}} $ and $ {\mathrm {R}^2} $ variables in the Electron Multijet category for the 2b-tag (upper) and ${\geq }$3b-tag (lower) bins. A detailed explanation of the panels is given in the caption of Fig. 7. |
png pdf |
Figure 22-a:
Comparison of the predicted background with the observed data in bins of $ {M_\mathrm {R}} $ and $ {\mathrm {R}^2} $ variables in the Electron Multijet category for the 2b-tag bin. A detailed explanation of the panels is given in the caption of Fig. 7. |
png pdf |
Figure 22-b:
Comparison of the predicted background with the observed data in bins of $ {M_\mathrm {R}} $ and $ {\mathrm {R}^2} $ variables in the Electron Multijet category for the ${\geq }$3b-tag bin. A detailed explanation of the panels is given in the caption of Fig. 7. |
| Tables | |

png pdf |
Table 1:
Summary of the main instrumental and theoretical systematic uncertainties. The systematic uncertainty associated to the modeling of the initial-state radiation is only applied for events with recoil above 400 GeV. |
| Summary |
| We have presented an inclusive search for supersymmetry in events with no more than one lepton, a large multiplicity of energetic jets, and missing transverse energy. The search is sensitive to a broad range of SUSY scenarios including pair production of gluinos and top squarks. The event categorization in the number of leptons and the number of b-tagged jets enhances the search sensitivity for a variety of different SUSY signal scenarios. Two alternative background estimation methods are presented, both based on transfer factors between data control regions and the search regions, but having very different systematic assumptions: one relying on the simulation and associated corrections derived in the control regions, and the other relying on the accuracy of an assumed functional form for the shape of background distribution in the ${M_\mathrm{R}} $ and ${\mathrm{R}}^{2}$ variables. The two predictions agree within their uncertainties, thereby demonstrating the robustness of the background modeling. No significant deviations from the predicted standard model background are observed in any of the search regions, and this result is interpreted in the context of simplified models of gluino or top squark pair production. For decays to a top quark and an LSP with a mass of 100 GeV, we exclude top squarks with masses below 750 GeV. Considering separately the decays to bottom quarks and the LSP or first- and second-generation quarks and the LSP, gluino masses up to 1.65 TeV or 1.4 TeV are excluded, respectively. Furthermore, this search goes beyond the existing simplified model paradigm by interpreting results in a broader context inspired by natural SUSY, with multiple gluino decay modes considered simultaneously. By scanning over all possible branching fractions for three-body gluino decays to third generation quarks, exclusion limits are derived on gluino pair production that are valid for any values of the gluino decay branching fractions. For a chargino NLSP nearly degenerate in mass with the LSP and LSP masses in the range between 200 and 600 GeV, we exclude gluinos with mass below 1.55 to 1.6 TeV, regardless of their decays. This result is a more generic constraint on gluino production than previously reported at the LHC. |
| References | ||||
| 1 | J. Wess and B. Zumino | Supergauge transformations in four-dimensions | NPB 70 (1974) 39 | |
| 2 | \relax Yu. A. Gol'fand and E. P. Likhtman | Extension of the algebra of Poincar$ \'e $ group generators and violation of P invariance | JEPTL 13 (1971) 323 | |
| 3 | D. V. Volkov and V. P. Akulov | Possible universal neutrino interaction | JEPTL 16 (1972) 438 | |
| 4 | A. H. Chamseddine, R. L. Arnowitt, and P. Nath | Locally supersymmetric grand unification | PRL 49 (1982) 970 | |
| 5 | G. L. Kane, C. F. Kolda, L. Roszkowski, and J. D. Wells | Study of constrained minimal supersymmetry | PRD 49 (1994) 6173 | hep-ph/9312272 |
| 6 | P. Fayet | Supergauge invariant extension of the Higgs mechanism and a model for the electron and its neutrino | NPB 90 (1975) 104 | |
| 7 | R. Barbieri, S. Ferrara, and C. A. Savoy | Gauge models with spontaneously broken local supersymmetry | PLB 119 (1982) 343 | |
| 8 | L. J. Hall, J. D. Lykken, and S. Weinberg | Supergravity as the messenger of supersymmetry breaking | PRD 27 (1983) 2359 | |
| 9 | P. Ramond | Dual theory for free fermions | PRD 3 (1971) 2415 | |
| 10 | E. Witten | Dynamical breaking of supersymmetry | NPB 188 (1981) 513 | |
| 11 | S. Dimopoulos and H. Georgi | Softly broken supersymmetry and SU(5) | NPB 193 (1981) 150 | |
| 12 | M. Dine, W. Fischler, and M. Srednicki | Supersymmetric technicolor | NPB 189 (1981) 575 | |
| 13 | S. Dimopoulos and S. Raby | Supercolor | NPB 192 (1981) 353 | |
| 14 | N. Sakai | Naturalness in supersymmetric GUTs | Z. Phys. C 11 (1981) 153 | |
| 15 | R. K. Kaul and P. Majumdar | Cancellation of quadratically divergent mass corrections in globally supersymmetric spontaneously broken gauge theories | NPB 199 (1982) 36 | |
| 16 | S. Dimopoulos, S. Raby, and F. Wilczek | Supersymmetry and the scale of unification | PRD 24 (1981) 1681 | |
| 17 | W. J. Marciano and G. Senjanovic | Predictions of supersymmetric grand unified theories | PRD 25 (1982) 3092 | |
| 18 | M. B. Einhorn and D. R. T. Jones | The weak mixing angle and unification mass in supersymmetric SU(5) | NPB 196 (1982) 475 | |
| 19 | L. E. Ibanez and G. G. Ross | Low-energy predictions in supersymmetric grand unified theories | PLB 105 (1981) 439 | |
| 20 | U. Amaldi, W. de Boer, and H. Furstenau | Comparison of grand unified theories with electroweak and strong coupling constants measured at LEP | PLB 260 (1991) 447 | |
| 21 | P. Langacker and N. Polonsky | The strong coupling, unification, and recent data | PRD 52 (1995) 3081 | hep-ph/9503214 |
| 22 | J. R. Ellis et al. | Supersymmetric relics from the Big Bang | NPB 238 (1984) 453 | |
| 23 | G. Jungman, M. Kamionkowski, and K. Griest | Supersymmetric dark matter | PR 267 (1996) 195 | hep-ph/9506380 |
| 24 | CMS Collaboration | Search for top-squark pair production in the single-lepton final state in $ \mathrm{ p } \mathrm{ p } $ collisions at $ \sqrt{s} = $ 8 TeV | EPJC 73 (2013) 2677 | CMS-SUS-13-011 1308.1586 |
| 25 | CMS Collaboration | Search for gluino mediated bottom- and top-squark production in multijet final states in $ \mathrm{ p } \mathrm{ p } $ collisions at 8 TeV | PLB 725 (2013) 243 | CMS-SUS-12-024 1305.2390 |
| 26 | CMS Collaboration | Search for new physics in the multijet and missing transverse momentum final state in proton-proton collisions at $ \sqrt{s} = $ 8 TeV | JHEP 06 (2014) 055 | CMS-SUS-13-012 1402.4770 |
| 27 | CMS Collaboration | Search for supersymmetry in $ \mathrm{ p } \mathrm{ p } $ collisions at $ \sqrt{s} = $ 8 TeV in events with a single lepton, large jet multiplicity, and multiple b jets | PLB 733 (2014) 328 | CMS-SUS-13-007 1311.4937 |
| 28 | CMS Collaboration | Search for new physics in events with same-sign dileptons and jets in $ \mathrm{ p } \mathrm{ p } $ collisions at $ \sqrt{s} = $ 8 TeV | JHEP 01 (2014) 163 | CMS-SUS-13-013 1311.6736 |
| 29 | CMS Collaboration | Search for supersymmetry in hadronic final states with missing transverse energy using the variables $ \alpha_{\mathrm{T}} $ and $ \mathrm{ b }-quark $ multiplicity in $ \mathrm{ p } \mathrm{ p } $ collisions at 8 TeV | EPJC 73 (2013) 2568 | CMS-SUS-12-028 1303.2985 |
| 30 | CMS Collaboration | Searches for supersymmetry using the $ M_{\mathrm{T2}} $ variable in hadronic events produced in $ \mathrm{ p } \mathrm{ p } $ collisions at 8 TeV | JHEP 05 (2015) 078 | CMS-SUS-13-019 1502.04358 |
| 31 | ATLAS Collaboration | Search for new phenomena in final states with large jet multiplicities and missing transverse momentum at $ \sqrt{s} = $ 8 TeV proton-proton collisions using the ATLAS experiment | JHEP 10 (2013) 130 | 1308.1841 |
| 32 | ATLAS Collaboration | Search for strong production of supersymmetric particles in final states with missing transverse momentum and at least three $ \mathrm{ b } $-jets at $ \sqrt{s} = $ 8 TeV proton-proton collisions with the ATLAS detector | JHEP 10 (2014) 24 | 1407.0600 |
| 33 | ATLAS Collaboration | Search for supersymmetry at $ \sqrt{s} = $ 8 TeV in final states with jets and two same-sign leptons or three leptons with the ATLAS detector | JHEP 06 (2014) 035 | 1404.2500 |
| 34 | ATLAS Collaboration | Search for direct pair production of the top squark in all-hadronic final states in proton-proton collisions at $ \sqrt{s} = $ 8 TeV with the ATLAS detector | JHEP 09 (2014) 015 | 1406.1122 |
| 35 | ATLAS Collaboration | Search for direct top-squark pair production in final states with two leptons in $ \mathrm{ p } \mathrm{ p } $ collisions at $ \sqrt{s} = $ 8 TeV with the ATLAS detector | JHEP 06 (2014) 124 | 1403.4853 |
| 36 | ATLAS Collaboration | ATLAS Run 1 searches for direct pair production of third-generation squarks at the Large Hadron Collider | EPJC 75 (2015) 510 | 1506.08616 |
| 37 | ATLAS Collaboration | Summary of the searches for squarks and gluinos using $ \sqrt{s} = 8 TeV \mathrm{ p } \mathrm{ p } $ collisions with the ATLAS experiment at the LHC | JHEP 10 (2015) 054 | 1507.05525 |
| 38 | CMS Collaboration | Search for supersymmetry in the multijet and missing transverse momentum final state in $ \mathrm{ p } \mathrm{ p } $ collisions at 13 TeV | PLB 758 (2016) 152 | CMS-SUS-15-002 1602.06581 |
| 39 | CMS Collaboration | Search for new physics with the $ M_{\mathrm{T2}} $ variable in all-jets final states produced in $ \mathrm{ p } \mathrm{ p } $ collisions at $ \sqrt{s} = $ 13 TeV | Submitted to JHEP | CMS-SUS-15-003 1603.04053 |
| 40 | CMS Collaboration | Search for supersymmetry in $ \mathrm{ p } \mathrm{ p } $ collisions at $ \sqrt{s} = $ 13 TeV in the single-lepton final state using the sum of masses of large-radius jets | JHEP 08 (2016) 122 | CMS-SUS-15-007 1605.04608 |
| 41 | CMS Collaboration | Search for new physics in same-sign dilepton events in proton-proton collisions at $ \sqrt{s} = $ 13 TeV | EPJC 76 (2016) 439 | CMS-SUS-15-008 1605.03171 |
| 42 | CMS Collaboration | Search for new physics in final states with two opposite-sign, same-flavor leptons, jets, and missing transverse momentum in $ \mathrm{ p } \mathrm{ p } $ collisions at $ \sqrt{s} = $ 13 TeV | Submitted to JHEP | CMS-SUS-15-011 1607.00915 |
| 43 | ATLAS Collaboration | Search for new phenomena in final states with large jet multiplicities and missing transverse momentum with ATLAS using $ \sqrt{s} = $ 13 TeV proton-proton collisions | PLB 757 (2016) 334 | 1602.06194 |
| 44 | ATLAS Collaboration | Search for supersymmetry at $ \sqrt{s} = $ 13 TeV in final states with jets and two same-sign leptons or three leptons with the ATLAS detector | EPJC 76 (2016) 259 | 1602.09058 |
| 45 | ATLAS Collaboration | Search for new phenomena in final states with an energetic jet and large missing transverse momentum in $ pp $ collisions at $ \sqrt{s} = $ 13 TeV using the ATLAS detector | PRD 94 (2016) 032005 | 1604.07773 |
| 46 | ATLAS Collaboration | Search for squarks and gluinos in final states with jets and missing transverse momentum at $ \sqrt{s} = $ 13 TeV with the ATLAS detector | EPJC 76 (2016) 392 | 1605.03814 |
| 47 | ATLAS Collaboration | Search for gluinos in events with an isolated lepton, jets and missing transverse momentum at $ \sqrt{s} = $ 13 TeV with the ATLAS detector | Submitted to EPJC | 1605.04285 |
| 48 | ATLAS Collaboration | Search for pair production of gluinos decaying via stop and sbottom in events with $ b $-jets and large missing transverse momentum in $ pp $ collisions at $ \sqrt{s} = $ 13 TeV with the ATLAS detector | PRD 94 (2016) 032003 | 1605.09318 |
| 49 | ATLAS Collaboration | Search for top squarks in final states with one isolated lepton, jets, and missing transverse momentum in $ \sqrt{s} = 13 TeV pp $ collisions with the ATLAS detector | PRD 94 (2016) 052009 | 1606.03903 |
| 50 | ATLAS Collaboration | Search for bottom squark pair production in proton-proton collisions at $ \sqrt{s} = $ 13 TeV with the ATLAS detector | Submitted to EPJC | 1606.08772 |
| 51 | ATLAS Collaboration | Search for supersymmetry in a final state containing two photons and missing transverse momentum in $ \sqrt{s} = 13 TeV pp $ collisions at the LHC using the ATLAS detector | Submitted to EPJC | 1606.09150 |
| 52 | G. R. Farrar and P. Fayet | Phenomenology of the production, decay, and detection of new hadronic states associated with supersymmetry | PLB 76 (1978) 575 | |
| 53 | CMS Collaboration | Inclusive search for supersymmetry using the razor variables in $ \mathrm{ p } \mathrm{ p } $ collisions at $ \sqrt{s} = $ 7 TeV | PRL 111 (2013) 081802 | CMS-SUS-11-024 1212.6961 |
| 54 | CMS Collaboration | Search for supersymmetry with razor variables in $ \mathrm{ p } \mathrm{ p } $ collisions at $ \sqrt{s} = $ 7 TeV | PRD 90 (2014) 112001 | CMS-SUS-12-005 1405.3961 |
| 55 | CMS Collaboration | Inclusive search for squarks and gluinos in pp collisions at $ \sqrt{s} = $ 7 TeV | PRD 85 (2012) 012004 | CMS-SUS-10-009 1107.1279 |
| 56 | CMS Collaboration | Search for supersymmetry using razor variables in events with $ \mathrm{ b }-tagged $ jets in $ \mathrm{ p } \mathrm{ p } $ collisions at $ \sqrt{s} = $ 8 TeV | PRD 91 (2015) 052018 | CMS-SUS-13-004 1502.00300 |
| 57 | CMS Collaboration | Search for supersymmetry in $ \mathrm{ p } \mathrm{ p } $ collisions at $ \sqrt{s} = $ 8 TeV in final states with boosted W bosons and $ \mathrm{ b } $ jets using razor variables | PRD 93 (2016) 092009 | CMS-SUS-14-007 1602.02917 |
| 58 | CMS Collaboration | Search for dark matter particles in proton-proton collisions at $ \sqrt{s} = $ 8 TeV using the razor variables | Submitted to JHEP | CMS-EXO-14-004 1603.08914 |
| 59 | ATLAS Collaboration | Multi-channel search for squarks and gluinos in $ \sqrt{s} = 7 TeV pp $ collisions with the ATLAS detector | EPJC 73 (2013) 2362 | 1212.6149 |
| 60 | ATLAS Collaboration | Search for squarks and gluinos in events with isolated leptons, jets and missing transverse momentum at $ \sqrt{s} = $ 8 TeV with the ATLAS detector | JHEP 04 (2015) 116 | 1501.03555 |
| 61 | M. Papucci, J. T. Ruderman, and A. Weiler | Natural SUSY endures | JHEP 09 (2012) 035 | 1110.6926 |
| 62 | CMS Collaboration | The CMS experiment at the CERN LHC | JINST 3 (2008) S08004 | CMS-00-001 |
| 63 | J. Alwall et al. | MadGraph5: going beyond | JHEP 06 (2011) 128 | 1106.0522 |
| 64 | J. Alwall et al. | The automated computation of tree-level and next-to-leading order differential cross sections, and their matching to parton shower simulations | JHEP 07 (2014) 079 | 1405.0301 |
| 65 | S. Alioli, P. Nason, C. Oleari, and E. Re | NLO single-top production matched with shower in POWHEG: s- and t-channel contributions | JHEP 09 (2009) 111 | 0907.4076 |
| 66 | E. Re | Single-top $ Wt $-channel production matched with parton showers using the POWHEG method | EPJC 71 (2011) 1547 | 1009.2450 |
| 67 | T. Sjostrand, S. Mrenna, and P. Skands | A brief introduction to PYTHIA 8.1 | Comp. Phys. Commun. 178 (2008) 852 | |
| 68 | NNPDF Collaboration | Parton distributions for the LHC Run II | JHEP 04 (2015) 040 | 1410.8849 |
| 69 | GEANT4 Collaboration | GEANT4---a simulation toolkit | NIMA 506 (2003) 250 | |
| 70 | CMS Collaboration | The fast simulation of the CMS detector at LHC | J. Phys.: Conf. Ser. 331 (2011) 032049 | |
| 71 | W. Beenakker, R. Hopker, M. Spira, and P. M. Zerwas | Squark and gluino production at hadron colliders | NPB 492 (1997) 51 | hep-ph/9610490 |
| 72 | A. Kulesza and L. Motyka | Threshold resummation for squark-antisquark and gluino-pair production at the LHC | PRL 102 (2009) 111802 | 0807.2405 |
| 73 | A. Kulesza and L. Motyka | Soft gluon resummation for the production of gluino-gluino and squark-antisquark pairs at the LHC | PRD 80 (2009) 095004 | 0905.4749 |
| 74 | W. Beenakker et al. | Soft-gluon resummation for squark and gluino hadroproduction | JHEP 12 (2009) 041 | 0909.4418 |
| 75 | W. Beenakker et al. | Squark and gluino hadroproduction | Int. J. Mod. Phys. A 26 (2011) 2637 | 1105.1110 |
| 76 | C. Borschensky et al. | Squark and gluino production cross sections in $ pp $ collisions at $ \sqrt{s} = $ 13, 14, 33 and 100 TeV | EPJC 74 (2014) 3174 | 1407.5066 |
| 77 | CMS Collaboration | Particle-flow event reconstruction in CMS and performance for jets, taus, and $ E_{\mathrm{T}}^{\text{miss}} $ | CMS-PAS-PFT-09-001 | |
| 78 | CMS Collaboration | Commissioning of the particle-flow event with the first LHC collisions recorded in the CMS detector | CMS-PAS-PFT-10-001 | |
| 79 | M. Cacciari, G. P. Salam, and G. Soyez | The anti-$ k_t $ jet clustering algorithm | JHEP 04 (2008) 063 | 0802.1189 |
| 80 | M. Cacciari, G. P. Salam, and G. Soyez | FastJet user manual | EPJC 72 (2012) 1896 | 1111.6097 |
| 81 | CMS Collaboration | Jet performance in $ pp pp $ collisions at $ \sqrt{s}=$ 7 TeV | CMS-PAS-JME-10-003 | |
| 82 | CMS Collaboration | Jet energy scale and resolution in the CMS experiment in $ \mathrm{ p } \mathrm{ p } $ collisions at 8 TeV | Submitted to JINST | CMS-JME-13-004 1607.03663 |
| 83 | CMS Collaboration | Performance of electron reconstruction and selection with the CMS detector in proton-proton collisions at $ \sqrt{s} = $ 8 TeV | JINST 10 (2015) P06005 | CMS-EGM-13-001 1502.02701 |
| 84 | CMS Collaboration | Study of pileup removal algorithms for jets | CMS-PAS-JME-14-001 | CMS-PAS-JME-14-001 |
| 85 | CMS Collaboration | Performance of CMS muon reconstruction in $ \mathrm{ p } \mathrm{ p } $ collision events at $ \sqrt{s} = $ 7 TeV | JINST 7 (2012) P10002 | CMS-MUO-10-004 1206.4071 |
| 86 | CMS Collaboration | Reconstruction and identification of $ \tau $ lepton decays to hadrons and $ \nu_{\tau} $ at CMS | JINST 11 (2016) P01019 | CMS-TAU-14-001 1510.07488 |
| 87 | CMS Collaboration | Identification of b quark jets at the cms experiment in the lhc run 2 | CMS-PAS-JME-14-001 | CMS-PAS-JME-14-001 |
| 88 | CMS Collaboration | Identification of $ \mathrm{ b }-quark $ jets with the CMS experiment | JINST 8 (2013) P04013 | CMS-BTV-12-001 1211.4462 |
| 89 | CMS Collaboration | Performance of photon reconstruction and identification with the CMS detector in proton-proton collisions at $ \sqrt{s} = $ 8 TeV | JINST 10 (2015) P08010 | CMS-EGM-14-001 1502.02702 |
| 90 | CMS Collaboration | Missing transverse energy performance of the CMS detector | JINST 6 (2011) P09001 | CMS-JME-10-009 1106.5048 |
| 91 | CMS Collaboration | Performance of the CMS missing transverse momentum reconstruction in $ \mathrm{ p } \mathrm{ p } $ data at $ \sqrt{s} = $ 8 TeV | JINST 10 (2015) P02006 | CMS-JME-13-003 1411.0511 |
| 92 | T. Junk | Confidence level computation for combining searches with small statistics | NIMA 434 (1999) 435 | hep-ex/9902006 |
| 93 | A. L. Read | Presentation of search results: the $ \mathrm{CL_{s}} $ technique | JPG 28 (2002) 2693 | |
| 94 | A. L. Read | Modified frequentist analysis of search results (the $ \mathrm{CL_{s}} $ method) | ||
| 95 | G. Cowan, K. Cranmer, E. Gross, and O. Vitells | Asymptotic formulae for likelihood-based tests of new physics | EPJC 71 (2011) 1554 | 1007.1727 |
| 96 | ATLAS and CMS Collaborations | Procedure for the LHC Higgs boson search combination in summer 2011 | CMS-NOTE-2011-005 | |
| 97 | CMS Collaboration | CMS luminosity measurement for the 2015 data taking period | CMS-PAS-LUM-15-001 | CMS-PAS-LUM-15-001 |
| 98 | Particle Data Group, K. A. Olive et al. | Review of particle physics | CPC 38 (2014) 090001 | |
| 99 | M. Dine, A. Kagan, and S. Samuel | Naturalness in supersymmetry, or raising the supersymmetry breaking scale | Physics Letters B 243 (1990), no. 3, 250 | |
| 100 | A. G. Cohen, D. B. Kaplan, and A. E. Nelson | The more Minimal Supersymmetric Standard Model | PLB 388 (1996) 588 | hep-ph/9607394 |
|
|
Compact Muon Solenoid LHC, CERN |
|

|

|

|

|

|