

Compact Muon Solenoid
LHC, CERN
| CMS-TOP-16-008 ; CERN-EP-2016-227 | ||
| Measurement of differential cross sections for top quark pair production using the lepton+jets final state in proton-proton collisions at 13 TeV | ||
| CMS Collaboration | ||
| 13 October 2016 | ||
| Phys. Rev. D 95 (2017) 092001 | ||
| Abstract: Differential and double-differential cross sections for the production of top quark pairs in proton-proton collisions at 13 TeV are measured as a function of jet multiplicity and of kinematic variables of the top quarks and the top quark-antiquark system. This analysis is based on data collected by the CMS experiment at the LHC corresponding to an integrated luminosity of 2.3 fb$^{-1}$. The measurements are performed in the lepton+jets decay channels with a single muon or electron in the final state. The differential cross sections are presented at particle level, within a phase space close to the experimental acceptance, and at parton level in the full phase space. The results are compared to several standard model predictions. | ||
| Links: e-print arXiv:1610.04191 [hep-ex] (PDF) ; CDS record ; inSPIRE record ; HepData record ; CADI line (restricted) ; | ||
| Figures | |

png pdf |
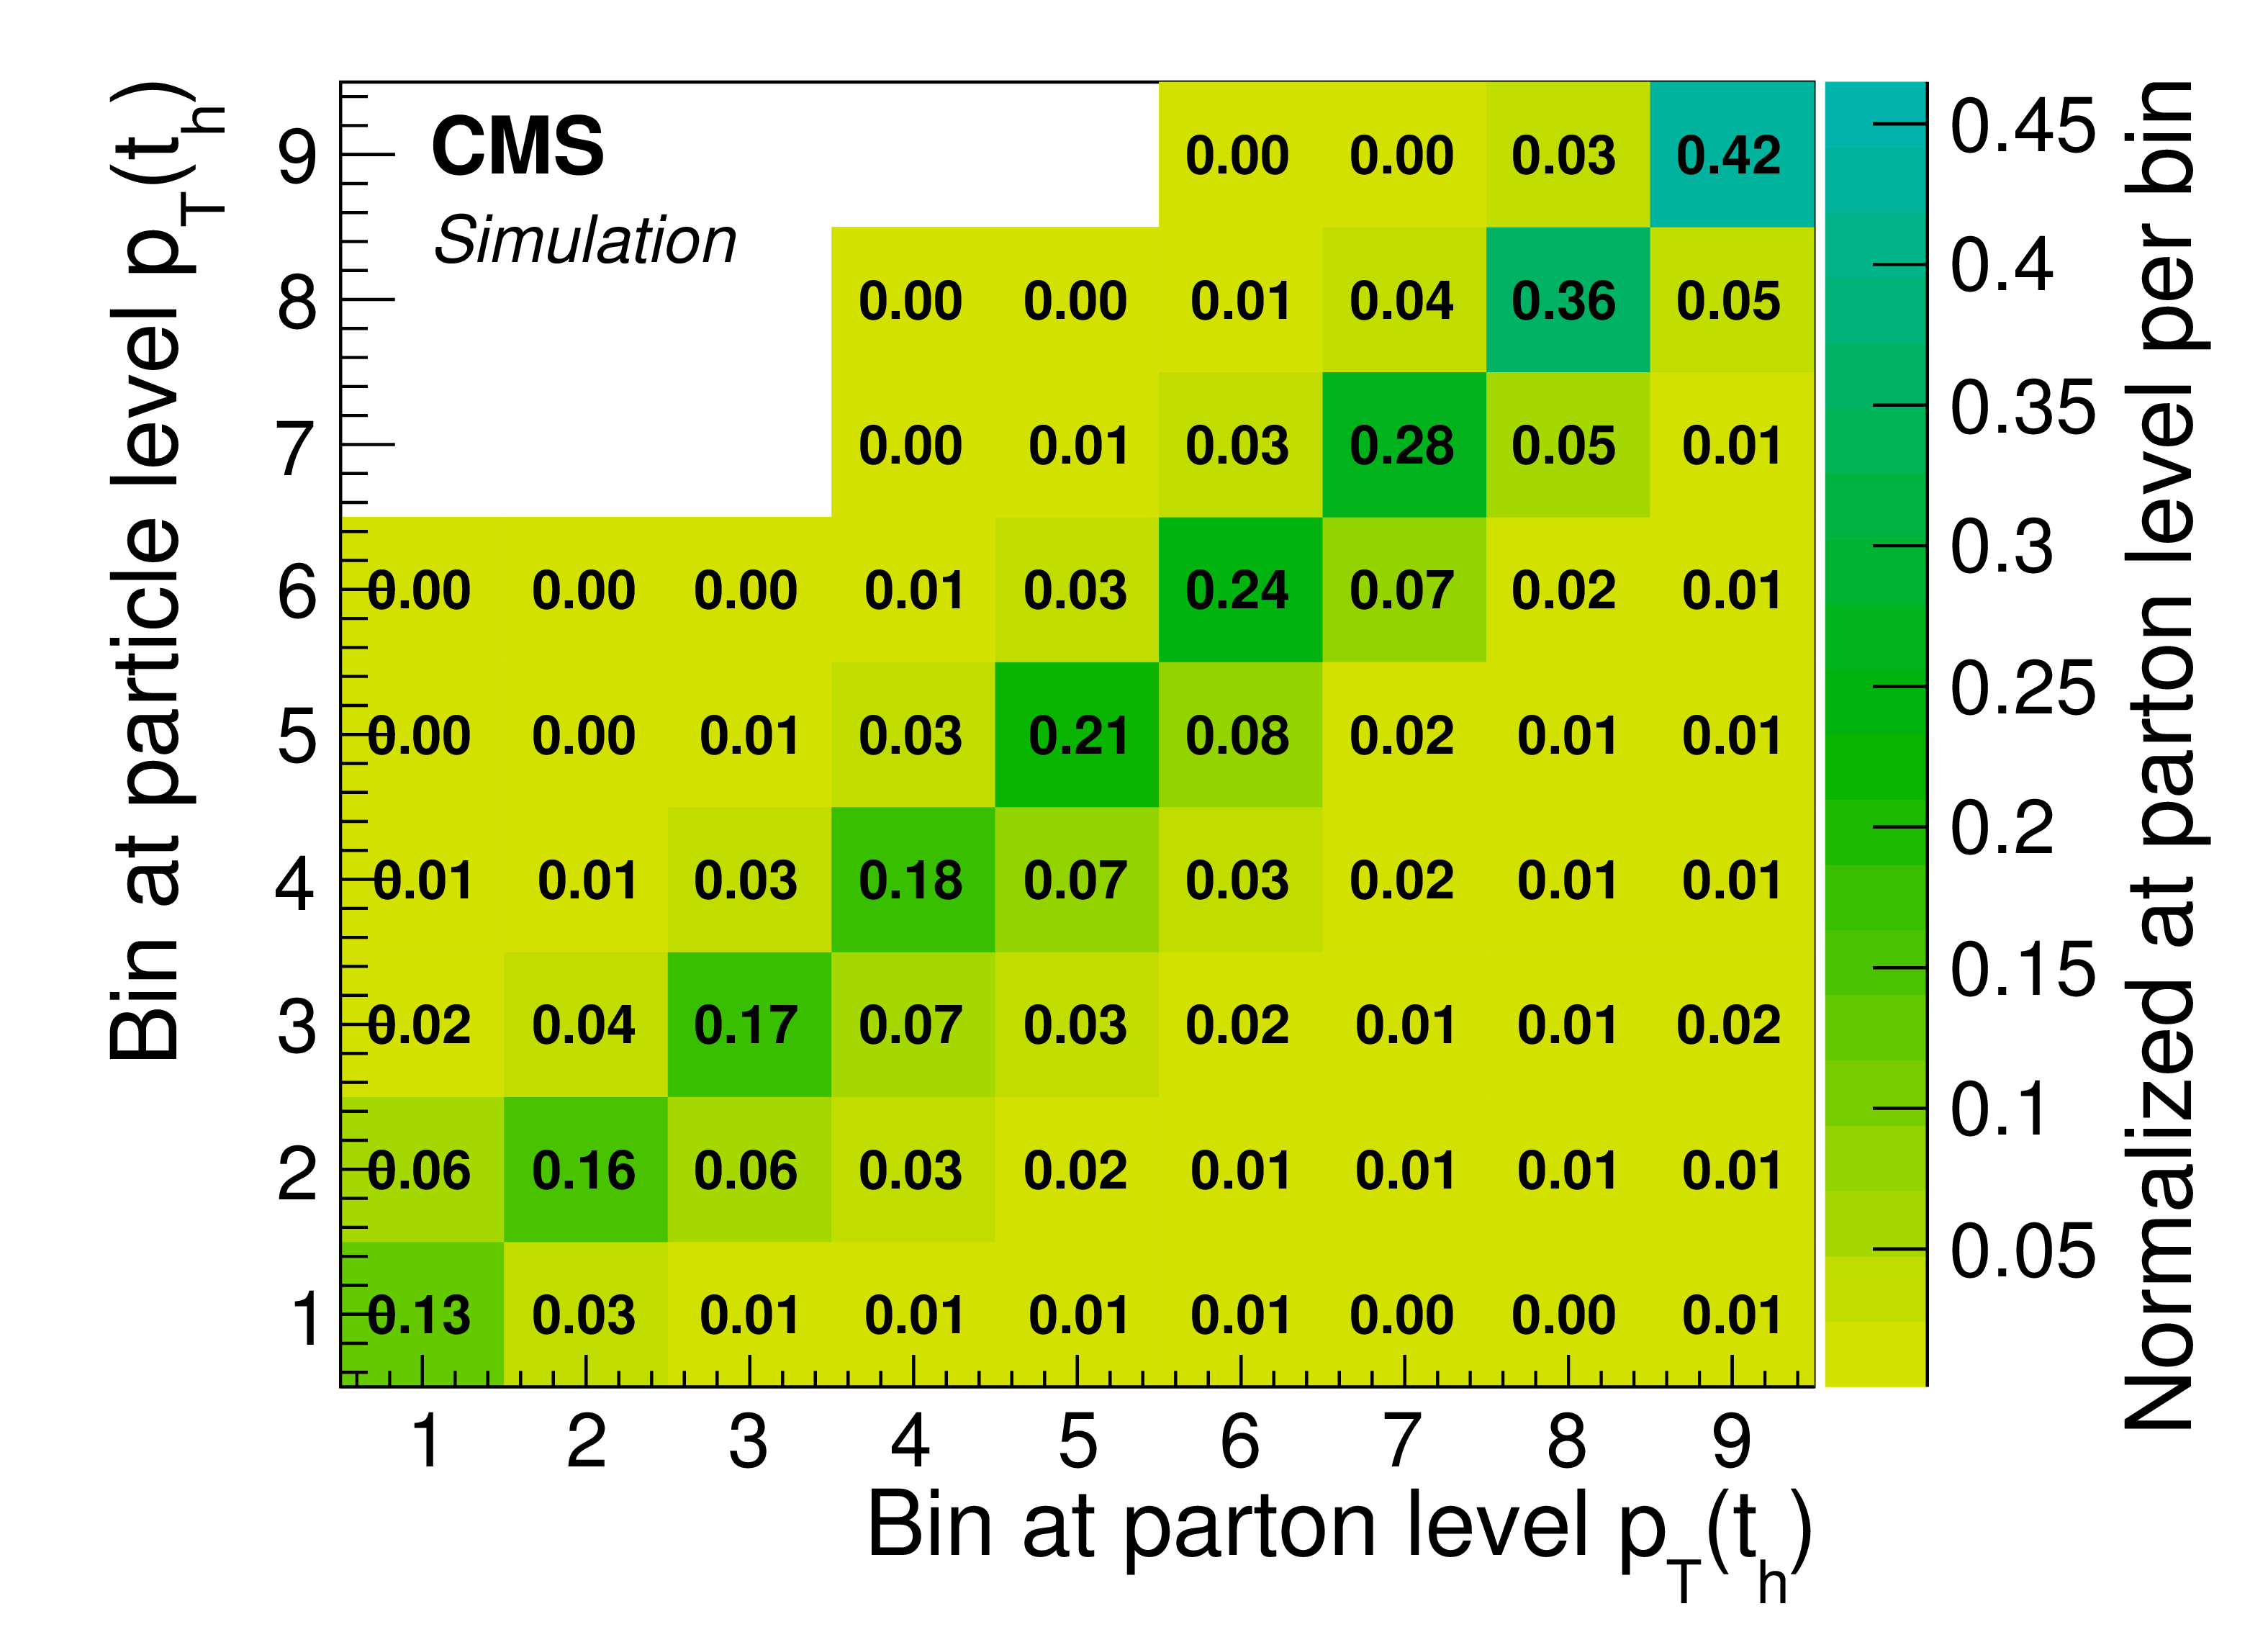
Figure 1:
Comparison between the $ {p_{\mathrm {T}}} ( {\mathrm{ t } _\mathrm {h}} )$ at particle and parton level, extracted from the POWHEG+PYTHIA8 simulation. Left : fraction of parton-level top quarks in the same bin at particle level (purity), fraction of particle-level top quarks in the same bin at parton level (stability), ratio of the number of particle- to parton-level top quarks, and fraction of events with a particle-level top quark pair that are not considered as signal events at parton level. Right : bin migrations between particle and parton level. The ${p_{\mathrm {T}}}$ range of the bins can be taken from the left panel. Each column is normalized to the number of events per column at parton level in the full phase space. |

png pdf |
Figure 1-a:
Comparison between the $ {p_{\mathrm {T}}} ( {\mathrm{ t } _\mathrm {h}} )$ at particle and parton level, extracted from the POWHEG+PYTHIA8 simulation: fraction of parton-level top quarks in the same bin at particle level (purity), fraction of particle-level top quarks in the same bin at parton level (stability), ratio of the number of particle- to parton-level top quarks, and fraction of events with a particle-level top quark pair that are not considered as signal events at parton level. |
png pdf |
Figure 1-b:
Comparison between the $ {p_{\mathrm {T}}} ( {\mathrm{ t } _\mathrm {h}} )$ at particle and parton level, extracted from the POWHEG+PYTHIA8 simulation: bin migrations between particle and parton level. The ${p_{\mathrm {T}}}$ range of the bins can be taken from Fig. 1-a. Each column is normalized to the number of events per column at parton level in the full phase space. |
png pdf |
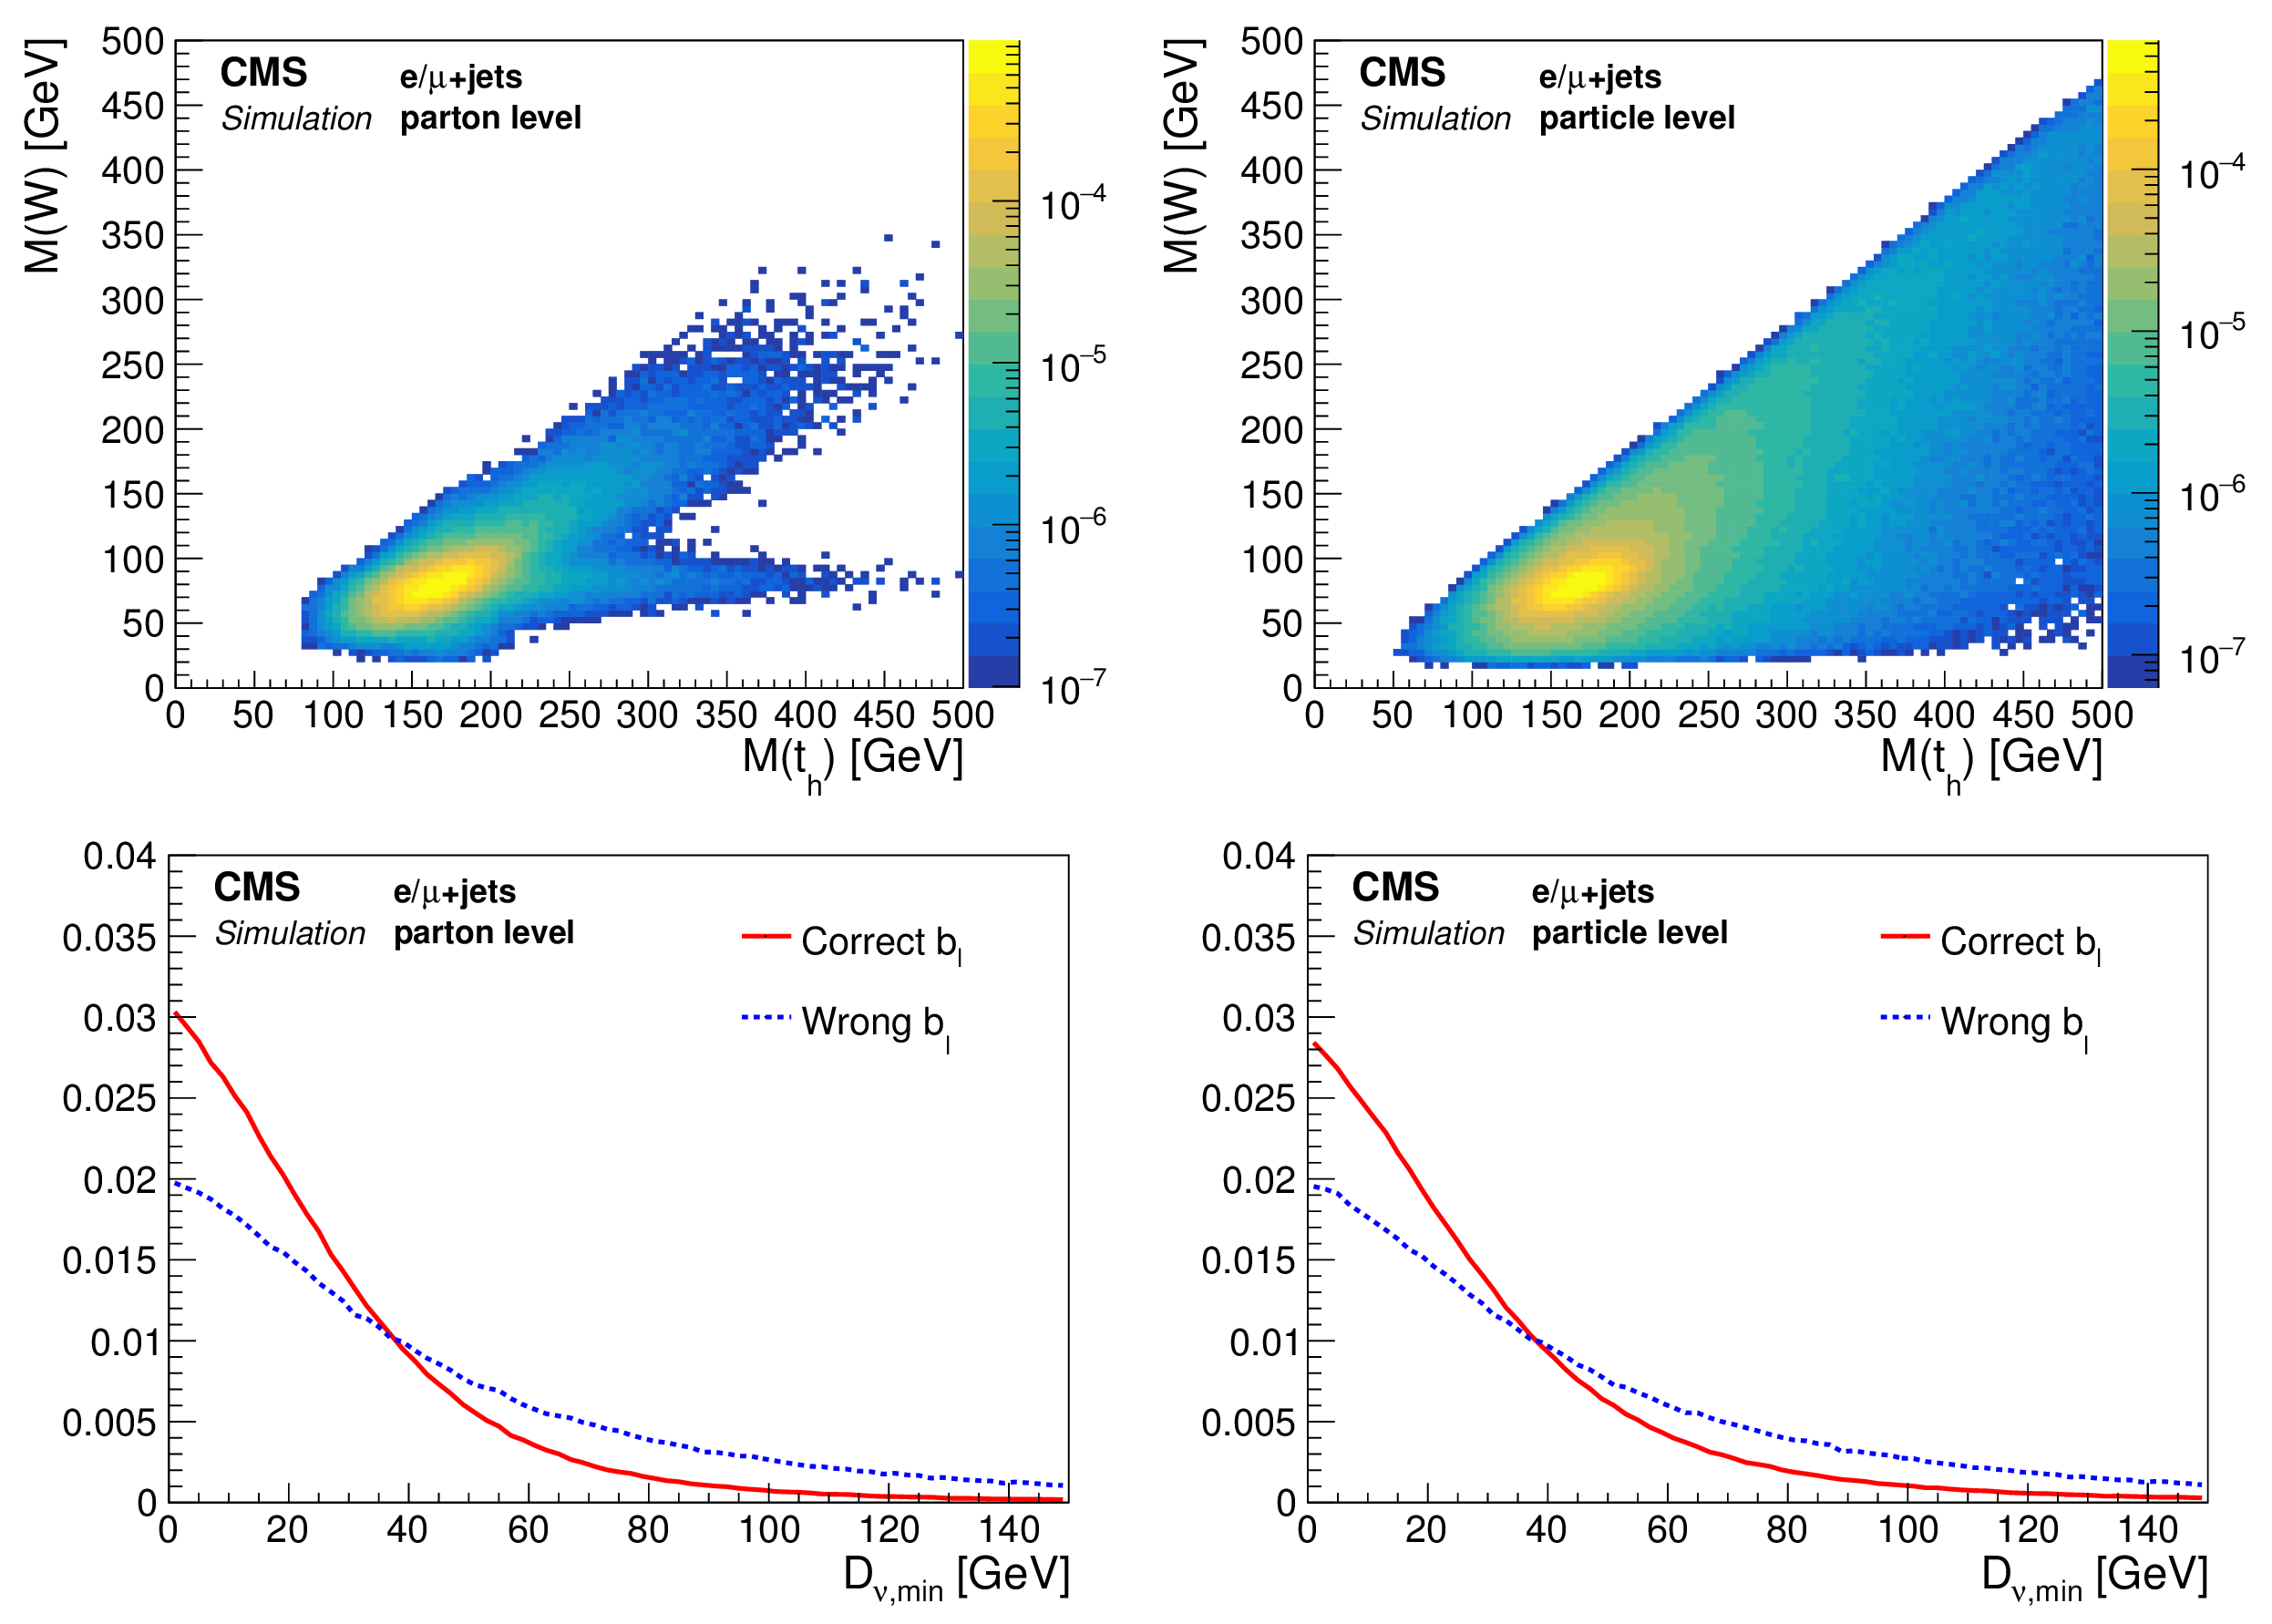
Figure 2:
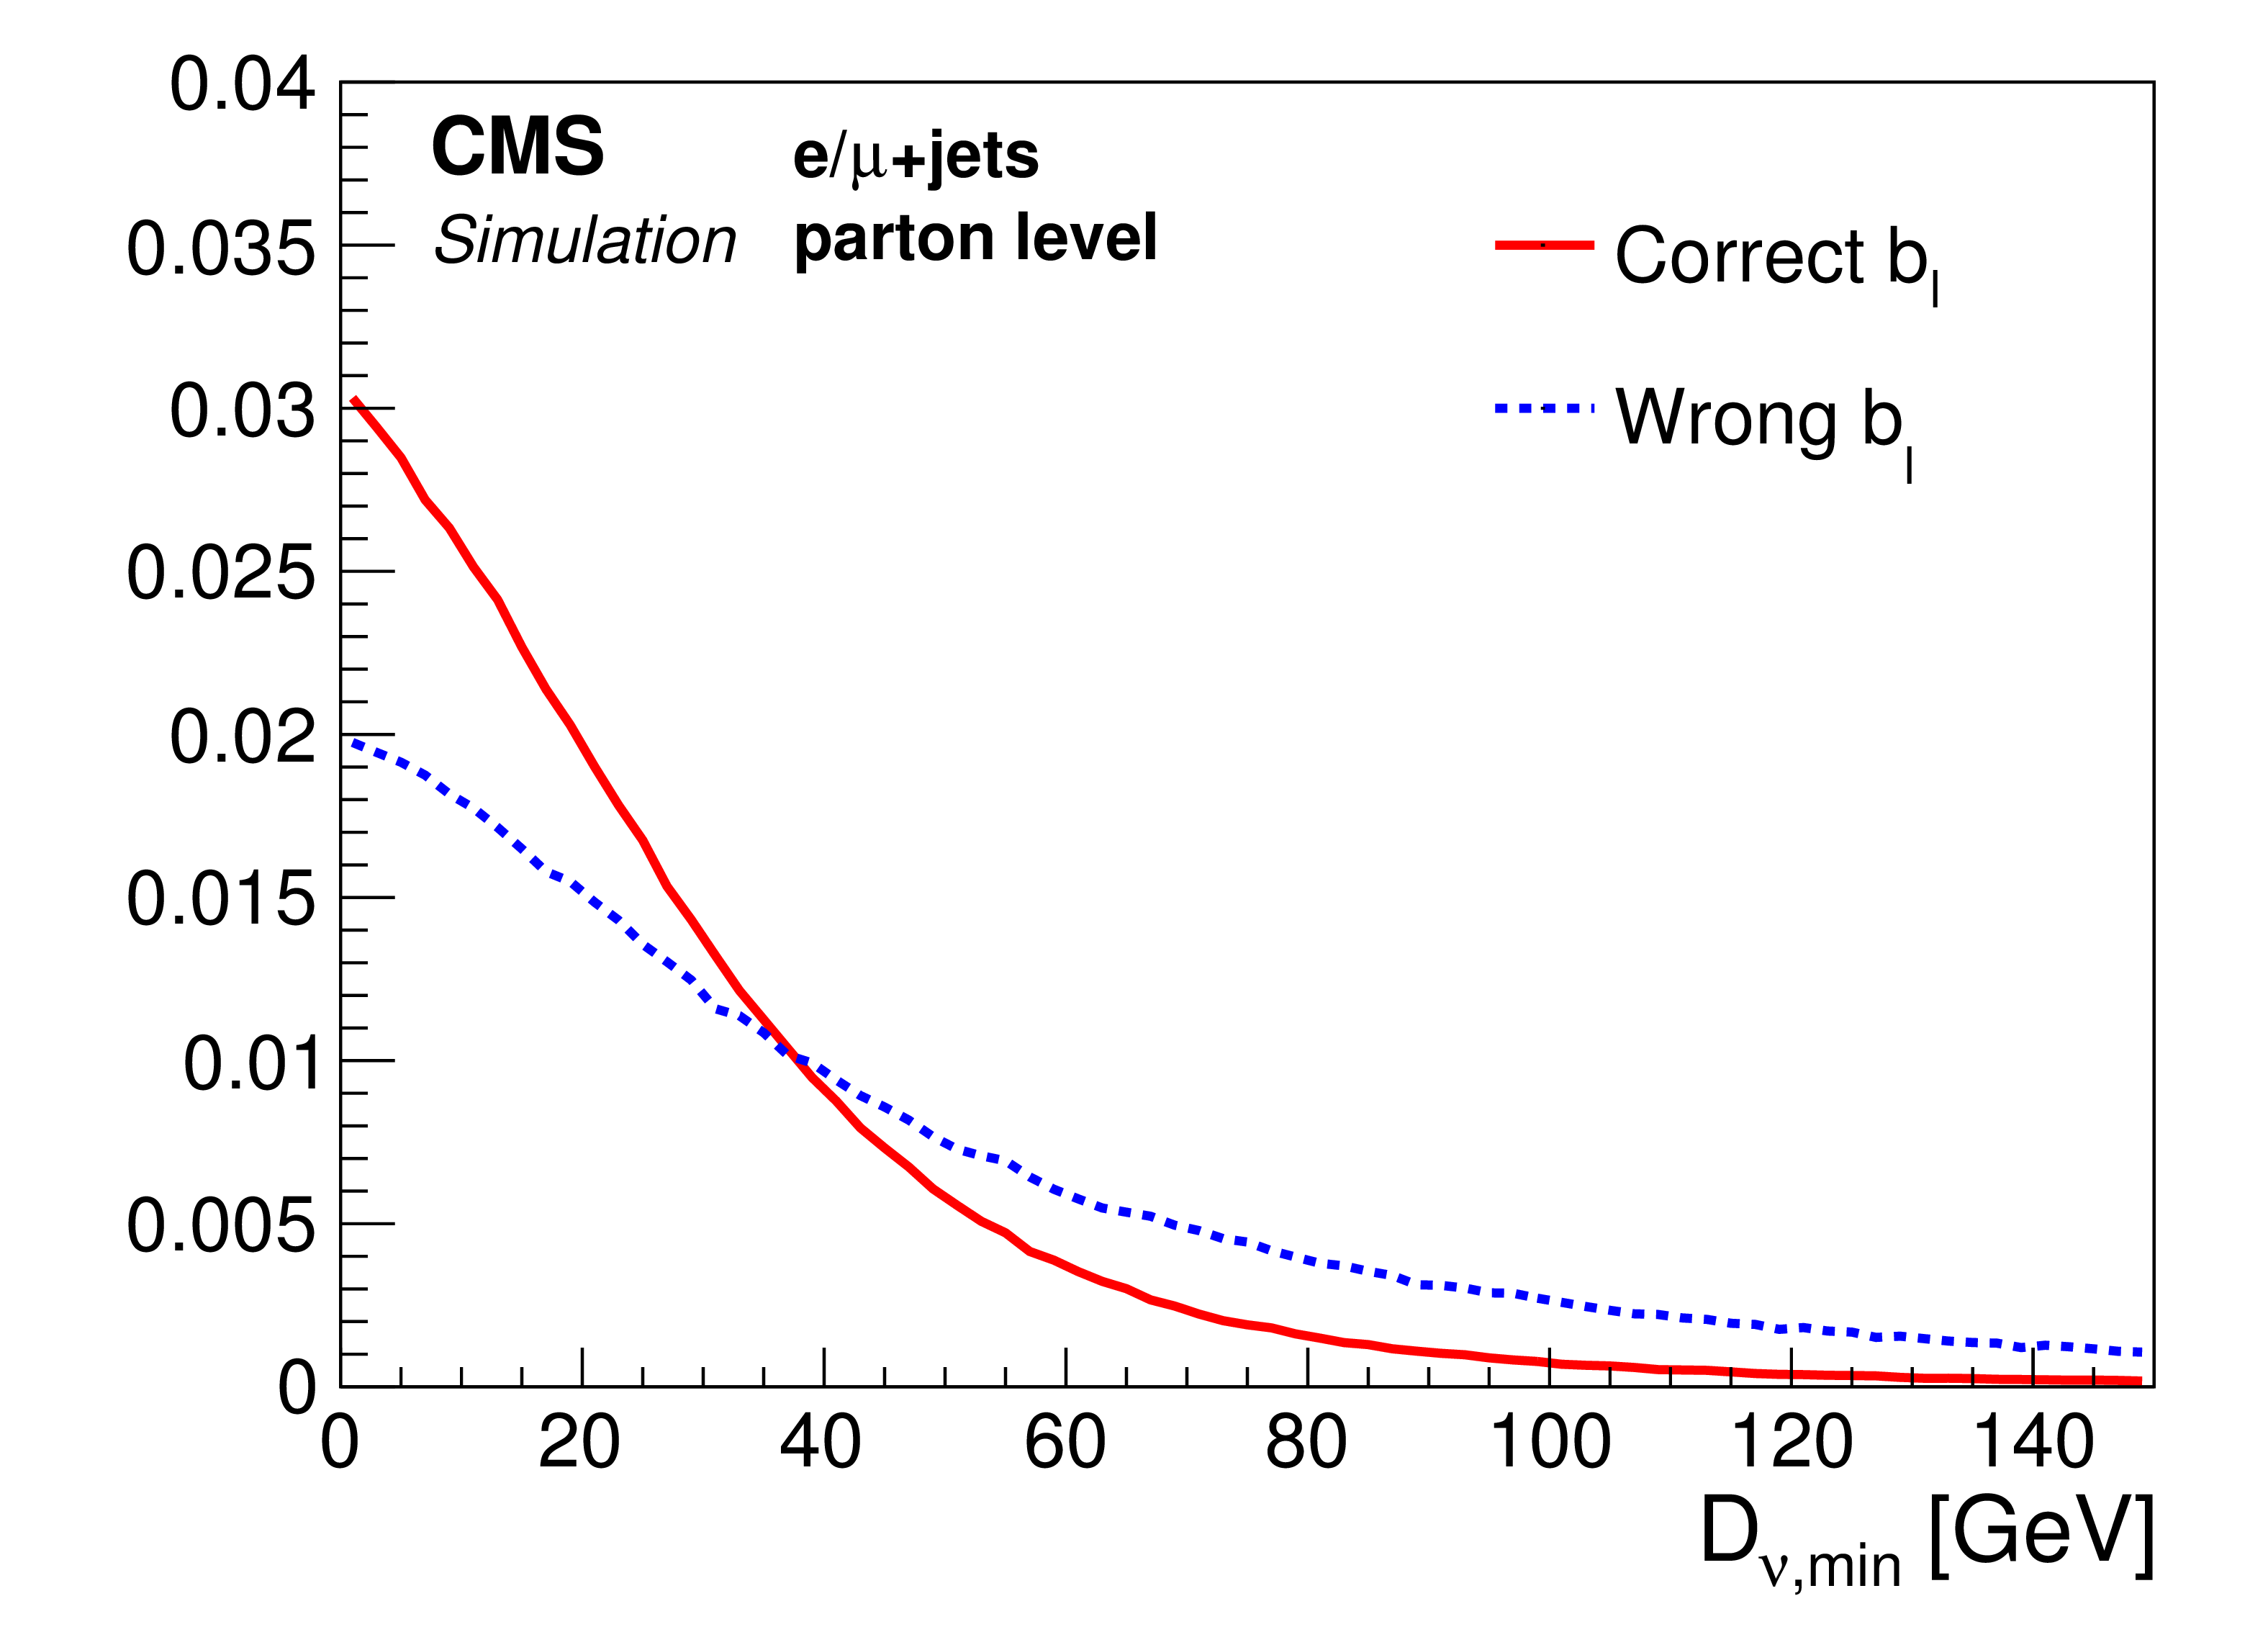
Top: normalized two-dimensional mass distribution of the correct reconstructed hadronically decaying W bosons $M(\mathrm{ W } )$ and the correct reconstructed top quarks $M( {\mathrm{ t } _\mathrm {h}} )$ for the parton- (left) and the particle- (right) level measurements. Bottom: normalized distributions of the distance ${D_{\nu ,\text {min}}}$ for correctly and wrongly selected $\mathrm{ b } $ jets from the leptonically decaying top quarks. The distributions are taken from the POWHEG+PYTHIA8 ${\mathrm{ t } \mathrm{ \bar{t} } }$ simulation. |
png pdf |
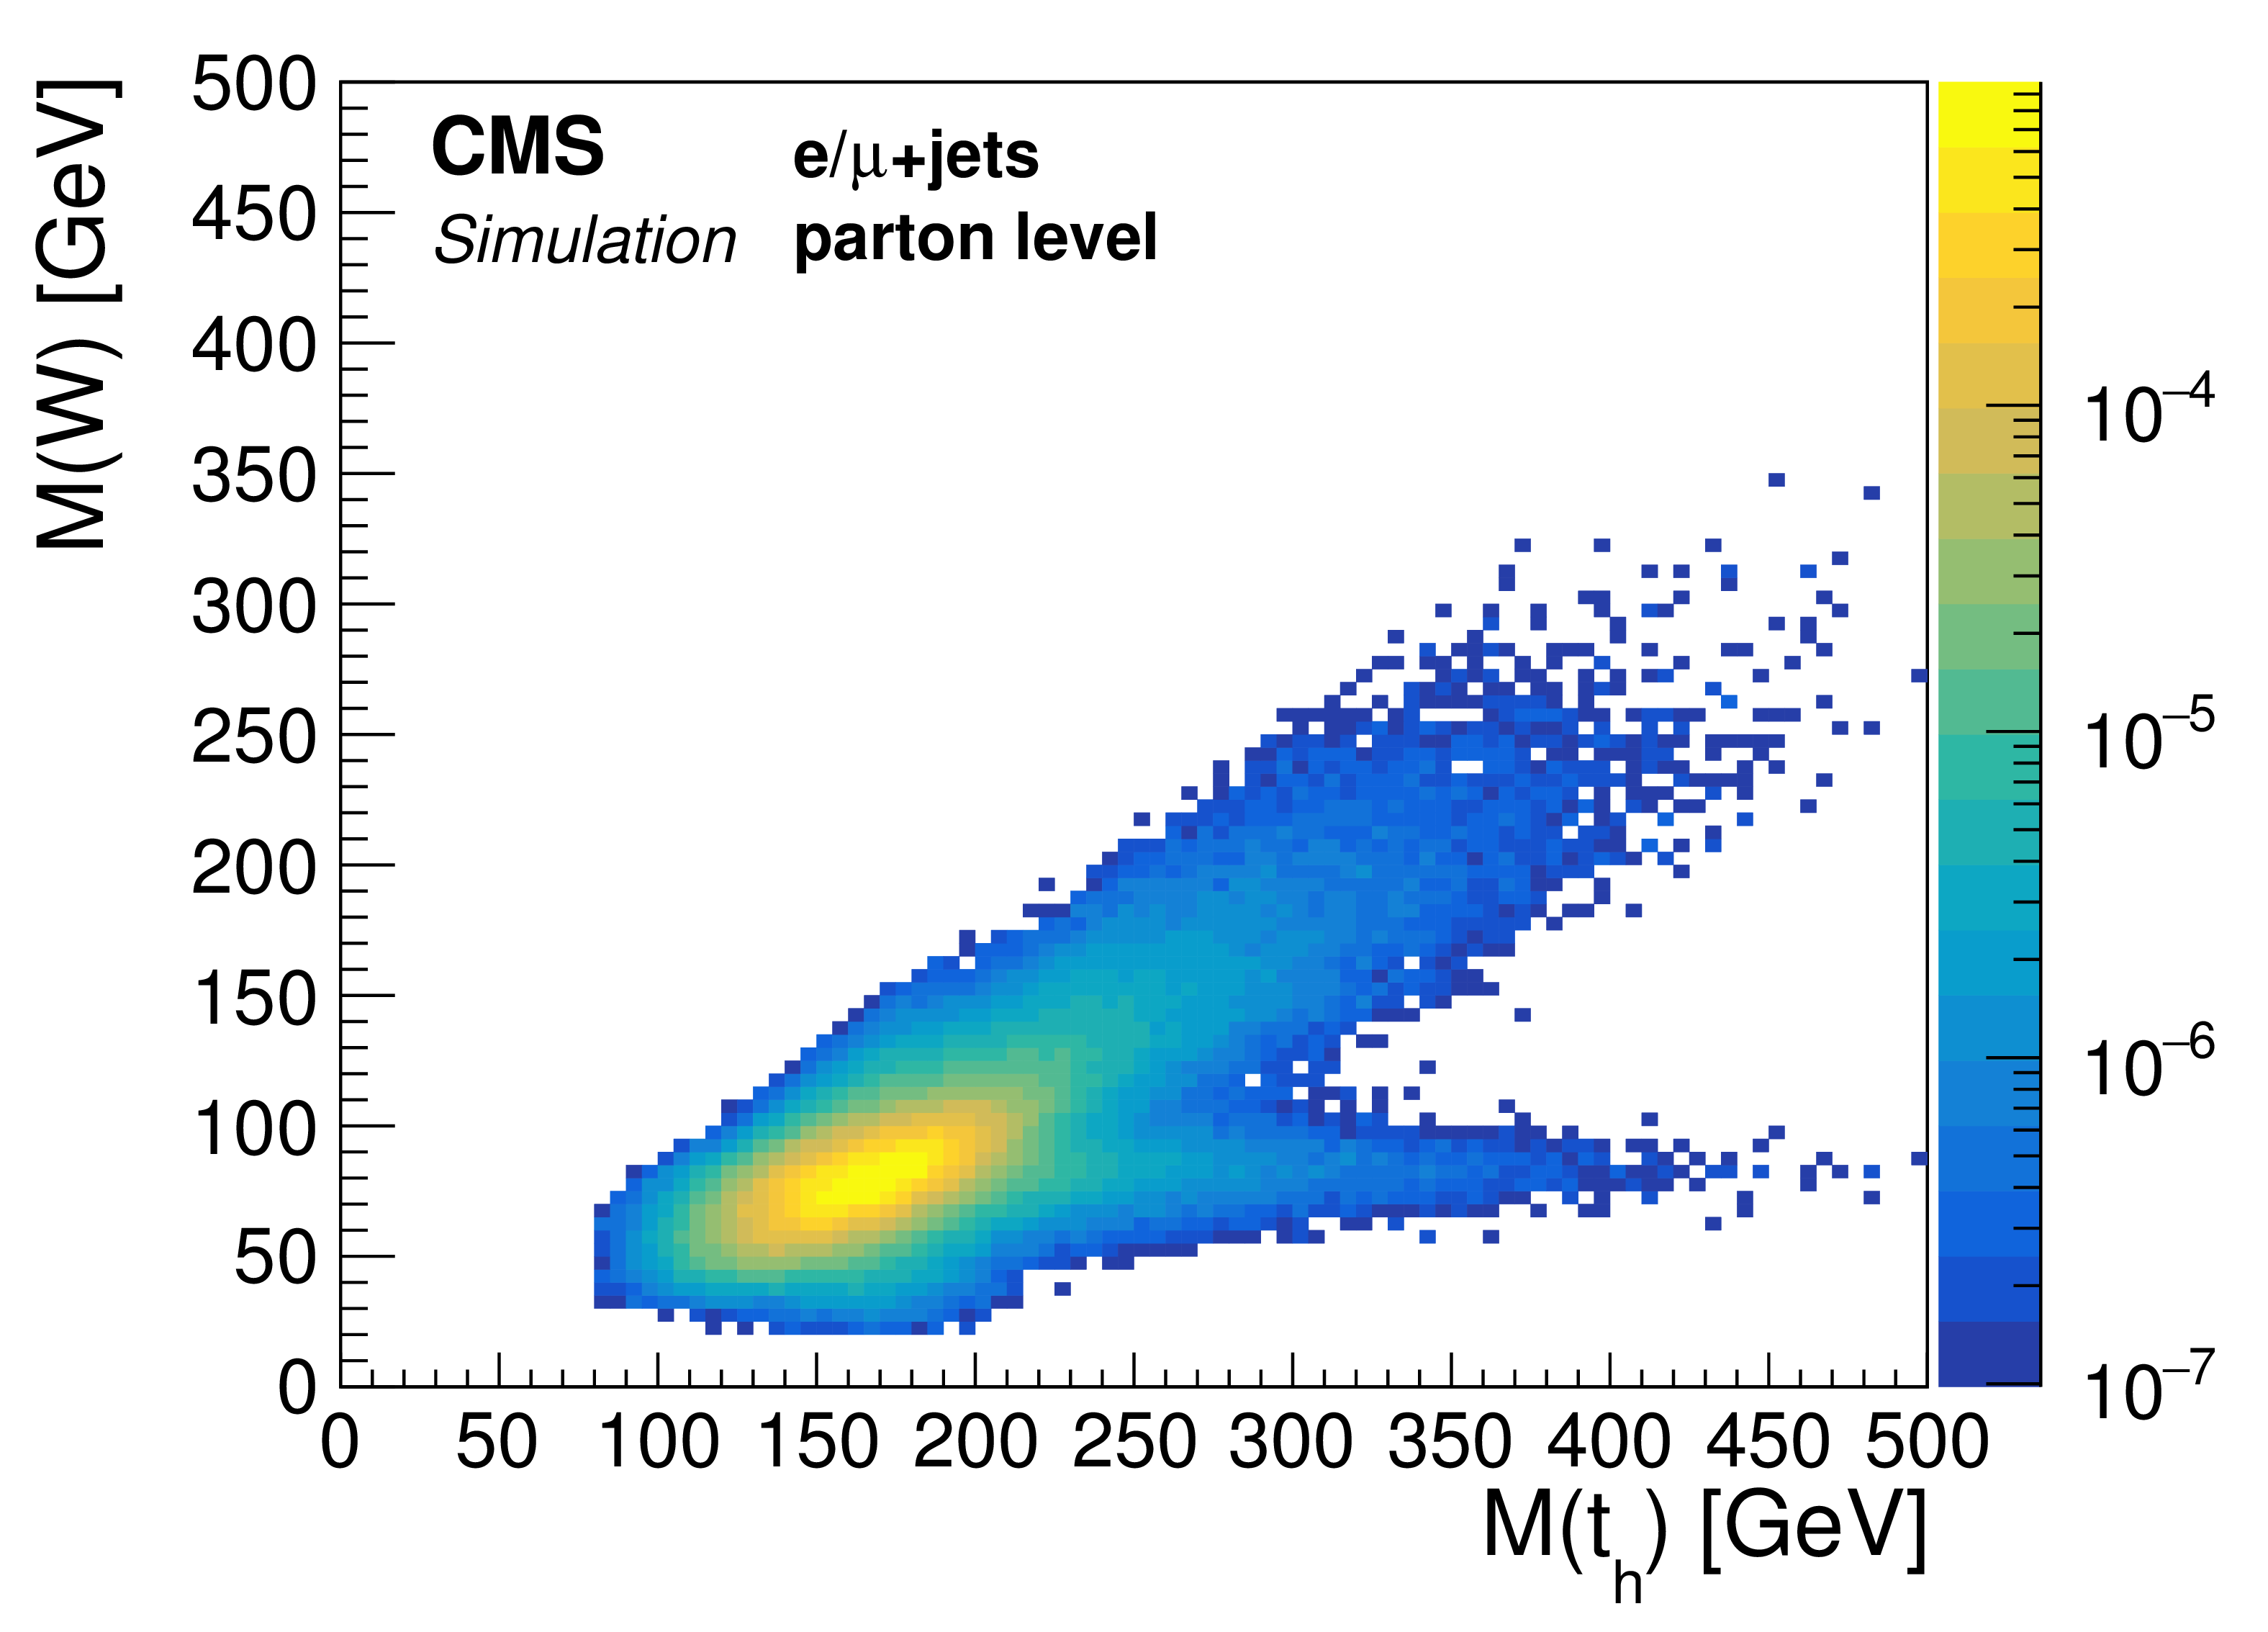
Figure 2-a:
Normalized two-dimensional mass distribution of the correct reconstructed hadronically decaying W bosons $M(\mathrm{ W } )$ and the correct reconstructed top quarks $M( {\mathrm{ t } _\mathrm {h}} )$ for the parton level measurement. The distribution is taken from the POWHEG+PYTHIA8 ${\mathrm{ t } \mathrm{ \bar{t} } }$ simulation. |
png pdf |
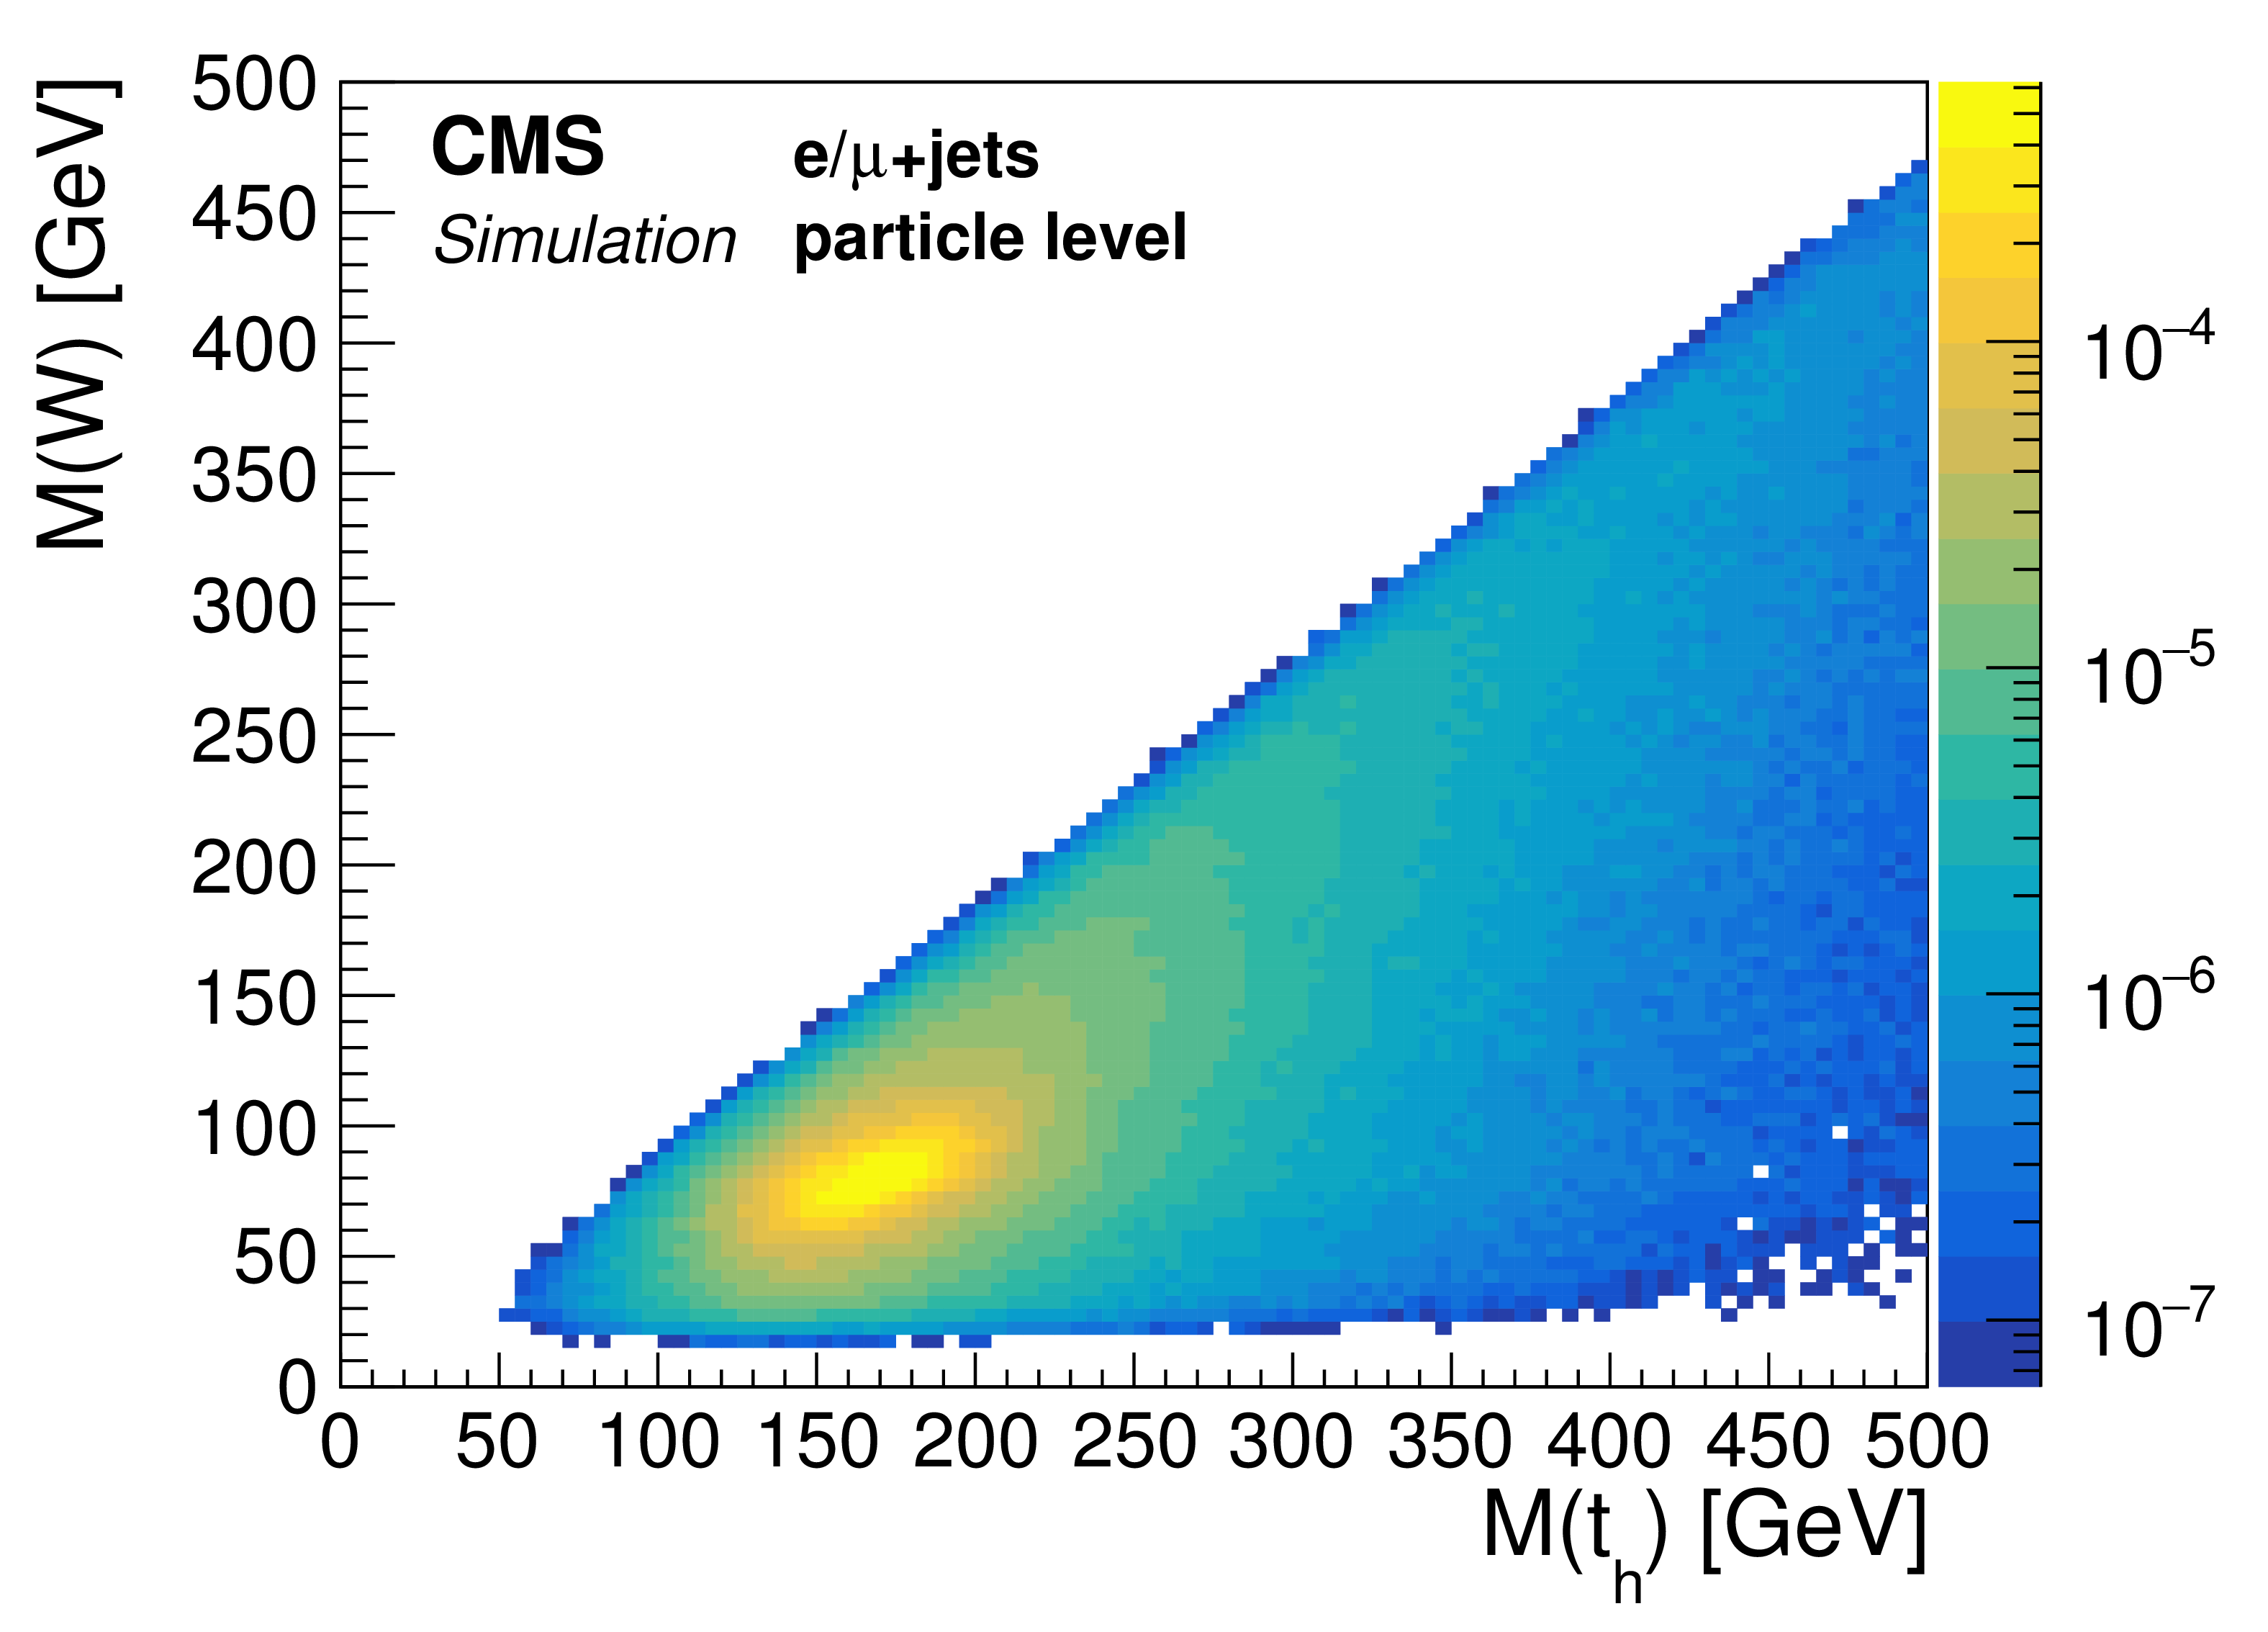
Figure 2-b:
Normalized two-dimensional mass distribution of the correct reconstructed hadronically decaying W bosons $M(\mathrm{ W } )$ and the correct reconstructed top quarks $M( {\mathrm{ t } _\mathrm {h}} )$ for the particle level measurement. The distribution is taken from the POWHEG+PYTHIA8 ${\mathrm{ t } \mathrm{ \bar{t} } }$ simulation. |
png pdf |
Figure 2-c:
Normalized distribution of the distance ${D_{\nu ,\text {min}}}$ for correctly selected $\mathrm{ b } $ jets from the leptonically decaying top quarks. The distribution is taken from the POWHEG+PYTHIA8 ${\mathrm{ t } \mathrm{ \bar{t} } }$ simulation. |

png pdf |
Figure 2-d:
Normalized distribution of the distance ${D_{\nu ,\text {min}}}$ for wrongly selected $\mathrm{ b } $ jets from the leptonically decaying top quarks. The distribution is taken from the POWHEG+PYTHIA8 ${\mathrm{ t } \mathrm{ \bar{t} } }$ simulation. |
png pdf |
Figure 3:
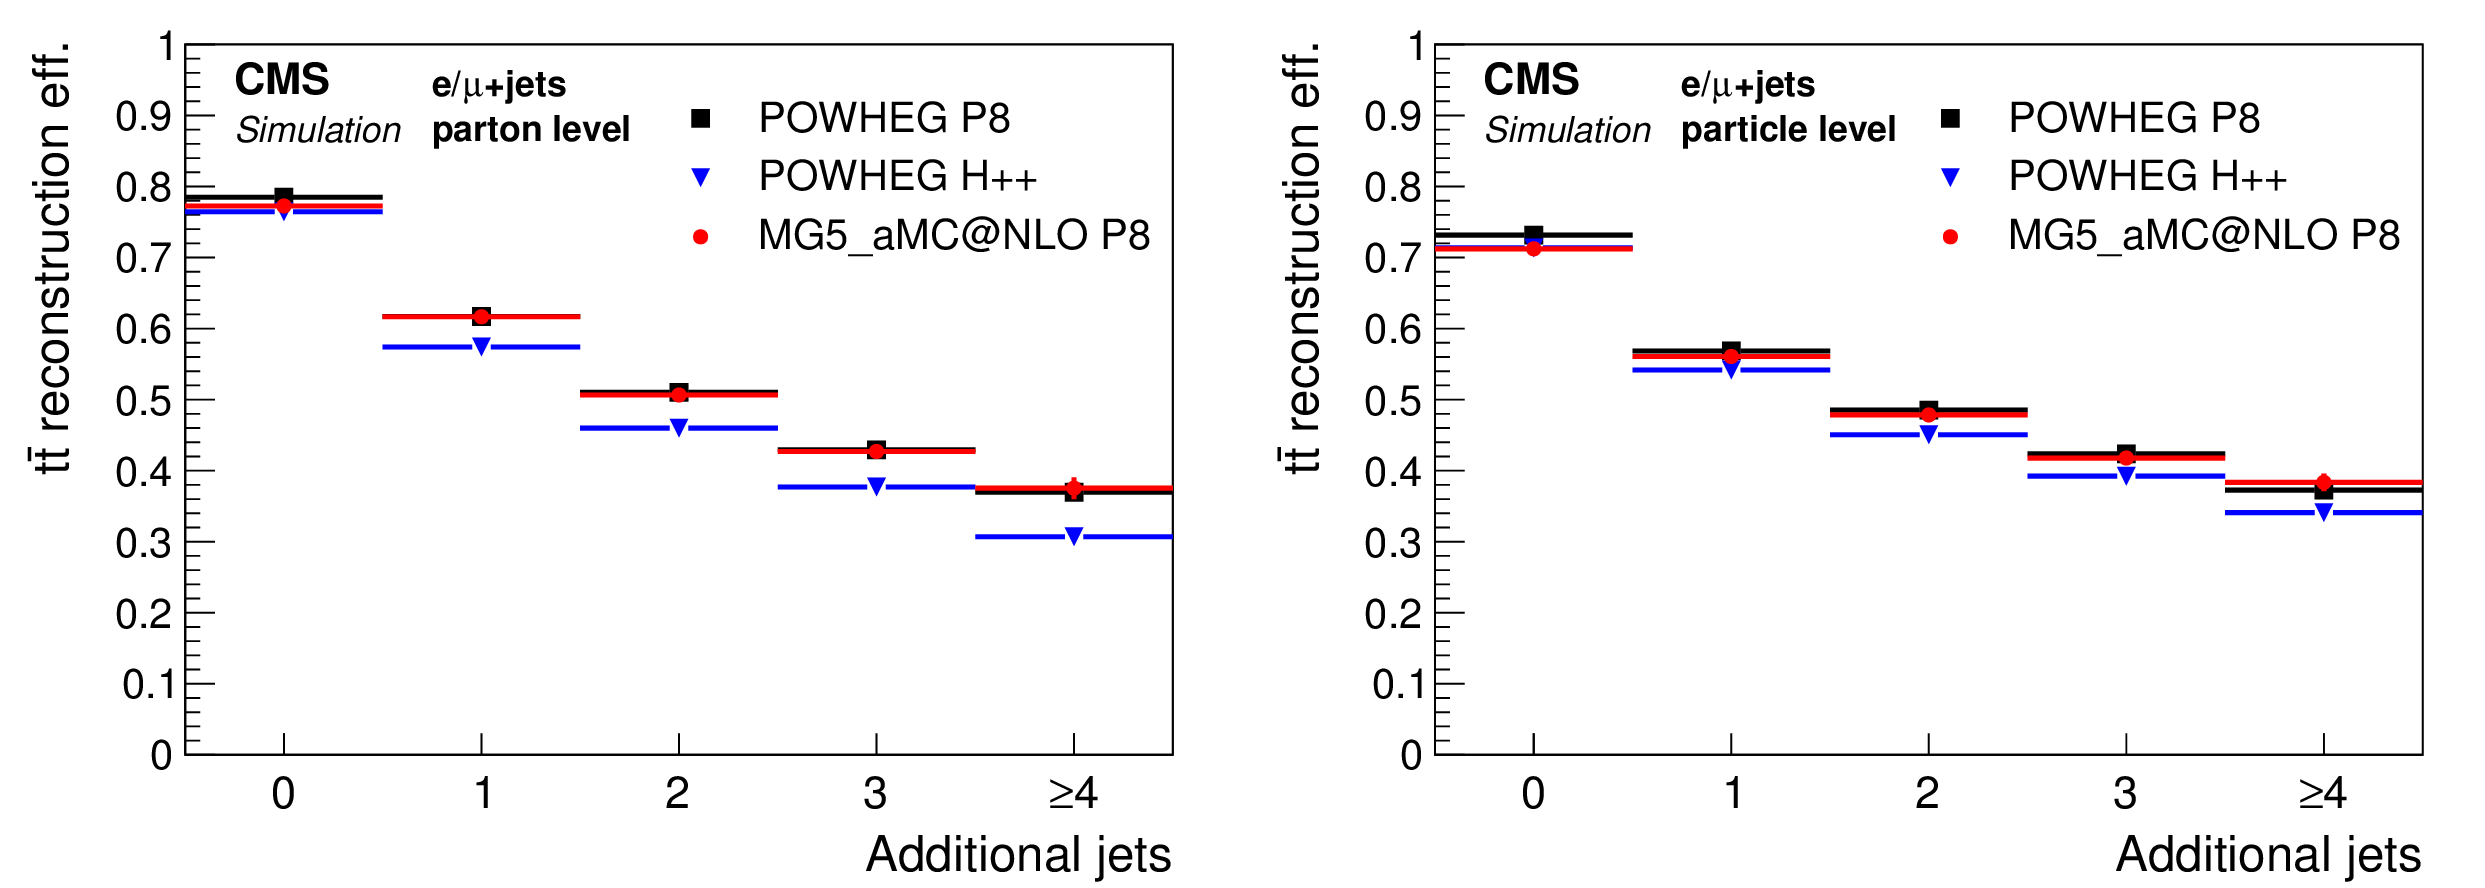
Reconstruction efficiency of the ${\mathrm{ t } \mathrm{ \bar{t} } }$ system as a function of the number of additional jets for the parton- (left ) and particle- (right ) level measurements calculated based on the simulations with POWHEG+PYTHIA8 (P8), POWHEG+HERWIG++ (H++), and MG5-MC@NLO +PYTHIA8 . |
png pdf |
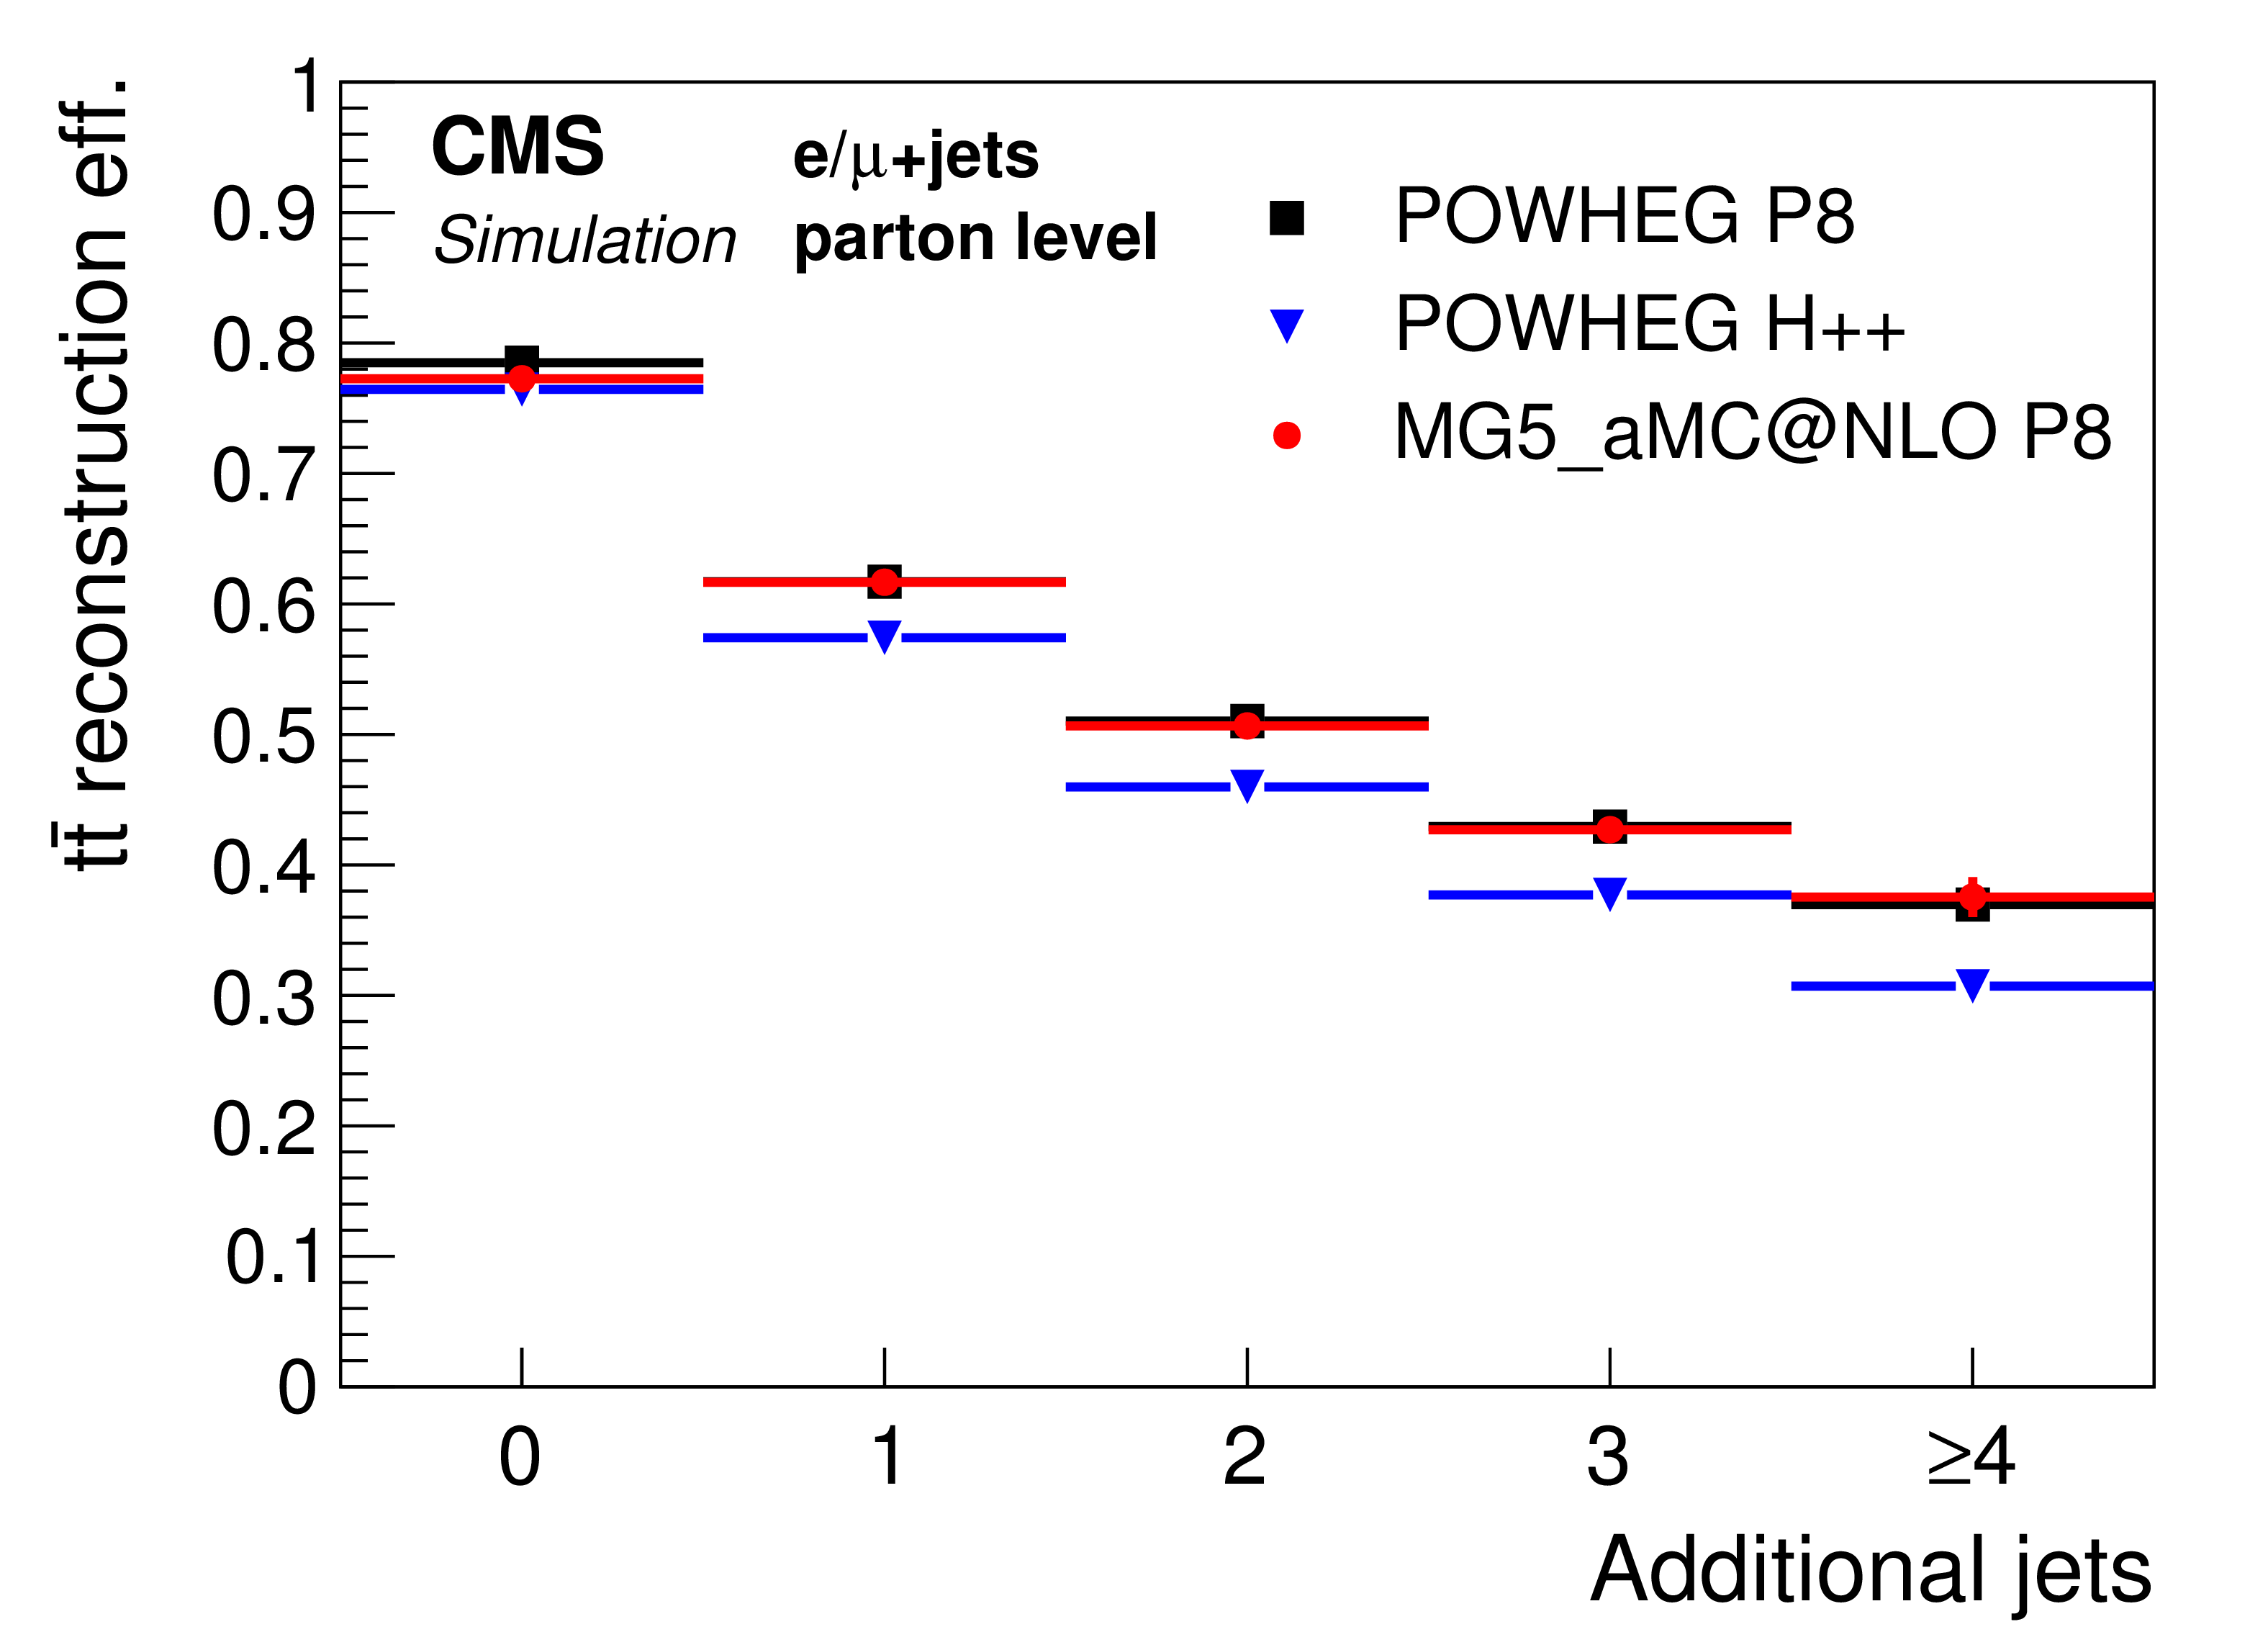
Figure 3-a:
Reconstruction efficiency of the ${\mathrm{ t } \mathrm{ \bar{t} } }$ system as a function of the number of additional jets for the parton-level measurement calculated based on the simulations with POWHEG+PYTHIA8 (P8), POWHEG+HERWIG++ (H++), and MG5-MC@NLO +PYTHIA8 . |
png pdf |
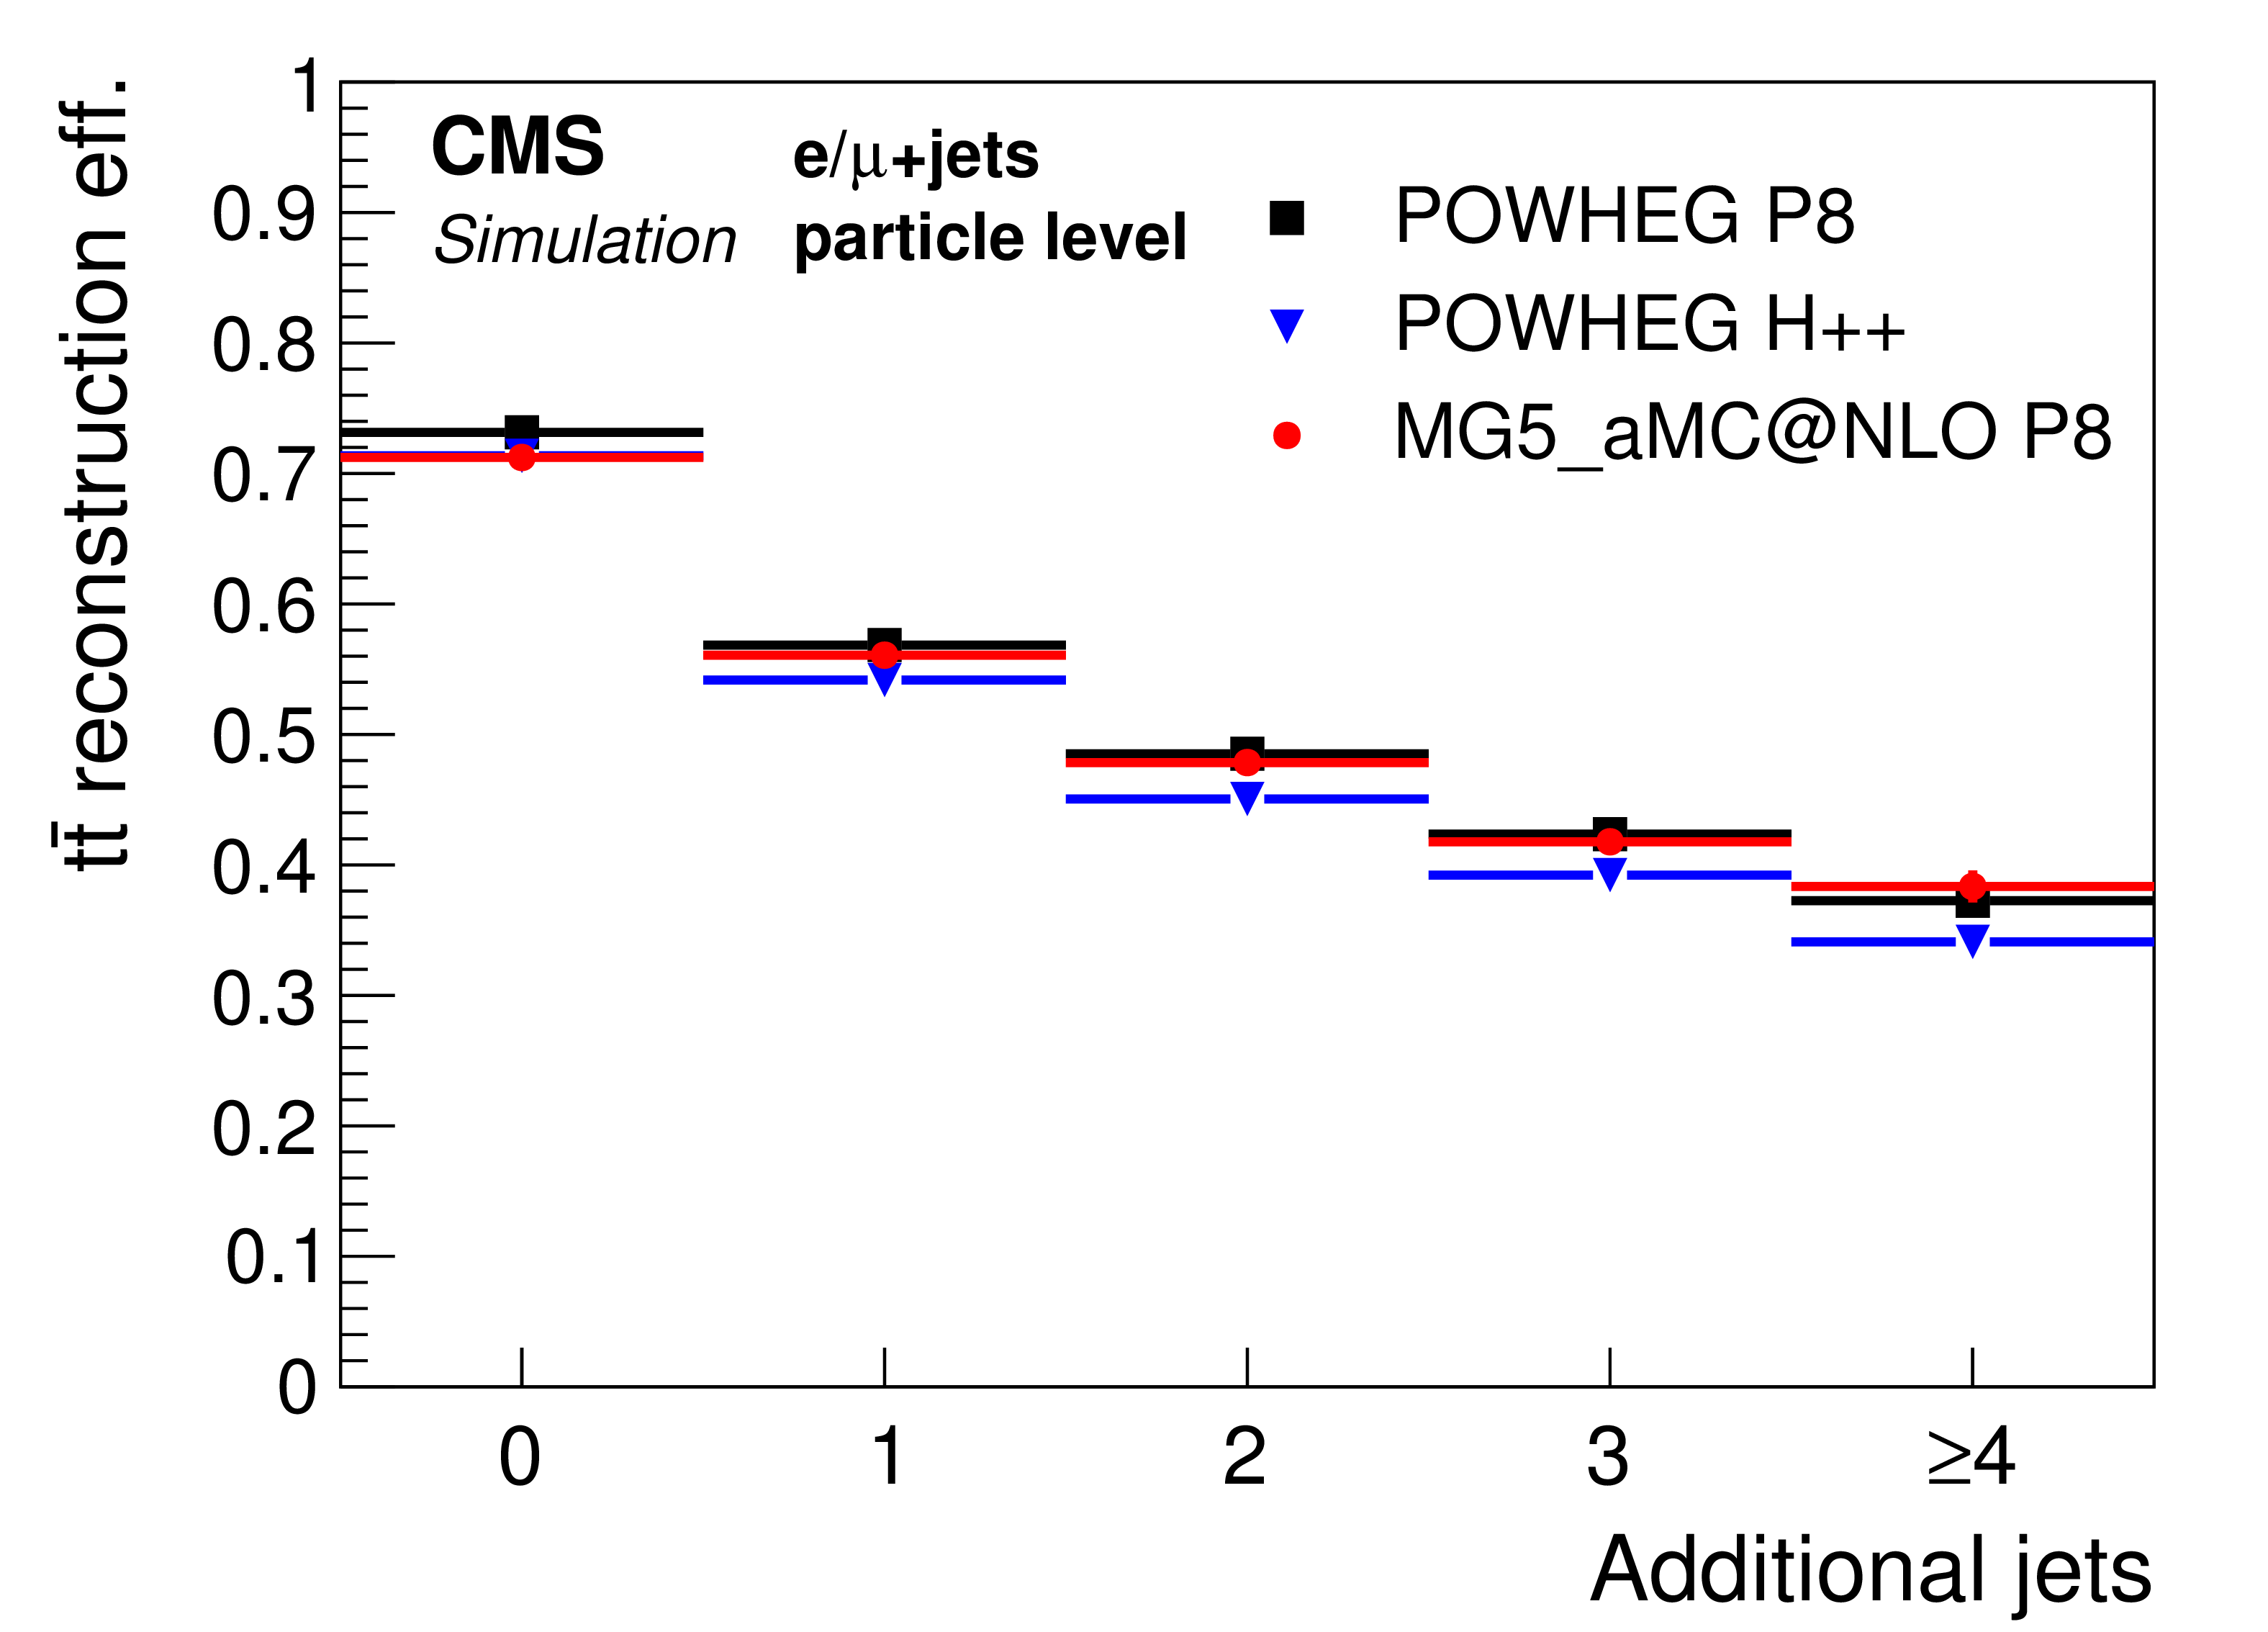
Figure 3-b:
Reconstruction efficiency of the ${\mathrm{ t } \mathrm{ \bar{t} } }$ system as a function of the number of additional jets for the particle-level measurement calculated based on the simulations with POWHEG+PYTHIA8 (P8), POWHEG+HERWIG++ (H++), and MG5-MC@NLO +PYTHIA8 . |
png pdf |
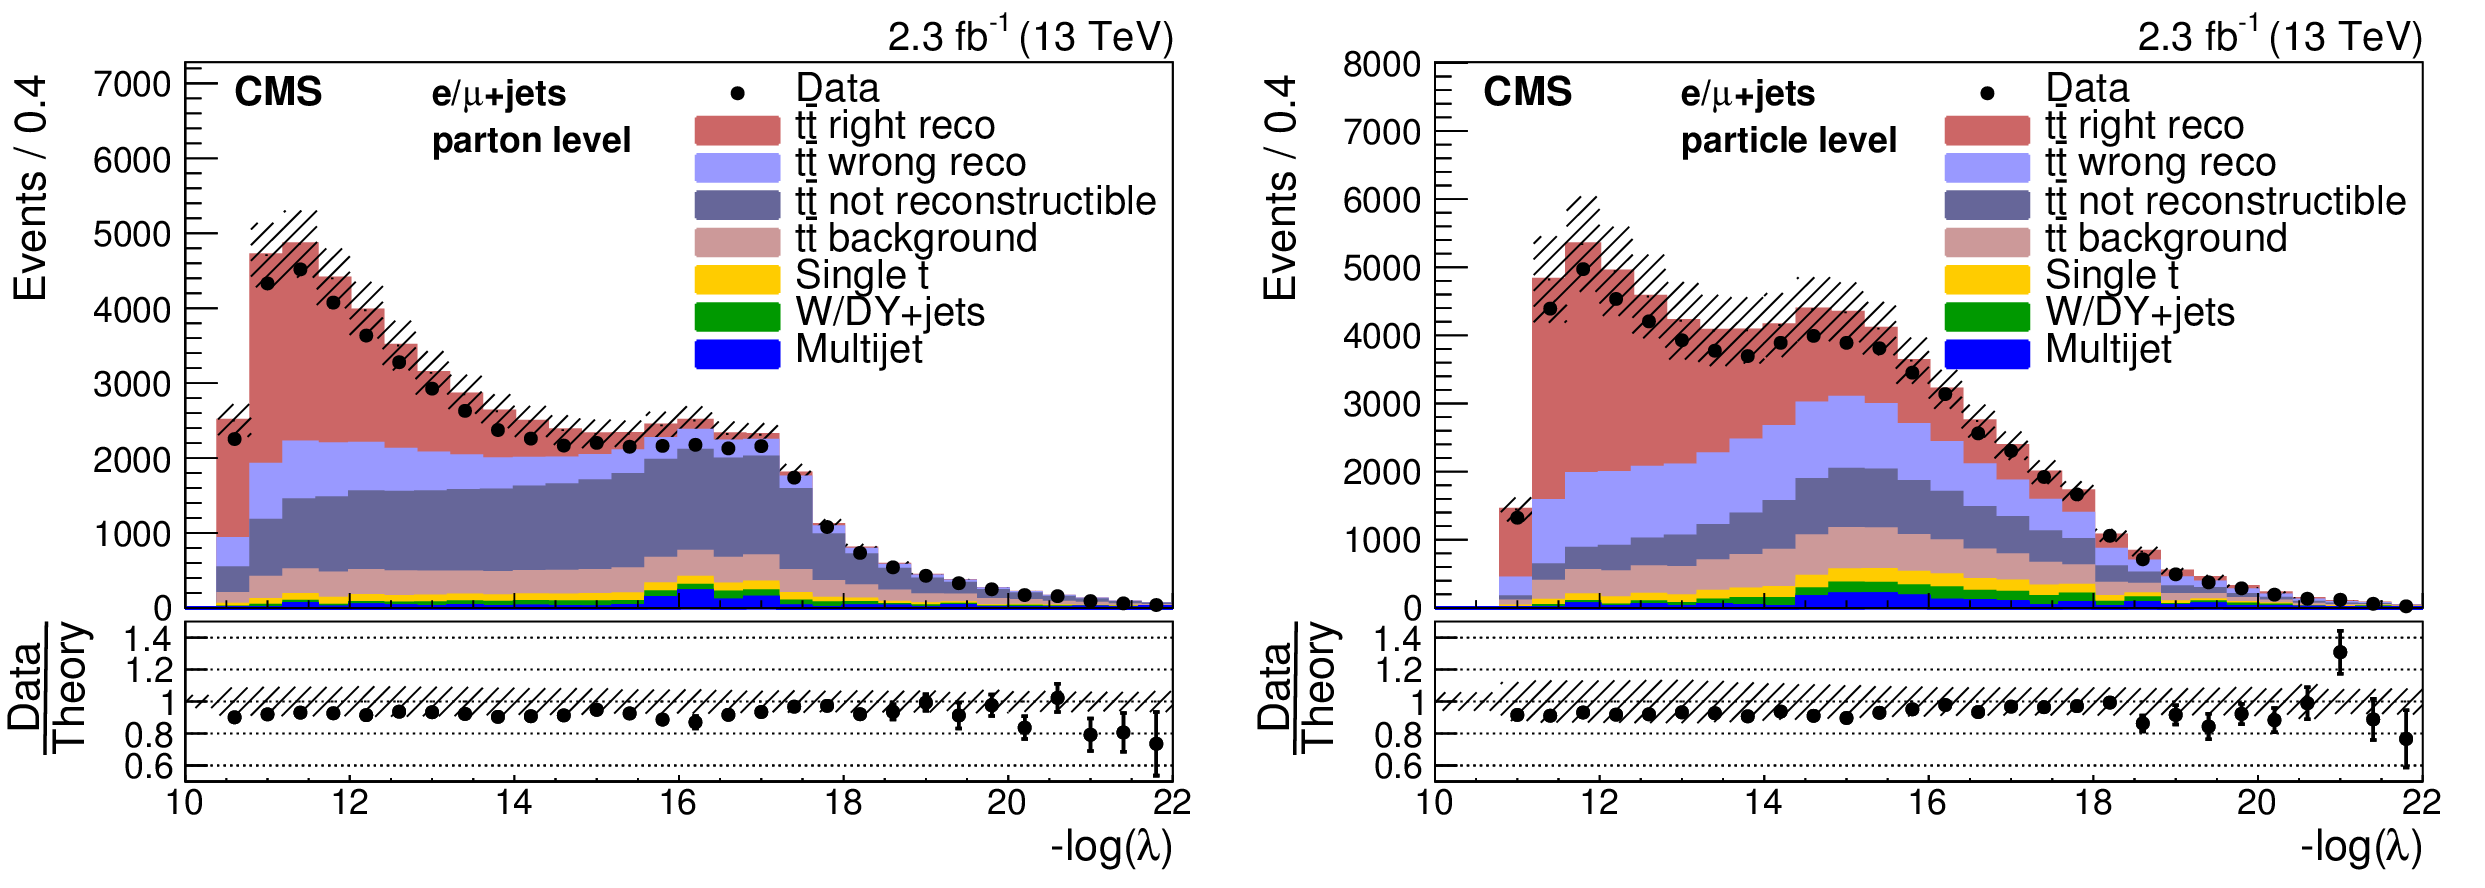
Figure 4:
Distribution of the negative log-likelihood for the selected best permutation in the parton- (left ) and the particle- (right ) level measurements in data and simulations. The simulation of POWHEG+PYTHIA8 is used to describe the ${\mathrm{ t } \mathrm{ \bar{t} } }$ production. Experimental (cf. Section 10) and statistical uncertainties (hatched area) are shown for the total simulated yield, which is normalized to the measured integrated luminosity. The ratios of data to the sum of the expected yields are provided at the bottom of each panel. |
png pdf |
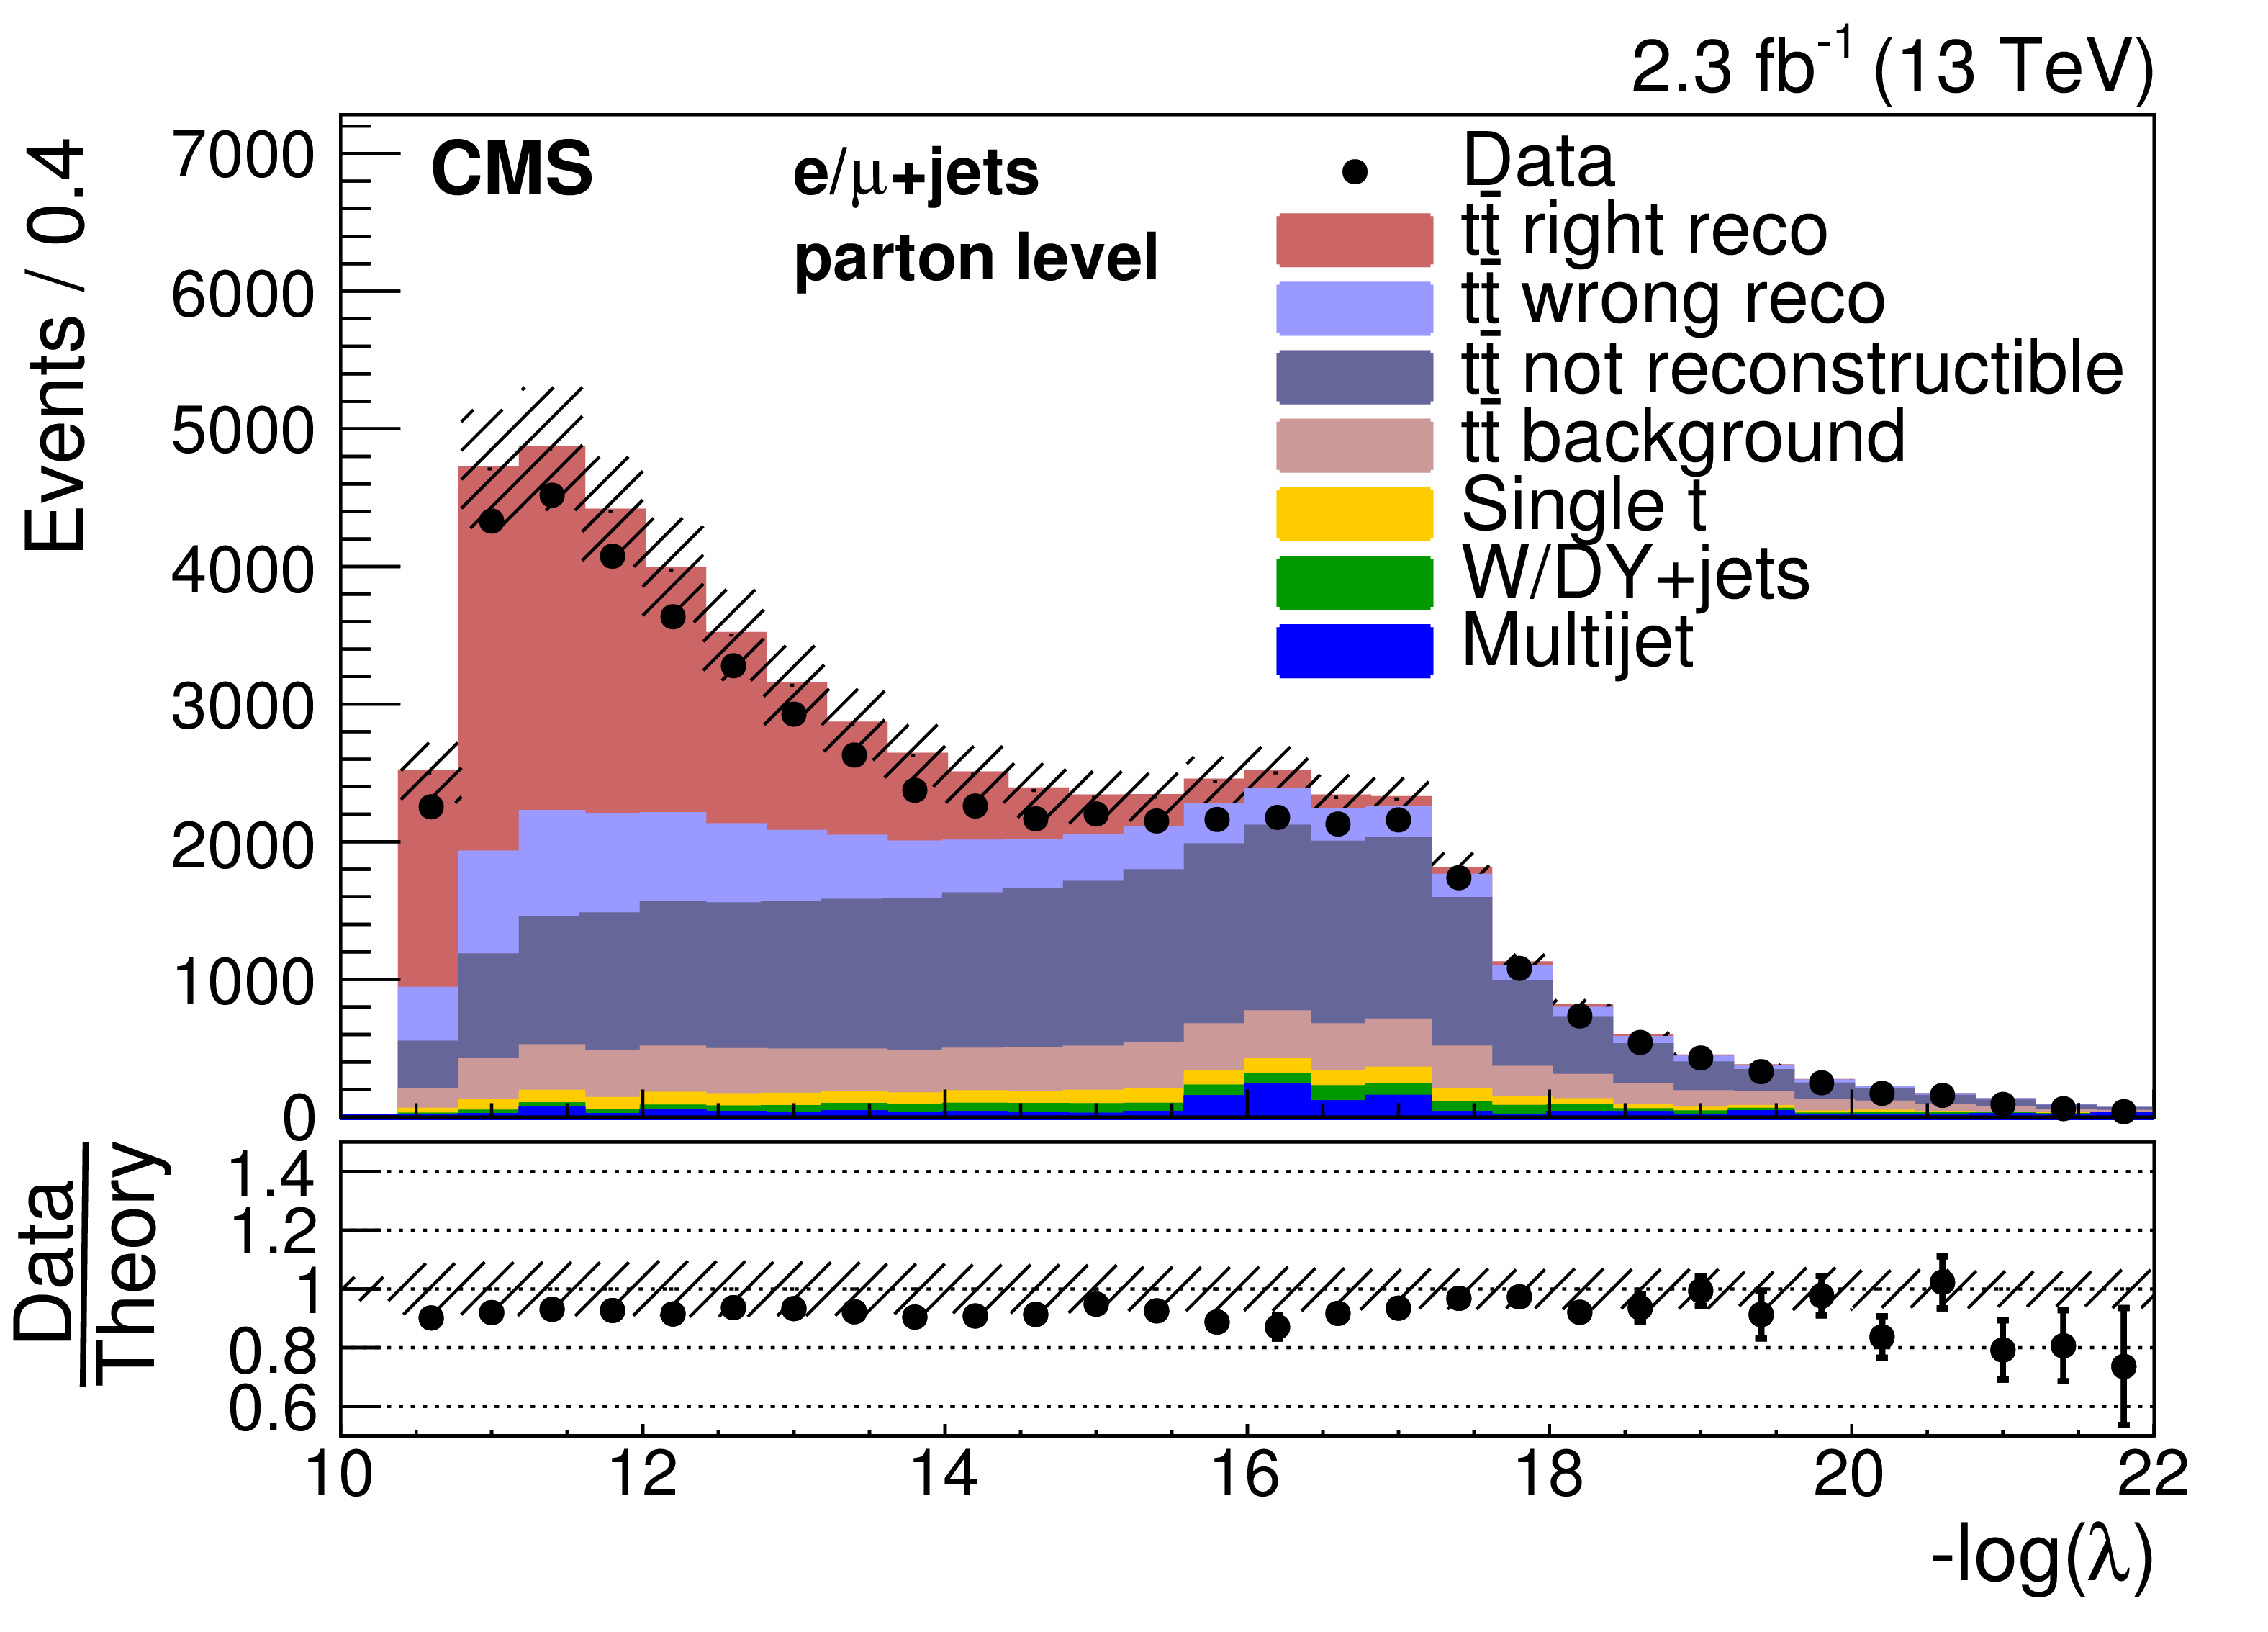
Figure 4-a:
Distribution of the negative log-likelihood for the selected best permutation in the parton-level measurement in data and simulations. The simulation of POWHEG+PYTHIA8 is used to describe the ${\mathrm{ t } \mathrm{ \bar{t} } }$ production. Experimental (cf. Section 10) and statistical uncertainties (hatched area) are shown for the total simulated yield, which is normalized to the measured integrated luminosity. The ratios of data to the sum of the expected yields are provided at the bottom of each panel. |

png pdf |
Figure 4-b:
Distribution of the negative log-likelihood for the selected best permutation in the particle-level measurement in data and simulations. The simulation of POWHEG+PYTHIA8 is used to describe the ${\mathrm{ t } \mathrm{ \bar{t} } }$ production. Experimental (cf. Section 10) and statistical uncertainties (hatched area) are shown for the total simulated yield, which is normalized to the measured integrated luminosity. The ratios of data to the sum of the expected yields are provided at the bottom of each panel. |

png pdf |
Figure 5:
Comparisons of the reconstructed $ {p_{\mathrm {T}}} ( {\mathrm{ t } _\mathrm {h}} )$ (top) and $ {| y( {\mathrm{ t } _\mathrm {h}} ) | }$ (bottom) in data and simulations for the parton (left) and the particle (right) level. The simulation of POWHEG+PYTHIA8 is used to describe the ${\mathrm{ t } \mathrm{ \bar{t} } }$ production. Experimental (cf. Section 10) and statistical uncertainties (hatched area) are shown for the total simulated yield, which is normalized according to the measured integrated luminosity. The ratios of data to the expected yields are given at the bottom of each panel. |

png pdf |
Figure 5-a:
Comparisons of the reconstructed $ {p_{\mathrm {T}}} ( {\mathrm{ t } _\mathrm {h}} )$ in data and simulations for the parton level. The simulation of POWHEG+PYTHIA8 is used to describe the ${\mathrm{ t } \mathrm{ \bar{t} } }$ production. Experimental (cf. Section 10) and statistical uncertainties (hatched area) are shown for the total simulated yield, which is normalized according to the measured integrated luminosity. The ratio of data to the expected yields is given at the bottom of the panel. |
png pdf |
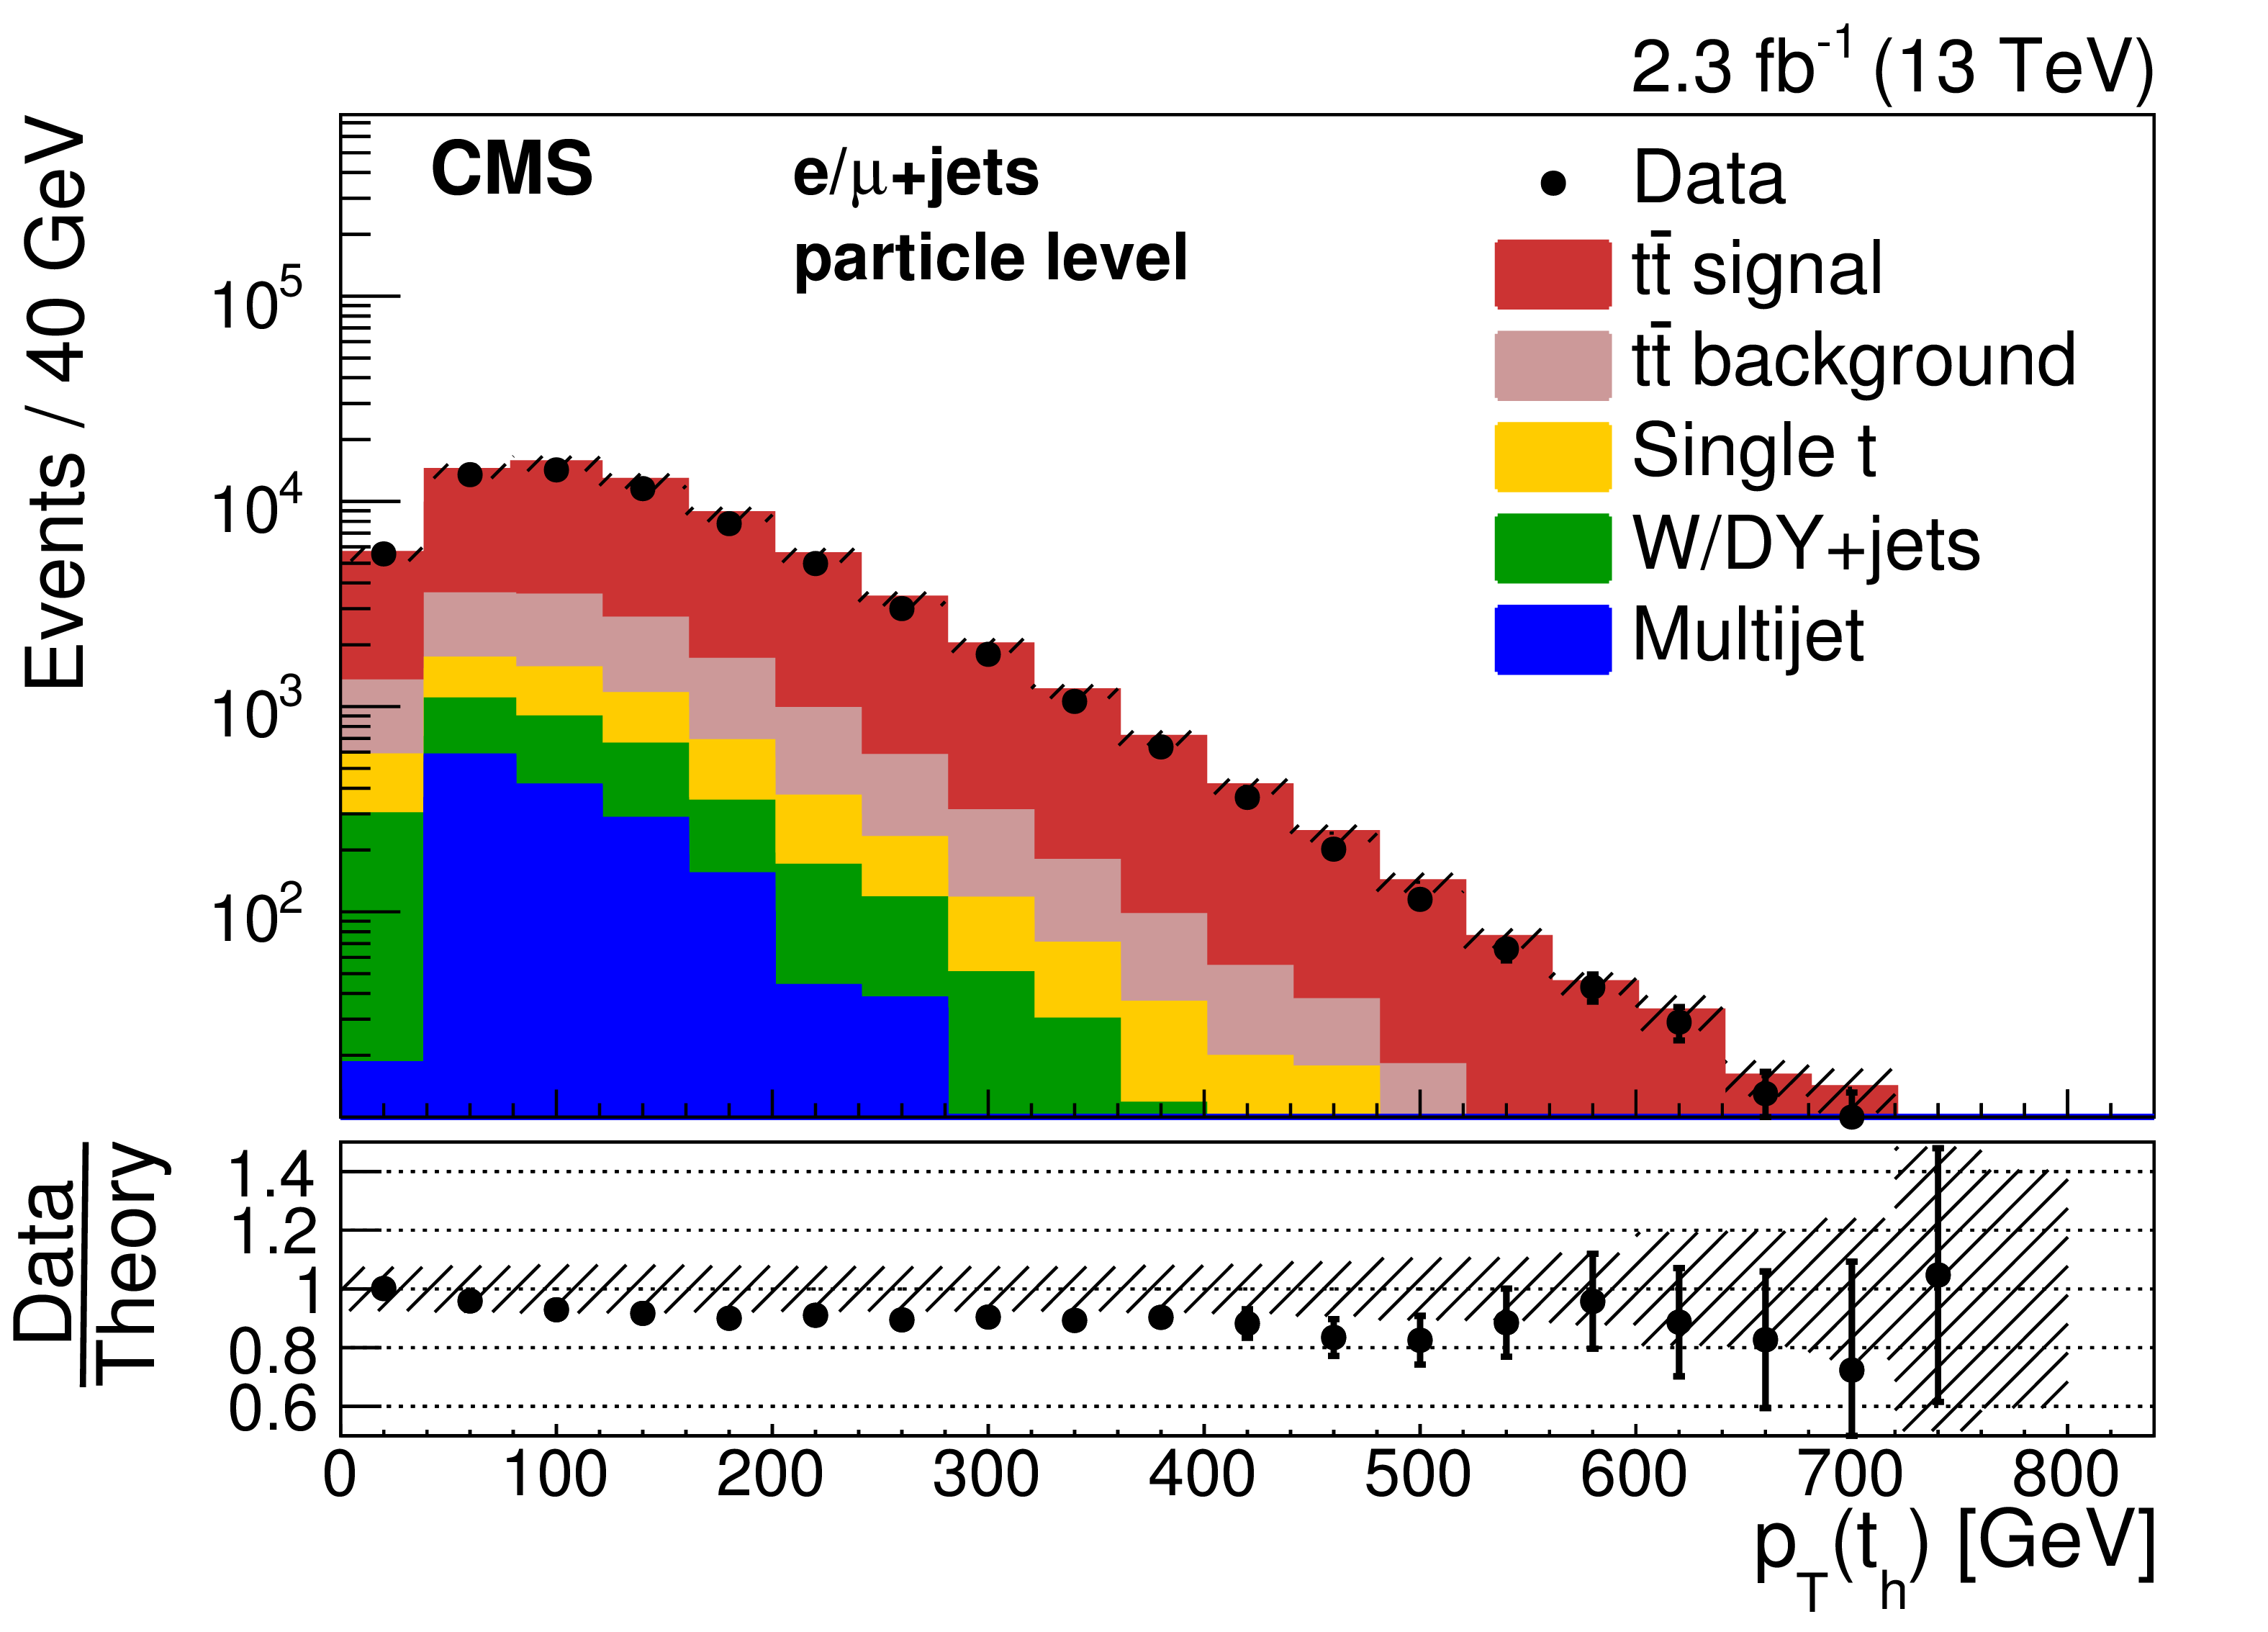
Figure 5-b:
Comparisons of the reconstructed $ {p_{\mathrm {T}}} ( {\mathrm{ t } _\mathrm {h}} )$ in data and simulations for the particle level. The simulation of POWHEG+PYTHIA8 is used to describe the ${\mathrm{ t } \mathrm{ \bar{t} } }$ production. Experimental (cf. Section 10) and statistical uncertainties (hatched area) are shown for the total simulated yield, which is normalized according to the measured integrated luminosity. The ratio of data to the expected yields is given at the bottom of the panel. |
png pdf |
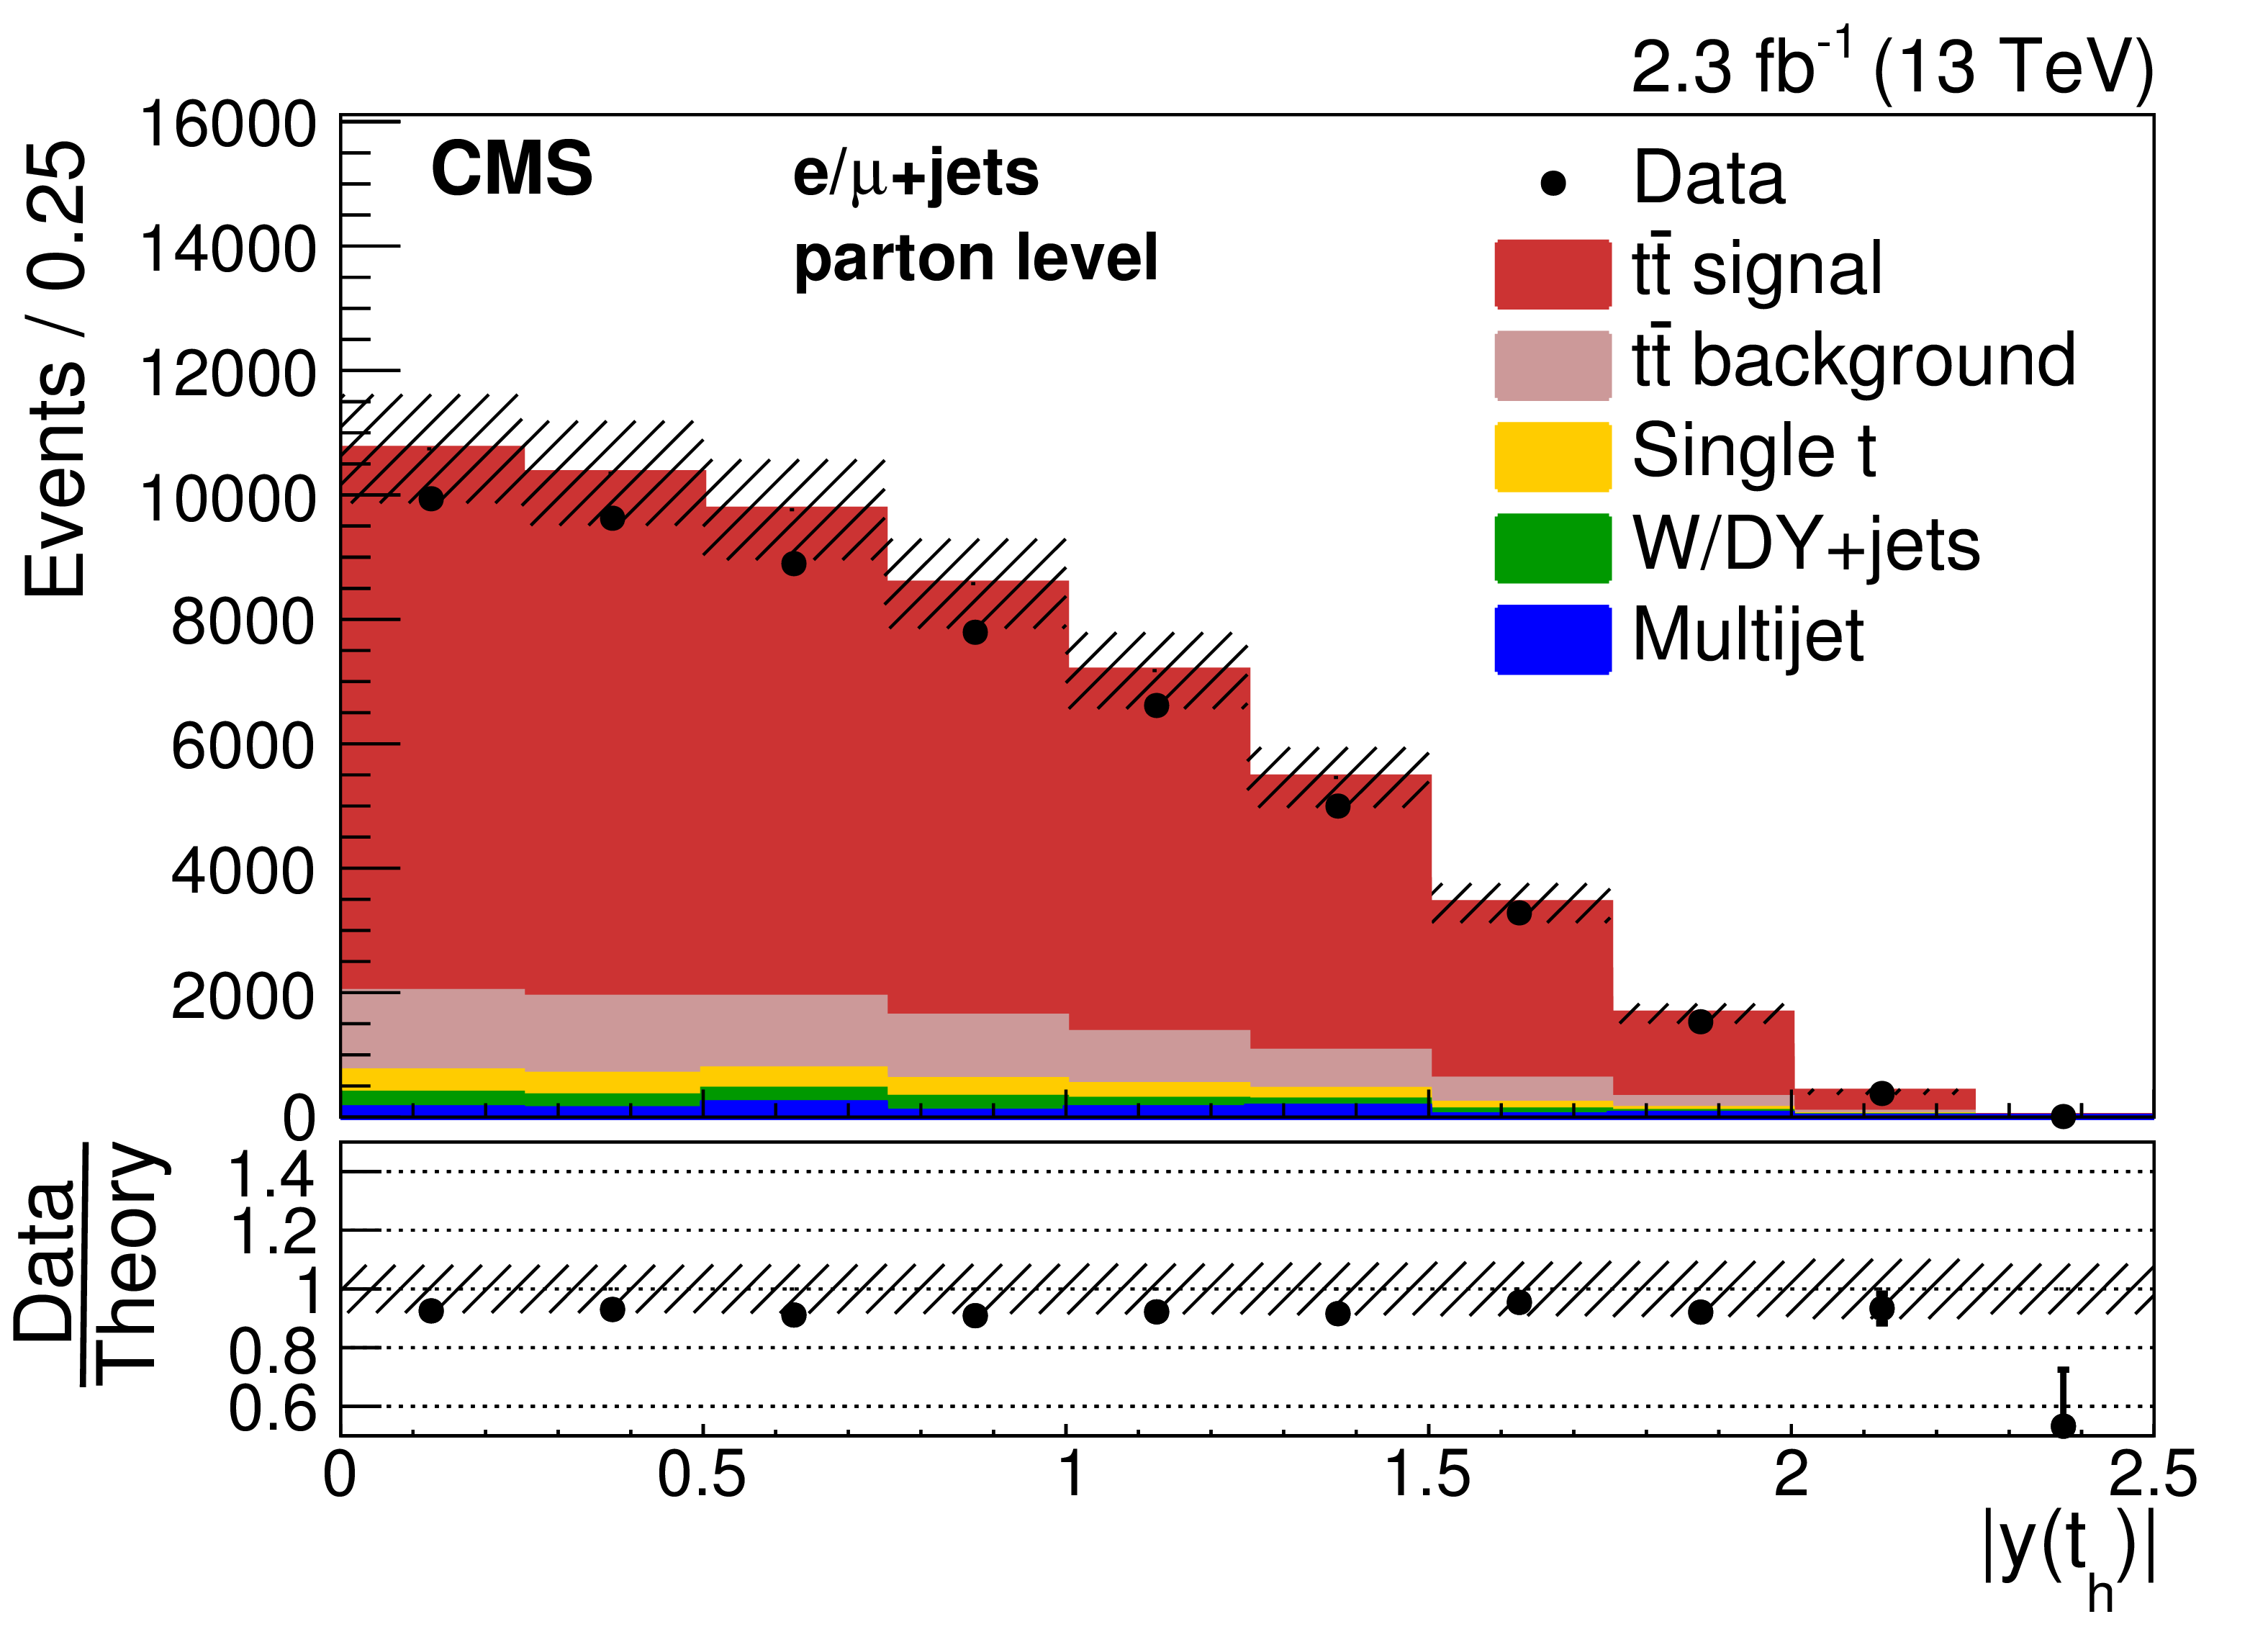
Figure 5-c:
Comparisons of the reconstructed $ {| y( {\mathrm{ t } _\mathrm {h}} ) | }$ in data and simulations for the parton level. The simulation of POWHEG+PYTHIA8 is used to describe the ${\mathrm{ t } \mathrm{ \bar{t} } }$ production. Experimental (cf. Section 10) and statistical uncertainties (hatched area) are shown for the total simulated yield, which is normalized according to the measured integrated luminosity. The ratio of data to the expected yields is given at the bottom of the panel. |

png pdf |
Figure 5-d:
Comparisons of the reconstructed $ {| y( {\mathrm{ t } _\mathrm {h}} ) | }$ in data and simulations for the particle level. The simulation of POWHEG+PYTHIA8 is used to describe the ${\mathrm{ t } \mathrm{ \bar{t} } }$ production. Experimental (cf. Section 10) and statistical uncertainties (hatched area) are shown for the total simulated yield, which is normalized according to the measured integrated luminosity. The ratio of data to the expected yields is given at the bottom of the panel. |
png pdf |
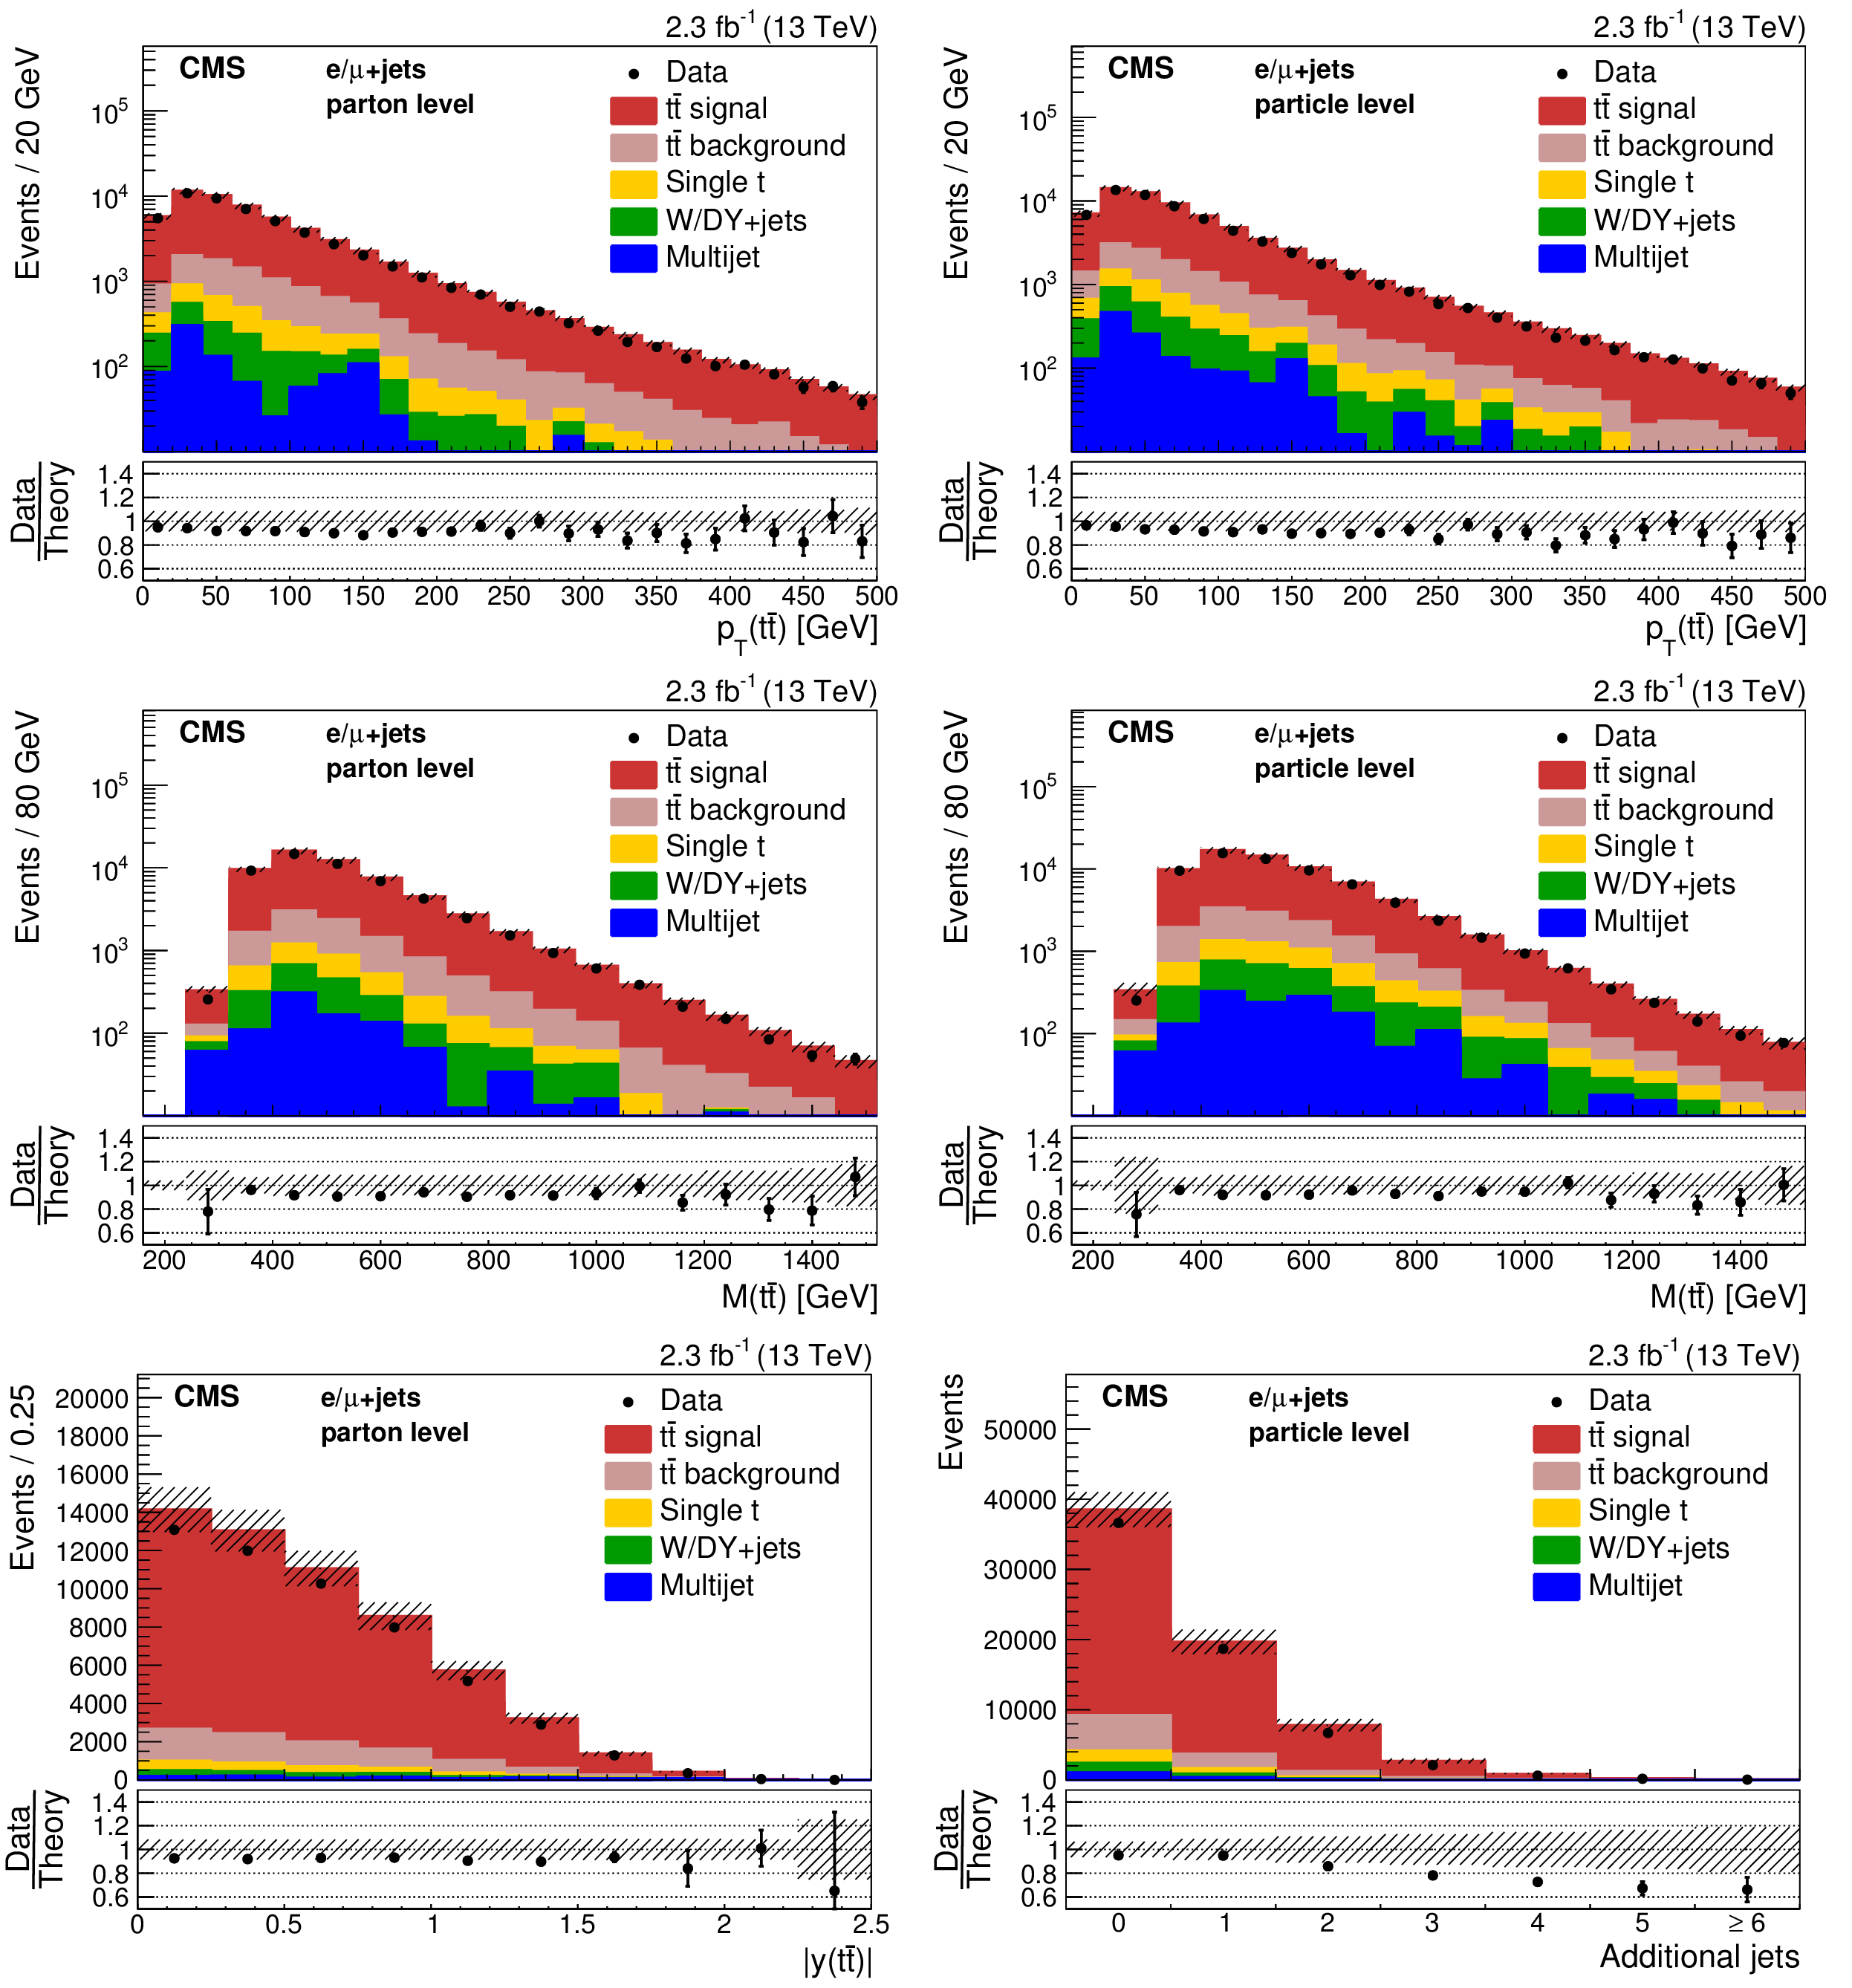
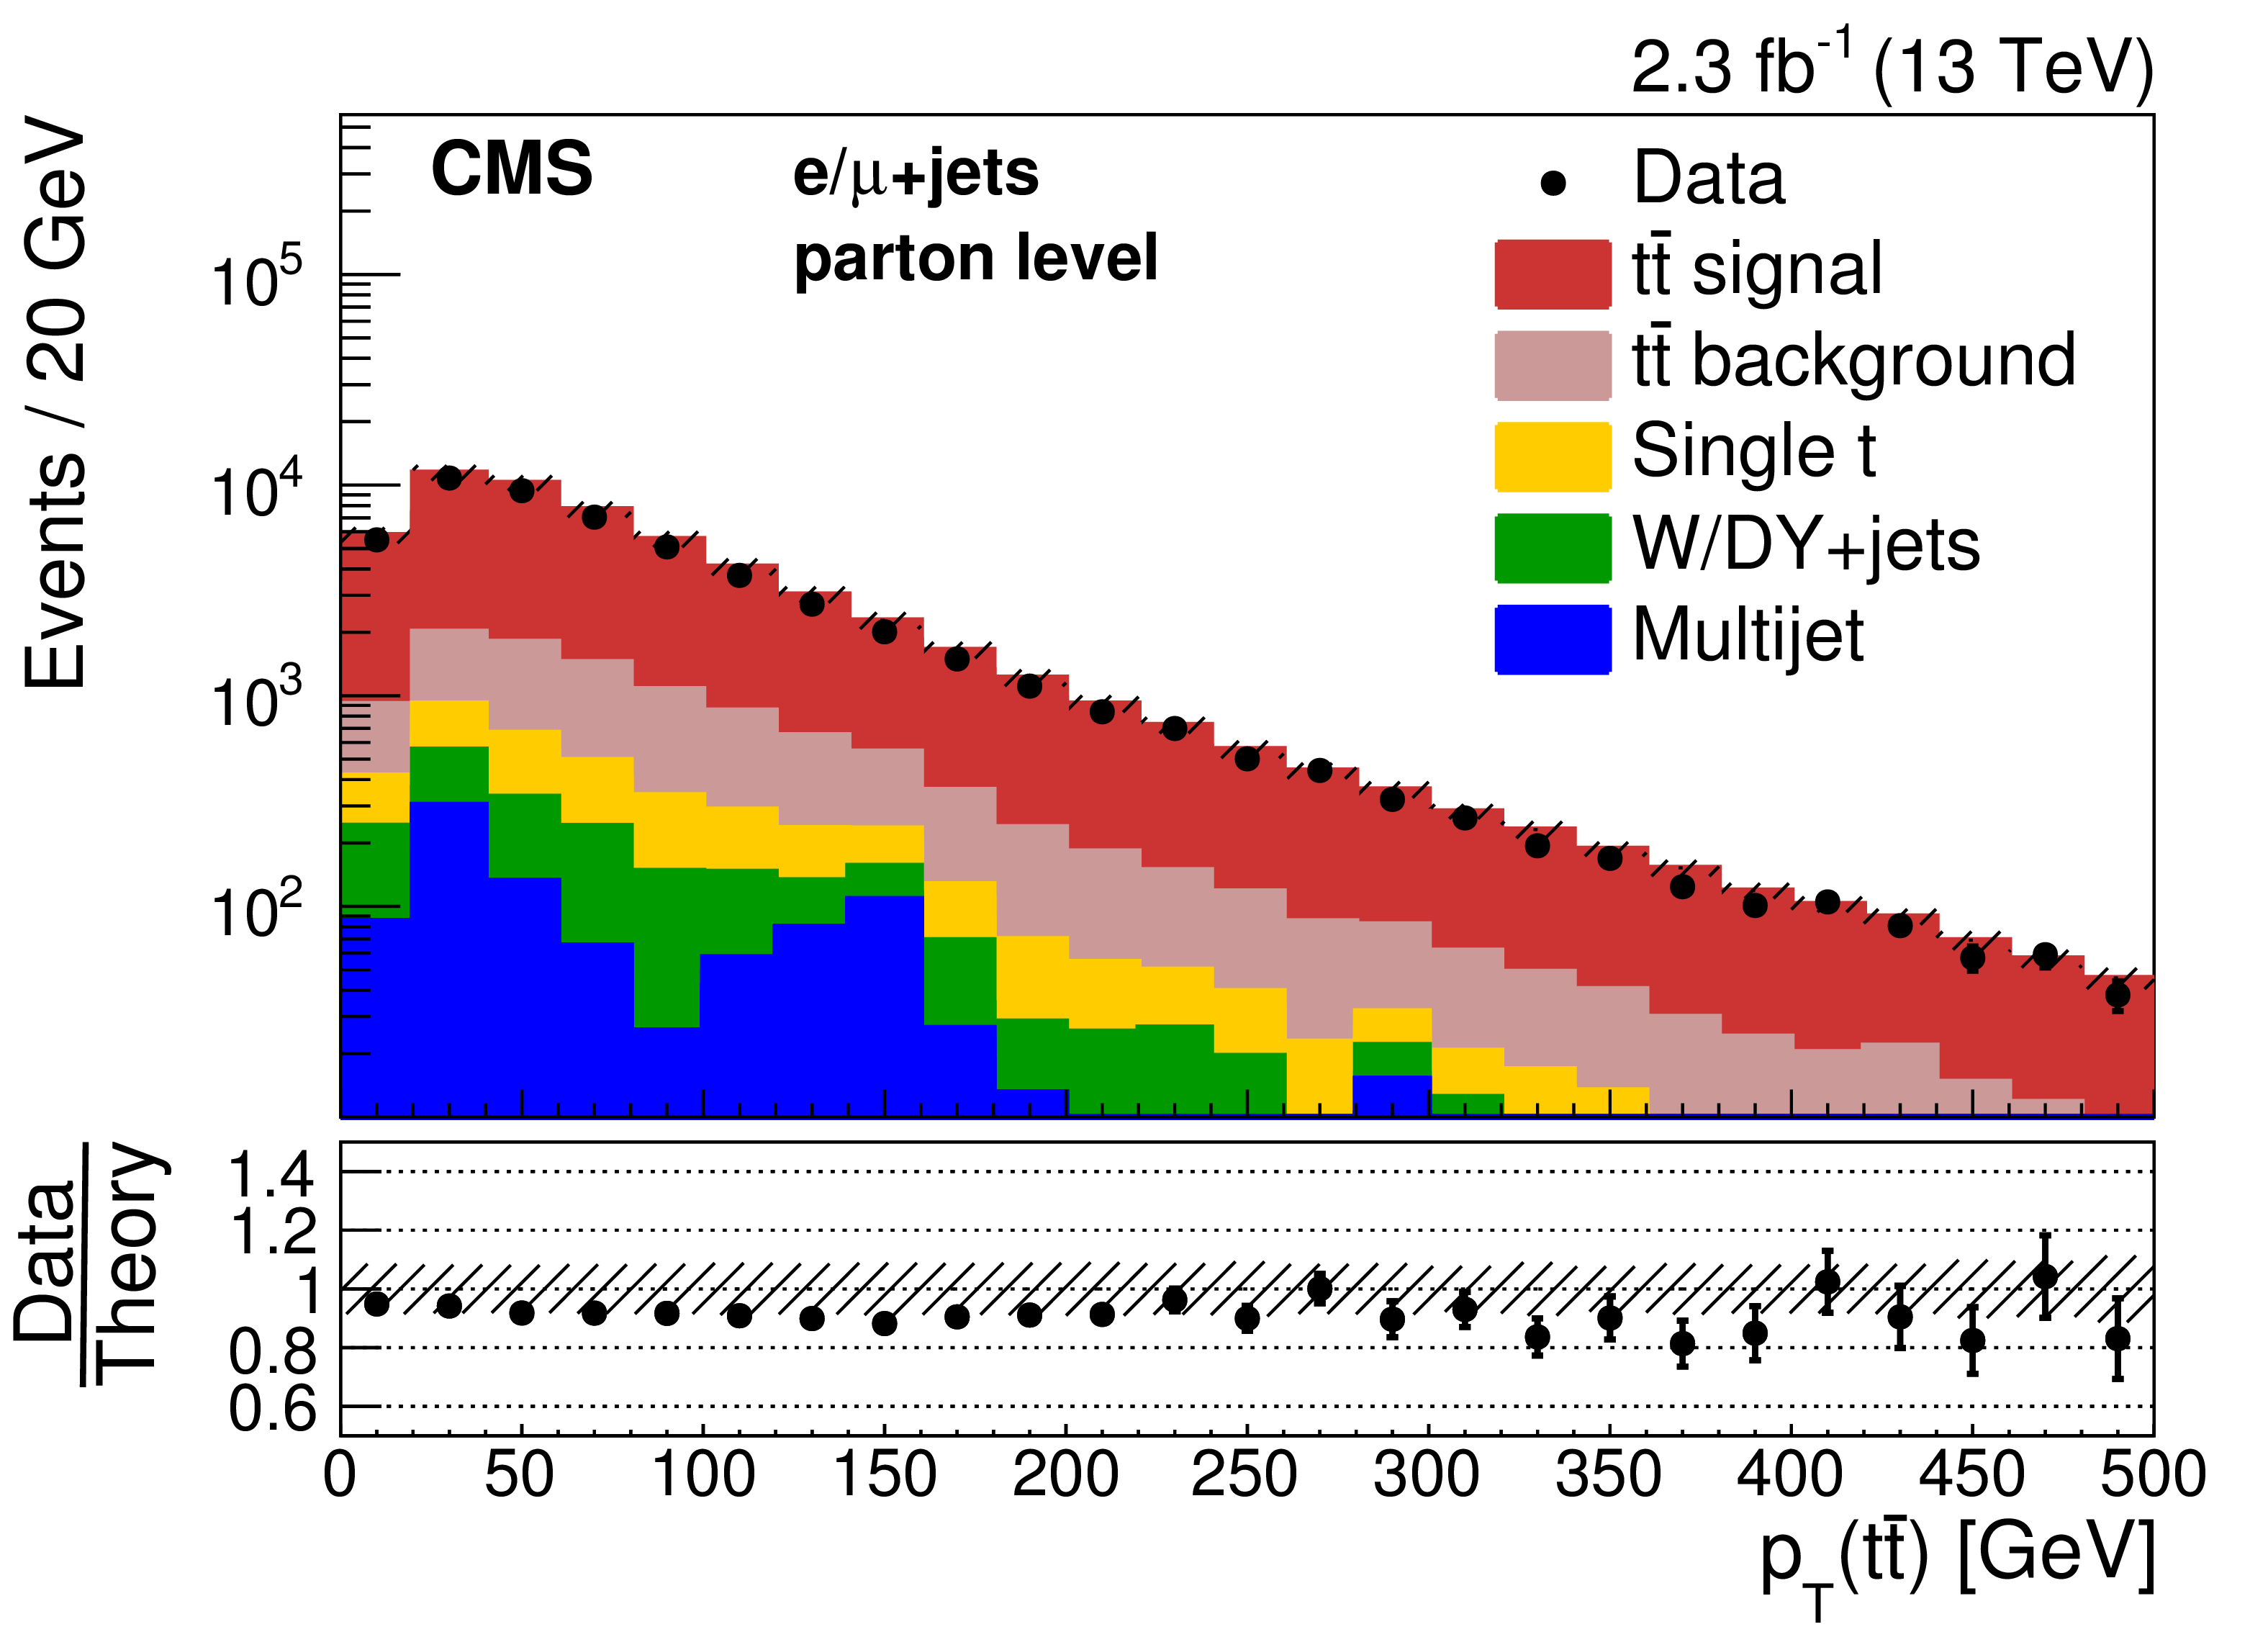
Figure 6:
Comparisons of the reconstructed distributions of $ {p_{\mathrm {T}}} ({\mathrm{ t } \mathrm{ \bar{t} } } )$ (top) and $M({\mathrm{ t } \mathrm{ \bar{t} } } )$ (middle) for the parton- (left) and the particle- (right) level measurements in data and simulations. Bottom: distributions of $ {| y({\mathrm{ t } \mathrm{ \bar{t} } } ) | }$ (left) and the number of additional jets (right). The simulation of POWHEG+PYTHIA8 is used to describe the $ {\mathrm{ t } \mathrm{ \bar{t} } } $ production. Experimental (cf. Section 10) and statistical uncertainties (hatched area) are shown for the total simulated yield, which is normalized according to the measured integrated luminosity. The ratios of data to the expected yields are given at the bottom of each panel. |
png pdf |
Figure 6-a:
Comparisons of the reconstructed distributions of $ {p_{\mathrm {T}}} ({\mathrm{ t } \mathrm{ \bar{t} } } )$ for the parton-level measurement in data and simulations. The simulation of POWHEG+PYTHIA8 is used to describe the $ {\mathrm{ t } \mathrm{ \bar{t} } } $ production. Experimental (cf. Section 10) and statistical uncertainties (hatched area) are shown for the total simulated yield, which is normalized according to the measured integrated luminosity. The ratio of data to the expected yields is given at the bottom of the panel. |
png pdf |
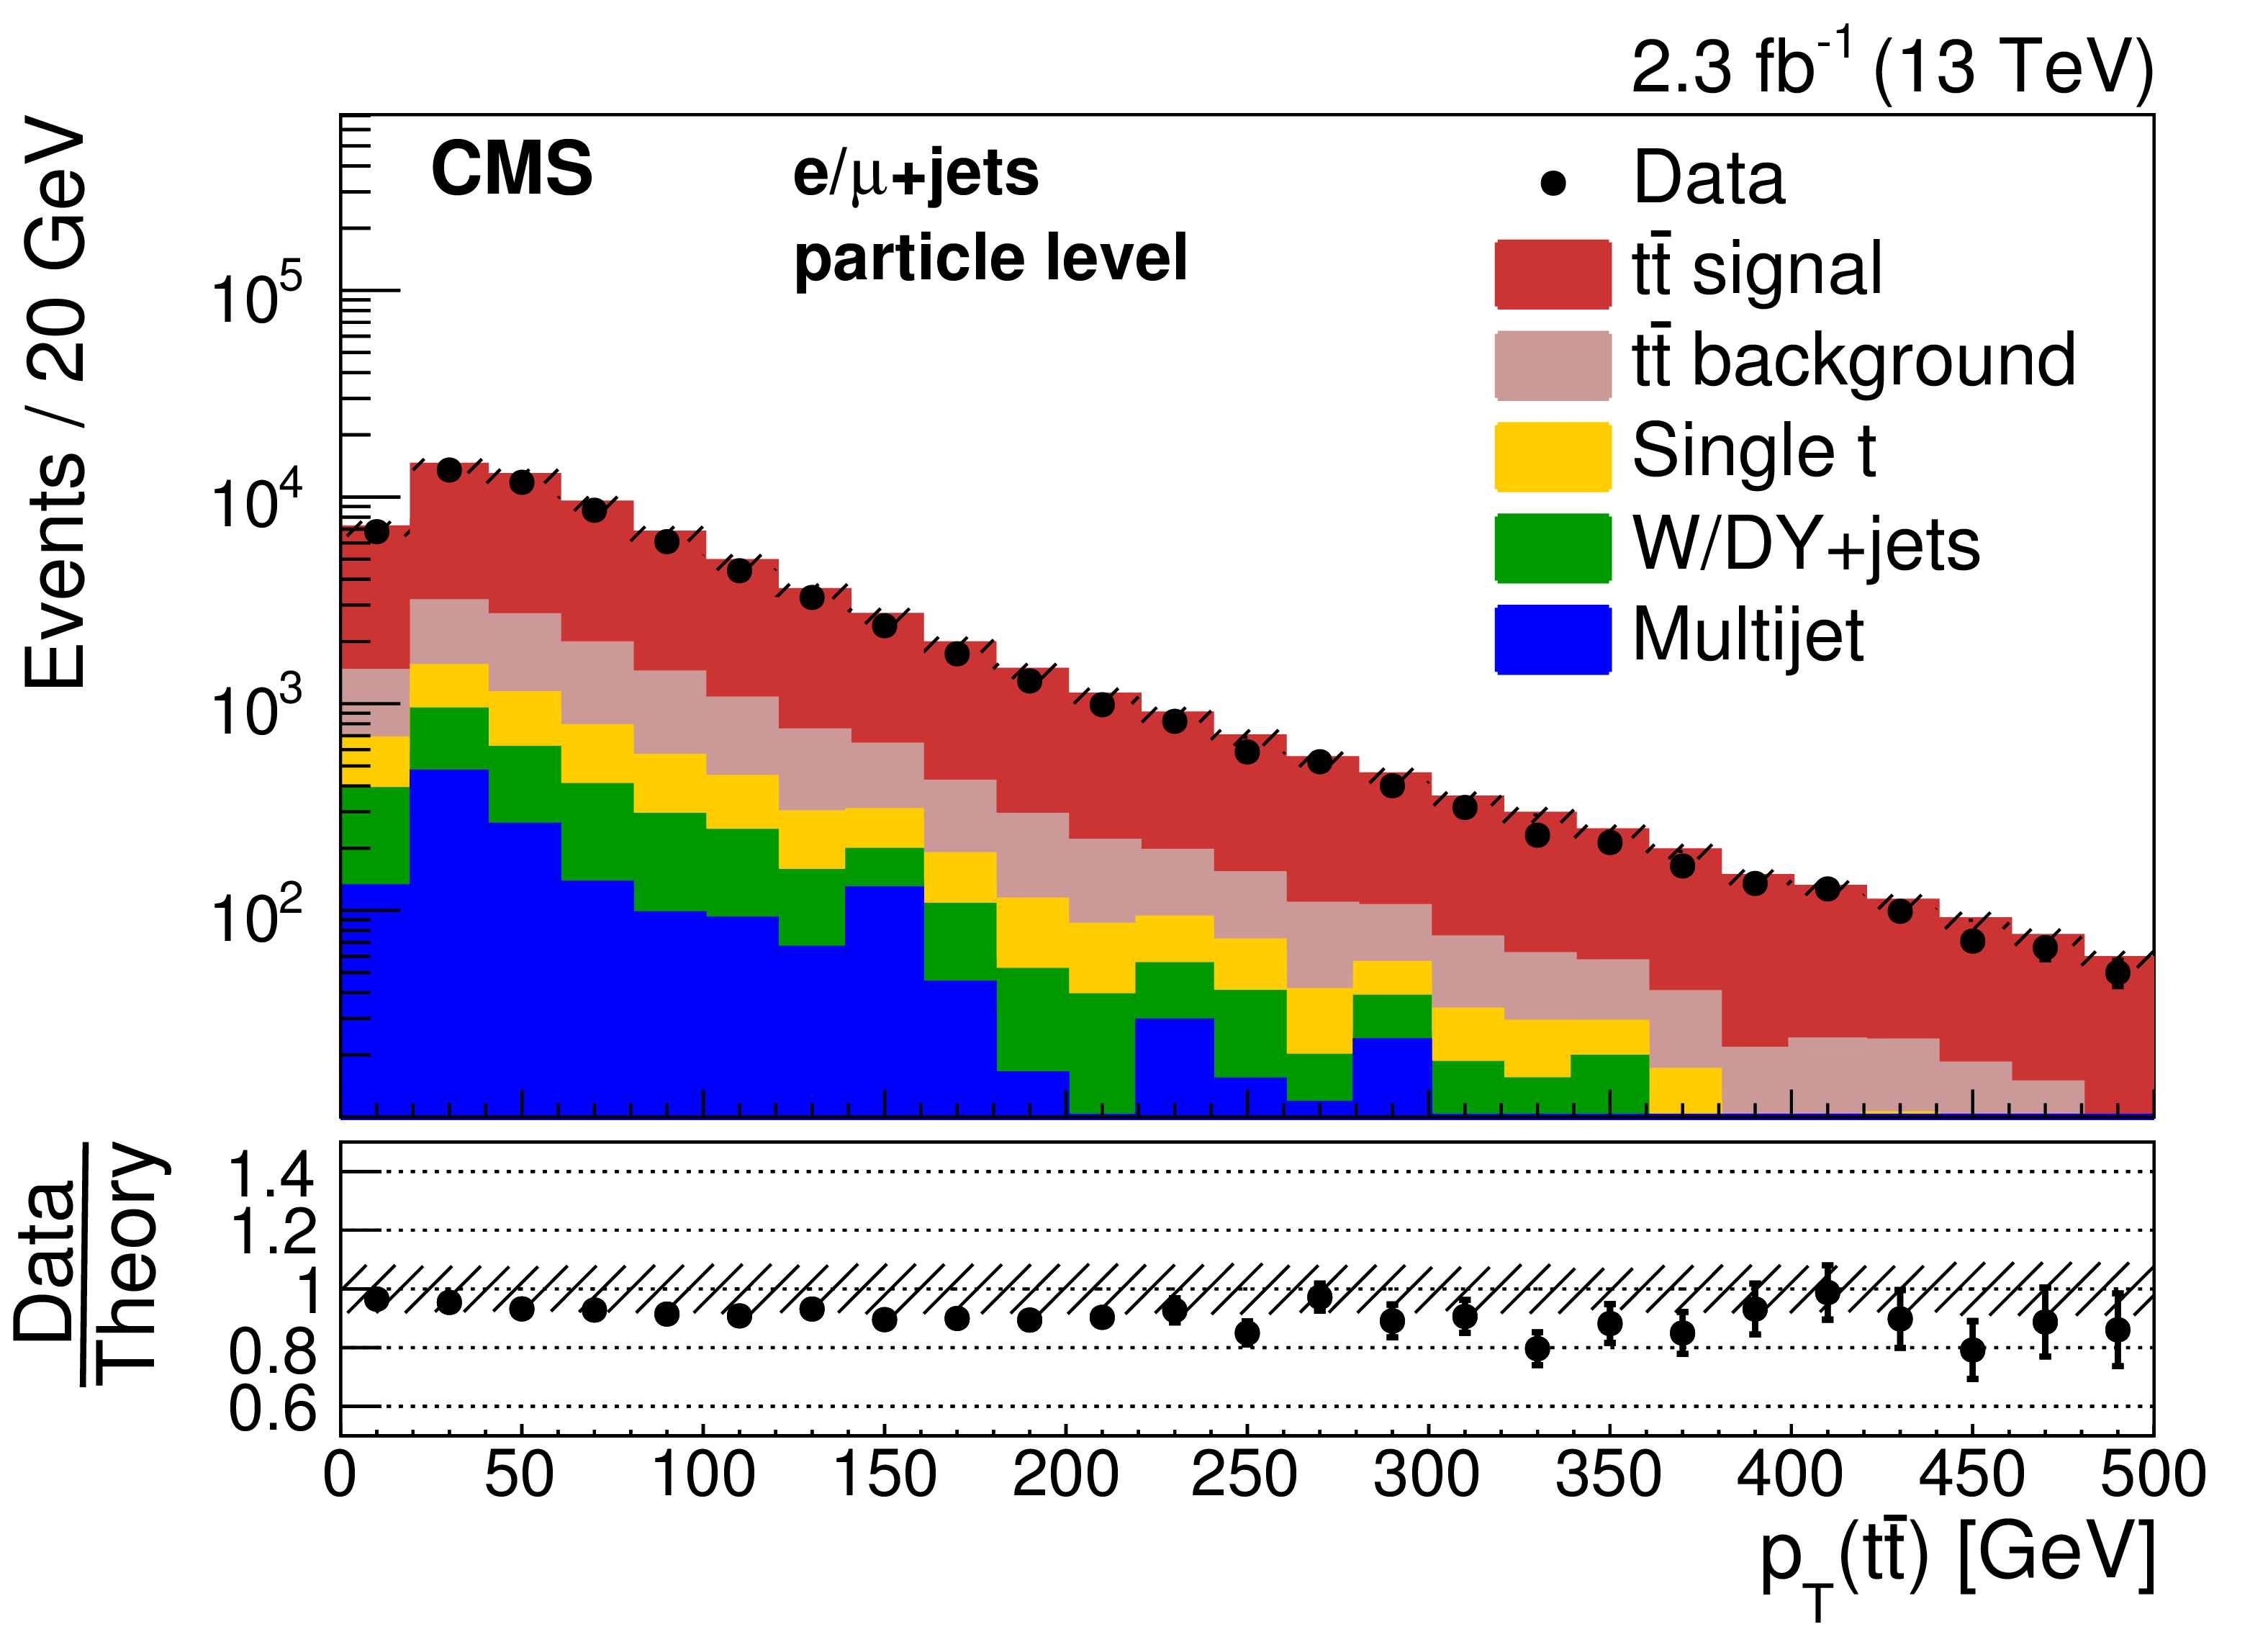
Figure 6-b:
Comparisons of the reconstructed distributions of $ {p_{\mathrm {T}}} ({\mathrm{ t } \mathrm{ \bar{t} } } )$ for the particle-level measurement in data and simulations. The simulation of POWHEG+PYTHIA8 is used to describe the $ {\mathrm{ t } \mathrm{ \bar{t} } } $ production. Experimental (cf. Section 10) and statistical uncertainties (hatched area) are shown for the total simulated yield, which is normalized according to the measured integrated luminosity. The ratio of data to the expected yields is given at the bottom of the panel. |
png pdf |
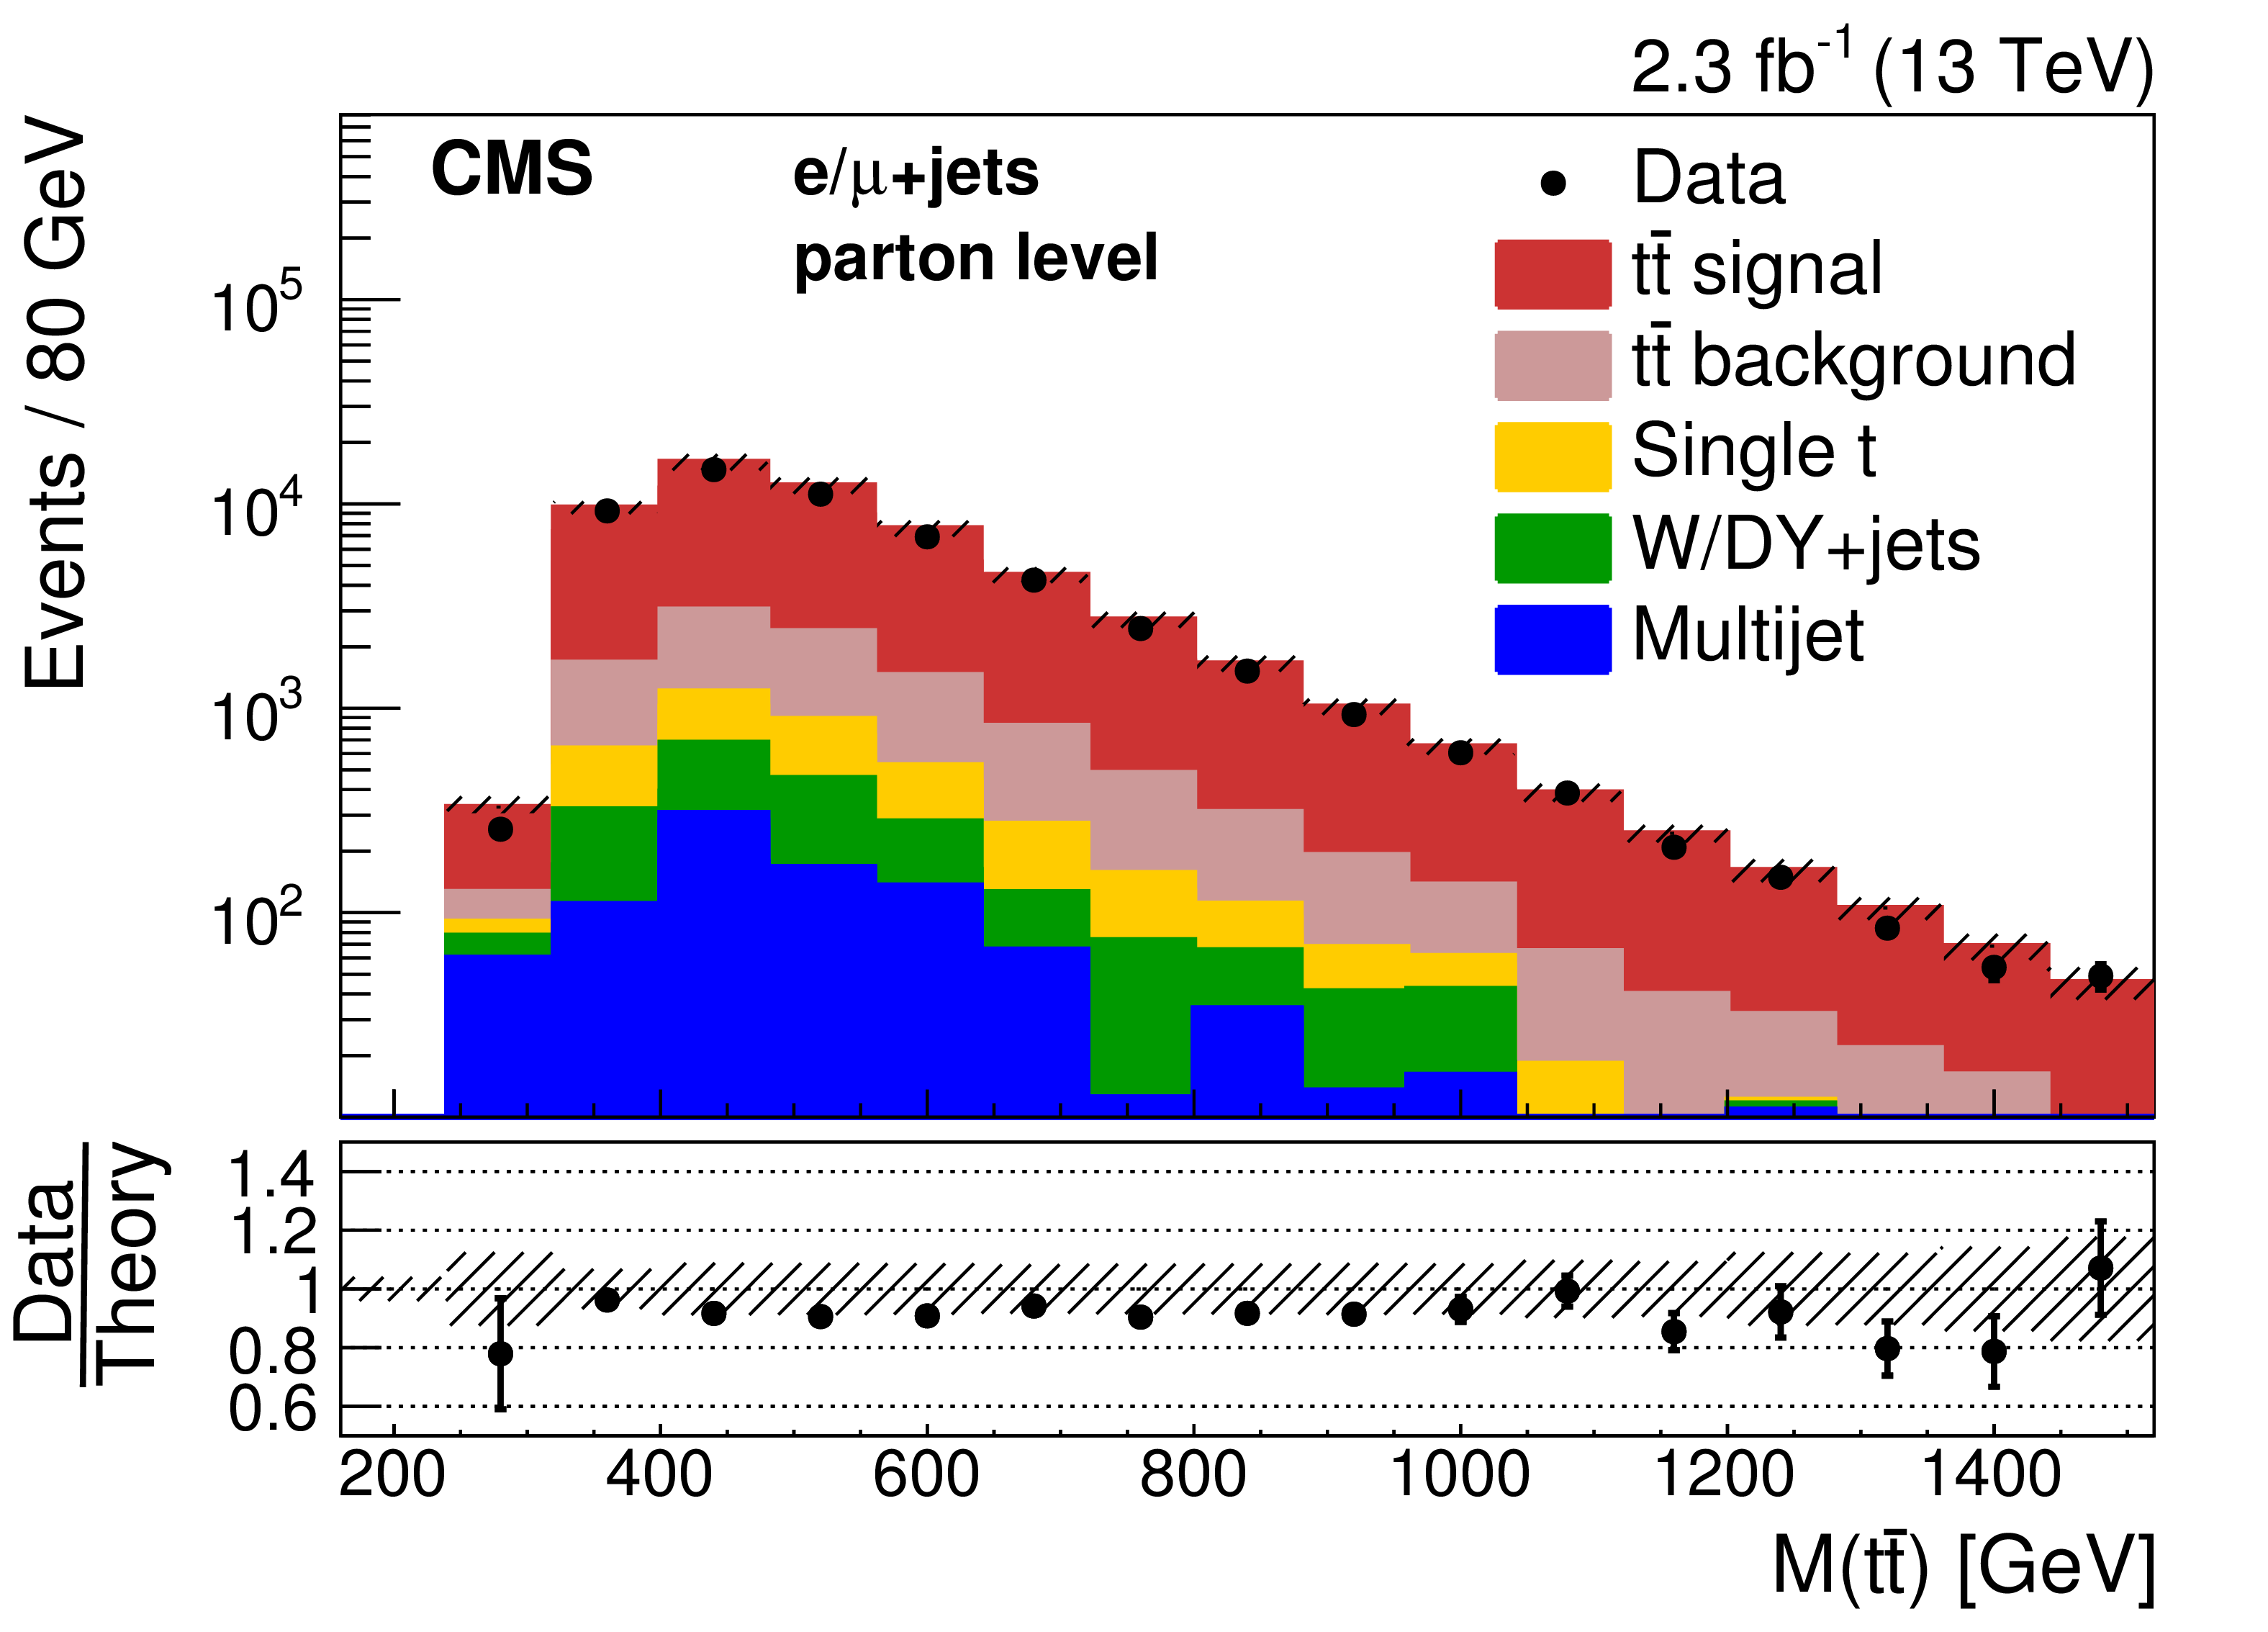
Figure 6-c:
Comparisons of the reconstructed distributions of $M({\mathrm{ t } \mathrm{ \bar{t} } } )$ for the parton-level measurement in data and simulations. The simulation of POWHEG+PYTHIA8 is used to describe the $ {\mathrm{ t } \mathrm{ \bar{t} } } $ production. Experimental (cf. Section 10) and statistical uncertainties (hatched area) are shown for the total simulated yield, which is normalized according to the measured integrated luminosity. The ratio of data to the expected yields is given at the bottom of the panel. |
png pdf |
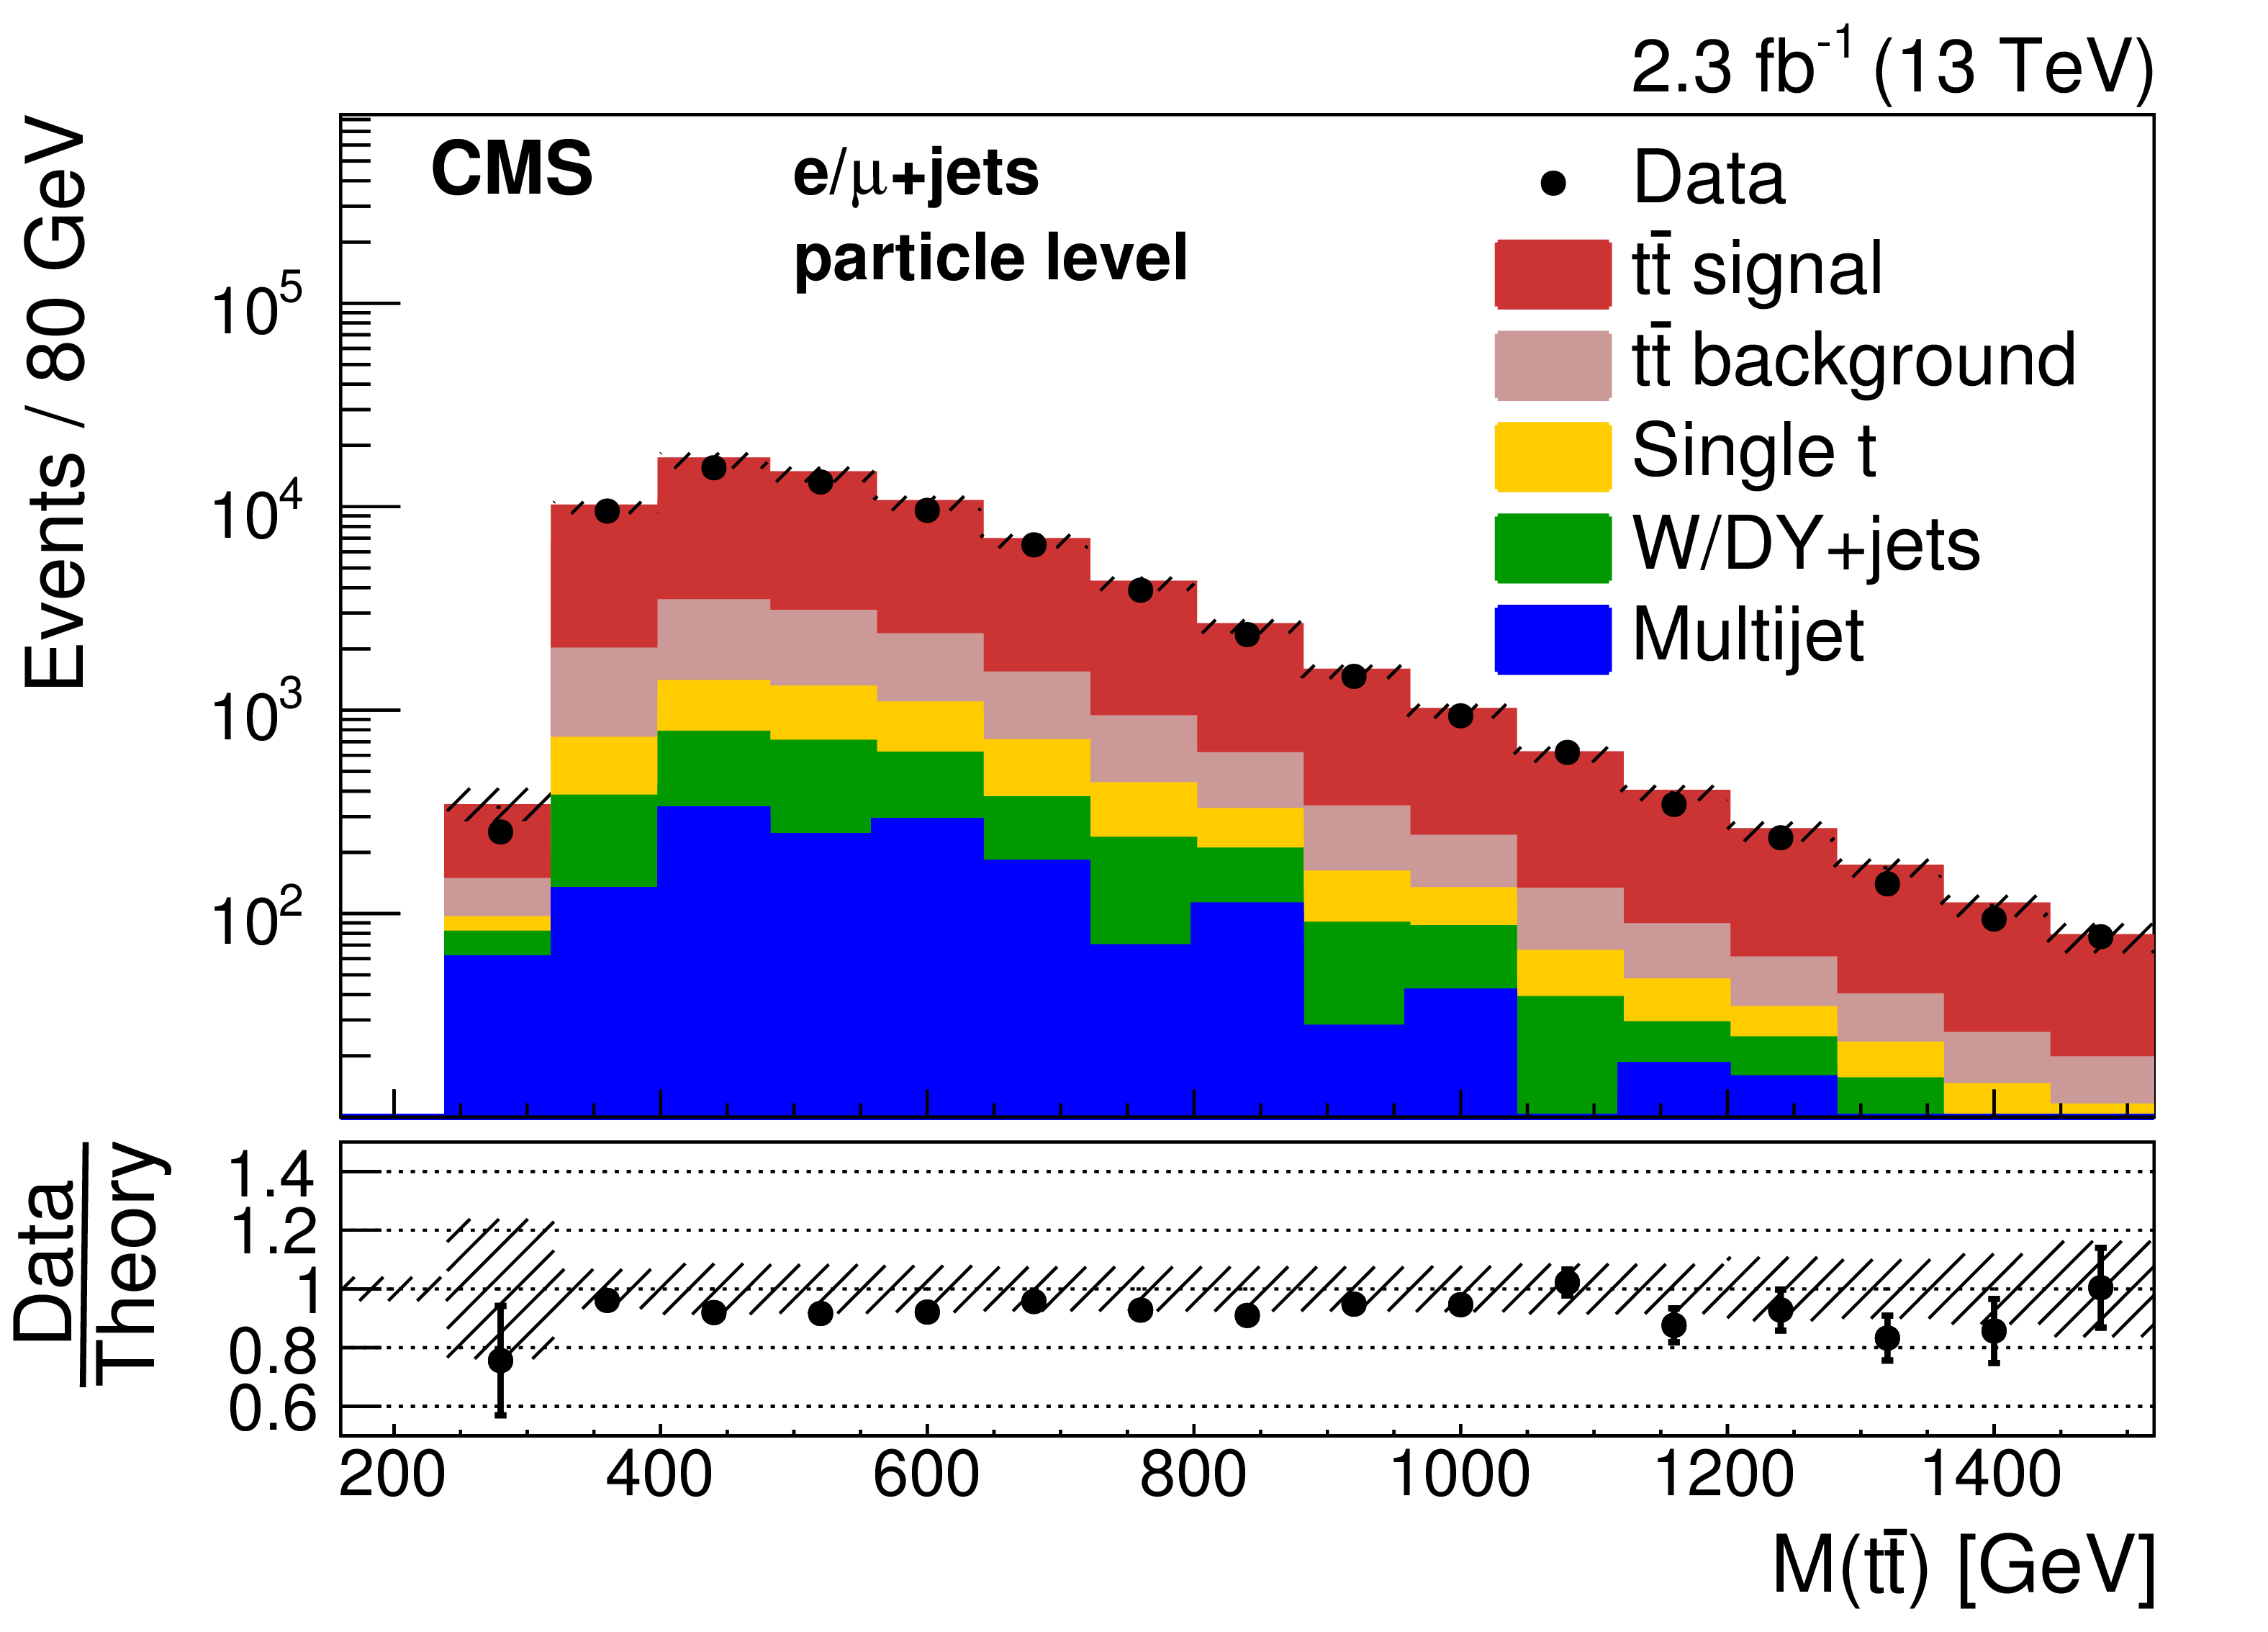
Figure 6-d:
Comparisons of the reconstructed distributions of $M({\mathrm{ t } \mathrm{ \bar{t} } } )$ for the particle-level measurement in data and simulations. The simulation of POWHEG+PYTHIA8 is used to describe the $ {\mathrm{ t } \mathrm{ \bar{t} } } $ production. Experimental (cf. Section 10) and statistical uncertainties (hatched area) are shown for the total simulated yield, which is normalized according to the measured integrated luminosity. The ratio of data to the expected yields is given at the bottom of the panel. |
png pdf |
Figure 6-e:
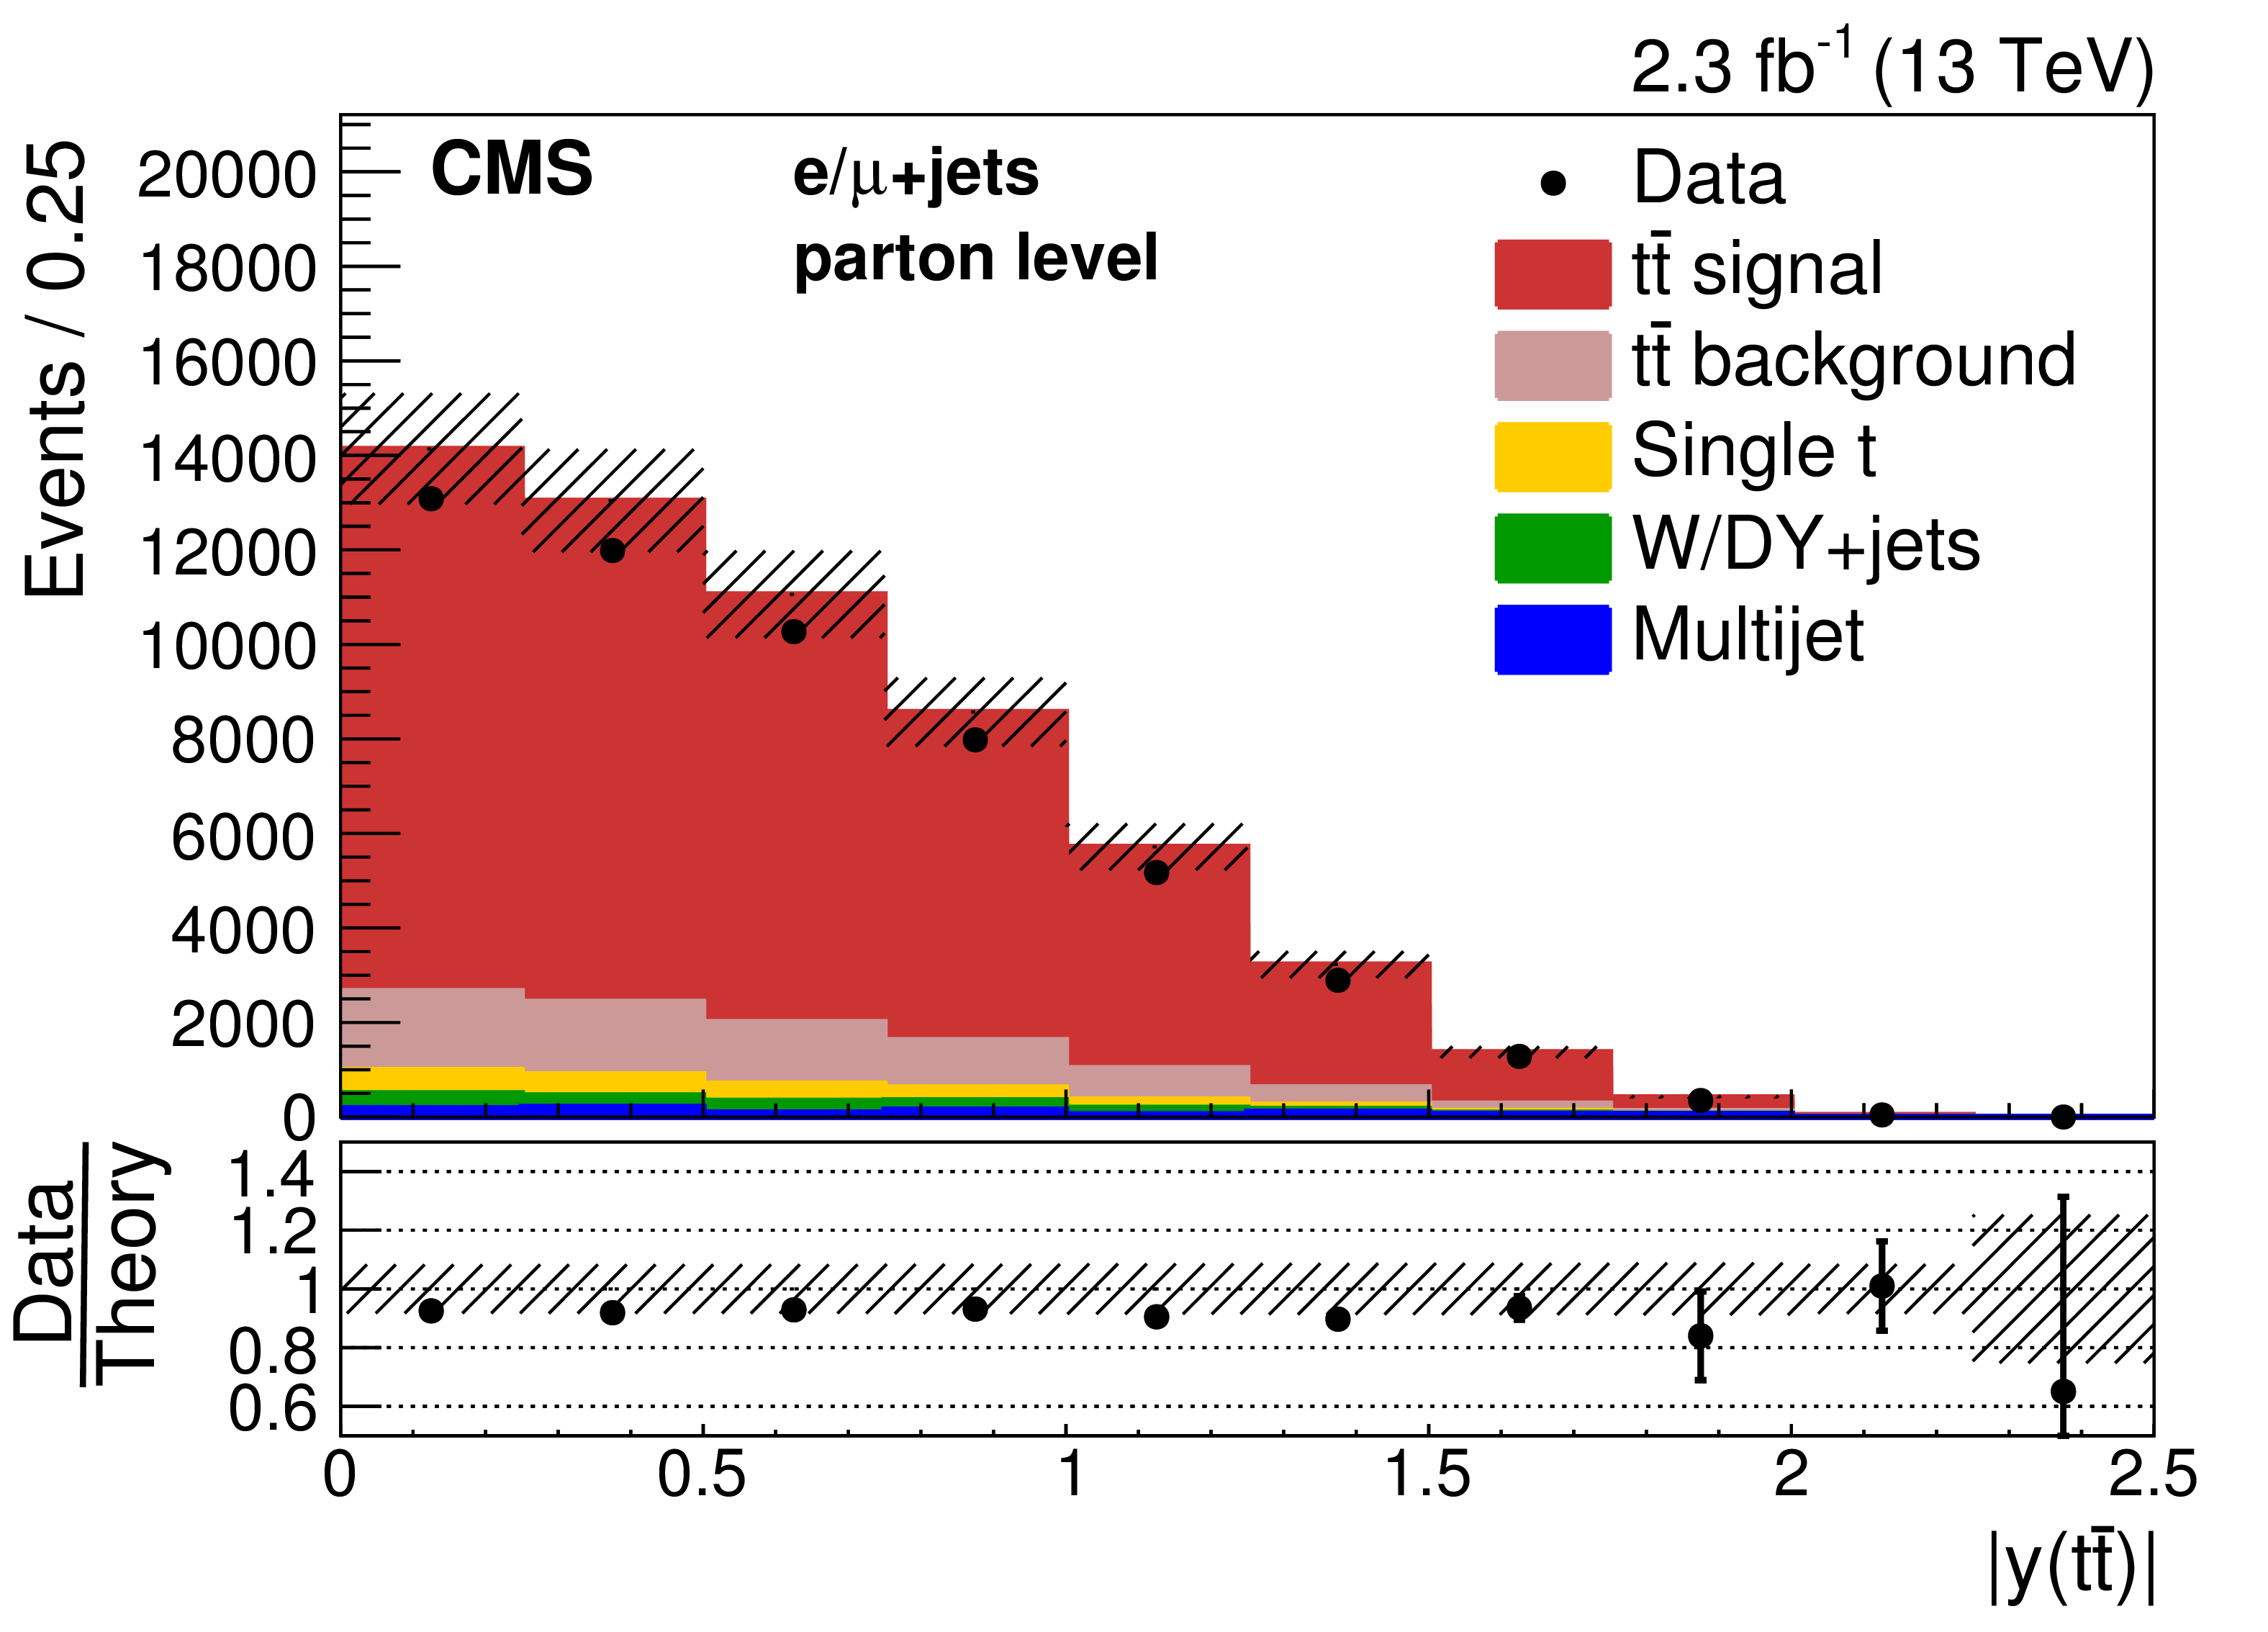
Distribution of $ {| y({\mathrm{ t } \mathrm{ \bar{t} } } ) | }$ (left) and the number of additional jets (right). The simulation of POWHEG+PYTHIA8 is used to describe the $ {\mathrm{ t } \mathrm{ \bar{t} } } $ production. Experimental (cf. Section 10) and statistical uncertainties (hatched area) are shown for the total simulated yield, which is normalized according to the measured integrated luminosity. The ratio of data to the expected yields is given at the bottom of the panel. |

png pdf |
Figure 6-f:
Distribution of the number of additional jets (right). The simulation of POWHEG+PYTHIA8 is used to describe the $ {\mathrm{ t } \mathrm{ \bar{t} } } $ production. Experimental (cf. Section 10) and statistical uncertainties (hatched area) are shown for the total simulated yield, which is normalized according to the measured integrated luminosity. The ratio of data to the expected yields is given at the bottom of the panel. |
png pdf |
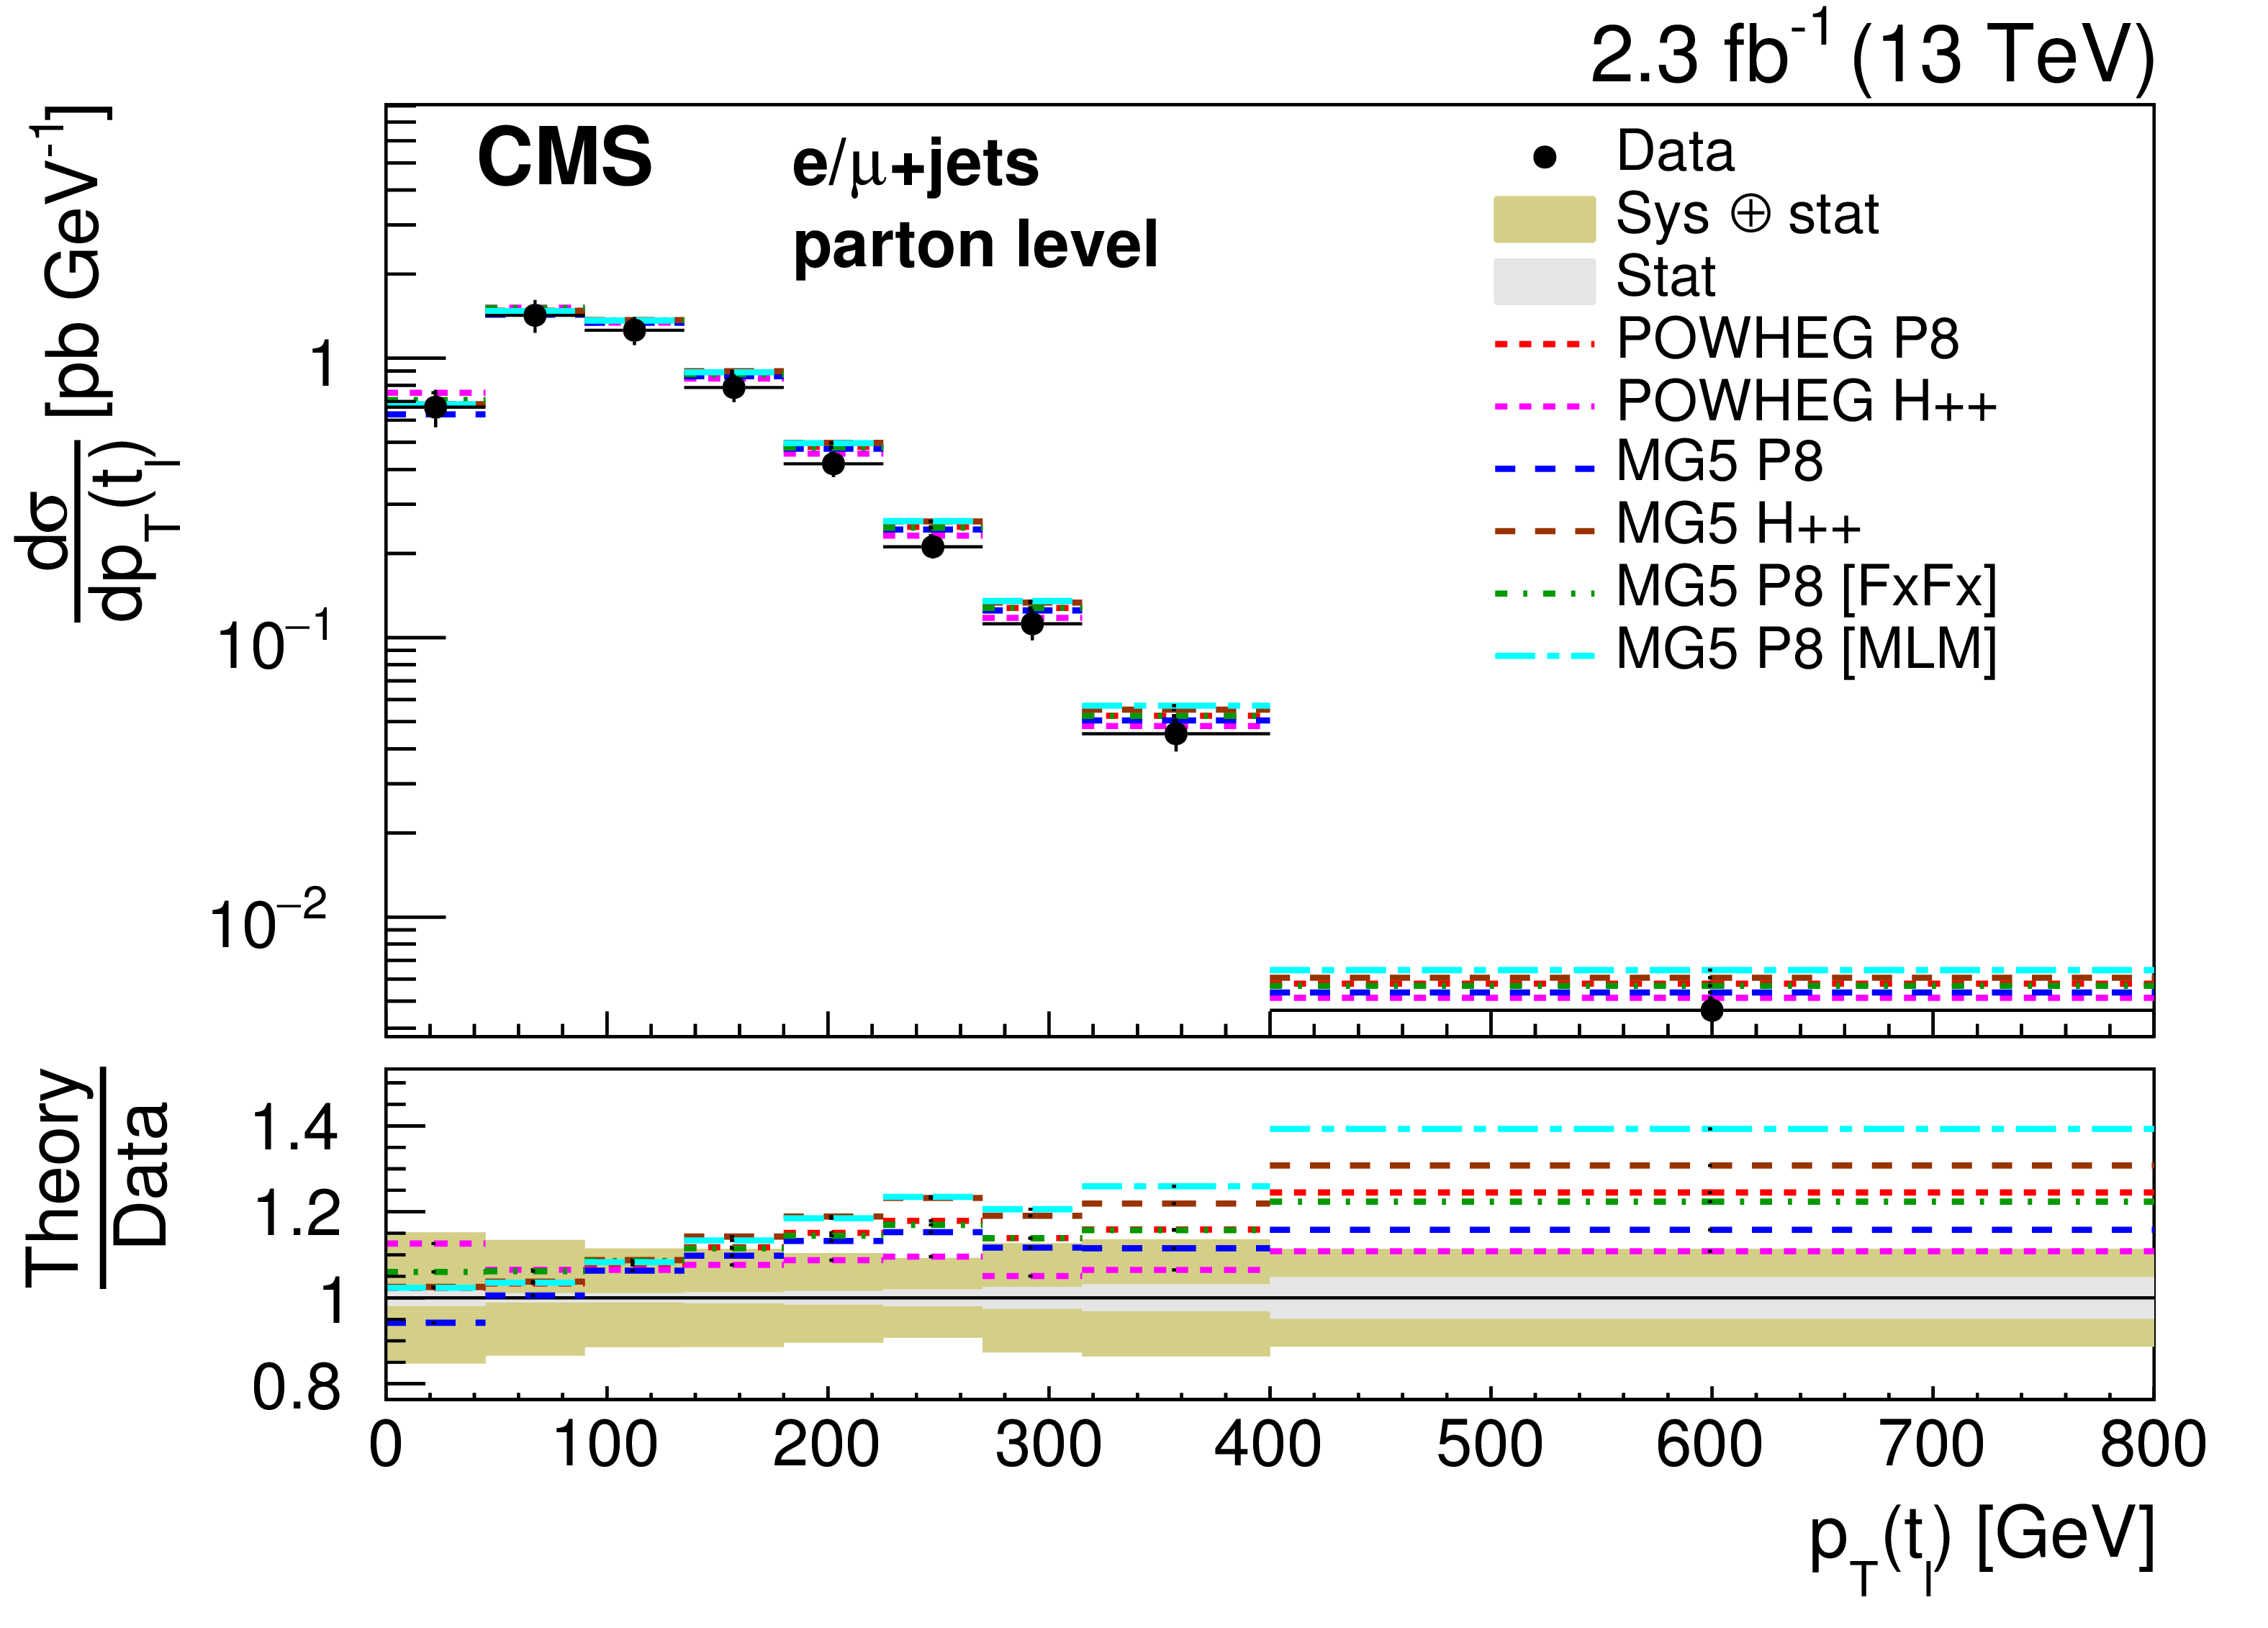
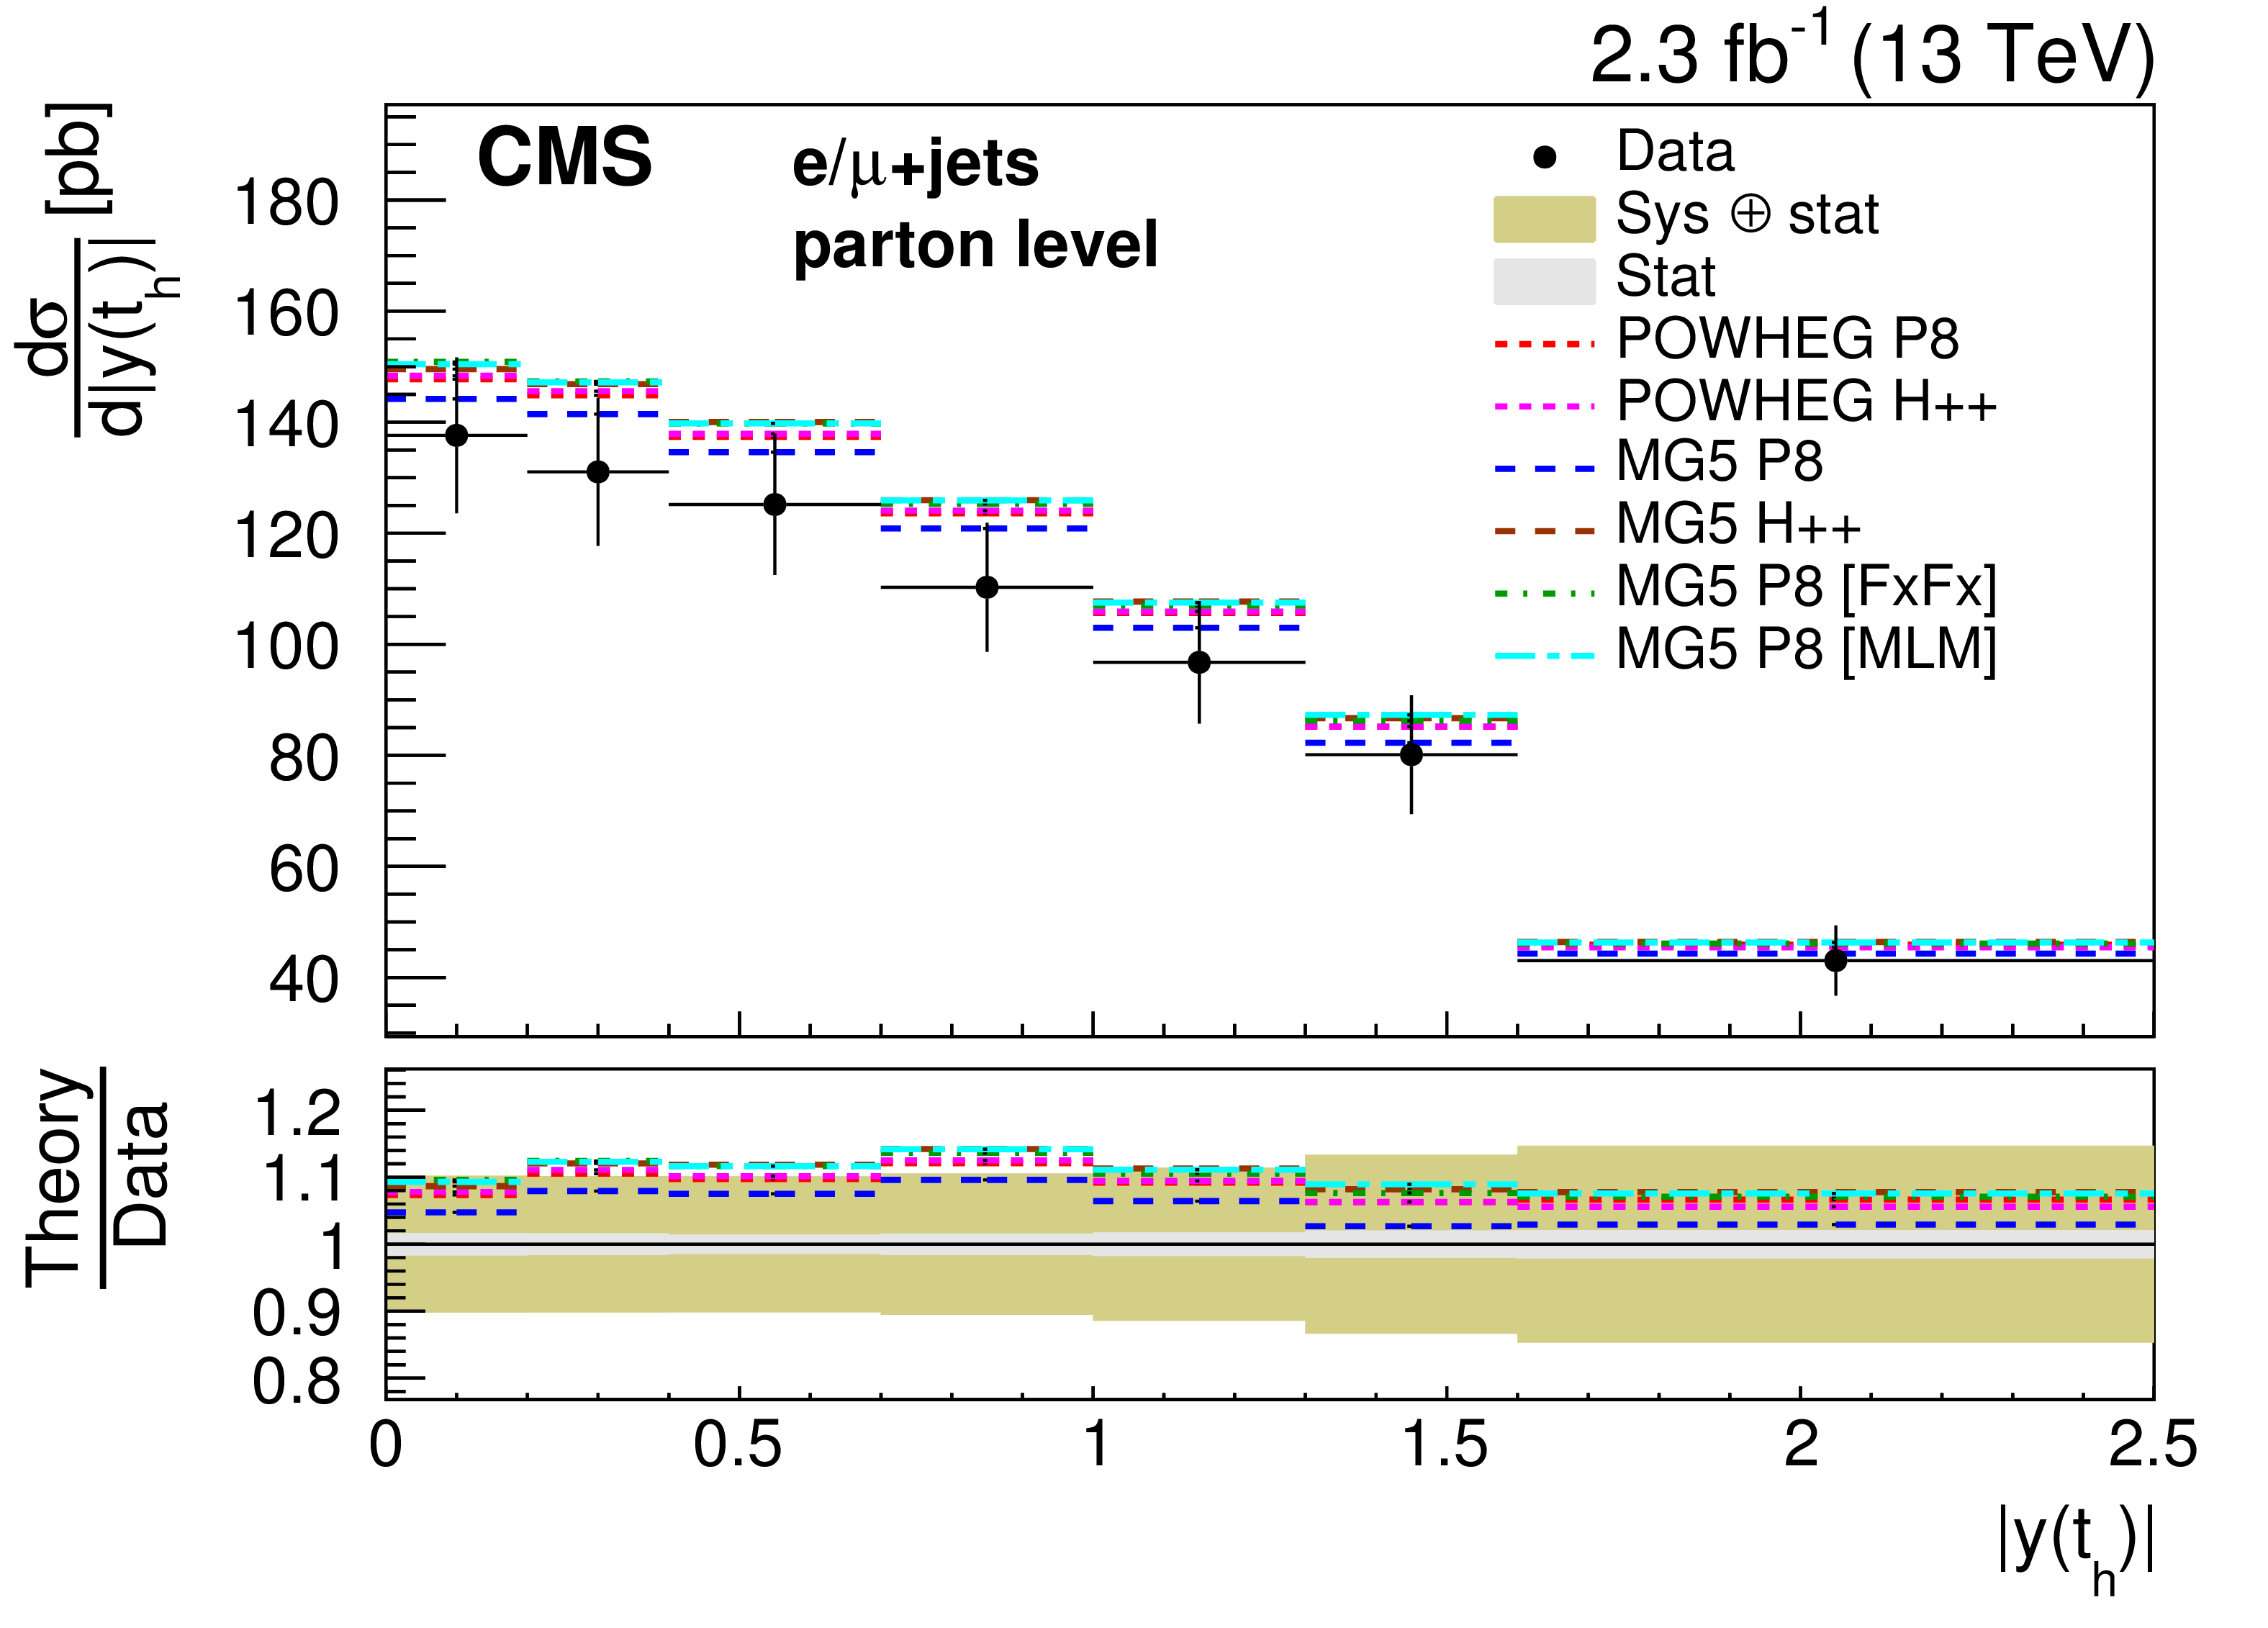
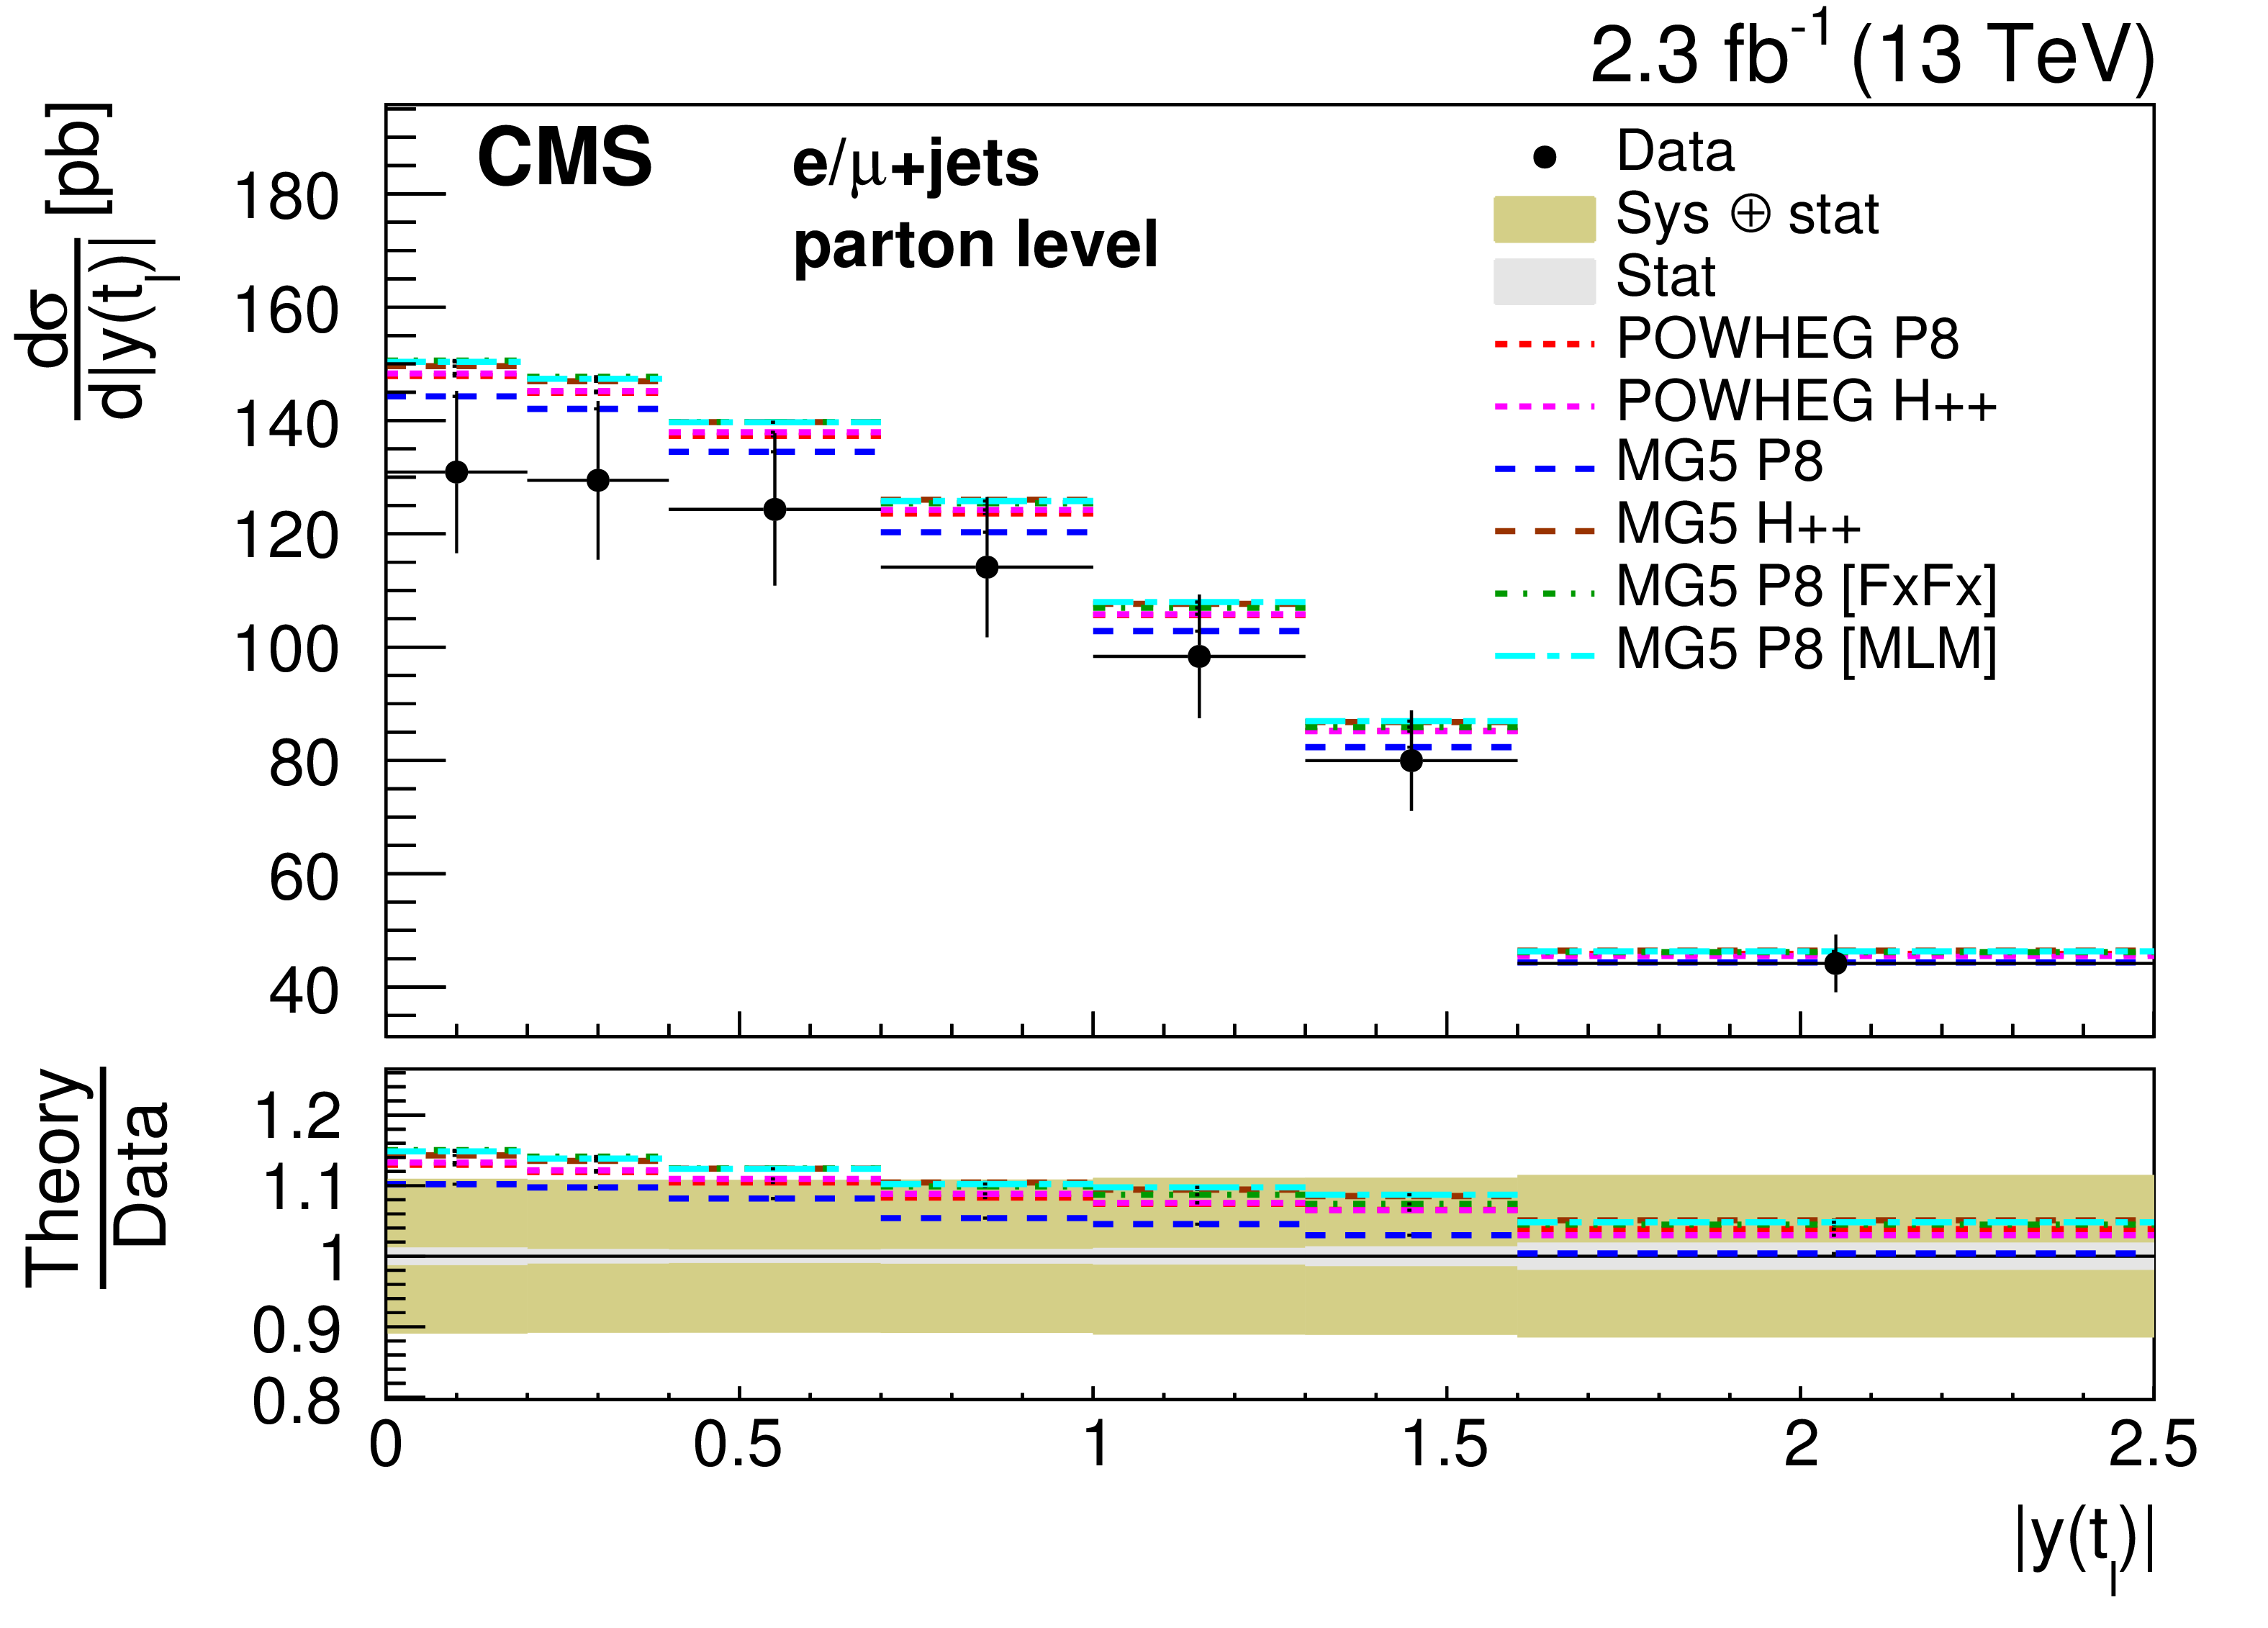
Figure 7:
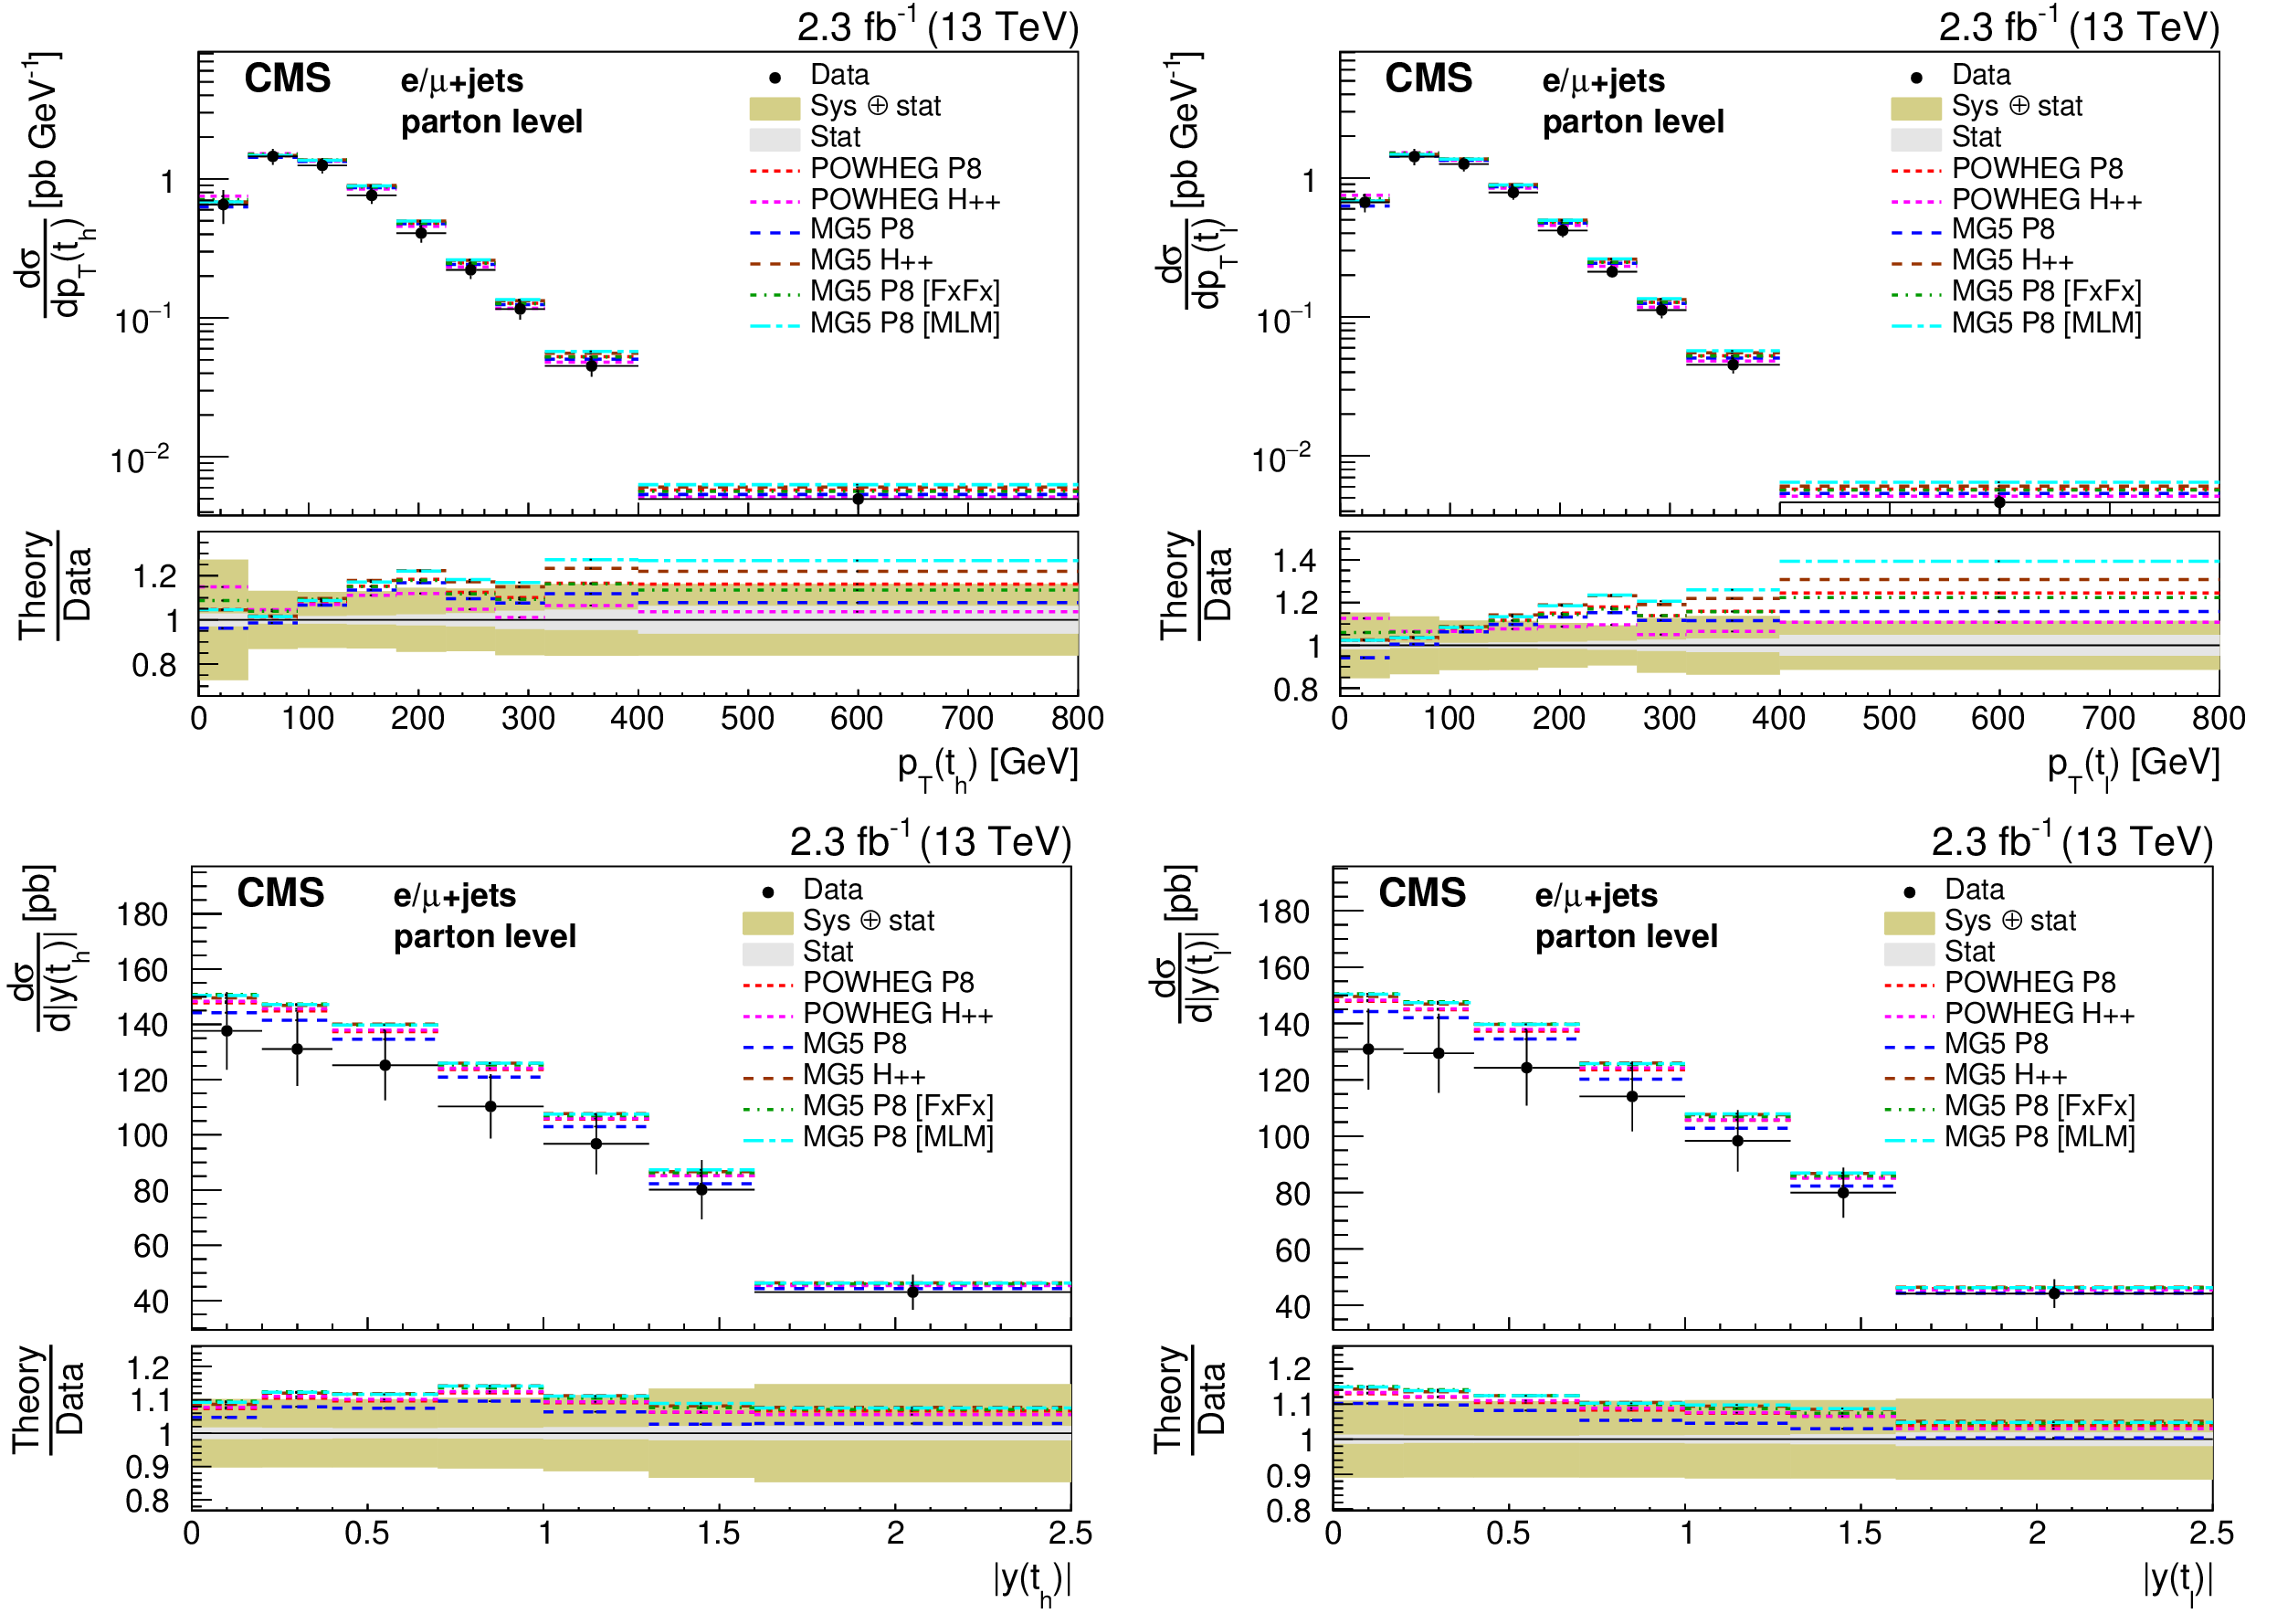
Differential cross sections at parton level as a function of $ {p_{\mathrm {T}}} (\mathrm{ t } )$ (top) and $ {| y(\mathrm{ t } ) | }$ (bottom) measured separately for the hadronically (left) and leptonically (right) decaying top quarks. The cross sections are compared to the predictions of POWHEG and MG5-MC@NLO (MG5) combined with PYTHIA8 (P8) or HERWIG++ (H++) and the multiparton simulations MG5-MC@NLO +PYTHIA8 MLM and MG5-MC@NLO +PYTHIA8 FxFx. The ratios of the various predictions to the measured cross sections are shown at the bottom of each panel together with the statistical and systematic uncertainties of the measurement. |
png pdf |
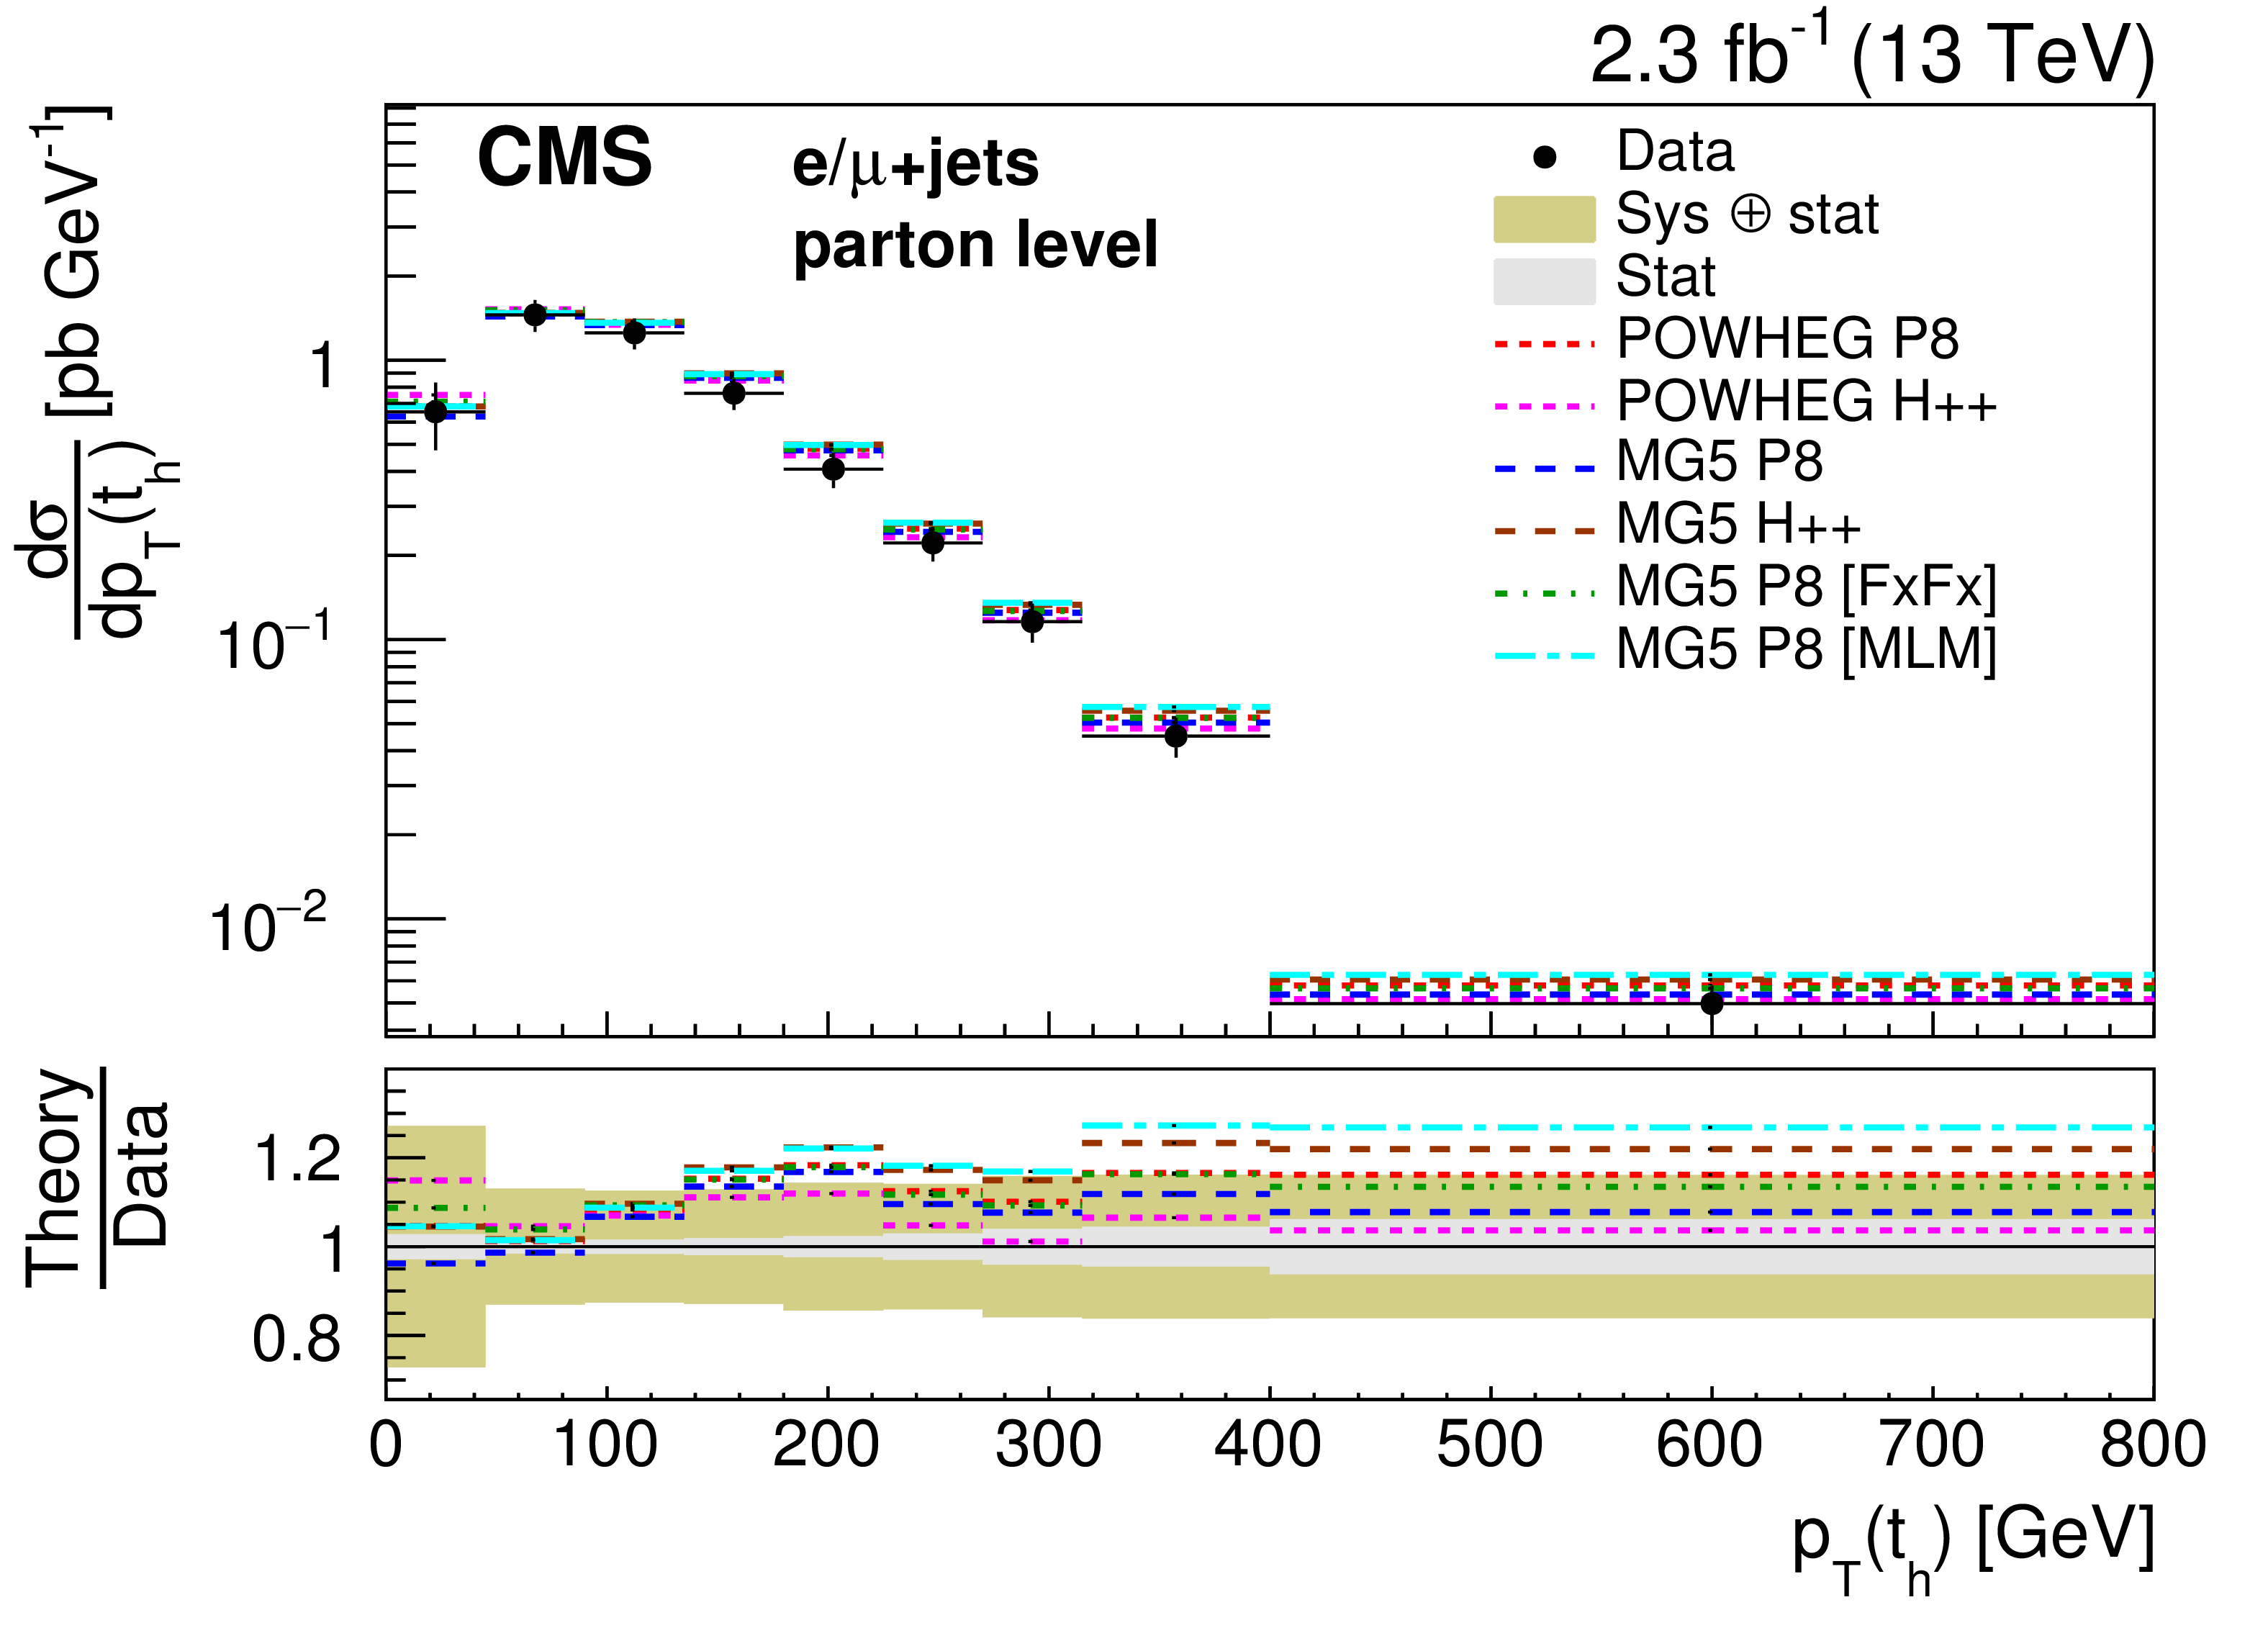
Figure 7-a:
Differential cross section at parton level as a function of $ {p_{\mathrm {T}}} (\mathrm{ t } )$ measured separately for the hadronically decaying top quarks. The cross section is compared to the predictions of POWHEG and MG5-MC@NLO (MG5) combined with PYTHIA8 (P8) or HERWIG++ (H++) and the multiparton simulations MG5-MC@NLO +PYTHIA8 MLM and MG5-MC@NLO +PYTHIA8 FxFx. The ratios of the various predictions to the measured cross section are shown at the bottom of the panel together with the statistical and systematic uncertainties of the measurement. |
png pdf |
Figure 7-b:
Differential cross section at parton level as a function of $ {p_{\mathrm {T}}} (\mathrm{ t } )$ measured separately for the leptonically decaying top quarks. The cross section is compared to the predictions of POWHEG and MG5-MC@NLO (MG5) combined with PYTHIA8 (P8) or HERWIG++ (H++) and the multiparton simulations MG5-MC@NLO +PYTHIA8 MLM and MG5-MC@NLO +PYTHIA8 FxFx. The ratios of the various predictions to the measured cross section are shown at the bottom of the panel together with the statistical and systematic uncertainties of the measurement. |
png pdf |
Figure 7-c:
Differential cross section at parton level as a function of $ {| y(\mathrm{ t } ) | }$ measured separately for the hadronically decaying top quarks. The cross section is compared to the predictions of POWHEG and MG5-MC@NLO (MG5) combined with PYTHIA8 (P8) or HERWIG++ (H++) and the multiparton simulations MG5-MC@NLO +PYTHIA8 MLM and MG5-MC@NLO +PYTHIA8 FxFx. The ratios of the various predictions to the measured cross section are shown at the bottom of the panel together with the statistical and systematic uncertainties of the measurement. |
png pdf |
Figure 7-d:
Differential cross section at parton level as a function of $ {| y(\mathrm{ t } ) | }$ measured separately for the leptonically decaying top quarks. The cross section is compared to the predictions of POWHEG and MG5-MC@NLO (MG5) combined with PYTHIA8 (P8) or HERWIG++ (H++) and the multiparton simulations MG5-MC@NLO +PYTHIA8 MLM and MG5-MC@NLO +PYTHIA8 FxFx. The ratios of the various predictions to the measured cross section are shown at the bottom of the panel together with the statistical and systematic uncertainties of the measurement. |
png pdf |
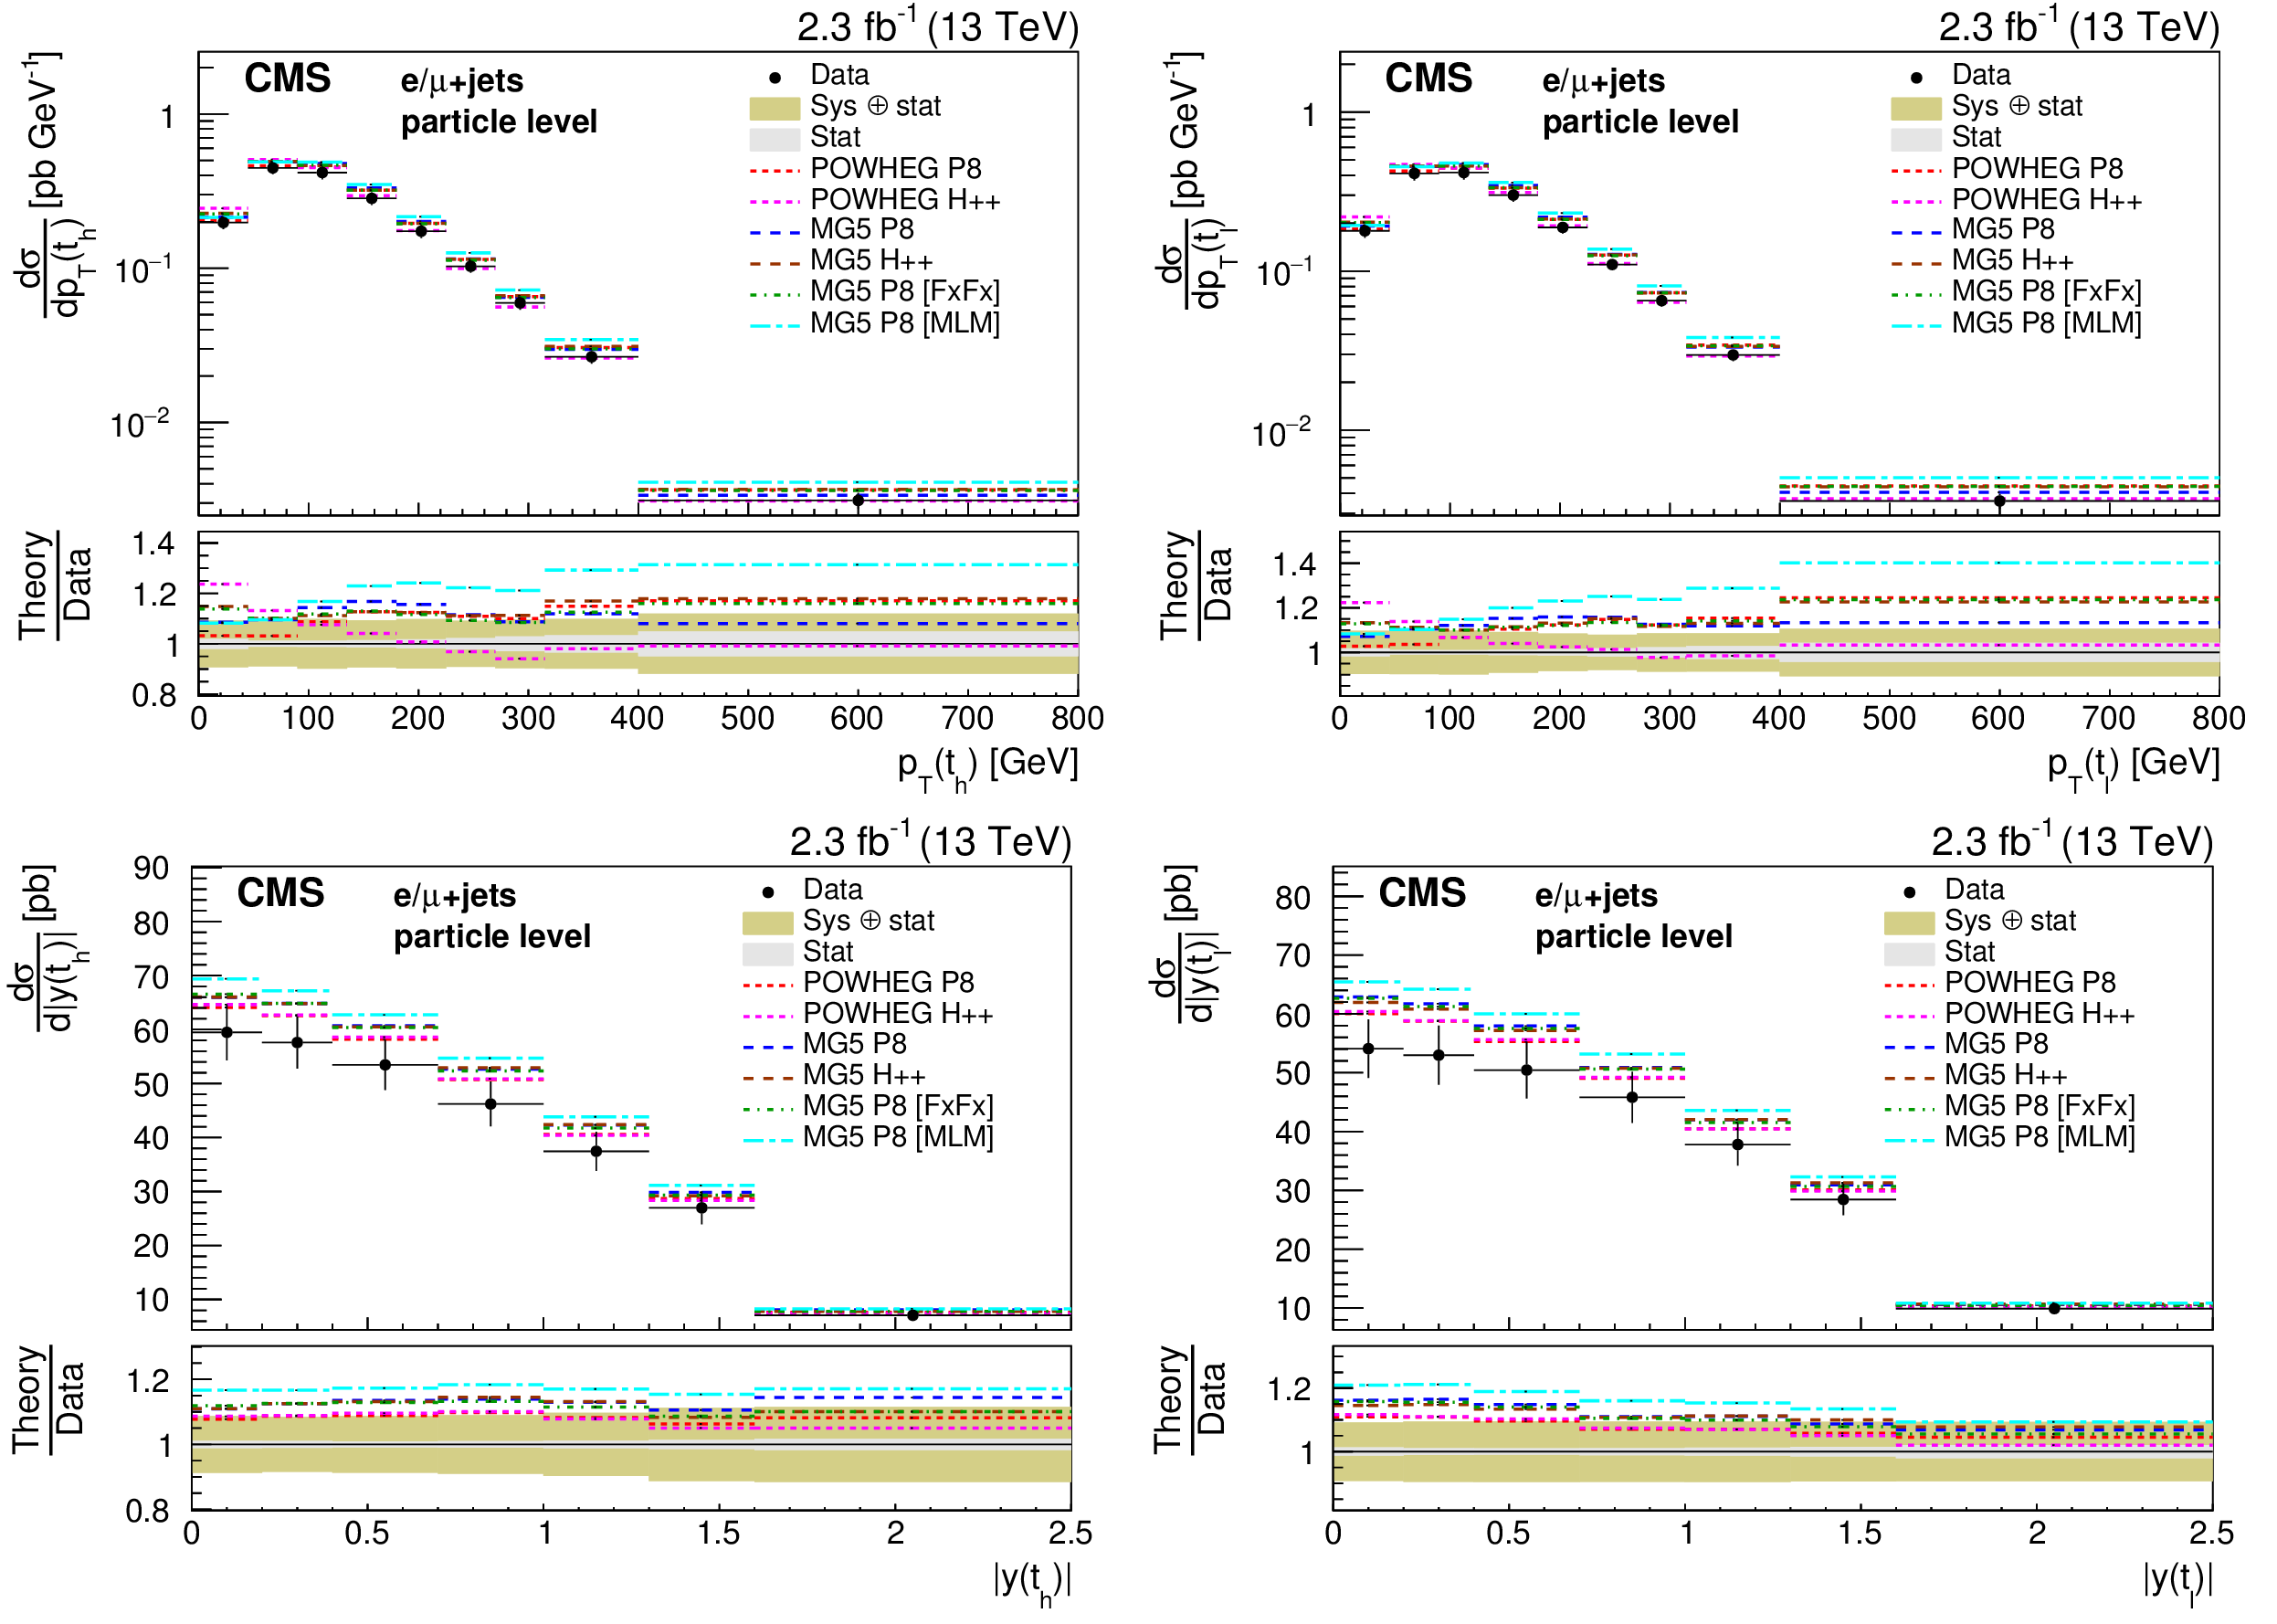
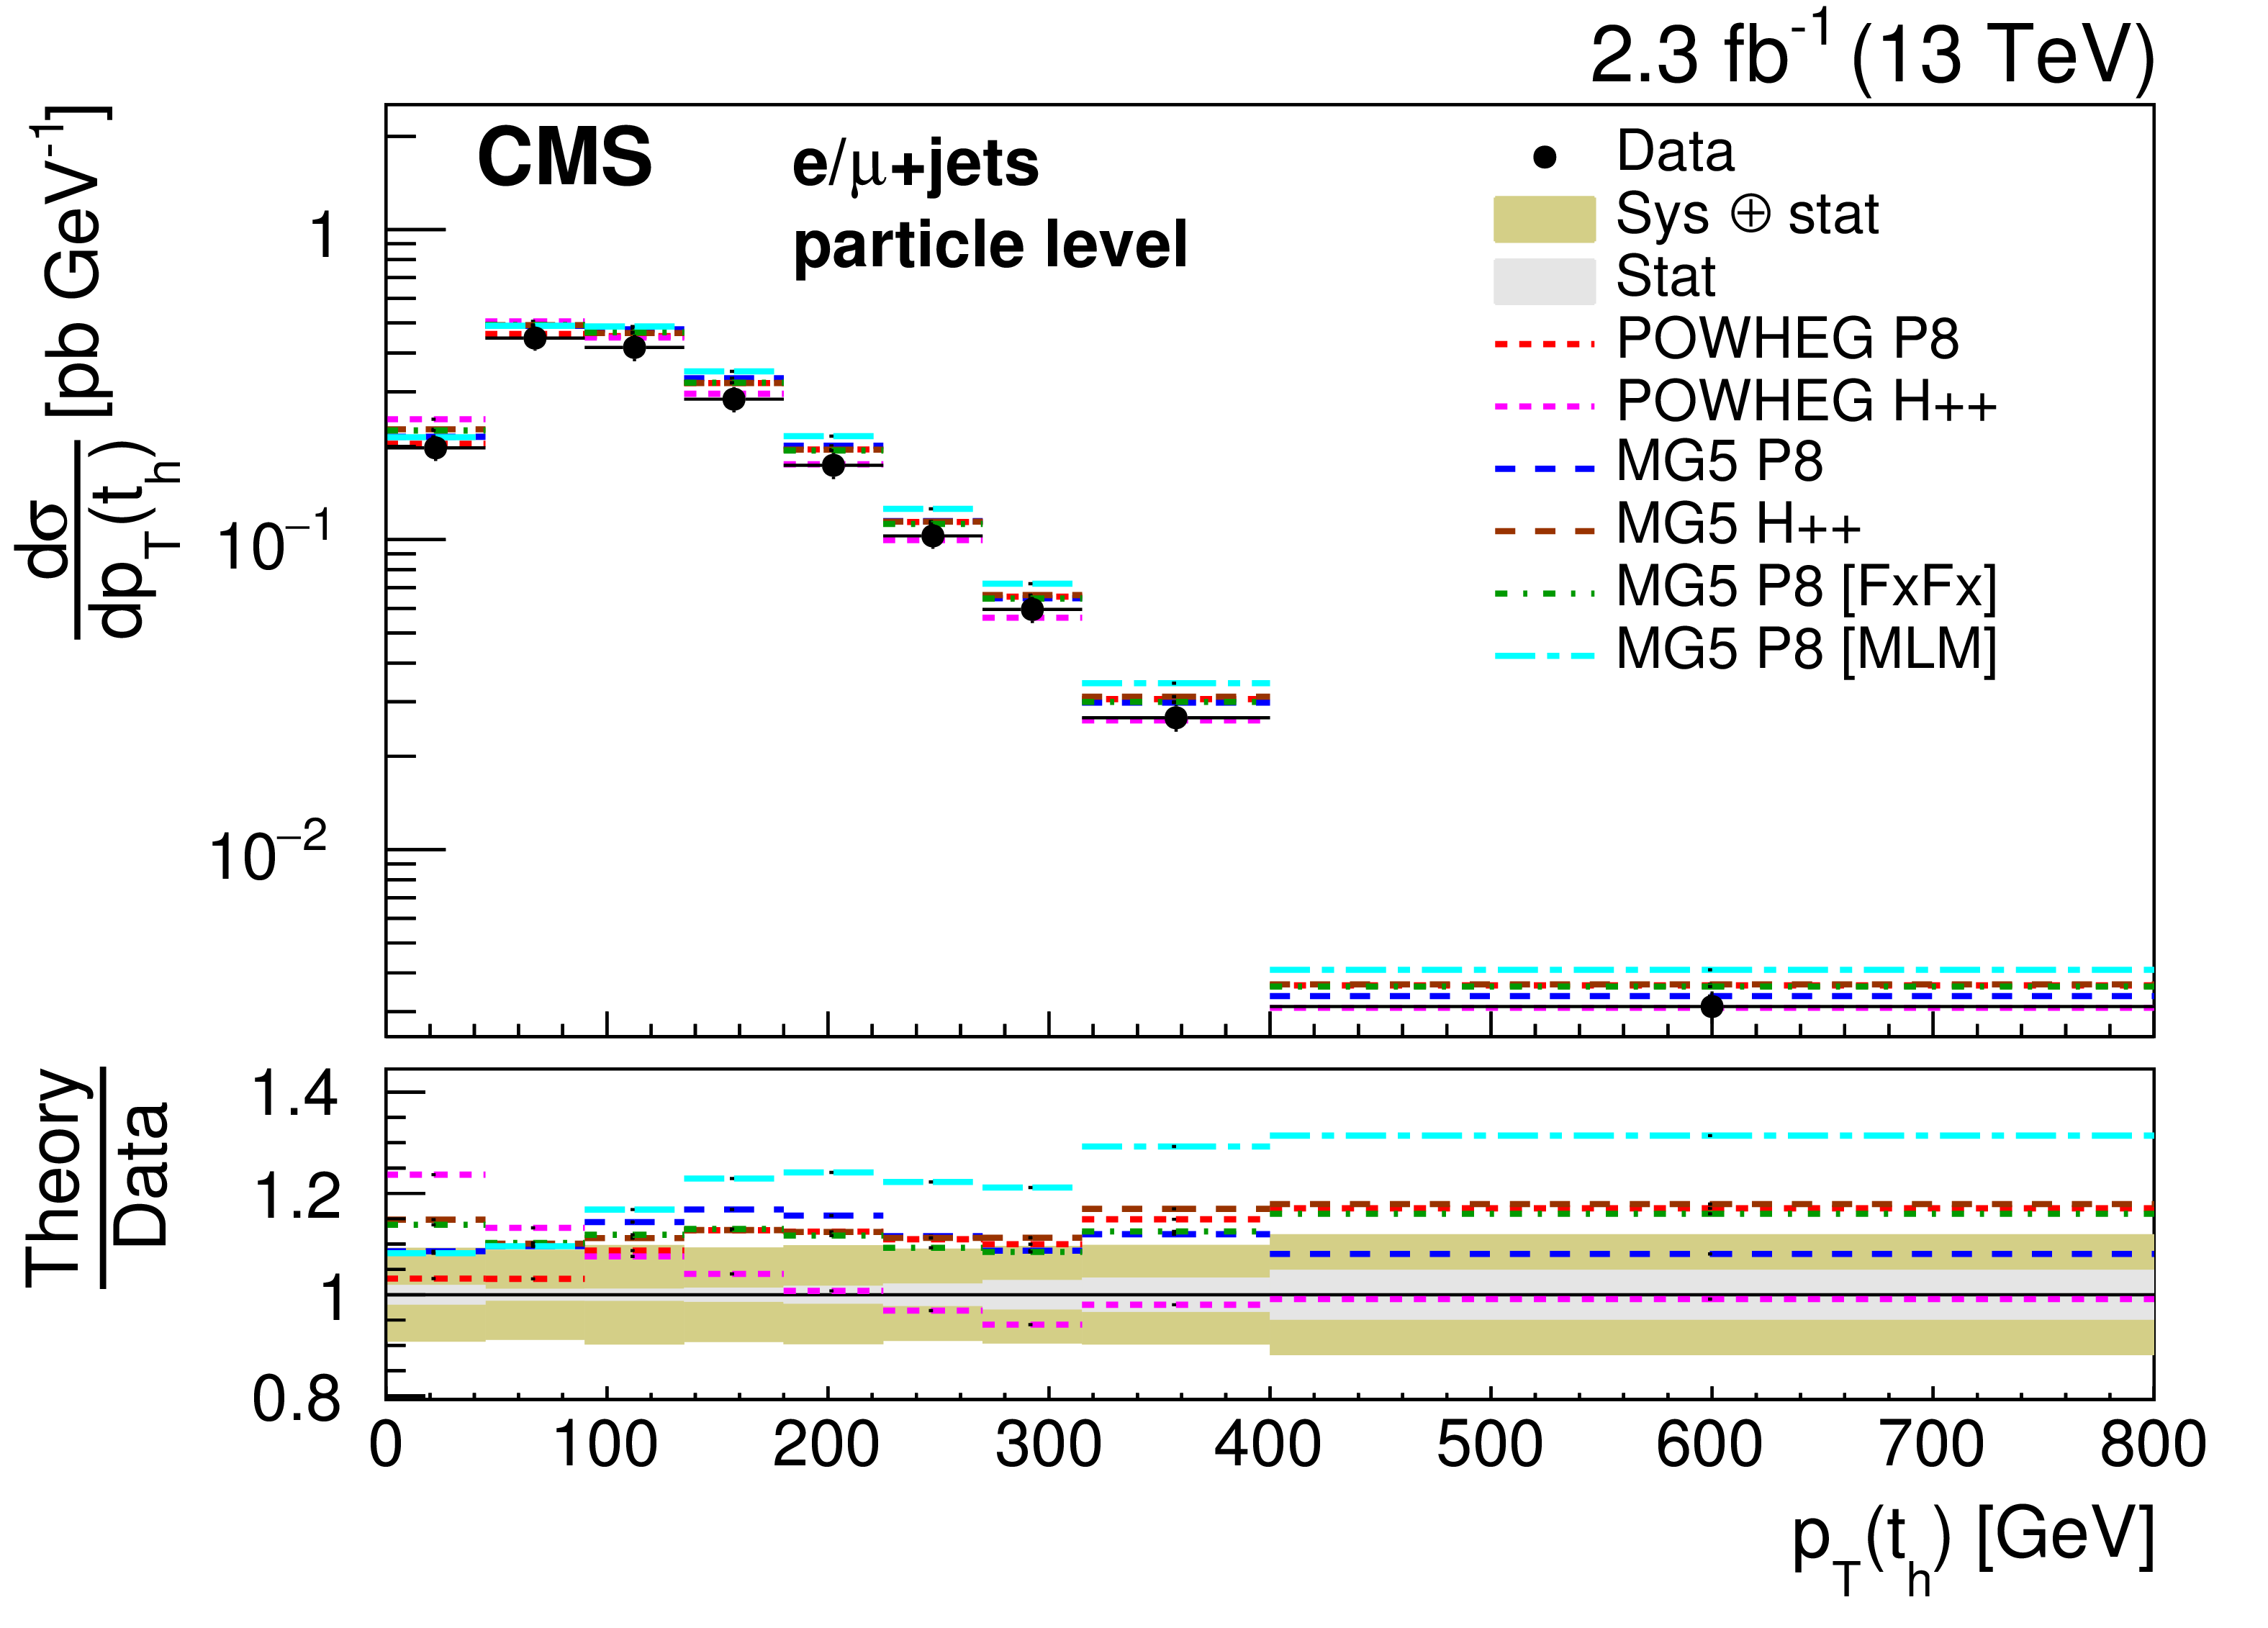
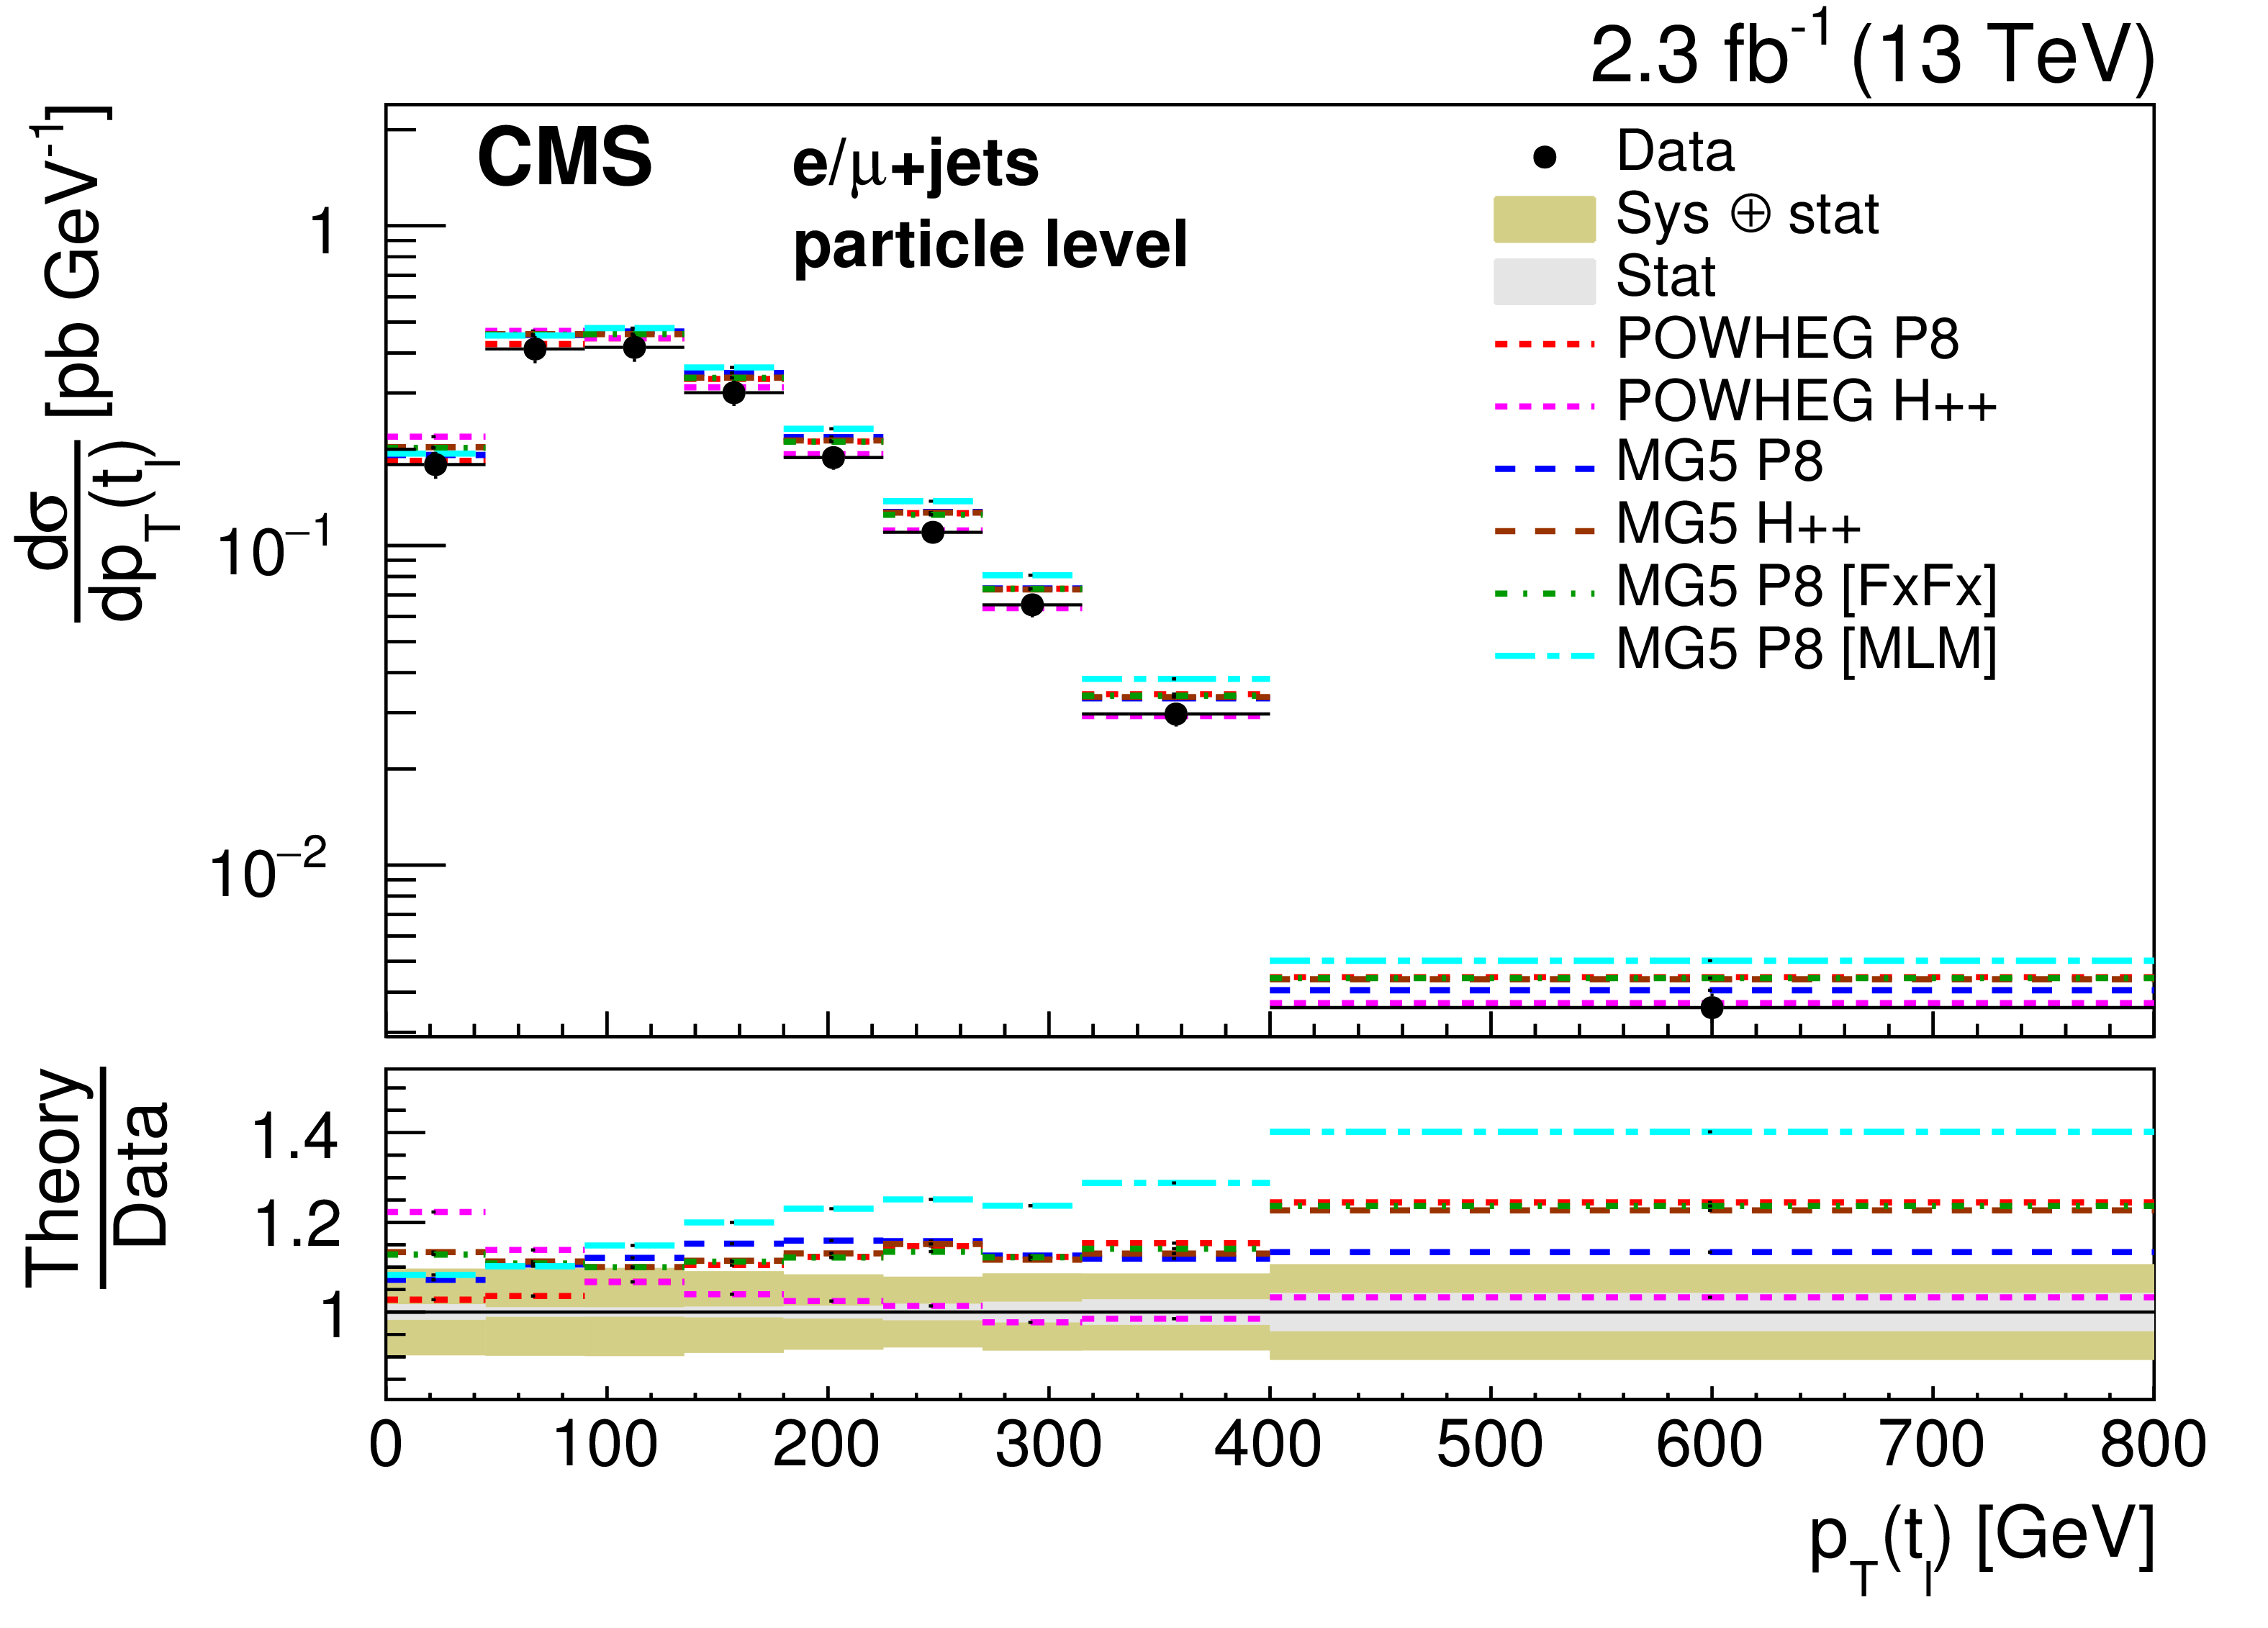
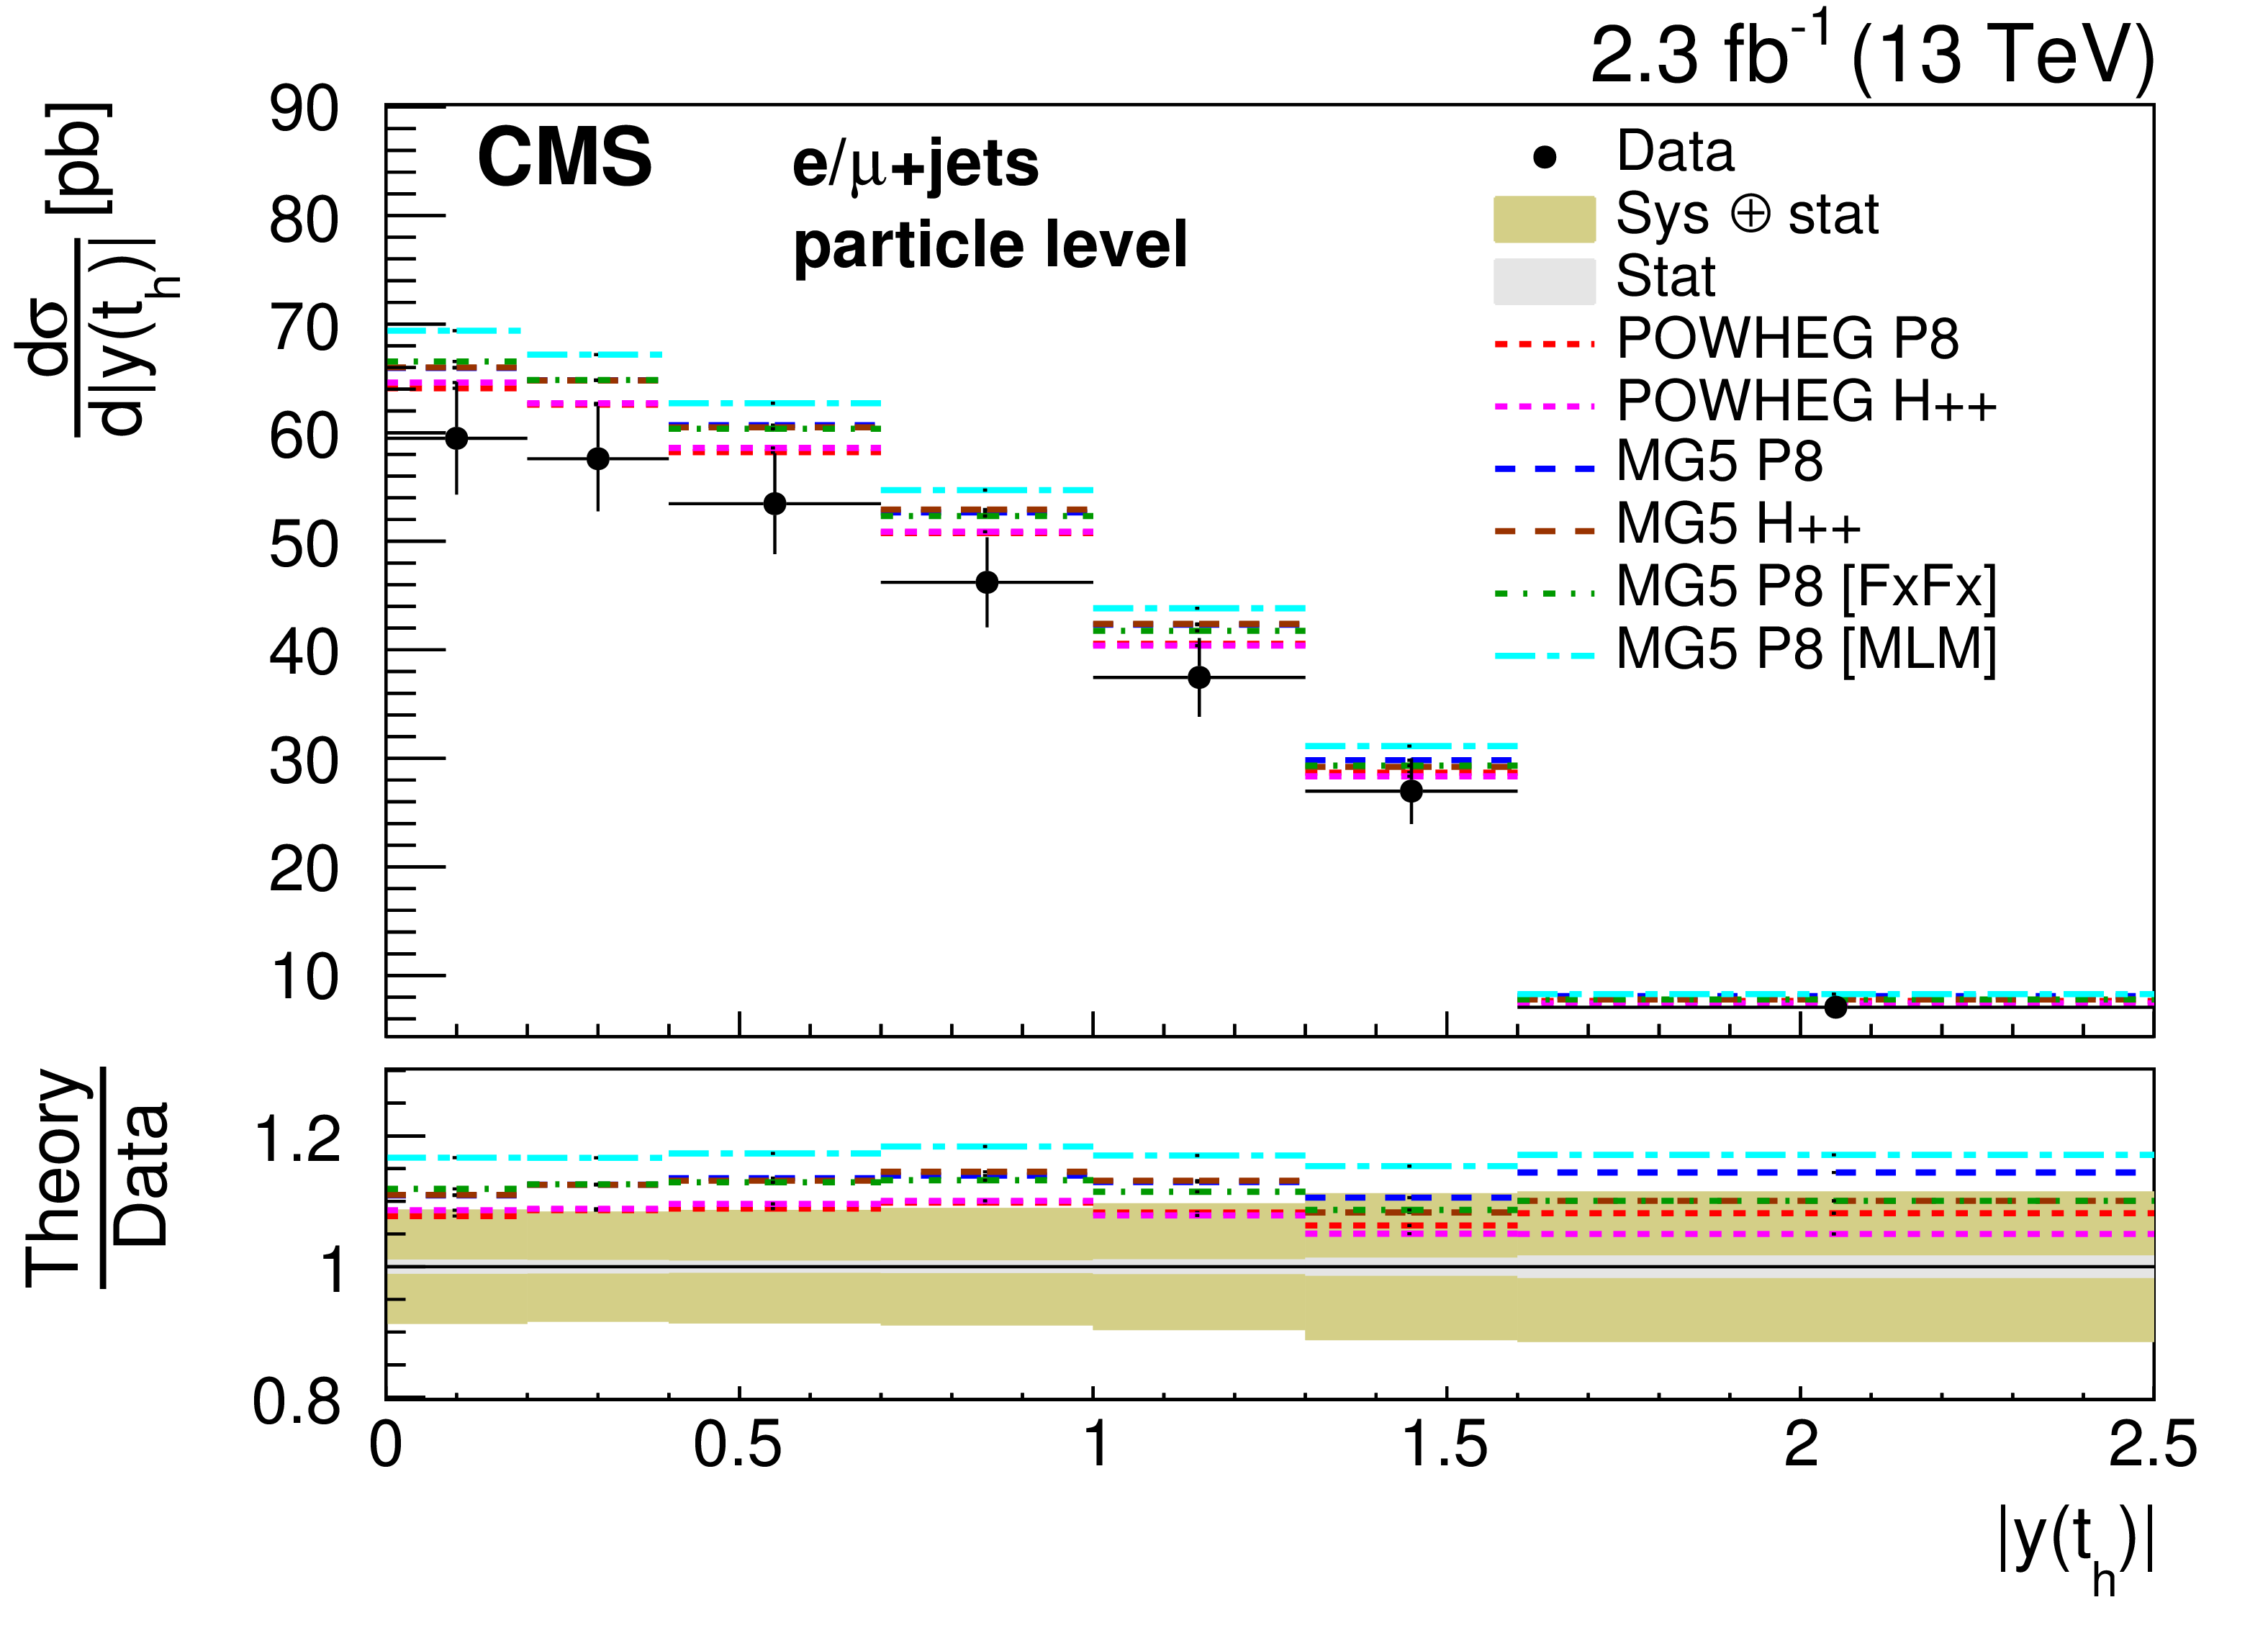
Figure 8:
Differential cross sections at particle level as a function of $ {p_{\mathrm {T}}} (\mathrm{ t } )$ (top) and $ {| y(\mathrm{ t } ) | }$ (bottom) measured separately for the hadronically (left) and leptonically (right) decaying particle-level top quarks. The cross sections are compared to the predictions of POWHEG and MG5-MC@NLO (MG5) combined with PYTHIA8 (P8) or HERWIG++ (H++) and the multiparton simulations MG5-MC@NLO +PYTHIA8 MLM and MG5-MC@NLO +PYTHIA8 FxFx. The ratios of the various predictions to the measured cross sections are shown at the bottom of each panel together with the statistical and systematic uncertainties of the measurement. |
png pdf |
Figure 8-a:
Differential cross section at particle level as a function of $ {p_{\mathrm {T}}} (\mathrm{ t } )$ measured separately for the hadronically decaying particle-level top quarks. The cross section is compared to the predictions of POWHEG and MG5-MC@NLO (MG5) combined with PYTHIA8 (P8) or HERWIG++ (H++) and the multiparton simulations MG5-MC@NLO +PYTHIA8 MLM and MG5-MC@NLO +PYTHIA8 FxFx. The ratios of the various predictions to the measured cross sections are shown at the bottom of the panel together with the statistical and systematic uncertainties of the measurement. |
png pdf |
Figure 8-b:
Differential cross section at particle level as a function of $ {p_{\mathrm {T}}} (\mathrm{ t } )$ measured separately for the leptonically decaying particle-level top quarks. The cross section is compared to the predictions of POWHEG and MG5-MC@NLO (MG5) combined with PYTHIA8 (P8) or HERWIG++ (H++) and the multiparton simulations MG5-MC@NLO +PYTHIA8 MLM and MG5-MC@NLO +PYTHIA8 FxFx. The ratios of the various predictions to the measured cross sections are shown at the bottom of the panel together with the statistical and systematic uncertainties of the measurement. |
png pdf |
Figure 8-c:
Differential cross section at particle level as a function of $ {| y(\mathrm{ t } ) | }$ measured separately for the hadronically decaying particle-level top quarks. The cross section is compared to the predictions of POWHEG and MG5-MC@NLO (MG5) combined with PYTHIA8 (P8) or HERWIG++ (H++) and the multiparton simulations MG5-MC@NLO +PYTHIA8 MLM and MG5-MC@NLO +PYTHIA8 FxFx. The ratios of the various predictions to the measured cross sections are shown at the bottom of the panel together with the statistical and systematic uncertainties of the measurement. |

png pdf |
Figure 8-d:
Differential cross section at particle level as a function of $ {| y(\mathrm{ t } ) | }$ measured separately for the leptonically decaying particle-level top quarks. The cross section is compared to the predictions of POWHEG and MG5-MC@NLO (MG5) combined with PYTHIA8 (P8) or HERWIG++ (H++) and the multiparton simulations MG5-MC@NLO +PYTHIA8 MLM and MG5-MC@NLO +PYTHIA8 FxFx. The ratios of the various predictions to the measured cross sections are shown at the bottom of the panel together with the statistical and systematic uncertainties of the measurement. |
png pdf |
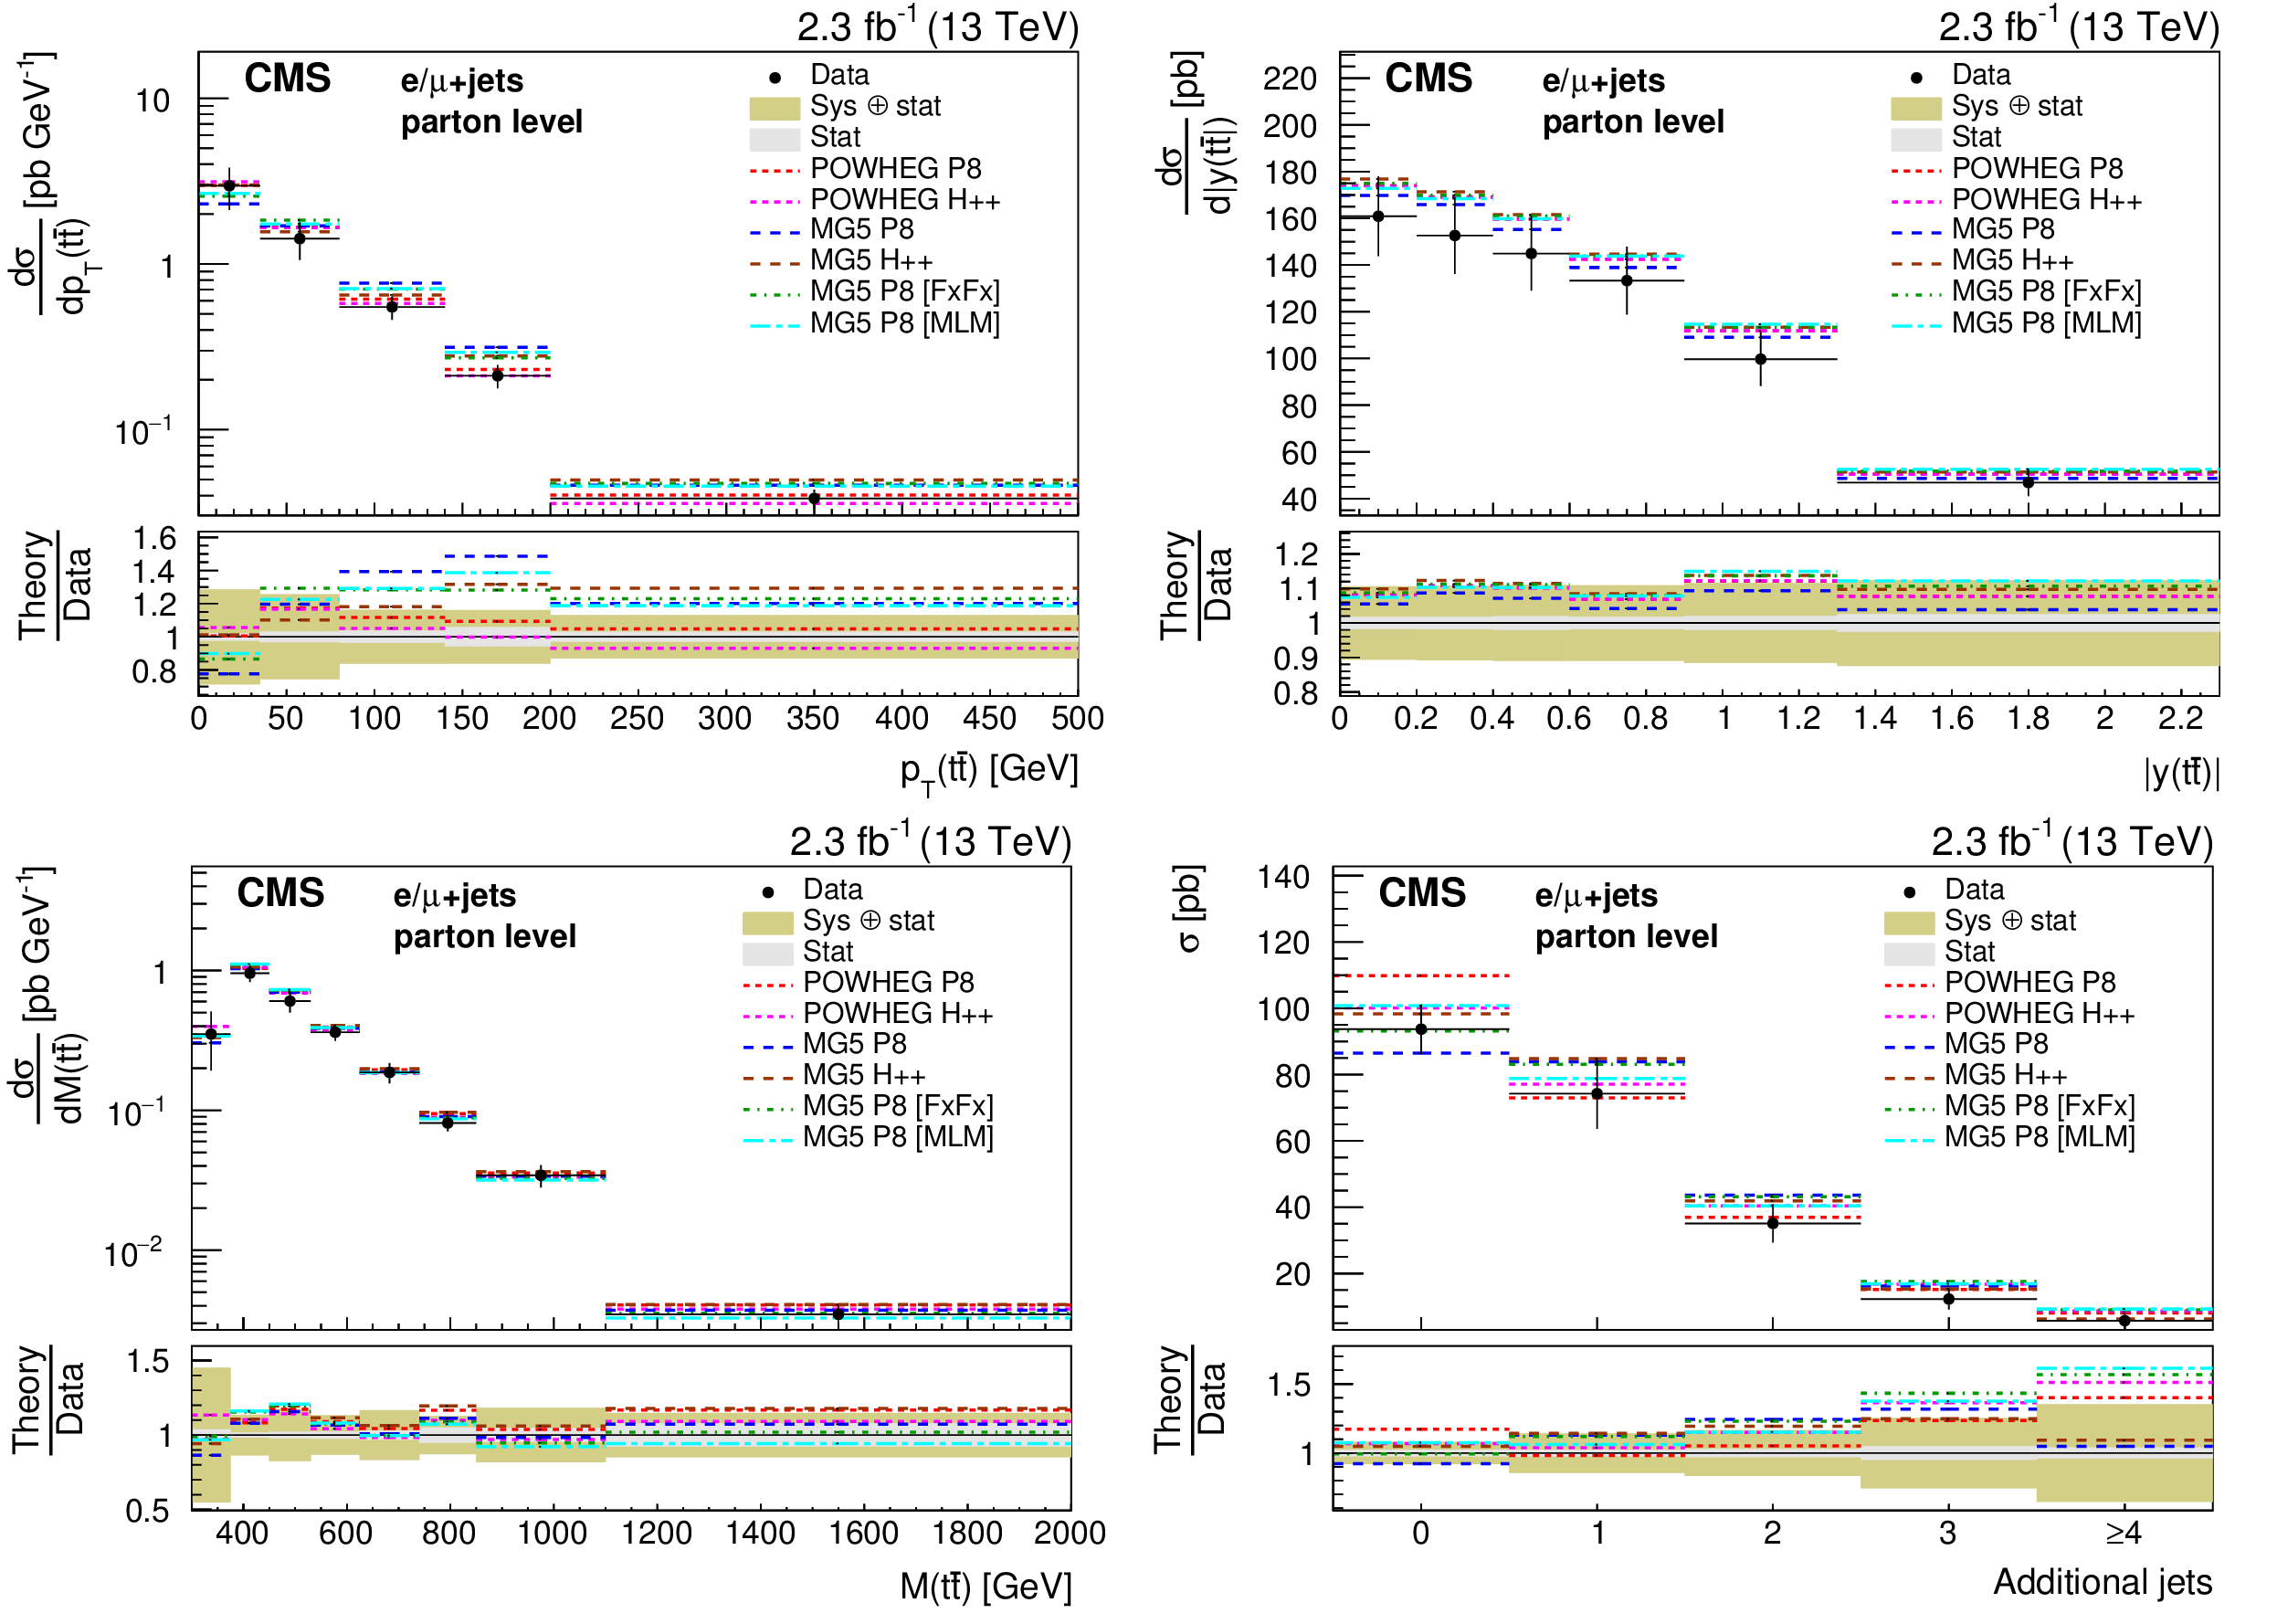
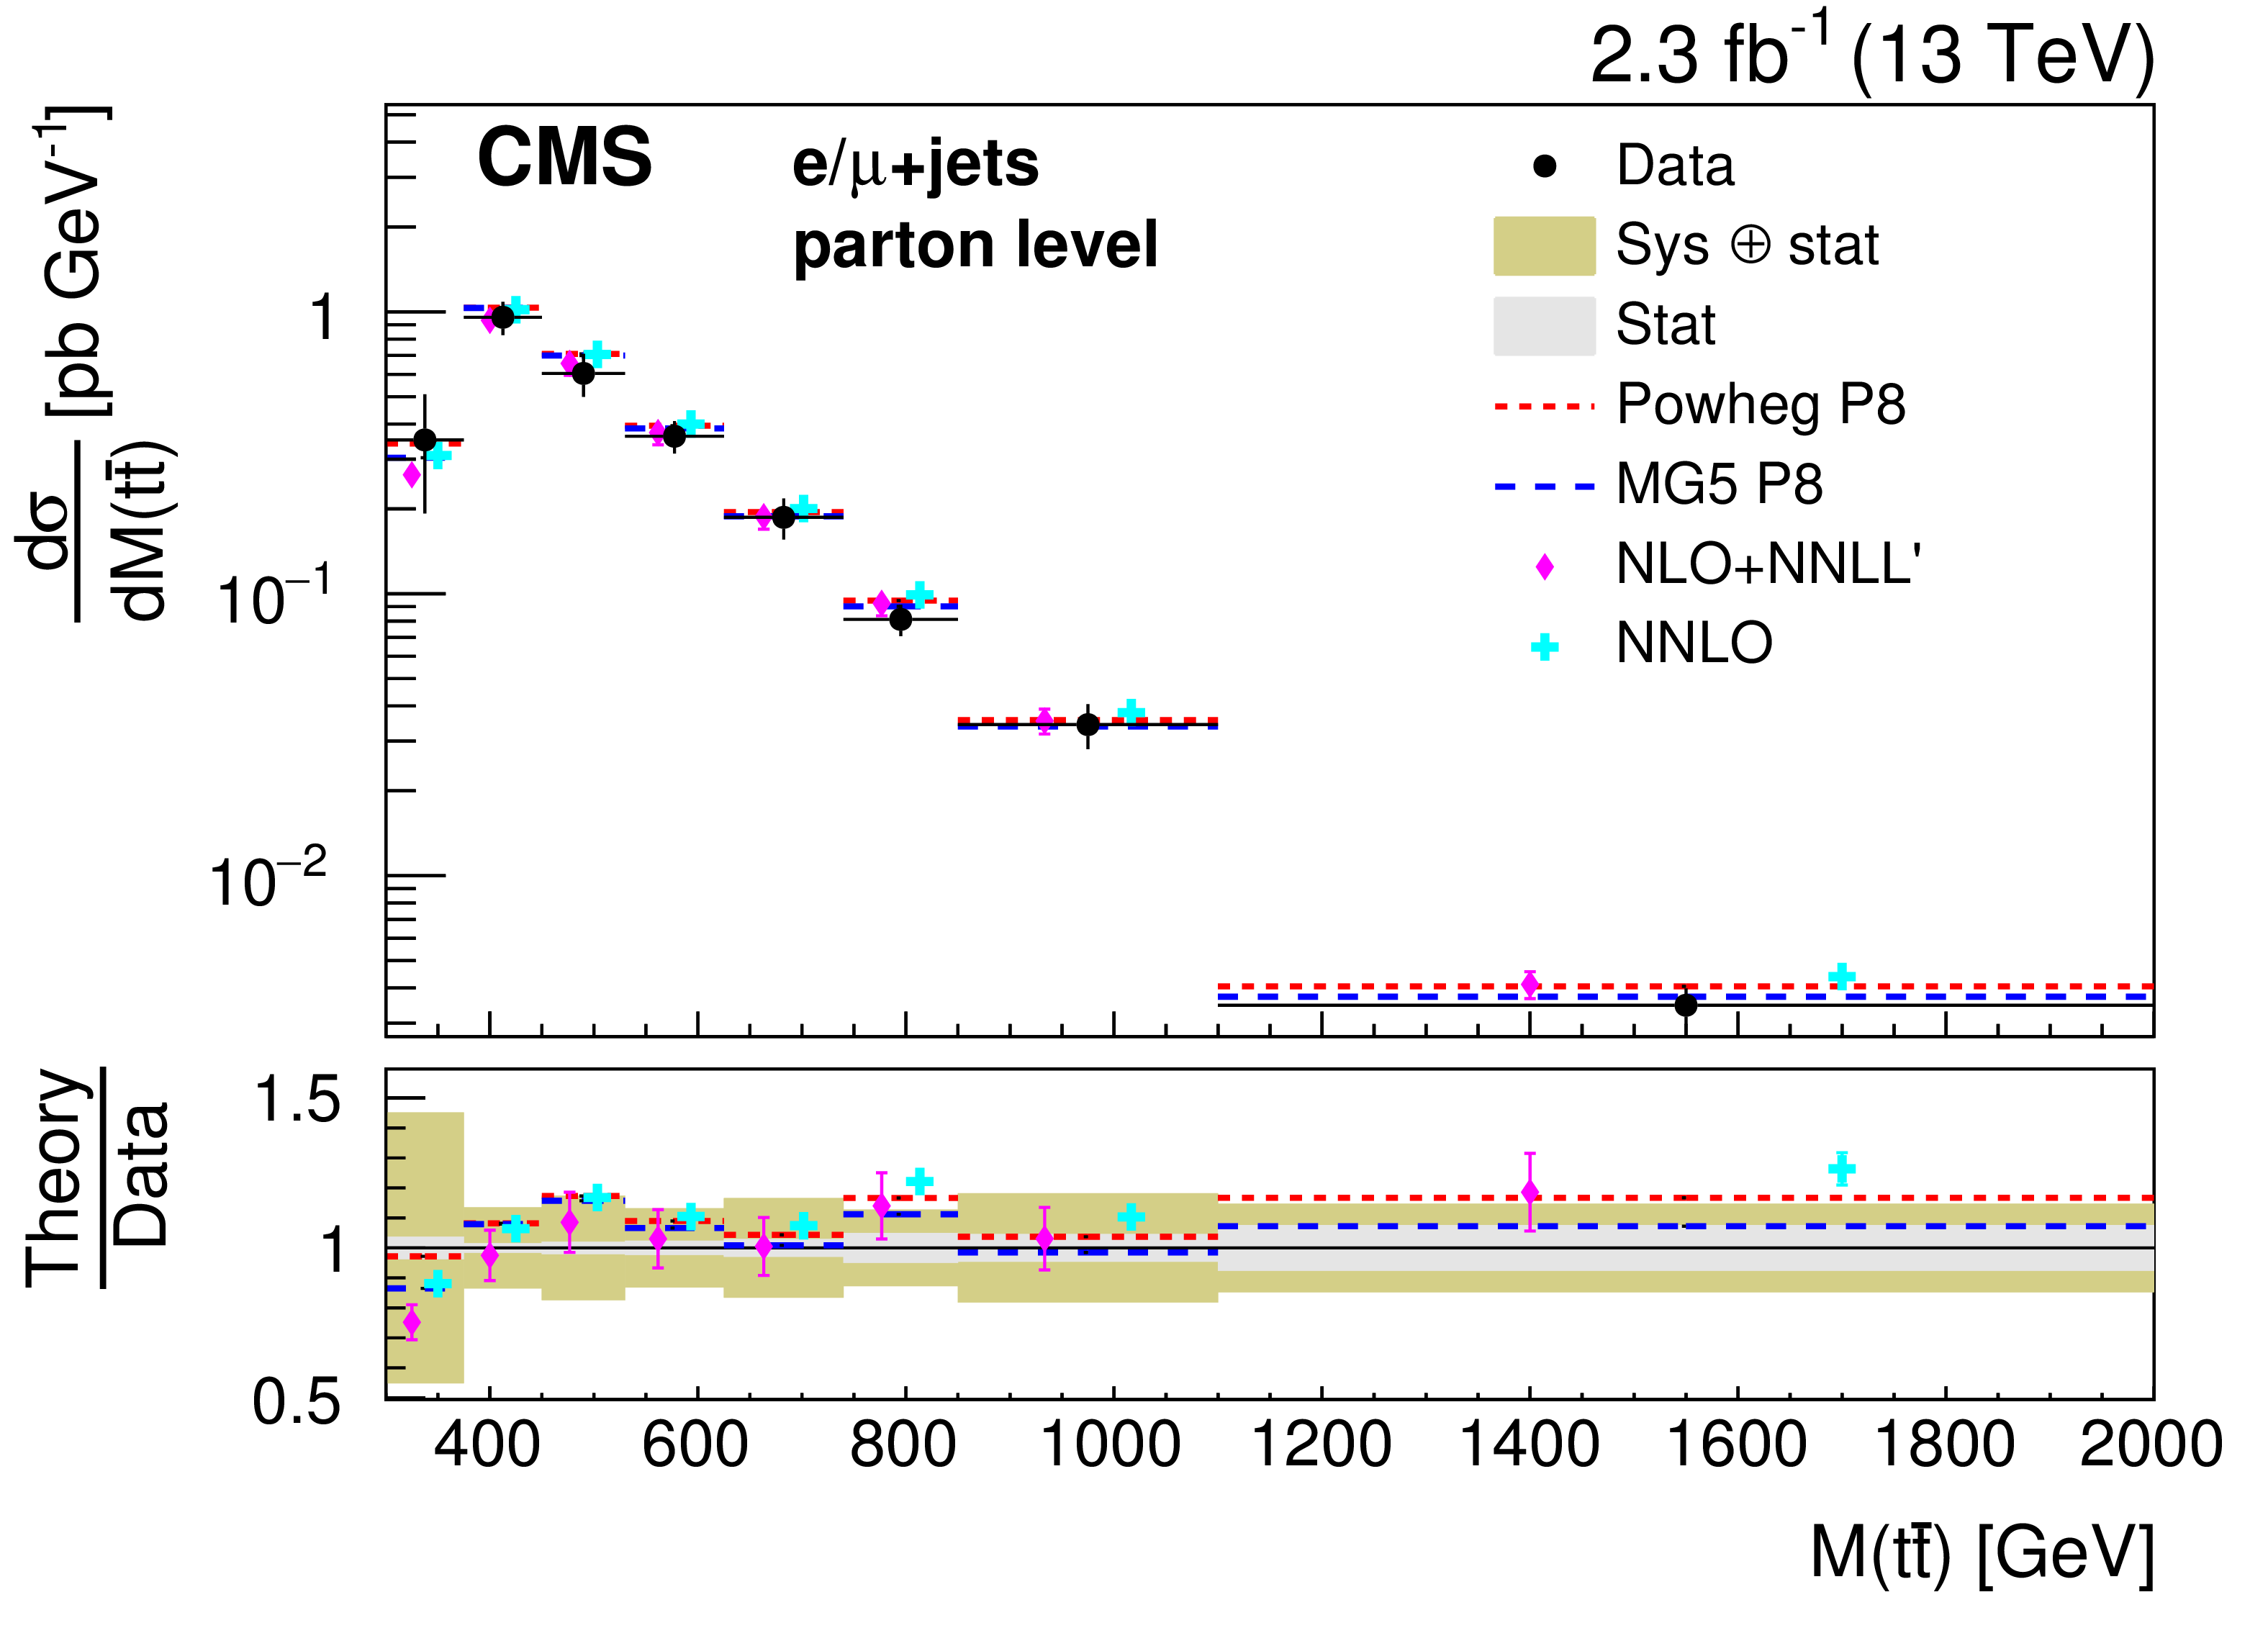
Figure 9:
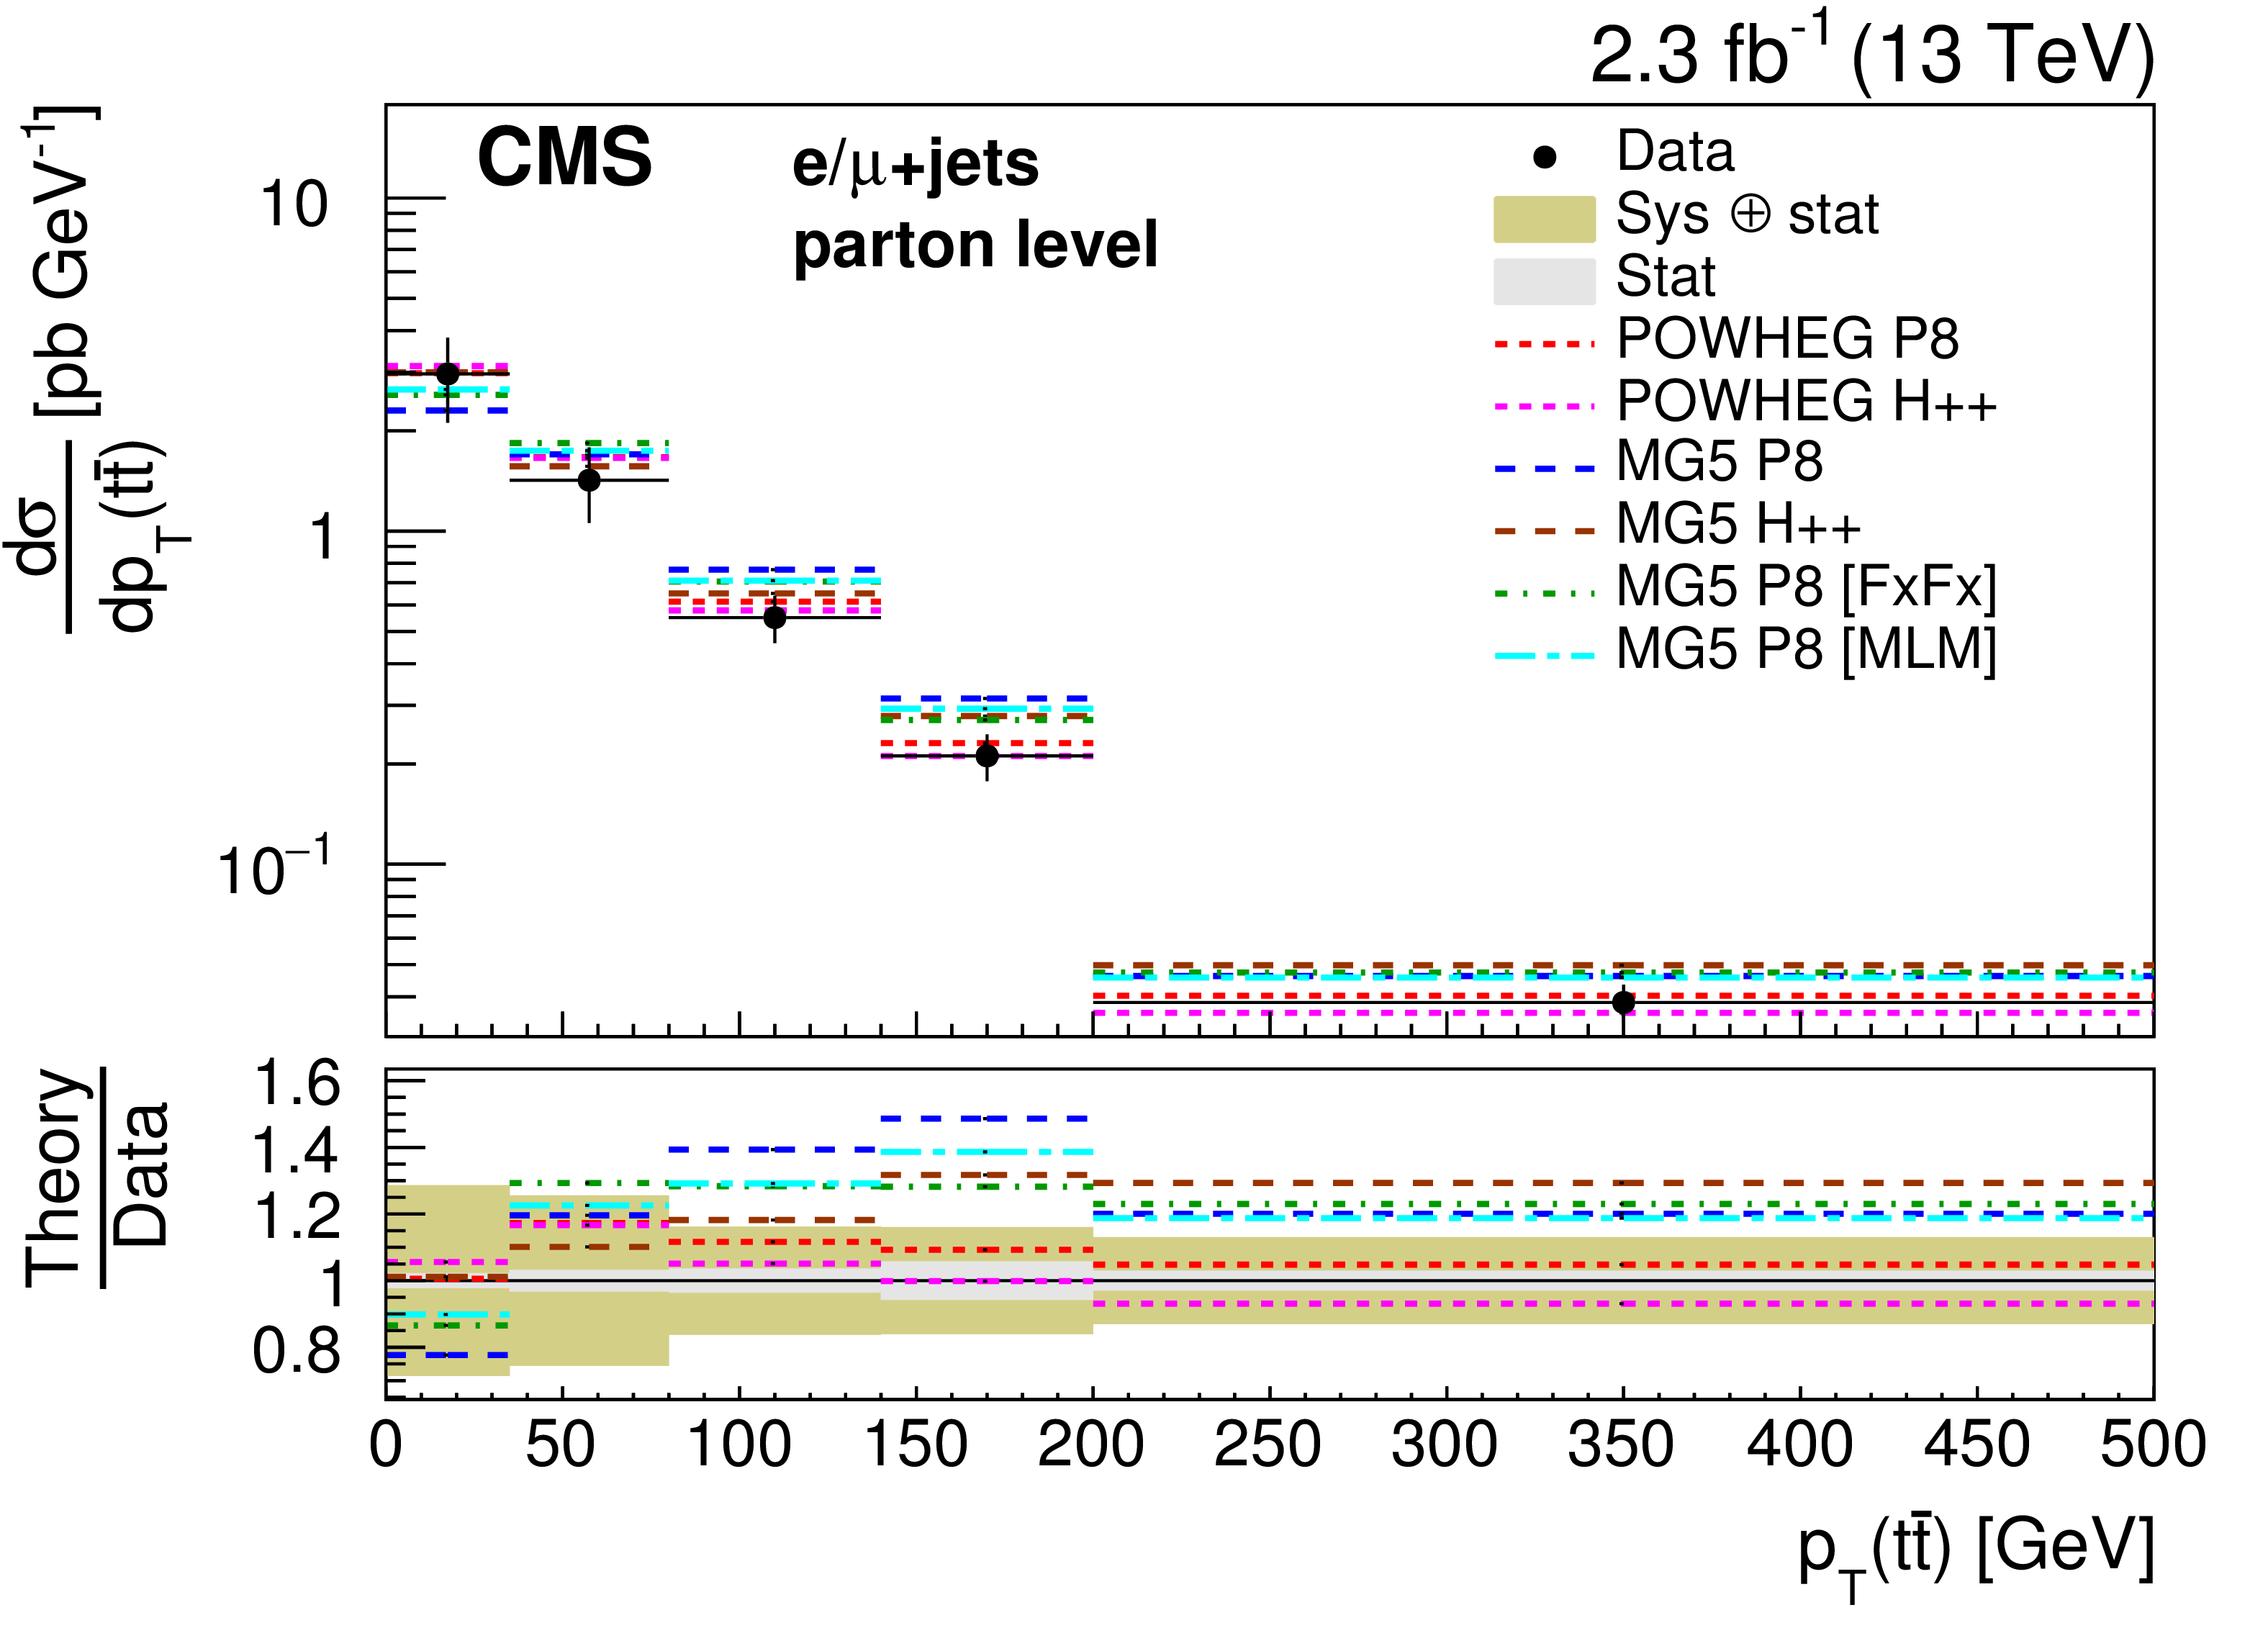
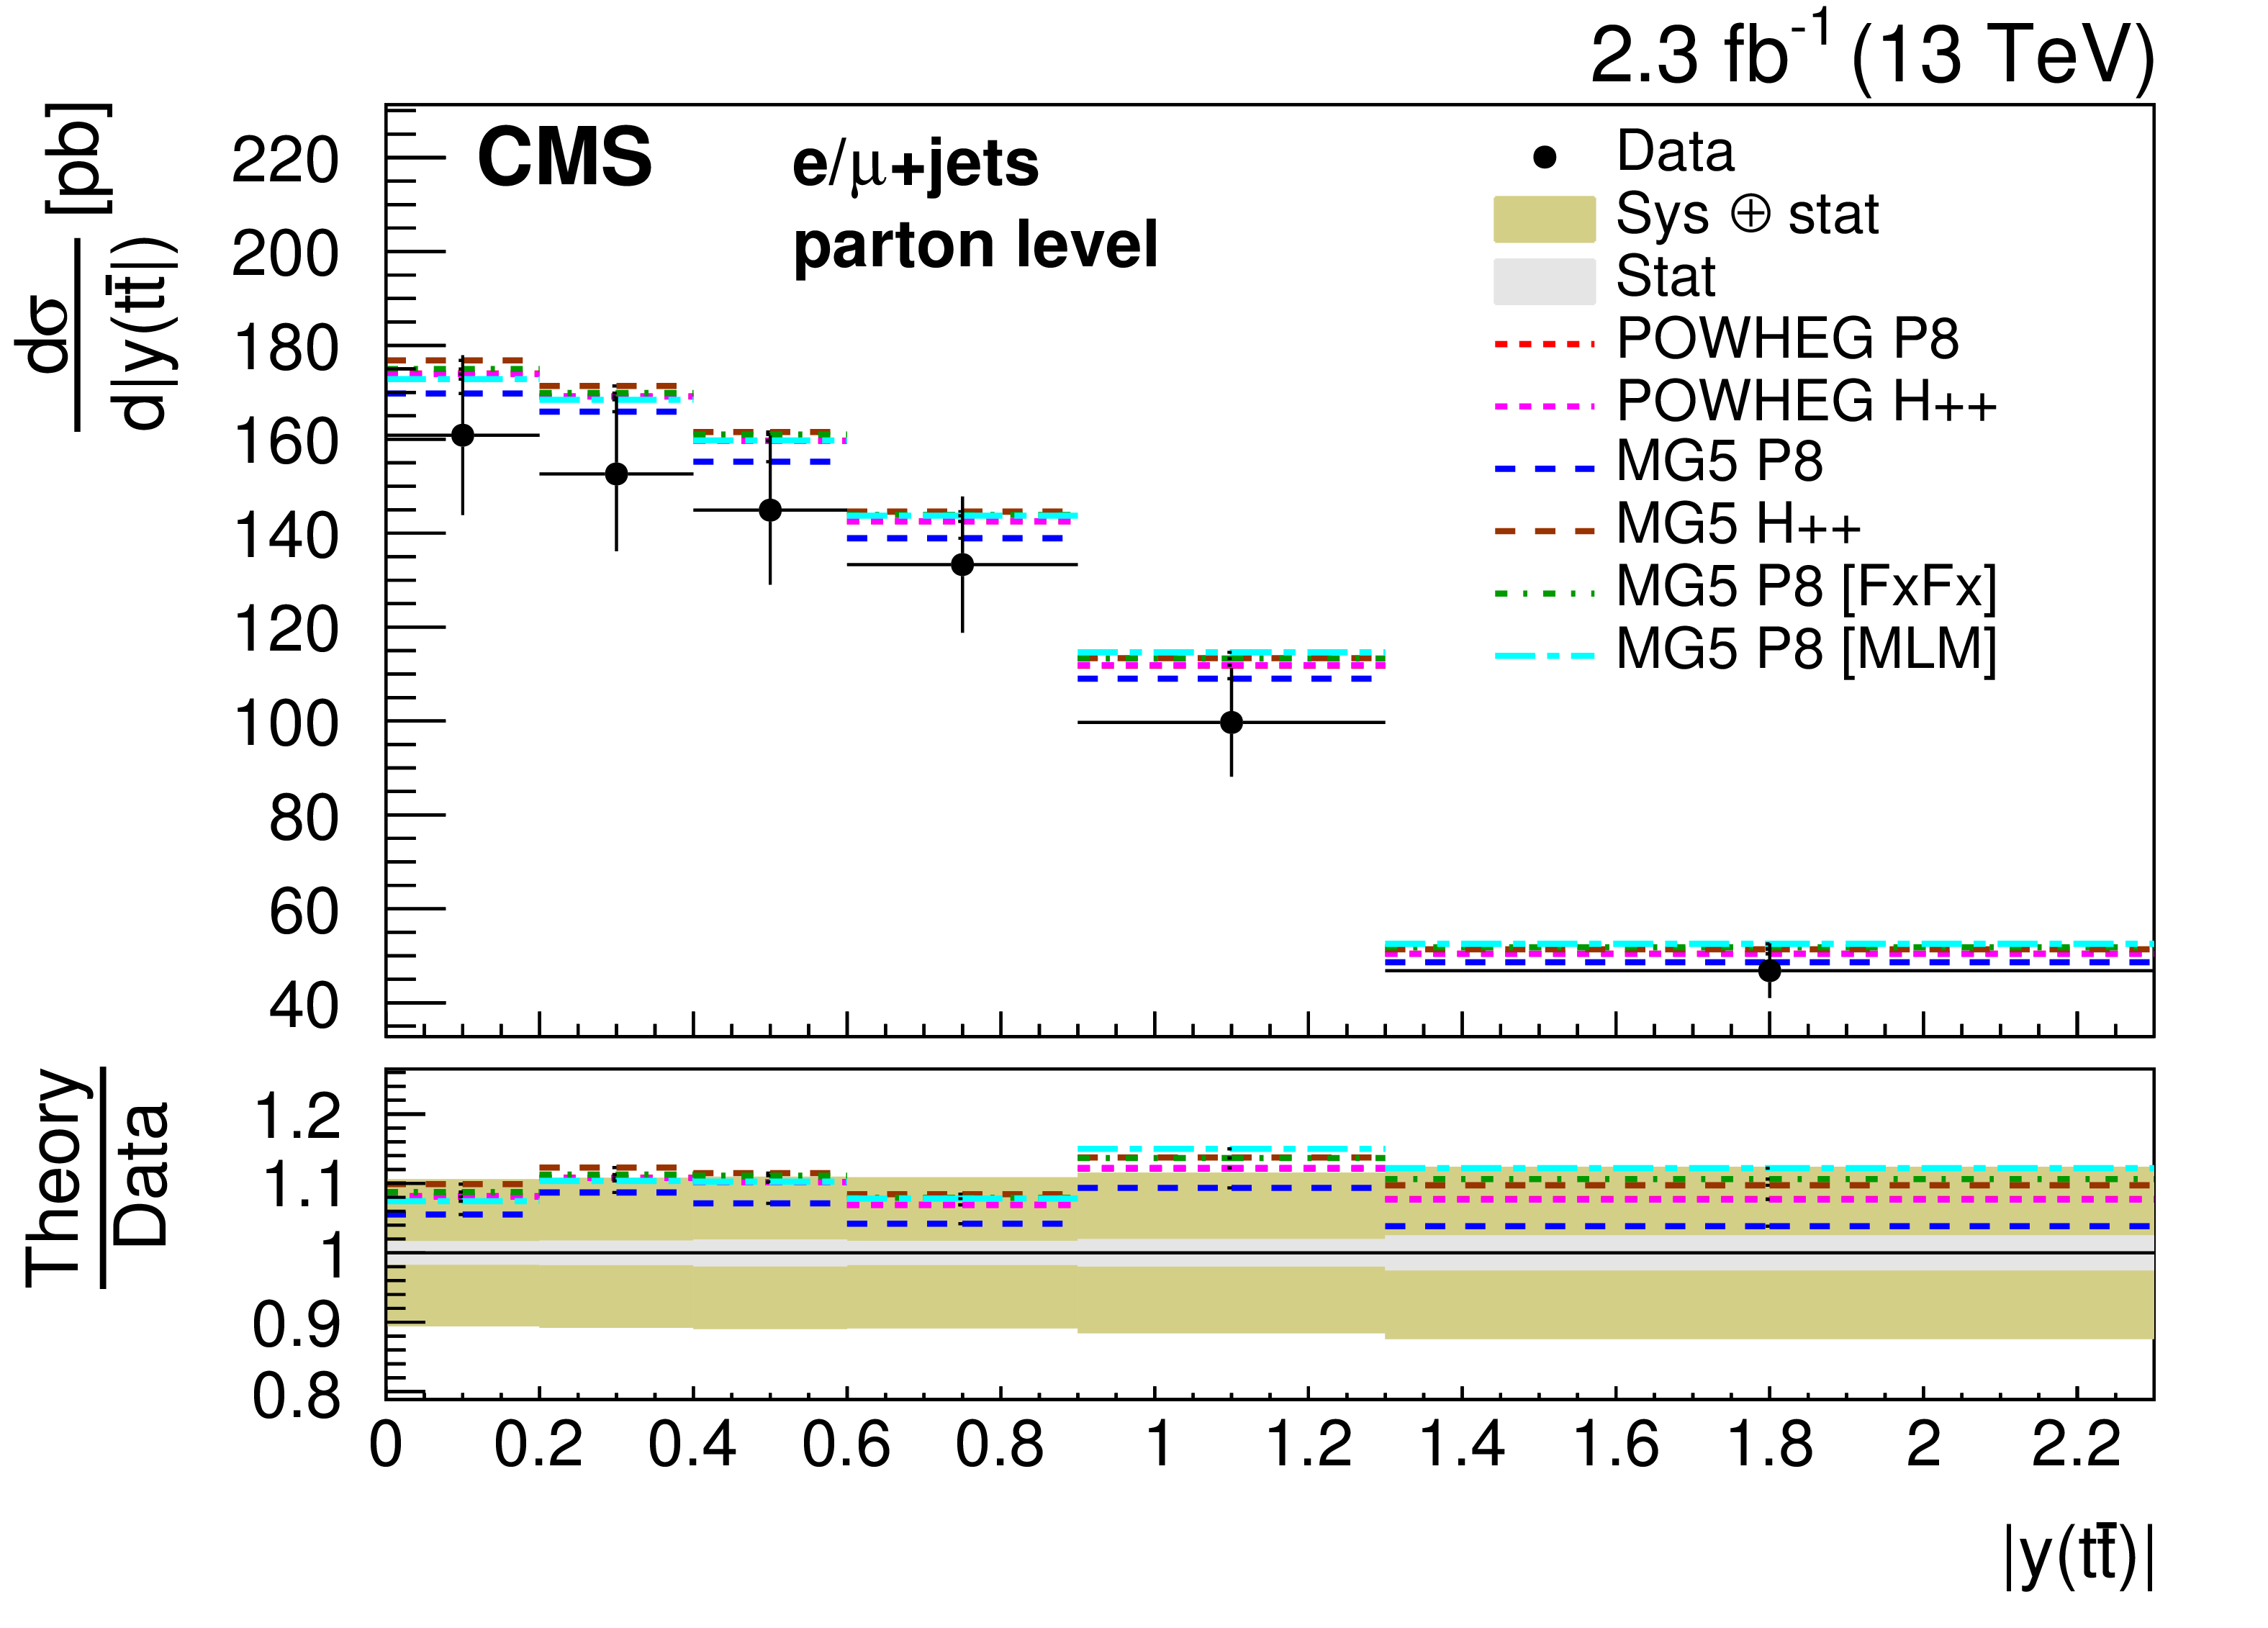
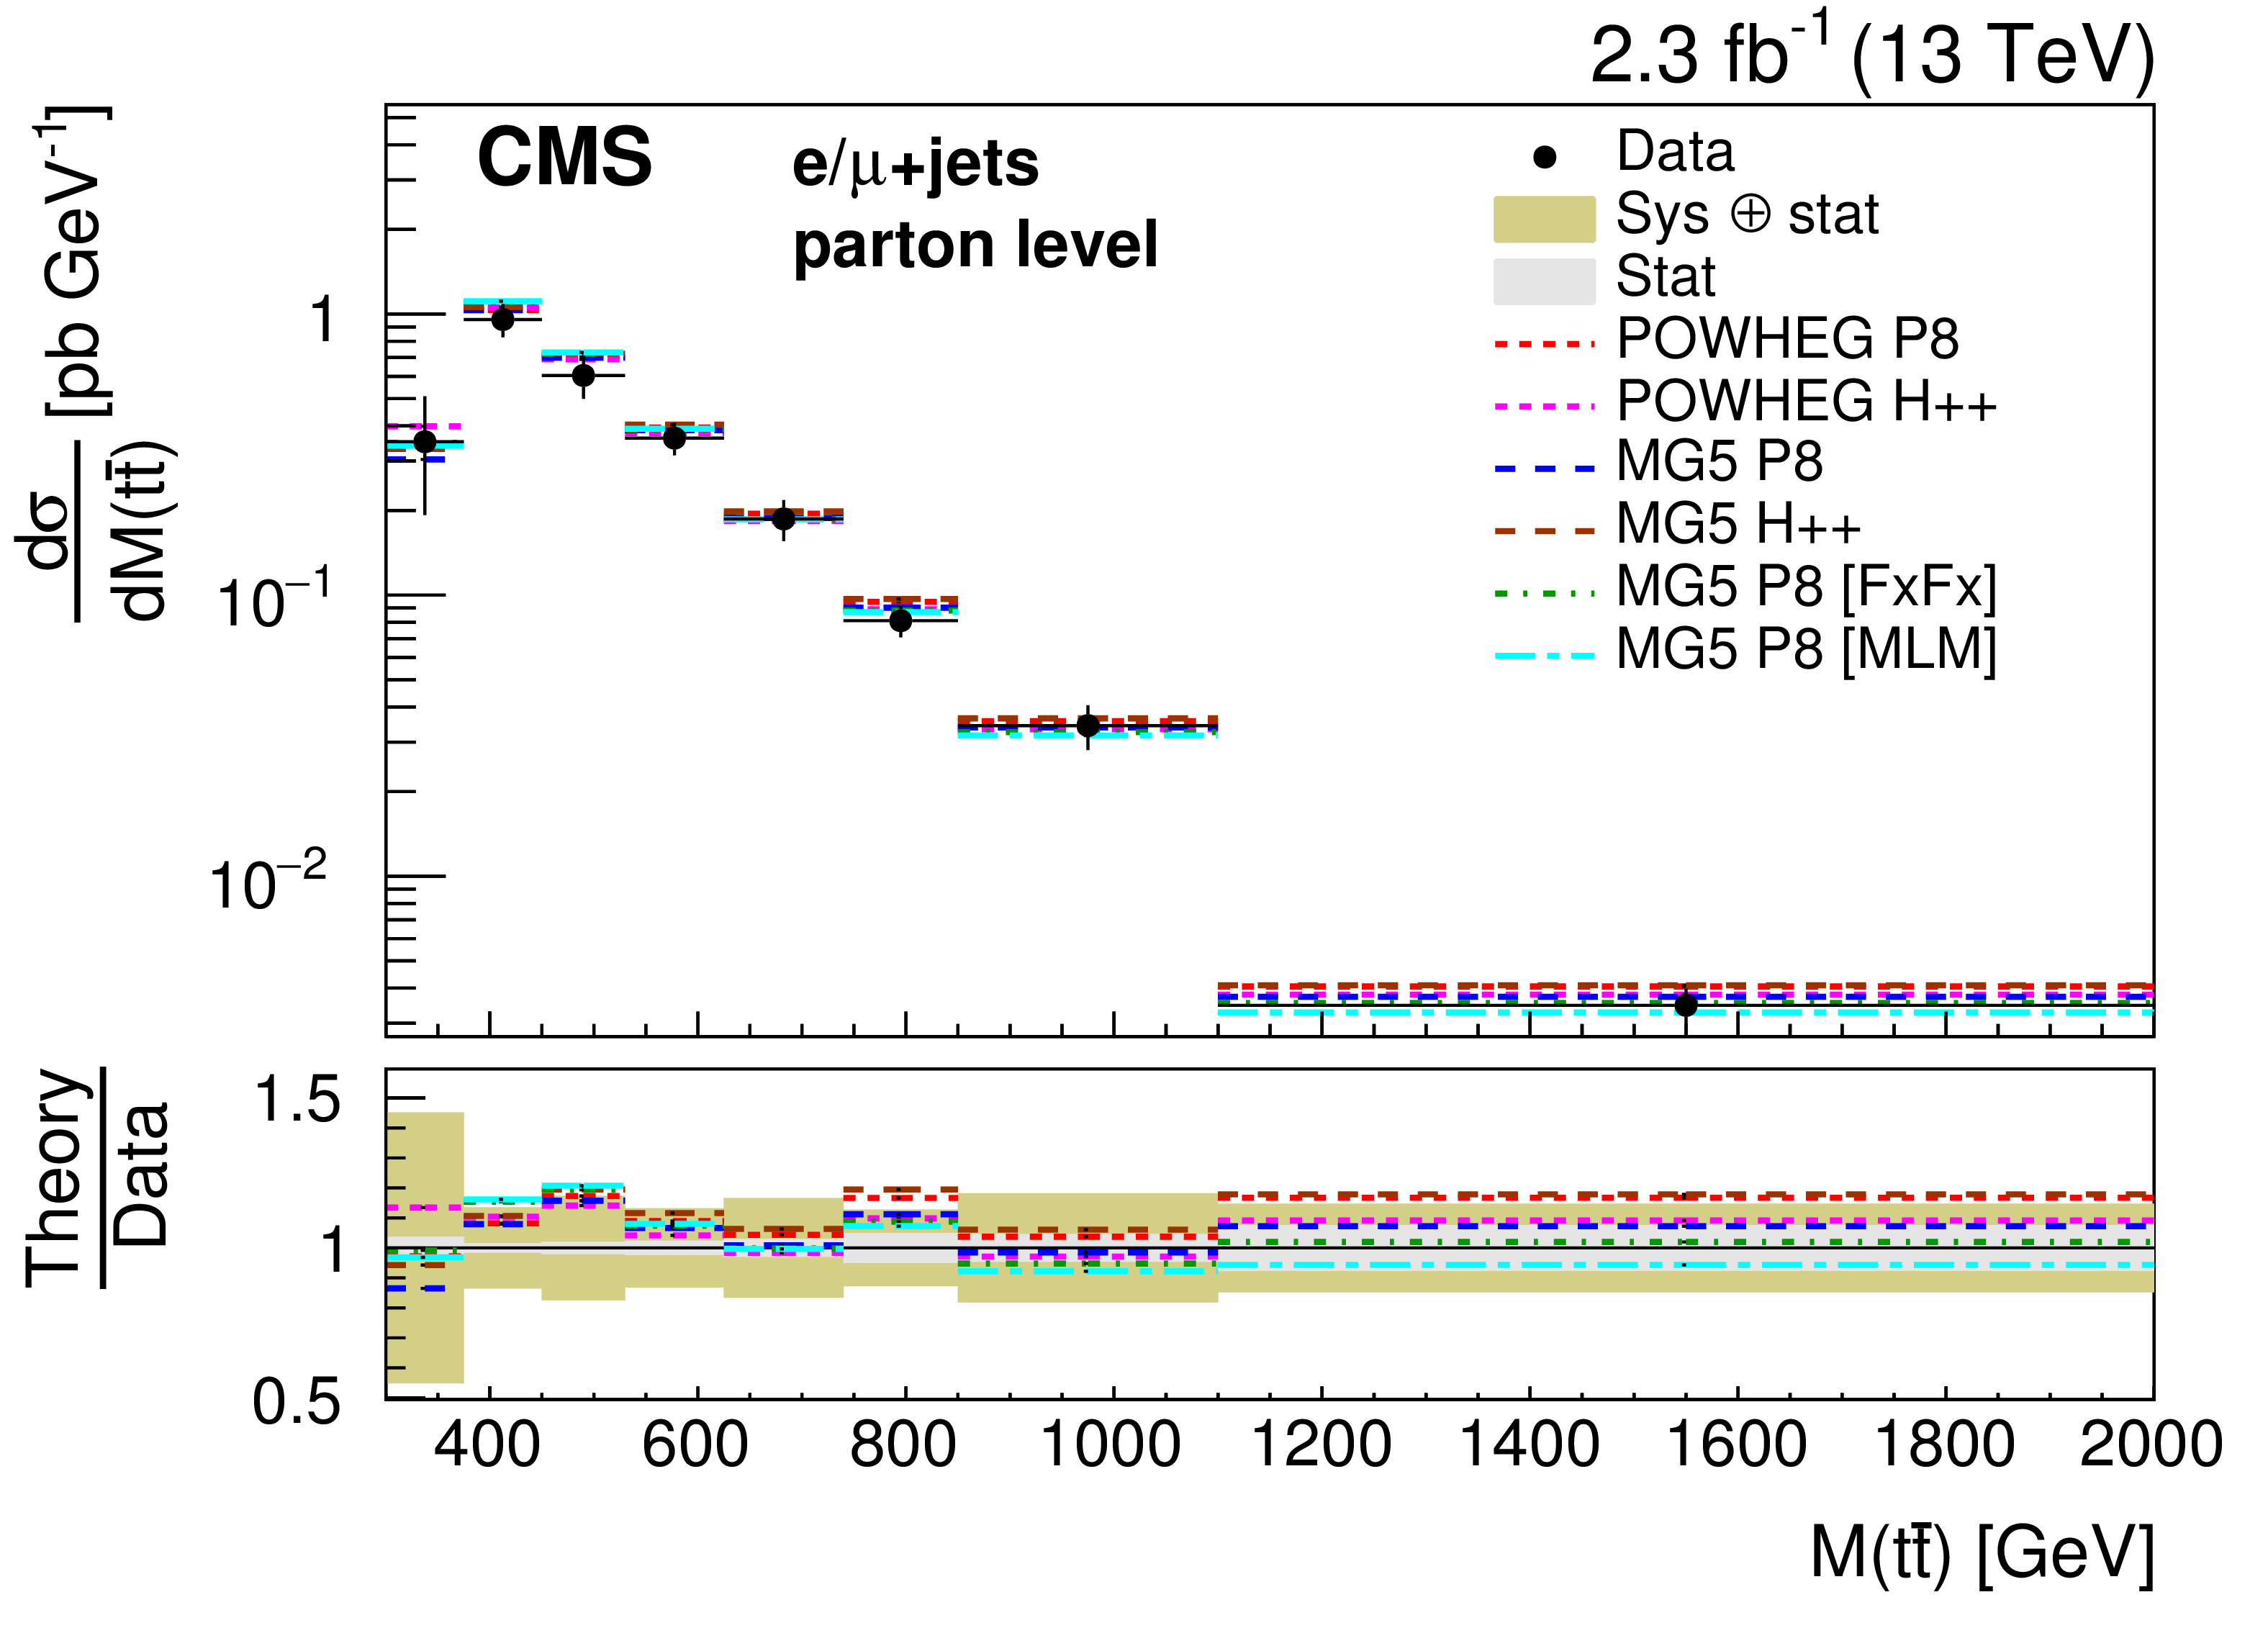
Differential cross sections at parton level as a function of $ {p_{\mathrm {T}}} ({\mathrm{ t } \mathrm{ \bar{t} } } )$, $ {| y({\mathrm{ t } \mathrm{ \bar{t} } } ) | }$, $M({\mathrm{ t } \mathrm{ \bar{t} } } )$, and cross sections as a function of the number of additional jets compared to the predictions of POWHEG and MG5-MC@NLO (MG5) combined with PYTHIA8 (P8) or HERWIG++ (H++) and the multiparton simulations MG5-MC@NLO +PYTHIA8 MLM and MG5-MC@NLO +PYTHIA8 FxFx. The ratios of the various predictions to the measured cross sections are shown at the bottom of each panel together with the statistical and systematic uncertainties of the measurement. |
png pdf |
Figure 9-a:
Differential cross section at parton level as a function of $ {p_{\mathrm {T}}} ({\mathrm{ t } \mathrm{ \bar{t} } } )$, compared to the predictions of POWHEG and MG5-MC@NLO (MG5) combined with PYTHIA8 (P8) or HERWIG++ (H++) and the multiparton simulations MG5-MC@NLO +PYTHIA8 MLM and MG5-MC@NLO +PYTHIA8 FxFx. The ratios of the various predictions to the measured cross sections are shown at the bottom of the panel together with the statistical and systematic uncertainties of the measurement. |
png pdf |
Figure 9-b:
Differential cross section at parton level as a function of $ {| y({\mathrm{ t } \mathrm{ \bar{t} } } ) | }$, compared to the predictions of POWHEG and MG5-MC@NLO (MG5) combined with PYTHIA8 (P8) or HERWIG++ (H++) and the multiparton simulations MG5-MC@NLO +PYTHIA8 MLM and MG5-MC@NLO +PYTHIA8 FxFx. The ratios of the various predictions to the measured cross sections are shown at the bottom of the panel together with the statistical and systematic uncertainties of the measurement. |
png pdf |
Figure 9-c:
Differential cross section at parton level as a function of $M({\mathrm{ t } \mathrm{ \bar{t} } } )$, compared to the predictions of POWHEG and MG5-MC@NLO (MG5) combined with PYTHIA8 (P8) or HERWIG++ (H++) and the multiparton simulations MG5-MC@NLO +PYTHIA8 MLM and MG5-MC@NLO +PYTHIA8 FxFx. The ratios of the various predictions to the measured cross sections are shown at the bottom of the panel together with the statistical and systematic uncertainties of the measurement. |

png pdf |
Figure 9-d:
Cross sections as a function of the number of additional jets compared to the predictions of POWHEG and MG5-MC@NLO (MG5) combined with PYTHIA8 (P8) or HERWIG++ (H++) and the multiparton simulations MG5-MC@NLO +PYTHIA8 MLM and MG5-MC@NLO +PYTHIA8 FxFx. The ratios of the various predictions to the measured cross sections are shown at the bottom of the panel together with the statistical and systematic uncertainties of the measurement. |

png pdf |
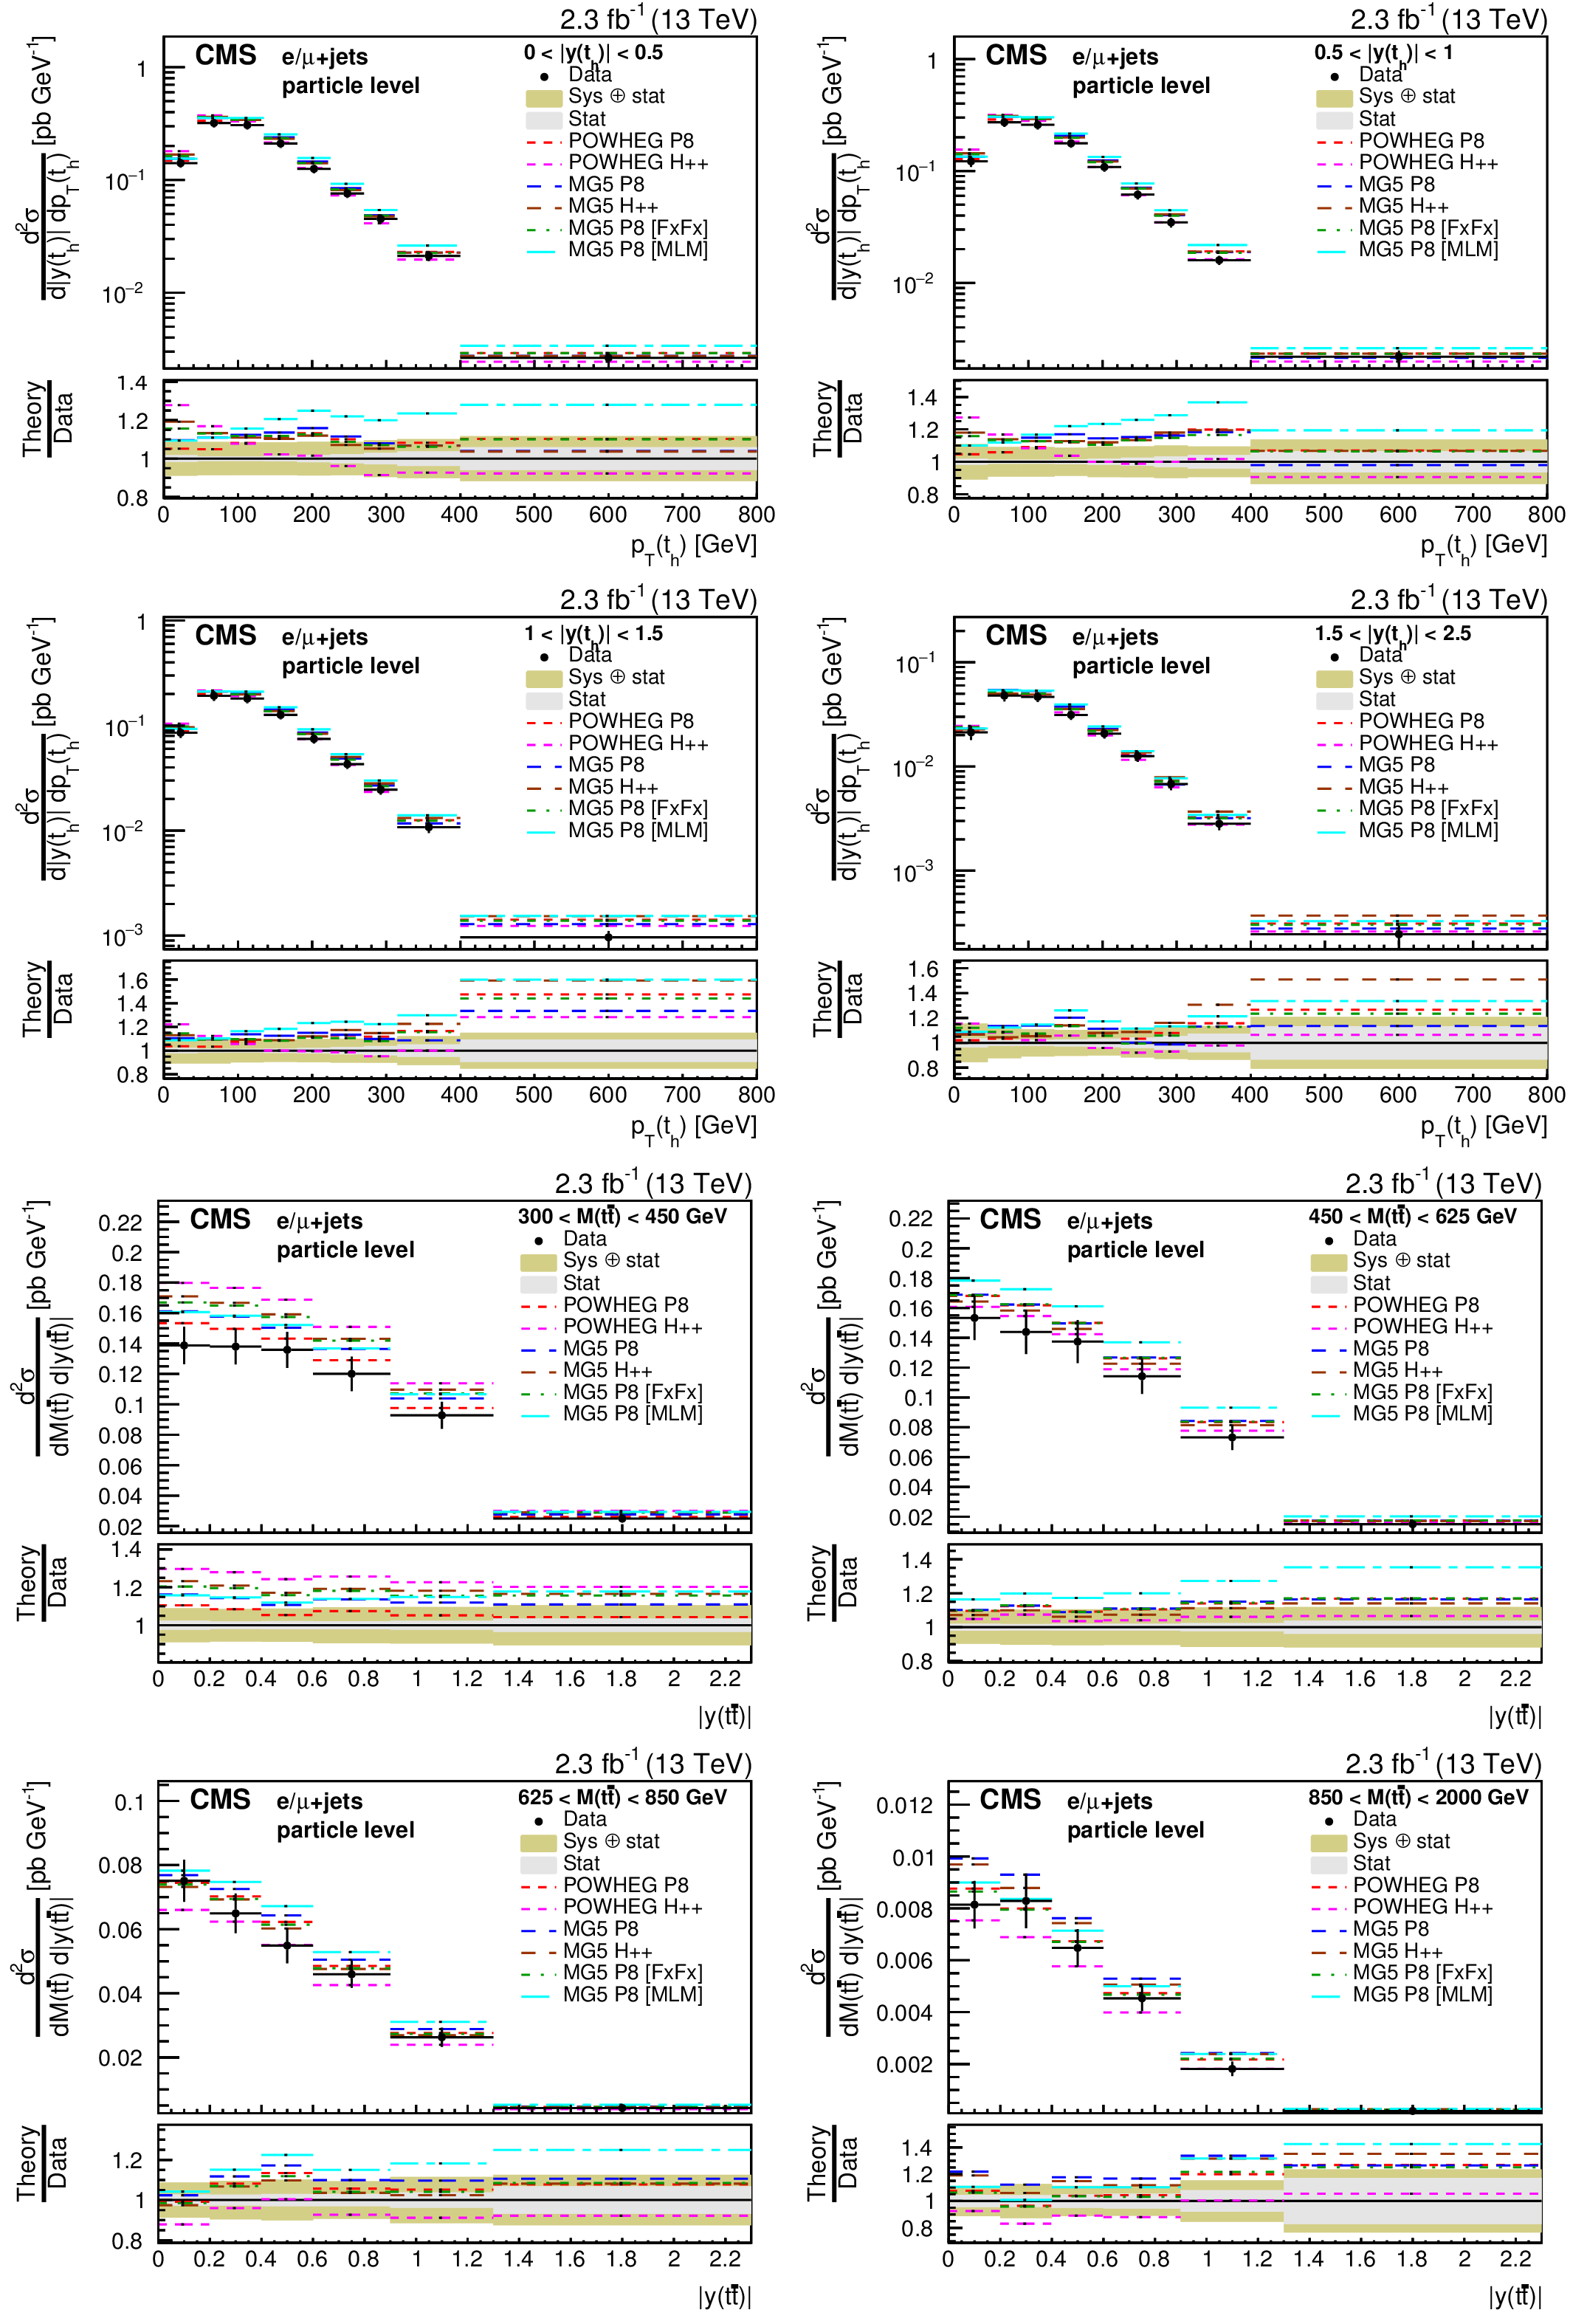
Figure 10:
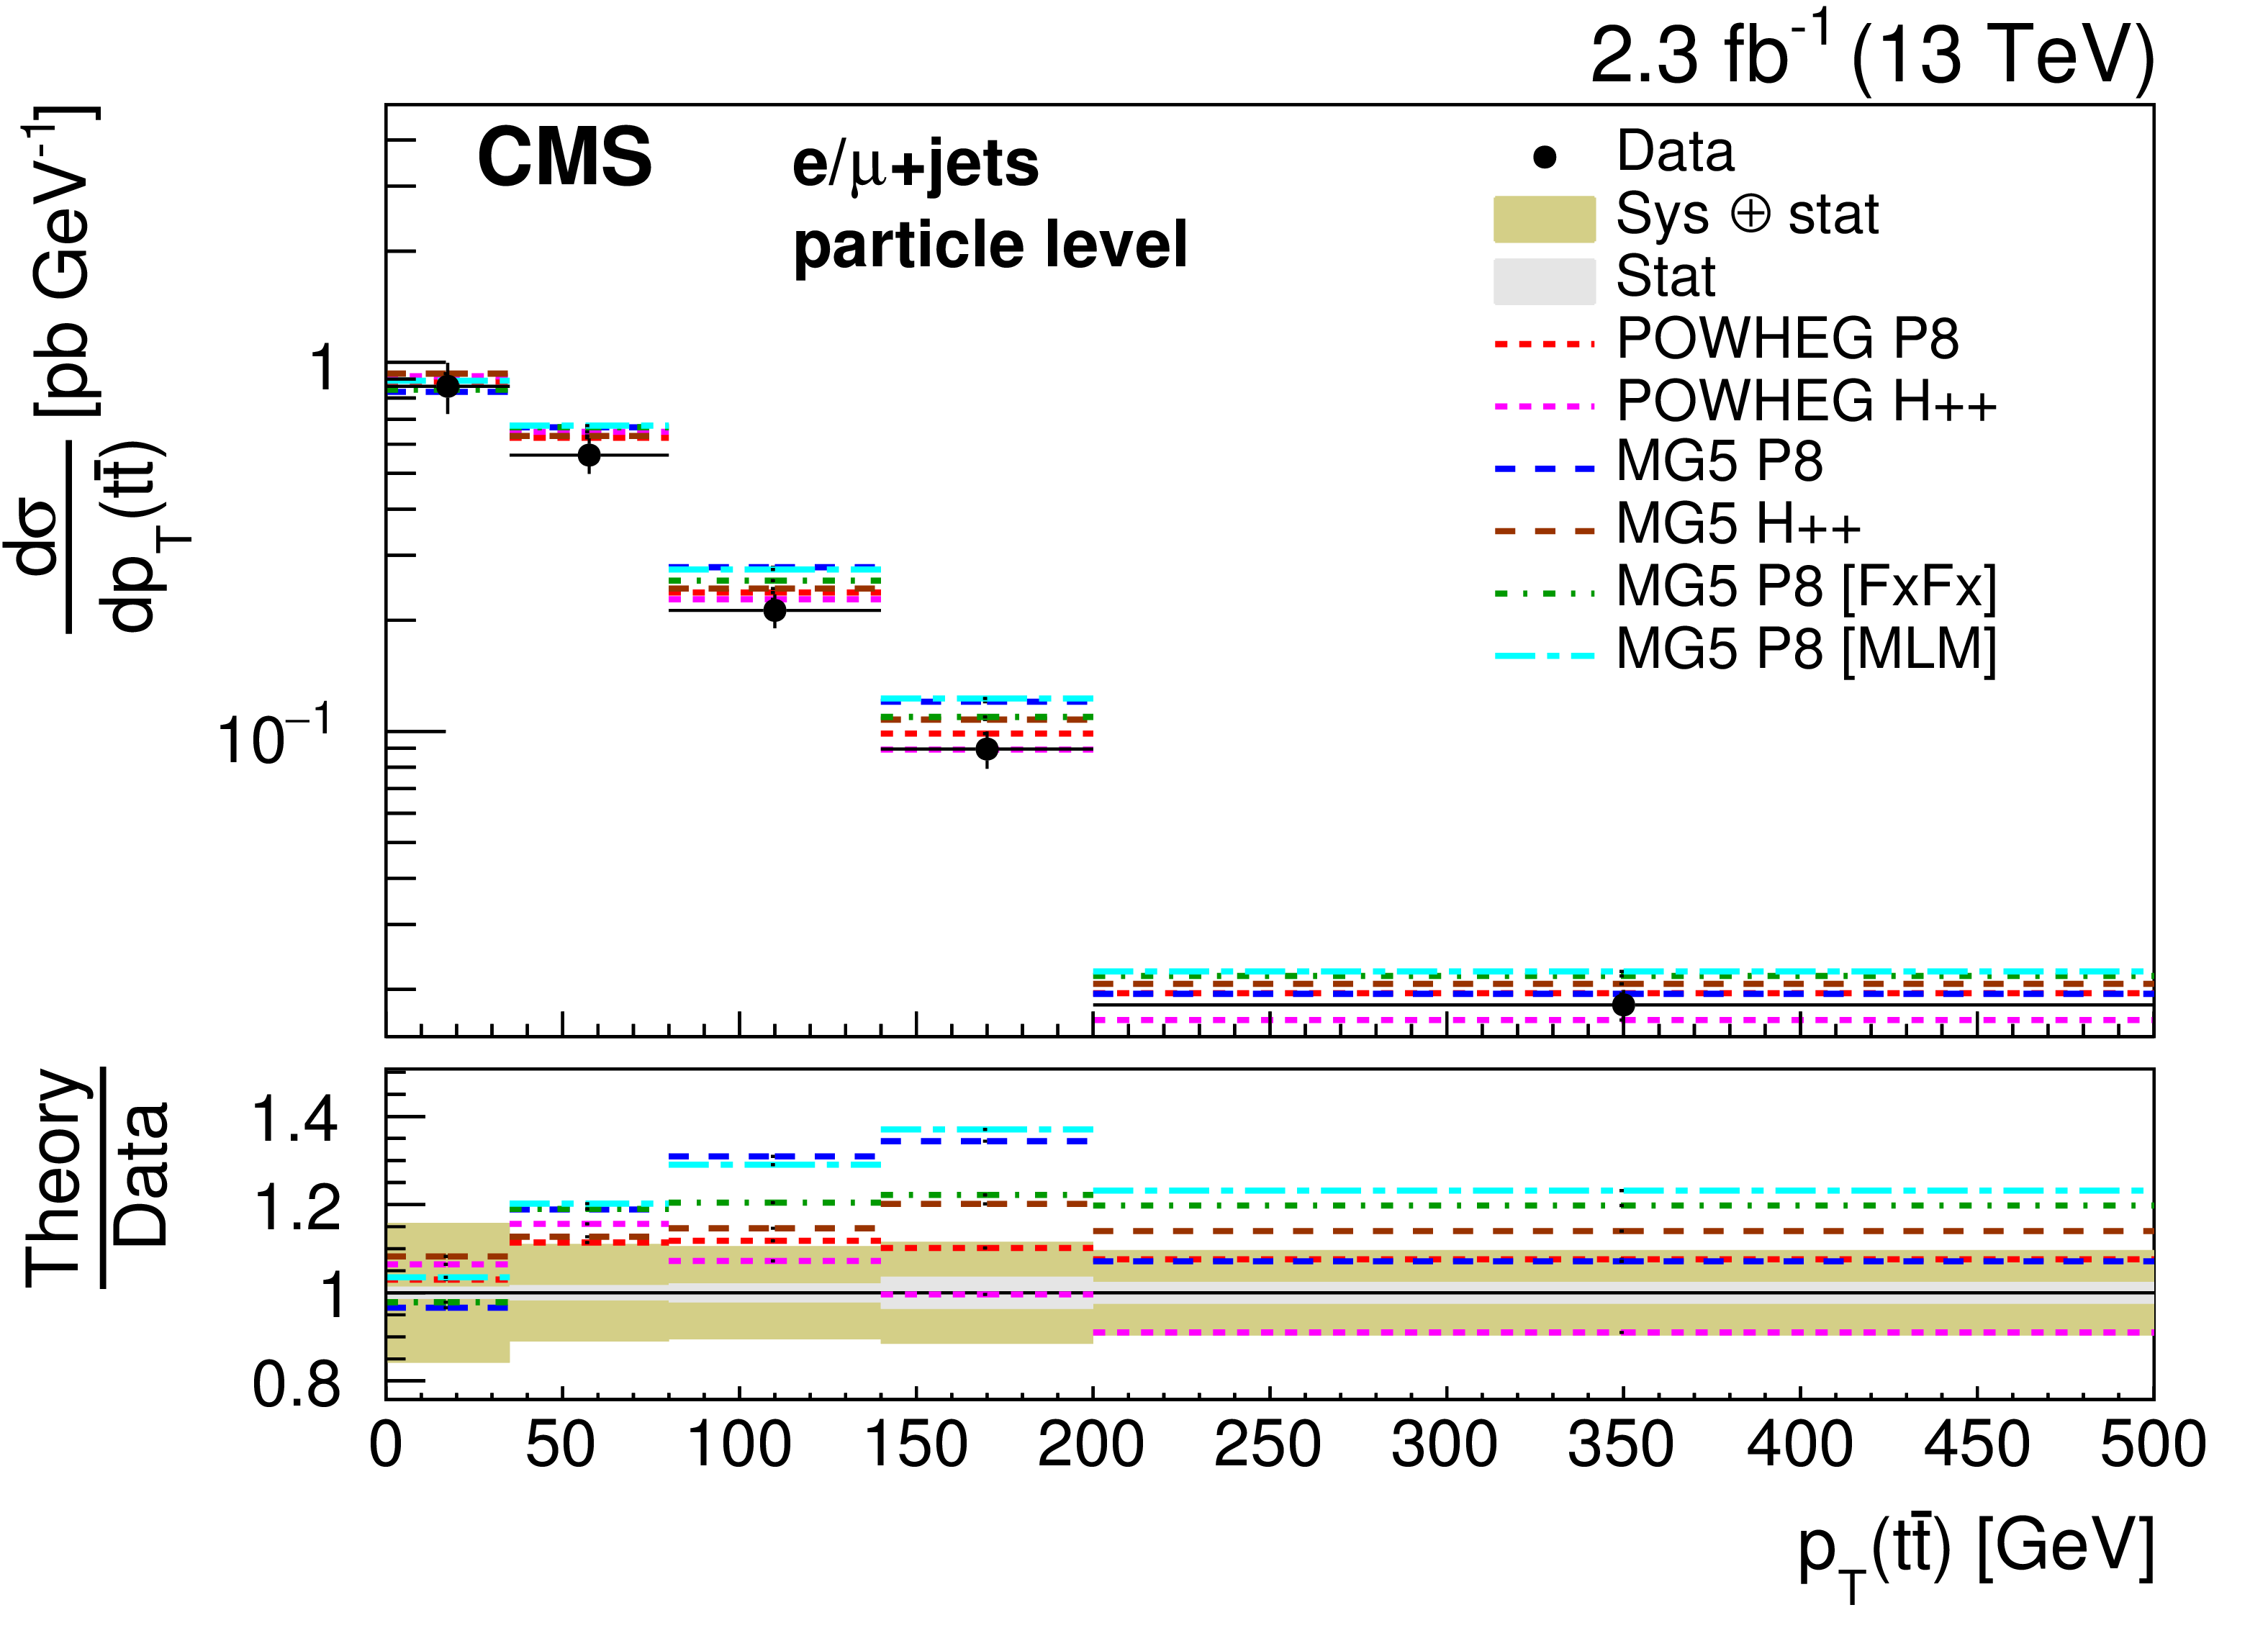
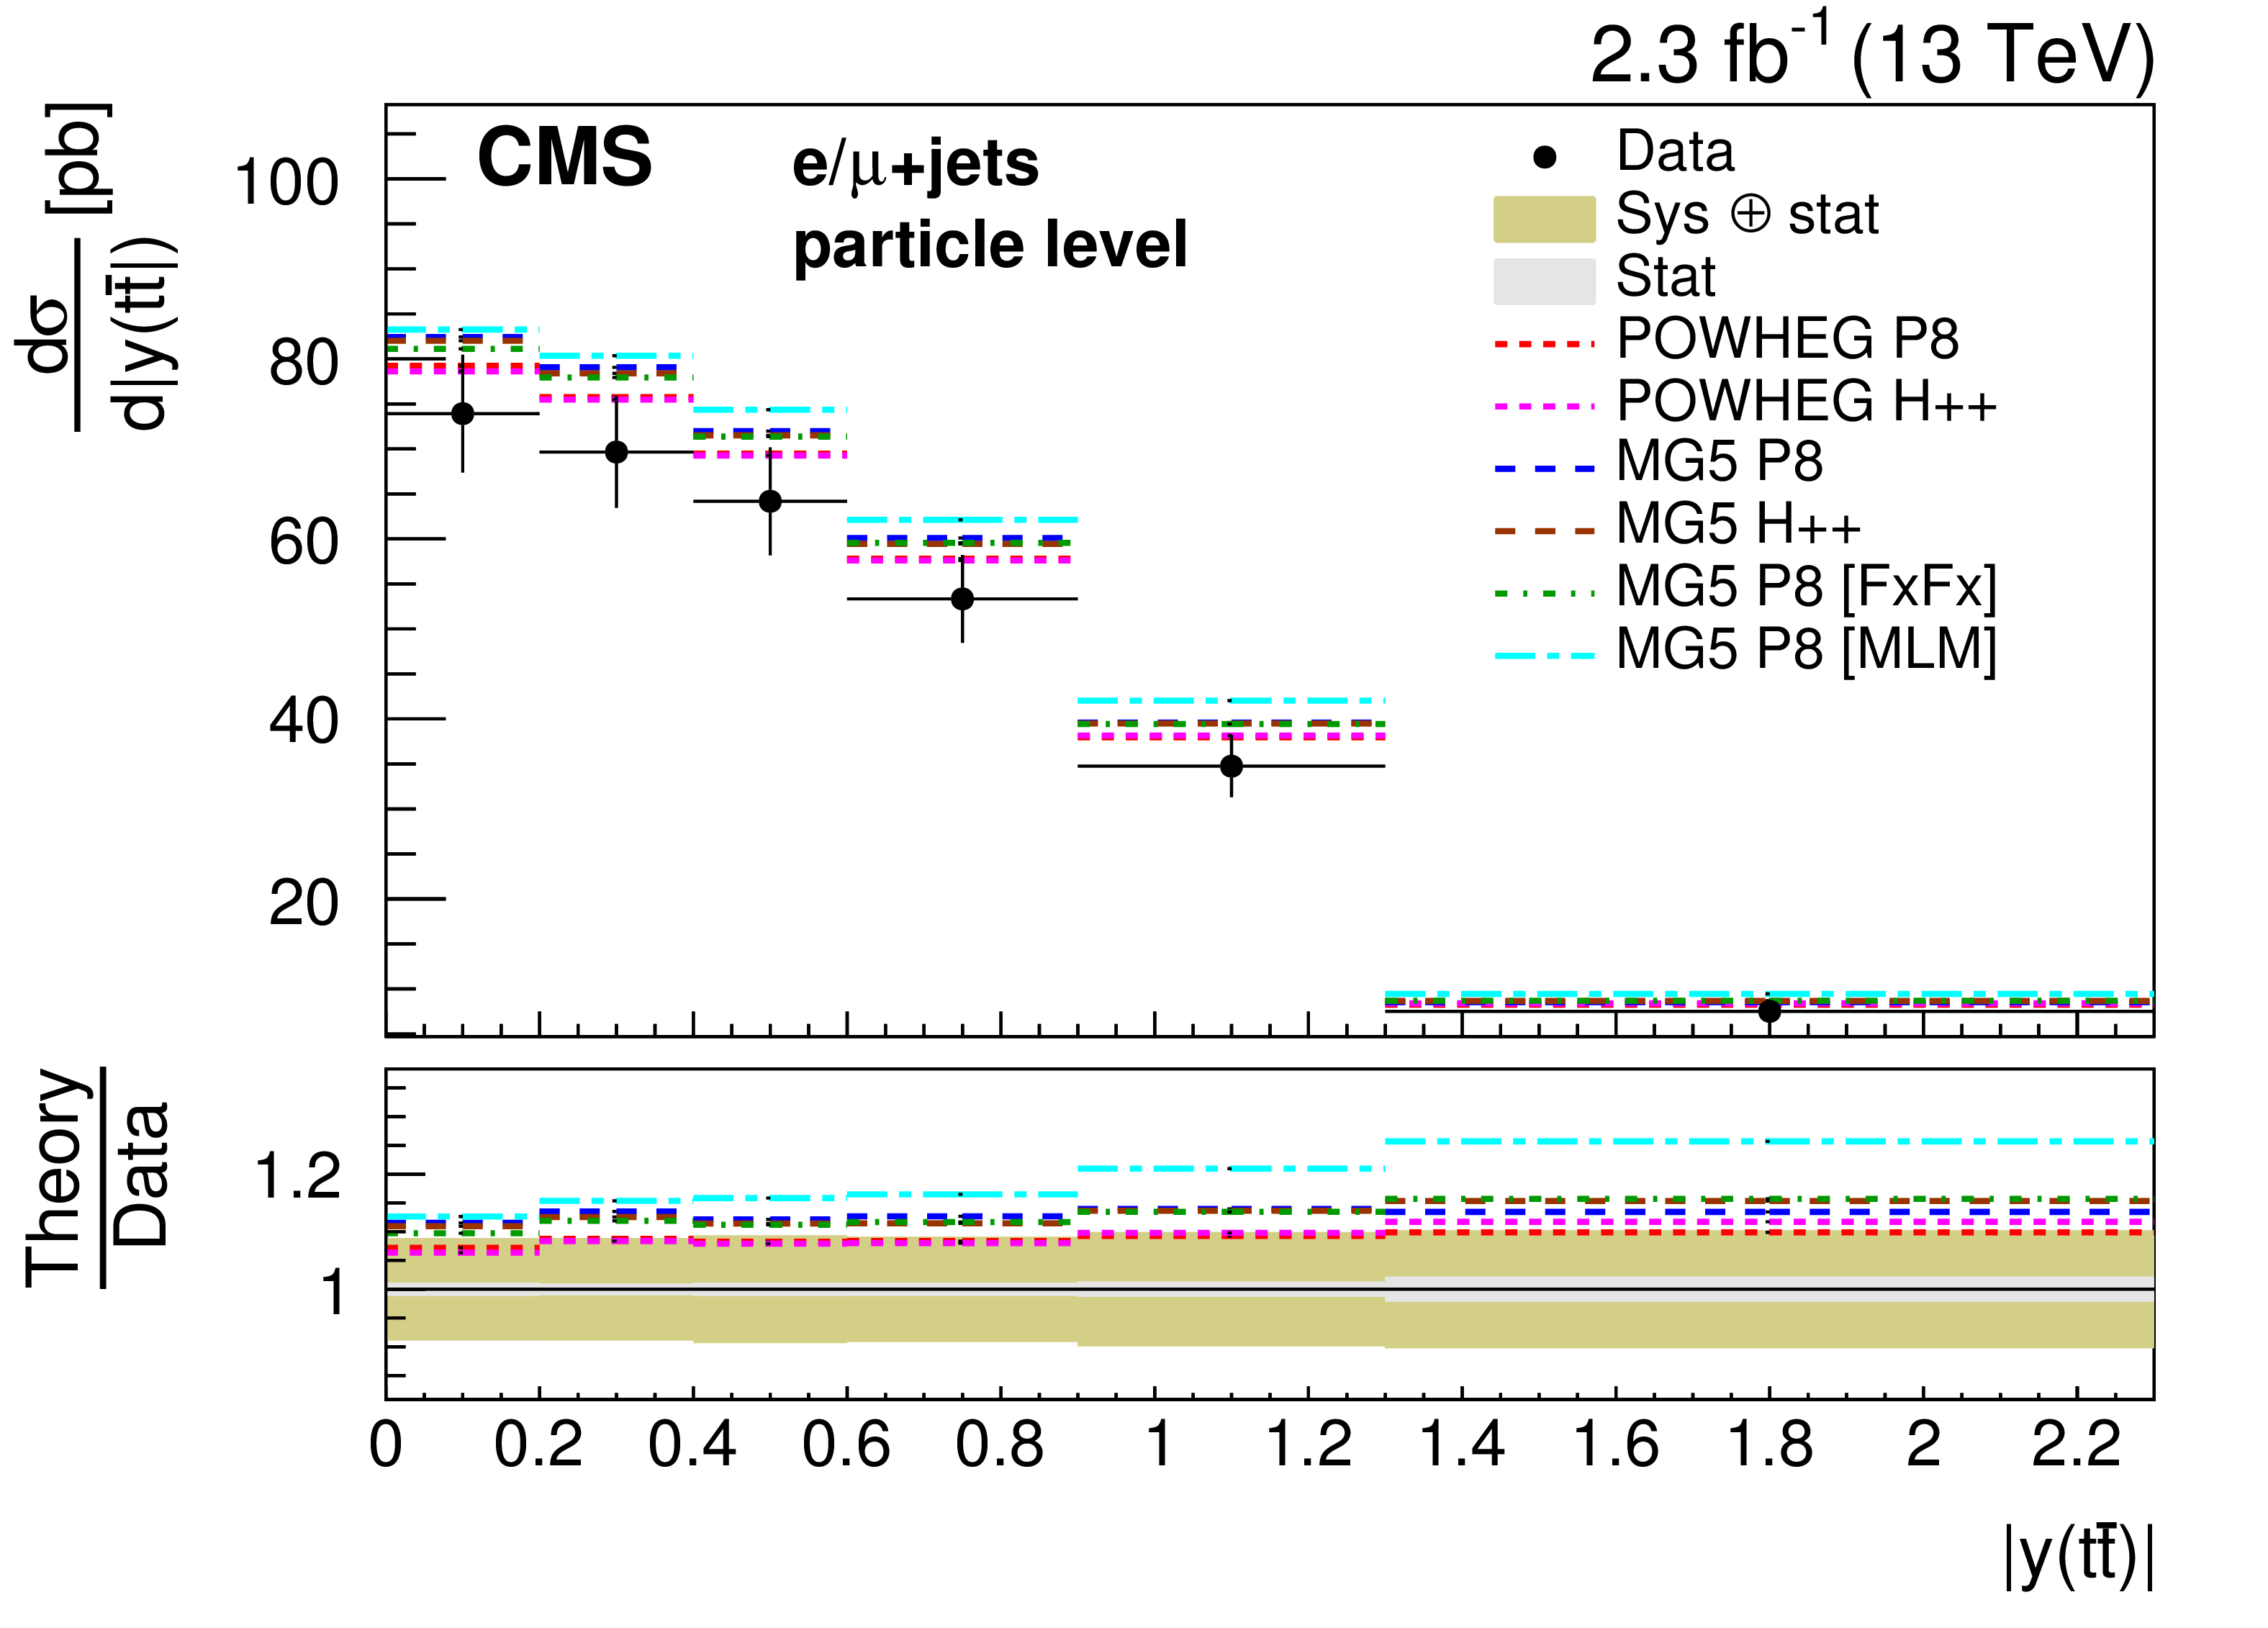
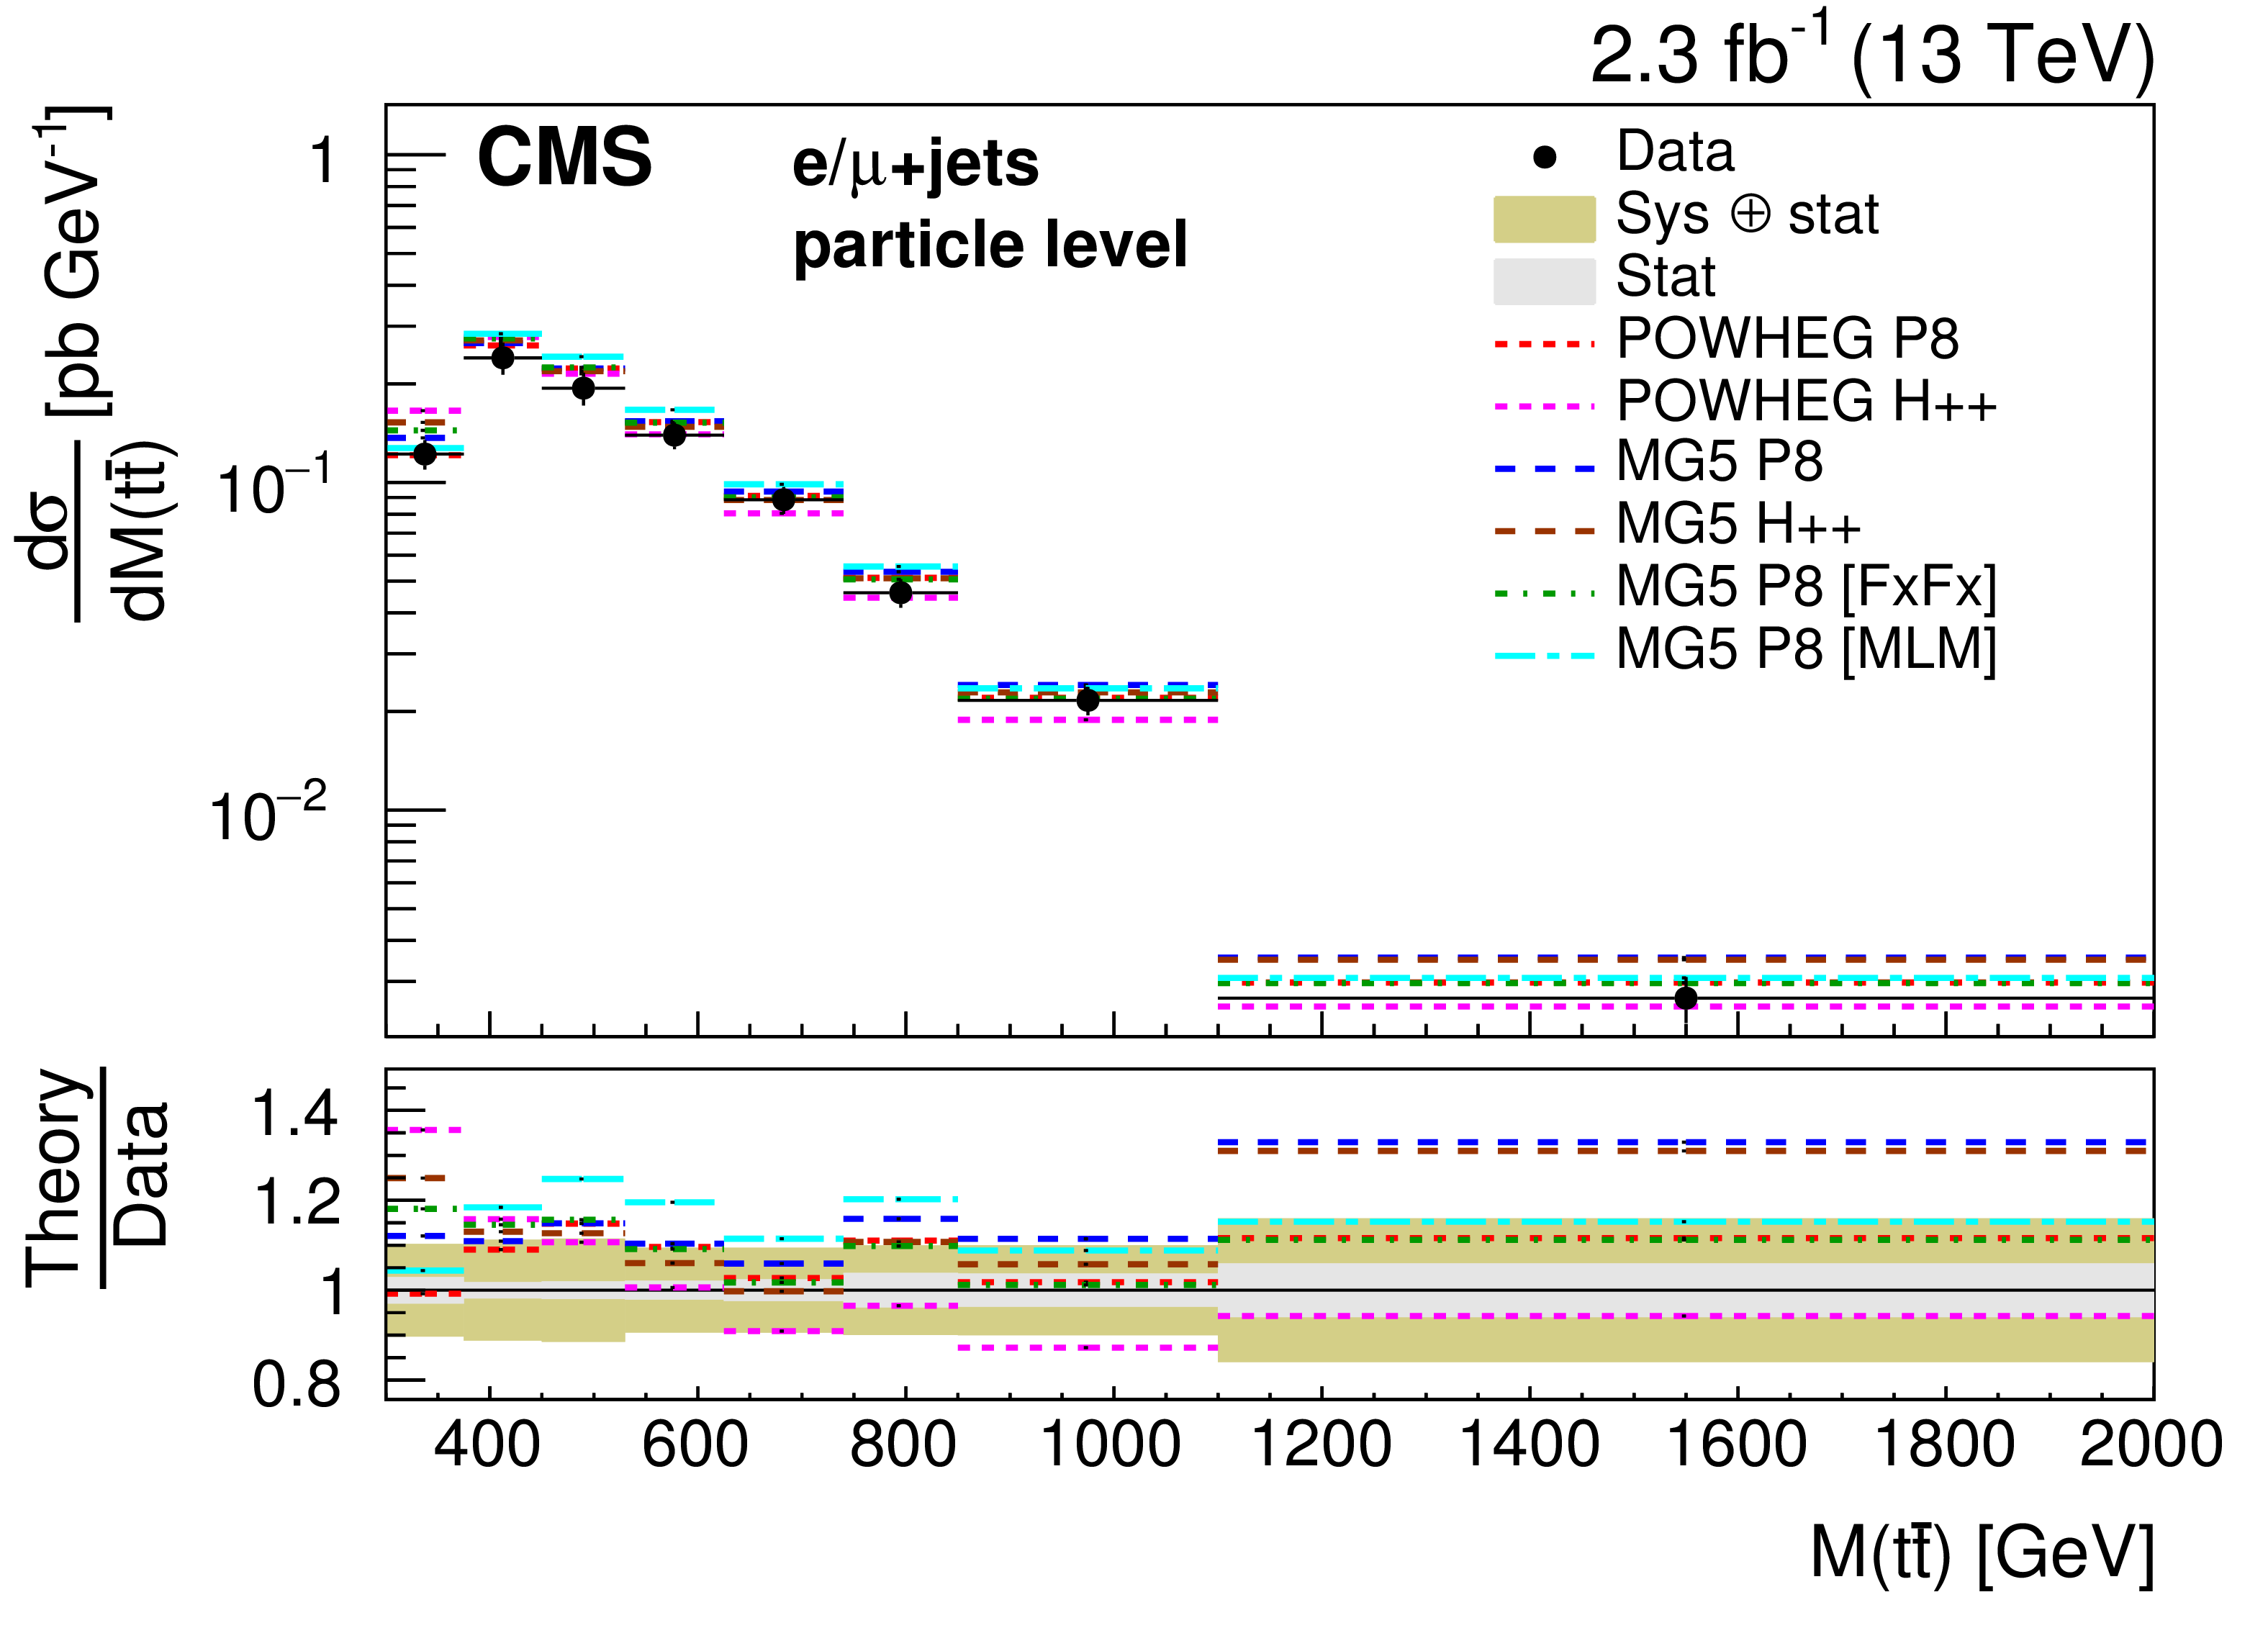
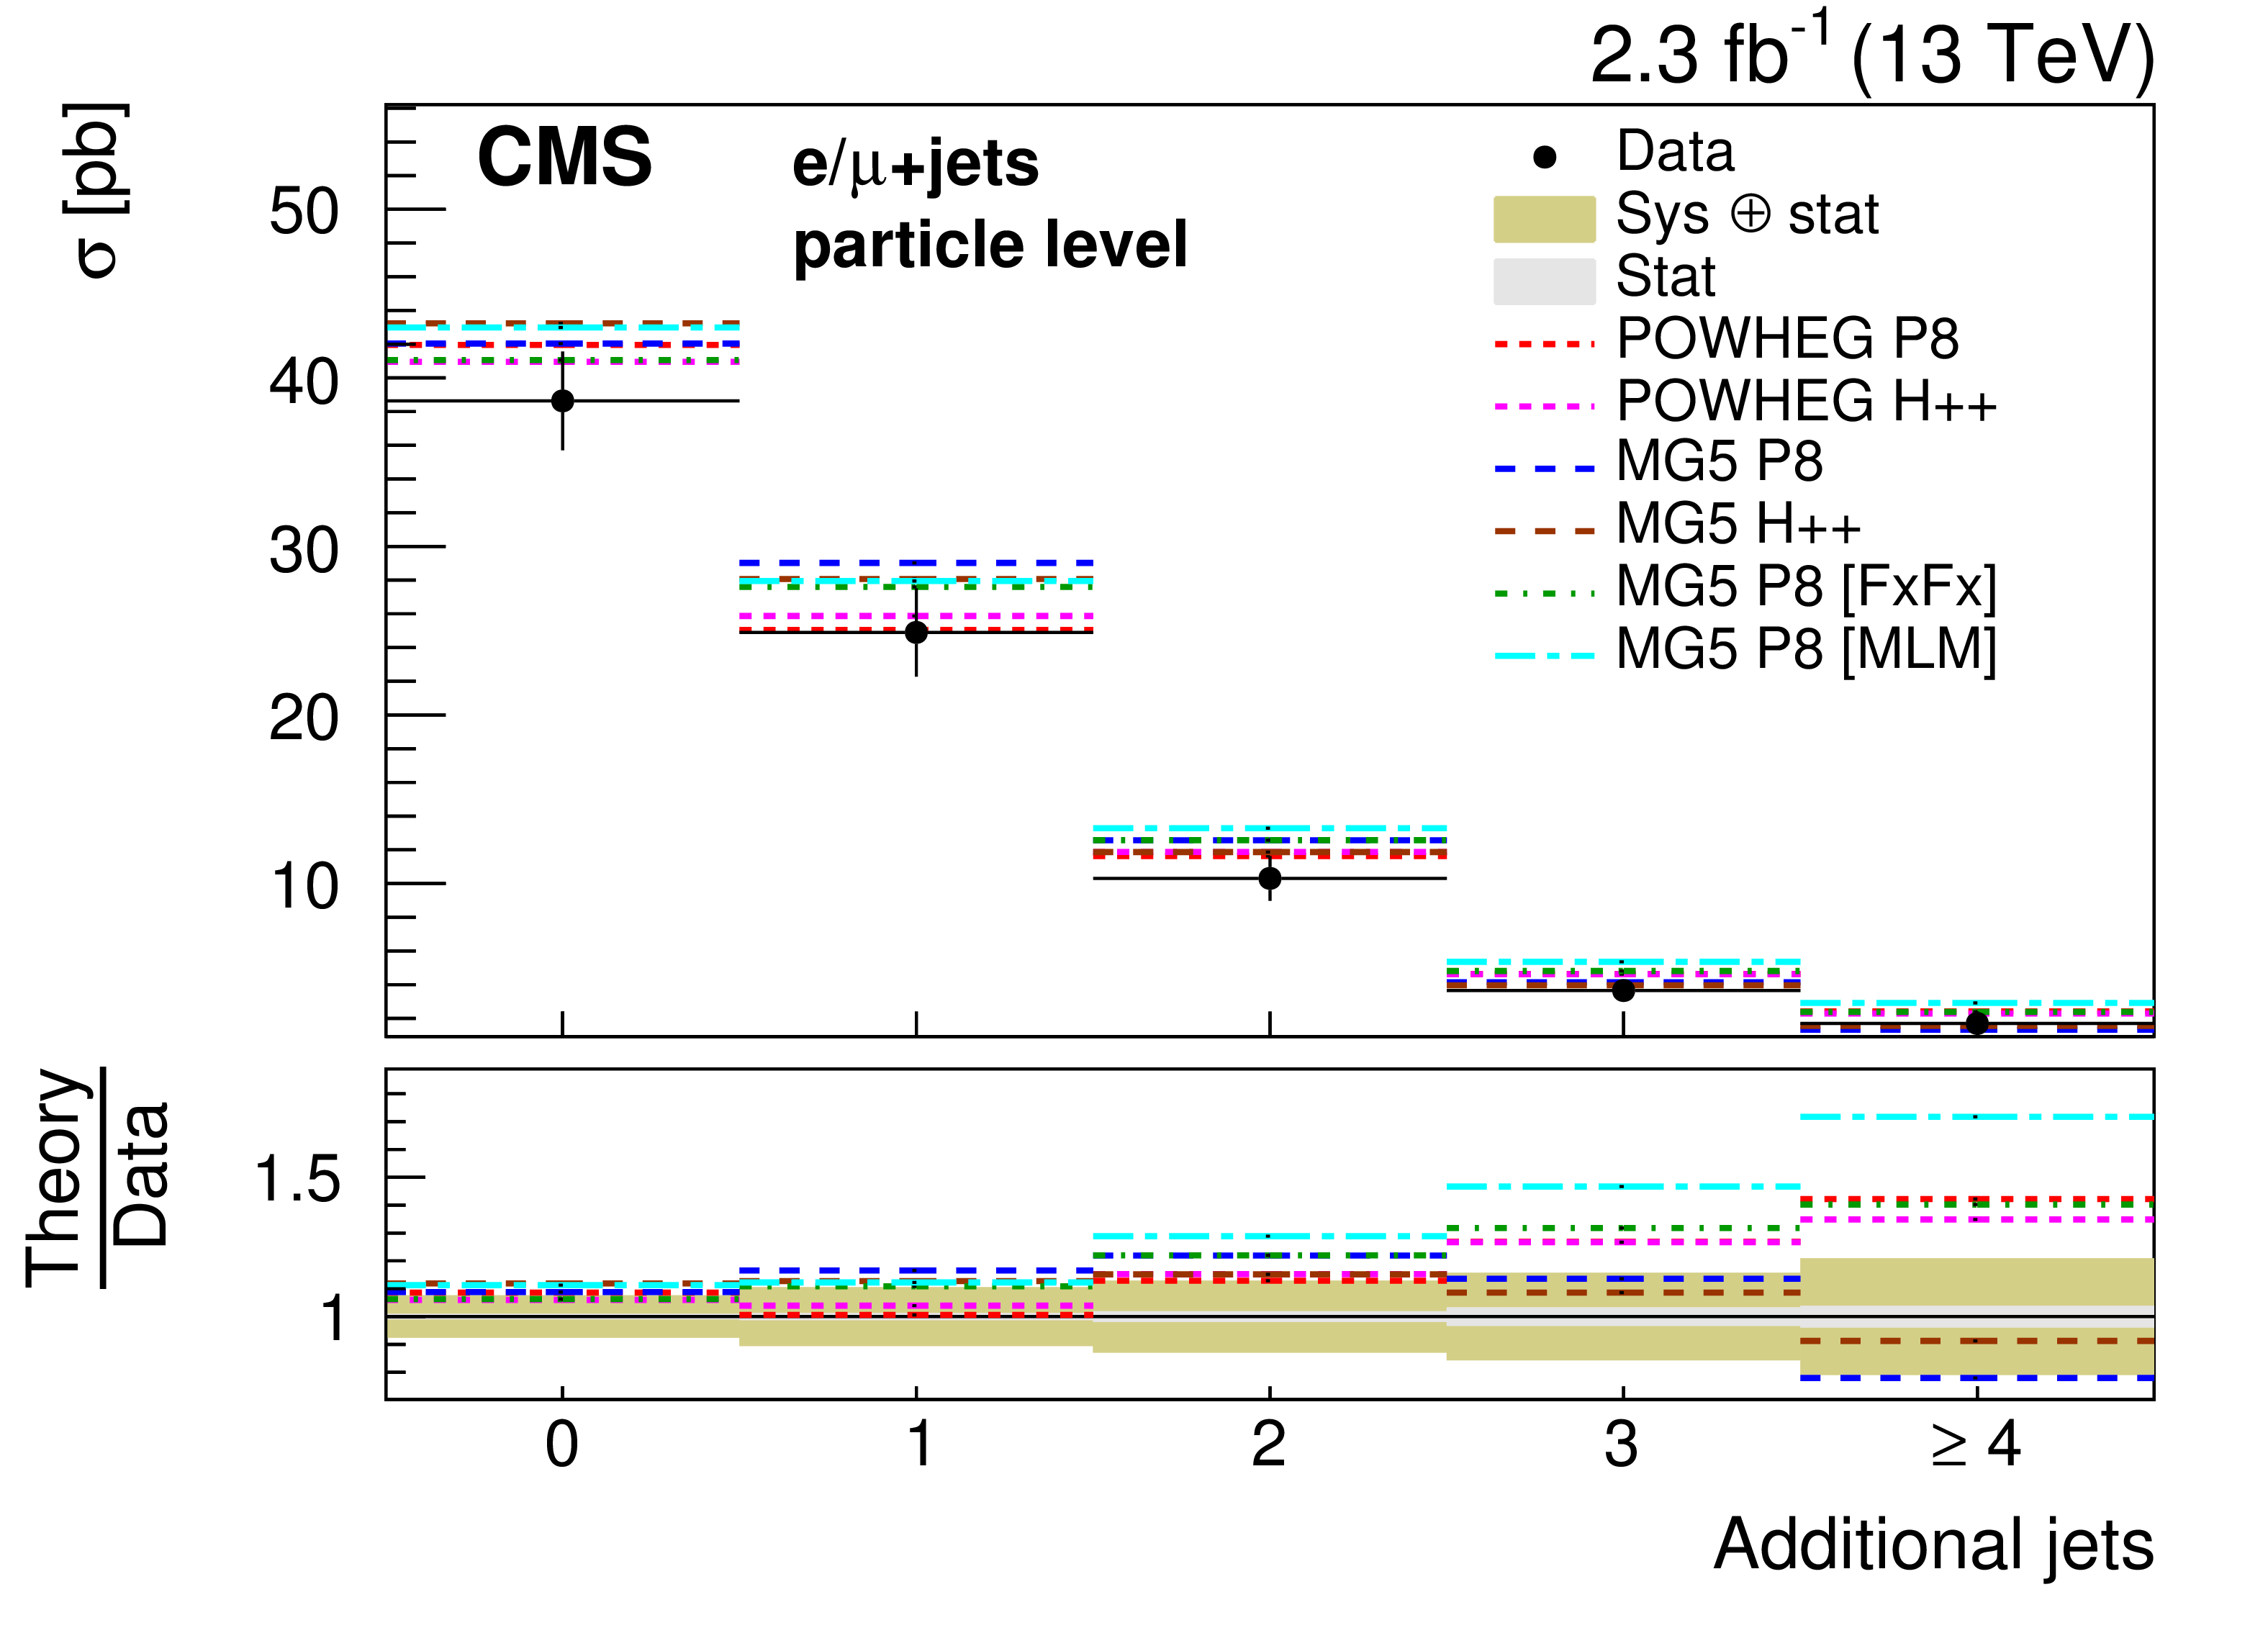
Differential cross sections at particle level as a function of $ {p_{\mathrm {T}}} ({\mathrm{ t } \mathrm{ \bar{t} } } )$, $ {| y({\mathrm{ t } \mathrm{ \bar{t} } } ) | }$, $M({\mathrm{ t } \mathrm{ \bar{t} } } )$, and cross sections as a function of the number of additional jets compared to the predictions of POWHEG and MG5-MC@NLO (MG5) combined with PYTHIA8 (P8) or HERWIG++ (H++) and the multiparton simulations MG5-MC@NLO +PYTHIA8 MLM and MG5-MC@NLO +PYTHIA8 FxFx. The ratios of the various predictions to the measured cross sections are shown at the bottom of each panel together with the statistical and systematic uncertainties of the measurement. |
png pdf |
Figure 10-a:
Differential cross section at particle level as a function of $ {p_{\mathrm {T}}} ({\mathrm{ t } \mathrm{ \bar{t} } } )$, compared to the predictions of POWHEG and MG5-MC@NLO (MG5) combined with PYTHIA8 (P8) or HERWIG++ (H++) and the multiparton simulations MG5-MC@NLO +PYTHIA8 MLM and MG5-MC@NLO +PYTHIA8 FxFx. The ratios of the various predictions to the measured cross sections are shown at the bottom of the panel together with the statistical and systematic uncertainties of the measurement. |
png pdf |
Figure 10-b:
Differential cross section at particle level as a function of $ {| y({\mathrm{ t } \mathrm{ \bar{t} } } ) | }$, compared to the predictions of POWHEG and MG5-MC@NLO (MG5) combined with PYTHIA8 (P8) or HERWIG++ (H++) and the multiparton simulations MG5-MC@NLO +PYTHIA8 MLM and MG5-MC@NLO +PYTHIA8 FxFx. The ratios of the various predictions to the measured cross sections are shown at the bottom of the panel together with the statistical and systematic uncertainties of the measurement. |
png pdf |
Figure 10-c:
Differential cross section at particle level as a function of $M({\mathrm{ t } \mathrm{ \bar{t} } } )$, compared to the predictions of POWHEG and MG5-MC@NLO (MG5) combined with PYTHIA8 (P8) or HERWIG++ (H++) and the multiparton simulations MG5-MC@NLO +PYTHIA8 MLM and MG5-MC@NLO +PYTHIA8 FxFx. The ratios of the various predictions to the measured cross sections are shown at the bottom of the panel together with the statistical and systematic uncertainties of the measurement. |
png pdf |
Figure 10-d:
Cross sections as a function of the number of additional jets compared to the predictions of POWHEG and MG5-MC@NLO (MG5) combined with PYTHIA8 (P8) or HERWIG++ (H++) and the multiparton simulations MG5-MC@NLO +PYTHIA8 MLM and MG5-MC@NLO +PYTHIA8 FxFx. The ratios of the various predictions to the measured cross sections are shown at the bottom of the panel together with the statistical and systematic uncertainties of the measurement. |
png pdf |
Figure 11:
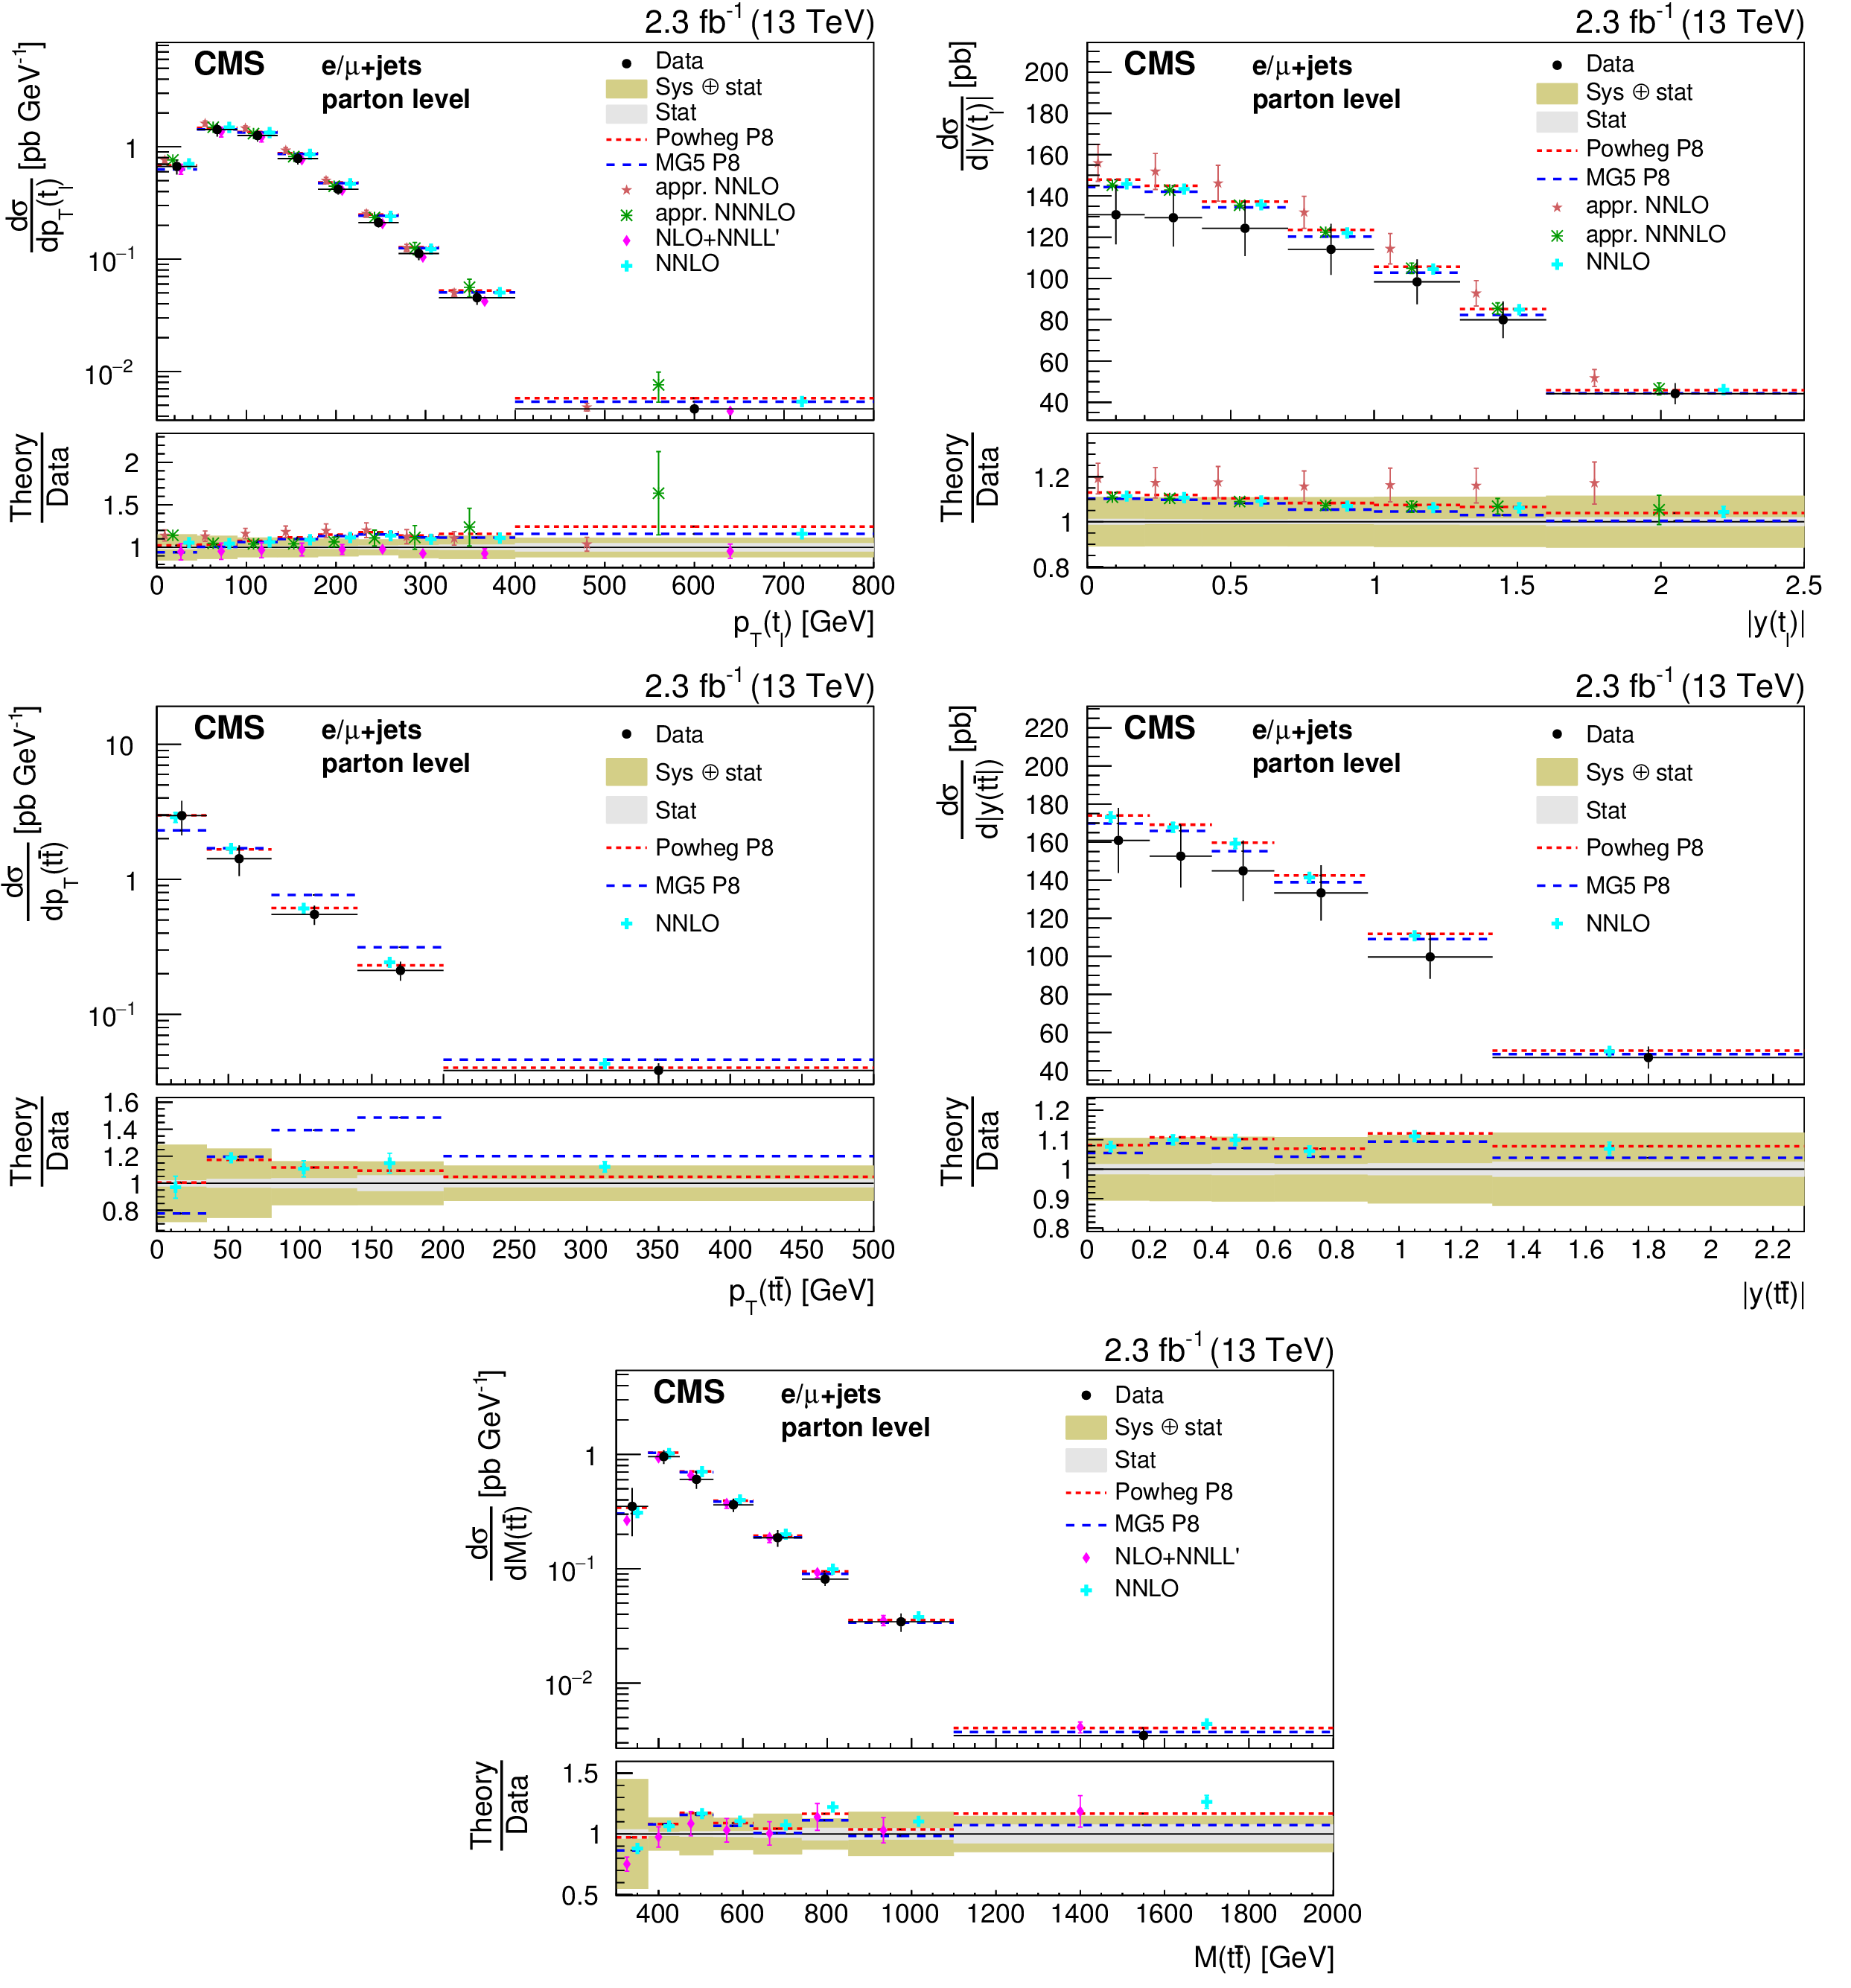
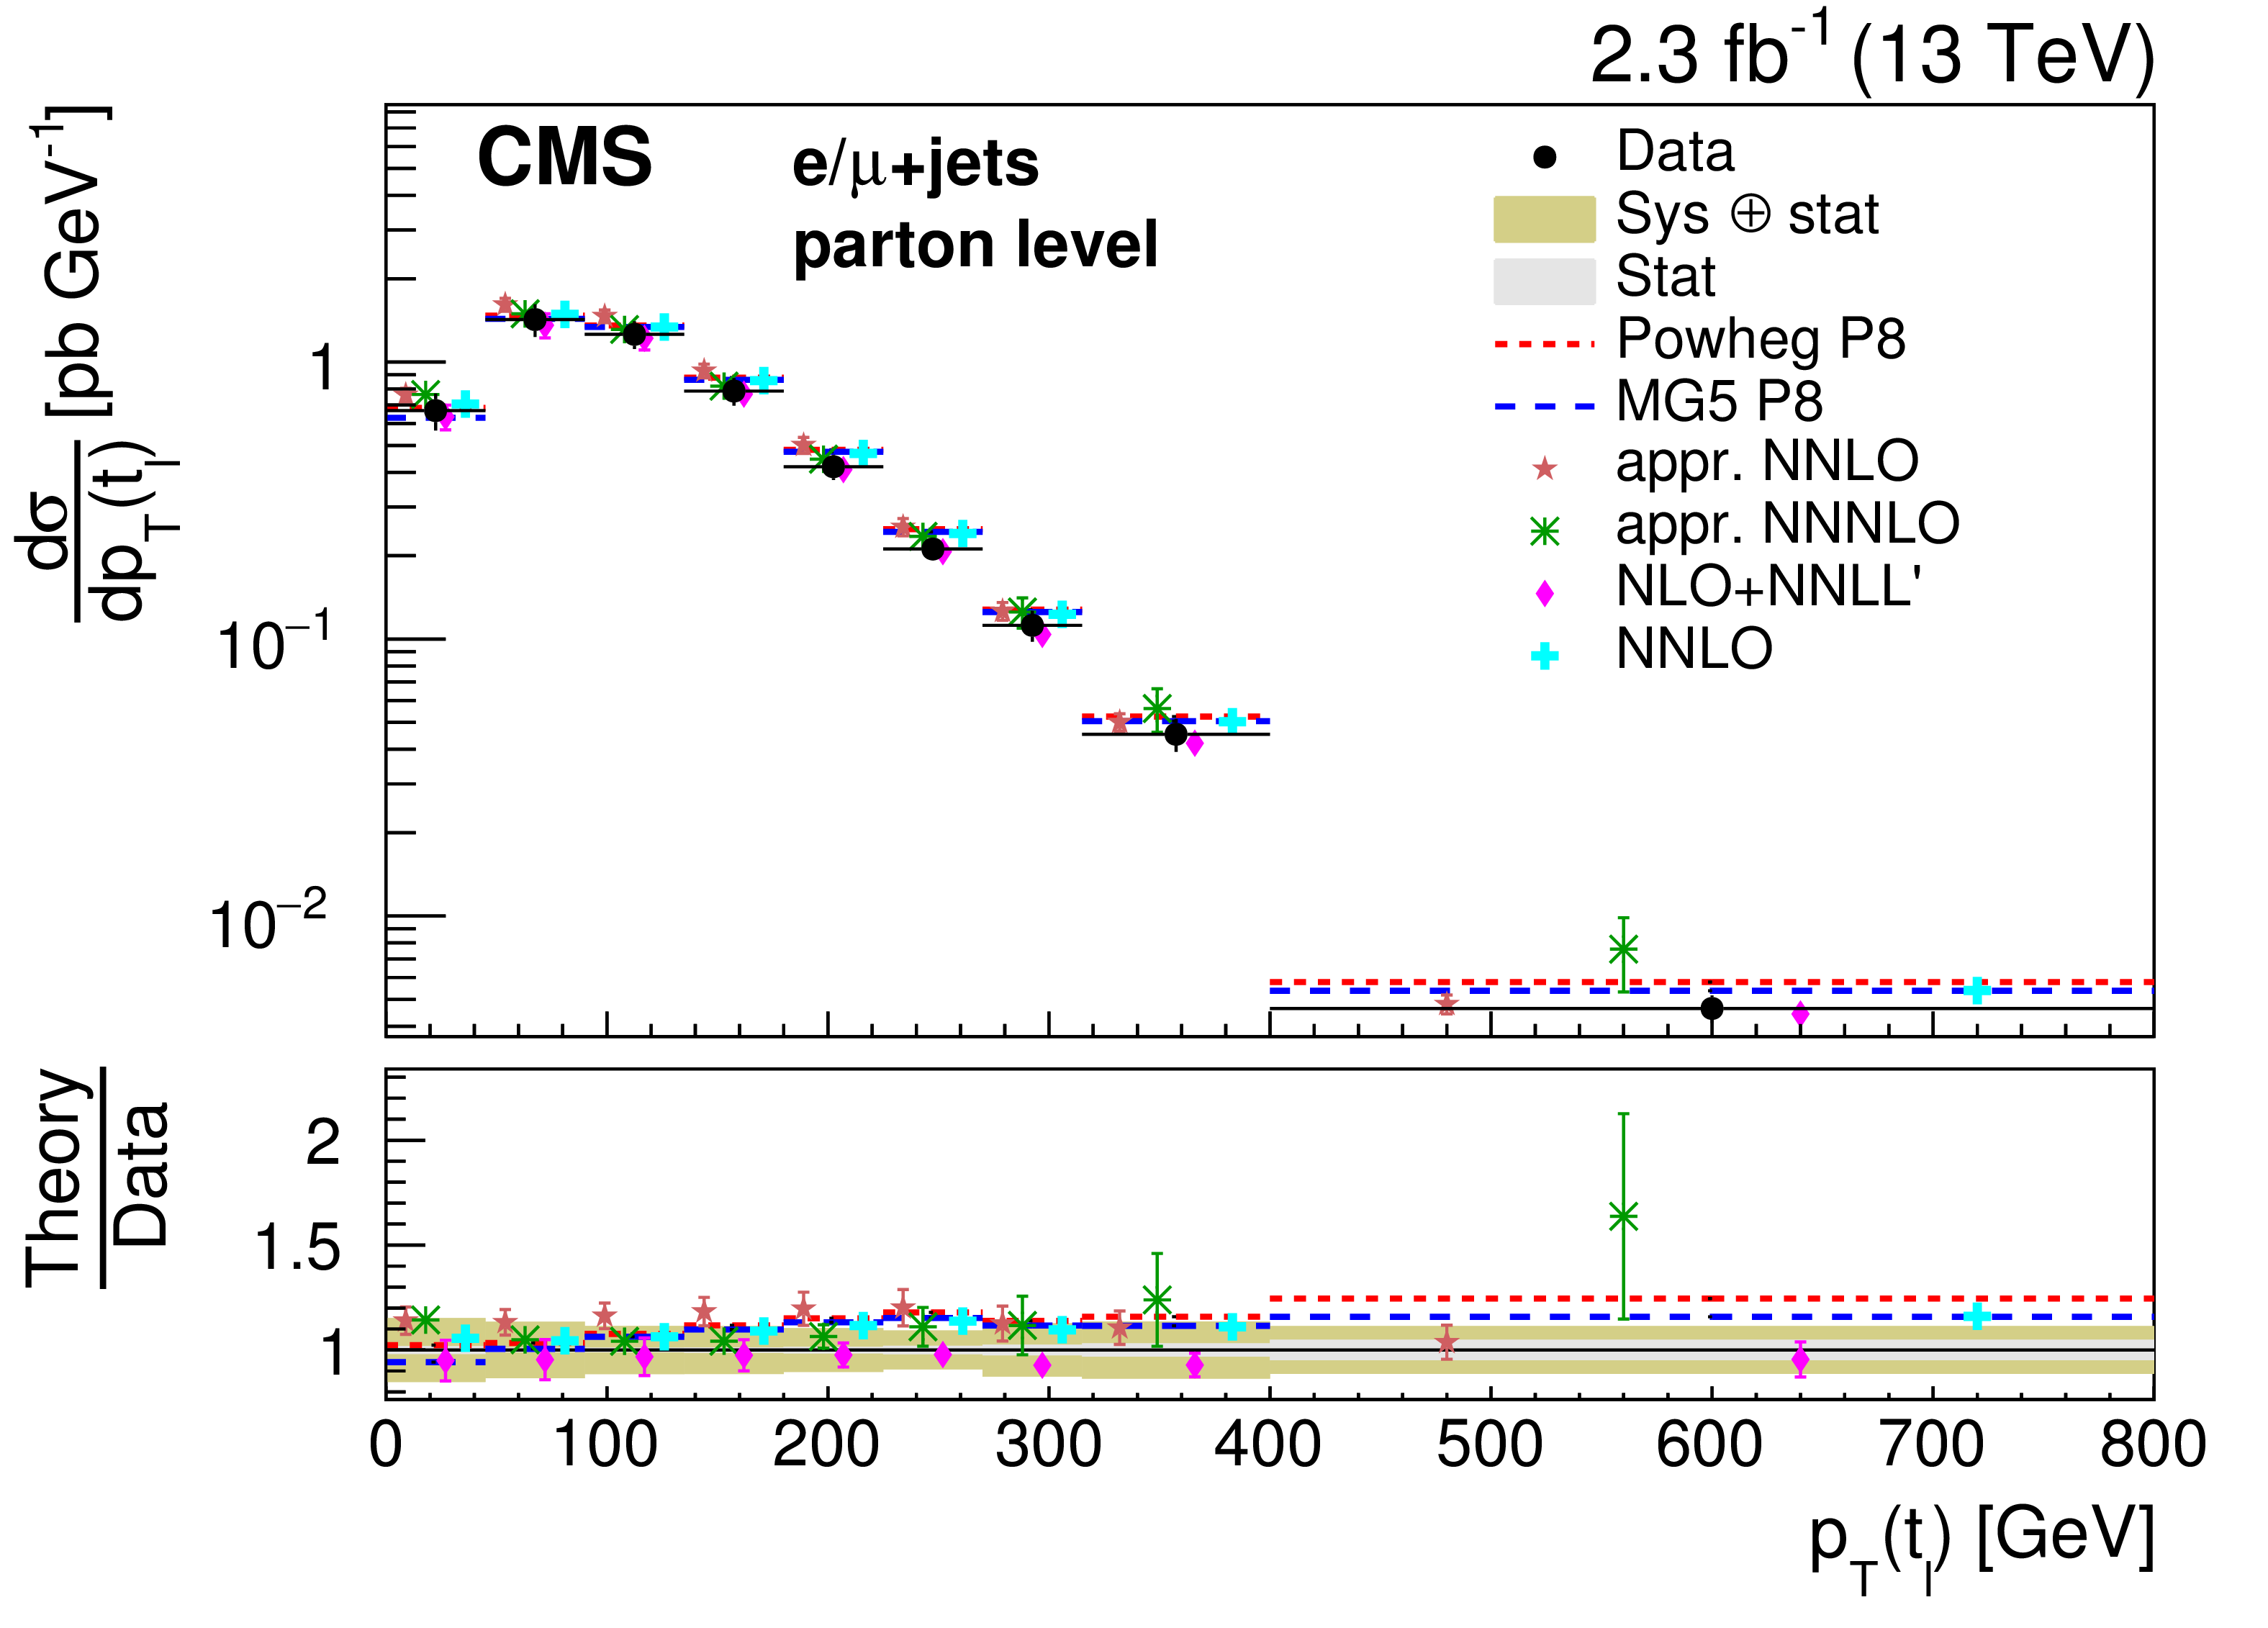
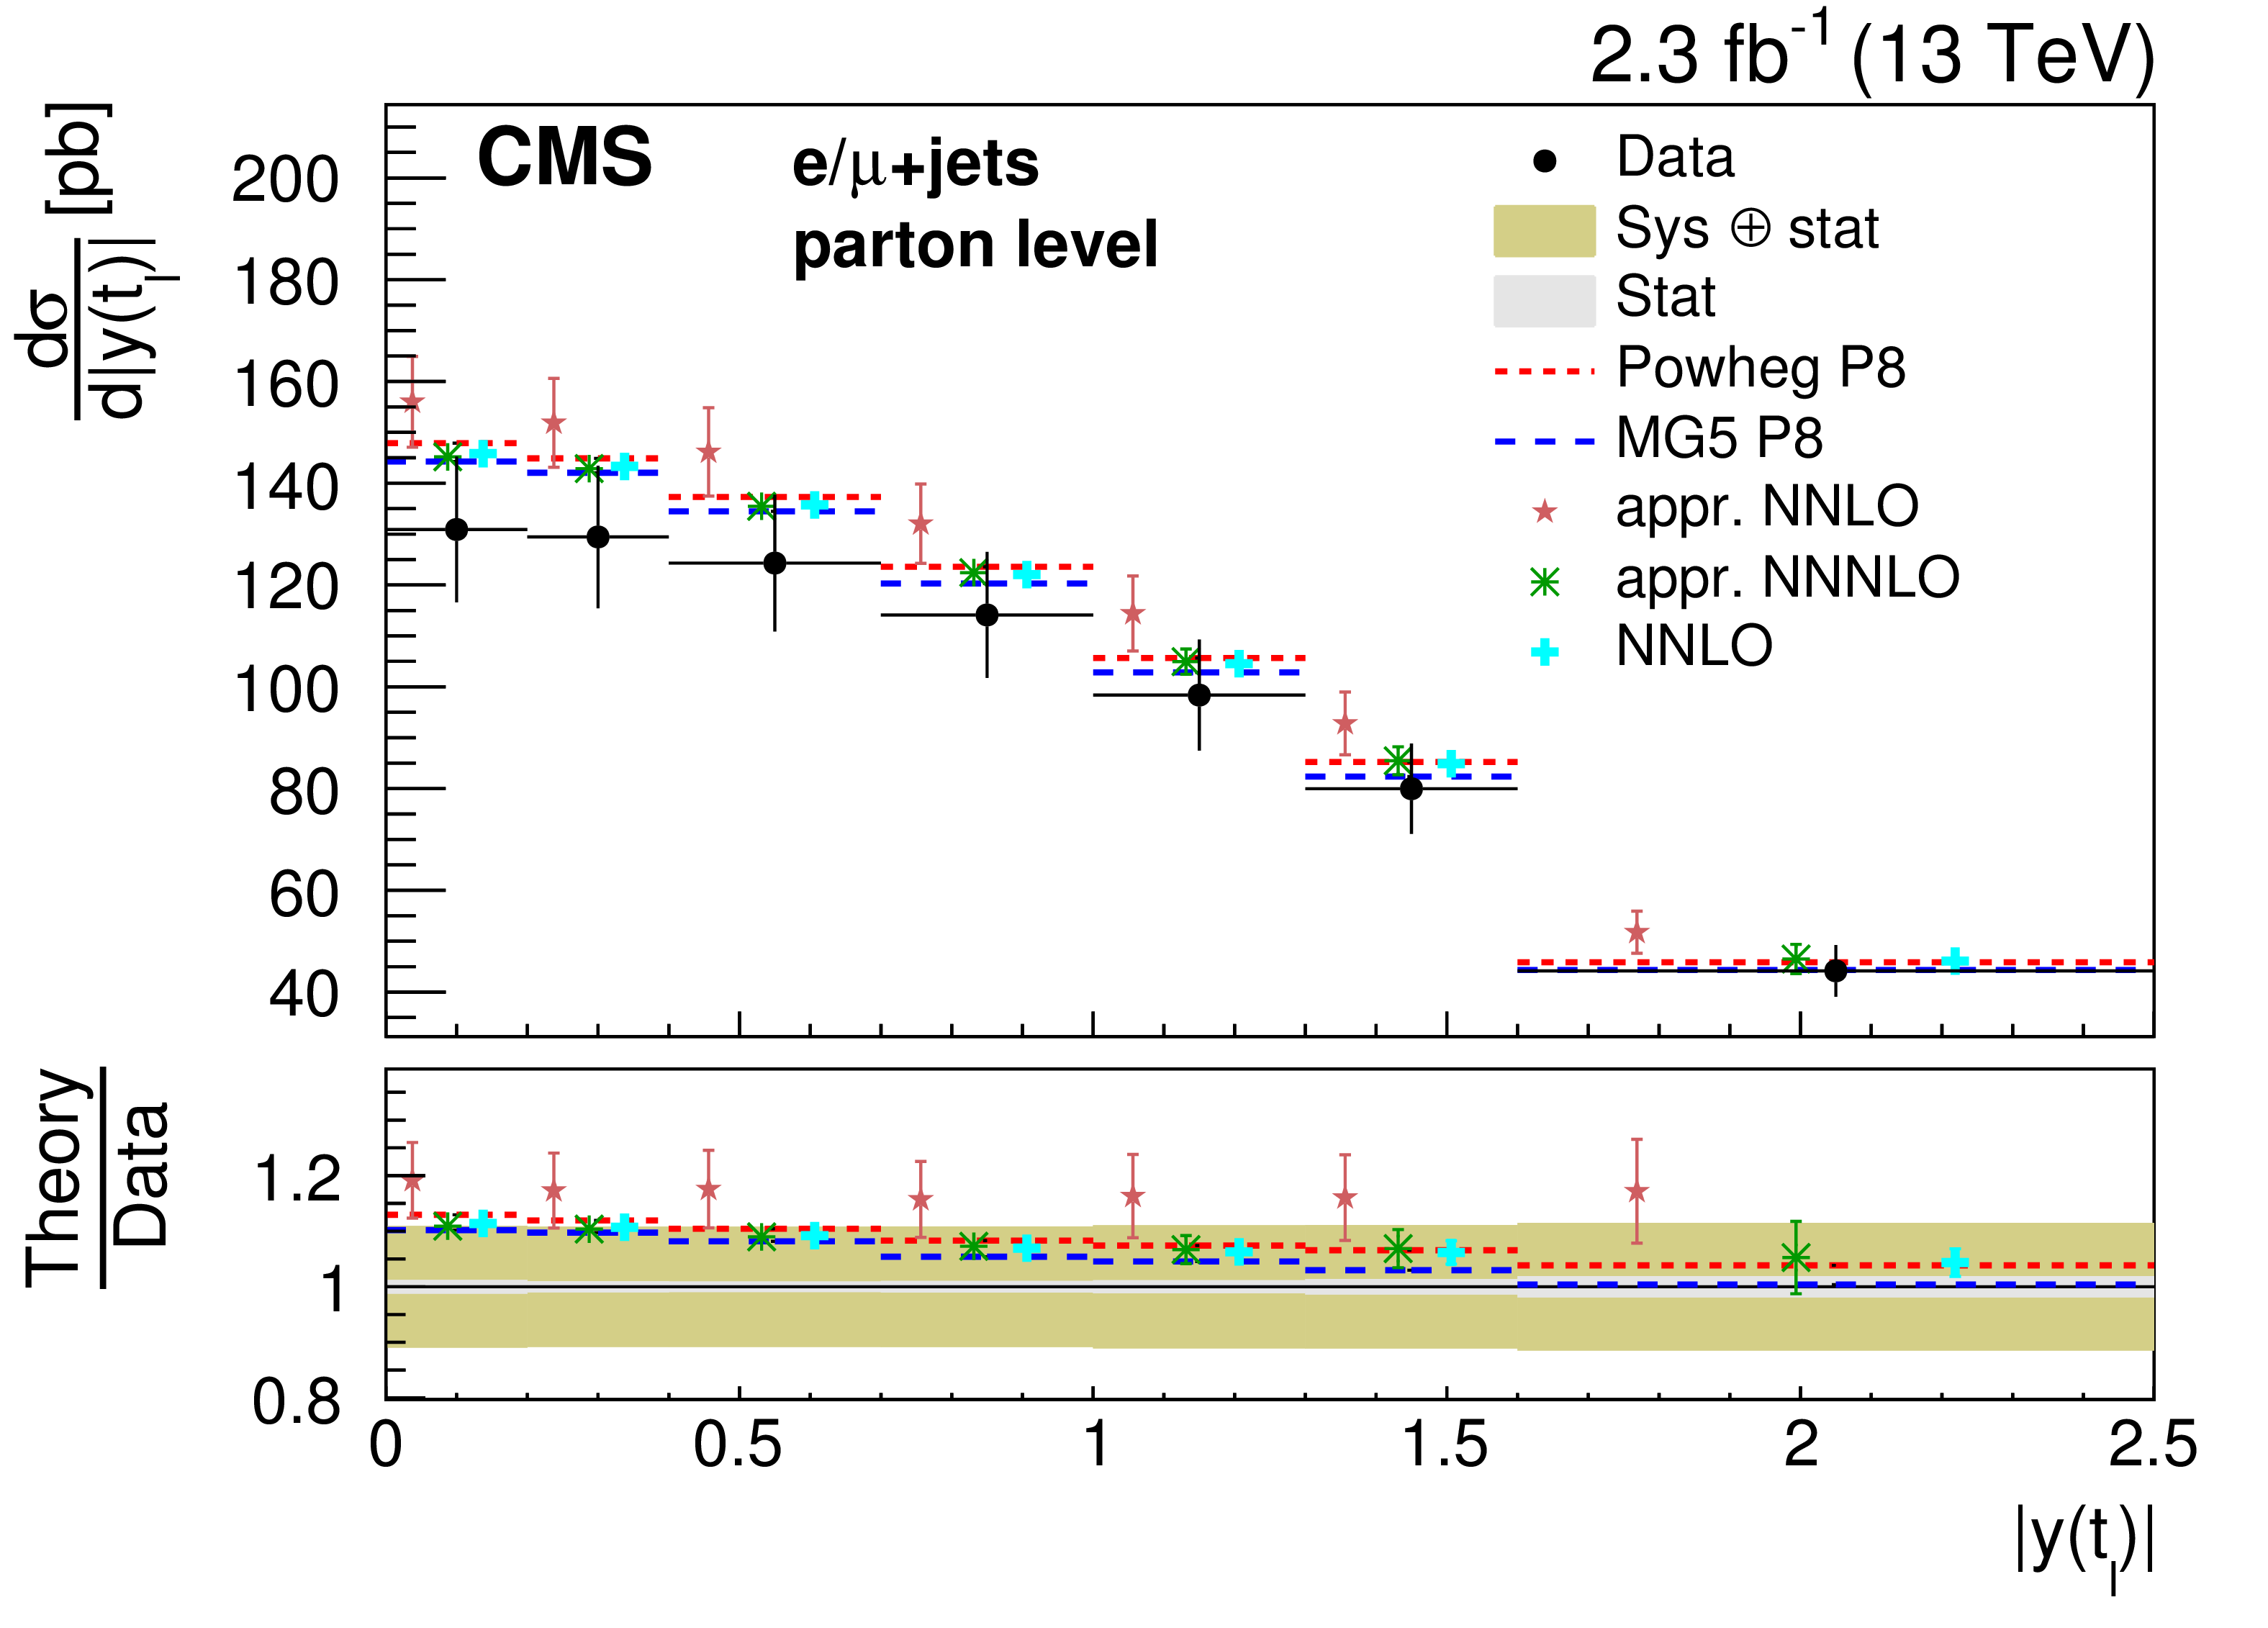
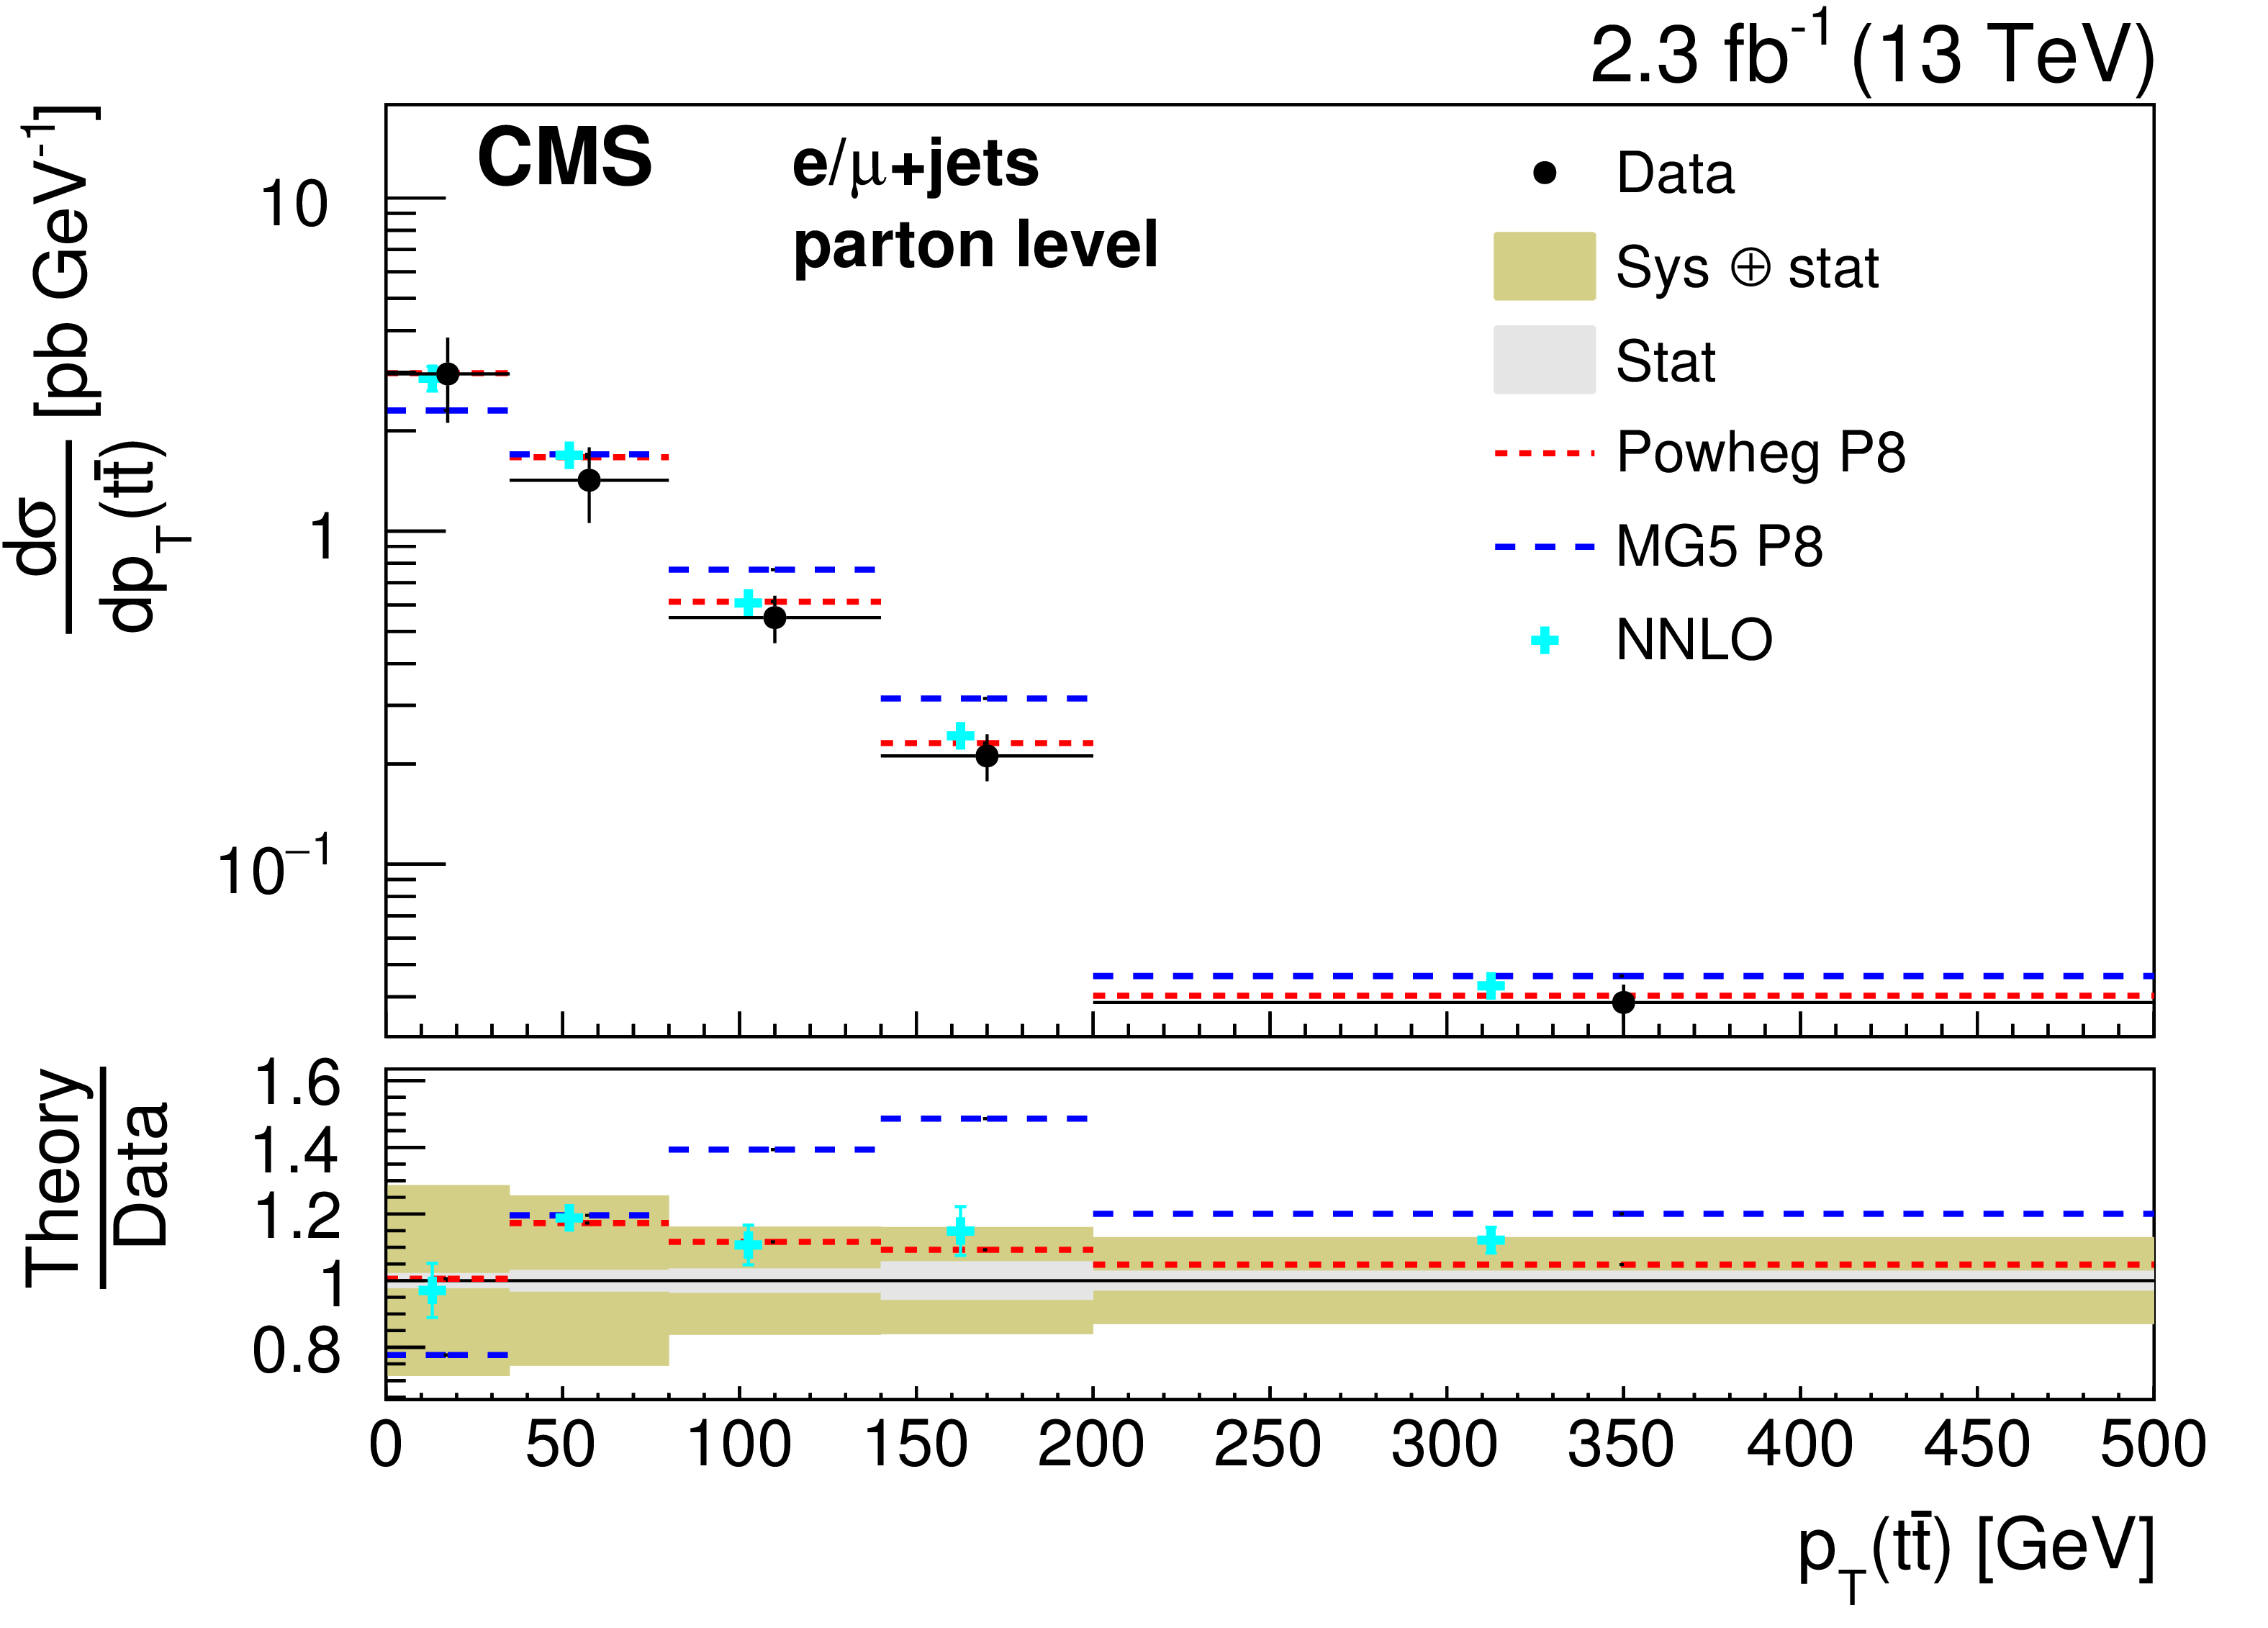
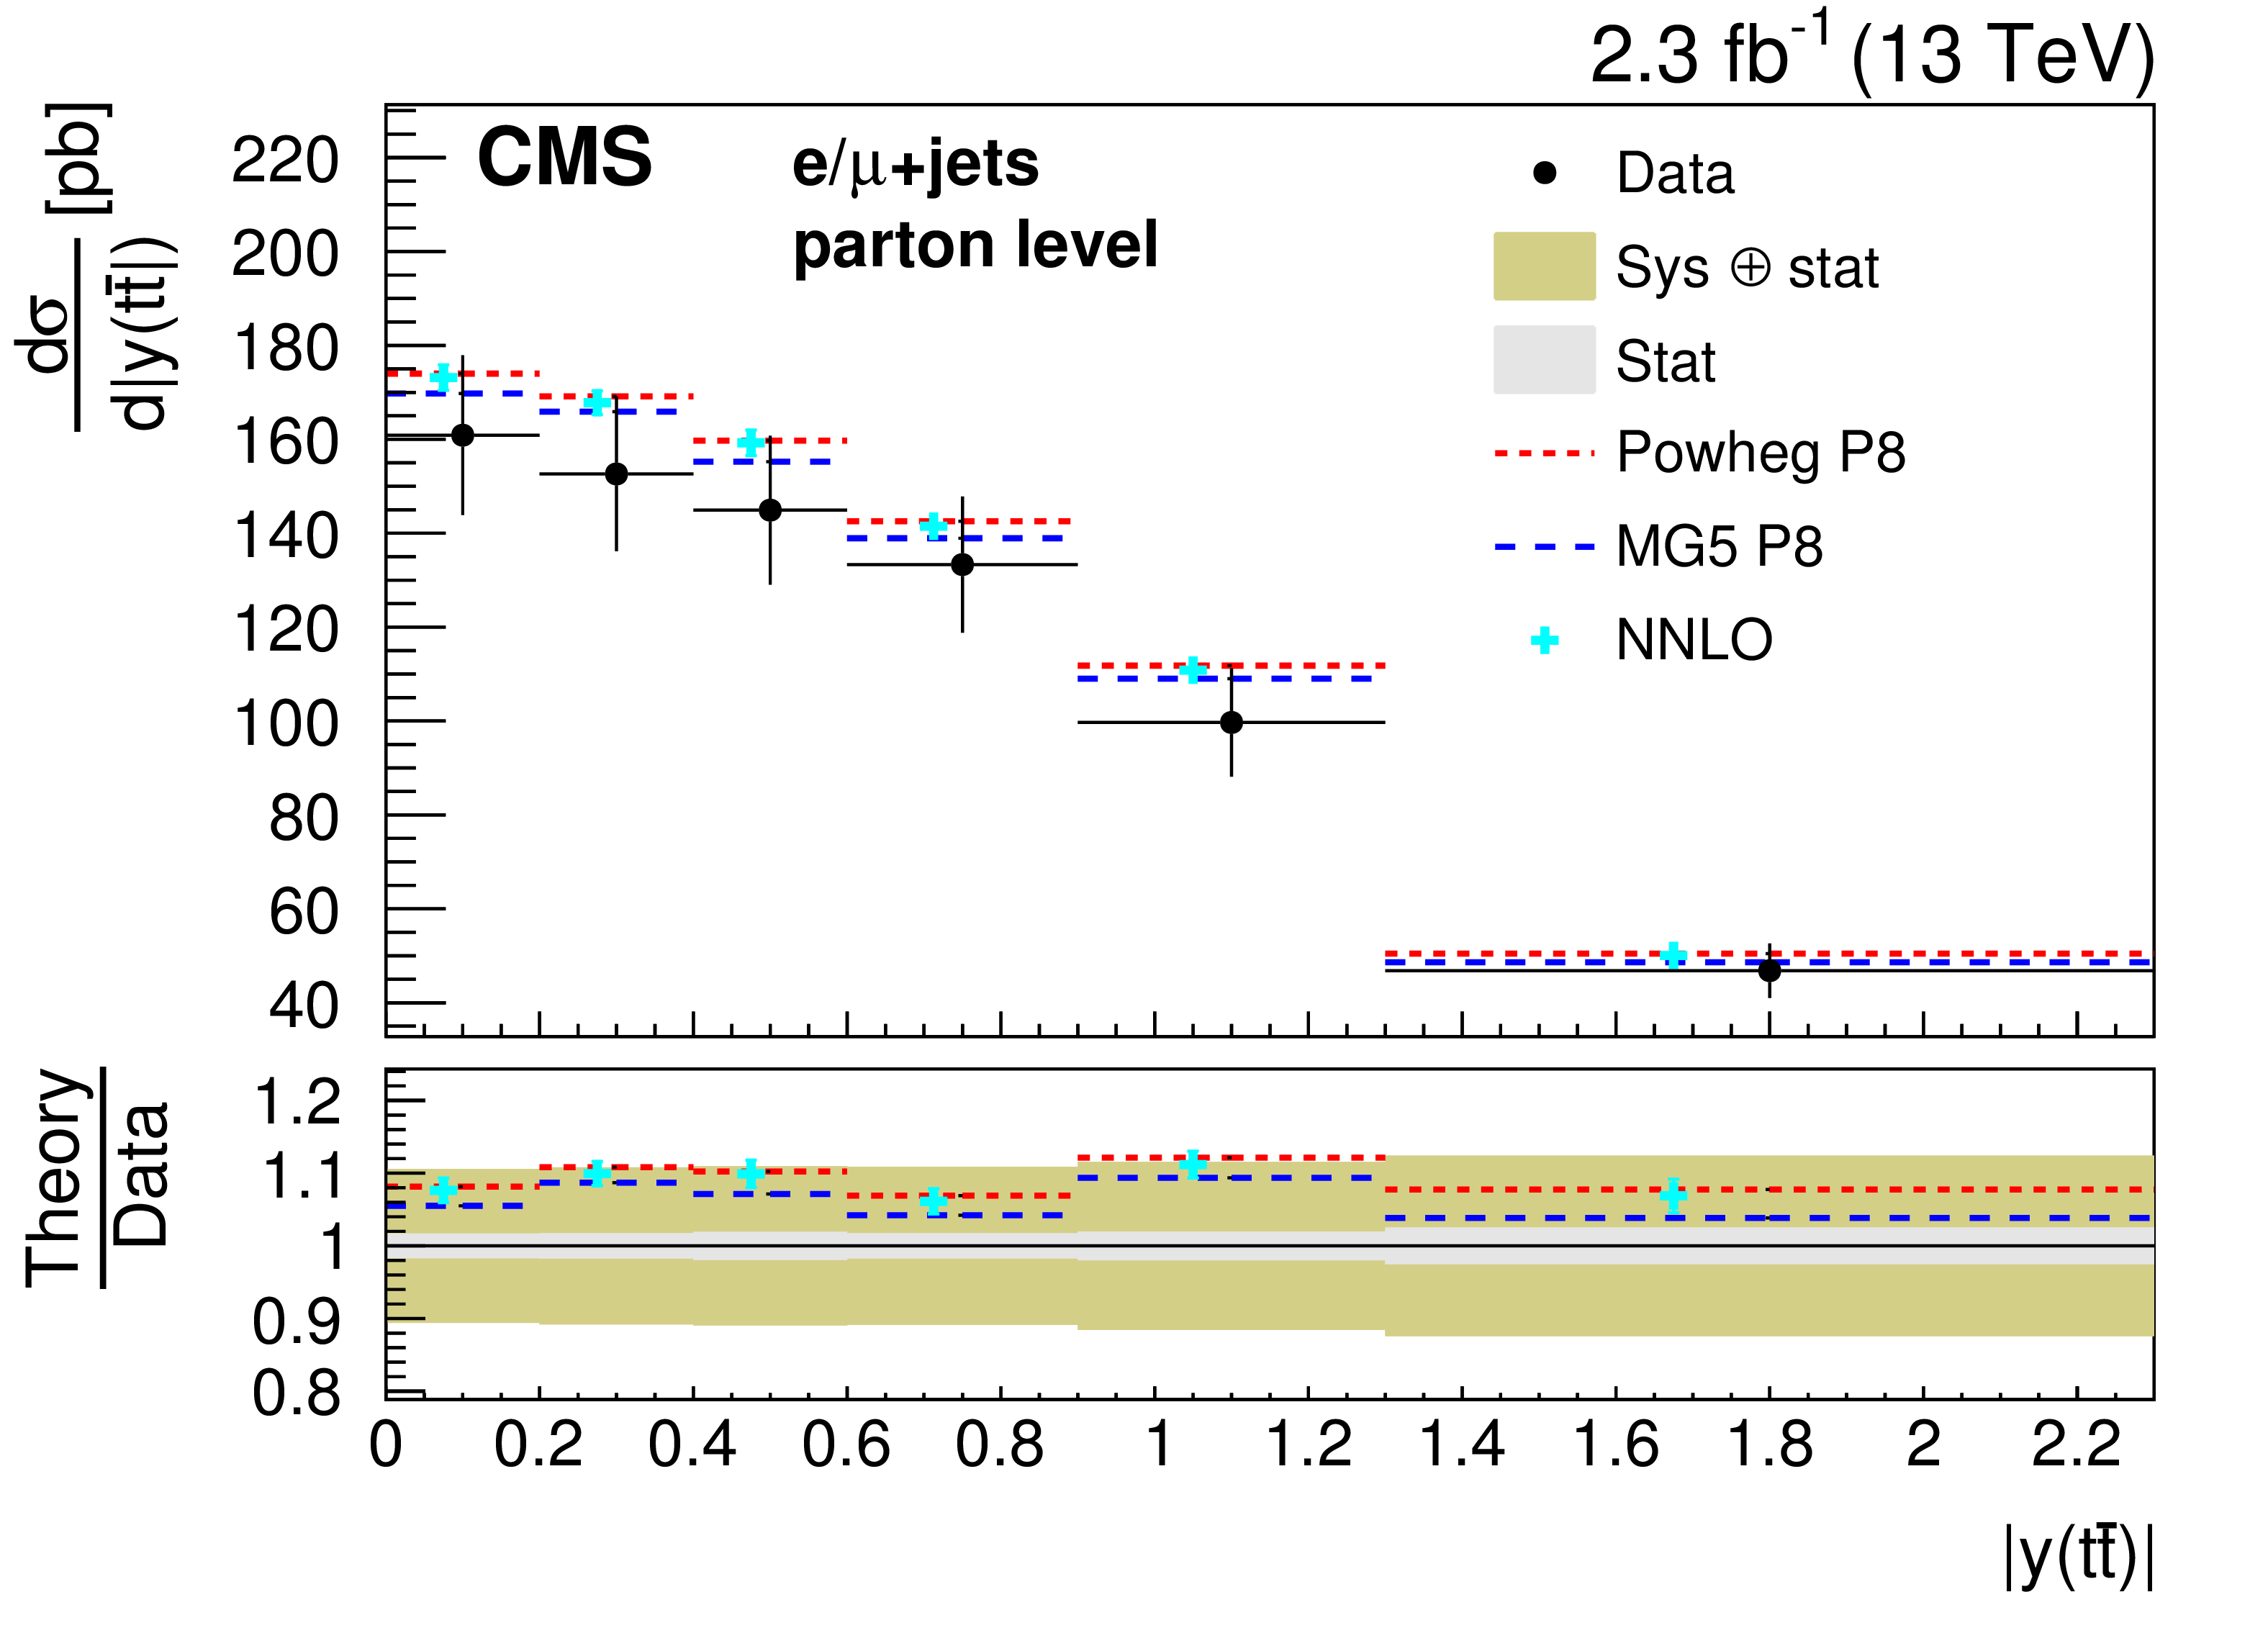
Differential cross sections at parton level as a function of $ {p_{\mathrm {T}}} (\mathrm{ t } )$, $ {| y(\mathrm{ t } ) | }$, $ {p_{\mathrm {T}}} ({\mathrm{ t } \mathrm{ \bar{t} } } )$, $ {| y({\mathrm{ t } \mathrm{ \bar{t} } } ) | }$, and $M({\mathrm{ t } \mathrm{ \bar{t} } } )$ compared to the available predictions of an approximate NNLO calculation [40], an approximate NNNLO calculation [42,43], a NLO+NNLL' calculation [45], and a full NNLO calculation [46]. For these models uncertainties due to the choices of scales are shown. To improve the visibility the theoretical predictions are horizontally shifted. The ratios of the various predictions to the measured cross sections are shown at the bottom of each panel together with the statistical and systematic uncertainties of the measurement. |
png pdf |
Figure 11-a:
Differential cross section at parton level as a function of $ {p_{\mathrm {T}}} (\mathrm{ t } )$, compared to the available predictions of an approximate NNLO calculation [40], an approximate NNNLO calculation [42,43], a NLO+NNLL' calculation [45], and a full NNLO calculation [46]. For these models uncertainties due to the choices of scales are shown. To improve the visibility the theoretical predictions are horizontally shifted. The ratios of the various predictions to the measured cross sections are shown at the bottom of the panel together with the statistical and systematic uncertainties of the measurement. |
png pdf |
Figure 11-b:
Differential cross section at parton level as a function of $ {| y(\mathrm{ t } ) | }$, compared to the available predictions of an approximate NNLO calculation [40], an approximate NNNLO calculation [42,43], a NLO+NNLL' calculation [45], and a full NNLO calculation [46]. For these models uncertainties due to the choices of scales are shown. To improve the visibility the theoretical predictions are horizontally shifted. The ratios of the various predictions to the measured cross sections are shown at the bottom of the panel together with the statistical and systematic uncertainties of the measurement. |
png pdf |
Figure 11-c:
Differential cross section at parton level as a function of $ {p_{\mathrm {T}}} ({\mathrm{ t } \mathrm{ \bar{t} } } )$, compared to the available predictions of an approximate NNLO calculation [40], an approximate NNNLO calculation [42,43], a NLO+NNLL' calculation [45], and a full NNLO calculation [46]. For these models uncertainties due to the choices of scales are shown. To improve the visibility the theoretical predictions are horizontally shifted. The ratios of the various predictions to the measured cross sections are shown at the bottom of the panel together with the statistical and systematic uncertainties of the measurement. |
png pdf |
Figure 11-d:
Differential cross section at parton level as a function of $ {| y({\mathrm{ t } \mathrm{ \bar{t} } } ) | }$, compared to the available predictions of an approximate NNLO calculation [40], an approximate NNNLO calculation [42,43], a NLO+NNLL' calculation [45], and a full NNLO calculation [46]. For these models uncertainties due to the choices of scales are shown. To improve the visibility the theoretical predictions are horizontally shifted. The ratios of the various predictions to the measured cross sections are shown at the bottom of the panel together with the statistical and systematic uncertainties of the measurement. |
png pdf |
Figure 11-e:
Differential cross section at parton level as a function of $M({\mathrm{ t } \mathrm{ \bar{t} } } )$, compared to the available predictions of an approximate NNLO calculation [40], an approximate NNNLO calculation [42,43], a NLO+NNLL' calculation [45], and a full NNLO calculation [46]. For these models uncertainties due to the choices of scales are shown. To improve the visibility the theoretical predictions are horizontally shifted. The ratios of the various predictions to the measured cross sections are shown at the bottom of the panel together with the statistical and systematic uncertainties of the measurement. |
png pdf |
Figure 12:
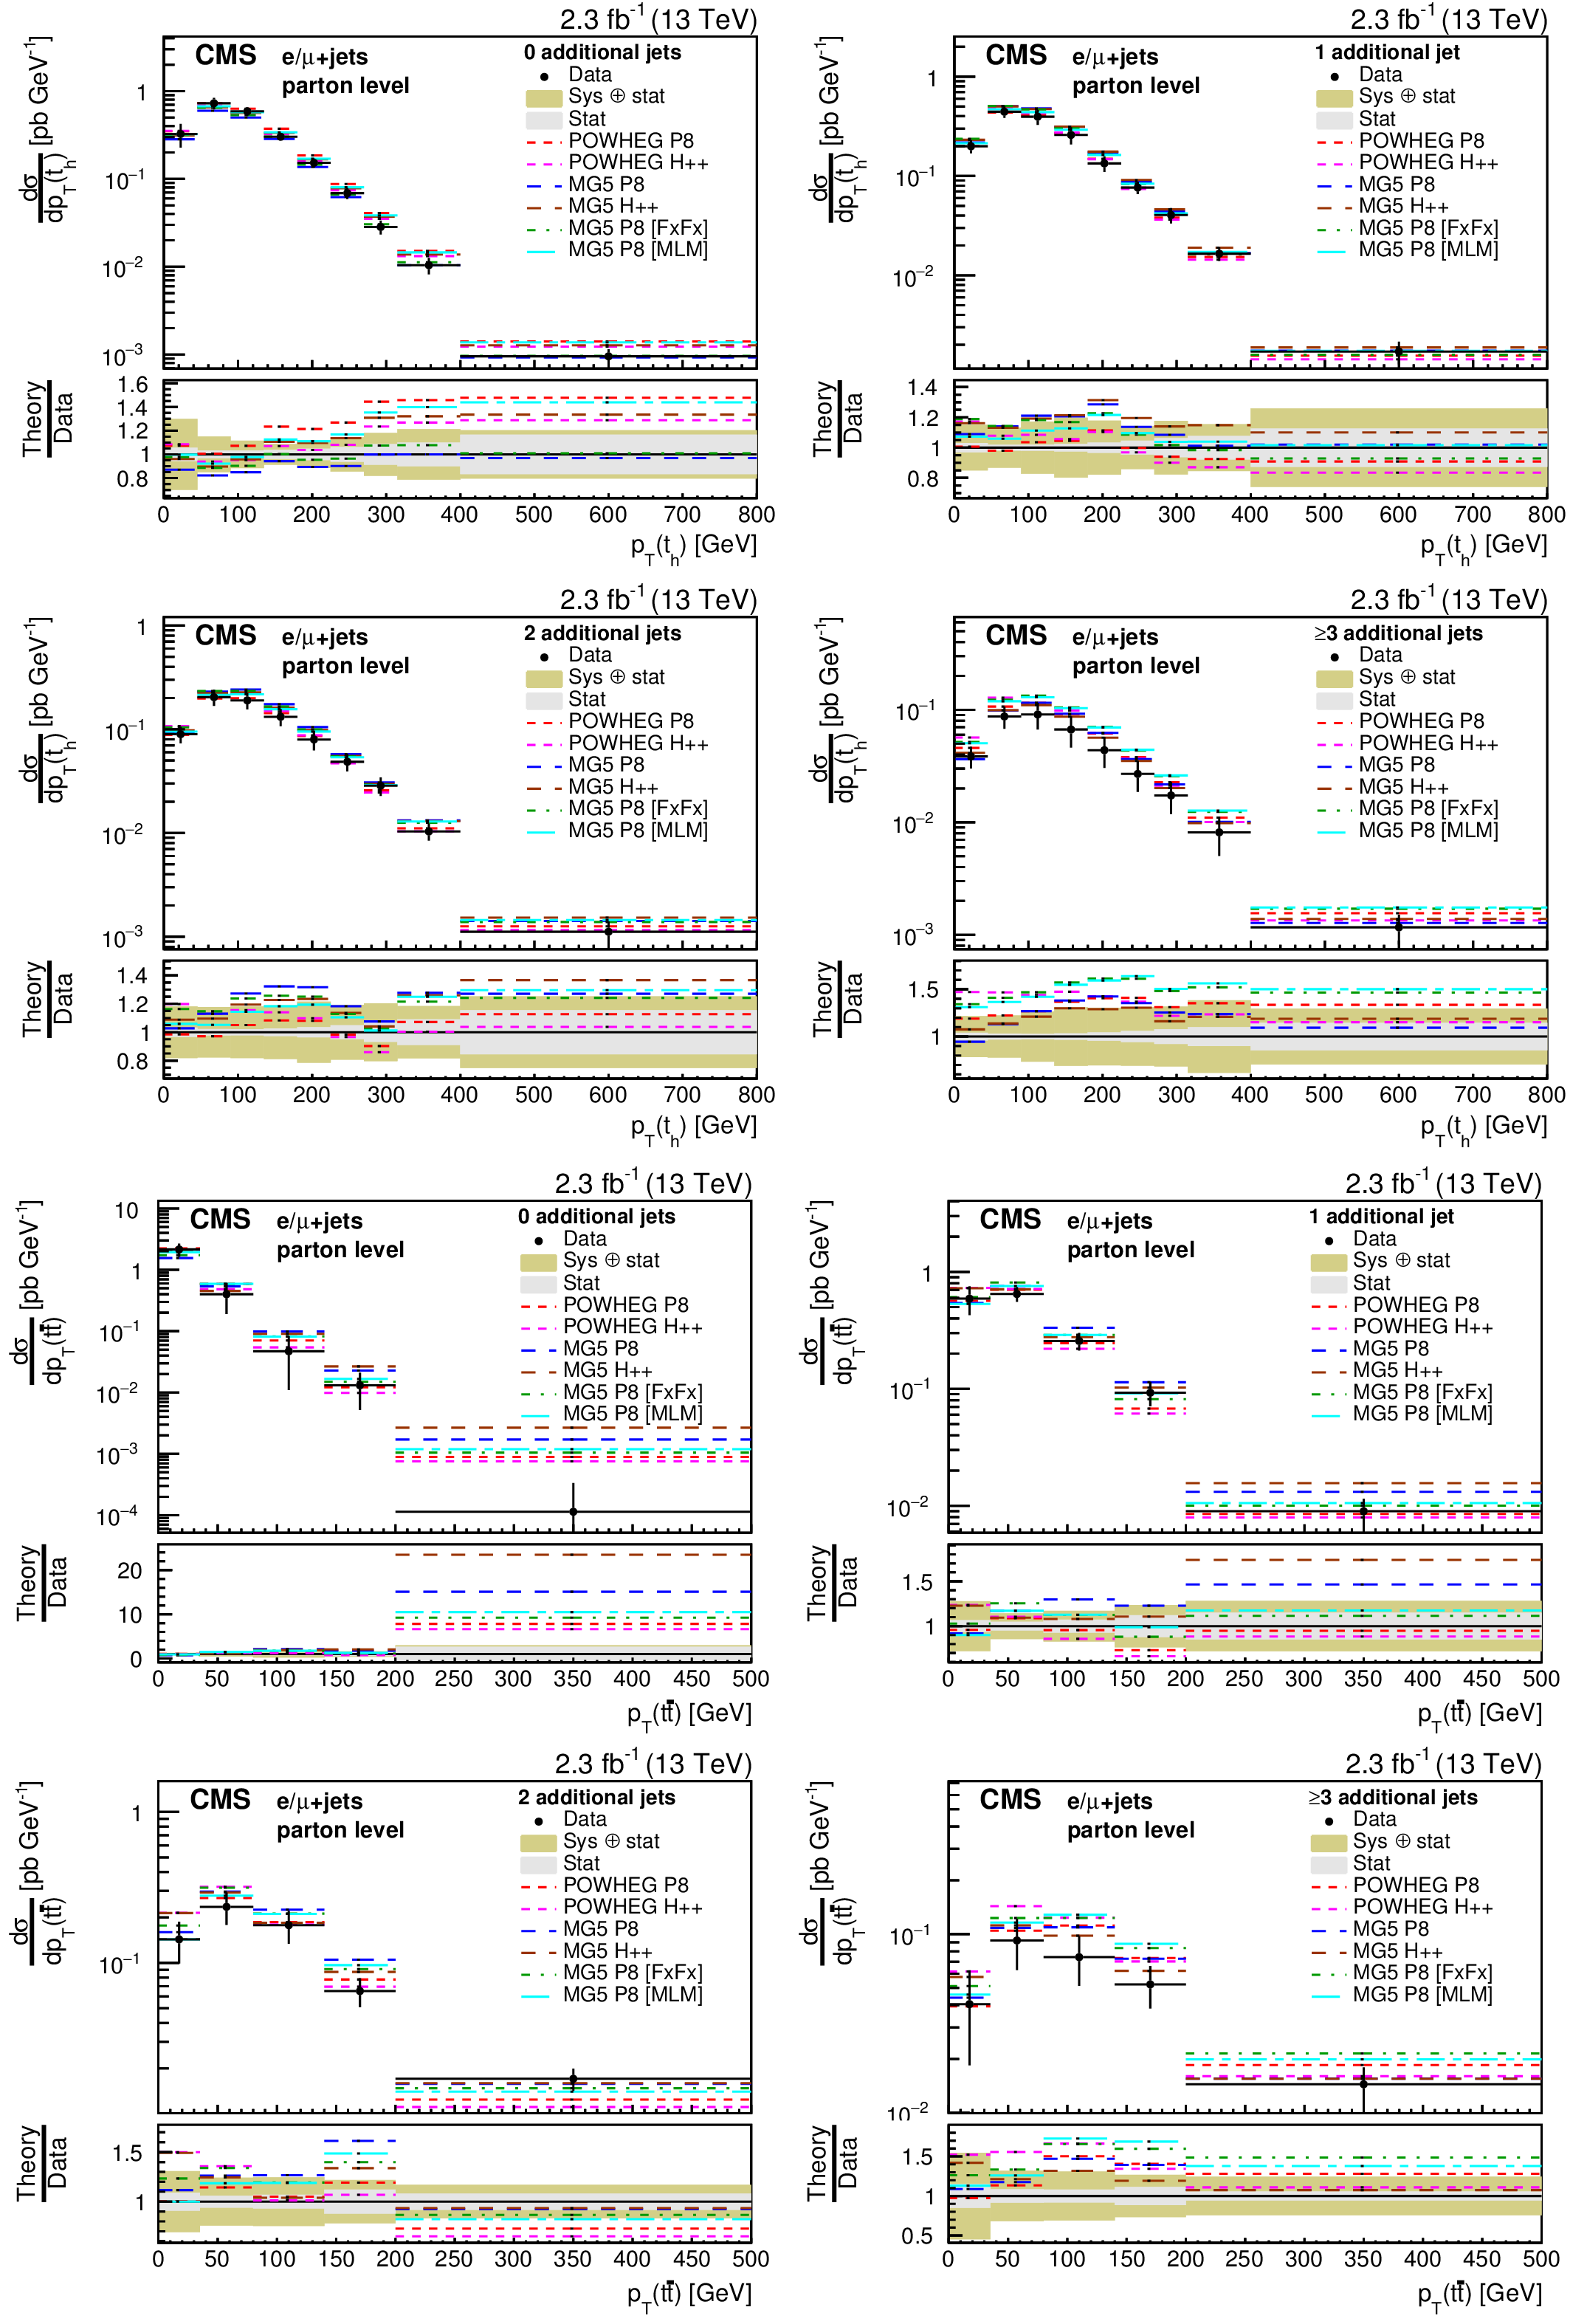
Differential cross sections at parton level as a function of $ {p_{\mathrm {T}}} ( {\mathrm{ t } _\mathrm {h}} )$ (upper two rows) and $ {p_{\mathrm {T}}} ({\mathrm{ t } \mathrm{ \bar{t} } } )$ (lower two rows) in bins of the number of additional jets. The measurements are compared to the predictions of POWHEG and MG5-MC@NLO (MG5) combined with PYTHIA8 (P8) or HERWIG++ (H++) and the multiparton simulations MG5-MC@NLO +PYTHIA8 MLM and MG5-MC@NLO +PYTHIA8 FxFx. The ratios of the predictions to the measured cross sections are shown at the bottom of each panel together with the statistical and systematic uncertainties of the measurement. |

png pdf |
Figure 12-a:
Differential cross sections at parton level as a function of $ {p_{\mathrm {T}}} ( {\mathrm{ t } _\mathrm {h}} )$ in bins of the number of additional jets. The measurements are compared to the predictions of POWHEG and MG5-MC@NLO (MG5) combined with PYTHIA8 (P8) or HERWIG++ (H++) and the multiparton simulations MG5-MC@NLO +PYTHIA8 MLM and MG5-MC@NLO +PYTHIA8 FxFx. The ratios of the predictions to the measured cross sections are shown at the bottom of each panel together with the statistical and systematic uncertainties of the measurement. |
png pdf |
Figure 12-b:
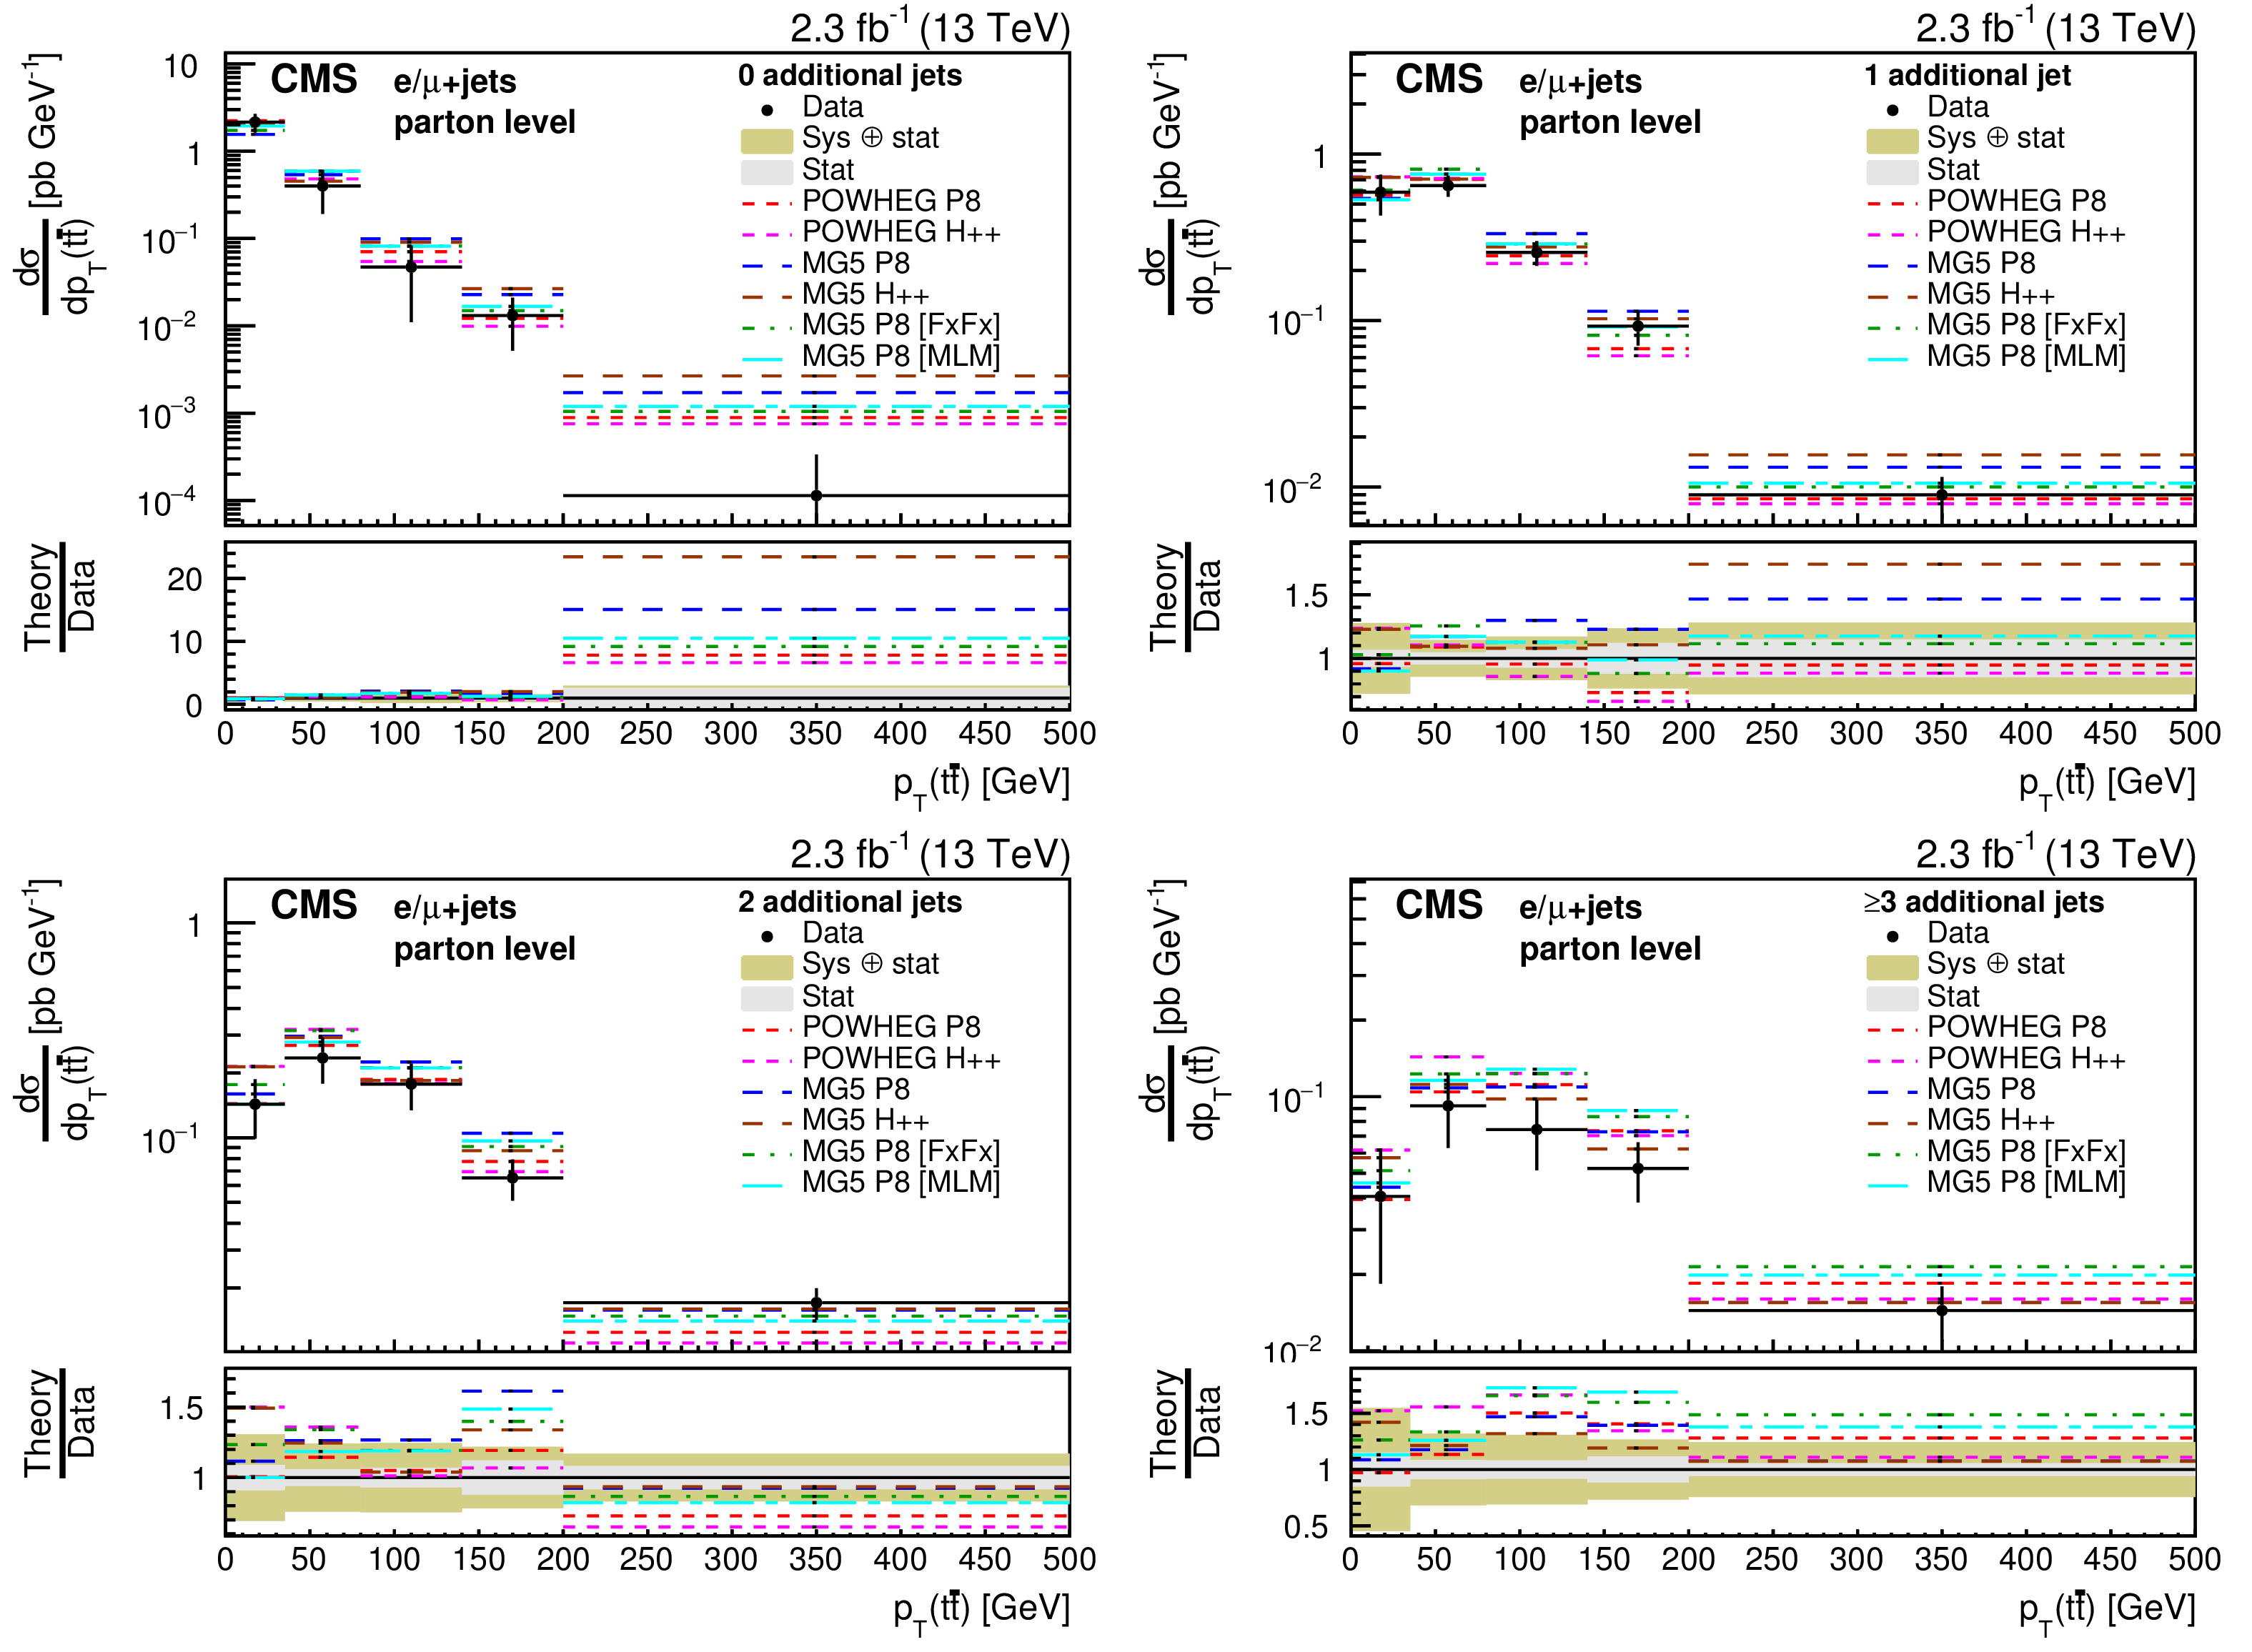
Differential cross sections at parton level as a function of $ {p_{\mathrm {T}}} ({\mathrm{ t } \mathrm{ \bar{t} } } )$ in bins of the number of additional jets. The measurements are compared to the predictions of POWHEG and MG5-MC@NLO (MG5) combined with PYTHIA8 (P8) or HERWIG++ (H++) and the multiparton simulations MG5-MC@NLO +PYTHIA8 MLM and MG5-MC@NLO +PYTHIA8 FxFx. The ratios of the predictions to the measured cross sections are shown at the bottom of each panel together with the statistical and systematic uncertainties of the measurement. |
png pdf |
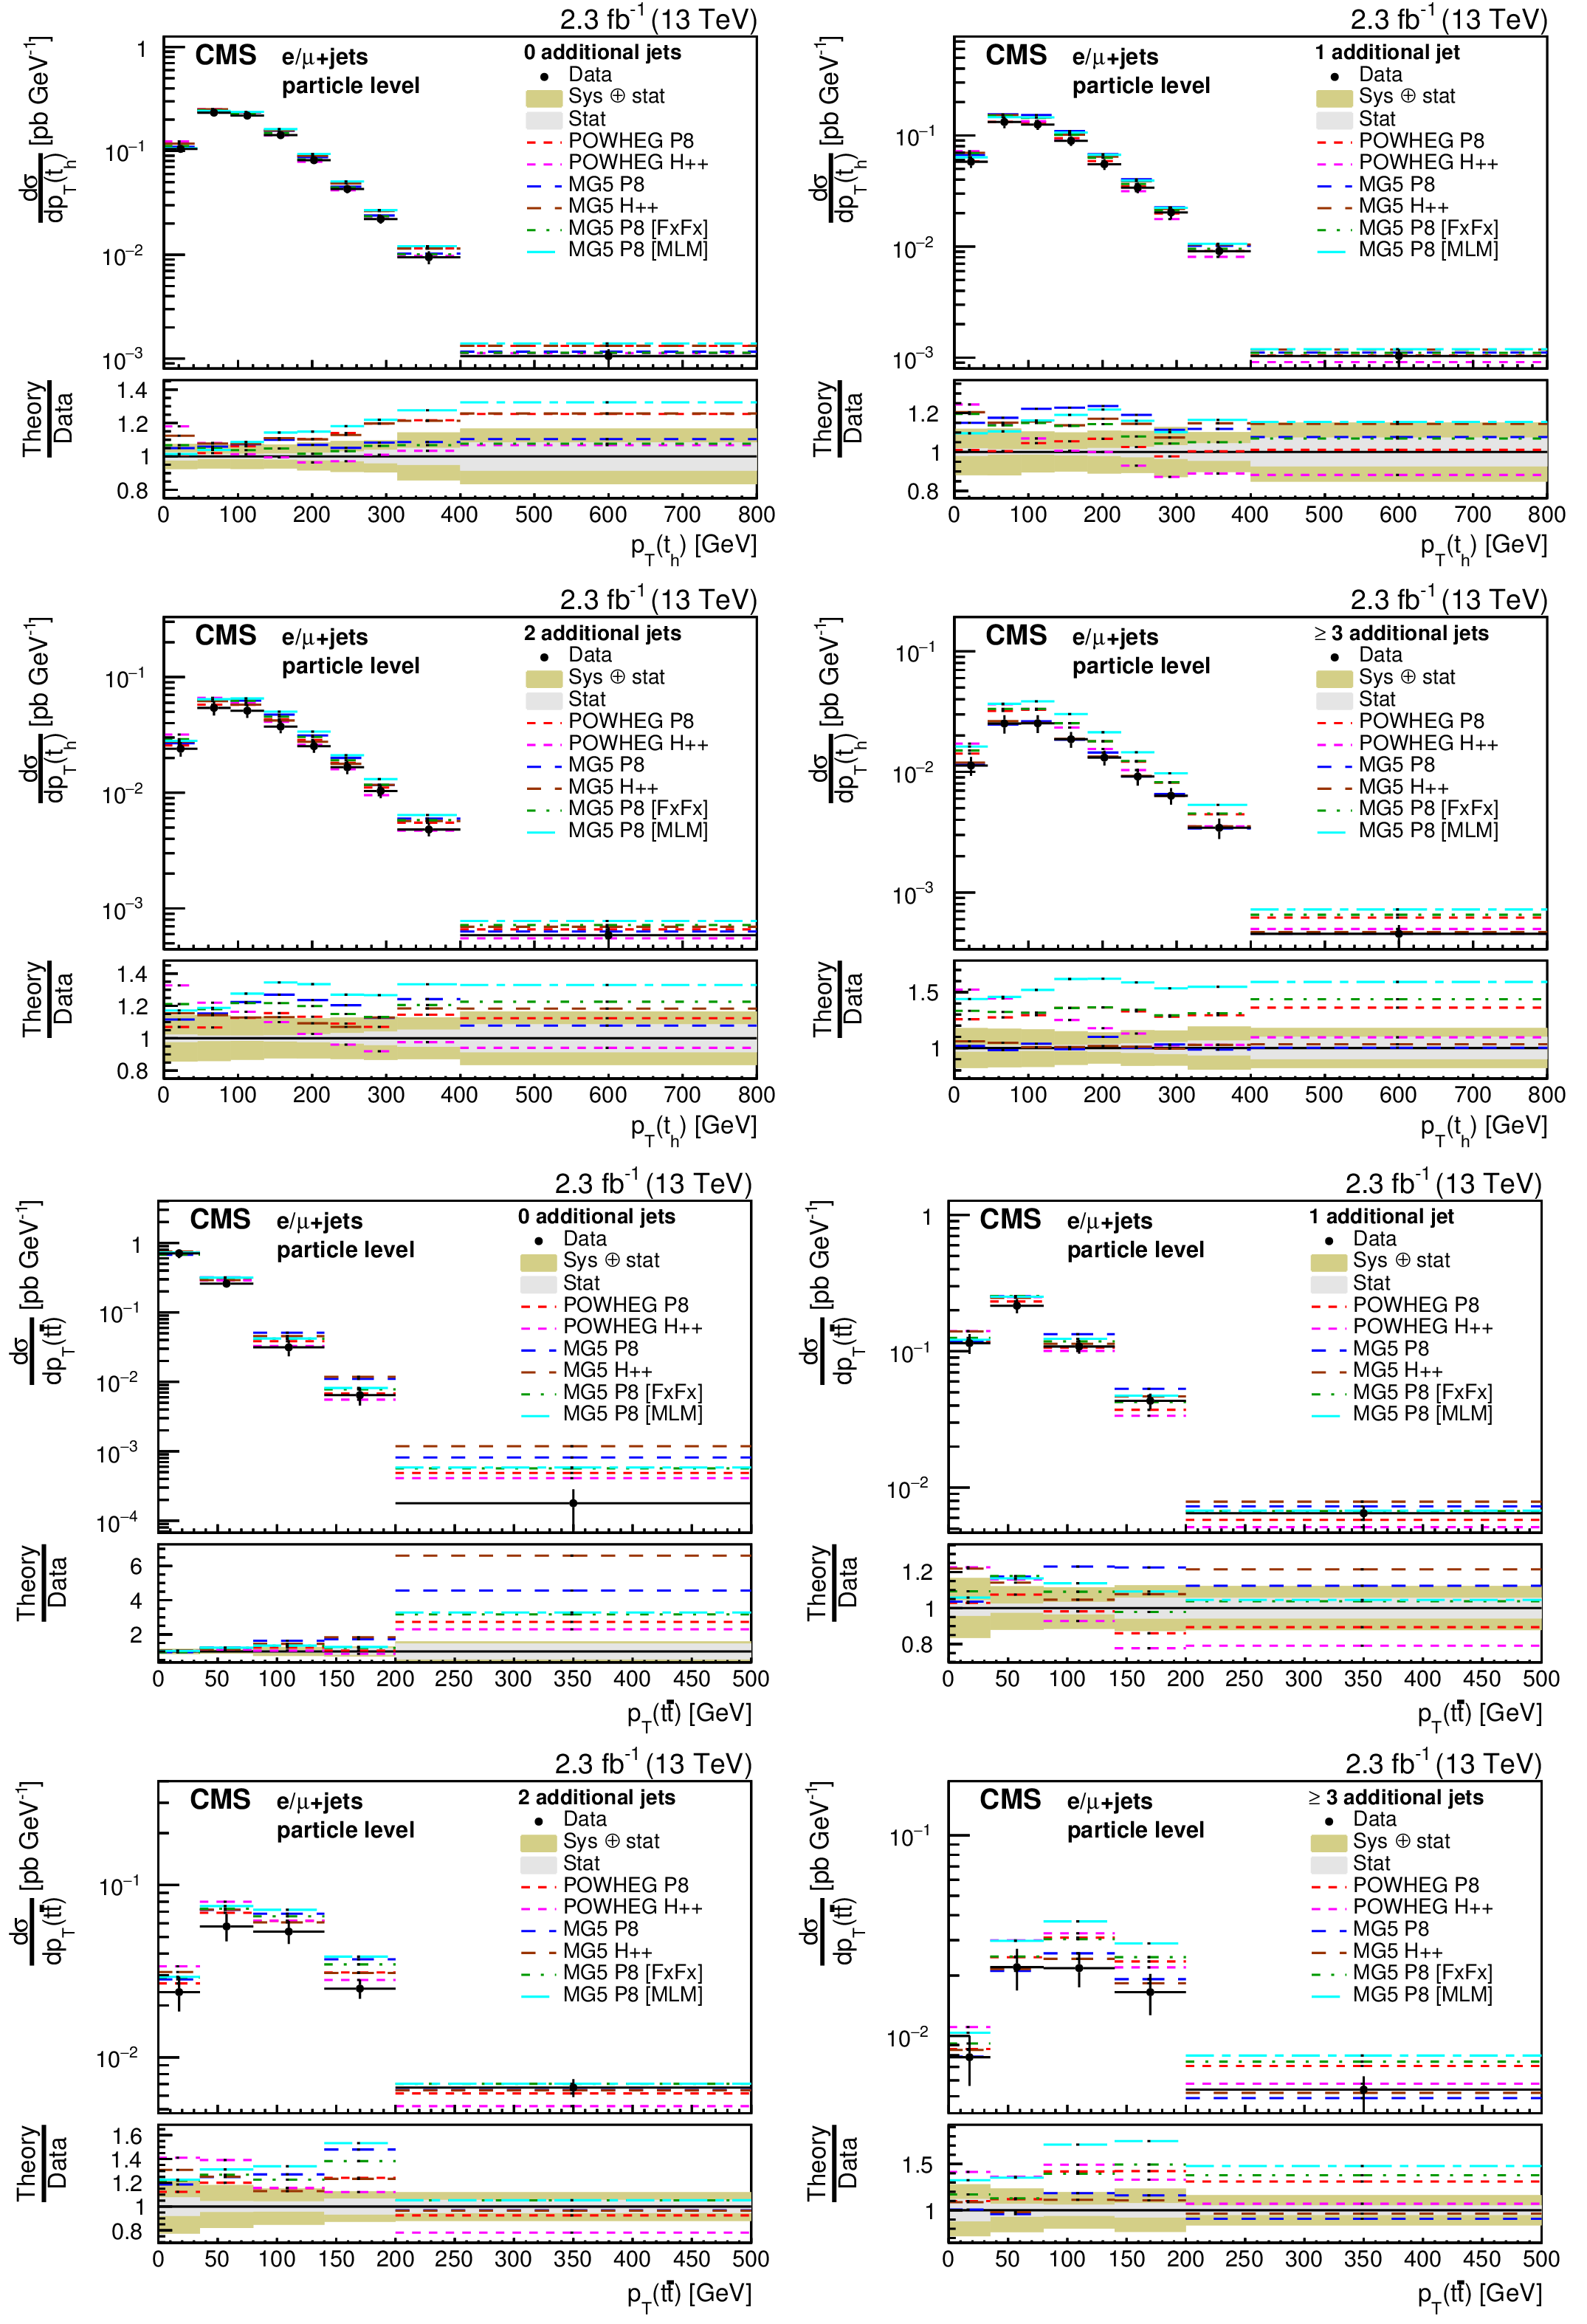
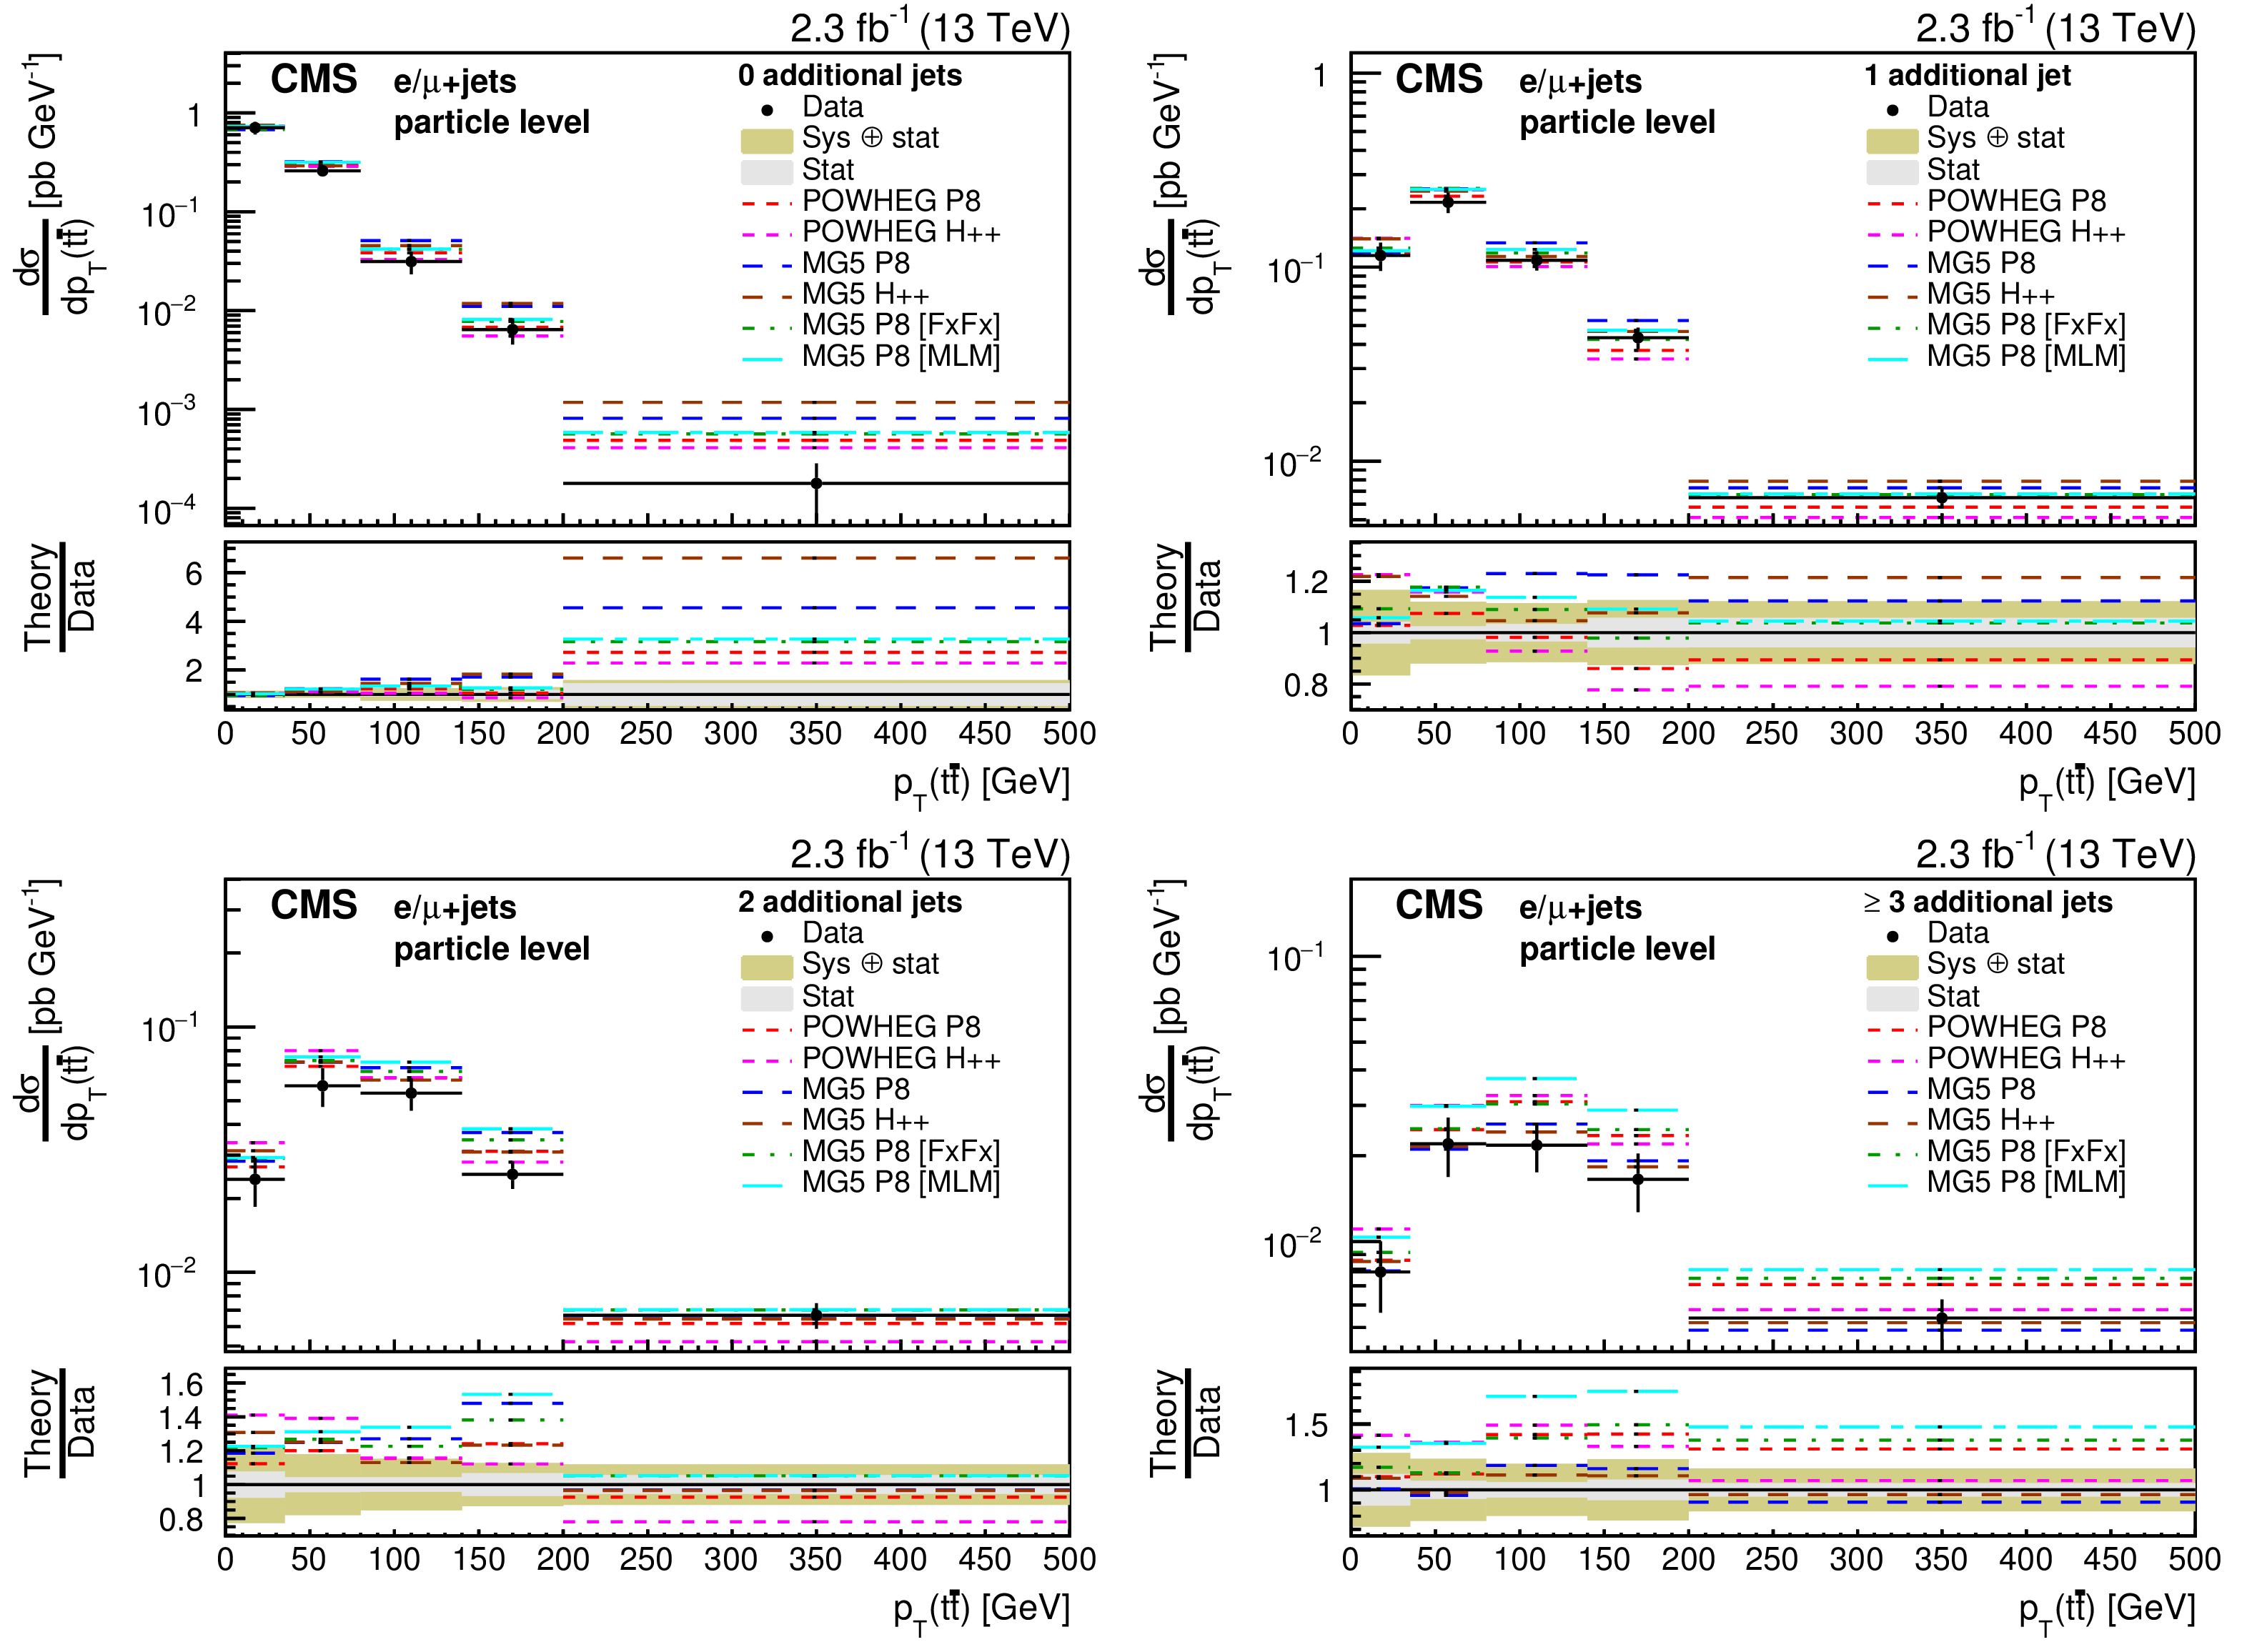
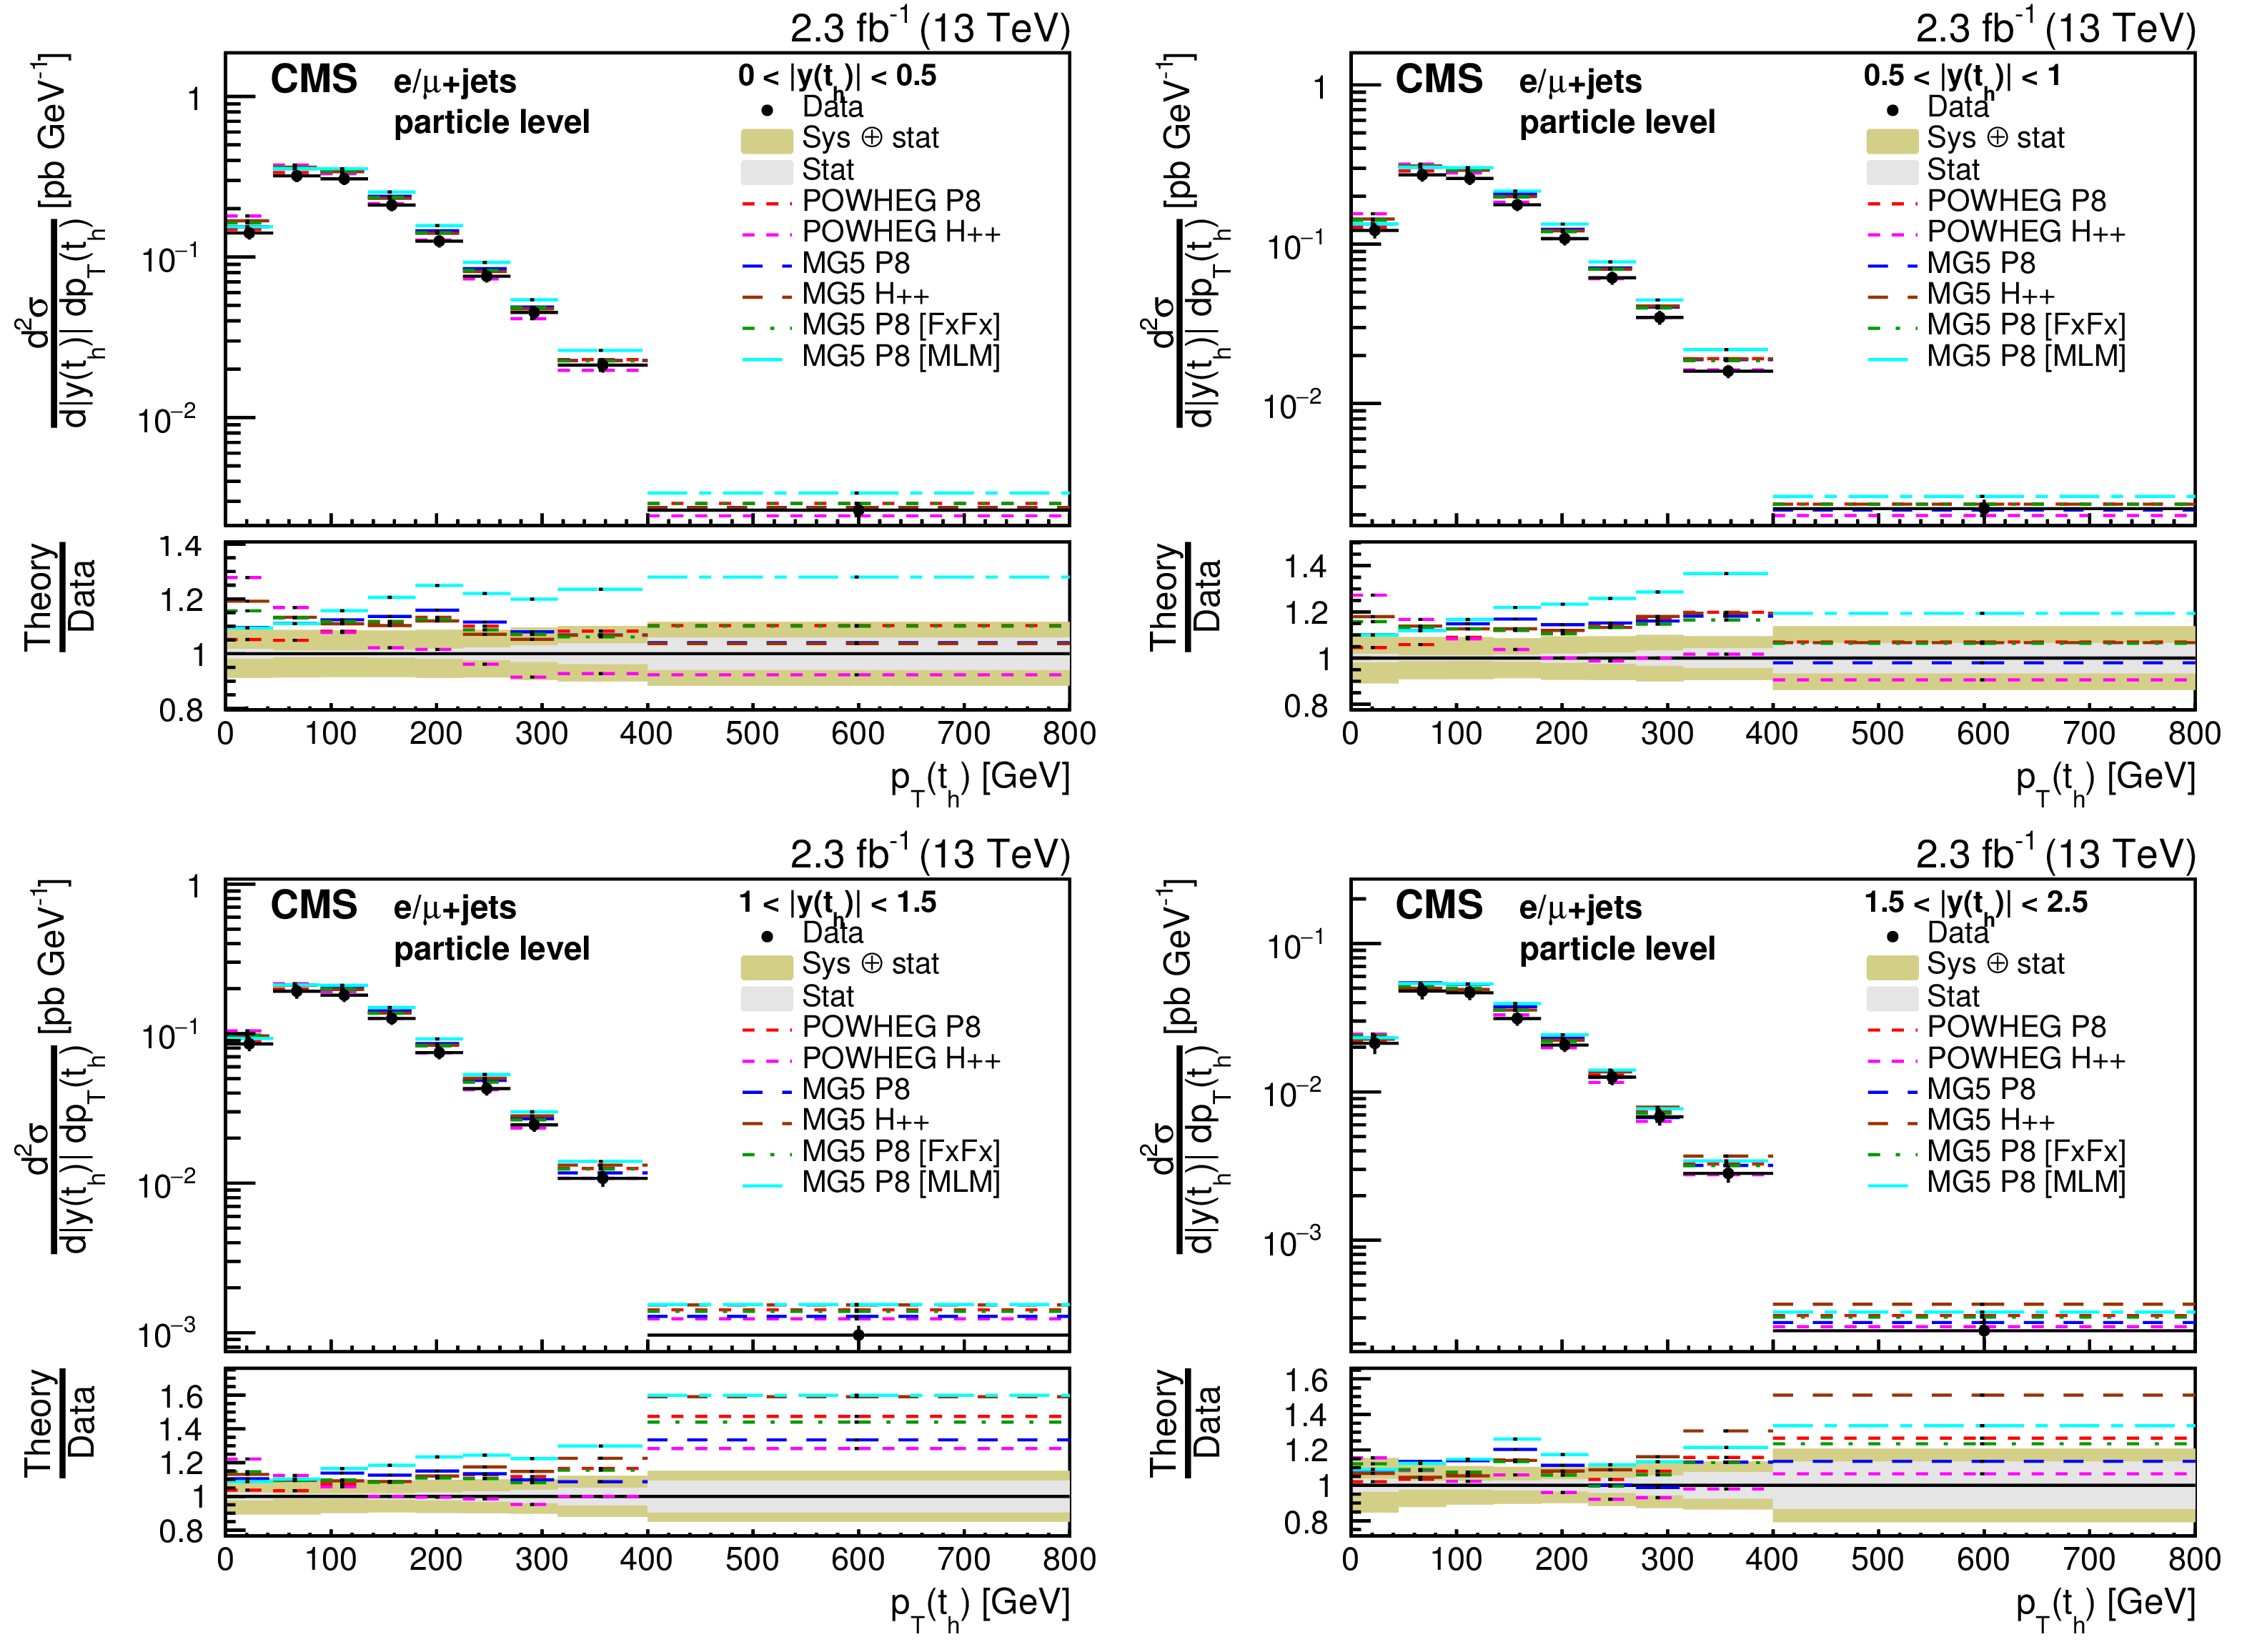
Figure 13:
Differential cross sections at particle level as a function of $ {p_{\mathrm {T}}} ( {\mathrm{ t } _\mathrm {h}} )$ (upper two rows) and $ {p_{\mathrm {T}}} ({\mathrm{ t } \mathrm{ \bar{t} } } )$ (lower two rows) in bins of the number of additional jets. The measurements are compared to the predictions of POWHEG and MG5-MC@NLO (MG5) combined with PYTHIA8 (P8) or HERWIG++ (H++) and the multiparton simulations MG5-MC@NLO +PYTHIA8 MLM and MG5-MC@NLO +PYTHIA8 FxFx. The ratios of the predictions to the measured cross sections are shown at the bottom of each panel together with the statistical and systematic uncertainties of the measurement. |

png pdf |
Figure 13-a:
Differential cross sections at particle level as a function of $ {p_{\mathrm {T}}} ( {\mathrm{ t } _\mathrm {h}} )$ in bins of the number of additional jets. The measurements are compared to the predictions of POWHEG and MG5-MC@NLO (MG5) combined with PYTHIA8 (P8) or HERWIG++ (H++) and the multiparton simulations MG5-MC@NLO +PYTHIA8 MLM and MG5-MC@NLO +PYTHIA8 FxFx. The ratios of the predictions to the measured cross sections are shown at the bottom of each panel together with the statistical and systematic uncertainties of the measurement. |
png pdf |
Figure 13-b:
Differential cross sections at particle level as a function of $ {p_{\mathrm {T}}} ({\mathrm{ t } \mathrm{ \bar{t} } } )$ in bins of the number of additional jets. The measurements are compared to the predictions of POWHEG and MG5-MC@NLO (MG5) combined with PYTHIA8 (P8) or HERWIG++ (H++) and the multiparton simulations MG5-MC@NLO +PYTHIA8 MLM and MG5-MC@NLO +PYTHIA8 FxFx. The ratios of the predictions to the measured cross sections are shown at the bottom of each panel together with the statistical and systematic uncertainties of the measurement. |
png pdf |
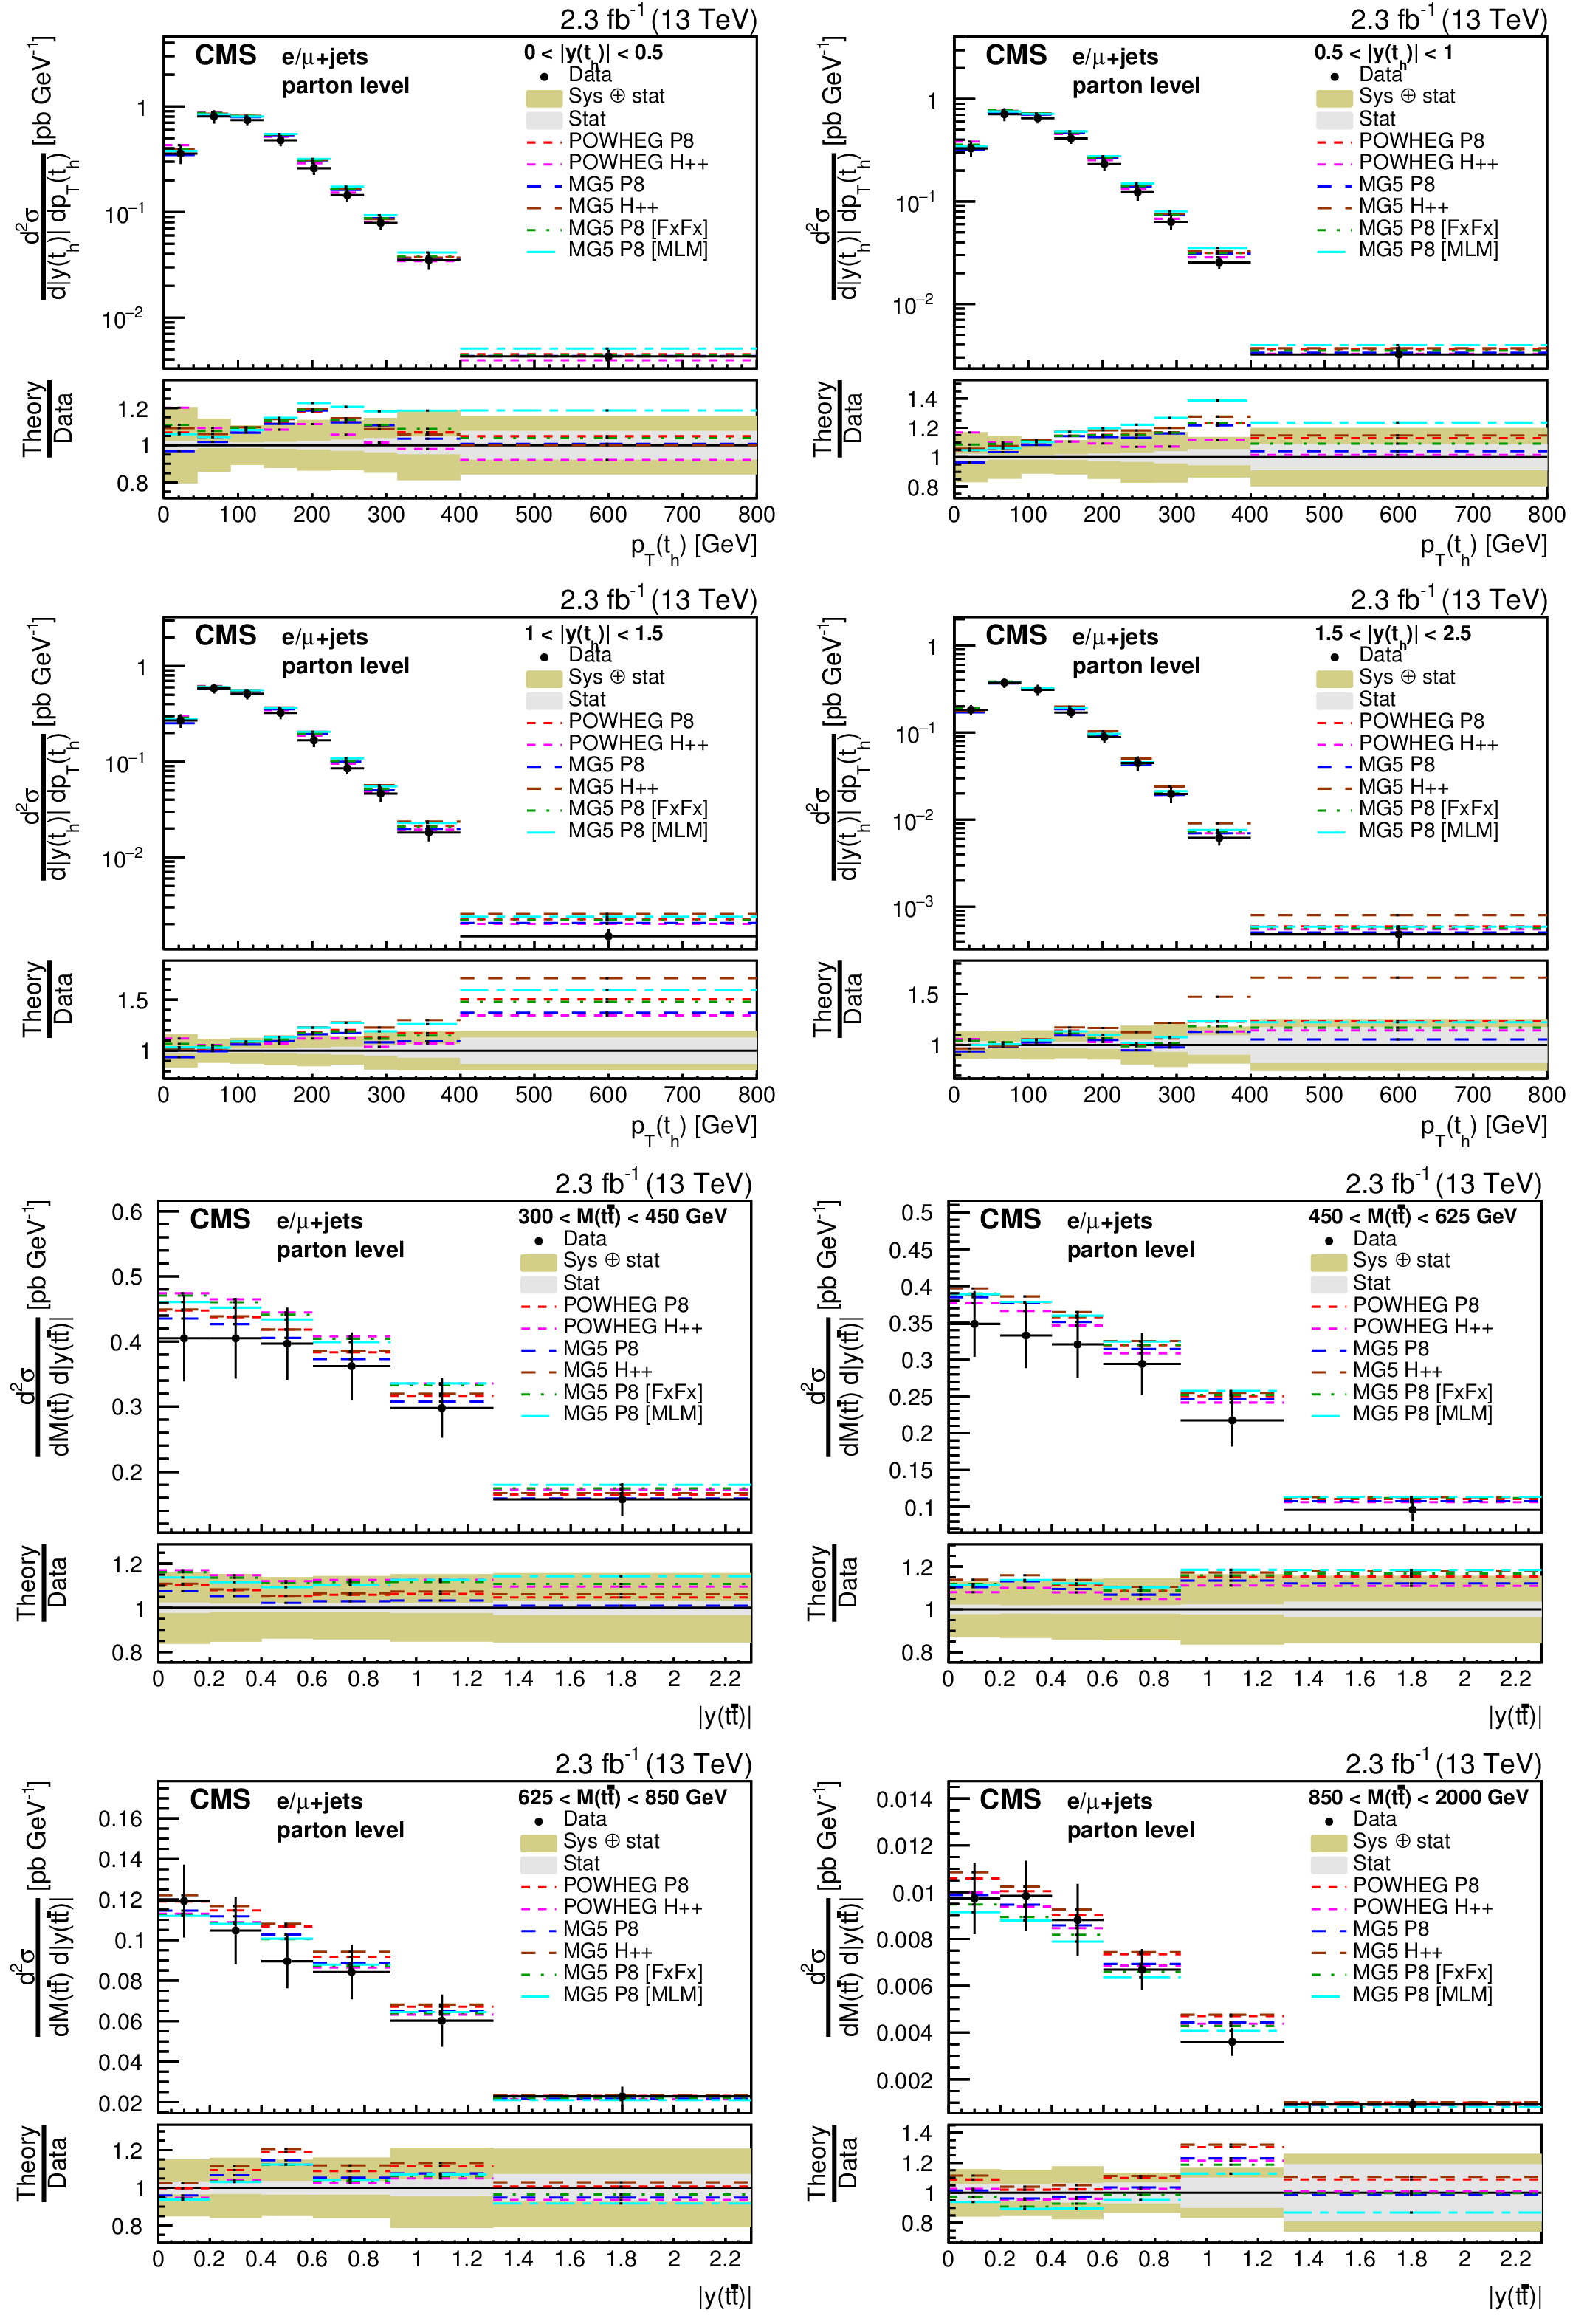
Figure 14:
Double-differential cross sections at parton level as a function of $ {| y( {\mathrm{ t } _\mathrm {h}} ) | }$ vs. $ {p_{\mathrm {T}}} ( {\mathrm{ t } _\mathrm {h}} )$ (upper two rows) and $M({\mathrm{ t } \mathrm{ \bar{t} } } )$ vs. $ {| y({\mathrm{ t } \mathrm{ \bar{t} } } ) | }$ (lower two rows). The measurements are compared to the predictions of POWHEG and MG5-MC@NLO (MG5) combined with PYTHIA8 (P8) or HERWIG++ (H++) and the multiparton simulations MG5-MC@NLO +PYTHIA8 MLM and MG5-MC@NLO +PYTHIA8 FxFx. The ratios of the predictions to the measured cross sections are shown at the bottom of each panel together with the statistical and systematic uncertainties of the measurement. |
png pdf |
Figure 14-a:
Double-differential cross sections at parton level as a function of $ {| y( {\mathrm{ t } _\mathrm {h}} ) | }$ vs. $ {p_{\mathrm {T}}} ( {\mathrm{ t } _\mathrm {h}} )$. The measurements are compared to the predictions of POWHEG and MG5-MC@NLO (MG5) combined with PYTHIA8 (P8) or HERWIG++ (H++) and the multiparton simulations MG5-MC@NLO +PYTHIA8 MLM and MG5-MC@NLO +PYTHIA8 FxFx. The ratios of the predictions to the measured cross sections are shown at the bottom of each panel together with the statistical and systematic uncertainties of the measurement. |
png pdf |
Figure 14-b:
Double-differential cross sections at parton level as a function of $M({\mathrm{ t } \mathrm{ \bar{t} } } )$ vs. $ {| y({\mathrm{ t } \mathrm{ \bar{t} } } ) | }$. The measurements are compared to the predictions of POWHEG and MG5-MC@NLO (MG5) combined with PYTHIA8 (P8) or HERWIG++ (H++) and the multiparton simulations MG5-MC@NLO +PYTHIA8 MLM and MG5-MC@NLO +PYTHIA8 FxFx. The ratios of the predictions to the measured cross sections are shown at the bottom of each panel together with the statistical and systematic uncertainties of the measurement. |

png pdf |
Figure 15:
Double-differential cross section at parton level as a function of $ {p_{\mathrm {T}}} ({\mathrm{ t } \mathrm{ \bar{t} } } )$ vs. $M({\mathrm{ t } \mathrm{ \bar{t} } } )$. The measurements are compared to the predictions of POWHEG and MG5-MC@NLO (MG5) combined with PYTHIA8 (P8) or HERWIG++ (H++) and the multiparton simulations MG5-MC@NLO +PYTHIA8 MLM and MG5-MC@NLO +PYTHIA8 FxFx. The ratios of the predictions to the measured cross sections are shown at the bottom of each panel together with the statistical and systematic uncertainties of the measurement. |
png pdf |
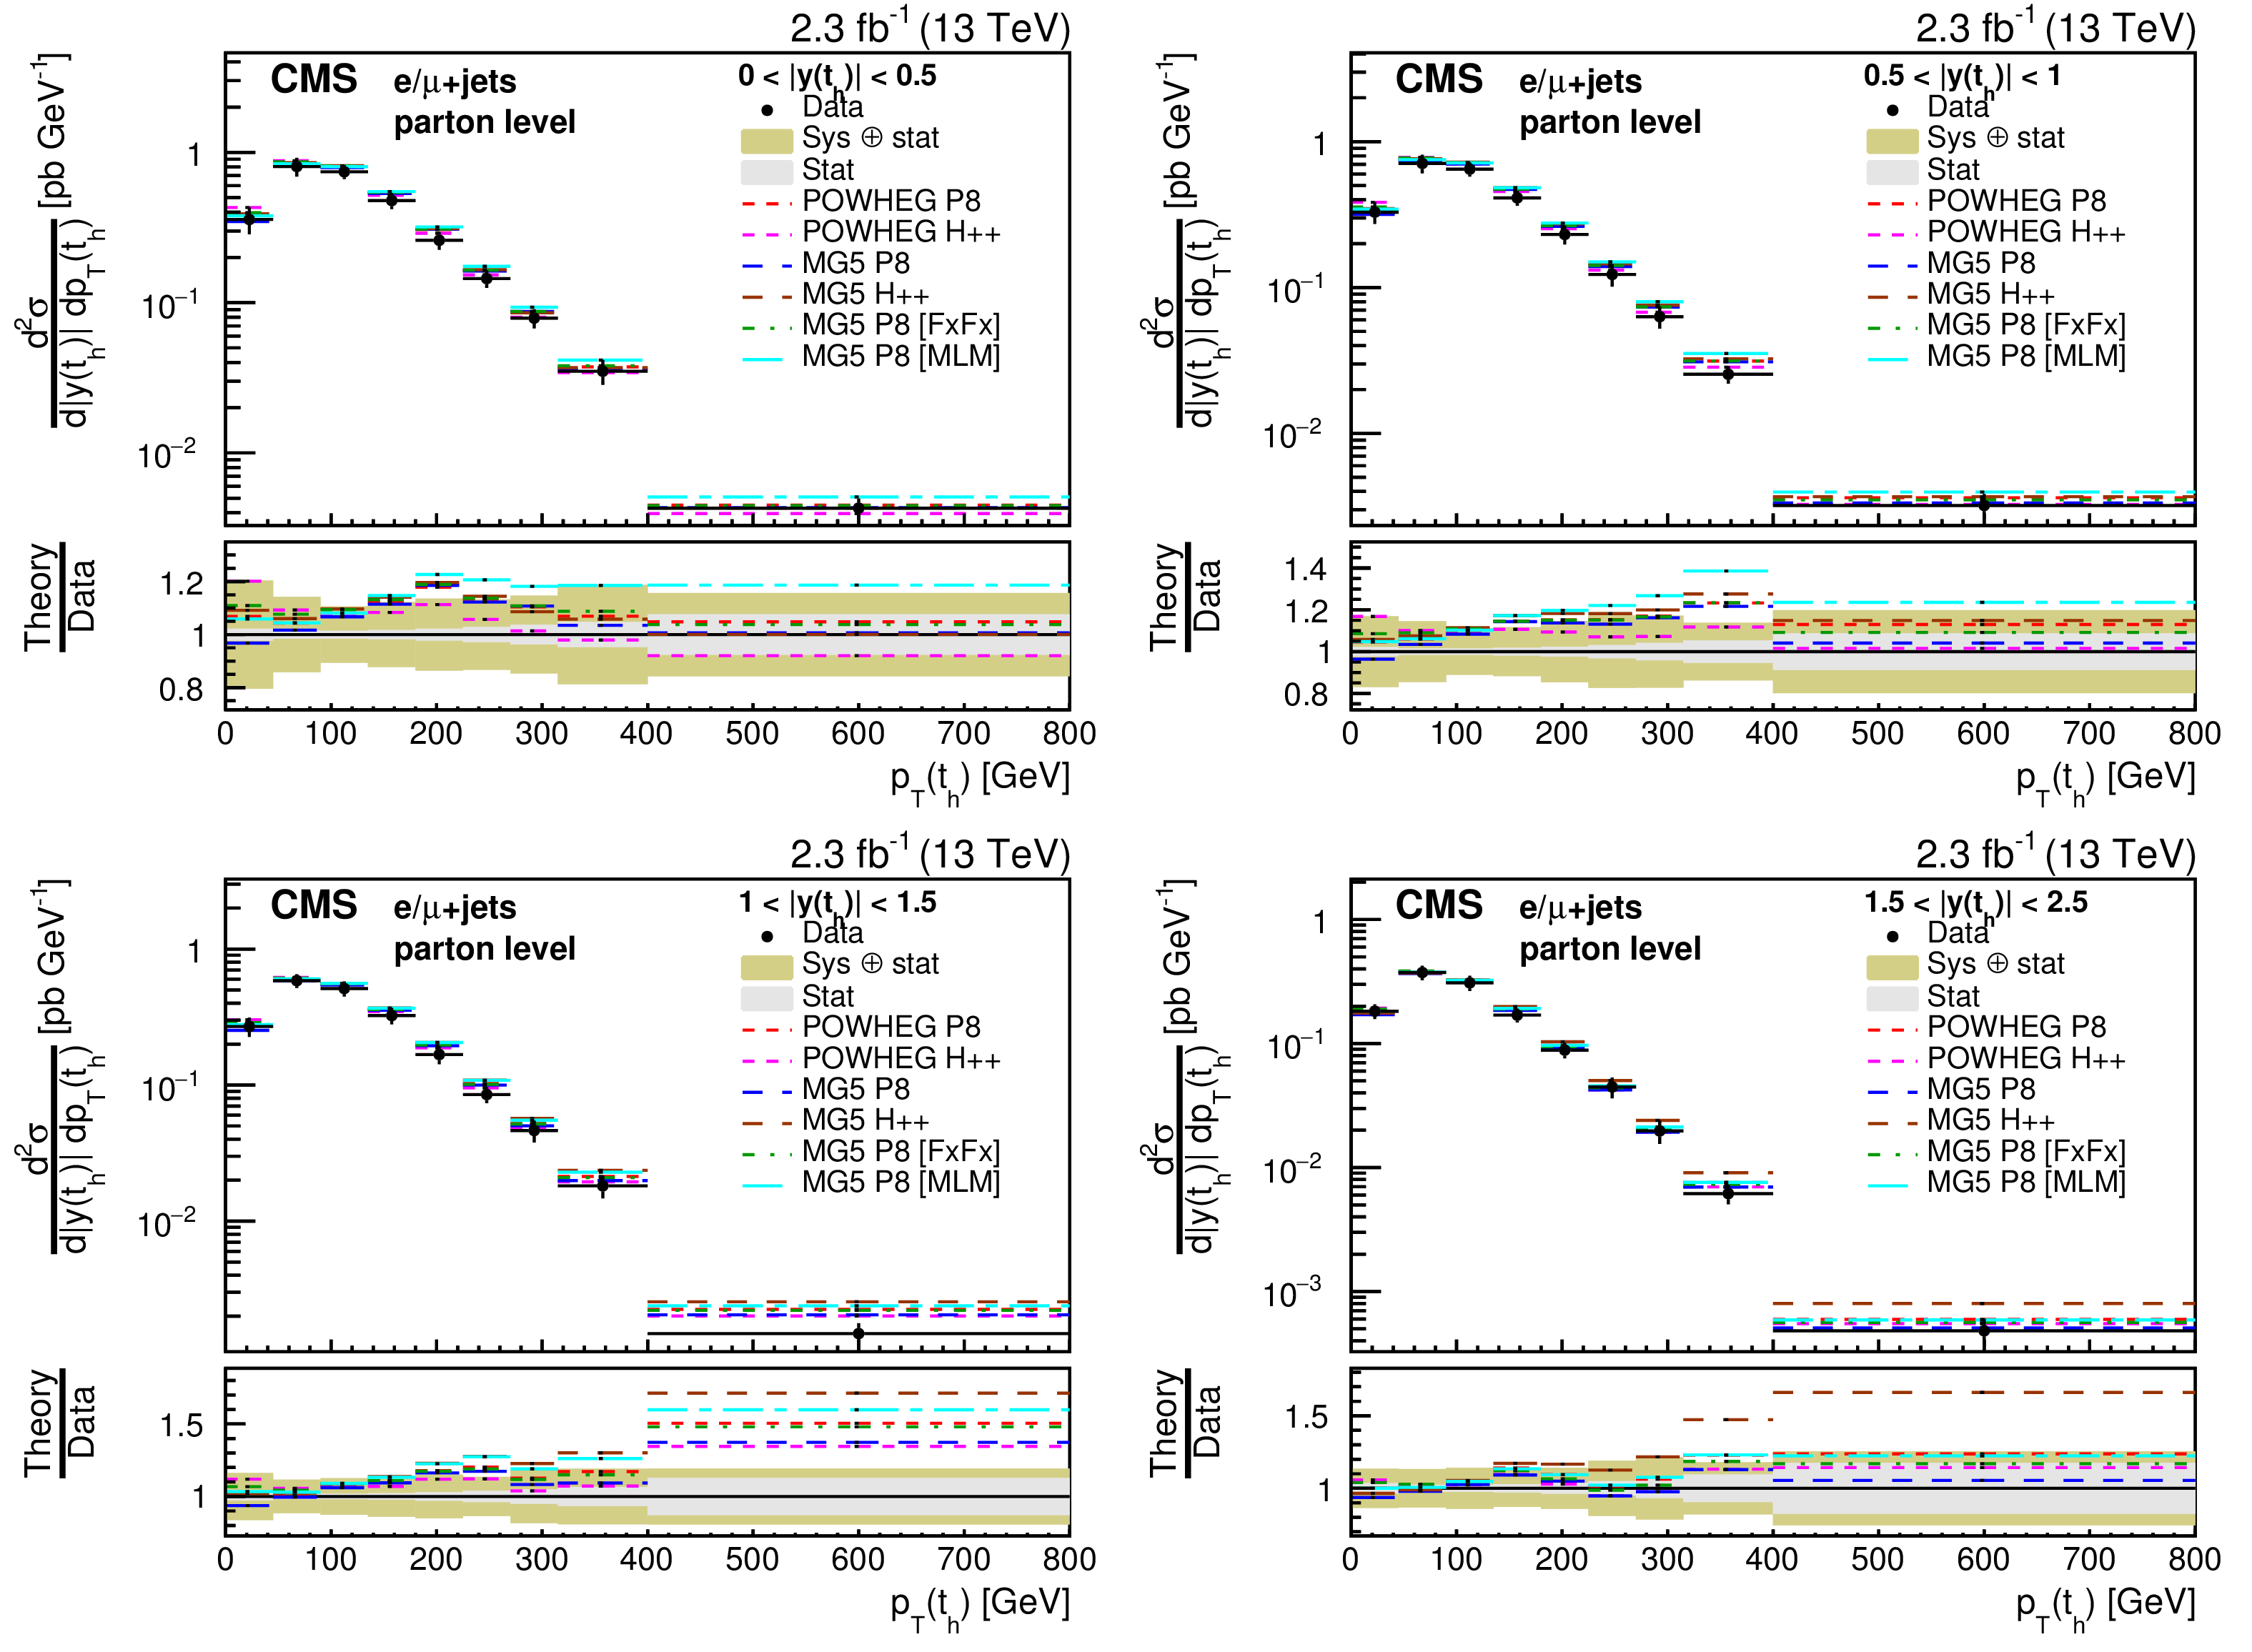
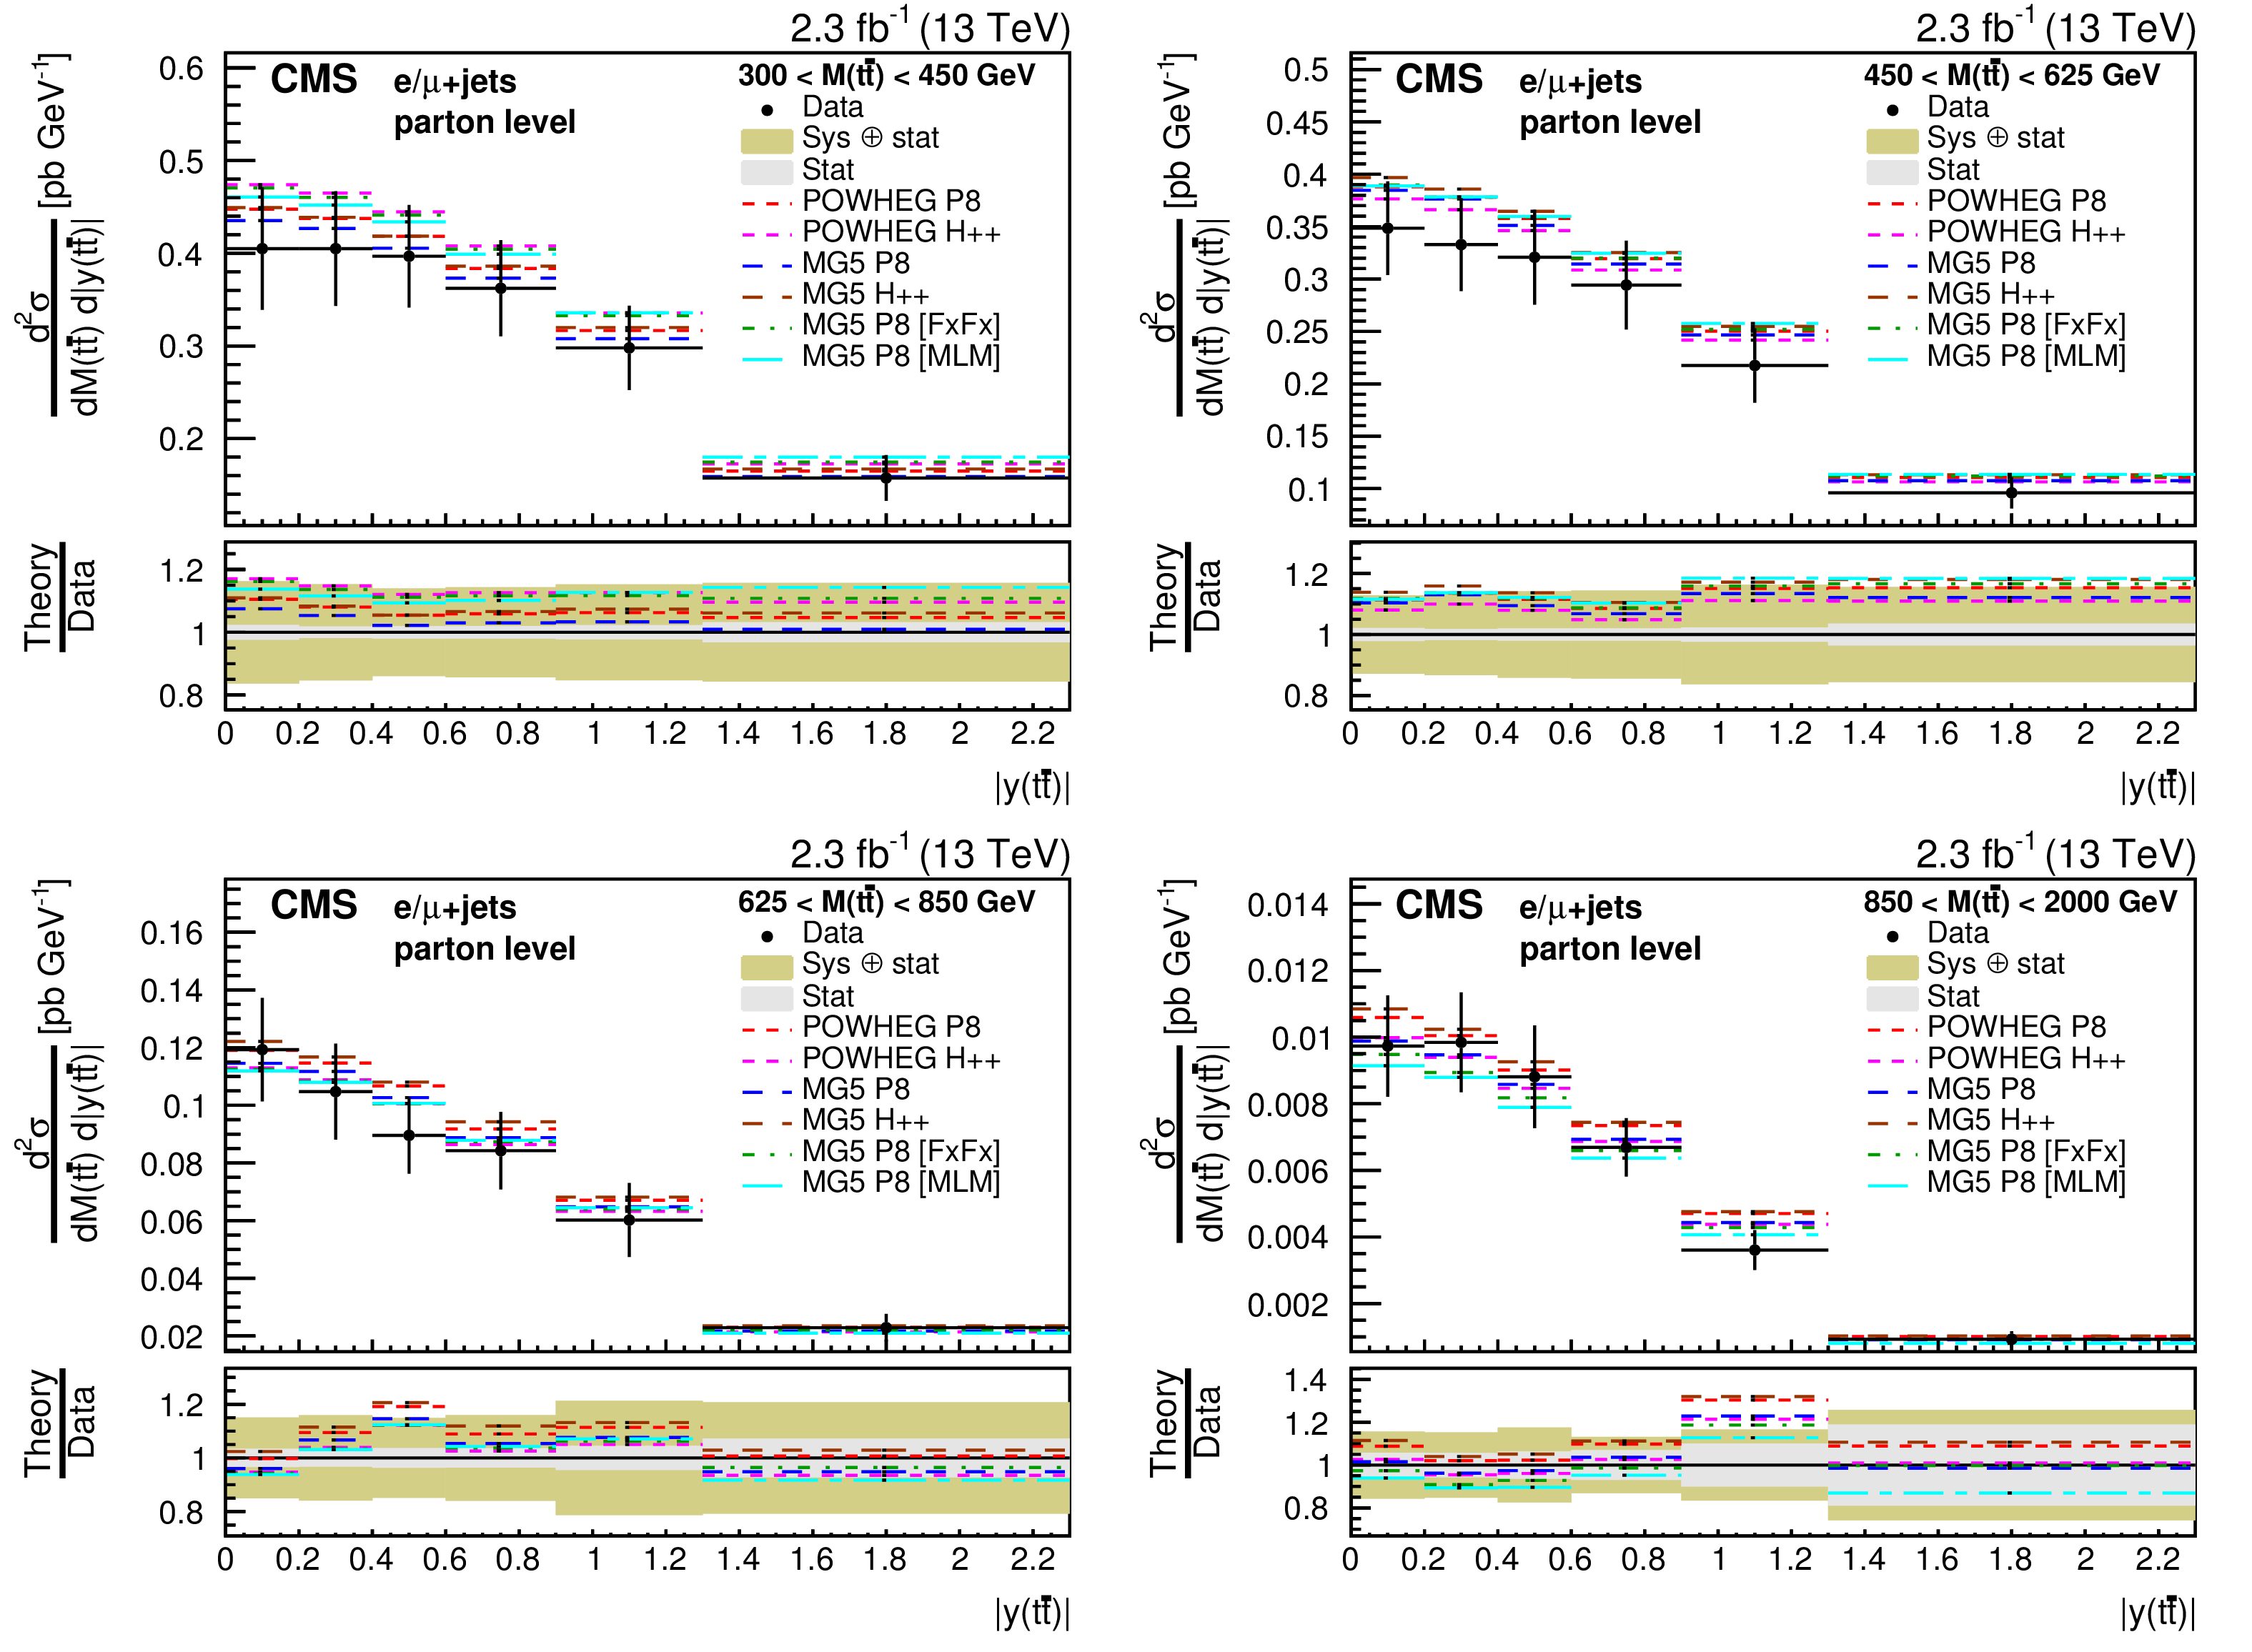
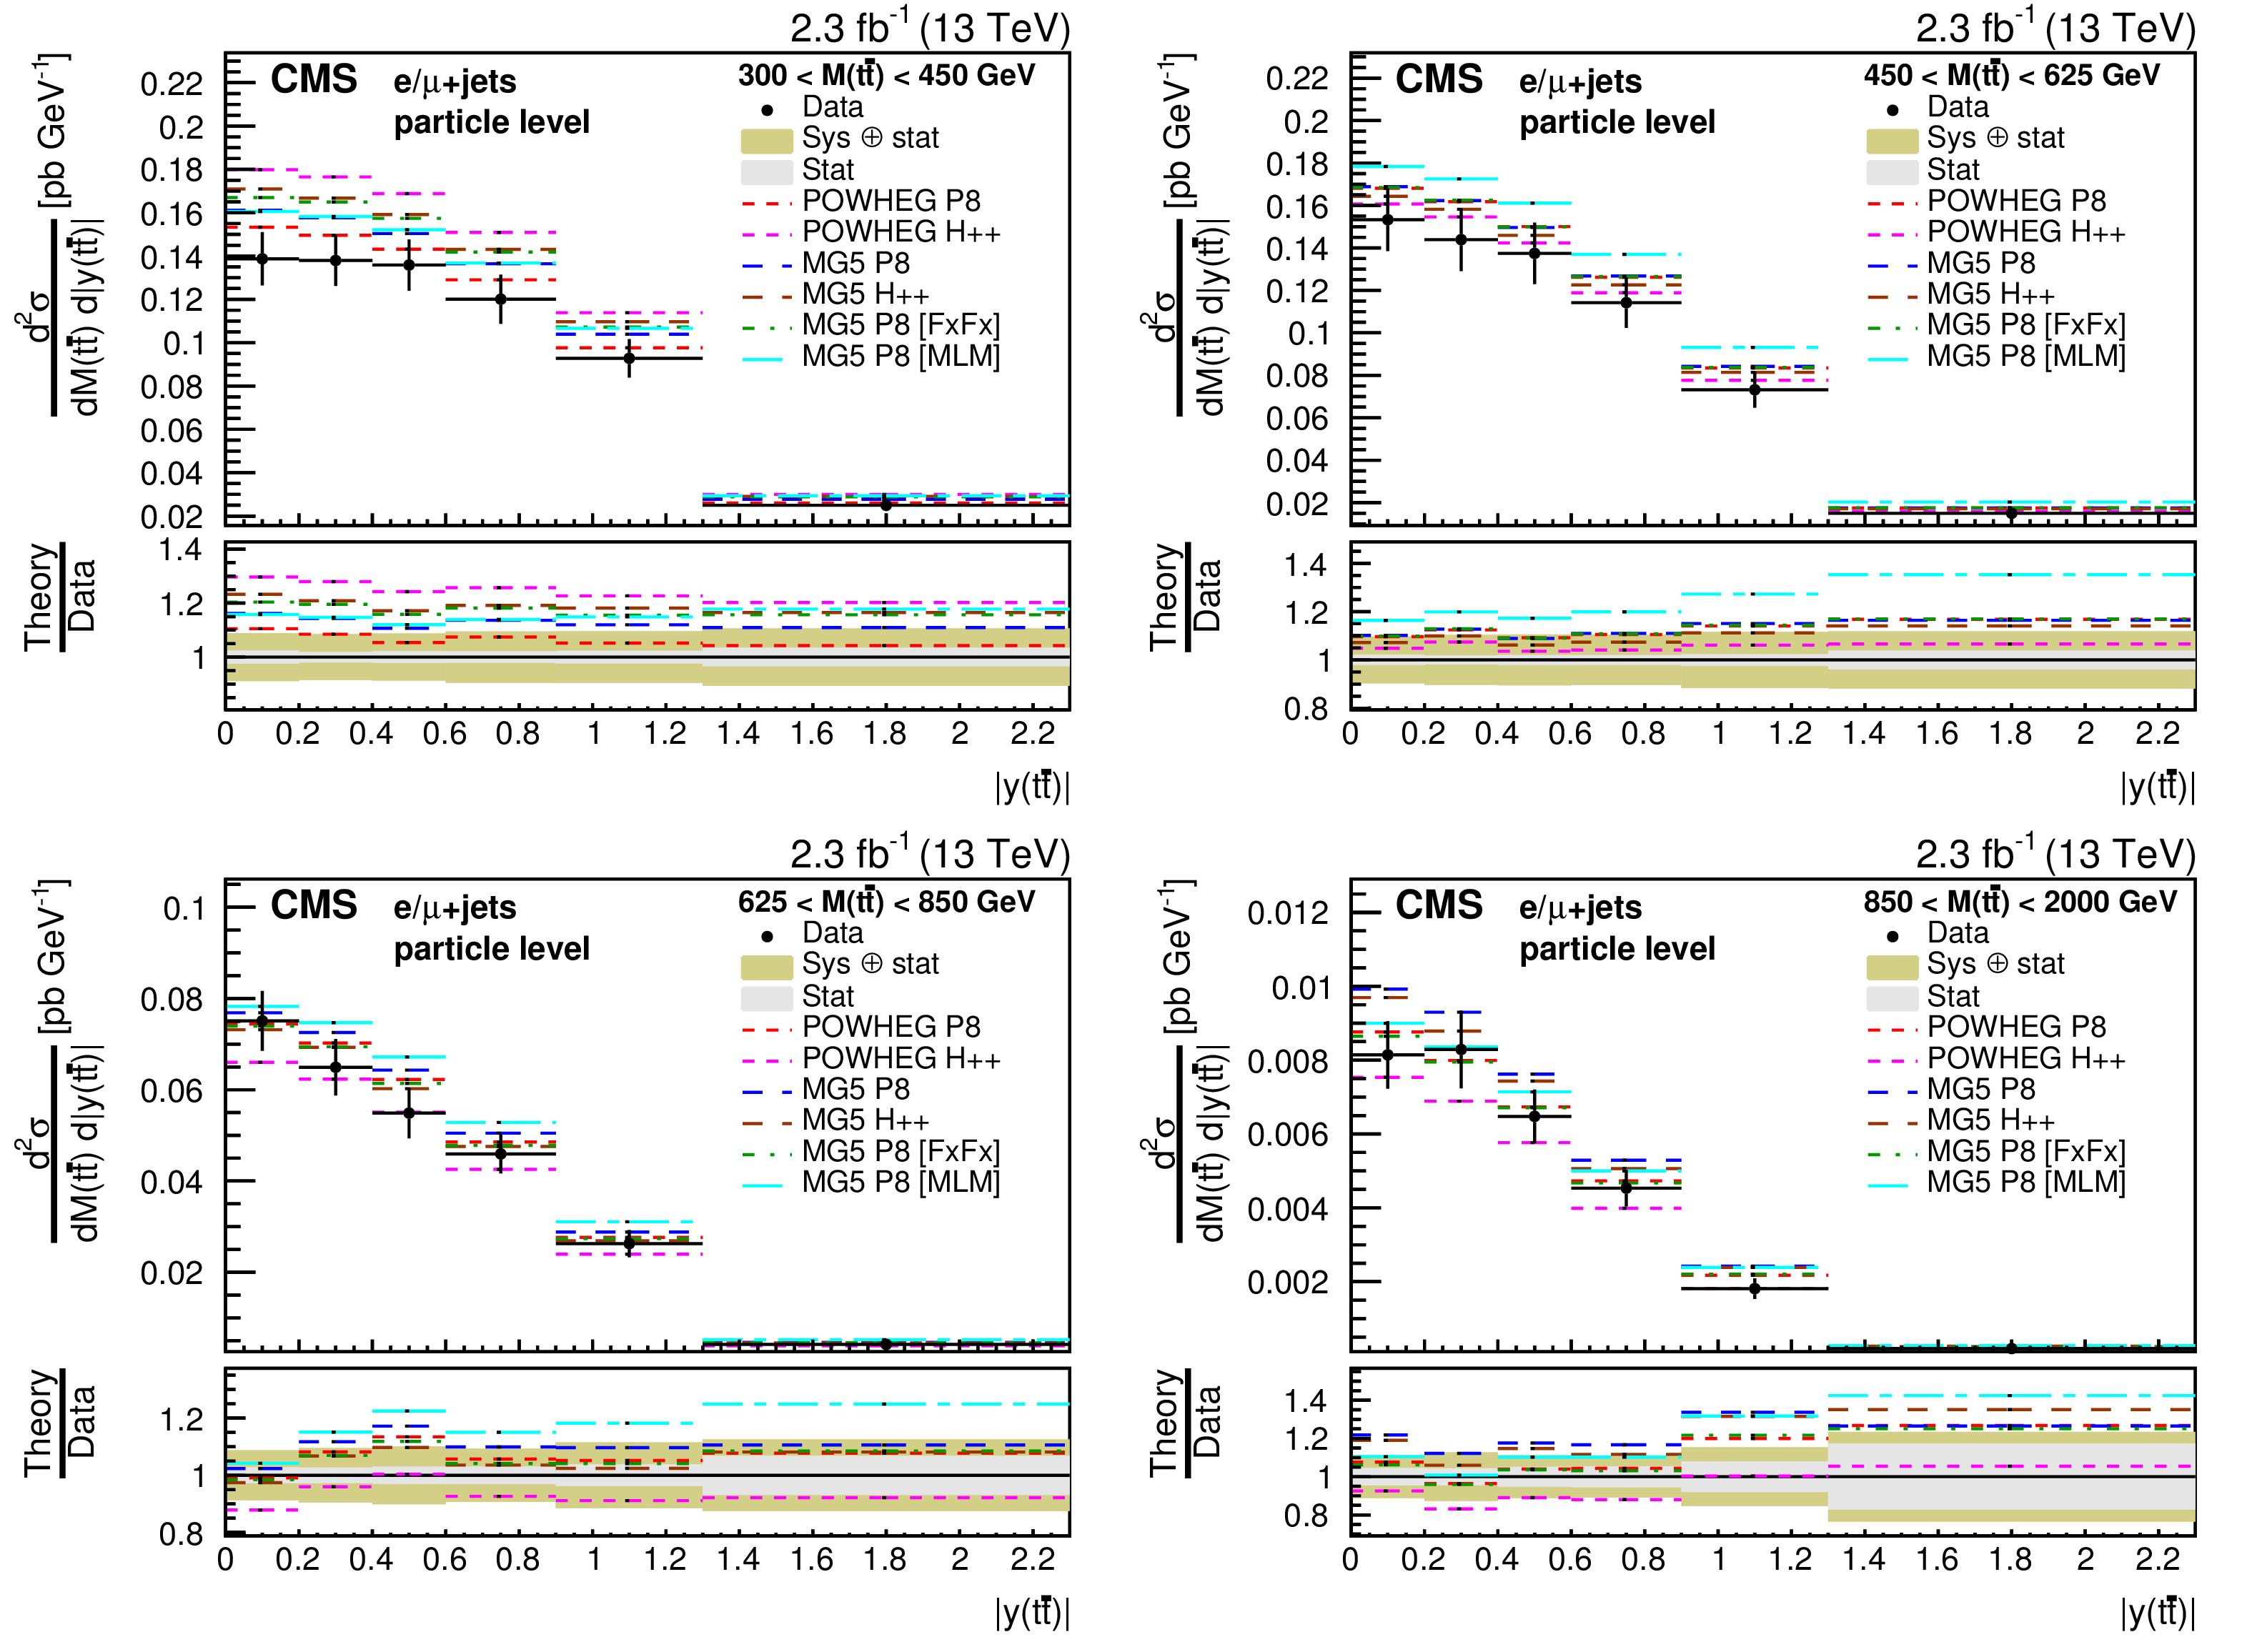
Figure 16:
Double-differential cross sections at particle level as a function of $ {| y( {\mathrm{ t } _\mathrm {h}} ) | }$ vs. $ {p_{\mathrm {T}}} ( {\mathrm{ t } _\mathrm {h}} )$ (upper two rows) and $M({\mathrm{ t } \mathrm{ \bar{t} } } )$ vs. $ {| y({\mathrm{ t } \mathrm{ \bar{t} } } ) | }$ (lower two rows). The measurements are compared to the predictions of POWHEG and MG5-MC@NLO (MG5) combined with PYTHIA8 (P8) or HERWIG++ (H++) and the multiparton simulations MG5-MC@NLO +PYTHIA8 MLM and MG5-MC@NLO +PYTHIA8 FxFx. The ratios of the predictions to the measured cross sections are shown at the bottom of each panel together with the statistical and systematic uncertainties of the measurement. |
png pdf |
Figure 16-a:
Double-differential cross sections at particle level as a function of $ {| y( {\mathrm{ t } _\mathrm {h}} ) | }$ vs. $ {p_{\mathrm {T}}} ( {\mathrm{ t } _\mathrm {h}} )$. The measurements are compared to the predictions of POWHEG and MG5-MC@NLO (MG5) combined with PYTHIA8 (P8) or HERWIG++ (H++) and the multiparton simulations MG5-MC@NLO +PYTHIA8 MLM and MG5-MC@NLO +PYTHIA8 FxFx. The ratios of the predictions to the measured cross sections are shown at the bottom of each panel together with the statistical and systematic uncertainties of the measurement. |
png pdf |
Figure 16-b:
Double-differential cross sections at particle level as a function of $M({\mathrm{ t } \mathrm{ \bar{t} } } )$ vs. $ {| y({\mathrm{ t } \mathrm{ \bar{t} } } ) | }$. The measurements are compared to the predictions of POWHEG and MG5-MC@NLO (MG5) combined with PYTHIA8 (P8) or HERWIG++ (H++) and the multiparton simulations MG5-MC@NLO +PYTHIA8 MLM and MG5-MC@NLO +PYTHIA8 FxFx. The ratios of the predictions to the measured cross sections are shown at the bottom of each panel together with the statistical and systematic uncertainties of the measurement. |
png pdf |
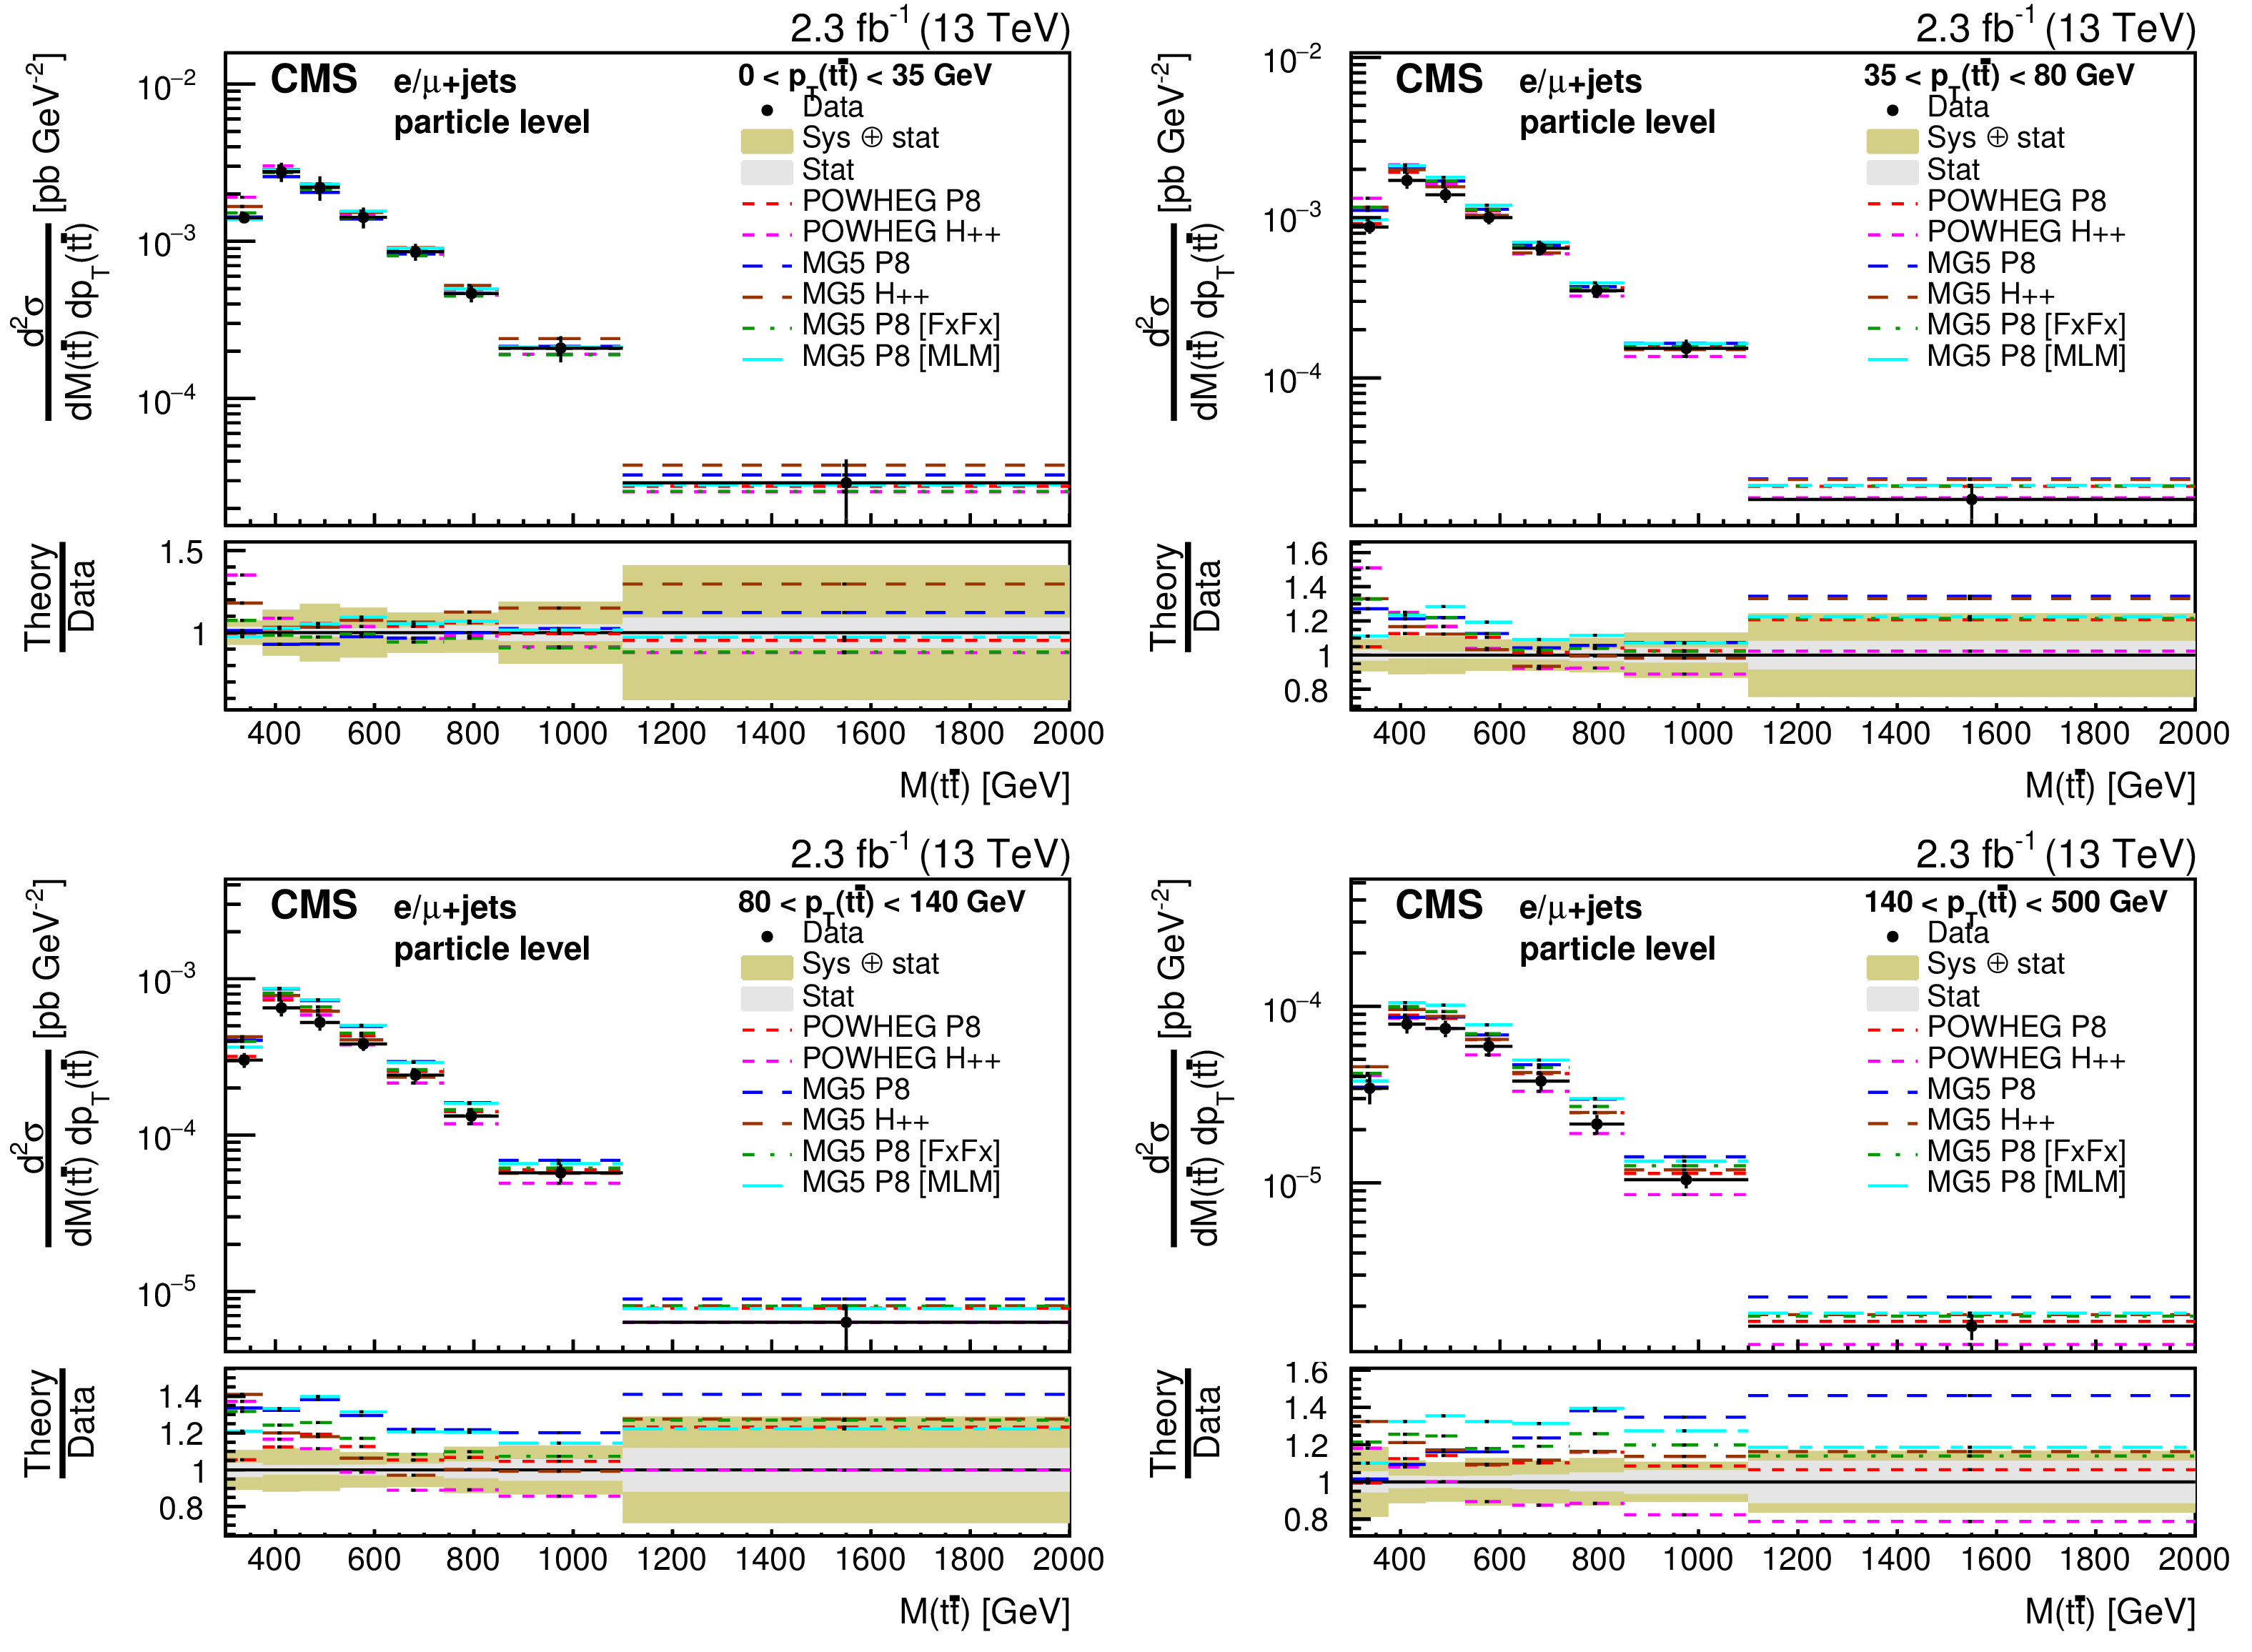
Figure 17:
Double-differential cross section at particle level as a function of $ {p_{\mathrm {T}}} ({\mathrm{ t } \mathrm{ \bar{t} } } )$ vs. $M({\mathrm{ t } \mathrm{ \bar{t} } } )$. The measurements are compared to the predictions of POWHEG and MG5-MC@NLO (MG5) combined with PYTHIA8 (P8) or HERWIG++ (H++) and the multiparton simulations MG5-MC@NLO +PYTHIA8 MLM and MG5-MC@NLO +PYTHIA8 FxFx. The ratios of the predictions to the measured cross sections are shown at the bottom of each panel together with the statistical and systematic uncertainties of the measurement. |
| Tables | |

png pdf |
Table 1:
Overview of the uncertainties in the differential cross section measurements at particle and at parton level. Typical ranges of uncertainties in the bins are shown. |
png pdf |
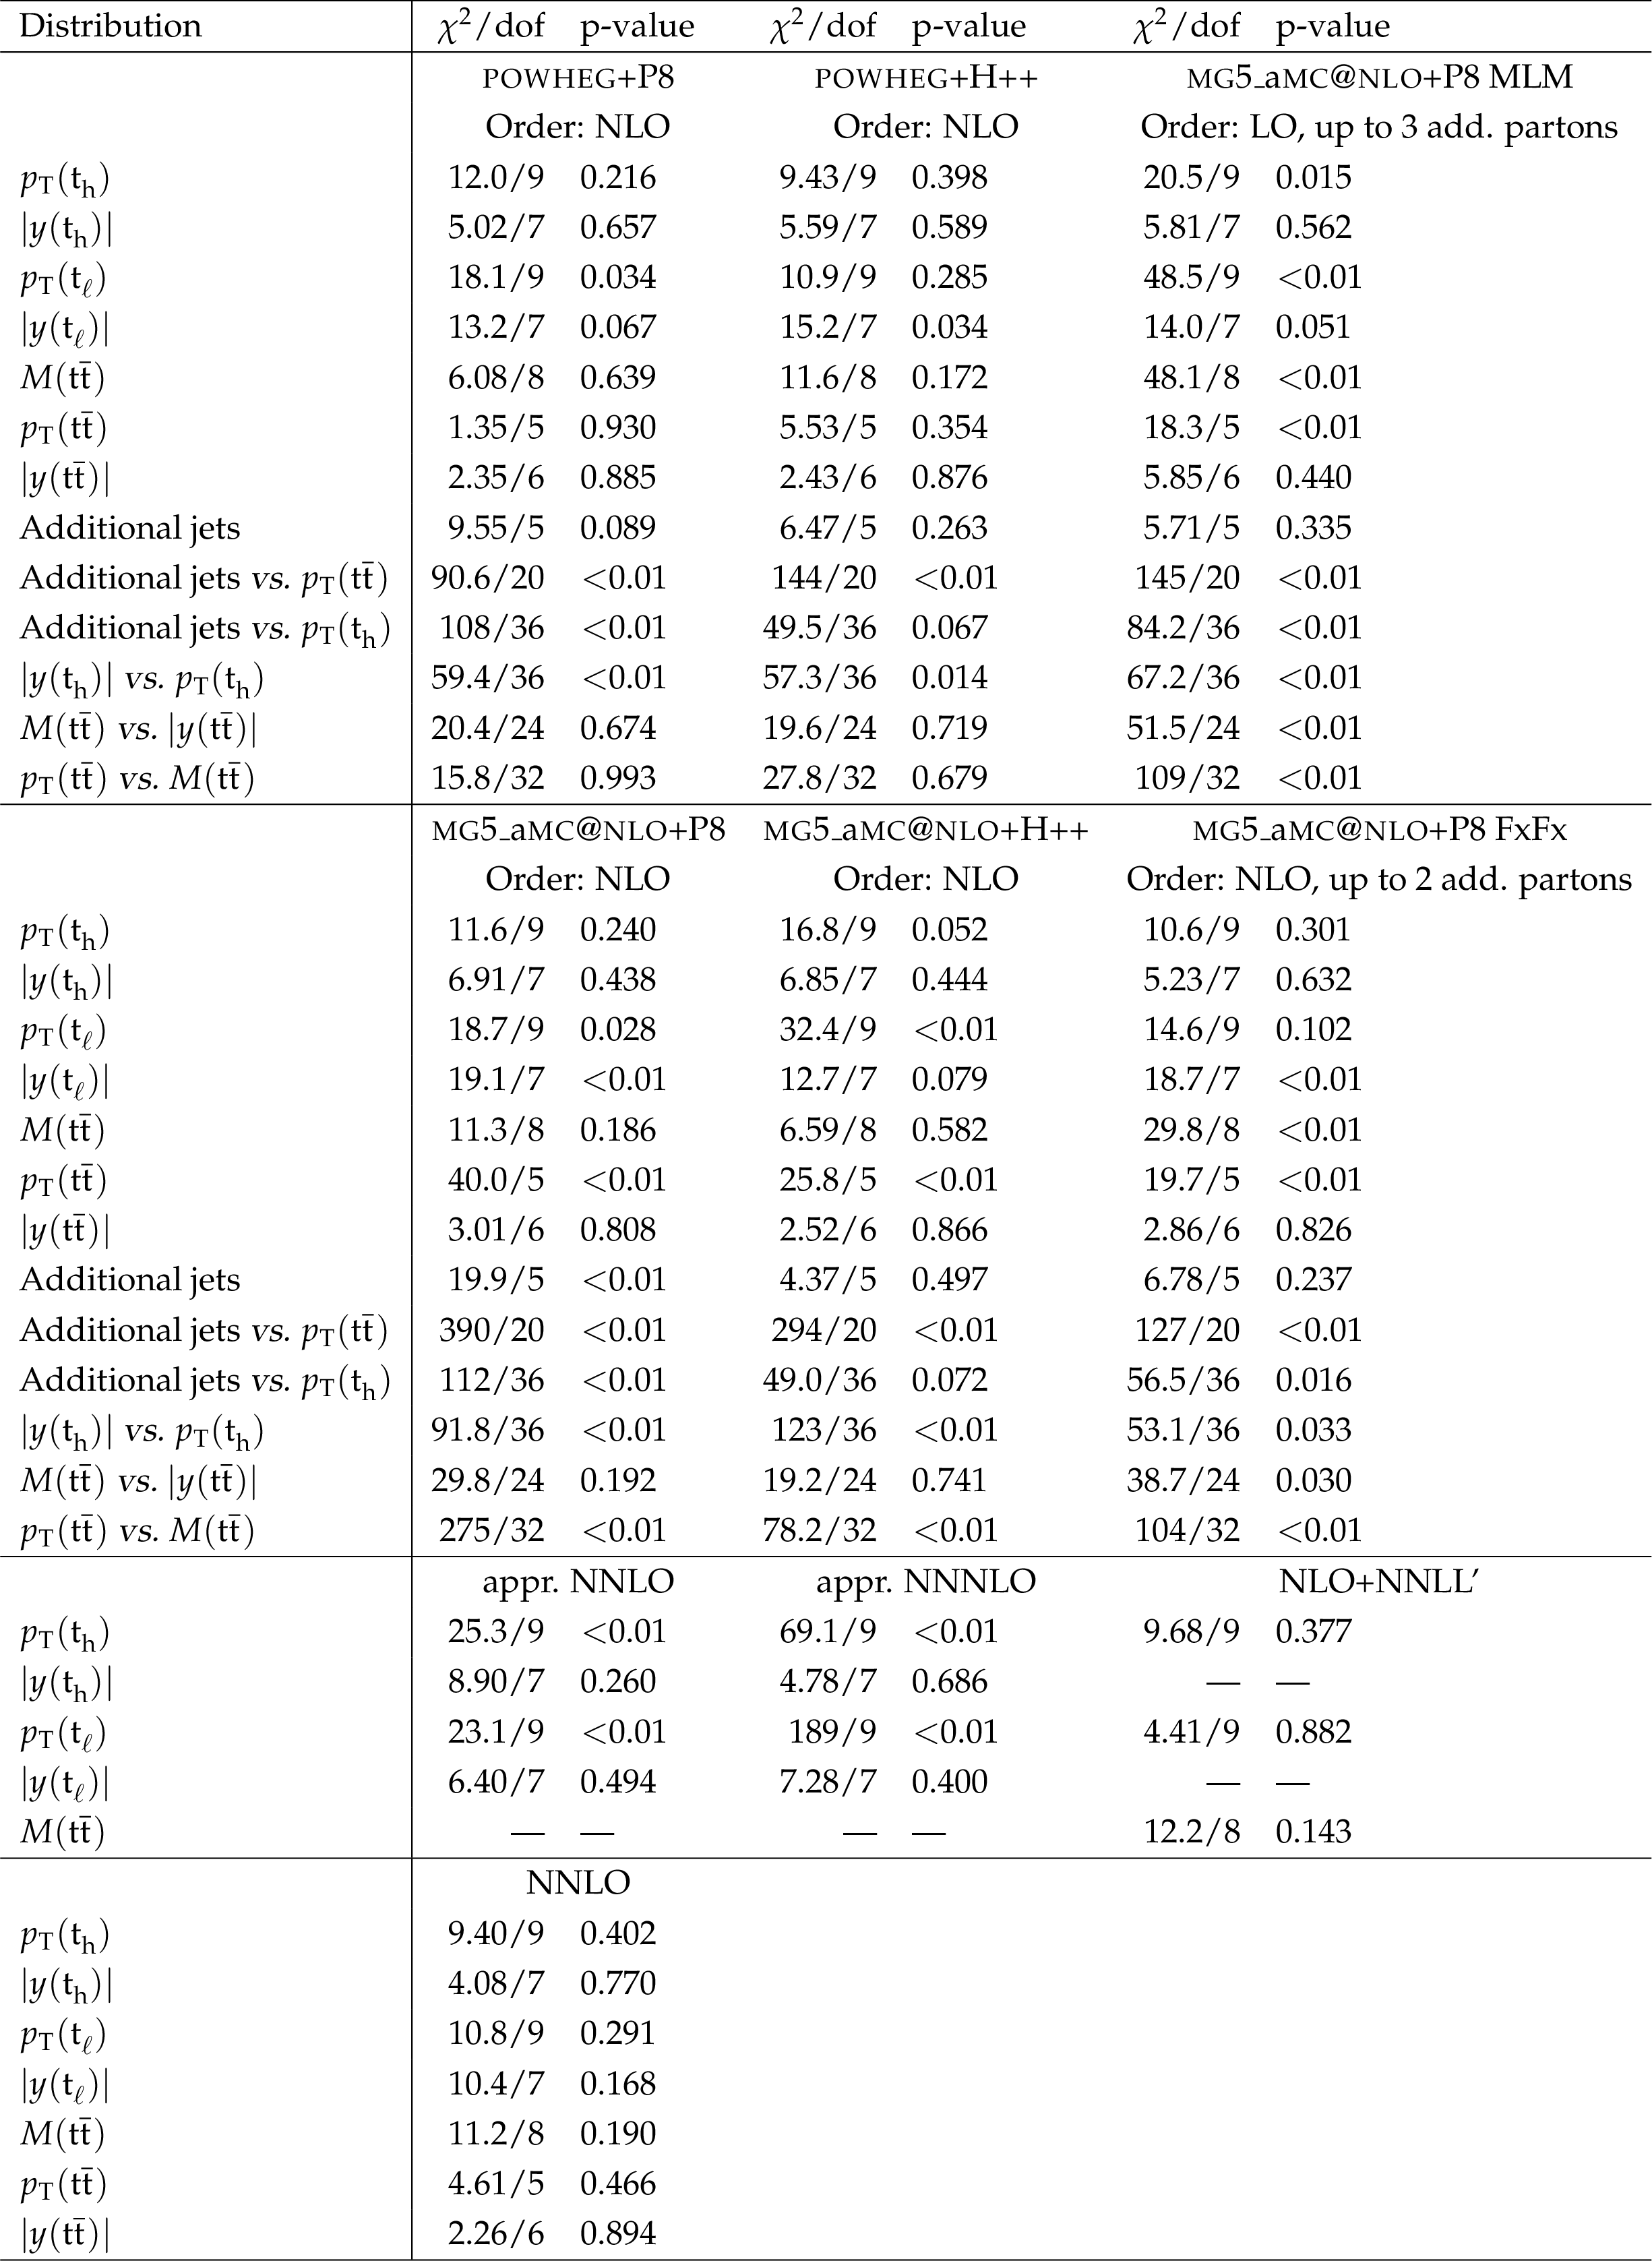
Table 2:
Comparison between the measured distributions at parton level and the predictions of POWHEG and MG5-MC@NLO combined with PYTHIA8 (P8) or HERWIG++ (H++) and the multiparton simulations MG5-MC@NLO MLM and MG5-MC@NLO FxFx, as well as the predictions of an approximate NNNLO calculation [42,43], a NLO+NNLL' calculation [45], and a full NNLO calculation [46]. We list the results of the $\chi ^2$ tests together with the numbers of degrees of freedom (dof) and the corresponding p-values. For the comparison no uncertainties in the theoretical predictions are taken into account. |

png pdf |
Table 3:
Comparison between the measured distributions at particle level and the predictions of POWHEG and MG5-MC@NLO combined with PYTHIA8 (P8) or HERWIG++ (H++) and the multiparton simulations MG5-MC@NLO MLM and MG5-MC@NLO FxFx. We list the results of the $\chi ^2$ tests together with the numbers of degrees of freedom (dof) and the corresponding p-values. For the comparison no uncertainties in the theoretical predictions are taken into account. |
png pdf |
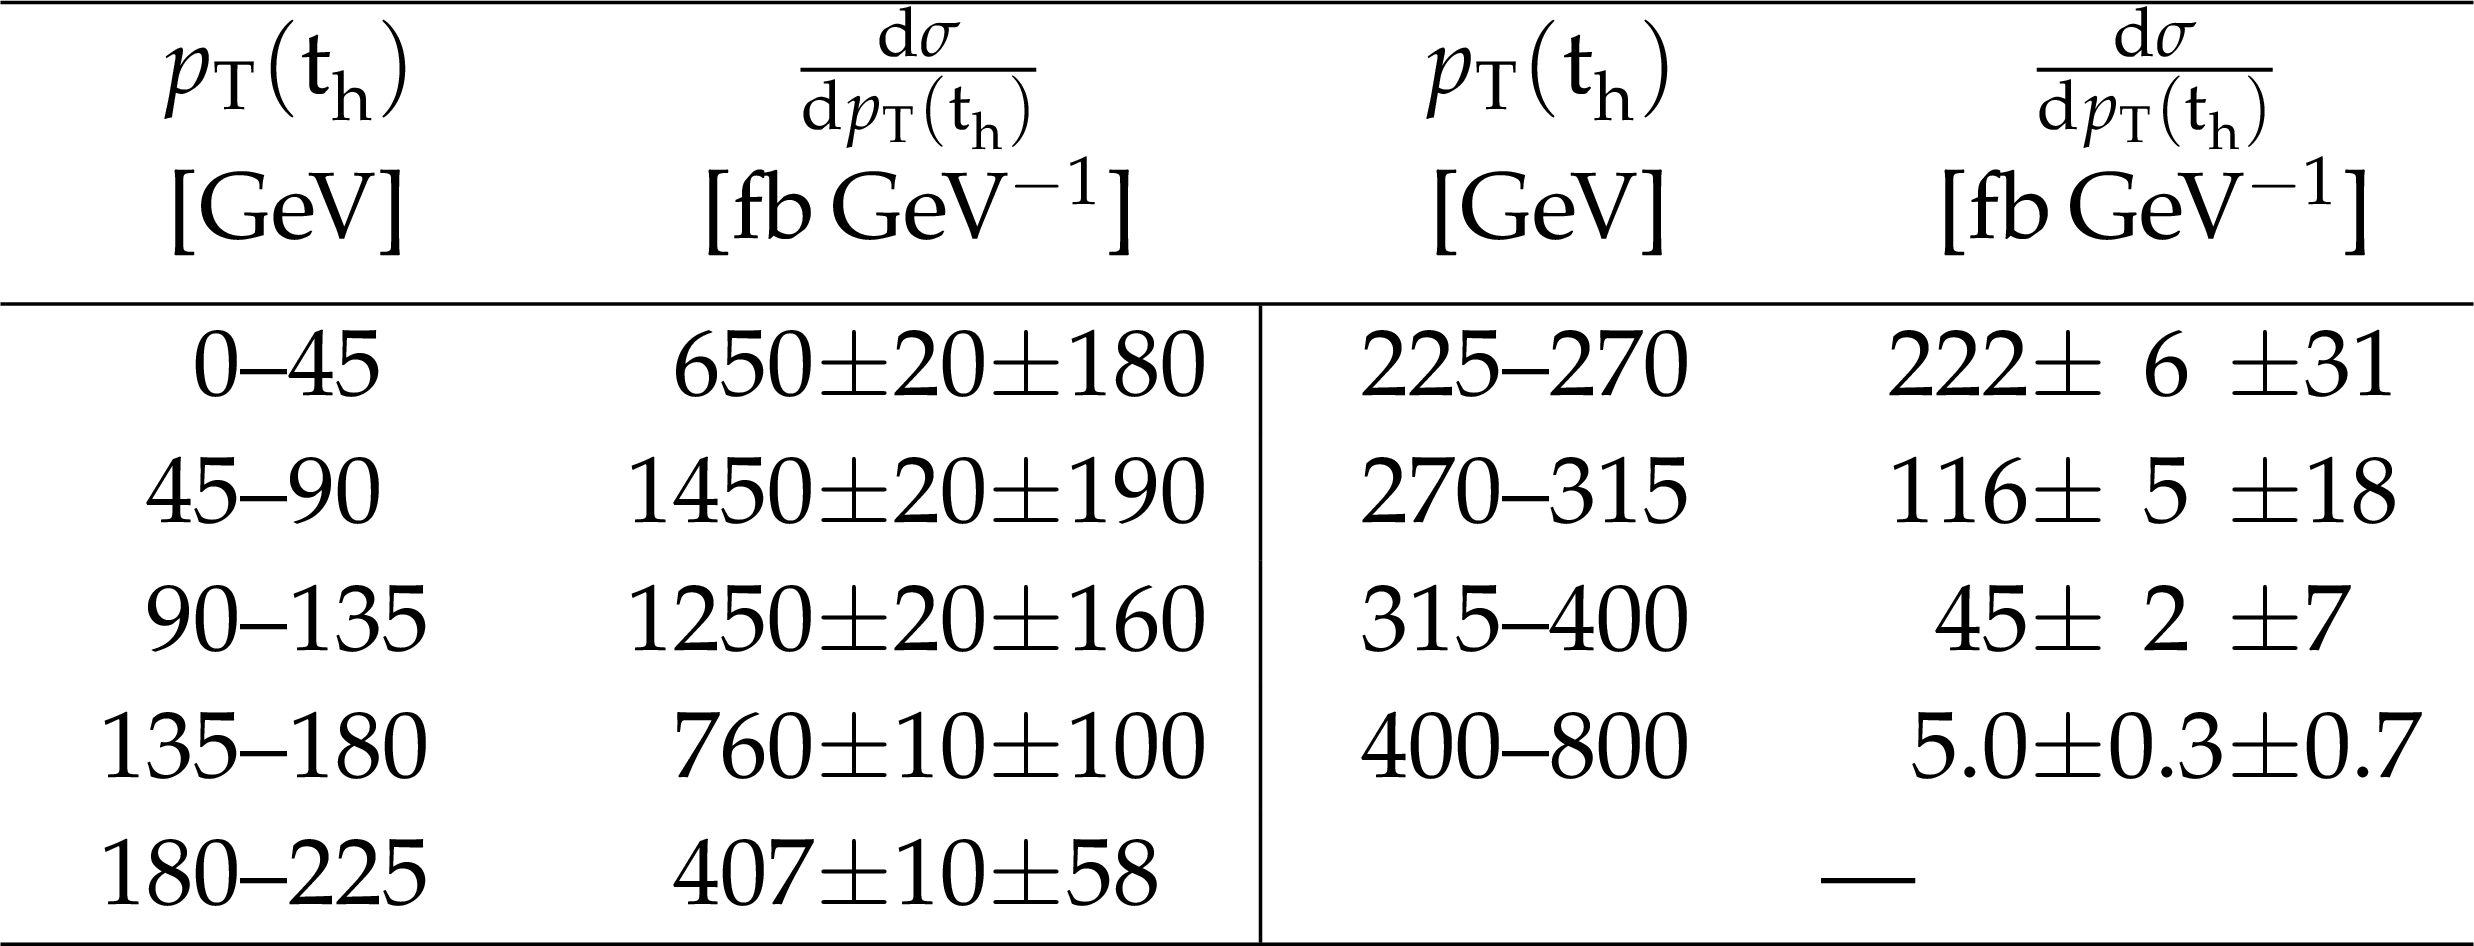
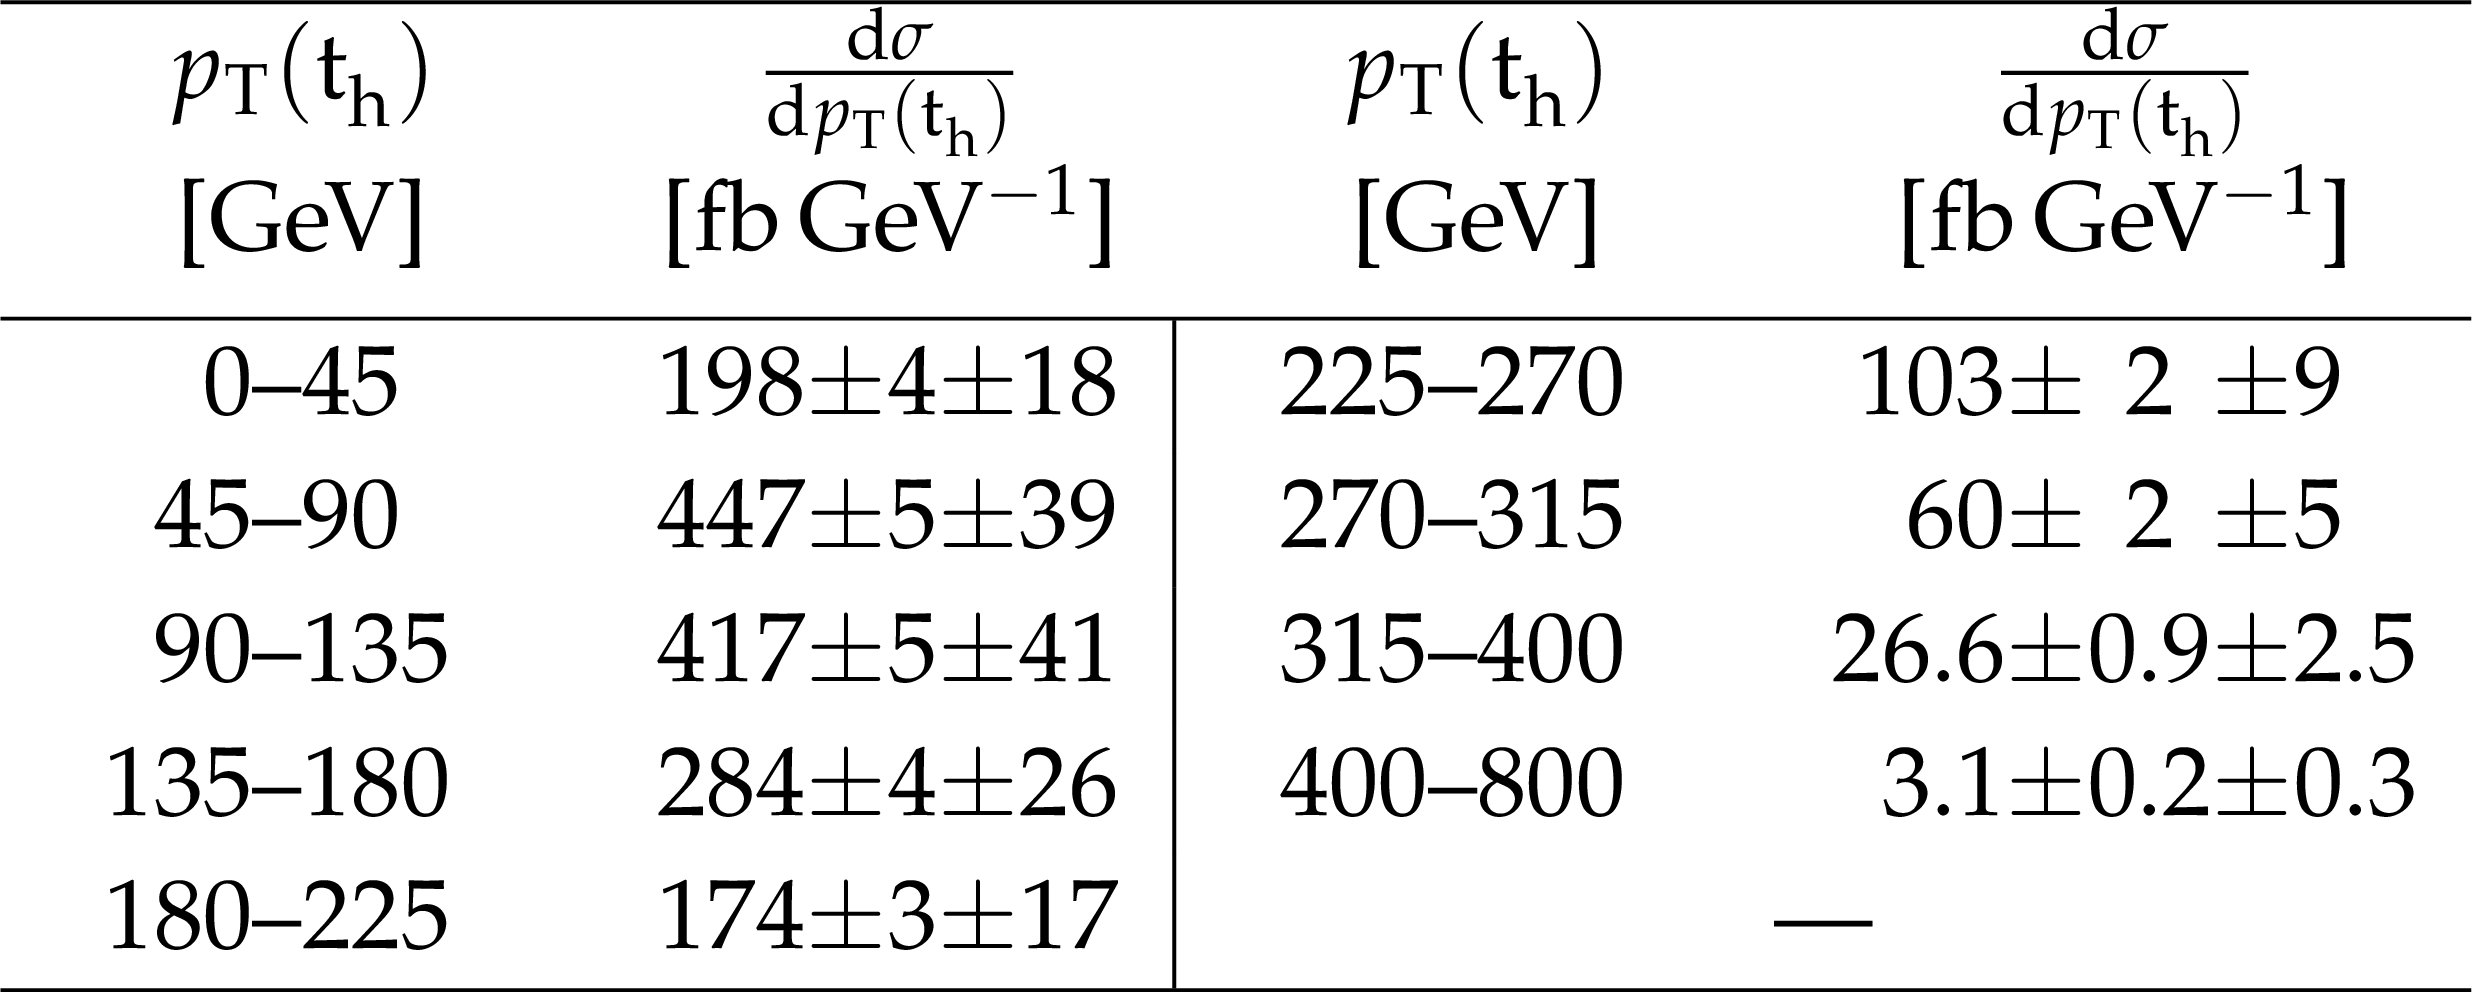
Table 4:
Differential cross section at parton level as a function of $ {p_{\mathrm {T}}} ( {\mathrm{ t } _\mathrm {h}} )$. The values are shown together with their statistical and systematic uncertainties. |

png pdf |
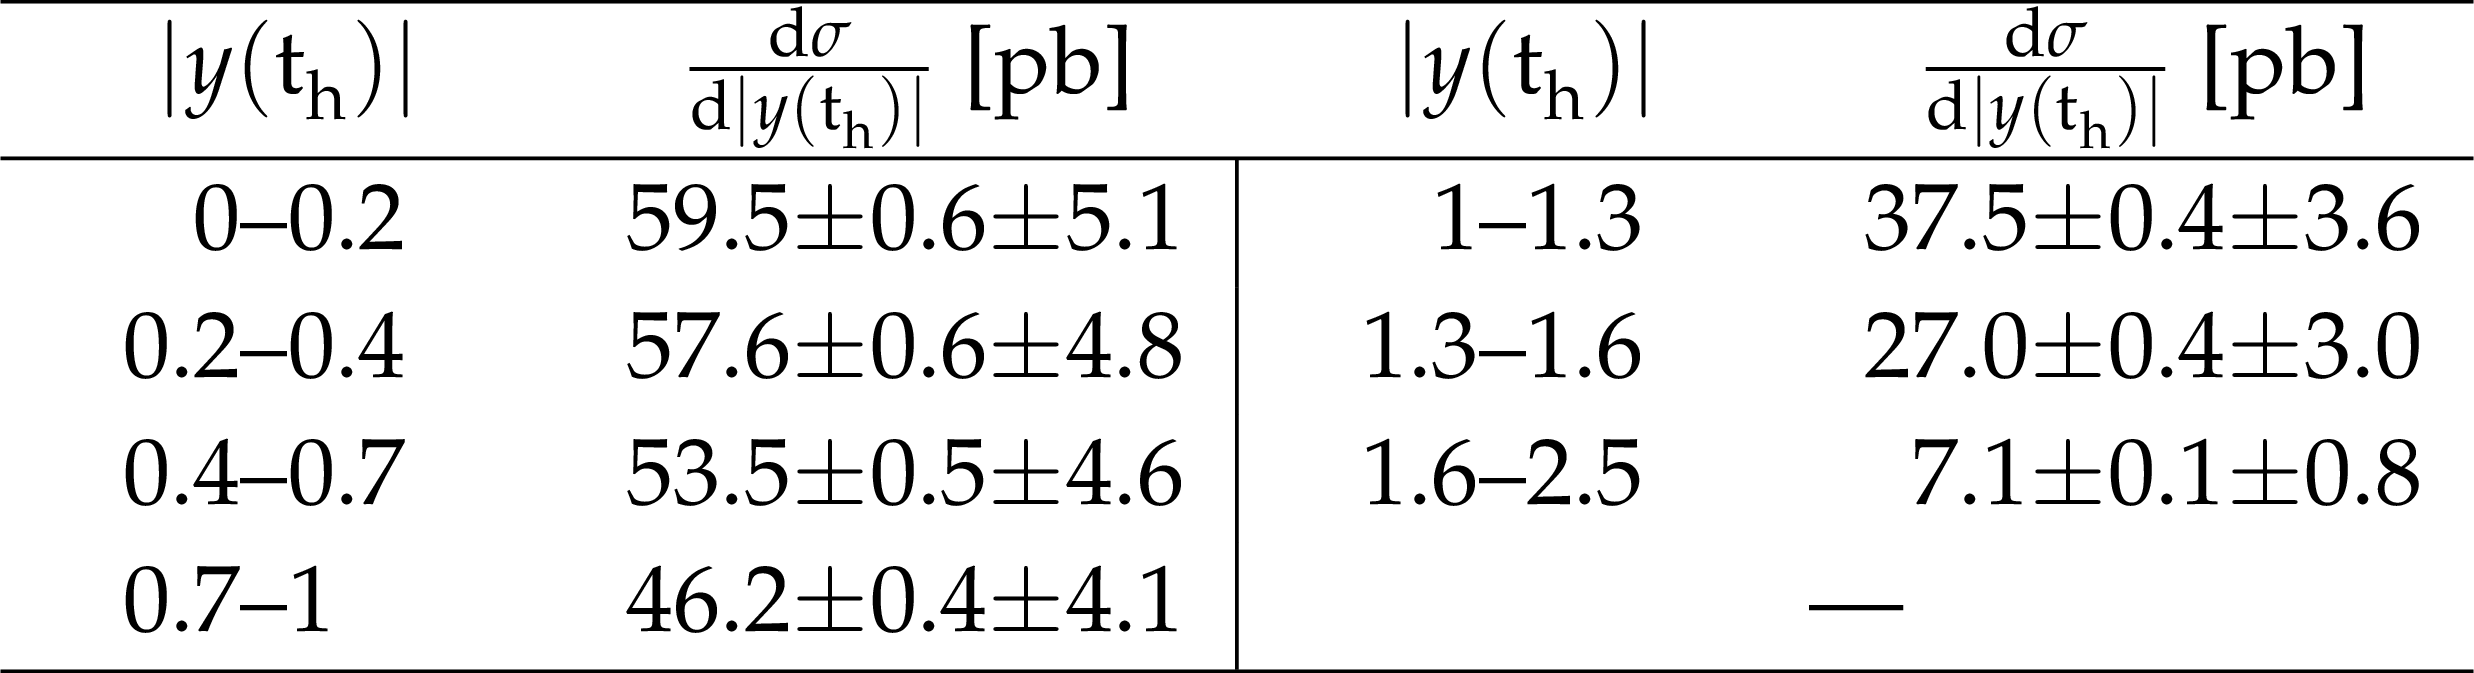
Table 5:
Differential cross section at parton level as a function of $ {| y( {\mathrm{ t } _\mathrm {h}} ) | }$. The values are shown together with their statistical and systematic uncertainties. |

png pdf |
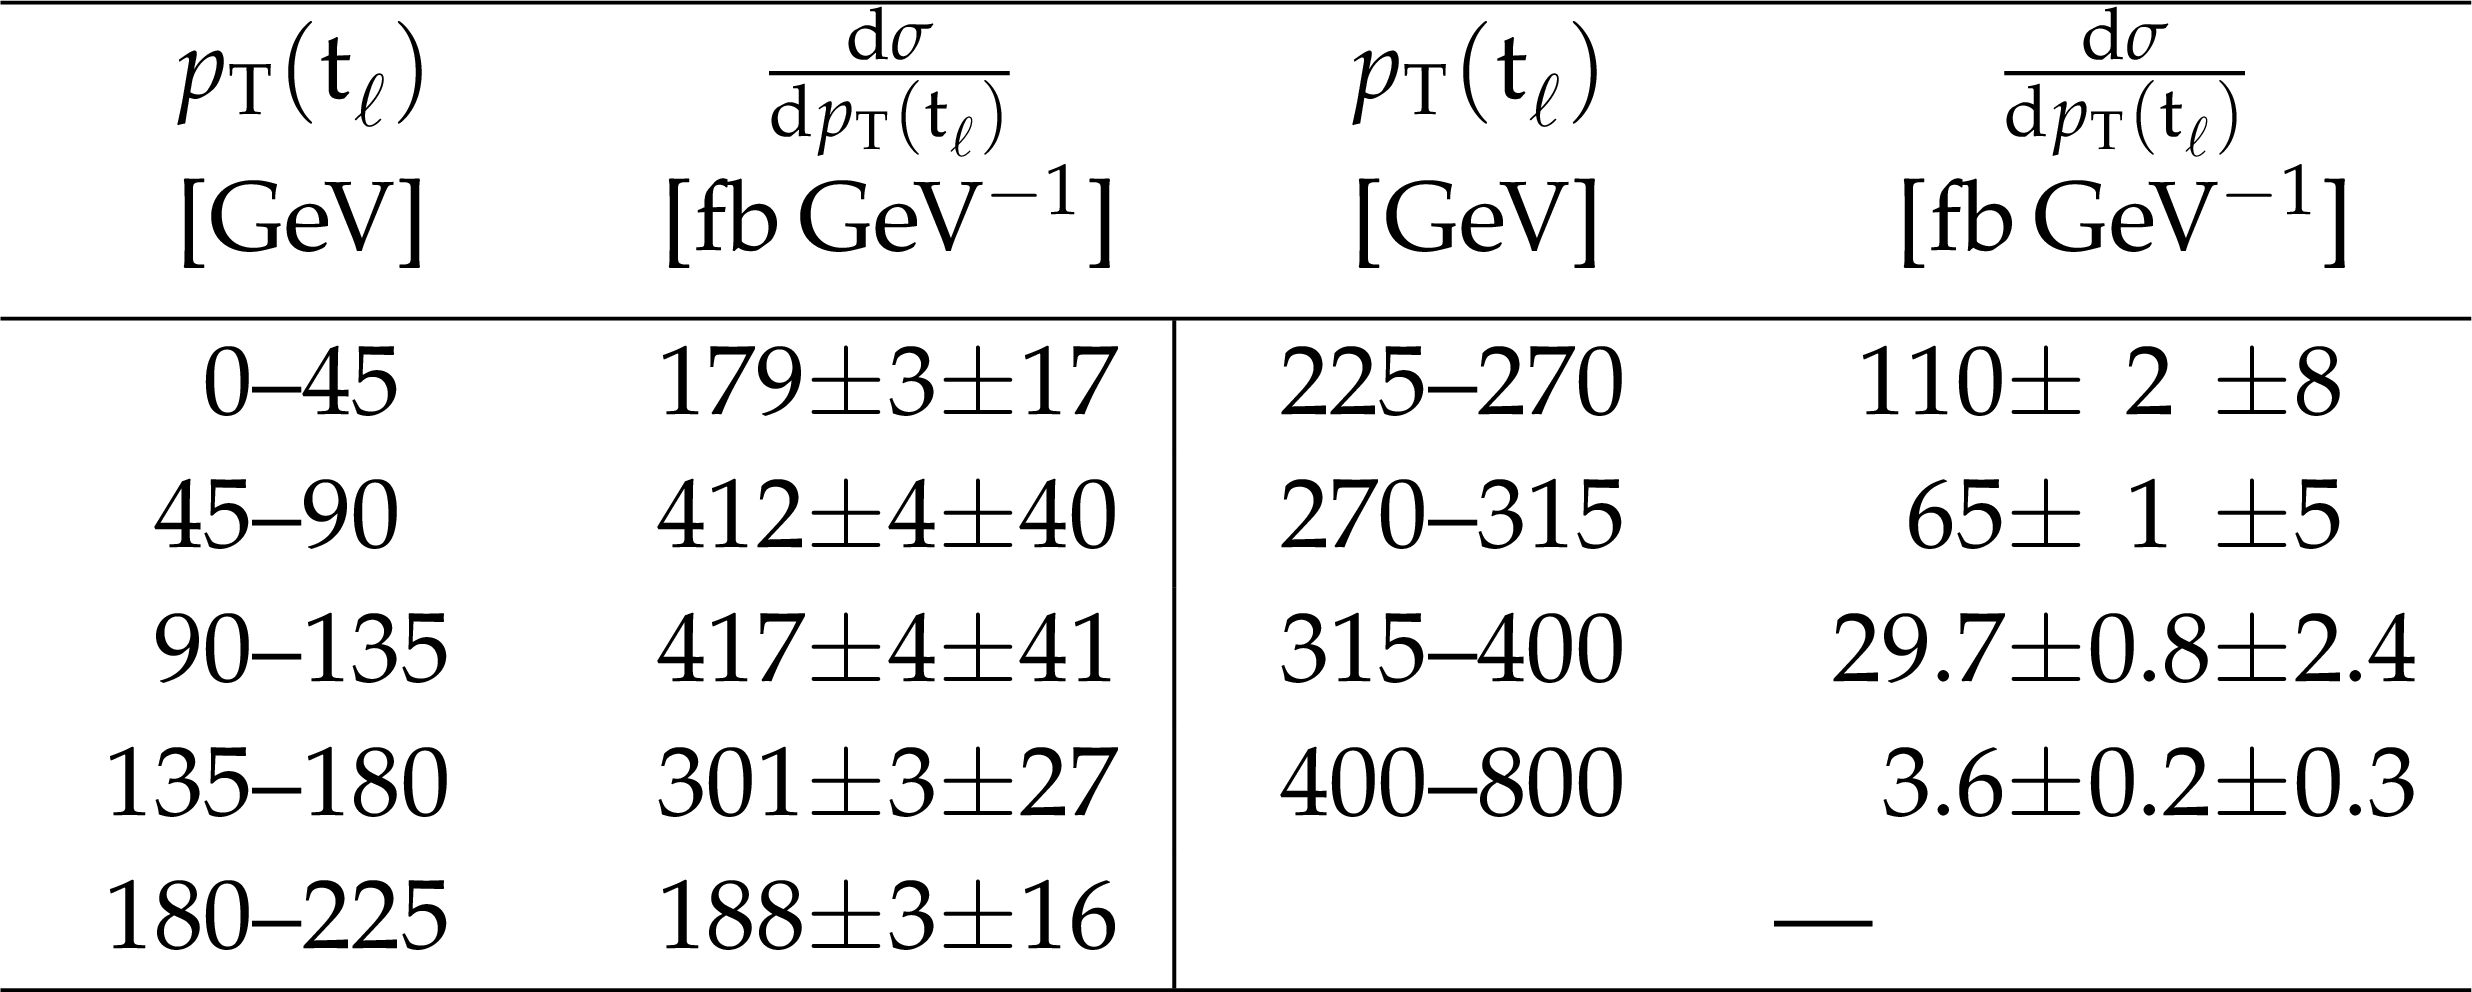
Table 6:
Differential cross section at parton level as a function of $ {p_{\mathrm {T}}} ( {\mathrm{ t } _\ell } )$. The values are shown together with their statistical and systematic uncertainties. |
png pdf |
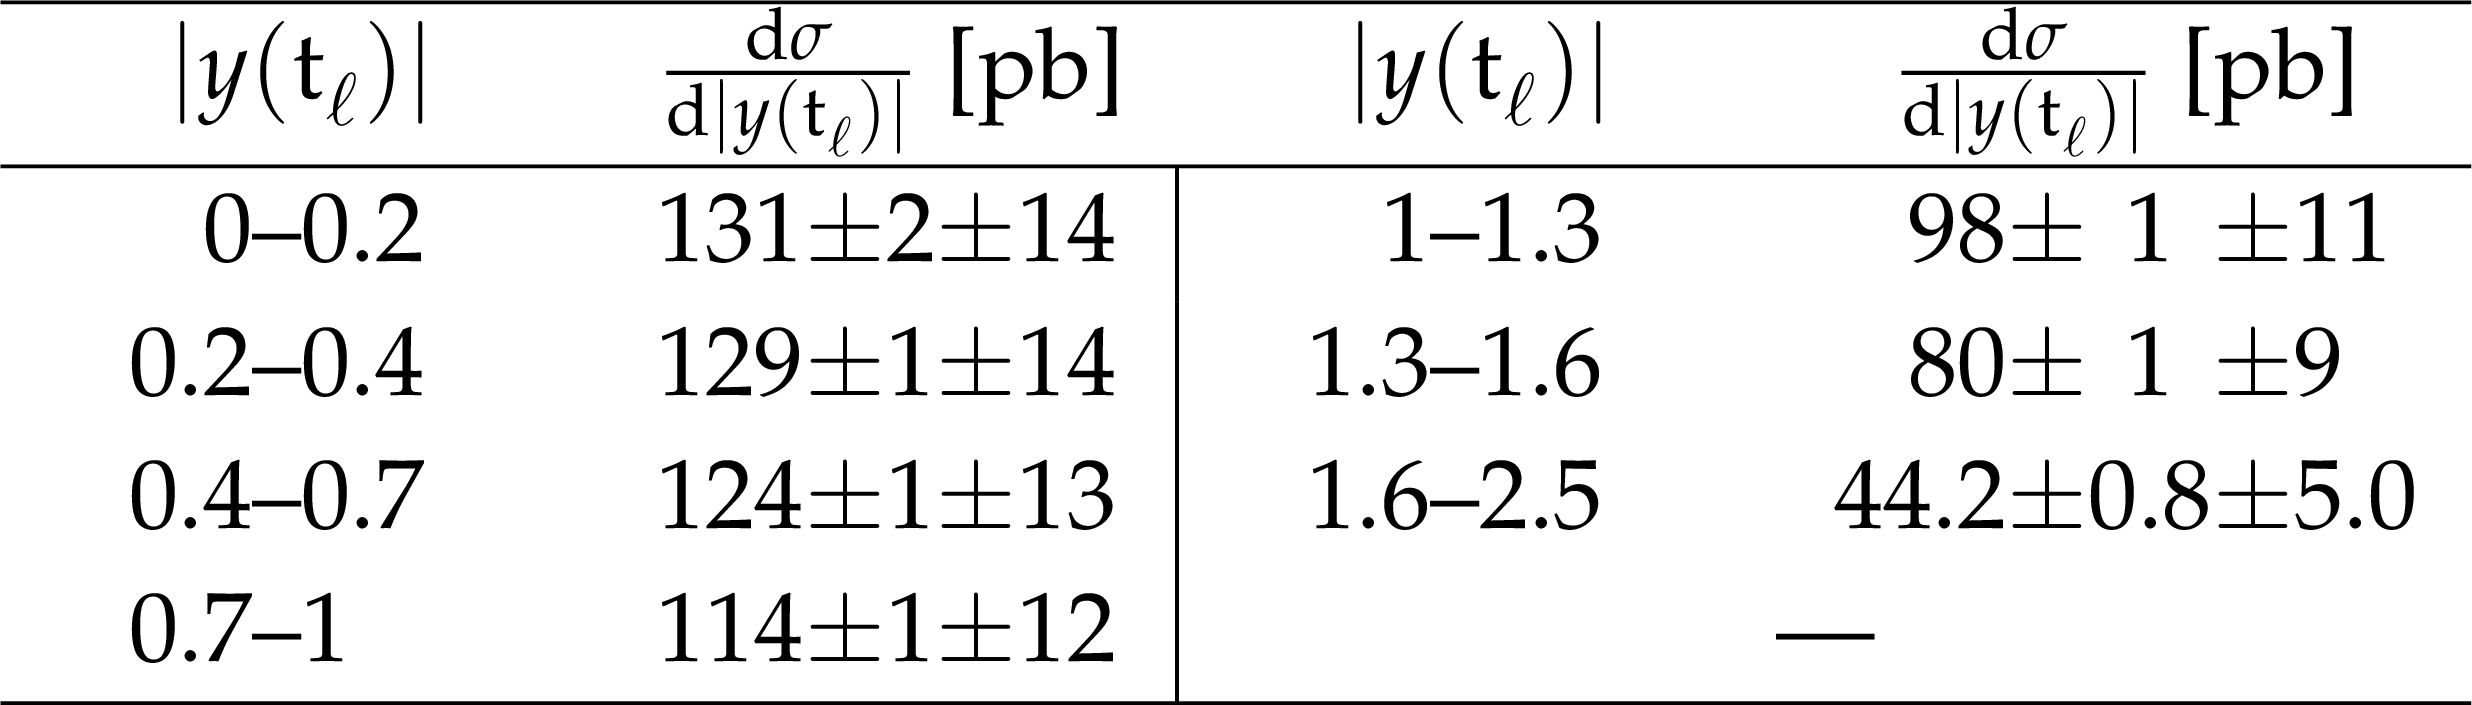
Table 7:
Differential cross section at parton level as a function of $|y( {\mathrm{ t } _\ell } )|$. The values are shown together with their statistical and systematic uncertainties. |
png pdf |
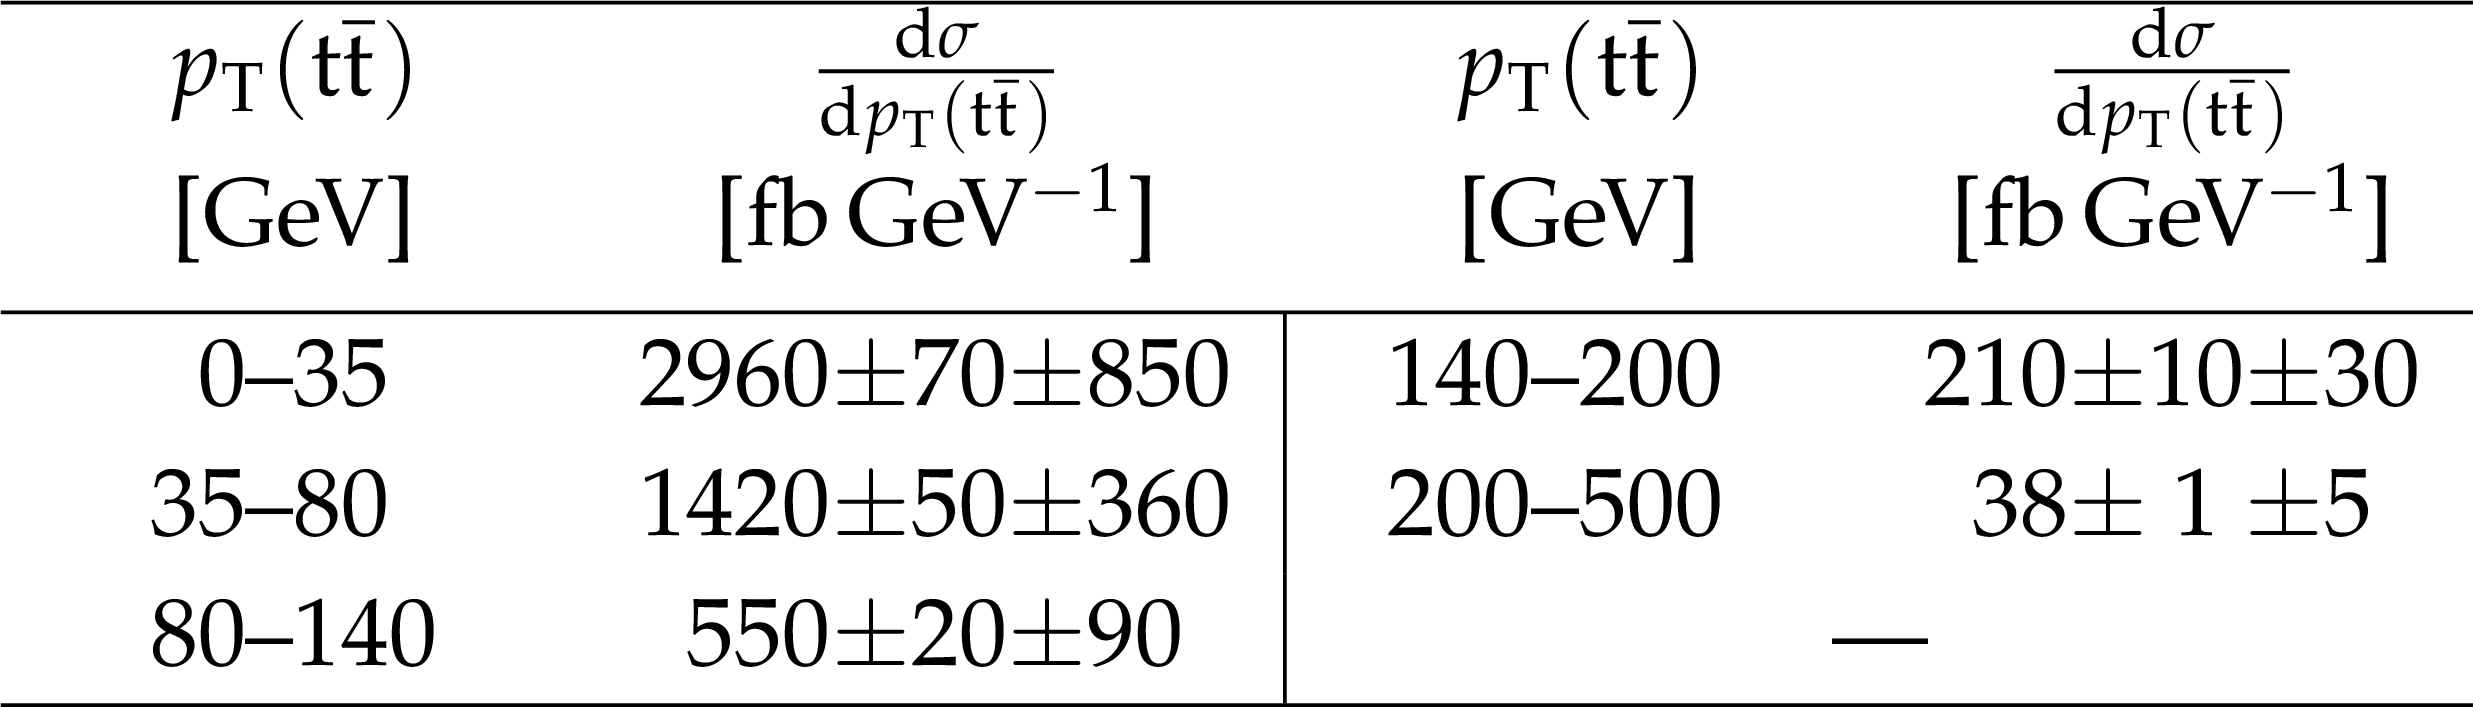
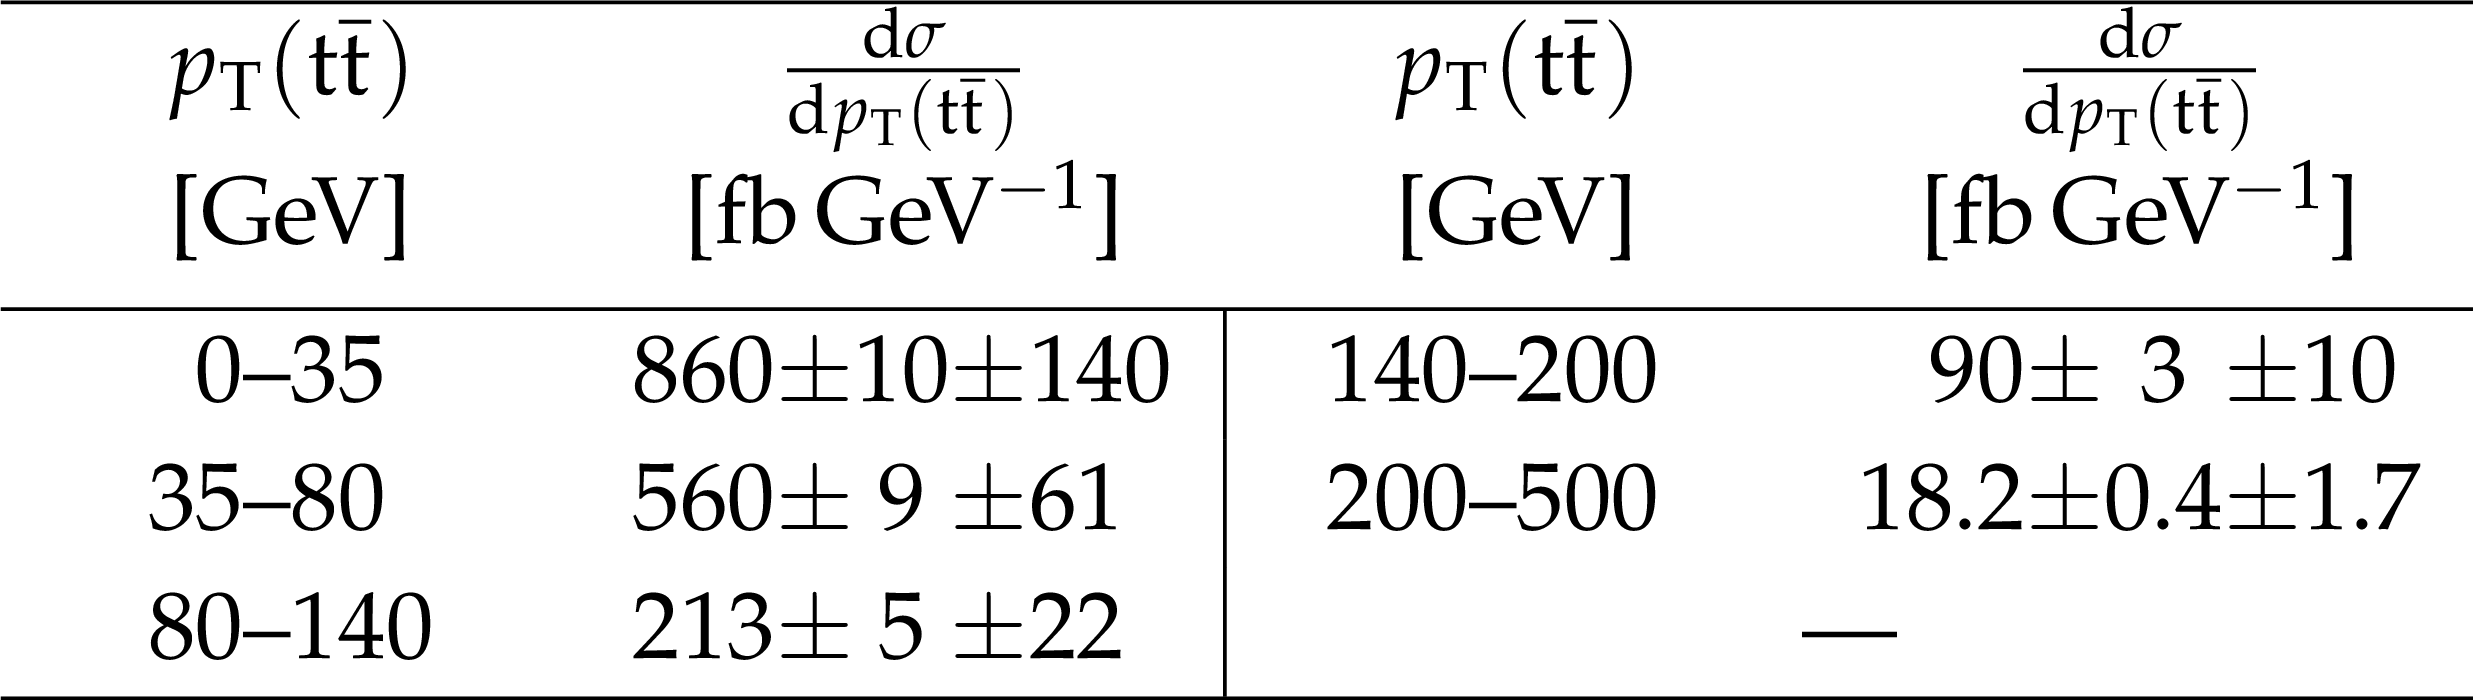
Table 8:
Differential cross section at parton level as a function of $ {p_{\mathrm {T}}} ({\mathrm{ t } \mathrm{ \bar{t} } } )$. The values are shown together with their statistical and systematic uncertainties. |
png pdf |
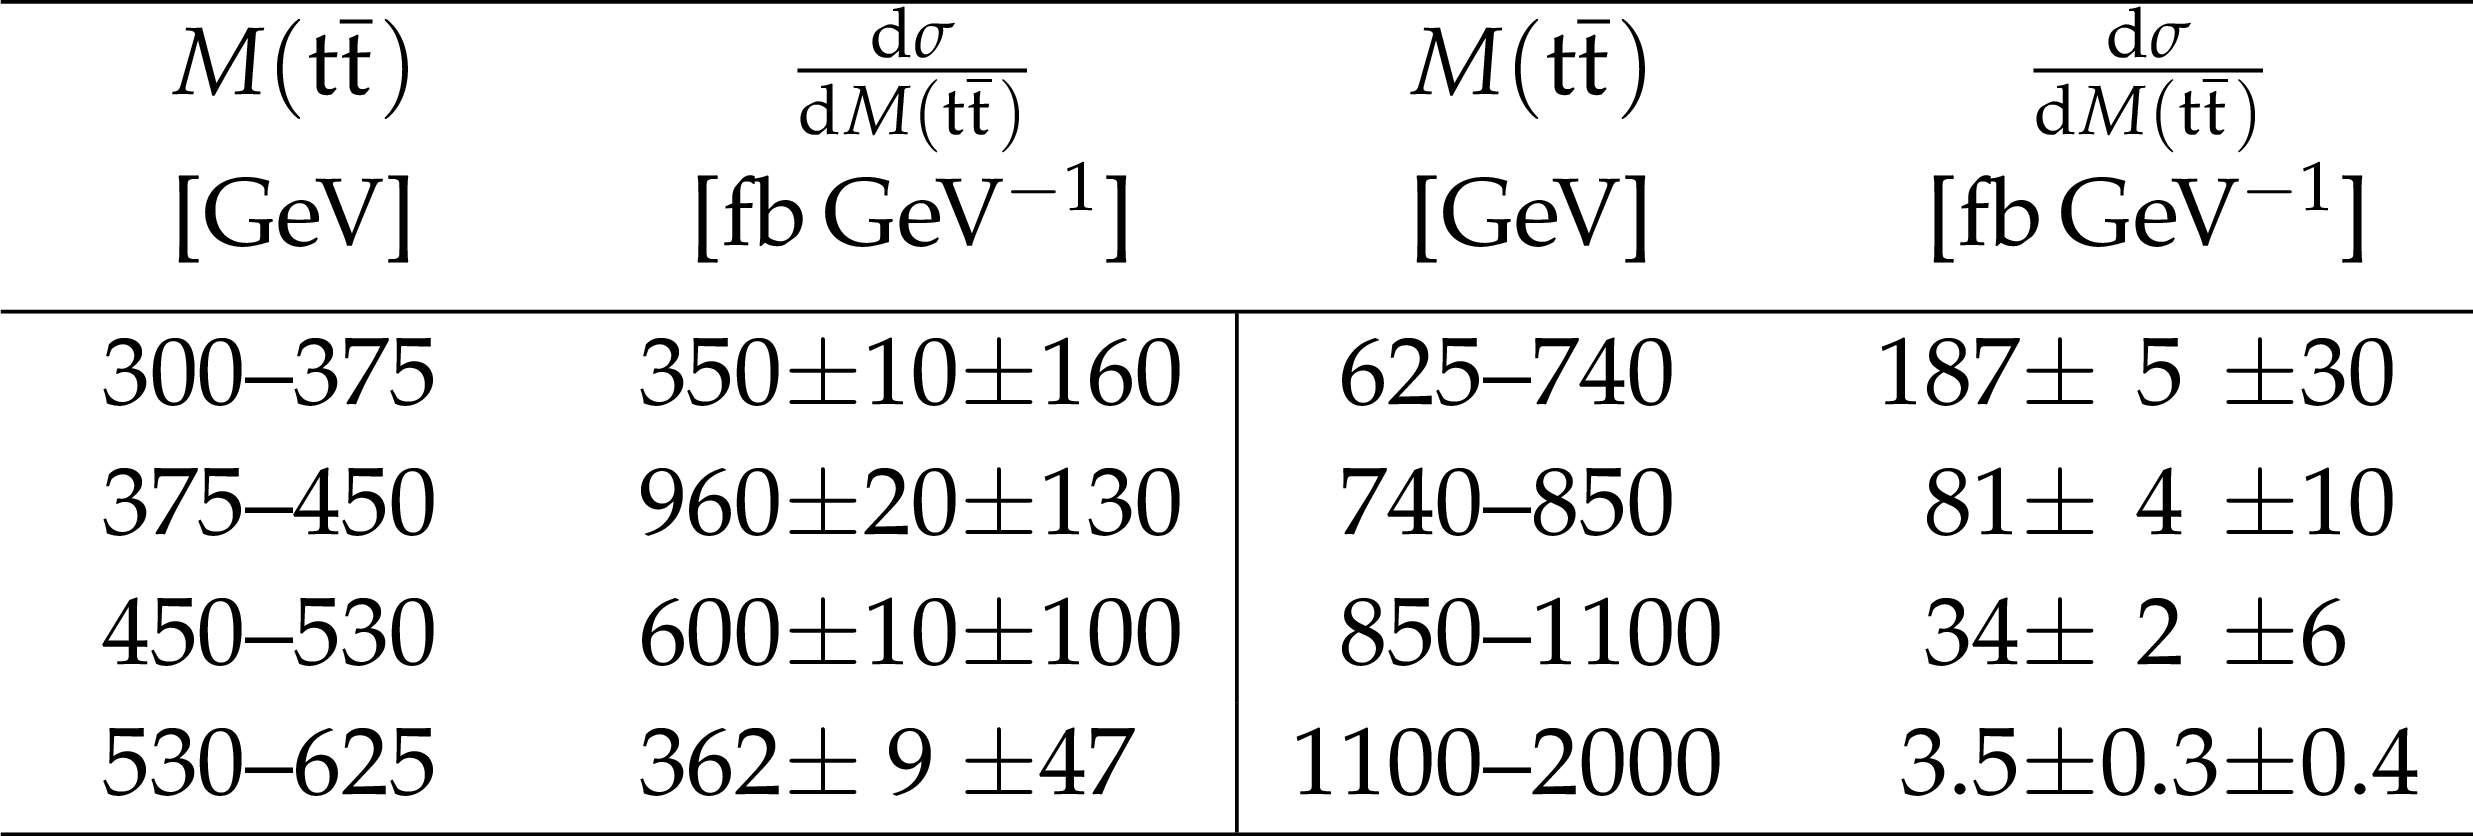
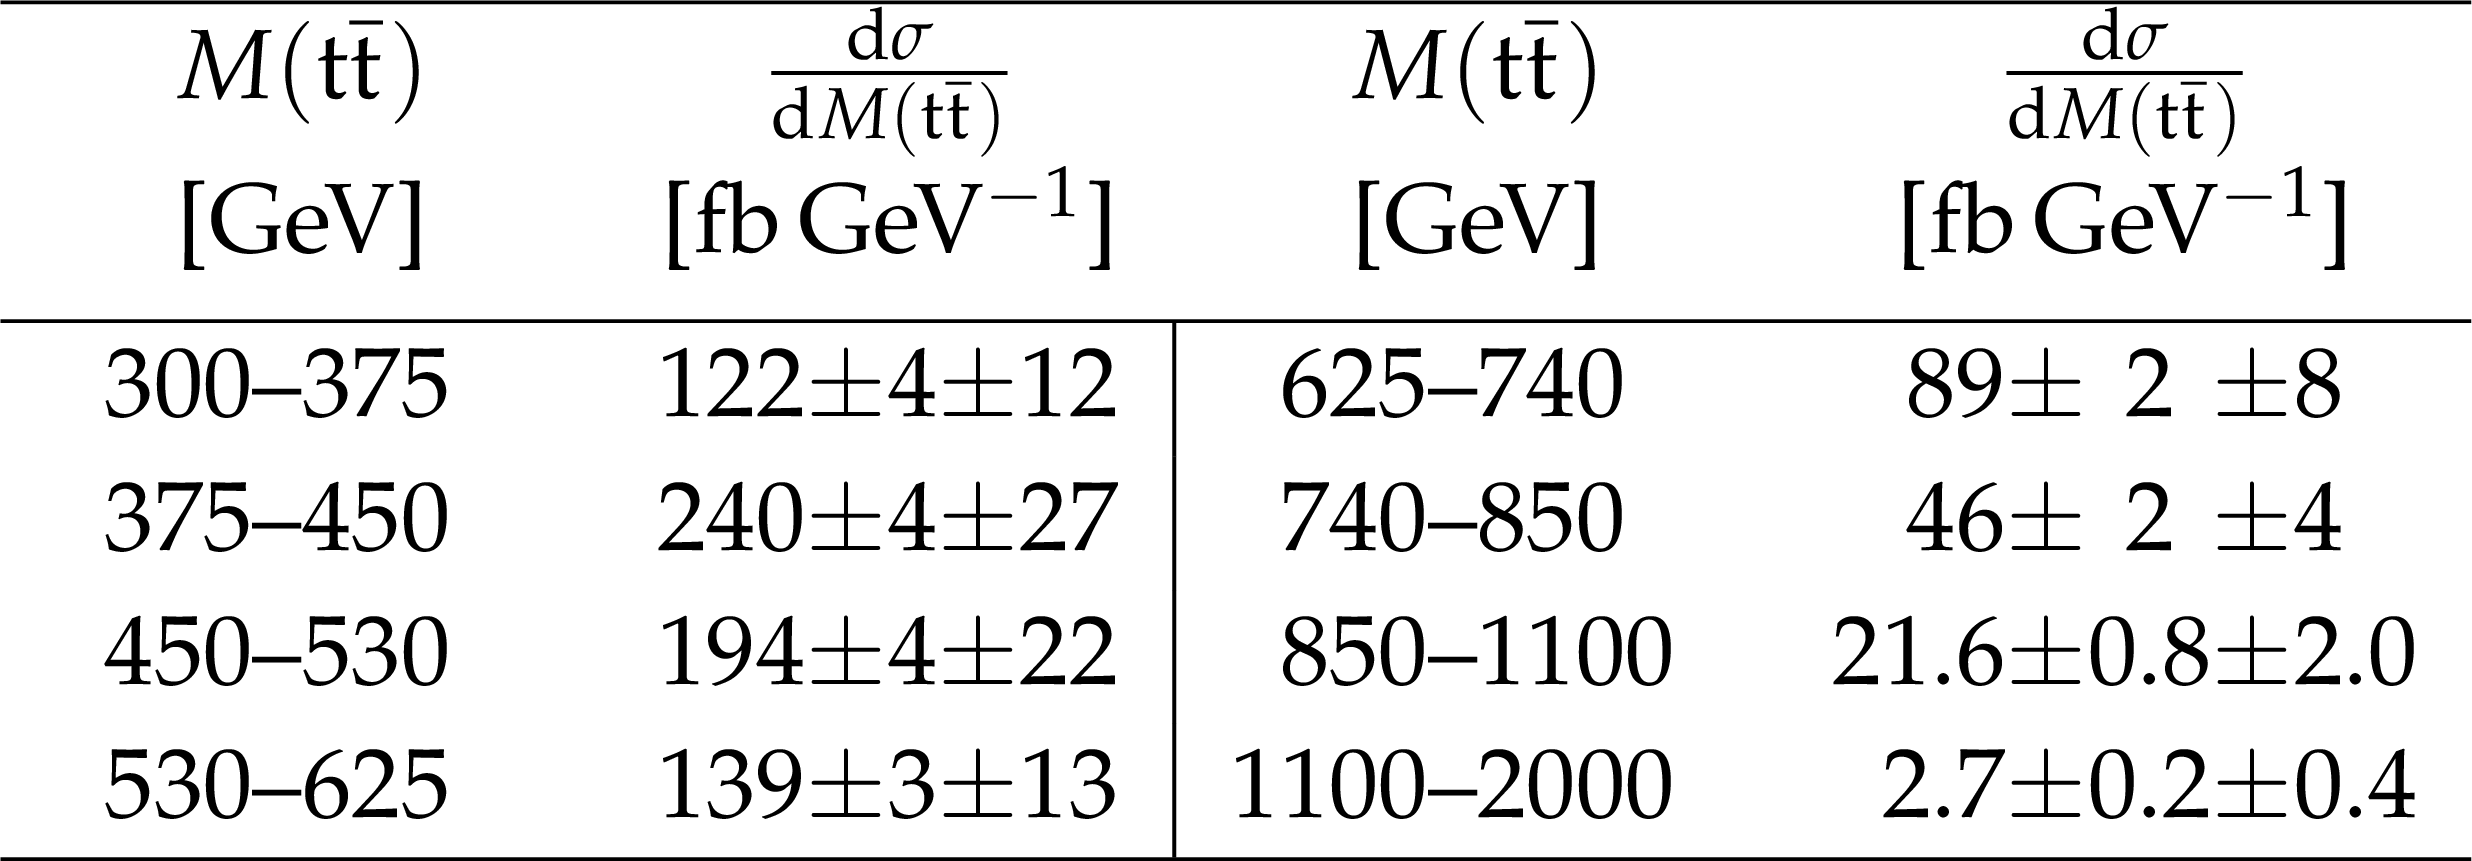
Table 9:
Differential cross section at parton level as a function of $M({\mathrm{ t } \mathrm{ \bar{t} } } )$. The values are shown together with their statistical and systematic uncertainties. |
png pdf |
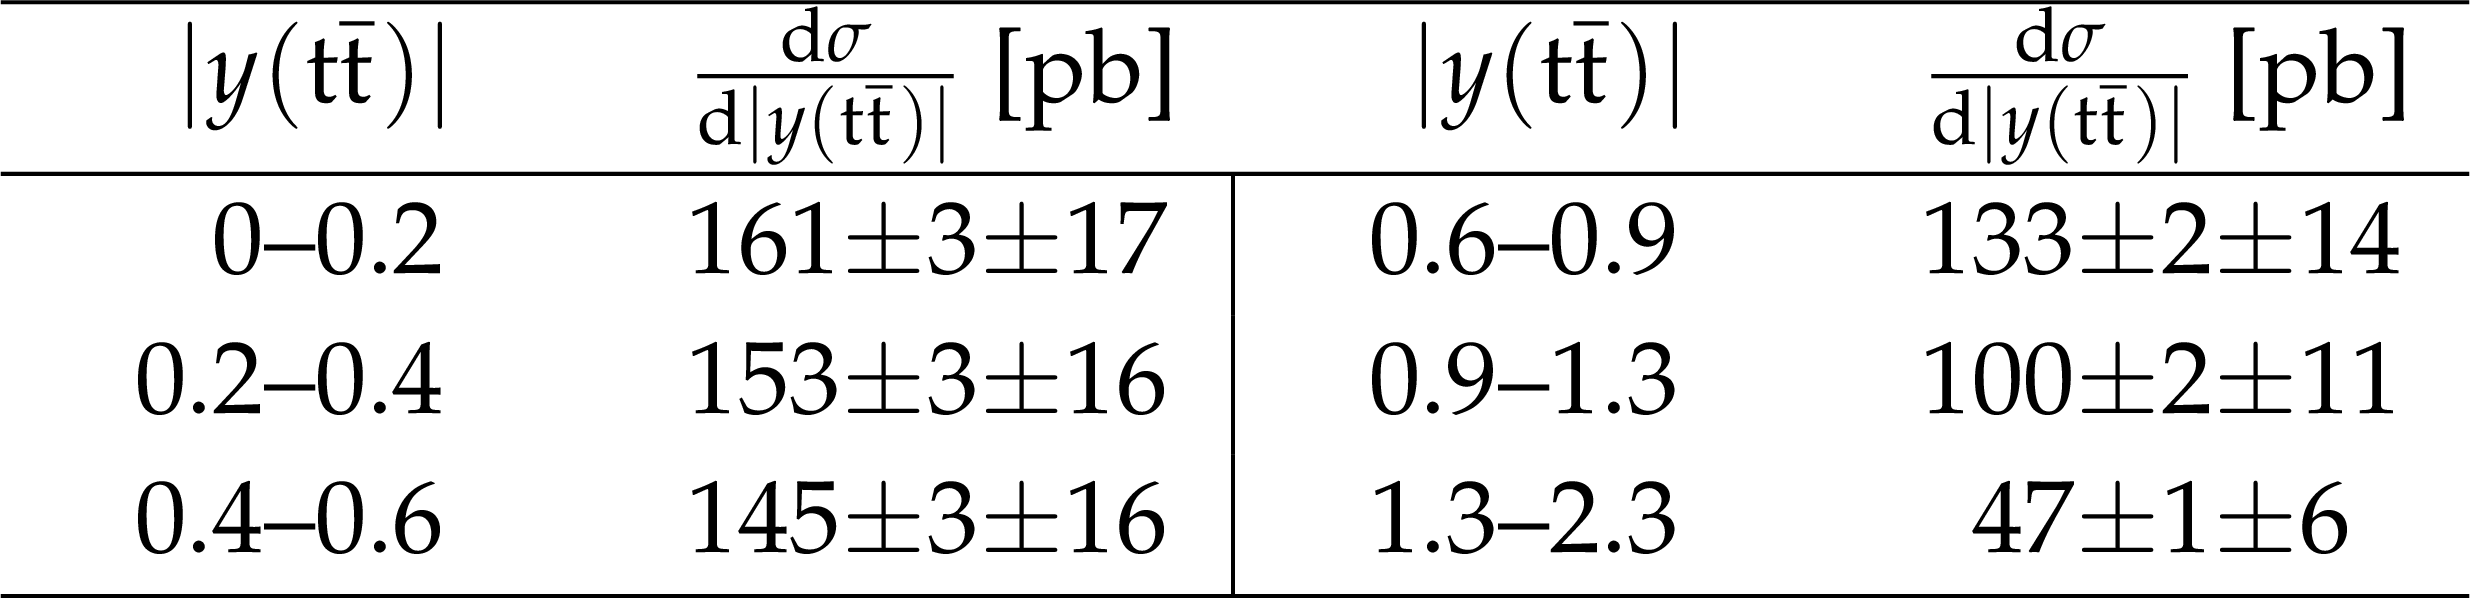
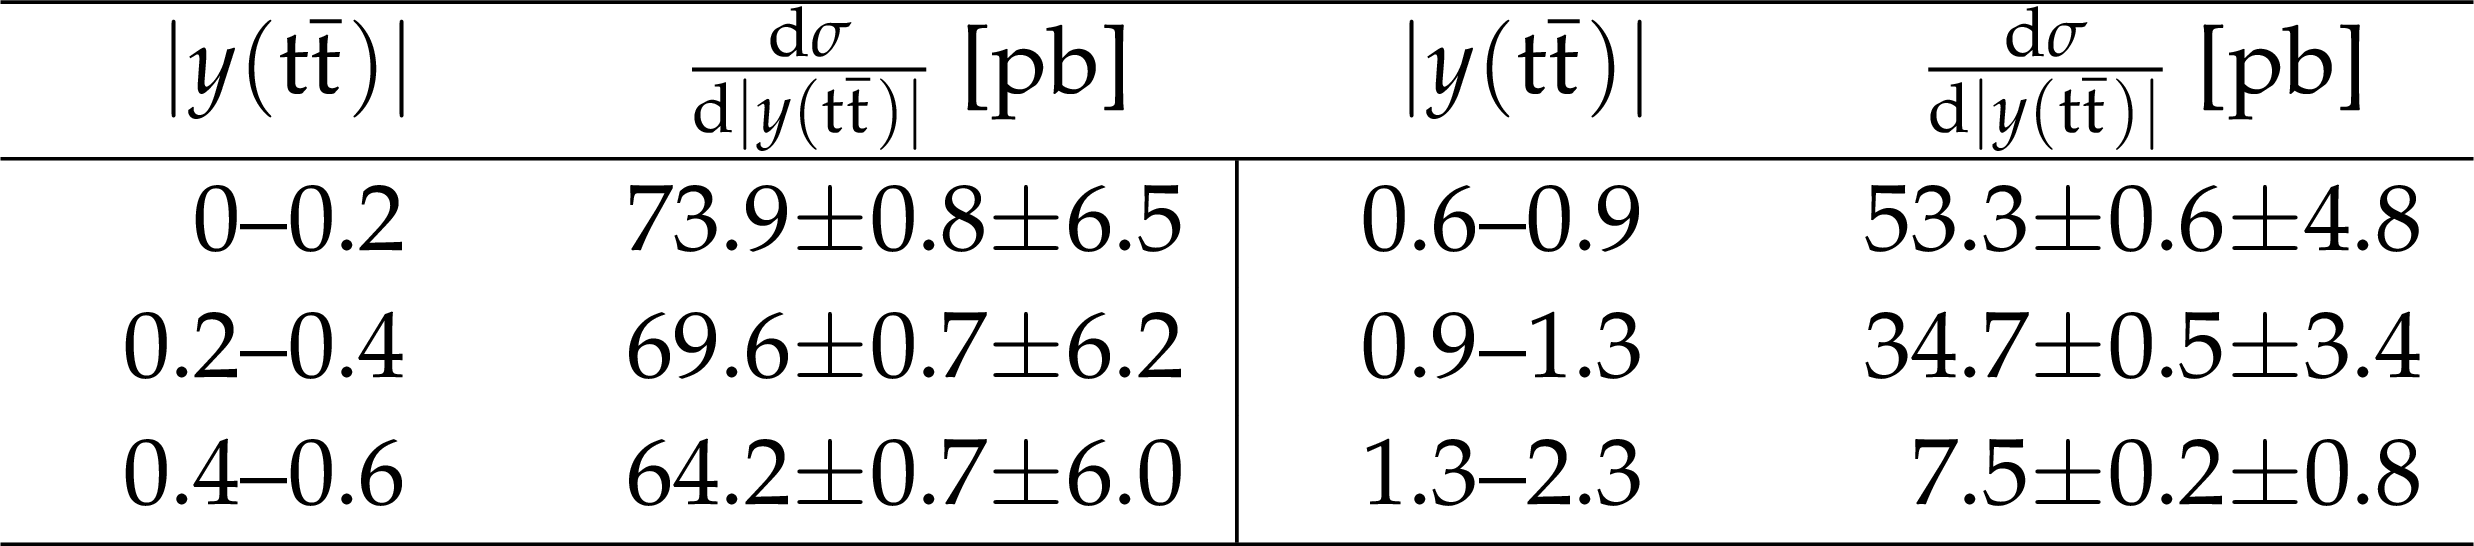
Table 10:
Differential cross section at parton level as a function of $|y({\mathrm{ t } \mathrm{ \bar{t} } } )|$. The values are shown together with their statistical and systematic uncertainties. |

png pdf |
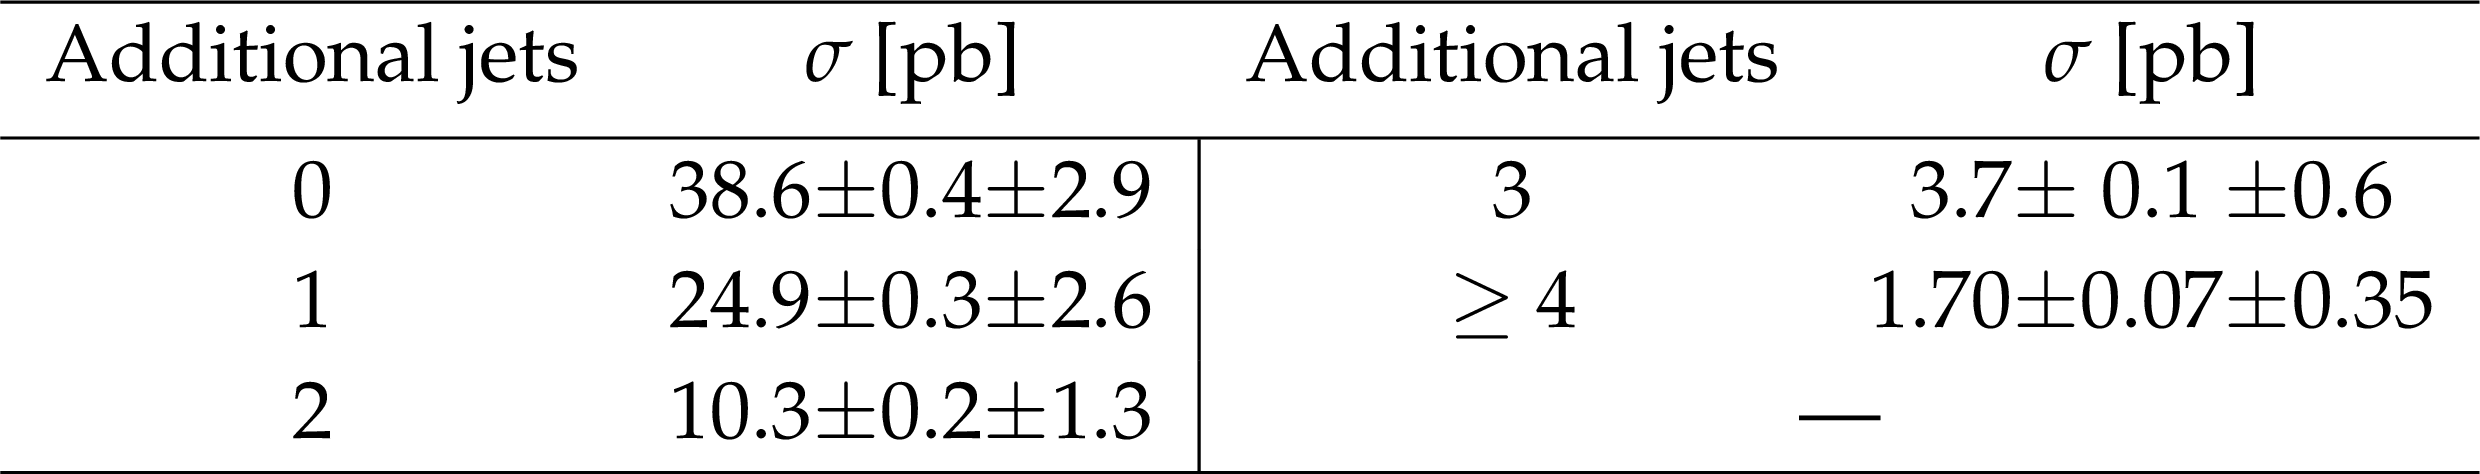
Table 11:
Cross sections at parton level in bins of the number of additional jets. The values are shown together with their statistical and systematic uncertainties. |
png pdf |
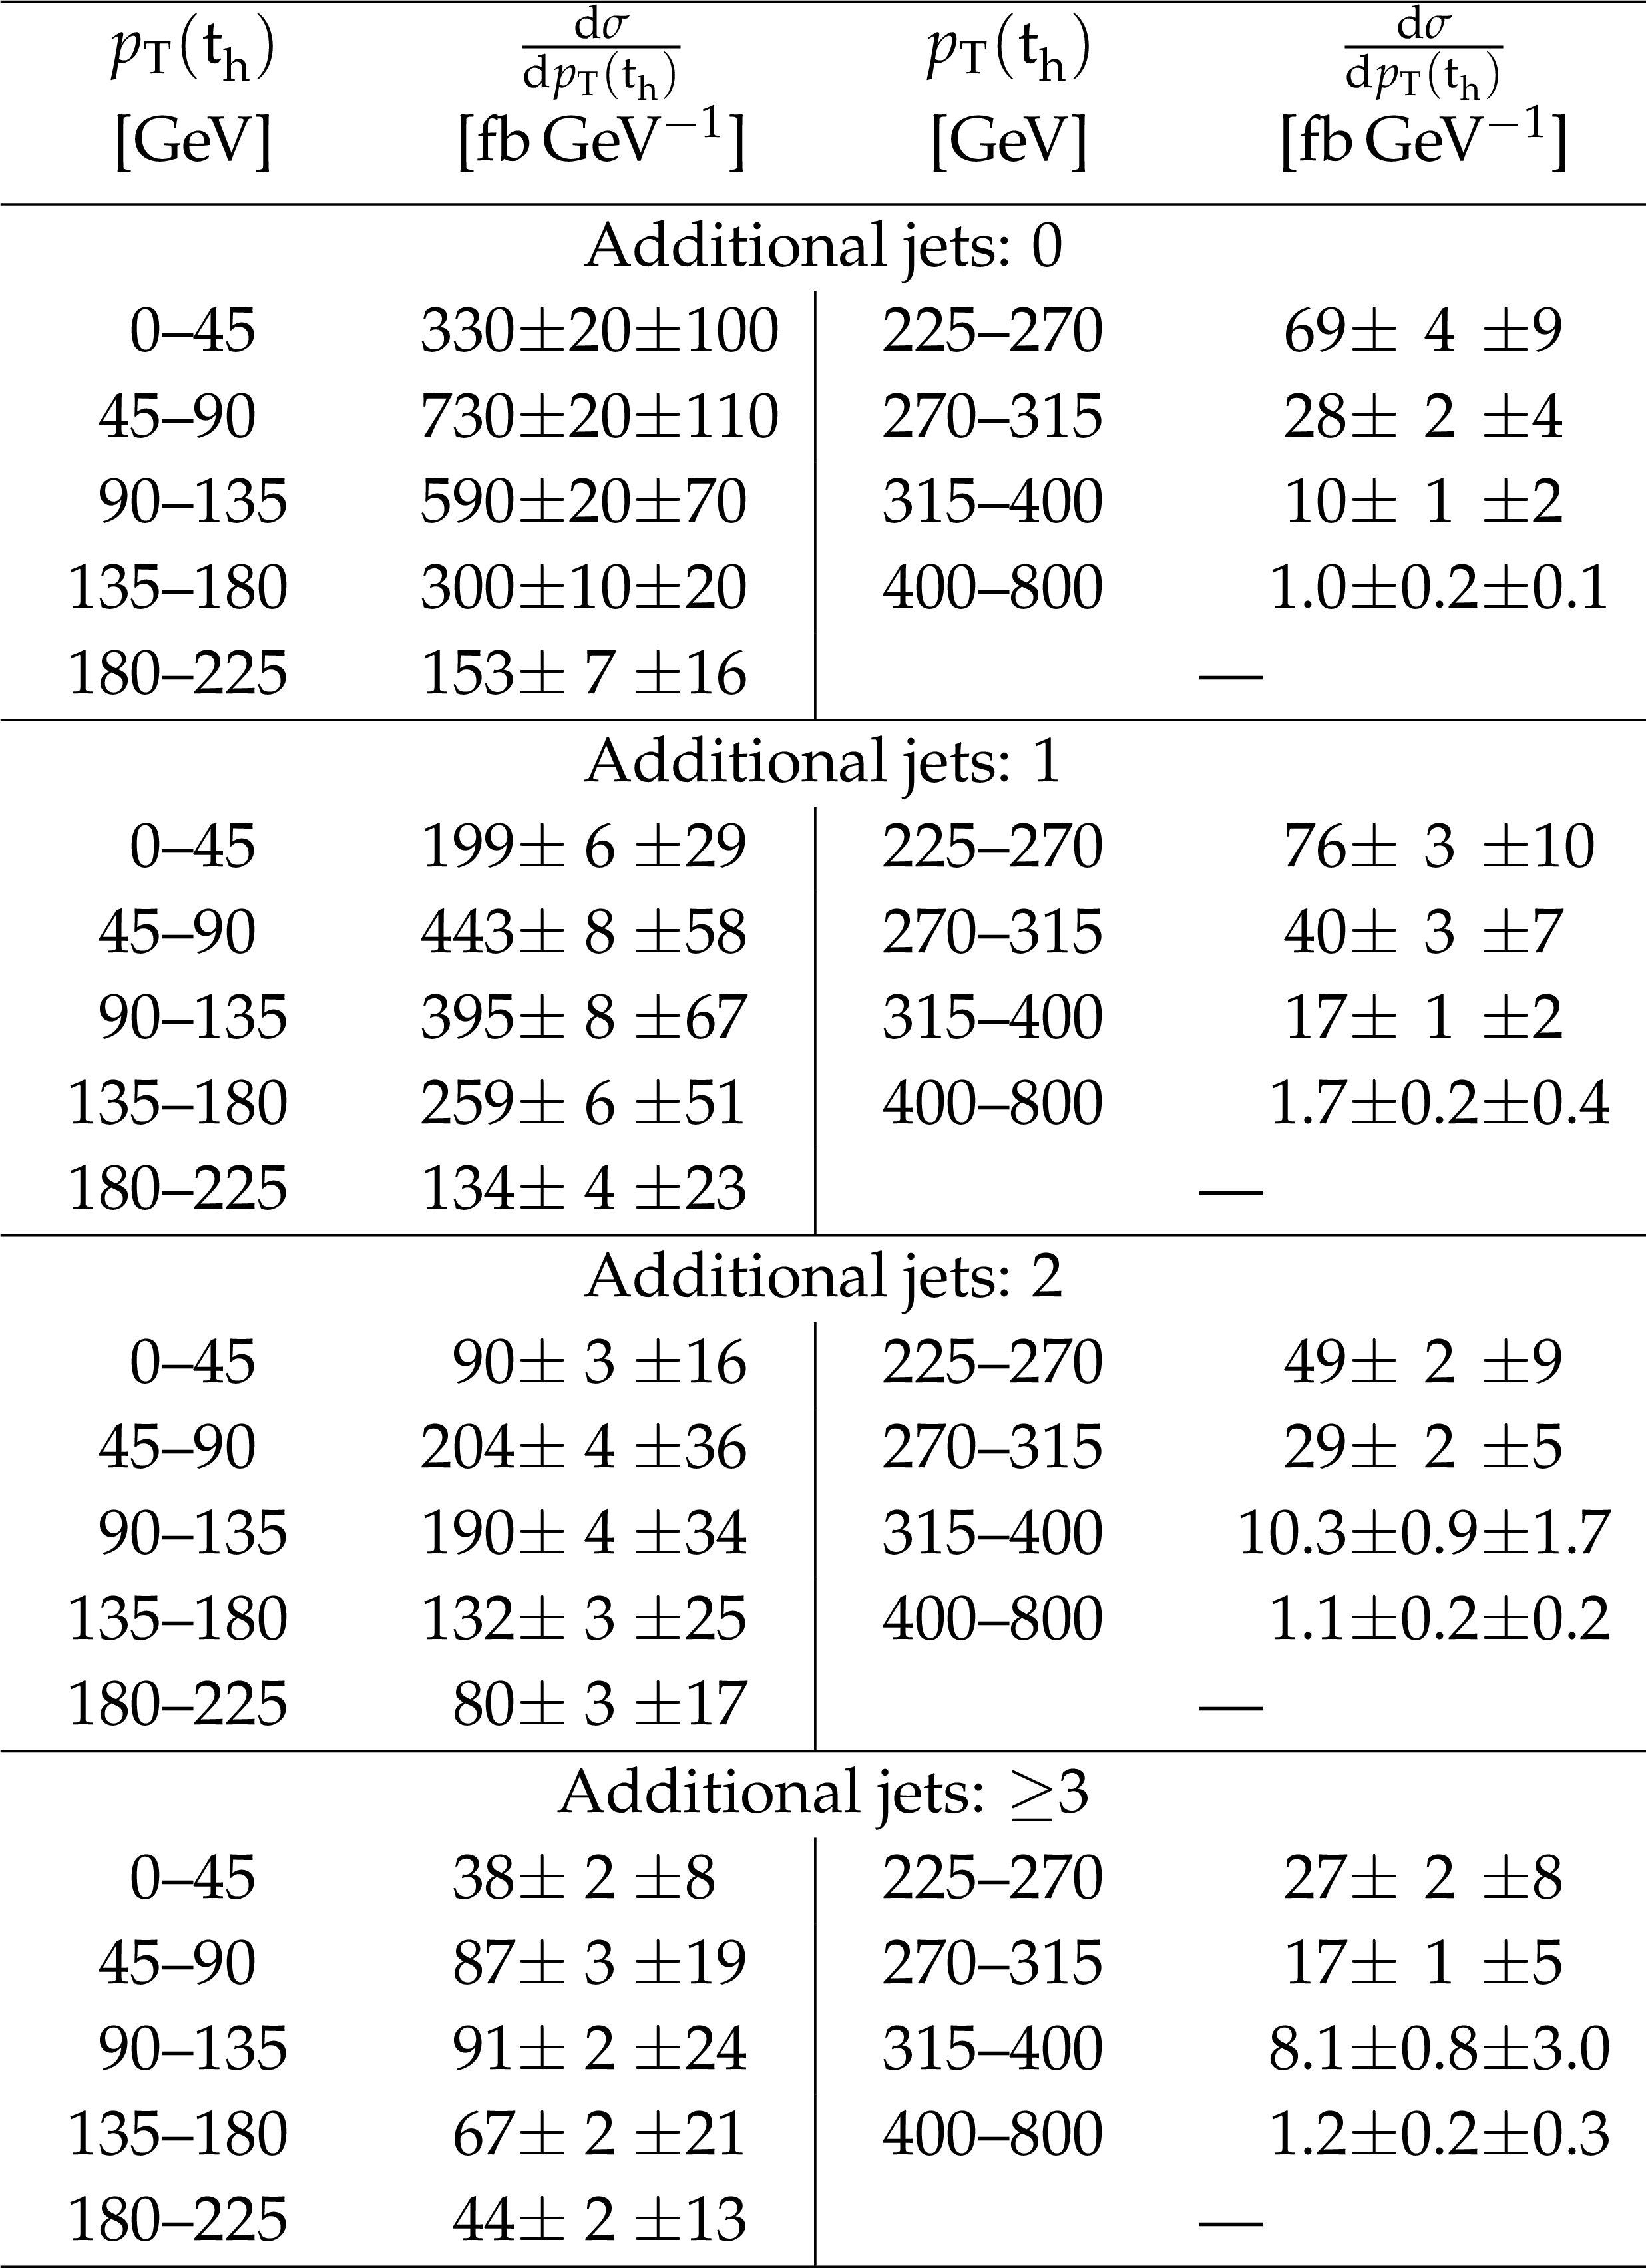
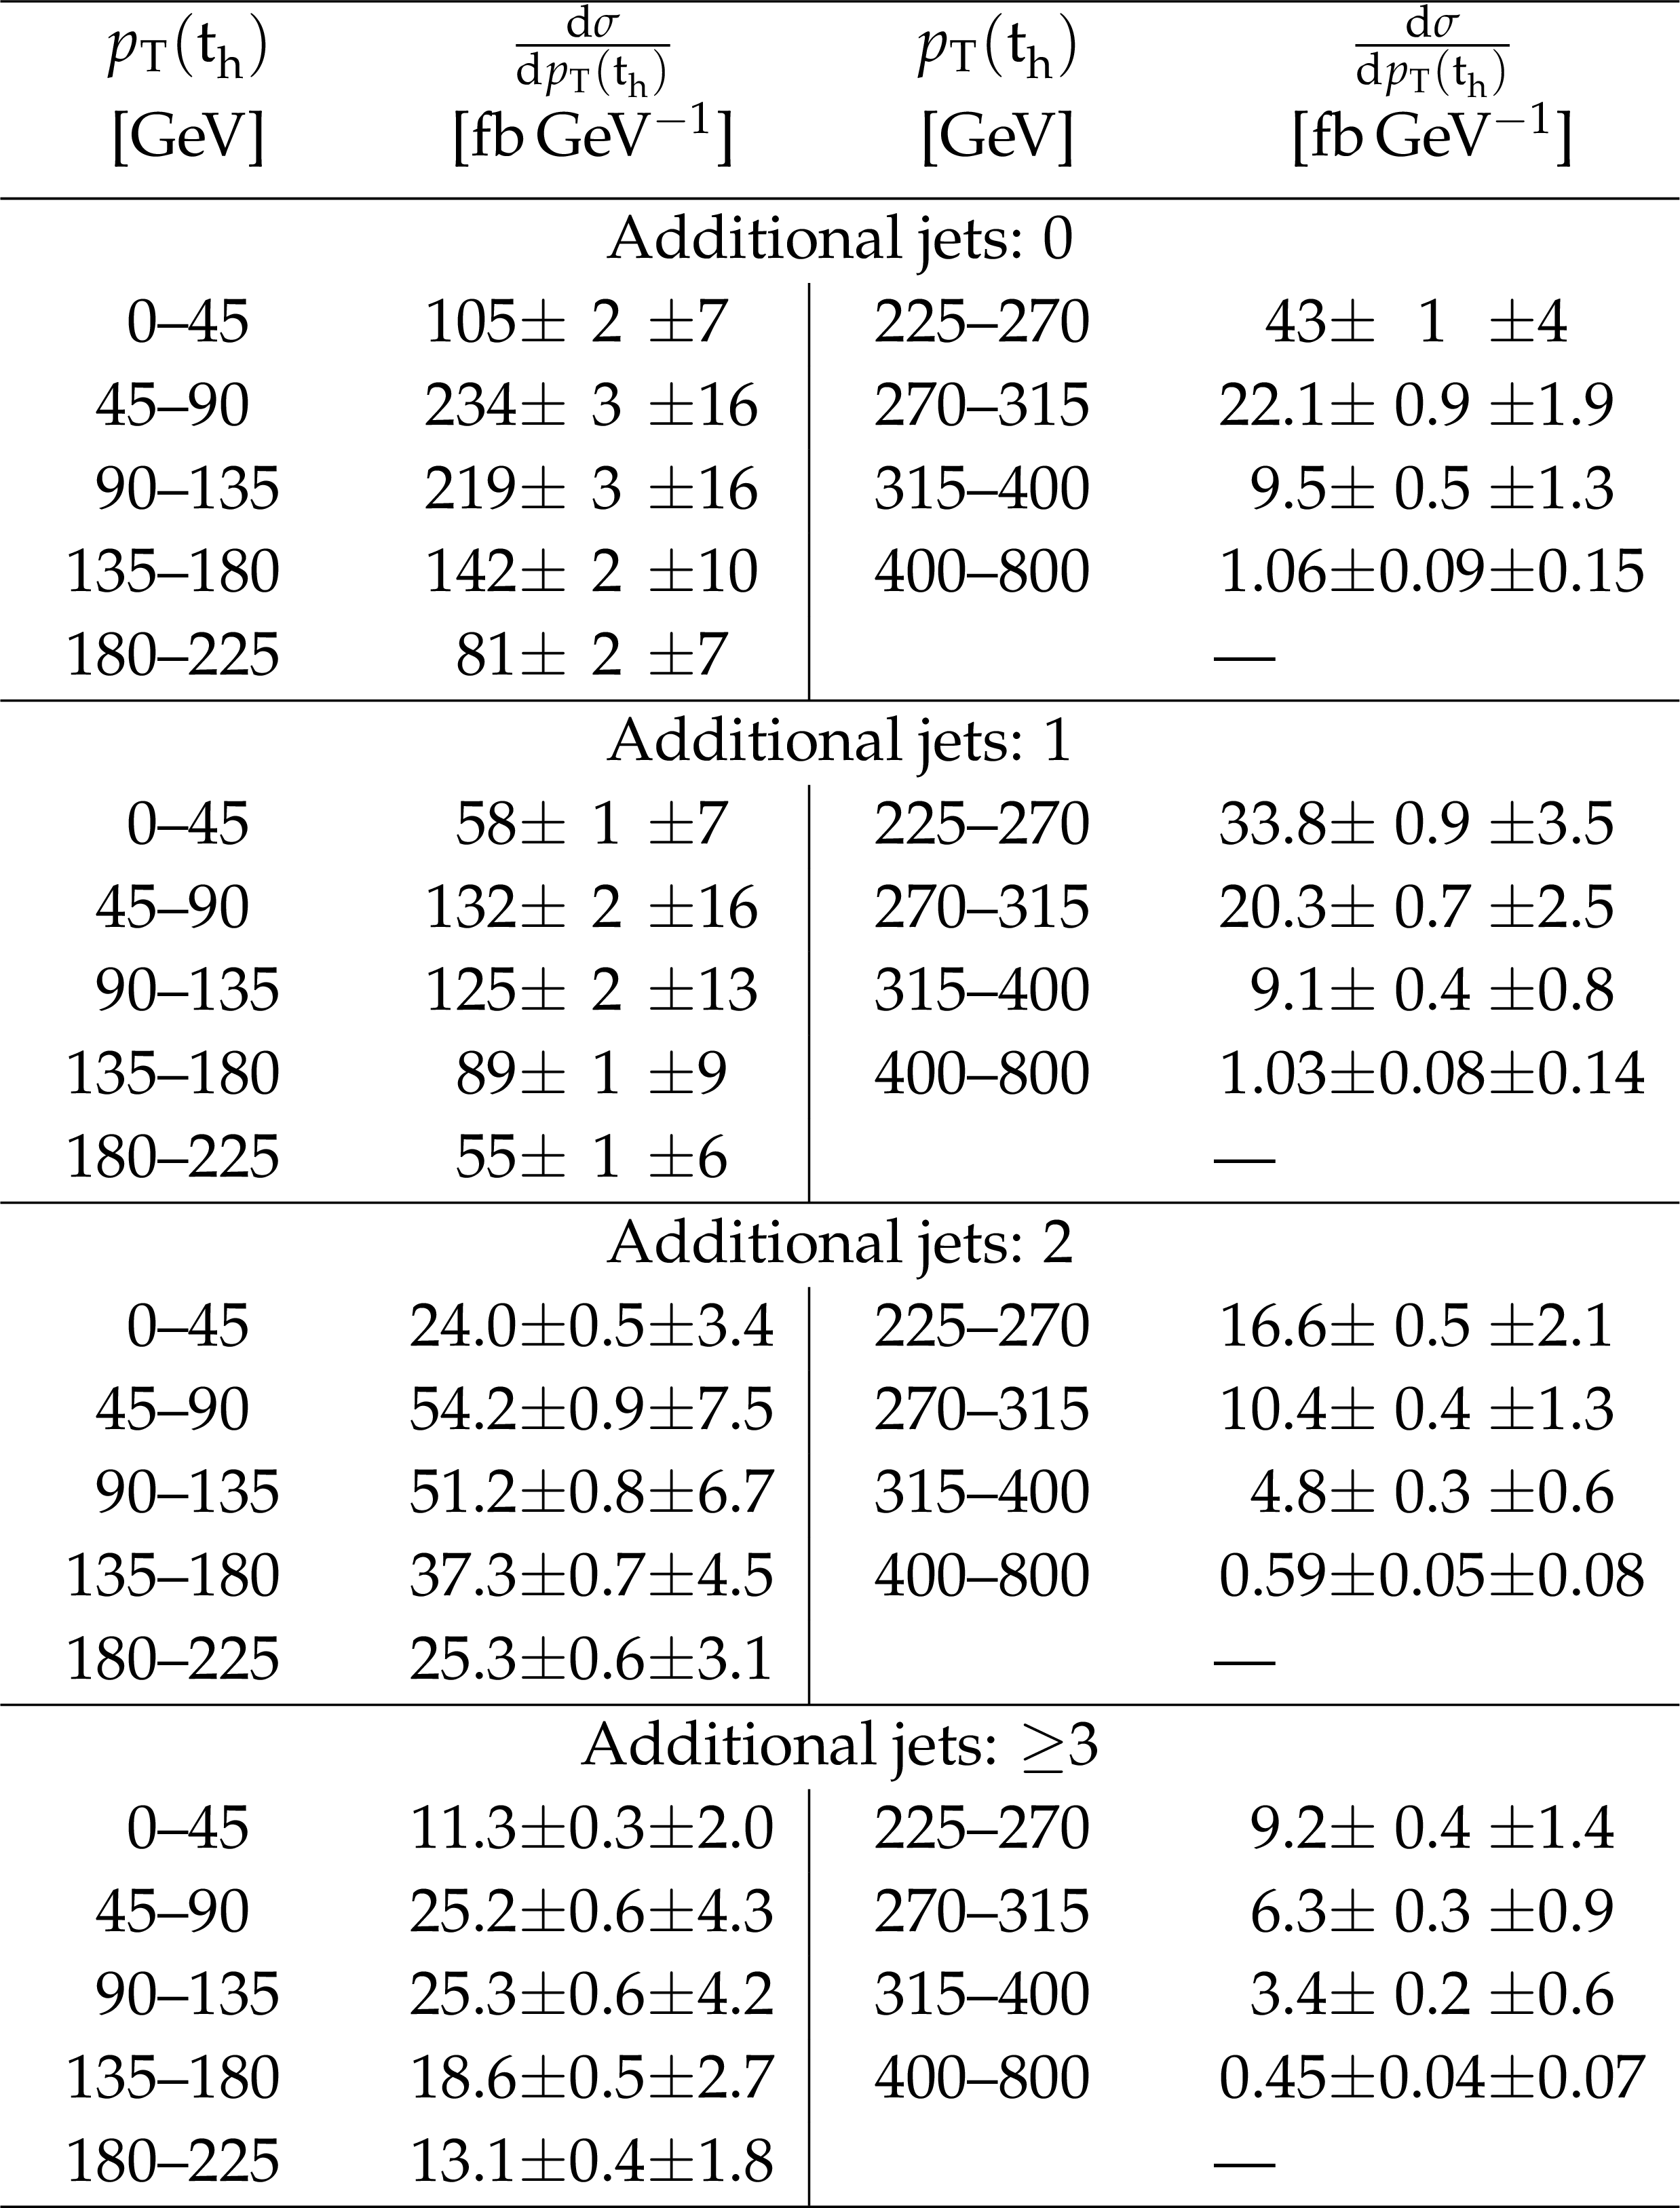
Table 12:
Differential cross sections at parton level as a function of $ {p_{\mathrm {T}}} ( {\mathrm{ t } _\mathrm {h}} )$ in bins of the number of additional jets. The values are shown together with their statistical and systematic uncertainties. |
png pdf |
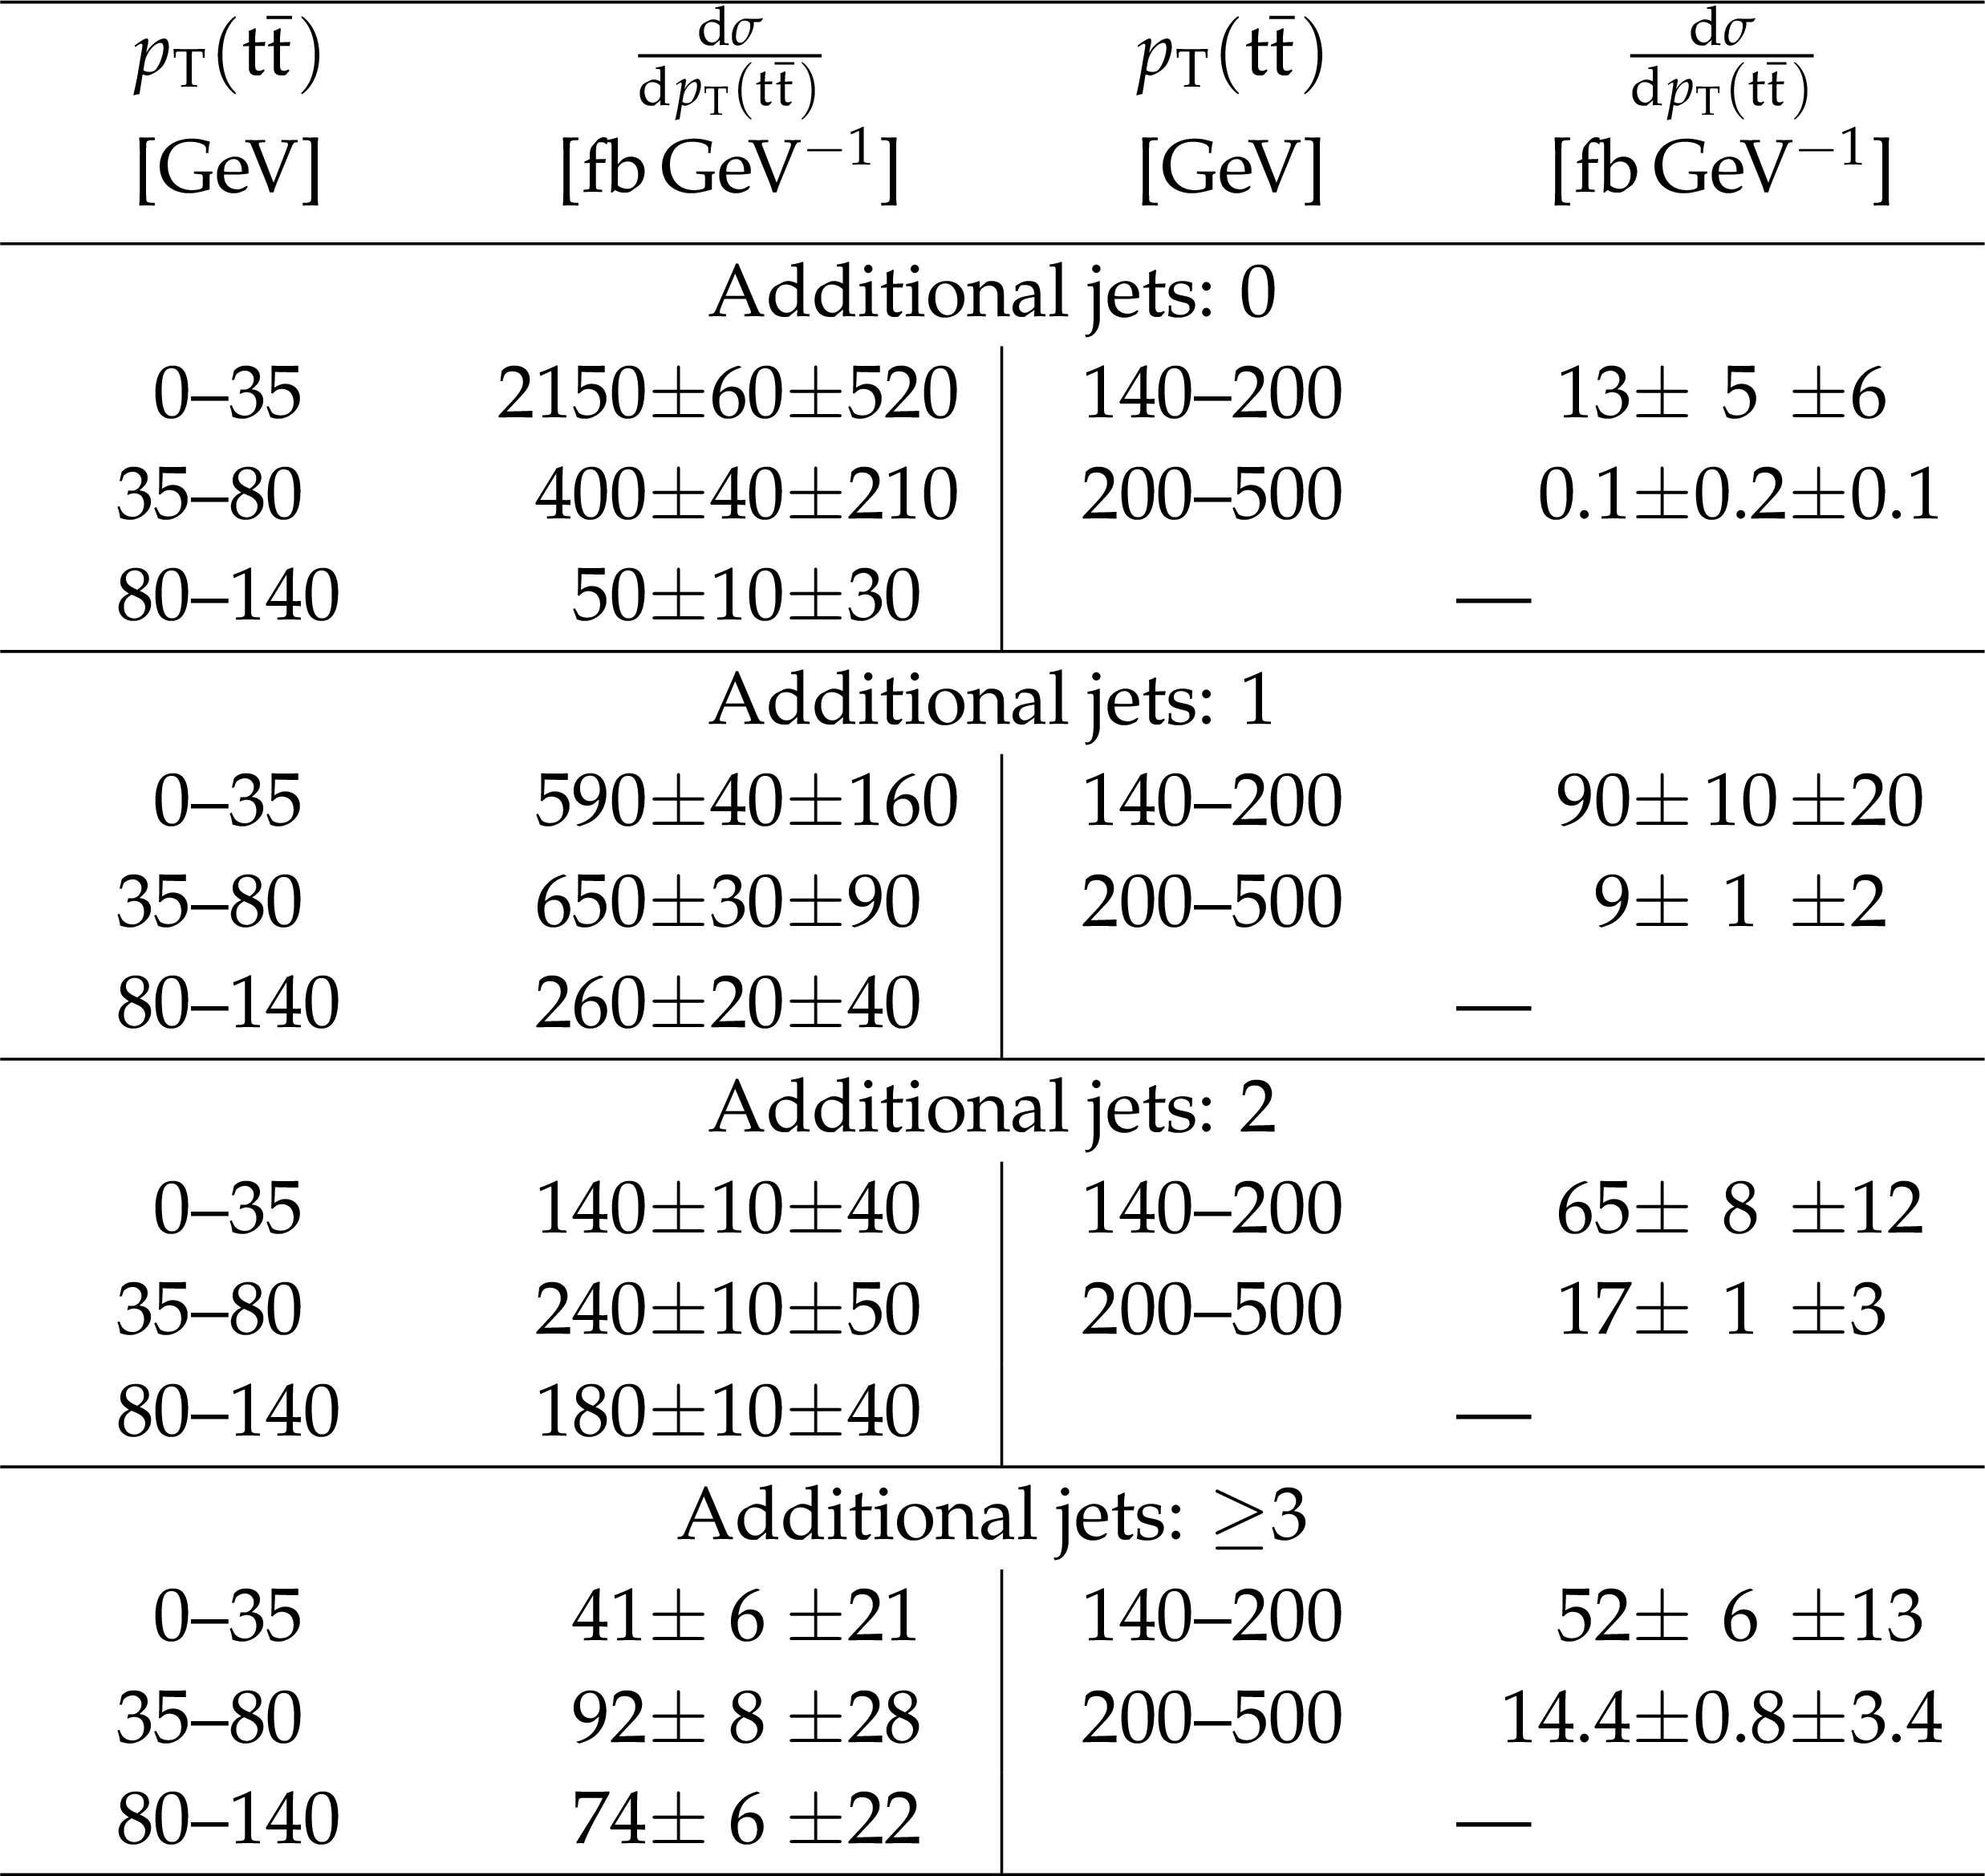
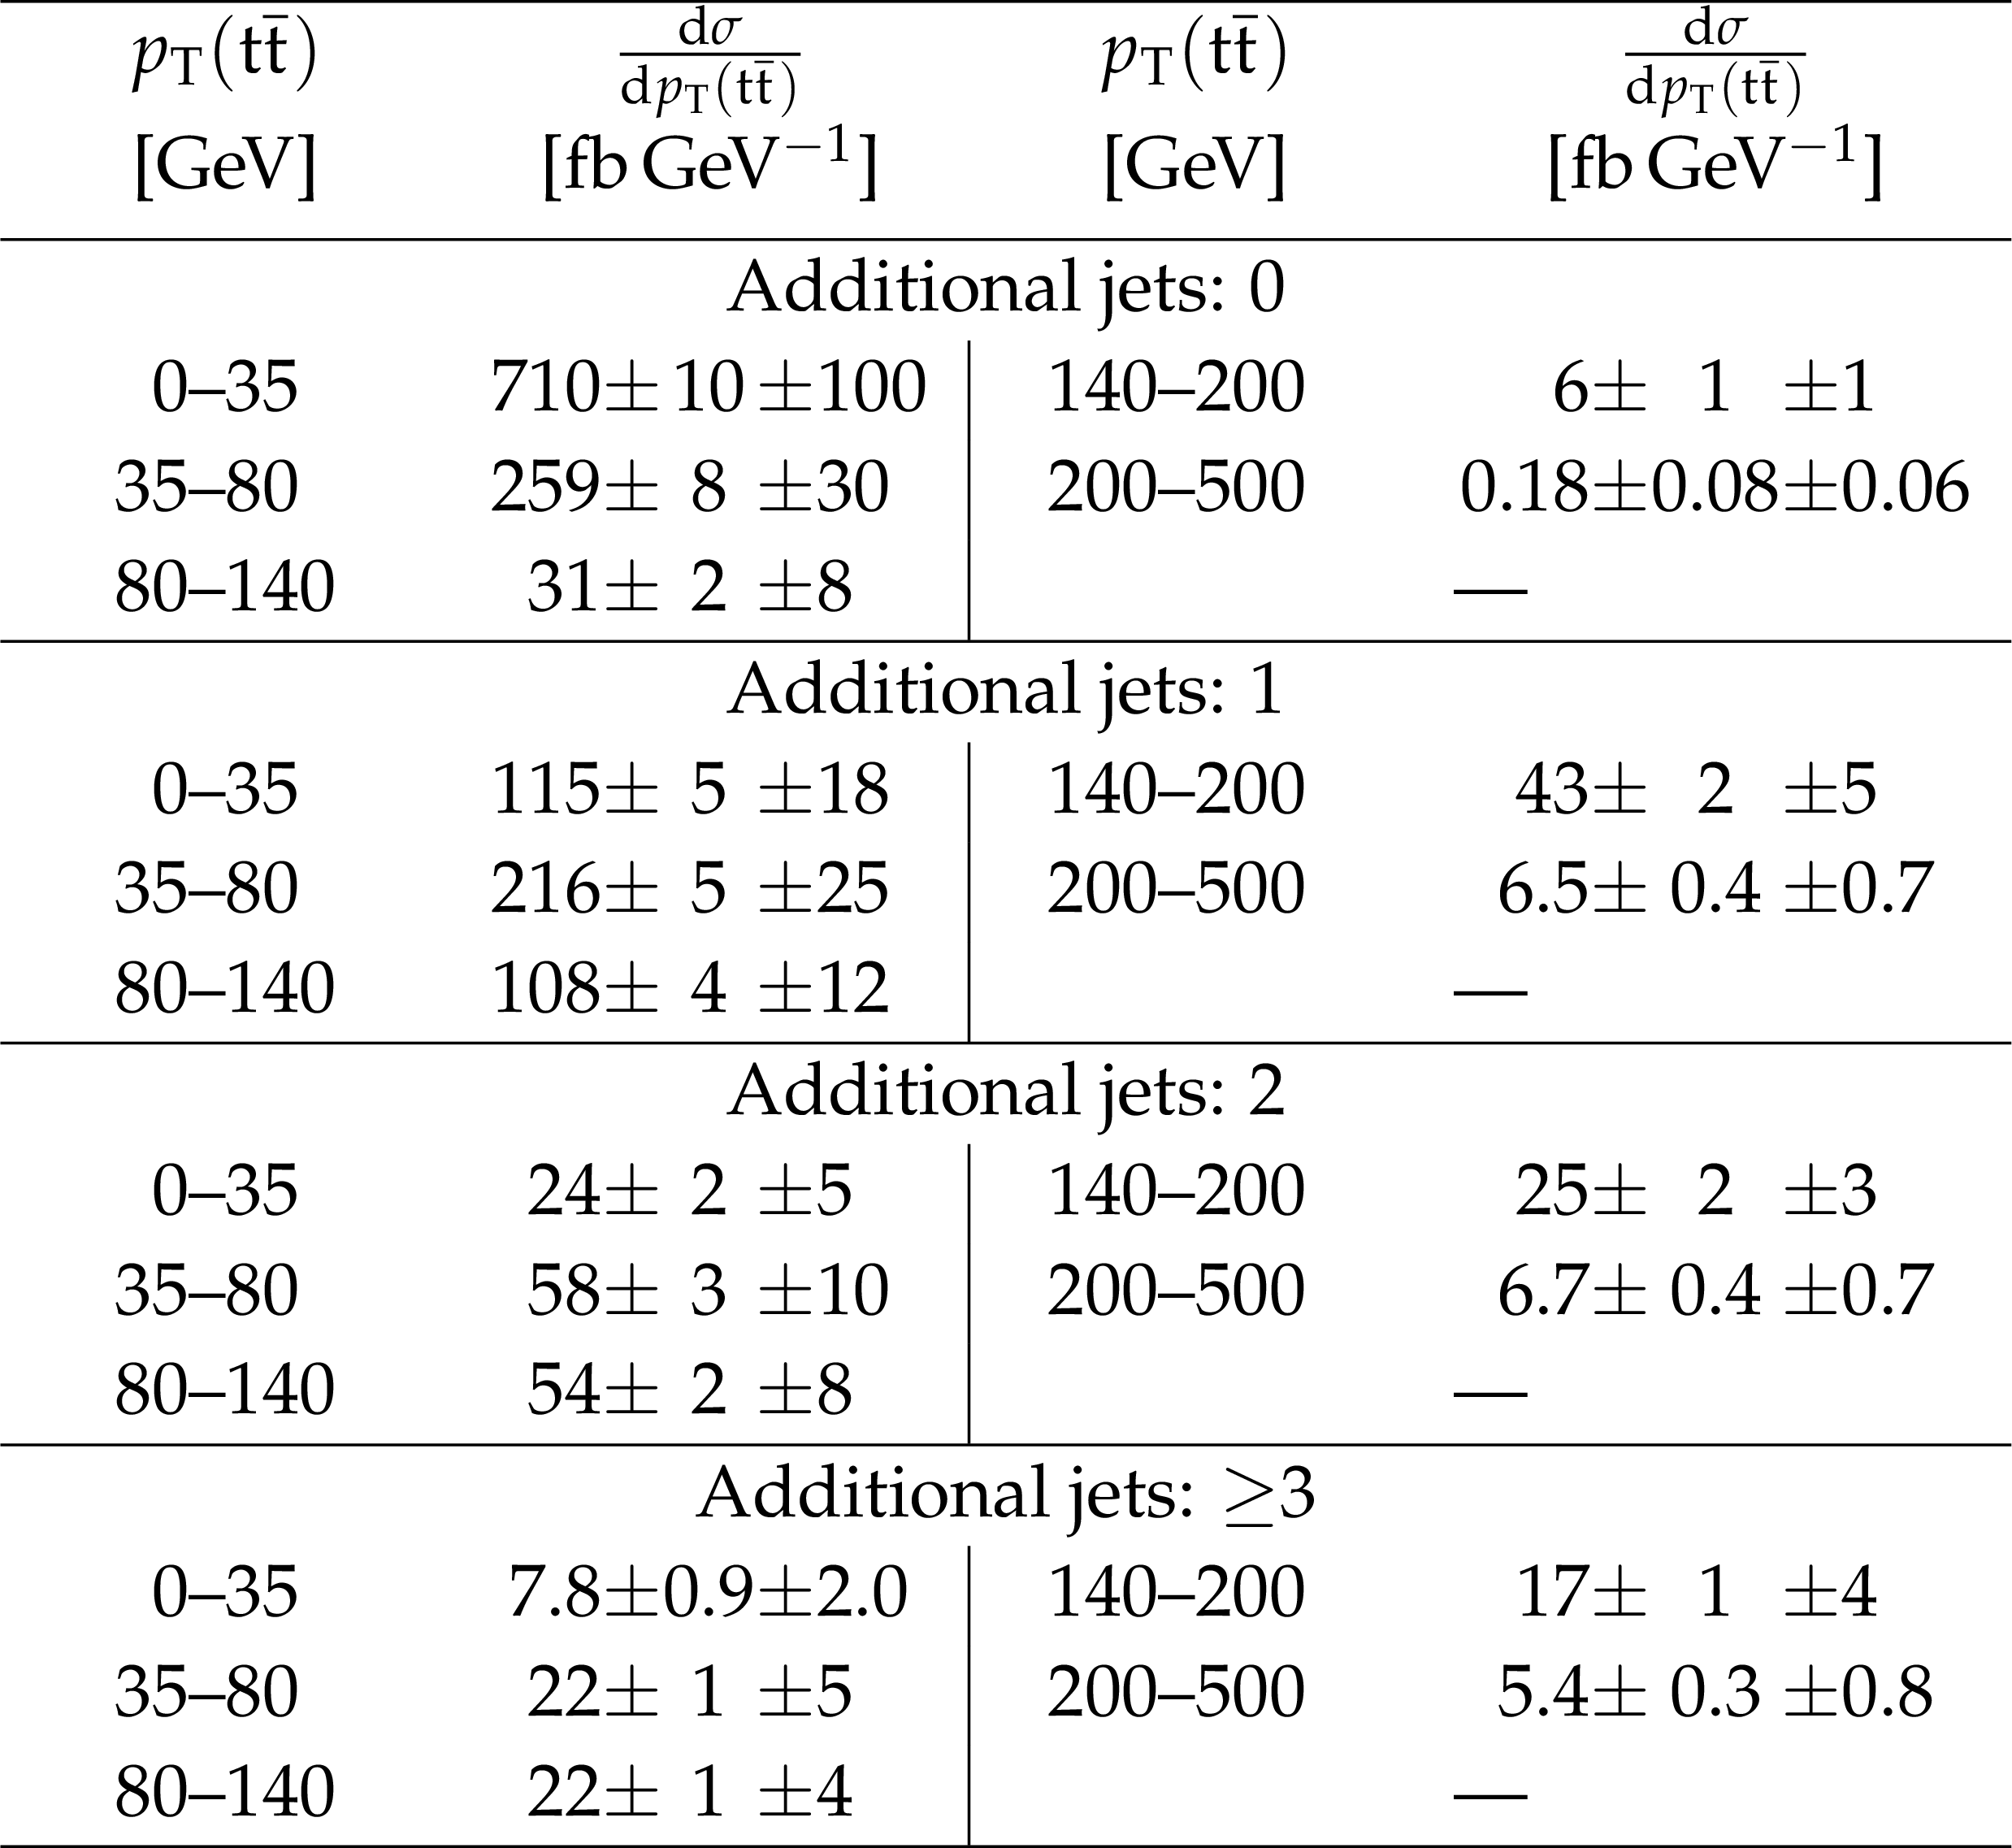
Table 13:
Differential cross sections at parton level as a function of $ {p_{\mathrm {T}}} ({\mathrm{ t } \mathrm{ \bar{t} } } )$ in bins of the number of additional jets. The values are shown together with their statistical and systematic uncertainties. |
png pdf |
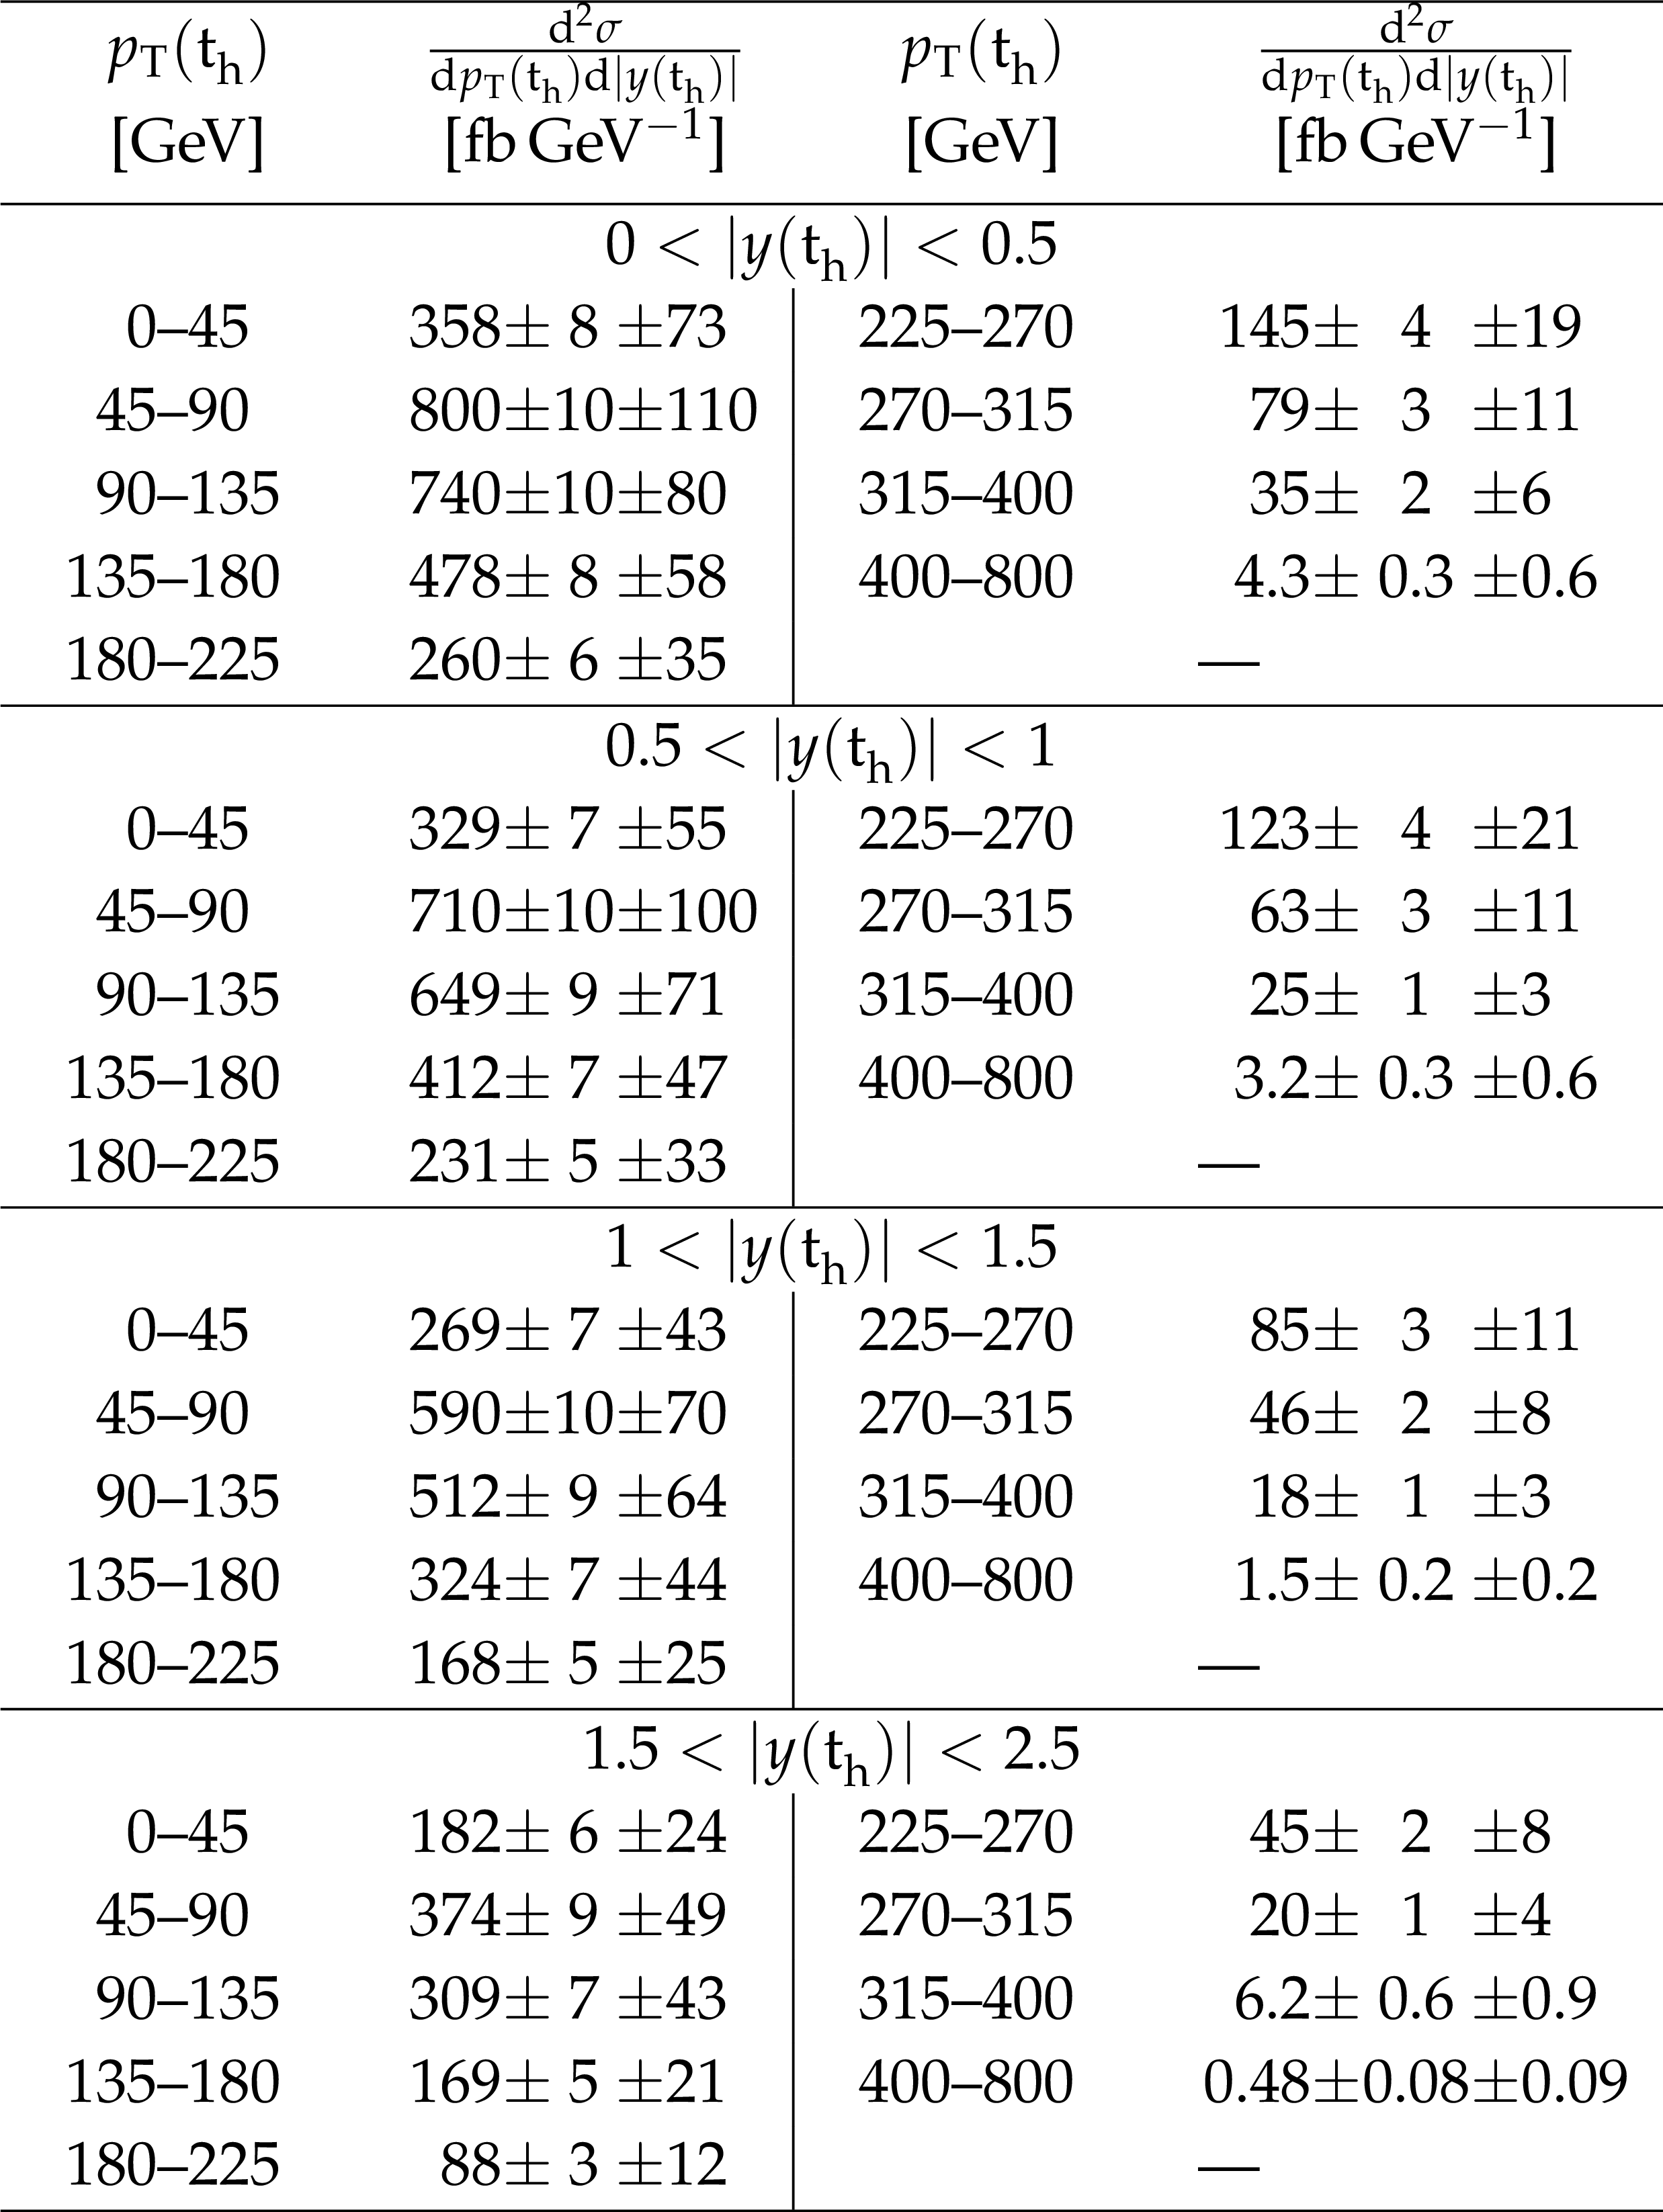
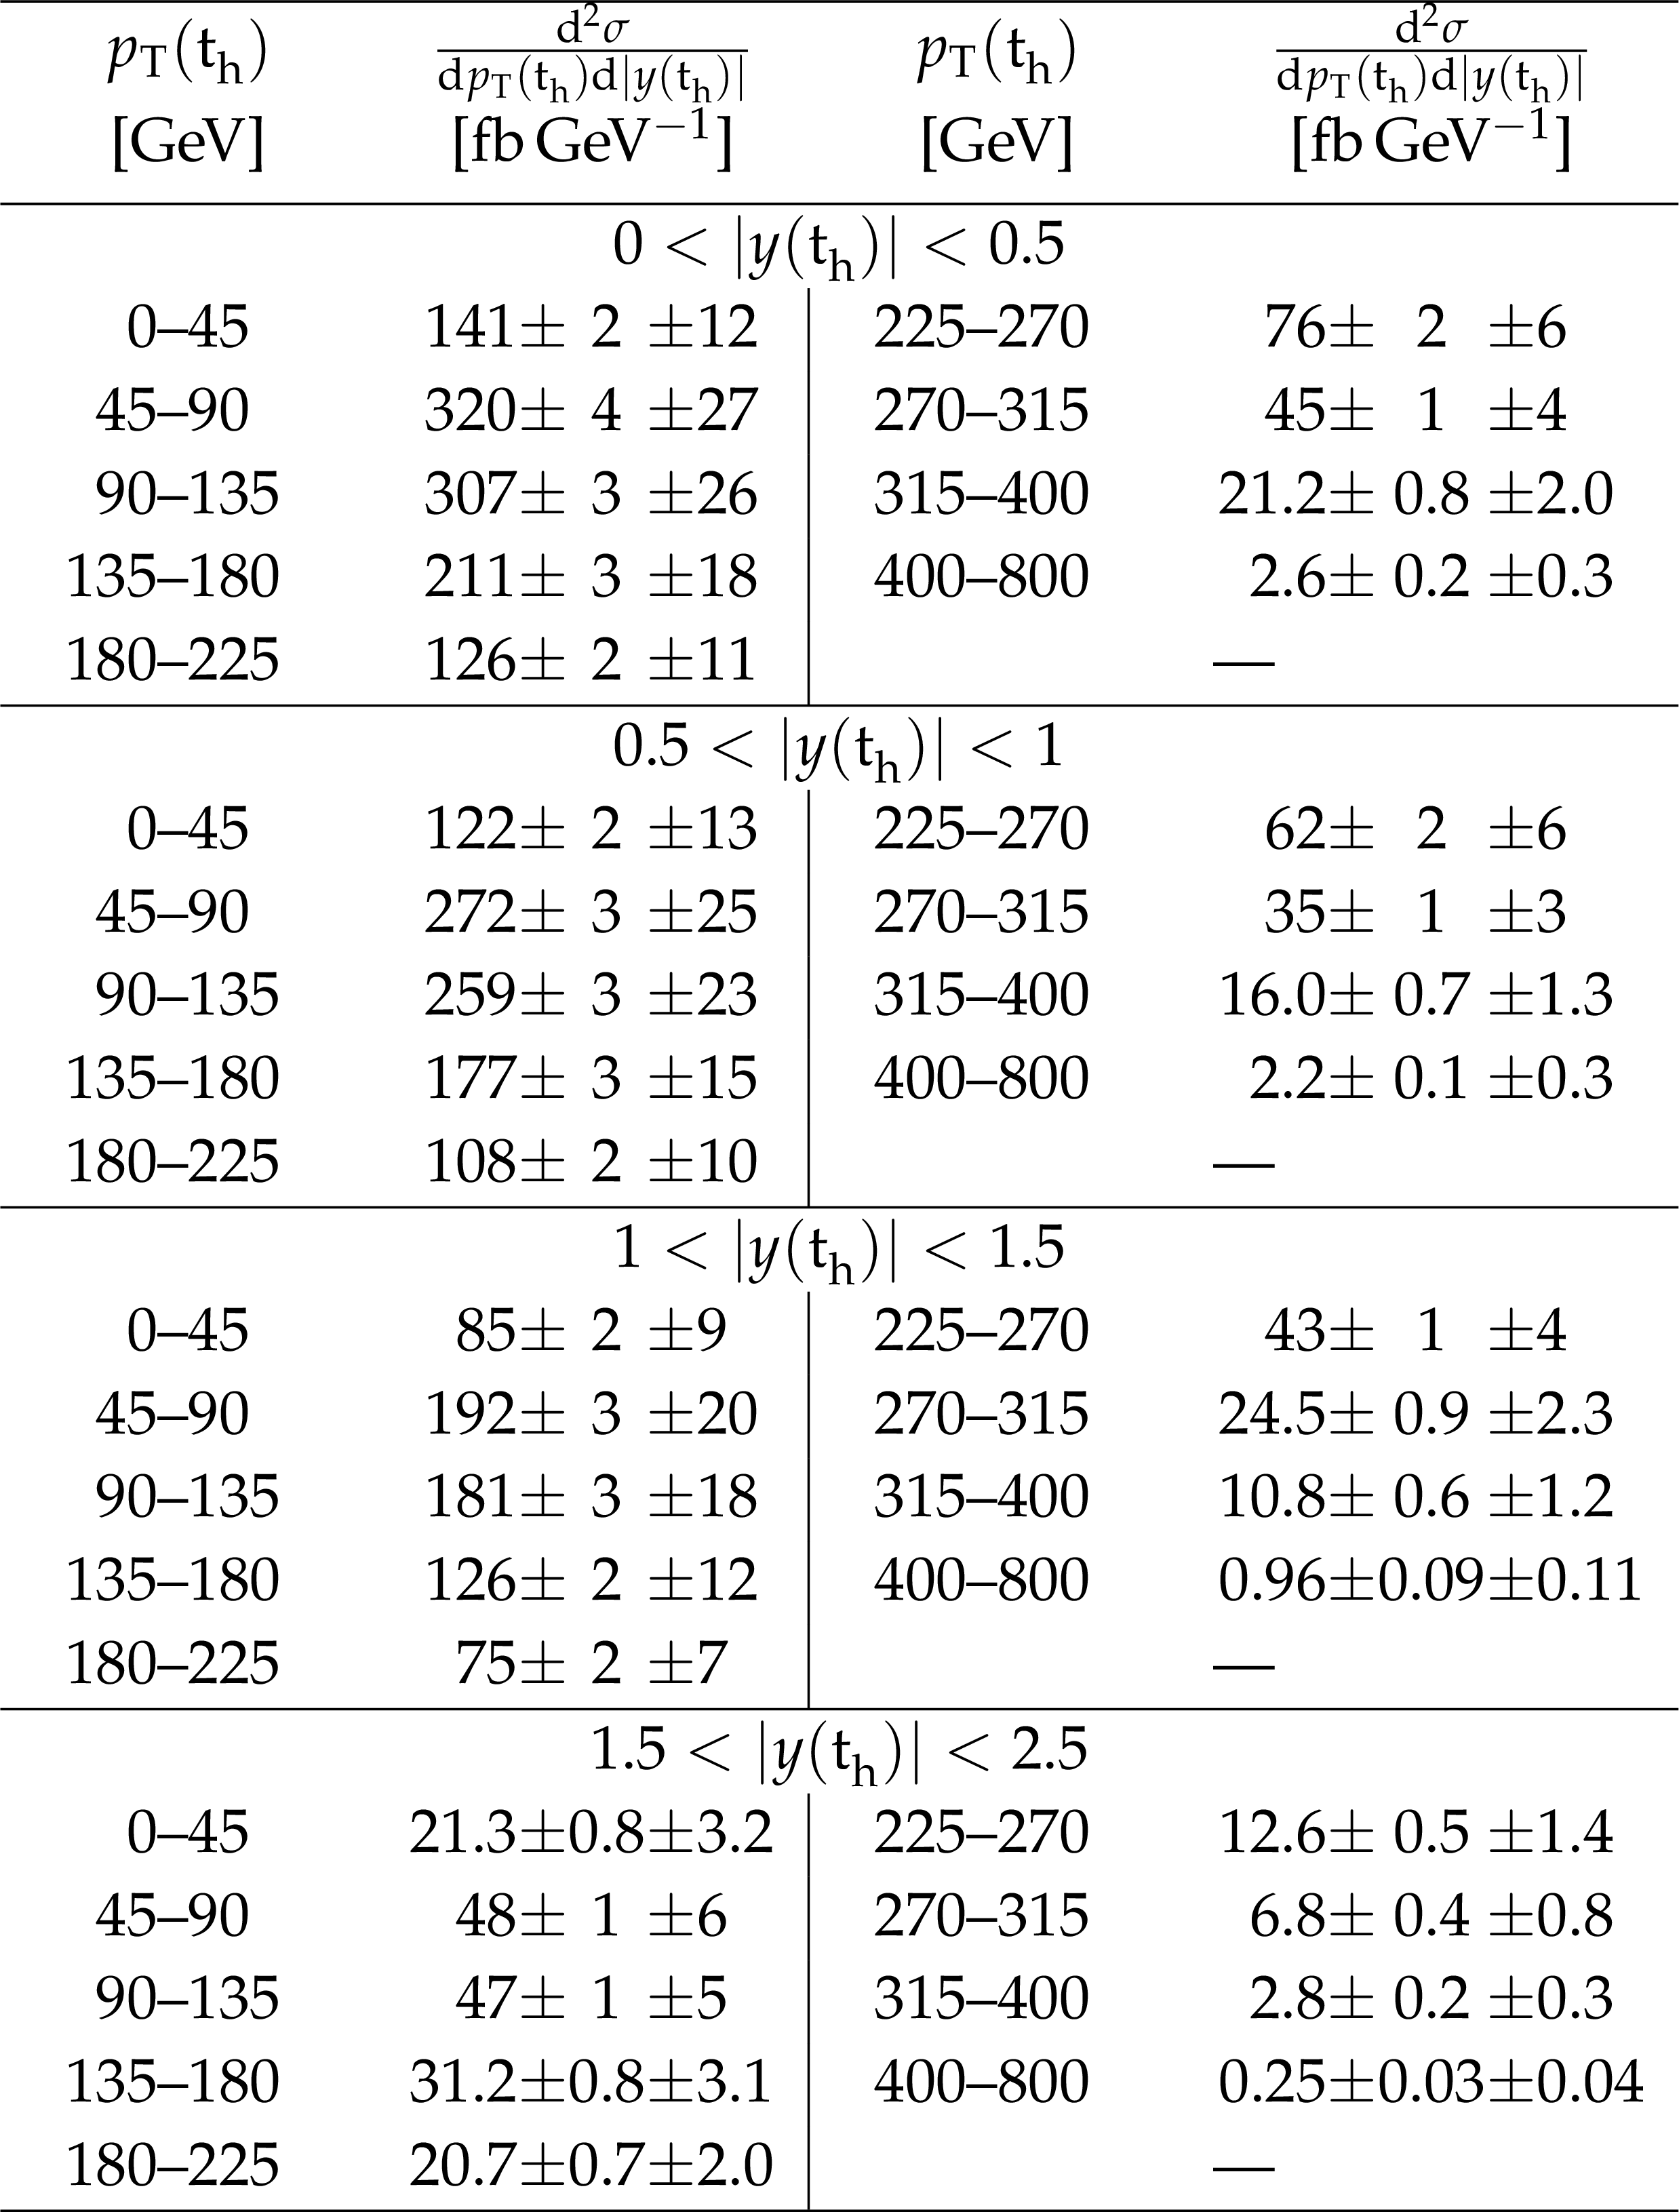
Table 14:
Double-differential cross section at parton level as a function of $ {| y( {\mathrm{ t } _\mathrm {h}} ) | }$ vs. $ {p_{\mathrm {T}}} ( {\mathrm{ t } _\mathrm {h}} )$. The values are shown together with their statistical and systematic uncertainties. |

png pdf |
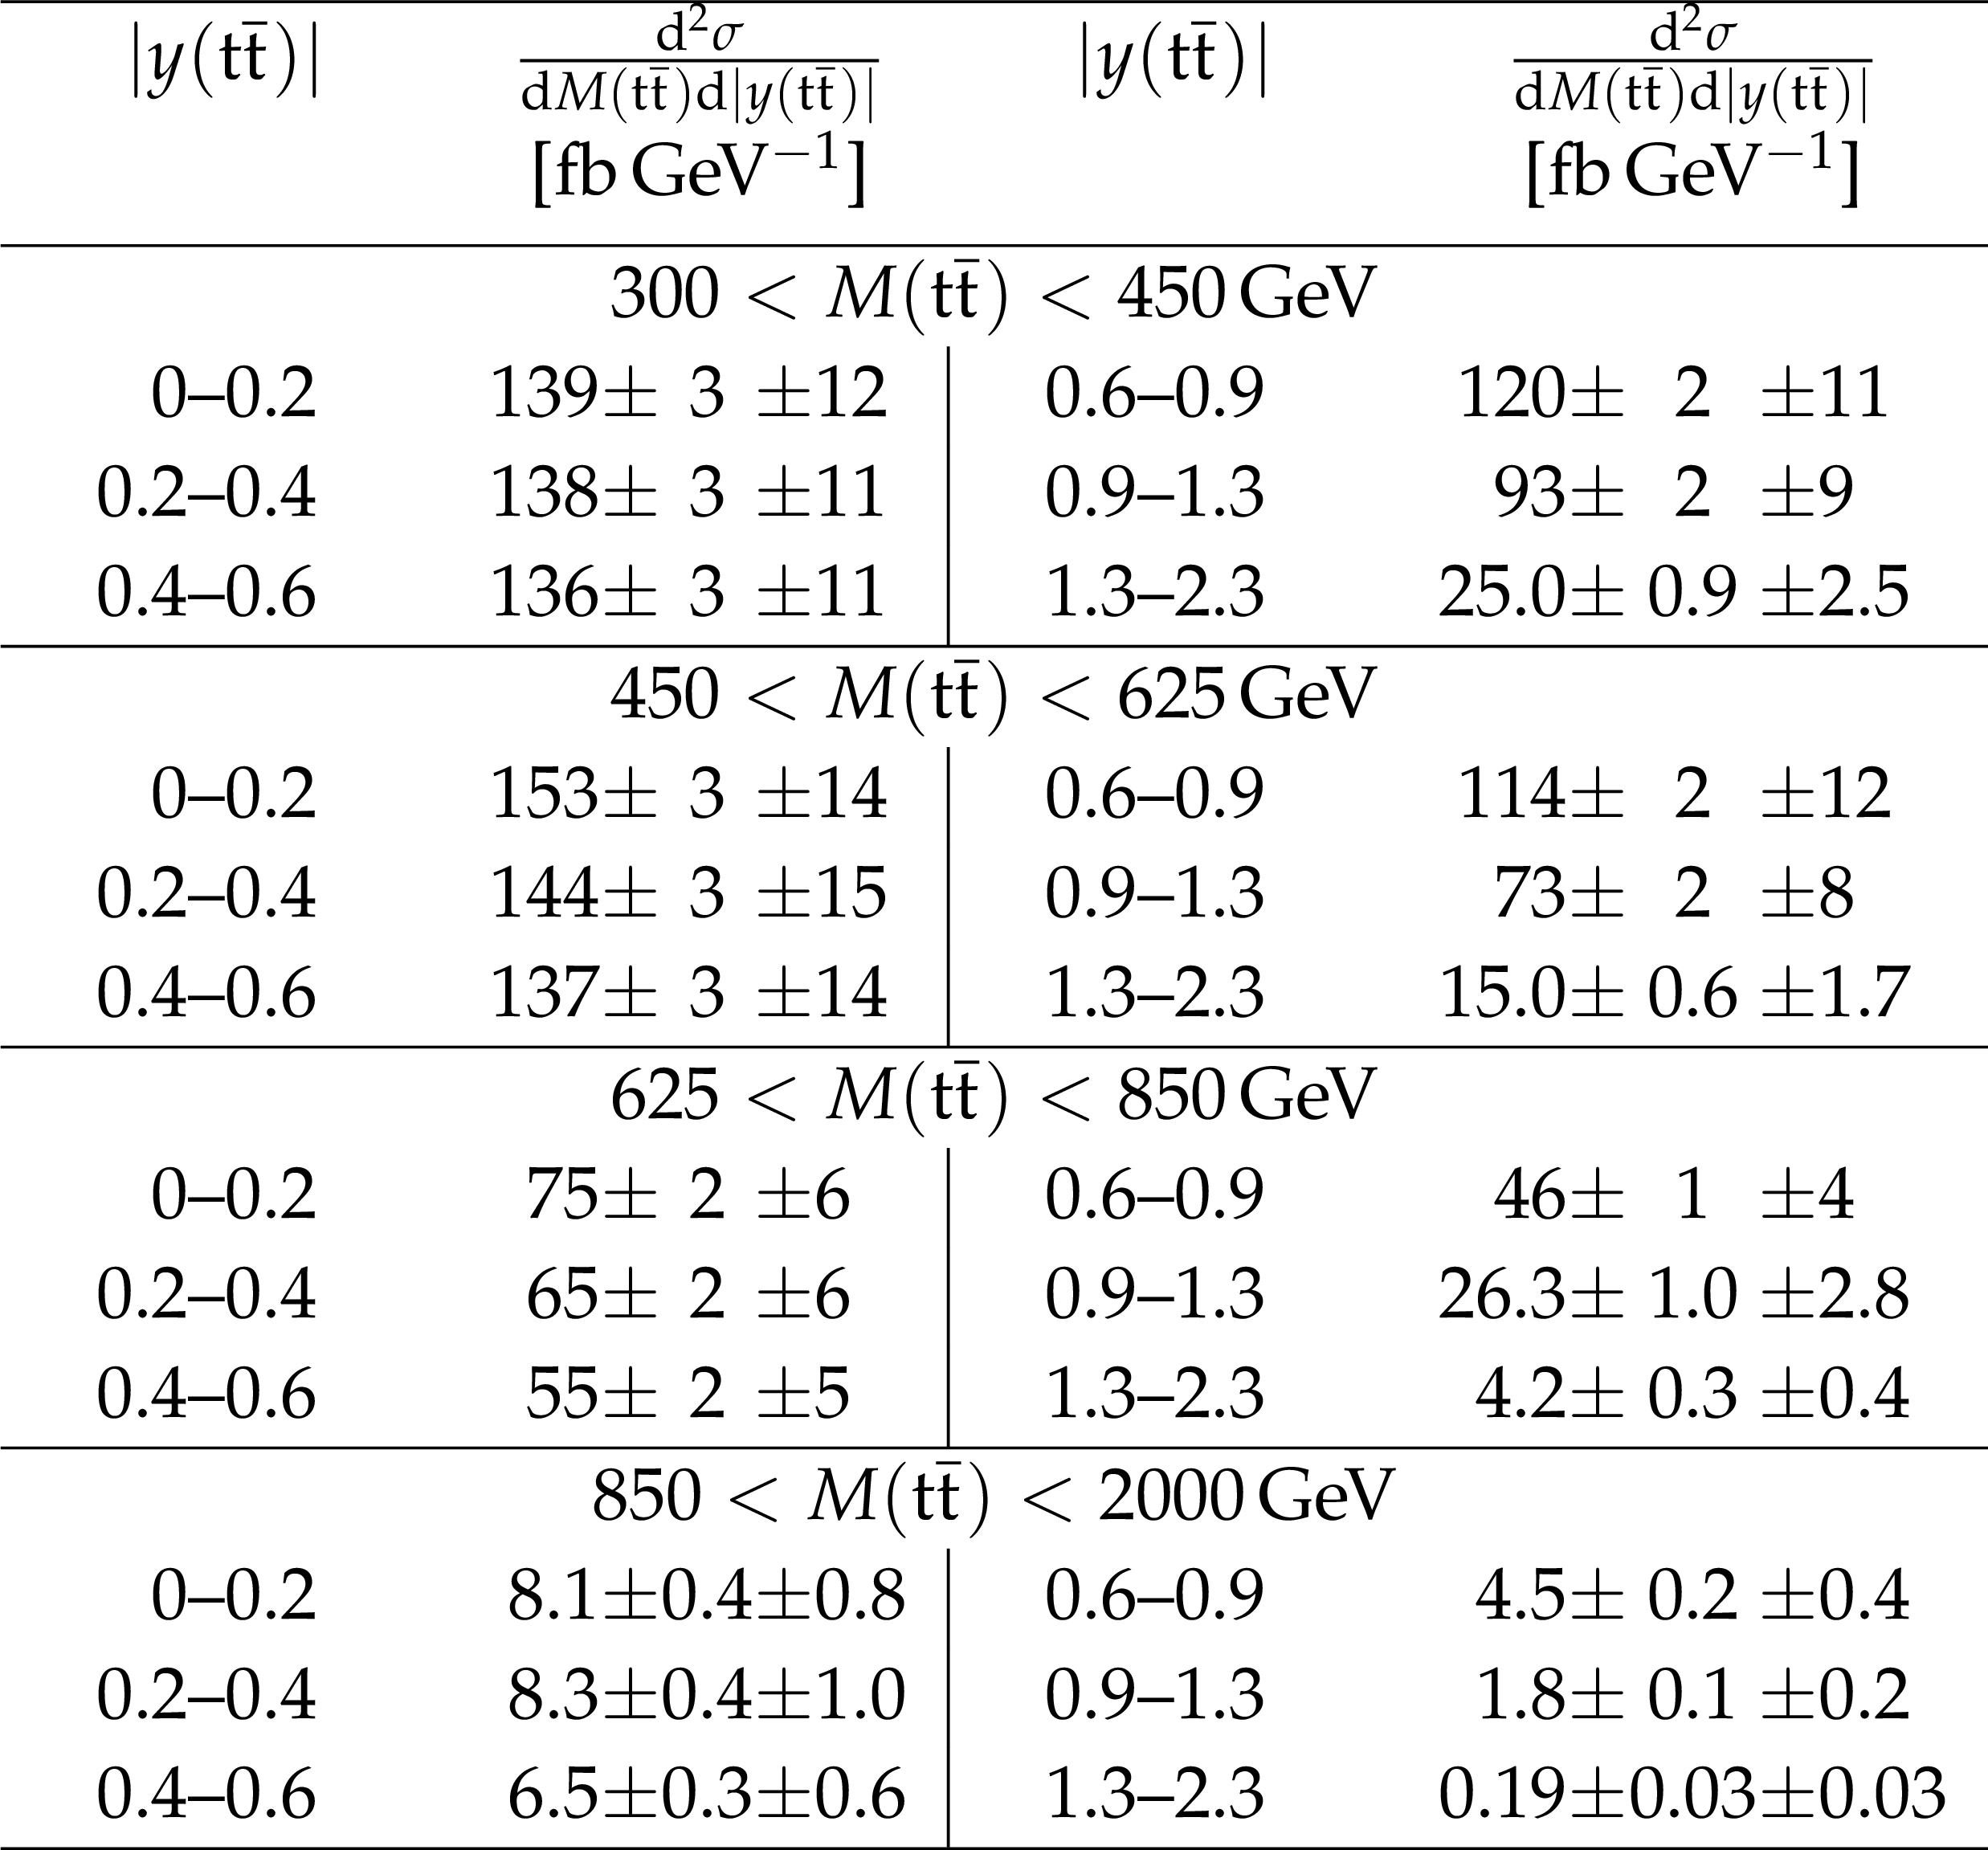
Table 15:
Double-differential cross section at parton level as a function of $M({\mathrm{ t } \mathrm{ \bar{t} } } )$ vs. $|y({\mathrm{ t } \mathrm{ \bar{t} } } )|$. The values are shown together with their statistical and systematic uncertainties. |

png pdf |
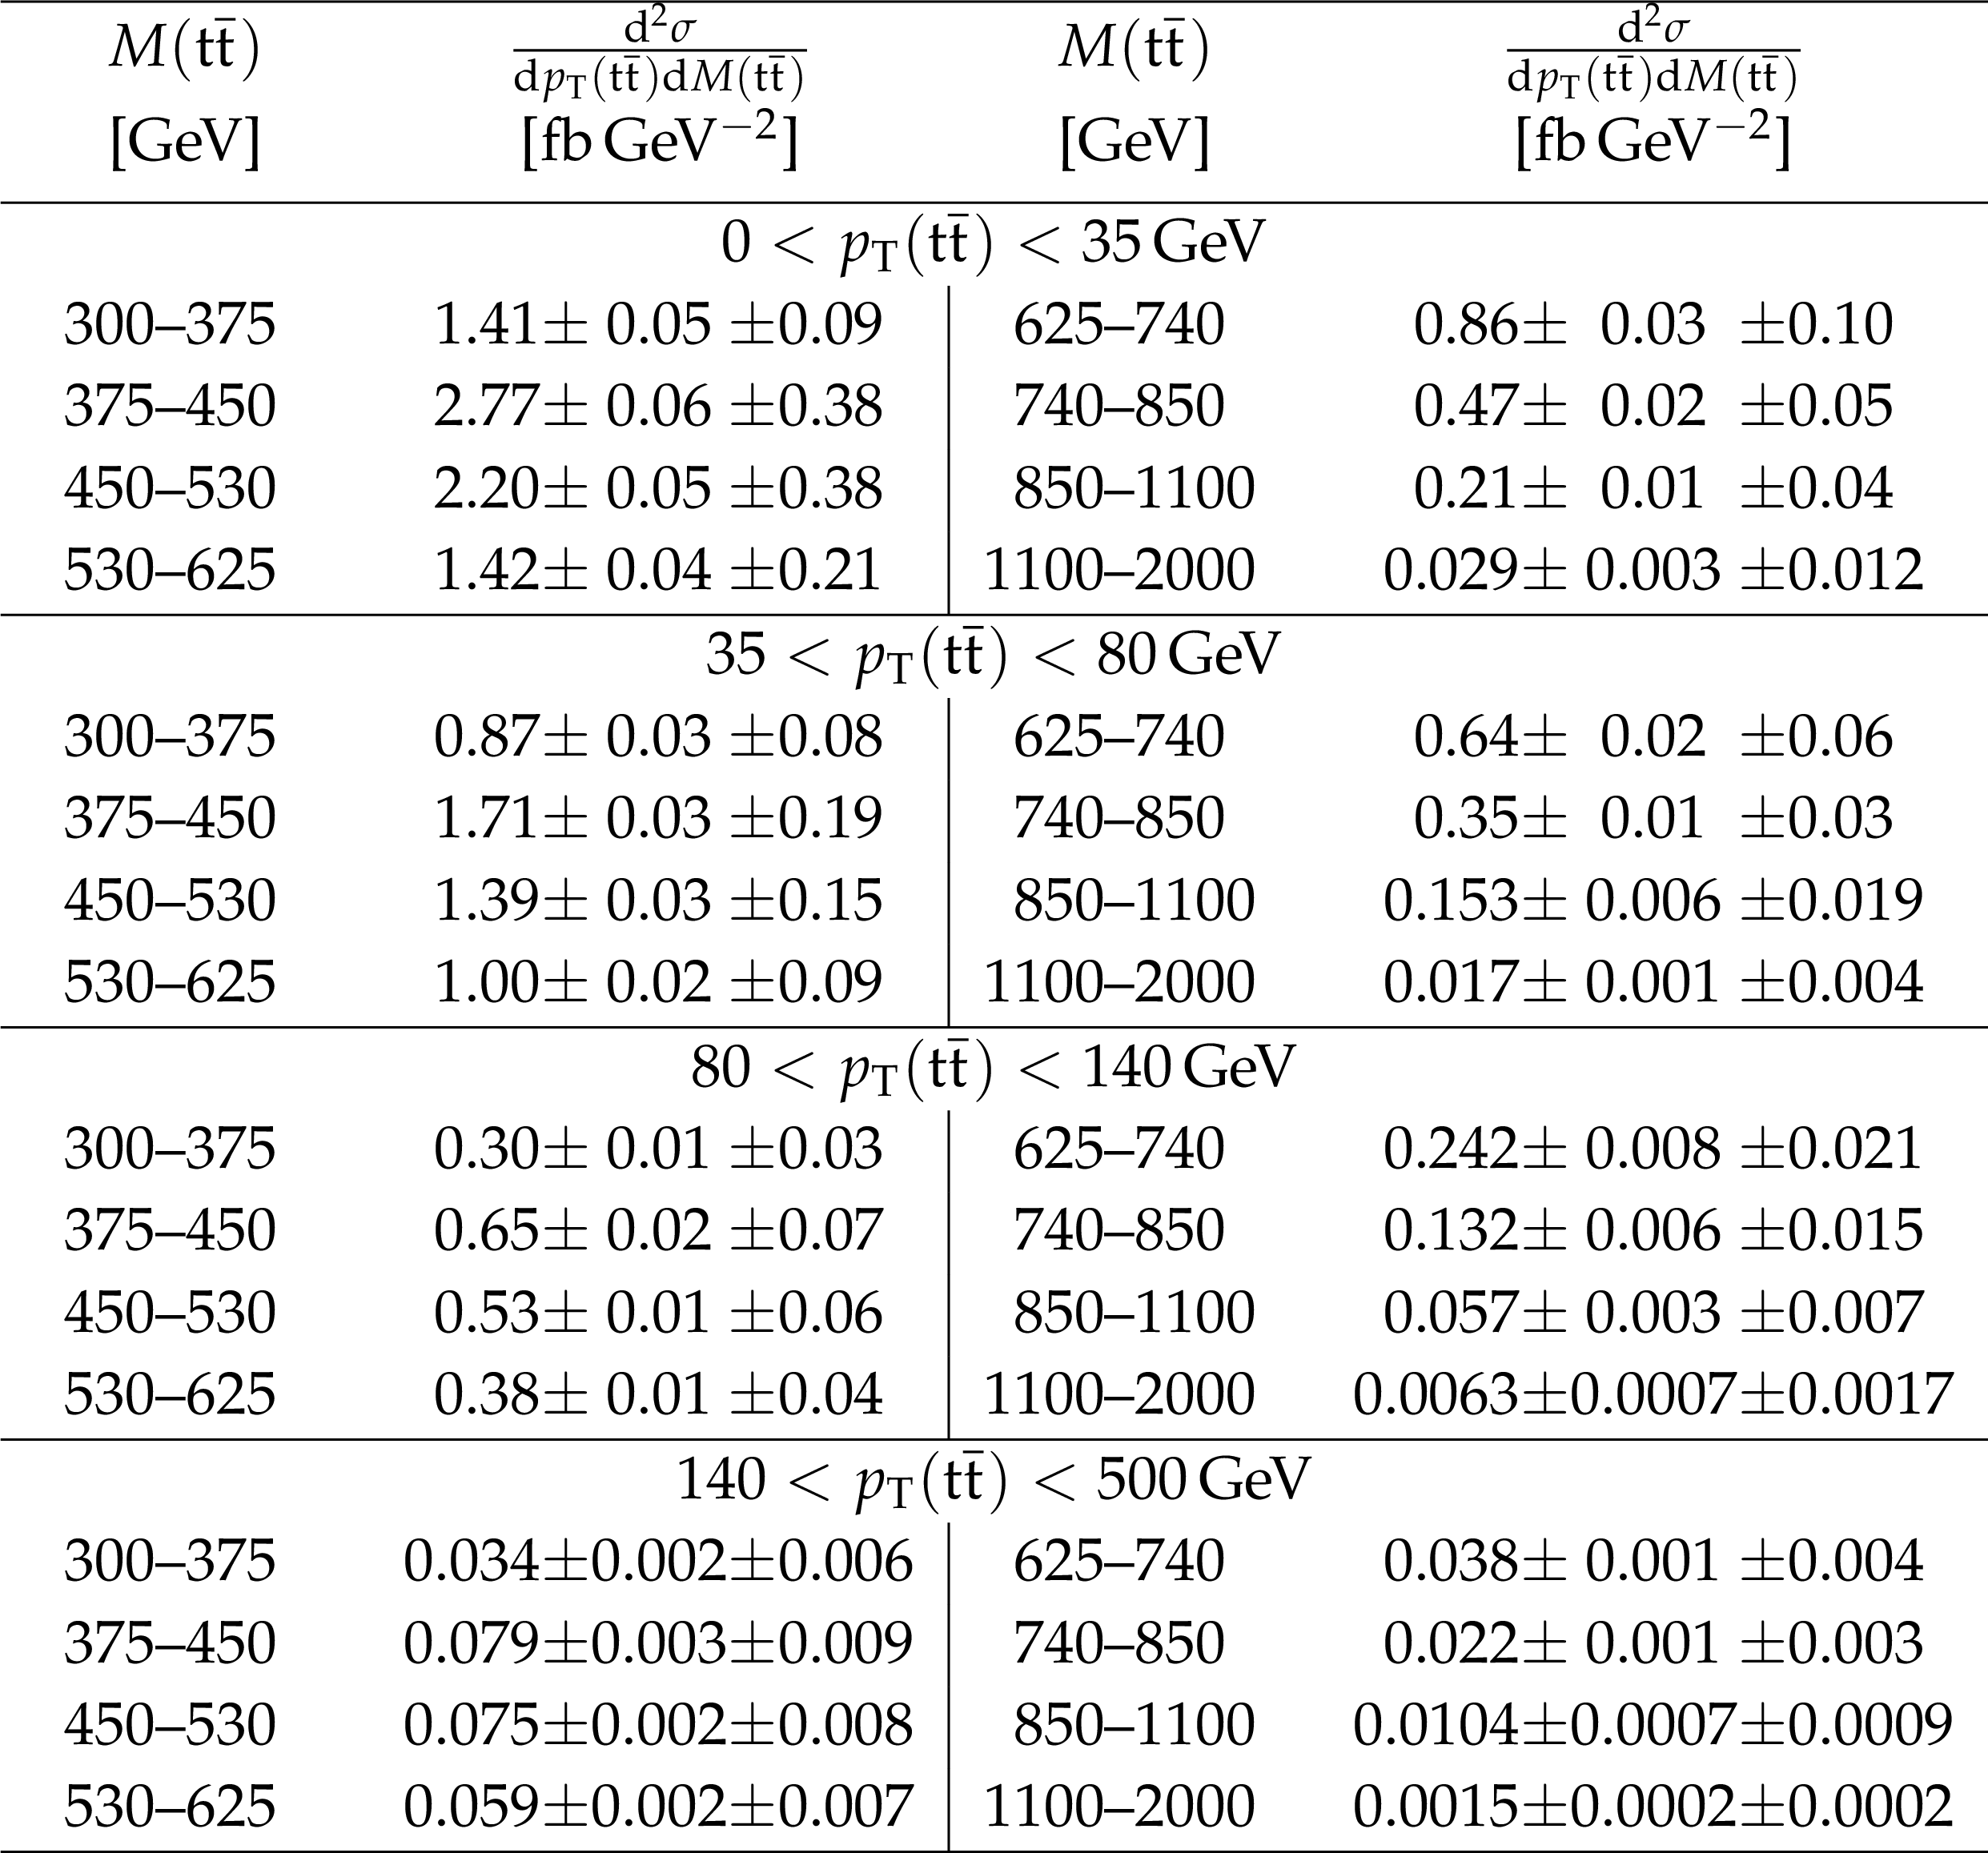
Table 16:
Double-differential cross section at parton level as a function of $ {p_{\mathrm {T}}} ({\mathrm{ t } \mathrm{ \bar{t} } } )$ vs. $M({\mathrm{ t } \mathrm{ \bar{t} } } )$. The values are shown together with their statistical and systematic uncertainties. |
png pdf |
Table 17:
Differential cross section at particle level as a function of $ {p_{\mathrm {T}}} ( {\mathrm{ t } _\mathrm {h}} )$. The values are shown together with their statistical and systematic uncertainties. |
png pdf |
Table 18:
Differential cross section at particle level as a function of $ {| y( {\mathrm{ t } _\mathrm {h}} ) | }$. The values are shown together with their statistical and systematic uncertainties. |
png pdf |
Table 19:
Differential cross section at particle level as a function of $ {p_{\mathrm {T}}} ( {\mathrm{ t } _\ell } )$. The values are shown together with their statistical and systematic uncertainties. |

png pdf |
Table 20:
Differential cross section at particle level as a function of $|y( {\mathrm{ t } _\ell } )|$. The values are shown together with their statistical and systematic uncertainties. |
png pdf |
Table 21:
Differential cross section at particle level as a function of $ {p_{\mathrm {T}}} ({\mathrm{ t } \mathrm{ \bar{t} } } )$. The values are shown together with their statistical and systematic uncertainties. |
png pdf |
Table 22:
Differential cross section at particle level as a function of $M({\mathrm{ t } \mathrm{ \bar{t} } } )$. The values are shown together with their statistical and systematic uncertainties. |
png pdf |
Table 23:
Differential cross section at particle level as a function of $|y({\mathrm{ t } \mathrm{ \bar{t} } } )|$. The values are shown together with their statistical and systematic uncertainties. |
png pdf |
Table 24:
Cross sections at particle level in bins of the number of additional jets. The values are shown together with their statistical and systematic uncertainties. |
png pdf |
Table 25:
Differential cross sections at particle level as a function of $ {p_{\mathrm {T}}} ( {\mathrm{ t } _\mathrm {h}} )$ in bins of the number of additional jets. The values are shown together with their statistical and systematic uncertainties. |
png pdf |
Table 26:
Differential cross sections at particle level as a function of $ {p_{\mathrm {T}}} ({\mathrm{ t } \mathrm{ \bar{t} } } )$ in bins of the number of additional jets. The values are shown together with their statistical and systematic uncertainties. |
png pdf |
Table 27:
Double-differential cross section at particle level as a function of $ {| y( {\mathrm{ t } _\mathrm {h}} ) | }$ vs. $ {p_{\mathrm {T}}} ( {\mathrm{ t } _\mathrm {h}} )$. The values are shown together with their statistical and systematic uncertainties. |
png pdf |
Table 28:
Double-differential cross section at particle level as a function of $M({\mathrm{ t } \mathrm{ \bar{t} } } )$ vs. $|y({\mathrm{ t } \mathrm{ \bar{t} } } )|$. The values are shown together with their statistical and systematic uncertainties. |
png pdf |
Table 29:
Double-differential cross section at particle level as a function of $ {p_{\mathrm {T}}} ({\mathrm{ t } \mathrm{ \bar{t} } } )$ vs. $M({\mathrm{ t } \mathrm{ \bar{t} } } )$. The values are shown together with their statistical and systematic uncertainties. |
| Summary |
| Measurements of the differential and double-differential cross sections for $\mathrm{ t \bar{t} }$ production in proton-proton collisions at 13 TeV have been presented. The data correspond to an integrated luminosity of 2.3\, fb$^{-1}$ recorded by the CMS experiment. The $\mathrm{ t \bar{t} }$ production cross section is measured in the lepton+jets channel as a function of transverse momentum $p_{\mathrm{T}}$ and rapidity $|{y}|$ of the top quarks; $p_{\mathrm{T}}$, $|{y}|$, and invariant mass of the $\mathrm{ t \bar{t} }$ system; and the number of additional jets. The measurement at parton level is dominated by the uncertainties in the parton shower and hadronization modeling. The dependence on these theoretical models is reduced for the particle-level measurement, for which the experimental uncertainties of jet energy calibration and $\mathrm{ b }$ tagging efficiency are dominant. The results are compared to several standard model predictions that use different methods and approximations for their calculations. In general, the measured cross sections are slightly lower than predicted, but within the uncertainty compatible with the expectation. The measured distributions are in agreement with the predictions of the event generators with some exceptions in the $p_{\mathrm{T}}(\mathrm{ t \bar{t} })$ and $M(\mathrm{ t \bar{t} })$ distributions. The number of additional jets is lower and the measured $p_{\mathrm{T}}$ of the top quarks is slightly softer than predicted by most of the event generators. A softer $p_{\mathrm{T}}$ of the top quarks has already been observed in previous measurements and is predicted by the NNLO and the NLO+NNLL' QCD calculation. |
| References | ||||
| 1 | CMS Collaboration | CMS Luminosity Measurement for the 2015 Data Taking Period | CMS-PAS-LUM-15-001 | CMS-PAS-LUM-15-001 |
| 2 | CMS Collaboration | Measurement of differential top-quark pair production cross sections in pp colisions at $ \sqrt{s}=$ 7 TeV | EPJC 73 (2013) 2339 | CMS-TOP-11-013 1211.2220 |
| 3 | ATLAS Collaboration | Differential top-antitop cross-section measurements as a function of observables constructed from final-state particles using pp collisions at $ \sqrt{s}=$ 7 TeV in the ATLAS detector | JHEP 06 (2015) 100 | 1502.05923 |
| 4 | CMS Collaboration | Measurement of the differential cross section for top quark pair production in pp collisions at $ \sqrt{s}=$ 8 TeV | EPJC 75 (2015) 542 | CMS-TOP-12-028 1505.04480 |
| 5 | ATLAS Collaboration | Measurements of top-quark pair differential cross-sections in the lepton+jets channel in pp collisions at $ \sqrt{s}=$ 8 TeV using the ATLAS detector | Submitted to EPJC | 1511.04716 |
| 6 | ATLAS Collaboration | Measurement of the differential cross-section of highly boosted top quarks as a function of their transverse momentum in $ \sqrt{s}=$ 8 TeV proton-proton collisions using the ATLAS detector | PRD 93 (2016) 032009 | 1510.03818 |
| 7 | CMS Collaboration | Measurement of the $ \mathrm{ t \bar{t} } $ production cross section in the all-jets final state in pp collisions at $ \sqrt{s}=$ 8 TeV | EPJC 76 (2016) 128 | CMS-TOP-14-018 1509.06076 |
| 8 | CMS Collaboration | Measurement of the integrated and differential $ \mathrm{t \bar{t}} $ production cross sections for high-$ p_{\mathrm{T}} $ top quarks in pp collisions at $ \sqrt{s} = $ 8 TeV | Submitted to PRD | CMS-TOP-14-012 1605.00116 |
| 9 | P. Nason | A new method for combining NLO QCD with shower Monte Carlo algorithms | JHEP 11 (2004) 040 | hep-ph/0409146 |
| 10 | S. Frixione, P. Nason, and C. Oleari | Matching NLO QCD computations with Parton Shower simulations: the POWHEG method | JHEP 11 (2007) 070 | 0709.2092 |
| 11 | S. Alioli, P. Nason, C. Oleari, and E. Re | A general framework for implementing NLO calculations in shower Monte Carlo programs: the POWHEG BOX | JHEP 06 (2010) 043 | 1002.2581 |
| 12 | J. M. Campbell, R. K. Ellis, P. Nason, and E. Re | Top-pair production and decay at NLO matched with parton showers | JHEP 04 (2015) 114 | 1412.1828 |
| 13 | J. Alwall et al. | The automated computation of tree-level and next-to-leading order differential cross sections, and their matching to parton shower simulations | JHEP 07 (2014) 079 | 1405.0301 |
| 14 | T. Sj\"ostrand, S. Mrenna, and P. Skands | PYTHIA 6.4 physics and manual | JHEP 05 (2006) 026 | hep-ph/0603175 |
| 15 | T. Sj\"ostrand, S. Mrenna, and P. Z. Skands | A brief introduction to PYTHIA 8.1 | CPC 178 (2008) 852 | 0710.3820 |
| 16 | P. Skands, S. Carrazza, and J. Rojo | Tuning PYTHIA 8.1: the Monash 2013 Tune | EPJC 74 (2014) 3024 | 1404.5630 |
| 17 | J. Alwall et al. | Comparative study of various algorithms for the merging of parton showers and matrix elements in hadronic collisions | EPJC 53 (2008) 473 | 0706.2569 |
| 18 | R. Frederix and S. Frixione | Merging meets matching in MC@NLO | JHEP 12 (2012) 061 | 1209.6215 |
| 19 | NNPDF Collaboration | Parton distributions for the LHC Run II | JHEP 04 (2015) 040 | 1410.8849 |
| 20 | M. Czakon and A. Mitov | Top++: A Program for the Calculation of the Top-Pair Cross-Section at Hadron Colliders | CPC 185 (2014) 2930 | 1112.5675 |
| 21 | M. B\"ahr et al. | Herwig++ physics and manual | EPJC 58 (2008) 639 | 0803.0883 |
| 22 | M. H. Seymour and A. Siodmok | Constraining MPI models using $ \sigma_{eff} $ and recent Tevatron and LHC Underlying Event data | JHEP 10 (2013) 113 | 1307.5015 |
| 23 | Y. Li and F. Petriello | Combining QCD and electroweak corrections to dilepton production in FEWZ | PRD 86 (2012) 094034 | 1208.5967 |
| 24 | P. Kant et al. | HatHor for single top-quark production: Updated predictions and uncertainty estimates for single top-quark production in hadronic collisions | CPC 191 (2015) 74 | 1406.4403 |
| 25 | N. Kidonakis | NNLL threshold resummation for top-pair and single-top production | Phys. Part. Nucl. 45 (2014) 714 | 1210.7813 |
| 26 | J. Allison et al. | Geant4 developments and applications | IEEE Trans. Nucl. Sci. 53 (2006) 270 | |
| 27 | M. Cacciari, G. P. Salam, and G. Soyez | The anti-$ k_\mathrm{t} $ jet clustering algorithm | JHEP 04 (2008) 063 | 0802.1189 |
| 28 | M. Cacciari, G. P. Salam, and G. Soyez | FastJet user manual | EPJC 72 (2012) 1896 | 1111.6097 |
| 29 | CMS Collaboration | The CMS experiment at the CERN LHC | JINST 3 (2008) S08004 | CMS-00-001 |
| 30 | CMS Collaboration | Particle-flow event reconstruction in CMS and performance for jets, taus, and $ E_{\mathrm{T}}^{\text{miss}} $ | CDS | |
| 31 | CMS Collaboration | Commissioning of the particle-flow event reconstruction with the first LHC collisions recorded in the CMS detector | CDS | |
| 32 | CMS Collaboration | Performance of CMS muon reconstruction in pp collision events at $ \sqrt{s}=$ 7 TeV | JINST 7 (2012) P10002 | CMS-MUO-10-004 1206.4071 |
| 33 | CMS Collaboration | Measurement of inclusive W and Z boson production cross sections in $ pp $ collisions at $ \sqrt{s} = $ 8 TeV | PRL 112 (2014) 191802 | CMS-SMP-12-011 1402.0923 |
| 34 | M. Cacciari and G. P. Salam | Pileup subtraction using jet areas | PLB 659 (2008) 119 | 0707.1378 |
| 35 | CMS Collaboration | Performance of electron reconstruction and selection with the CMS detector in proton-proton collisions at $ \sqrt{s}=$ 8 TeV | JINST 10 (2015) P06005 | CMS-EGM-13-001 1502.02701 |
| 36 | CMS Collaboration | Jet energy scale and resolution in the CMS experiment in pp collisions at 8 TeV | Submitted to JINST | CMS-JME-13-004 1607.03663 |
| 37 | CMS Collaboration | Identification of b quark jets at the CMS Experiment in the LHC Run 2 | CMS-PAS-BTV-15-001 | CMS-PAS-BTV-15-001 |
| 38 | B. A. Betchart, R. Demina, and A. Harel | Analytic solutions for neutrino momenta in decay of top quarks | NIMA 736 (2014) 169 | 1305.1878 |
| 39 | G. D'Agostini | A multidimensional unfolding method based on Bayes' theorem | NIMA 362 (1995) 487 | |
| 40 | M. Guzzi, K. Lipka, and S.-O. Moch | Top-quark pair production at hadron colliders: differential cross section and phenomenological applications with DiffTop | JHEP 01 (2015) 082 | 1406.0386 |
| 41 | S. Dulat et al. | New parton distribution functions from a global analysis of quantum chromodynamics | PRD 93 (2016) 033006 | 1506.07443 |
| 42 | N. Kidonakis | NNNLO soft-gluon corrections for the top-antitop pair production cross section | PRD 90 (2014) 014006 | 1405.7046 |
| 43 | N. Kidonakis | NNNLO soft-gluon corrections for the top-quark $ p_{\mathrm{T}} $ and rapidity distributions | PRD 91 (2015) 031501 | 1411.2633 |
| 44 | A. D. Martin, W. J. Stirling, R. S. Thorne, and G. Watt | Parton distributions for the LHC | EPJC 63 (2009) 189 | 0901.0002 |
| 45 | B. Pecjak, D. Scott, X. Wang, and L. L. Yang | Resummed Differential Cross Sections for Top-Quark Pairs at the LHC | PRL 116 (2016) 202001 | 1601.07020 |
| 46 | M. Czakon, D. Heymes, and A. Mitov | High-Precision Differential Predictions for Top-Quark Pairs at the LHC | PRL 116 (2016) 082003 | 1511.00549 |
|
|
Compact Muon Solenoid LHC, CERN |
|

|

|

|

|

|