

Compact Muon Solenoid
LHC, CERN
| CMS-B2G-17-007 ; CERN-EP-2017-155 | ||
| Search for single production of a vector-like T quark decaying to a Z boson and a top quark in proton-proton collisions at $ \sqrt{s} = $ 13 TeV | ||
| CMS Collaboration | ||
| 3 August 2017 | ||
| Phys. Lett. B 781 (2018) 574 | ||
| Abstract: A search is presented for single production of a vector-like quark (T) decaying to a Z boson and a top quark, with the Z boson decaying leptonically and the top quark decaying hadronically. The search uses data collected by the CMS experiment in proton-proton collisions at a center-of-mass energy of 13 TeV in 2016, corresponding to an integrated luminosity of 35.9 fb$^{-1}$. The presence of forward jets is a particular characteristic of single production of vector-like quarks that is used in the analysis. Different T quark width hypotheses are studied, from negligibly small to 30% of the new particle mass. At the 95% confidence level, the product of cross section and branching fraction is excluded above values in the range 0.27-0.04 pb for T quark masses in the range 0.7-1.7 TeV, assuming a negligible width. A similar sensitivity is observed for widths of up to 30% of the T quark mass. The production of a heavy Z' boson decaying to Tt, with T $\rightarrow$ tZ, is also searched for, and limits on the product of cross section and branching fractions for this process are set between 0.13 and 0.06 pb for Z' boson masses in the range from 1.5 to 2.5 TeV. These are the best limits to date on the single production of heavy vector-like T quarks, the first to set limits for a variety of resonance widths, and the best limits for the production of a Z' boson decaying to Tt. | ||
| Links: e-print arXiv:1708.01062 [hep-ex] (PDF) ; CDS record ; inSPIRE record ; CADI line (restricted) ; | ||
| Figures | |

png pdf |
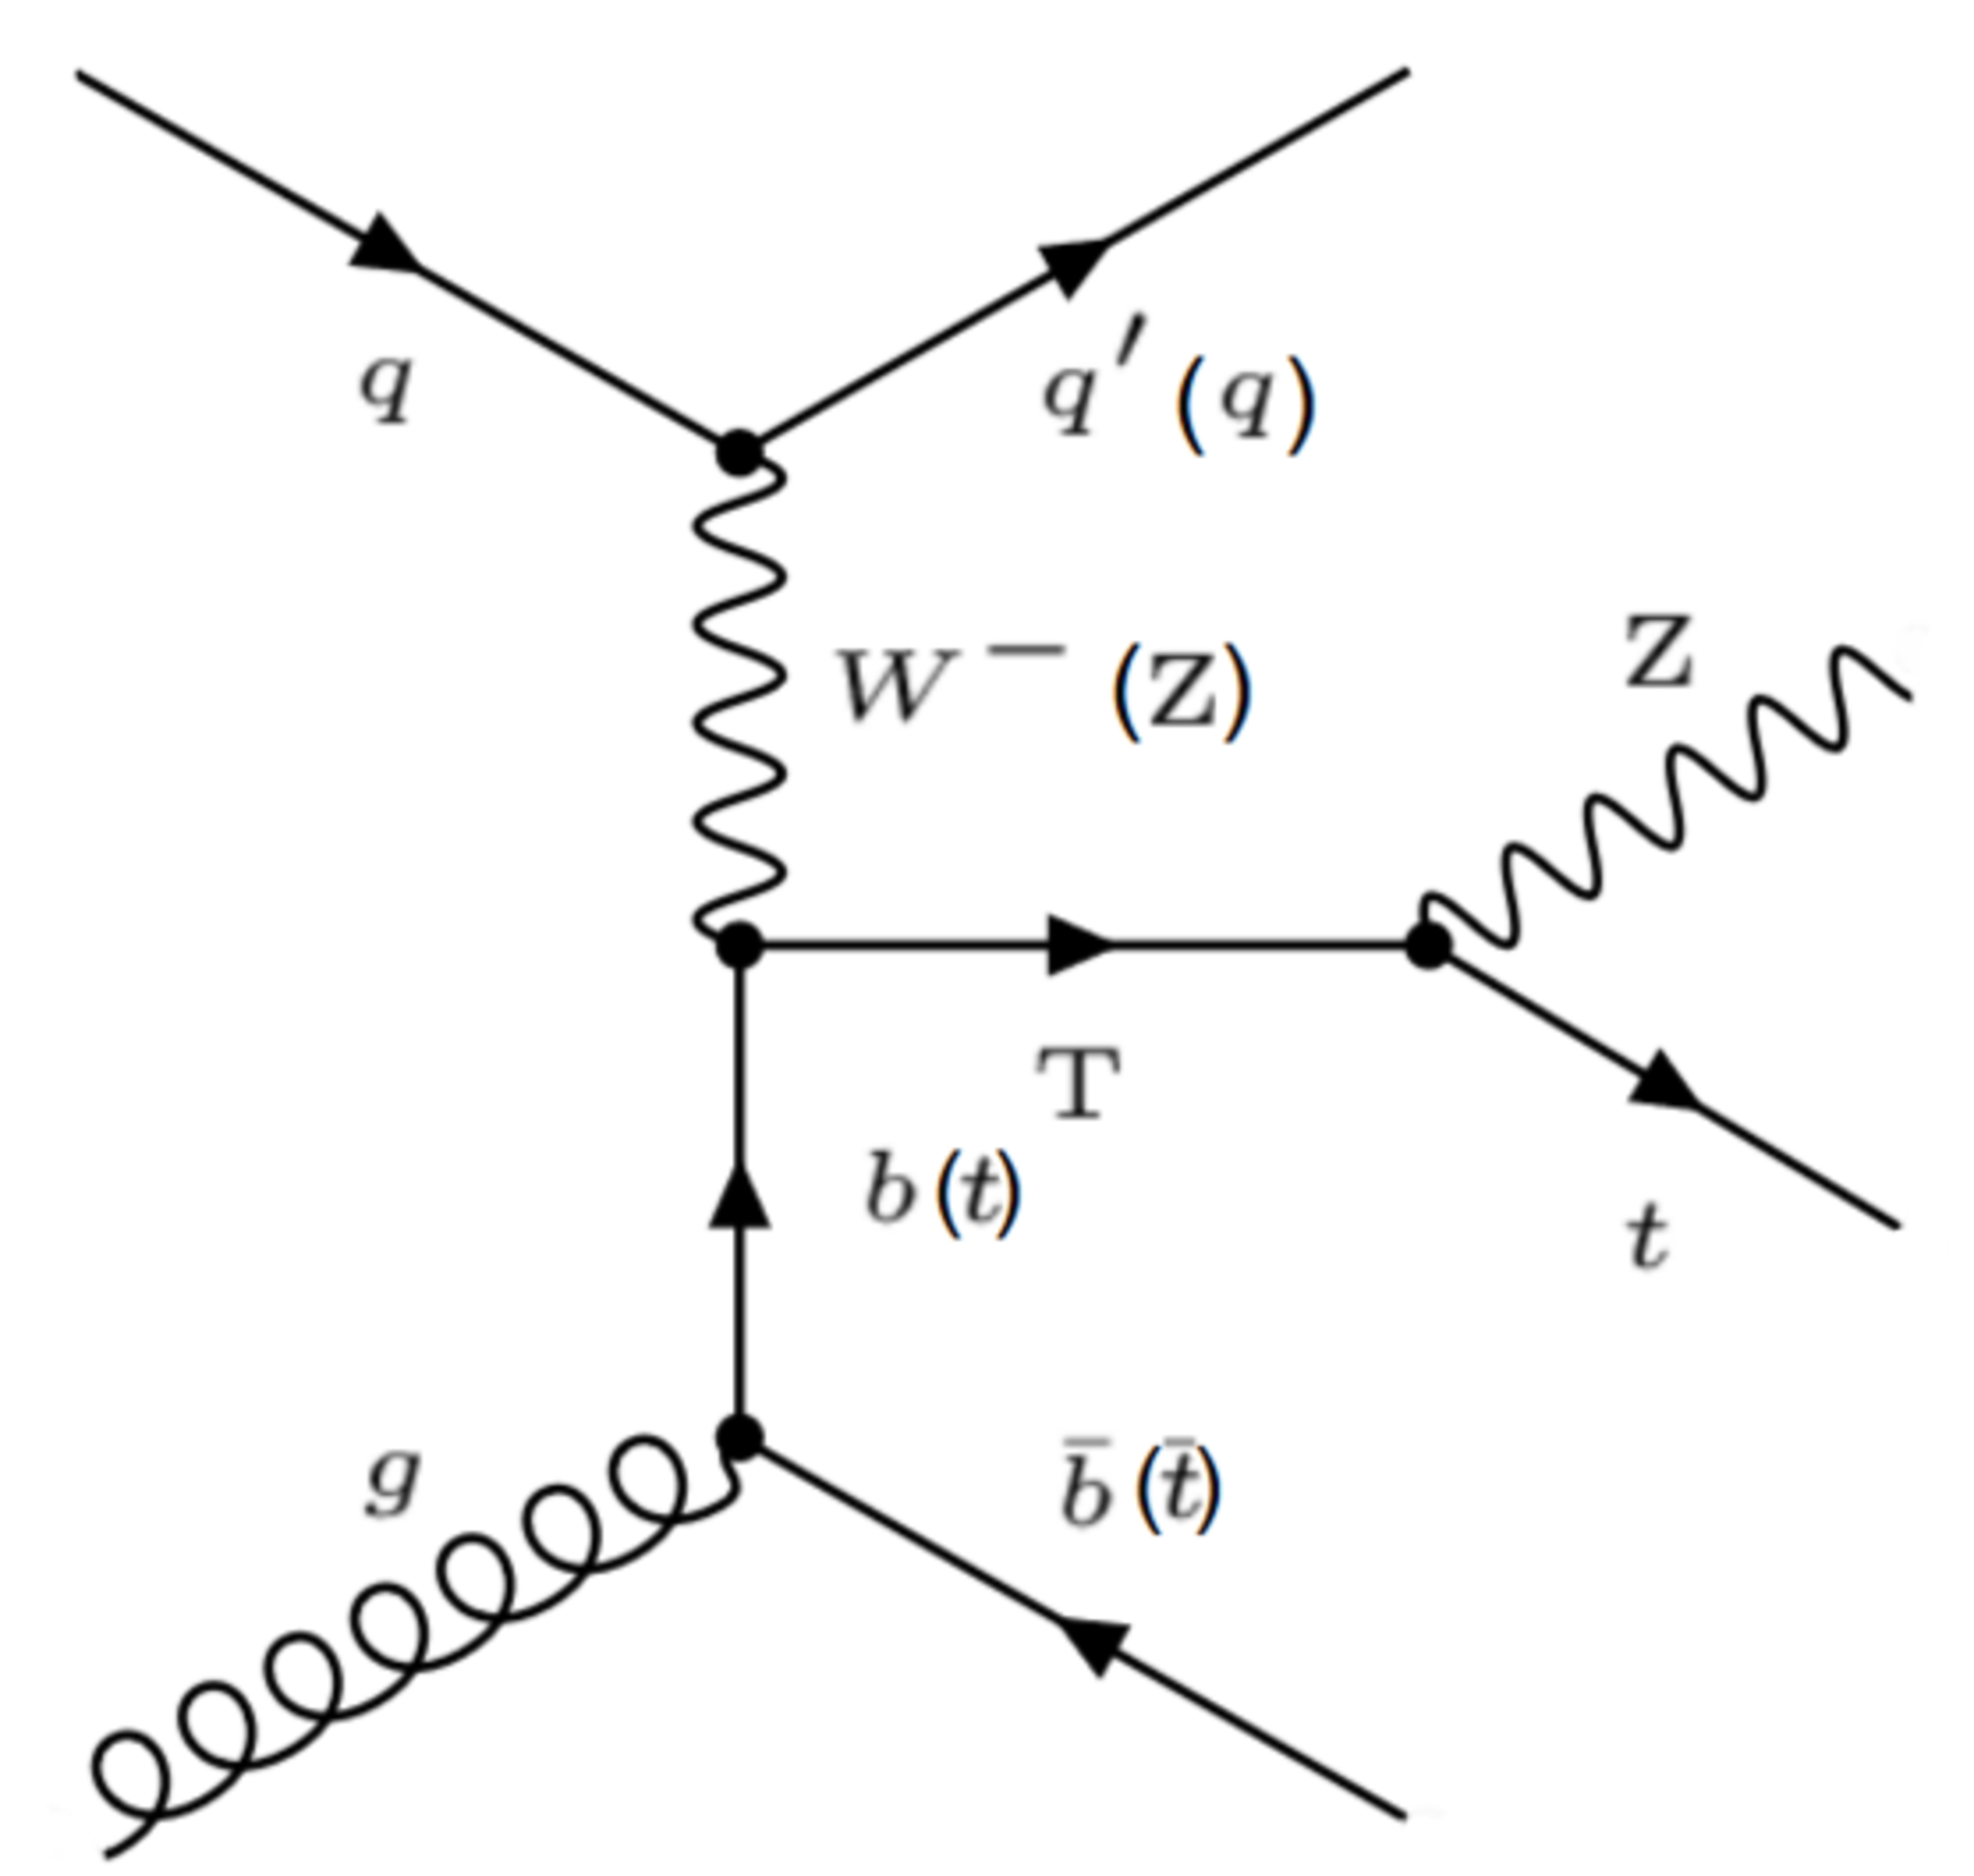
Figure 1:
Leading-order Feynman diagrams for the production of a single vector-like T quark and its decay to a Z boson and a t quark, either in association with a b quark or a t quark (left), or in the decay of a Z' boson to Tt (right). |
png pdf |
Figure 1-a:
Leading-order Feynman diagram for the production of a single vector-like T quark and its decay to a Z boson and a t quark, in association with a b quark or a t quark. |
png pdf |
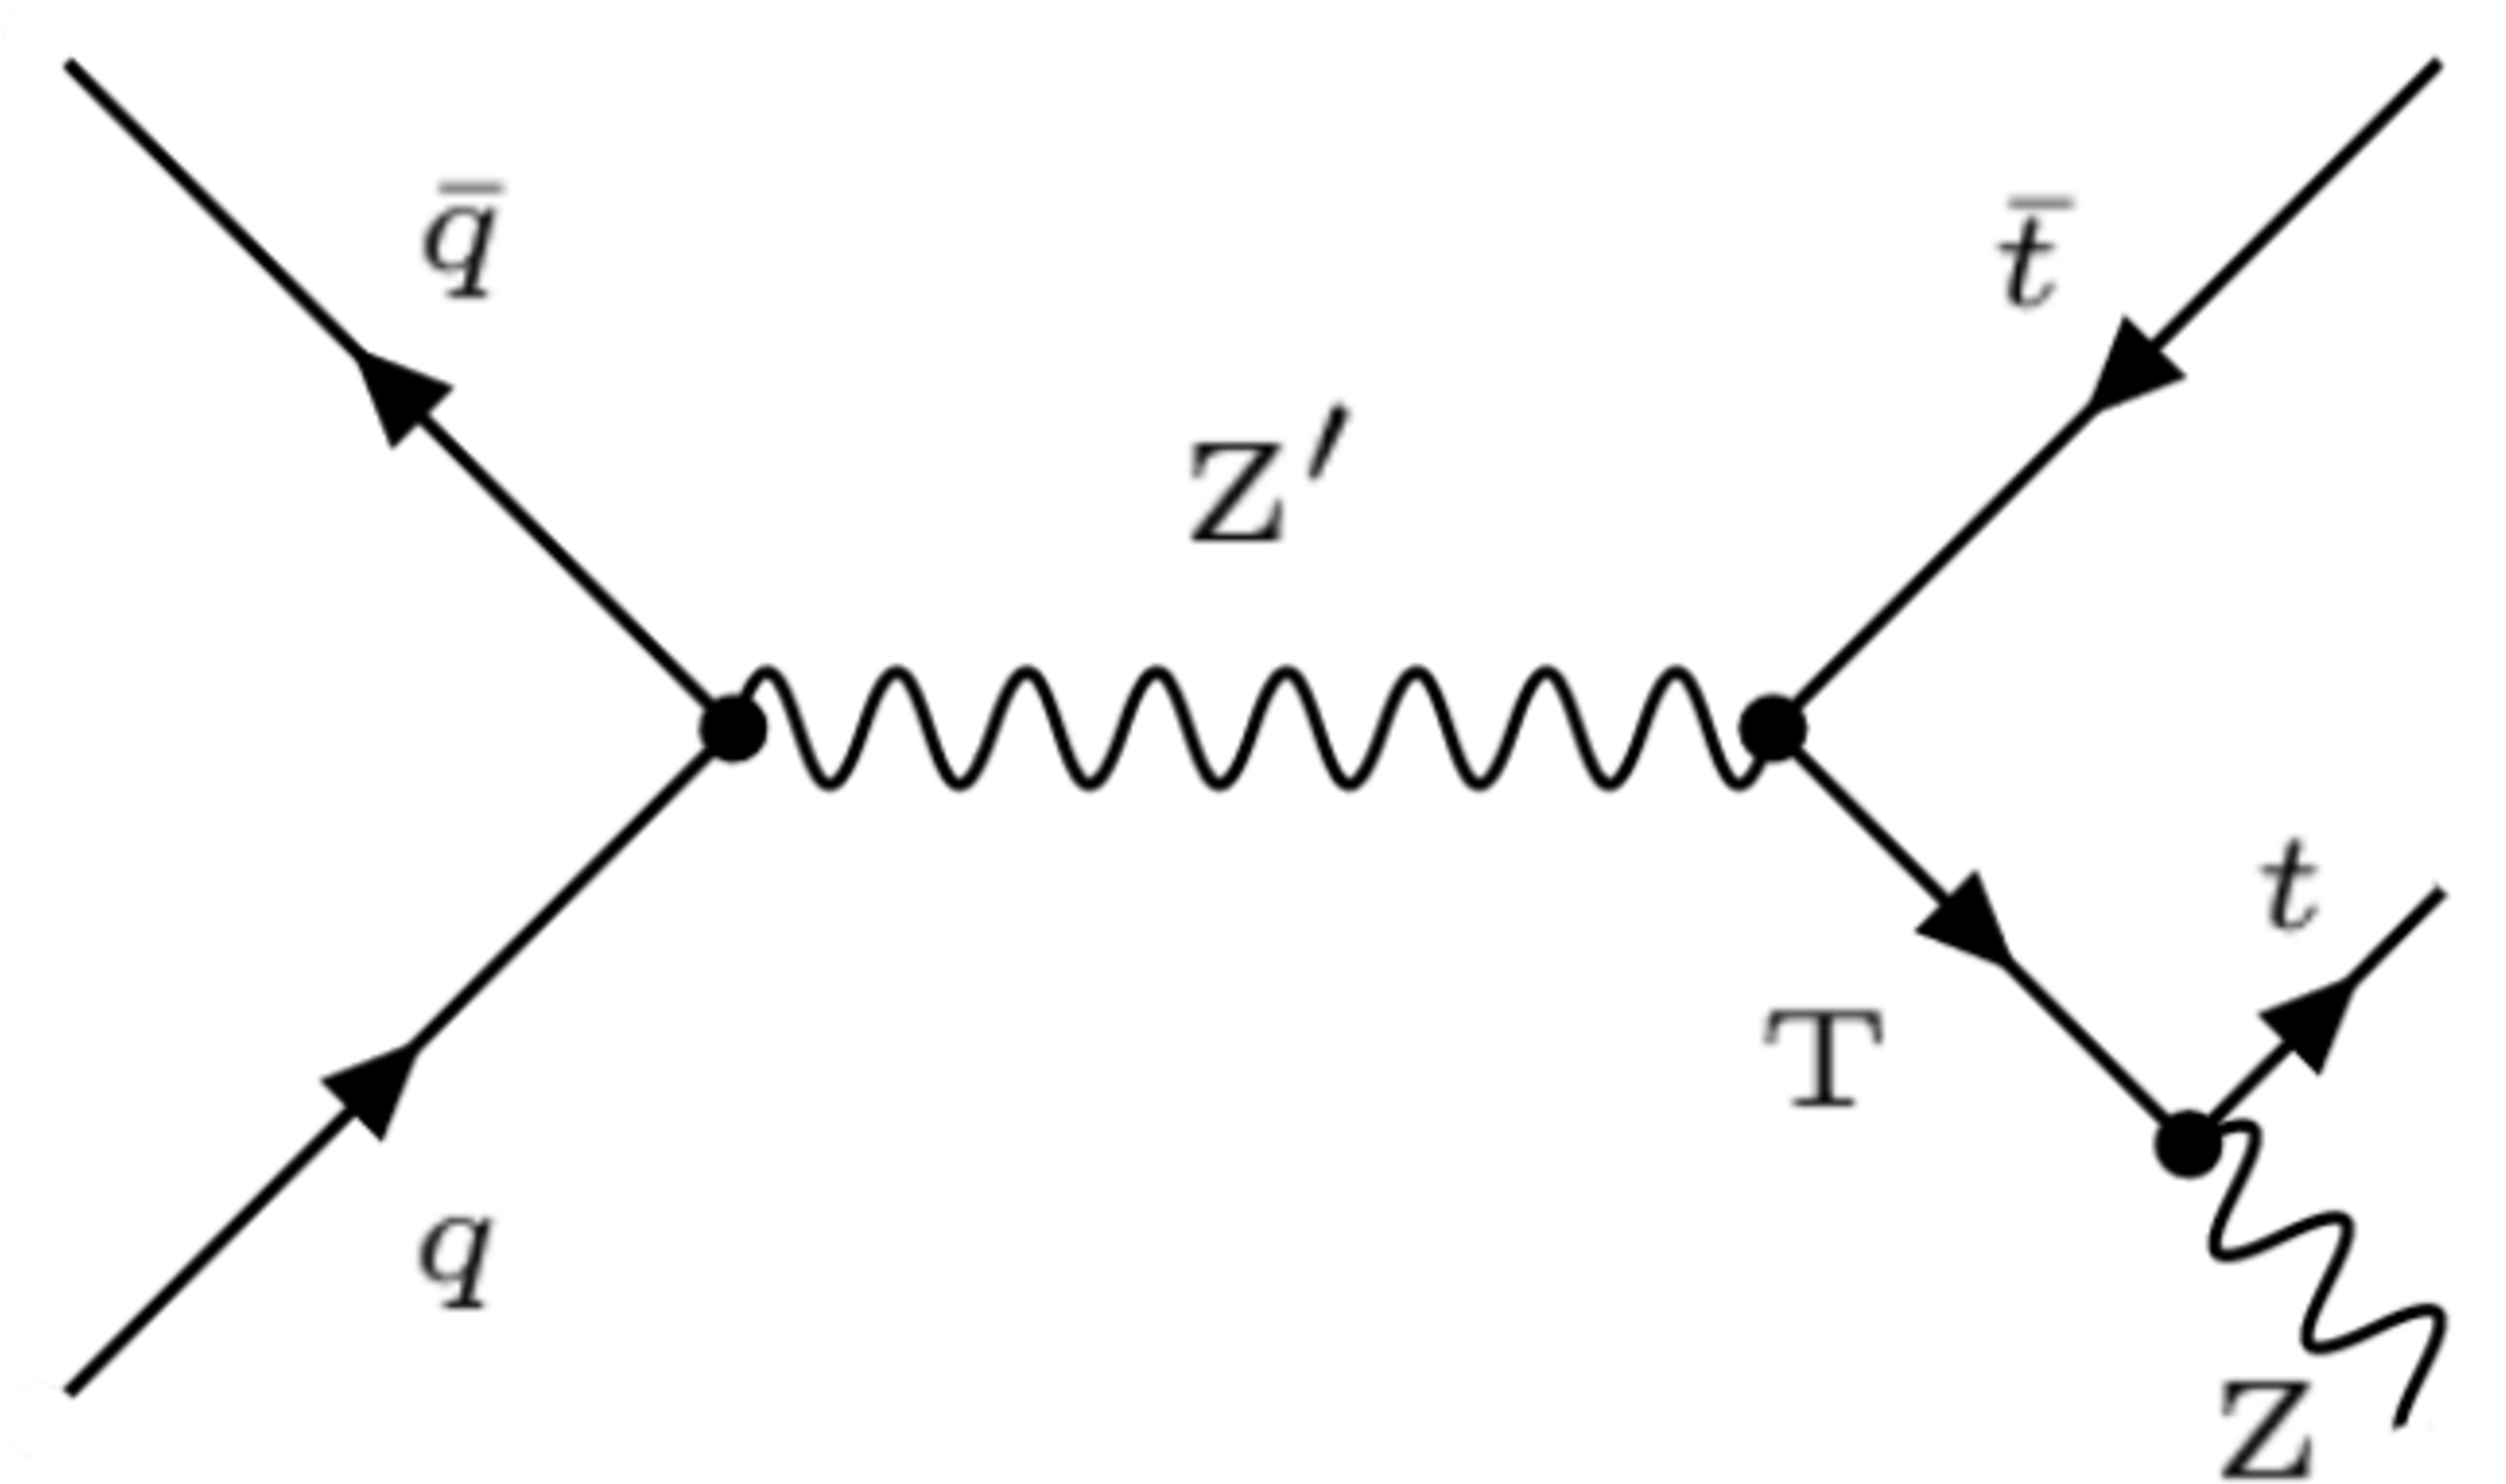
Figure 1-b:
Leading-order Feynman diagram for the production of a single vector-like T quark in the decay of a Z' boson to Tt, and its decay to a Z boson and a t quark. |

png pdf |
Figure 2:
Comparison between the data, the background estimate, and the expected signal for the 2 categories where the T quark is reconstructed in the fully merged topology, for events with the Z boson decaying into muons (left) and electrons (right). The background composition is taken from simulation. The uncertainties in the background estimate include both statistical and systematic components. The lower panel in each plot shows the ratio of the data and the background estimation, with the shaded band representing the uncertainties in the background estimate. The vertical bars for the data points show the Poisson errors associated with each bin, while the horizontal bars indicate the bin width. |

png pdf |
Figure 2-a:
Comparison between the data, the background estimate, and the expected signal for the 2 categories where the T quark is reconstructed in the fully merged topology, for events with the Z boson decaying into muons. The background composition is taken from simulation. The uncertainties in the background estimate include both statistical and systematic components. The lower panel shows the ratio of the data and the background estimation, with the shaded band representing the uncertainties in the background estimate. The vertical bars for the data points show the Poisson errors associated with each bin, while the horizontal bars indicate the bin width. |
png pdf |
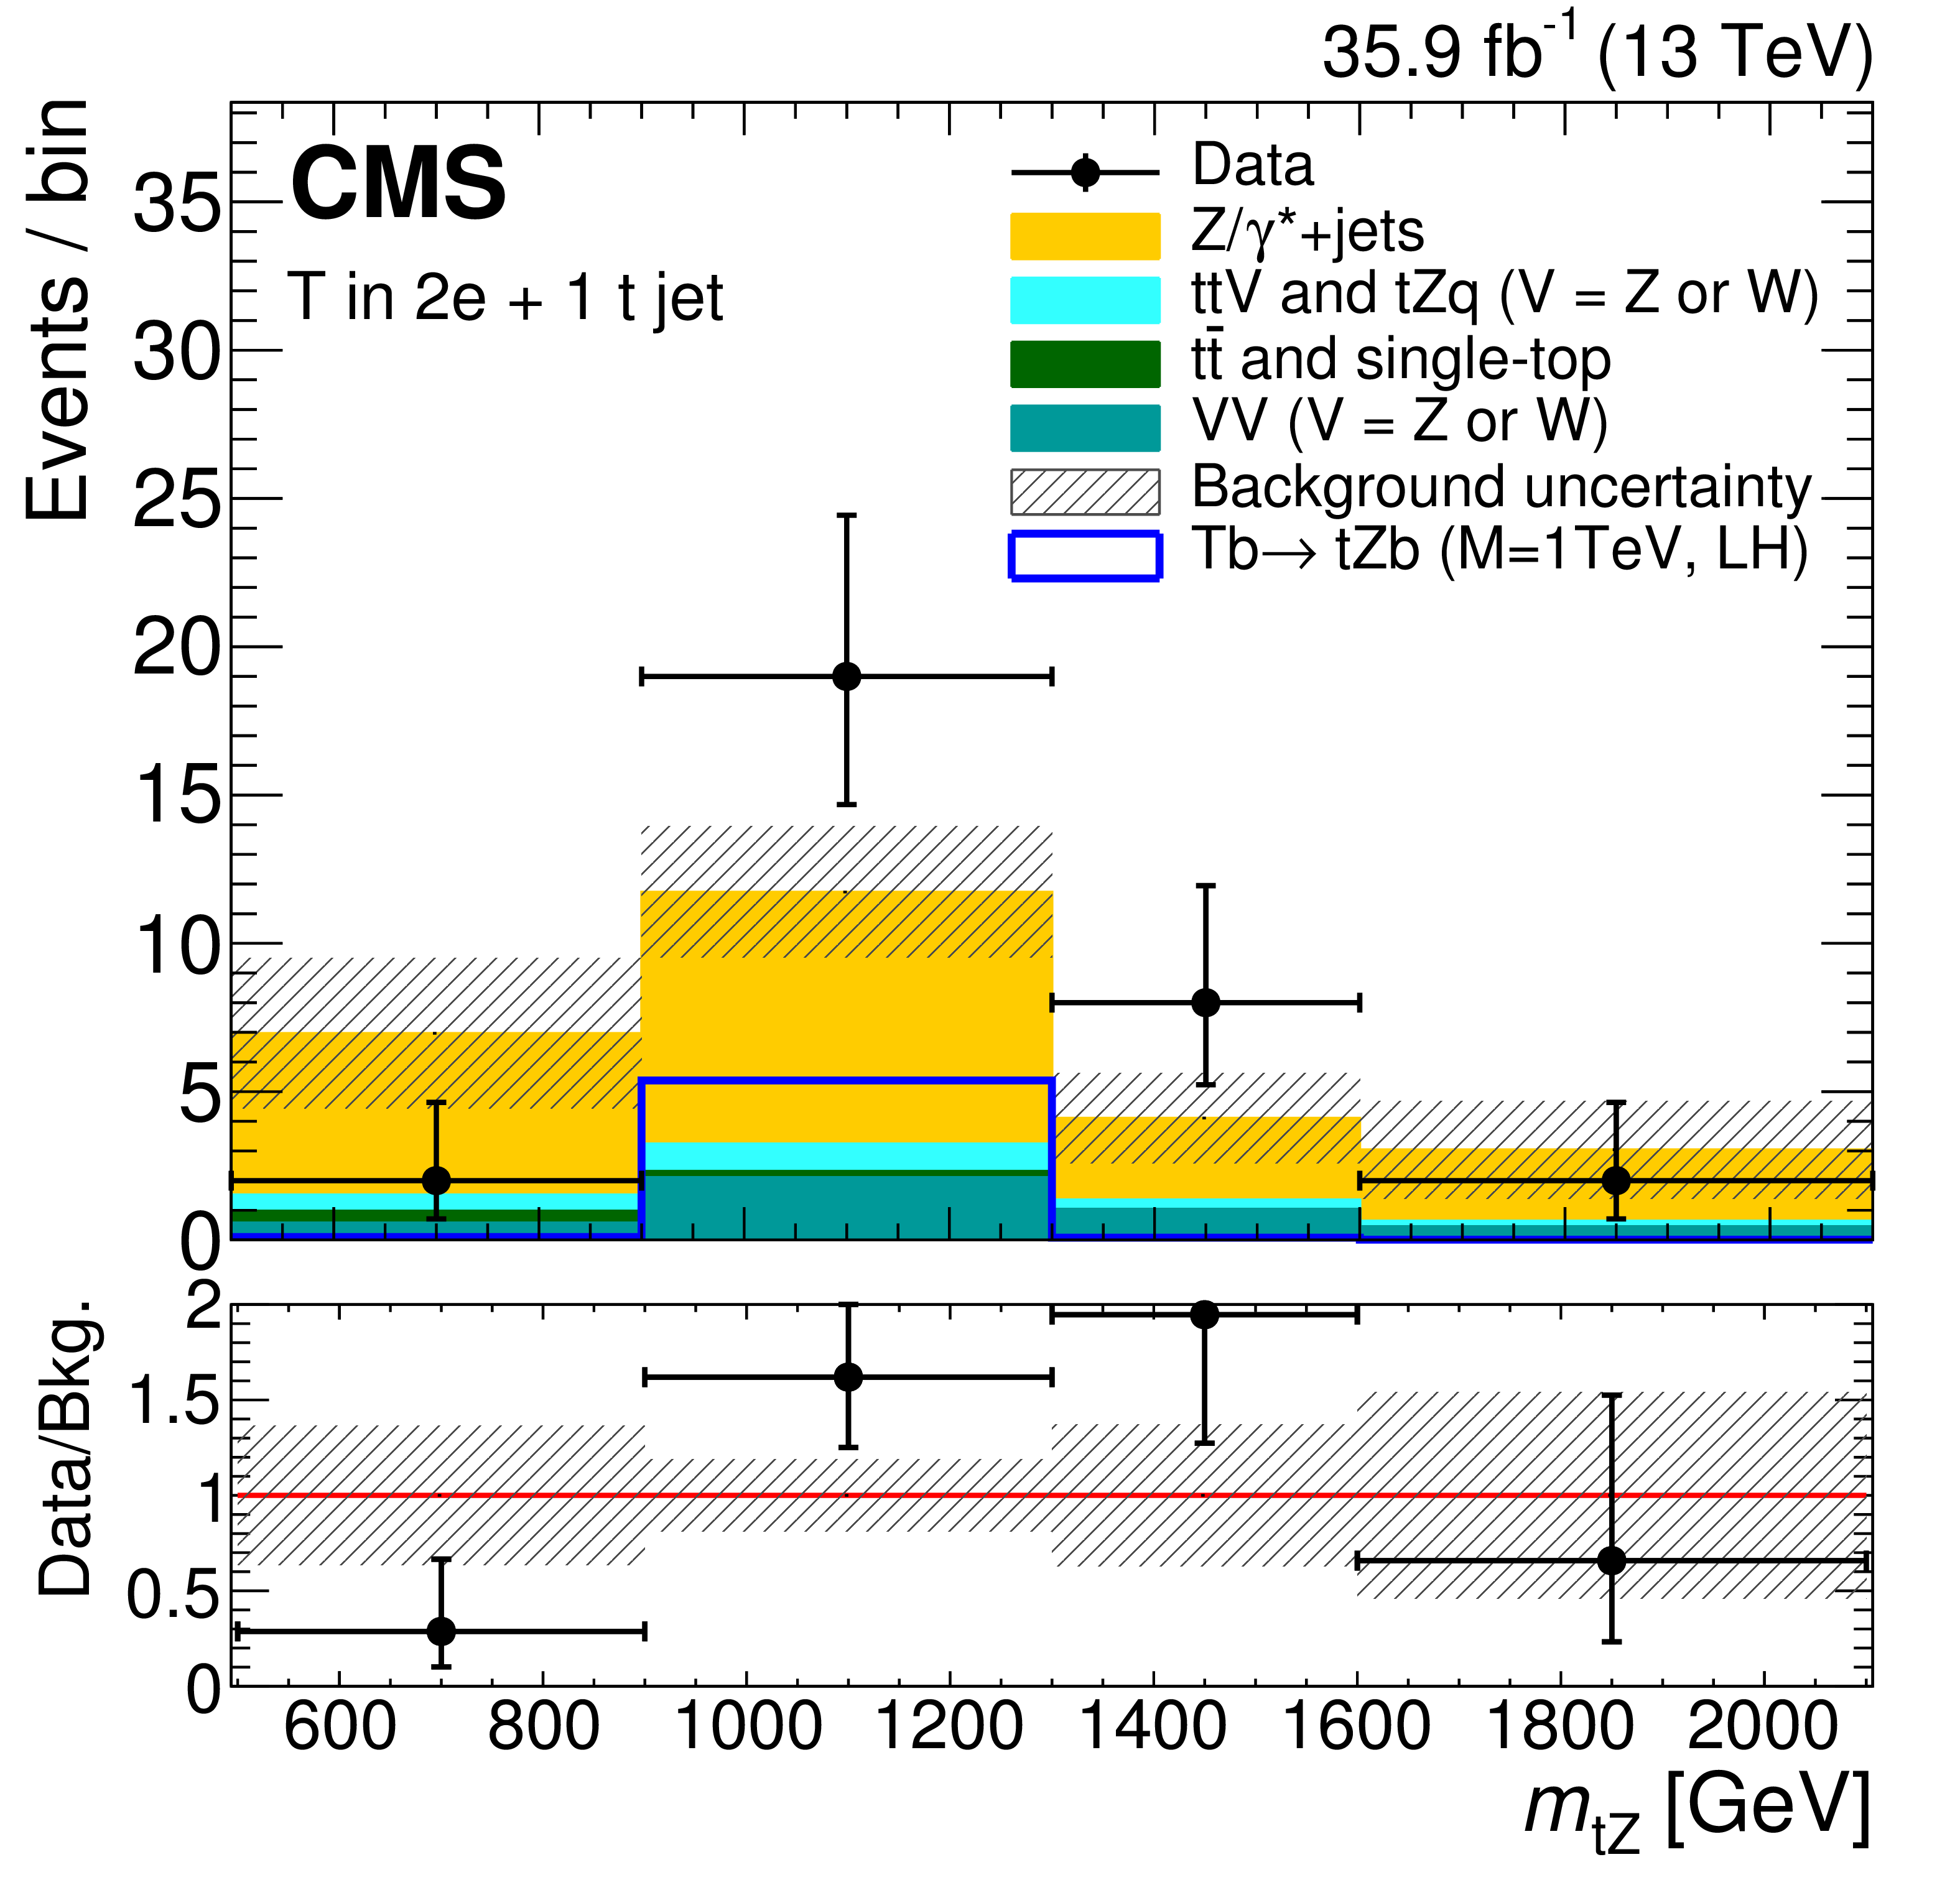
Figure 2-b:
Comparison between the data, the background estimate, and the expected signal for the 2 categories where the T quark is reconstructed in the fully merged topology, for events with the Z boson decaying into electrons. The background composition is taken from simulation. The uncertainties in the background estimate include both statistical and systematic components. The lower panel shows the ratio of the data and the background estimation, with the shaded band representing the uncertainties in the background estimate. The vertical bars for the data points show the Poisson errors associated with each bin, while the horizontal bars indicate the bin width. |
png pdf |
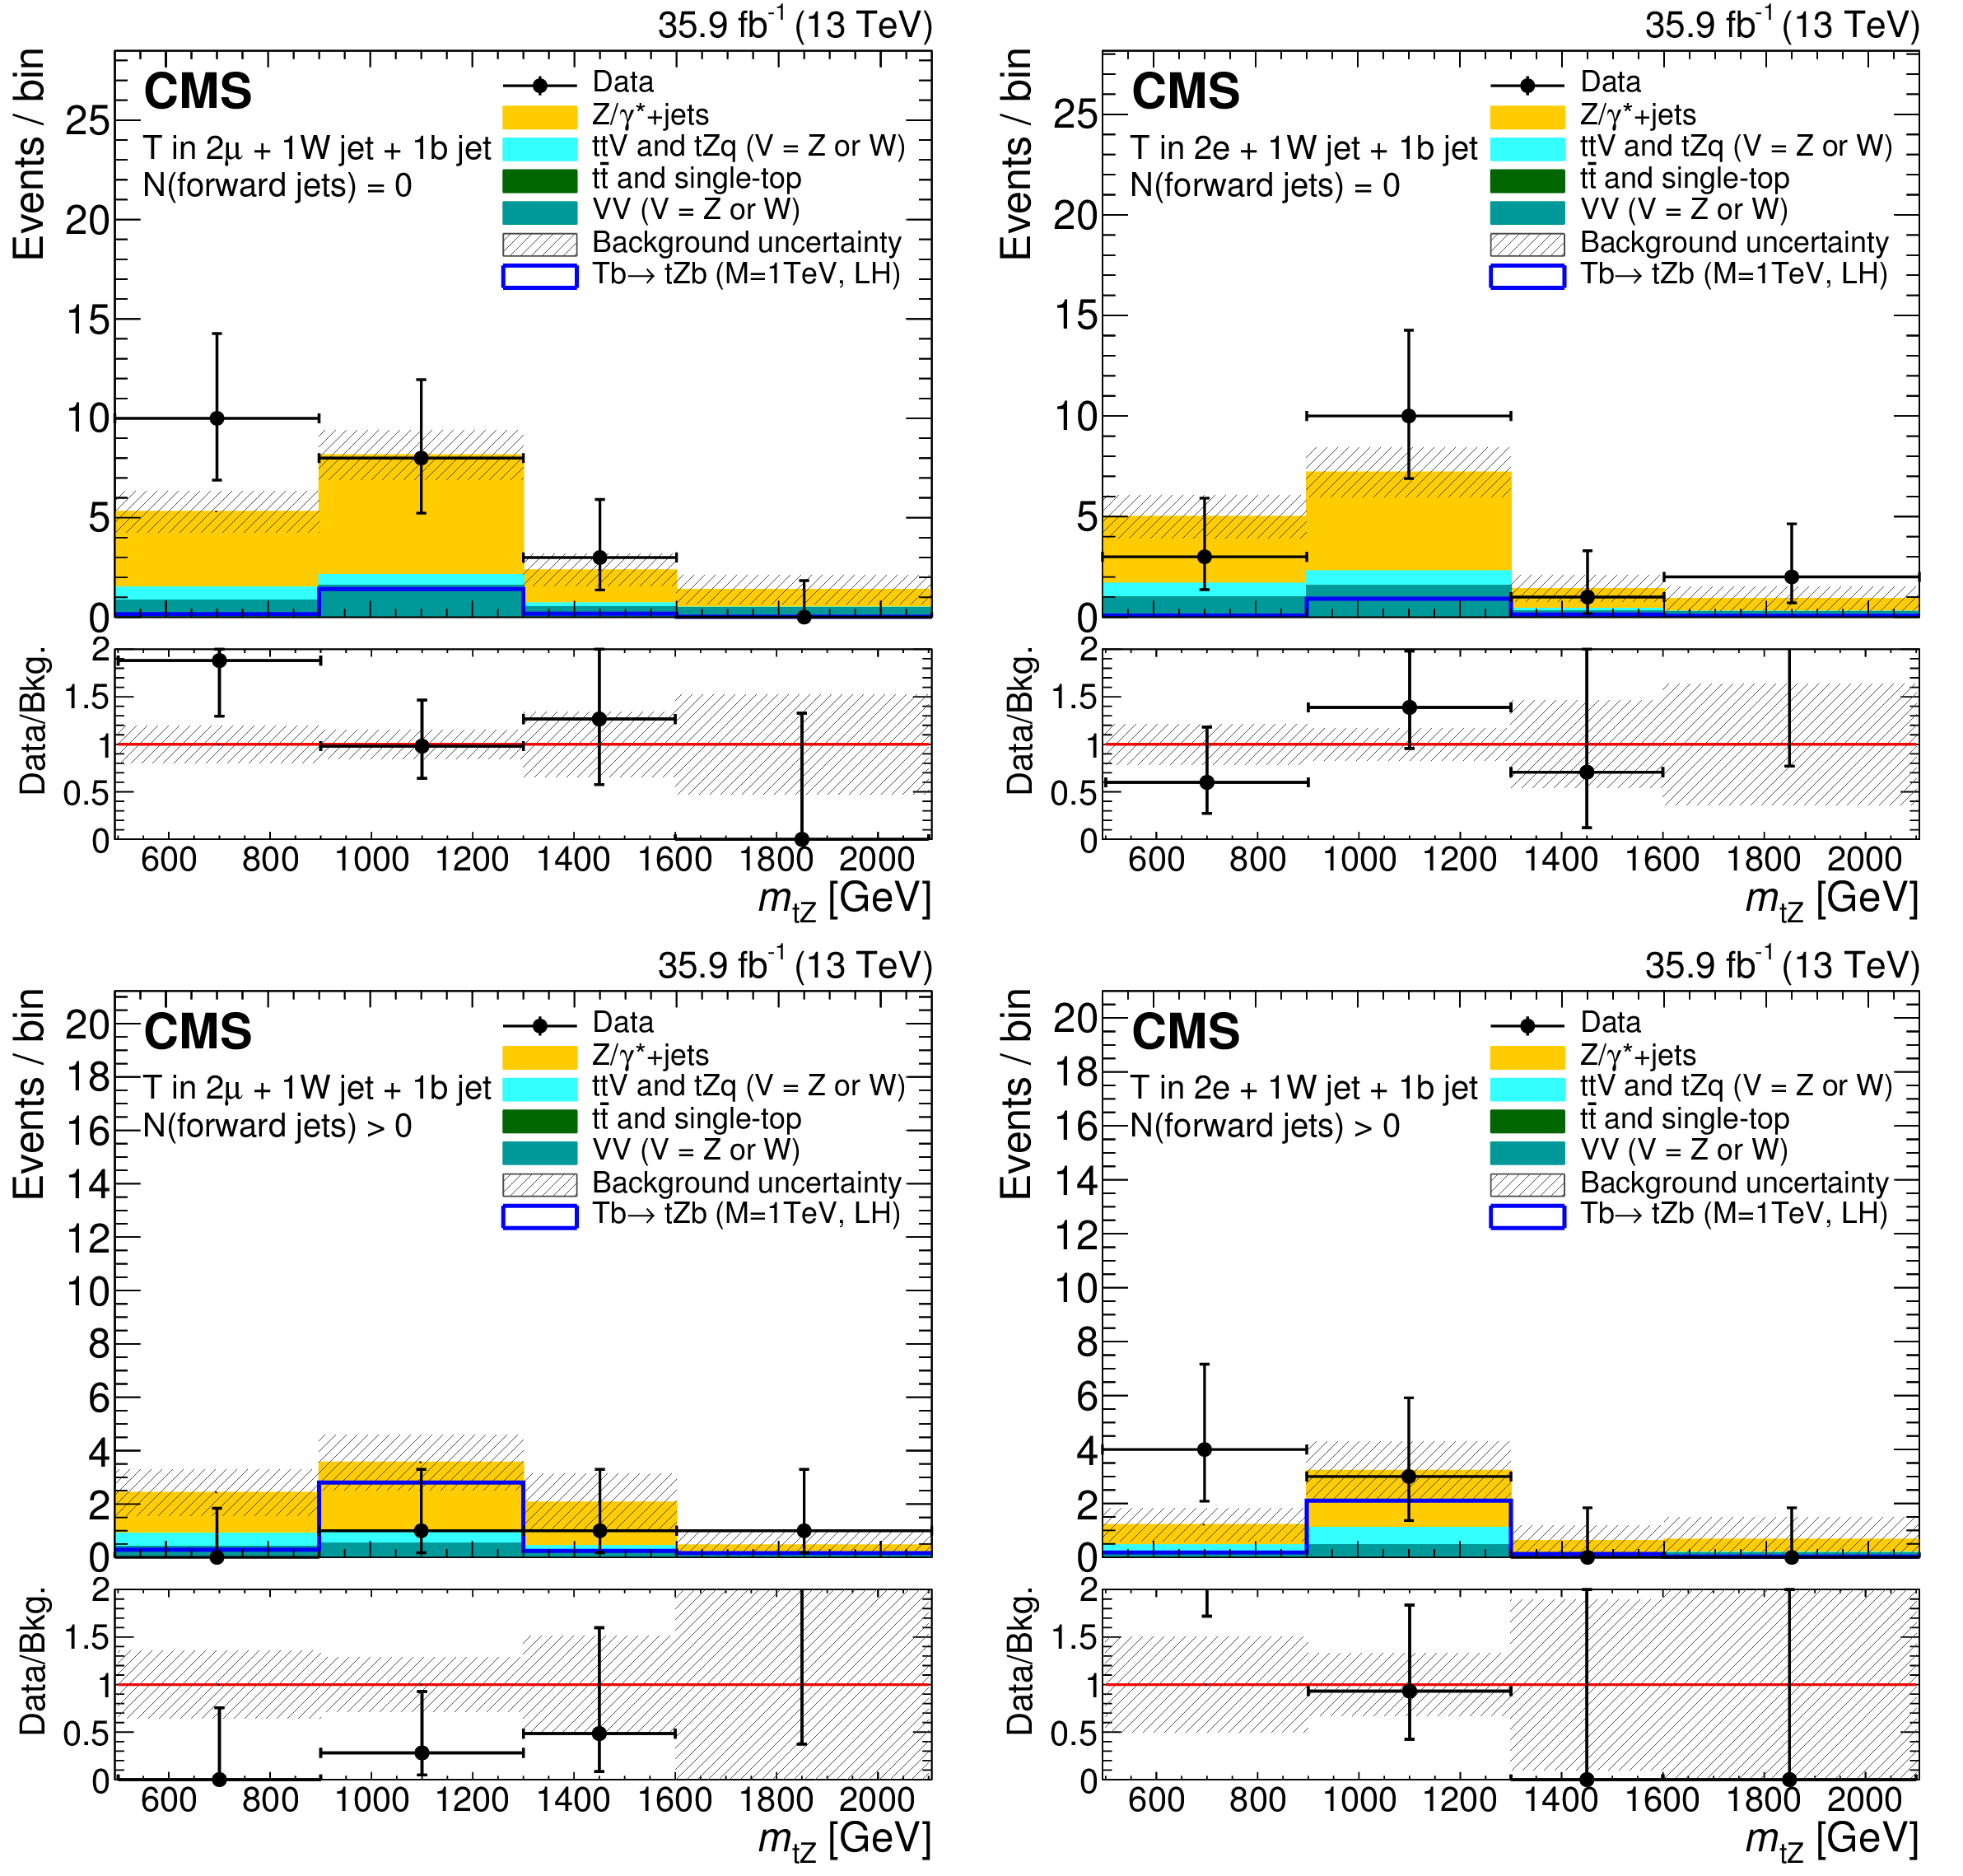
Figure 3:
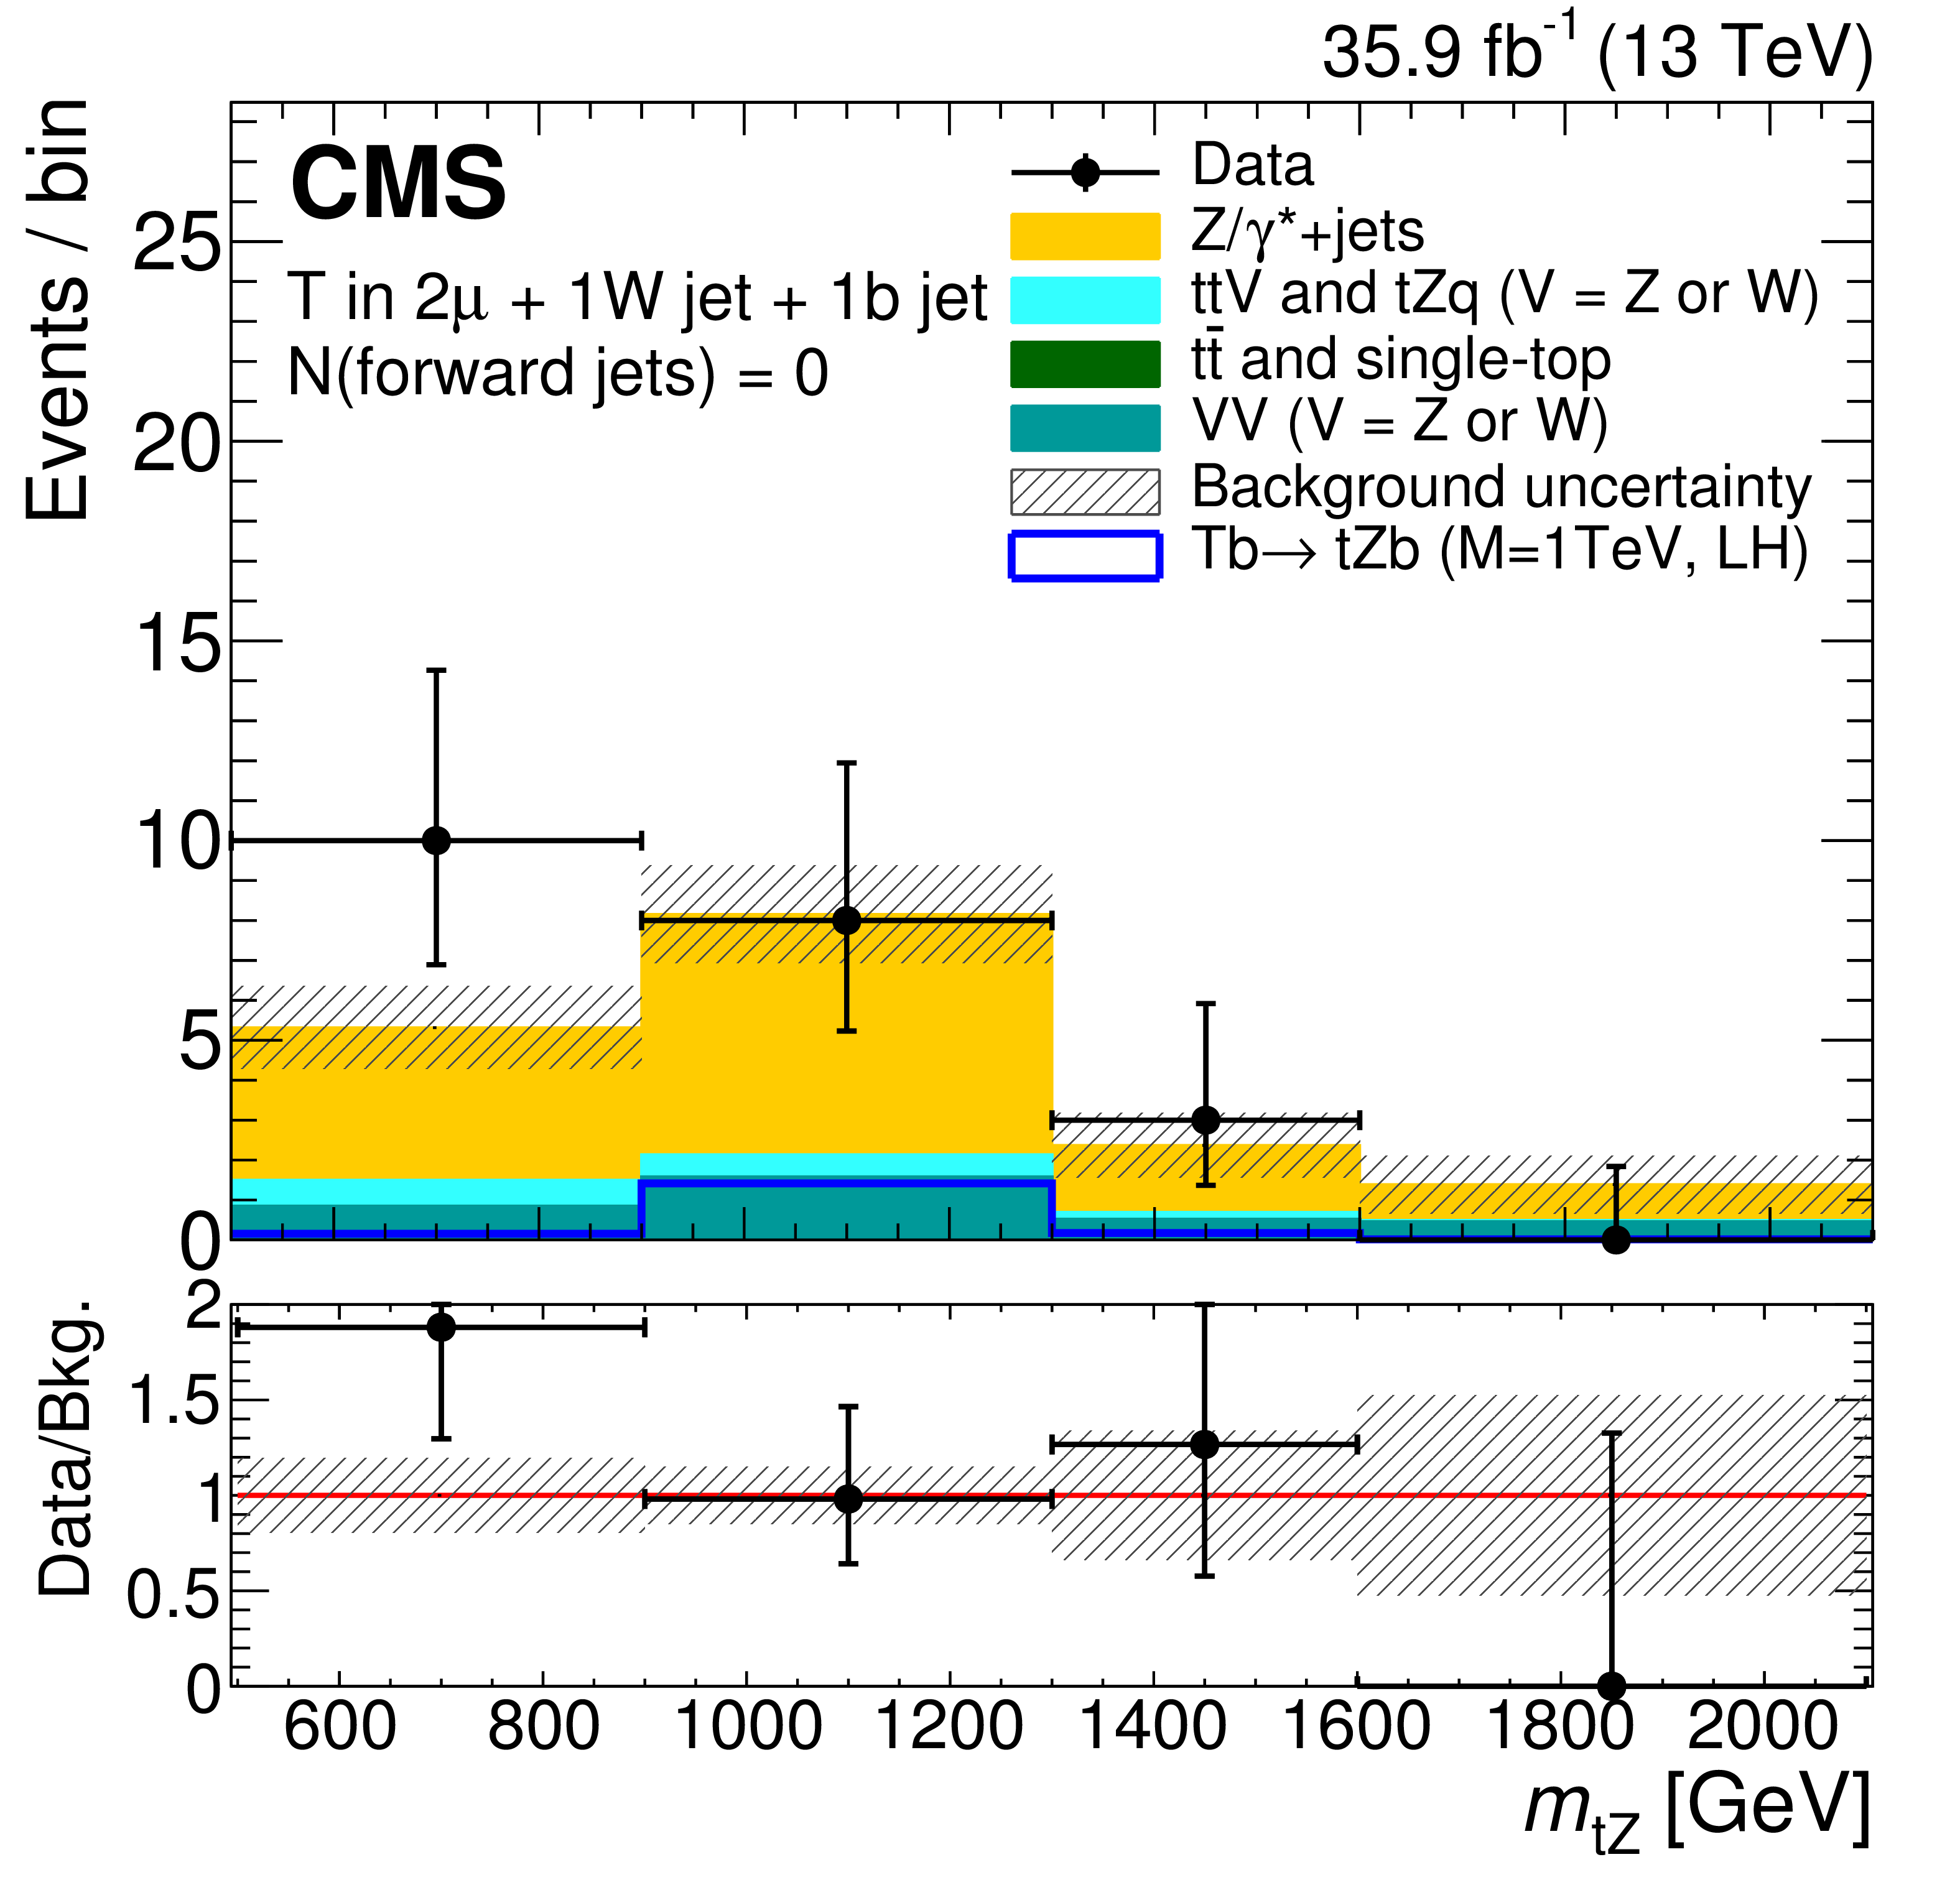
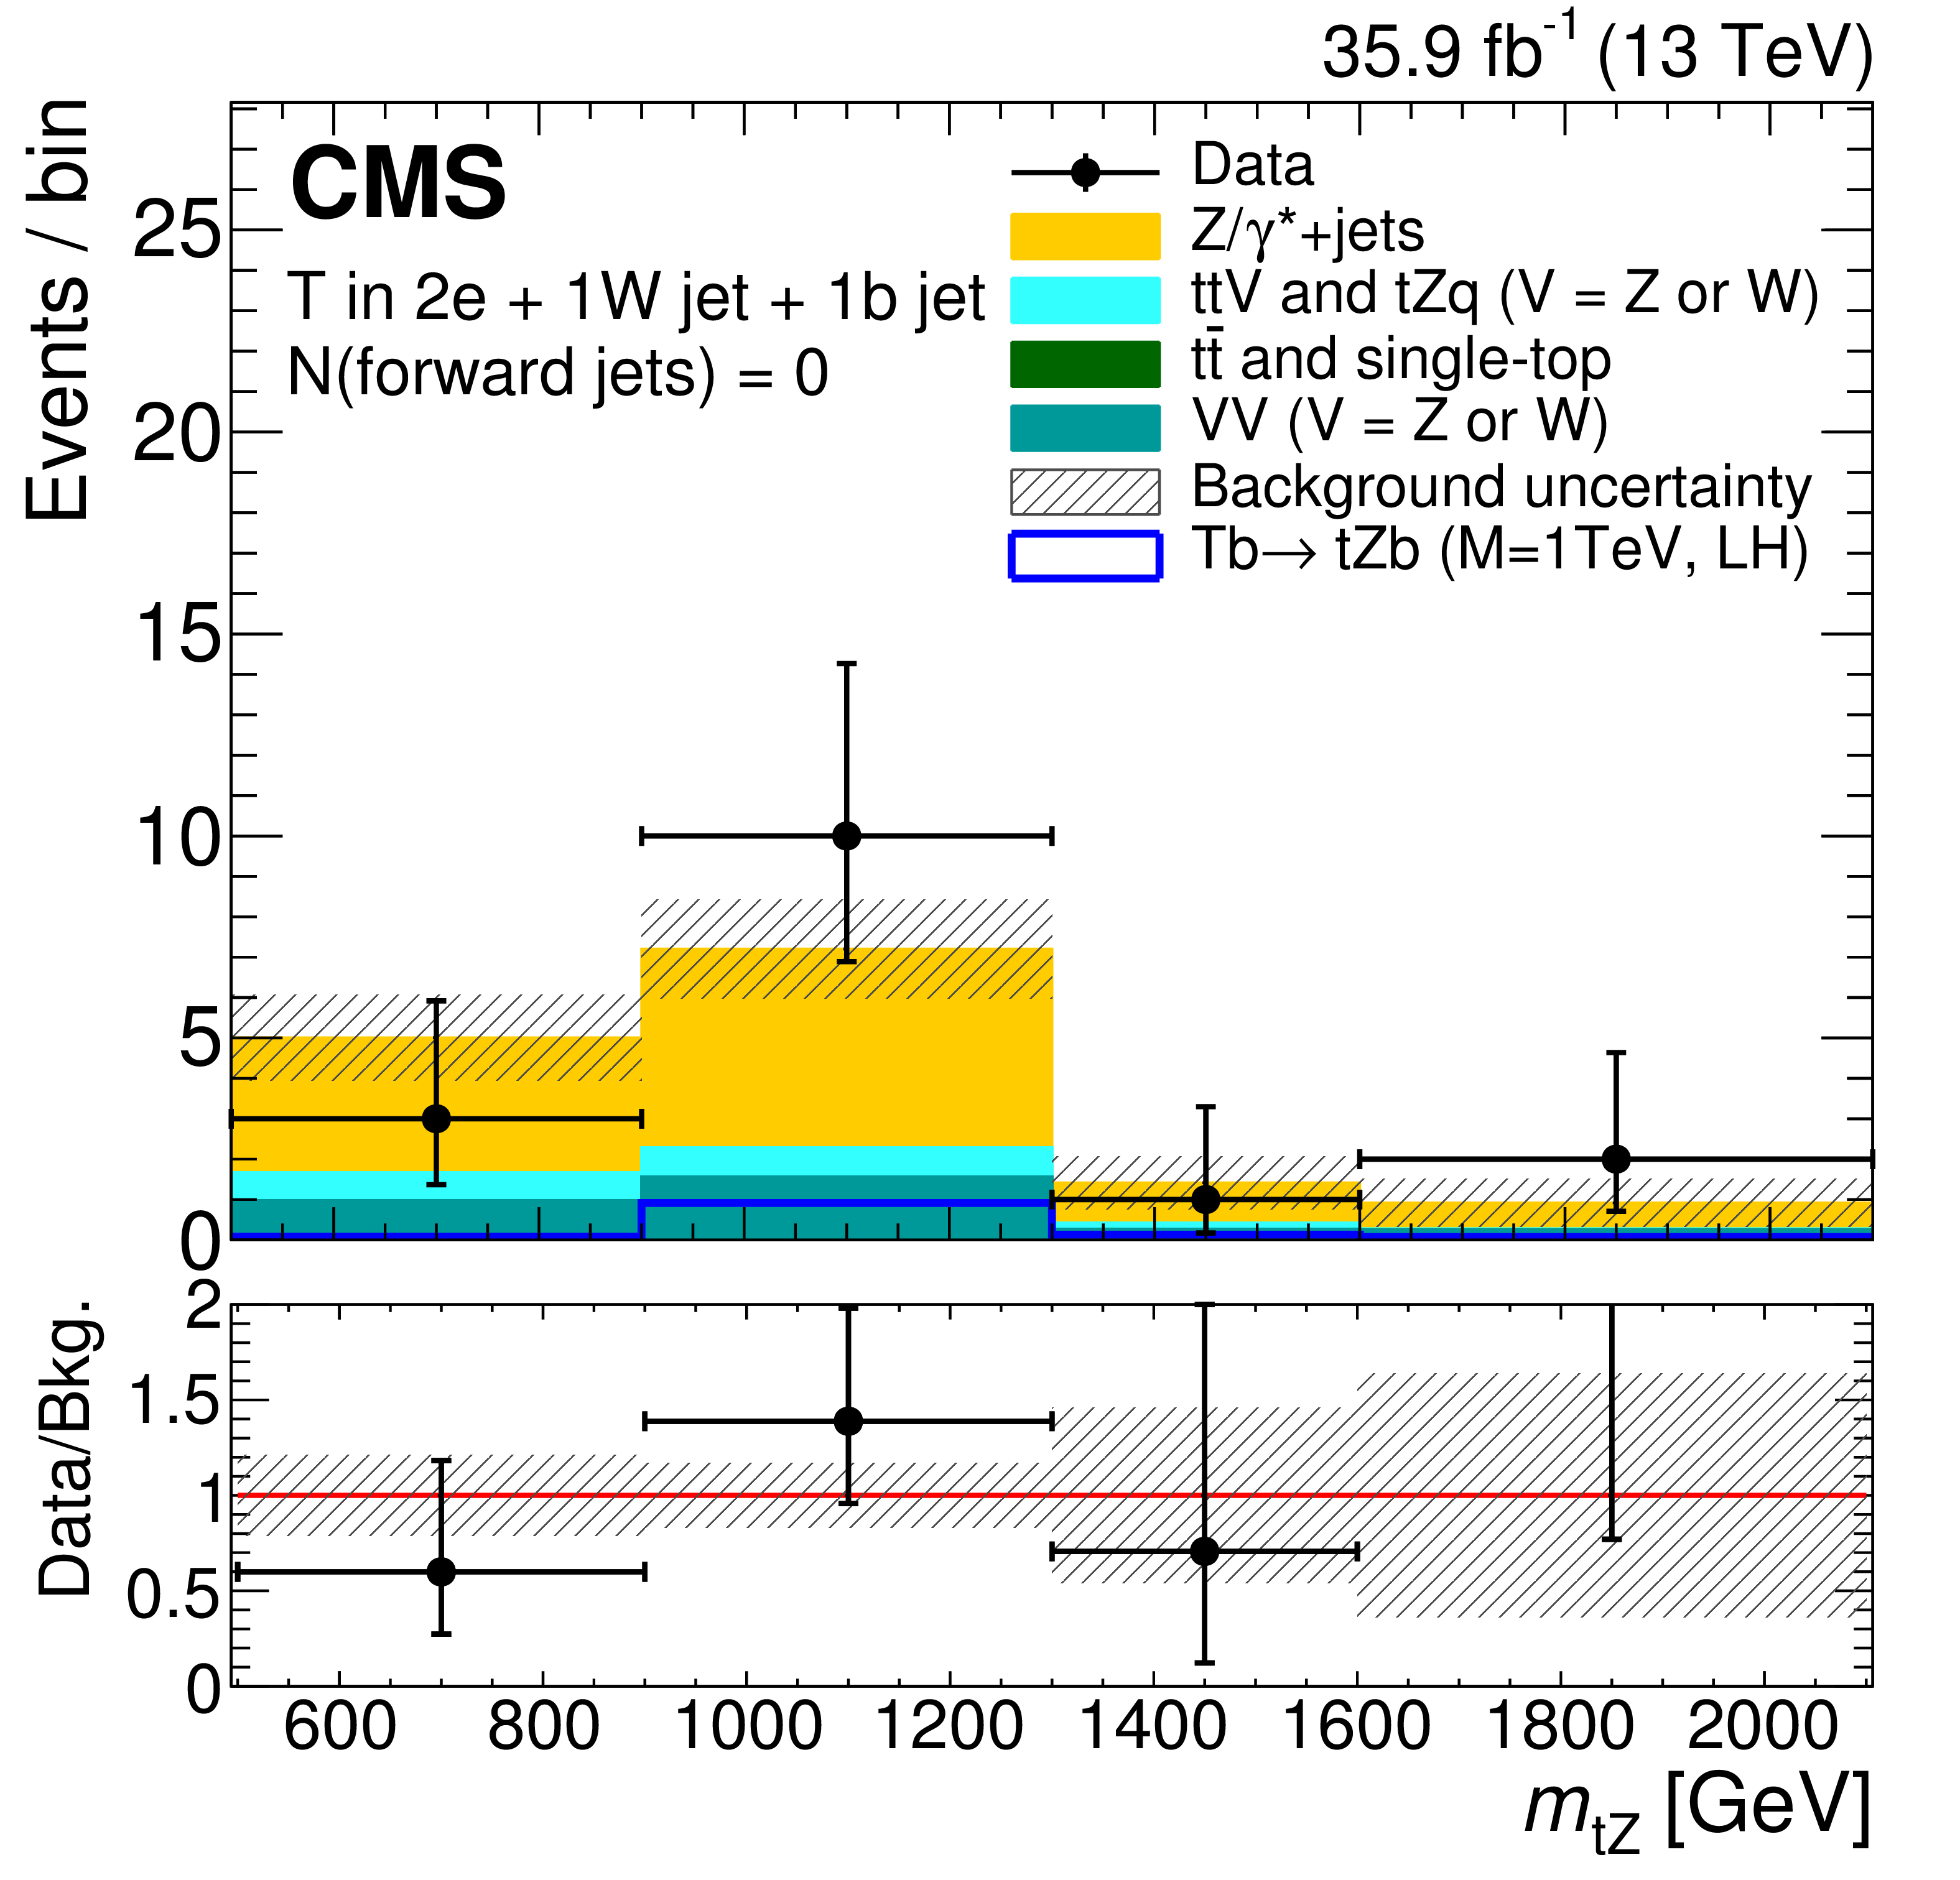
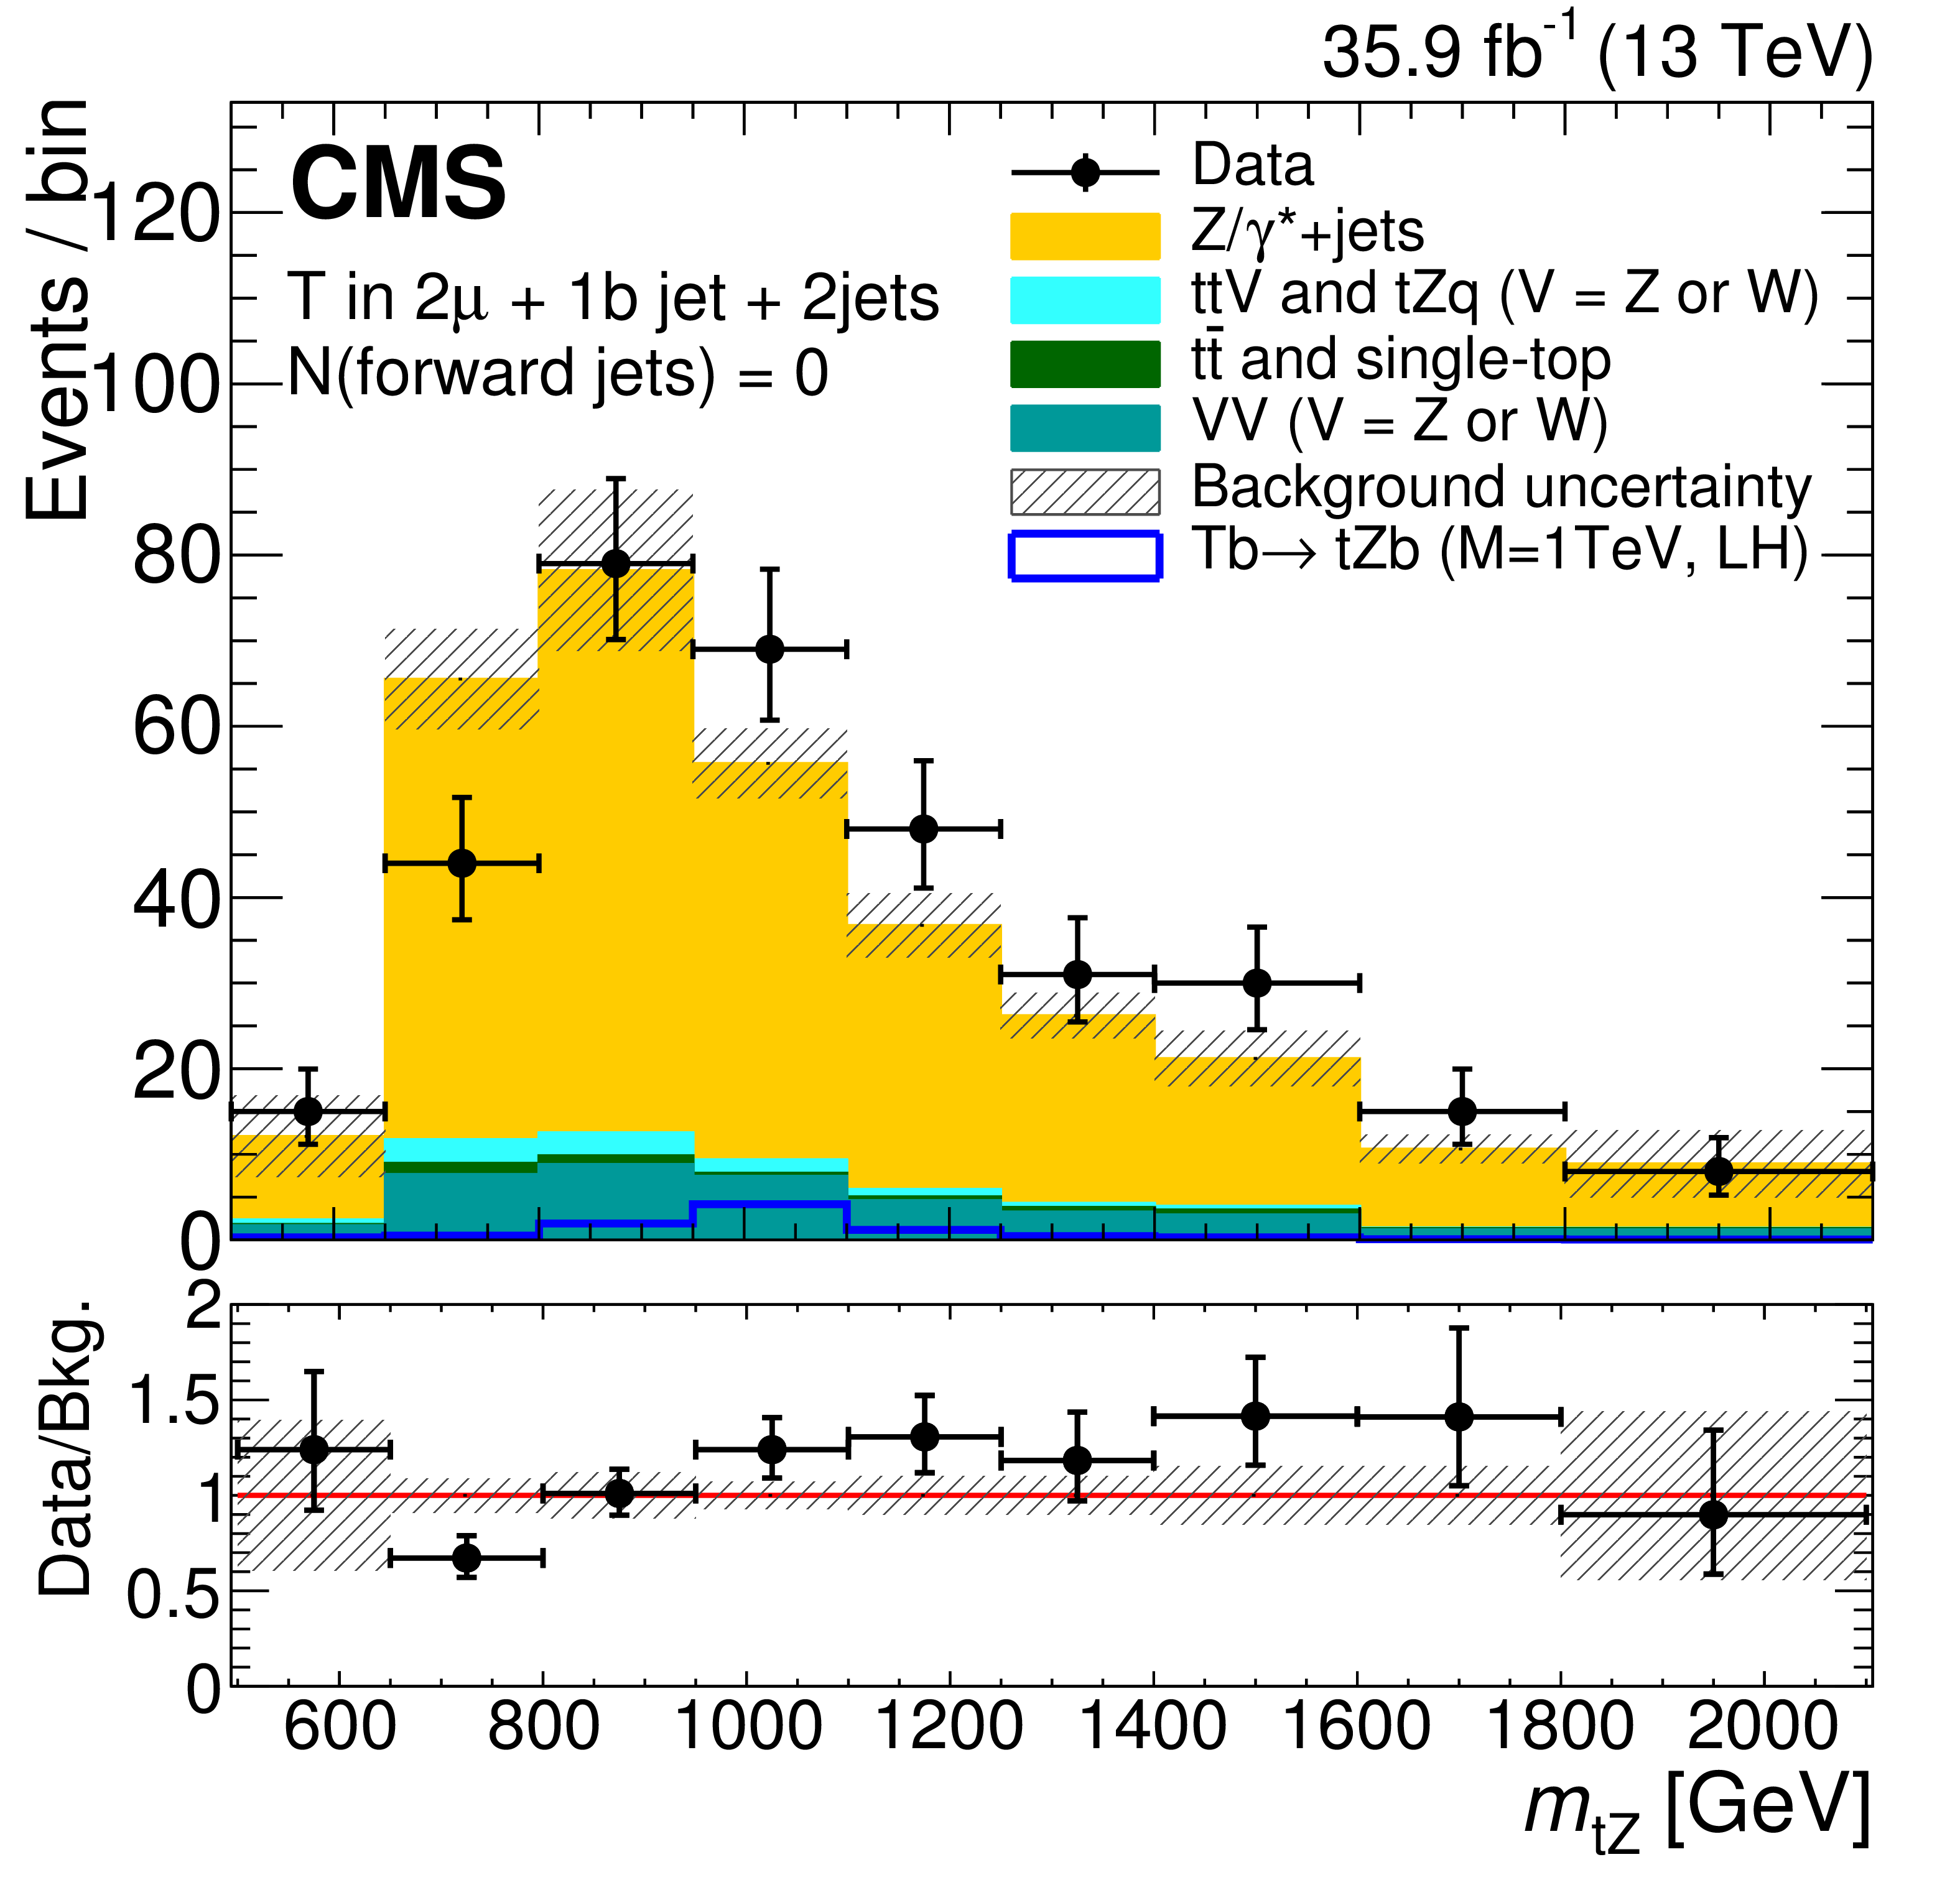
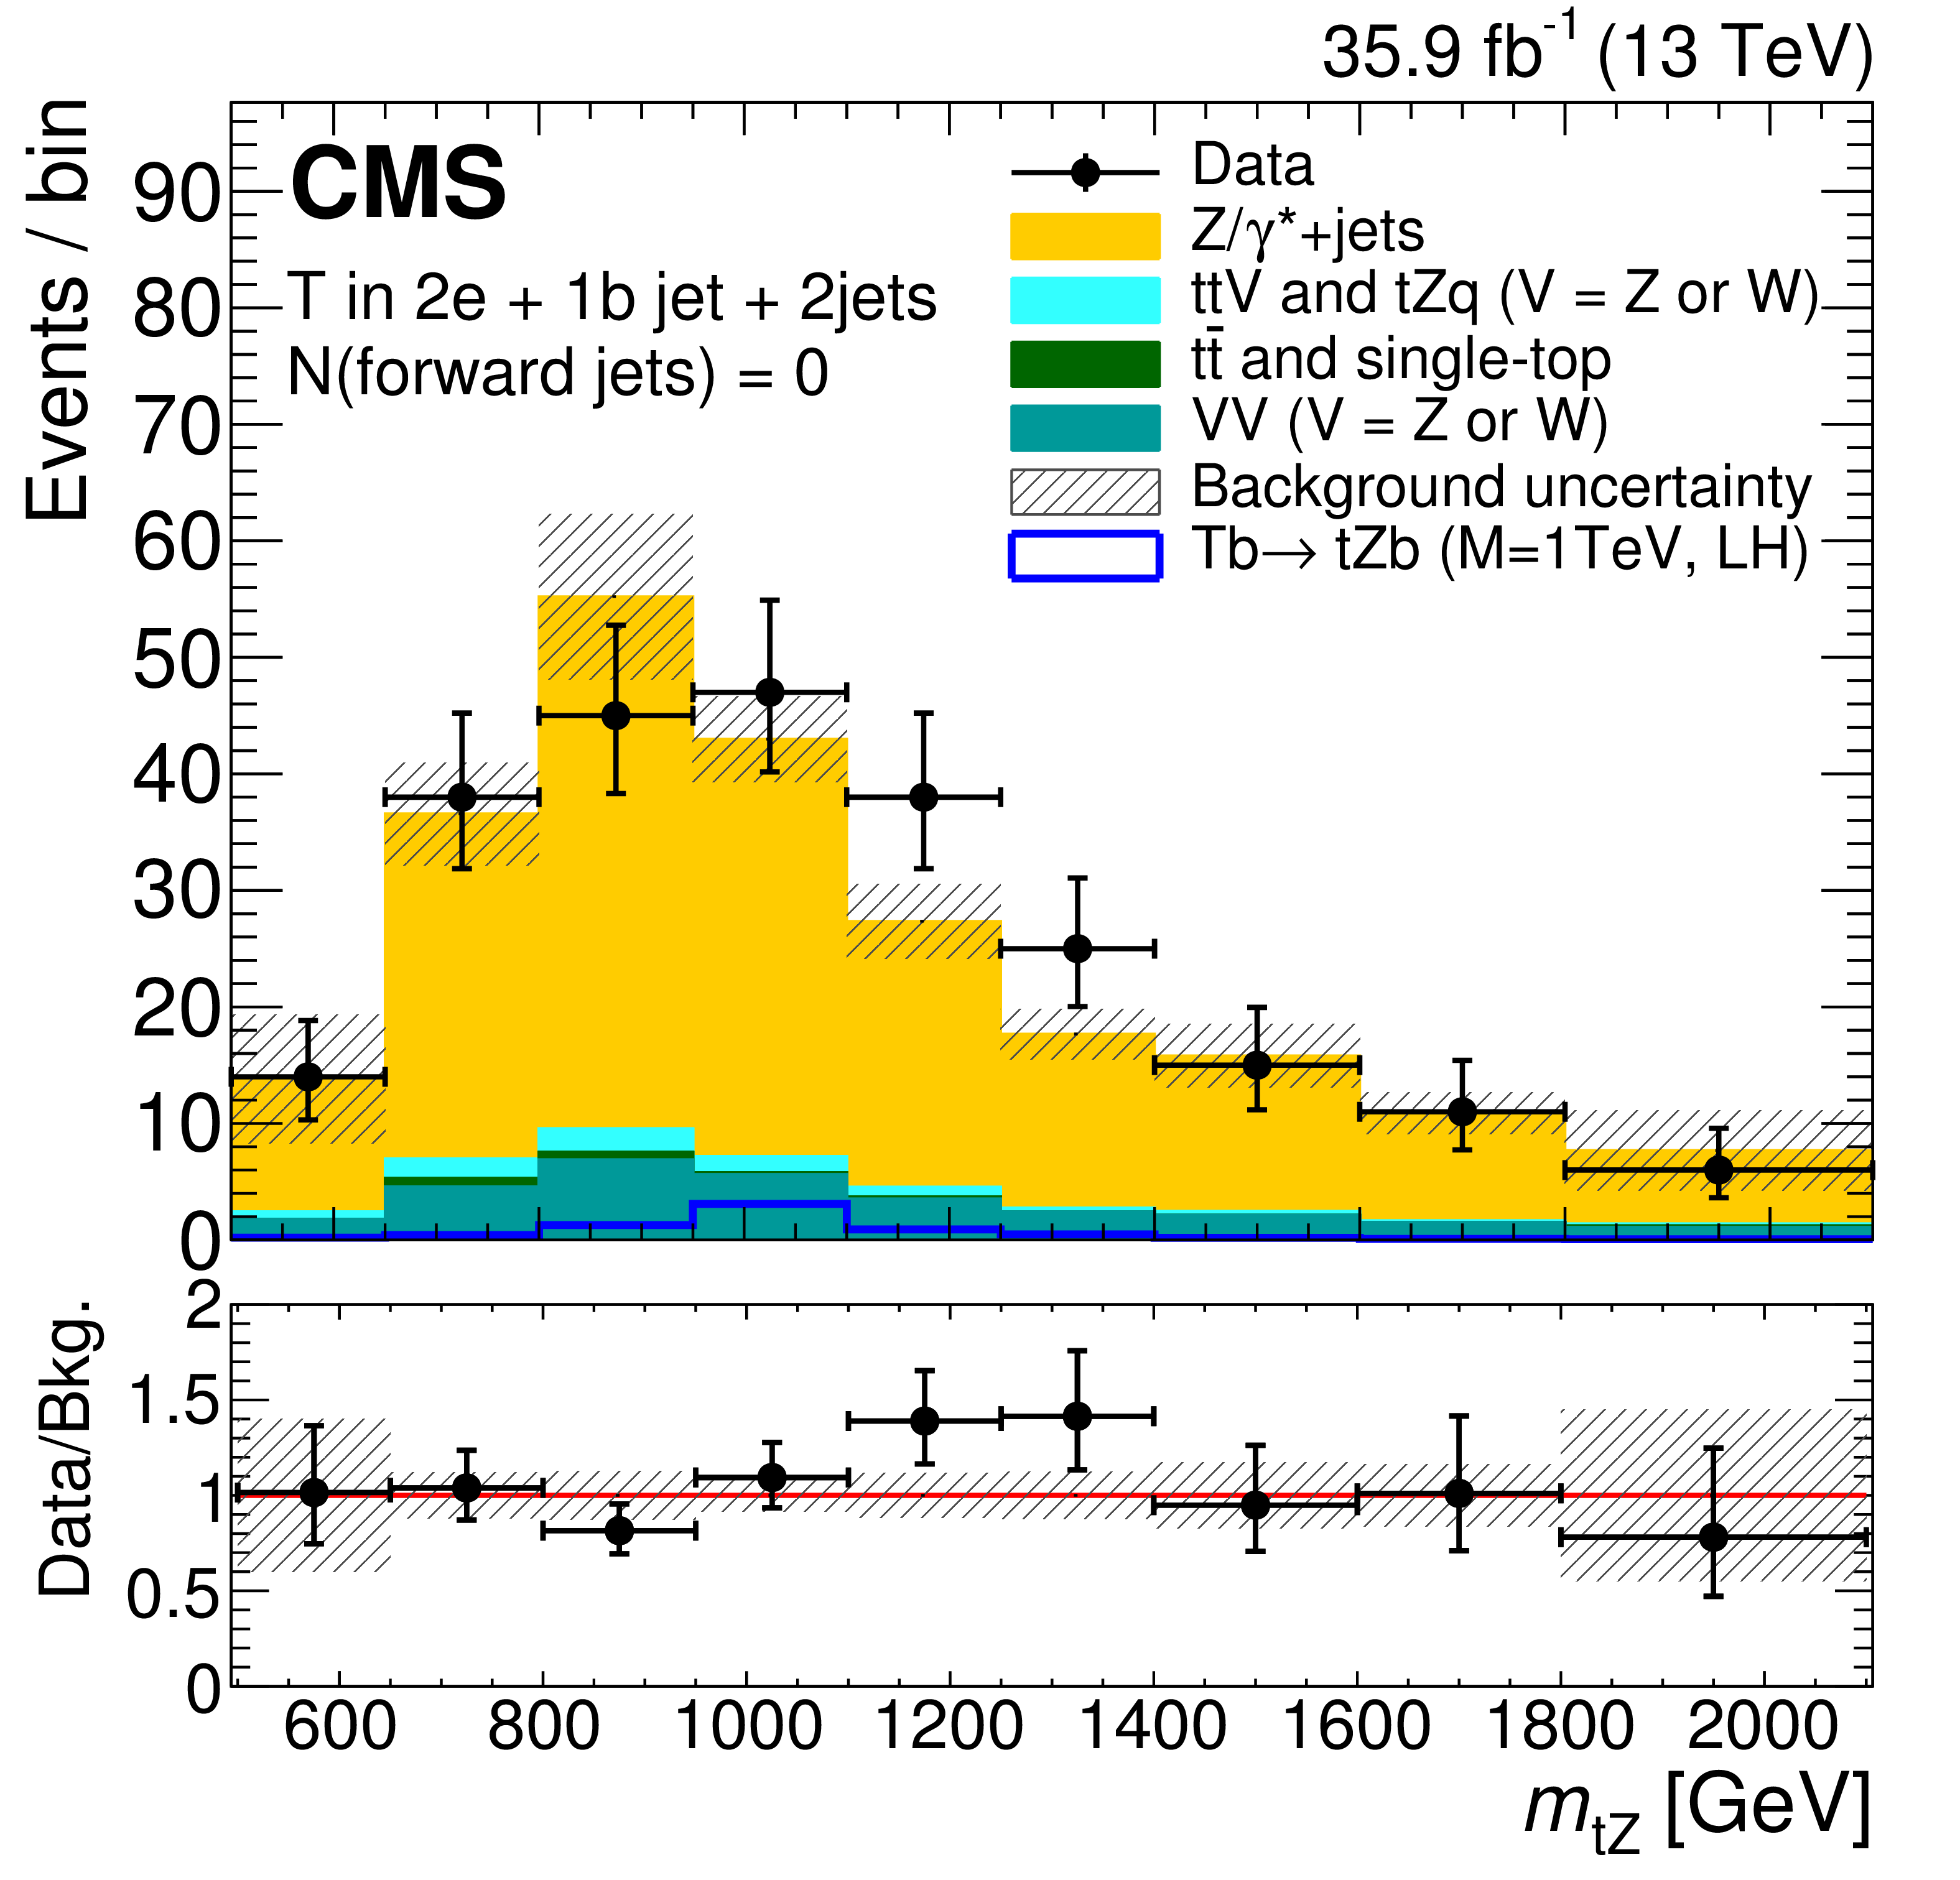
Comparison between the data, the background estimate, and the expected signal for the 4 categories where the T quark is reconstructed in the partially merged topology, for events with the Z boson decaying into muons (left) and electrons (right), and zero (at least one) forward jets in the upper (lower) row. The background composition is taken from simulation. The uncertainties in the background estimate include both statistical and systematic components. The lower panel in each plot shows the ratio of the data and the background estimation, with the shaded band representing the uncertainties in the background estimate. The vertical bars for the data points show the Poisson errors associated with each bin, while the horizontal bars indicate the bin width. |
png pdf |
Figure 3-a:
Comparison between the data, the background estimate, and the expected signal for the 4 categories where the T quark is reconstructed in the partially merged topology, for events with the Z boson decaying into muons, and zero forward jet. The background composition is taken from simulation. The uncertainties in the background estimate include both statistical and systematic components. The lower panel shows the ratio of the data and the background estimation, with the shaded band representing the uncertainties in the background estimate. The vertical bars for the data points show the Poisson errors associated with each bin, while the horizontal bars indicate the bin width. |
png pdf |
Figure 3-b:
Comparison between the data, the background estimate, and the expected signal for the 4 categories where the T quark is reconstructed in the partially merged topology, for events with the Z boson decaying into electrons, and zero forward jet. The background composition is taken from simulation. The uncertainties in the background estimate include both statistical and systematic components. The lower panel shows the ratio of the data and the background estimation, with the shaded band representing the uncertainties in the background estimate. The vertical bars for the data points show the Poisson errors associated with each bin, while the horizontal bars indicate the bin width. |
png pdf |
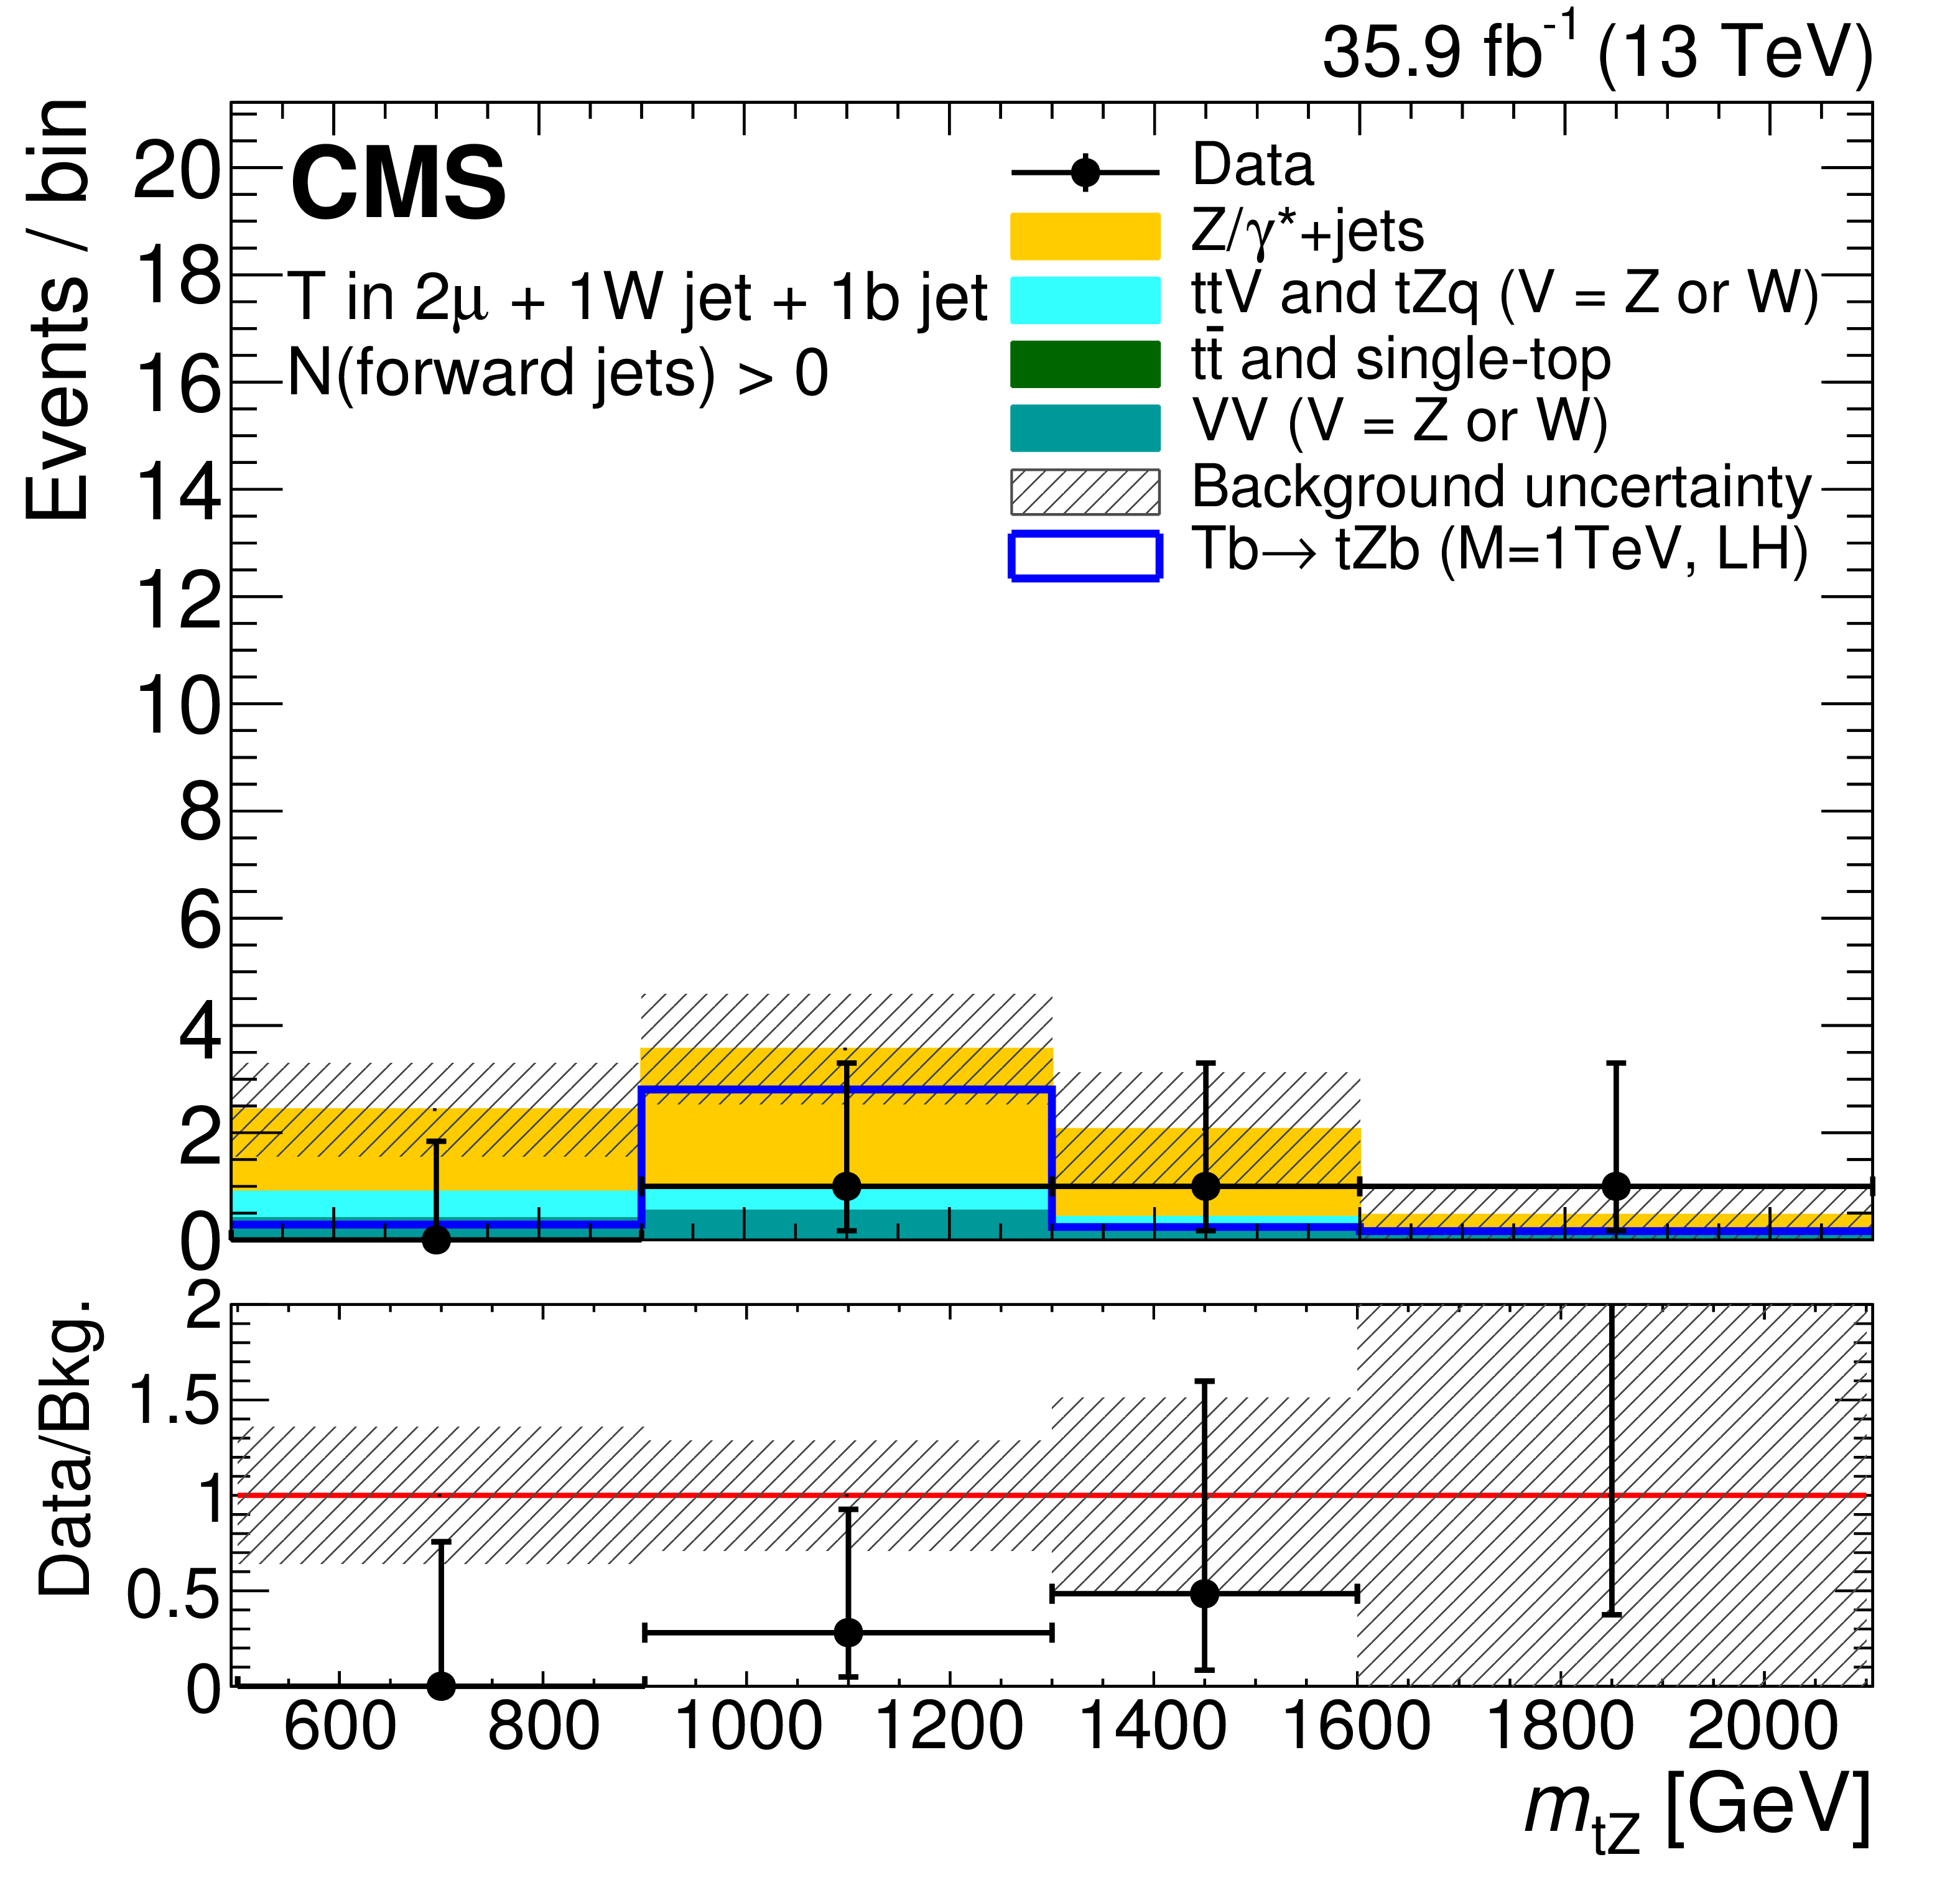
Figure 3-c:
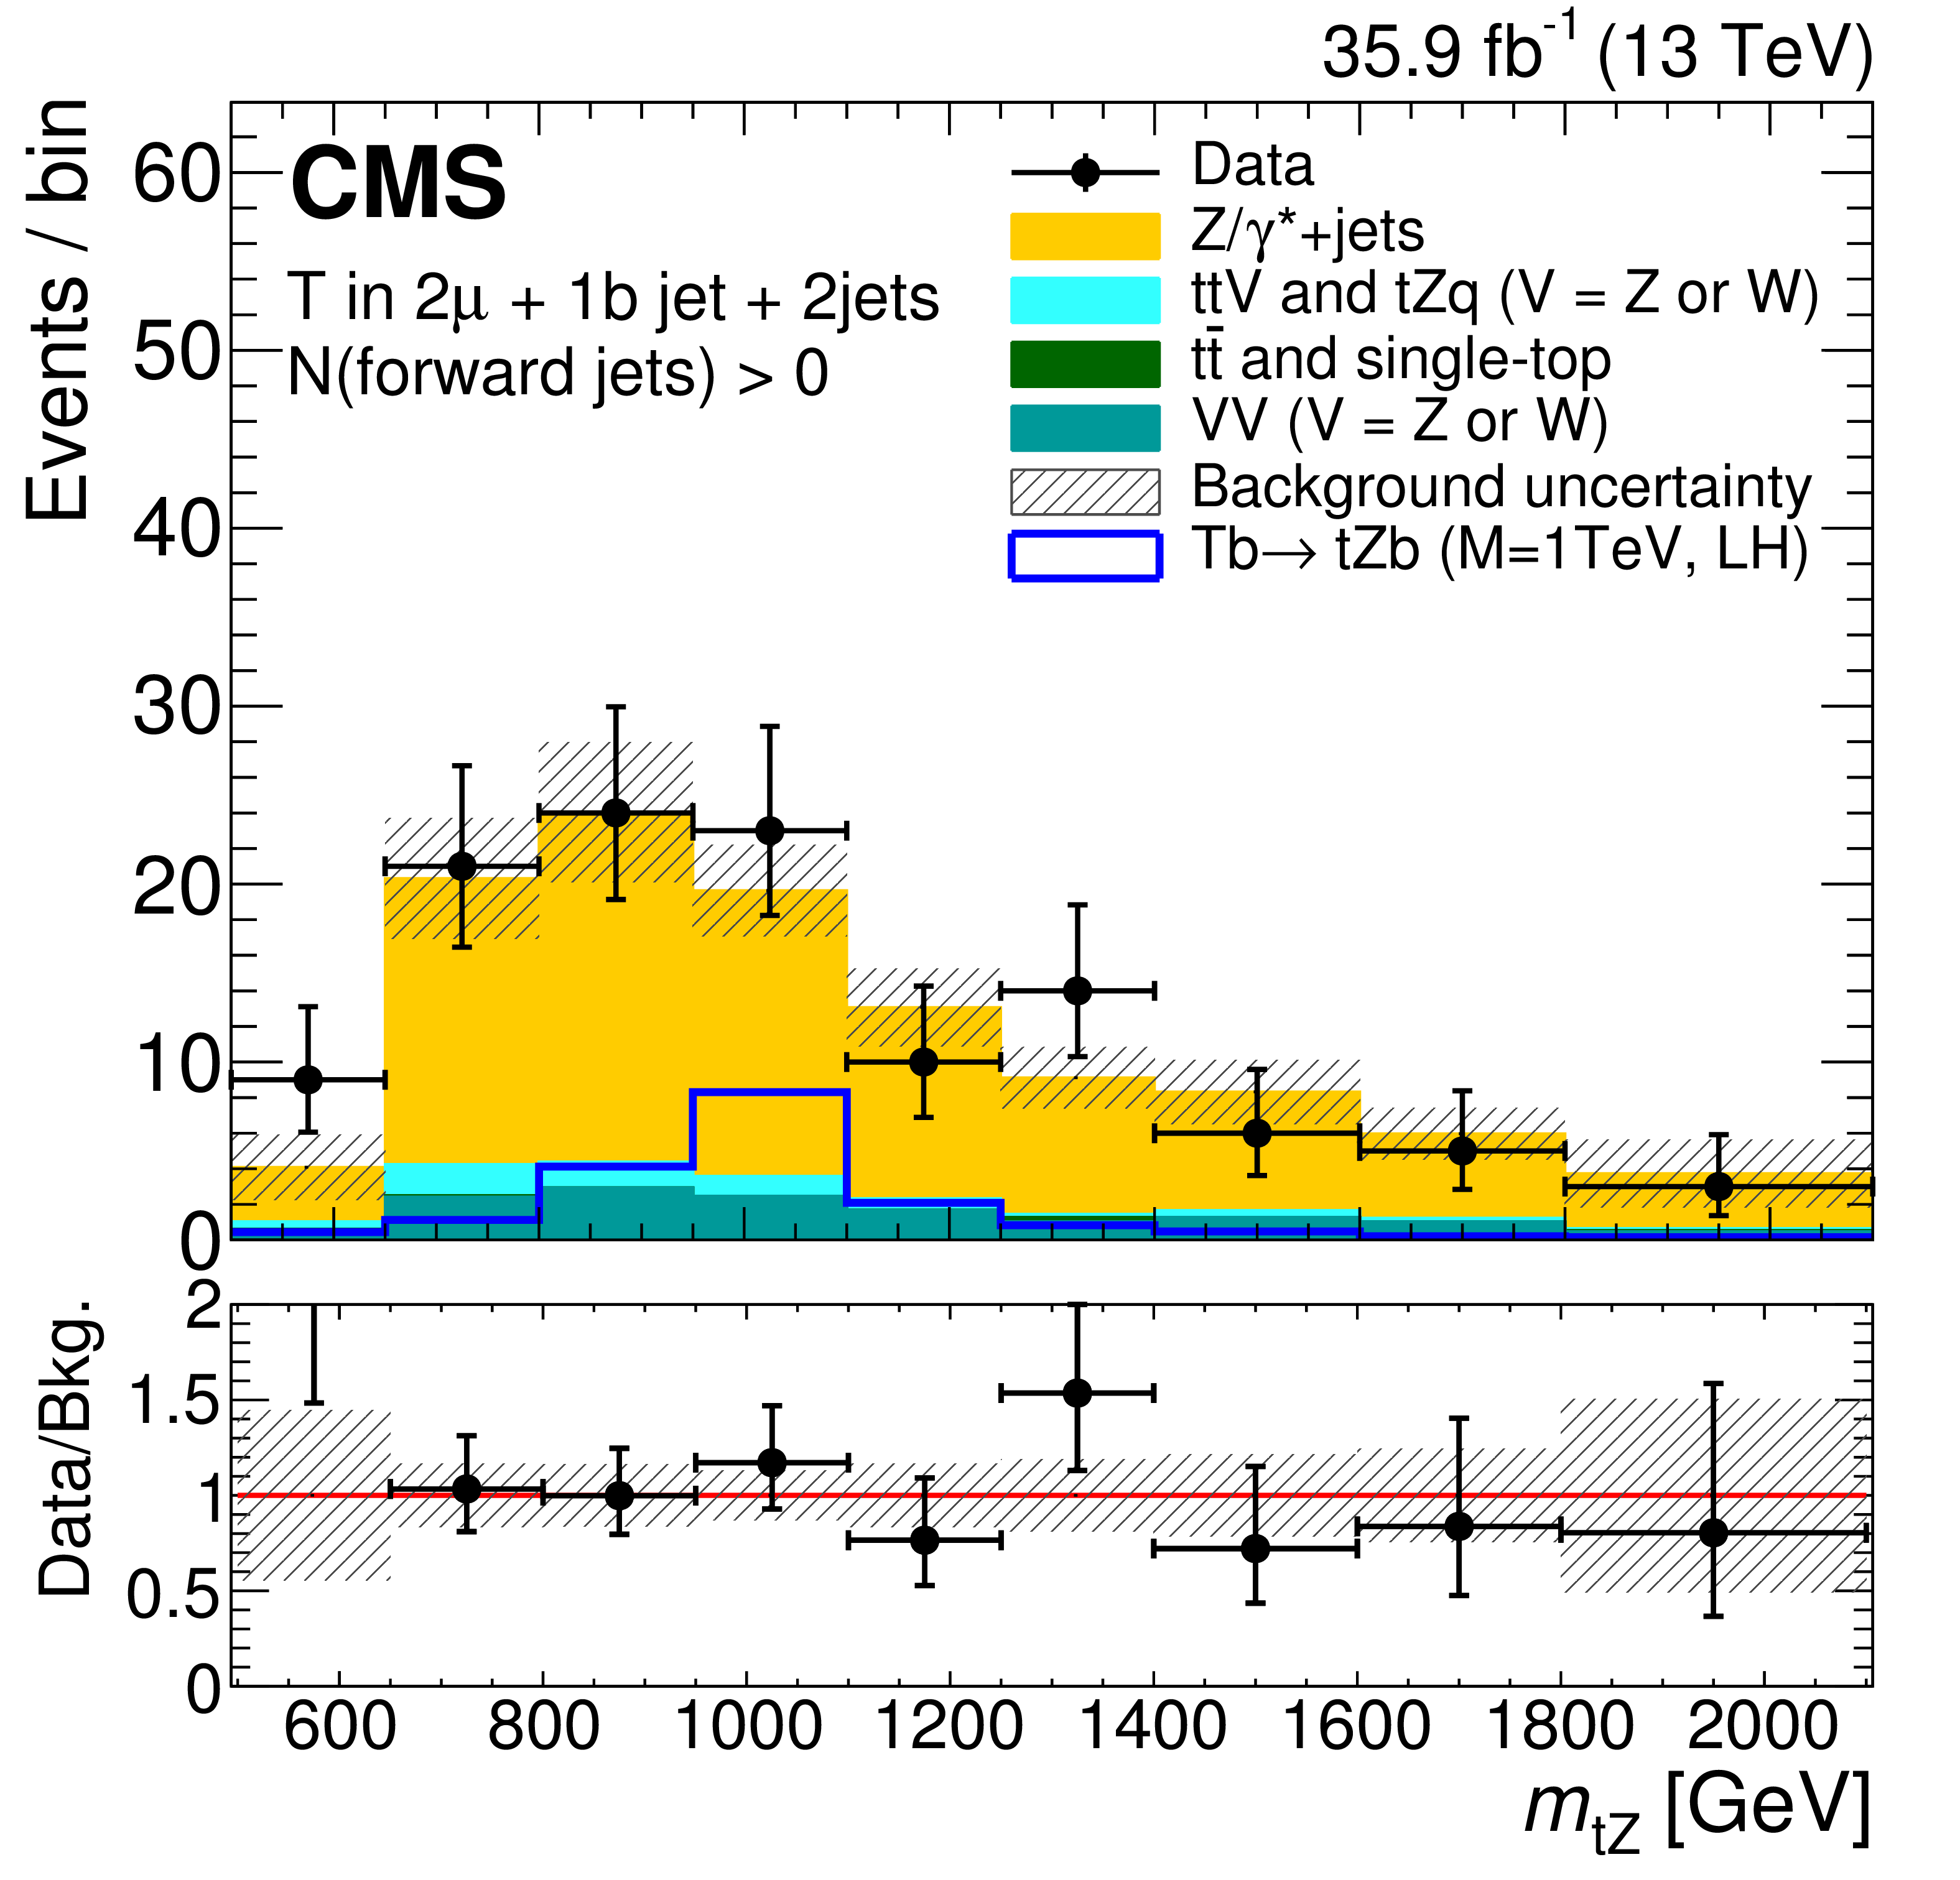
Comparison between the data, the background estimate, and the expected signal for the 4 categories where the T quark is reconstructed in the partially merged topology, for events with the Z boson decaying into muons, and at least one forward jet. The background composition is taken from simulation. The uncertainties in the background estimate include both statistical and systematic components. The lower panel shows the ratio of the data and the background estimation, with the shaded band representing the uncertainties in the background estimate. The vertical bars for the data points show the Poisson errors associated with each bin, while the horizontal bars indicate the bin width. |
png pdf |
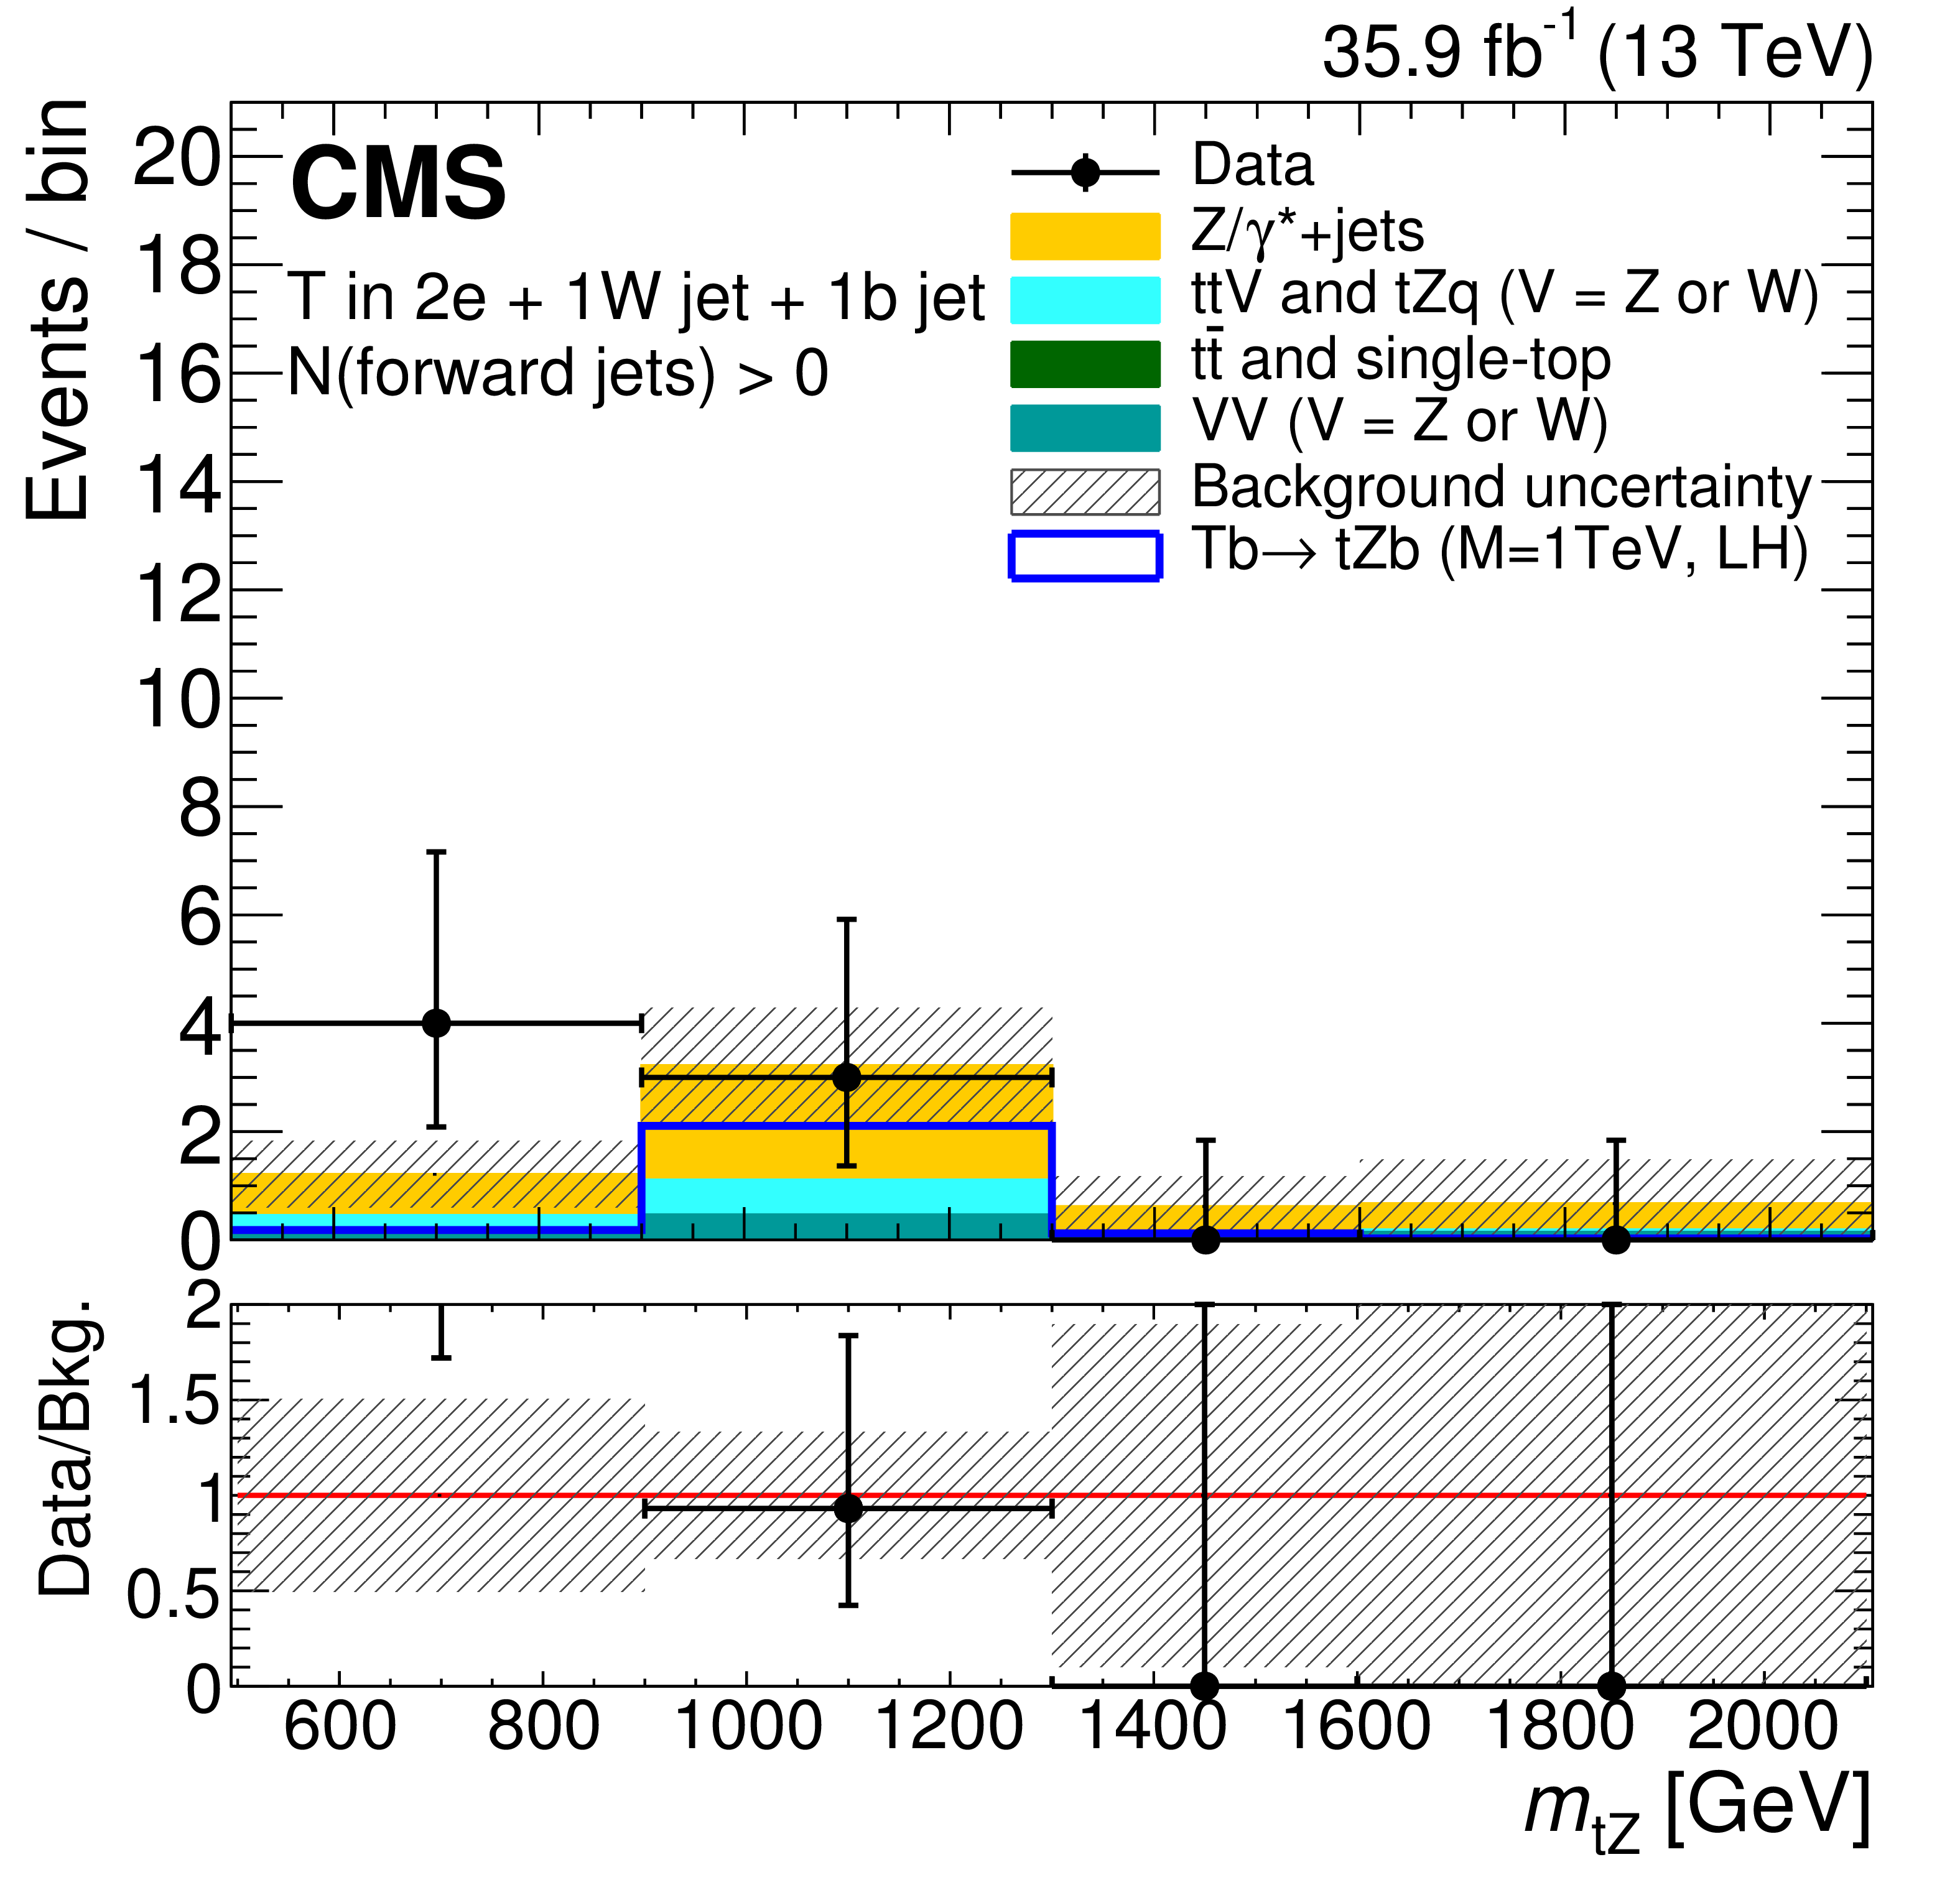
Figure 3-d:
Comparison between the data, the background estimate, and the expected signal for the 4 categories where the T quark is reconstructed in the partially merged topology, for events with the Z boson decaying into electrons, and at least one forward jet. The background composition is taken from simulation. The uncertainties in the background estimate include both statistical and systematic components. The lower panel shows the ratio of the data and the background estimation, with the shaded band representing the uncertainties in the background estimate. The vertical bars for the data points show the Poisson errors associated with each bin, while the horizontal bars indicate the bin width. |

png pdf |
Figure 4:
Comparison between the data, the background estimate, and the expected signal for the 4 categories where the T quark is reconstructed in the resolved topology, for events with the Z boson decaying into muons (left) and electrons (right), and zero (at least one) forward jets in the upper (lower) row. The background composition is taken from simulation. The uncertainties in the background estimate include both statistical and systematic components. The lower panel in each plot shows the ratio of the data and the background estimation, with the shaded band representing the uncertainties in the background estimate. The vertical bars for the data points show the Poisson errors associated with each bin, while the horizontal bars indicate the bin width. |
png pdf |
Figure 4-a:
Comparison between the data, the background estimate, and the expected signal for the 4 categories where the T quark is reconstructed in the resolved topology, for events with the Z boson decaying into muons, and zero forward jet. The background composition is taken from simulation. The uncertainties in the background estimate include both statistical and systematic components. The lower panel shows the ratio of the data and the background estimation, with the shaded band representing the uncertainties in the background estimate. The vertical bars for the data points show the Poisson errors associated with each bin, while the horizontal bars indicate the bin width. |
png pdf |
Figure 4-b:
Comparison between the data, the background estimate, and the expected signal for the 4 categories where the T quark is reconstructed in the resolved topology, for events with the Z boson decaying into electrons, and zero forward jet. The background composition is taken from simulation. The uncertainties in the background estimate include both statistical and systematic components. The lower panel shows the ratio of the data and the background estimation, with the shaded band representing the uncertainties in the background estimate. The vertical bars for the data points show the Poisson errors associated with each bin, while the horizontal bars indicate the bin width. |
png pdf |
Figure 4-c:
Comparison between the data, the background estimate, and the expected signal for the 4 categories where the T quark is reconstructed in the resolved topology, for events with the Z boson decaying into muons, and at least one forward jet. The background composition is taken from simulation. The uncertainties in the background estimate include both statistical and systematic components. The lower panel shows the ratio of the data and the background estimation, with the shaded band representing the uncertainties in the background estimate. The vertical bars for the data points show the Poisson errors associated with each bin, while the horizontal bars indicate the bin width. |

png pdf |
Figure 4-d:
Comparison between the data, the background estimate, and the expected signal for the 4 categories where the T quark is reconstructed in the resolved topology, for events with the Z boson decaying into electrons, and at least one forward jet. The background composition is taken from simulation. The uncertainties in the background estimate include both statistical and systematic components. The lower panel shows the ratio of the data and the background estimation, with the shaded band representing the uncertainties in the background estimate. The vertical bars for the data points show the Poisson errors associated with each bin, while the horizontal bars indicate the bin width. |
png pdf |
Figure 5:
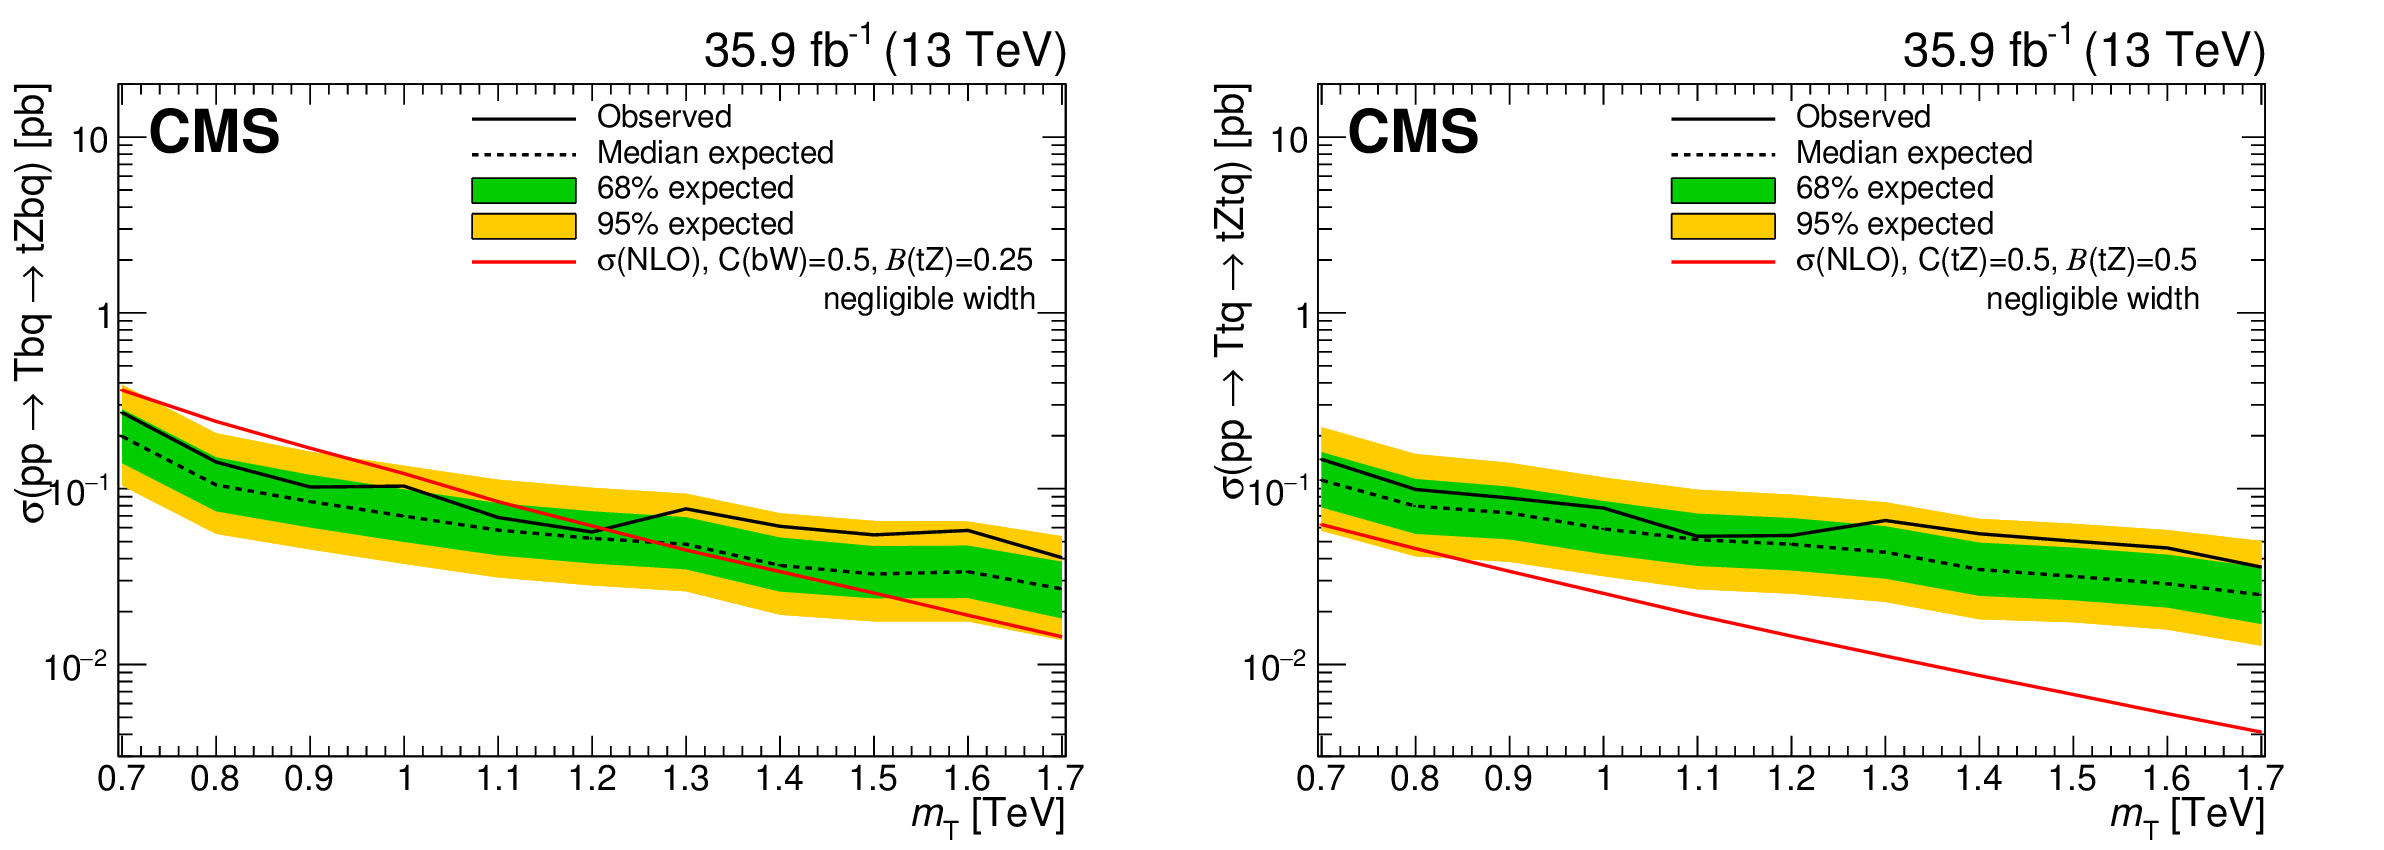
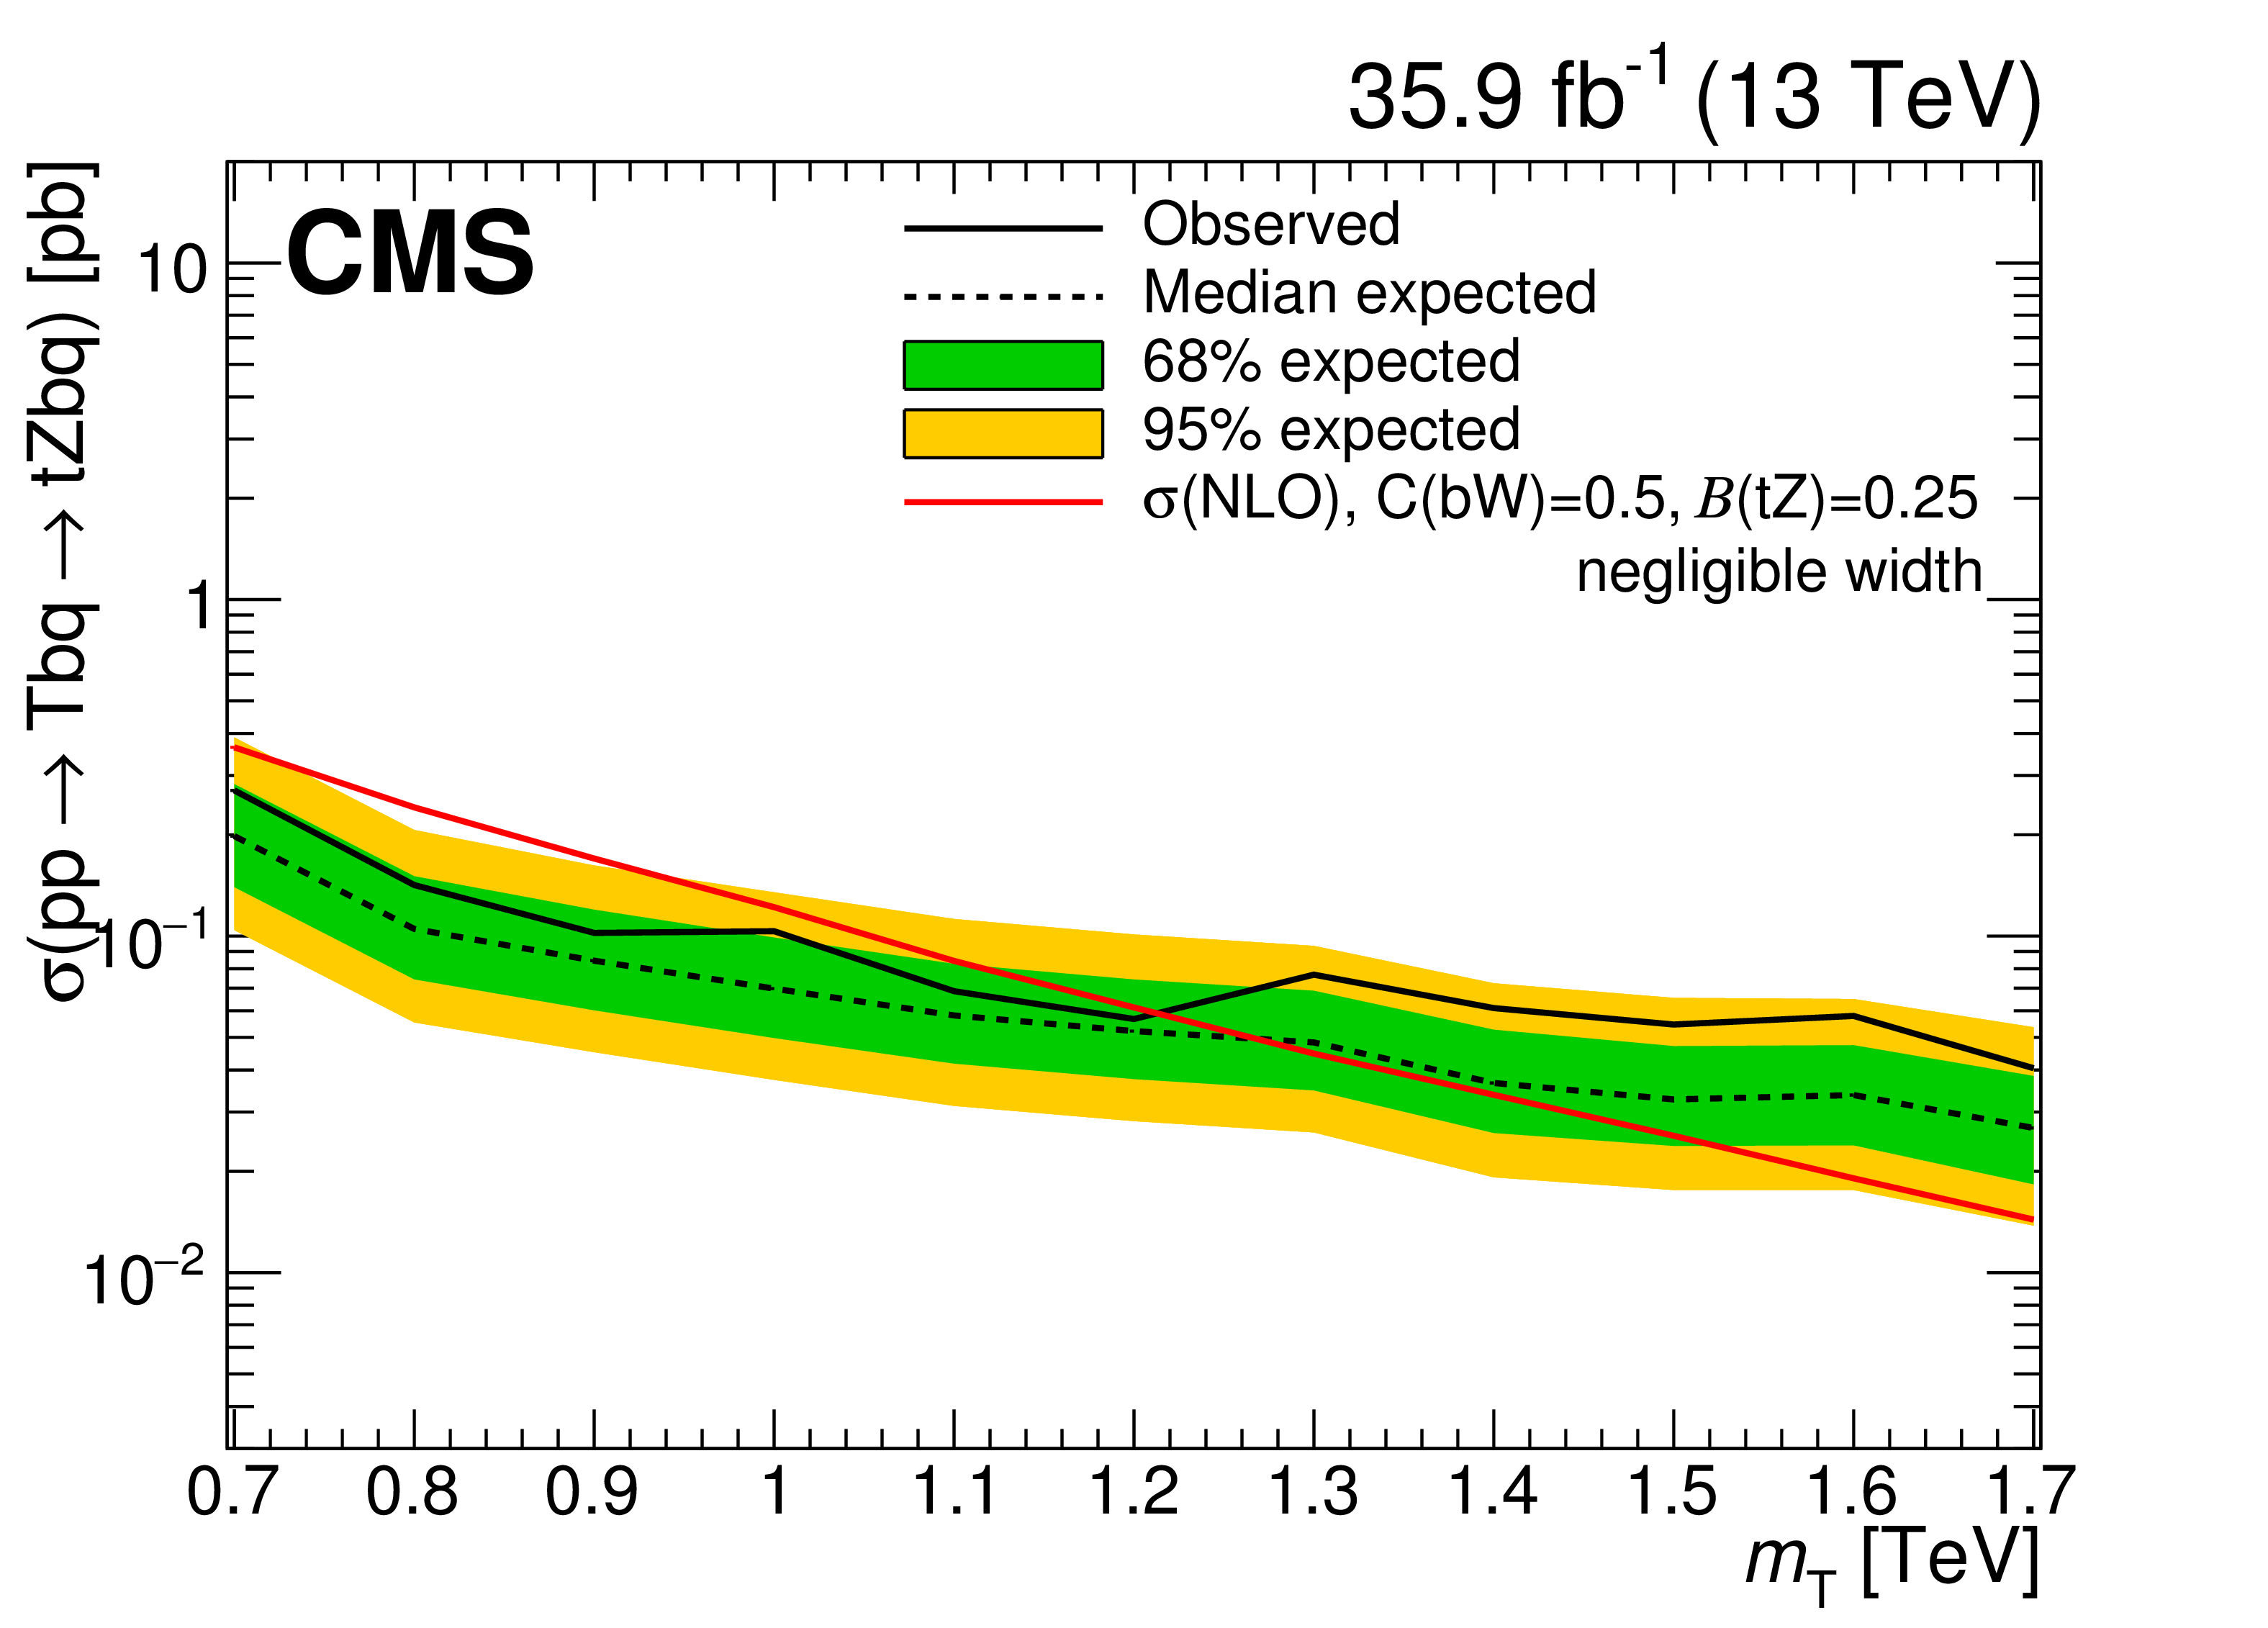
Observed and expected limits at 95% CL on the product of the single production cross section and branching fraction for the singlet LH T quark produced in association with a b quark (left) and for the doublet RH T quark produced in association with a t quark (right), where the T quark has a narrow width and decays to tZ. The inner green and outer yellow bands represent the 1 and 2 standard deviation uncertainties in the expected limit. The red lines indicate theoretical cross sections, as calculated at next-to-leading order in Ref. [4]. The branching fraction $\mathcal {B}$(T$\rightarrow $ tZ) is 0.25 (0.5) for the left (right) plot. |
png pdf |
Figure 5-a:
Observed and expected limits at 95% CL on the product of the single production cross section and branching fraction for the singlet LH T quark produced in association with a b quark, where the T quark has a narrow width and decays to tZ. The inner green and outer yellow bands represent the 1 and 2 standard deviation uncertainties in the expected limit. The red lines indicate theoretical cross sections, as calculated at next-to-leading order in Ref. [4]. The branching fraction $\mathcal {B}$(T$\rightarrow $ tZ) is 0.25. |
png pdf |
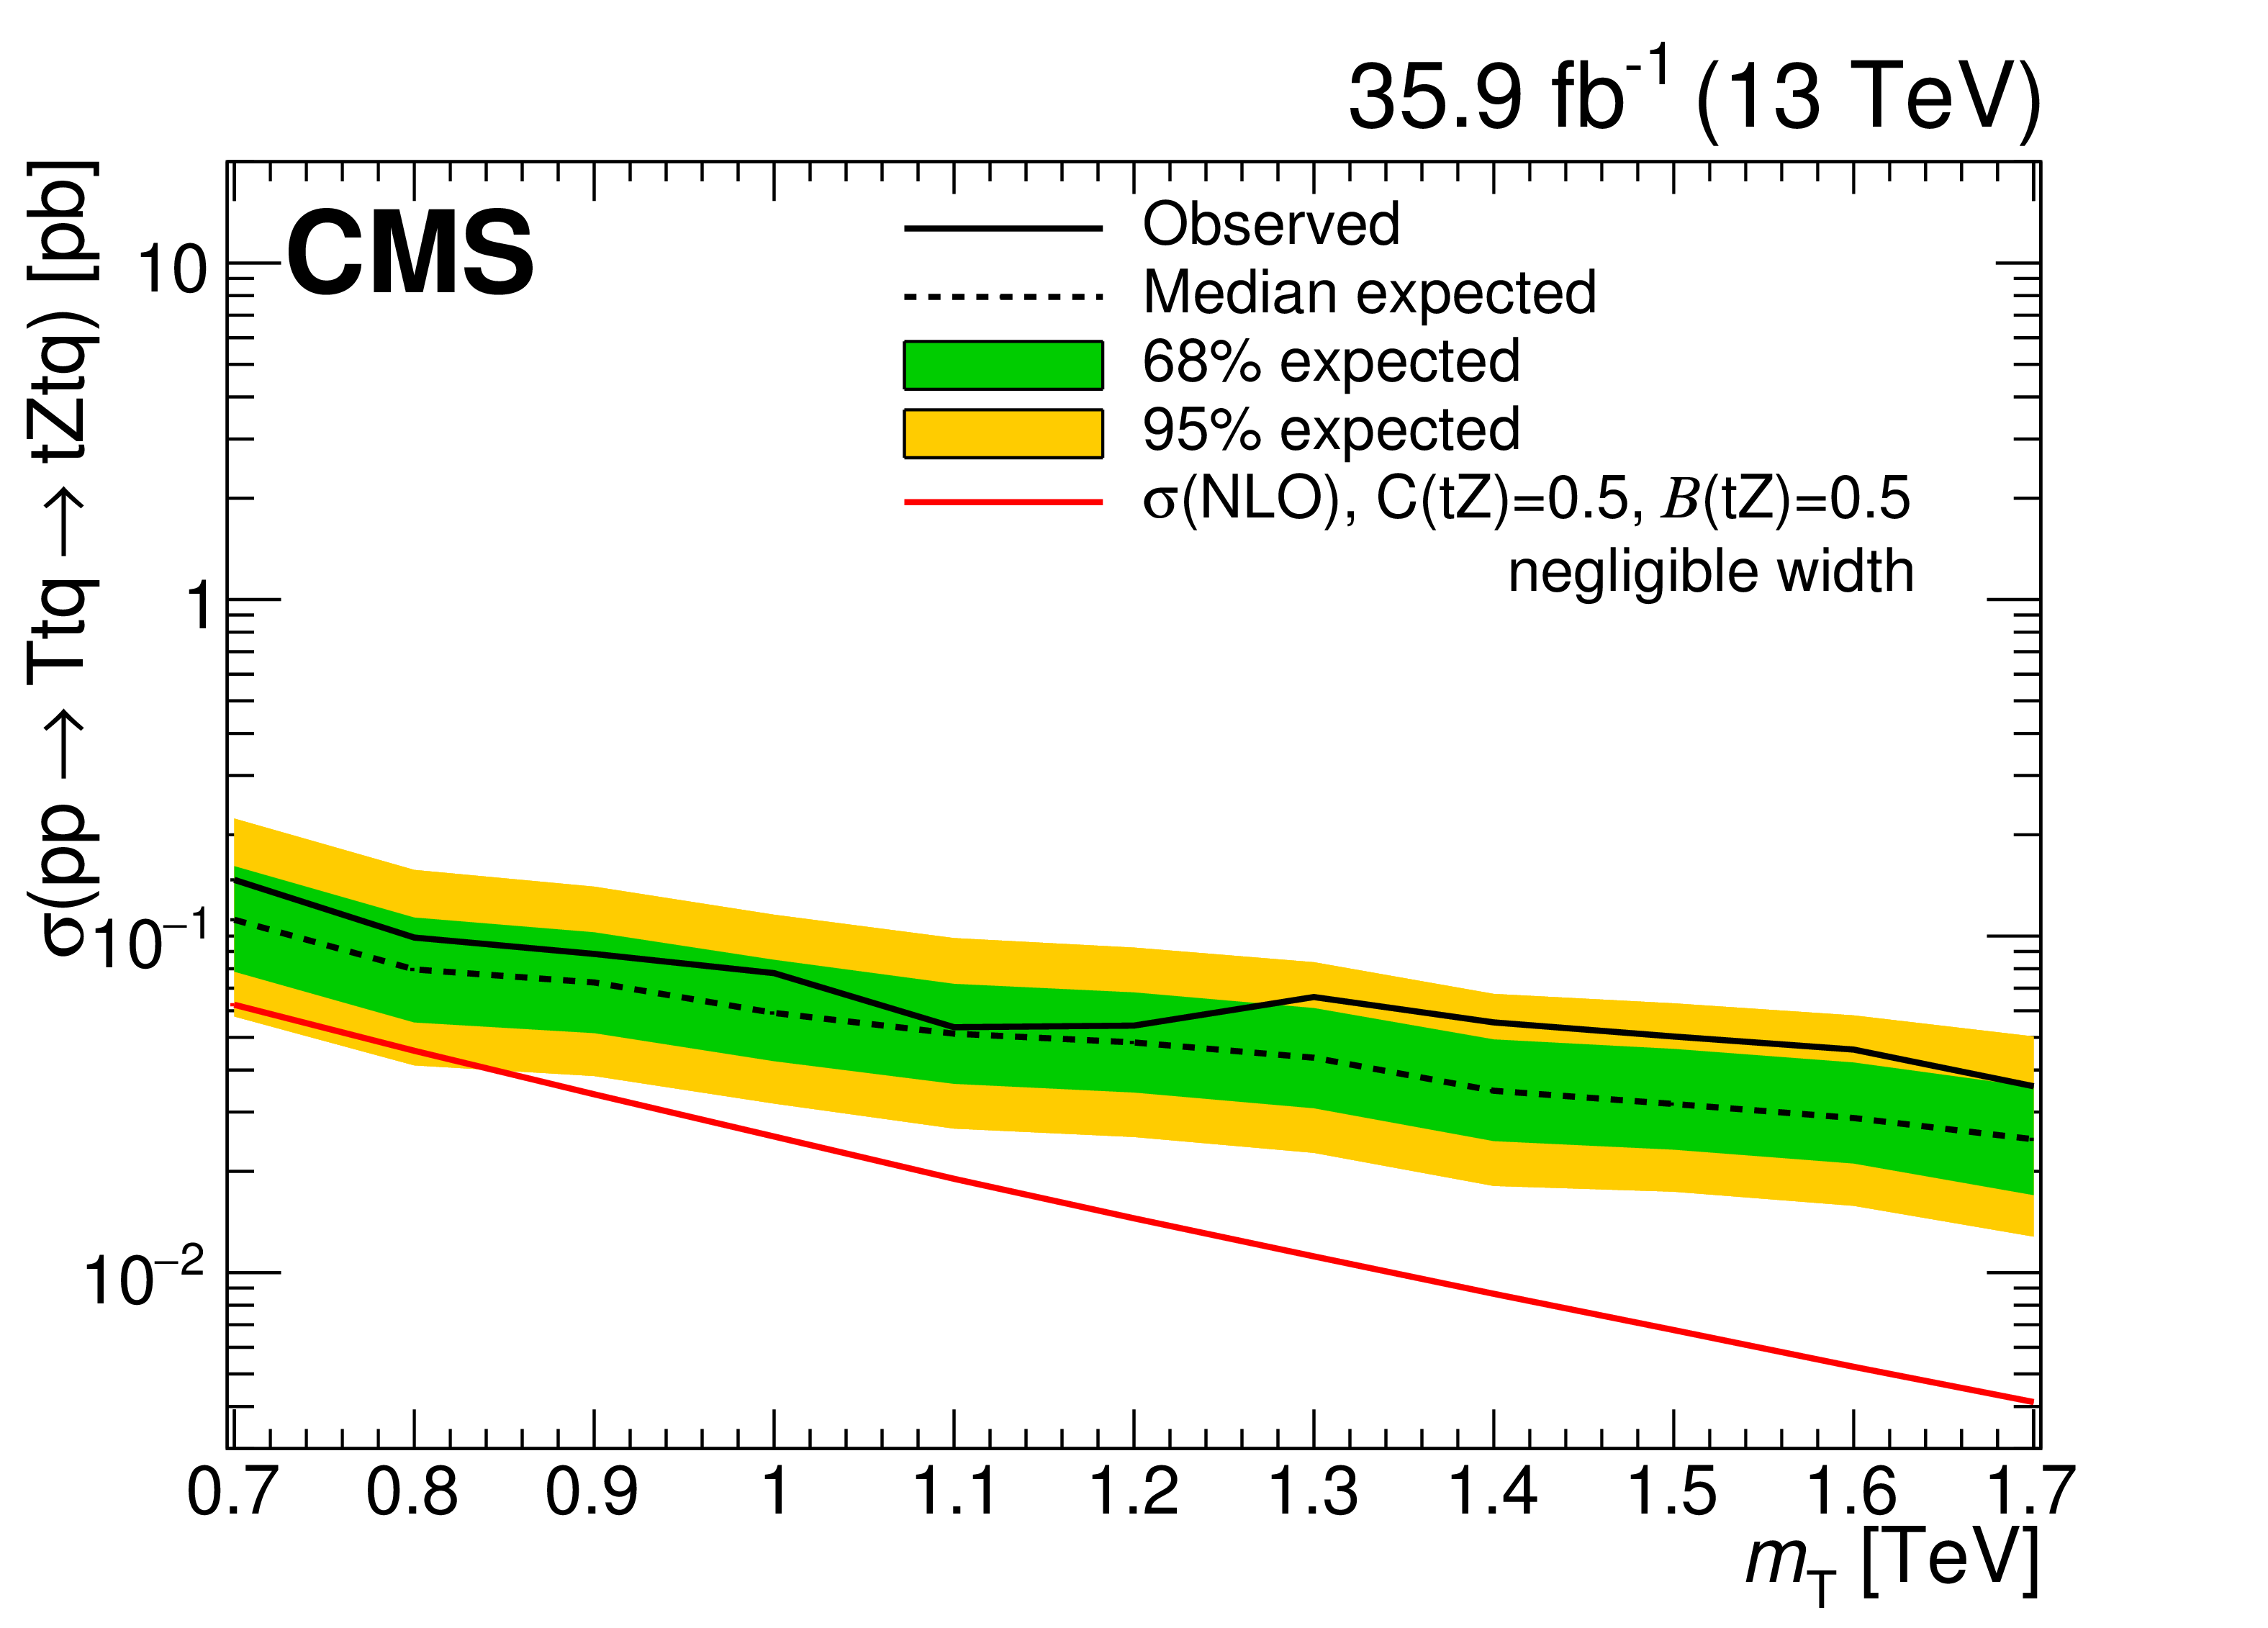
Figure 5-b:
Observed and expected limits at 95% CL on the product of the single production cross section and branching fraction for the doublet RH T quark produced in association with a t quark, where the T quark has a narrow width and decays to tZ. The inner green and outer yellow bands represent the 1 and 2 standard deviation uncertainties in the expected limit. The red lines indicate theoretical cross sections, as calculated at next-to-leading order in Ref. [4]. The branching fraction $\mathcal {B}$(T$\rightarrow $ tZ) is 0.5. |
png pdf |
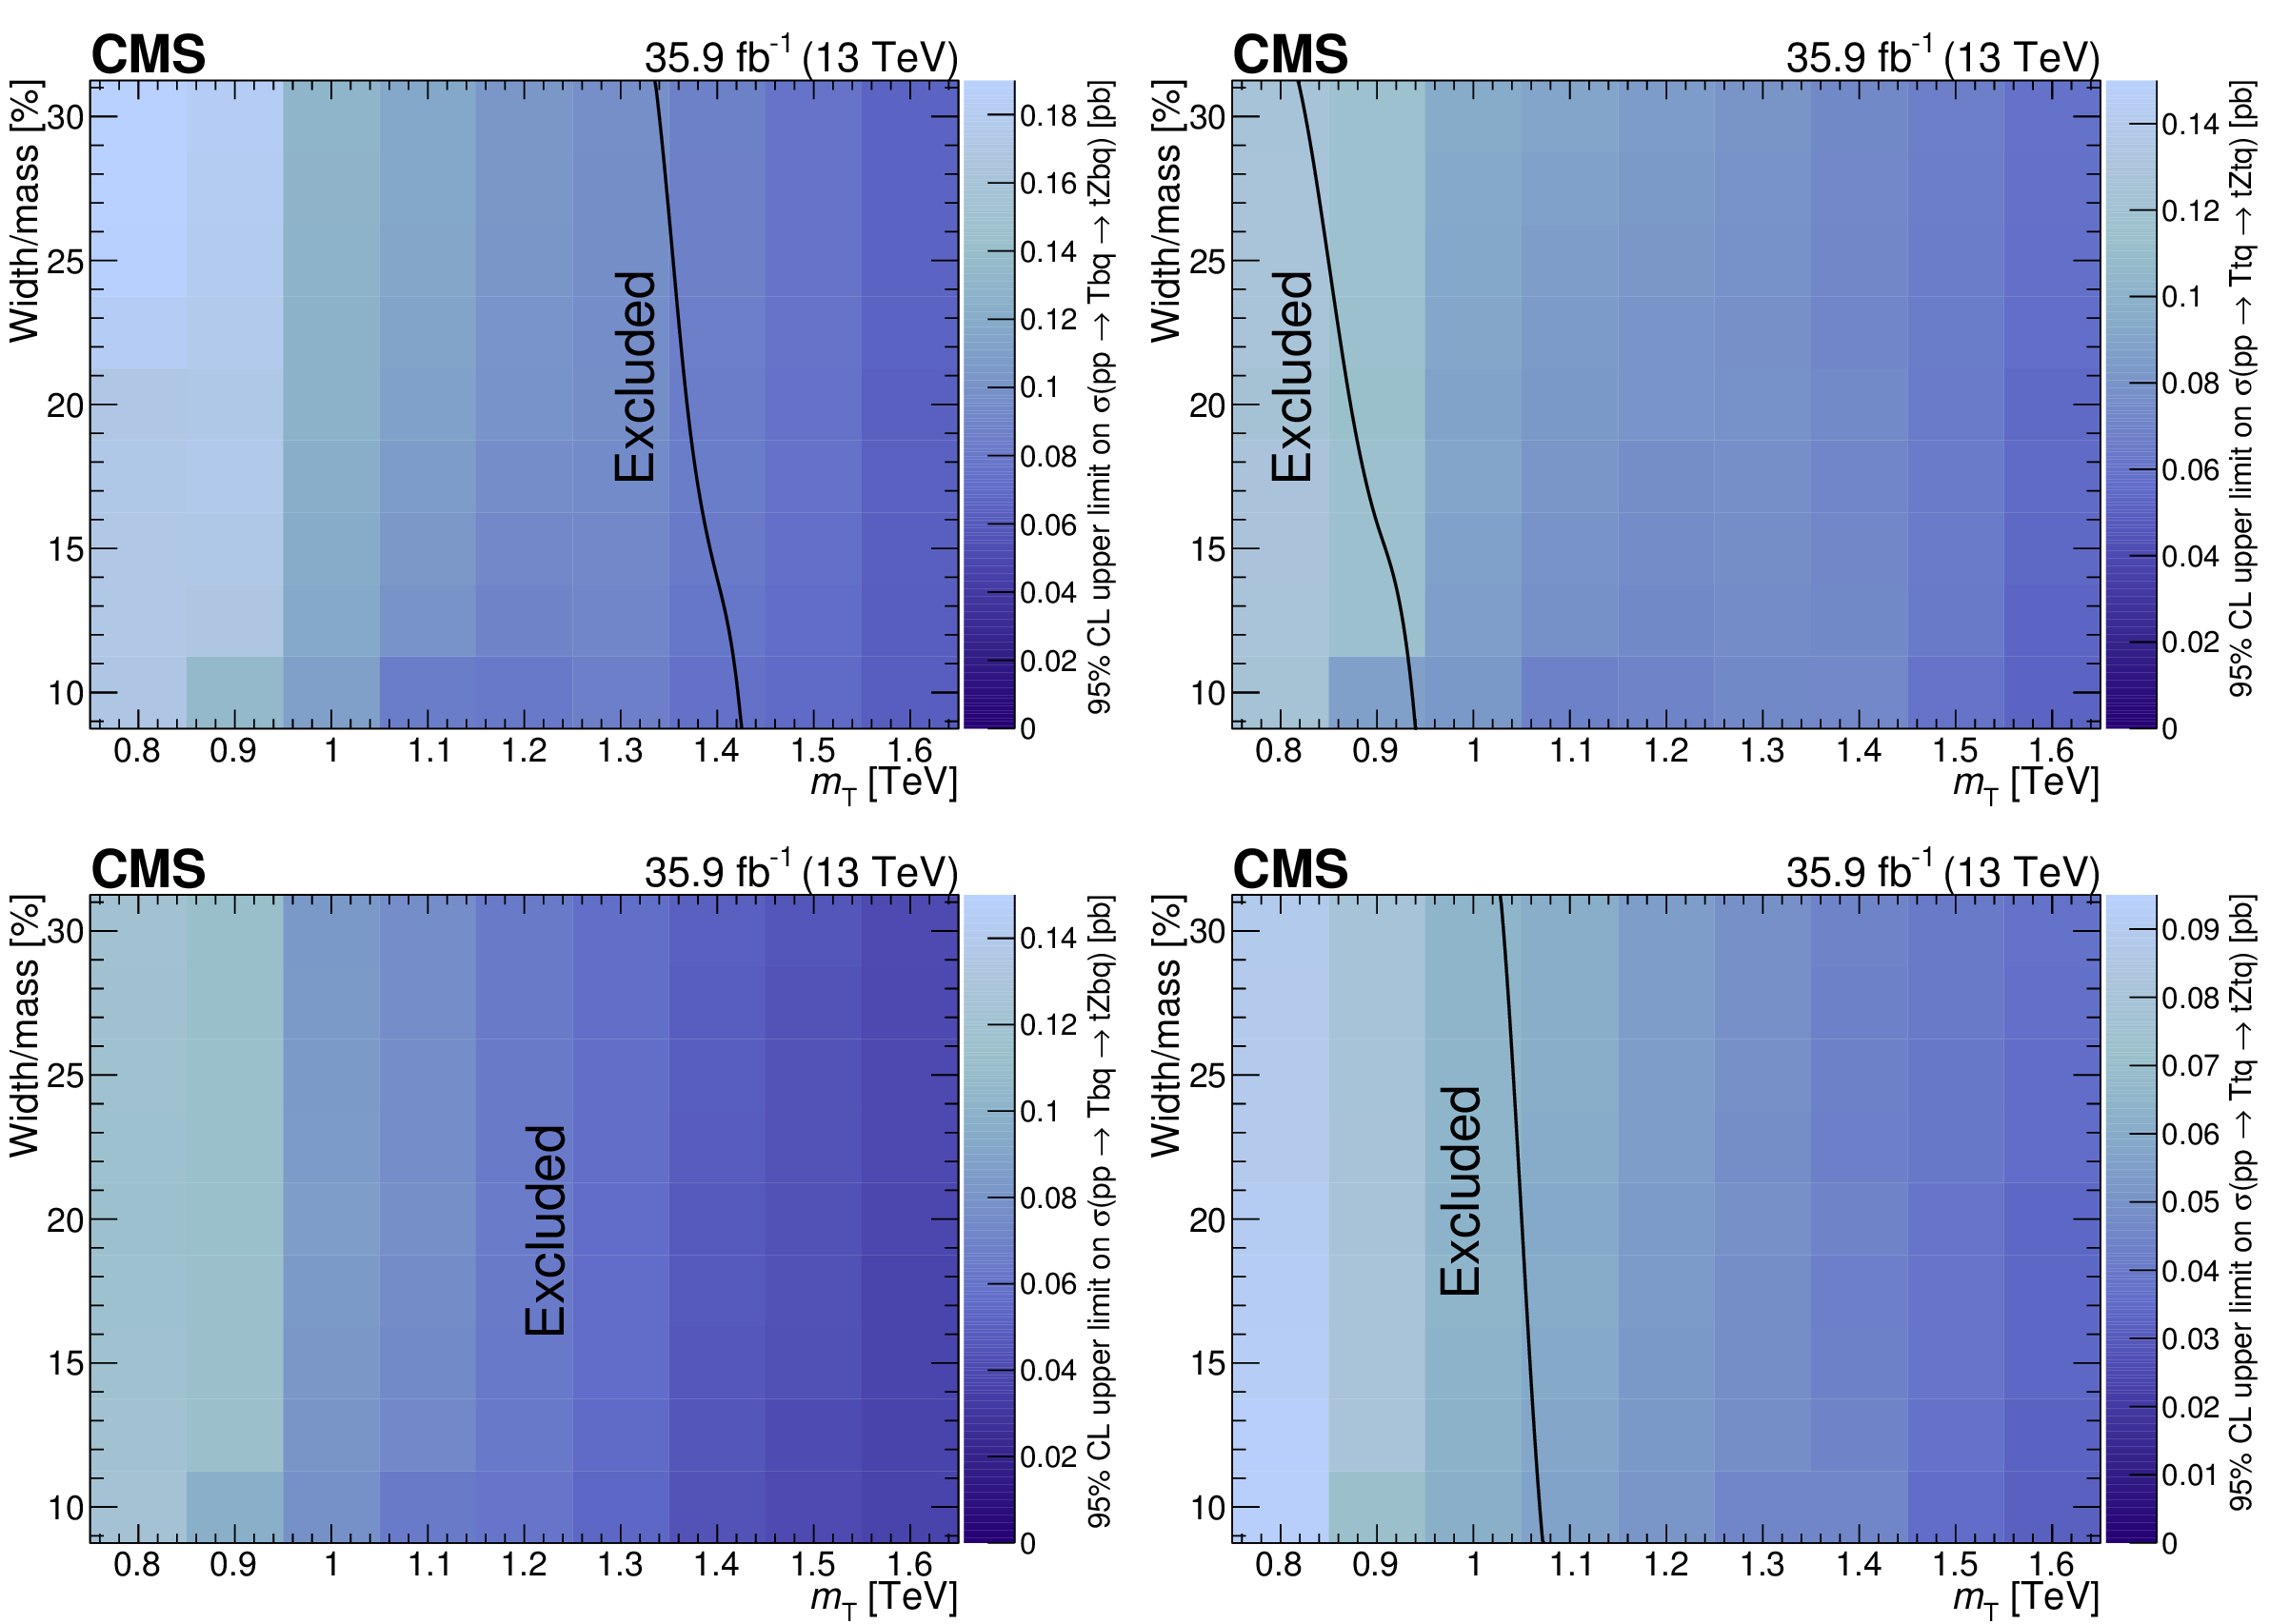
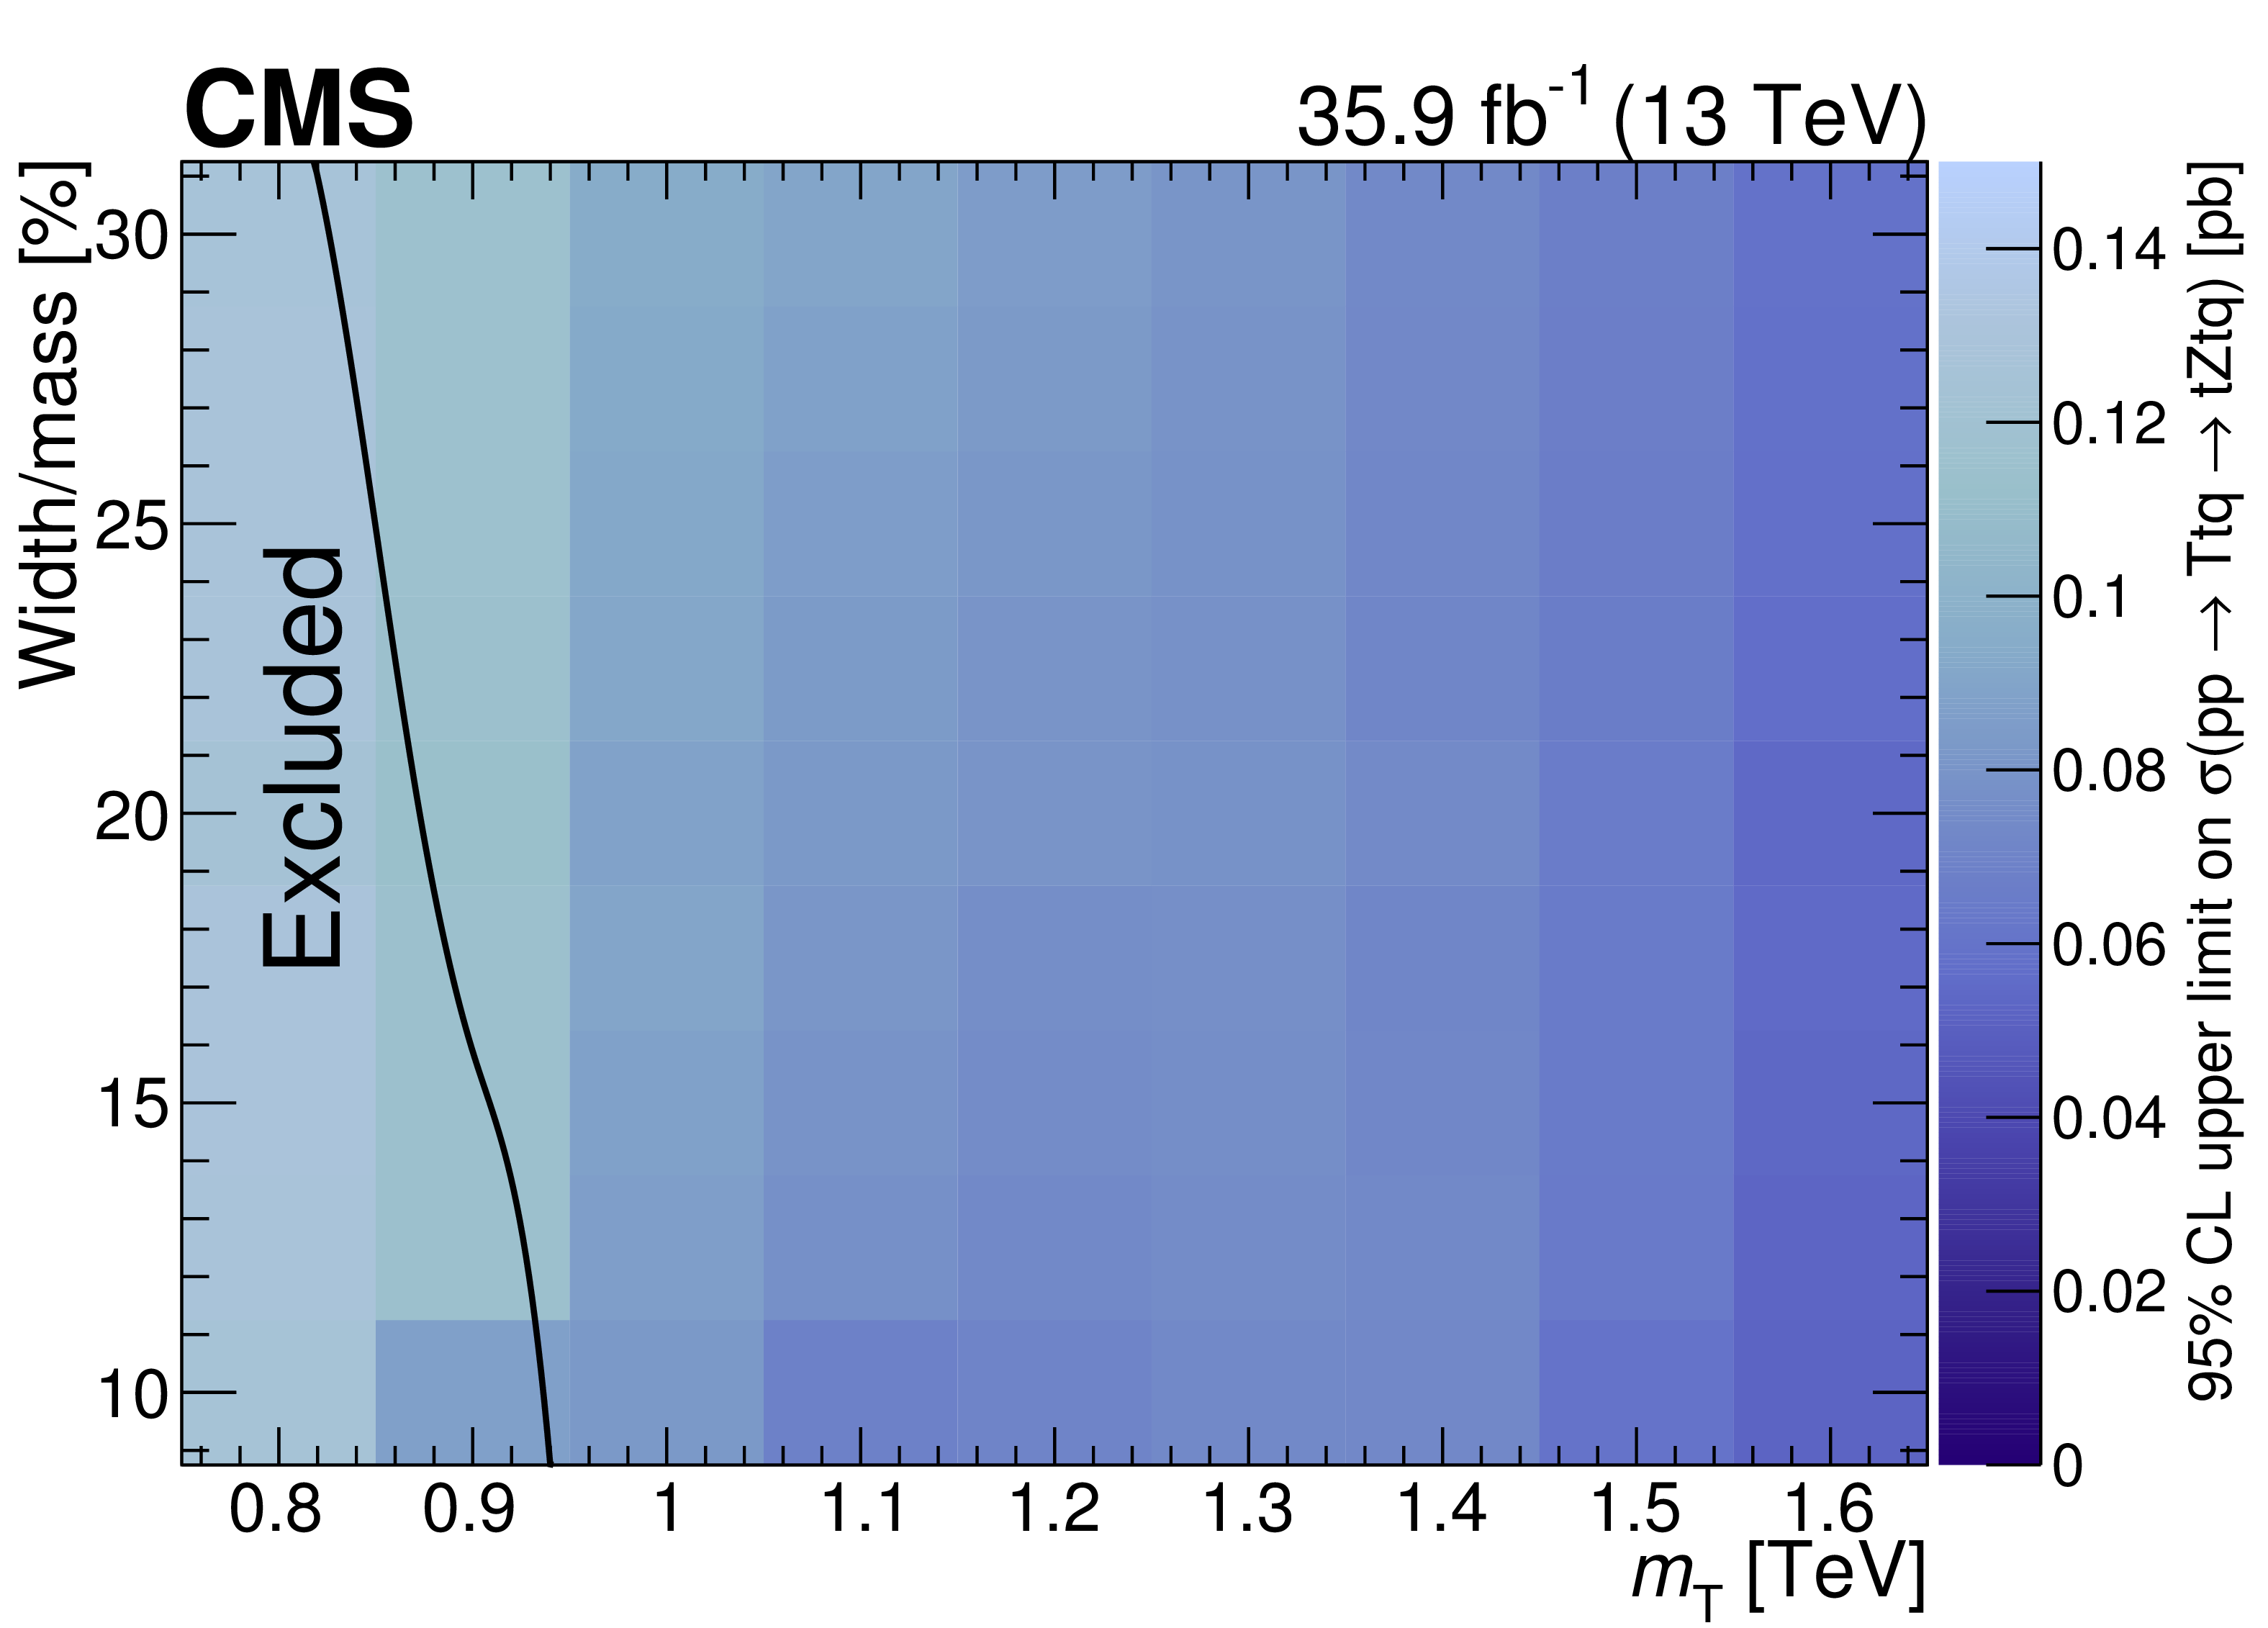
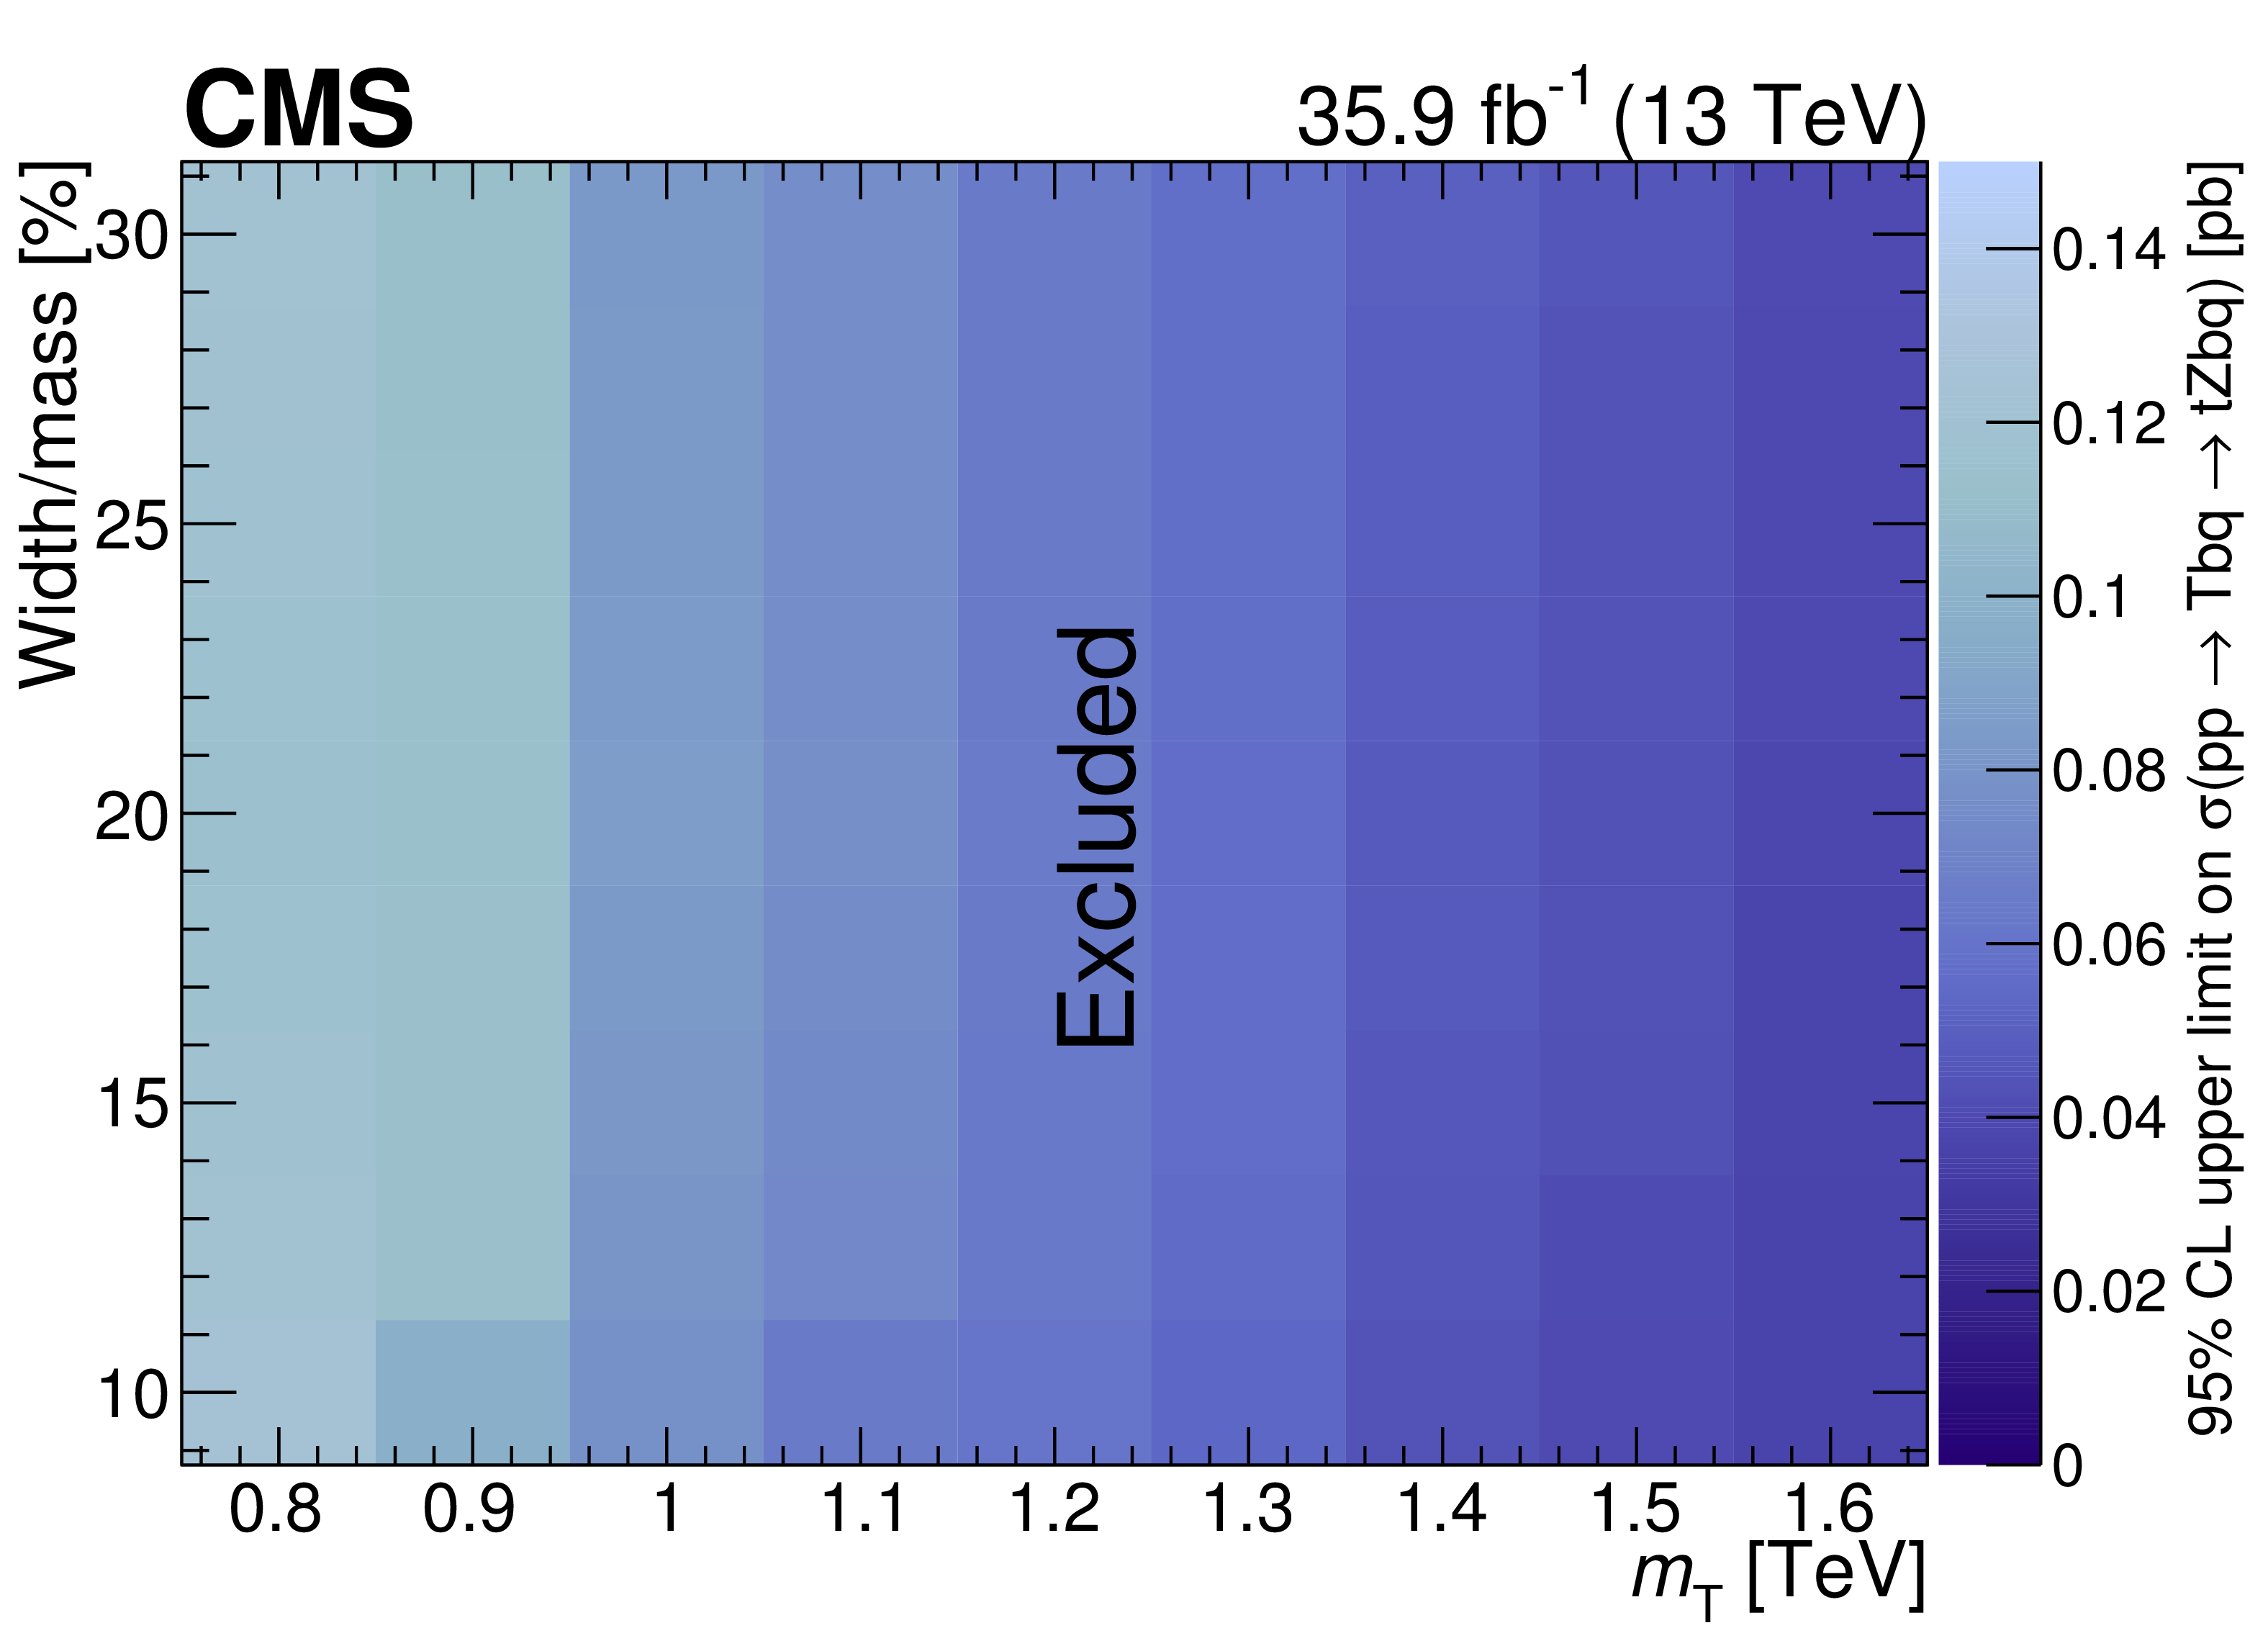
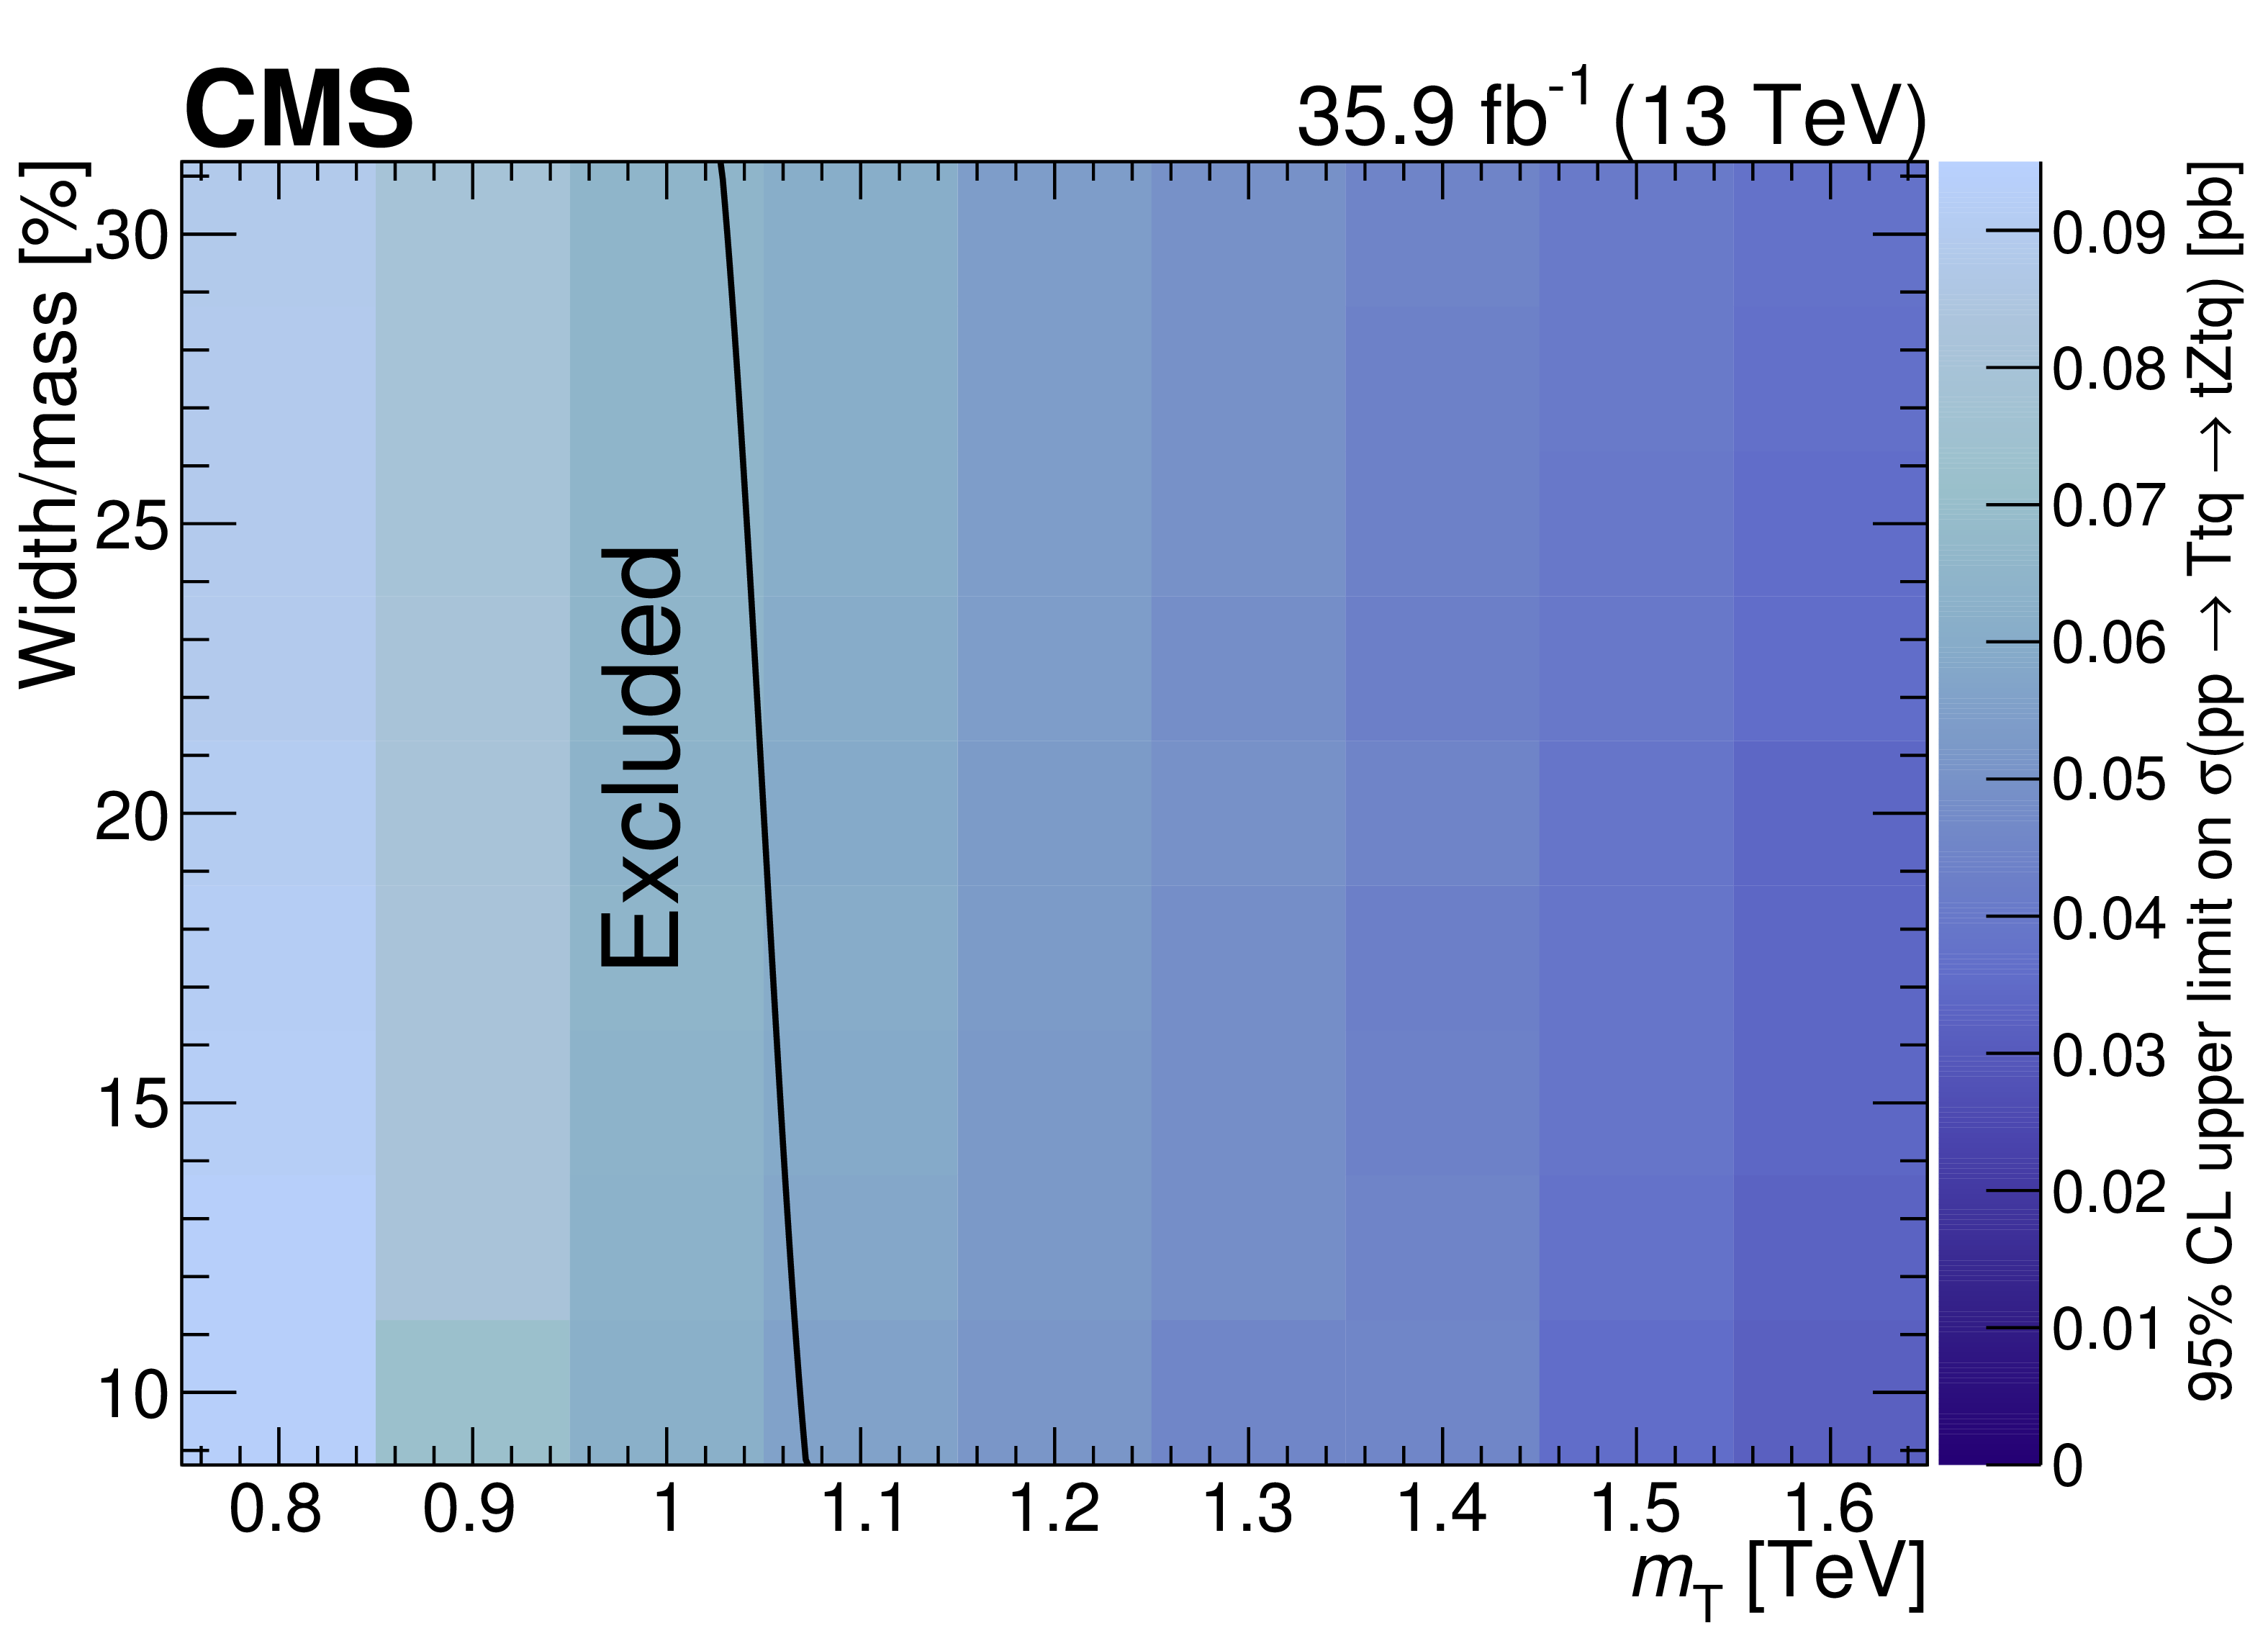
Figure 6:
Observed (upper) and expected (lower) limits at 95% CL on the product of the single production cross section and branching fraction for the singlet LH T quark produced in association with a b quark (left) and for the doublet RH T quark produced in association with a t quark (right), where the T quark has a width from 10% to 30% of its mass and decays to tZ. The solid black lines indicate theoretical cross sections, as calculated at leading order using a modified version of the model constructed by the authors of Refs. [5,45,46] and reported in Table 2. In each plot, the excluded region lies to the left of the line, except in the lower-left plot where the entire region shown is excluded. |
png pdf |
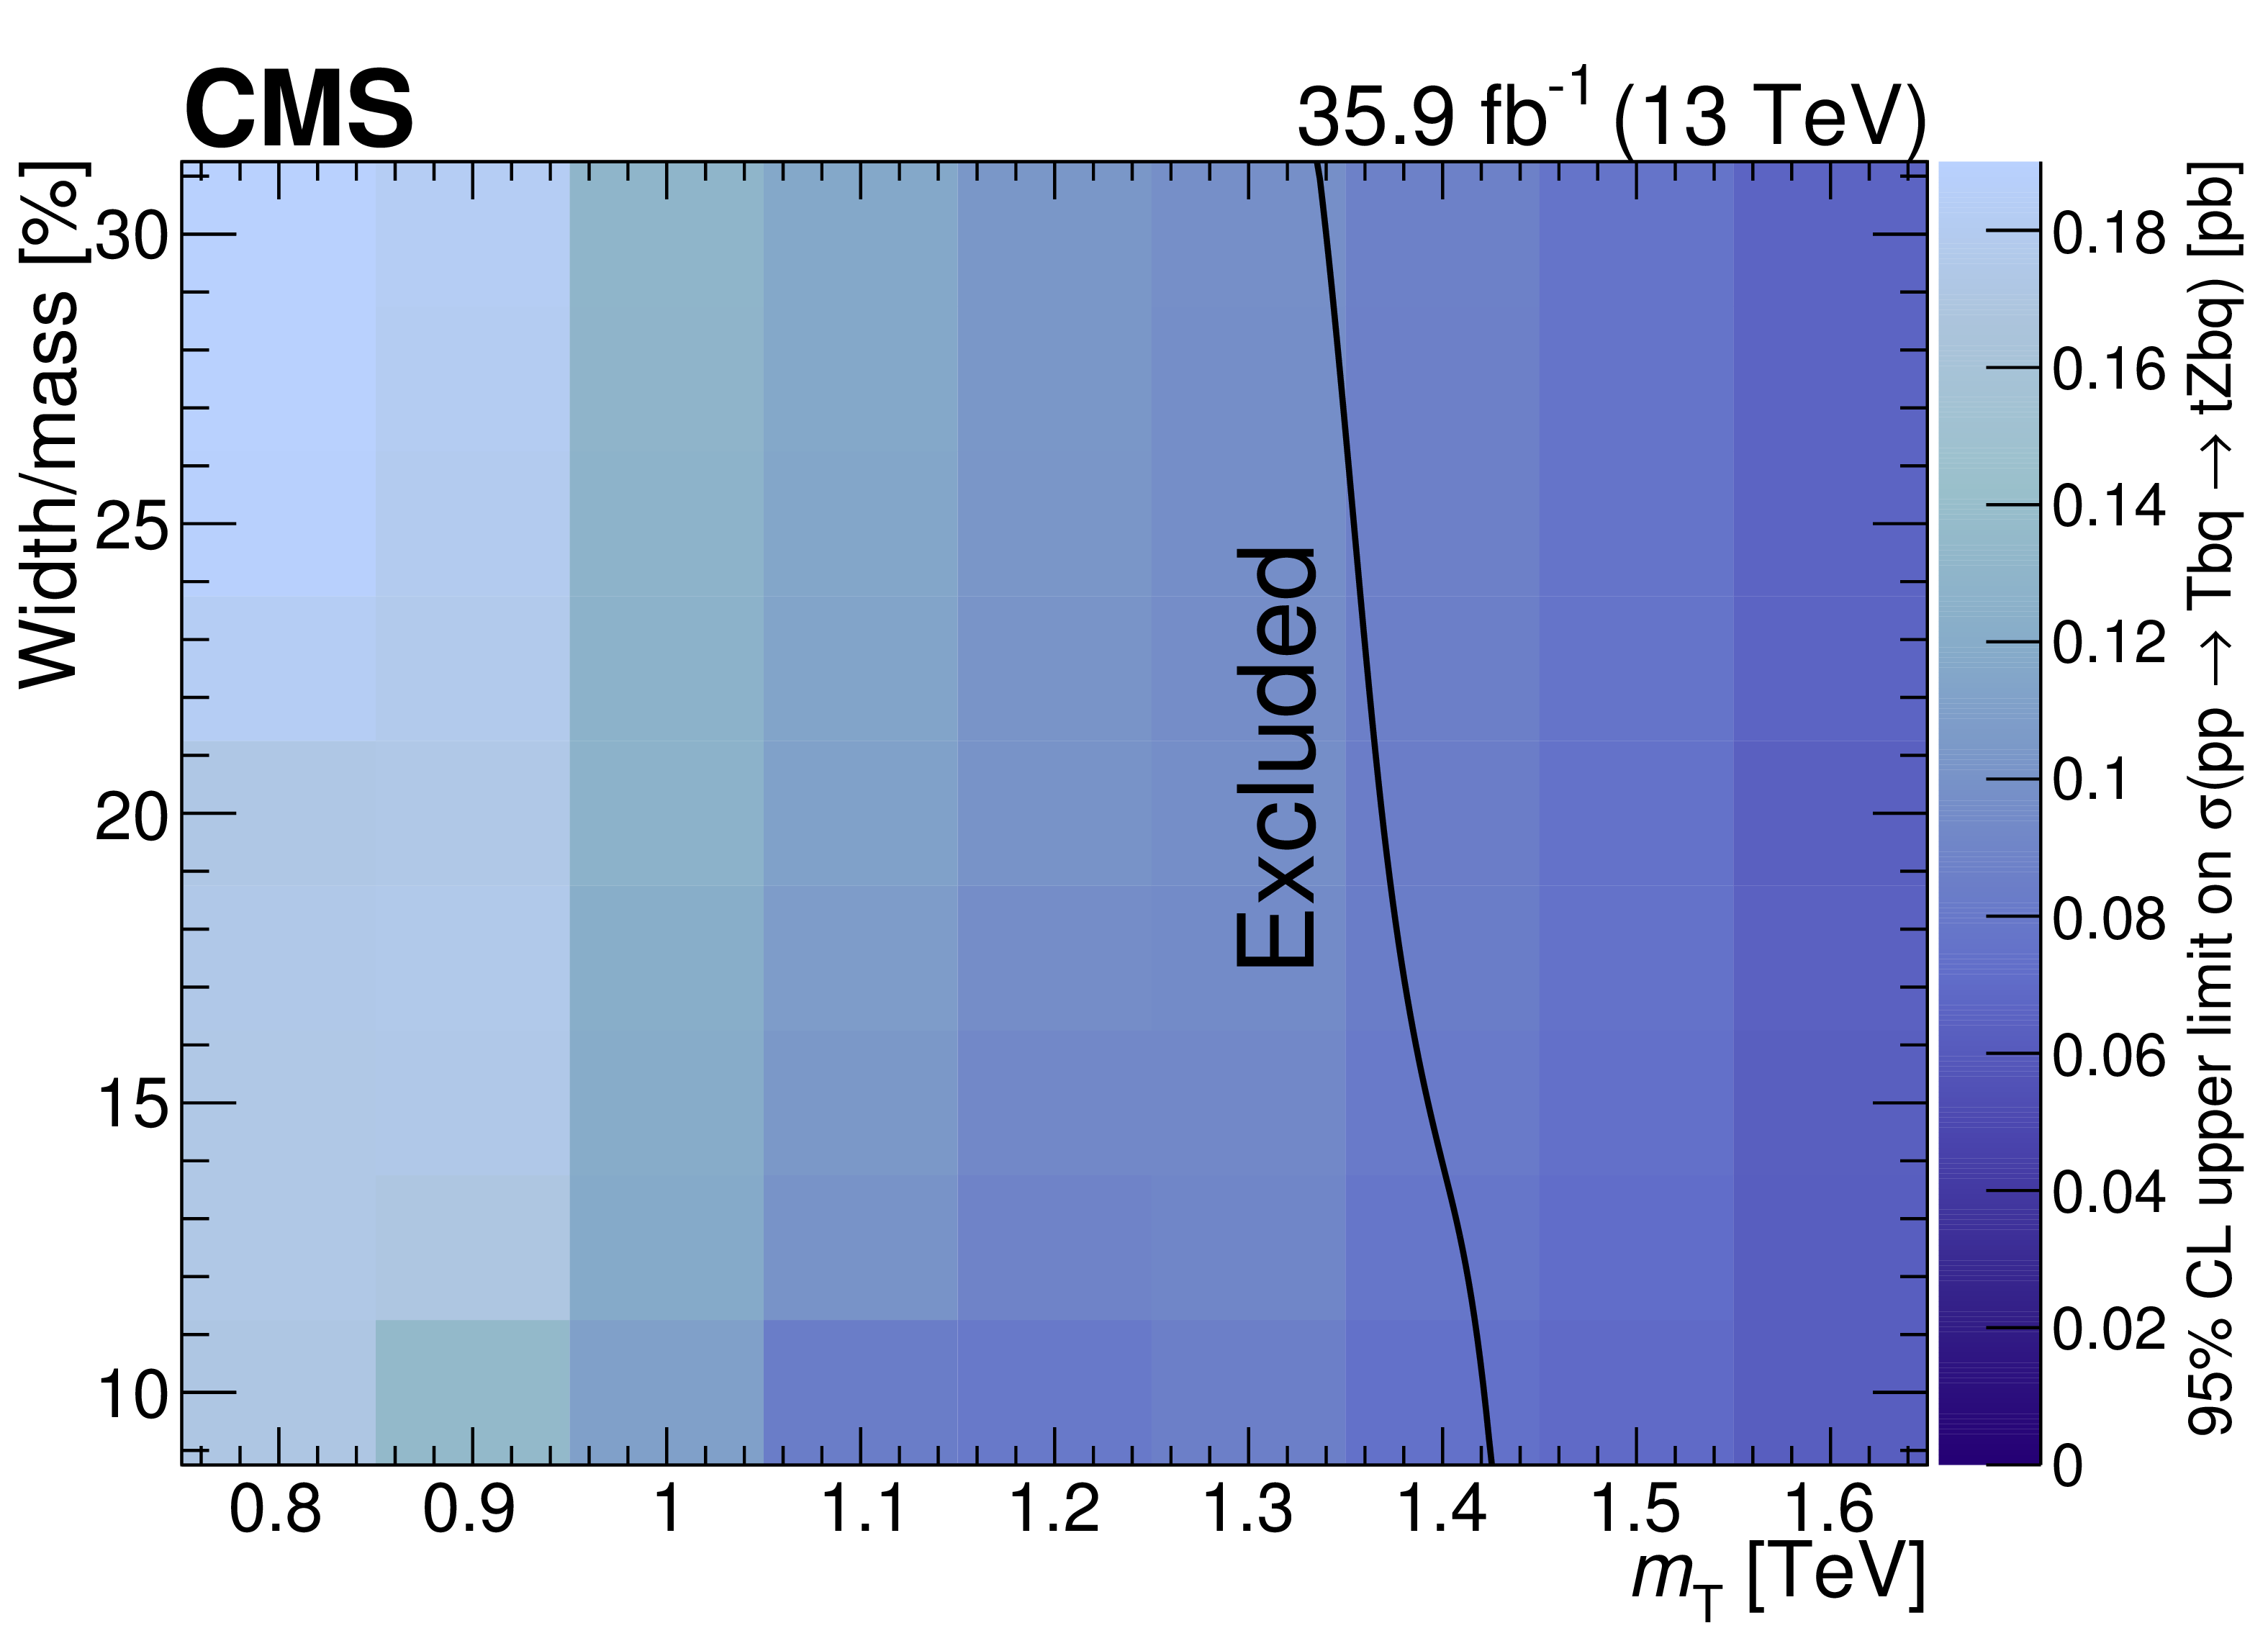
Figure 6-a:
Observed limits at 95% CL on the product of the single production cross section and branching fraction for the singlet LH T quark produced in association with a b quark, where the T quark has a width from 10% to 30% of its mass and decays to tZ. The solid black lines indicate theoretical cross sections, as calculated at leading order using a modified version of the model constructed by the authors of Refs. [5,45,46] and reported in Table 2. The excluded region lies to the left of the line. |
png pdf |
Figure 6-b:
Observed limits at 95% CL on the product of the single production cross section and branching fraction for the doublet RH T quark produced in association with a t quark, where the T quark has a width from 10% to 30% of its mass and decays to tZ. The solid black lines indicate theoretical cross sections, as calculated at leading order using a modified version of the model constructed by the authors of Refs. [5,45,46] and reported in Table 2. The excluded region lies to the left of the line. |
png pdf |
Figure 6-c:
Expected limits at 95% CL on the product of the single production cross section and branching fraction for the singlet LH T quark produced in association with a b quark, where the T quark has a width from 10% to 30% of its mass and decays to tZ. The solid black lines indicate theoretical cross sections, as calculated at leading order using a modified version of the model constructed by the authors of Refs. [5,45,46] and reported in Table 2. The entire region shown is excluded. |
png pdf |
Figure 6-d:
Expected limits at 95% CL on the product of the single production cross section and branching fraction for the doublet RH T quark produced in association with a t quark, where the T quark has a width from 10% to 30% of its mass and decays to tZ. The solid black lines indicate theoretical cross sections, as calculated at leading order using a modified version of the model constructed by the authors of Refs. [5,45,46] and reported in Table 2. The excluded region lies to the left of the line. |
| Tables | |
png pdf |
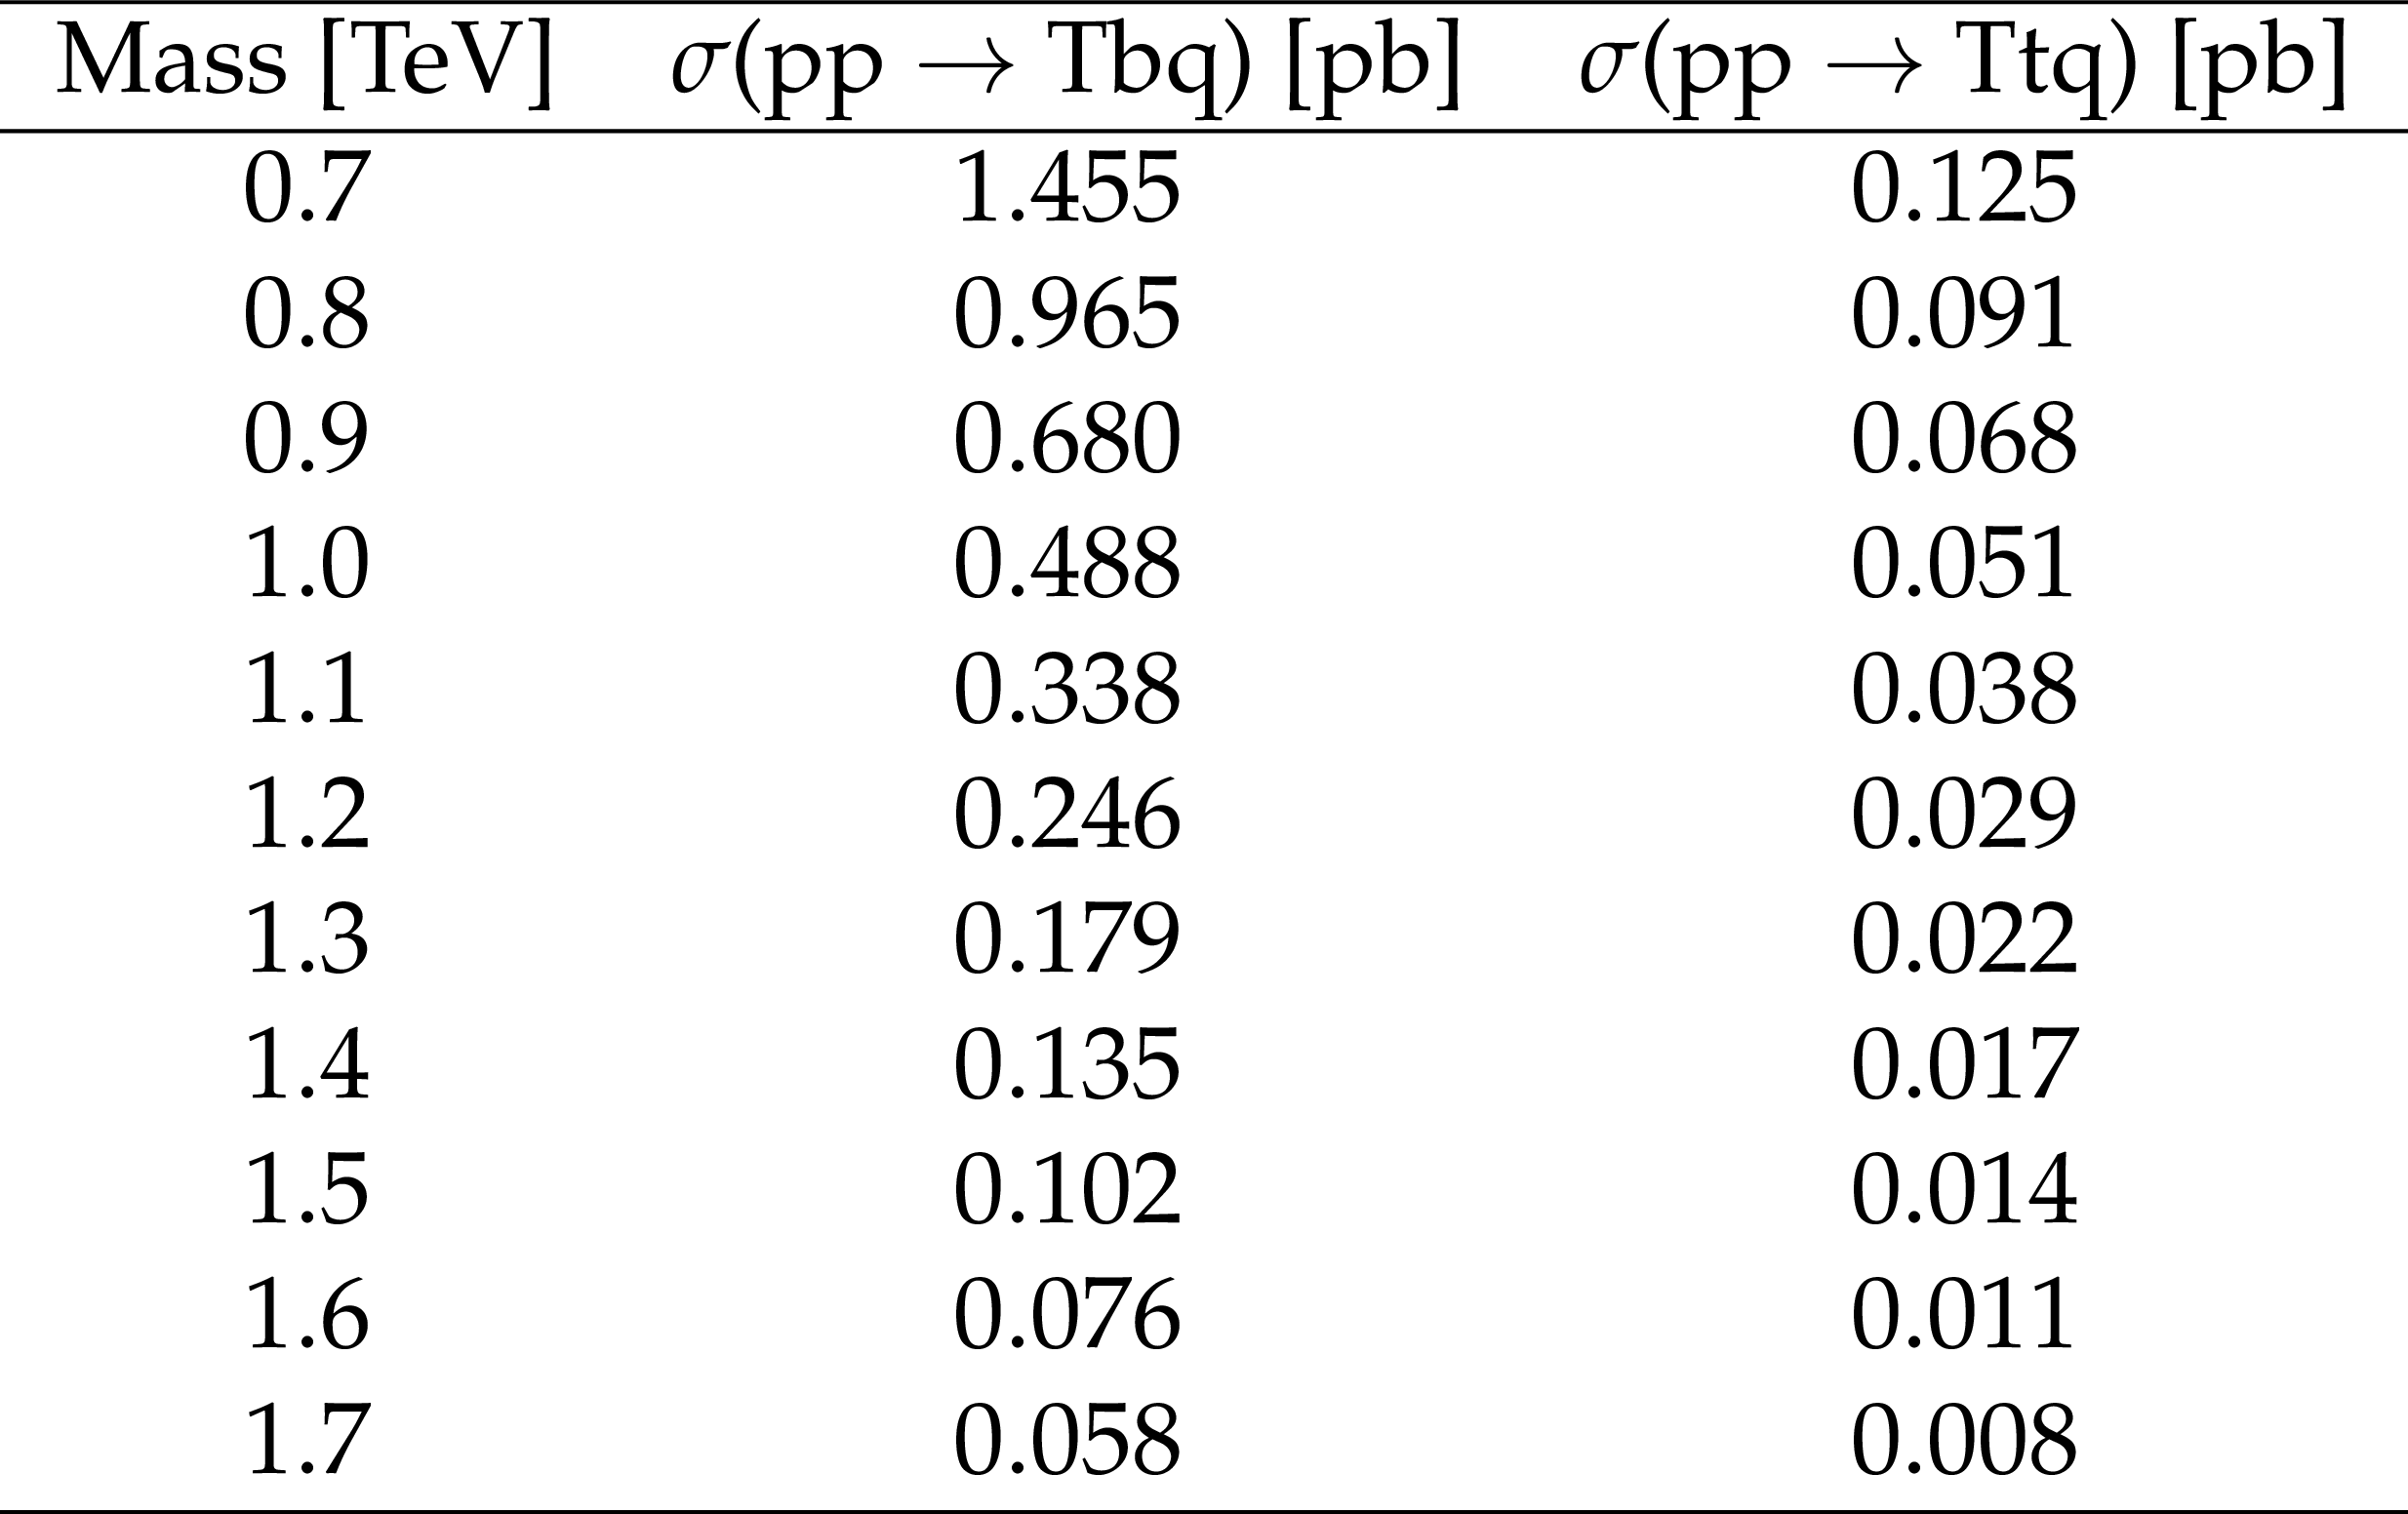
Table 1:
Theoretical cross sections at next-to-leading order for single production of a T quark in association with a b or t quark for the benchmark masses considered in the analysis, with the couplings set to 0.5 and using the narrow-width T quark assumption, calculated following the procedures described in Ref. [4]. The cross sections do not depend on the chirality of the T quark. The narrow-width assumption is valid for any value of the couplings less than or equal to 0.5. |
png pdf |
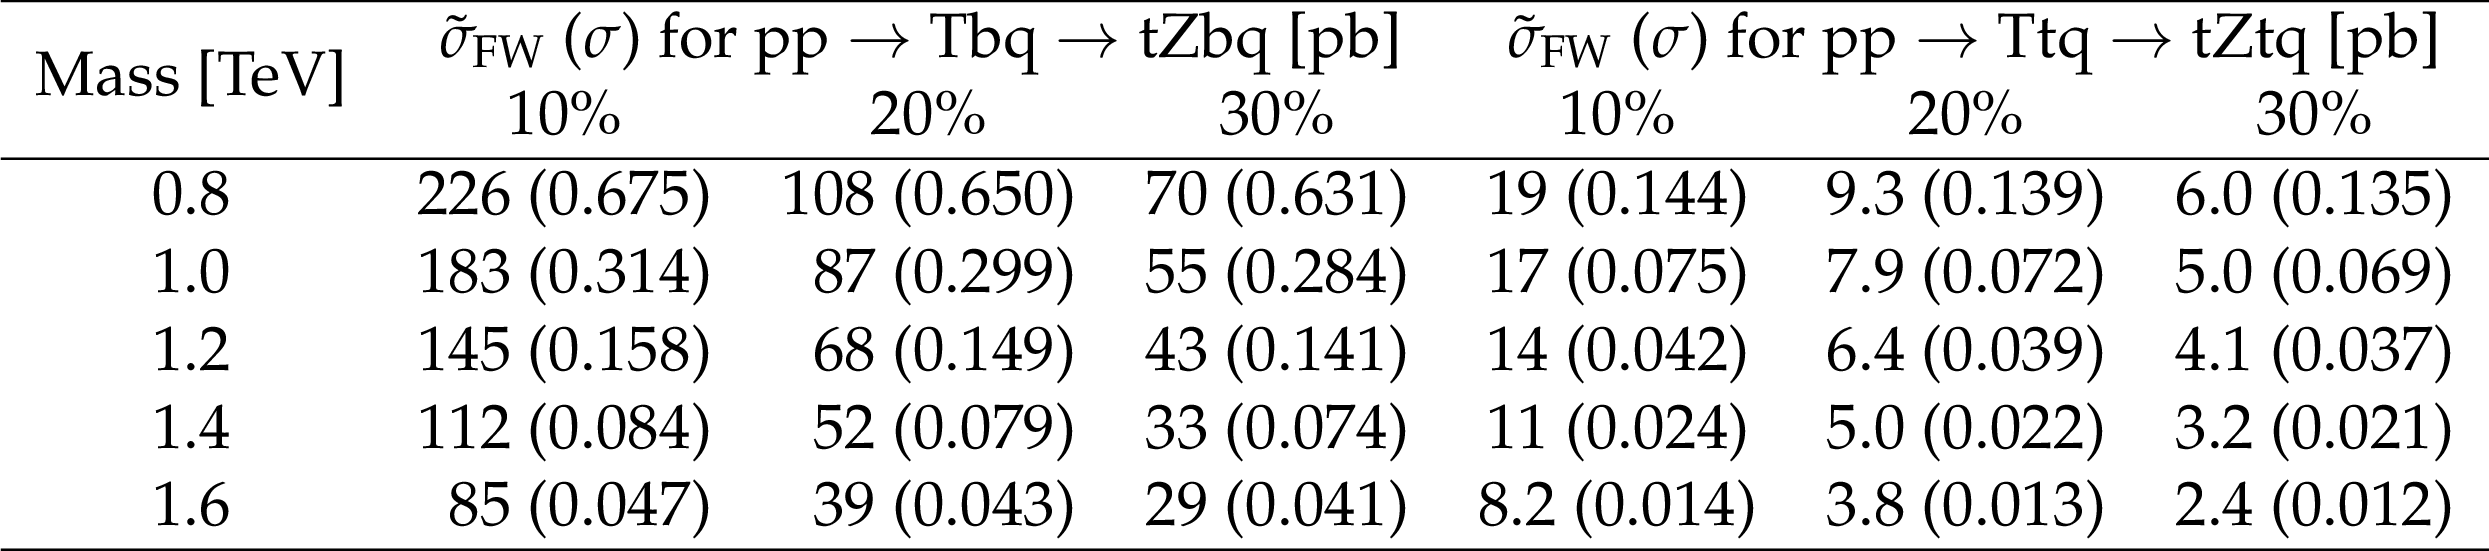
Table 2:
Theoretical reduced cross sections $\tilde{\sigma }_{\text {FW}}$ for single production of a T quark with a b or a t quark, where the T quark decays to tZ and its width is 10, 20, and 30% of its mass, for the benchmark masses considered in the analysis. The corresponding leading order cross sections $\sigma $ are shown in parentheses. |
png pdf |
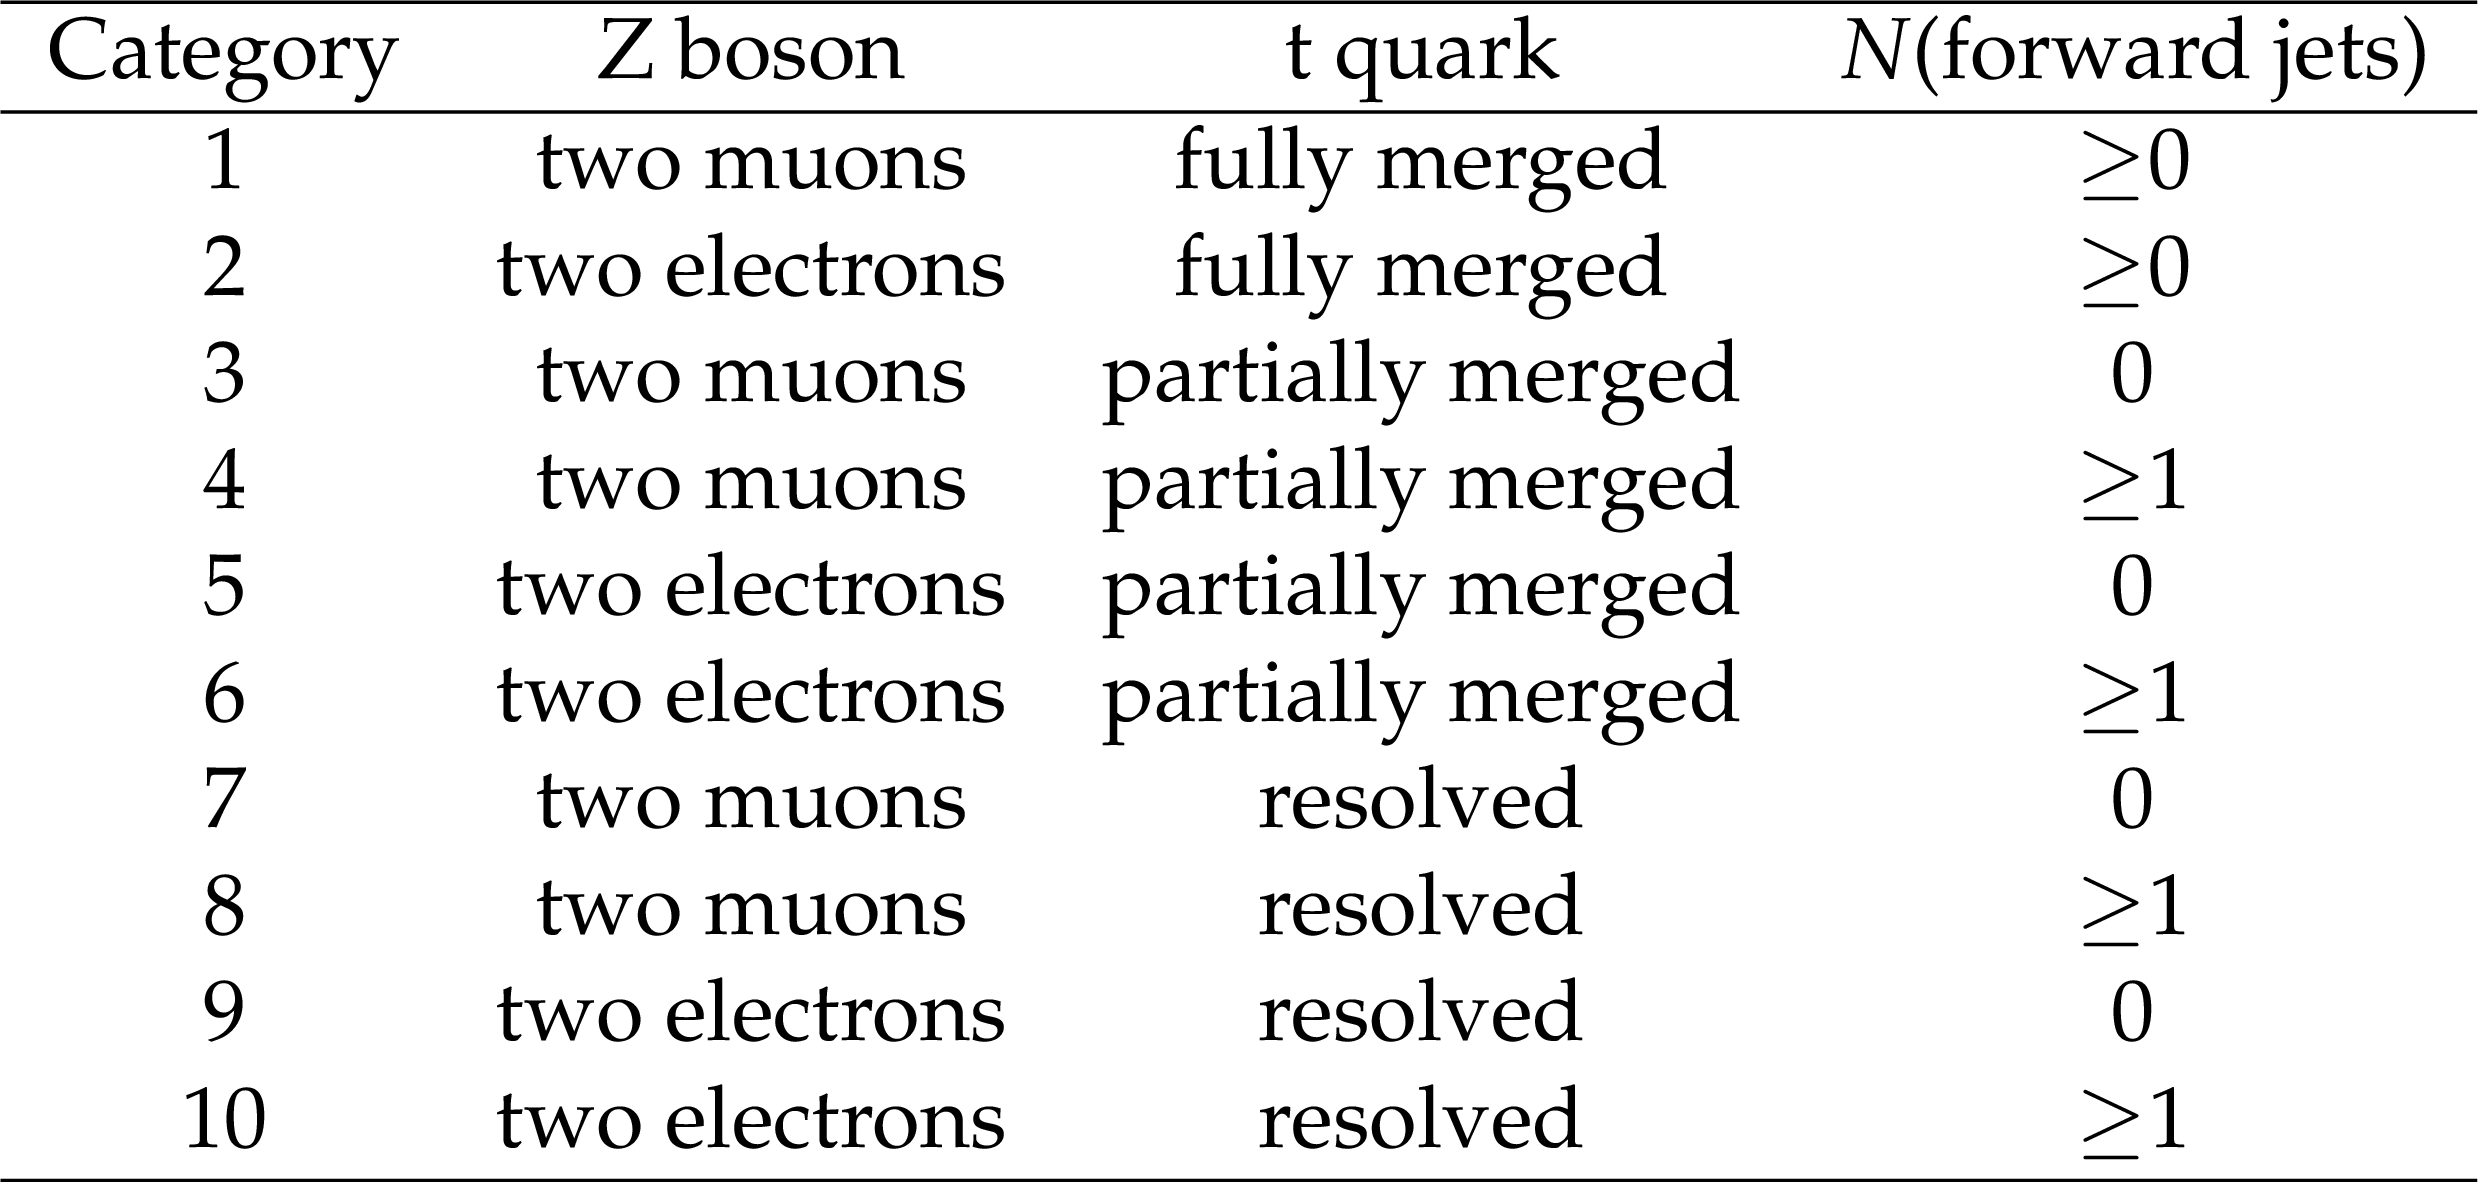
Table 3:
Summary of the ten categories of the analysis. |
png pdf |
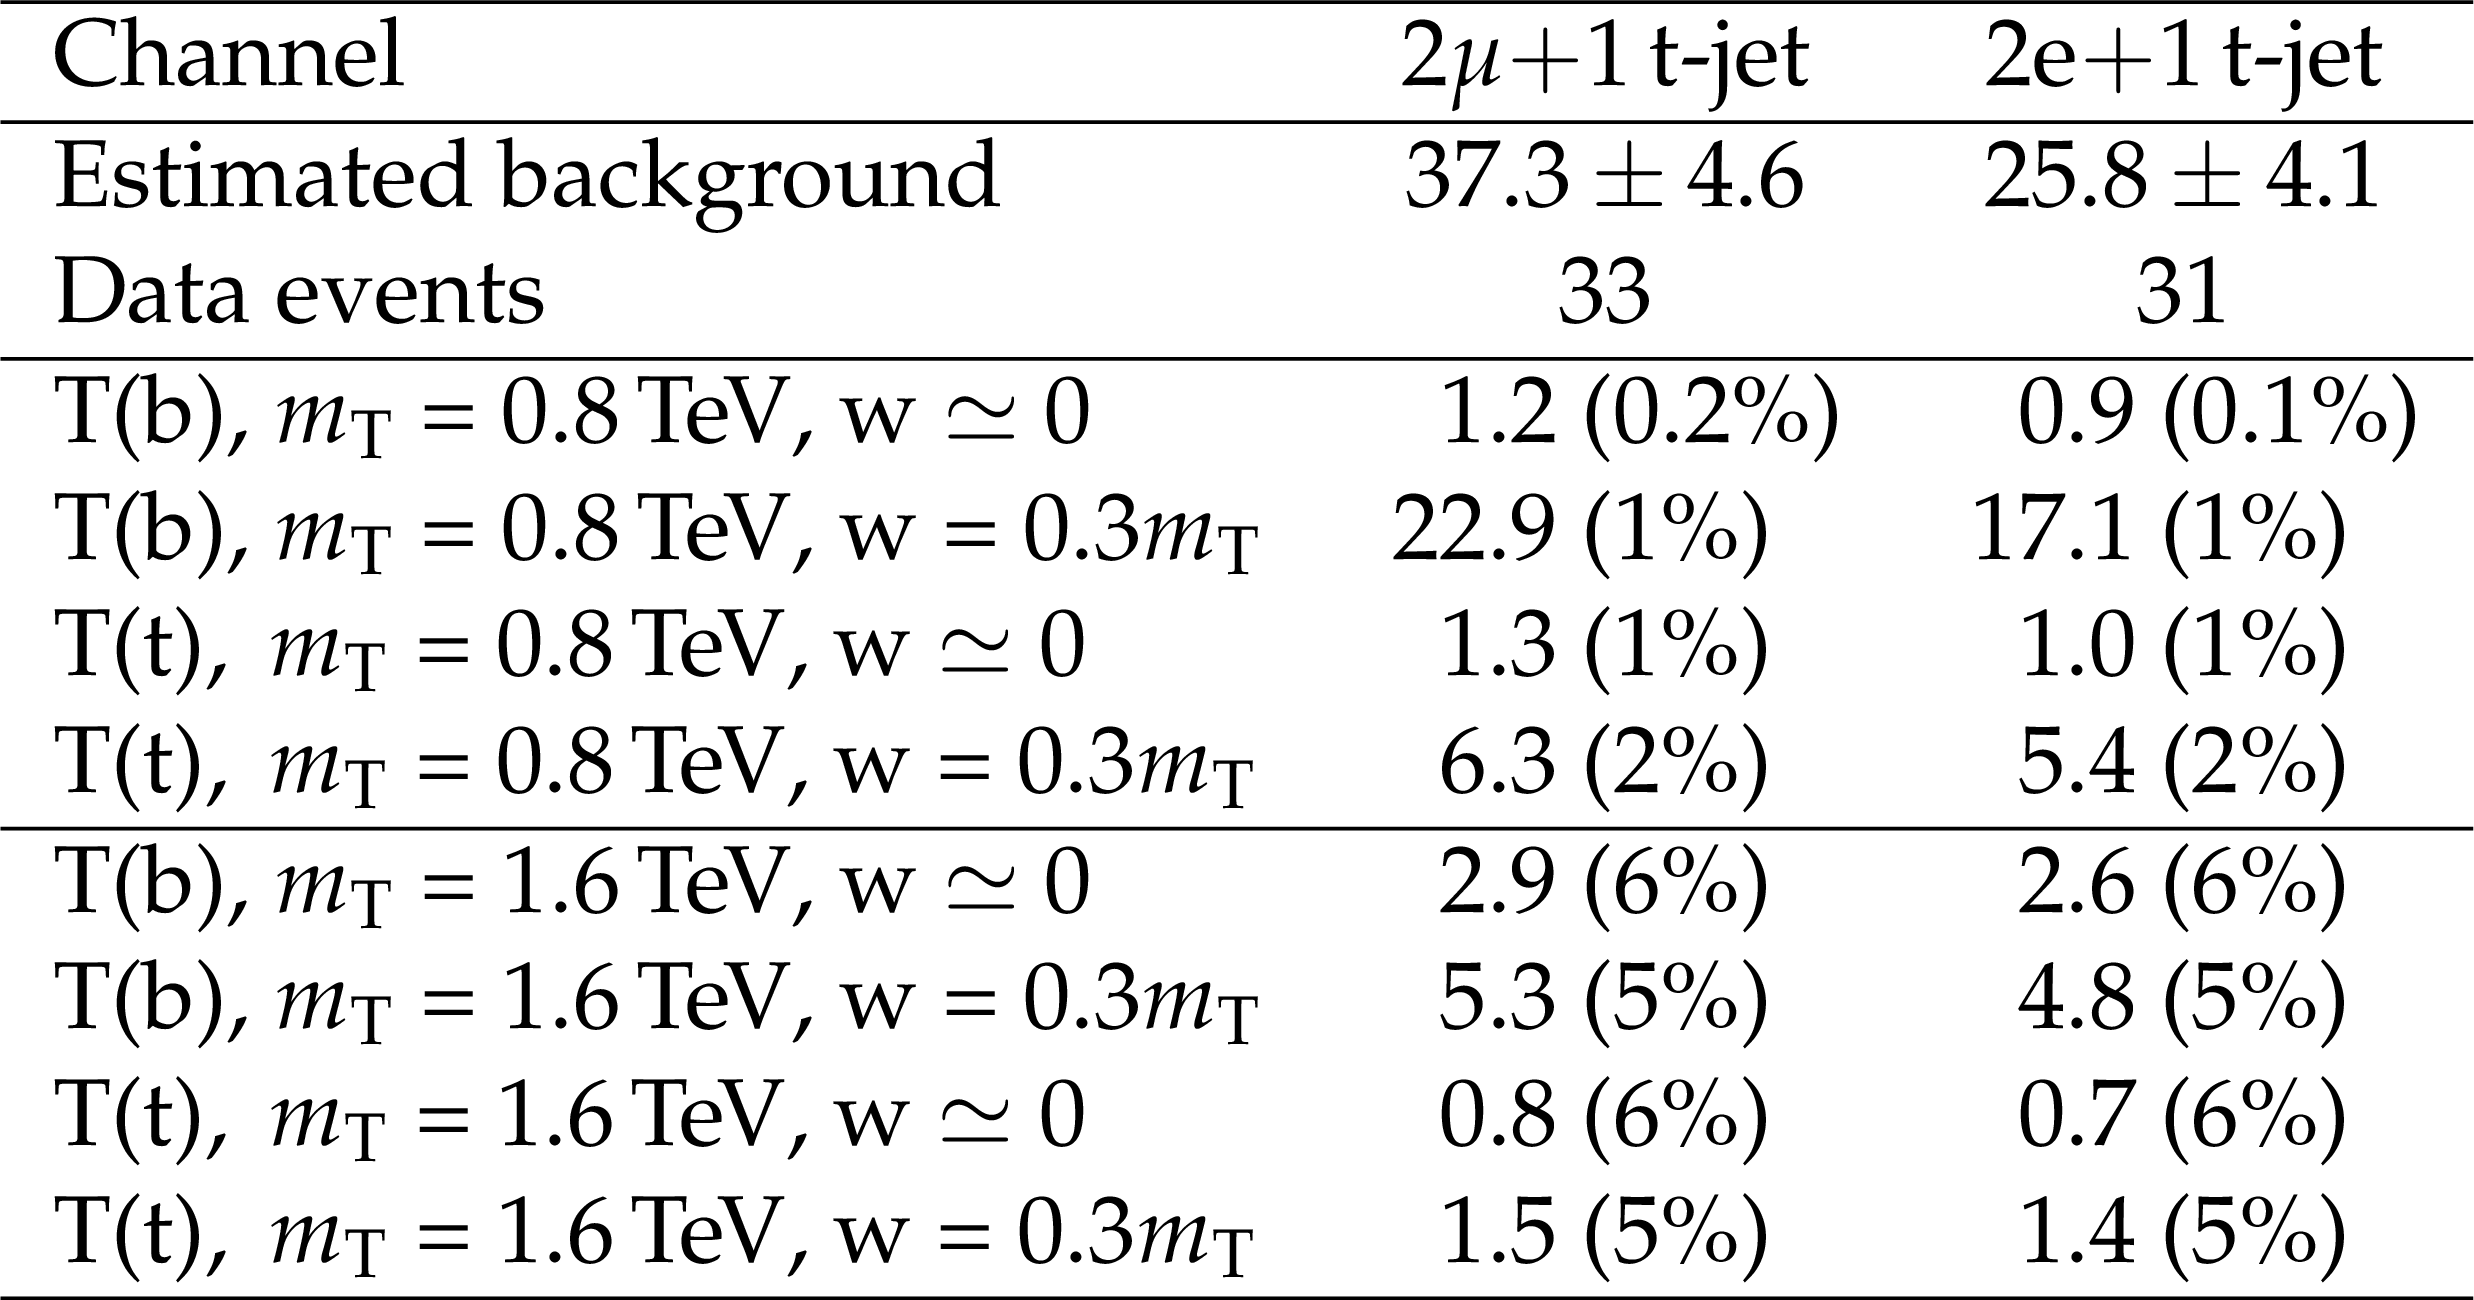
Table 4:
The number of estimated background events compared to the observed number of events for the two fully merged categories. The quoted uncertainties in the background estimates include both statistical and systematic components, as described in Section {sec:systematics}. Expected signal yields, and their respective efficiencies with parentheses, for events with the Z boson decaying to electrons or muons, are given for two benchmark masses and two values of the width "w'', for a T quark produced in association with a b, T(b), and a T quark produced in association with a t, T(t). |
png pdf |
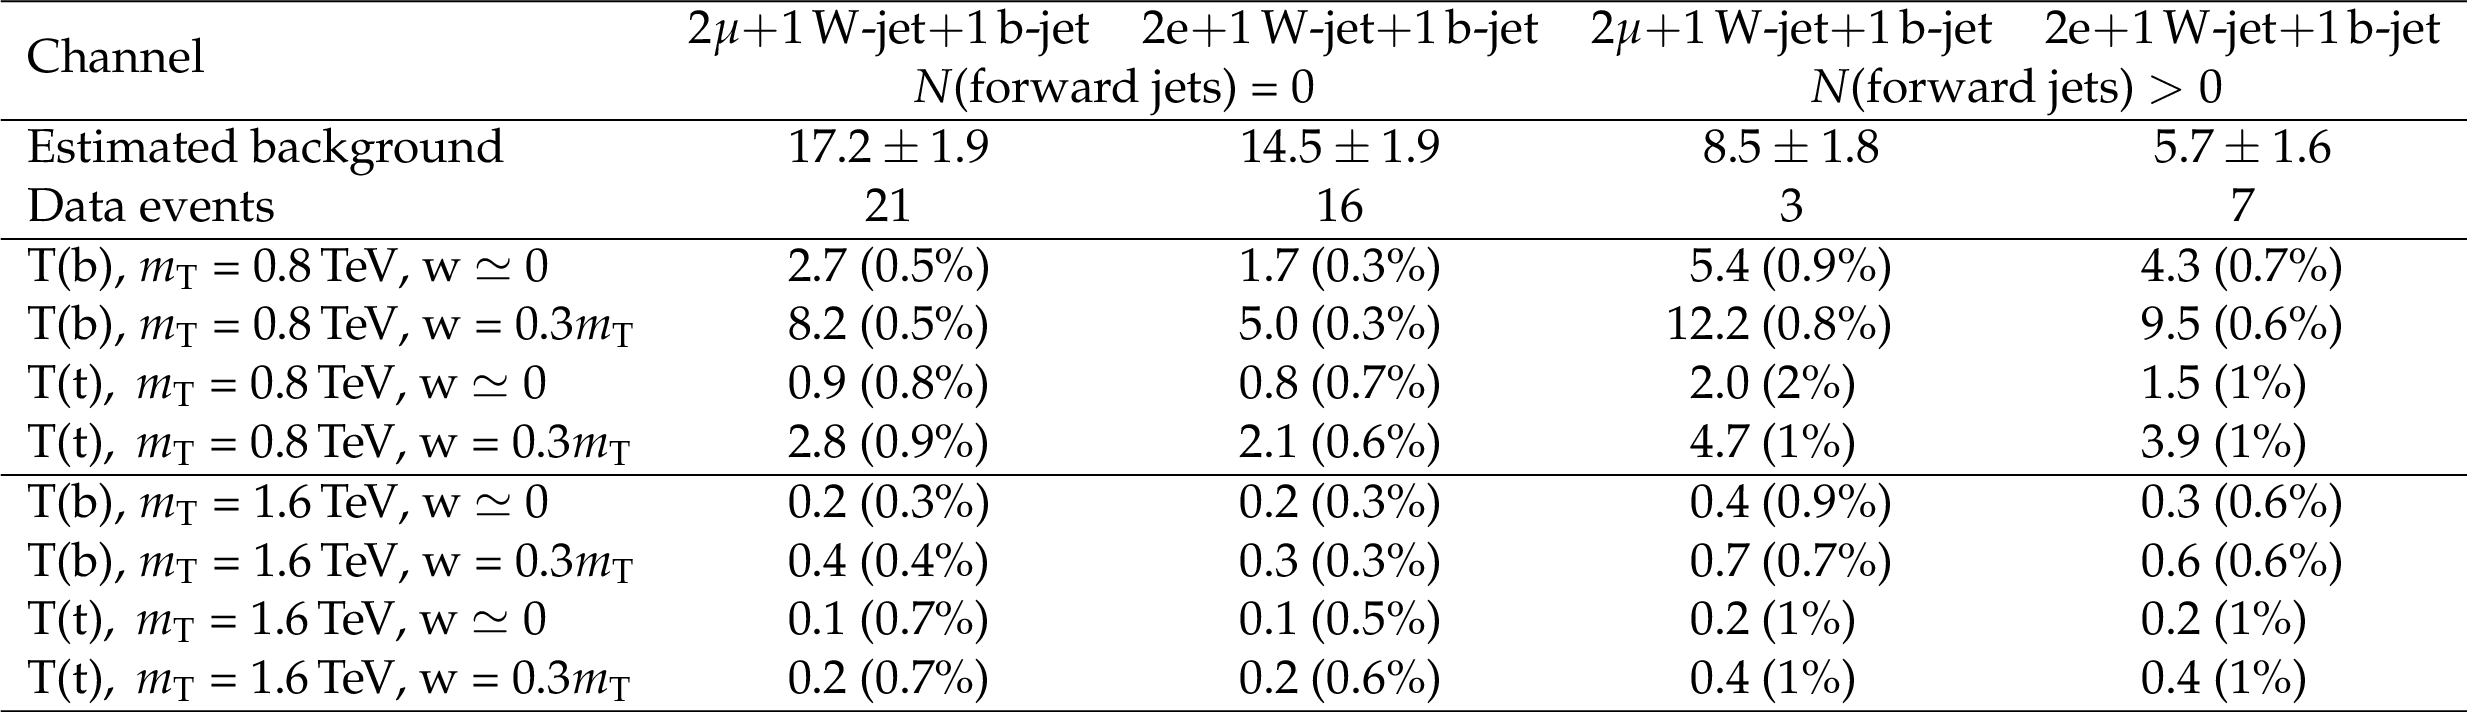
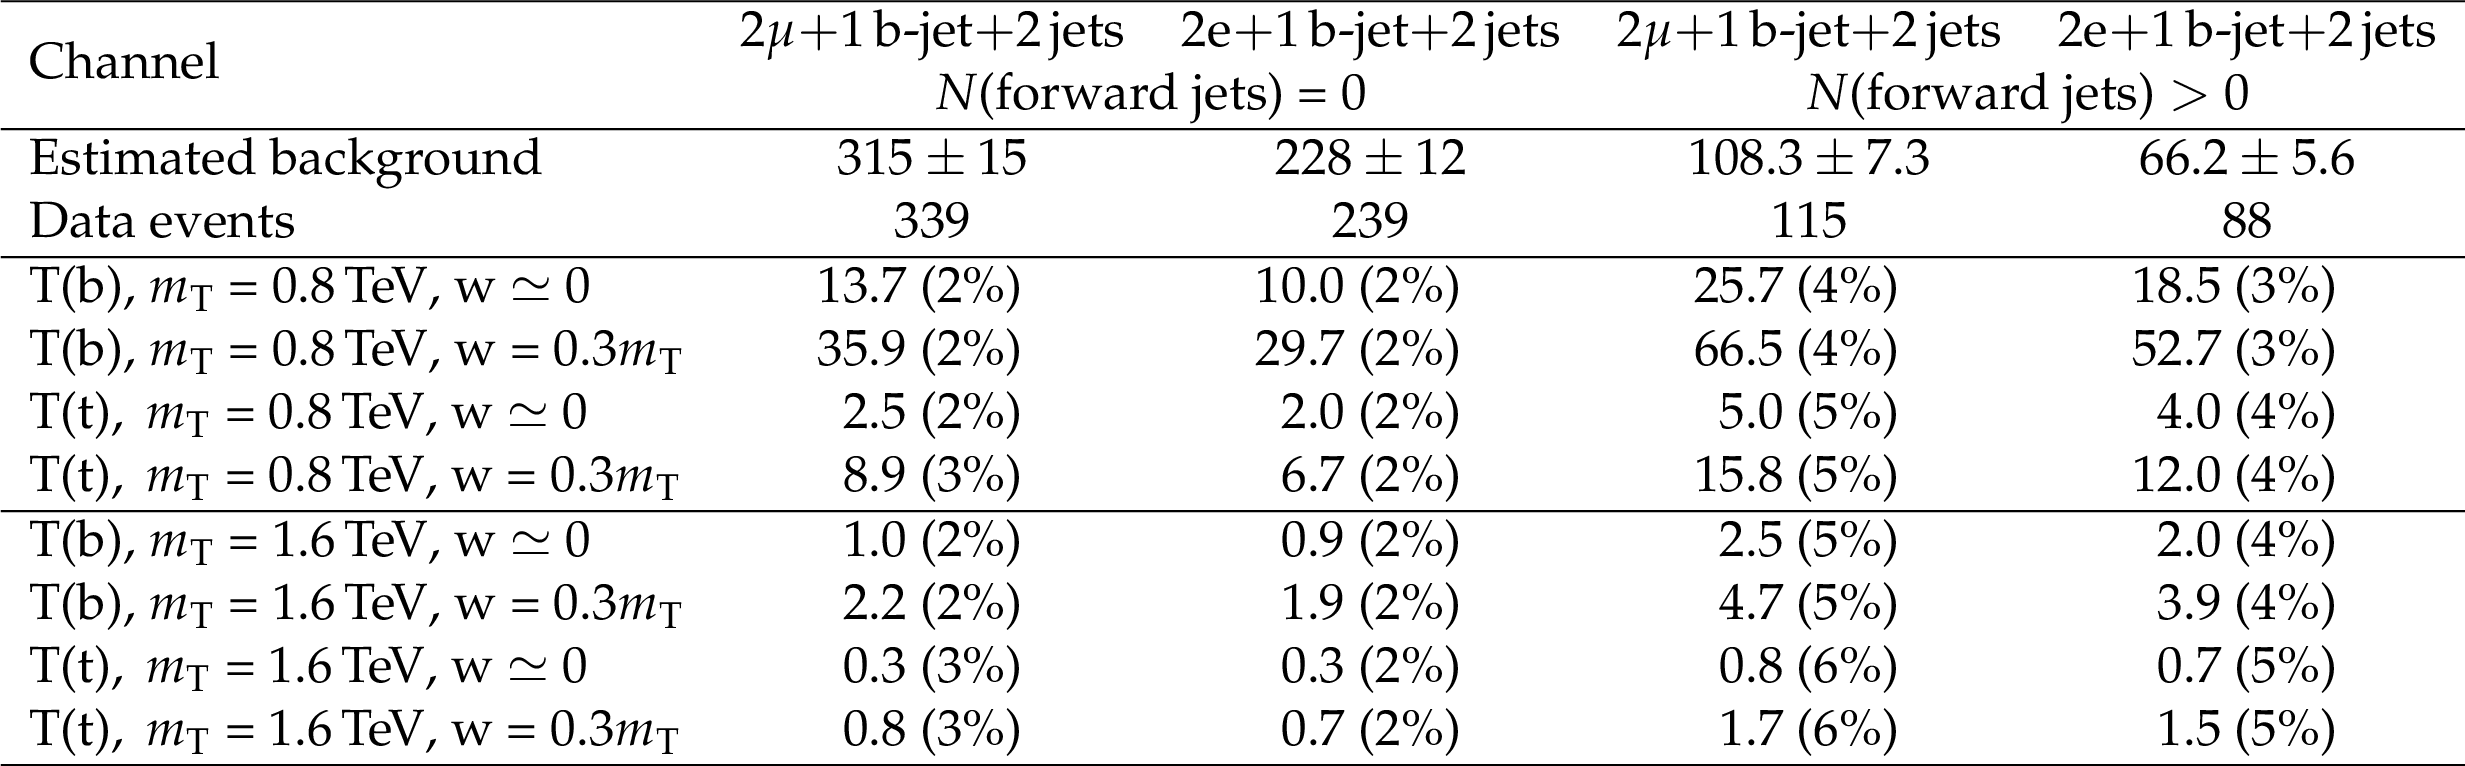
Table 5:
The number of estimated background events compared to the observed number of events for the four partially merged categories. The quoted uncertainties in the background estimates include both statistical and systematic components, as described in Section {sec:systematics}. Expected signal yields, and their respective efficiencies with parentheses, for events with the Z boson decaying to electrons or muons, are given for two benchmark masses and two values of the width "w'', for a T quark produced in association with a b, T(b), and a T quark produced in association with a t, T(t). |
png pdf |
Table 6:
The number of estimated background events compared to the observed number of events for the four resolved categories. The quoted uncertainties in the background estimates include both statistical and systematic components, as described in Section {sec:systematics}. Expected signal yields, and their respective efficiencies with parentheses, for events with the Z boson decaying to electrons or muons, are given for two benchmark masses and two values of the width "w'', for a T quark produced in association with a b, T(b), and a T quark produced in association with a t, T(t). |
png pdf |
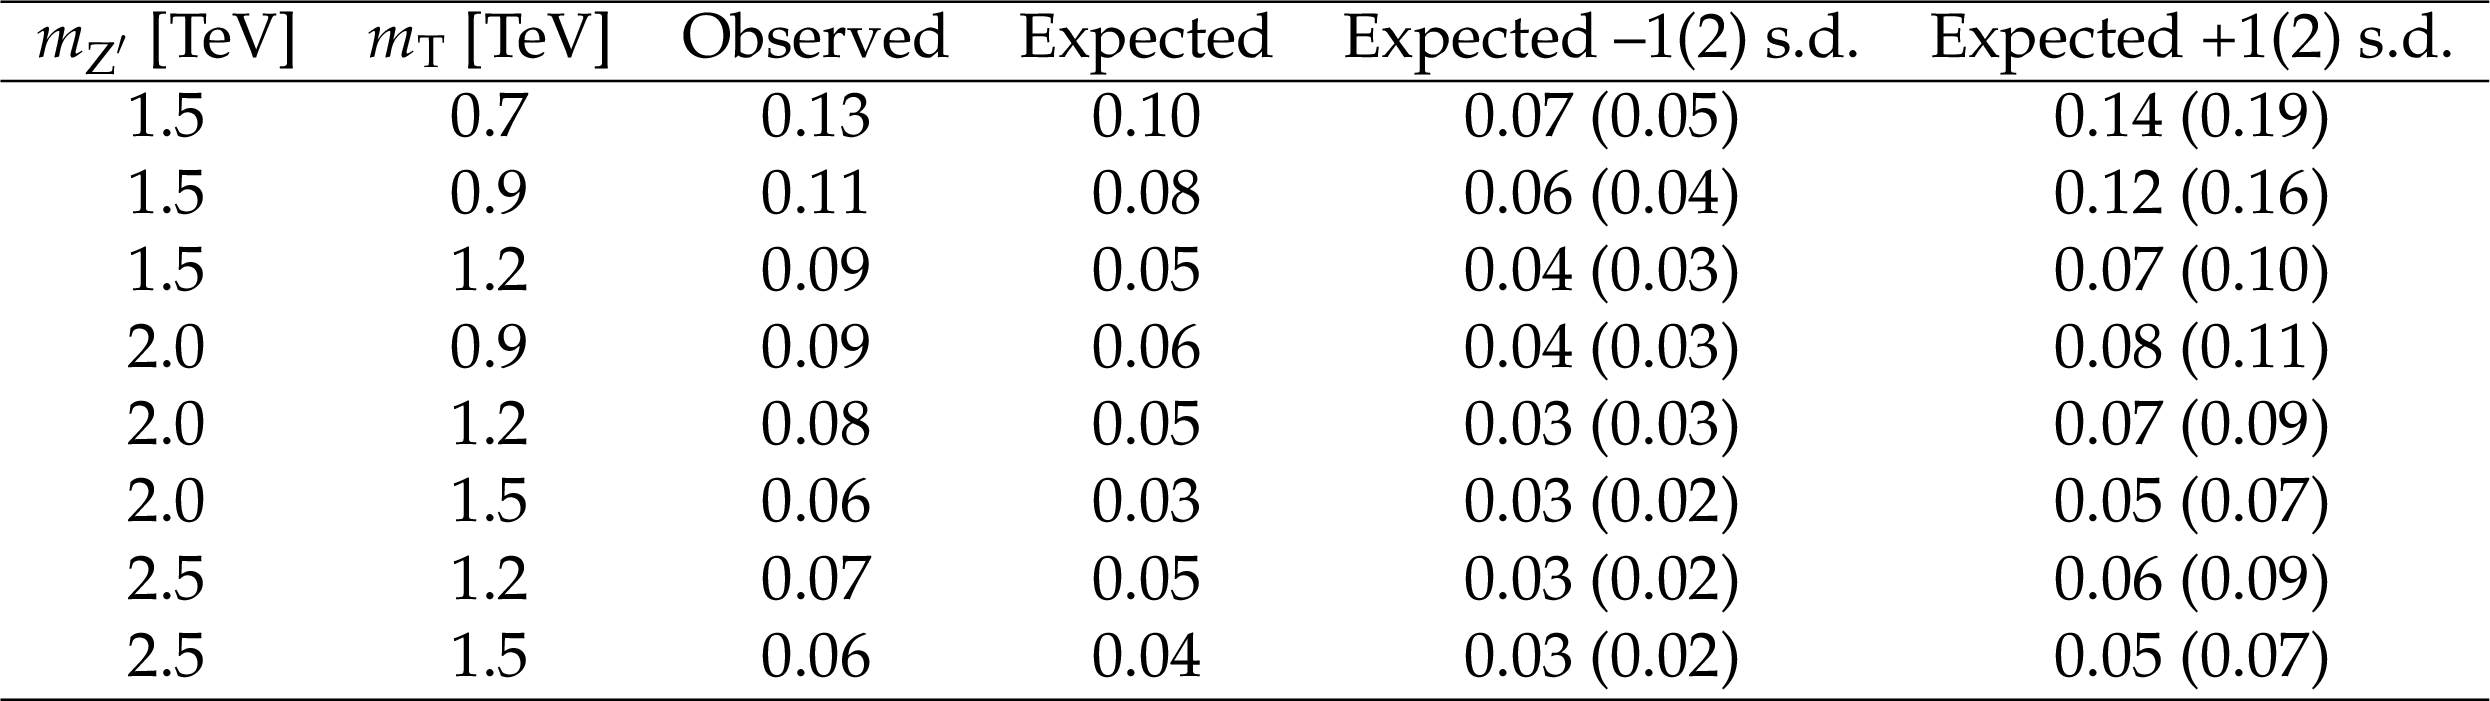
Table 7:
Observed and expected 95%CL upper limit on $\sigma $(pp$\rightarrow $Z') $\mathcal {B}$(Z'$\rightarrow $Tt) $\mathcal {B}$(T$\rightarrow $tZ). The $\pm $1 and $\pm $2 standard deviation (s.d.) expected limits are also given. The limits are given in pb. |
| Summary |
| Results were presented of a search for the single production of a T quark with a charge of $+2/3$, decaying to a Z boson and a t quark. No deviations were observed relative to the expected standard model background. Upper limits on the product of the cross section and branching fraction range between 0.27 and 0.04 pb at 95% confidence level for a left-handed T quark produced in association with a b quark, T(b), and between 0.15 and 0.04 pb for a right-handed T quark produced in association with a t quark, T(t), for the range of masses between 0.7 and 1.7 TeV. This result was obtained under the hypothesis of a narrow-width T quark, providing an interpretation of results through the simplified approach of Ref. [4]. In this case, left-handed T quarks produced in association with a b quark and with a coupling C(bW) of 0.5 were excluded below the mass of 1.2 TeV. A large gain in the search sensitivity was found relative to previous results [17] because of improvements introduced in the analysis as well as the increase in the integrated luminosity. The effect of a nonnegligible width was also studied; values of the width between 10 and 30% of the T quark mass were considered, and similar sensitivities were observed. The results were interpreted using a modified version of the model constructed by the authors of Refs. [5,45,46], and a left-handed T(b) signal was excluded for masses below values in the range 1.34-1.42 TeV, depending on the width, while a right-handed T(t) signal was excluded for masses below values in the range 0.82-0.94 TeV. Finally, the production of a Z' boson that decays to Tt was excluded for values of the product of cross section and branching fractions below the range of 0.13-0.06 pb, for Z' boson and T quark masses in the respective ranges of 1.5 to 2.5 TeV and 0.7 to 1.5 TeV. The results presented in this paper are the best limits to date on the single production of heavy vector-like T quarks, the first to set limits for a variety of resonance widths, and the best limits for the production of a Z' boson decaying to Tt. |
| References | ||||
| 1 | J. A. Aguilar-Saavedra, R. Benbrik, S. Heinemeyer, and M. Perez-Victoria | Handbook of vectorlike quarks: Mixing and single production | PRD 88 (2013) 094010 | 1306.0572 |
| 2 | J. A. Aguilar-Saavedra | Identifying top partners at LHC | JHEP 11 (2009) 030 | 0907.3155 |
| 3 | A. De Simone, O. Matsedonskyi, R. Rattazzi, and A. Wulzer | A first top partner hunter's guide | JHEP 04 (2013) 004 | 1211.5663 |
| 4 | O. Matsedonskyi, G. Panico, and A. Wulzer | On the interpretation of top partners searches | JHEP 12 (2014) 097 | 1409.0100 |
| 5 | M. Buchkremer, G. Cacciapaglia, A. Deandrea, and L. Panizzi | Model independent framework for searches of top partners | NPB 876 (2013) 376 | 1305.4172 |
| 6 | O. Eberhardt et al. | Joint analysis of Higgs decays and electroweak precision observables in the standard model with a sequential fourth generation | PRD 86 (2012) 013011 | 1204.3872 |
| 7 | ATLAS Collaboration | Search for production of vector-like quark pairs and of four top quarks in the lepton-plus-jets final state in $ pp $ collisions at $ \sqrt{s} = $ 8 TeV with the ATLAS detector | JHEP 08 (2015) 105 | 1505.04306 |
| 8 | ATLAS Collaboration | Search for vector-like $ B $ quarks in events with one isolated lepton, missing transverse momentum and jets at $ \sqrt{s} = $ 8 TeV with the ATLAS detector | PRD 91 (2015) 112011 | 1503.05425 |
| 9 | ATLAS Collaboration | Search for pair and single production of new heavy quarks that decay to a $ Z $ boson and a third-generation quark in pp collisions at $ \sqrt{s} = $ 8 TeV with the ATLAS detector | JHEP 11 (2014) 104 | 1409.5500 |
| 10 | ATLAS Collaboration | Search for single production of a vector-like quark via a heavy gluon in the 4$ b $ final state with the ATLAS detector in $ pp $ collisions at $ \sqrt{s} = $ 8 TeV | PLB 758 (2016) | 1602.06034 |
| 11 | ATLAS Collaboration | Search for single production of vector-like quarks decaying into $ Wb $ in $ pp $ collisions at $ \sqrt{s} = $ 8 TeV with the ATLAS detector | EPJC 76 (2016) 442 | 1602.05606 |
| 12 | ATLAS Collaboration | Search for the production of single vector-like and excited quarks in the $ Wt $ final state in $ pp $ collisions at $ \sqrt{s} = $ 8 TeV with the ATLAS detector | JHEP 02 (2016) 110 | 1510.02664 |
| 13 | ATLAS Collaboration | Search for pair production of vector-like top quarks in events with one lepton, jets, and missing transverse momentum in $ \sqrt{s} = $ 13 TeV $pp $ collisions with the ATLAS detector | Submitted to JHEP | 1705.10751 |
| 14 | CMS Collaboration | Search for vector-like charge 2/3 T quarks in proton-proton collisions at $ \sqrt{s} = $ 8 TeV | PRD 93 (2016) 012003 | CMS-B2G-13-005 1509.04177 |
| 15 | CMS Collaboration | Search for pair-produced vector-like B quarks in proton-proton collisions at $ \sqrt{s} = $ 8 TeV | PRD 93 (2016) 112009 | CMS-B2G-13-006 1507.07129 |
| 16 | CMS Collaboration | Search for top-quark partners with charge 5/3 in the same-sign dilepton final state | PRL 112 (2014) 171801 | CMS-B2G-12-012 1312.2391 |
| 17 | CMS Collaboration | Search for single production of vector-like quarks decaying to a Z boson and a top or a bottom quark in proton-proton collisions at $ \sqrt{s} = $ 13 TeV | JHEP 05 (2017) 029 | CMS-B2G-16-001 1701.07409 |
| 18 | CMS Collaboration | Search for single production of a heavy vector-like T quark decaying to a Higgs boson and a top quark with a lepton and jets in the final state | PLB 771 (2017) 80 | CMS-B2G-15-008 1612.00999 |
| 19 | CMS Collaboration | Search for electroweak production of a vector-like quark decaying to a top quark and a Higgs boson using boosted topologies in fully hadronic final states | JHEP 04 (2017) 136 | CMS-B2G-16-005 1612.05336 |
| 20 | CMS Collaboration | Search for single production of vector-like quarks decaying into a b quark and a W boson in proton-proton collisions at $ \sqrt{s} = $ 13 TeV | PLB 772 (2017) 634 | CMS-B2G-16-006 1701.08328 |
| 21 | CMS Collaboration | Search for pair production of vector-like T and B quarks in single-lepton final states using boosted jet substructure techniques at $ \sqrt{s} = $ 13 TeV | Submitted to JHEP | CMS-B2G-16-024 1706.03408 |
| 22 | D0 Collaboration | Search for single vector-like quarks in $ p\overline{p} $ collisions at $ \sqrt{s} = $ 1.96 TeV | PRL 106 (2011) 081801 | 1010.1466 |
| 23 | D0 Collaboration | Search for a fourth generation $ t^\prime $ quark in $ p\overline{p} $ collisions at $ \sqrt{s} = $ 1.96 TeV | PRL 107 (2011) 082001 | 1104.4522 |
| 24 | CDF Collaboration | Search for new particles leading to $ Z $+jets final states in $ p\overline{p} $ collisions at $ \sqrt{s} = $ 1.96 TeV | PRD 76 (2007) 072006 | 0706.3264 |
| 25 | CDF Collaboration | Search for new bottomlike quark pair decays $ q\overline{Q} {\rightarrow}(t{W}^{ {\mp}})(\overline{t}{W}^{\pm}) $ in same-charge dilepton events | PRL 104 (2010) 091801 | 0912.1057 |
| 26 | CDF Collaboration | Search for New $ T^\prime $ Particles in Final States with Large Jet Multiplicities and Missing Transverse Energy in $ p\overline{p} $ Collisions at $ \sqrt{s} = $ 1.96 TeV | PRL 107 (2011) 191803 | 1107.3574 |
| 27 | CDF Collaboration | Search for Production of Heavy Particles Decaying to Top Quarks and Invisible Particles in $ p\overline{p} $ collisions at $ \sqrt{s} = $ 1.96 TeV | PRL 106 (2011) 191801 | 1103.2482 |
| 28 | CDF Collaboration | Search for Heavy Bottomlike Quarks Decaying to an Electron or Muon and Jets in $ p\overline{p} $ Collisions at $ \sqrt{s} = $ 1.96 TeV | PRL 106 (2011) 141803 | 1101.5728 |
| 29 | CDF Collaboration | Search for a Heavy Top-Like Quark in $ p\overline{p} $ Collisions at $ \sqrt{s} = $ 1.96 TeV | PRL 107 (2011) 261801 | 1107.3875 |
| 30 | B. W. Lee, C. Quigg, and H. B. Thacker | Weak interactions at very high-energies: The role of the Higgs boson mass | PRD 16 (1977) 1519 | |
| 31 | G. Cacciapaglia et al. | Heavy vector-like top partners at the LHC and flavour constraints | JHEP 03 (2012) 070 | 1108.6329 |
| 32 | C. Bini, R. Contino, and N. Vignaroli | Heavy-light decay topologies as a new strategy to discover a heavy gluon | JHEP 01 (2012) 157 | 1110.6058 |
| 33 | E. Accomando et al. | Z' physics with early LHC data | PRD 83 (2011) 075012 | 1010.6058 |
| 34 | D. Greco and D. Liu | Hunting composite vector resonances at the LHC: naturalness facing data | JHEP 12 (2014) 126 | 1410.2883 |
| 35 | CMS Collaboration | Search for a heavy resonance decaying to a top quark and a vector-like top quark at $ \sqrt{s} = $ 13 TeV | Submitted to JHEP | CMS-B2G-16-013 1703.06352 |
| 36 | CMS Collaboration | The CMS experiment at the CERN LHC | JINST 3 (2008) S08004 | CMS-00-001 |
| 37 | J. Alwall et al. | The automated computation of tree-level and next-to-leading order differential cross sections, and their matching to parton shower simulations | JHEP 07 (2014) 079 | 1405.0301 |
| 38 | P. Nason | A new method for combining NLO QCD with shower Monte Carlo algorithms | JHEP 11 (2004) 040 | hep-ph/0409146 |
| 39 | S. Frixione, P. Nason, and C. Oleari | Matching NLO QCD computations with Parton Shower simulations: the POWHEG method | JHEP 11 (2007) 070 | 0709.2092 |
| 40 | S. Alioli, P. Nason, C. Oleari, and E. Re | A general framework for implementing NLO calculations in shower Monte Carlo programs: the POWHEG BOX | JHEP 06 (2010) 043 | 1002.2581 |
| 41 | S. Alioli, S.-O. Moch, and P. Uwer | Hadronic top-quark pair-production with one jet and parton showering | JHEP 01 (2012) 137 | 1110.5251 |
| 42 | T. Sjostrand et al. | An introduction to PYTHIA 8.2 | CPC 191 (2015) 159 | 1410.3012 |
| 43 | CMS Collaboration | Investigations of the impact of the parton shower tuning in Pythia 8 in the modelling of $ \mathrm{t\overline{t}} $ at $ \sqrt{s}= $ 8 and 13 TeV | CMS-PAS-TOP-16-021 | CMS-PAS-TOP-16-021 |
| 44 | P. Artoisenet, R. Frederix, O. Mattelaer, and R. Rietkerk | Automatic spin-entangled decays of heavy resonances in Monte Carlo simulations | JHEP 03 (2013) 015 | 1212.3460 |
| 45 | B. Fuks and H.-S. Shao | QCD next-to-leading-order predictions matched to parton showers for vector-like quark models | EPJC 77 (2017) 135 | 1610.04622 |
| 46 | A. Oliveira | Gravity particles from warped extra dimensions, predictions for LHC | 1404.0102 | |
| 47 | GEANT4 Collaboration | GEANT4---A simulation toolkit | NIMA 506 (2003) 250 | |
| 48 | J. Allison et al. | GEANT4 developments and applications | IEEE Trans. Nucl. Sci. 53 (2006) 270 | |
| 49 | NNPDF Collaboration | Parton distributions for the LHC Run II | JHEP 04 (2015) 040 | 1410.8849 |
| 50 | CMS Collaboration | Description and performance of track and primary-vertex reconstruction with the CMS tracker | JINST 9 (2014) P10009 | CMS-TRK-11-001 1405.6569 |
| 51 | M. Cacciari, G. P. Salam, and G. Soyez | The anti-$ k_t $ jet clustering algorithm | JHEP 04 (2008) 063 | 0802.1189 |
| 52 | M. Cacciari, G. P. Salam, and G. Soyez | FastJet user manual | EPJC 72 (2012) 1896 | 1111.6097 |
| 53 | CMS Collaboration | Particle-flow reconstruction and global event description with the CMS detector | Submitted to JINST | CMS-PRF-14-001 1706.04965 |
| 54 | CMS Collaboration | Performance of electron reconstruction and selection with the CMS detector in proton-proton collisions at $ \sqrt{s} = $ 8 TeV | JINST 10 (2015) P06005 | CMS-EGM-13-001 1502.02701 |
| 55 | CMS Collaboration | Performance of CMS muon reconstruction in pp collision events at $ \sqrt{s} = $ 7 TeV | JINST 7 (2012) P10002 | CMS-MUO-10-004 1206.4071 |
| 56 | S. D. Ellis, C. K. Vermilion, and J. R. Walsh | Techniques for improved heavy particle searches with jet substructure | PRD 80 (2009) 051501 | 0903.5081 |
| 57 | CMS Collaboration | Identification techniques for highly boosted W bosons that decay into hadrons | JHEP 12 (2014) 017 | CMS-JME-13-006 1410.4227 |
| 58 | M. Dasgupta, A. Fregoso, S. Marzani, and G. P. Salam | Towards an understanding of jet substructure | JHEP 09 (2013) 029 | 1307.0007 |
| 59 | A. J. Larkoski, S. Marzani, G. Soyez, and J. Thaler | Soft Drop | JHEP 05 (2014) 146 | 1402.2657 |
| 60 | CMS Collaboration | Identification of b-quark jets with the CMS experiment | JINST 8 (2013) P04013 | CMS-BTV-12-001 1211.4462 |
| 61 | CMS Collaboration | Identification of b quark jets at the CMS experiment in the LHC Run 2 | CMS-PAS-BTV-15-001 | CMS-PAS-BTV-15-001 |
| 62 | CMS Collaboration | Measurement of the production cross sections for a Z boson and one or more b jets in pp collisions at $ \sqrt{s} = $ 7 TeV | JHEP 06 (2014) 120 | CMS-SMP-13-004 1402.1521 |
| 63 | J. Butterworth et al. | PDF4LHC recommendations for LHC Run II | JPG 43 (2016) 023001 | 1510.03865 |
| 64 | ATLAS Collaboration | Measurement of the Inelastic Proton-Proton Cross Section at $ \sqrt{s} = $ 13 TeV with the ATLAS Detector at the LHC | PRL 117 (2016) 182002 | 1606.02625 |
| 65 | CMS Collaboration | CMS luminosity measurements for the 2016 data taking period | CMS-PAS-LUM-17-001 | CMS-PAS-LUM-17-001 |
| 66 | A. L. Read | Presentation of search results: the $ CL_s $ technique | JPG 28 (2002) 2693 | |
| 67 | T. Junk | Confidence level computation for combining searches with small statistics | NIMA 434 (1999) 435 | hep-ex/9902006 |
| 68 | G. Cowan, K. Cranmer, E. Gross, and O. Vitells | Asymptotic formulae for likelihood-based tests of new physics | EPJC 71 (2011) 1554 | 1007.1727 |
| 69 | ATLAS and CMS Collaborations | Procedure for the LHC Higgs boson search combination in summer 2011 | CMS-NOTE-2011/005, ATL-PHYS-PUB-2011-011 | |
|
|
Compact Muon Solenoid LHC, CERN |
|

|

|

|

|

|