

Compact Muon Solenoid
LHC, CERN
| CMS-BPH-20-001 ; CERN-EP-2020-110 | ||
| Measurement of the CP-violating phase ${\phi_{\mathrm{s}}}$ in the ${\mathrm{B^{0}_{s}}\to\mathrm{J}/\psi\,\phi(1020) \to \mu^{+}\mu^{-}\,{\mathrm{K^{+}}\mathrm{K^{-}}} } $ channel in proton-proton collisions at $\sqrt{s} = $ 13 TeV | ||
| CMS Collaboration | ||
| 5 July 2020 | ||
| Phys. Lett. B 816 (2021) 136188 | ||
| Abstract: The CP-violating weak phase ${\phi_{\mathrm{s}}}$ and the decay width difference $\Delta\Gamma_{\mathrm{s}}$ between the light and heavy $\mathrm{B^{0}_{s}}$ mass eigenstates are measured with the CMS detector at the LHC in a sample of 48 500 reconstructed ${\mathrm{B^{0}_{s}}\to\mathrm{J}/\psi\,\phi(1020) \to \mu^{+}\mu^{-}\,{\mathrm{K^{+}}\mathrm{K^{-}}} }$ events. The measurement is based on a data sample corresponding to an integrated luminosity of 96.4 fb$^{-1}$, collected in proton-proton collisions at $\sqrt{s} = $ 13 TeV in 2017-2018. To extract the values of ${\phi_{\mathrm{s}}}$ and $\Delta\Gamma_{\mathrm{s}}$, a time-dependent and flavor-tagged angular analysis of the $ {\mu^{+}\mu^{-}} {\mathrm{K^{+}}\mathrm{K^{-}}} $ final state is performed. The analysis employs a dedicated tagging trigger and a novel opposite-side muon flavor tagger based on machine learning techniques. The measurement yields ${\phi_{\mathrm{s}}} = -11 \pm 50 {\,\text{(stat)}} \pm 10 {\,\text{(syst)}} $ mrad and $\Delta\Gamma_{\mathrm{s}} = 0.114 \pm 0.014 {\,\text{(stat)}} \pm 0.007 {\,\text{(syst)}}$ ps$^{-1}$, in agreement with the standard model predictions. When combined with the previous CMS measurement at $\sqrt{s} = $ 8 TeV, the following values are obtained: ${\phi_{\mathrm{s}}} = -21 \pm 45 $ mrad, $\Delta\Gamma_{\mathrm{s}} = 0.1073 \pm 0.0097$ ps$^{-1}$, a significant improvement over the 8 TeV result. | ||
| Links: e-print arXiv:2007.02434 [hep-ex] (PDF) ; CDS record ; inSPIRE record ; CADI line (restricted) ; | ||
| Figures | |
png pdf |
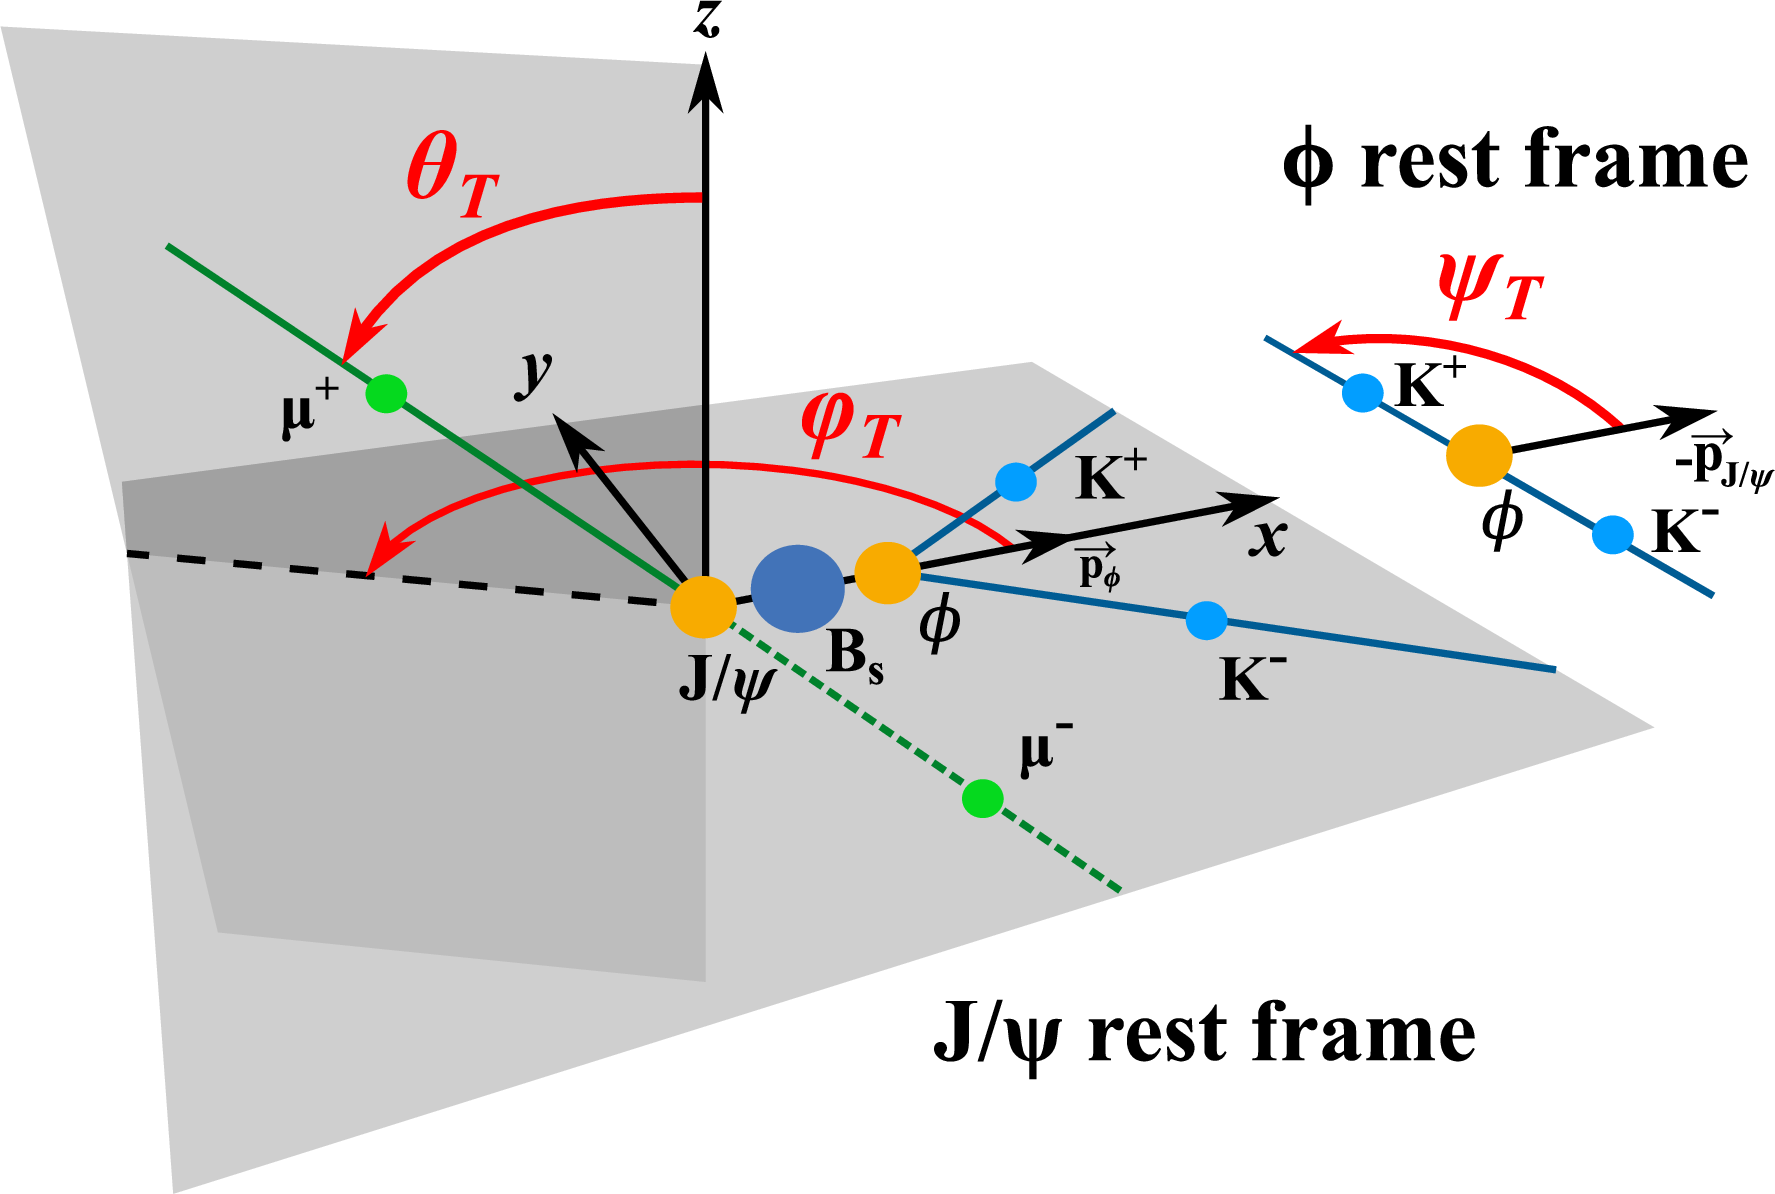
Figure 1:
Definition of the three angles ${\theta _\mathrm {T}}$, ${\psi _\mathrm {T}}$, and ${\varphi _\mathrm {T}} $ describing the topology of the ${\mathrm{B^{0}_{s}} \to \mathrm{J}/\psi \,\phi \to {\mu^{+} \mu^{-}} \, {\mathrm{K^{+}} \mathrm{K^{-}}}}$ decay. |
png pdf |
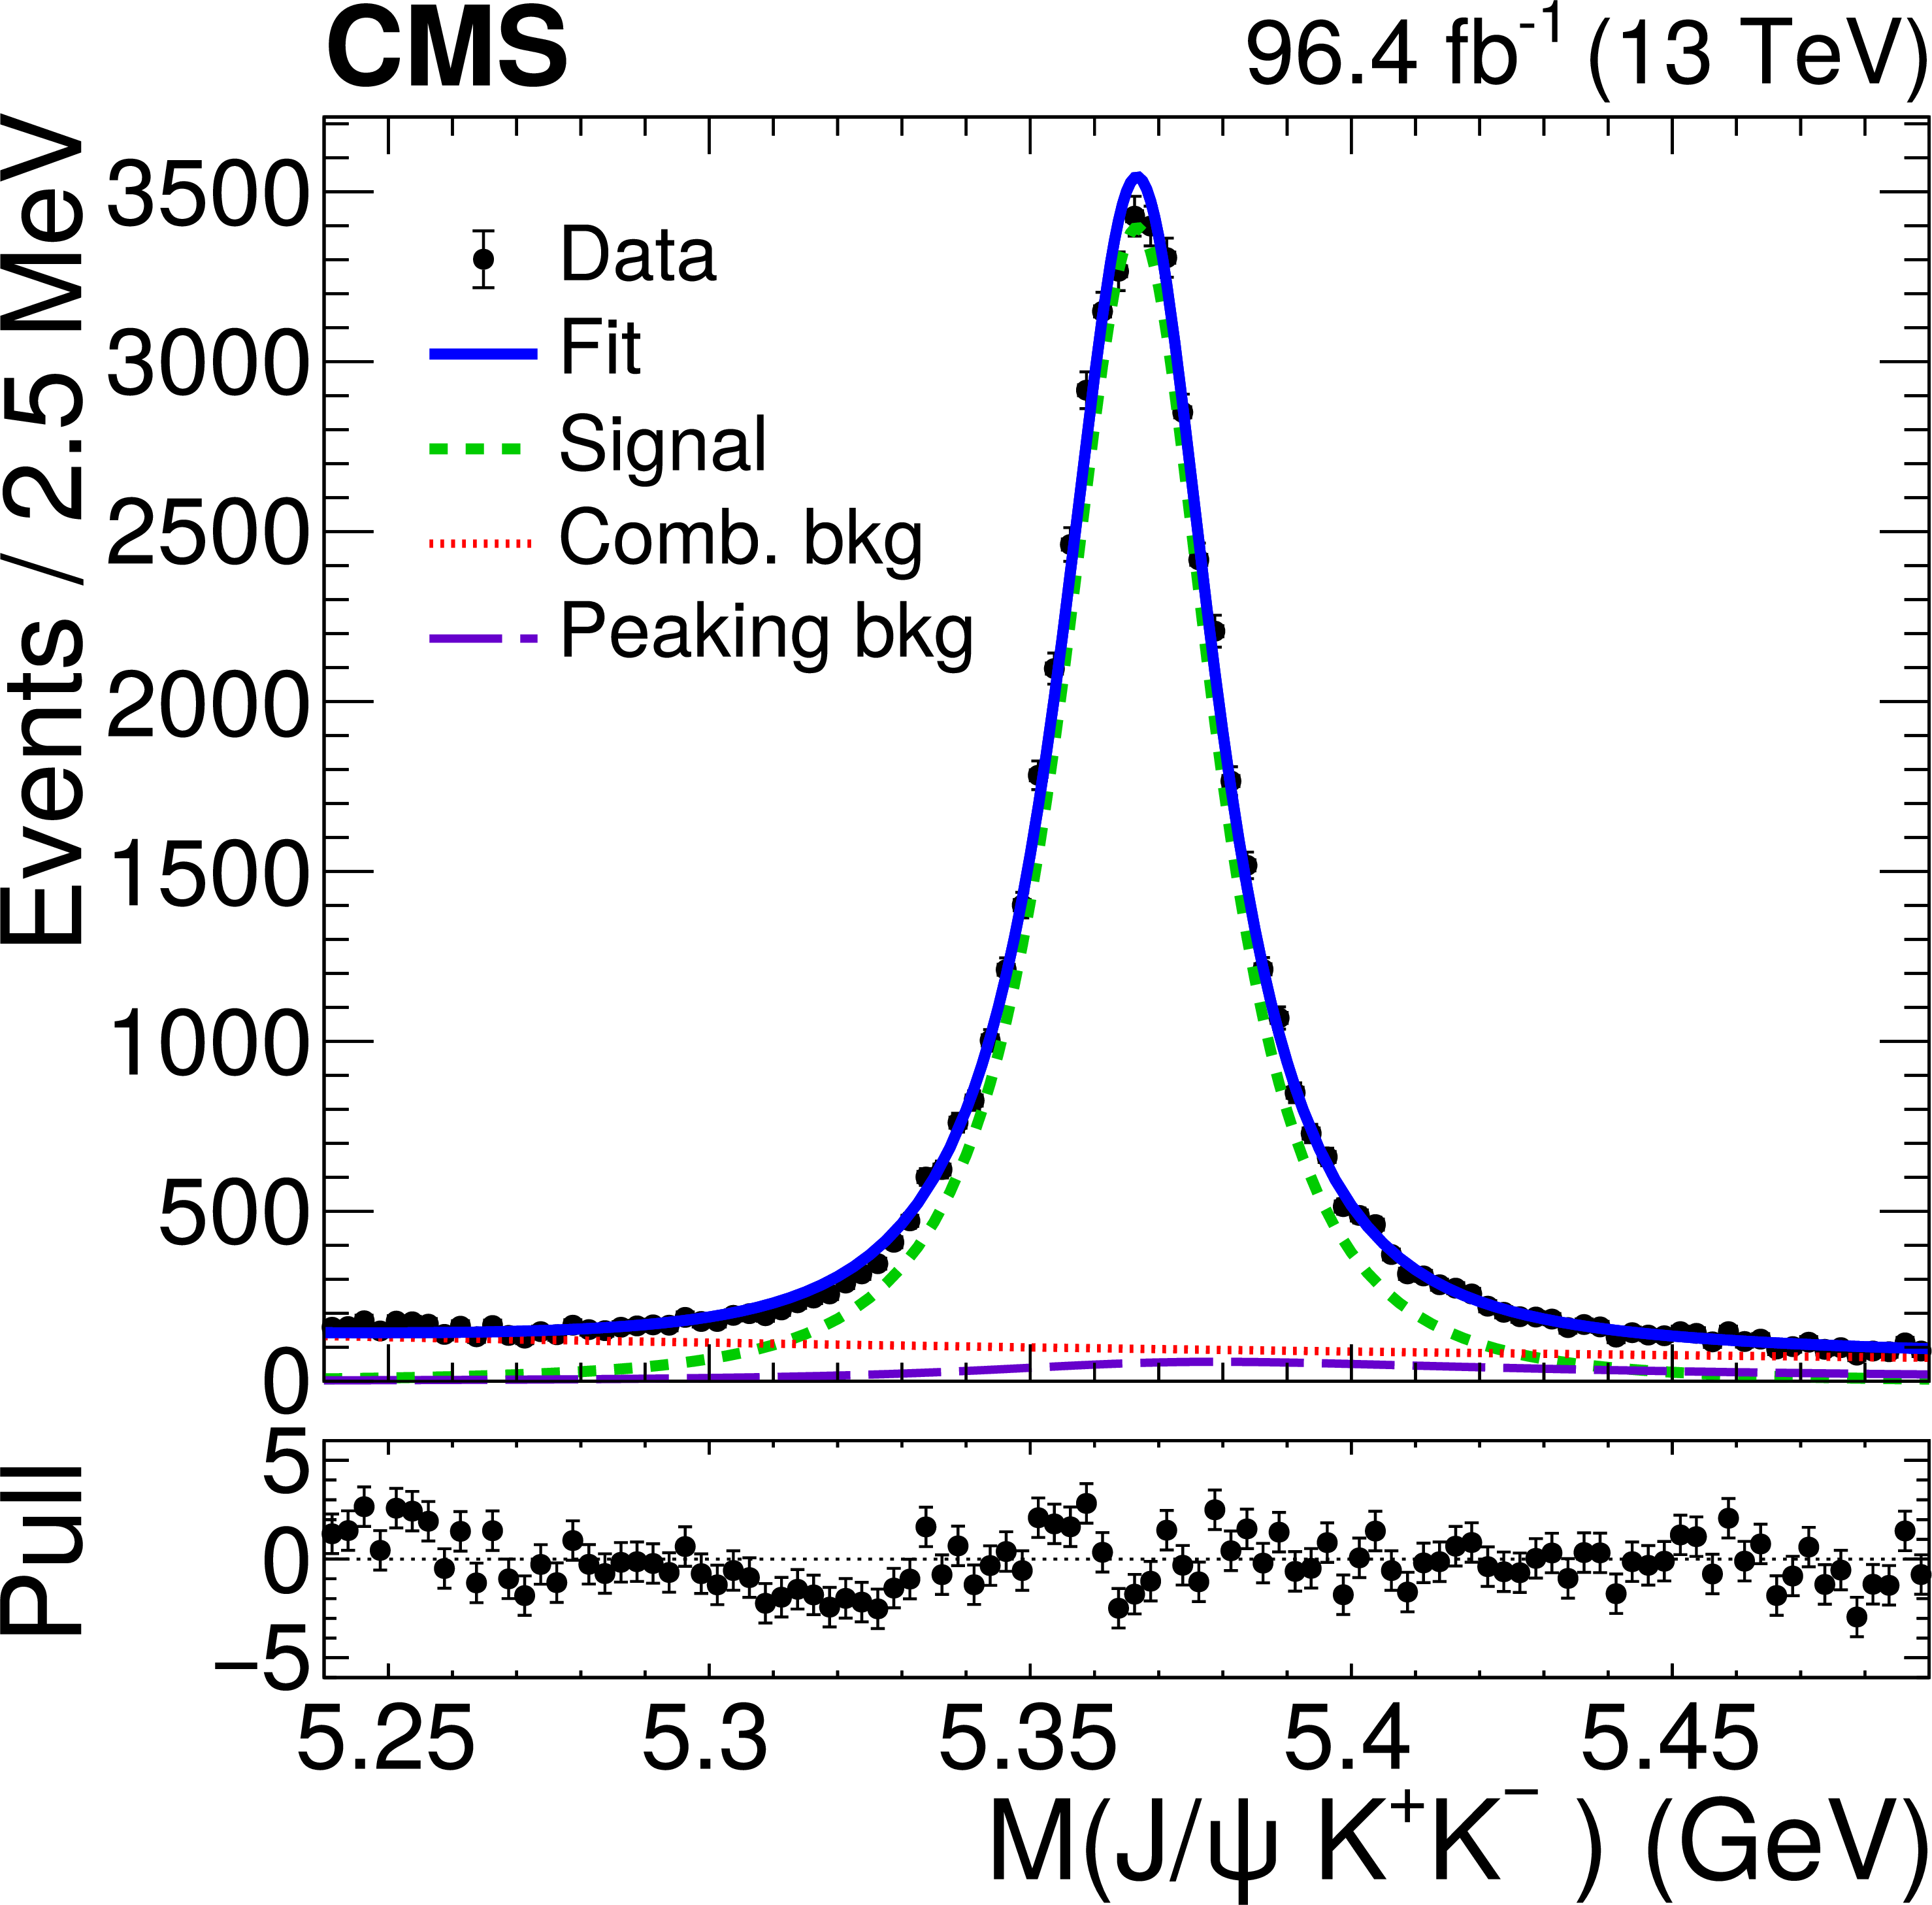
Figure 2:
The invariant mass distribution of the ${\mathrm{B^{0}_{s}} \to \mathrm{J}/\psi \,\phi \to {\mu^{+} \mu^{-}} \, {\mathrm{K^{+}} \mathrm{K^{-}}}}$ candidates in data. The vertical bars on the points represent the statistical uncertainties. The solid line represents a projection of the fit to data (as discussed in Section 5, solid markers), the dashed line corresponds to the signal, the dotted line to the combinatorial background, and the long-dashed line to the peaking background from $\mathrm{B}^{0} \to \mathrm{J}/\psi \, {\mathrm{K^{*(892)}}}^0 \to {\mu^{+} \mu^{-}} \,\mathrm{K^{+}} \pi^{-} $, as obtained from the fit. The distribution of the differences between the data and the fit, divided by the combined uncertainty in the data and the best fit function for each bin (pulls) is displayed in the lower panel. |
png pdf |
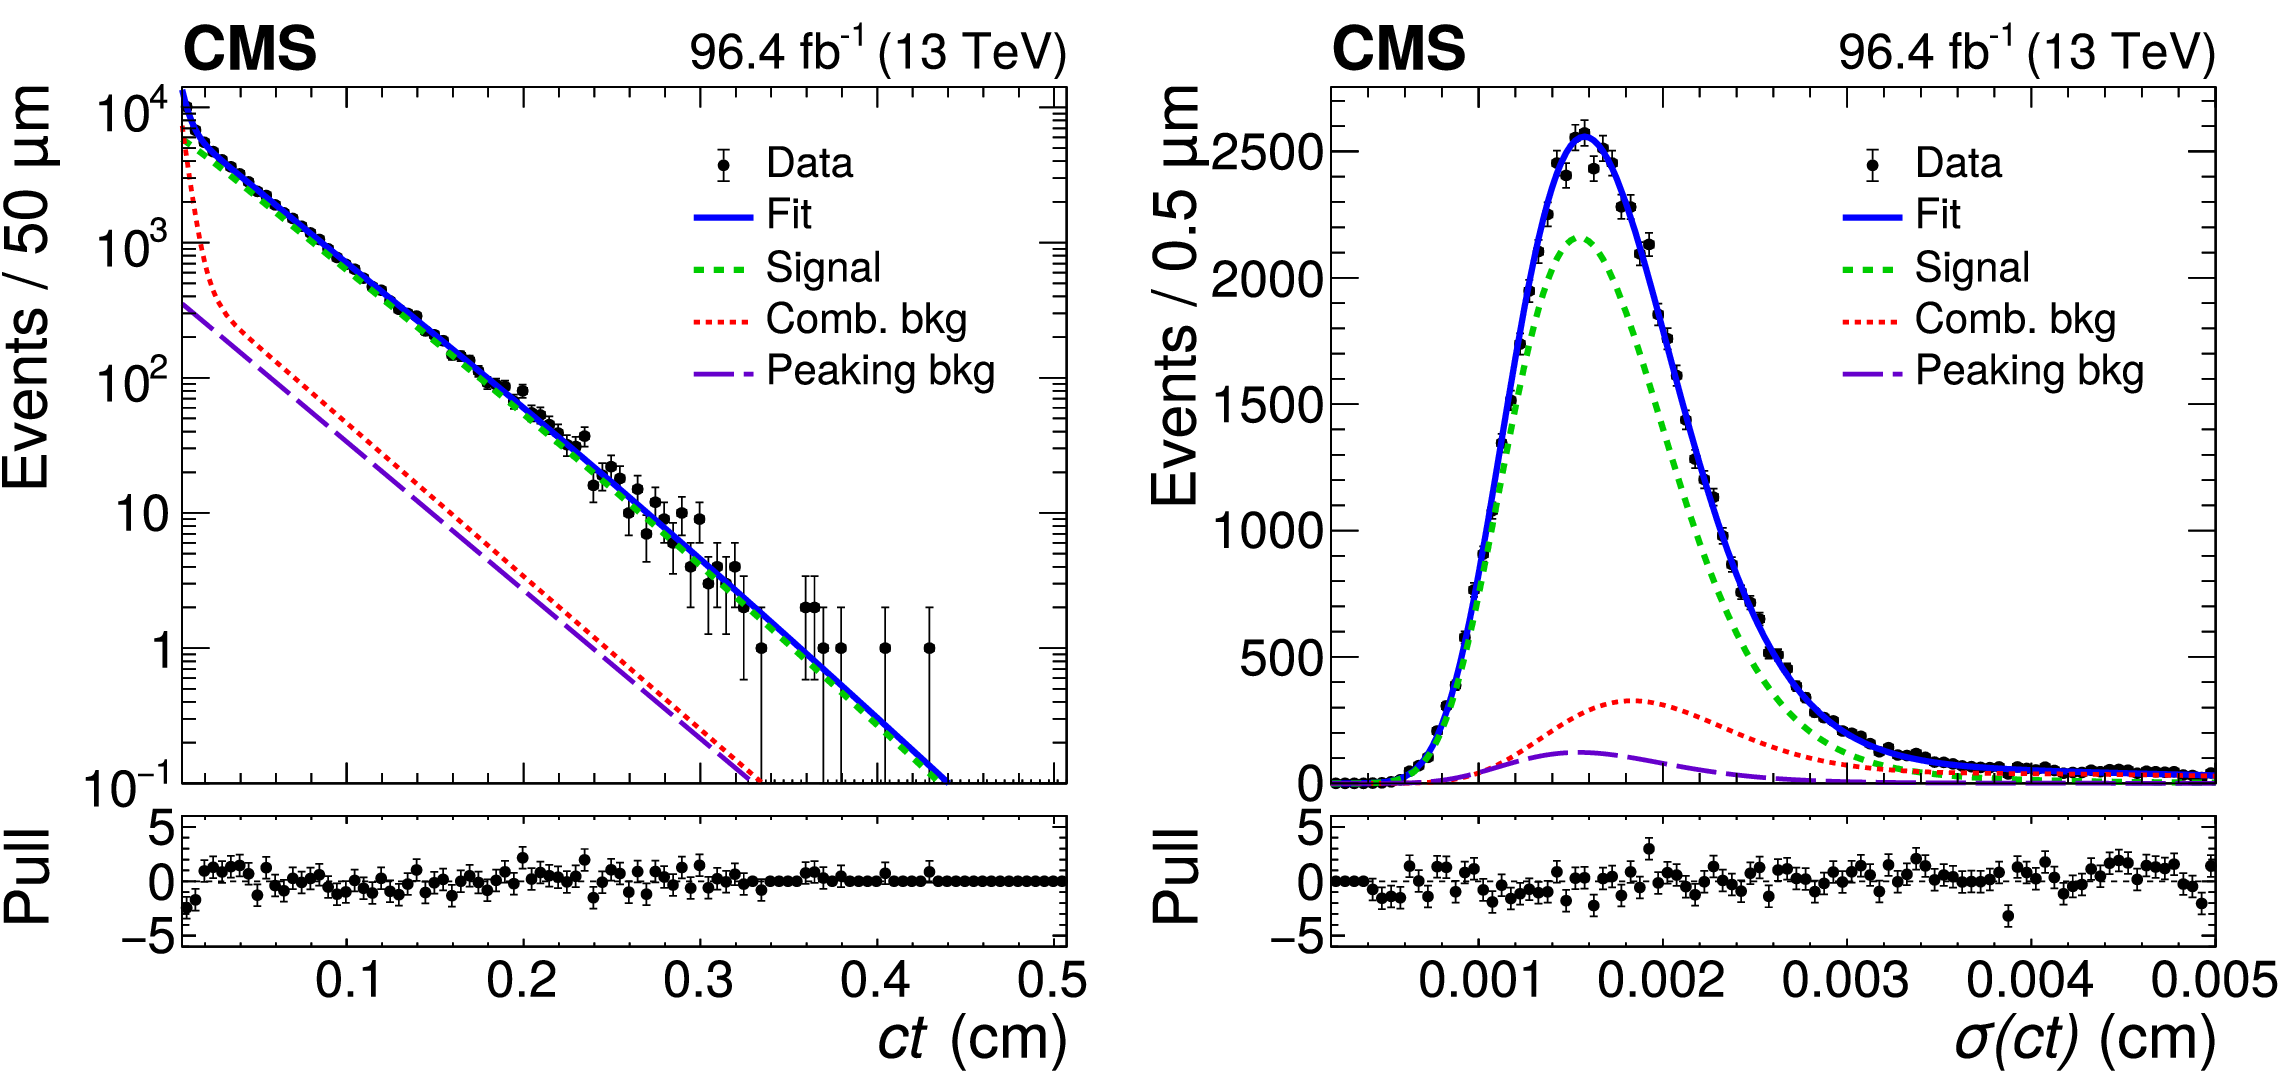
Figure 3:
The ${ct}$ distribution (left) and its uncertainty (right) for the ${\mathrm{B^{0}_{s}} \to \mathrm{J}/\psi \,\phi \to {\mu^{+} \mu^{-}} \, {\mathrm{K^{+}} \mathrm{K^{-}}}}$ candidates in data. The notations are as in Fig. 2. |
png pdf |
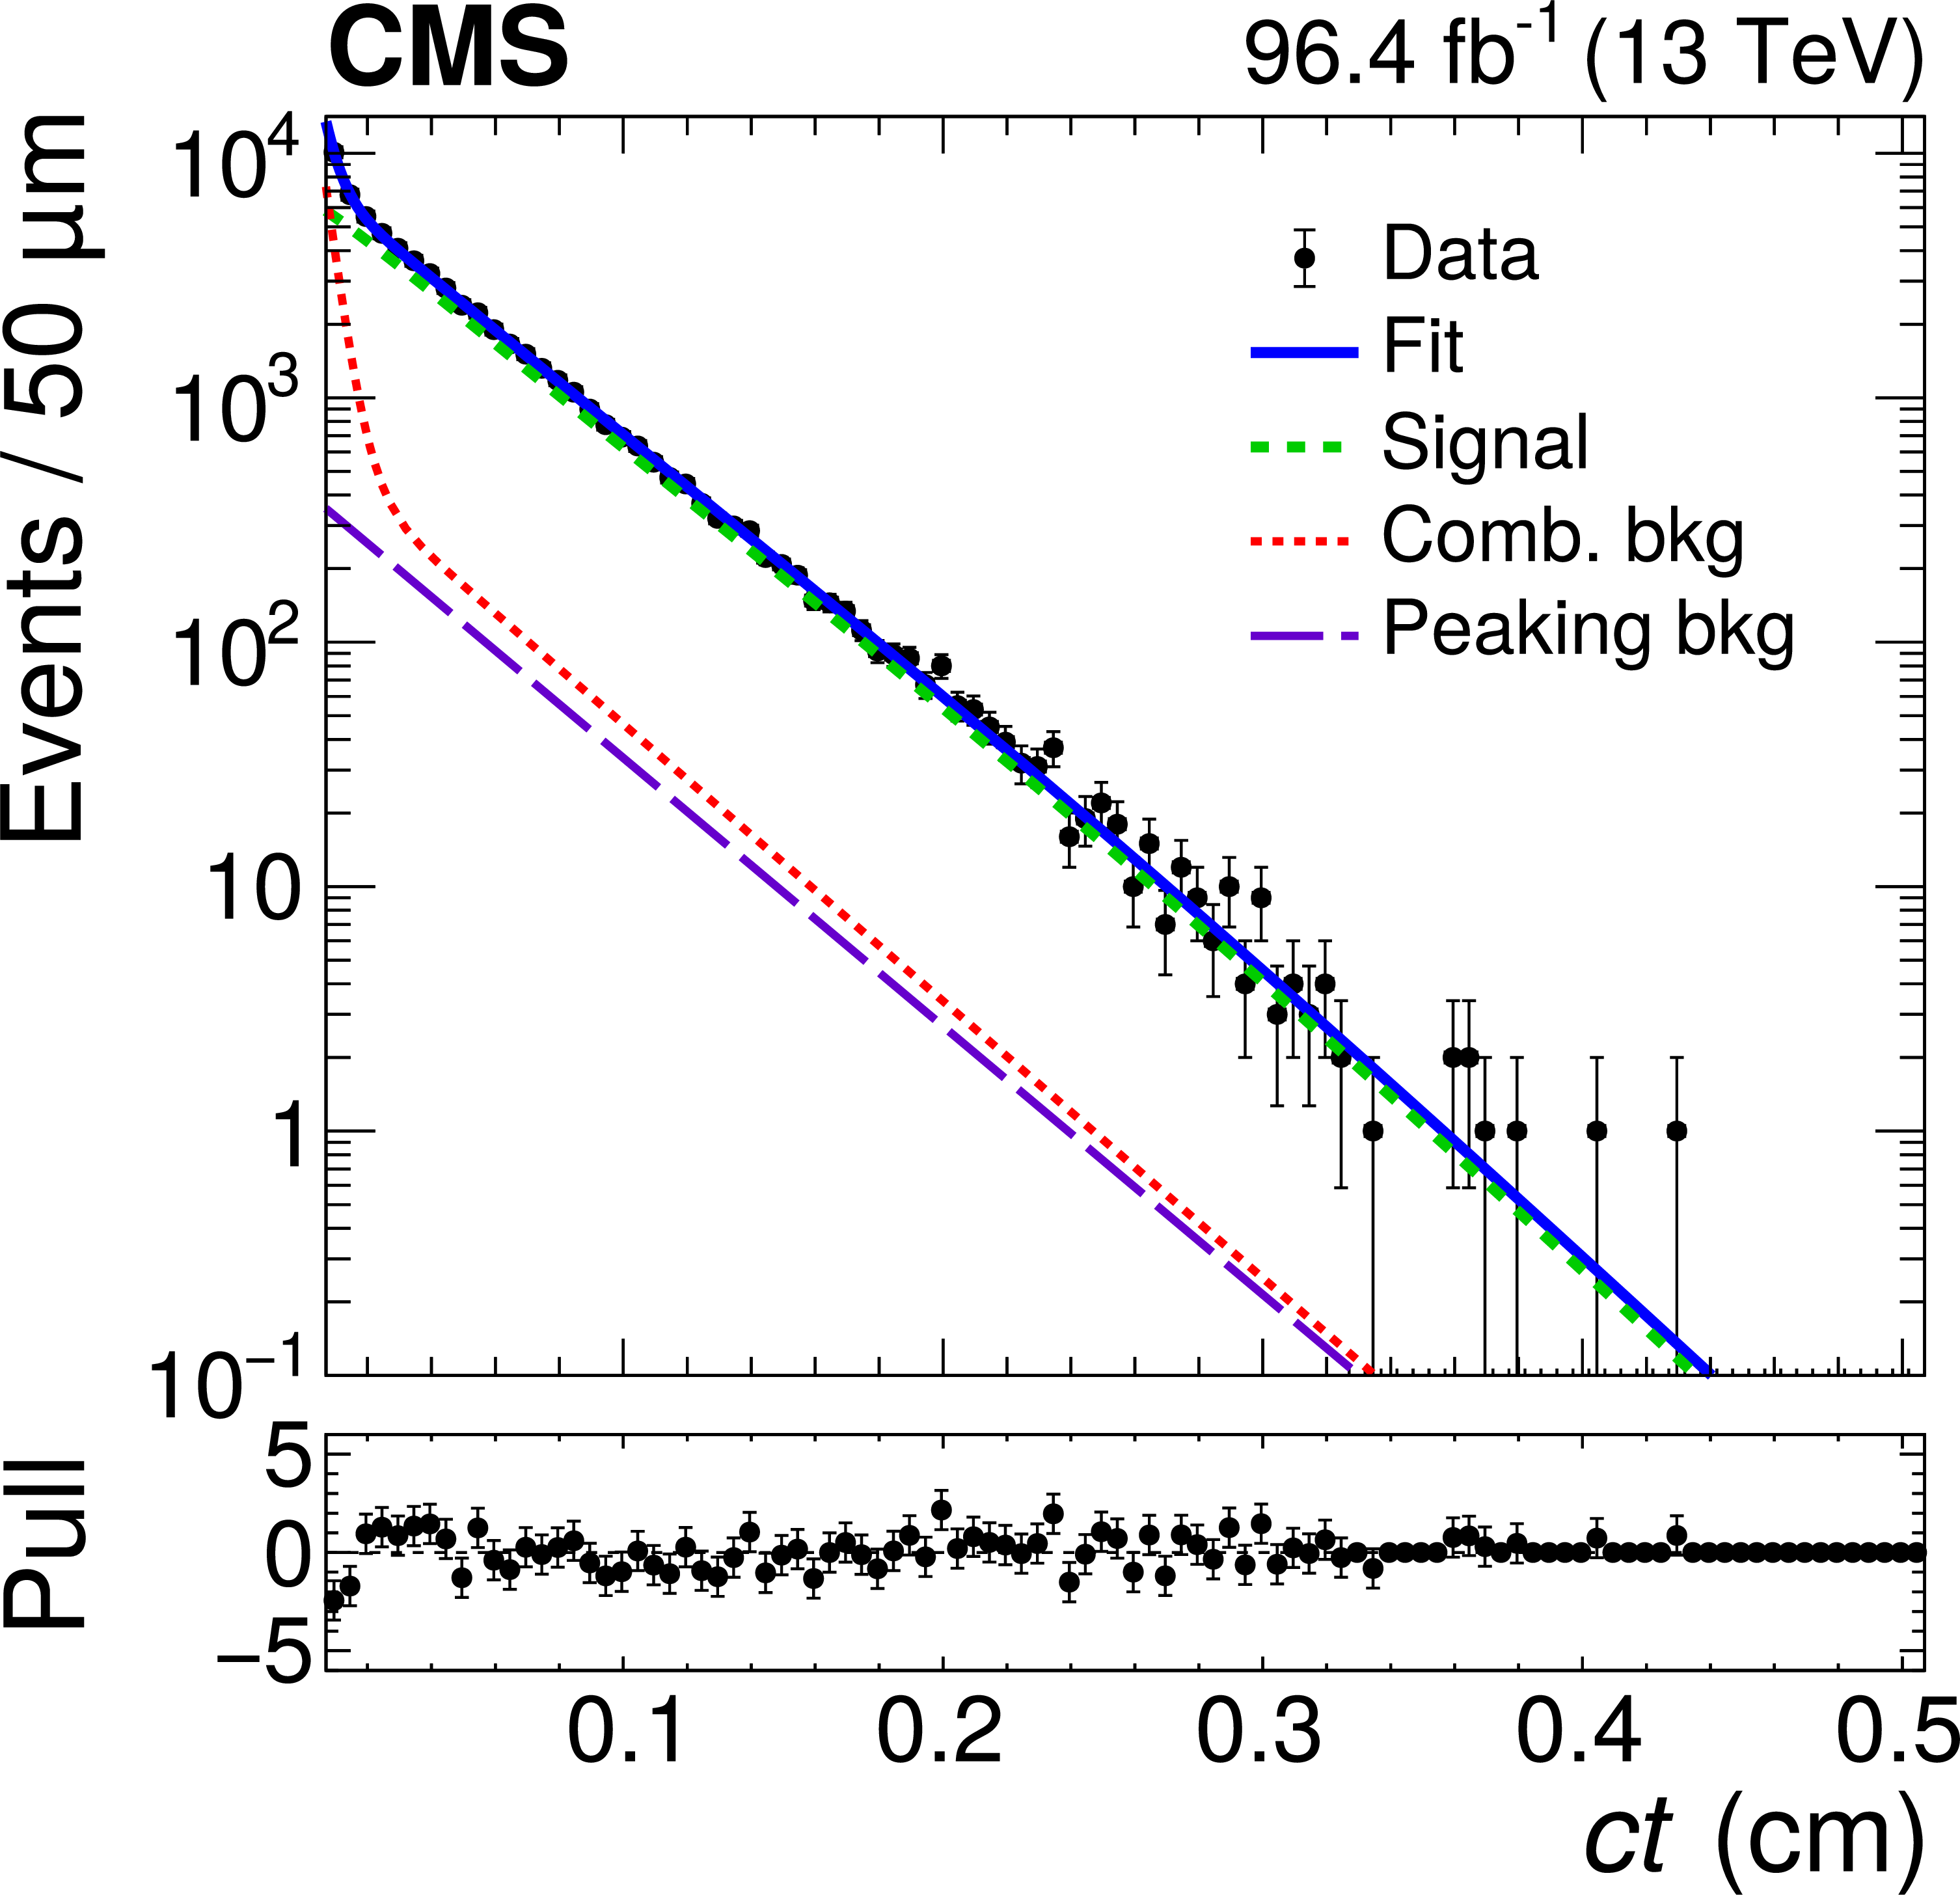
Figure 3-a:
The ${ct}$ distribution for the ${\mathrm{B^{0}_{s}} \to \mathrm{J}/\psi \,\phi \to {\mu^{+} \mu^{-}} \, {\mathrm{K^{+}} \mathrm{K^{-}}}}$ candidates in data. The notations are as in Fig. 2. |

png pdf |
Figure 3-b:
The uncertainty in ${ct}$ for the ${\mathrm{B^{0}_{s}} \to \mathrm{J}/\psi \,\phi \to {\mu^{+} \mu^{-}} \, {\mathrm{K^{+}} \mathrm{K^{-}}}}$ candidates in data. The notations are as in Fig. 2. |
png pdf |
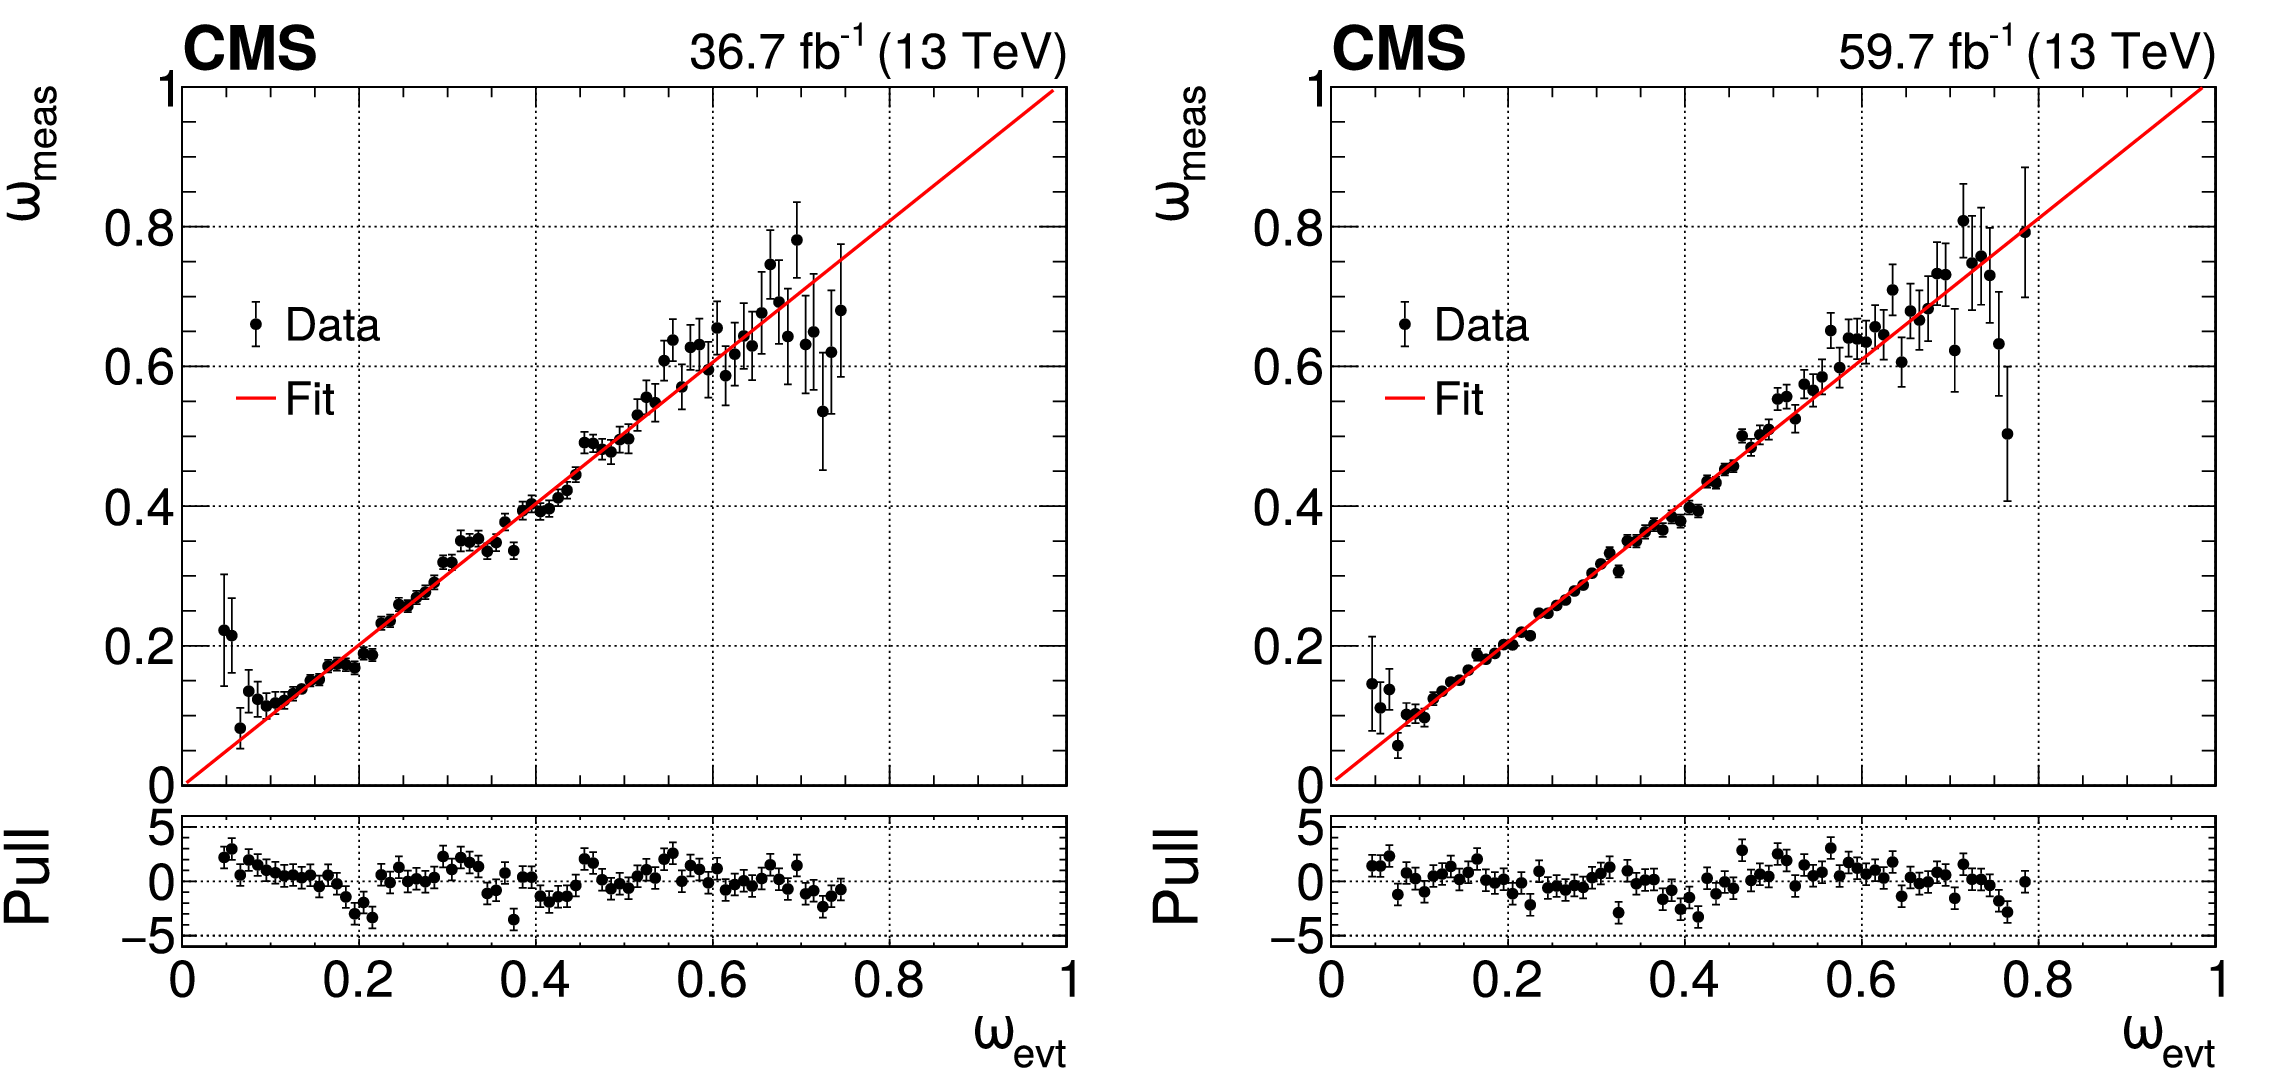
Figure 4:
Results of the calibration of the per-event mistag probability ${\omega _{\text {evt}}}$ based on ${\mathrm{B^{\pm}} \to \mathrm{J}/\psi \,\mathrm{K^{\pm}} \to {\mu^{+} \mu^{-}} \,\mathrm{K^{\pm}}}$ decays from the 2017 (left) and 2018 (right) data samples. The vertical bars represent the statistical uncertainties. The solid line shows a linear fit to data (solid markers). The pull distributions between the data and the fit function in each bin are shown in the lower panels. |
png pdf |
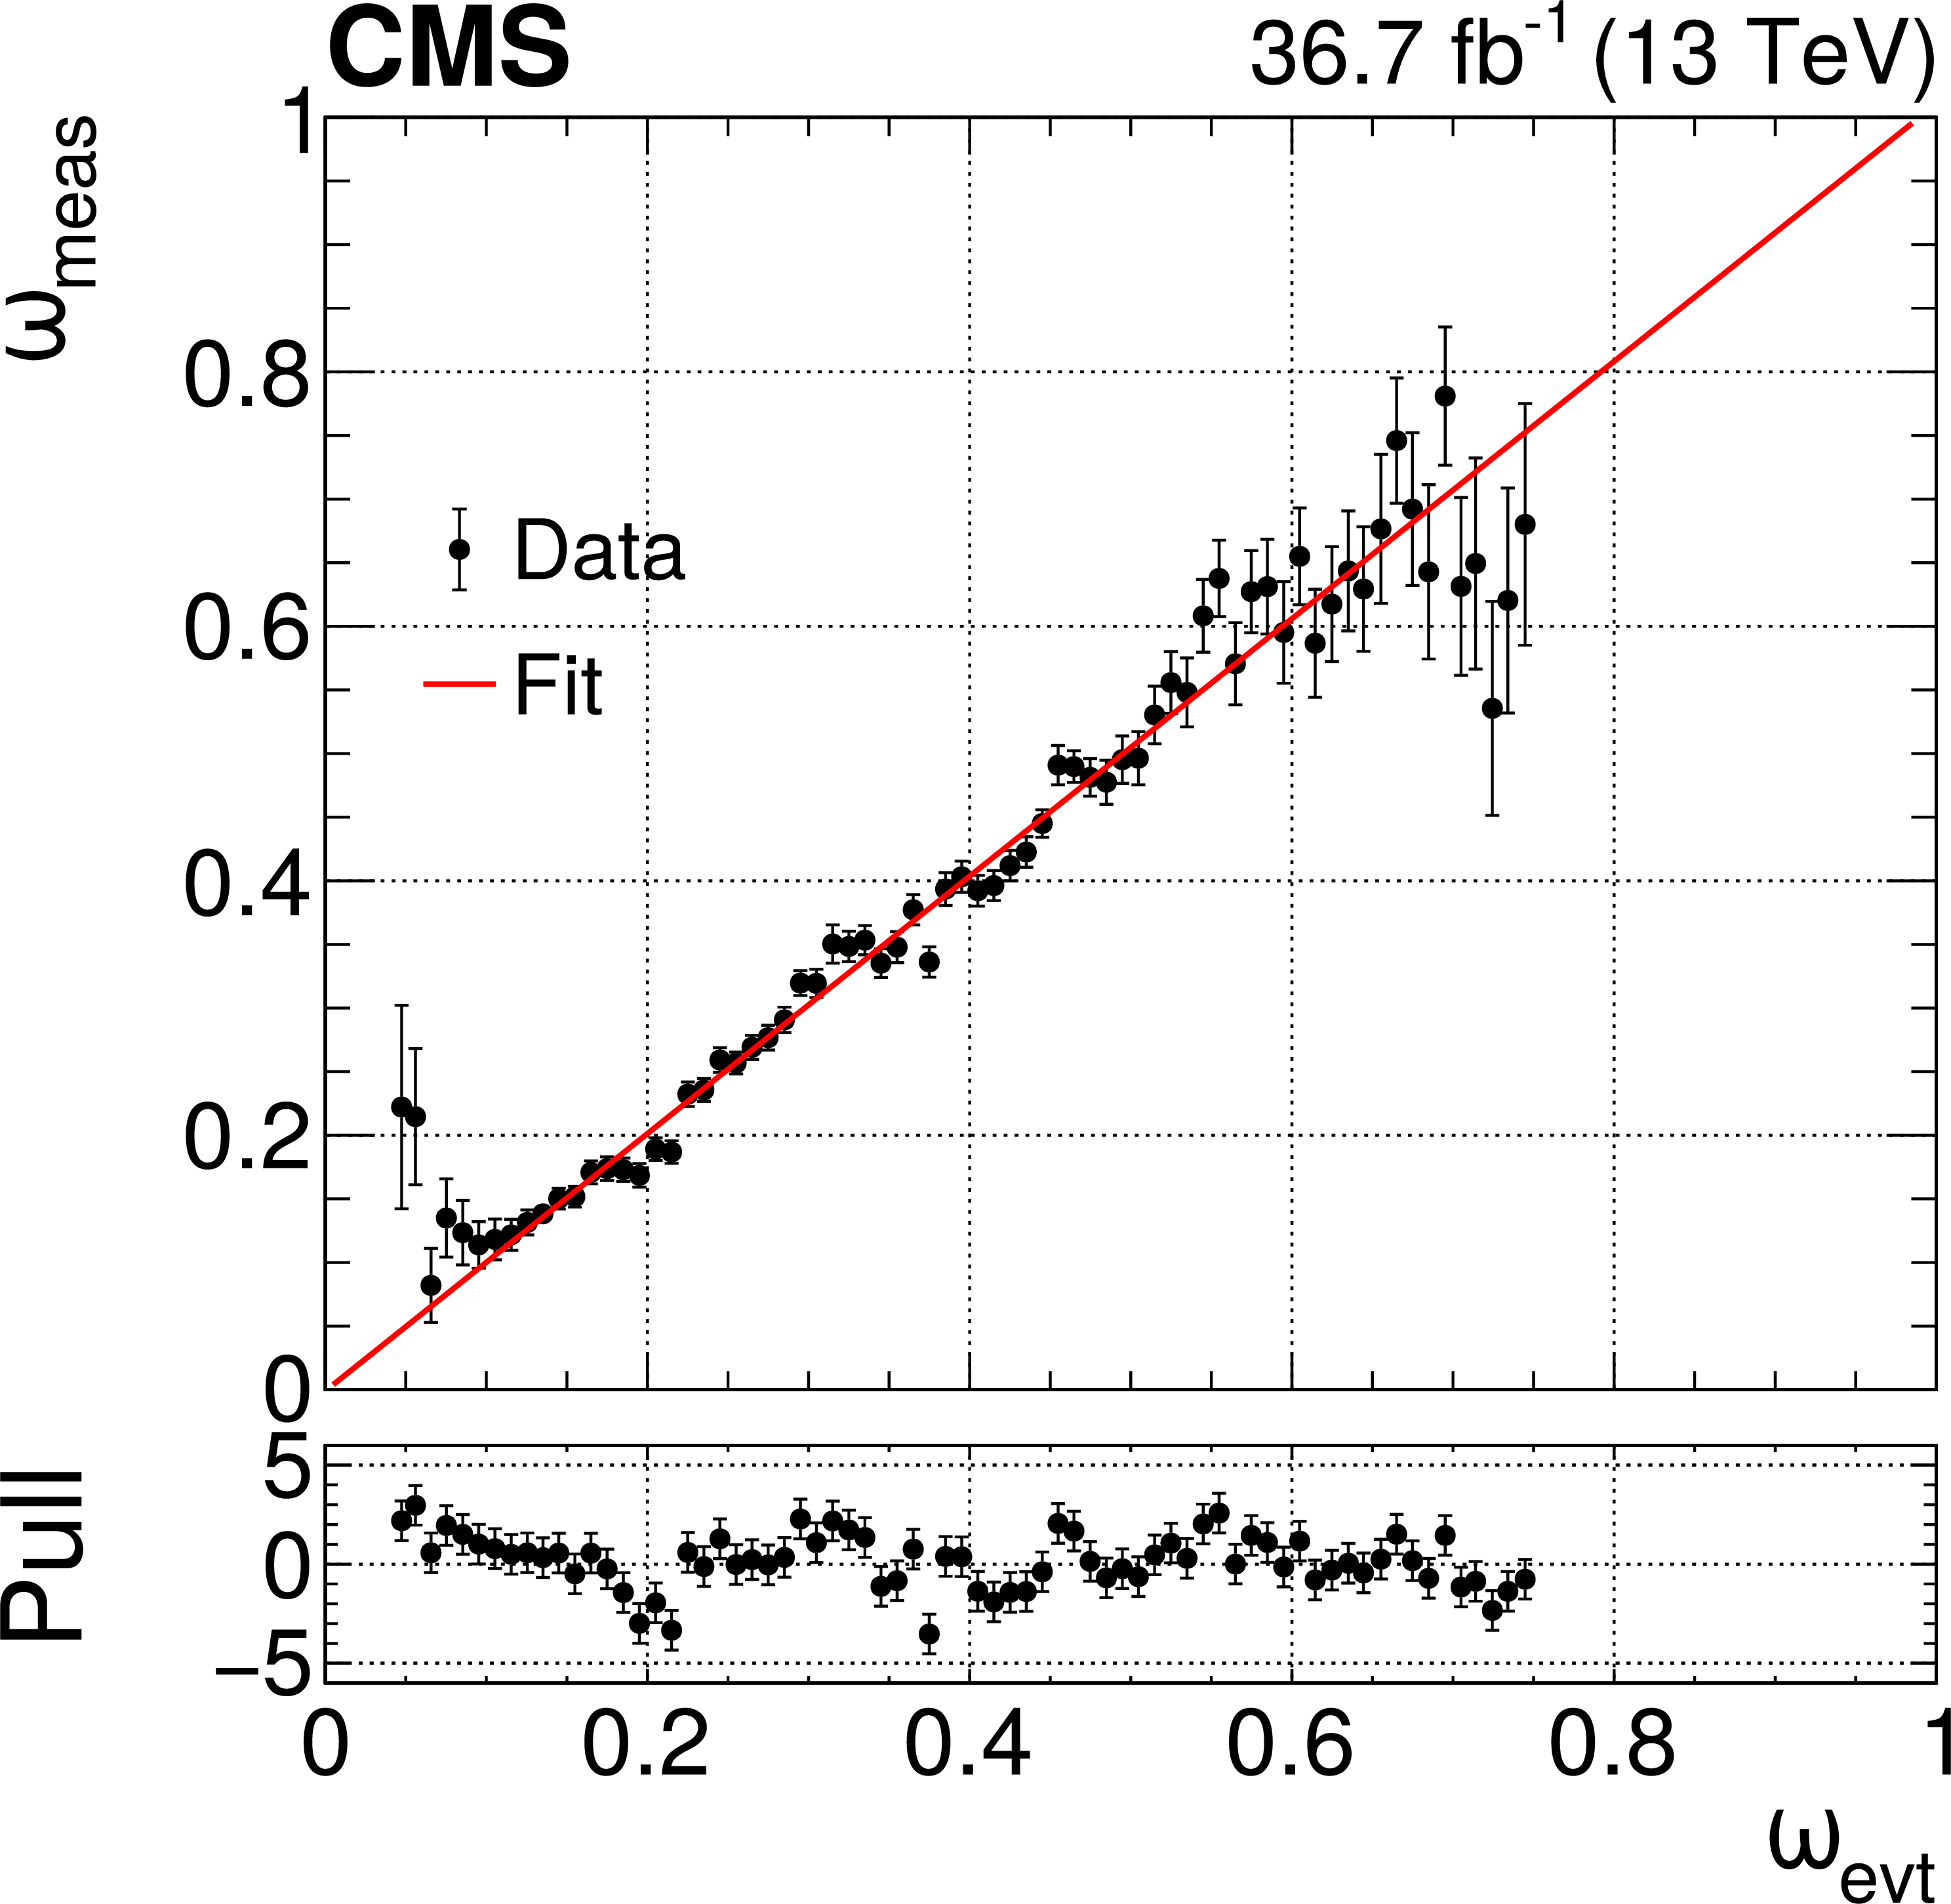
Figure 4-a:
Results of the calibration of the per-event mistag probability ${\omega _{\text {evt}}}$ based on ${\mathrm{B^{\pm}} \to \mathrm{J}/\psi \,\mathrm{K^{\pm}} \to {\mu^{+} \mu^{-}} \,\mathrm{K^{\pm}}}$ decays from the 2017 data sample. The vertical bars represent the statistical uncertainties. The solid line shows a linear fit to data (solid markers). The pull distribution between the data and the fit function in each bin is shown in the lower panel. |
png pdf |
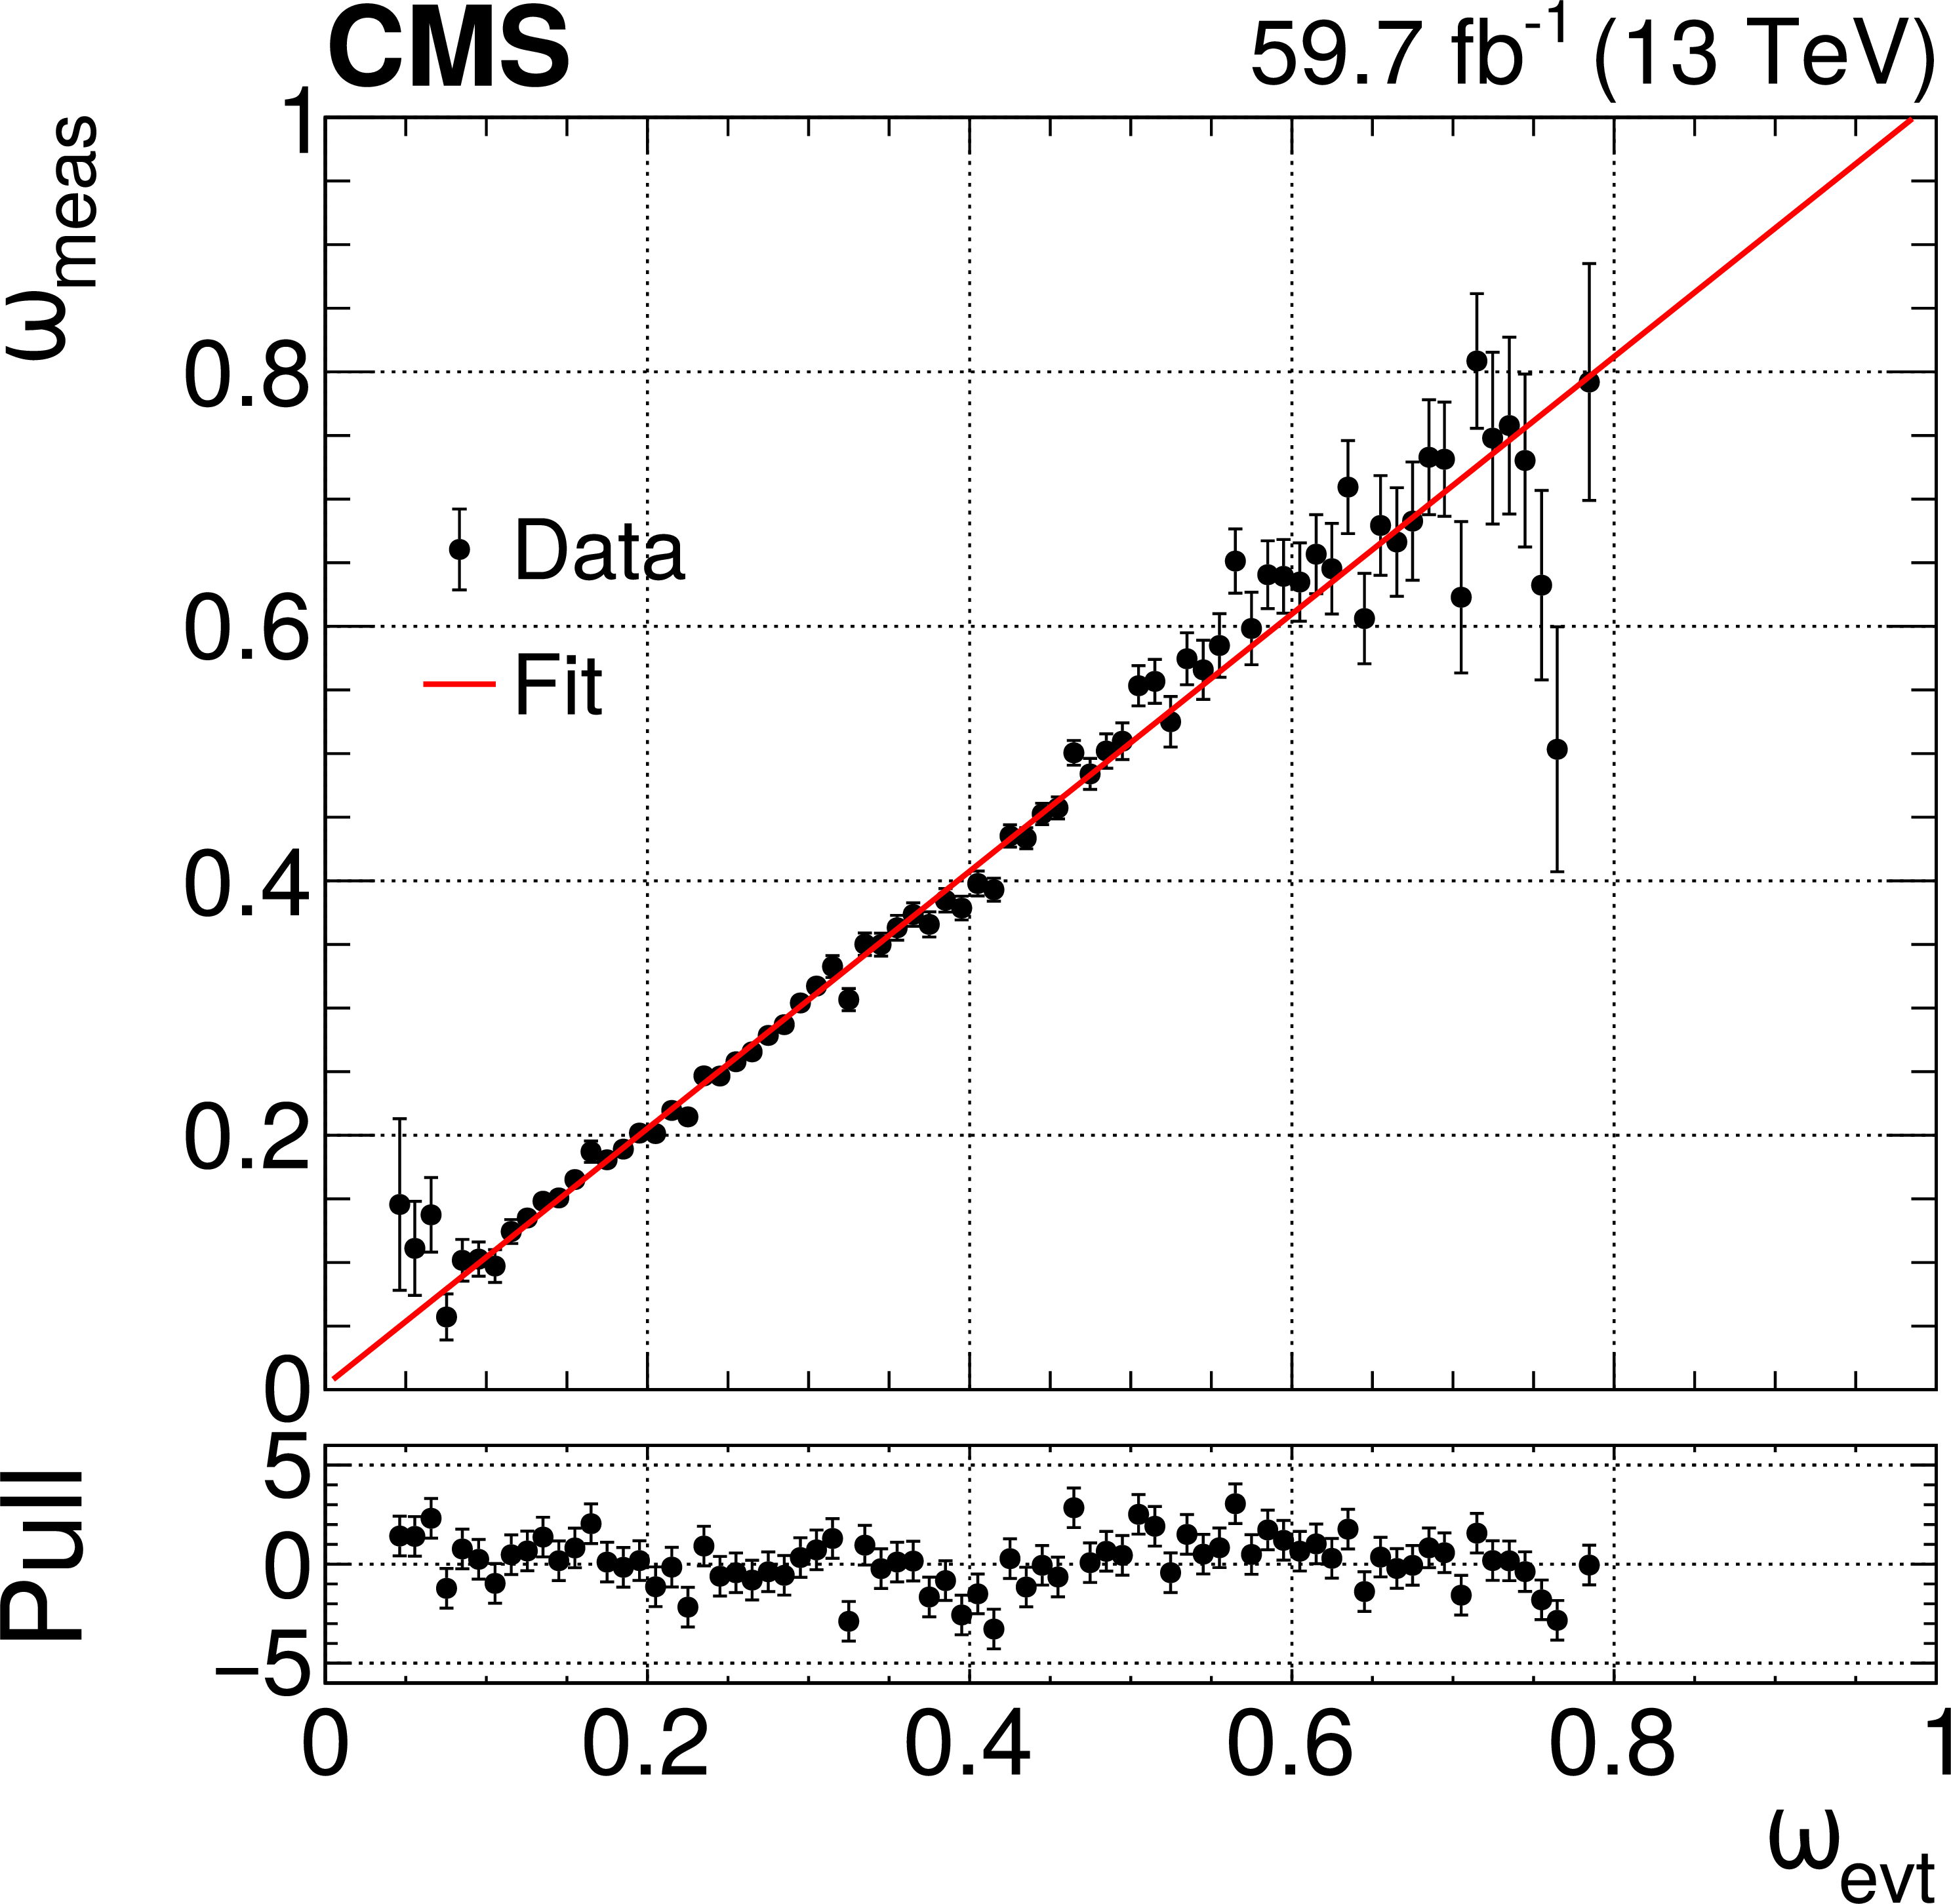
Figure 4-b:
Results of the calibration of the per-event mistag probability ${\omega _{\text {evt}}}$ based on ${\mathrm{B^{\pm}} \to \mathrm{J}/\psi \,\mathrm{K^{\pm}} \to {\mu^{+} \mu^{-}} \,\mathrm{K^{\pm}}}$ decays from the 2018 data sample. The vertical bars represent the statistical uncertainties. The solid line shows a linear fit to data (solid markers). The pull distribution between the data and the fit function in each bin is shown in the lower panel. |

png pdf |
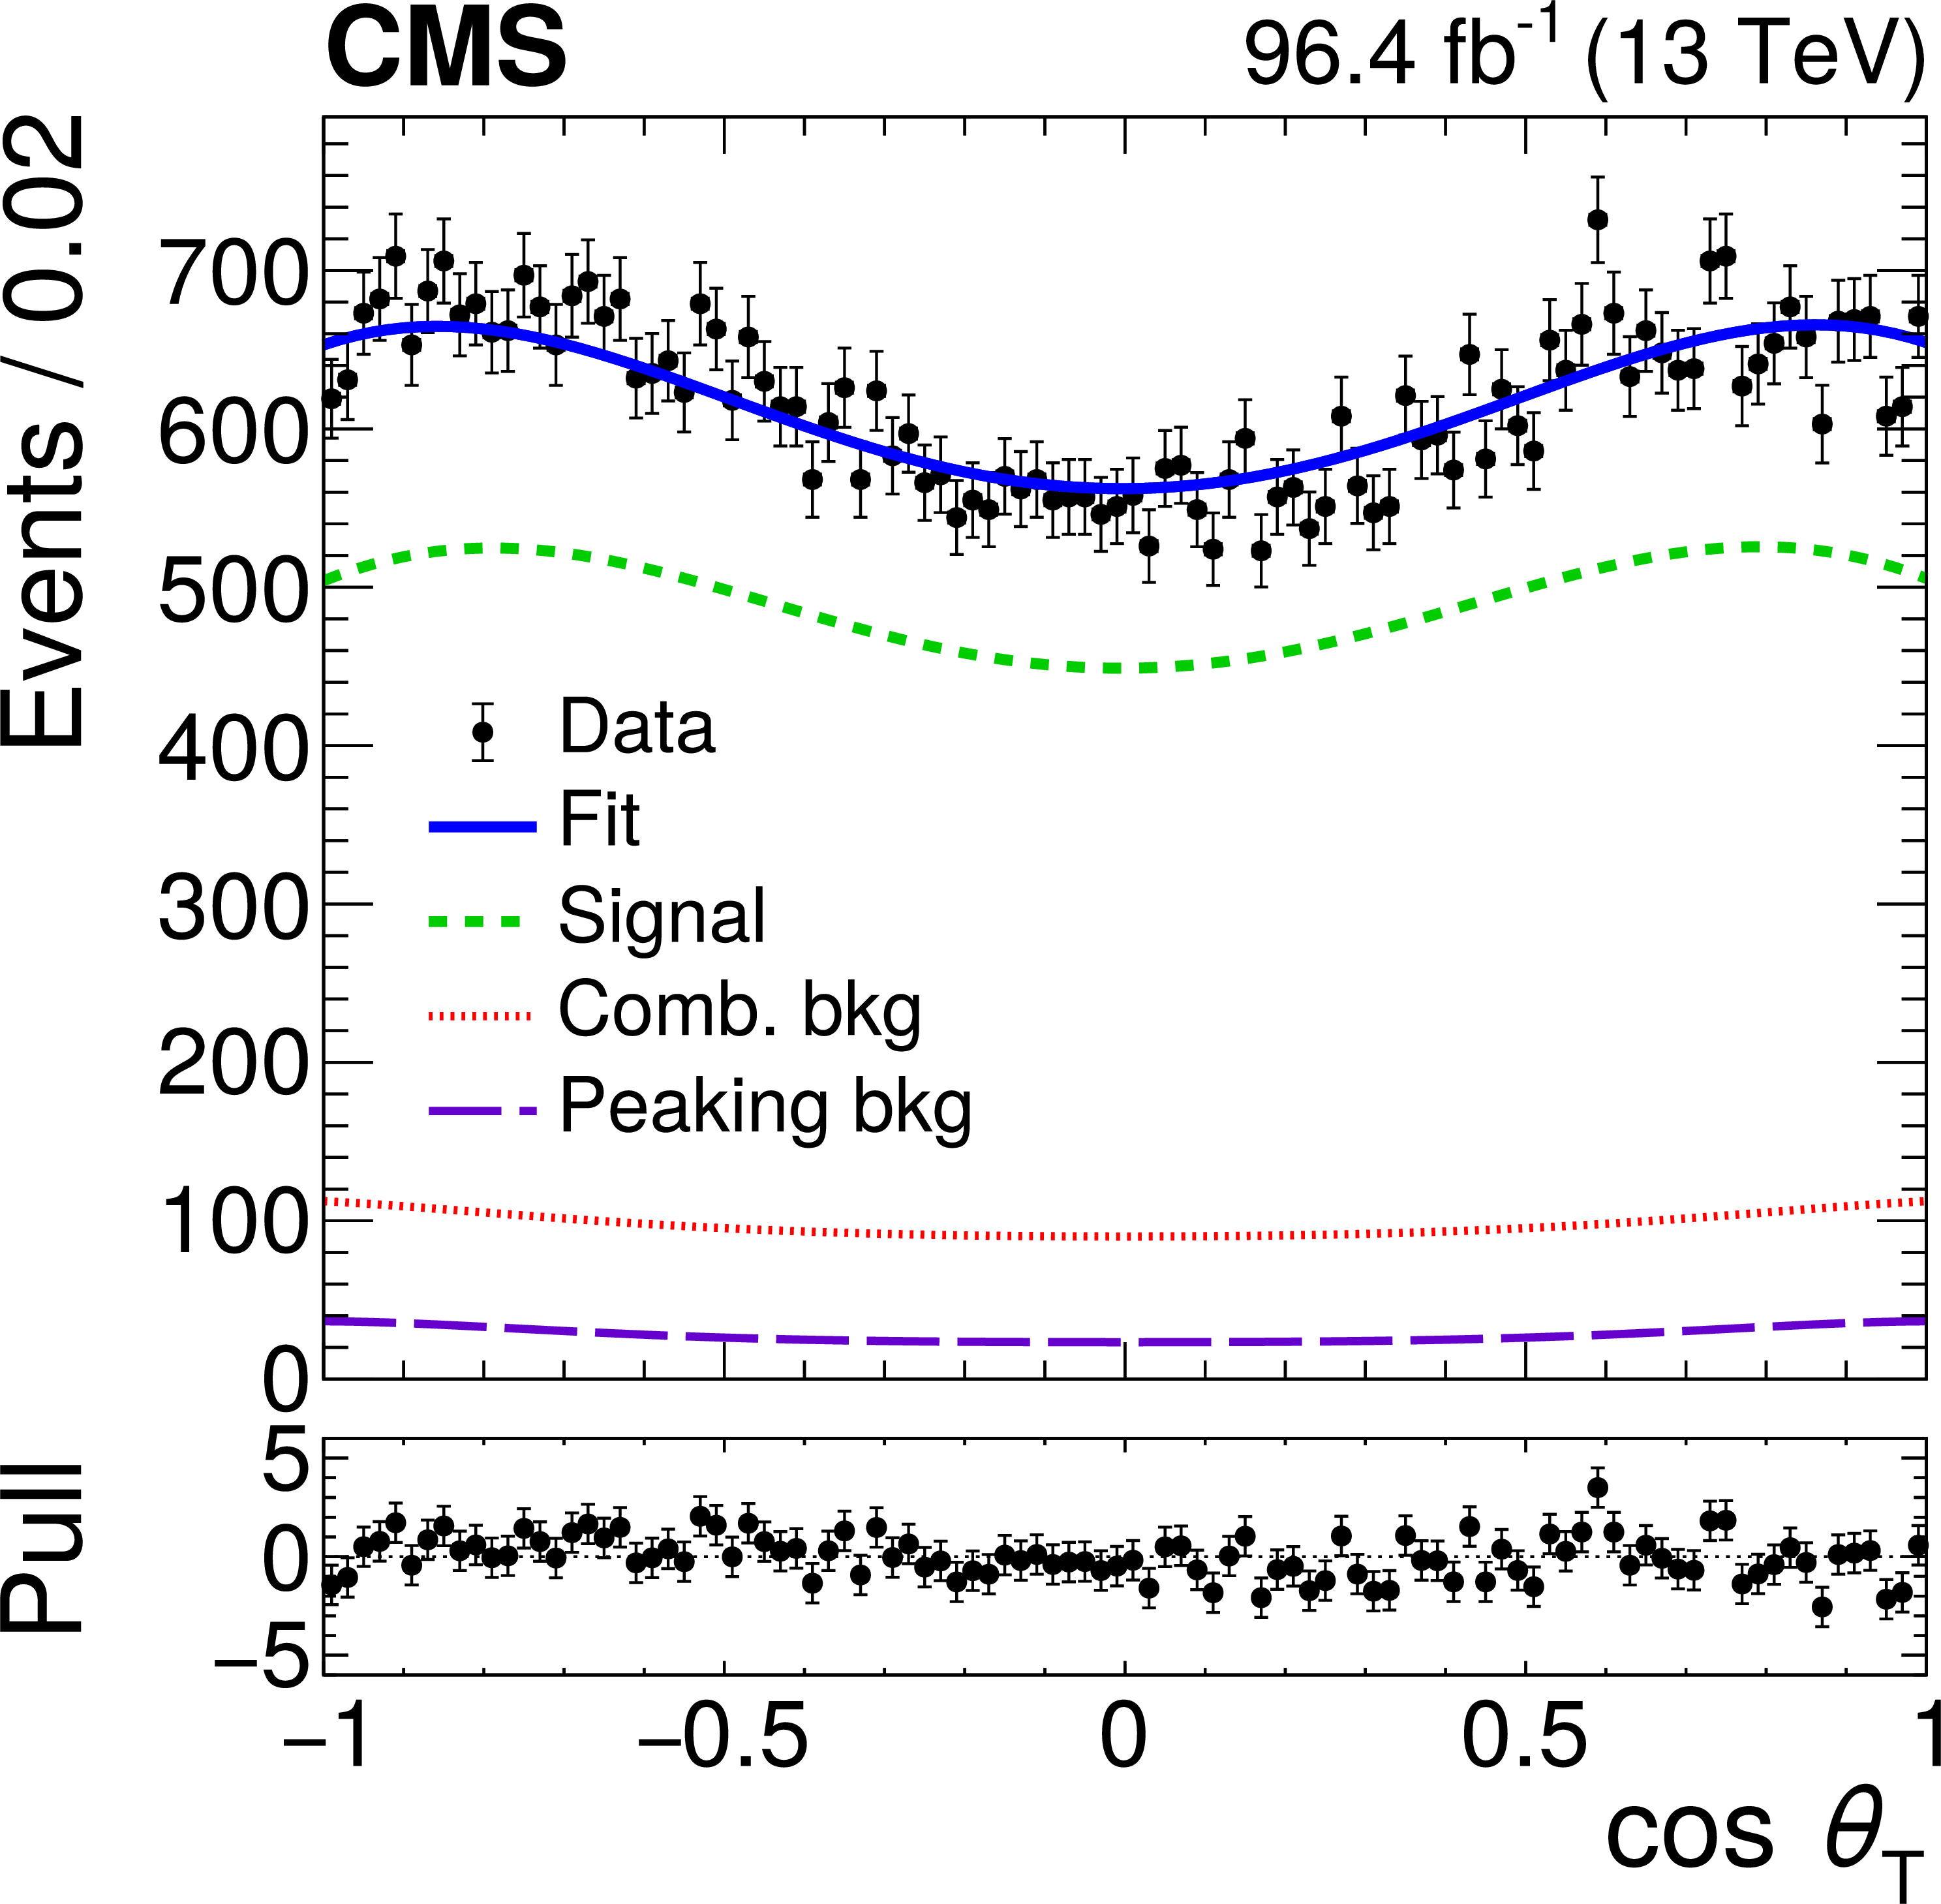
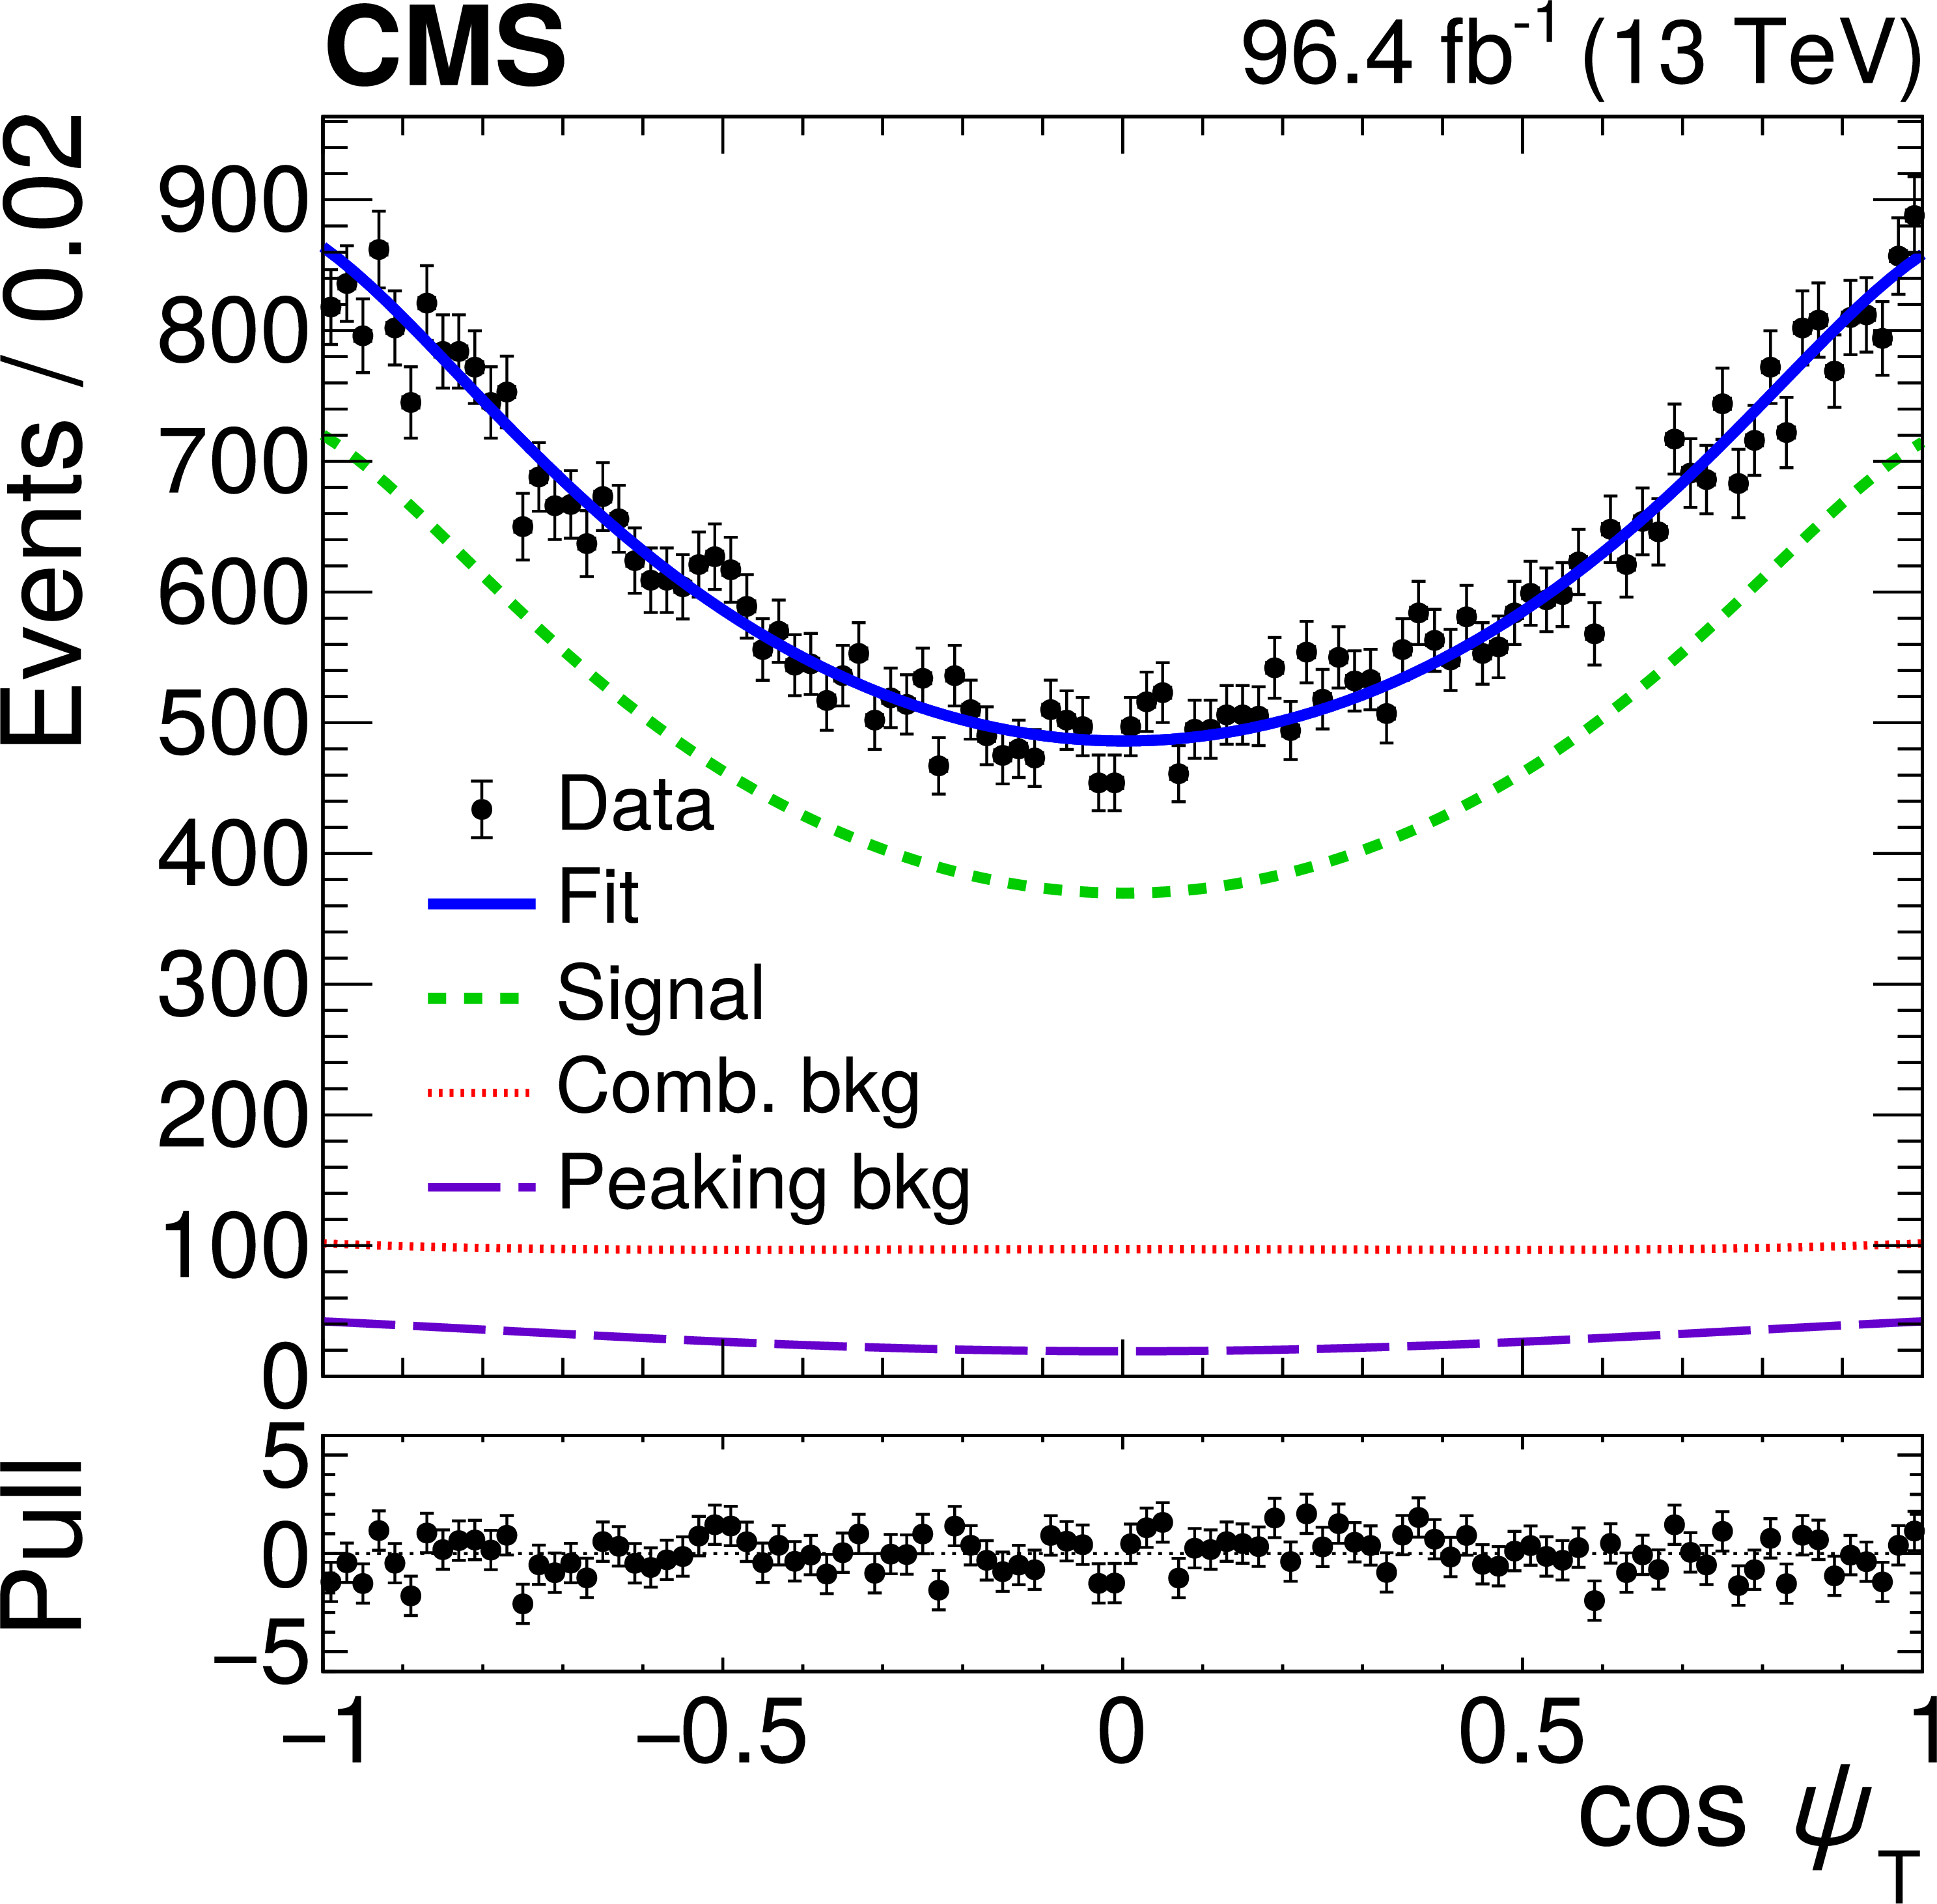
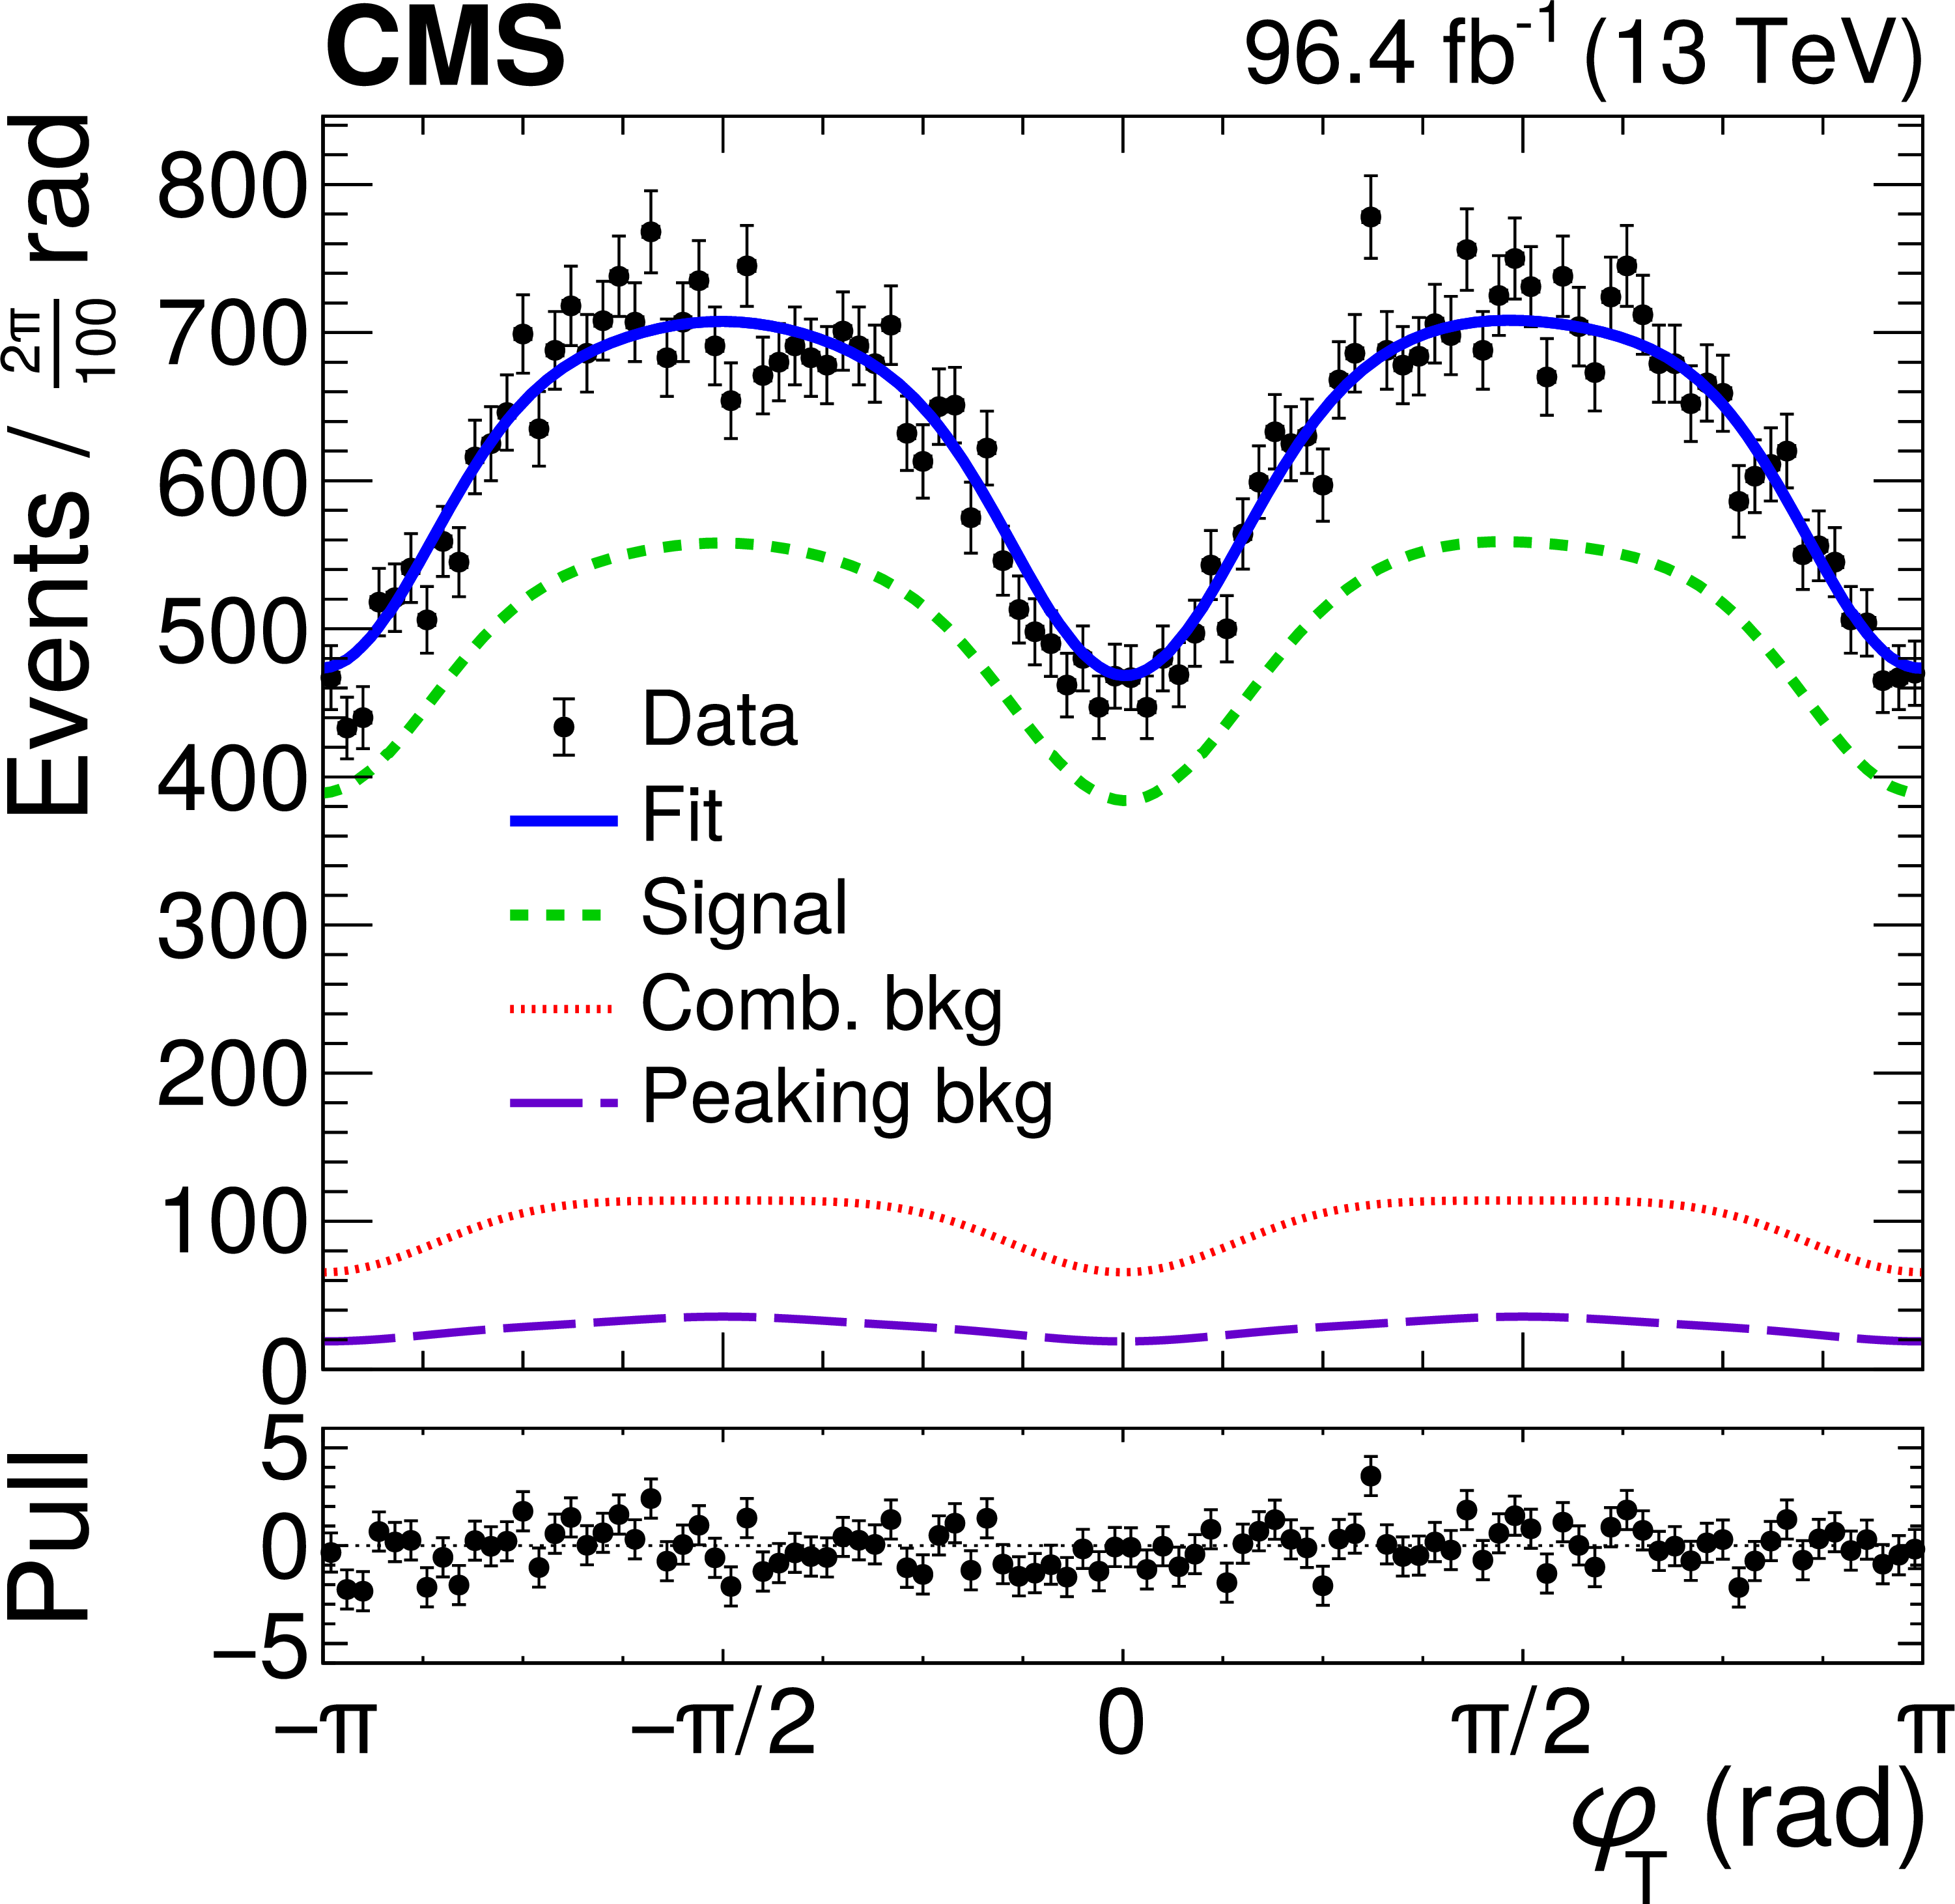
Figure 5:
The angular distributions $\cos {\theta _\mathrm {T}} $ (left), $\cos {\psi _\mathrm {T}} $ (middle), and $ {\varphi _\mathrm {T}} $ (right) for the $\mathrm{B^{0}_{s}}$ candidates and the projections from the fit. The notations are as in Fig. 2. |
png pdf |
Figure 5-a:
The $\cos {\theta _\mathrm {T}} $ angular distribution for the $\mathrm{B^{0}_{s}}$ candidates and the projections from the fit. The notations are as in Fig. 2. |
png pdf |
Figure 5-b:
The $\cos {\psi _\mathrm {T}} $ angular distribution for the $\mathrm{B^{0}_{s}}$ candidates and the projections from the fit. The notations are as in Fig. 2. |
png pdf |
Figure 5-c:
The $ {\varphi _\mathrm {T}} $ angular distribution for the $\mathrm{B^{0}_{s}}$ candidates and the projections from the fit. The notations are as in Fig. 2. |
png pdf |
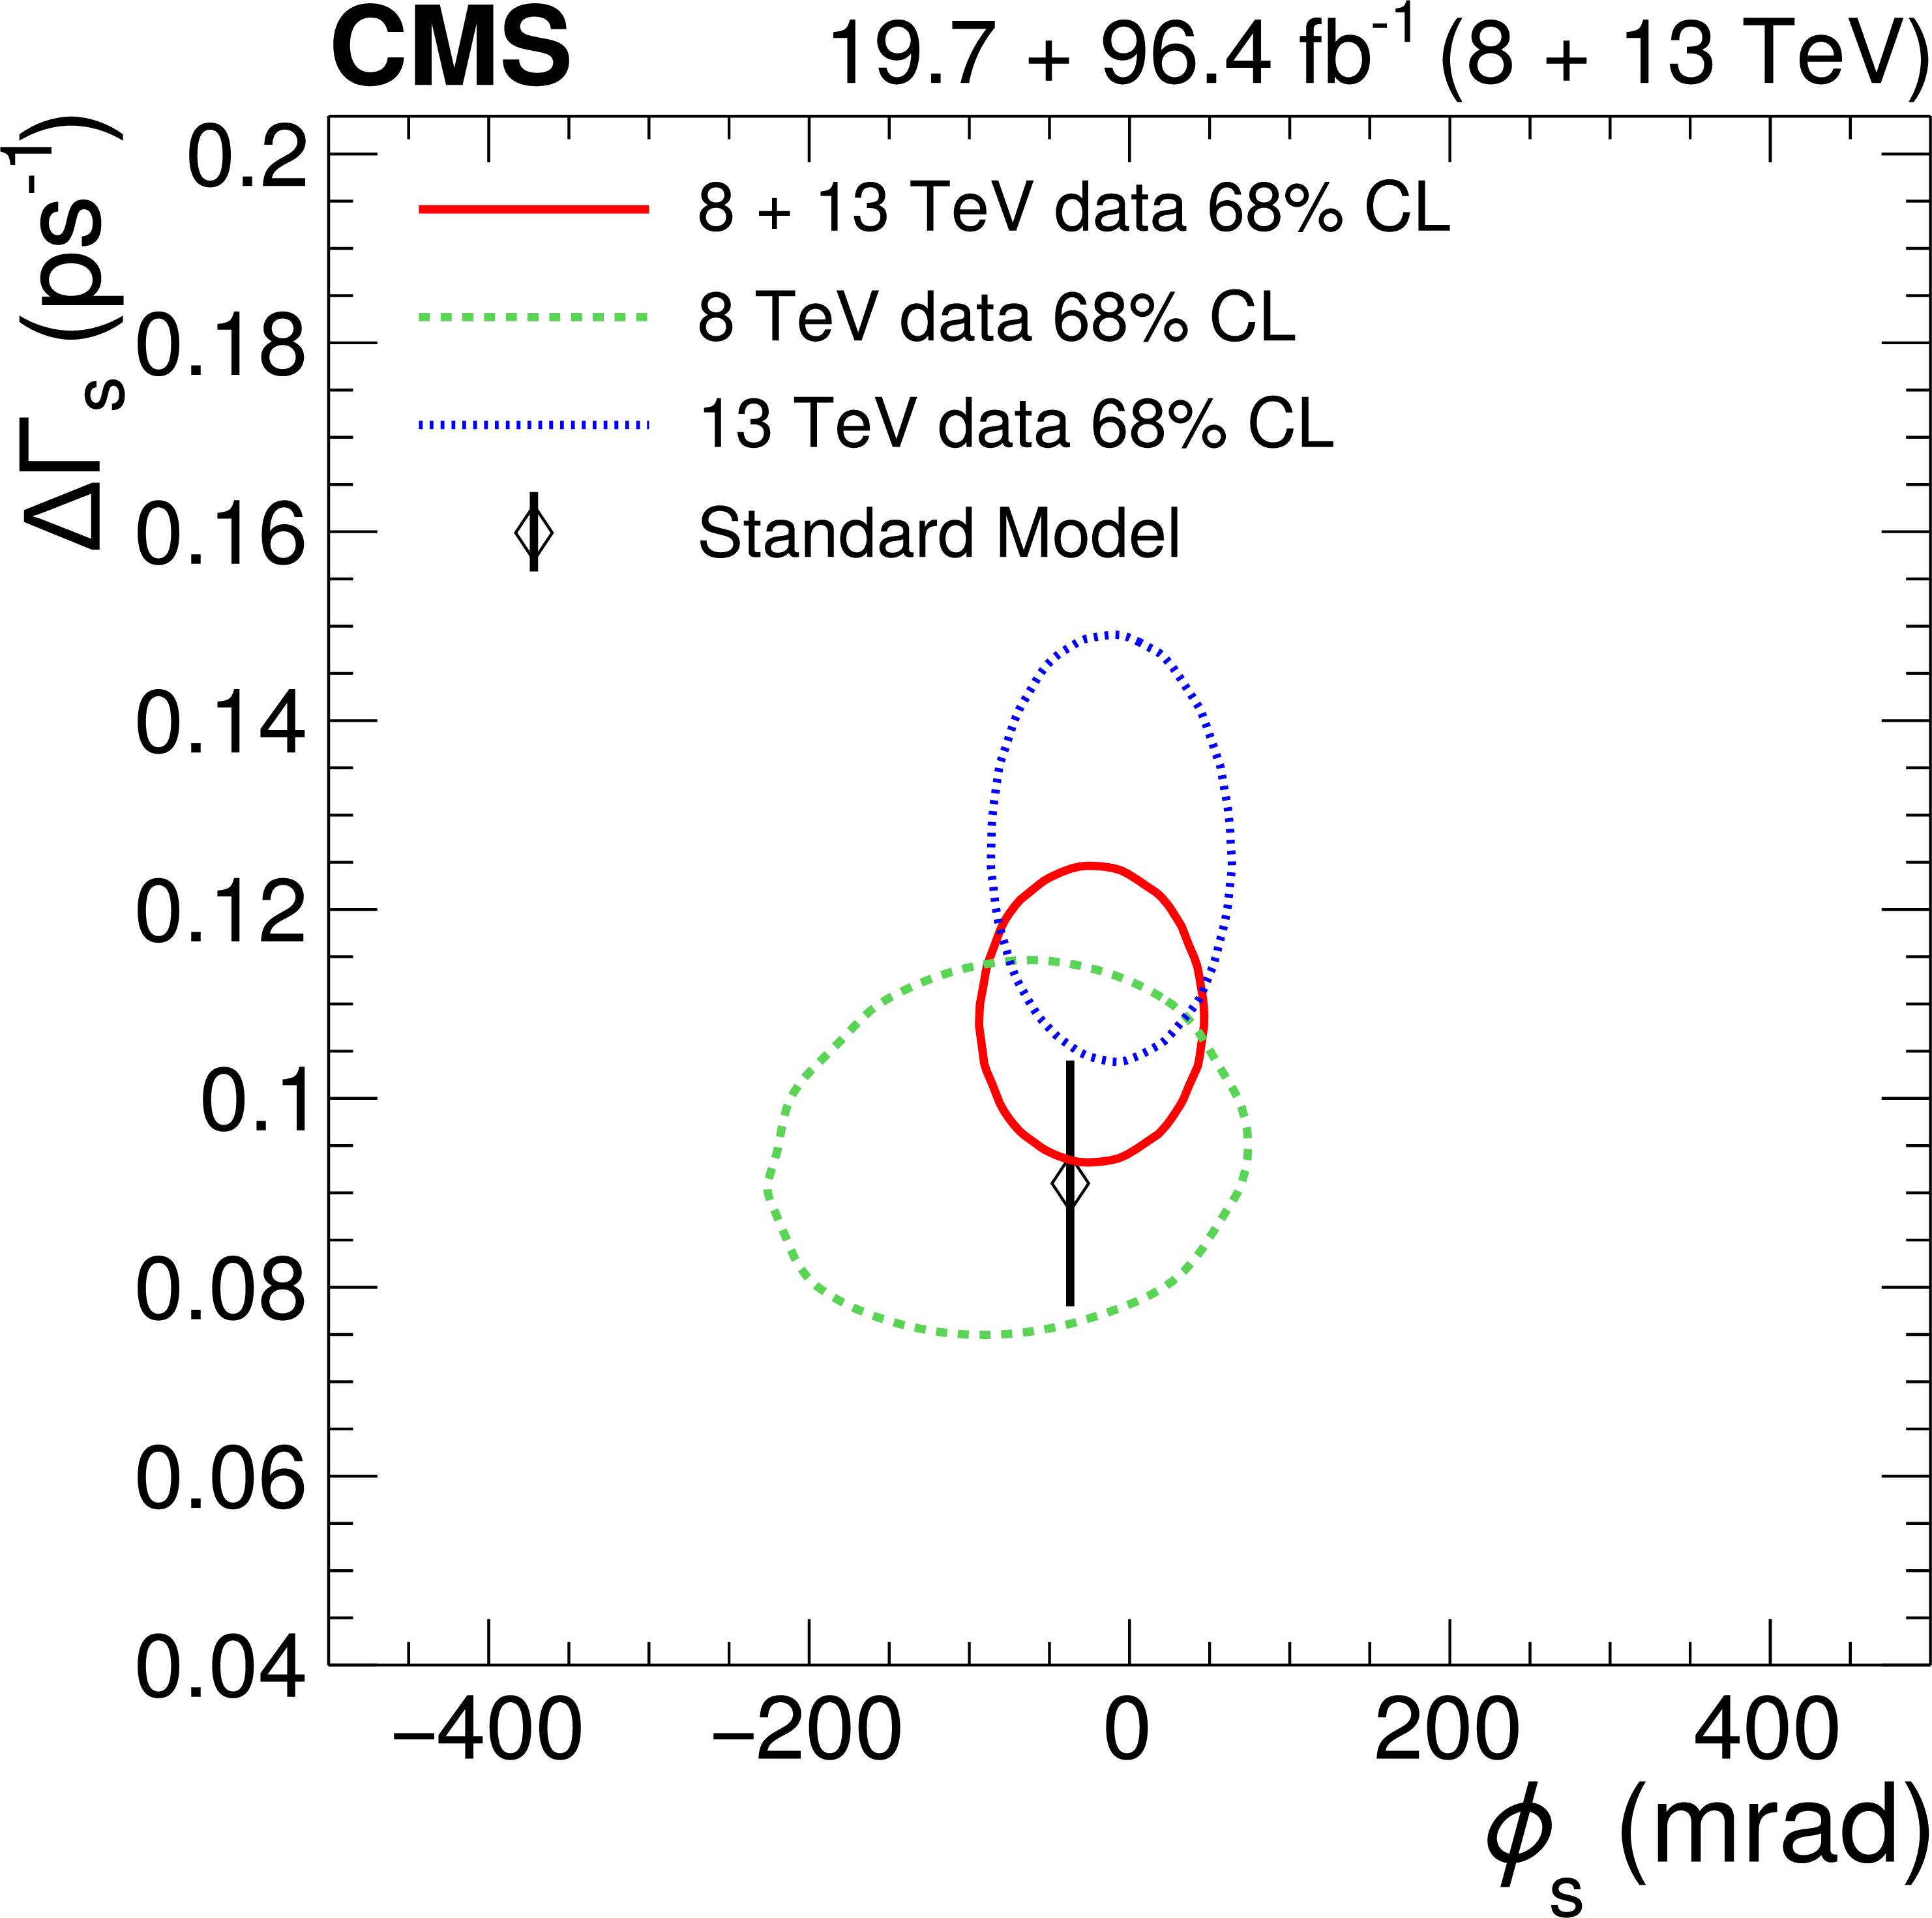
Figure 6:
The two-dimensional likelihood contours at 68% CL in the $ {\phi _{\mathrm {s}}} $-$ {\Delta \Gamma _{\mathrm {s}}} $ plane, for the CMS 8 TeV (dashed line), 13 TeV (dotted line), and combined (solid line) results. The SM prediction is shown with the diamond marker [1,3]. |
| Tables | |
png pdf |
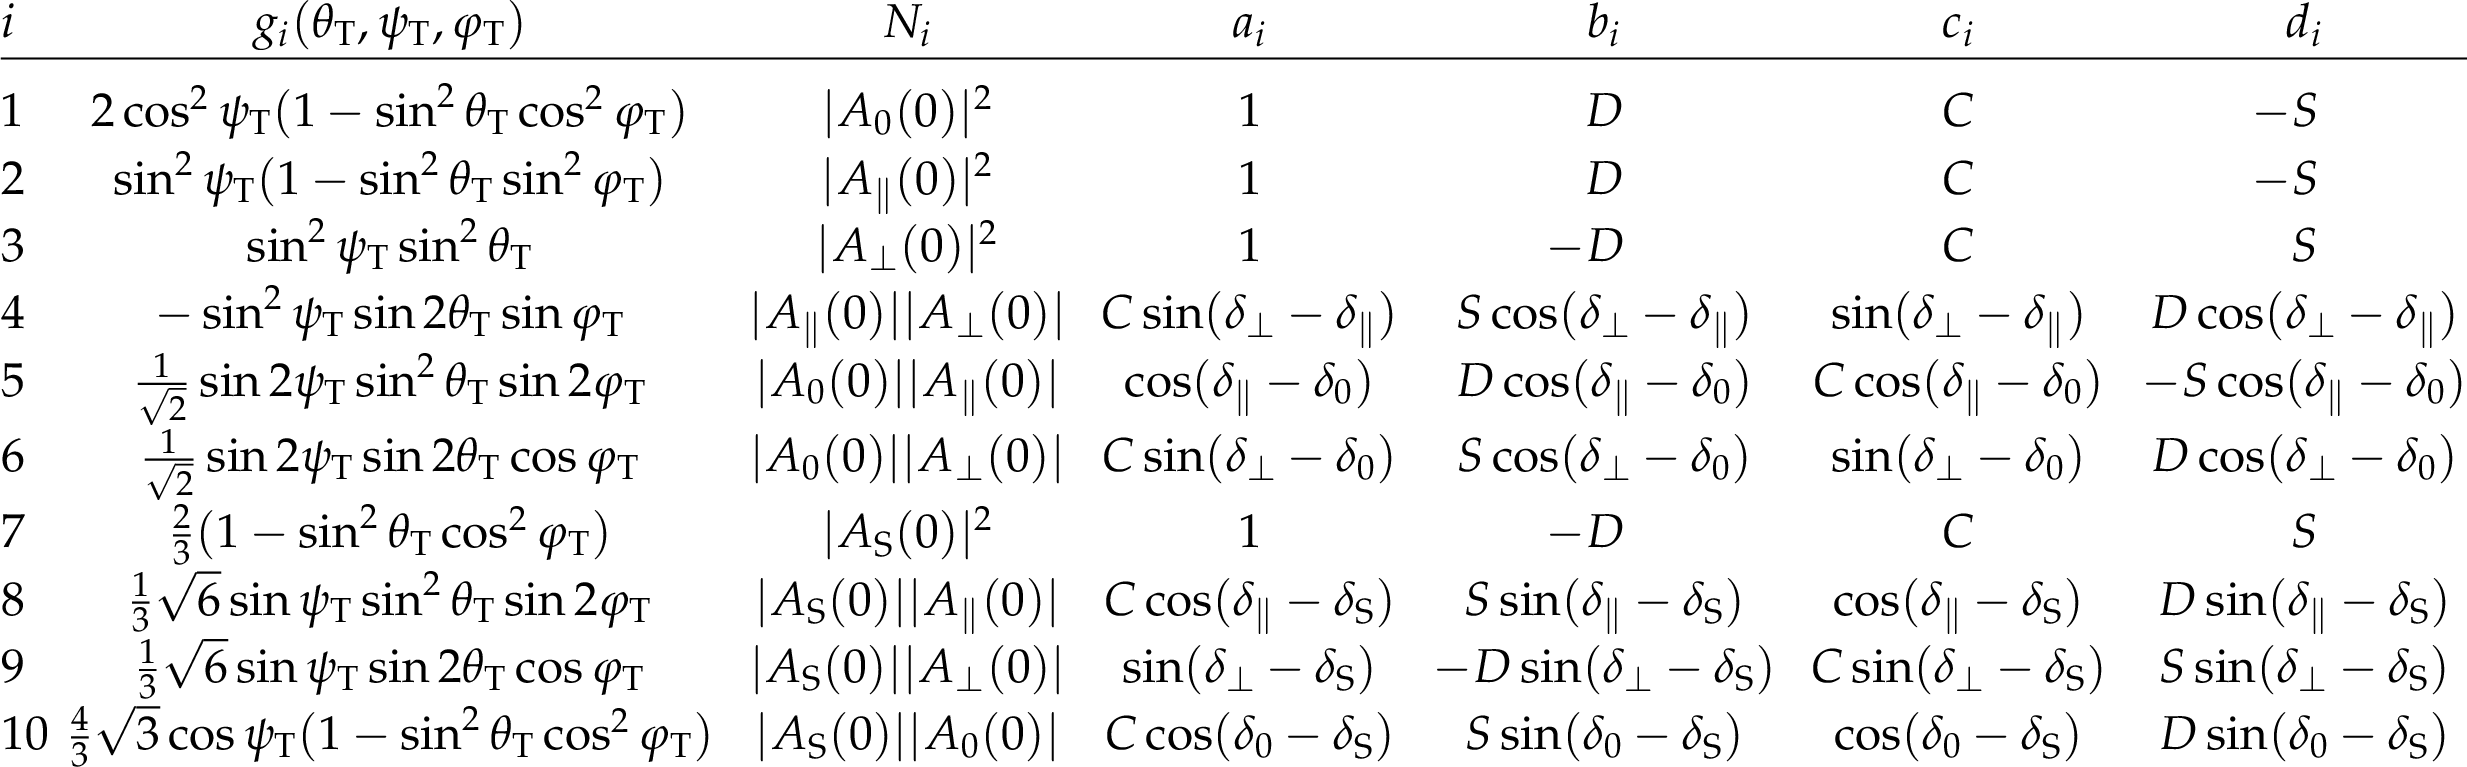
Table 1:
Angular and time-dependent terms of the signal model. |
png pdf |
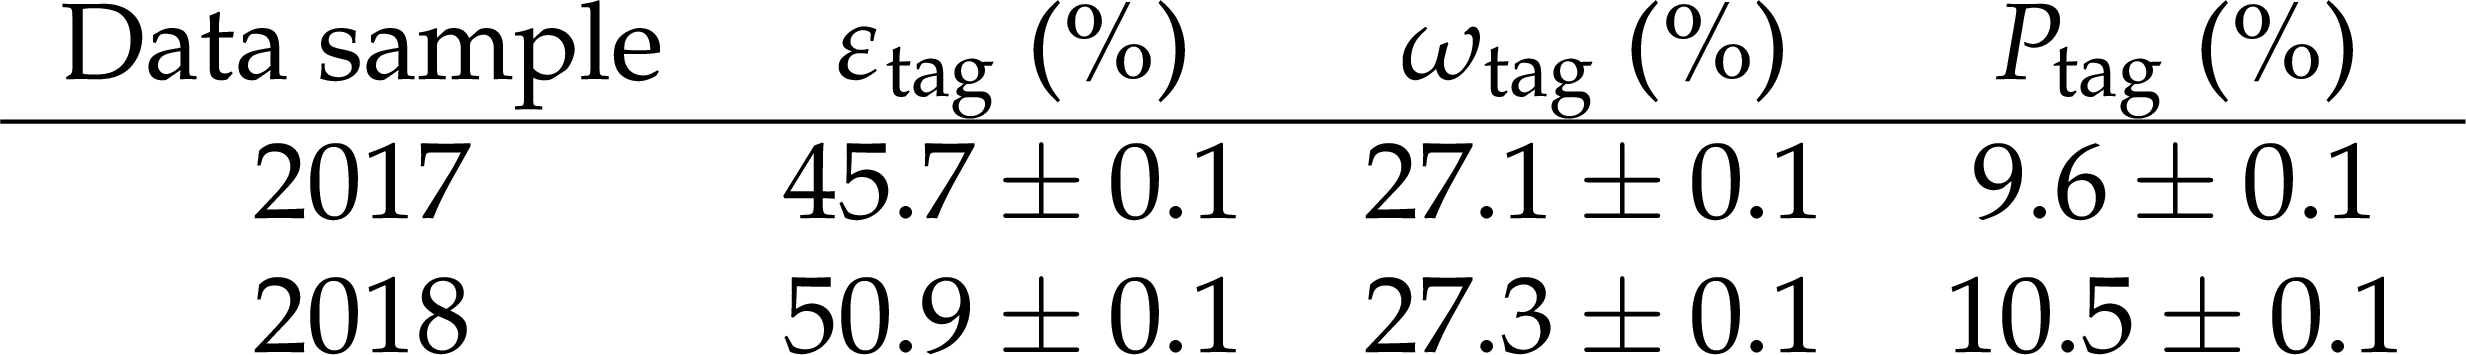
Table 2:
Calibrated opposite-side muon tagger performance evaluated using ${\mathrm{B^{\pm}} \to \mathrm{J}/\psi \,\mathrm{K^{\pm}}}$ events in the 2017 and 2018 data samples. The uncertainties shown are statistical only. |
png pdf |
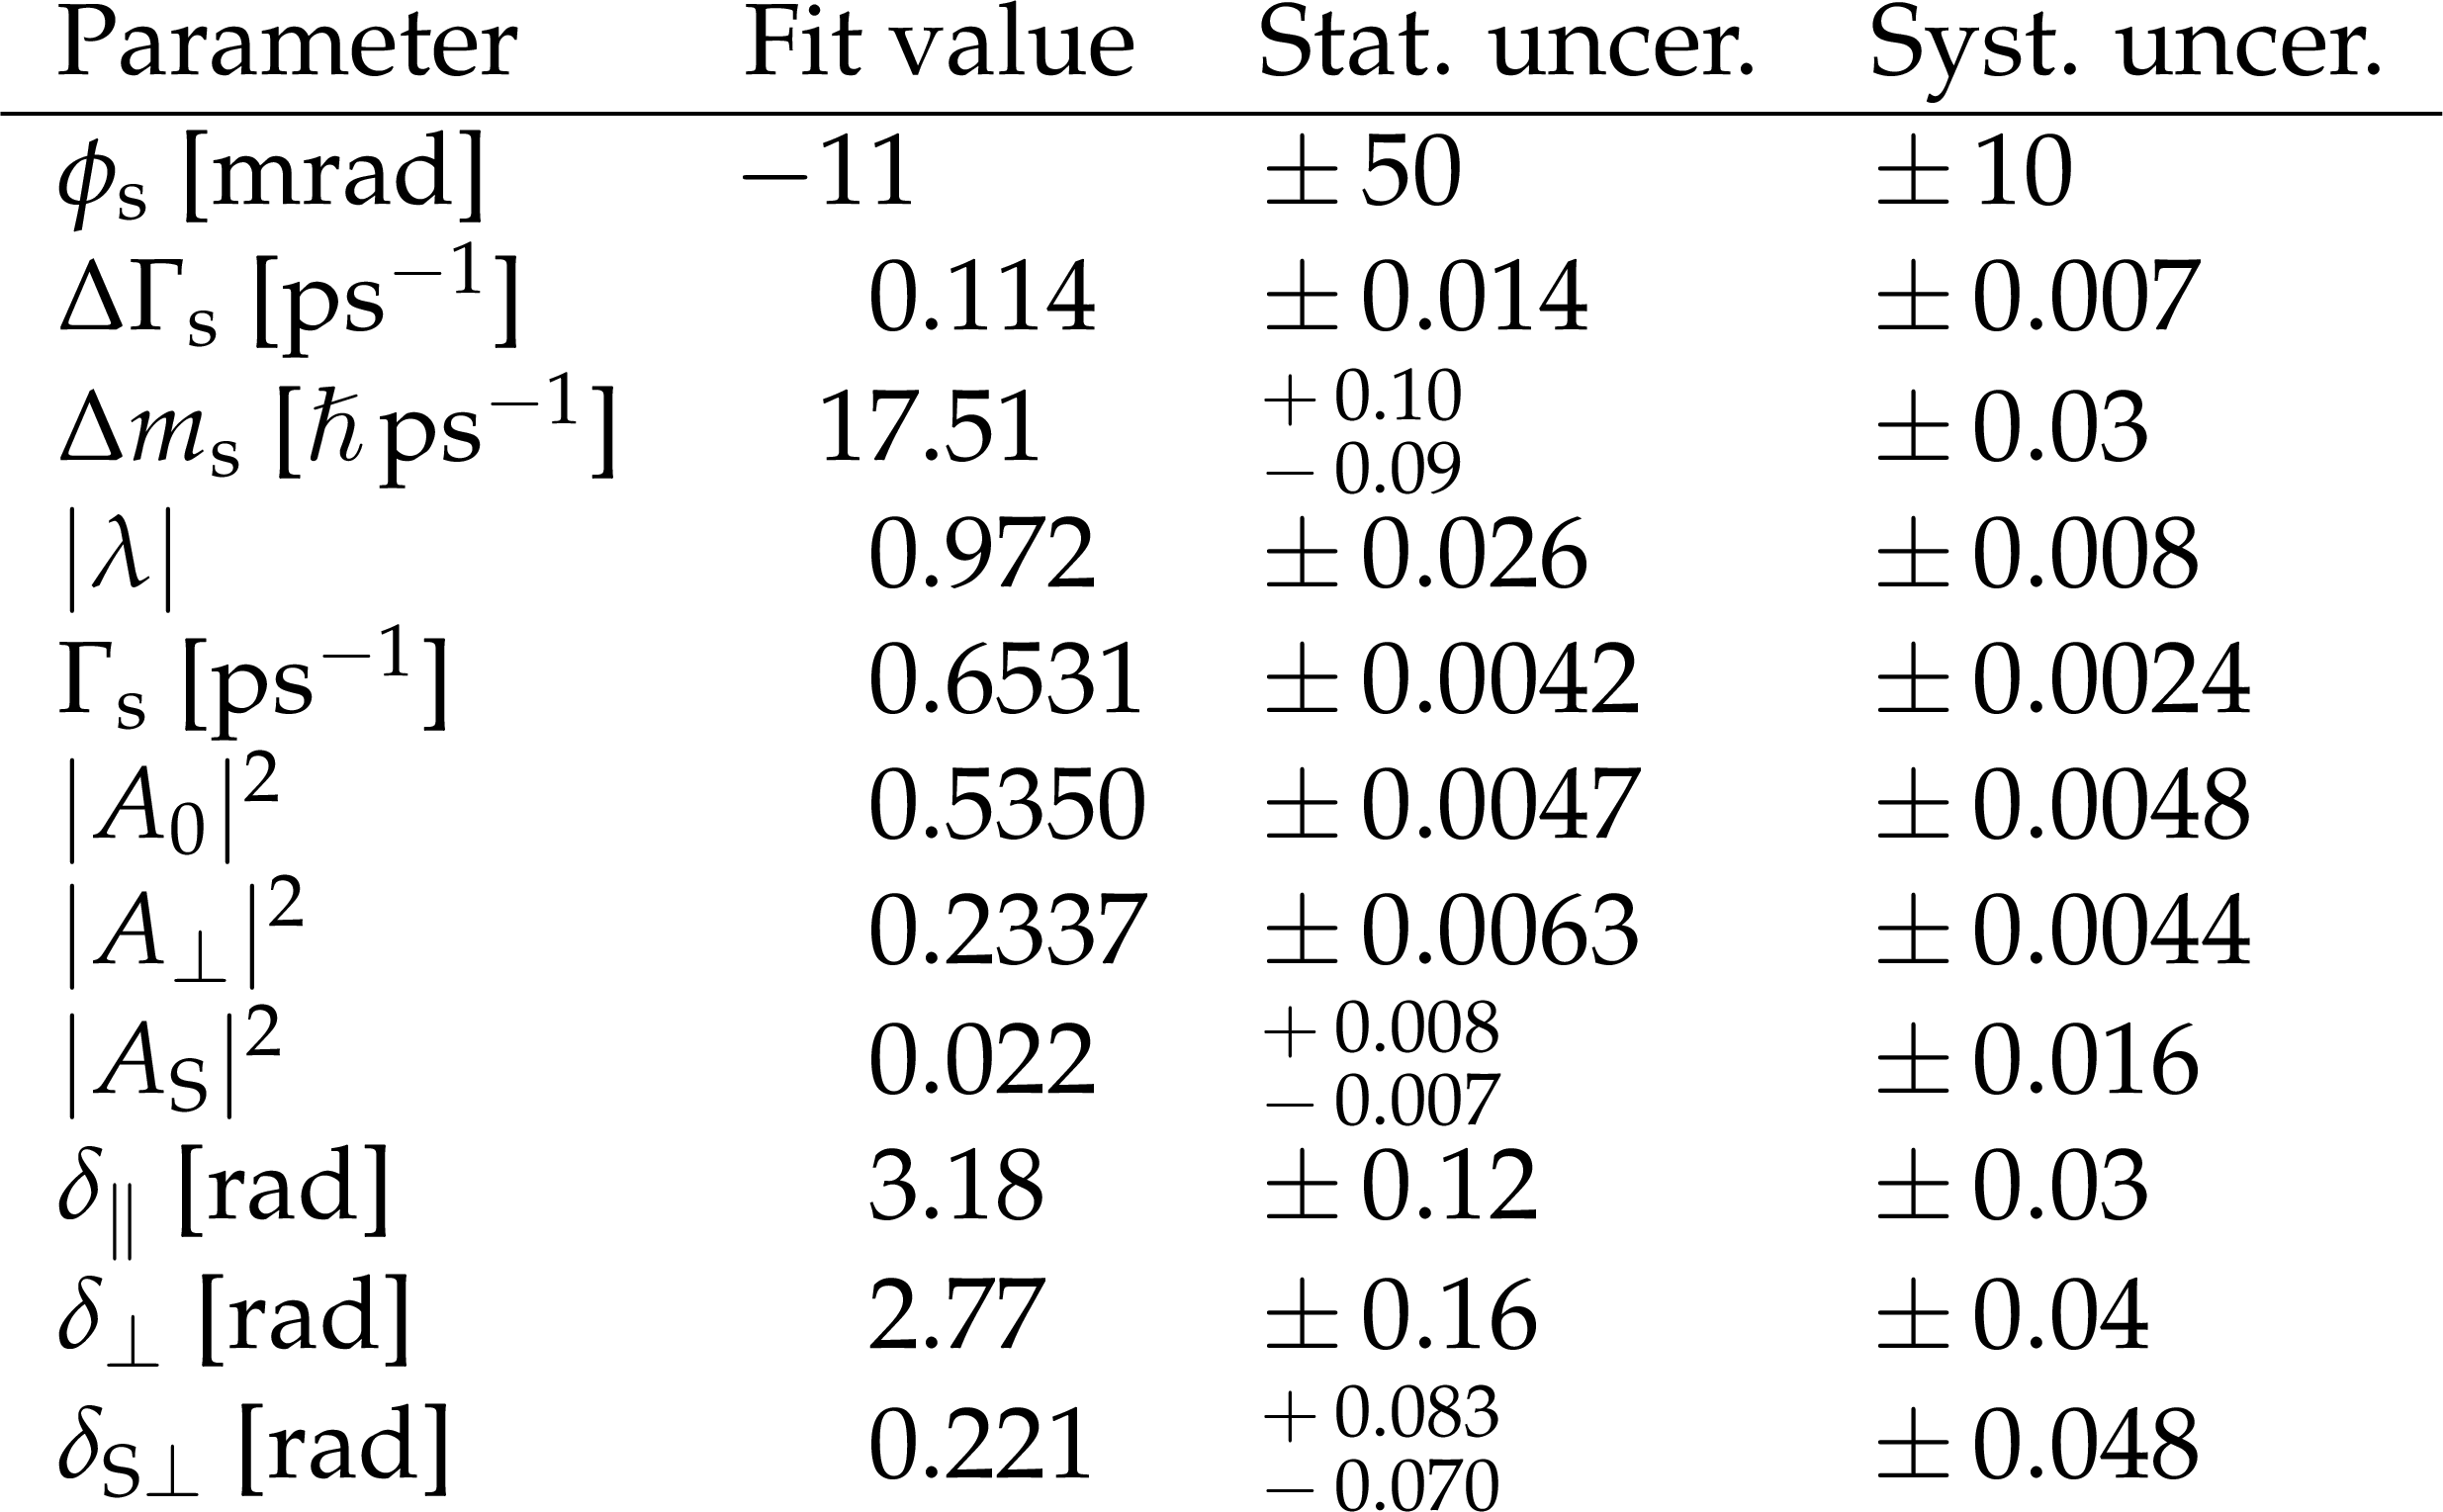
Table 3:
Results of the fit to data. Statistical uncertainties are obtained from the increase in $-\log{\mathcal {L}}$ by 0.5, whereas systematic uncertainties are described below and summarized in Table 4. |
png pdf |
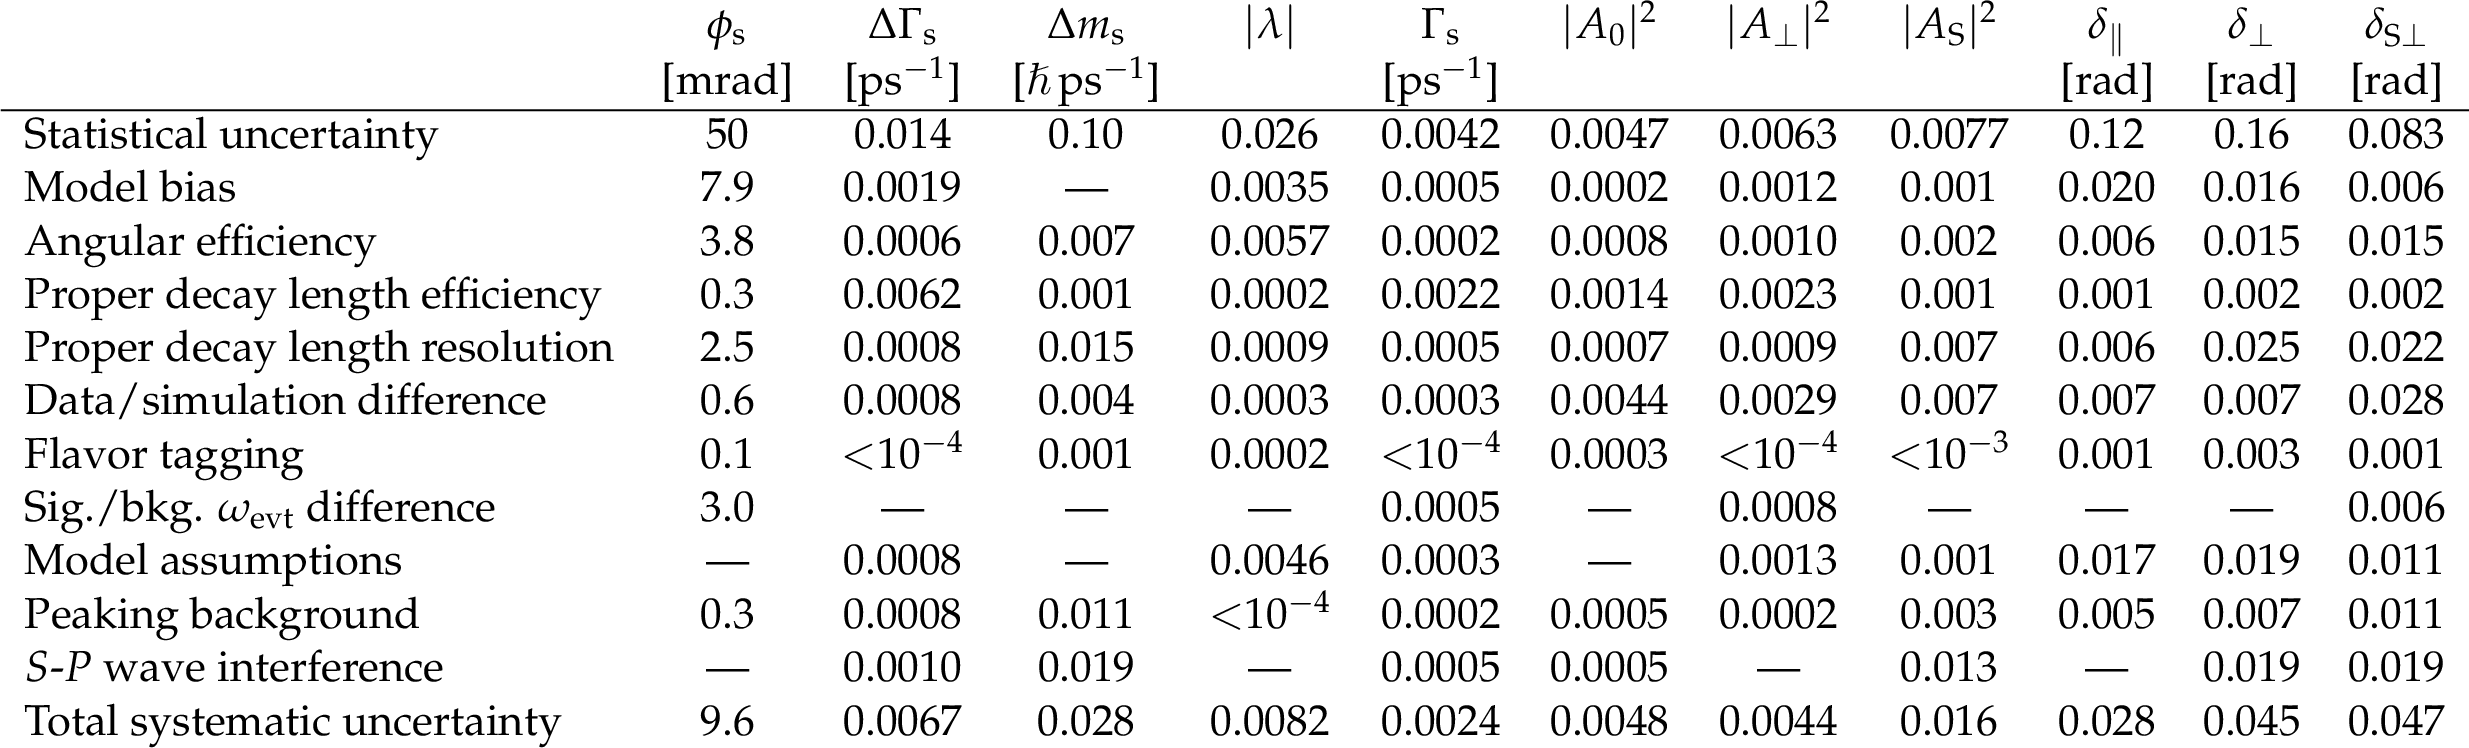
Table 4:
Summary of the systematic uncertainties. The dashes ({\text {--}}) mean that the corresponding uncertainty is not applicable. The total systematic uncertainty is obtained as the quadratic sum of the individual contributions. |
| Summary |
|
The CP-violating phase ${\phi_{\mathrm{s}}} $ and the decay width difference $\Delta\Gamma_{\mathrm{s}}$ between the light and heavy $\mathrm{B^{0}_{s}}$ meson mass eigenstates are measured using a total of 48 500 ${\mathrm{B^{0}_{s}}\to\mathrm{J}/\psi\,\phi(1020) \to \mu^{+}\mu^{-}\,{\mathrm{K^{+}}\mathrm{K^{-}}} }$ signal events, collected by the CMS experiment at the LHC in proton-proton collisions at $\sqrt{s} = $ 13 TeV, corresponding to an integrated luminosity of 96.4 fb$^{-1}$. Events are selected using a trigger that requires an additional muon, which can be exploited to infer the flavor of the $\mathrm{B^{0}_{s}}$ meson at the time of production. A novel opposite-side muon tagger based on deep neural networks has been developed to maximize the sensitivity of the present analysis. A high tagging power of ${\approx}$10% is achieved, aided by the requirement of an additional muon in the signal sample imposed at the trigger level. The CP-violating phase is measured to be ${\phi_{\mathrm{s}}} = -11 \pm 50 {\,\text{(stat)}} \pm 10 {\,\text{(syst)}}$ mrad, consistent both with the SM prediction ${\phi_{\mathrm{s}}} = {-36.96\,^{+0.72}_{-0.84}}$ mrad [1] and with the absence of CP violation in the mixing-decay interference. The decay width difference between the $\mathrm{B^{0}_{s}}$ mass eigenstates is measured to be $\Delta\Gamma_{\mathrm{s}}= 0.114 \pm 0.014 {\,\text{(stat)}} \pm 0.007 {\,\text{(syst)}}$ ps$^{-1}$, consistent with the theoretical prediction $\Delta\Gamma_{\mathrm{s}} = 0.091 \pm 0.013 $ ps$^{-1}$ [3]. In addition, the CP-violating parameter $|\lambda|$ and the average lifetime of the heavy and light $\mathrm{B^{0}_{s}}$ mass eigenstates, as well as their mass difference, have been measured. The uncertainties in all these measurements are dominated by the statistical components. The results presented in this Letter are further combined with those obtained by CMS at $\sqrt{s} = $ 8 TeV [13], yielding ${\phi_{\mathrm{s}}} = -21 \pm 45 $ mrad and $\Delta\Gamma_{\mathrm{s}}= 0.1073 \pm 0.0097$ ps$^{-1}$. These results are significantly more precise than those from the previous CMS measurement at 8 TeV, and can be used to further constrain possible new-physics effects in $\mathrm{B^{0}_{s}}$ meson decay and mixing. |
| References | ||||
| 1 | The CKMfitter Group Collaboration | Predictions of selected flavour observables within the Standard Model | PRD 84 (2011) 033005 | 1106.4041 |
| 2 | C.-W. Chiang et al. | New physics in $ \mathrm{B^{0}_s} \to \mathrm{J}/\psi\phi $: a general analysis | JHEP 04 (2010) 031 | 0910.2929 |
| 3 | A. Lenz and G. Tetlalmatzi-Xolocotzi | Model-independent bounds on new physics effects in non-leptonic tree-level decays of B-mesons | (12, 2019) | 1912.07621 |
| 4 | D0 Collaboration | Measurement of $ \mathrm{B^{0}_s} $ mixing parameters from the flavor-tagged decay $ \mathrm{B^{0}_s} \to \mathrm{J}/\psi\phi $ | PRL 101 (2008) 241801 | 0802.2255 |
| 5 | D0 Collaboration | Measurement of the CP-violating phase $ \phi_{\mathrm{s}}^{\mathrm{J}/\psi\phi} $ using the flavor-tagged decay $ \mathrm{B^{0}_s} \to \mathrm{J}/\psi\phi $ in 8 fb$^{-1}$ of $p \overline{\textrm{p}} $ collisions | PRD 85 (2012) 032006 | 1109.3166 |
| 6 | CDF Collaboration | First flavor-tagged determination of bounds on mixing-induced CP violation in $ \mathrm{B^{0}_s} \to \mathrm{J}/\psi\phi $ decays | PRL 100 (2008) 161802 | 0712.2397 |
| 7 | CDF Collaboration | Measurement of the CP-violating phase $ \beta_{\mathrm{s}}^{\mathrm{J}/\psi\phi} $ in $ \mathrm{B^{0}_s} \to \mathrm{J}/\psi\phi $ decays with the CDF II detector | PRD 85 (2012) 072002 | 1112.1726 |
| 8 | CDF Collaboration | Measurement of the bottom-strange meson mixing phase in the full CDF data set | PRL 109 (2012) 171802 | 1208.2967 |
| 9 | ATLAS Collaboration | Time-dependent angular analysis of the decay $ \mathrm{B^{0}_s} \to \mathrm{J}/\psi\phi $ and extraction of $ \Delta\Gamma_{\mathrm{s}} $ and the CP-violating weak phase $ \phi_{\mathrm{s}} $ by ATLAS | JHEP 12 (2012) 072 | 1208.0572 |
| 10 | ATLAS Collaboration | Flavor tagged time-dependent angular analysis of the $ \mathrm{B^{0}_s} \to \mathrm{J}/\psi\phi $ decay and extraction of $ \Delta\Gamma_{\mathrm{s}} $ and the weak phase $ \phi_{\mathrm{s}} $ in ATLAS | PRD 90 (2014) 052007 | 1407.1796 |
| 11 | ATLAS Collaboration | Measurement of the CP-violating phase $ \phi_{\mathrm{s}} $ and the $ \mathrm{B^{0}_s} $ meson decay width difference with $ \mathrm{B^{0}_s} \to \mathrm{J}/\psi\phi $ decays in ATLAS | JHEP 12 (2016) 072 | 1601.03297 |
| 12 | ATLAS Collaboration | Measurement of the $ CP $-violating phase $ \phi_s $ in $ \mathrm{B^{0}_s} \to \mathrm{J}/\psi\phi $ decays in ATLAS at 13 TeV | Submitted to EPJC | 2001.07115 |
| 13 | CMS Collaboration | Measurement of the CP-violating weak phase $ \phi_{\mathrm{s}}\ $ and the decay width difference $ \Delta\Gamma_{\mathrm{s}}\ $ using the $ \mathrm{B_s \to J/\psi \phi} \ $ decay channel in pp collisions at $ \sqrt{s} = $ 8 TeV | PLB 757 (2016) 97 | CMS-BPH-13-012 1507.07527 |
| 14 | LHCb Collaboration | Measurement of the CP-violating phase $ \phi_{\mathrm{s}} $ in $ {\mathrm{\overline{B}}^0}s \to \mathrm{J}/\psi\pi^+\pi^- $ decays | PLB 713 (2012) 378 | 1204.5675 |
| 15 | LHCb Collaboration | Measurement of CP violation and the $ \mathrm{B^{0}_s} $ meson decay width difference with $ \mathrm{B^{0}_s} \to \mathrm{J}/\psi\mathrm{K}^+\mathrm{K}^- $ and $ \mathrm{B^{0}_s} \to \mathrm{J}/\psi\pi^+\pi^- $ decays | PRD 87 (2013) 112010 | 1304.2600 |
| 16 | LHCb Collaboration | Measurement of the CP-violating phase $ \phi_{\mathrm{s}} $ in $ {\mathrm{\overline{B}}^0}s\to \mathrm{J}/\psi\pi^+\pi^- $ decays | PLB 736 (2014) 186 | 1405.4140 |
| 17 | LHCb Collaboration | Precision measurement of CP violation in $ \mathrm{B^{0}_s} \to \mathrm{J}/\psi\mathrm{K}^+\mathrm{K}^- $ decays | PRL 114 (2015) 041801 | 1411.3104 |
| 18 | LHCb Collaboration | First study of the CP-violating phase and decay-width difference in $ \mathrm{B^{0}_s} \to \psi(2\text{S})\phi $ | PLB 762 (2016) 253 | 1608.04855 |
| 19 | LHCb Collaboration | Measurement of the CP-violating phase $ \phi_{\mathrm{s}} $ in $ {\mathrm{\overline{B}}^0}s \to {\mathrm{D^+}}s\mathrm{D^{-}}s $ decays | PRL 113 (2014) 211801 | 1409.4619 |
| 20 | A. S. Dighe, I. Dunietz, and R. Fleischer | Extracting CKM phases and $ \mathrm{B^{0}_s} $--$ {\mathrm{\overline{B}}^0}s $ mixing parameters from angular distributions of non-leptonic B decays | EPJC 6 (1999) 647 | hep-ph/9804253 |
| 21 | A. S. Dighe, I. Dunietz, H. J. Lipkin, and J. L. Rosner | Angular distributions and lifetime differences in $ \mathrm{B^{0}_s} \to \mathrm{J}/\psi\phi $ decays | PLB 369 (1996) 144 | hep-ph/9511363 |
| 22 | G. C. Branco, L. Lavoura, and J. P. Silva | CP Violation | volume 1031999 | |
| 23 | CMS Collaboration | Performance of the CMS muon detector and muon reconstruction with proton-proton collisions at $ \sqrt{s} = $ 13 TeV | JINST 13 (2018) P06015 | CMS-MUO-16-001 1804.04528 |
| 24 | CMS Collaboration | The CMS trigger system | JINST 12 (2017) P01020 | CMS-TRG-12-001 1609.02366 |
| 25 | CMS Collaboration | The CMS Experiment at the CERN LHC | JINST 3 (2008) S08004 | CMS-00-001 |
| 26 | I. Antcheva et al. | ROOT --- A C++ framework for petabyte data storage, statistical analysis and visualization | CPC 180 (2009) 2499 | 1508.07749 |
| 27 | H. Voss, A. Hocker, J. Stelzer, and F. Tegenfeldt | TMVA, the toolkit for multivariate data analysis with ROOT | in XIth International Workshop on Advanced Computing and Analysis Techniques in Physics Research (ACAT) | physics/0703039 |
| 28 | R. Fruhwirth | Application of Kalman filtering to track and vertex fitting | NIMA 262 (1987) 444 | |
| 29 | Particle Data Group, M. Tanabashi et al. | Review of particle physics | PRD 98 (2018) 030001 | |
| 30 | CMS Collaboration | Description and performance of track and primary-vertex reconstruction with the CMS tracker | JINST 9 (2014) P10009 | CMS-TRK-11-001 1405.6569 |
| 31 | T. Sjostrand et al. | An introduction to PYTHIA 8.2 | CPC 191 (2015) 159 | 1410.3012 |
| 32 | CMS Collaboration | Extraction and validation of a new set of CMS PYTHIA8 tunes from underlying-event measurements | EPJC 80 (2020) 4 | CMS-GEN-17-001 1903.12179 |
| 33 | NNPDF Collaboration | Parton distributions from high-precision collider data | EPJC 77 (2017) 663 | 1706.00428 |
| 34 | D. J. Lange | The EvtGen particle decay simulation package | NIMA 462 (2001) 152 | |
| 35 | E. Barberio, B. van Eijk, and Z. W\cas | PHOTOS --- a universal Monte Carlo for QED radiative corrections in decays | CPC 66 (1991) 115 | |
| 36 | E. Barberio and Z. W\cas | PHOTOS --- a universal Monte Carlo for QED radiative corrections: version 2.0 | CPC 79 (1994) 291 | |
| 37 | GEANT4 Collaboration | GEANT4 --- A simulation toolkit | NIMA 506 (2003) 250 | |
| 38 | F. Chollet et al. | Keras | ||
| 39 | CMS Collaboration | Particle-flow reconstruction and global event description with the CMS detector | JINST 12 (2017) P10003 | CMS-PRF-14-001 1706.04965 |
| 40 | D. Kingma and J. Ba | Adam: A method for stochastic optimization | (12, 2014) | 1412.6980 |
| 41 | W. Verkerke and D. Kirkby | The roofit toolkit for data modeling | 2003 | |
| 42 | N. L. Johnson | Systems of frequency curves generated by methods of translation | Biometrika 36 (1949) 149 | |
| 43 | M. Rosenblatt | Remarks on some nonparametric estimates of a density function | Ann. Math. Statist. 27 (1956) 832 | |
| 44 | E. Parzen | On estimation of a probability density function and mode | Ann. Math. Statist. 33 (1962) 1065 | |
|
|
Compact Muon Solenoid LHC, CERN |
|

|

|

|

|

|