

Compact Muon Solenoid
LHC, CERN
| CMS-CAT-23-001 ; CERN-EP-2024-078 | ||
| The CMS statistical analysis and combination tool: Combine | ||
| CMS Collaboration | ||
| 10 April 2024 | ||
| Submitted to Computing and Software for Big Science | ||
| Abstract: This paper describes the Combine software package used for statistical analyses by the CMS Collaboration. The package, originally designed to perform searches for a Higgs boson and the combined analysis of those searches, has evolved to become the statistical analysis tool presently used in the majority of measurements and searches performed by the CMS Collaboration. It is not specific to the CMS experiment, and this paper is intended to serve as a reference for users outside of the CMS Collaboration, providing an outline of the most salient features and capabilities. Readers are provided with the possibility to run Combine and reproduce examples provided in this paper using a publicly available container image. Since the package is constantly evolving to meet the demands of ever-increasing data sets and analysis sophistication, this paper cannot cover all details of Combine. However, the online documentation referenced within this paper provides an up-to-date and complete user guide. | ||
| Links: e-print arXiv:2404.06614 [hep-ex] (PDF) ; CDS record ; inSPIRE record ; Physics Briefing ; CADI line (restricted) ; | ||
| Link to the Combine manual |
| Figures | |

png pdf |
Figure 1:
Histograms used to define the pdfs for Datacard dc:template. The red and blue histograms show the nominal yields in each bin $ \omega_{b}^{0} $ for the background and signal processes, respectively. The dotted and dashed lines show the histograms that provide the values of $ \omega_{b}^{+} $ and $ \omega_{b}^{-} $, respectively for each of the systematic uncertainties that modify the shape of the signal and background pdfs. The red dashed and dotted lines are associated with the effect of the nuisance parameter alpha on the background process, while the blue dashed and dotted lines are associated with the effect of the nuisance parameter sigma affecting the signal process. The black points show the observed number of events in data in each bin. The error bars indicate the statistical uncertainty. |
png pdf |
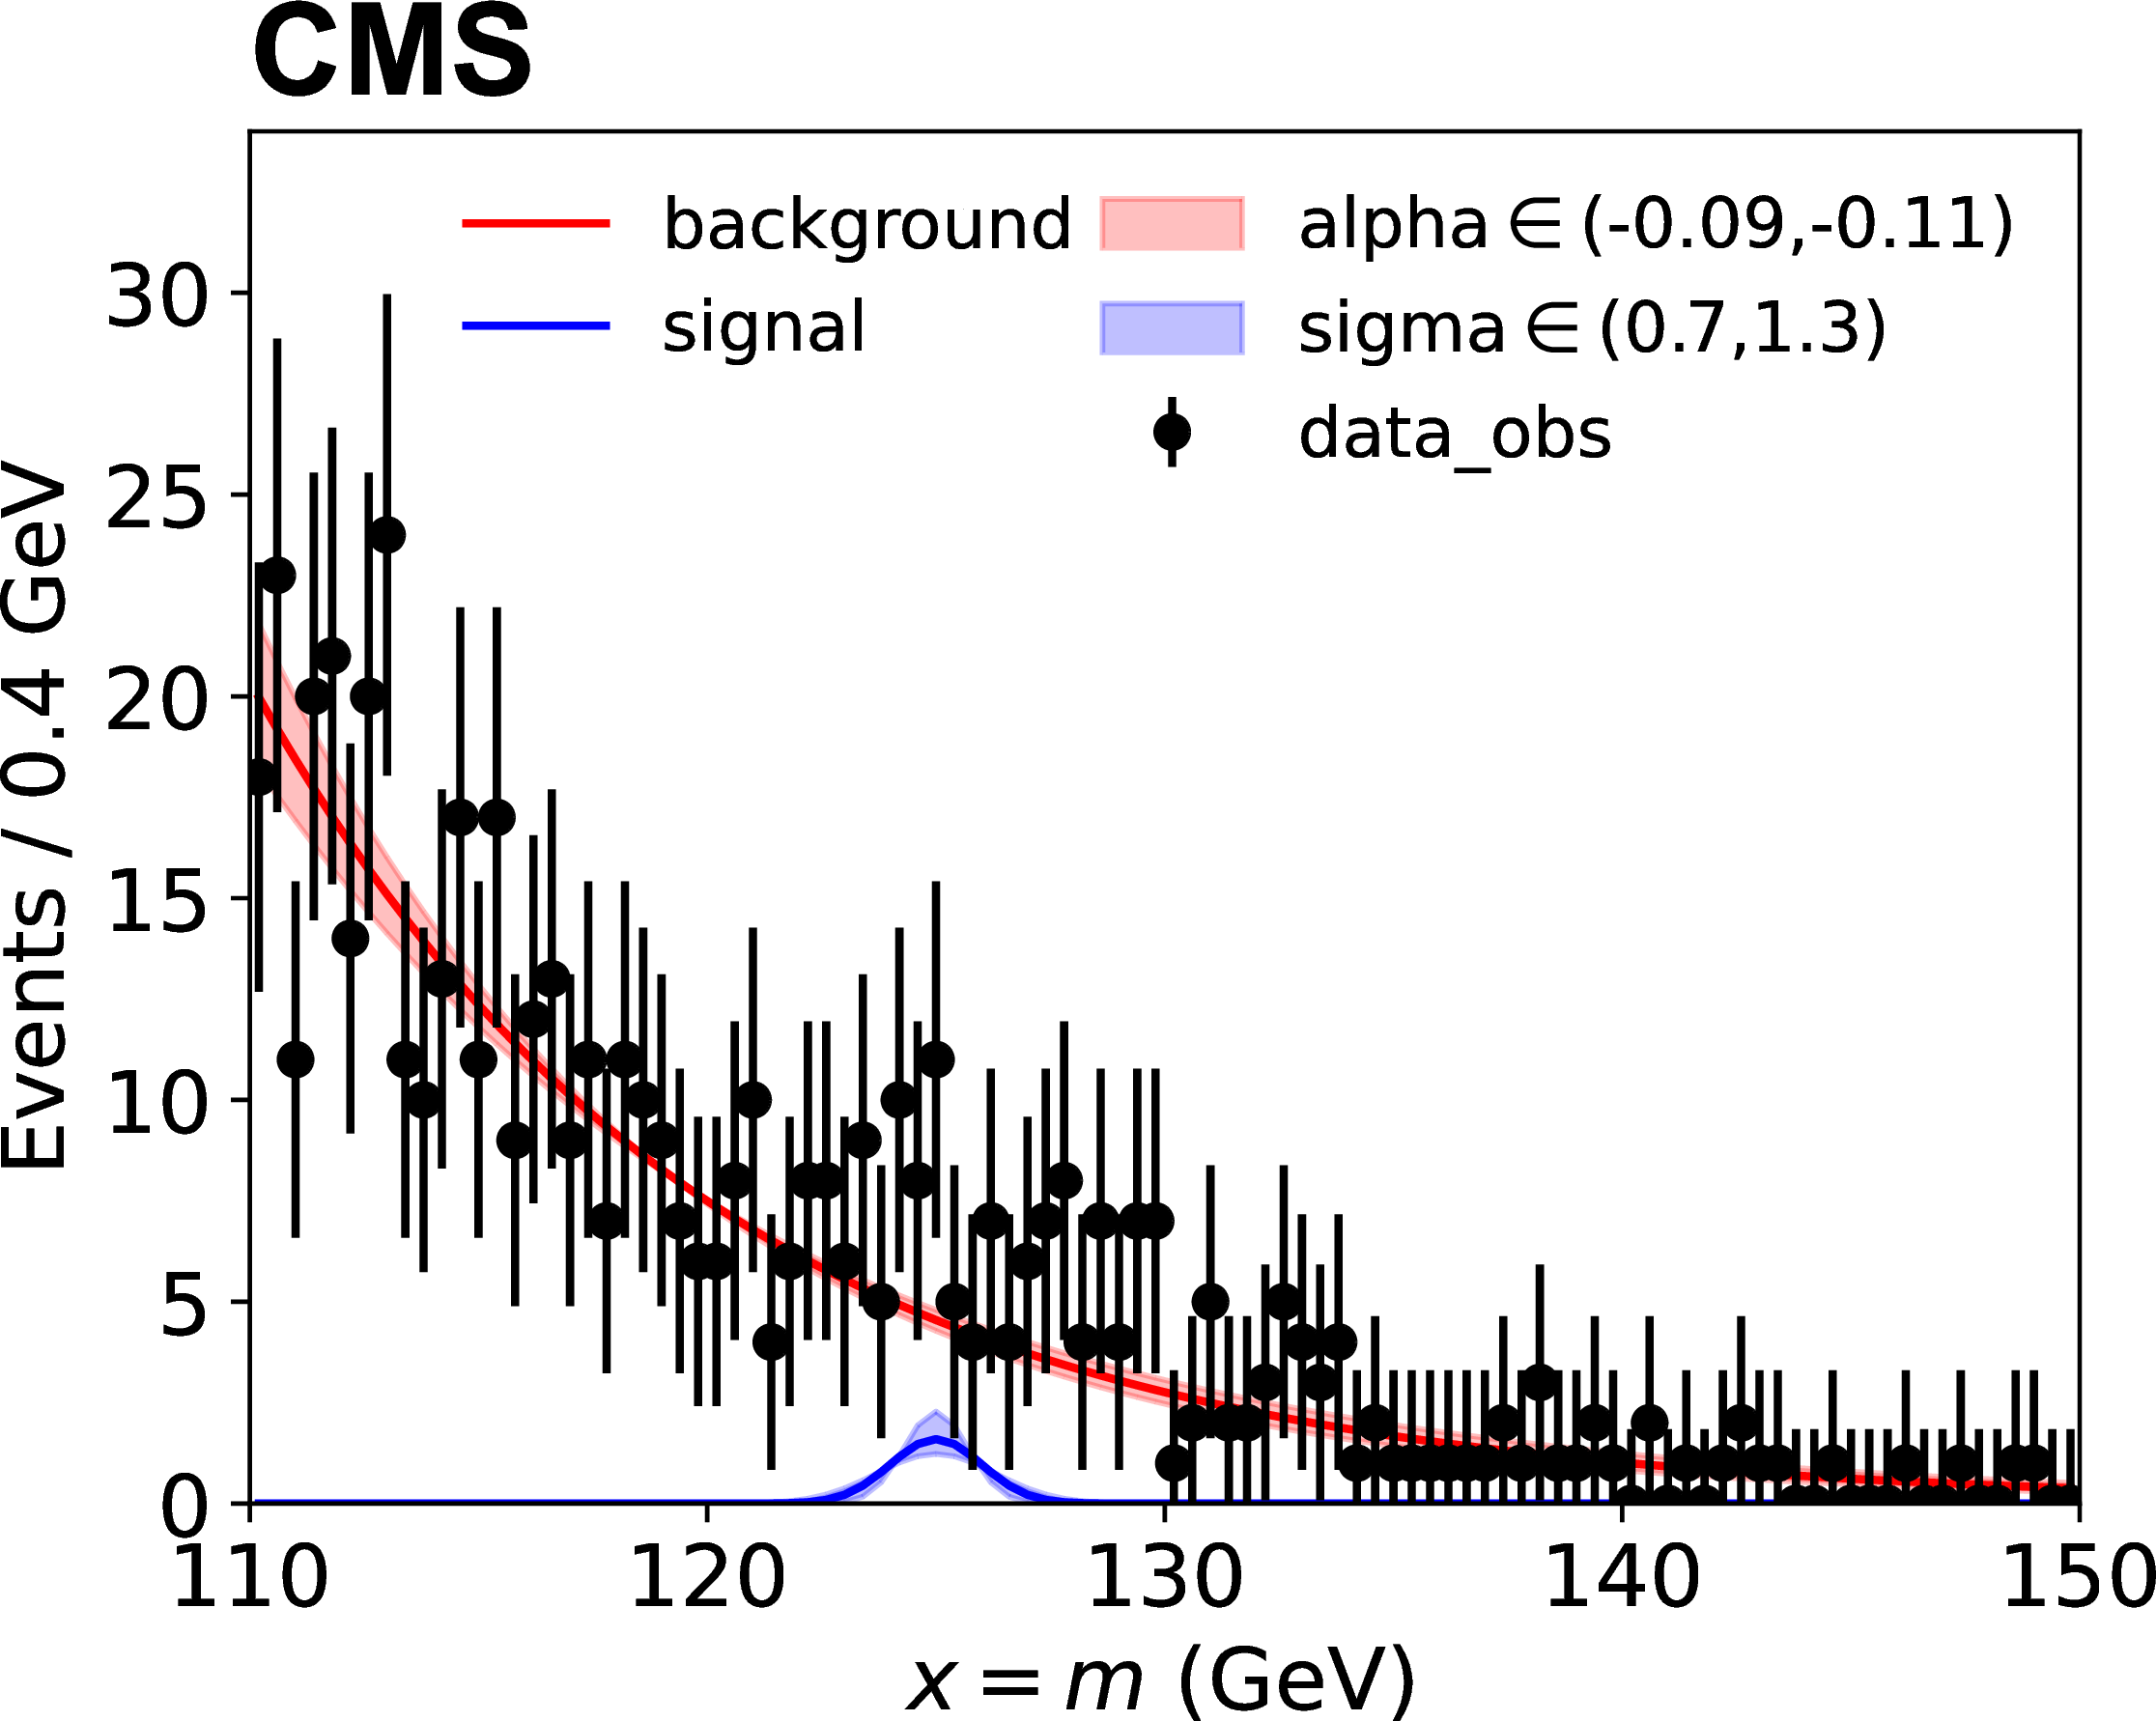
Figure 2:
Distributions of the invariant mass observable for the signal and background processes defined in Datacard dc:param. The red and blue curves show the parametric functions used to define the probability density for the invariant mass for the background and signal processes, respectively, at the default values of the nuisance parameters, normalized to their expected total yields. The blue shaded band shows the variation of the signal pdf when sigma is varied between 0.7 and 1.3. The red shaded region shows the variation of the background pdf when alpha is varied within 10% of its default value of-0.1. The black points show the distribution of the observed data. The binning and error bars are only for visualization and neither are used by Combine to build the likelihood function. |
png pdf |
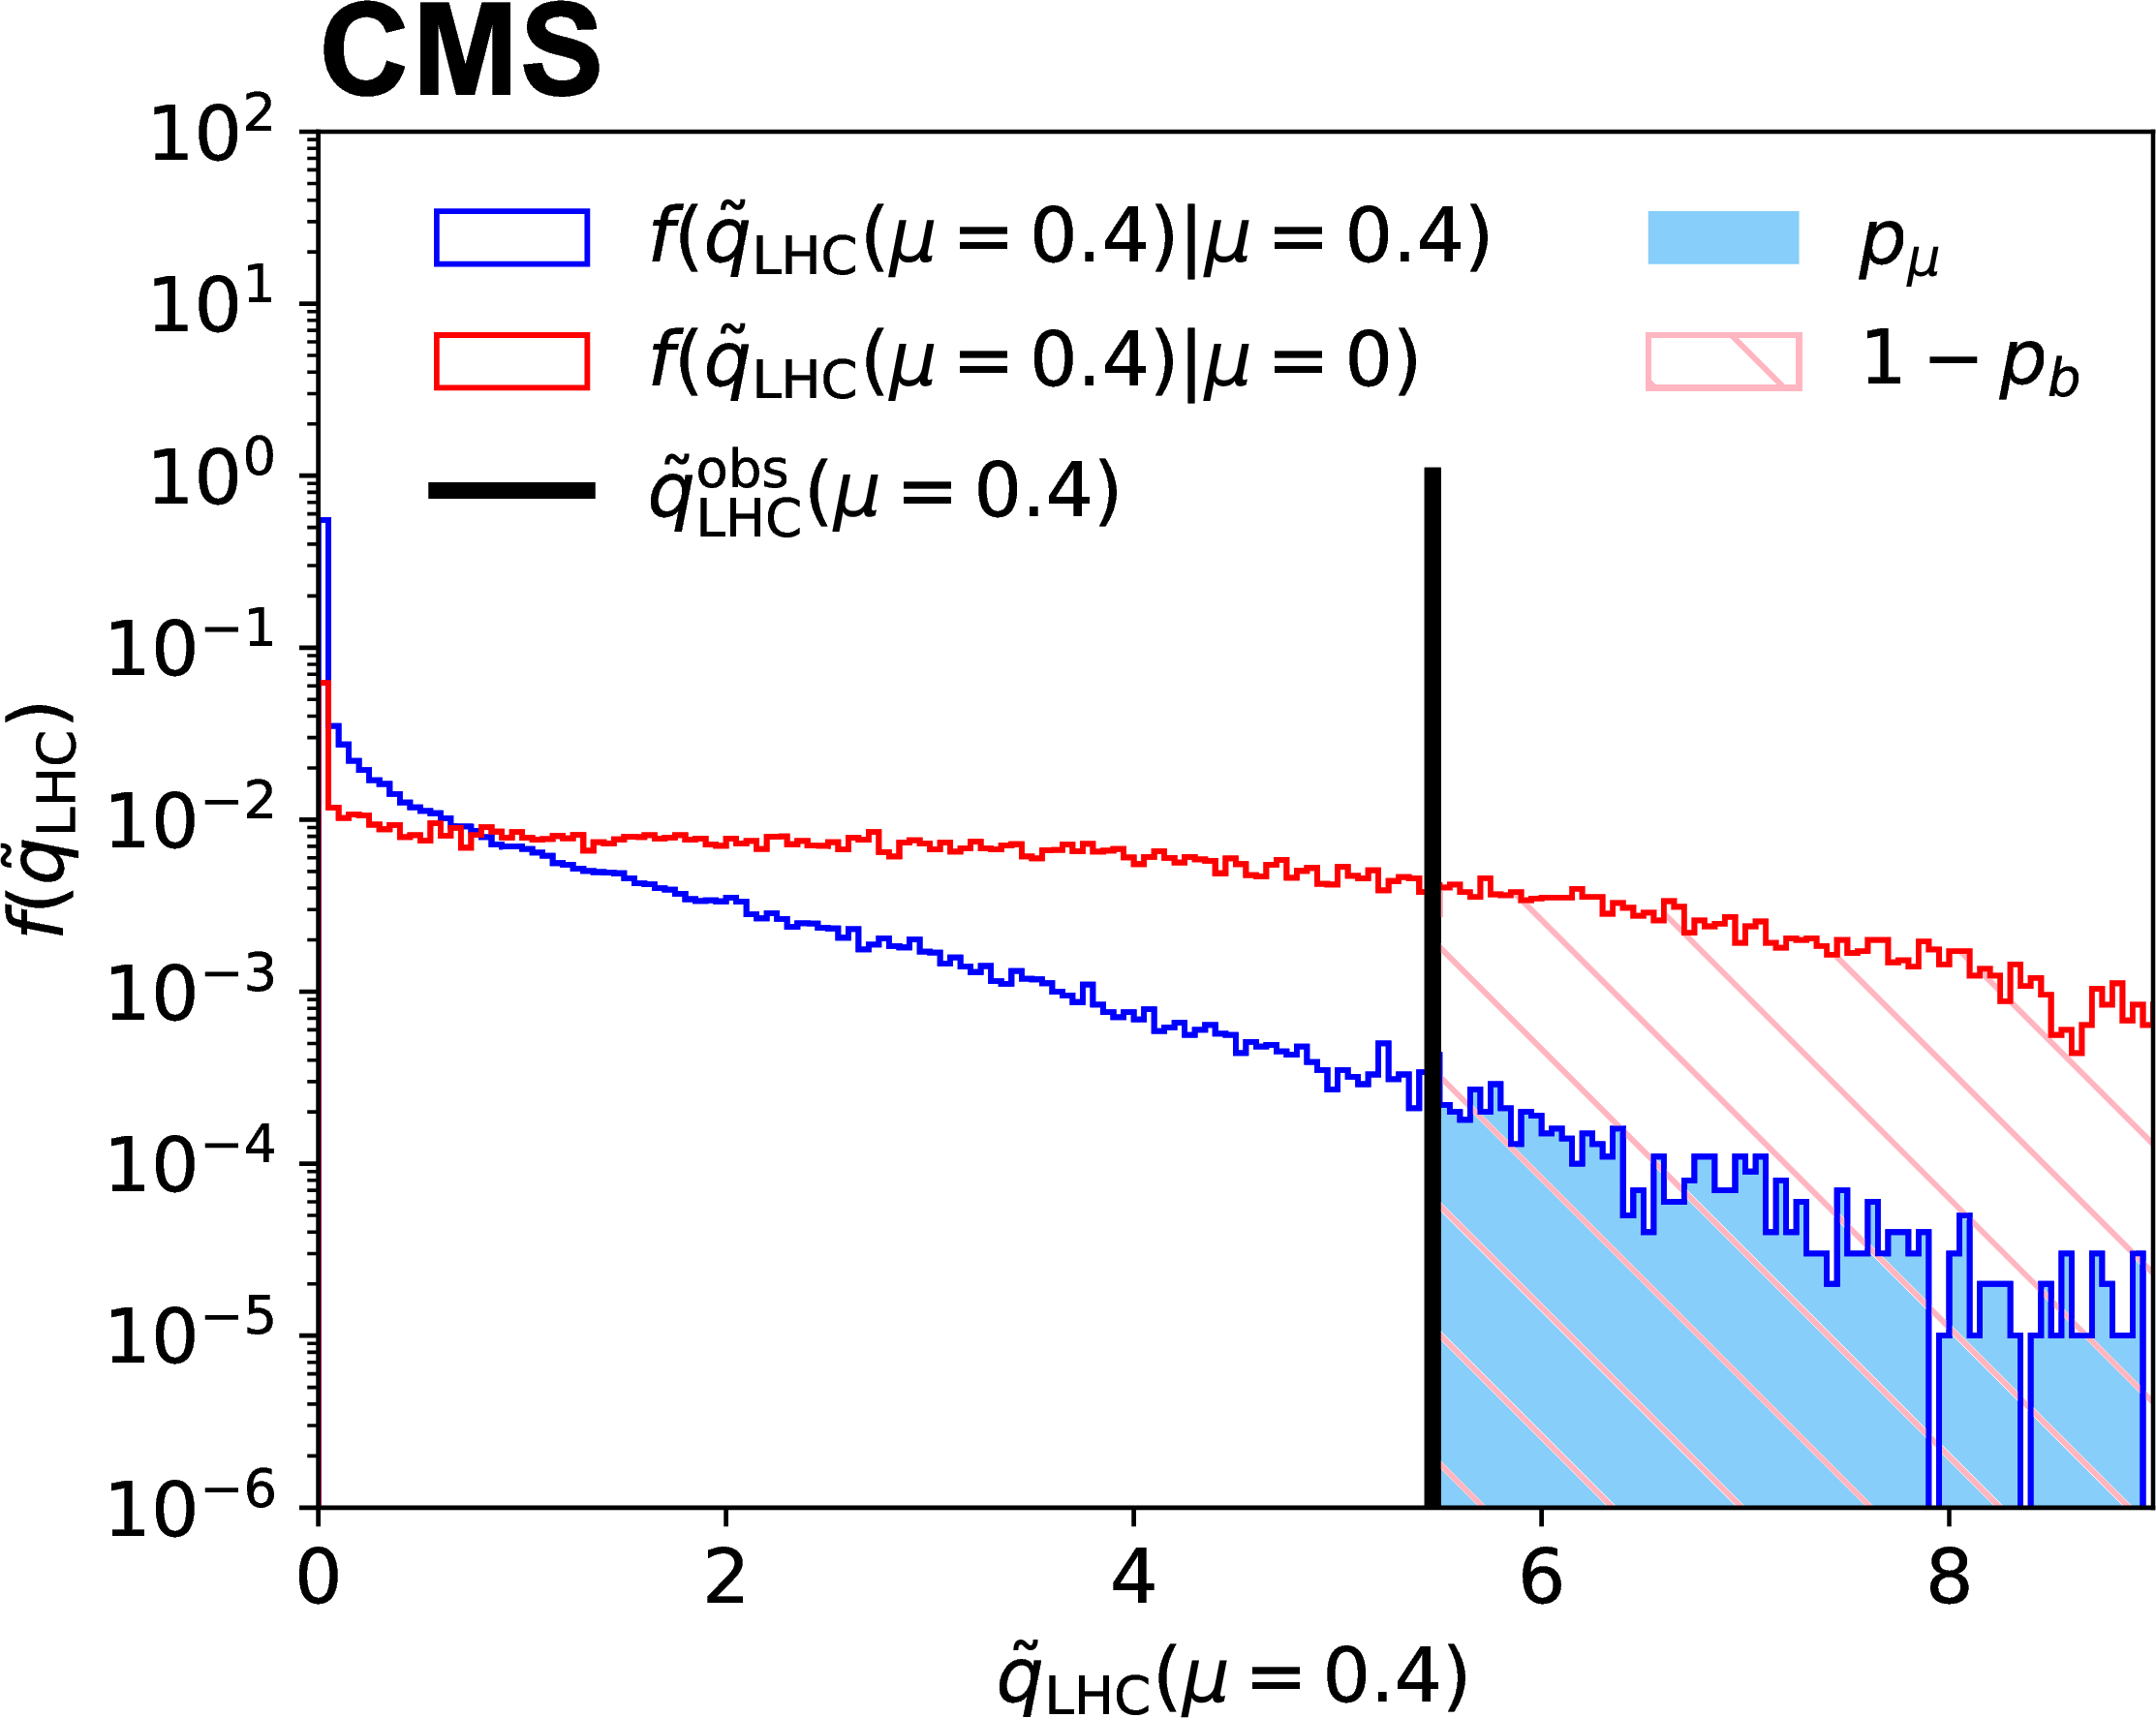
Figure 3:
Distributions of $ \widetilde{q}_{\mathrm{LHC}}(\mu=0.4) $ from 100,000 pseudo-data sets for $ \mu= $ 0 (red histogram) and $ \mu= $ 0.4 (blue histogram) using the analysis described in Datacard dc:template. The observed value of the test statistic is indicated by the black vertical line and the regions used to determine 1 $ -p_{b} $ and $ p_{\mu} $ are indicated by the pink hatched and light blue shaded regions, respectively. |
png pdf |
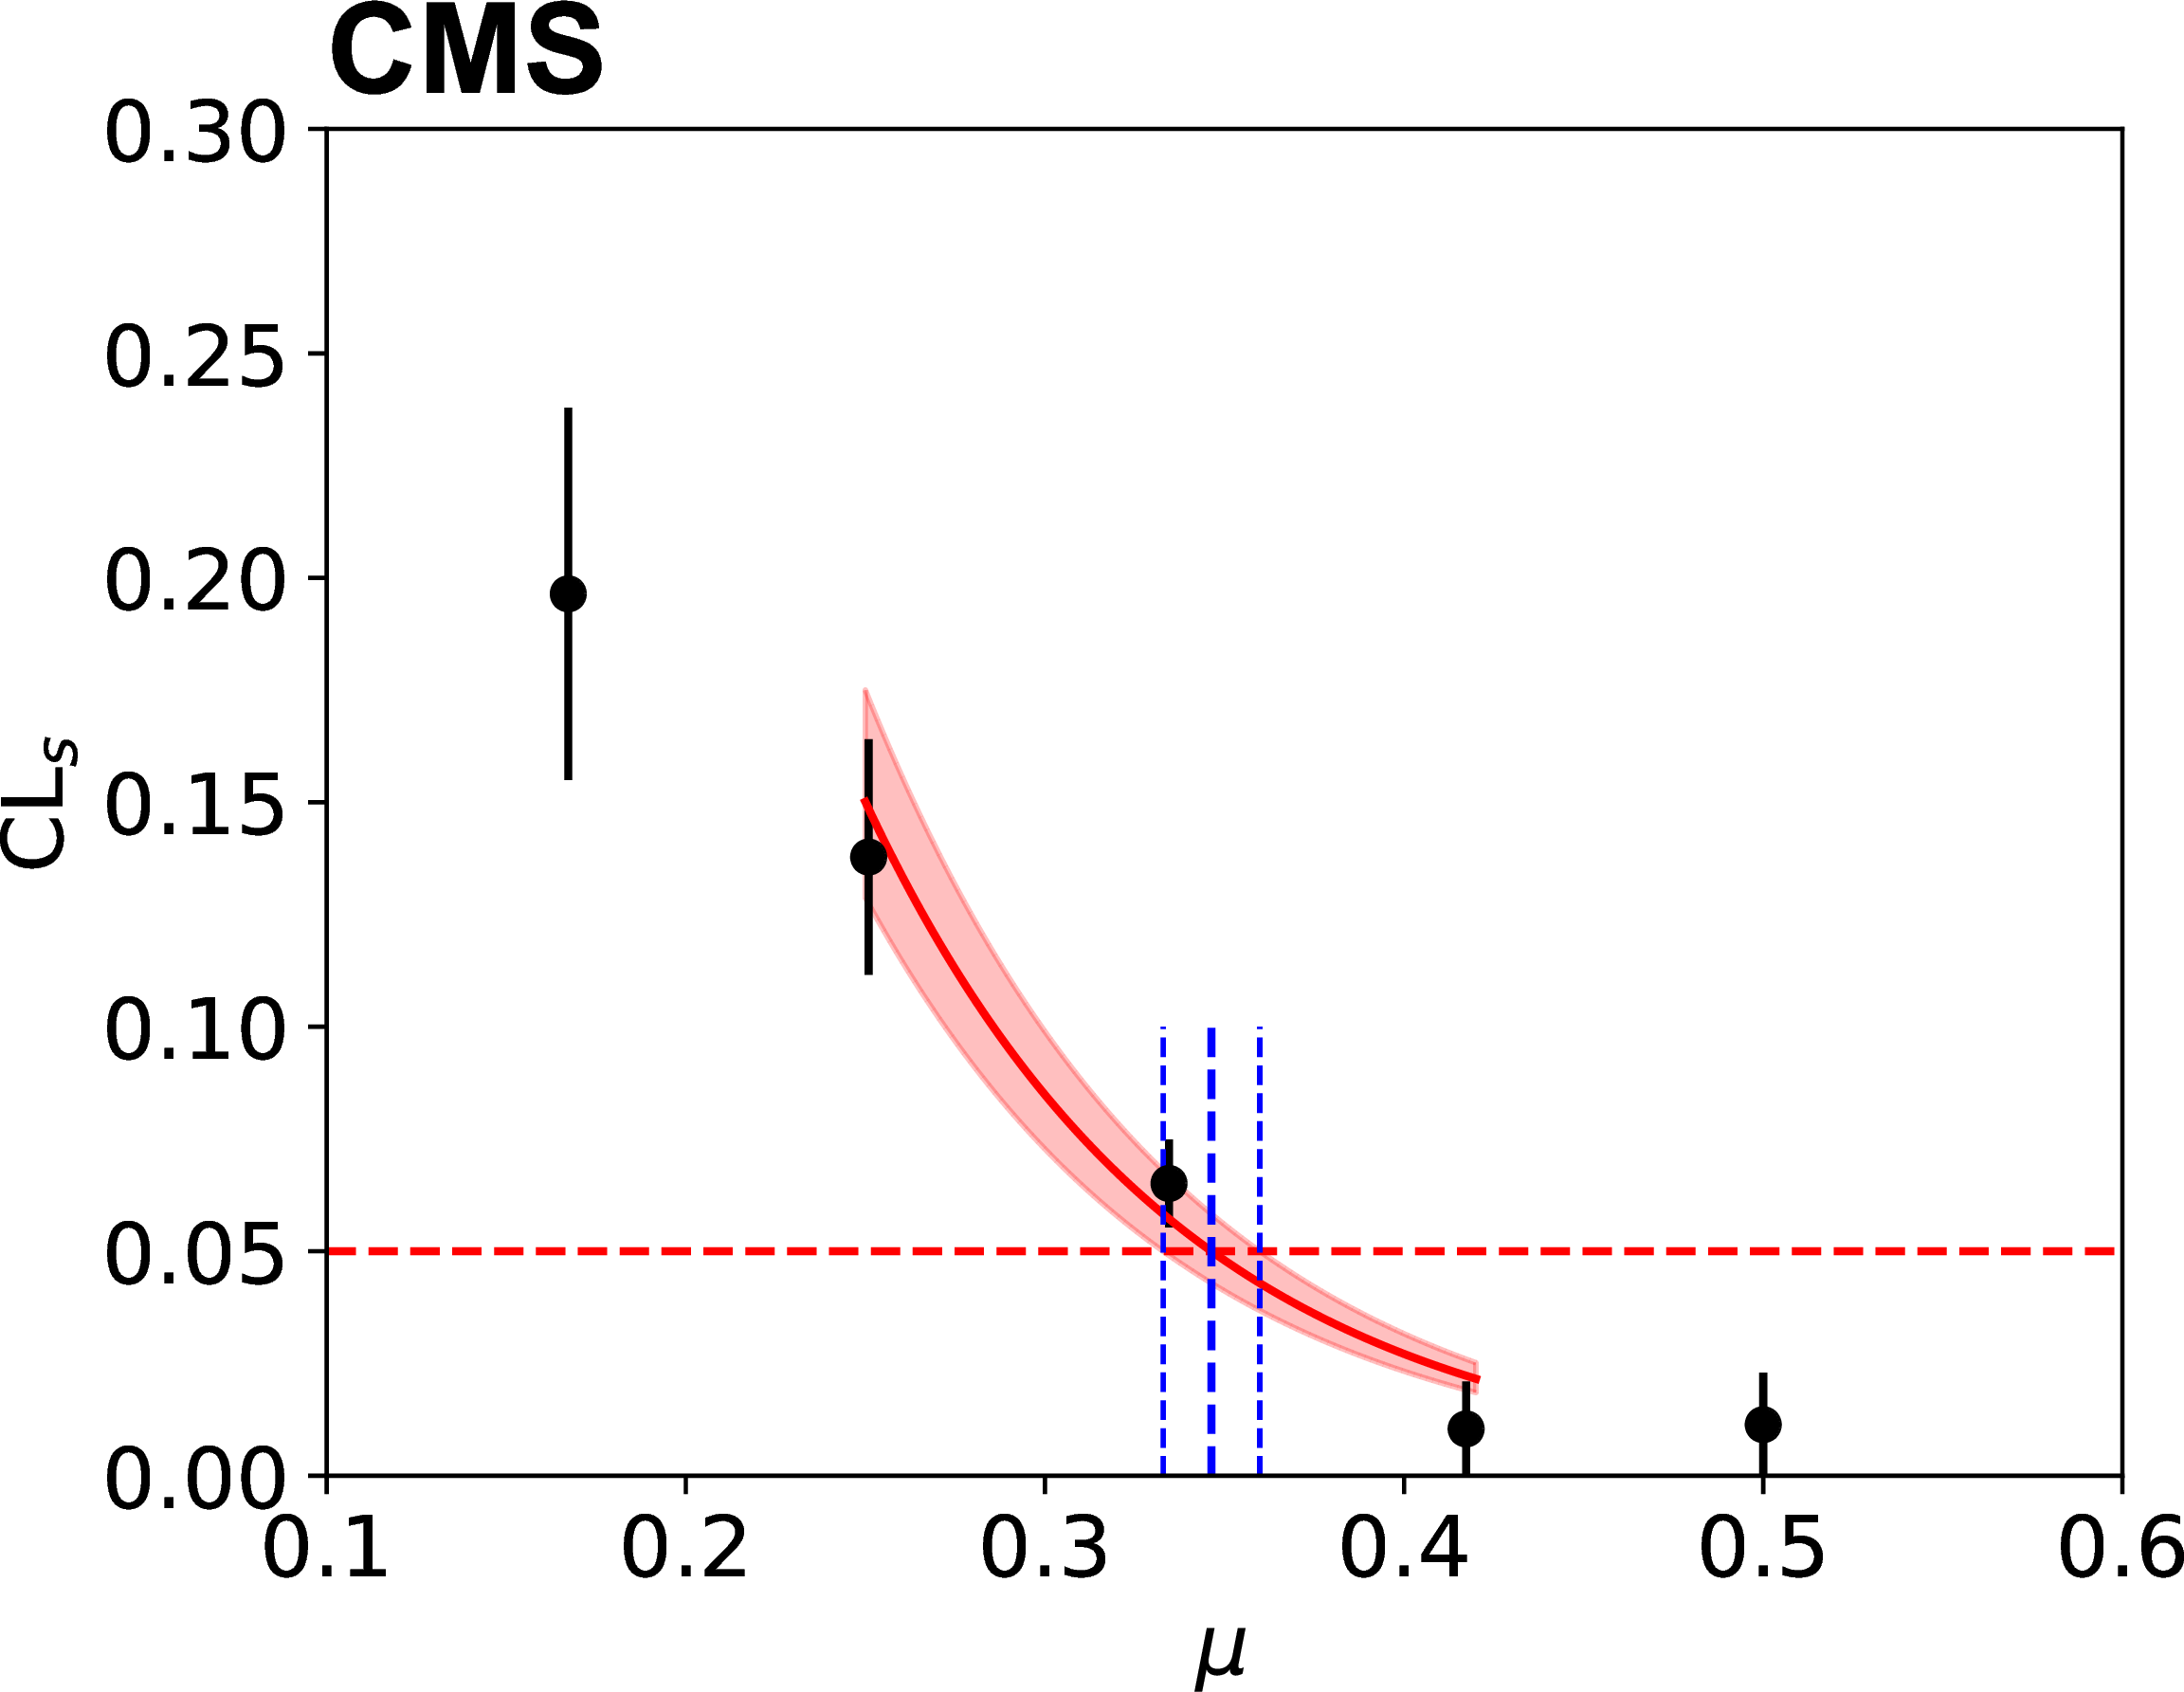
Figure 4:
Calculated $ \text{CL}_\text{s} $ as a function of $ \mu $, used to determine the 95% CL upper limit for Datacard dc:template. The solid red line is used to interpolate the $ \text{CL}_\text{s} $ values to find the crossing at 0.05, and the shaded band indicates the uncertainty in the interpolation that is used to estimate an uncertainty in the upper limit. The vertical dashed blue lines show the derived upper limit and the estimated uncertainty due to the number of pseudo-data sets used in the calculation. |
png pdf |
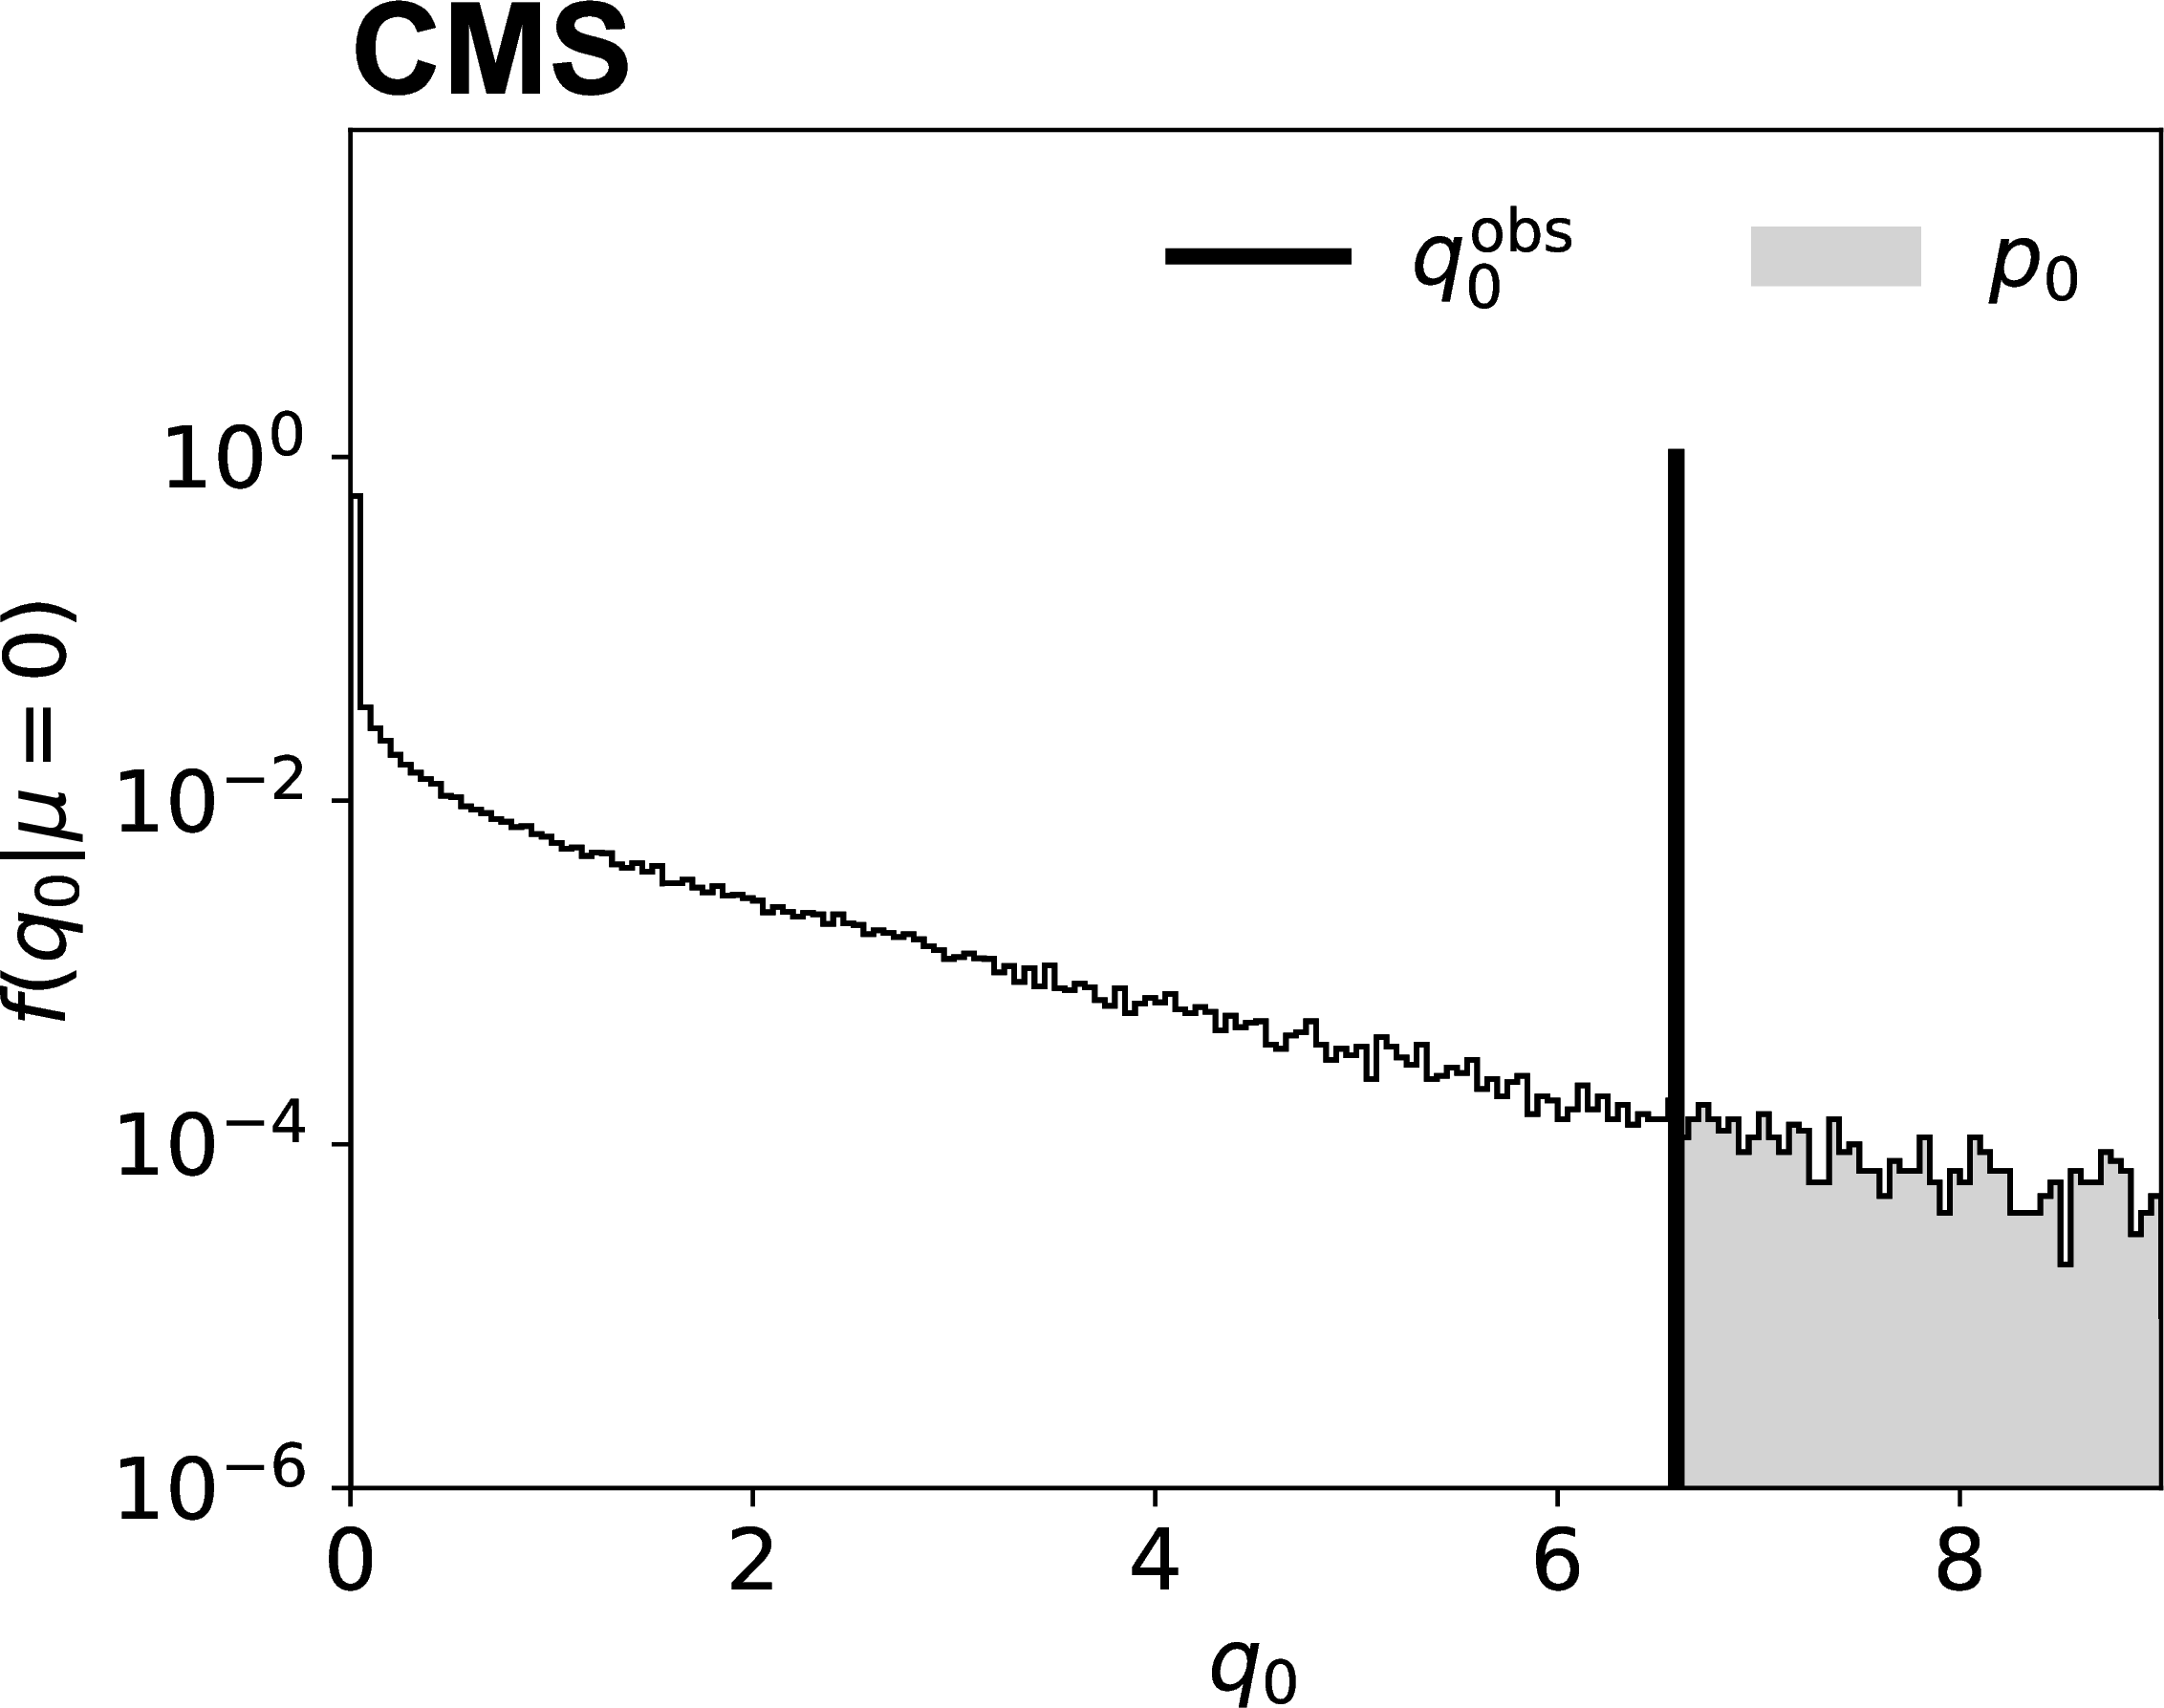
Figure 5:
Distribution of $ q_{0} $ in 100,000 pseudo-data sets from Datacard dc:param. The observed value of the test statistic is indicated by the black vertical line and the region used to determine $ p_{0} $ is indicated by the light gray shaded region. |
png pdf |
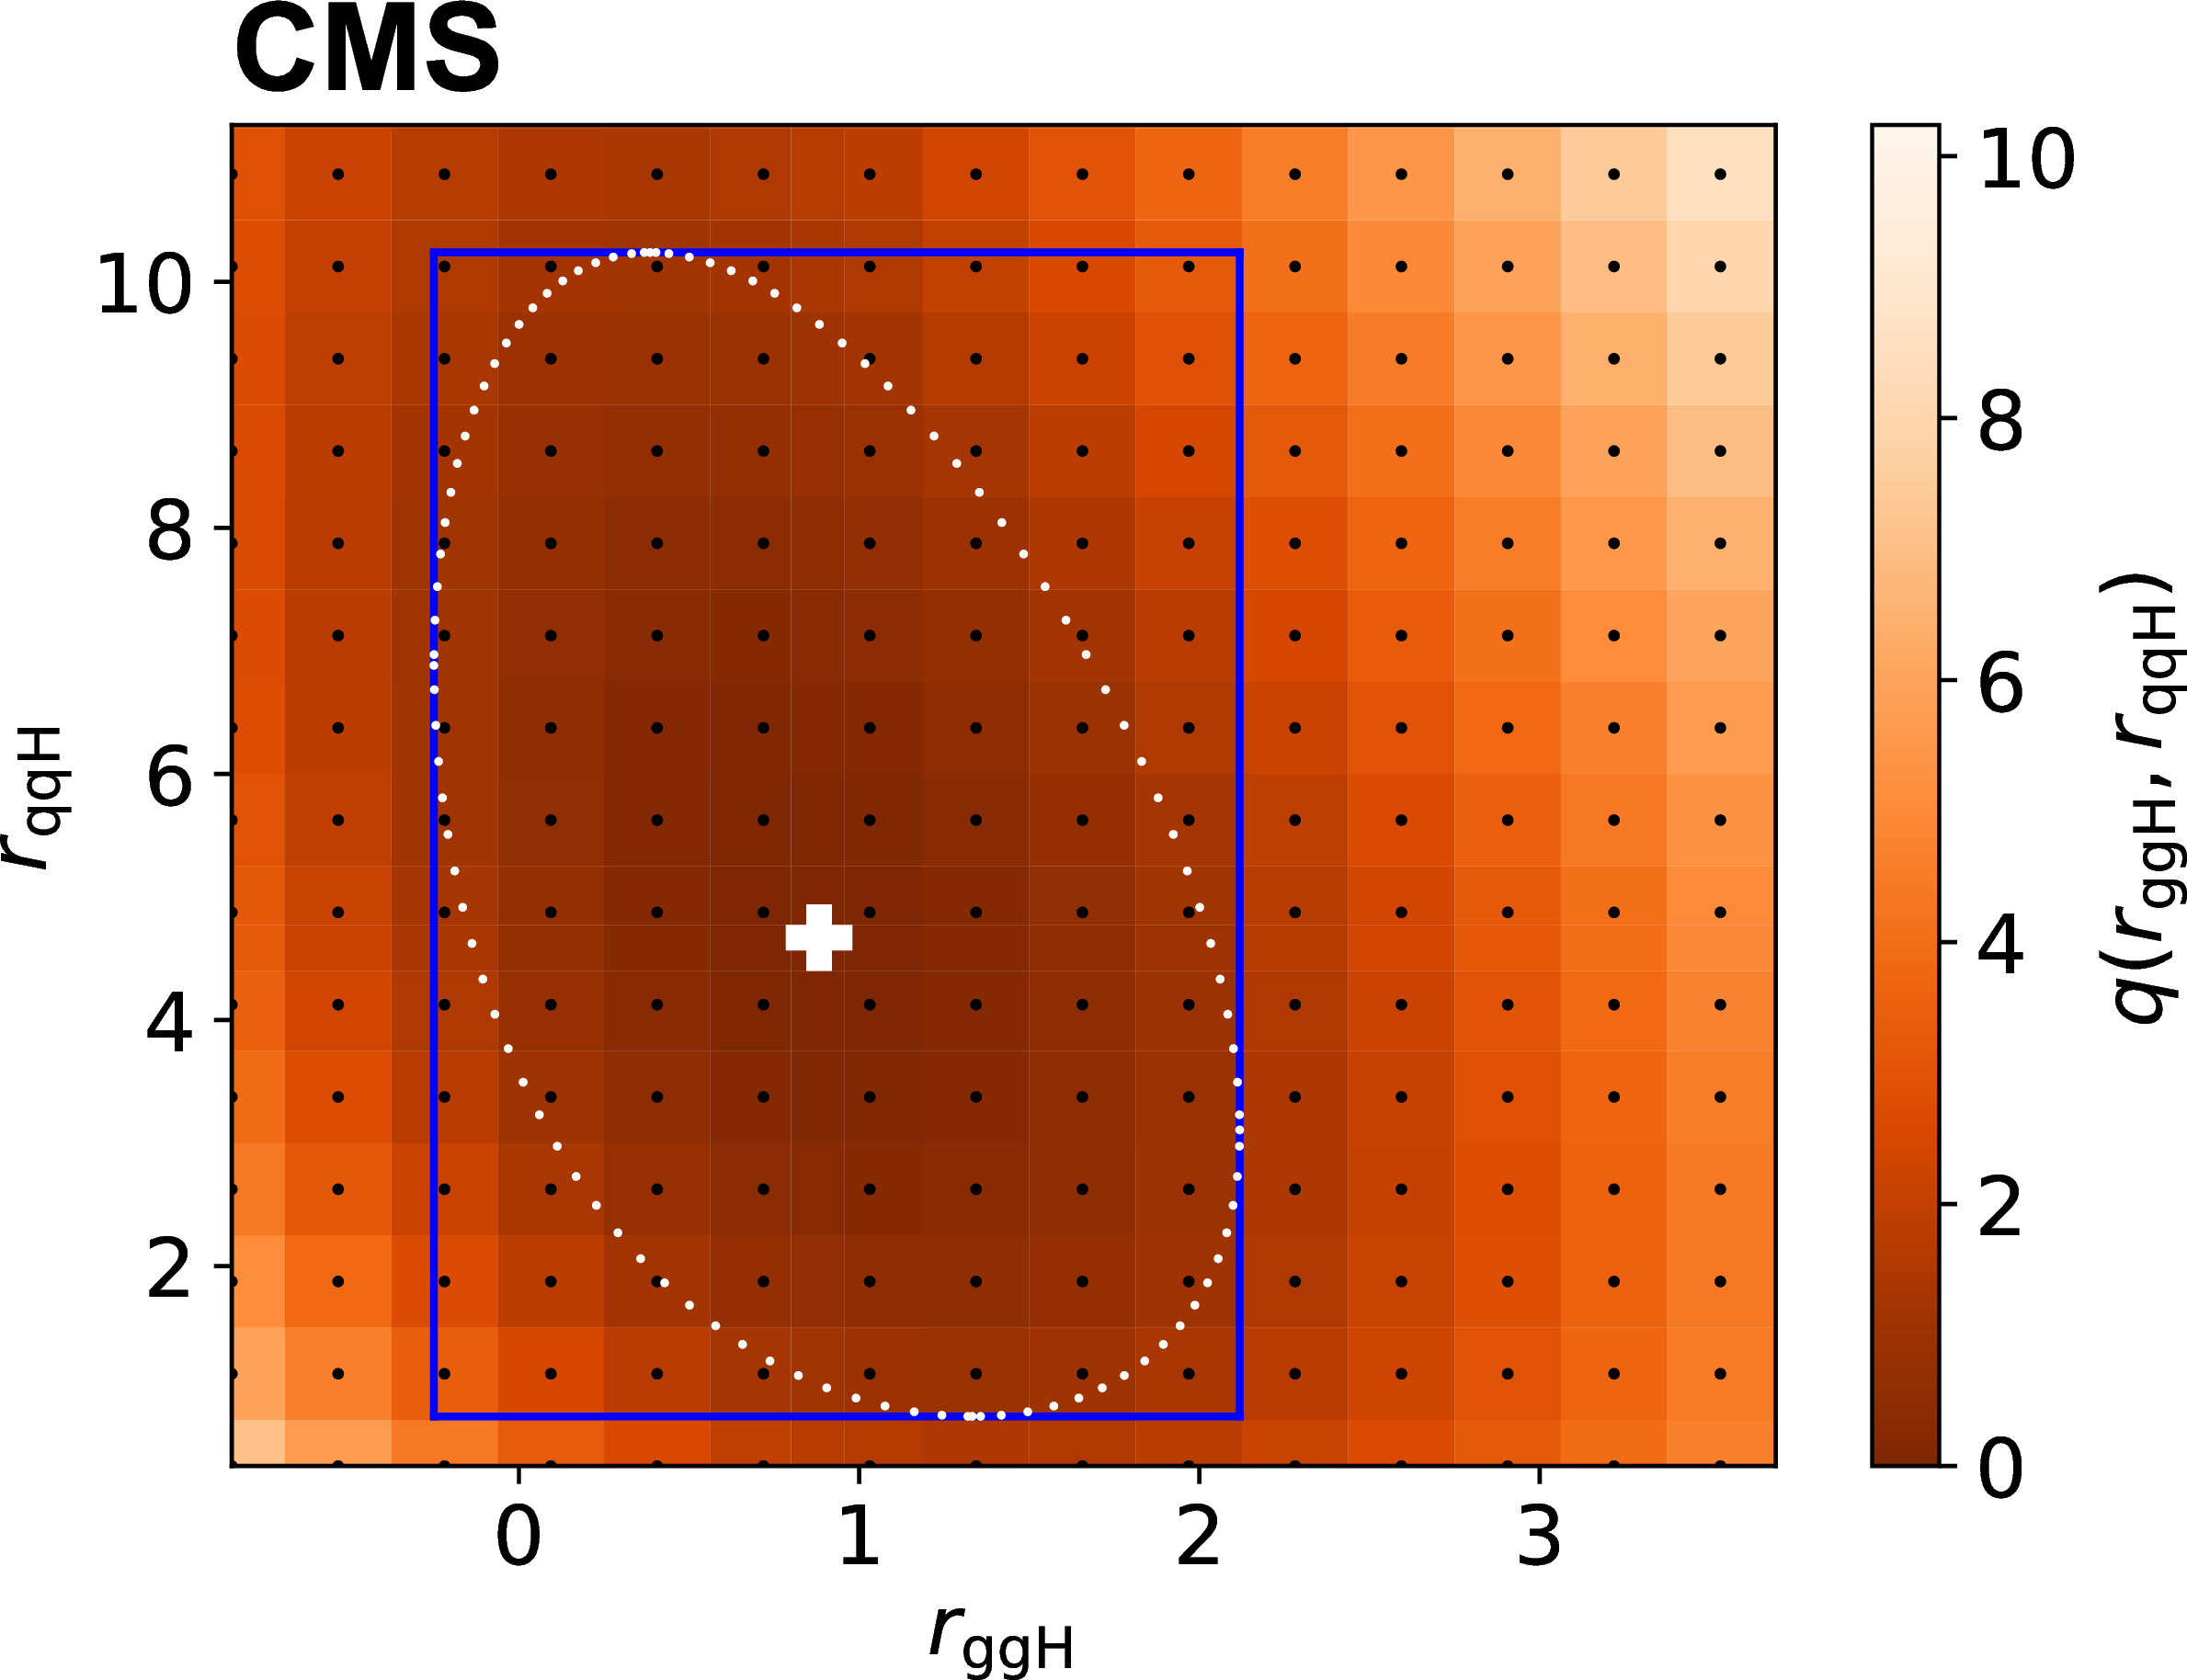
Figure 6:
Values of $ q(r_{\mathrm{g}\mathrm{g}\mathrm{H}},r_{\mathrm{q}\mathrm{q}\mathrm{H}}) $ for Datacard dc:multisig in a model with two parameters of interest $ r_{\mathrm{g}\mathrm{g}\mathrm{H}} $ and $ r_{\mathrm{q}\mathrm{q}\mathrm{H}} $. The orange scale shows the values obtained in Combine at the set of points indicated by the black dots, using the grid algorithm. The blue box is constructed using the cross algorithm with $ (1-\alpha)= $ 0.68. The white cross and white dots indicate, respectively, the maximum likelihood estimates for $ r_{\mathrm{g}\mathrm{g}\mathrm{H}} $ and $ r_{\mathrm{q}\mathrm{q}\mathrm{H}} $ from the best fit, and the 68% CL confidence region obtained using the contour2d algorithm defined as the values of $ (r_{\mathrm{g}\mathrm{g}\mathrm{H}},r_{\mathrm{q}\mathrm{q}\mathrm{H}}) $ for which $ q(r_{\mathrm{g}\mathrm{g}\mathrm{H}},r_{\mathrm{q}\mathrm{q}\mathrm{H}})= $ 2.3. |
png pdf |
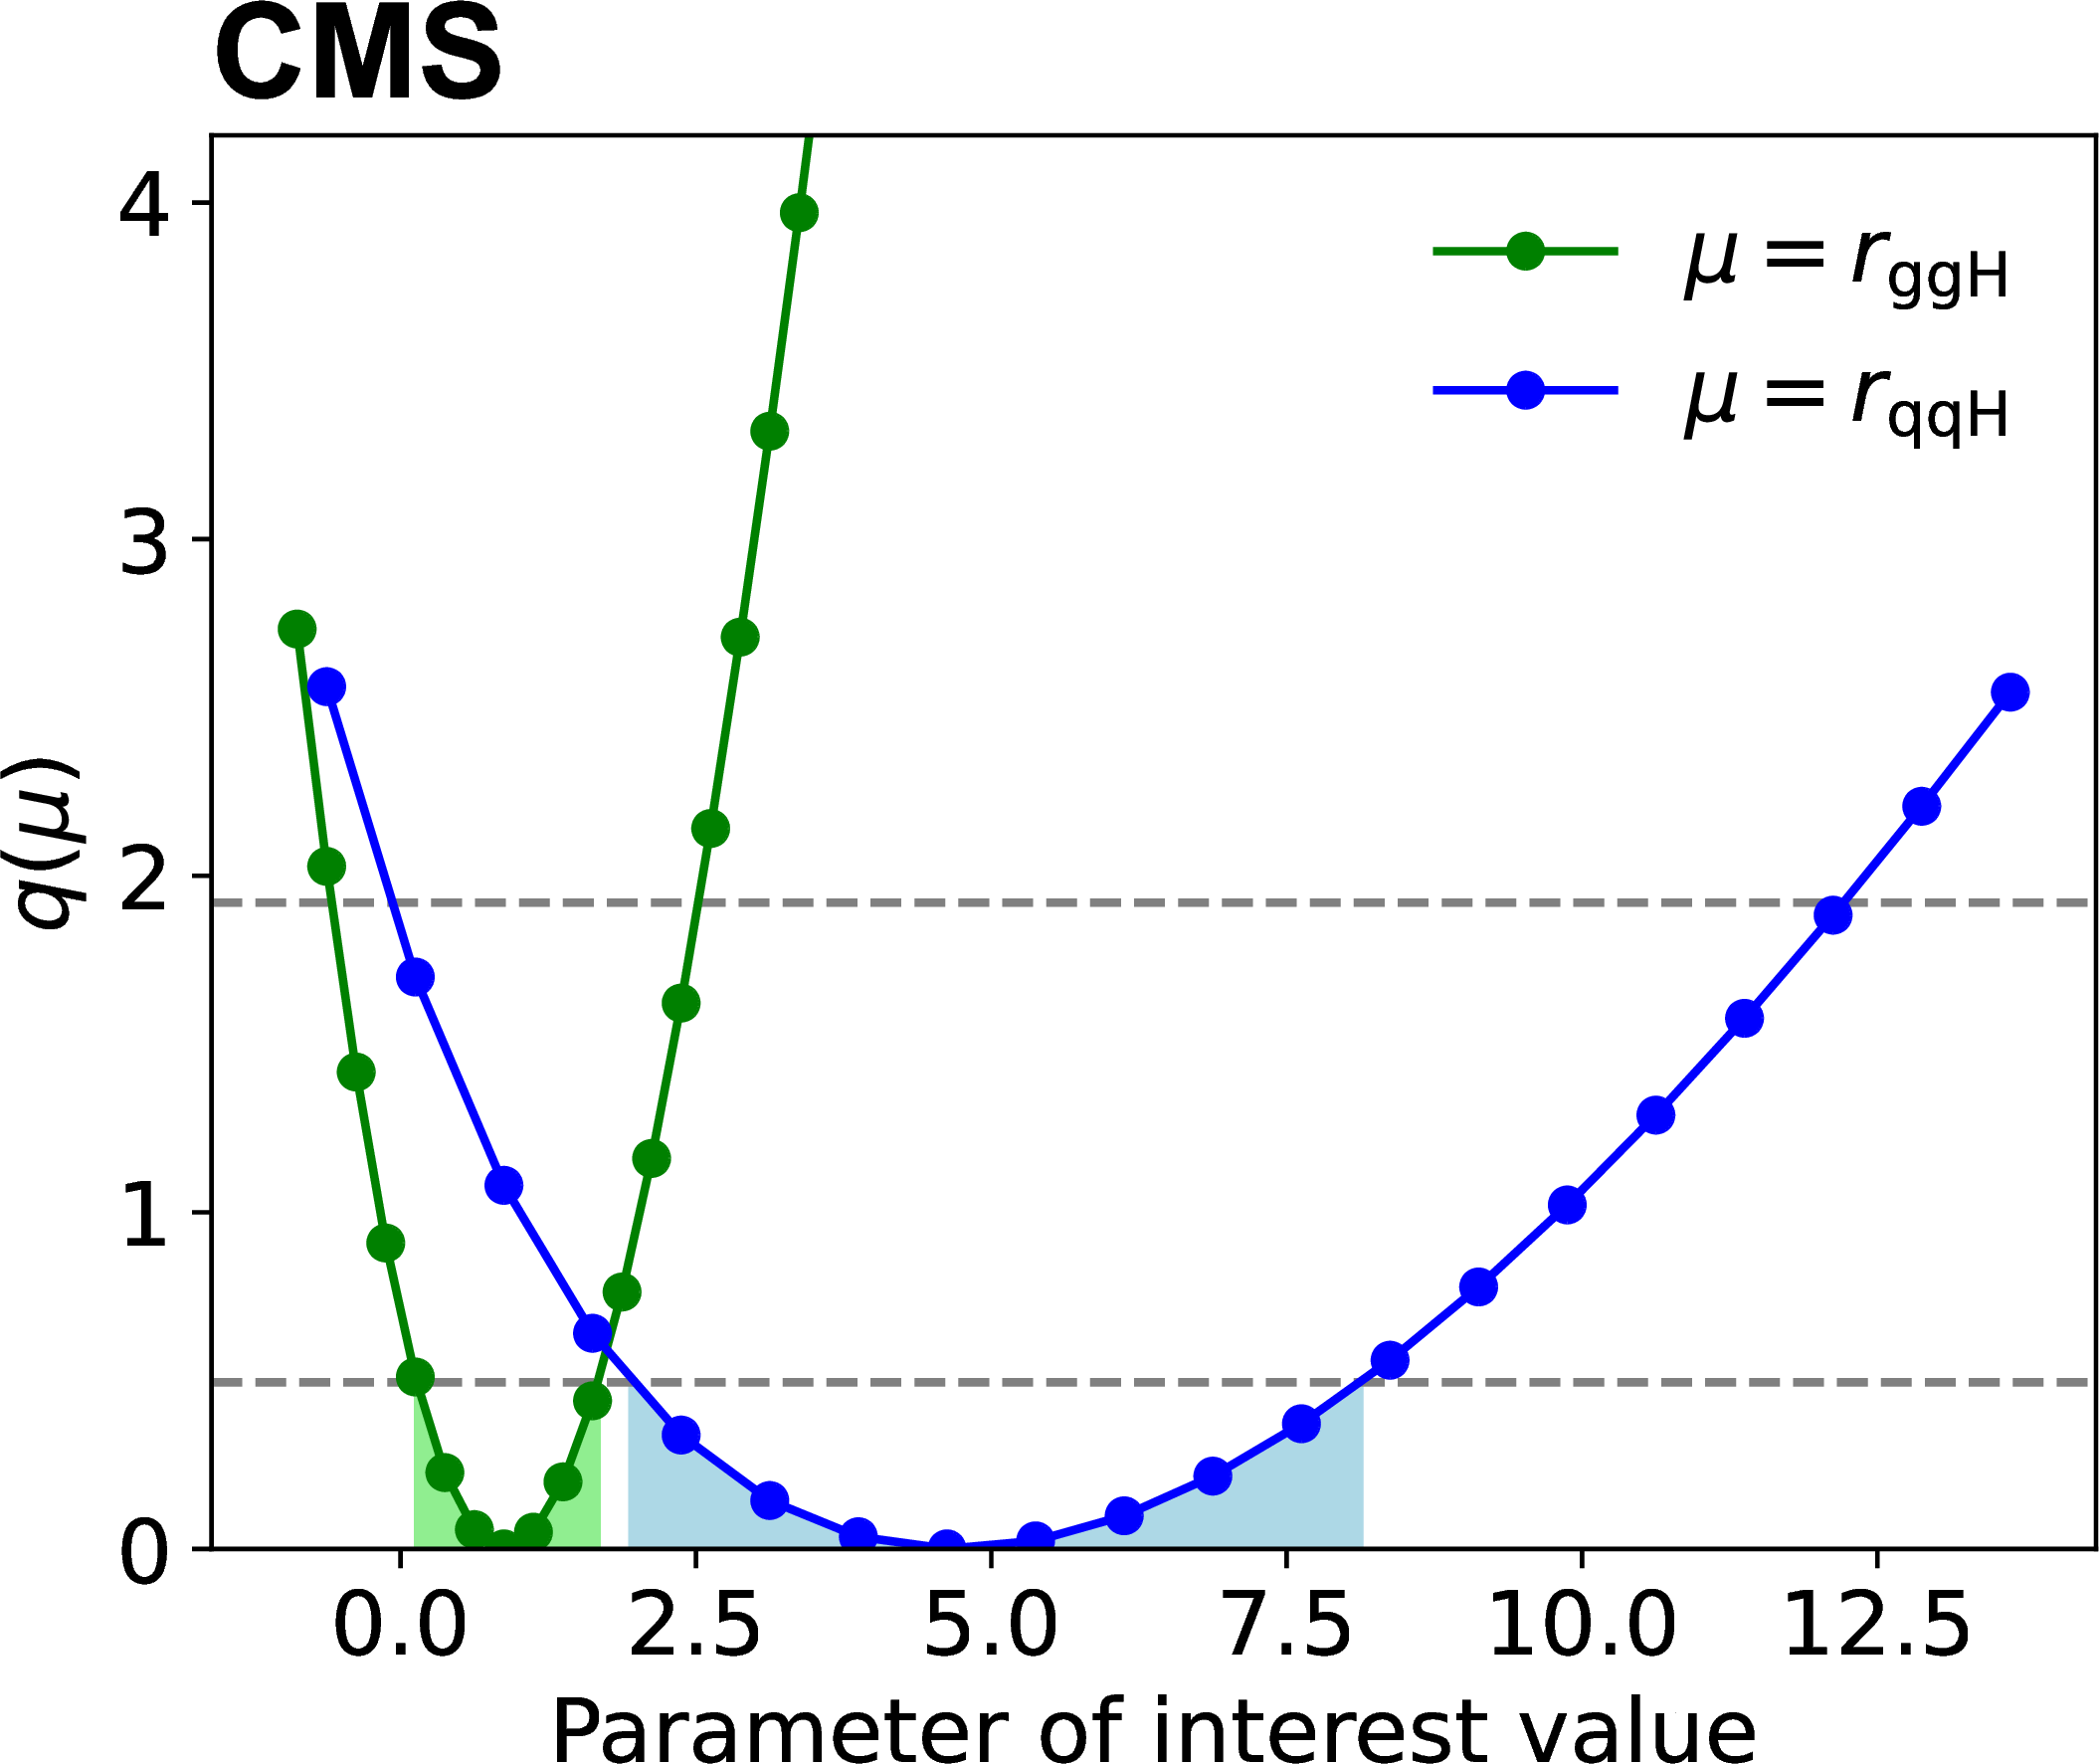
Figure 7:
Example of $ q(r_{\mathrm{g}\mathrm{g}\mathrm{H}},\hat{r}_{\mathrm{q}\mathrm{q}\mathrm{H}}) $ and $ q(r_{\mathrm{q}\mathrm{q}\mathrm{H}},\hat{r}_{\mathrm{g}\mathrm{g}\mathrm{H}}) $ obtained from Combine with Datacard dc:multisig. The points indicate the values at which the functions are evaluated using the grid algorithm, and the shaded region indicates the 68% CL intervals on each parameter obtained using the singles algorithm. The horizontal dashed lines indicate the values of $ q(\mu) $ used to define 68% and 95% CL intervals. |
png pdf |
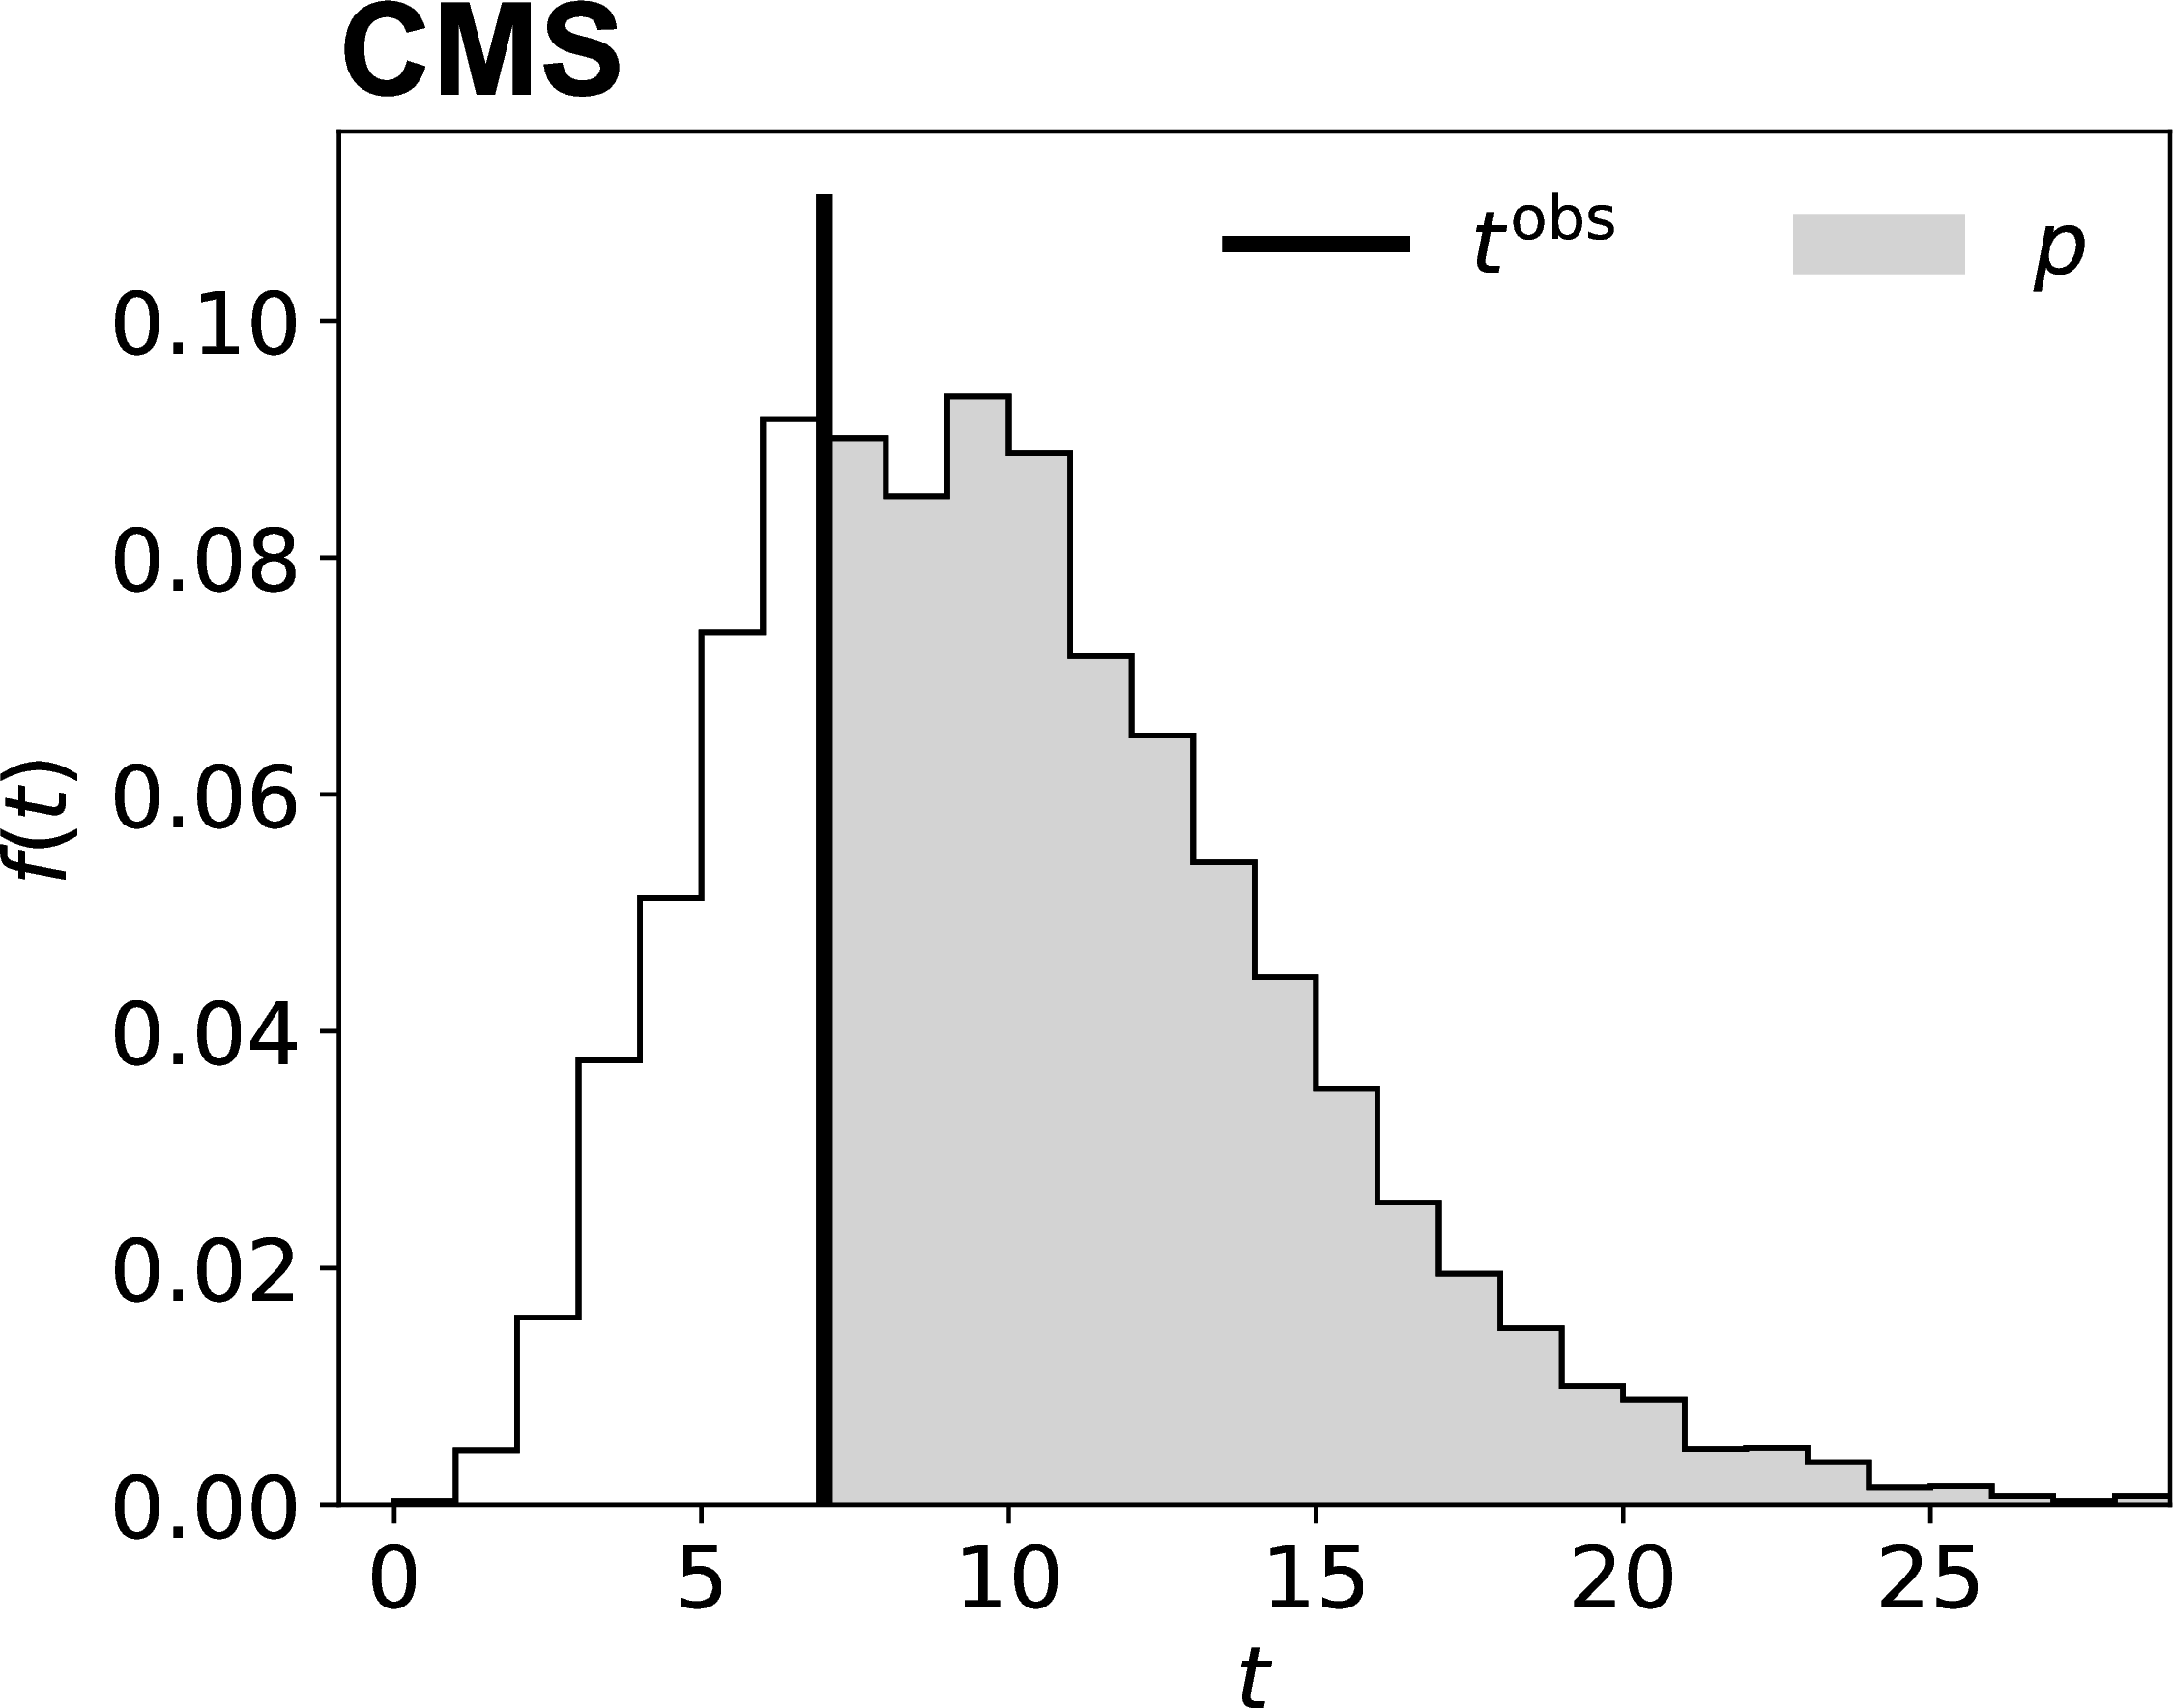
Figure 8:
Distribution of the saturated test statistic $ t $ in 10,000 pseudo-data sets using Datacard dc:template. The observed value of the test statistic is indicated by the black vertical line and the region used to determine $ p $ is indicated by the light gray shaded region. |
png pdf |
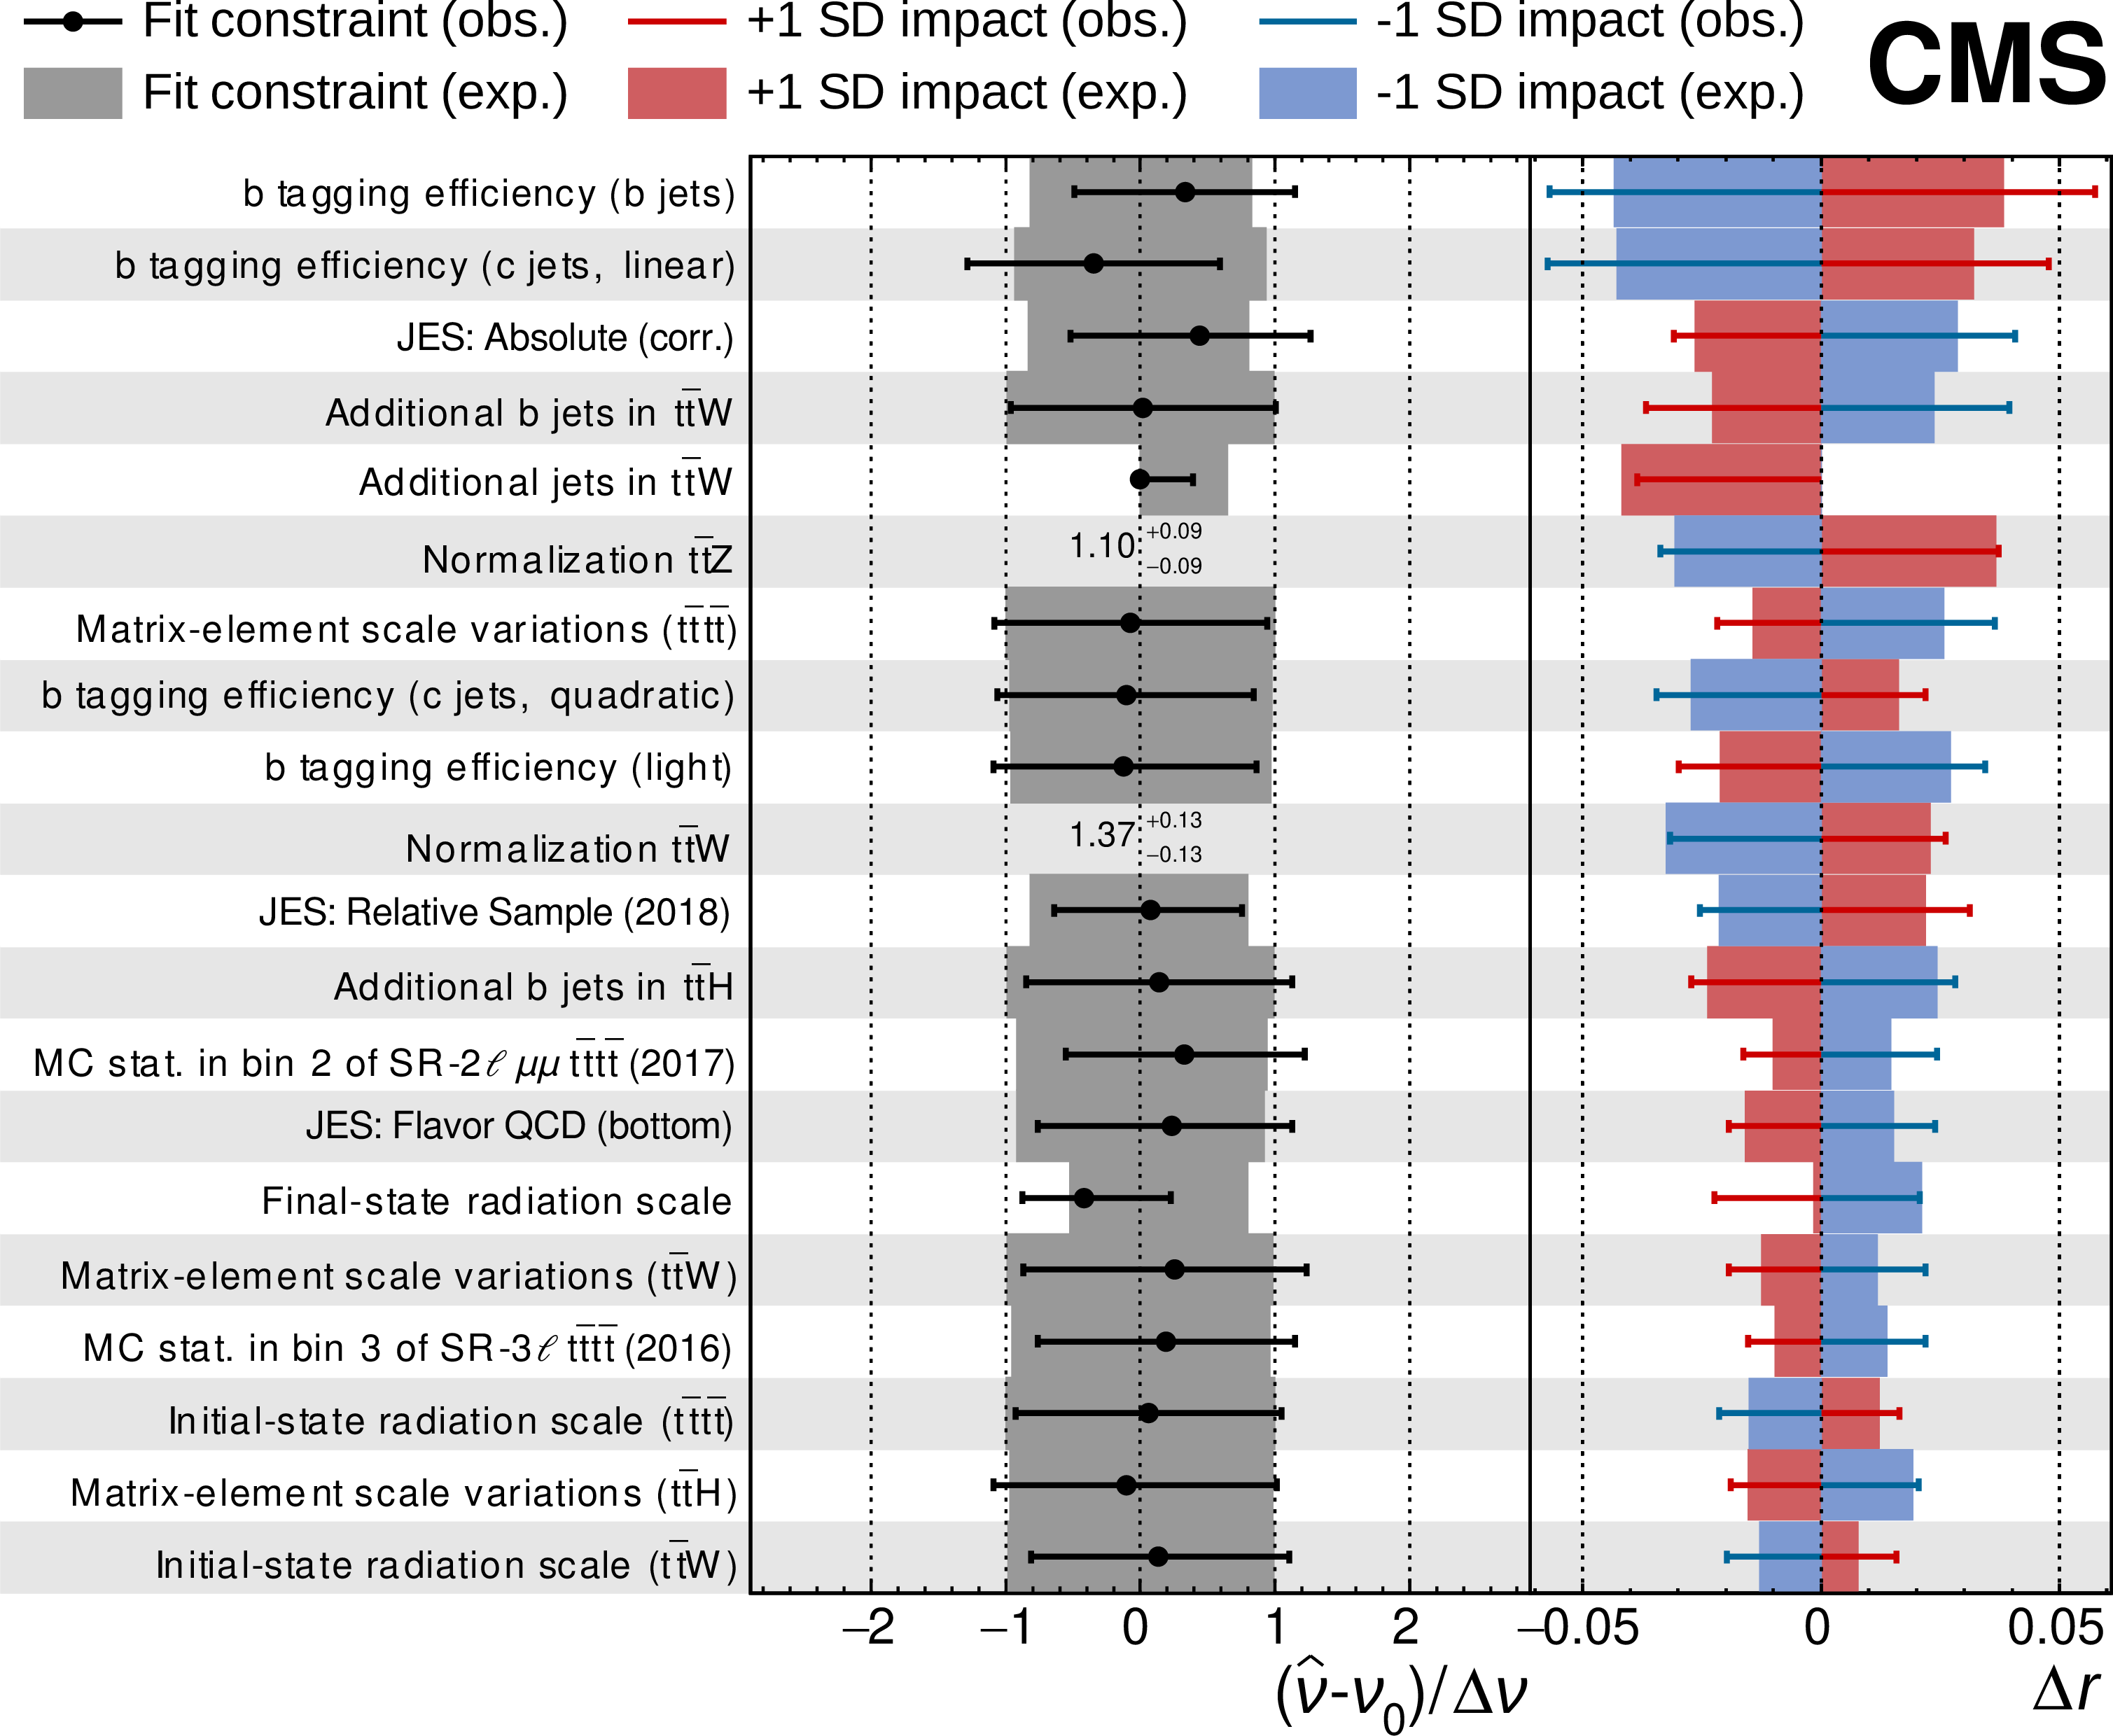
Figure 9:
Example of nuisance parameter uncertainties and impacts calculated in Combine for the observation of four top quark production. Each row gives the name of the nuisance parameter, the difference in its maximum likelihood estimate $ \hat{\nu} $ with respect to its default value $ \nu_{0} $ relative to its uncertainty $ \Delta\nu $, and the impact with respect to the default physics model parameter $ \Delta r $. The nuisance parameter constraints and impacts are calculated using the observed data set (obs.) and an Asimov dataset constructed assuming standard model production of four top quarks (exp.). The red and blue lines in each row represent the positive impact $ \Delta r^{+} $ and negative impact $ \Delta r^{-} $, respectively, for the observed data. Similarly, the red and blue shaded boxes represent the same quantities for the Asimov dataset. The error bars on the fit constraint values indicate the ratio of $ \Delta^{-}\nu $ or $ \Delta^{+}\nu $, to their default values. The two numerical values displayed in the figure give the value of $ \hat{\nu}^{+ \Delta^{+}\nu}_{- \Delta^{-}\nu} $ for two rate parameters, which do not have well-defined default uncertainty values. Figure adapted from Ref. [22]. |
png pdf |
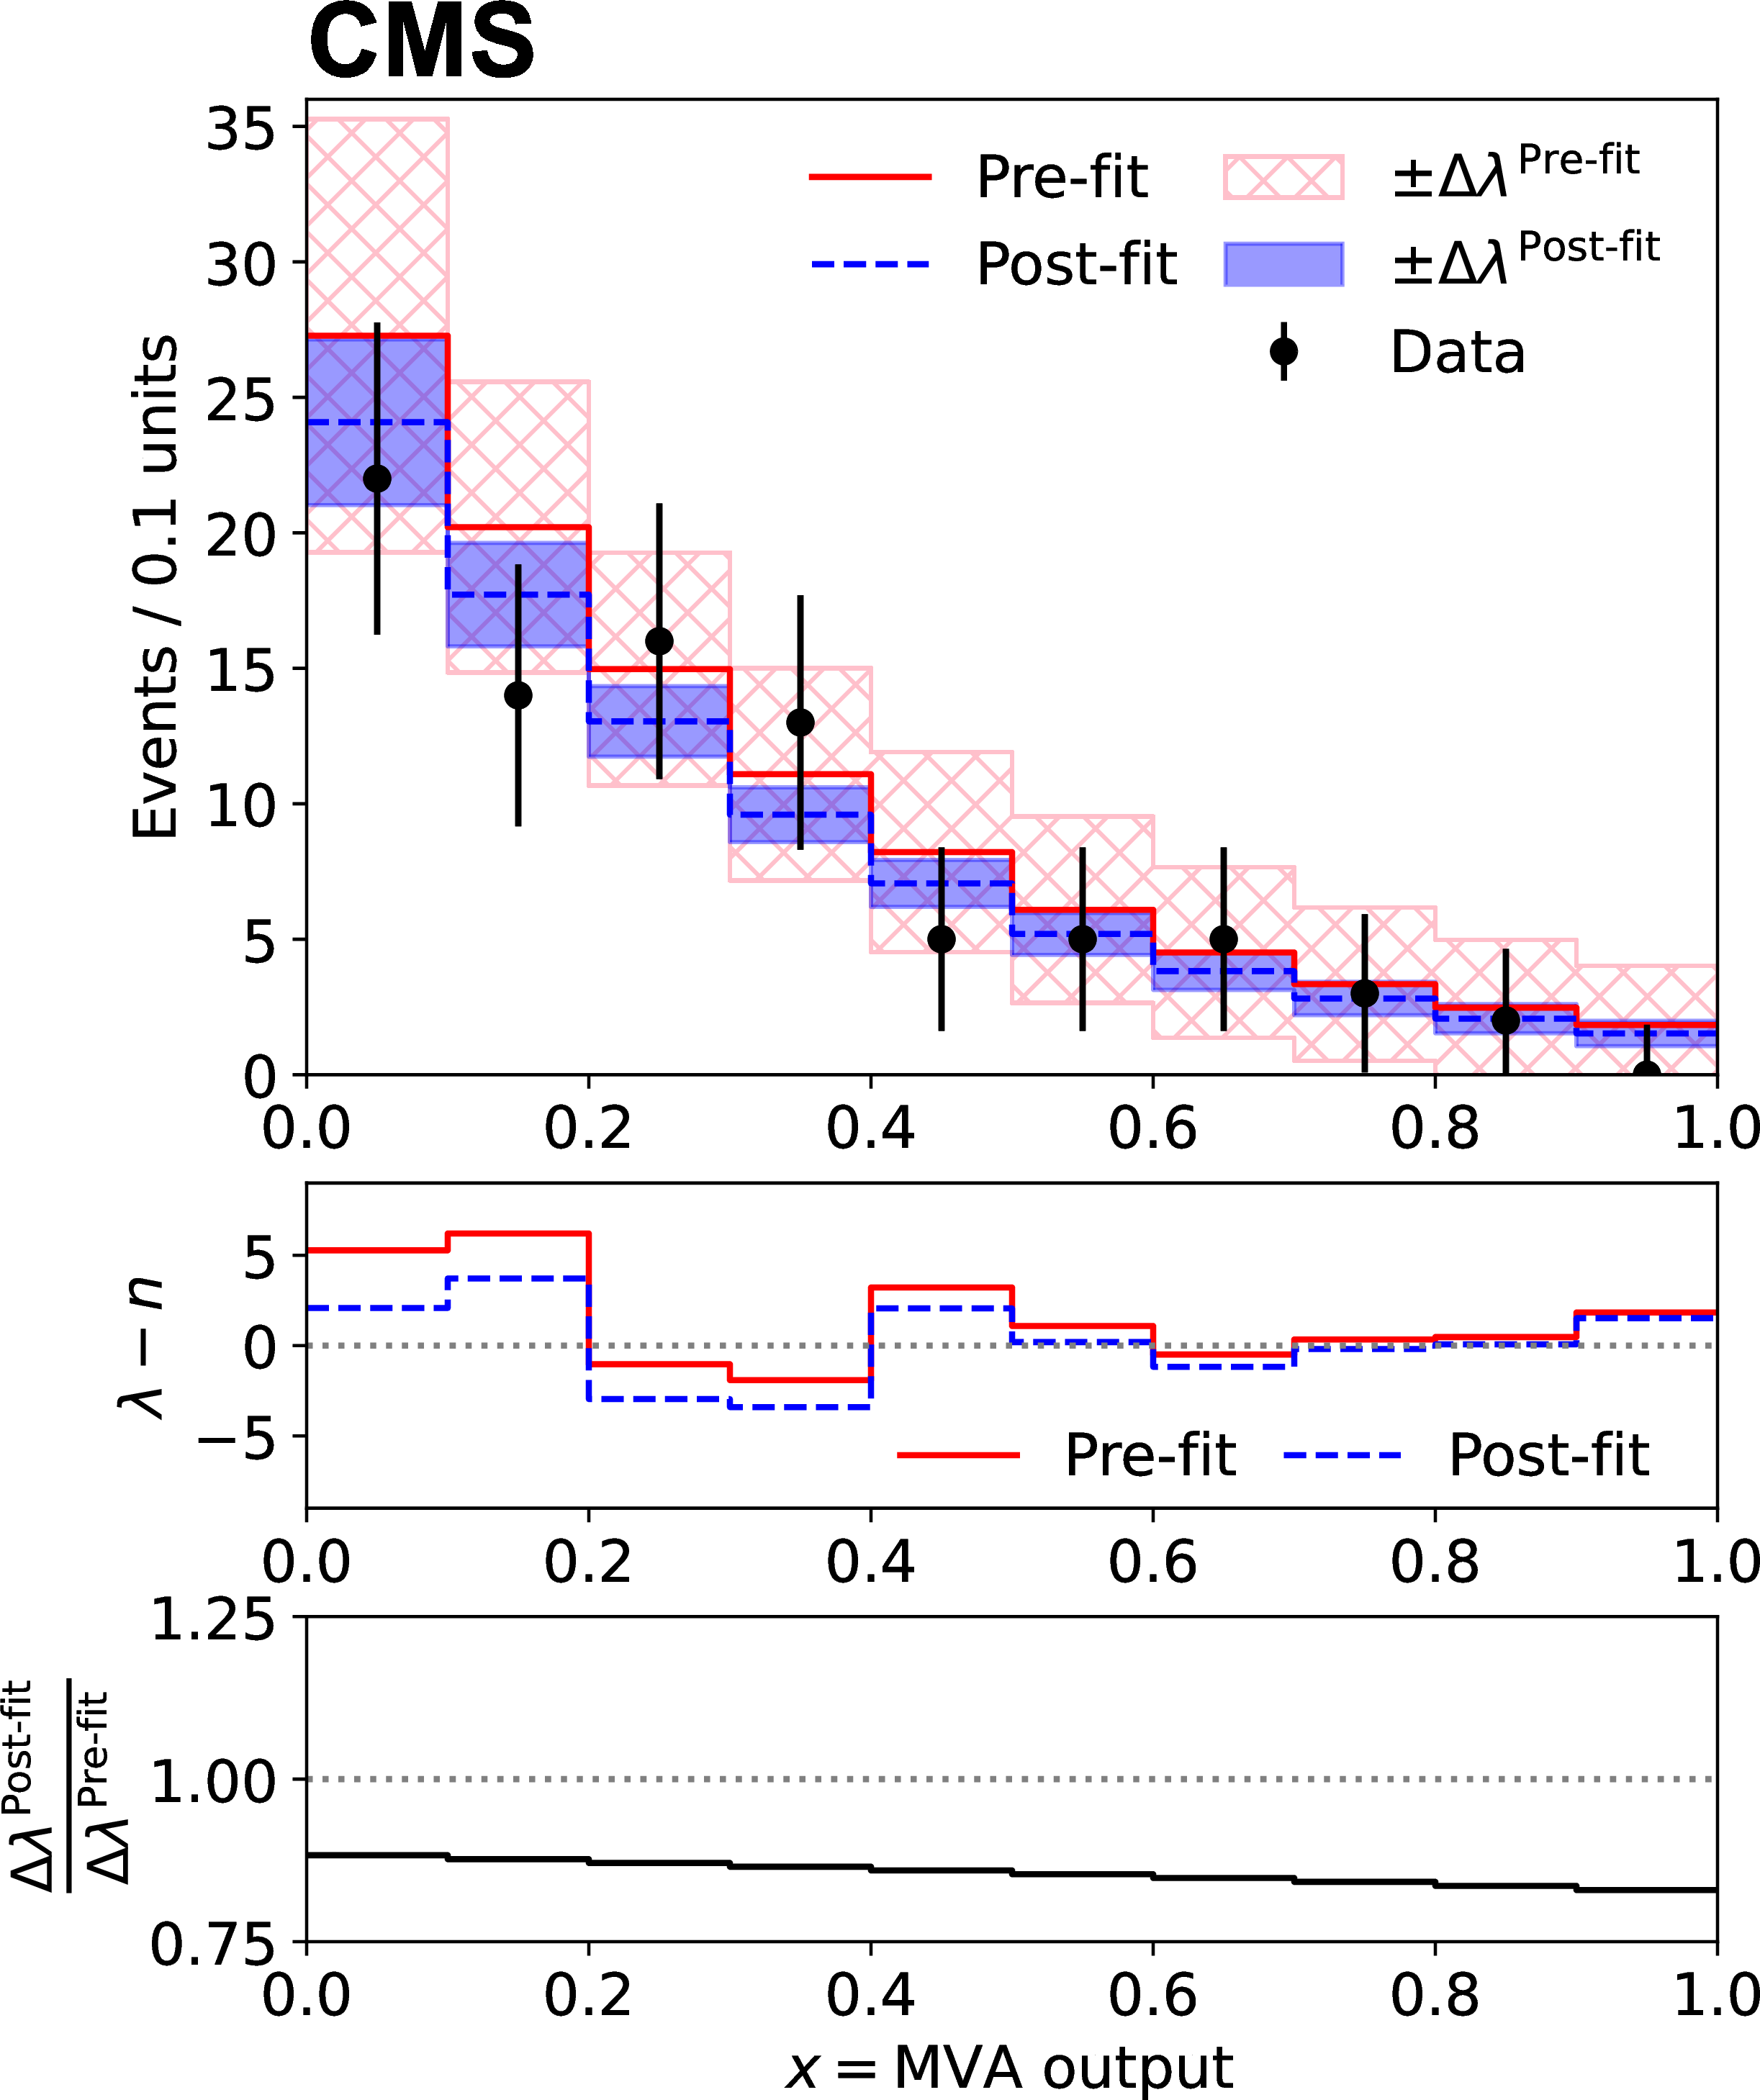
Figure 10:
Distributions of the observable $ x $ for the data and background process in Datacard dc:template and their uncertainties. The upper panel shows the distribution for the default values of the nuisance parameters (red solid line, pre-fit) and for the maximum likelihood estimates assuming no signal (blue dashed line, post-fit). The pink hatched and blue shaded bands show the estimate of the uncertainty in each bin for the pre-fit and post-fit distributions, respectively. The middle panel shows the difference between the expected number of events in the background processes ($ \lambda $) and the data ($ n $) in the pre-fit (red solid line) and post-fit (blue dashed line) cases, and the lower panel shows the ratios of the estimated uncertainties of the post-fit distribution $ \Delta\lambda^{\text{Post-fit}} $ to the pre-fit $ \Delta\lambda^{\text{Pre-fit}} $ in each bin. |
| Tables | |
png pdf |
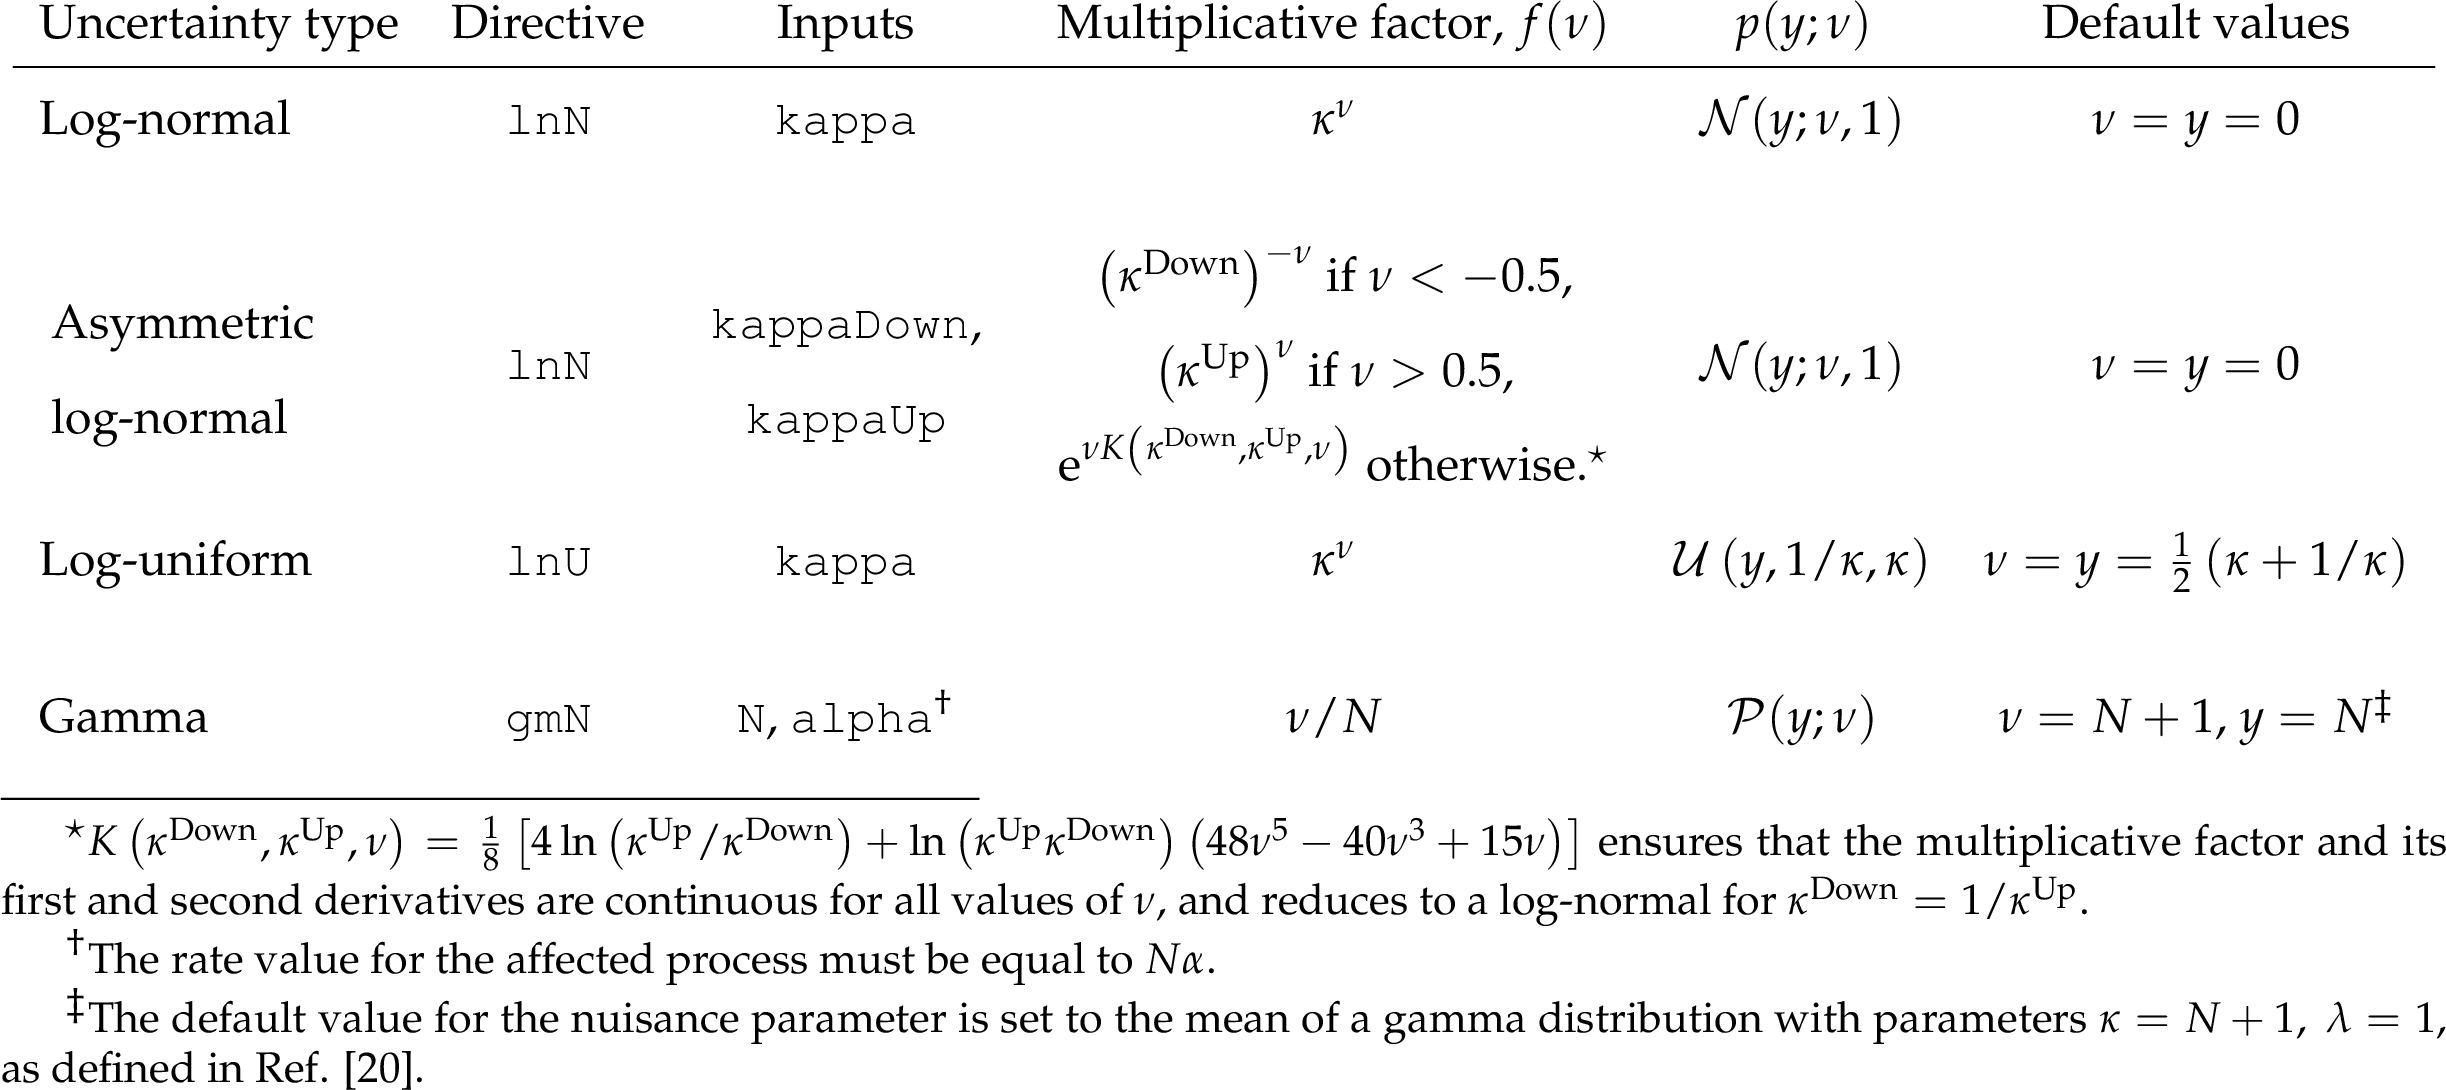
Table 1:
Available uncertainty types for counting experiments. The second and third columns indicate the entries for the datacard required to specify the type, and the relative effect on the yield of each process in each channel. The fourth and fifth columns indicate the resulting multiplicative factor by which Combine scales the normalization of the relevant process in the specified channel, and the term $ p(y;\nu) $ that is included in Eq. (1). Finally, the last column indicates the default values of $ \nu $ and $ y $. Where relevant, the value of $ \kappa- $ 1 can be interpreted as the relative uncertainty in the process normalization in a given channel. |
| Summary |
| After a decade of development, the Combine package has become the main tool used for statistical analysis of data by the CMS Collaboration. The tool is based on the ROOT [1], ROOFIT [2], and RooStats [2] software packages to provide a command-line interface to several common statistical workflows used in high-energy physics. The statistical model is constructed from a text file provided by the user and a configurable physics model that encodes the parameters of interest and the nuisance parameters that model systematic uncertainties. The Combine package can perform a variety of statistical procedures including calculating confidence or credible intervals, evaluating profile likelihoods, and performing goodness of fit tests. The online documentation [12] contains comprehensive information on the capabilities and instructions for running the Combine package, as well as detailed instructions for its installation. |
| References | ||||
| 1 | R. Brun and F. Rademakers | ROOT: An object oriented data analysis framework | NIM A 389 (1997) 81 | |
| 2 | W. Verkerke and D. P. Kirkby | The RooFit toolkit for data modeling | in Proceedings of the 13th International Conference for Computing in High-Energy and Nuclear Physics (CHEP03), 2003 [eConf C0303241, MOLT007] |
physics/0306116 |
| 3 | ATLAS and CMS Collaborations, and LHC Higgs Combination Group | Procedure for the LHC Higgs boson search combination in Summer 2011 | Technical Report CMS-NOTE-2011-005, ATL-PHYS-PUB-2011-11, 2011 | |
| 4 | CMS Collaboration | Combined results of searches for the standard model Higgs boson in pp collisions at $ \sqrt{s}= $ 7 TeV | PLB 710 (2012) 26 | CMS-HIG-11-032 1202.1488 |
| 5 | CMS Collaboration | Observation of a new boson at a mass of 125 GeV with the CMS experiment at the LHC | PLB 716 (2012) 30 | CMS-HIG-12-028 1207.7235 |
| 6 | CMS Collaboration | Observation of a new boson with mass near 125 GeV in pp collisions at $ \sqrt{s} = $ 7 and 8 TeV | JHEP 06 (2013) 081 | CMS-HIG-12-036 1303.4571 |
| 7 | CMS Collaboration | Combined measurements of Higgs boson couplings in proton-proton collisions at $ \sqrt{s}= $ 13 TeV | EPJC 79 (2019) 421 | CMS-HIG-17-031 1809.10733 |
| 8 | CMS Collaboration | Combined searches for the production of supersymmetric top quark partners in proton-proton collisions at $ \sqrt{s} = $ 13 TeV | EPJC 81 (2021) 970 | CMS-SUS-20-002 2107.10892 |
| 9 | CMS Collaboration | Measurement of the top quark pole mass using $ \textrm{t}\overline{\textrm{t}} $+jet events in the dilepton final state in proton-proton collisions at $ \sqrt{s} $ = 13 TeV | JHEP 07 (2023) 077 | CMS-TOP-21-008 2207.02270 |
| 10 | ATLAS and CMS Collaborations | Combined measurement of the Higgs boson mass in $ pp $ collisions at $ \sqrt{s}= $ 7 and 8 TeV with the ATLAS and CMS experiments | PRL 114 (2015) 191803 | 1503.07589 |
| 11 | ATLAS and CMS Collaborations | Measurements of the Higgs boson production and decay rates and constraints on its couplings from a combined ATLAS and CMS analysis of the LHC $ pp $ collision data at $ \sqrt{s} $ = 7 and 8 TeV | JHEP 08 (2016) 45 | 1606.02266 |
| 12 | CMS Collaboration | Combine | HiggsAnalysis-CombinedLimit package, 2004 github |
|
| 13 | D. Piparo, V. Innocente, and T. Hauth | Speeding up HEP experiment software with a library of fast and auto-vectorisable mathematical functions | J. Phys. Conf. Ser 513 (2014) 052027 | |
| 14 | M. Galassi et al. | GNU Scientific Library Reference Manual | 3rd edition, ISBN~978-0-9546120-7-8, 2009 | |
| 15 | B. Jacob, G. Guennebaud | Eigen | 2024 link |
|
| 16 | The Boost C++ community | Boost C++ libraries | link | |
| 17 | Free Software Foundation | GNU Gzip | link | |
| 18 | D. Merkel | Docker: Lightweight Linux containers for consistent development and deployment | Linux J. 2014 (2014) | |
| 19 | F. E. James | Statistical methods in experimental physics | World Scientific, Singapore, 2nd edition, ISBN~978-981-270-527-3, 2006 link |
|
| 20 | Particle Data Group , R. L. Workman et al. | Review of particle physics | Prog. Theor. Exp. Phys. 2022 (2022) 083C01 | |
| 21 | CMS Collaboration | Observation of Higgs boson decay to bottom quarks | PRL 121 (2018) 121801 | CMS-HIG-18-016 1808.08242 |
| 22 | CMS Collaboration | Observation of four top quark production in proton-proton collisions at $ \sqrt{s}= $ 13 TeV | PLB 847 (2023) 138290 | CMS-TOP-22-013 2305.13439 |
| 23 | CMS Collaboration | Search for the standard model Higgs boson decaying to $ \mathrm{W}^{+}\mathrm{W}^{-} $ in the fully leptonic final state in pp collisions at $ \sqrt{s}= $ 7 TeV | PLB 710 (2012) 91 | CMS-HIG-11-024 1202.1489 |
| 24 | K. Cranmer | Practical statistics for the LHC | in Proc. 2011 European School of High-Energy Physics, 2014 link |
1503.07622 |
| 25 | R. Barlow and C. Beeston | Fitting using finite Monte Carlo samples | Comput. Phys. Commun. 77 (1993) 219 | |
| 26 | J. S. Conway | Incorporating nuisance parameters in likelihoods for multisource spectra | in PHYSTAT : Workshop on statistical issues related to discovery claims in search experiments and unfolding, 2011 link |
1103.0354 |
| 27 | CMS Collaboration | Measurements of production cross sections of the Higgs boson in the four-lepton final state in proton-proton collisions at $ \sqrt{s} = $ 13 TeV | EPJC 81 (2021) 488 | CMS-HIG-19-001 2103.04956 |
| 28 | CMS Collaboration | Evidence for Higgs boson decay to a pair of muons | JHEP 01 (2021) 148 | CMS-HIG-19-006 2009.04363 |
| 29 | R. Barlow | Asymmetric errors | in PHYSTAT : Statistical problems in particle physics, astrophysics, and cosmology, [eConf C030908, WEMT002], 2003 | physics/0401042 |
| 30 | CDF Collaboration | A measurement of $ \sigma B (\mathrm{W} \to \mathrm{e} \nu) $ and $ \sigma B (\mathrm{Z^0} \to \mathrm{e}^+ \mathrm{e}^-) $ in $ \overline{\mathrm{p}}\mathrm{p} $ collisions at $ \sqrt{s} = $ 1800 GeV | PRD 44 (1991) 29 | |
| 31 | CMS Collaboration | Measurement of the inclusive and differential Higgs boson production cross sections in the decay mode to a pair of $ \tau $ leptons in pp collisions at $ \sqrt{s} = $ 13 TeV | PRL 128 (2022) 081805 | CMS-HIG-20-015 2107.11486 |
| 32 | P. D. Dauncey, M. Kenzie, N. Wardle, and G. J. Davies | Handling uncertainties in background shapes: the discrete profiling method | JINST 10 (2015) P04015 | 1408.6865 |
| 33 | F. James and M. Roos | Minuit: A system for function minimization and analysis of the parameter errors and correlations | Comput. Phys. Commun. 10 (1975) 343 | |
| 34 | G. Cowan, K. Cranmer, E. Gross, and O. Vitells | Asymptotic formulae for likelihood-based tests of new physics | EPJC 71 (2011) 1554 | 1007.1727 |
| 35 | C. Langenbruch | Parameter uncertainties in weighted unbinned maximum likelihood fits | EPJC 82 (2022) 393 | 1911.01303 |
| 36 | B. Efron | Bootstrap methods: Another look at the jackknife | See ``Remark K'', 1979 Ann. Statist. 7 (1979) 1 |
|
| 37 | S. M. S. Lee and G. A. Young | Parametric bootstrapping with nuisance parameters | Stat. Probab. Lett. 71 (2005) 143 | |
| 38 | G. J. Feldman and R. D. Cousins | Unified approach to the classical statistical analysis of small signals | PRD 57 (1998) 3873 | physics/9711021 |
| 39 | LEP Working Group for Higgs boson searches, ALEPH, DELPHI, L3 and OPAL Collaborations | Search for the standard model Higgs boson at LEP | PLB 565 (2003) 61 | hep-ex/0306033 |
| 40 | CMS Collaboration | Constraints on the spin-parity and anomalous HVV couplings of the Higgs boson in proton collisions at 7 and 8 TeV | PRD 92 (2015) 012004 | CMS-HIG-14-018 1411.3441 |
| 41 | J. O. Berger, B. Liseo, and R. L. Wolpert | Integrated likelihood methods for eliminating nuisance parameters | Stat. Scien. 14 (1999) 1 | |
| 42 | R. D. Cousins and V. L. Highland | Incorporating systematic uncertainties into an upper limit | NIM A 320 (1992) 331 | |
| 43 | CMS Collaboration | Search for the lepton flavor violating $ \tau \to $ 3$ \mu $ decay in proton-proton collisions at $ \sqrt{s} $ = 13 TeV | Submitted to Phys. Lett. B, 2023 | CMS-BPH-21-005 2312.02371 |
| 44 | T. Junk | Confidence level computation for combining searches with small statistics | NIM A 434 (1999) 435 | hep-ex/9902006 |
| 45 | A. L. Read | Presentation of search results: The CL$ _{\text{s}} $ technique | JPG 28 (2002) 2693 | |
| 46 | CMS Collaboration | Measurement of the properties of a Higgs boson in the four-lepton final state | PRD 89 (2014) 092007 | CMS-HIG-13-002 1312.5353 |
| 47 | H. Jeffreys | Theory of Probability | Oxford University Press, Oxford, 3rd edition, ISBN~978003682, 1961 | |
| 48 | L. Moneta et al. | The RooStats project | in 13th International Workshop on Advanced Computing and Analysis Techniques in Physics Research (ACAT). SISSA, 2010 link |
1009.1003 |
| 49 | CMS Collaboration | A portrait of the Higgs boson by the CMS experiment ten years after the discovery | Nature 607 (2022) 60 | CMS-HIG-22-001 2207.00043 |
| 50 | S. S. Wilks | The large-sample distribution of the likelihood ratio for testing composite hypotheses | Ann. Math. Statist. 9 (1938) 60 | |
| 51 | A. Wald | Tests of statistical hypotheses concerning several parameters when the number of observations is large | Trans. Amer. Math. Soc. 54 (1943) 426 | |
| 52 | R. F. Engle | Chapter 13: Wald, likelihood ratio, and Lagrange multiplier tests in econometrics | in Handbook of Econometrics, volume 2, Elsevier, 1984 link |
|
| 53 | R. D. Cousins | Lectures on statistics in theory: Prelude to statistics in practice | 1807.05996 | |
| 54 | A. N. Kolmogorov | Sulla determinazione empirica di una legge di distribuzione | Giorn. Ist. Ital. Attuari 4 (1933) 83 | |
| 55 | N. Smirnov | Table for estimating the goodness of fit of empirical distributions | Ann. Math. Statist. 19 (1948) 279 | |
| 56 | T. W. Anderson and D. A. Darling | Asymptotic theory of certain `goodness of fit' criteria based on stochastic processes | Ann. Math. Statist. 23 (1952) 193 | |
| 57 | M. A. Stephens | EDF statistics for goodness of fit and some comparisons | J. Am. Stat. Assoc. 69 (1974) 730 | |
| 58 | ATLAS Collaboration | Search for the $ b\bar{b} $ decay of the standard model Higgs boson in associated $ (W/Z)H $ production with the ATLAS detector | JHEP 01 (2015) 069 | 1409.6212 |
|
|
Compact Muon Solenoid LHC, CERN |
|

|

|

|

|

|