

Compact Muon Solenoid
LHC, CERN
| CMS-HIG-19-001 ; CERN-EP-2021-016 | ||
| Measurements of production cross sections of the Higgs boson in the four-lepton final state in proton-proton collisions at $\sqrt{s} = $ 13 TeV | ||
| CMS Collaboration | ||
| 8 March 2021 | ||
| Eur. Phys. J. C 81 (2021) 488 | ||
| Abstract: Production cross sections of the Higgs boson are measured in the $\mathrm{H}\to\mathrm{Z}\mathrm{Z}\to4\ell$ ($\ell = $ e, $\mu$) decay channel. A data sample of proton-proton collisions at a center-of-mass energy of 13 TeV, collected by the CMS detector at the LHC and corresponding to an integrated luminosity of 137 fb$^{-1}$ is used. The signal strength modifier $\mu$, defined as the ratio of the Higgs boson production rate in the 4$\ell$ channel to the standard model (SM) expectation, is measured to be $\mu=$ 0.94 $\pm$ 0.07 (stat) $^{+0.09}_{-0.08}$ (syst) at a fixed value of $m_{\mathrm{H}} = $ 125.38 GeV. The signal strength modifiers for the individual Higgs boson production modes are also reported. The inclusive fiducial cross section for the $\mathrm{H}\to4\ell$ process is measured to be 2.84 $^{+0.23}_{-0.22}$ (stat) $^{+0.26}_{-0.21}$ (syst) fb, which is compatible with the SM prediction of 2.84 $\pm$ 0.15 fb for the same fiducial region. Differential cross sections as a function of the transverse momentum and rapidity of the Higgs boson, the number of associated jets, and the transverse momentum of the leading associated jet are measured. A new set of cross section measurements in mutually exclusive categories targeted to identify production mechanisms and kinematical features of the events is presented. The results are in agreement with the SM predictions. | ||
| Links: e-print arXiv:2103.04956 [hep-ex] (PDF) ; CDS record ; inSPIRE record ; HepData record ; CADI line (restricted) ; | ||
| Figures | |
png pdf |
Figure 1:
Binning of the gluon fusion production process, the electroweak production process (combines VBF and VH with hadronic V decay), the VH production process with leptonic V decay (combining WH, ZH, and gluon fusion ZH production), and the $ {{\mathrm{t} {}\mathrm{\bar{t}}} \mathrm{H}}$ production process in the merged stage 1.2 of the STXS framework used in the $ {\mathrm{H} \to \mathrm{Z} \mathrm{Z} \to 4\ell}$ analysis. |
png pdf |
Figure 2:
The shape of the parametric signal model for each year of simulated data, and for the sum of all years together. The black points represent weighted simulation events of the ggH production mechanism for $ {m_{\mathrm{H}}} = $ 125 GeV and the blue line the corresponding model. Also shown is the $\sigma _{\text {CB}}$ value (half the width of the narrowest interval containing 68% of the invariant mass distribution) in the gray shaded area. The contribution of the signal model from each year of data-taking is illustrated with the dotted lines. The models are shown for the 4e (left) and 4$\mu $ (right) final states in the untagged event category. |
png pdf |
Figure 2-a:
The shape of the parametric signal model for each year of simulated data, and for the sum of all years together. The black points represent weighted simulation events of the ggH production mechanism for $ {m_{\mathrm{H}}} = $ 125 GeV and the blue line the corresponding model. Also shown is the $\sigma _{\text {CB}}$ value (half the width of the narrowest interval containing 68% of the invariant mass distribution) in the gray shaded area. The contribution of the signal model from each year of data-taking is illustrated with the dotted lines. The models are shown for the 4e final state in the untagged event category. |
png pdf |
Figure 2-b:
The shape of the parametric signal model for each year of simulated data, and for the sum of all years together. The black points represent weighted simulation events of the ggH production mechanism for $ {m_{\mathrm{H}}} = $ 125 GeV and the blue line the corresponding model. Also shown is the $\sigma _{\text {CB}}$ value (half the width of the narrowest interval containing 68% of the invariant mass distribution) in the gray shaded area. The contribution of the signal model from each year of data-taking is illustrated with the dotted lines. The models are shown for the 4$\mu $ final state in the untagged event category. |
png pdf |
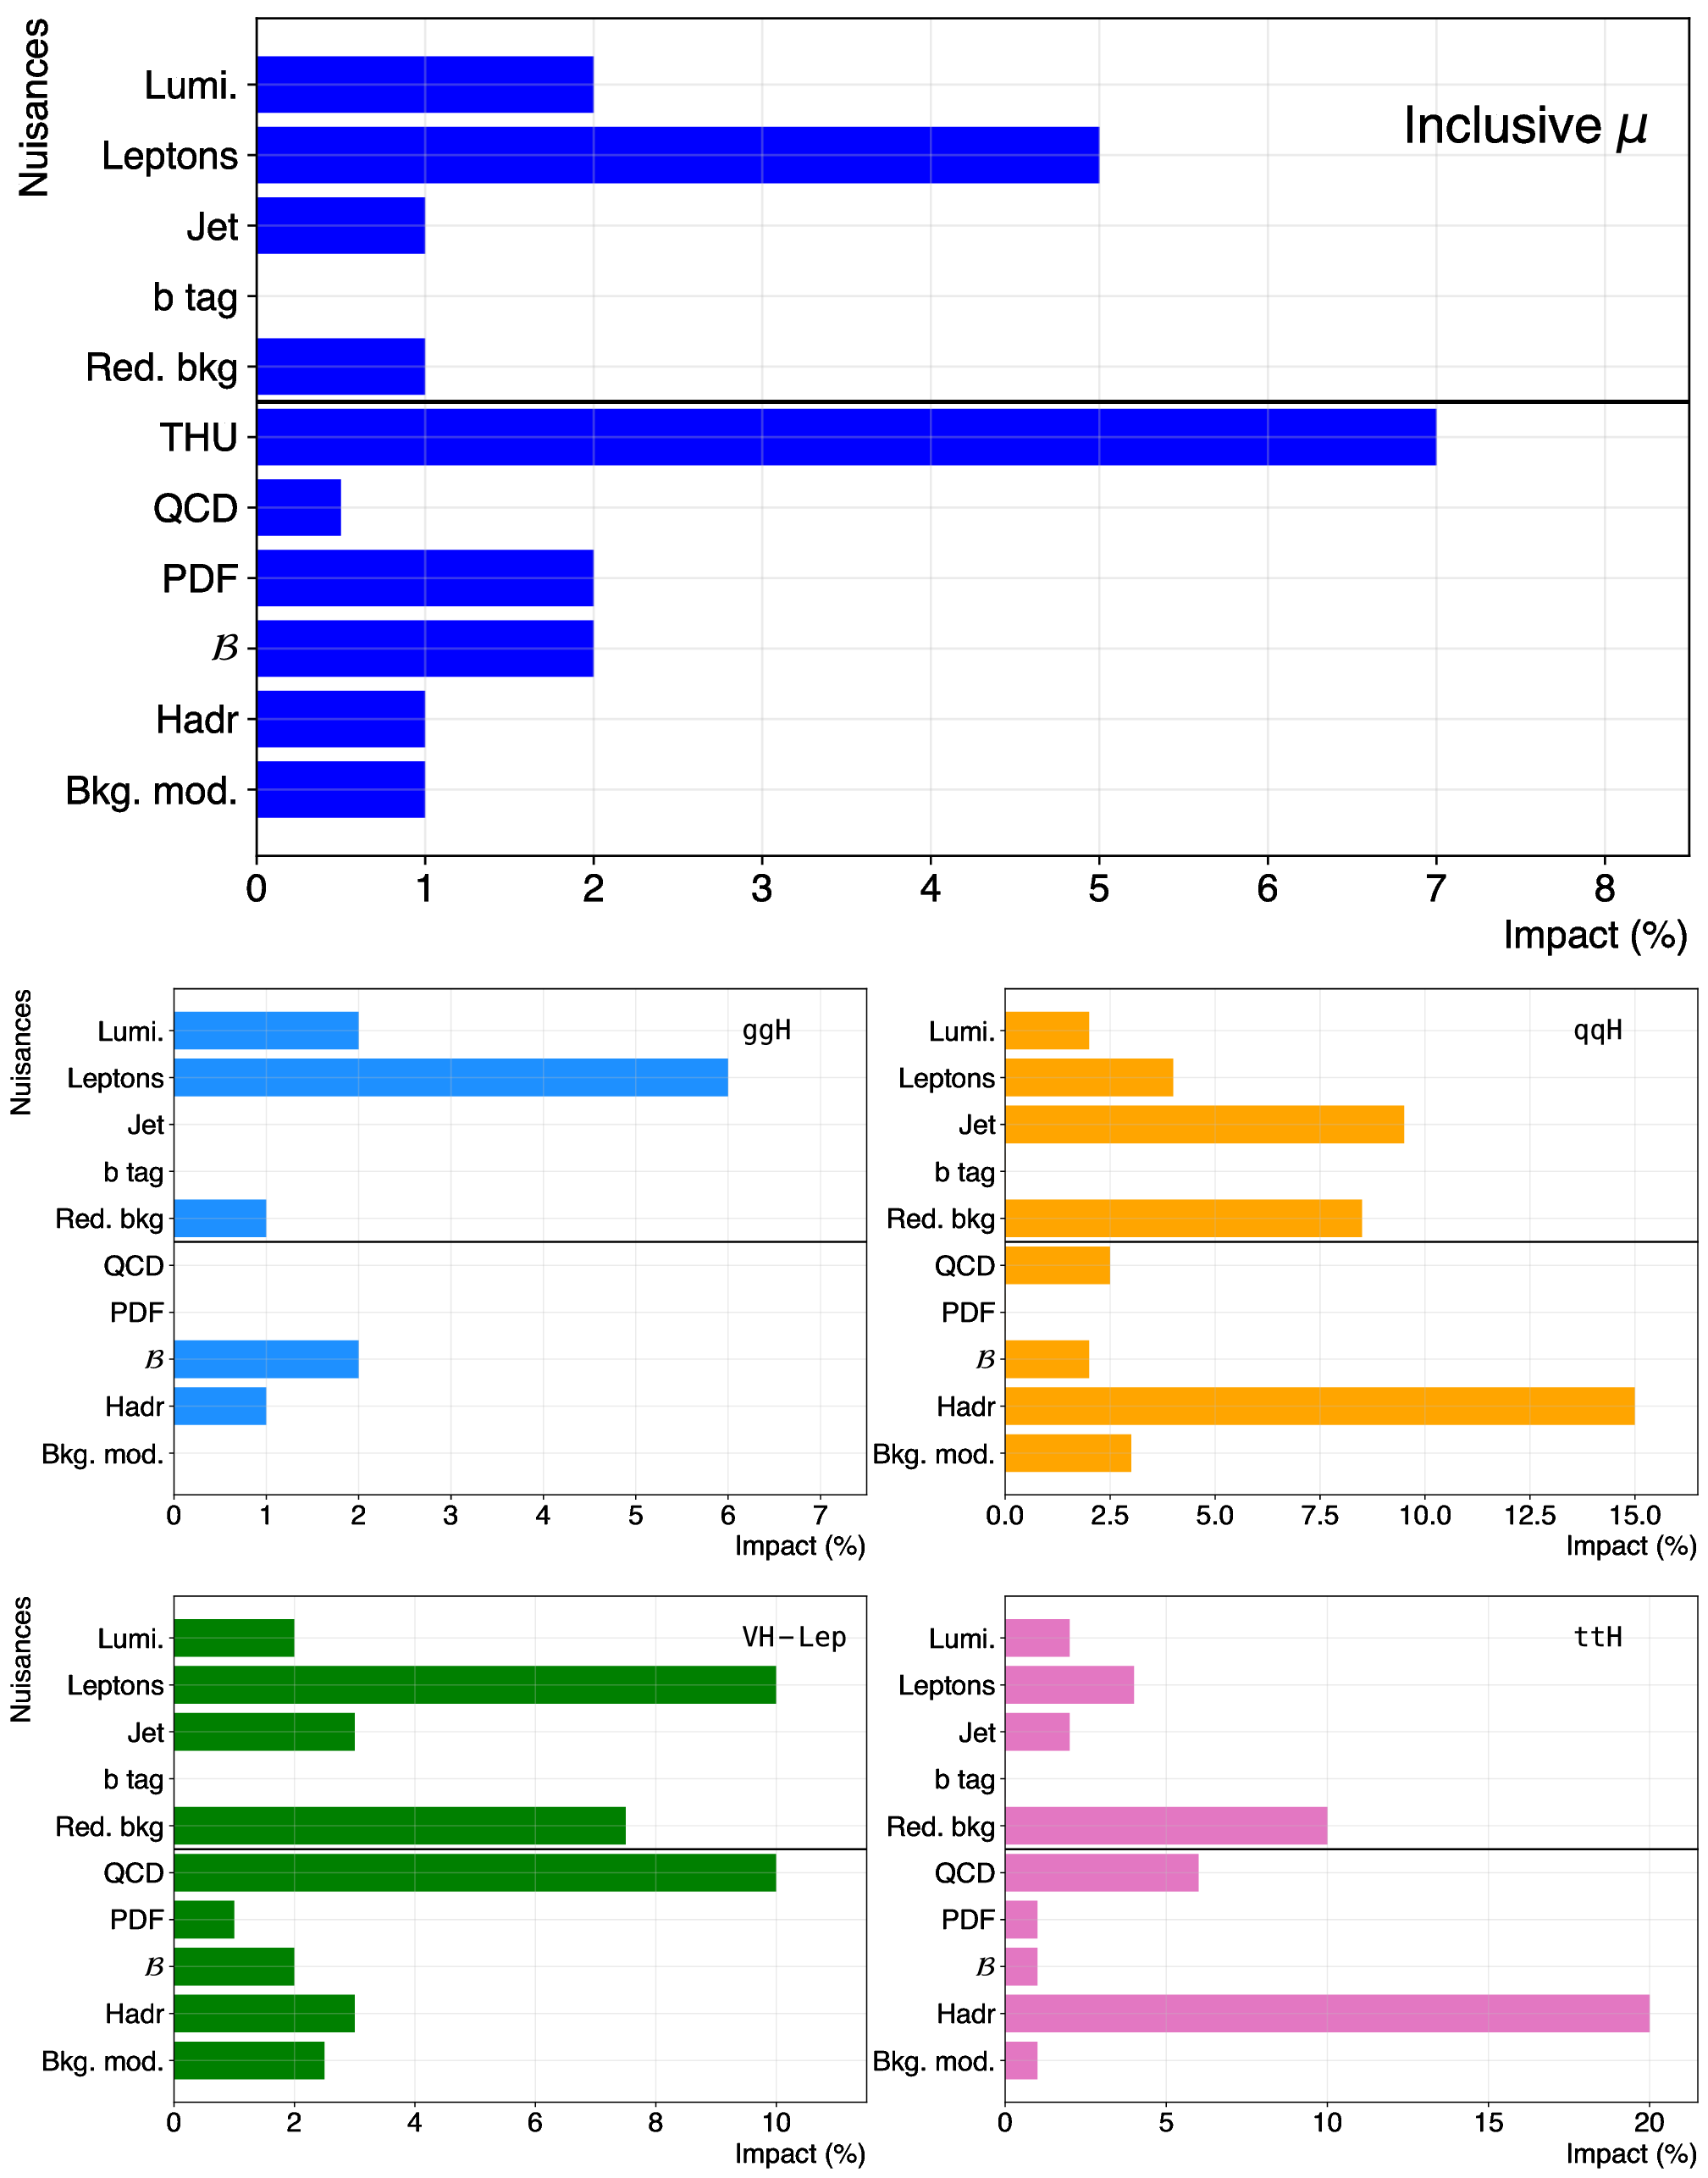
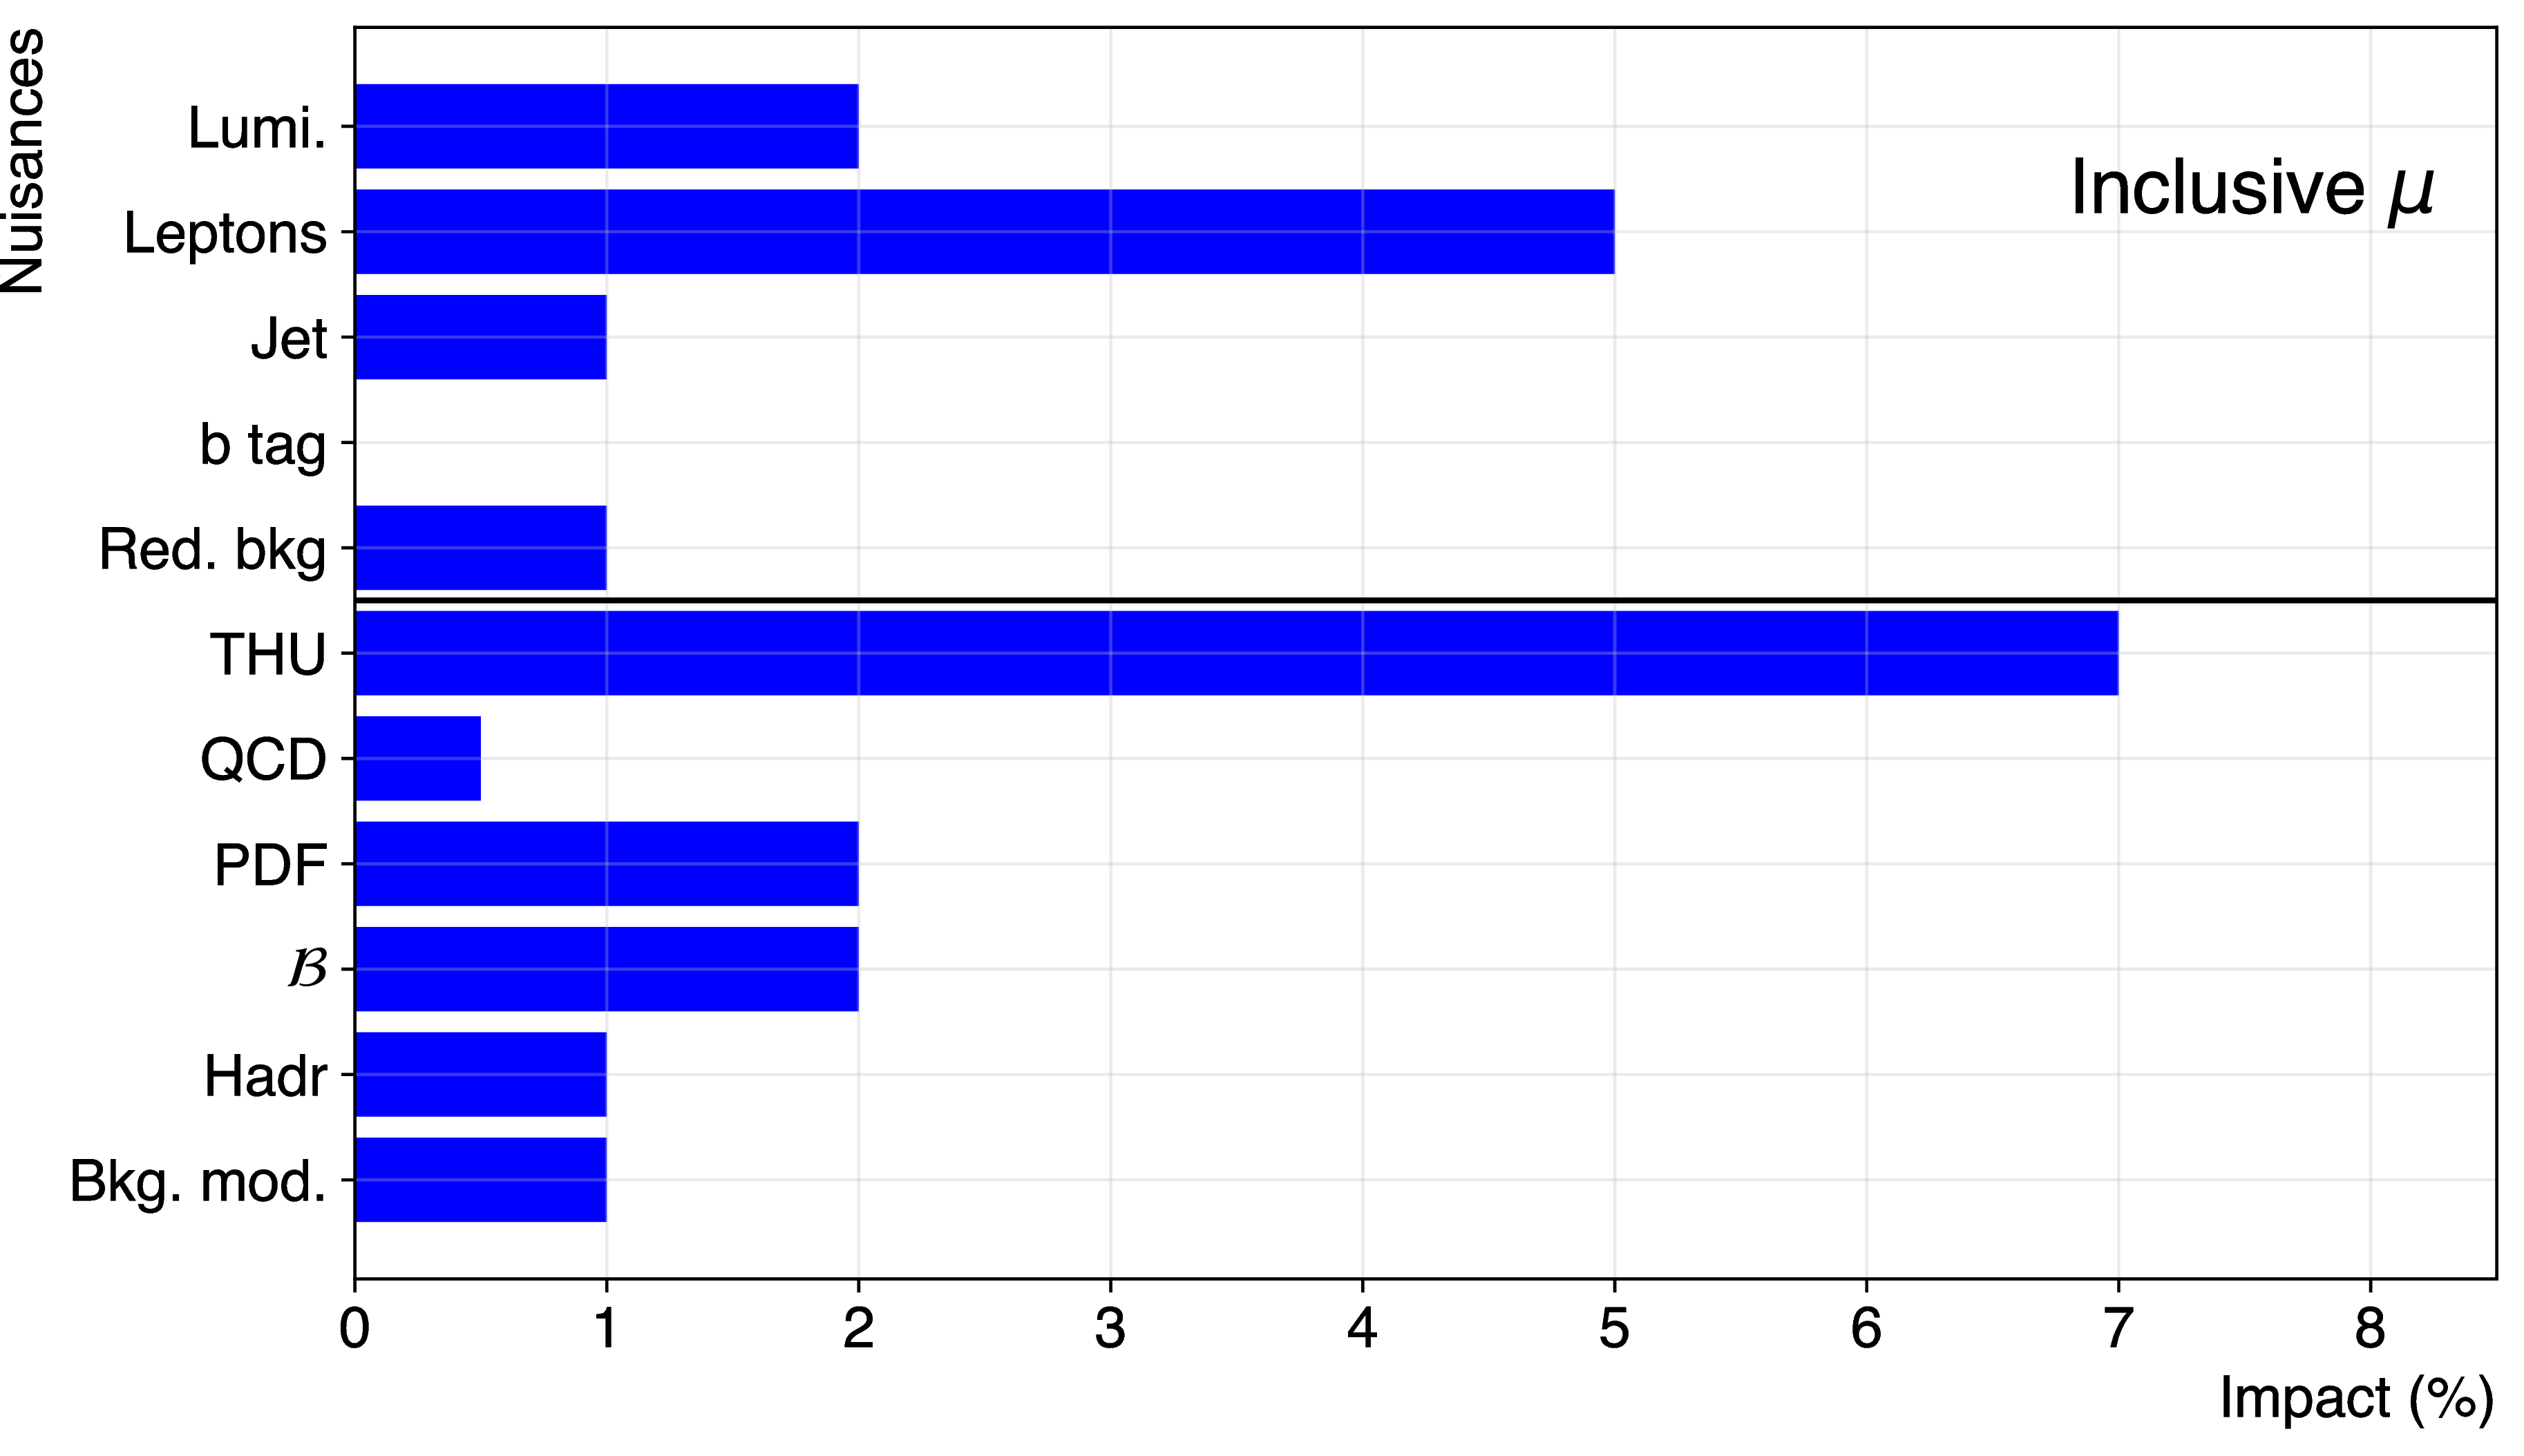
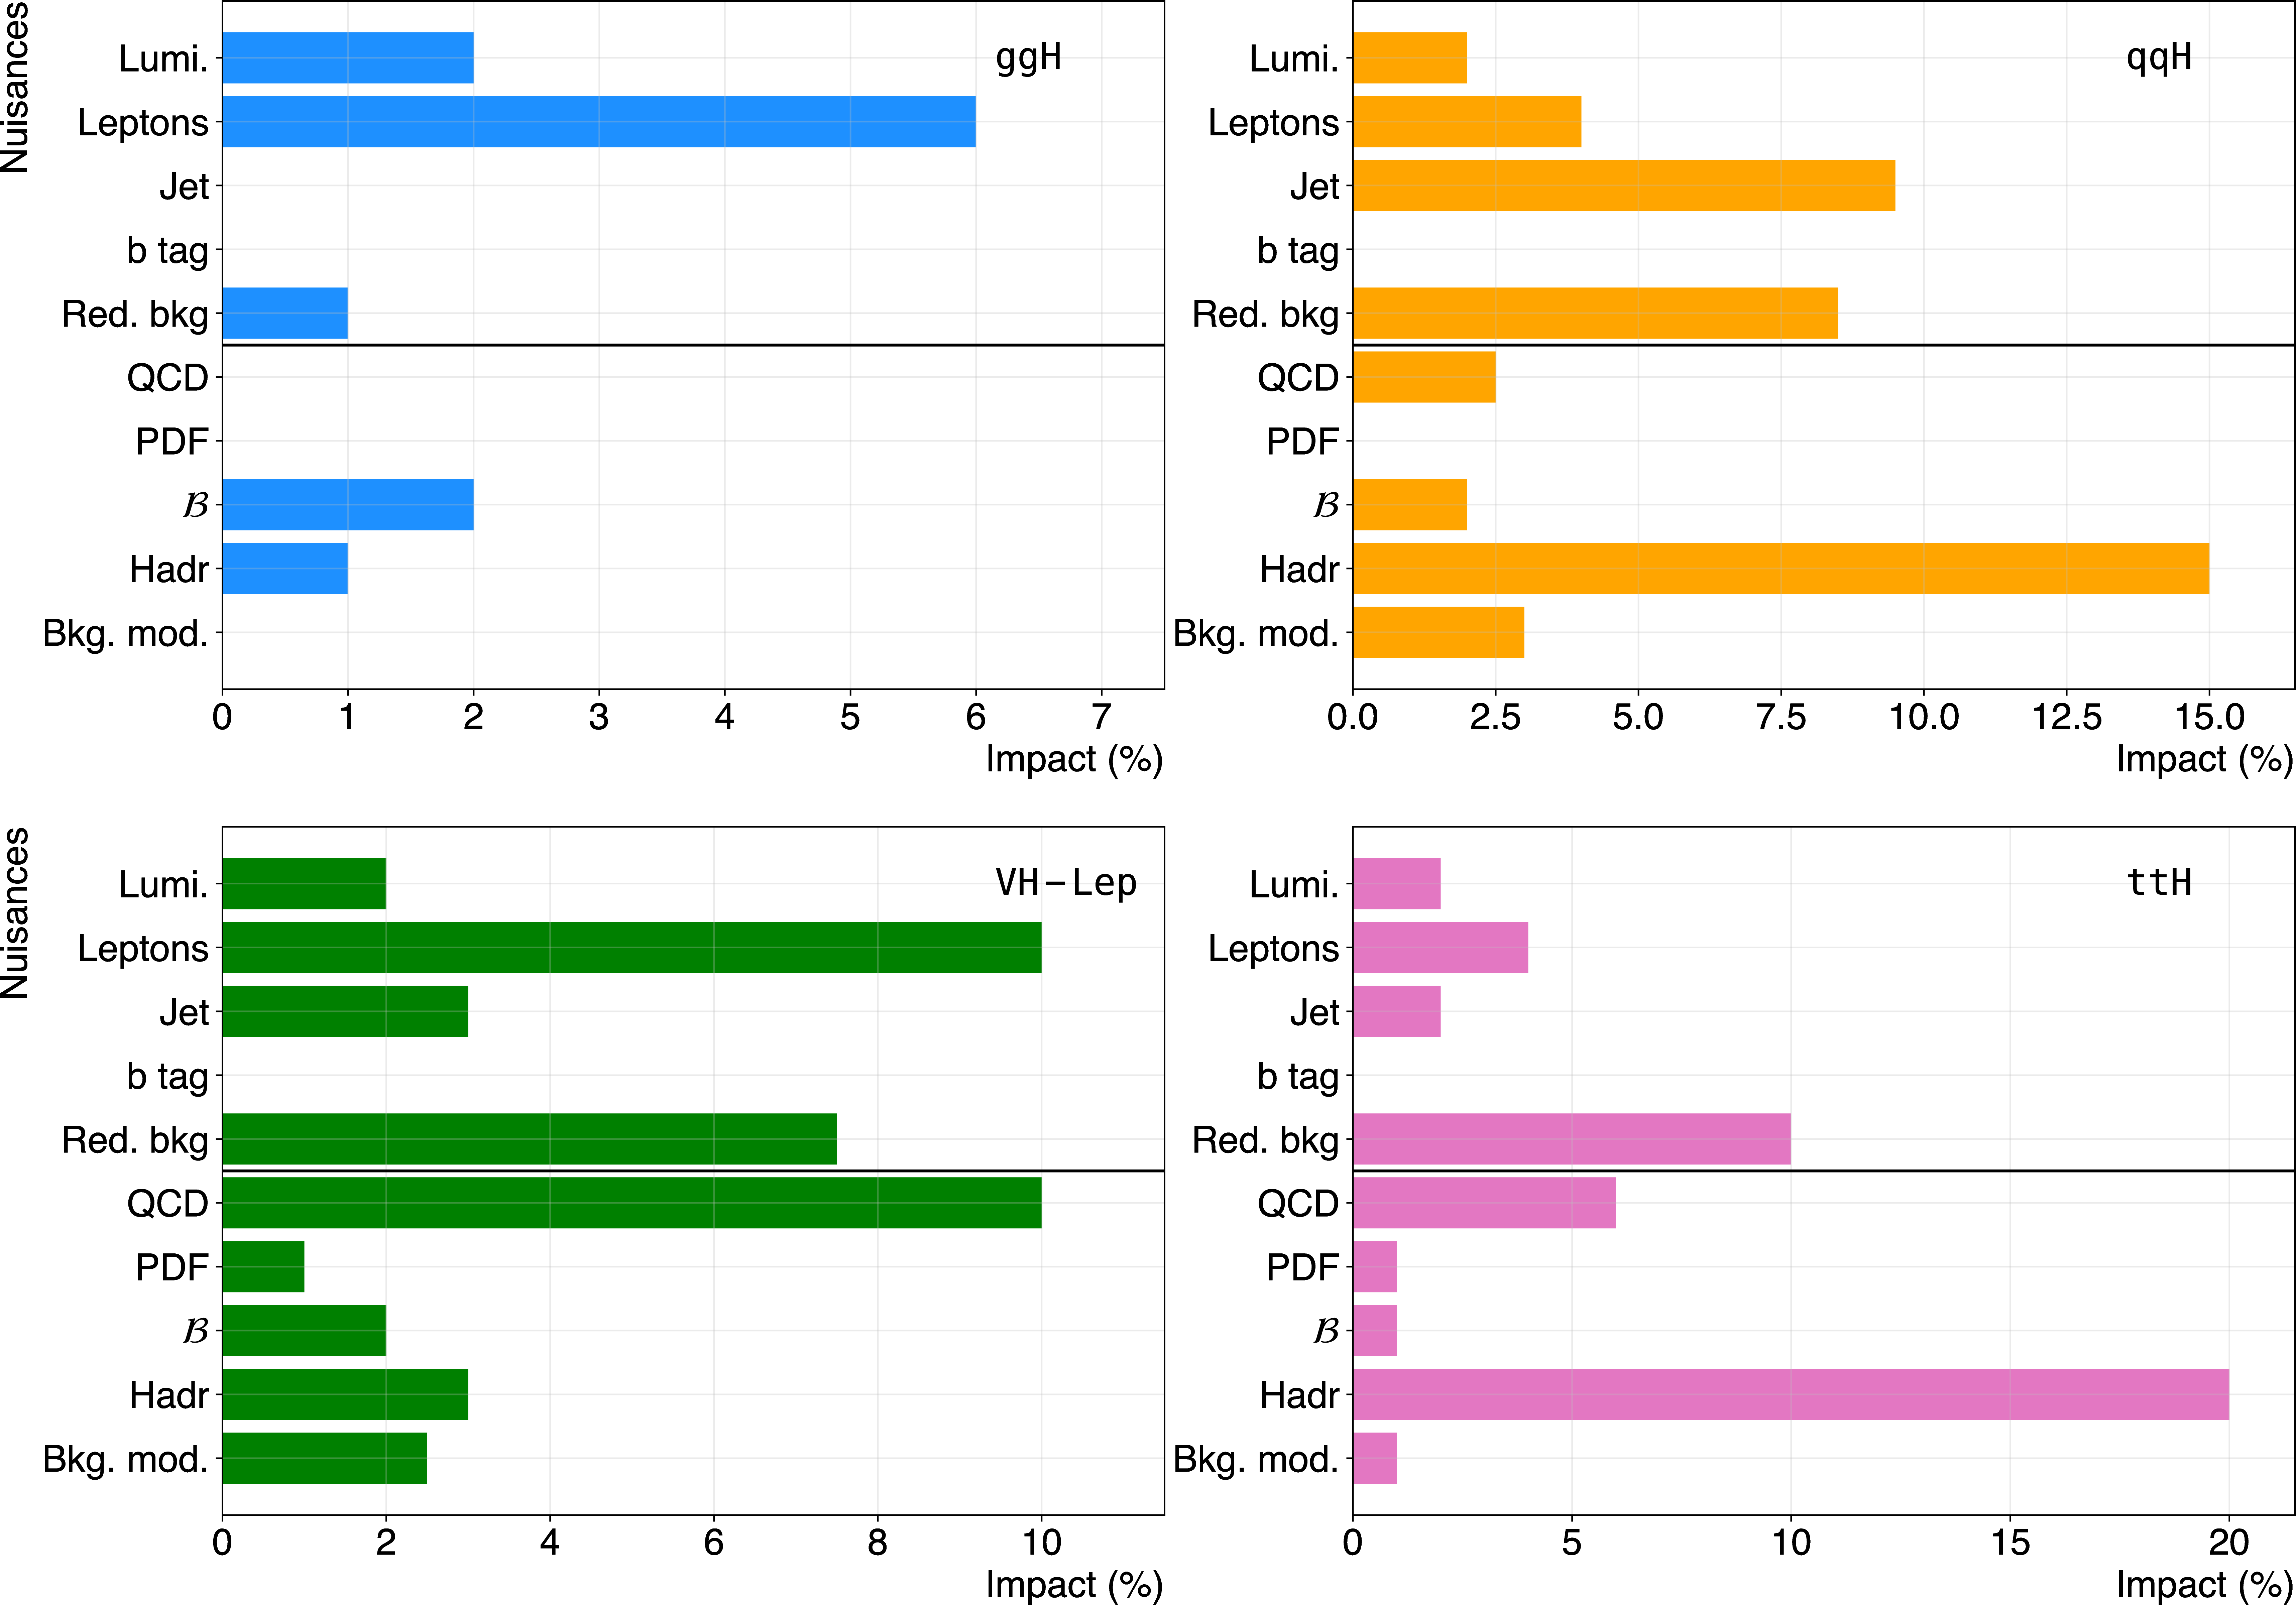
Figure 3:
The impact of the dominant systematic uncertainties (in percent) on the inclusive signal strength $\mu $ and stage 0 production mode cross section described in Section 10. Impacts from different NPs are combined assuming no correlation. Only dominant experimental sources are presented: integrated luminosity uncertainty (Lumi.), lepton reconstruction and selection efficiency, scale and resolution (Leptons), jet energy scale and resolution (Jet), b-tagging efficiency (B-tag), and reducible background estimation uncertainty (Red. bkg). Only dominant theoretical sources are presented: ggH, VBF, and VH cross section theoretical uncertainty scheme (THU), renormalization and factorization scale (QCD), choice of the PDF set (PDF), the branching fraction of $ {\mathrm{H} \to 4\ell}$ ($\mathcal {B}$), modeling of hadronization and the underlying event (Hadr), and background modeling (Bkg. mod.). The THU uncertainty is not considered in the stage 0 cross section measurements. The uncertainties are rounded to the nearest 0.5%. |
png pdf |
Figure 3-a:
The impact of the dominant systematic uncertainties (in percent) on the inclusive signal strength $\mu $ and stage 0 production mode cross section described in Section 10. Impacts from different NPs are combined assuming no correlation. Only dominant experimental sources are presented: integrated luminosity uncertainty (Lumi.), lepton reconstruction and selection efficiency, scale and resolution (Leptons), jet energy scale and resolution (Jet), b-tagging efficiency (B-tag), and reducible background estimation uncertainty (Red. bkg). Only dominant theoretical sources are presented: ggH, VBF, and VH cross section theoretical uncertainty scheme (THU), renormalization and factorization scale (QCD), choice of the PDF set (PDF), the branching fraction of $ {\mathrm{H} \to 4\ell}$ ($\mathcal {B}$), modeling of hadronization and the underlying event (Hadr), and background modeling (Bkg. mod.). The THU uncertainty is not considered in the stage 0 cross section measurements. The uncertainties are rounded to the nearest 0.5%. |
png pdf |
Figure 3-b:
The impact of the dominant systematic uncertainties (in percent) on the inclusive signal strength $\mu $ and stage 0 production mode cross section described in Section 10. Impacts from different NPs are combined assuming no correlation. Only dominant experimental sources are presented: integrated luminosity uncertainty (Lumi.), lepton reconstruction and selection efficiency, scale and resolution (Leptons), jet energy scale and resolution (Jet), b-tagging efficiency (B-tag), and reducible background estimation uncertainty (Red. bkg). Only dominant theoretical sources are presented: ggH, VBF, and VH cross section theoretical uncertainty scheme (THU), renormalization and factorization scale (QCD), choice of the PDF set (PDF), the branching fraction of $ {\mathrm{H} \to 4\ell}$ ($\mathcal {B}$), modeling of hadronization and the underlying event (Hadr), and background modeling (Bkg. mod.). The THU uncertainty is not considered in the stage 0 cross section measurements. The uncertainties are rounded to the nearest 0.5%. |
png pdf |
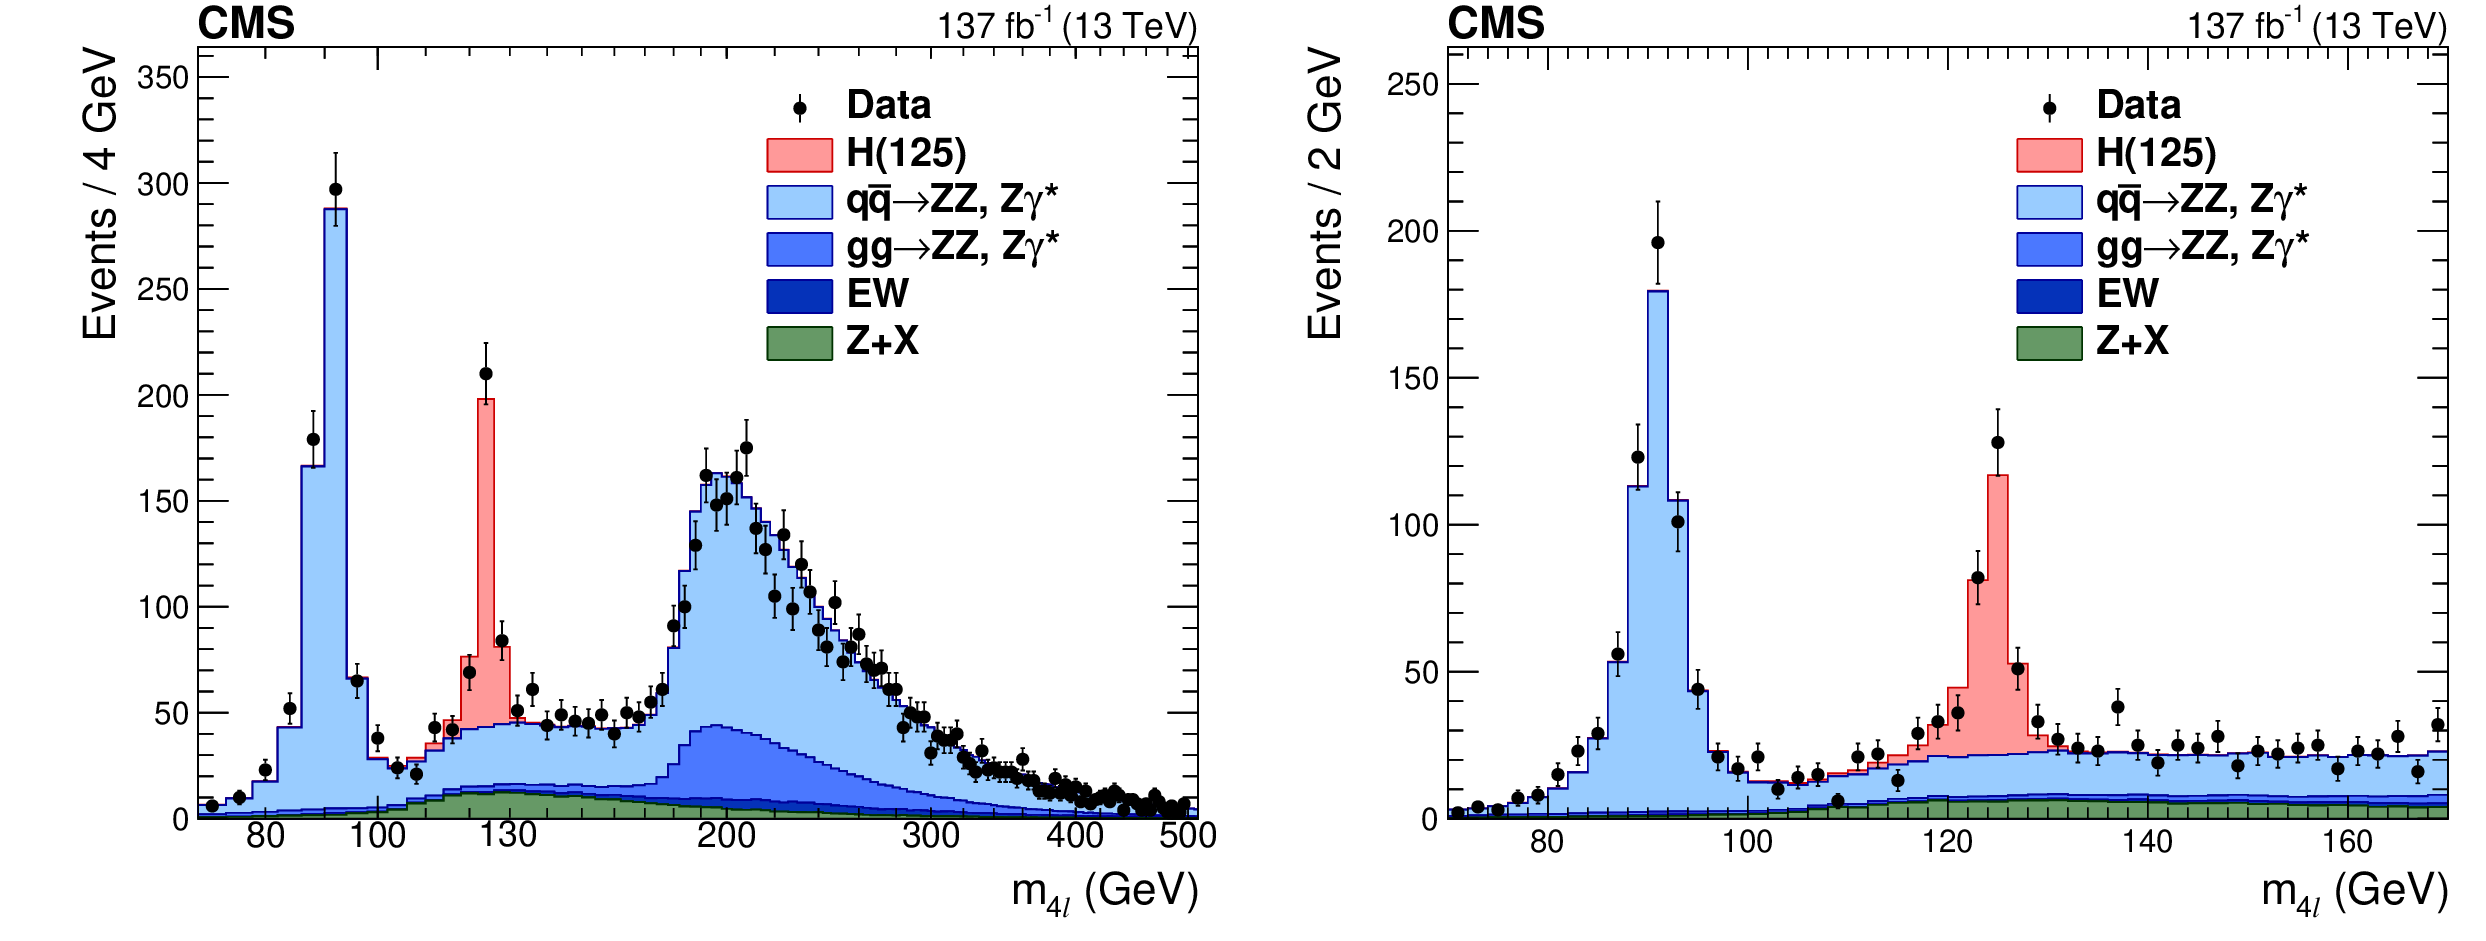
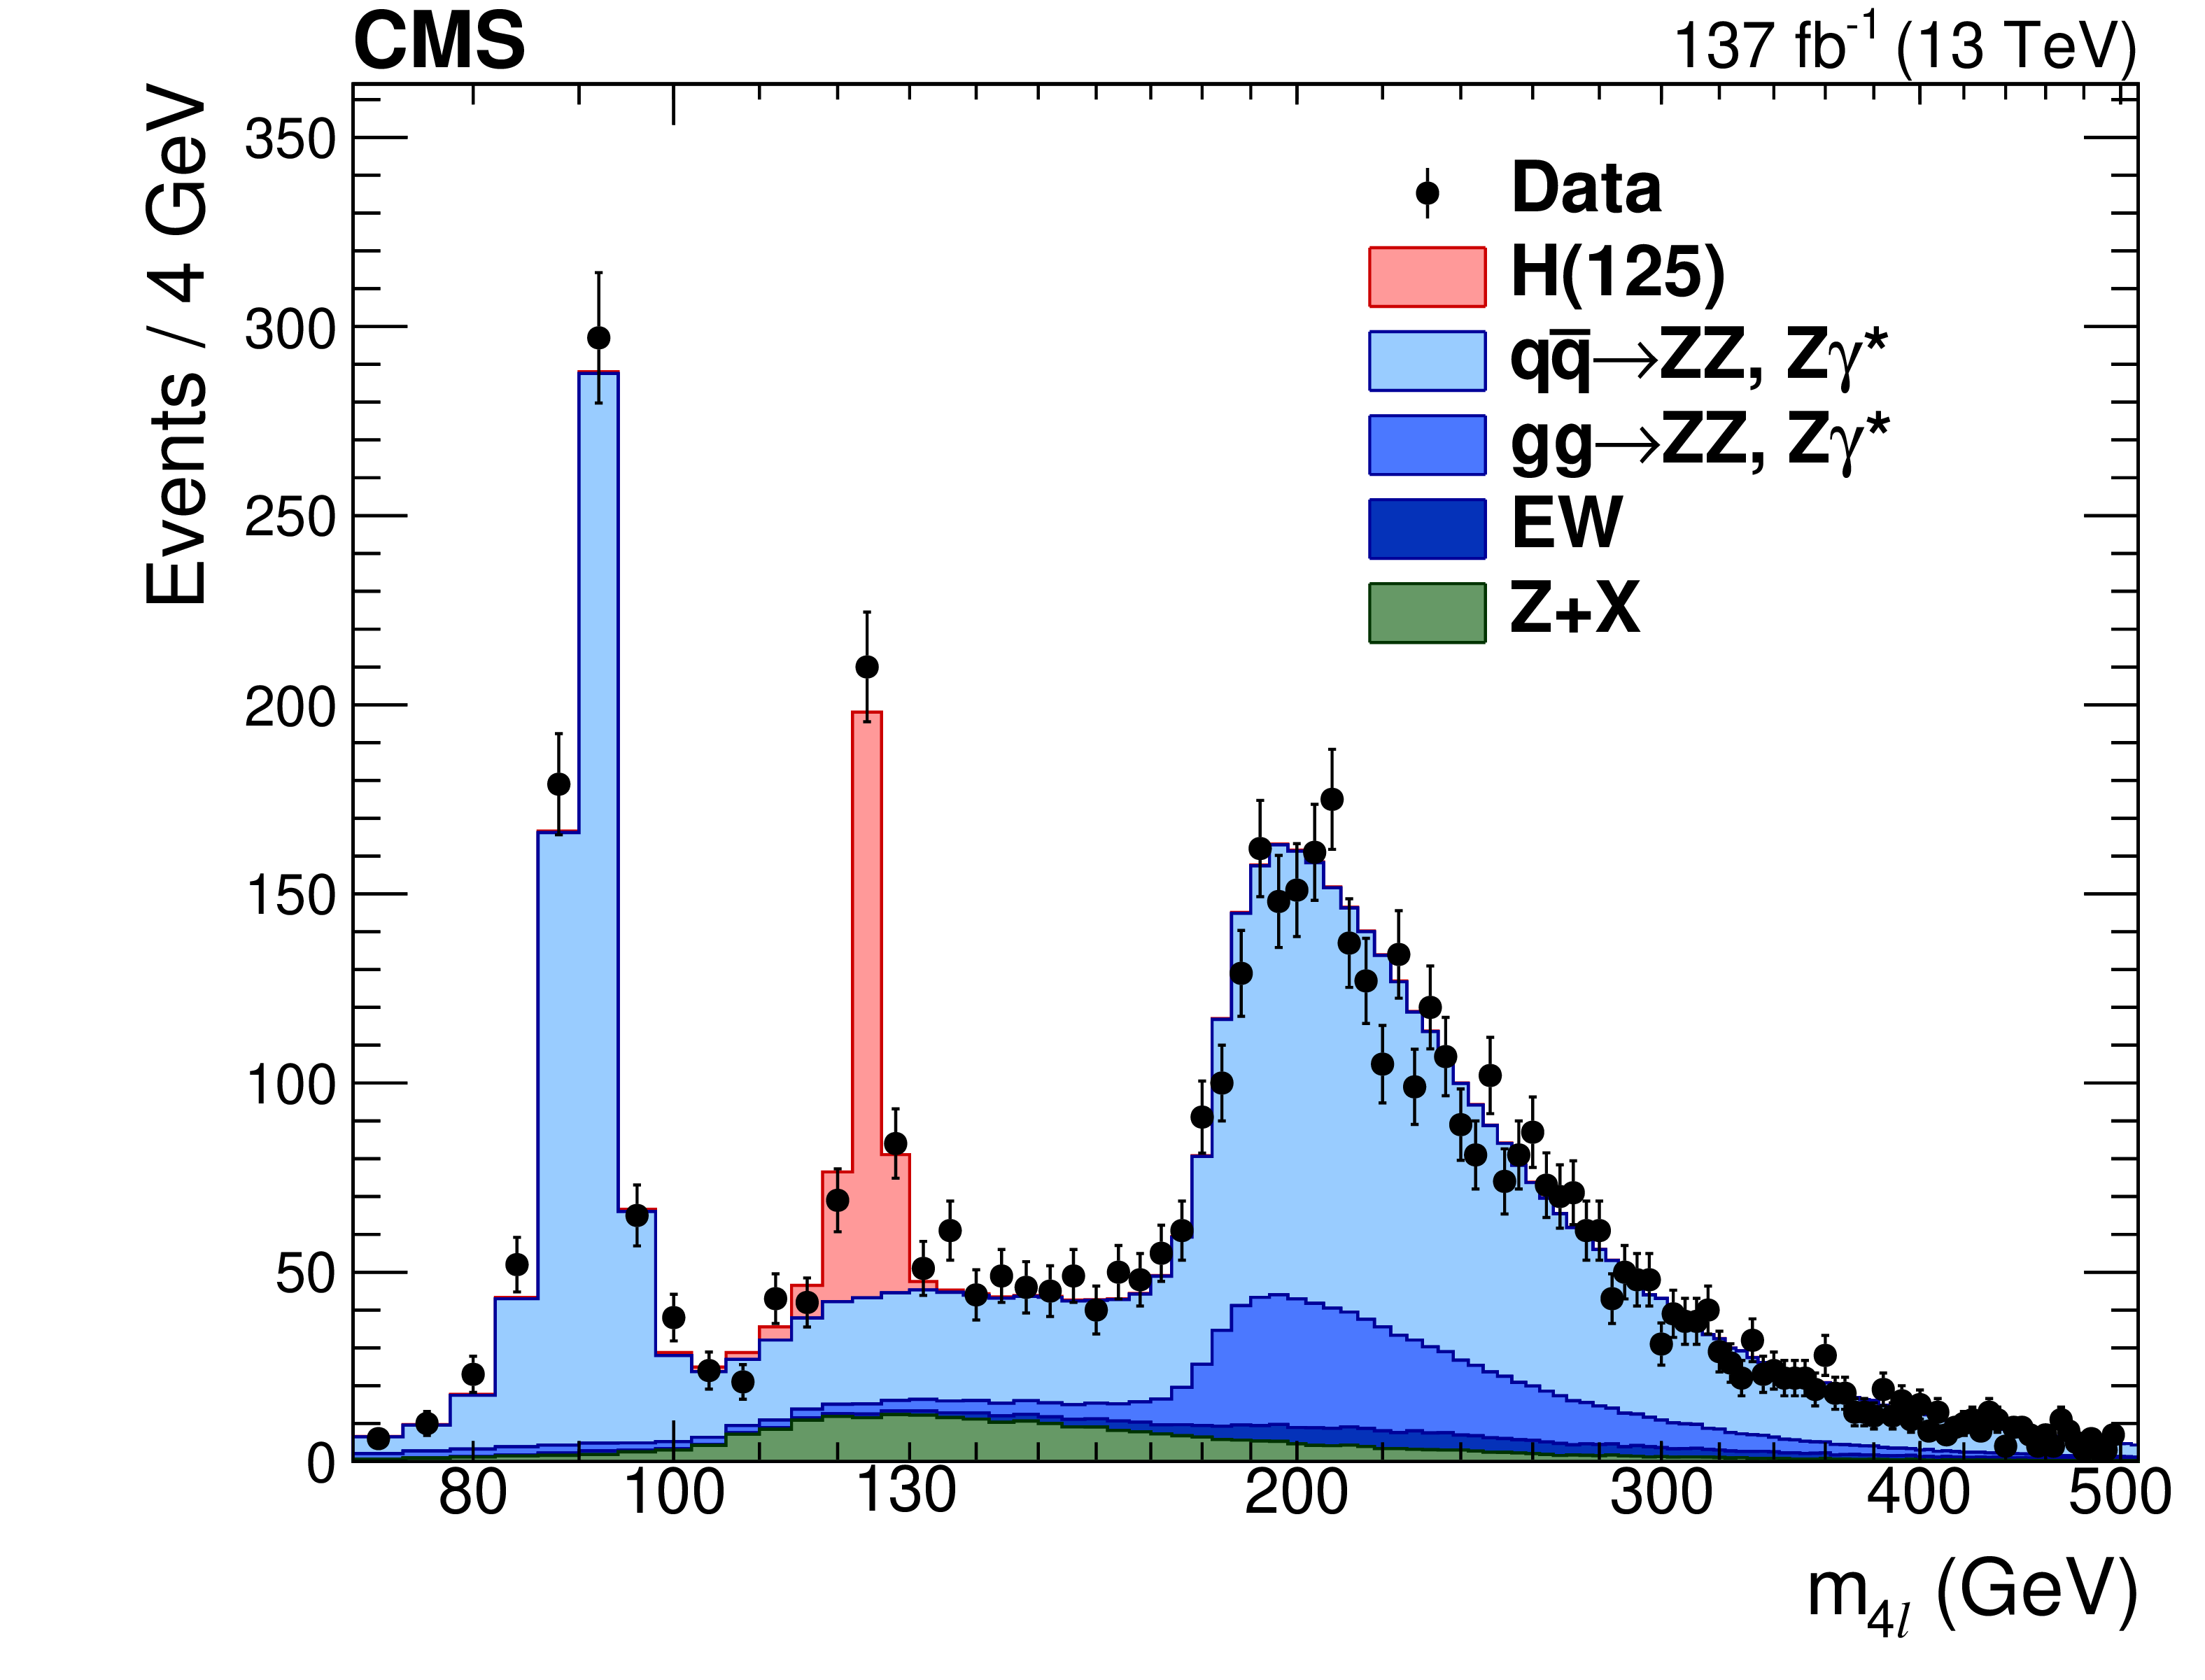
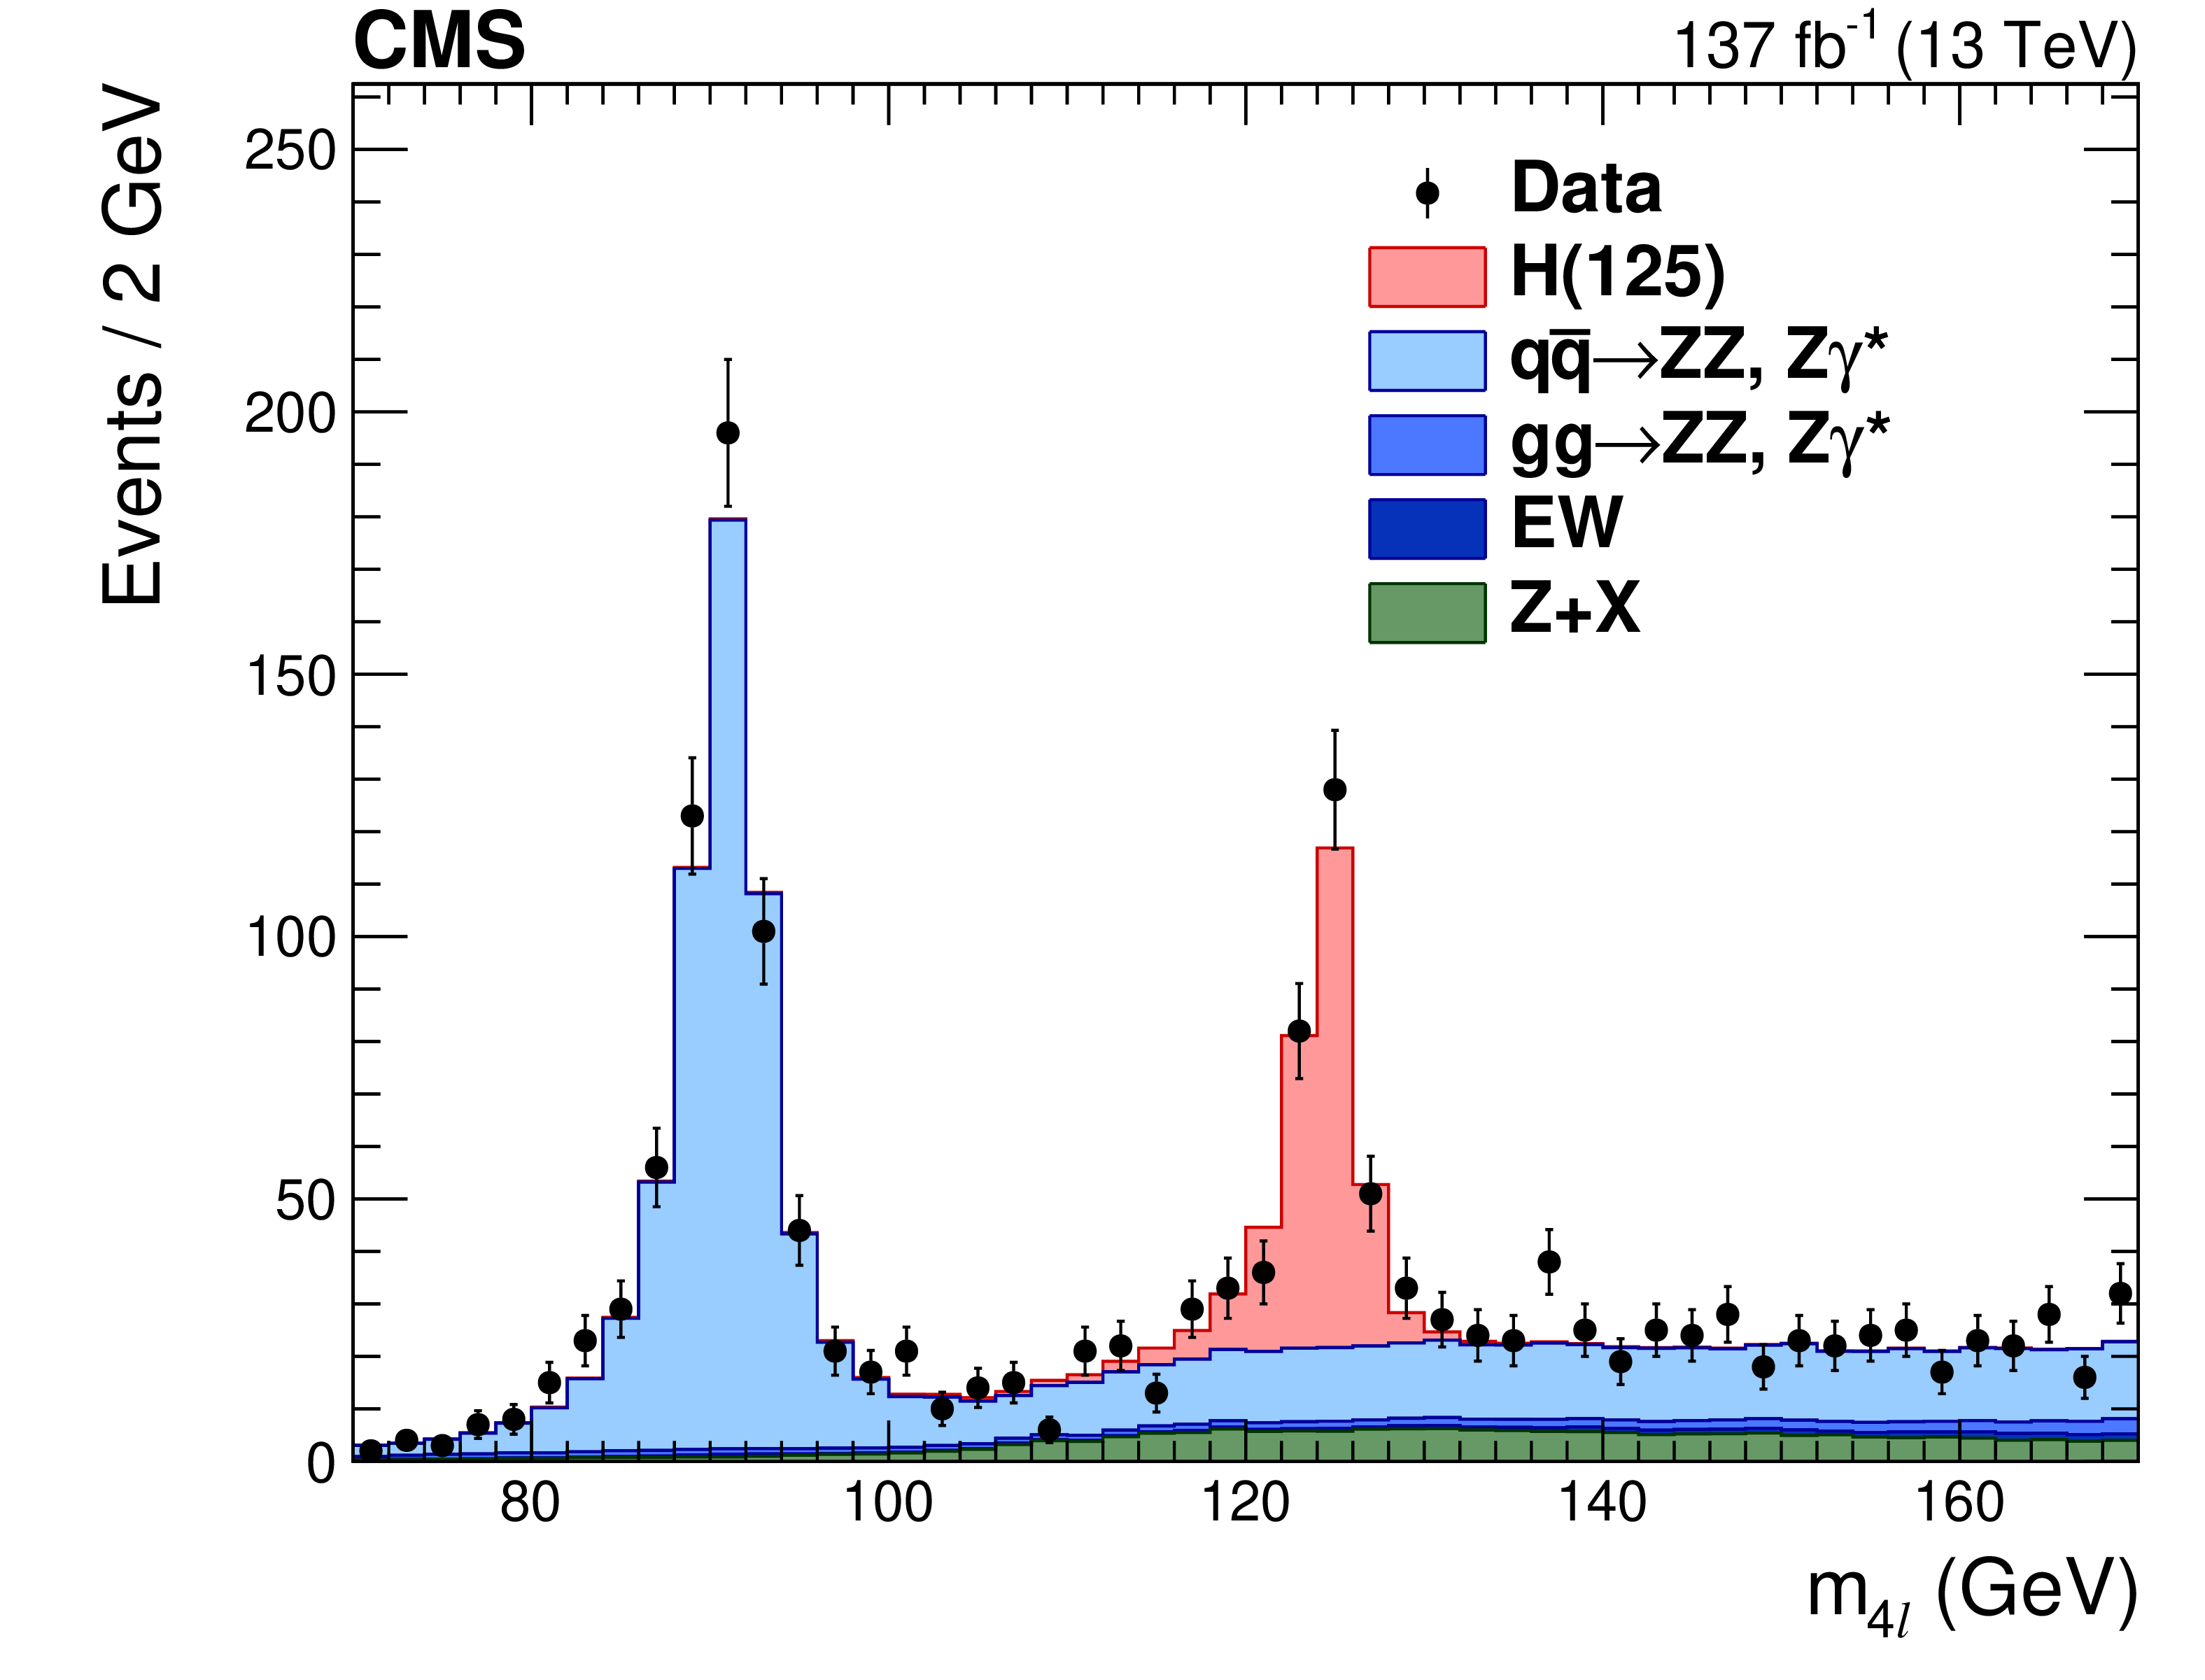
Figure 4:
Four-lepton mass distribution, $ {m_{4\ell}}$, up to 500 GeV with 4 GeV bin size (left) and in the low-mass range with 2 GeV bin size (right). Points with error bars represent the data and stacked histograms represent the expected distributions for the signal and background processes. The SM Higgs boson signal with $ {m_{\mathrm{H}}} = $ 125 GeV, denoted as H(125), the ZZ and rare electroweak backgrounds are normalized to the SM expectation, the Z+X background to the estimation from data. |
png pdf |
Figure 4-a:
Four-lepton mass distribution, $ {m_{4\ell}}$, up to 500 GeV with 4 GeV bin size. Points with error bars represent the data and stacked histograms represent the expected distributions for the signal and background processes. The SM Higgs boson signal with $ {m_{\mathrm{H}}} = $ 125 GeV, denoted as H(125), the ZZ and rare electroweak backgrounds are normalized to the SM expectation, the Z+X background to the estimation from data. |
png pdf |
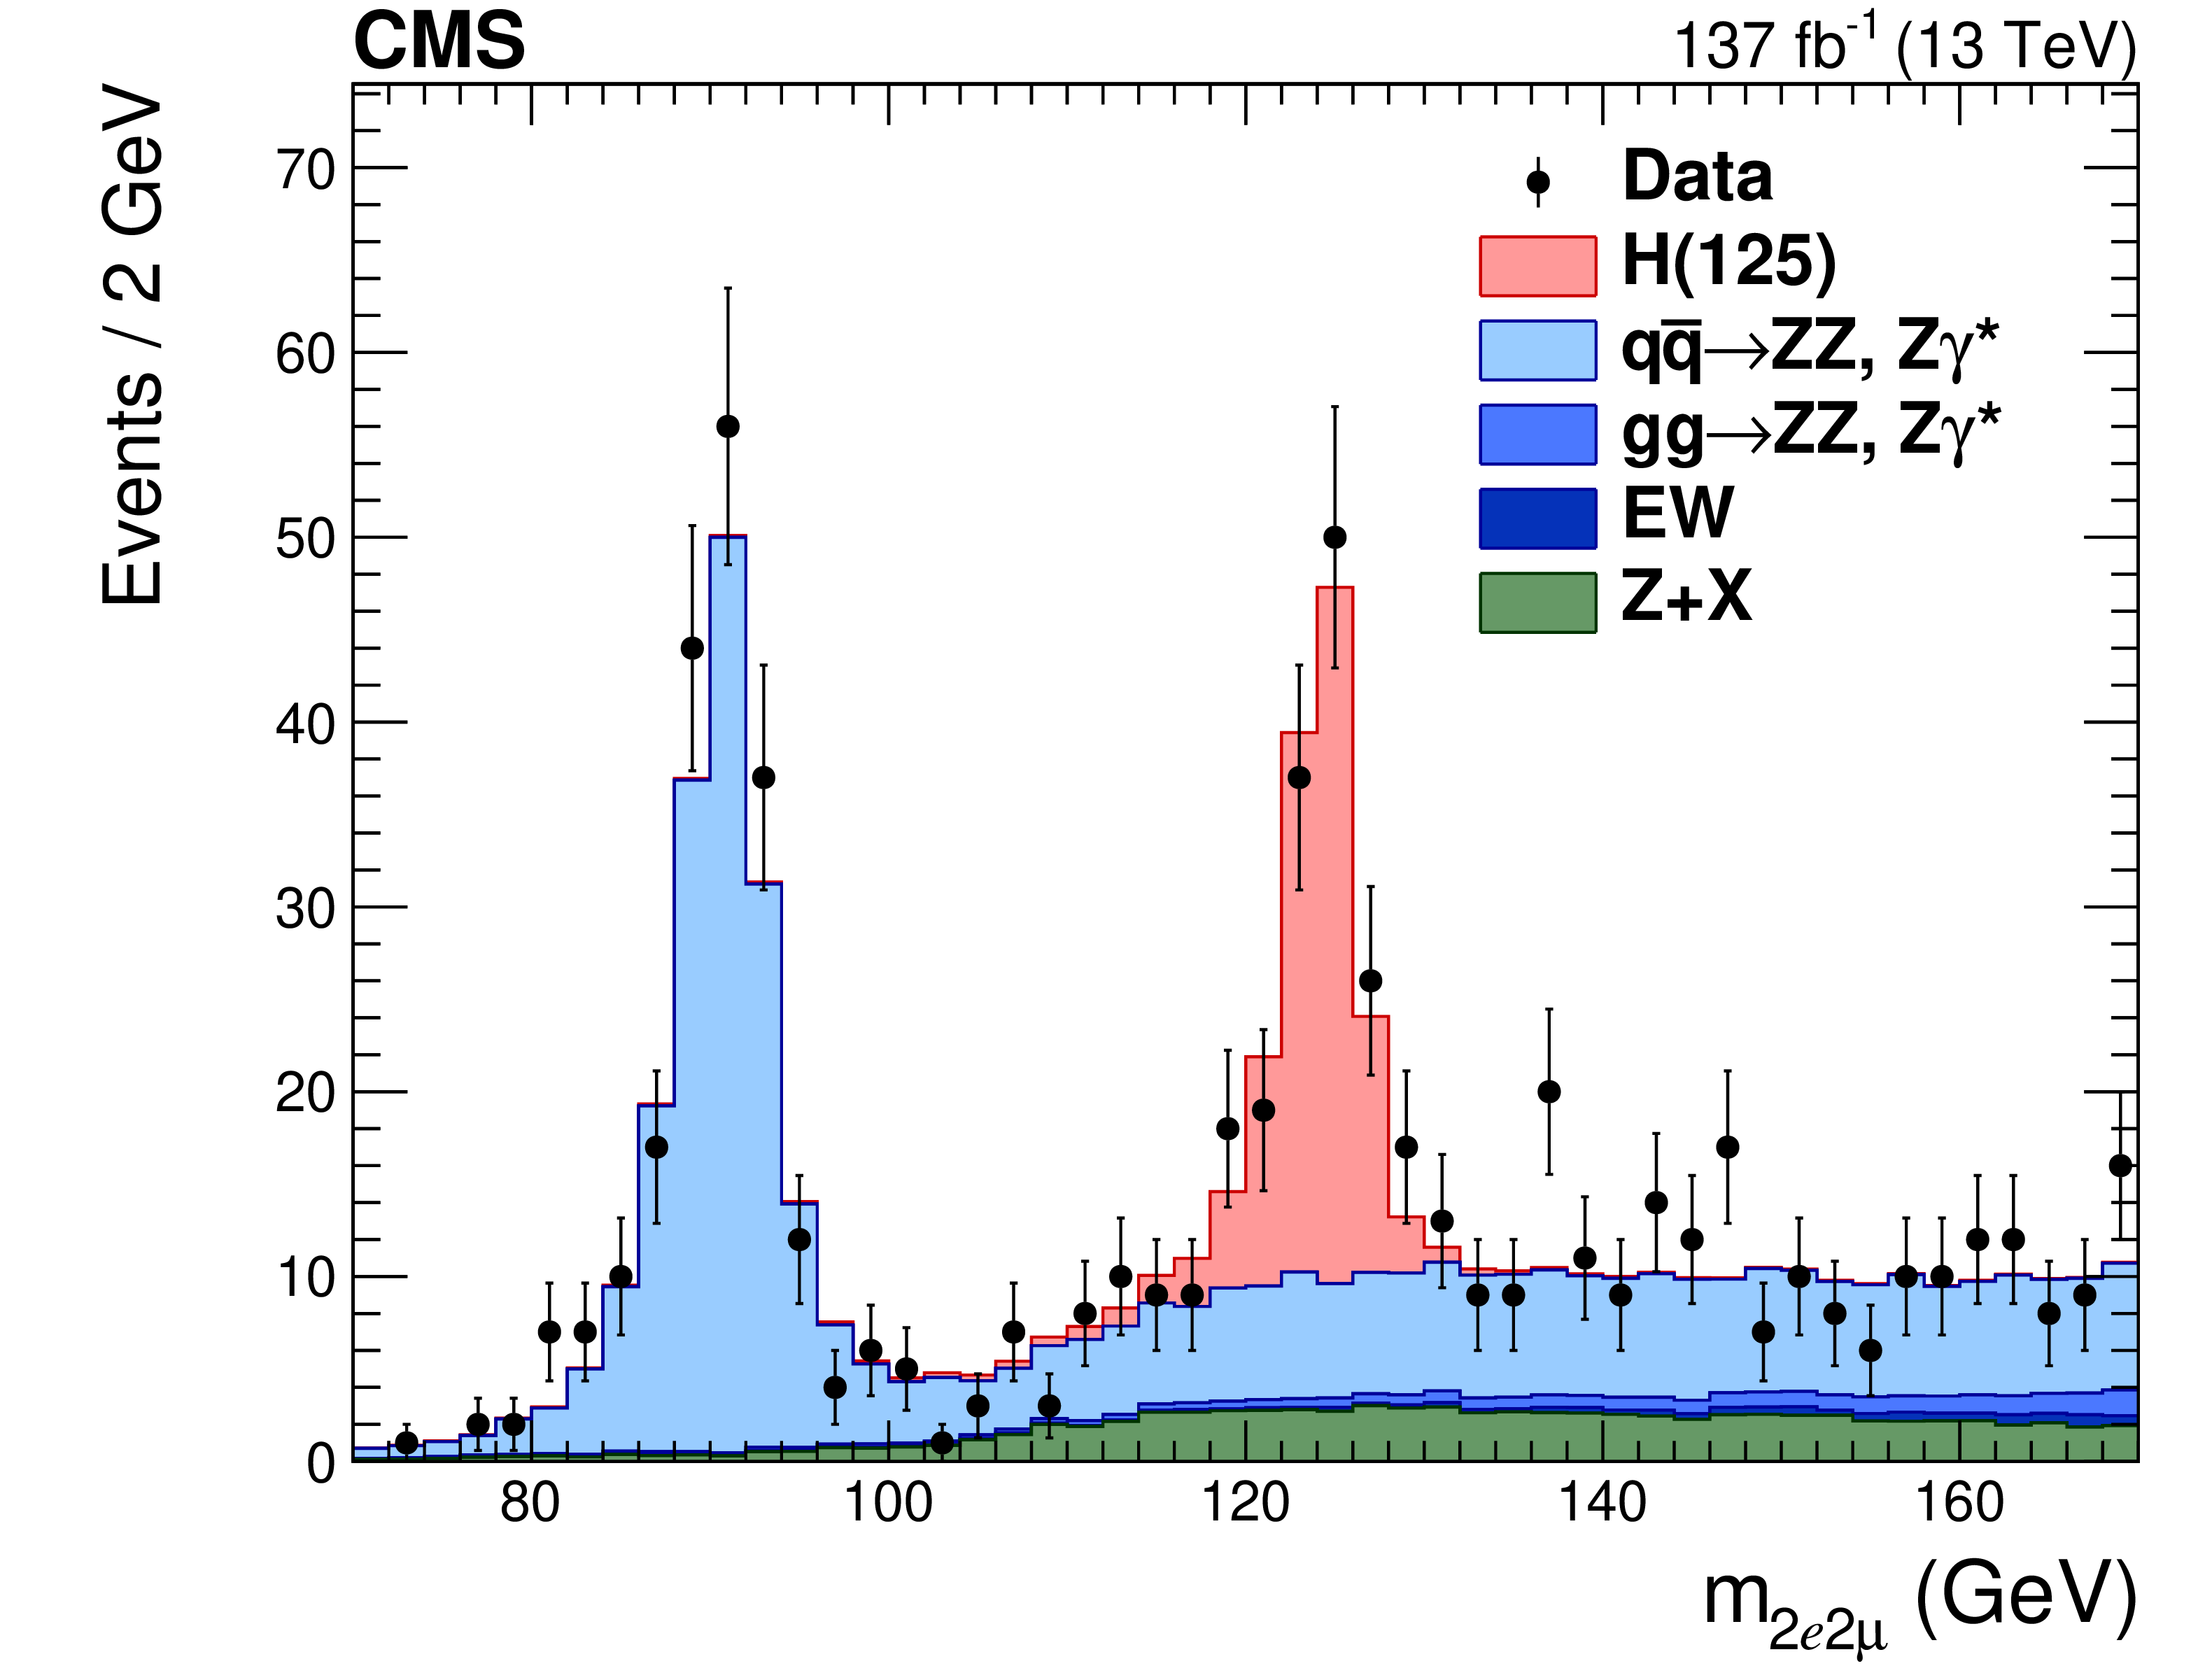
Figure 4-b:
Four-lepton mass distribution, $ {m_{4\ell}}$, in the low-mass range with 2 GeV bin size. Points with error bars represent the data and stacked histograms represent the expected distributions for the signal and background processes. The SM Higgs boson signal with $ {m_{\mathrm{H}}} = $ 125 GeV, denoted as H(125), the ZZ and rare electroweak backgrounds are normalized to the SM expectation, the Z+X background to the estimation from data. |
png pdf |
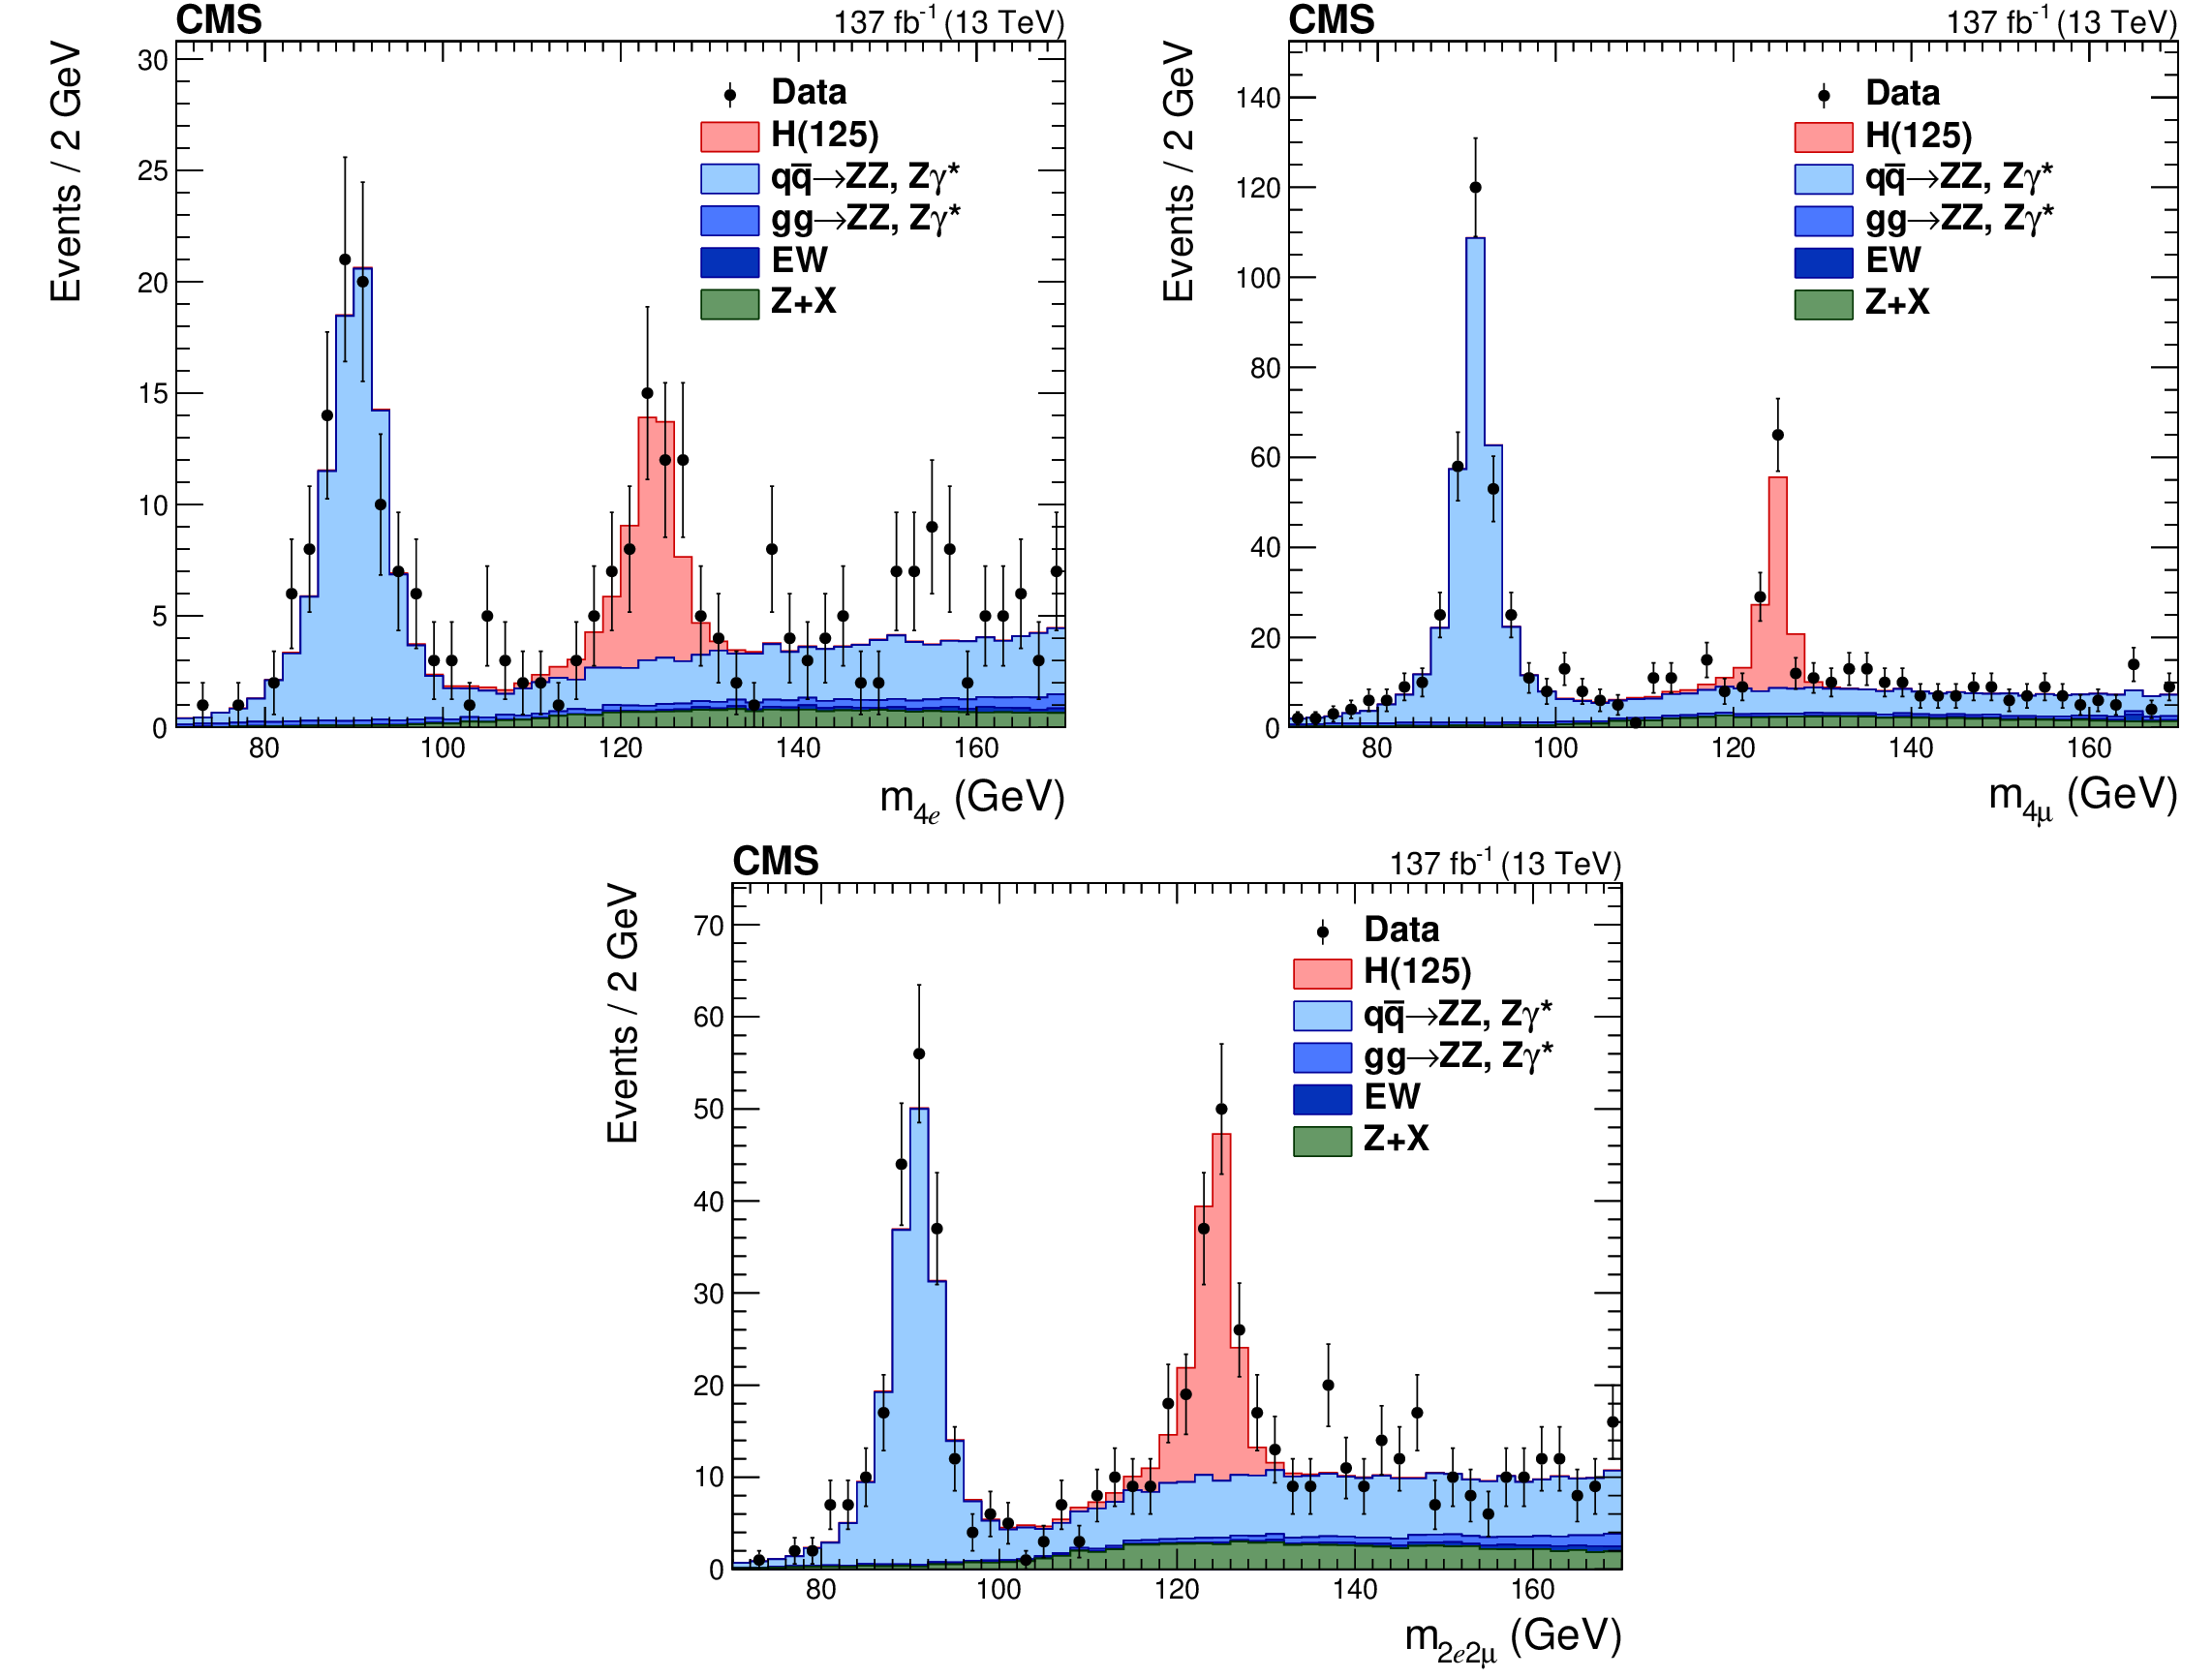
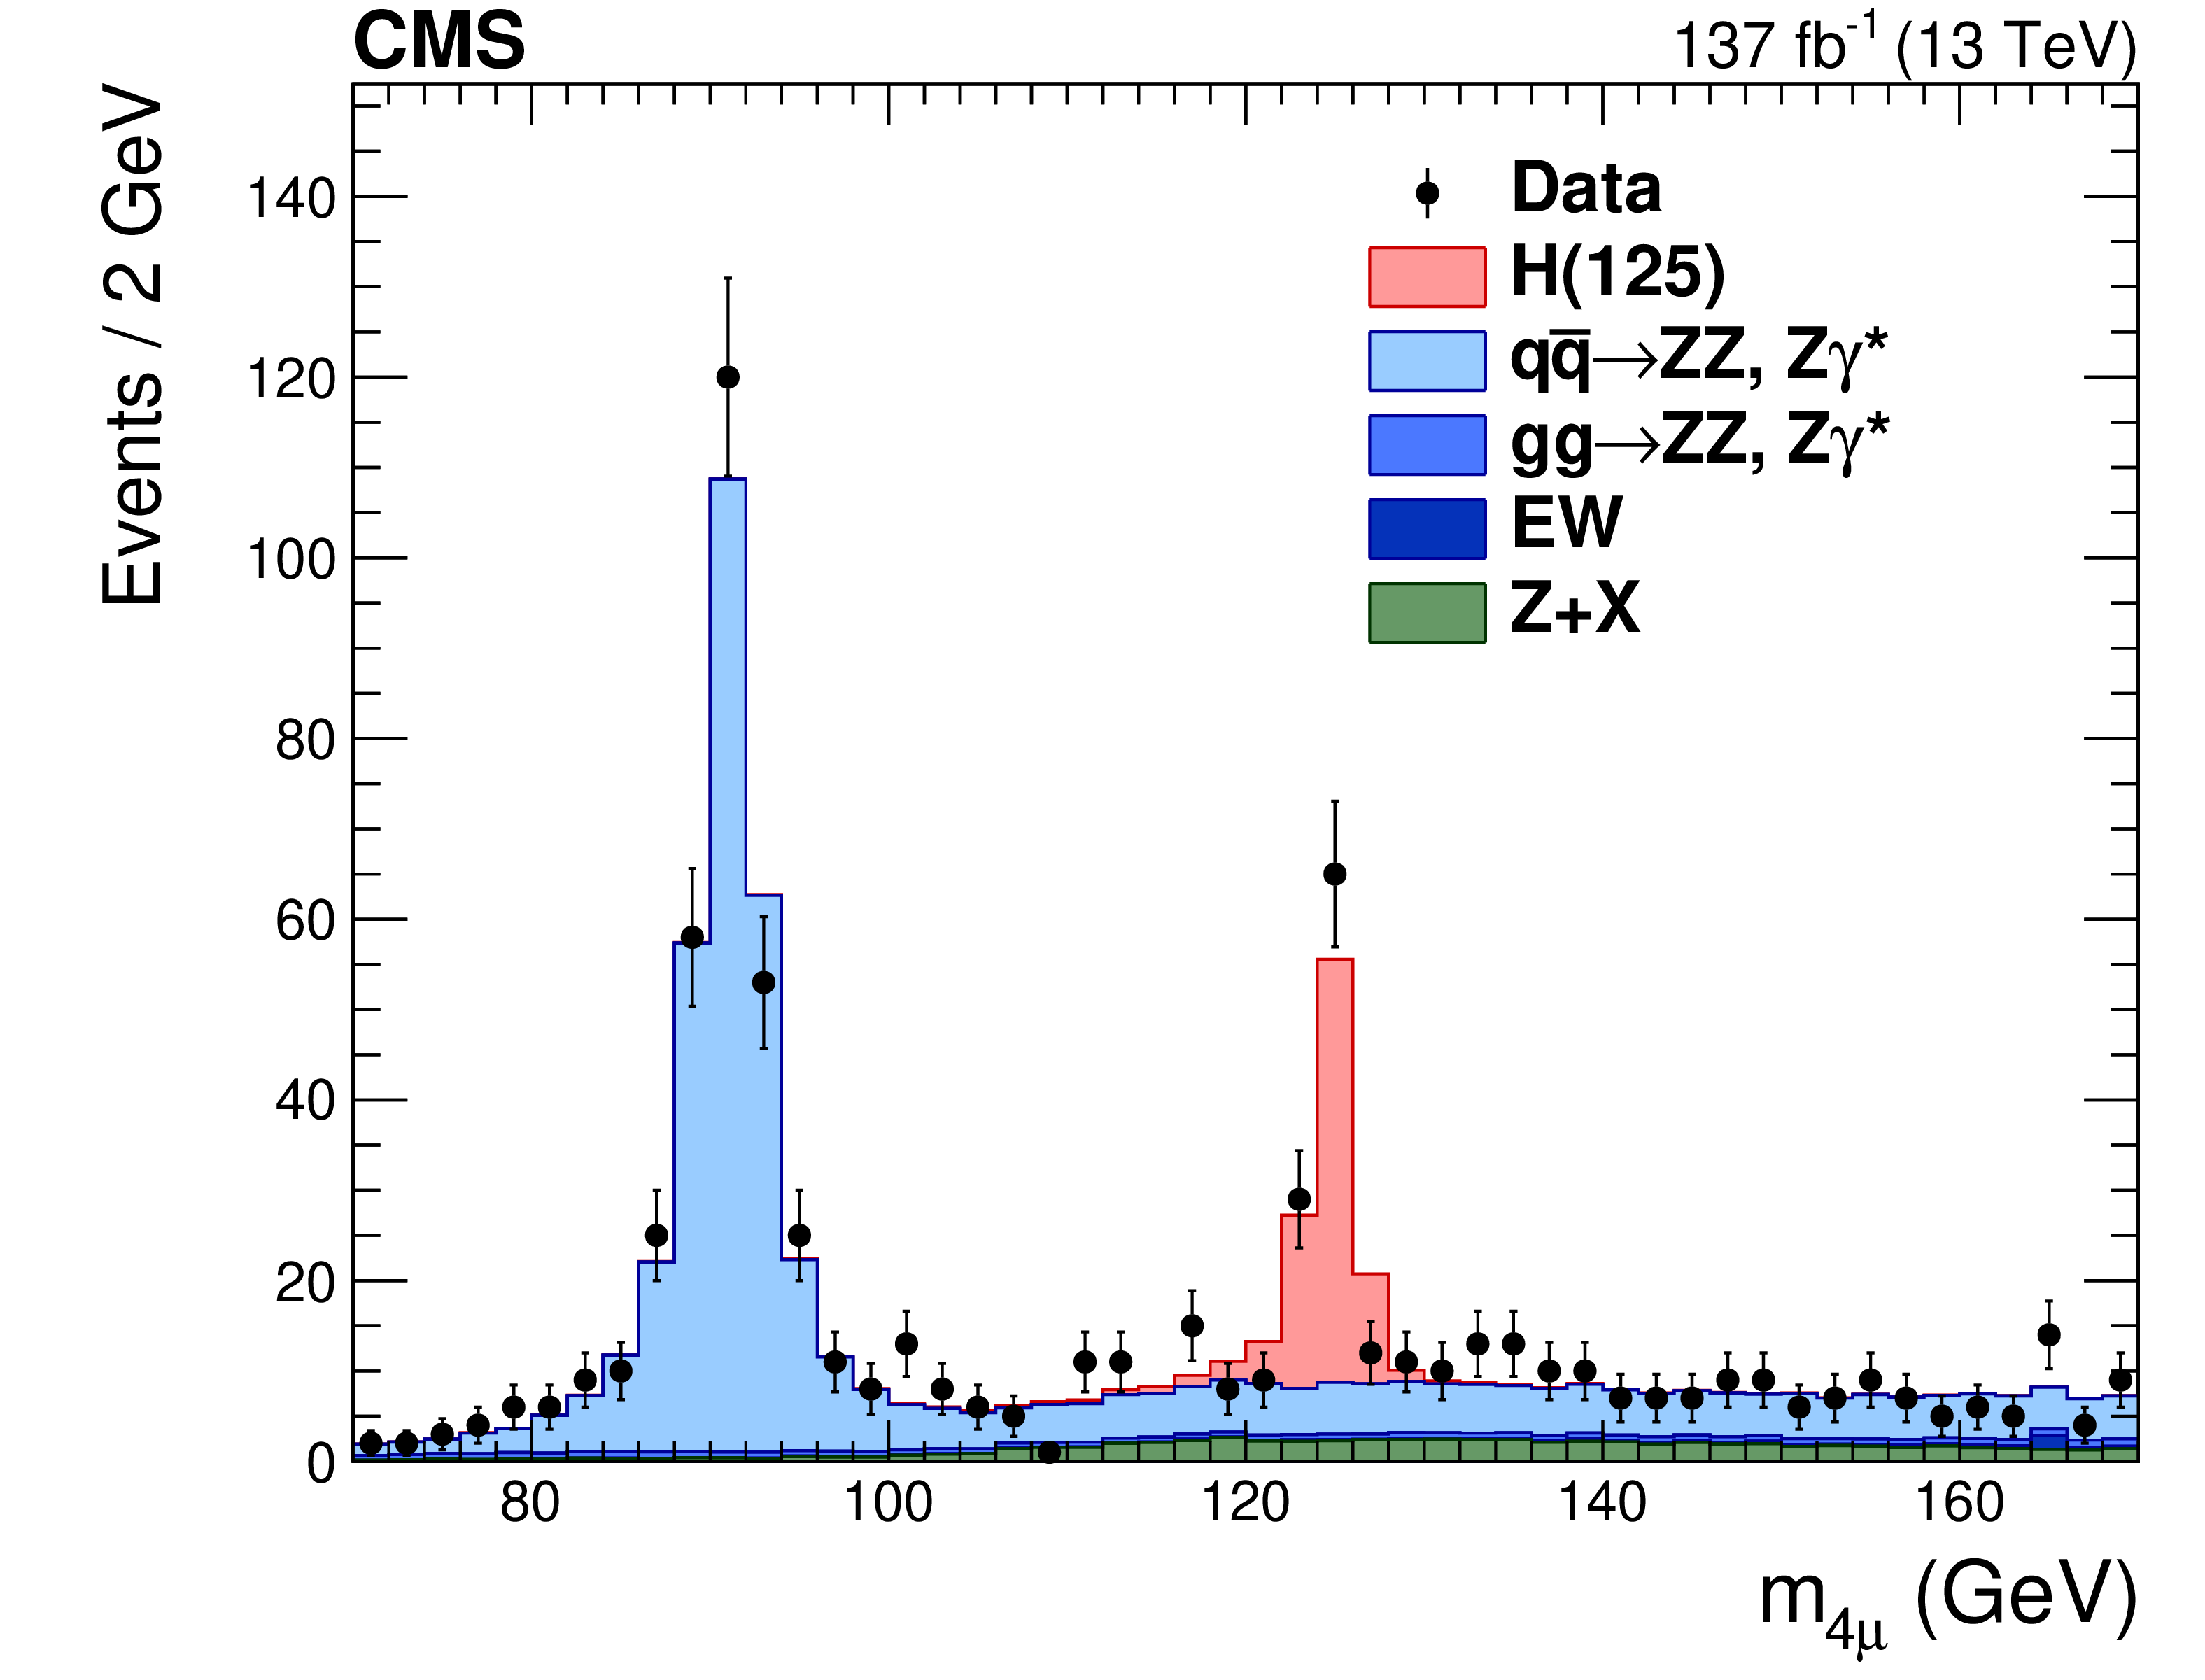
Figure 5:
Four-lepton mass distribution in three final states: 4e (upper left), 4$\mu $ (upper right), and 2e2$\mu $ (lower). Points with error bars represent the data and stacked histograms represent the expected distributions for the signal and background processes. The SM Higgs boson signal with $ {m_{\mathrm{H}}} = $ 125 GeV, denoted as H(125), the ZZ and rare electroweak backgrounds are normalized to the SM expectation, the Z+X background to the estimation from data. |

png pdf |
Figure 5-a:
Four-lepton mass distribution in 4e final state. Points with error bars represent the data and stacked histograms represent the expected distributions for the signal and background processes. The SM Higgs boson signal with $ {m_{\mathrm{H}}} = $ 125 GeV, denoted as H(125), the ZZ and rare electroweak backgrounds are normalized to the SM expectation, the Z+X background to the estimation from data. |
png pdf |
Figure 5-b:
Four-lepton mass distribution in 4$\mu$ final state. Points with error bars represent the data and stacked histograms represent the expected distributions for the signal and background processes. The SM Higgs boson signal with $ {m_{\mathrm{H}}} = $ 125 GeV, denoted as H(125), the ZZ and rare electroweak backgrounds are normalized to the SM expectation, the Z+X background to the estimation from data. |
png pdf |
Figure 5-c:
Four-lepton mass distribution in 2e2$\mu $ final state. Points with error bars represent the data and stacked histograms represent the expected distributions for the signal and background processes. The SM Higgs boson signal with $ {m_{\mathrm{H}}} = $ 125 GeV, denoted as H(125), the ZZ and rare electroweak backgrounds are normalized to the SM expectation, the Z+X background to the estimation from data. |
png pdf |
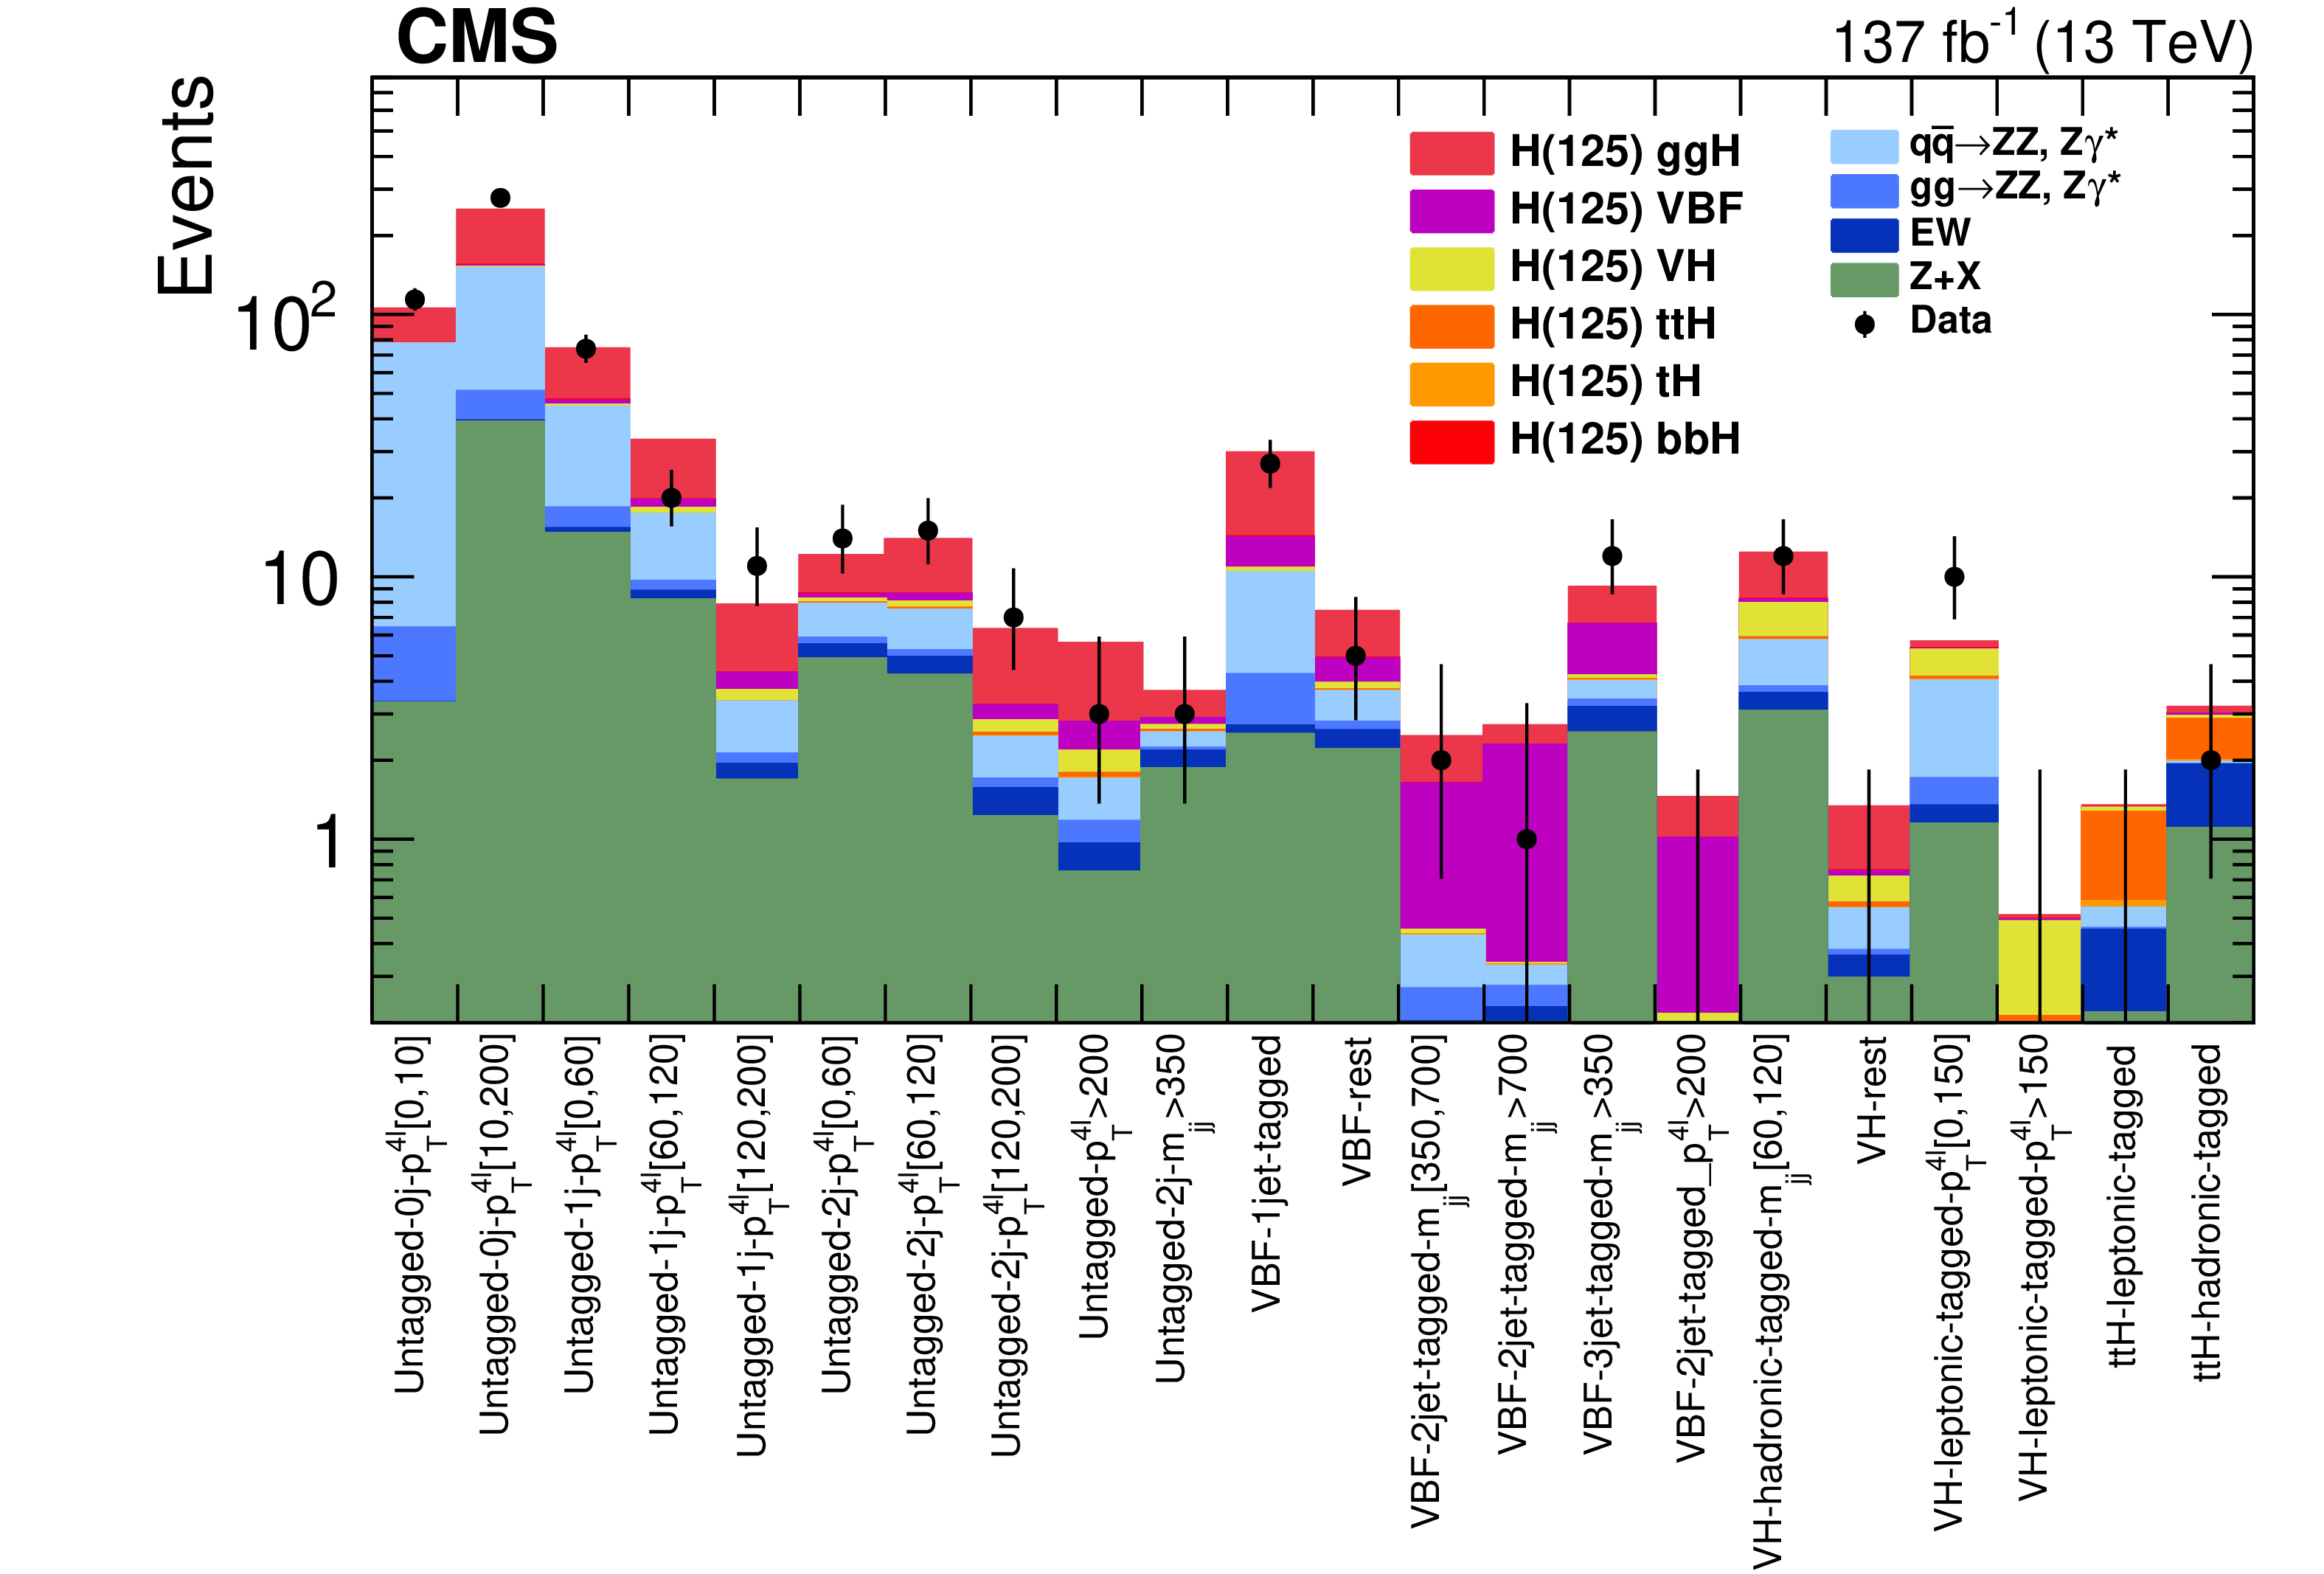
Figure 6:
Distributions of the expected and observed number of events for the reconstructed event categories in the mass region 105 $ < {m_{4\ell}} < $ 140 GeV. Points with error bars represent the data and stacked histograms represent the expected numbers of the signal and background events. The yields of the different H boson production mechanisms with $ {m_{\mathrm{H}}} = $ 125 GeV, denoted as H(125), and those of the ZZ and rare electroweak backgrounds are normalized to the SM expectations, while the Z+X background yield is normalized to the estimate from the data. |
png pdf |
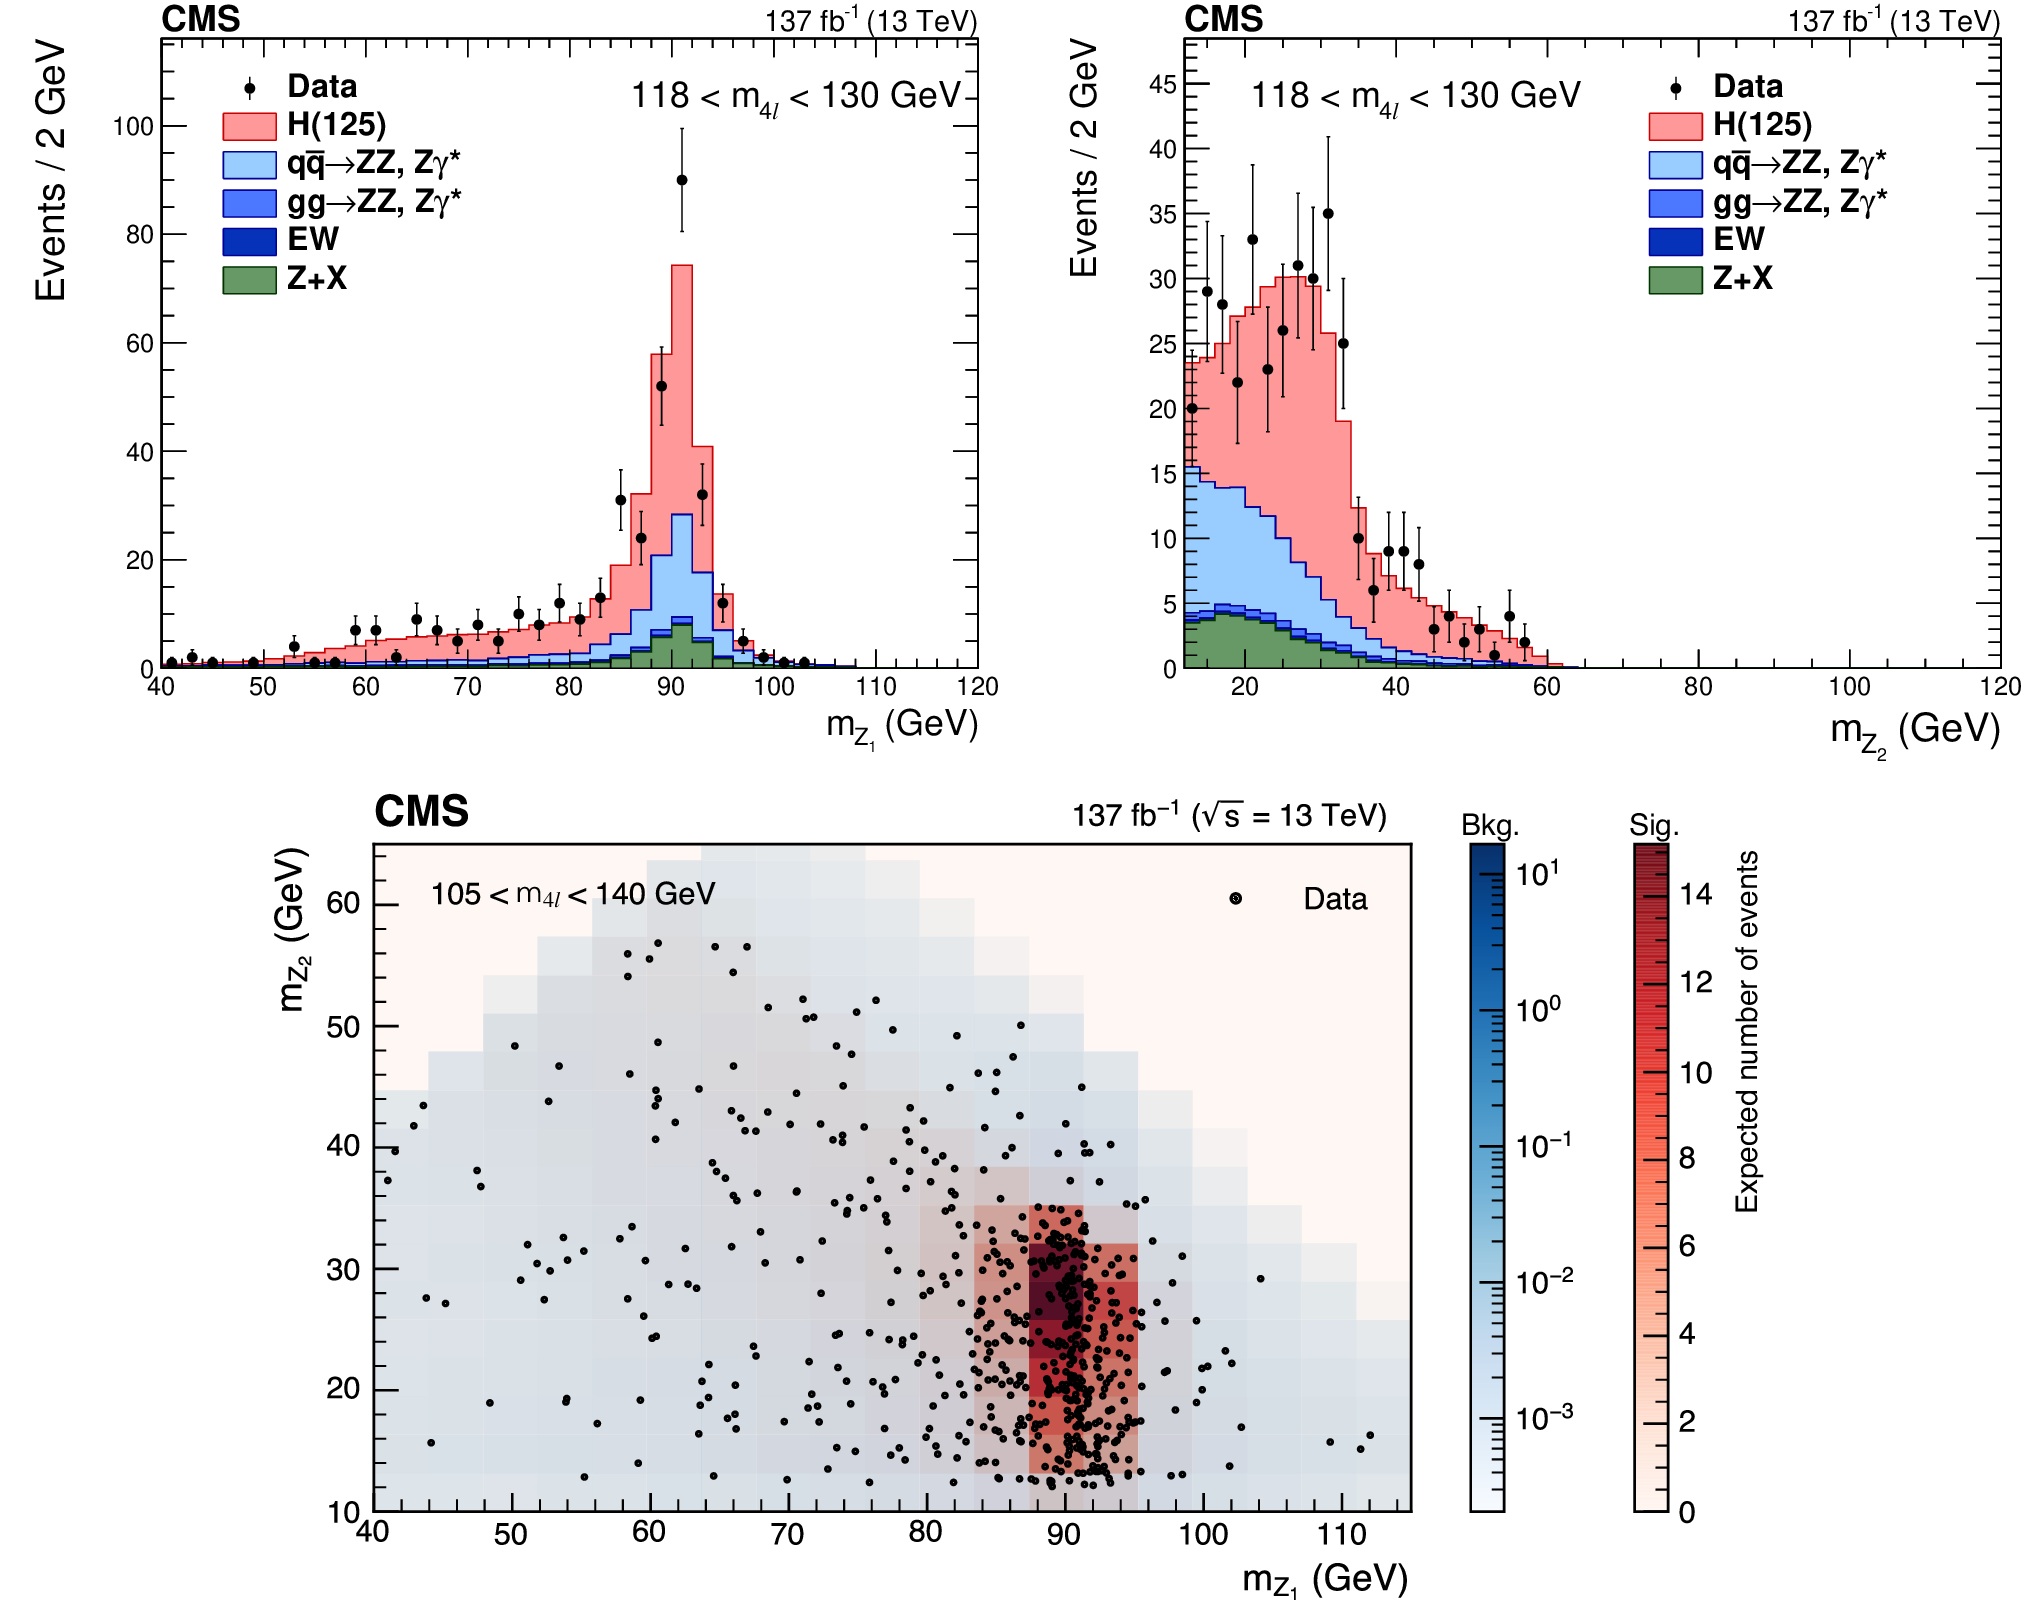
Figure 7:
Distribution of the $\mathrm{Z} _1$ (upper left) and $\mathrm{Z} _2$ (upper right) reconstructed masses in the 118 $ < {m_{4\ell}} < $ 130 GeV mass region and their 2D distribution (lower) in the 105 $ < {m_{4\ell}} < $ 140 GeV mass region. The stacked histograms and the red and blue scales represent expected distributions of the signal and background processes and the points represent the data. The yields of the different H boson production mechanisms with $ {m_{\mathrm{H}}} = $ 125 GeV, denoted as H(125), and those of the ZZ and rare electroweak backgrounds are normalized to the SM expectations, while the Z+X background yield is normalized to the estimate from the data. |
png pdf |
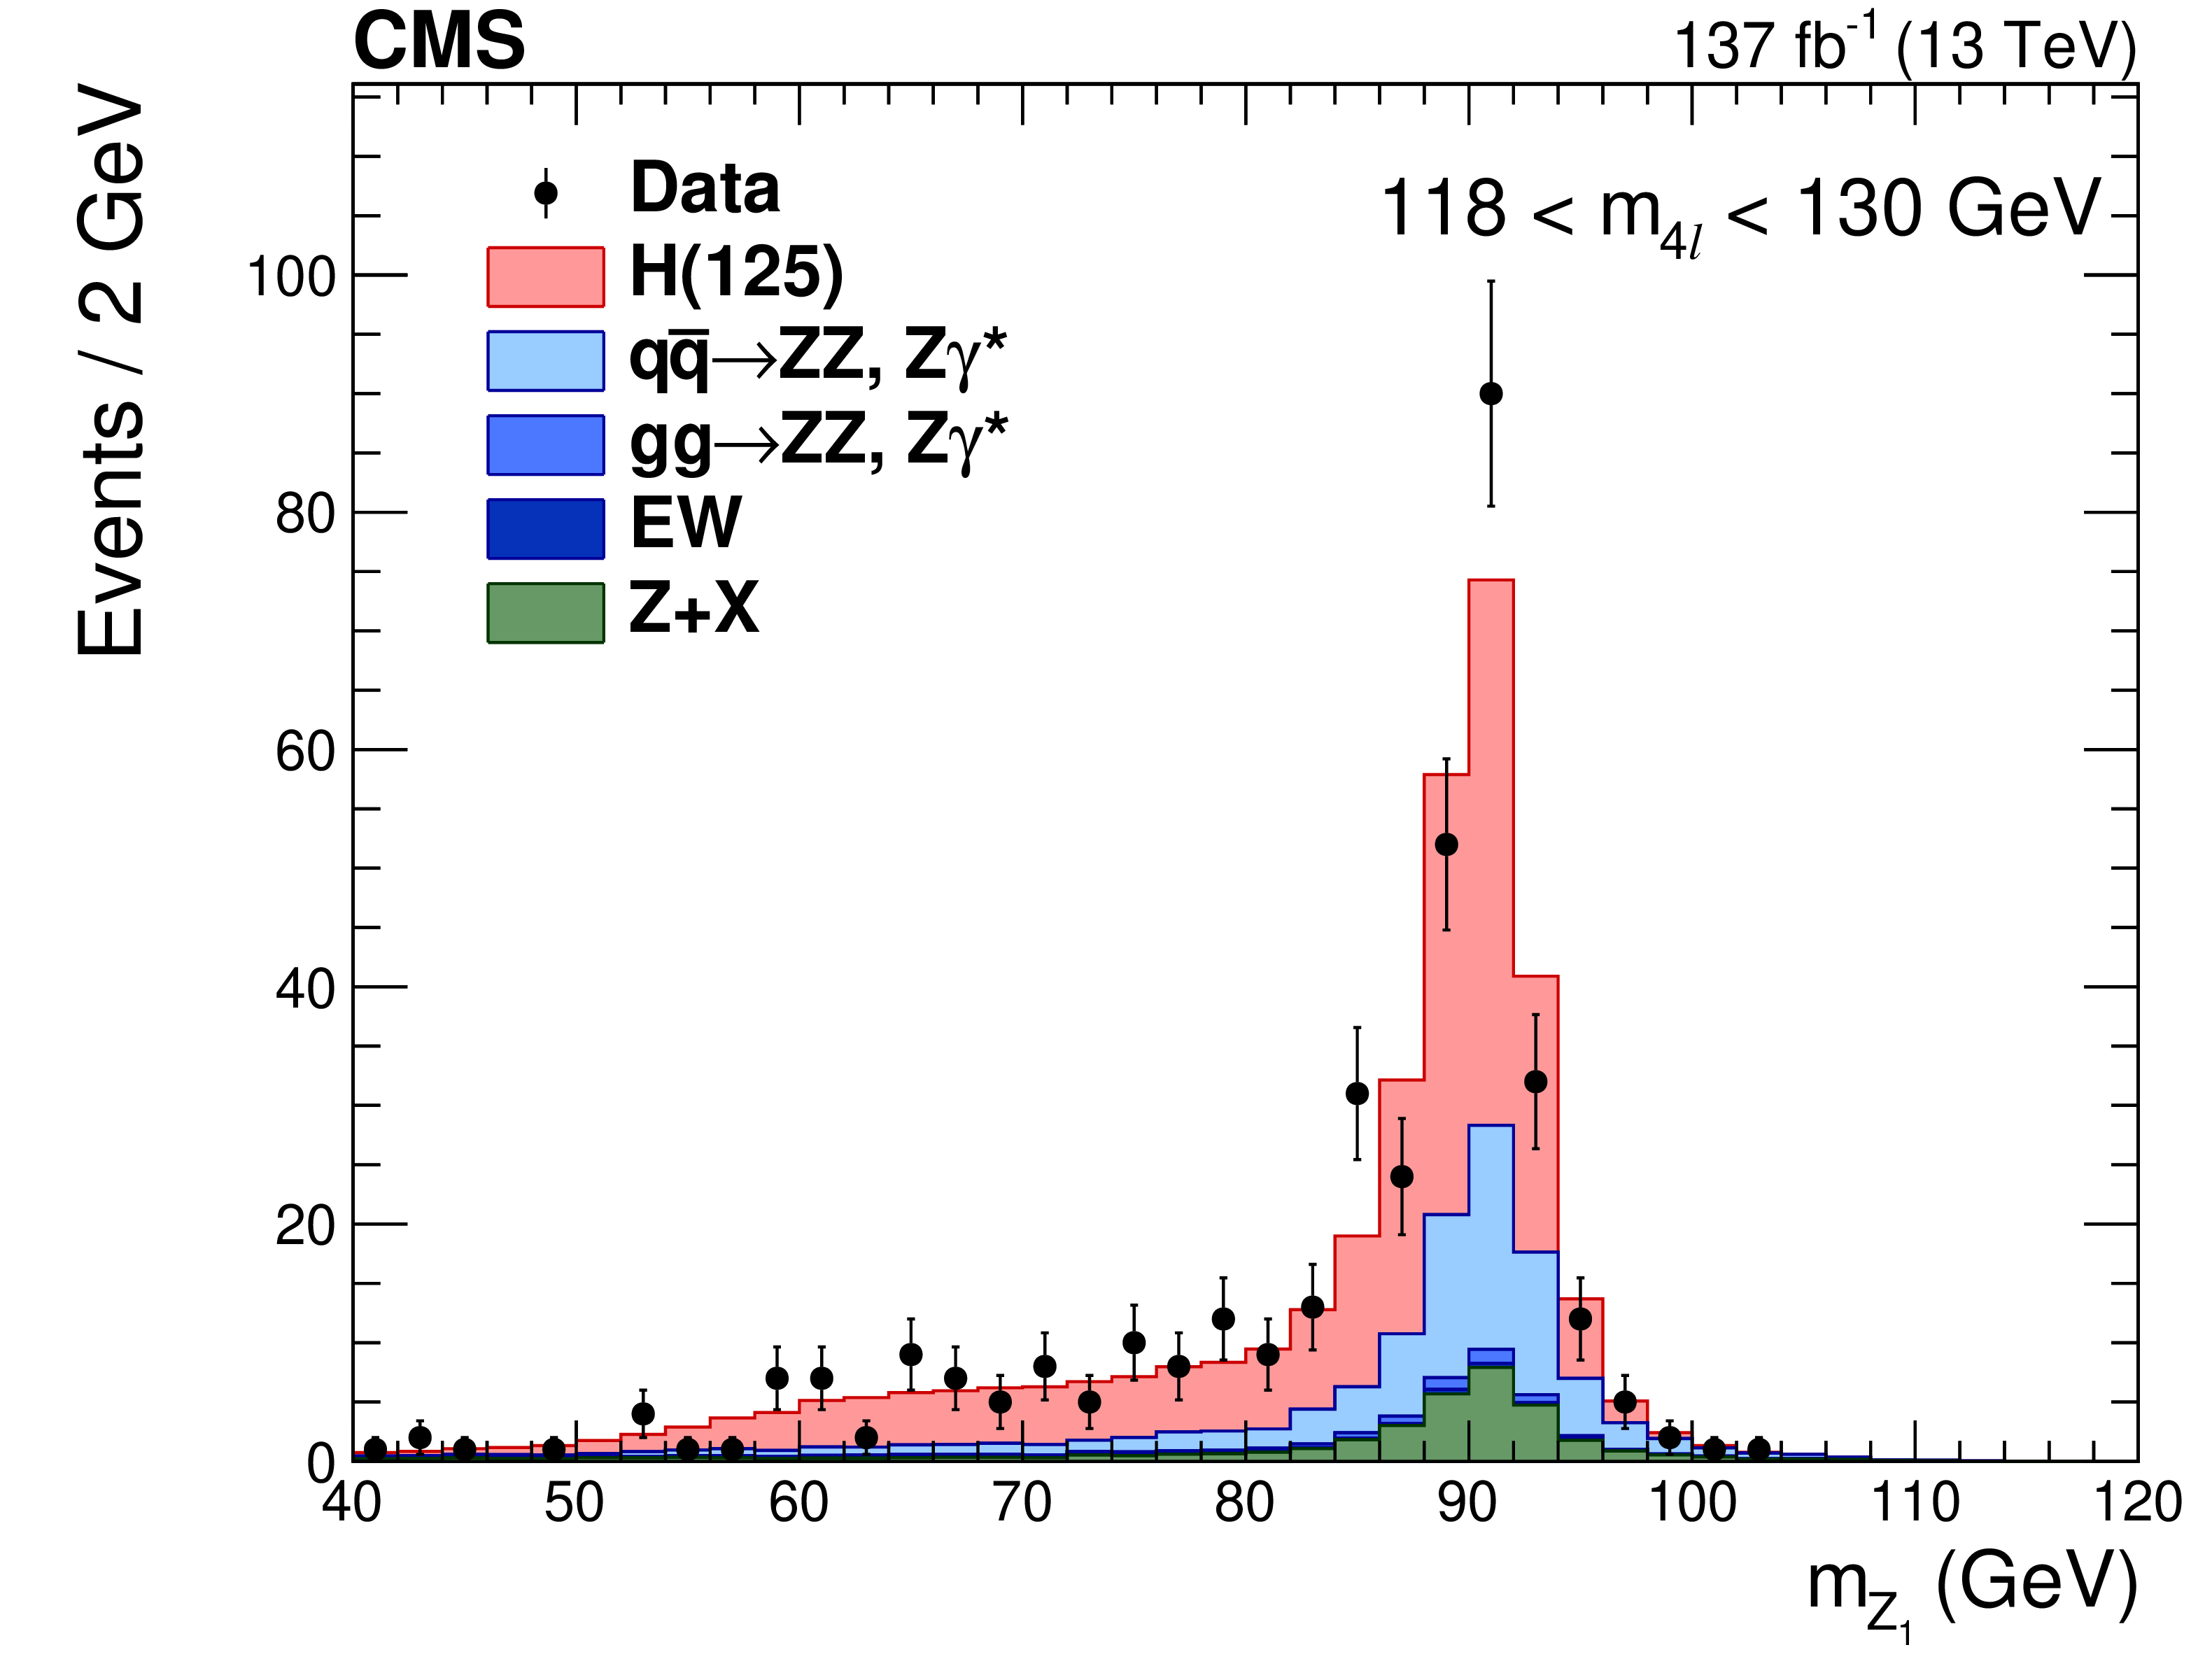
Figure 7-a:
Distribution of the $\mathrm{Z} _1$ reconstructed mass in the 118 $ < {m_{4\ell}} < $ 130 GeV mass region. The stacked histograms represent expected distributions of the signal and background processes and the points represent the data. The yields of the different H boson production mechanisms with $ {m_{\mathrm{H}}} = $ 125 GeV, denoted as H(125), and those of the ZZ and rare electroweak backgrounds are normalized to the SM expectations, while the Z+X background yield is normalized to the estimate from the data. |
png pdf |
Figure 7-b:
Distribution of the $\mathrm{Z} _2$ reconstructed mass in the 118 $ < {m_{4\ell}} < $ 130 GeV mass region. The stacked histograms represent expected distributions of the signal and background processes and the points represent the data. The yields of the different H boson production mechanisms with $ {m_{\mathrm{H}}} = $ 125 GeV, denoted as H(125), and those of the ZZ and rare electroweak backgrounds are normalized to the SM expectations, while the Z+X background yield is normalized to the estimate from the data. |
png pdf |
Figure 7-c:
2D distribution of the $\mathrm{Z} _1$ and $\mathrm{Z} _2$ reconstructed masses in the 105 $ < {m_{4\ell}} < $ 140 GeV mass region. The red and blue scales represent expected distributions of the signal and background processes and the points represent the data. The yields of the different H boson production mechanisms with $ {m_{\mathrm{H}}} = $ 125 GeV, denoted as H(125), and those of the ZZ and rare electroweak backgrounds are normalized to the SM expectations, while the Z+X background yield is normalized to the estimate from the data. |
png pdf |
Figure 8:
Distribution of categorization discriminants in the mass region 118 $ < {m_{4\ell}} < $ 130 GeV: ${{\mathcal D}_{\text {2jet}}^{{\mathrm {VBF}}}}$ (upper left), ${{\mathcal D}_{\text {1jet}}^{{\mathrm {VBF}}}}$ (upper right), ${{\mathcal D}_{\text {2jet}}^{{\mathrm{V} \mathrm{H}}}}$ (lower) = max(${{\mathcal D}_{\text {2jet}}^{{\mathrm{W} \mathrm{H}}}}$, ${{\mathcal D}_{\text {2jet}}^{{\mathrm{Z} \mathrm{H}}}}$). Points with error bars represent the data and stacked histograms represent expected distributions of the signal and background processes. The SM Higgs boson signal with $ {m_{\mathrm{H}}} = $ 125 GeV, denoted as H(125), and the ZZ backgrounds and rare electroweak backgrounds are normalized to the SM expectation, the Z+X background to the estimation from data. The vertical dashed lines denote the working points used in the event categorization. The SM H boson signal is separated into two components: the production mode which is targeted by the specific discriminant, and other production modes, where the gluon fusion process dominates. |
png pdf |
Figure 8-a:
Distribution of the ${{\mathcal D}_{\text {2jet}}^{{\mathrm {VBF}}}}$ categorization discriminant in the mass region 118 $ < {m_{4\ell}} < $ 130 GeV. Points with error bars represent the data and stacked histograms represent expected distributions of the signal and background processes. The SM Higgs boson signal with $ {m_{\mathrm{H}}} = $ 125 GeV, denoted as H(125), and the ZZ backgrounds and rare electroweak backgrounds are normalized to the SM expectation, the Z+X background to the estimation from data. The vertical dashed lines denote the working points used in the event categorization. The SM H boson signal is separated into two components: the production mode which is targeted by the specific discriminant, and other production modes, where the gluon fusion process dominates. |
png pdf |
Figure 8-b:
Distribution of the ${{\mathcal D}_{\text {1jet}}^{{\mathrm {VBF}}}}$ categorization discriminant in the mass region 118 $ < {m_{4\ell}} < $ 130 GeV. Points with error bars represent the data and stacked histograms represent expected distributions of the signal and background processes. The SM Higgs boson signal with $ {m_{\mathrm{H}}} = $ 125 GeV, denoted as H(125), and the ZZ backgrounds and rare electroweak backgrounds are normalized to the SM expectation, the Z+X background to the estimation from data. The vertical dashed lines denote the working points used in the event categorization. The SM H boson signal is separated into two components: the production mode which is targeted by the specific discriminant, and other production modes, where the gluon fusion process dominates. |

png pdf |
Figure 8-c:
Distribution of the ${{\mathcal D}_{\text {2jet}}^{{\mathrm{V} \mathrm{H}}}}$ = max(${{\mathcal D}_{\text {2jet}}^{{\mathrm{W} \mathrm{H}}}}$, ${{\mathcal D}_{\text {2jet}}^{{\mathrm{Z} \mathrm{H}}}}$) categorization discriminant in the mass region 118 $ < {m_{4\ell}} < $ 130 GeV. Points with error bars represent the data and stacked histograms represent expected distributions of the signal and background processes. The SM Higgs boson signal with $ {m_{\mathrm{H}}} = $ 125 GeV, denoted as H(125), and the ZZ backgrounds and rare electroweak backgrounds are normalized to the SM expectation, the Z+X background to the estimation from data. The vertical dashed lines denote the working points used in the event categorization. The SM H boson signal is separated into two components: the production mode which is targeted by the specific discriminant, and other production modes, where the gluon fusion process dominates. |
png pdf |
Figure 9:
Distribution of three different kinematic discriminants versus $ {m_{4\ell}}$: $ {{\mathcal D}^{\text {kin}}_{\text {bkg}}} $ (upper), $ {{\mathcal {D}}^{\mathrm {VBF}+\text {dec}}_{\text {bkg}}} $ (middle) and $ {{\mathcal {D}}^{{\mathrm{V} \mathrm{H}}+\text {dec}}_{\text {bkg}}} $ (lower) shown in the mass region 105 $ < {m_{4\ell}} < $ 140 GeV. The blue scale represents the expected total number of ZZ, rare electroweak, and Z+X background events. The red scale represents the number of expected SM H boson signal events for $ {m_{\mathrm{H}}} = $ 125 GeV. The points show the data from the categories listed in the legend. |
png pdf |
Figure 9-a:
Distribution of the $ {{\mathcal D}^{\text {kin}}_{\text {bkg}}} $ kinematic discriminant versus $ {m_{4\ell}}$, shown in the mass region 105 $ < {m_{4\ell}} < $ 140 GeV. The blue scale represents the expected total number of ZZ, rare electroweak, and Z+X background events. The red scale represents the number of expected SM H boson signal events for $ {m_{\mathrm{H}}} = $ 125 GeV. The points show the data from the categories listed in the legend. |
png pdf |
Figure 9-b:
Distribution of the $ {{\mathcal {D}}^{\mathrm {VBF}+\text {dec}}_{\text {bkg}}} $ kinematic discriminant versus $ {m_{4\ell}}$, shown in the mass region 105 $ < {m_{4\ell}} < $ 140 GeV. The blue scale represents the expected total number of ZZ, rare electroweak, and Z+X background events. The red scale represents the number of expected SM H boson signal events for $ {m_{\mathrm{H}}} = $ 125 GeV. The points show the data from the categories listed in the legend. |
png pdf |
Figure 9-c:
Distribution of the $ {{\mathcal {D}}^{{\mathrm{V} \mathrm{H}}+\text {dec}}_{\text {bkg}}} $ kinematic discriminant versus $ {m_{4\ell}}$, shown in the mass region 105 $ < {m_{4\ell}} < $ 140 GeV. The blue scale represents the expected total number of ZZ, rare electroweak, and Z+X background events. The red scale represents the number of expected SM H boson signal events for $ {m_{\mathrm{H}}} = $ 125 GeV. The points show the data from the categories listed in the legend. |
png pdf |
Figure 10:
Distribution of kinematic discriminants in the mass region 118 $ < {m_{4\ell}} < $ 130 GeV: (upper left) ${{\mathcal D}^{\text {kin}}_{\text {bkg}}}$, (upper right) ${{\mathcal {D}}^{\mathrm {VBF}+\text {dec}}_{\text {bkg}}}$, (lower) ${{\mathcal {D}}^{{\mathrm{V} \mathrm{H}}+\text {dec}}_{\text {bkg}}}$. Points with error bars represent the data and stacked histograms represent expected distributions of the signal and background processes. The yields of the different H boson production mechanisms with $ {m_{\mathrm{H}}} = $ 125 GeV, denoted as H(125), and those of the ZZ and rare electroweak backgrounds are normalized to the SM expectations, while the Z+X background yield is normalized to the estimate from the data. In the middle and right figures the SM H boson signal is separated into two components: the production mode which is targeted by the specific discriminant, and other production modes, where the gluon fusion process dominates. |
png pdf |
Figure 10-a:
Distribution of the ${{\mathcal D}^{\text {kin}}_{\text {bkg}}}$ kinematic discriminant in the mass region 118 $ < {m_{4\ell}} < $ 130 GeV. Points with error bars represent the data and stacked histograms represent expected distributions of the signal and background processes. The yields of the different H boson production mechanisms with $ {m_{\mathrm{H}}} = $ 125 GeV, denoted as H(125), and those of the ZZ and rare electroweak backgrounds are normalized to the SM expectations, while the Z+X background yield is normalized to the estimate from the data. In the middle and right figures the SM H boson signal is separated into two components: the production mode which is targeted by the specific discriminant, and other production modes, where the gluon fusion process dominates. |
png pdf |
Figure 10-b:
Distribution of the ${{\mathcal {D}}^{\mathrm {VBF}+\text {dec}}_{\text {bkg}}}$ kinematic discriminant in the mass region 118 $ < {m_{4\ell}} < $ 130 GeV. Points with error bars represent the data and stacked histograms represent expected distributions of the signal and background processes. The yields of the different H boson production mechanisms with $ {m_{\mathrm{H}}} = $ 125 GeV, denoted as H(125), and those of the ZZ and rare electroweak backgrounds are normalized to the SM expectations, while the Z+X background yield is normalized to the estimate from the data. In the middle and right figures the SM H boson signal is separated into two components: the production mode which is targeted by the specific discriminant, and other production modes, where the gluon fusion process dominates. |
png pdf |
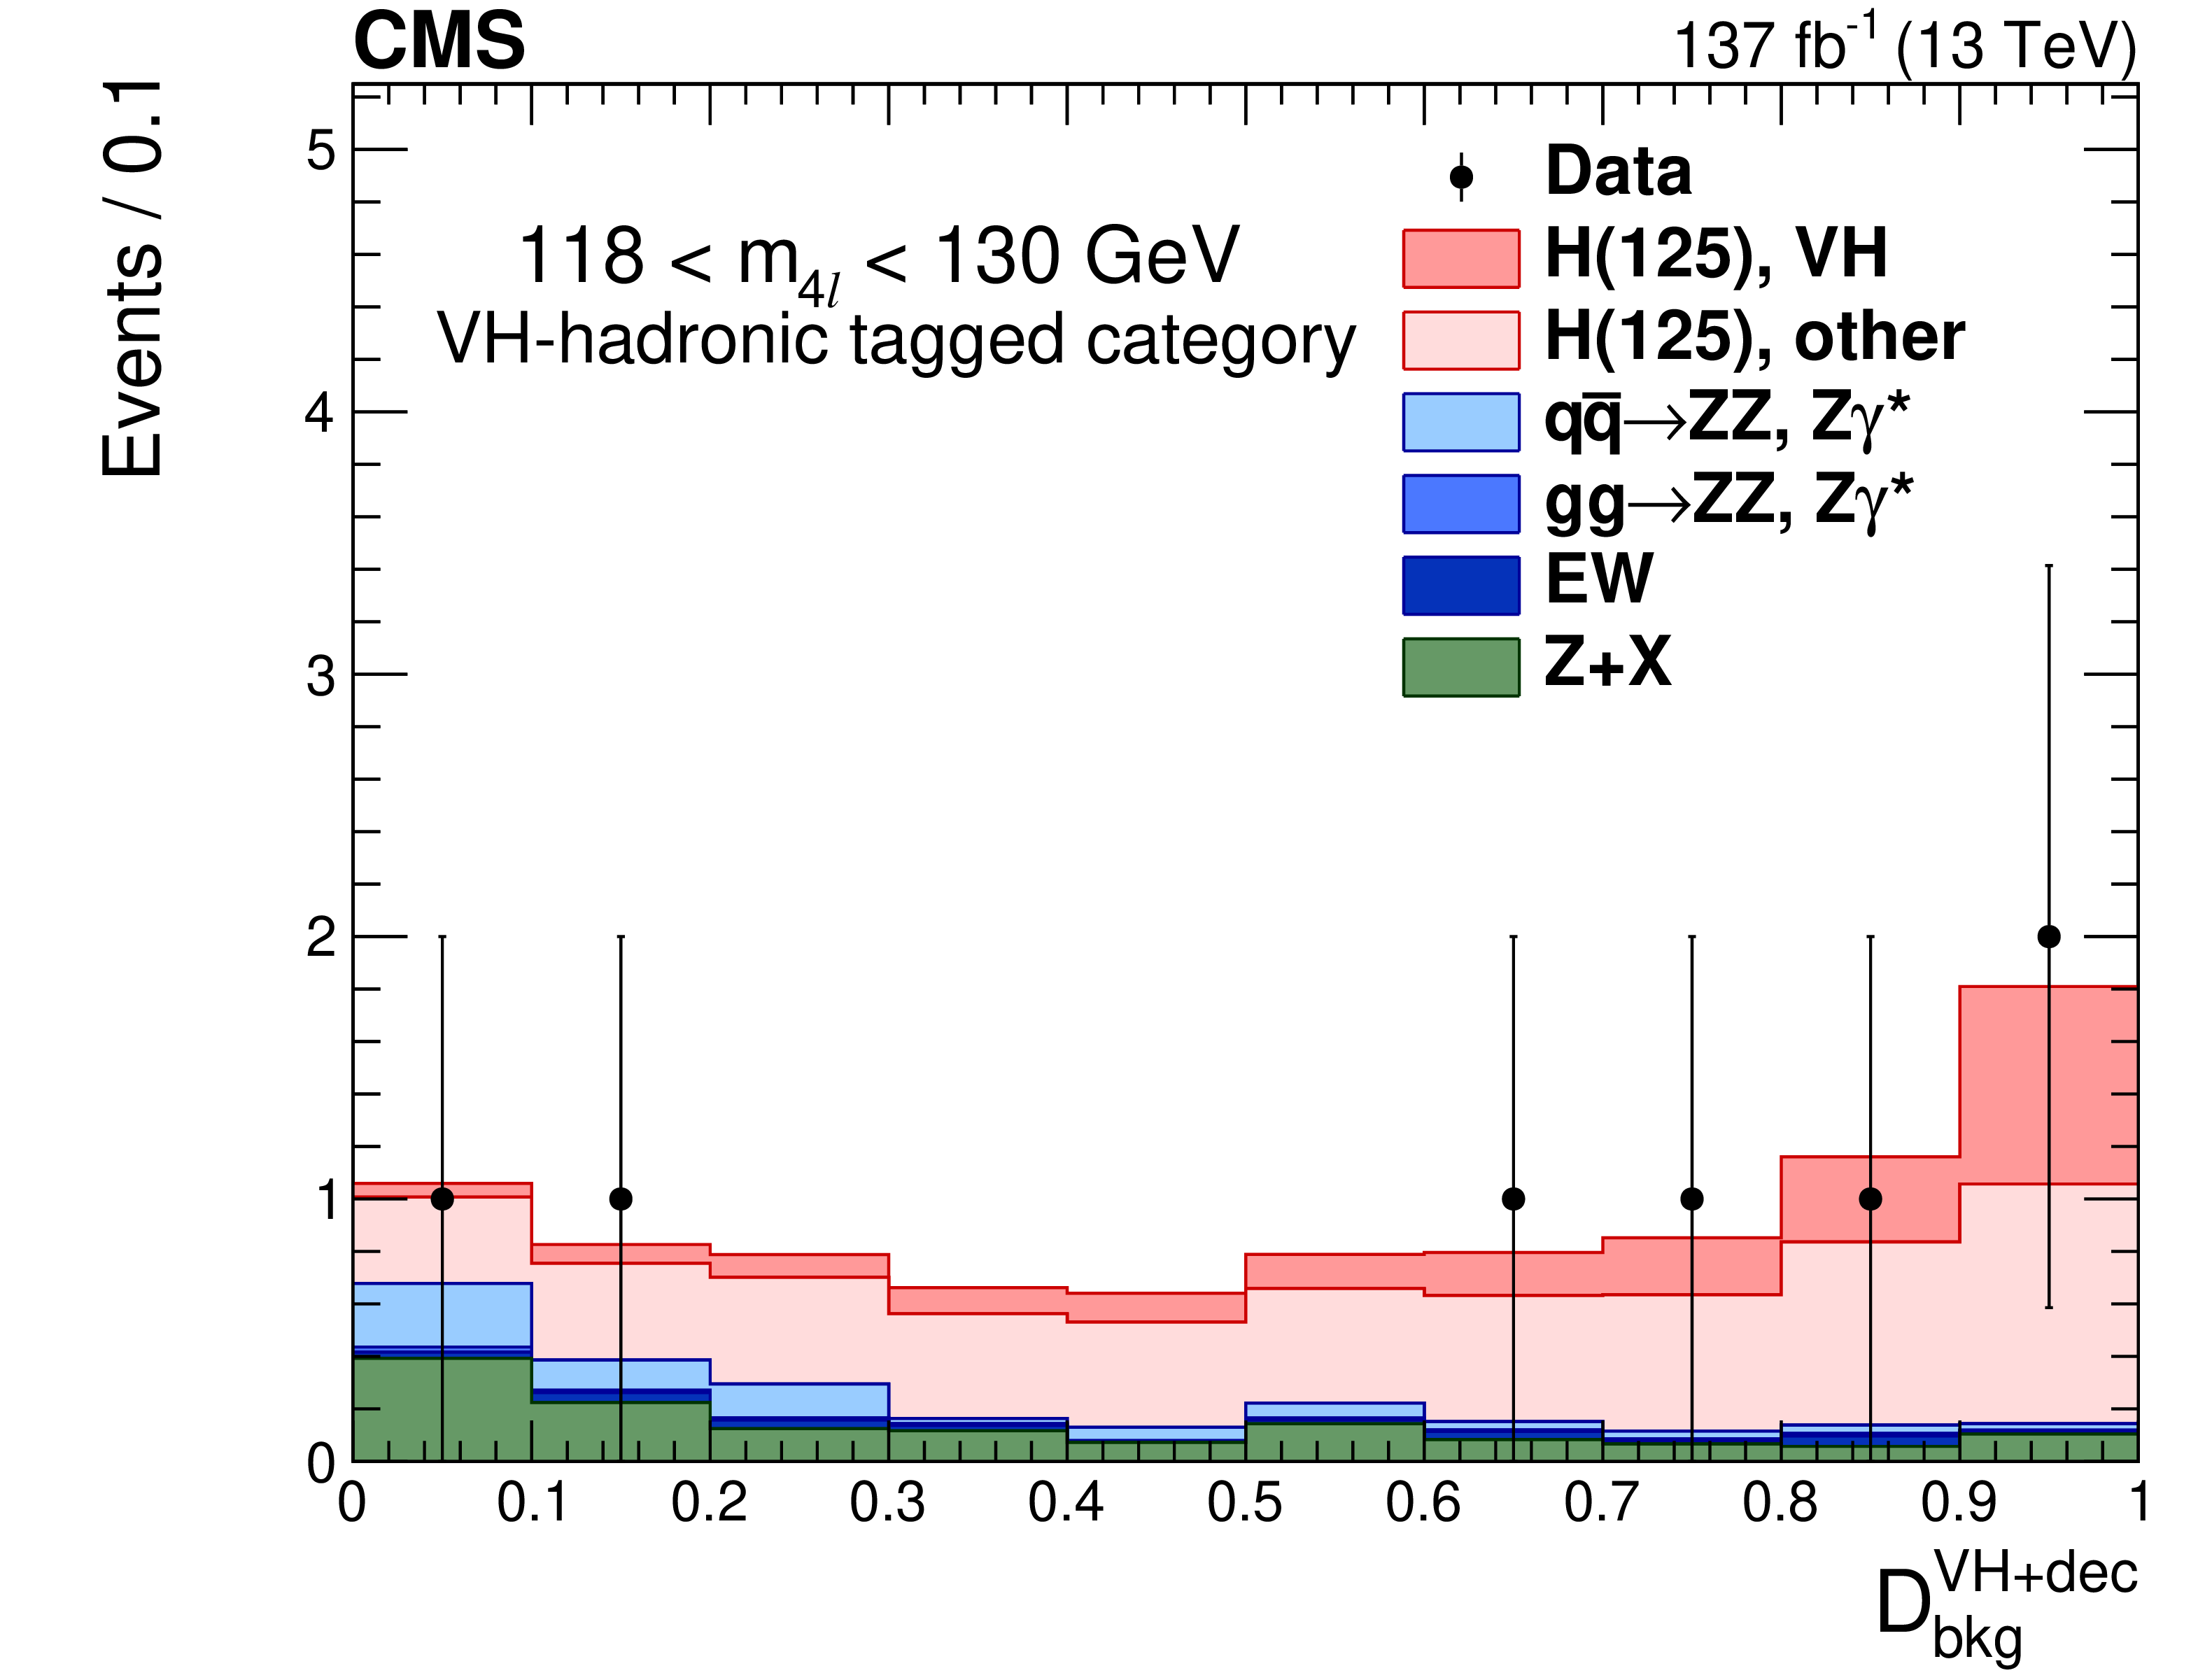
Figure 10-c:
Distribution of the ${{\mathcal {D}}^{{\mathrm{V} \mathrm{H}}+\text {dec}}_{\text {bkg}}}$ kinematic discriminant in the mass region 118 $ < {m_{4\ell}} < $ 130 GeV. Points with error bars represent the data and stacked histograms represent expected distributions of the signal and background processes. The yields of the different H boson production mechanisms with $ {m_{\mathrm{H}}} = $ 125 GeV, denoted as H(125), and those of the ZZ and rare electroweak backgrounds are normalized to the SM expectations, while the Z+X background yield is normalized to the estimate from the data. In the middle and right figures the SM H boson signal is separated into two components: the production mode which is targeted by the specific discriminant, and other production modes, where the gluon fusion process dominates. |
png pdf |
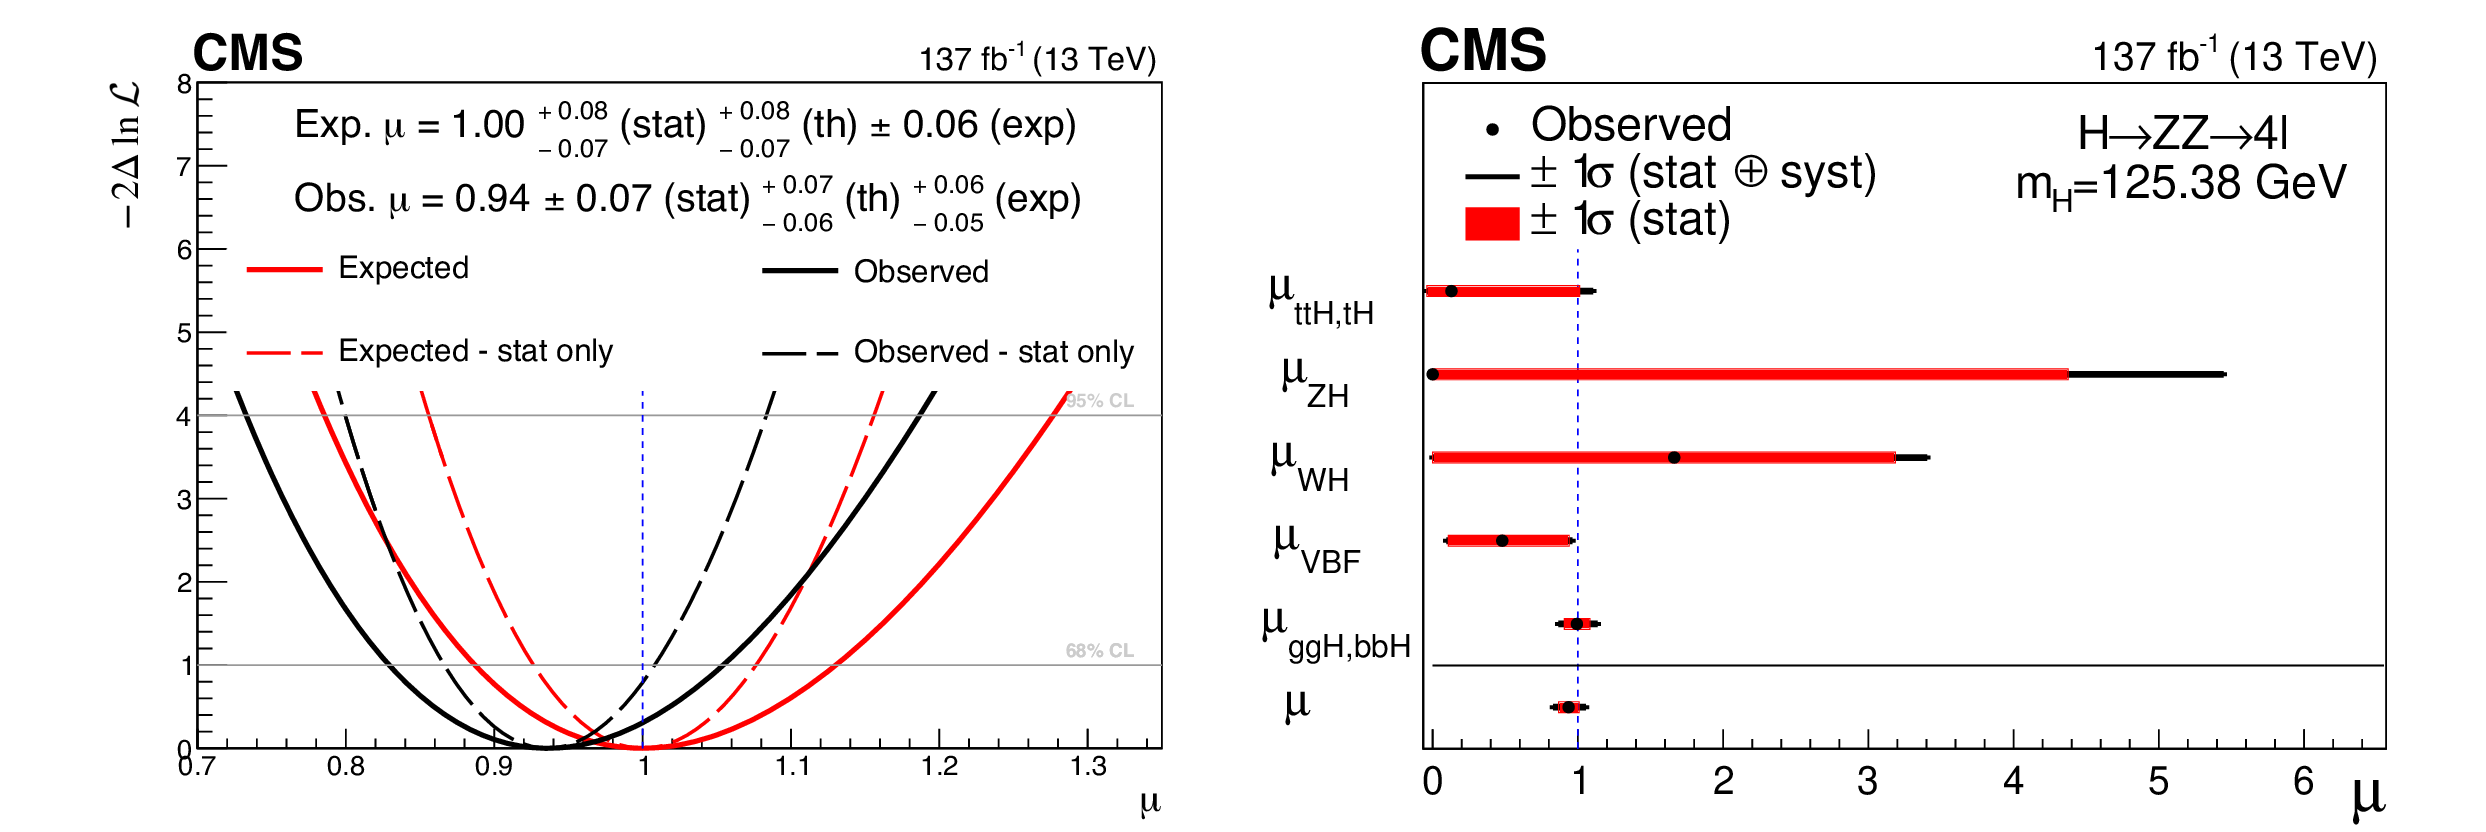
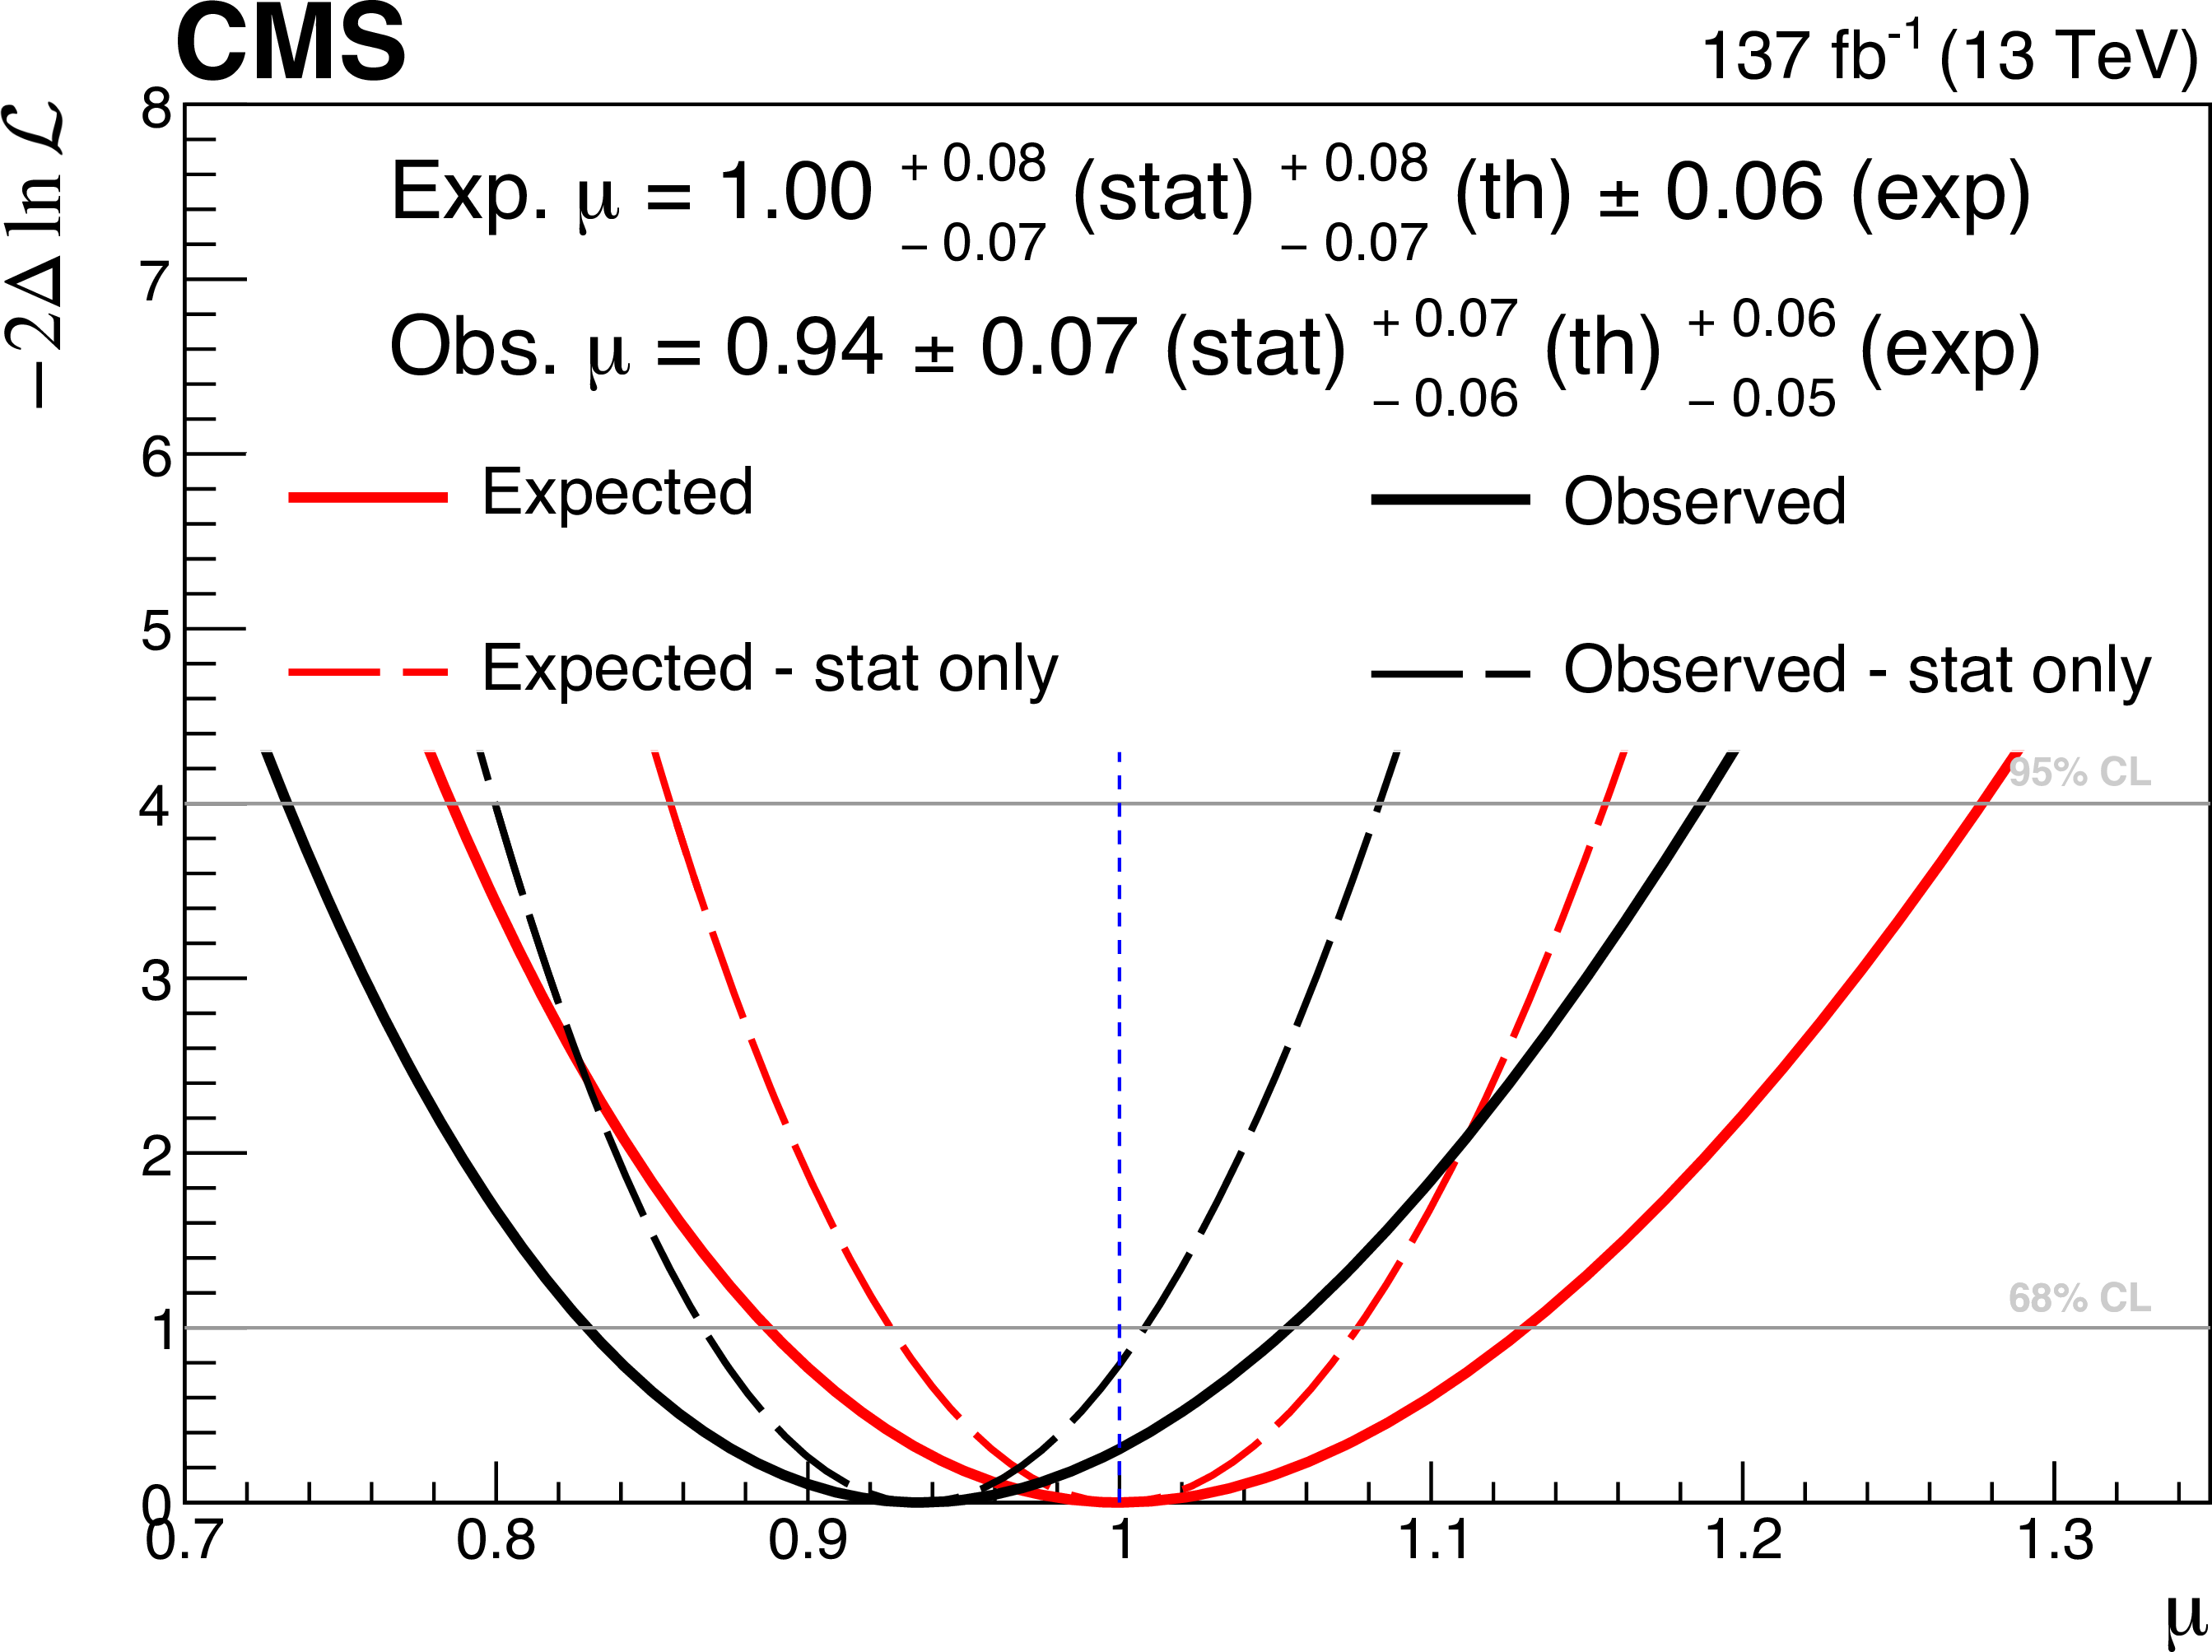
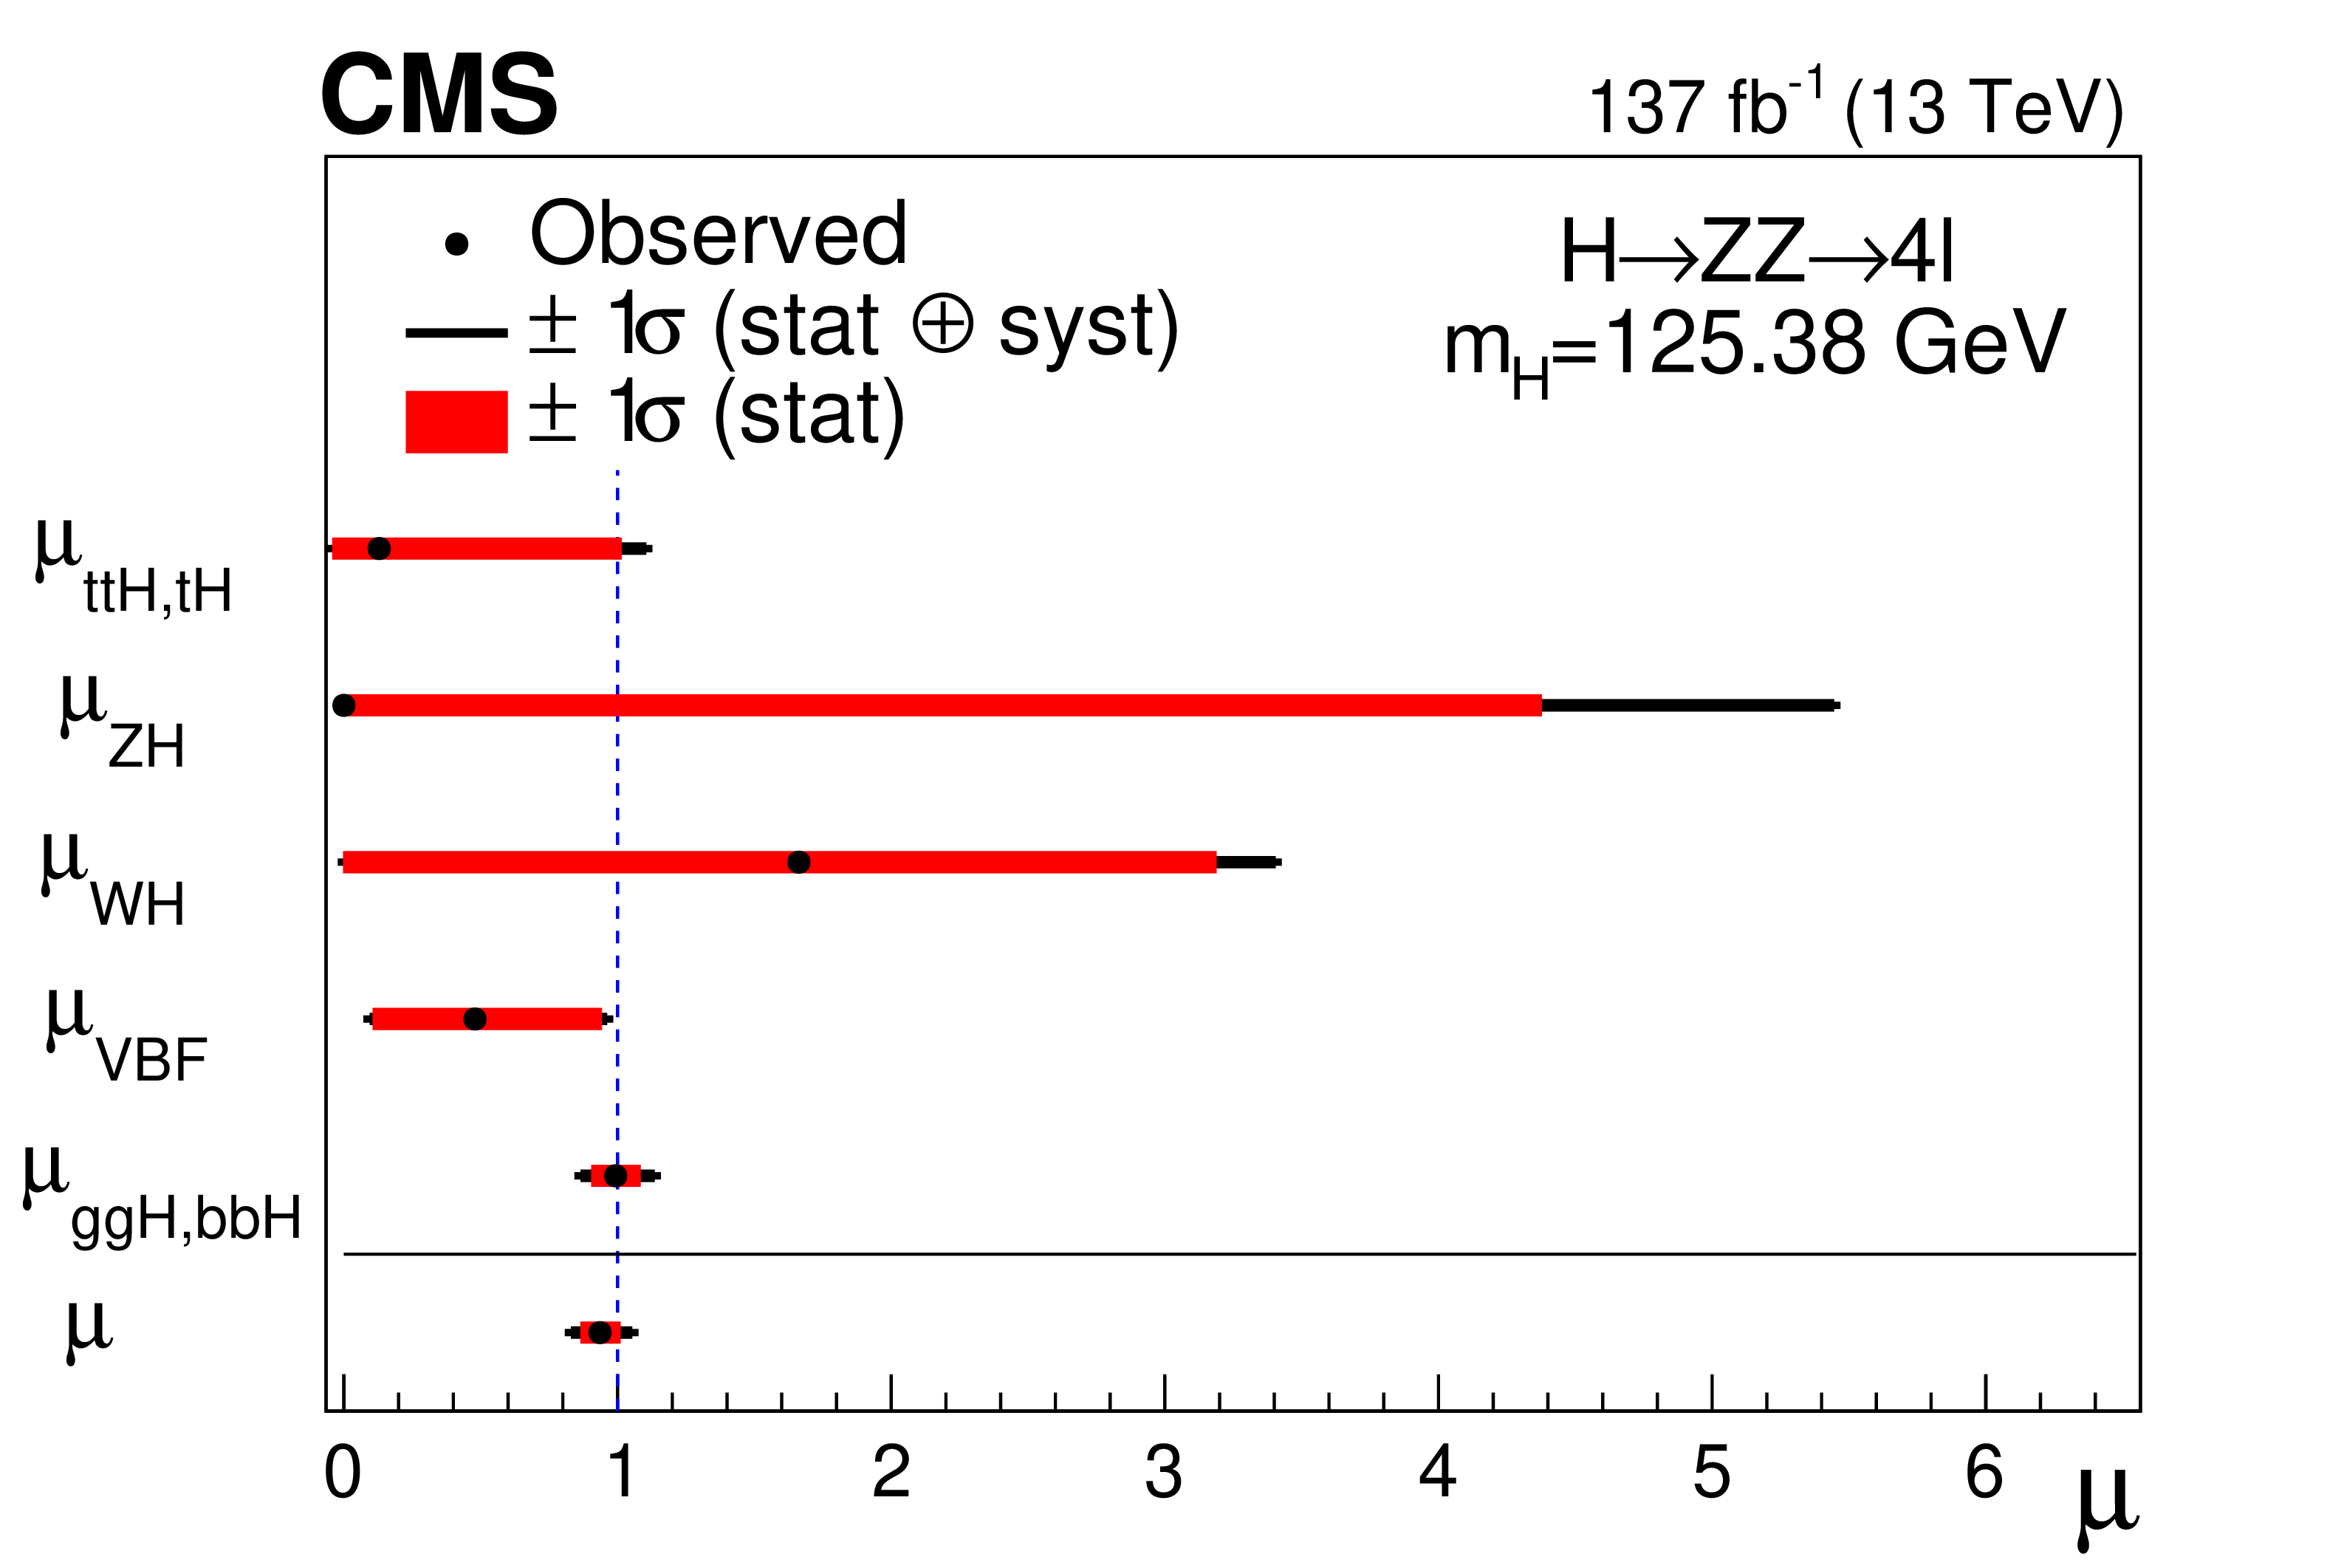
Figure 11:
(left) The observed and expected profile likelihood scans of the inclusive signal strength modifier. The scans are shown both with (solid line) and without (dashed line) systematic uncertainties. (right) Results of likelihood scans for the signal strength modifiers corresponding to the five main SM H boson production mechanisms, compared to the SM prediction shown as a vertical dashed line. The thick black lines indicate the one standard deviation confidence intervals including both statistical and systematic sources. The thick red lines indicate the statistical uncertainties corresponding to the one standard deviation confidence intervals. |
png pdf |
Figure 11-a:
The observed and expected profile likelihood scans of the inclusive signal strength modifier. The scans are shown both with (solid line) and without (dashed line) systematic uncertainties. |
png pdf |
Figure 11-b:
Results of likelihood scans for the signal strength modifiers corresponding to the five main SM H boson production mechanisms, compared to the SM prediction shown as a vertical dashed line. The thick black lines indicate the one standard deviation confidence intervals including both statistical and systematic sources. The thick red lines indicate the statistical uncertainties corresponding to the one standard deviation confidence intervals. |

png pdf |
Figure 12:
Result of the 2D likelihood scan for the $ {\mu _{\mathrm {f}}}\equiv {\mu _{\mathrm{g} \mathrm{g} \mathrm{H},\, {{\mathrm{t} {}\mathrm{\bar{t}}} \mathrm{H}}, {\mathrm{b} {}\mathrm{\bar{b}} \mathrm{H}}, {\mathrm{q}t \mathrm{H}}}} $ and $ {\mu _{\mathrm{V}}}\equiv {\mu _{\mathrm {VBF},\mathrm{V} \mathrm{H}}}$ signal strength modifiers. The solid and dashed contours show the 68 and 95% CL regions, respectively. The cross indicates the best fit value, and the diamond represents the expected value for the SM Higgs boson. |
png pdf |
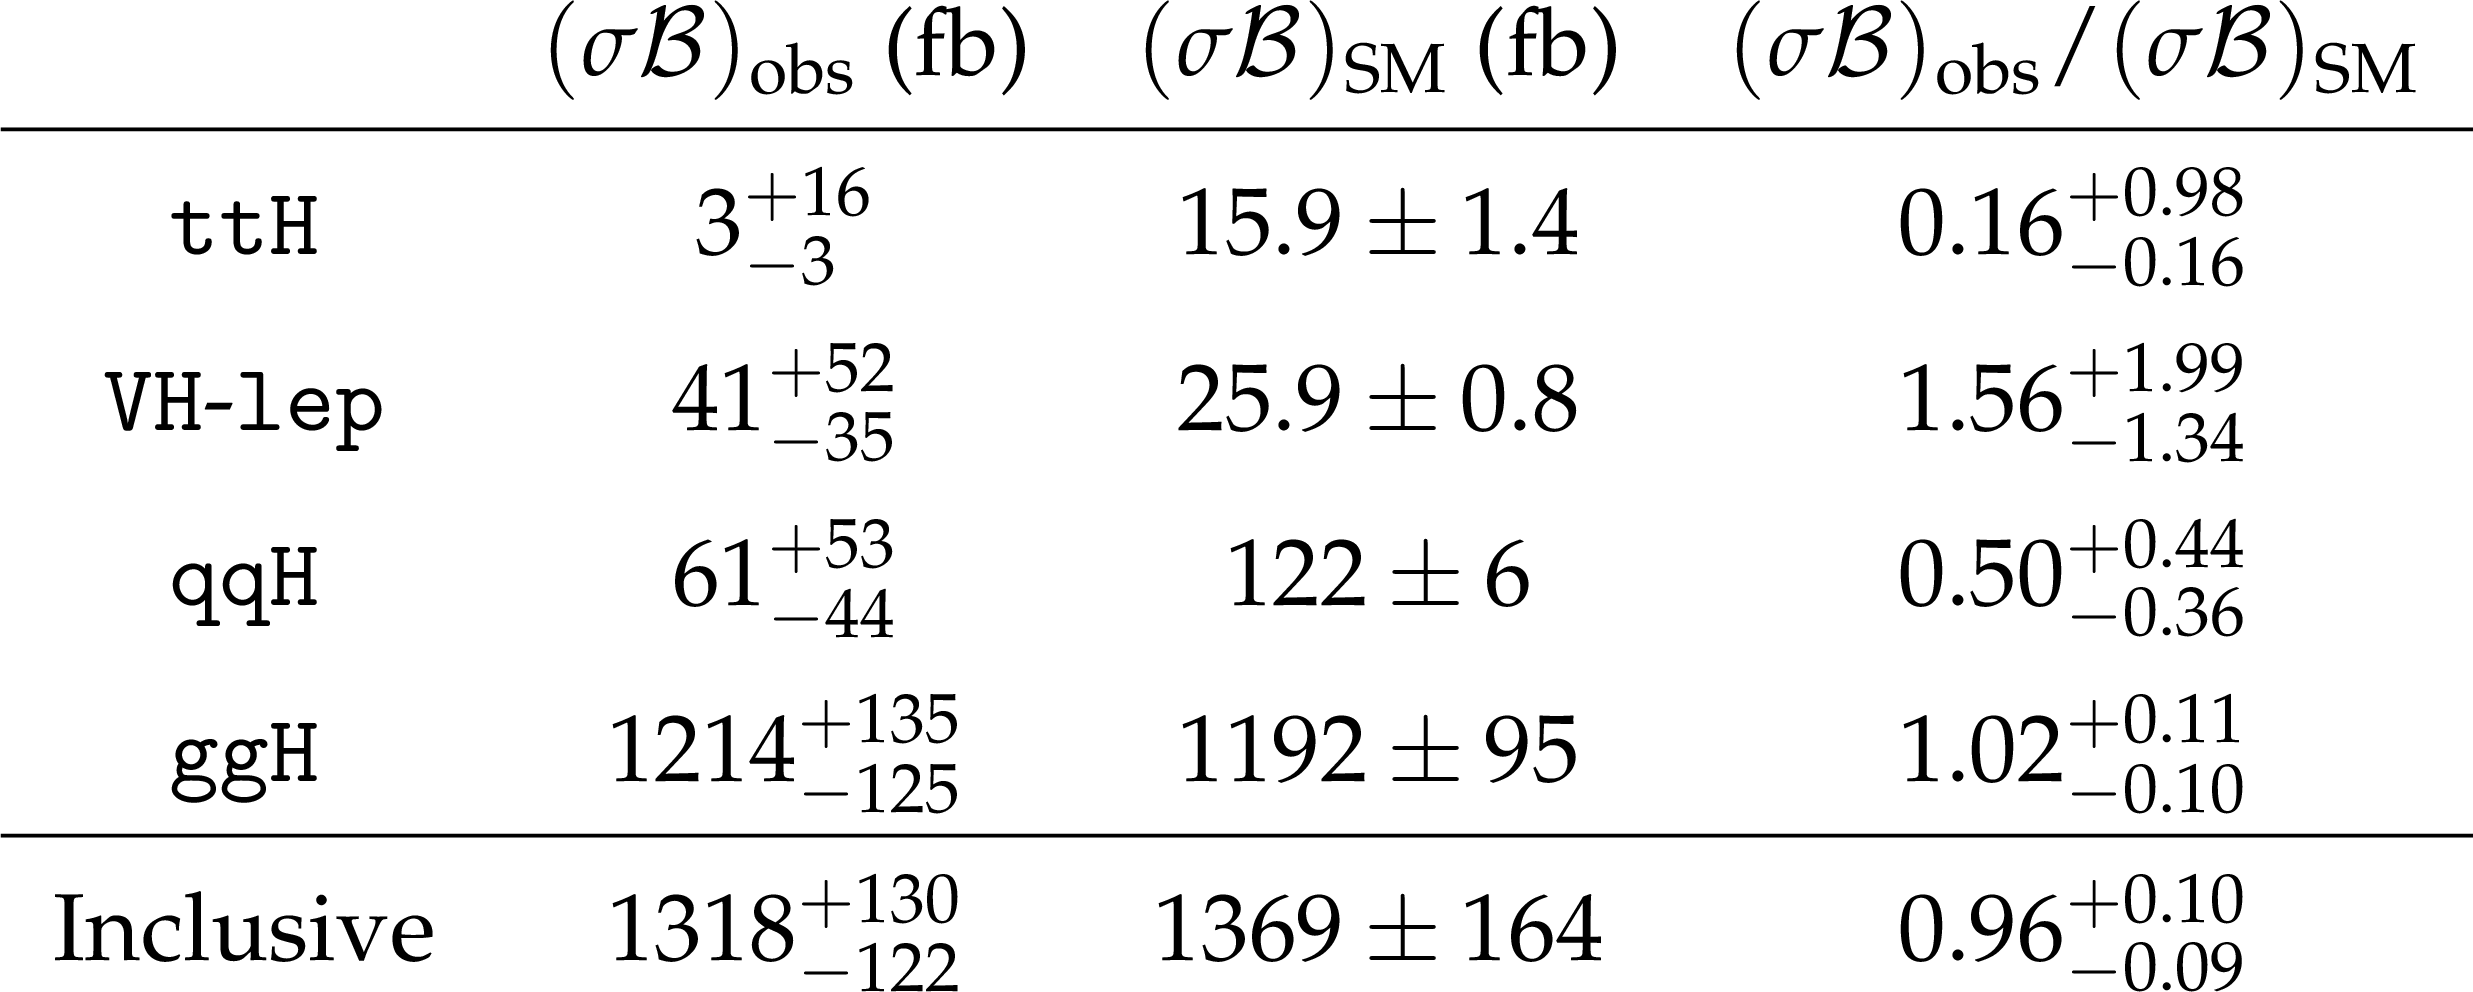
Figure 13:
The measured product of cross section times branching fraction for $ {\mathrm{H} \to \mathrm{Z} \mathrm{Z}}$ decay $ {(\sigma \mathcal {B})_{{\text {obs}}}}$ and the SM predictions $ {(\sigma \mathcal {B})_{\mathrm {SM}}}$ for the stage 0 STXS production bins and the inclusive measurement at $ {m_{\mathrm{H}}} = $ 125.38 GeV. Points with error bars represent measured values and black dashed lines with gray uncertainty bands represent the SM predictions. In the bottom panel ratios of the measured cross sections and the SM predictions are shown along with the uncertainties for each of the bins and the inclusive measurement. |
png pdf |
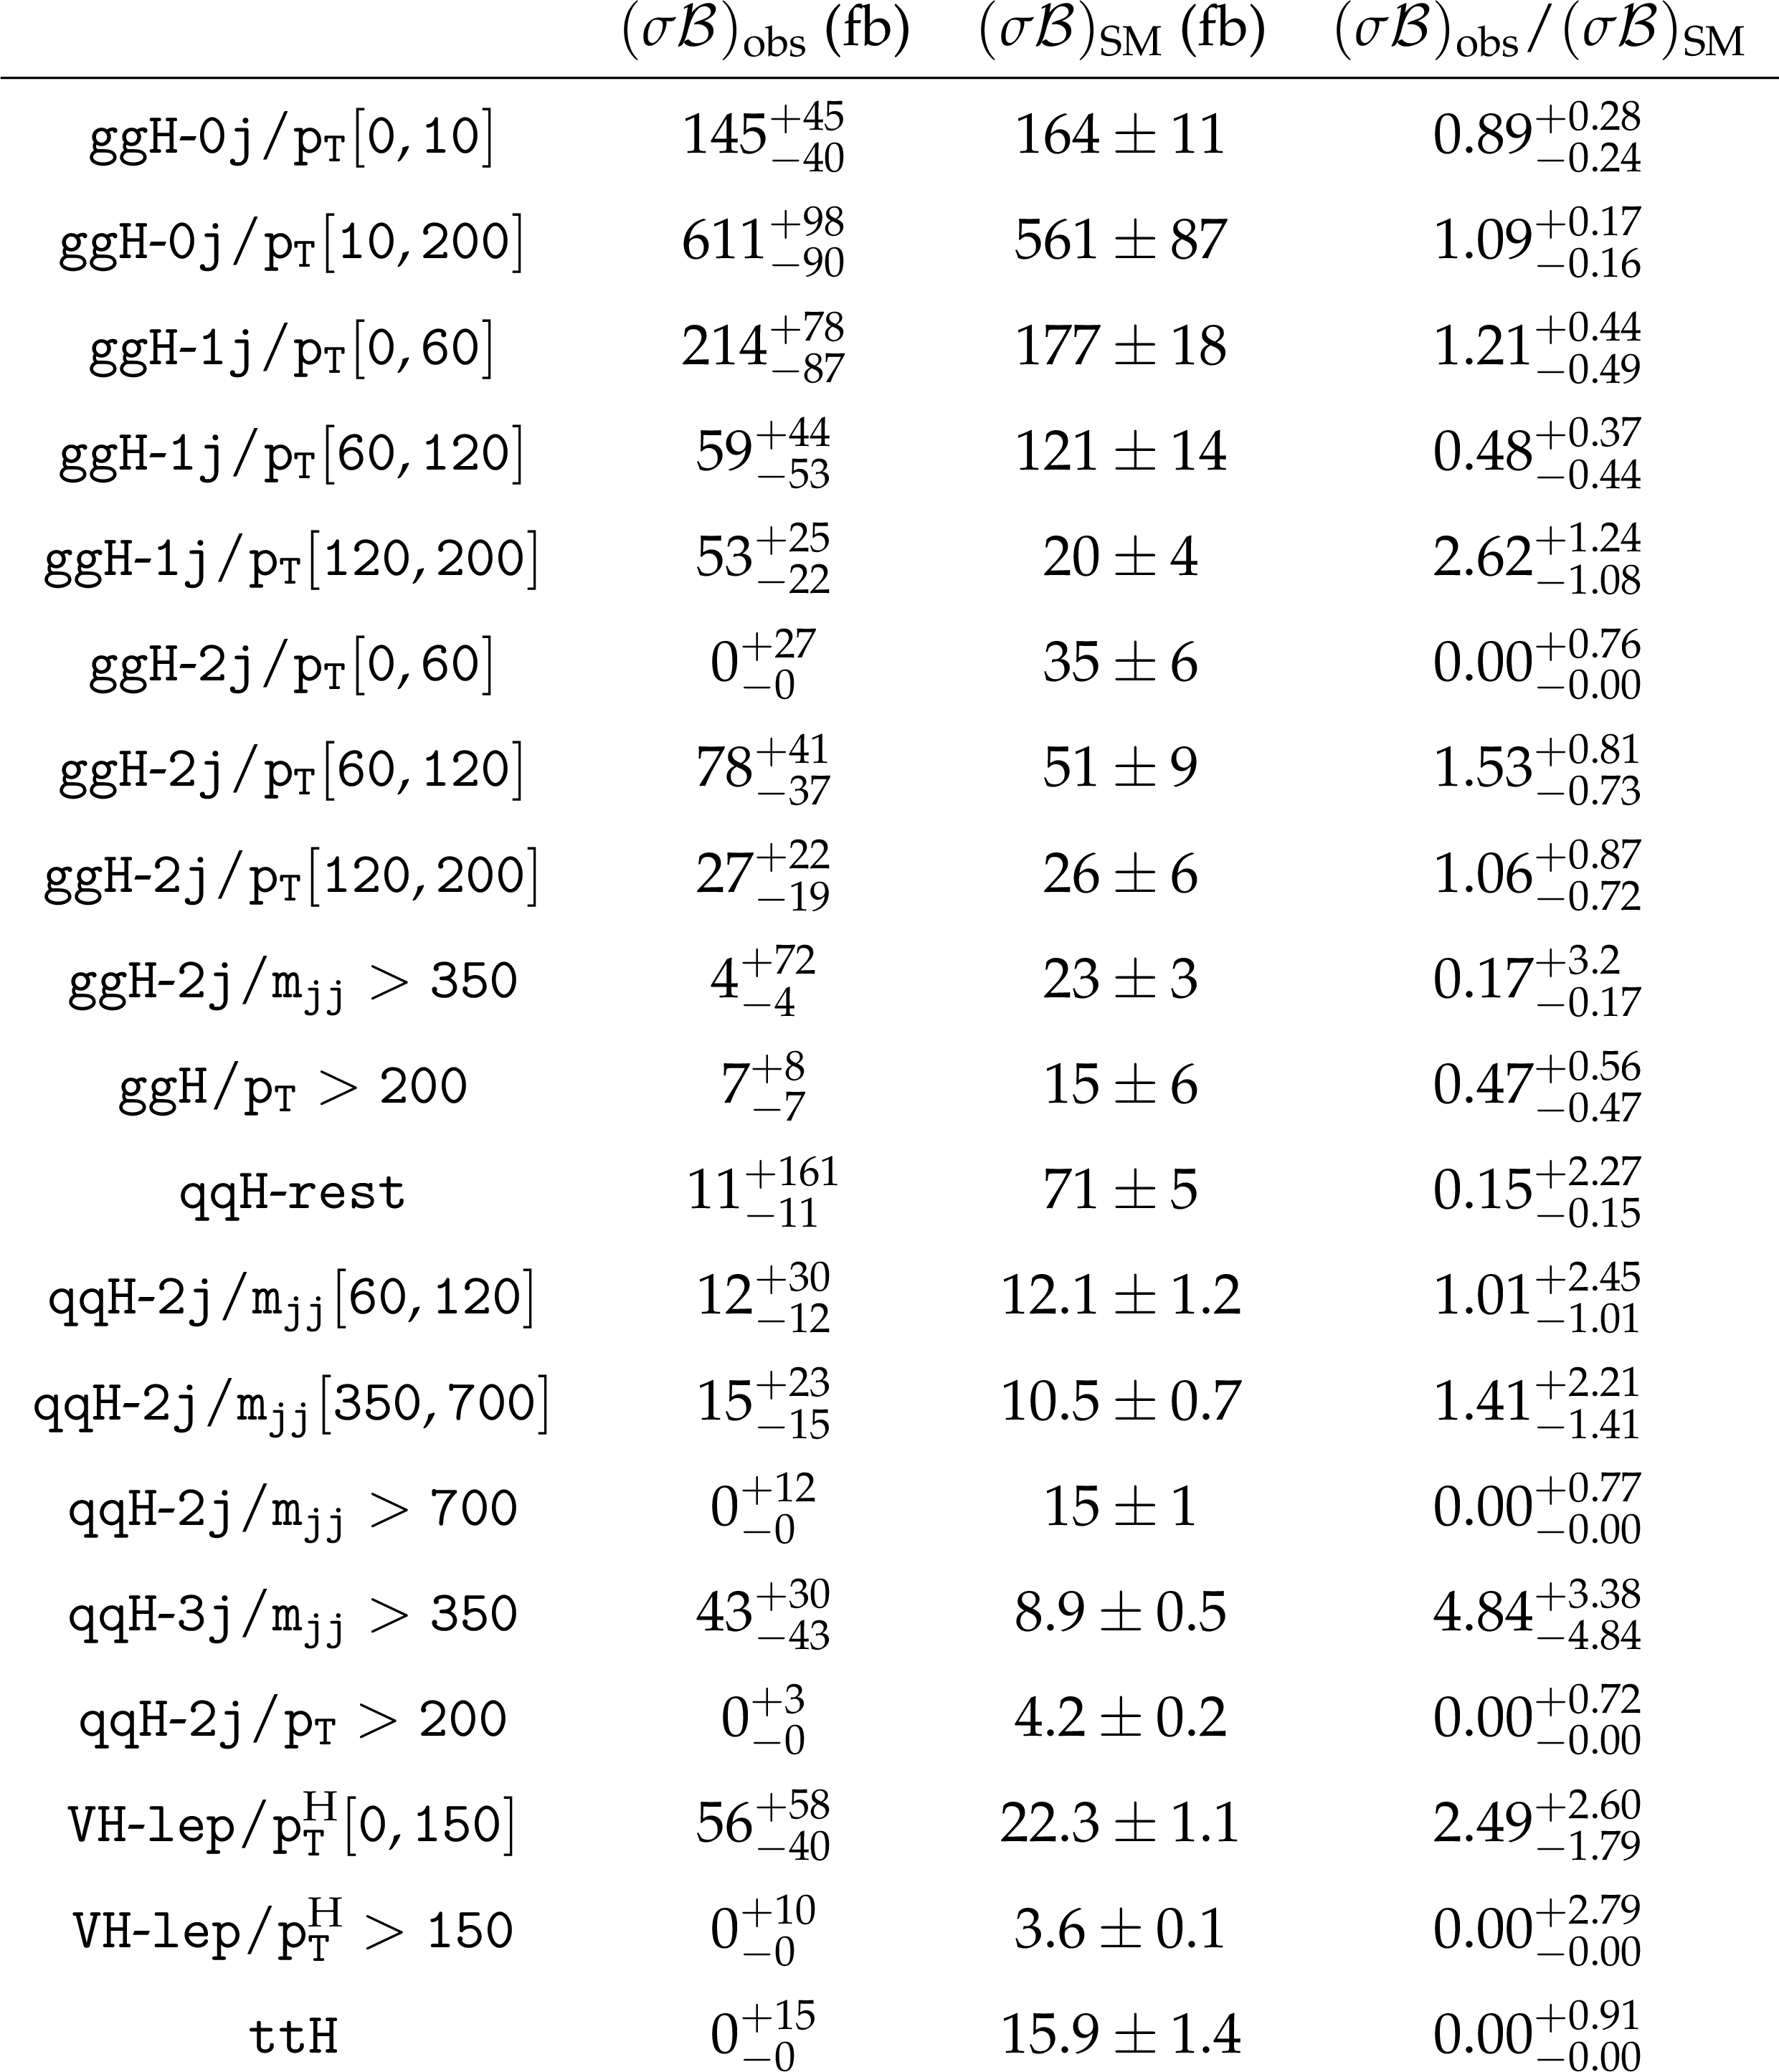
Figure 14:
The measured cross sections $ {(\sigma \mathcal {B})_{{\text {obs}}}}$ and the SM predictions $ {(\sigma \mathcal {B})_{\mathrm {SM}}}$ for $ {\mathrm{H} \to \mathrm{Z} \mathrm{Z}}$ decay and the merged stage 1.2 STXS production bins at $ {m_{\mathrm{H}}} = $ 125.38 GeV. Points with error bars represent measured values and black dashed lines with gray uncertainty bands represent the SM predictions. In the bottom panel ratios of the measured cross sections and the SM predictions are shown with corresponding uncertainties for each of the bins. |
png pdf |
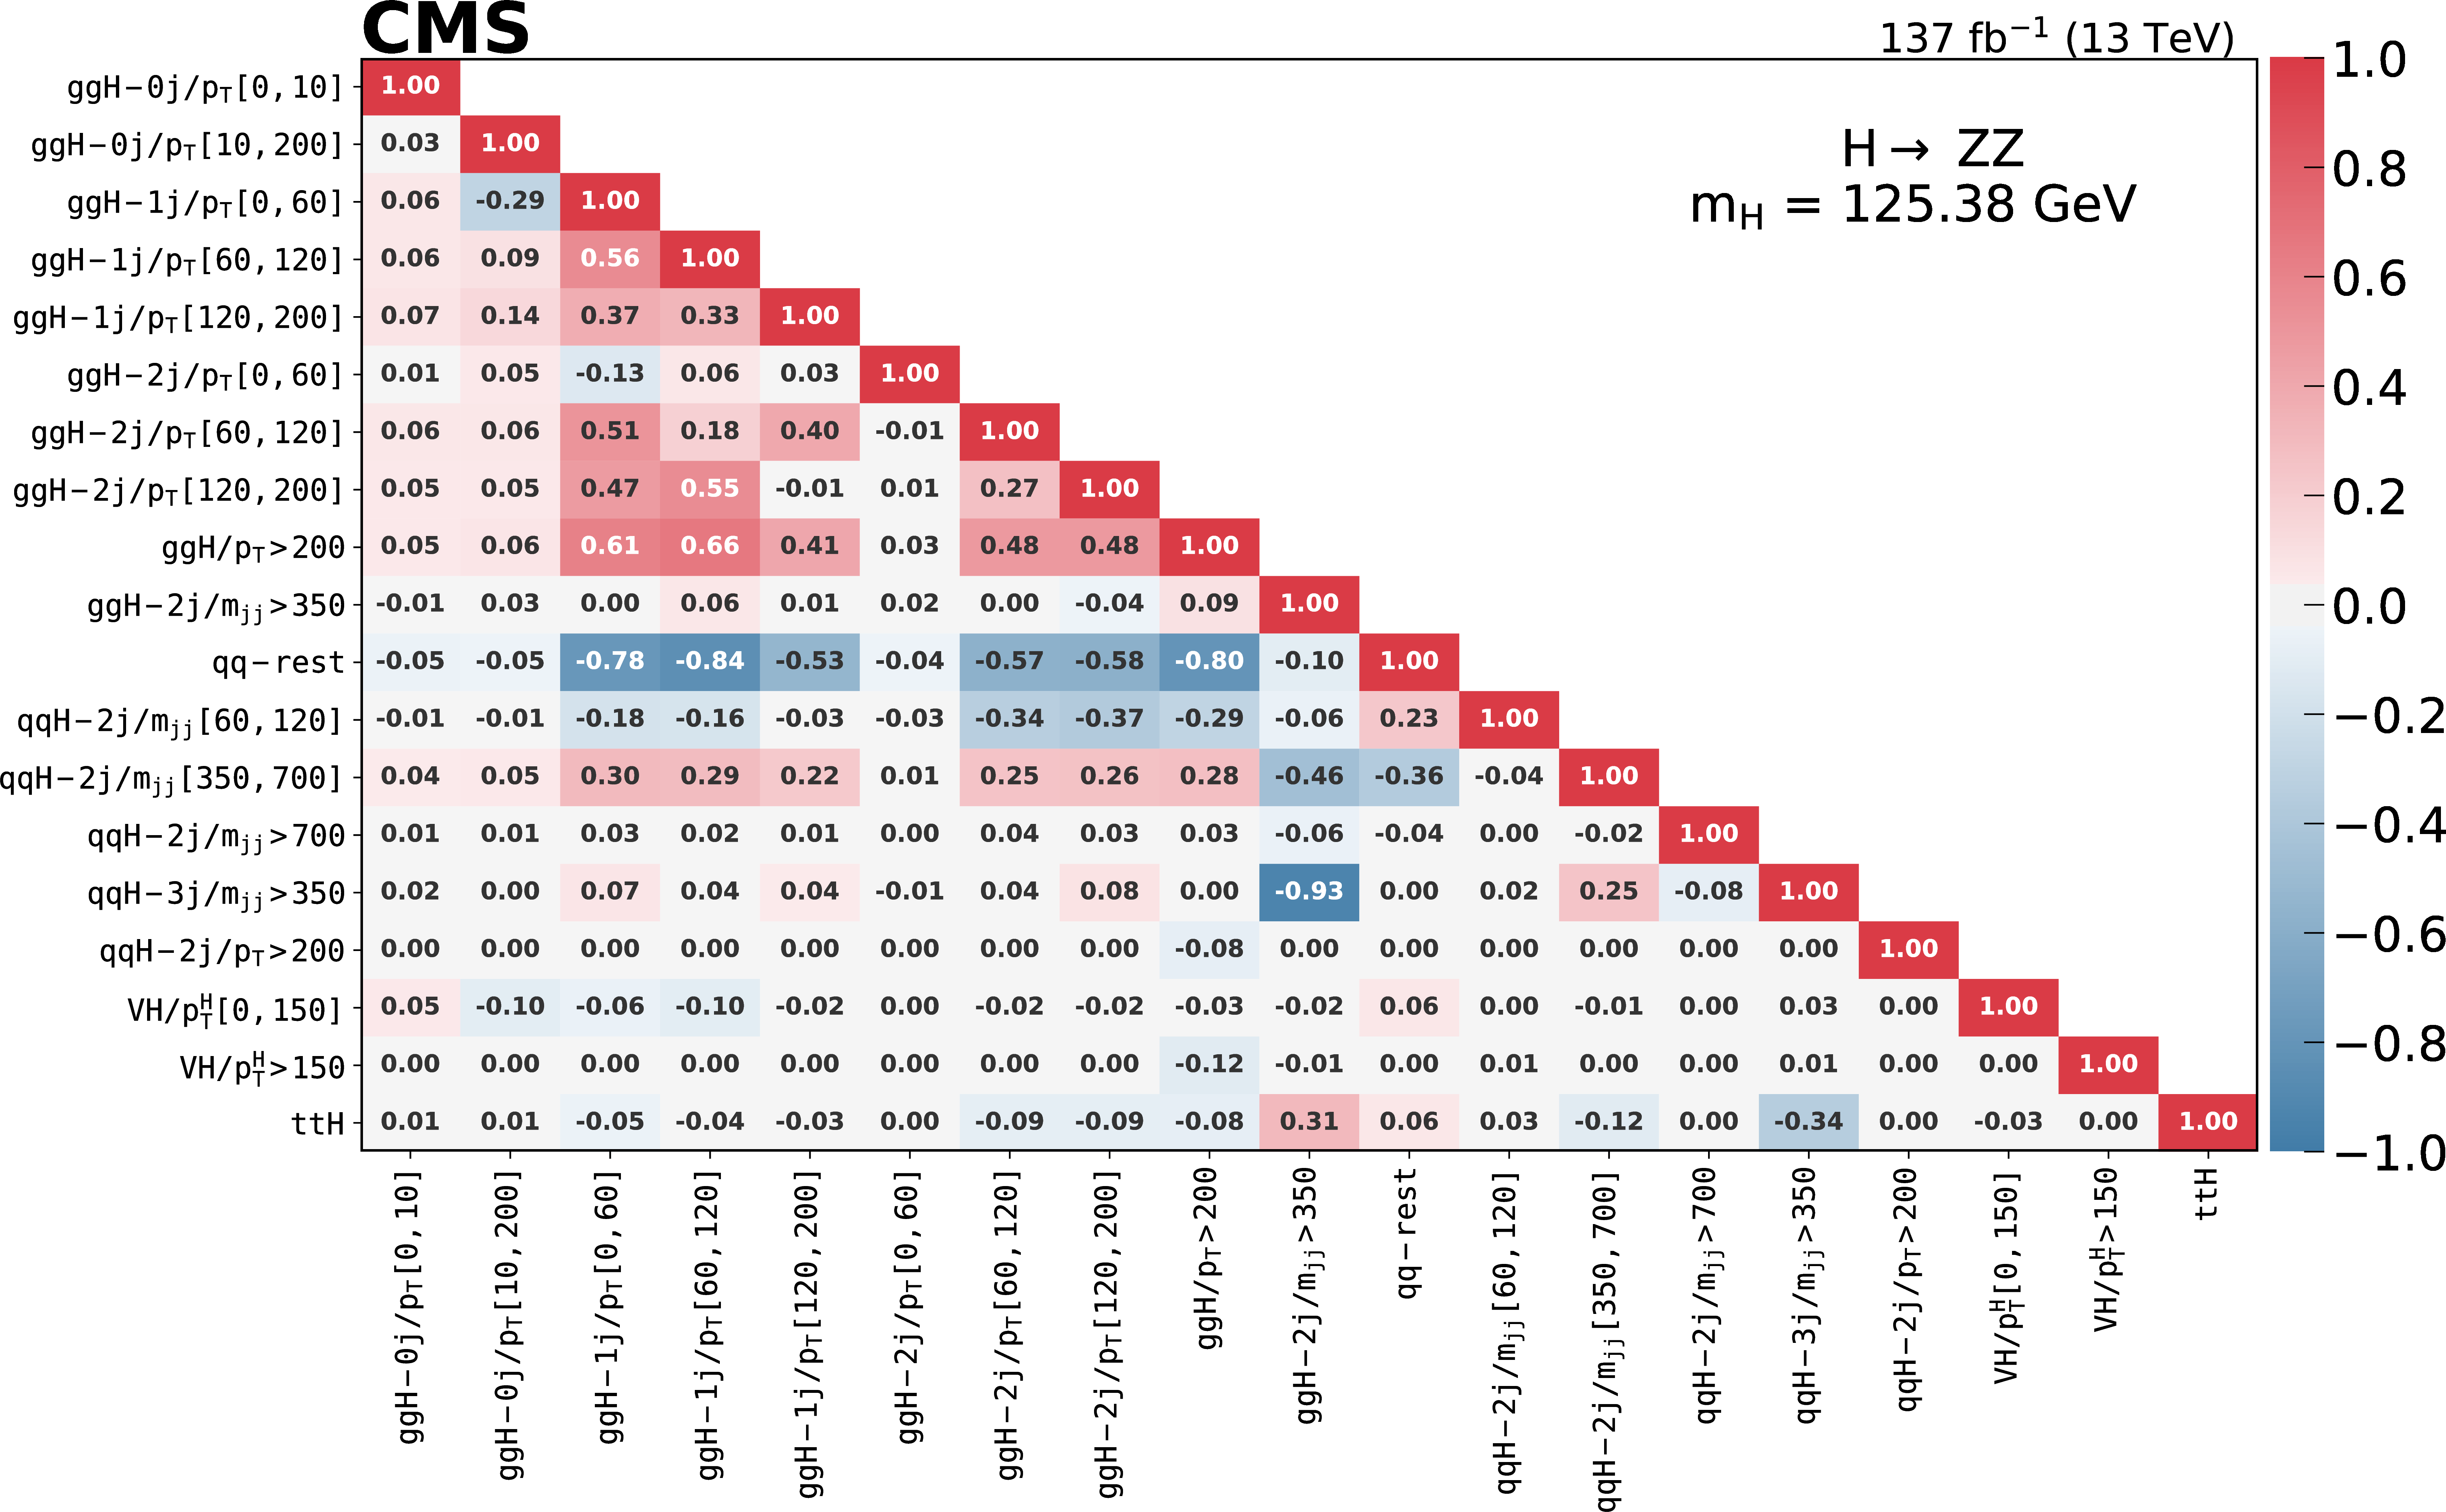
Figure 15:
Correlation matrices between the measured cross sections for the stage 0 (upper) and the merged stage 1.2 (lower) for $ {\mathrm{H} \to \mathrm{Z} \mathrm{Z}}$ decay. |
png pdf |
Figure 15-a:
Correlation matrice between the measured cross sections for the stage 0 for $ {\mathrm{H} \to \mathrm{Z} \mathrm{Z}}$ decay. |
png pdf |
Figure 15-b:
Correlation matrice between the measured cross sections for the merged stage 1.2 for $ {\mathrm{H} \to \mathrm{Z} \mathrm{Z}}$ decay. |
png pdf |
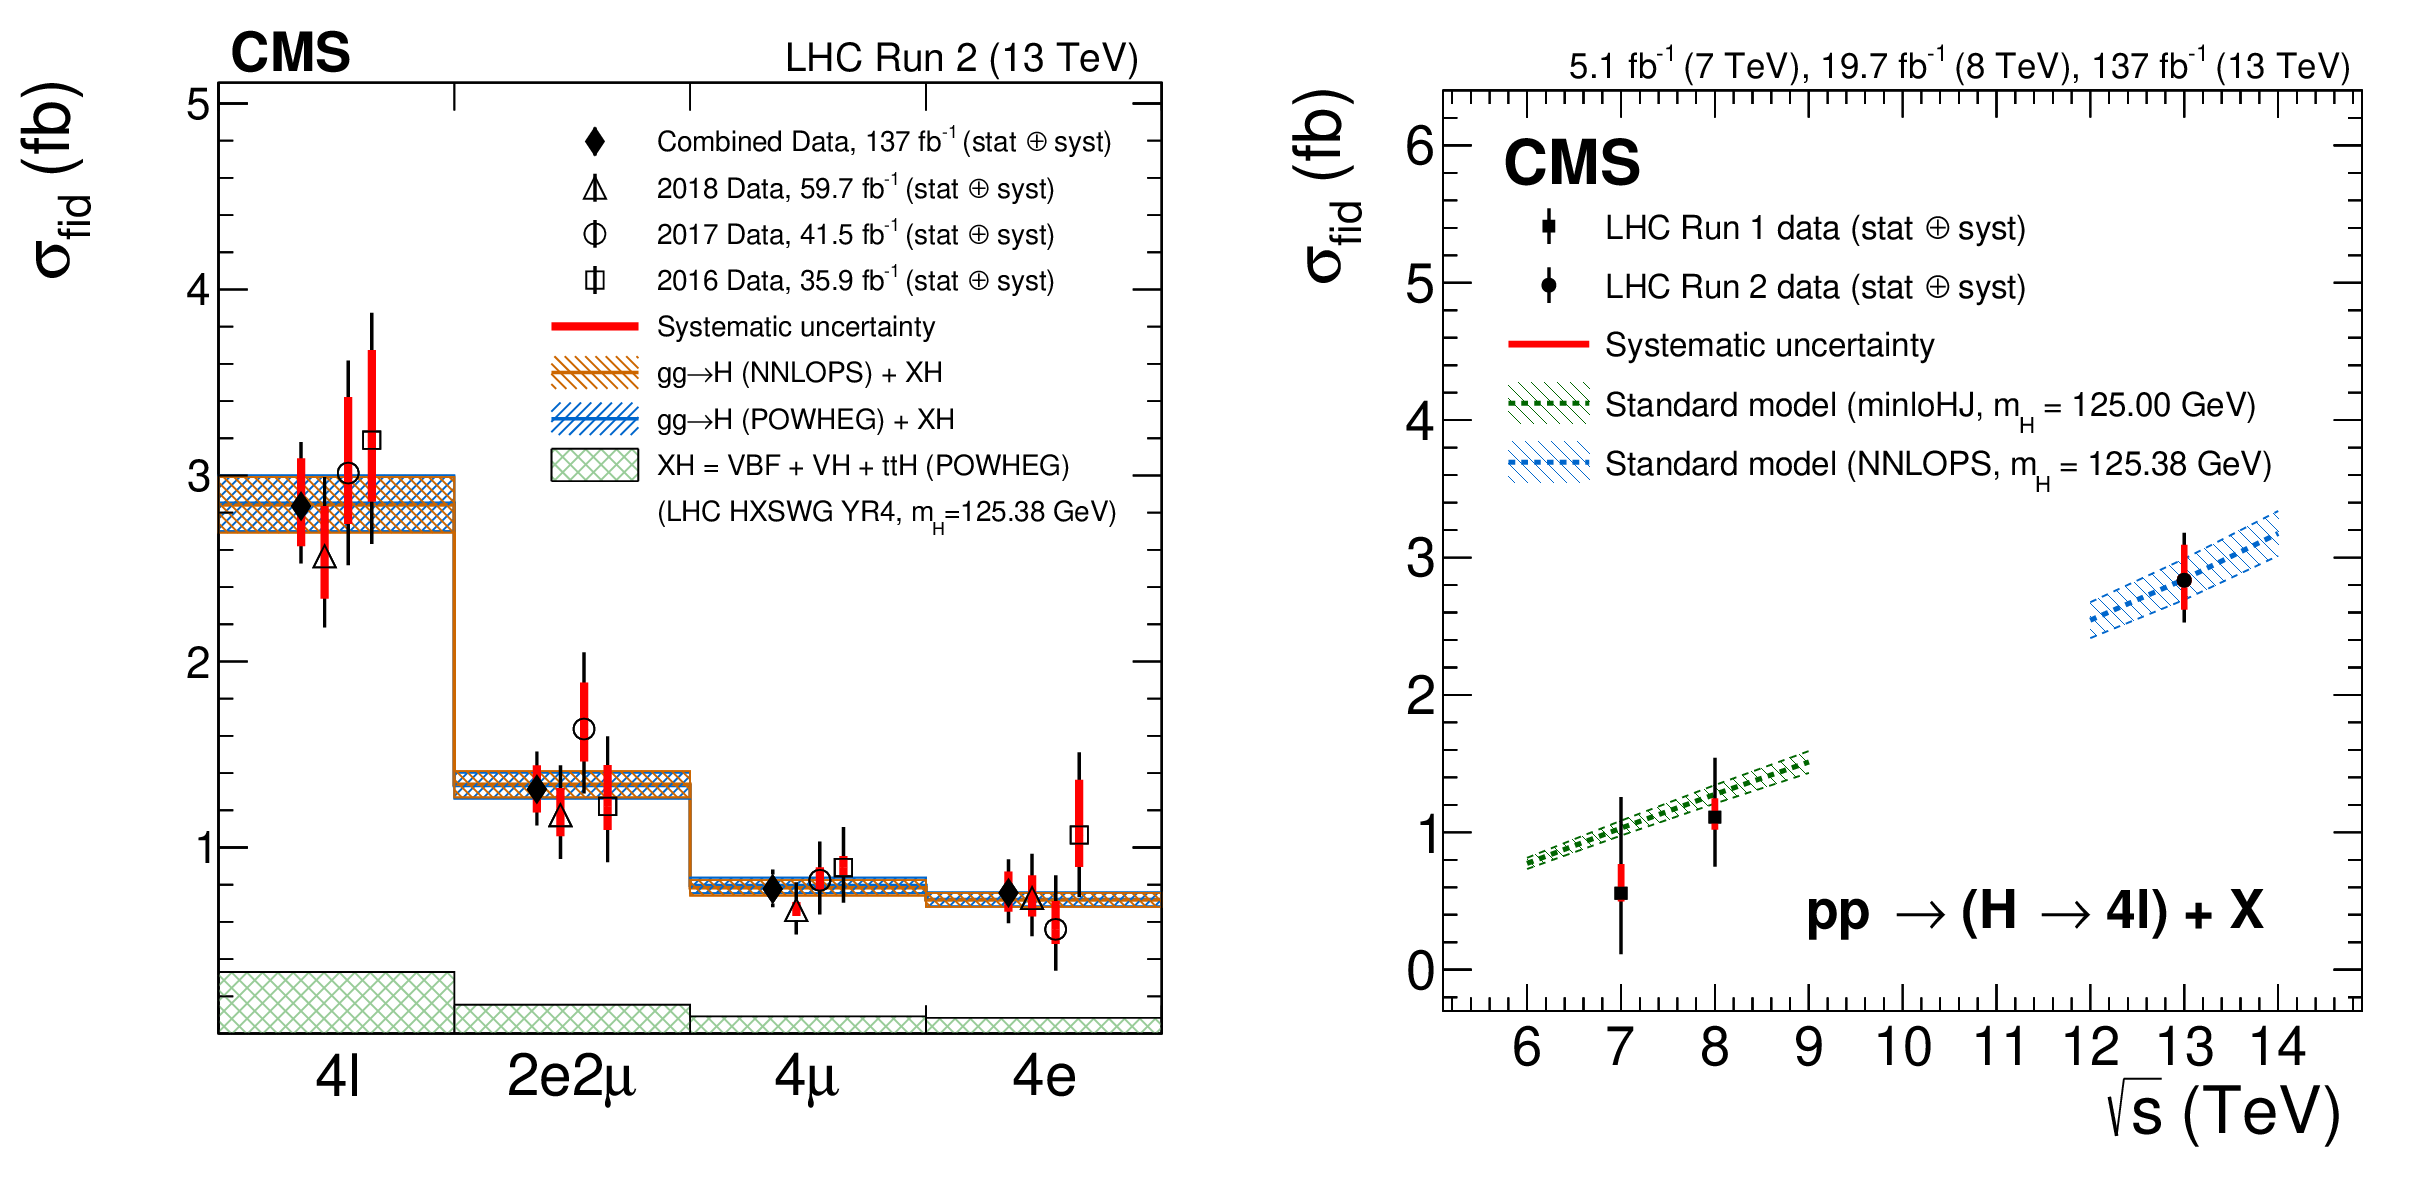
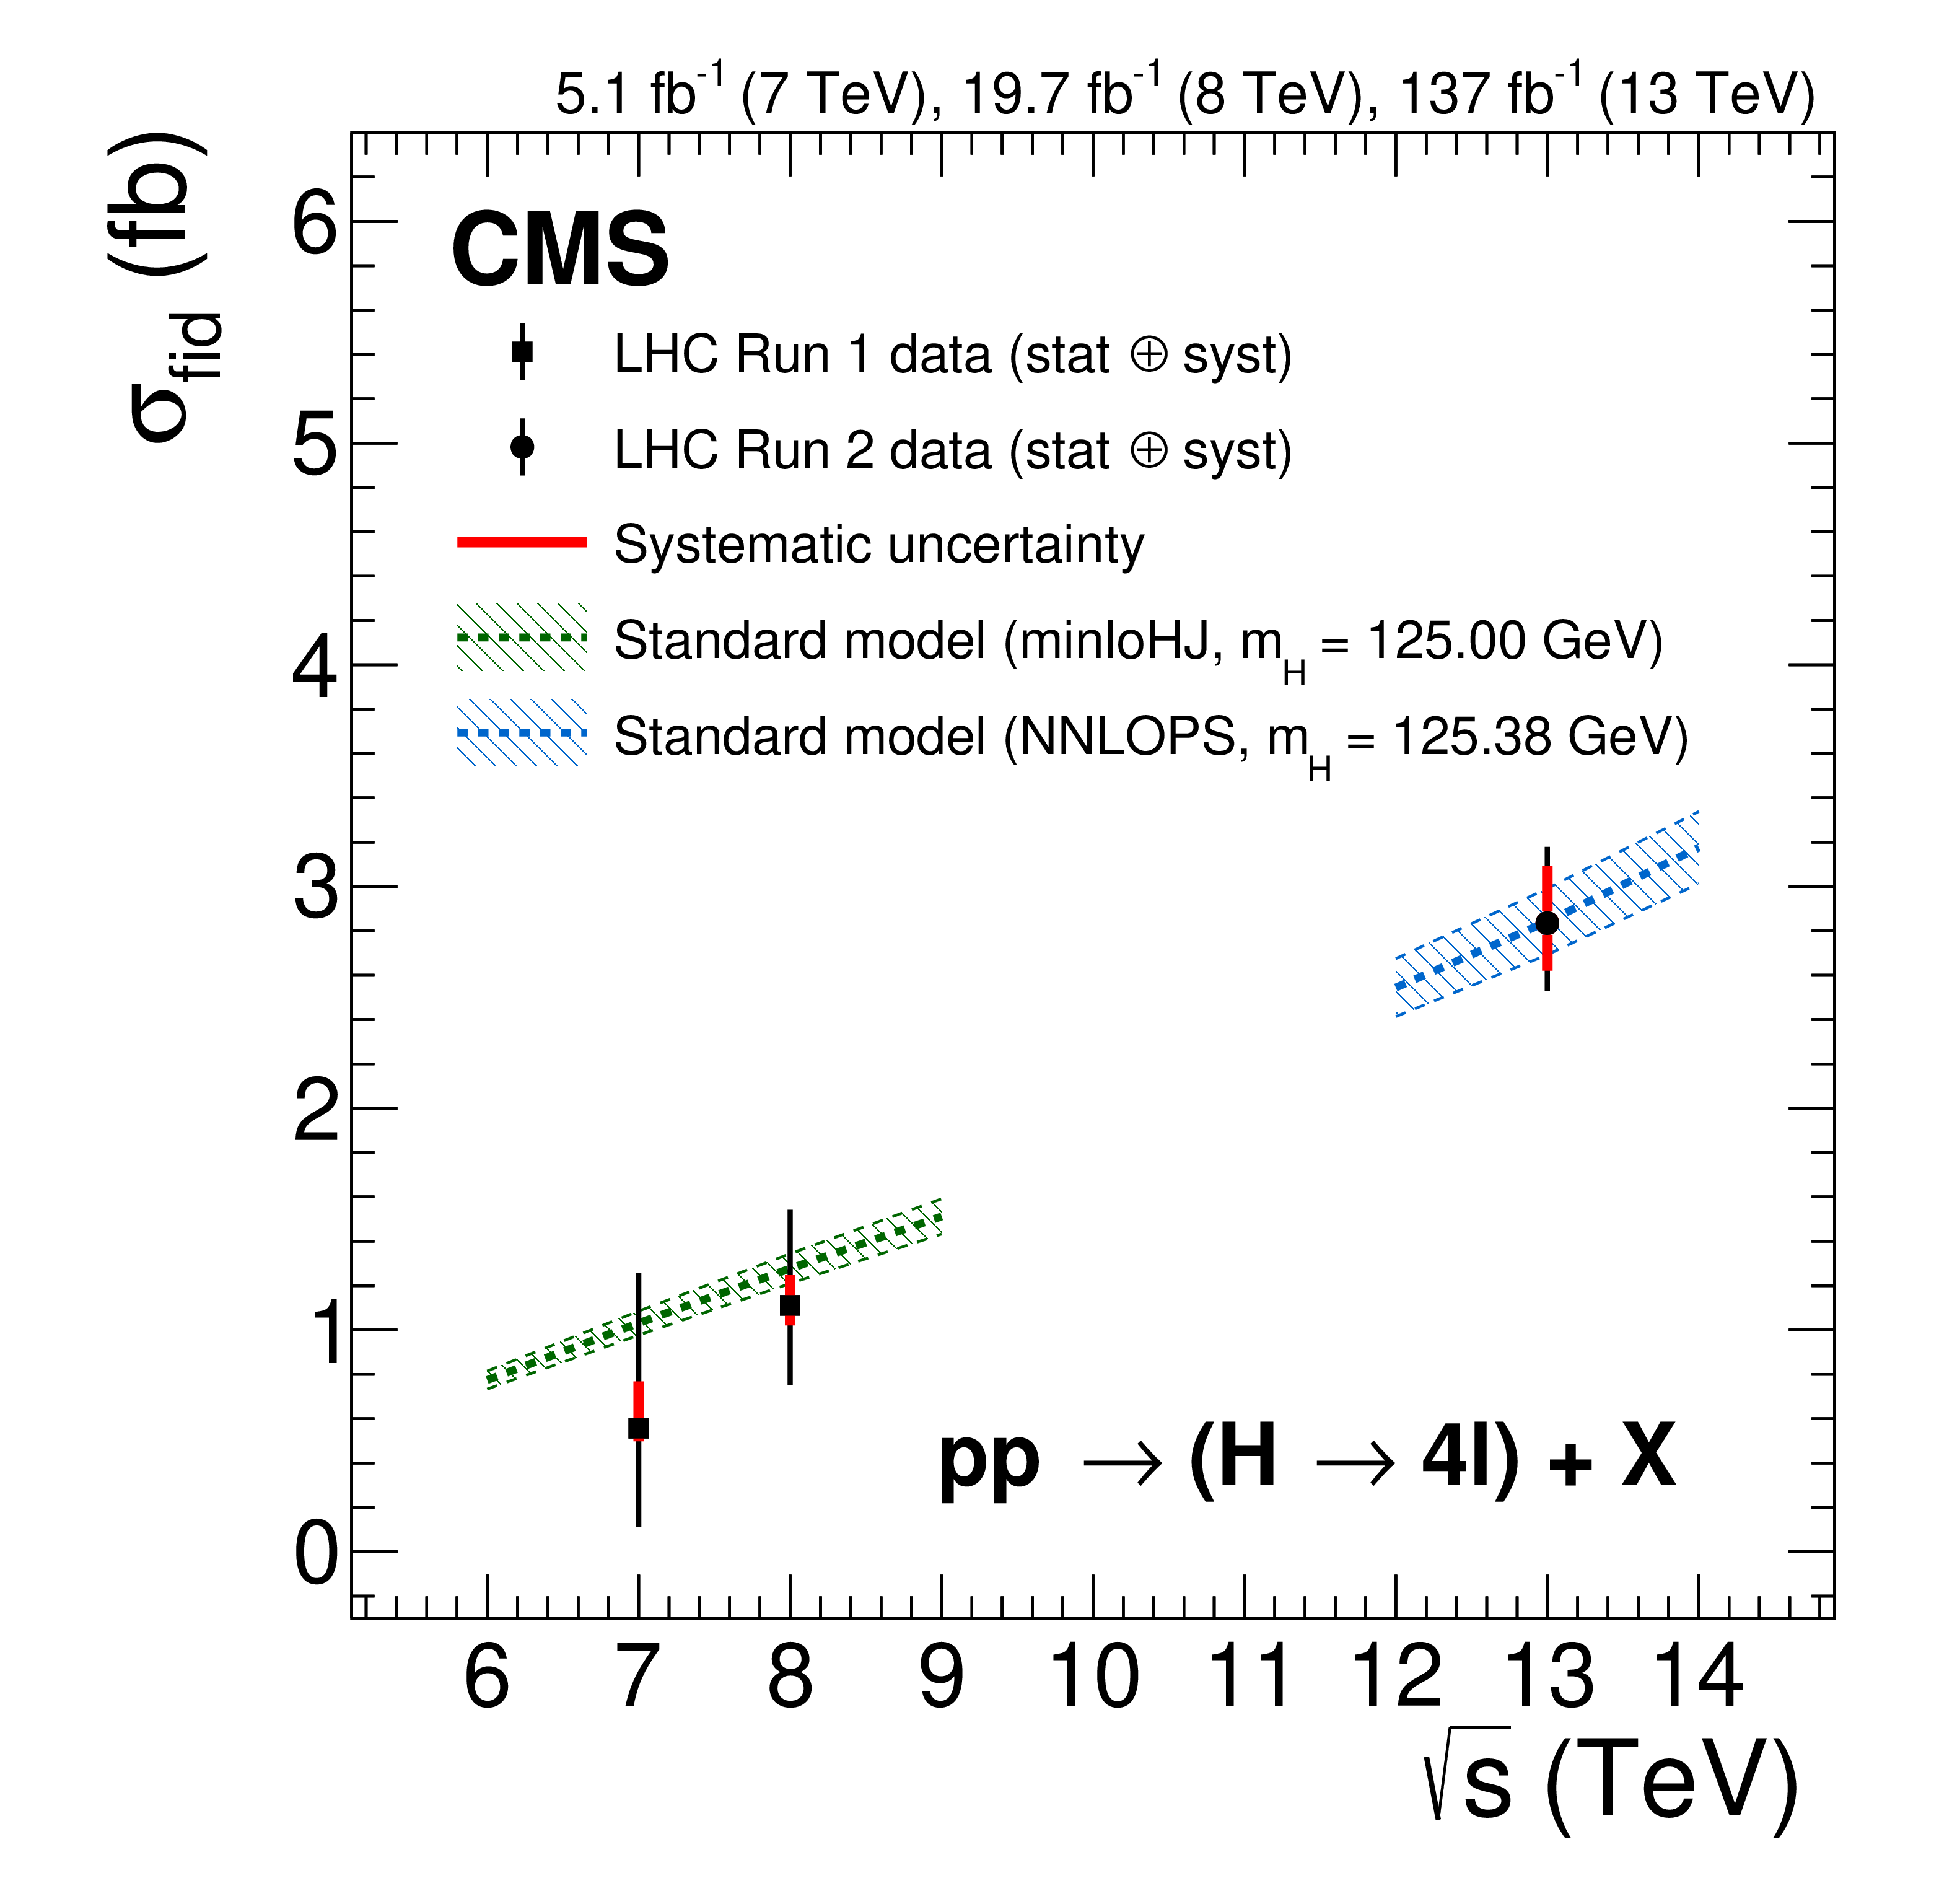
Figure 16:
The measured inclusive fiducial cross section in different final states (left) and integrated as a function of $\sqrt {s}$ (right). The acceptance is calculated using POWHEG at $\sqrt {s} = $ 13 TeV and HRes [107,109] at $\sqrt {s}=$ 7 and 8 TeV, and the total gluon fusion cross section and uncertainty are taken from Ref. [58]. The fiducial volume for $\sqrt {s}=$ 6-9 TeV uses the lepton isolation definition from Ref. [25] and the SM predictions and measurements are calculated at $ {m_{\mathrm{H}}} = $ 125.0 GeV, while for $\sqrt {s}=$ 12-14 TeV the definition described in the text is used and SM predictions and measurements are calculated at $ {m_{\mathrm{H}}} = $ 125.38 GeV. |

png pdf |
Figure 16-a:
The measured inclusive fiducial cross section in different final states. The acceptance is calculated using POWHEG at $\sqrt {s} = $ 13 TeV and HRes [107,109] at $\sqrt {s}=$ 7 and 8 TeV, and the total gluon fusion cross section and uncertainty are taken from Ref. [58]. The fiducial volume for $\sqrt {s}=$ 6-9 TeV uses the lepton isolation definition from Ref. [25] and the SM predictions and measurements are calculated at $ {m_{\mathrm{H}}} = $ 125.0 GeV, while for $\sqrt {s}=$ 12-14 TeV the definition described in the text is used and SM predictions and measurements are calculated at $ {m_{\mathrm{H}}} = $ 125.38 GeV. |
png pdf |
Figure 16-b:
The measured inclusive fiducial cross section integrated as a function of $\sqrt {s}$. The acceptance is calculated using POWHEG at $\sqrt {s} = $ 13 TeV and HRes [107,109] at $\sqrt {s}=$ 7 and 8 TeV, and the total gluon fusion cross section and uncertainty are taken from Ref. [58]. The fiducial volume for $\sqrt {s}=$ 6-9 TeV uses the lepton isolation definition from Ref. [25] and the SM predictions and measurements are calculated at $ {m_{\mathrm{H}}} = $ 125.0 GeV, while for $\sqrt {s}=$ 12-14 TeV the definition described in the text is used and SM predictions and measurements are calculated at $ {m_{\mathrm{H}}} = $ 125.38 GeV. |

png pdf |
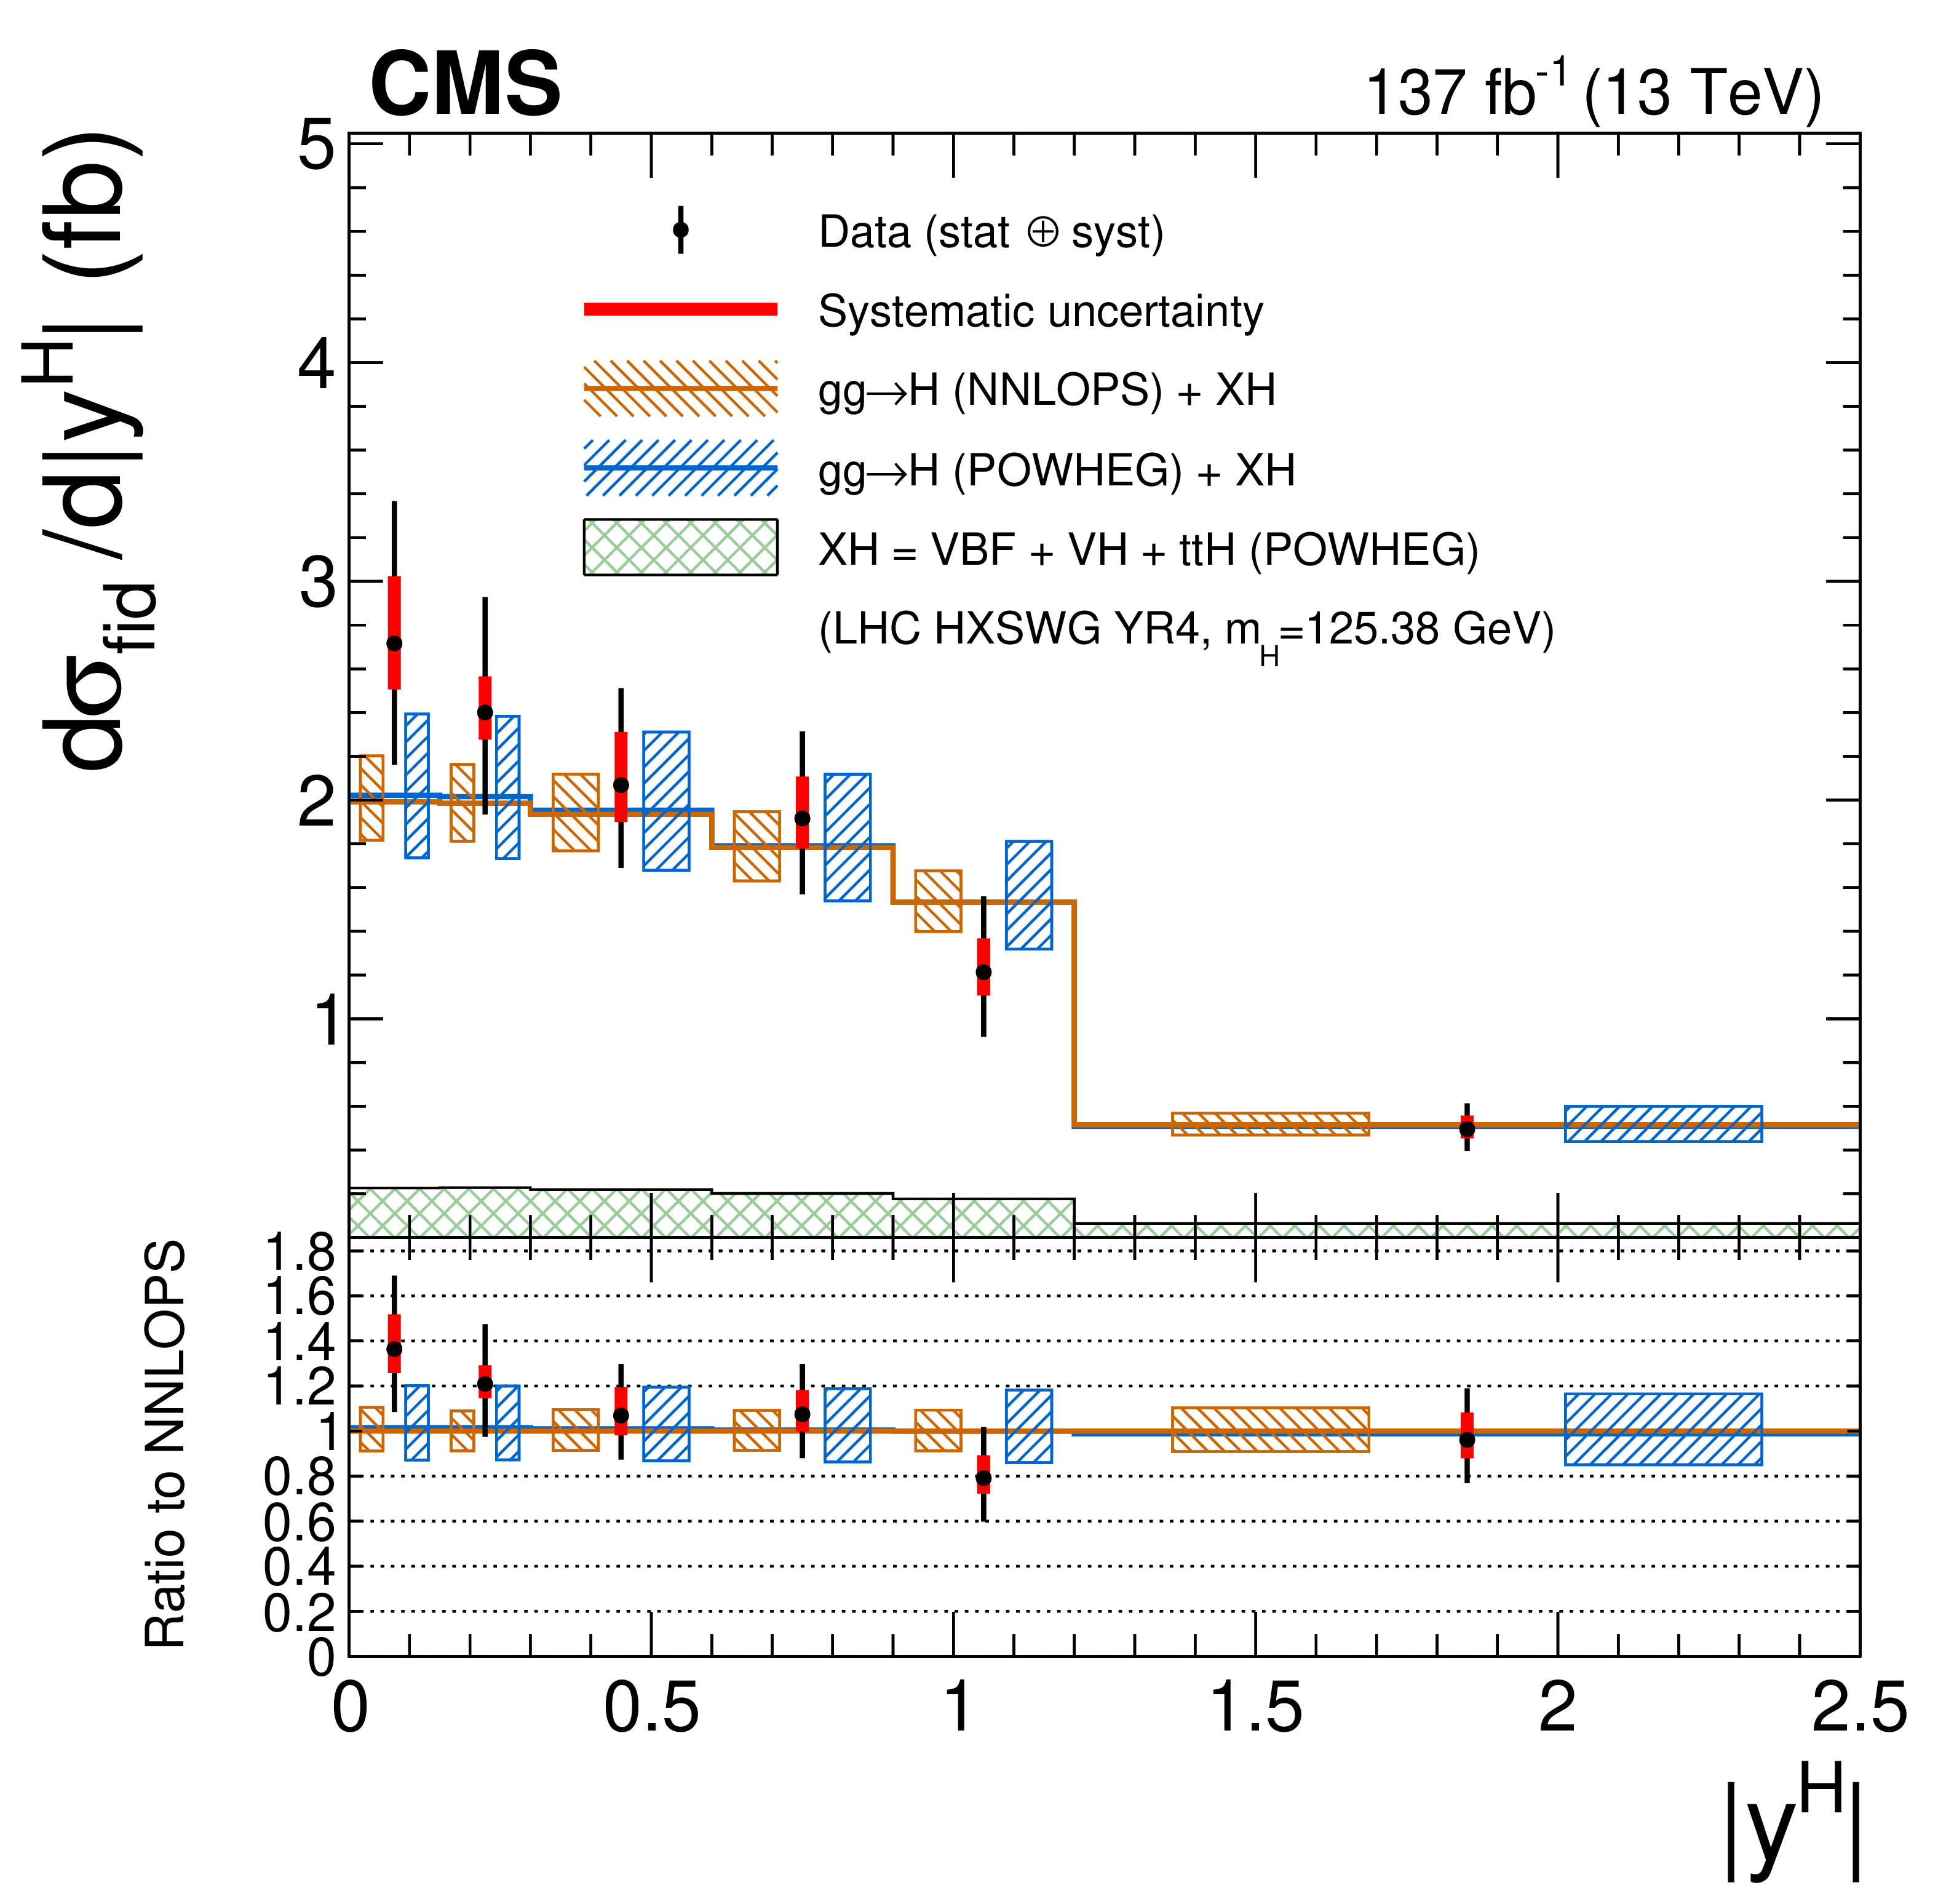
Figure 17:
Differential cross sections as a function of $ {p_{\mathrm {T}}} ^{\mathrm{H}}$ (left) and $ {| y^{\mathrm{H}} |}$ (right). The acceptance and theoretical uncertainties in the differential bins are calculated using POWHEG. The sub-dominant component of the signal ($ {\mathrm {VBF}}+ {\mathrm{V} \mathrm{H}}+ {{\mathrm{t} {}\mathrm{\bar{t}}} \mathrm{H}}$) is denoted as XH. |

png pdf |
Figure 17-a:
Differential cross sections as a function of $ {p_{\mathrm {T}}} ^{\mathrm{H}}$. The acceptance and theoretical uncertainties in the differential bins are calculated using POWHEG. The sub-dominant component of the signal ($ {\mathrm {VBF}}+ {\mathrm{V} \mathrm{H}}+ {{\mathrm{t} {}\mathrm{\bar{t}}} \mathrm{H}}$) is denoted as XH. |
png pdf |
Figure 17-b:
Differential cross sections as a function of $ {| y^{\mathrm{H}} |}$. The acceptance and theoretical uncertainties in the differential bins are calculated using POWHEG. The sub-dominant component of the signal ($ {\mathrm {VBF}}+ {\mathrm{V} \mathrm{H}}+ {{\mathrm{t} {}\mathrm{\bar{t}}} \mathrm{H}}$) is denoted as XH. |
png pdf |
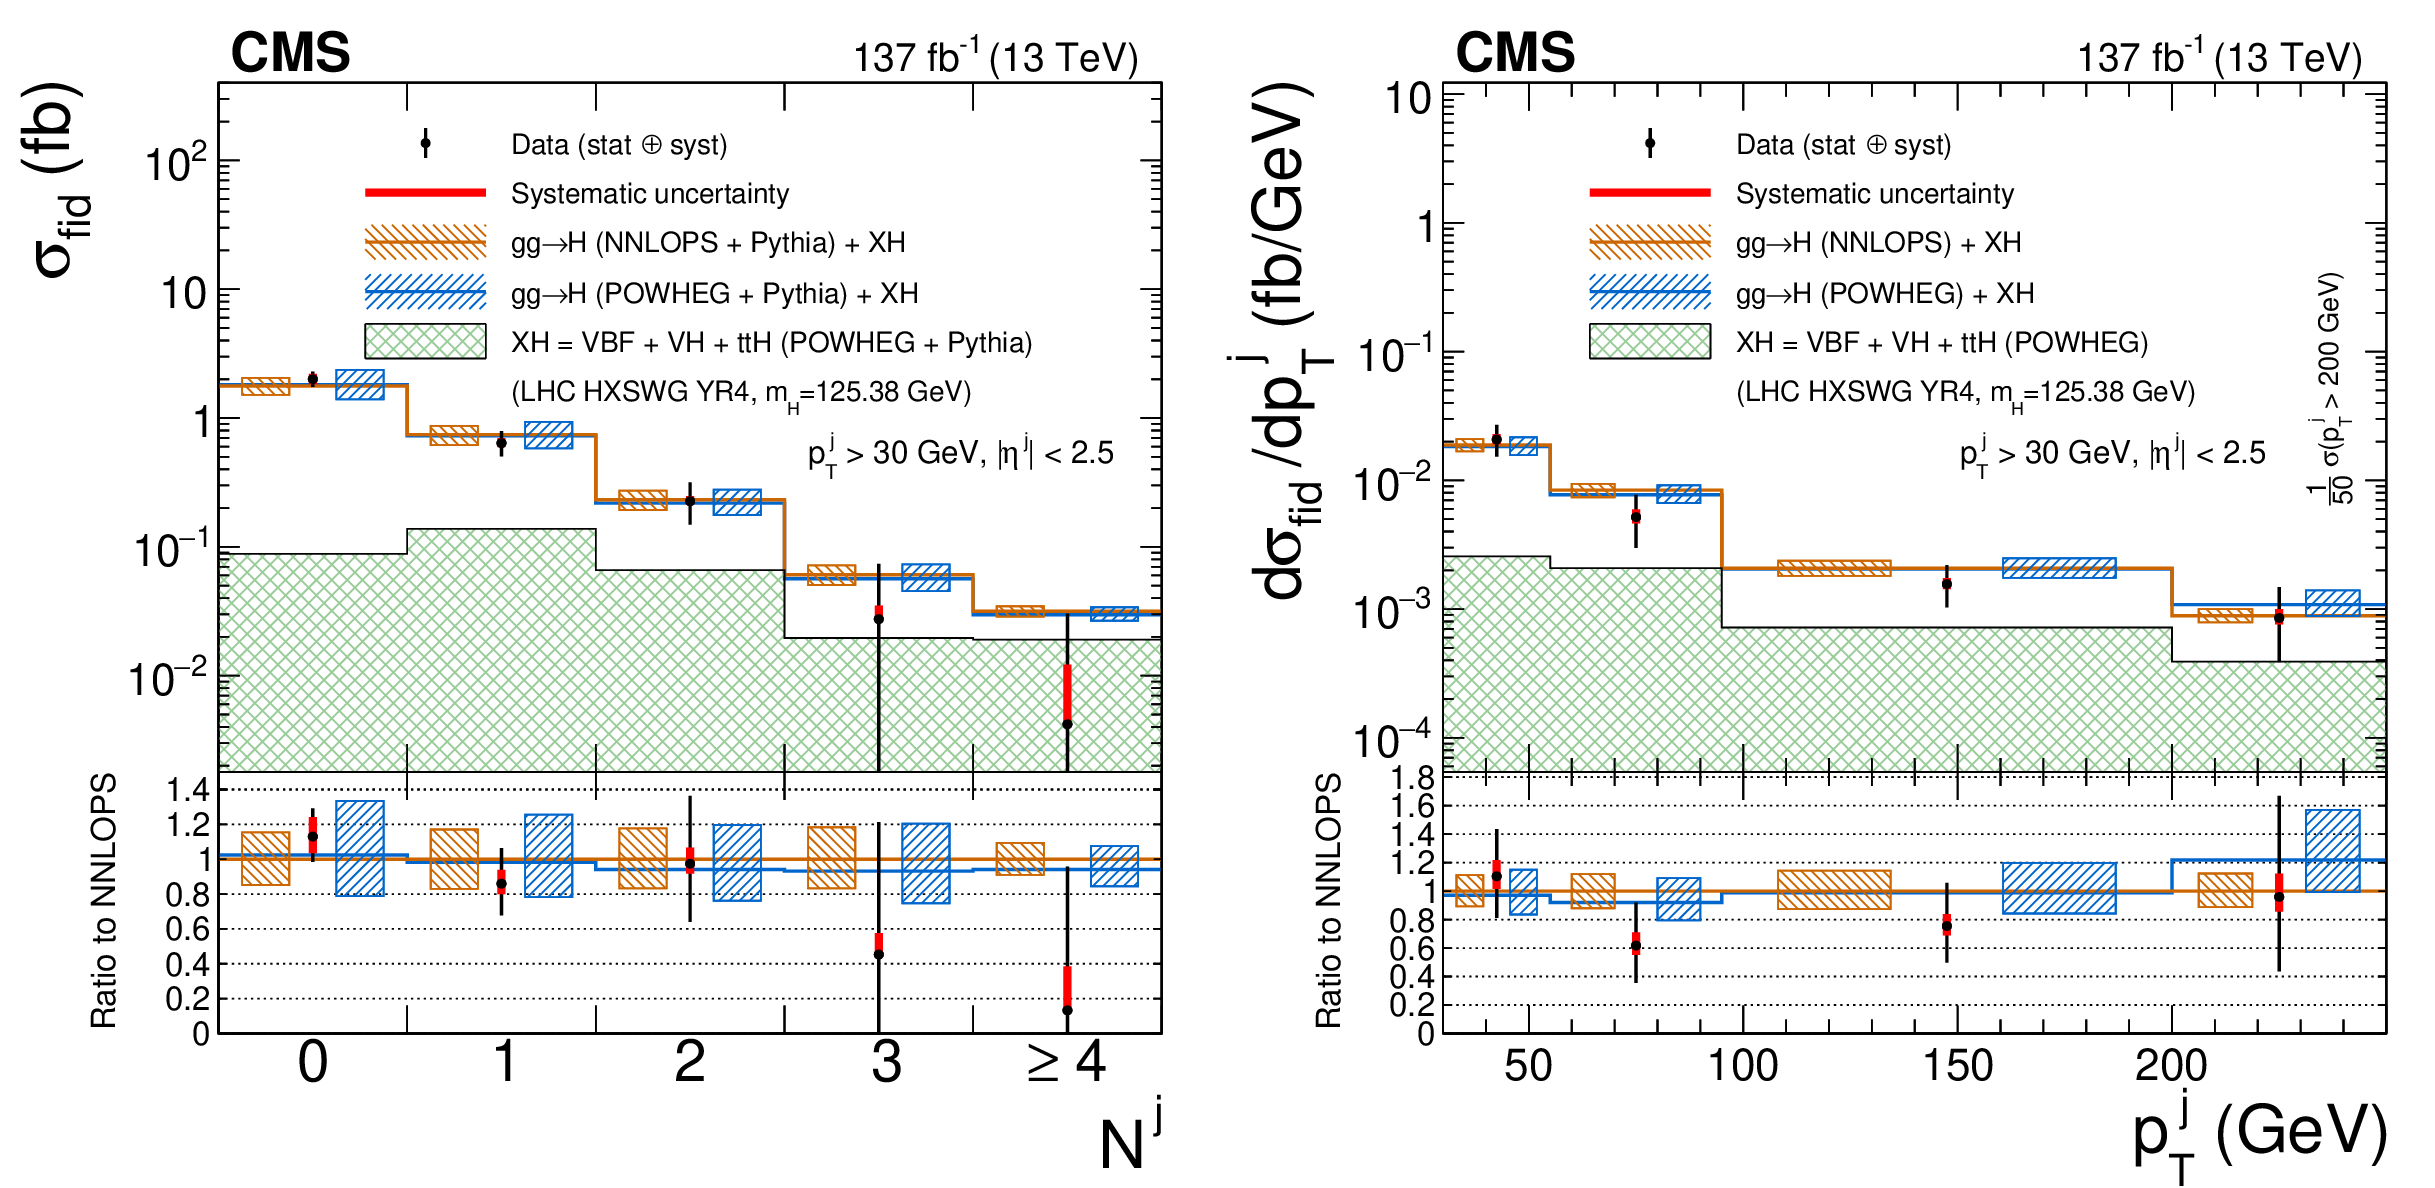
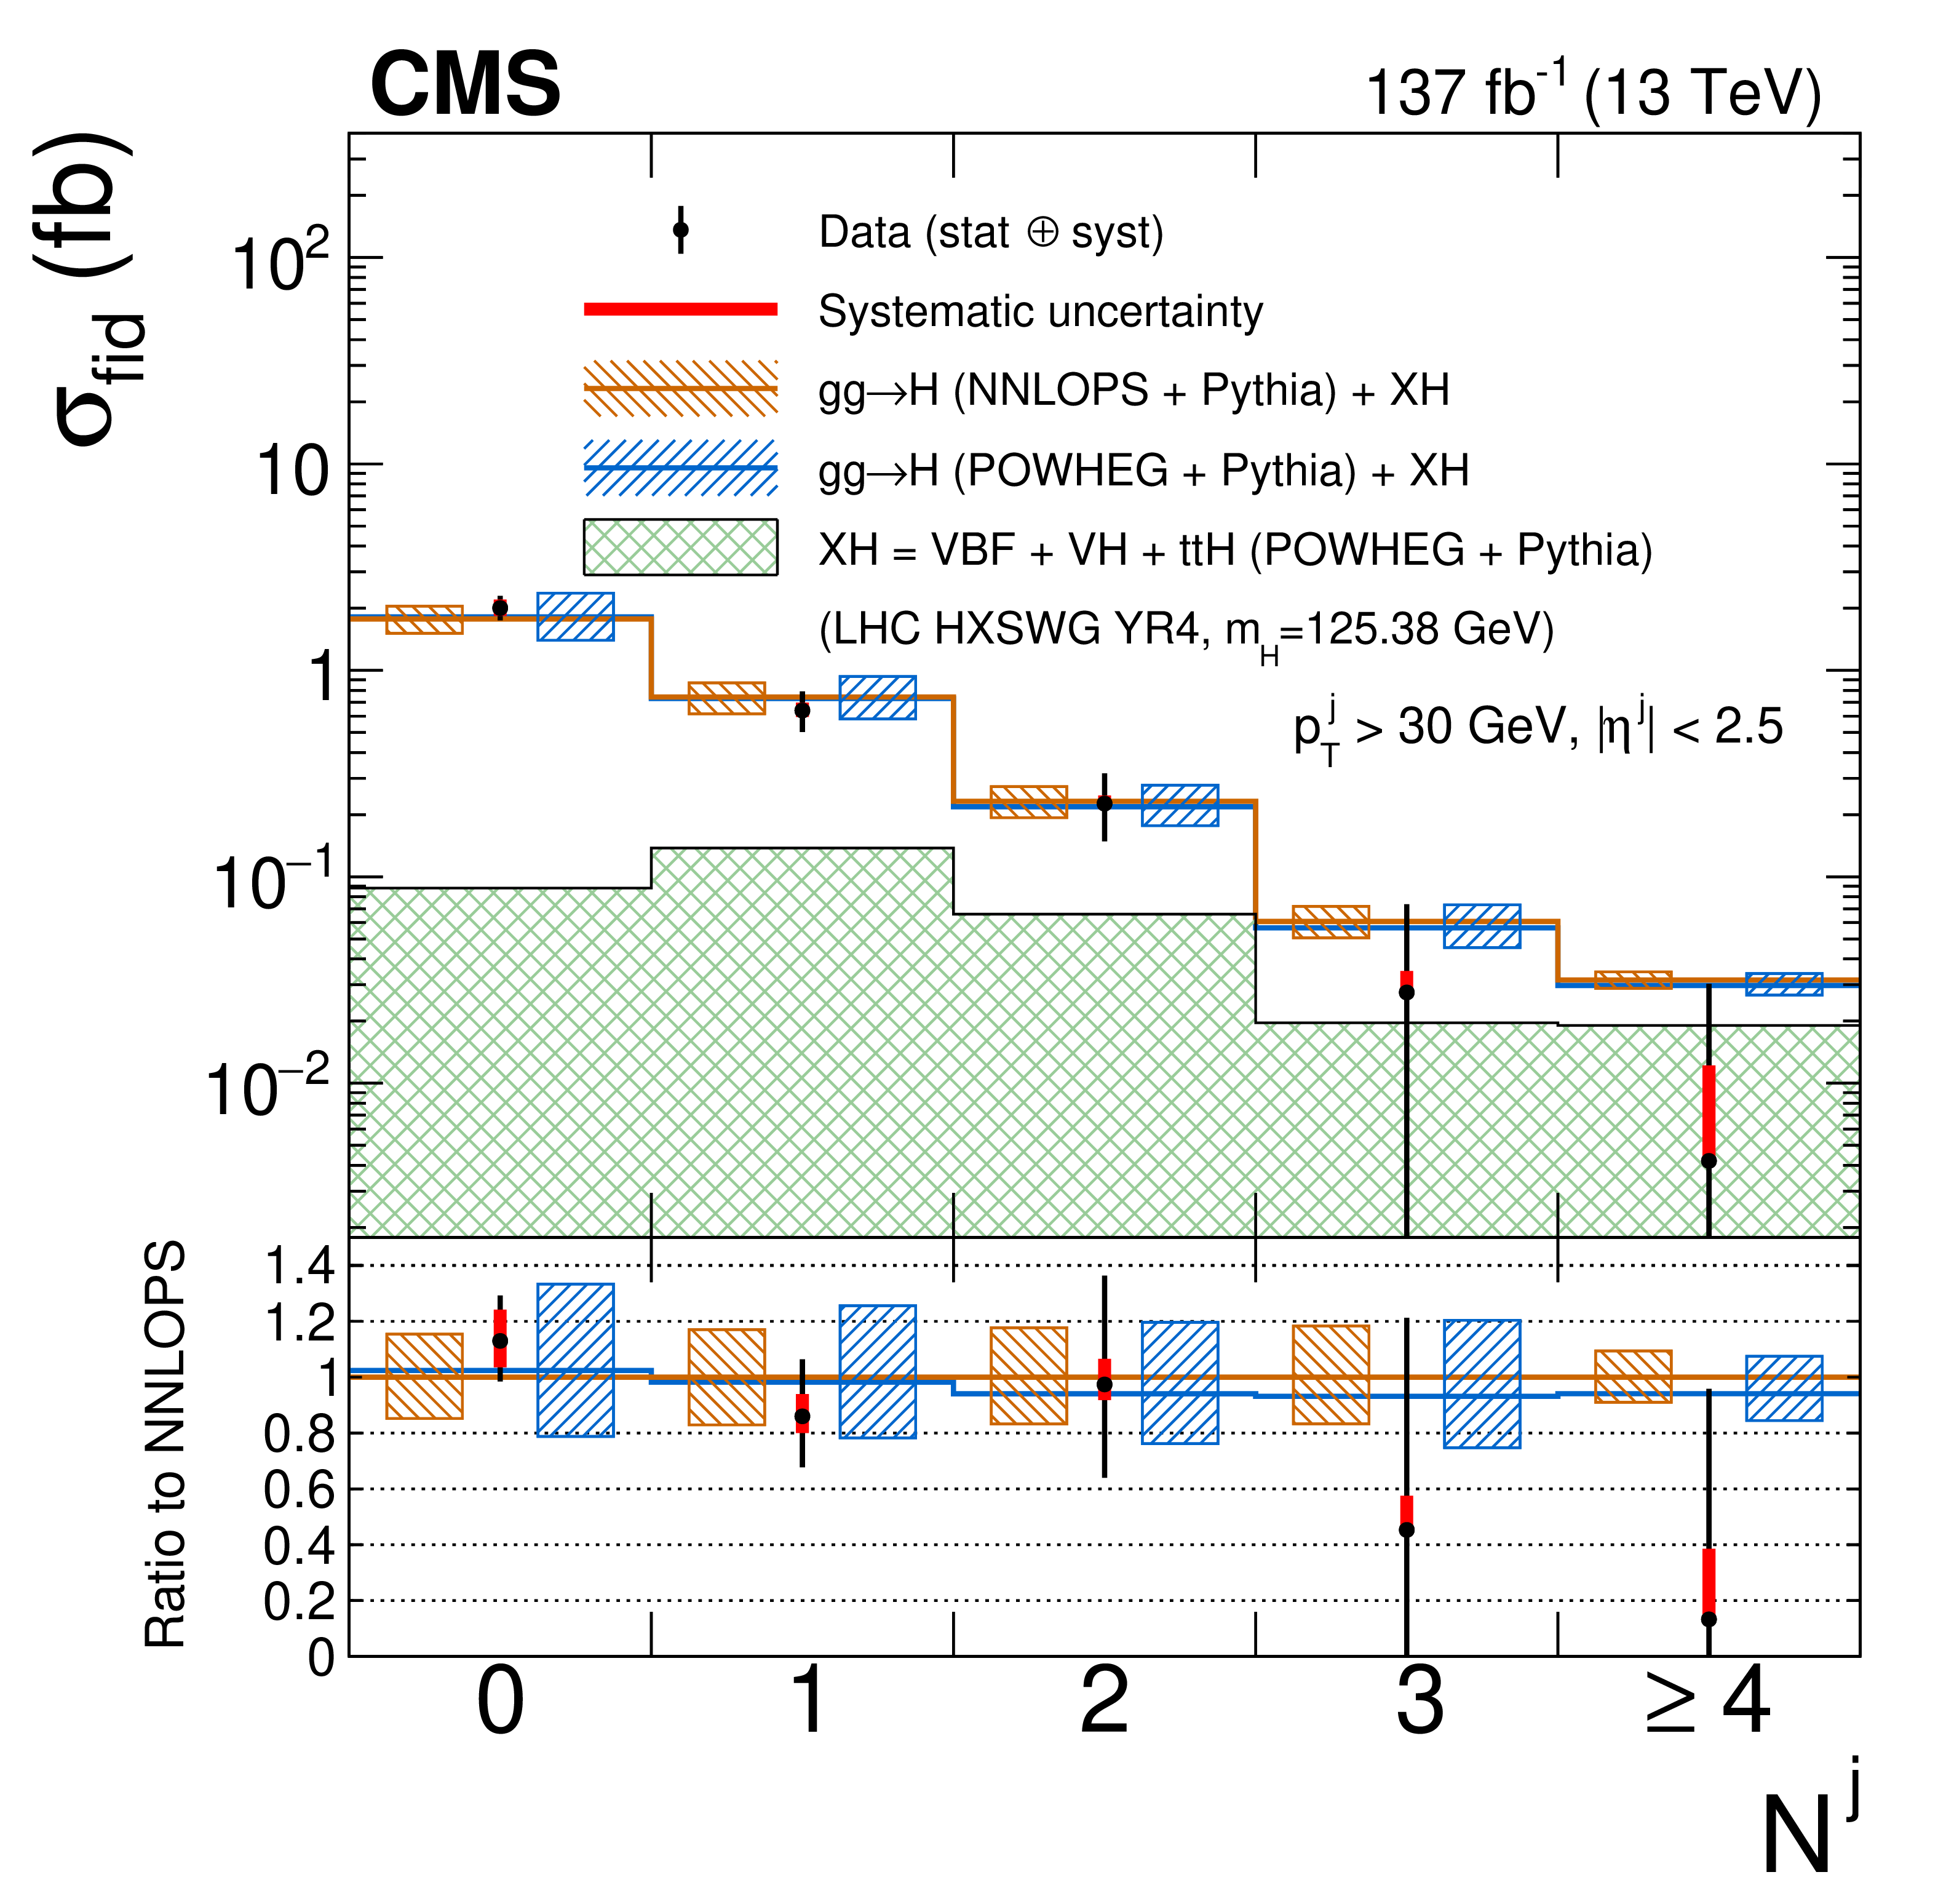
Figure 18:
Differential cross sections as a function of the number of associated jets (left), and ${p_{\mathrm {T}}}$ of the leading jet (right). The acceptance and theoretical uncertainties in the differential bins are calculated using POWHEG. The sub-dominant component of the signal ($ {\mathrm {VBF}}+ {\mathrm{V} \mathrm{H}}+ {{\mathrm{t} {}\mathrm{\bar{t}}} \mathrm{H}}$) is denoted as XH. |
png pdf |
Figure 18-a:
Differential cross sections as a function of the number of associated jets. The acceptance and theoretical uncertainties in the differential bins are calculated using POWHEG. The sub-dominant component of the signal ($ {\mathrm {VBF}}+ {\mathrm{V} \mathrm{H}}+ {{\mathrm{t} {}\mathrm{\bar{t}}} \mathrm{H}}$) is denoted as XH. |

png pdf |
Figure 18-b:
Differential cross sections as a function of the ${p_{\mathrm {T}}}$ of the leading jet. The acceptance and theoretical uncertainties in the differential bins are calculated using POWHEG. The sub-dominant component of the signal ($ {\mathrm {VBF}}+ {\mathrm{V} \mathrm{H}}+ {{\mathrm{t} {}\mathrm{\bar{t}}} \mathrm{H}}$) is denoted as XH. |
| Tables | |

png pdf |
Table 1:
The minimal ${p_{\mathrm {T}}}$ of the leading/subleading leptons for the main di-electron (e/e), di-muon ($\mu$/$\mu$), and electron-muon (e/$\mu$, $\mu$/e) high-level trigger algorithms used in the $ {\mathrm{H} \to 4\ell}$ analysis in 2016, 2017, and 2018. |
png pdf |
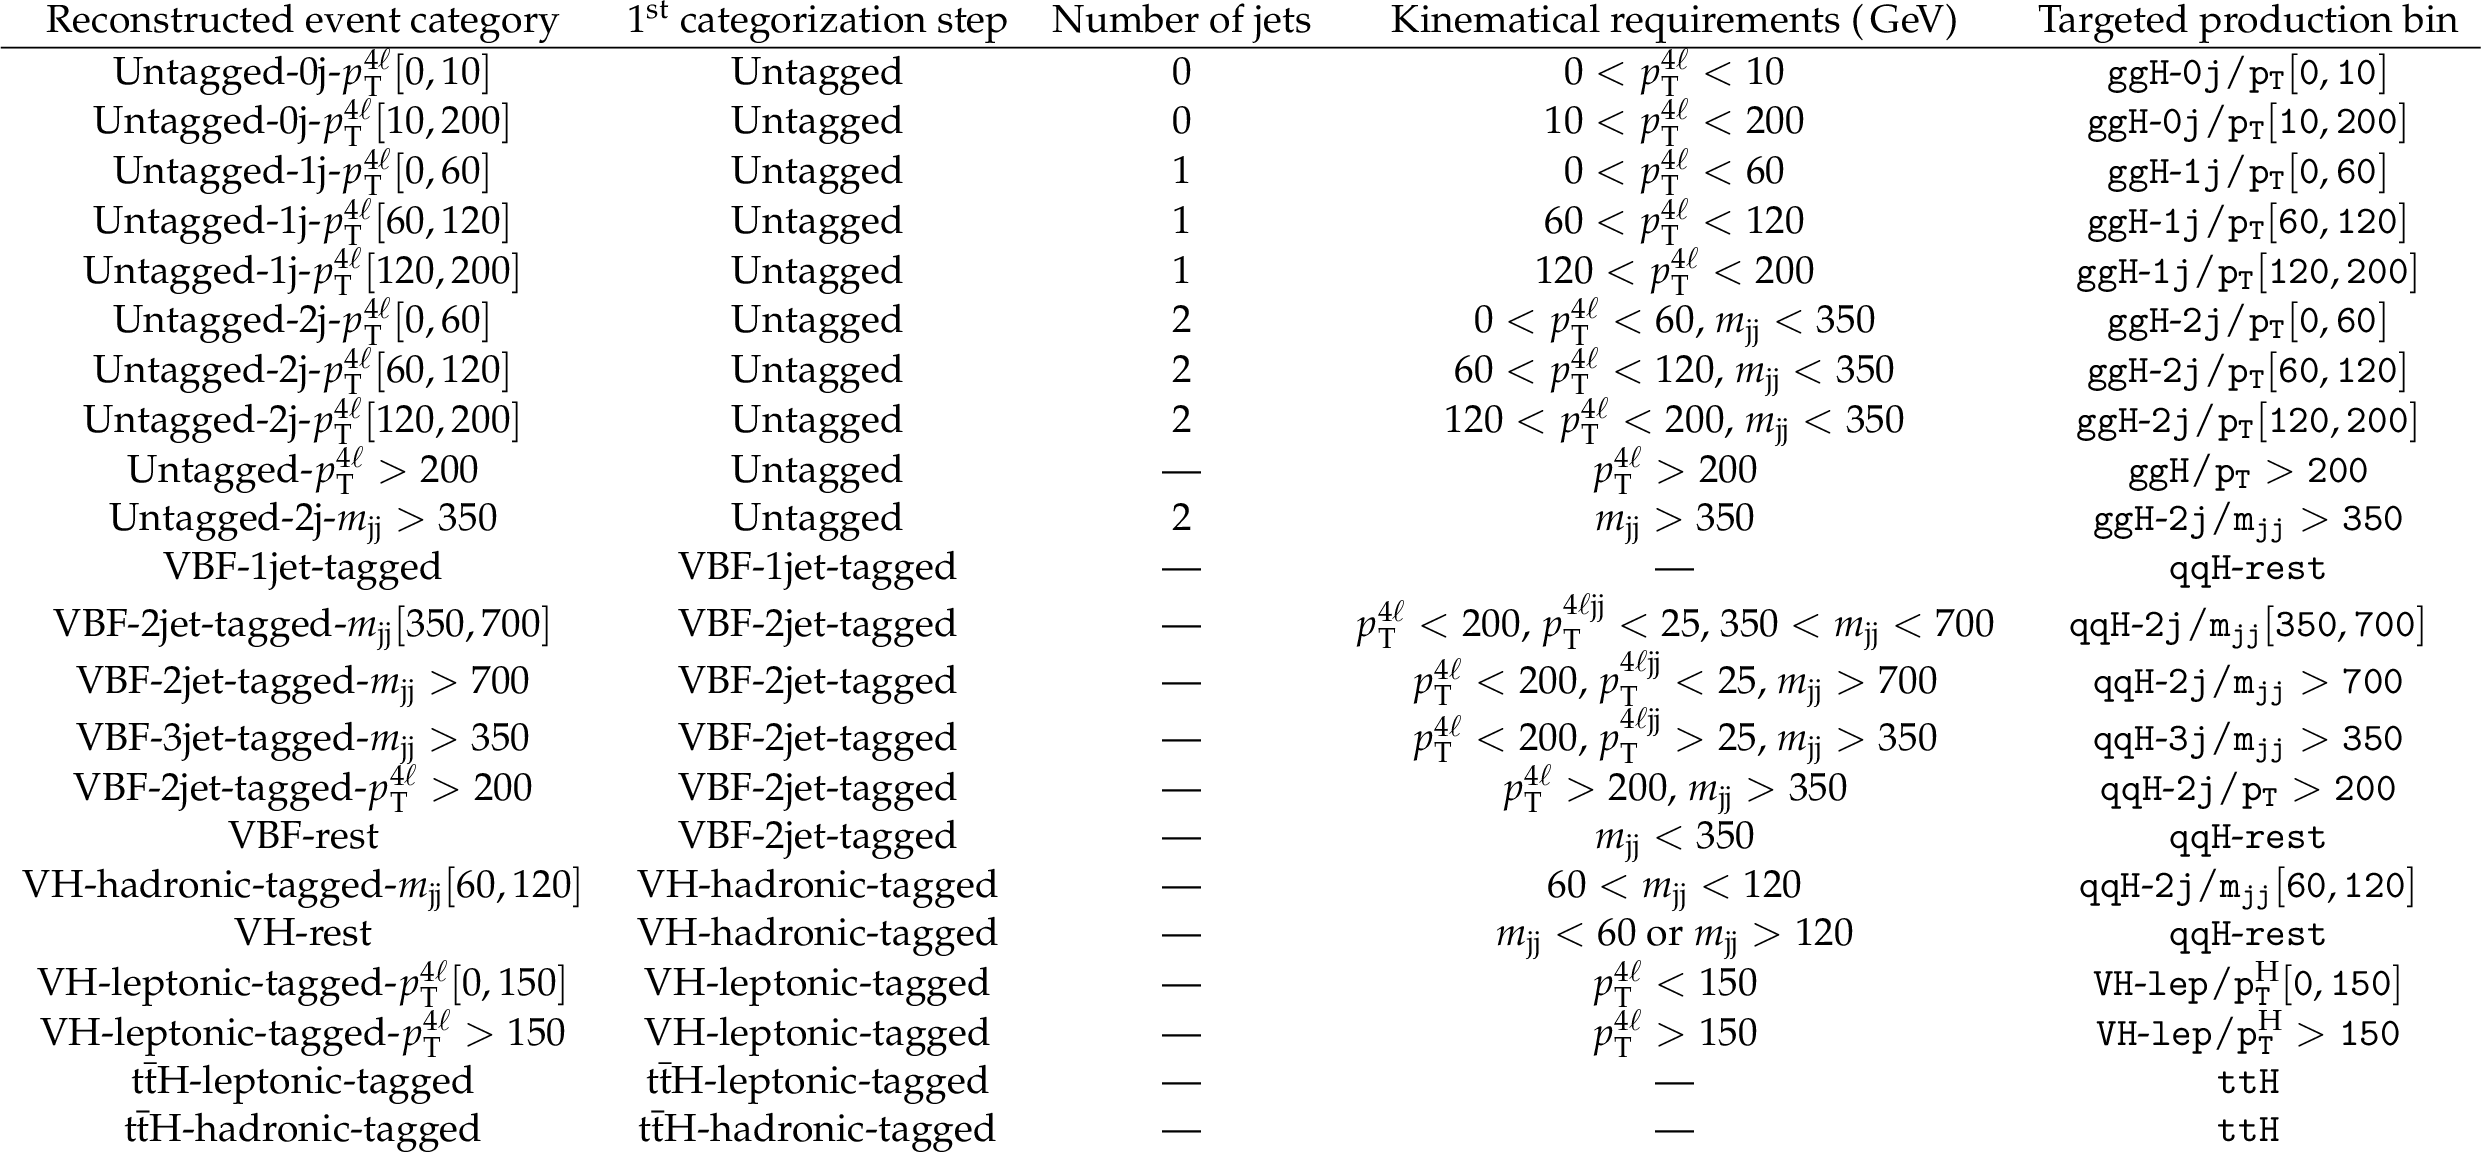
Table 2:
Event categorization criteria of the $ {\mathrm{H} \to 4\ell}$ analysis targeting stage 1.2 STXS production bins. Events from the first step of the categorization are further classified based on the kinematical properties listed in the table. A dash indicates no requirement. |

png pdf |
Table 3:
Number of expected background and signal events and number of observed candidates after full analysis selection, for each event category, in the mass range 105 $ < {m_{4\ell}} < $ 140 GeV and for an integrated luminosity of 137 fb$^{-1}$. The yields are given for the different production modes. The uncertainties listed are statistical only. Signal is estimated from MC simulation at $ {m_{\mathrm{H}}} = $ 125 GeV, ZZ and rare electroweak backgrounds are also estimated from MC simulation, and Z+X is estimated from data. |
png pdf |
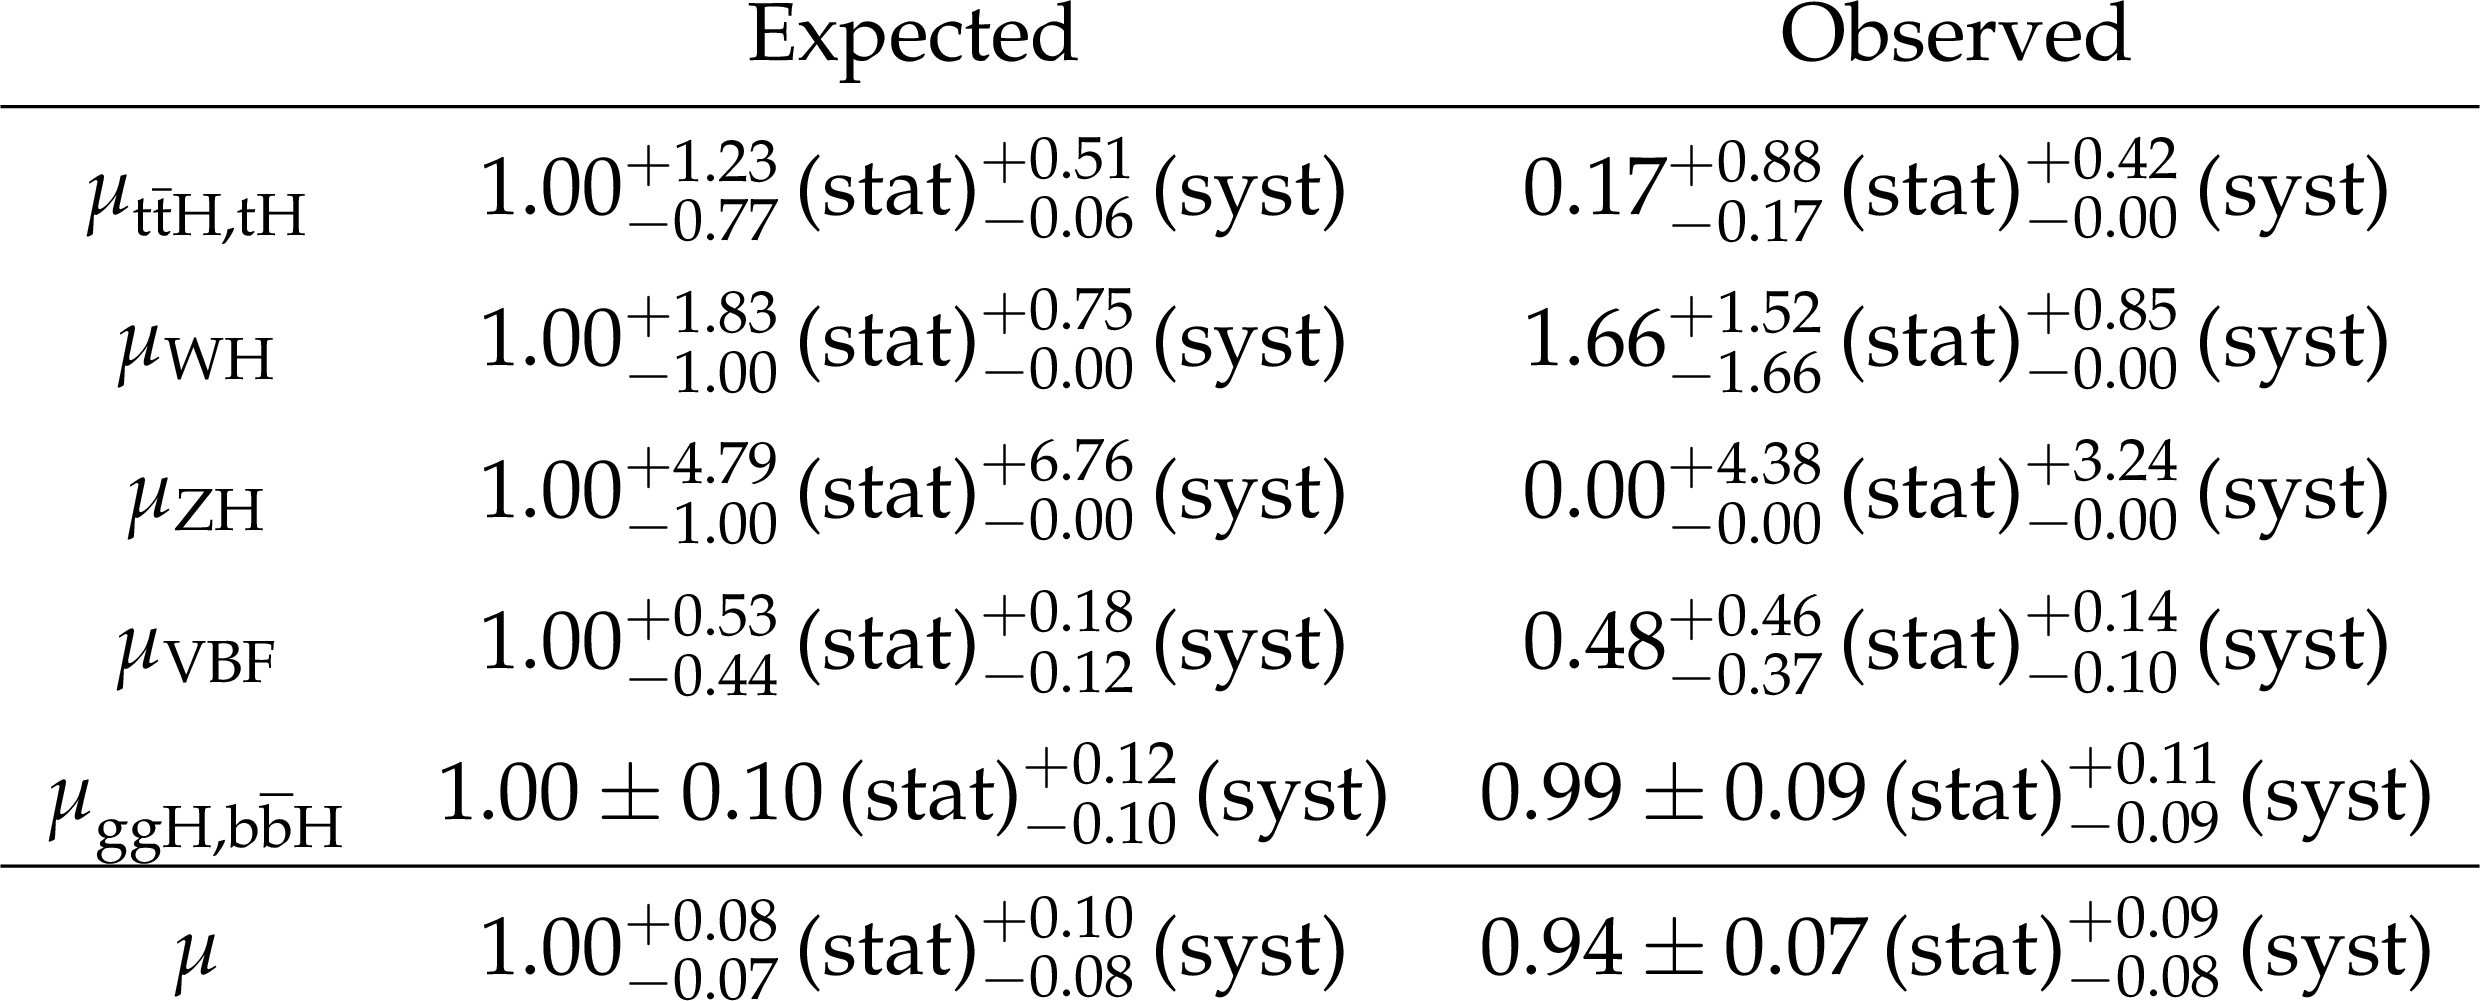
Table 4:
Best fit values and $ \pm $1 standard deviation uncertainties for the expected and observed signal strength modifiers at $ {m_{\mathrm{H}}} = $ 125.38 GeV. The statistical and systematic uncertainties are given separately. |
png pdf |
Table 5:
Best fit values and $ \pm $1 standard deviation uncertainties for the measured cross sections $ {(\sigma \mathcal {B})_{{\text {obs}}}}$, the SM predictions $ {(\sigma \mathcal {B})_{\mathrm {SM}}}$, and their ratio for the stage 0 STXS production bins at $ {m_{\mathrm{H}}} = $ 125.38 GeV for $ {\mathrm{H} \to \mathrm{Z} \mathrm{Z}}$ decay. |
png pdf |
Table 6:
Best fit values and $ \pm $1 standard deviation uncertainties for the measured cross sections $ {(\sigma \mathcal {B})_{{\text {obs}}}}$, the SM predictions $ {(\sigma \mathcal {B})_{\mathrm {SM}}}$, and their ratio for the merged stage 1.2 STXS production bins at $ {m_{\mathrm{H}}} = $ 125.38 GeV for $ {\mathrm{H} \to \mathrm{Z} \mathrm{Z}}$ decay. |
png pdf |
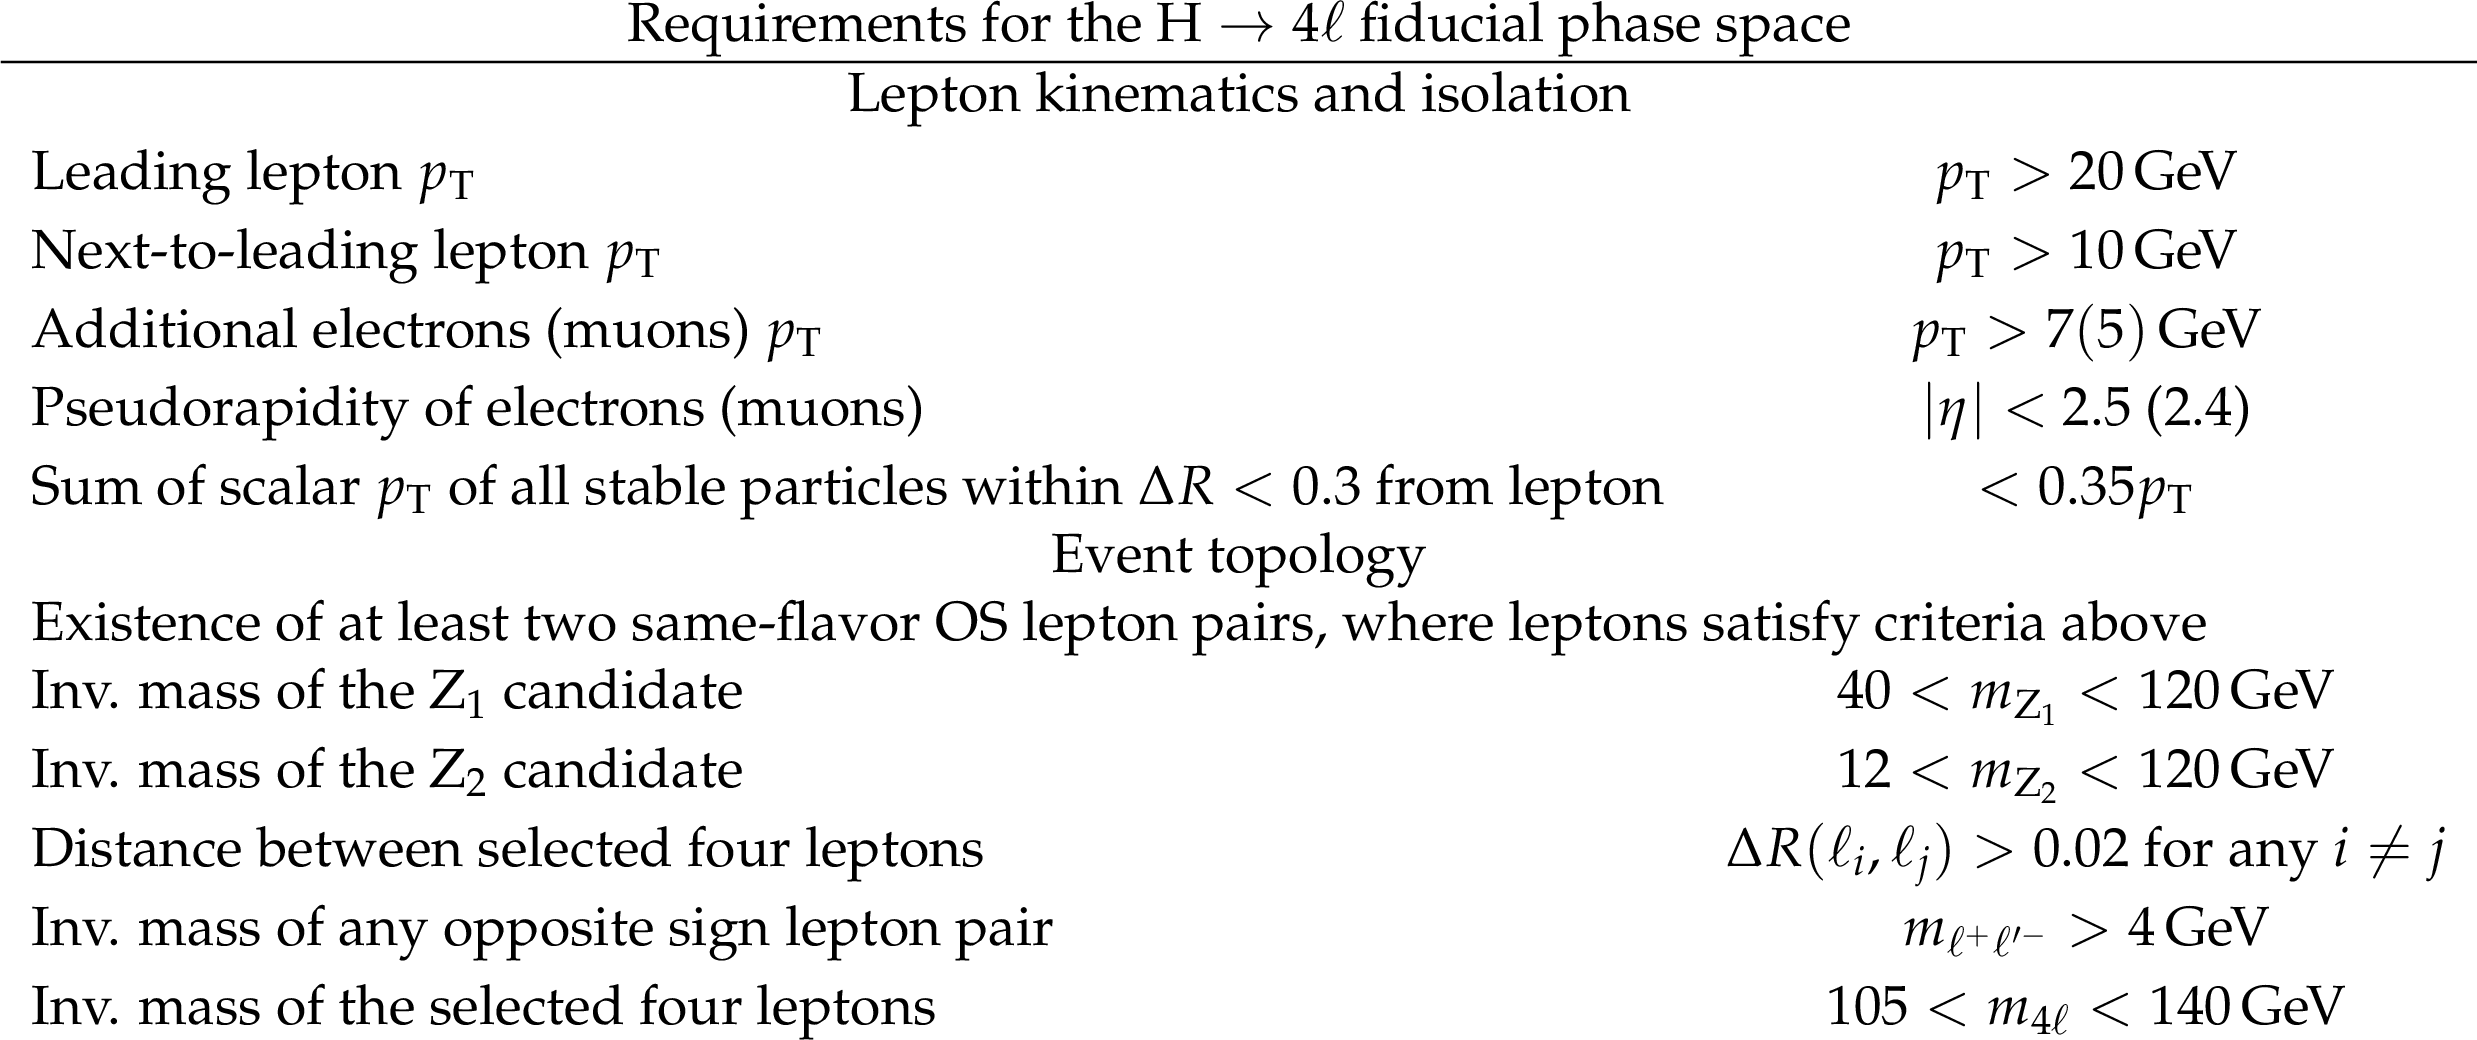
Table 7:
Summary of requirements used in the definition of the fiducial phase space for the $ {\mathrm{H} \to 4\ell}$ cross section measurements. |
png pdf |
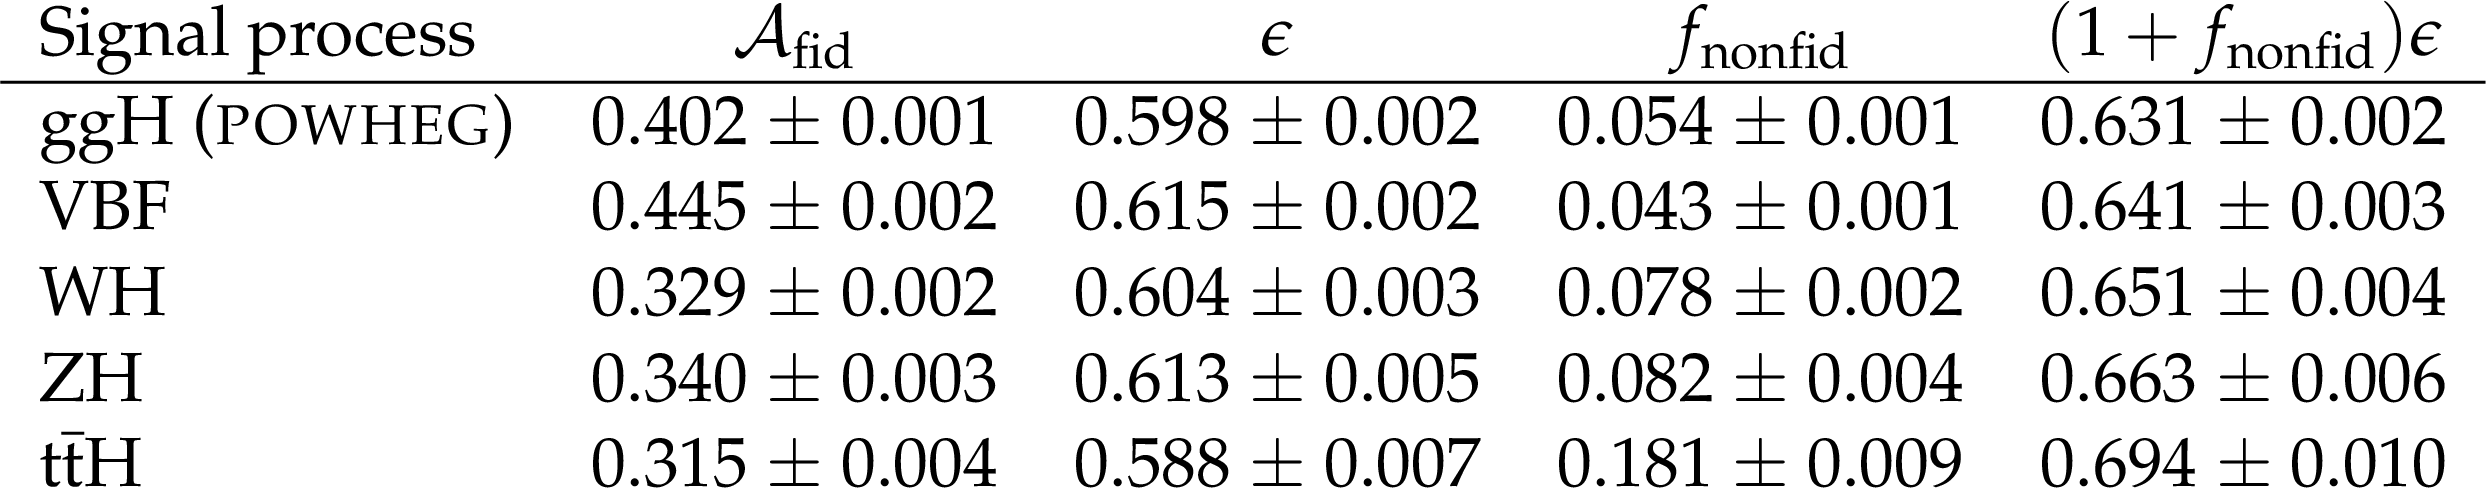
Table 8:
Summary of the fraction of signal events for different SM signal production modes within the fiducial phase space (acceptance $\mathcal {A}_{\mathrm {fid}}$), reconstruction efficiency ($\epsilon $) for signal events in the fiducial phase space, and ratio of the number of reconstructed events outside the fiducial phase space to that of the reconstructed events in the fiducial phase space ($f_{\mathrm {nonfid}}$). For all production modes the values given are for $ {m_{\mathrm{H}}} = $ 125 GeV. Also shown in the last column is the factor $(1+f_{\mathrm {nonfid}})\epsilon $ which regulates the signal yield for a given fiducial cross section, as shown in Eq. (8). The uncertainties listed are statistical only. The theoretical uncertainty in $\mathcal {A}_{\mathrm {fid}}$ for the SM is less than 1%. |
png pdf |
Table 9:
The measured inclusive fiducial cross section and $ \pm $1 standard deviation uncertainties for different final states and data-taking periods at $ {m_{\mathrm{H}}} = $ 125.38 GeV. The statistical and systematic uncertainties are given separately for the inclusive measurements. |
png pdf |
Table 10:
The measured differential fiducial cross section and $ \pm $1 standard deviation uncertainties for the $ {p_{\mathrm {T}}} ^{\mathrm{H}}$ observable at $ {m_{\mathrm{H}}} = $ 125.38 GeV. The breakdown of the total uncertainty (unc.) into statistical and systematic components is given. |
png pdf |
Table 11:
The measured differential fiducial cross section and $ \pm $1 standard deviation uncertainties for the $ {| y^{\mathrm{H}} |}$ observable at $ {m_{\mathrm{H}}} = $ 125.38 GeV. The breakdown of the total uncertainty (unc.) into statistical and systematic components is given. |
png pdf |
Table 12:
The measured differential fiducial cross section and $ \pm $1 standard deviation uncertainties for the $N^{\text {j}}$ observable at $ {m_{\mathrm{H}}} = $ 125.38 GeV. The breakdown of the total uncertainty (unc.) into statistical and systematic components is given. |

png pdf |
Table 13:
The measured differential fiducial cross section and $ \pm $1 standard deviation uncertainties for the $ {p_{\mathrm {T}}} ^\text {j}$ observable at $ {m_{\mathrm{H}}} = $ 125.38 GeV. The breakdown of the total uncertainty (unc.) into statistical and systematic components is given. |
| Summary |
| Several measurements of the Higgs boson production in the four-lepton final state at $\sqrt{s} = $ 13 TeV have been presented, using data samples corresponding to an integrated luminosity of 137 fb$^{-1}$. Thanks to a large signal-to-background ratio and the complete reconstruction of the final state decay products, this channel enables a detailed study of the Higgs boson production properties. The measured signal strength modifier is $\mu=$ 0.94 $\pm$ 0.07 (stat) $^{+0.07}_{-0.06}${ (theo) $^{+0.06}_{-0.05}$ (exp) and the integrated fiducial cross section is measured to be $\sigma_{\text{fid}}=$ 2.84 $^{+0.23}_{-0.22}$ (stat) $^{+0.26}_{-0.21}$ (syst) fb with a standard model prediction of 2.84 $\pm$ 0.15 fb for the same fiducial region. The signal strength modifiers for the main Higgs boson production modes are also reported. A new set of measurements, designed to quantify the different Higgs boson production processes in specific kinematical regions of phase space, have also been presented. The differential cross sections as a function of the transverse momentum and rapidity of the Higgs boson, the number of associated jets, and the transverse momentum of the leading associated jet are determined. All results are consistent, within their uncertainties, with the expectations for the standard model Higgs boson. |
| References | ||||
| 1 | ATLAS Collaboration | Observation of a new particle in the search for the standard model Higgs boson with the ATLAS detector at the LHC | PLB 716 (2012) 1 | 1207.7214 |
| 2 | CMS Collaboration | Observation of a new boson at a mass of 125 GeV with the CMS experiment at the LHC | PLB 716 (2012) 30 | CMS-HIG-12-028 1207.7235 |
| 3 | CMS Collaboration | Observation of a new boson with mass near 125 GeV in pp collisions at $ \sqrt{s} = $ 7 and 8 TeV | JHEP 06 (2013) 081 | CMS-HIG-12-036 1303.4571 |
| 4 | F. Englert and R. Brout | Broken symmetry and the mass of gauge vector mesons | PRL 13 (1964) 321 | |
| 5 | P. W. Higgs | Broken symmetries, massless particles and gauge fields | PL12 (1964) 132 | |
| 6 | P. W. Higgs | Broken symmetries and the masses of gauge bosons | PRL 13 (1964) 508 | |
| 7 | G. S. Guralnik, C. R. Hagen, and T. W. B. Kibble | Global conservation laws and massless particles | PRL 13 (1964) 585 | |
| 8 | P. W. Higgs | Spontaneous symmetry breakdown without massless bosons | PR145 (1966) 1156 | |
| 9 | T. W. B. Kibble | Symmetry breaking in nonabelian gauge theories | PR155 (1967) 1554 | |
| 10 | ATLAS Collaboration | Measurements of the Higgs boson production and decay rates and coupling strengths using $ pp $ collision data at $ \sqrt{s}= $ 7 and 8 TeV in the ATLAS experiment | EPJC 76 (2016) | 1507.04548 |
| 11 | CMS Collaboration | Precise determination of the mass of the Higgs boson and tests of compatibility of its couplings with the standard model predictions using proton collisions at 7 and 8 TeV | EPJC 75 (2015) 212 | CMS-HIG-14-009 1412.8662 |
| 12 | ATLAS and CMS Collaborations | Combined measurement of the Higgs boson mass in $ pp $ collisions at $ \sqrt{s}= $ 7 and 8 TeV with the ATLAS and CMS experiments | PRL 114 (2015) 191803 | 1503.07589 |
| 13 | ATLAS and CMS Collaborations | Measurements of the Higgs boson production and decay rates and constraints on its couplings from a combined ATLAS and CMS analysis of the LHC pp collision data at $ \sqrt{s}= $ 7 and 8 TeV | JHEP 08 (2016) 45 | 1606.02266 |
| 14 | ATLAS Collaboration | Measurements of Higgs boson production and couplings in the four-lepton channel in pp collisions at center-of-mass energies of 7 and 8 TeV with the ATLAS detector | PRD 91 (2015) 012006 | 1408.5191 |
| 15 | CMS Collaboration | Measurement of the properties of a Higgs boson in the four-lepton final state | PRD 89 (2014) 092007 | CMS-HIG-13-002 1312.5353 |
| 16 | CMS Collaboration | Study of the mass and spin-parity of the Higgs boson candidate via its decays to $ Z $ boson pairs | PRL 110 (2013) 081803 | CMS-HIG-12-041 1212.6639 |
| 17 | CMS Collaboration | Constraints on the spin-parity and anomalous HVV couplings of the Higgs boson in proton collisions at 7 and 8 TeV | PRD 92 (2015) 012004 | CMS-HIG-14-018 1411.3441 |
| 18 | CMS Collaboration | Measurements of properties of the Higgs boson decaying into the four-lepton final state in pp collisions at $ \sqrt{s}= $ 13 TeV | JHEP 11 (2017) 047 | CMS-HIG-16-041 1706.09936 |
| 19 | ATLAS Collaboration | Measurement of the Higgs boson coupling properties in the $ H\rightarrow ZZ^{*} \rightarrow 4\ell $ decay channel at $ \sqrt{s} = $ 13 TeV with the ATLAS detector | JHEP 03 (2018) 095 | 1712.02304 |
| 20 | CMS Collaboration | Constraints on the Higgs boson width from off-shell production and decay to $ \mathrm{Z} $-boson pairs | PLB 736 (2014) 64 | CMS-HIG-14-002 1405.3455 |
| 21 | CMS Collaboration | Limits on the Higgs boson lifetime and width from its decay to four charged leptons | PRD 92 (2015) 072010 | CMS-HIG-14-036 1507.06656 |
| 22 | ATLAS Collaboration | Constraints on the off-shell Higgs boson signal strength in the high-mass $ ZZ $ and $ WW $ final states with the ATLAS detector | EPJC 75 (2015) 335 | 1503.01060 |
| 23 | ATLAS Collaboration | Constraints on off-shell Higgs boson production and the Higgs boson total width in $ ZZ\to4\ell $ and $ ZZ\to2\ell2\nu $ final states with the ATLAS detector | PLB 786 (2018) 223 | 1808.01191 |
| 24 | ATLAS Collaboration | Fiducial and differential cross sections of Higgs boson production measured in the four-lepton decay channel in $ pp $ collisions at $ \sqrt{s} = $ 8 TeV with the ATLAS detector | PLB 738 (2014) 234 | 1408.3226 |
| 25 | CMS Collaboration | Measurement of differential and integrated fiducial cross sections for Higgs boson production in the four-lepton decay channel in pp collisions at $ \sqrt{s}= $ 7 and 8 TeV | JHEP 04 (2016) 005 | CMS-HIG-14-028 1512.08377 |
| 26 | ATLAS Collaboration | Measurement of inclusive and differential cross sections in the $ H \rightarrow ZZ^* \rightarrow 4\ell $ decay channel in $ pp $ collisions at $ \sqrt{s}= $ 13 TeV with the ATLAS detector | JHEP 10 (2017) 132 | 1708.02810 |
| 27 | ATLAS Collaboration | Higgs boson production cross-section measurements and their EFT interpretation in the $ 4\ell $ decay channel at $ \sqrt{s} = $ 13 TeV with the ATLAS detector | EPJC 80 (2020) | 2004.03447v2 |
| 28 | ATLAS Collaboration | Measurements of the Higgs boson inclusive and differential fiducial cross sections in the 4$ \ell $ decay channel at $ \sqrt{s} = $ 13 TeV | EPJC 80 (2020) | arXiv:2004.03969v3 |
| 29 | CMS Collaboration | Constraints on anomalous Higgs boson couplings using production and decay information in the four-lepton final state | PLB 775 (2017) 1 | CMS-HIG-17-011 1707.00541 |
| 30 | CMS Collaboration | Measurements of the Higgs boson width and anomalous HVV couplings from on-shell and off-shell production in the four-lepton final state | PRD 99 (2019) 112003 | CMS-HIG-18-002 1901.00174 |
| 31 | J. Bendavid et al., eds. | Les Houches 2017: Physics at TeV Colliders Standard ModelWorking Group Report | link | 1803.07977 |
| 32 | D. de Florian et al. | Handbook of LHC Higgs cross sections: 4. Deciphering the nature of the Higgs sector | CERN-2017-002-M | 1610.07922 |
| 33 | N. Berger et al. | Simplified template cross sections - stage 1.1 | 1906.02754 | |
| 34 | CMS Collaboration | Performance of the CMS Level-1 trigger in proton-proton collisions at $ \sqrt{s} = $ 13 TeV | JINST 15 (2020) P10017 | CMS-TRG-17-001 2006.10165 |
| 35 | CMS Collaboration | The CMS trigger system | JINST 12 (2017) P01020 | CMS-TRG-12-001 1609.02366 |
| 36 | M. Cacciari, G. P. Salam, and G. Soyez | The anti-$ {k_{\mathrm{T}}} $ jet clustering algorithm | JHEP 04 (2008) 063 | 0802.1189 |
| 37 | M. Cacciari, G. P. Salam, and G. Soyez | FastJet user manual | EPJC 72 (2012) 1896 | 1111.6097 |
| 38 | CMS Collaboration | Performance of electron reconstruction and selection with the CMS detector in proton-proton collisions at $ \sqrt{s} = $ 8 TeV | JINST 10 (2015) P06005 | CMS-EGM-13-001 1502.02701 |
| 39 | CMS Collaboration | Performance of the CMS muon detector and muon reconstruction with proton-proton collisions at $ \sqrt{s} = $ 13 TeV | JINST 13 (2018) P06015 | CMS-MUO-16-001 1804.04528 |
| 40 | CMS Collaboration | The CMS experiment at the CERN LHC | JINST 3 (2008) S08004 | CMS-00-001 |
| 41 | CMS Collaboration | CMS luminosity measurements for the 2016 data-taking period | CMS-PAS-LUM-17-001 | CMS-PAS-LUM-17-001 |
| 42 | CMS Collaboration | CMS luminosity measurement for the 2017 data-taking period at $ \sqrt{s} = $ 13 TeV | CMS-PAS-LUM-17-004 | CMS-PAS-LUM-17-004 |
| 43 | CMS Collaboration | CMS luminosity measurement for the 2018 data-taking period at $ \sqrt{s} = $ 13 TeV | CMS-PAS-LUM-18-002 | CMS-PAS-LUM-18-002 |
| 44 | P. Nason | A new method for combining NLO QCD with shower Monte Carlo algorithms | JHEP 11 (2004) 040 | hep-ph/0409146 |
| 45 | S. Frixione, P. Nason, and C. Oleari | Matching NLO QCD computations with parton shower simulations: the POWHEG method | JHEP 11 (2007) 070 | 0709.2092 |
| 46 | S. Alioli, P. Nason, C. Oleari, and E. Re | A general framework for implementing NLO calculations in shower Monte Carlo programs: the POWHEG BOX | JHEP 06 (2010) 043 | 1002.2581 |
| 47 | S. Alioli, P. Nason, C. Oleari, and E. Re | NLO Higgs boson production via gluon fusion matched with shower in POWHEG | JHEP 04 (2009) 002 | 0812.0578 |
| 48 | P. Nason and C. Oleari | NLO Higgs boson production via vector-boson fusion matched with shower in POWHEG | JHEP 02 (2010) 037 | 0911.5299 |
| 49 | G. Luisoni, P. Nason, C. Oleari, and F. Tramontano | HW$ ^{\pm} $/HZ + 0 and 1 jet at NLO with the POWHEG BOX interfaced to GoSam and their merging within MiNLO | JHEP 10 (2013) 1 | 1306.2542 |
| 50 | H. B. Hartanto, B. Jager, L. Reina, and D. Wackeroth | Higgs boson production in association with top quarks in the POWHEG BOX | PRD 91 (2015) 094003 | 1501.04498 |
| 51 | Y. Gao et al. | Spin determination of single-produced resonances at hadron colliders | PRD 81 (2010) 075022 | 1001.3396 |
| 52 | S. Bolognesi et al. | On the spin and parity of a single-produced resonance at the LHC | PRD 86 (2012) 095031 | 1208.4018 |
| 53 | I. Anderson et al. | Constraining anomalous $ HVV $ interactions at proton and lepton colliders | PRD 89 (2014) 035007 | 1309.4819 |
| 54 | A. V. Gritsan, R. Roentsch, M. Schulze, and M. Xiao | Constraining anomalous Higgs boson couplings to the heavy flavor fermions using matrix element techniques | PRD 94 (2016) 055023 | 1606.03107 |
| 55 | A. V. Gritsan et al. | New features in the JHU generator framework: constraining Higgs boson properties from on-shell and off-shell production | PRD 102 (2020) 056022 | 2002.09888 |
| 56 | J. Alwall et al. | The automated computation of tree-level and next-to-leading order differential cross sections, and their matching to parton shower simulations | JHEP 07 (2014) 079 | 1405.0301 |
| 57 | C. Anastasiou et al. | Higgs boson gluon-fusion production in QCD at three loops | PRL 114 (2015) 212001 | 1503.06056 |
| 58 | C. Anastasiou et al. | High precision determination of the gluon fusion Higgs boson cross-section at the LHC | JHEP 05 (2016) 58 | 1602.00695 |
| 59 | M. Ciccolini, A. Denner, and S. Dittmaier | Strong and electroweak corrections to the production of a Higgs boson+2 jets via weak interactions at the Large Hadron Collider | PRL 99 (2007) 161803 | 0707.0381 |
| 60 | M. Ciccolini, A. Denner, and S. Dittmaier | Electroweak and QCD corrections to Higgs production via vector-boson fusion at the LHC | PRD 77 (2008) 013002 | 0710.4749 |
| 61 | P. Bolzoni, F. Maltoni, S.-O. Moch, and M. Zaro | Higgs production via vector-boson fusion at NNLO in QCD | PRL 105 (2010) 011801 | 1003.4451 |
| 62 | P. Bolzoni, F. Maltoni, S.-O. Moch, and M. Zaro | Vector boson fusion at next-to-next-to-leading order in QCD: Standard model Higgs boson and beyond | PRD 85 (2012) 035002 | 1109.3717 |
| 63 | O. Brein, A. Djouadi, and R. Harlander | NNLO QCD corrections to the Higgs-strahlung processes at hadron colliders | PLB 579 (2004) 149 | hep-ph/0307206 |
| 64 | M. L. Ciccolini, S. Dittmaier, and M. Kramer | Electroweak radiative corrections to associated $ WH $ and $ ZH $ production at hadron colliders | PRD 68 (2003) 073003 | hep-ph/0306234 |
| 65 | W. Beenakker et al. | Higgs radiation off top quarks at the Tevatron and the LHC | PRL 87 (2001) 201805 | hep-ph/0107081 |
| 66 | W. Beenakker et al. | NLO QCD corrections to $ \mathrm{t\bar{t}} $ H production in hadron collisions. | NPB 653 (2003) 151 | hep-ph/0211352 |
| 67 | S. Dawson, L. H. Orr, L. Reina, and D. Wackeroth | Associated top quark Higgs boson production at the LHC | PRD 67 (2003) 071503 | hep-ph/0211438 |
| 68 | S. Dawson et al. | Associated Higgs production with top quarks at the Large Hadron Collider: NLO QCD corrections | PRD 68 (2003) 034022 | hep-ph/0305087 |
| 69 | Z. Yu et al. | QCD NLO and EW NLO corrections to $ t\bar{t}H $ production with top quark decays at hadron collider | PLB 738 (2014) 1 | 1407.1110 |
| 70 | S. S. Frixione et al. | Weak corrections to Higgs hadroproduction in association with a top-quark pair | JHEP 09 (2014) 65 | 1407.0823 |
| 71 | F. Demartin, F. Maltoni, K. Mawatari, and M. Zaro | Higgs production in association with a single top quark at the LHC | EPJC 75 (2015) 267 | 1504.0611 |
| 72 | F. Demartin et al. | tWH associated production at the LHC | EPJC 77 (2017) 34 | 1607.05862 |
| 73 | A. Denner et al. | Standard model Higgs-boson branching ratios with uncertainties | EPJC 71 (2011) 1753 | 1107.5909 |
| 74 | A. Djouadi, J. Kalinowski, and M. Spira | HDECAY: A program for Higgs boson decays in the standard model and its supersymmetric extension | CPC 108 (1998) 56 | hep-ph/9704448 |
| 75 | A. Djouadi, J. Kalinowski, M. Muhlleitner, and M. Spira | An update of the program HDECAY | in The Les Houches 2009 workshop on TeV colliders: The tools and Monte Carlo working group summary report 2010 | 1003.1643 |
| 76 | A. Bredenstein, A. Denner, S. Dittmaier, and M. M. Weber | Precise predictions for the Higgs-boson decay H $ \rightarrow $ WW/ZZ $ \rightarrow $ 4 leptons | PRD 74 (2006) 013004 | hep-ph/0604011 |
| 77 | A. Bredenstein, A. Denner, S. Dittmaier, and M. M. Weber | Radiative corrections to the semileptonic and hadronic Higgs-boson decays H $ \rightarrow $WW/ZZ$ \rightarrow $ 4 fermions | JHEP 02 (2007) 80 | hep-ph/0611234 |
| 78 | S. Boselli et al. | Higgs boson decay into four leptons at NLOPS electroweak accuracy | JHEP 06 (2015) 23 | 1503.07394 |
| 79 | S. Actis, G. Passarino, C. Sturm, and S. Uccirati | NNLO computational techniques: the cases $ H \to \gamma \gamma $ and $ H \to g g $ | NPB 811 (2009) 182 | 0809.3667 |
| 80 | T. Melia, P. Nason, R. Rontsch, and G. Zanderighi | W+W-, WZ and ZZ production in the POWHEG BOX | JHEP 11 (2011) 078 | 1107.5051 |
| 81 | J. M. Campbell and R. K. Ellis | MCFM for the Tevatron and the LHC | NPPS 205 (2010) 10 | 1007.3492 |
| 82 | T. Sjostrand et al. | An introduction to PYTHIA 8.2 | CPC 191 (2015) 159 | 1410.3012 |
| 83 | CMS Collaboration | Event generator tunes obtained from underlying event and multiparton scattering measurements | EPJC 76 (2016) 155 | CMS-GEN-14-001 1512.00815 |
| 84 | CMS Collaboration | Extraction and validation of a new set of CMS PYTHIA8 tunes from underlying-event measurements | EPJC 80 (2020) 4 | CMS-GEN-17-001 1903.12179 |
| 85 | NNPDF Collaboration | Parton distributions for the LHC Run II | JHEP 04 (2015) 040 | 1410.8849 |
| 86 | GEANT4 Collaboration | GEANT4: a simulation toolkit | NIMA 506 (2003) 250 | |
| 87 | J. Allison et al. | Geant4 developments and applications | IEEE Trans. Nucl. Sci. 53 (2006) 270 | |
| 88 | CMS Collaboration | Particle-flow reconstruction and global event description with the CMS detector | JINST 12 (2017) P10003 | CMS-PRF-14-001 1706.04965 |
| 89 | CMS Collaboration | Performance of missing transverse momentum reconstruction in proton-proton collisions at $ \sqrt{s} = $ 13 TeV using the CMS detector | JINST 14 (2019) P07004 | CMS-JME-17-001 1903.06078 |
| 90 | CMS Collaboration | Performance of CMS muon reconstruction in $ pp $ collision events at $ \sqrt{s} = $ 7 TeV | JINST 7 (2012) P10002 | CMS-MUO-10-004 1206.4071 |
| 91 | CMS Collaboration | Pileup mitigation at CMS in 13 TeV data | JINST 15 (2020) P09018 | CMS-JME-18-001 2003.00503 |
| 92 | CMS Collaboration | Electron and photon performance in CMS with the full 2017 data sample and additional highlights for the CALOR 2018 conference | CDS | |
| 93 | T. Chen and C. Guestrin | XGBoost: A scalable tree boosting system | 1603.02754 | |
| 94 | CMS Collaboration | Measurement of the inclusive $ W $ and $ Z $ production cross sections in $ pp $ collisions at $ \sqrt{s}= $ 7 TeV | JHEP 10 (2011) 132 | CMS-EWK-10-005 1107.4789 |
| 95 | CMS Collaboration | Jet energy scale and resolution in the CMS experiment in pp collisions at 8 TeV | JINST 12 (2017) P02014 | CMS-JME-13-004 1607.03663 |
| 96 | CMS Collaboration | Identification of heavy-flavour jets with the CMS detector in pp collisions at 13 TeV | JINST 13 (2018) P05011 | CMS-BTV-16-002 1712.07158 |
| 97 | Particle Data Group, P. A. Zyla et al. | Review of particle physics | Prog. Theor. Exp. Phys. 2020 (2020) 083C01 | |
| 98 | CMS Collaboration | Search for a Higgs boson in the mass range from 145 to 1000 GeV decaying to a pair of W or Z bosons | JHEP 10 (2015) 144 | CMS-HIG-13-031 1504.00936 |
| 99 | M. Grazzini, S. Kallweit, and D. Rathlev | ZZ production at the LHC: Fiducial cross sections and distributions in NNLO QCD | PLB 750 (2015) 407 | 1507.06257 |
| 100 | A. Bierweiler, T. Kasprzik, and J. H. Kuhn | Vector-boson pair production at the LHC to $ \mathcal{O}(\alpha^3) $ accuracy | JHEP 12 (2013) 071 | 1305.5402 |
| 101 | M. Bonvini et al. | Signal-background interference effects in $ gg \to H \to WW $ beyond leading order | PRD 88 (2013) 034032 | 1304.3053 |
| 102 | K. Melnikov and M. Dowling | Production of two Z-bosons in gluon fusion in the heavy top quark approximation | PLB 744 (2015) 43 | 1503.01274 |
| 103 | C. S. Li, H. T. Li, D. Y. Shao, and J. Wang | Soft gluon resummation in the signal-background interference process of gg($ \rightarrow $ h$ ^{*} $) $ \rightarrow $ ZZ | JHEP 08 (2015) 065 | 1504.02388 |
| 104 | G. Passarino | Higgs CAT | EPJC 74 (2014) 2866 | 1312.2397 |
| 105 | S. Catani and M. Grazzini | An NNLO subtraction formalism in hadron collisions and its application to Higgs boson production at the LHC | PRL 98 (2007) 222002 | hep-ph/0703012 |
| 106 | M. Grazzini | NNLO predictions for the Higgs boson signal in the H $ \to $ WW $ \to\ell\nu\ell\nu $ and H$ \to $ ZZ $ \to4\ell $ decay channels | JHEP 02 (2008) 043 | 0801.3232 |
| 107 | M. Grazzini and H. Sargsyan | Heavy-quark mass effects in Higgs boson production at the LHC | JHEP 09 (2013) 129 | 1306.4581 |
| 108 | L. Landau | On the energy loss of fast particles by ionization | J. Phys. (USSR) 8 (1944)201 | |
| 109 | D. de Florian, G. Ferrera, M. Grazzini, and D. Tommasini | Higgs boson production at the LHC: transverse momentum resummation effects in the $ H \to \gamma \gamma $, $ H \to WW \to \ell\nu\ell\nu $ and $ H \to ZZ \to 4\ell $ decay modes | JHEP 06 (2012) 132 | 1203.6321 |
| 110 | E. Bagnaschi, G. Degrassi, P. Slavich, and A. Vicini | Higgs production via gluon fusion in the POWHEG approach in the SM and in the MSSM | JHEP 02 (2012) 088 | 1111.2854 |
| 111 | K. Hamilton, P. Nason, E. Re, and G. Zanderighi | NNLOPS simulation of Higgs boson production | JHEP 10 (2013) 222 | 1309.0017 |
| 112 | M. J. Oreglia | A study of the reactions $\psi' \to \gamma\gamma \psi$ | PhD thesis, Stanford University, 1980 SLAC Report SLAC-R-236, see A | |
| 113 | CMS Collaboration | Determination of jet energy calibration and transverse momentum resolution in CMS | JINST 6 (2011) P11002 | CMS-JME-10-011 1107.4277 |
| 114 | M. Botje et al. | The PDF4LHC working group interim recommendations | 1101.0538 | |
| 115 | S. Alekhin et al. | The PDF4LHC working group interim report | 1101.0536 | |
| 116 | F. Garwood | Fiducial limits for the Poisson distribution | Biometrika 28 (1936) 437 | |
| 117 | G. Cowan, K. Cranmer, E. Gross, and O. Vitells | Asymptotic formulae for likelihood-based tests of new physics | Euro. Phys. J. C 71 (2011) 1554 | |
| 118 | The ATLAS Collaboration, The CMS Collaboration, The LHC Higgs Combination Group | Procedure for the LHC Higgs boson search combination in Summer 2011 | CMS-NOTE-2011-005 | |
| 119 | CMS Collaboration | A measurement of the Higgs boson mass in the diphoton decay channel | PLB 805 (2020) 135425 | CMS-HIG-19-004 2002.06398 |
| 120 | CMS Collaboration | Measurement of differential cross sections for Higg boson production in the diphoton decay channel in pp collisions at $ \sqrt{s} = $ 8 TeV | EPJC 76 (2015) 13 | CMS-HIG-14-016 1508.07819 |
|
|
Compact Muon Solenoid LHC, CERN |
|

|

|

|

|

|