

Compact Muon Solenoid
LHC, CERN
| CMS-TOP-21-008 ; CERN-EP-2022-112 | ||
| Measurement of the top quark pole mass using $\mathrm{t\bar{t}}$+jet events in the dilepton final state in proton-proton collisions at $\sqrt{s} = $ 13 TeV | ||
| CMS Collaboration | ||
| 5 July 2022 | ||
| JHEP 07 (2023) 077 | ||
| Abstract: A measurement of the top quark pole mass ${{m_{\mathrm{t}}} ^{\text{pole}}}$ in events where a top quark-antiquark pair ($\mathrm{t\bar{t}}$) is produced in association with at least one additional jet ($\mathrm{t\bar{t}}$+jet) is presented. This analysis is performed using proton-proton collision data at $\sqrt{s} = $ 13 TeV collected by the CMS experiment at the CERN LHC, corresponding to a total integrated luminosity of 36.3 fb$^{-1}$. Events with two opposite-sign leptons in the final state (e$^{+}$e$^{-}$, $\mu^{+}\mu^{-}$, e$^{\pm}\mu^{\mp}$) are analyzed. The reconstruction of the main observable and the event classification are optimized using multivariate analysis techniques based on machine learning. The production cross section is measured as a function of the inverse of the invariant mass of the $\mathrm{t\bar{t}}$+jet system at the parton level using a maximum likelihood unfolding. Given a reference parton distribution function (PDF), the top quark pole mass is extracted using the theoretical predictions at next-to-leading order. For the ABMP16NLO PDF, this results in ${{m_{\mathrm{t}}} ^{\text{pole}}} =$ 172.94 $\pm$ 1.37 GeV. | ||
| Links: e-print arXiv:2207.02270 [hep-ex] (PDF) ; CDS record ; inSPIRE record ; HepData record ; CADI line (restricted) ; | ||
| Figures | |
png pdf |
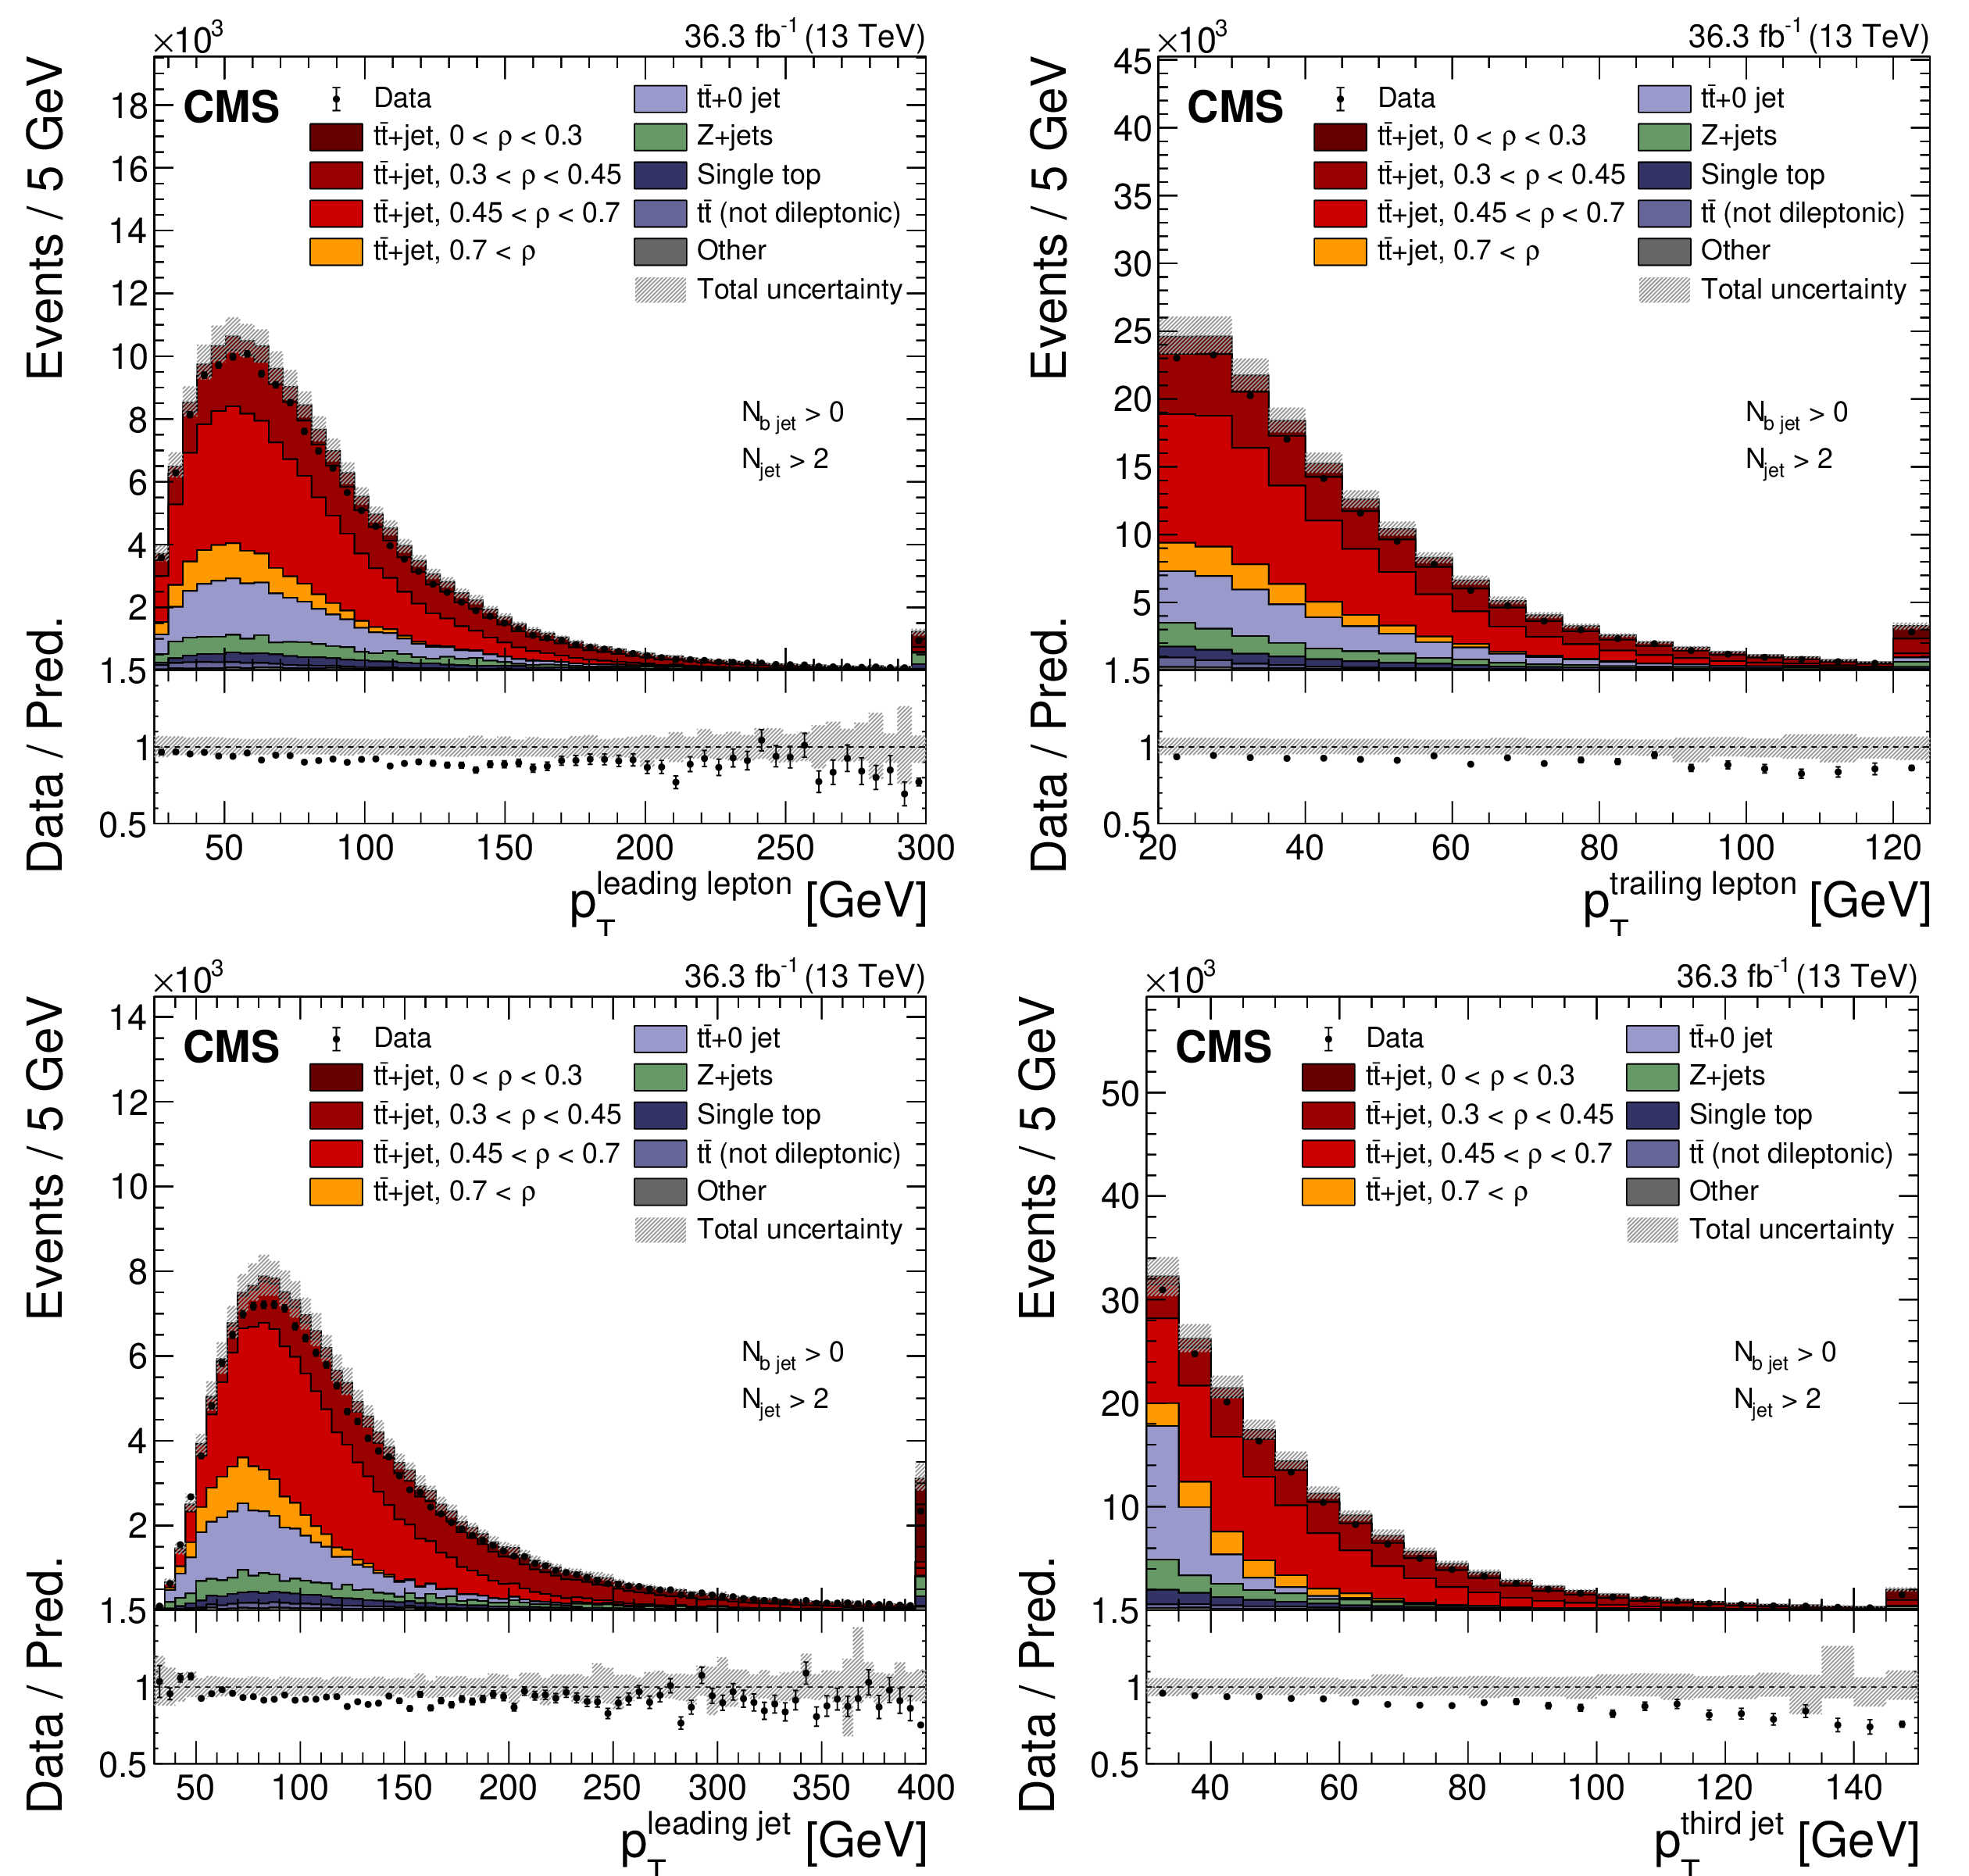
Figure 1:
The observed (points) and predicted (stacked histograms) signal and background yields as a function of the leading (upper left) and subleading (upper right) lepton ${p_{\mathrm {T}}}$ and leading (lower left) and third-highest (lower right) jet ${p_{\mathrm {T}}}$ after applying the signal selection. The vertical bars on the points represent the statistical uncertainty in the data. The hatched band represents the total uncertainty in the sum of the simulated signal and background predictions. The lower panels show the ratio of the data to the sum of the signal and background predictions. |
png pdf |
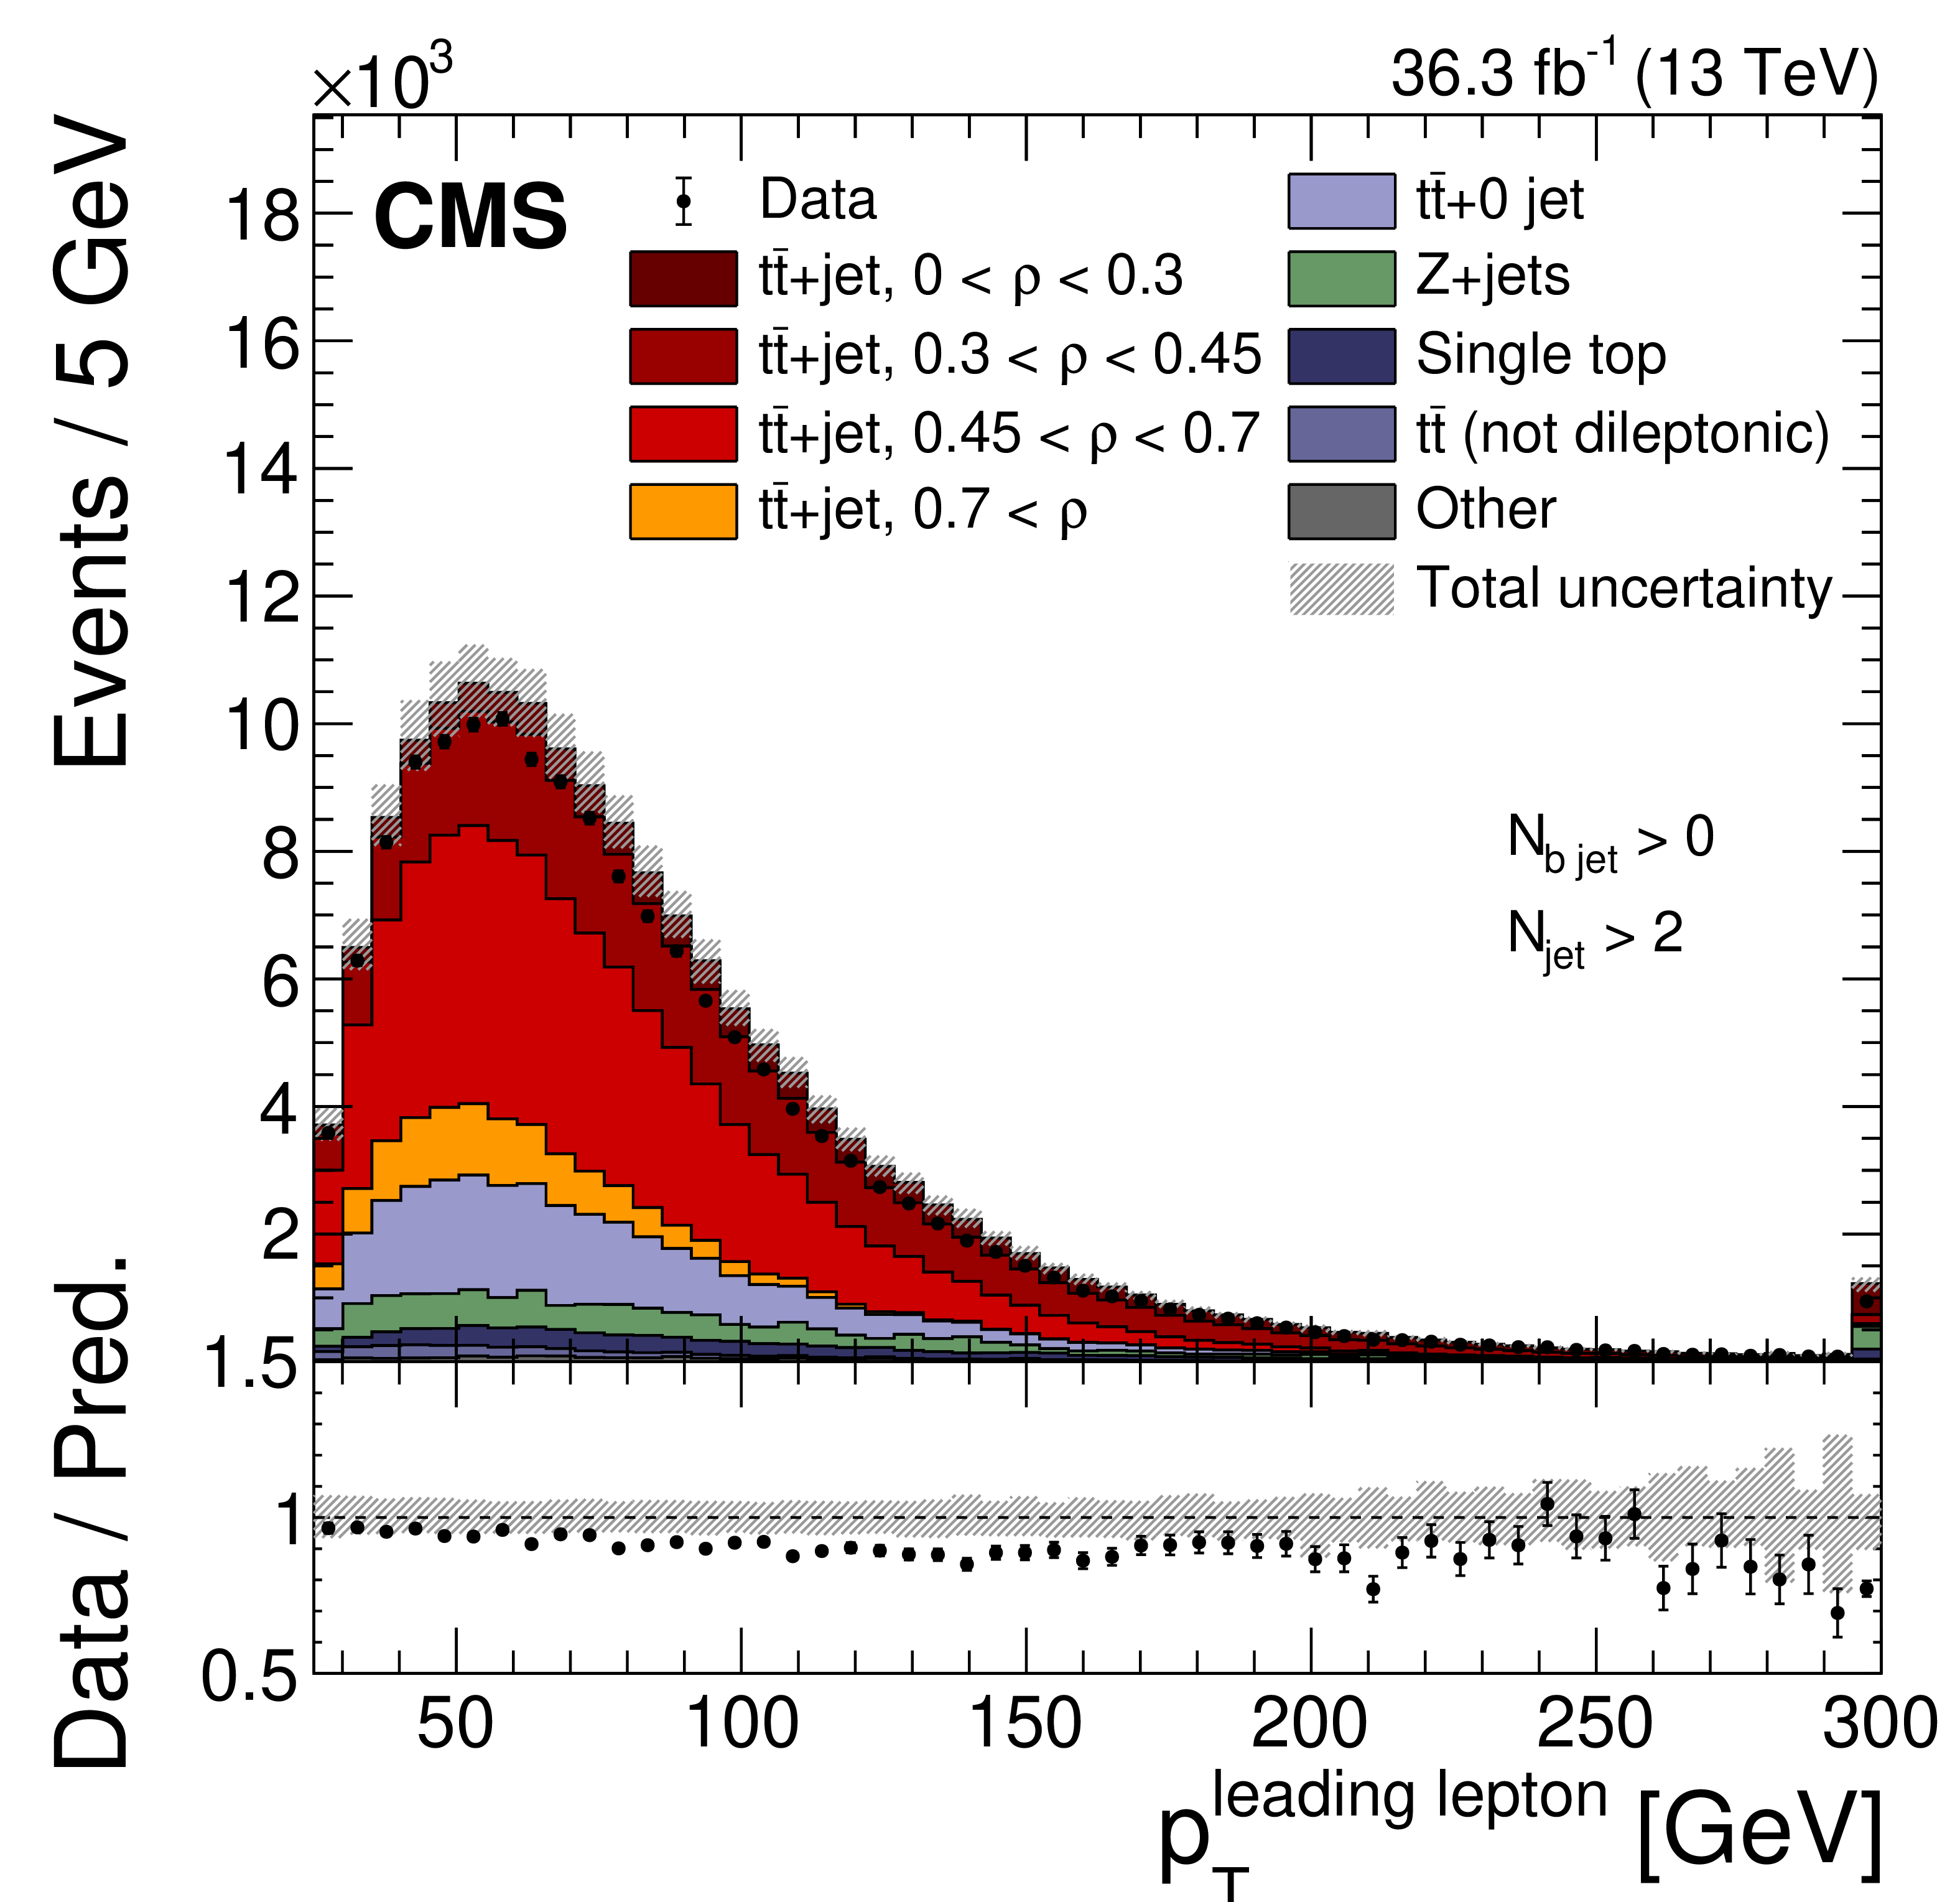
Figure 1-a:
The observed (points) and predicted (stacked histograms) signal and background yields as a function of the leading lepton ${p_{\mathrm {T}}}$ after applying the signal selection. The vertical bars on the points represent the statistical uncertainty in the data. The hatched band represents the total uncertainty in the sum of the simulated signal and background predictions. The lower panel shows the ratio of the data to the sum of the signal and background predictions. |
png pdf |
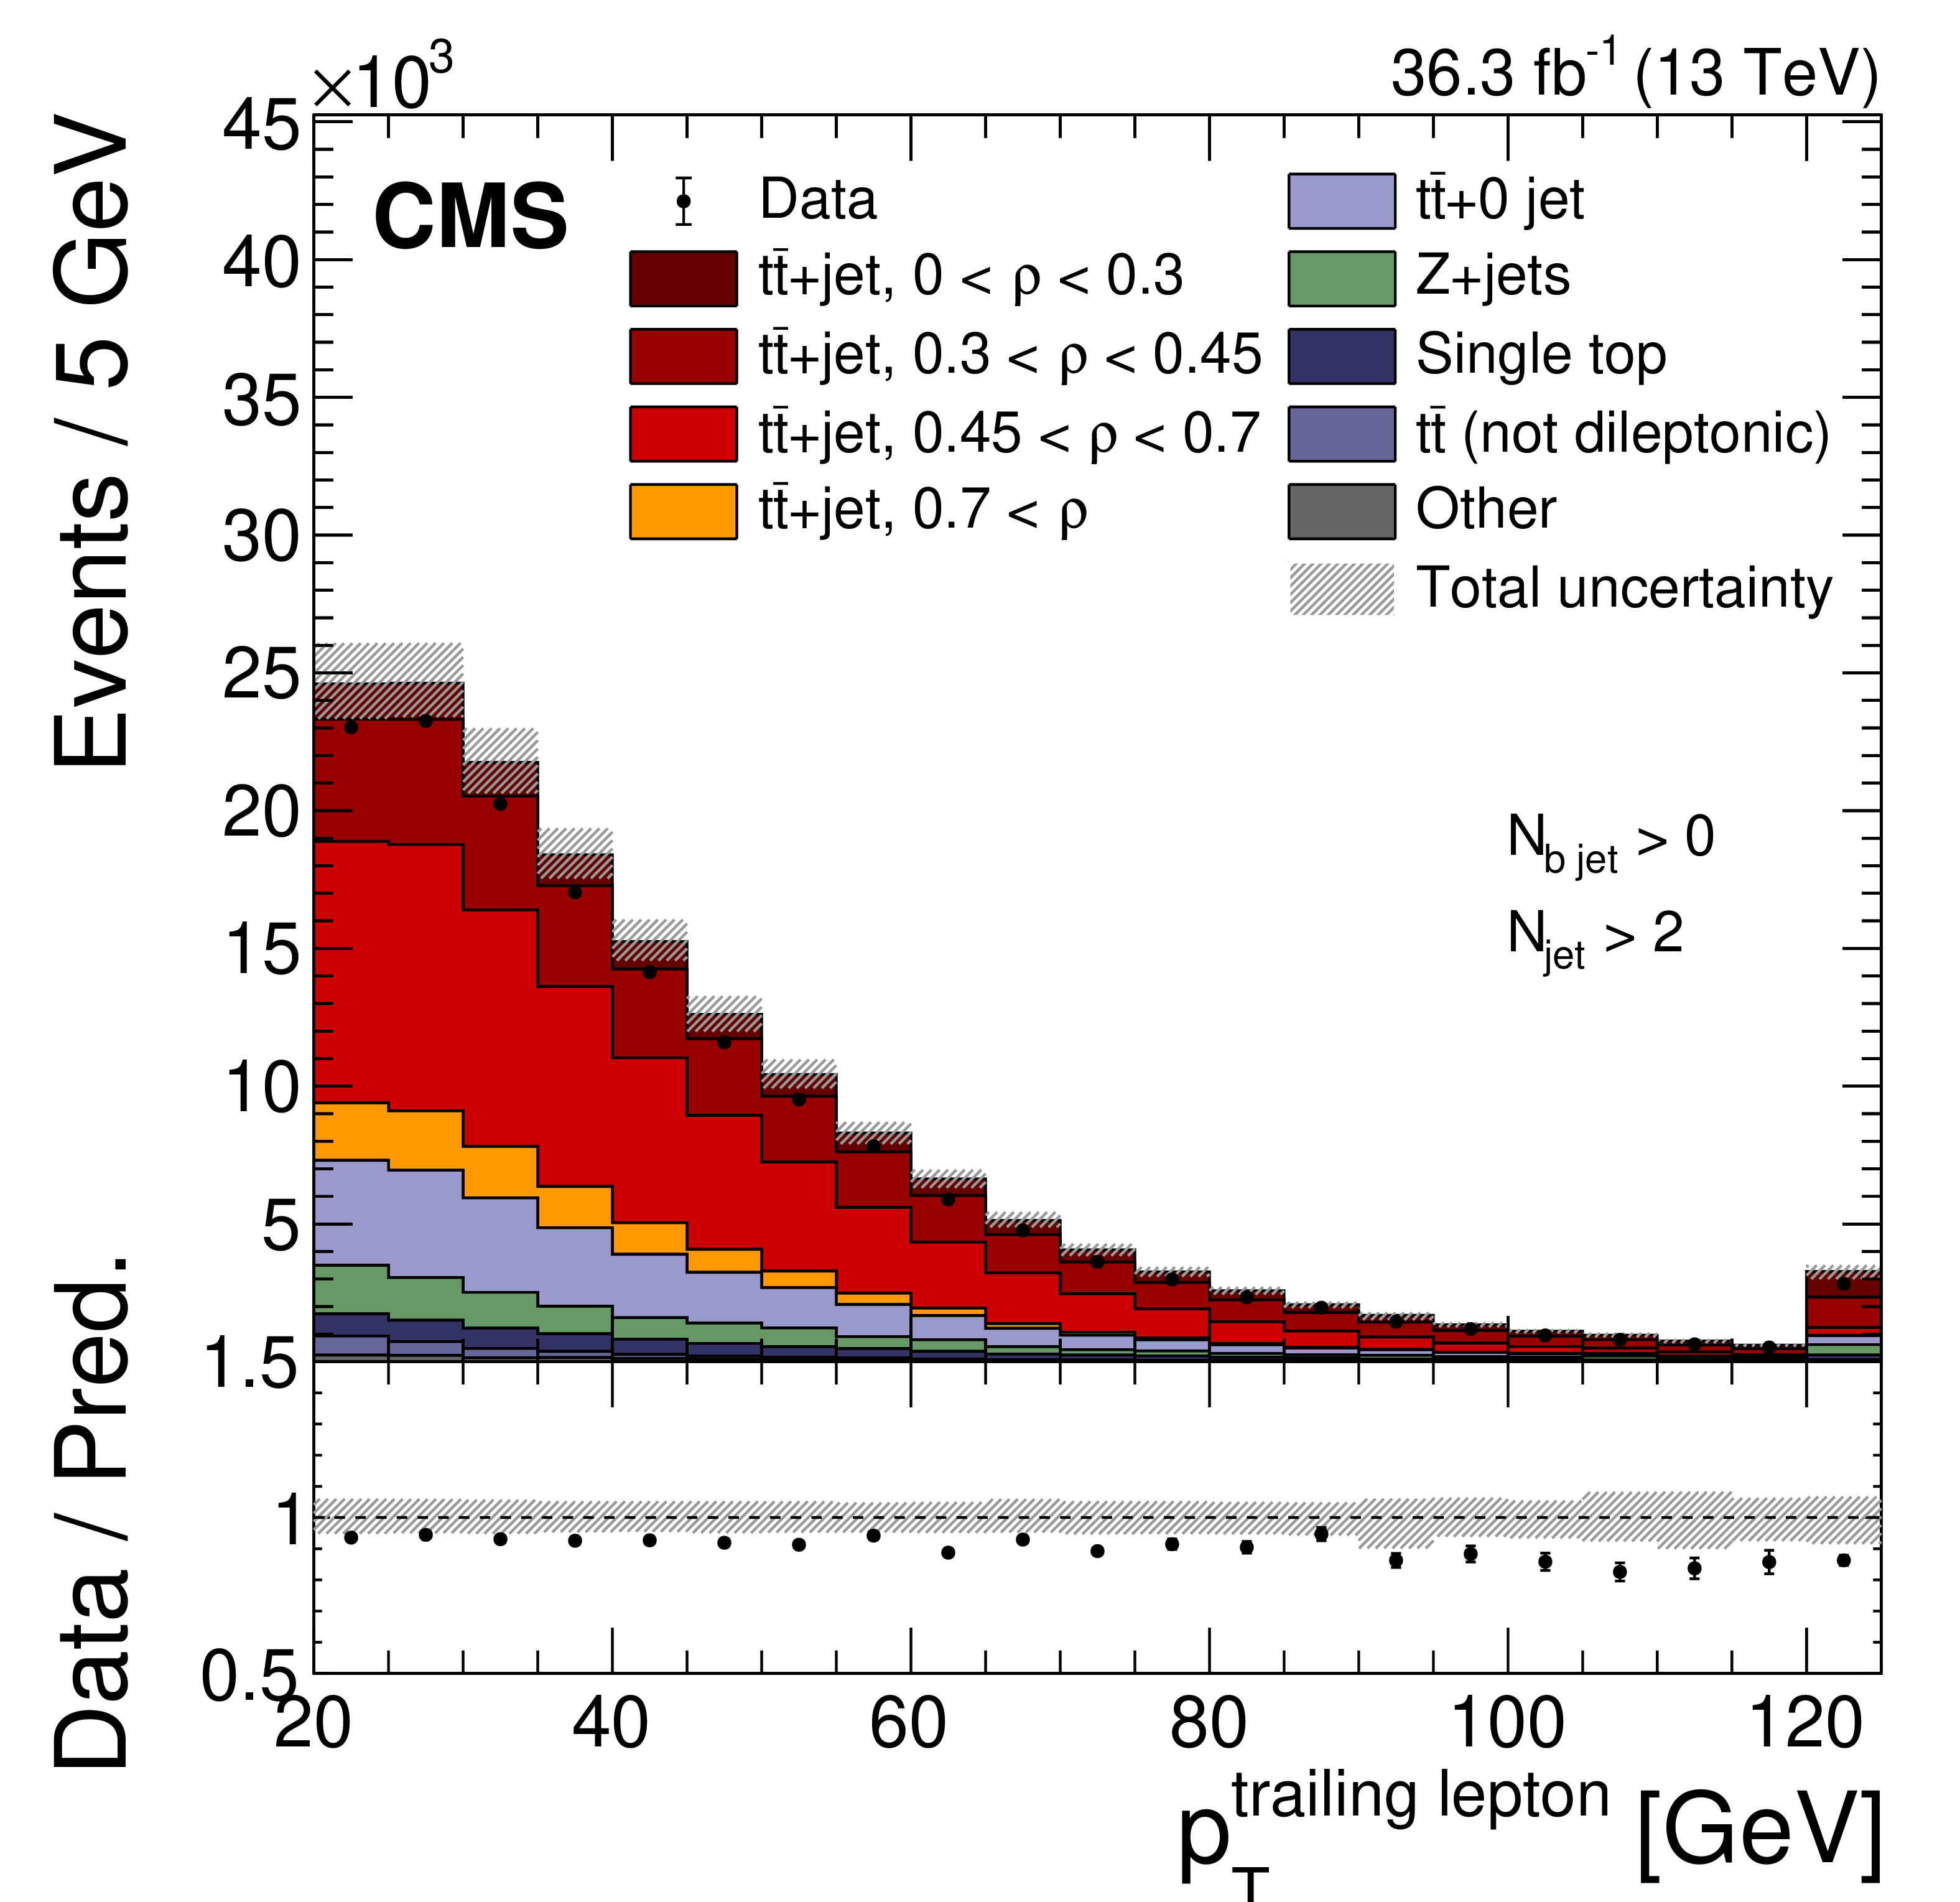
Figure 1-b:
The observed (points) and predicted (stacked histograms) signal and background yields as a function of the subleading lepton ${p_{\mathrm {T}}}$ after applying the signal selection. The vertical bars on the points represent the statistical uncertainty in the data. The hatched band represents the total uncertainty in the sum of the simulated signal and background predictions. The lower panel shows the ratio of the data to the sum of the signal and background predictions. |
png pdf |
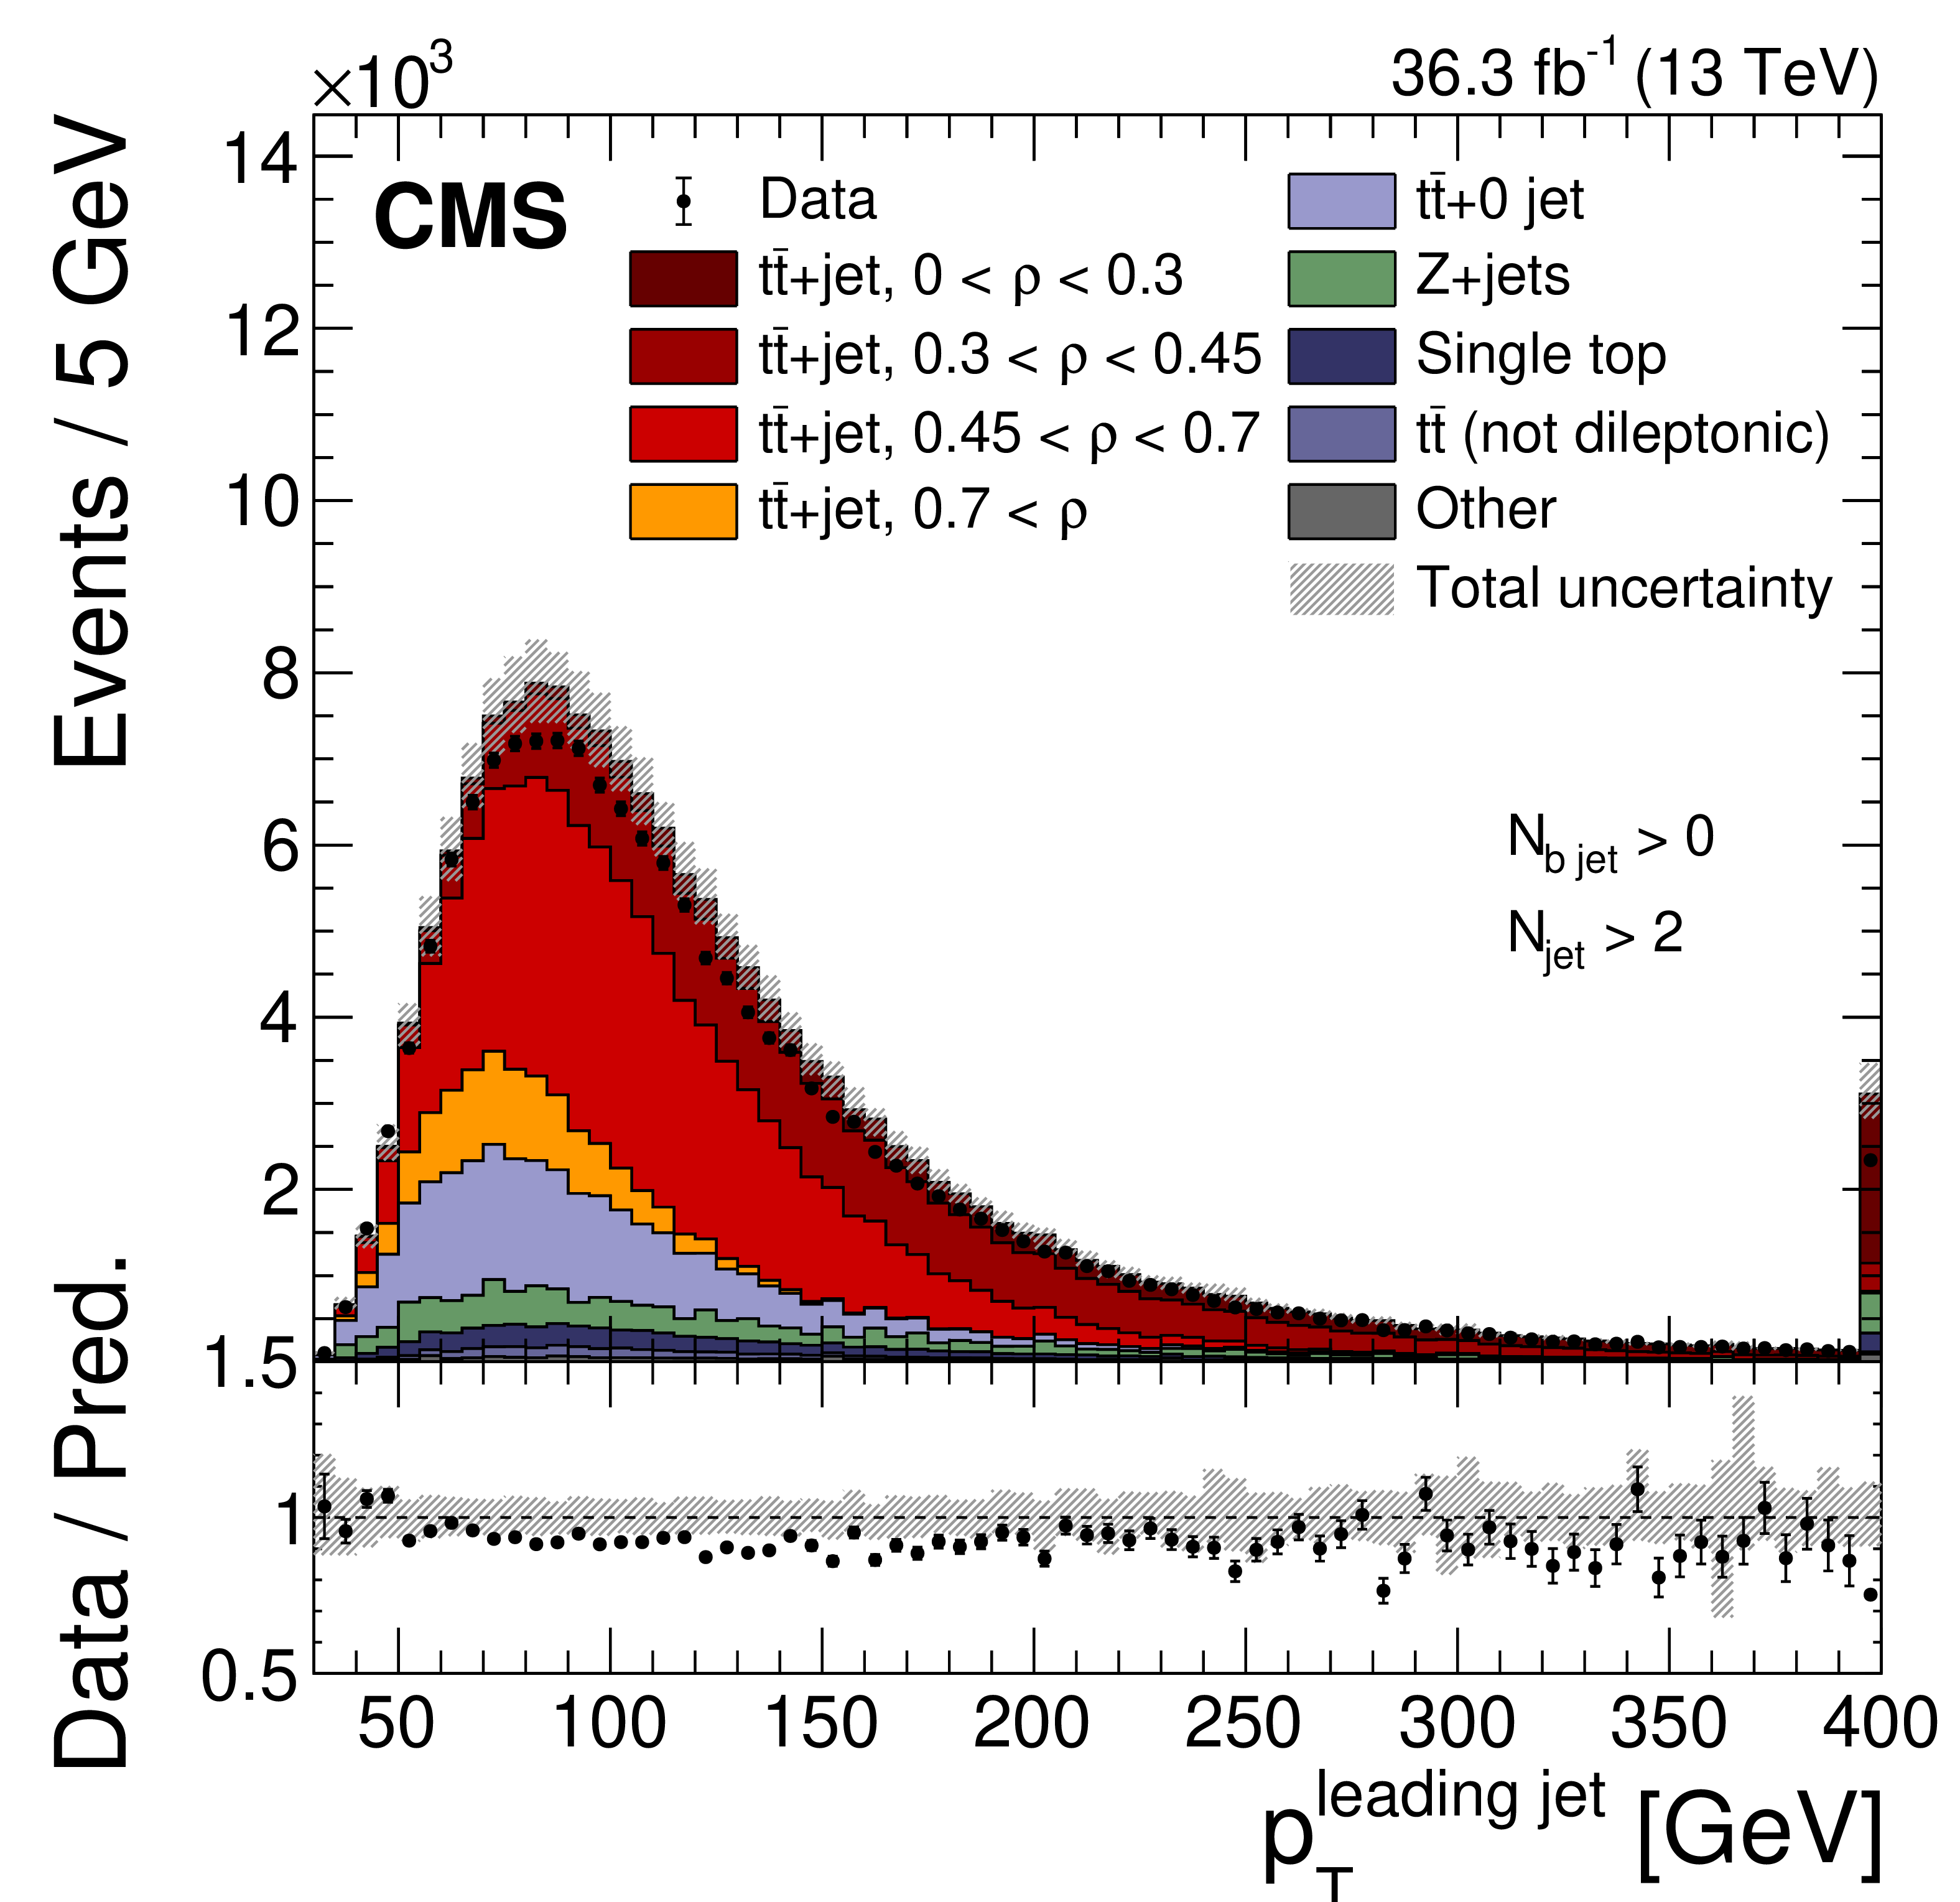
Figure 1-c:
The observed (points) and predicted (stacked histograms) signal and background yields as a function of the leading jet ${p_{\mathrm {T}}}$ after applying the signal selection. The vertical bars on the points represent the statistical uncertainty in the data. The hatched band represents the total uncertainty in the sum of the simulated signal and background predictions. The lower panel shows the ratio of the data to the sum of the signal and background predictions. |
png pdf |
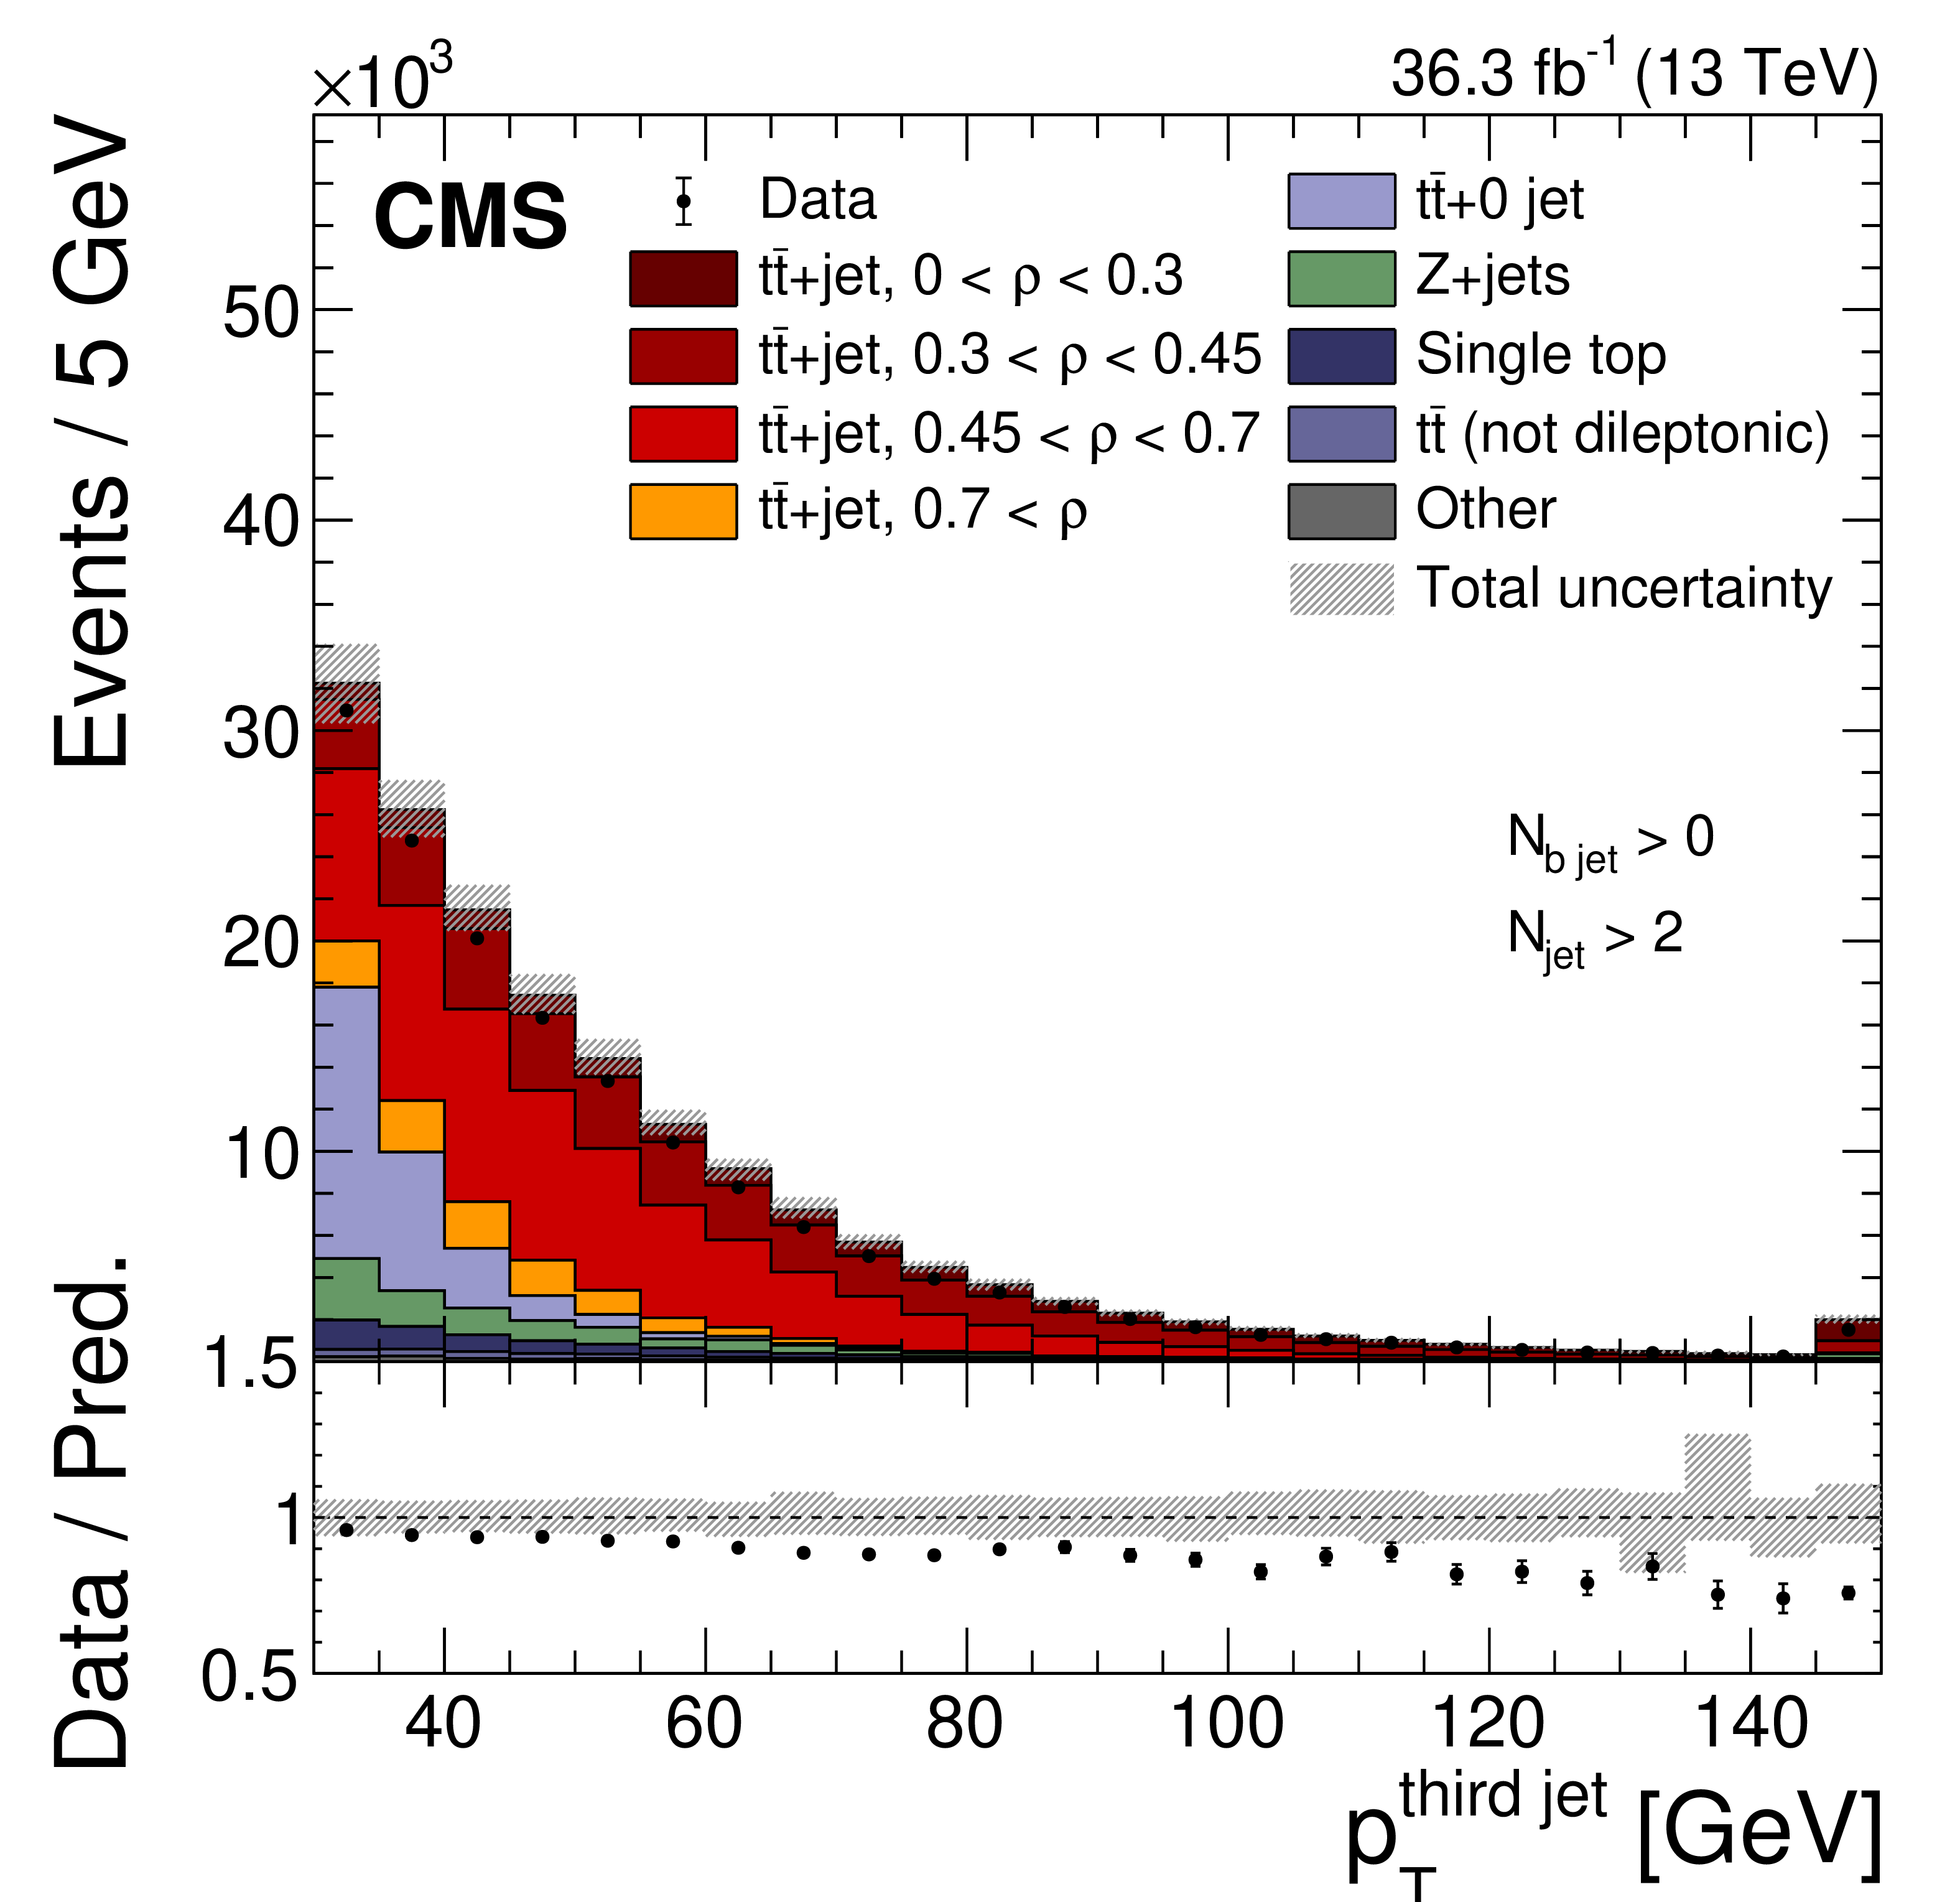
Figure 1-d:
The observed (points) and predicted (stacked histograms) signal and background yields as a function of the third-highest jet ${p_{\mathrm {T}}}$ after applying the signal selection. The vertical bars on the points represent the statistical uncertainty in the data. The hatched band represents the total uncertainty in the sum of the simulated signal and background predictions. The lower panel shows the ratio of the data to the sum of the signal and background predictions. |

png pdf |
Figure 2:
The observed (points) and predicted (stacked histograms) signal and background yields as a function of the jet (left), and b jet (right) multiplicities, after applying the signal selection. The vertical bars on the points represent the statistical uncertainty in the data. The hatched band represents the total uncertainty in the sum of the simulated signal and background predictions. The lower panels show the ratio of the data to the sum of the signal and background predictions. |
png pdf |
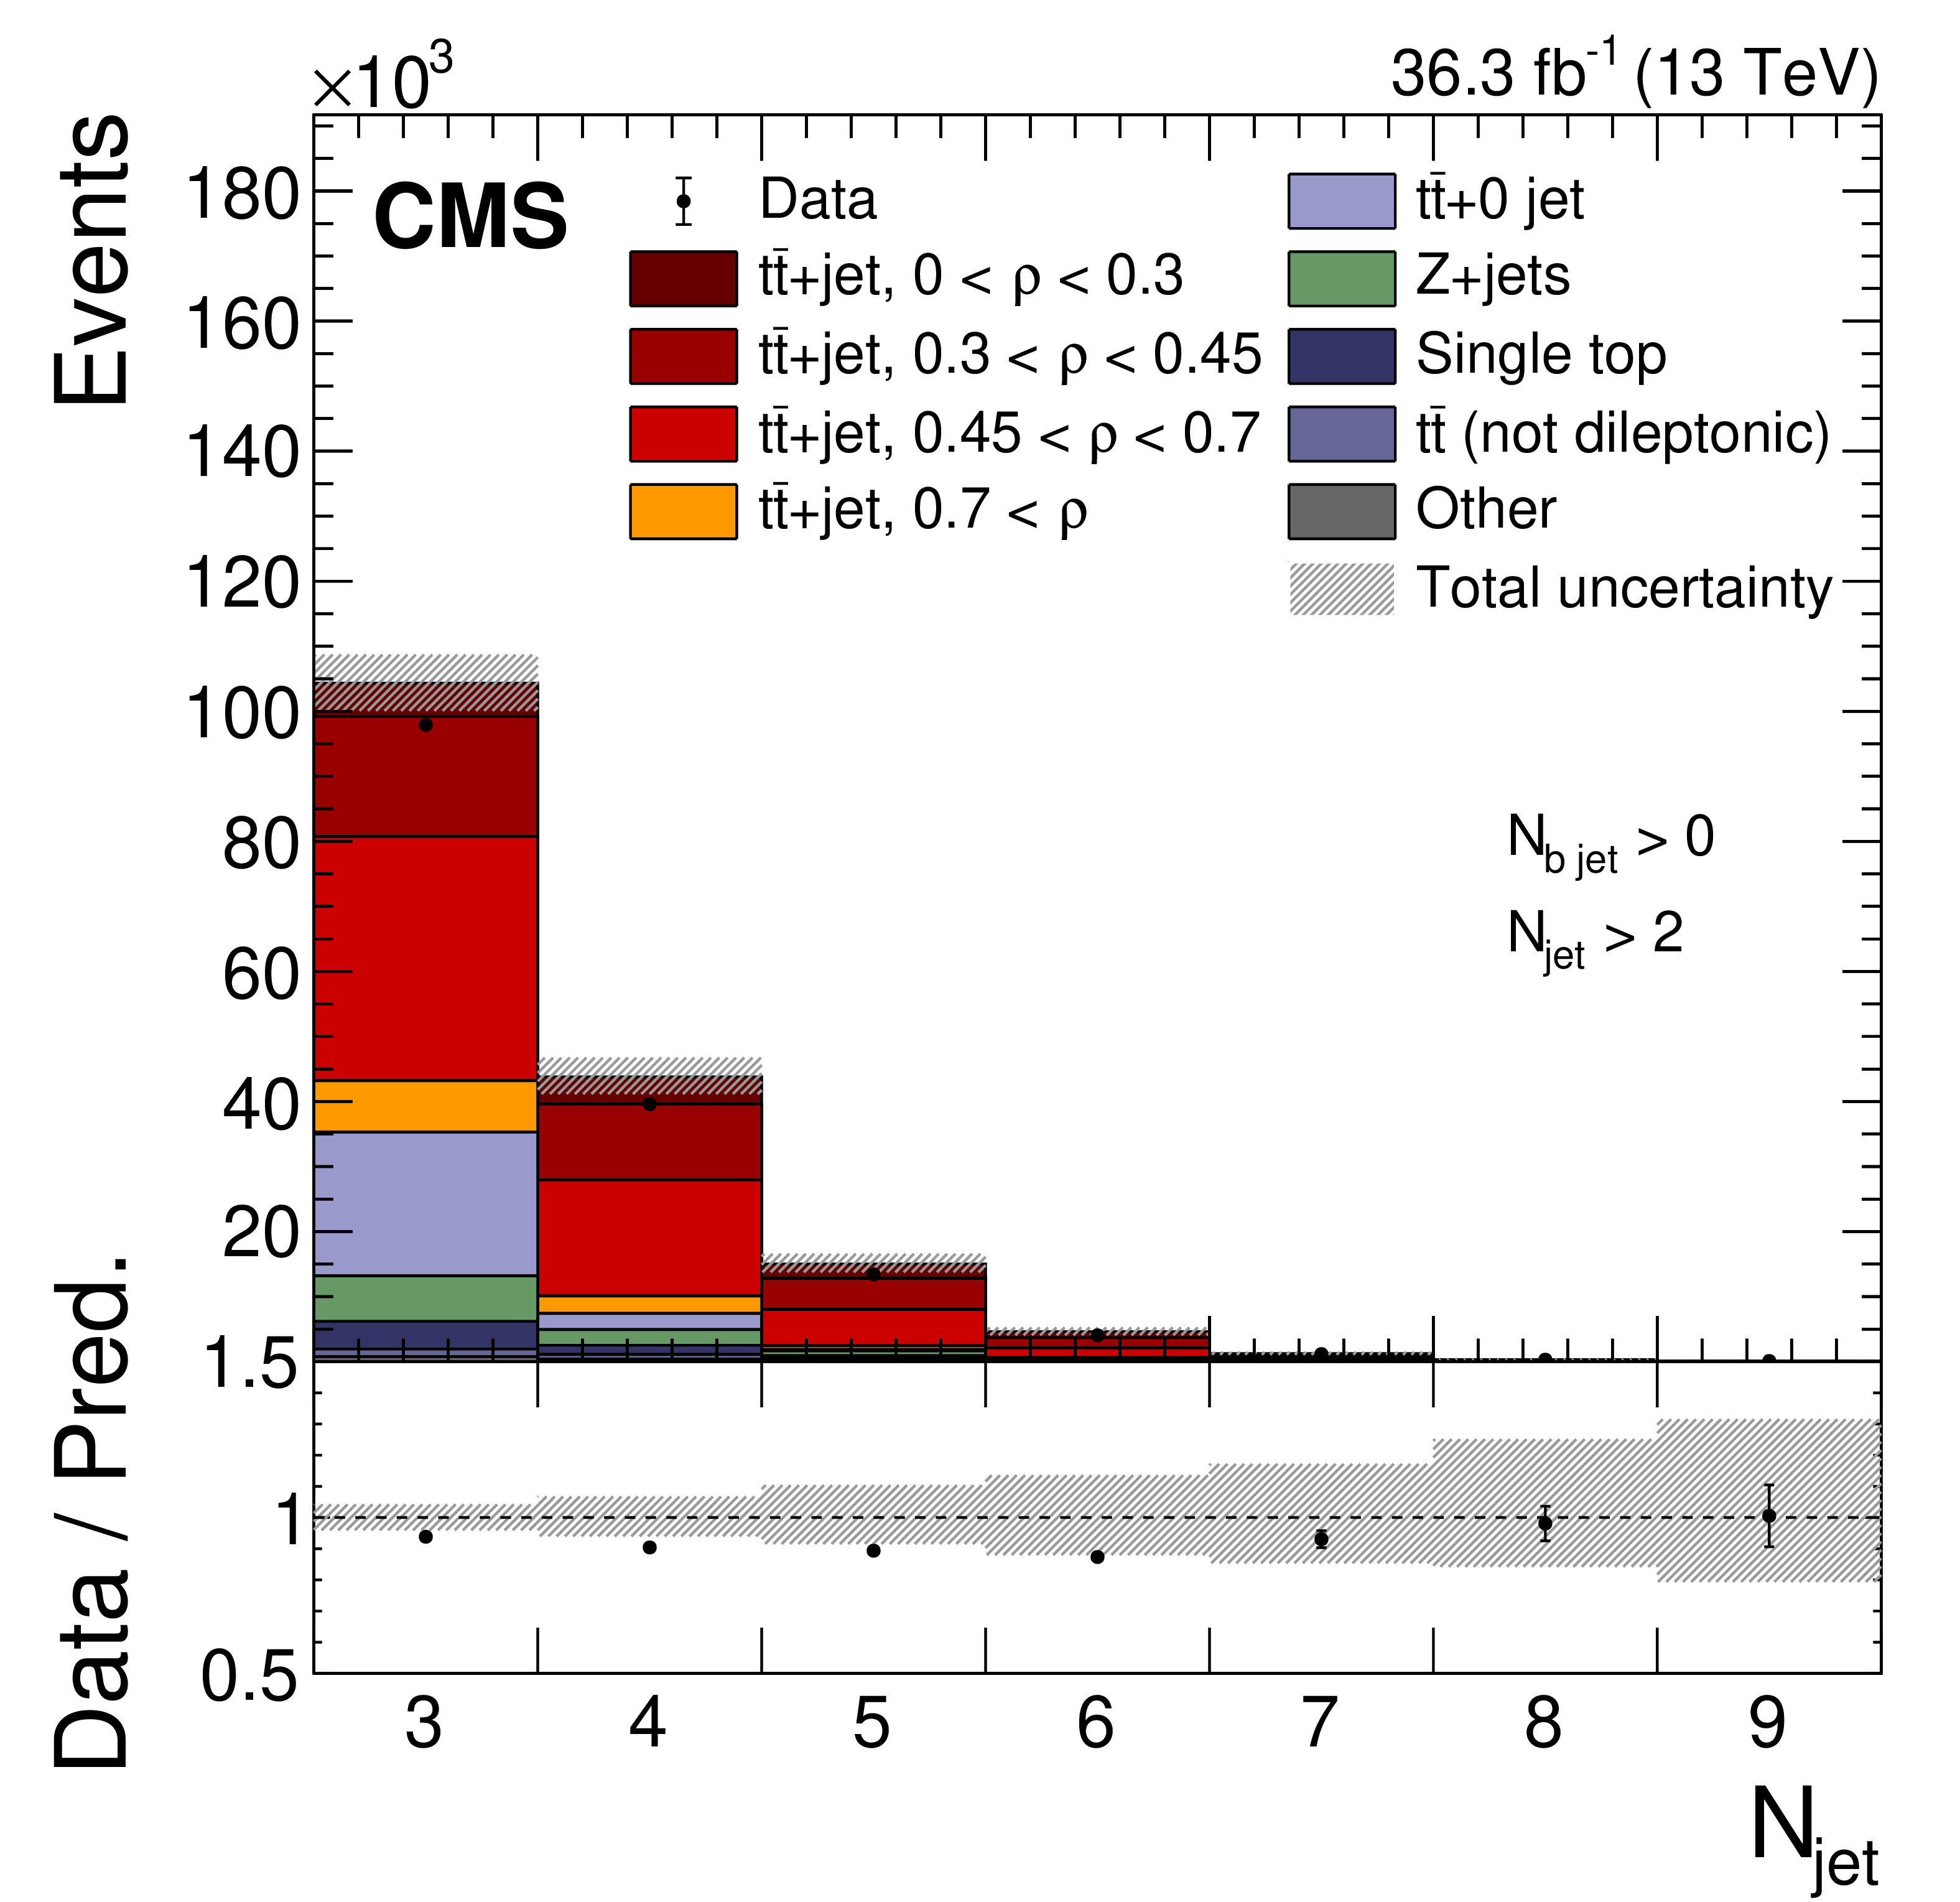
Figure 2-a:
The observed (points) and predicted (stacked histograms) signal and background yields as a function of the jet multiplicity, after applying the signal selection. The vertical bars on the points represent the statistical uncertainty in the data. The hatched band represents the total uncertainty in the sum of the simulated signal and background predictions. The lower panel shows the ratio of the data to the sum of the signal and background predictions. |
png pdf |
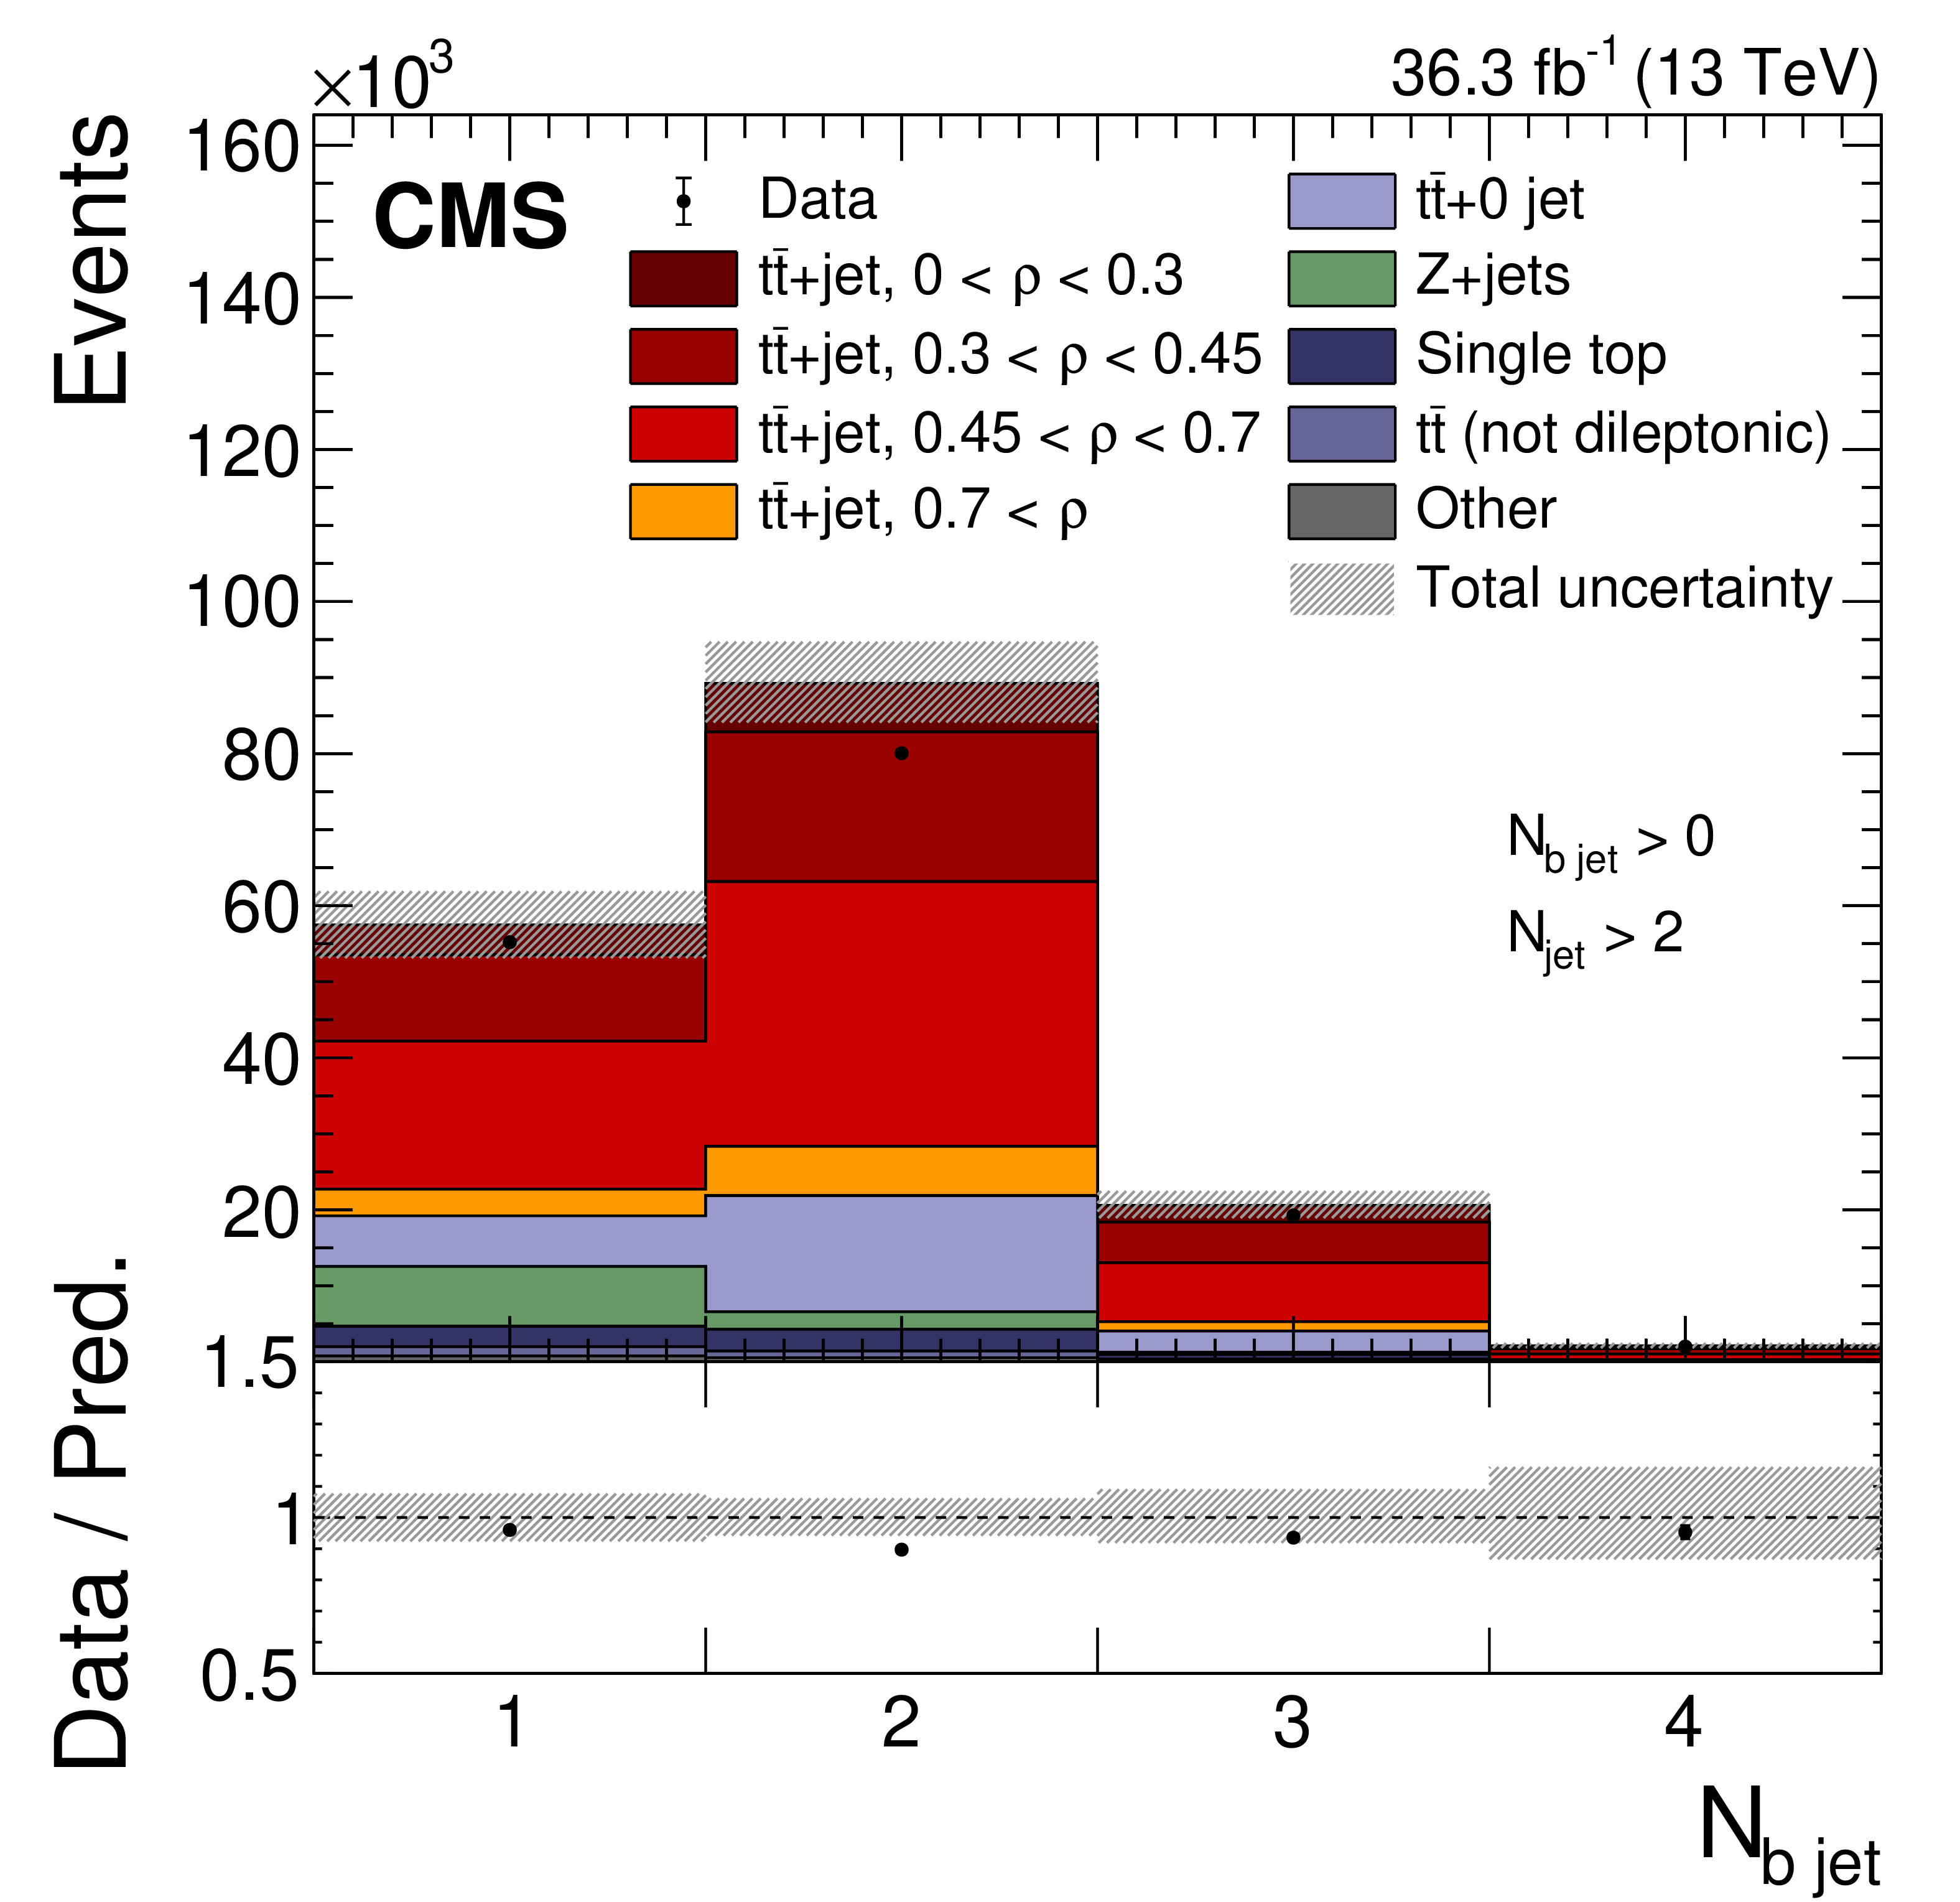
Figure 2-b:
The observed (points) and predicted (stacked histograms) signal and background yields as a function of the b jet multiplicity, after applying the signal selection. The vertical bars on the points represent the statistical uncertainty in the data. The hatched band represents the total uncertainty in the sum of the simulated signal and background predictions. The lower panel shows the ratio of the data to the sum of the signal and background predictions. |
png pdf |
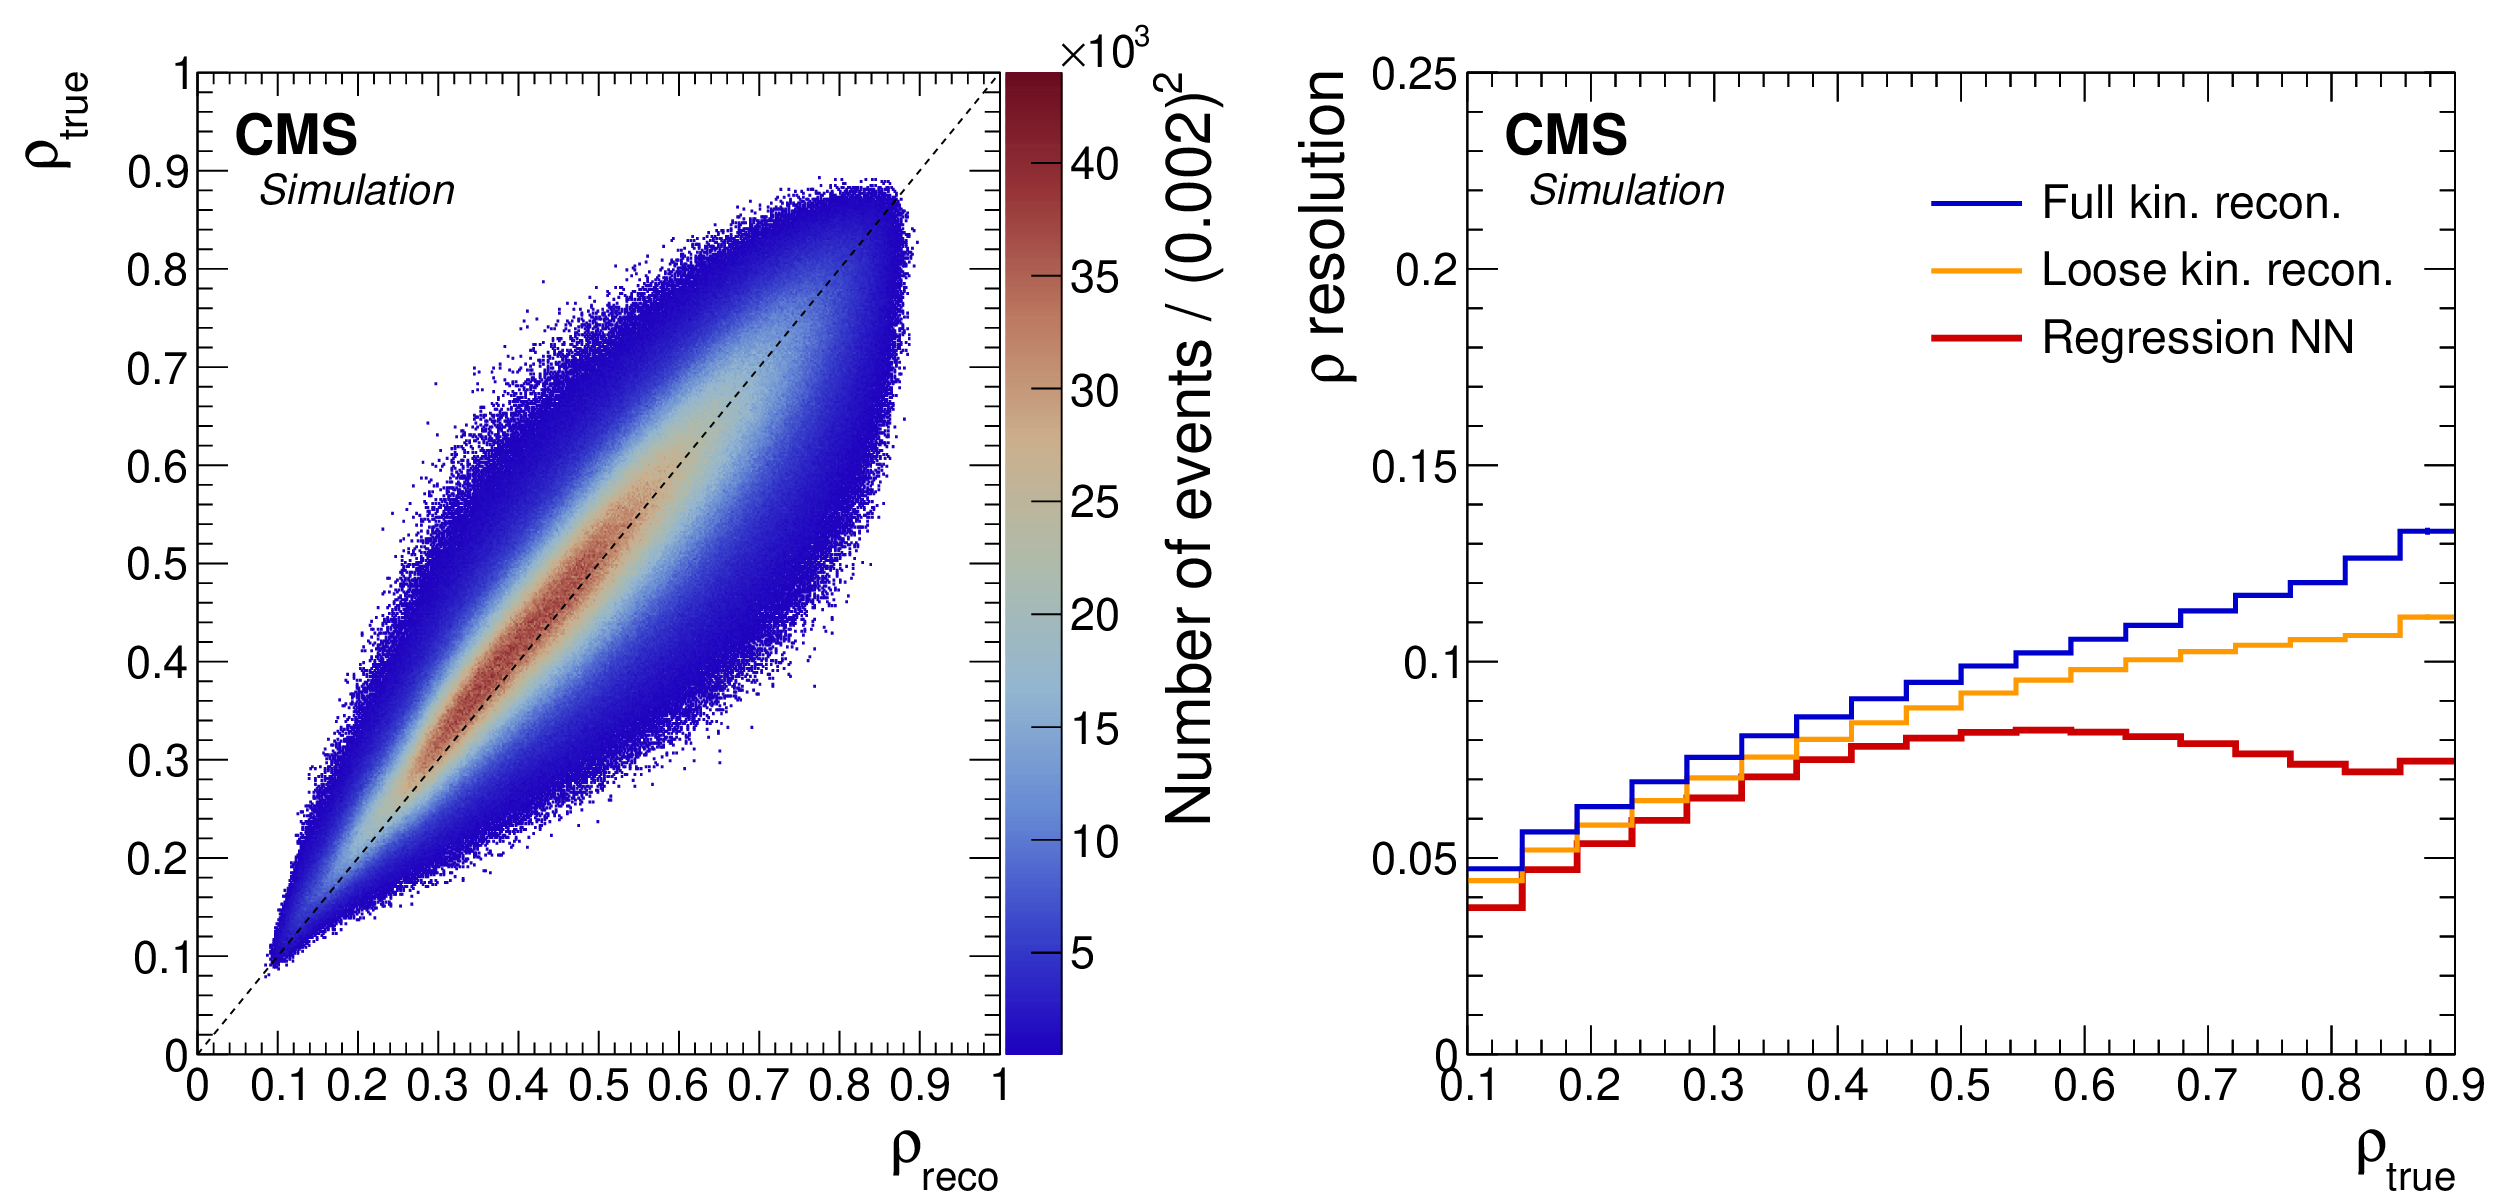
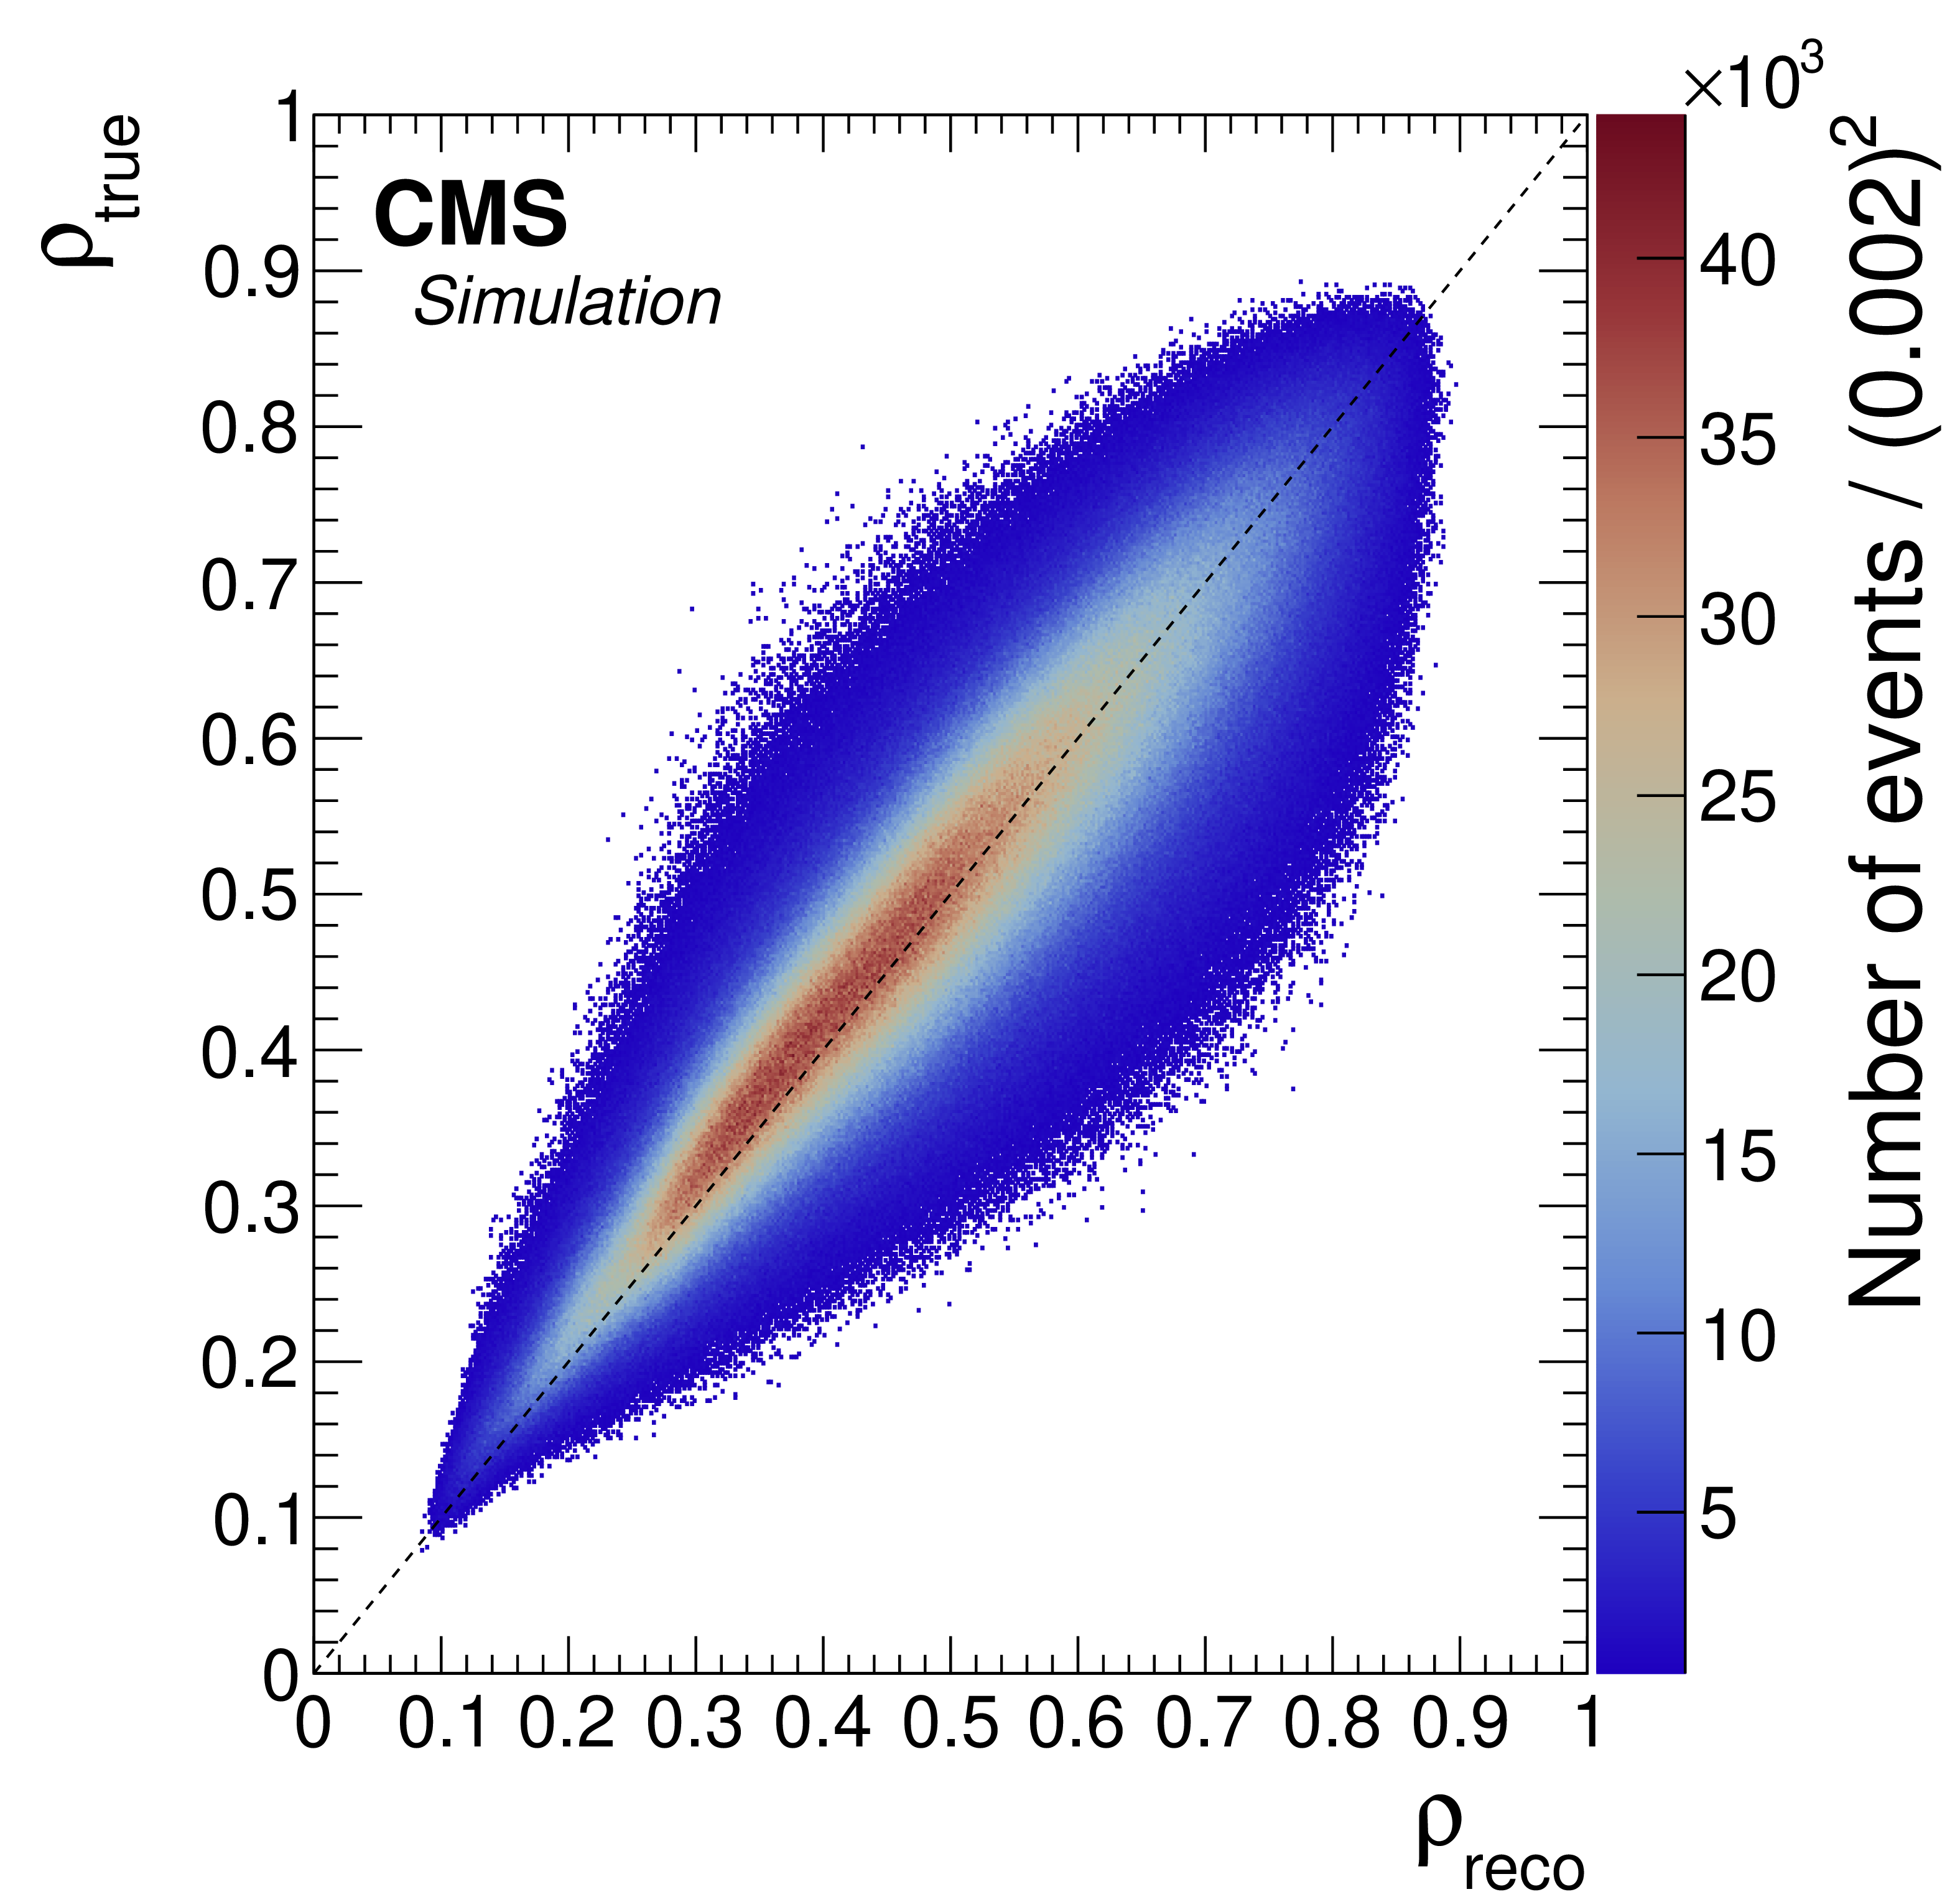
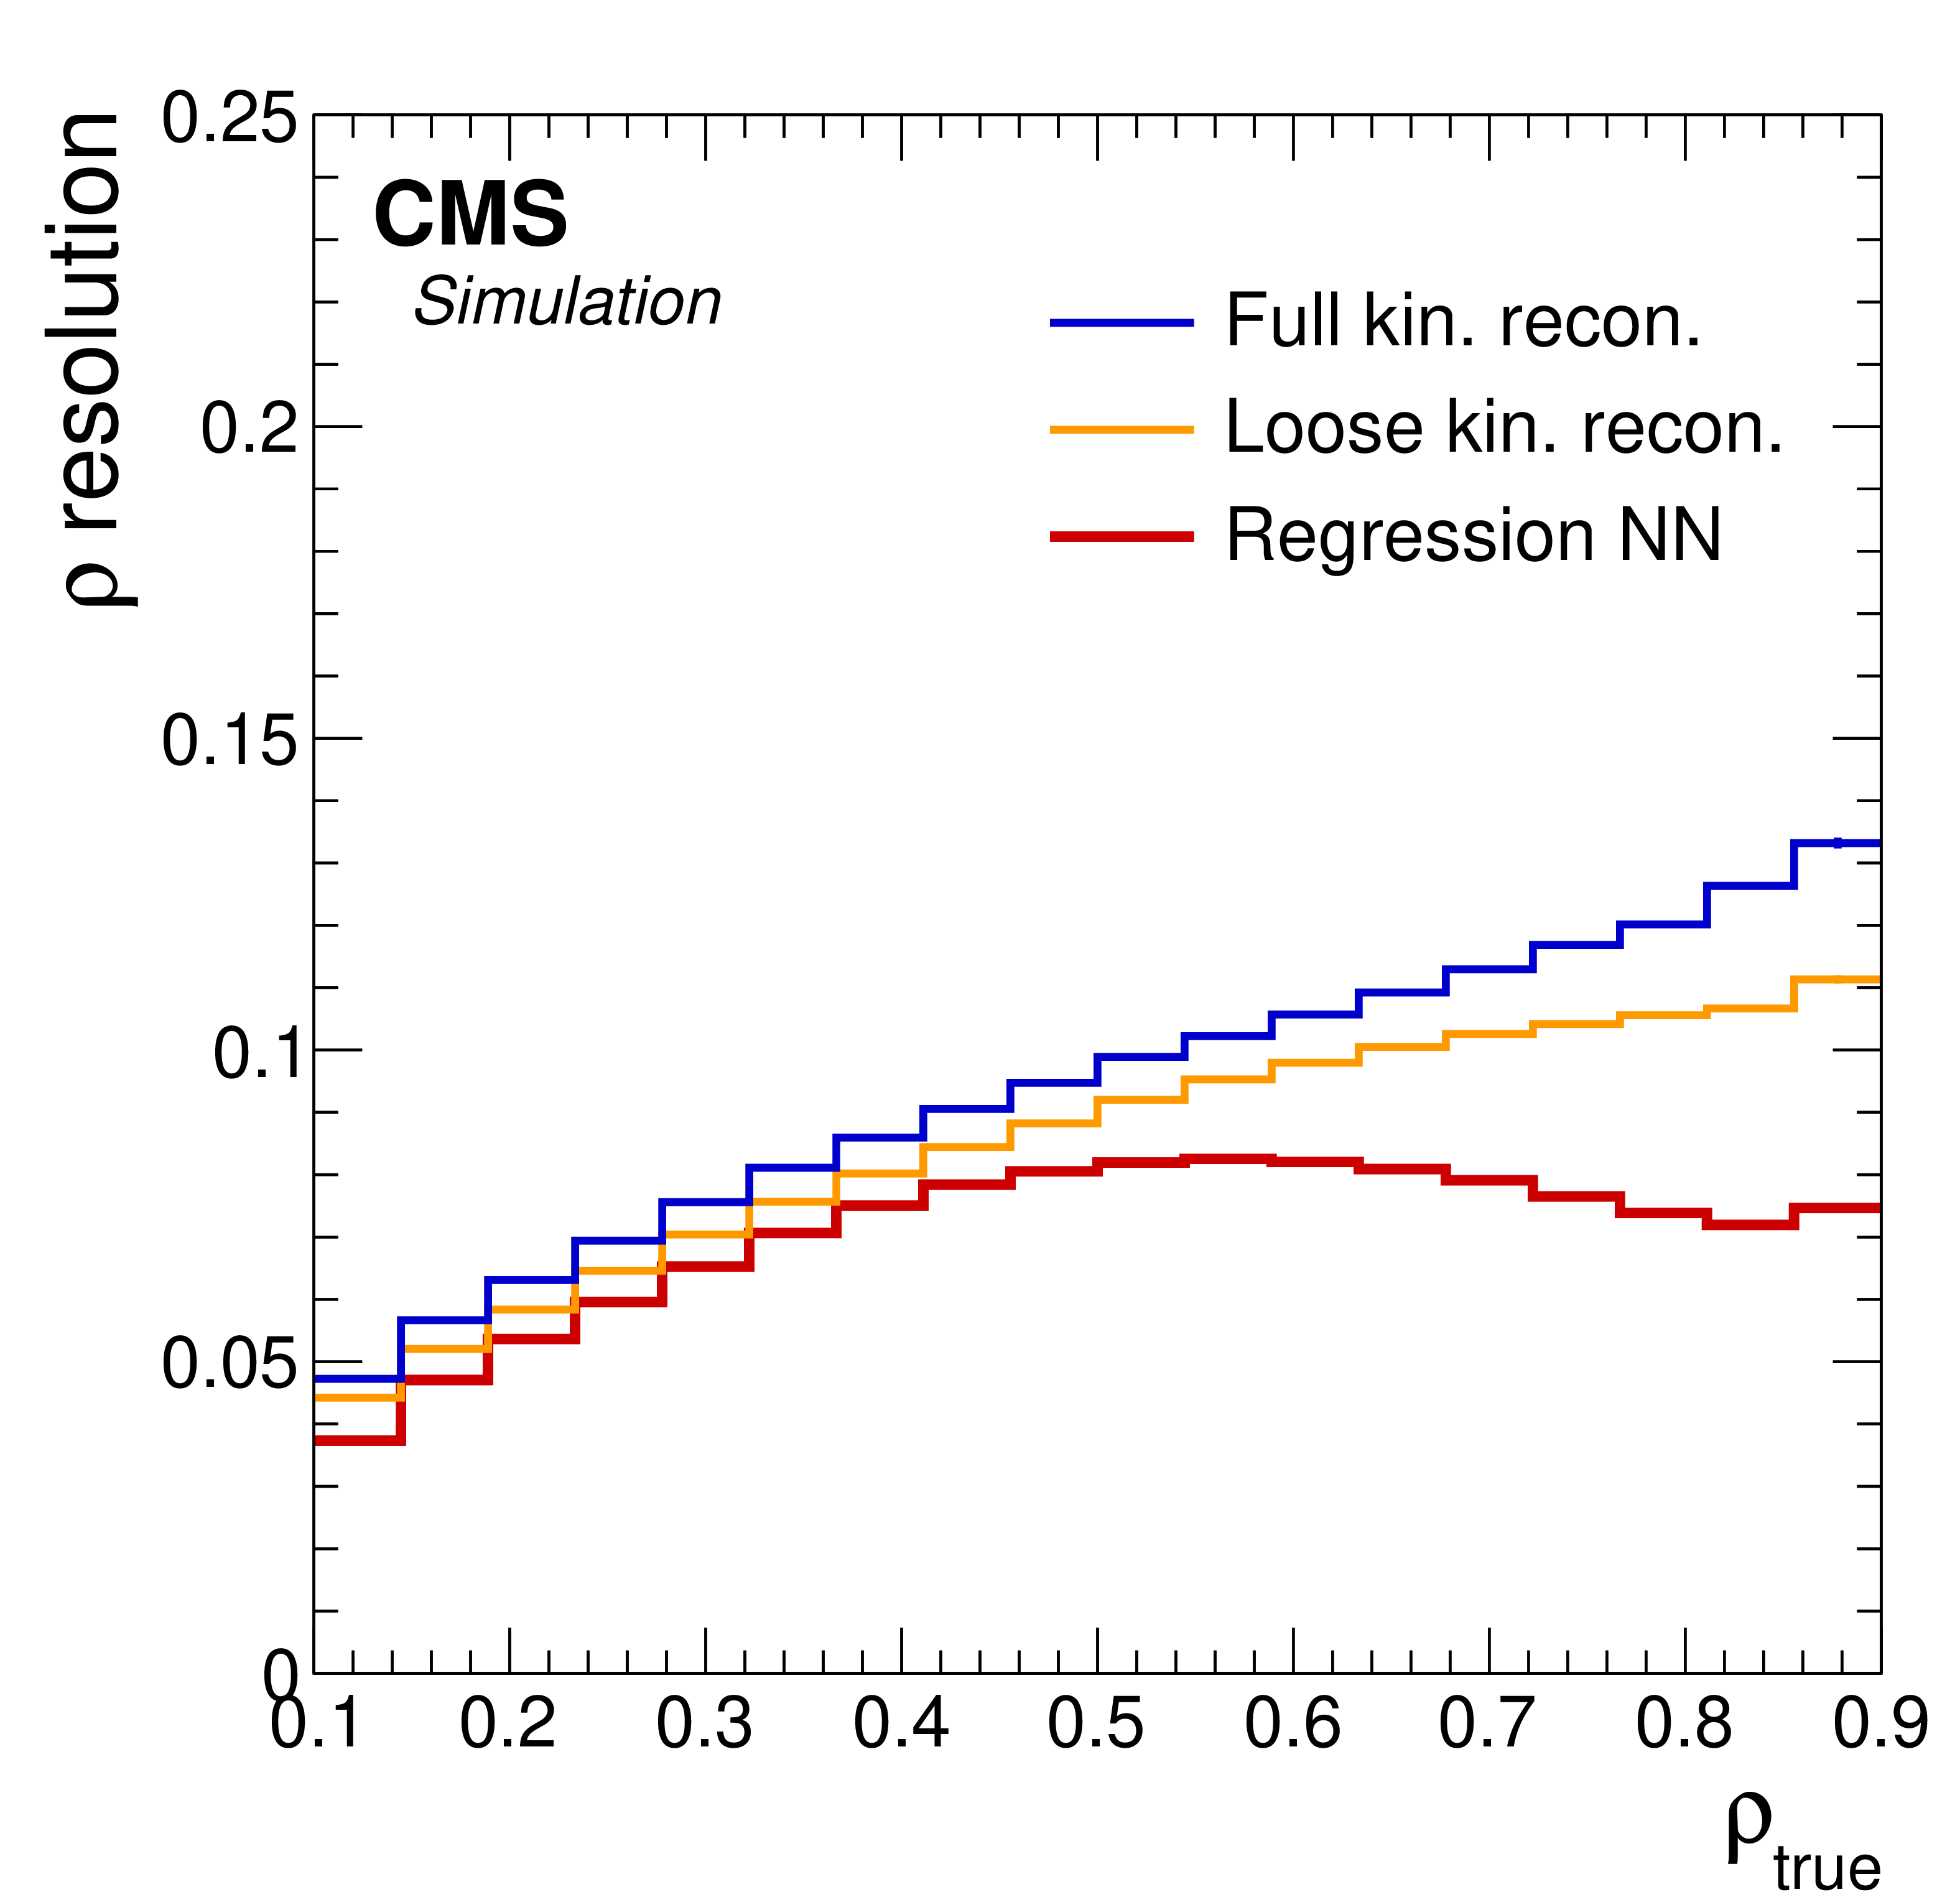
Figure 3:
The correlation between ${\rho _{\text {true}}}$ and ${\rho _{\text {reco}}}$ is shown for the regression NN reconstruction method (left). The ${\rho _{\text {reco}}}$ resolution, defined in the text, as a function of ${\rho _{\text {true}}}$ (right) for the full (blue line) and loose (orange line) kinematic reconstructions and the regression NN (red line) methods. The number of events per bin in the left plot is shown by the color scale. |
png pdf |
Figure 3-a:
The correlation between ${\rho _{\text {true}}}$ and ${\rho _{\text {reco}}}$ is shown for the regression NN reconstruction method. The number of events per bin is shown by the color scale. |
png pdf |
Figure 3-b:
The ${\rho _{\text {reco}}}$ resolution, defined in the text, as a function of ${\rho _{\text {true}}}$ for the full (blue line) and loose (orange line) kinematic reconstructions and the regression NN (red line) methods. |

png pdf |
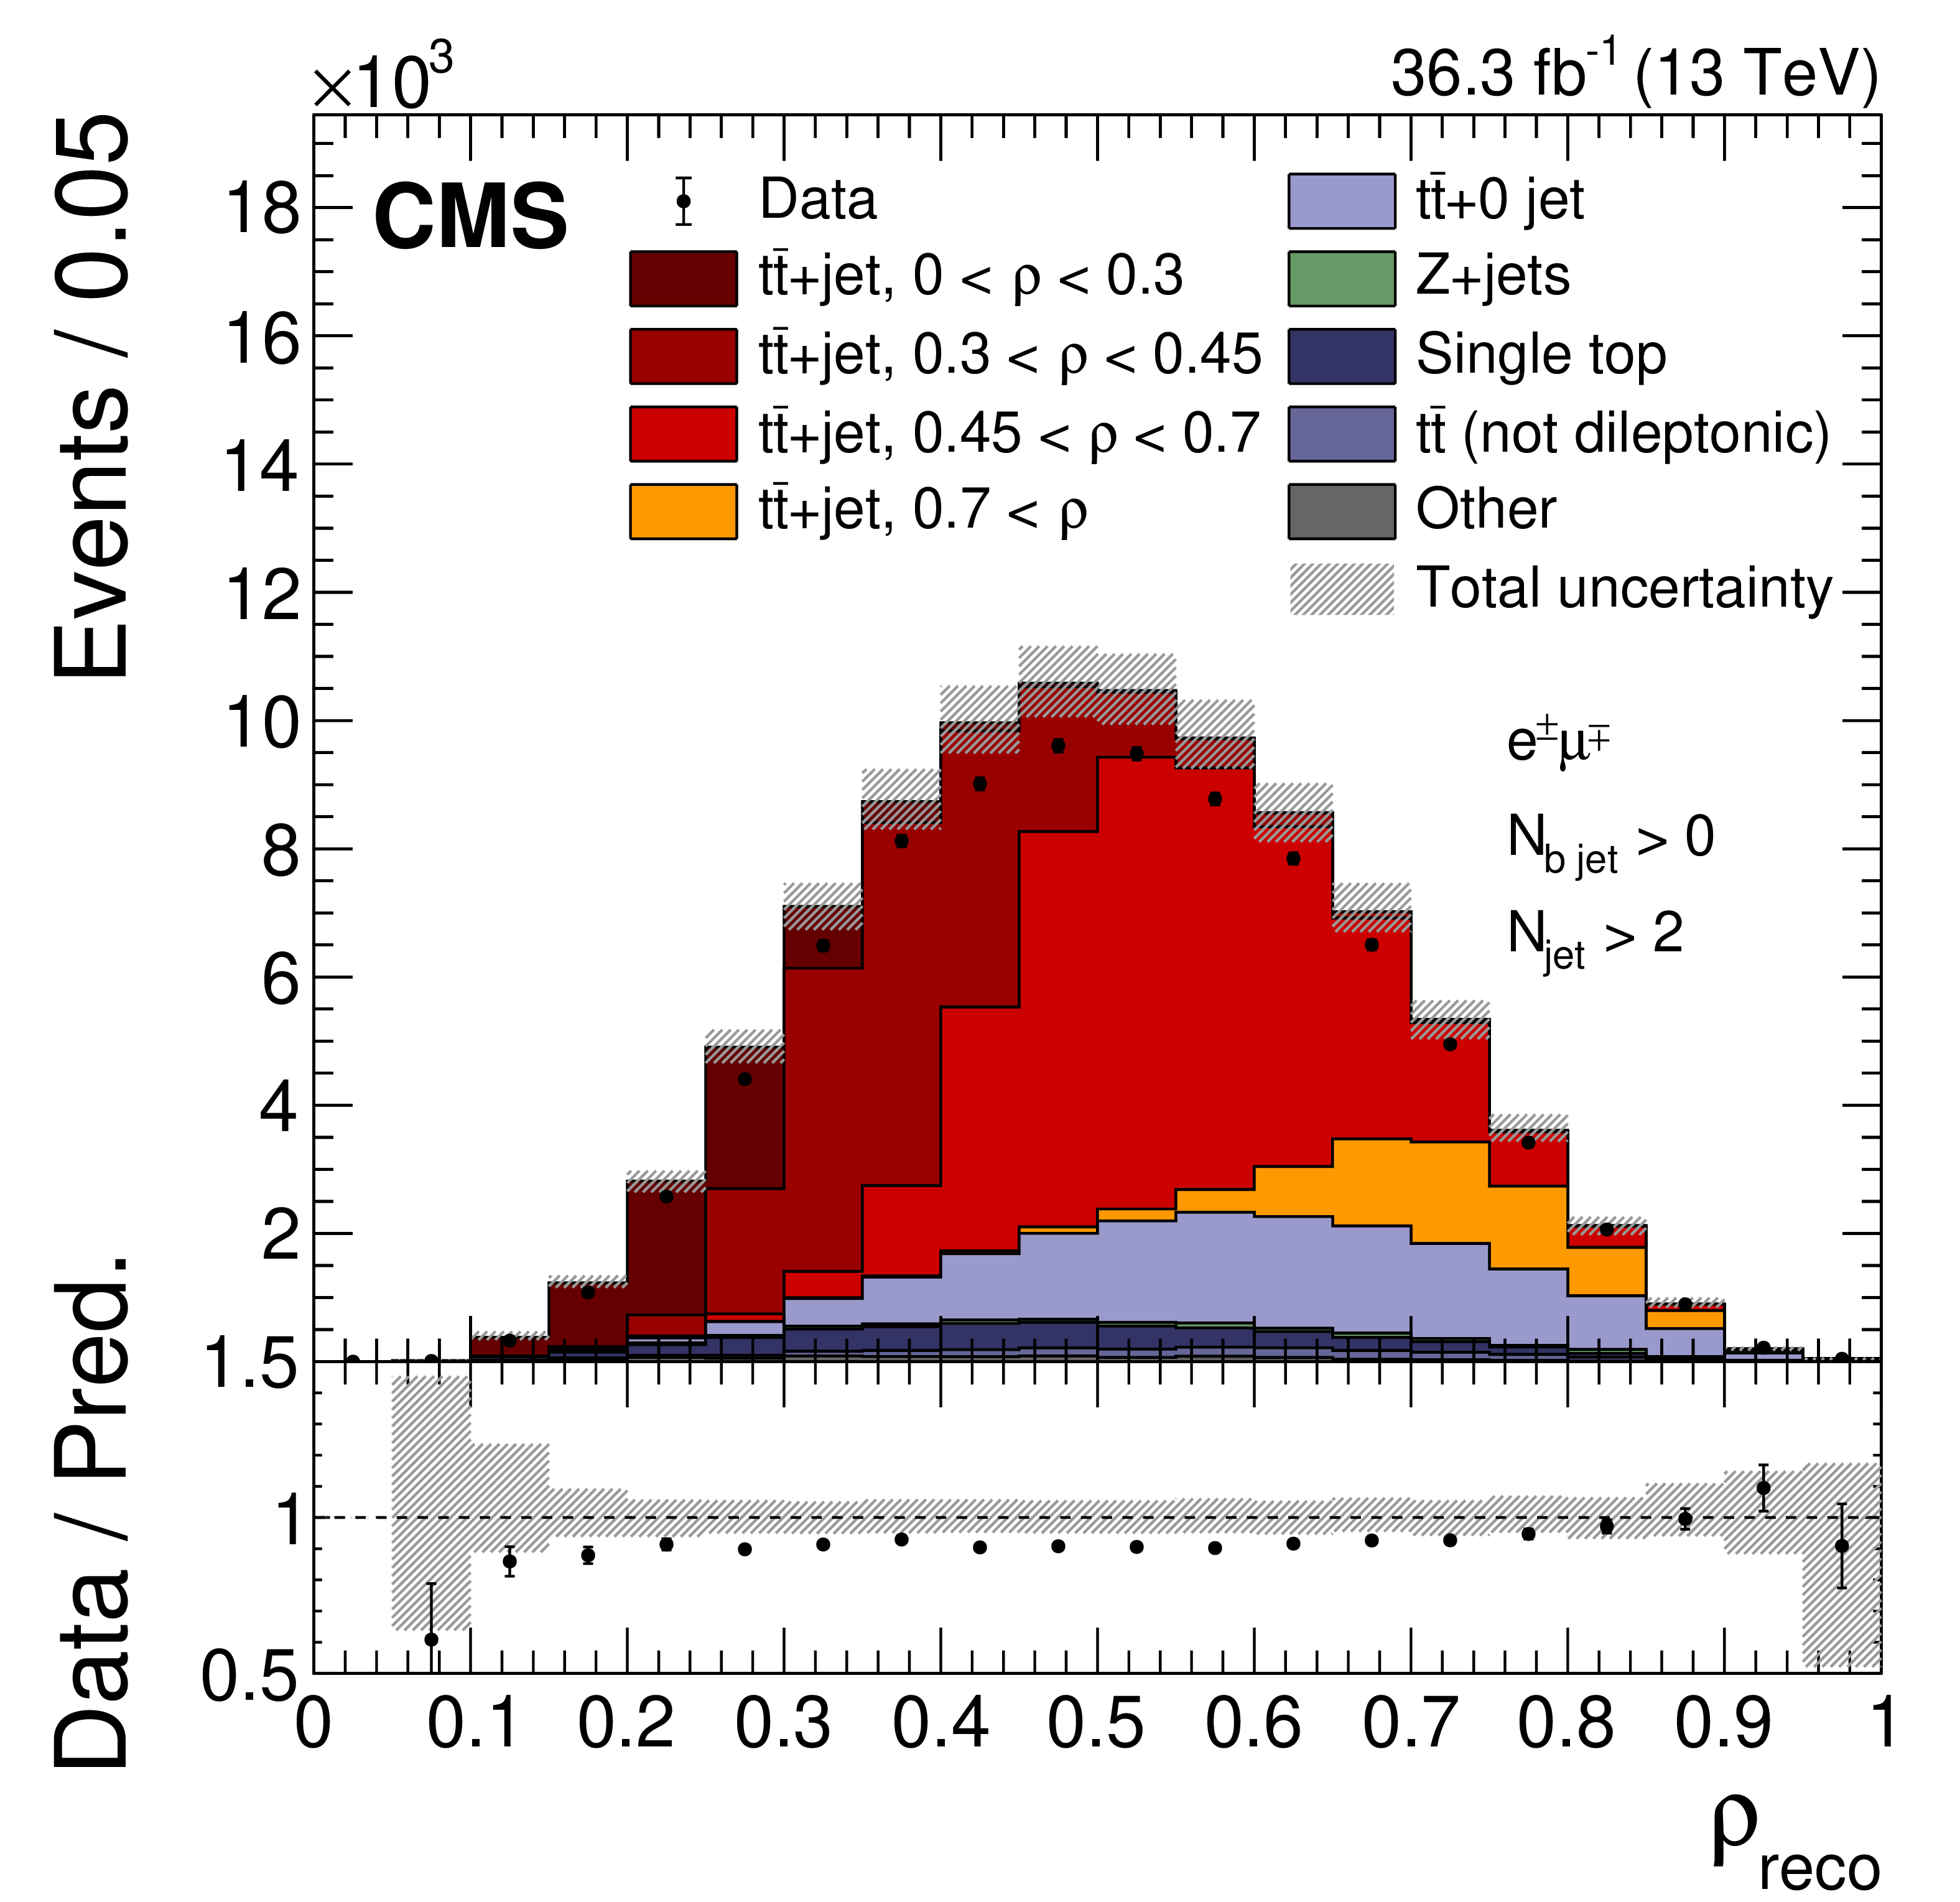
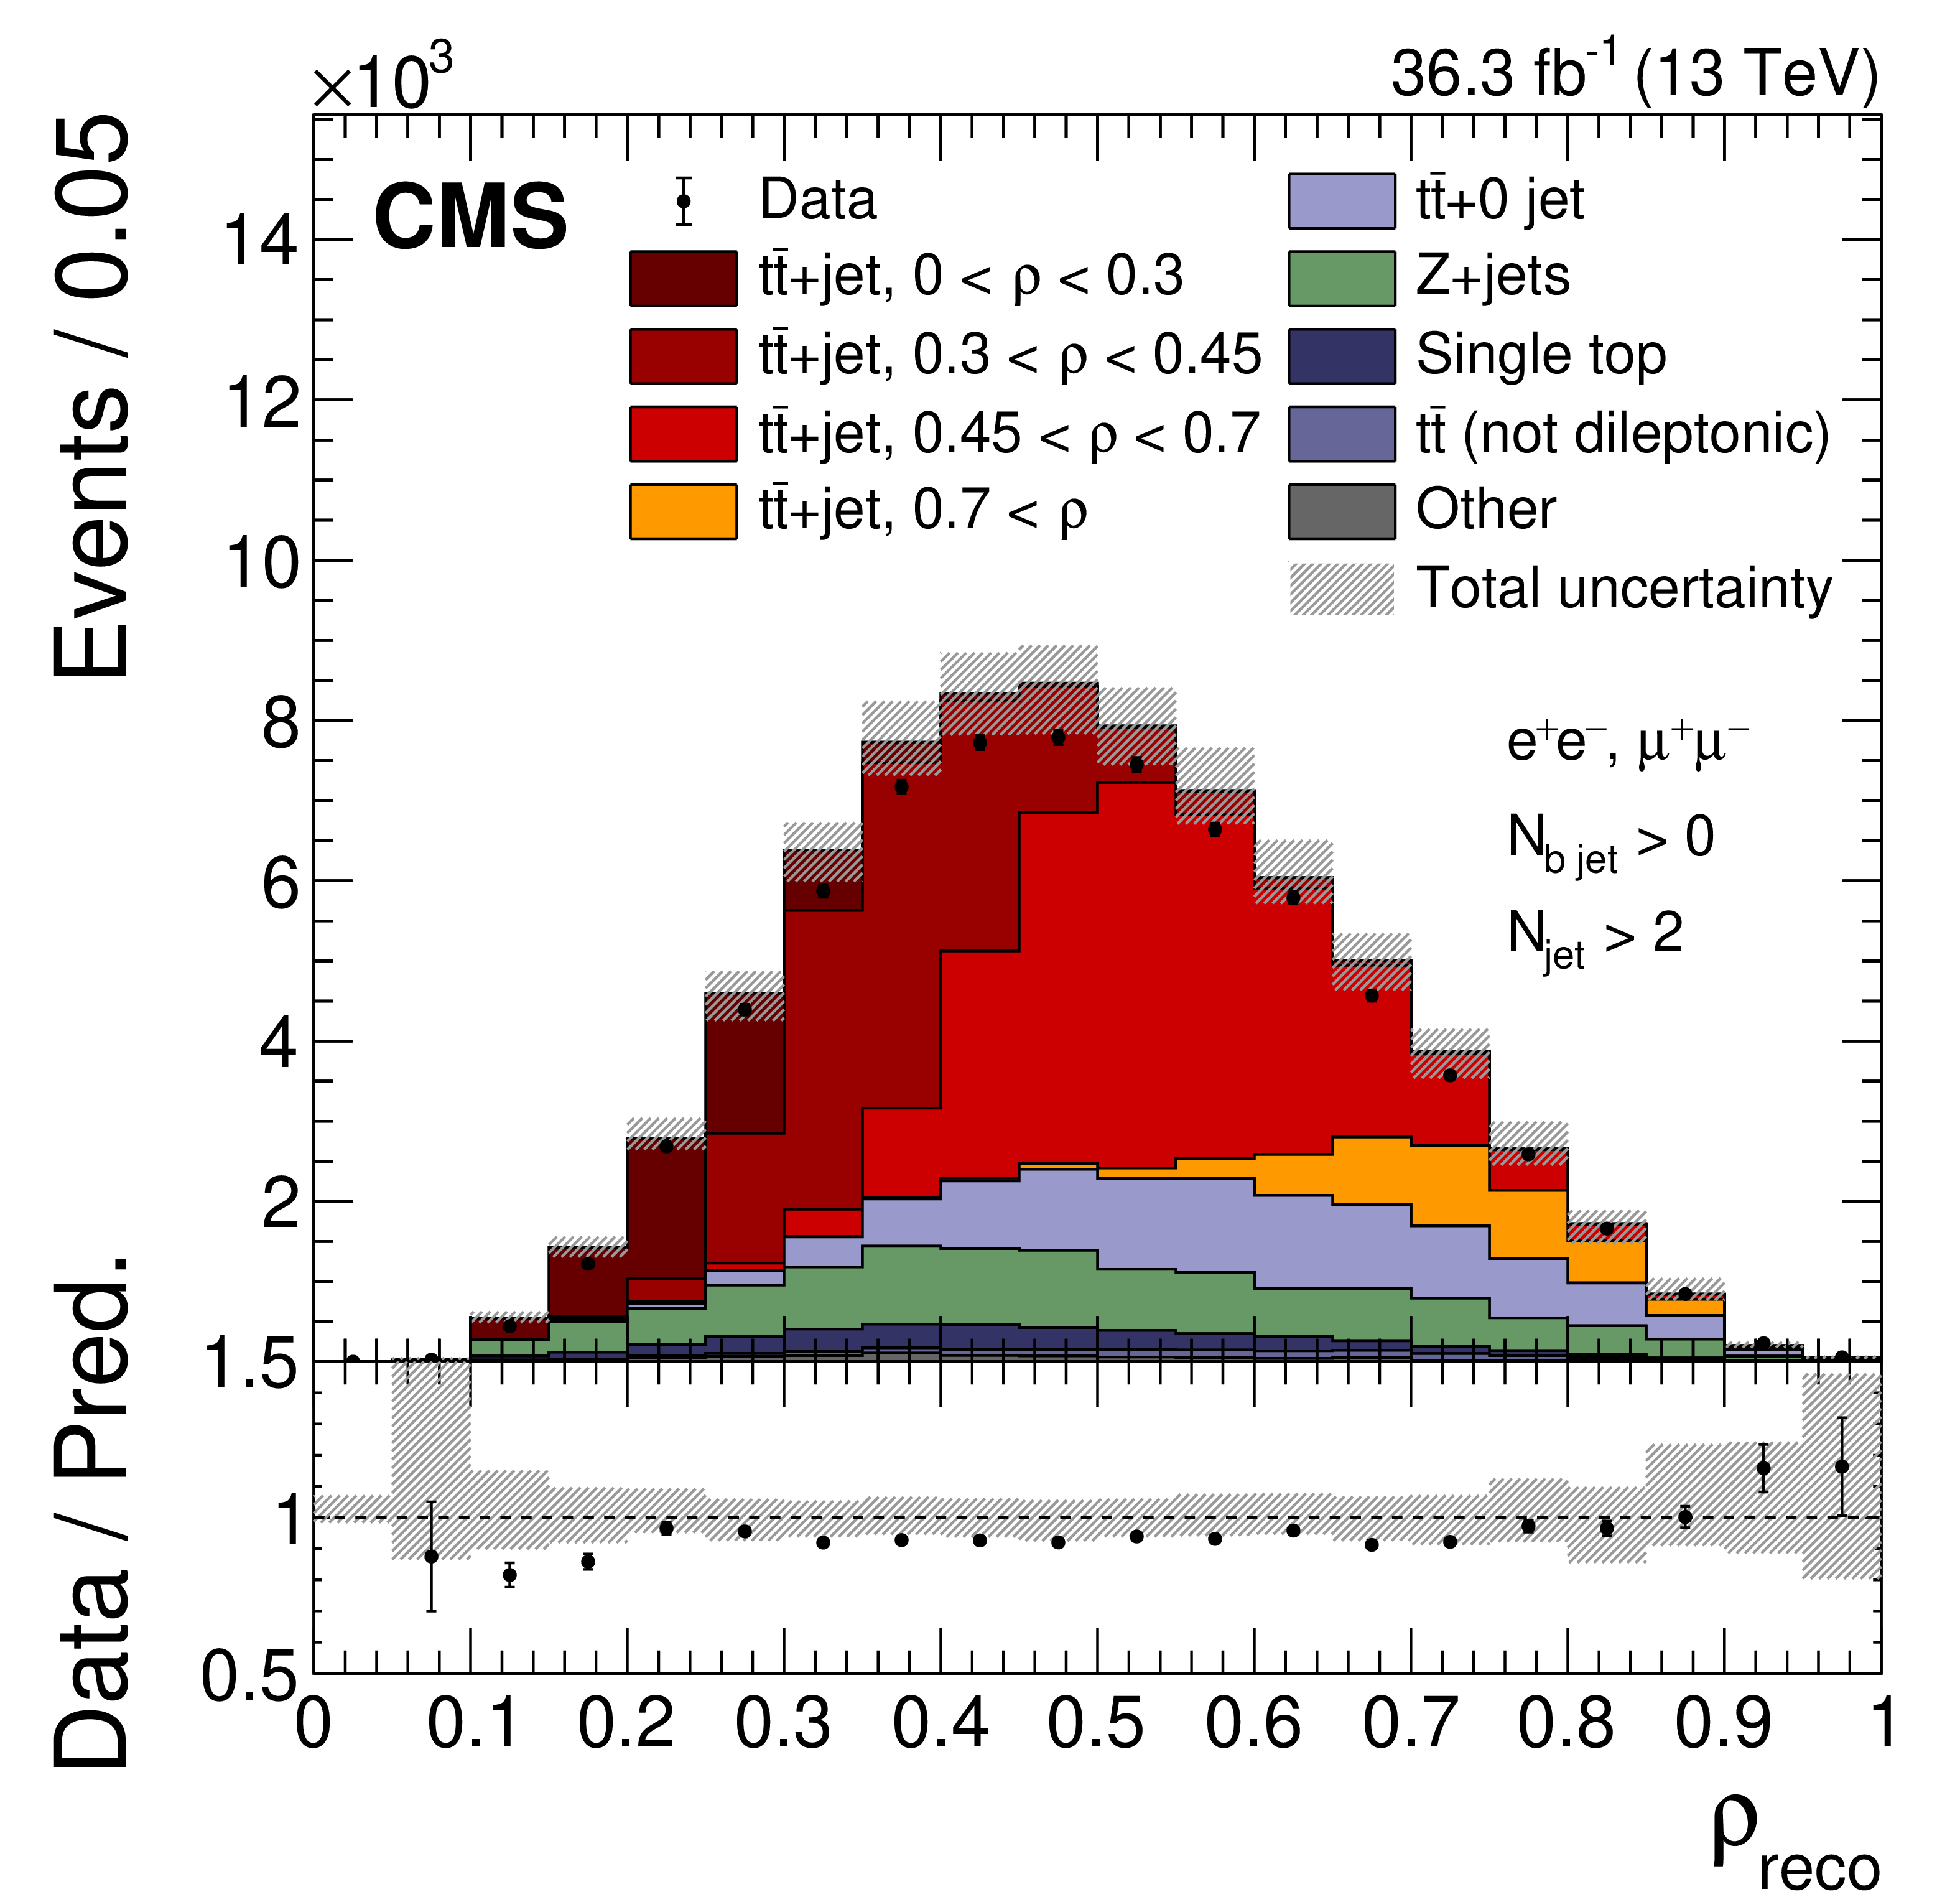
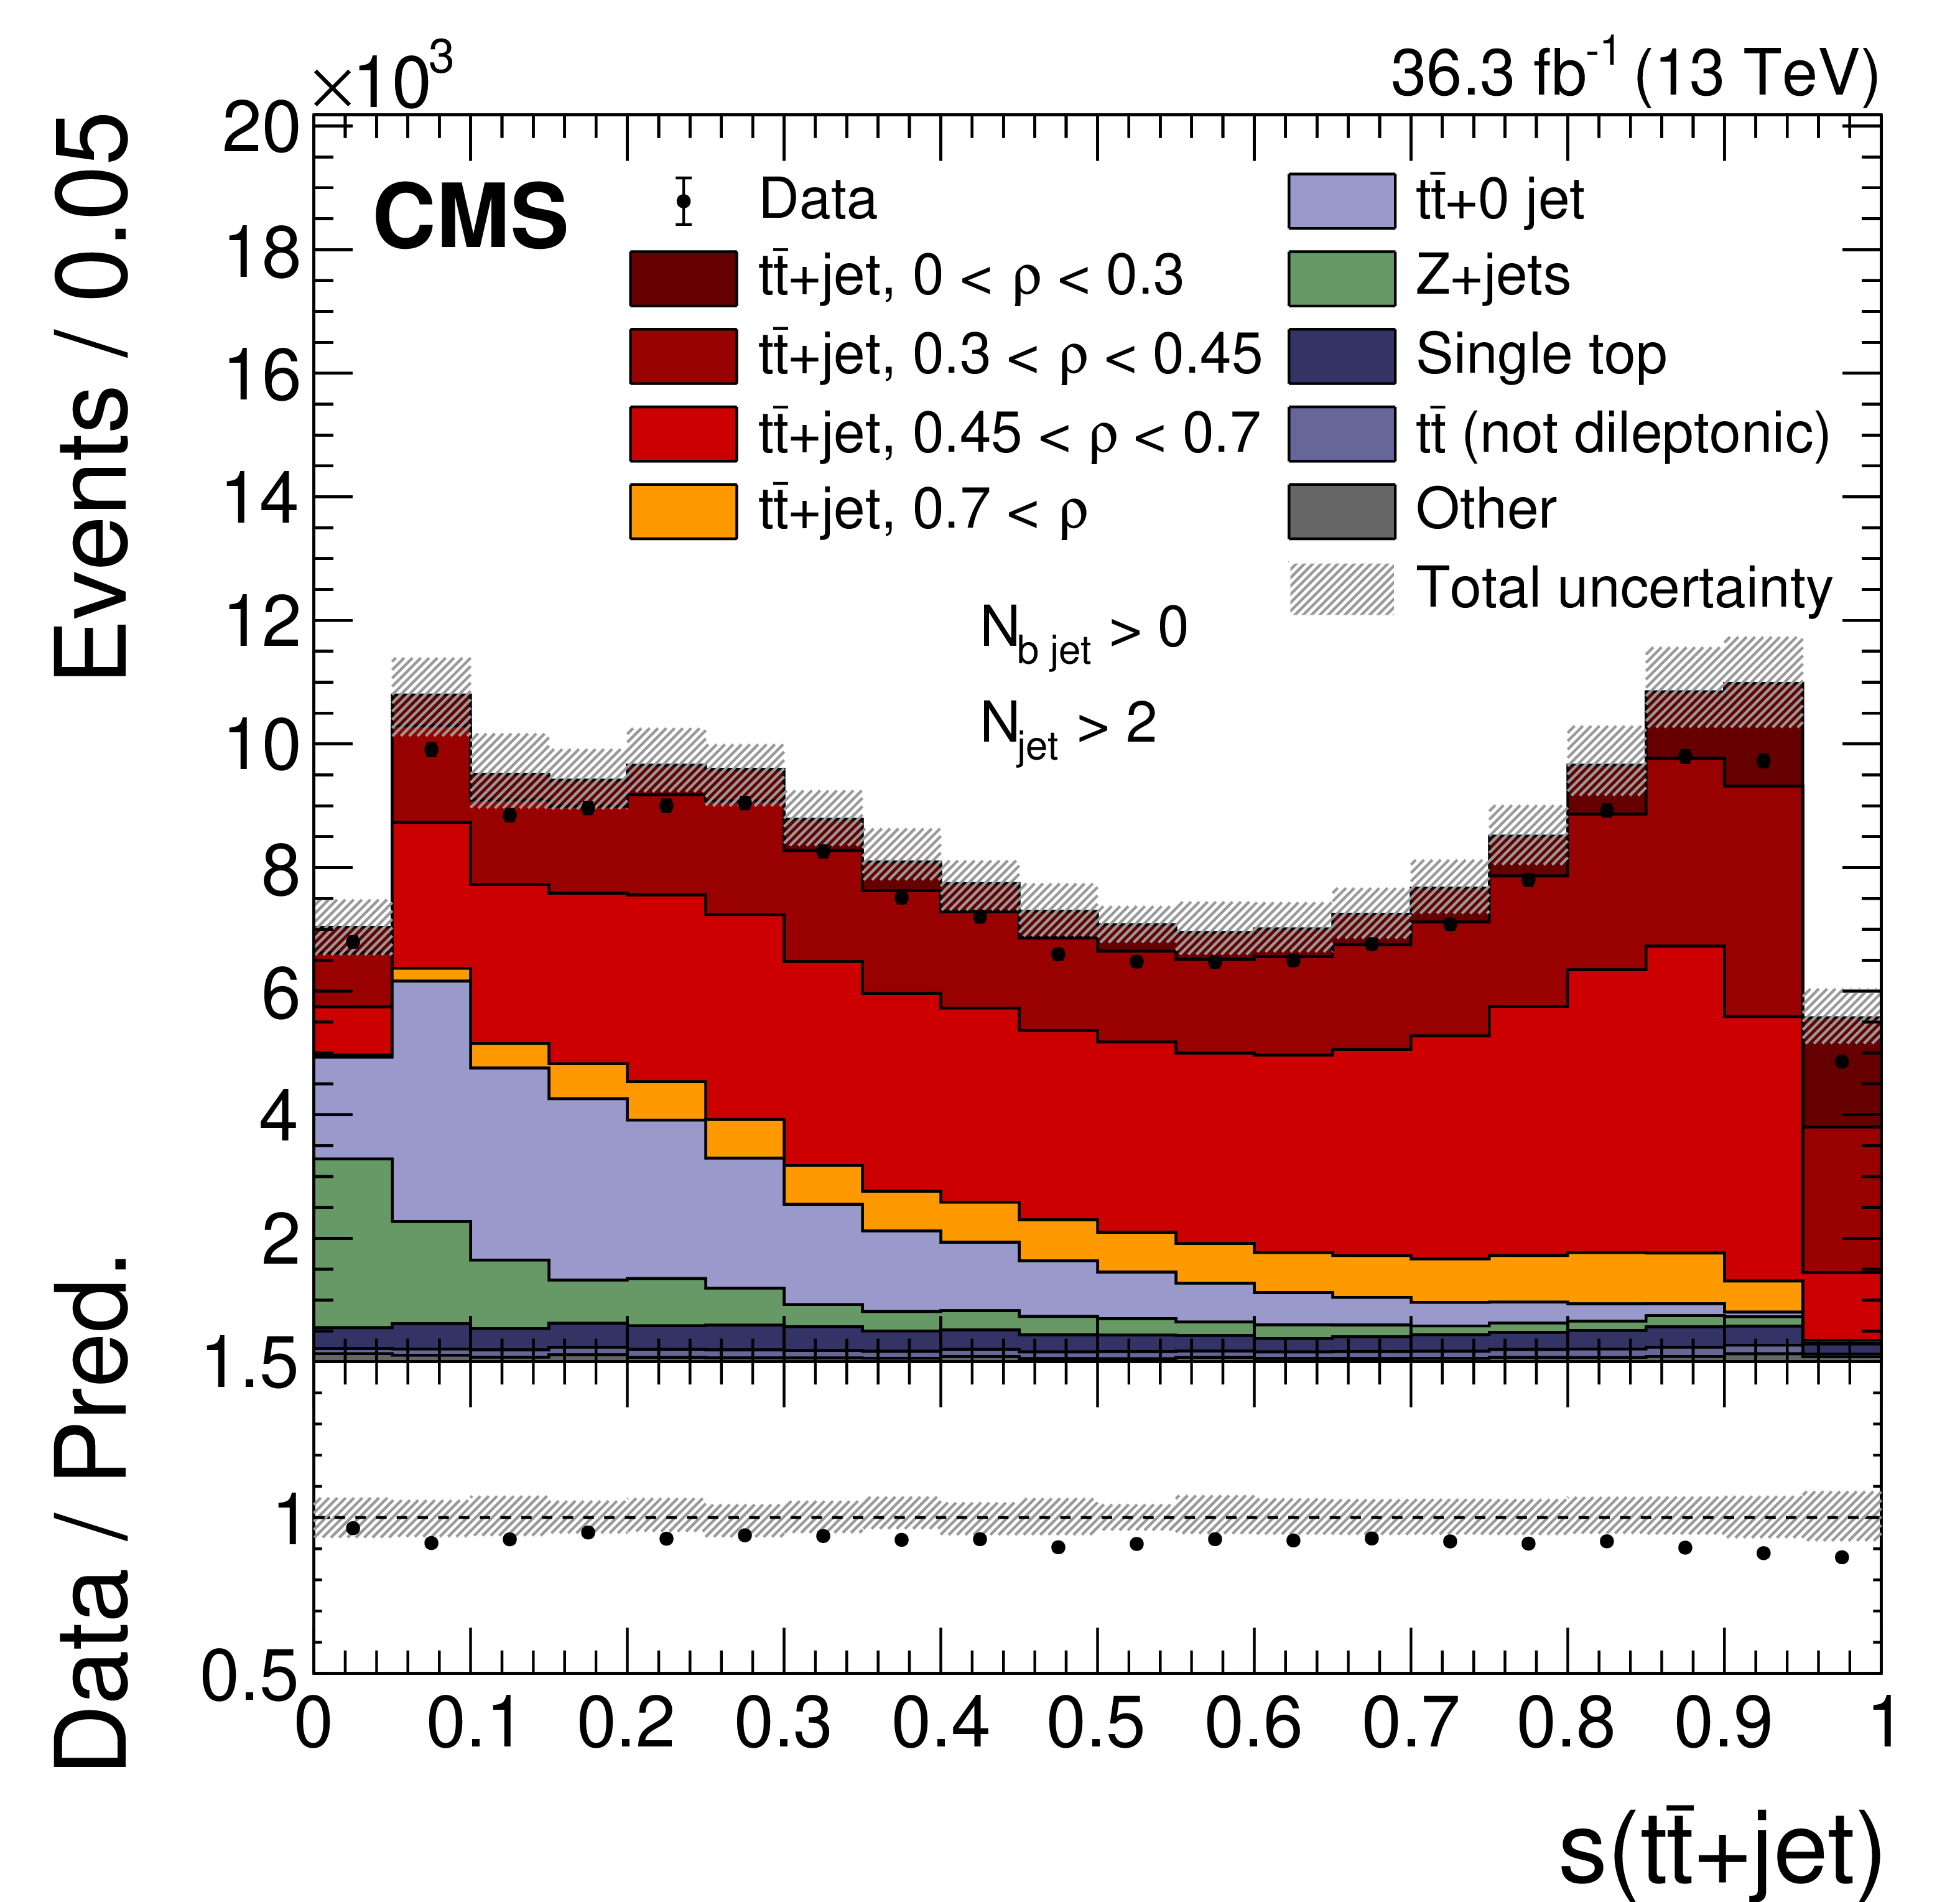
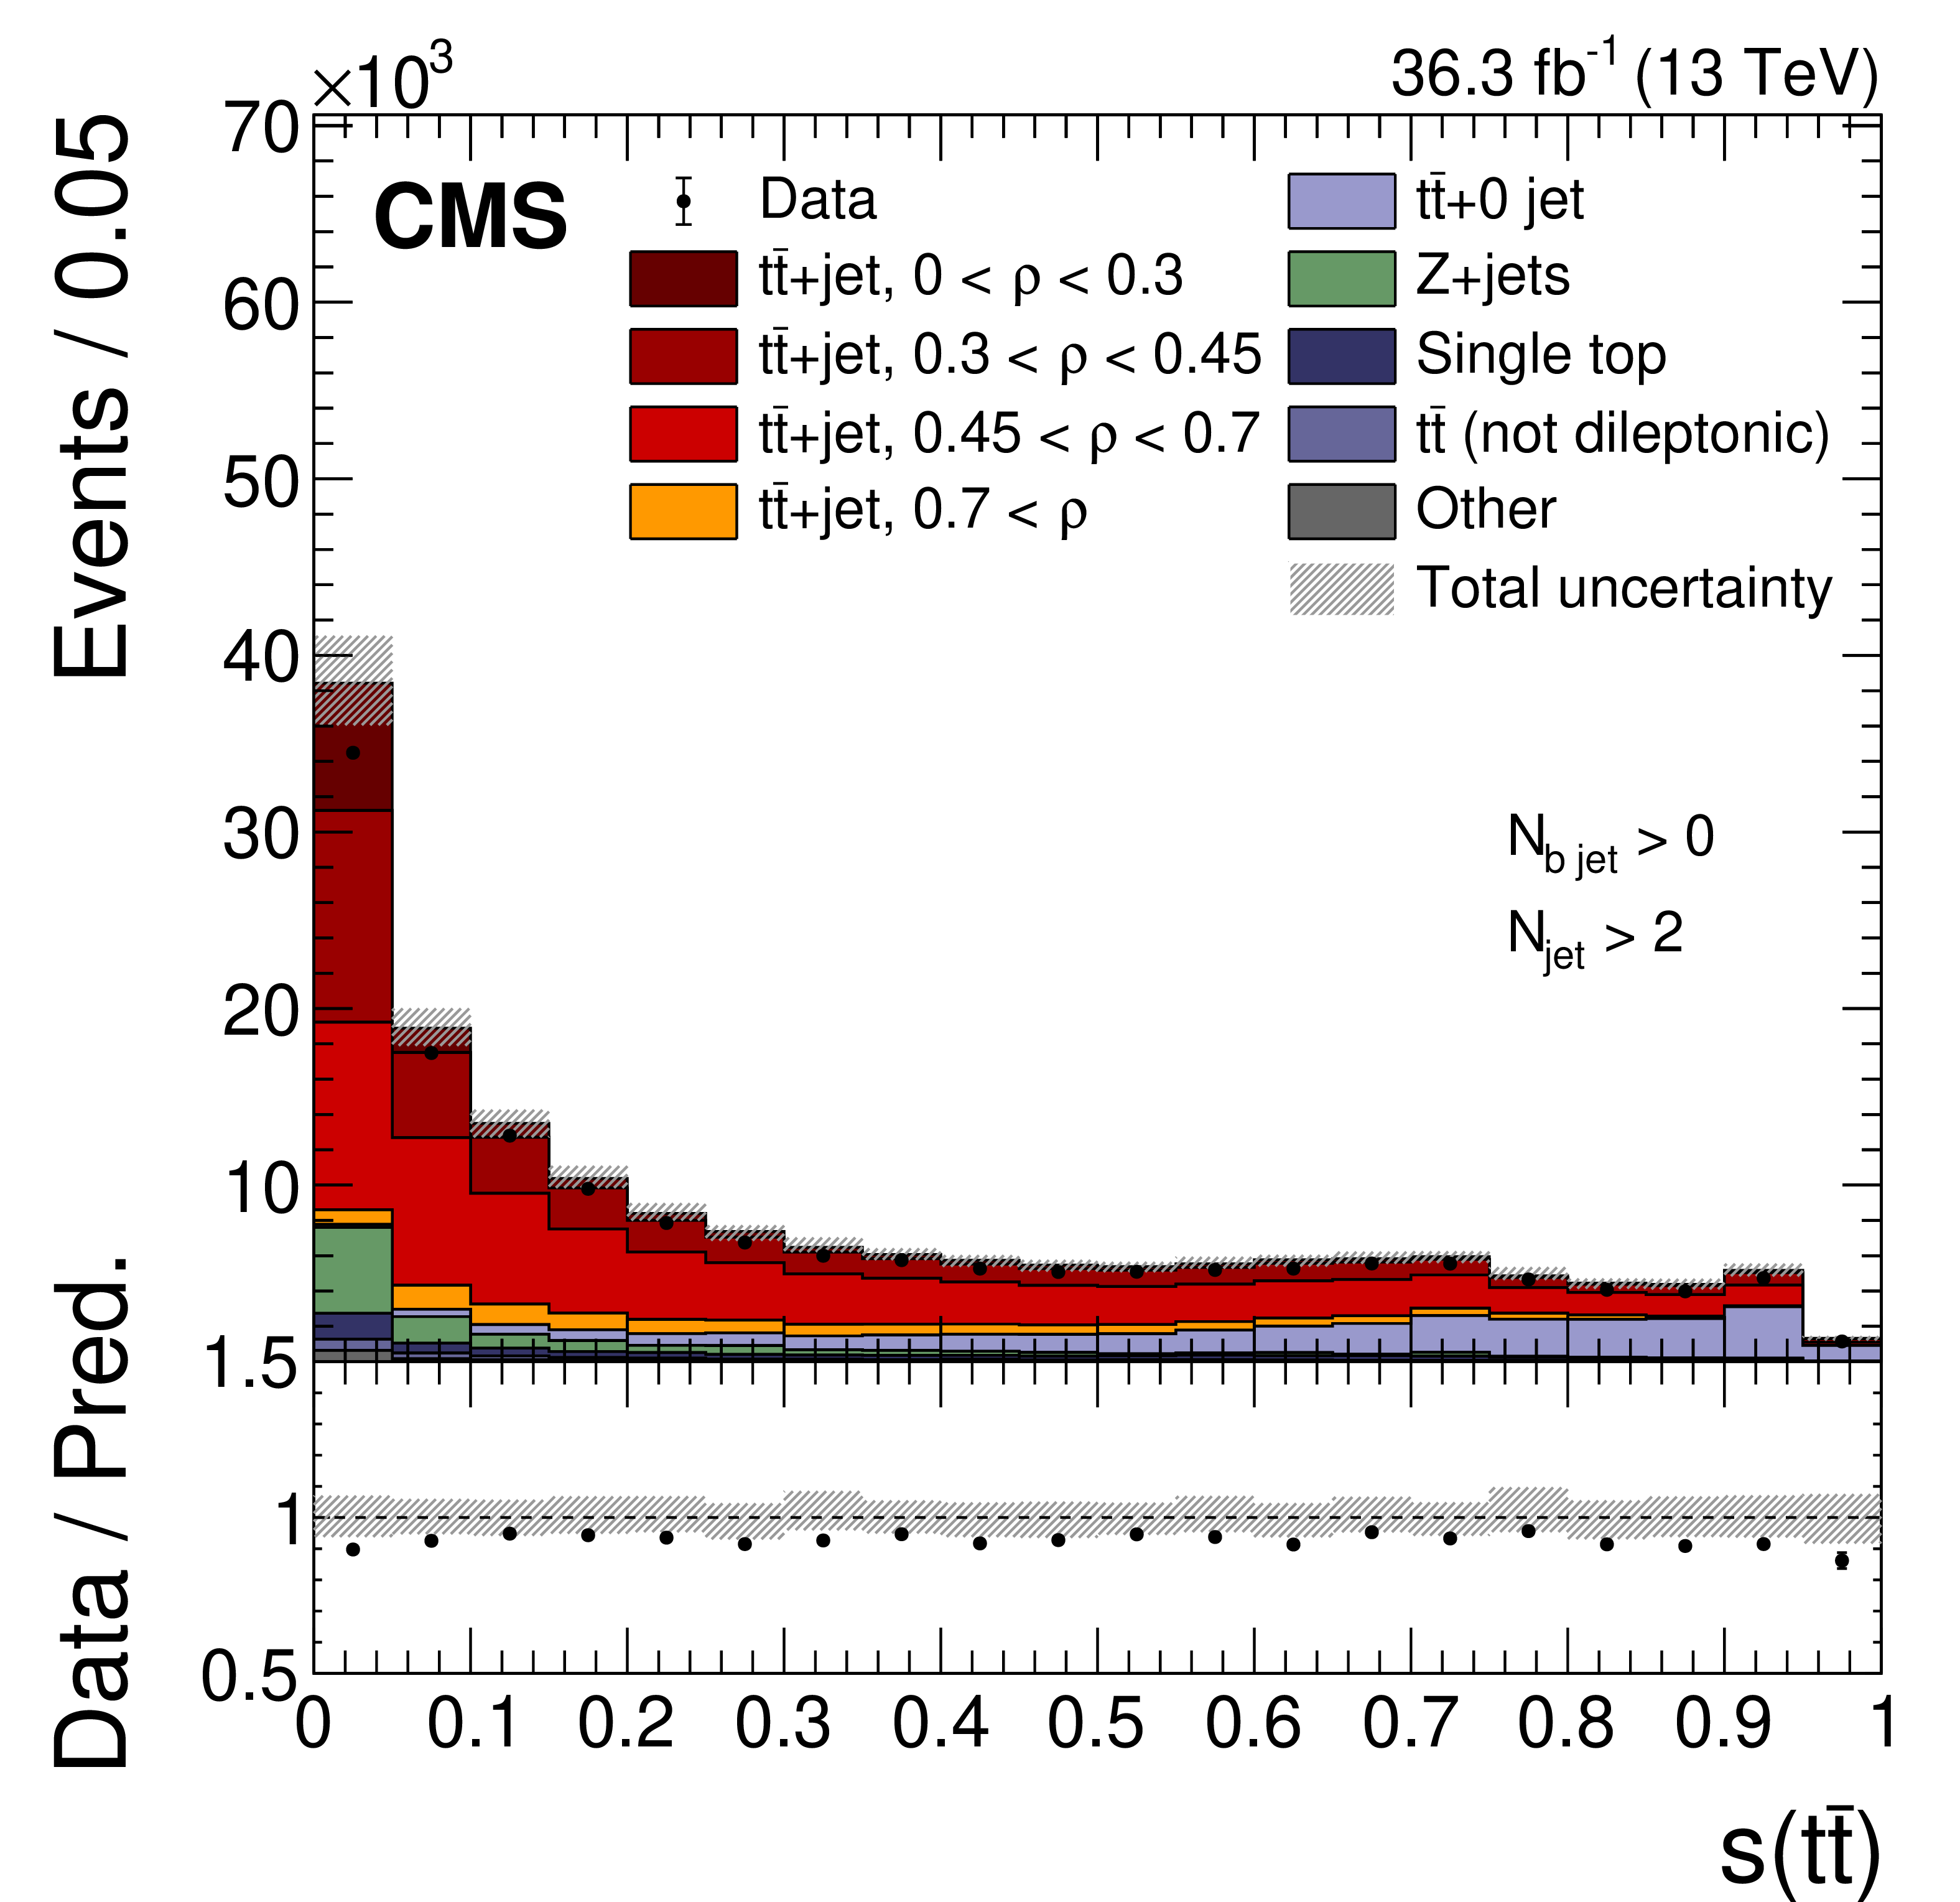
Figure 4:
The observed (points) and MC predicted (stacked histograms) signal and background yields as a function of ${\rho _{\text {reco}}}$ as determined by the NN reconstruction method for the e$^{\pm} \mu^{\mp}$ (left) and same-flavor dilepton channels (right). The vertical bars on the points represent the statistical uncertainty in the data. The hatched band represents the total uncertainty in the sum of the simulated signal and background predictions. The lower panels show the ratio of the data to the sum of the signal and background predictions. |
png pdf |
Figure 4-a:
The observed (points) and MC predicted (stacked histograms) signal and background yields as a function of ${\rho _{\text {reco}}}$ as determined by the NN reconstruction method for the e$^{\pm} \mu^{\mp}$ channel. The vertical bars on the points represent the statistical uncertainty in the data. The hatched band represents the total uncertainty in the sum of the simulated signal and background predictions. The lower panel shows the ratio of the data to the sum of the signal and background predictions. |
png pdf |
Figure 4-b:
The observed (points) and MC predicted (stacked histograms) signal and background yields as a function of ${\rho _{\text {reco}}}$ as determined by the NN reconstruction method for the same-flavor dilepton channel. The vertical bars on the points represent the statistical uncertainty in the data. The hatched band represents the total uncertainty in the sum of the simulated signal and background predictions. The lower panel shows the ratio of the data to the sum of the signal and background predictions. |

png pdf |
Figure 5:
The observed (points) and MC predicted (stacked histograms) signal and background yields as a function of the signal (left) and ${\mathrm{t} {}\mathrm{\bar{t}}}$+0 jet background (right) output node score of the classifier NN. The vertical bars on the points represent the statistical uncertainty in the data. The hatched band represents the total uncertainty in the sum of the simulated signal and background predictions. The lower panels show the ratio of the data to the sum of the signal and background predictions. |
png pdf |
Figure 5-a:
The observed (points) and MC predicted (stacked histograms) signal and background yields as a function of the signal output node score of the classifier NN. The vertical bars on the points represent the statistical uncertainty in the data. The hatched band represents the total uncertainty in the sum of the simulated signal and background predictions. The lower panel shows the ratio of the data to the sum of the signal and background predictions. |
png pdf |
Figure 5-b:
The observed (points) and MC predicted (stacked histograms) signal and background yields as a function of the ${\mathrm{t} {}\mathrm{\bar{t}}}$+0 jet background output node score of the classifier NN. The vertical bars on the points represent the statistical uncertainty in the data. The hatched band represents the total uncertainty in the sum of the simulated signal and background predictions. The lower panel shows the ratio of the data to the sum of the signal and background predictions. |
png pdf |
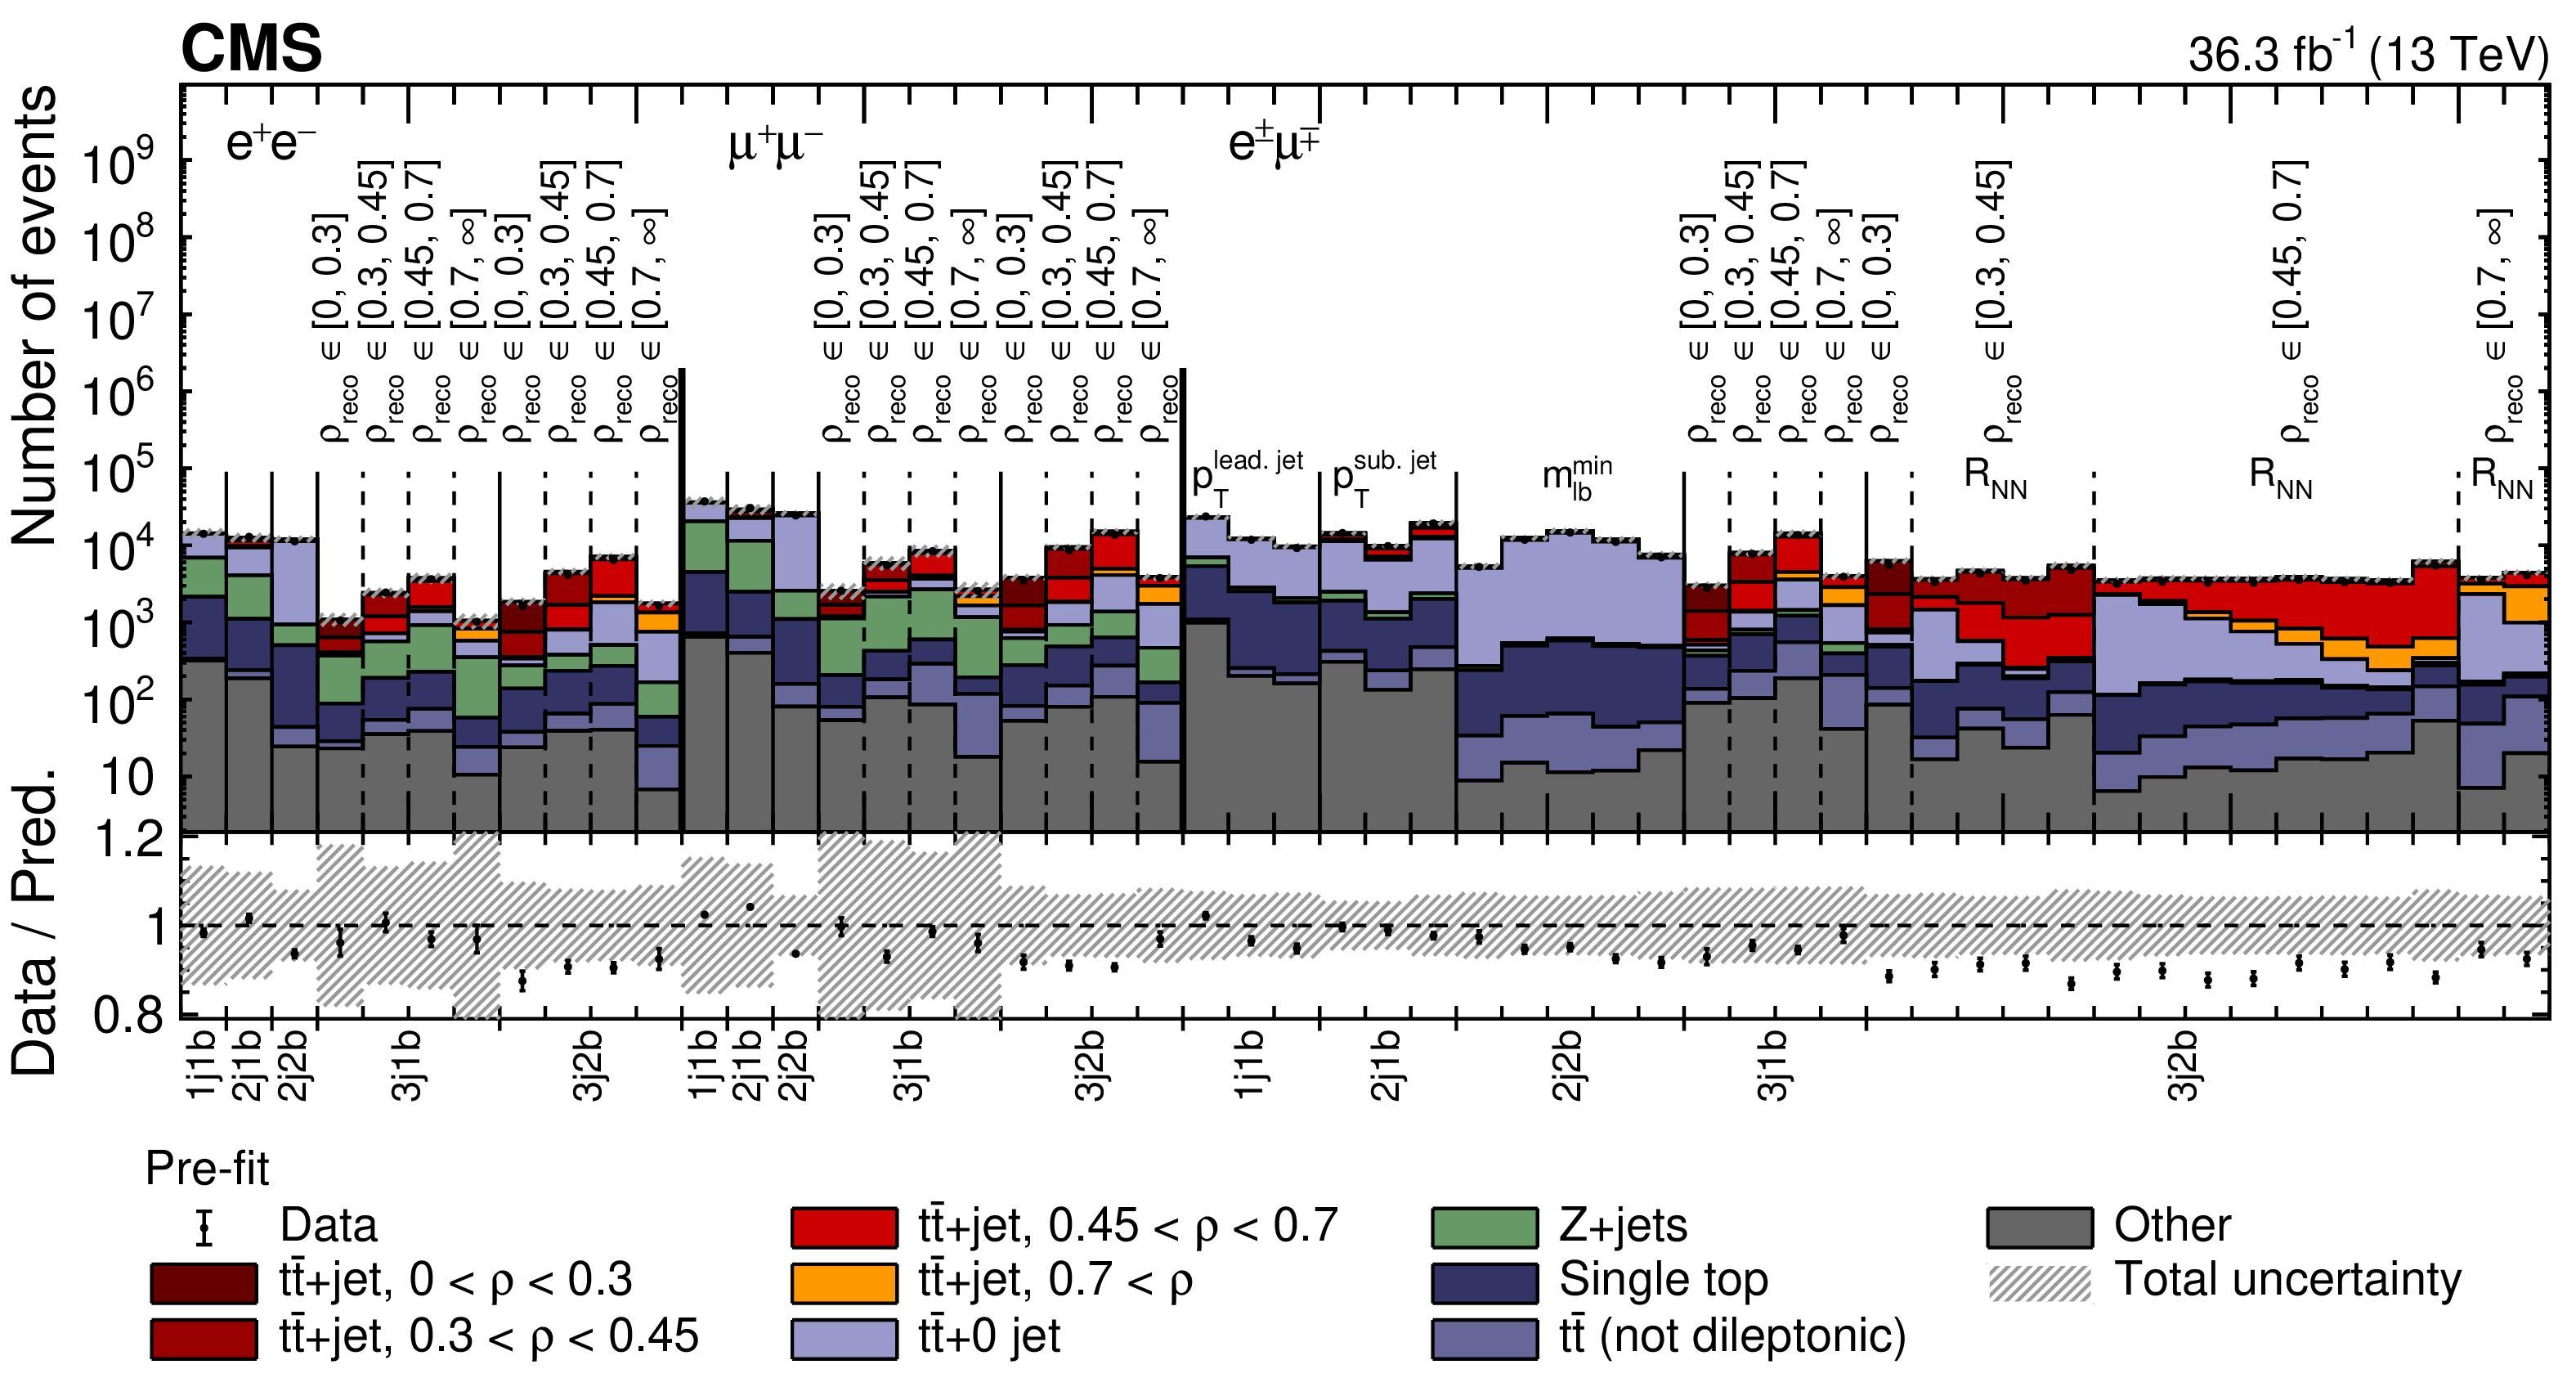
Figure 6:
The distributions from data (points) and simulated signal and background (colored histograms) used in the maximum likelihood fits before the fit to the data. The distributions are shown for each dilepton type and each event category, where the x-axis label "mjnb'' refers to events with m jets and n b jets. The vertical bars on the points show the statistical uncertainty in the data. The hatched band represents the total uncertainty in the sum of the simulated signal and background predictions. The lower panel gives the ratio of the data to the sum of the simulated predictions. |
png pdf |
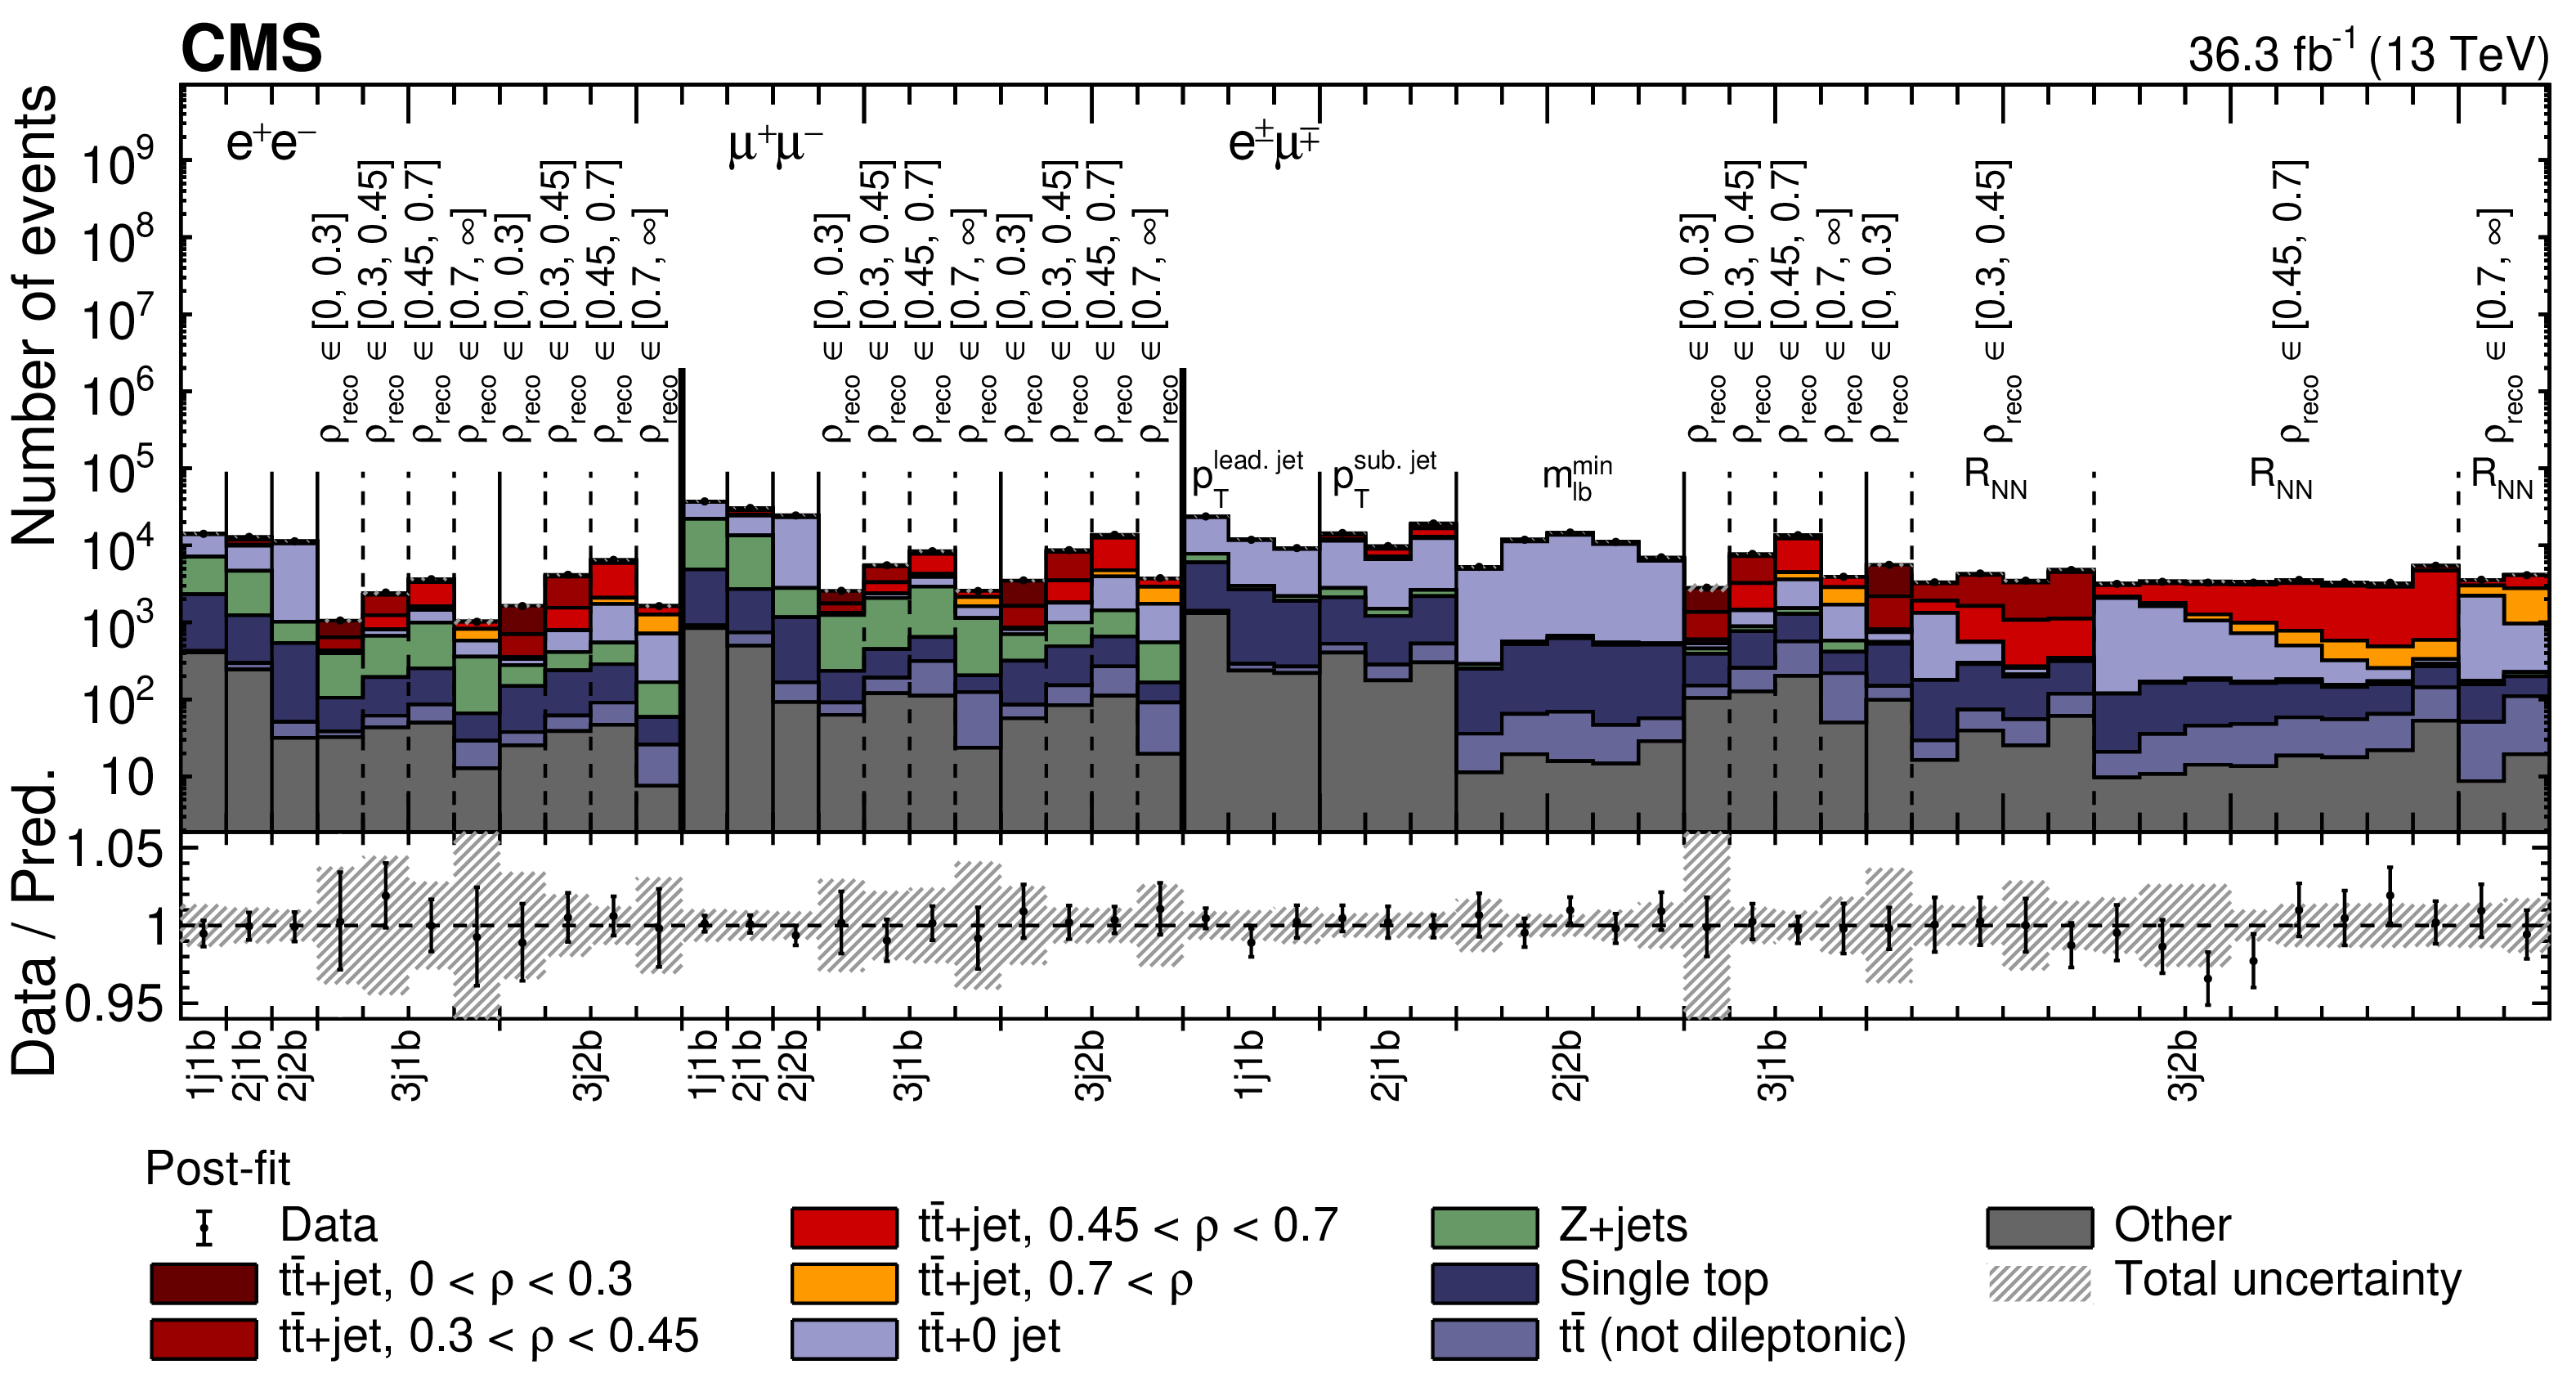
Figure 7:
The distributions from data (points) and simulated signal and background (colored histograms) used in the maximum likelihood fits after the fit to the data. The distributions are shown for each dilepton type and each event category, where the x-axis label "$m$j$n$b'' refers to events with $m$ jets and $n$ b jets. The vertical bars on the points show the statistical uncertainty in the data. The hatched band represents the total uncertainty in the sum of the simulated signal and background predictions. The lower panel gives the ratio of the data to the sum of the simulated predictions. |

png pdf |
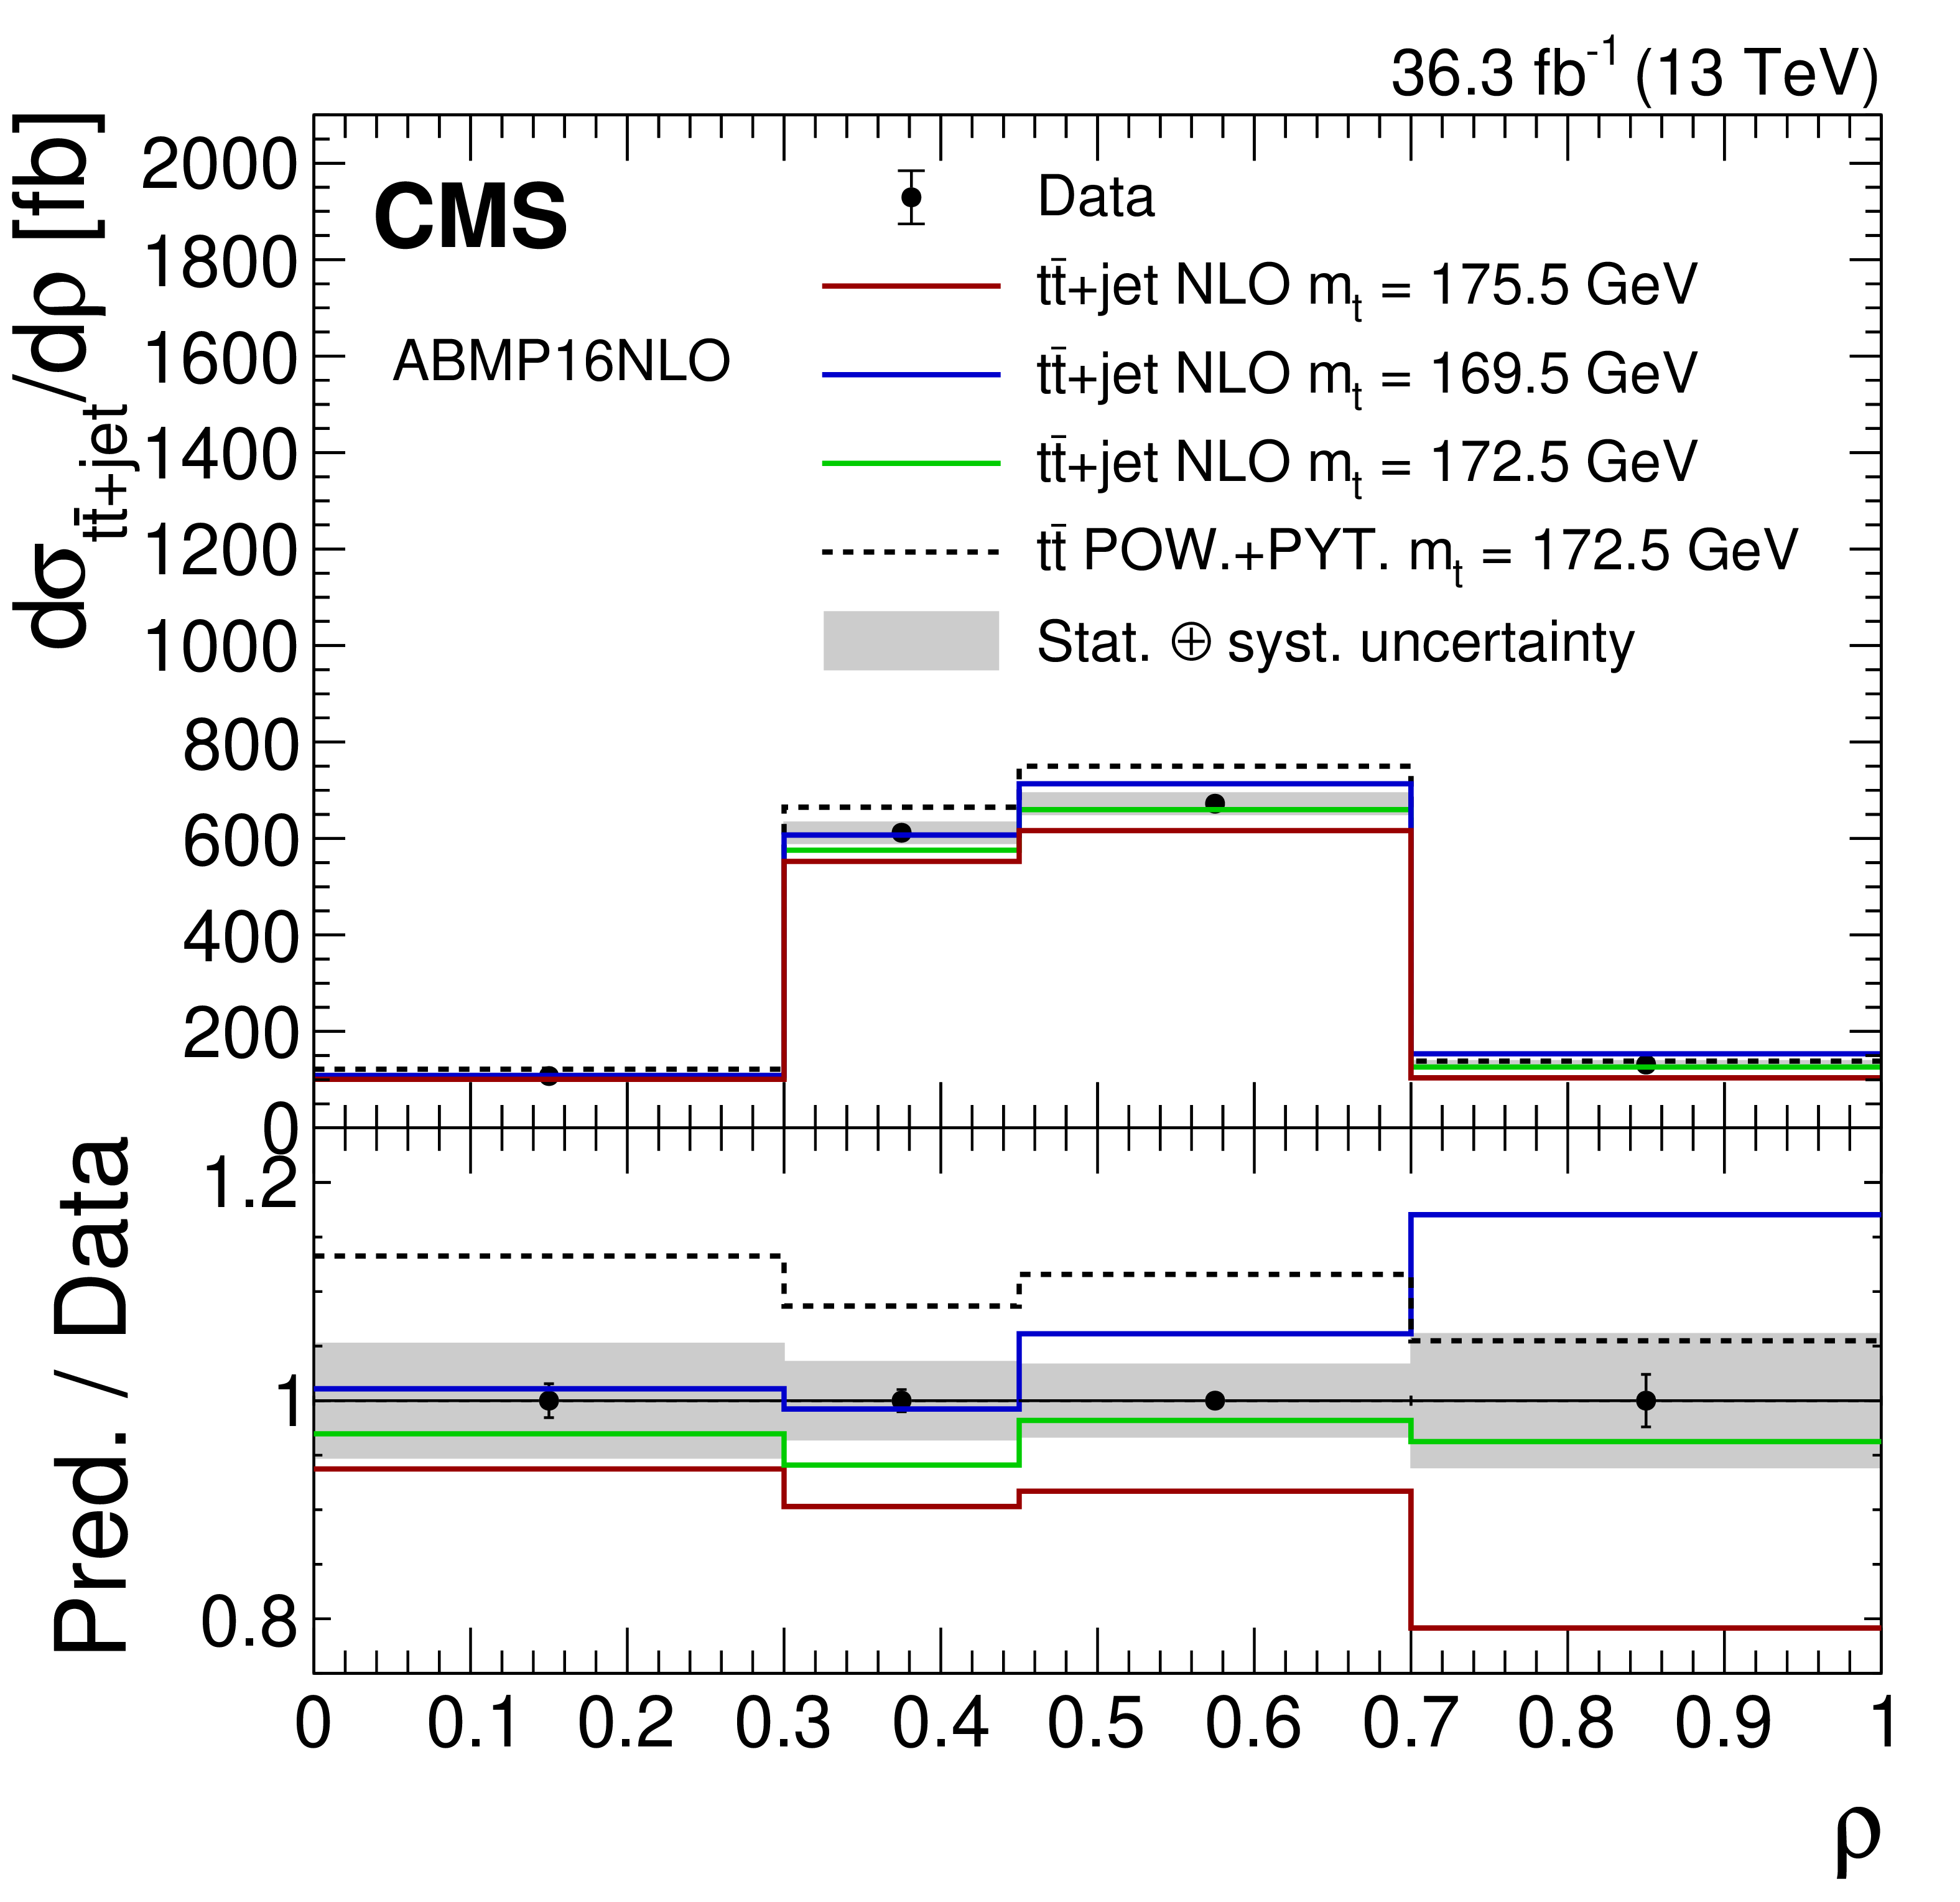
Figure 8:
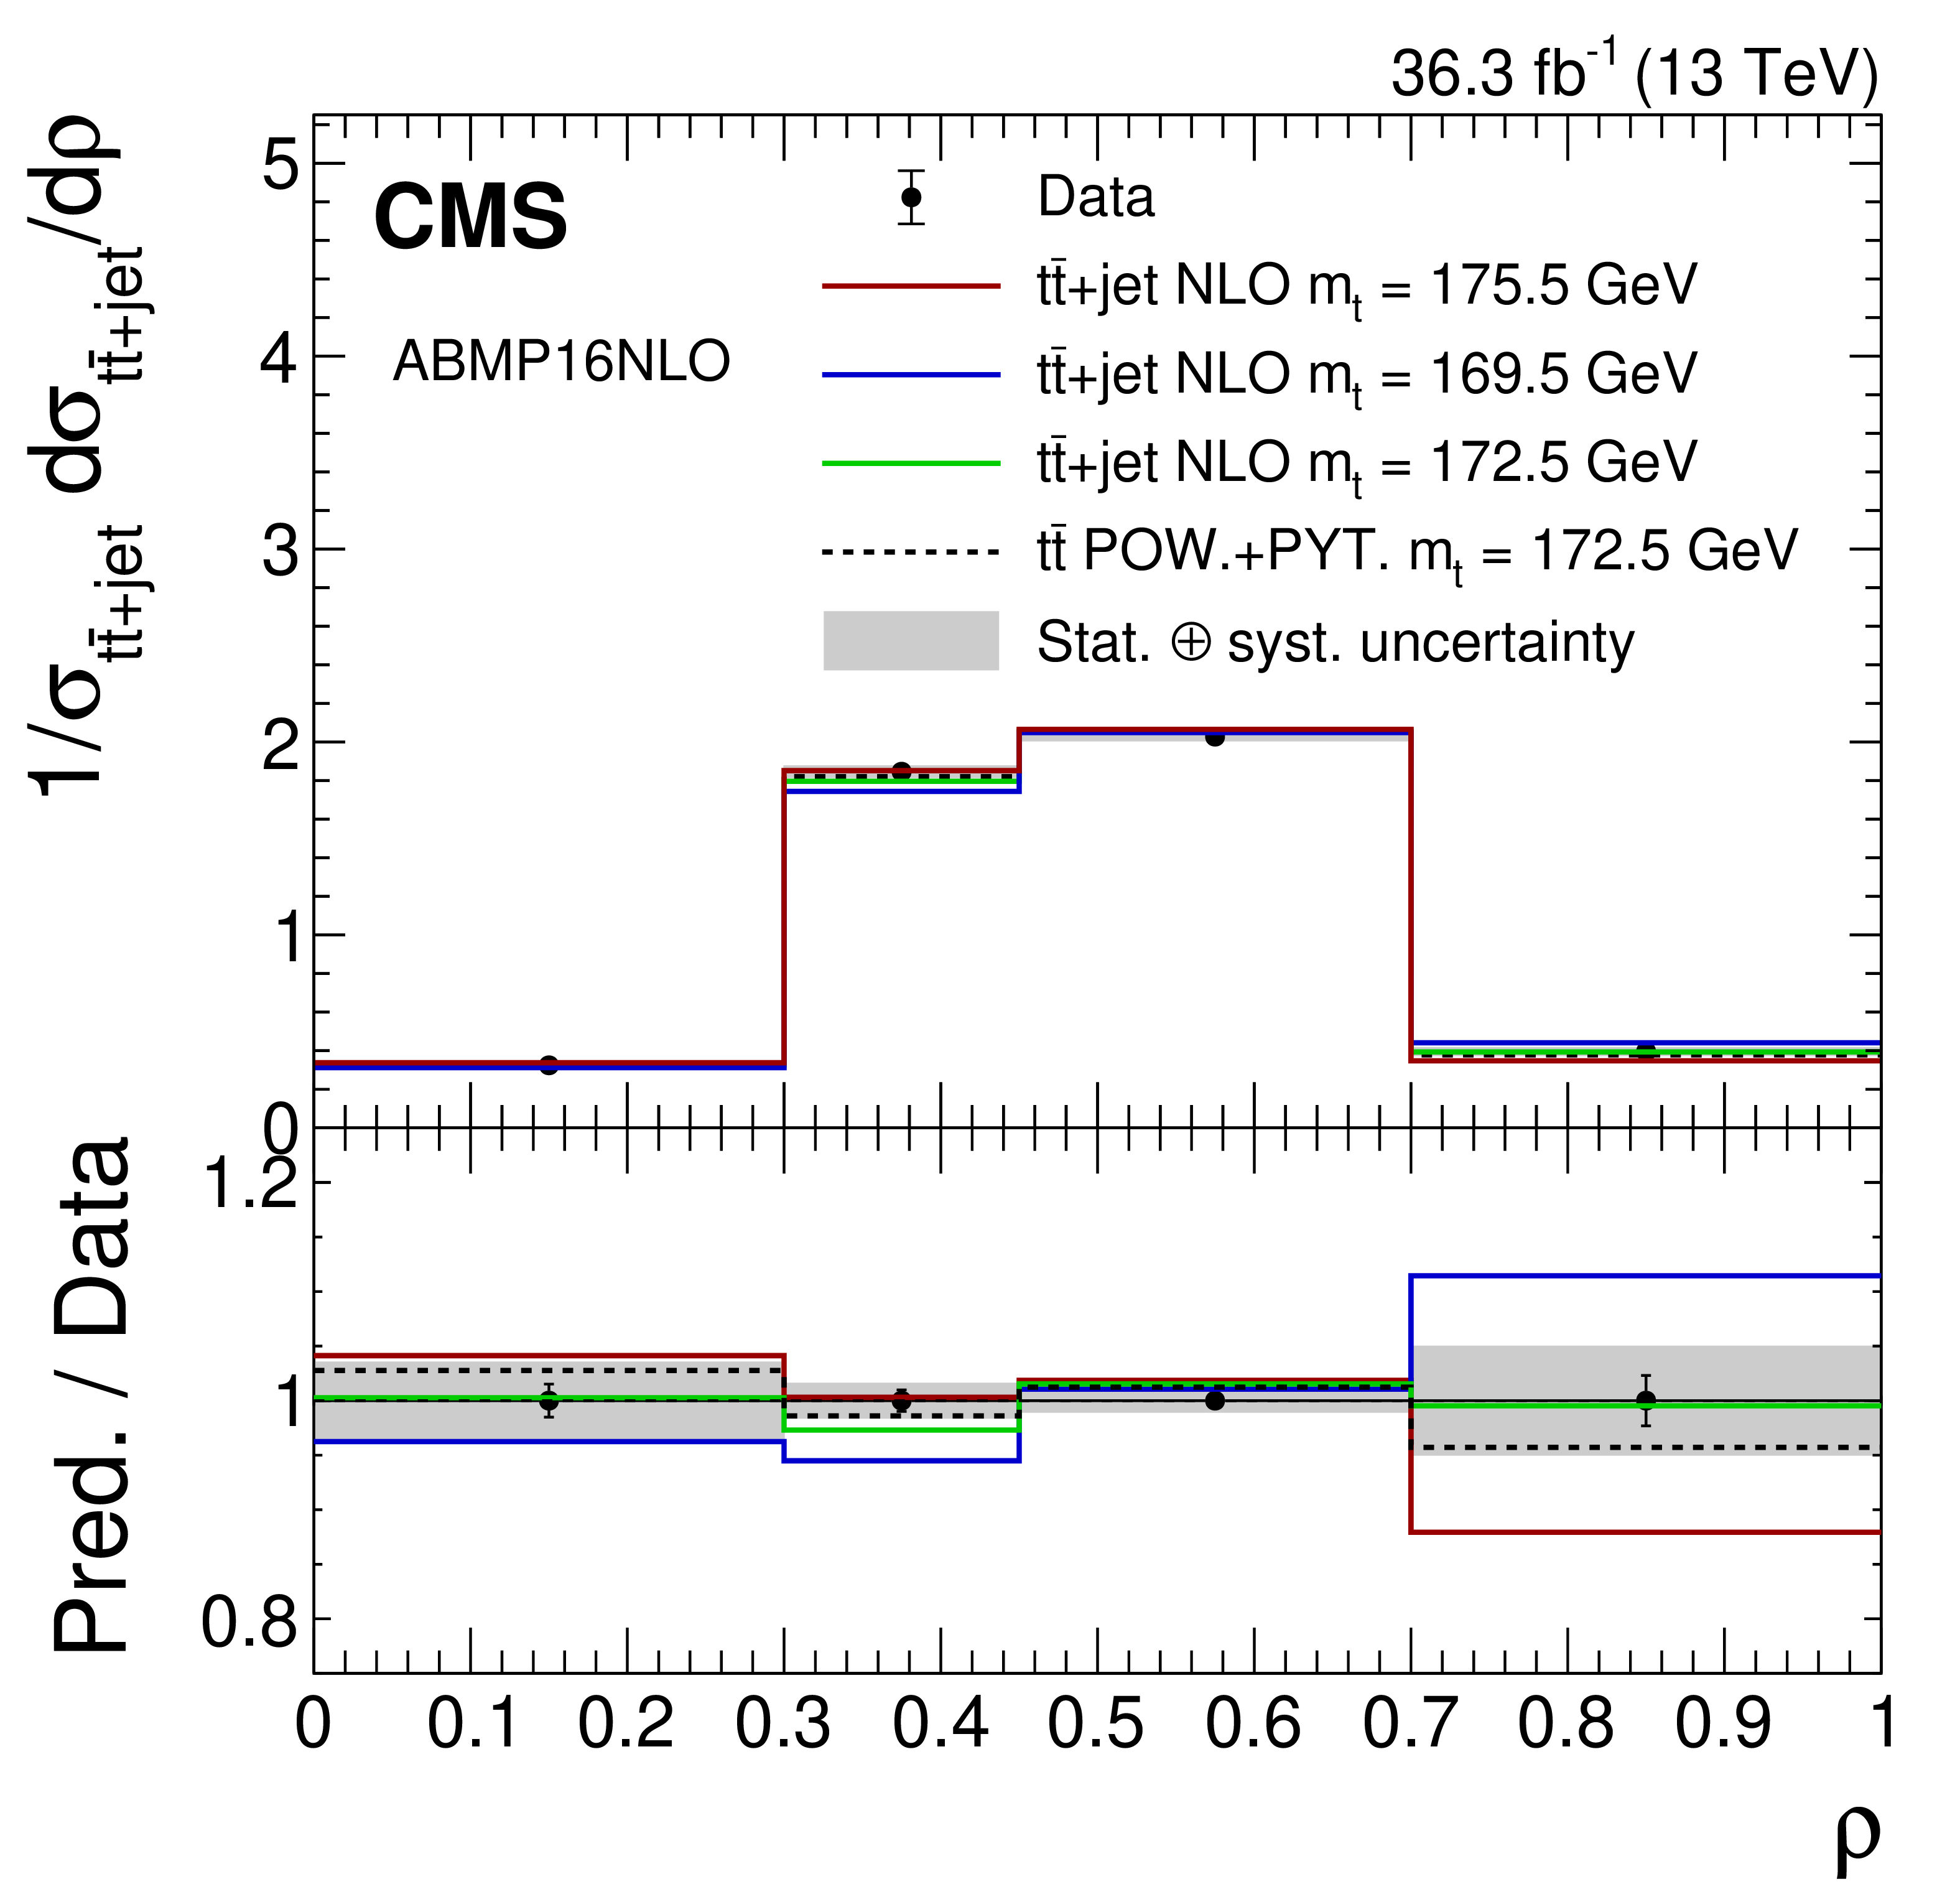
The absolute (left) and normalized (right) ${\mathrm{t} \mathrm{\bar{t}}}$+jet differential cross section as a function of $\rho $ for the data (points) and theoretical predictions described in the text using the AMBP16NLO PDF set from the NLO MC with three different ${m_{\mathrm{t}}}$ values and from the POWHEG (POW) + PYTHIA 8 (PYT) calculations (lines). The vertical bars on the points show the statistical uncertainty in the data and the shaded region represents the total uncertainty in the measurement. The lower panels give the ratio of the predictions to the data. |
png pdf |
Figure 8-a:
The absolute ${\mathrm{t} \mathrm{\bar{t}}}$+jet differential cross section as a function of $\rho $ for the data (points) and theoretical predictions described in the text using the AMBP16NLO PDF set from the NLO MC with three different ${m_{\mathrm{t}}}$ values and from the POWHEG (POW) + PYTHIA 8 (PYT) calculations (lines). The vertical bars on the points show the statistical uncertainty in the data and the shaded region represents the total uncertainty in the measurement. The lower panel gives the ratio of the predictions to the data. |
png pdf |
Figure 8-b:
The normalized ${\mathrm{t} \mathrm{\bar{t}}}$+jet differential cross section as a function of $\rho $ for the data (points) and theoretical predictions described in the text using the AMBP16NLO PDF set from the NLO MC with three different ${m_{\mathrm{t}}}$ values and from the POWHEG (POW) + PYTHIA 8 (PYT) calculations (lines). The vertical bars on the points show the statistical uncertainty in the data and the shaded region represents the total uncertainty in the measurement. The lower panel gives the ratio of the predictions to the data. |
png pdf |
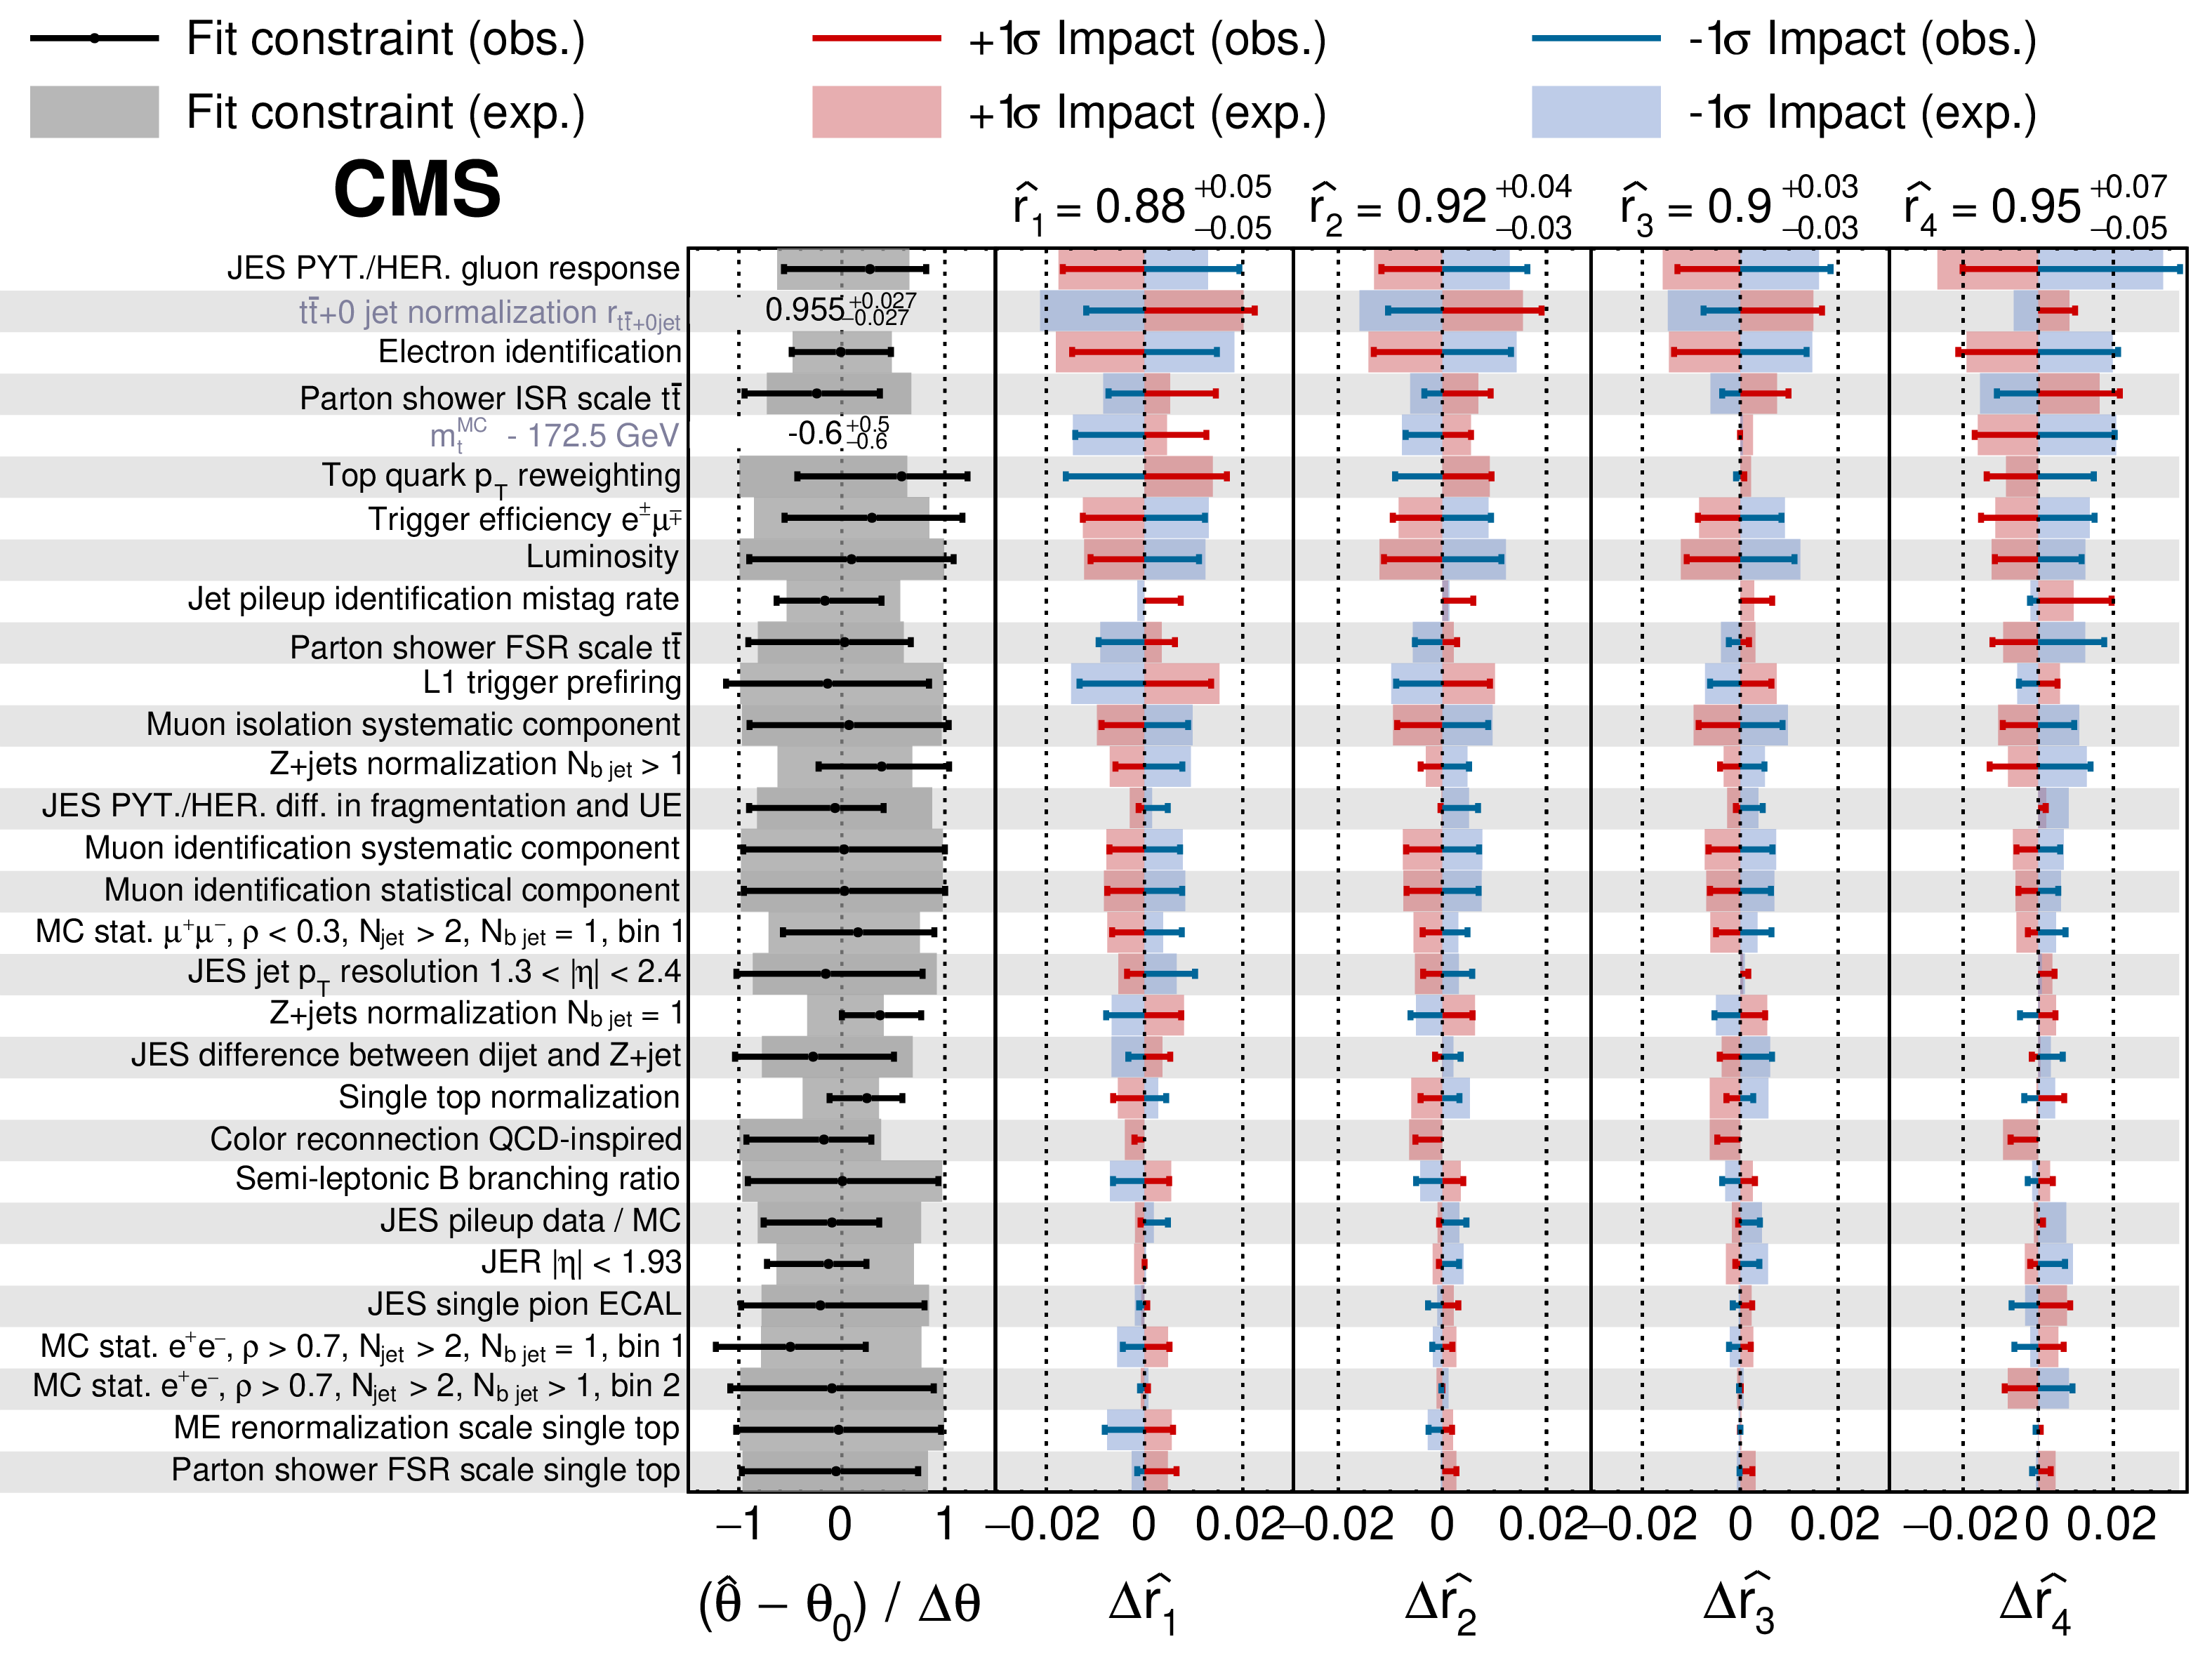
Figure 9:
The fitted nuisance-parameter values and their impacts ${\Delta {\hat{r}_k}}$ on the signal strengths ${\hat{r}_k}$ from the fit to the data, ordered by their relative summed impact. Only the 30 highest ranked parameters are shown. The resulting fitted values of ${\hat{r}_k}$ and their total uncertainties are also given. The nuisance-parameter values (${\hat{\theta}}$, black lines) are shown in comparison to their input values ${\theta _0}$ before the fit and relative to their uncertainty ${\Delta \theta}$. The impact ${\Delta {\hat{r}_k}}$ for each nuisance parameter is the difference between the nominal best fit value of ${r_k}$ and the best fit value when only that nuisance parameter is set to its best fit value ${\hat{\theta}}$ while all others are left free. The red and blue lines correspond to the variation in ${\Delta {\hat{r}_k}}$ when the nuisance parameter is varied up and down by its fitted uncertainty (${\Delta \theta}$), respectively. The corresponding gray, red, and blue regions show the expected values from fits to pseudo-data. For the nuisance parameters associated with the ${\mathrm{t} \mathrm{\bar{t}}}$+0-jet normalization and ${{m_{\mathrm{t}}} ^{\text {MC}}}$, the values after the fit to the data are given, because no prior pdf is assigned. |
png pdf |
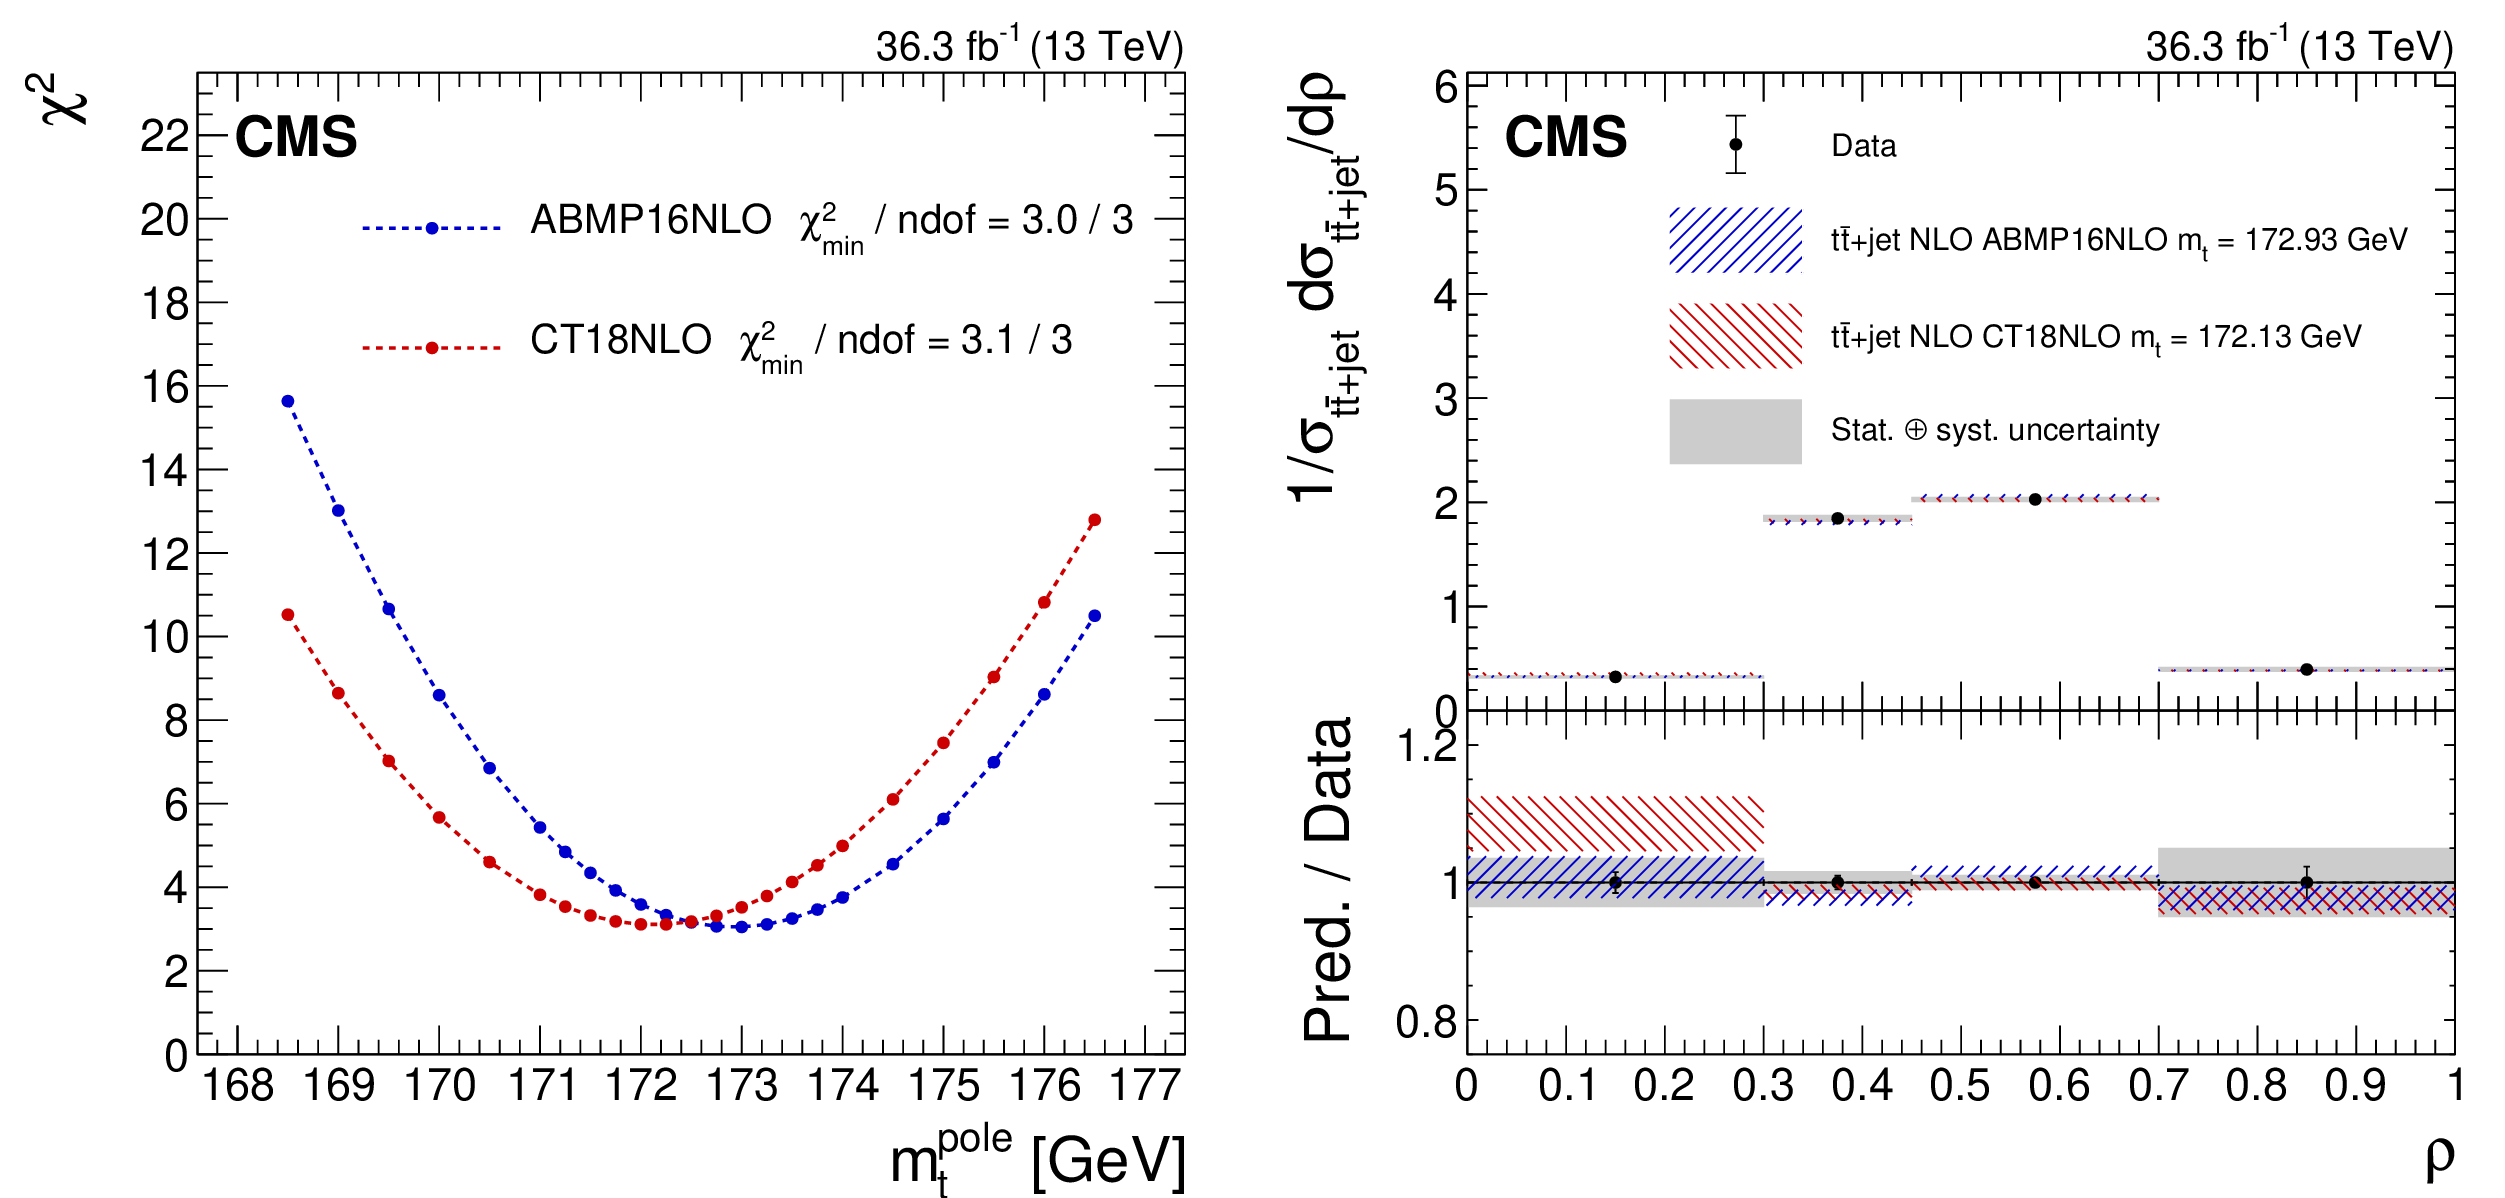
Figure 10:
Left: The ${\chi ^2}$ values versus ${{m_{\mathrm{t}}} ^{\text {pole}}}$ from the fit of the measured normalized ${\mathrm{t} \mathrm{\bar{t}}}$+jet differential cross sections to the theoretical predictions using the ABMP16NLO (blue points) and CT18NLO (red points) PDF sets. The minimum ${\chi ^2}$ value and the number of degrees of freedom (ndof) are given for each fit. Right: The measured normalized ${\mathrm{t} \mathrm{\bar{t}}}$+jet differential cross section (points) as a function of $\rho $, compared to the predictions using the two PDF sets and the corresponding best fit values for ${{m_{\mathrm{t}}} ^{\text {pole}}}$ (hatched bands). The lower panel gives the ratio of the theoretical predictions to the measured values. For both panels, the vertical bars on the points show the statistical uncertainty in the data, the height of the hatched bands represent the theoretical uncertainties in the predictions, and the gray band gives the total uncertainty in the measured cross section. |

png pdf |
Figure 10-a:
The ${\chi ^2}$ values versus ${{m_{\mathrm{t}}} ^{\text {pole}}}$ from the fit of the measured normalized ${\mathrm{t} \mathrm{\bar{t}}}$+jet differential cross sections to the theoretical predictions using the ABMP16NLO (blue points) and CT18NLO (red points) PDF sets. The minimum ${\chi ^2}$ value and the number of degrees of freedom (ndof) are given for each fit. |

png pdf |
Figure 10-b:
The measured normalized ${\mathrm{t} \mathrm{\bar{t}}}$+jet differential cross section (points) as a function of $\rho $, compared to the predictions using the two PDF sets and the corresponding best fit values for ${{m_{\mathrm{t}}} ^{\text {pole}}}$ (hatched bands). The lower panel gives the ratio of the theoretical predictions to the measured values. For both panels, the vertical bars on the points show the statistical uncertainty in the data, the height of the hatched bands represent the theoretical uncertainties in the predictions, and the gray band gives the total uncertainty in the measured cross section. |
| Tables | |
png pdf |
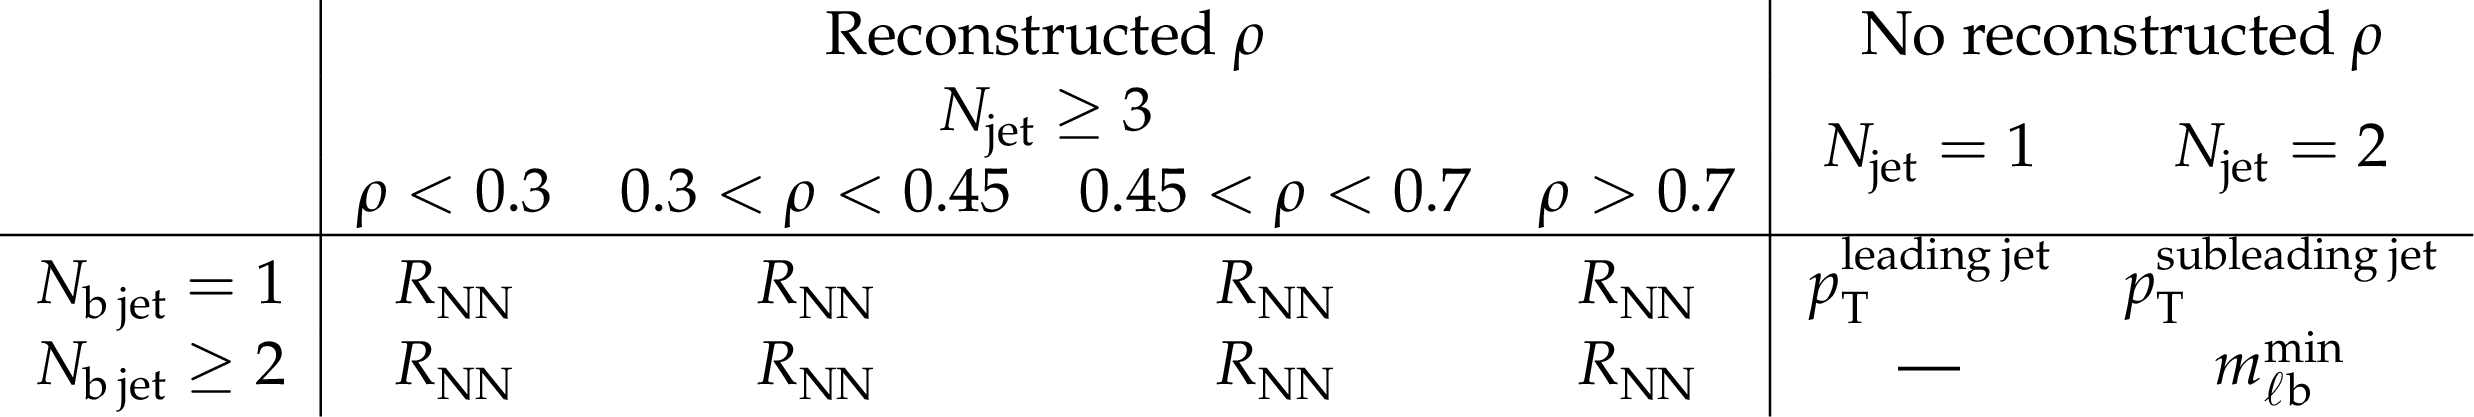
Table 1:
A list of the event categories and distributions used in the maximum likelihood fit. |

png pdf |
Table 2:
The relative uncertainties $\Delta {{{\sigma _{{{\mathrm{t} {}\mathrm{\bar{t}}} \text {+jet}}}} ^k}}$ in the parton-level cross section values ${{\sigma _{{{\mathrm{t} {}\mathrm{\bar{t}}} \text {+jet}}}} ^k}$ and their sources in each bin $k$ of the $\rho $ distribution. The statistical uncertainty is evaluated by keeping all nuisance parameters fixed to their values after the fit to data. The breakdown of the uncertainty is obtained by repeating the fit after fixing all but the nuisance parameters related to the components under consideration to their fitted values. The partial uncertainty is then estimated by subtracting the statistical component from the total uncertainty obtained with this procedure. The quadratic sum of the contributions is different from the total uncertainty because of correlations between the nuisance parameters. |
| Summary |
| Measurements are presented of the normalized differential cross section of top quark-antiquark pair ($\mathrm{t\bar{t}}$) production in association with at least one additional jet as a function of the inverse of the invariant mass of the $\mathrm{t\bar{t}}$+jet system $\rho=2{m_0} /{m_{\mathrm{t\bar{t}}+\text{jet}}} $, with the scaling constant ${m_0} = $ 170 GeV. Proton-proton collision data collected by the CMS experiment at the CERN LHC at a center-of-mass energy of 13 TeV are used, corresponding to an integrated luminosity of 36.3 fb$^{-1}$. Events in the dilepton decay channel are considered, and a novel multivariate analysis technique is applied to maximize the sensitivity to the signal process. The differential cross section is measured at the parton level using a maximum likelihood fit to final-state observables, where all systematic uncertainties are profiled. The value of the top quark pole mass ${{m_{\mathrm{t}}} ^{\text{pole}}}$ is extracted by comparing the measured $\mathrm{t\bar{t}}$+jet normalized differential cross section as a function of $\rho$ to theoretical predictions at next-to-leading order in quantum chromodynamics, obtained with two sets of parton distribution functions. The ${{m_{\mathrm{t}}} ^{\text{pole}}}$ values is determined to be 172.94 $\pm$ 1.37 GeV and 172.16 $\pm$ 1.44 GeV using the ABMP16NLO and CT18NLO parton distribution functions, respectively. Here, the uncertainties shown include the total statistical and systematic uncertainties including extrapolation uncertainties, and the theoretical uncertainties from the parton distribution functions and the matrix-element scales. The results are in good agreement with previous measurements. |
| References | ||||
| 1 | Gfitter Group Collaboration | The global electroweak fit at NNLO and prospects for the LHC and ILC | EPJC 74 (2014) 3046 | 1407.3792 |
| 2 | J. de Blas et al. | Electroweak precision observables and Higgs-boson signal strengths in the standard model and beyond: present and future | JHEP 12 (2016) 135 | 1608.01509 |
| 3 | S. Alekhin, J. Blumlein, S. Moch, and R. Placakyte | Parton distribution functions, $ {\alpha_S}, $ and heavy-quark masses for LHC Run II | PRD 96 (2017) 014011 | 1701.05838 |
| 4 | Particle Data Group, P. A. Zyla et al. | Review of particle physics | Prog. Theor. Exp. Phys. 2020 (2020) 083C01 | |
| 5 | G. Degrassi et al. | Higgs mass and vacuum stability in the standard model at NNLO | JHEP 08 (2012) 098 | 1205.6497 |
| 6 | S. Alekhin, A. Djouadi, and S. Moch | The top quark and Higgs boson masses and the stability of the electroweak vacuum | PLB 716 (2012) 214 | 1207.0980 |
| 7 | ATLAS Collaboration | Measurement of the top quark mass in the $ \mathrm{t\bar{t}}\to{} $dilepton channel from $ \sqrt{s} =$ 8 TeV ATLAS data | PLB 761 (2016) 350 | 1606.02179 |
| 8 | ATLAS Collaboration | Top-quark mass measurement in the all-hadronic $ \mathrm{t\bar{t}} $ decay channel at $ \sqrt{s} =$ 8 TeV with the ATLAS detector | JHEP 09 (2017) 118 | 1702.07546 |
| 9 | ATLAS Collaboration | Measurement of the top quark mass in the $ \mathrm{t\bar{t}}\to{} $lepton+jets channel from $ \sqrt{s} =$ 8 TeV ATLAS data and combination with previous results | EPJC 79 (2019) 290 | 1810.01772 |
| 10 | CMS Collaboration | Measurement of the top quark mass using proton-proton data at $ \sqrt{s} = $ 7 and 8 TeV | PRD 93 (2016) 072004 | CMS-TOP-14-022 1509.04044 |
| 11 | CMS Collaboration | Measurement of the top quark mass in the dileptonic $ \mathrm{t\bar{t}} $ decay channel using the mass observables $ m_{\mathrm{b}\ell} $, $ m_{\mathrm{T2}}$, $ and $ m_{\mathrm{b}\ell\nu} $ in pp collisions at $ \sqrt{s} =$ 8 TeV | PRD 96 (2017) 032002 | CMS-TOP-15-008 1704.06142 |
| 12 | CMS Collaboration | Measurement of the top quark mass with lepton+jets final states using pp collisions at $ \sqrt{s} =$ 13 TeV | EPJC 78 (2018) 891 | CMS-TOP-17-007 1805.01428 |
| 13 | CMS Collaboration | Measurement of the top quark mass in the all-jets final state at $ \sqrt{s} =$ 13 TeV and combination with the lepton+jets channel | EPJC 79 (2019) 313 | CMS-TOP-17-008 1812.10534 |
| 14 | CMS Collaboration | Measurement of the top quark mass using events with a single reconstructed top quark in pp collisions at $ \sqrt{s} =$ 13 TeV | JHEP 12 (2021) 161 | CMS-TOP-19-009 2108.10407 |
| 15 | S. Ferrario Ravasio, T. Je\vzo, P. Nason, and C. Oleari | A theoretical study of top-mass measurements at the LHC using NLO+PS generators of increasing accuracy | EPJC 78 (2018) 458 | 1906.09166 |
| 16 | M. Butenschoen et al. | Top quark mass calibration for Monte Carlo event generators | PRL 117 (2016) 232001 | 1608.01318 |
| 17 | ATLAS, CDF, CMS, and D0 Collaborations | First combination of Tevatron and LHC measurements of the top-quark mass | 2014 | 1403.4427 |
| 18 | S. Moch et al. | High precision fundamental constants at the TeV scale | 2014 | 1405.4781 |
| 19 | A. Juste et al. | Determination of the top quark mass circa 2013: methods, subtleties, perspectives | EPJC 74 (2014) 3119 | 1310.0799 |
| 20 | A. H. Hoang | What is the top quark mass? | Ann. Rev. Nucl. Part. Sci. 70 (2020) 225 | 2004.12915 |
| 21 | A. H. Hoang | The top mass: interpretation and theoretical uncertainties | in Proc. 7th Int. Workshop on Top Quark Physics (TOP2014): Cannes, France, September 28--October 3, 2014 2014 | 1412.3649 |
| 22 | CMS Collaboration | Measurement of the $ \mathrm{t\bar{t}} $ production cross section, the top quark mass, and the strong coupling constant using dilepton events in pp collisions at $ \sqrt{s} =$ 13 TeV | EPJC 79 (2019) 368 | CMS-TOP-17-001 1812.10505 |
| 23 | ATLAS Collaboration | Measurement of the $ \mathrm{t\bar{t}} $ production cross-section using e$\mu$ events with b-tagged jets in pp collisions at $ \sqrt{s} = $ 7 and 8 TeV with the ATLAS detector | EPJC 74 (2014) 3109 | 1406.5375 |
| 24 | CMS Collaboration | Measurement of the $ \mathrm{t\bar{t}} $ production cross section in the e$\mu$ channel in proton-proton collisions at $ \sqrt{s} = $ 7 and 8 TeV | JHEP 08 (2016) 029 | CMS-TOP-13-004 1603.02303 |
| 25 | CMS Collaboration | Measurement of the $ \mathrm{t\bar{t}} $ production cross section using events with one lepton and at least one jet in pp collisions at $ \sqrt{s} =$ 13 TeV | JHEP 09 (2017) 051 | CMS-TOP-16-006 1701.06228 |
| 26 | ATLAS Collaboration | Determination of the top-quark pole mass using $ \mathrm{t\bar{t}}+1 $-jet events collected with the ATLAS experiment in 7 $ TeV pp $ collisions | JHEP 10 (2015) 121 | 1507.01769 |
| 27 | D0 Collaboration | Measurement of the inclusive $ \mathrm{t\bar{t}} $ production cross section in $ {{\mathrm{p}}\mathrm{\bar{p}}} $ collisions at $ \sqrt{s} = $1.96 TeV and determination of the top quark pole mass | PRD 94 (2016) 092004 | 1605.06168 |
| 28 | ATLAS Collaboration | Measurement of lepton differential distributions and the top quark mass in $ \mathrm{t\bar{t}} $ production in pp collisions at $ \sqrt{s} =$ 8 TeV with the ATLAS detector | EPJC 77 (2017) 804 | 1709.09407 |
| 29 | CMS Collaboration | Measurement of $ \mathrm{t\bar{t}} $ normalised multi-differential cross sections in pp collisions at $ \sqrt{s} =$ 13 TeV, and simultaneous determination of the strong coupling strength, top quark pole mass, and parton distribution functions | EPJC 80 (2020) 658 | CMS-TOP-18-004 1904.05237 |
| 30 | U. Langenfeld, S. Moch, and P. Uwer | Measuring the running top-quark mass | PRD 80 (2009) 054009 | 0906.5273 |
| 31 | J. Fuster et al. | Extracting the top-quark running mass using $ \mathrm{t\bar{t}}+1 $-jet events produced at the Large Hadron Collider | EPJC 77 (2017) 794 | 1704.00540 |
| 32 | CMS Collaboration | Running of the top quark mass from proton-proton collisions at $ \sqrt{s} =$ 13 TeV | PLB 803 (2020) 135263 | CMS-TOP-19-007 1909.09193 |
| 33 | S. Alioli et al. | A new observable to measure the top-quark mass at hadron colliders | EPJC 73 (2013) 2438 | 1303.6415 |
| 34 | G. Bevilacqua et al. | Top quark mass studies with $ \mathrm{t\bar{t}}\text{j} $ at the LHC | JHEP 03 (2018) 169 | 1710.07515 |
| 35 | ATLAS Collaboration | Measurement of the top-quark mass in $ \mathrm{t\bar{t}}+1 $-jet events collected with the ATLAS detector in pp collisions at $ \sqrt{s} =$ 8 TeV | JHEP 11 (2019) 150 | 1905.02302 |
| 36 | CMS Collaboration | HEPData record for this analysis | link | |
| 37 | CMS Collaboration | Performance of the CMS L1 trigger in proton-proton collisions at $ \sqrt{s} =$ 13 TeV | JINST 15 (2020) P10017 | CMS-TRG-17-001 2006.10165 |
| 38 | CMS Collaboration | The CMS trigger system | JINST 12 (2017) P01020 | CMS-TRG-12-001 1609.02366 |
| 39 | CMS Collaboration | The CMS experiment at the CERN LHC | JINST 3 (2008) S08004 | CMS-00-001 |
| 40 | CMS Collaboration | Technical proposal for the Phase-II upgrade of the Compact Muon Solenoid | CMS-PAS-TDR-15-002 | CMS-PAS-TDR-15-002 |
| 41 | CMS Collaboration | Particle-flow reconstruction and global event description with the CMS detector | JINST 12 (2017) P10003 | CMS-PRF-14-001 1706.04965 |
| 42 | CMS Collaboration | Jet energy scale and resolution in the CMS experiment in pp collisions at 8 TeV | JINST 12 (2017) P02014 | CMS-JME-13-004 1607.03663 |
| 43 | CMS Collaboration | Performance of missing transverse momentum reconstruction in proton-proton collisions at $ \sqrt{s} =$ 13 TeV using the CMS detector | JINST 14 (2019) P07004 | CMS-JME-17-001 1903.06078 |
| 44 | D. Bertolini, P. Harris, M. Low, and N. Tran | Pileup per particle identification | JHEP 10 (2014) 059 | 1407.6013 |
| 45 | CMS Collaboration | Pileup mitigation at CMS in 13 TeV data | JINST 15 (2020) P09018 | CMS-JME-18-001 2003.00503 |
| 46 | CMS Collaboration | ECAL 2016 refined calibration and Run 2 summary plots | CDS | |
| 47 | CMS Collaboration | Electron and photon reconstruction and identification with the CMS experiment at the CERN LHC | JINST 16 (2021) P05014 | CMS-EGM-17-001 2012.06888 |
| 48 | CMS Collaboration | Performance of the CMS muon detector and muon reconstruction with proton-proton collisions at $ \sqrt{s} =$ 13 TeV | JINST 13 (2018) P06015 | CMS-MUO-16-001 1804.04528 |
| 49 | S. Frixione, P. Nason, and C. Oleari | Matching NLO QCD computations with parton shower simulations: the POWHEG method | JHEP 11 (2007) 070 | 0709.2092 |
| 50 | S. Frixione, G. Ridolfi, and P. Nason | A positive-weight next-to-leading-order Monte Carlo for heavy flavour hadroproduction | JHEP 09 (2007) 126 | 0707.3088 |
| 51 | S. Alioli, P. Nason, C. Oleari, and E. Re | A general framework for implementing NLO calculations in shower Monte Carlo programs: the POWHEG box | JHEP 06 (2010) 043 | 1002.2581 |
| 52 | NNPDF Collaboration | Unbiased global determination of parton distributions and their uncertainties at NNLO and at LO | NPB 855 (2012) 153 | 1107.2652 |
| 53 | NNPDF Collaboration | Parton distributions from high-precision collider data | EPJC 77 (2017) 663 | 1706.00428 |
| 54 | T. Sjostrand et al. | An introduction to PYTHIA 8.2 | CPC 191 (2015) 159 | 1410.3012 |
| 55 | CMS Collaboration | Extraction and validation of a new set of CMS $ {PYTHIA8} $ tunes from underlying-event measurements | EPJC 80 (2020) 4 | CMS-GEN-17-001 1903.12179 |
| 56 | J. Alwall et al. | The automated computation of tree-level and next-to-leading order differential cross sections, and their matching to parton shower simulations | JHEP 07 (2014) 079 | 1405.0301 |
| 57 | R. Frederix and S. Frixione | Merging meets matching in MCatNLO | JHEP 12 (2012) 061 | 1209.6215 |
| 58 | P. Artoisenet, R. Frederix, O. Mattelaer, and R. Rietkerk | Automatic spin-entangled decays of heavy resonances in Monte Carlo simulations | JHEP 03 (2013) 015 | 1212.3460 |
| 59 | E. Re | Single-top $ \mathrm{W}\mathrm{t} $-channel production matched with parton showers using the POWHEG method | EPJC 71 (2011) 1547 | 1009.2450 |
| 60 | S. Alioli, P. Nason, C. Oleari, and E. Re | NLO single-top production matched with shower in POWHEG: $ s $- and $ t $-channel contributions | JHEP 09 (2009) 111 | 0907.4076 |
| 61 | CMS Collaboration | Investigations of the impact of the parton shower tuning in PYTHIA 8} in the modelling of $ \mathrm{t\bar{t}} $ at $ \sqrt{s} = $ 8 and 13 TeV | CMS-PAS-TOP-16-021 | CMS-PAS-TOP-16-021 |
| 62 | CMS Collaboration | Event generator tunes obtained from underlying event and multiparton scattering measurements | EPJC 76 (2016) 155 | CMS-GEN-14-001 1512.00815 |
| 63 | P. Skands, S. Carrazza, and J. Rojo | Tuning PYTHIA8.1: the Monash 2013 tune | EPJC 74 (2014) 3024 | 1404.5630 |
| 64 | M. L. Mangano, M. Moretti, F. Piccinini, and M. Treccani | Matching matrix elements and shower evolution for top-pair production in hadronic collisions | JHEP 01 (2007) 013 | hep-ph/0611129 |
| 65 | S. Mrenna and P. Richardson | Matching matrix elements and parton showers with HERWIG and PYTHIA | JHEP 05 (2004) 040 | hep-ph/0312274 |
| 66 | M. Czakon and A. Mitov | Top++: A program for the calculation of the top-pair cross-section at hadron colliders | CPC 185 (2014) 2930 | 1112.5675 |
| 67 | M. Cacciari et al. | Top-pair production at hadron colliders with next-to-next-to-leading logarithmic soft-gluon resummation | PLB 710 (2012) 612 | 1111.5869 |
| 68 | P. Barnreuther, M. Czakon, and A. Mitov | Percent level precision physics at the Tevatron: Next-to-next-to-leading order QCD corrections to $ \mathrm{q\bar{q}}\to\mathrm{t\bar{t}}+{\mathrm{X}} $ | PRL 109 (2012) 132001 | 1204.5201 |
| 69 | M. Czakon and A. Mitov | NNLO corrections to top-pair production at hadron colliders: the all-fermionic scattering channels | JHEP 12 (2012) 054 | 1207.0236 |
| 70 | M. Czakon and A. Mitov | NNLO corrections to top pair production at hadron colliders: the quark-gluon reaction | JHEP 01 (2013) 080 | 1210.6832 |
| 71 | M. Beneke, P. Falgari, S. Klein, and C. Schwinn | Hadronic top-quark pair production with NNLL threshold resummation | NPB 855 (2012) 695 | 1109.1536 |
| 72 | M. Czakon, P. Fiedler, and A. Mitov | Total top-quark pair-production cross section at hadron colliders through $ \mathcal{O}({{\alpha_S}}^4) $ | PRL 110 (2013) 252004 | 1303.6254 |
| 73 | N. Kidonakis | Two-loop soft anomalous dimensions for single top quark associated production with a $ \mathrm{W^{-}} $ or $ \mathrm{H}^{-} $ | PRD 82 (2010) 054018 | 1005.4451 |
| 74 | J. M. Campbell, R. K. Ellis, and C. Williams | Vector boson pair production at the LHC | JHEP 07 (2011) 018 | 1105.0020 |
| 75 | Y. Li and F. Petriello | Combining QCD and electroweak corrections to dilepton production in the framework of the FEWZ simulation code | PRD 86 (2012) 094034 | 1208.5967 |
| 76 | GEANT4 Collaboration | GEANT4--a simulation toolkit | NIMA 506 (2003) 250 | |
| 77 | ATLAS Collaboration | Measurement of the inelastic proton-proton cross section at $ \sqrt{s} =$ 13 TeV with the ATLAS detector at the LHC | PRL 117 (2016) 182002 | 1606.02625 |
| 78 | M. Cacciari, G. P. Salam, and G. Soyez | The anti-$ {k_{\mathrm{T}}} $ jet clustering algorithm | JHEP 04 (2008) 063 | 0802.1189 |
| 79 | M. Cacciari, G. P. Salam, and G. Soyez | $ FastJet $ user manual | EPJC 72 (2012) 1896 | 1111.6097 |
| 80 | CMS Collaboration | Identification of heavy-flavour jets with the CMS detector in pp collisions at 13 TeV | JINST 13 (2018) P05011 | CMS-BTV-16-002 1712.07158 |
| 81 | CMS Collaboration | A deep neural network for simultaneous estimation of $ \mathrm{b} $ jet energy and resolution | Comput. Softw. Big Sci. 4 (2020) 10 | CMS-HIG-18-027 1912.06046 |
| 82 | CMS Collaboration | Measurement of the differential cross section for top quark pair production in pp collisions at $ \sqrt{s} =$ 8 TeV | EPJC 75 (2015) 542 | CMS-TOP-12-028 1505.04480 |
| 83 | CMS Collaboration | Measurement of double-differential cross sections for top quark pair production in pp collisions at $ \sqrt{s} =$ 8 TeV and impact on parton distribution functions | EPJC 77 (2017) 459 | CMS-TOP-14-013 1703.01630 |
| 84 | CMS Collaboration | Measurement of normalized differential $ \mathrm{t\bar{t}} $ cross sections in the dilepton channel from pp collisions at $ \sqrt{s} =$ 13 TeV | JHEP 04 (2018) 060 | CMS-TOP-16-007 1708.07638 |
| 85 | CMS Collaboration | Measurements of $ \mathrm{t\bar{t}} $ differential cross sections in proton-proton collisions at $ \sqrt{s} =$ 13 TeV using events containing two leptons | JHEP 02 (2019) 149 | CMS-TOP-17-014 1811.06625 |
| 86 | L. Sonnenschein | Analytical solution of $ \mathrm{t\bar{t}} $ dilepton equations | PRD 73 (2006) 054015 | hep-ph/0603011 |
| 87 | M. Abadi et al. | TensorFlow: large-scale machine learning on heterogeneous distributed systems | 2016. Software available from | 1603.04467 |
| 88 | F. Chollet et al. | Keras | 2015 | |
| 89 | J. Snoek, H. Larochelle, and R. P. Adams | Practical Bayesian optimization of machine learning algorithms | 2012 | 1206.2944 |
| 90 | E. Brochu, V. M. Cora, and N. de Freitas | A tutorial on Bayesian optimization of expensive cost functions, with application to active user modeling and hierarchical reinforcement learning | 2010 | 1012.2599 |
| 91 | F. Nogueira | Bayesian optimization: open source constrained global optimization tool for Python | link | |
| 92 | R. D. Cousins | Generalization of chisquare goodness-of-fit test for binned data using saturated models, with application to histograms | 2013 | |
| 93 | Y. Ganin and V. Lempitsky | Unsupervised domain adaptation by backpropagation | 2015 | 1409.7495 |
| 94 | J. Kieseler, K. Lipka, and S. Moch | Calibration of the top-quark Monte Carlo mass | PRL 116 (2016) 162001 | 1511.00841 |
| 95 | F. James and M. Roos | MINUIT--a system for function minimization and analysis of the parameter errors and correlations | CPC 10 (1975) 343 | |
| 96 | ATLAS and CMS Collaborations, and LHC Higgs Combination Group | Procedure for the LHC Higgs boson search combination in summer 2011 | CMS-NOTE-2011-005 | |
| 97 | CMS Collaboration | Precise determination of the mass of the Higgs boson and tests of compatibility of its couplings with the standard model predictions using proton collisions at 7 and 8 TeV | EPJC 75 (2015) 212 | CMS-HIG-14-009 1412.8662 |
| 98 | ATLAS and CMS Collaborations | Measurements of the Higgs boson production and decay rates and constraints on its couplings from a combined ATLAS and CMS analysis of the LHC pp collision data at $ \sqrt{s} = $ 7 and 8 TeV | JHEP 08 (2016) 045 | 1606.02266 |
| 99 | J. S. Conway | Incorporating nuisance parameters in likelihoods for multisource spectra | in Proc. 2011 Workshop on Statistical Issues Related to Discovery Claims in Search Experiments and Unfolding (PHYSTAT 2011), Geneva, 2011 | 1103.0354 |
| 100 | CMS Collaboration | Precision luminosity measurement in proton-proton collisions at $ \sqrt{s} =$ 13 TeV in 2015 and 2016 at CMS | EPJC 81 (2021) 800 | CMS-LUM-17-003 2104.01927 |
| 101 | CMS Collaboration | Performance of missing energy reconstruction in 13 $ TeV pp $ collision data using the CMS detector | CMS-PAS-JME-16-004 | CMS-PAS-JME-16-004 |
| 102 | CMS Collaboration | Performance of the pile up jet identification in CMS for Run 2 | CDS | |
| 103 | CMS Collaboration | Performance of the CMS muon trigger system in proton-proton collisions at $ \sqrt{s} =$ 13 TeV | JINST 16 (2021) P07001 | CMS-MUO-19-001 2102.04790 |
| 104 | S. Argyropoulos and T. Sjostrand | Effects of color reconnection on $ \mathrm{t\bar{t}} $ final states at the LHC | JHEP 11 (2014) 043 | 1407.6653 |
| 105 | J. R. Christiansen and P. Z. Skands | String formation beyond leading colour | JHEP 08 (2015) 003 | 1505.01681 |
| 106 | M. G. Bowler | e$^{+}$e$^{-}$ production of heavy quarks in the string model | Z. Phys. C 11 (1981) 169 | |
| 107 | C. Peterson, D. Schlatter, I. Schmitt, and P. M. Zerwas | Scaling violations in inclusive e$^{+}$e$^{-}$ annihilation spectra | PRD 27 (1983) 105 | |
| 108 | CMS Collaboration | Measurement of the $ \mathrm{t} \overline{\mathrm{t}} $ production cross section in the all-jets final state in pp collisions at $ \sqrt{s} = $ 8 TeV | EPJC 76 (2016) 128 | CMS-TOP-14-018 1509.06076 |
| 109 | CMS Collaboration | Measurement of differential cross sections for top quark pair production using the lepton+jets final state in proton-proton collisions at 13 TeV | PRD 95 (2017) 092001 | CMS-TOP-16-008 1610.04191 |
| 110 | CMS Collaboration | Measurement of the differential cross section for $ \mathrm{t} \overline{\mathrm{t}} $ production in the dilepton final state at $ \sqrt{s} = $ 13 TeV | CMS Physics Analysis Summary , CERN, 2016 CMS-PAS-TOP-16-011 |
CMS-PAS-TOP-16-011 |
| 111 | R. Barlow and C. Beeston | Fitting using finite Monte Carlo samples | CPC 77 (1993) 219 | |
| 112 | S. Alioli, S. Moch, and P. Uwer | Hadronic top-quark pair-production with one jet and parton showering | JHEP 01 (2012) 137 | 1110.5251 |
| 113 | S. Alekhin, J. Blumlein, and S. Moch | NLO PDFs from the ABMP16 fit | EPJC 78 (2018) 477 | 1803.07537 |
| 114 | T.-J. Hou et al. | Progress in the CTEQ-TEA NNLO global QCD analysis | 2019 | 1908.11394 |
| 115 | G. Bevilacqua, H. B. Hartanto, M. Kraus, and M. Worek | Off-shell top quarks with one jet at the LHC: a comprehensive analysis at NLO QCD | JHEP 11 (2016) 098 | 1609.01659 |
| 116 | S. Alioli et al. | Phenomenology of $ \mathrm{t\bar{t}}\text{j}+{\mathrm{X}} $ production at the LHC | JHEP 05 (2022) 146 | 2202.07975 |
|
|
Compact Muon Solenoid LHC, CERN |
|

|

|

|

|

|