

Compact Muon Solenoid
LHC, CERN
| CMS-HIG-18-016 ; CERN-EP-2018-223 | ||
| Observation of Higgs boson decay to bottom quarks | ||
| CMS Collaboration | ||
| 24 August 2018 | ||
| Phys. Rev. Lett. 121 (2018) 121801 | ||
| Abstract: The observation of the standard model (SM) Higgs boson decay to a pair of bottom quarks is presented. The main contribution to this result is from processes in which Higgs bosons are produced in association with a W or Z boson (VH), and are searched for in final states including 0, 1, or 2 charged leptons and two identified bottom quark jets. The results from the measurement of these processes in a data sample recorded by the CMS experiment in 2017, comprising 41.3 fb$^{-1}$ of proton-proton collisions at $\sqrt{s} = $ 13 TeV, are described. When combined with previous VH measurements using data collected at $\sqrt{s}= $ 7, 8, and 13 TeV, an excess of events is observed at ${m_\mathrm{H}} = $ 125.09 GeV with a significance of 4.8 standard deviations, where the expectation for the SM Higgs boson is 4.9. The corresponding measured signal strength is 1.01 $\pm$ 0.22. The combination of this result with searches by the CMS experiment for ${\mathrm{H}\to\mathrm{b\bar{b}}}$ in other production processes yields an observed (expected) significance of 5.6 (5.5) standard deviations and a signal strength of 1.04 $\pm$ 0.20. | ||
| Links: e-print arXiv:1808.08242 [hep-ex] (PDF) ; CDS record ; inSPIRE record ; HepData record ; CADI line (restricted) ; | ||
| Figures & Tables | Summary | Additional Figures & Tables | References | CMS Publications |
|---|
| Figures | |
png pdf |
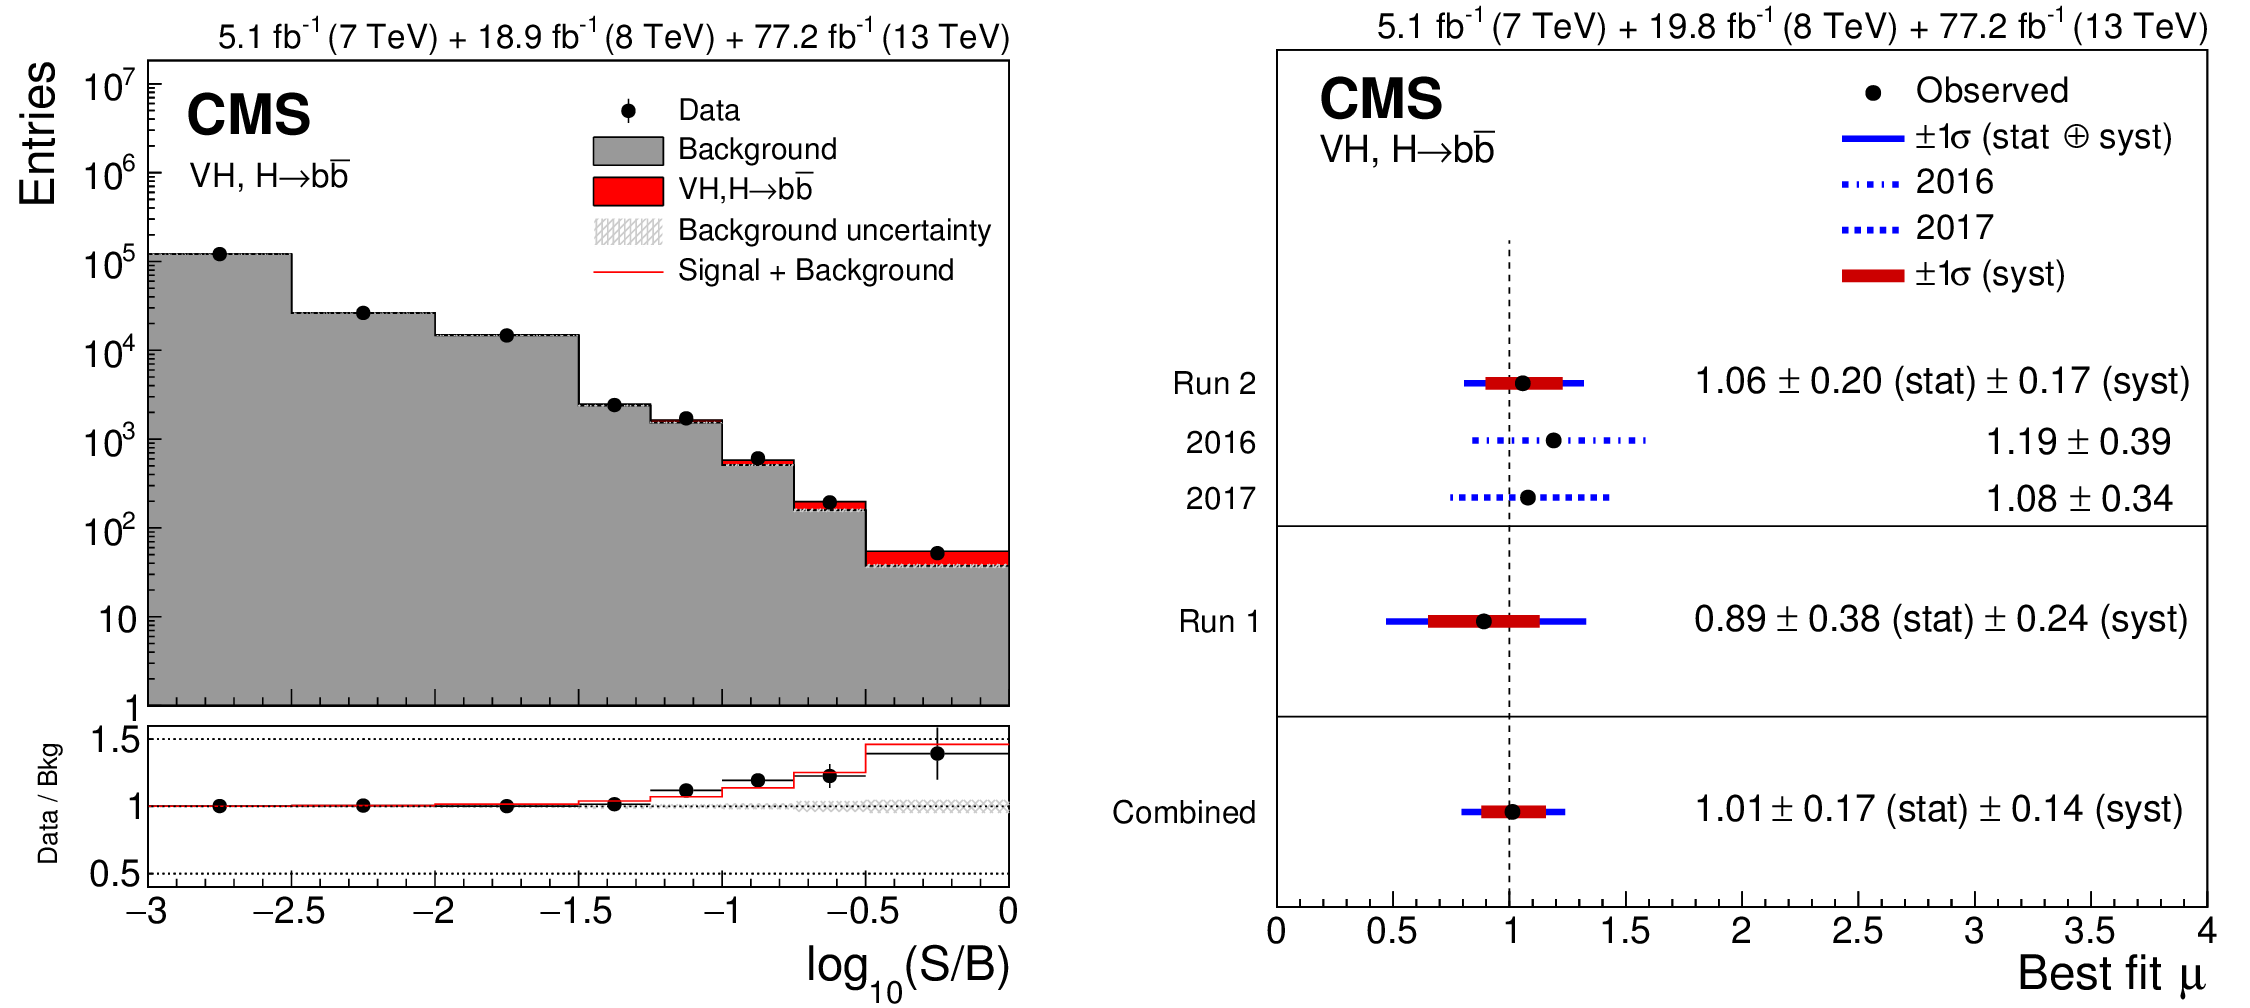
Figure 1:
Left: distributions of signal, background, and data event yields sorted into bins of similar signal-to-background ratio, as given by the result of the fit to their corresponding multivariate discriminant. All events in the VH, ${{\mathrm {H}} \to {{\mathrm {b}} {\overline {\mathrm {b}}}}}$ signal regions of the combined Run 1 and Run 2 data sets are included. The red histogram indicates the Higgs boson signal contribution, while the grey histogram is the sum of all background yields. The bottom panel shows the ratio of the data to the background, with the total uncertainty in the background yield indicated by the grey hatching. The red line indicates the sum of signal plus background contribution divided by the background yield. Right: best-fit value of the signal strength $\mu $, at $ {m_ {\mathrm {H}}} = $ 125.09 GeV, for the fit of all VH, ${{\mathrm {H}} \to {{\mathrm {b}} {\overline {\mathrm {b}}}}}$ channels in the Run 1 and Run 2 data sets. Also shown are the individual results of the 2016 and 2017 measurements, the Run 2 combination, and the Run 1 result. Horizontal error bars indicate the 1$\sigma $ systematic (red) and 1$\sigma $ total (blue) uncertainties, and the vertical dashed line indicates the SM expectation. |
png pdf |
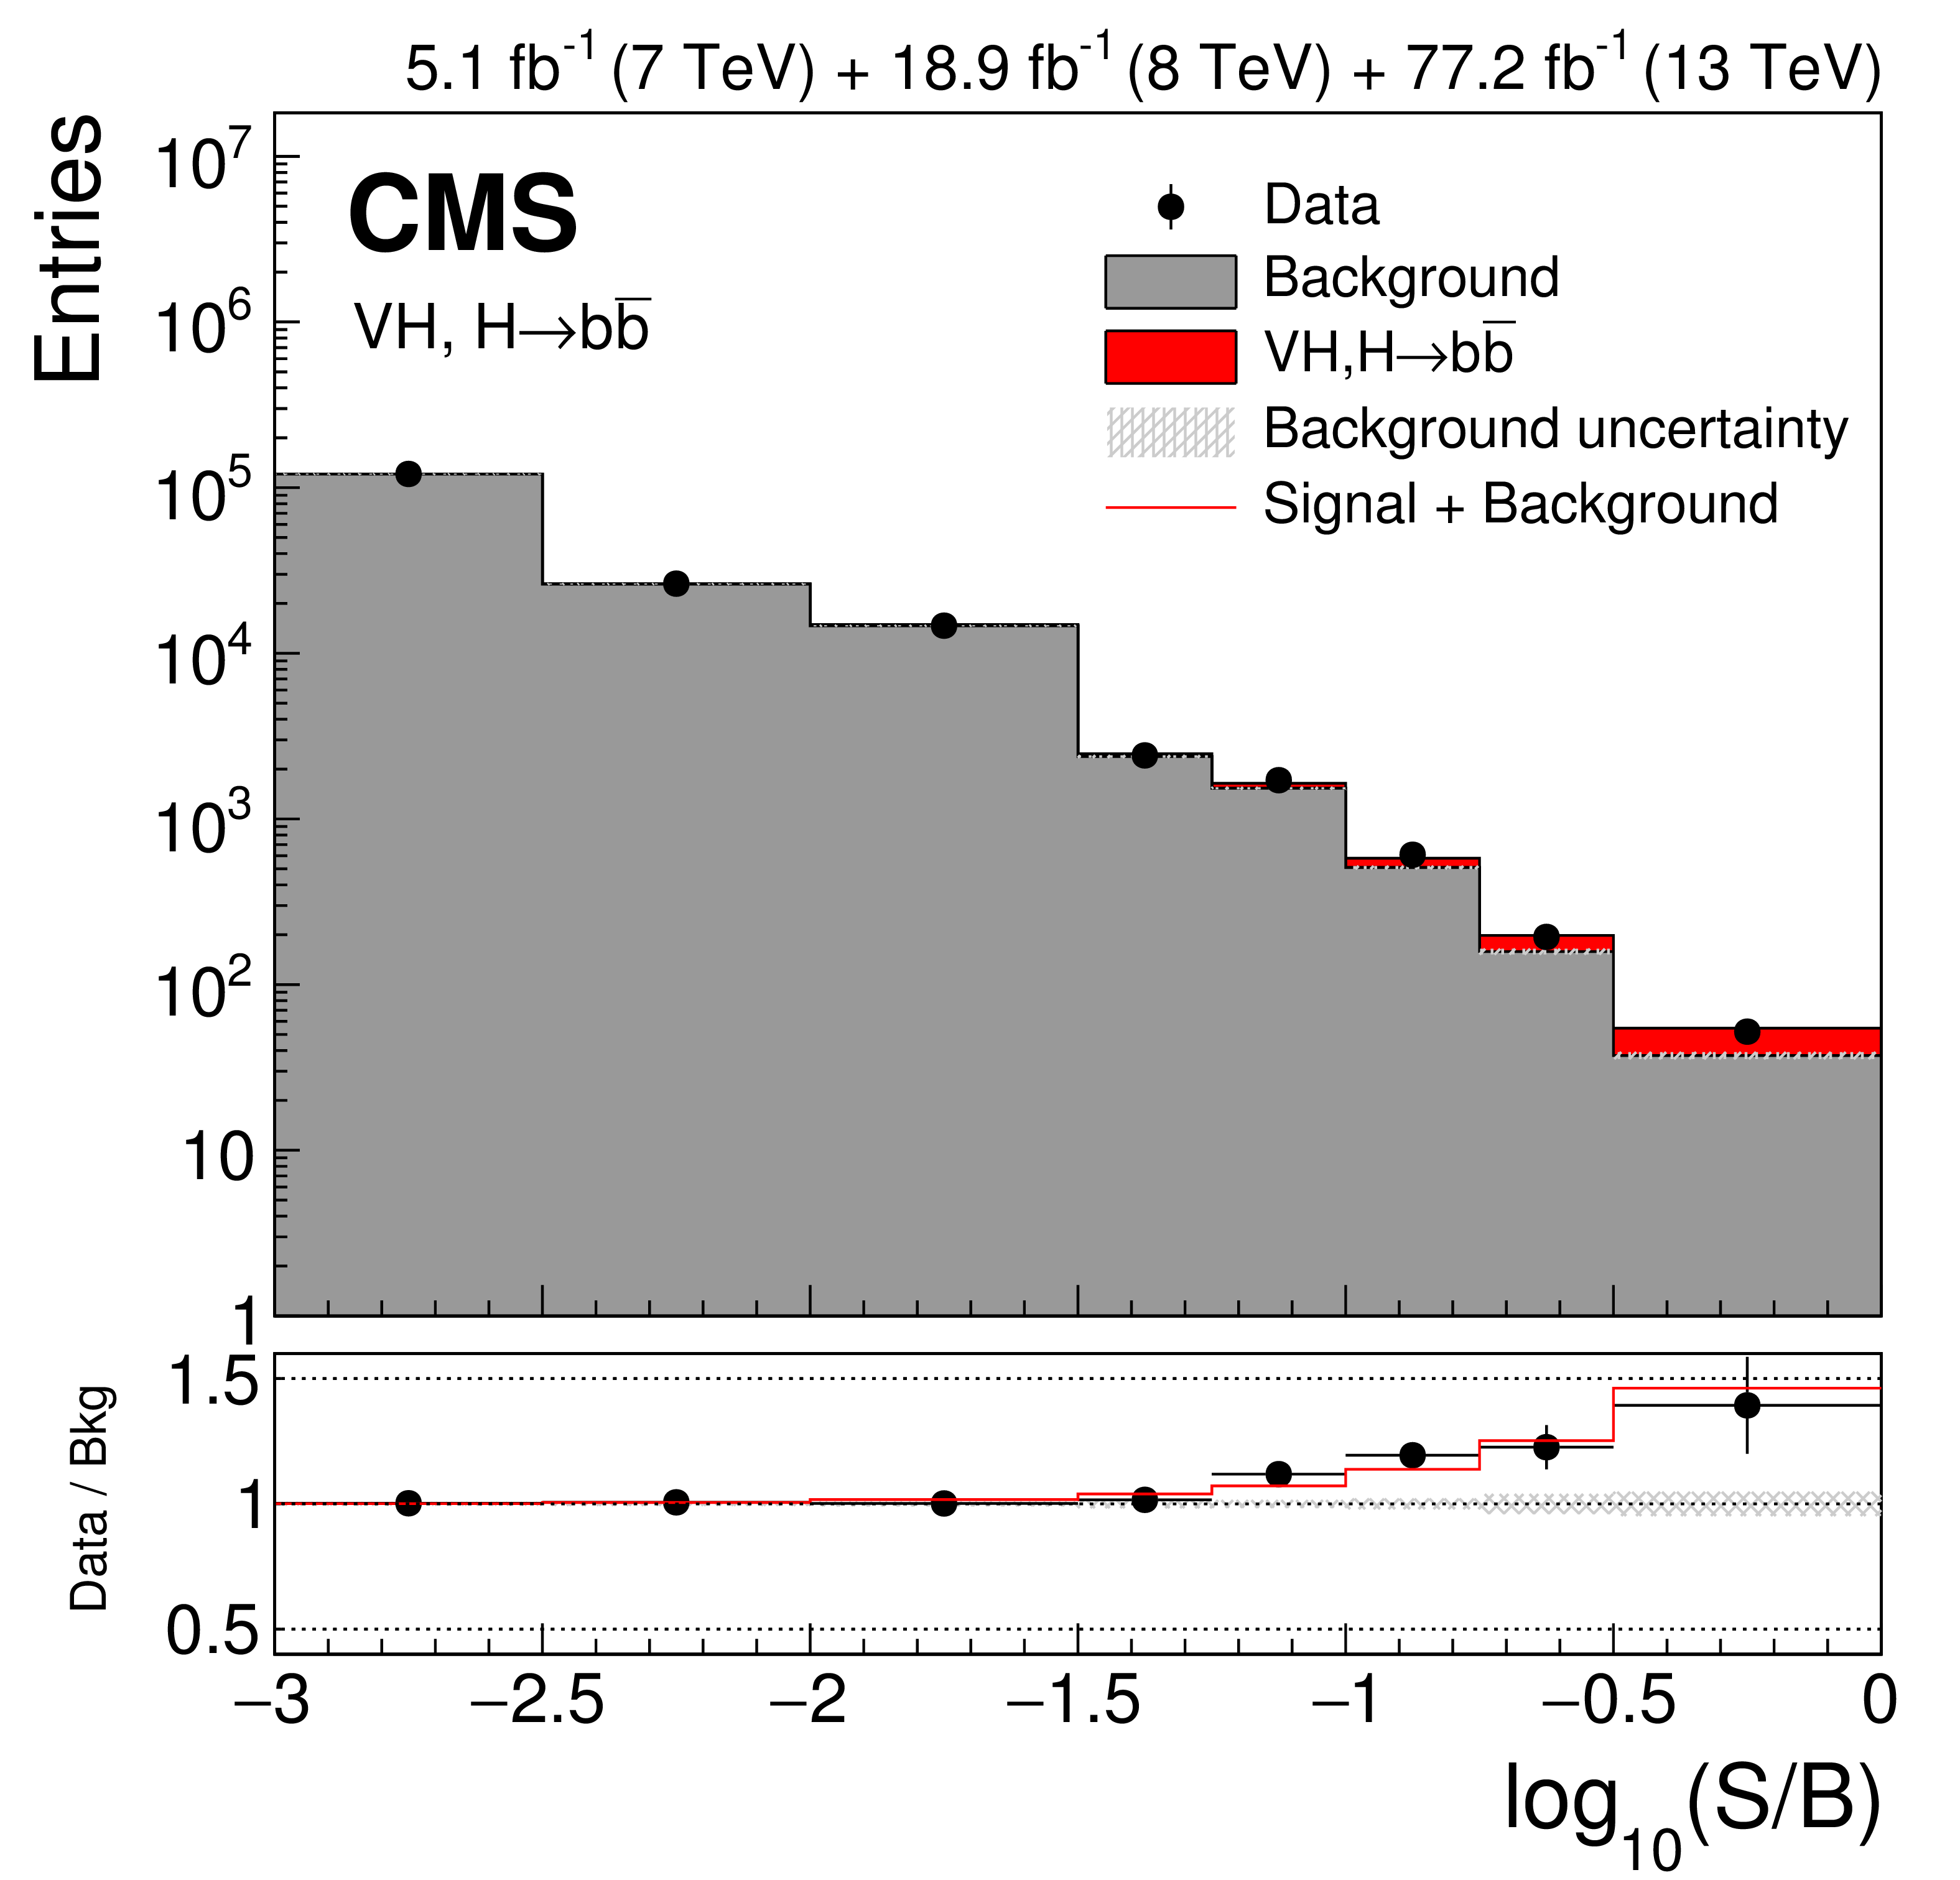
Figure 1-a:
Distributions of signal, background, and data event yields sorted into bins of similar signal-to-background ratio, as given by the result of the fit to their corresponding multivariate discriminant. All events in the VH, ${{\mathrm {H}} \to {{\mathrm {b}} {\overline {\mathrm {b}}}}}$ signal regions of the combined Run 1 and Run 2 data sets are included. The red histogram indicates the Higgs boson signal contribution, while the grey histogram is the sum of all background yields. The bottom panel shows the ratio of the data to the background, with the total uncertainty in the background yield indicated by the grey hatching. The red line indicates the sum of signal plus background contribution divided by the background yield. |
png pdf |
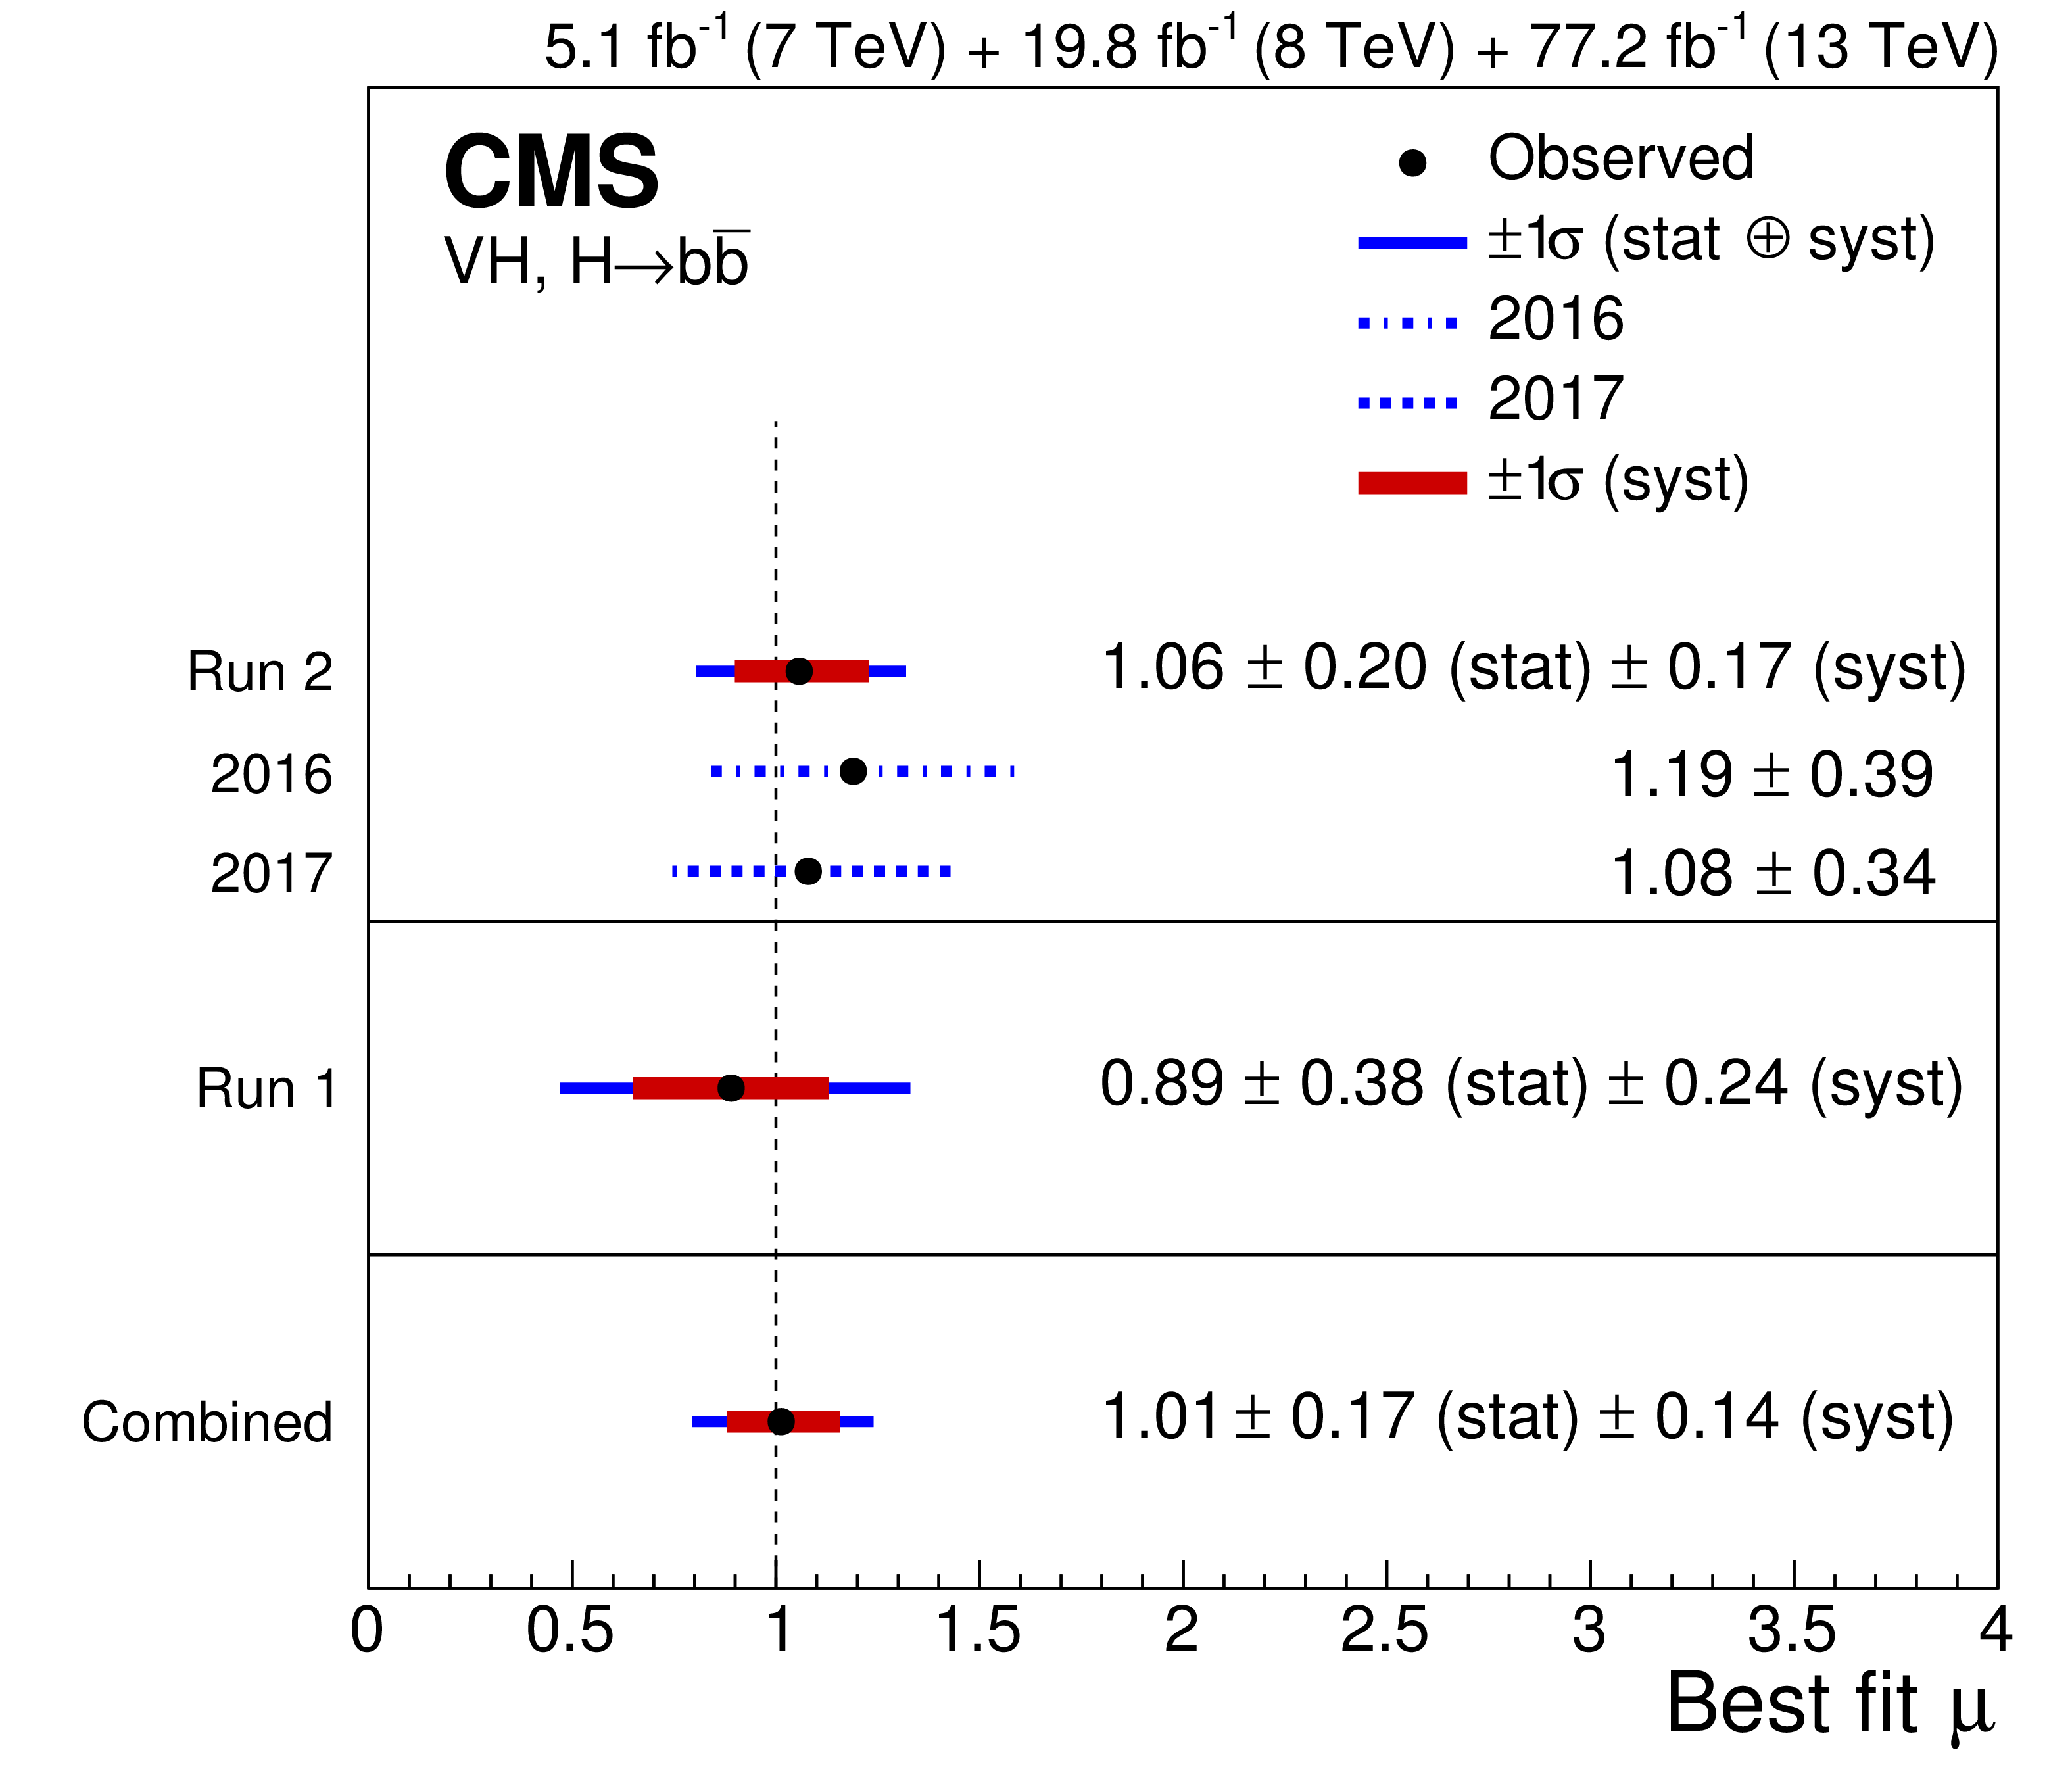
Figure 1-b:
Best-fit value of the signal strength $\mu $, at $ {m_ {\mathrm {H}}} = $ 125.09 GeV, for the fit of all VH, ${{\mathrm {H}} \to {{\mathrm {b}} {\overline {\mathrm {b}}}}}$ channels in the Run 1 and Run 2 data sets. Also shown are the individual results of the 2016 and 2017 measurements, the Run 2 combination, and the Run 1 result. Horizontal error bars indicate the 1$\sigma $ systematic (red) and 1$\sigma $ total (blue) uncertainties, and the vertical dashed line indicates the SM expectation. |
png pdf |
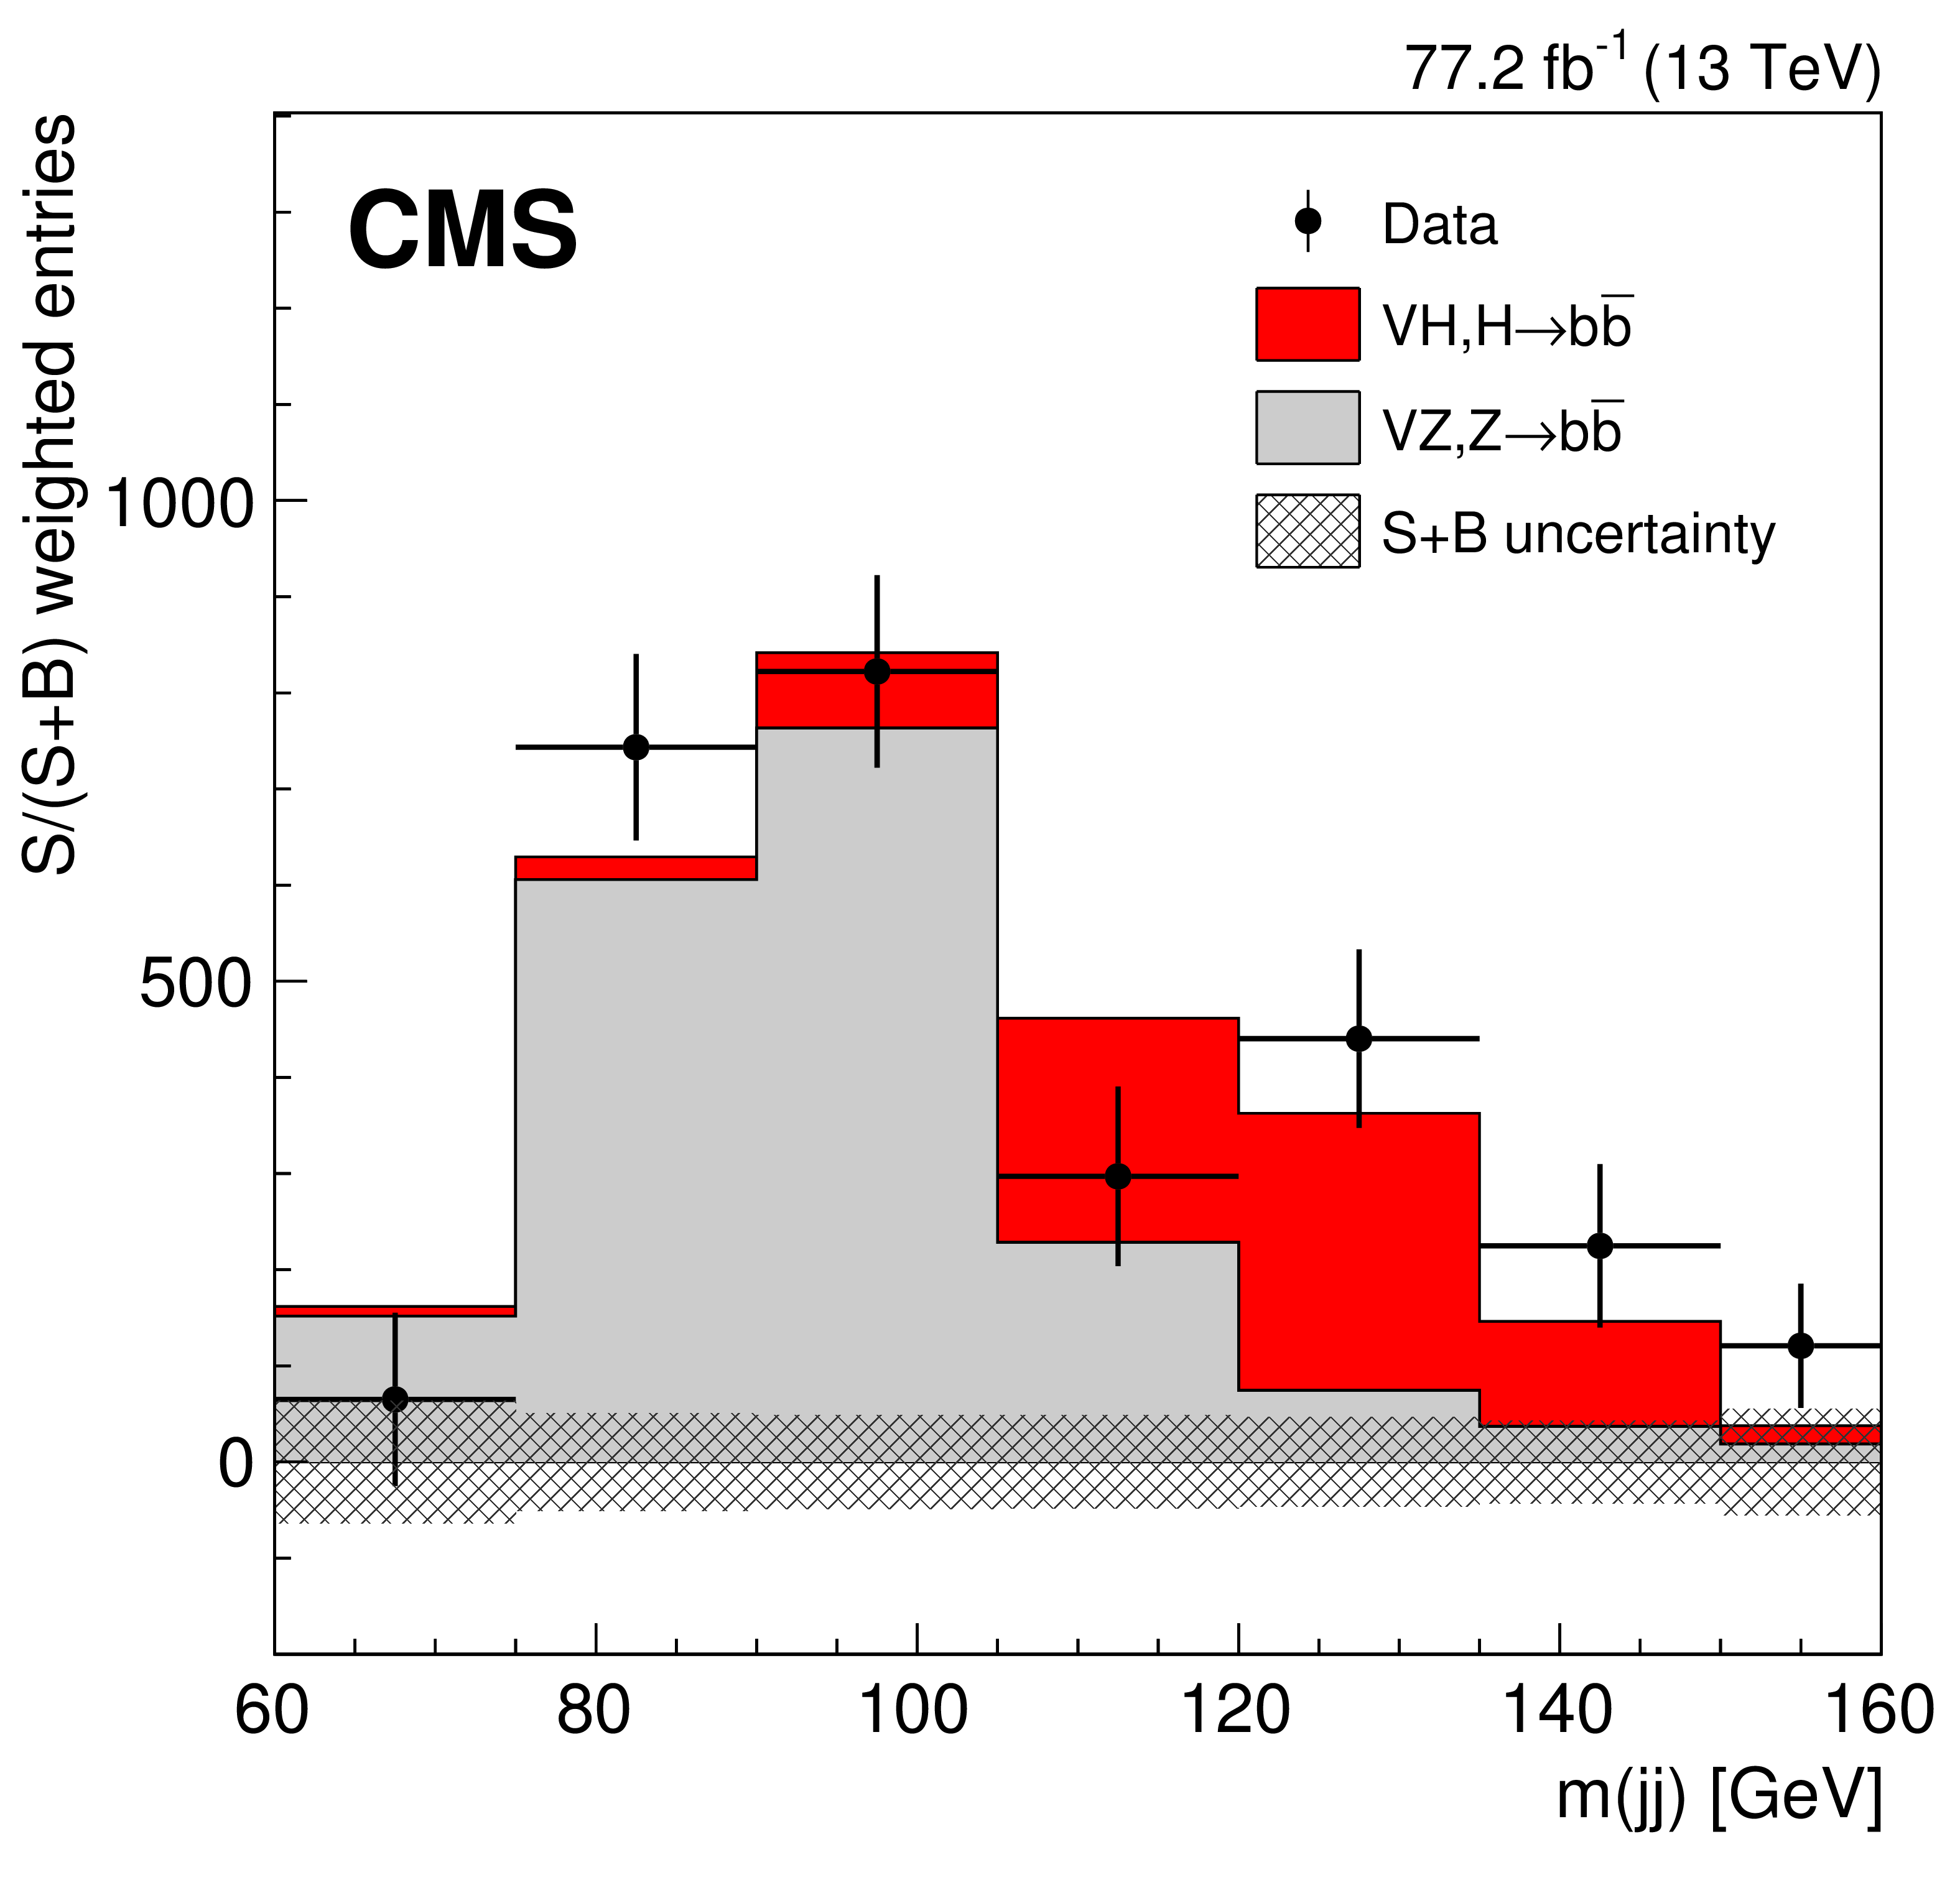
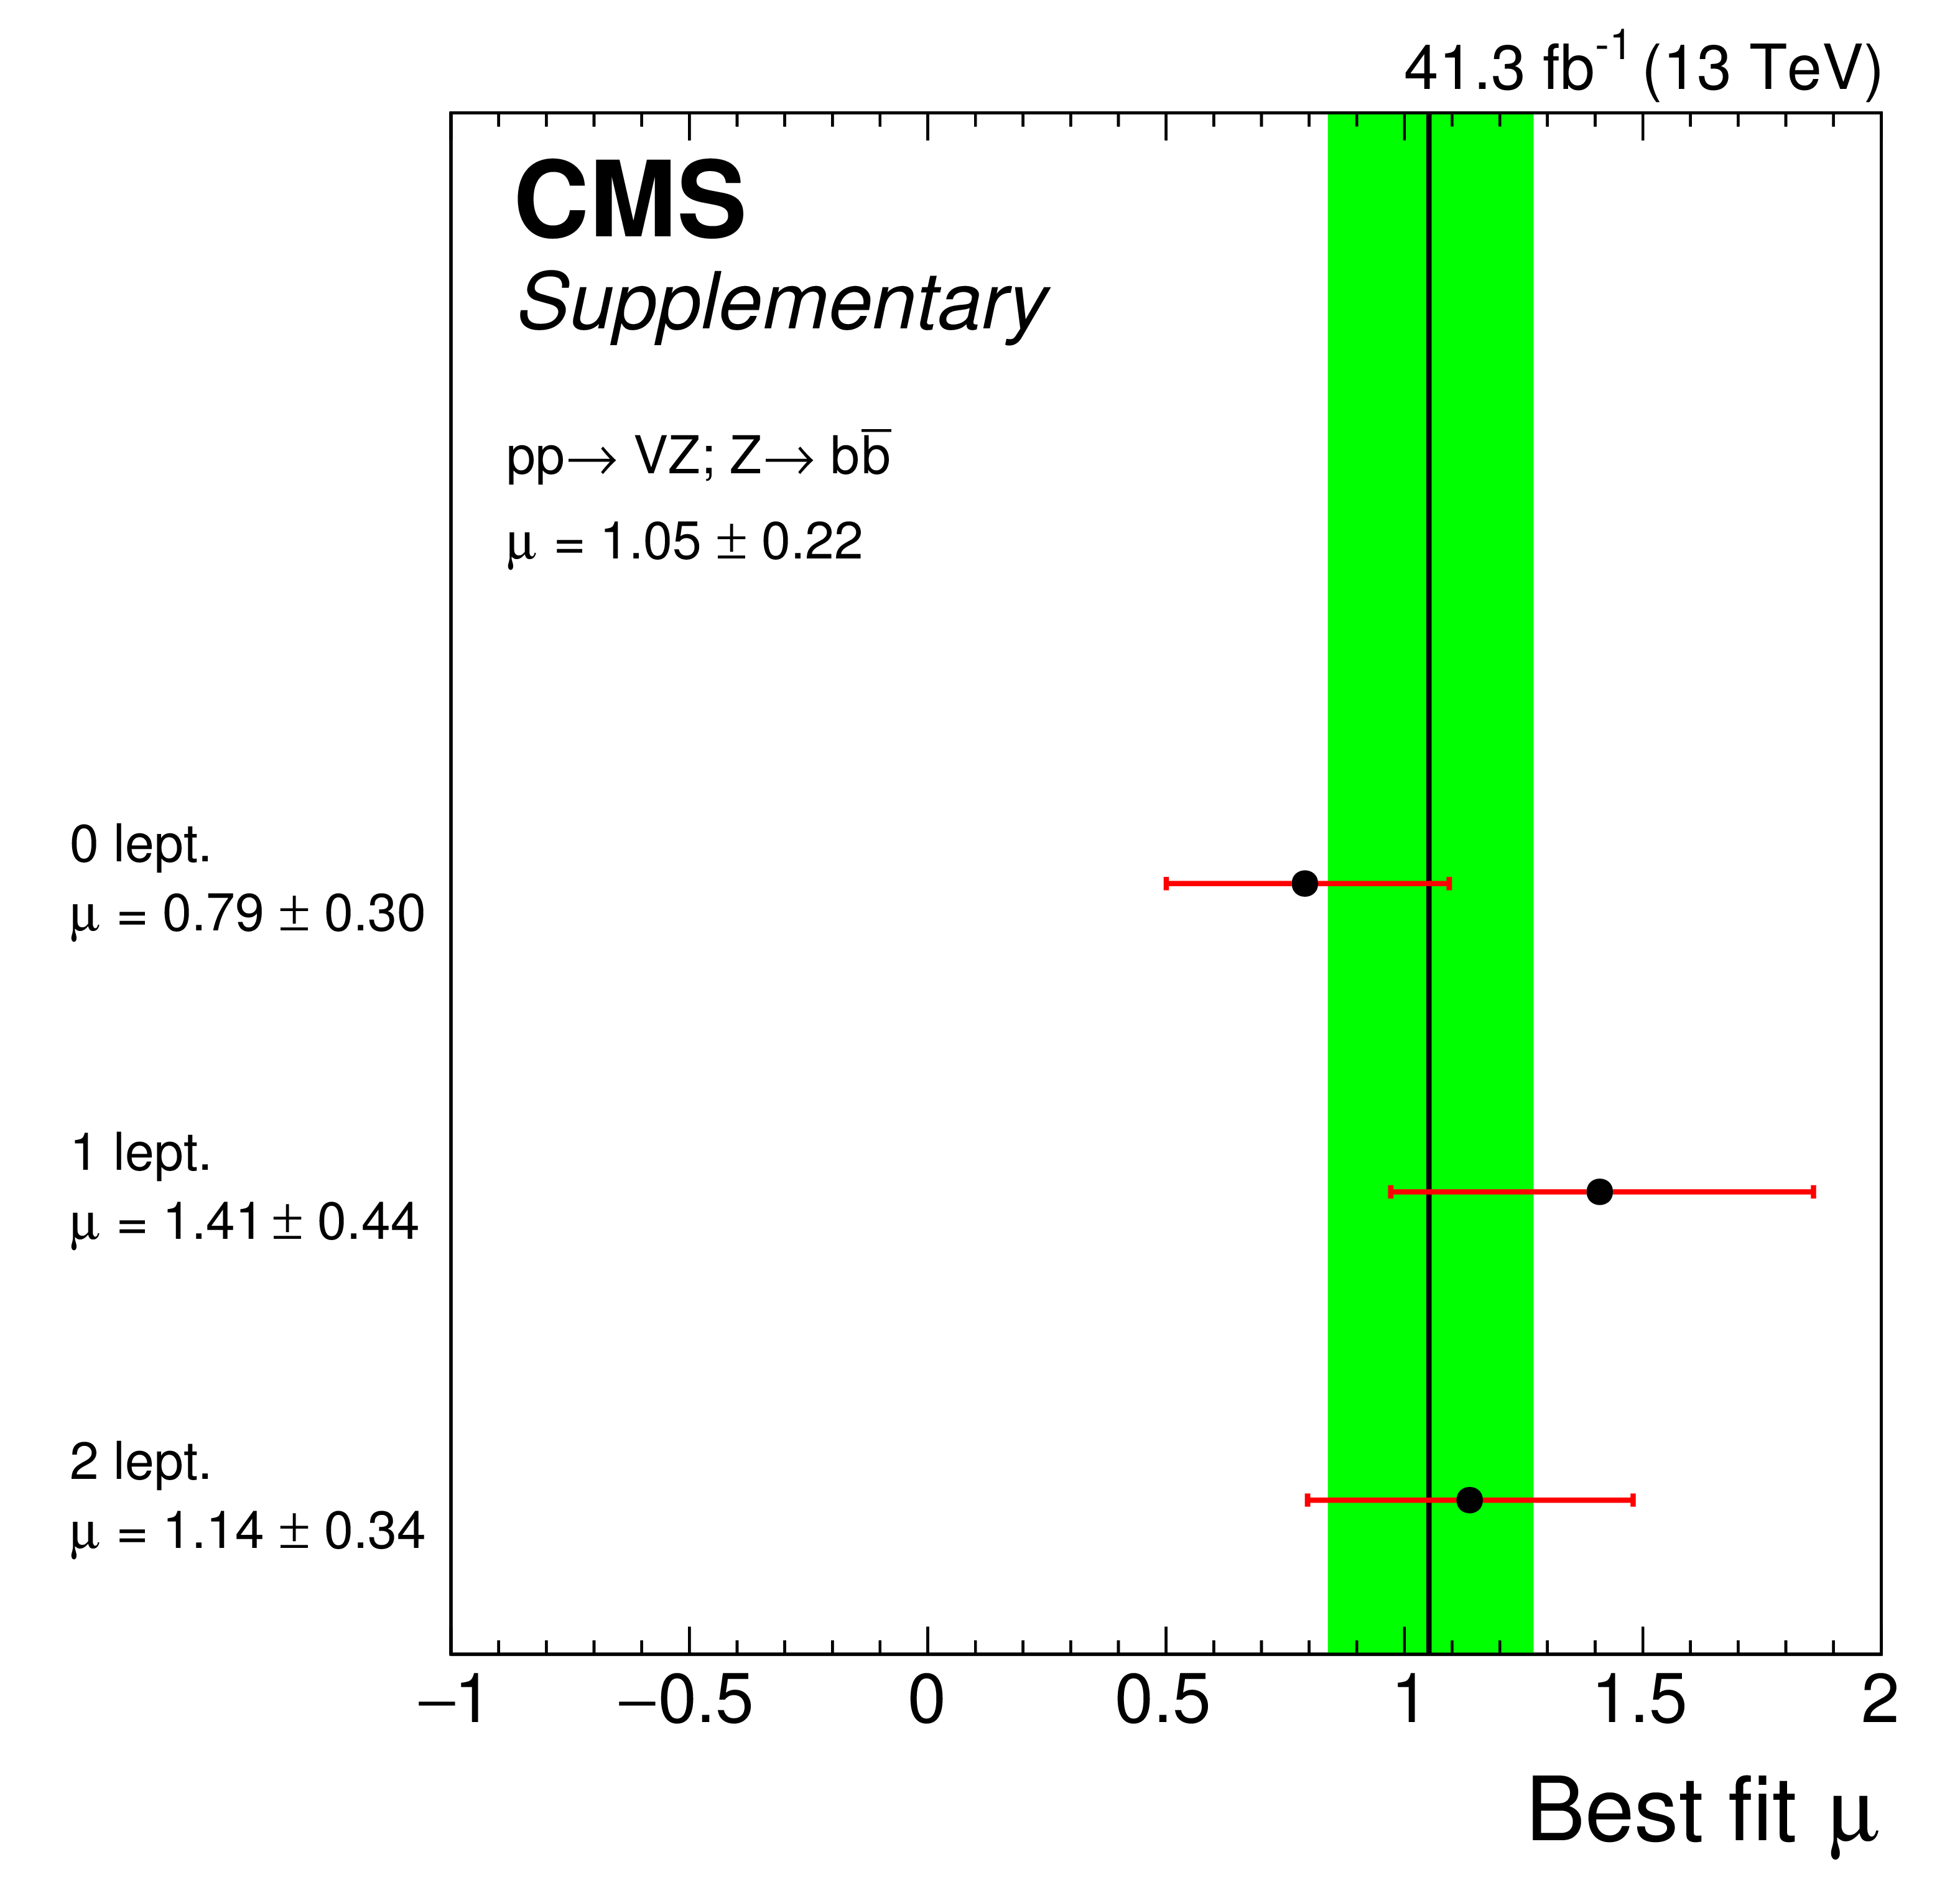
Figure 2:
Dijet invariant mass distribution for events weighted by $S/(S+B)$ in all channels combined in the 2016 and 2017 data sets. Weights are derived from a fit to the ${m\mathrm {(jj)}}$ distribution, as described in the text. Shown are data (points) and the fitted VH signal (red) and VZ background (grey) distributions, with all other fitted background processes subtracted. The error bar for each bin represents the pre-subtraction 1$\sigma $ statistical uncertainty on the data, while the grey hatching indicates the 1$\sigma $ total uncertainty on the signal and all background components. |
png pdf |
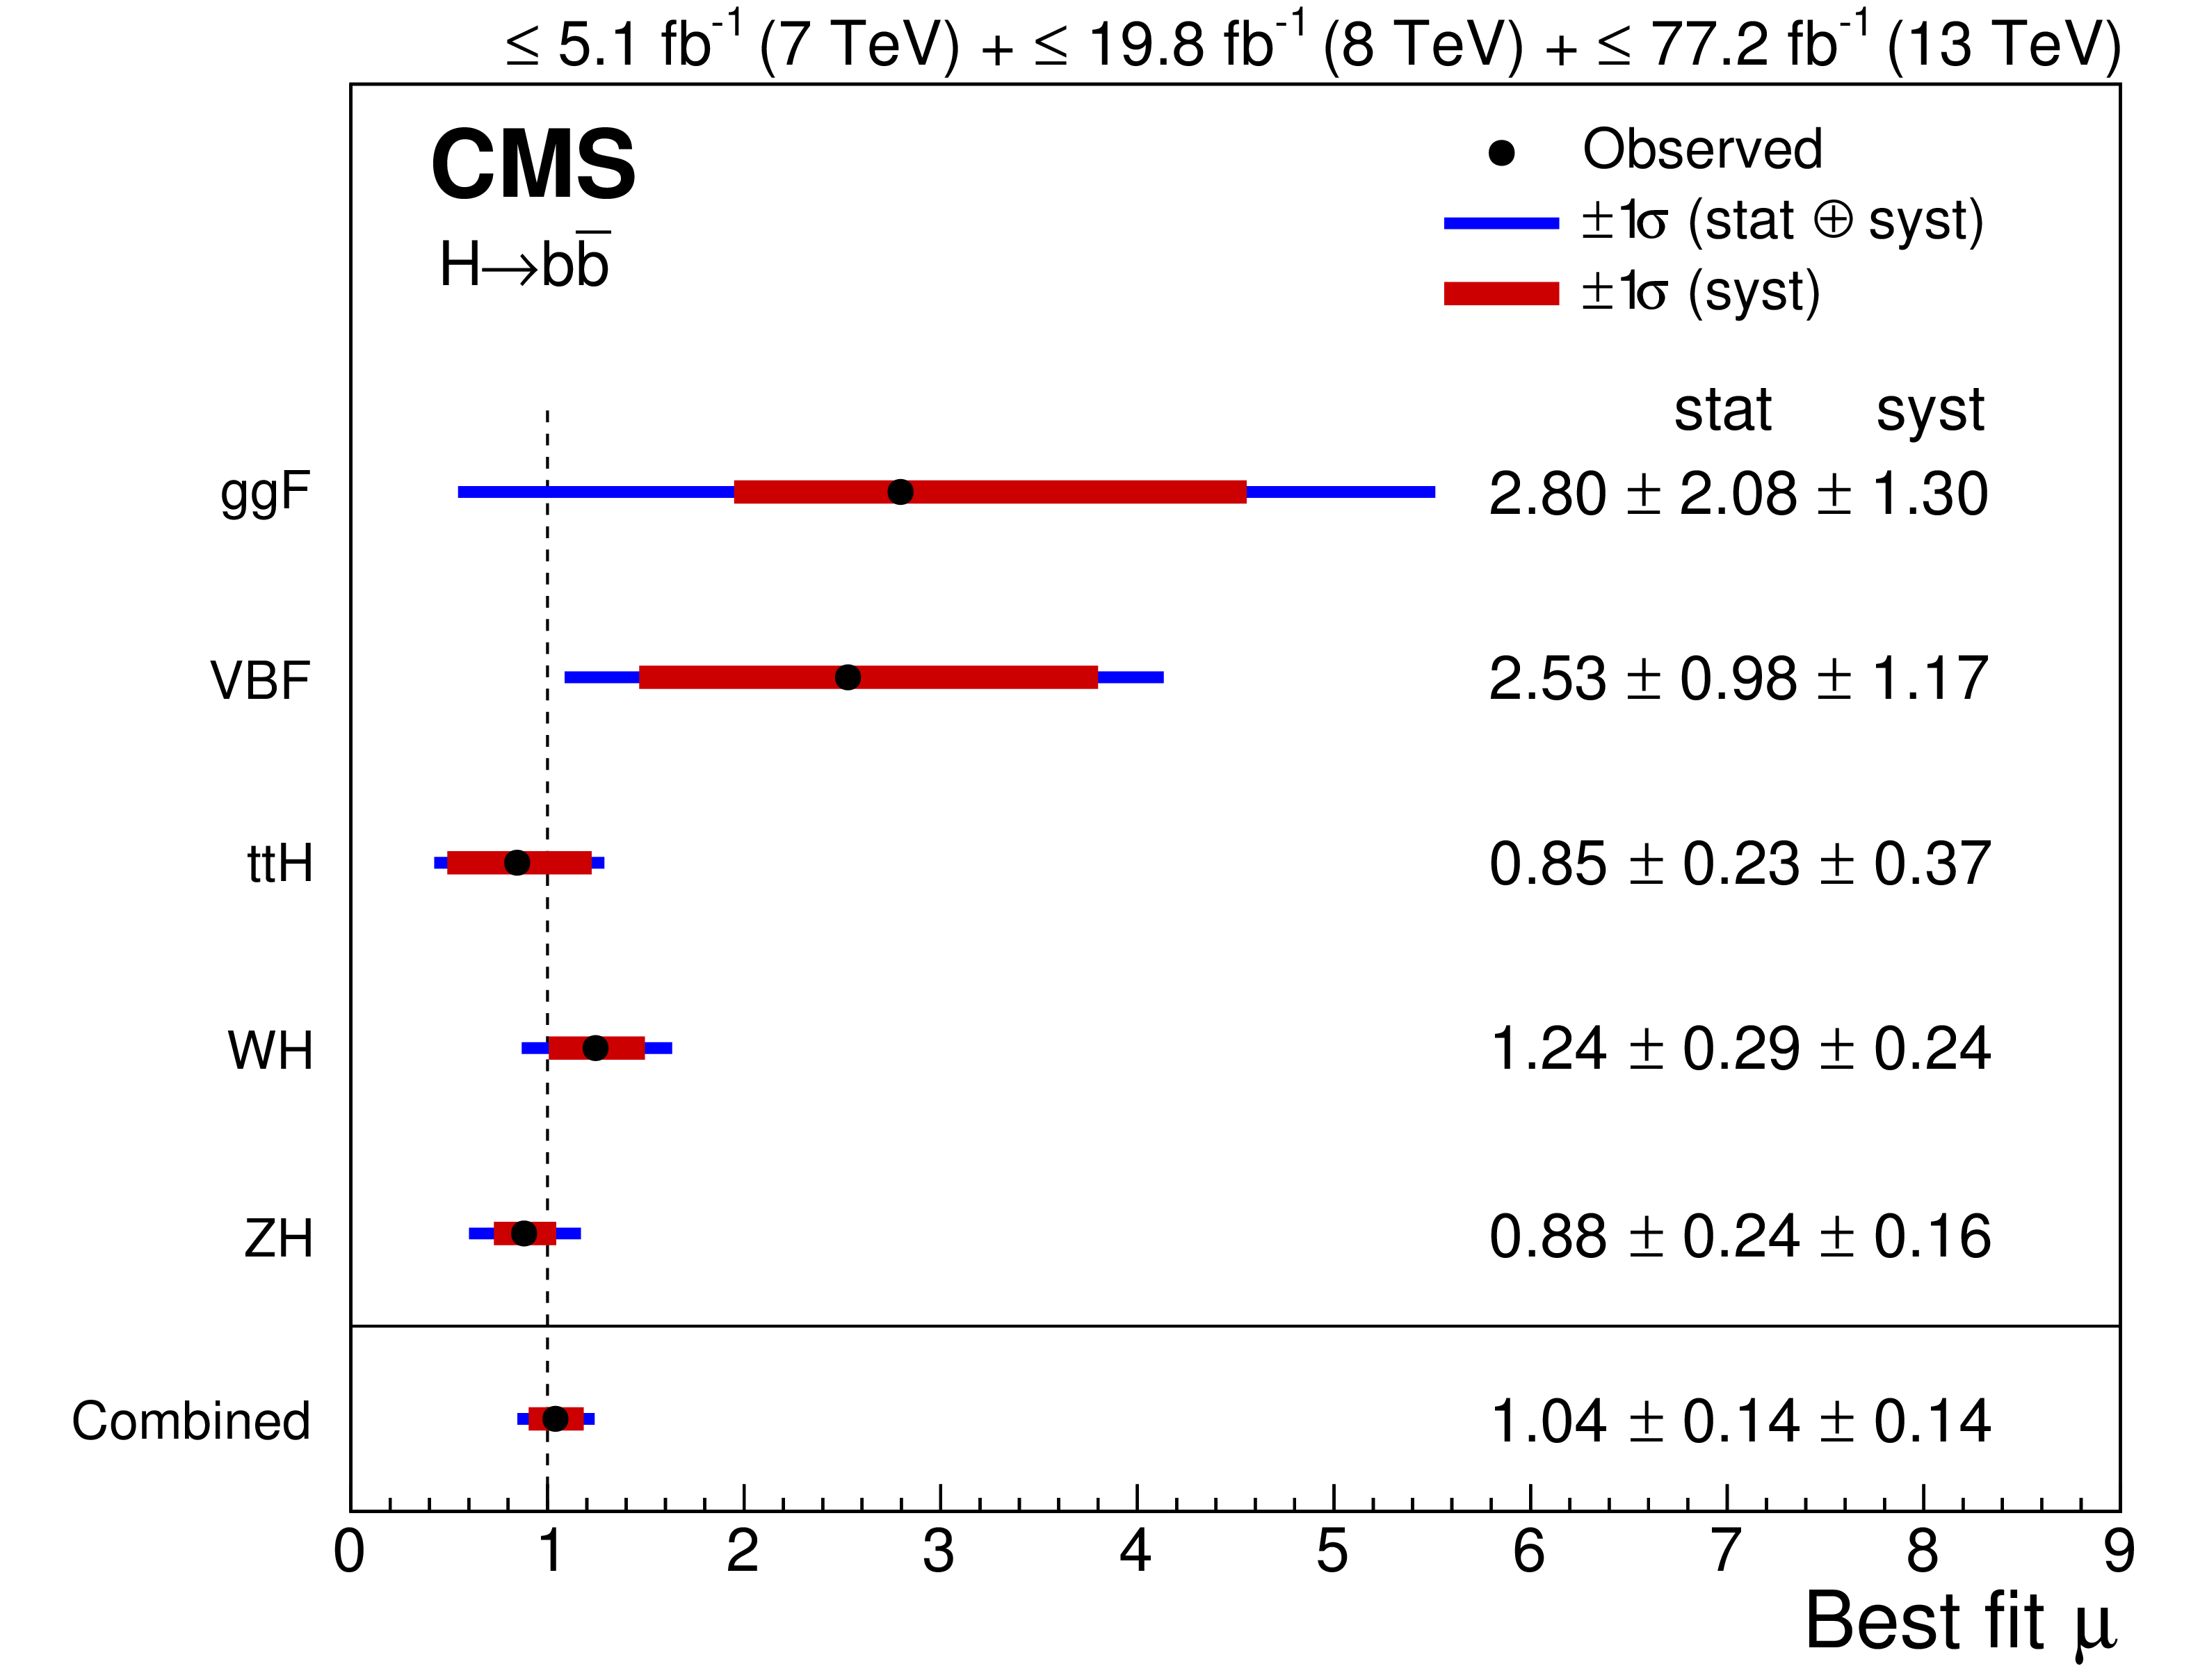
Figure 3:
Best-fit value of the $ {{\mathrm {H}} \to {{\mathrm {b}} {\overline {\mathrm {b}}}}} $ signal strength with its 1$\sigma $ systematic (red) and total (blue) uncertainties for the five individual production modes considered, as well as the overall combined result. The vertical dashed line indicates the standard model expectation. All results are extracted from a single fit combining all input analyses, with $ {m_ {\mathrm {H}}} = $ 125.09 GeV. |
| Tables | |
png pdf |
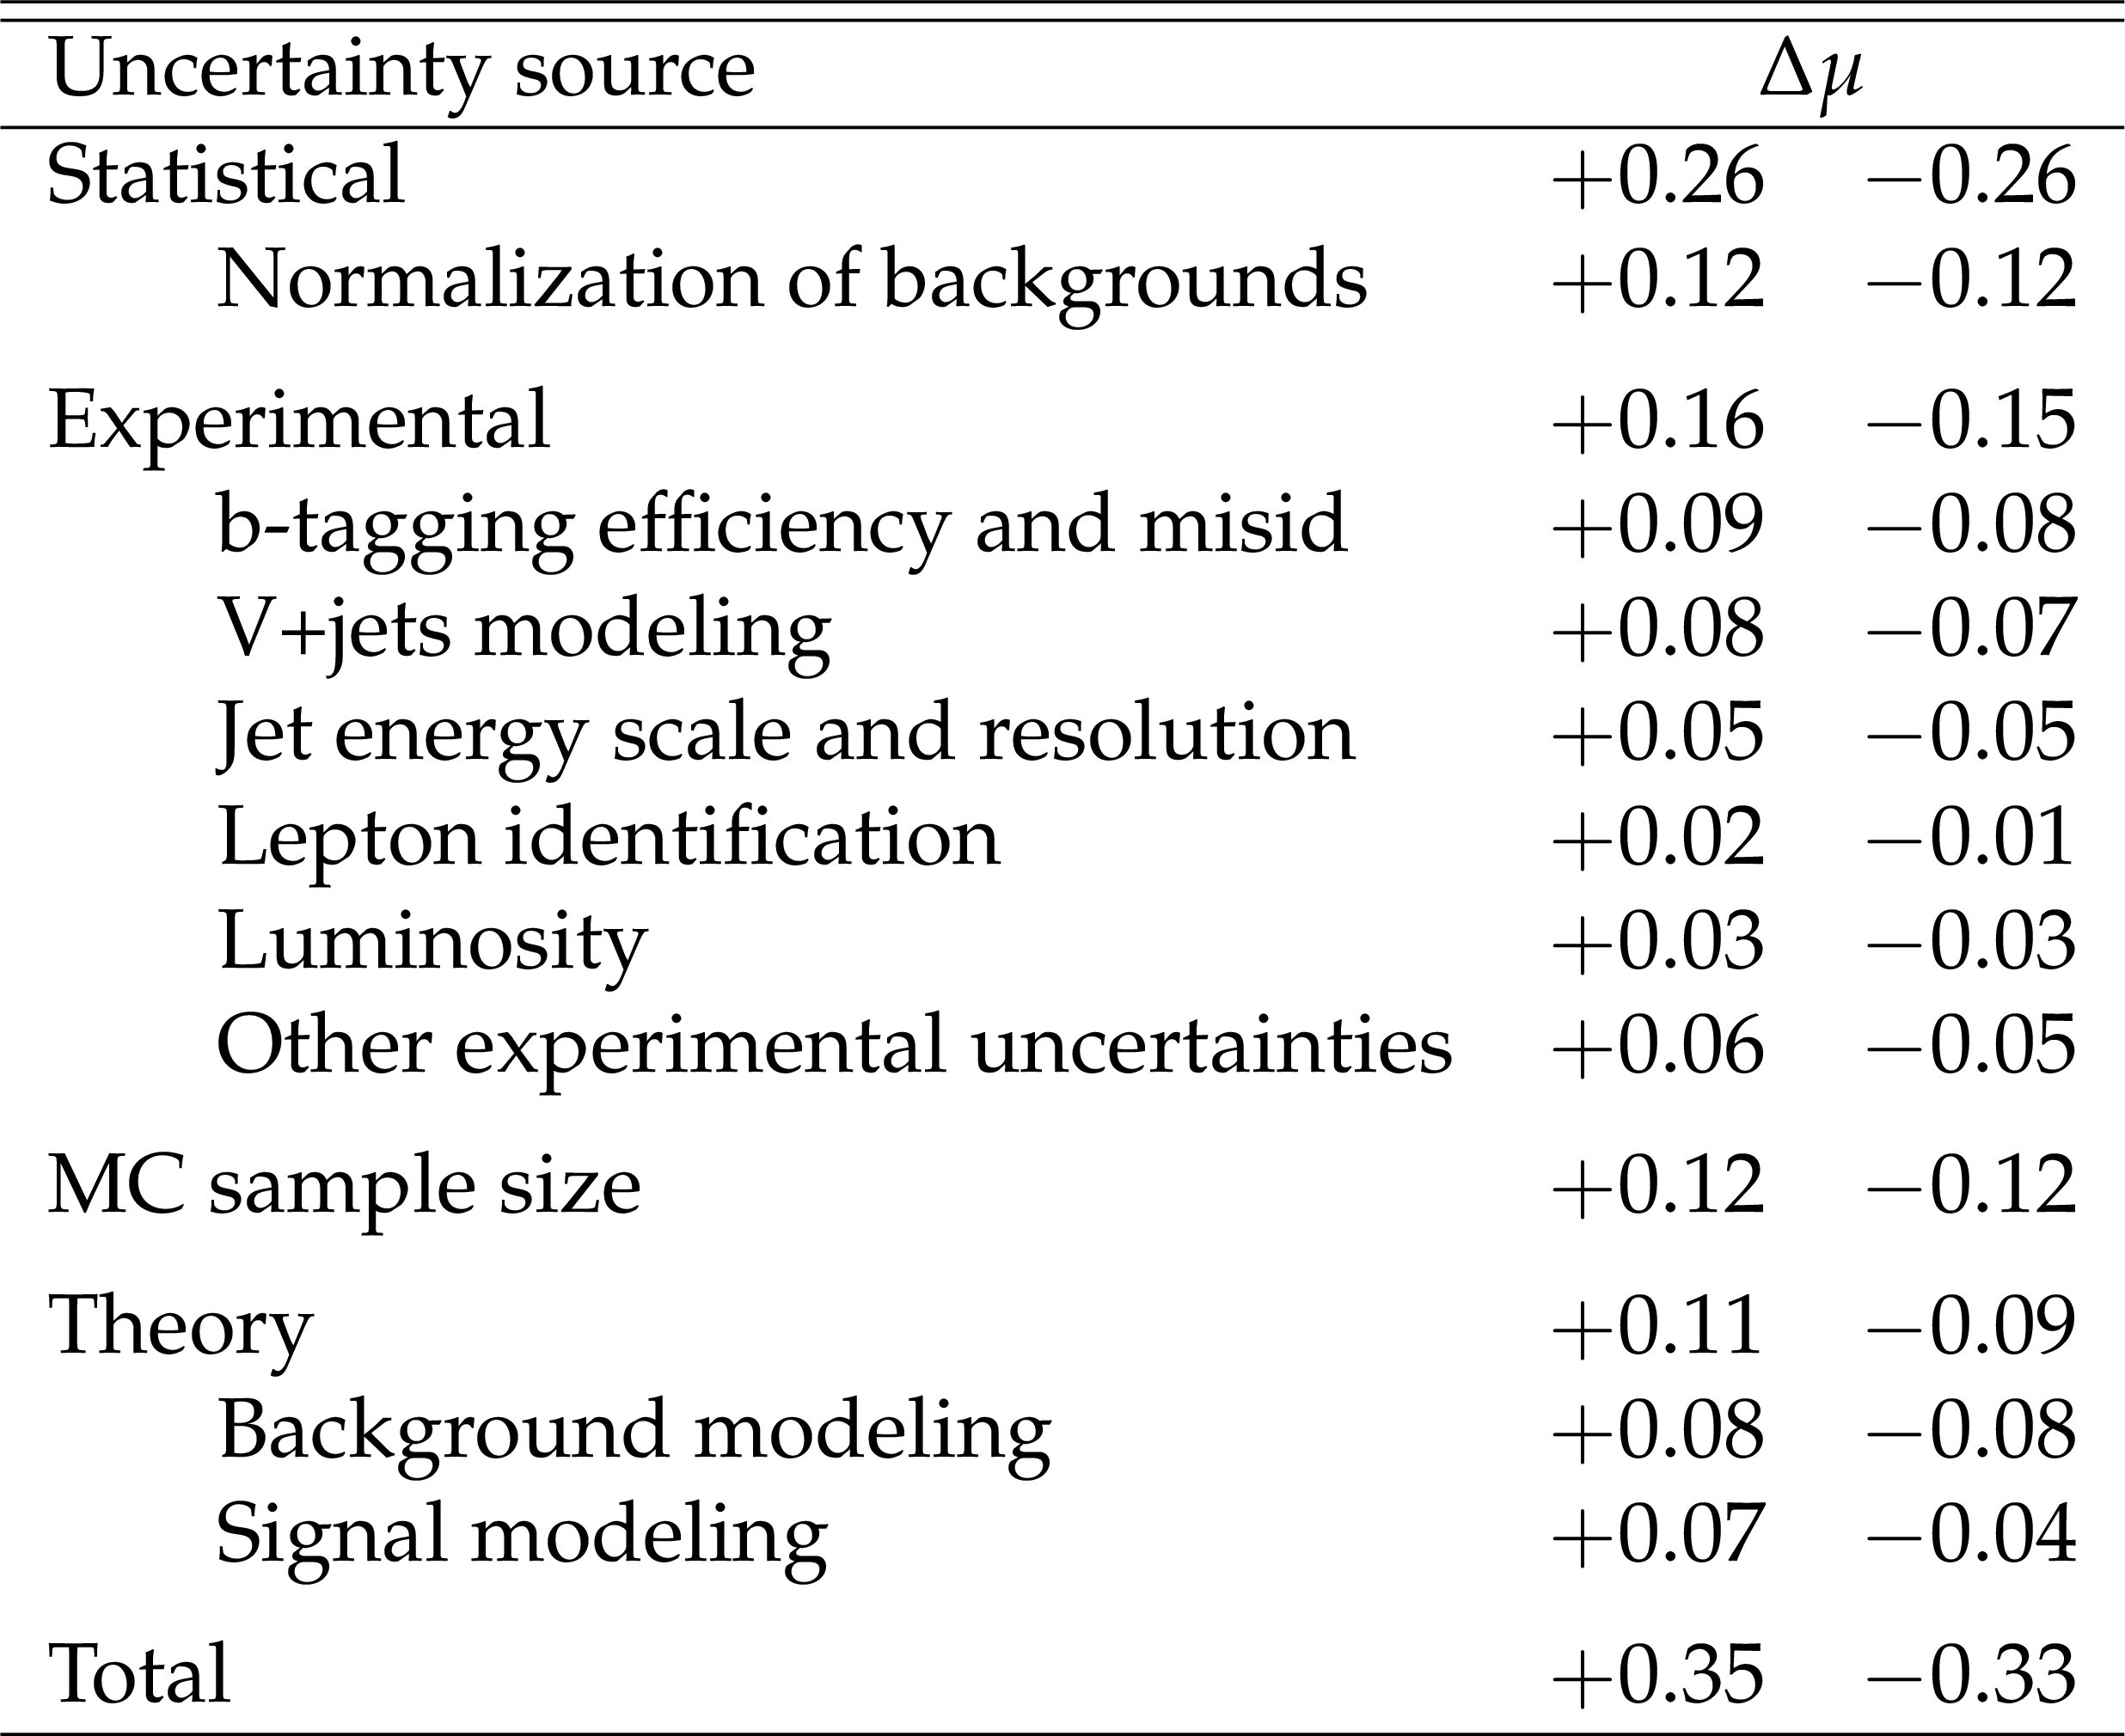
Table 1:
Major sources of uncertainty in the measurement of the signal strength $\mu $, and their observed impact ($\Delta \mu $) from a fit to the 2017 data set, are listed. The total uncertainty is separated into four components: statistical (including data yields), experimental, MC sample size, and theory. Detailed decompositions of the statistical, experimental, and theory components are specified. The impact of each uncertainty is evaluated considering only that source. Because of correlations in the combined fit between nuisance parameters in different sources, the sum in quadrature for each source does not in general equal the total uncertainty of each component. |
png pdf |
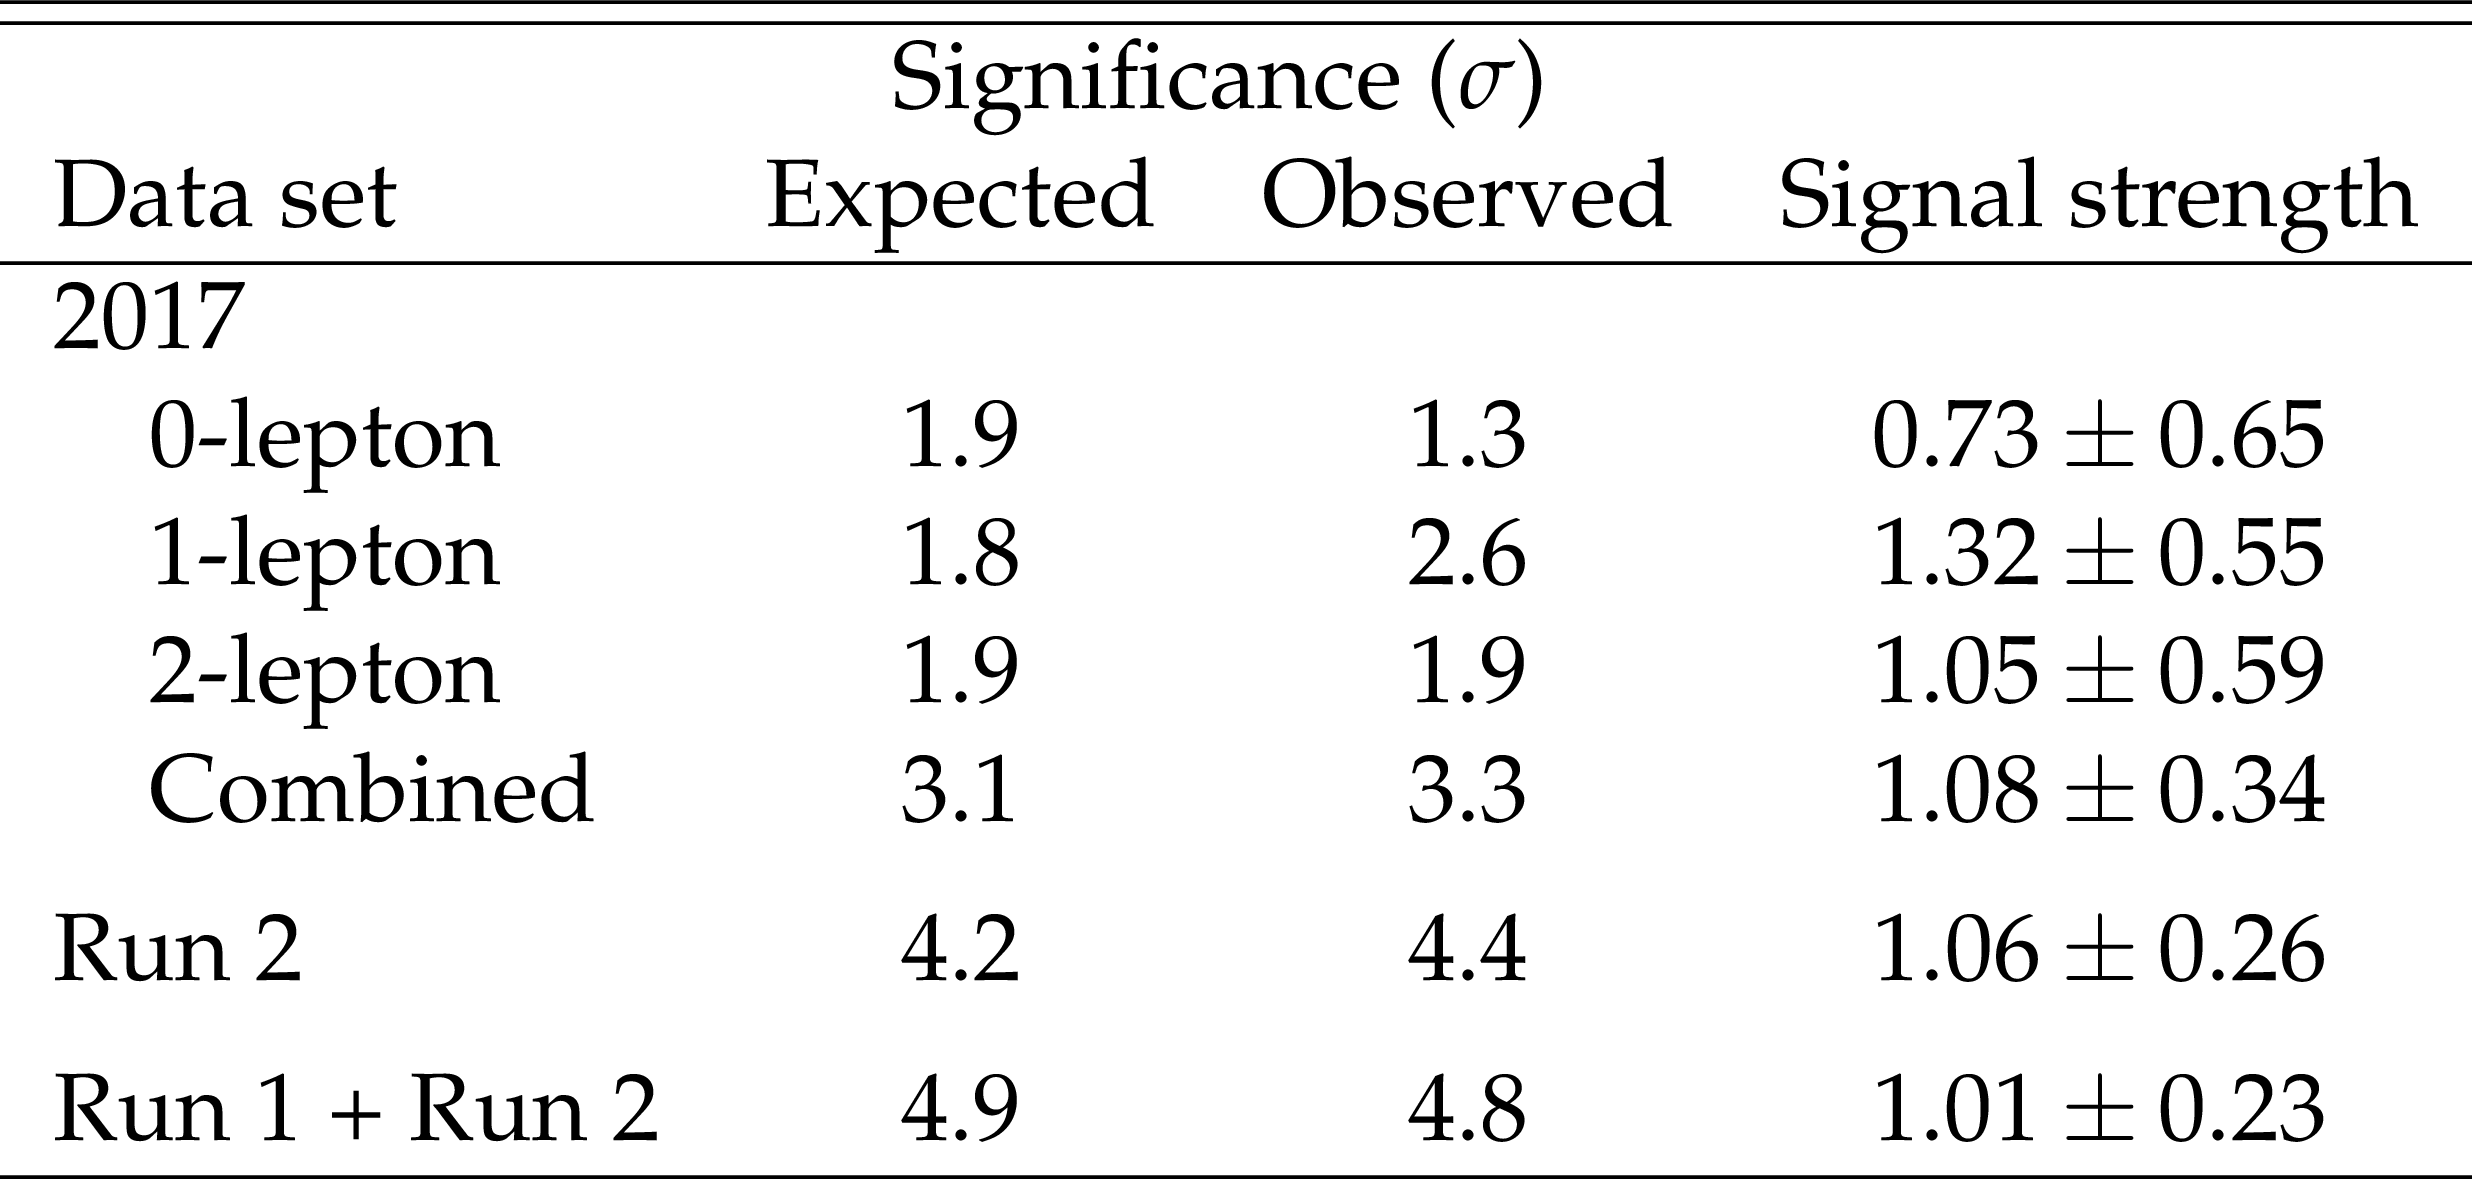
Table 2:
Expected and observed significances, in $\sigma $, and observed signal strengths for the VH production process with ${{\mathrm {H}} \to {{\mathrm {b}} {\overline {\mathrm {b}}}}}$. Results are shown separately for 2017 data, combined Run 2 (2016 and 2017) data, and for the combination of the Run 1 and Run 2 data sets. For the 2017 analysis, results are shown separately for the individual signal strengths for each channel from a combined simultaneous fit to all channels. All results are obtained for $ {m_ {\mathrm {H}}} = $ 125.09 GeV combining statistical and systematic uncertainties. |
| Summary |
| In summary, measurement of the standard model Higgs boson decaying to bottom quarks has been presented. A combination of all CMS measurements of the VH, ${\mathrm{H}\to\mathrm{b\bar{b}}}$ process using proton-proton collisions recorded at center of mass energies of 7, 8, and 13 TeV, yields an observed (expected) significance of 4.8 (4.9) standard deviations at ${m_ {\mathrm {H}}} = $ 125.09 GeV, and the signal strength is $\mu = $ 1.01 $\pm$ 0.22. Combining this result with previous measurements by the CMS Collaboration of the ${\mathrm{H}\to\mathrm{b\bar{b}}}$ decay in events where the Higgs boson is produced through gluon fusion, vector boson fusion, or in association with top quarks, the observed (expected) significance increases to 5.6 (5.5) standard deviations and the signal strength is $\mu = $ 1.04 $\pm$ 0.20. This constitutes the observation of the ${\mathrm{H}\to\mathrm{b\bar{b}}}$ decay by the CMS Collaboration. |
| Additional Figures | |
png pdf |
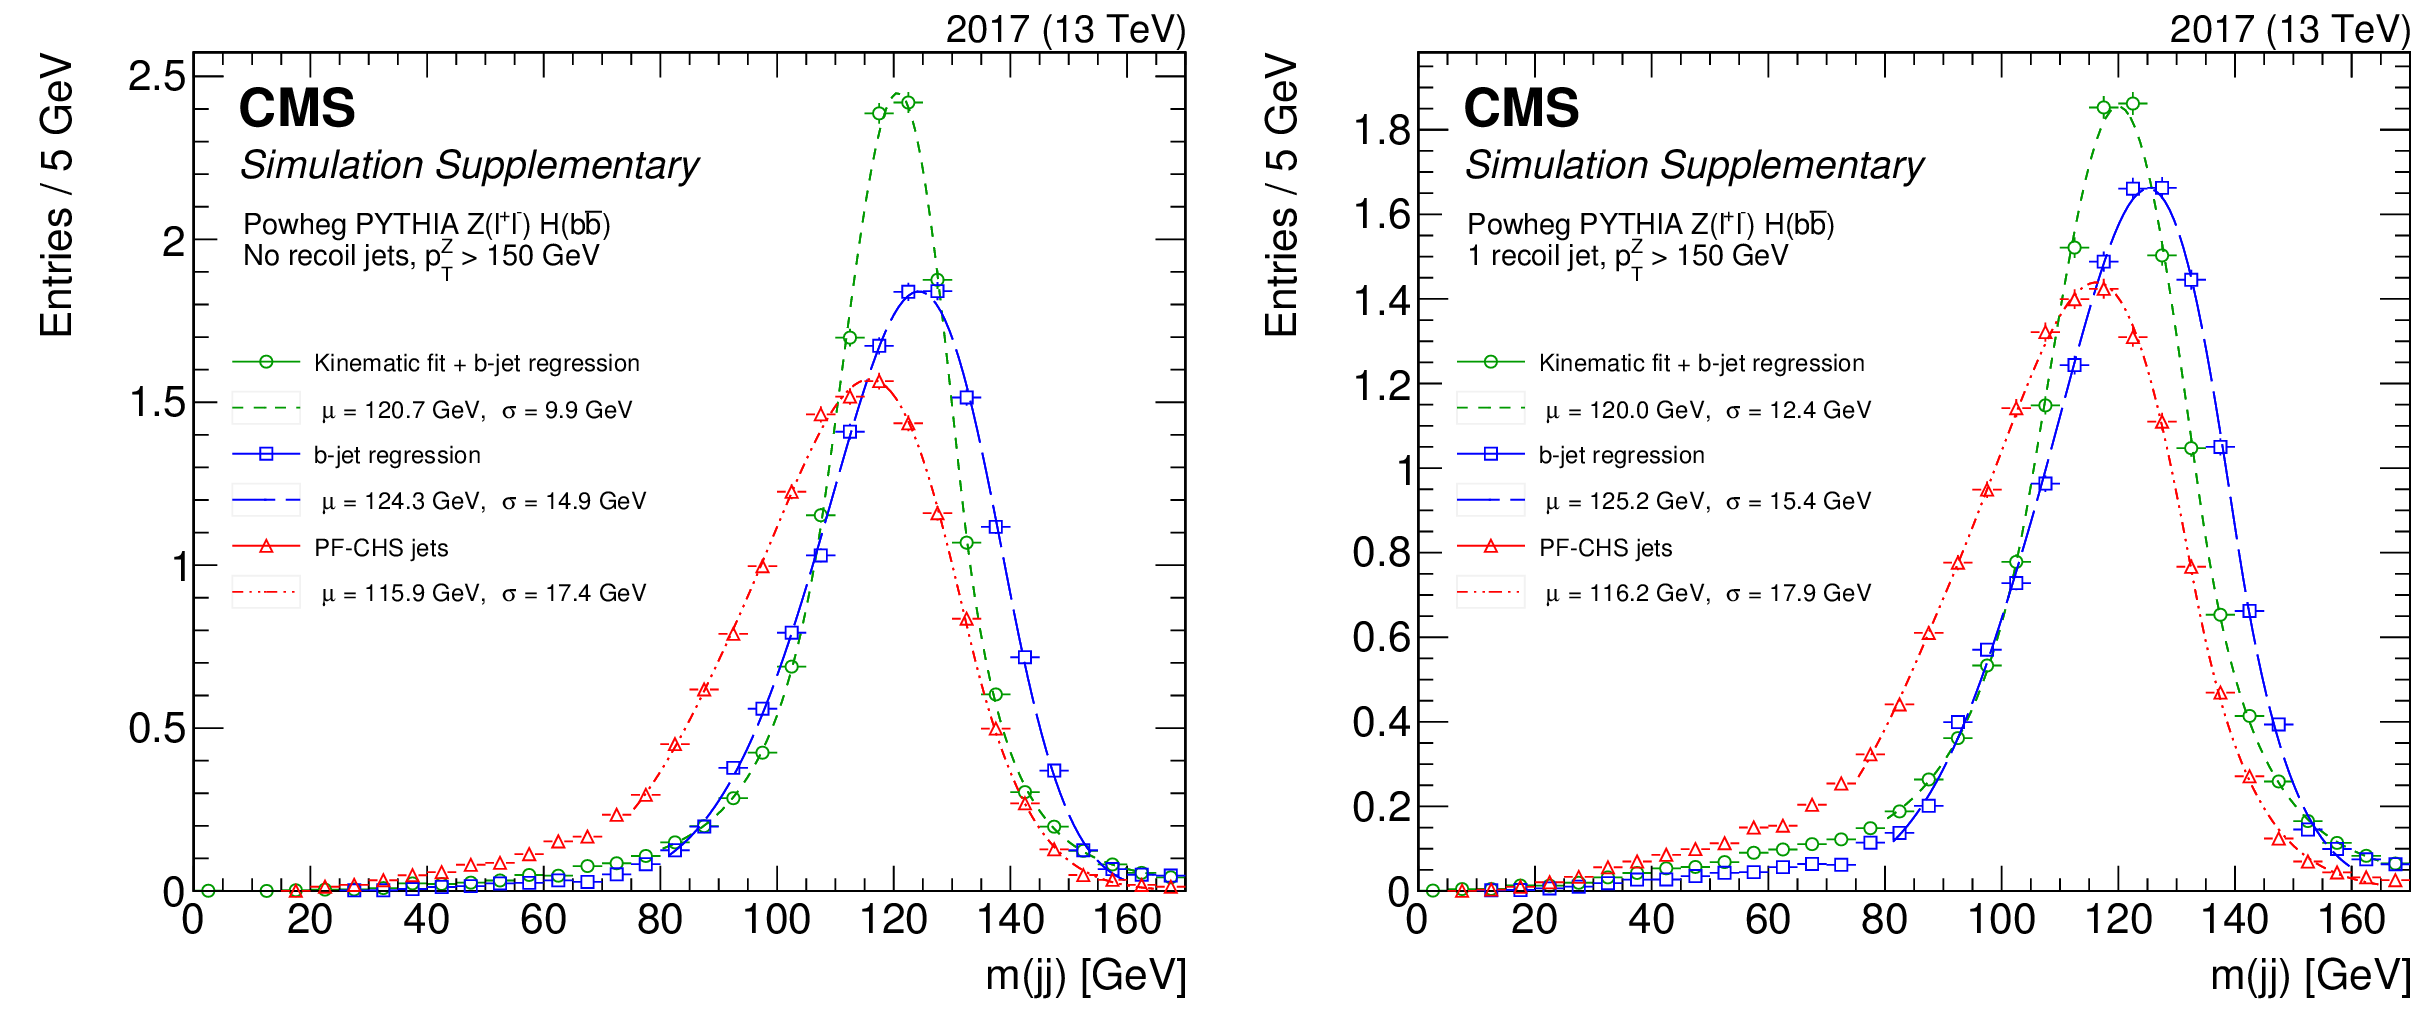
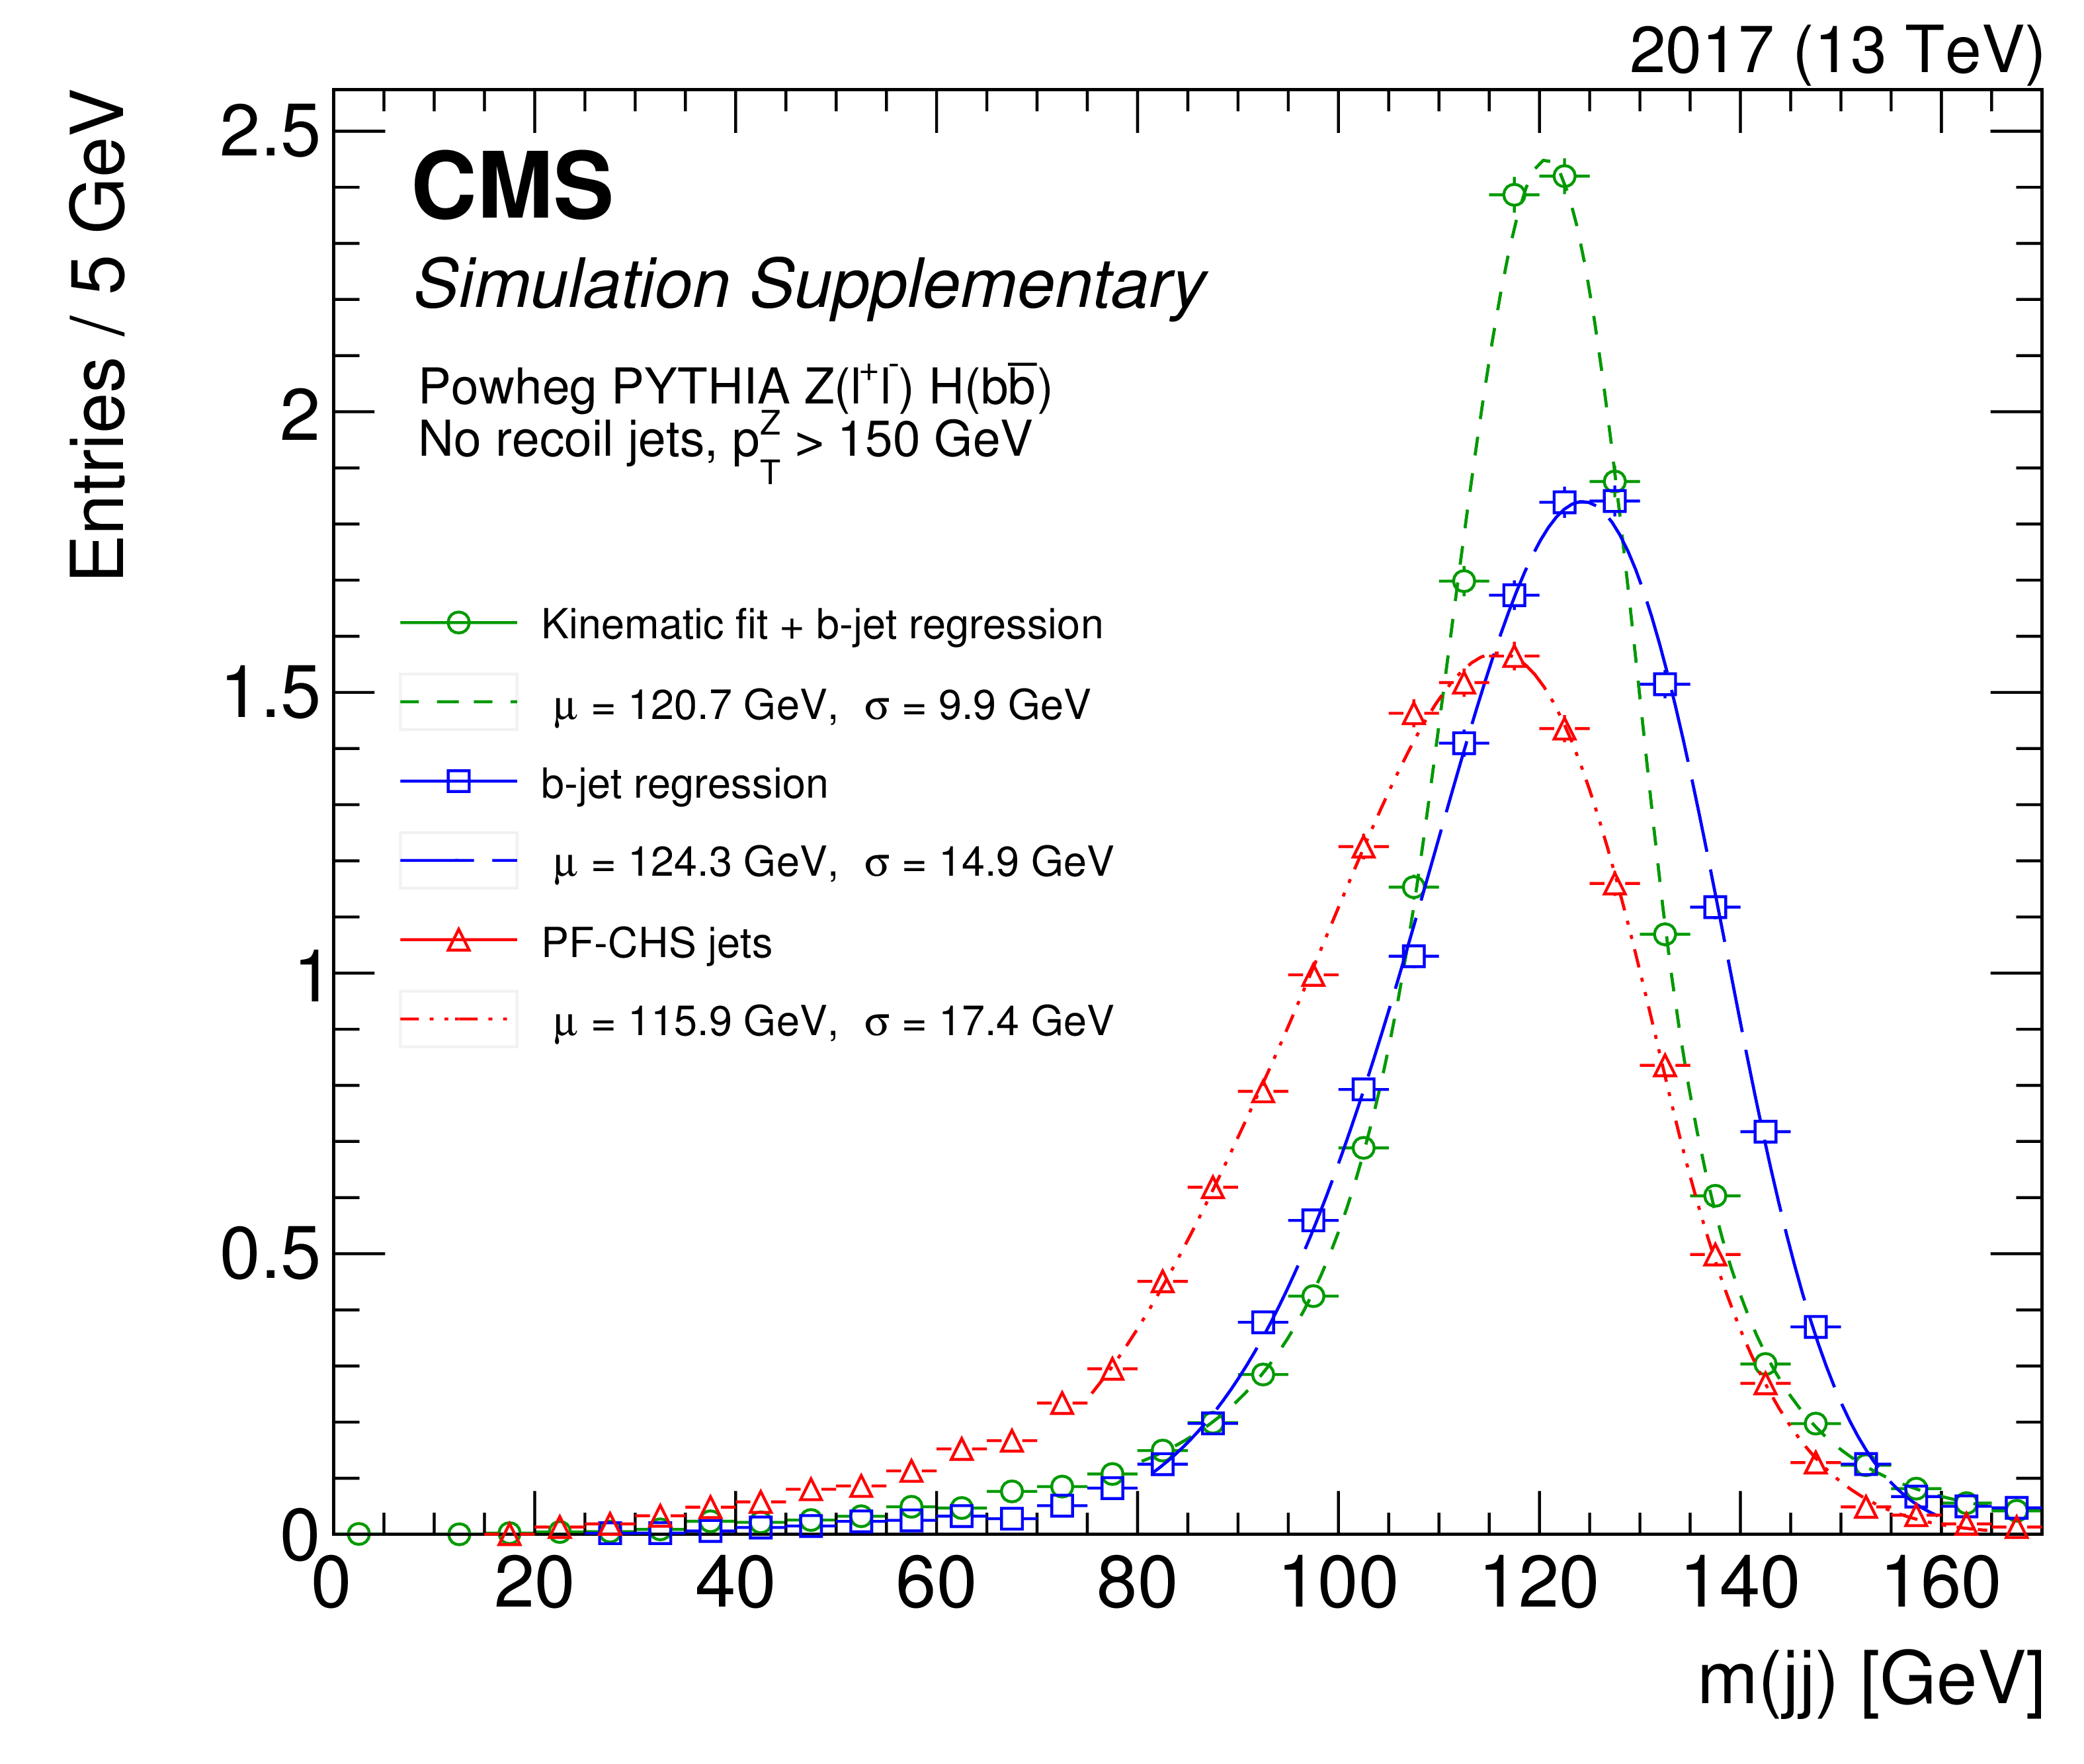
Additional Figure 1:
Dijet invariant mass distributions for simulated samples of ${{\mathrm {Z}}(\ell \ell) {\mathrm {H}} ({\mathrm {b}} {\mathrm {b}})}$ events ($m_{\mathrm{H}} = $ 125 GeV) without (left) and with one additional recoiling jet (right). Distributions are shown before (red) and after (blue) the energy corrections from the b-jet regression are applied, and when a kinematic fit procedure (green) is used on top of them. A Bukin function is used to fit the distribution. The fitted mean and width of the core of the distribution are displayed on the figure. |
png pdf |
Additional Figure 1-a:
Dijet invariant mass distributions for simulated samples of ${{\mathrm {Z}}(\ell \ell) {\mathrm {H}} ({\mathrm {b}} {\mathrm {b}})}$ events ($m_{\mathrm{H}} = $ 125 GeV) without any additional recoiling jet. Distributions are shown before (red) and after (blue) the energy corrections from the b-jet regression are applied, and when a kinematic fit procedure (green) is used on top of them. A Bukin function is used to fit the distribution. The fitted mean and width of the core of the distribution are displayed on the figure. |

png pdf |
Additional Figure 1-b:
Dijet invariant mass distributions for simulated samples of ${{\mathrm {Z}}(\ell \ell) {\mathrm {H}} ({\mathrm {b}} {\mathrm {b}})}$ events ($m_{\mathrm{H}} = $ 125 GeV) with one additional recoiling jet. Distributions are shown before (red) and after (blue) the energy corrections from the b-jet regression are applied, and when a kinematic fit procedure (green) is used on top of them. A Bukin function is used to fit the distribution. The fitted mean and width of the core of the distribution are displayed on the figure. |

png pdf |
Additional Figure 2:
The best-fit signal strength and uncertainty per-channel and for the WH and ZH processes, extracted from a simultaneous fit of all channels for the 2017 analysis. The per-channel signal strengths are compatible with the single signal strength fit with a probability of 96.9%. |
png pdf |
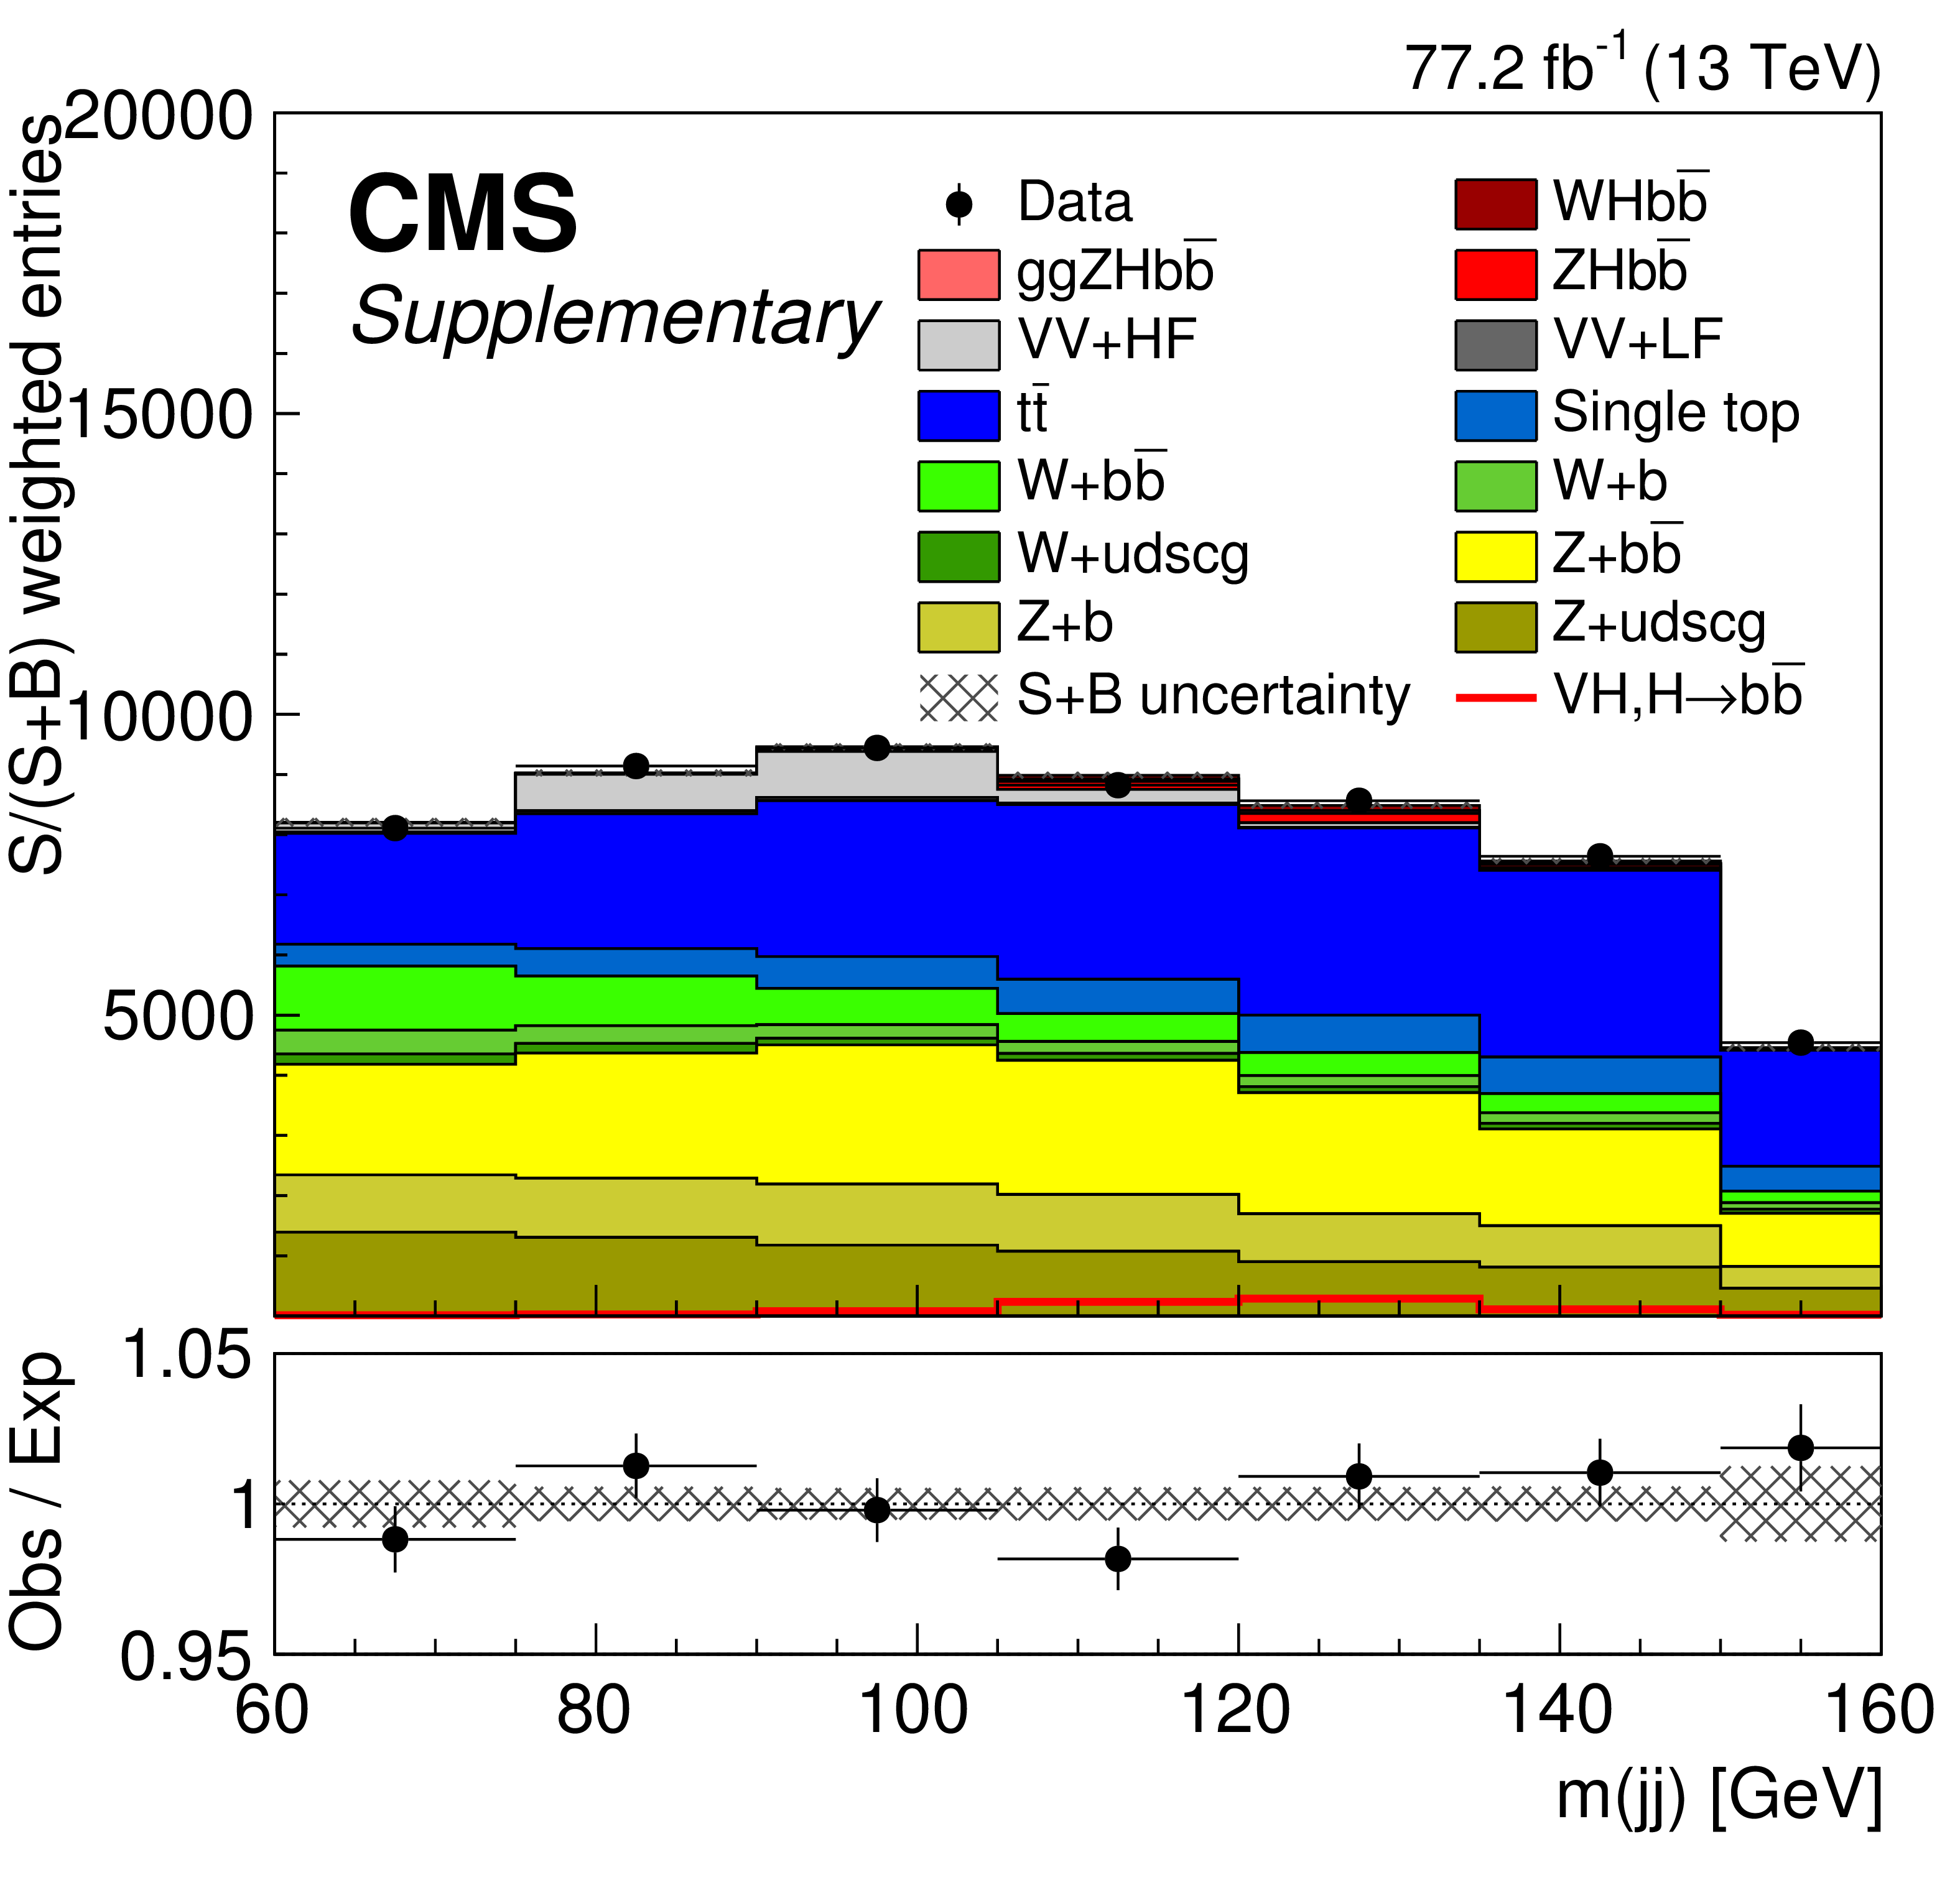
Additional Figure 3:
Dijet invariant mass distribution for events weighted by S/(S+B) in all channels combined in the 2016 and 2017 data sets. Weights are derived from a fit to the ${m_{\mathrm {(jj)}}}$ distribution, as described in the text. Shown are data (points) and the fitted VH signal (red) and VZ background (grey) distributions, as well as all other backgrounds. |

png pdf |
Additional Figure 4:
Dijet invariant mass distribution for events weighted by S/(S+B) in all channels combined in the 2016 and 2017 data sets. Weights are derived from a fit to the ${m_{\mathrm {(jj)}}}$ distribution, as described in the text. Shown are data (points) and the fitted VH signal (red) and VZ background (grey) distributions, with all other fitted background processes subtracted. The error bar for each bin represents the pre-subtraction 1$\sigma $ statistical uncertainty on the data, while the grey hatching indicates the 1$\sigma $ total uncertainty on the signal and all background components. Same as in paper, but the VZ is on top. |
png pdf |
Additional Figure 5:
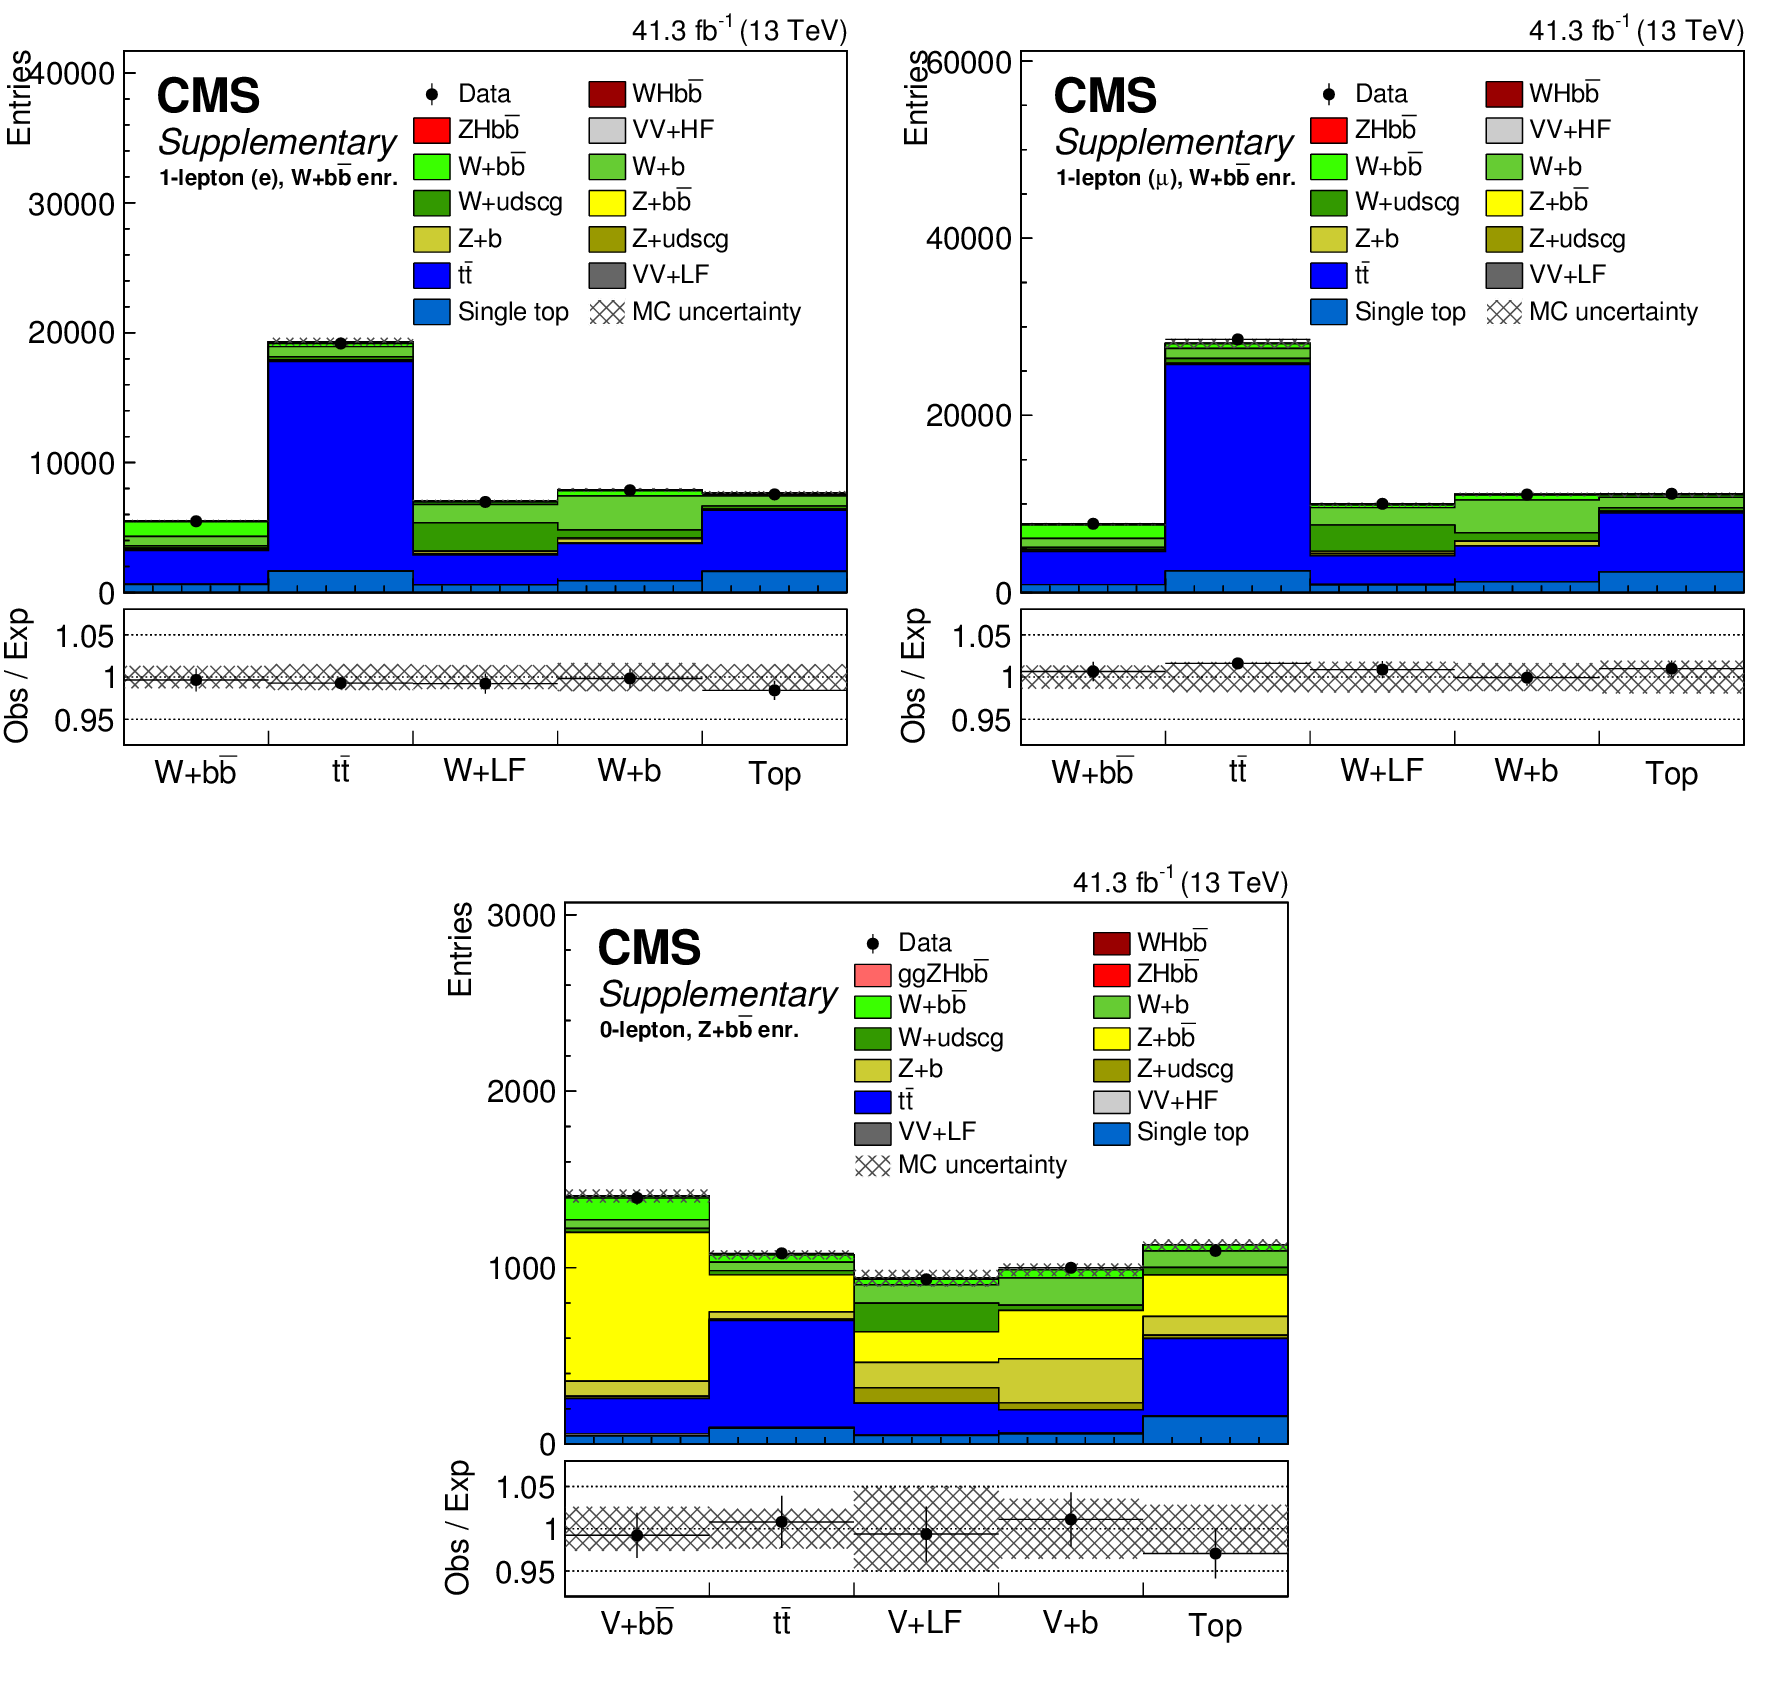
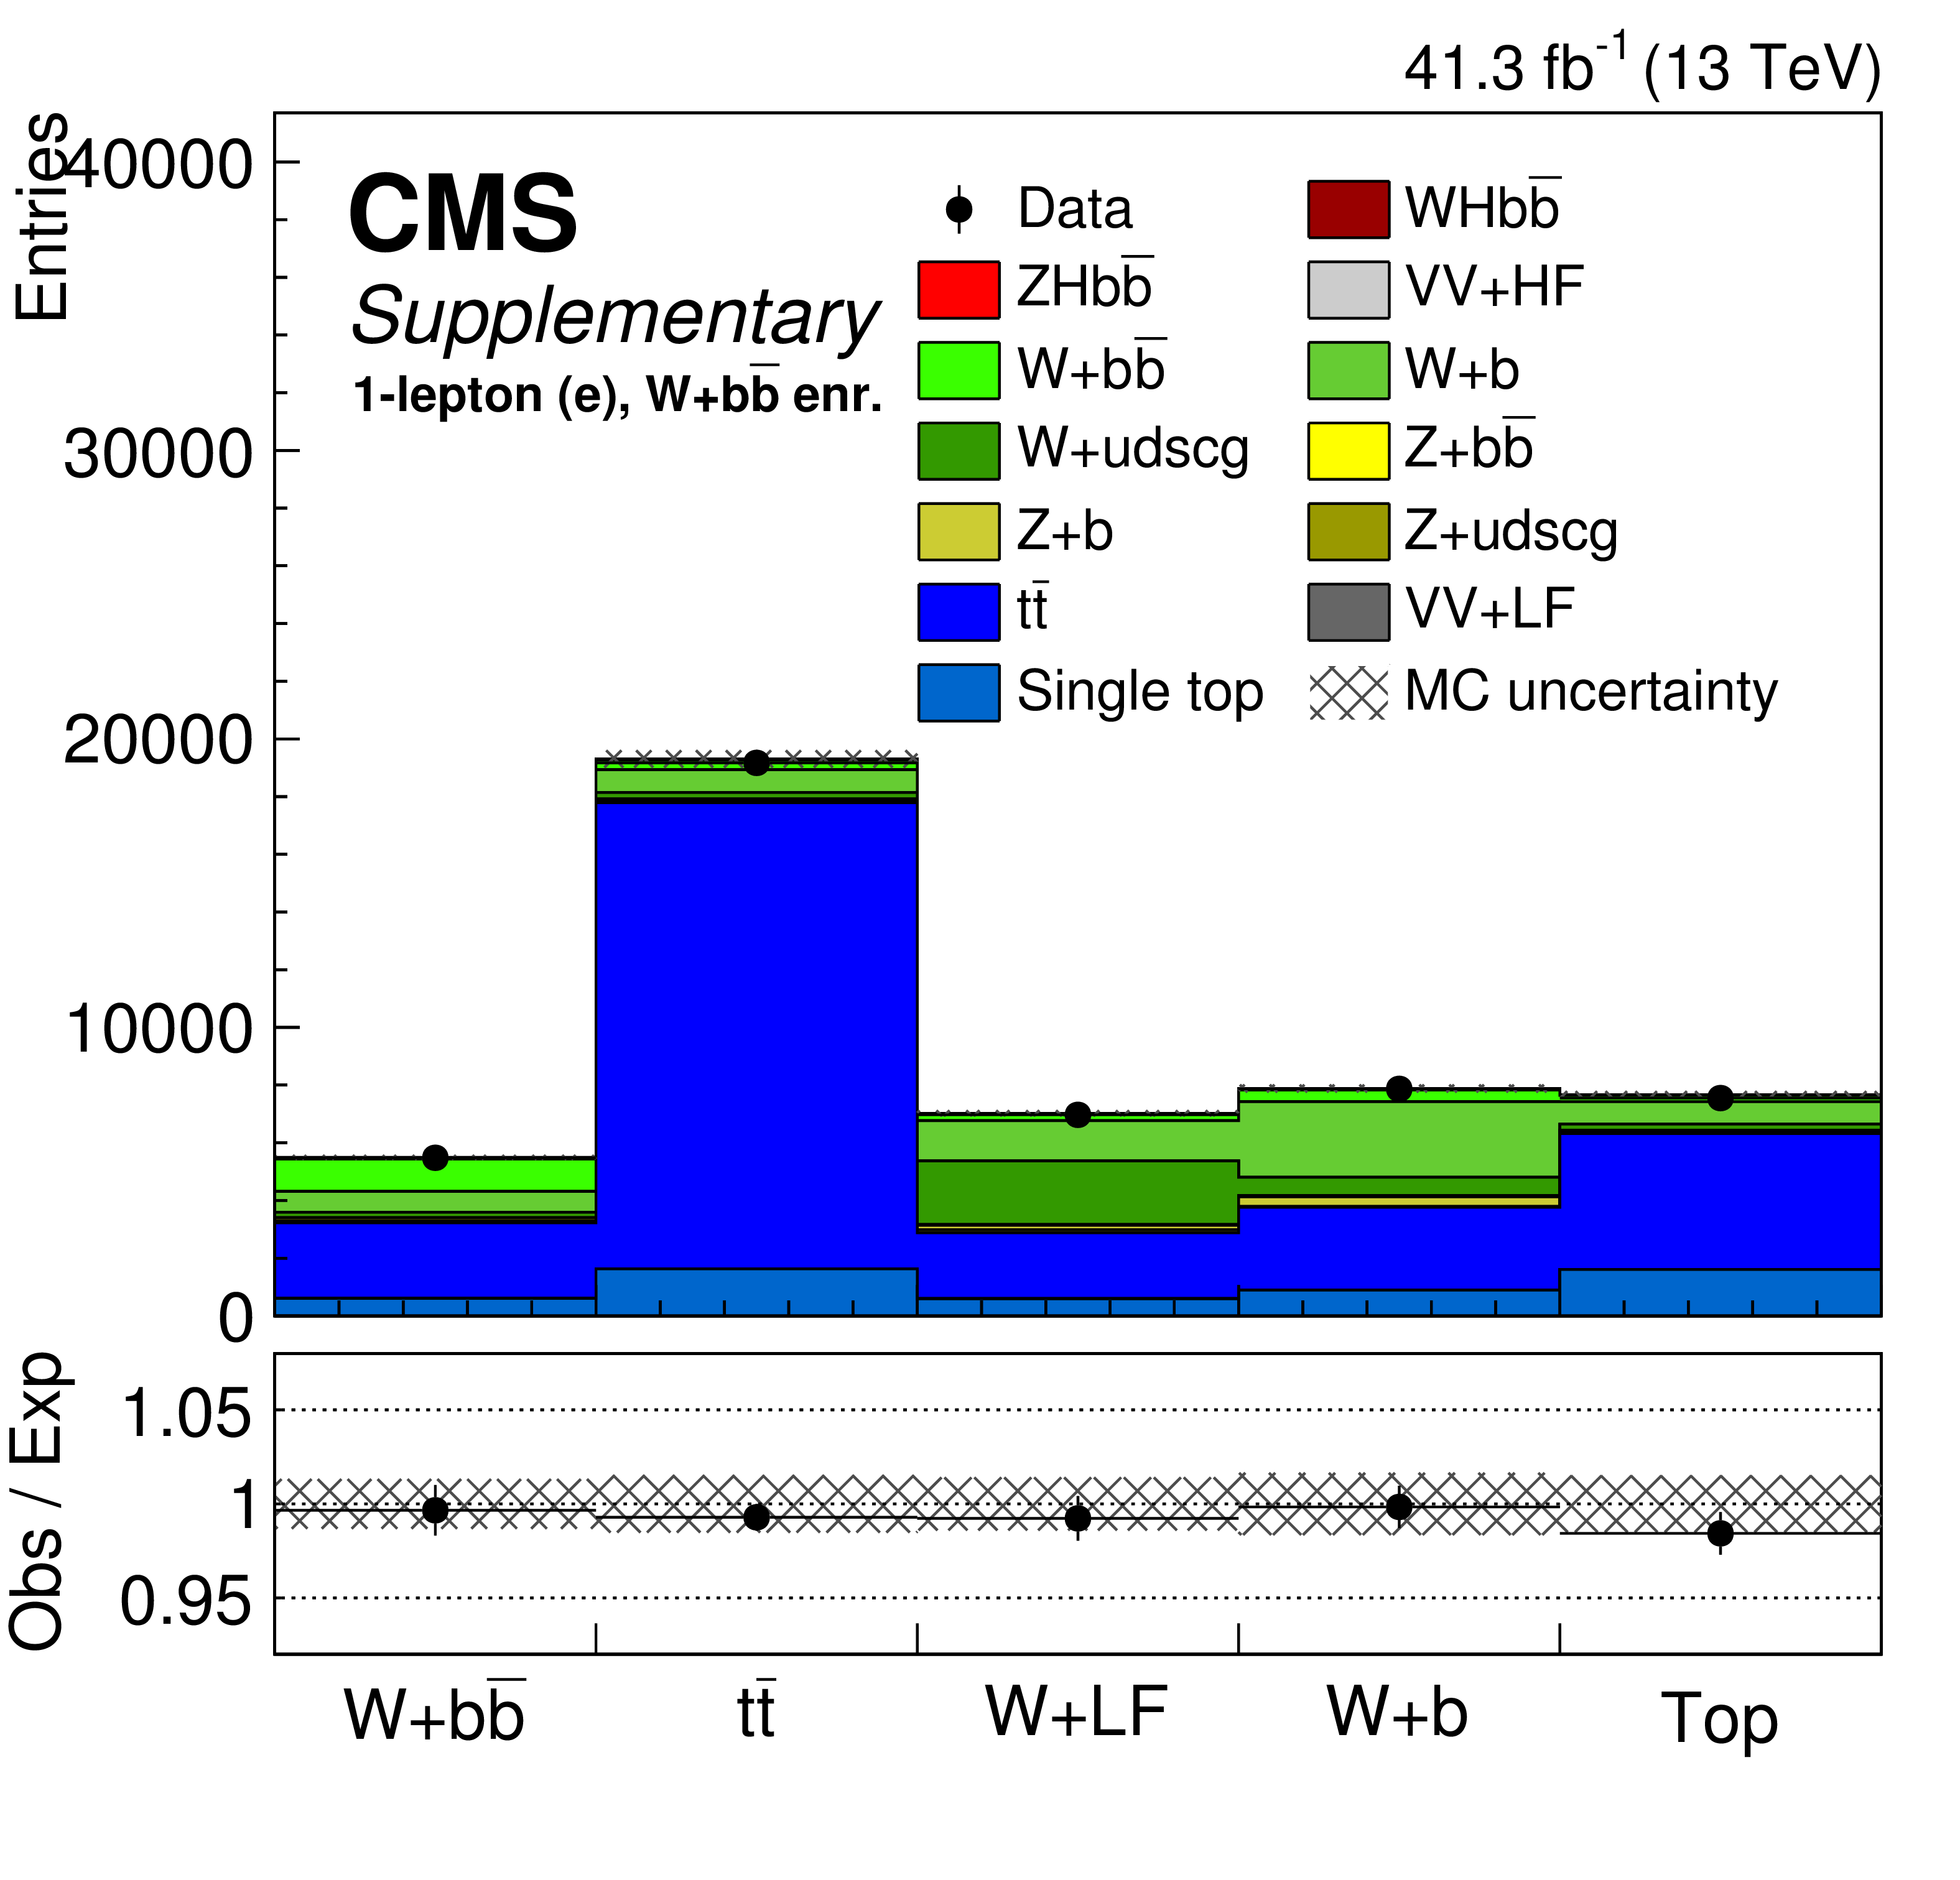
Post-fit distributions of the Multi-background DNN fit variable for 2017 analysis in the 1-lepton channel (top row) for muon (left) and electron (right) control regions, and for the 0-lepton channel (bottom row). |
png pdf |
Additional Figure 5-a:
Post-fit distributions of the Multi-background DNN fit variable for 2017 analysis in the 1-lepton channel for muon electron control region. Additional Figure 5-b |

png pdf |
Additional Figure 5-b:
Post-fit distributions of the Multi-background DNN fit variable for 2017 analysis in the 1-lepton channel (top row) for muon (left) and electron (right) control regions, and for the 0-lepton channel (bottom row). |

png pdf |
Additional Figure 5-c:
Post-fit distributions of the Multi-background DNN fit variable for 2017 analysis in the 1-lepton channel (top row) for muon (left) and electron (right) control regions, and for the 0-lepton channel (bottom row). |

png pdf |
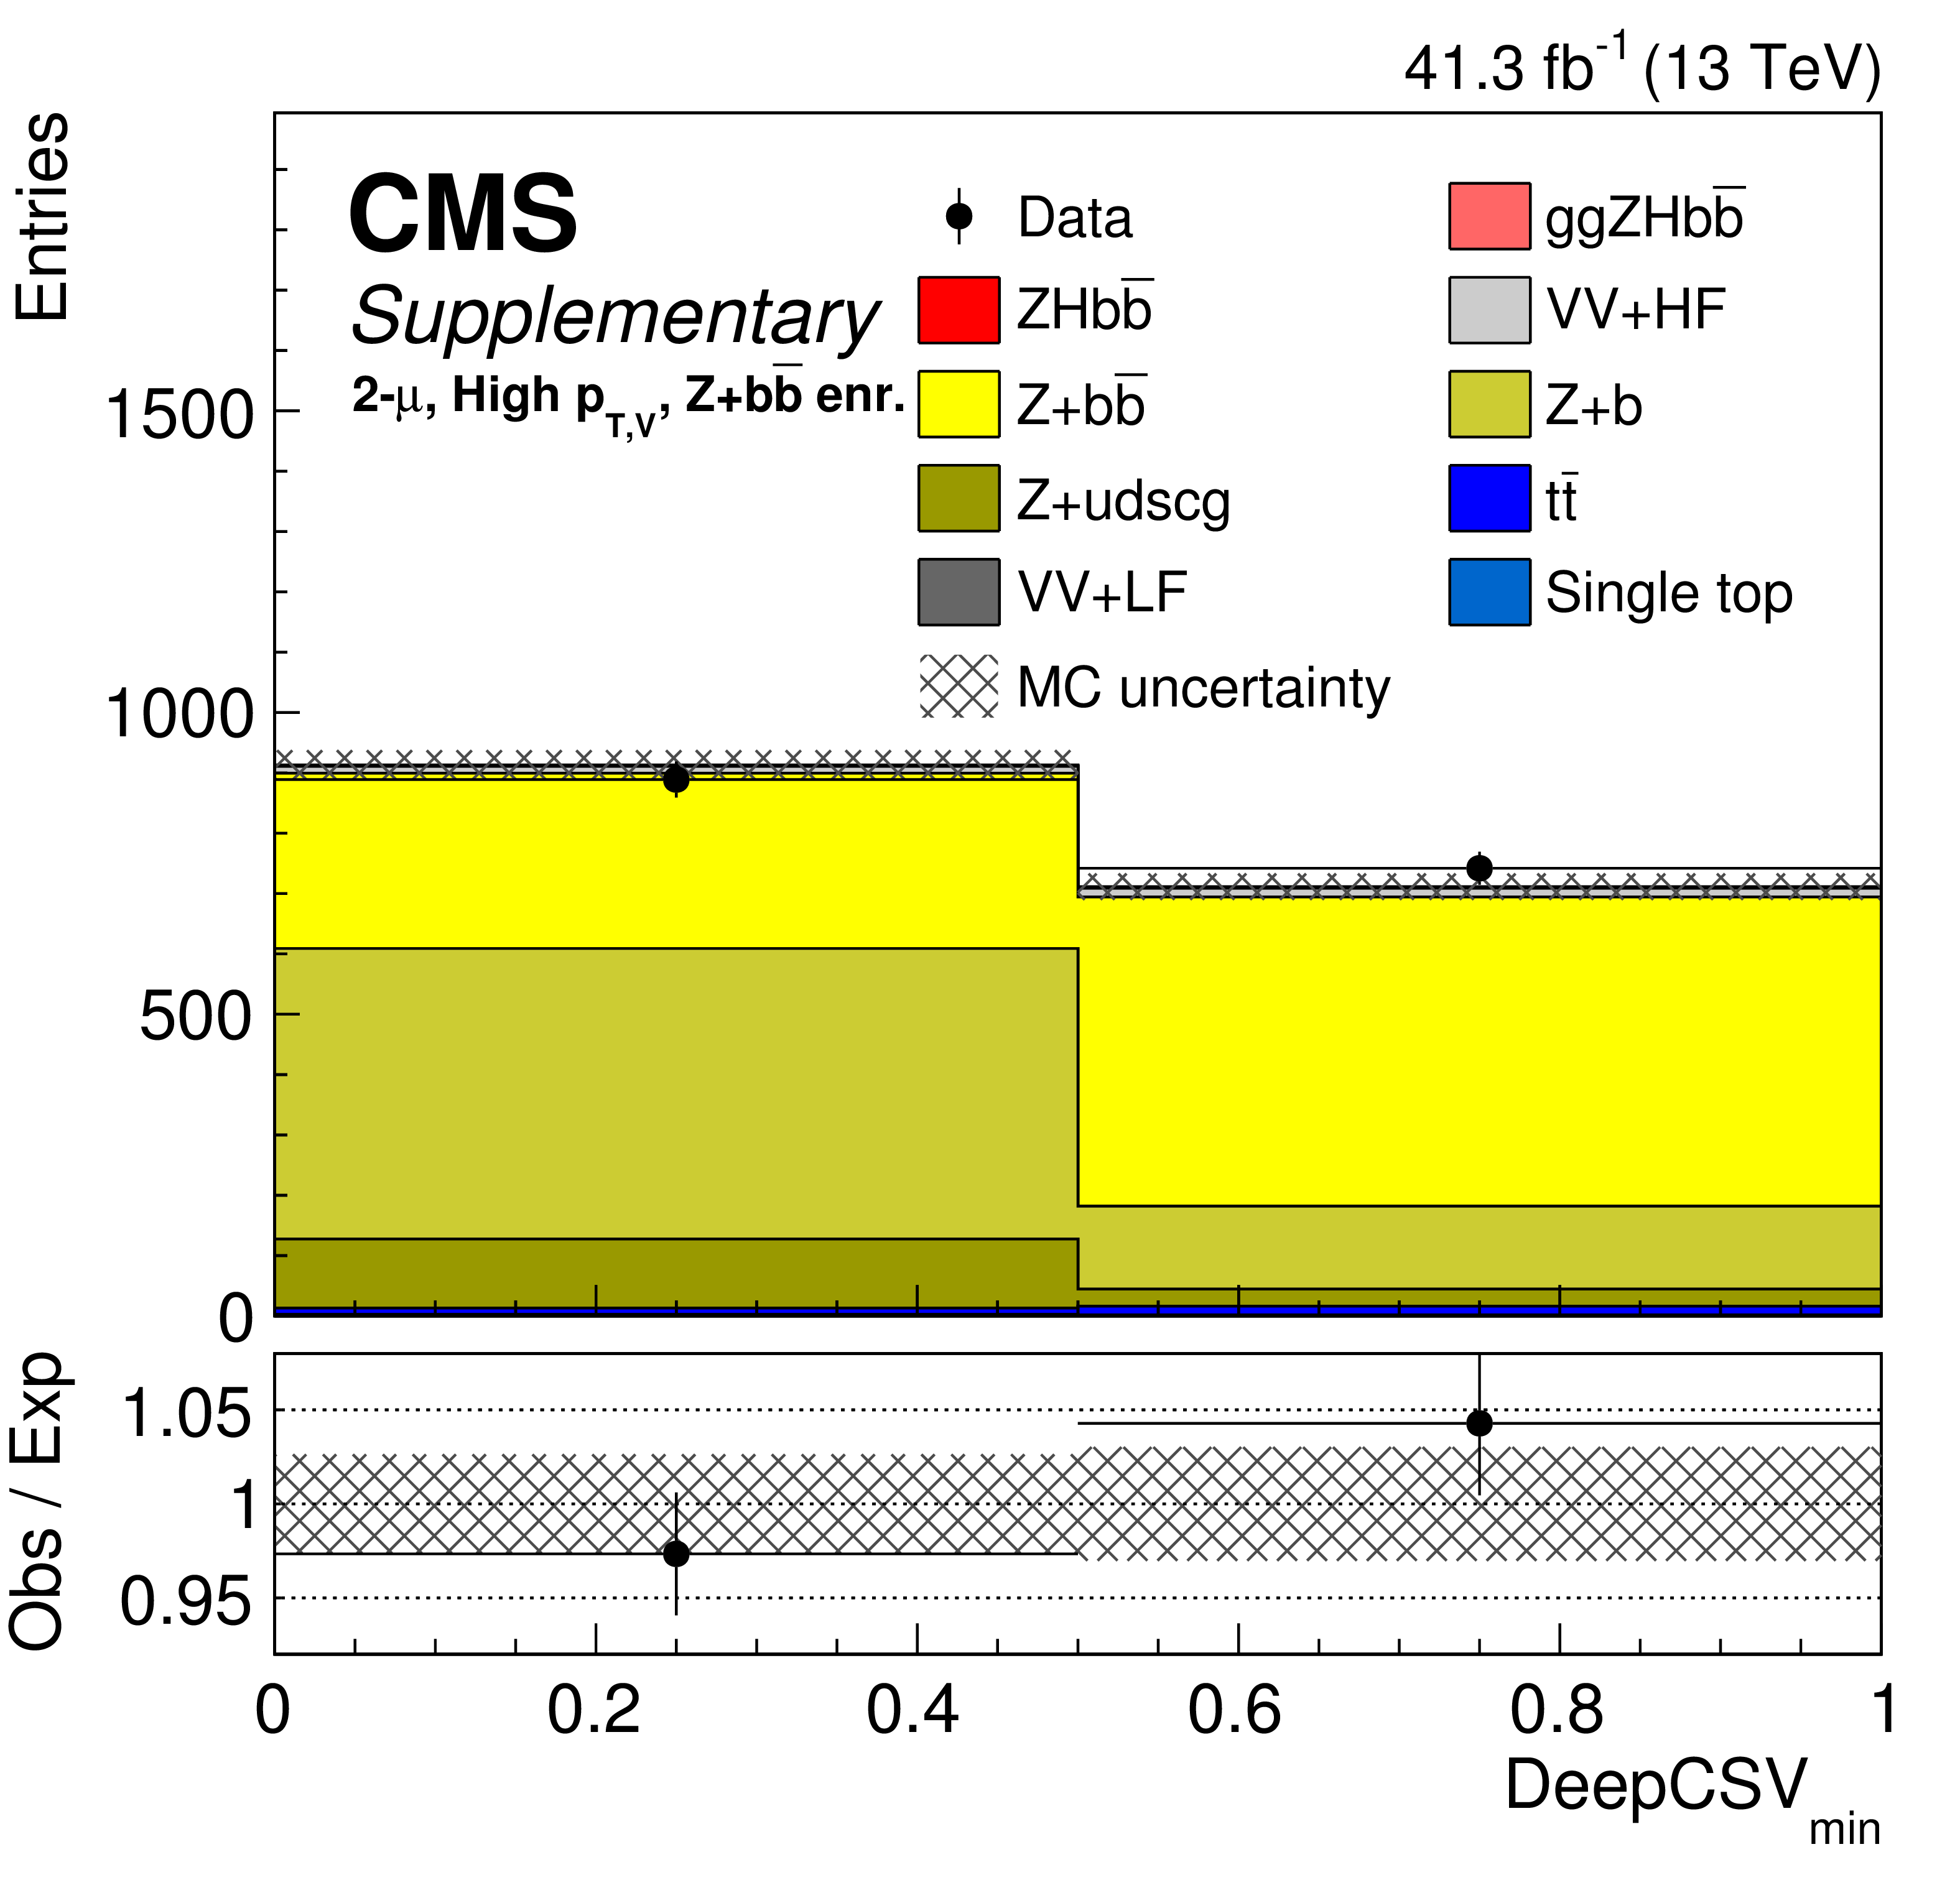
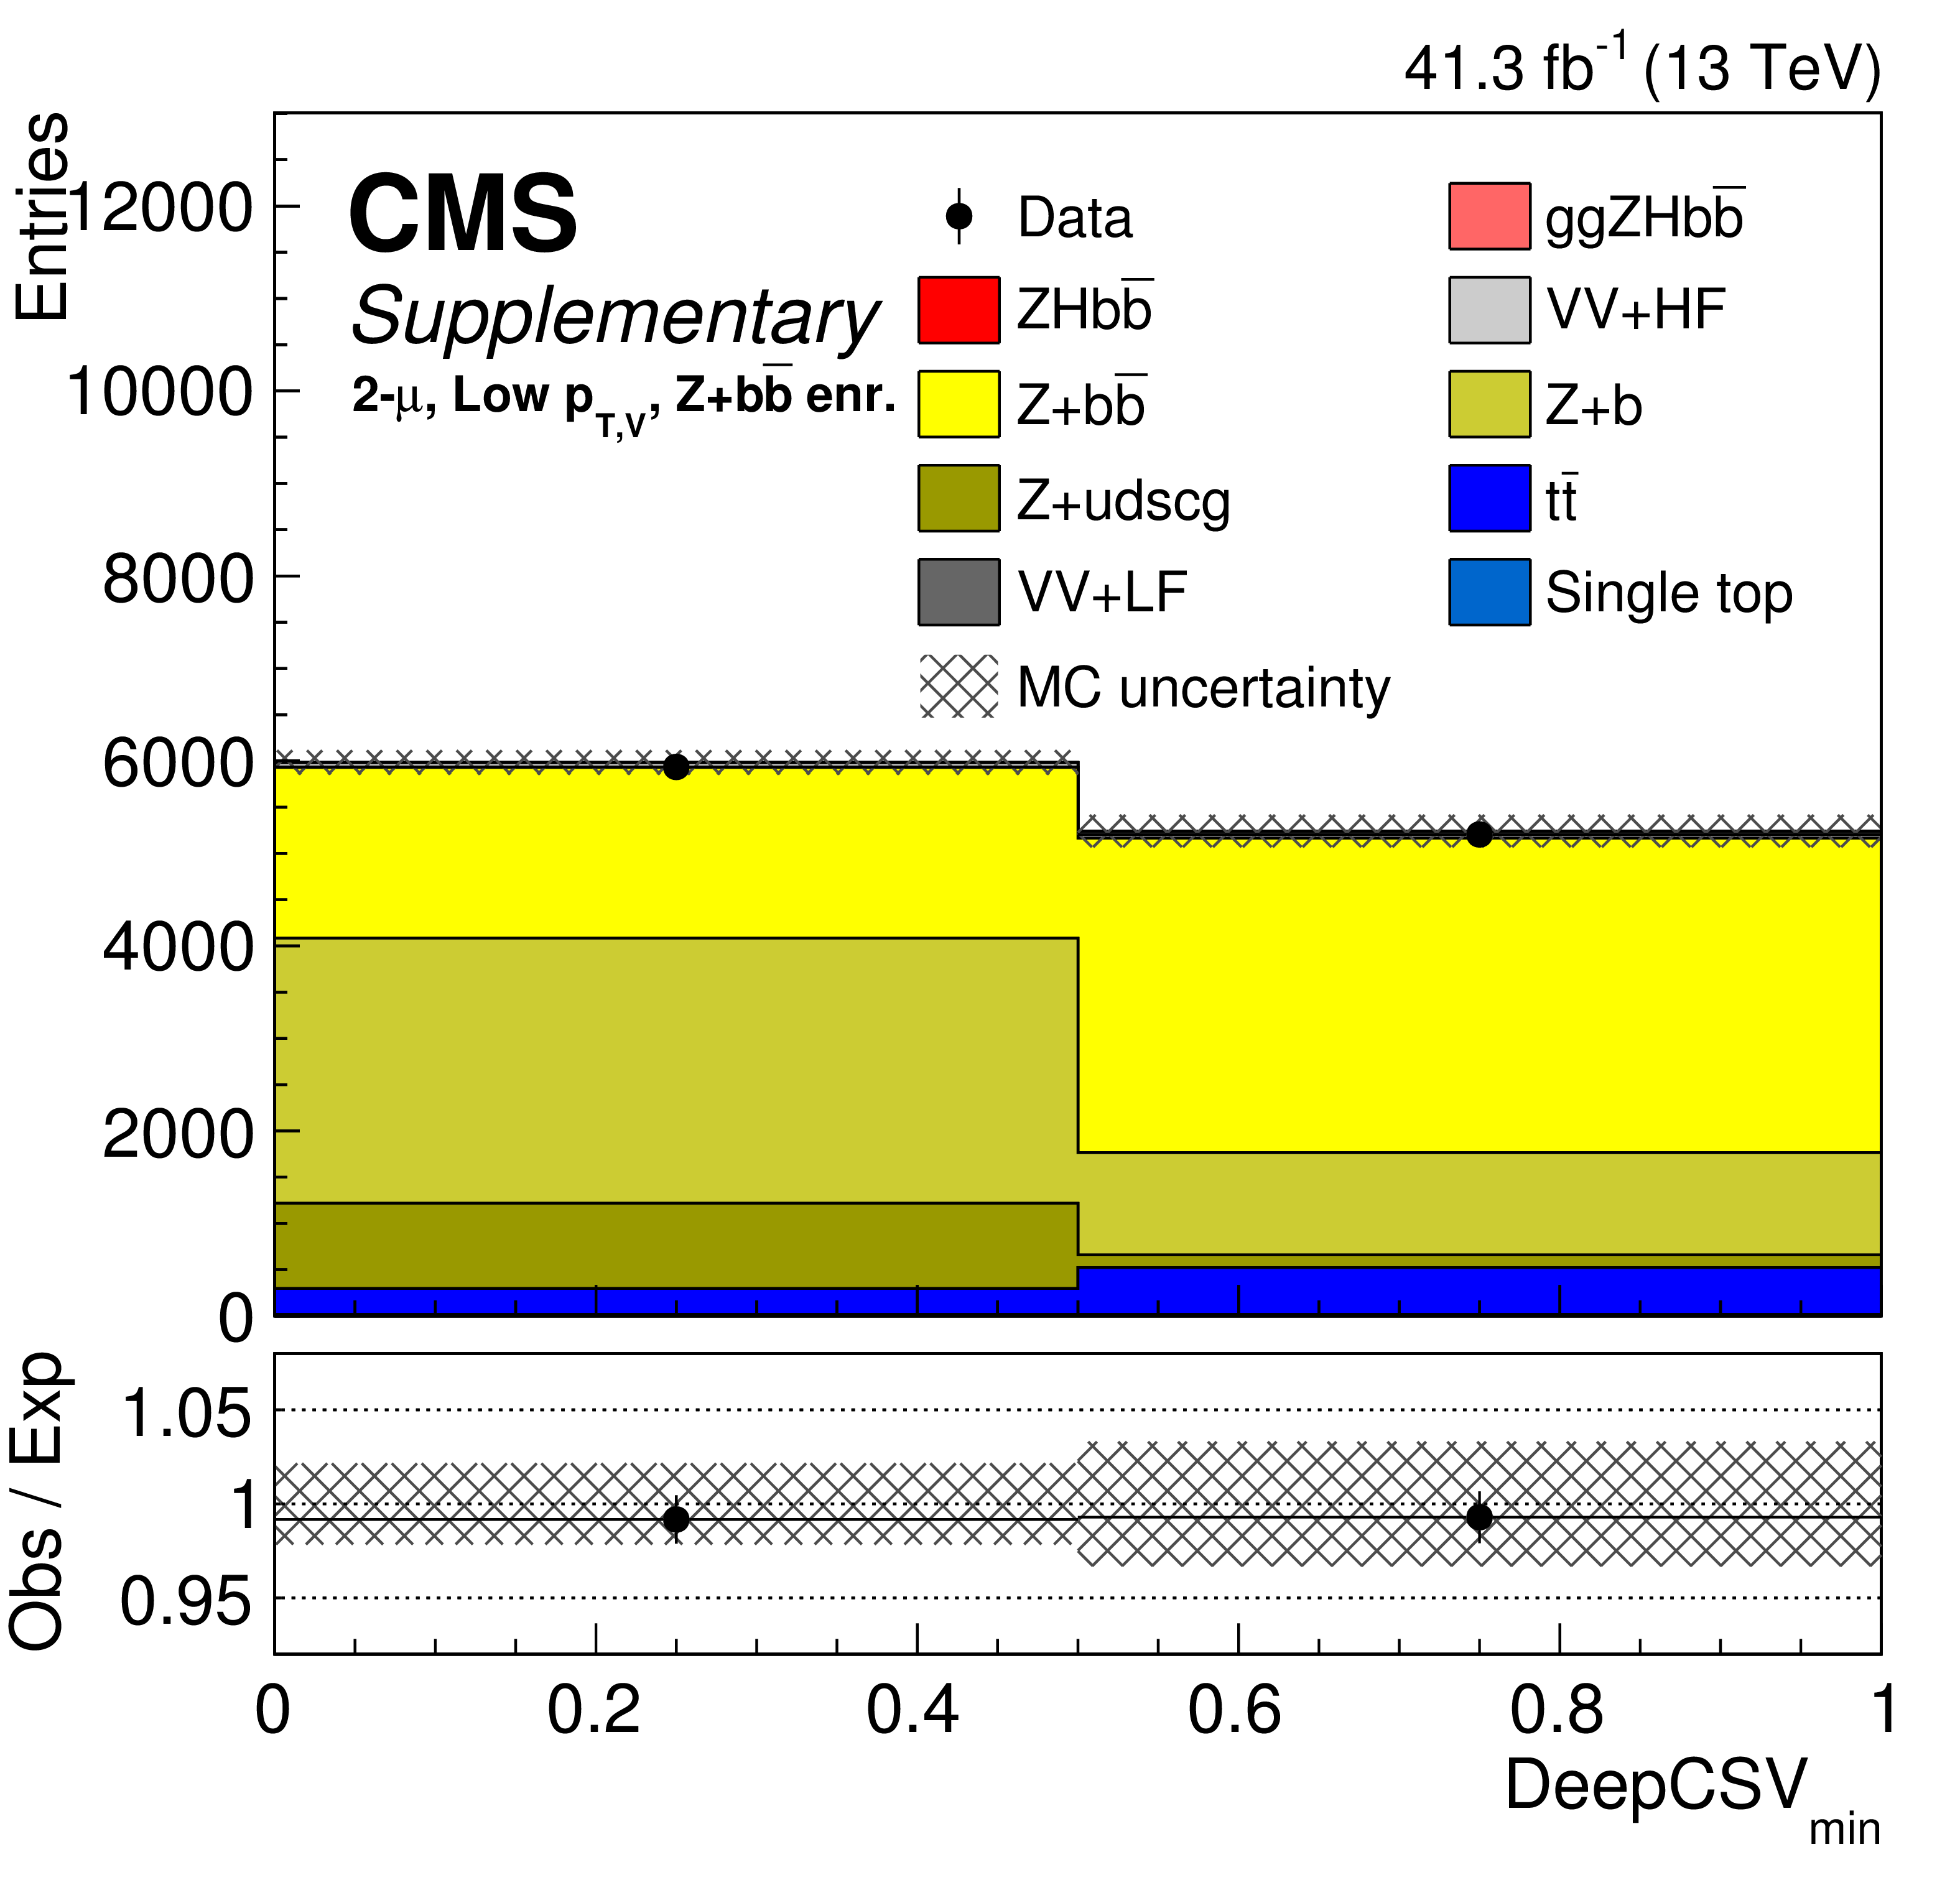
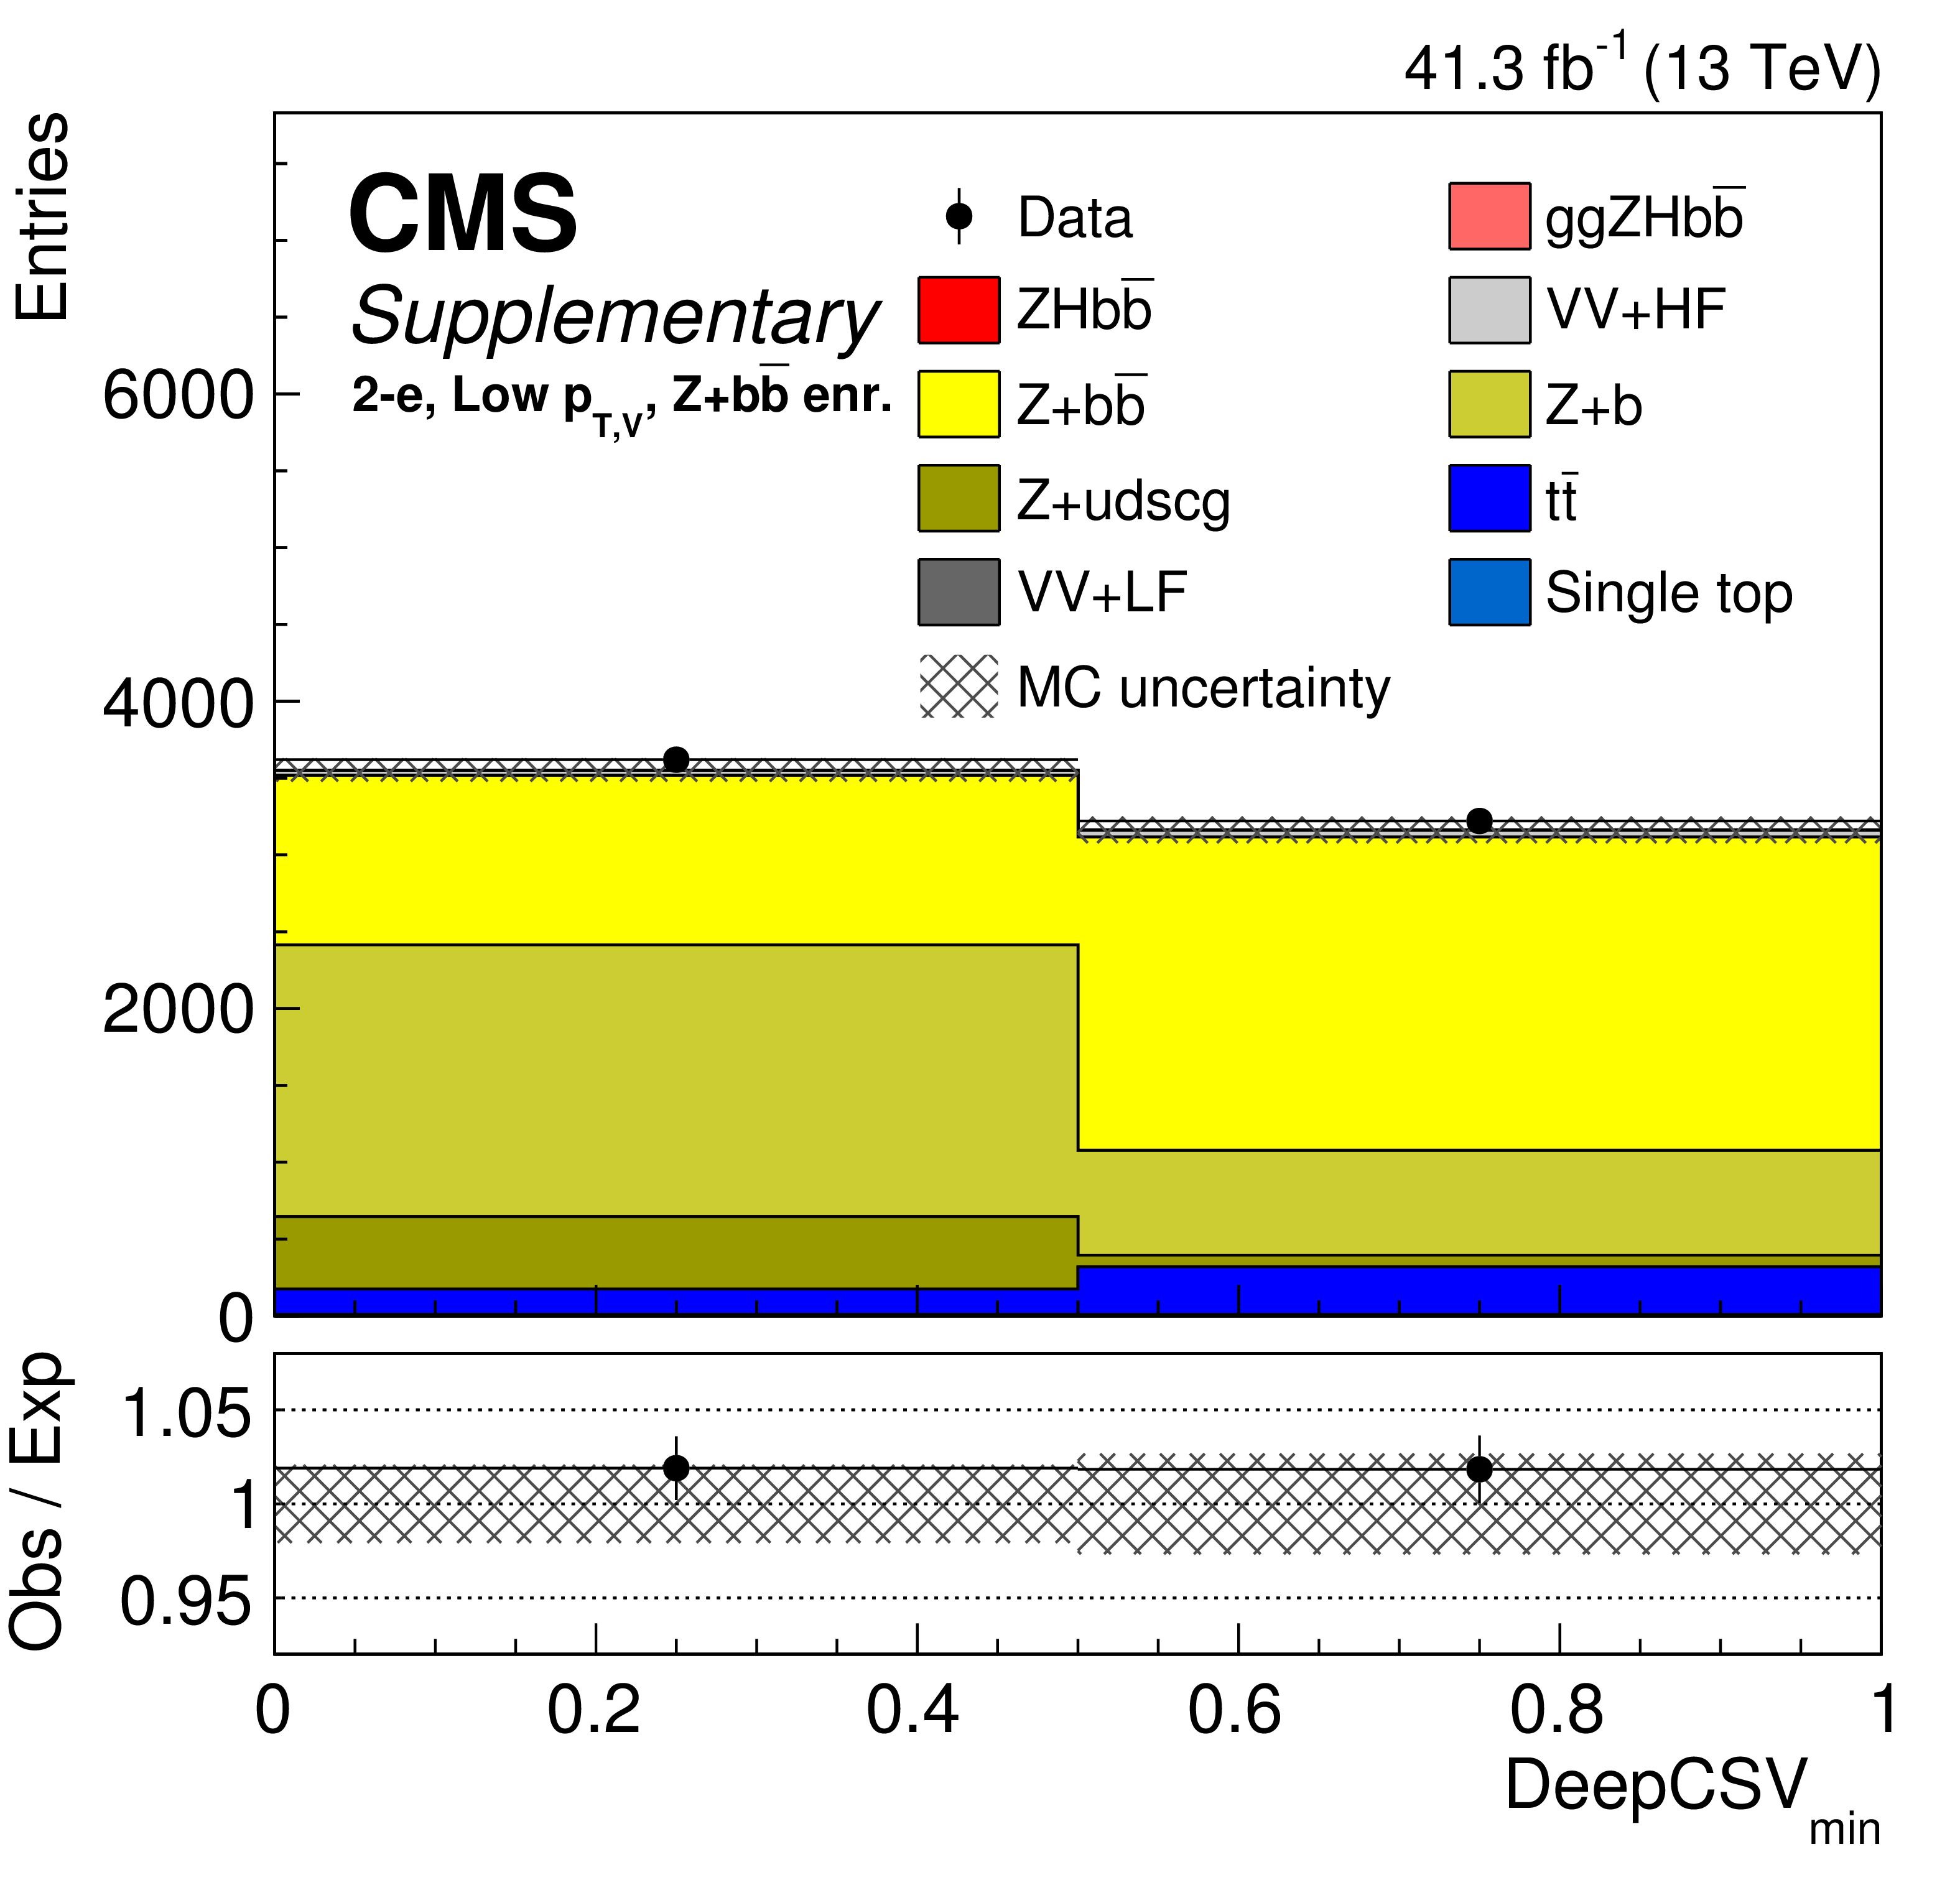
Additional Figure 6:
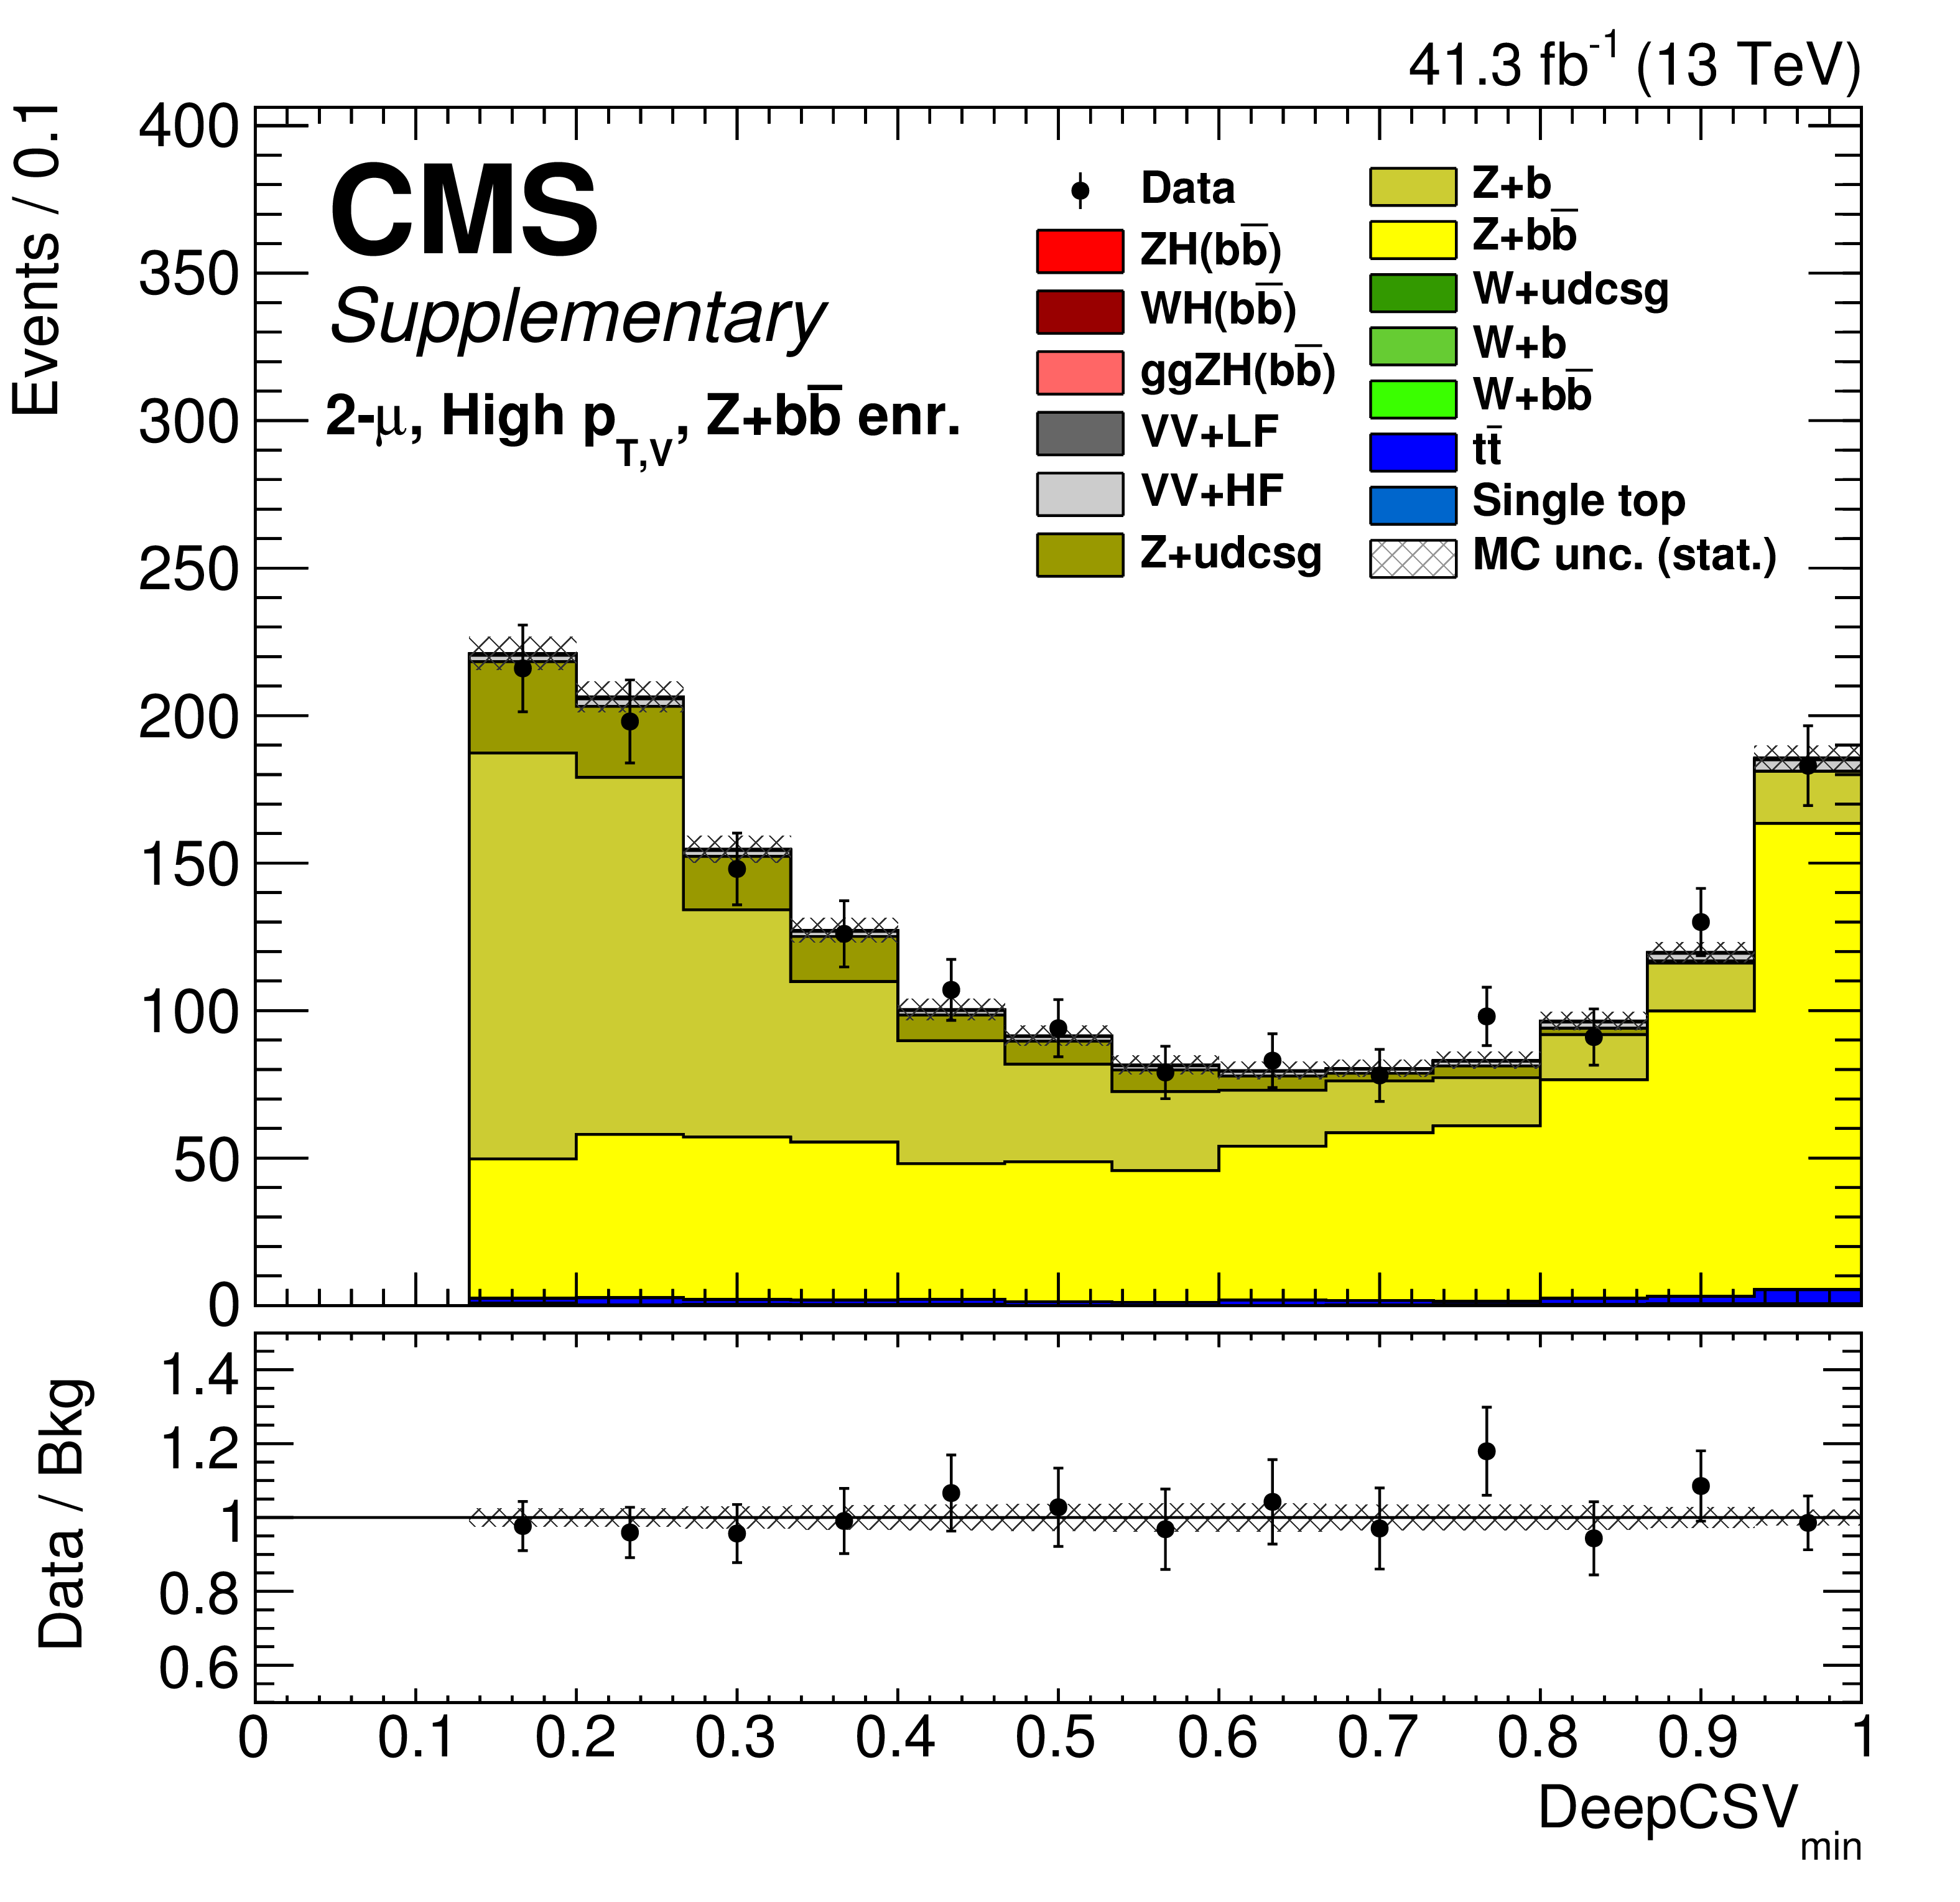
Post-fit distributions of the two fitted bins of ${\mathrm {DeepCSV_{min}}}$ in the 2-lepton Z+HF control regions. Above are the high ${{p_{\mathrm {T}}} ({\mathrm {V}})}$ categories and below are the low ${{p_{\mathrm {T}}} ({\mathrm {V}})}$. The left shows the distributions for 2$\mu $ channels and on the right are the same for 2e channels. |
png pdf |
Additional Figure 6-a:
Post-fit distributions of the two fitted bins of ${\mathrm {DeepCSV_{min}}}$ in the 2-lepton Z+HF control regions: high ${{p_{\mathrm {T}}} ({\mathrm {V}})}$ category for the 2$\mu $ channel. |

png pdf |
Additional Figure 6-b:
Post-fit distributions of the two fitted bins of ${\mathrm {DeepCSV_{min}}}$ in the 2-lepton Z+HF control regions: low ${{p_{\mathrm {T}}} ({\mathrm {V}})}$ category for the 2e channel. |
png pdf |
Additional Figure 6-c:
Post-fit distributions of the two fitted bins of ${\mathrm {DeepCSV_{min}}}$ in the 2-lepton Z+HF control regions: high ${{p_{\mathrm {T}}} ({\mathrm {V}})}$ category for the 2$\mu $ channel. |
png pdf |
Additional Figure 6-d:
Post-fit distributions of the two fitted bins of ${\mathrm {DeepCSV_{min}}}$ in the 2-lepton Z+HF control regions: low ${{p_{\mathrm {T}}} ({\mathrm {V}})}$ category for the 2e channel. |
png pdf |
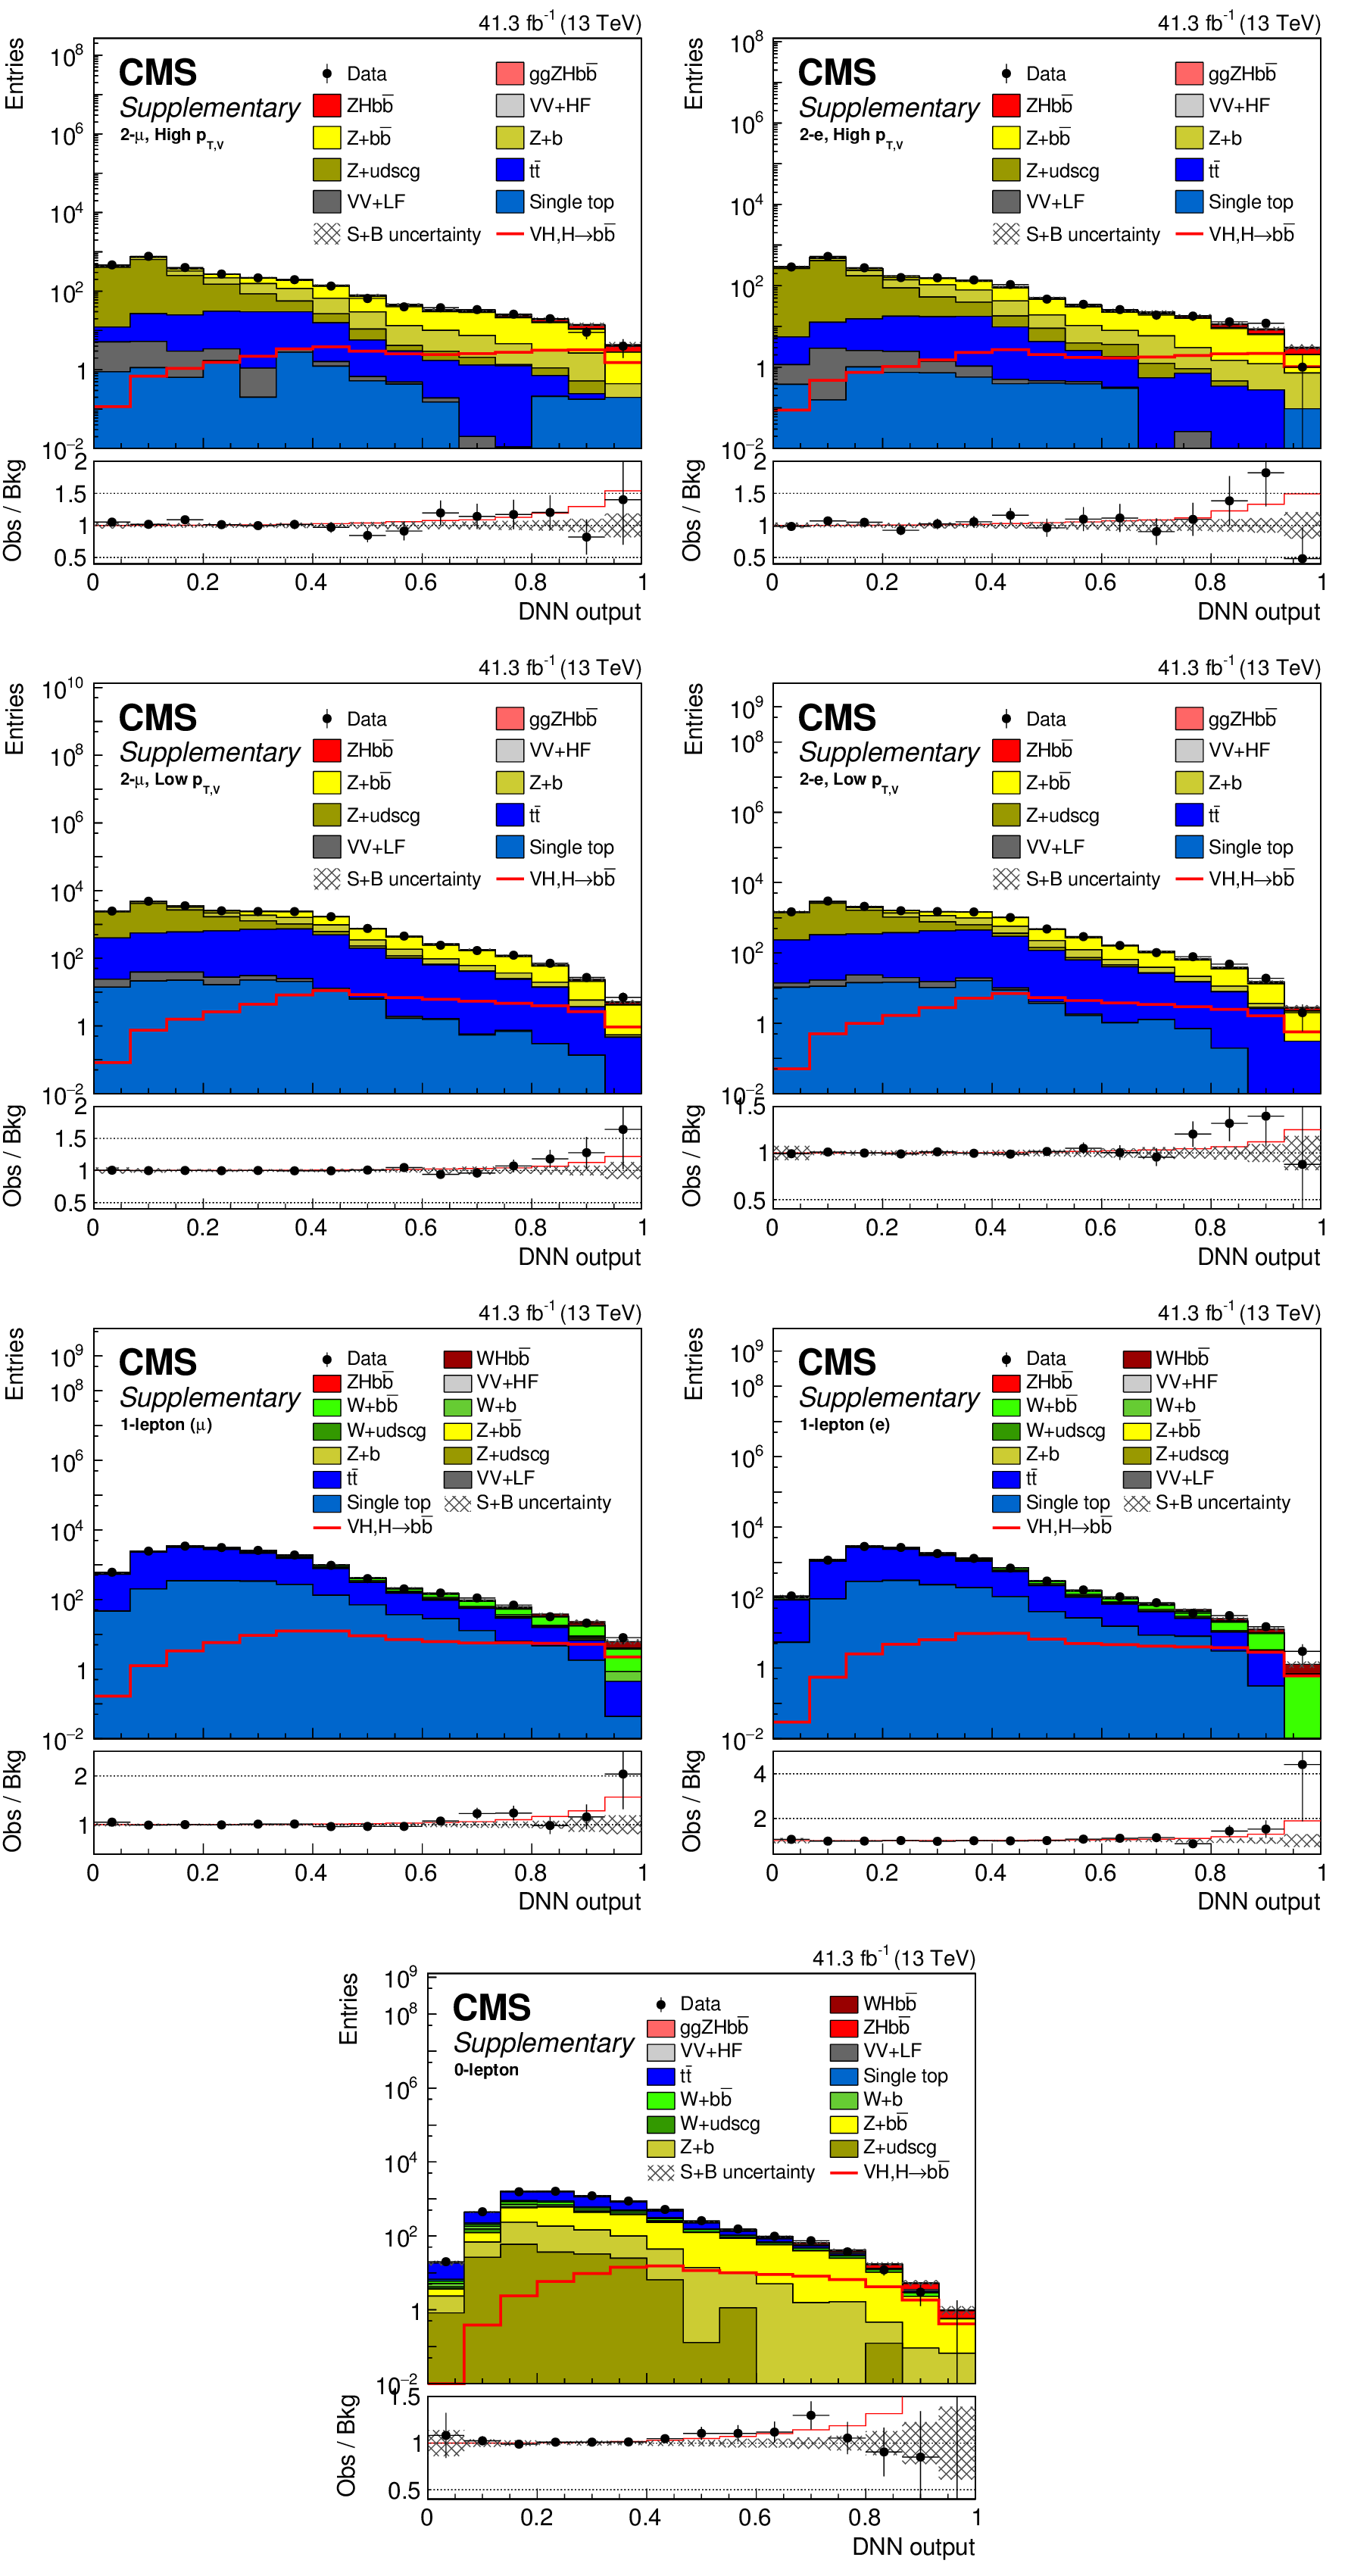
Additional Figure 7:
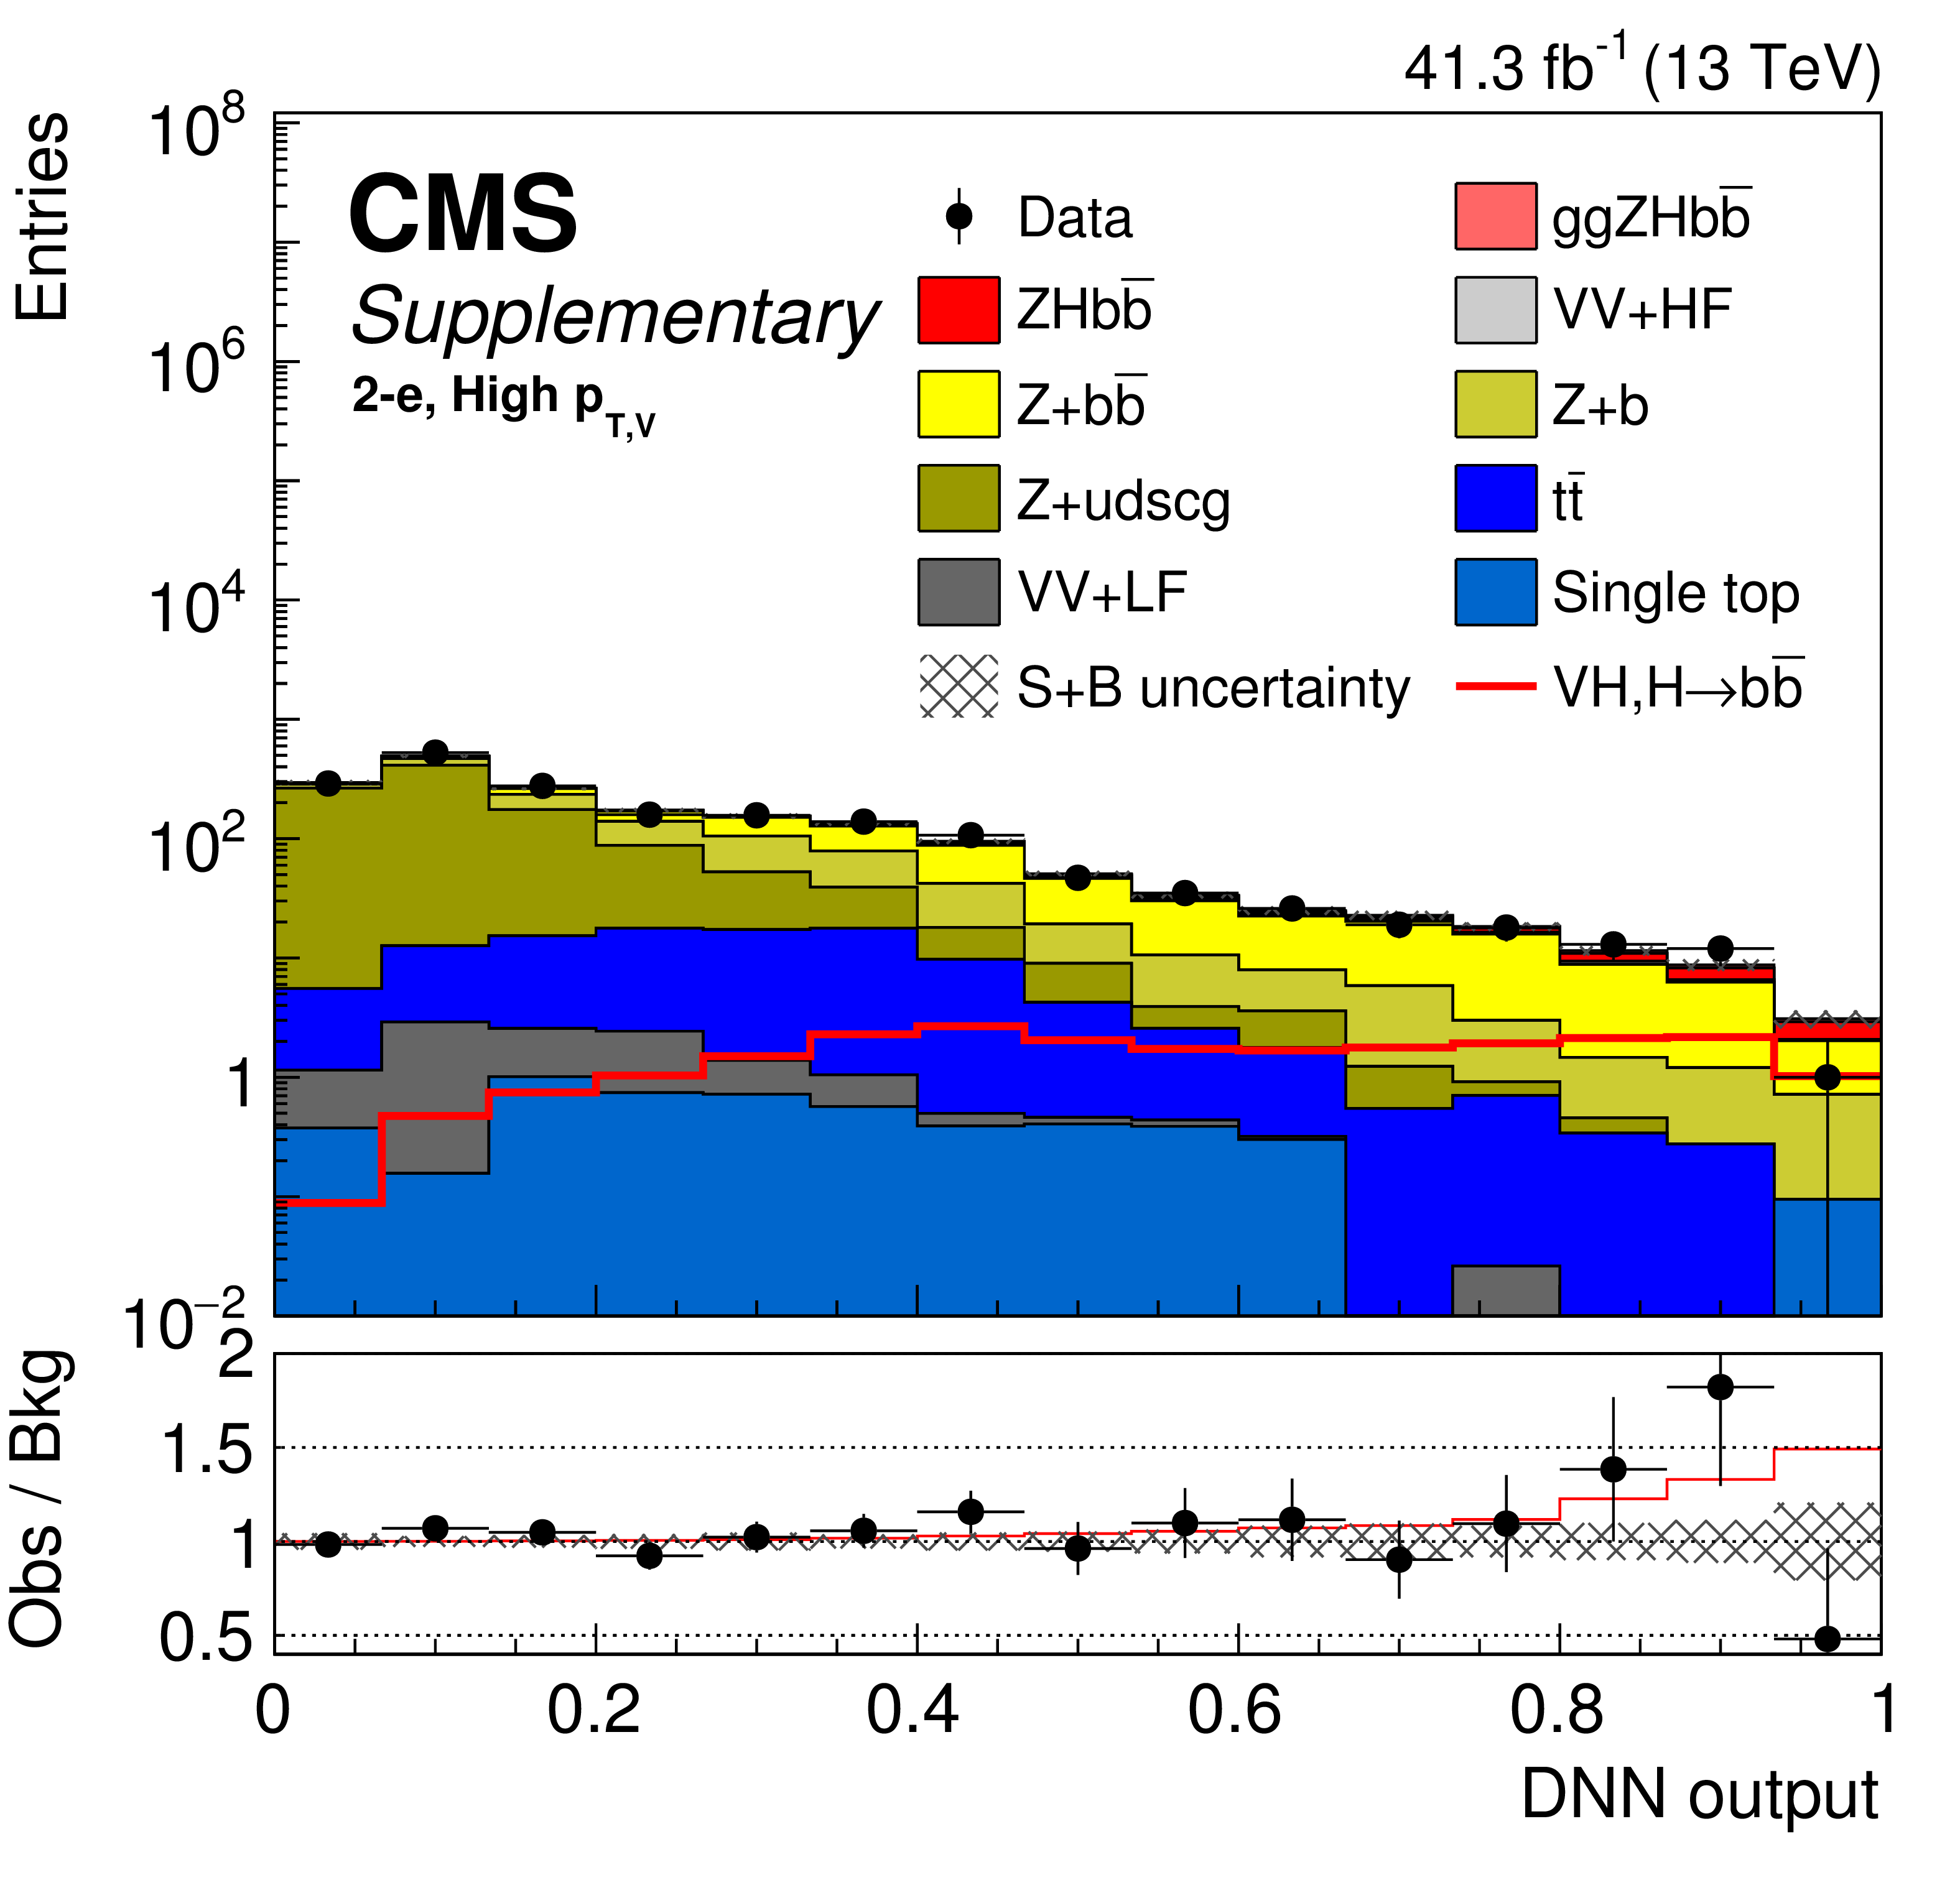
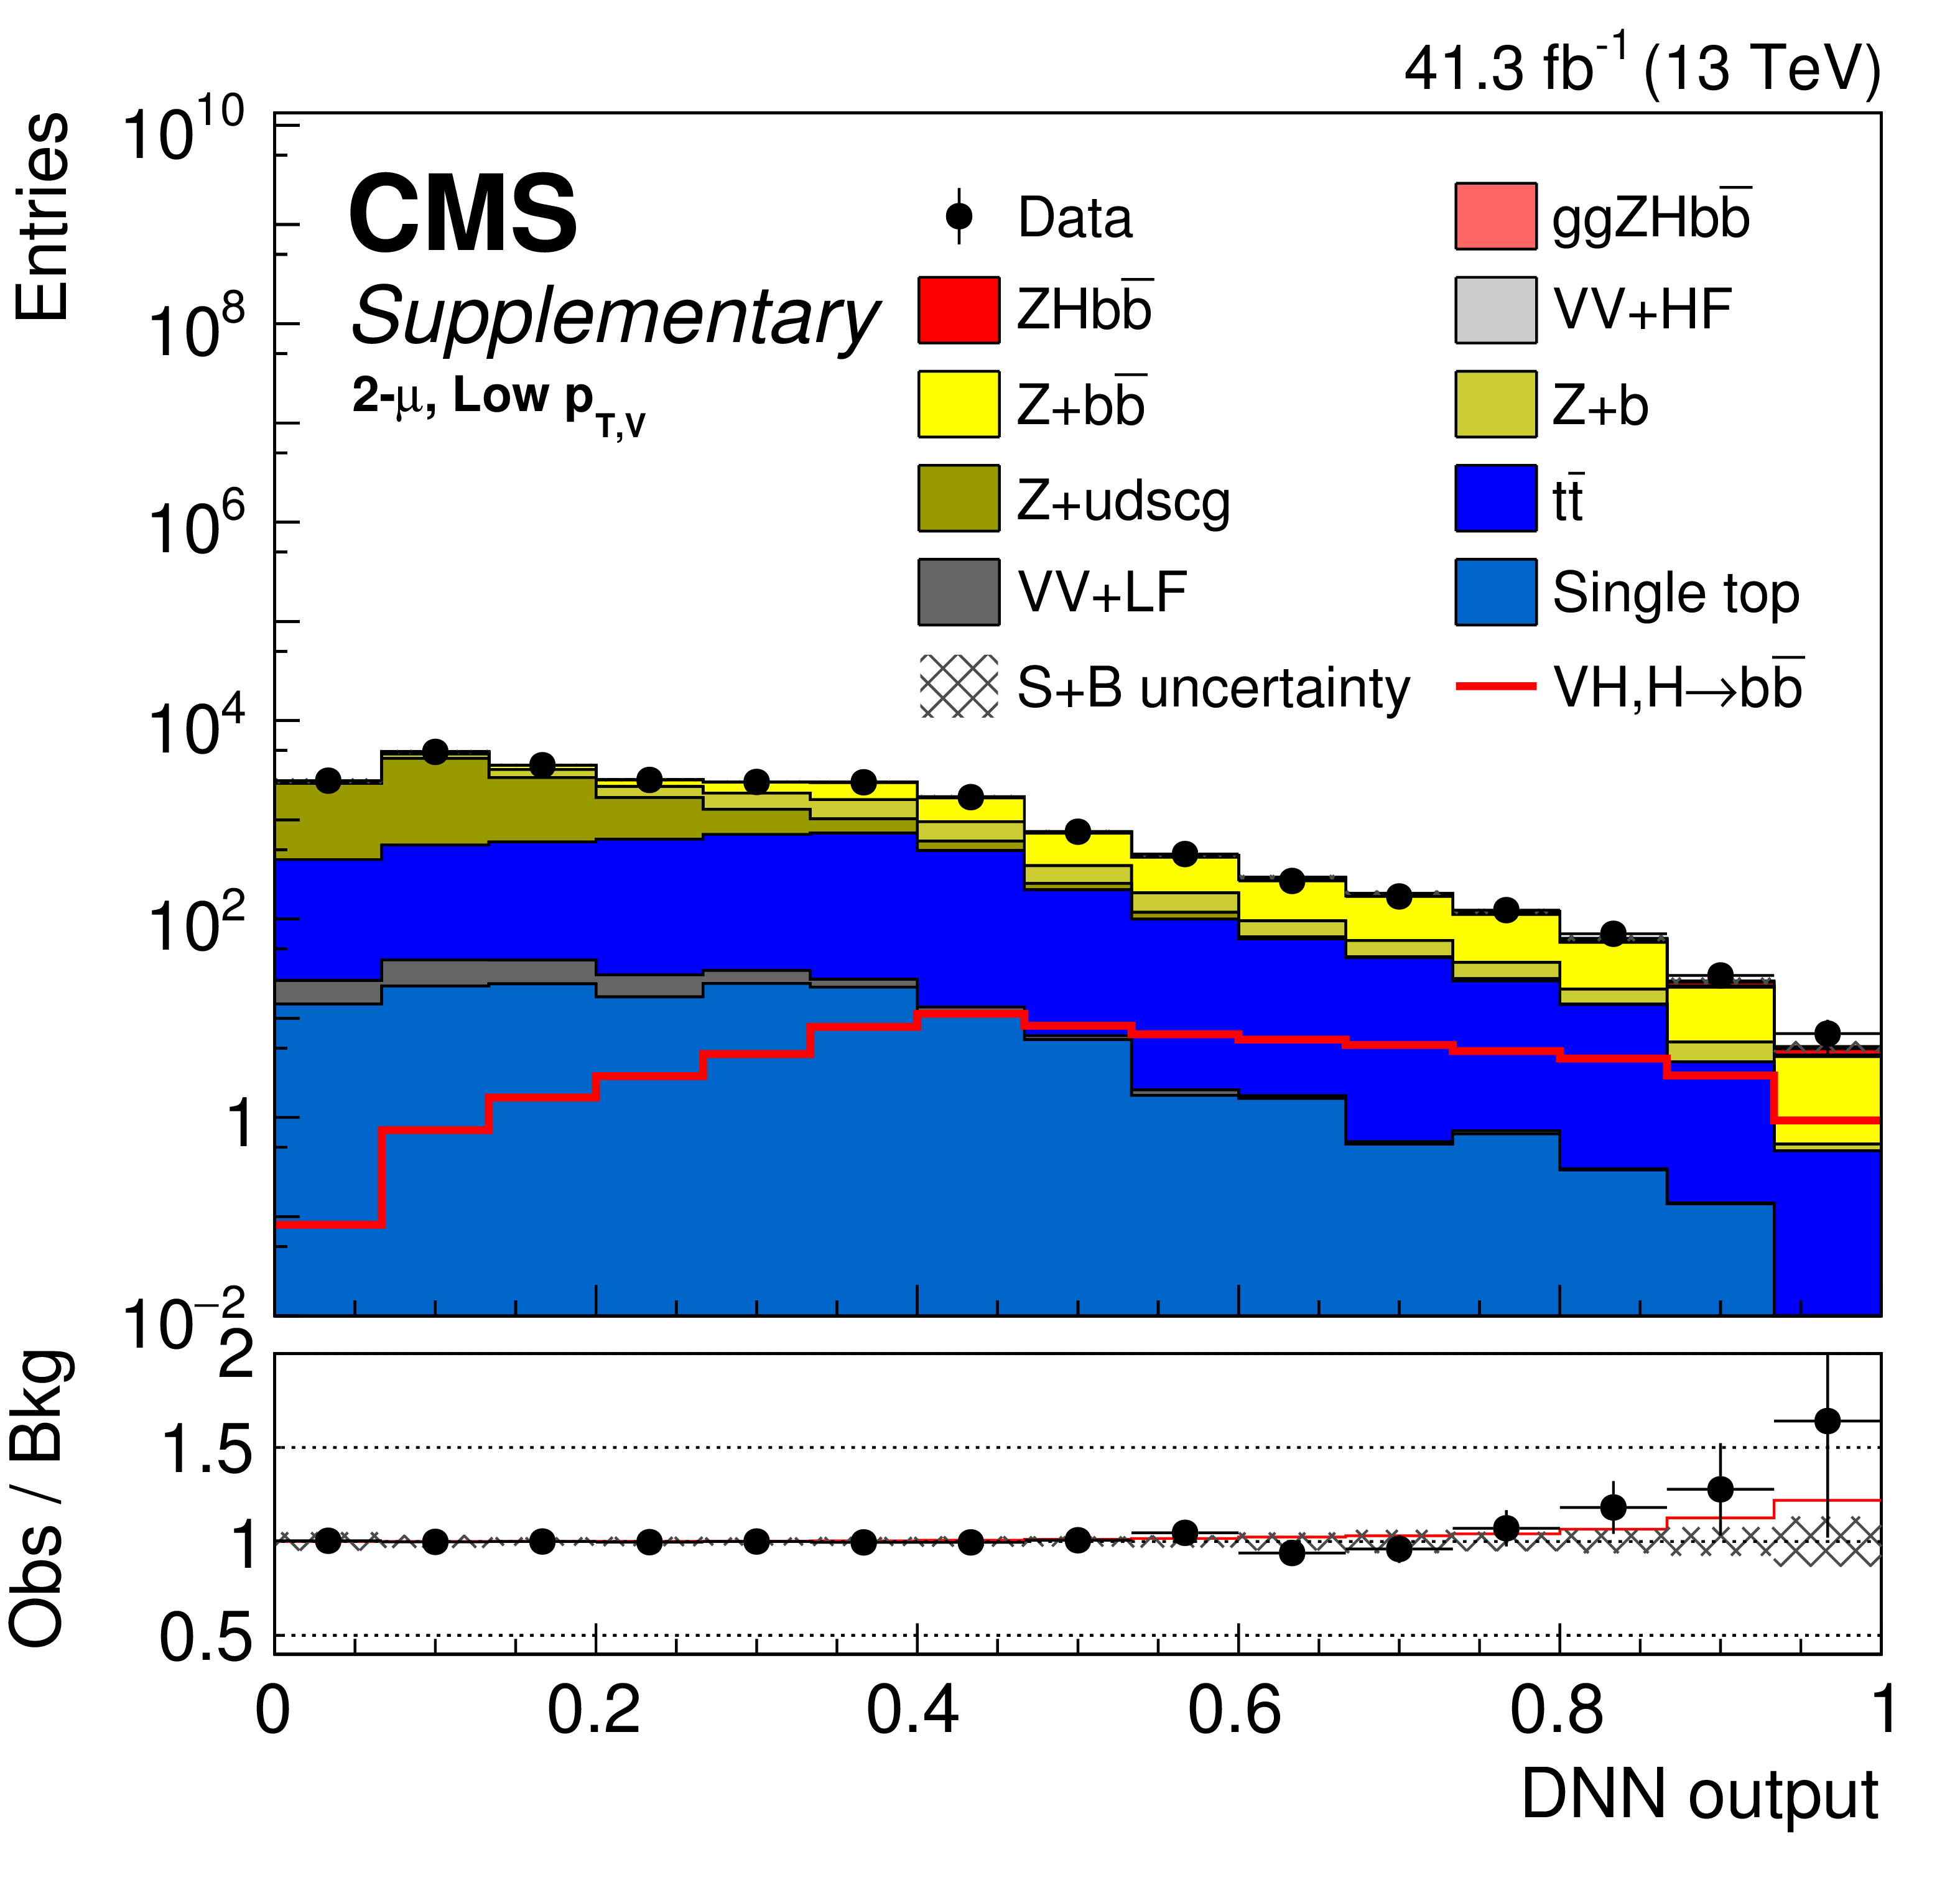
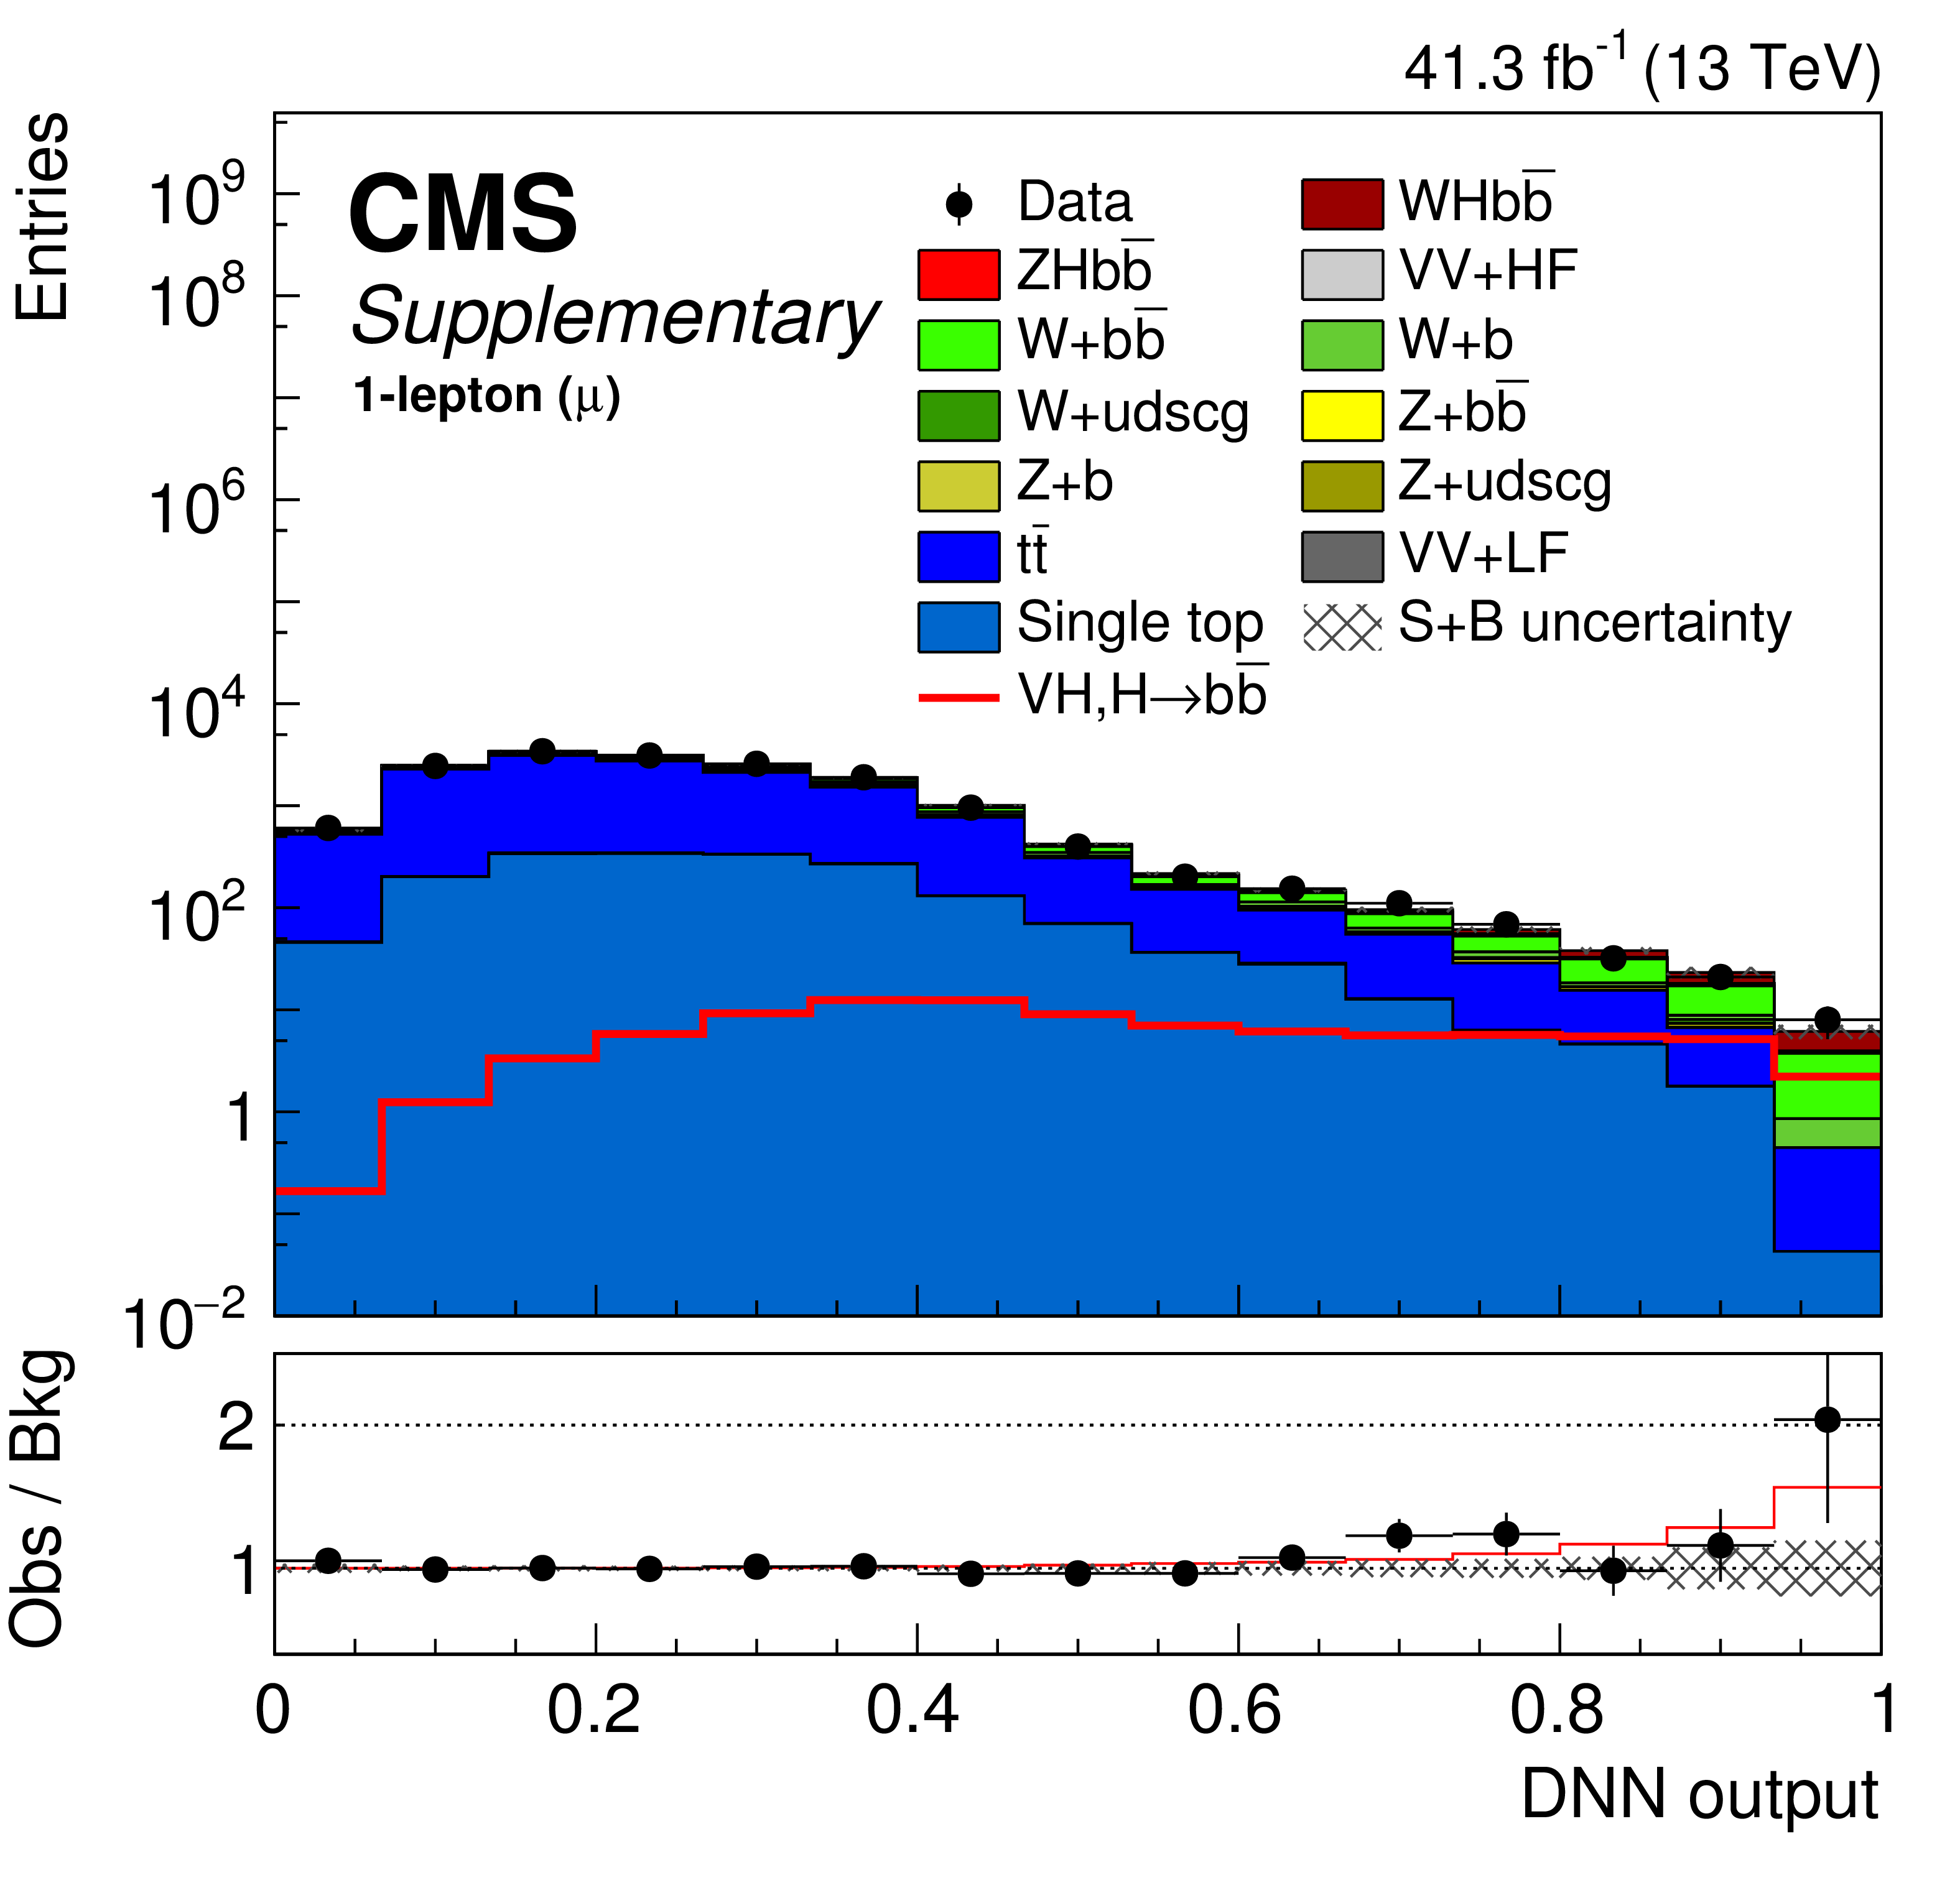
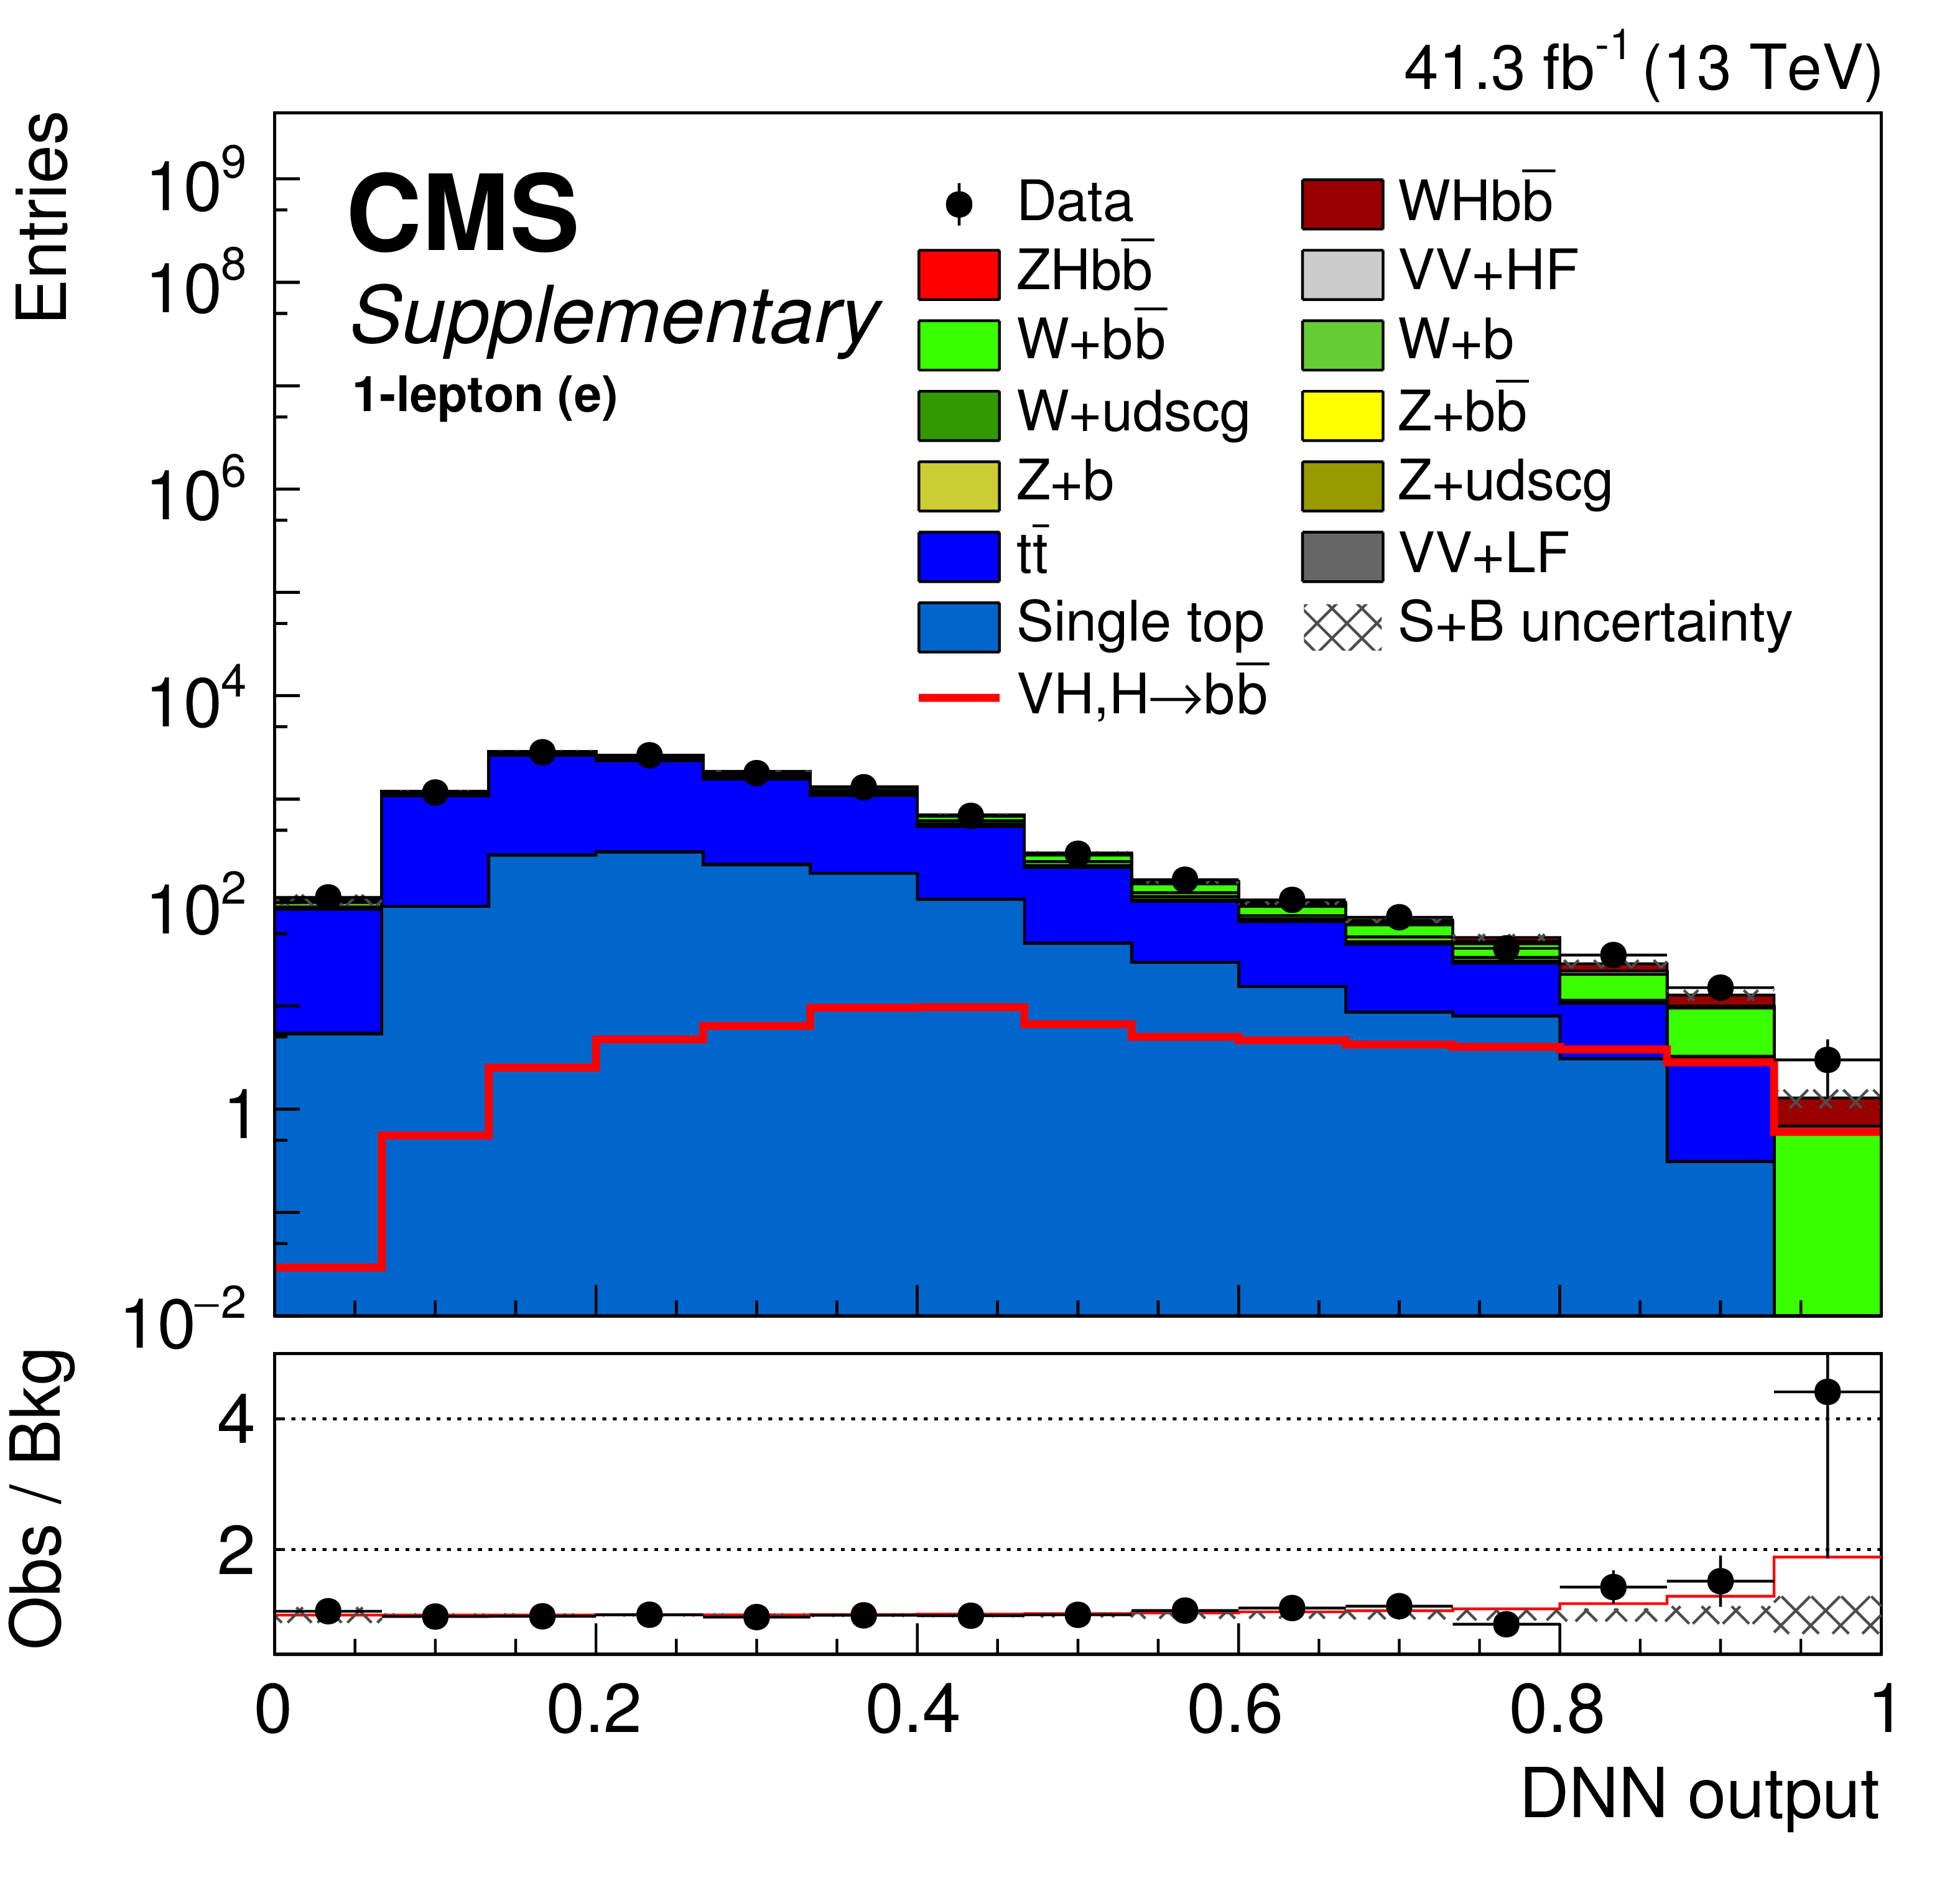
Post-fit distributions of multivariate discriminator output channels for 2017 analysis, after all signal region pre-selection criteria have been applied. First row: 2-lepton muon (left) and electron (right) channel for high ${{p_{\mathrm {T}}} ({\mathrm {V}})}$ region, in the second row the low ${{p_{\mathrm {T}}} ({\mathrm {V}})}$ is shown. Third row: 1-lepton muon (left) and electron (right) channel. Fourth row: 0-lepton channel. |

png pdf |
Additional Figure 7-a:
Post-fit distributions of multivariate discriminator output channels for 2017 analysis, after all signal region pre-selection criteria have been applied: 2-lepton muon channel for high ${{p_{\mathrm {T}}} ({\mathrm {V}})}$ region. |
png pdf |
Additional Figure 7-b:
Post-fit distributions of multivariate discriminator output channels for 2017 analysis, after all signal region pre-selection criteria have been applied: 2-lepton electron channel for high ${{p_{\mathrm {T}}} ({\mathrm {V}})}$ region. |
png pdf |
Additional Figure 7-c:
Post-fit distributions of multivariate discriminator output channels for 2017 analysis, after all signal region pre-selection criteria have been applied: 2-lepton muon channel for low ${{p_{\mathrm {T}}} ({\mathrm {V}})}$ region. |

png pdf |
Additional Figure 7-d:
Post-fit distributions of multivariate discriminator output channels for 2017 analysis, after all signal region pre-selection criteria have been applied: 2-lepton electron channel for low ${{p_{\mathrm {T}}} ({\mathrm {V}})}$ region. |
png pdf |
Additional Figure 7-e:
Post-fit distributions of multivariate discriminator output channels for 2017 analysis, after all signal region pre-selection criteria have been applied: 1-lepton muon channel. |
png pdf |
Additional Figure 7-f:
Post-fit distributions of multivariate discriminator output channels for 2017 analysis, after all signal region pre-selection criteria have been applied: 1-lepton electron channel. |
png pdf |
Additional Figure 7-g:
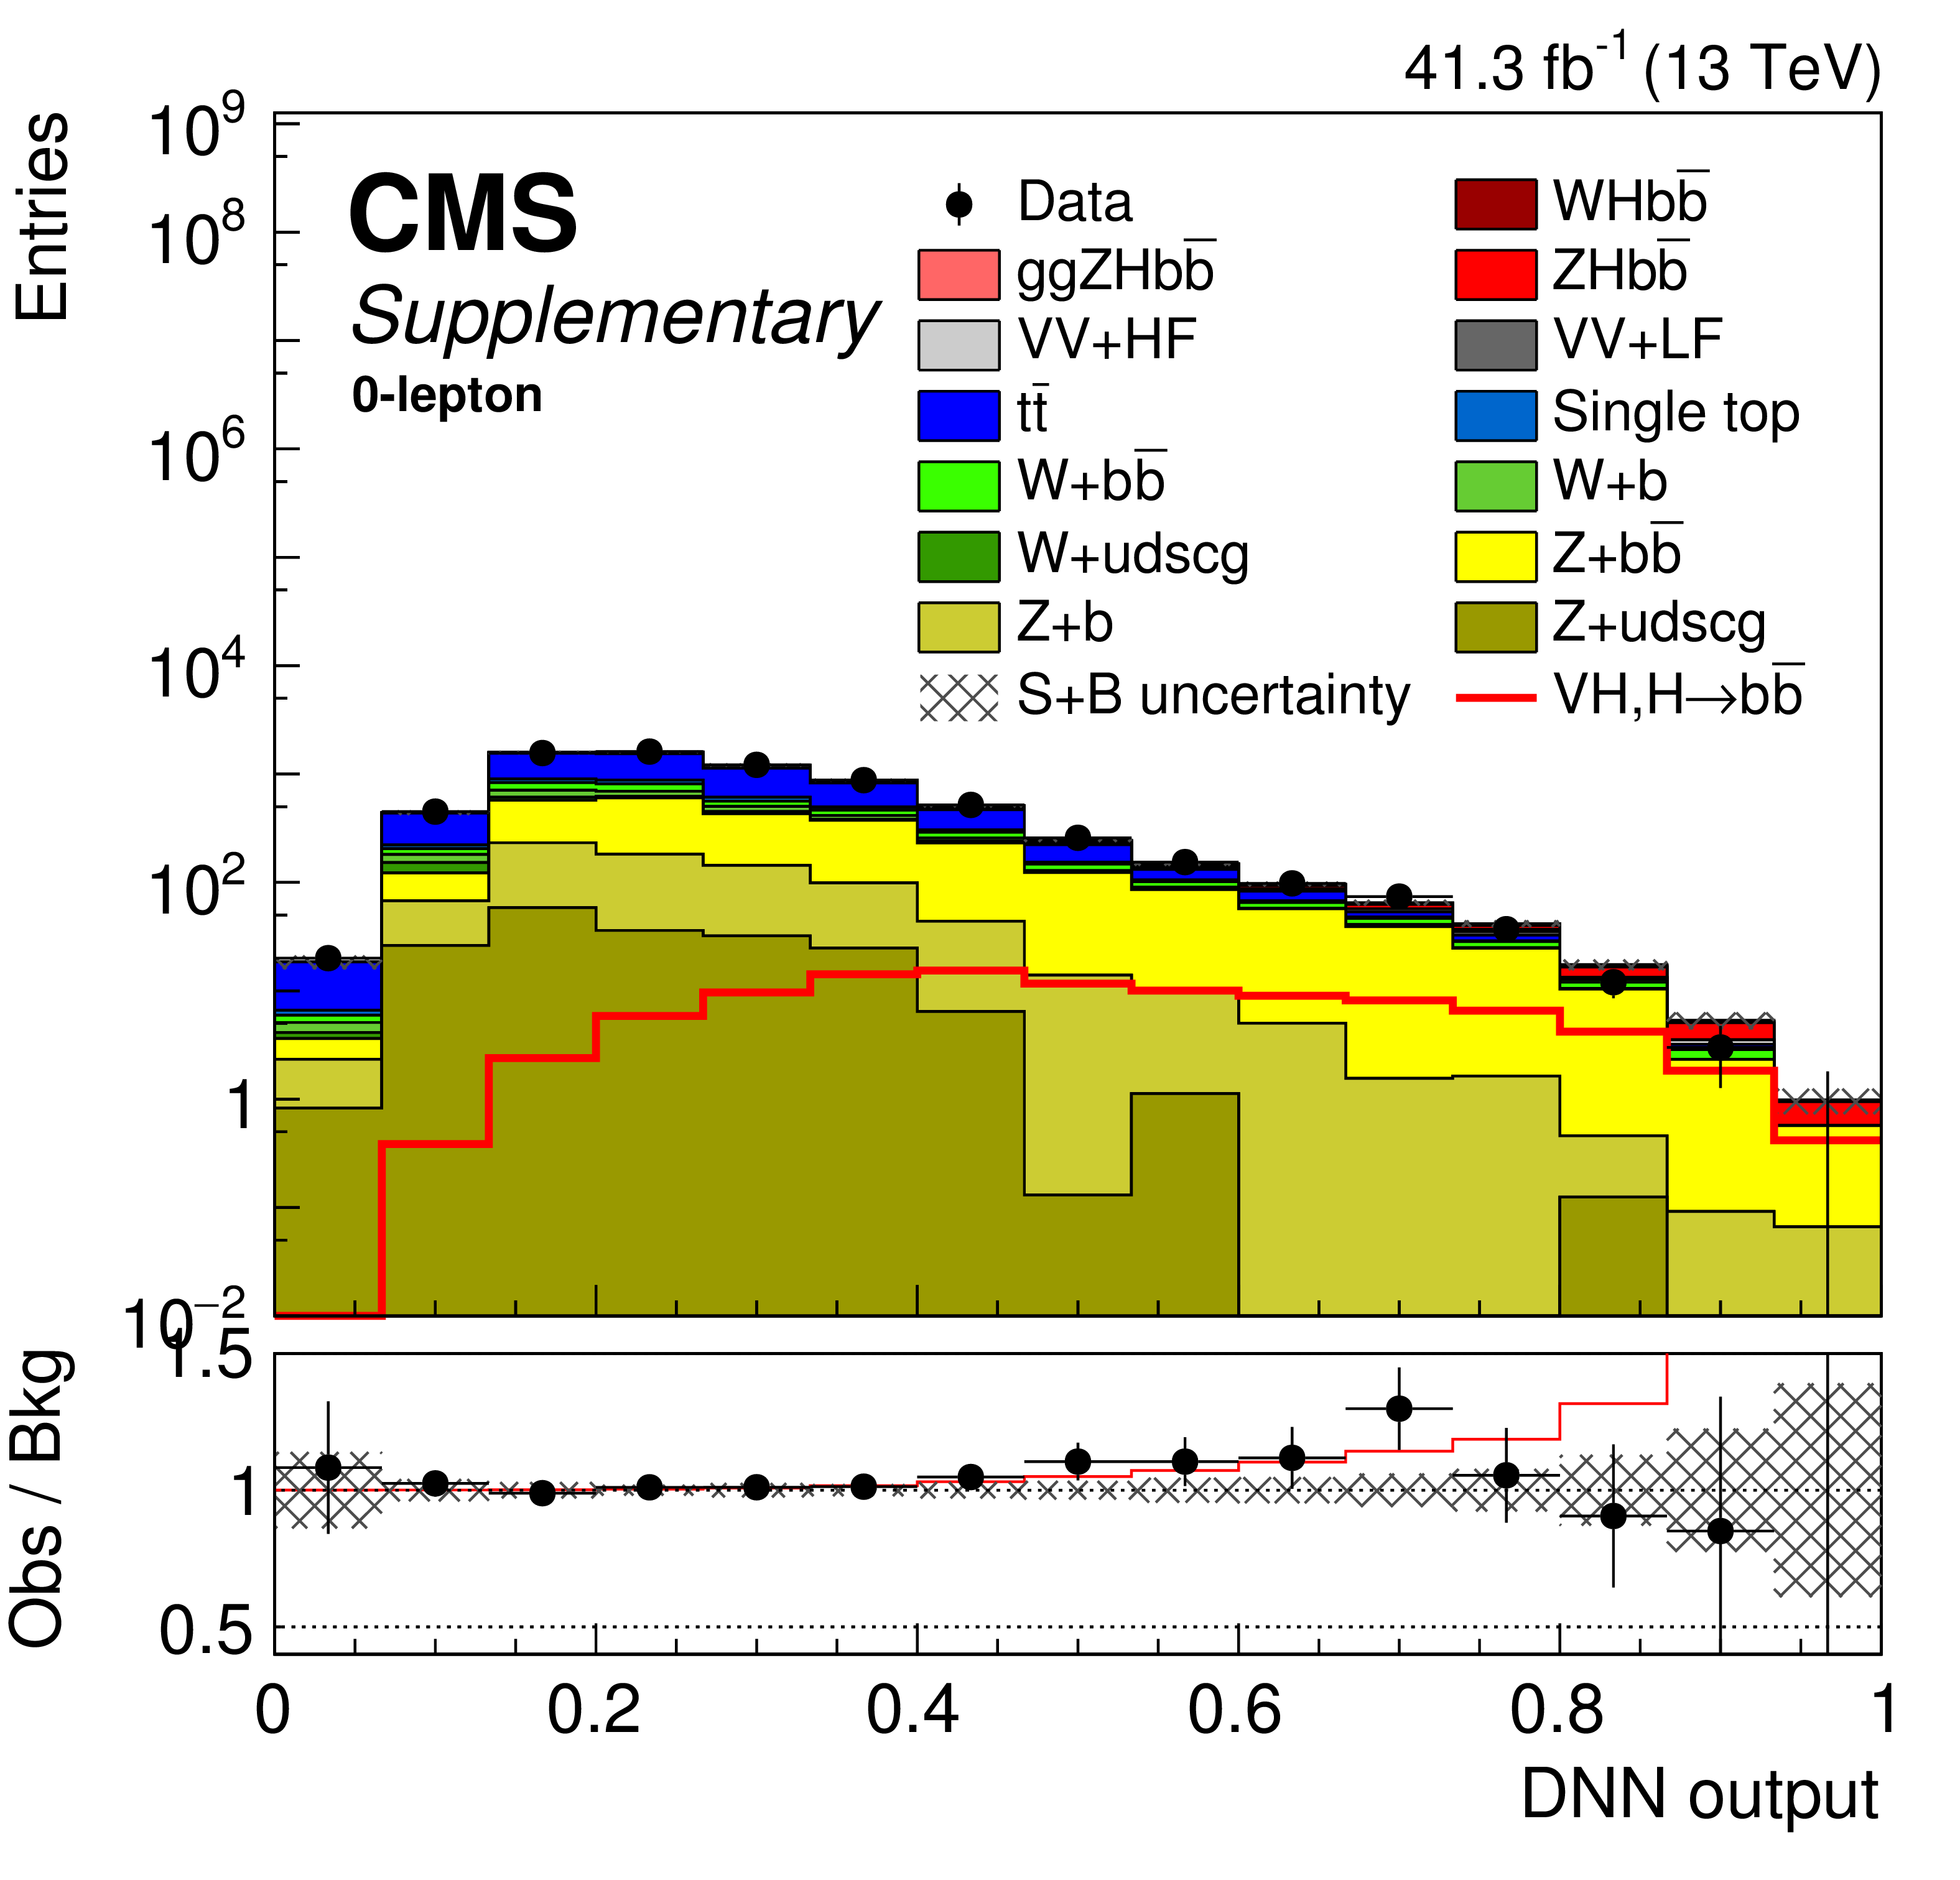
Post-fit distributions of multivariate discriminator output channels for 2017 analysis, after all signal region pre-selection criteria have been applied: 0-lepton channel. |
png pdf |
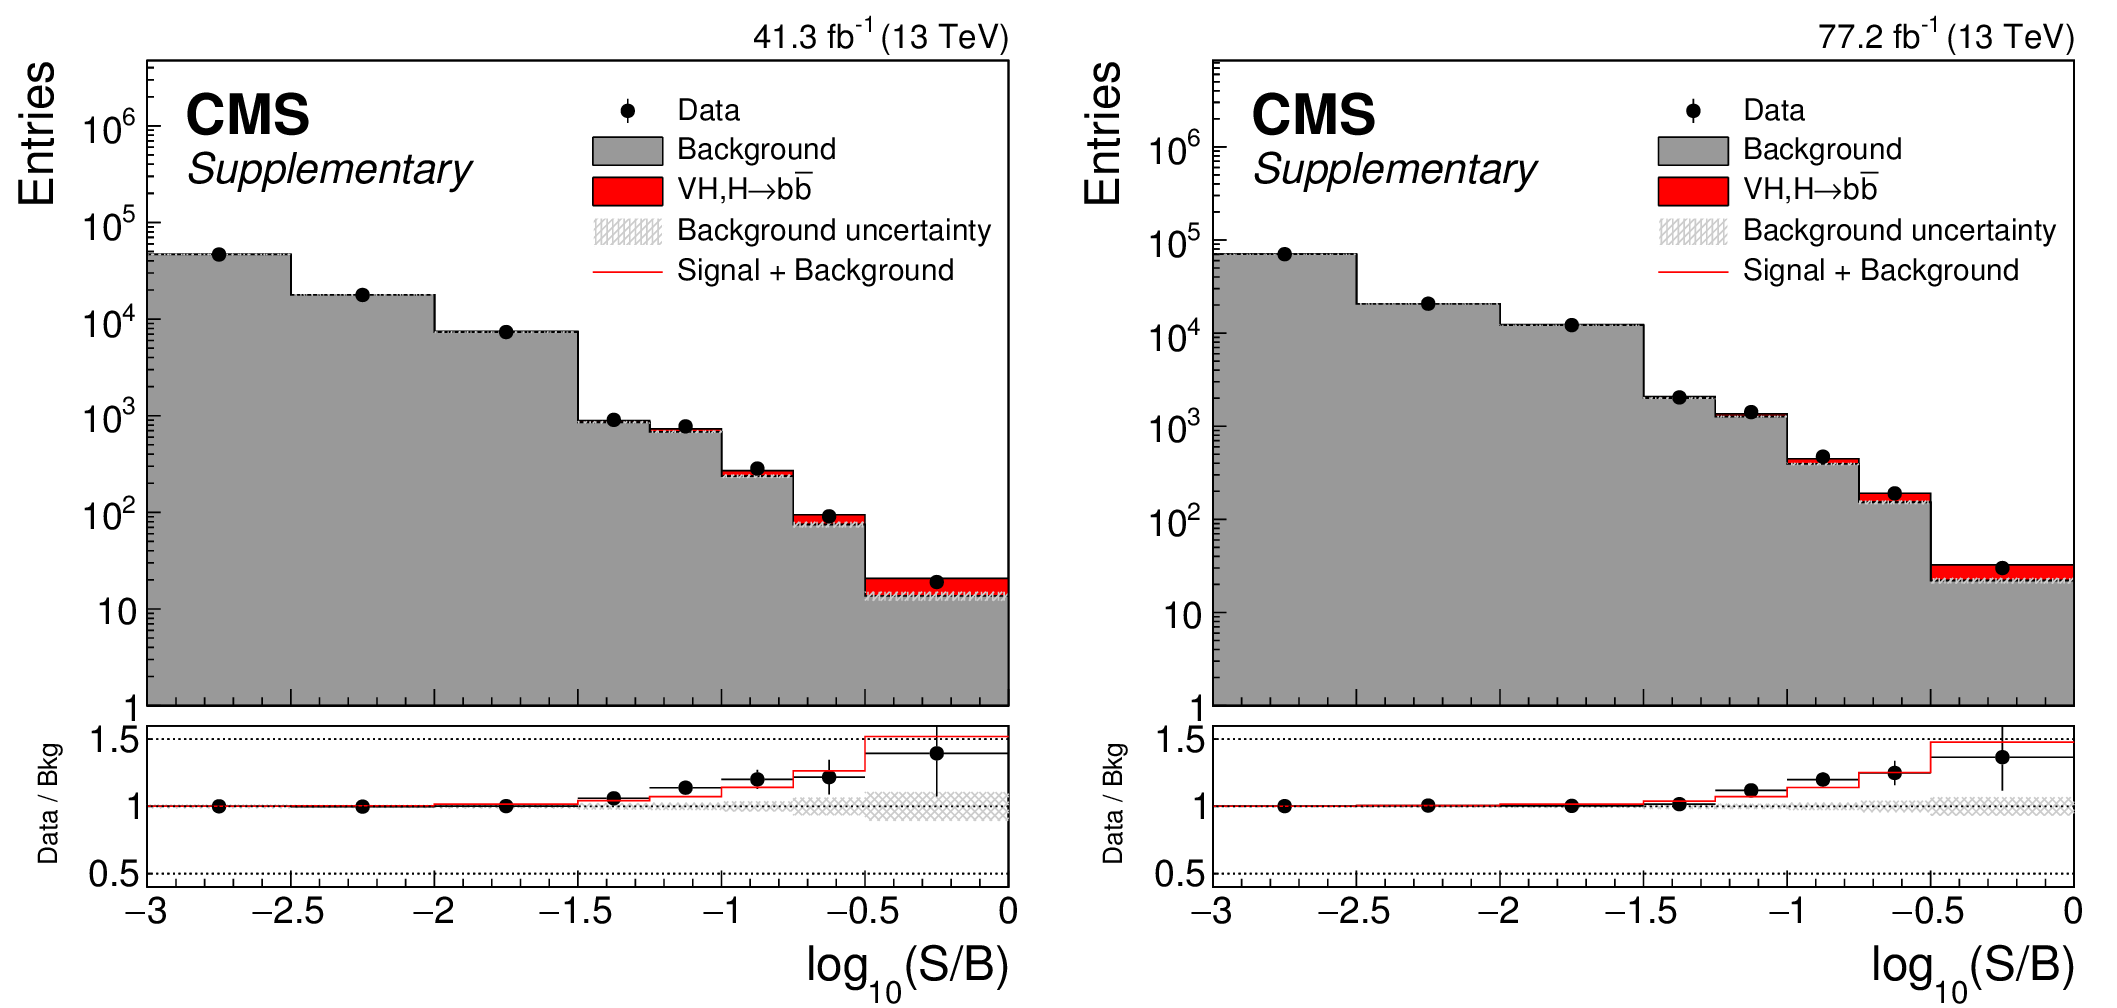
Additional Figure 8:
Distributions of signal, background, and data event yields sorted into bins of similar signal-to-background ratio, as given by the result of the fit to their corresponding multivariate discriminant. All events in the 2017 VH, ${{\mathrm {H}} \to {{\mathrm {b}} {\overline {\mathrm {b}}}}}$ signal regions are included on the left while the currently analyzed Run 2 data (2016+2017) are shown on the right. The red histogram indicates the Higgs boson signal contribution, while the grey histogram is the sum of all background yields. |
png pdf |
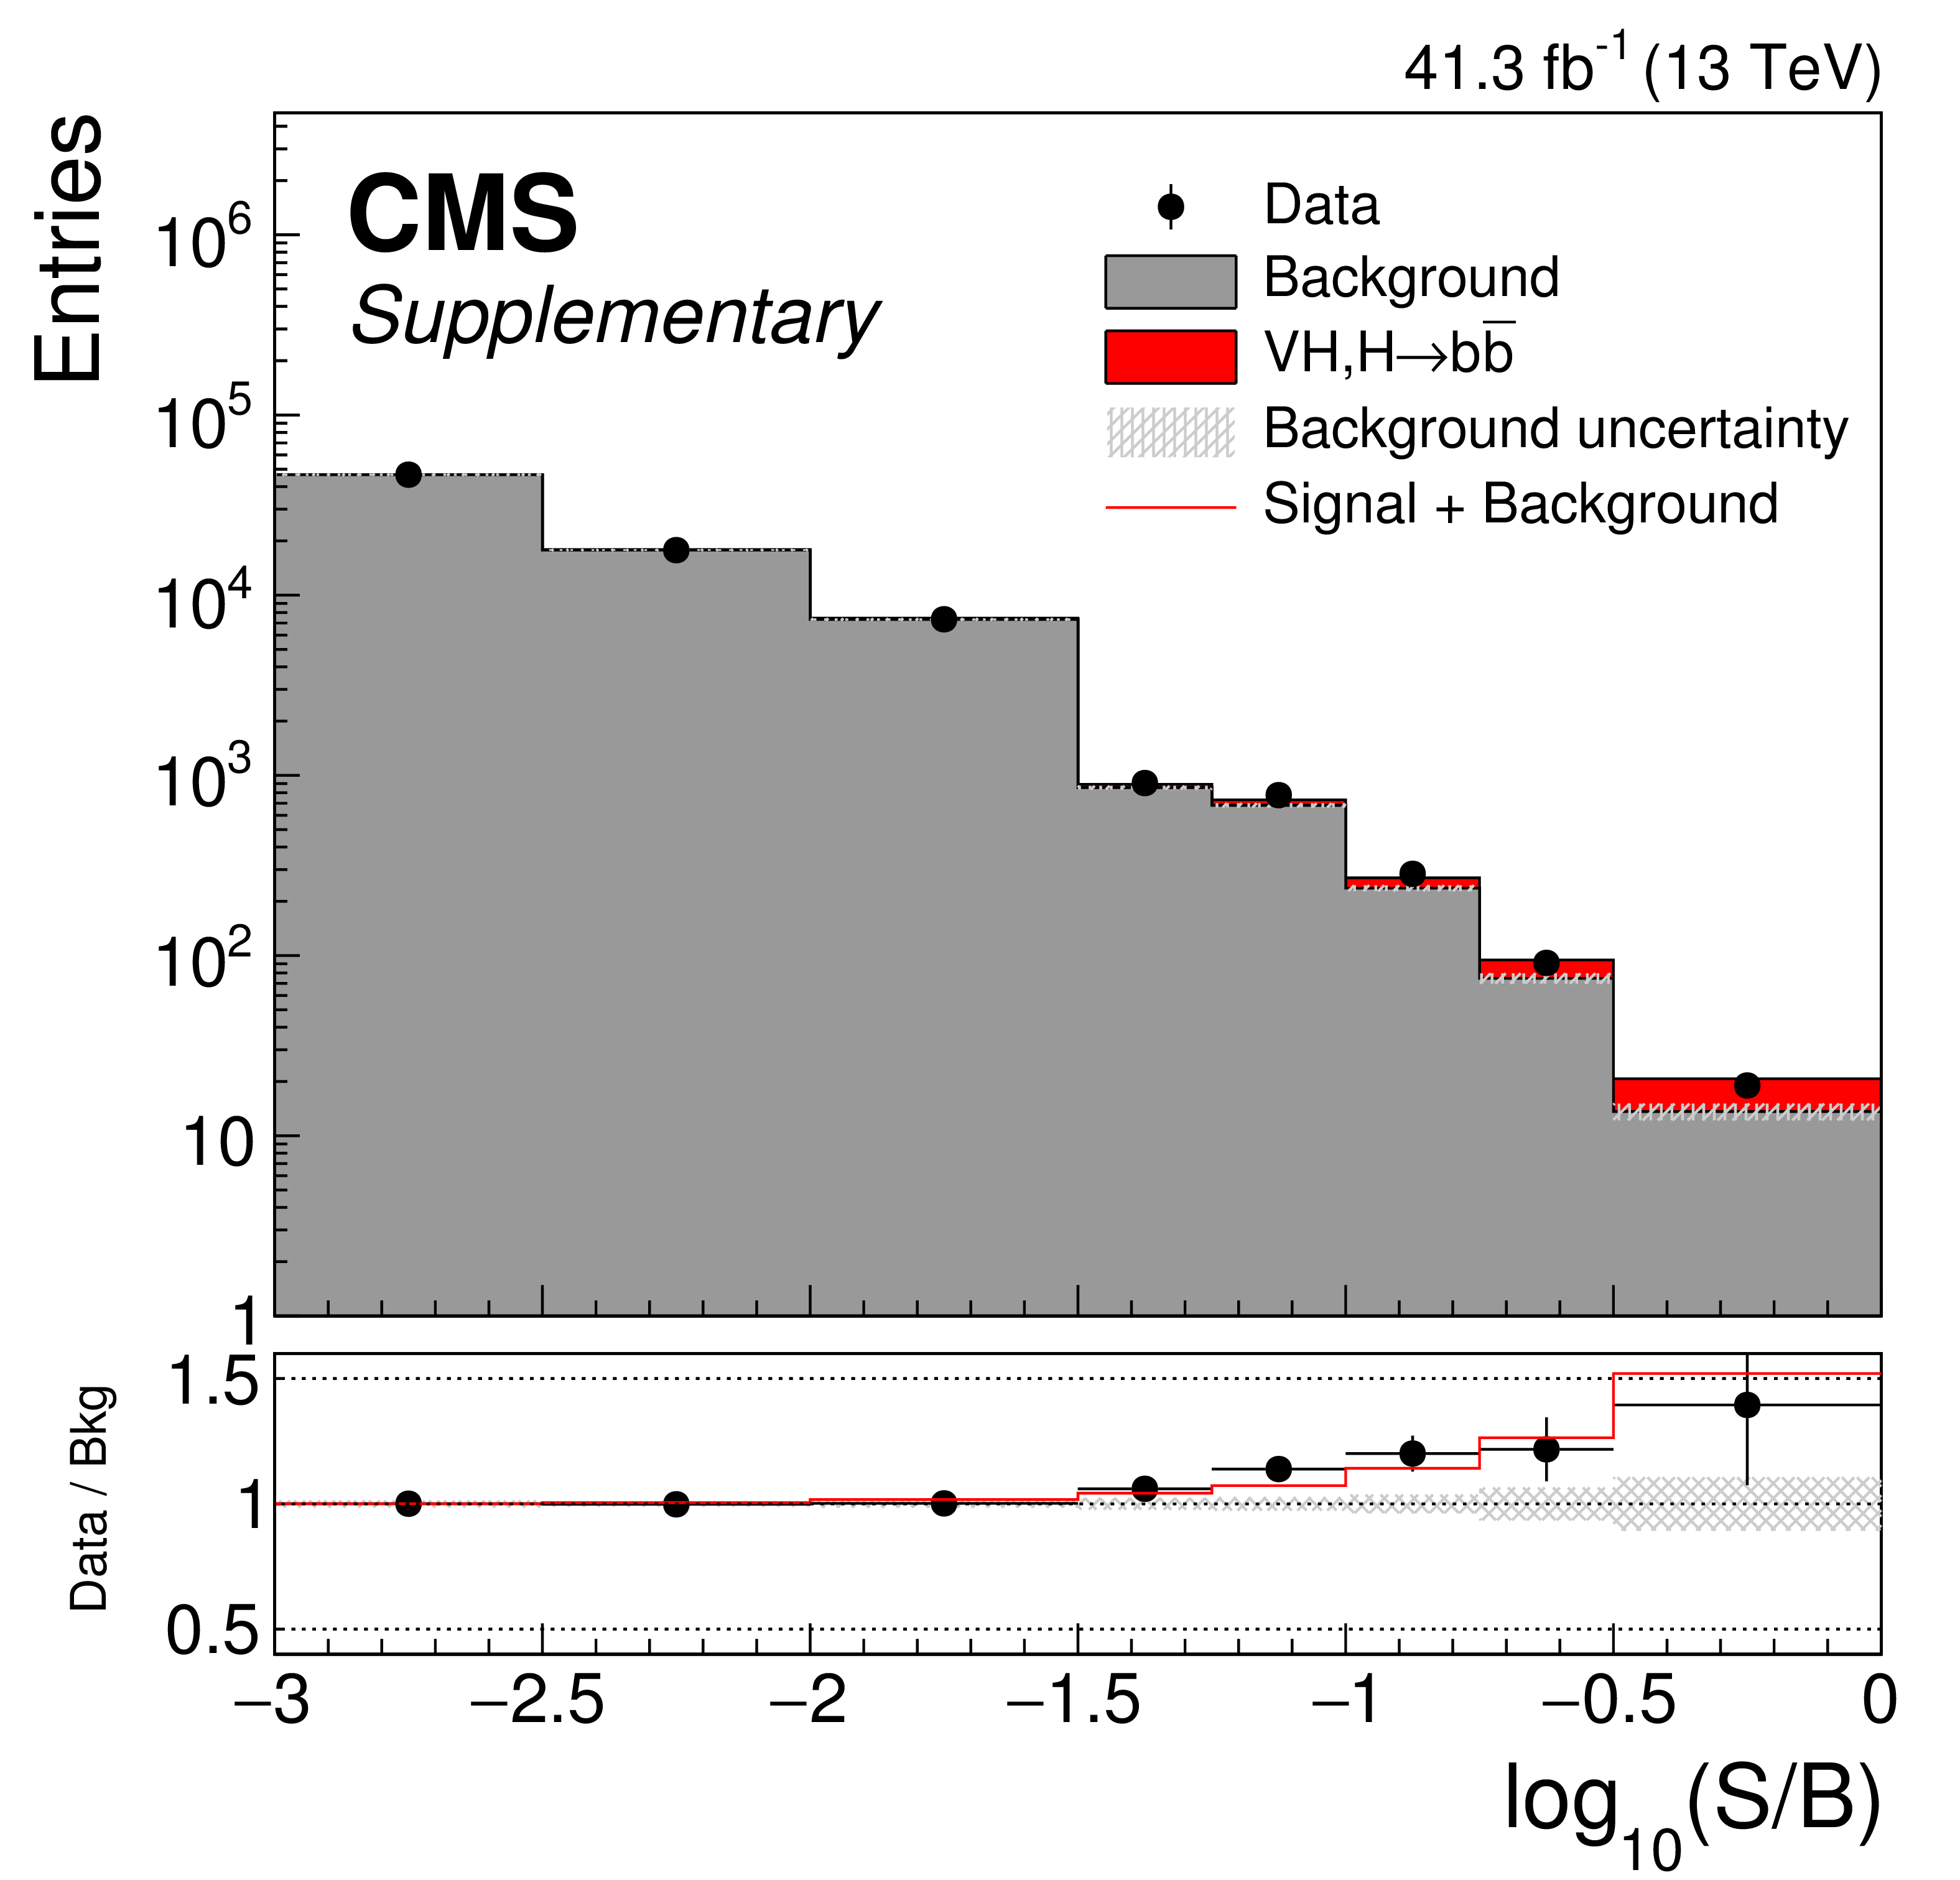
Additional Figure 8-a:
Distributions of signal, background, and data event yields sorted into bins of similar signal-to-background ratio, as given by the result of the fit to their corresponding multivariate discriminant. All events in the 2017 VH, ${{\mathrm {H}} \to {{\mathrm {b}} {\overline {\mathrm {b}}}}}$ signal regions are included. The red histogram indicates the Higgs boson signal contribution, while the grey histogram is the sum of all background yields. |

png pdf |
Additional Figure 8-b:
Distributions of signal, background, and data event yields sorted into bins of similar signal-to-background ratio, as given by the result of the fit to their corresponding multivariate discriminant. The currently analyzed Run 2 data (2016+2017) are shown. The red histogram indicates the Higgs boson signal contribution, while the grey histogram is the sum of all background yields. |
png pdf |
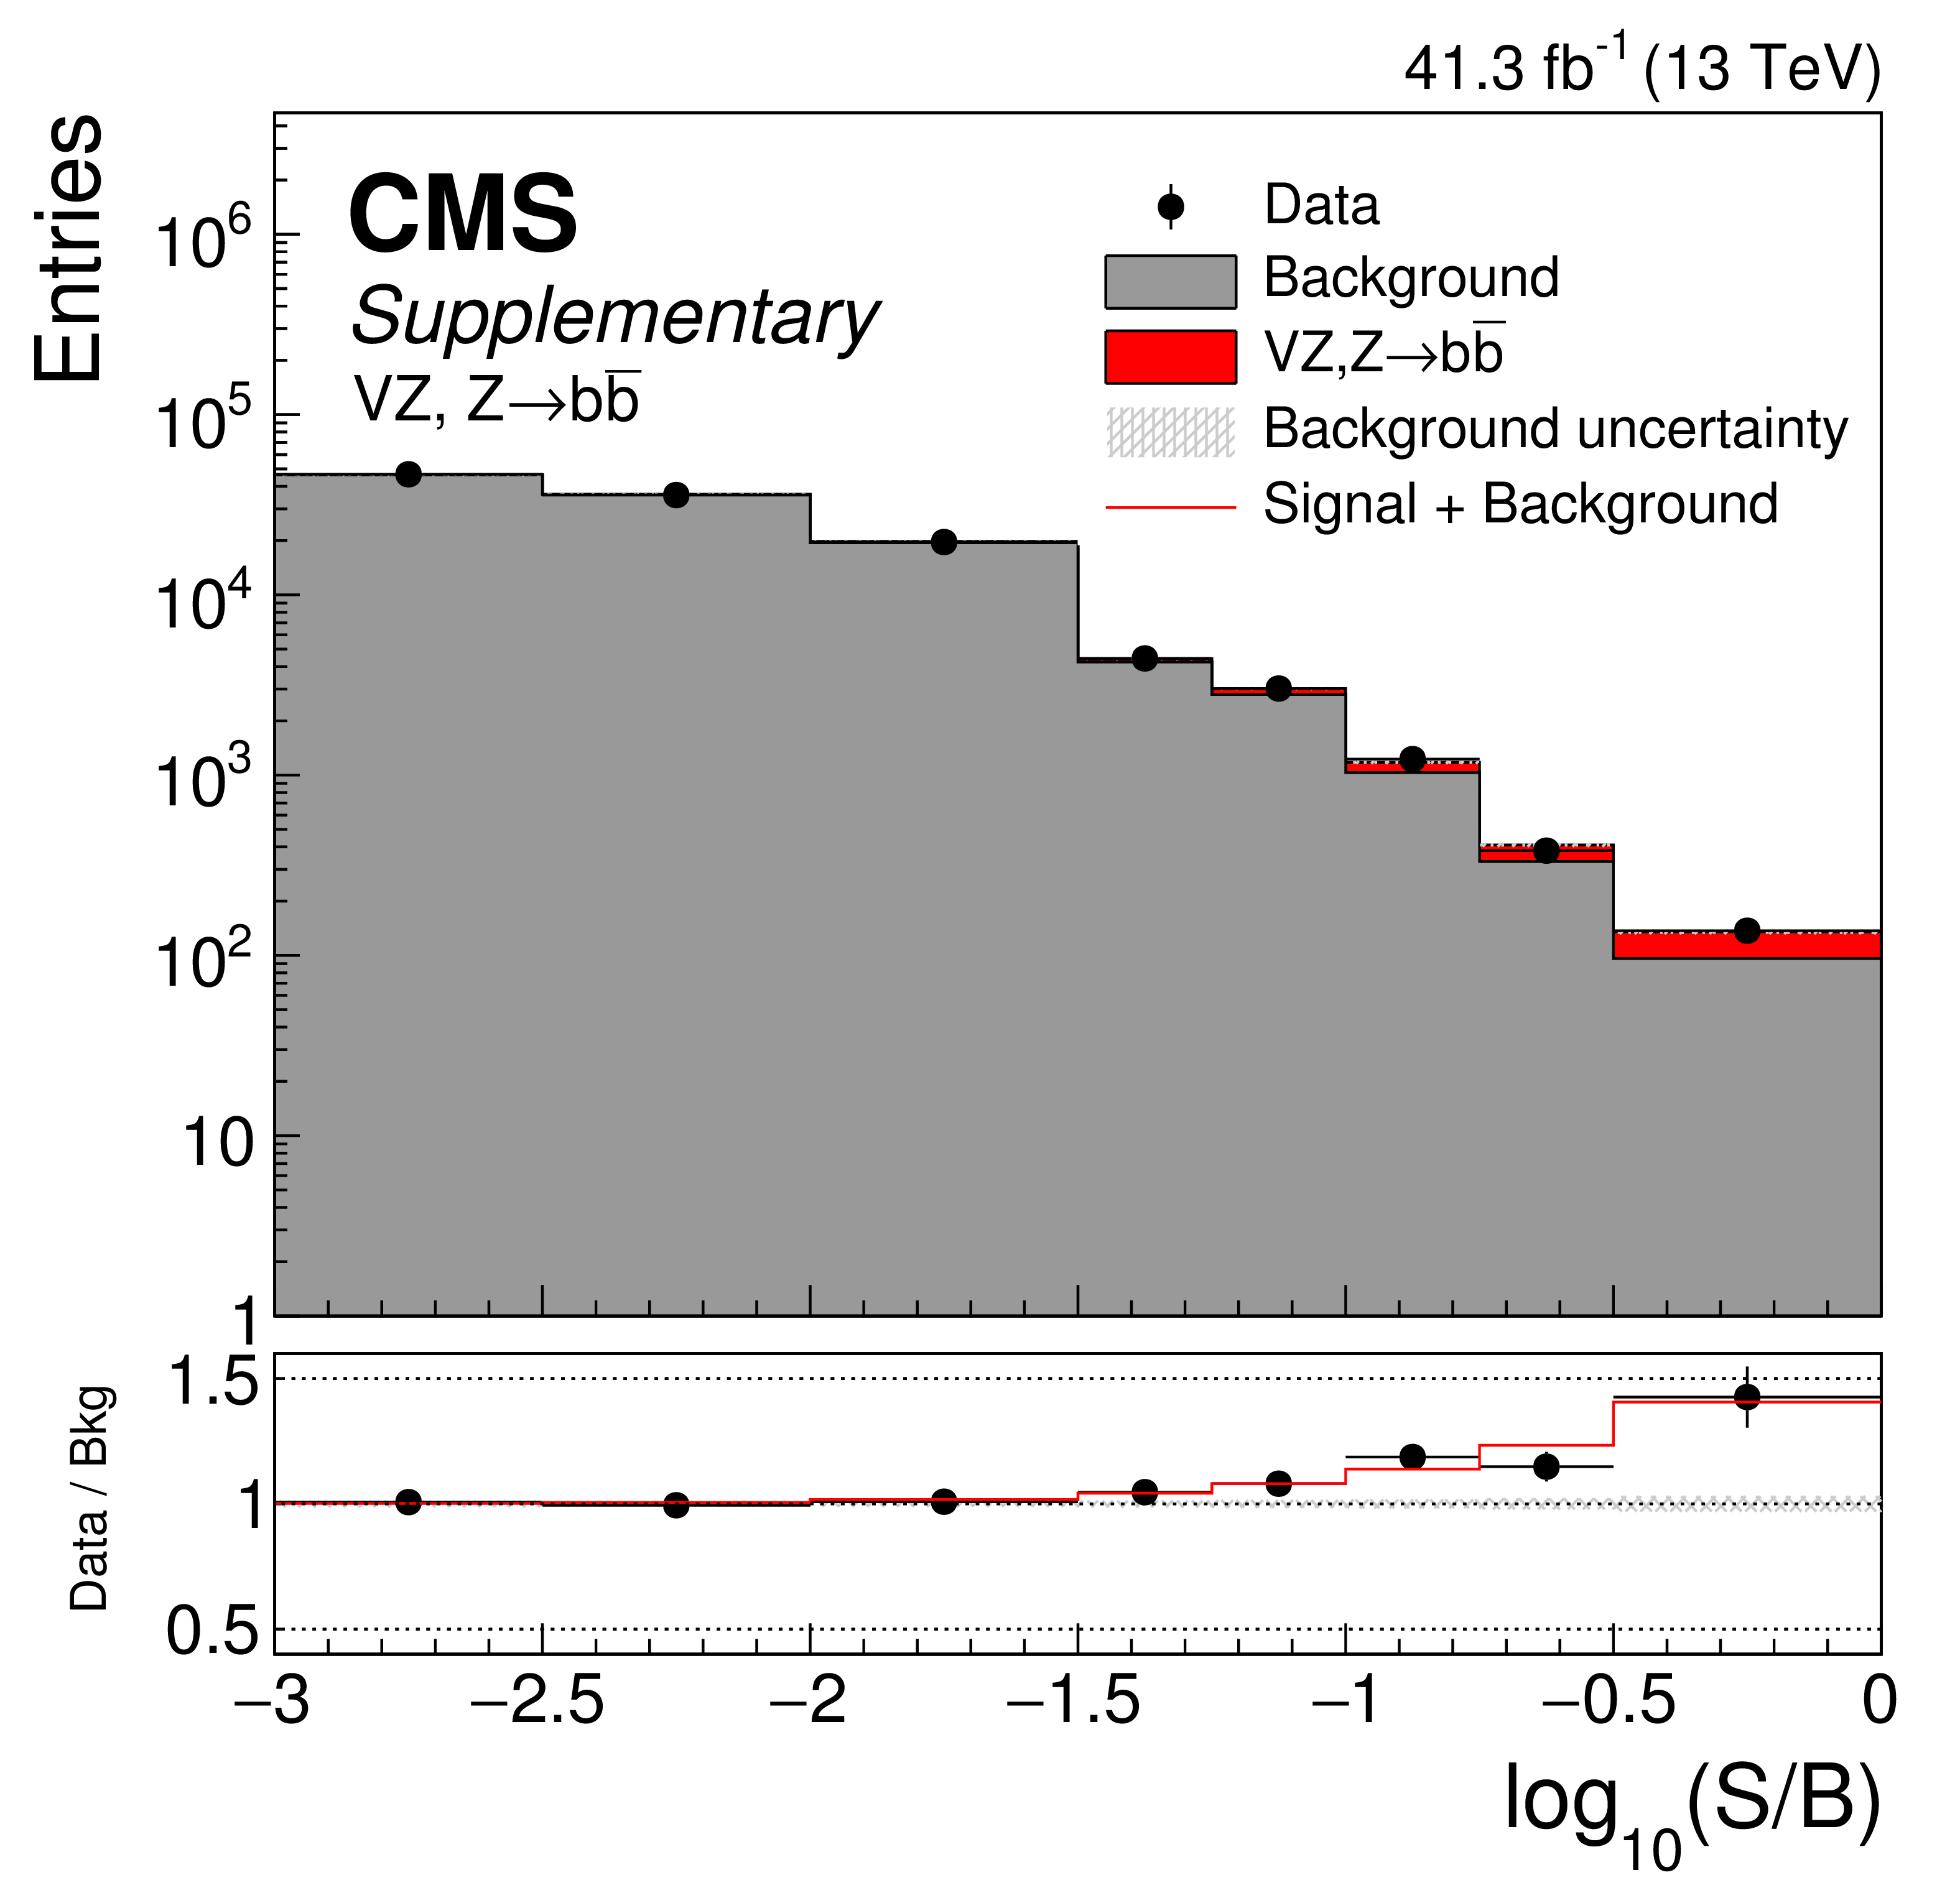
Additional Figure 9:
Distributions of signal, background, and data event yields sorted into bins of similar signal-to-background ratio, as given by the result of the fit to their corresponding multivariate discriminant. All events in the 2017 VZ, ${{\mathrm {Z}}\to {{\mathrm {b}} {\overline {\mathrm {b}}}}}$ signal regions are included. The red histogram indicates the ${{\mathrm {Z}}\to {{\mathrm {b}} {\overline {\mathrm {b}}}}} $ signal contribution, while the grey histogram is the sum of all background yields. |
png pdf |
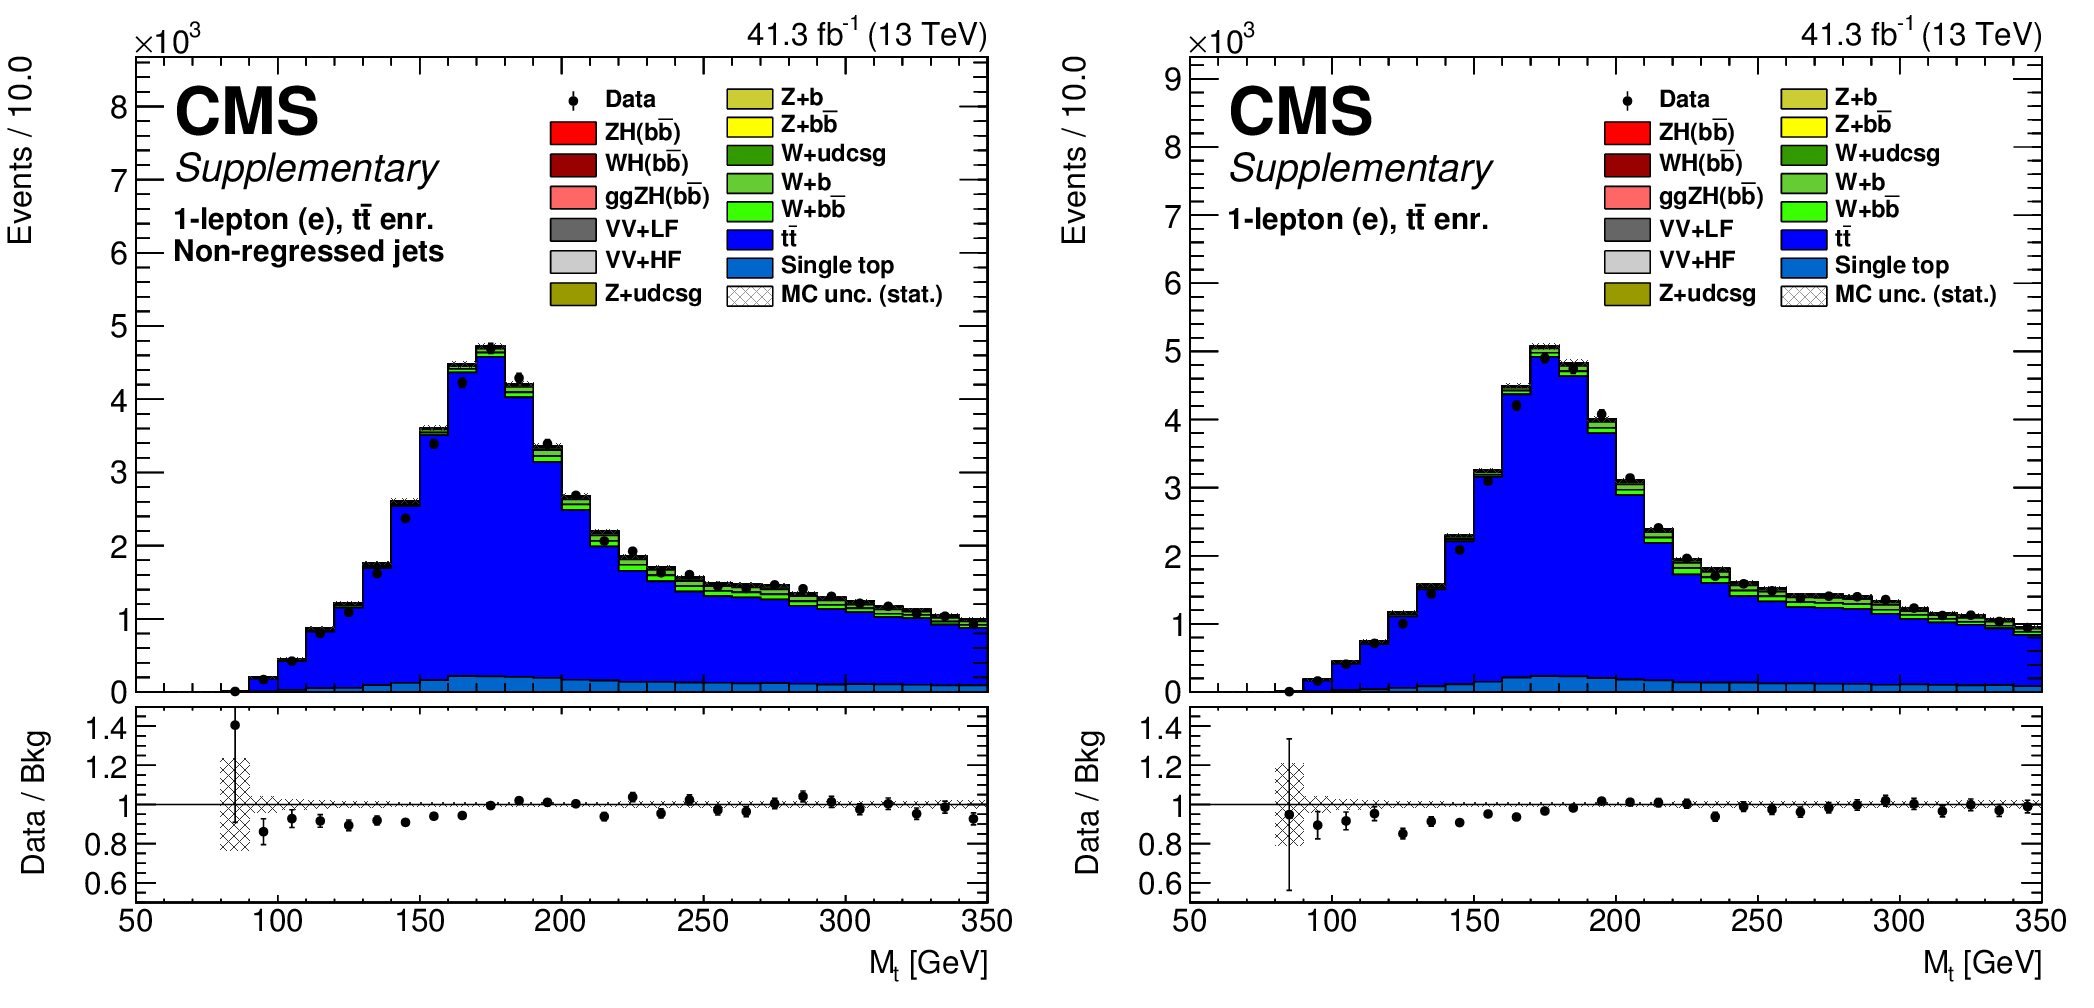
Additional Figure 10:
The two plots above show the top quark mass reconstructed in the 1-lepton ${{\mathrm {t}\overline {\mathrm {t}}}} $ control region using the tagged lepton, ${{p}_{\mathrm {T}}^{\text {miss}}}$, one of the two b-jets and the constraint of the W mass to estimate the longitudinal component of the neutrino. The reconstruction on the left uses the un-regressed b-jet energy and the right uses regressed b-jet energy. |
png pdf |
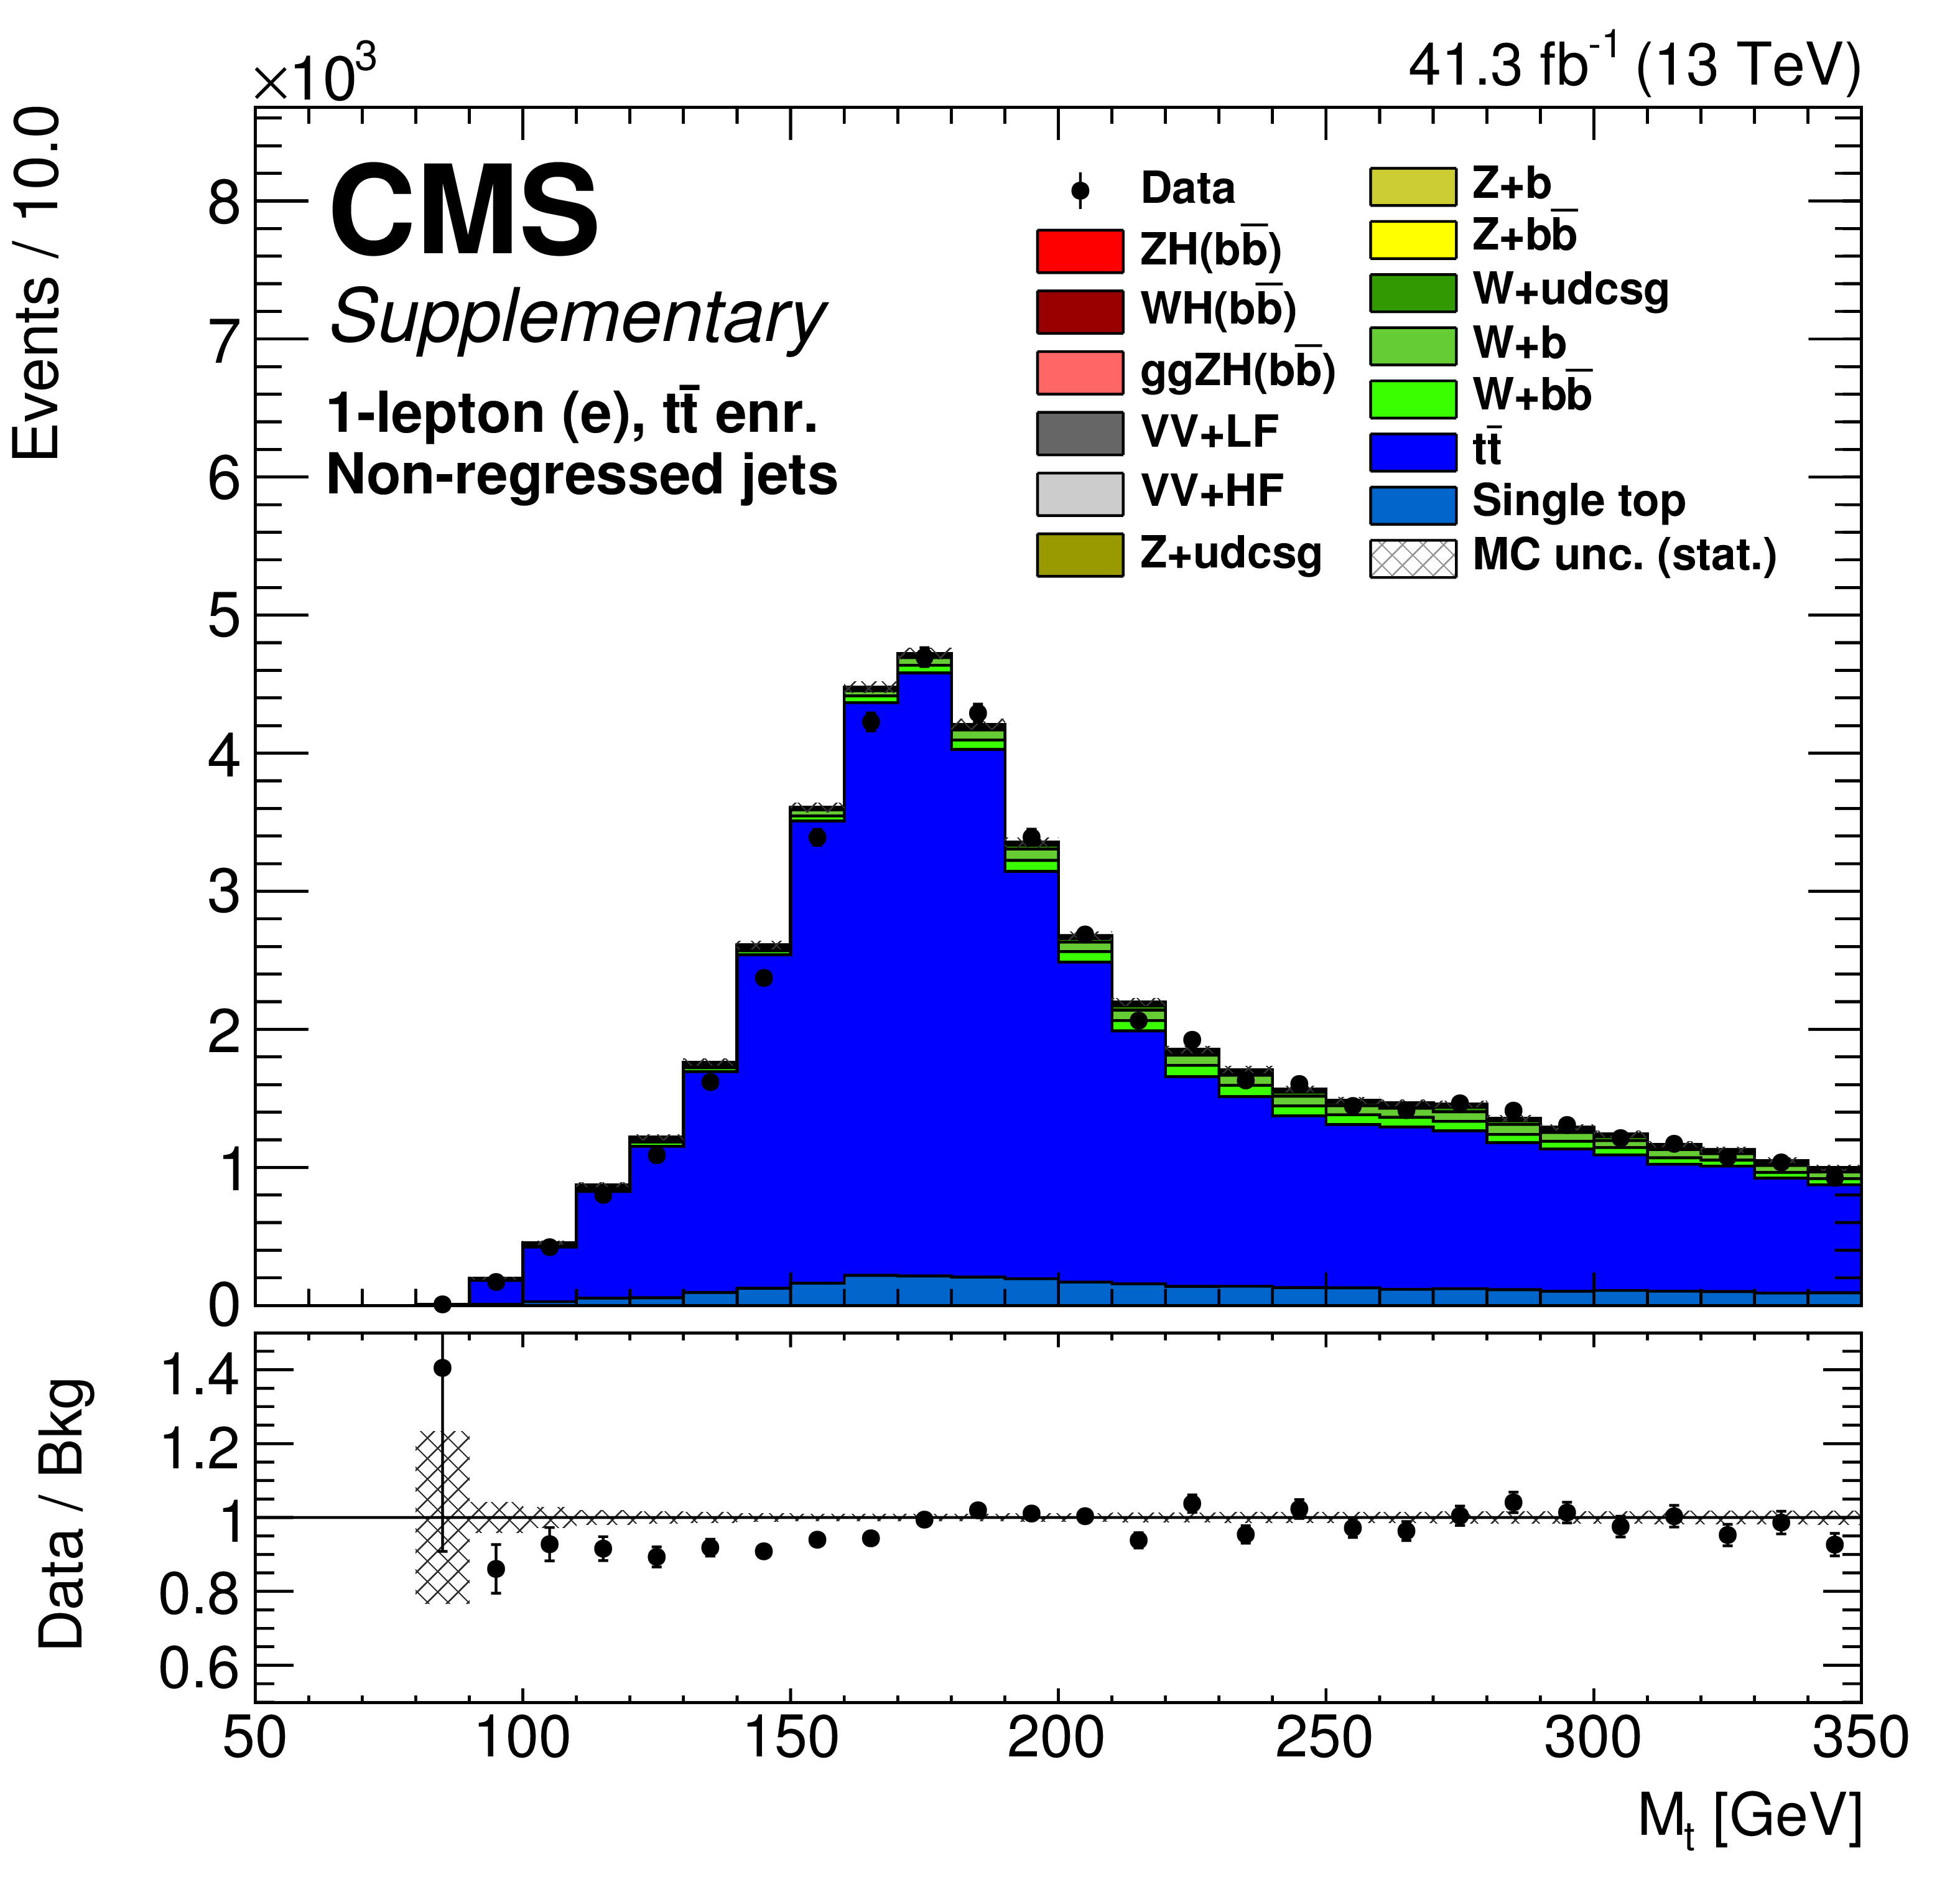
Additional Figure 10-a:
The plot above shows the top quark mass reconstructed in the 1-lepton ${{\mathrm {t}\overline {\mathrm {t}}}} $ control region using the tagged lepton, ${{p}_{\mathrm {T}}^{\text {miss}}}$, one of the two b-jets and the constraint of the W mass to estimate the longitudinal component of the neutrino. The reconstruction uses the un-regressed b-jet energy. |
png pdf |
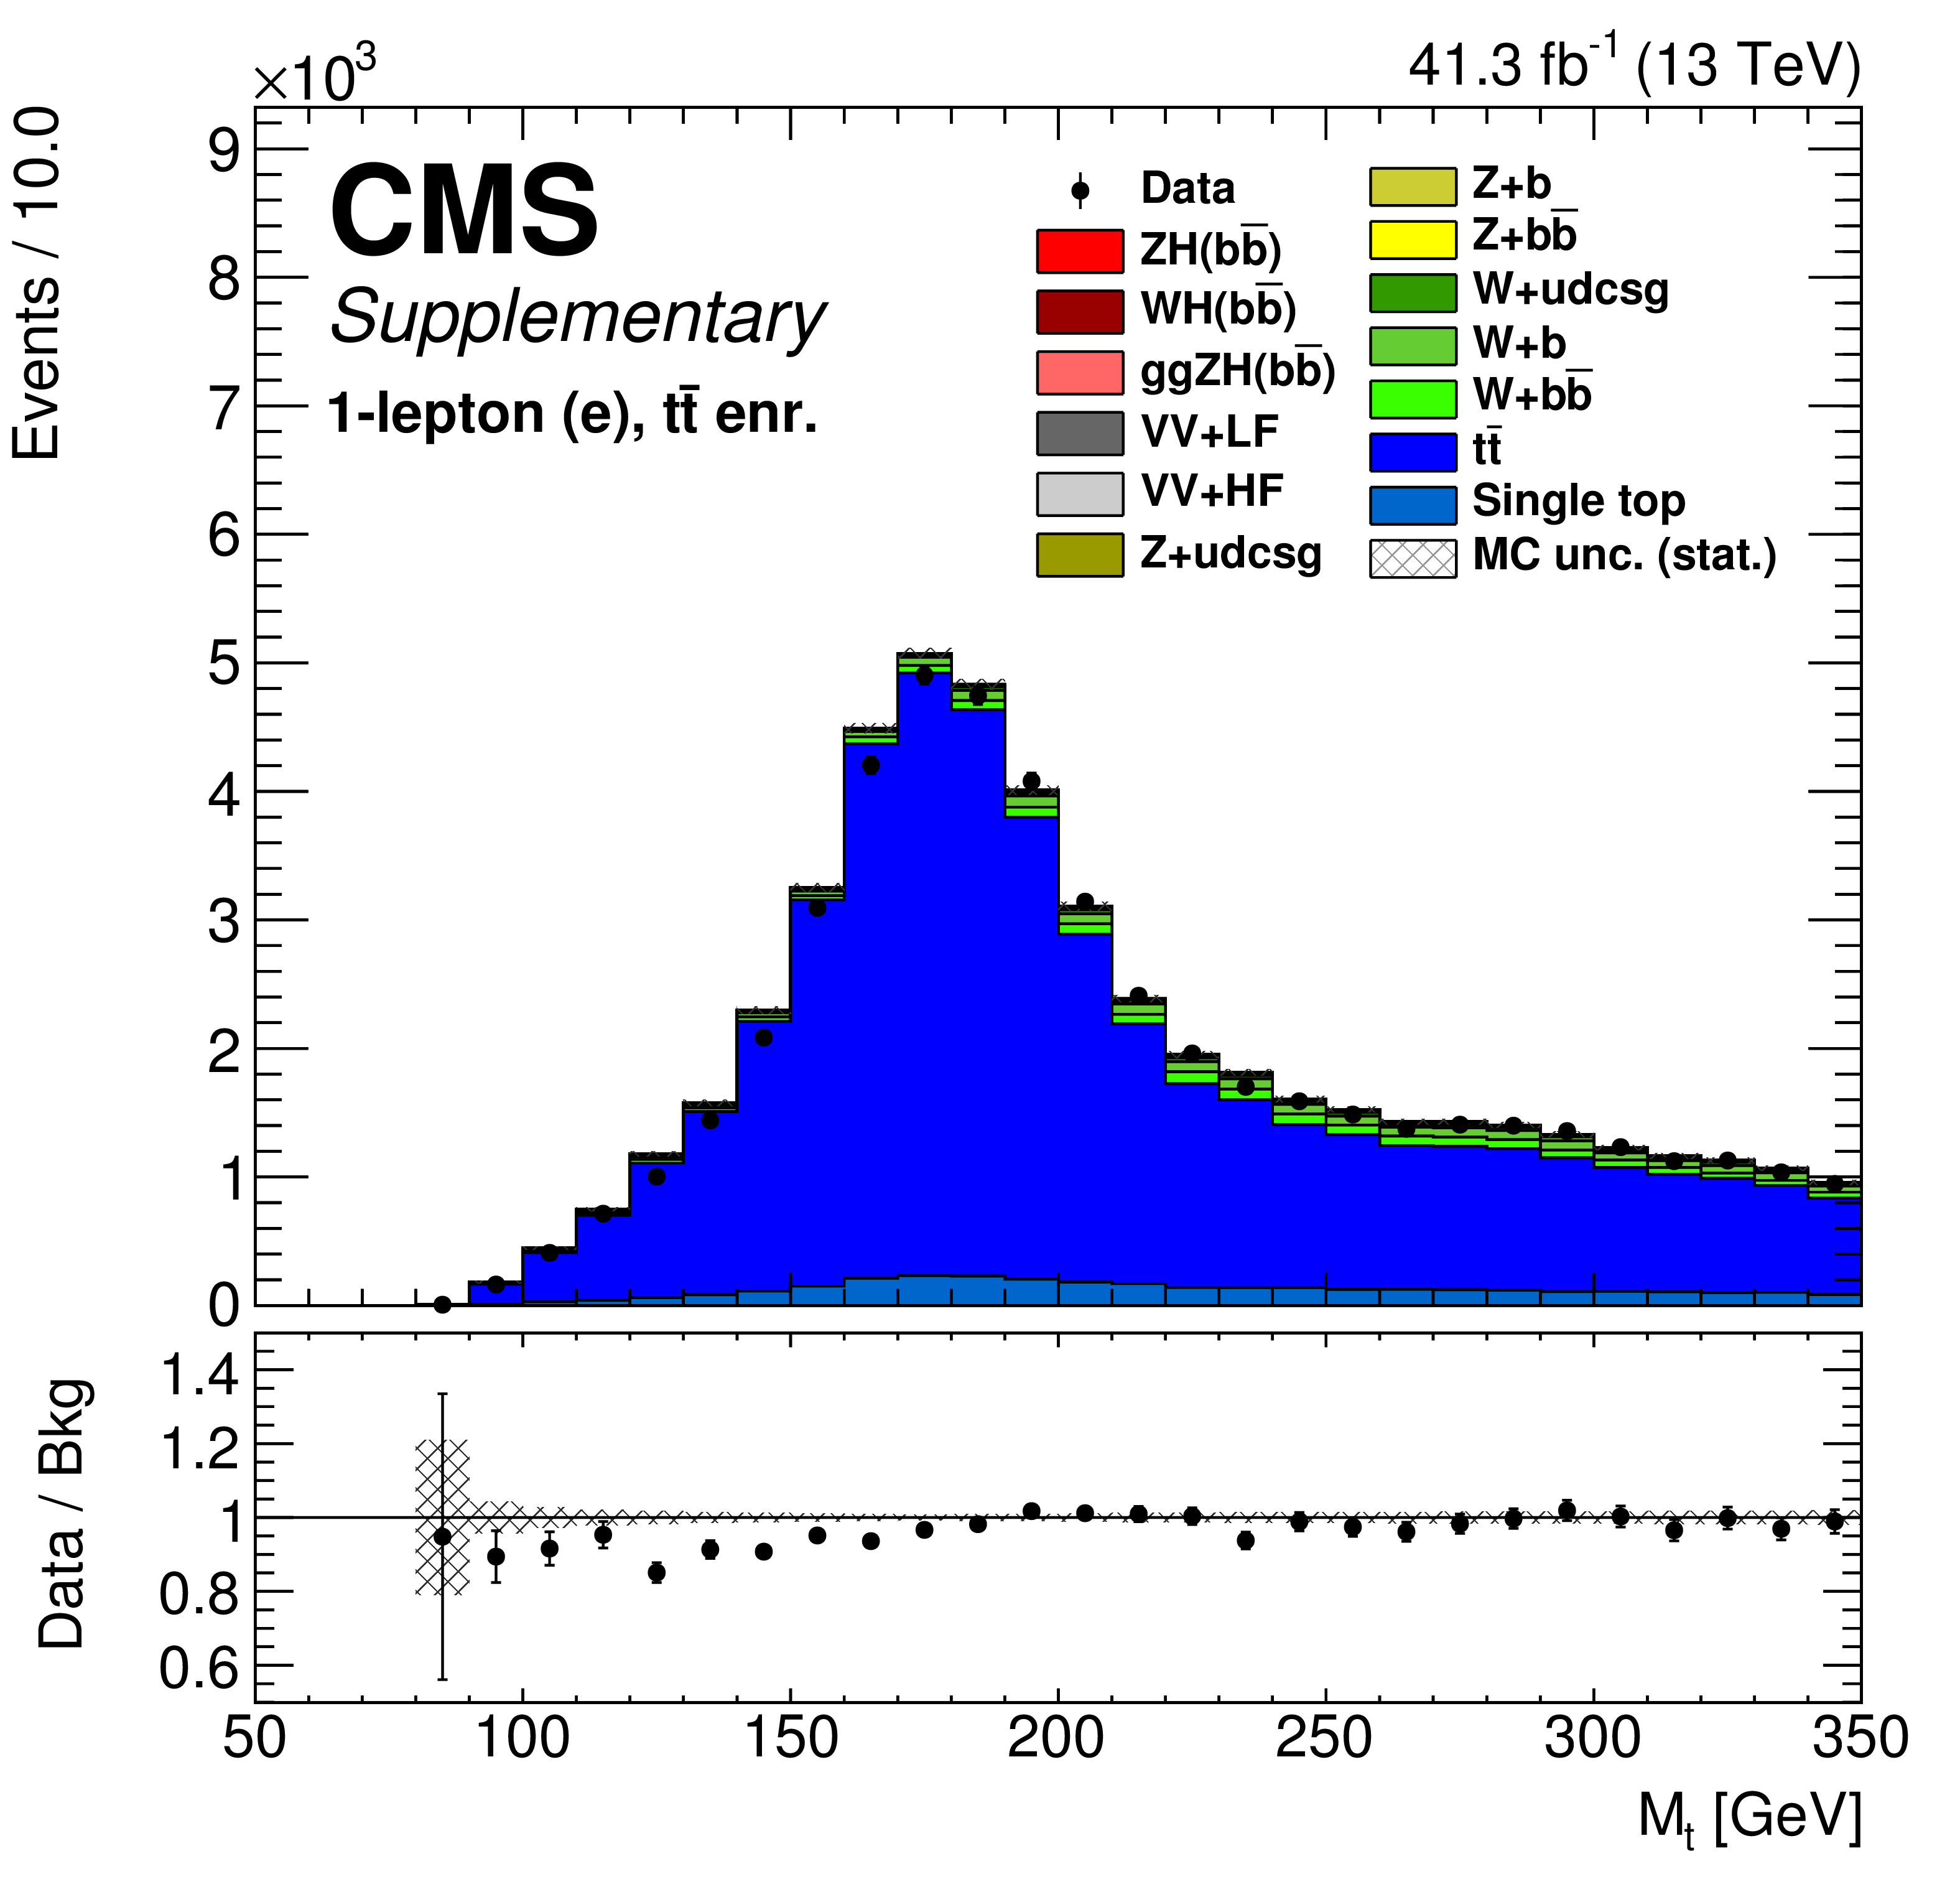
Additional Figure 10-b:
The plot above shows the top quark mass reconstructed in the 1-lepton ${{\mathrm {t}\overline {\mathrm {t}}}} $ control region using the tagged lepton, ${{p}_{\mathrm {T}}^{\text {miss}}}$, one of the two b-jets and the constraint of the W mass to estimate the longitudinal component of the neutrino. The reconstruction uses the regressed b-jet energy. |
png pdf |
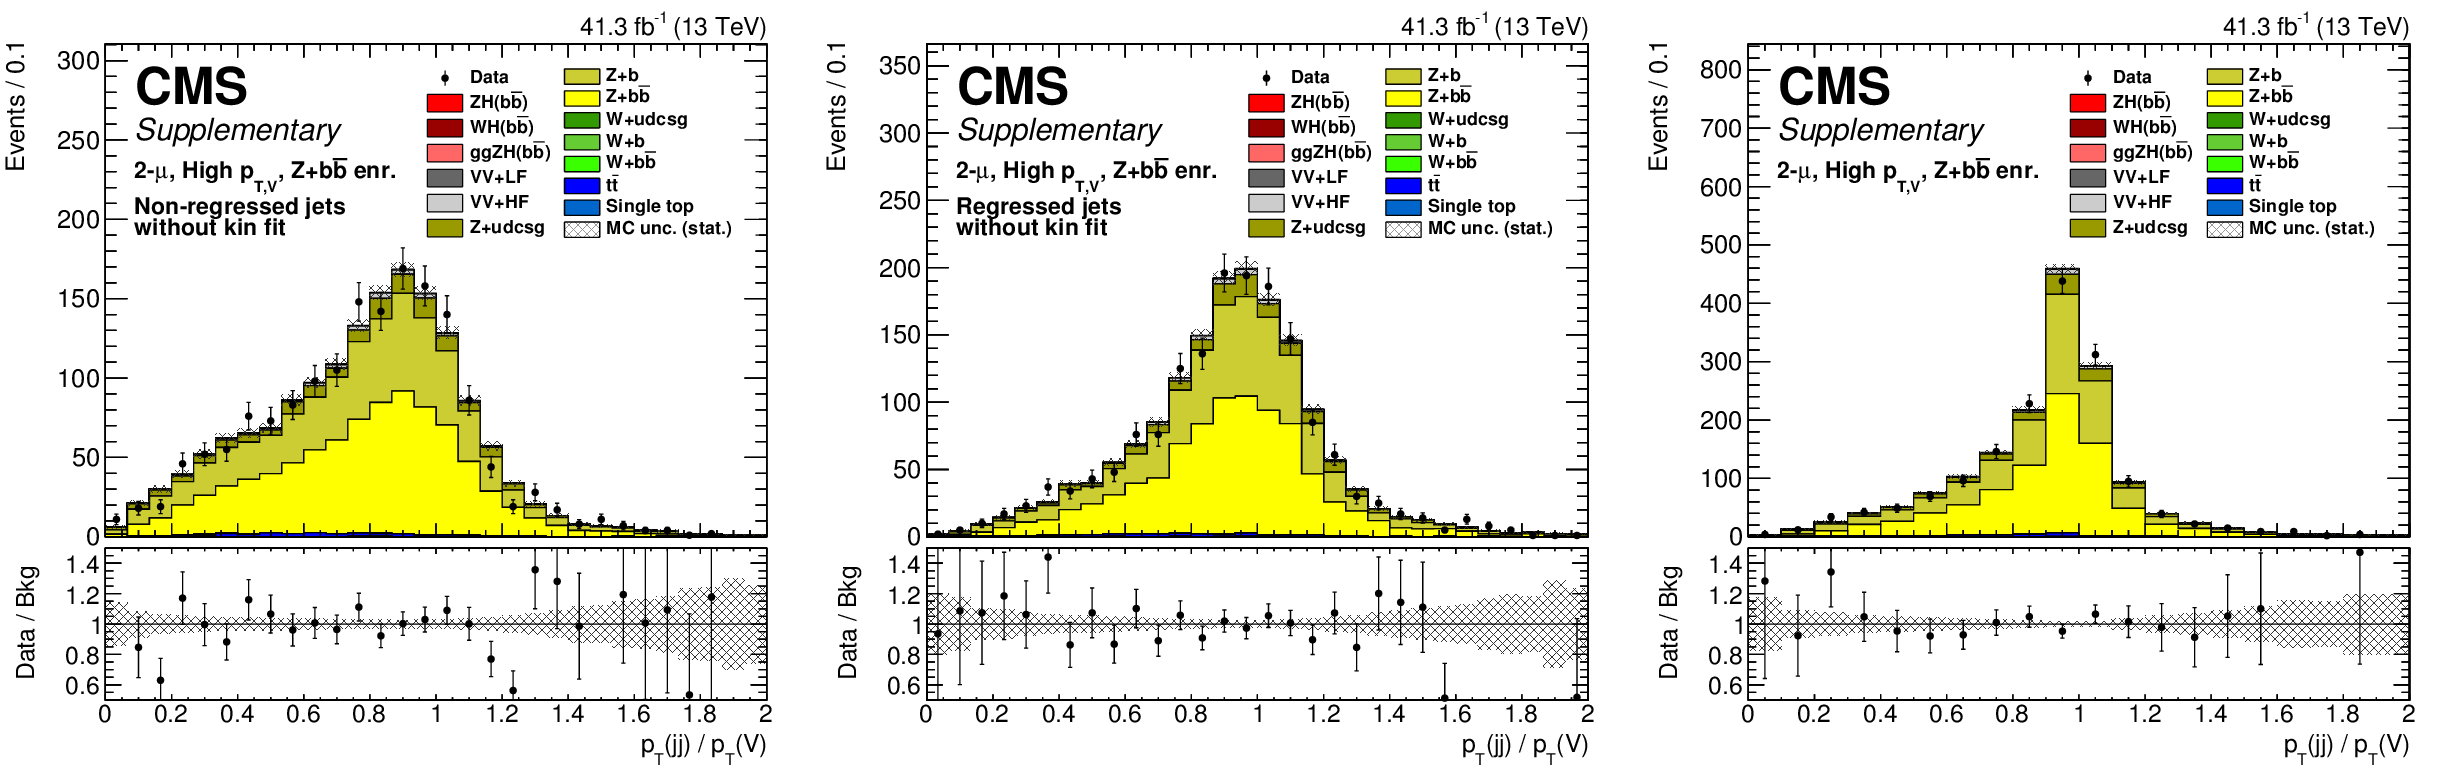
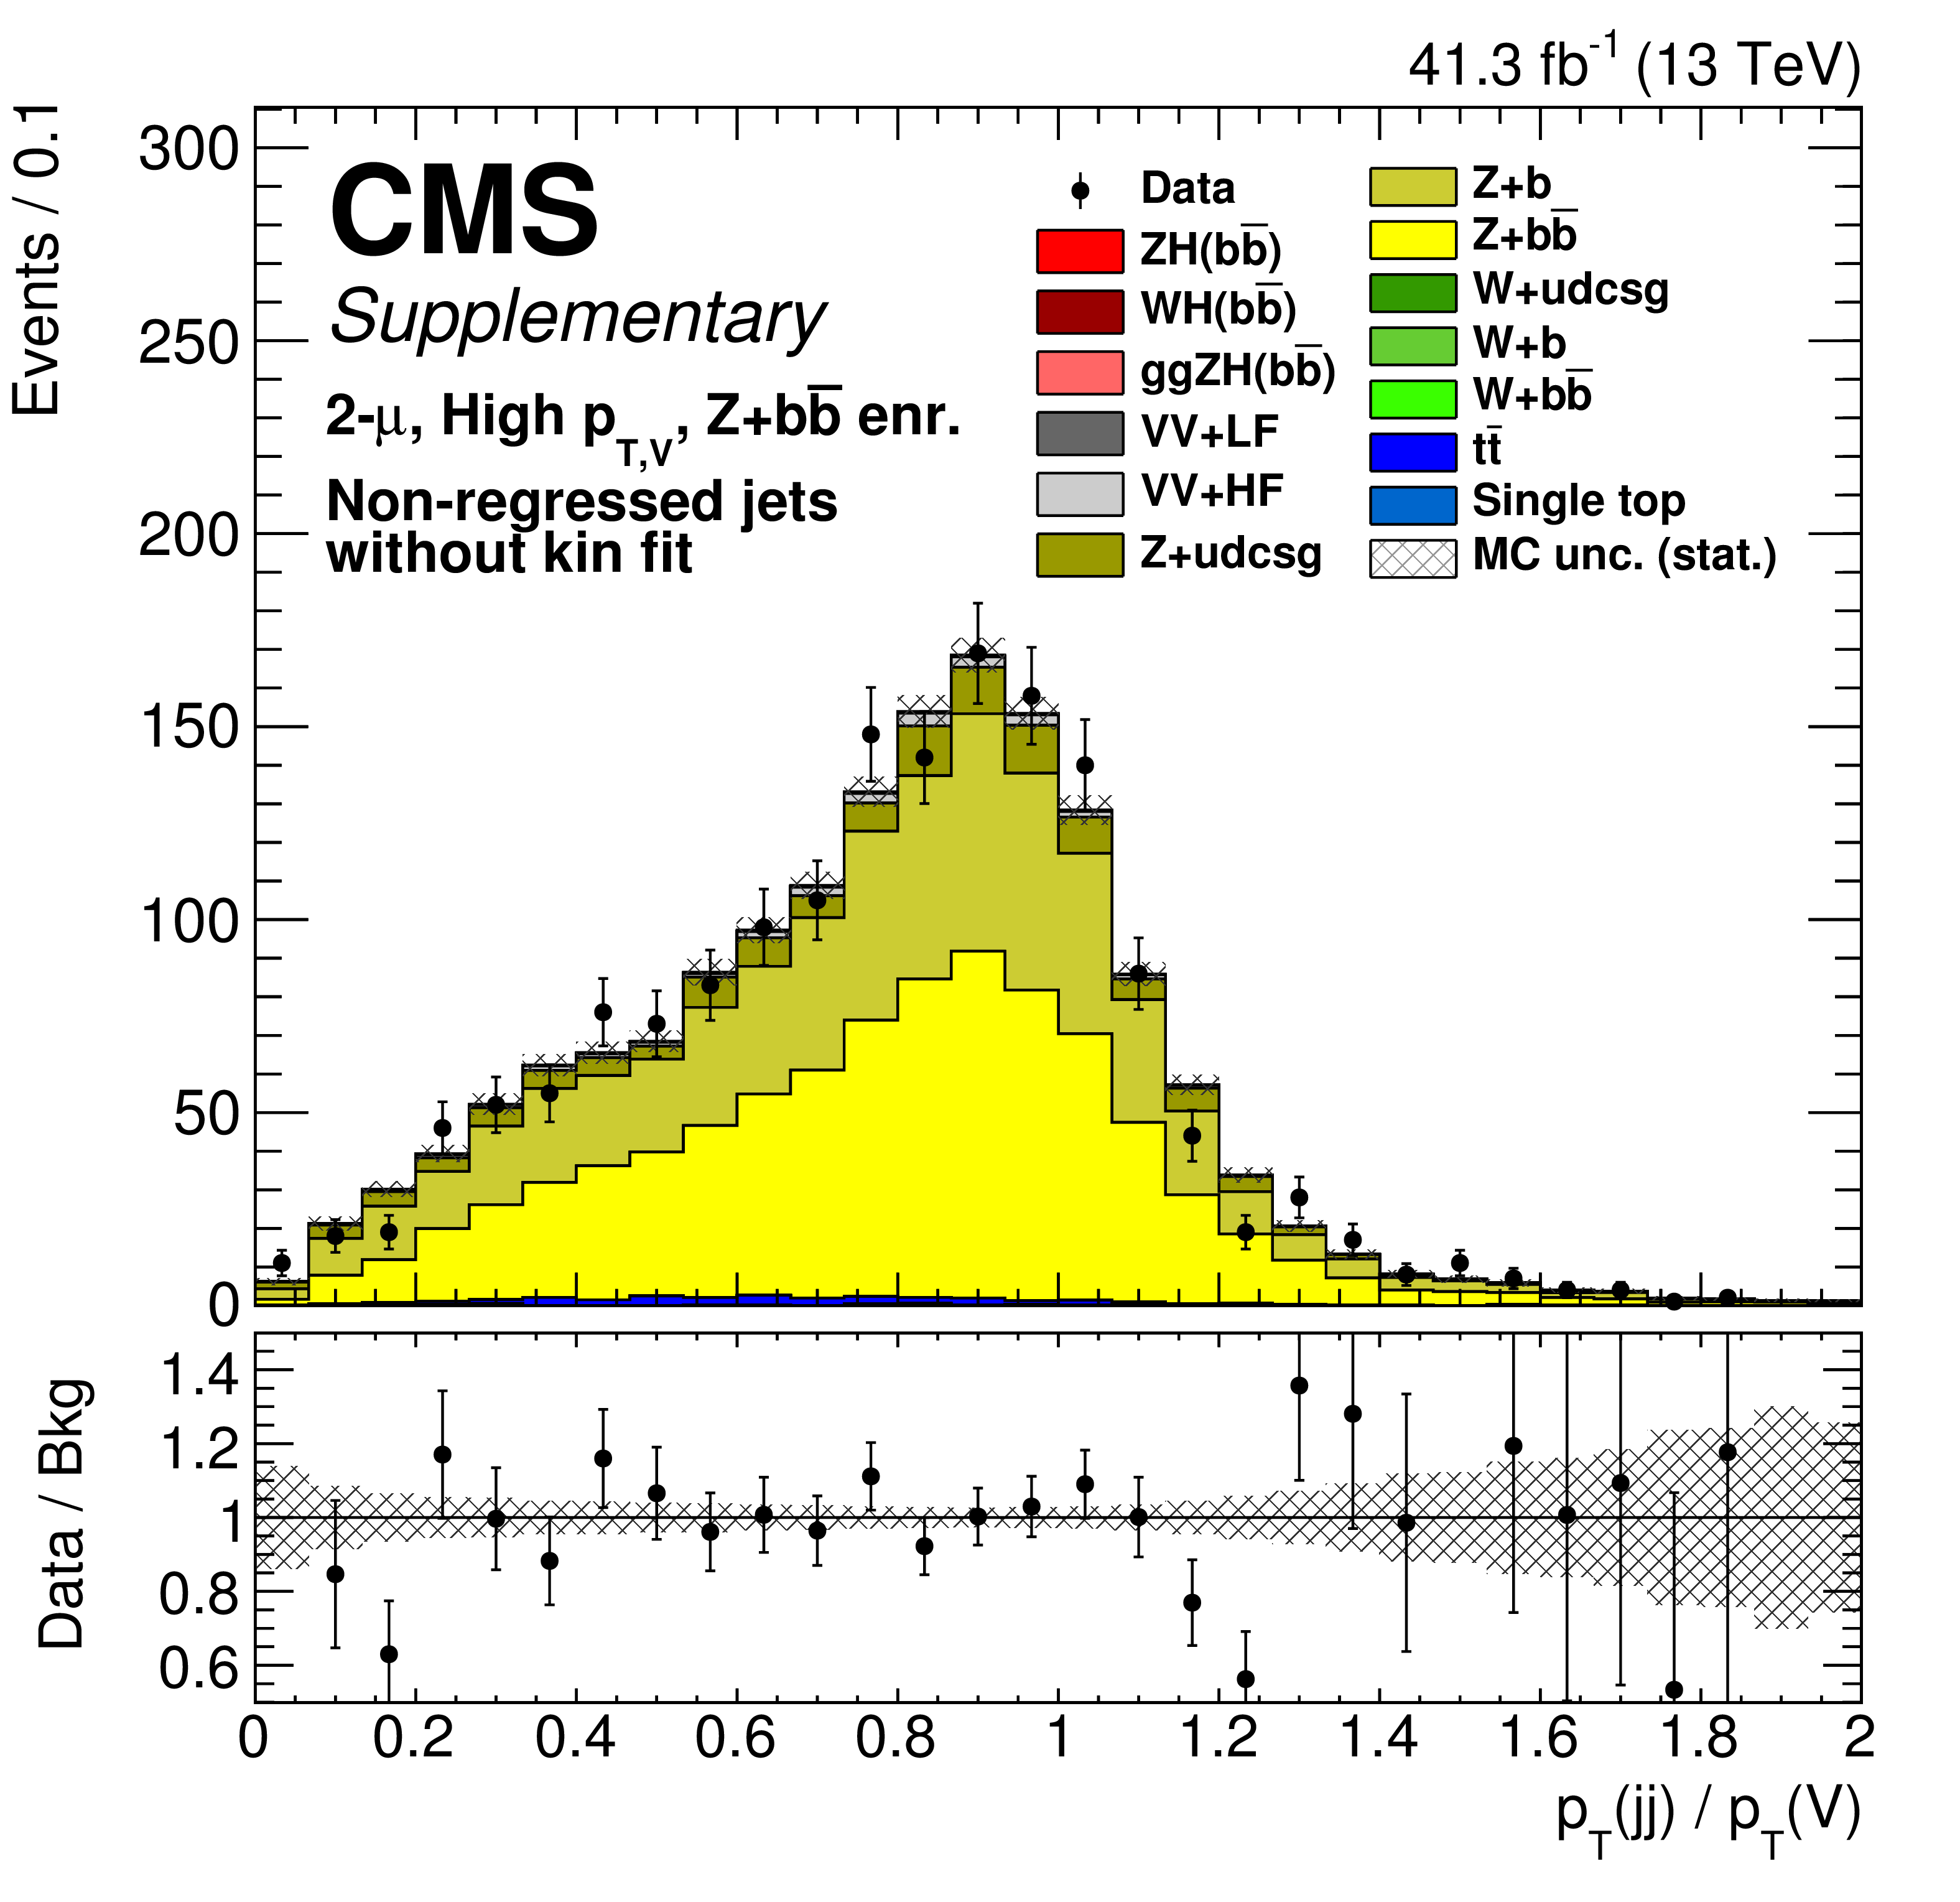
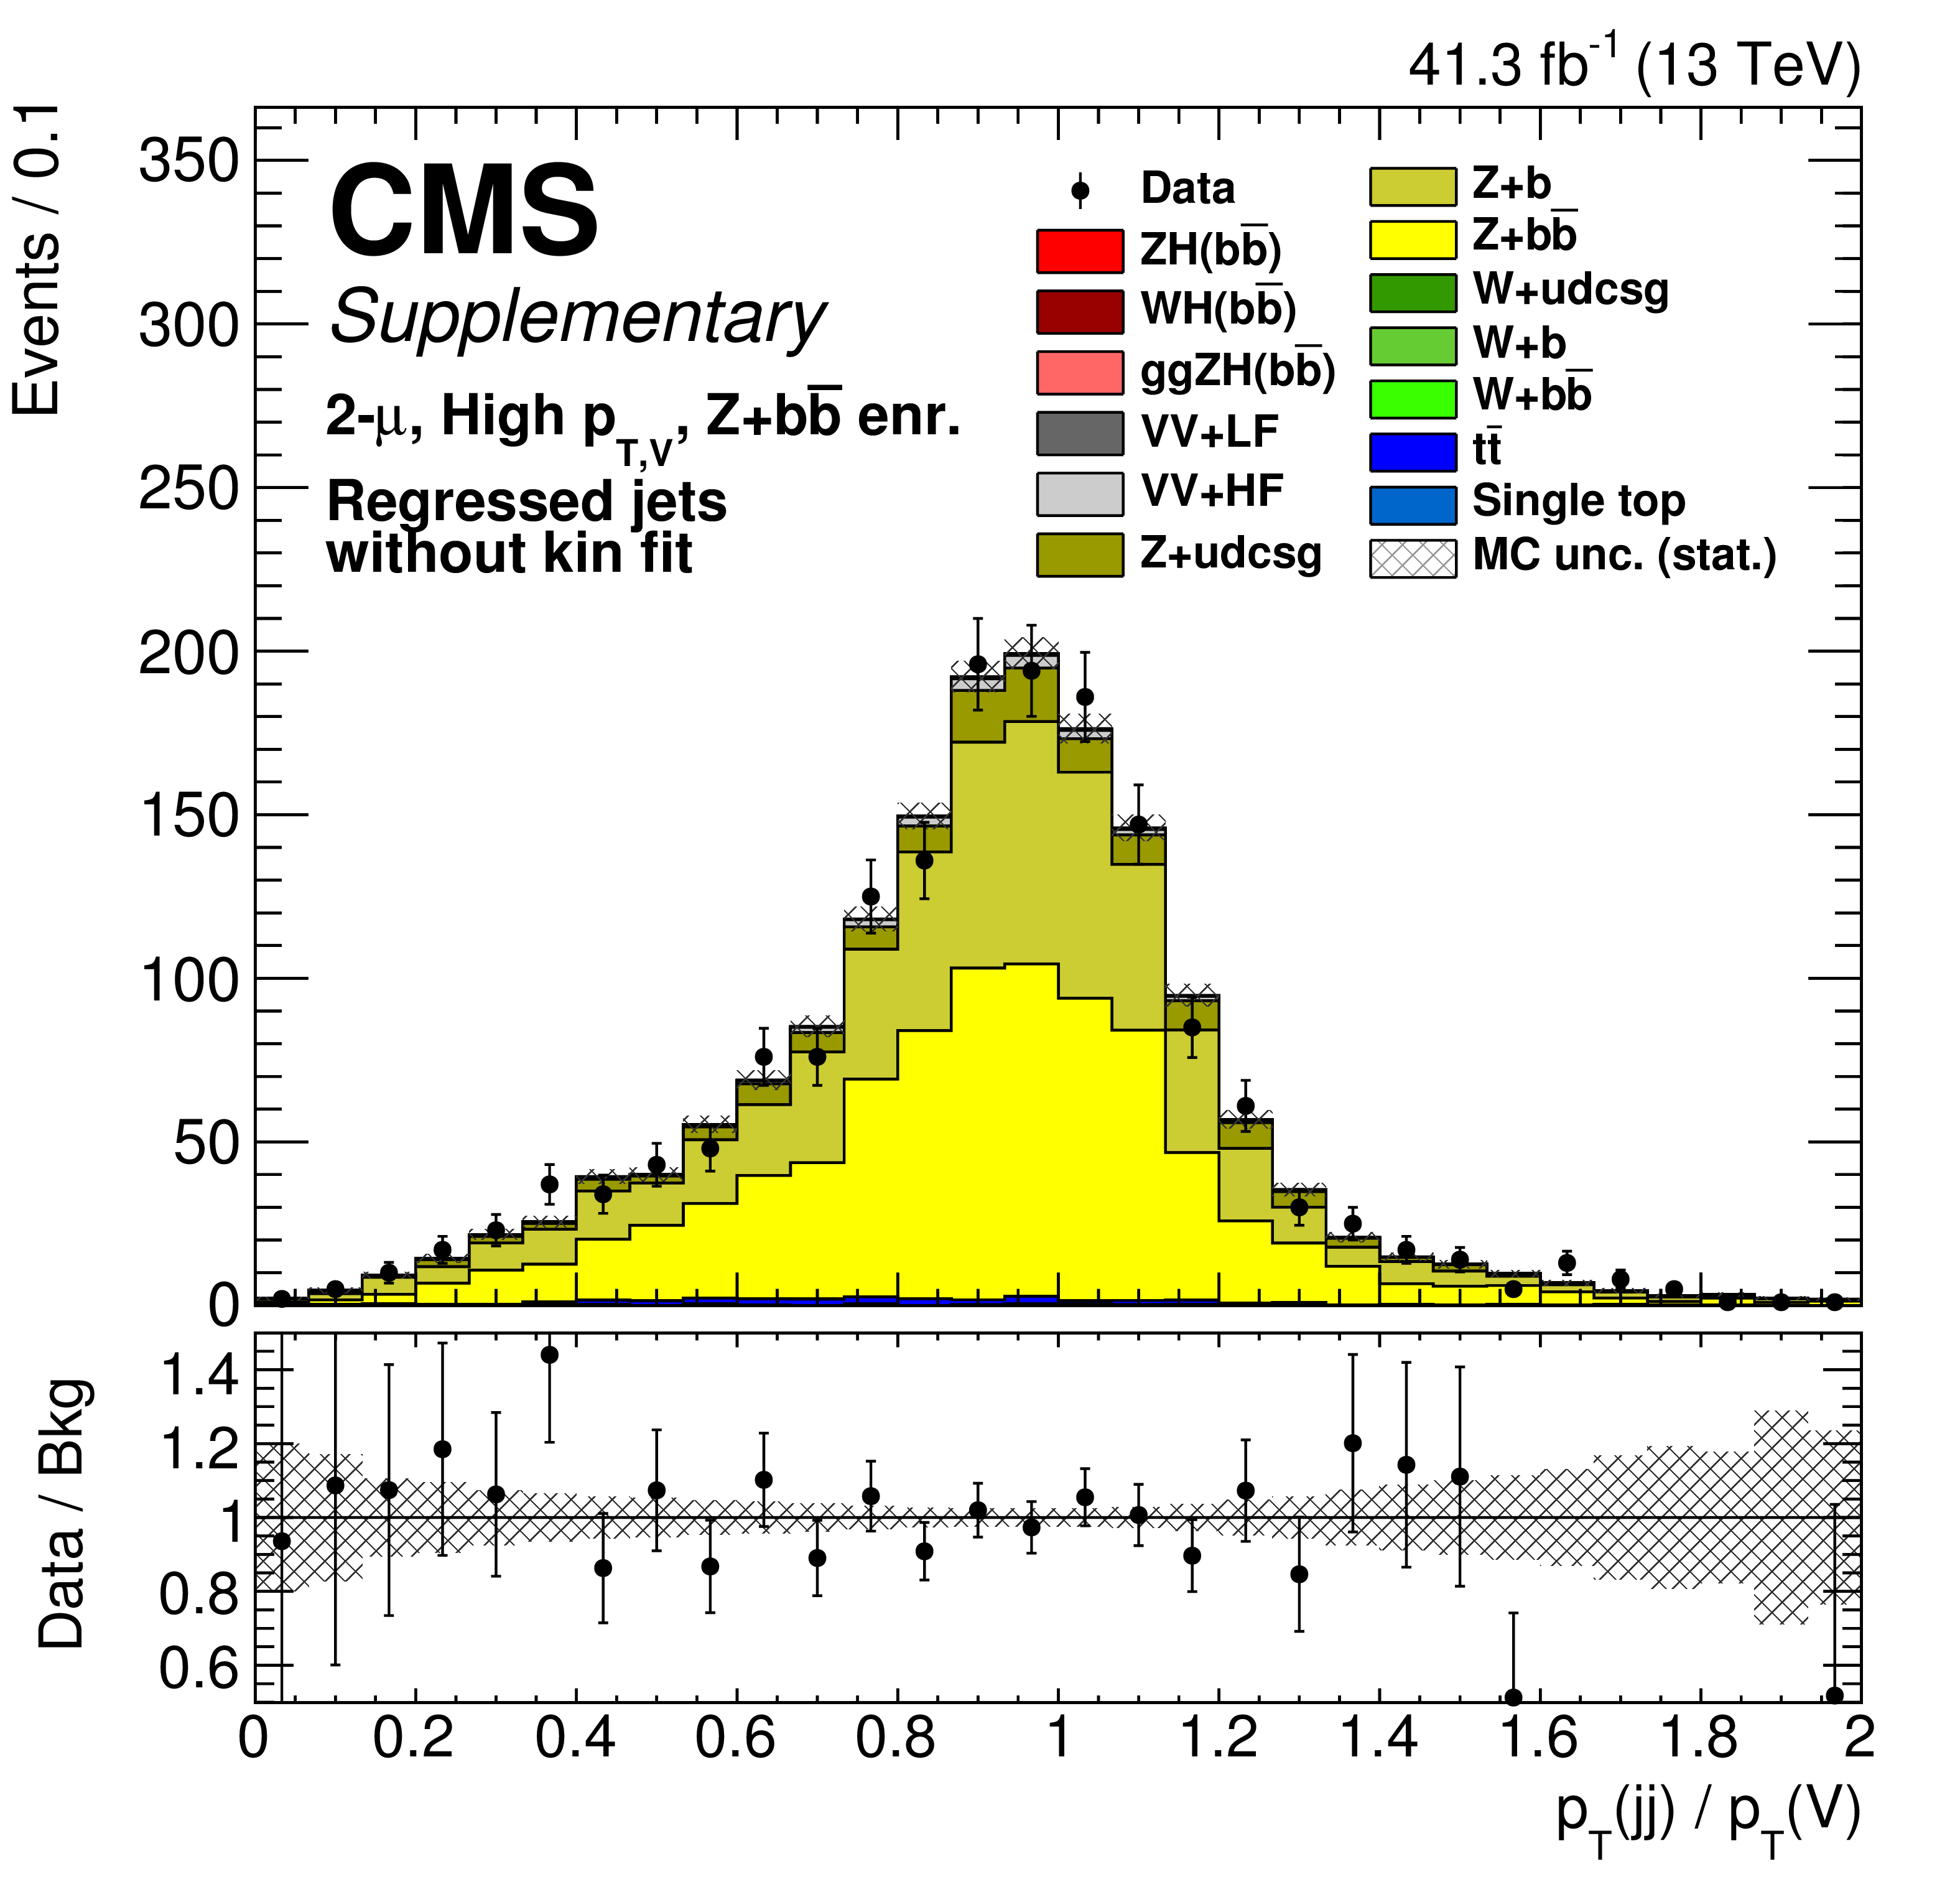
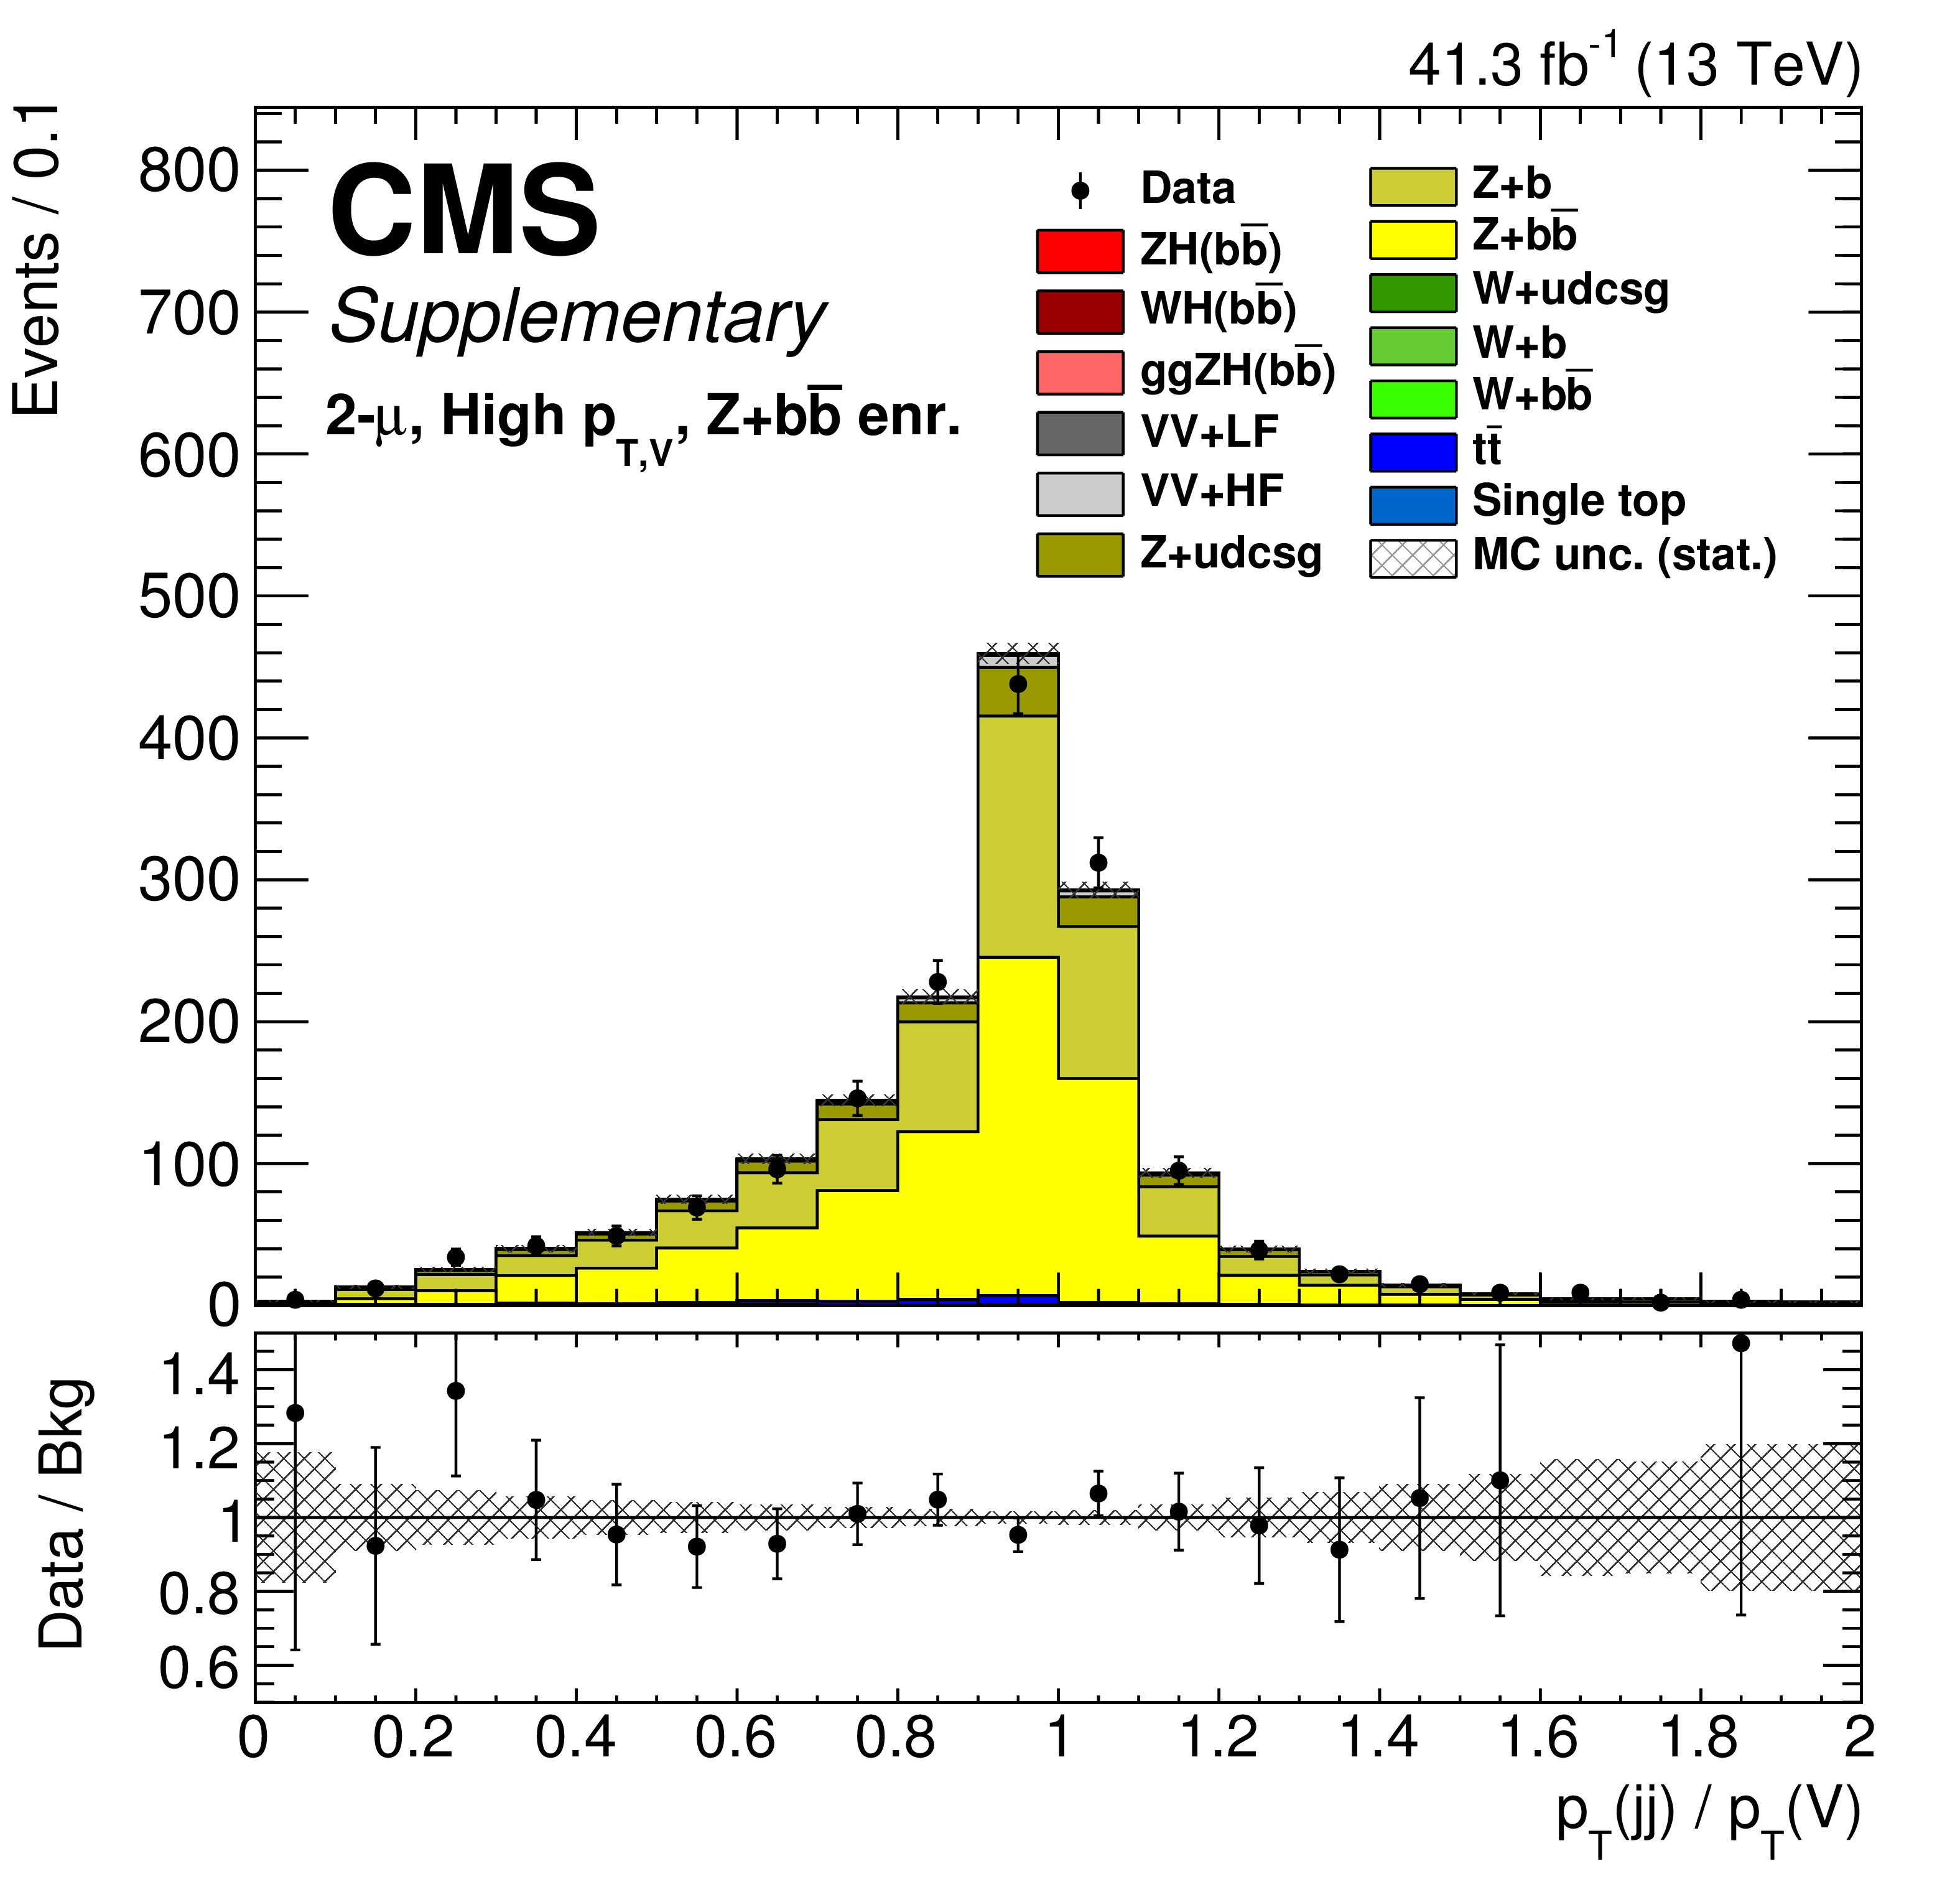
Additional Figure 11:
All three figures above show the ratio of the di-jet ${p_{\mathrm {T}}}$ to the di-lepton (V) ${p_{\mathrm {T}}}$ in the 2-lepton HF control region. The b-jets in the left plot come directly from CMS reconstruction with charged hadron subtraction applied. The b-jets in the center plot have been updated by the regression. The resolution is visible improved from left to center. On the right the b-jet energies are updated once again with a kinematic fit which constrains the b-jet energies using the lepton resolution. Again there is a visible improvement in b-jet resolution inferred by the narrowing balance of the di-jet plus di-lepton system. |
png pdf |
Additional Figure 11-a:
The figure above shows the ratio of the di-jet ${p_{\mathrm {T}}}$ to the di-lepton (V) ${p_{\mathrm {T}}}$ in the 2-lepton HF control region. The b-jets come directly from CMS reconstruction with charged hadron subtraction applied. |
png pdf |
Additional Figure 11-b:
The figure above shows the ratio of the di-jet ${p_{\mathrm {T}}}$ to the di-lepton (V) ${p_{\mathrm {T}}}$ in the 2-lepton HF control region. The b-jets have been updated by the regression. The resolution is visible improved from left to center. |
png pdf |
Additional Figure 11-c:
The figure above shows the ratio of the di-jet ${p_{\mathrm {T}}}$ to the di-lepton (V) ${p_{\mathrm {T}}}$ in the 2-lepton HF control region. The b-jet energies are updated once again with a kinematic fit which constrains the b-jet energies using the lepton resolution. Again there is a visible improvement in b-jet resolution inferred by the narrowing balance of the di-jet plus di-lepton system. |
png pdf |
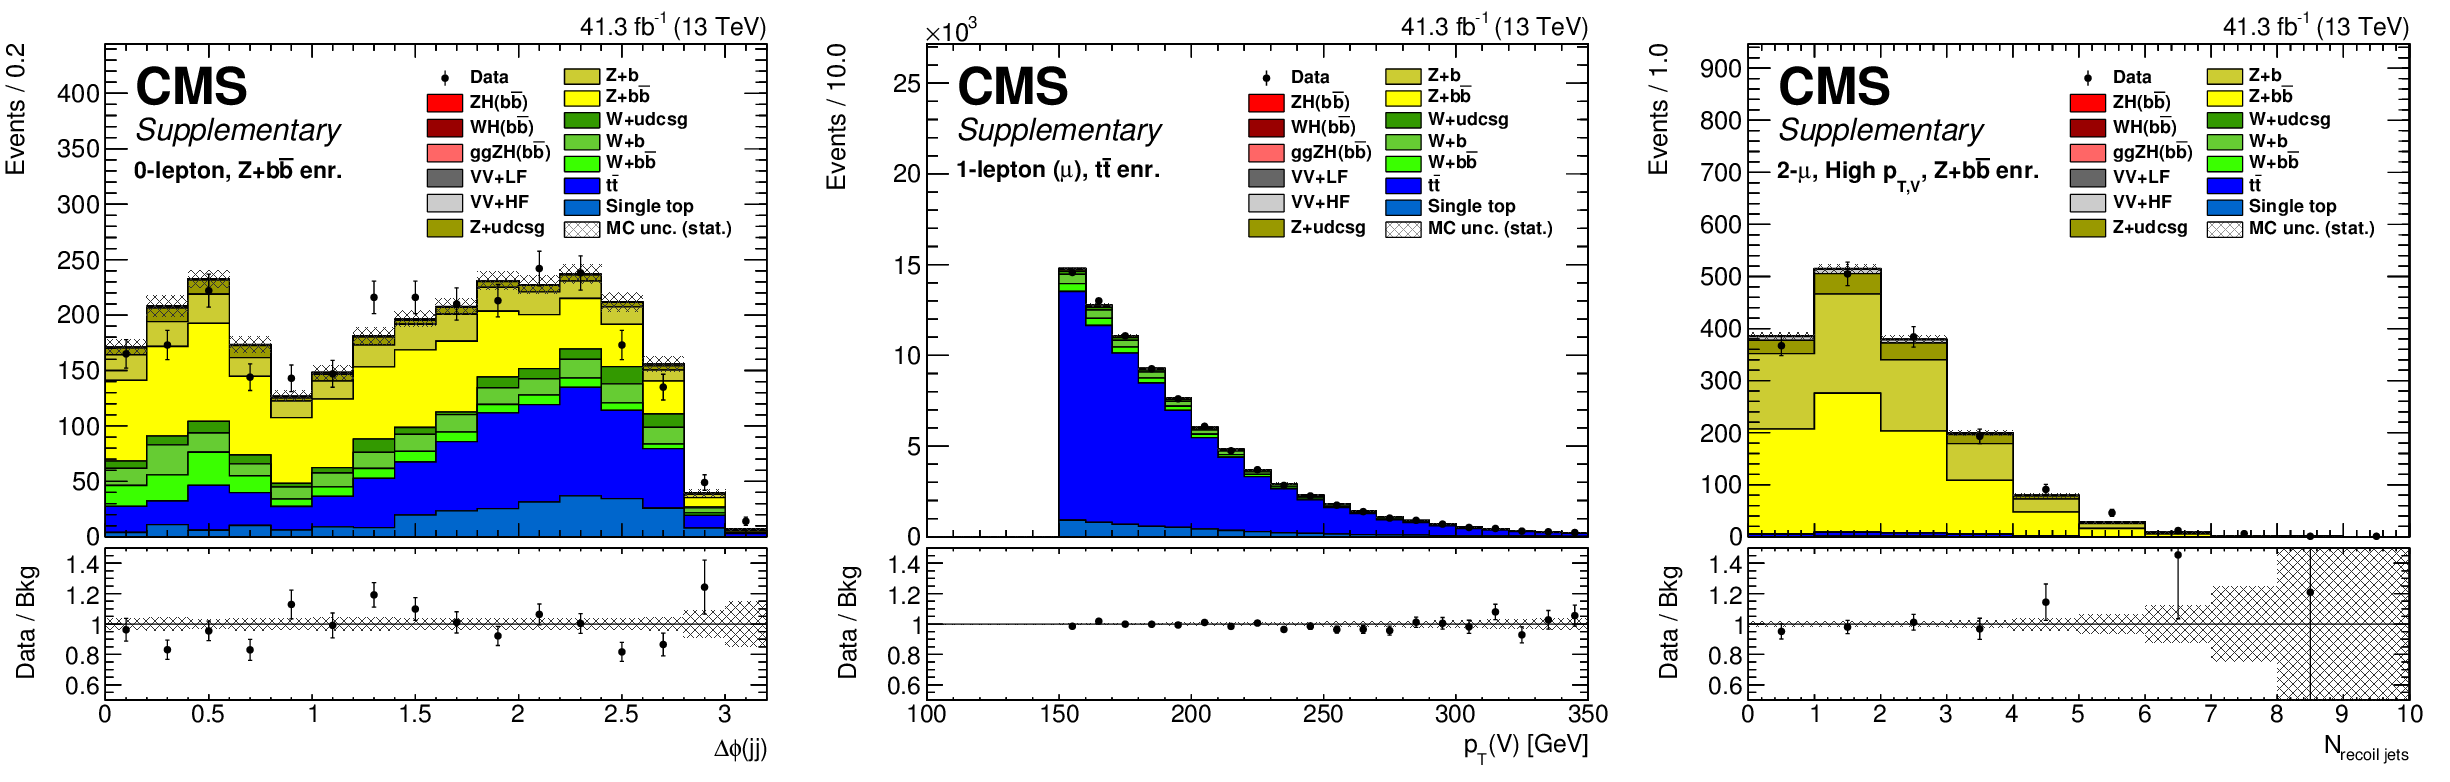
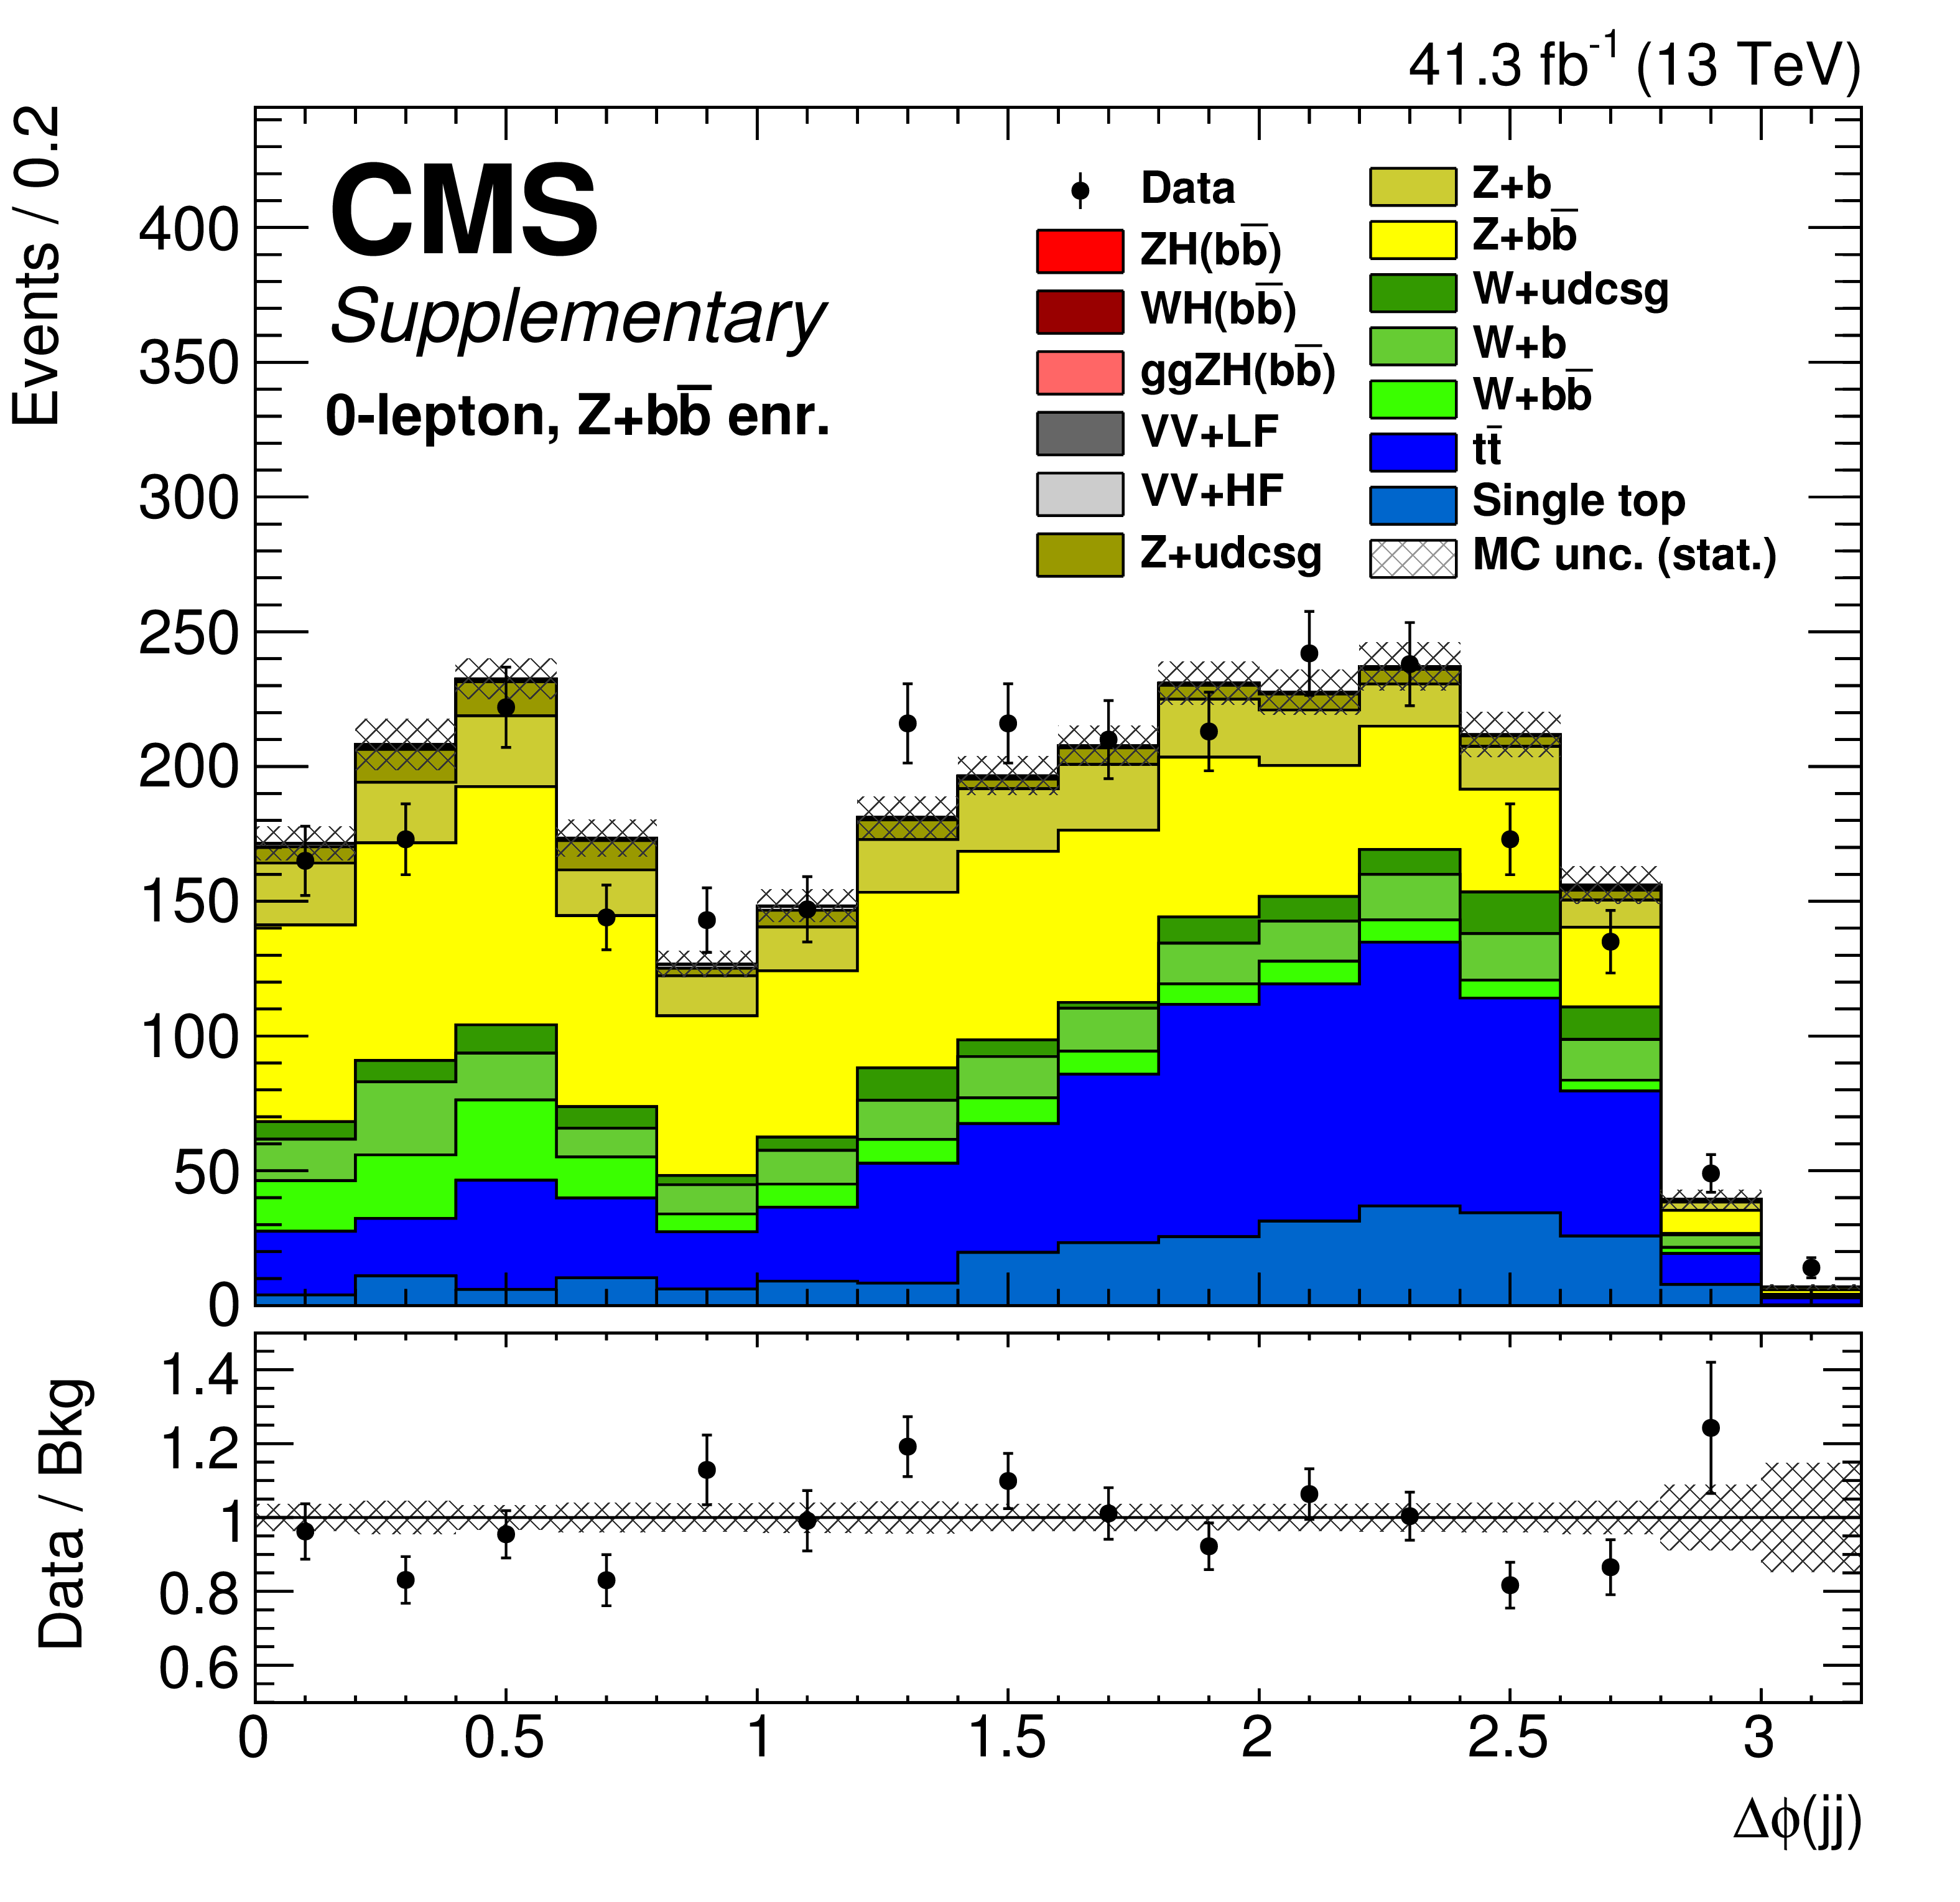
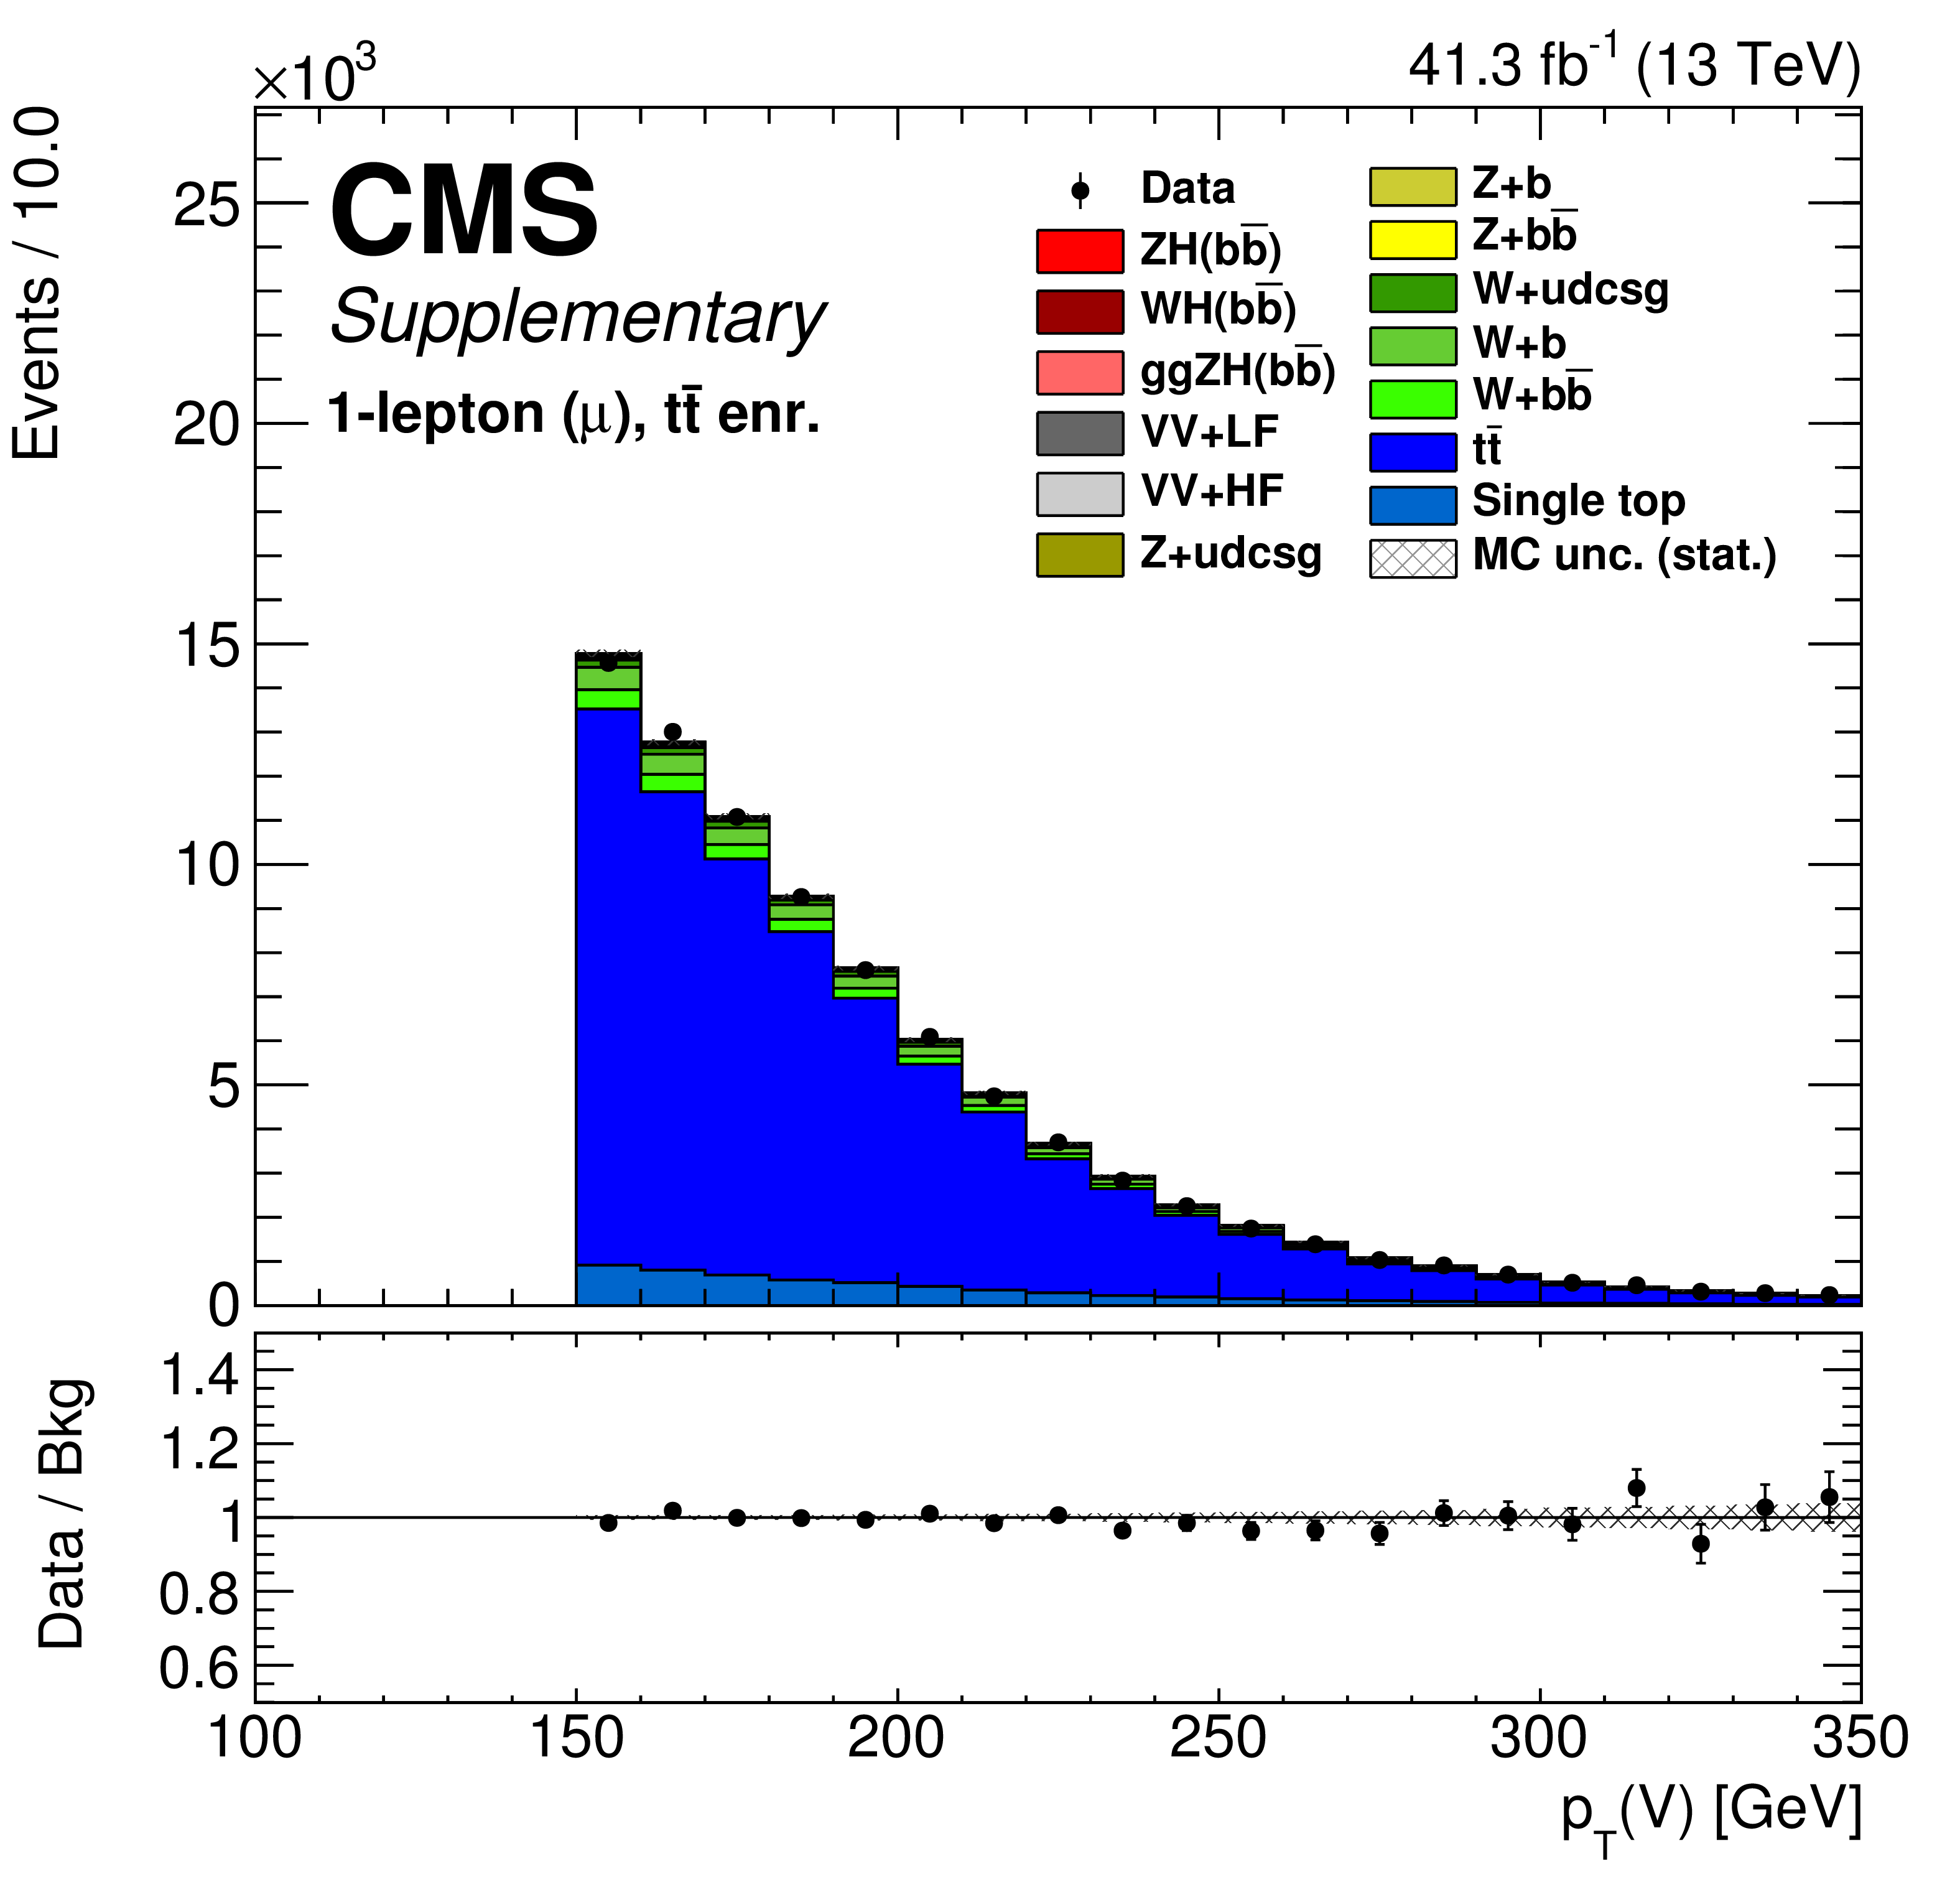
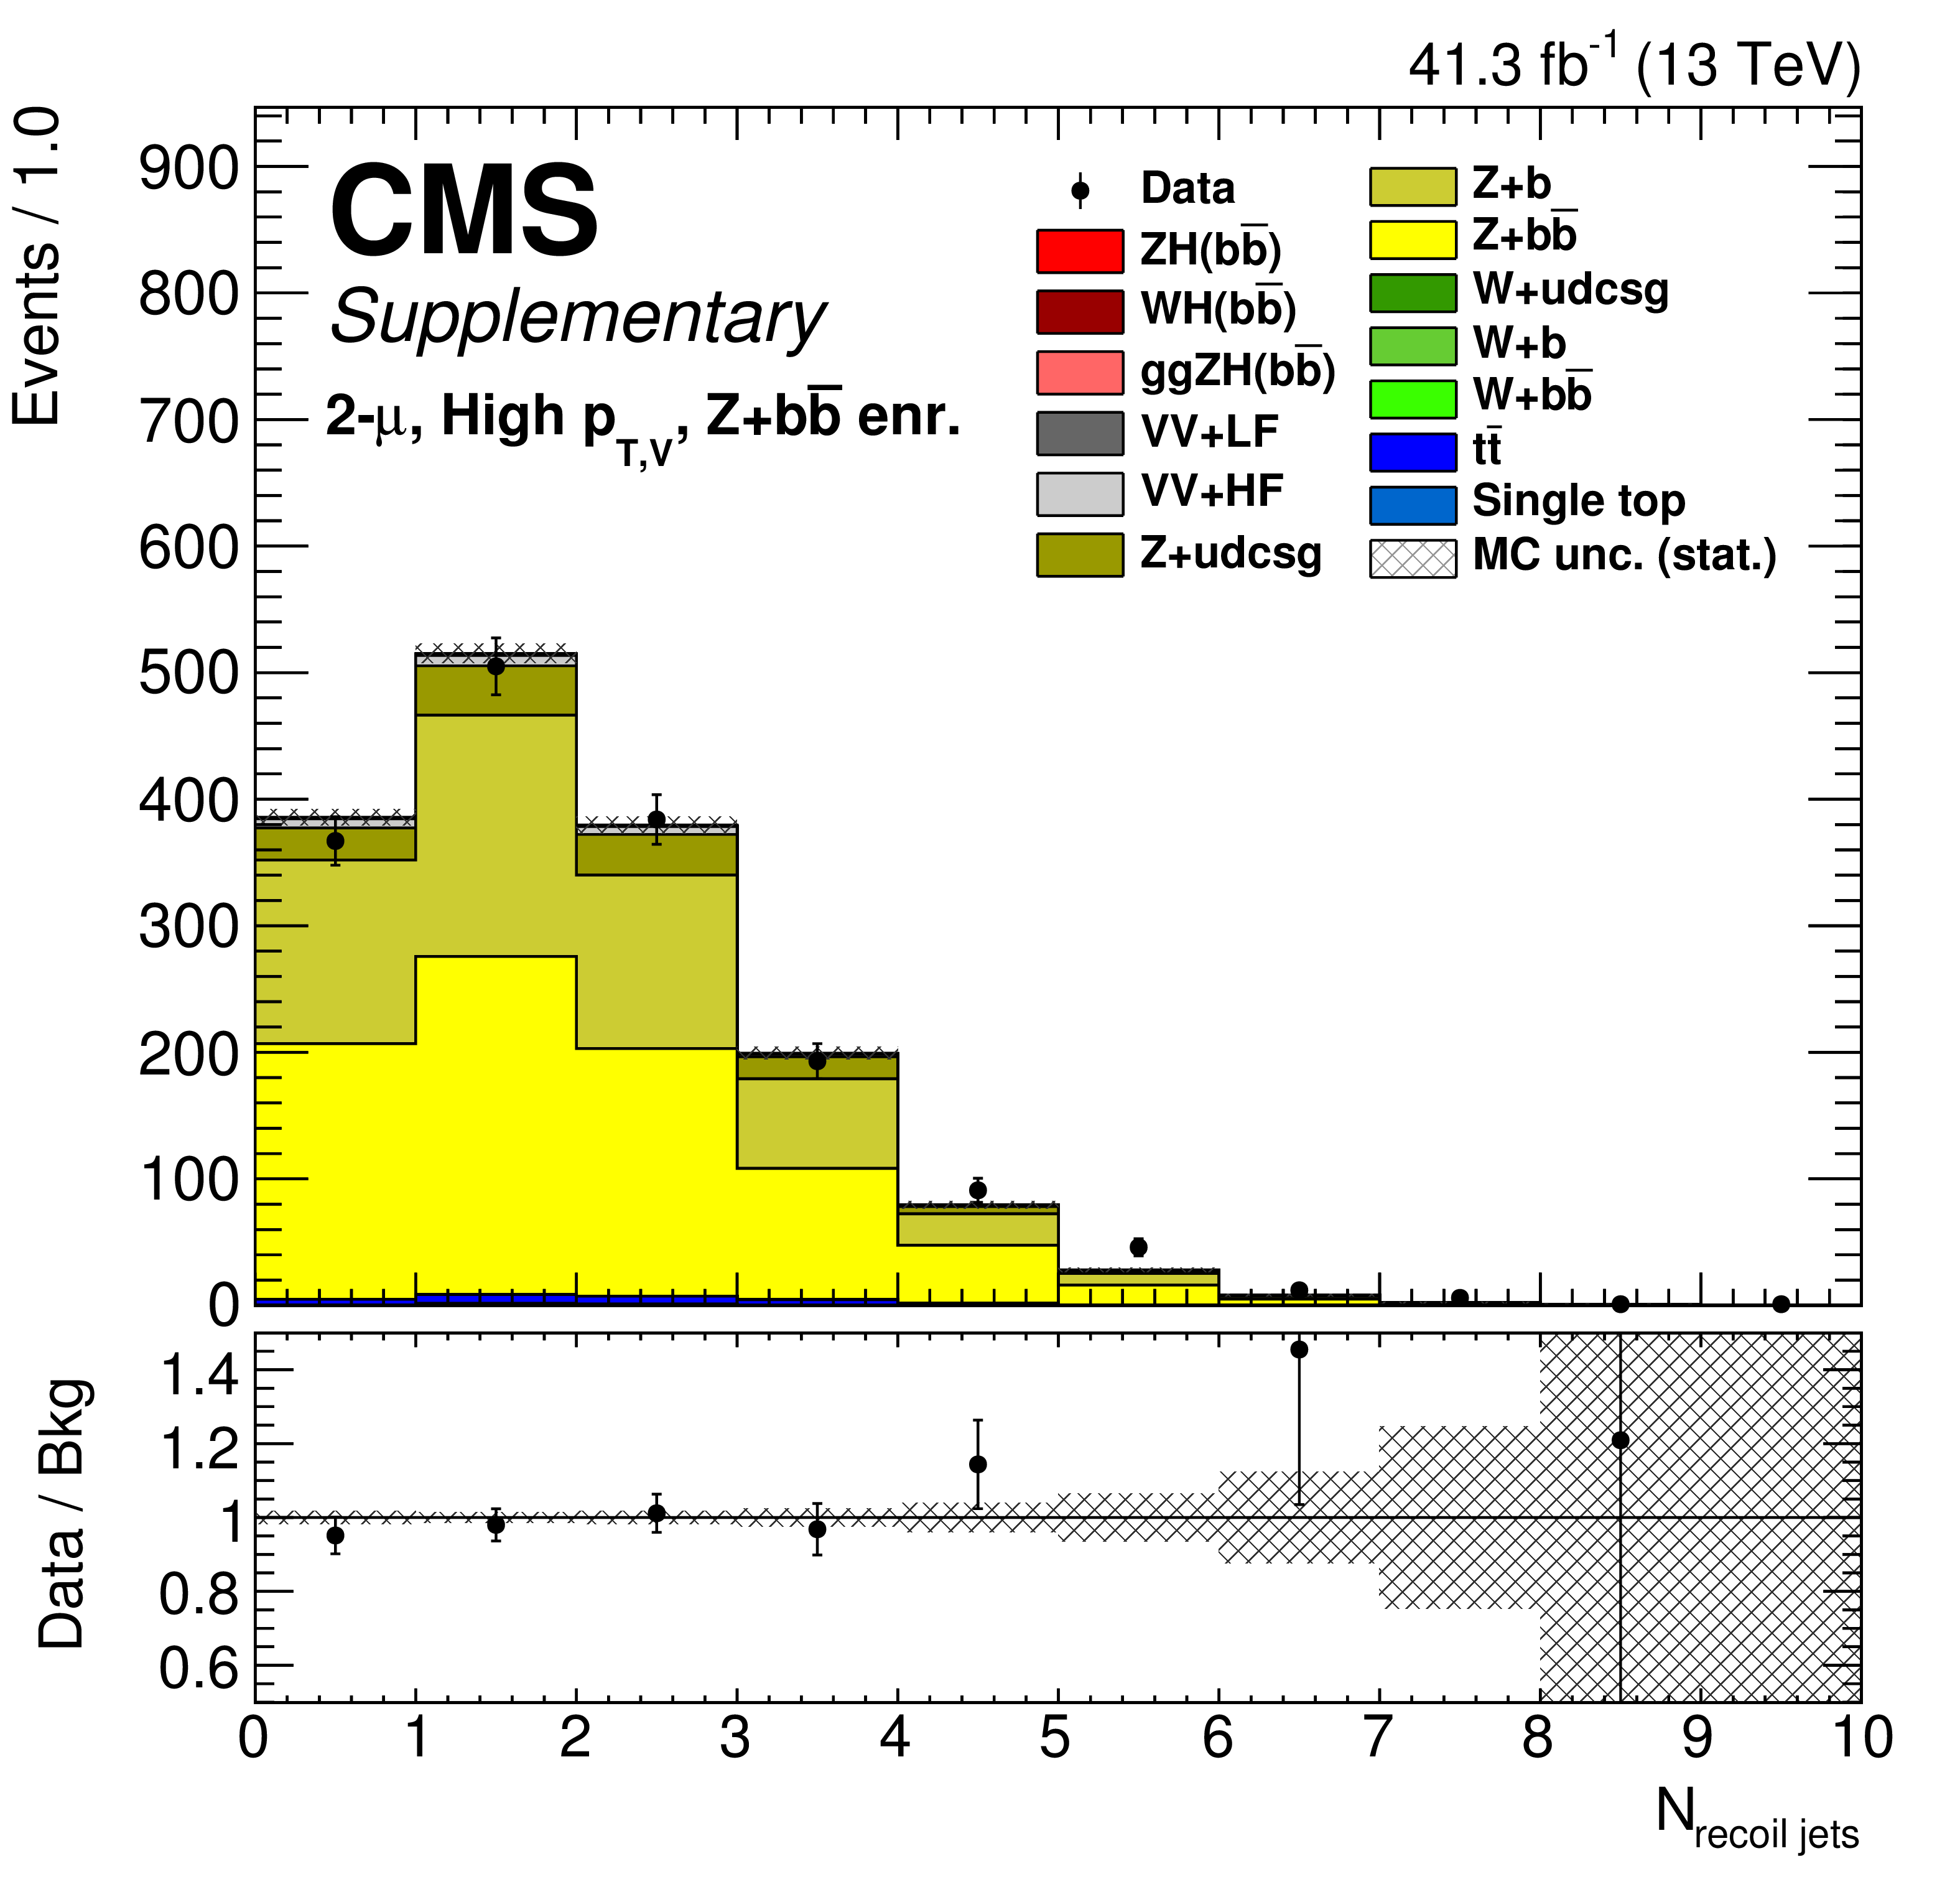
Additional Figure 12:
The three figures above highlight a few of the discriminating variables in control regions. The left plot is the azimuthal angle between the two candidate jets in the 0-lepton heavy flavor control region. The middle plot is the ${p_{\mathrm {T}}} $ of reconstructed W boson in the 1-lepton ttbar control region. The right plot is the number of tagged recoil jets used in the kinematic fit in the 2-lepton heavy flavor control region. |
png pdf |
Additional Figure 12-a:
The figure above highlights a few of the discriminating variables in control regions. The plot is the azimuthal angle between the two candidate jets in the 0-lepton heavy flavor control region. |
png pdf |
Additional Figure 12-b:
The figure above highlights a few of the discriminating variables in control regions. The plot is the ${p_{\mathrm {T}}} $ of reconstructed W boson in the 1-lepton ttbar control region. |
png pdf |
Additional Figure 12-c:
The figure above highlights a few of the discriminating variables in control regions. The plot is the number of tagged recoil jets used in the kinematic fit in the 2-lepton heavy flavor control region. |
png pdf |
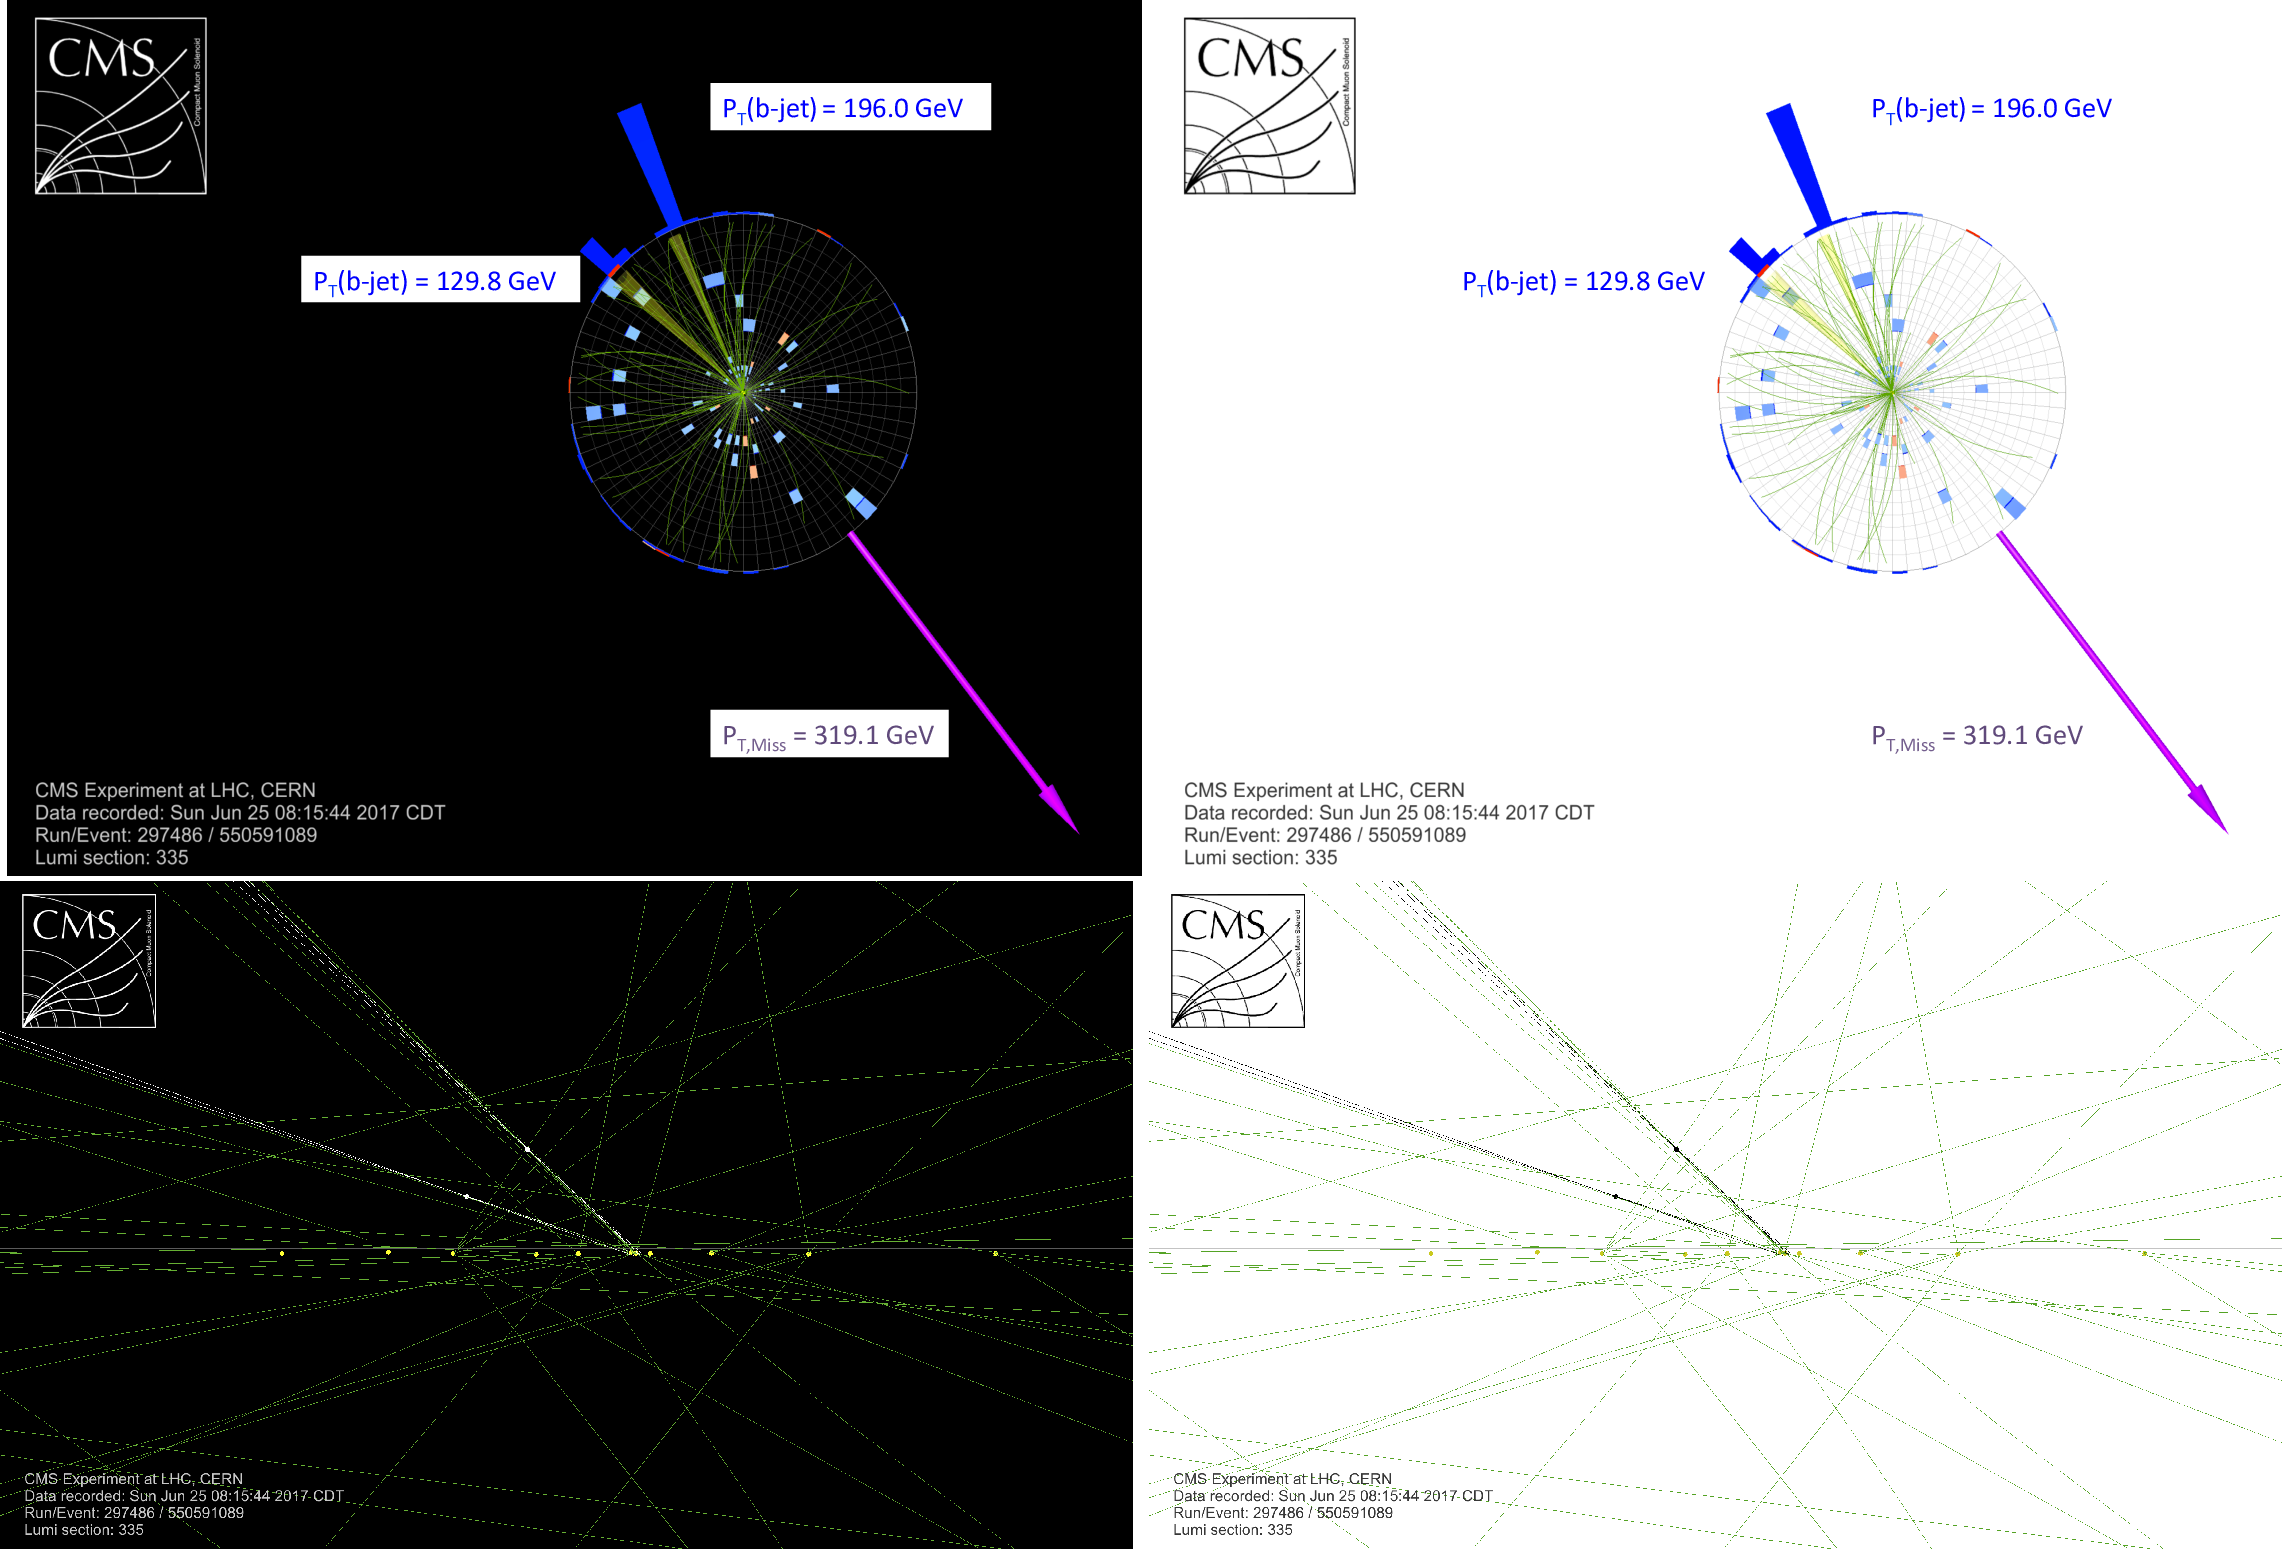
Additional Figure 13:
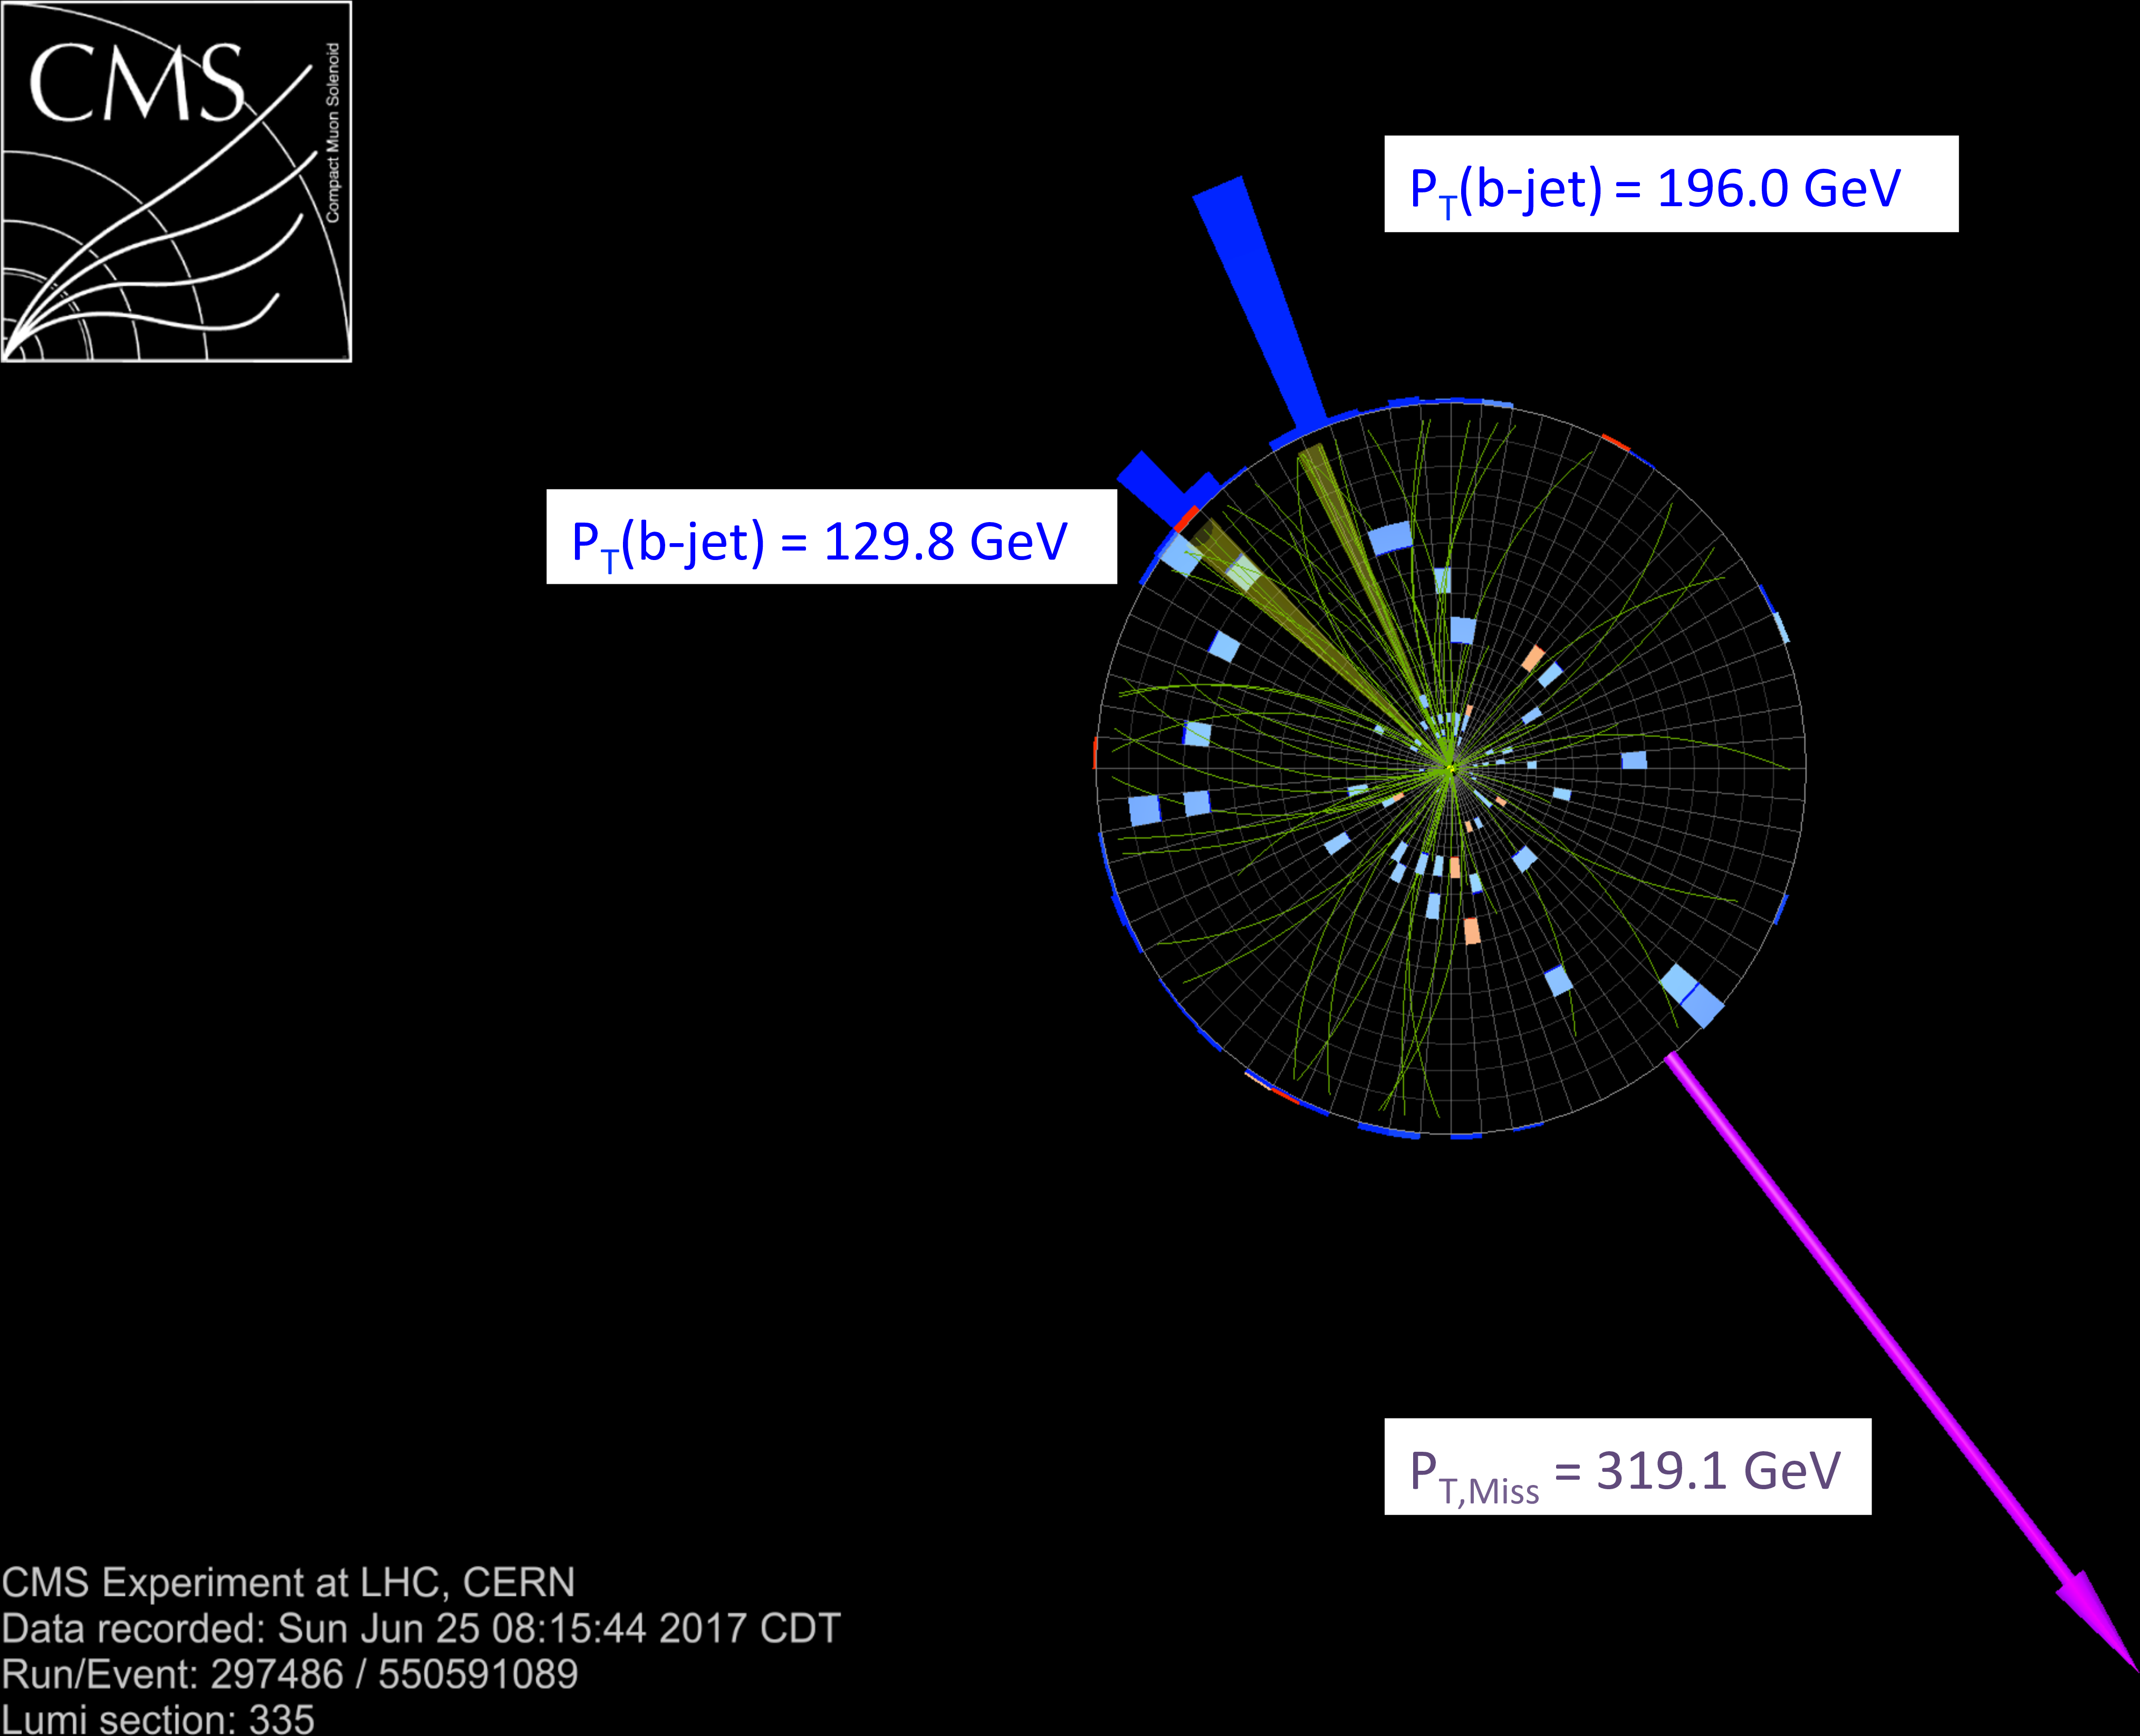
An event candidate for the production of a Z boson in conjunction with a Higgs boson in CMS detector. The Higgs boson decays to two bottom quarks whose decays are characterized by jets (shown in blue) with secondary vertices which are separated by a few centimeters from the pp collision primary vertices (shown in lowers plots). The Z boson decays into two neutrinos which are inferred from the large missing transverse momentum (shown in purple). |
png pdf |
Additional Figure 13-a:
An event candidate for the production of a Z boson in conjunction with a Higgs boson in CMS detector. The Higgs boson decays to two bottom quarks whose decays are characterized by jets (shown in blue) with secondary vertices which are separated by a few centimeters from the pp collision primary vertices (shown in lowers plots). The Z boson decays into two neutrinos which are inferred from the large missing transverse momentum (shown in purple). |
png pdf |
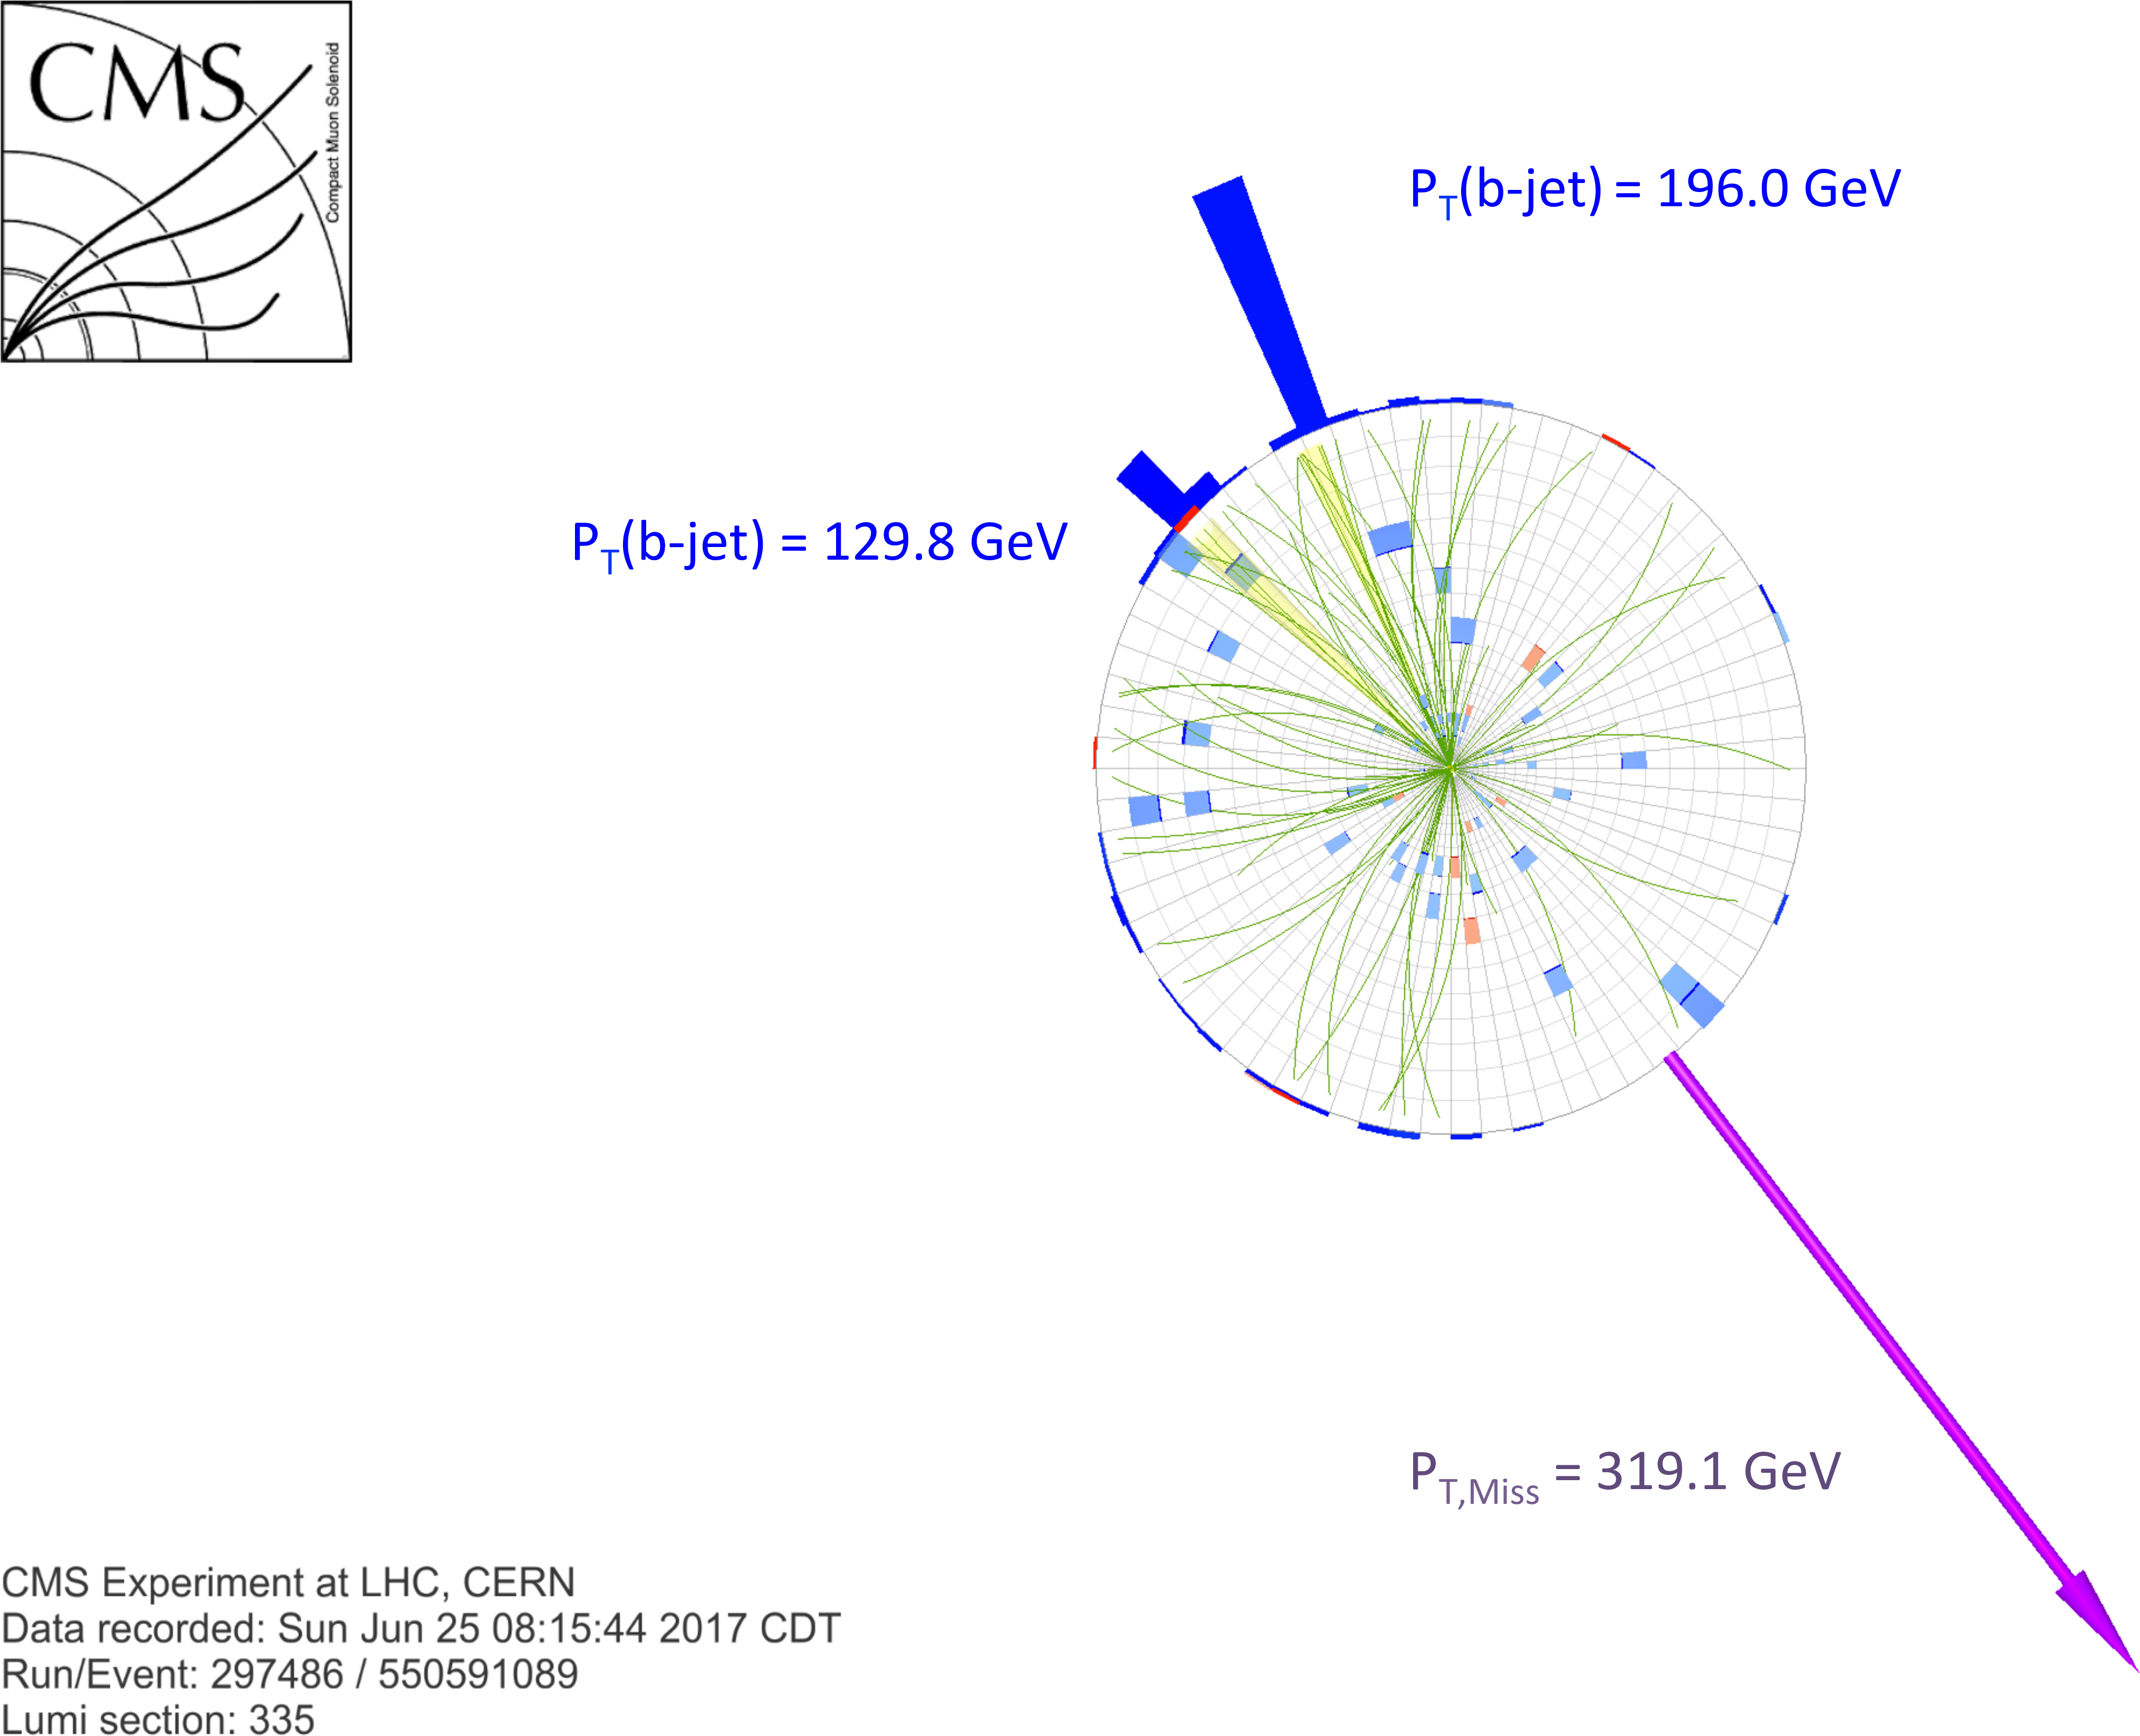
Additional Figure 13-b:
An event candidate for the production of a Z boson in conjunction with a Higgs boson in CMS detector. The Higgs boson decays to two bottom quarks whose decays are characterized by jets (shown in blue) with secondary vertices which are separated by a few centimeters from the pp collision primary vertices (shown in lowers plots). The Z boson decays into two neutrinos which are inferred from the large missing transverse momentum (shown in purple). |
png |
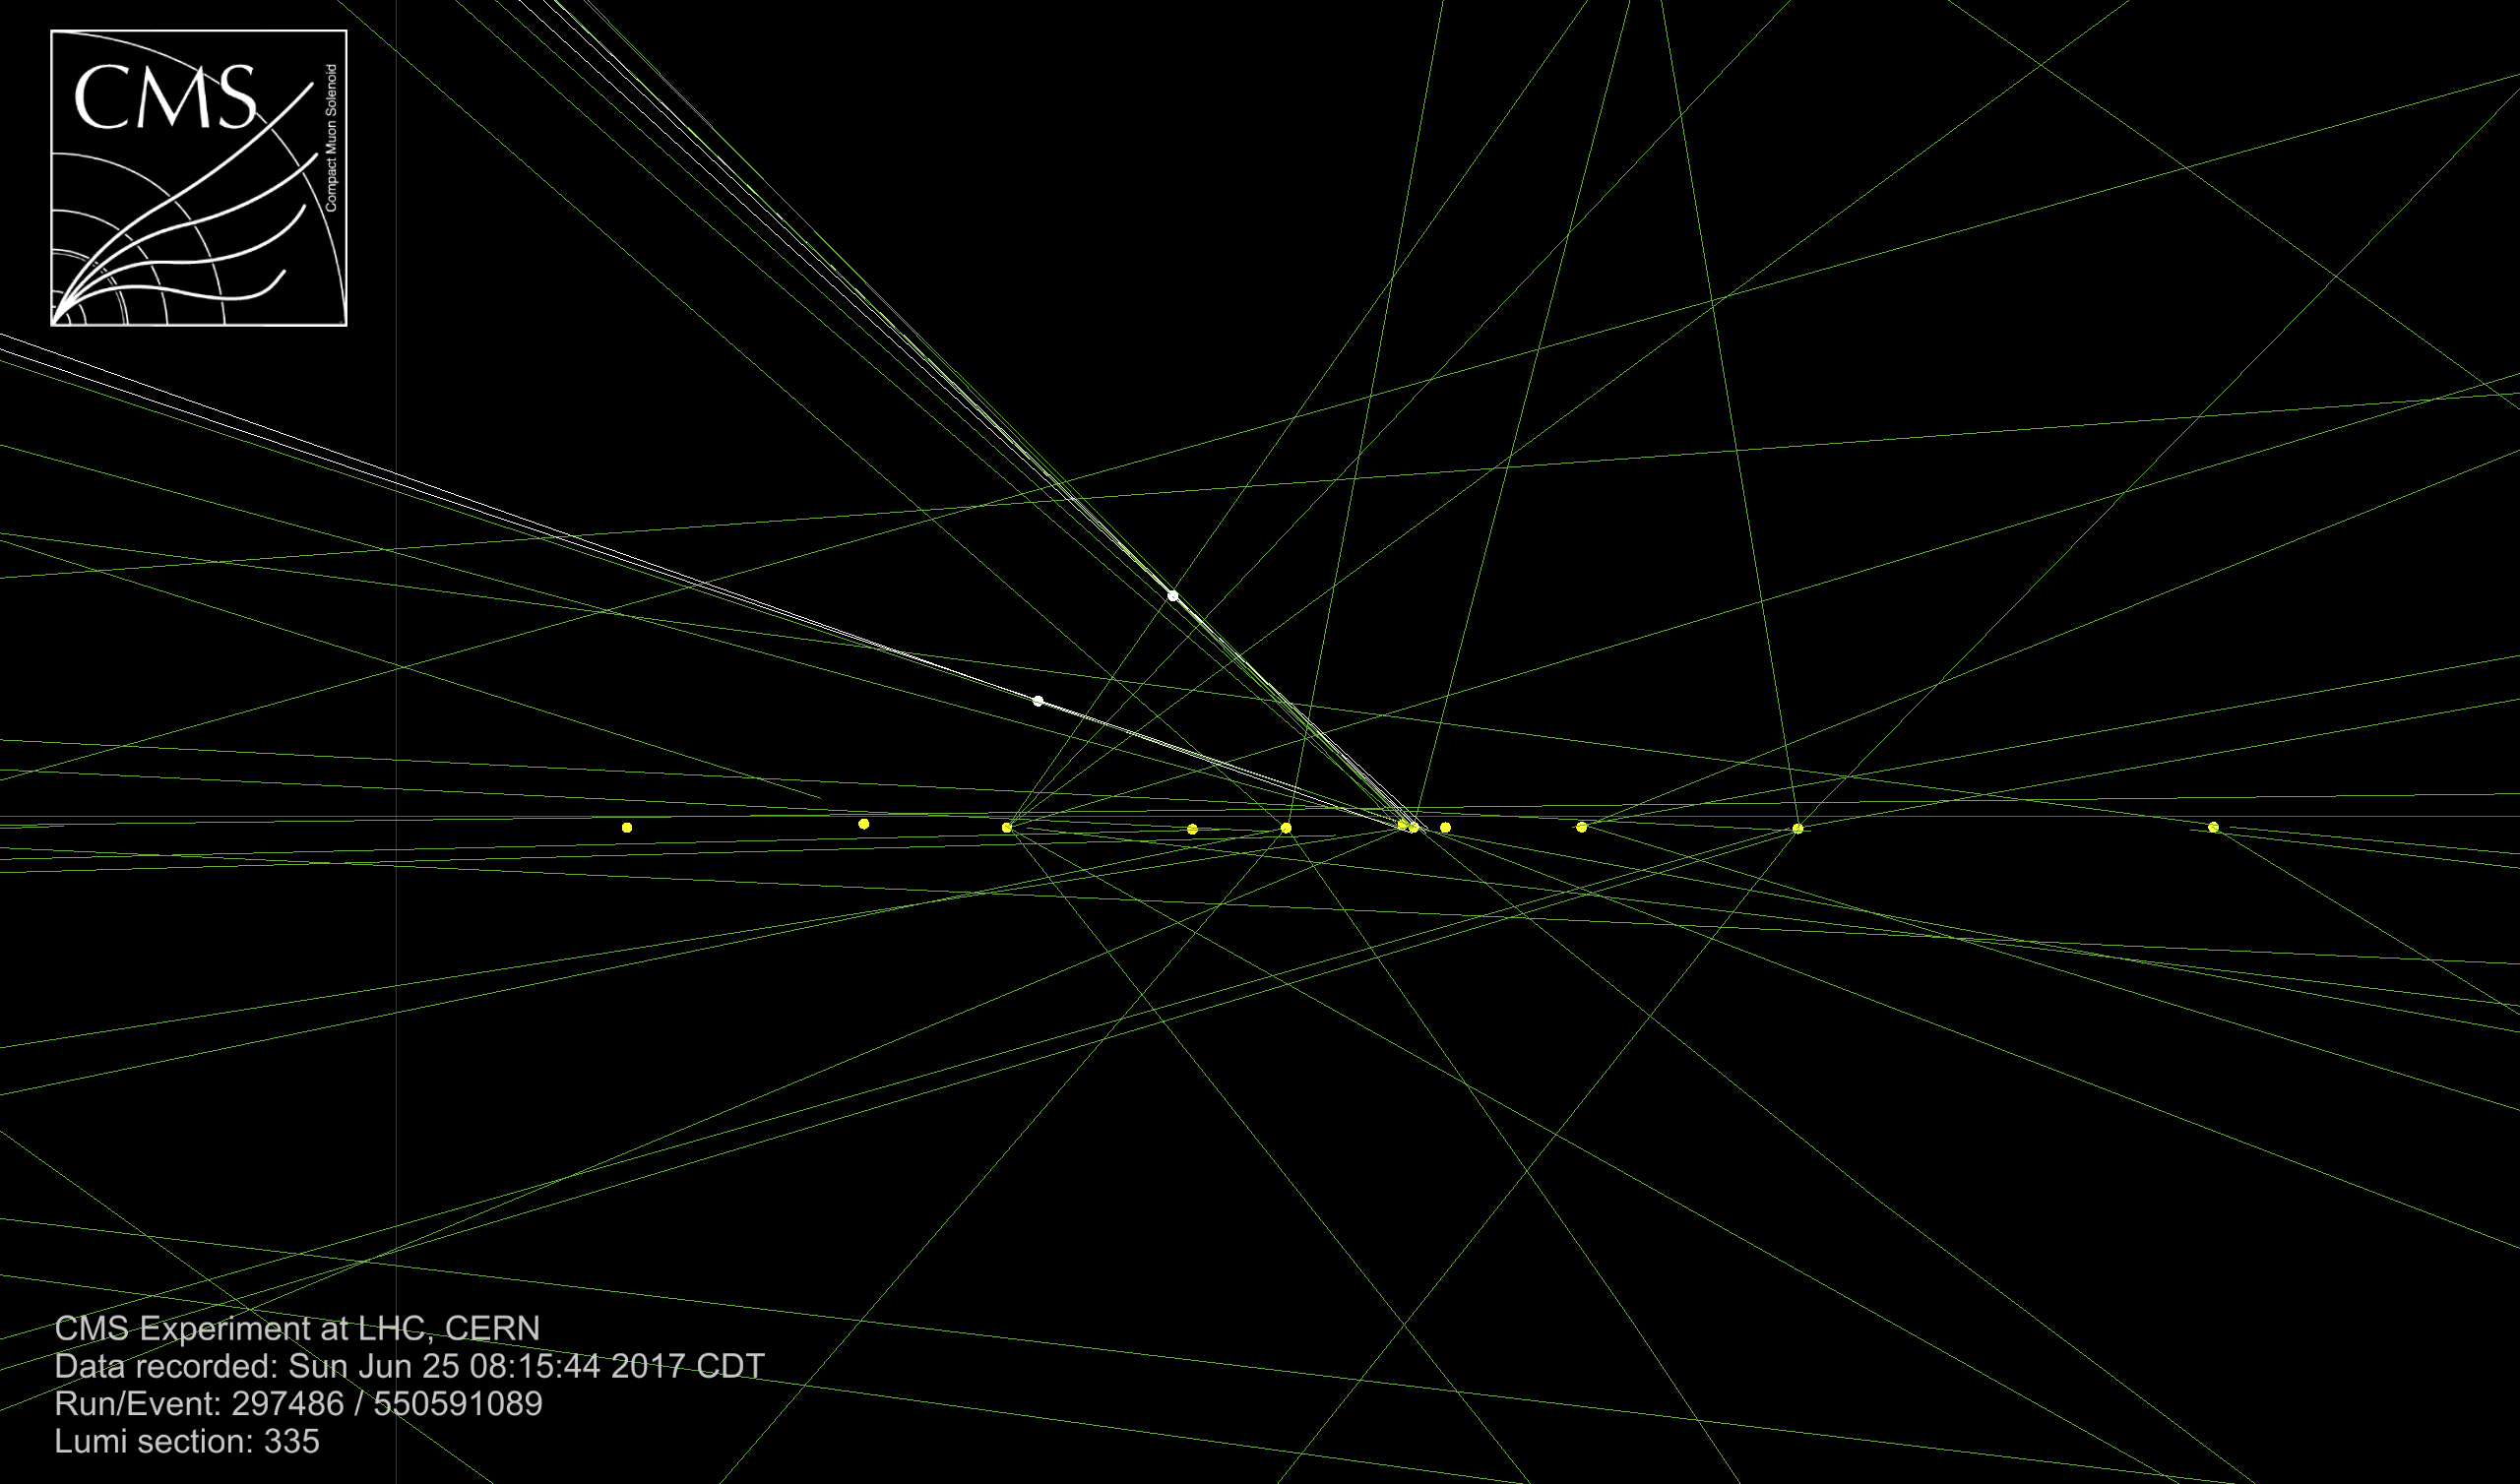
Additional Figure 13-c:
An event candidate for the production of a Z boson in conjunction with a Higgs boson in CMS detector. The Higgs boson decays to two bottom quarks whose decays are characterized by jets (shown in blue) with secondary vertices which are separated by a few centimeters from the pp collision primary vertices (shown in lowers plots). The Z boson decays into two neutrinos which are inferred from the large missing transverse momentum (shown in purple). |
png |
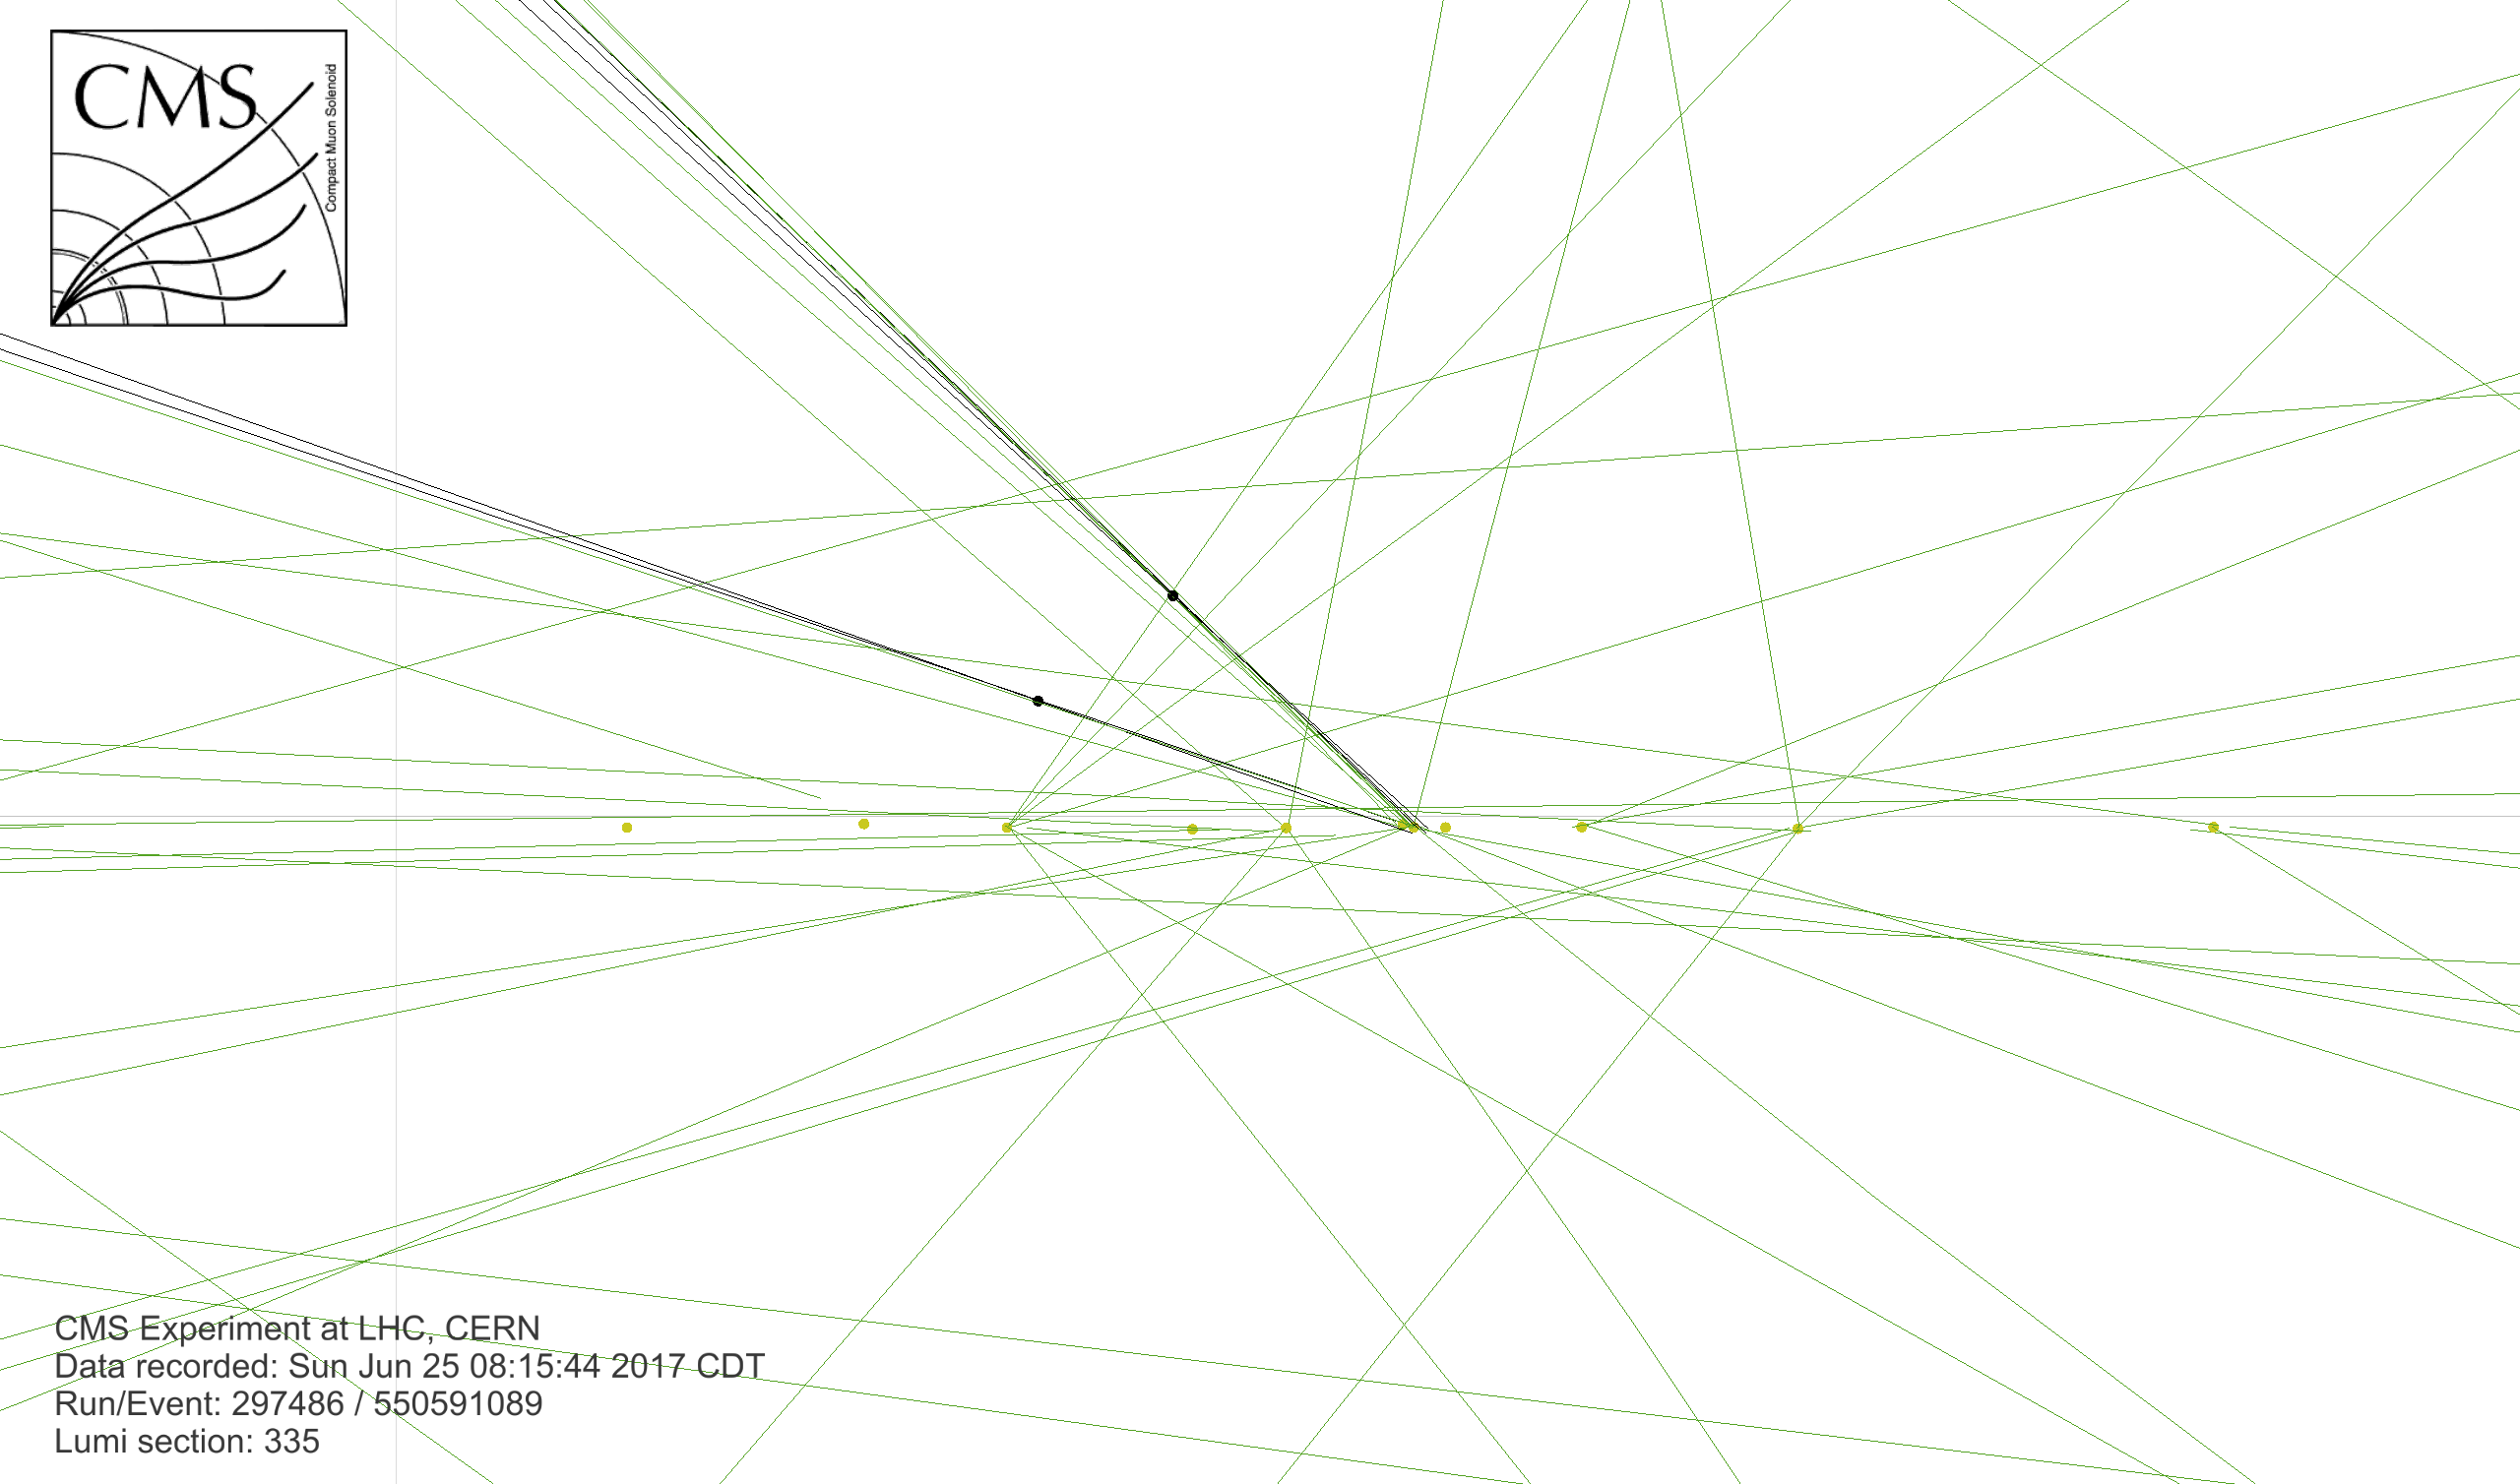
Additional Figure 13-d:
An event candidate for the production of a Z boson in conjunction with a Higgs boson in CMS detector. The Higgs boson decays to two bottom quarks whose decays are characterized by jets (shown in blue) with secondary vertices which are separated by a few centimeters from the pp collision primary vertices (shown in lowers plots). The Z boson decays into two neutrinos which are inferred from the large missing transverse momentum (shown in purple). |
png pdf |
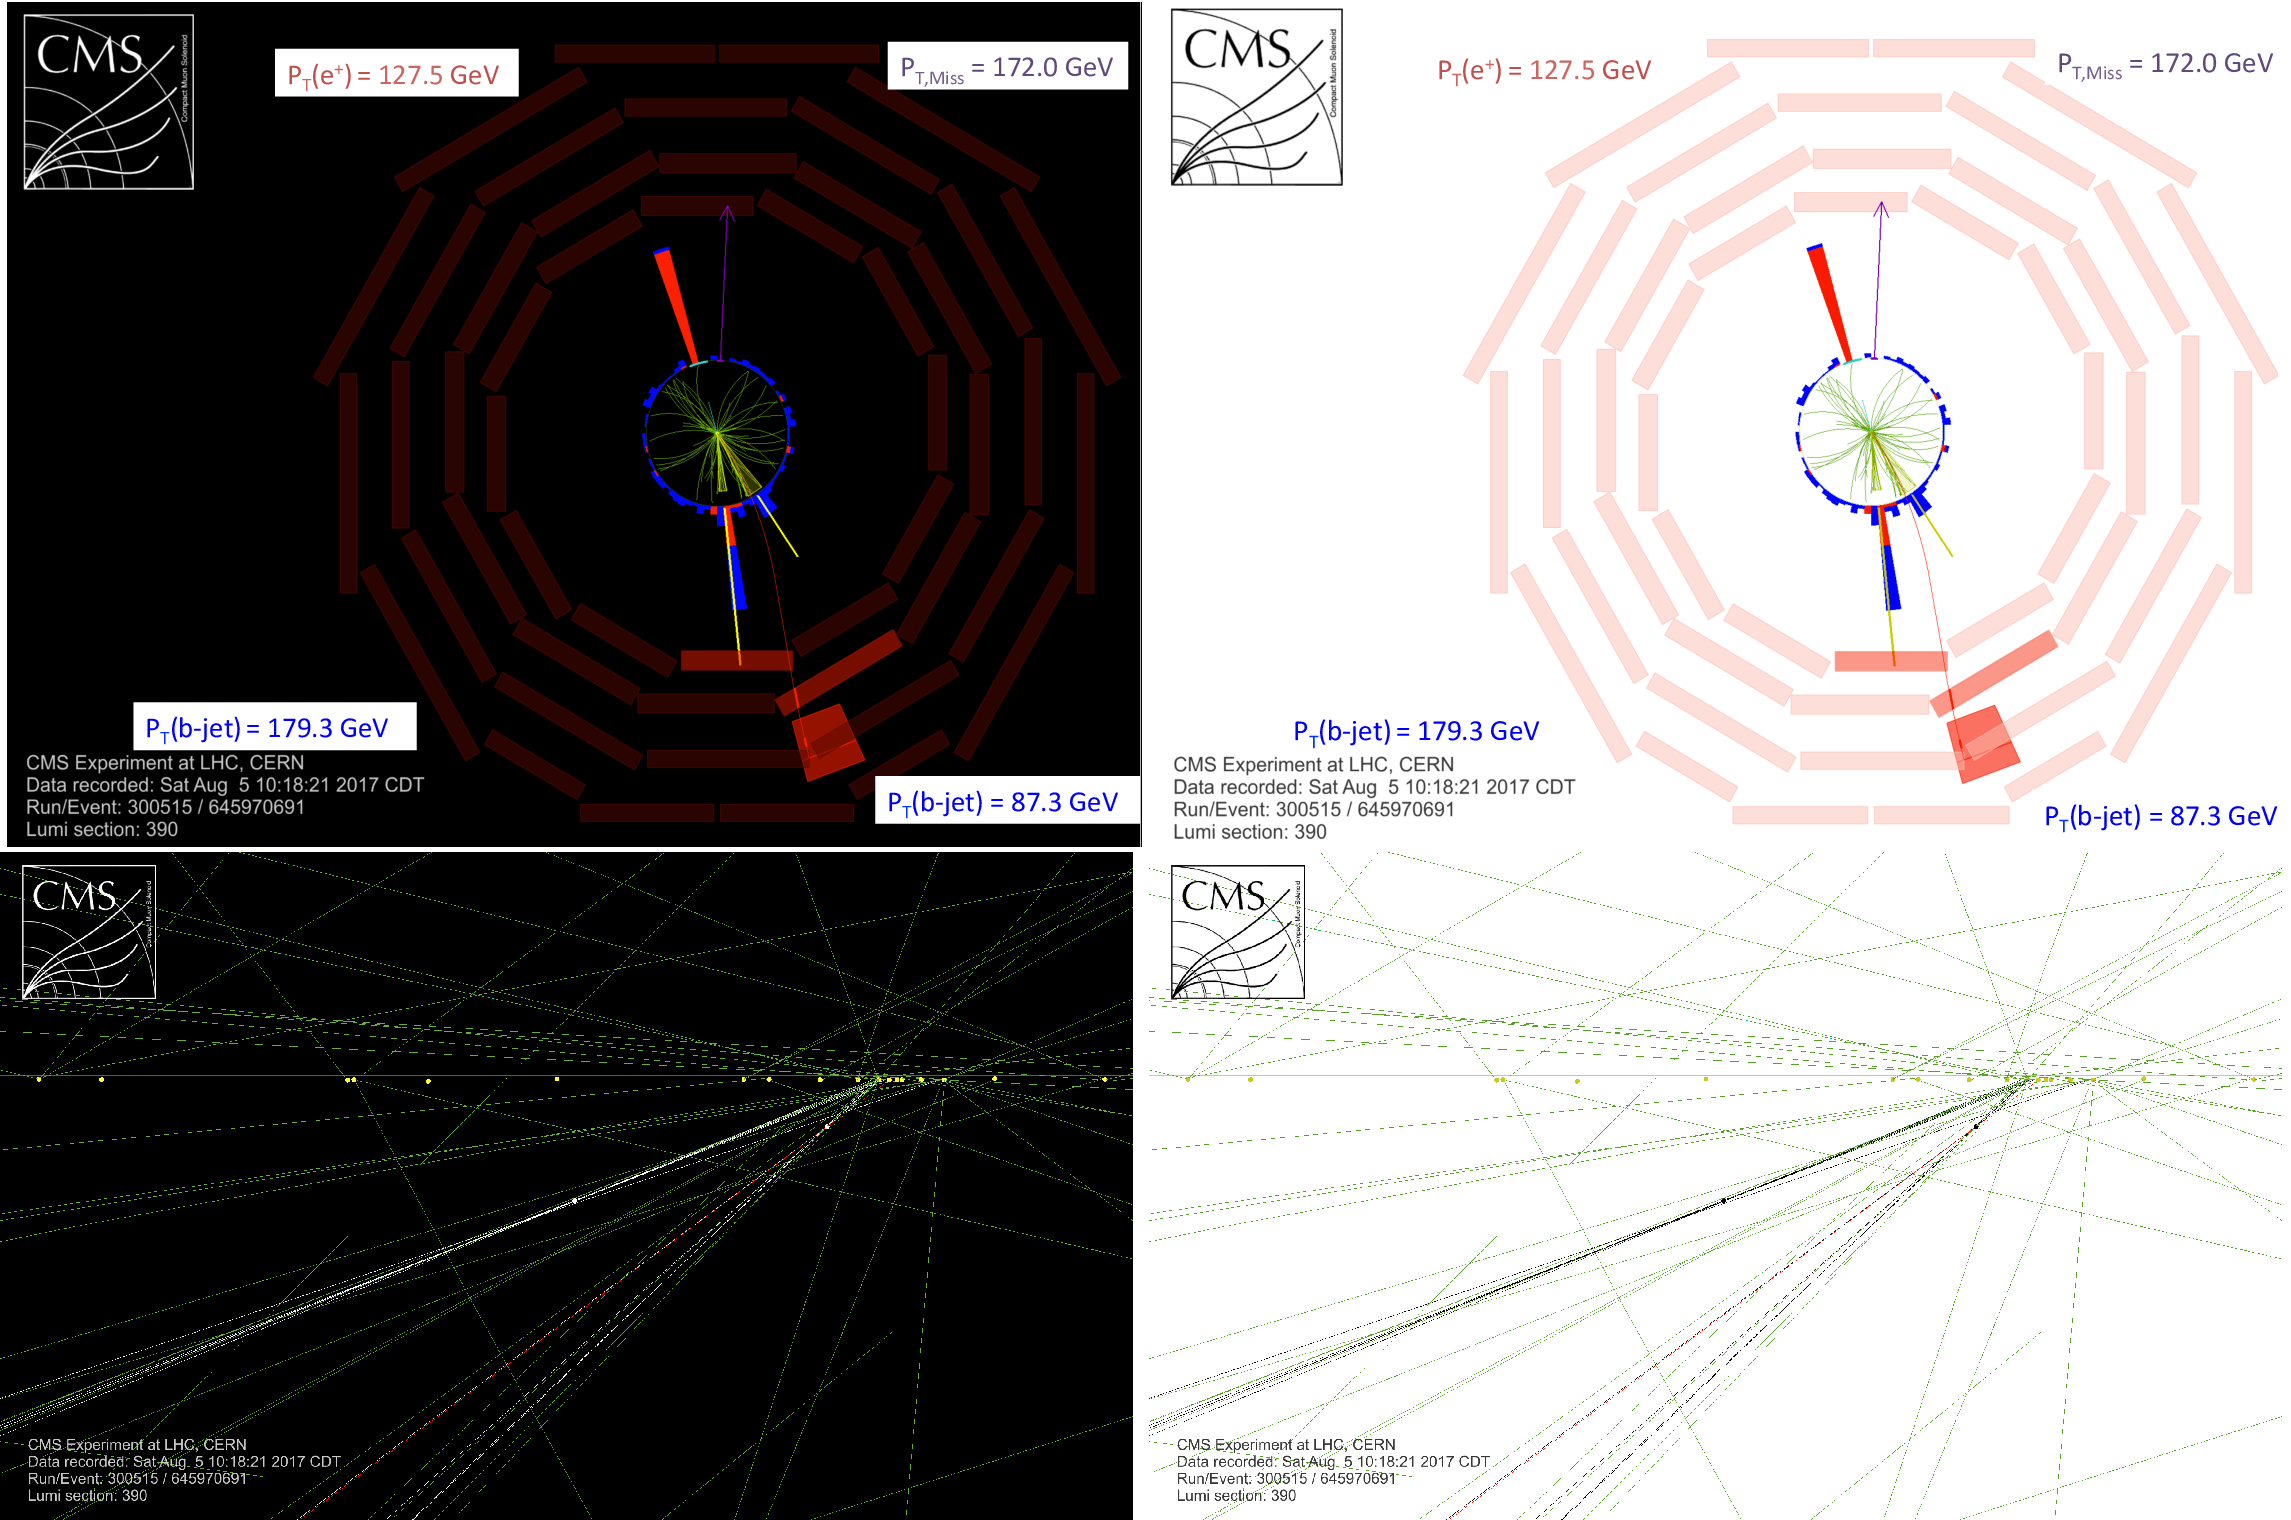
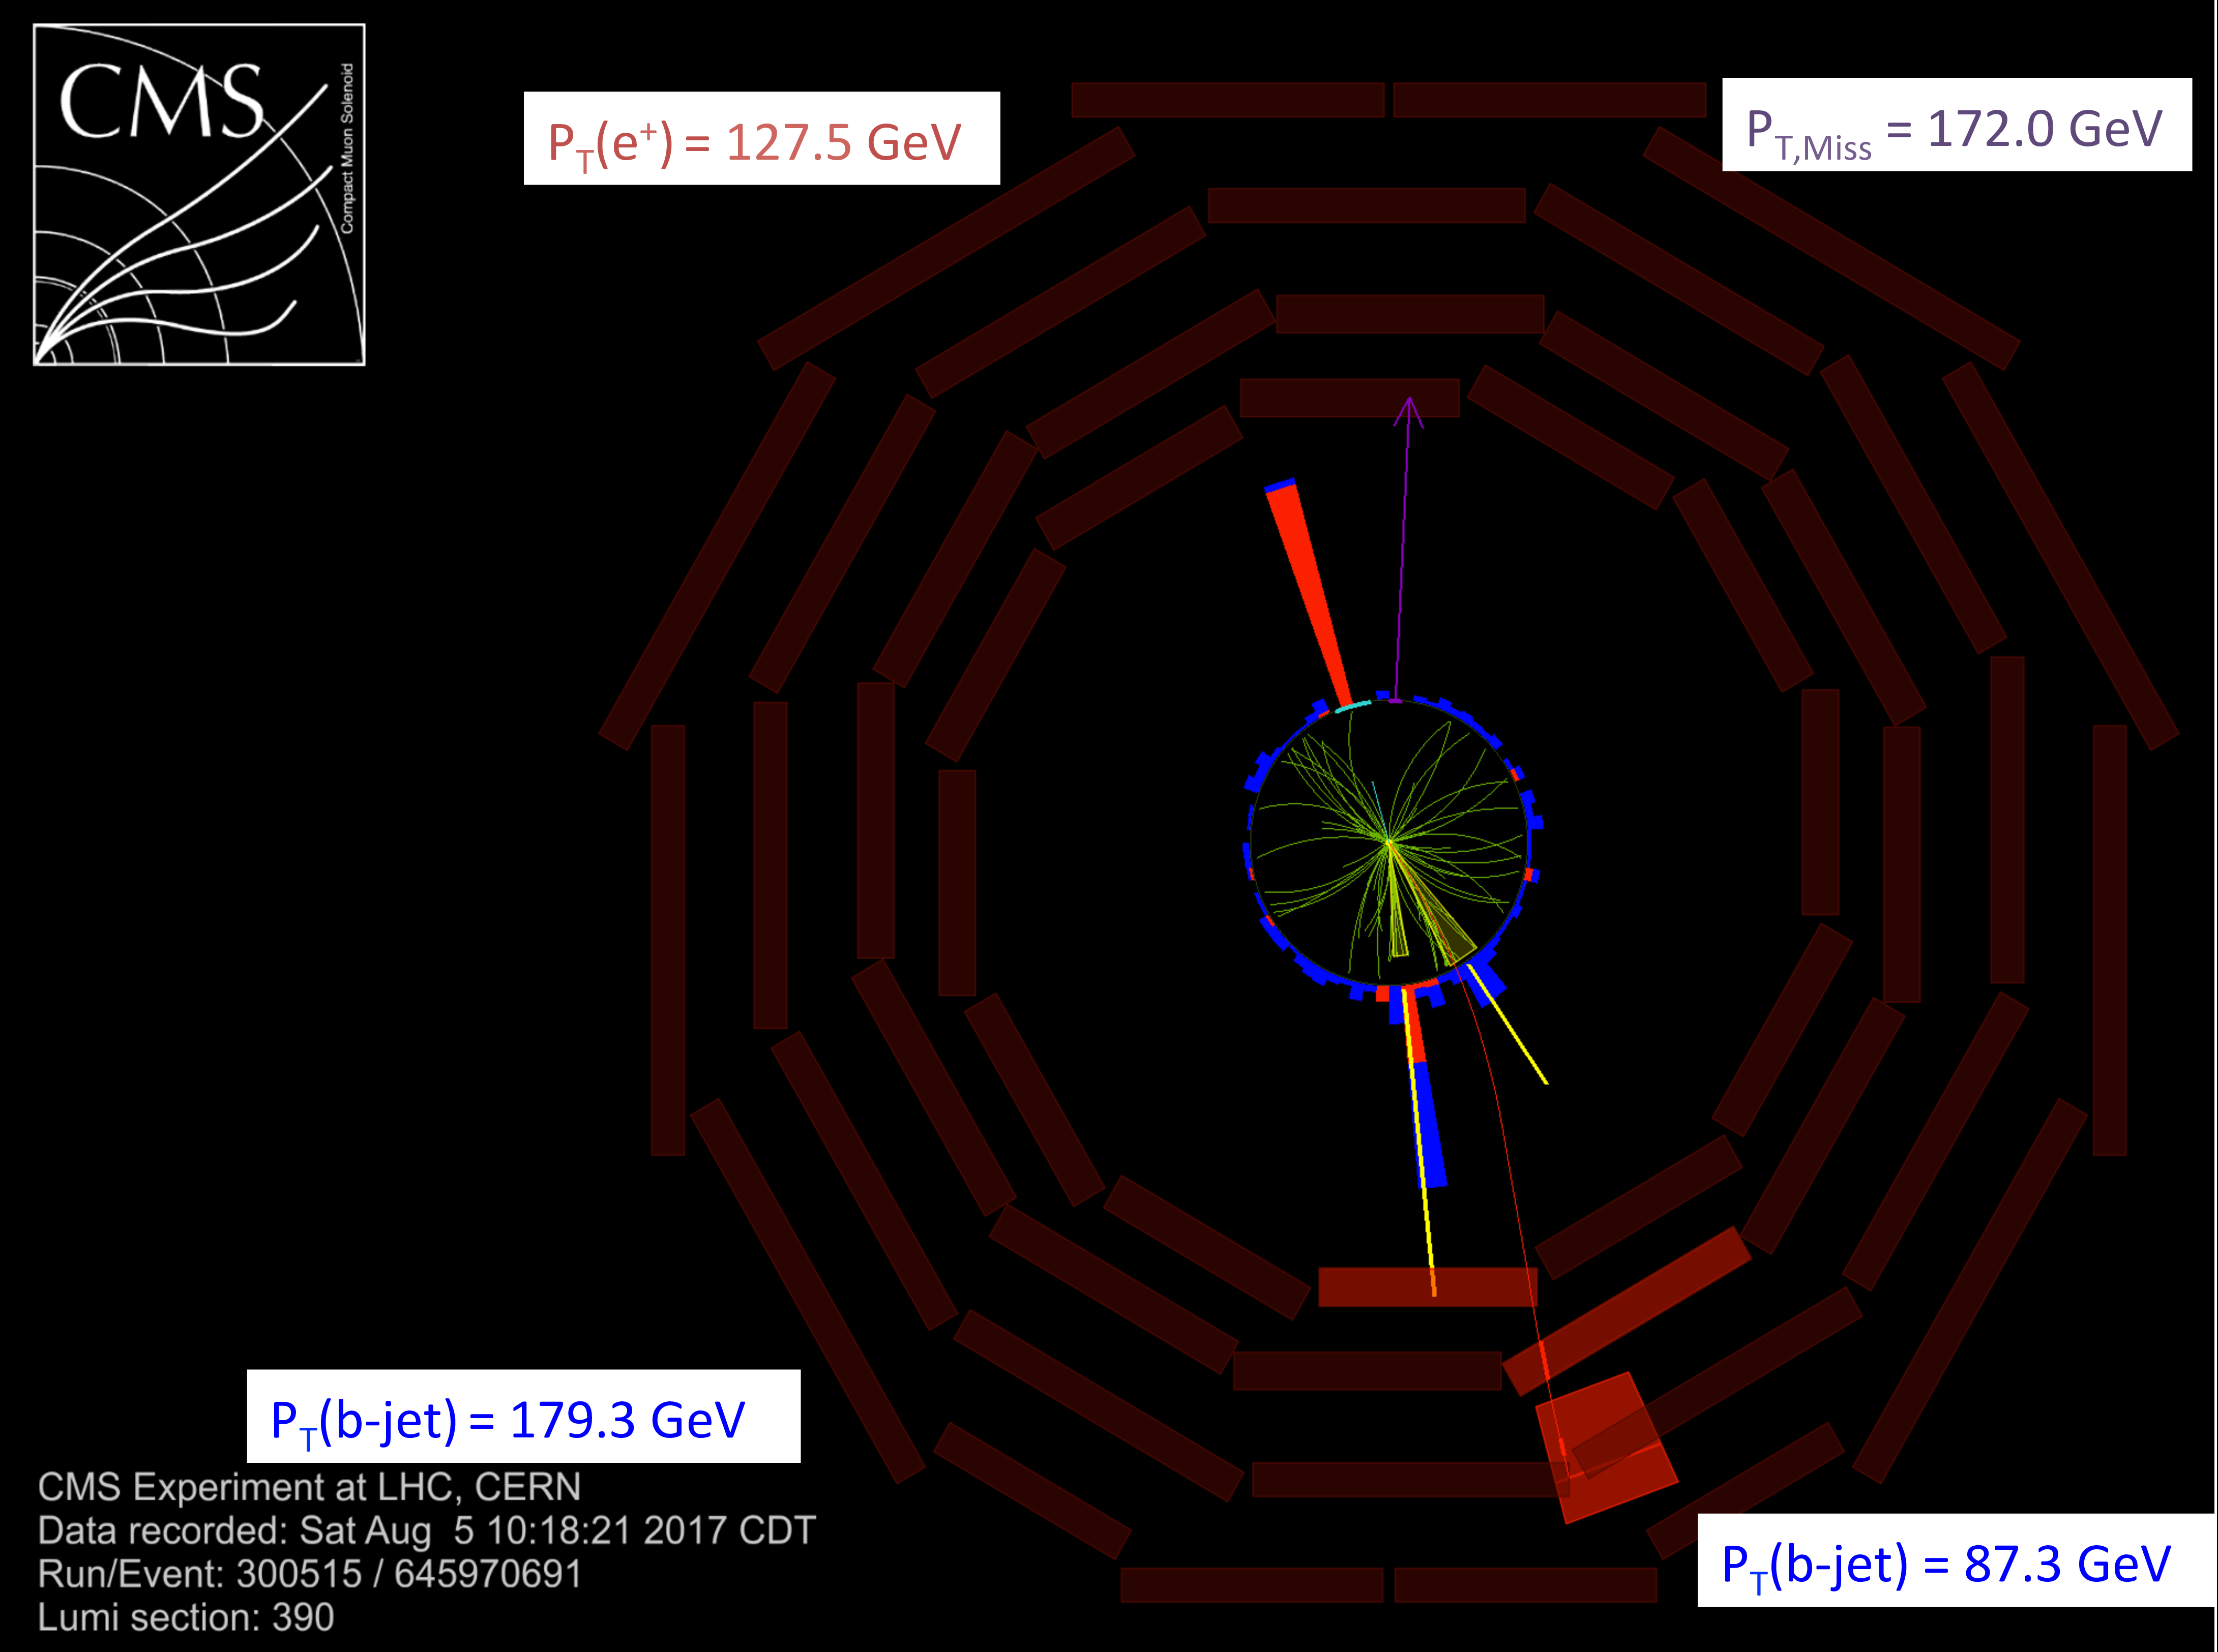
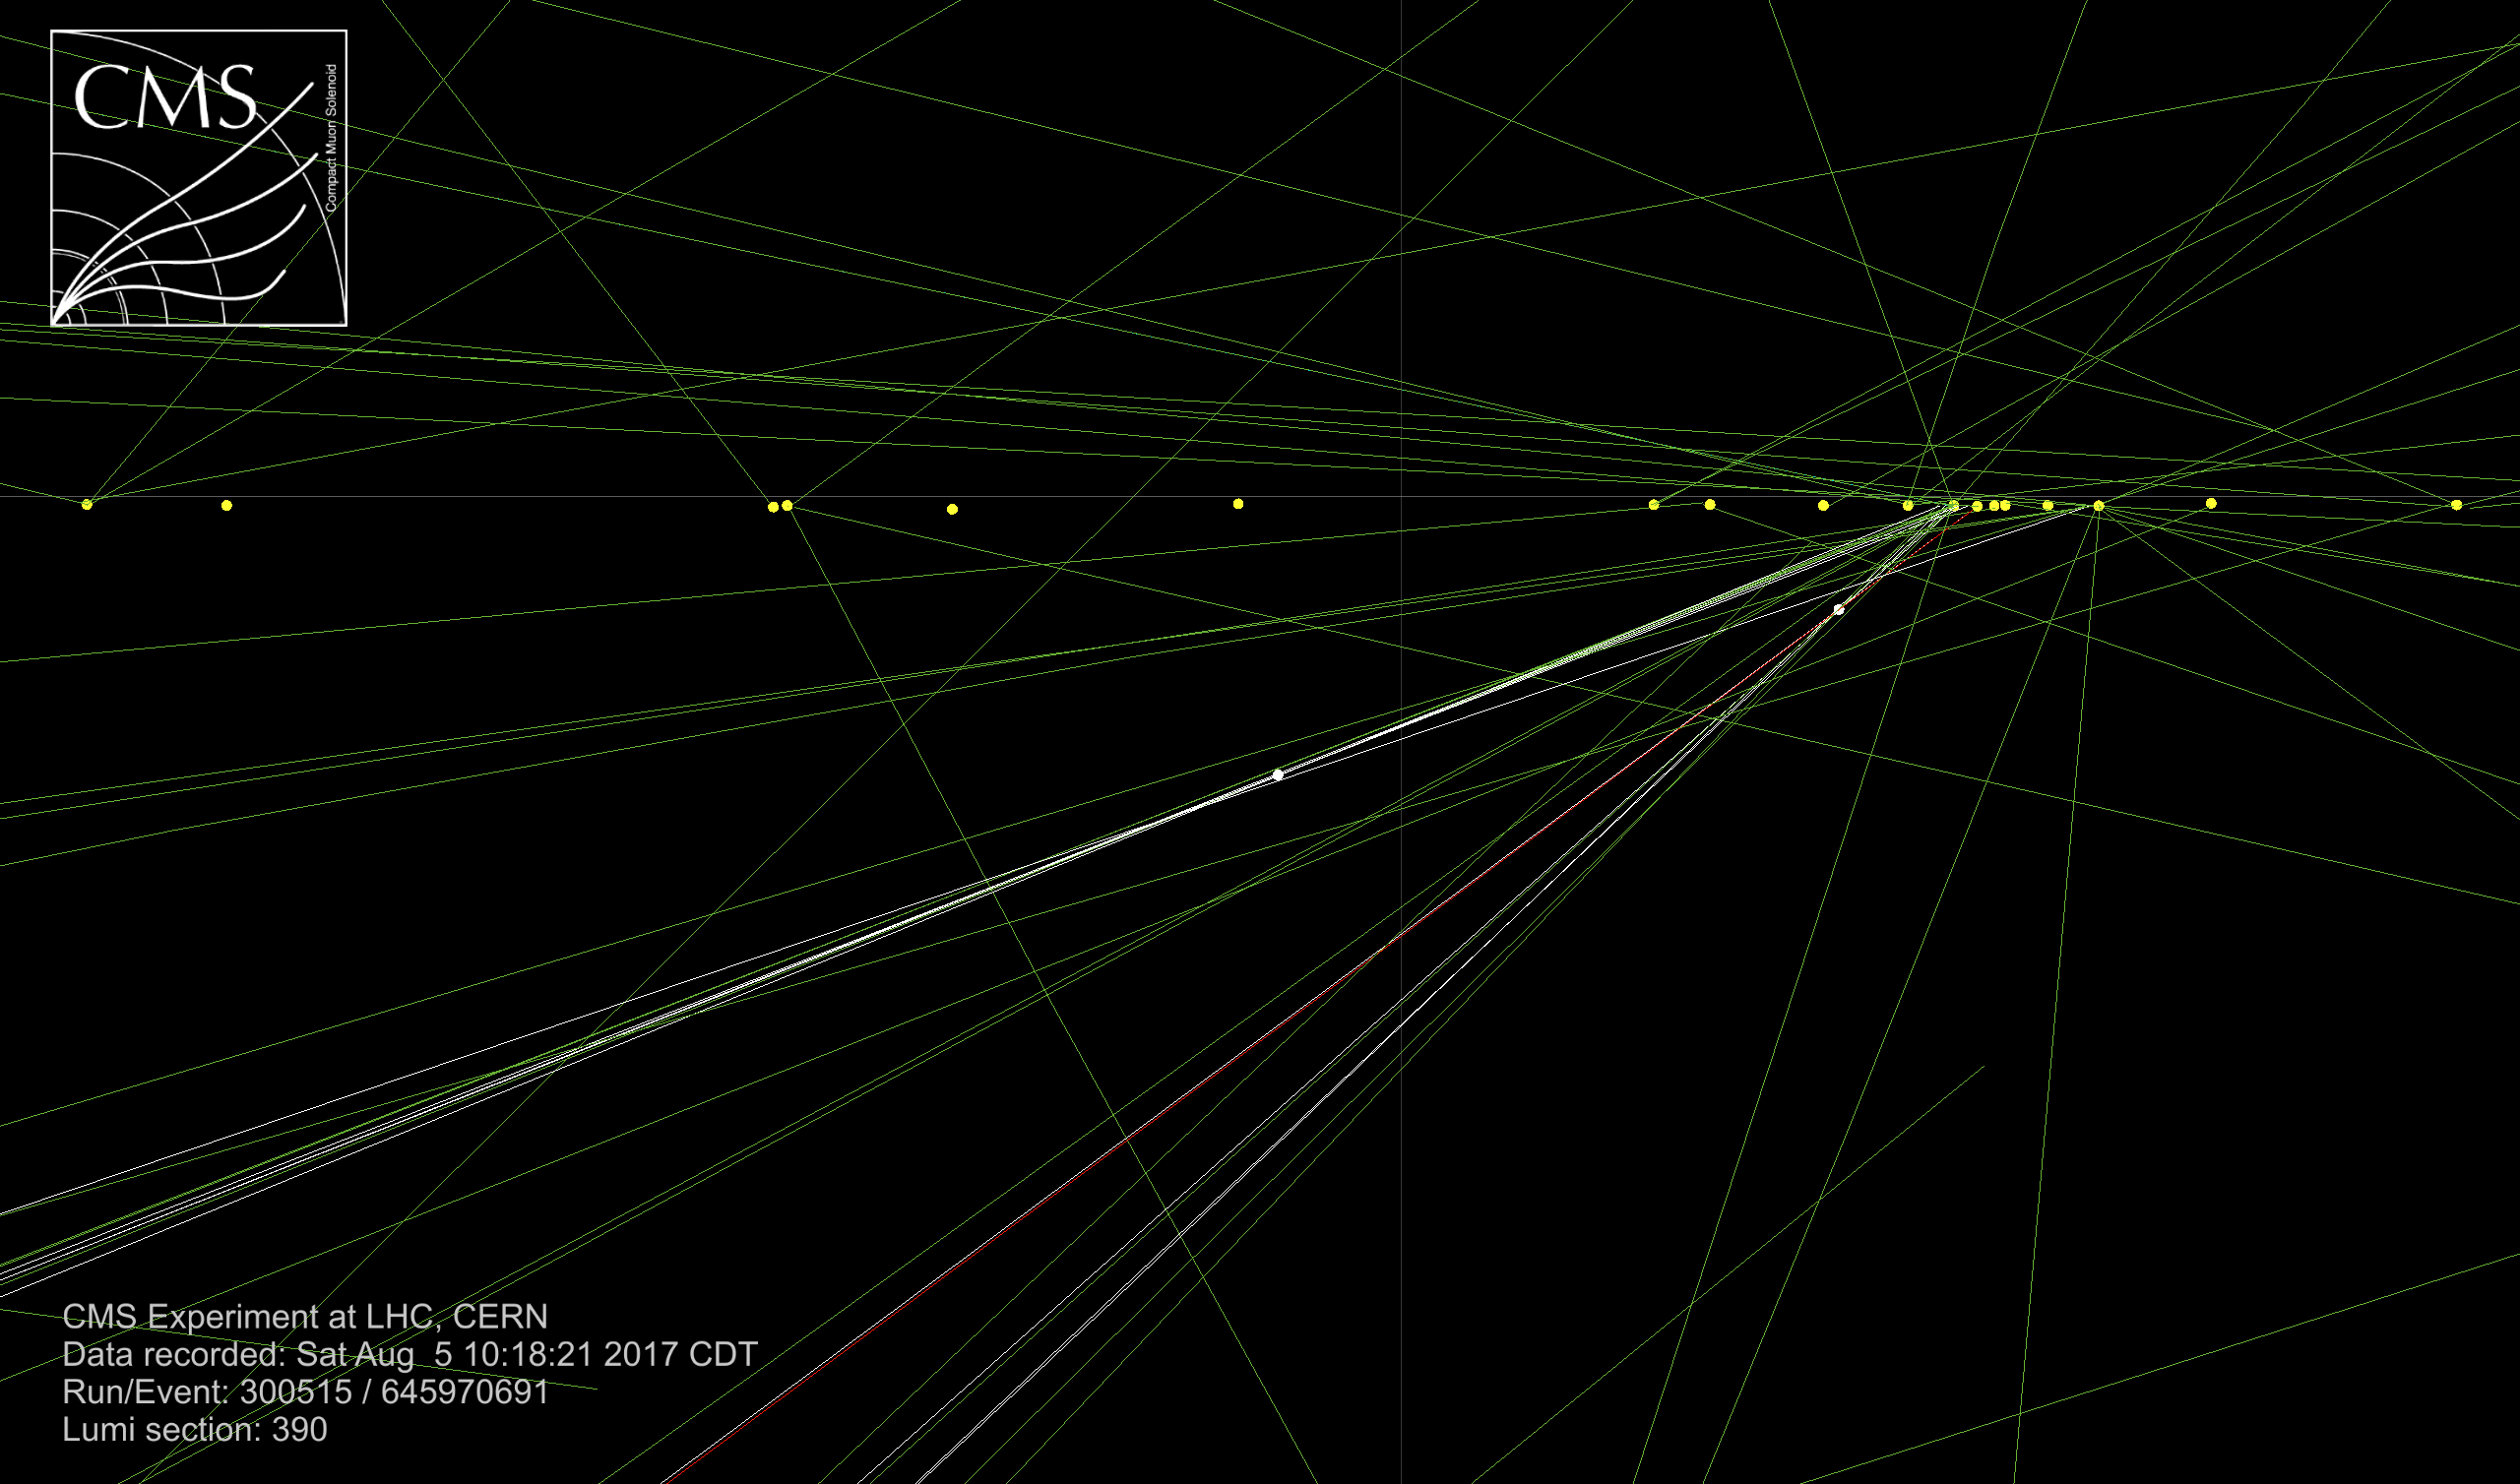
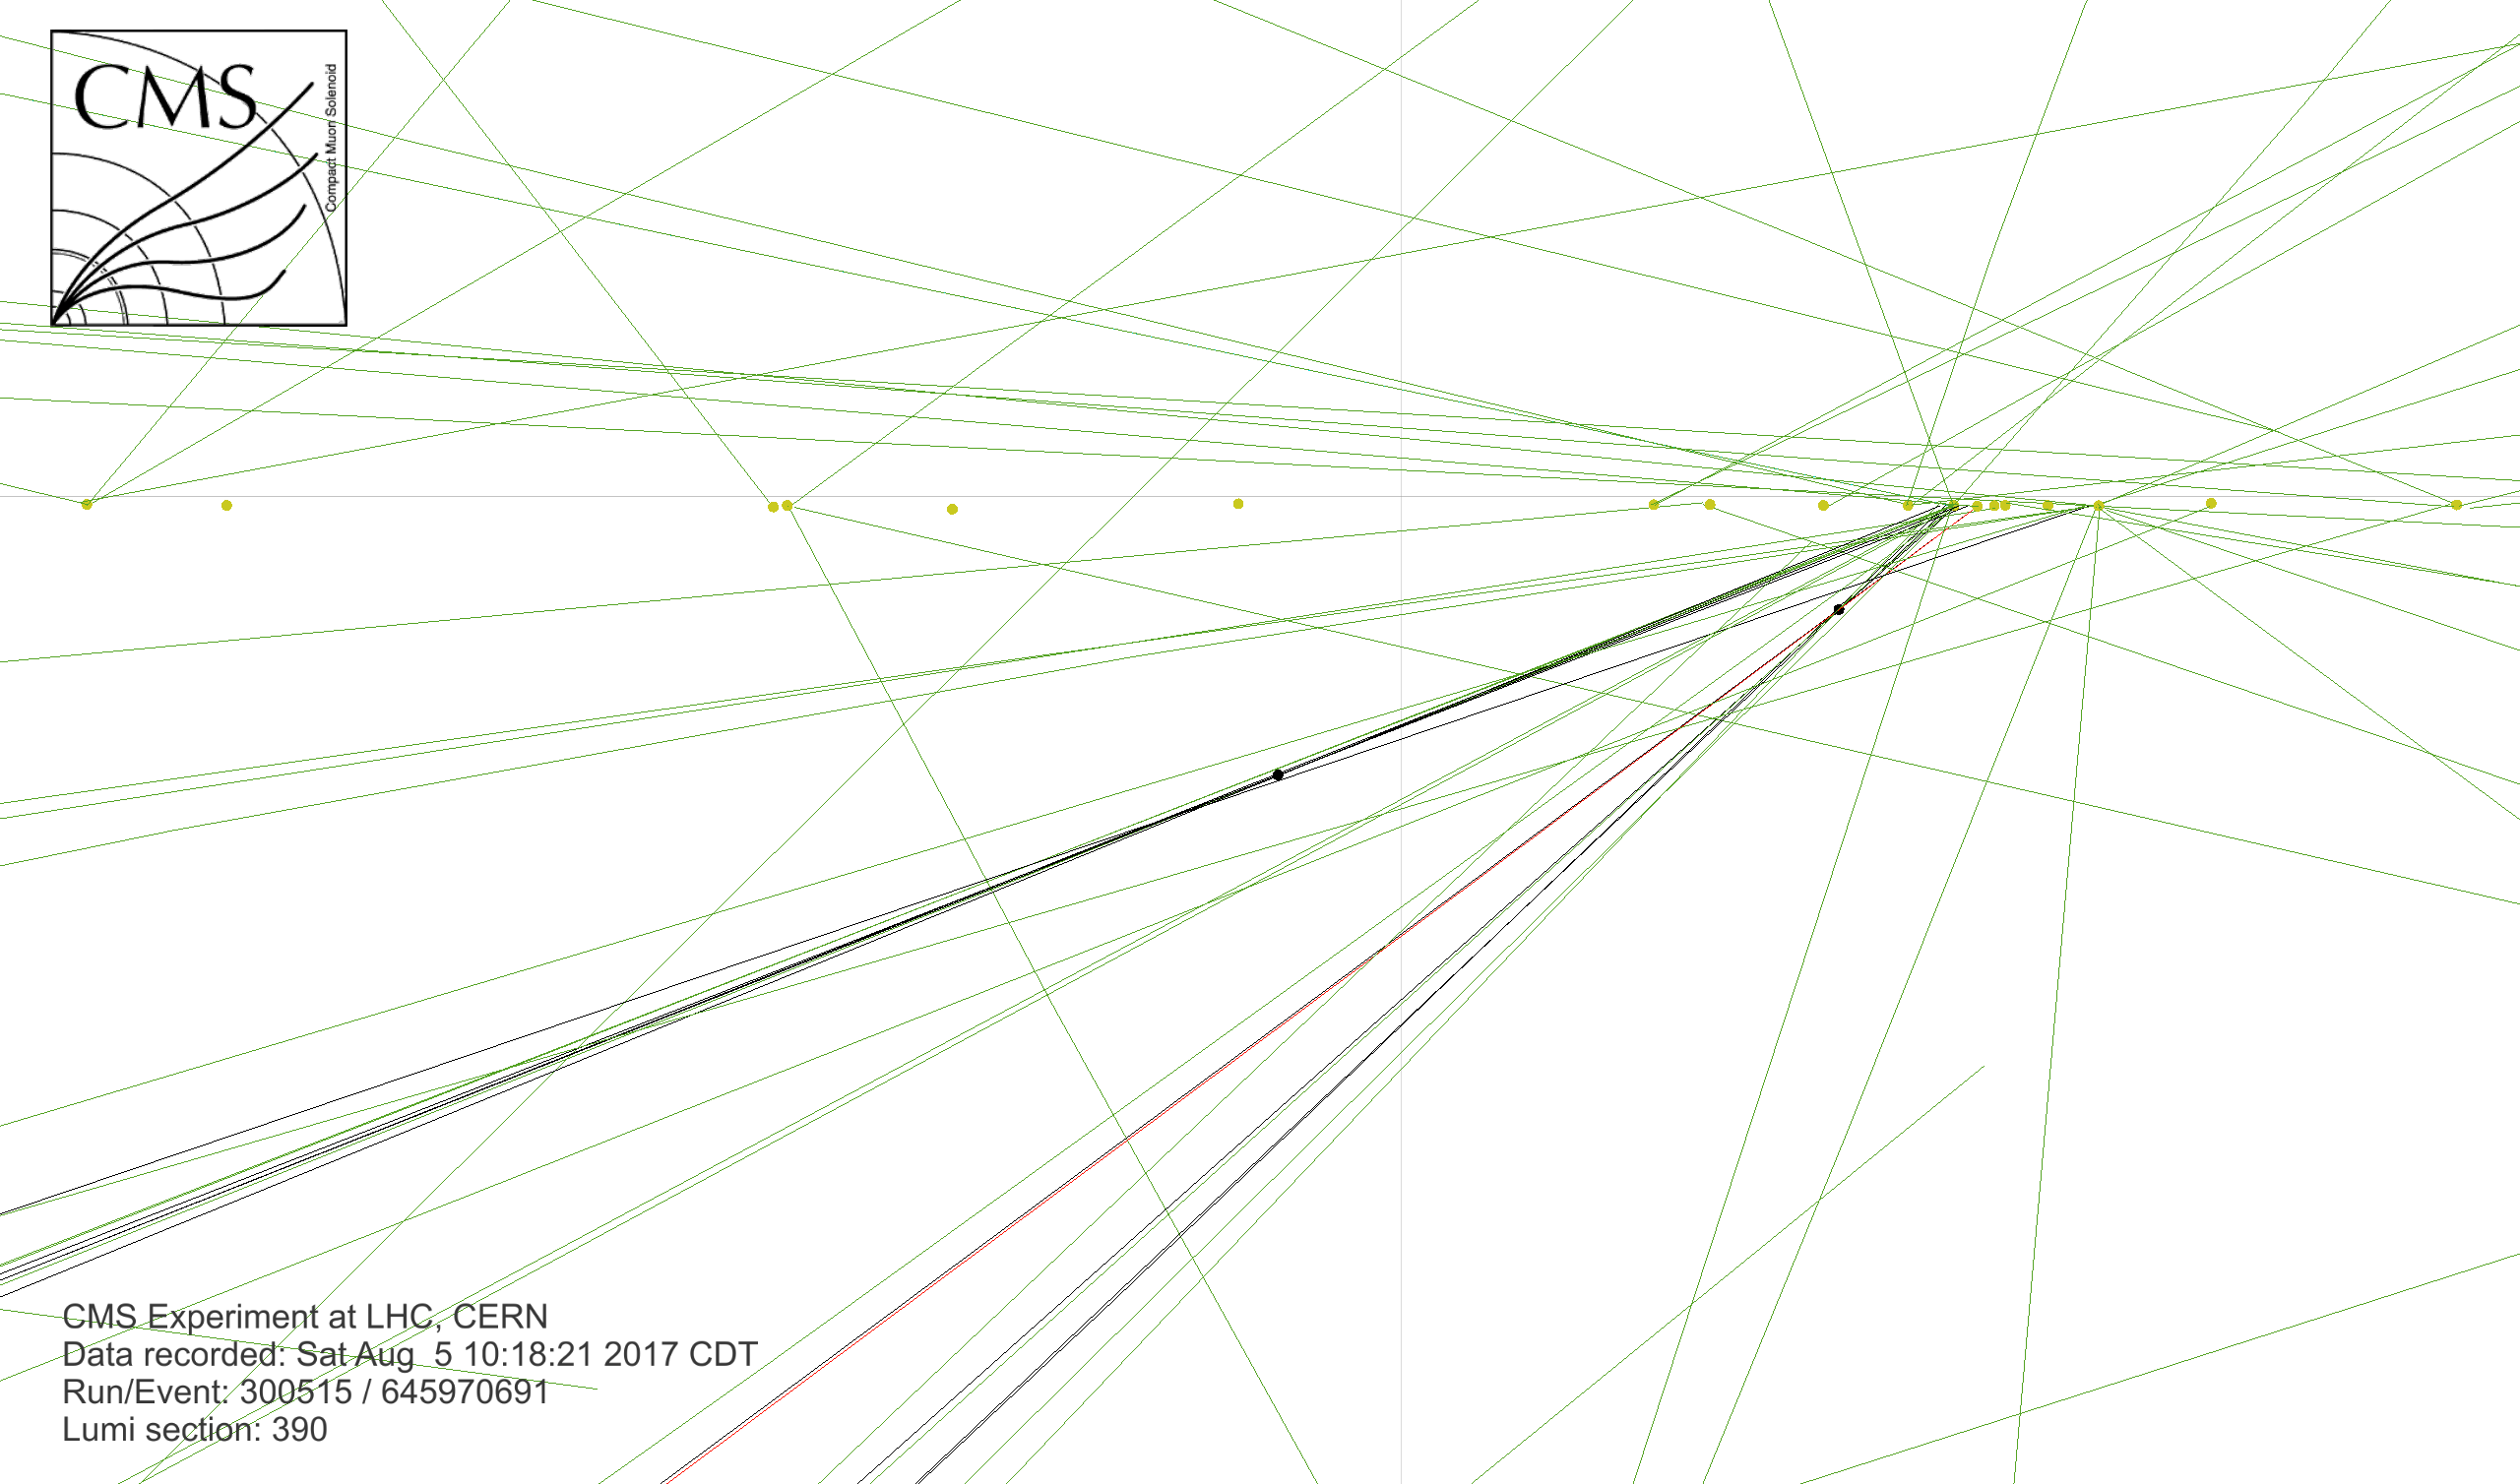
Additional Figure 14:
An event candidate for the production of a W boson in conjunction with a Higgs boson in CMS detector. The Higgs boson decays to two bottom quarks whose decays are characterized by jets (shown in blue) with secondary vertices which are separated by a few centimeters from the pp collision primary vertices (shown in lowers plots). The W boson decays into one electron, which is shown in red, and a neutrino which is inferred from the large missing transverse momentum (shown in purple). |
png pdf |
Additional Figure 14-a:
An event candidate for the production of a W boson in conjunction with a Higgs boson in CMS detector. The Higgs boson decays to two bottom quarks whose decays are characterized by jets (shown in blue) with secondary vertices which are separated by a few centimeters from the pp collision primary vertices (shown in lowers plots). The W boson decays into one electron, which is shown in red, and a neutrino which is inferred from the large missing transverse momentum (shown in purple). |

png pdf |
Additional Figure 14-b:
An event candidate for the production of a W boson in conjunction with a Higgs boson in CMS detector. The Higgs boson decays to two bottom quarks whose decays are characterized by jets (shown in blue) with secondary vertices which are separated by a few centimeters from the pp collision primary vertices (shown in lowers plots). The W boson decays into one electron, which is shown in red, and a neutrino which is inferred from the large missing transverse momentum (shown in purple). |
png |
Additional Figure 14-c:
An event candidate for the production of a W boson in conjunction with a Higgs boson in CMS detector. The Higgs boson decays to two bottom quarks whose decays are characterized by jets (shown in blue) with secondary vertices which are separated by a few centimeters from the pp collision primary vertices (shown in lowers plots). The W boson decays into one electron, which is shown in red, and a neutrino which is inferred from the large missing transverse momentum (shown in purple). |
png |
Additional Figure 14-d:
An event candidate for the production of a W boson in conjunction with a Higgs boson in CMS detector. The Higgs boson decays to two bottom quarks whose decays are characterized by jets (shown in blue) with secondary vertices which are separated by a few centimeters from the pp collision primary vertices (shown in lowers plots). The W boson decays into one electron, which is shown in red, and a neutrino which is inferred from the large missing transverse momentum (shown in purple). |

png pdf |
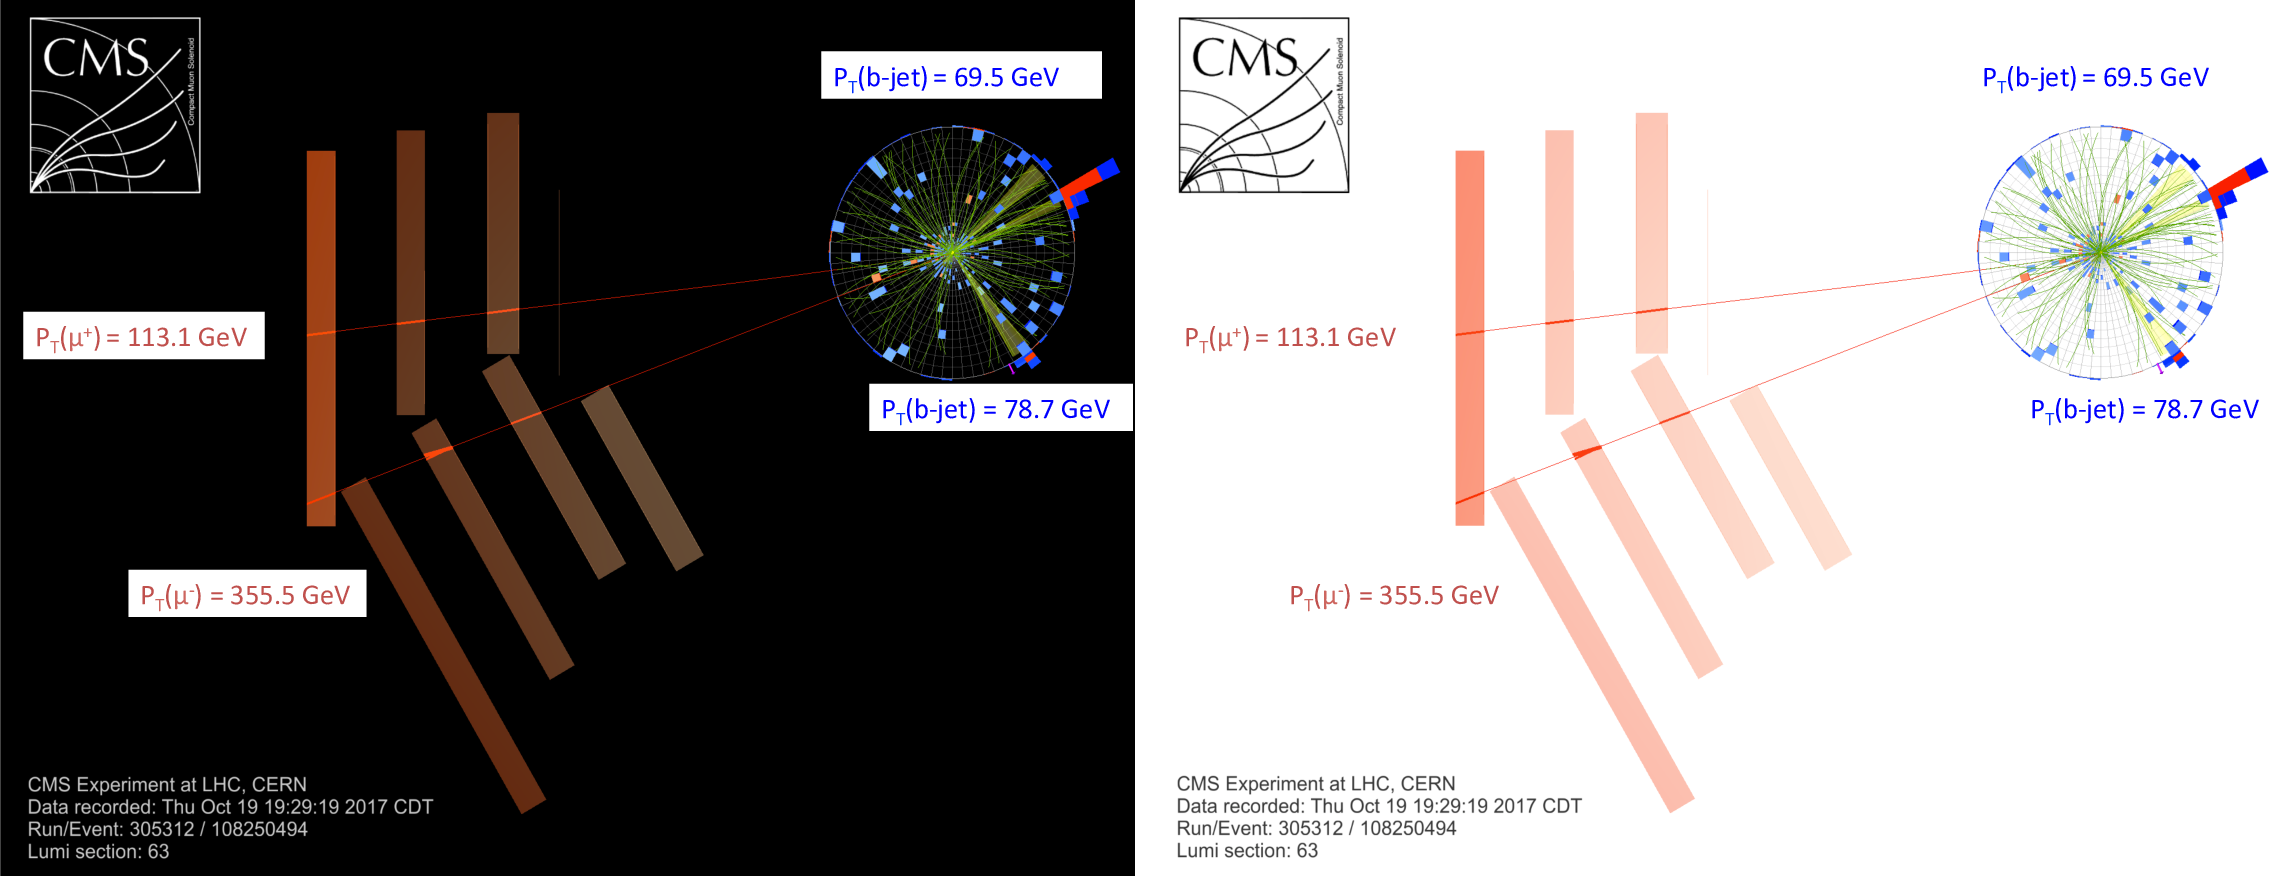
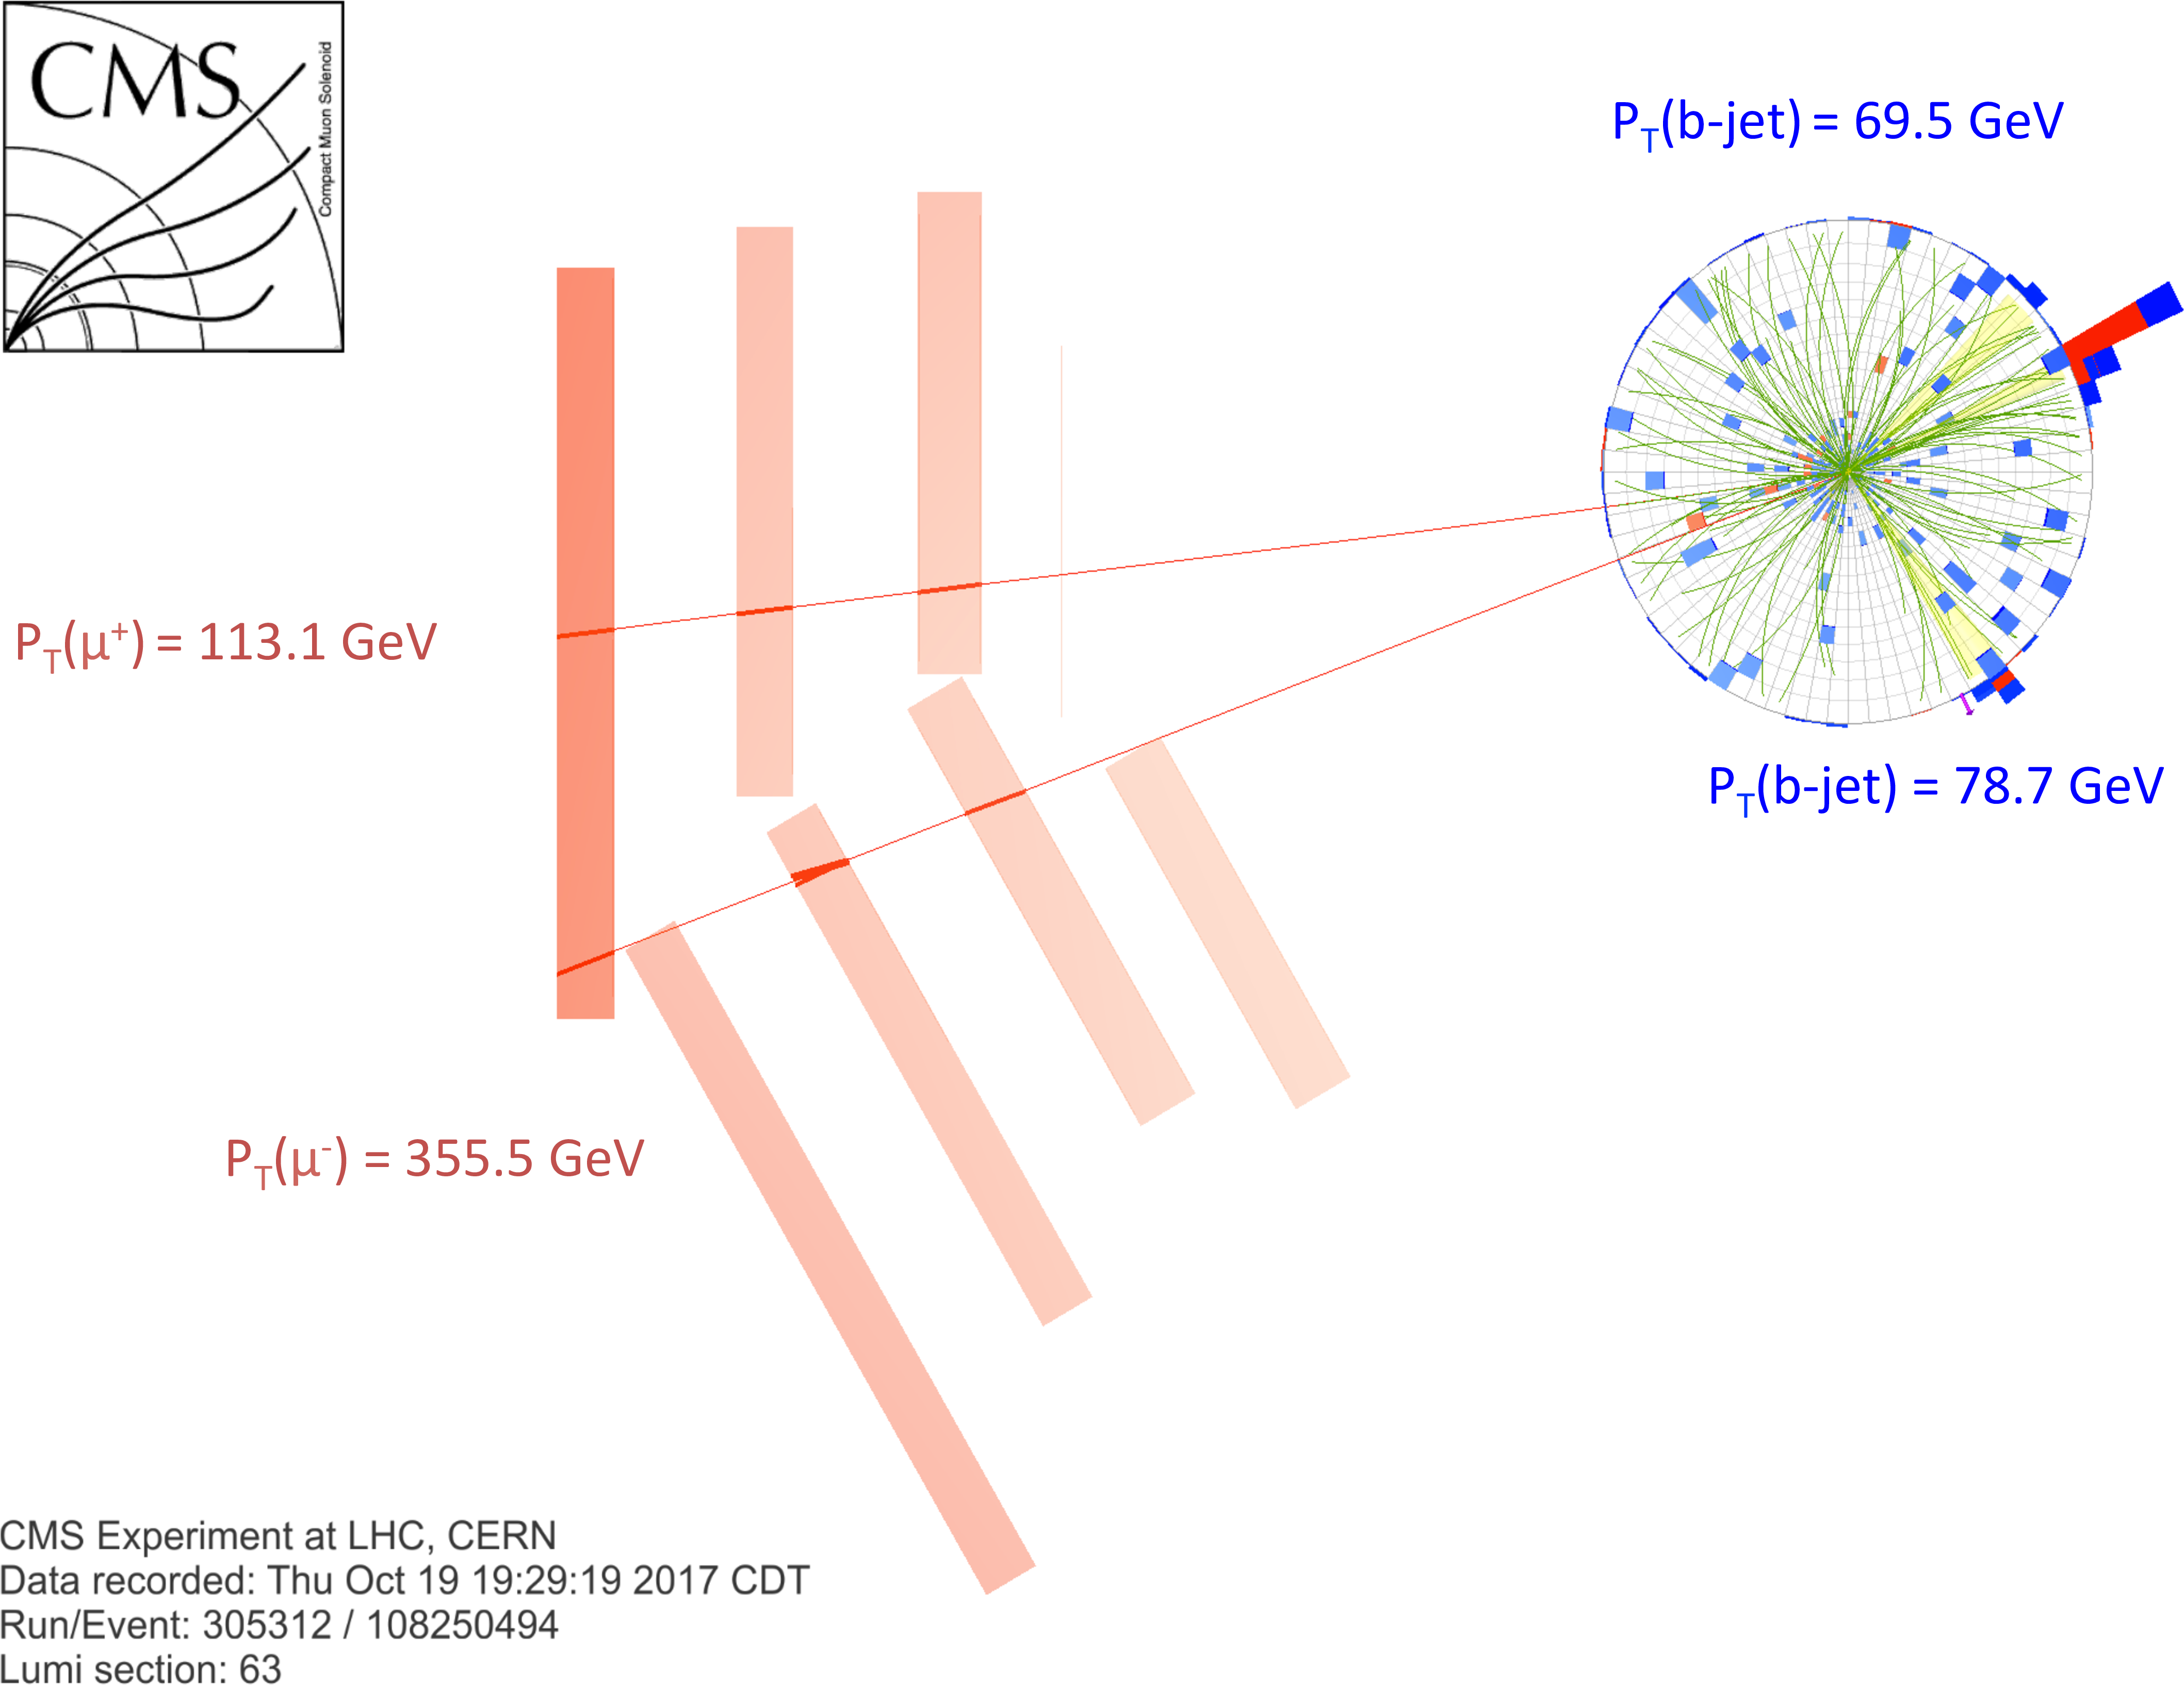
Additional Figure 15:
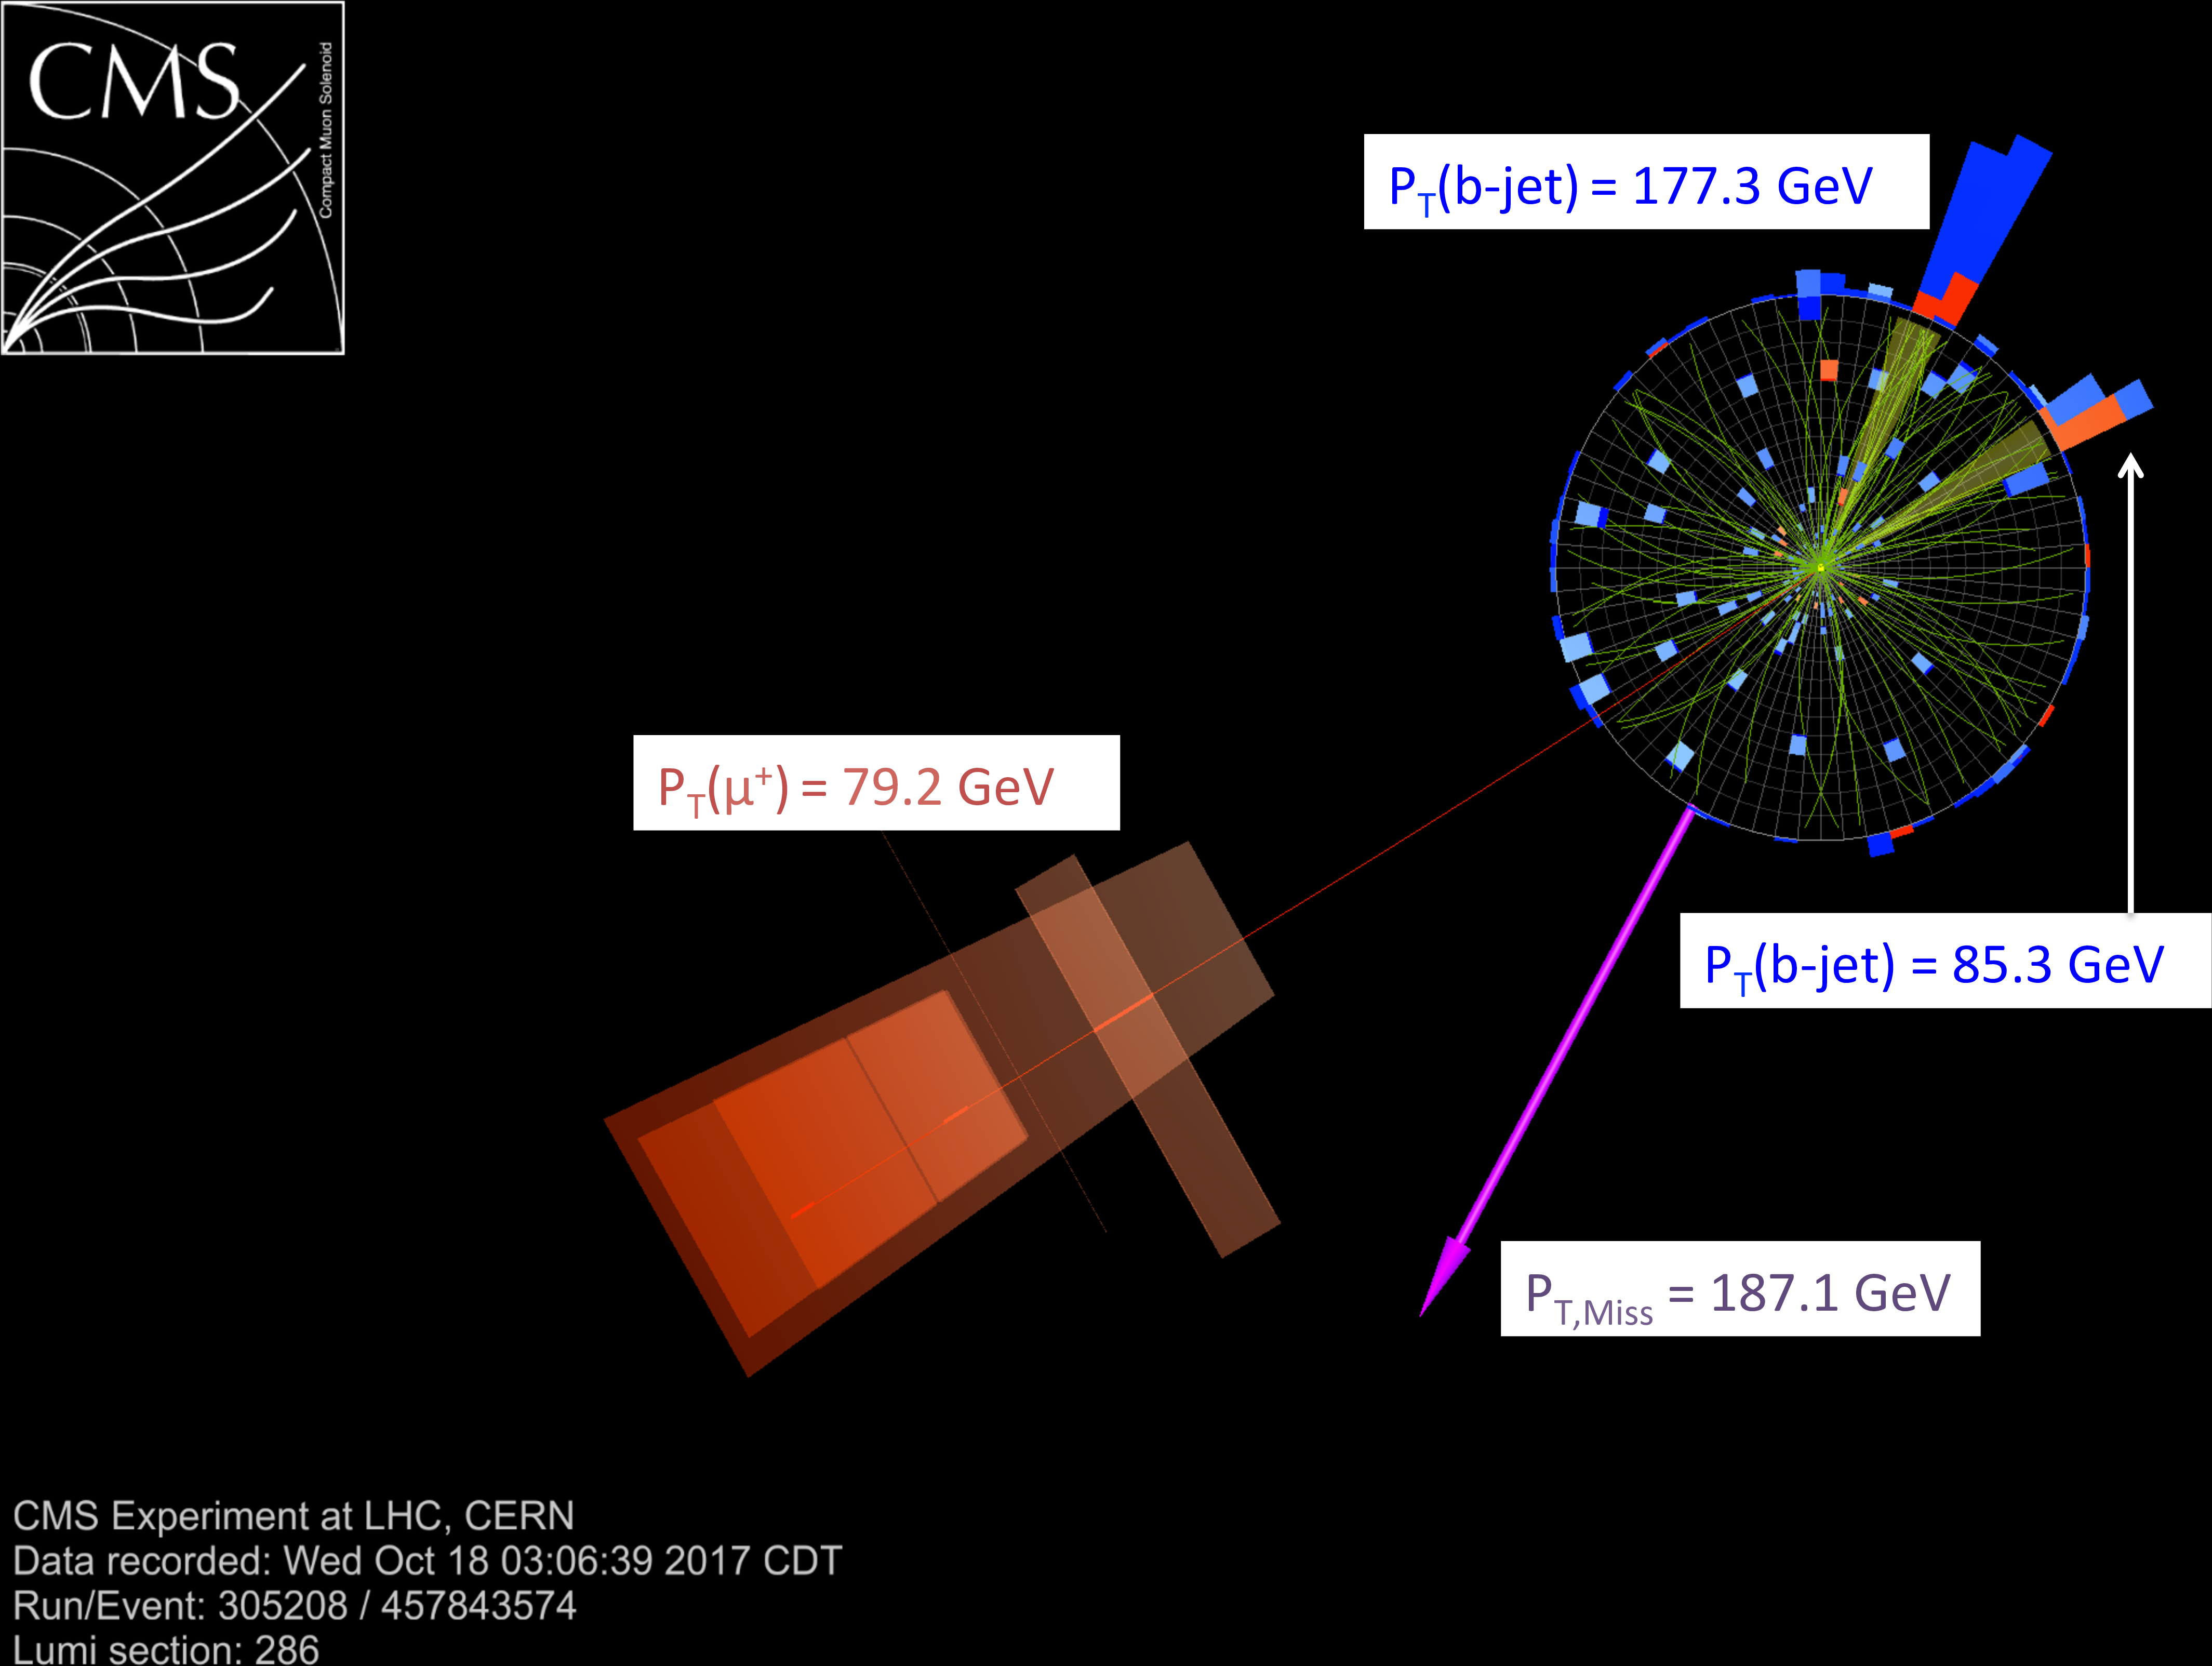
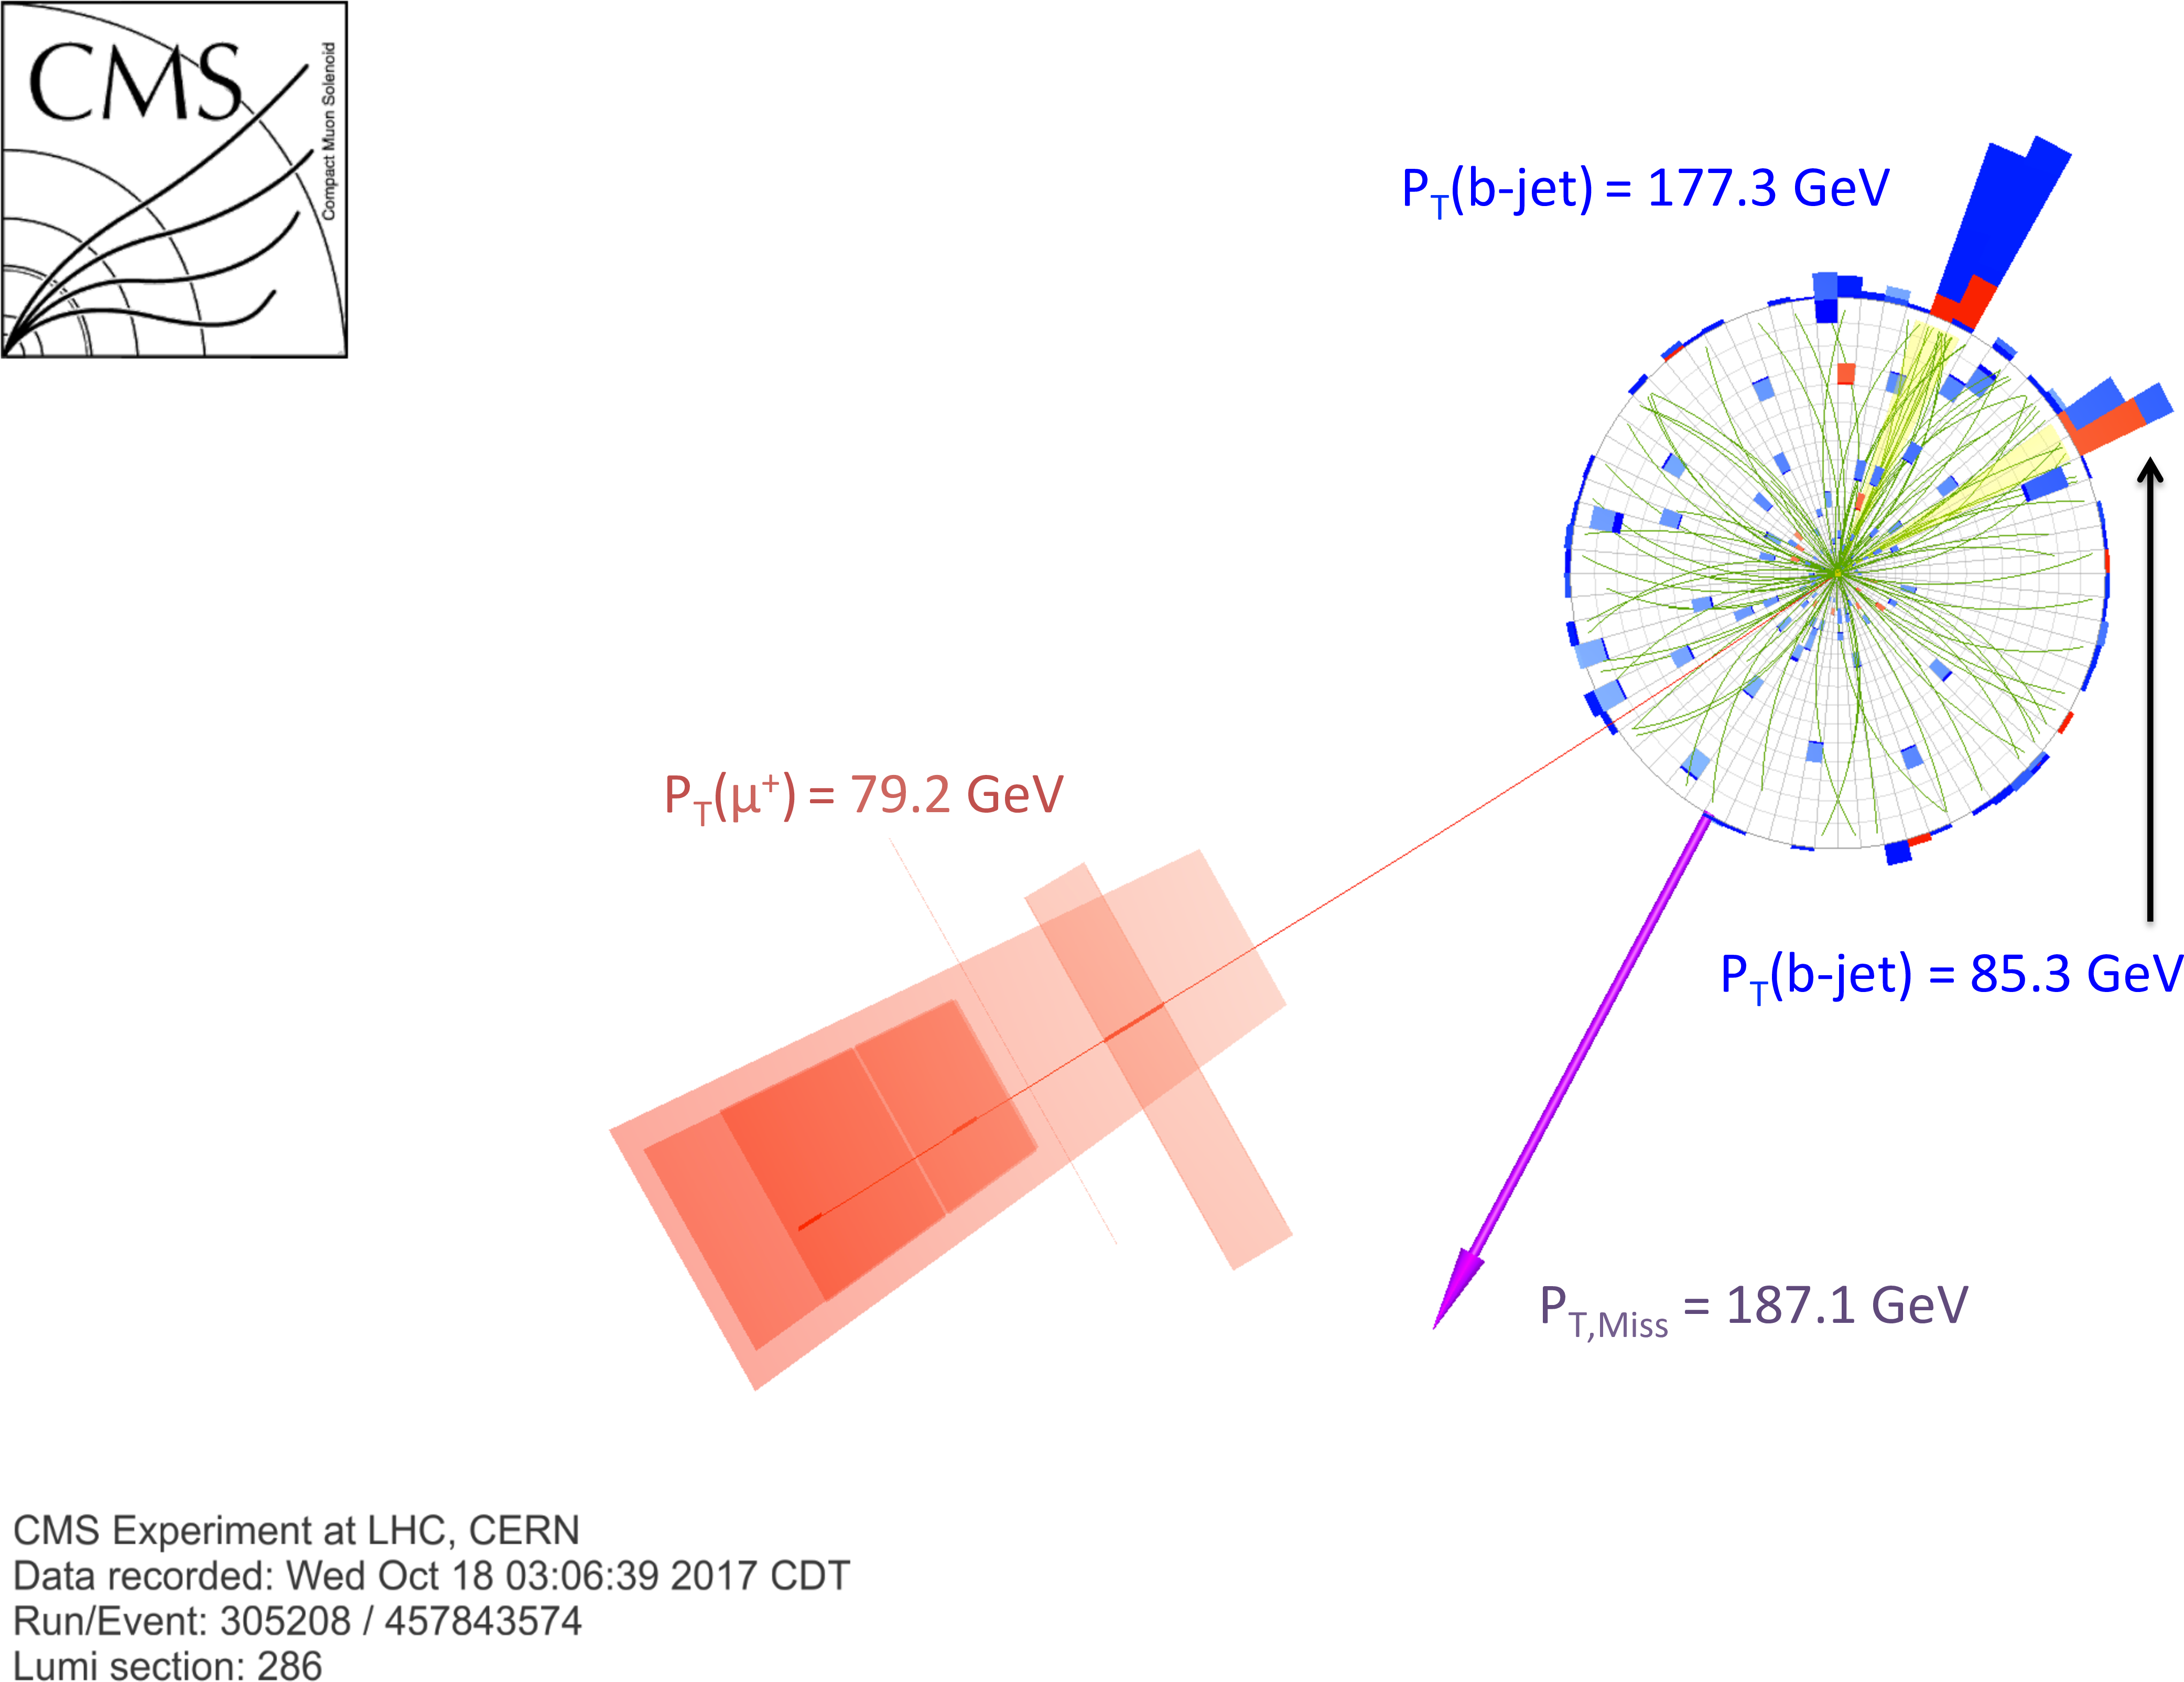
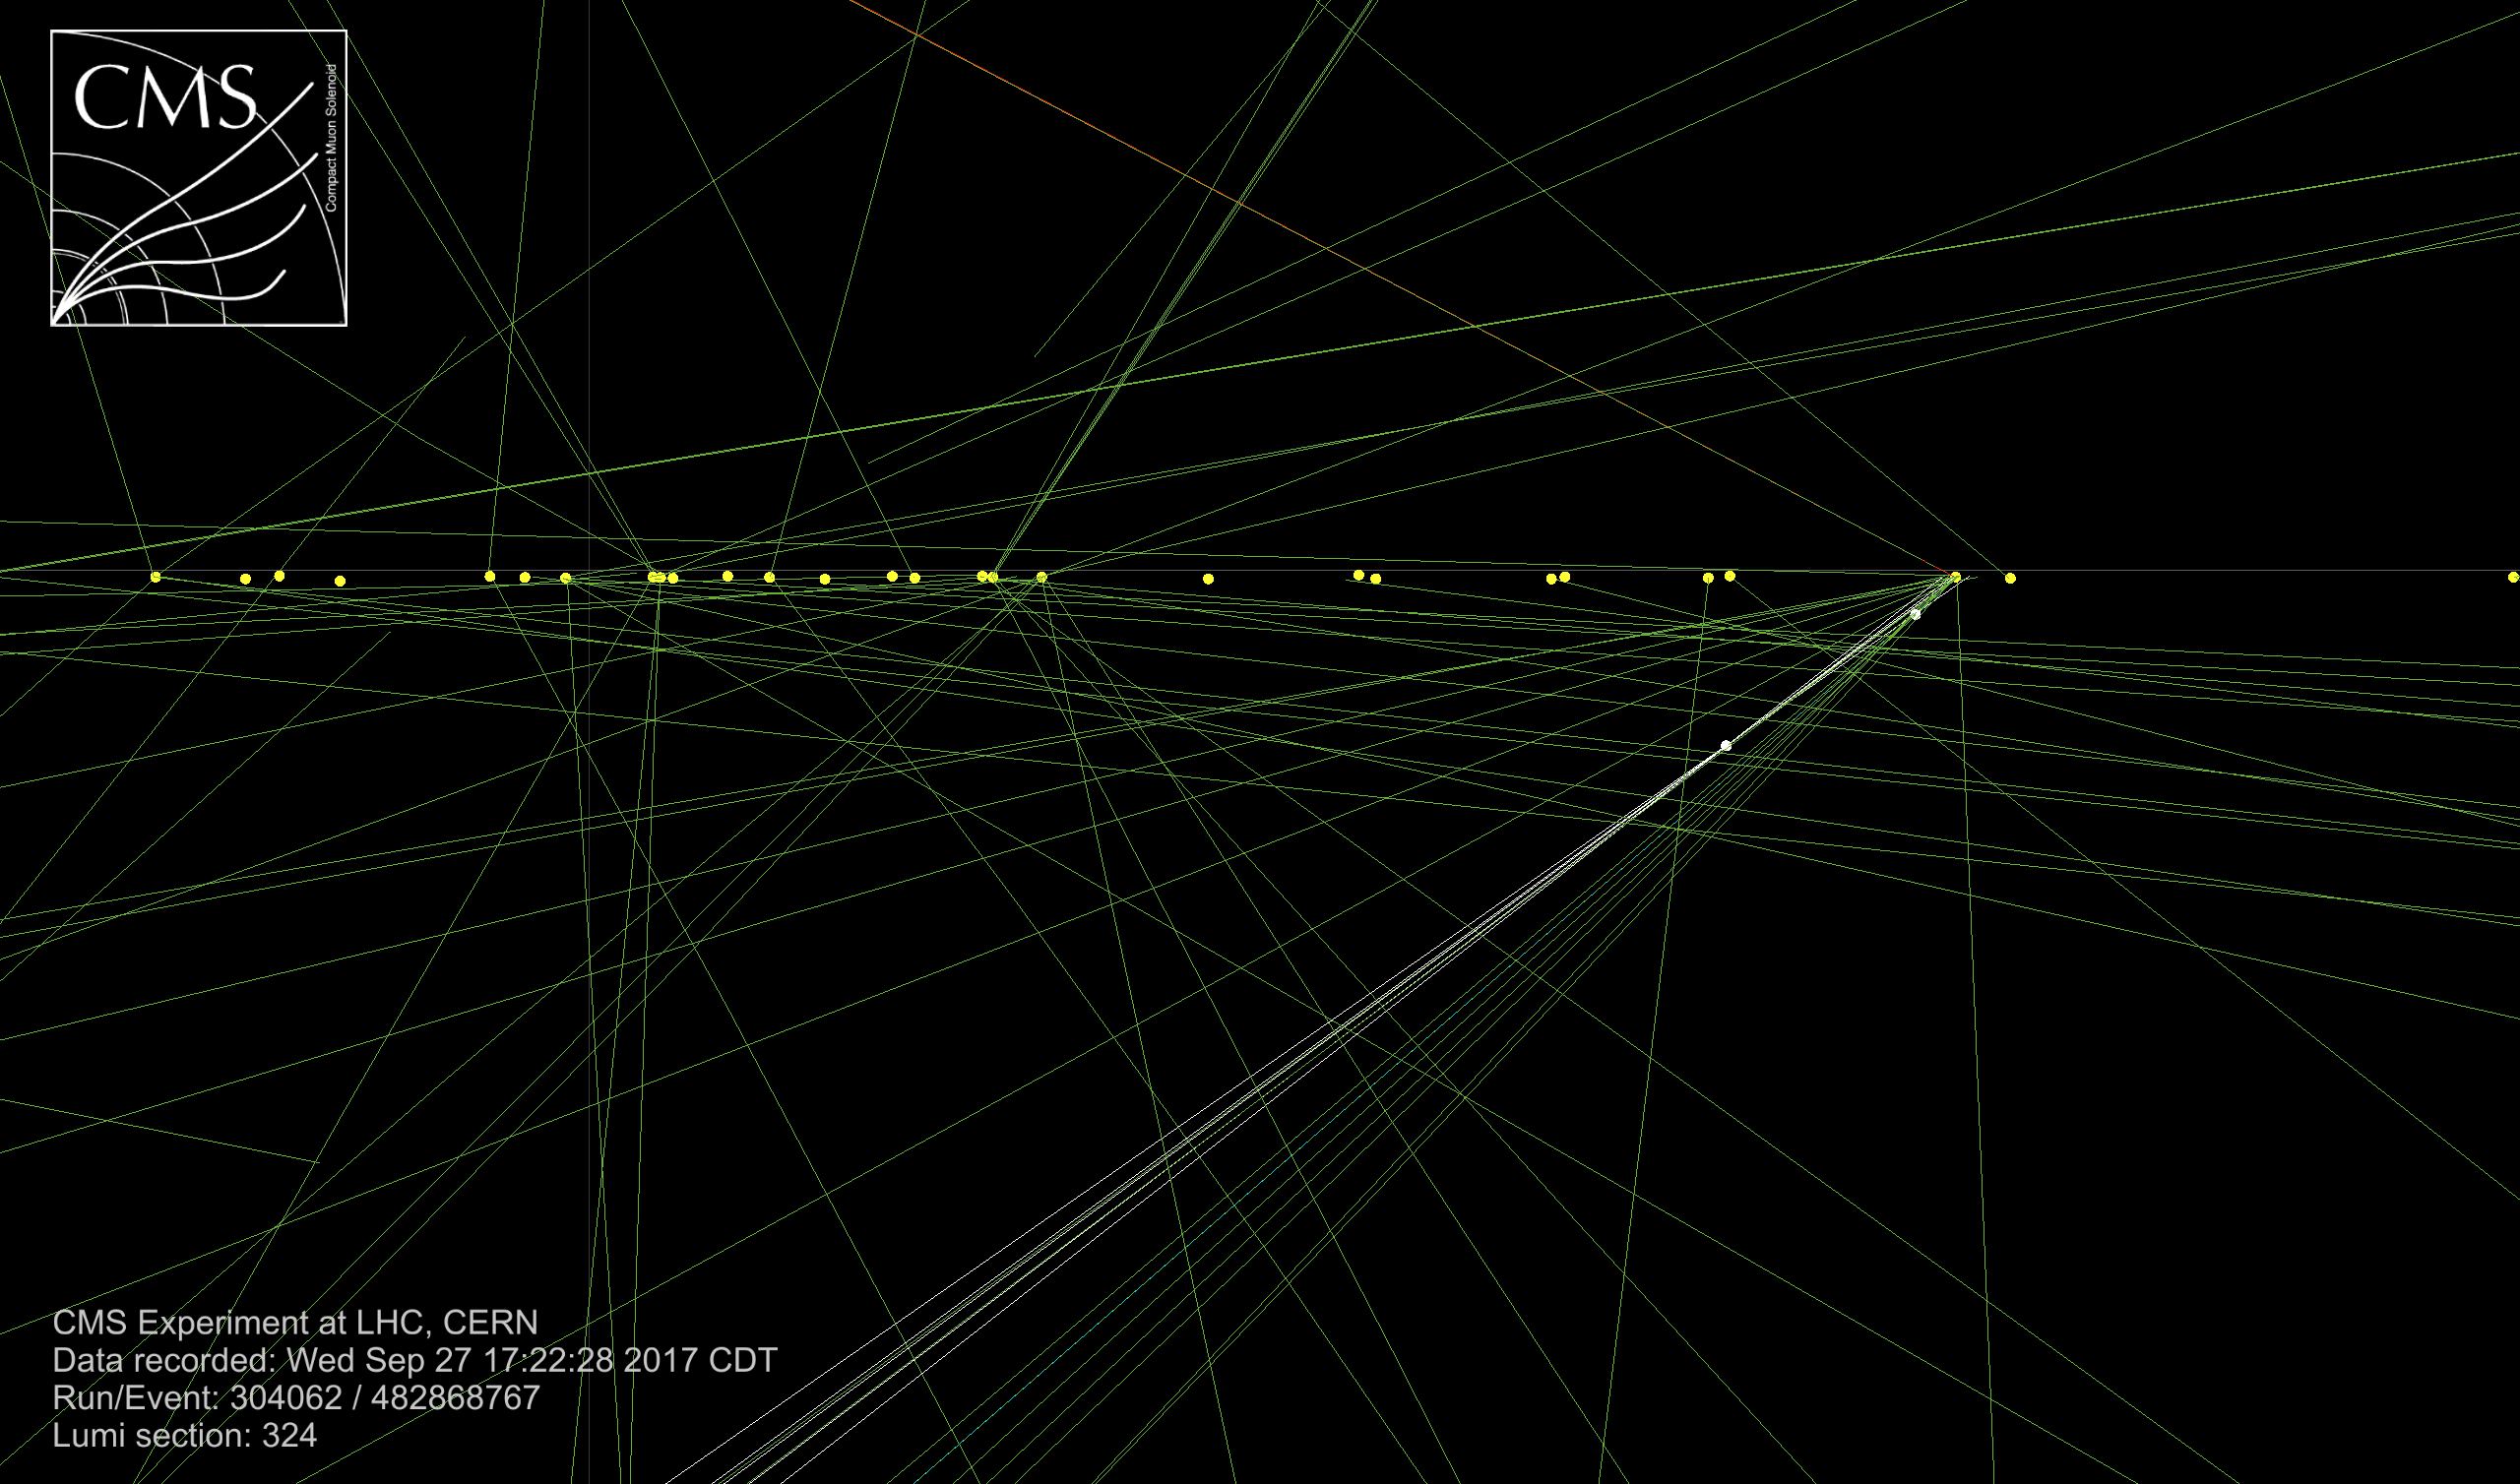
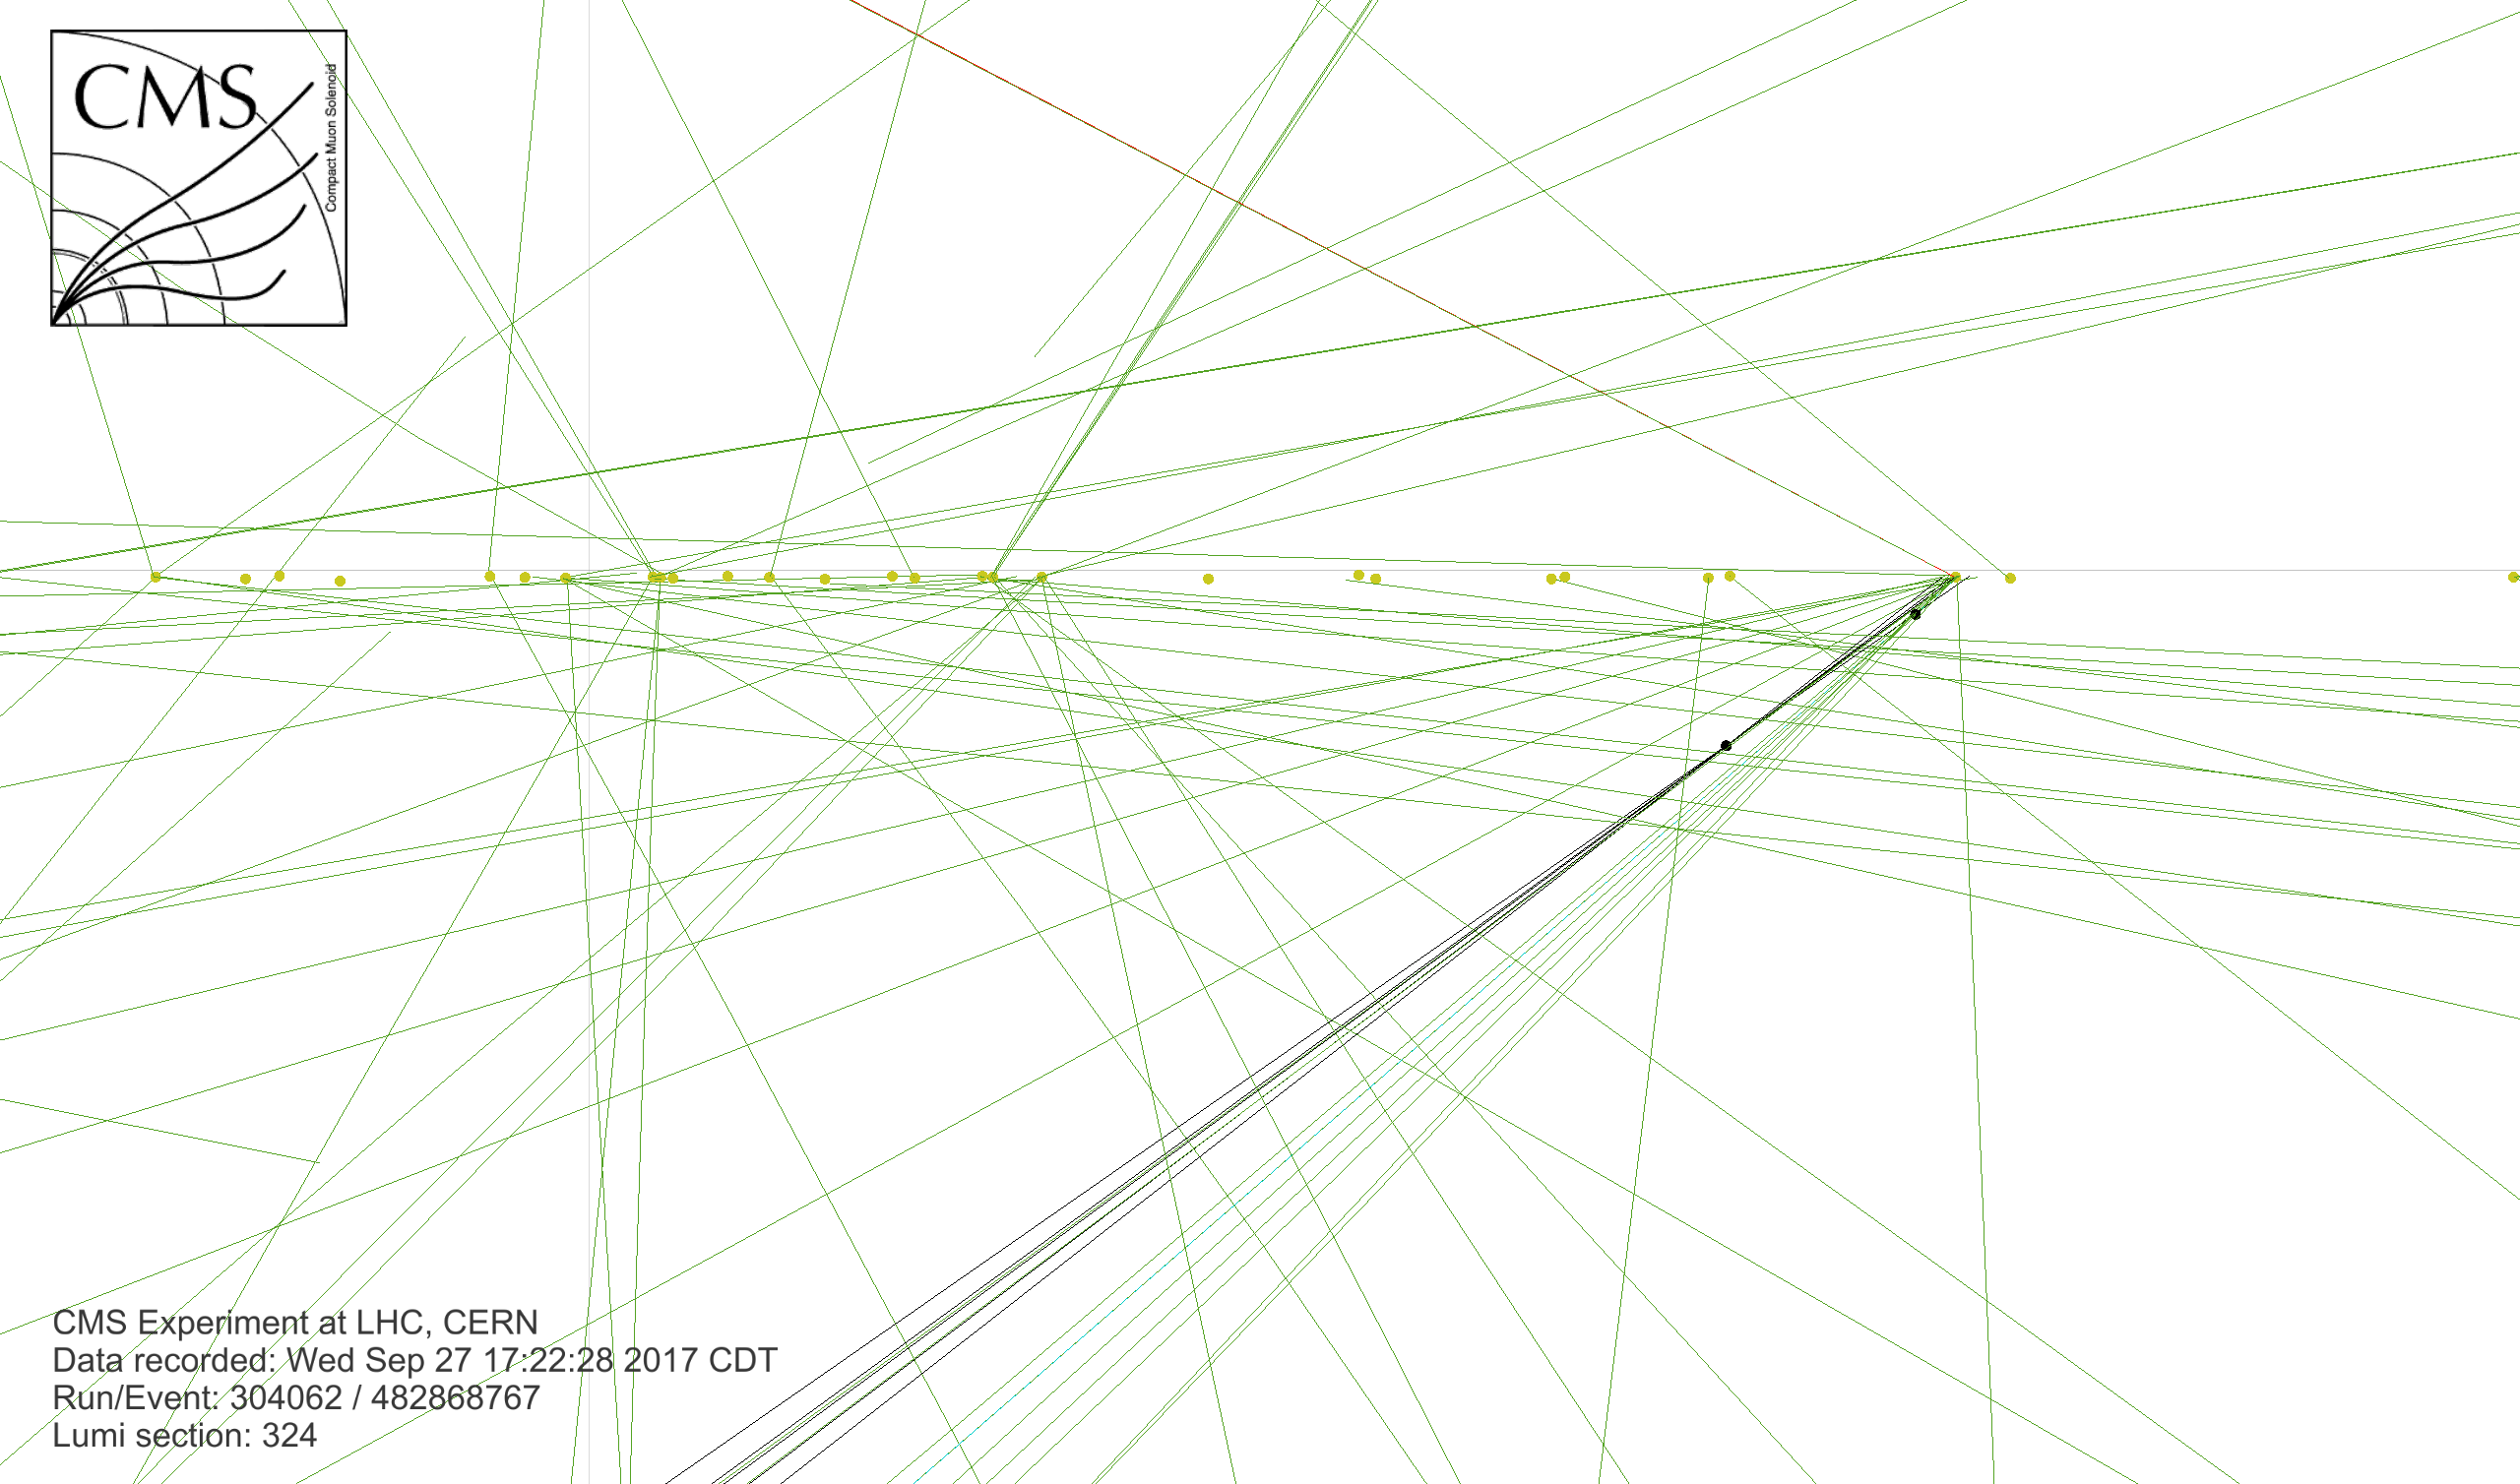
An event candidate for the production of a W boson in conjunction with a Higgs boson in CMS detector. The Higgs boson decays to two bottom quarks whose decays are characterized by jets (shown in blue) with secondary vertices which are separated by a few centimeters from the pp collision primary vertices (shown in lowers plots). The W boson decays into one muon, which is shown going through muon chambers in red, and a neutrino which is inferred from the large missing transverse momentum (shown in purple). |
png pdf |
Additional Figure 15-a:
An event candidate for the production of a W boson in conjunction with a Higgs boson in CMS detector. The Higgs boson decays to two bottom quarks whose decays are characterized by jets (shown in blue) with secondary vertices which are separated by a few centimeters from the pp collision primary vertices (shown in lowers plots). The W boson decays into one muon, which is shown going through muon chambers in red, and a neutrino which is inferred from the large missing transverse momentum (shown in purple). |
png pdf |
Additional Figure 15-b:
An event candidate for the production of a W boson in conjunction with a Higgs boson in CMS detector. The Higgs boson decays to two bottom quarks whose decays are characterized by jets (shown in blue) with secondary vertices which are separated by a few centimeters from the pp collision primary vertices (shown in lowers plots). The W boson decays into one muon, which is shown going through muon chambers in red, and a neutrino which is inferred from the large missing transverse momentum (shown in purple). |
png |
Additional Figure 15-c:
An event candidate for the production of a W boson in conjunction with a Higgs boson in CMS detector. The Higgs boson decays to two bottom quarks whose decays are characterized by jets (shown in blue) with secondary vertices which are separated by a few centimeters from the pp collision primary vertices (shown in lowers plots). The W boson decays into one muon, which is shown going through muon chambers in red, and a neutrino which is inferred from the large missing transverse momentum (shown in purple). |
png |
Additional Figure 15-d:
An event candidate for the production of a W boson in conjunction with a Higgs boson in CMS detector. The Higgs boson decays to two bottom quarks whose decays are characterized by jets (shown in blue) with secondary vertices which are separated by a few centimeters from the pp collision primary vertices (shown in lowers plots). The W boson decays into one muon, which is shown going through muon chambers in red, and a neutrino which is inferred from the large missing transverse momentum (shown in purple). |
png pdf |
Additional Figure 16:
An event candidate for the production of a Z boson in conjunction with a Higgs boson in CMS detector. The Higgs boson decays to two bottom quarks whose decays are characterized by jets (shown in blue) with secondary vertices which are separated by a few centimeters from the pp collision primary vertices. The Z boson decays into two muons, which are shown going through muon chambers in red. |

png pdf |
Additional Figure 16-a:
An event candidate for the production of a Z boson in conjunction with a Higgs boson in CMS detector. The Higgs boson decays to two bottom quarks whose decays are characterized by jets (shown in blue) with secondary vertices which are separated by a few centimeters from the pp collision primary vertices. The Z boson decays into two muons, which are shown going through muon chambers in red. |
png pdf |
Additional Figure 16-b:
An event candidate for the production of a Z boson in conjunction with a Higgs boson in CMS detector. The Higgs boson decays to two bottom quarks whose decays are characterized by jets (shown in blue) with secondary vertices which are separated by a few centimeters from the pp collision primary vertices. The Z boson decays into two muons, which are shown going through muon chambers in red. |

png pdf |
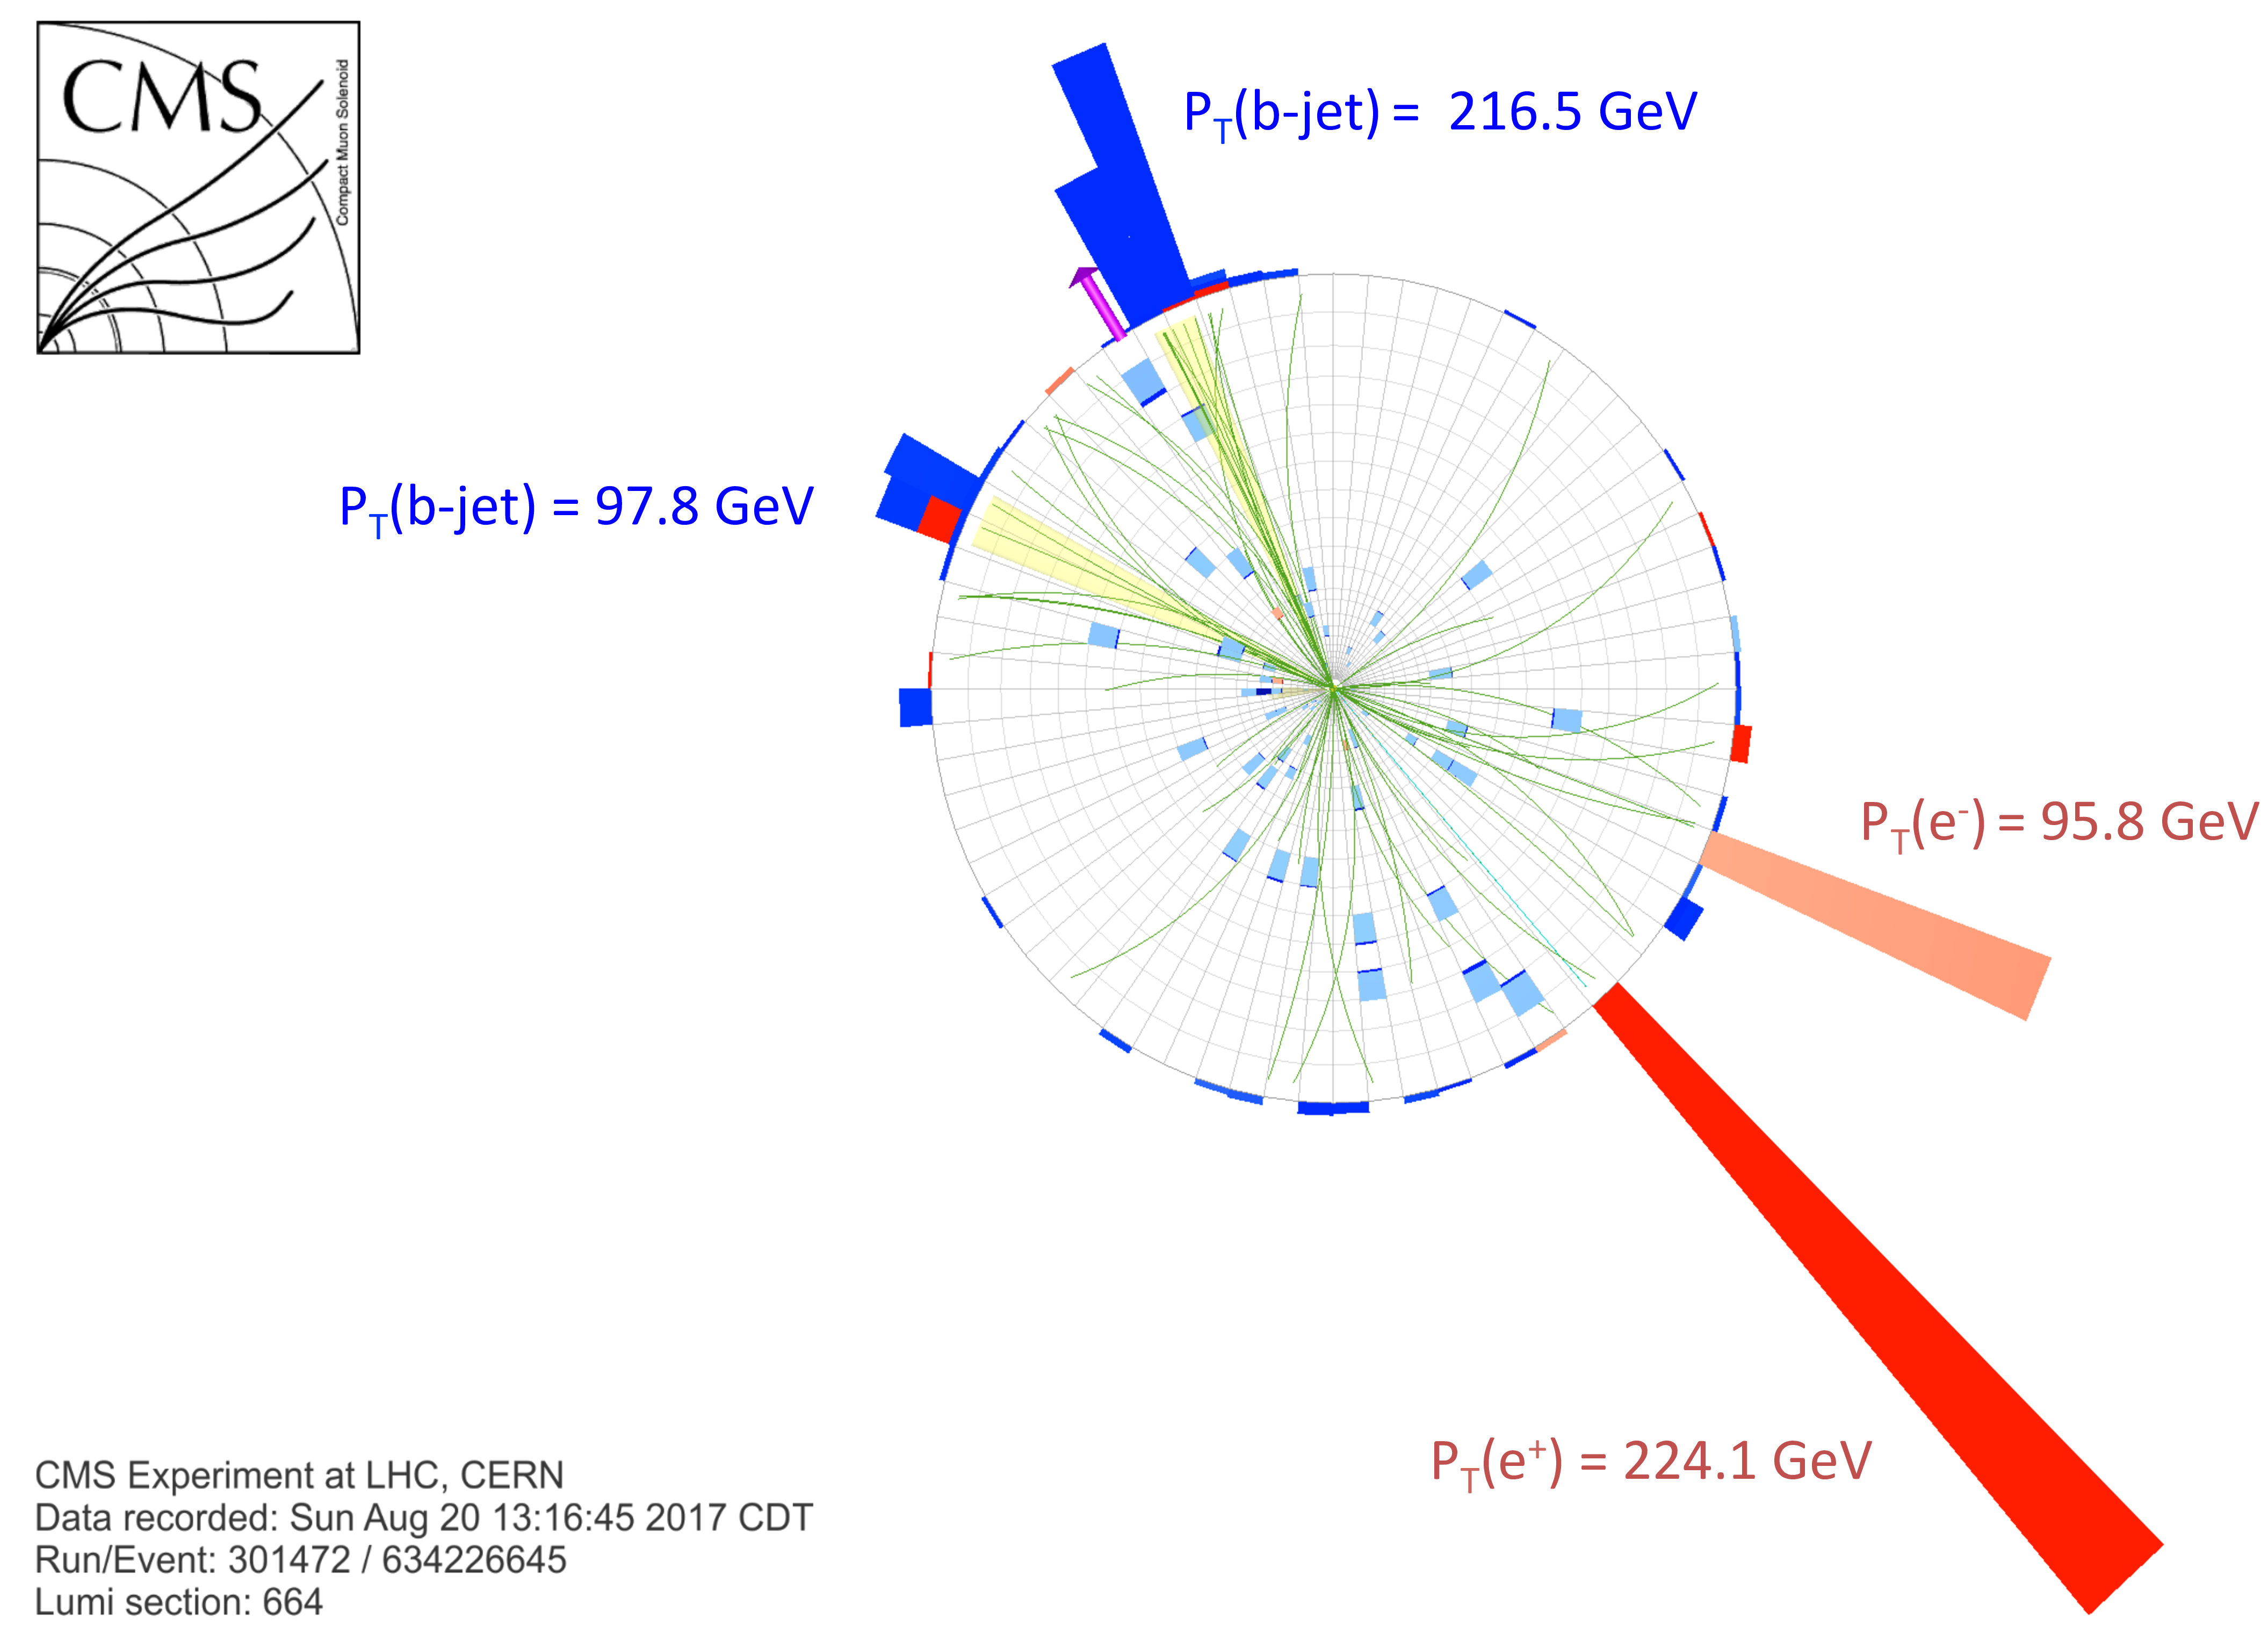
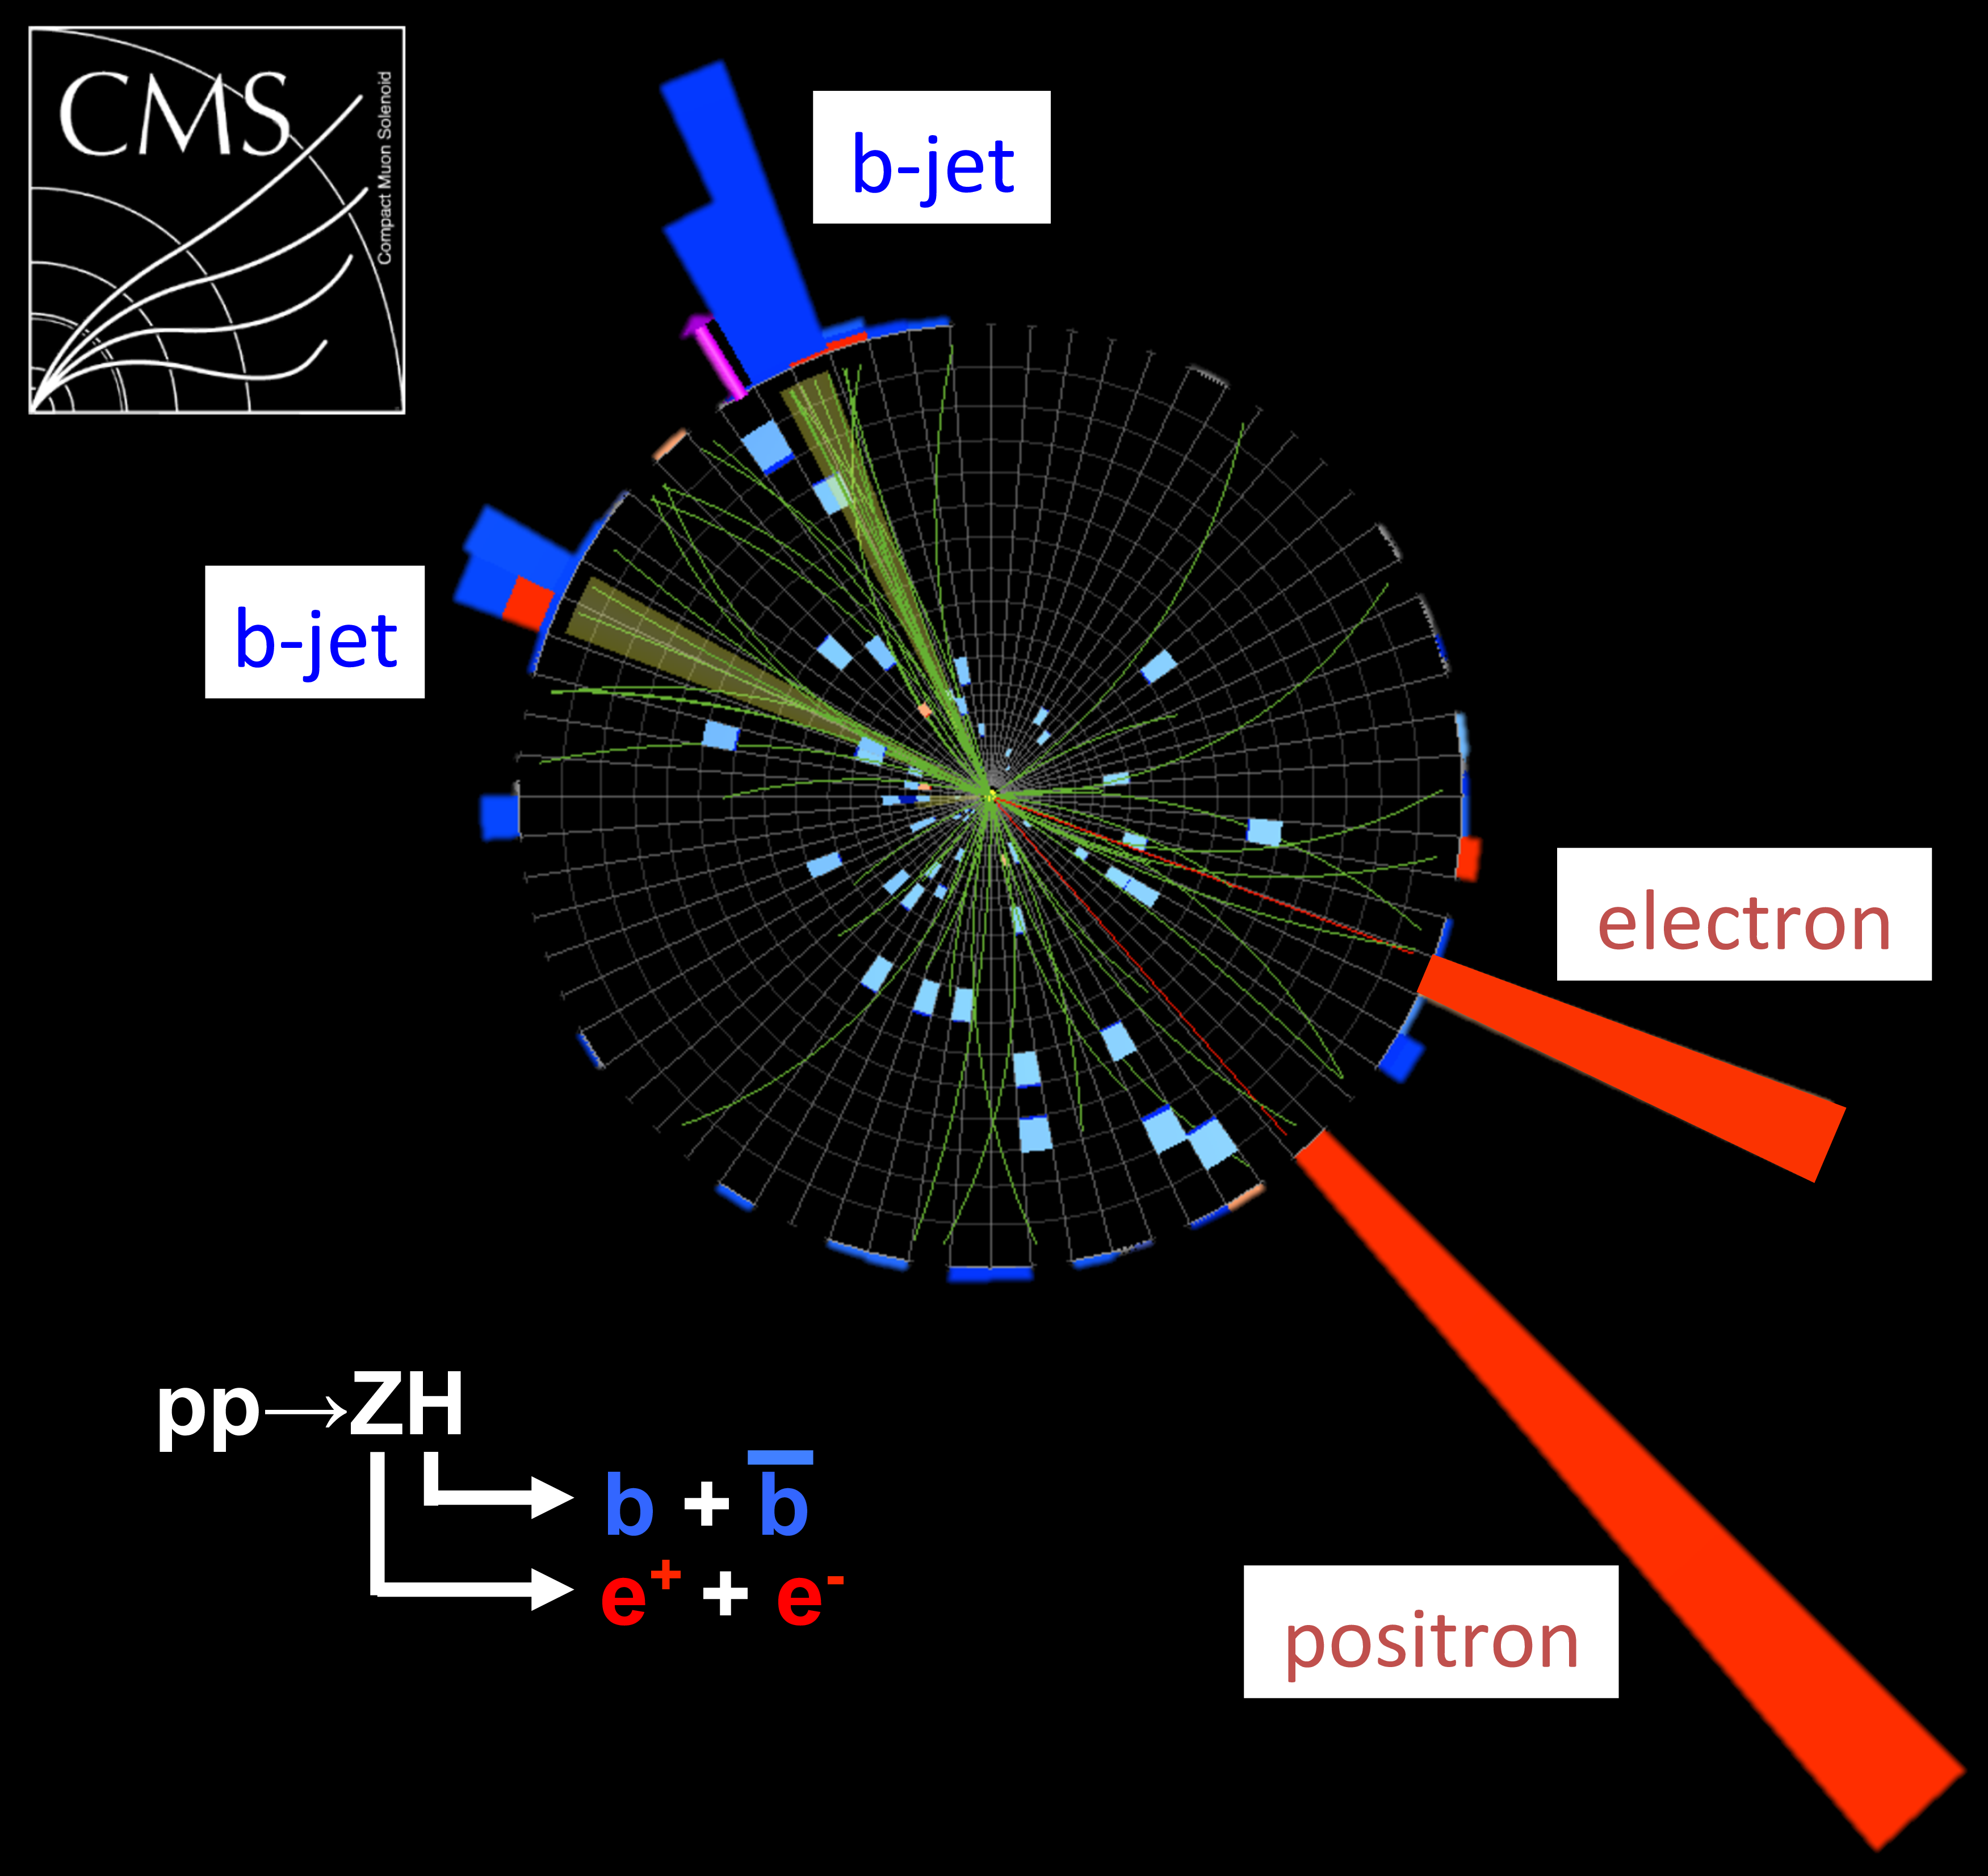
Additional Figure 17:
An event candidate for the production of a Z boson in conjunction with a Higgs boson in CMS detector. The Higgs boson decays to two bottom quarks whose decays are characterized by jets (shown in blue) with secondary vertices which are separated by a few centimeters from the pp collision primary vertices. These secondary vertices are shown in the zoomed figure. The Z boson decays into an electron and a positron (shown in red). |

png pdf |
Additional Figure 17-a:
An event candidate for the production of a Z boson in conjunction with a Higgs boson in CMS detector. The Higgs boson decays to two bottom quarks whose decays are characterized by jets (shown in blue) with secondary vertices which are separated by a few centimeters from the pp collision primary vertices. These secondary vertices are shown in the zoomed figure. The Z boson decays into an electron and a positron (shown in red). |
png pdf |
Additional Figure 17-b:
An event candidate for the production of a Z boson in conjunction with a Higgs boson in CMS detector. The Higgs boson decays to two bottom quarks whose decays are characterized by jets (shown in blue) with secondary vertices which are separated by a few centimeters from the pp collision primary vertices. These secondary vertices are shown in the zoomed figure. The Z boson decays into an electron and a positron (shown in red). |

png pdf |
Additional Figure 17-c:
An event candidate for the production of a Z boson in conjunction with a Higgs boson in CMS detector. The Higgs boson decays to two bottom quarks whose decays are characterized by jets (shown in blue) with secondary vertices which are separated by a few centimeters from the pp collision primary vertices. These secondary vertices are shown in the zoomed figure. The Z boson decays into an electron and a positron (shown in red). |
png pdf |
Additional Figure 17-d:
An event candidate for the production of a Z boson in conjunction with a Higgs boson in CMS detector. The Higgs boson decays to two bottom quarks whose decays are characterized by jets (shown in blue) with secondary vertices which are separated by a few centimeters from the pp collision primary vertices. These secondary vertices are shown in the zoomed figure. The Z boson decays into an electron and a positron (shown in red). |
png pdf |
Additional Figure 18:
The best-fit and uncertainty per-channel signal strengths extracted from a simultaneous fit of all channels for the 2017 analysis in the VZbb validation analysis. The per-channel signal strengths are compatible with the single signal strength fit with a probability of 64.2%. |
png pdf |
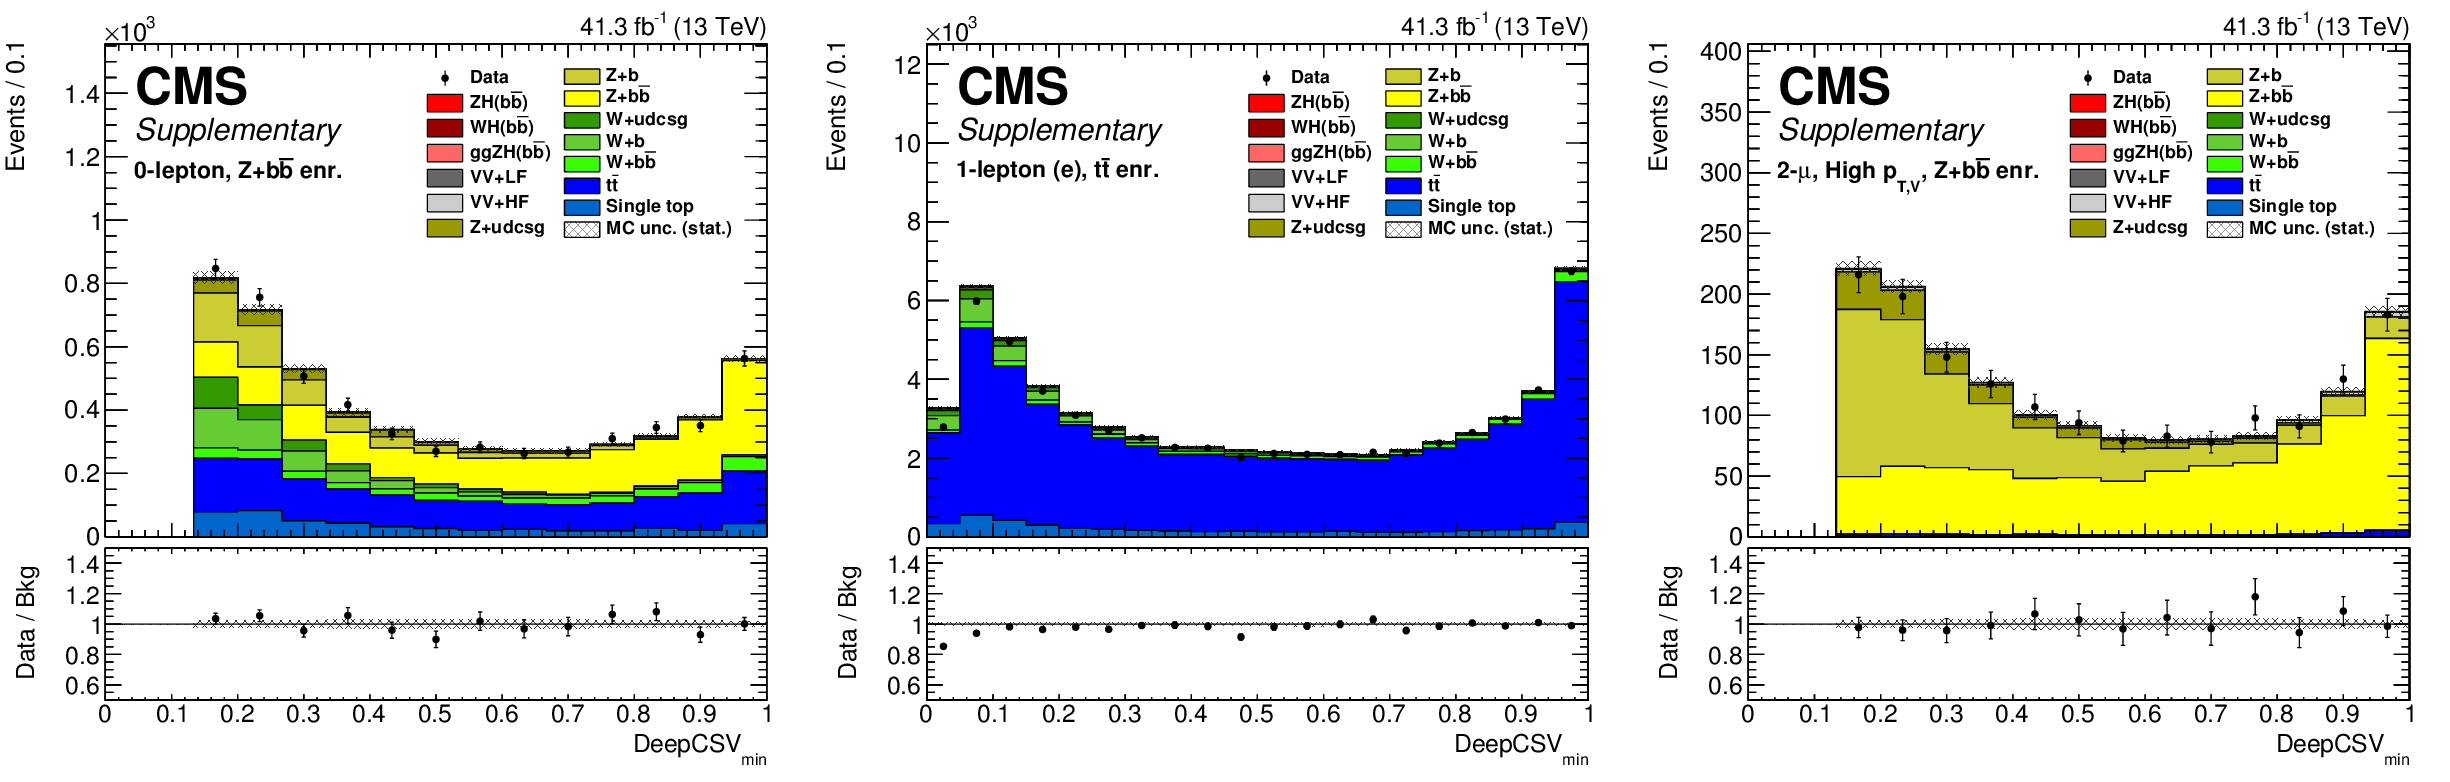
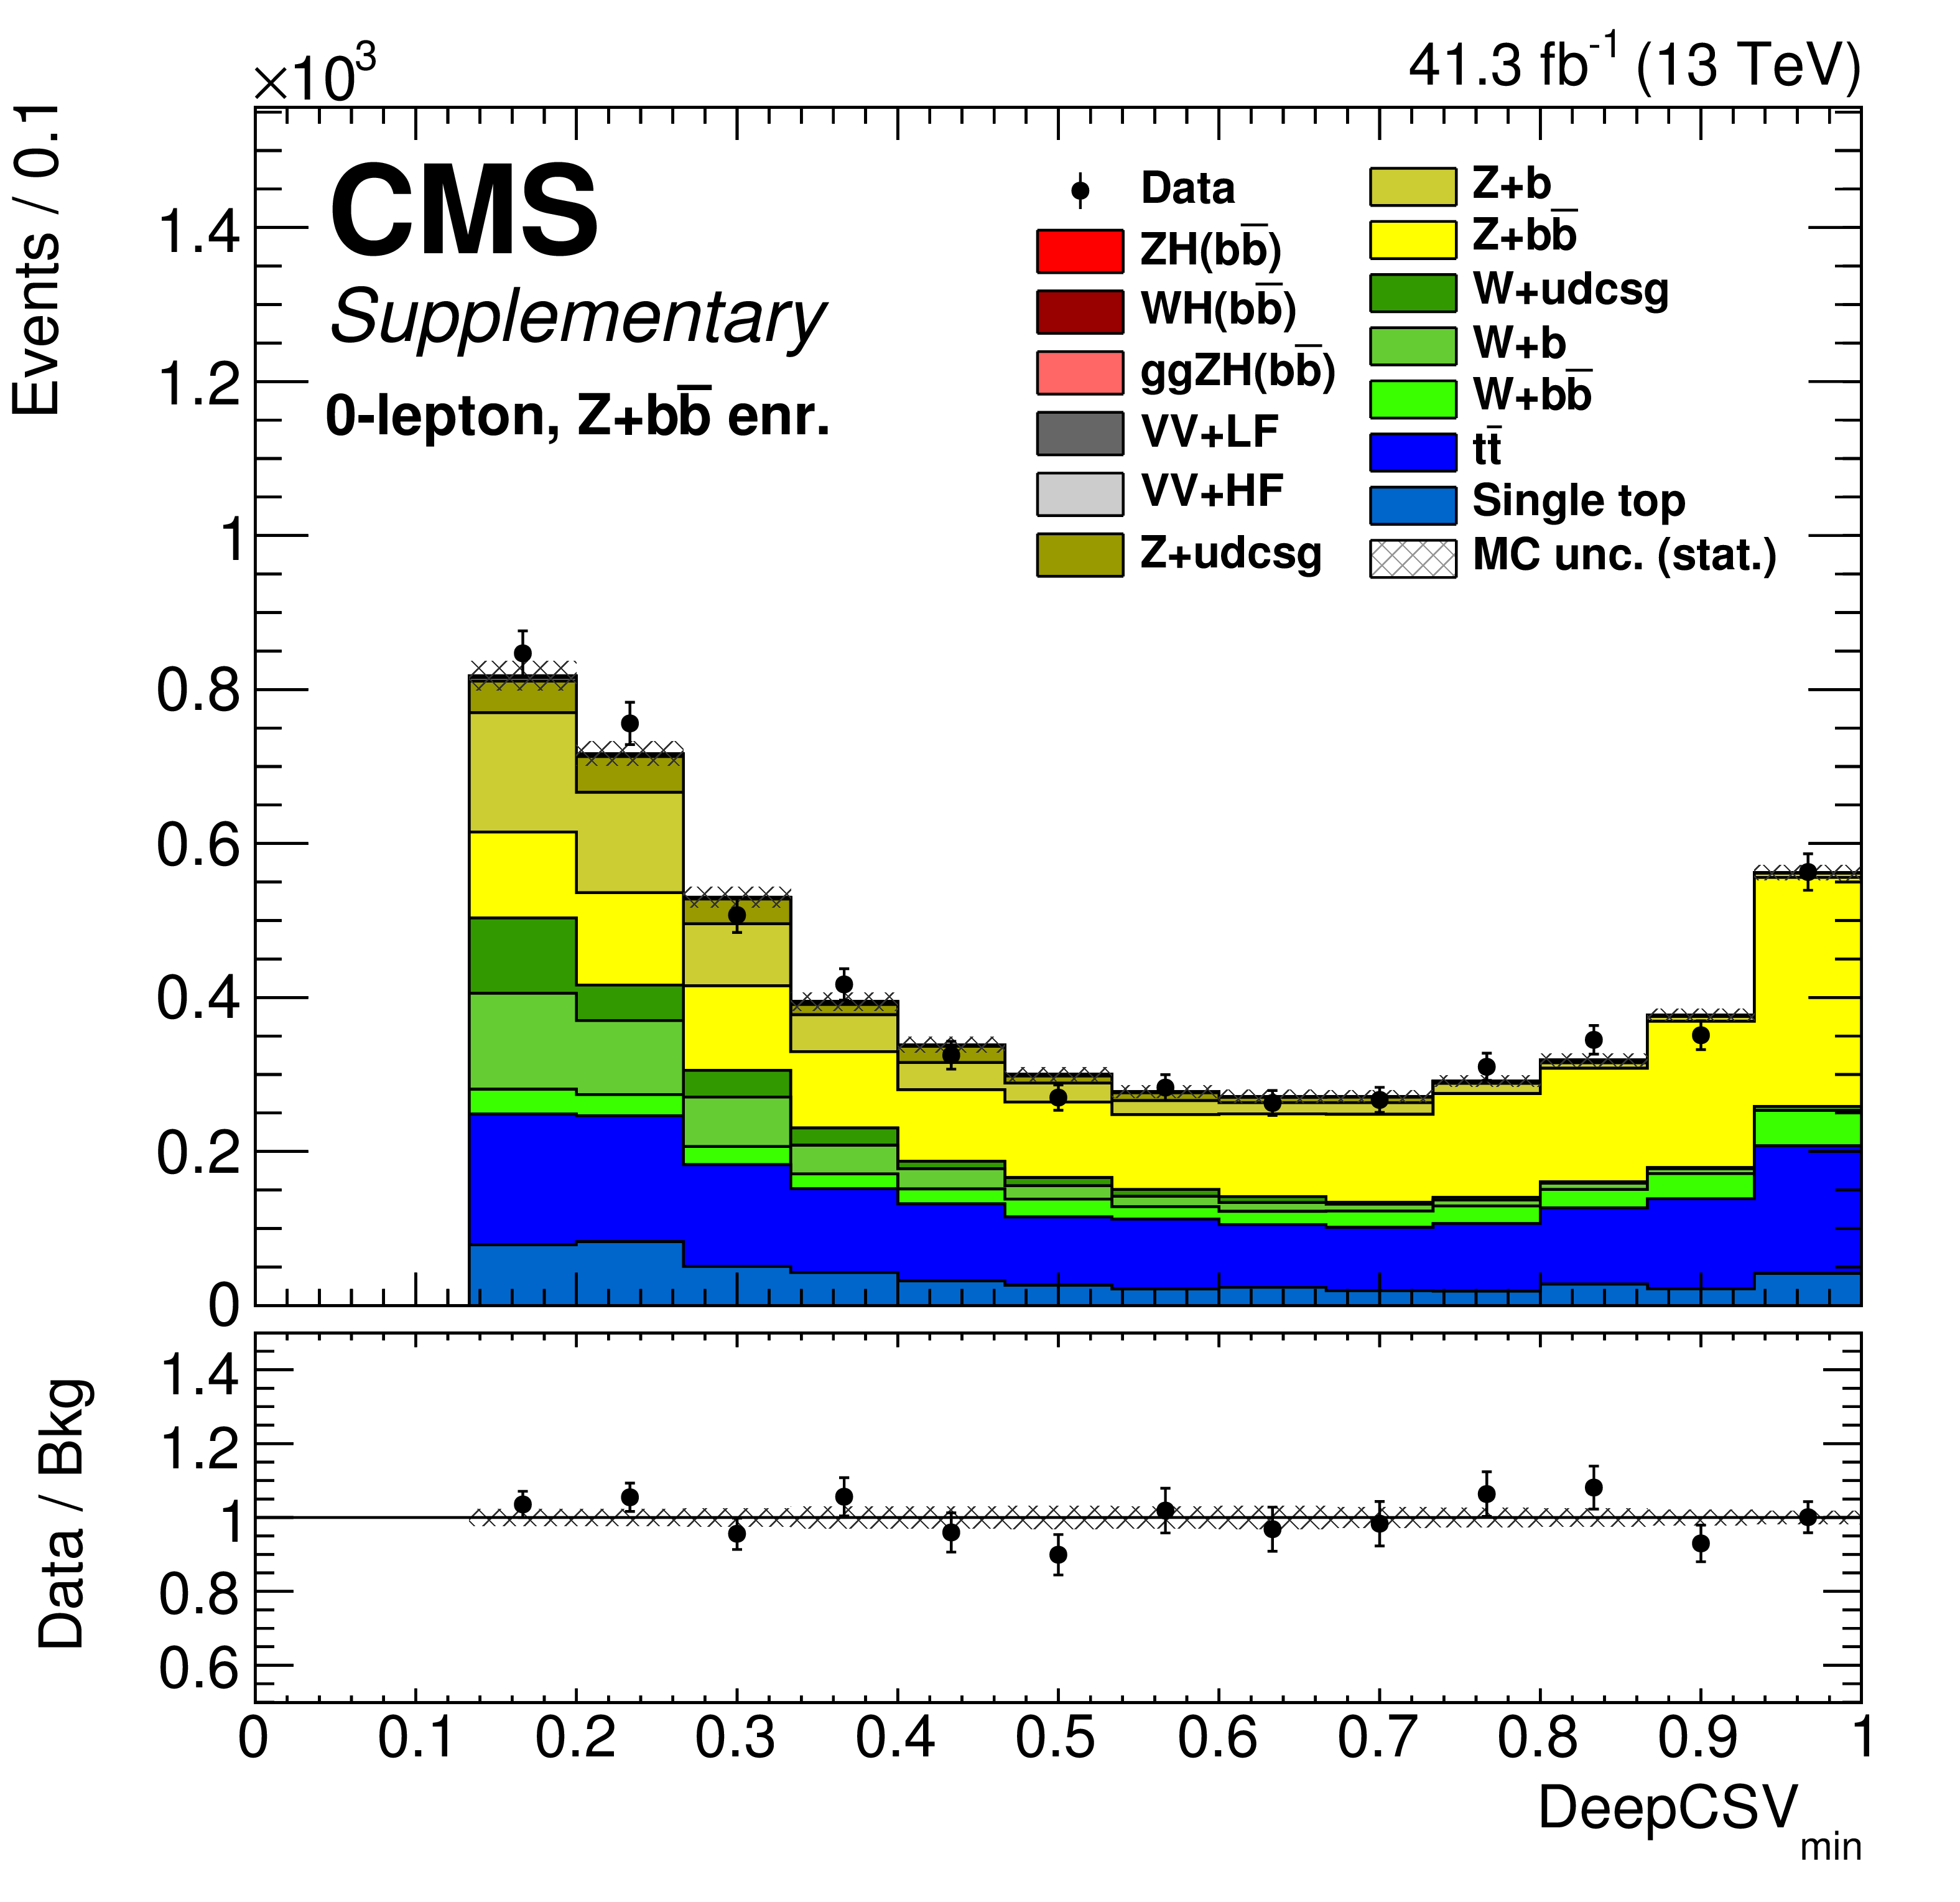
Additional Figure 19:
Tagging jets from b-quarks is fundamental to this analysis. The distributions of the deepCSV b-tagging discriminator are shown for the less b-like jet of the two b-jet candidates in three different control regions. The left, center and right control regions are 0-lepton heavy flavor, 1-lepton ttbar and 2-lepton heavy flavor, respectively. |
png pdf |
Additional Figure 19-a:
Tagging jets from b-quarks is fundamental to this analysis. The distributions of the deepCSV b-tagging discriminator are shown for the less b-like jet of the two b-jet candidates in 0-lepton heavy flavor control region. |
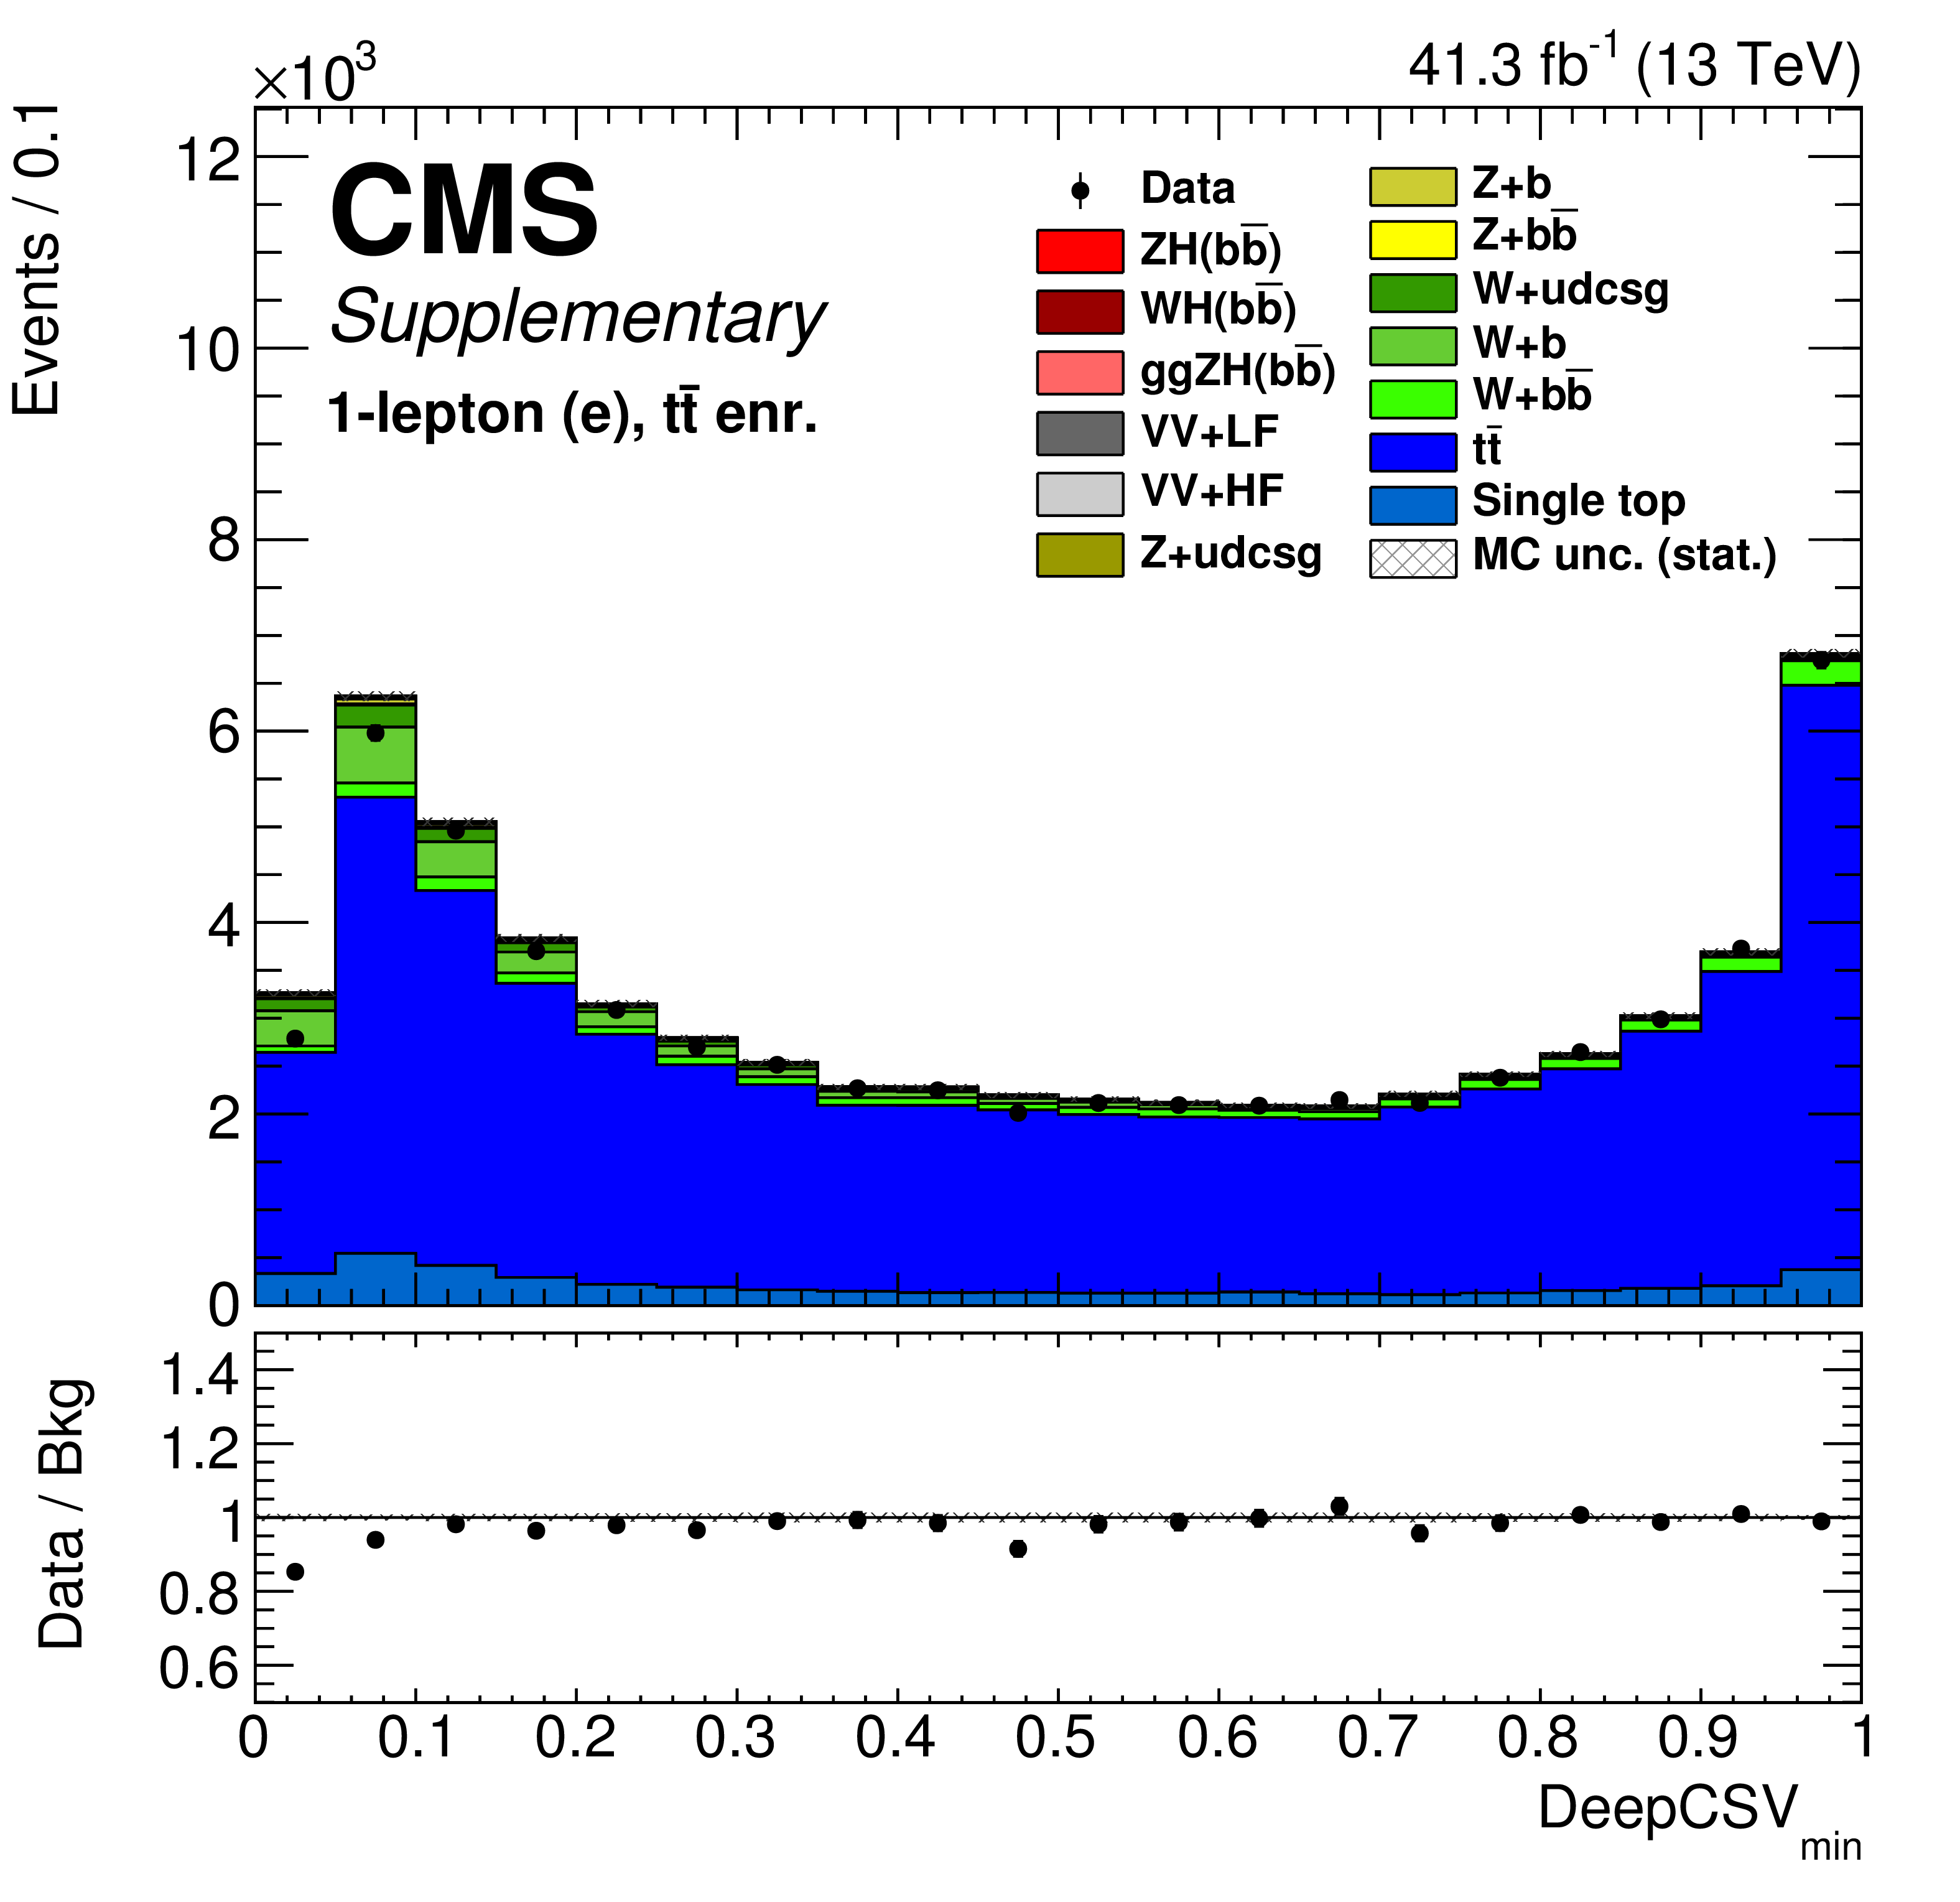
png pdf |
Additional Figure 19-b:
Tagging jets from b-quarks is fundamental to this analysis. The distributions of the deepCSV b-tagging discriminator are shown for the less b-like jet of the two b-jet candidates in 1-lepton ttbar control region. |
png pdf |
Additional Figure 19-c:
Tagging jets from b-quarks is fundamental to this analysis. The distributions of the deepCSV b-tagging discriminator are shown for the less b-like jet of the two b-jet candidates in 2-lepton heavy flavor control region. |
| Additional Tables | |
png pdf |
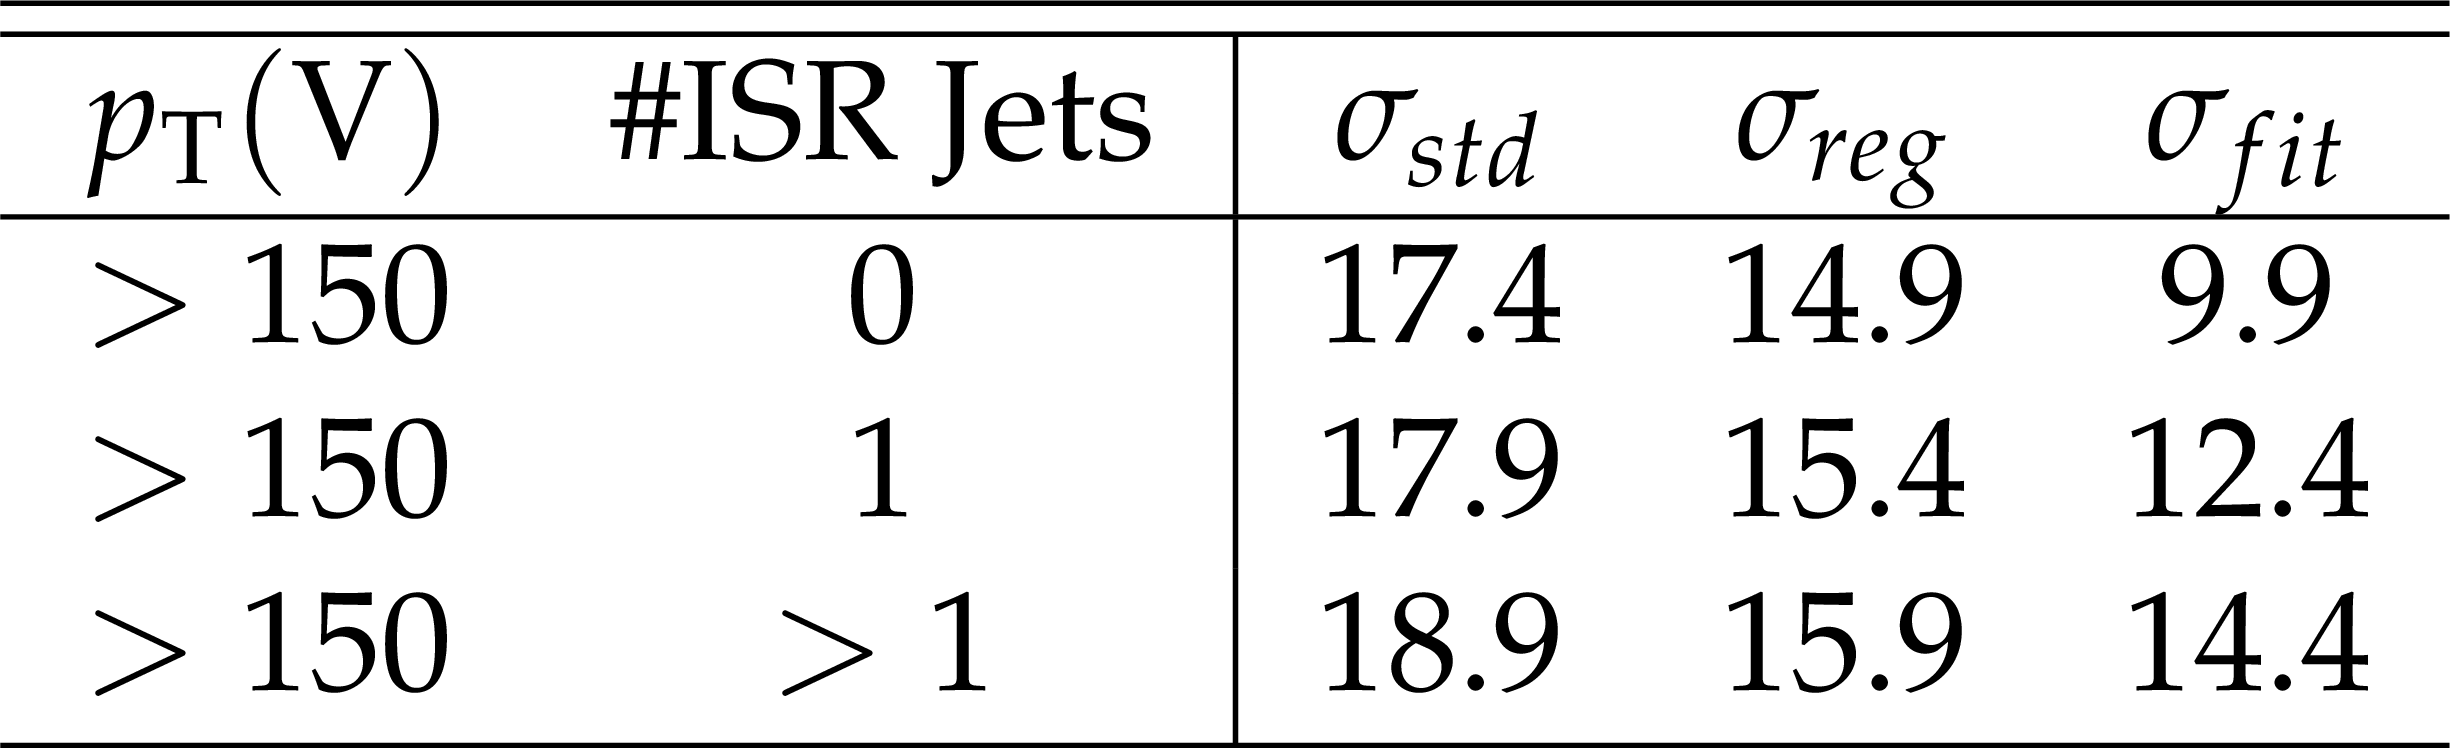
Additional Table 1:
Higgs boson invariant mass resolution before (including regression) and after the kinematic fit in bins of ${{p_{\mathrm {T}}} ({\mathrm {V}})}$ and number of ISR jets. These estimates are made with Z bosons plus Higgs boson events where the Z boson decays to two charged leptons. This sample is simulated with POWHEG while showering is simulated with PYTHIA. The resolution listed in the table are the sigma in GeV of a Bukin function fit. |
png pdf |
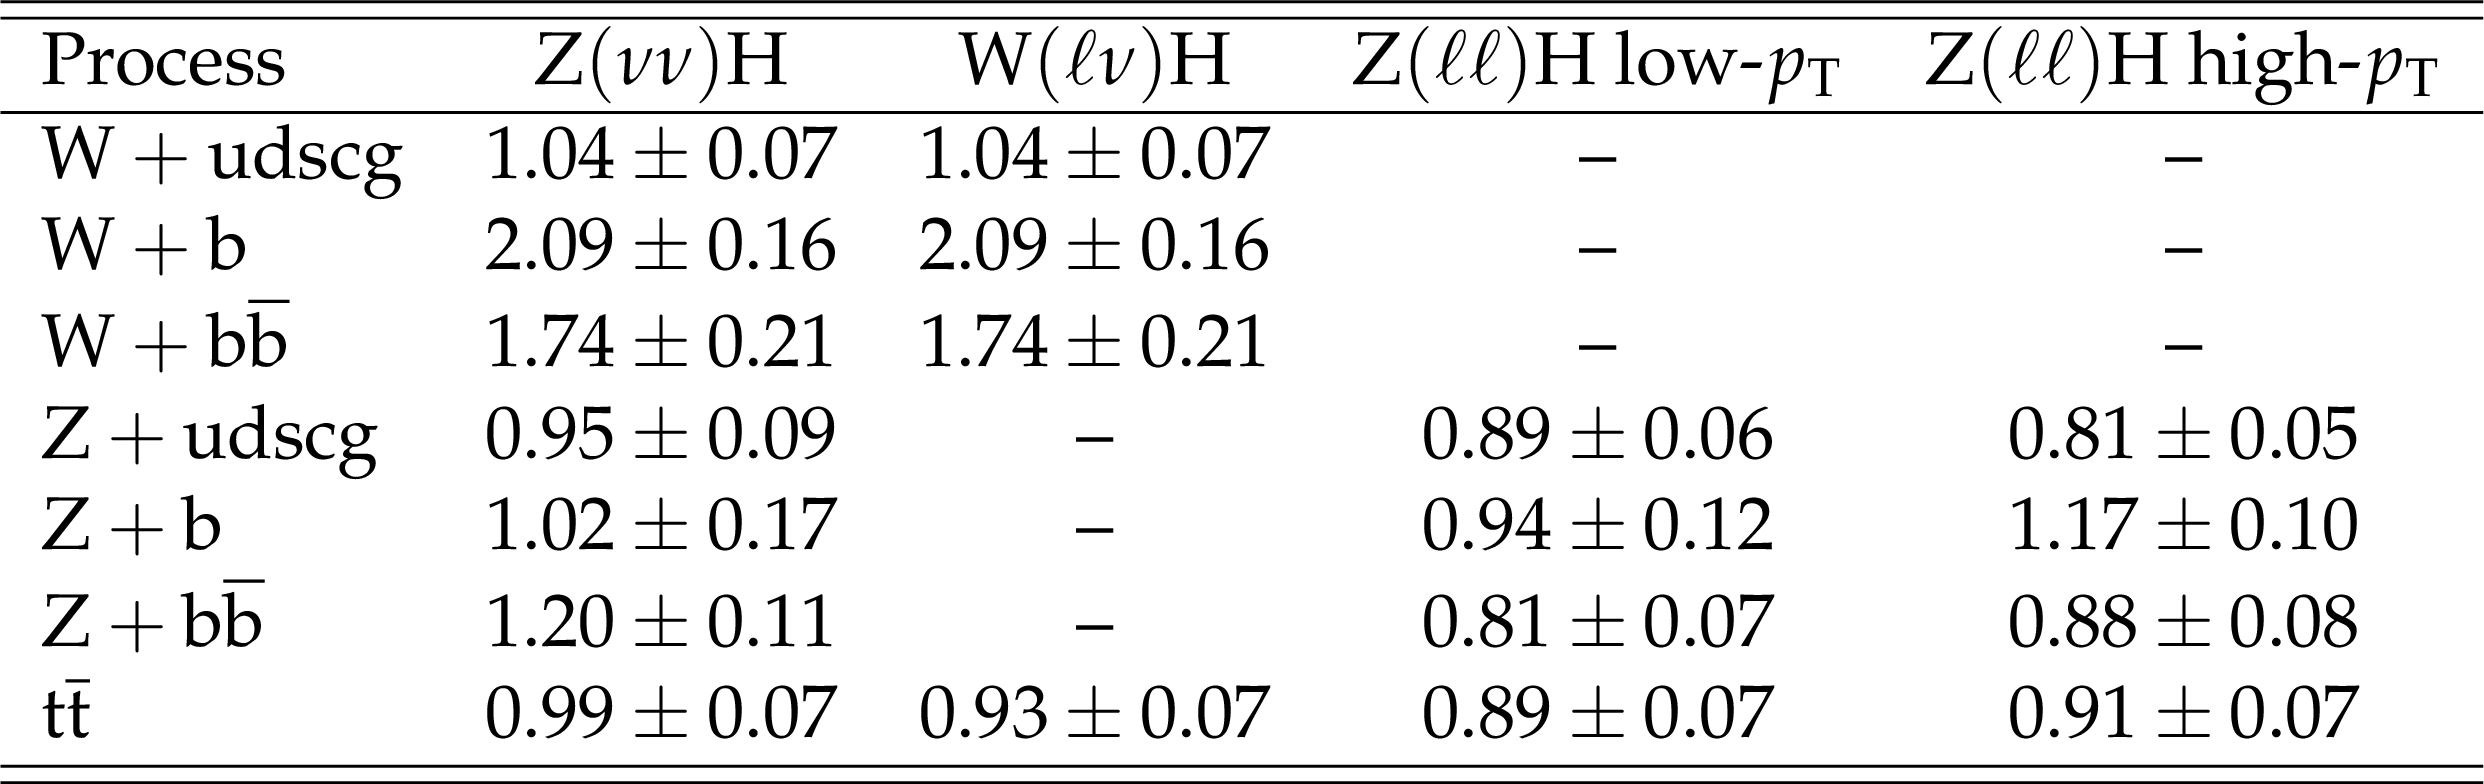
Additional Table 2:
Data/MC scale factors are needed per process to compensate for potential mis-modeling in the very specific phasespace of this analysis. Deviations from unity are not considered to have physical meaning. The 2017 fitted scale factors in the 0-, 1- and 2-lepton channels from SR+CRs fit are listed. The errors include both statistical and systematic uncertainties. Compatible fitted values are obtained from the CR-only fit. |
| References | ||||
| 1 | ATLAS Collaboration | Observation of a new particle in the search for the standard model Higgs boson with the ATLAS detector at the LHC | PLB 716 (2012) 1 | 1207.7214 |
| 2 | CMS Collaboration | Observation of a new boson at a mass of 125 GeV with the CMS experiment at the LHC | PLB 716 (2012) 30 | CMS-HIG-12-028 1207.7235 |
| 3 | CMS Collaboration | Observation of a new boson with mass near 125 GeV in pp collisions at $ \sqrt{s} = $ 7 and 8 TeV | JHEP 06 (2013) 081 | CMS-HIG-12-036 1303.4571 |
| 4 | F. Englert and R. Brout | Broken symmetry and the mass of gauge vector mesons | PRL 13 (1964) 321 | |
| 5 | P. W. Higgs | Broken symmetries, massless particles and gauge fields | PL12 (1964) 132 | |
| 6 | P. W. Higgs | Broken symmetries and the masses of gauge bosons | PRL 13 (1964) 508 | |
| 7 | G. S. Guralnik, C. R. Hagen, and T. W. B. Kibble | Global conservation laws and massless particles | PRL 13 (1964) 585 | |
| 8 | P. W. Higgs | Spontaneous symmetry breakdown without massless bosons | PR145 (1966) 1156 | |
| 9 | T. W. B. Kibble | Symmetry breaking in non-Abelian gauge theories | PR155 (1967) 1554 | |
| 10 | ATLAS Collaboration | Measurement of Higgs boson production in the diphoton decay channel in pp collisions at center-of-mass energies of 7 and 8 TeV with the ATLAS detector | PRD 90 (2014) 112015 | 1408.7084 |
| 11 | CMS Collaboration | Observation of the diphoton decay of the Higgs boson and measurement of its properties | EPJC 74 (2014) 3076 | CMS-HIG-13-001 1407.0558 |
| 12 | ATLAS Collaboration | Measurements of Higgs boson production and couplings in the four-lepton channel in pp collisions at center-of-mass energies of 7 and 8 TeV with the ATLAS detector | PRD 91 (2015) 012006 | 1408.5191 |
| 13 | CMS Collaboration | Measurement of the properties of a Higgs boson in the four-lepton final state | PRD 89 (2014) 092007 | CMS-HIG-13-002 1312.5353 |
| 14 | ATLAS Collaboration | Observation and measurement of Higgs boson decays to WW$ ^* $ with the ATLAS detector | PRD 92 (2015) 012006 | 1412.2641 |
| 15 | ATLAS Collaboration | Study of (W/Z)H production and Higgs boson couplings using H $ \rightarrow $ WW$ ^{\ast} $ decays with the ATLAS detector | JHEP 08 (2015) 137 | 1506.06641 |
| 16 | CMS Collaboration | Measurement of Higgs boson production and properties in the WW decay channel with leptonic final states | JHEP 01 (2014) 096 | CMS-HIG-13-023 1312.1129 |
| 17 | ATLAS Collaboration | Evidence for the Higgs-boson Yukawa coupling to tau leptons with the ATLAS detector | JHEP 04 (2015) 117 | 1501.04943 |
| 18 | CMS Collaboration | Evidence for the 125 GeV Higgs boson decaying to a pair of $ \tau $ leptons | JHEP 05 (2014) 104 | CMS-HIG-13-004 1401.5041 |
| 19 | CMS Collaboration | Observation of Higgs boson decays to a pair of tau leptons | PLB 779 (2017) 283 | CMS-HIG-16-043 1708.00373 |
| 20 | CMS Collaboration | Measurements of properties of the Higgs boson decaying to a W boson pair in pp collisions at $ \sqrt{s}= $ 13 TeV | Submitted to \it PLB | CMS-HIG-16-042 1806.05246 |
| 21 | ATLAS Collaboration | Measurements of the Higgs boson production and decay rates and coupling strengths using pp collision data at $ \sqrt{s}= $ 7 and 8 TeV in the ATLAS experiment | EPJC 76 (2016) 6 | 1507.04548 |
| 22 | CMS Collaboration | Precise determination of the mass of the Higgs boson and tests of compatibility of its couplings with the standard model predictions using proton collisions at 7 and 8 TeV | EPJC 75 (2015) 212 | CMS-HIG-14-009 1412.8662 |
| 23 | CMS Collaboration | Study of the mass and spin-parity of the Higgs boson candidate via its decays to Z boson pairs | PRL 110 (2013) 081803 | CMS-HIG-12-041 1212.6639 |
| 24 | ATLAS Collaboration | Evidence for the spin-0 nature of the Higgs boson using ATLAS data | PLB 726 (2013) 120 | 1307.1432 |
| 25 | ATLAS and CMS Collaborations | Measurements of the Higgs boson production and decay rates and constraints on its couplings from a combined ATLAS and CMS analysis of the LHC pp collision data at $ \sqrt{s}= $ 7 and 8 TeV | JHEP 08 (2016) 045 | 1606.02266 |
| 26 | ATLAS and CMS Collaborations | Combined measurement of the Higgs boson mass in pp collisions at $ \sqrt{s}= $ 7 and 8 TeV with the ATLAS and CMS experiments | PRL 114 (2015) 191803 | 1503.07589 |
| 27 | CMS Collaboration | Measurements of properties of the Higgs boson decaying into the four-lepton final state in pp collisions at $ \sqrt{s}= $ 13 TeV | JHEP 11 (2017) 047 | CMS-HIG-16-041 1706.09936 |
| 28 | ATLAS Collaboration | Combined measurement of differential and total cross sections in the $ H \rightarrow \gamma \gamma $ and the $ H \rightarrow ZZ^* \rightarrow 4\ell $ decay channels at $ \sqrt{s} = $ 13 TeV with the ATLAS detector | Submitted to \it PLB | 1805.10197 |
| 29 | ATLAS Collaboration | Measurement of the Higgs boson mass in the $ H\rightarrow ZZ^* \rightarrow 4\ell $ and $ H \rightarrow \gamma\gamma $ channels with $ \sqrt{s}=13 TeV pp $ collisions using the ATLAS detector | Submitted to \it PLB | 1806.00242 |
| 30 | CMS Collaboration | Observation of $ \mathrm{t\overline{t}} $H production | PRL 120 (2018) 231801 | CMS-HIG-17-035 1804.02610 |
| 31 | ATLAS Collaboration | Observation of Higgs boson production in association with a top quark pair at the LHC with the ATLAS detector | PLB 784 (2018) 173 | 1806.00425 |
| 32 | D. de Florian et al. | Handbook of LHC Higgs cross sections: 4. deciphering the nature of the Higgs sector | CERN-2017-002-M | 1610.07922 |
| 33 | S. Weinberg | A model of leptons | PRL 19 (1967) 1264 | |
| 34 | Y. Nambu and G. Jona-Lasinio | Dynamical model of elementary particles based on an analogy with superconductivity. I | PR122 (1961) 345 | |
| 35 | ATLAS Collaboration | Evidence for the $ \mathrm{H}\rightarrow\mathrm{b\bar{b}} $ decay with the ATLAS detector | JHEP 12 (2017) 24 | 1708.03299 |
| 36 | CMS Collaboration | Evidence for the Higgs boson decay to a bottom quark-antiquark pair | PLB 780 (2018) 501 | CMS-HIG-16-044 1709.07497 |
| 37 | ATLAS Collaboration | Search for the $ \mathrm{b}\overline{\mathrm{b}} $ decay of the standard model Higgs boson in associated (W/Z)H production with the ATLAS detector | JHEP 01 (2015) 069 | 1409.6212 |
| 38 | CMS Collaboration | Search for the standard model Higgs boson produced in association with a W or a Z boson and decaying to bottom quarks | PRD 89 (2014) 012003 | CMS-HIG-13-012 1310.3687 |
| 39 | CDF and D0 Collaborations | Evidence for a particle produced in association with weak bosons and decaying to a bottom-antibottom quark pair in Higgs boson searches at the Tevatron | PRL 109 (2012) 071804 | 1207.6436 |
| 40 | CDF and D0 Collaboration | Higgs boson studies at the tevatron | PRD 88 (2013) 052014 | 1303.6346 |
| 41 | CMS Collaboration | Inclusive search for a highly boosted Higgs boson decaying to a bottom quark-antiquark pair | PRL 120 (2018) 071802 | CMS-HIG-17-010 1709.05543 |
| 42 | ATLAS Collaboration | Search for the standard model Higgs boson produced in association with top quarks and decaying into $ \mathrm{b}\overline{\mathrm{b}} $ in pp collisions at $ \sqrt{s} = $ 8 TeV with the ATLAS detector | EPJC 75 (2015) 349 | 1503.05066 |
| 43 | ATLAS Collaboration | Search for the standard model Higgs boson decaying into $ \mathrm{b}\overline{\mathrm{b}} $ produced in association with top quarks decaying hadronically in pp collisions at $ \sqrt{s}= $ 8 TeV with the ATLAS detector | JHEP 05 (2016) 160 | 1604.03812 |
| 44 | CMS Collaboration | Search for the standard model Higgs boson produced in association with a top-quark pair in pp collisions at the LHC | JHEP 05 (2013) 145 | CMS-HIG-12-035 1303.0763 |
| 45 | CMS Collaboration | Search for the associated production of the higgs boson with a top-quark pair | JHEP 09 (2014) 087 | CMS-HIG-13-029 1408.1682 |
| 46 | ATLAS Collaboration | Search for the standard model Higgs boson produced by vector-boson fusion and decaying to bottom quarks in $ \sqrt{s}= $ 8 TeV pp collisions with the ATLAS detector | JHEP 11 (2016) 112 | 1606.02181 |
| 47 | CMS Collaboration | Search for the standard model Higgs boson produced through vector boson fusion and decaying to $ \mathrm{b}\overline{\mathrm{b}} $ | PRD 92 (2015) 032008 | CMS-HIG-14-004 1506.01010 |
| 48 | CMS Collaboration | CMS luminosity measurement for the 2017 data-taking period at $ \sqrt{s} = $ 13 TeV | CMS-PAS-LUM-17-004 | CMS-PAS-LUM-17-004 |
| 49 | CMS Collaboration | The CMS experiment at the CERN LHC | JINST 3 (2008) S08004 | CMS-00-001 |
| 50 | GEANT4 Collaboration | $ GEANT4--A $ simulation toolkit | NIMA 506 (2003) 250 | |
| 51 | P. Nason | A new method for combining NLO QCD with shower Monte Carlo algorithms | JHEP 11 (2004) 040 | hep-ph/0409146 |
| 52 | S. Frixione, P. Nason, and C. Oleari | Matching NLO QCD computations with parton shower simulations: the POWHEG method | JHEP 11 (2007) 070 | 0709.2092 |
| 53 | S. Alioli, P. Nason, C. Oleari, and E. Re | A general framework for implementing NLO calculations in shower Monte Carlo programs: the POWHEG BOX | JHEP 06 (2010) 043 | 1002.2581 |
| 54 | K. Hamilton, P. Nason, and G. Zanderighi | MINLO: Multi-Scale Improved NLO | JHEP 10 (2012) 155 | 1206.3572 |
| 55 | G. Luisoni, P. Nason, C. Oleari, and F. Tramontano | HW$ ^{\pm} $/HZ + 0 and 1 jet at NLO with the POWHEG BOX interfaced to GoSam and their merging within MiNLO | JHEP 10 (2013) 083 | 1306.2542 |
| 56 | J. Alwall et al. | The automated computation of tree-level and next-to-leading order differential cross sections, and their matching to parton shower simulations | JHEP 07 (2014) 079 | 1405.0301 |
| 57 | R. Frederix and S. Frixione | Merging meets matching in MC@NLO | JHEP 12 (2012) 061 | 1209.6215 |
| 58 | J. Alwall et al. | Comparative study of various algorithms for the merging of parton showers and matrix elements in hadronic collisions | EPJC 53 (2008) 473 | 0706.2569 |
| 59 | S. Frixione, P. Nason, and G. Ridolfi | A positive-weight next-to-leading-order Monte Carlo for heavy flavour hadroproduction | JHEP 09 (2007) 126 | 0707.3088 |
| 60 | E. Re | Single-top Wt-channel production matched with parton showers using the POWHEG method | EPJC 71 (2011) 1547 | 1009.2450 |
| 61 | R. Frederix, E. Re, and P. Torrielli | Single-top $ t $-channel hadroproduction in the four-flavour scheme with POWHEG and aMC@NLO | JHEP 09 (2012) 130 | 1207.5391 |
| 62 | S. Alioli, P. Nason, C. Oleari, and E. Re | NLO single-top production matched with shower in POWHEG: $ s $- and $ t $-channel contributions | JHEP 09 (2009) 111 | 0907.4076 |
| 63 | NNPDF Collaboration | Parton distributions from high-precision collider data | EPJC 77 (2017) 663 | 1706.00428 |
| 64 | T. Sjostrand et al. | An Introduction to PYTHIA 8.2 | CPC 191 (2015) 159 | 1410.3012 |
| 65 | G. Ferrera, M. Grazzini, and F. Tramontano | Higher-order QCD effects for associated WH production and decay at the LHC | JHEP 04 (2014) 039 | 1312.1669 |
| 66 | G. Ferrera, M. Grazzini, and F. Tramontano | Associated ZH production at hadron colliders: the fully differential NNLO QCD calculation | PLB 740 (2015) 51 | 1407.4747 |
| 67 | G. Ferrera, M. Grazzini, and F. Tramontano | Associated WH production at hadron colliders: a fully exclusive QCD calculation at NNLO | PRL 107 (2011) 152003 | 1107.1164 |
| 68 | G. Ferrera, G. Somogyi, and F. Tramontano | Associated production of a Higgs boson decaying into bottom quarks at the LHC in full NNLO QCD | PLB 780 (2018) 346 | 1705.10304 |
| 69 | O. Brein, R. V. Harlander, and T. J. E. Zirke | vh@nnlo --- Higgs Strahlung at hadron colliders | CPC 184 (2013) 998 | 1210.5347 |
| 70 | R. V. Harlander, S. Liebler, and T. Zirke | Higgs Strahlung at the Large Hadron Collider in the 2-Higgs-Doublet Model | JHEP 02 (2014) 023 | 1307.8122 |
| 71 | A. Denner, S. Dittmaier, S. Kallweit, and A. Muck | HAWK 2.0: A Monte Carlo program for Higgs production in vector-boson fusion and Higgs strahlung at hadron colliders | CPC 195 (2015) 161 | 1412.5390 |
| 72 | M. Czakon and A. Mitov | Top++: A Program for the Calculation of the Top-Pair Cross-Section at Hadron Colliders | CPC 185 (2014) 2930 | 1112.5675 |
| 73 | Y. Li and F. Petriello | Combining QCD and electroweak corrections to dilepton production in FEWZ | PRD 86 (2012) 094034 | 1208.5967 |
| 74 | S. Kallweit et al. | NLO QCD+EW predictions for V+jets including off-shell vector-boson decays and multijet merging | JHEP 04 (2016) 021 | 1511.08692 |
| 75 | CMS Collaboration | Measurement of differential cross sections for top quark pair production using the $ \text{lepton}{+}\text{jets} $ final state in proton-proton collisions at 13 TeV | PRD 95 (2017) 092001 | CMS-TOP-16-008 1610.04191 |
| 76 | CMS Collaboration | Particle-flow reconstruction and global event description with the CMS detector | JINST 12 (2017) P10003 | CMS-PRF-14-001 1706.04965 |
| 77 | M. Cacciari, G. P. Salam, and G. Soyez | The anti-$ {k_{\mathrm{T}}} $ jet clustering algorithm | JHEP 04 (2008) 063 | 0802.1189 |
| 78 | M. Cacciari, G. P. Salam, and G. Soyez | FastJet User Manual | EPJC 72 (2012) 1896 | 1111.6097 |
| 79 | M. Cacciari and G. P. Salam | Dispelling the $ N^{3} $ myth for the $ k_t $ jet-finder | PLB 641 (2006) 57 | hep-ph/0512210 |
| 80 | CMS Collaboration | The CMS trigger system | JINST 12 (2017) P01020 | CMS-TRG-12-001 1609.02366 |
| 81 | CMS Collaboration | Identification of heavy-flavour jets with the CMS detector in pp collisions at 13 TeV | JINST 13 (2018) P05011 | CMS-BTV-16-002 1712.07158 |
| 82 | J. M. Butterworth, A. R. Davison, M. Rubin, and G. P. Salam | Jet substructure as a new Higgs search channel at the LHC | PRL 100 (2008) 242001 | 0802.2470 |
| 83 | T. Junk | Confidence level computation for combining searches with small statistics | NIMA 434 (1999) 435 | hep-ex/9902006 |
| 84 | A. L. Read | Presentation of search results: The $ CL_s $ technique | JPG 28 (2002) 2693 | |
| 85 | ATLAS and CMS Collaborations, LHC Higgs Combination Group | Procedure for the LHC Higgs boson search combination in Summer 2011 | ATL-PHYS-PUB 011-11/CMS NOTE 2011-005 | |
| 86 | G. Cowan, K. Cranmer, E. Gross, and O. Vitells | Asymptotic formulae for likelihood-based tests of new physics | EPJC 71 (2011) 1554 | 1007.1727 |
|
|
Compact Muon Solenoid LHC, CERN |
|

|

|

|

|

|