

Compact Muon Solenoid
LHC, CERN
| CMS-BPH-21-005 ; CERN-EP-2023-249 | ||
| Search for the lepton flavor violating $ \tau \!\to\! 3\mu $ decay in proton-proton collisions at $ \sqrt{s} = $ 13 TeV | ||
| CMS Collaboration | ||
| 4 December 2023 | ||
| PLB 853 (2024) 138633 | ||
| Abstract: A search for the lepton flavor violating $ \tau \!\to\! 3\mu $ decay is performed using proton-proton collision events at a center-of-mass energy of 13 TeV collected by the CMS experiment at the LHC in 2017--2018, corresponding to an integrated luminosity of 97.7 fb$ ^{-1} $. Tau leptons produced in both heavy-flavor hadron and W boson decays are exploited in the analysis. No evidence for the decay is observed. The results of this search are combined with an earlier null result based on data collected in 2016 to obtain a total integrated luminosity of 131 fb$ ^{-1} $. The observed (expected) upper limits on the branching fraction $ \mathcal{B}(\tau \!\to\! 3\mu) $ at confidence levels of 90 and 95% are 2.9 $ \times $ 10$^{-8} $ (2.4 $ \times $ 10$^{-8} $) and 3.6 $ \times $ 10$^{-8} $ (3.0 $ \times $ 10$^{-8} $), respectively. | ||
| Links: e-print arXiv:2312.02371 [hep-ex] (PDF) ; CDS record ; inSPIRE record ; HepData record ; Physics Briefing ; CADI line (restricted) ; | ||
| Figures | Summary | Additional Figures | References | CMS Publications |
|---|
| Figures | |
png pdf |
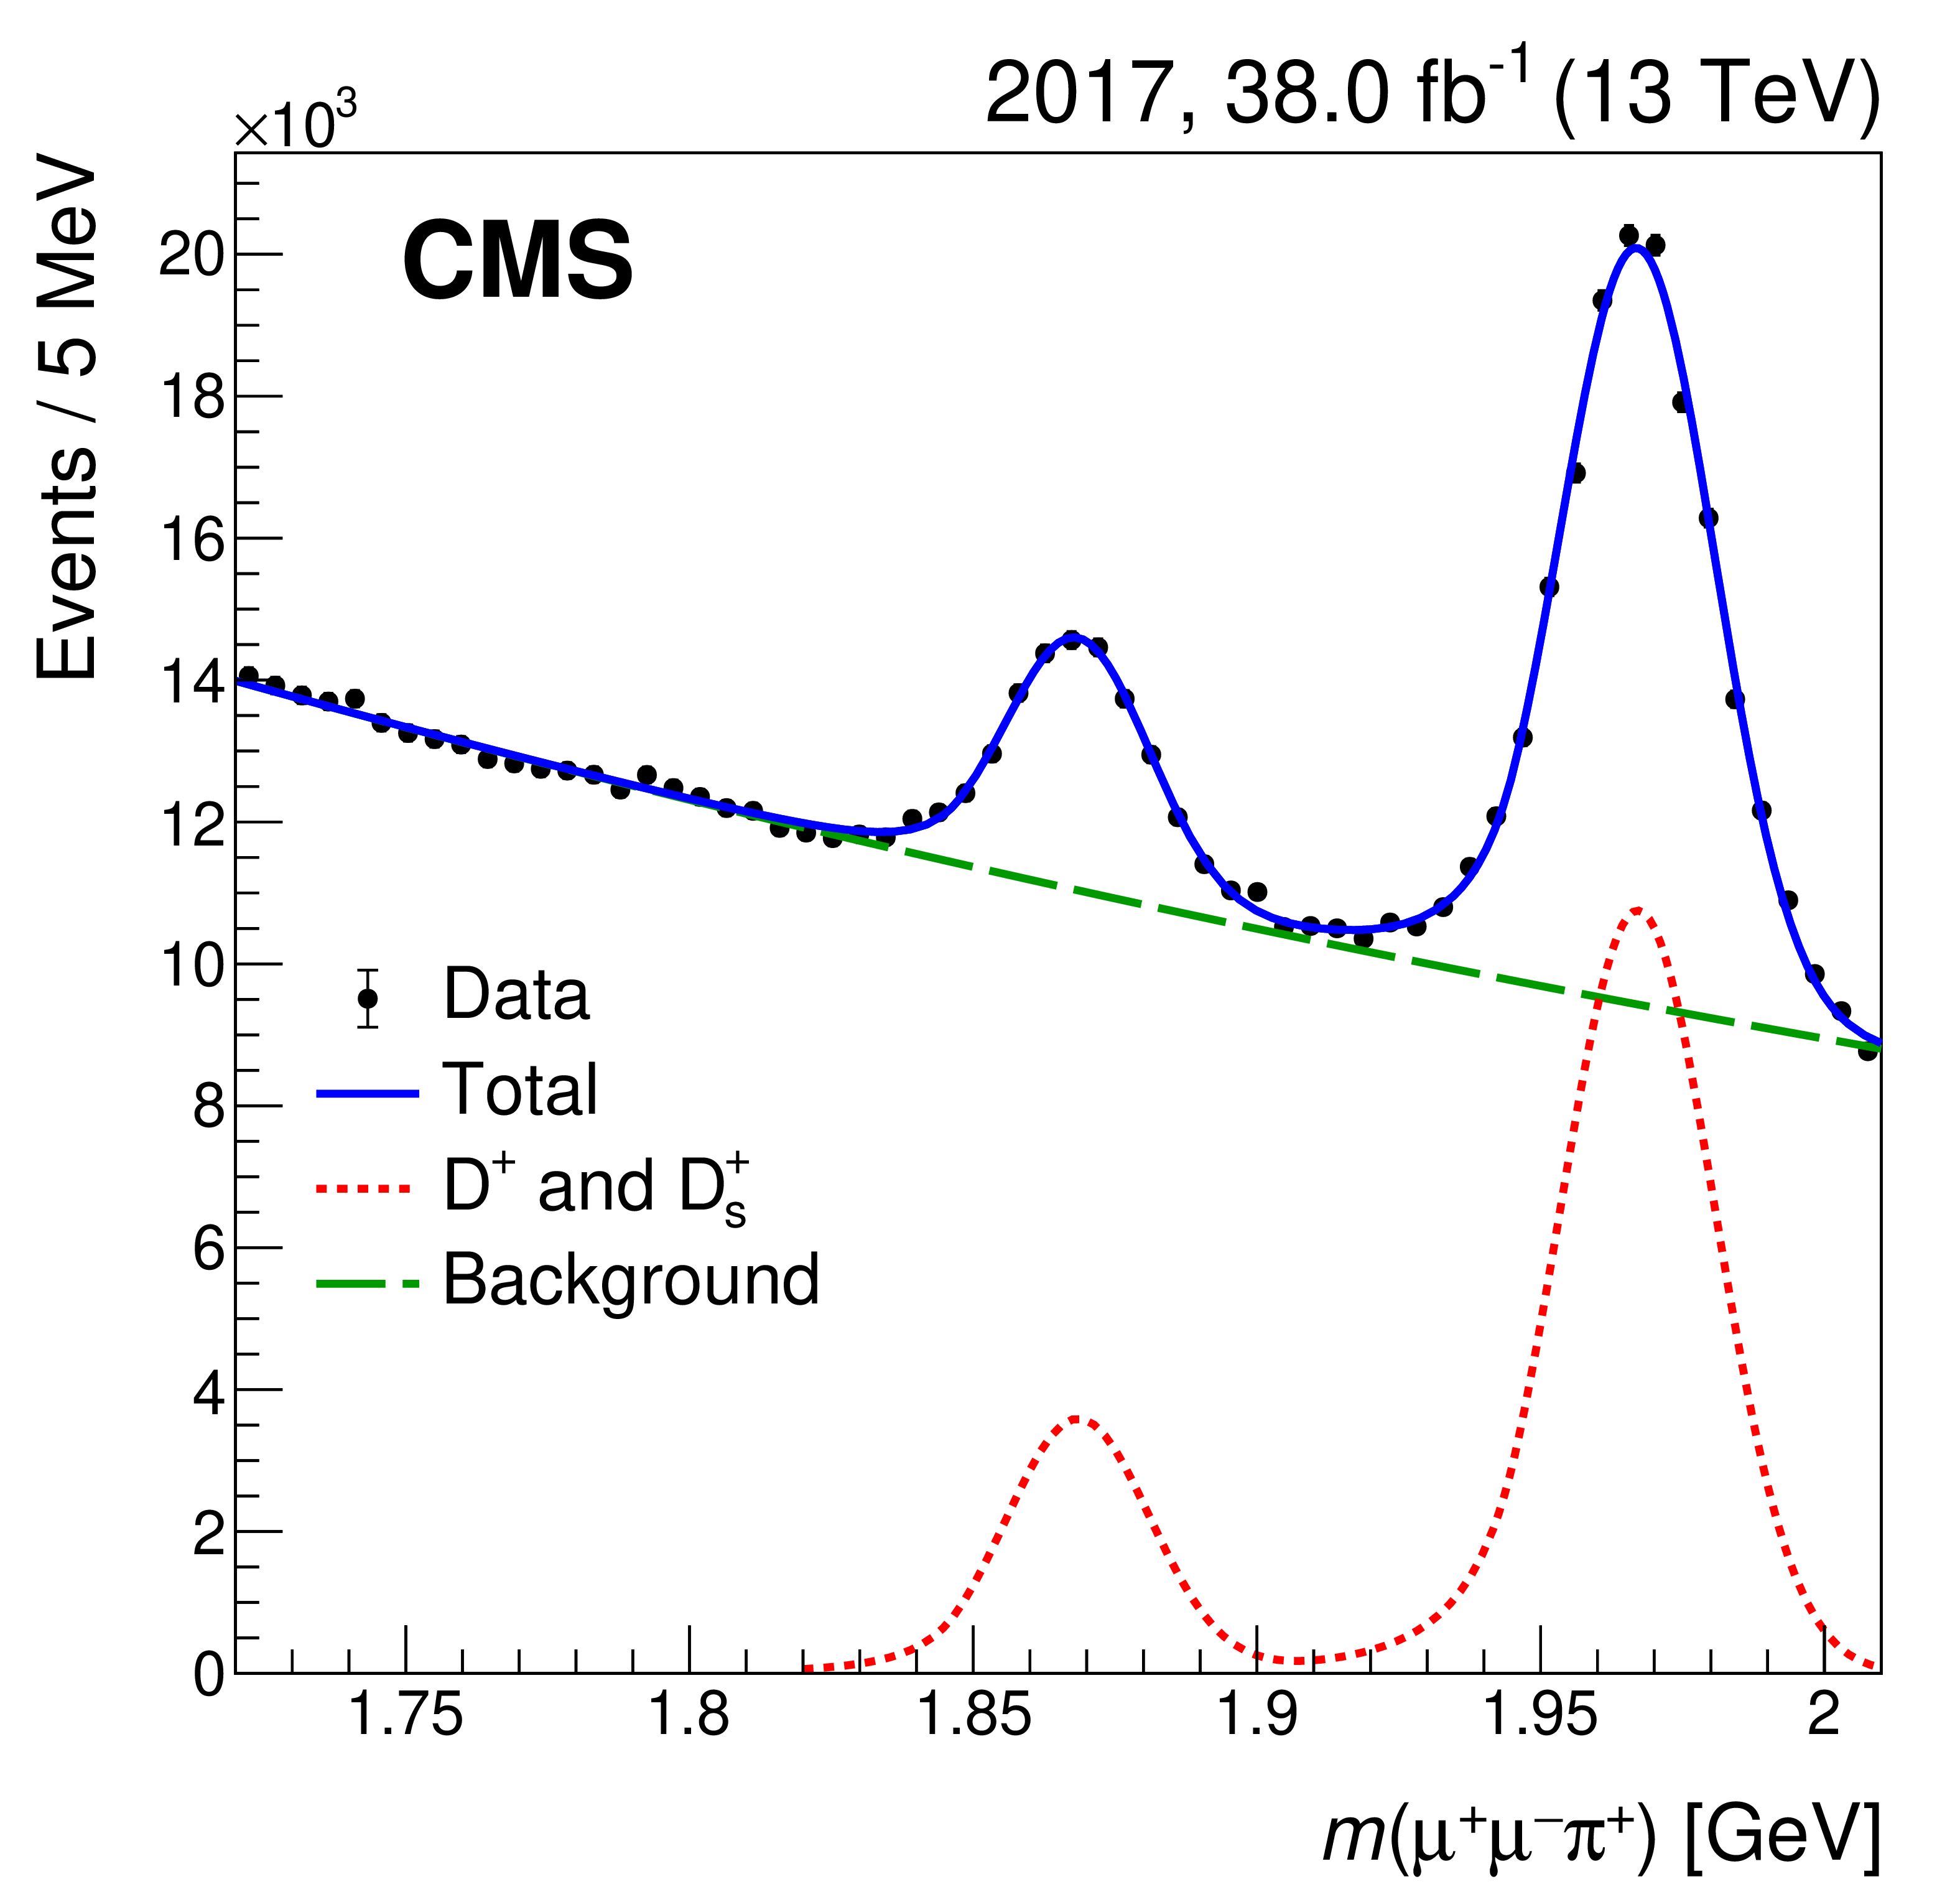
Figure 1:
The $ \mu^{+}\mu^{-}\pi^{+} $ invariant mass distribution with the fits to the sum of the $ \mathrm{D^+} $ (1.870 GeV) and $ \mathrm{D}_{s}^{+} $ (1.968 GeV) [29] resonances and the background in 2017 data. |
png pdf |
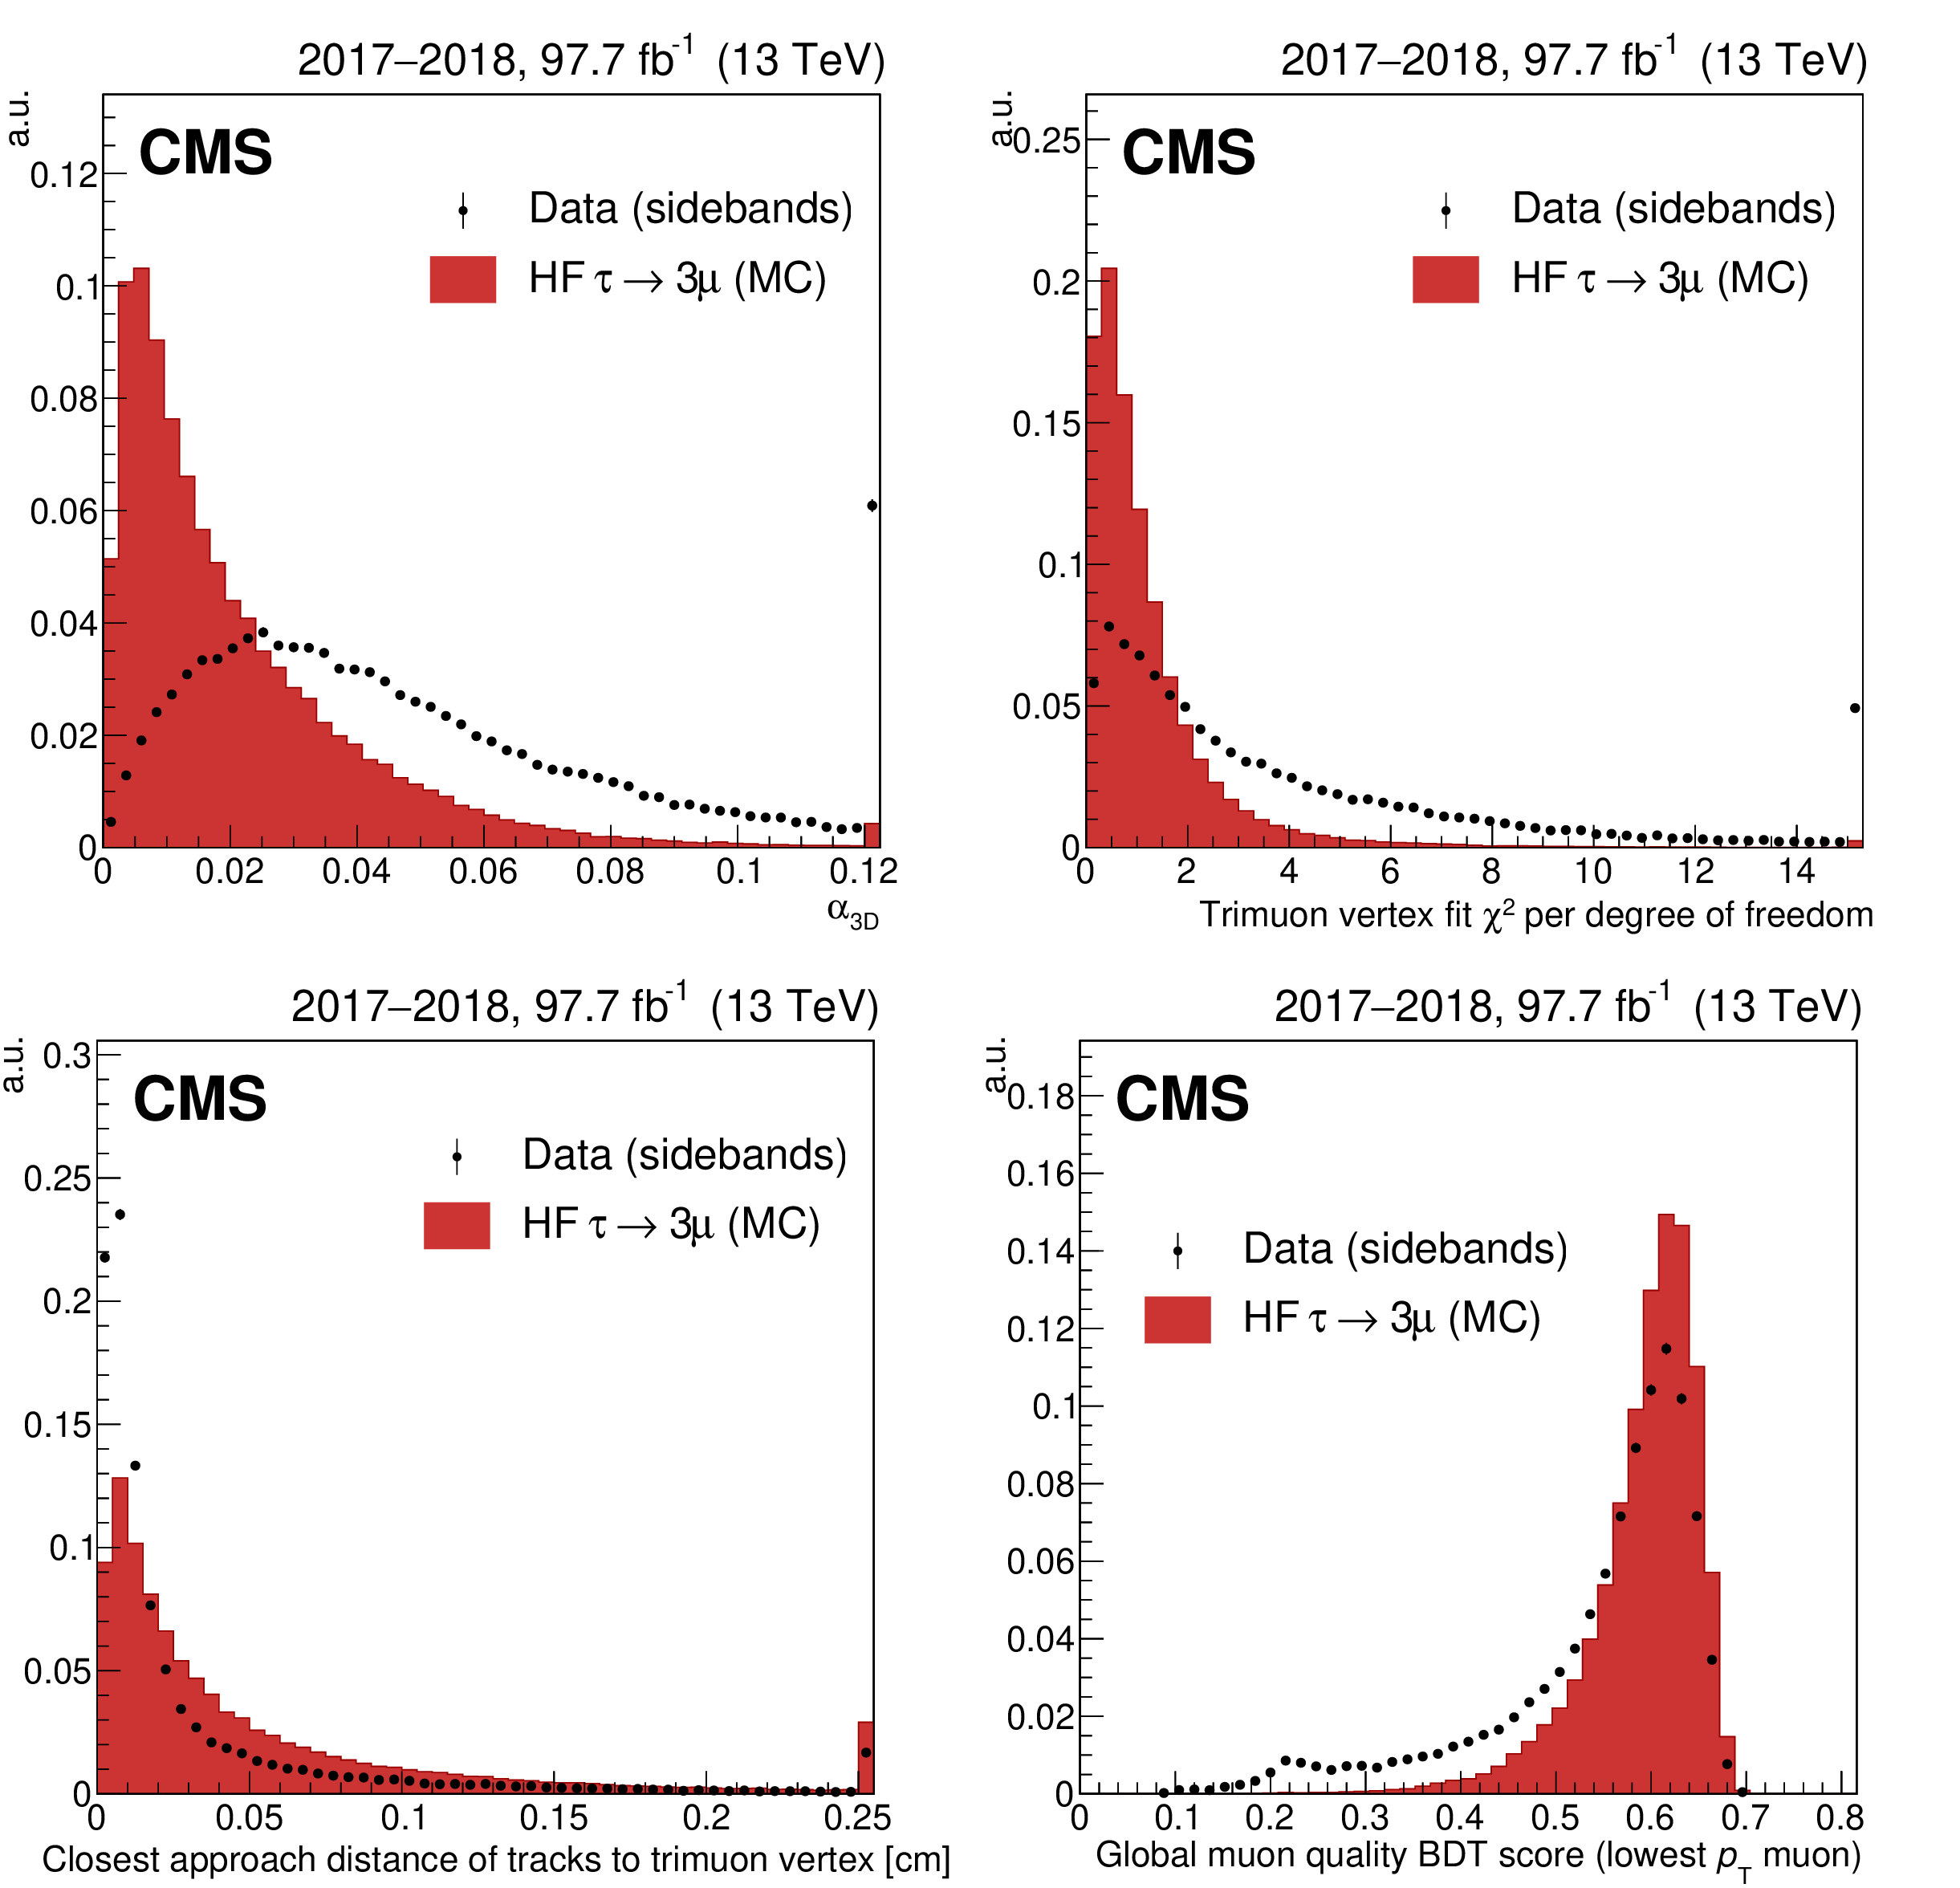
Figure 2:
Signal and background distributions for the four observables with the highest discrimination power used for the heavy-flavor (HF) analysis BDT training: $ \alpha_{\mathrm{3D}} $ (upper left), $ \chi^2 $ per degree of freedom of the trimuon vertex fit (upper right), the smallest distance of closest approach to the trimuon vertex of all the other tracks in the event with $ p_{\mathrm{T}} > $ 1 GeV (lower left), and the muon reconstruction quality BDT score of the lowest $ p_{\mathrm{T}} $ muon of the triplet (lower right). The signal and background distributions are obtained respectively from MC simulation and from the mass-sideband regions in data. All distributions are normalized to unit area. The rightmost bins include overflow. |
png pdf |
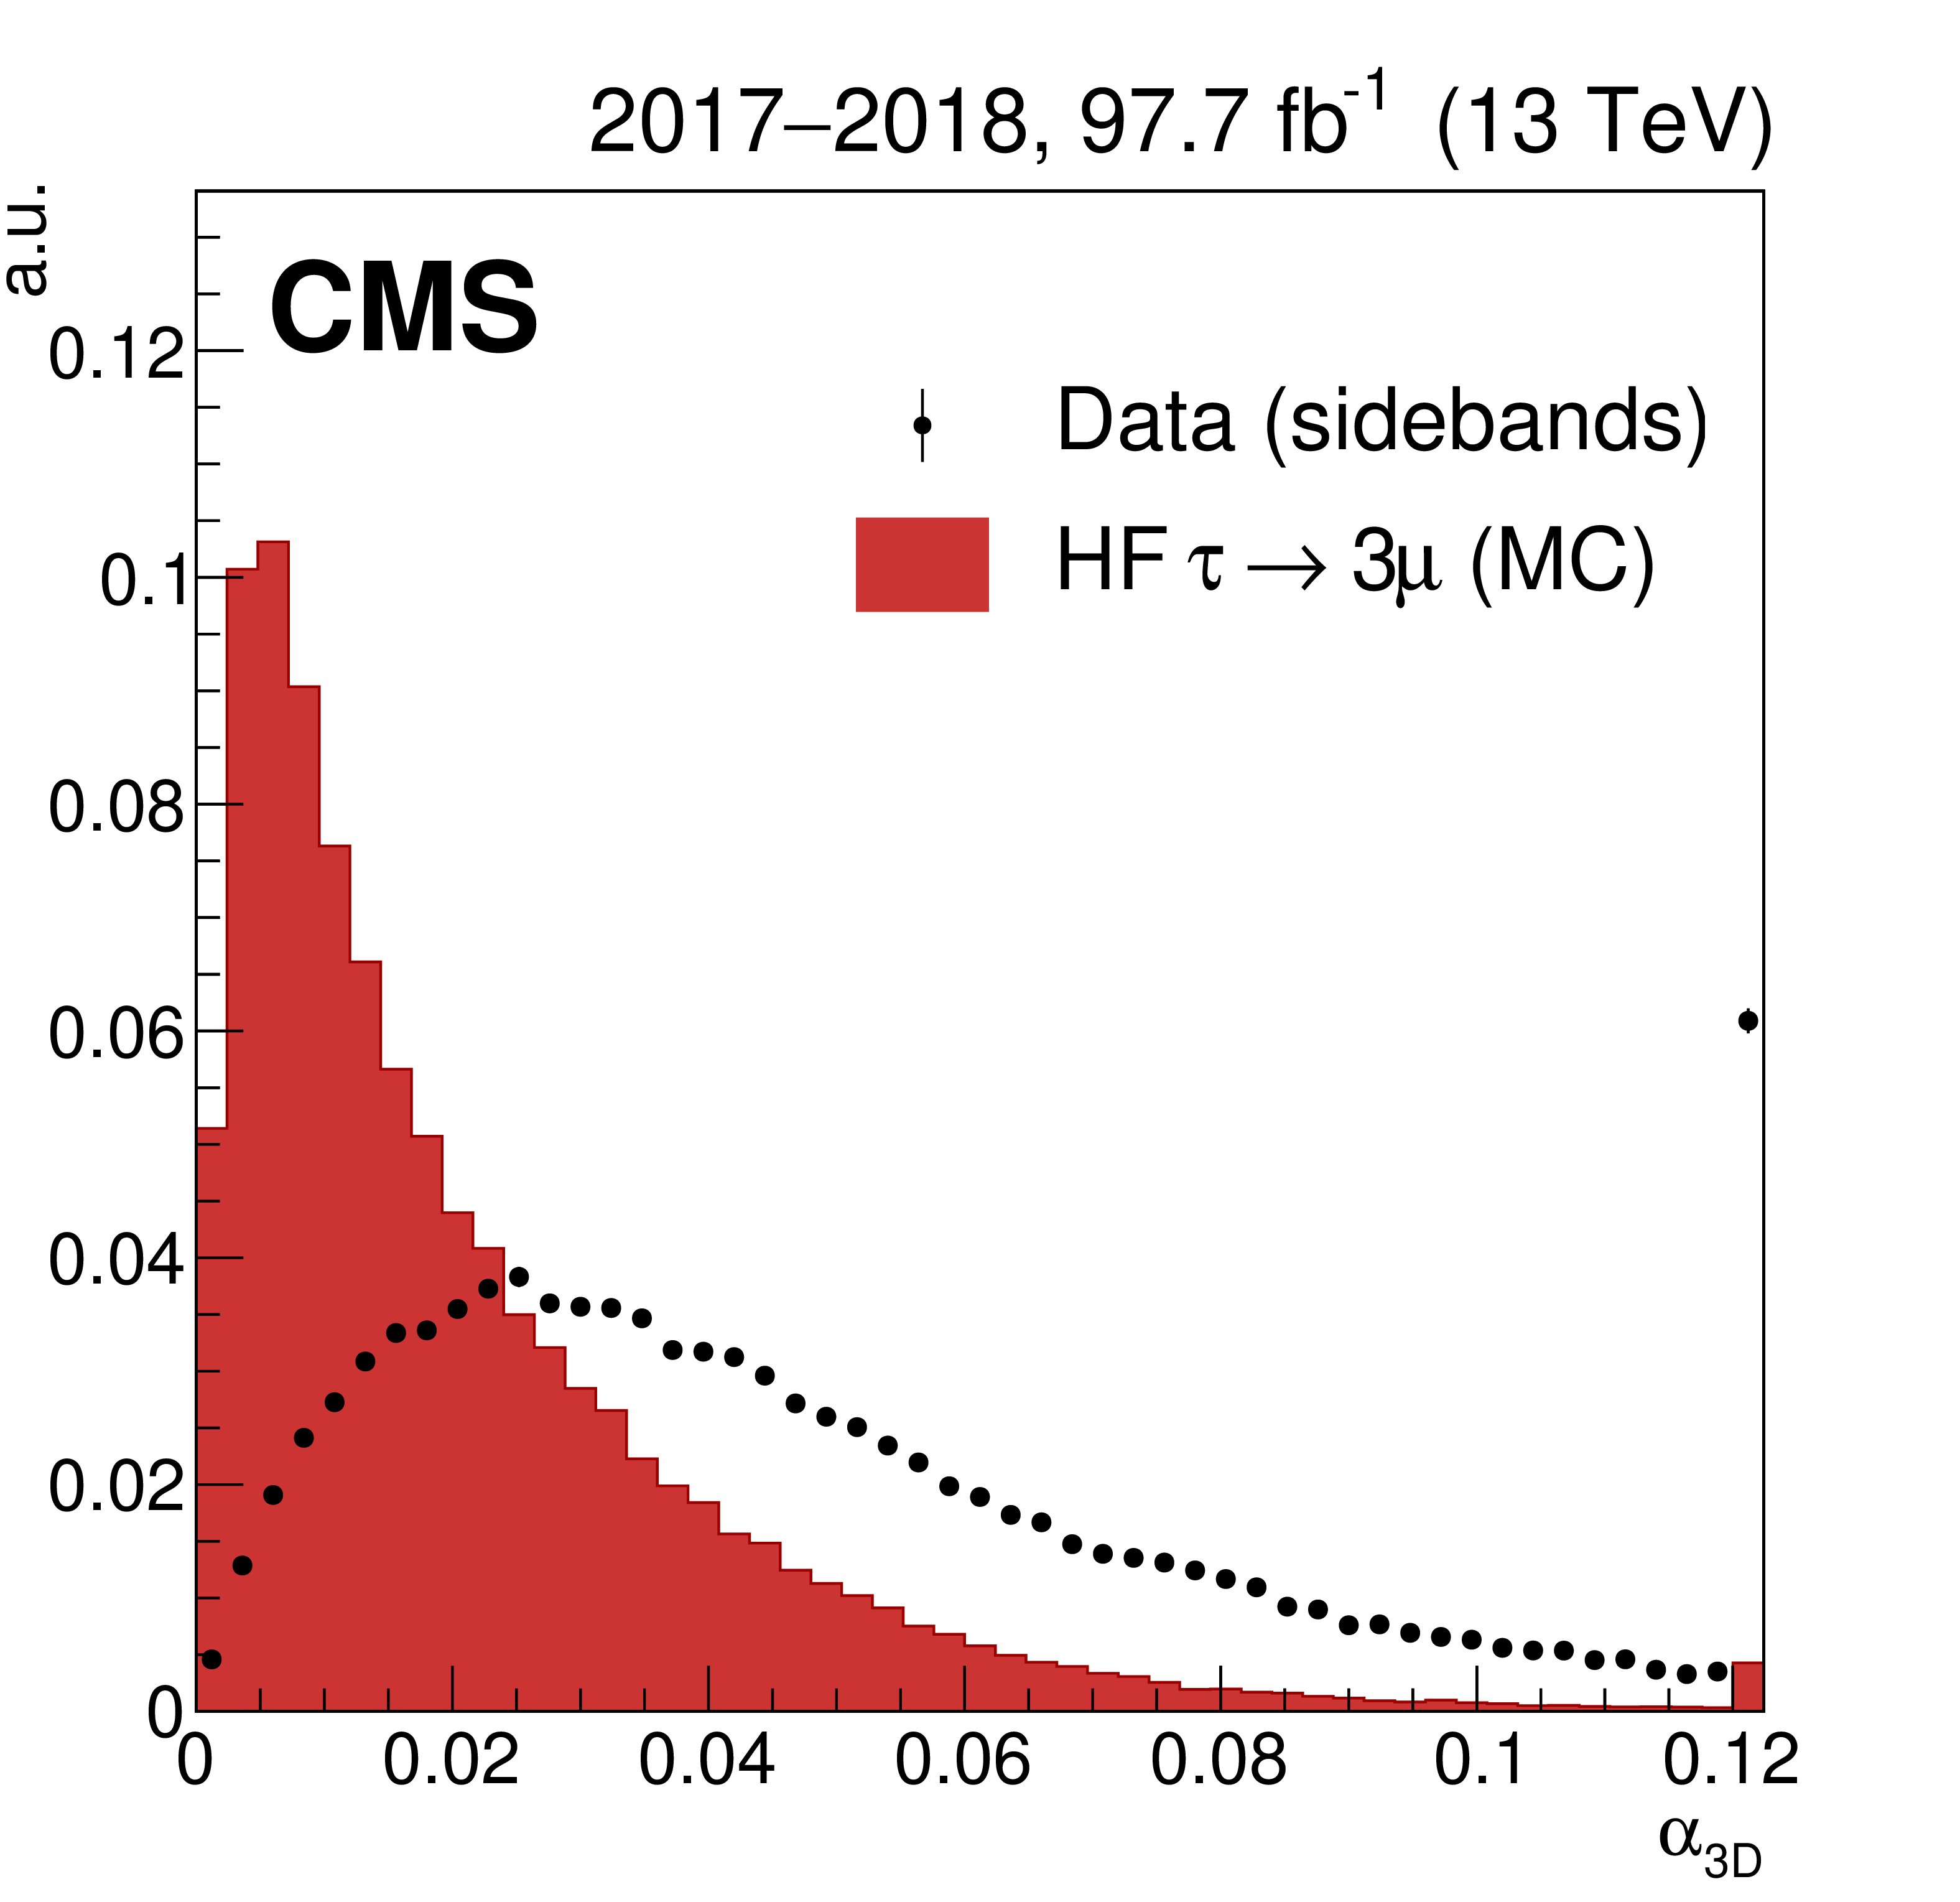
Figure 2-a:
Signal and background distributions for $ \alpha_{\mathrm{3D}} $, a variable used for the heavy-flavor (HF) analysis BDT training. The signal and background distributions are obtained respectively from MC simulation and from the mass-sideband regions in data. All distributions are normalized to unit area. The rightmost bin includes overflow. |

png pdf |
Figure 2-b:
Signal and background distributions for $ \chi^2 $ per degree of freedom of the trimuon vertex fit, a variable used for the heavy-flavor (HF) analysis BDT training. The signal and background distributions are obtained respectively from MC simulation and from the mass-sideband regions in data. All distributions are normalized to unit area. The rightmost bin includes overflow. |

png pdf |
Figure 2-c:
Signal and background distributions for the muon reconstruction quality BDT score of the lowest $ p_{\mathrm{T}} $ muon of the triplet, a variable used for the heavy-flavor (HF) analysis BDT training. The signal and background distributions are obtained respectively from MC simulation and from the mass-sideband regions in data. All distributions are normalized to unit area. The rightmost bin includes overflow. |

png pdf |
Figure 2-d:
Signal and background distributions for the muon reconstruction quality BDT score of the lowest $ p_{\mathrm{T}} $ muon of the triplet, a variable used for the heavy-flavor (HF) analysis BDT training. The signal and background distributions are obtained respectively from MC simulation and from the mass-sideband regions in data. All distributions are normalized to unit area. The rightmost bin includes overflow. |

png pdf |
Figure 3:
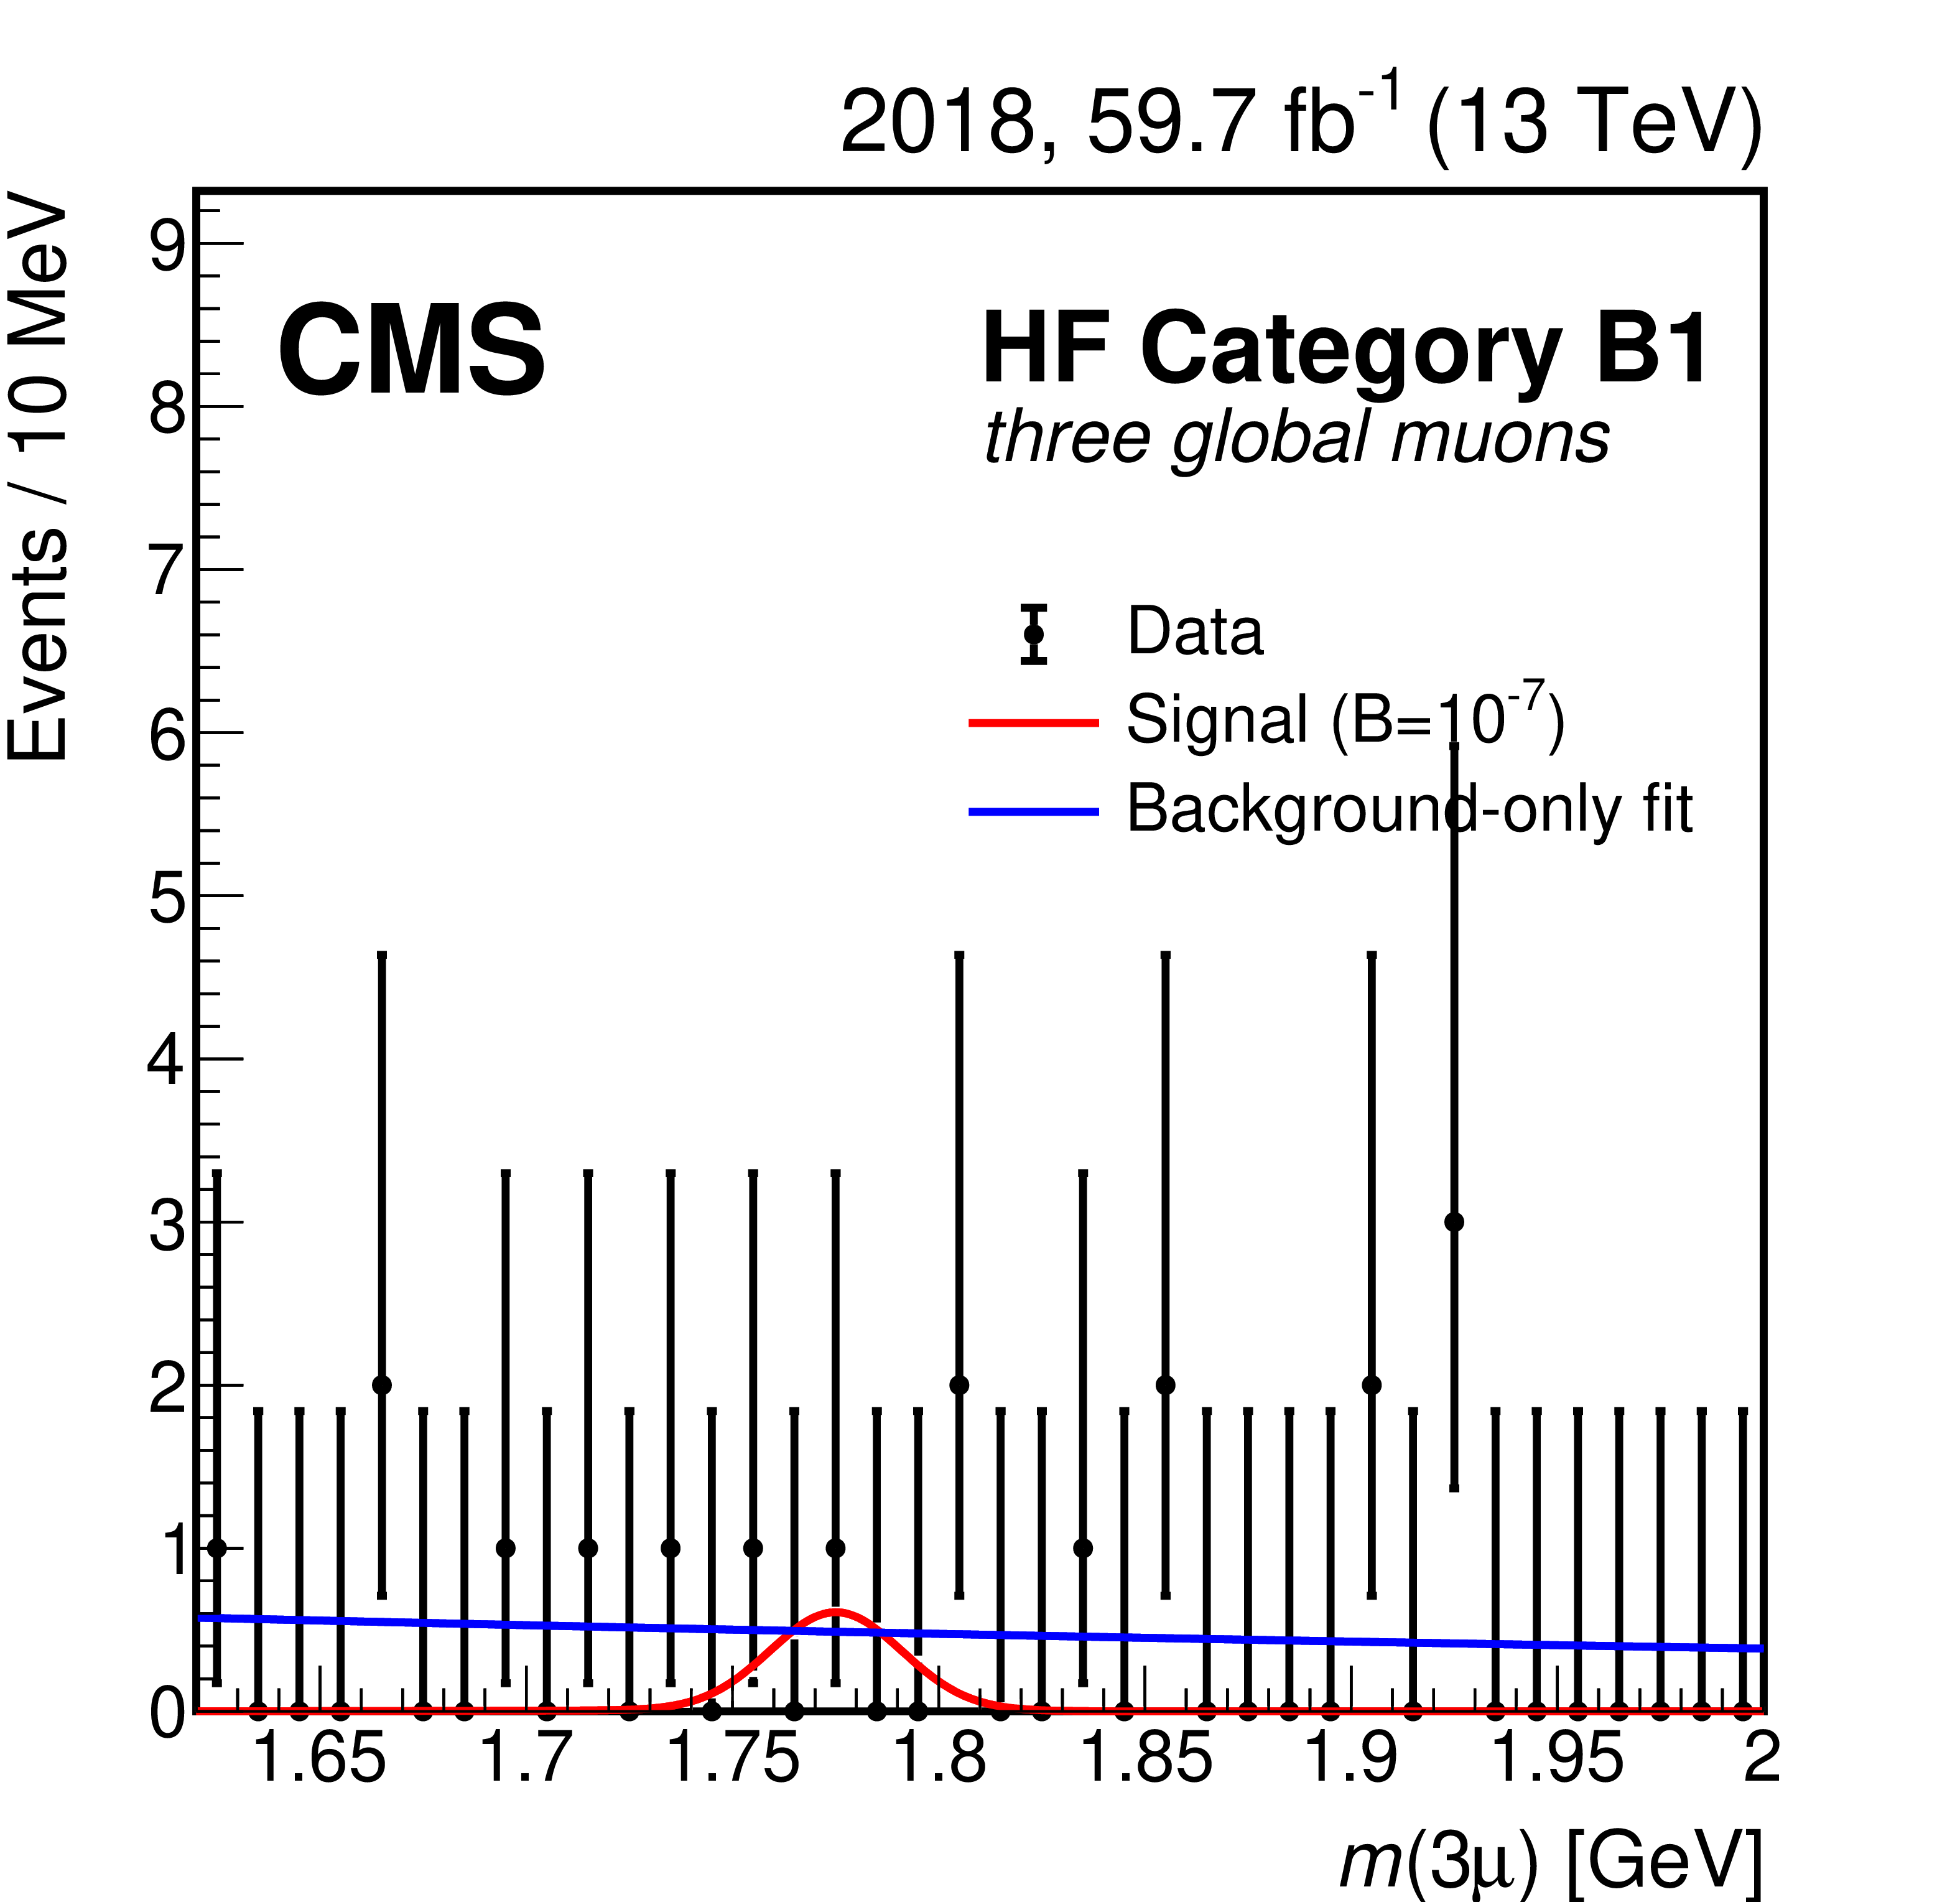
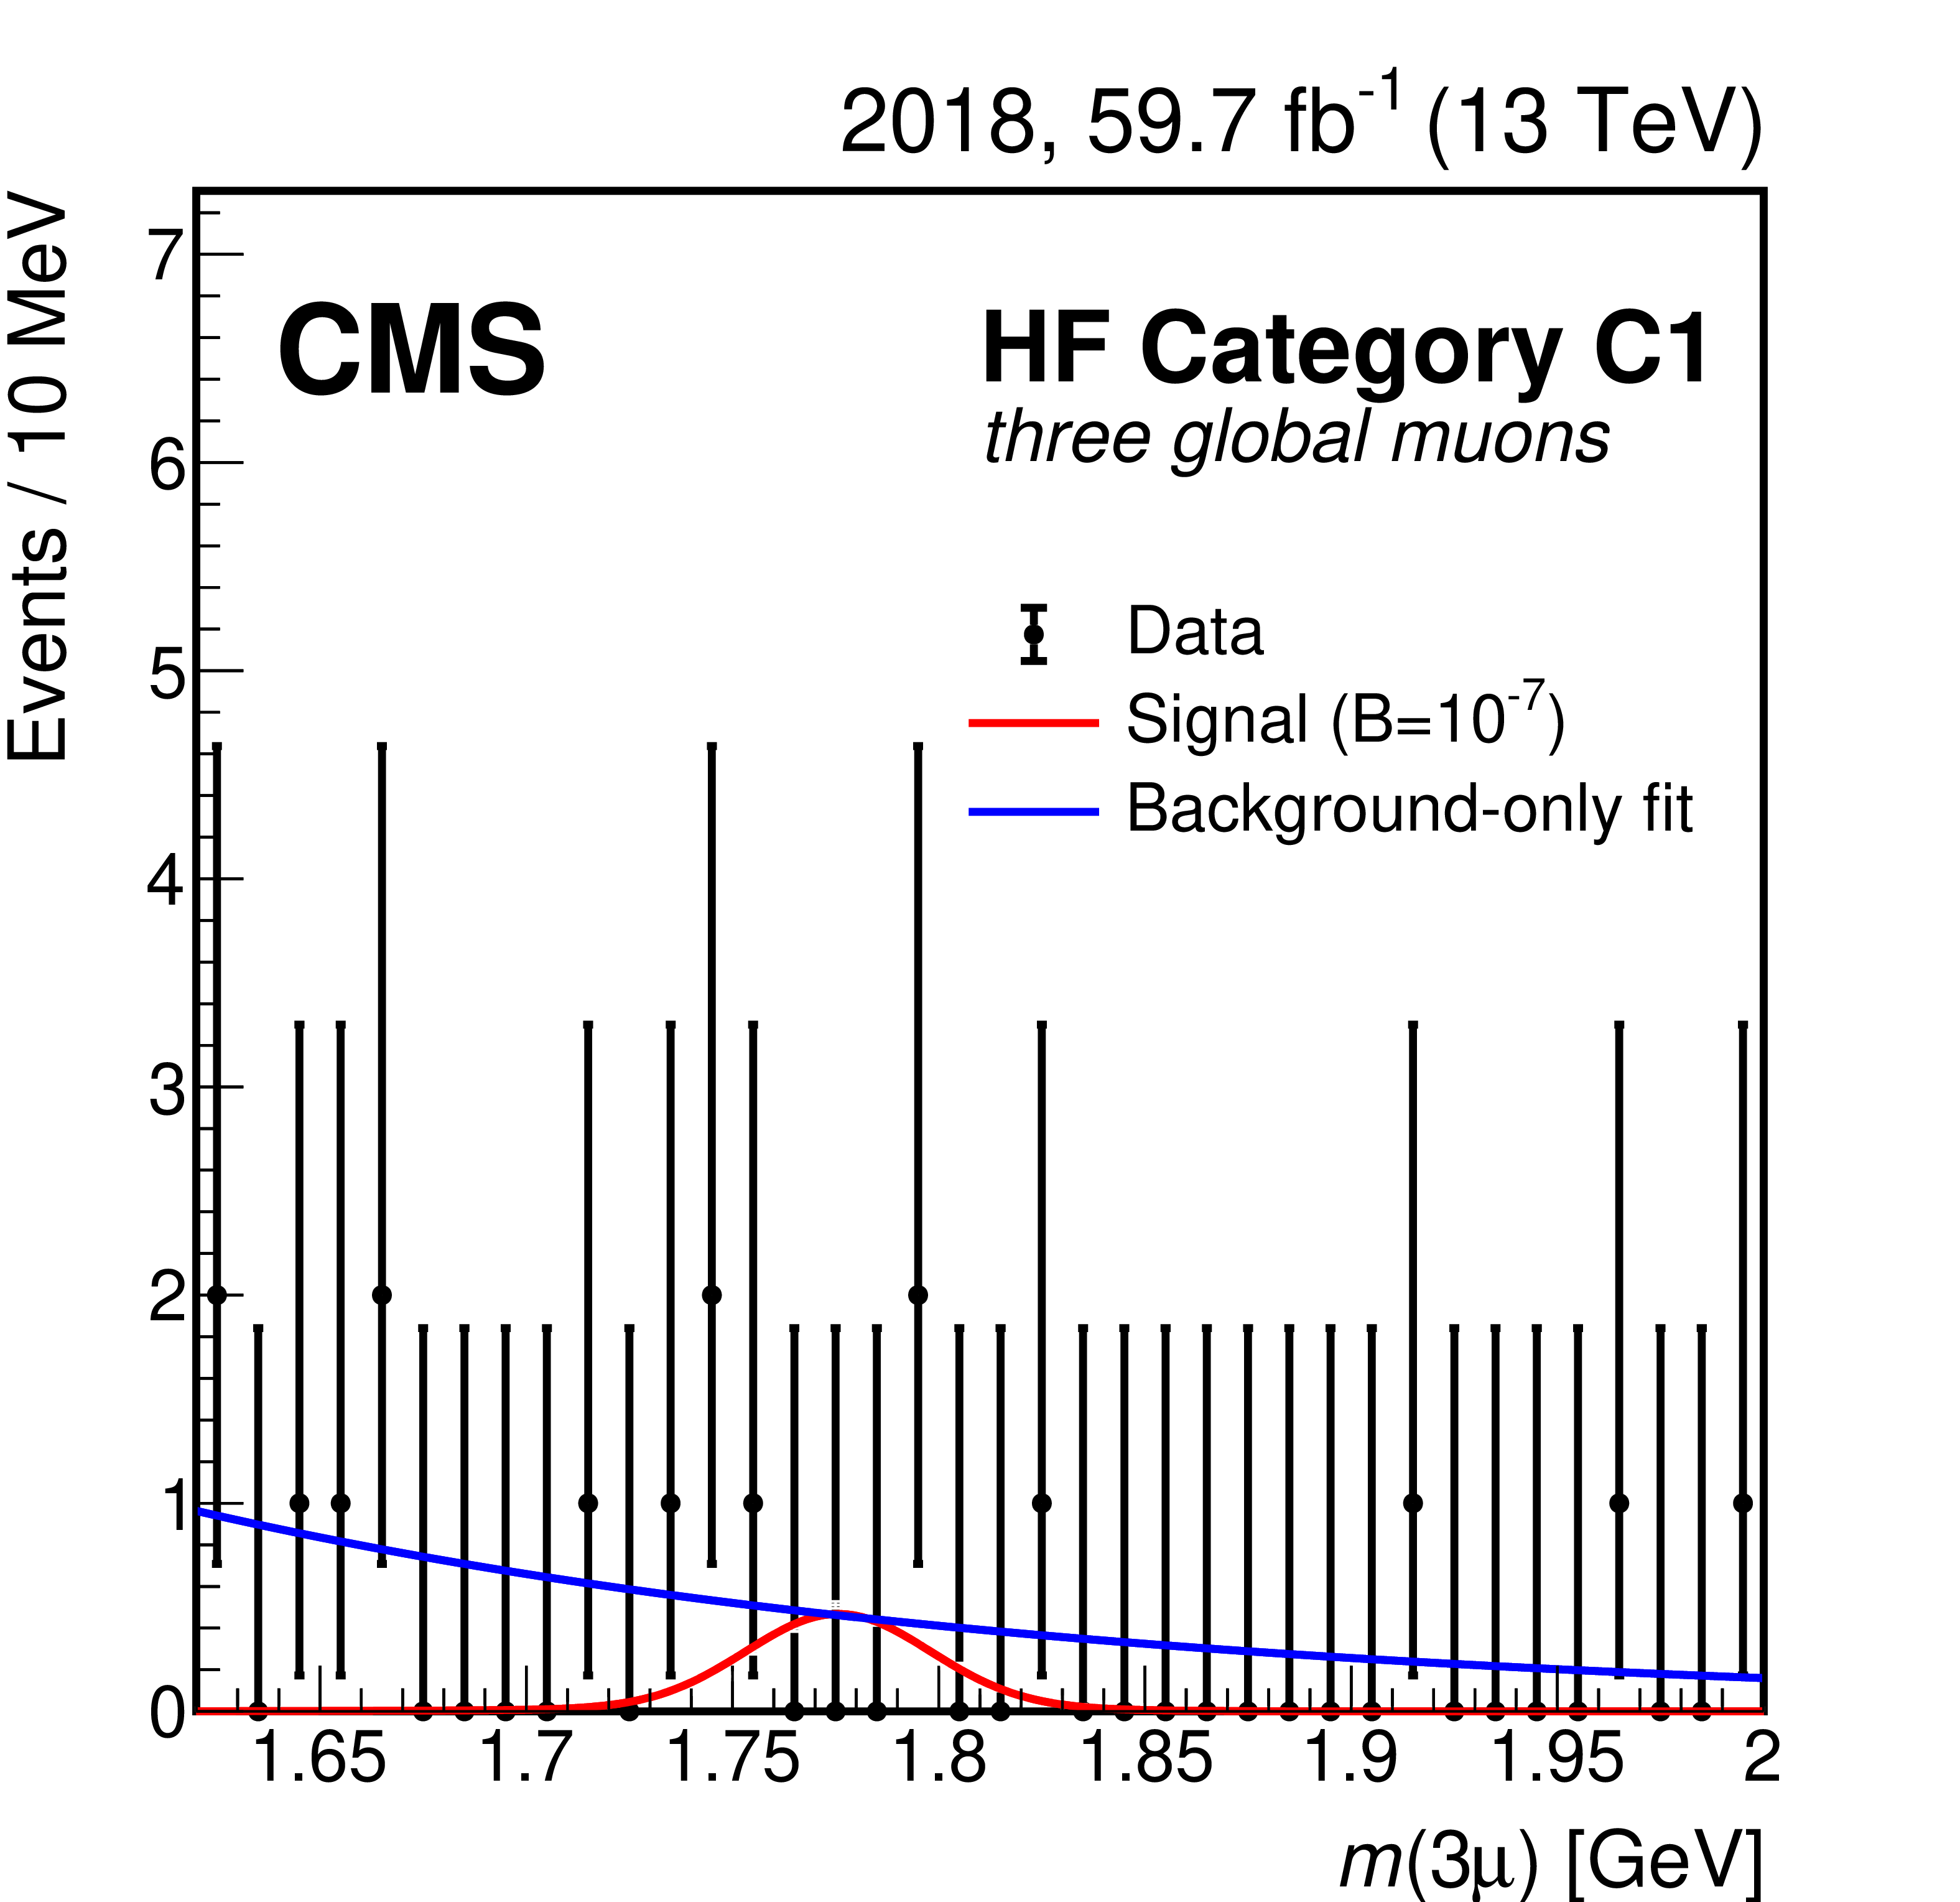
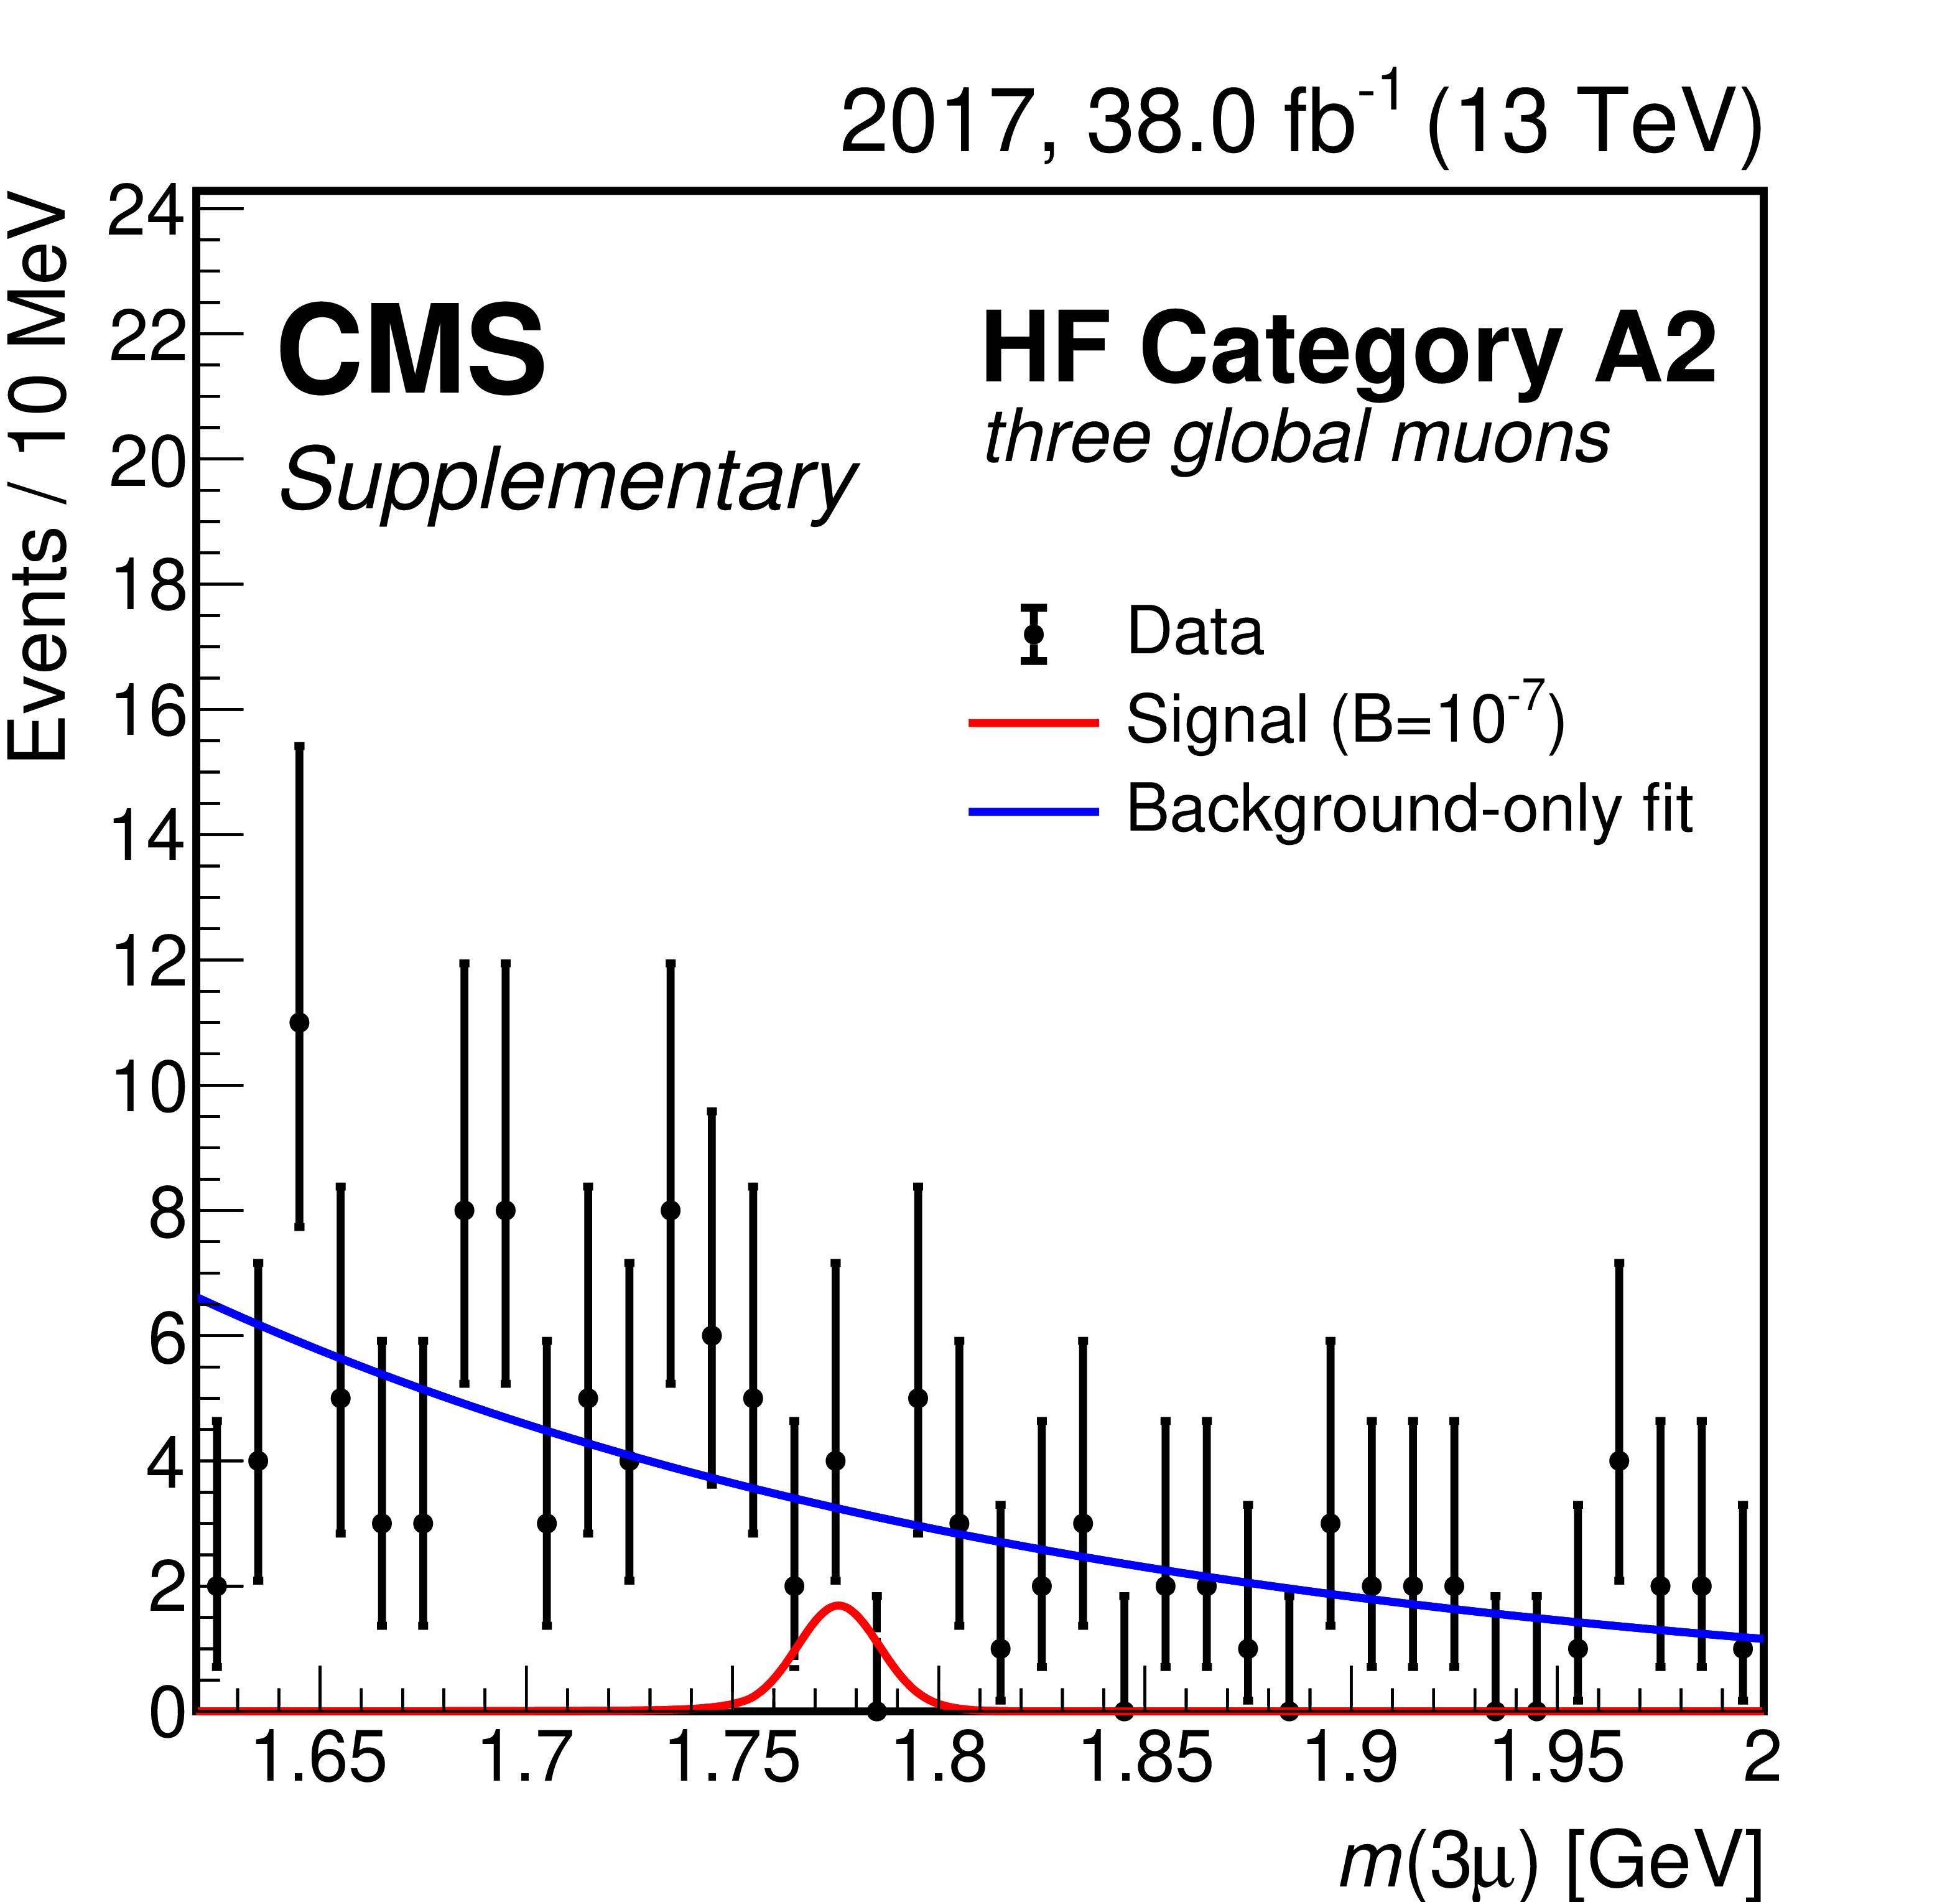
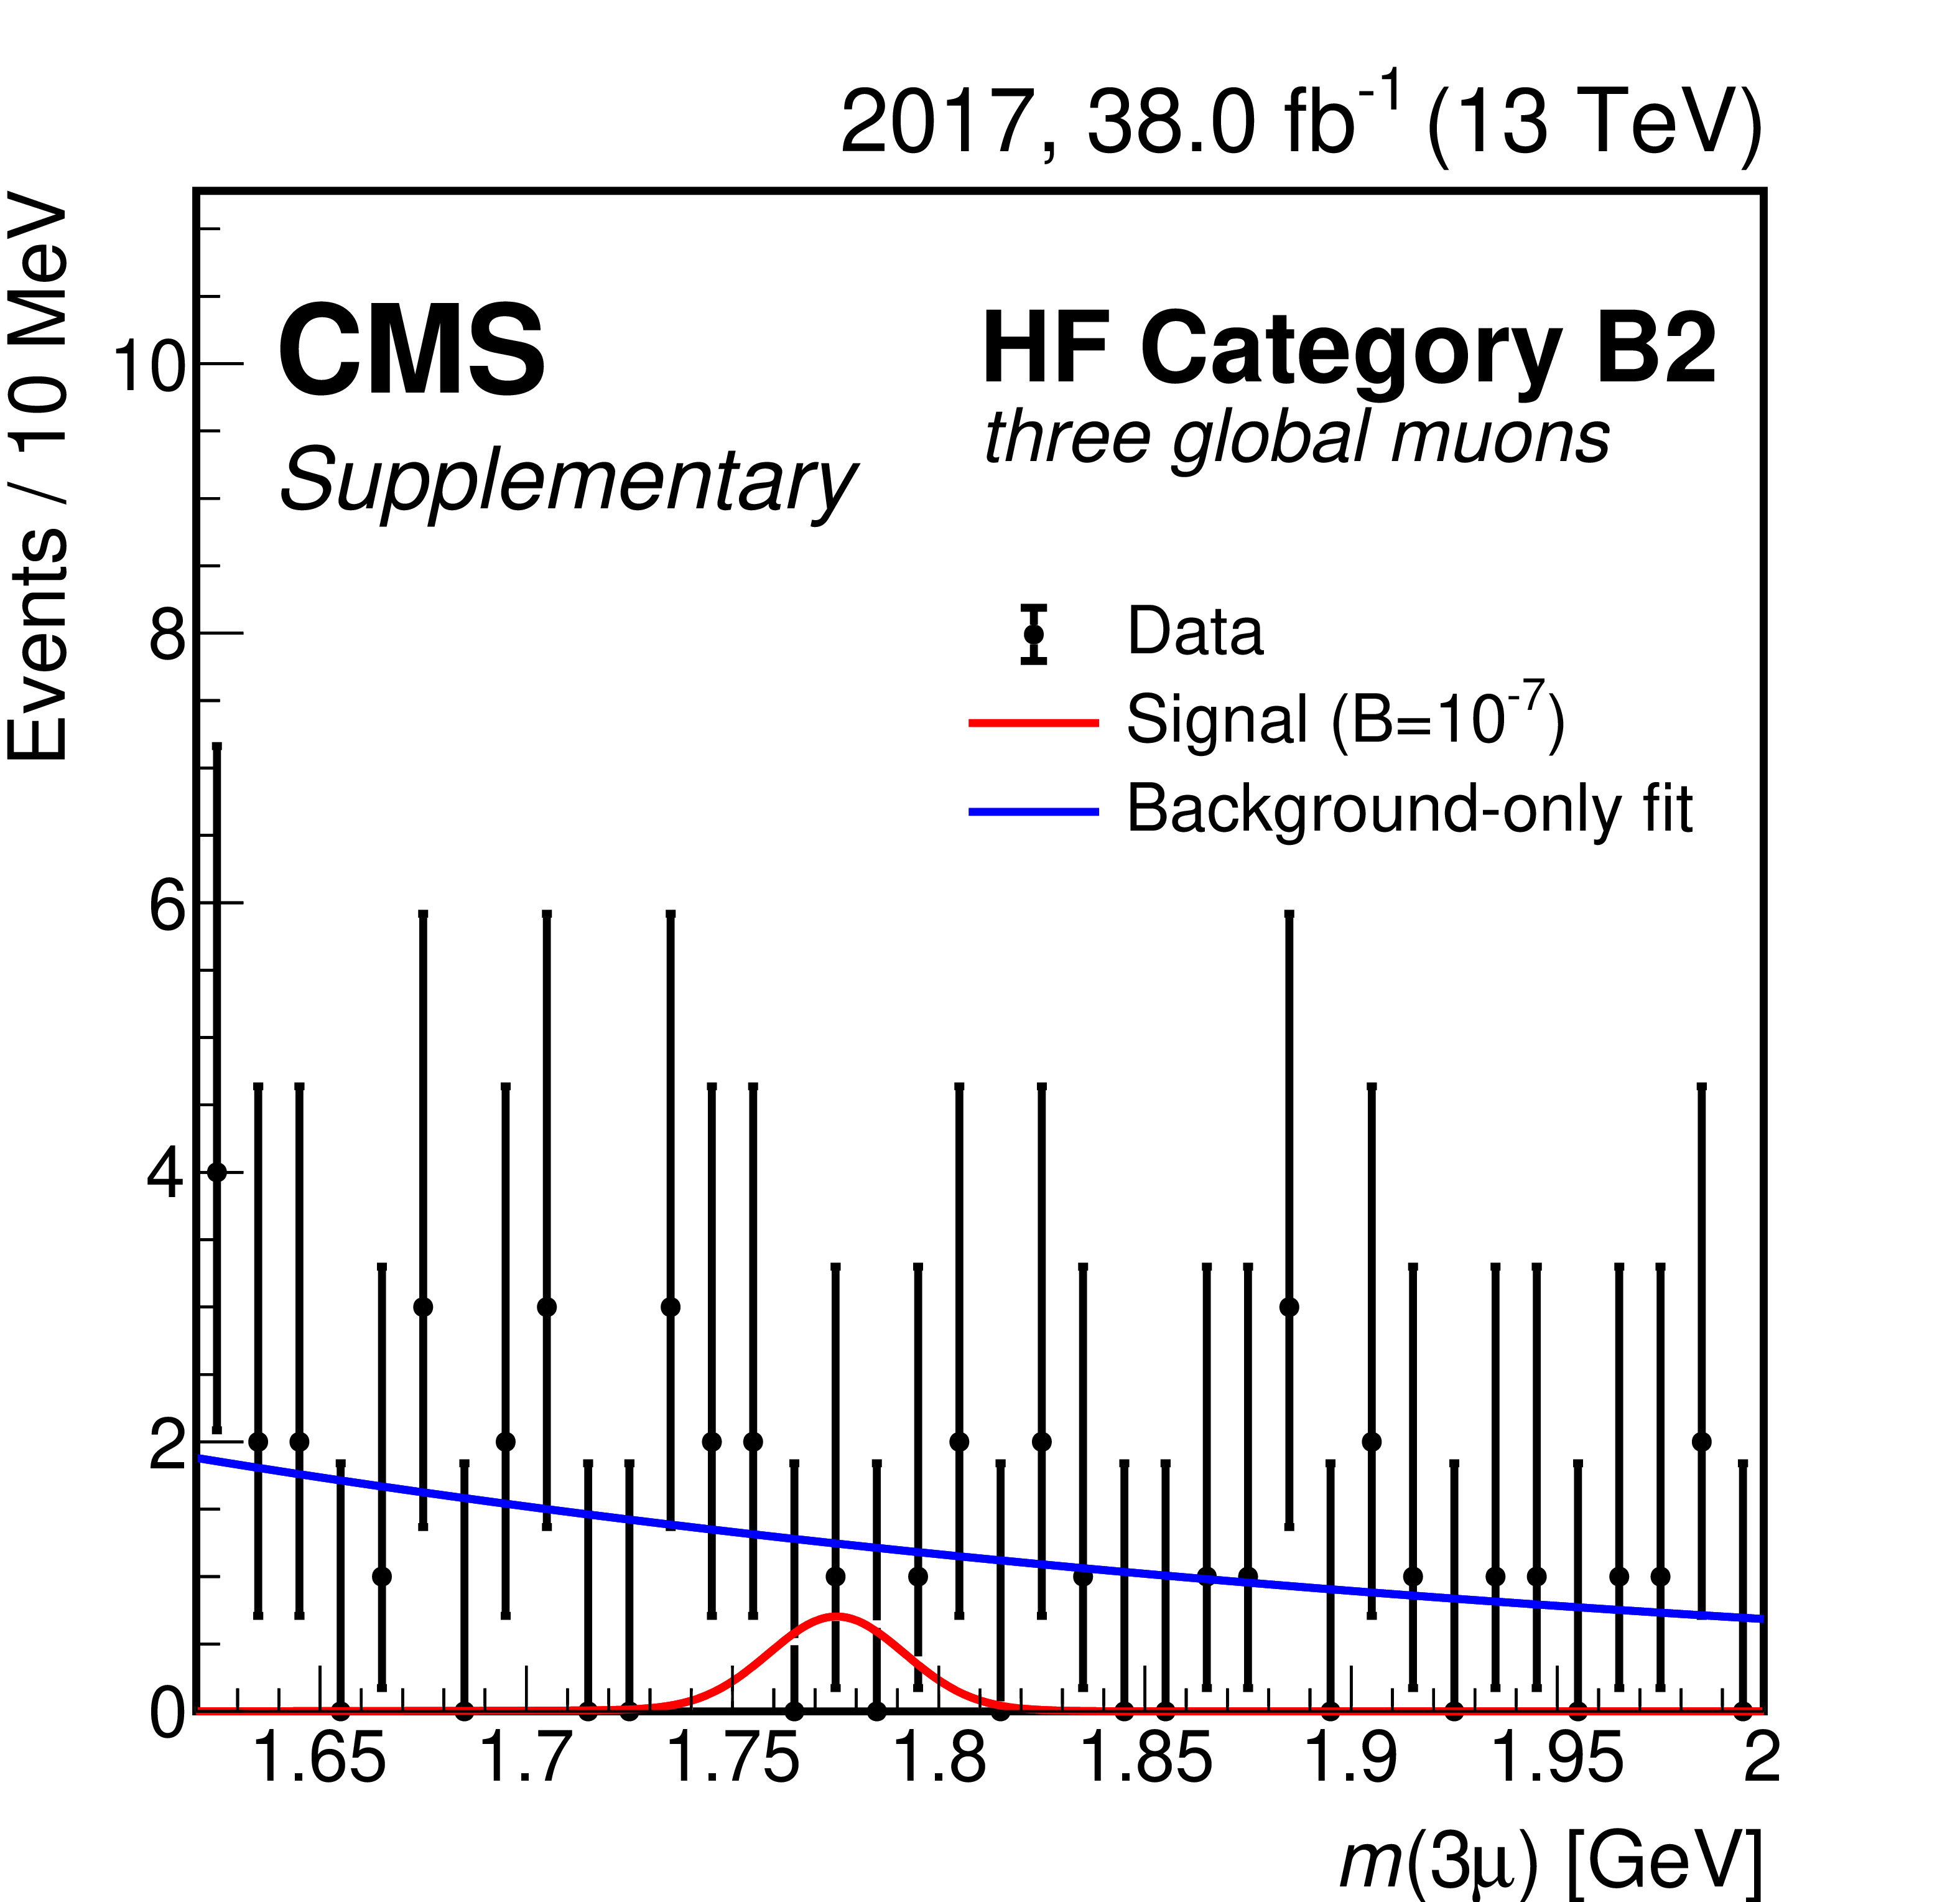
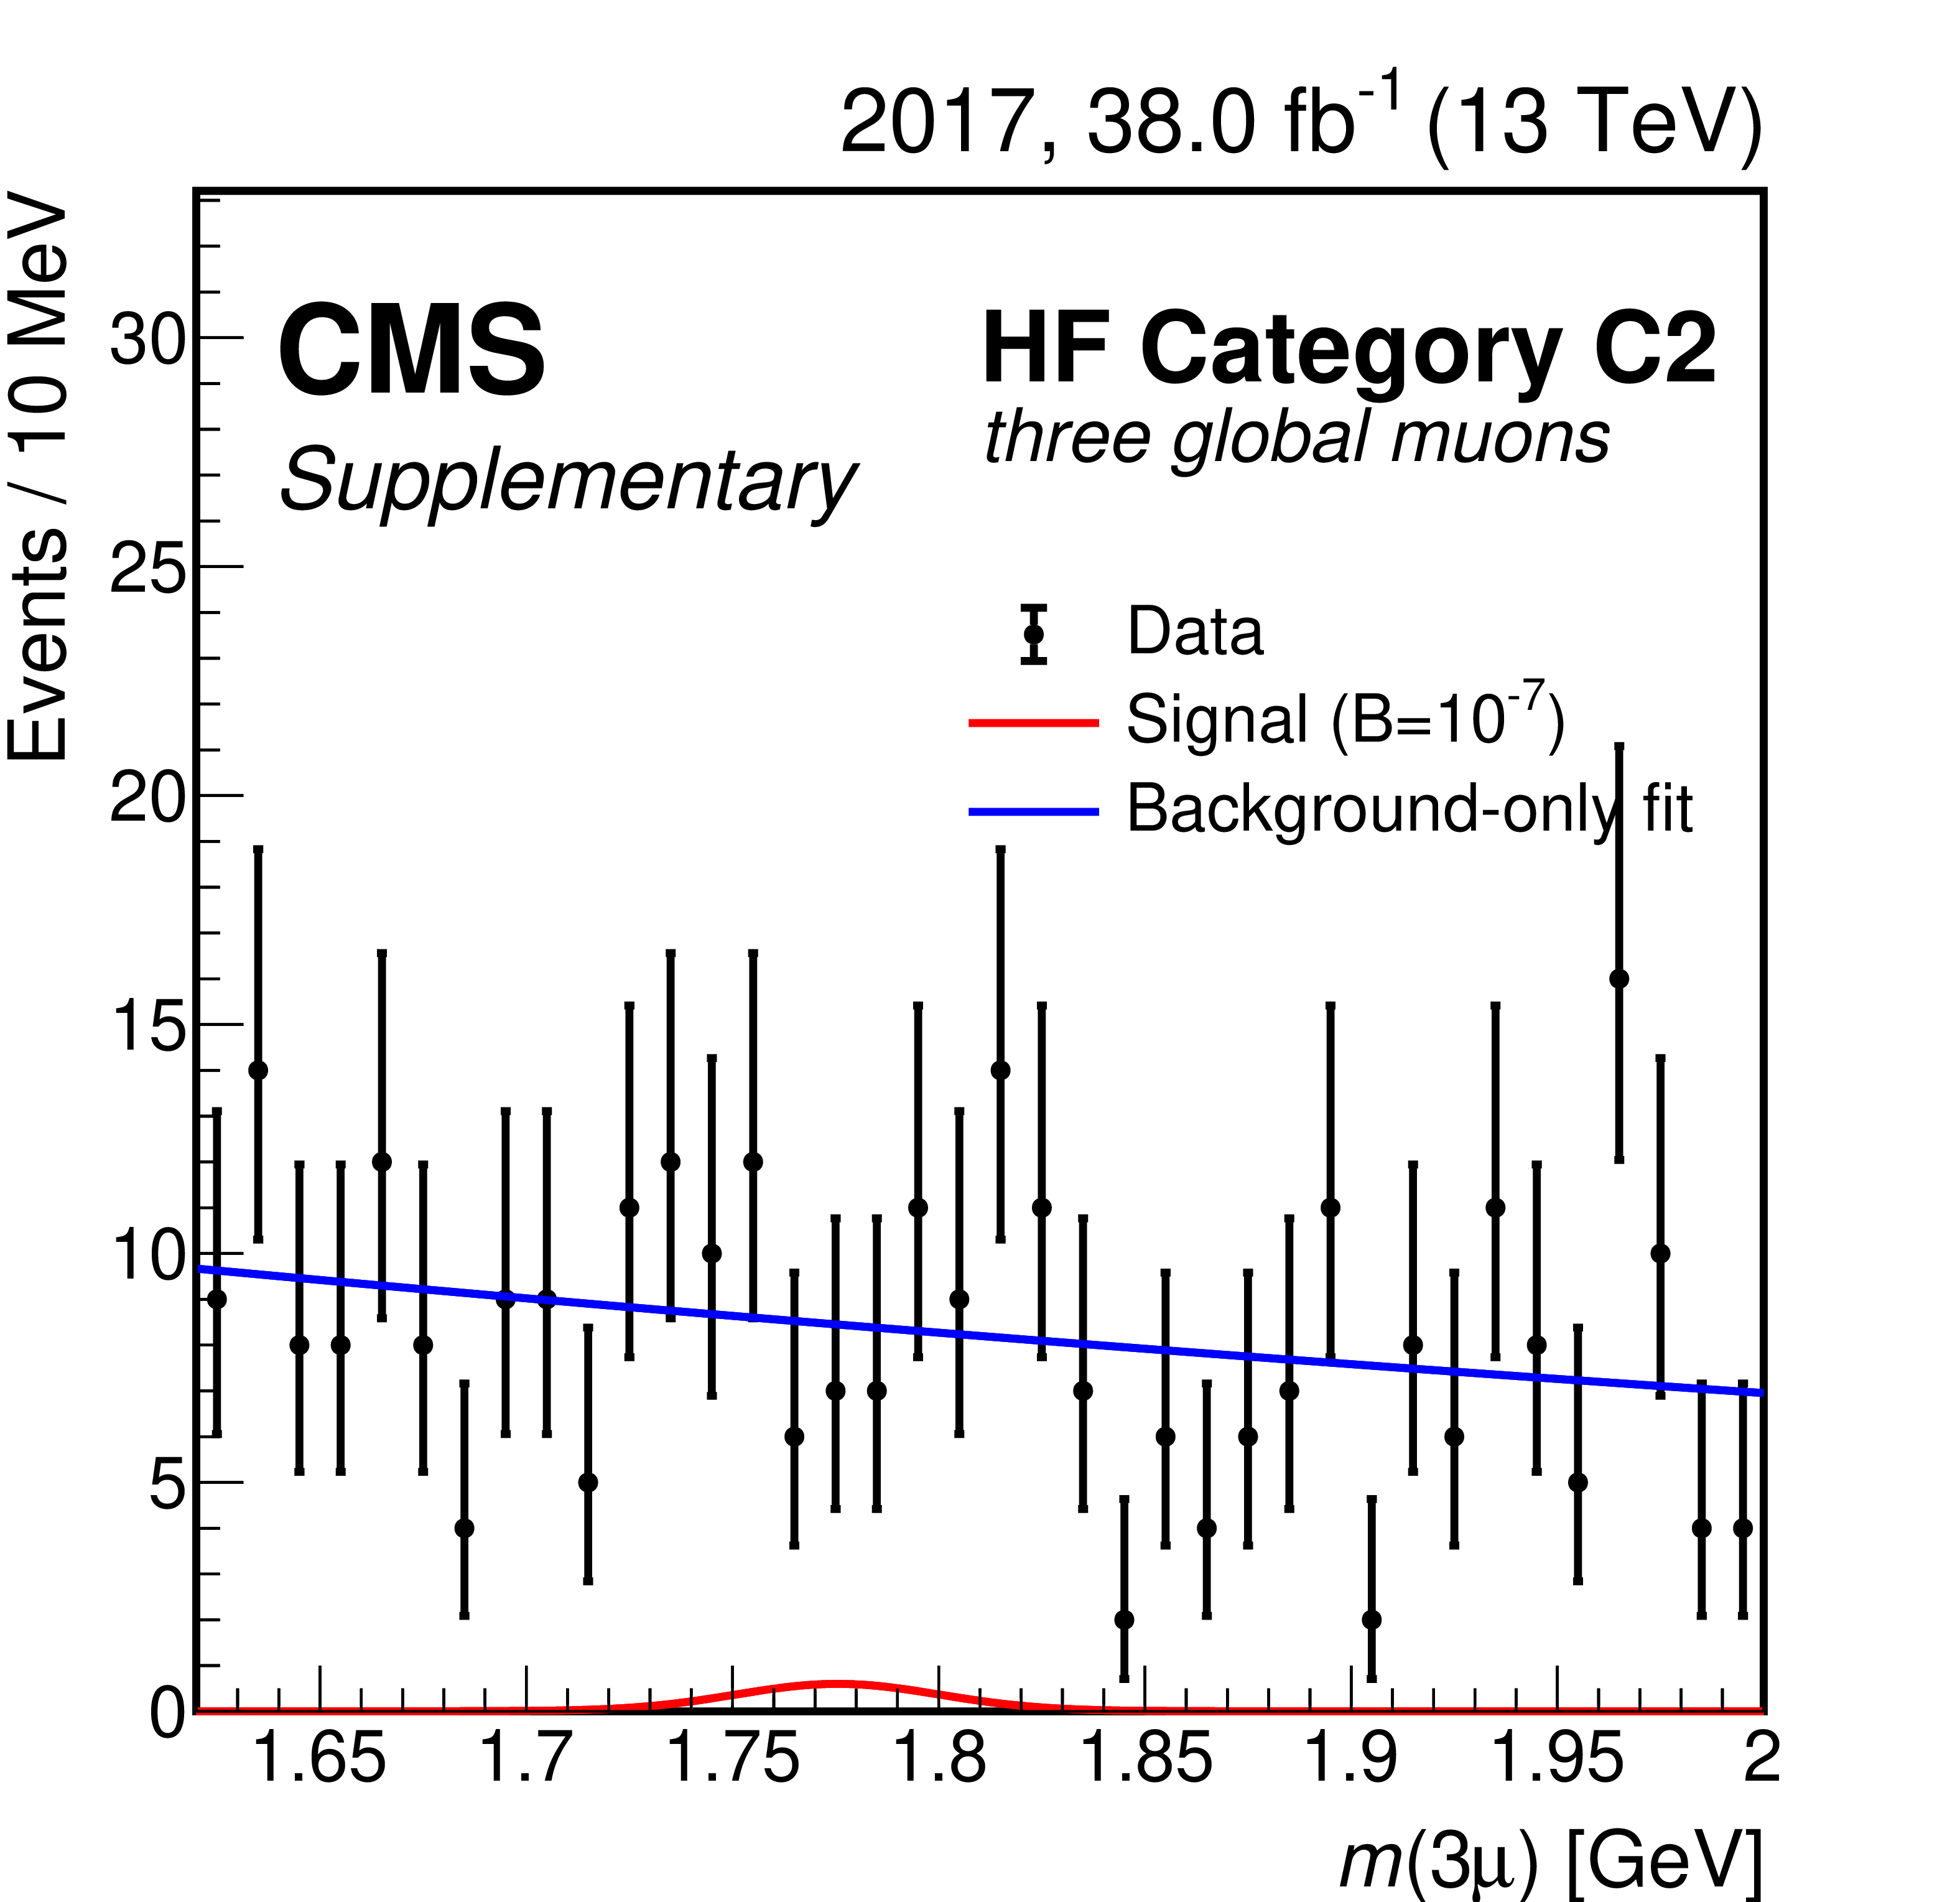
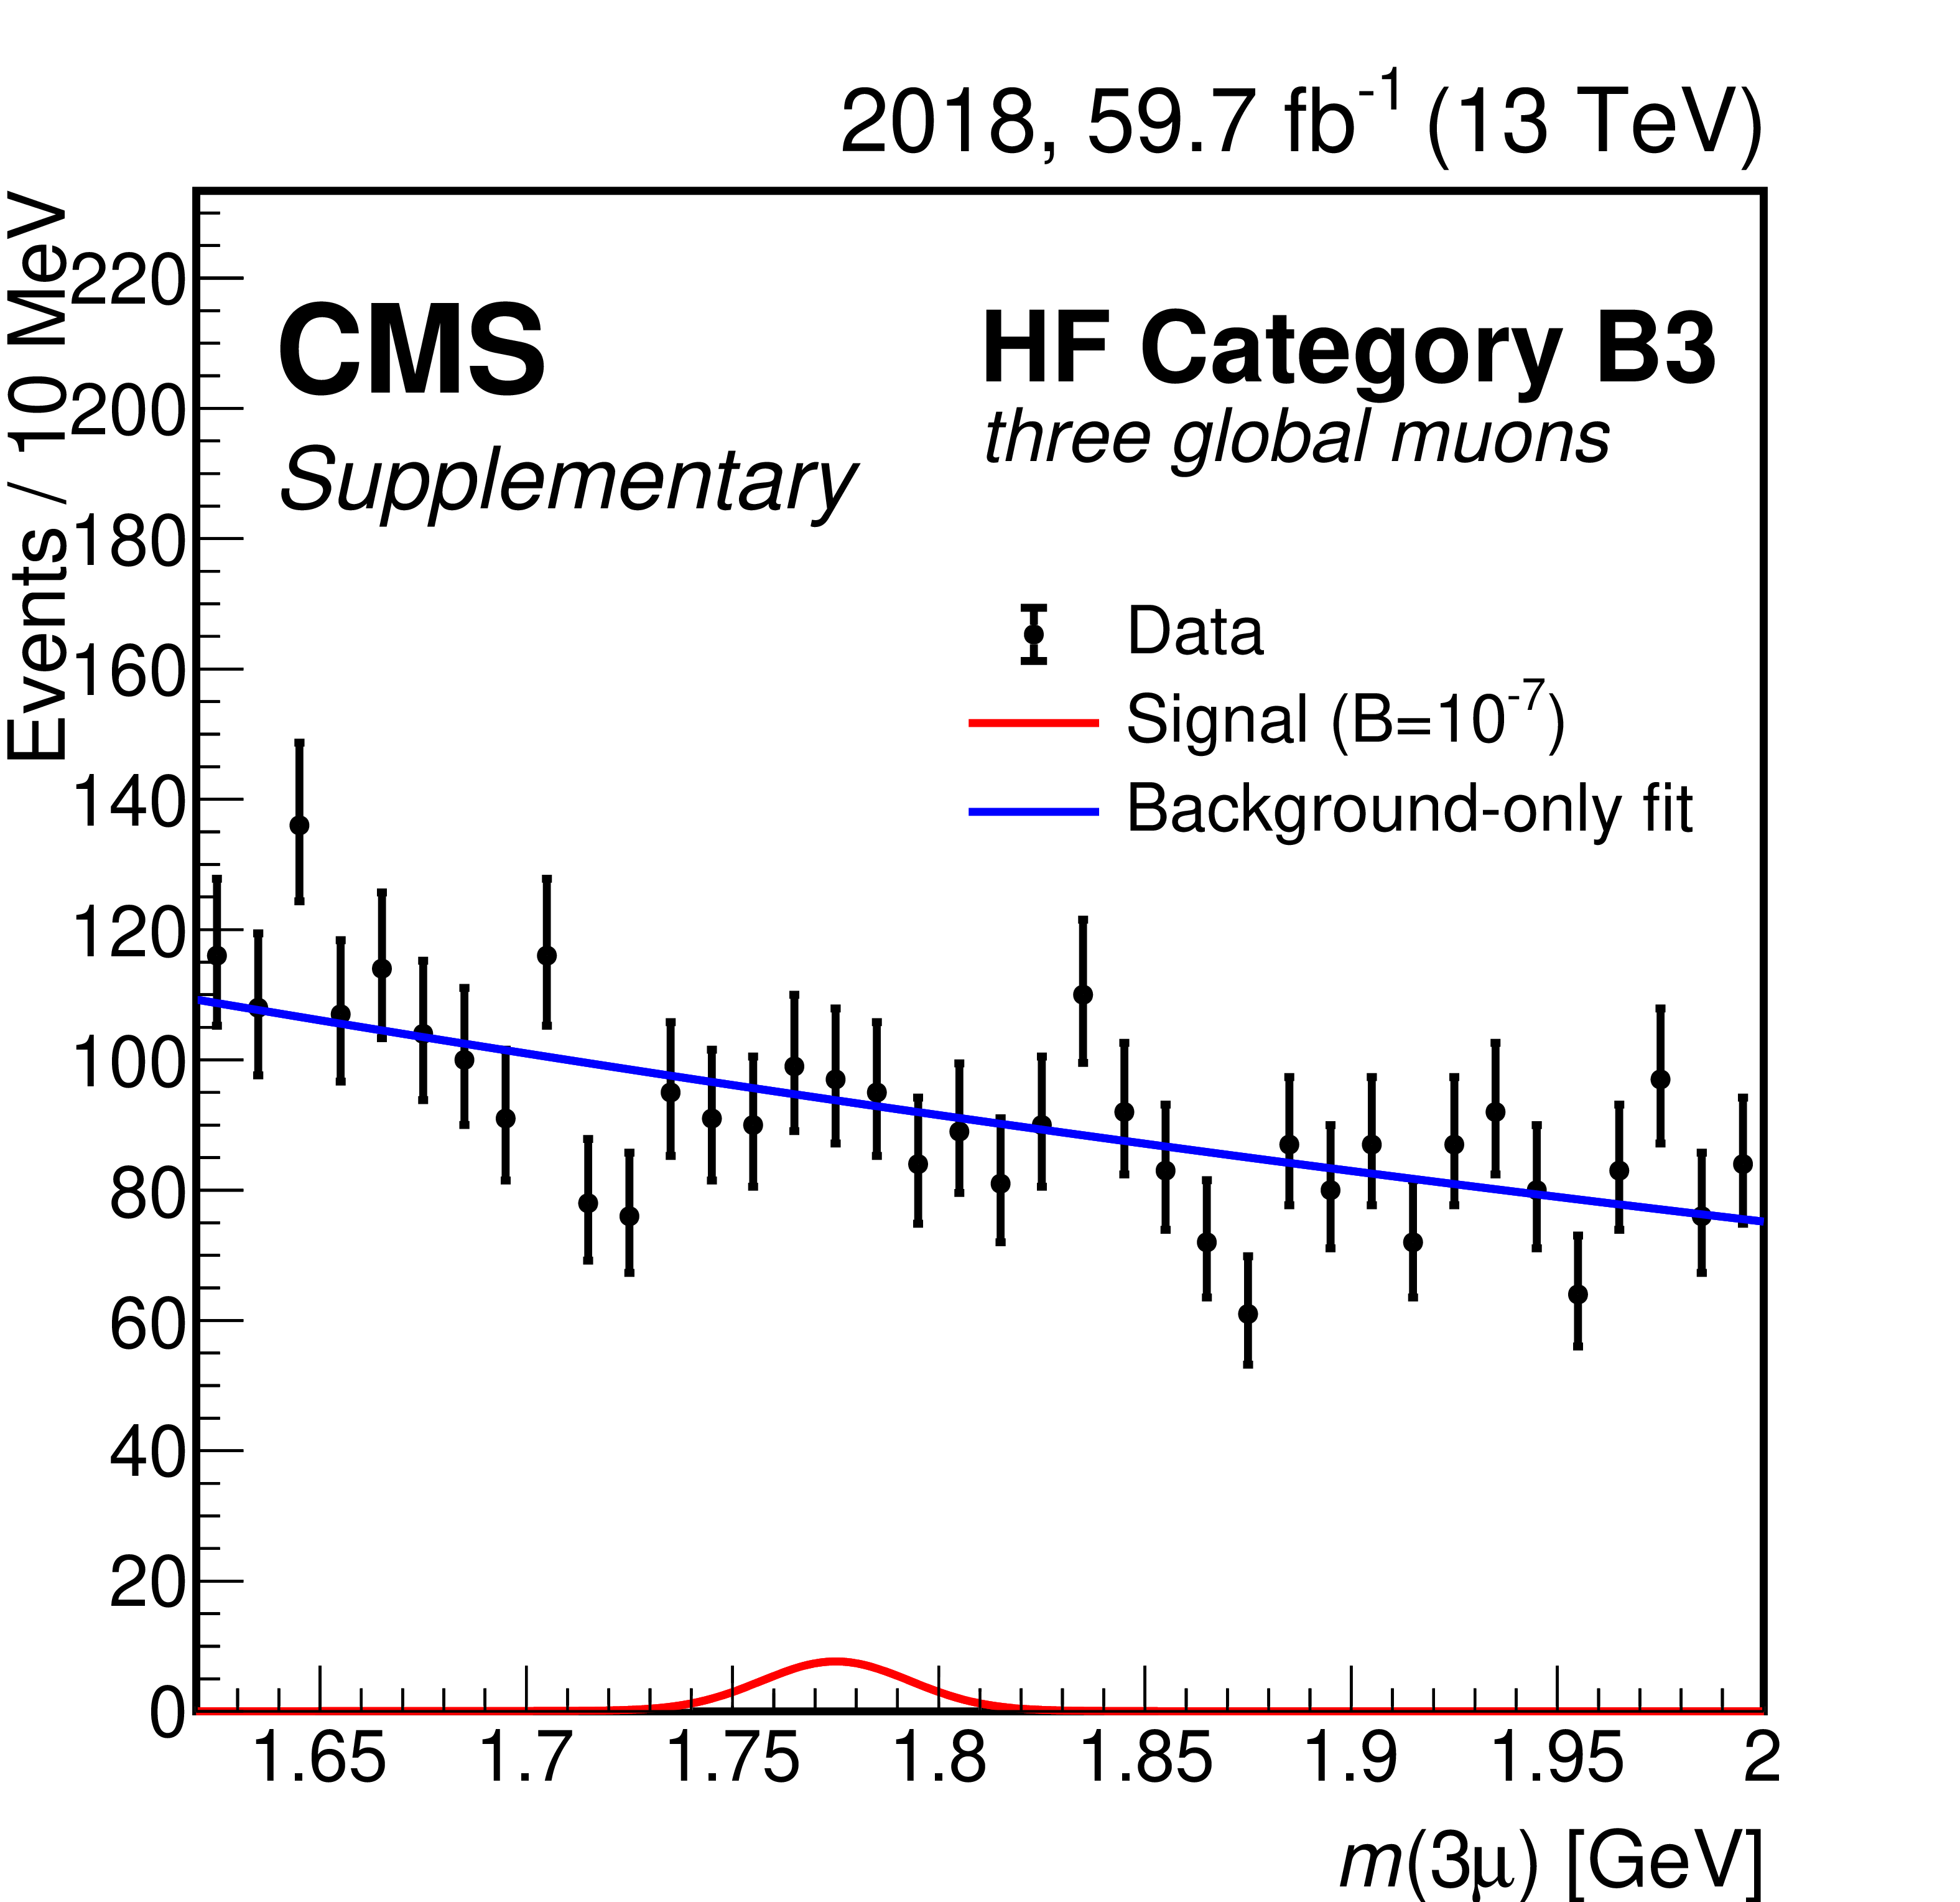
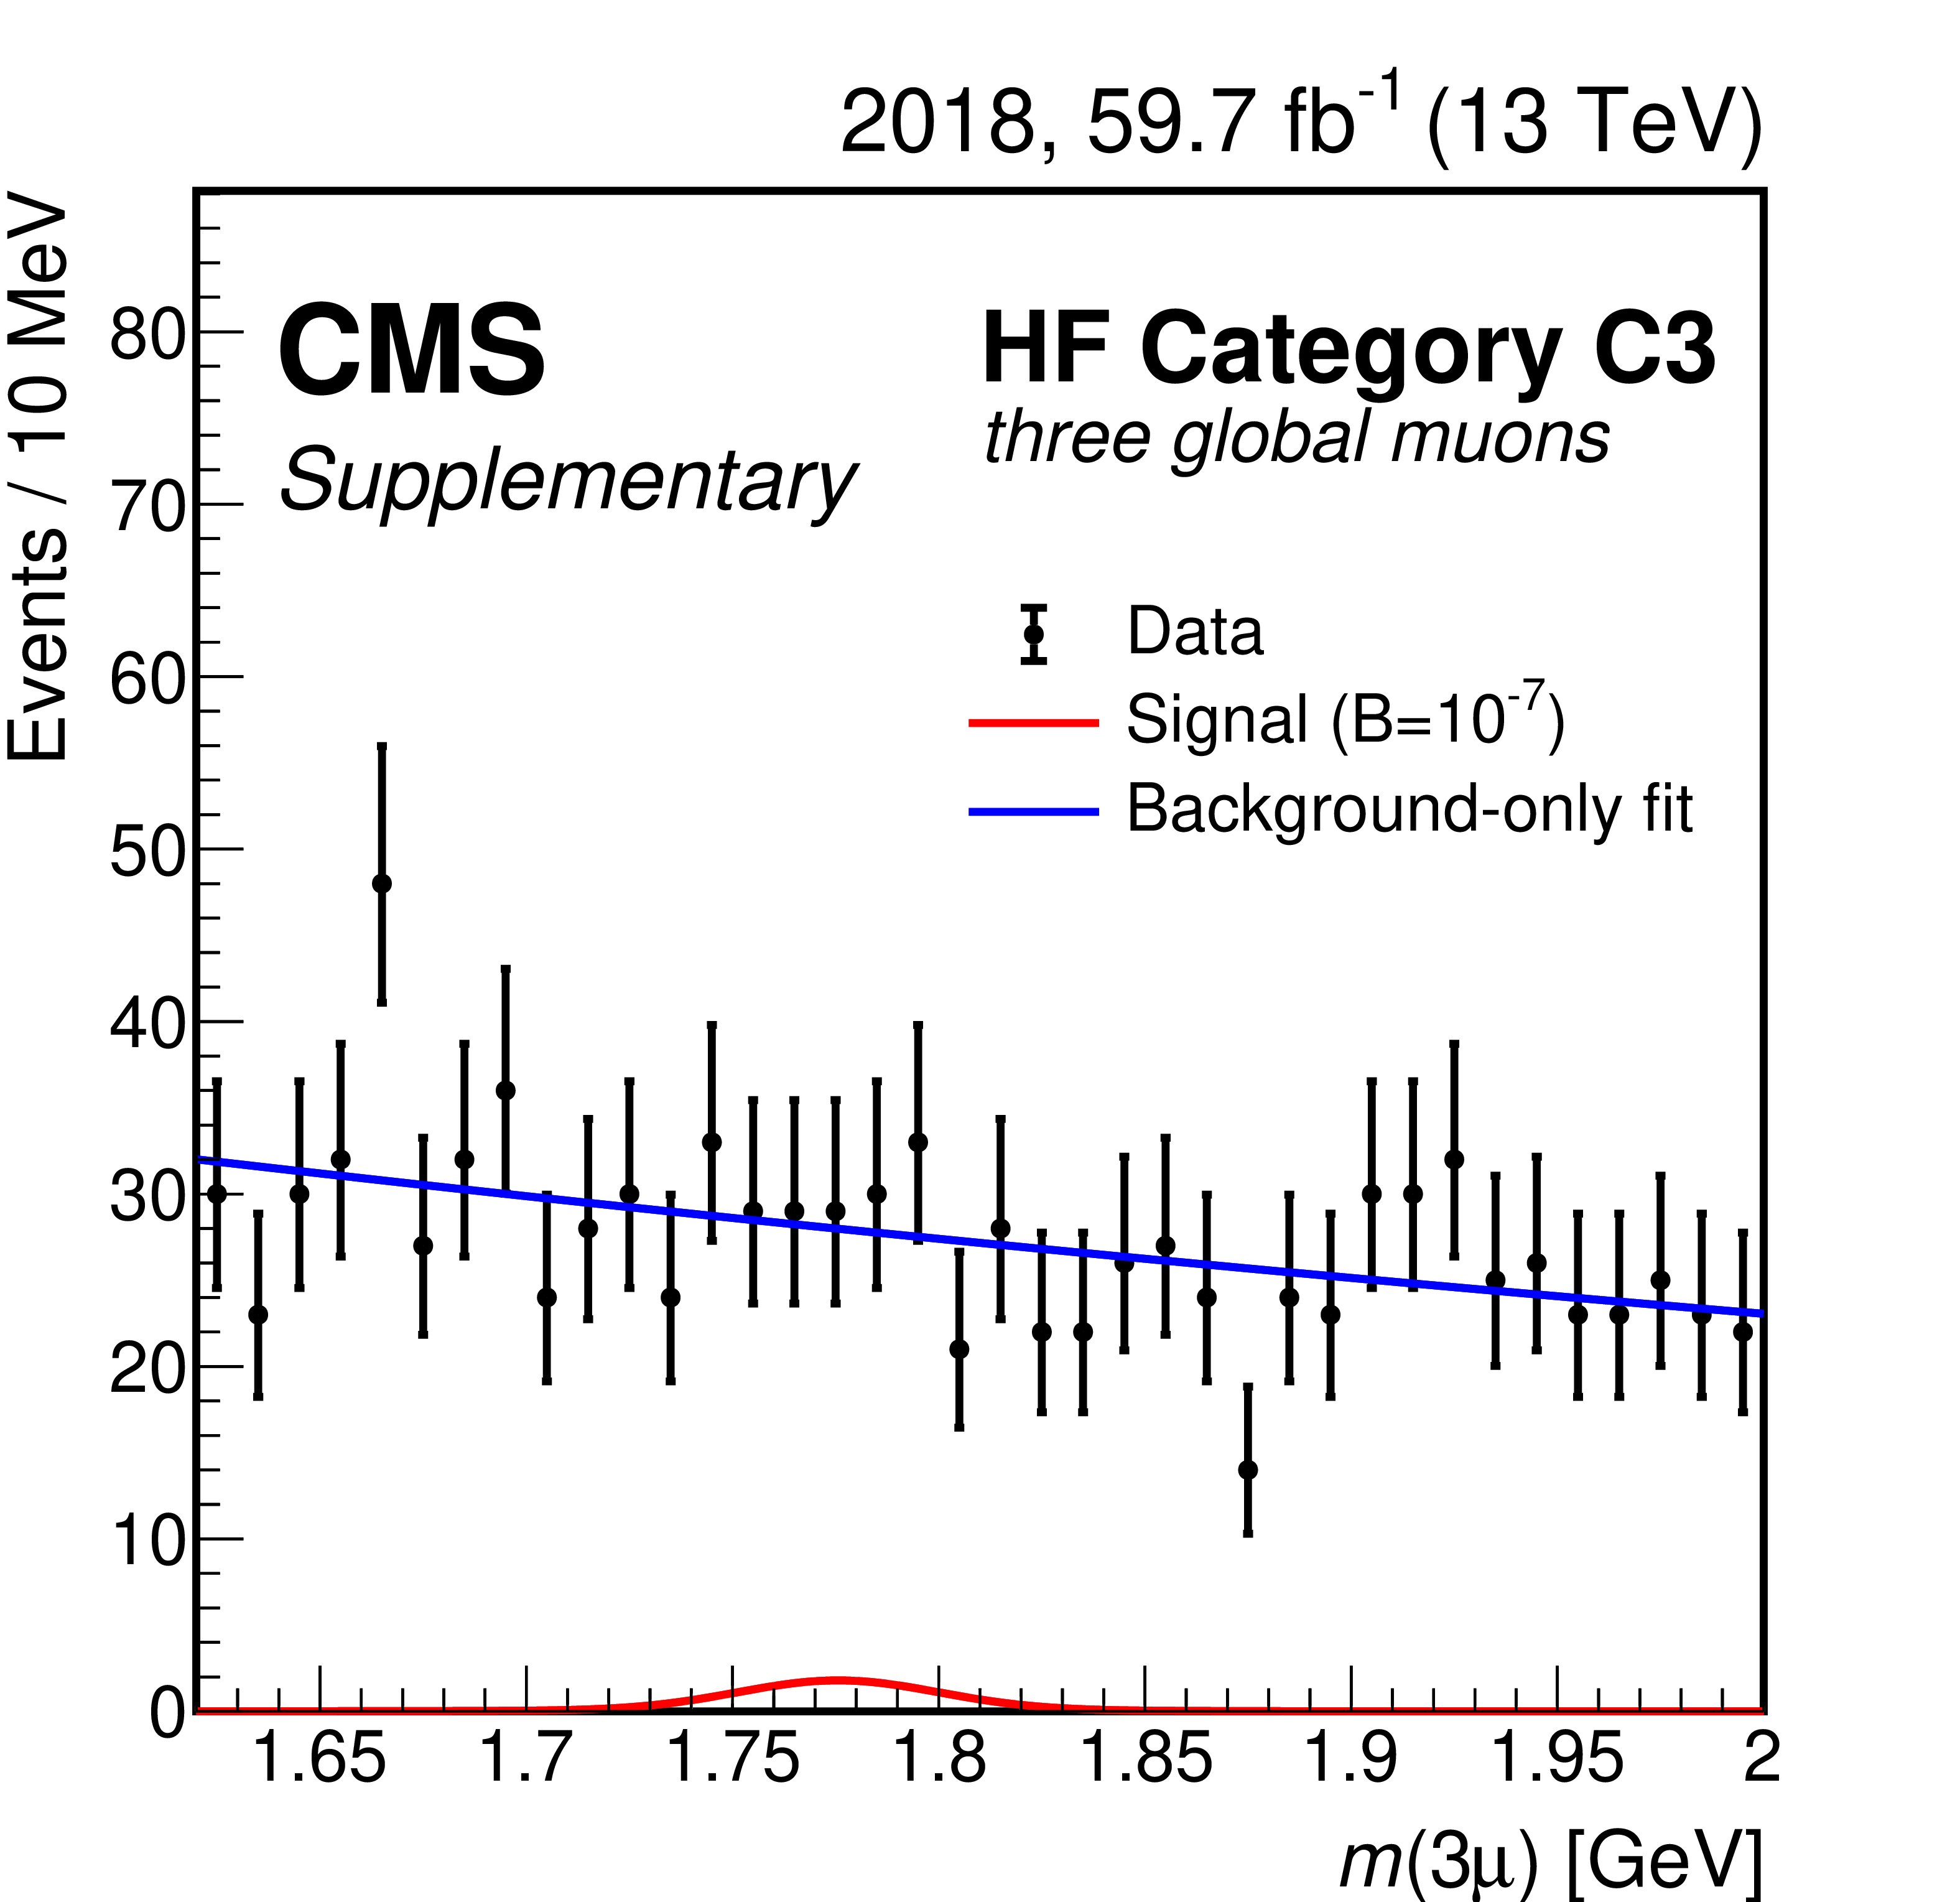
Trimuon mass distributions in the highest BDT score subcategory of each of the three mass resolution categories of the heavy-flavor (HF) analysis: A1 (upper), B1 (middle), and C1 (lower) for 2017 (left) and 2018 (right) candidate events with three global muons. Data are shown with black markers. The background-only fit and the expected signal for $ \mathcal{B}(\tau \!\to\! 3\mu) = $ 10$^{-7} $ are shown with blue and red lines, respectively. |

png pdf |
Figure 3-a:
Trimuon mass distributions in the highest BDT score subcategory of the A1 mass resolution category of the heavy-flavor (HF) analysis for 2017 candidate events with three global muons. Data are shown with black markers. The background-only fit and the expected signal for $ \mathcal{B}(\tau \!\to\! 3\mu) = $ 10$^{-7} $ are shown with blue and red lines, respectively. |

png pdf |
Figure 3-b:
Trimuon mass distributions in the highest BDT score subcategory of the A1 mass resolution category of the heavy-flavor (HF) analysis for 2018 candidate events with three global muons. Data are shown with black markers. The background-only fit and the expected signal for $ \mathcal{B}(\tau \!\to\! 3\mu) = $ 10$^{-7} $ are shown with blue and red lines, respectively. |
png pdf |
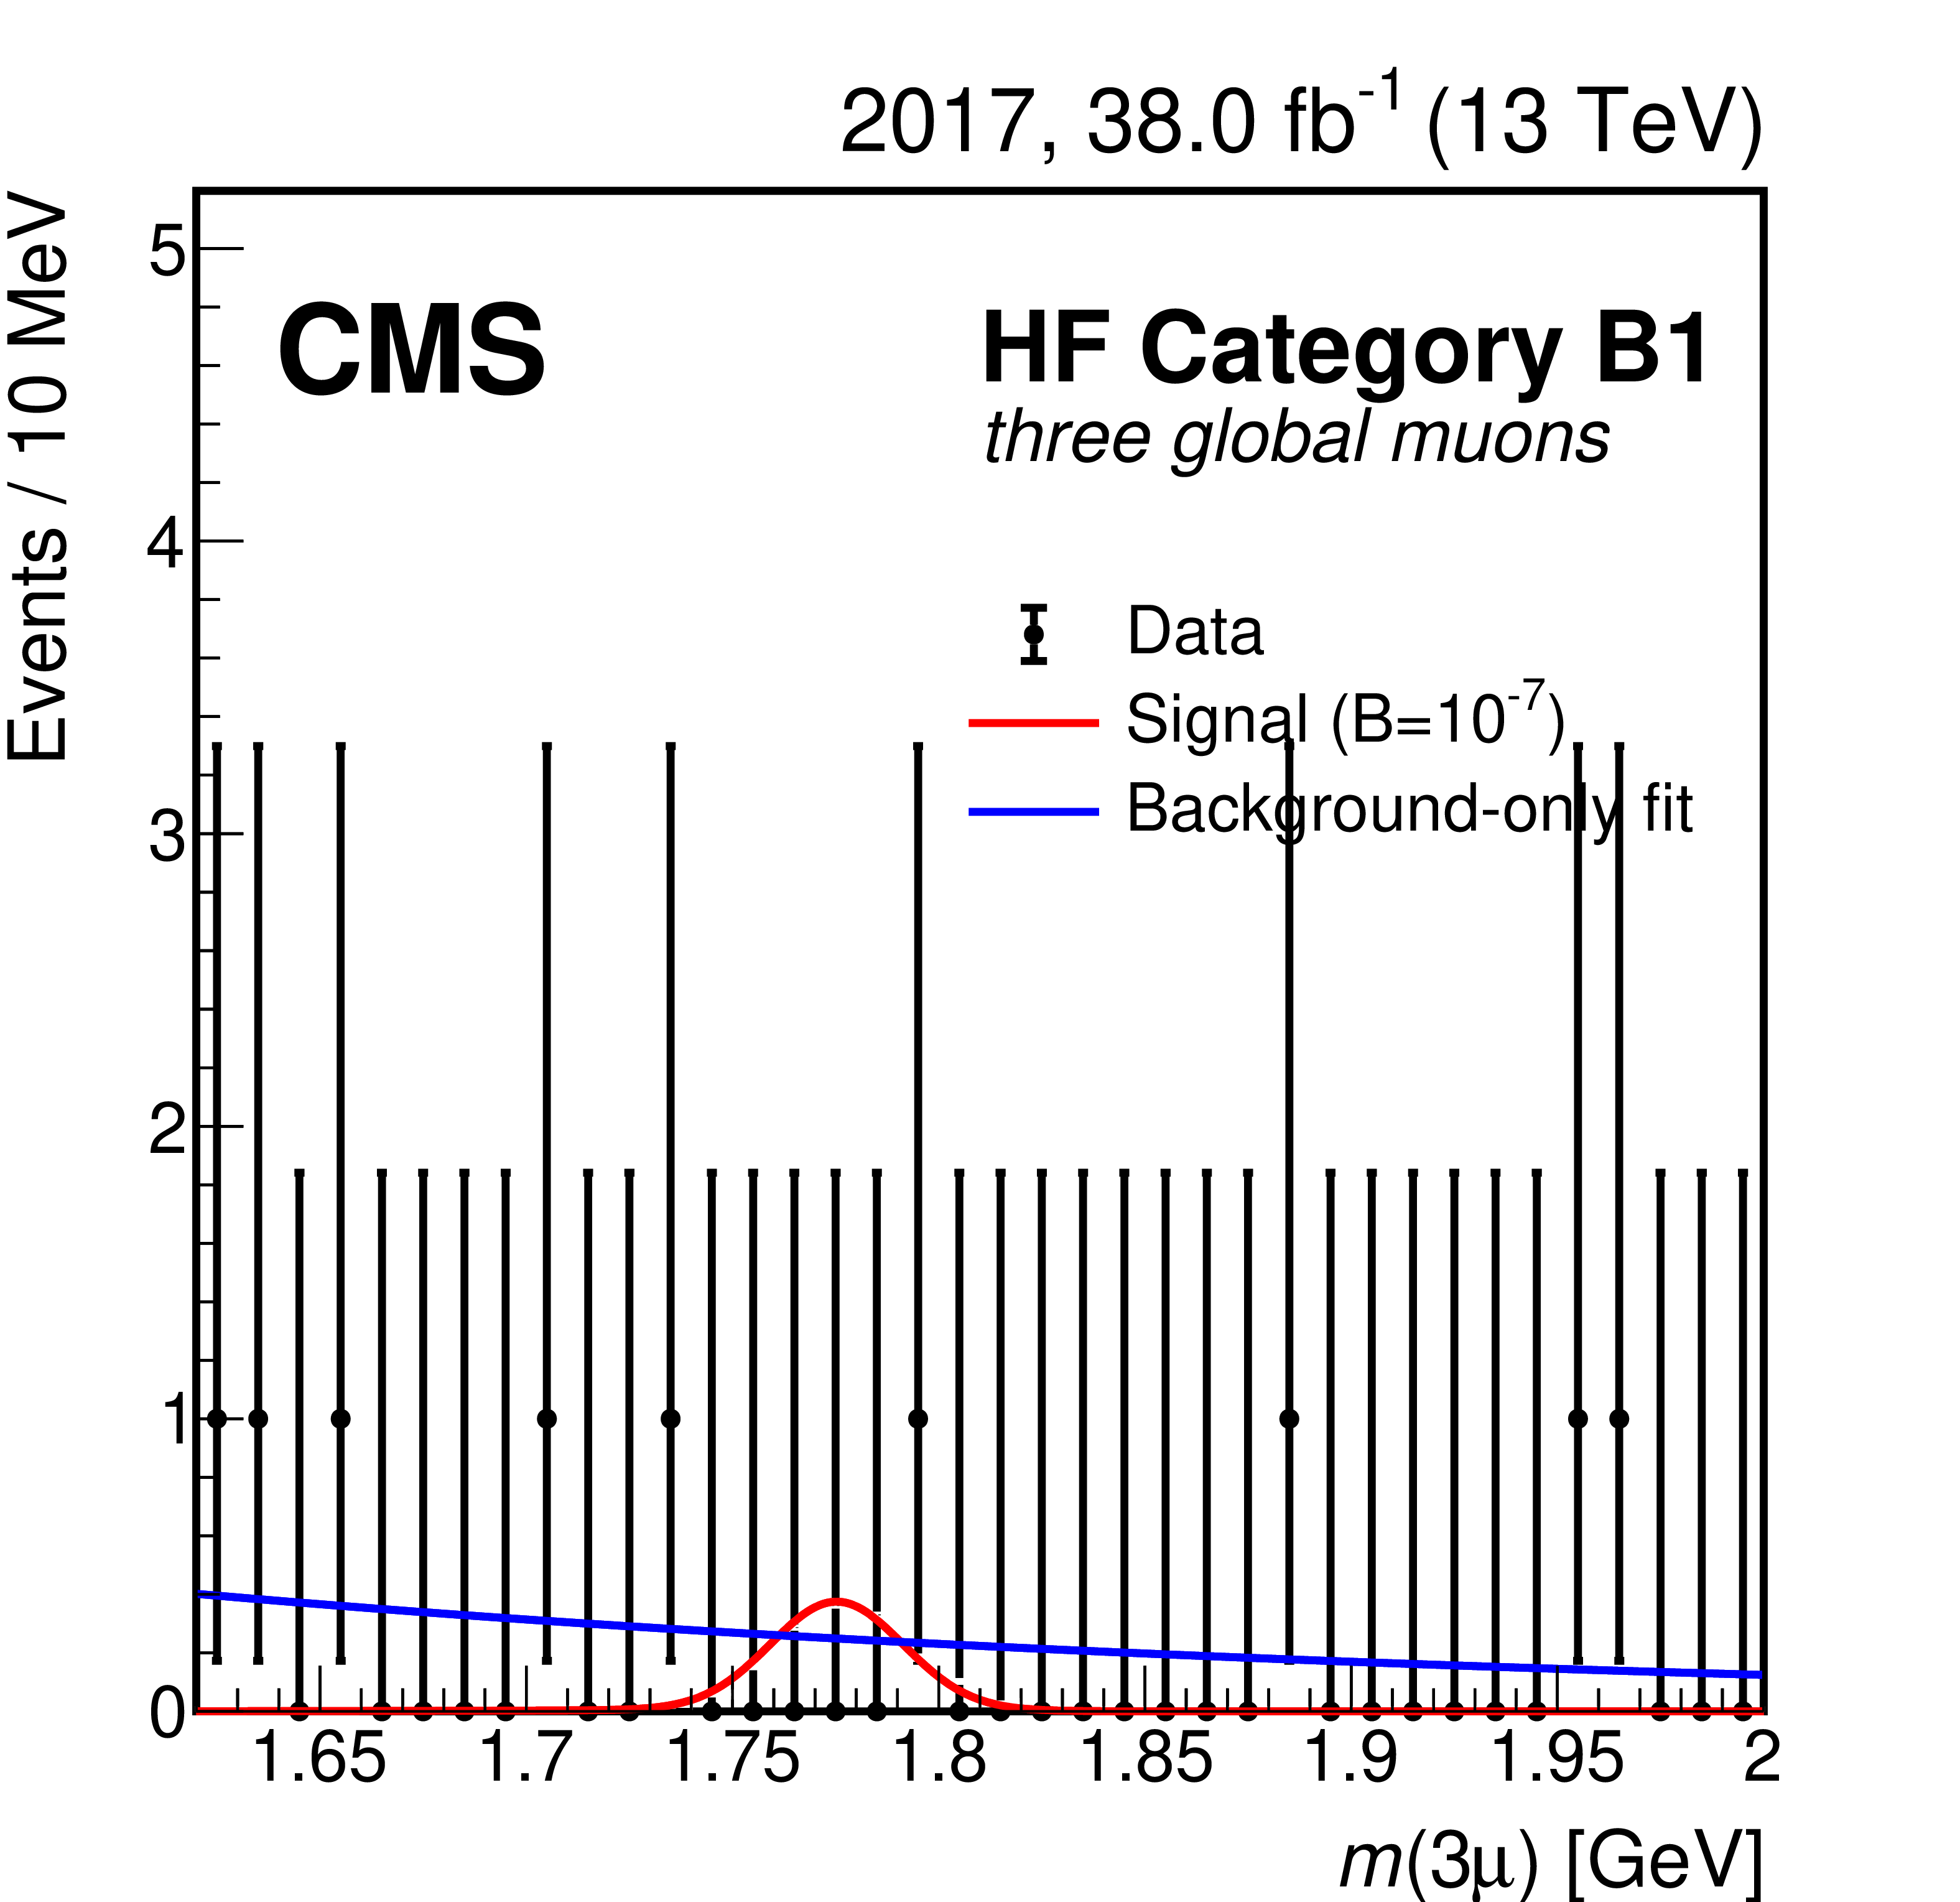
Figure 3-c:
Trimuon mass distributions in the highest BDT score subcategory of the B1 mass resolution category of the heavy-flavor (HF) analysis for 2017 candidate events with three global muons. Data are shown with black markers. The background-only fit and the expected signal for $ \mathcal{B}(\tau \!\to\! 3\mu) = $ 10$^{-7} $ are shown with blue and red lines, respectively. |
png pdf |
Figure 3-d:
Trimuon mass distributions in the highest BDT score subcategory of the B1 mass resolution category of the heavy-flavor (HF) analysis for 2018 candidate events with three global muons. Data are shown with black markers. The background-only fit and the expected signal for $ \mathcal{B}(\tau \!\to\! 3\mu) = $ 10$^{-7} $ are shown with blue and red lines, respectively. |

png pdf |
Figure 3-e:
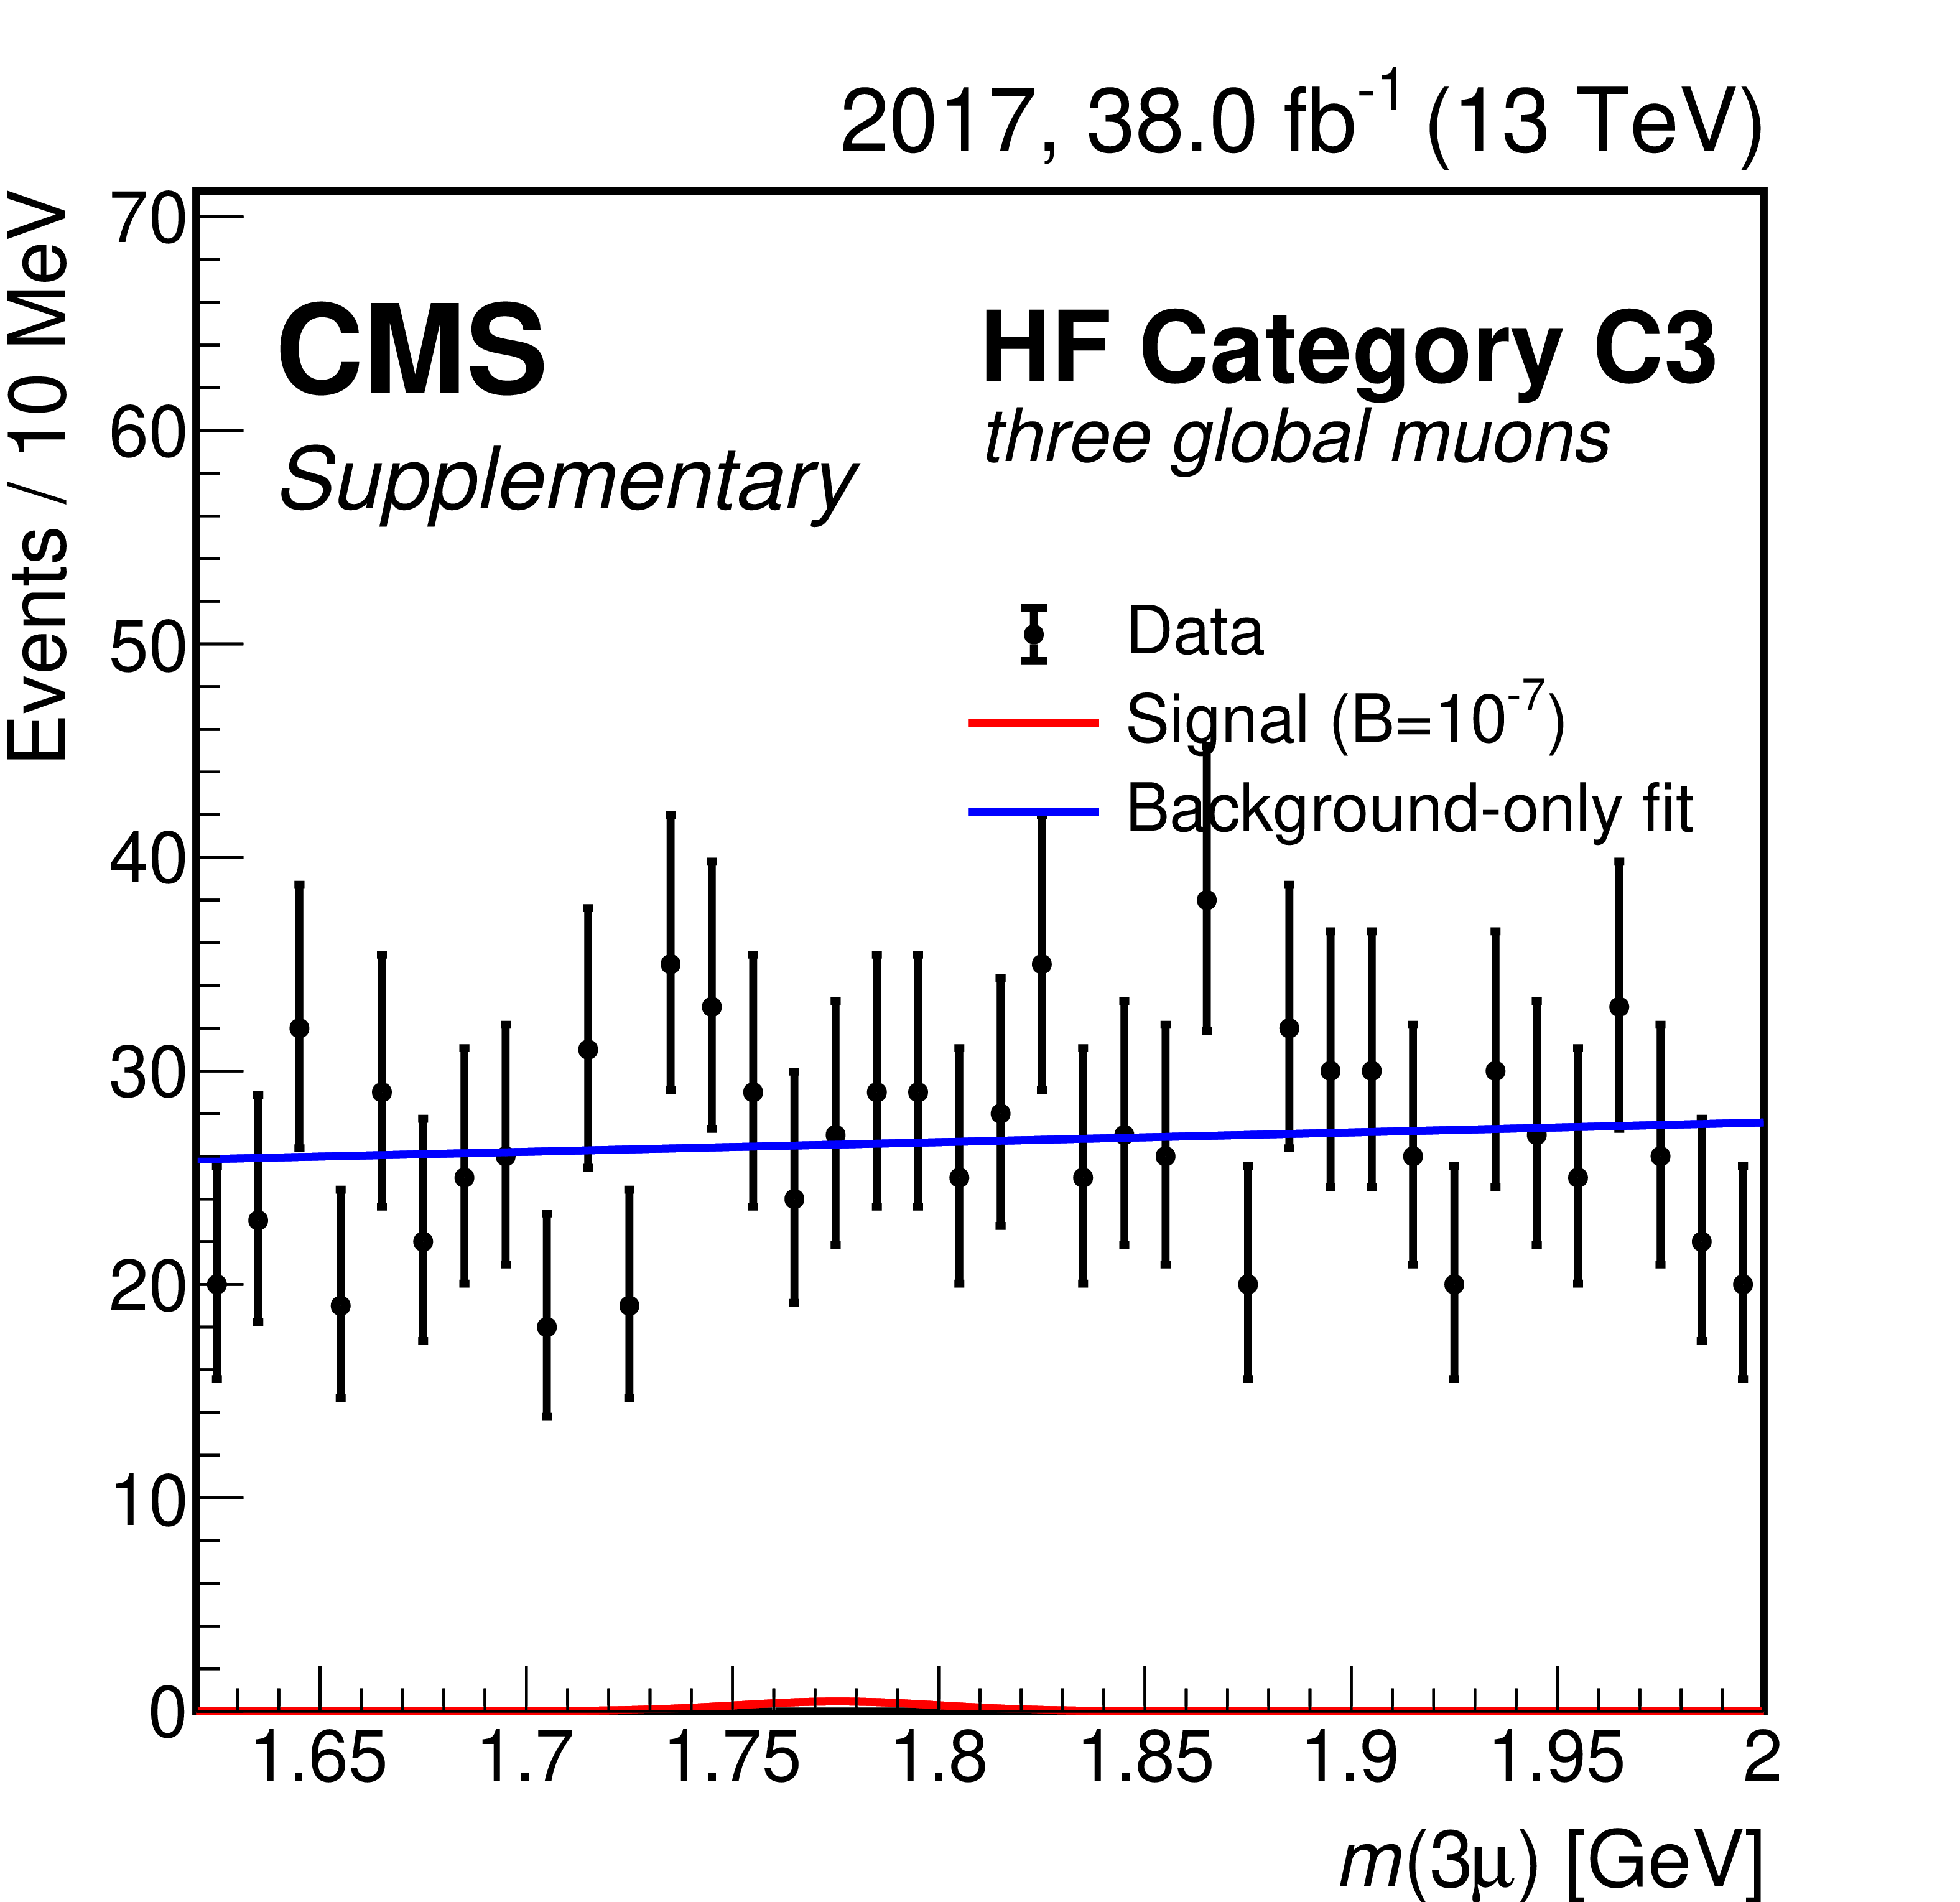
Trimuon mass distributions in the highest BDT score subcategory of the C1 mass resolution category of the heavy-flavor (HF) analysis for 2017 candidate events with three global muons. Data are shown with black markers. The background-only fit and the expected signal for $ \mathcal{B}(\tau \!\to\! 3\mu) = $ 10$^{-7} $ are shown with blue and red lines, respectively. |
png pdf |
Figure 3-f:
Trimuon mass distributions in the highest BDT score subcategory of the C1 mass resolution category of the heavy-flavor (HF) analysis for 2018 candidate events with three global muons. Data are shown with black markers. The background-only fit and the expected signal for $ \mathcal{B}(\tau \!\to\! 3\mu) = $ 10$^{-7} $ are shown with blue and red lines, respectively. |
png pdf |
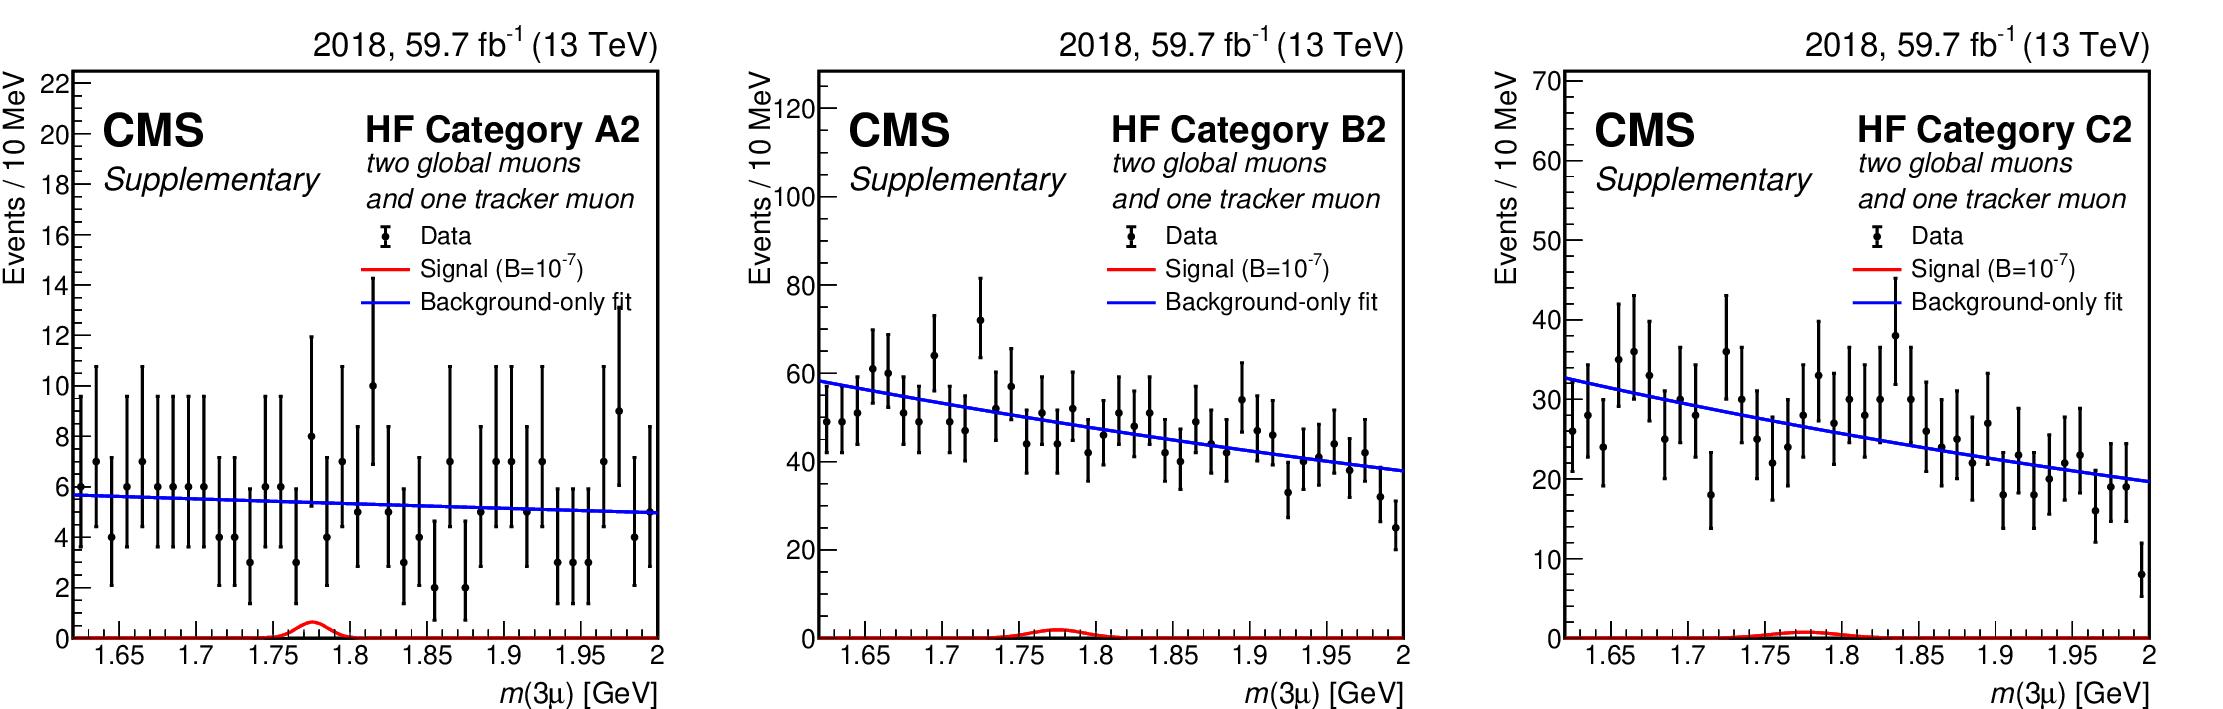
Figure 4:
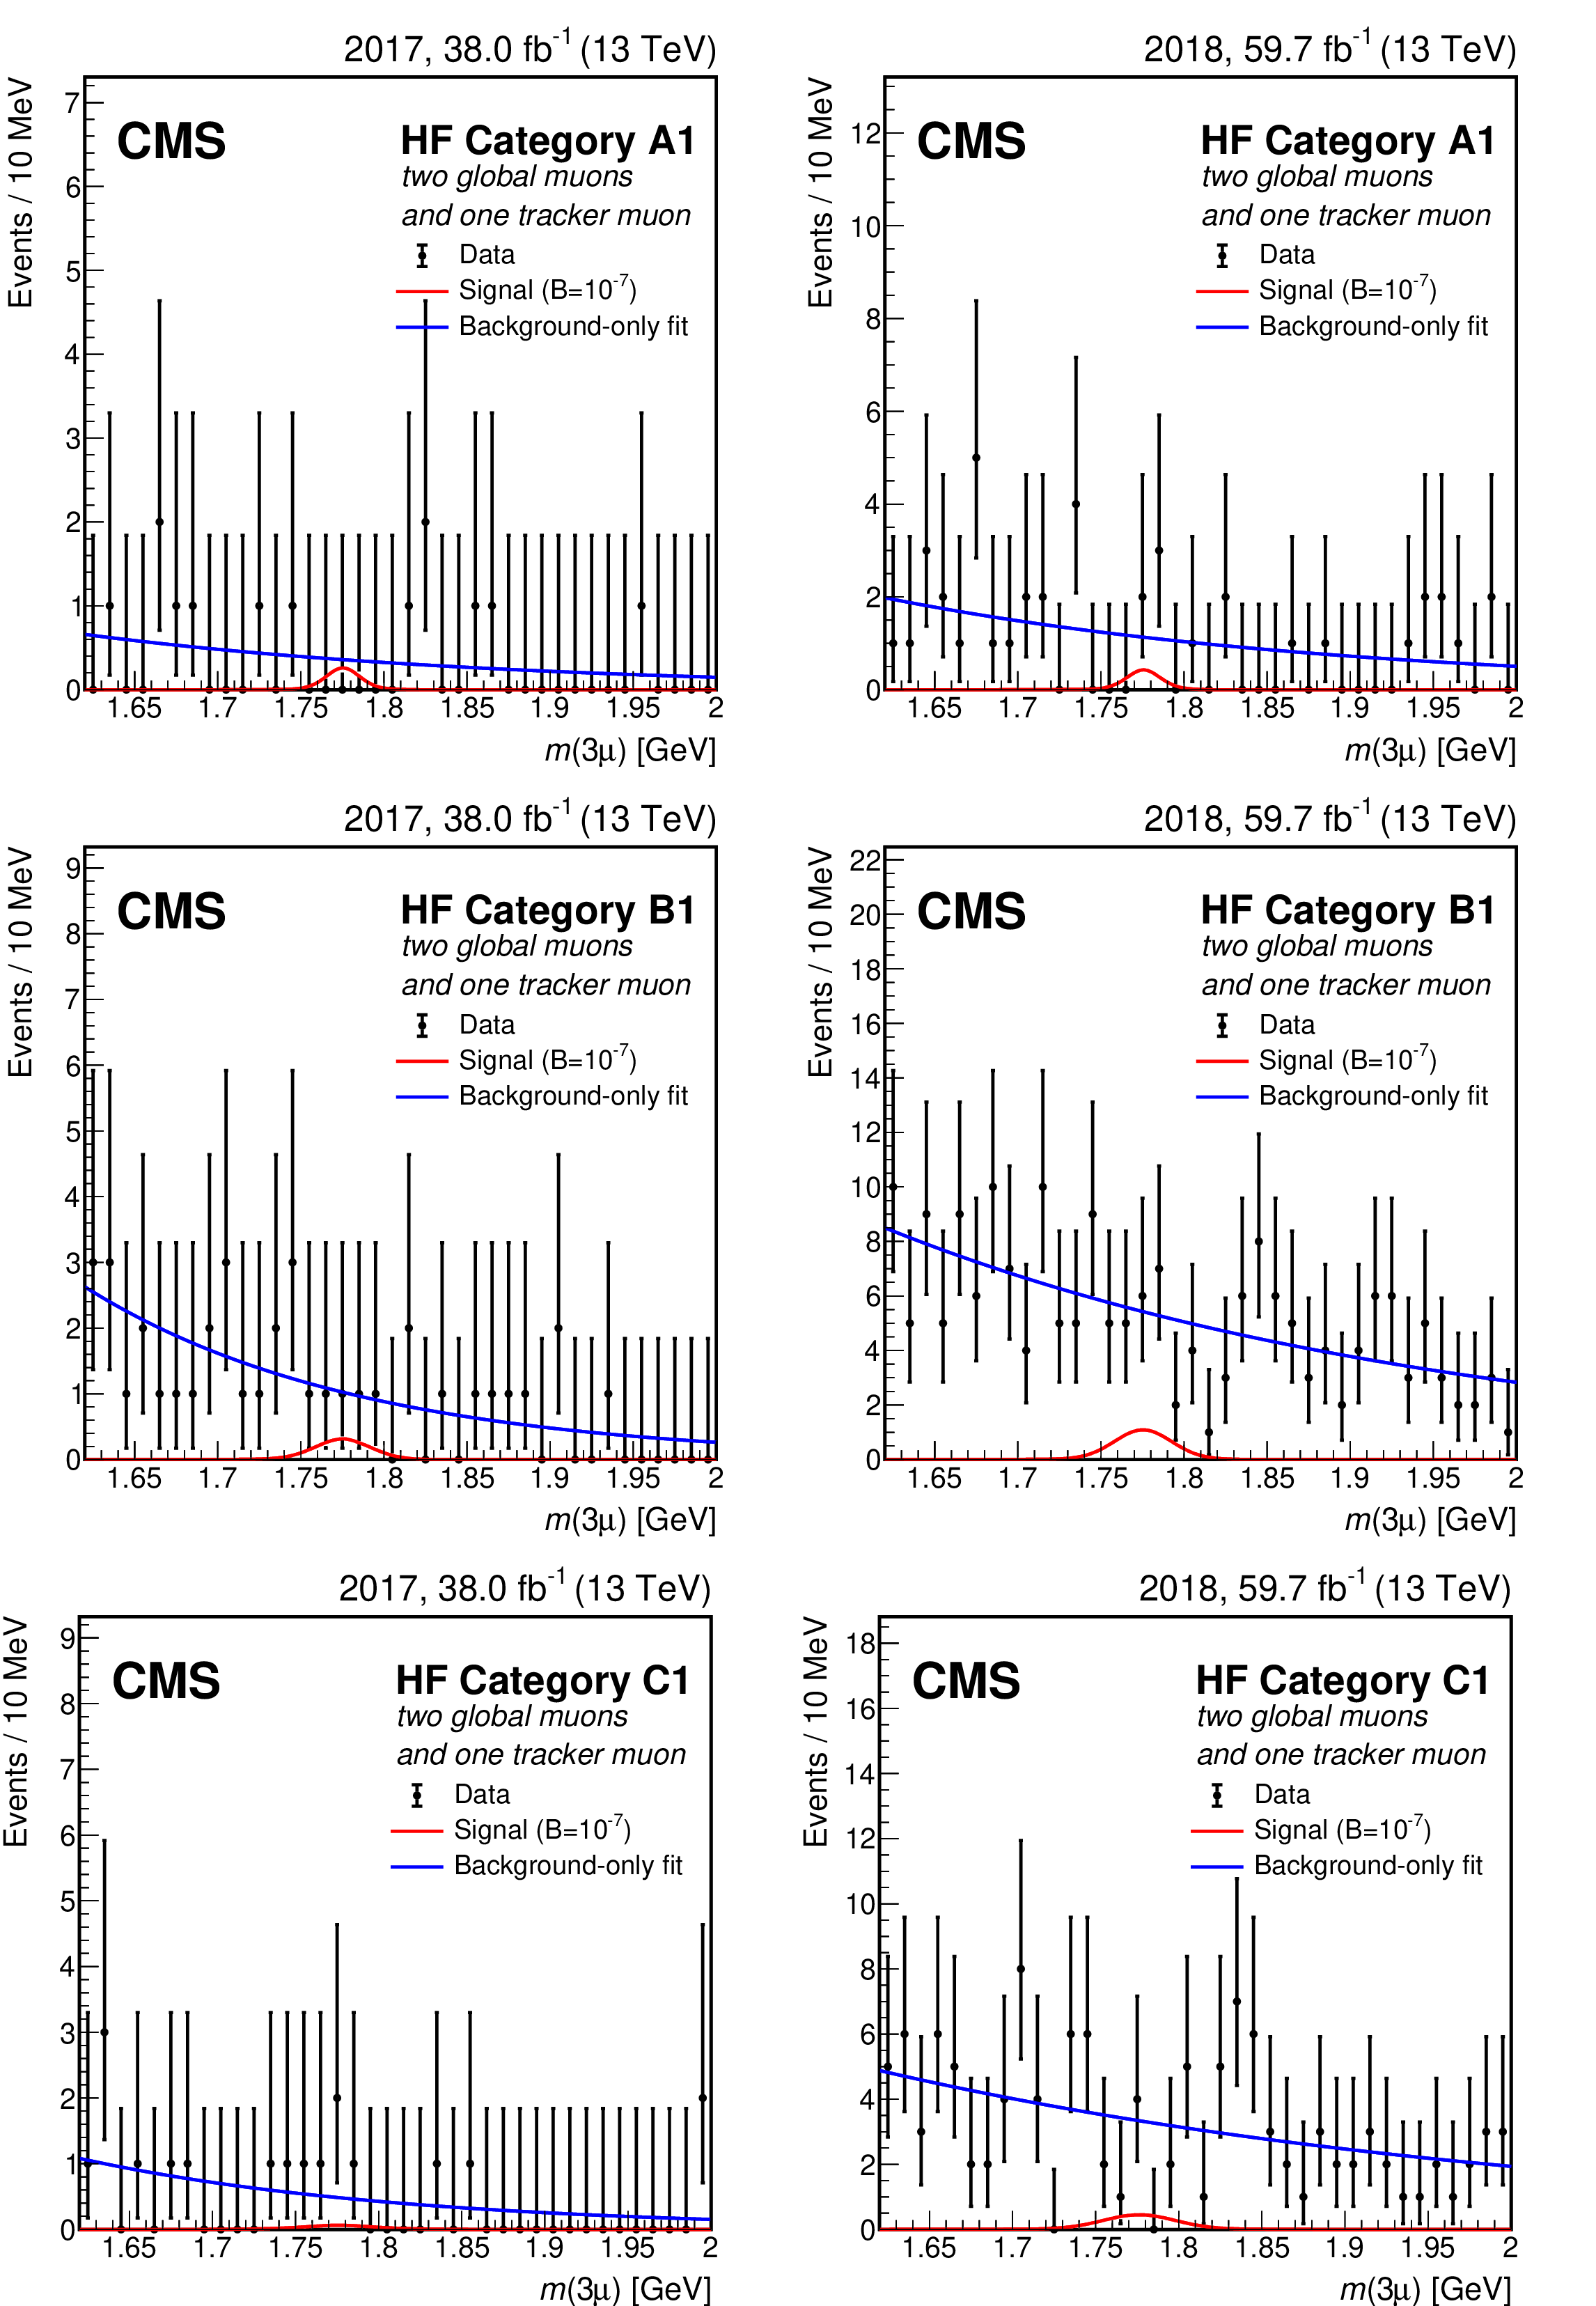
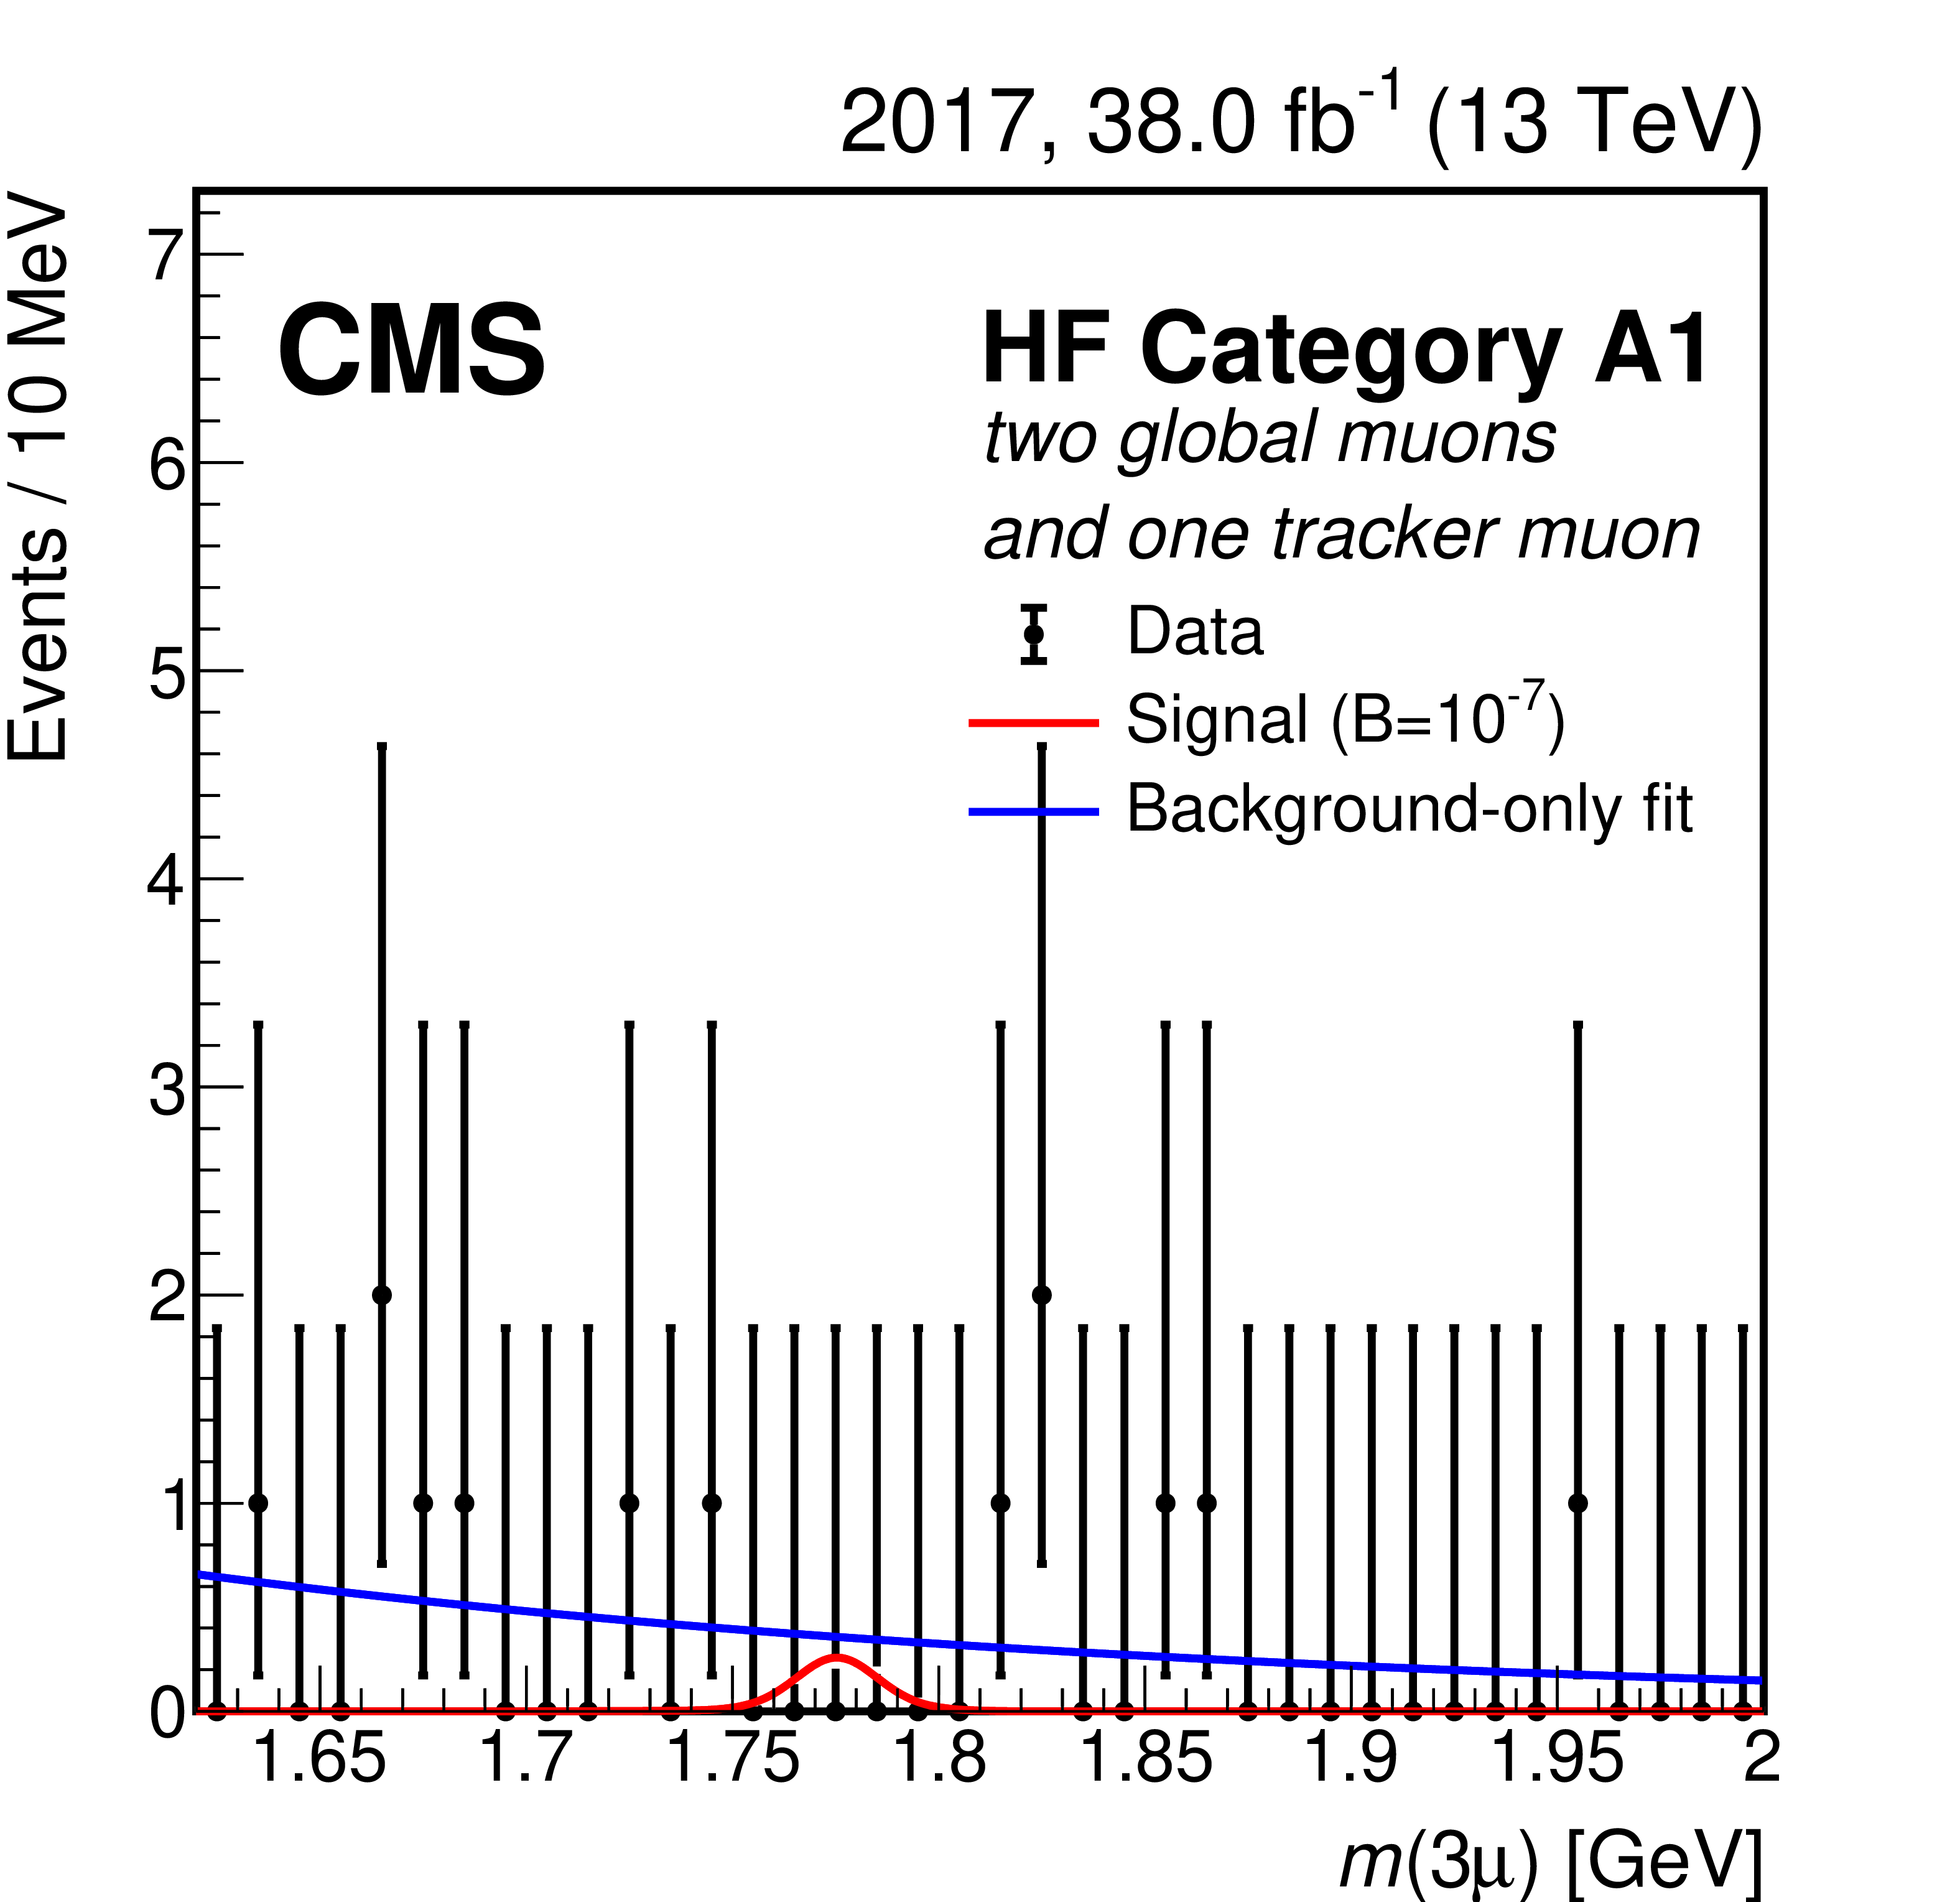
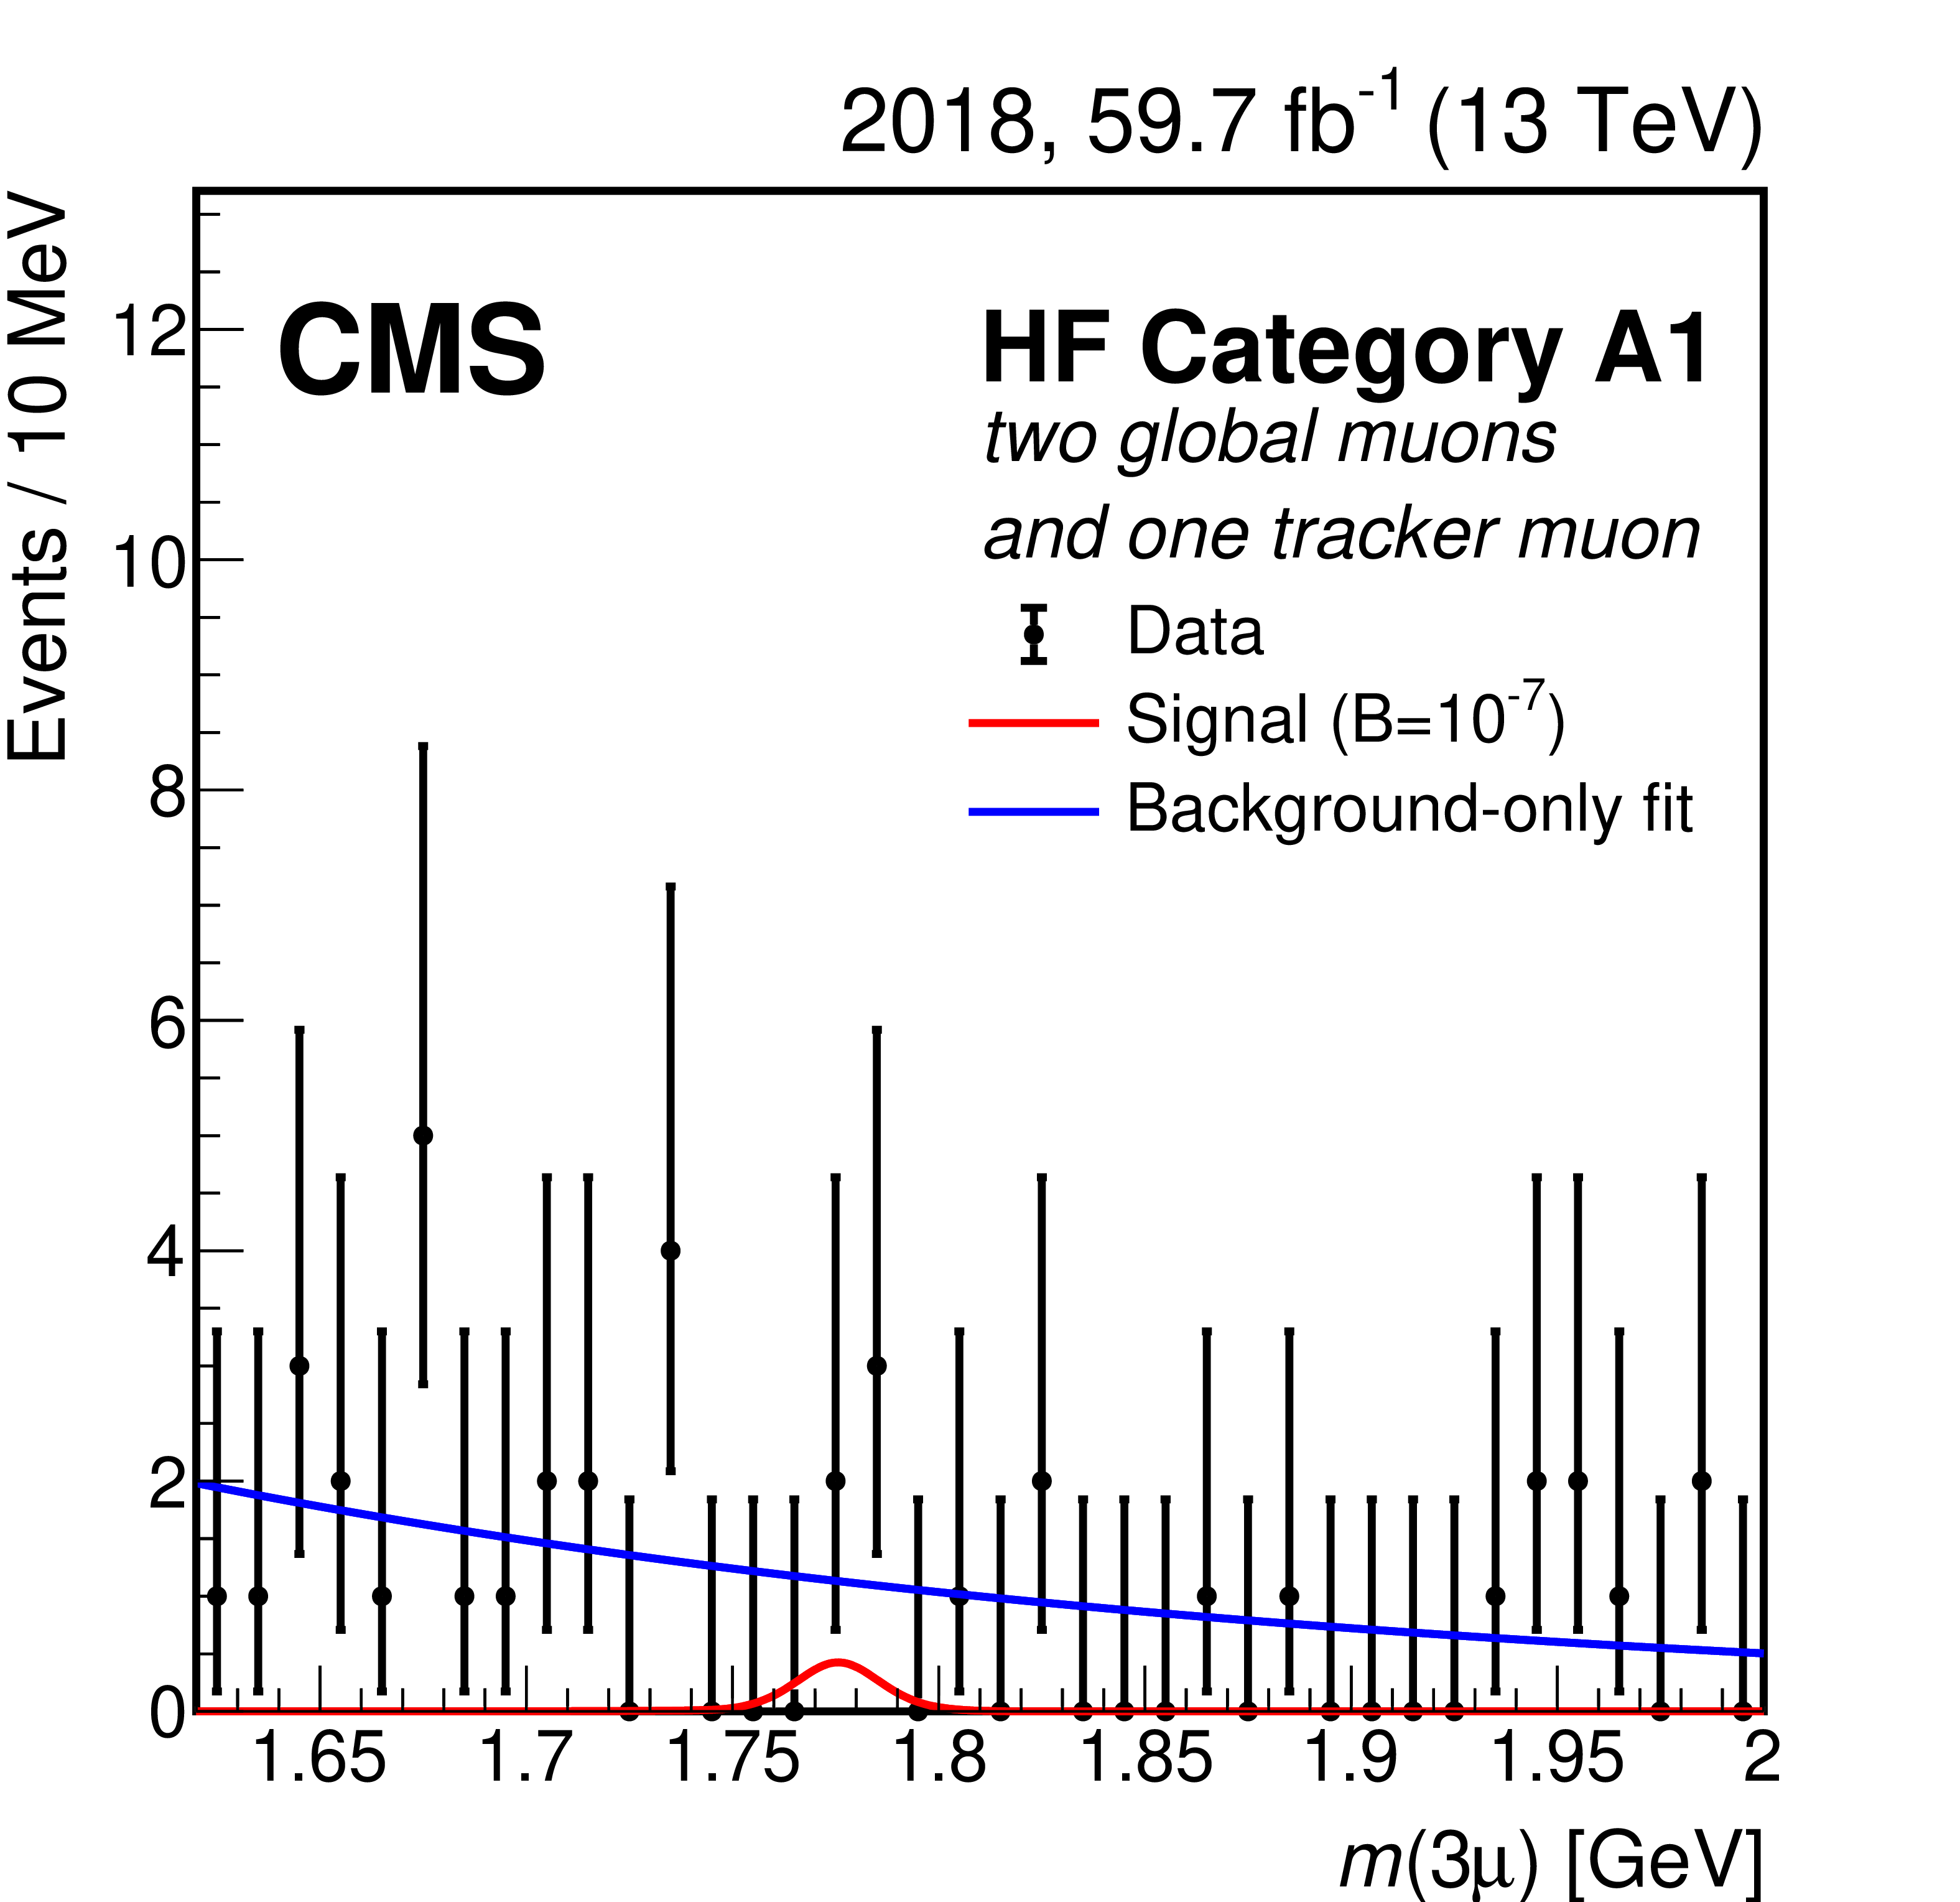
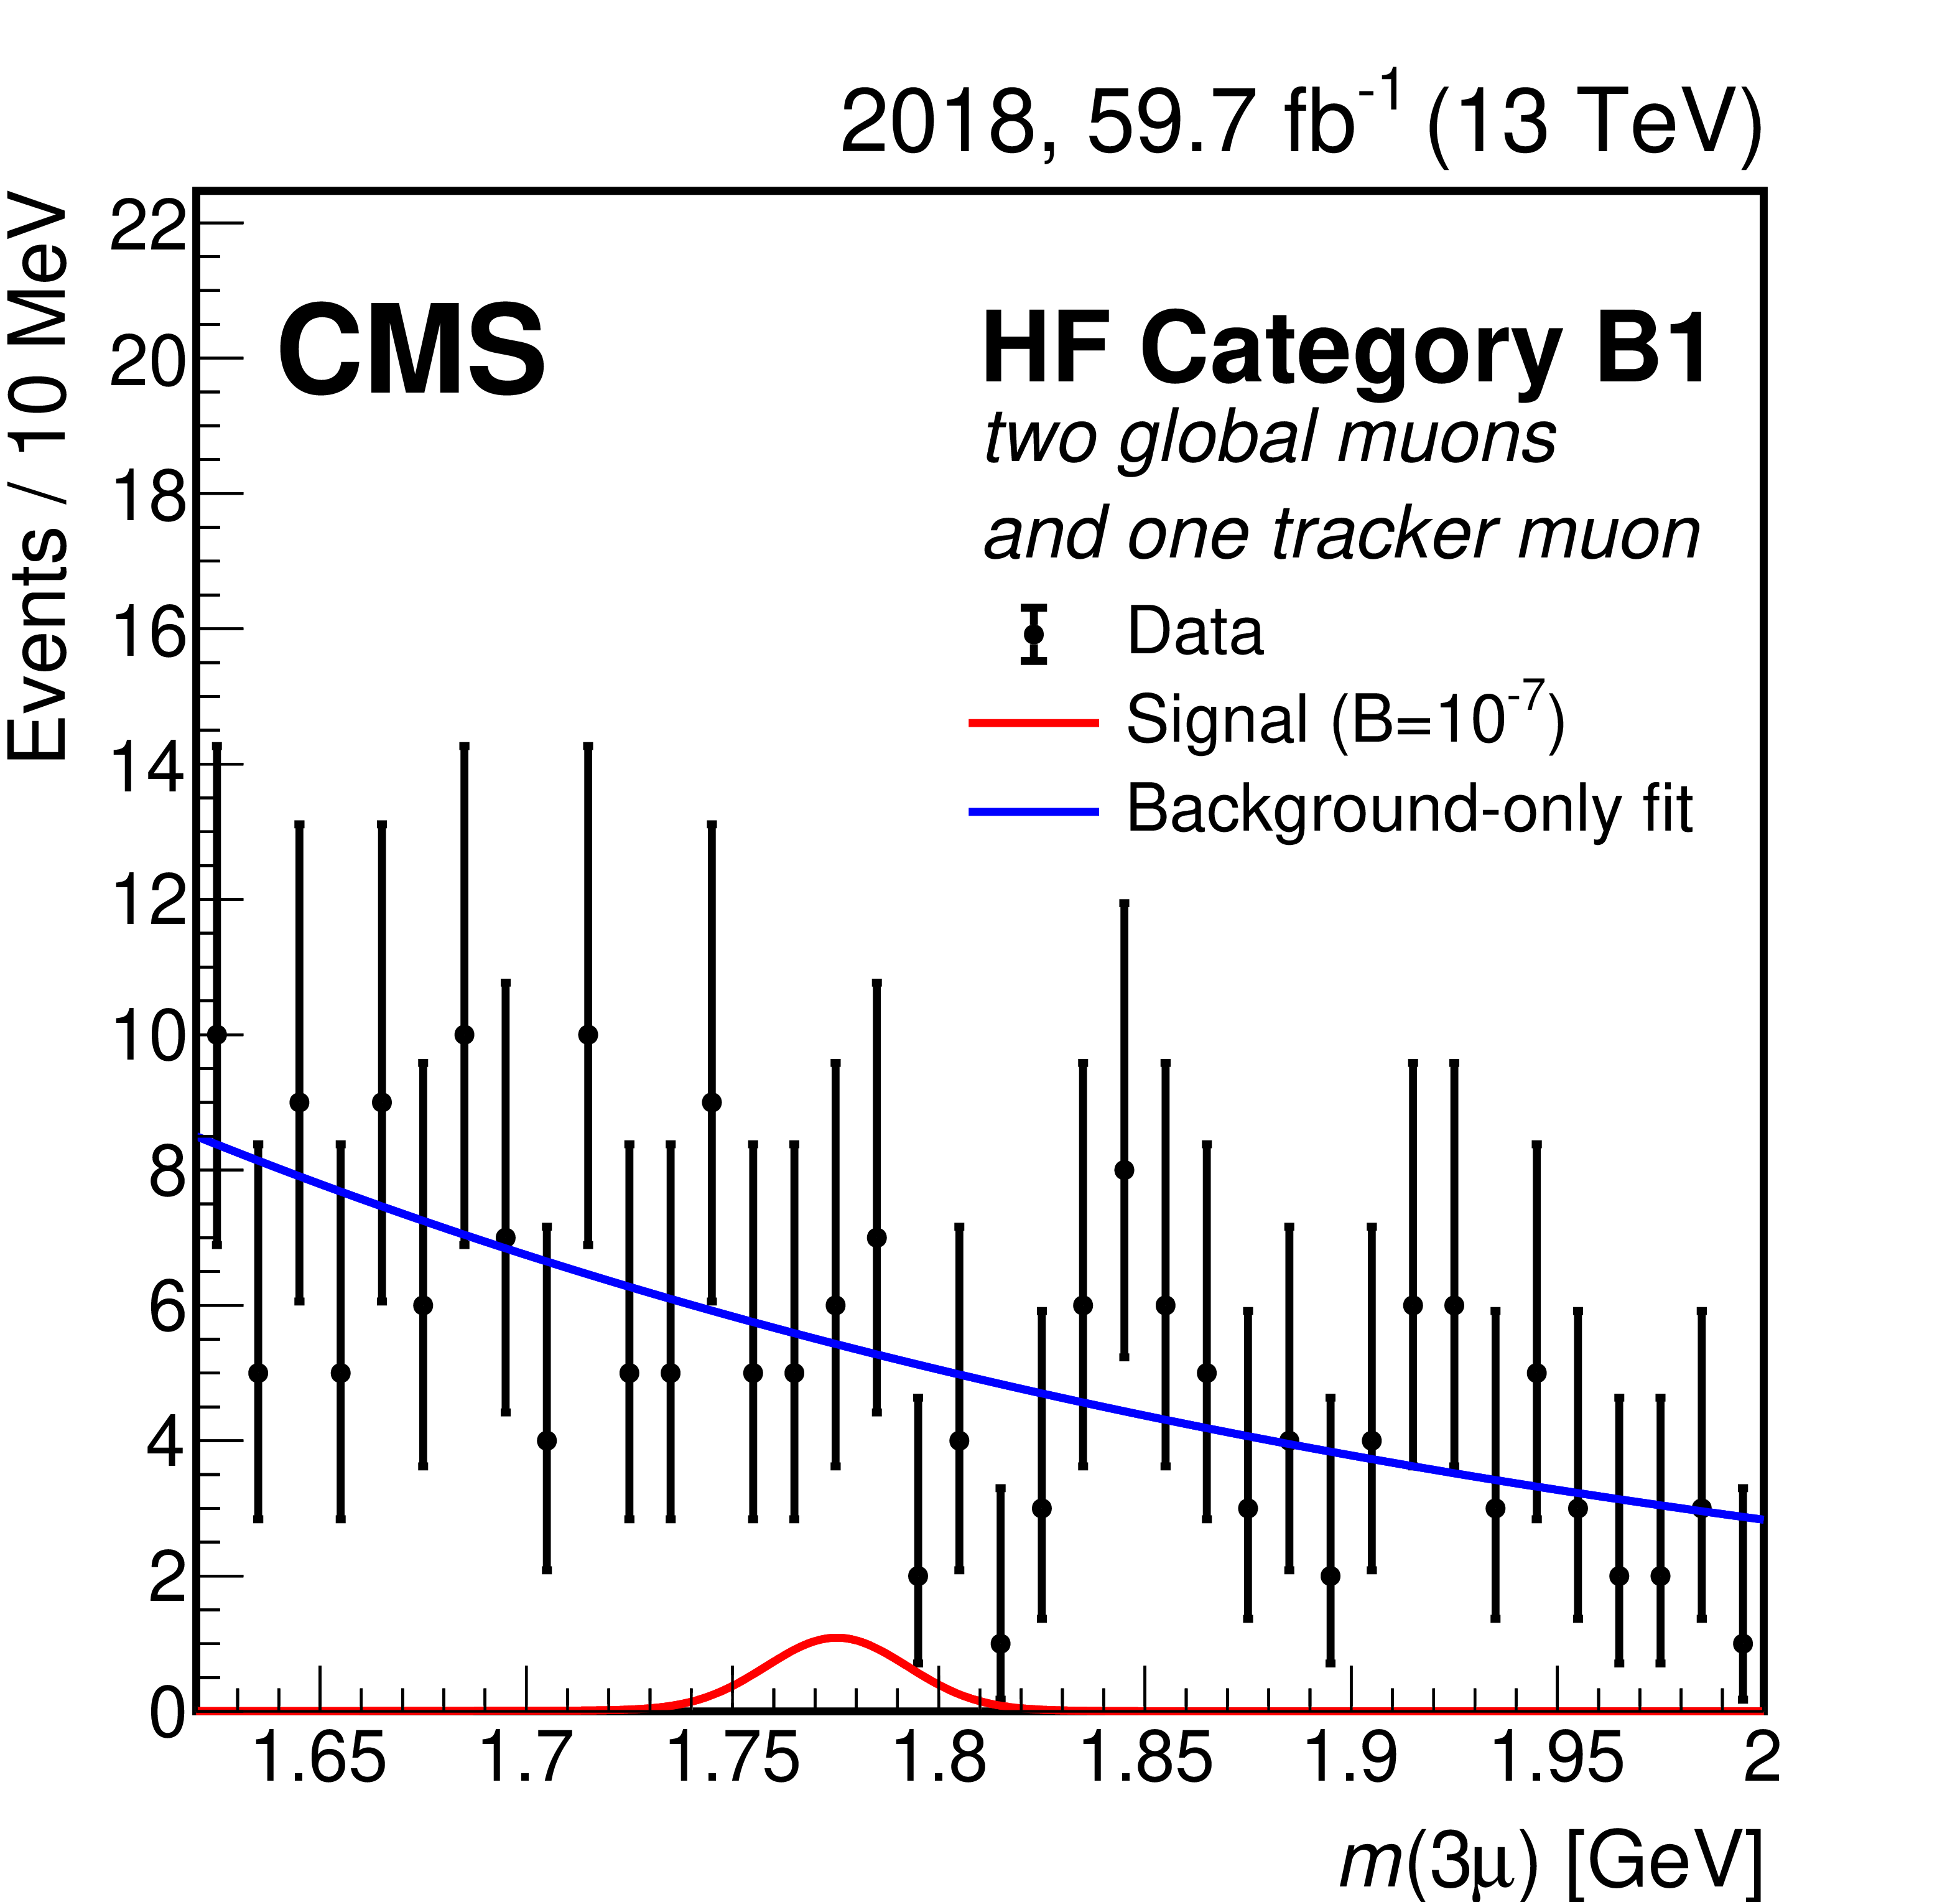
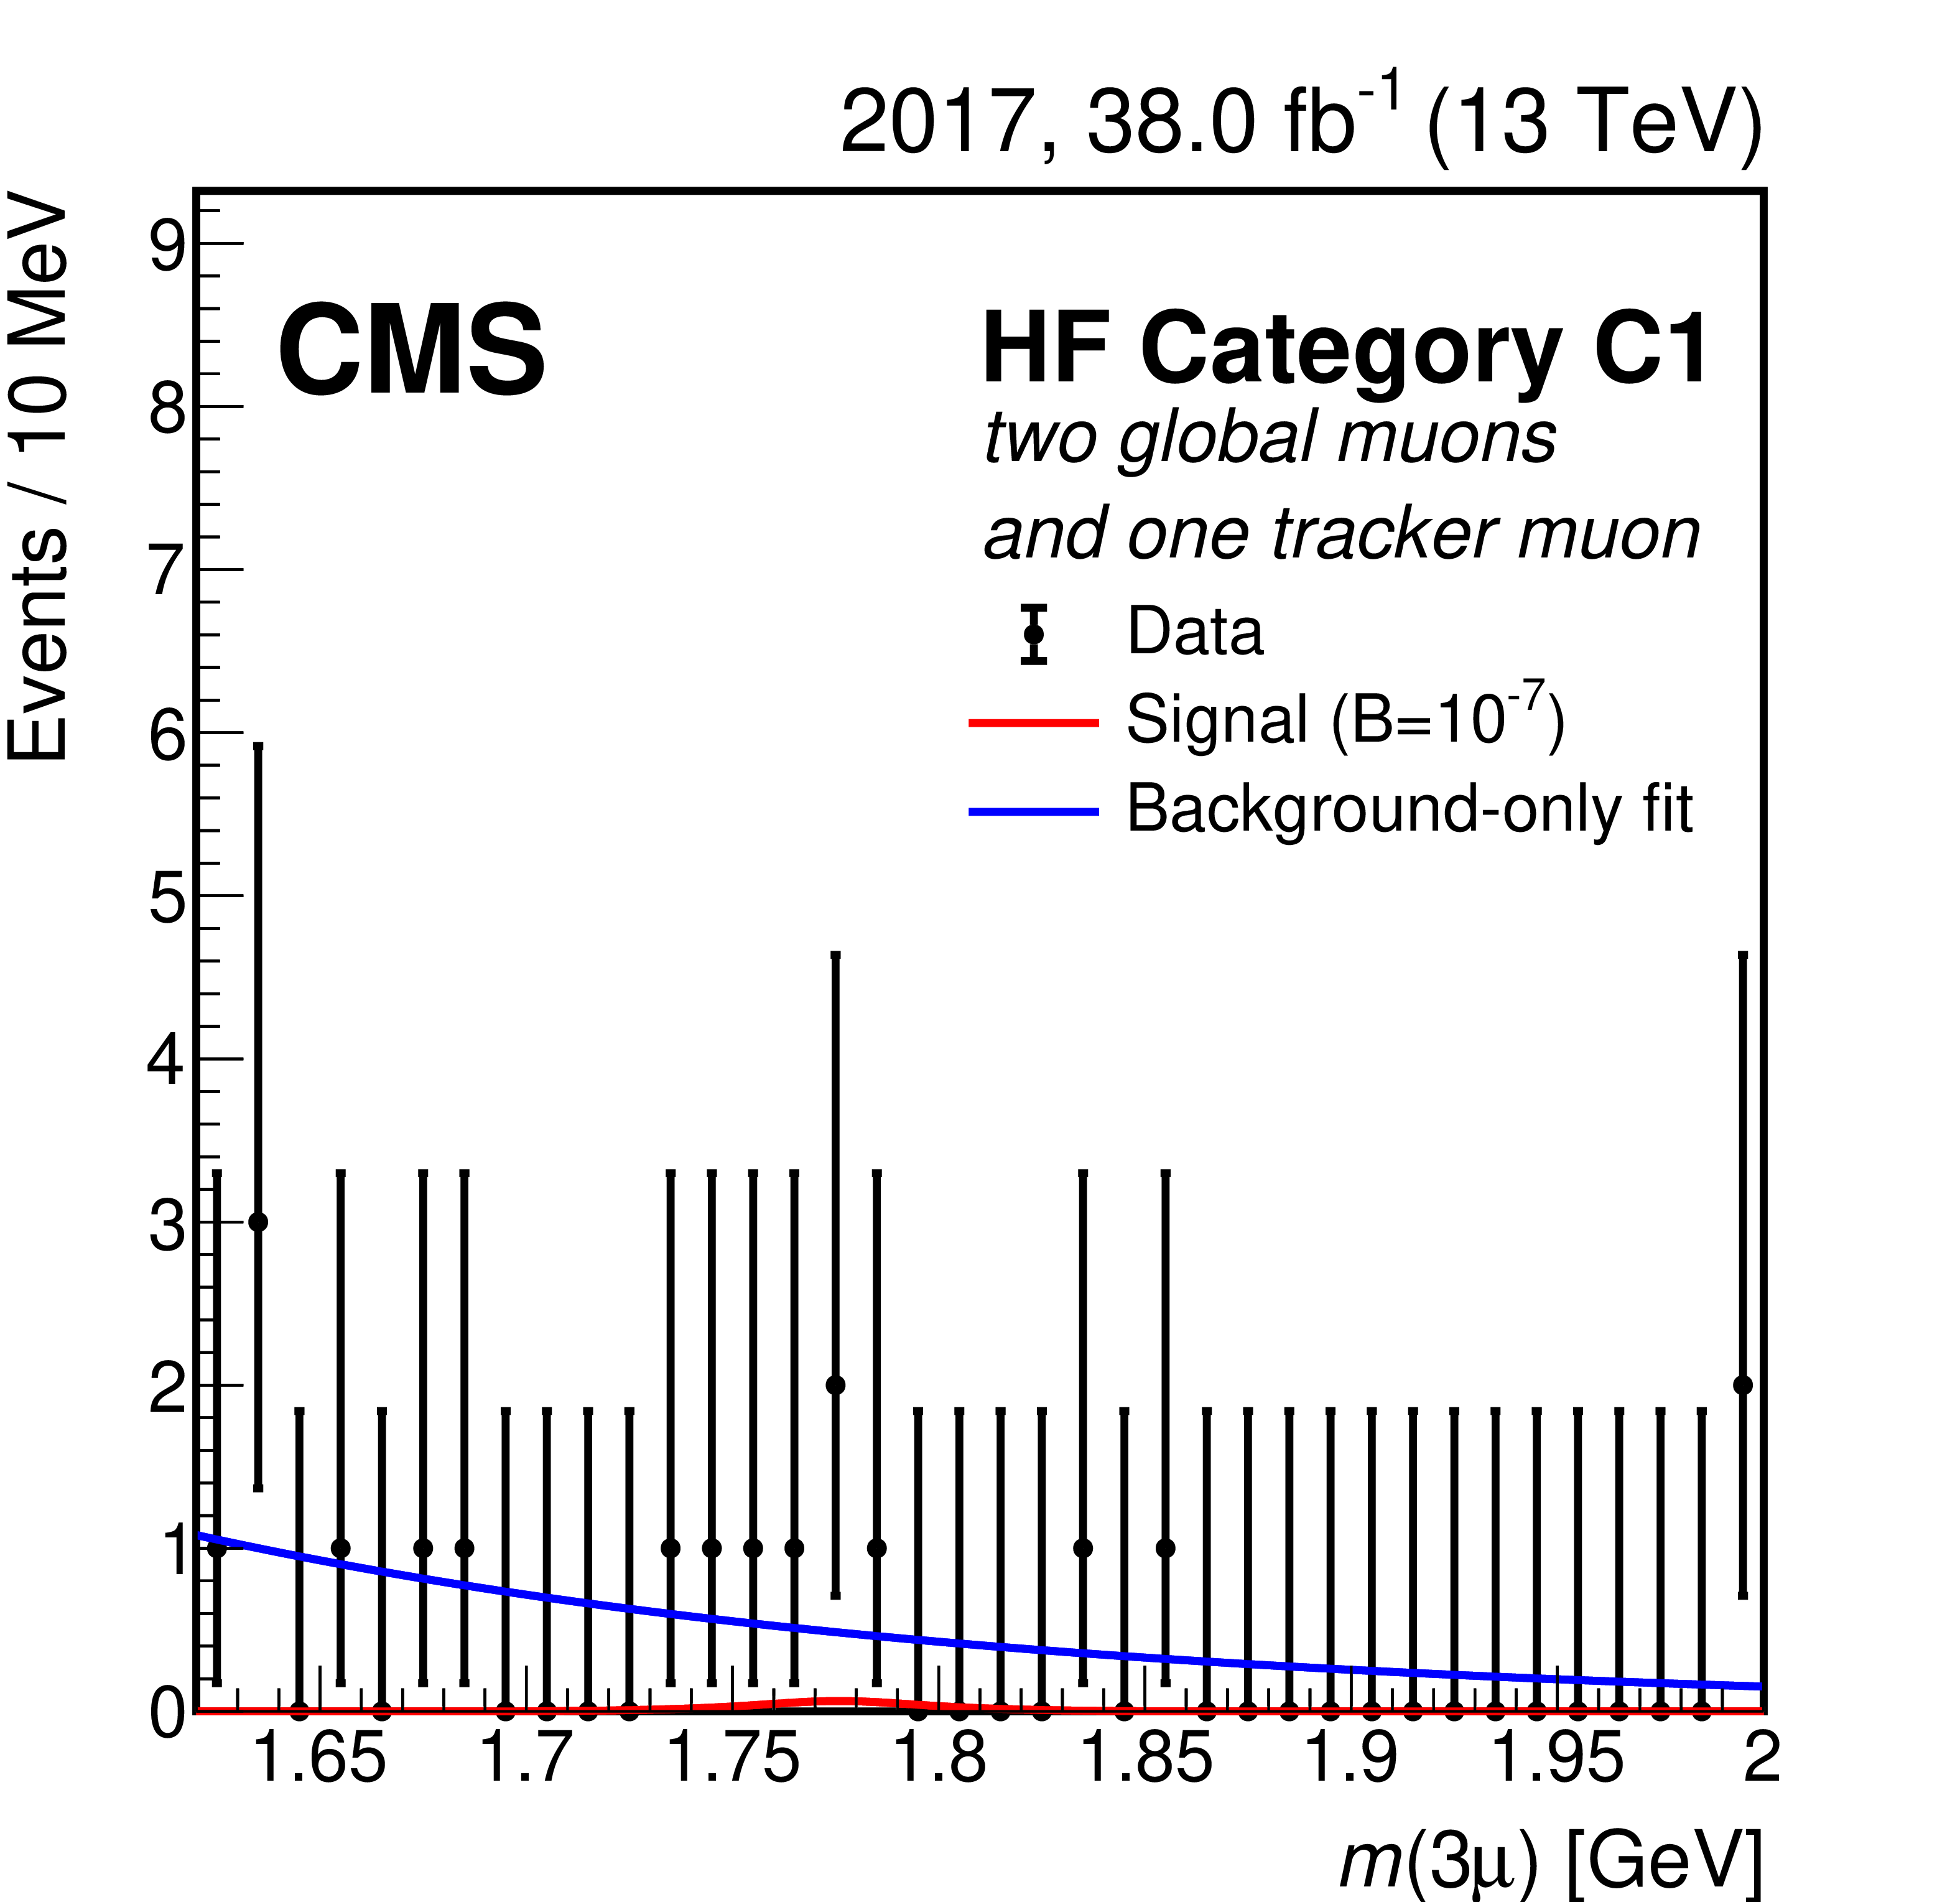
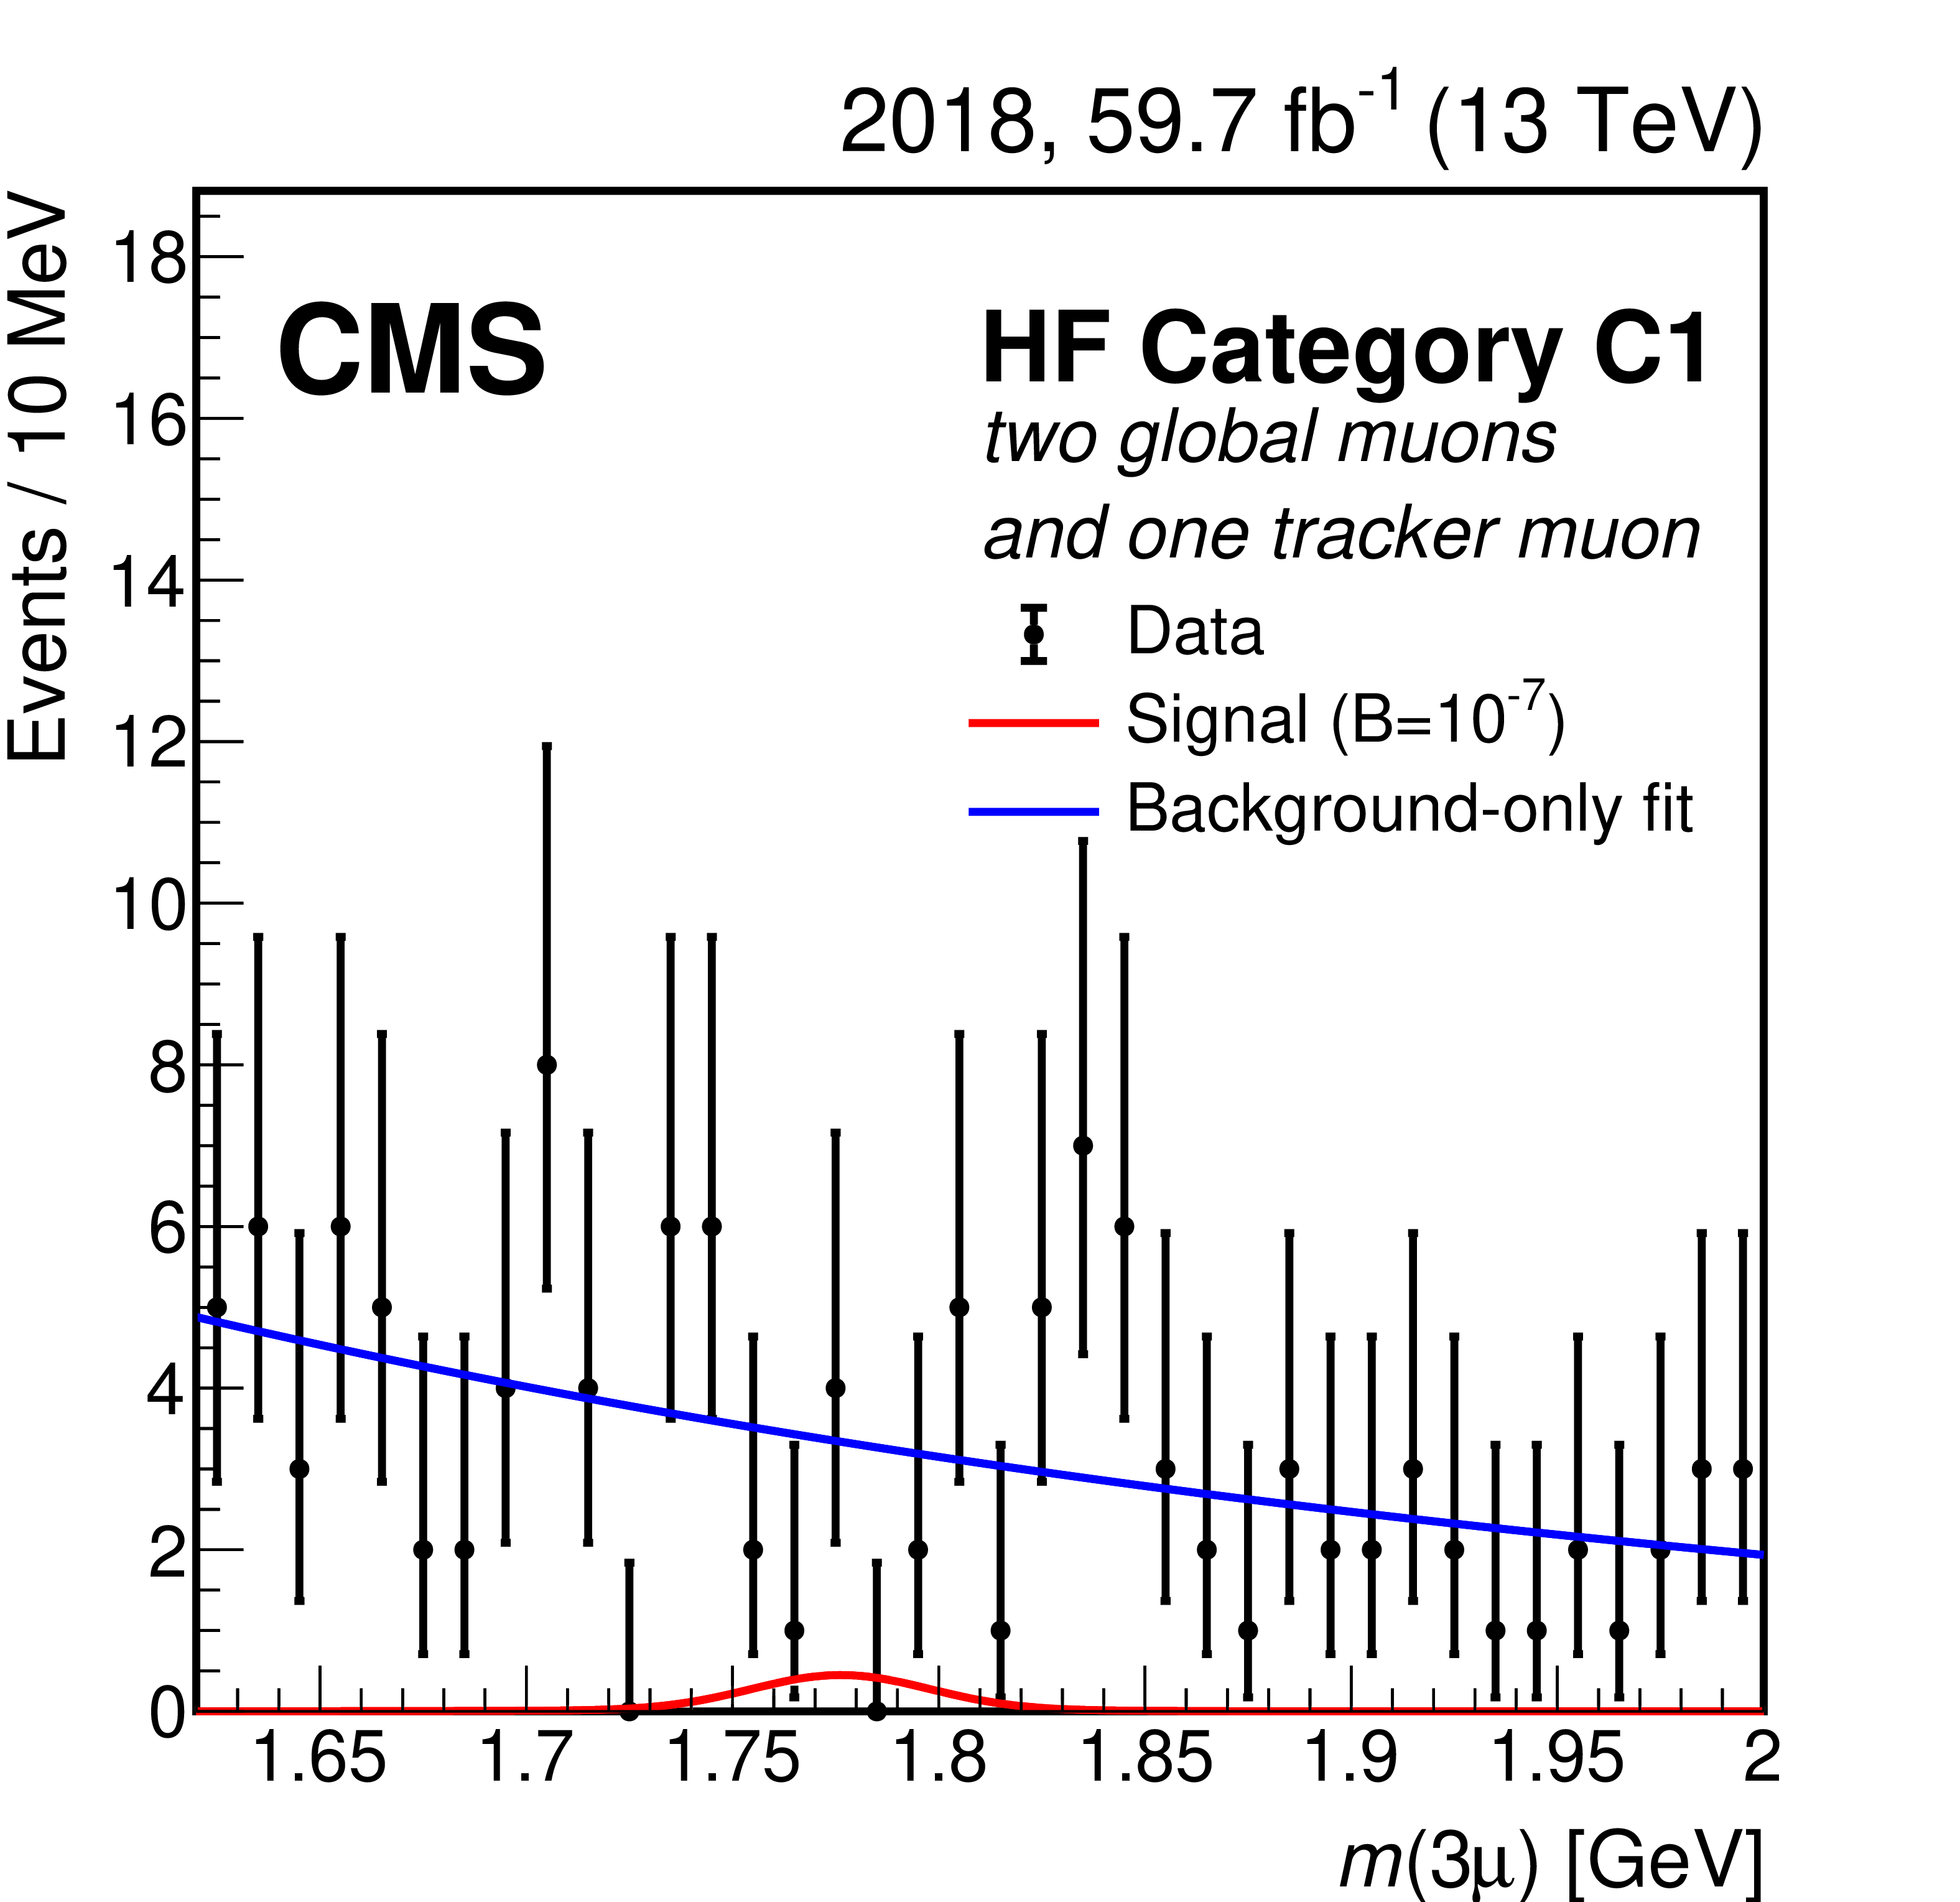
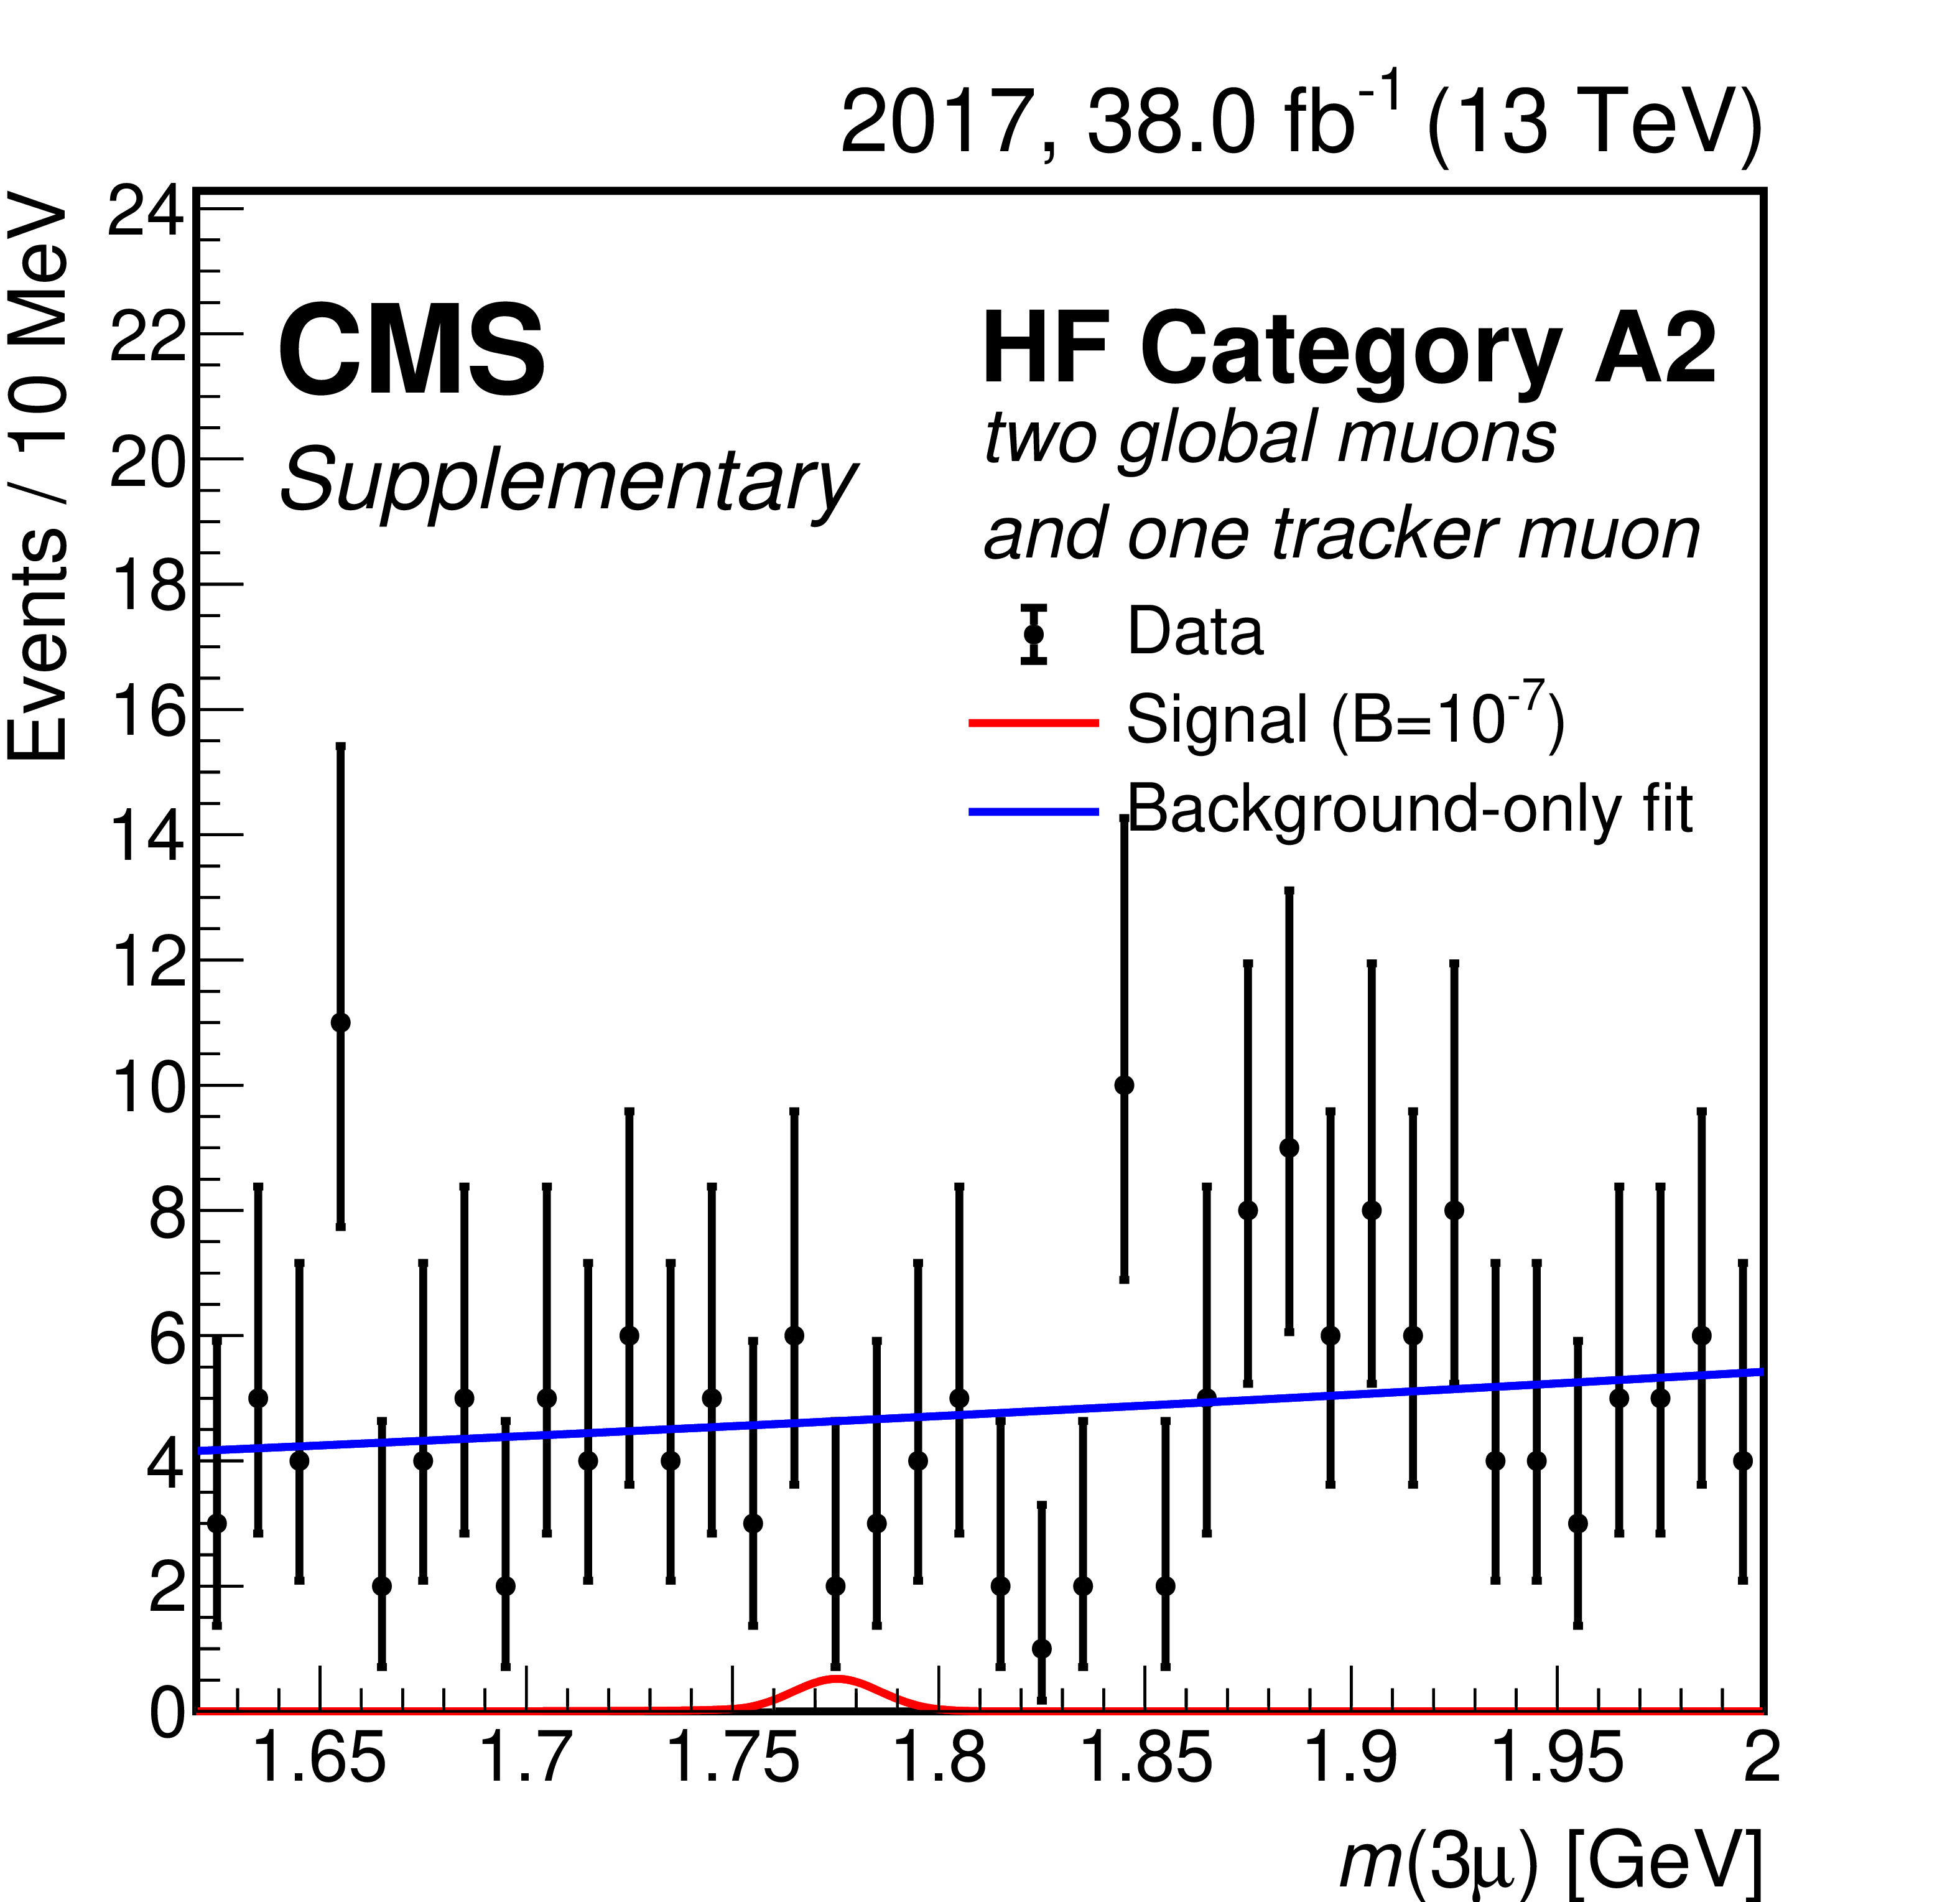
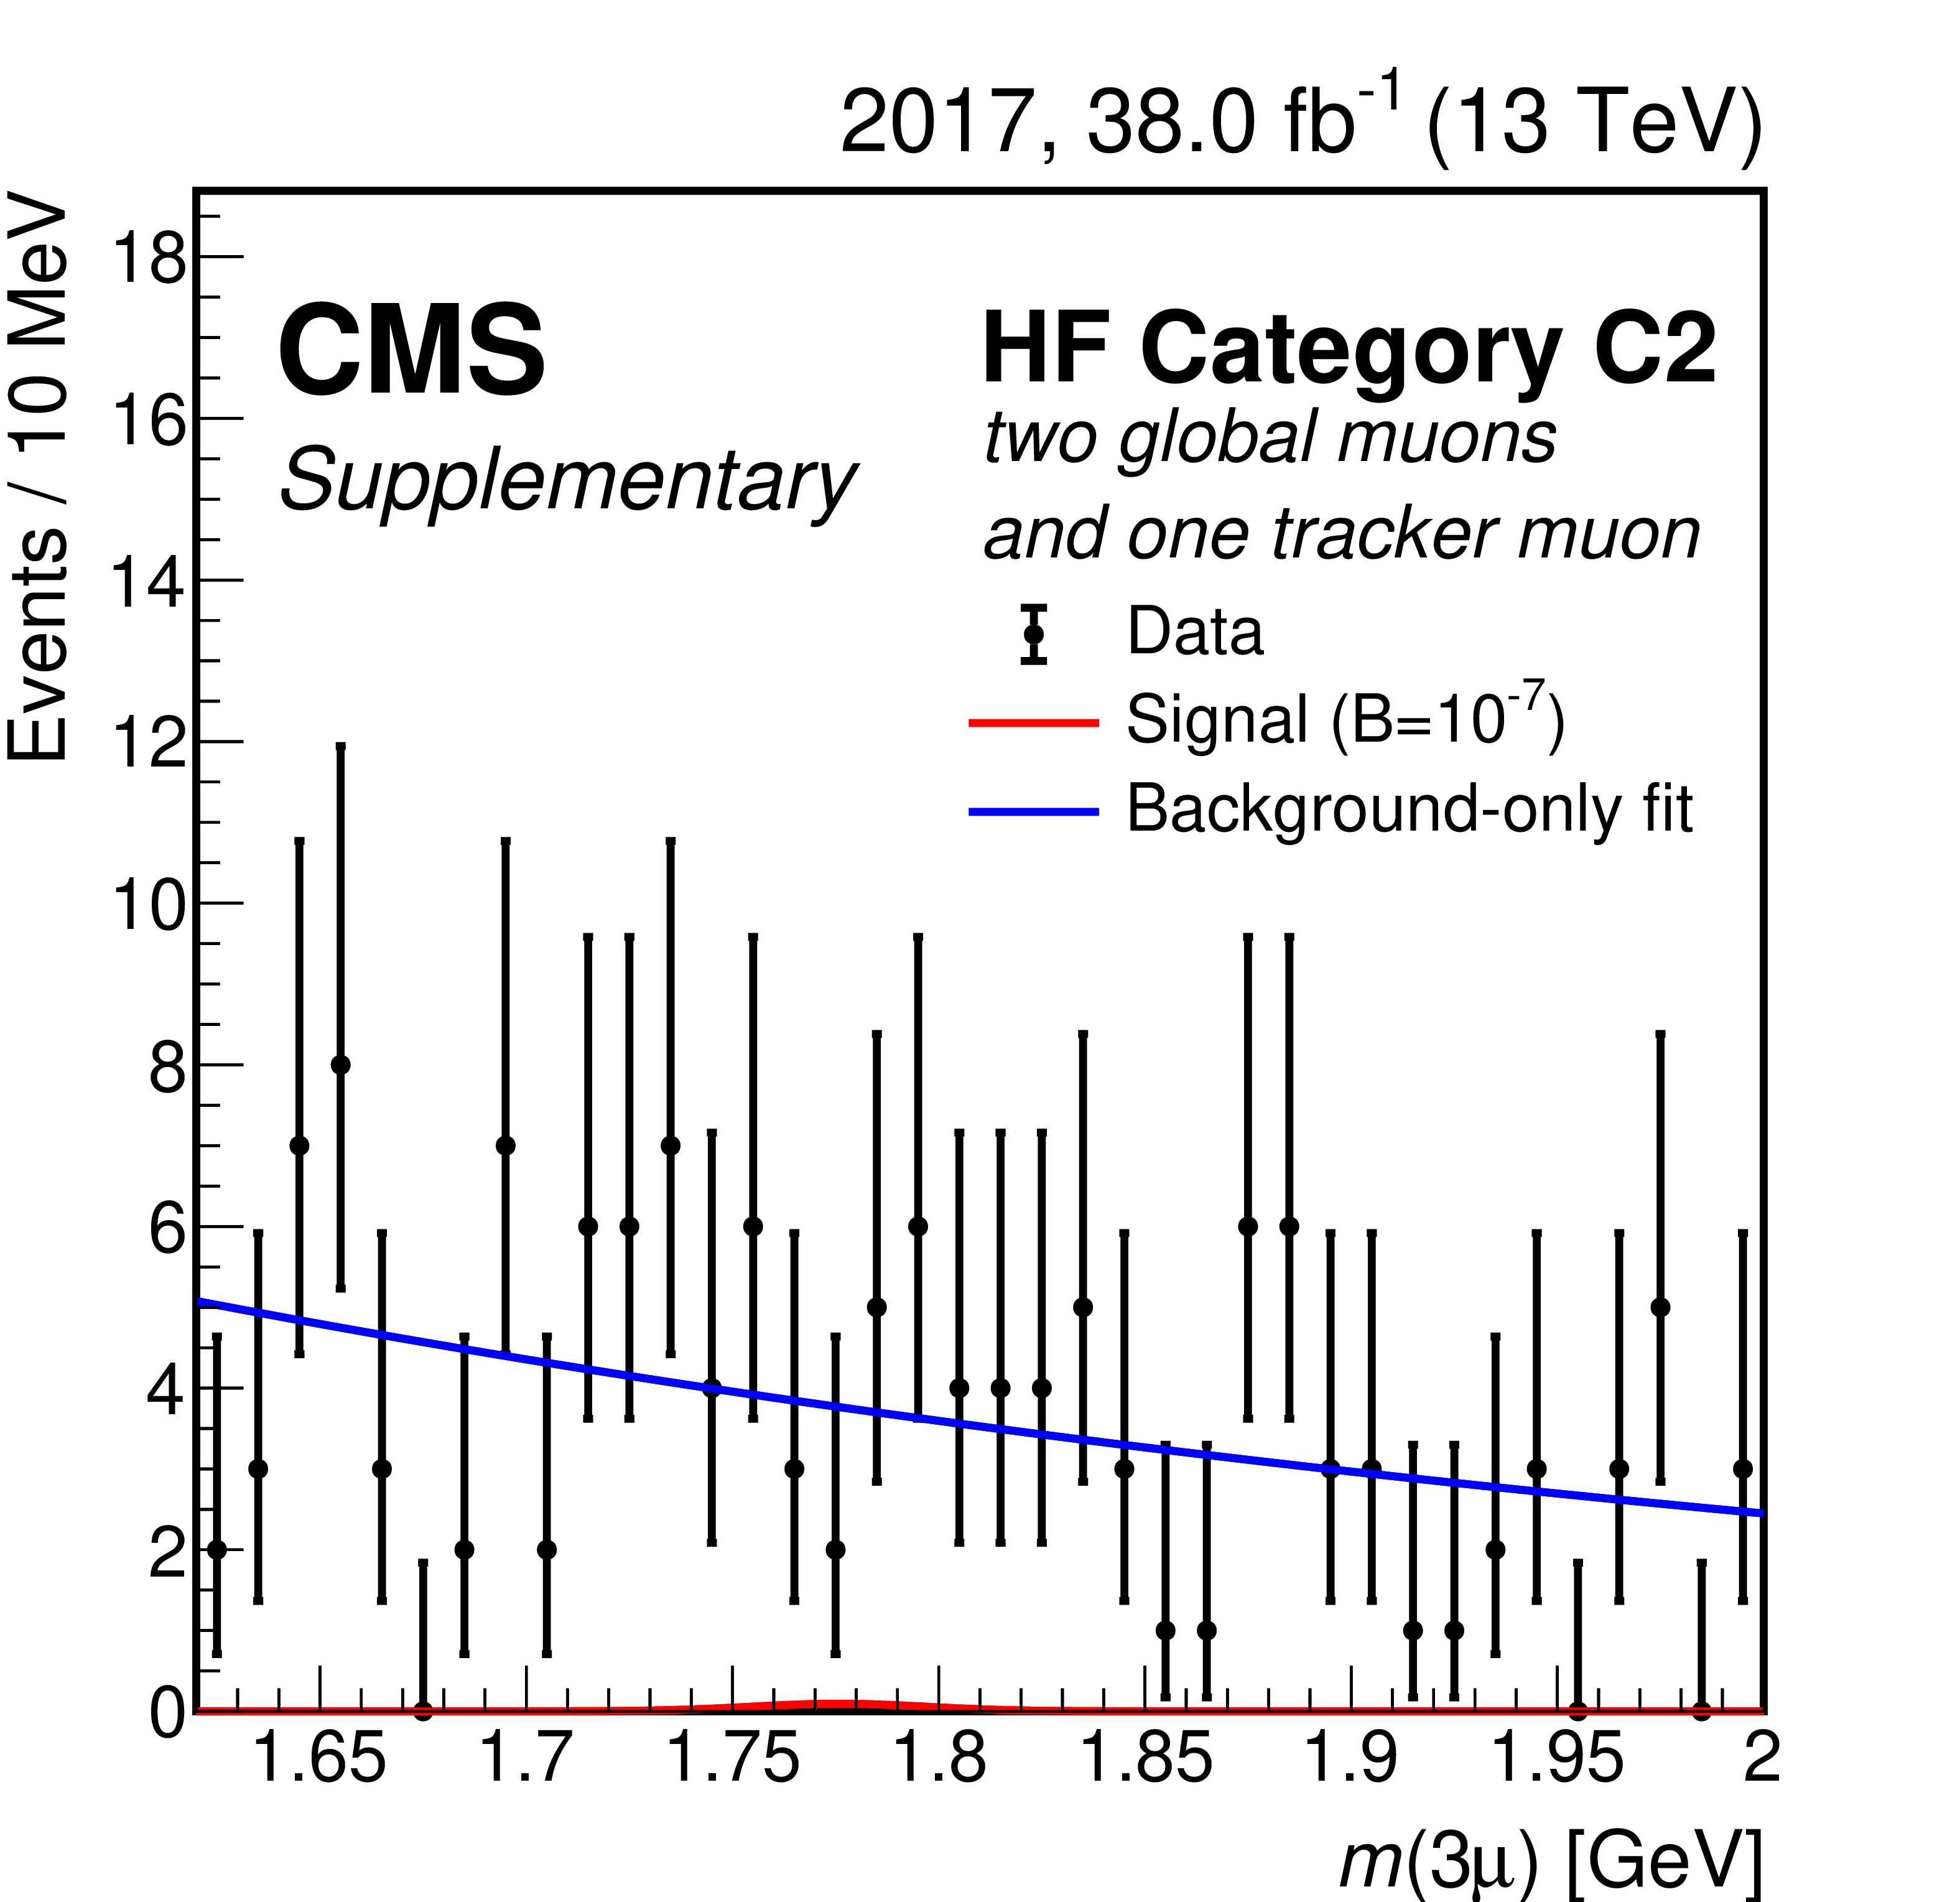
Trimuon mass distributions in the highest BDT score subcategories of each of the three mass resolution categories of the heavy-flavor (HF) analysis: A1 (upper), B1 (middle), and C1 (lower) for 2017 (left) and 2018 (right) candidate events with two global muons and one tracker muon. Data are shown with black markers. The background-only fit and the expected signal for $ \mathcal{B}(\tau \!\to\! 3\mu) = $ 10$^{-7} $ are shown with blue and red lines, respectively. |
png pdf |
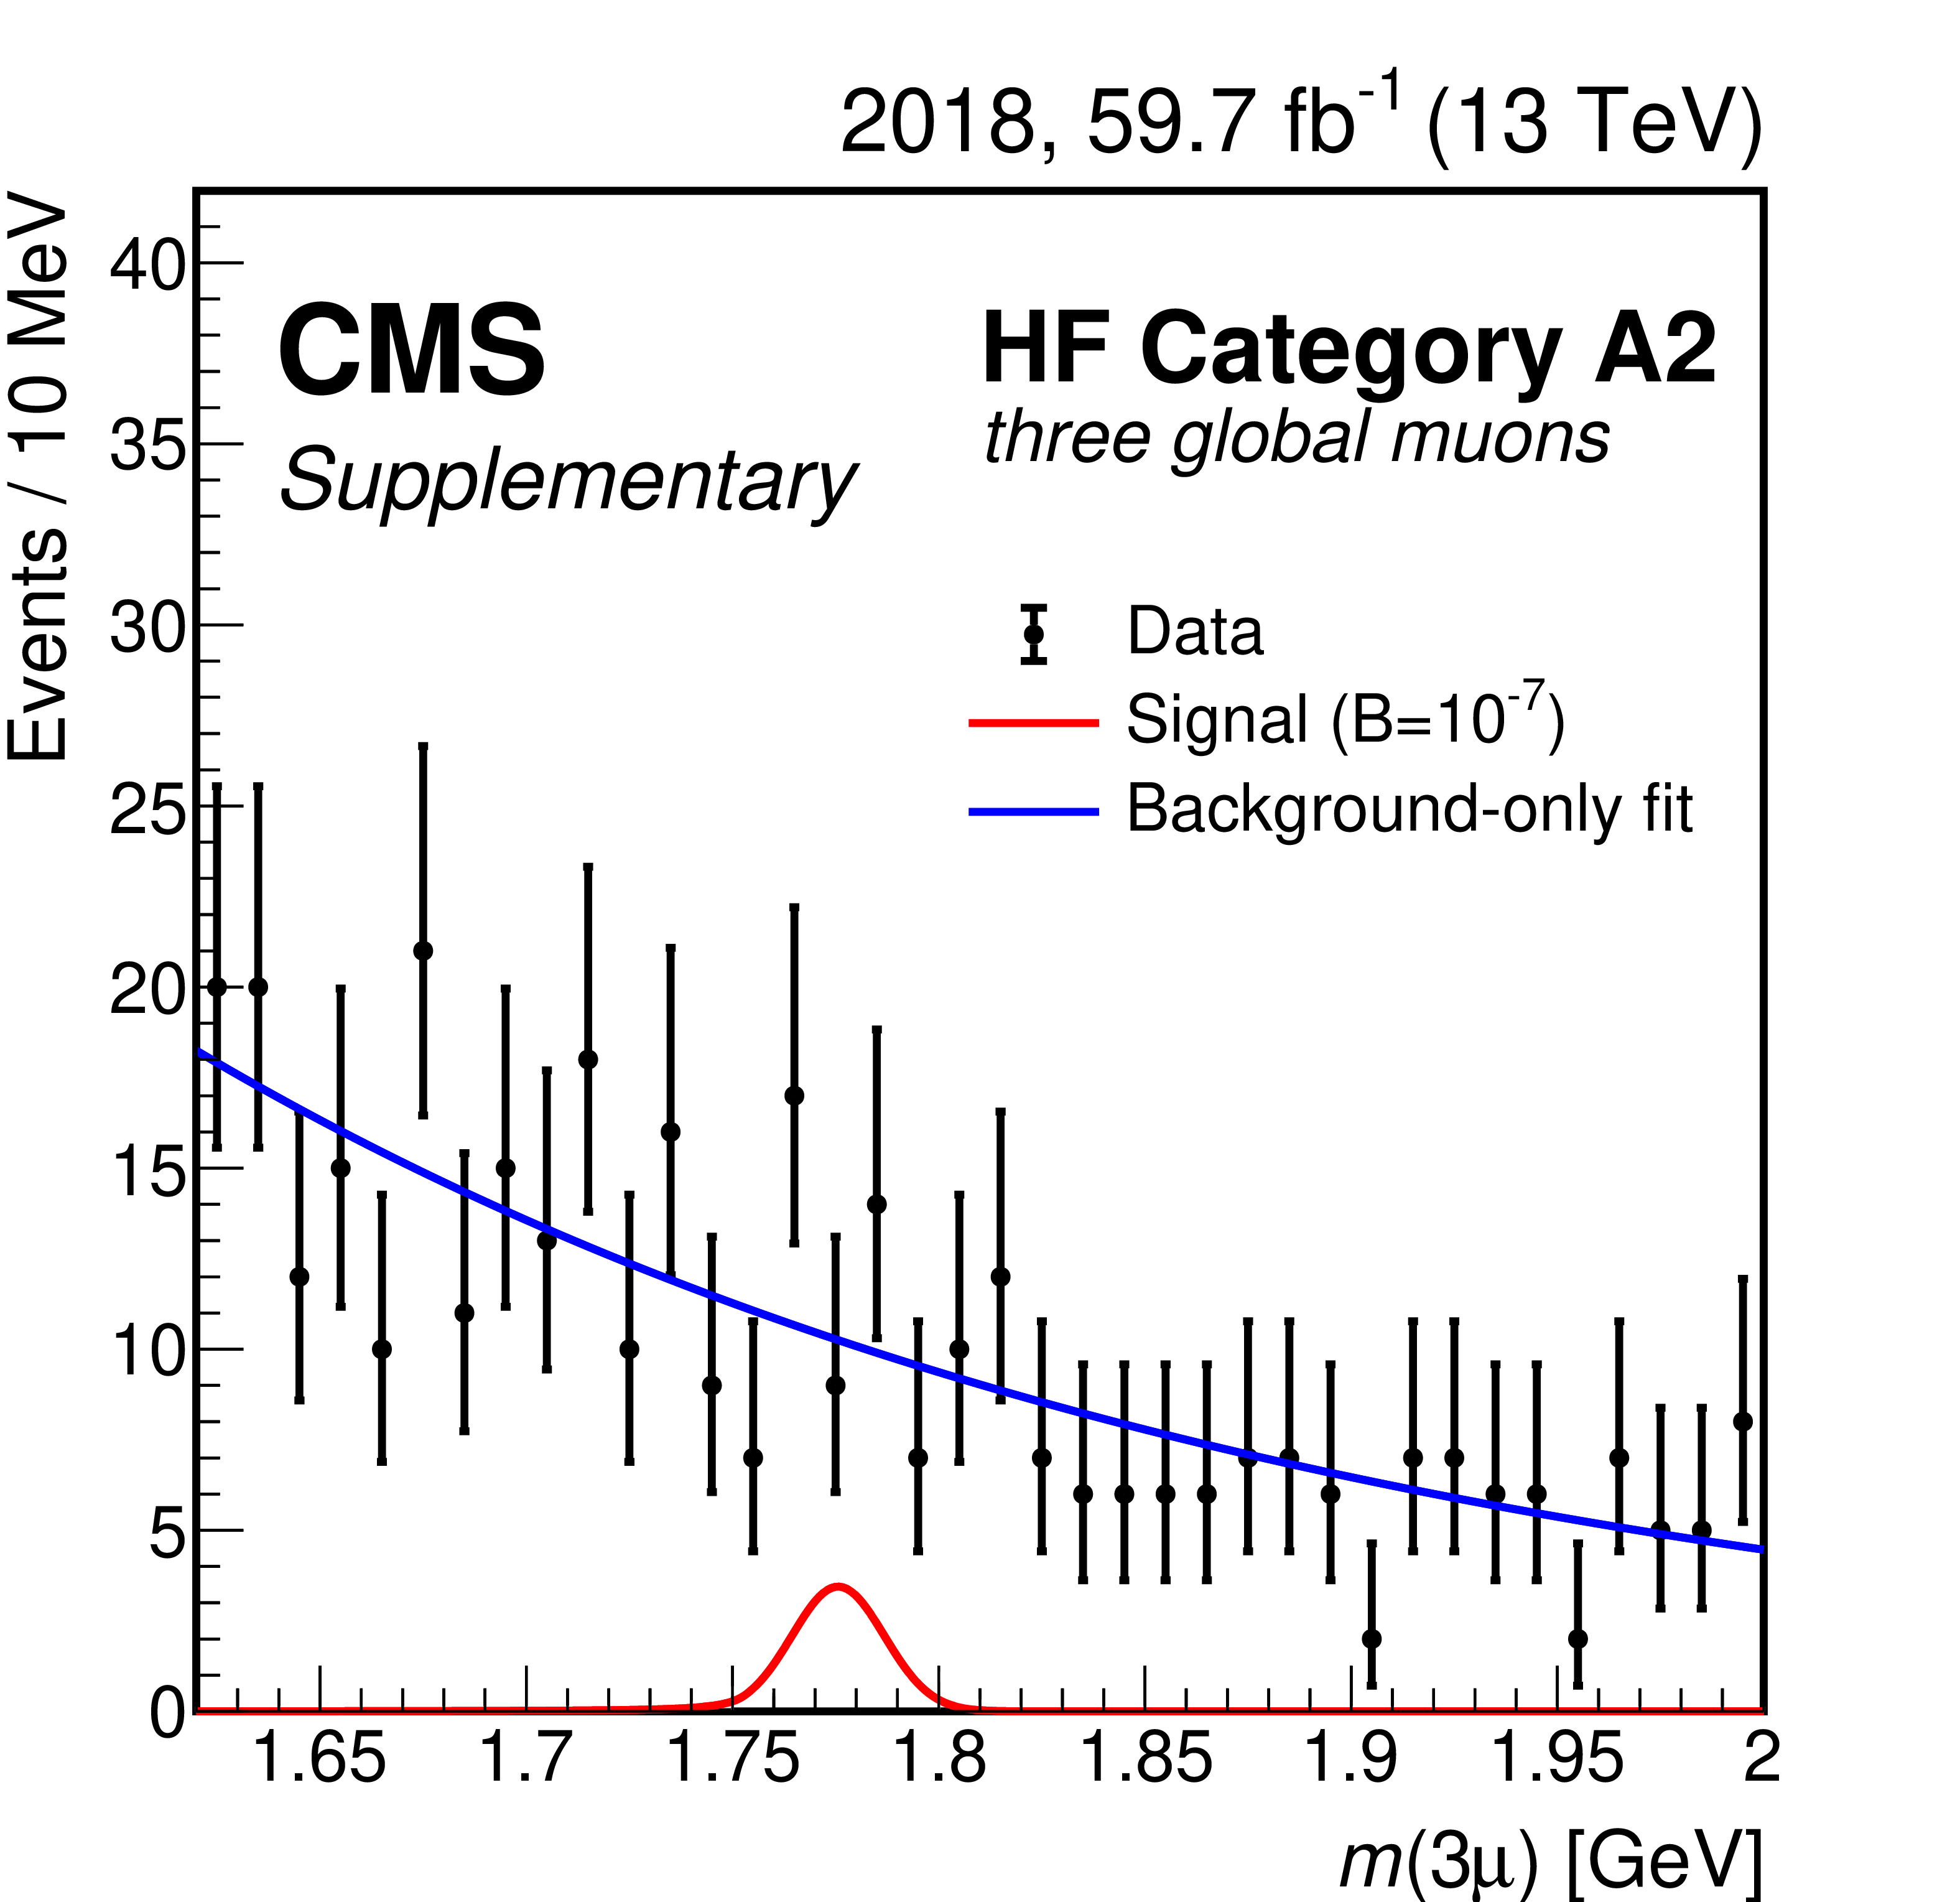
Figure 4-a:
Trimuon mass distributions in the highest BDT score subcategories of the A1 mass resolution category of the heavy-flavor (HF) analysis for 2017 candidate events with two global muons and one tracker muon. Data are shown with black markers. The background-only fit and the expected signal for $ \mathcal{B}(\tau \!\to\! 3\mu) = $ 10$^{-7} $ are shown with blue and red lines, respectively. |
png pdf |
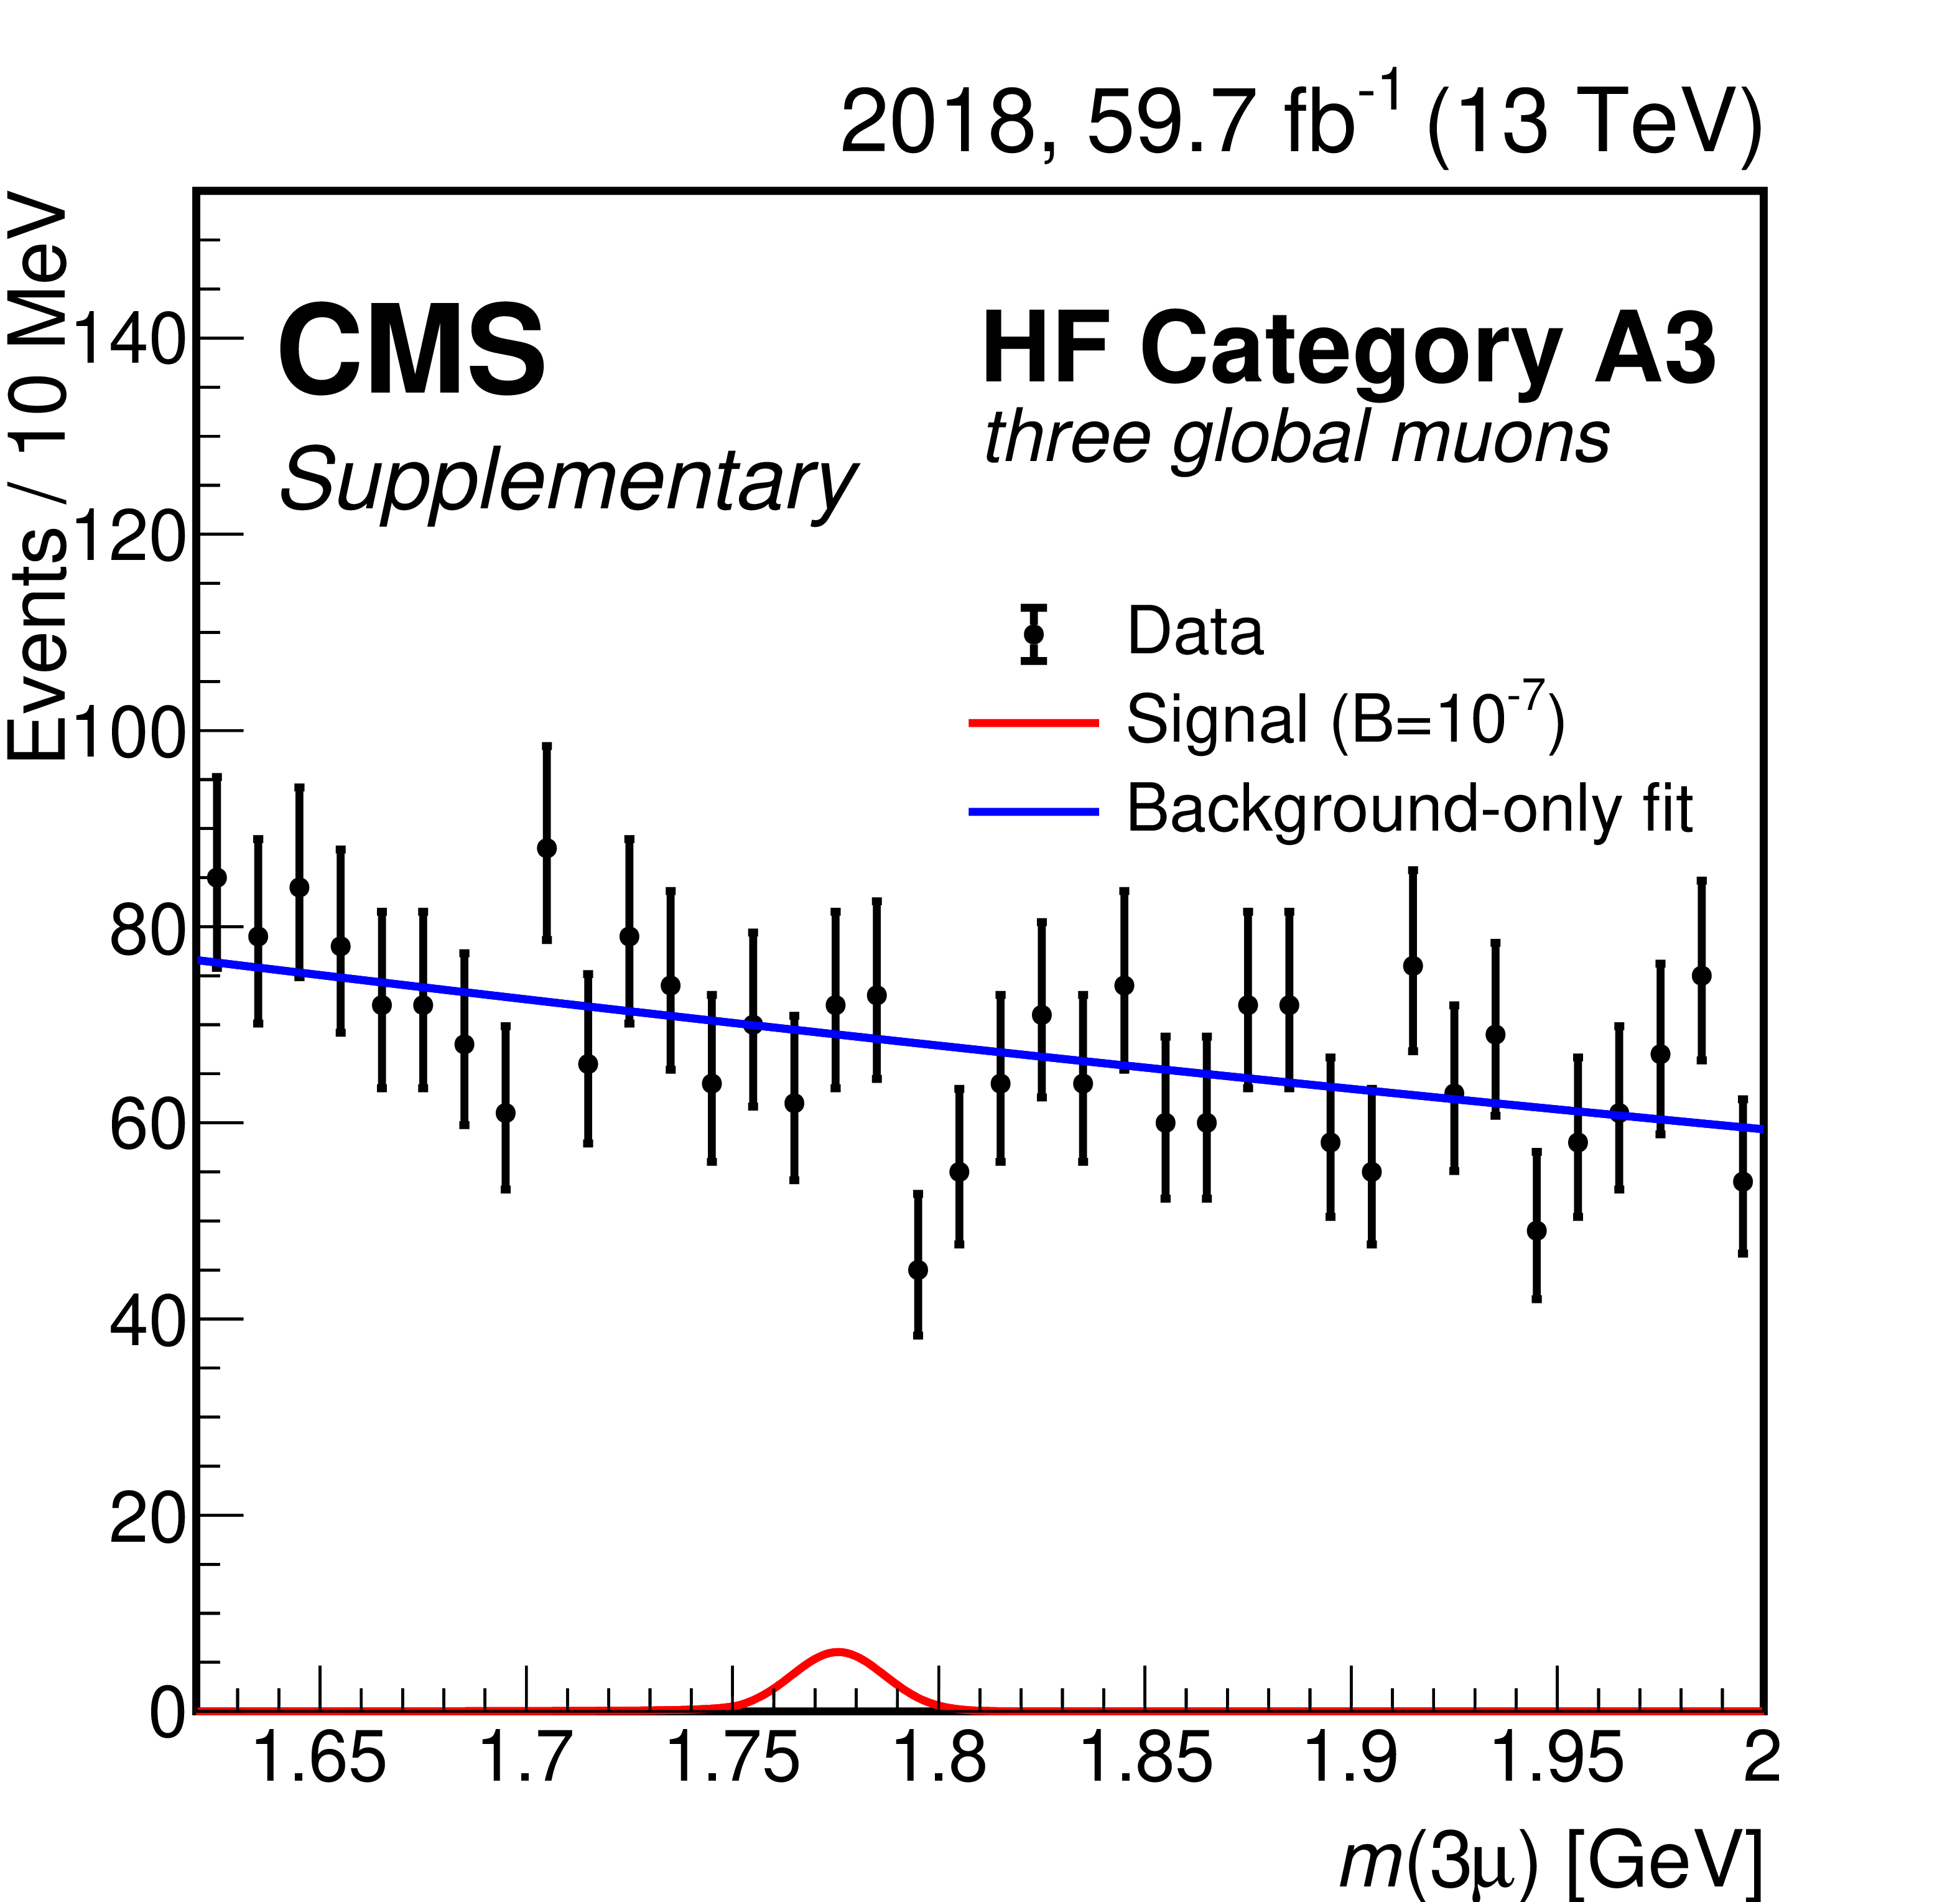
Figure 4-b:
Trimuon mass distributions in the highest BDT score subcategories of the A1 mass resolution category of the heavy-flavor (HF) analysis for 2018 candidate events with two global muons and one tracker muon. Data are shown with black markers. The background-only fit and the expected signal for $ \mathcal{B}(\tau \!\to\! 3\mu) = $ 10$^{-7} $ are shown with blue and red lines, respectively. |

png pdf |
Figure 4-c:
Trimuon mass distributions in the highest BDT score subcategories of the B1 mass resolution category of the heavy-flavor (HF) analysis for 2017 candidate events with two global muons and one tracker muon. Data are shown with black markers. The background-only fit and the expected signal for $ \mathcal{B}(\tau \!\to\! 3\mu) = $ 10$^{-7} $ are shown with blue and red lines, respectively. |
png pdf |
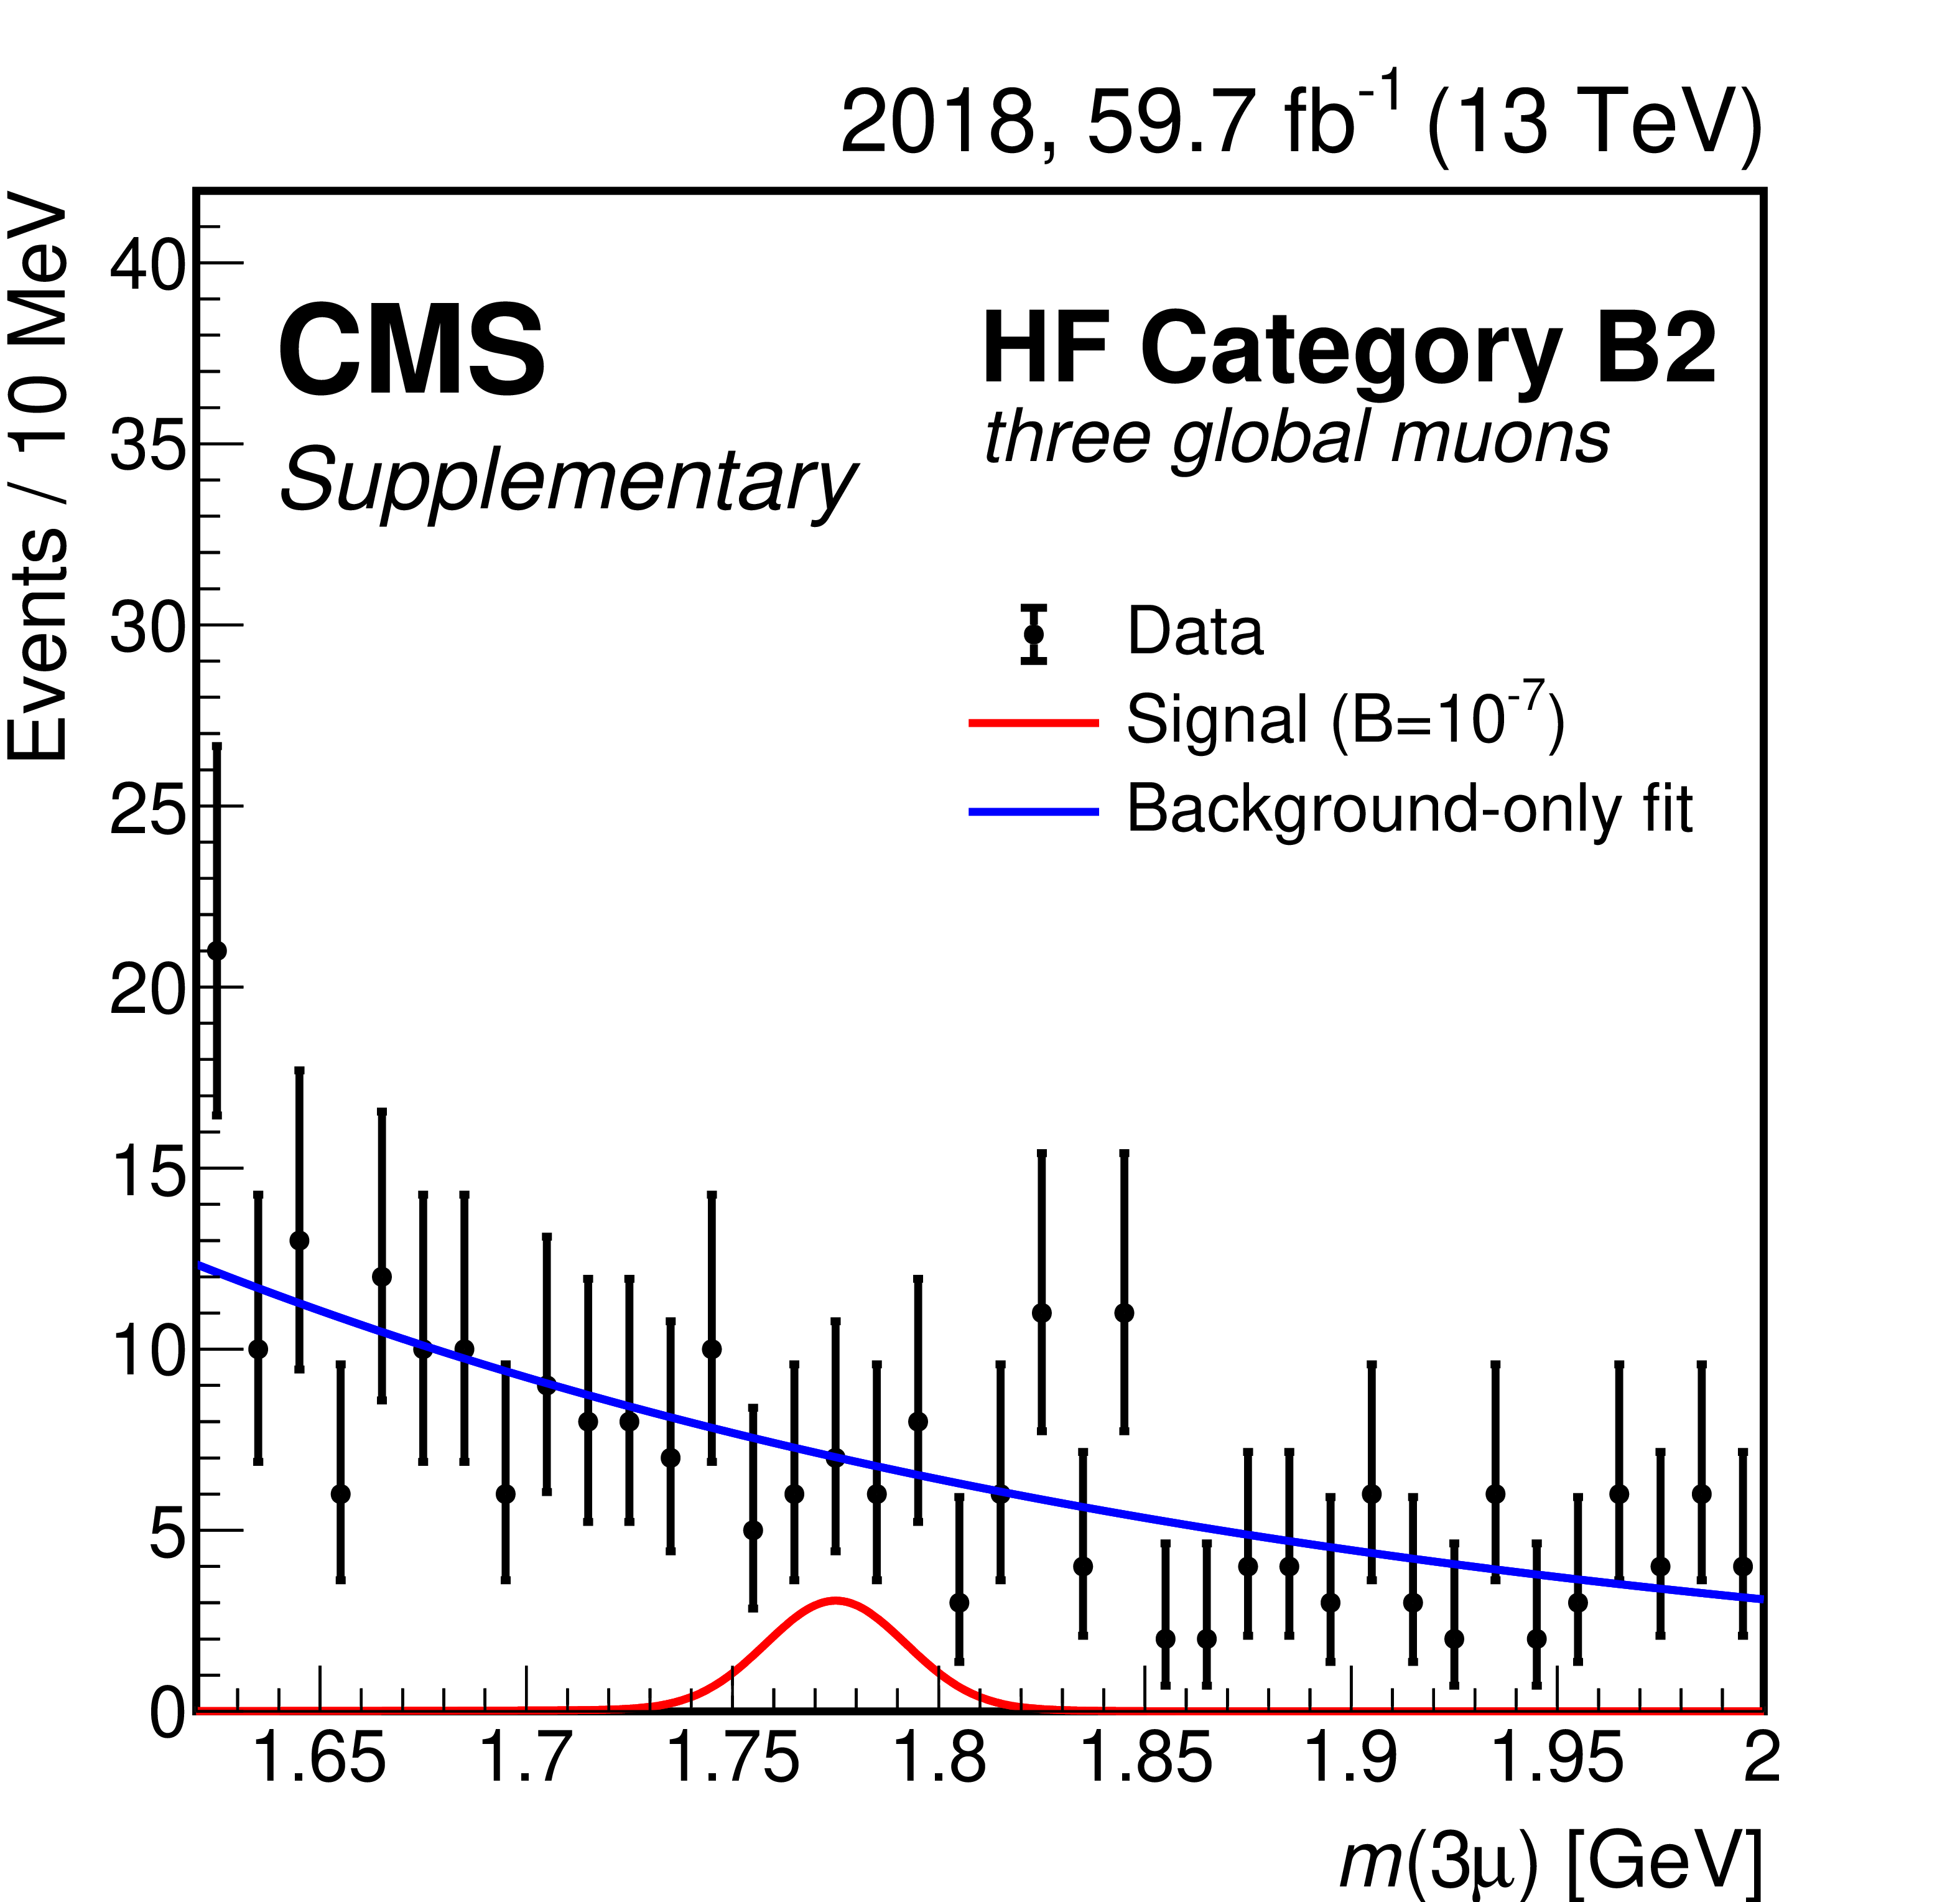
Figure 4-d:
Trimuon mass distributions in the highest BDT score subcategories of the B1 mass resolution category of the heavy-flavor (HF) analysis for 2018 candidate events with two global muons and one tracker muon. Data are shown with black markers. The background-only fit and the expected signal for $ \mathcal{B}(\tau \!\to\! 3\mu) = $ 10$^{-7} $ are shown with blue and red lines, respectively. |
png pdf |
Figure 4-e:
Trimuon mass distributions in the highest BDT score subcategories of the C1 mass resolution category of the heavy-flavor (HF) analysis for 2017 candidate events with two global muons and one tracker muon. Data are shown with black markers. The background-only fit and the expected signal for $ \mathcal{B}(\tau \!\to\! 3\mu) = $ 10$^{-7} $ are shown with blue and red lines, respectively. |
png pdf |
Figure 4-f:
Trimuon mass distributions in the highest BDT score subcategories of the C1 mass resolution category of the heavy-flavor (HF) analysis for 2018 candidate events with two global muons and one tracker muon. Data are shown with black markers. The background-only fit and the expected signal for $ \mathcal{B}(\tau \!\to\! 3\mu) = $ 10$^{-7} $ are shown with blue and red lines, respectively. |
png pdf |
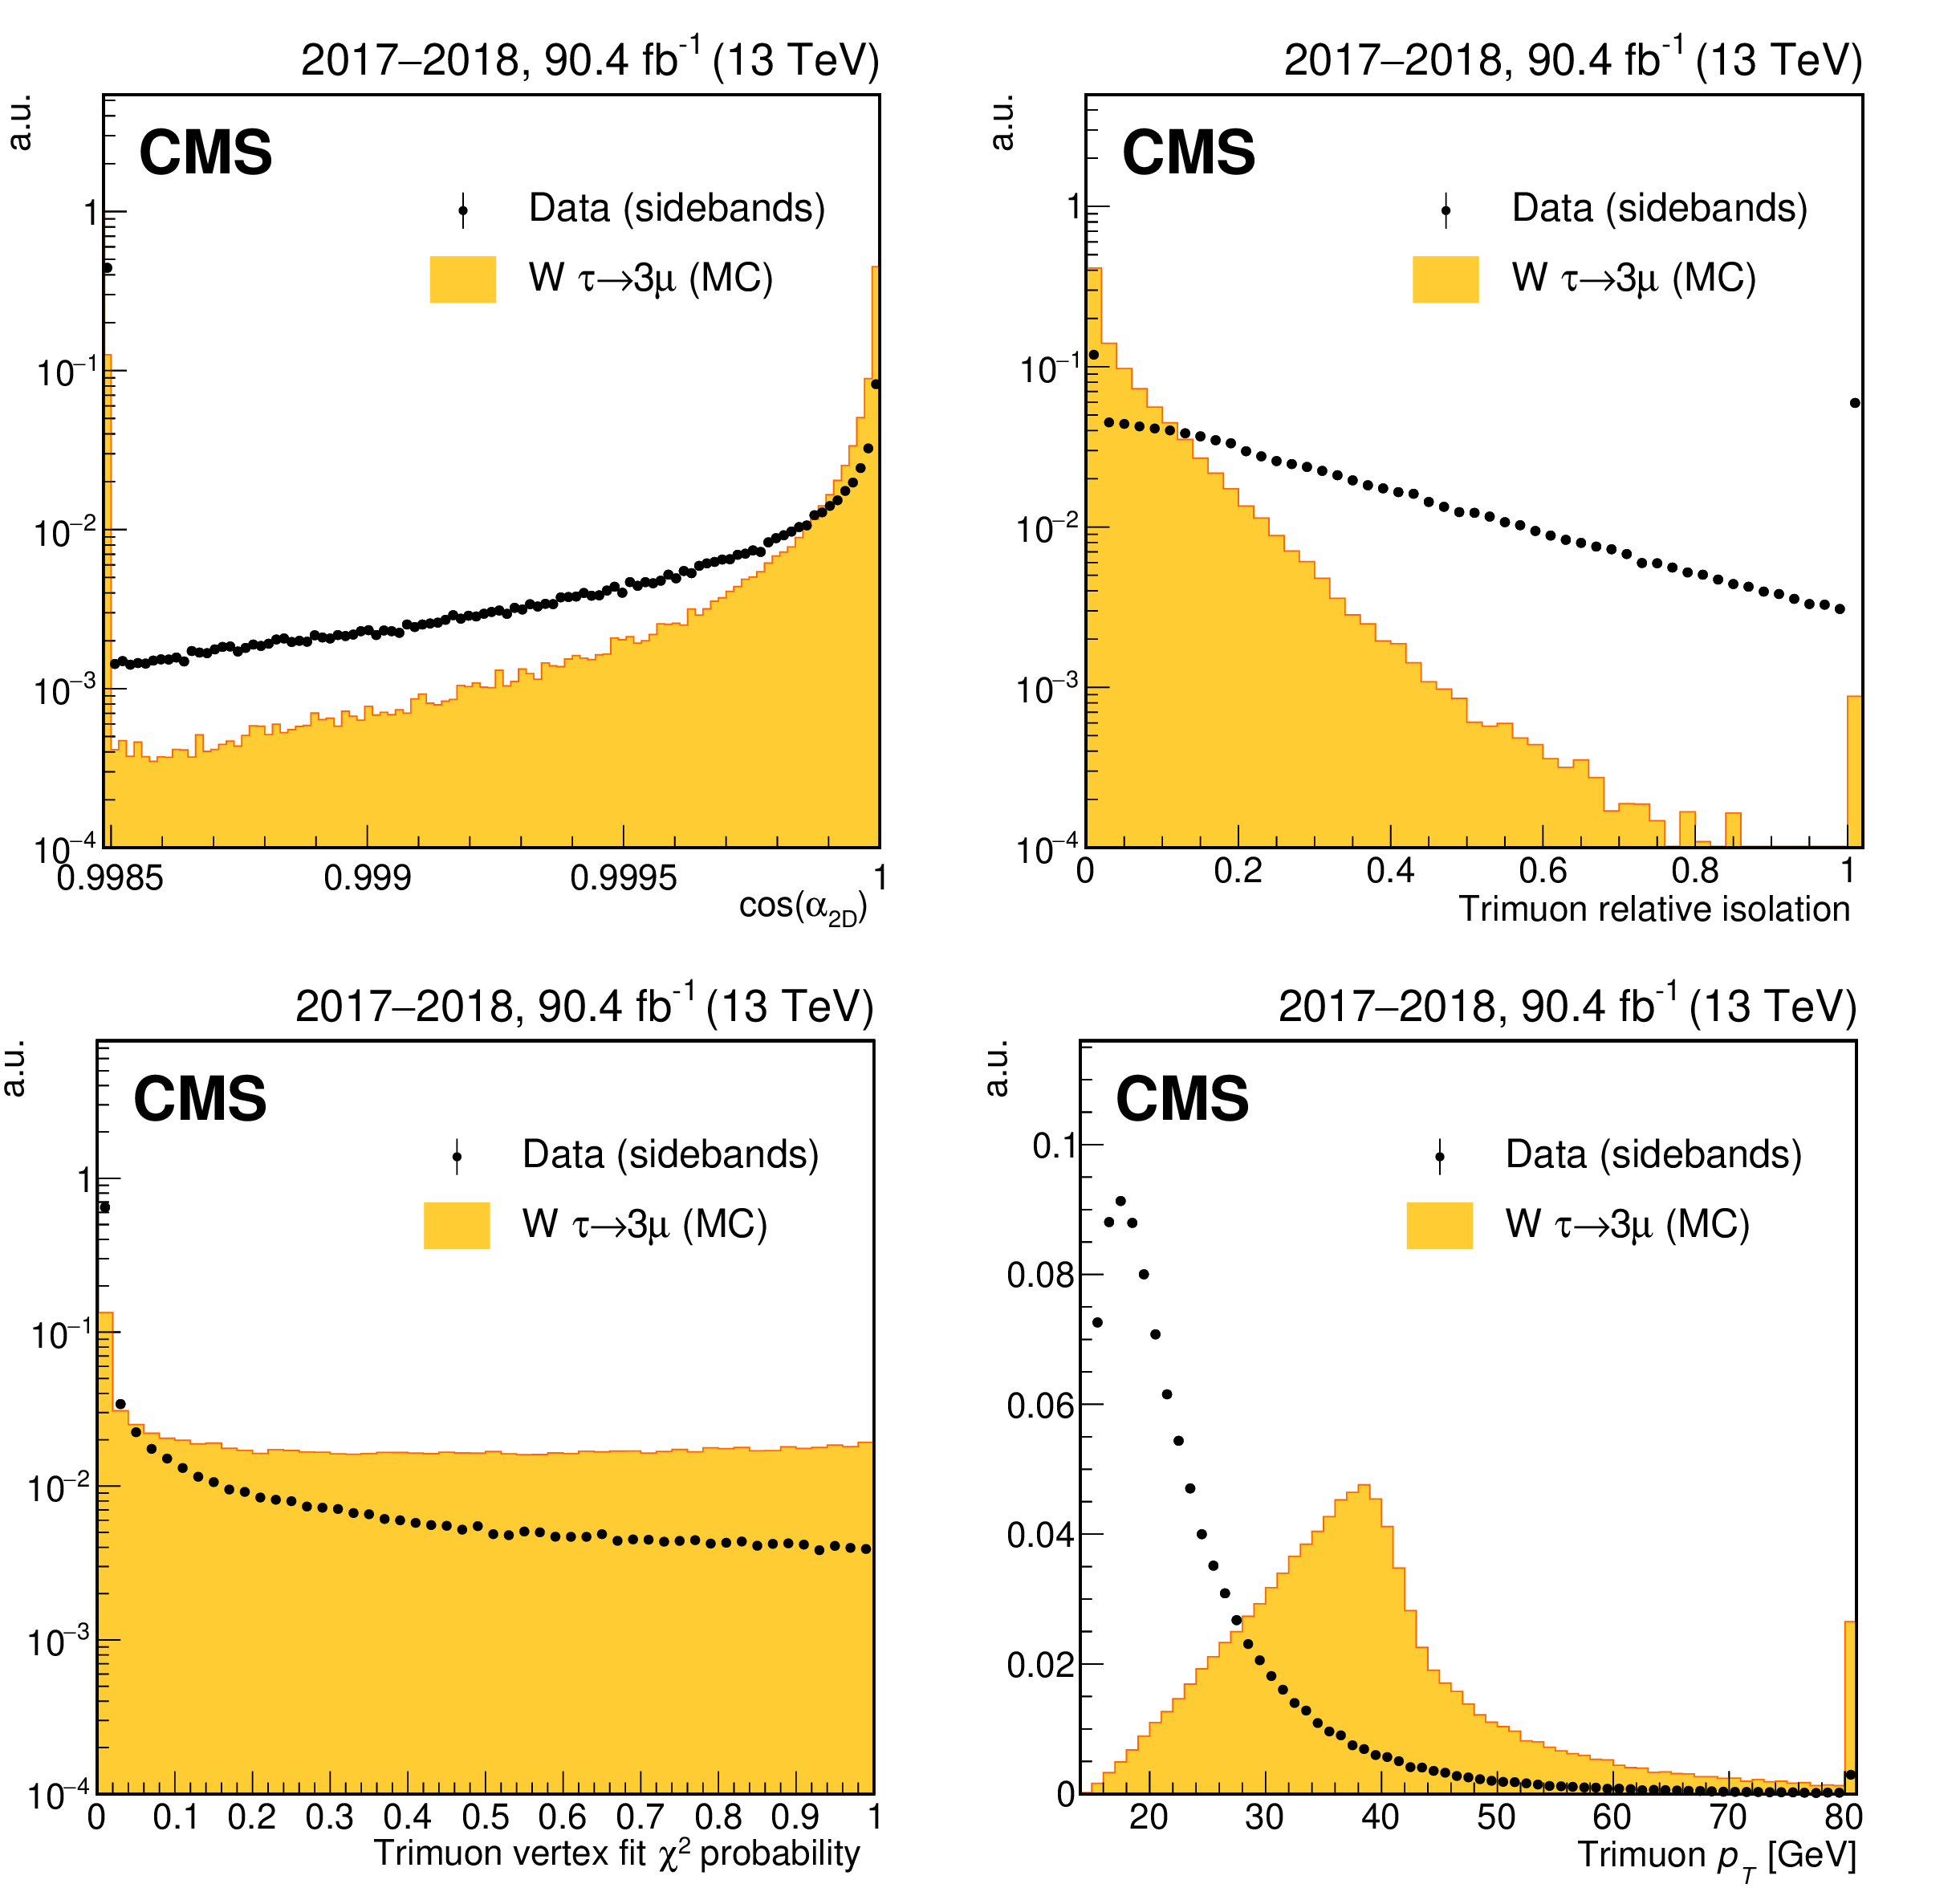
Figure 5:
Signal and background distributions for the four observables with the highest discrimination power used for the W boson analysis BDT training: cos($ \alpha_{\mathrm{2D}} $) (upper left), relative isolation observable of the trimuon system (upper right), trimuon vertex fit $ \chi^2 $ probability (lower left), trimuon $ p_{\mathrm{T}} $ (lower right). The signal and background distributions are obtained respectively from MC simulation and from the mass-sideband regions in data. All distributions are normalized to unit area. The leftmost (rightmost) bins include underflow (overflow). |

png pdf |
Figure 5-a:
Signal and background distributions for cos($ \alpha_{\mathrm{2D}} $), a variable used for the W boson analysis BDT training. The signal and background distributions are obtained respectively from MC simulation and from the mass-sideband regions in data. All distributions are normalized to unit area. The leftmost (rightmost) bin includes underflow (overflow). |
png pdf |
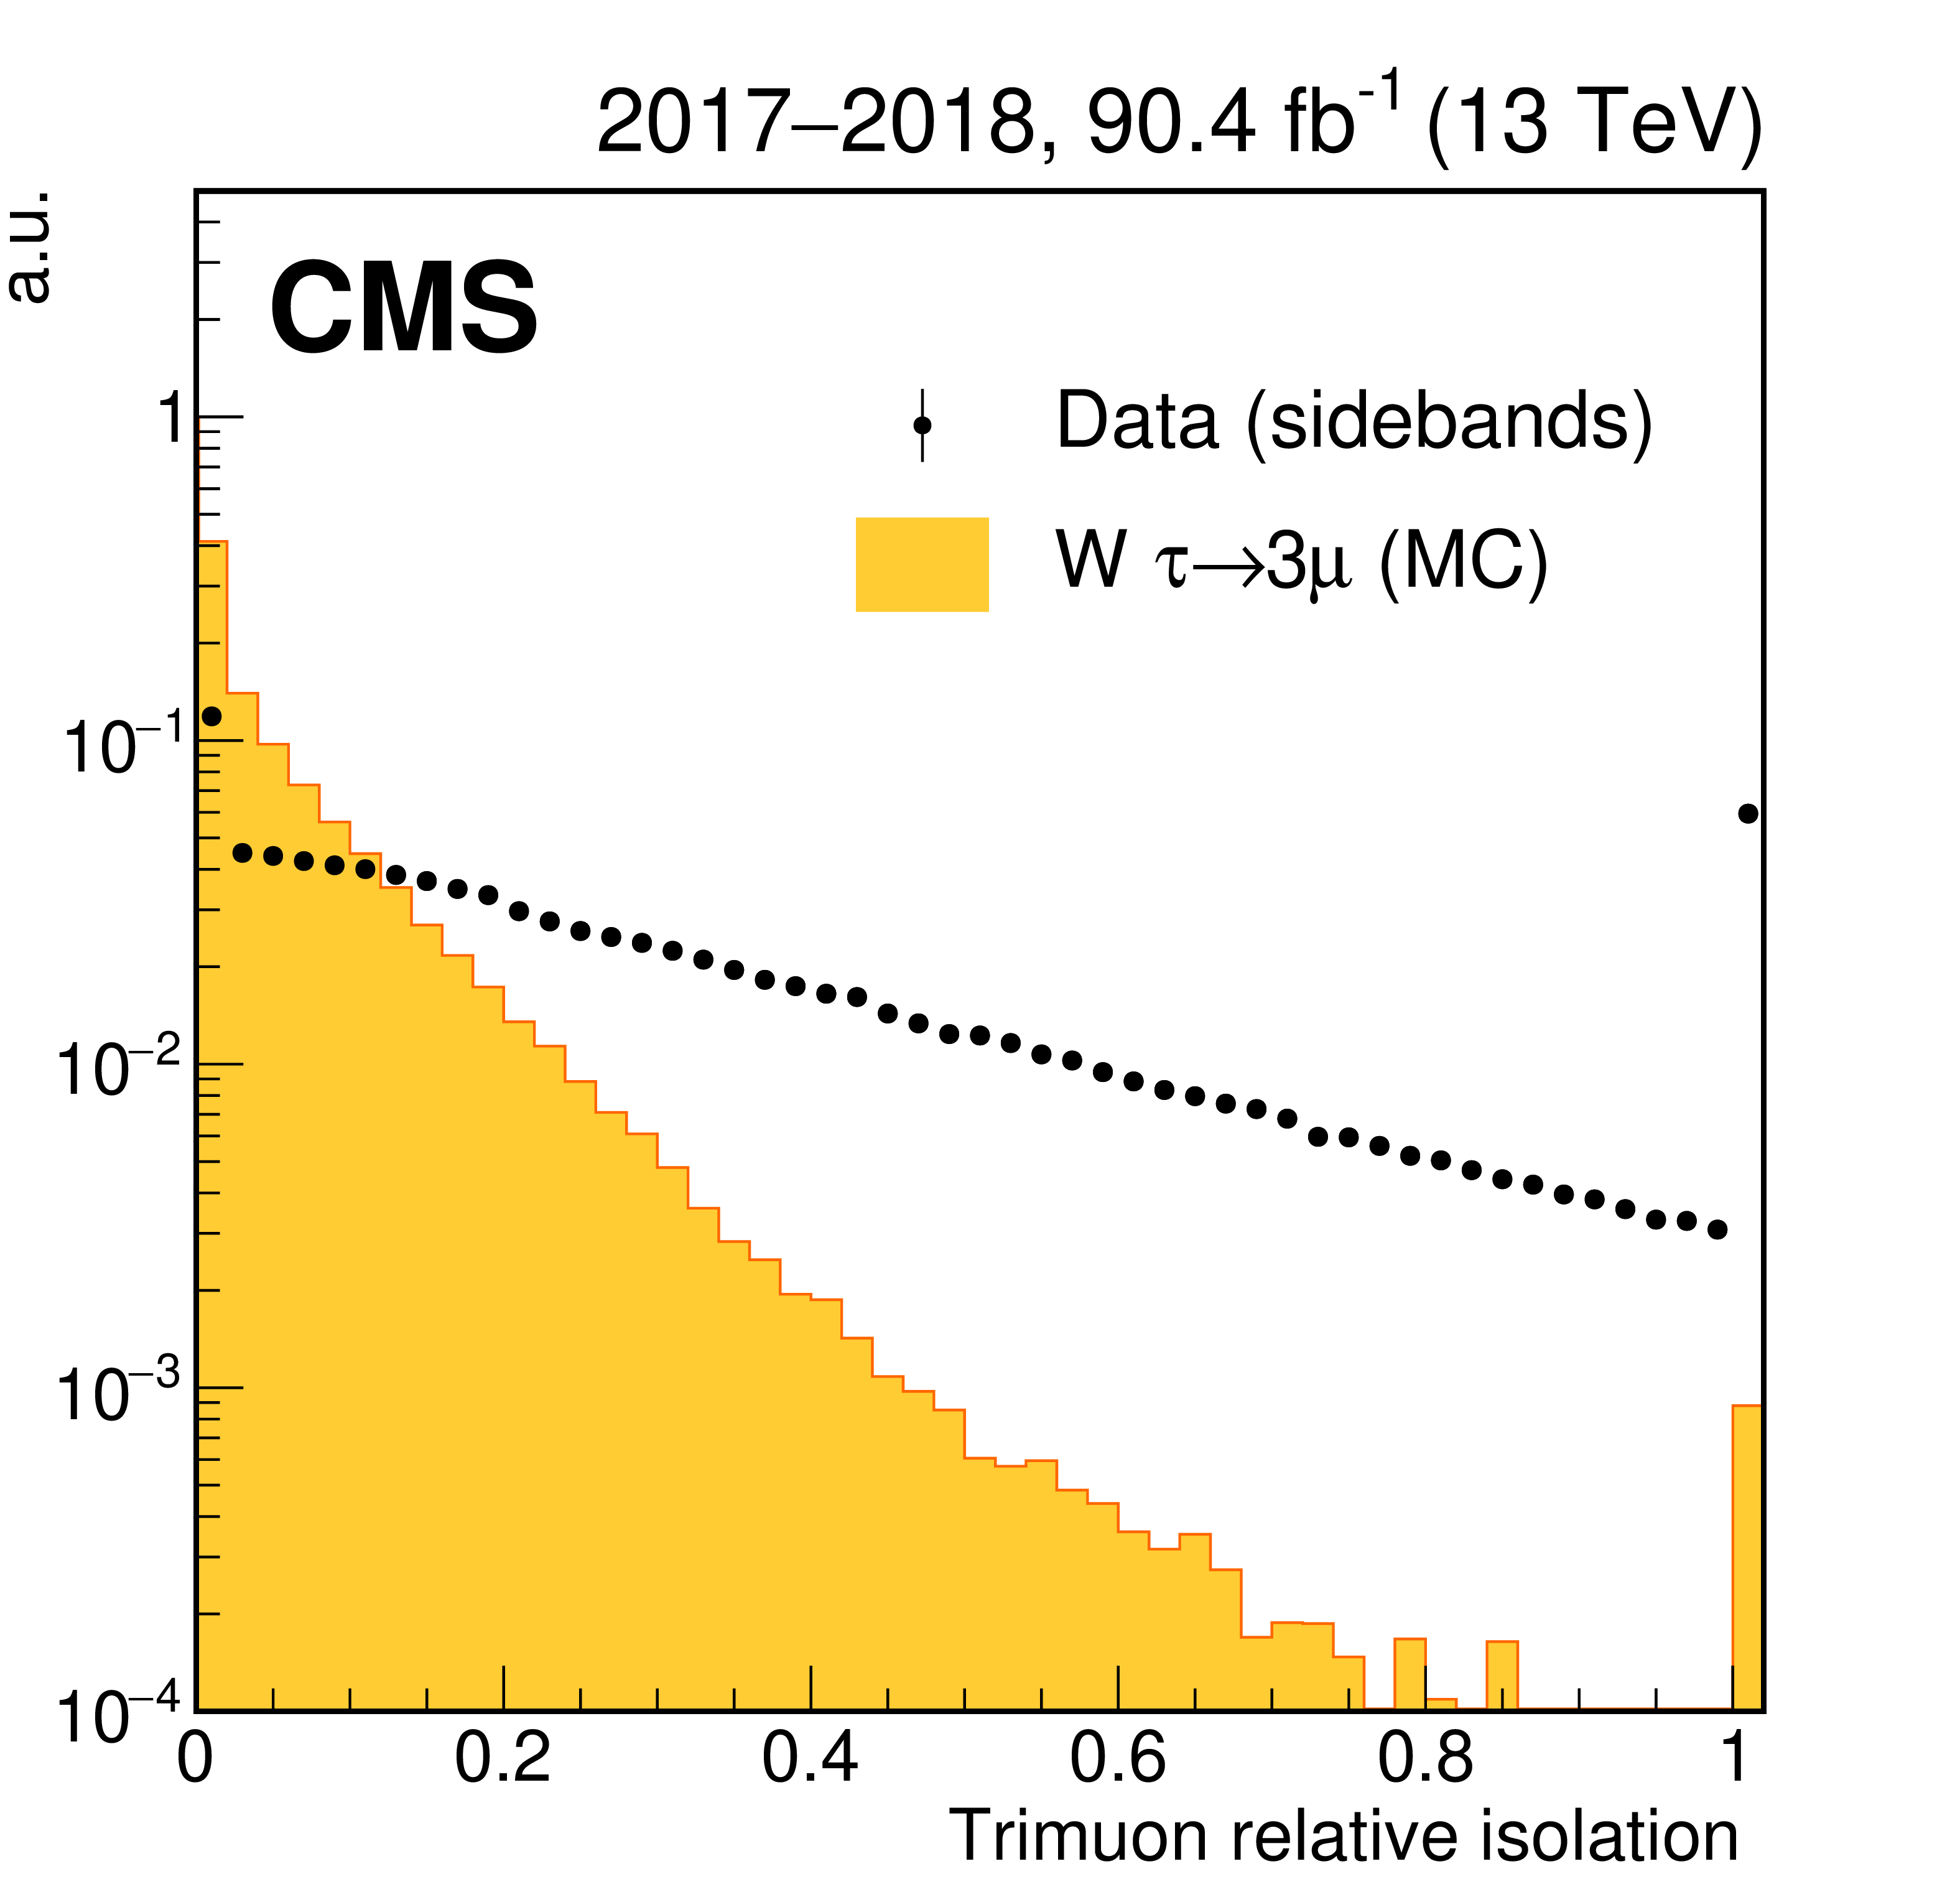
Figure 5-b:
Signal and background distributions for the relative isolation observable of the trimuon system, a variable used for the W boson analysis BDT training. The signal and background distributions are obtained respectively from MC simulation and from the mass-sideband regions in data. All distributions are normalized to unit area. The rightmost bin includes overflow. |
png pdf |
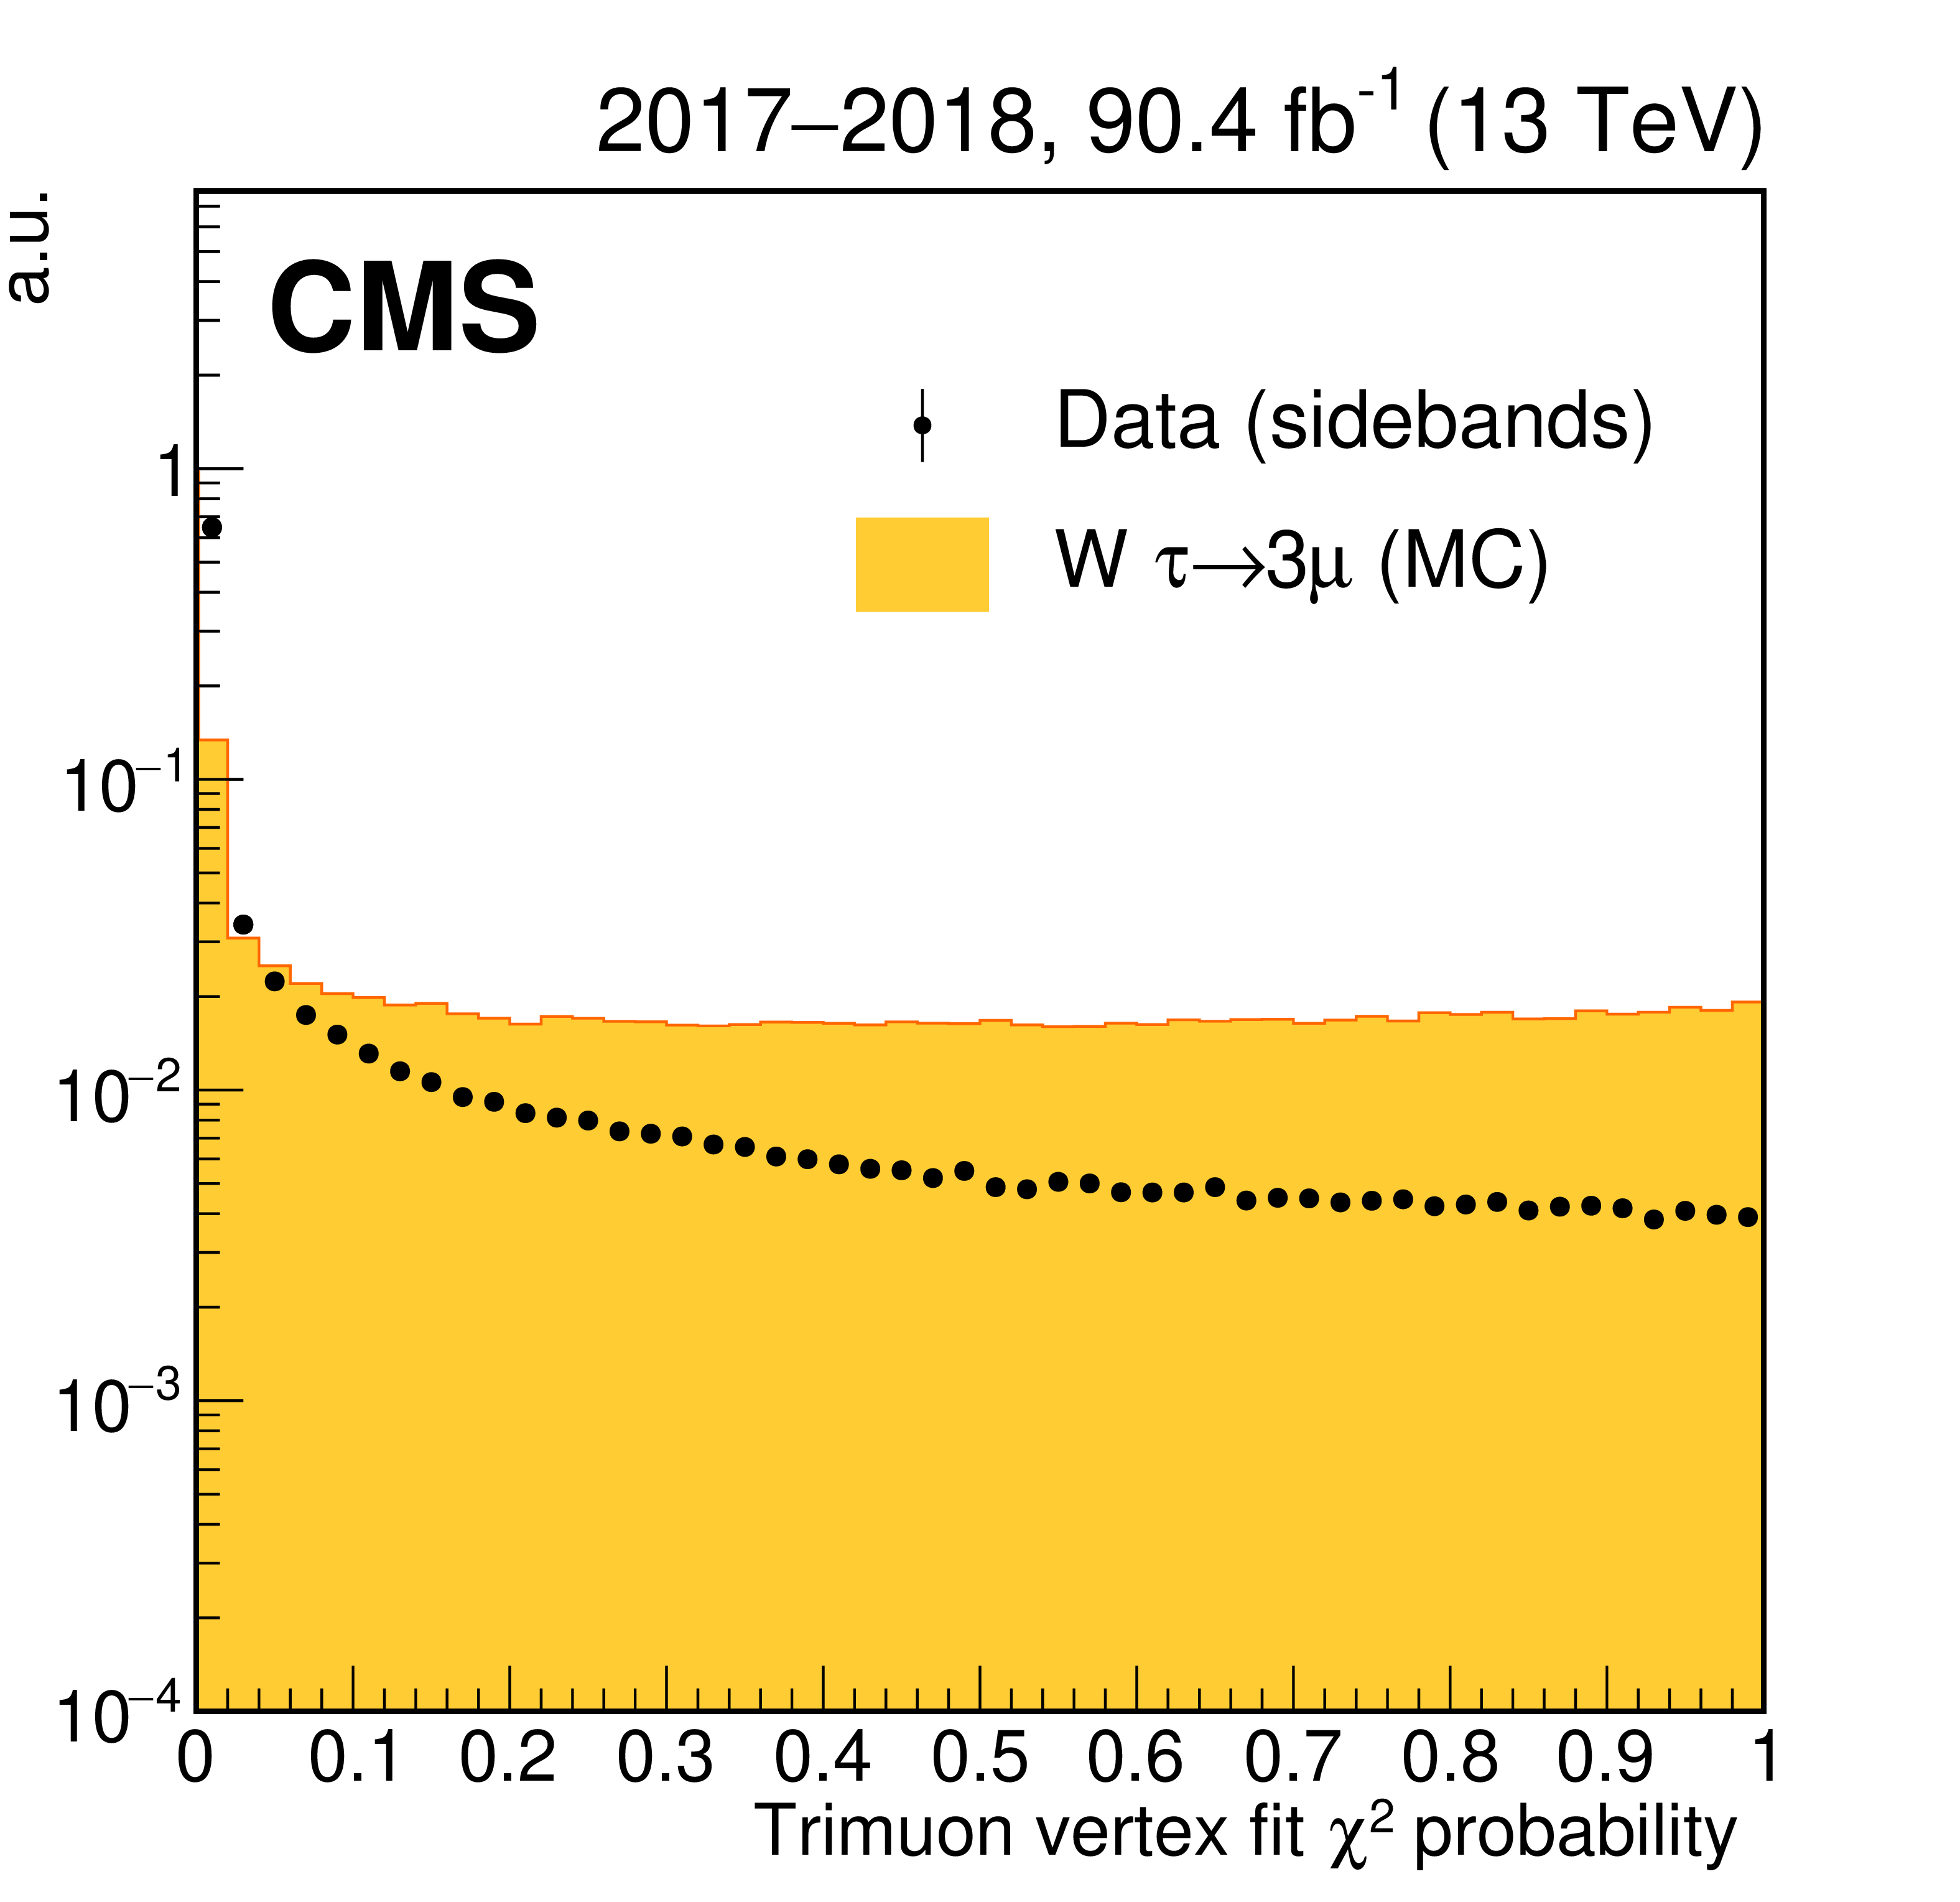
Figure 5-c:
Signal and background distributions for thetrimuon vertex fit $ \chi^2 $ probability, a variable used for the W boson analysis BDT training. The signal and background distributions are obtained respectively from MC simulation and from the mass-sideband regions in data. All distributions are normalized to unit area. The rightmost bin includes overflow. |

png pdf |
Figure 5-d:
Signal and background distributions for the trimuon $ p_{\mathrm{T}} $ , a variable used for the W boson analysis BDT training. The signal and background distributions are obtained respectively from MC simulation and from the mass-sideband regions in data. All distributions are normalized to unit area. The rightmost bin includes overflow. |

png pdf |
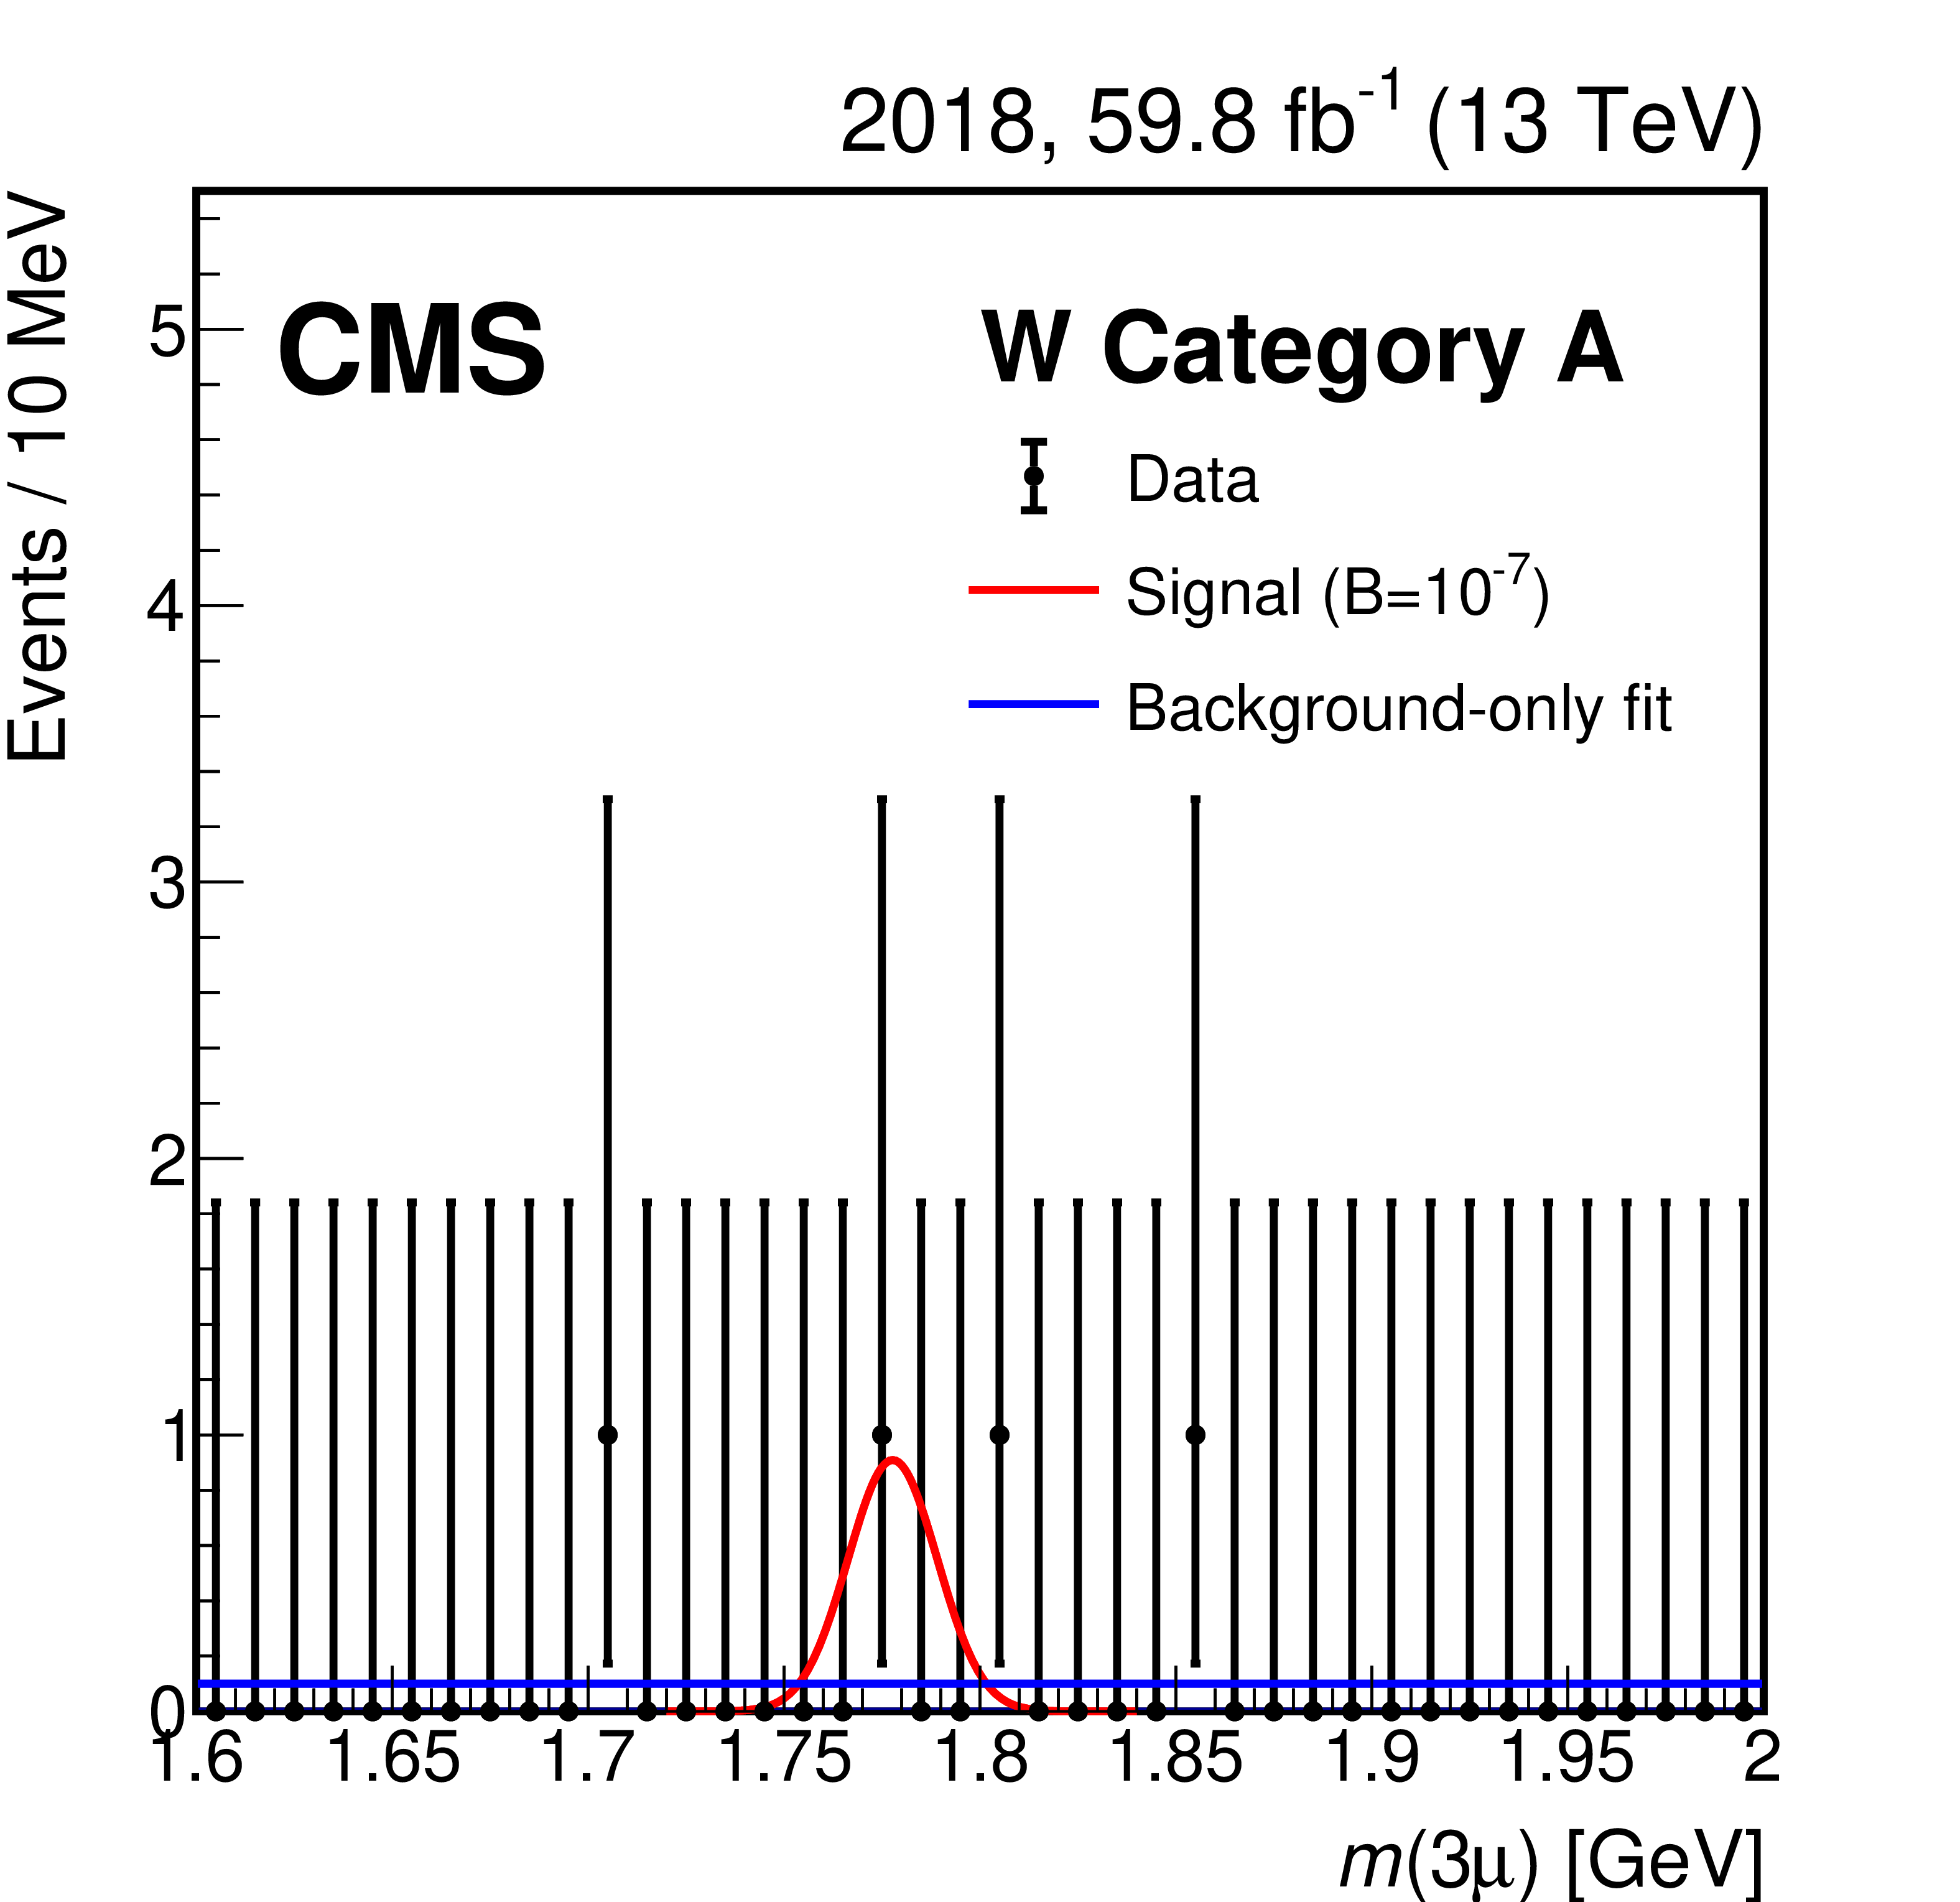
Figure 6:
Trimuon mass distributions of the 2017 (left) and 2018 (right) data events in the three mass resolution categories A (upper), B (middle), and C (lower) of the W boson analysis. Data are shown with black markers. The background-only fit and the expected signal for $ \mathcal{B}(\tau \!\to\! 3\mu) = $ 10$^{-7} $ are shown with blue and red lines, respectively. |
png pdf |
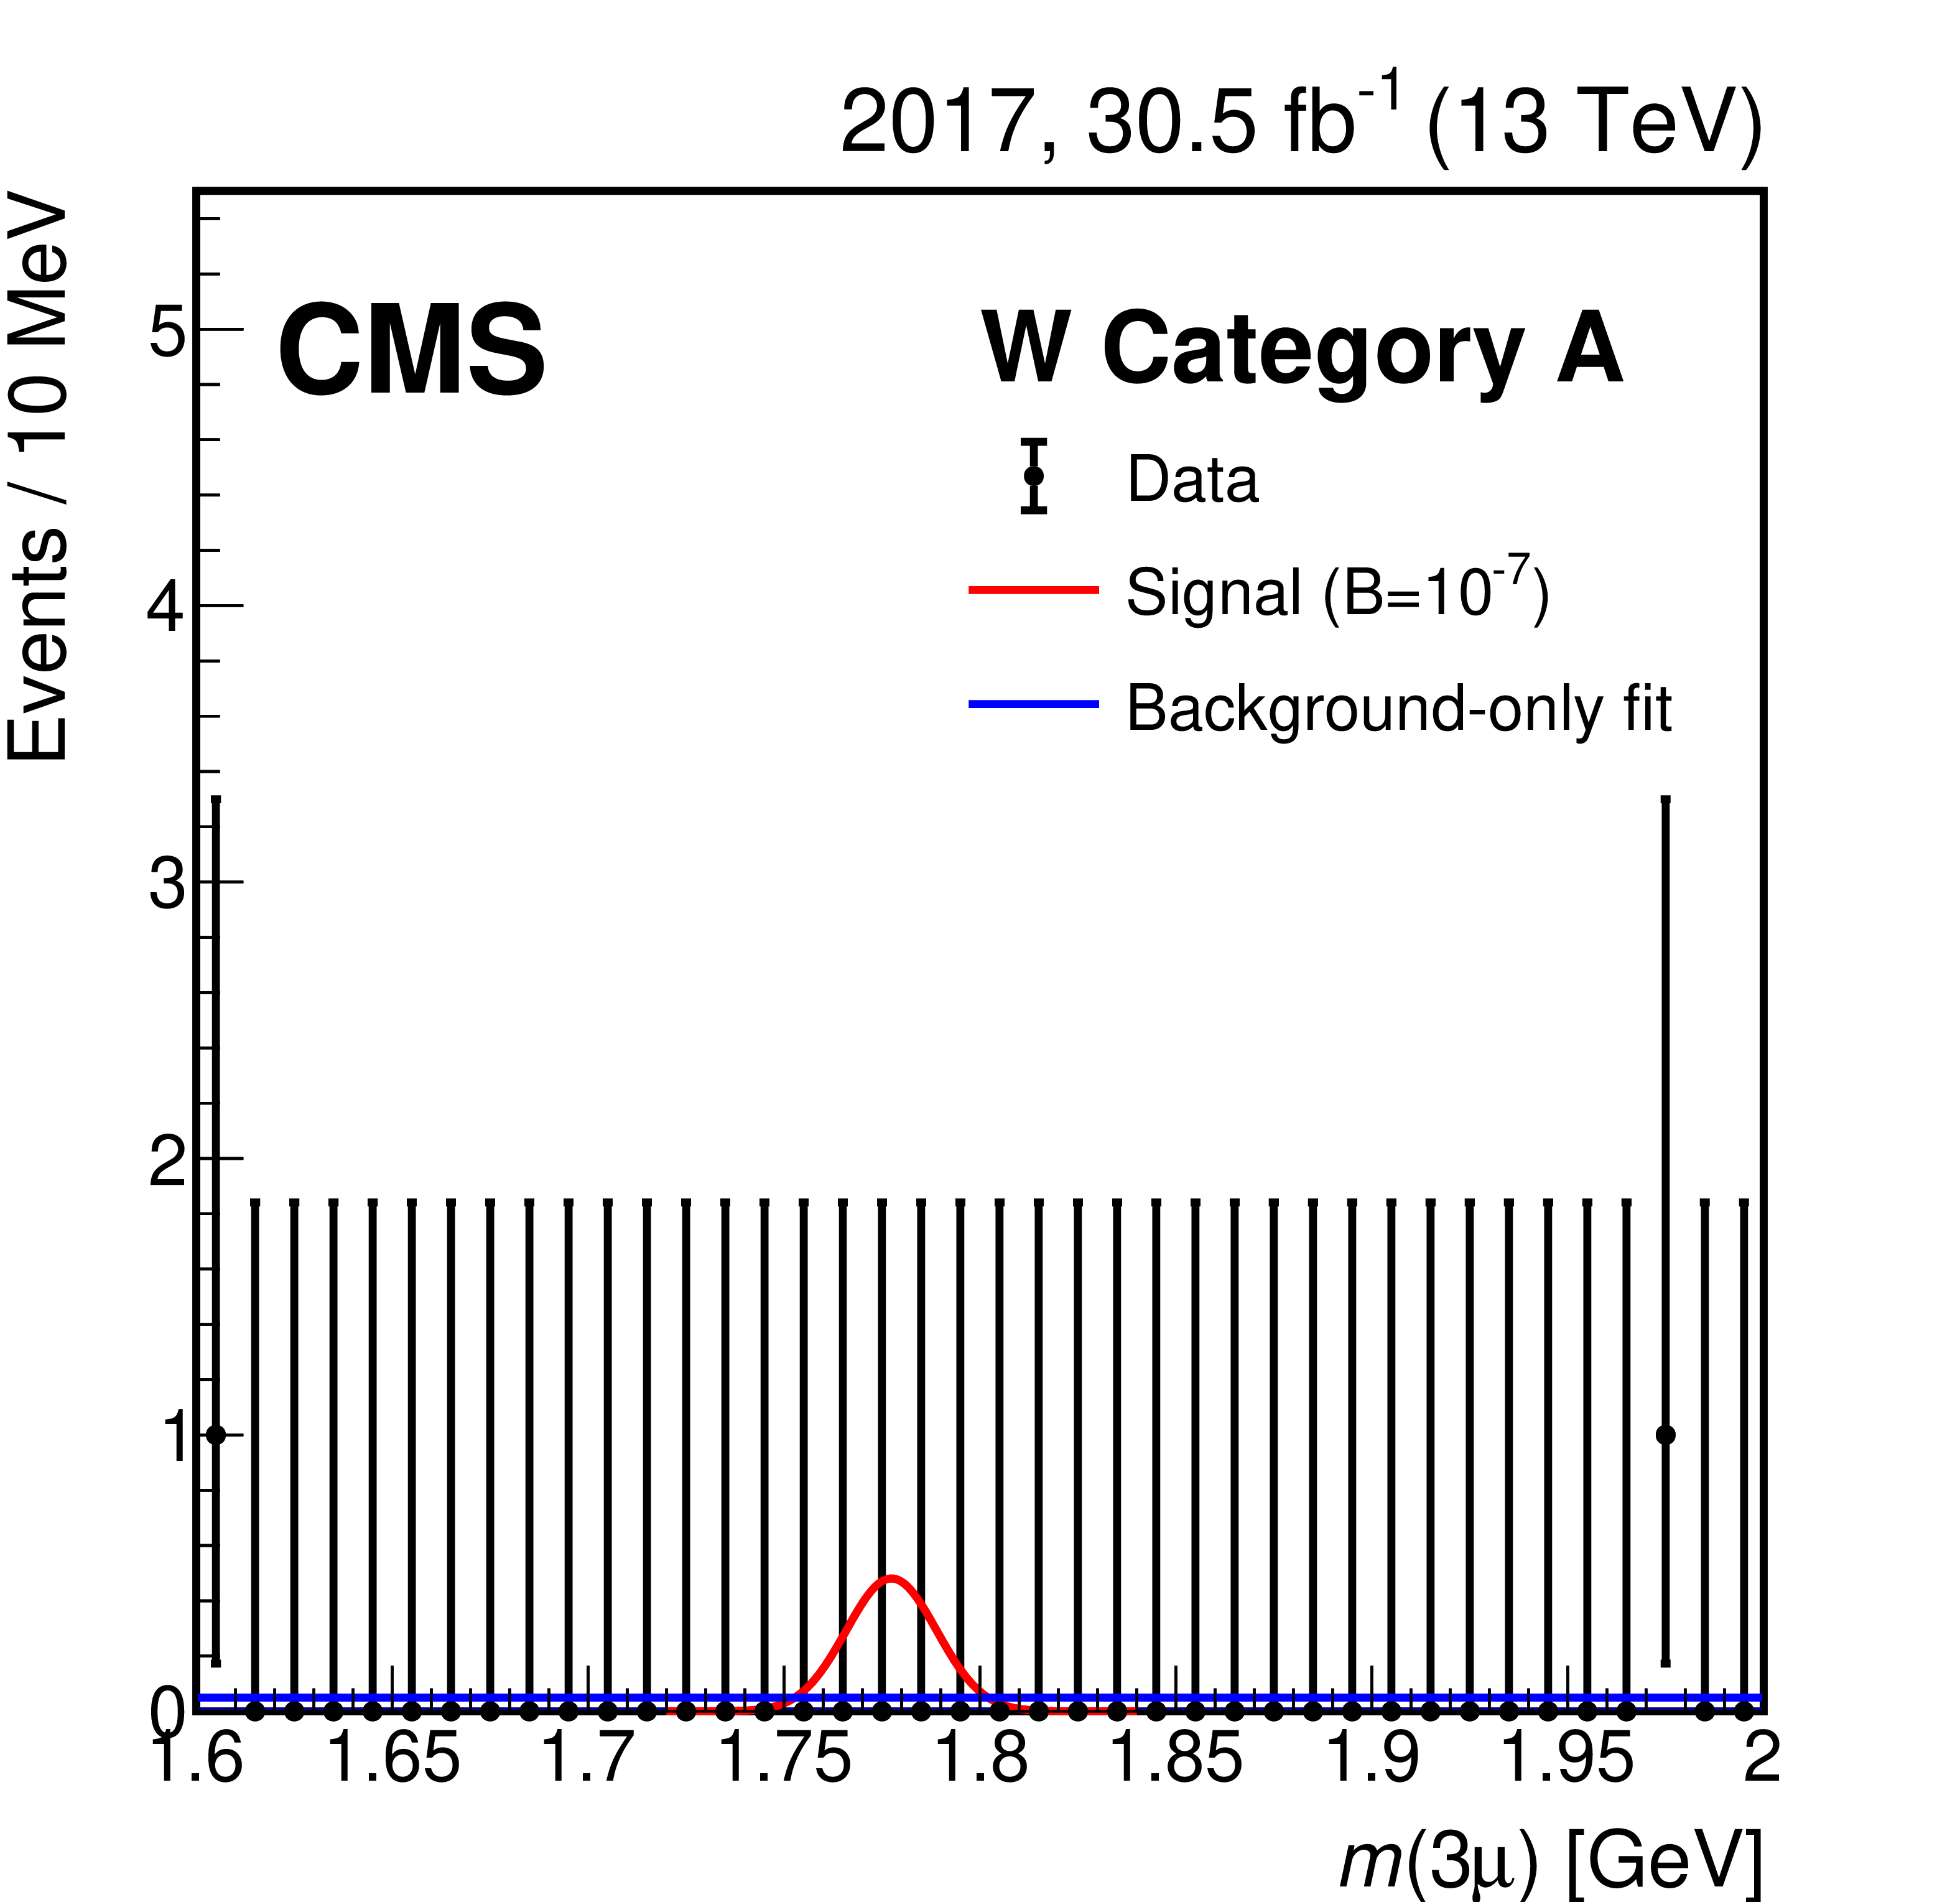
Figure 6-a:
Trimuon mass distribution of the 2017 data events in the A mass resolution category of the W boson analysis. Data are shown with black markers. The background-only fit and the expected signal for $ \mathcal{B}(\tau \!\to\! 3\mu) = $ 10$^{-7} $ are shown with blue and red lines, respectively. |
png pdf |
Figure 6-b:
Trimuon mass distribution of the 2018 data events in the A mass resolution category of the W boson analysis. Data are shown with black markers. The background-only fit and the expected signal for $ \mathcal{B}(\tau \!\to\! 3\mu) = $ 10$^{-7} $ are shown with blue and red lines, respectively. |
png pdf |
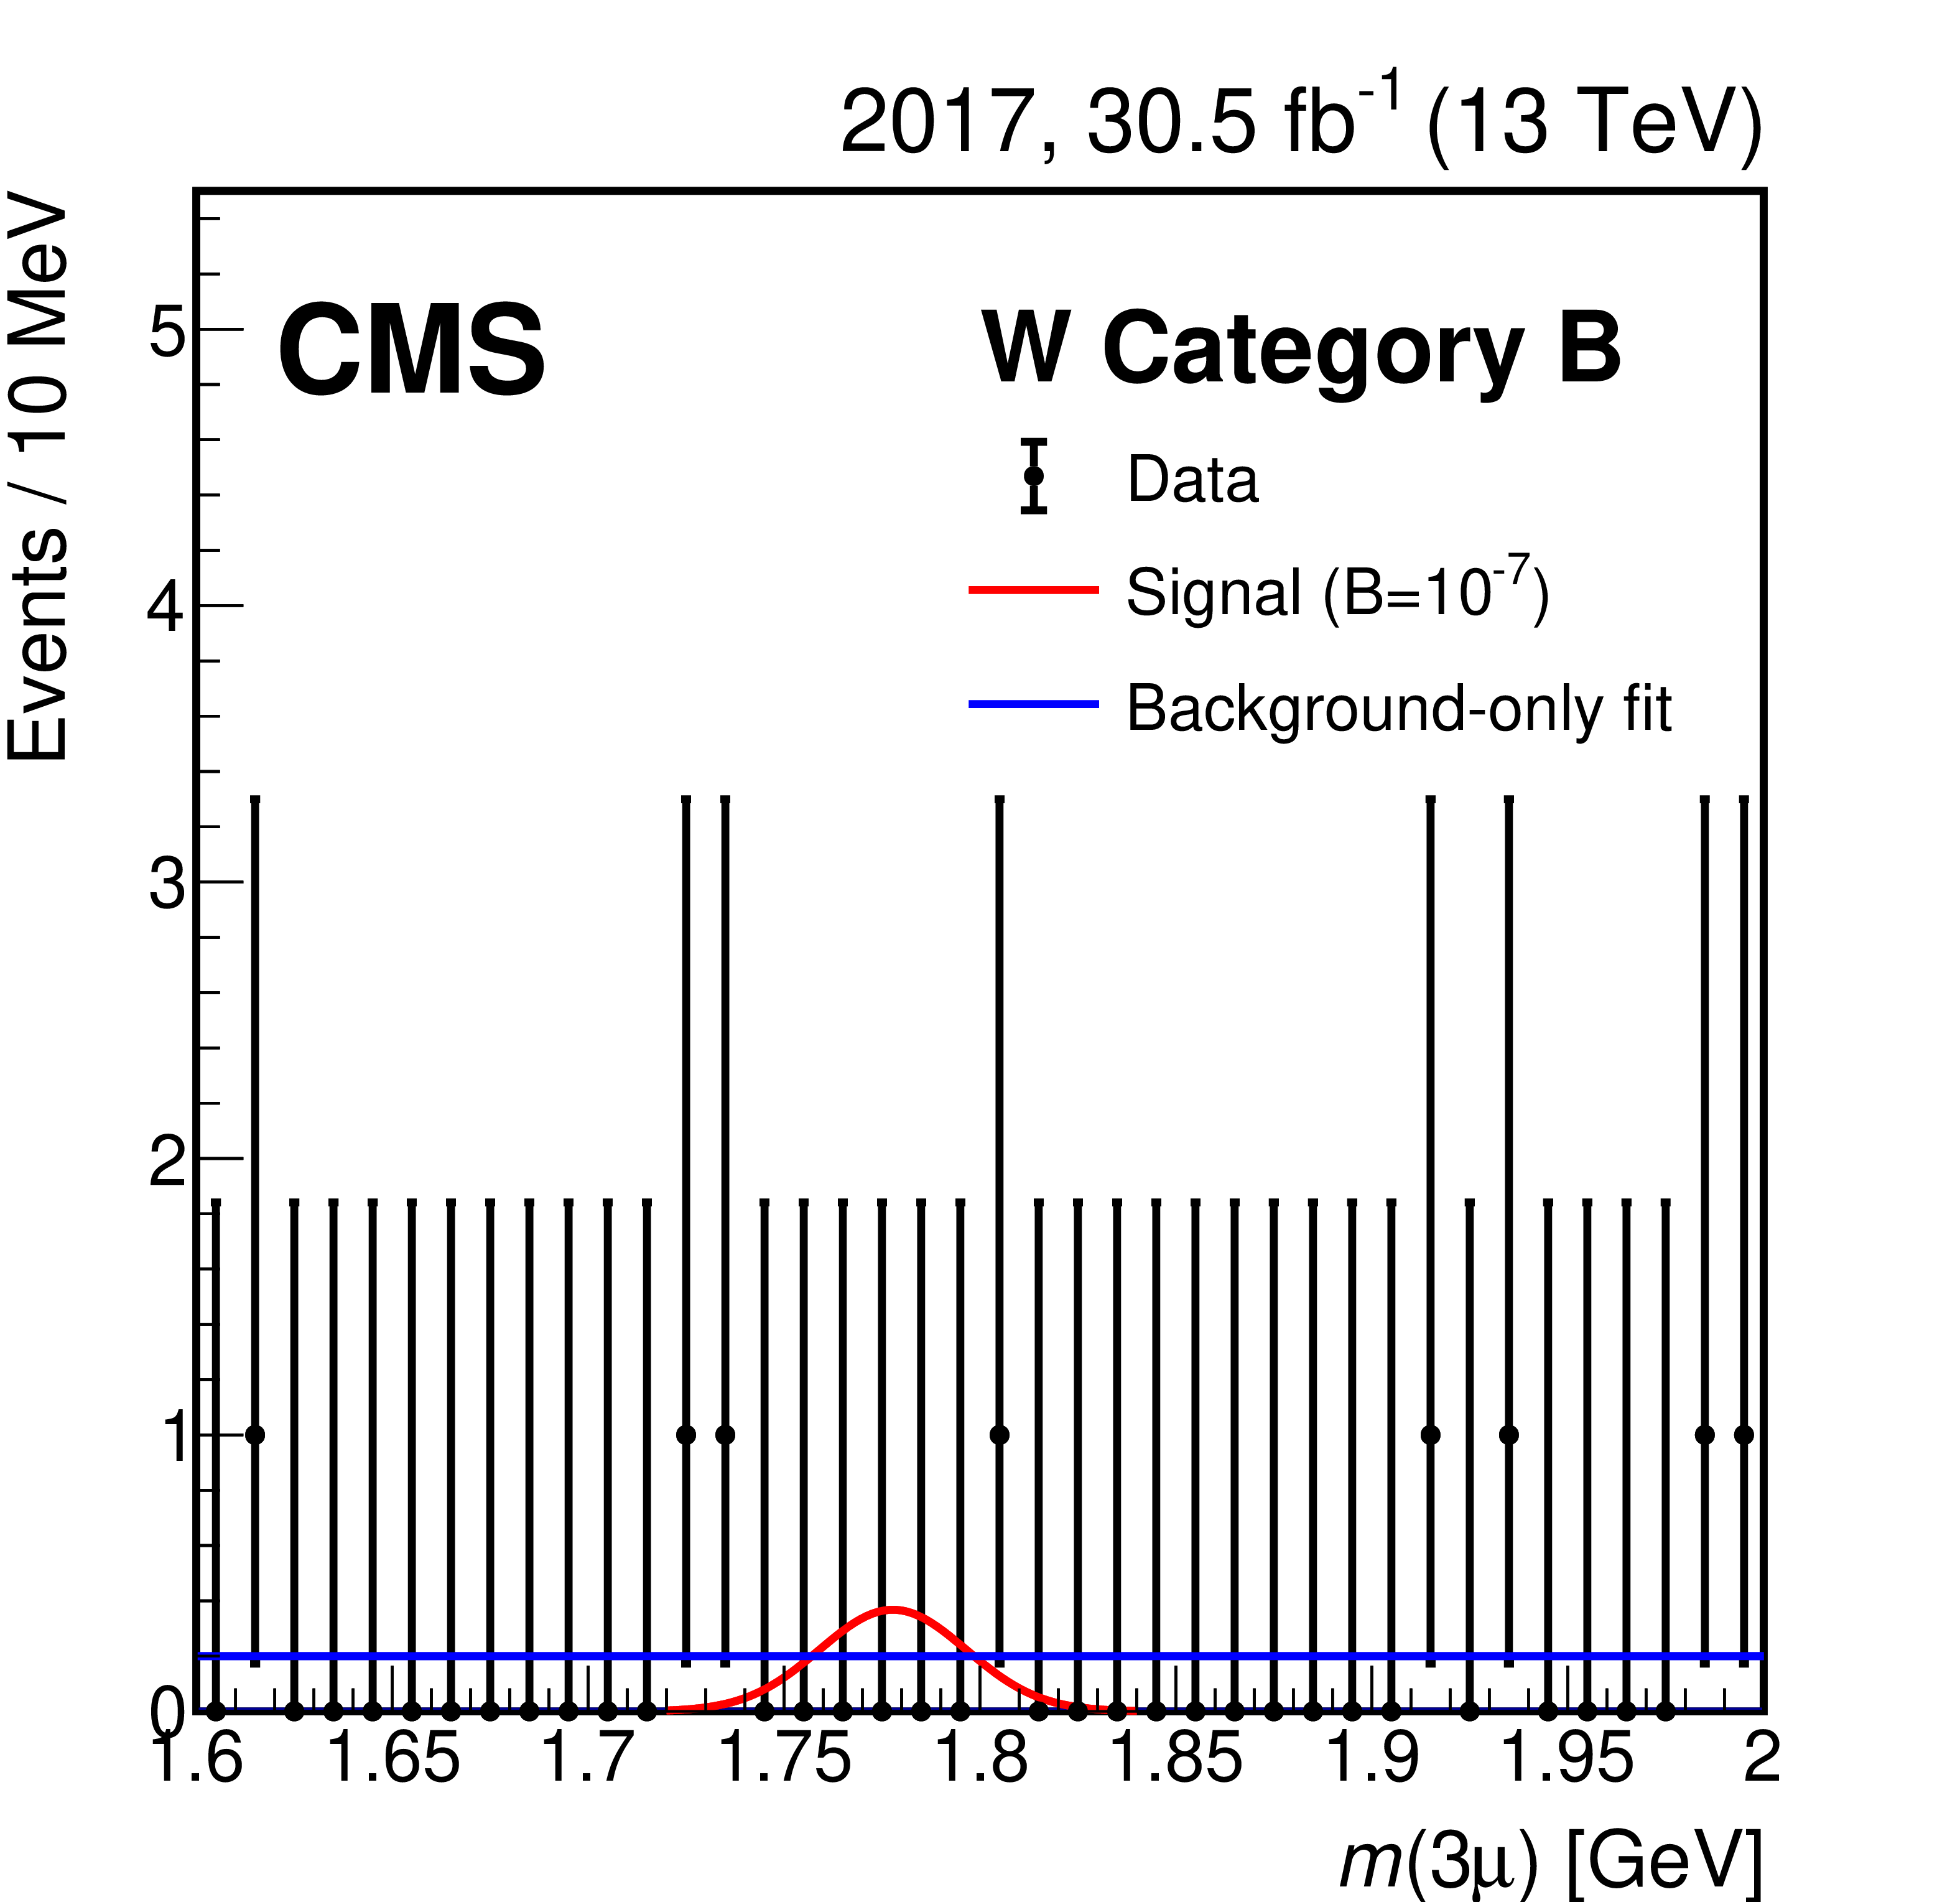
Figure 6-c:
Trimuon mass distribution of the 2017 data events in the B mass resolution category of the W boson analysis. Data are shown with black markers. The background-only fit and the expected signal for $ \mathcal{B}(\tau \!\to\! 3\mu) = $ 10$^{-7} $ are shown with blue and red lines, respectively. |
png pdf |
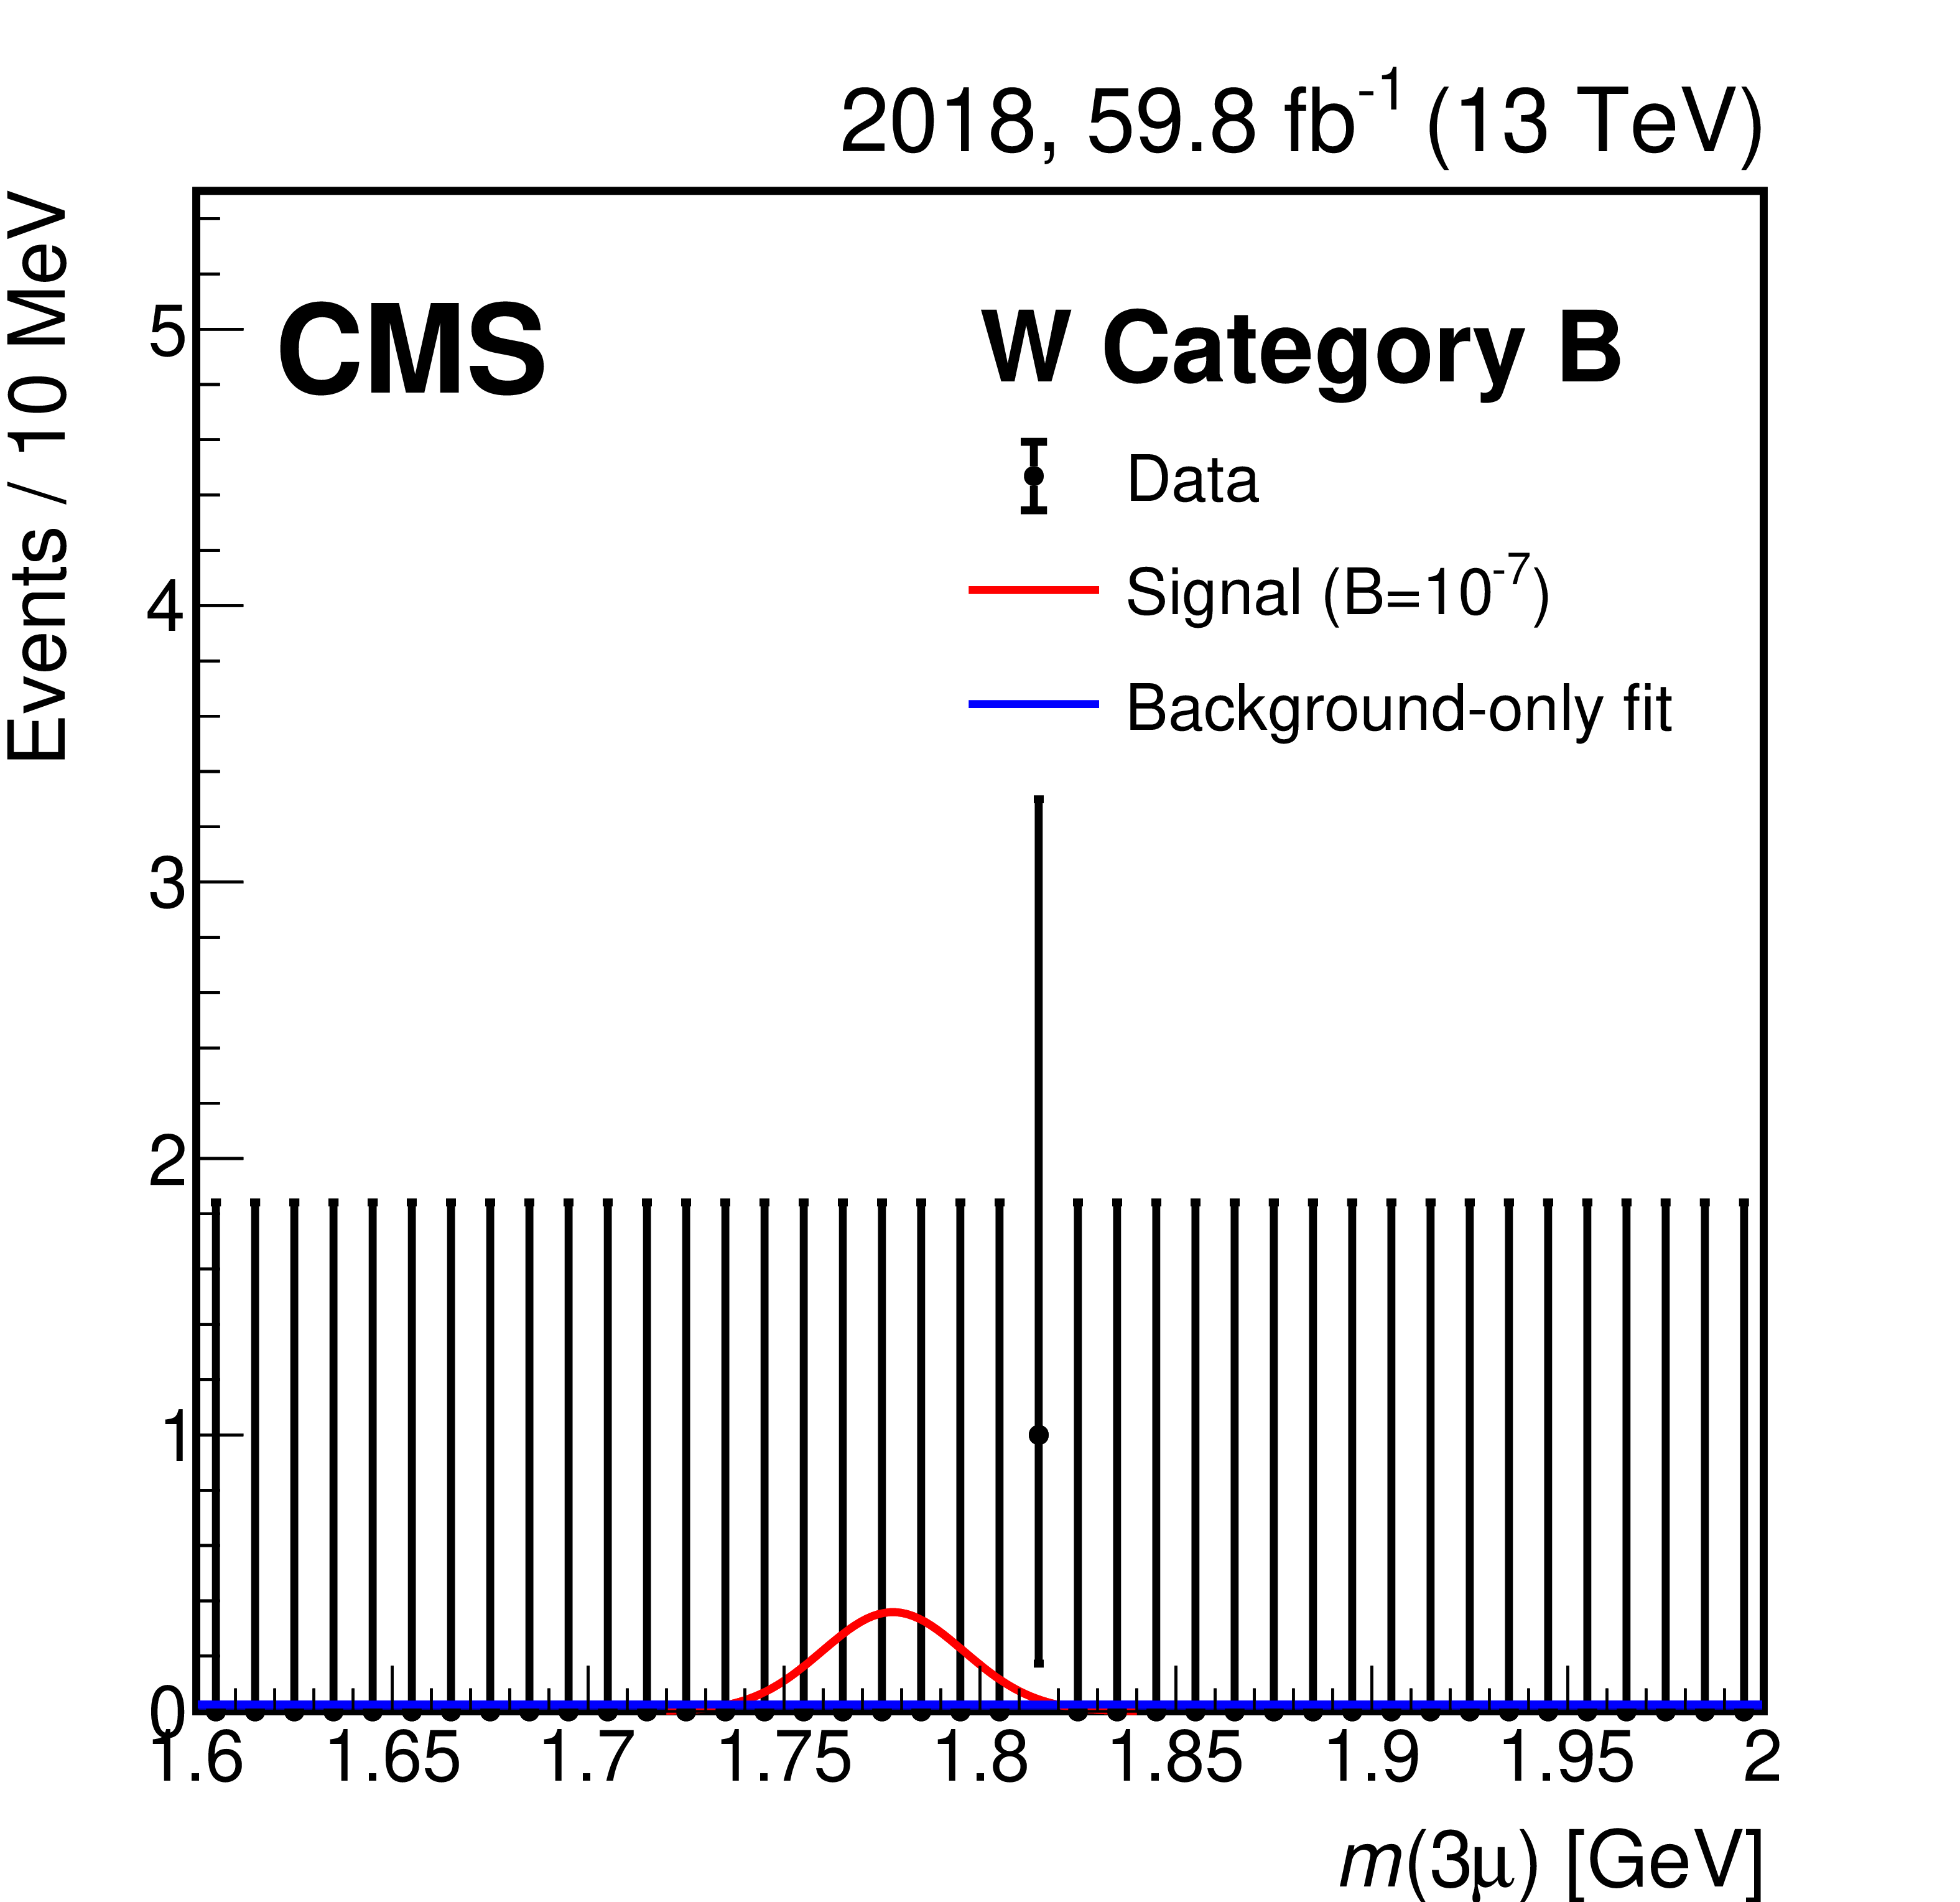
Figure 6-d:
Trimuon mass distribution of the 2018 data events in the B mass resolution category of the W boson analysis. Data are shown with black markers. The background-only fit and the expected signal for $ \mathcal{B}(\tau \!\to\! 3\mu) = $ 10$^{-7} $ are shown with blue and red lines, respectively. |

png pdf |
Figure 6-e:
Trimuon mass distribution of the 2017 data events in the C mass resolution category of the W boson analysis. Data are shown with black markers. The background-only fit and the expected signal for $ \mathcal{B}(\tau \!\to\! 3\mu) = $ 10$^{-7} $ are shown with blue and red lines, respectively. |
png pdf |
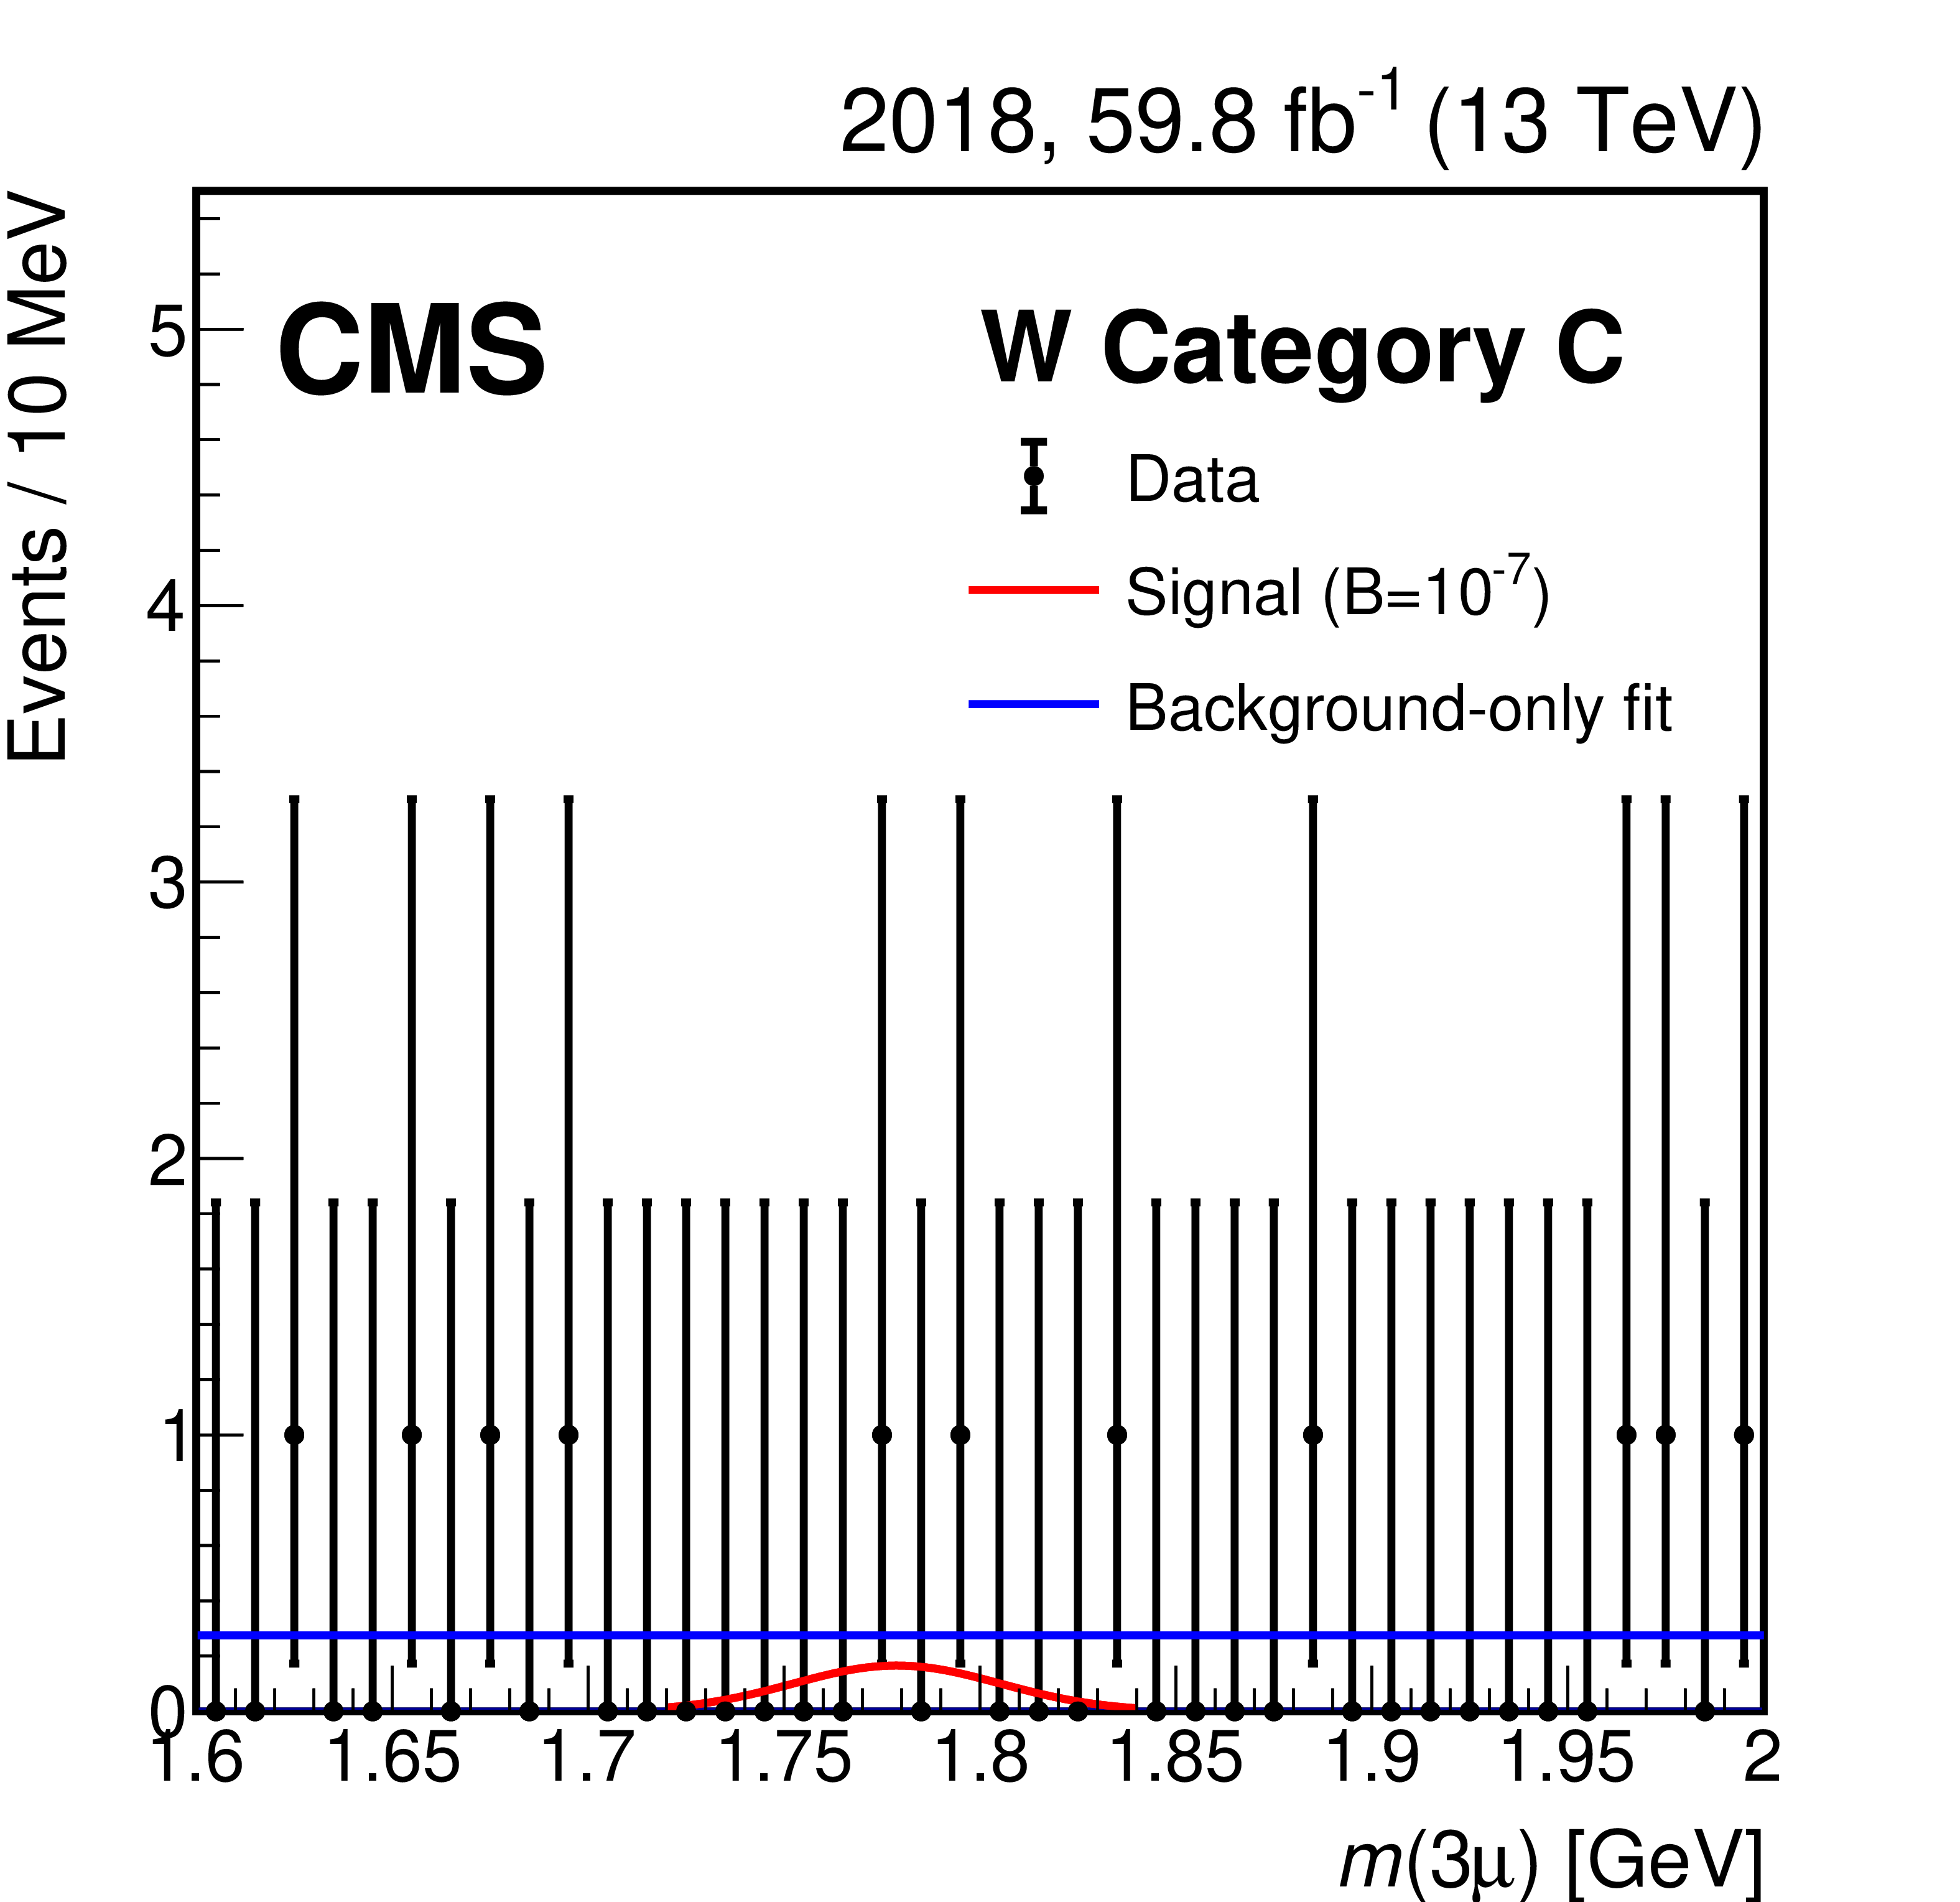
Figure 6-f:
Trimuon mass distribution of the 2018 data events in the C mass resolution category of the W boson analysis. Data are shown with black markers. The background-only fit and the expected signal for $ \mathcal{B}(\tau \!\to\! 3\mu) = $ 10$^{-7} $ are shown with blue and red lines, respectively. |
png pdf |
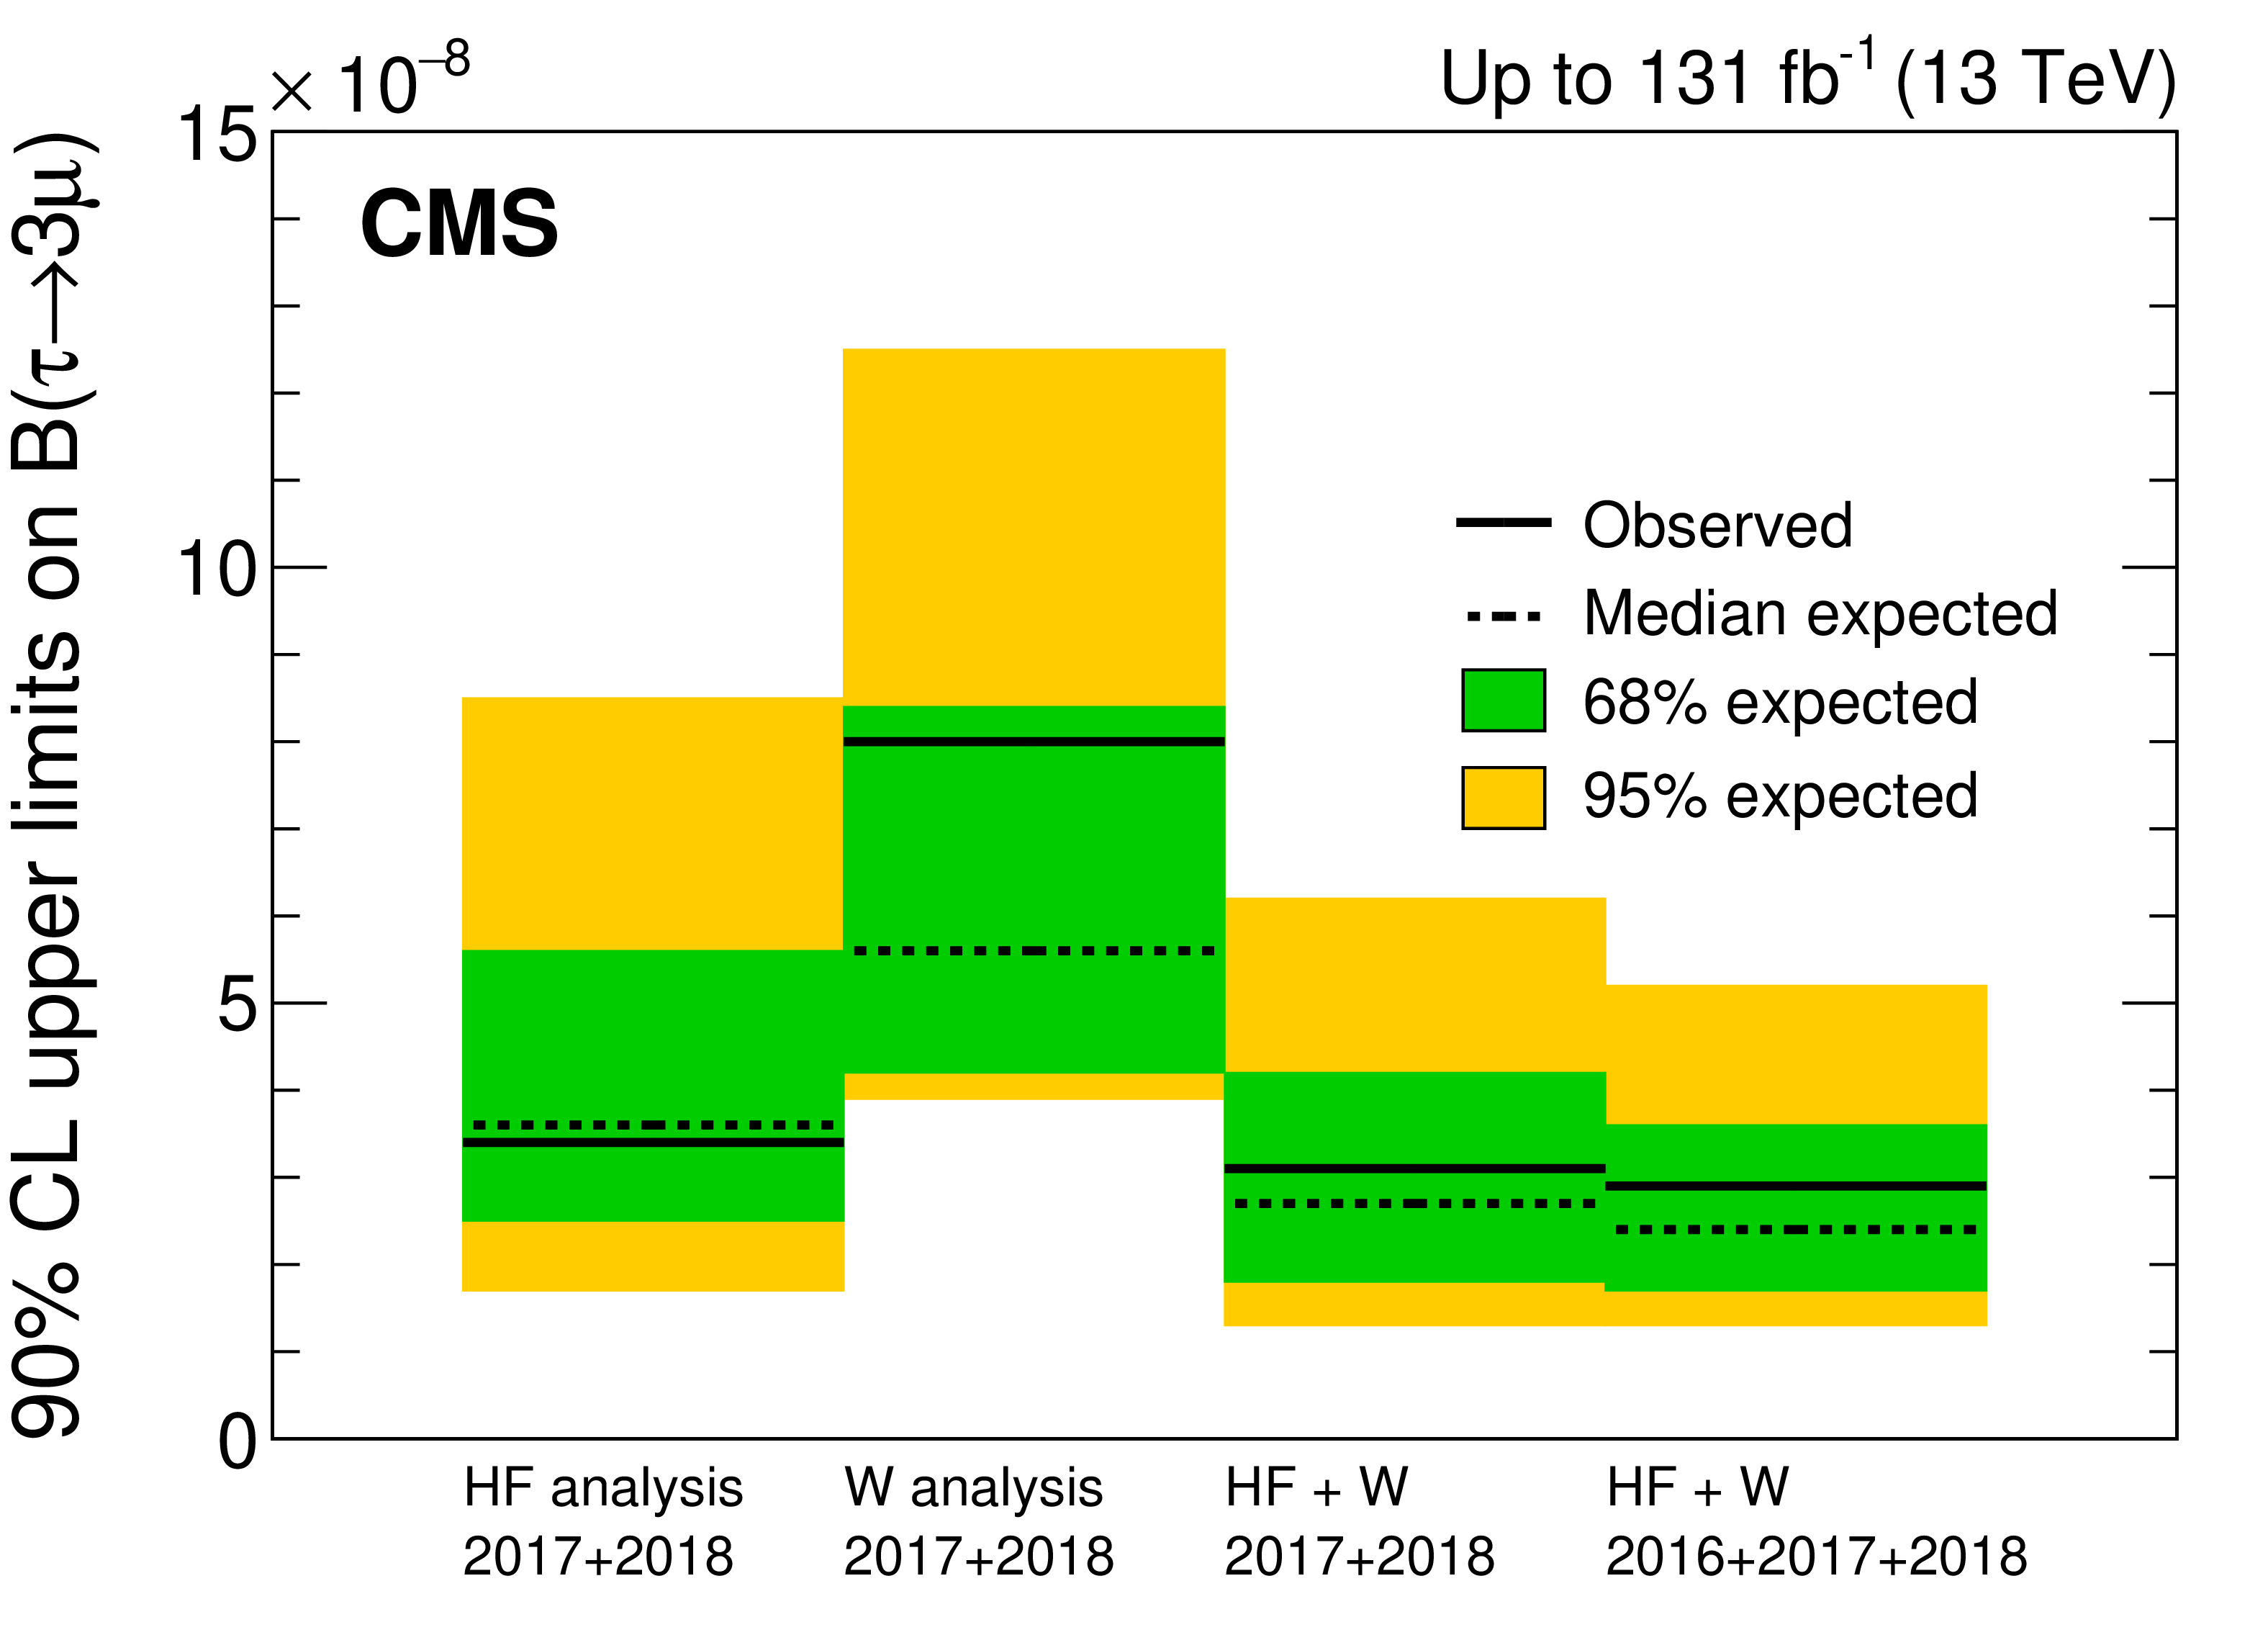
Figure 7:
Observed and expected upper limits on $ \mathcal{B}(\tau \!\to\! 3\mu) $ at 90% CL, from the heavy-flavor (HF) analysis, the W boson analysis, the combination of the two analyses, as well as their combination with the previously published result using 2016 data. |
| Summary |
| A search has been presented for the lepton flavor violating decay $ \tau \!\to\! 3\mu $, using proton-proton collisions at a center-of-mass energy of 13 TeV recorded by the CMS experiment at the LHC in 2017--2018. Tau leptons produced in heavy-flavor hadron decays and W boson decays are exploited in the analysis. The results from this analysis are combined with those of an earlier analysis using 2016 data, which gives a combined total integrated luminosity of 131 fb$ ^{-1} $. The observed (expected) upper limit on the branching fraction $ \mathcal{B}(\tau \!\to\! 3\mu) $ is 2.9 (2.4) $\times $ 10$^{-8} $ at 90% confidence level, and 3.6 (3.0) $\times $ 10$^{-8} $ at 95% confidence level. The result obtained in this search is the best from a hadron collider experiment, and comparable with the current most restrictive one from the Belle experiment. As this limit is dominated by the statistical uncertainty, the additional data now being collected will provide even more stringent tests of the standard model with this decay channel. |
| Additional Figures | |
png pdf |
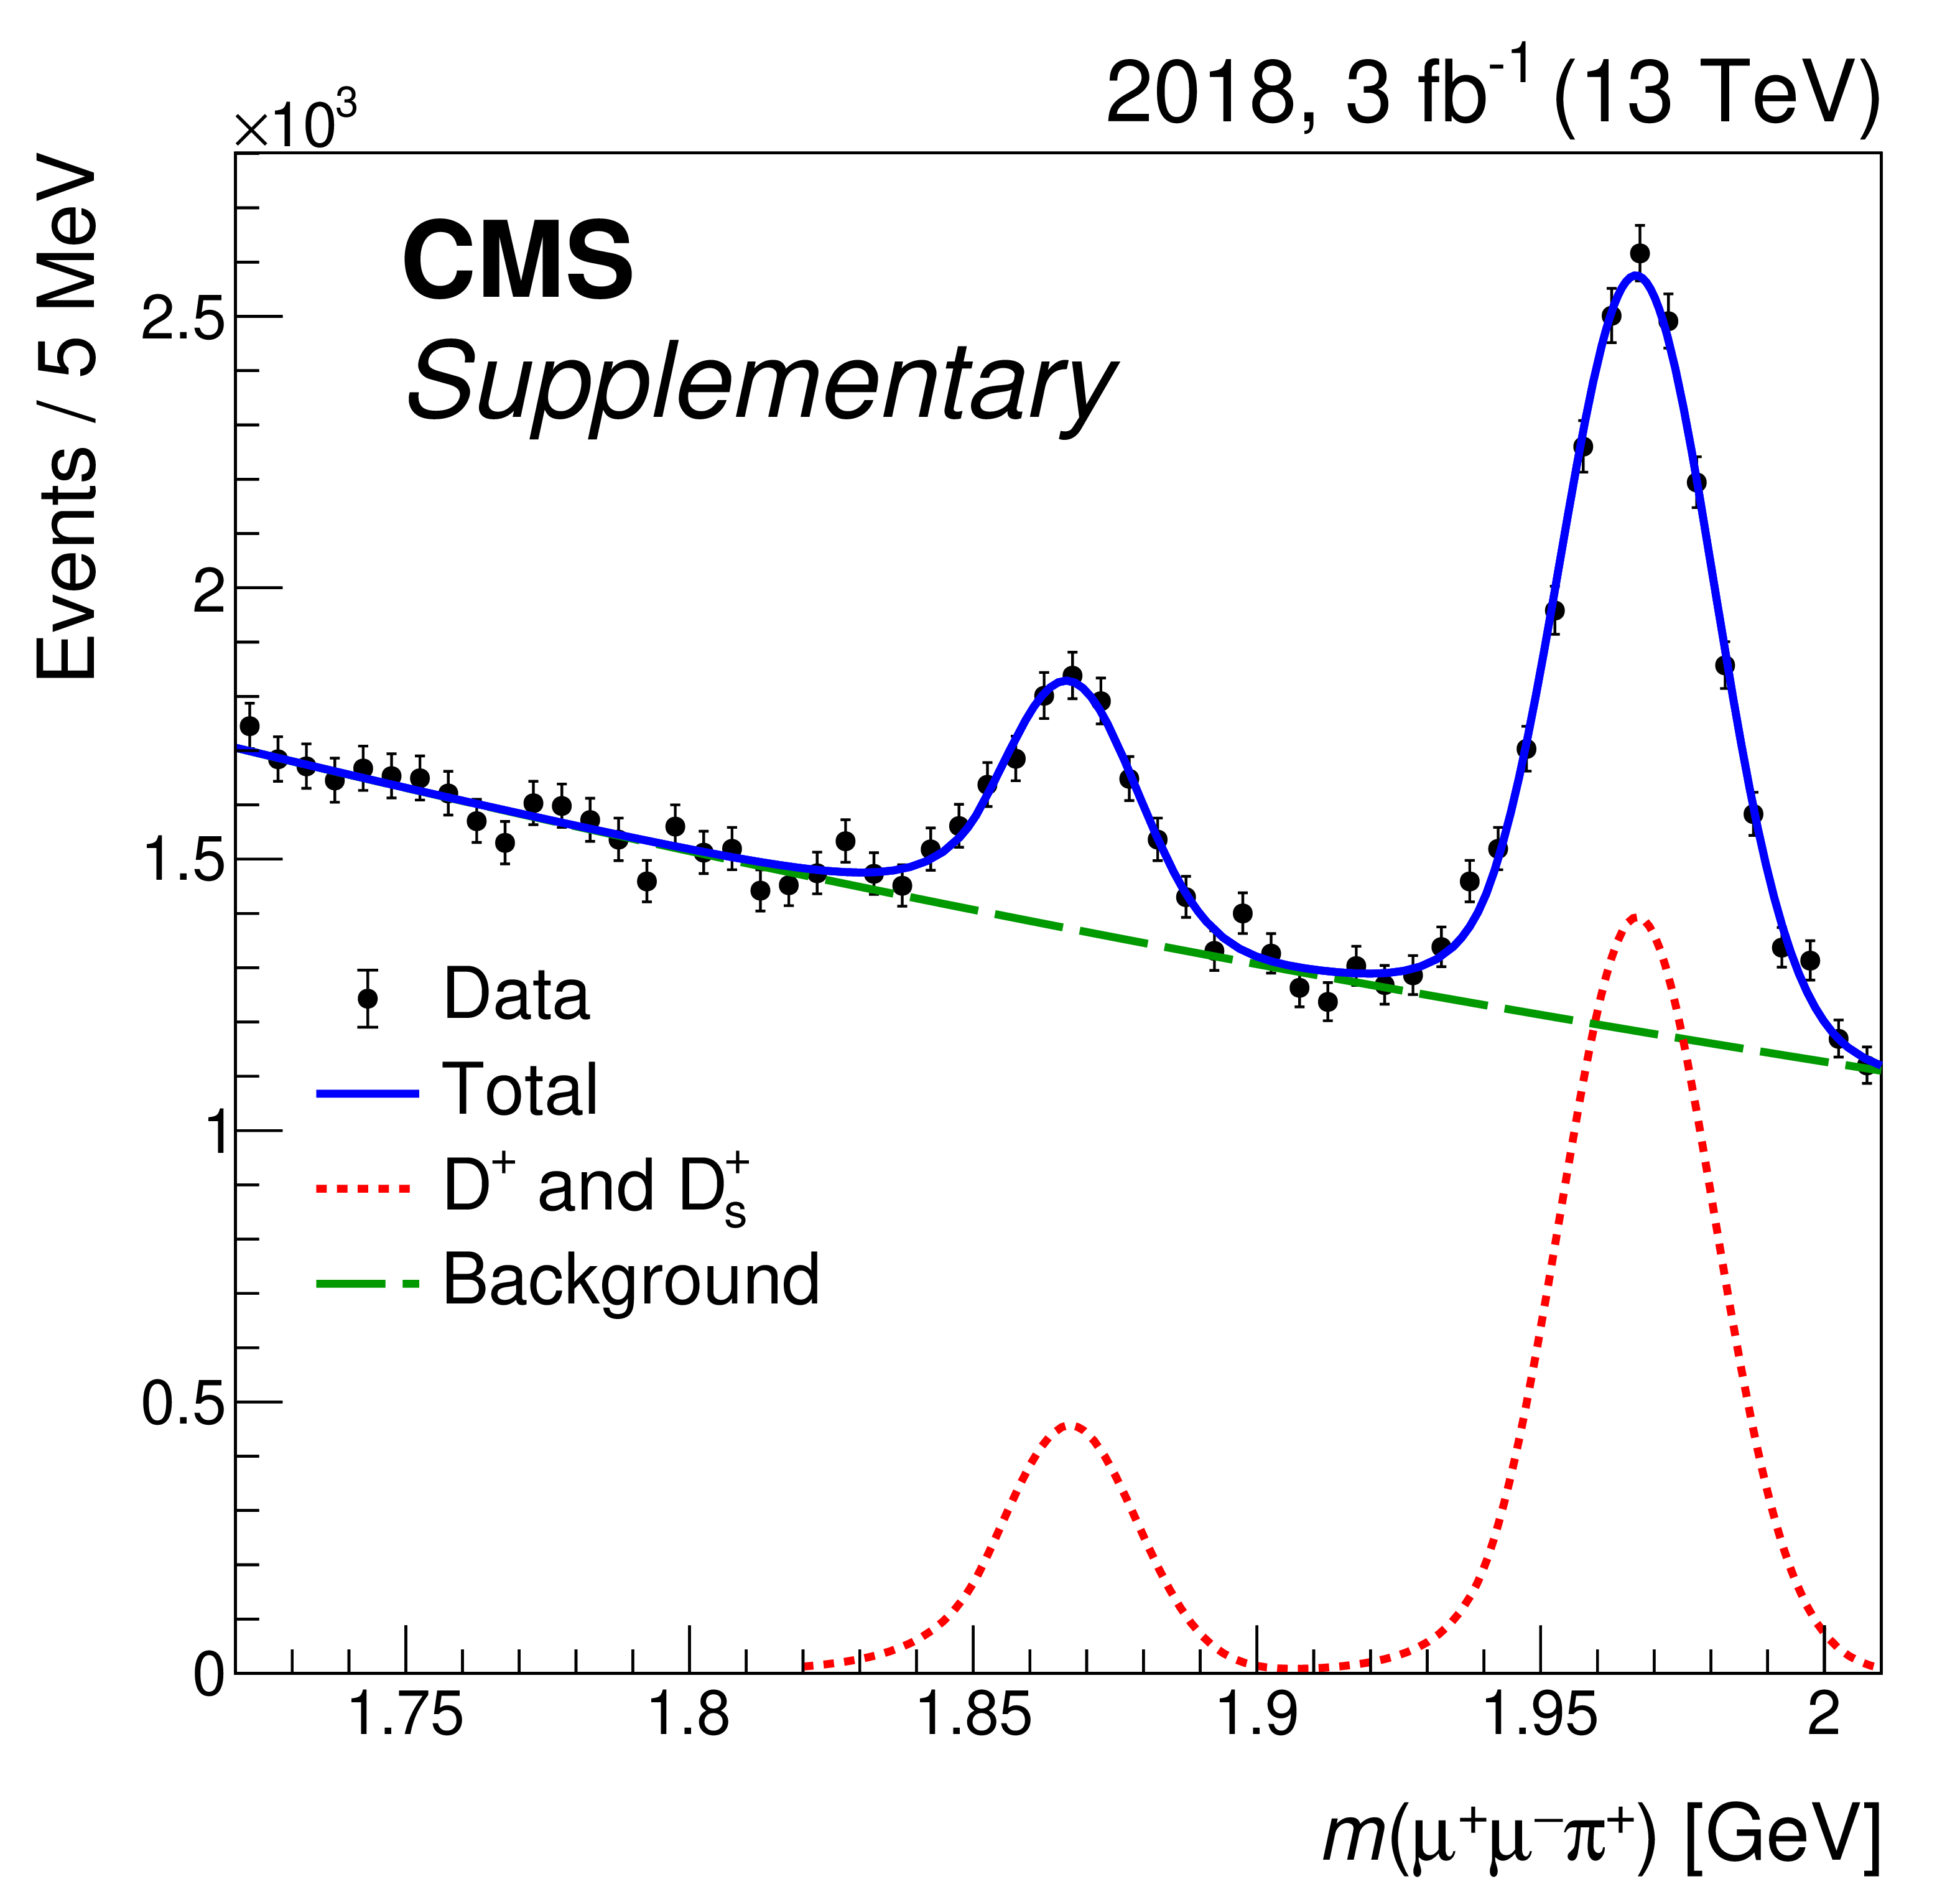
Additional Figure 1:
The $ \mu\mu\pi $ invariant mass distribution in 2018 data. The data was pre-scaled by a factor of 20 at trigger level, and are equivalent to 3.0 fb$ ^{-1} $. The $ \mathrm{D^+} $ and $ \mathrm{D}_{s}^{+} $ peaks are fitted with Crystal Ball functions (red line), while the background model is an exponential function (green line). The blue line shows the combined model fitted to data. |
png pdf |
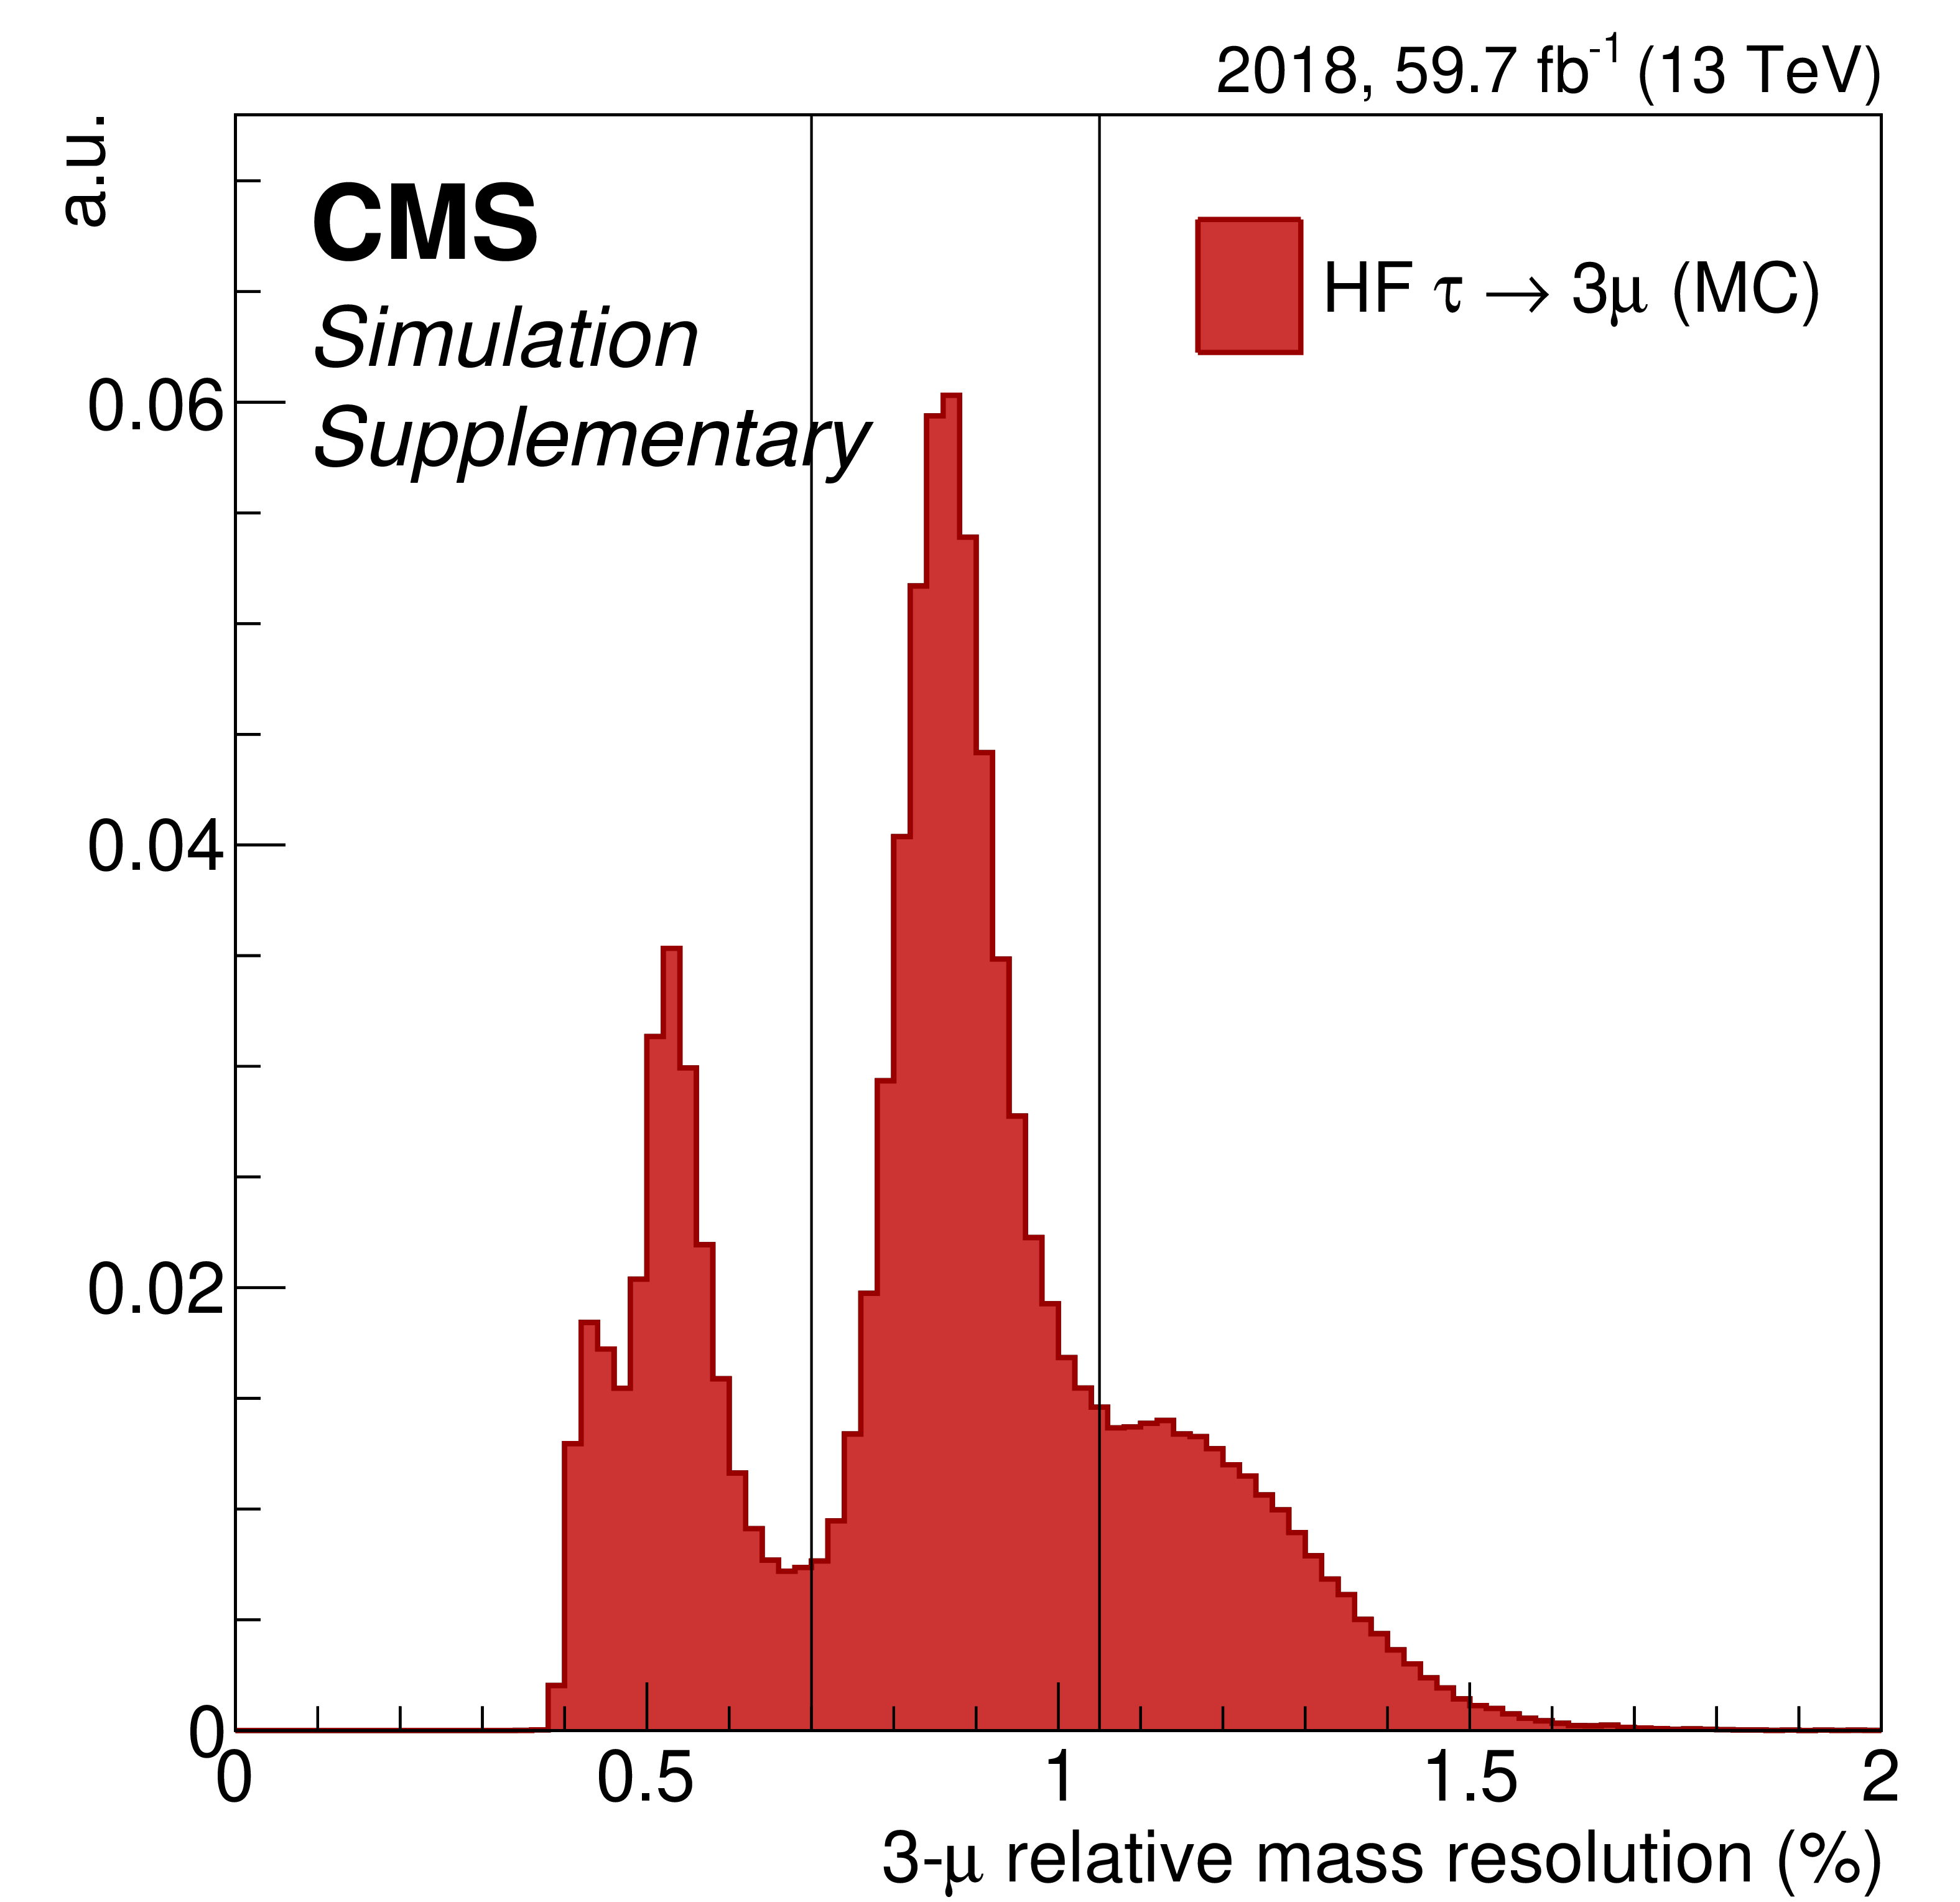
Additional Figure 2:
Relative mass resolution ($ \sigma_m/m $) of trimuon candidates selected in signal MC events. The event categorisation used in the analysis is indicated by vertical lines: $ \sigma_m/m < $ 0.7% (category A), 0.7 $ % < \sigma_m/m < $ 1.1% (category B), and $ \sigma_m/m > $ 1.1% (category C). |
png pdf |
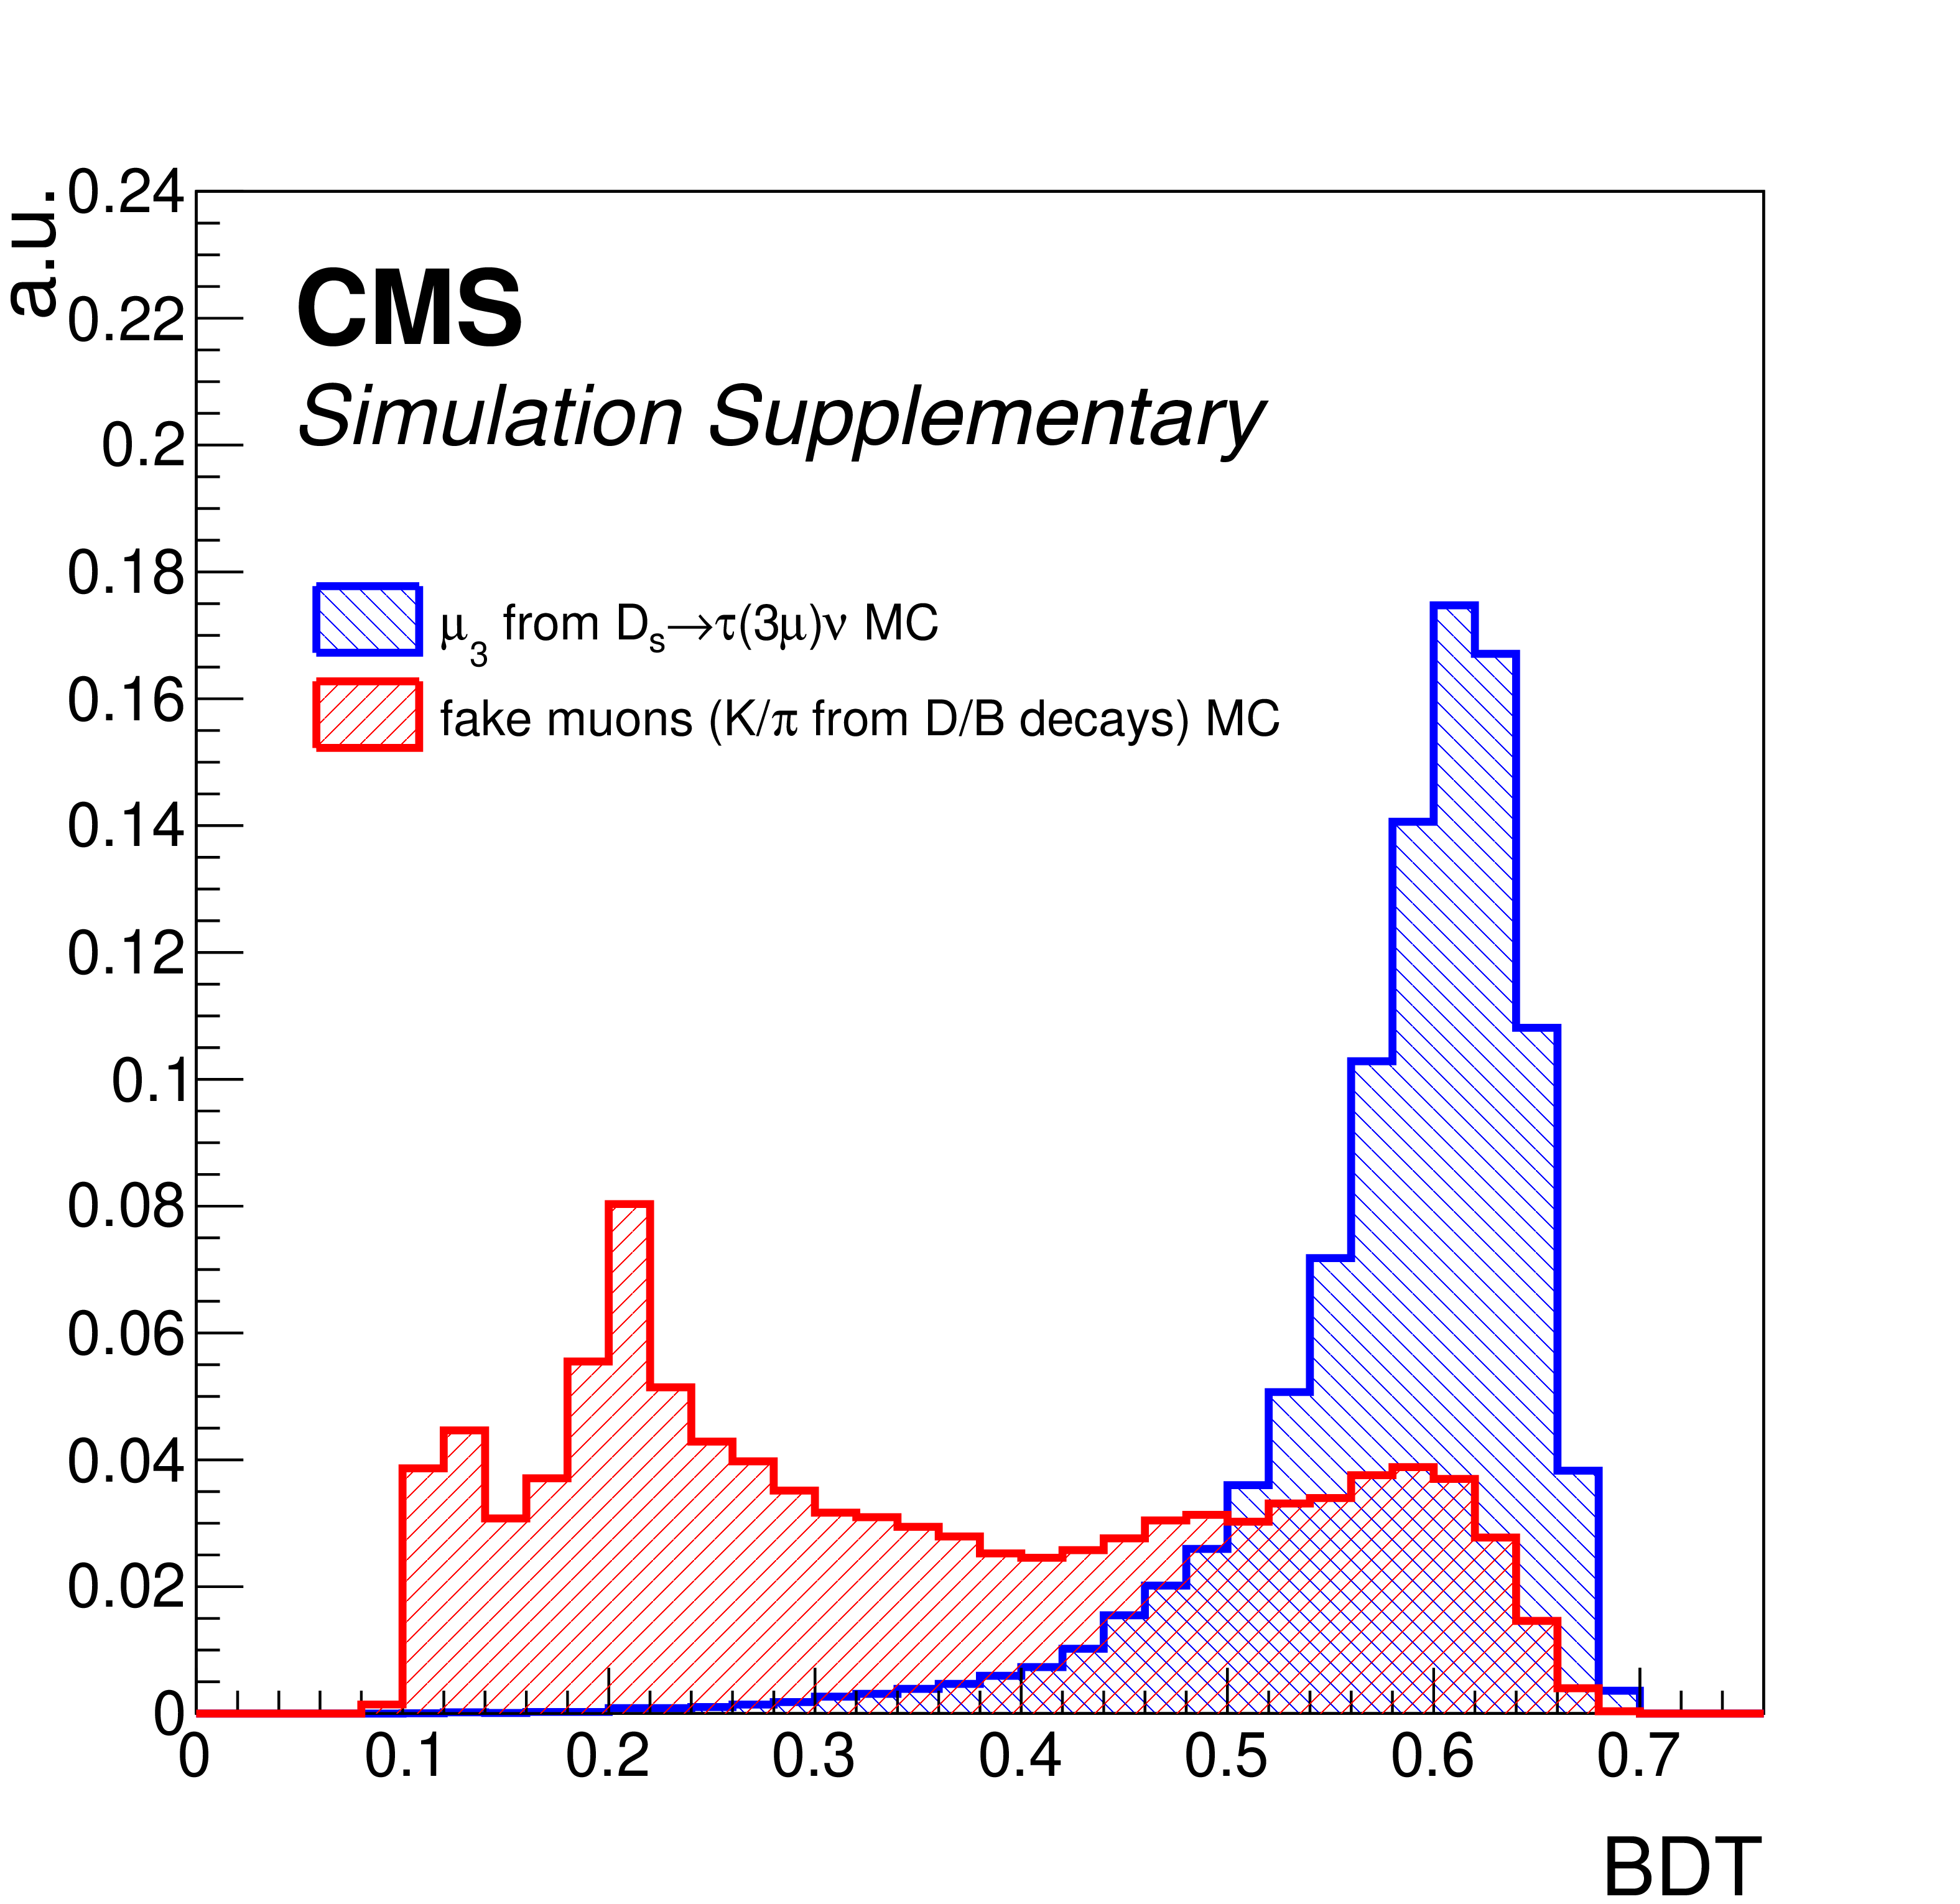
Additional Figure 3:
Distribution of muon reconstruction quality BDT score for the lowest-$ p_{\mathrm{T}} $ muon in signal MC (blue) and for simulated kaons or pions from D and B meson decays misidentified as global muons (red). Distributions are normalised to unity. The peak in the distribution for misidentified hadrons at $ \sim $0.2 is due to kaons decaying in flight with high values of track kink finder algorithm [Sirunyan:2018fpa]. |

png pdf |
Additional Figure 4:
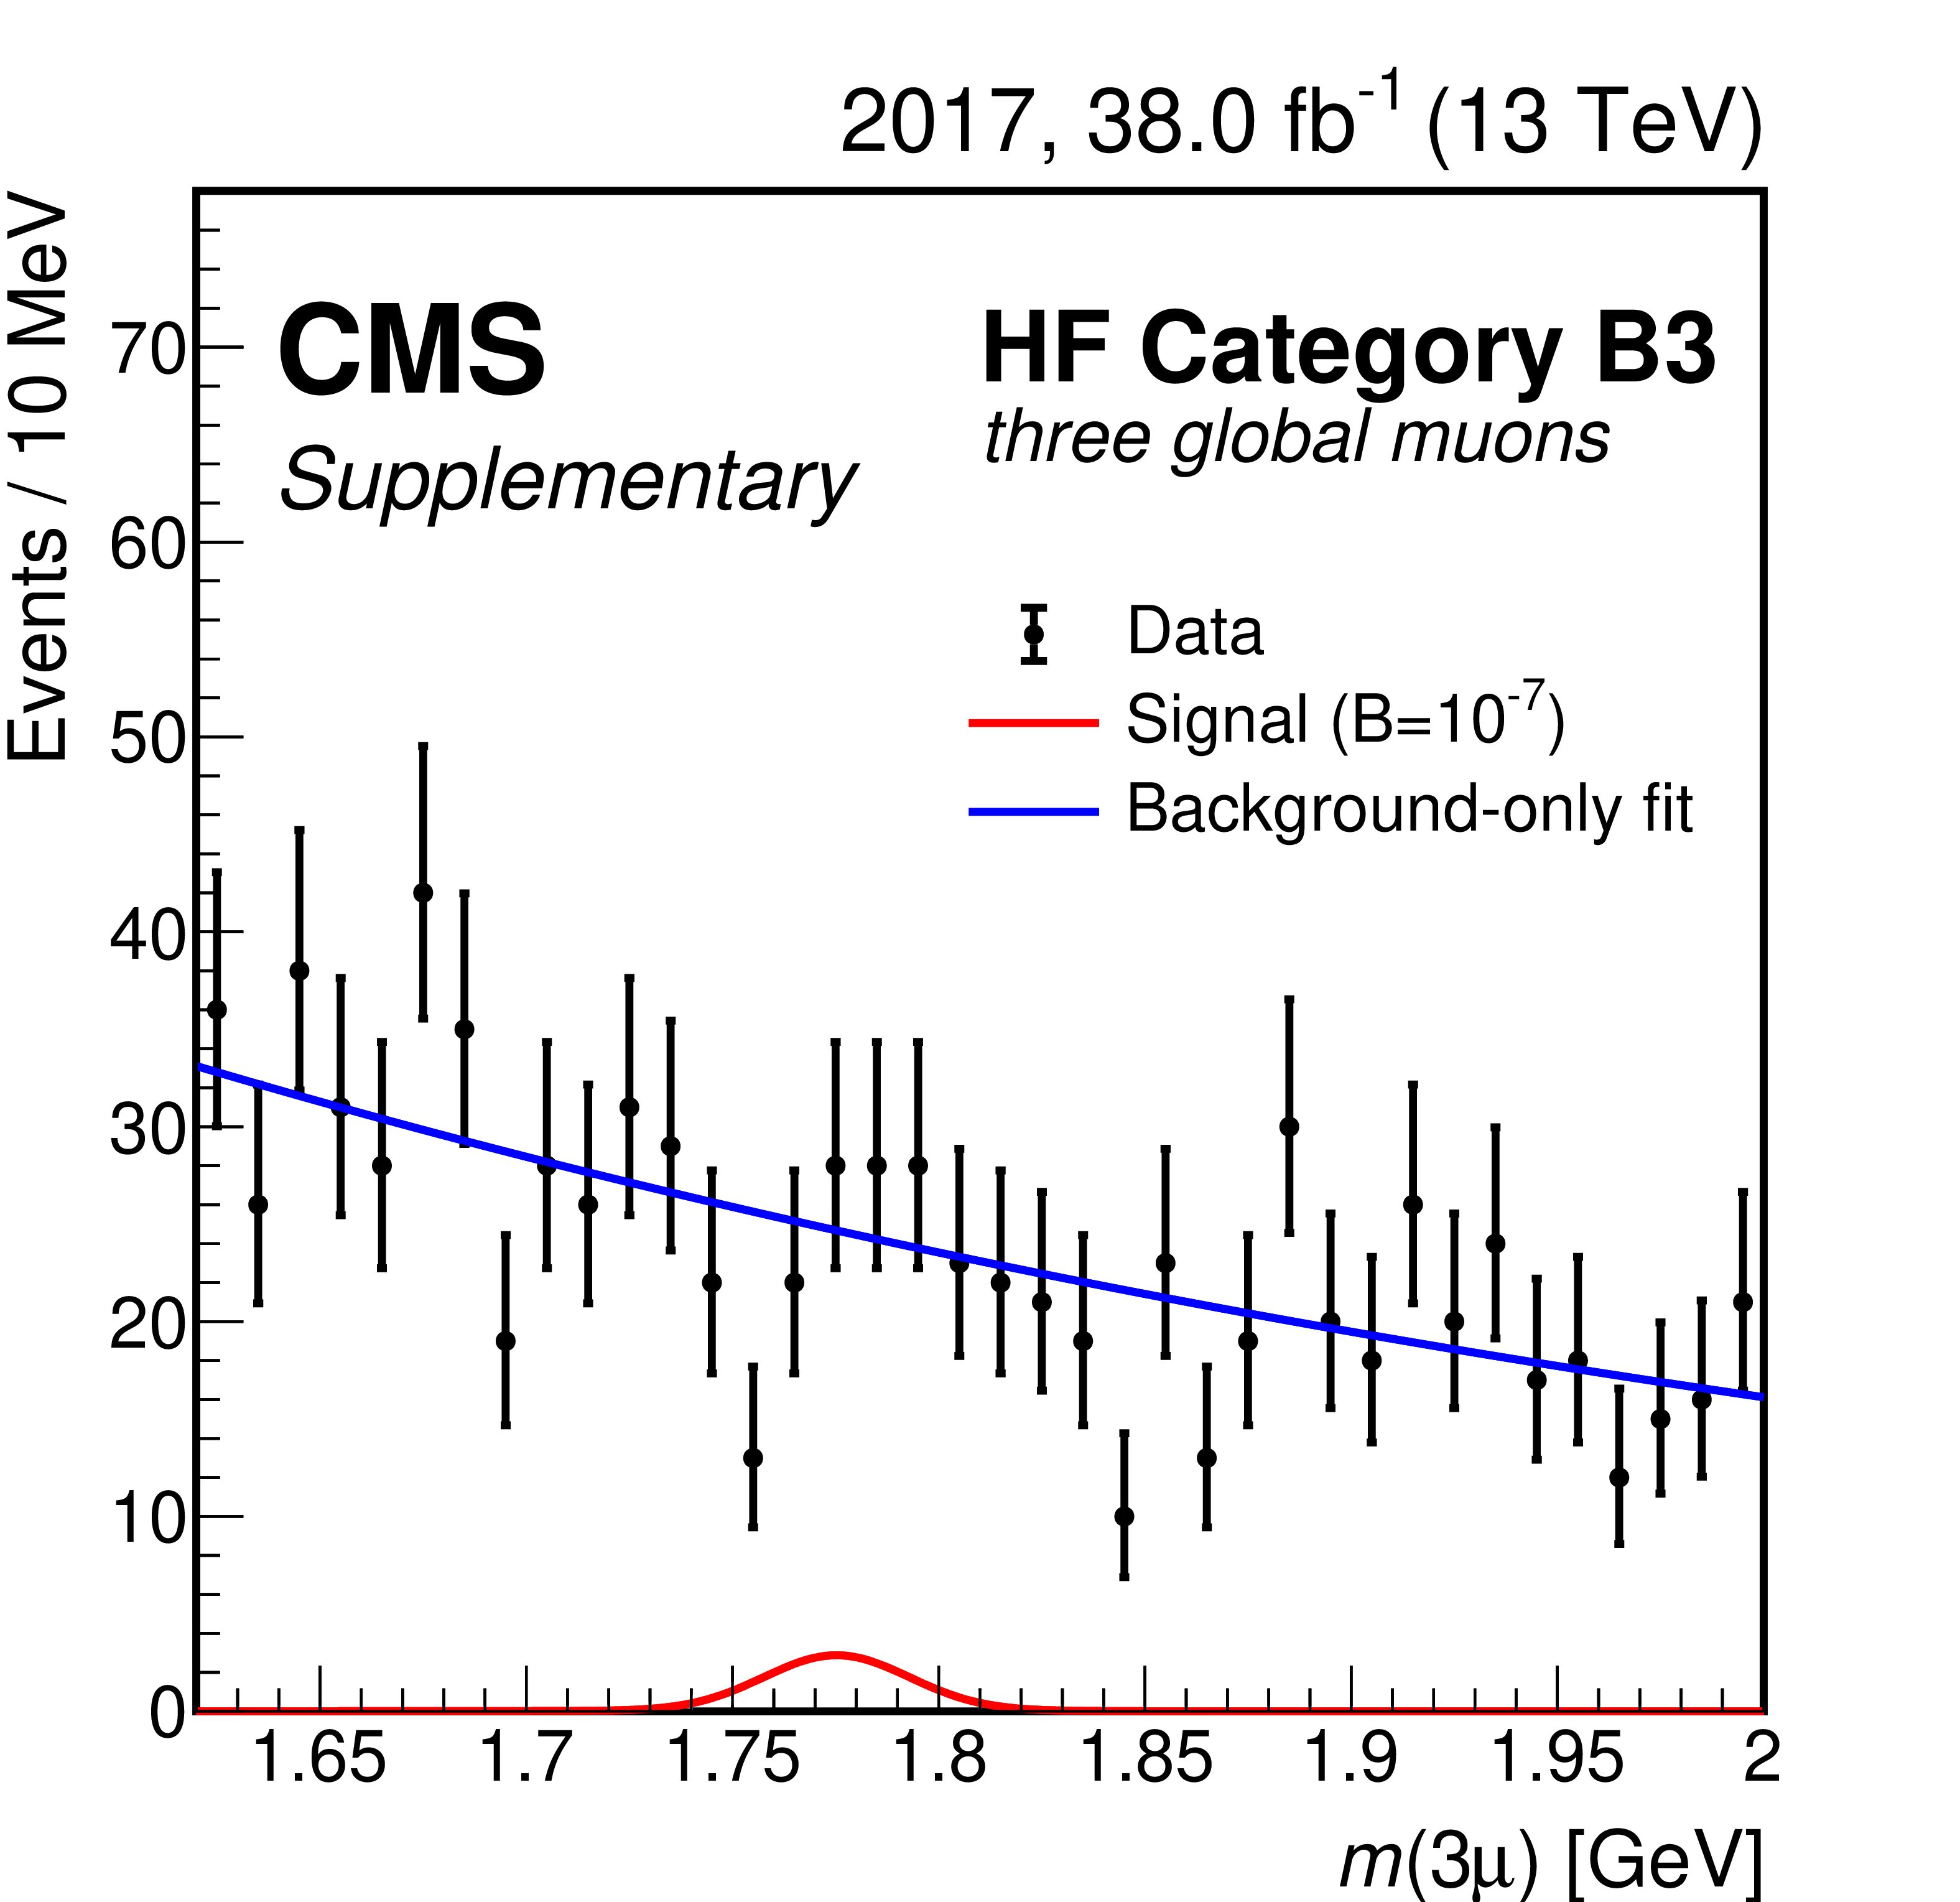
Trimuon mass distributions in the second and third BDT score subcategories of each of the three mass resolution categories of the heavy-flavor analysis (A, B, C), in the 2017 data events with three global muons. Data are shown with black markers. The background-only fit and the expected signal for $ \mathcal{B}(\tau \!\to\! 3\mu) = $ 10$^{-7} $ are shown with blue and red lines, respectively. |
png pdf |
Additional Figure 4-a:
Trimuon mass distribution in the second BDT score subcategory of the A mass resolution category of the heavy-flavor analysis, in the 2017 data events with three global muons. Data are shown with black markers. The background-only fit and the expected signal for $ \mathcal{B}(\tau \!\to\! 3\mu) = $ 10$^{-7} $ are shown with blue and red lines, respectively. |
png pdf |
Additional Figure 4-b:
Trimuon mass distribution in the second BDT score subcategory of the B mass resolution category of the heavy-flavor analysis, in the 2017 data events with three global muons. Data are shown with black markers. The background-only fit and the expected signal for $ \mathcal{B}(\tau \!\to\! 3\mu) = $ 10$^{-7} $ are shown with blue and red lines, respectively. |
png pdf |
Additional Figure 4-c:
Trimuon mass distribution in the second BDT score subcategory of the C mass resolution category of the heavy-flavor analysis, in the 2017 data events with three global muons. Data are shown with black markers. The background-only fit and the expected signal for $ \mathcal{B}(\tau \!\to\! 3\mu) = $ 10$^{-7} $ are shown with blue and red lines, respectively. |

png pdf |
Additional Figure 4-d:
Trimuon mass distribution in the third BDT score subcategory of the A mass resolution category of the heavy-flavor analysis, in the 2017 data events with three global muons. Data are shown with black markers. The background-only fit and the expected signal for $ \mathcal{B}(\tau \!\to\! 3\mu) = $ 10$^{-7} $ are shown with blue and red lines, respectively. |
png pdf |
Additional Figure 4-e:
Trimuon mass distribution in the third BDT score subcategory of the B mass resolution category of the heavy-flavor analysis, in the 2017 data events with three global muons. Data are shown with black markers. The background-only fit and the expected signal for $ \mathcal{B}(\tau \!\to\! 3\mu) = $ 10$^{-7} $ are shown with blue and red lines, respectively. |
png pdf |
Additional Figure 4-f:
Trimuon mass distribution in the third BDT score subcategories of the C mass resolution category of the heavy-flavor analysis, in the 2017 data events with three global muons. Data are shown with black markers. The background-only fit and the expected signal for $ \mathcal{B}(subcategory \!\to\! 3\mu) = $ 10$^{-7} $ are shown with blue and red lines, respectively. |

png pdf |
Additional Figure 5:
Trimuon mass distributions in the second and third BDT score subcategories of each of the three mass resolution categories of the heavy-flavor analysis (A, B, C), in the 2018 data events with three global. Data are shown with black markers. The background-only fit and the expected signal for $ \mathcal{B}(\tau \!\to\! 3\mu) = $ 10$^{-7} $ are shown with blue and red lines, respectively. |
png pdf |
Additional Figure 5-a:
Trimuon mass distribution in the second BDT score subcategory of each of the A mass resolution category of the heavy-flavor analysis, in the 2018 data events with three global. Data are shown with black markers. The background-only fit and the expected signal for $ \mathcal{B}(\tau \!\to\! 3\mu) = $ 10$^{-7} $ are shown with blue and red lines, respectively. |
png pdf |
Additional Figure 5-b:
Trimuon mass distribution in the second BDT score subcategory of each of the B mass resolution category of the heavy-flavor analysis, in the 2018 data events with three global. Data are shown with black markers. The background-only fit and the expected signal for $ \mathcal{B}(\tau \!\to\! 3\mu) = $ 10$^{-7} $ are shown with blue and red lines, respectively. |

png pdf |
Additional Figure 5-c:
Trimuon mass distribution in the second BDT score subcategory of each of the C mass resolution category of the heavy-flavor analysis, in the 2018 data events with three global. Data are shown with black markers. The background-only fit and the expected signal for $ \mathcal{B}(\tau \!\to\! 3\mu) = $ 10$^{-7} $ are shown with blue and red lines, respectively. |
png pdf |
Additional Figure 5-d:
Trimuon mass distribution in the third BDT score subcategory of each of the A mass resolution category of the heavy-flavor analysis, in the 2018 data events with three global. Data are shown with black markers. The background-only fit and the expected signal for $ \mathcal{B}(\tau \!\to\! 3\mu) = $ 10$^{-7} $ are shown with blue and red lines, respectively. |
png pdf |
Additional Figure 5-e:
Trimuon mass distribution in the third BDT score subcategory of each of the B mass resolution category of the heavy-flavor analysis, in the 2018 data events with three global. Data are shown with black markers. The background-only fit and the expected signal for $ \mathcal{B}(\tau \!\to\! 3\mu) = $ 10$^{-7} $ are shown with blue and red lines, respectively. |
png pdf |
Additional Figure 5-f:
Trimuon mass distribution in the third BDT score subcategory of each of the C mass resolution category of the heavy-flavor analysis, in the 2018 data events with three global. Data are shown with black markers. The background-only fit and the expected signal for $ \mathcal{B}(\tau \!\to\! 3\mu) = $ 10$^{-7} $ are shown with blue and red lines, respectively. |

png pdf |
Additional Figure 6:
Trimuon mass distributions in the second BDT score subcategory of each of the three mass resolution categories of the heavy-flavor analysis (A, B, C), in the 2017 data events with two global muons and one tracker muon. Data are shown with black markers. The background-only fit and the expected signal for $ \mathcal{B}(\tau \!\to\! 3\mu) = $ 10$^{-7} $ are shown with blue and red lines, respectively. |
png pdf |
Additional Figure 6-a:
Trimuon mass distribution in the second BDT score subcategory of the A mass resolution category of the heavy-flavor analysis, in the 2017 data events with two global muons and one tracker muon. Data are shown with black markers. The background-only fit and the expected signal for $ \mathcal{B}(\tau \!\to\! 3\mu) = $ 10$^{-7} $ are shown with blue and red lines, respectively. |

png pdf |
Additional Figure 6-b:
Trimuon mass distribution in the second BDT score subcategory of the B mass resolution category of the heavy-flavor analysis, in the 2017 data events with two global muons and one tracker muon. Data are shown with black markers. The background-only fit and the expected signal for $ \mathcal{B}(\tau \!\to\! 3\mu) = $ 10$^{-7} $ are shown with blue and red lines, respectively. |
png pdf |
Additional Figure 6-c:
Trimuon mass distribution in the second BDT score subcategory of the C mass resolution category of the heavy-flavor analysis, in the 2017 data events with two global muons and one tracker muon. Data are shown with black markers. The background-only fit and the expected signal for $ \mathcal{B}(\tau \!\to\! 3\mu) = $ 10$^{-7} $ are shown with blue and red lines, respectively. |
png pdf |
Additional Figure 7:
Trimuon mass distributions in the second BDT score subcategory of each of the three mass resolution categories of the heavy-flavor analysis (A, B, C), in the 2018 data events with two global muons and one tracker muon. Data are shown with black markers. The background-only fit and the expected signal for $ \mathcal{B}(\tau \!\to\! 3\mu) = $ 10$^{-7} $ are shown with blue and red lines, respectively. |

png pdf |
Additional Figure 7-a:
Trimuon mass distribution in the second BDT score subcategory of the A mass resolution category of the heavy-flavor analysis, in the 2018 data events with two global muons and one tracker muon. Data are shown with black markers. The background-only fit and the expected signal for $ \mathcal{B}(\tau \!\to\! 3\mu) = $ 10$^{-7} $ are shown with blue and red lines, respectively. |

png pdf |
Additional Figure 7-b:
Trimuon mass distribution in the second BDT score subcategory of the B mass resolution category of the heavy-flavor analysis, in the 2018 data events with two global muons and one tracker muon. Data are shown with black markers. The background-only fit and the expected signal for $ \mathcal{B}(\tau \!\to\! 3\mu) = $ 10$^{-7} $ are shown with blue and red lines, respectively. |

png pdf |
Additional Figure 7-c:
Trimuon mass distribution in the second BDT score subcategory of the C mass resolution category of the heavy-flavor analysis, in the 2018 data events with two global muons and one tracker muon. Data are shown with black markers. The background-only fit and the expected signal for $ \mathcal{B}(\tau \!\to\! 3\mu) = $ 10$^{-7} $ are shown with blue and red lines, respectively. |
| References | ||||
| 1 | X.-Y. Pham | Lepton flavor changing in neutrinoless $ \tau $ decays | EPJC 8 (1999) 513 | hep-ph/9810484 |
| 2 | G. Hernández-Tomé, G. López Castro, and P. Roig | Flavor violating leptonic decays of $ \tau $ and $ \mu $ leptons in the Standard Model with massive neutrinos | EPJC 79 (2019) 84 | 1807.06050 |
| 3 | P. Blackstone, M. Fael, and E. Passemar | $ \tau \to \mu\mu\mu $ at a rate of one out of 10$^{14} $ tau decays? | EPJC 80 (2020) 506 | 1912.09862 |
| 4 | W. J. Marciano, T. Mori, and J. M. Roney | Charged lepton flavor violation experiments | Ann. Rev. Nucl. Part. Sci. 58 (2008) 315 | |
| 5 | M. Raidal et al. | Flavour physics of leptons and dipole moments | EPJC 57 (2008) 13 | 0801.1826 |
| 6 | E. Arganda and M. J. Herrero | Testing supersymmetry with lepton flavor violating $ \tau $ and $ \mu $ decays | PRD 73 (2006) 055003 | hep-ph/0510405 |
| 7 | Belle Collaboration | Search for lepton flavor violating $ \tau $ decays into three leptons with 719 million produced $ \tau^+\tau^- $ pairs | PLB 687 (2010) 139 | 1001.3221 |
| 8 | BaBar Collaboration | Limits on $ \tau $ lepton-flavor violating decays in three charged leptons | PRD 81 (2010) 111101 | 1002.4550 |
| 9 | LHCb Collaboration | Search for the lepton flavour violating decay $ \tau^- \to \mu^-\mu^+\mu^- $ | JHEP 02 (2015) 121 | 1409.8548 |
| 10 | ATLAS Collaboration | Probing lepton flavour violation via neutrinoless $ \tau \to 3\mu $ decays with the ATLAS detector | EPJC 76 (2016) 232 | 1601.03567 |
| 11 | CMS Collaboration | Search for the lepton flavor violating decay $ \tau\to 3 \mu $ in proton-proton collisions at $ \sqrt{s} = $ 13 TeV | JHEP 01 (2021) 163 | CMS-BPH-17-004 2007.05658 |
| 12 | CMS Collaboration | HEPData record for this analysis | link | |
| 13 | CMS Collaboration | The CMS experiment at the CERN LHC | JINST 3 (2008) S08004 | |
| 14 | CMS Collaboration | Performance of the CMS Level-1 trigger in proton-proton collisions at $ \sqrt{s} = $ 13 TeV | JINST 15 (2020) P10017 | CMS-TRG-17-001 2006.10165 |
| 15 | CMS Collaboration | The CMS trigger system | JINST 12 (2017) P01020 | CMS-TRG-12-001 1609.02366 |
| 16 | CMS Collaboration | Electron and photon reconstruction and identification with the CMS experiment at the CERN LHC | JINST 16 (2021) P05014 | CMS-EGM-17-001 2012.06888 |
| 17 | CMS Collaboration | Performance of the CMS muon detector and muon reconstruction with proton-proton collisions at $ \sqrt{s}= $ 13 TeV | JINST 13 (2018) P06015 | CMS-MUO-16-001 1804.04528 |
| 18 | CMS Collaboration | Description and performance of track and primary-vertex reconstruction with the CMS tracker | JINST 9 (2014) P10009 | CMS-TRK-11-001 1405.6569 |
| 19 | CMS Collaboration | Particle-flow reconstruction and global event description with the CMS detector | JINST 12 (2017) P10003 | CMS-PRF-14-001 1706.04965 |
| 20 | CMS Collaboration | Performance of reconstruction and identification of $ \tau $ leptons decaying to hadrons and $ \nu_\tau $ in pp collisions at $ \sqrt{s}= $ 13 TeV | JINST 13 (2018) P10005 | CMS-TAU-16-003 1809.02816 |
| 21 | CMS Collaboration | Jet energy scale and resolution in the CMS experiment in pp collisions at 8 TeV | JINST 12 (2017) P02014 | CMS-JME-13-004 1607.03663 |
| 22 | CMS Collaboration | Performance of missing transverse momentum reconstruction in proton-proton collisions at $ \sqrt{s} = $ 13 TeV using the CMS detector | JINST 14 (2019) P07004 | CMS-JME-17-001 1903.06078 |
| 23 | T. Sjöstrand et al. | An introduction to PYTHIA 8.2 | Comput. Phys. Commun. 191 (2015) 159 | 1410.3012 |
| 24 | CMS Collaboration | Extraction and validation of a new set of CMS PYTHIA8 tunes from underlying-event measurements | EPJC 80 (2020) 4 | CMS-GEN-17-001 1903.12179 |
| 25 | D. J. Lange | The EvtGen particle decay simulation package | NIM A 462 (2001) 152 | |
| 26 | J. Alwall et al. | The automated computation of tree-level and next-to-leading order differential cross sections, and their matching to parton shower simulations | JHEP 07 (2014) 079 | 1405.0301 |
| 27 | GEANT4 Collaboration | GEANT 4---a simulation toolkit | NIM A 506 (2003) 250 | |
| 28 | M. J. Oreglia | A study of the reactions $ \psi^\prime \to \gamma \gamma \psi $ | PhD thesis, Stanford University, SLAC Report SLAC-R-236, 1980 link |
|
| 29 | Particle Data Group, R. L. Workman et al. | Review of particle physics | Prog. Theor. Exp. Phys. 2022 (2022) 083C01 | |
| 30 | T. Chen and C. Guestrin | XGBoost: A scalable tree boosting system | in 22nd ACM SIGKDD International Conference on Knowledge Discovery and Data Mining, KDD '16, ACM, New York, NY, 2016 link |
|
| 31 | CMS Collaboration | Measurement of the inclusive W and Z production cross sections in pp collisions at $ \sqrt{s}= $ 7 TeV | JHEP 10 (2011) 132 | CMS-EWK-10-005 1107.4789 |
| 32 | P. D. Dauncey, M. Kenzie, N. Wardle, and G. J. Davies | Handling uncertainties in background shapes: the discrete profiling method | JINST 10 (2015) P04015 | 1408.6865 |
| 33 | CMS Collaboration | Precision luminosity measurement in proton-proton collisions at $ \sqrt{s} = $ 13 TeV in 2015 and 2016 at CMS | EPJC 81 (2021) 800 | CMS-LUM-17-003 2104.01927 |
| 34 | CMS Collaboration | CMS luminosity measurement for the 2017 data-taking period at $ \sqrt{s} = $ 13 TeV | CMS Physics Analysis Summary, 2018 CMS-PAS-LUM-17-004 |
CMS-PAS-LUM-17-004 |
| 35 | CMS Collaboration | CMS luminosity measurement for the 2018 data-taking period at $ \sqrt{s} = $ 13 TeV | CMS Physics Analysis Summary, 2019 CMS-PAS-LUM-18-002 |
CMS-PAS-LUM-18-002 |
| 36 | ATLAS Collaboration | Measurement of $ \mathrm{W}^{\pm} $ and Z-boson production cross sections in pp collisions at $ \sqrt{s}= $ 13 TeV with the ATLAS detector | PLB 759 (2016) 601 | 1603.09222 |
| 37 | ATLAS and CMS Collaborations, and LHC Higgs Combination Group | Procedure for the LHC Higgs boson search combination in Summer 2011 | Technical Report CMS-NOTE-2011-005, ATL-PHYS-PUB-2011-11, 2011 | |
| 38 | A. L. Read | Presentation of search results: The CL$ _{\text{s}} $ technique | JPG 28 (2002) 2693 | |
| 39 | T. Junk | Confidence level computation for combining searches with small statistics | NIM A 434 (1999) 435 | hep-ex/9902006 |
| 40 | R. D. Cousins and V. L. Highland | Incorporating systematic uncertainties into an upper limit | NIM A 320 (1992) 331 | |
|
|
Compact Muon Solenoid LHC, CERN |
|

|

|

|

|

|