

Compact Muon Solenoid
LHC, CERN
| CMS-EXO-16-005 ; CERN-EP-2017-087 | ||
| Search for dark matter produced in association with heavy-flavor quark pairs in proton-proton collisions at $ \sqrt{s} = $ 13 TeV | ||
| CMS Collaboration | ||
| 8 June 2017 | ||
| EPJC 77 (2017) 845 | ||
| Abstract: A search is presented for an excess of events with heavy-flavor quark pairs ($\mathrm{ t \bar{t} }$ and $\mathrm{ b \bar{b} }$) and a large imbalance in transverse momentum in data from proton-proton collisions at a center-of-mass energy of 13 TeV. The data correspond to an integrated luminosity of 2.2 fb$^{-1}$ collected with the CMS detector at the CERN LHC. No deviations are observed with respect to standard model predictions. The results are used in the first interpretation of dark matter production in $\mathrm{ t \bar{t} }$ and $\mathrm{ b \bar{b} }$ final states in a simplified model. This analysis is also the first to perform a statistical combination of searches for dark matter produced with different heavy-flavor final states. The combination provides exclusions that are stronger than those achieved with individual heavy-flavor final states. | ||
| Links: e-print arXiv:1706.02581 [hep-ex] (PDF) ; CDS record ; inSPIRE record ; CADI line (restricted) ; | ||
| Figures | |

png pdf |
Figure 1:
A leading order Feynman diagram describing the production of a pair of DM particles ($\chi $) with heavy-flavor (top or bottom) quark pairs via scalar ($\phi $) or pseudoscalar ($\mathrm {a}$) mediators. |

png pdf |
Figure 2:
The distribution of the RTT discriminant in data enriched in $ \ell $+jets ${\mathrm{ t } {}\mathrm{ \bar{t} } } $ events. Simulated $ \ell $+jets ${\mathrm{ t } {}\mathrm{ \bar{t} } } $ events in which jets from the all-hadronic top quark decay are correctly chosen are labeled "${\mathrm{ t } {}\mathrm{ \bar{t} } } (1\ell)$ with matched jets''. Simulated $ \ell $+jets ${\mathrm{ t } {}\mathrm{ \bar{t} } } $ events in which an incorrect combination of jets is chosen are labeled "${\mathrm{ t } {}\mathrm{ \bar{t} } } (1\ell)$ combinatorial''. Events from processes that do not contain a hadronically-decaying top quark, such as dileptonic ${\mathrm{ t } {}\mathrm{ \bar{t} } } $, are labeled "other background''. The uncertainties shown in the ratios of data to simulation are statistical only. Jet triplets in the all-hadronic $ {{\mathrm{ t } {}\mathrm{ \bar{t} } } + { {p_{\mathrm {T}}} ^\text {miss}} } $ search are considered to be top quark tagged if their RTT discriminant value is larger than zero. |
png pdf |
Figure 3:
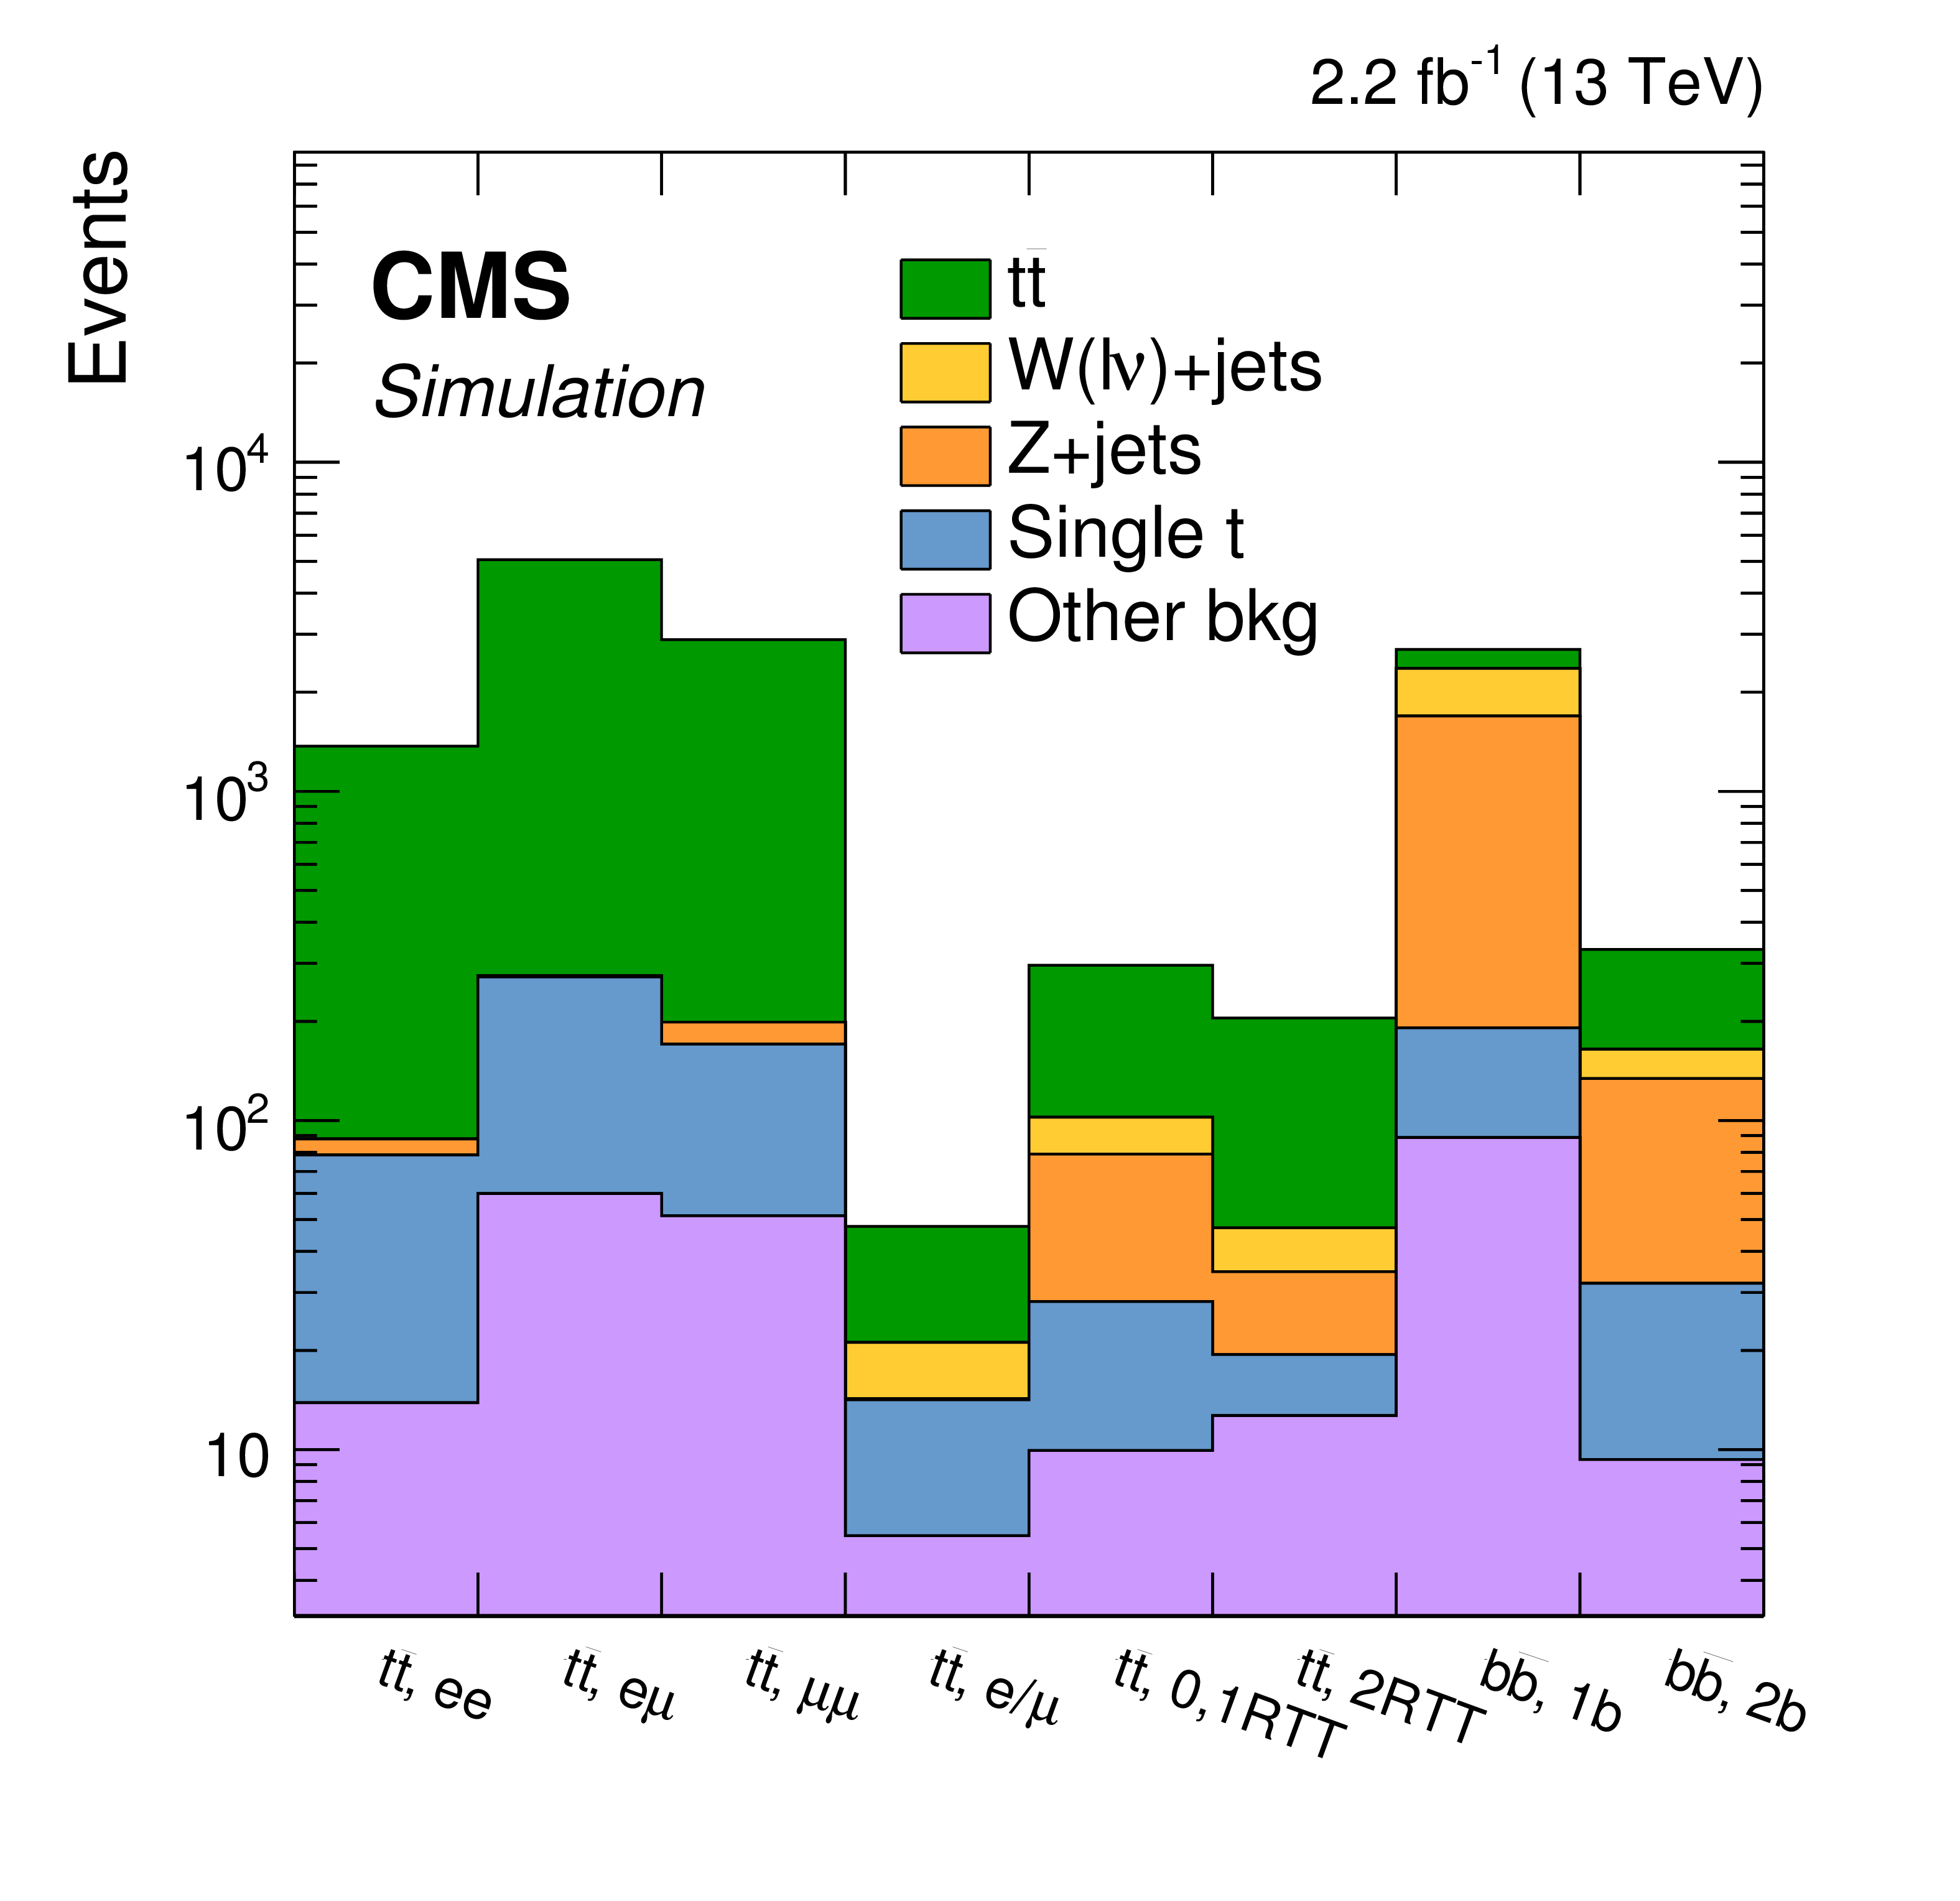
Simulation-derived background expectations in the $ {{\mathrm{ t } {}\mathrm{ \bar{t} } } + { {p_{\mathrm {T}}} ^\text {miss}} } $ and $ { {\mathrm{ b \bar{b} } } + { {p_{\mathrm {T}}} ^\text {miss}} } $ signal regions. |
png pdf |
Figure 4:
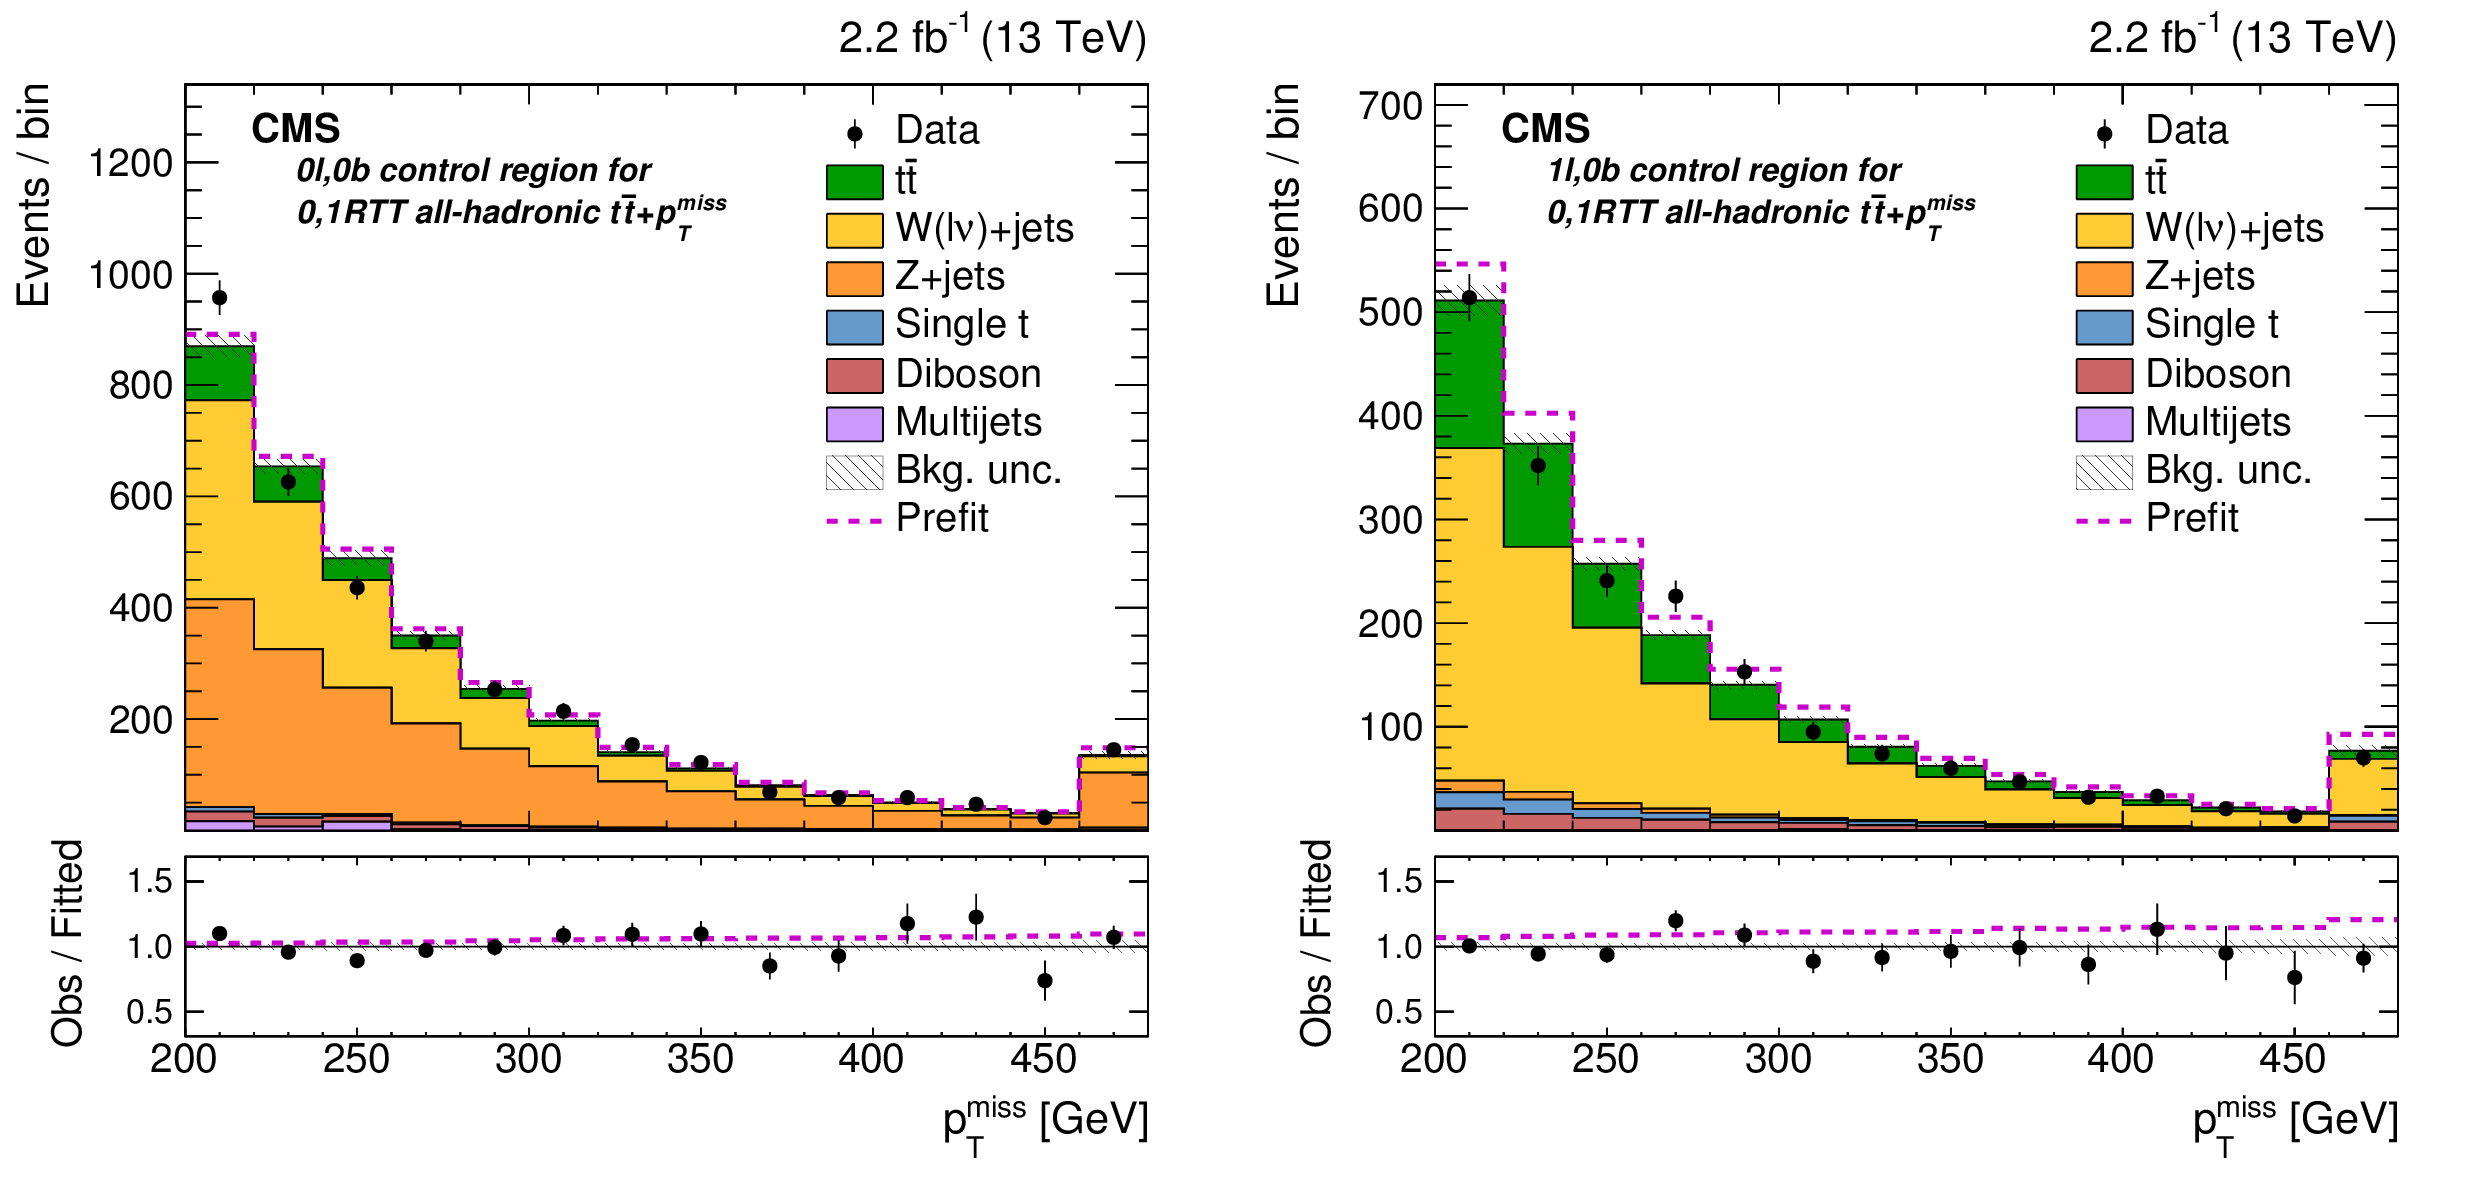
Observed data, and prefit and fitted background-only ${ {p_{\mathrm {T}}} ^\text {miss}}$ distributions in two control regions (hadB and hadC in Table 2) for the 0,1RTT hadronic $ {{\mathrm{ t } {}\mathrm{ \bar{t} } } + { {p_{\mathrm {T}}} ^\text {miss}} } $ signal region with 0 leptons (left) and with 1 lepton (right) and 0 b tags. The 0 lepton control region is used to constrain W+jets and Z+jets backgrounds. The 1 lepton CR provides an additional constraint on W+jets background. The last bin contains overflow events. The lower panels show the ratios of observed data to fitted background yields. In both panels, the statistical uncertainties of the data are indicated as vertical error bars and the fit uncertainties are indicated as hatched bands. Prefit yields and the ratios of prefit to fitted background expectations are shown as dashed magenta histograms. |
png pdf |
Figure 4-a:
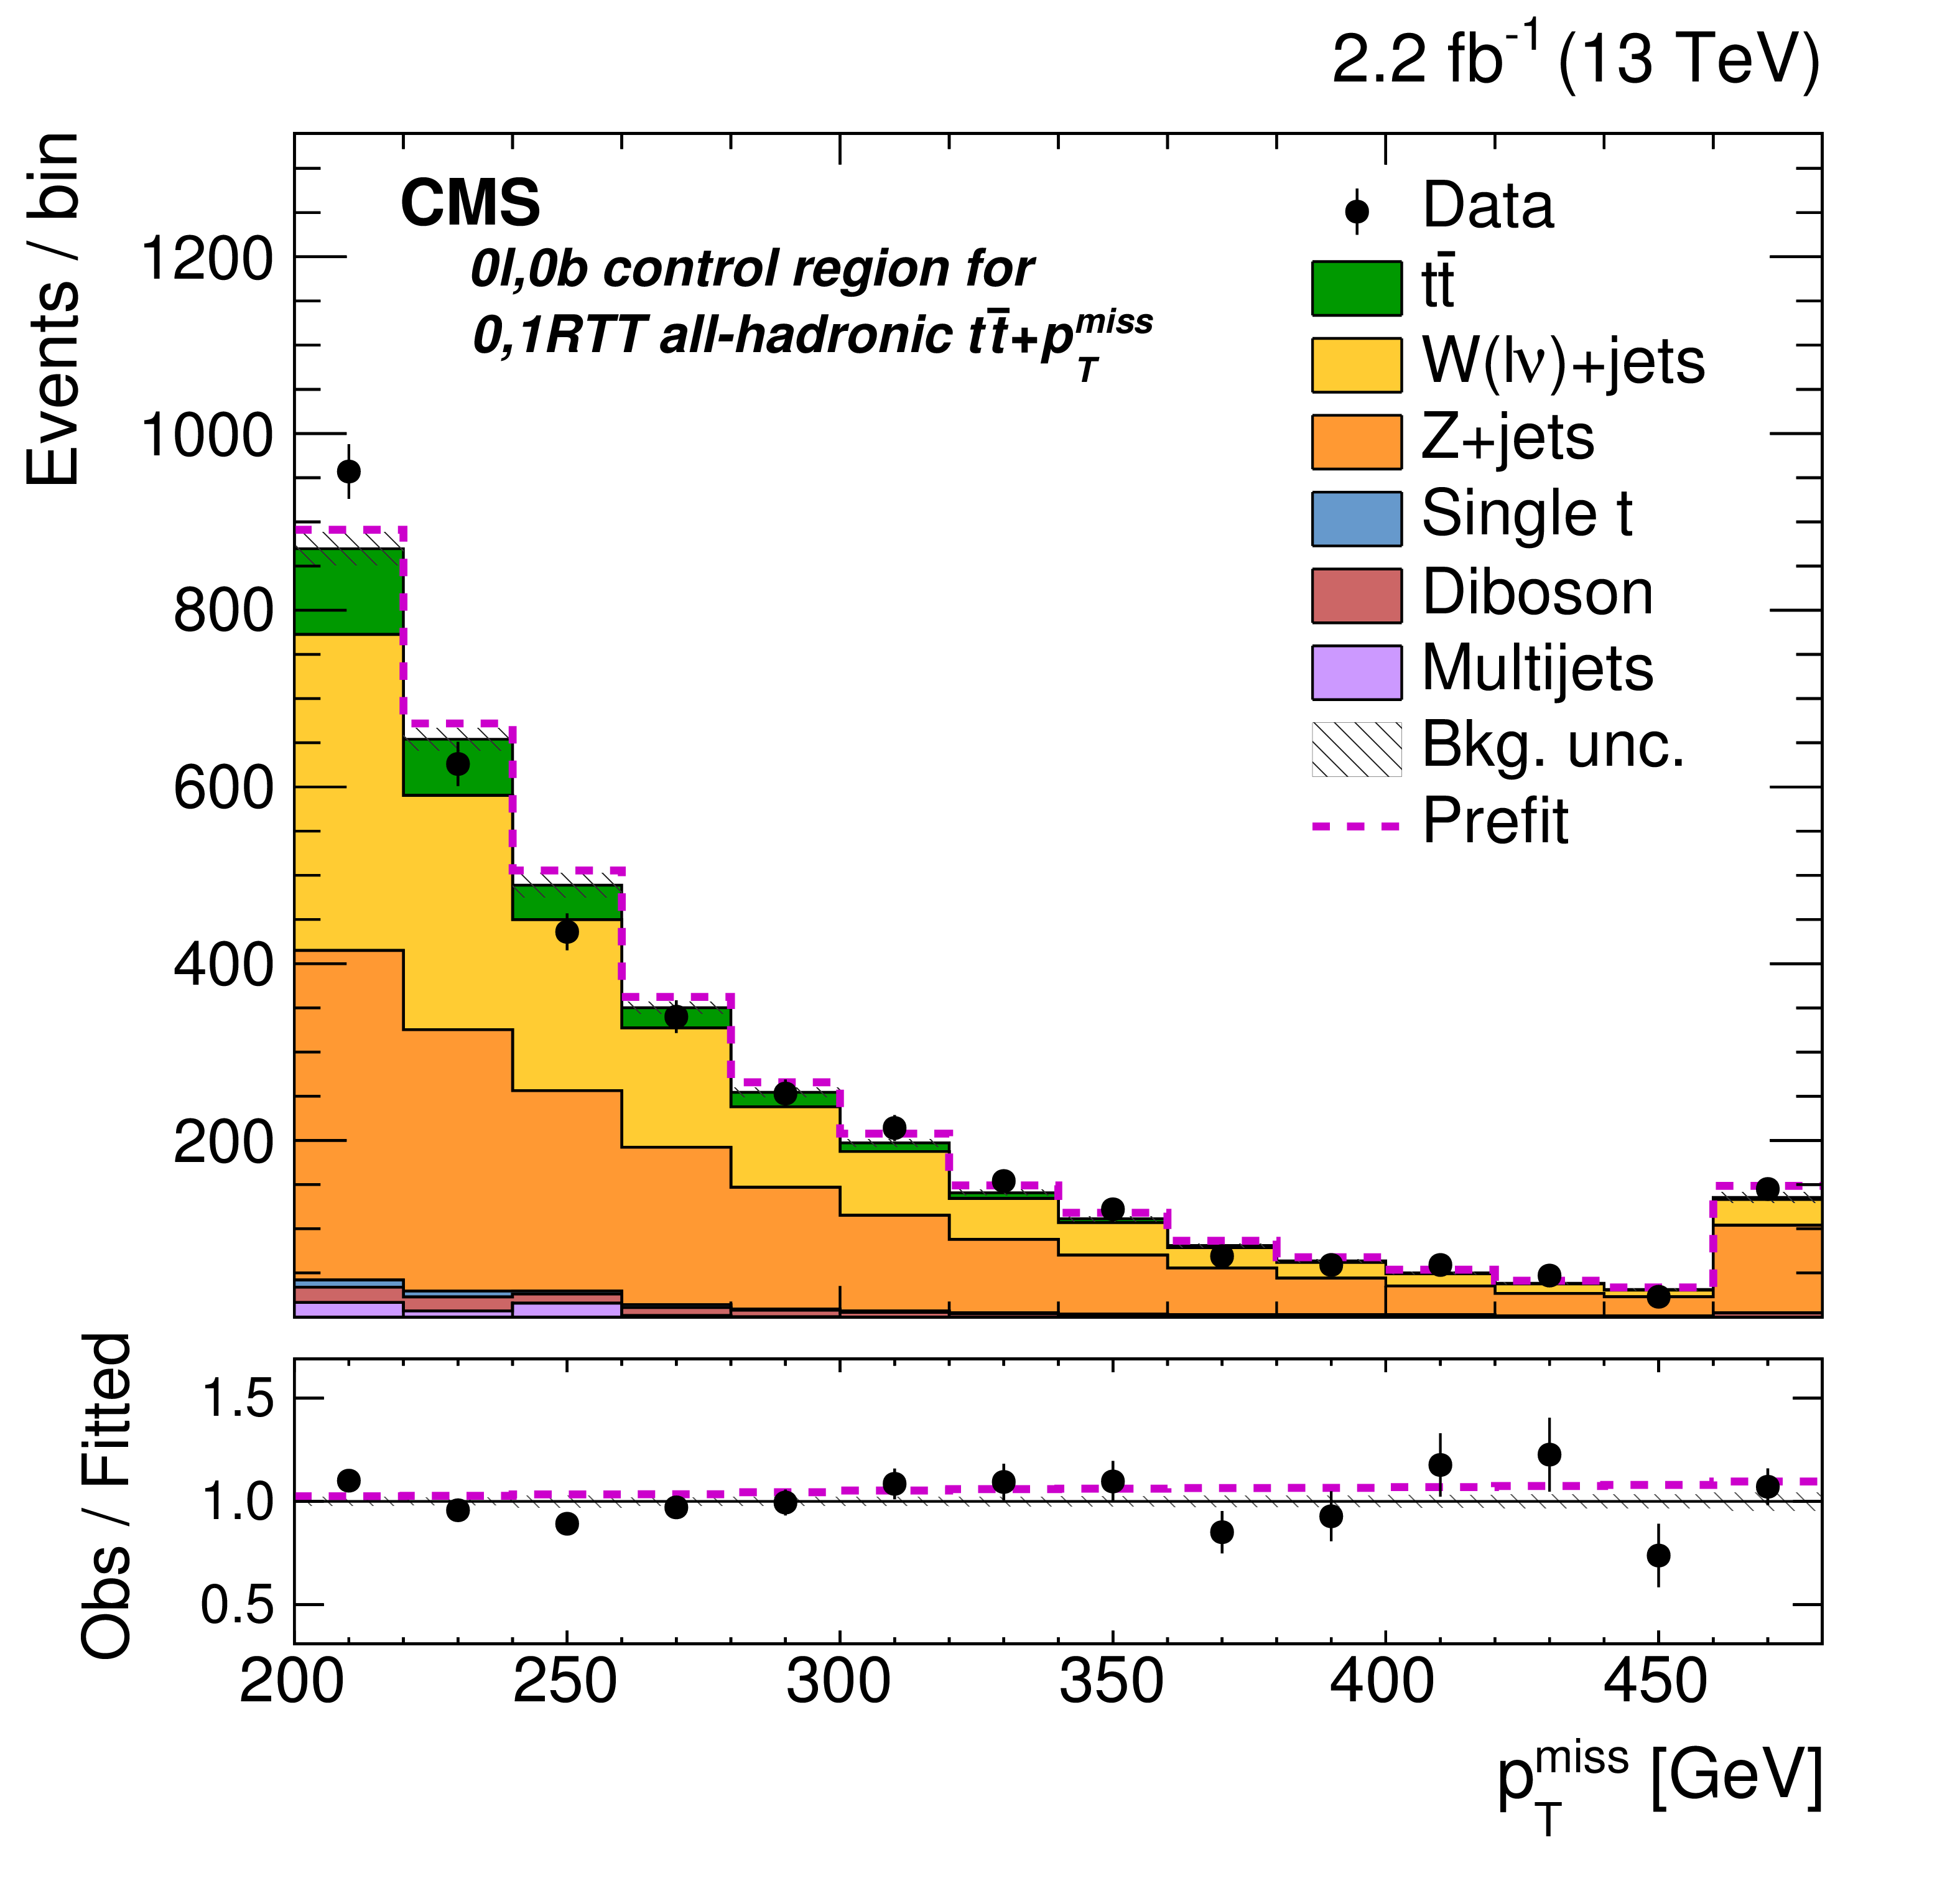
Observed data, and prefit and fitted background-only ${ {p_{\mathrm {T}}} ^\text {miss}}$ distributions in two control regions (hadB and hadC in Table 2) for the 0,1RTT hadronic $ {{\mathrm{ t } {}\mathrm{ \bar{t} } } + { {p_{\mathrm {T}}} ^\text {miss}} } $ signal region with 0 lepton and 0 b tags. The 0 lepton control region is used to constrain W+jets and Z+jets backgrounds. The last bin contains overflow events. The lower panel shows the ratios of observed data to fitted background yields. The statistical uncertainties of the data are indicated as vertical error bars and the fit uncertainties are indicated as hatched bands. Prefit yields and the ratios of prefit to fitted background expectations are shown as dashed magenta histogram. |
png pdf |
Figure 4-b:
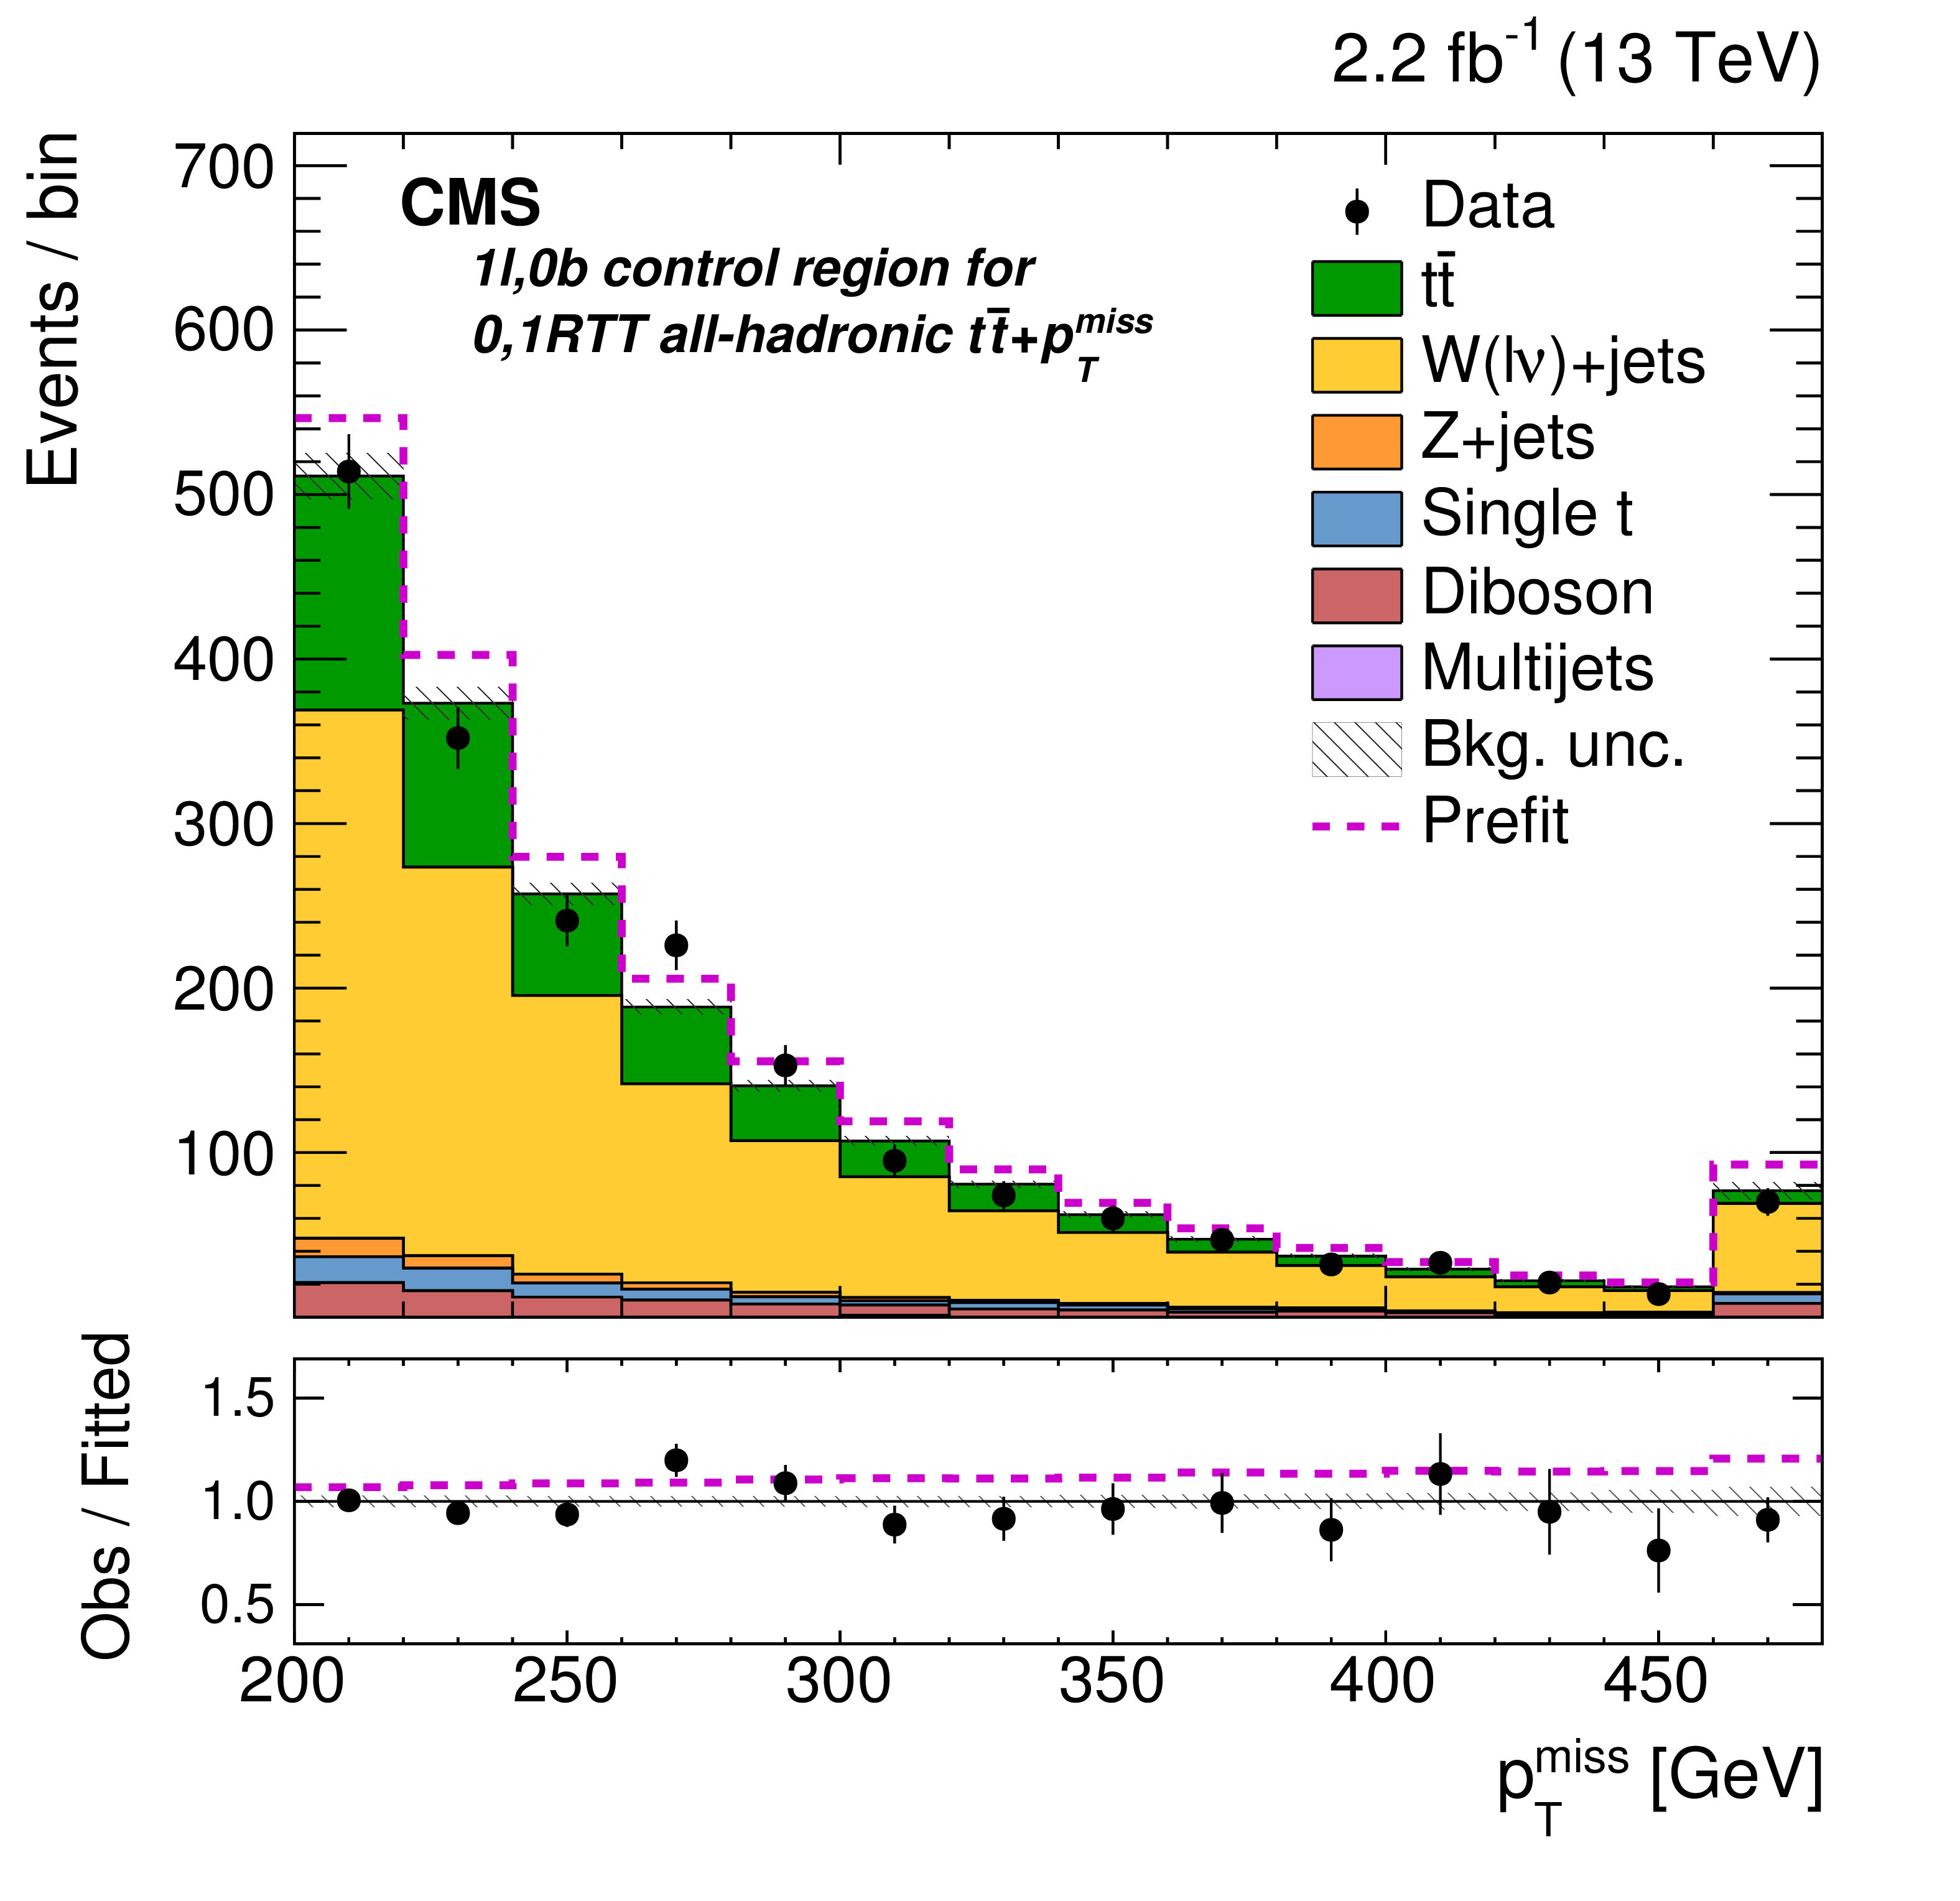
Observed data, and prefit and fitted background-only ${ {p_{\mathrm {T}}} ^\text {miss}}$ distributions in two control regions (hadB and hadC in Table 2) for the 0,1RTT hadronic $ {{\mathrm{ t } {}\mathrm{ \bar{t} } } + { {p_{\mathrm {T}}} ^\text {miss}} } $ signal region with 1 lepton and 0 b tags. The 1 lepton CR provides an additional constraint on W+jets background. The last bin contains overflow events. The lower panel shows the ratios of observed data to fitted background yields. The statistical uncertainties of the data are indicated as vertical error bars and the fit uncertainties are indicated as hatched bands. Prefit yields and the ratios of prefit to fitted background expectations are shown as dashed magenta histograms. |

png pdf |
Figure 5:
Observed data, and prefit and fitted background-only, lepton-subtracted ${ {p_{\mathrm {T}}} ^\text {miss}}$ distributions in the dileptonic control region (hadD in Table 2) for the all-hadronic $ {{\mathrm{ t } {}\mathrm{ \bar{t} } } + { {p_{\mathrm {T}}} ^\text {miss}} } $ signal regions. This control region is used to constrain Z($\nu \bar{\nu }$)+jets background. The selections for jets and $ { {p_{\mathrm {T}}} ^\text {miss}} $ used in the 0,1RTT signal region are applied, with those on $ { {p_{\mathrm {T}}} ^\text {miss}} $ applied to lepton-subtracted $ { {p_{\mathrm {T}}} ^\text {miss}} $. The signal region requirements on $ {\text{min}\Delta \phi ( \vec{p}_{\mathrm {T}} ^{\mathrm {jet_{i}}}, \vec{p}_{\mathrm {T}}^{\text {miss}})} $ and b tags are removed to increase Z+jets yields. The last bin contains overflow events. The lower panel shows the ratios of observed data to fitted background yields. In both panels, the statistical uncertainties of the data are indicated as vertical error bars and the fit uncertainties are indicated as hatched bands. Prefit yields and the ratios of prefit to fitted background expectations are shown as dashed magenta histograms. |

png pdf |
Figure 6:
Observed data, and prefit and fitted background-only event yields in the control regions associated with the $ \ell $+jets $ {{\mathrm{ t } {}\mathrm{ \bar{t} } } + { {p_{\mathrm {T}}} ^\text {miss}} } $ signal region. The 2 lepton, $\geq $0 b tag region (slA in Table 2) is used to constrain the dileptonic ${\mathrm{ t } {}\mathrm{ \bar{t} } } $ background in the $ \ell $+jets $ {{\mathrm{ t } {}\mathrm{ \bar{t} } } + { {p_{\mathrm {T}}} ^\text {miss}} } $ signal region, while the 1 lepton, 0 b tag control region (slB) constrains W+jets background. The lower panel shows the ratios of observed to fitted background yields. In both panels, the statistical uncertainties of the data are indicated as vertical error bars and the fit uncertainties as hatched bands. Prefit yields and the ratios of prefit to fitted background expectations are shown as dashed magenta histograms. |

png pdf |
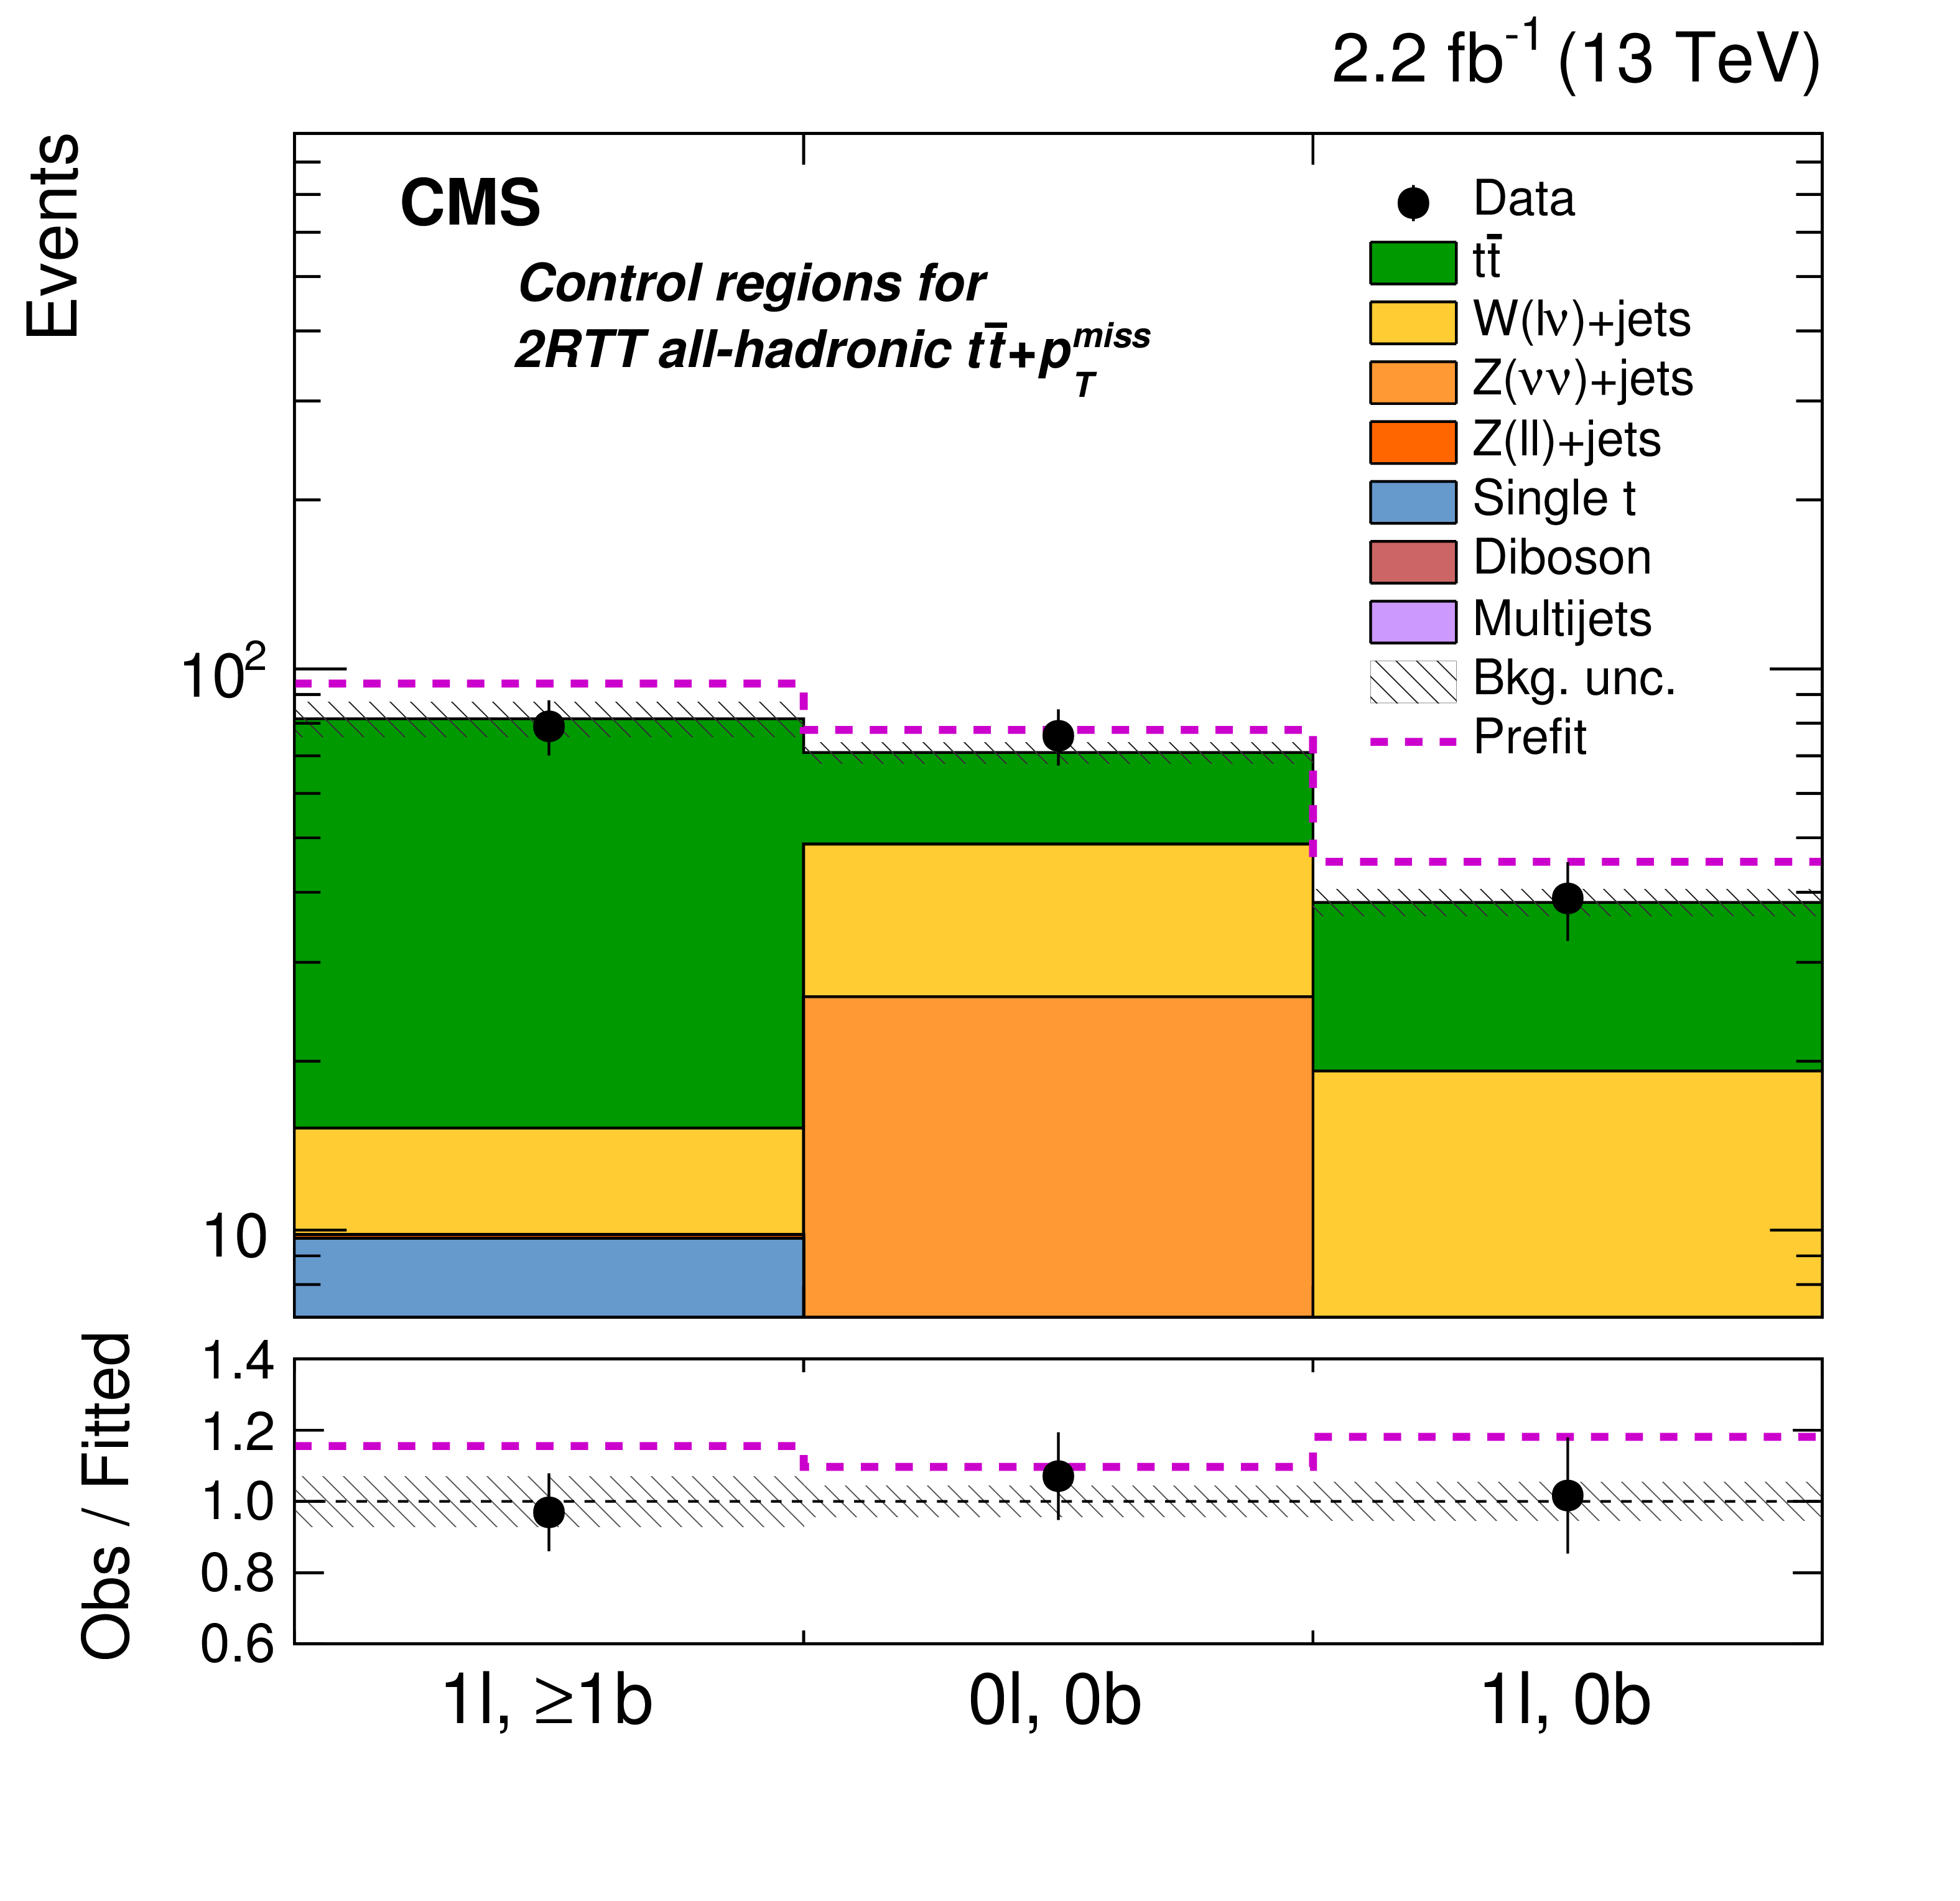
Figure 7:
Observed data, and prefit and fitted background-only event yields in the control regions associated with the 0,1RTT (left) and 2RTT (right) all-hadronic $ {{\mathrm{ t } {}\mathrm{ \bar{t} } } + { {p_{\mathrm {T}}} ^\text {miss}} } $ signal regions. The 1 lepton, ${\geq }$2 b tag control region (hadA in Table 2) constrains $ \ell $+jets ${\mathrm{ t } {}\mathrm{ \bar{t} } } $ background in the 0,1RTT signal region. This process is constrained in the 2RTT signal region using the 1 lepton, $\geq $1 b tag control region (hadE). The $\le $1 lepton, 0 b tag control regions (hadB, hadC, hadF, hadG) constrain W+jets and Z+jets backgrounds, while the 2 lepton, 0 b tag control region (hadD) provides an additional constraint on the Z+jets background. The lower panels show the ratios of observed to fitted background yields. In both panels, the statistical uncertainties of the data are indicated as vertical error bars and the fit uncertainties as hatched bands. Prefit yields and the ratios of prefit to fitted background expectations are shown as dashed magenta histograms. |

png pdf |
Figure 7-a:
Observed data, and prefit and fitted background-only event yields in the control regions associated with the 0,1RTT 2RTT all-hadronic $ {{\mathrm{ t } {}\mathrm{ \bar{t} } } + { {p_{\mathrm {T}}} ^\text {miss}} } $ signal regions. The lower panel shows the ratios of observed to fitted background yields. The statistical uncertainties of the data are indicated as vertical error bars and the fit uncertainties as hatched bands. Prefit yields and the ratios of prefit to fitted background expectations are shown as a dashed magenta histogram. |
png pdf |
Figure 7-b:
Observed data, and prefit and fitted background-only event yields in the control regions associated with the 0,1RTT 2RTT all-hadronic $ {{\mathrm{ t } {}\mathrm{ \bar{t} } } + { {p_{\mathrm {T}}} ^\text {miss}} } $ signal regions. The lower panel shows the ratios of observed to fitted background yields. The statistical uncertainties of the data are indicated as vertical error bars and the fit uncertainties as hatched bands. Prefit yields and the ratios of prefit to fitted background expectations are shown as a dashed magenta histogram. |
png pdf |
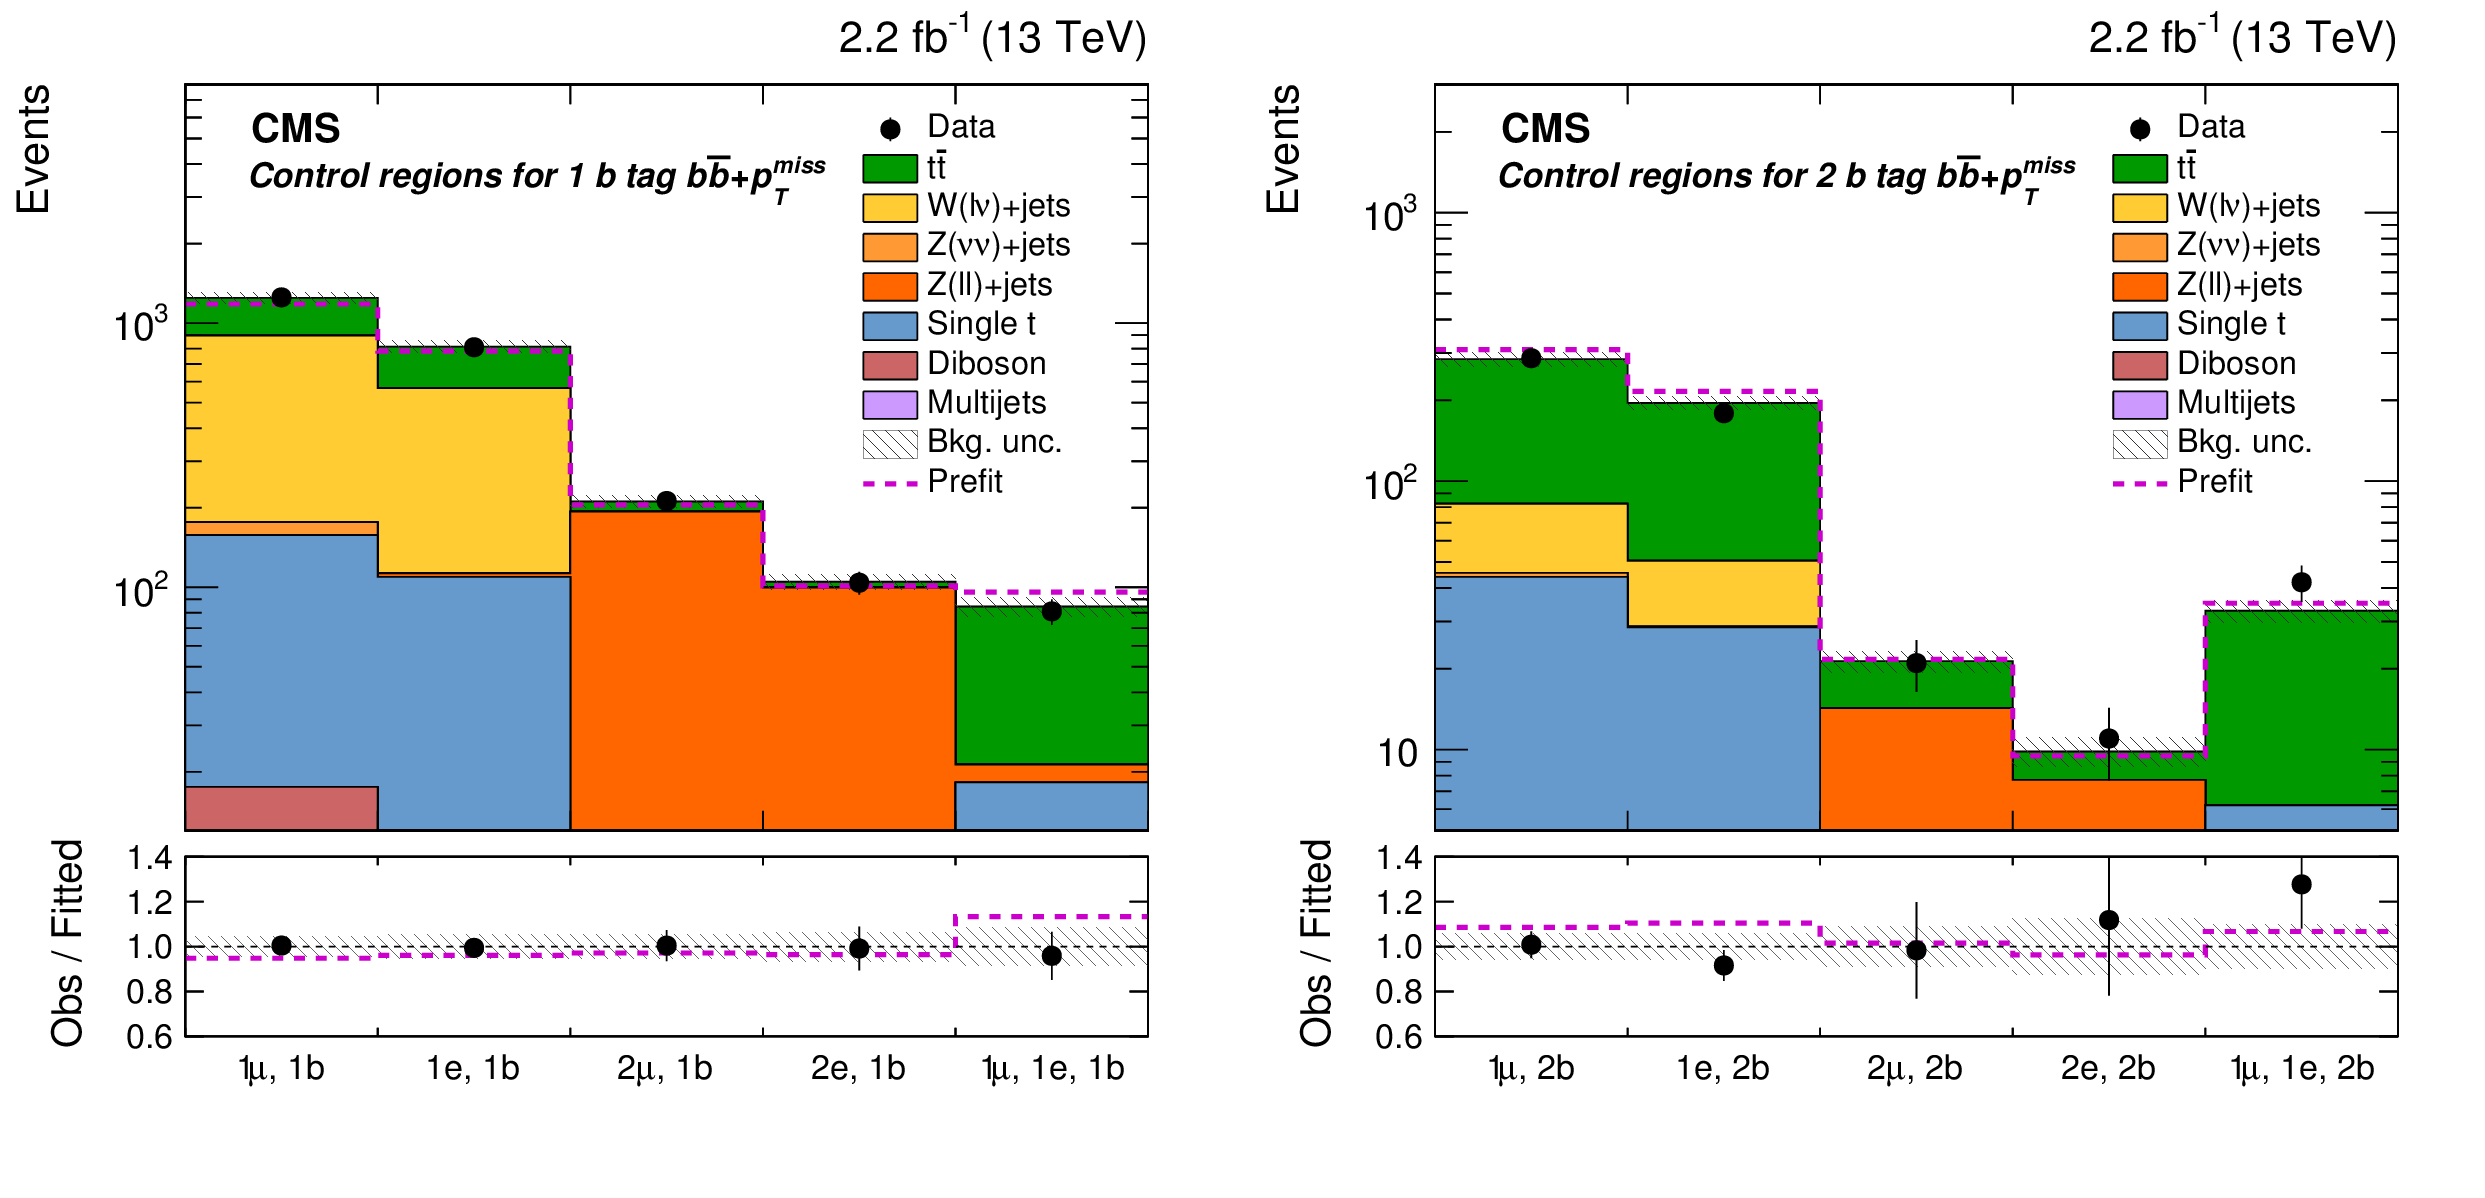
Figure 8:
Observed data, and prefit and fitted background-only event yields in the control regions associated with the $ { {\mathrm{ b \bar{b} } } + { {p_{\mathrm {T}}} ^\text {miss}} } $ signal region with 1 b tag (left) and with 2 b tags (right). The 1 lepton, $\geq $1 b control regions (bbA, bbB, bbF and bbG in Table 2) are used to constrain W+jets and ${\mathrm{ t } {}\mathrm{ \bar{t} } } $ backgrounds in the $ { {\mathrm{ b \bar{b} } } + { {p_{\mathrm {T}}} ^\text {miss}} } $ signal regions. The dileptonic control regions (bbC-bbE, bbH-bbJ) are used to constrain Z+jets and ${\mathrm{ t } {}\mathrm{ \bar{t} } } $ backgrounds. The lower panels show the ratio of observed to fitted background yields. In both panels, the statistical uncertainties of the data are indicated as vertical error bars and the fit uncertainties as hatched bands. Prefit yields and the ratios of prefit to fitted background expectations are shown as dashed magenta histograms. |
png pdf |
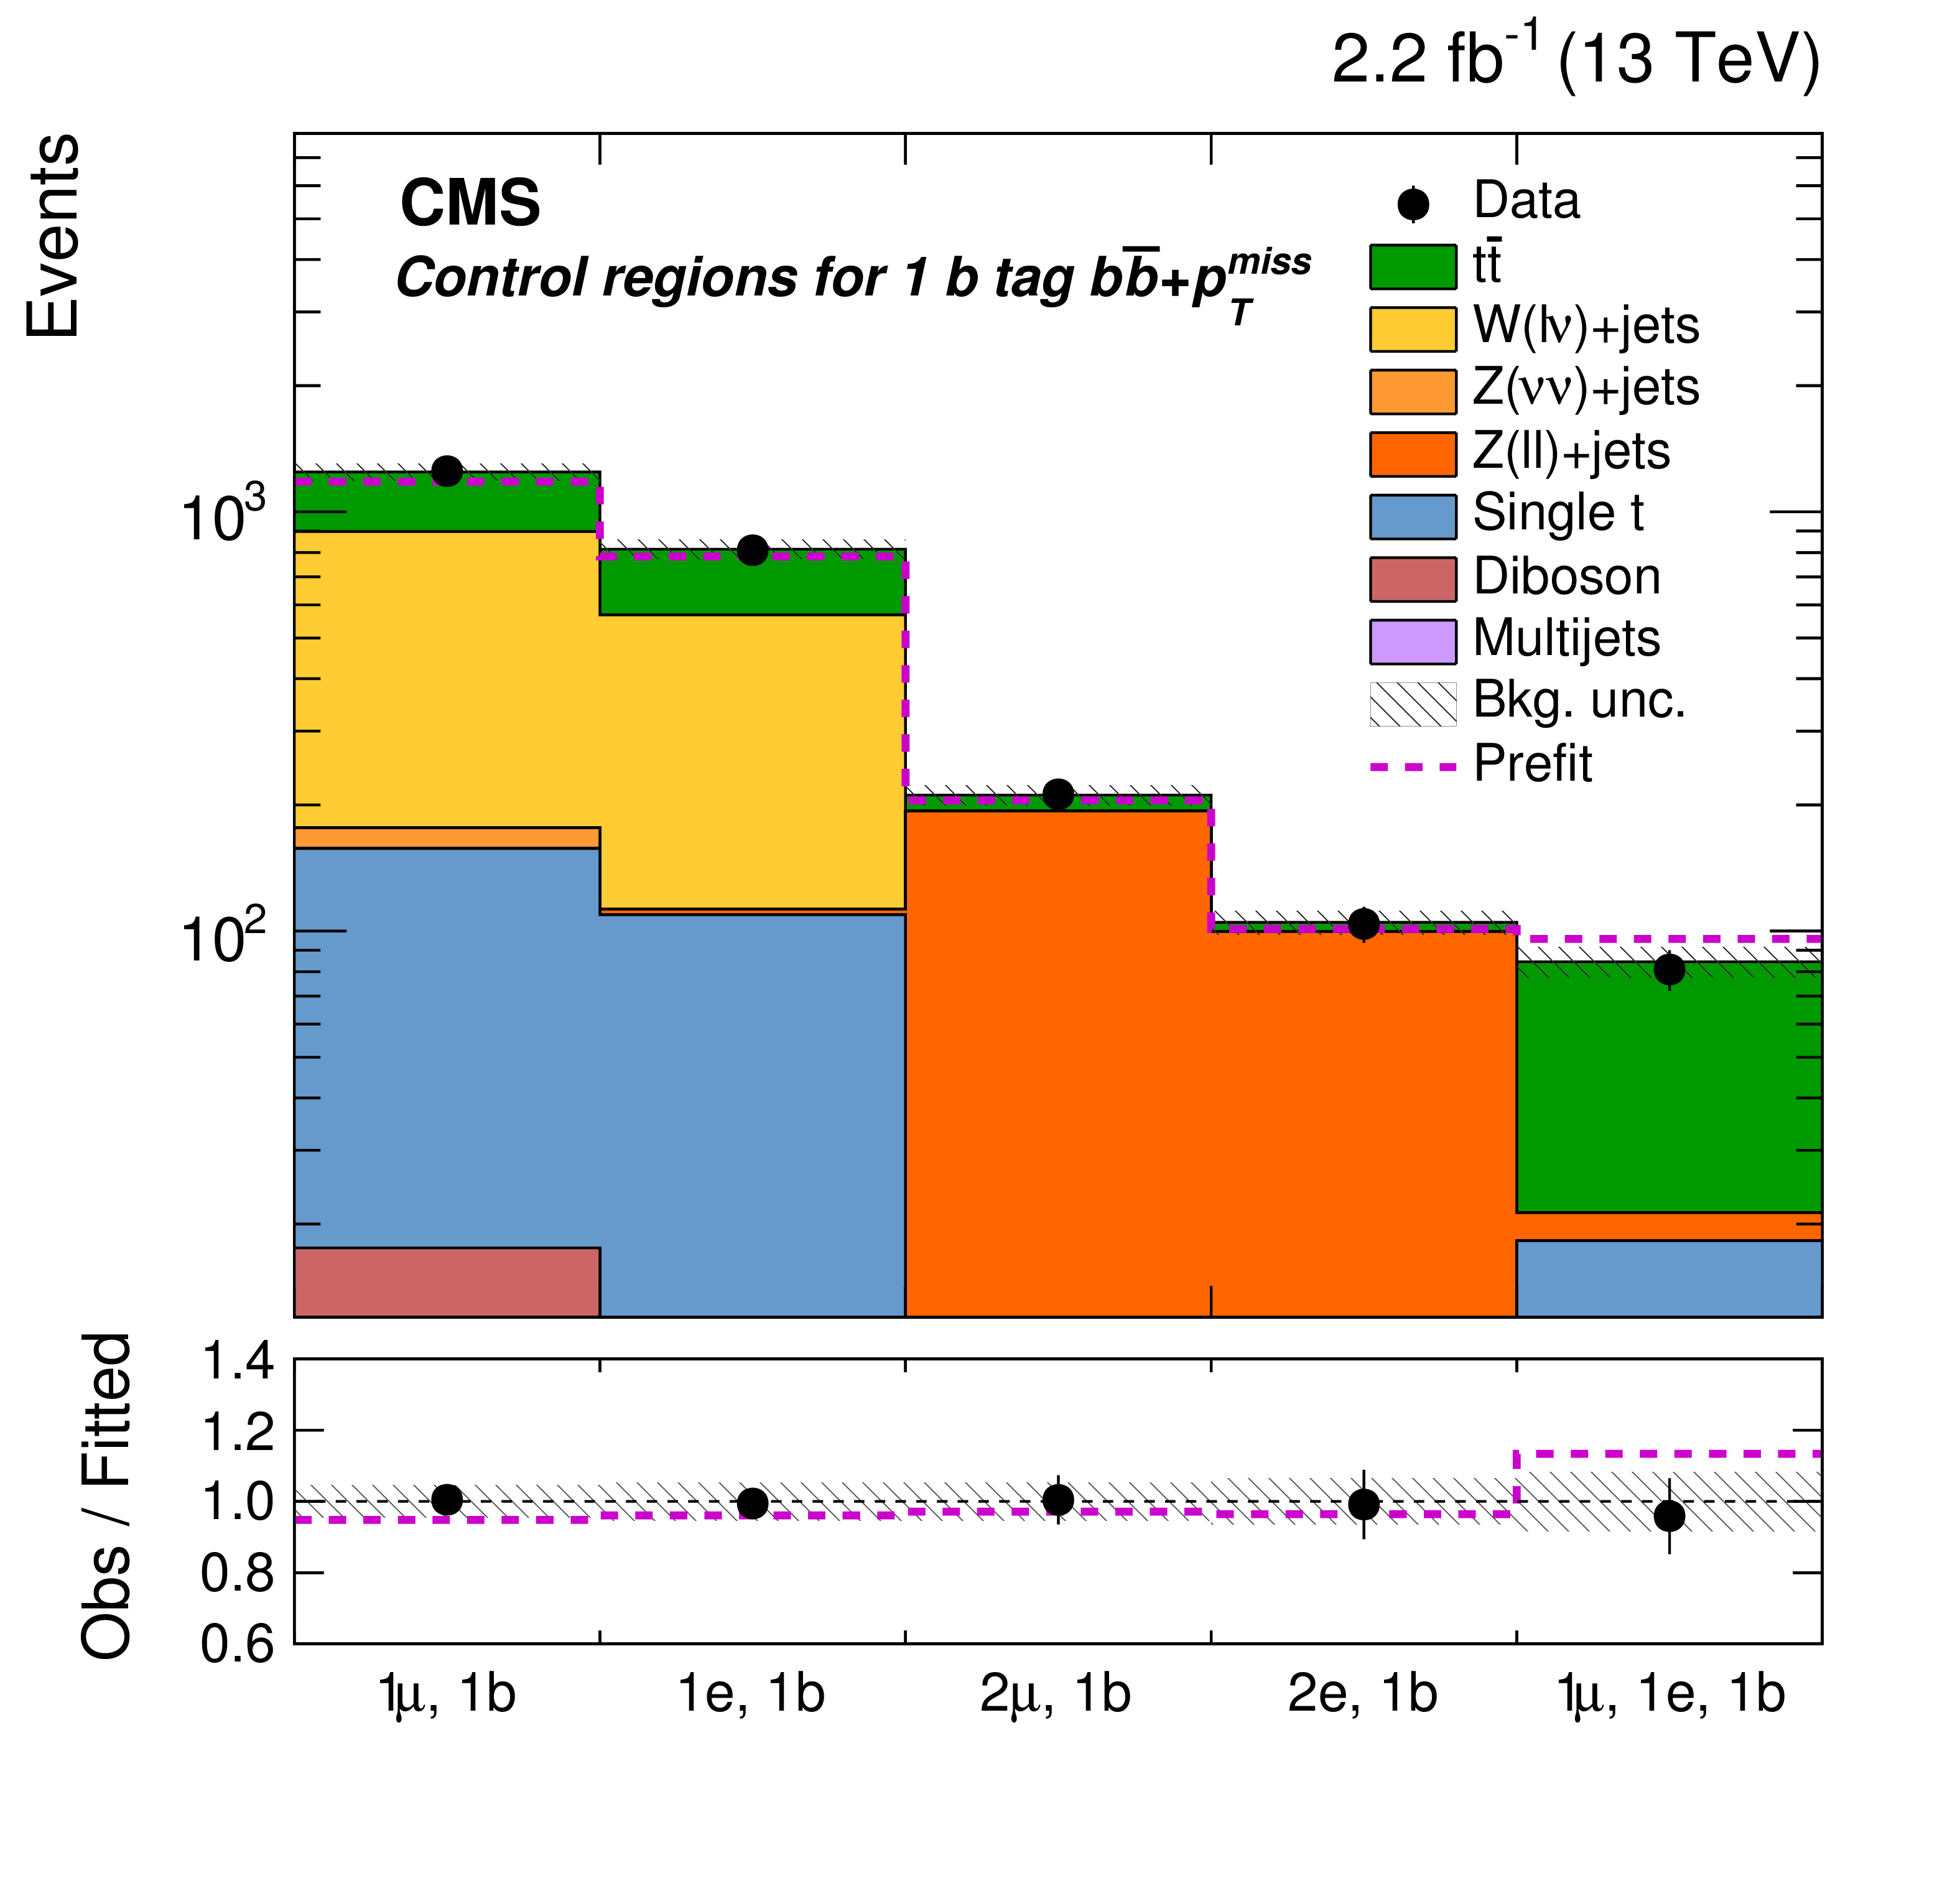
Figure 8-a:
Observed data, and prefit and fitted background-only event yields in the control regions associated with the $ { {\mathrm{ b \bar{b} } } + { {p_{\mathrm {T}}} ^\text {miss}} } $ signal region with 1 b tag. The lower panel shows the ratio of observed to fitted background yields. The statistical uncertainties of the data are indicated as vertical error bars and the fit uncertainties as hatched bands. Prefit yields and the ratios of prefit to fitted background expectations are shown as dashed magenta histograms. |

png pdf |
Figure 8-b:
Observed data, and prefit and fitted background-only event yields in the control regions associated with the $ { {\mathrm{ b \bar{b} } } + { {p_{\mathrm {T}}} ^\text {miss}} } $ signal region with 2 b tags. The lower panel shows the ratio of observed to fitted background yields. The statistical uncertainties of the data are indicated as vertical error bars and the fit uncertainties as hatched bands. Prefit yields and the ratios of prefit to fitted background expectations are shown as dashed magenta histograms. |

png pdf |
Figure 9:
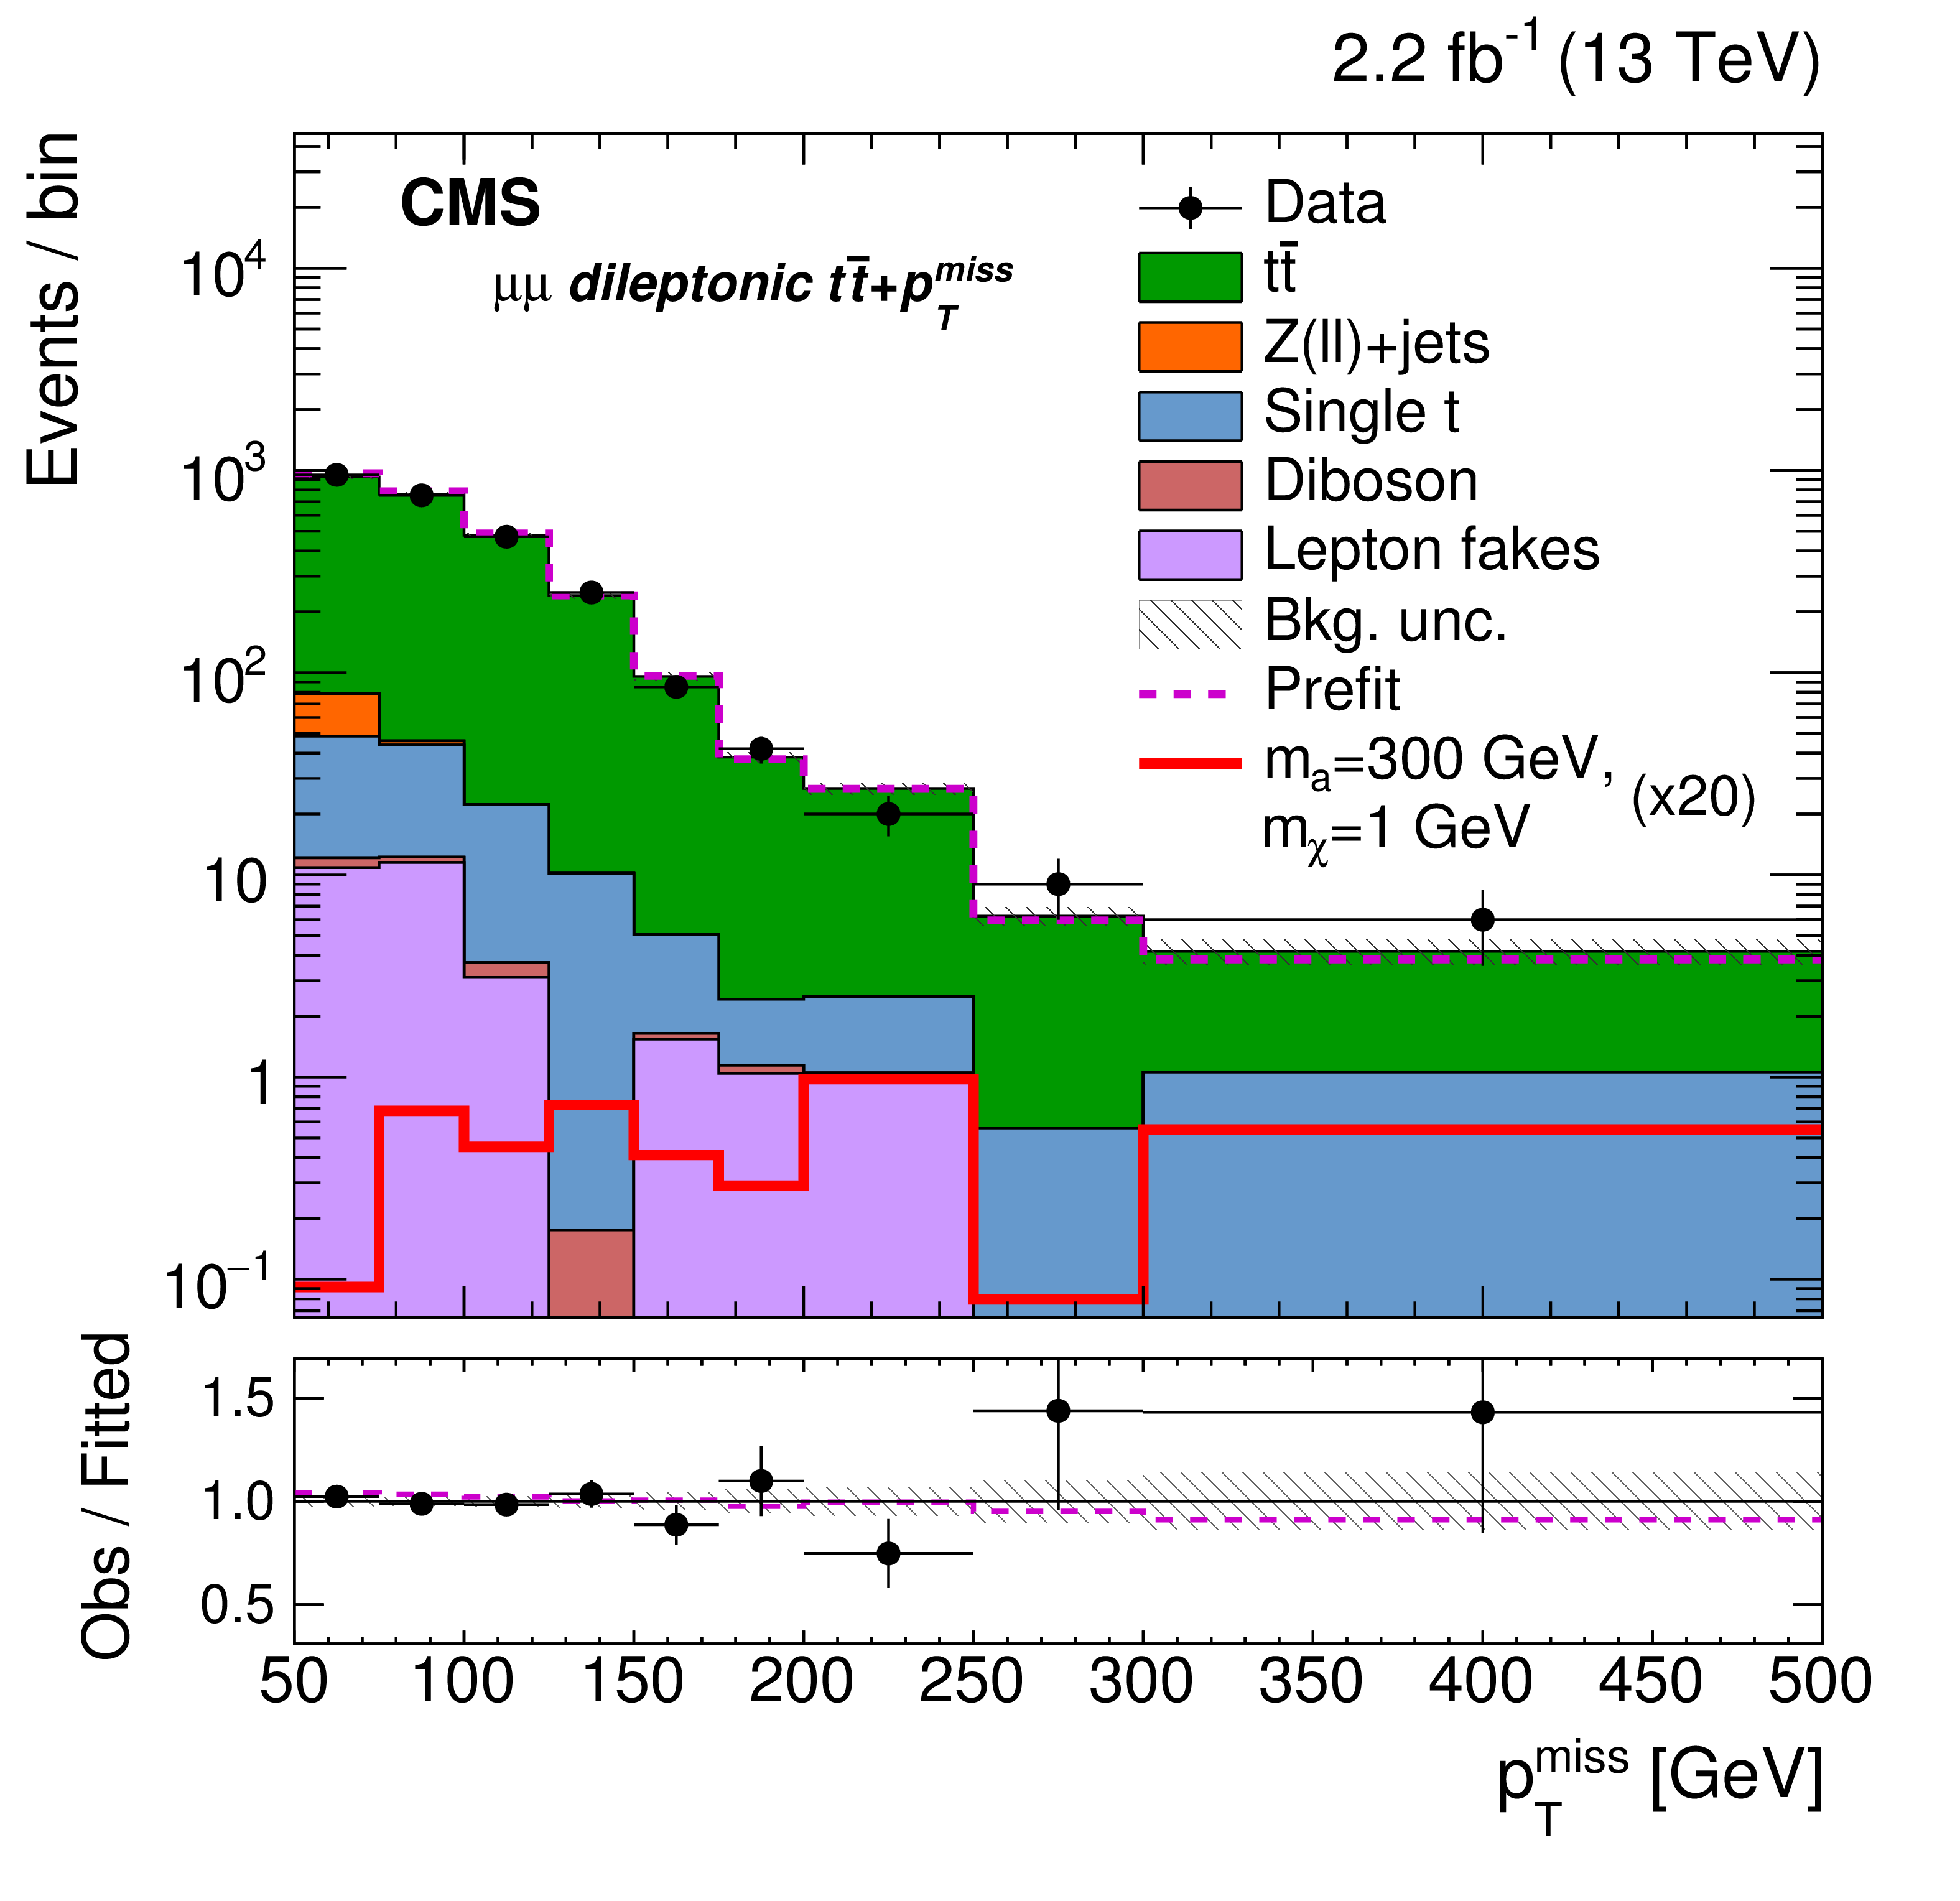
The $ { {p_{\mathrm {T}}} ^\text {miss}} $ distributions in the following signal regions: dileptonic $ {{\mathrm{ t } {}\mathrm{ \bar{t} } } + { {p_{\mathrm {T}}} ^\text {miss}} } $ in the ee signal region (upper left), in the $ {\mu \mu } $ region (upper right), in the e$ { \mu } $ region (lower left), and in $ \ell $+jets $ {{\mathrm{ t } {}\mathrm{ \bar{t} } } + { {p_{\mathrm {T}}} ^\text {miss}} } $ region (lower right). The $ { {p_{\mathrm {T}}} ^\text {miss}} $ distributions of background correspond to background-only fits to the individual $ {{\mathrm{ t } {}\mathrm{ \bar{t} } } + { {p_{\mathrm {T}}} ^\text {miss}} } $ signal regions and associated background control regions. The prefit $ { {p_{\mathrm {T}}} ^\text {miss}} $ distribution of an example signal (pseudoscalar mediator, $m_{\mathrm {a}} = $ 300 GeV and $m_{\chi } = $ 1 GeV) is scaled up by a factor of 20. The last bin contains overflow events. The lower panels of each plot show the ratio of observed data to fitted background. The uncertainty bands shown in these panels are the fitted values, and the magenta lines correspond to the ratio of prefit to fitted background expectations. |
png pdf |
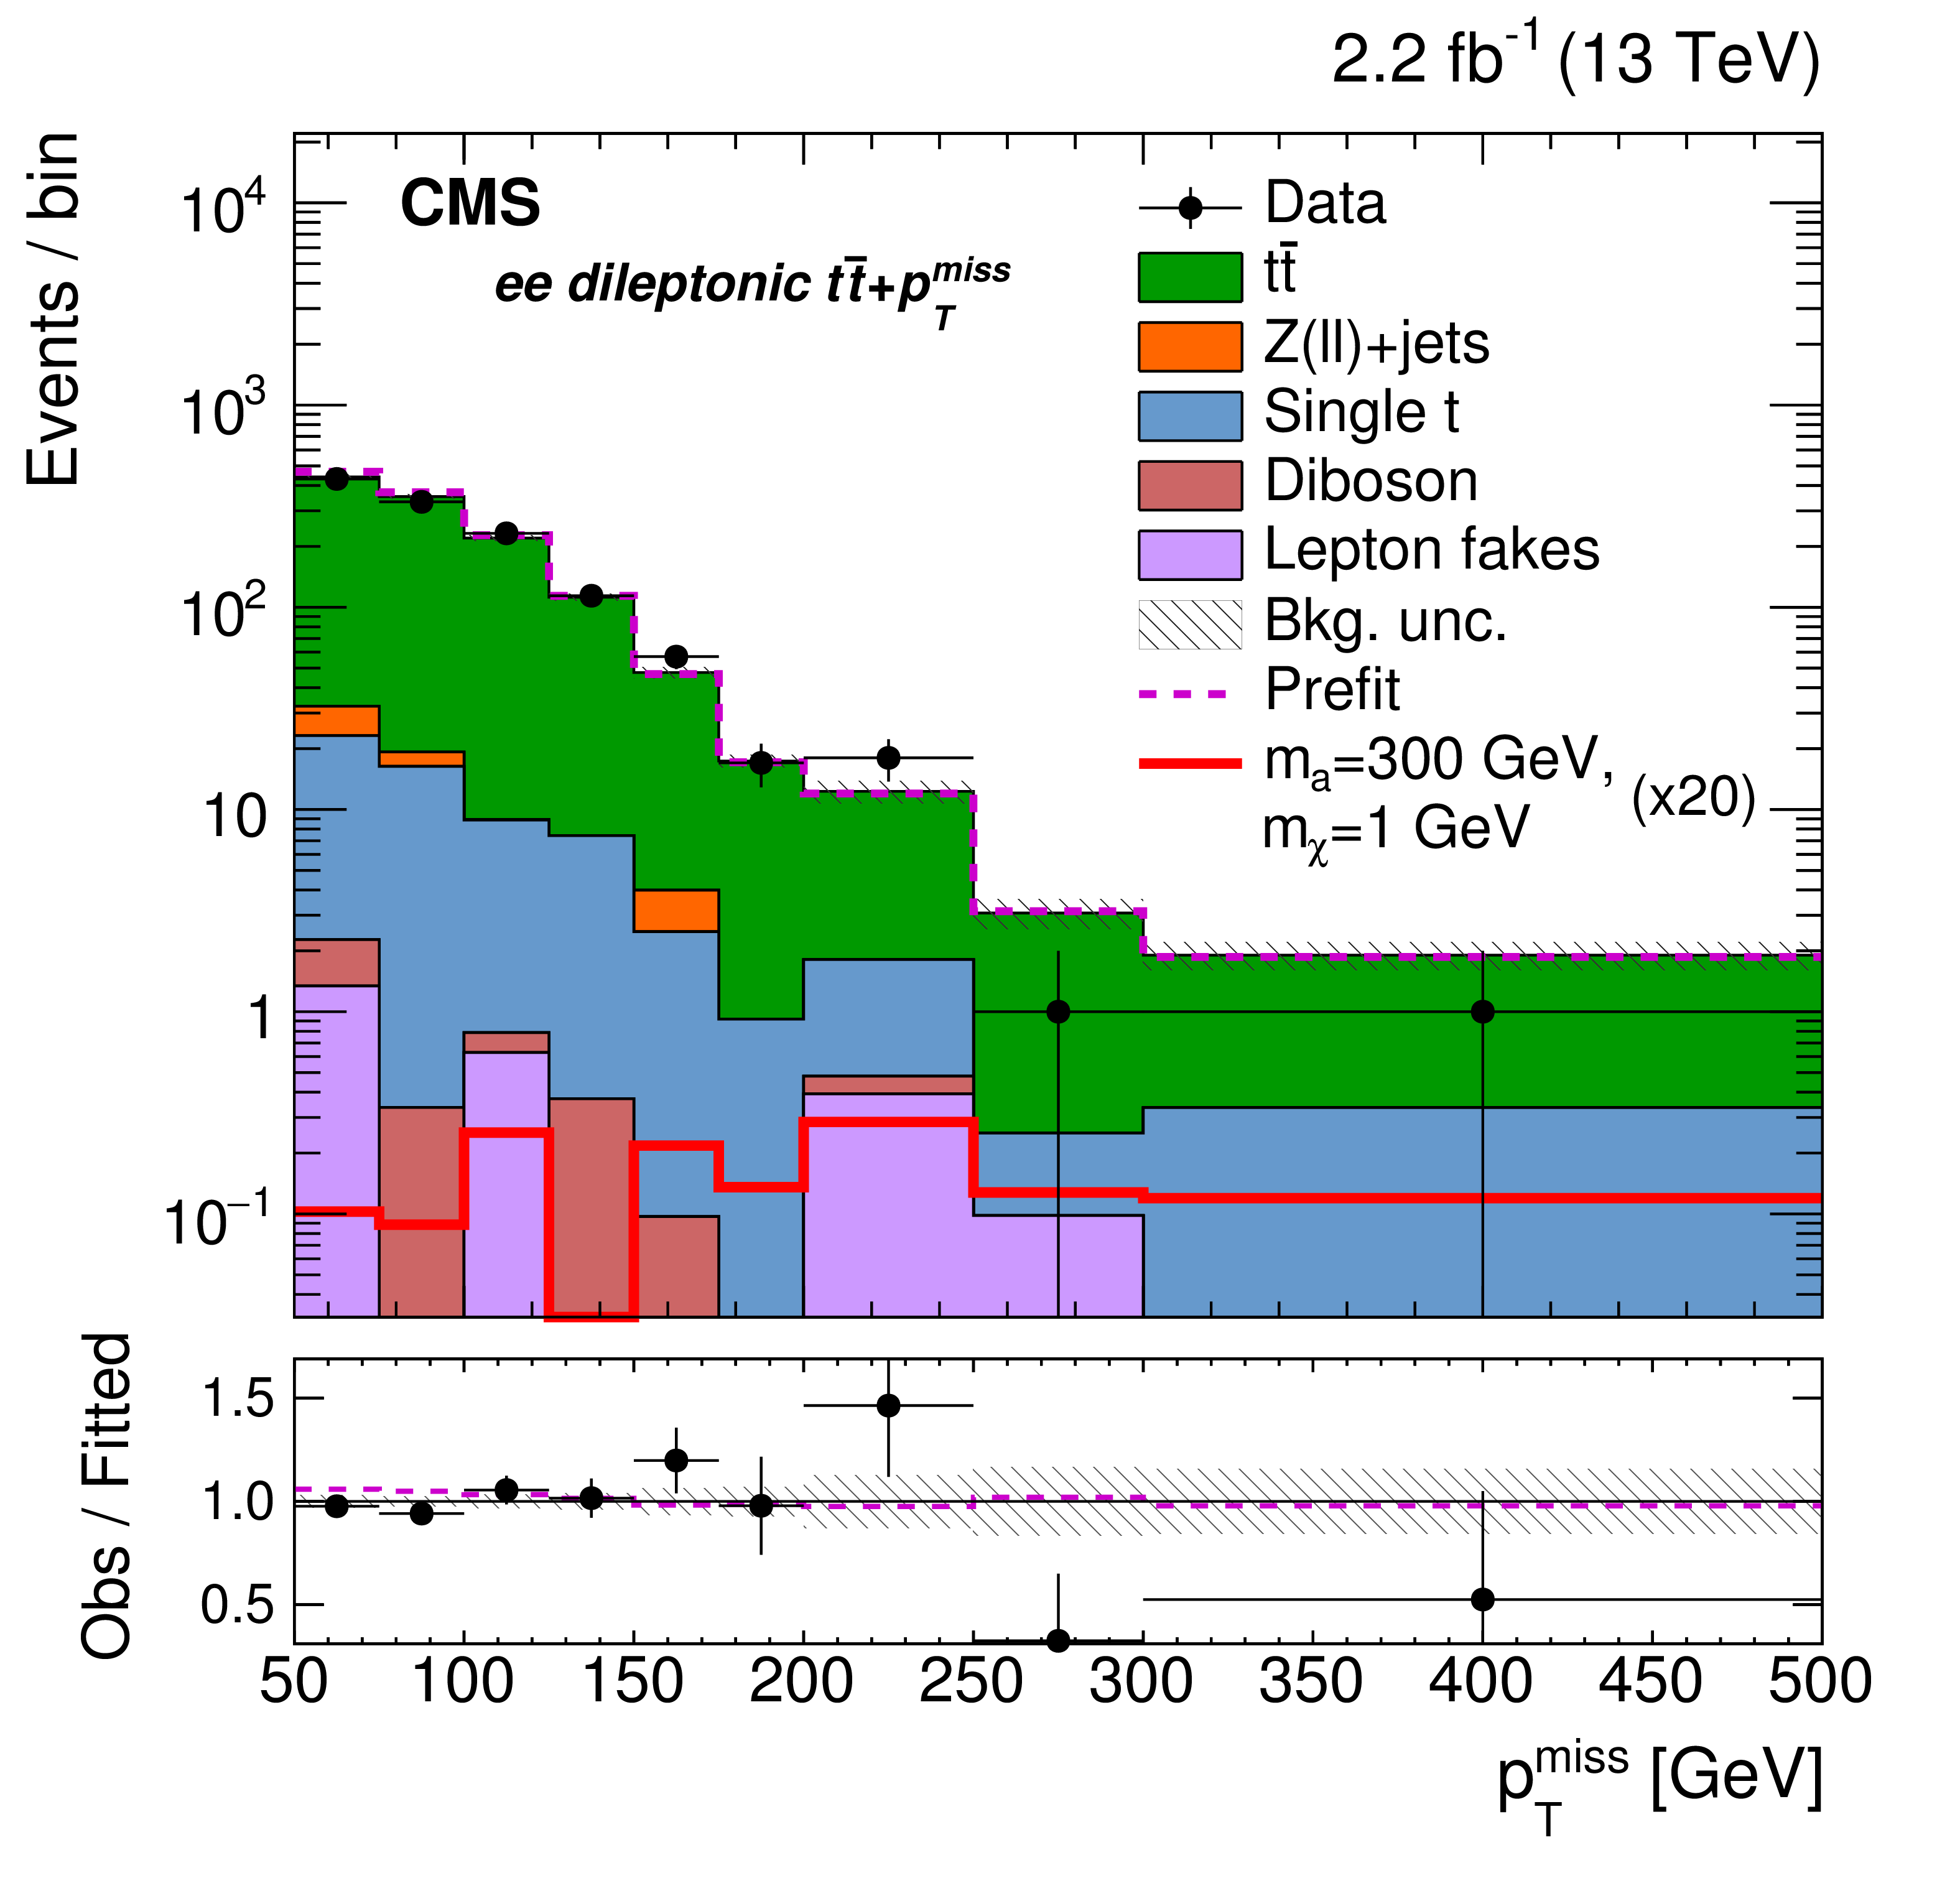
Figure 9-a:
The $ { {p_{\mathrm {T}}} ^\text {miss}} $ distribution in the dileptonic $ {{\mathrm{ t } {}\mathrm{ \bar{t} } } + { {p_{\mathrm {T}}} ^\text {miss}} } $ in the ee channel signal region.The $ { {p_{\mathrm {T}}} ^\text {miss}} $ distributions of background correspond to background-only fits to the individual $ {{\mathrm{ t } {}\mathrm{ \bar{t} } } + { {p_{\mathrm {T}}} ^\text {miss}} } $ signal regions and associated background control regions. The prefit $ { {p_{\mathrm {T}}} ^\text {miss}} $ distribution of an example signal (pseudoscalar mediator, $m_{\mathrm {a}} = $ 300 GeV and $m_{\chi } = $ 1 GeV) is scaled up by a factor of 20. The last bin contains overflow events. The lower panel shows the ratio of observed data to fitted background. The uncertainty band shown in this panel are the fitted values, and the magenta line corresponds to the ratio of prefit to fitted background expectations. |
png pdf |
Figure 9-b:
The $ { {p_{\mathrm {T}}} ^\text {miss}} $ distribution in the dileptonic $ {{\mathrm{ t } {}\mathrm{ \bar{t} } } + { {p_{\mathrm {T}}} ^\text {miss}} } $ in the $ {\mu \mu } $ channel signal region. The $ { {p_{\mathrm {T}}} ^\text {miss}} $ distributions of background correspond to background-only fits to the individual $ {{\mathrm{ t } {}\mathrm{ \bar{t} } } + { {p_{\mathrm {T}}} ^\text {miss}} } $ signal regions and associated background control regions. The prefit $ { {p_{\mathrm {T}}} ^\text {miss}} $ distribution of an example signal (pseudoscalar mediator, $m_{\mathrm {a}} = $ 300 GeV and $m_{\chi } = $ 1 GeV) is scaled up by a factor of 20. The last bin contains overflow events. The lower panel shows the ratio of observed data to fitted background. The uncertainty band shown in this panel are the fitted values, and the magenta line corresponds to the ratio of prefit to fitted background expectations. |

png pdf |
Figure 9-c:
The $ { {p_{\mathrm {T}}} ^\text {miss}} $ distribution in the dileptonic $ {{\mathrm{ t } {}\mathrm{ \bar{t} } } + { {p_{\mathrm {T}}} ^\text {miss}} } $ in the e$ { \mu } $ channel signal region. The $ { {p_{\mathrm {T}}} ^\text {miss}} $ distributions of background correspond to background-only fits to the individual $ {{\mathrm{ t } {}\mathrm{ \bar{t} } } + { {p_{\mathrm {T}}} ^\text {miss}} } $ signal regions and associated background control regions. The prefit $ { {p_{\mathrm {T}}} ^\text {miss}} $ distribution of an example signal (pseudoscalar mediator, $m_{\mathrm {a}} = $ 300 GeV and $m_{\chi } = $ 1 GeV) is scaled up by a factor of 20. The last bin contains overflow events. The lower panel shows the ratio of observed data to fitted background. The uncertainty band shown in this panel are the fitted values, and the magenta line corresponds to the ratio of prefit to fitted background expectations. |

png pdf |
Figure 9-d:
The $ { {p_{\mathrm {T}}} ^\text {miss}} $ distribution in the dileptonic $ {{\mathrm{ t } {}\mathrm{ \bar{t} } } + { {p_{\mathrm {T}}} ^\text {miss}} } $ in $ \ell $+jets $ {{\mathrm{ t } {}\mathrm{ \bar{t} } } + { {p_{\mathrm {T}}} ^\text {miss}} } $ region (lower right). The $ { {p_{\mathrm {T}}} ^\text {miss}} $ distributions of background correspond to background-only fits to the individual $ {{\mathrm{ t } {}\mathrm{ \bar{t} } } + { {p_{\mathrm {T}}} ^\text {miss}} } $ signal regions and associated background control regions. The prefit $ { {p_{\mathrm {T}}} ^\text {miss}} $ distribution of an example signal (pseudoscalar mediator, $m_{\mathrm {a}} = $ 300 GeV and $m_{\chi } = $ 1 GeV) is scaled up by a factor of 20. The last bin contains overflow events. The lower panel shows the ratio of observed data to fitted background. The uncertainty band shown in this panel are the fitted values, and the magenta line corresponds to the ratio of prefit to fitted background expectations. |
png pdf |
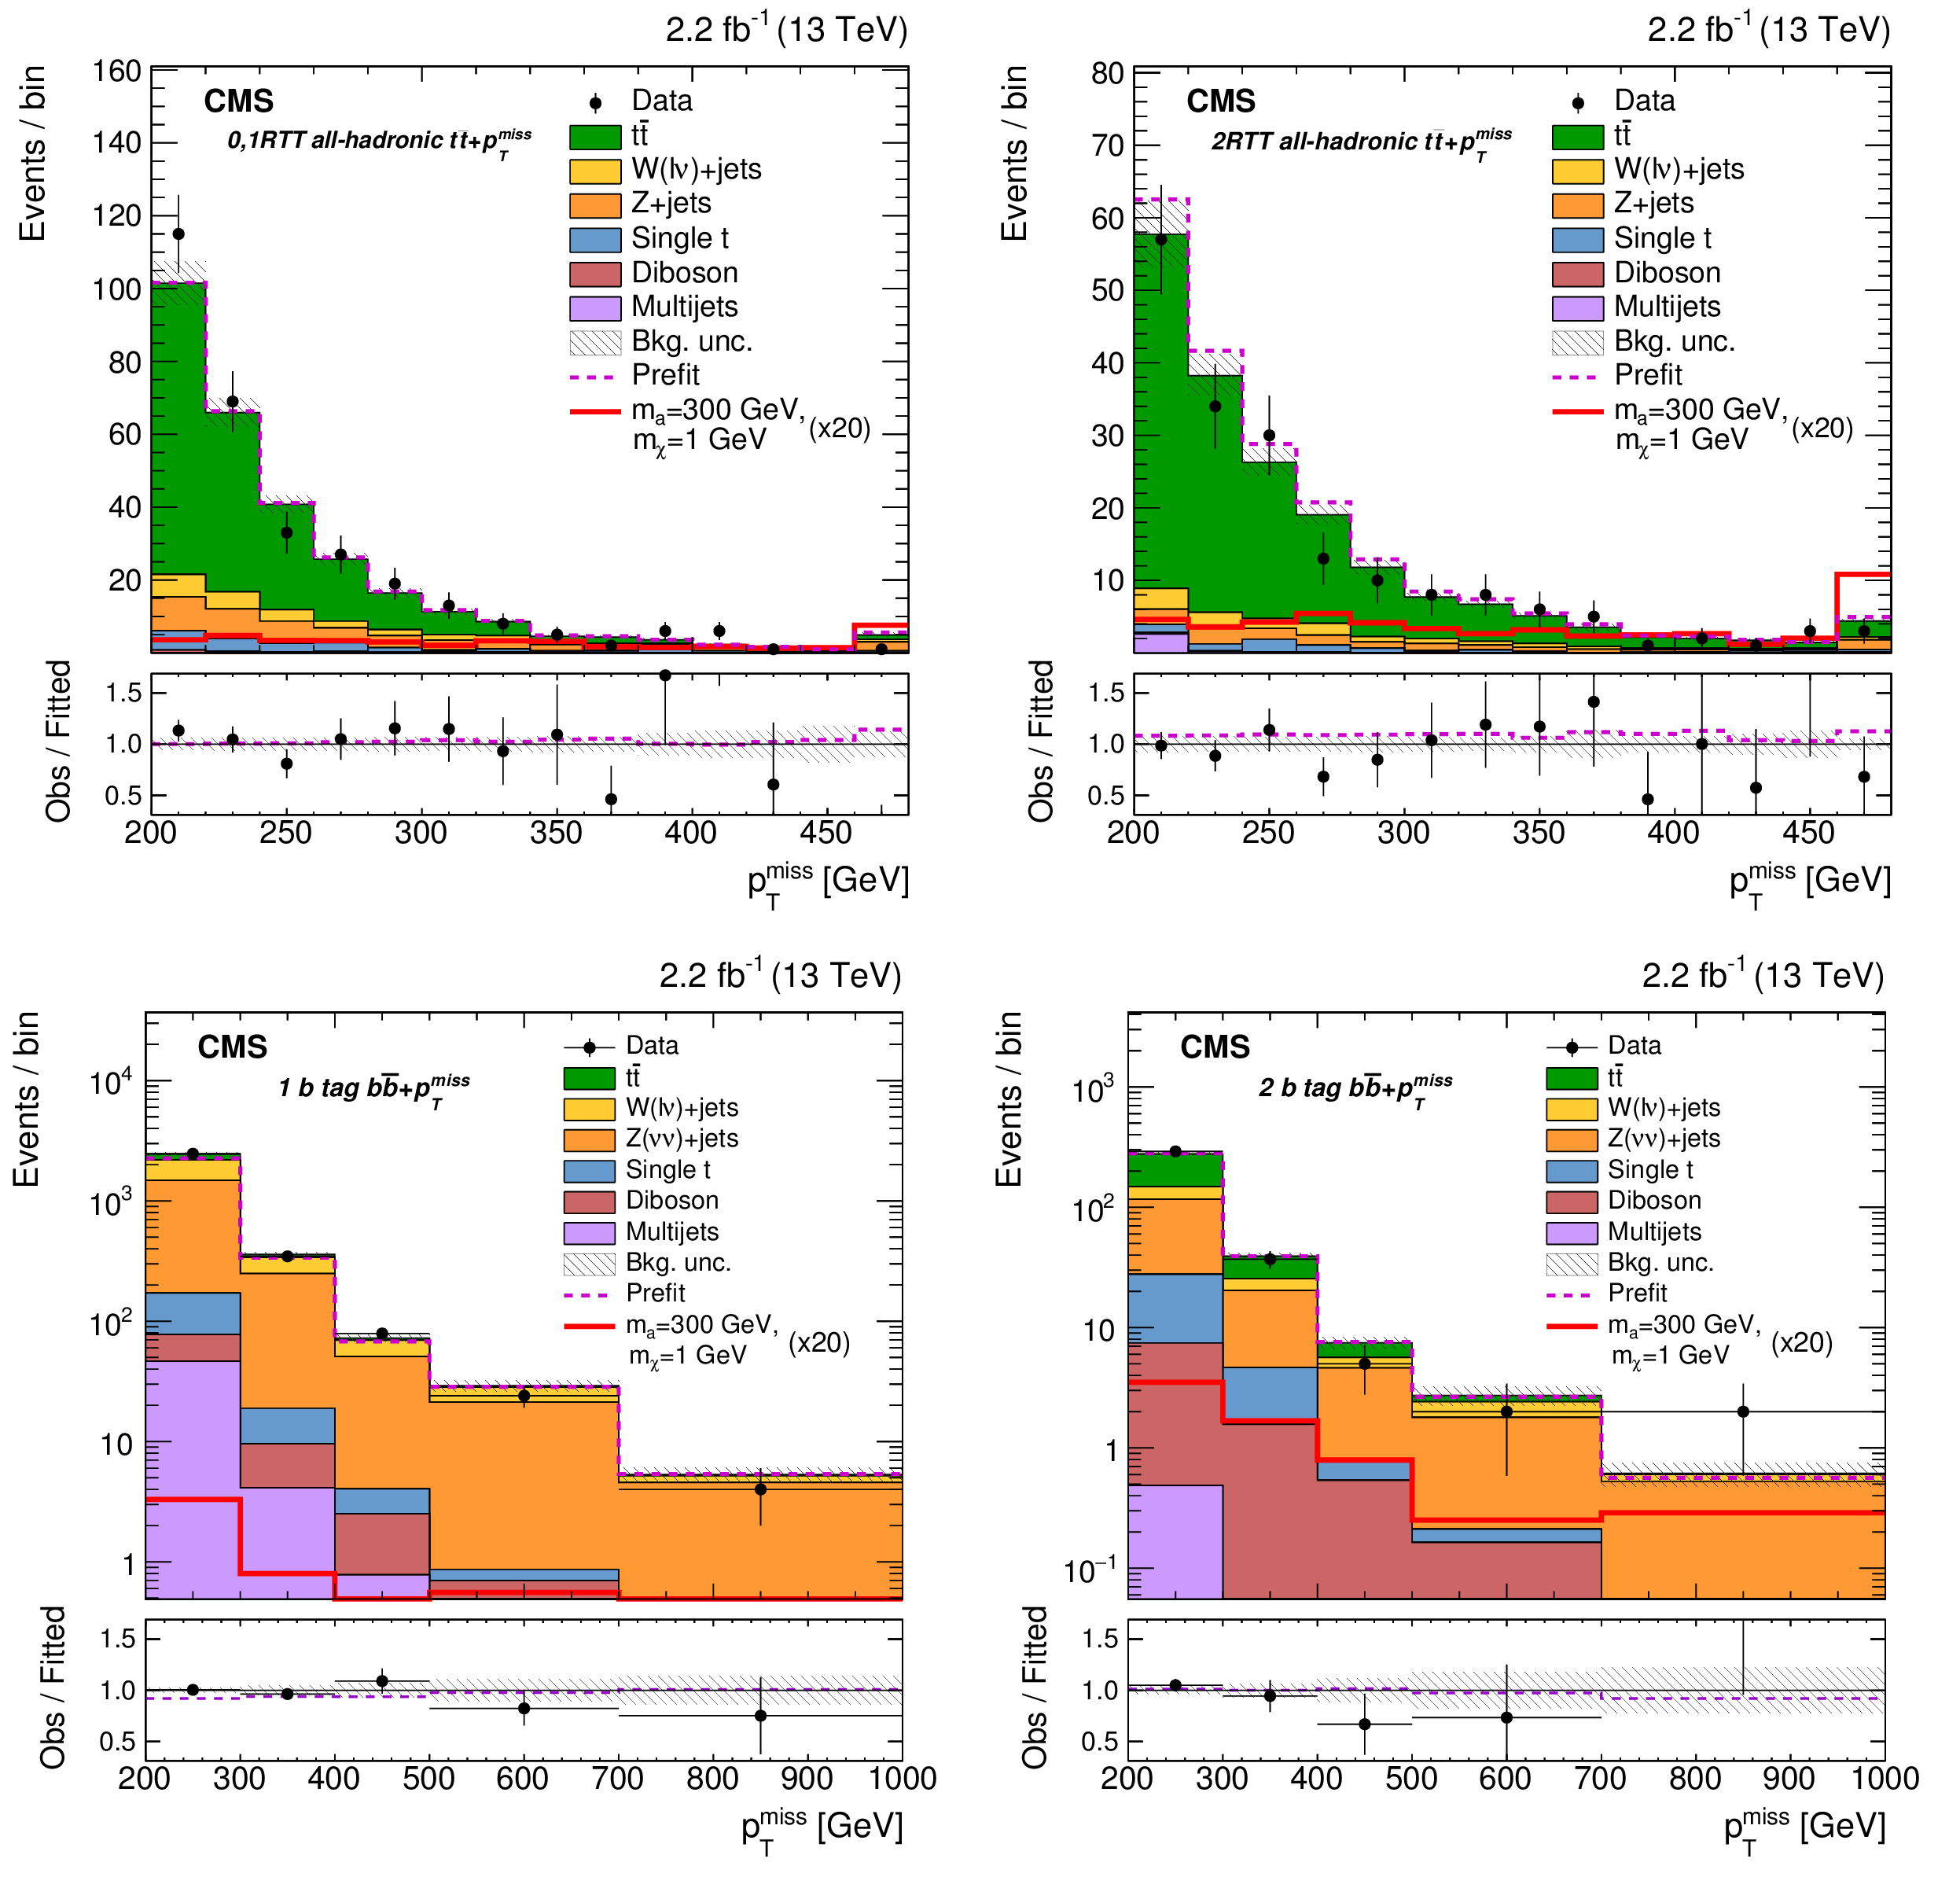
Figure 10:
The $ { {p_{\mathrm {T}}} ^\text {miss}} $ distributions in the following signal regions: all-hadronic $ {{\mathrm{ t } {}\mathrm{ \bar{t} } } + { {p_{\mathrm {T}}} ^\text {miss}} } $ with 0 or 1 RTTs (upper left), all-hadronic $ {{\mathrm{ t } {}\mathrm{ \bar{t} } } + { {p_{\mathrm {T}}} ^\text {miss}} } $ with 2 RTTs (upper right), $ { {\mathrm{ b \bar{b} } } + { {p_{\mathrm {T}}} ^\text {miss}} } $ with 1 b tag (lower left), and $ { {\mathrm{ b \bar{b} } } + { {p_{\mathrm {T}}} ^\text {miss}} } $ with 2 b tags (lower right). The $ { {p_{\mathrm {T}}} ^\text {miss}} $ distributions of background correspond to background-only fits to the individual $ {{\mathrm{ t } {}\mathrm{ \bar{t} } } + { {p_{\mathrm {T}}} ^\text {miss}} } $ and $ { {\mathrm{ b \bar{b} } } + { {p_{\mathrm {T}}} ^\text {miss}} } $ signal regions and associated background control regions. The prefit $ { {p_{\mathrm {T}}} ^\text {miss}} $ distribution of an example signal (pseudoscalar mediator, $m_{\mathrm {a}} = $ 300 GeV and $m_{\chi } = $ 1 GeV) is scaled up by a factor of 20. The last bin contains overflow events. The lower panels of each plot show the ratio of observed data to fitted background. The uncertainty bands shown in these panels are the fitted values, and the magenta lines correspond to the ratio of prefit to fitted background expectations. |

png pdf |
Figure 10-a:
The $ { {p_{\mathrm {T}}} ^\text {miss}} $ distribution in the all-hadronic $ {{\mathrm{ t } {}\mathrm{ \bar{t} } } + { {p_{\mathrm {T}}} ^\text {miss}} } $ with 0 or 1 RTTs signal region. The $ { {p_{\mathrm {T}}} ^\text {miss}} $ distributions of background correspond to background-only fits to the individual $ {{\mathrm{ t } {}\mathrm{ \bar{t} } } + { {p_{\mathrm {T}}} ^\text {miss}} } $ and $ { {\mathrm{ b \bar{b} } } + { {p_{\mathrm {T}}} ^\text {miss}} } $ signal regions and associated background control regions. The prefit $ { {p_{\mathrm {T}}} ^\text {miss}} $ distribution of an example signal (pseudoscalar mediator, $m_{\mathrm {a}} = $ 300 GeV and $m_{\chi } = $ 1 GeV) is scaled up by a factor of 20. The last bin contains overflow events. The lower panel shows the ratio of observed data to fitted background. The uncertainty band shown is the fitted values, and the magenta line corresponds to the ratio of prefit to fitted background expectations. |
png pdf |
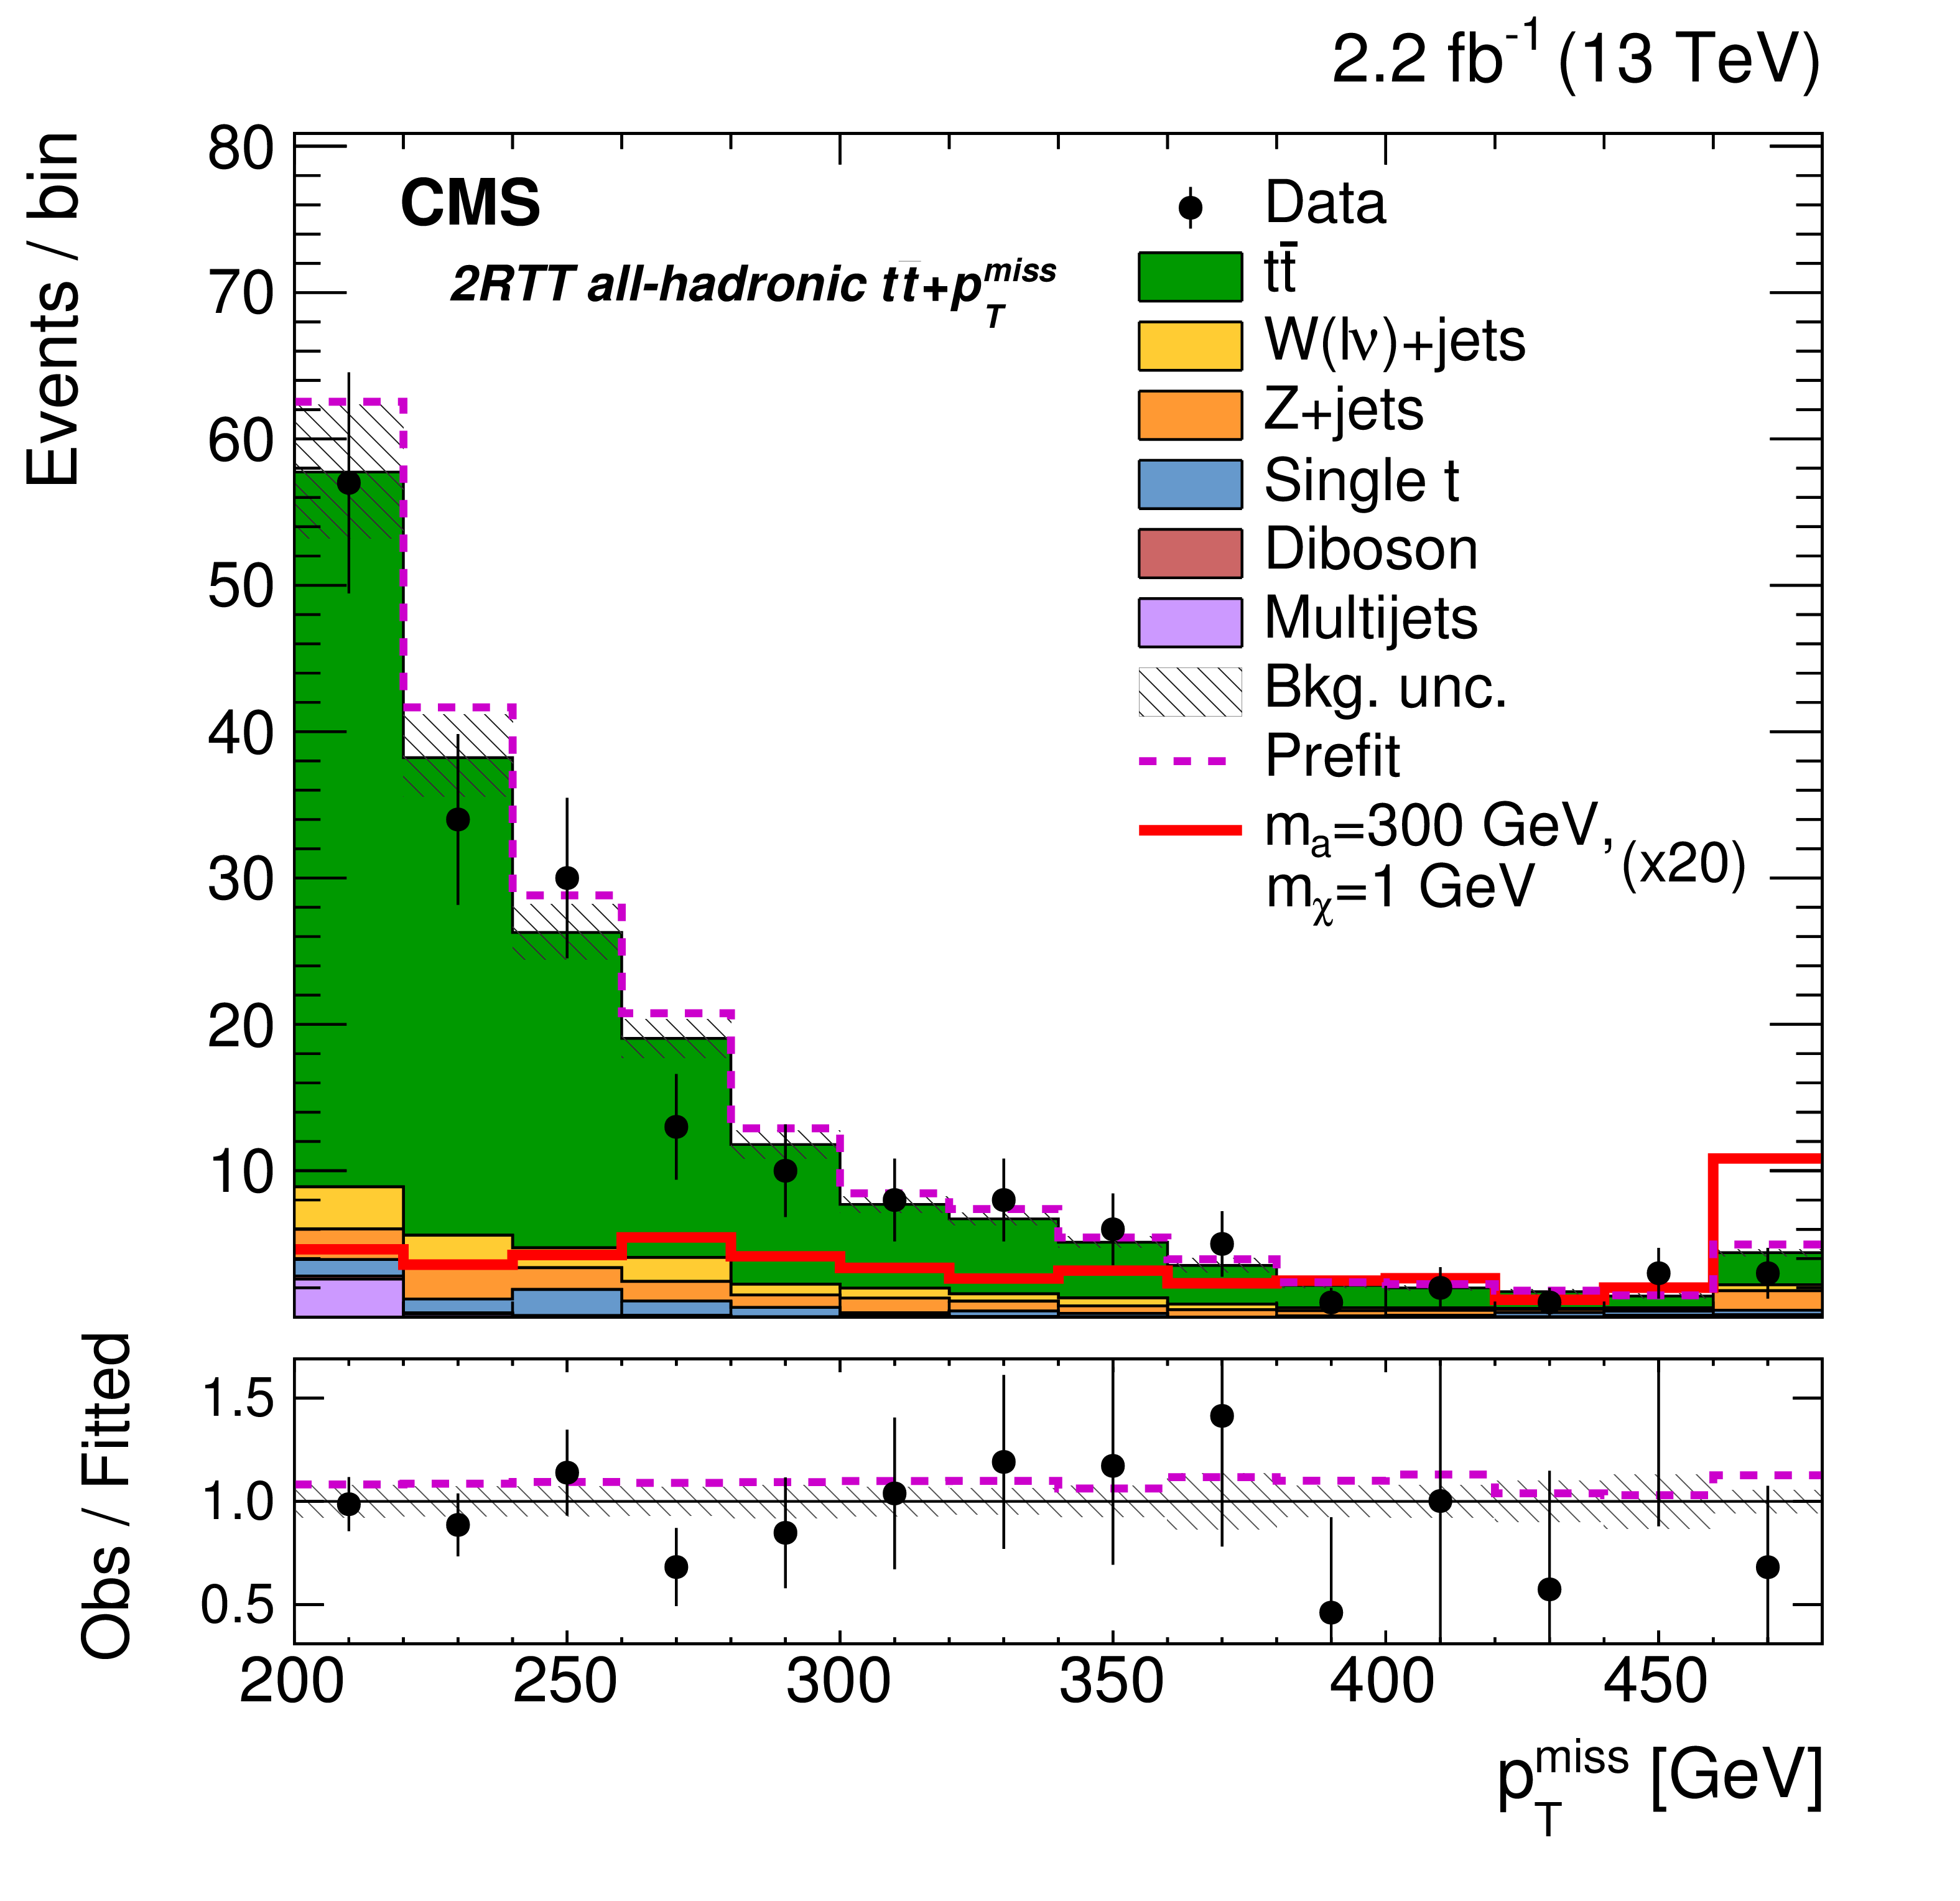
Figure 10-b:
The $ { {p_{\mathrm {T}}} ^\text {miss}} $ distribution in the all-hadronic $ {{\mathrm{ t } {}\mathrm{ \bar{t} } } + { {p_{\mathrm {T}}} ^\text {miss}} } $ with 2 RTTs signal region. The $ { {p_{\mathrm {T}}} ^\text {miss}} $ distributions of background correspond to background-only fits to the individual $ {{\mathrm{ t } {}\mathrm{ \bar{t} } } + { {p_{\mathrm {T}}} ^\text {miss}} } $ and $ { {\mathrm{ b \bar{b} } } + { {p_{\mathrm {T}}} ^\text {miss}} } $ signal regions and associated background control regions. The prefit $ { {p_{\mathrm {T}}} ^\text {miss}} $ distribution of an example signal (pseudoscalar mediator, $m_{\mathrm {a}} = $ 300 GeV and $m_{\chi } = $ 1 GeV) is scaled up by a factor of 20. The last bin contains overflow events. The lower panel shows the ratio of observed data to fitted background. The uncertainty band shown is the fitted values, and the magenta line corresponds to the ratio of prefit to fitted background expectations. |

png pdf |
Figure 10-c:
The $ { {p_{\mathrm {T}}} ^\text {miss}} $ distribution in the $ { {\mathrm{ b \bar{b} } } + { {p_{\mathrm {T}}} ^\text {miss}} } $ with 1 b tag signal region. The $ { {p_{\mathrm {T}}} ^\text {miss}} $ distributions of background correspond to background-only fits to the individual $ {{\mathrm{ t } {}\mathrm{ \bar{t} } } + { {p_{\mathrm {T}}} ^\text {miss}} } $ and $ { {\mathrm{ b \bar{b} } } + { {p_{\mathrm {T}}} ^\text {miss}} } $ signal regions and associated background control regions. The prefit $ { {p_{\mathrm {T}}} ^\text {miss}} $ distribution of an example signal (pseudoscalar mediator, $m_{\mathrm {a}} = $ 300 GeV and $m_{\chi } = $ 1 GeV) is scaled up by a factor of 20. The last bin contains overflow events. The lower panel shows the ratio of observed data to fitted background. The uncertainty band shown is the fitted values, and the magenta line corresponds to the ratio of prefit to fitted background expectations. |
png pdf |
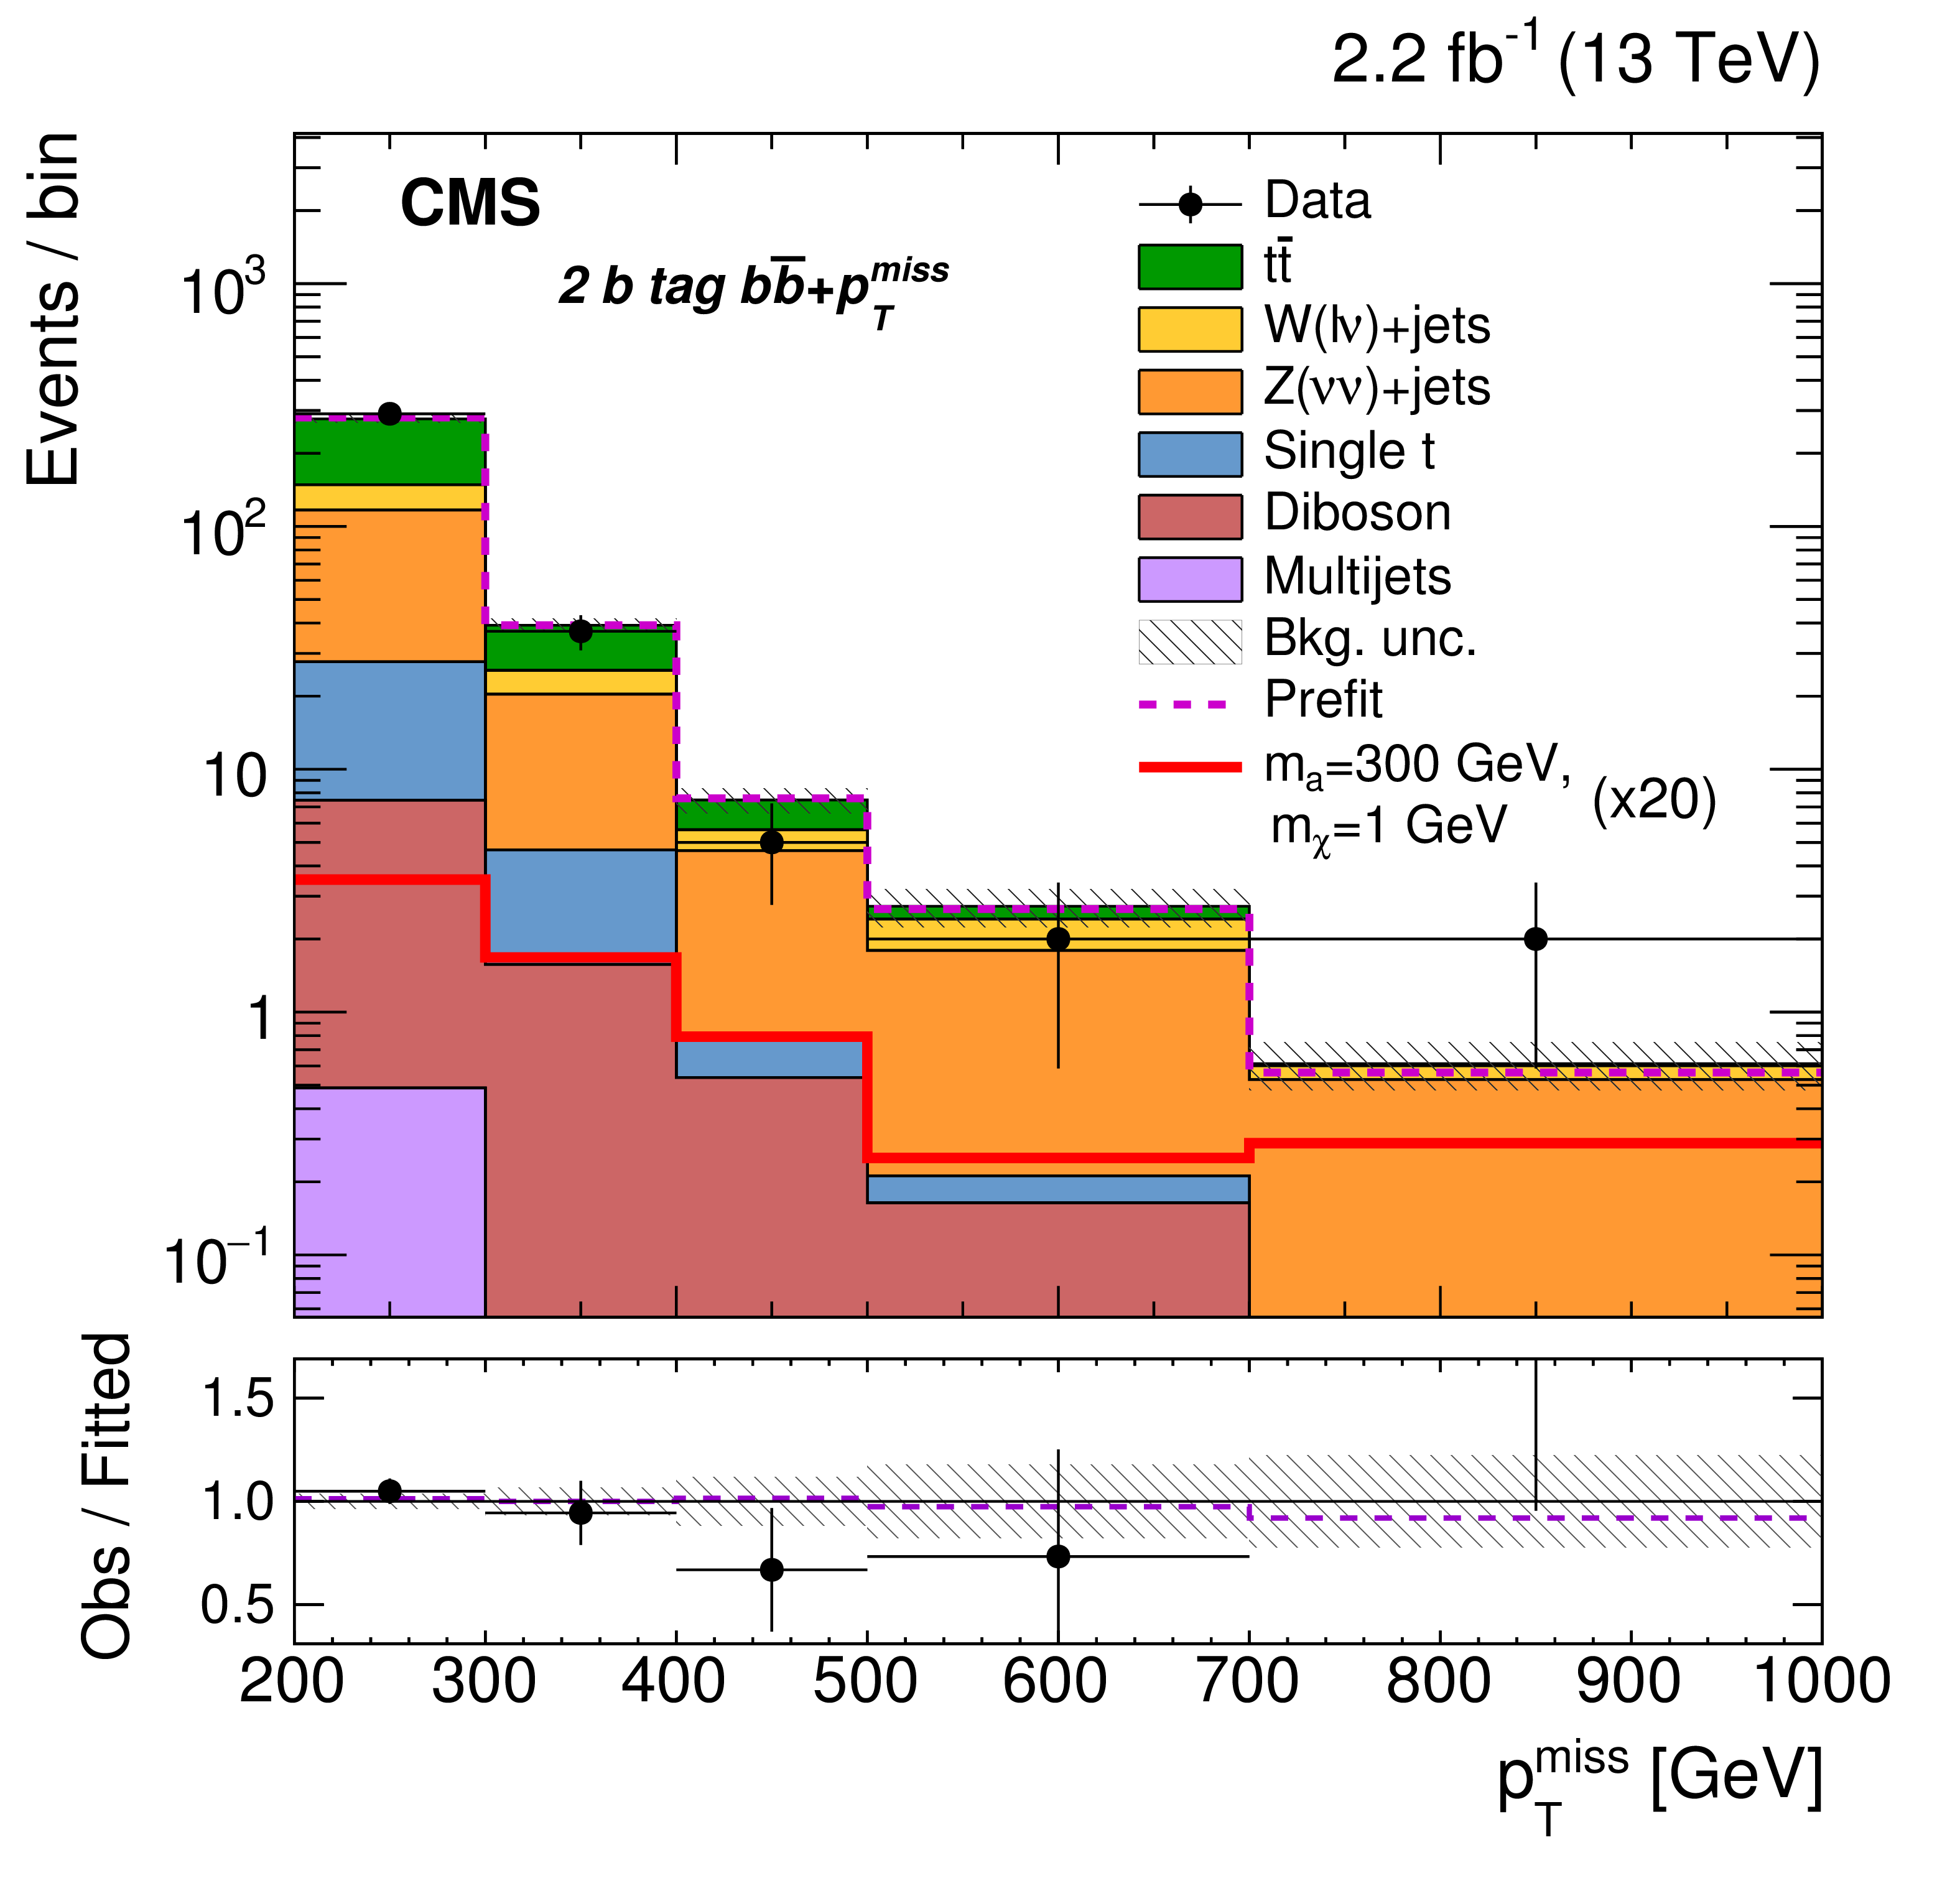
Figure 10-d:
The $ { {p_{\mathrm {T}}} ^\text {miss}} $ distribution in the $ { {\mathrm{ b \bar{b} } } + { {p_{\mathrm {T}}} ^\text {miss}} } $ with 2 b tags signal region. The $ { {p_{\mathrm {T}}} ^\text {miss}} $ distributions of background correspond to background-only fits to the individual $ {{\mathrm{ t } {}\mathrm{ \bar{t} } } + { {p_{\mathrm {T}}} ^\text {miss}} } $ and $ { {\mathrm{ b \bar{b} } } + { {p_{\mathrm {T}}} ^\text {miss}} } $ signal regions and associated background control regions. The prefit $ { {p_{\mathrm {T}}} ^\text {miss}} $ distribution of an example signal (pseudoscalar mediator, $m_{\mathrm {a}} = $ 300 GeV and $m_{\chi } = $ 1 GeV) is scaled up by a factor of 20. The last bin contains overflow events. The lower panel shows the ratio of observed data to fitted background. The uncertainty band shown is the fitted values, and the magenta line corresponds to the ratio of prefit to fitted background expectations. |
png pdf |
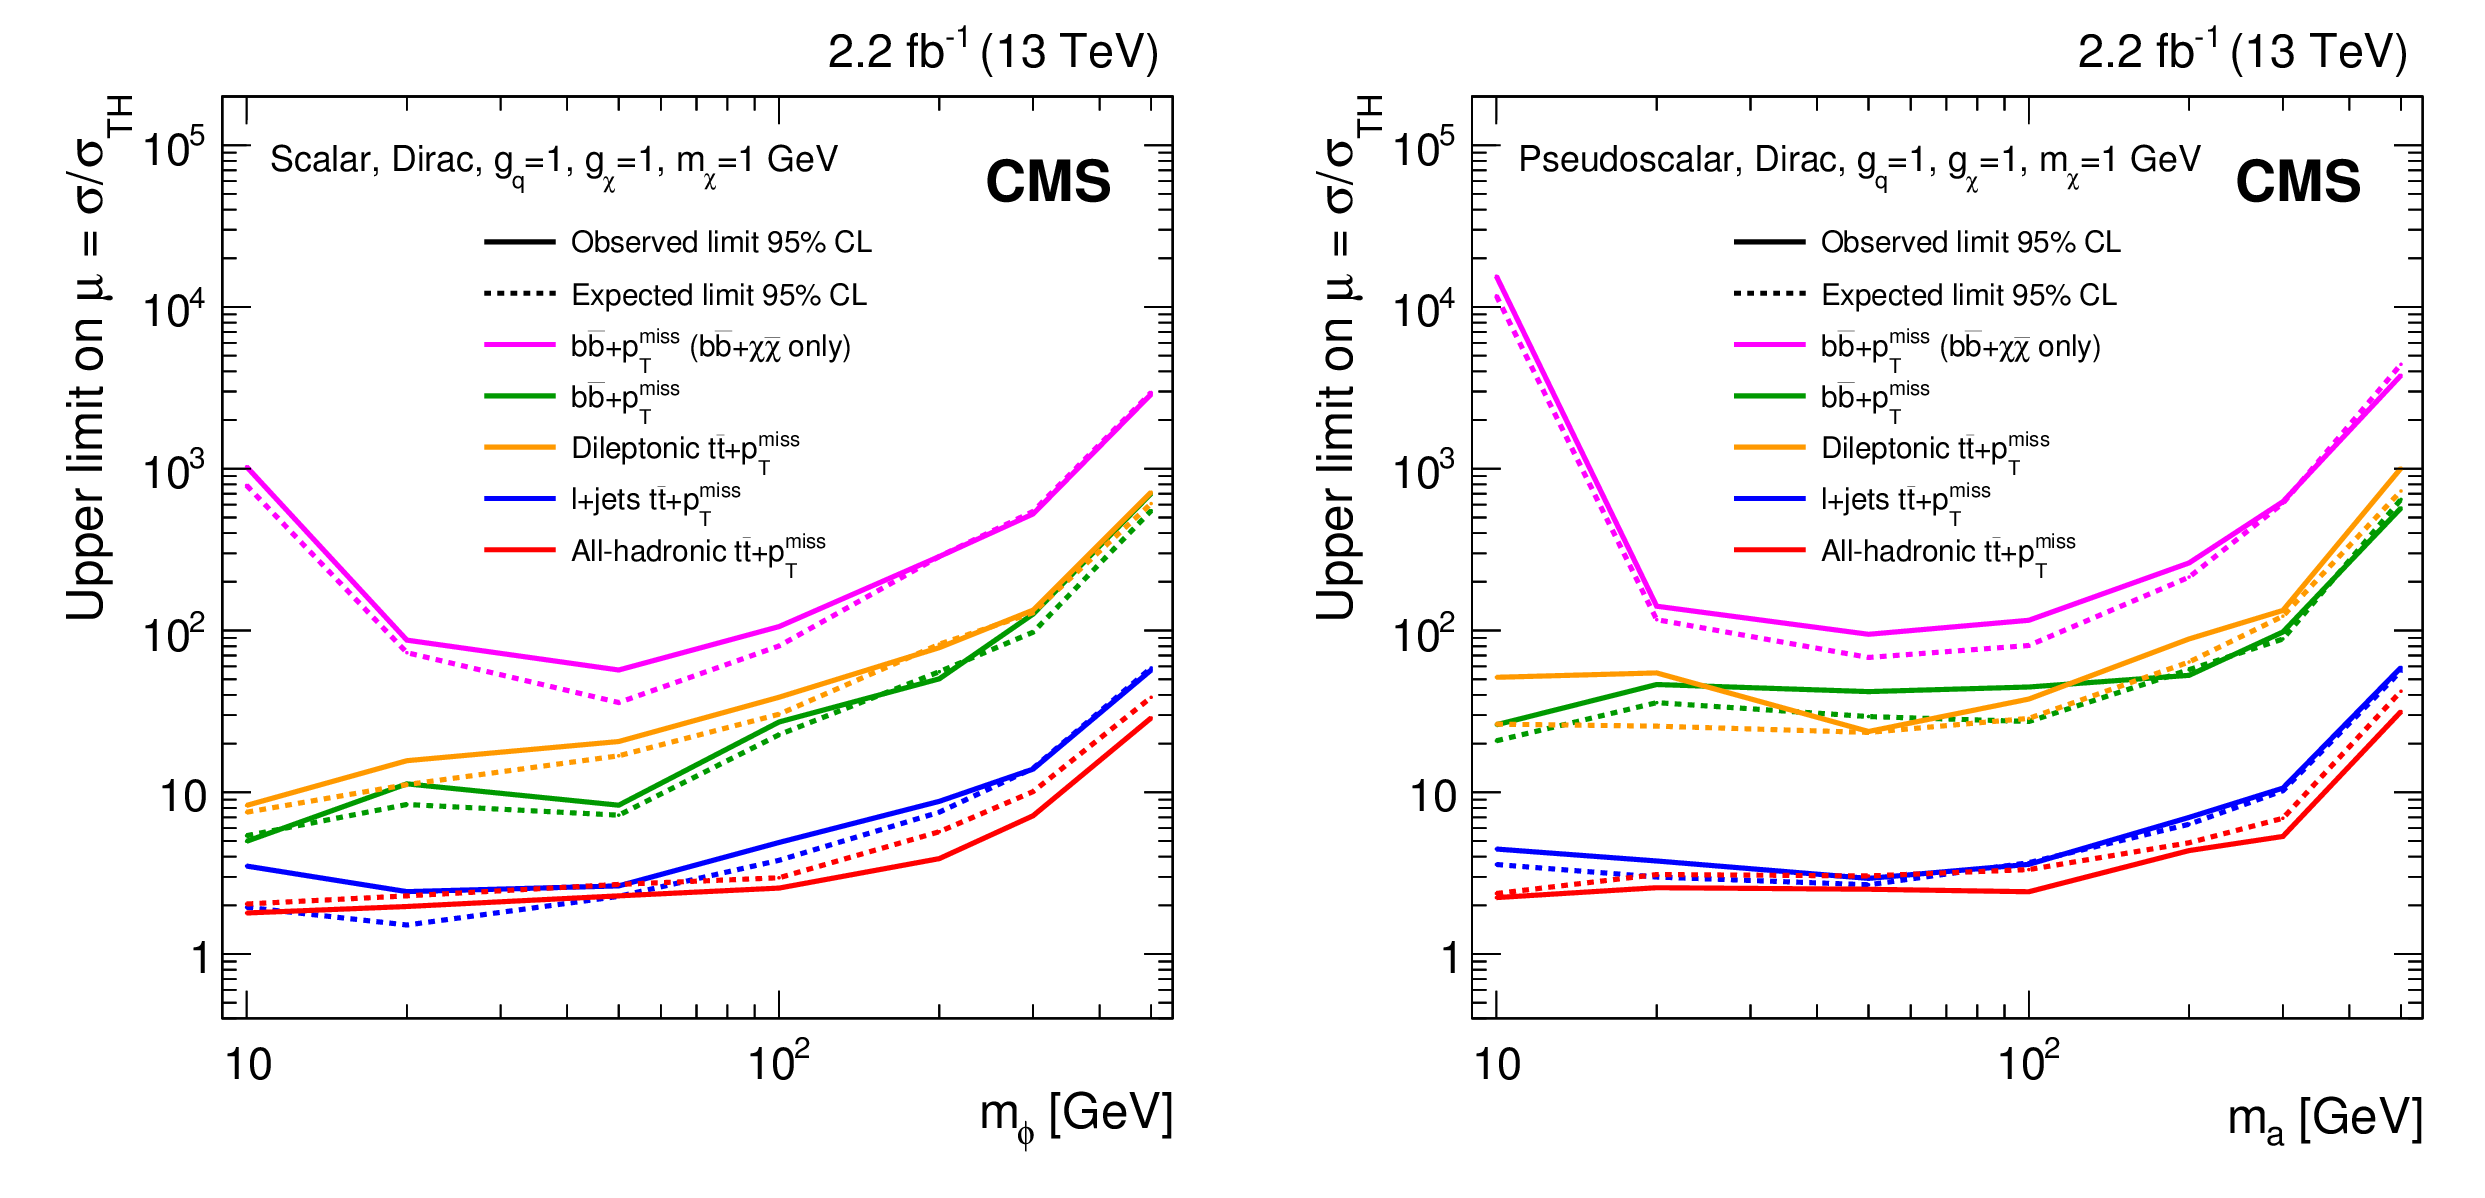
Figure 11:
The ratio ($\mu $) of 95% CL upper limits on the $ { {\mathrm{ b \bar{b} } } +\chi \overline {\chi }}$ and $ {{\mathrm{ t } {}\mathrm{ \bar{t} } } +\chi \overline {\chi }} $ cross sections to simplified model expectations. The limits are obtained from fits to the individual $ { {\mathrm{ b \bar{b} } } + { {p_{\mathrm {T}}} ^\text {miss}} } $ and $ {{\mathrm{ t } {}\mathrm{ \bar{t} } } + { {p_{\mathrm {T}}} ^\text {miss}} } $ search channels for the hypothesis of a scalar mediator (left) or a pseudoscalar mediator (right). A fermionic DM particle with a mass of 1 GeV is assumed in both panels. Mediator couplings correspond to $ {g_{\mathrm{ q } }} =g_{\chi }= $ 1. |

png pdf |
Figure 11-a:
The ratio ($\mu $) of 95% CL upper limits on the $ { {\mathrm{ b \bar{b} } } +\chi \overline {\chi }}$ and $ {{\mathrm{ t } {}\mathrm{ \bar{t} } } +\chi \overline {\chi }} $ cross sections to simplified model expectations. The limits are obtained from fits to the individual $ { {\mathrm{ b \bar{b} } } + { {p_{\mathrm {T}}} ^\text {miss}} } $ and $ {{\mathrm{ t } {}\mathrm{ \bar{t} } } + { {p_{\mathrm {T}}} ^\text {miss}} } $ search channels for the hypothesis of a scalar mediator. A fermionic DM particle with a mass of 1 GeV is assumed. Mediator couplings correspond to $ {g_{\mathrm{ q } }} =g_{\chi }= $ 1. |

png pdf |
Figure 11-b:
The ratio ($\mu $) of 95% CL upper limits on the $ { {\mathrm{ b \bar{b} } } +\chi \overline {\chi }}$ and $ {{\mathrm{ t } {}\mathrm{ \bar{t} } } +\chi \overline {\chi }} $ cross sections to simplified model expectations. The limits are obtained from fits to the individual $ { {\mathrm{ b \bar{b} } } + { {p_{\mathrm {T}}} ^\text {miss}} } $ and $ {{\mathrm{ t } {}\mathrm{ \bar{t} } } + { {p_{\mathrm {T}}} ^\text {miss}} } $ search channels for the hypothesis of a pseudoscalar mediator. A fermionic DM particle with a mass of 1 GeV is assumed. Mediator couplings correspond to $ {g_{\mathrm{ q } }} =g_{\chi }= $ 1. |

png pdf |
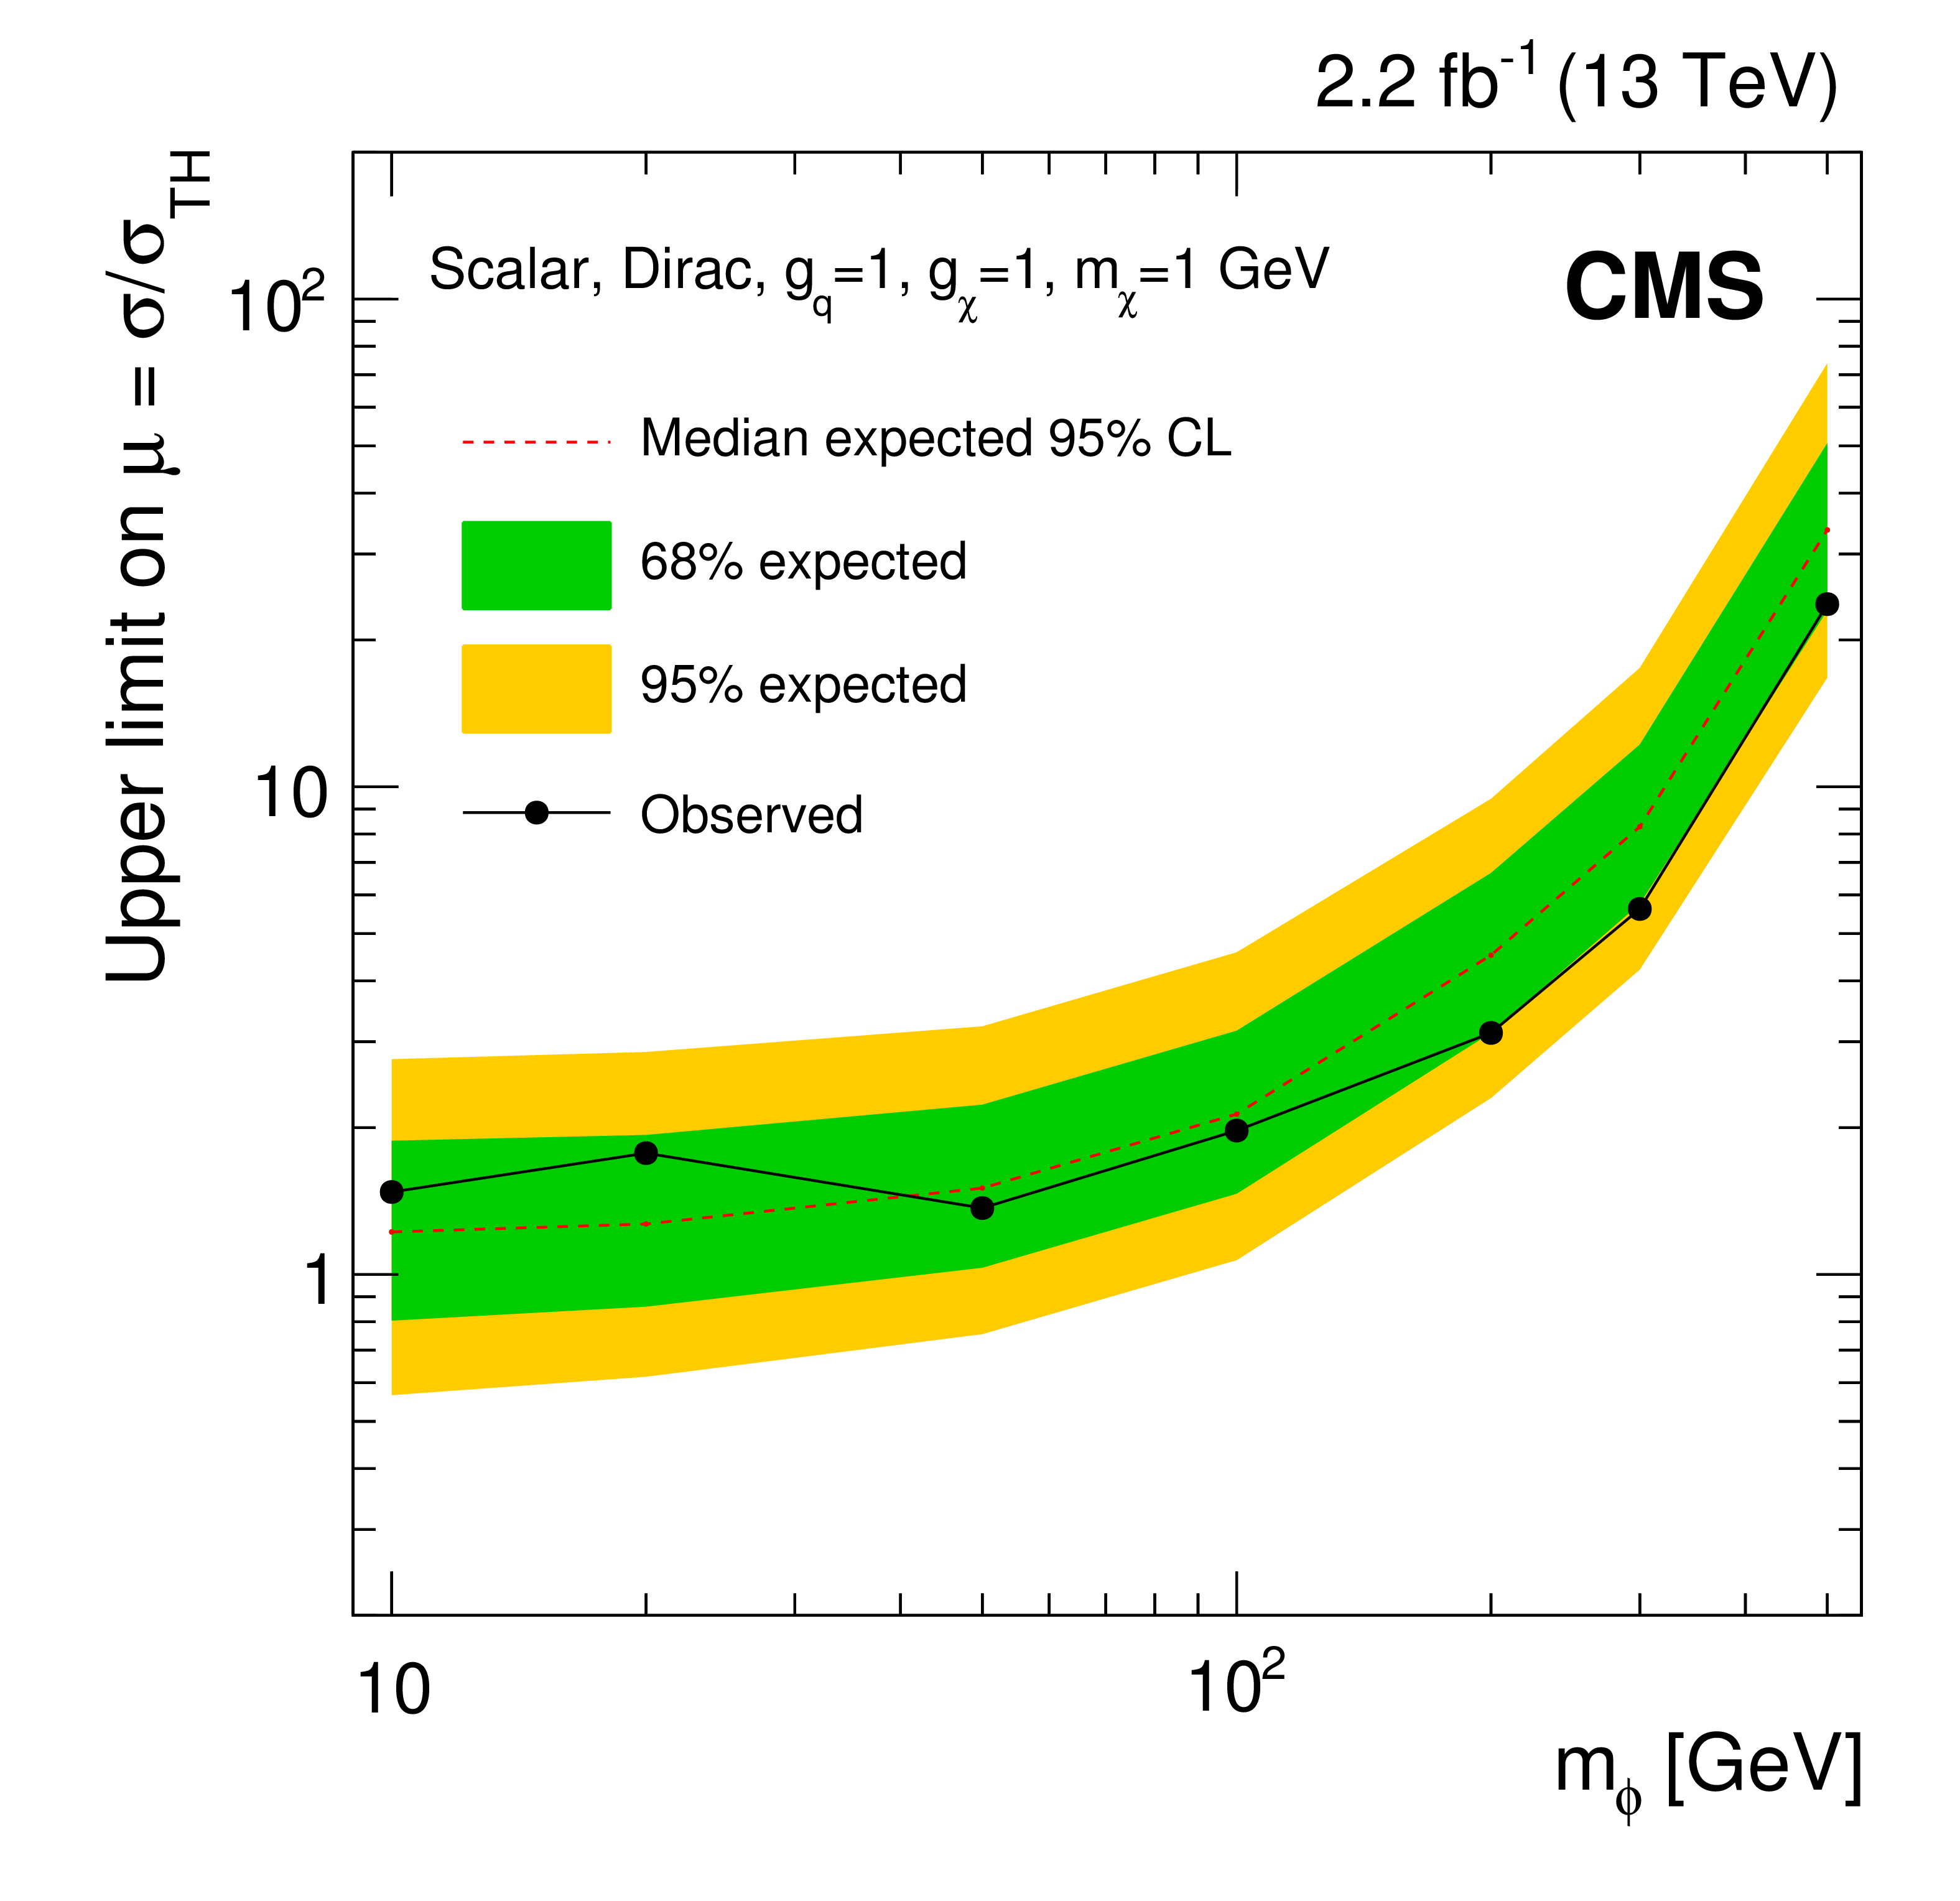
Figure 12:
The ratios ($\mu $) of the 95% CL upper limits on the combined $ {{\mathrm{ t } {}\mathrm{ \bar{t} } } +\chi \overline {\chi }} $ and $ { {\mathrm{ b \bar{b} } } +\chi \overline {\chi }}$ cross section to simplified model expectations. The limits are obtained from combined fits to the $ {{\mathrm{ t } {}\mathrm{ \bar{t} } } + { {p_{\mathrm {T}}} ^\text {miss}} } $ and $ { {\mathrm{ b \bar{b} } } + { {p_{\mathrm {T}}} ^\text {miss}} } $ signal and background control regions for the hypothesis of a scalar mediator (left) and a pseudoscalar mediator (right). A fermionic DM particle with a mass of 1 GeV is assumed in both panels. Mediator couplings correspond to $ {g_{\mathrm{ q } }} =g_{\chi }= $ 1. |
png pdf |
Figure 12-a:
The ratios ($\mu $) of the 95% CL upper limits on the combined $ {{\mathrm{ t } {}\mathrm{ \bar{t} } } +\chi \overline {\chi }} $ and $ { {\mathrm{ b \bar{b} } } +\chi \overline {\chi }}$ cross section to simplified model expectations. The limits are obtained from combined fits to the $ {{\mathrm{ t } {}\mathrm{ \bar{t} } } + { {p_{\mathrm {T}}} ^\text {miss}} } $ and $ { {\mathrm{ b \bar{b} } } + { {p_{\mathrm {T}}} ^\text {miss}} } $ signal and background control regions for the hypothesis of a scalar mediator. A fermionic DM particle with a mass of 1 GeV is assumed in both panels. Mediator couplings correspond to $ {g_{\mathrm{ q } }} =g_{\chi }= $ 1. |

png pdf |
Figure 12-b:
The ratios ($\mu $) of the 95% CL upper limits on the combined $ {{\mathrm{ t } {}\mathrm{ \bar{t} } } +\chi \overline {\chi }} $ and $ { {\mathrm{ b \bar{b} } } +\chi \overline {\chi }}$ cross section to simplified model expectations. The limits are obtained from combined fits to the $ {{\mathrm{ t } {}\mathrm{ \bar{t} } } + { {p_{\mathrm {T}}} ^\text {miss}} } $ and $ { {\mathrm{ b \bar{b} } } + { {p_{\mathrm {T}}} ^\text {miss}} } $ signal and background control regions for the hypothesis of a pseudoscalar mediator. A fermionic DM particle with a mass of 1 GeV is assumed in both panels. Mediator couplings correspond to $ {g_{\mathrm{ q } }} =g_{\chi }= $ 1. |
| Tables | |
png pdf |
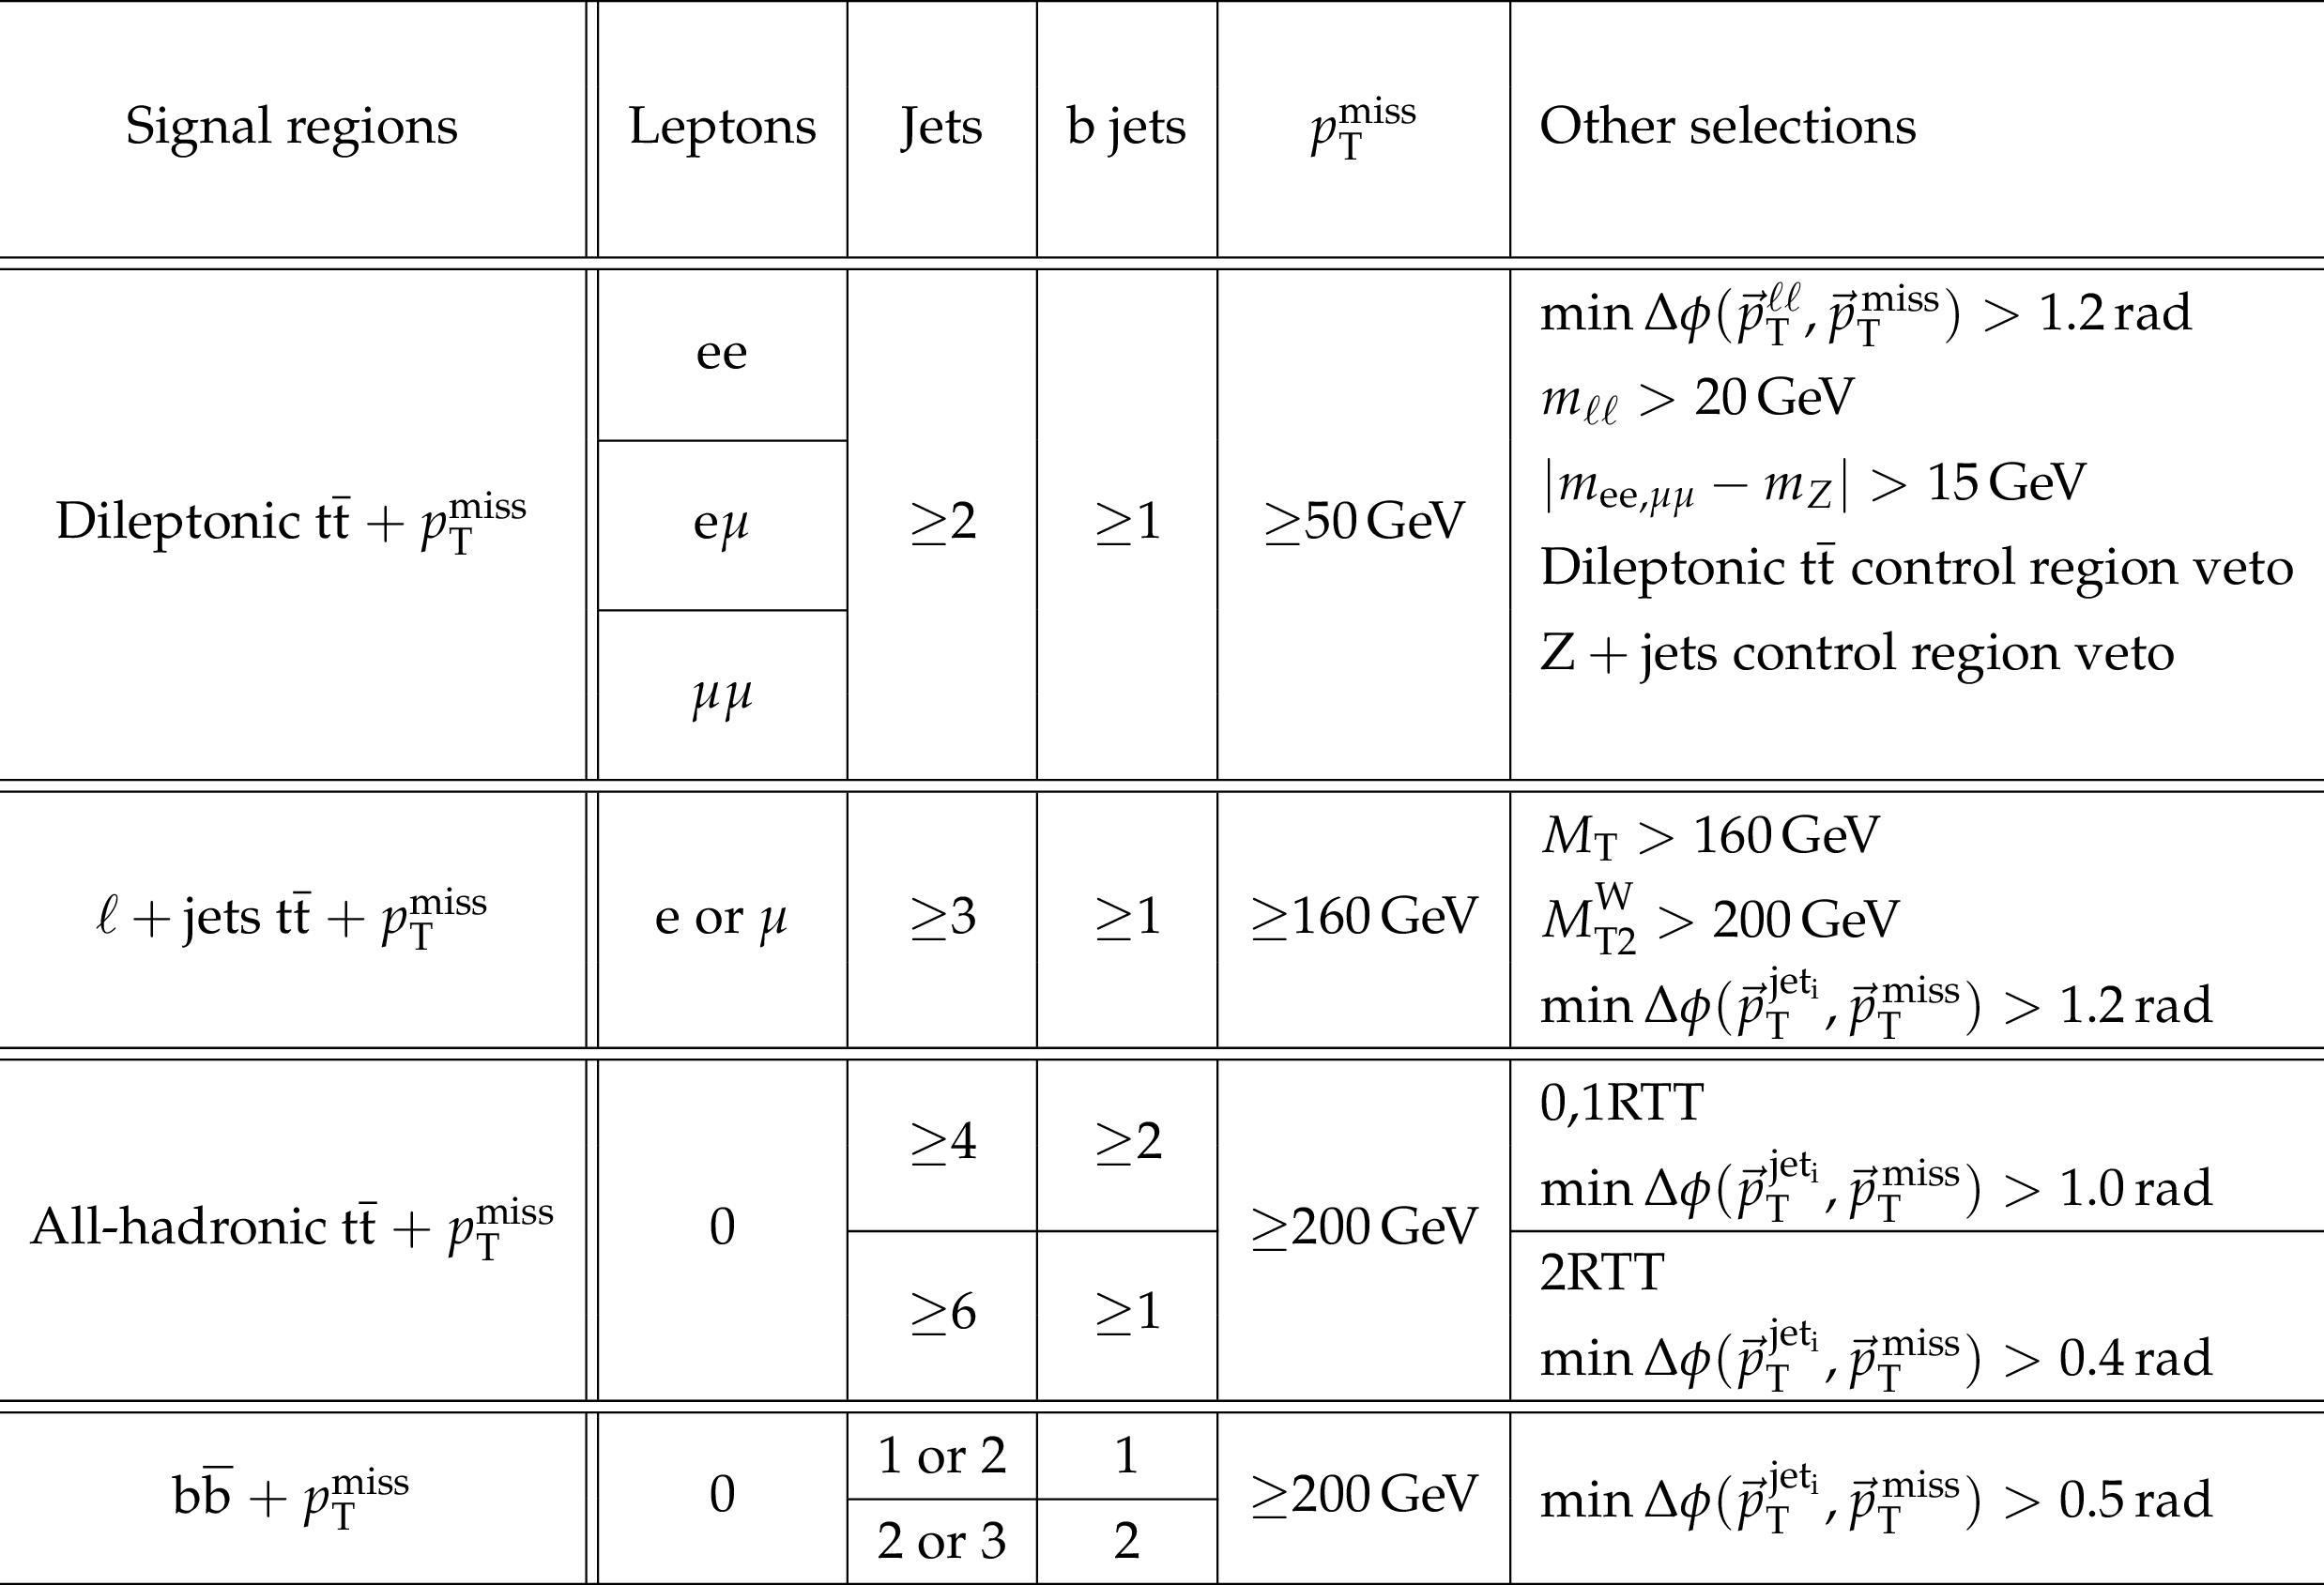
Table 1:
Overview of the selection criteria used to define the eight $ {{\mathrm{ t } {}\mathrm{ \bar{t} } } + { {p_{\mathrm {T}}} ^\text {miss}} } $ and $ { {\mathrm{ b \bar{b} } } + { {p_{\mathrm {T}}} ^\text {miss}} } $ signal regions. The signal region selections (including the definitions of the variables $ {M_{\mathrm {T}}} $ and $ {M^{\mathrm{ W } }_{\mathrm {T2}}} $) are described in detail in Section wwwww. Vetoes are applied in the dileptonic $ {{\mathrm{ t } {}\mathrm{ \bar{t} } } + { {p_{\mathrm {T}}} ^\text {miss}} } $ signal region to remove overlaps with the $ \ell $+jets $ {{\mathrm{ t } {}\mathrm{ \bar{t} } } + { {p_{\mathrm {T}}} ^\text {miss}} } $ and $ { {\mathrm{ b \bar{b} } } + { {p_{\mathrm {T}}} ^\text {miss}} } $ control regions. These control regions are summarized in Table 2 and discussed in Section 4.2. |
png pdf |
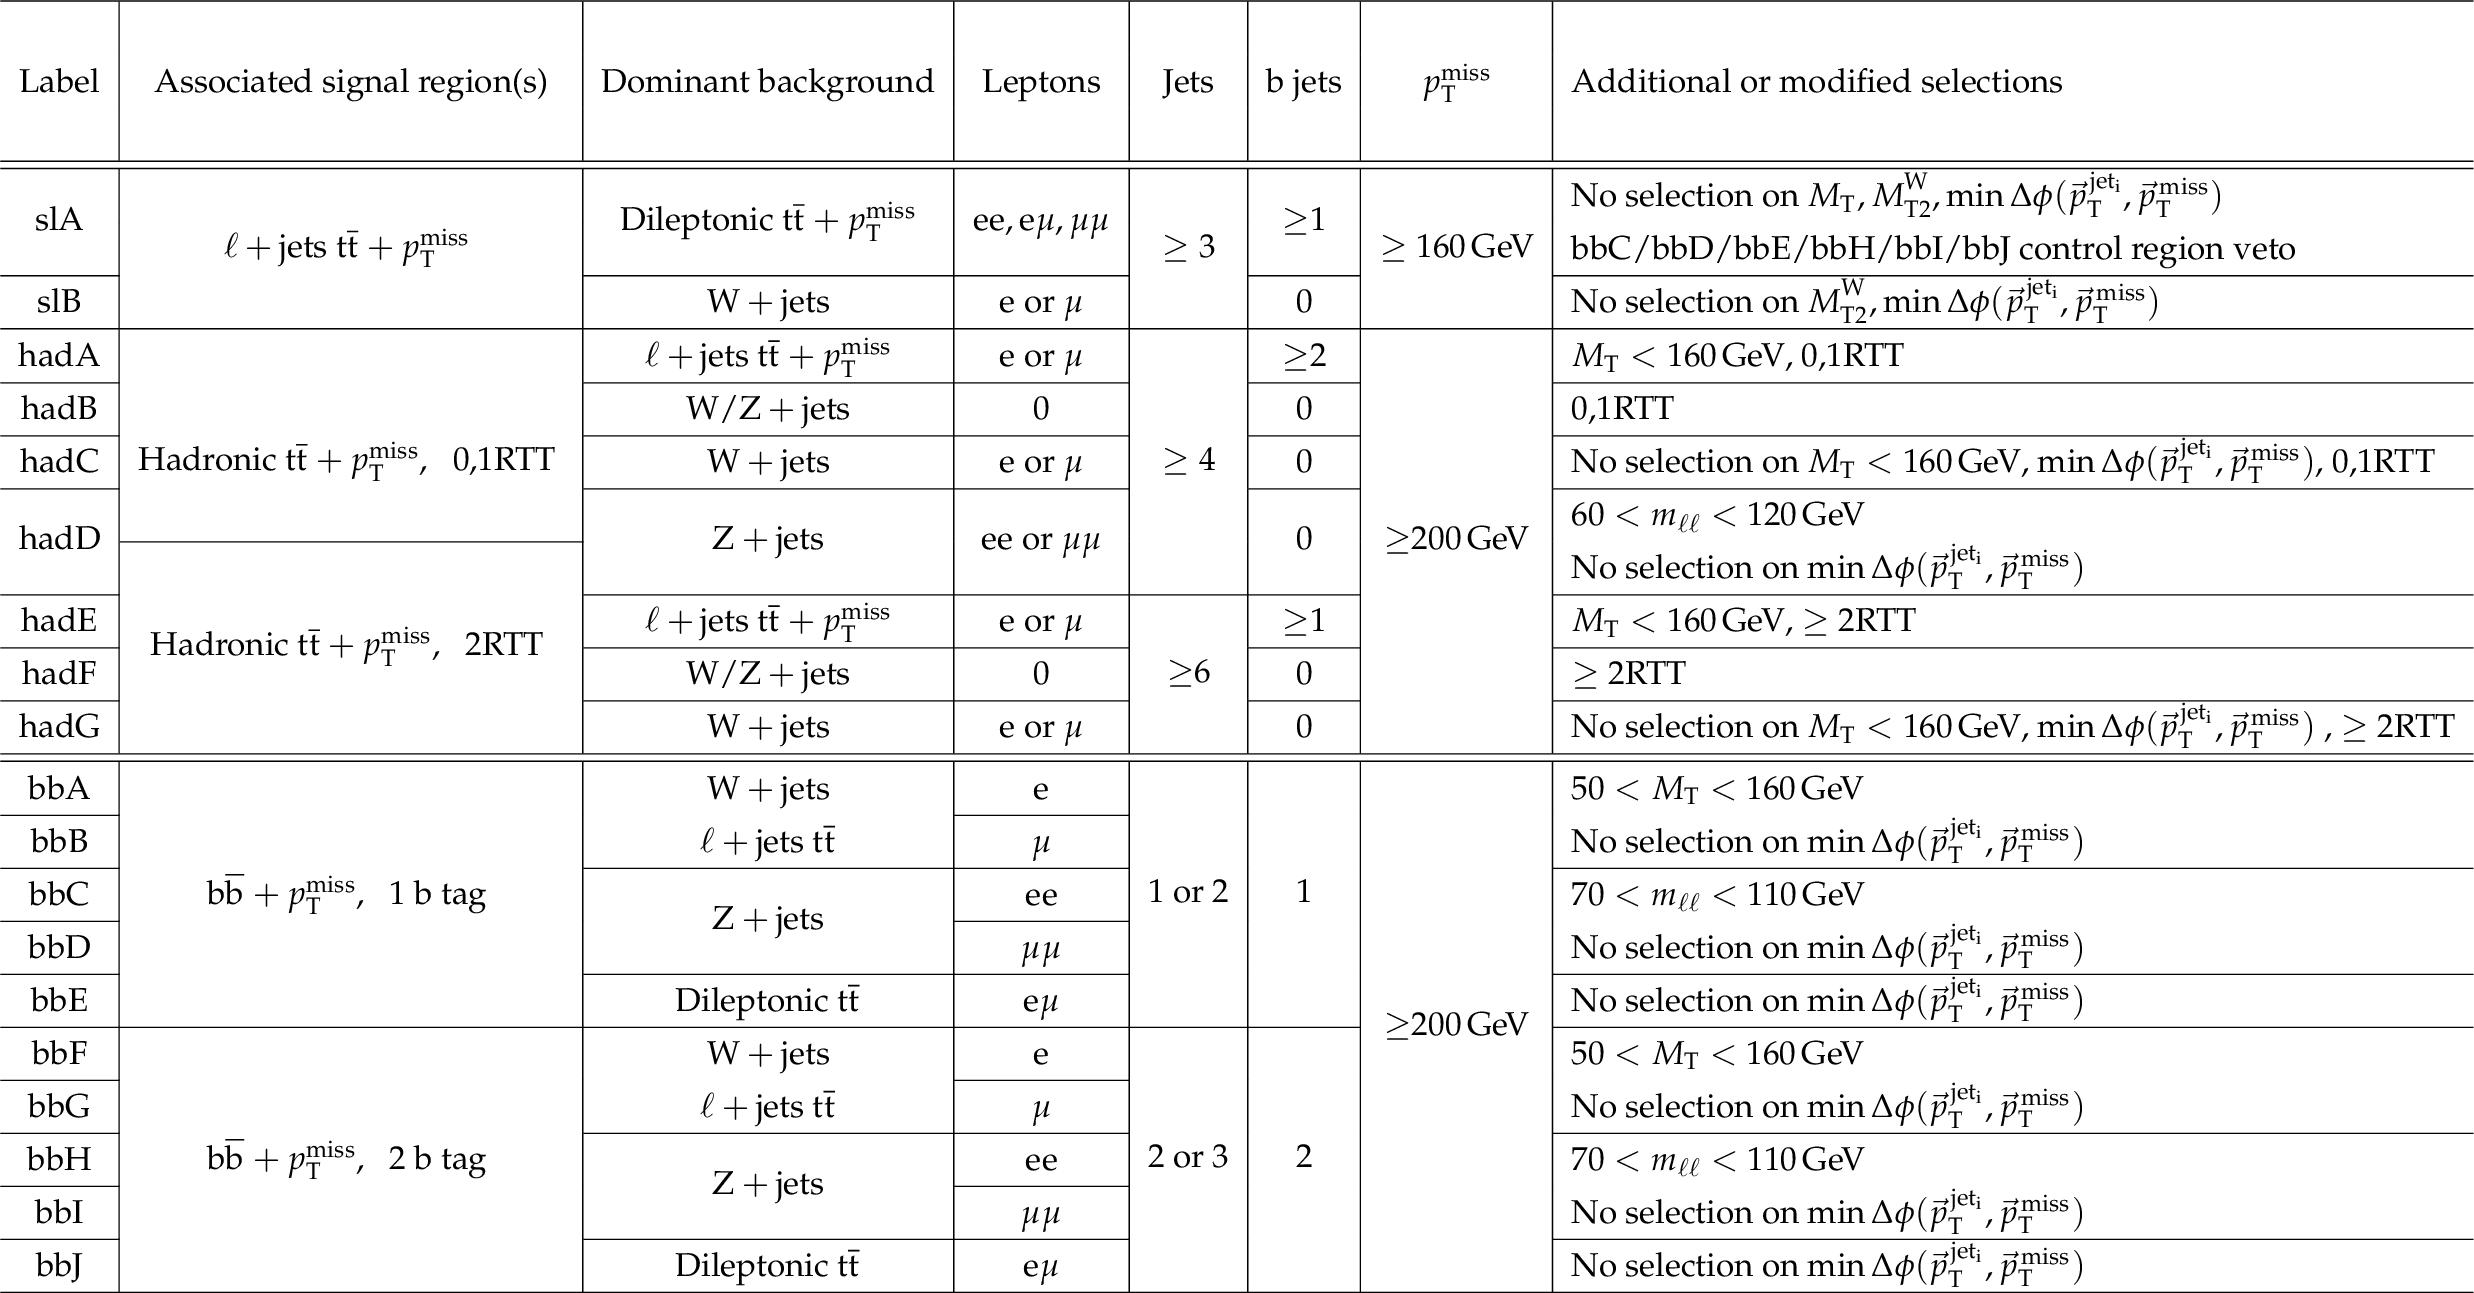
Table 2:
Overview of the selection criteria used to define the background control regions associated with the $ {{\mathrm{ t } {}\mathrm{ \bar{t} } } + { {p_{\mathrm {T}}} ^\text {miss}} } $ and $ { {\mathrm{ b \bar{b} } } + { {p_{\mathrm {T}}} ^\text {miss}} } $ signal regions. The control region selections are described in detail in Section 4.2. |
png pdf |
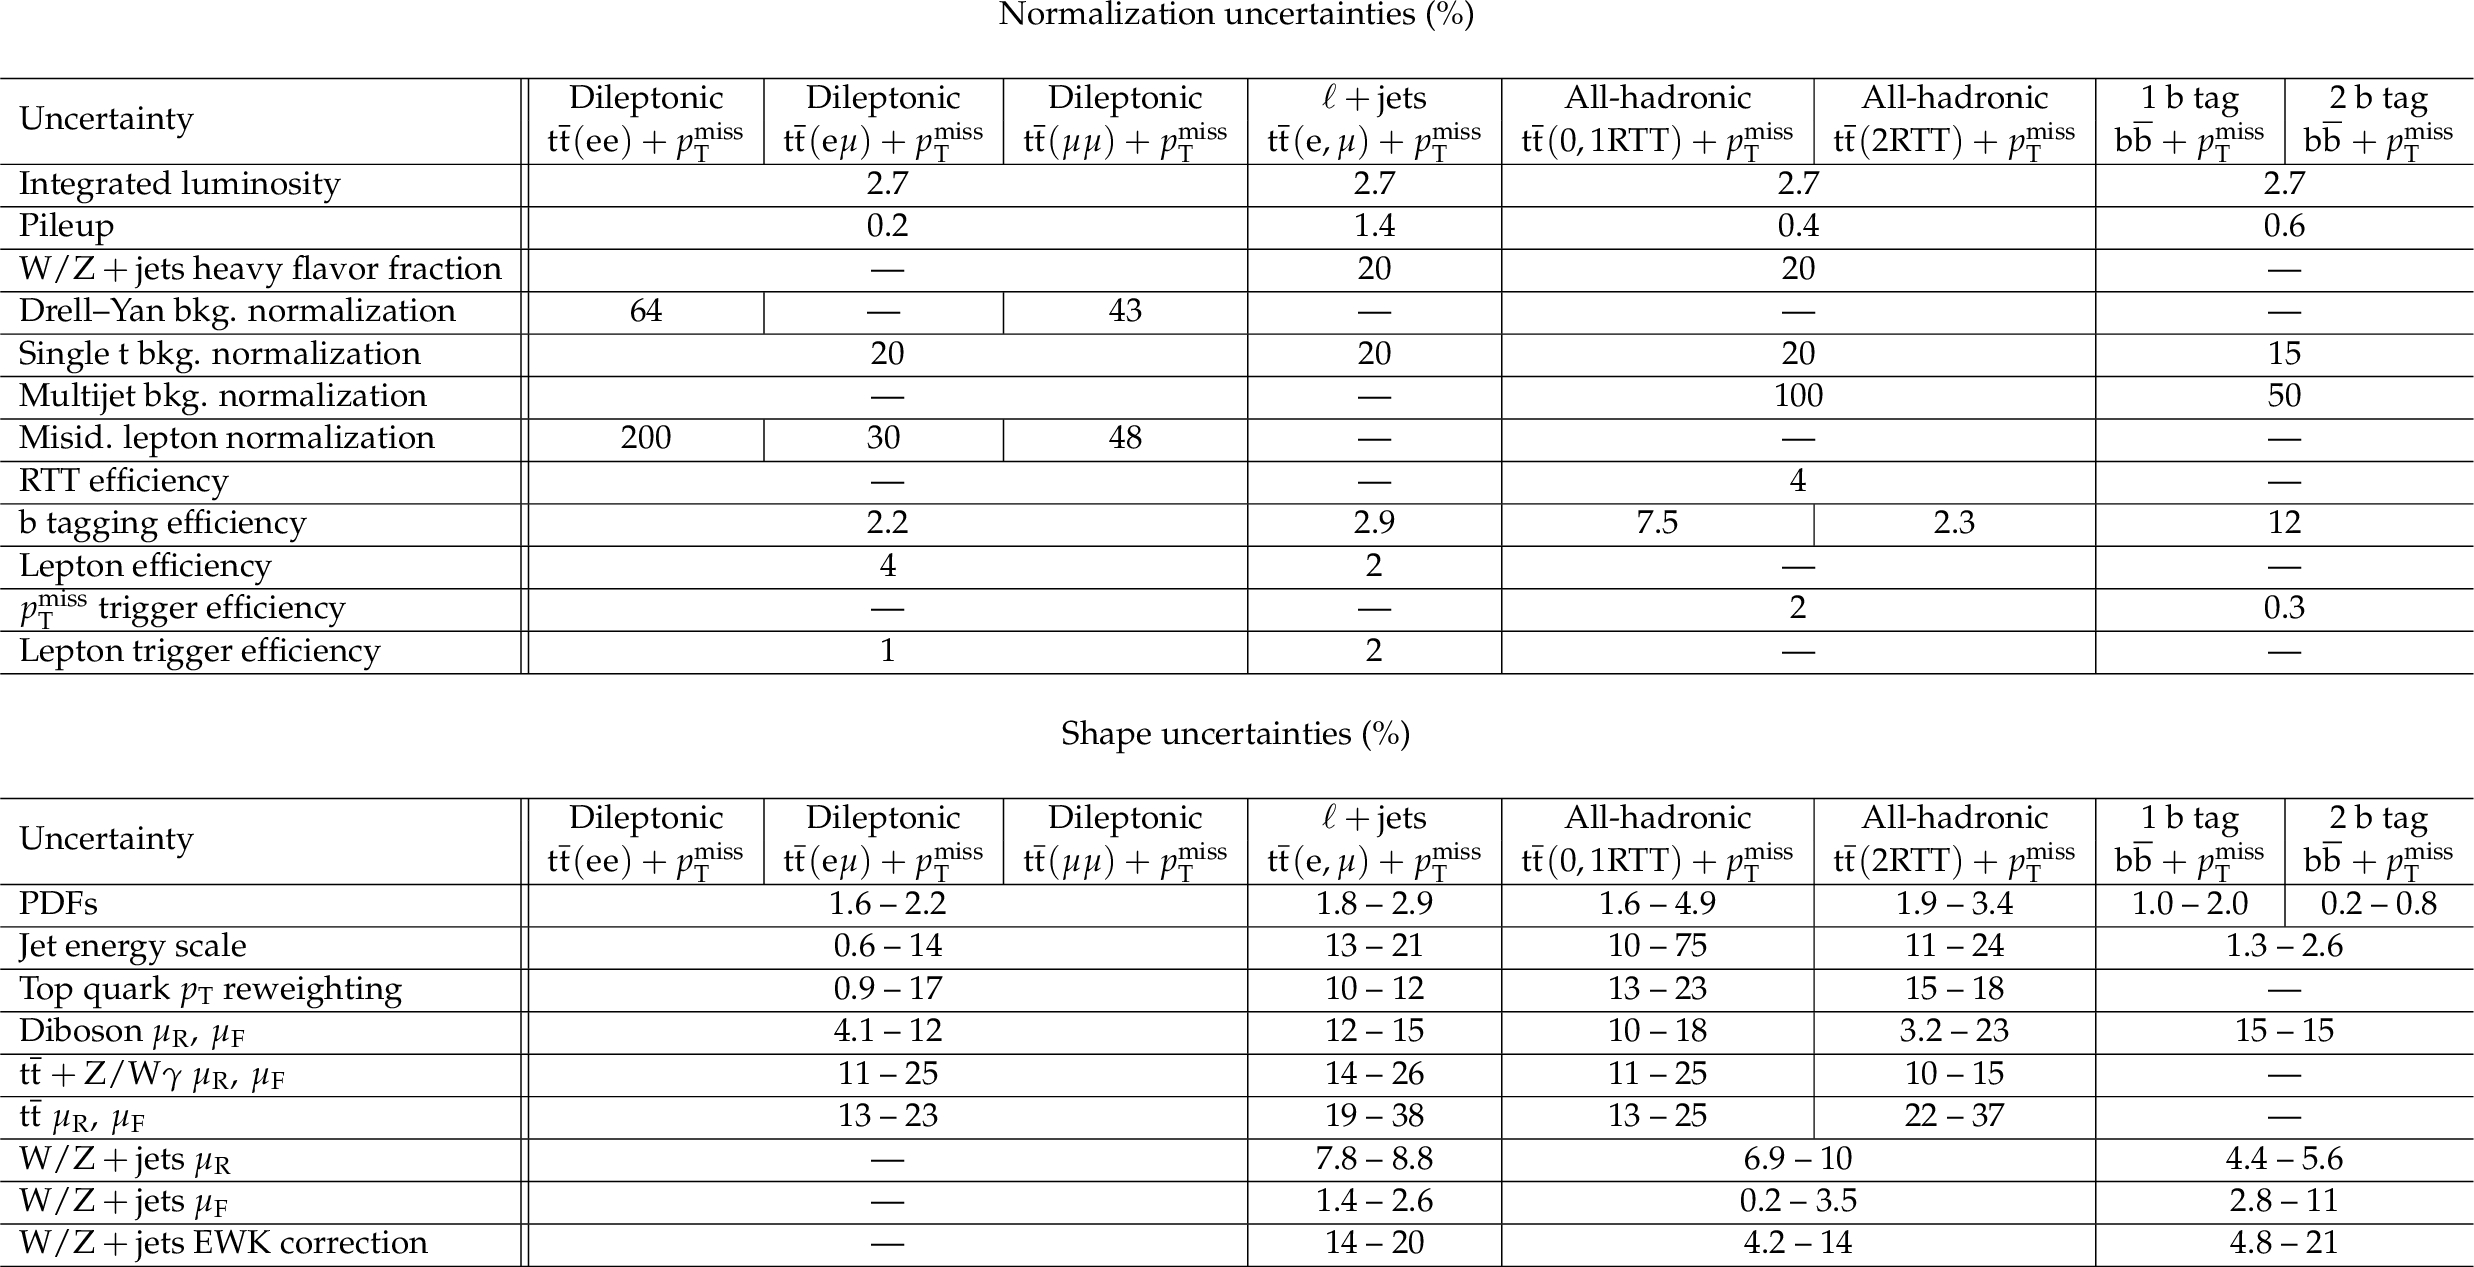
Table 3:
Summary of systematic uncertainties in the signal regions of each search channel. The values given for uncertainties that are not process specific correspond to the dominant background in each signal region (i.e. Z+jets in the 1 b tag $ { {\mathrm{ b \bar{b} } } + { {p_{\mathrm {T}}} ^\text {miss}} } $ region, and ${\mathrm{ t } {}\mathrm{ \bar{t} } } $ in all others). The systematic uncertainties are categorized as affecting either the normalization or the shape of the $ { {p_{\mathrm {T}}} ^\text {miss}} $ distribution. For shape uncertainties, the ranges quoted give the uncertainty in the yield for the lowest $ { {p_{\mathrm {T}}} ^\text {miss}} $ bin and for the highest $ { {p_{\mathrm {T}}} ^\text {miss}} $ bin. Sources of systematic uncertainties that are common across channels are considered to be fully correlated in the channel combination fit. |
png pdf |
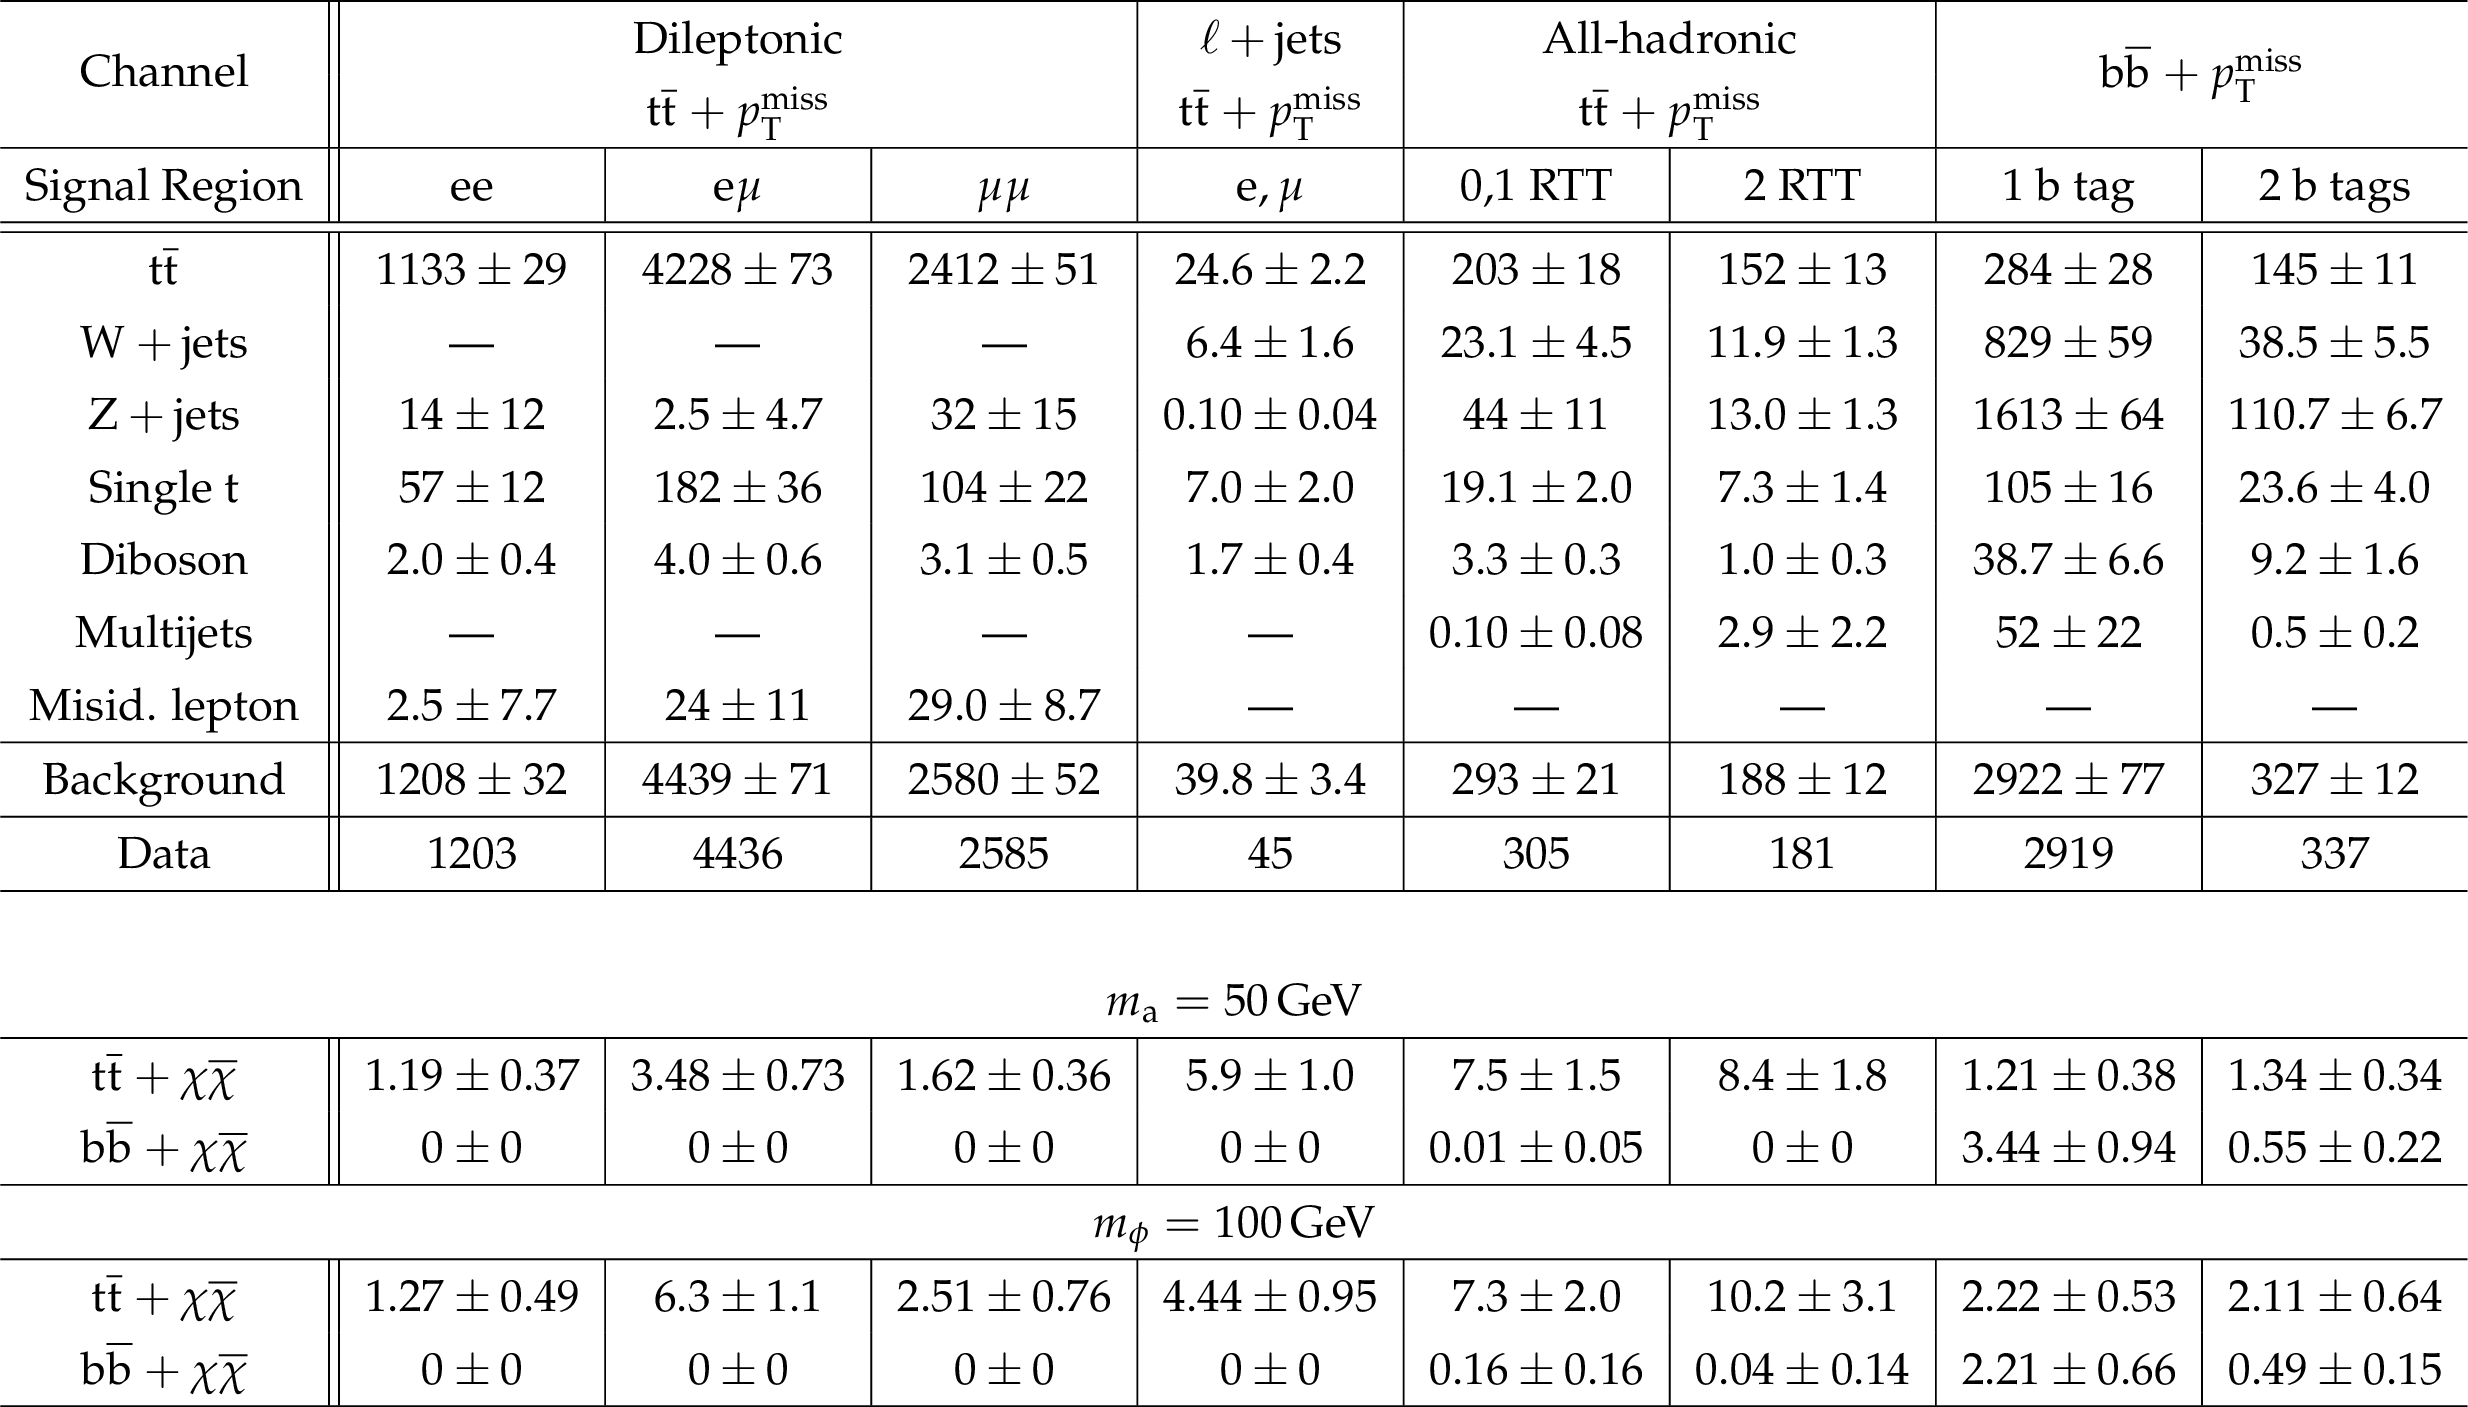
Table 4:
Fitted background yields for a background-only hypothesis in the $ {{\mathrm{ t } {}\mathrm{ \bar{t} } } + { {p_{\mathrm {T}}} ^\text {miss}} } $ and $ { {\mathrm{ b \bar{b} } } + { {p_{\mathrm {T}}} ^\text {miss}} } $ signal regions. The yields are obtained from separate fits to the $ { {\mathrm{ b \bar{b} } } + { {p_{\mathrm {T}}} ^\text {miss}} } $ and individual $ {{\mathrm{ t } {}\mathrm{ \bar{t} } } + { {p_{\mathrm {T}}} ^\text {miss}} } $ search channels. Prefit yields for DM produced via a pseudoscalar mediator with mass $m_{\mathrm {a}}= $ 50 GeV and a scalar mediator with mass $m_{\phi }=100 GeV $ are also shown. Mediator couplings are set to $ {g_{\mathrm{ q } }} =g_{\chi }= $ 1, and a DM particle of mass $m_{\chi }= $ 1 GeV is assumed. Uncertainties include both statistical and systematic components. |

png pdf |
Table 5:
Observed and expected 95% CL upper limits on the ratios ($\mu $) of the observed $ {{\mathrm{ t } {}\mathrm{ \bar{t} } } +\chi \overline {\chi }} $ and $ { {\mathrm{ b \bar{b} } } +\chi \overline {\chi }}$ cross sections to the simplified model expectations. The limits correspond to separate fits to the $ { {\mathrm{ b \bar{b} } } + { {p_{\mathrm {T}}} ^\text {miss}} } $ and individual $ {{\mathrm{ t } {}\mathrm{ \bar{t} } } + { {p_{\mathrm {T}}} ^\text {miss}} } $ search channels. DM mediators with scalar couplings of $ {g_{\mathrm{ q } }} =g_{\chi }= $ 1 are assumed. |

png pdf |
Table 6:
Same as Table 5, but for DM mediators with pseudoscalar couplings. Again, mediator couplings correspond to $ {g_{\mathrm{ q } }} =g_{\chi }= $ 1. |
png pdf |
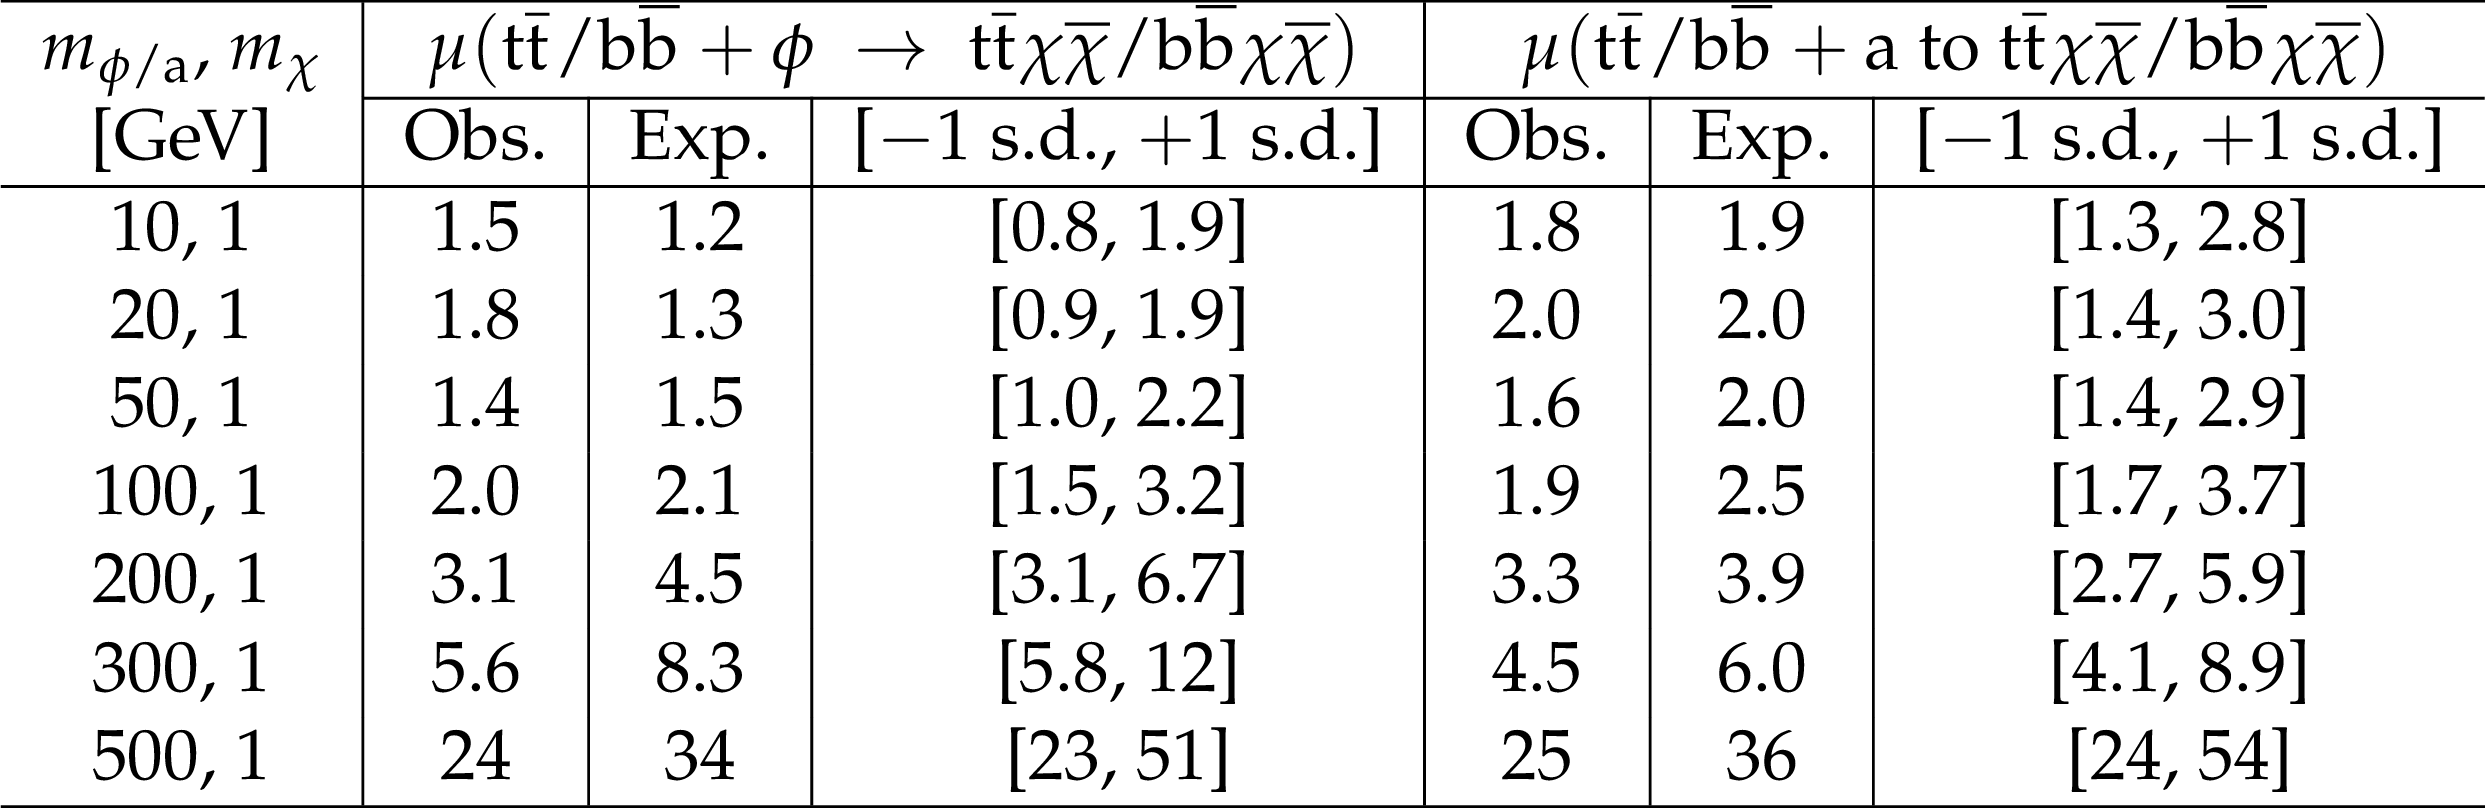
Table 7:
Observed and expected 95% CL upper limits on the ratio ($\mu $) of the combined $ {{\mathrm{ t } {}\mathrm{ \bar{t} } } +\chi \overline {\chi }} $ and $ { {\mathrm{ b \bar{b} } } +\chi \overline {\chi }}$ cross sections to the simplified model expectation. The limits are obtained from a combined fit to all signal and background control regions. DM mediators with scalar or pseudoscalar couplings are assumed. Mediator couplings correspond to $g_{q}=g_{\chi }= $ 1. |
| Summary |
| A search for an excess of events with large missing transverse momentum ($ p_{\mathrm{T}}^{\text{miss}} $) produced in association with a pair of heavy-flavor quarks has been performed with a sample of proton-proton interaction data at a center-of-mass energy of 13 TeV. The data correspond to an integrated luminosity of 2.2 fb$^{-1}$ collected with the CMS detector at the CERN LHC. The analysis explores ${\mathrm{ b \bar{b} }+p_{\mathrm{T}}^{\text{miss}}} $ and the dileptonic, ${\ell+\text{jets}} $, and all-hadronic ${\mathrm{ t \bar{t} }+p_{\mathrm{T}}^{\text{miss}}} $ final states. A resolved top quark tagger is used to categorize events in the all-hadronic channel. No significant deviation from the standard model background prediction is observed. Results are interpreted in terms of dark matter (DM) production, and constraints are placed on the parameter space of simplified models with scalar and pseudoscalar mediators. The DM search channels are considered both individually and, for the first time, in combination. The combined search excludes production cross sections larger than 1.5 or 1.8 times the values predicted for a 10 GeV scalar mediator or a 10 GeV pseudoscalar mediator, respectively, for couplings of ${g_{\mathrm{ q }}} =g_{\chi} = $ 1. The limits presented are the first achieved on simplified models of dark matter produced in association with heavy-flavor quark pairs. |
| References | ||||
| 1 | G. Bertone, D. Hooper, and J. Silk | Particle dark matter: evidence, candidates and constraints | PR 405 (2005) 279 | hep-ph/0404175 |
| 2 | J. L. Feng | Dark matter candidates from particle physics and methods of detection | Ann. Rev. Astron. Astrophys. 48 (2010) 495 | 1003.0904 |
| 3 | T. A. Porter, R. P. Johnson, and P. W. Graham | Dark matter searches with astroparticle data | Ann. Rev. Astron. Astrophys. 49 (2011) 155 | 1104.2836 |
| 4 | G. D'Ambrosio, G. F. Giudice, G. Isidori, and A. Strumia | Minimal flavor violation: an effective field theory approach | Nucl. Phys. 645 (2002) 155 | hep-ph/0207036 |
| 5 | G. Isidori and D. M. Straub | Minimal Flavour Violation and Beyond | EPJC 72 (2012) 2103 | 1202.0464 |
| 6 | U. Haisch, F. Kahlhoefer, and J. Unwin | The impact of heavy-quark loops on LHC dark matter searches | JHEP 07 (2013) 125 | 1208.4605 |
| 7 | T. Lin, E. W. Kolb, and L.-T. Wang | Probing dark matter couplings to top and bottom quarks at the LHC | PRD 88 (2013) 063510 | 1303.6638 |
| 8 | M. R. Buckley, D. Feld, and D. Gonalves | Scalar simplified models for dark matter | PRD 91 (2015) 015017 | 1410.6497 |
| 9 | U. Haisch and E. Re | Simplified dark matter top-quark interactions at the LHC | JHEP 06 (2015) 078 | 1503.00691 |
| 10 | C. Arina et al. | A comprehensive approach to dark matter studies: exploration of simplified top-philic models | JHEP 11 (2016) 111 | 1605.09242 |
| 11 | ATLAS Collaboration | Search for new phenomena in final states with an energetic jet and large missing transverse momentum in pp collisions at $ \sqrt{s} = $ 8 TeV with the ATLAS detector | EPJC 75 (2015) 299 | 1502.01518 |
| 12 | CMS Collaboration | Search for dark matter in proton-proton collisions at 8 TeV with missing transverse momentum and vector boson tagged jets | JHEP 12 (2016) 083 | CMS-EXO-12-055 1607.05764 |
| 13 | ATLAS Collaboration | Search for new phenomena in final states with an energetic jet and large missing transverse momentum in pp collisions at $ \sqrt{s} = $ 13 TeV using the ATLAS detector | PRD 94 (2016) 032005 | 1604.07773 |
| 14 | CMS Collaboration | Search for dark matter produced with an energetic jet or a hadronically decaying W or Z boson at $ \sqrt{s} = $ 13 TeV | CMS-EXO-16-037 1703.01651 |
|
| 15 | G. C. Branco et al. | Theory and phenomenology of two-Higgs-doublet models | PR 516 (2012) 001 | 1106.0034 |
| 16 | M. Beltran et al. | Maverick dark matter at colliders | JHEP 09 (2010) 037 | 1002.4137 |
| 17 | J. Goodman et al. | Constraints on dark matter from colliders | PRD 82 (2010) 116010 | 1008.1783 |
| 18 | K. Cheung et al. | The top window for dark matter | JHEP 10 (2010) 081 | 1009.0618 |
| 19 | CMS Collaboration | Search for the production of dark matter in association with top-quark pairs in the single-lepton final state in proton-proton collisions at $ \sqrt{s} = $ 8 TeV | JHEP 06 (2015) 121 | CMS-B2G-14-004 1504.03198 |
| 20 | ATLAS Collaboration | Search for dark matter in events with heavy quarks and missing transverse momentum in pp collisions with the ATLAS detector | EPJC 75 (2015) 92 | 1410.4031 |
| 21 | D. Abercrombie et al. | Dark matter benchmark models for early LHC run-2 searches: report of the ATLAS/CMS Dark Matter Forum | 1507.00966 | |
| 22 | CMS Collaboration | The CMS experiment at the CERN LHC | JINST 3 (2008) S08004 | CMS-00-001 |
| 23 | CMS Collaboration | Particle-Flow Event Reconstruction in CMS and Performance for Jets, Taus, and MET | CDS | |
| 24 | CMS Collaboration | Commissioning of the Particle-flow Event Reconstruction with the first LHC collisions recorded in the CMS detector | CDS | |
| 25 | CMS Collaboration | Description and performance of track and primary-vertex reconstruction with the CMS tracker | JINST 9 (2014) 10009 | CMS-TRK-11-001 1405.6569 |
| 26 | M. Cacciari, G. P. Salam, and G. Soyez | The anti-$ k_t $ jet clustering algorithm | JHEP 04 (2008) 063 | 0802.1189 |
| 27 | M. Cacciari, G. P. Salam, and G. Soyez | The catchment area of jets | JHEP 04 (2008) 005 | 0802.1188 |
| 28 | CMS Collaboration | Determination of jet energy calibration and transverse momentum resolution in CMS | JINST 6 (2011) P11002 | |
| 29 | CMS Collaboration | Identification of b-quark jets with the CMS experiment | JINST 8 (2013) P04013 | |
| 30 | CMS Collaboration | Identification of b quark jets at the CMS experiment in the LHC run 2 | CMS-PAS-BTV-15-001 | CMS-PAS-BTV-15-001 |
| 31 | CMS Collaboration | Performance of electron reconstruction and selection with the CMS detector in proton-proton collisions at $ \sqrt{s} = $ 8 TeV | JINST 10 (2015) 6005 | CMS-EGM-13-001 1502.02701 |
| 32 | CMS Collaboration | Performance of CMS muon reconstruction in pp collision events at $ \sqrt{s}=$ 7 TeV | JINST 7 (2012) 10002 | CMS-MUO-10-004 1206.4071 |
| 33 | CMS Collaboration | Measurement of the Inclusive W and Z production cross sections in pp collisions at $ \sqrt{s}=$ 7 TeV | JHEP 10 (2011) 132 | CMS-EWK-10-005 1107.4789 |
| 34 | CMS Collaboration | V Tagging Observables and Correlations | ||
| 35 | CMS Collaboration | Fitting of Event Topologies with External Kinematic Constraints in CMS | CDS | |
| 36 | H. Voss, A. H\"ocker, J. Stelzer, and F. Tegenfeldt | TMVA, the Toolkit for Multivariate Data Analysis with ROOT | in XIth International Workshop on Advanced Computing and Analysis Techniques in Physics Research (ACAT), 2007 | physics/0703039 |
| 37 | CMS Collaboration | Performance of tau-lepton reconstruction and identification in CMS | JINST 7 (2012) P01001 | CMS-TAU-11-001 1109.6034 |
| 38 | P. Nason | A New method for combining NLO QCD with shower Monte Carlo algorithms | JHEP 11 (2004) 040 | hep-ph/0409146 |
| 39 | S. Frixione, P. Nason, and C. Oleari | Matching NLO QCD computations with Parton Shower simulations: the POWHEG method | JHEP 11 (2007) 070 | 0709.2092 |
| 40 | S. Alioli, P. Nason, C. Oleari, and E. Re | A general framework for implementing NLO calculations in shower Monte Carlo programs: the POWHEG BOX | JHEP 06 (2010) 043 | 1002.2581 |
| 41 | T. Sj\"ostrand, S. Mrenna, and P. Z. Skands | A brief Introduction to PYTHIA 8.1 | CPC 178 (2008) 852 | 0710.3820 |
| 42 | CMS Collaboration | Event generator tunes obtained from underlying event and multiparton scattering measurements | EPJC 76 (2016) 155 | CMS-GEN-14-001 1512.00815 |
| 43 | J. Alwall et al. | The automated computation of tree-level and next-to-leading order differential cross sections, and their matching to parton shower simulations | JHEP 07 (2014) 079 | 1405.0301 |
| 44 | M. L. Mangano, M. Moretti, F. Piccinini, and M. Treccani | Matching matrix elements and shower evolution for top-quark production in hadronic collisions | JHEP 01 (2007) 013 | hep-ph/0611129 |
| 45 | R. Frederix and S. Frixione | Merging meets matching in MC@NLO | JHEP 12 (2012) 061 | 1209.6215 |
| 46 | G. Busoni et al. | Recommendations on presenting LHC searches for missing transverse energy signals using simplified $ s $-channel models of dark matter | 1603.04156 | |
| 47 | M. Bauer et al. | Towards the next generation of simplified dark matter models | 1607.06680 | |
| 48 | F. Boudjema, D. Guadagnoli, R. M. Godbole, and K. A. Mohan | Laboratory-frame observables for probing the top-Higgs boson interaction | PRD 92 (2015) 015019 | 1501.03157 |
| 49 | M. Backovi\'c et al. | Higher-order QCD predictions for dark matter production at the LHC in simplified models with s-channel mediators | EPJC 75 (2015) 482 | 1508.05327 |
| 50 | P. Artoisenet, R. Frederix, O. Mattelaer, and R. Rietkerk | Automatic spin-entangled decays of heavy resonances in Monte Carlo simulations | JHEP 03 (2013) 015 | 1212.3460 |
| 51 | P. Harris, V. V. Khoze, M. Spannowsky, and C. Williams | Constraining dark sectors at colliders: Beyond the effective theory approach | PRD 91 (2015) 055009 | 1411.0535 |
| 52 | F. Maltoni, G. Ridolfi, and M. Ubiali | b-initiated processes at the LHC: a reappraisal | JHEP 07 (2012) 022 | 1203.6393 |
| 53 | NNPDF Collaboration | Parton distributions for the LHC Run II | JHEP 04 (2015) 040 | 1410.8849 |
| 54 | GEANT4 Collaboration | GEANT4 --- a simulation toolkit | NIMA 506 (2003) 250 | |
| 55 | Particle Data Group | Review of Particle Physics | CPC 40 (2016) 100001 | |
| 56 | Y. Bai, H.-C. Cheng, J. Gallicchio, and J. Gu | Stop the top background of the stop search | JHEP 07 (2012) 110 | 1203.4813 |
| 57 | CMS Collaboration | Search for the standard model Higgs boson decaying to $ W^{+}W^{-} $ in the fully leptonic final state in pp collisions at $ \sqrt{s}=$ 7 TeV | PLB 710 (2012) 91 | CMS-HIG-11-024 1202.1489 |
| 58 | L. Moneta et al. | The RooStats Project | in 13th International Workshop on Advanced Computing and Analysis Techniques in Physics Research (ACAT2010), 2010 | 1009.1003 |
| 59 | J. S. Conway | Incorporating Nuisance Parameters in Likelihoods for Multisource Spectra | in Proceedings, PHYSTAT 2011 Workshop on Statistical Issues Related to Discovery Claims in Search Experiments and Unfolding, 2011 | 1103.0354}}.\newblock\href{http://dx.doi.org/10.5170/CERN-2011-006.115}{\doi{10.5170/CERN-2011-006.115 |
| 60 | CMS Collaboration | CMS Luminosity Measurement for the 2015 Data Taking Period | CMS-PAS-LUM-15-001 | CMS-PAS-LUM-15-001 |
| 61 | CMS Collaboration | Differential cross section measurements for the production of a W boson in association with jets in proton-proton collisions at $ \sqrt{s} = $ 7 TeV | PLB 741 (2014) 12 | |
| 62 | CMS Collaboration | Measurement of the production cross section for a W boson and two b jets in pp collisions at $ \sqrt{s} = $ 7 TeV | PLB 735 (2014) 204 | |
| 63 | CMS Collaboration | Measurements of jet multiplicity and differential production cross sections of $ Z $+jets events in proton-proton collisions at $ \sqrt{s}=$ 7 TeV | PRD 91 (2015) 052008 | |
| 64 | CMS Collaboration | Measurement of the production cross sections for a Z boson and one or more b jets in pp collisions at $ \sqrt{s} = $ 7 TeV | JHEP 06 (2014) 120 | CMS-SMP-13-004 1402.1521 |
| 65 | M. B\"ahr et al. | Herwig++ physics and manual | EPJC 58 (2008) 639 | 0803.0883 |
| 66 | J. Butterworth et al. | PDF4LHC recommendations for LHC Run II | JPG 43 (2016) 023001 | 1510.03865 |
| 67 | CMS Collaboration | Measurement of differential top-quark pair production cross sections in pp colisions at $ \sqrt{s}=$ 7 TeV | EPJC 73 (2013) 2339 | CMS-TOP-11-013 1211.2220 |
| 68 | R. Barlow and C. Beeston | Fitting using finite Monte Carlo samples | Comp. Phys. Comm. 77 (1993) 219 | |
| 69 | T. Lin, H.-B. Yu, and K. M. Zurek | On symmetric and asymmetric light dark matter | PRD 85 (2012) 063503 | 1111.0293 |
| 70 | D. Bauer et al. | Dark matter in the coming decade: Complementary paths to discovery and beyond | Phys. Dark Univ. 7-8 (2015) 16 | 1305.1605 |
| 71 | S. Baker and R. D. Cousins | Clarification of the use of CHI-square and likelihood functions in fits to histograms | Nucl. Instrum. Methods 221 (1984) 437 | |
| 72 | J. K. Lindsey | Oxford University Press, New York, 1996 | ||
| 73 | T. Junk | Confidence level computation for combining searches with small statistics | Nucl. Instrum. Methods A 434 (1999) 435 | |
| 74 | A. L. Read | Presentation of search results: the $ CL_s $ technique | JPG 28 (2002) 2693 | |
| 75 | G. Cowan, K. Cranmer, E. Gross, and O. Vitells | Asymptotic formulae for likelihood-based tests of new physics | EPJC 71 (2011) 1554 | 1007.1727 |
|
|
Compact Muon Solenoid LHC, CERN |
|

|

|

|

|

|