

Compact Muon Solenoid
LHC, CERN
| CMS-EXO-16-012 ; CERN-EP-2017-027 | ||
| Search for associated production of dark matter with a Higgs boson decaying to $\mathrm{b\overline{b}}$ or $\gamma\gamma$ at $ \sqrt{s} = $ 13 TeV | ||
| CMS Collaboration | ||
| 13 March 2017 | ||
| JHEP 10 (2017) 180 | ||
| Abstract: A search for dark matter is performed using events with large missing transverse momentum and a Higgs boson decaying either to a pair of bottom quarks or to a pair of photons. The data from proton-proton collisions at a center-of-mass energy of 13 TeV, collected with the CMS detector at the LHC, correspond to an integrated luminosity of 2.3 fb$^{-1}$. Results are interpreted in the context of a Z'-two-Higgs-doublet model, where a high-mass resonance Z' decays into a pseudoscalar boson A and a CP-even scalar Higgs boson, and the A decays to a pair of dark matter particles. No significant excesses are observed over the background prediction. Combining results from the two decay channels yields exclusion limits in the signal cross section in the $m_{\mathrm{Z'}} $-$ m_{\textrm{A}}$ phase space. The observed data exclude, for Z' coupling strength $g_{\mathrm{Z'}} = $ 0.8 and $m_{\mathrm{A}} = $ 300 GeV for example, the Z' mass range of 600 to 1860 GeV. This is the first result on a search for dark matter produced in association with a Higgs boson that includes constraints on $\mathrm{h} \to \gamma\gamma $ obtained at $ \sqrt{s} = $ 13 TeV. | ||
| Links: e-print arXiv:1703.05236 [hep-ex] (PDF) ; CDS record ; inSPIRE record ; CADI line (restricted) ; | ||
| Figures | |
png pdf |
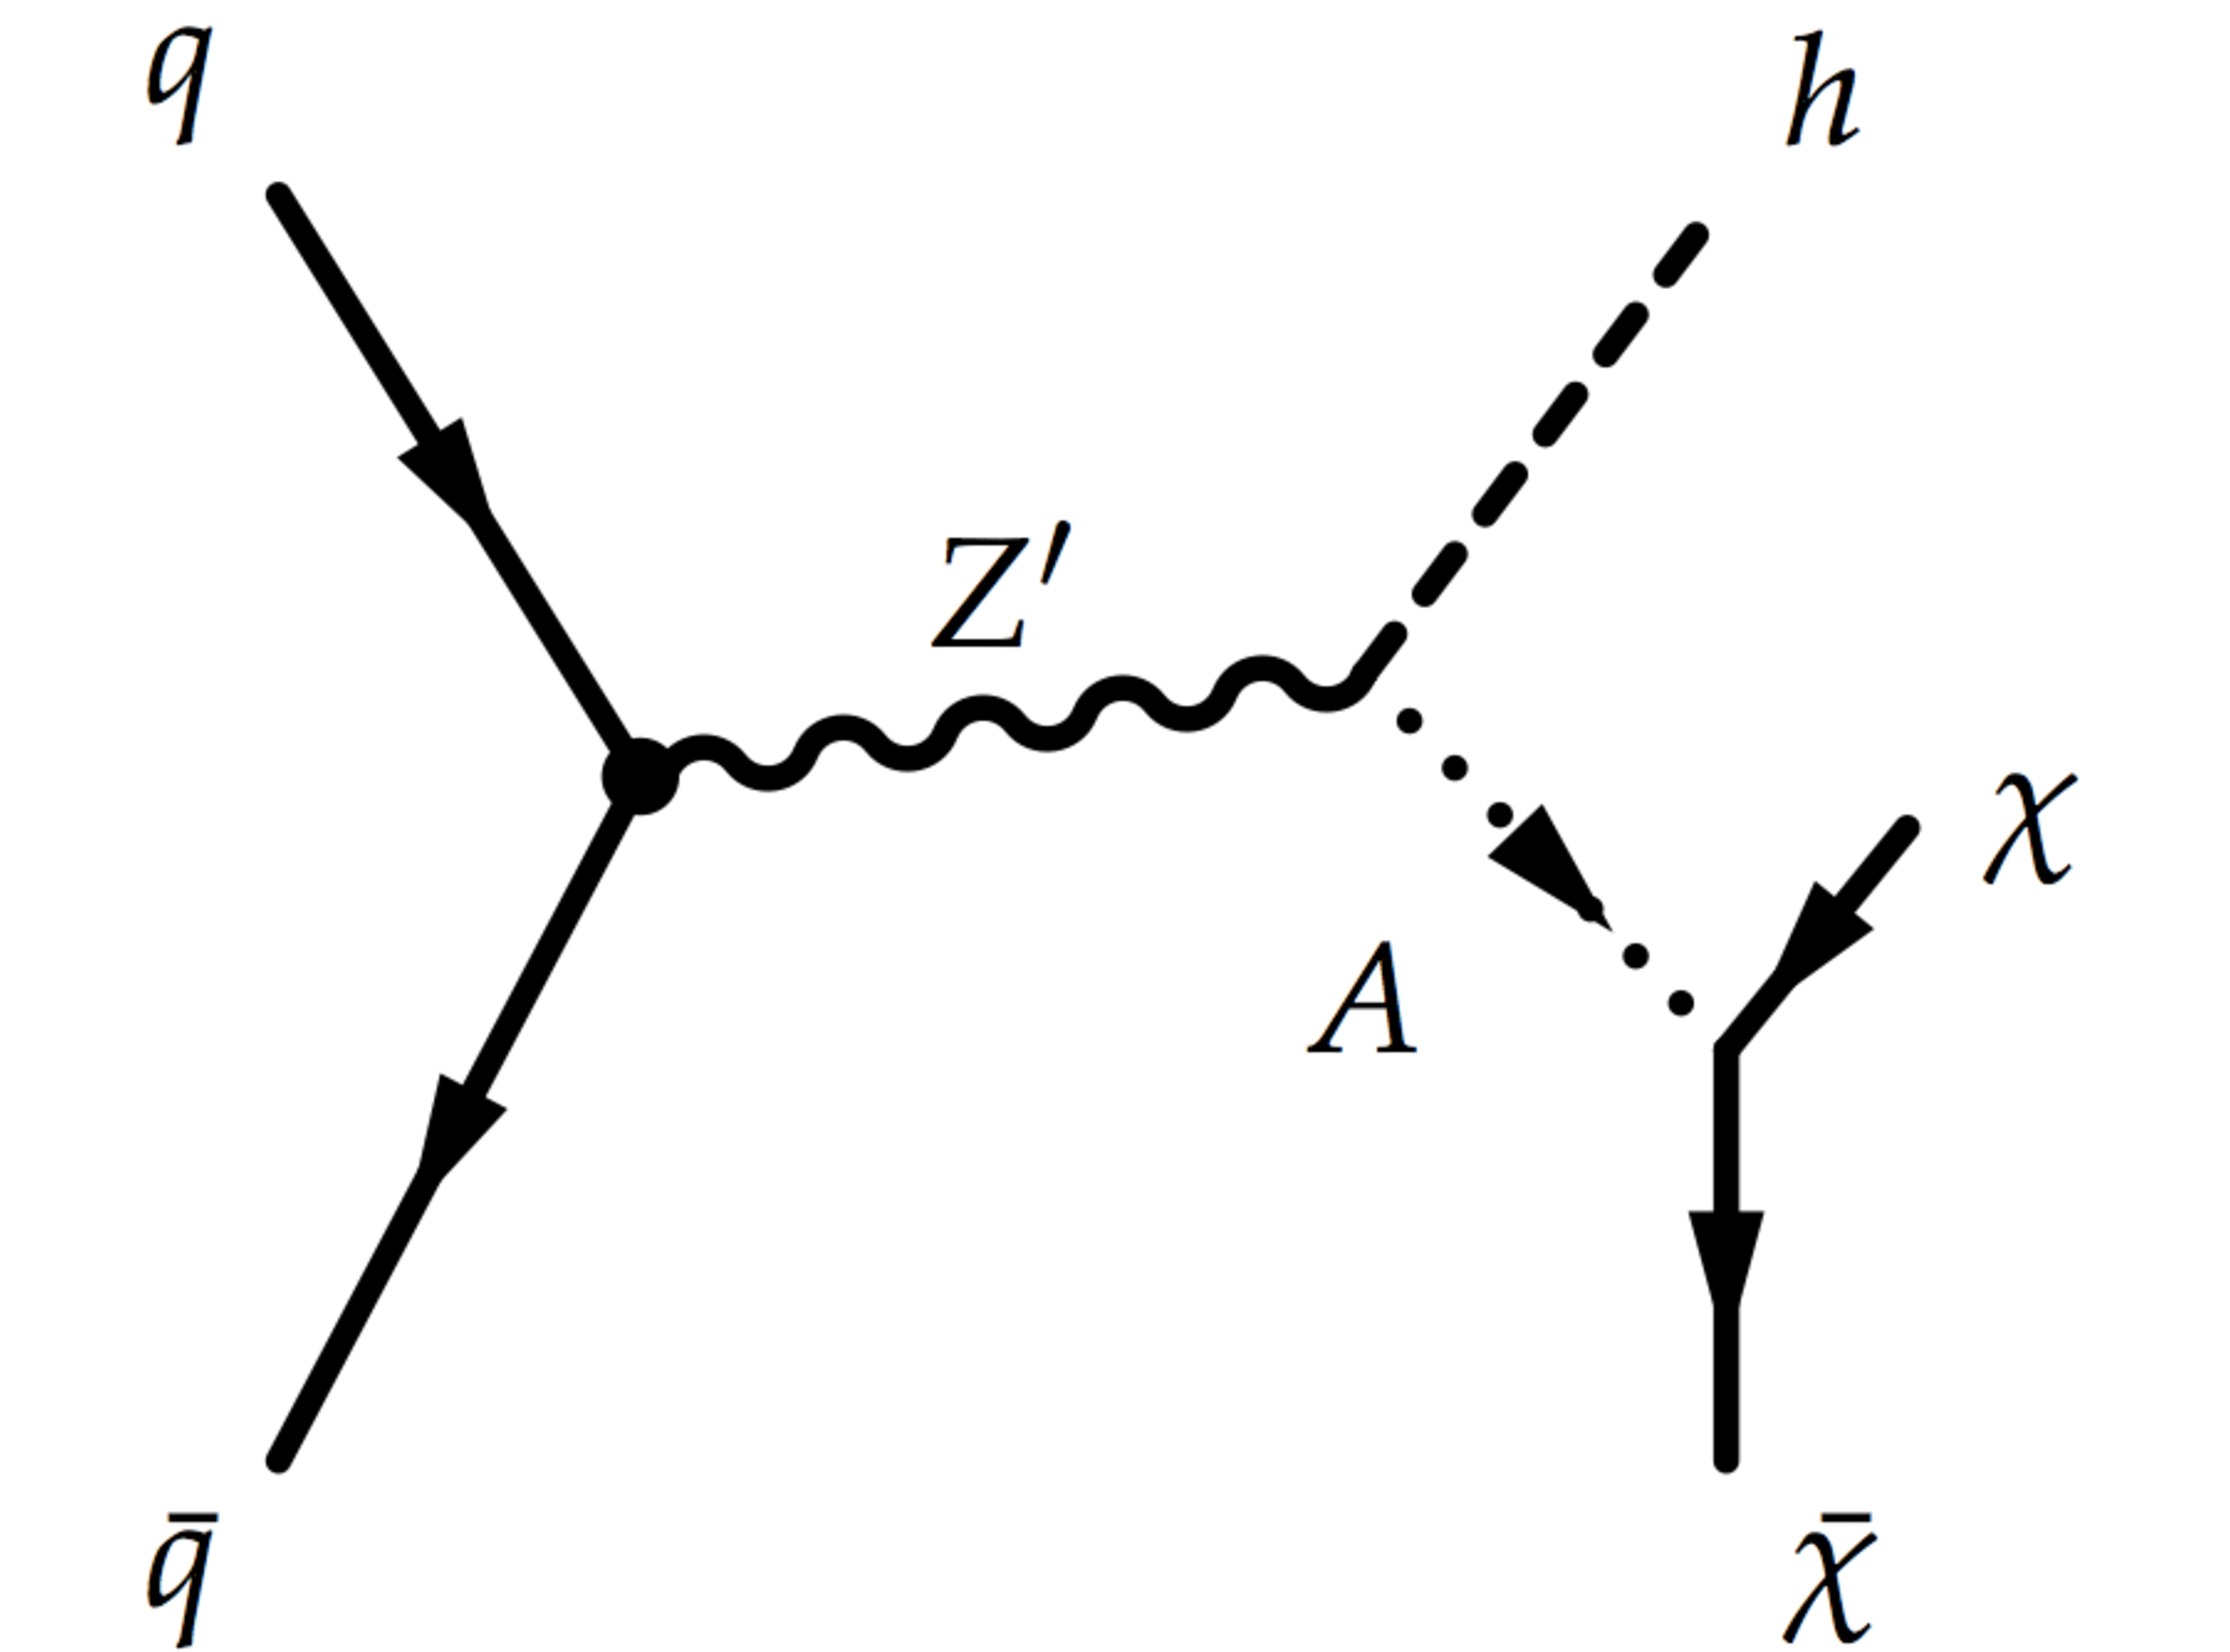
Figure 1:
Leading order Feynman diagram of the Z'-2HDM ``simplified model''. A pseudoscalar boson A decaying into invisible dark matter is produced from the decay of an on-shell Z' resonance. This gives rise to a Higgs boson and missing transverse momentum. |

png pdf |
Figure 2:
The ${p_{\mathrm {T}}^{\text {miss}}}$ distribution for ${m_{ {\mathrm {A}} }} = $ 300, 500, and 700 GeV with ${m_{\mathrm{Z'}}} = $ 1200 GeV. All other parameters of the model are fixed, as mentioned in the text. |

png pdf |
Figure 3:
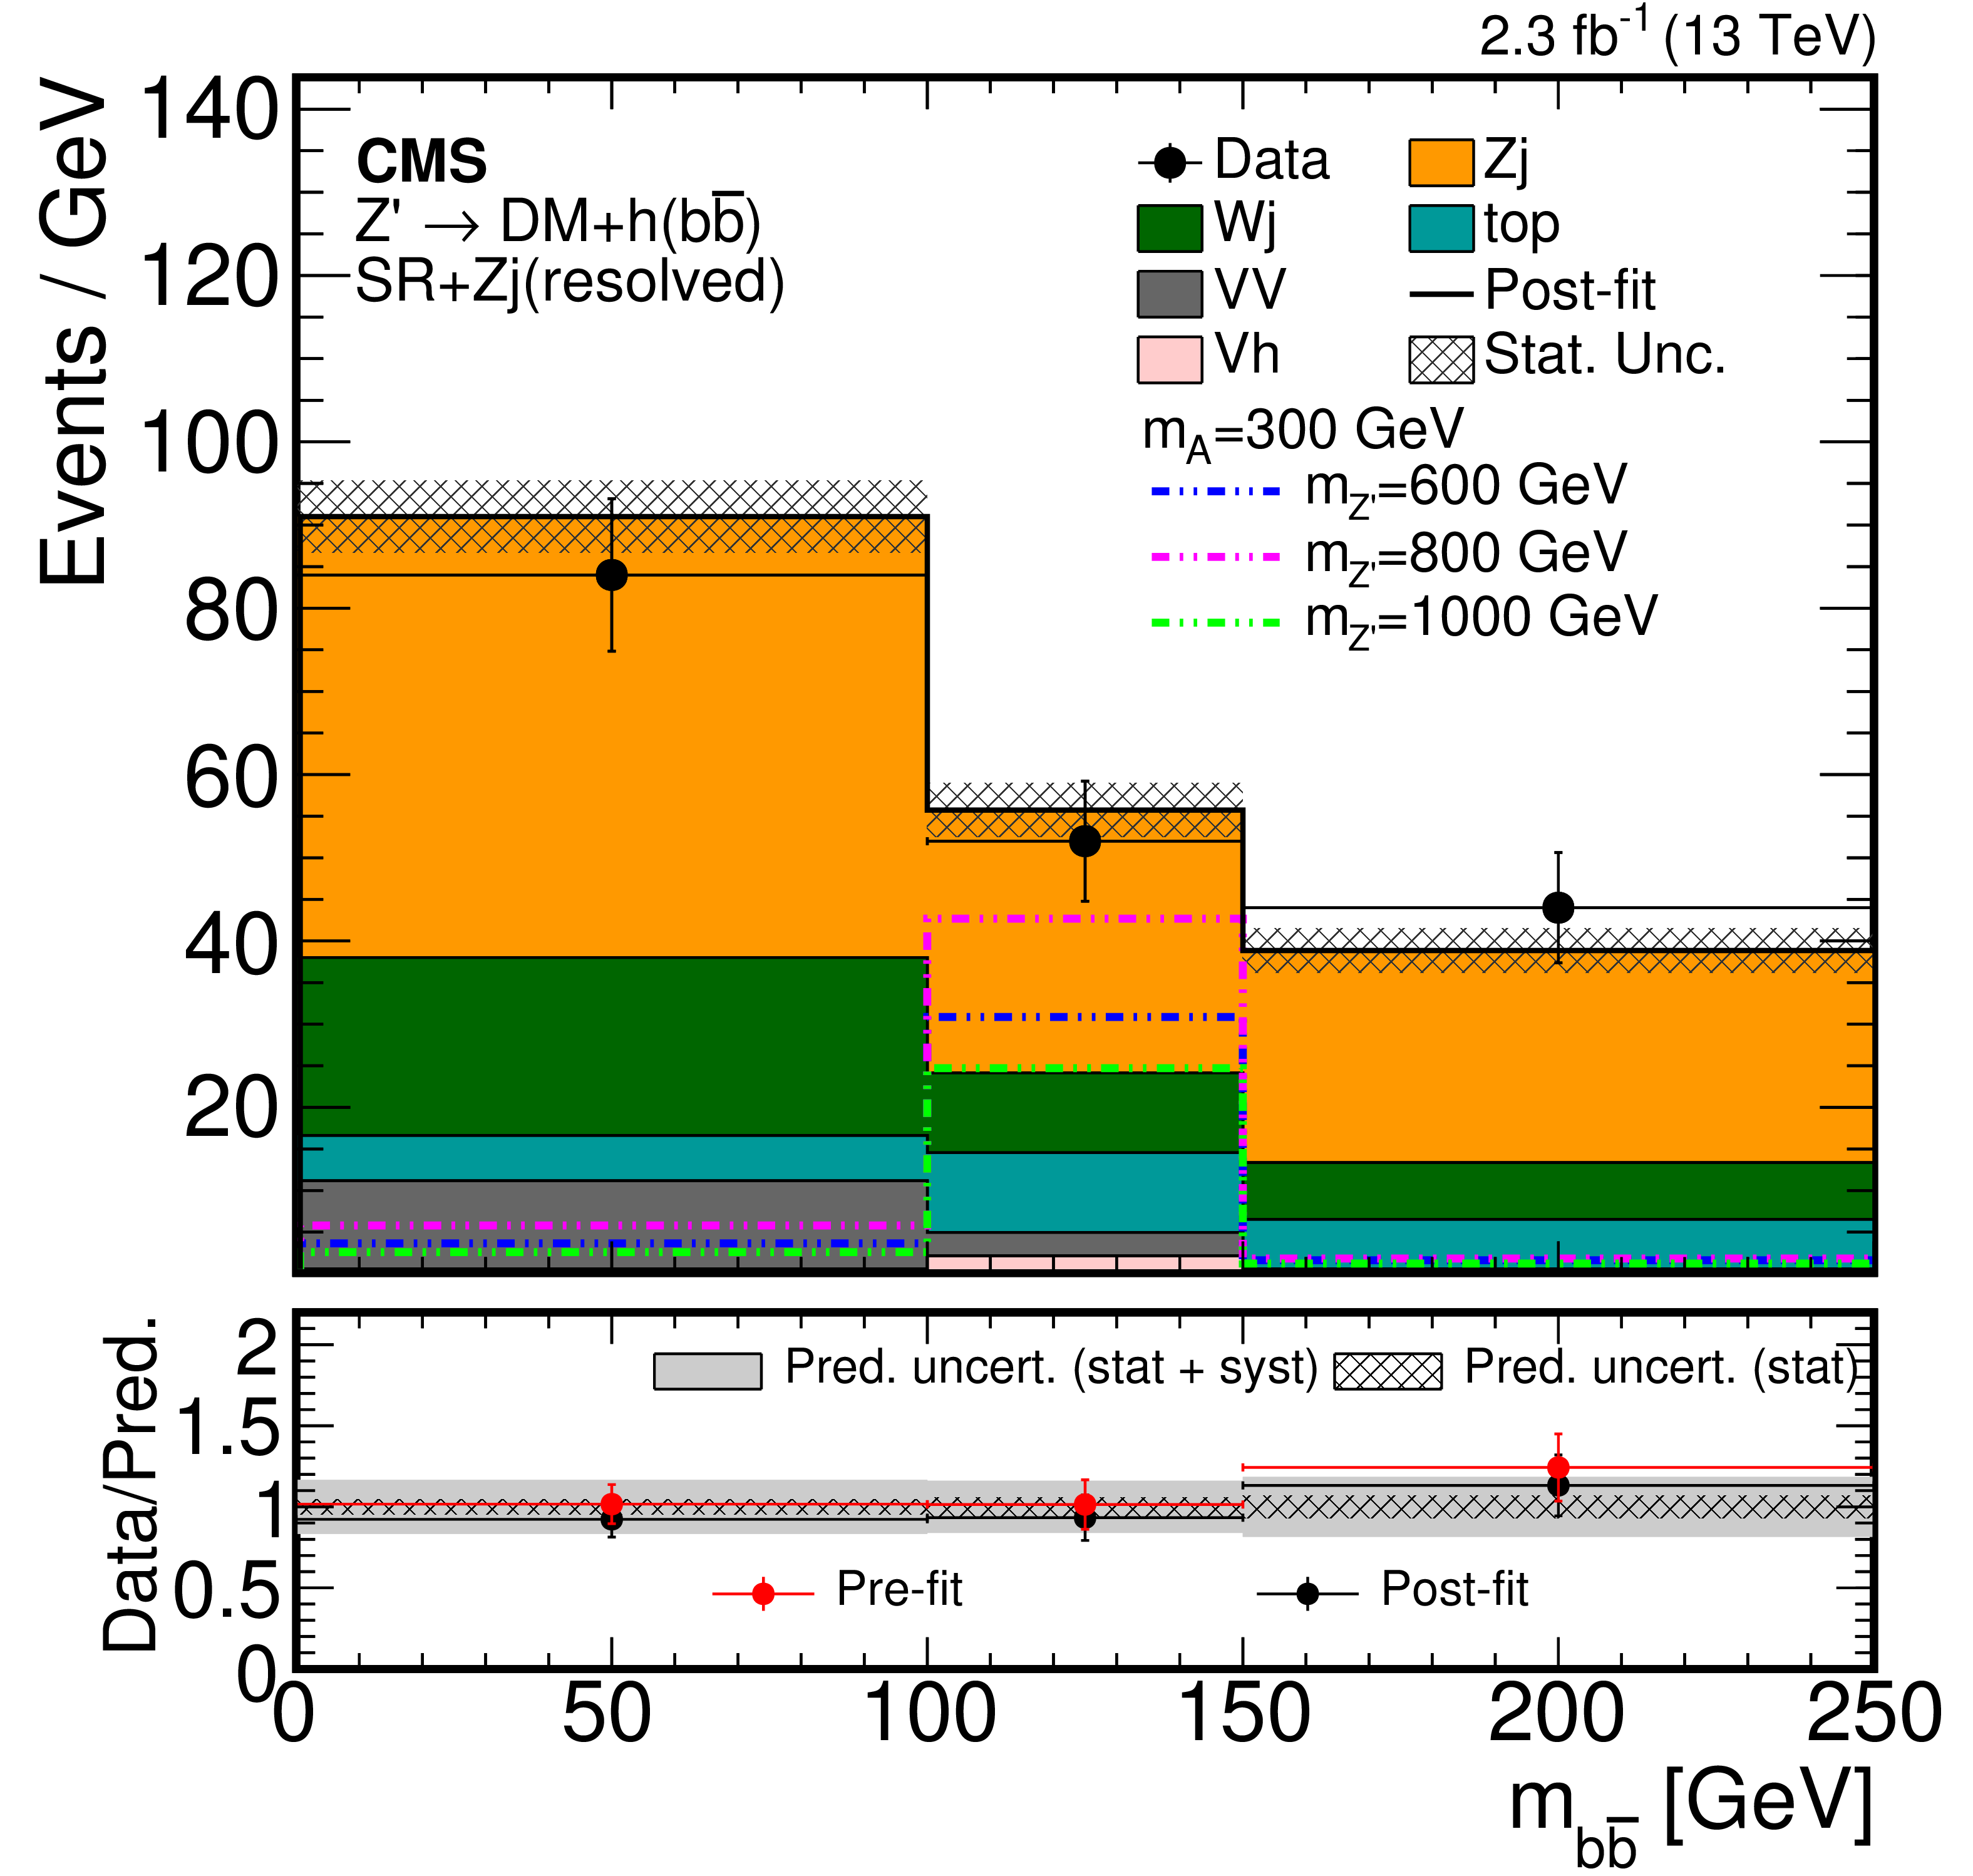
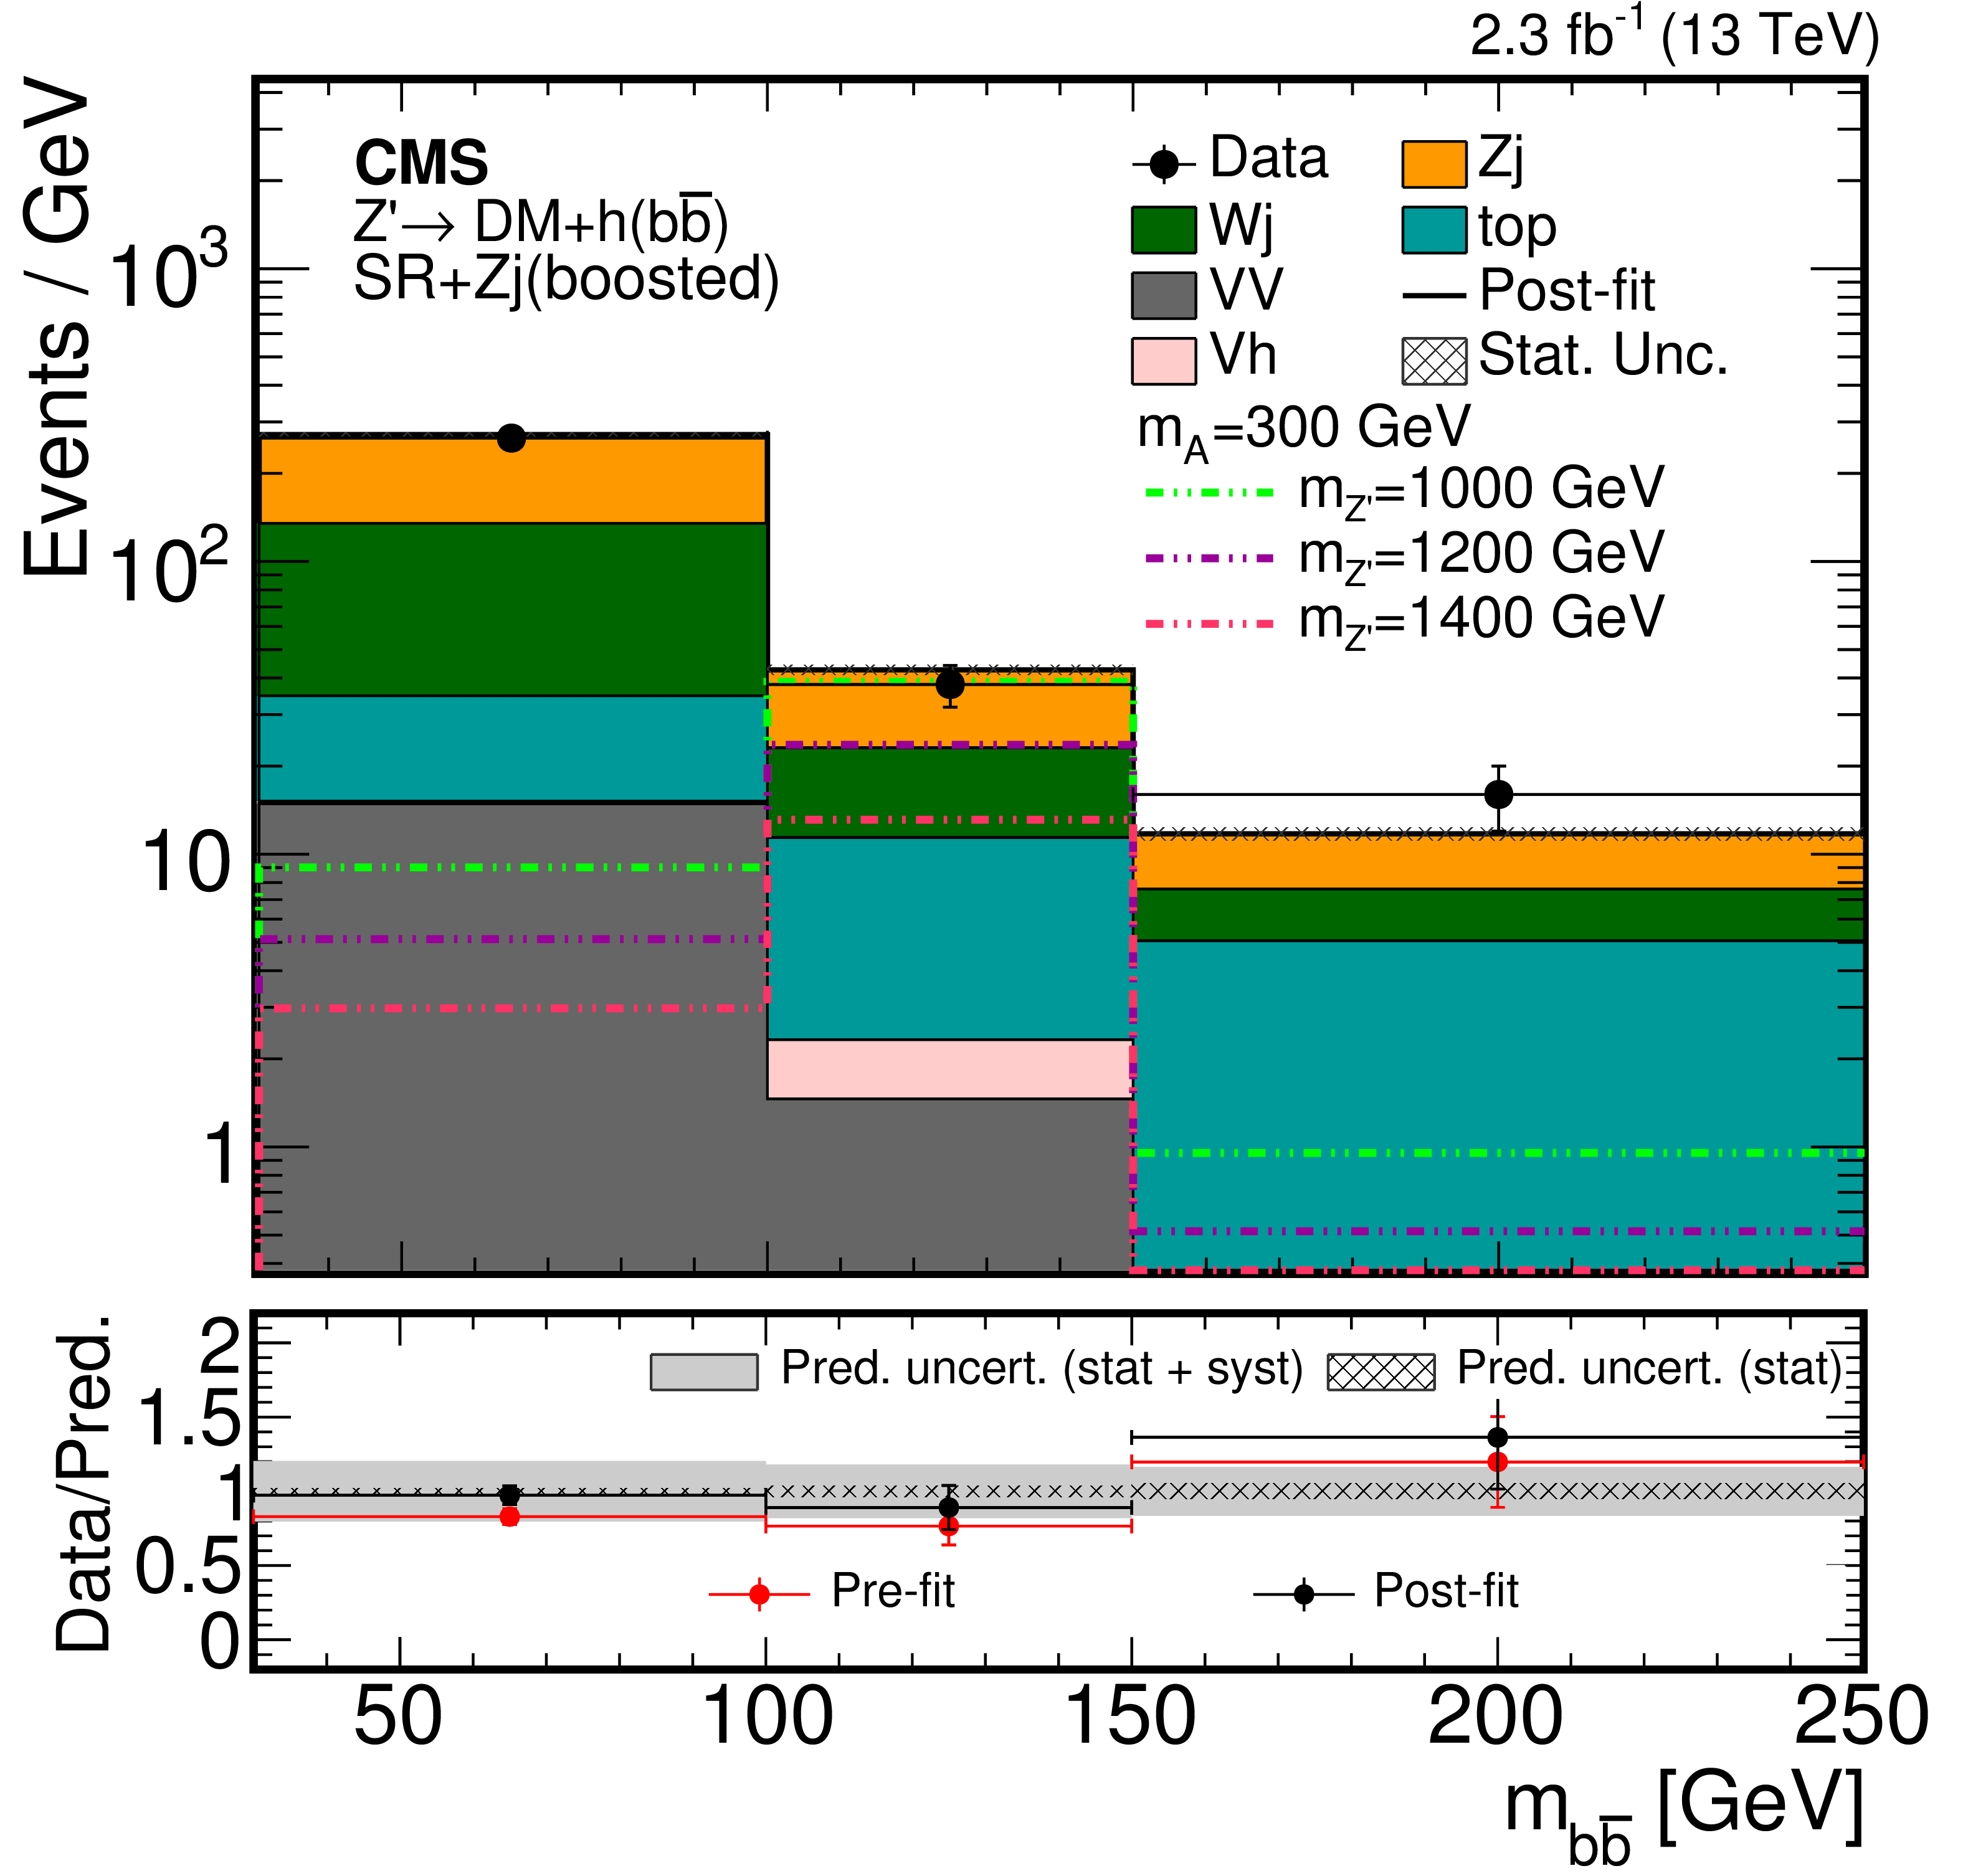
Post-fit distribution of the reconstructed Higgs boson candidate mass expected from SM backgrounds and observed in data for the resolved (left) and the boosted (right) regimes with three different ${m_{\mathrm{Z'}}}$ signal points overlaid. The cross section for the signal model is computed assuming ${g_{\mathrm{Z'}}} = $ 0.8. The bottom panels show the data-to-simulation ratios for pre-fit (red markers) and post-fit (black markers) background predictions with a hatched band corresponding to the uncertainty due to the finite size of simulated samples and a gray band that adds the systematic uncertainty onto the post-fit background prediction. The first and third bins in the distribution show the mass sidebands (Z($\rightarrow \nu \overline {\nu }$)+jets) CR; the second bin shows the SR. |
png pdf |
Figure 3-a:
Post-fit distribution of the reconstructed Higgs boson candidate mass expected from SM backgrounds and observed in data for the resolved regime with three different ${m_{\mathrm{Z'}}}$ signal points overlaid. The cross section for the signal model is computed assuming ${g_{\mathrm{Z'}}} = $ 0.8. The bottom panel shows the data-to-simulation ratios for pre-fit (red markers) and post-fit (black markers) background predictions with a hatched band corresponding to the uncertainty due to the finite size of simulated samples and a gray band that adds the systematic uncertainty onto the post-fit background prediction. The first and third bins in the distribution show the mass sidebands (Z($\rightarrow \nu \overline {\nu }$)+jets) CR; the second bin shows the SR. |
png pdf |
Figure 3-b:
Post-fit distribution of the reconstructed Higgs boson candidate mass expected from SM backgrounds and observed in data for the boosted regime with three different ${m_{\mathrm{Z'}}}$ signal points overlaid. The cross section for the signal model is computed assuming ${g_{\mathrm{Z'}}} = $ 0.8. The bottom panel shows the data-to-simulation ratios for pre-fit (red markers) and post-fit (black markers) background predictions with a hatched band corresponding to the uncertainty due to the finite size of simulated samples and a gray band that adds the systematic uncertainty onto the post-fit background prediction. The first and third bins in the distribution show the mass sidebands (Z($\rightarrow \nu \overline {\nu }$)+jets) CR; the second bin shows the SR. |
png pdf |
Figure 4:
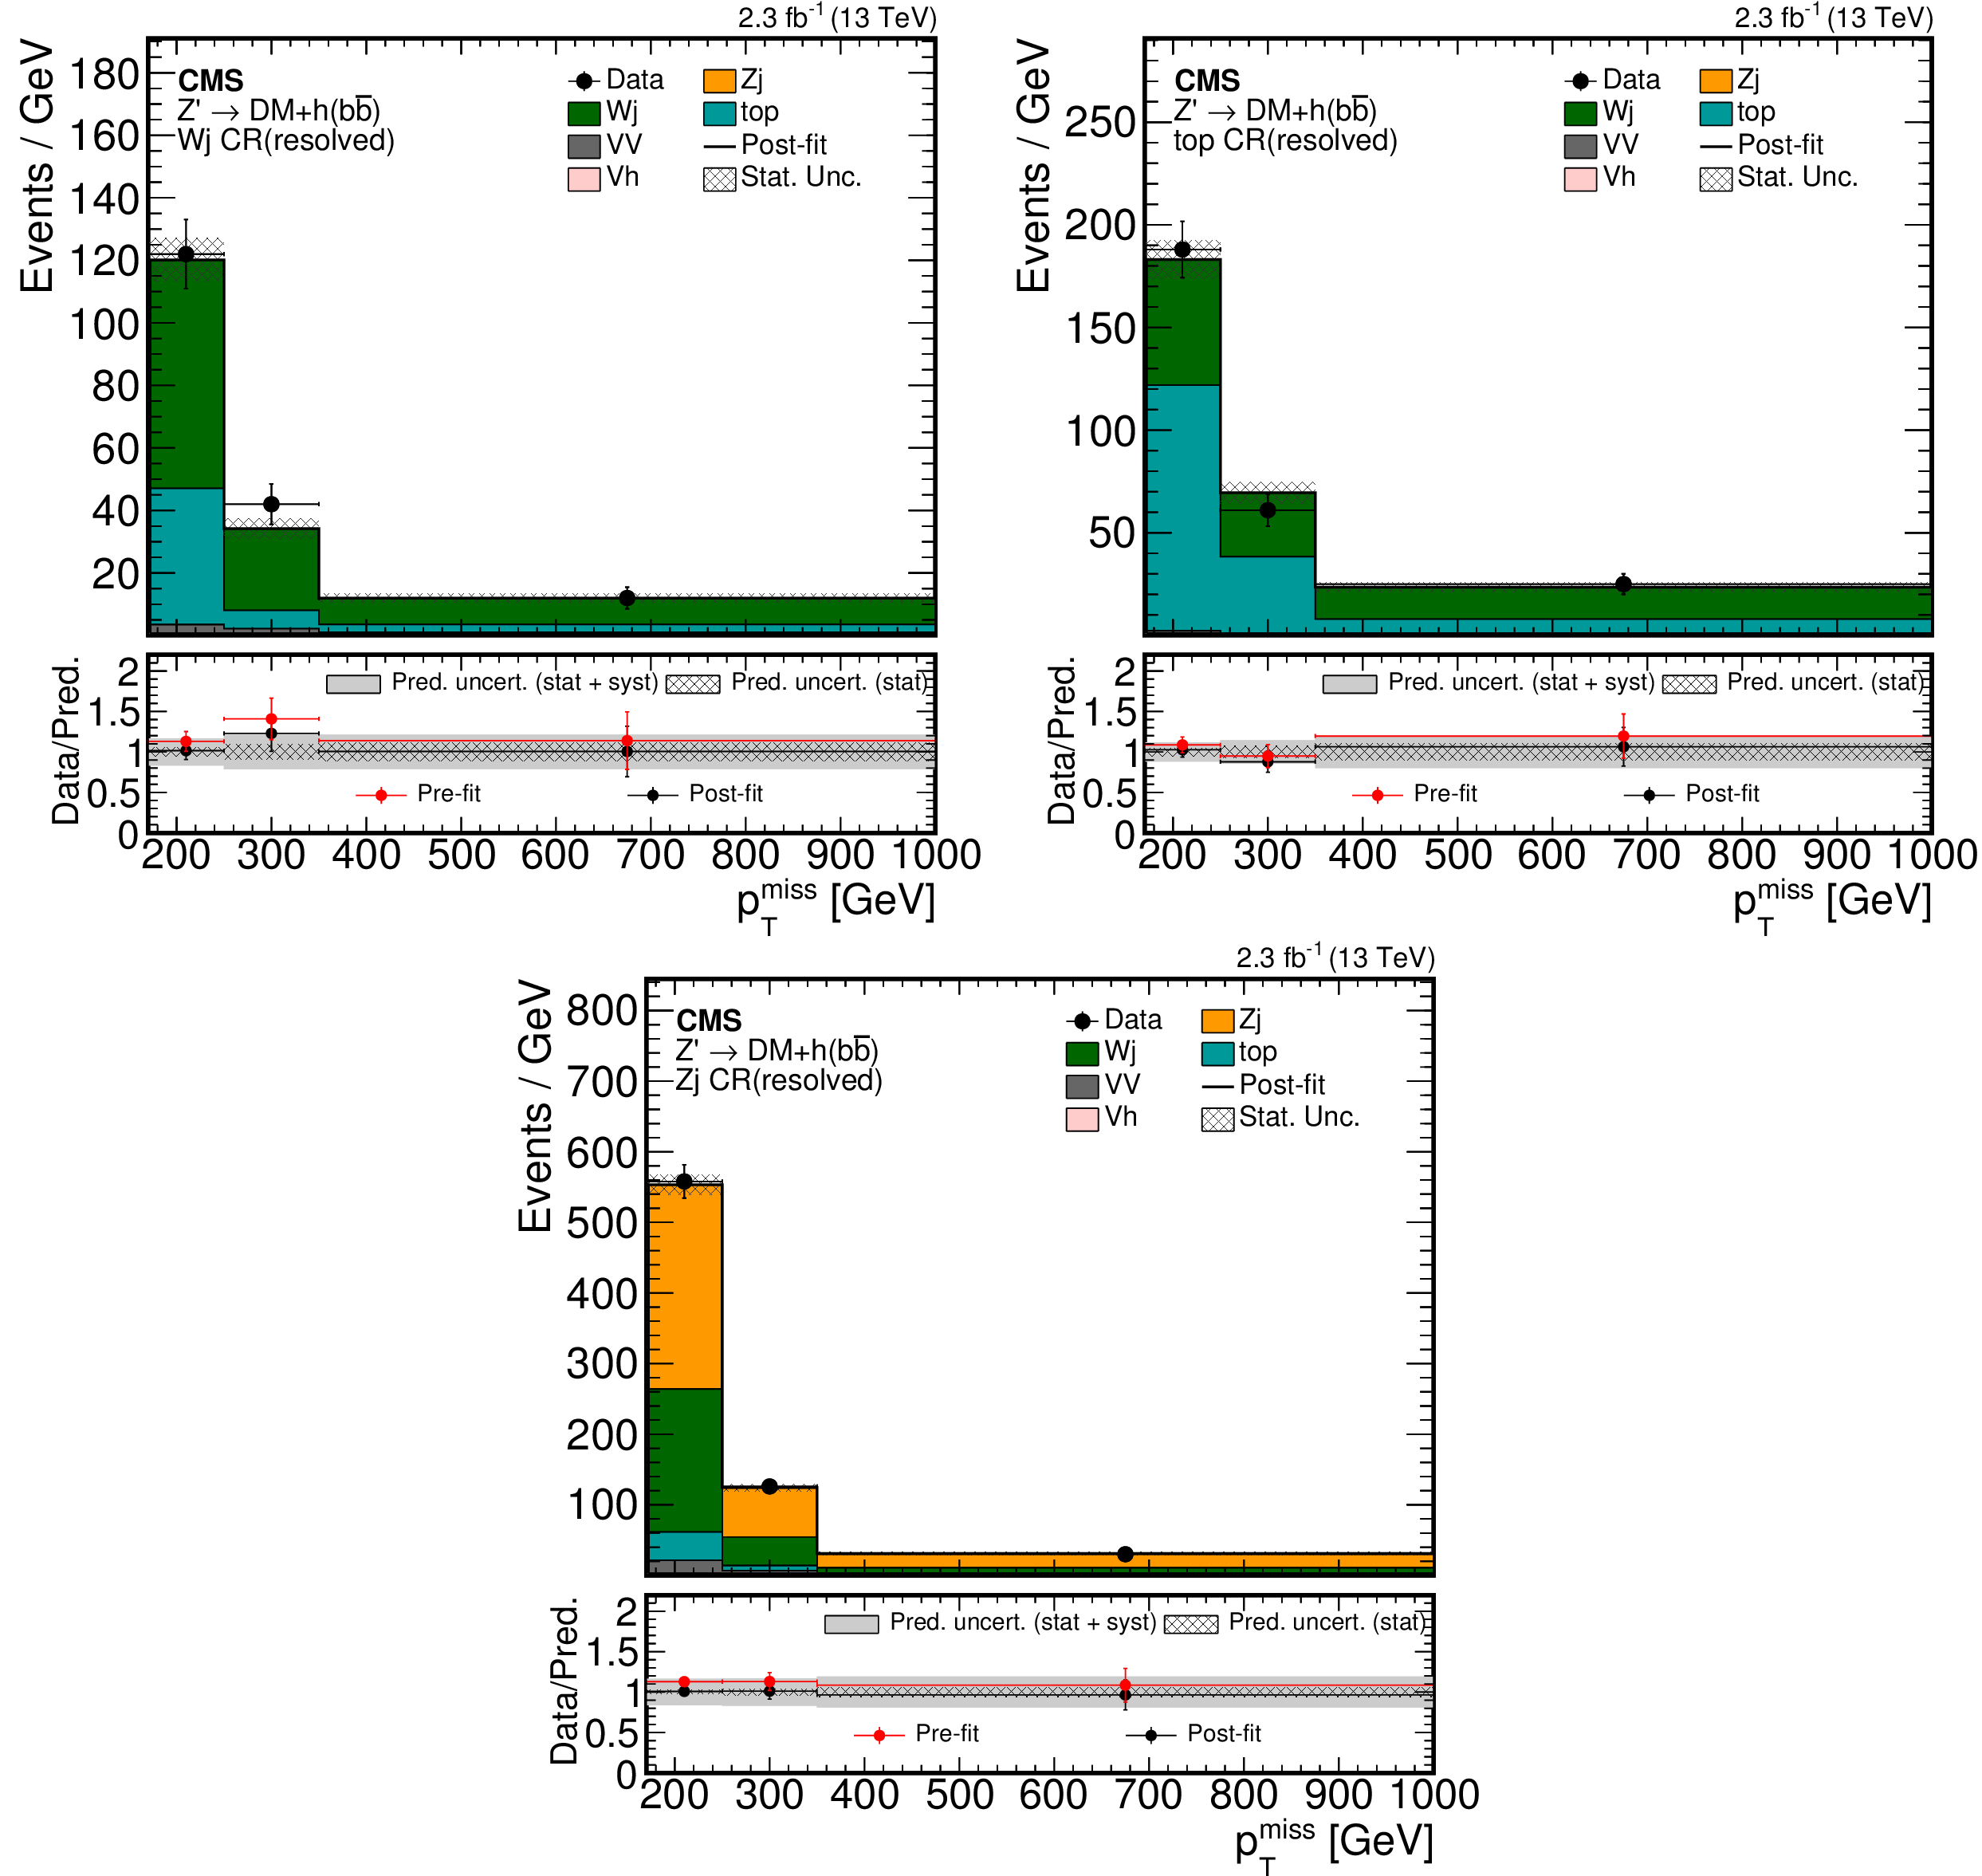
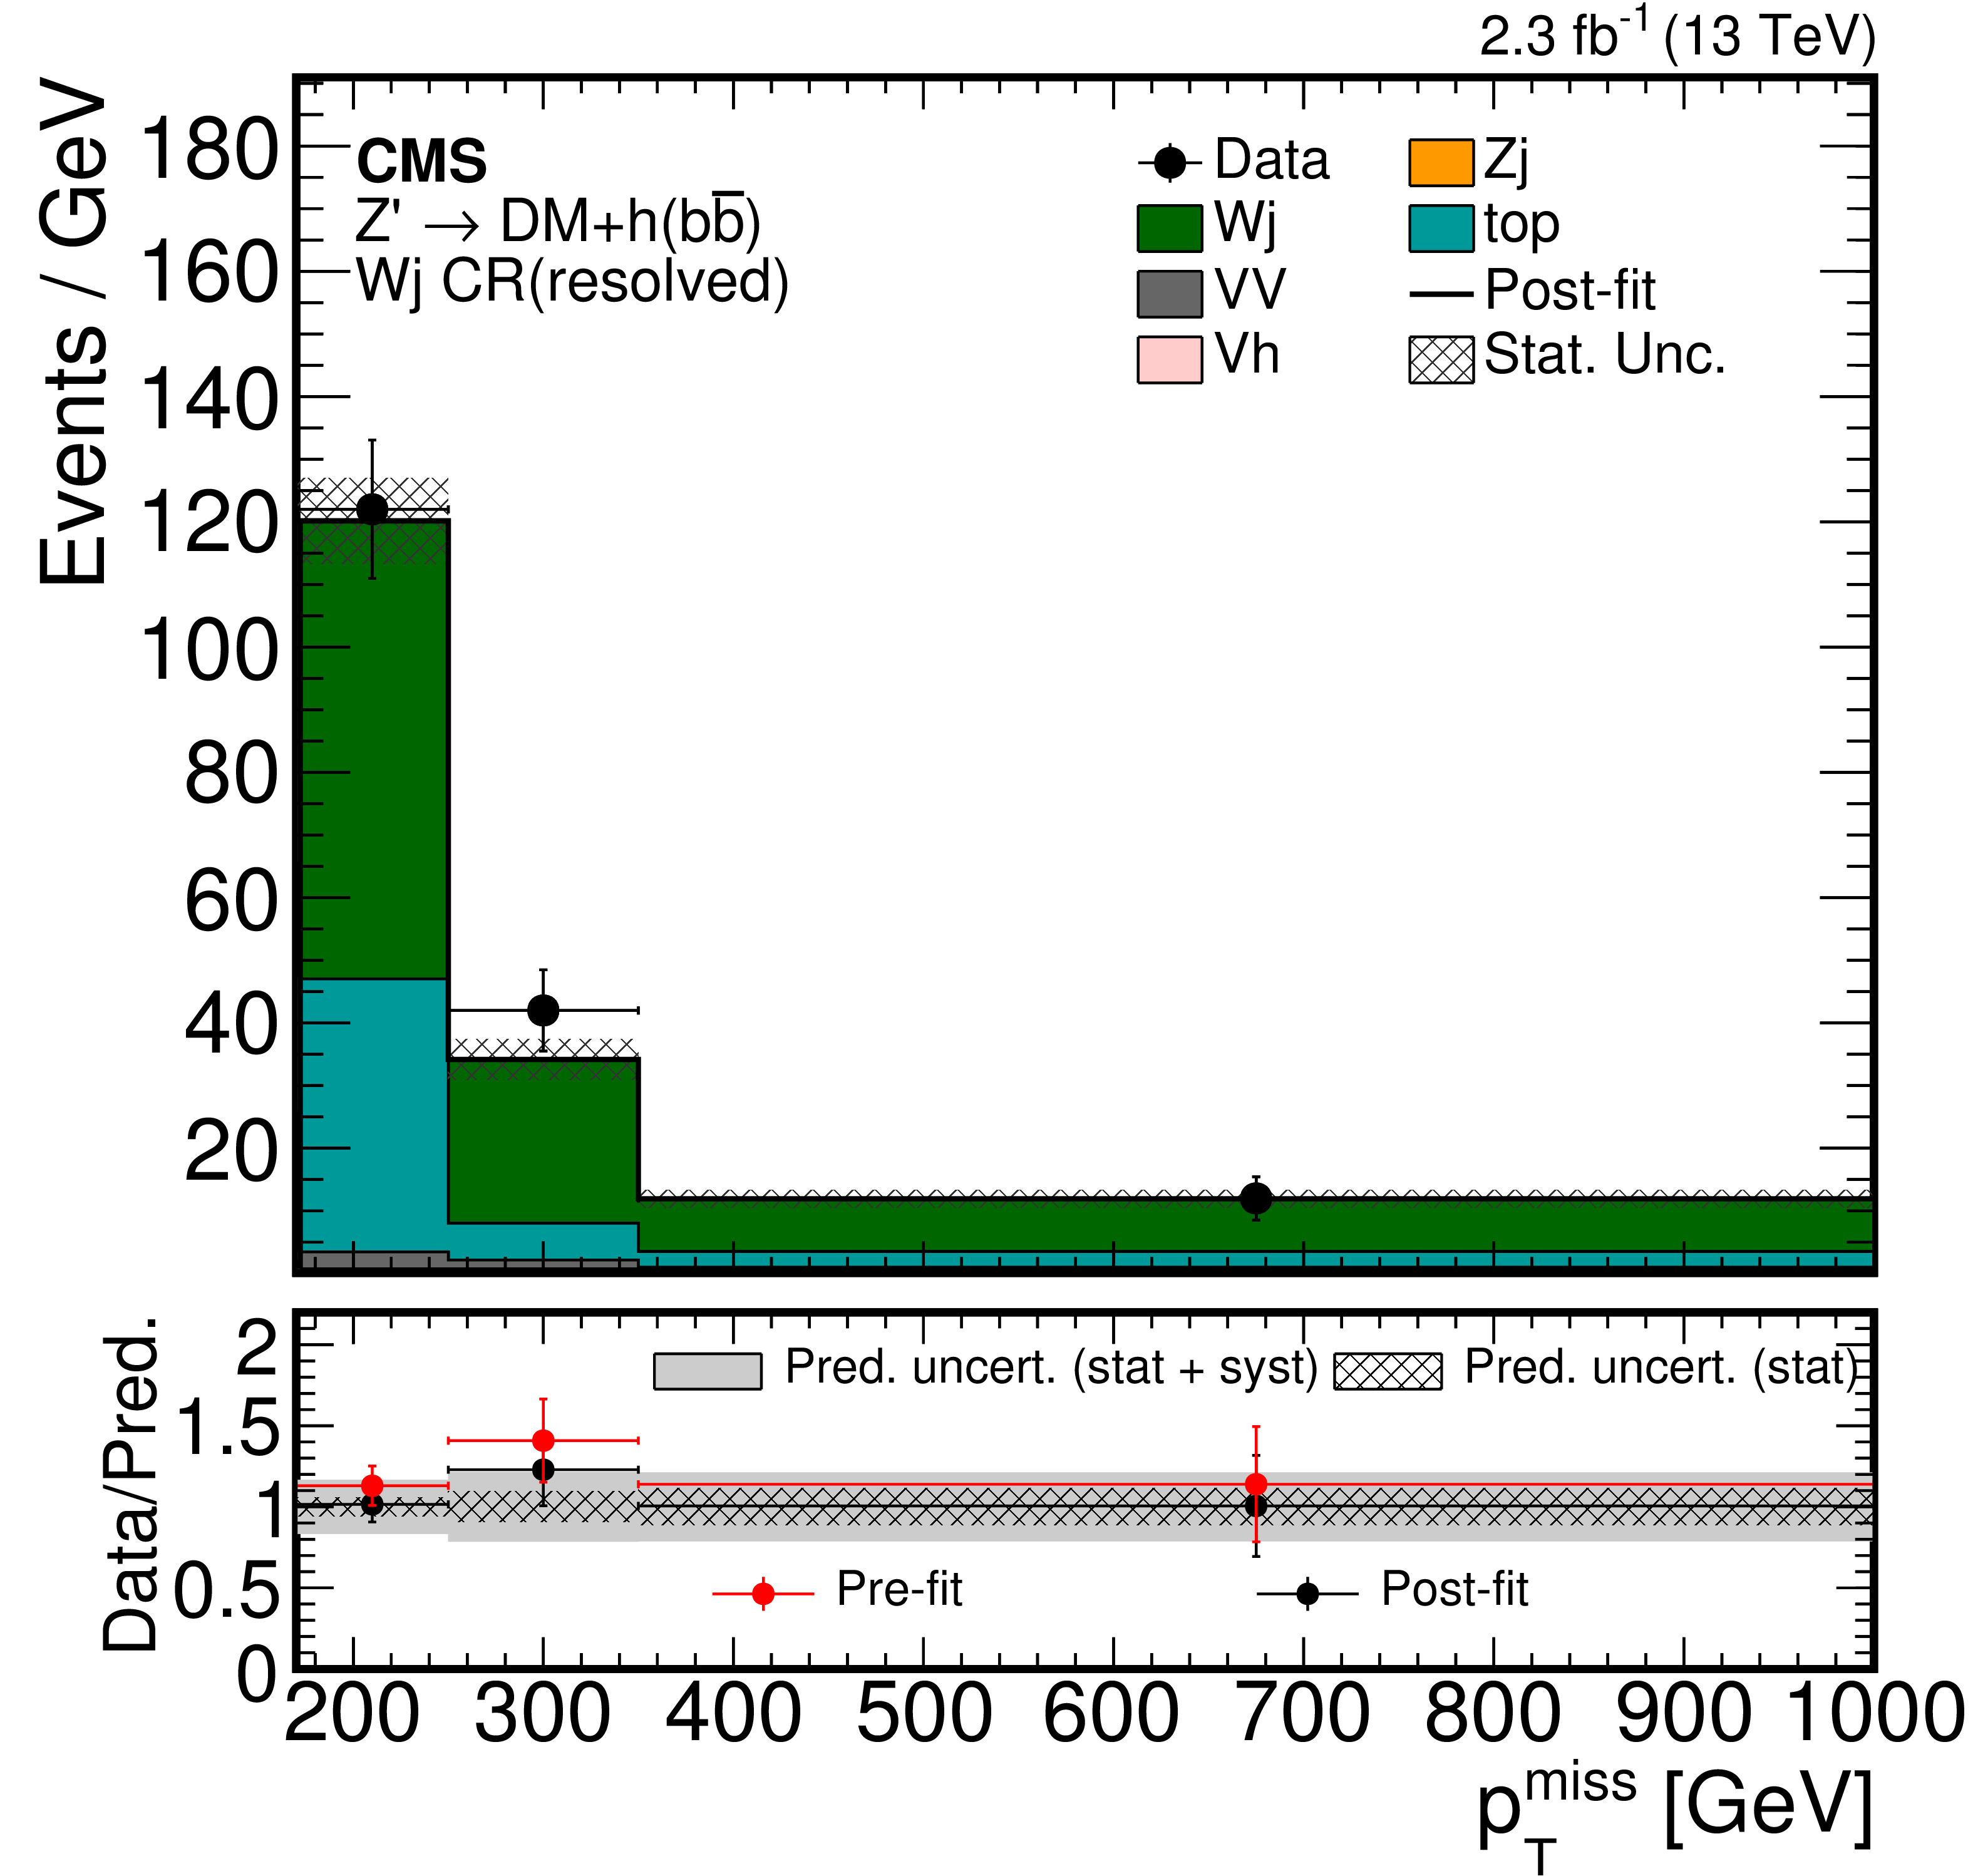
Post-fit distribution of ${p_{\mathrm {T}}^{\text {miss}}} $ expected from SM backgrounds and observed in data for the W+jets (upper left), top quark (upper right) and Z($\rightarrow \nu \overline {\nu }$)+jets (lower) CRs for the resolved regime. The bottom panels show the data-to-simulation ratios for pre-fit (red markers) and post-fit (black markers) background predictions with a hatched band corresponding to the uncertainty due to the finite size of simulated samples and a gray band that adds the systematic uncertainty onto the post-fit background prediction. The last bin includes all events with $ {p_{\mathrm {T}}^{\text {miss}}} > $ 350 GeV. |
png pdf |
Figure 4-a:
Post-fit distribution of ${p_{\mathrm {T}}^{\text {miss}}} $ expected from SM backgrounds and observed in data for the W+jets CR for the resolved regime. The bottom panel shows the data-to-simulation ratios for pre-fit (red markers) and post-fit (black markers) background predictions with a hatched band corresponding to the uncertainty due to the finite size of simulated samples and a gray band that adds the systematic uncertainty onto the post-fit background prediction. The last bin includes all events with $ {p_{\mathrm {T}}^{\text {miss}}} > $ 350 GeV. |
png pdf |
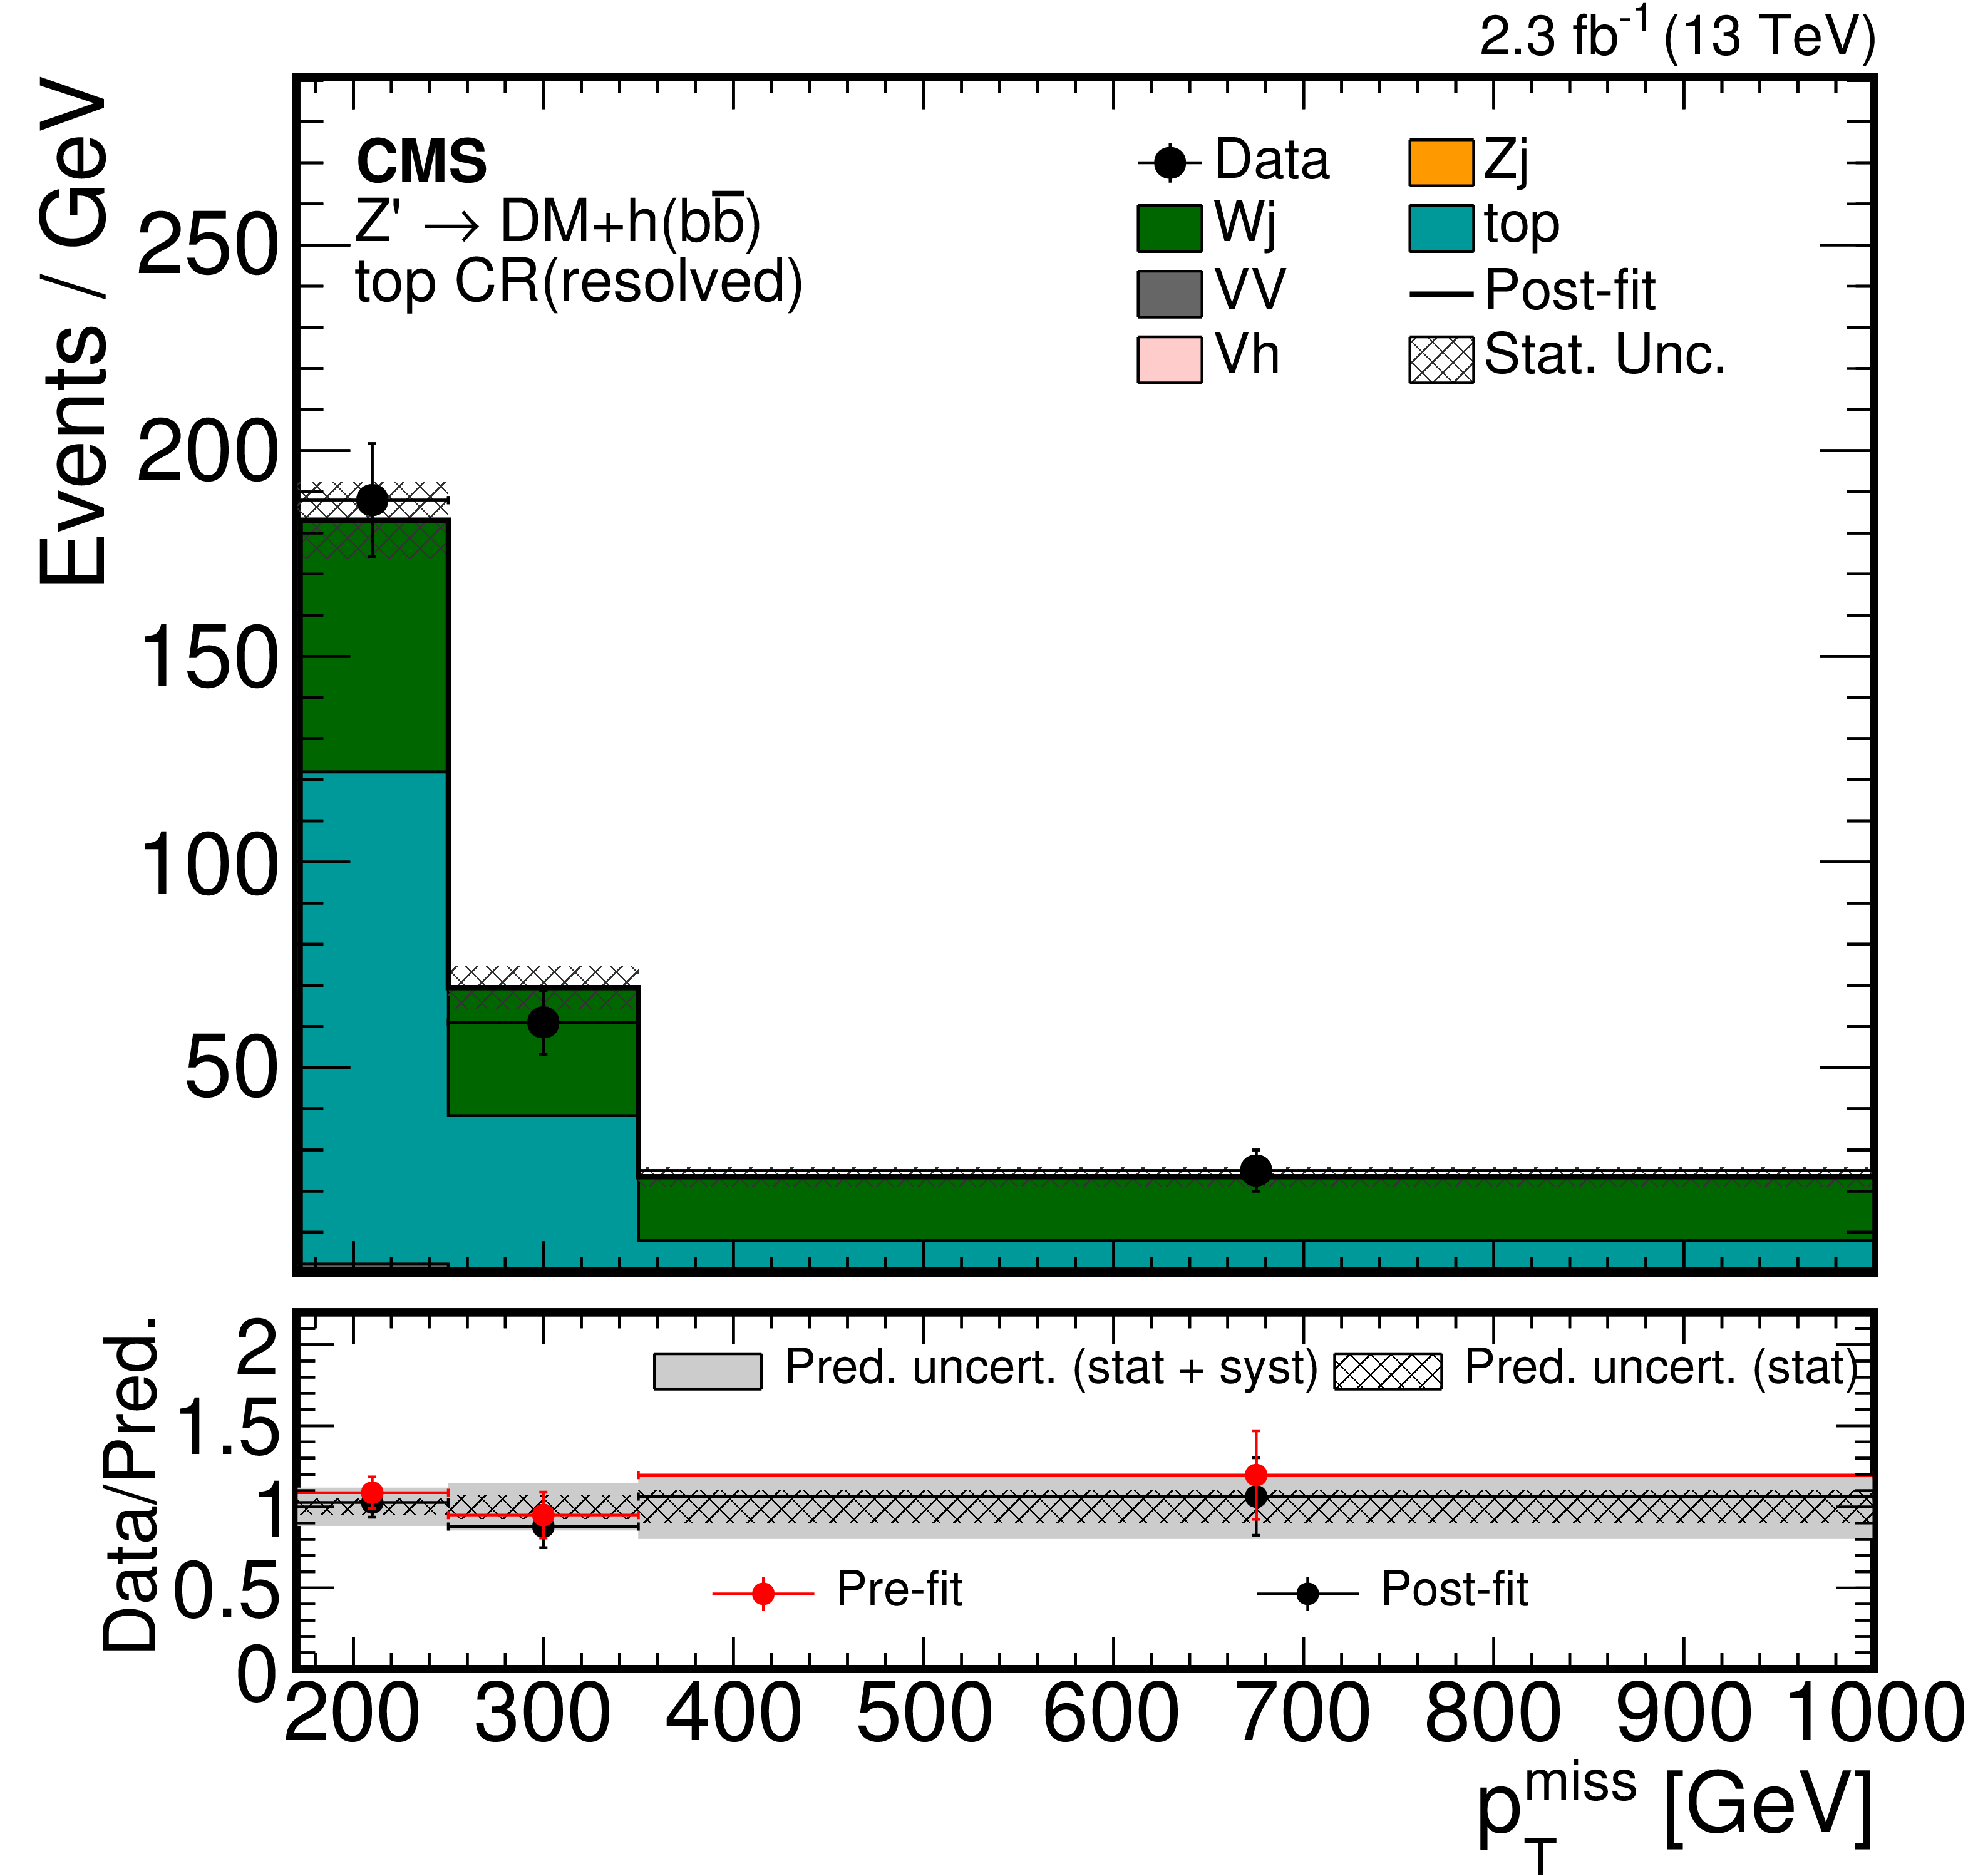
Figure 4-b:
Post-fit distribution of ${p_{\mathrm {T}}^{\text {miss}}} $ expected from SM backgrounds and observed in data for the top quark CR for the resolved regime. The bottom panel shows the data-to-simulation ratios for pre-fit (red markers) and post-fit (black markers) background predictions with a hatched band corresponding to the uncertainty due to the finite size of simulated samples and a gray band that adds the systematic uncertainty onto the post-fit background prediction. The last bin includes all events with $ {p_{\mathrm {T}}^{\text {miss}}} > $ 350 GeV. |
png pdf |
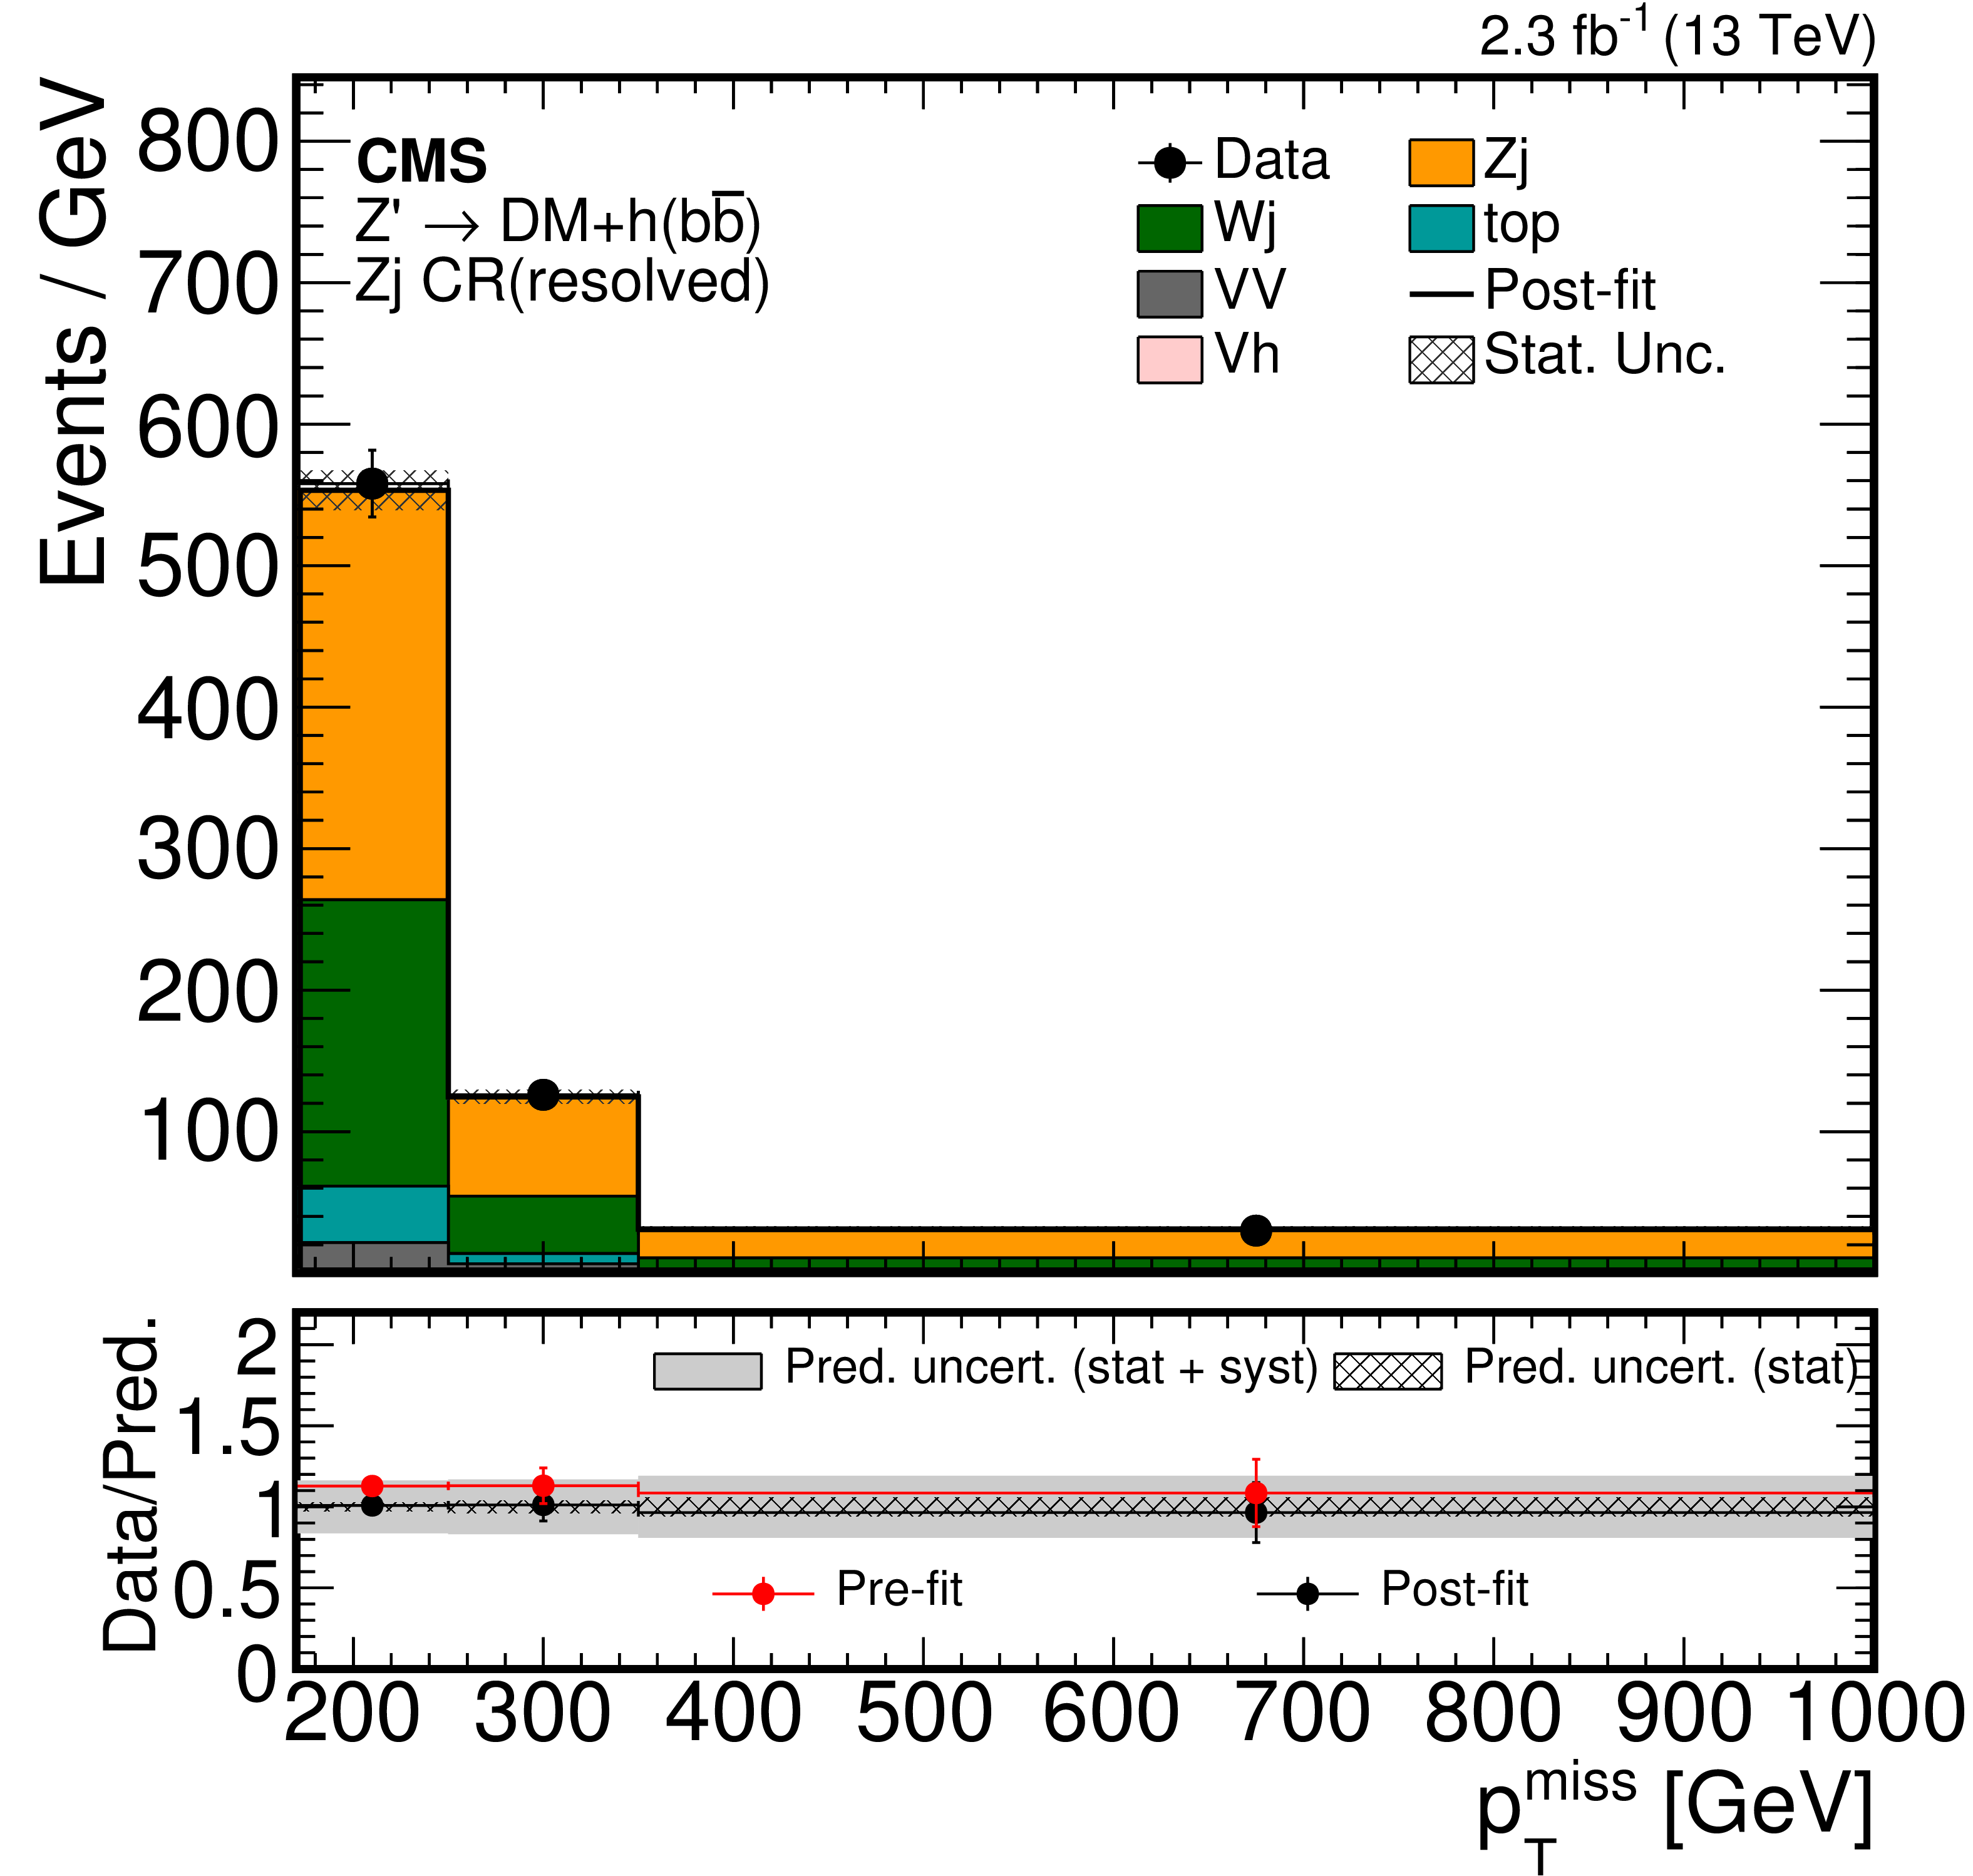
Figure 4-c:
Post-fit distribution of ${p_{\mathrm {T}}^{\text {miss}}} $ expected from SM backgrounds and observed in data for the Z($\rightarrow \nu \overline {\nu }$)+jets CR for the resolved regime. The bottom panel shows the data-to-simulation ratios for pre-fit (red markers) and post-fit (black markers) background predictions with a hatched band corresponding to the uncertainty due to the finite size of simulated samples and a gray band that adds the systematic uncertainty onto the post-fit background prediction. The last bin includes all events with $ {p_{\mathrm {T}}^{\text {miss}}} > $ 350 GeV. |
png pdf |
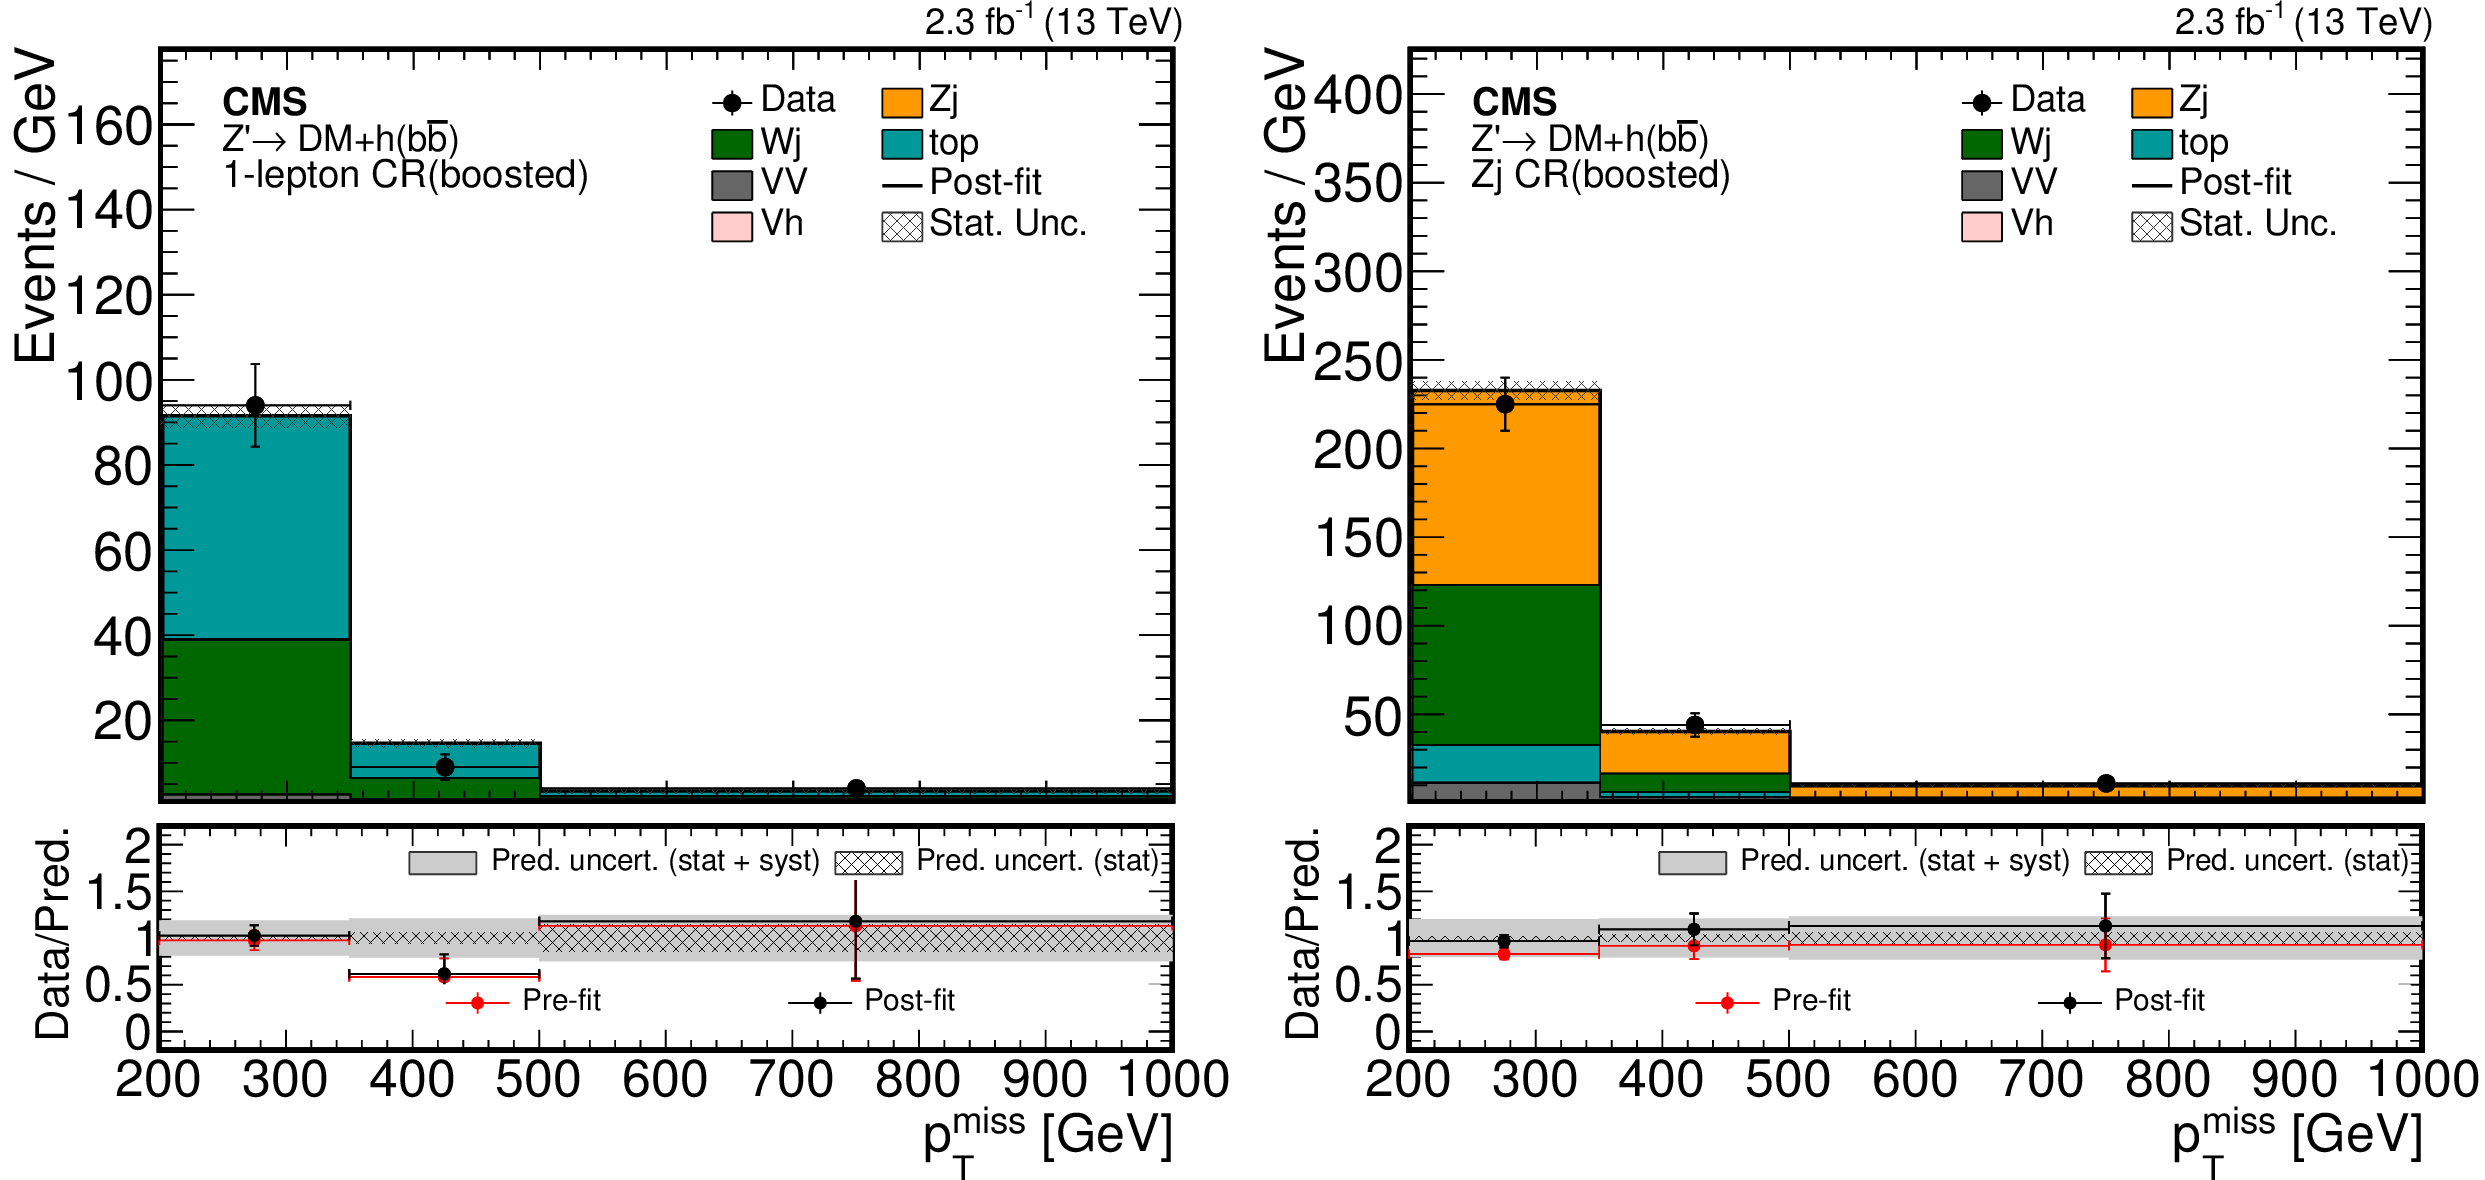
Figure 5:
Post-fit distribution of ${p_{\mathrm {T}}^{\text {miss}}}$ expected from SM backgrounds and observed in data for the single-lepton CR and Z($\rightarrow \nu \overline {\nu }$)+jets CRs for the boosted regime. The bottom panels show the data-to-simulation ratios for pre-fit (red markers) and post-fit (black markers) background predictions with a hatched band corresponding to the uncertainty due to the finite size of simulated samples and a gray band that adds the systematic uncertainty onto the post-fit background prediction. The last bin includes all events with $ {p_{\mathrm {T}}^{\text {miss}}} > $ 500 GeV. |
png pdf |
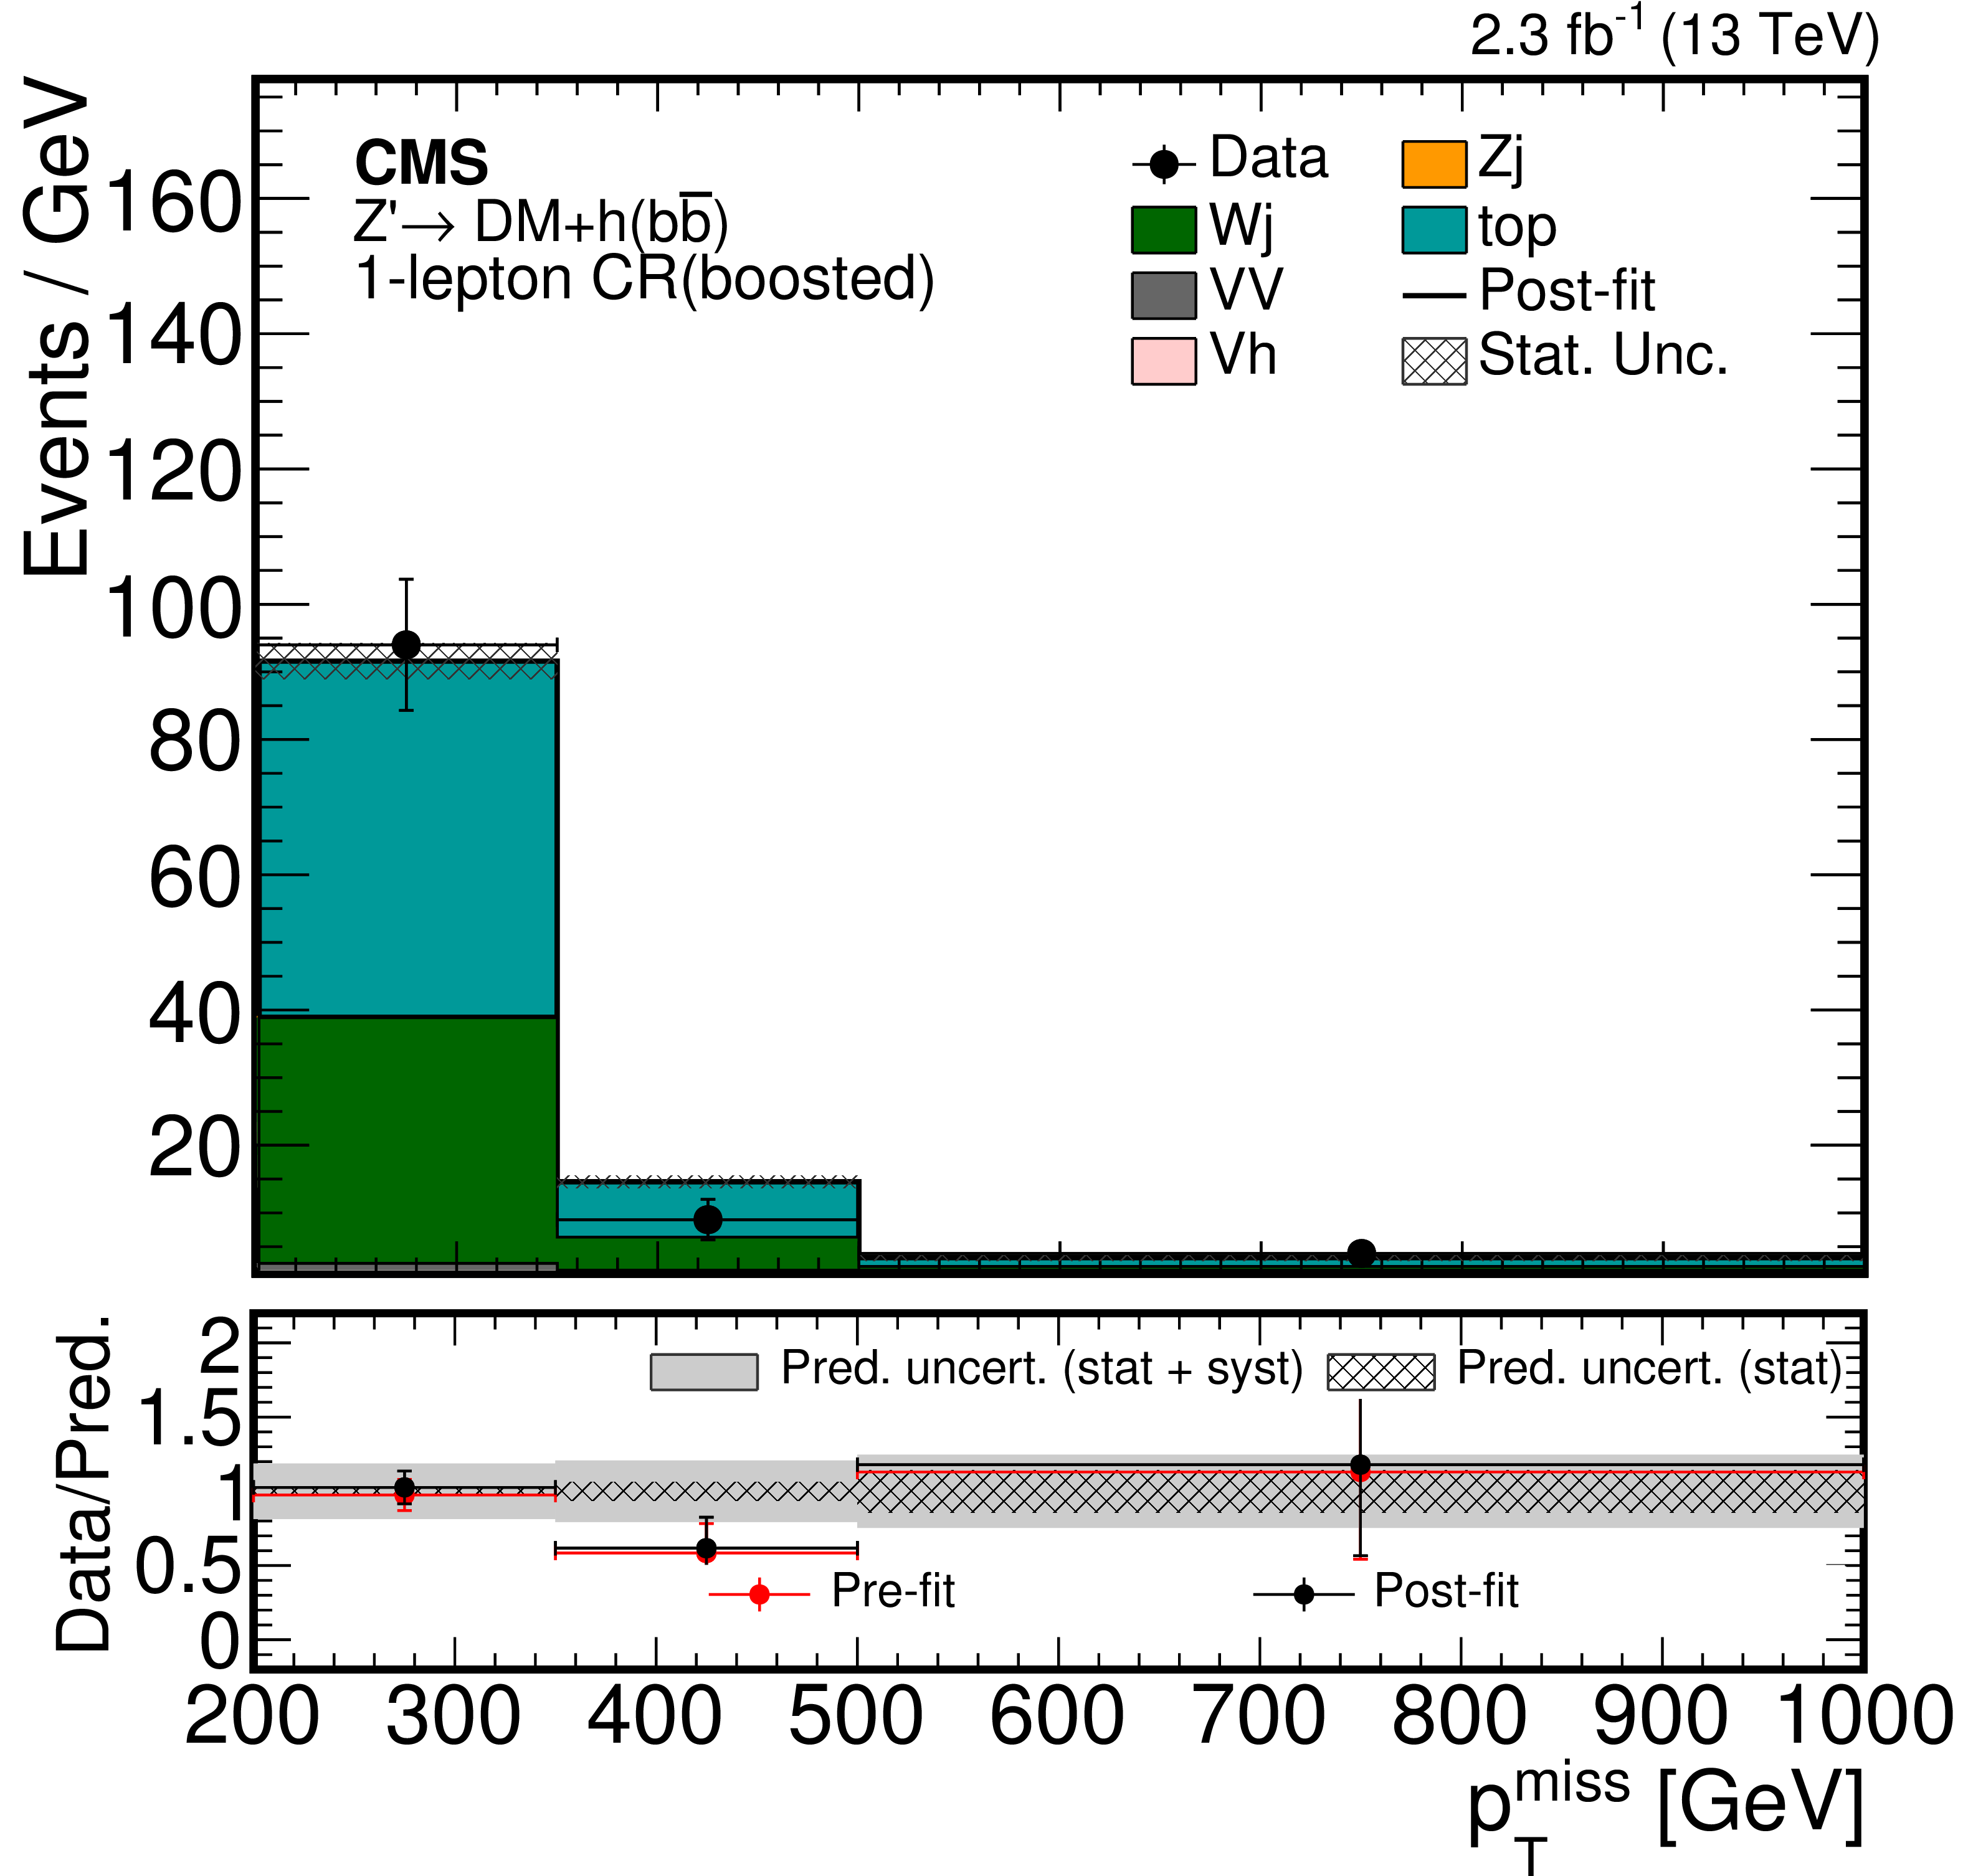
Figure 5-a:
Post-fit distribution of ${p_{\mathrm {T}}^{\text {miss}}}$ expected from SM backgrounds and observed in data for the single-lepton CR. The bottom panel shows the data-to-simulation ratios for pre-fit (red markers) and post-fit (black markers) background predictions with a hatched band corresponding to the uncertainty due to the finite size of simulated samples and a gray band that adds the systematic uncertainty onto the post-fit background prediction. The last bin includes all events with $ {p_{\mathrm {T}}^{\text {miss}}} > $ 500 GeV. |
png pdf |
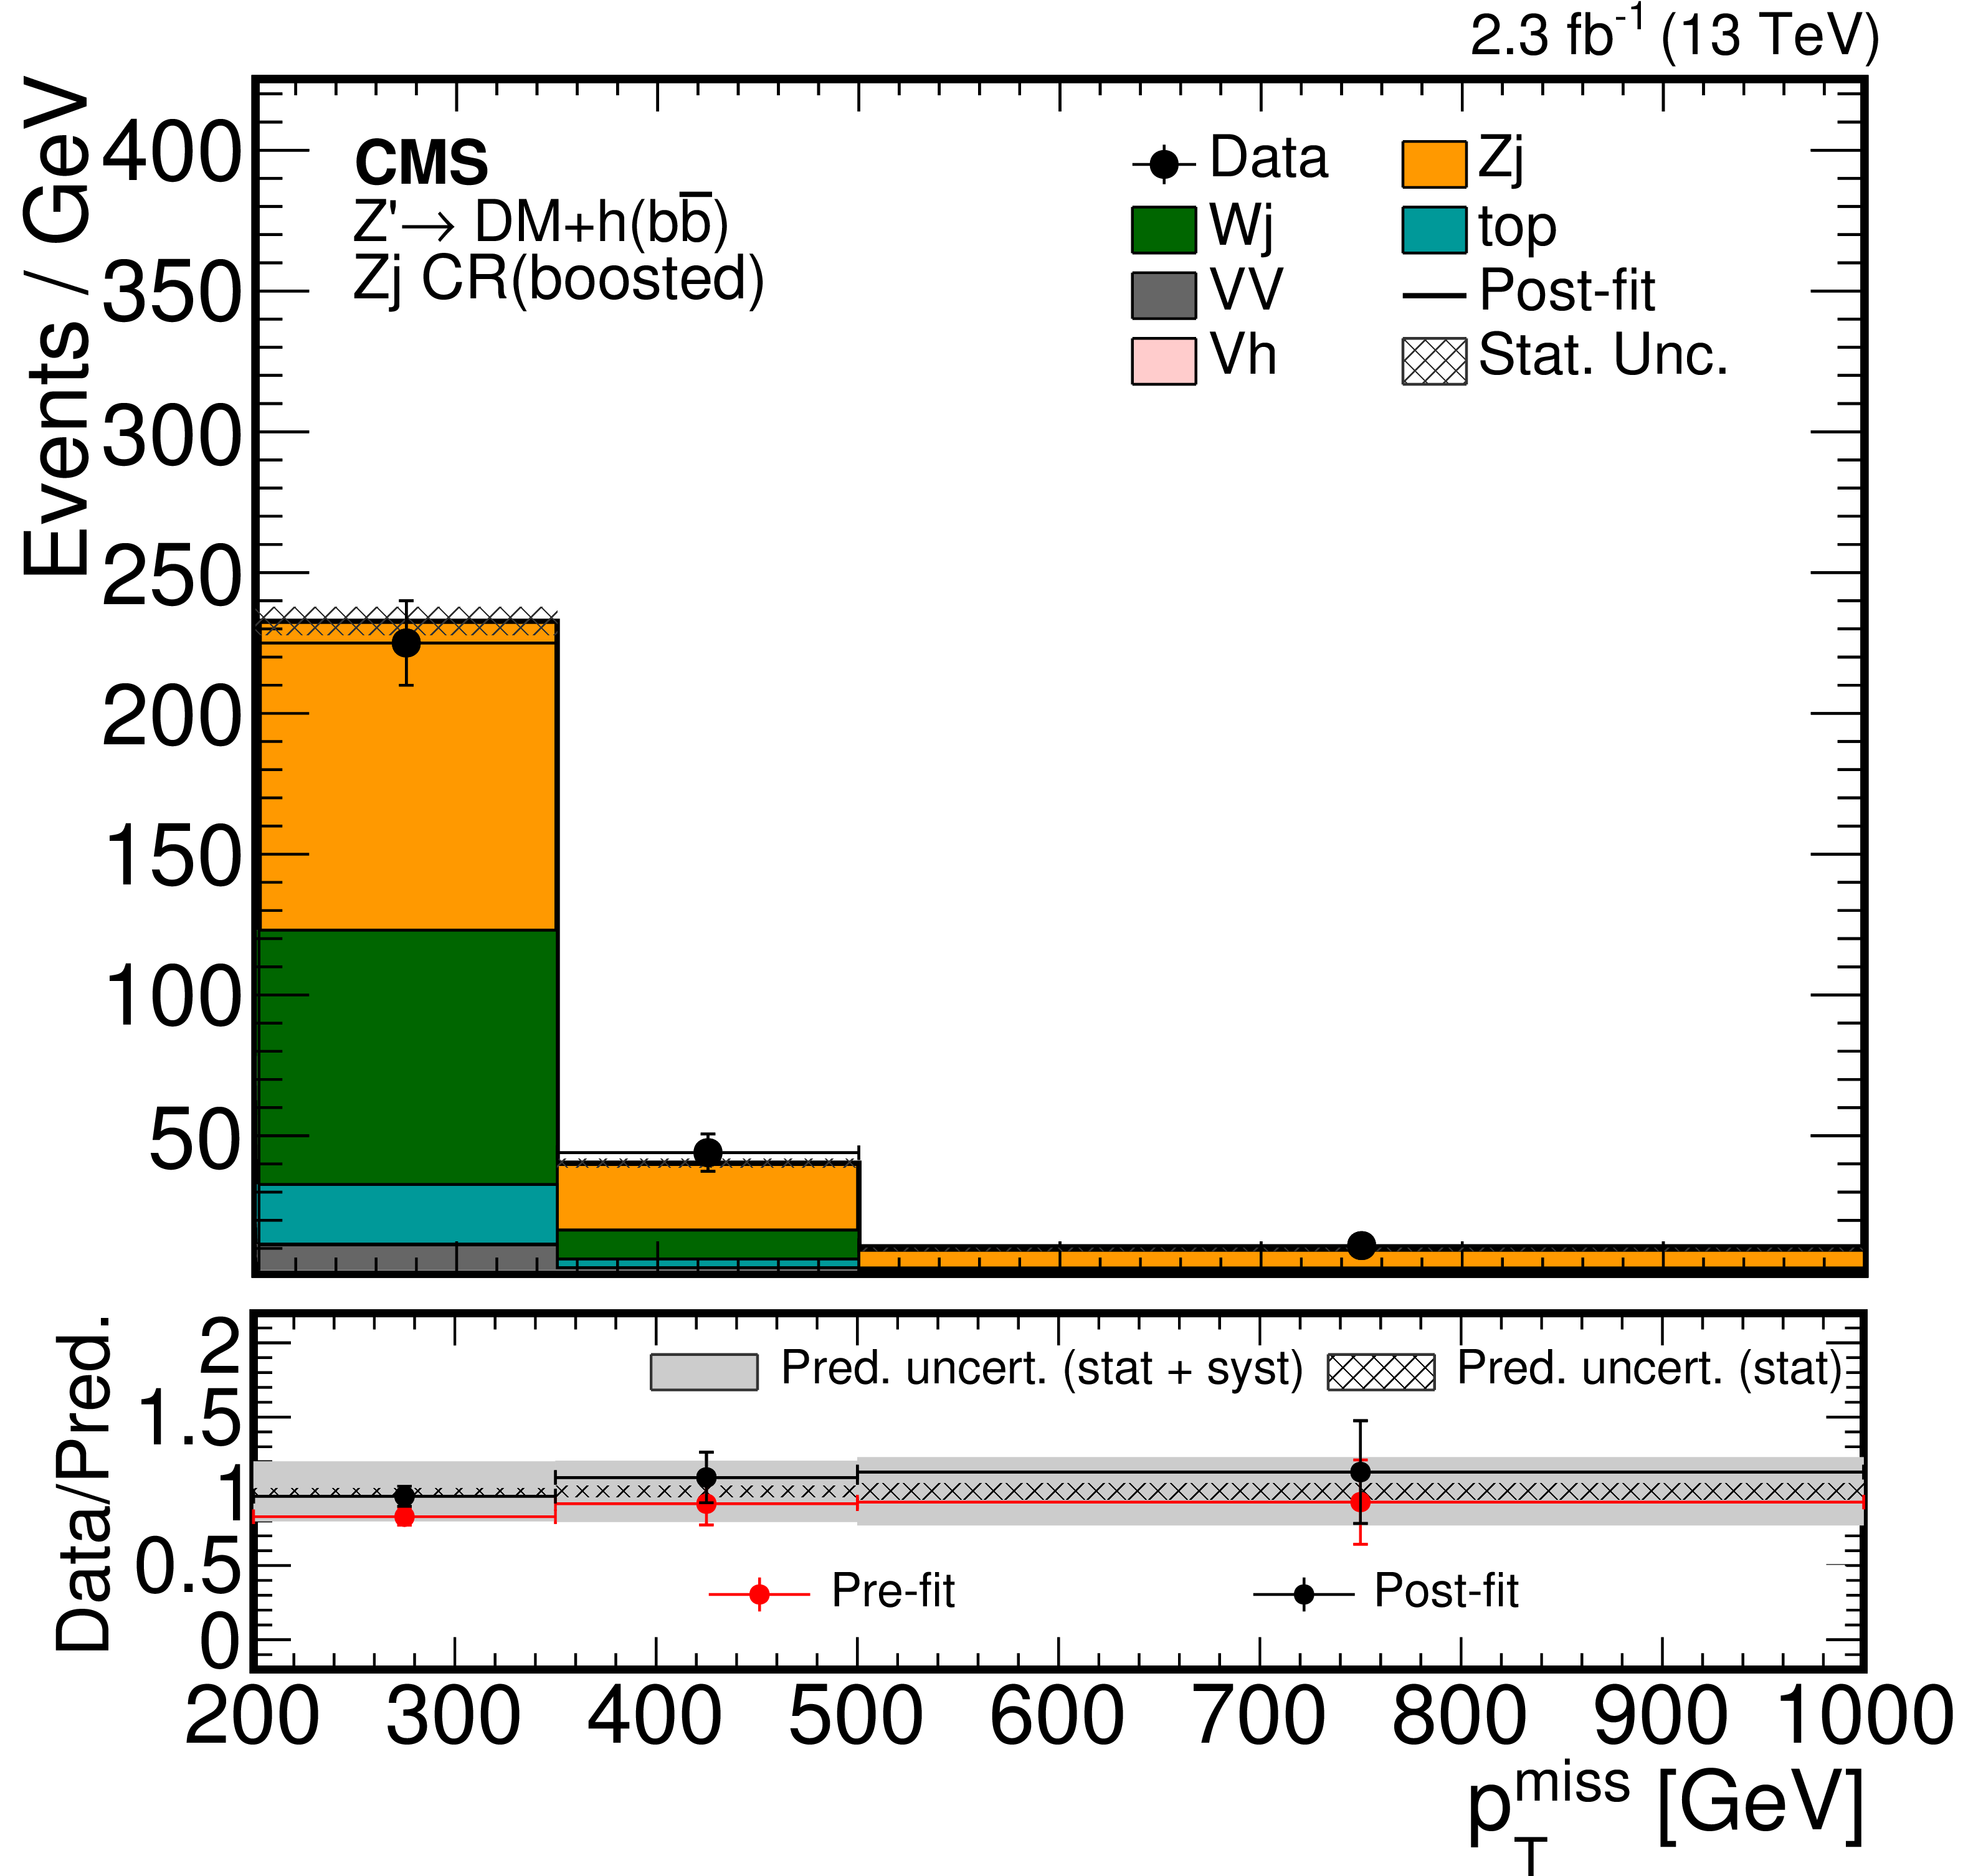
Figure 5-b:
Post-fit distribution of ${p_{\mathrm {T}}^{\text {miss}}}$ expected from SM backgrounds and observed in data for the Z($\rightarrow \nu \overline {\nu }$)+jets CRs for the boosted regime. The bottom panel shows the data-to-simulation ratios for pre-fit (red markers) and post-fit (black markers) background predictions with a hatched band corresponding to the uncertainty due to the finite size of simulated samples and a gray band that adds the systematic uncertainty onto the post-fit background prediction. The last bin includes all events with $ {p_{\mathrm {T}}^{\text {miss}}} > $ 500 GeV. |
png pdf |
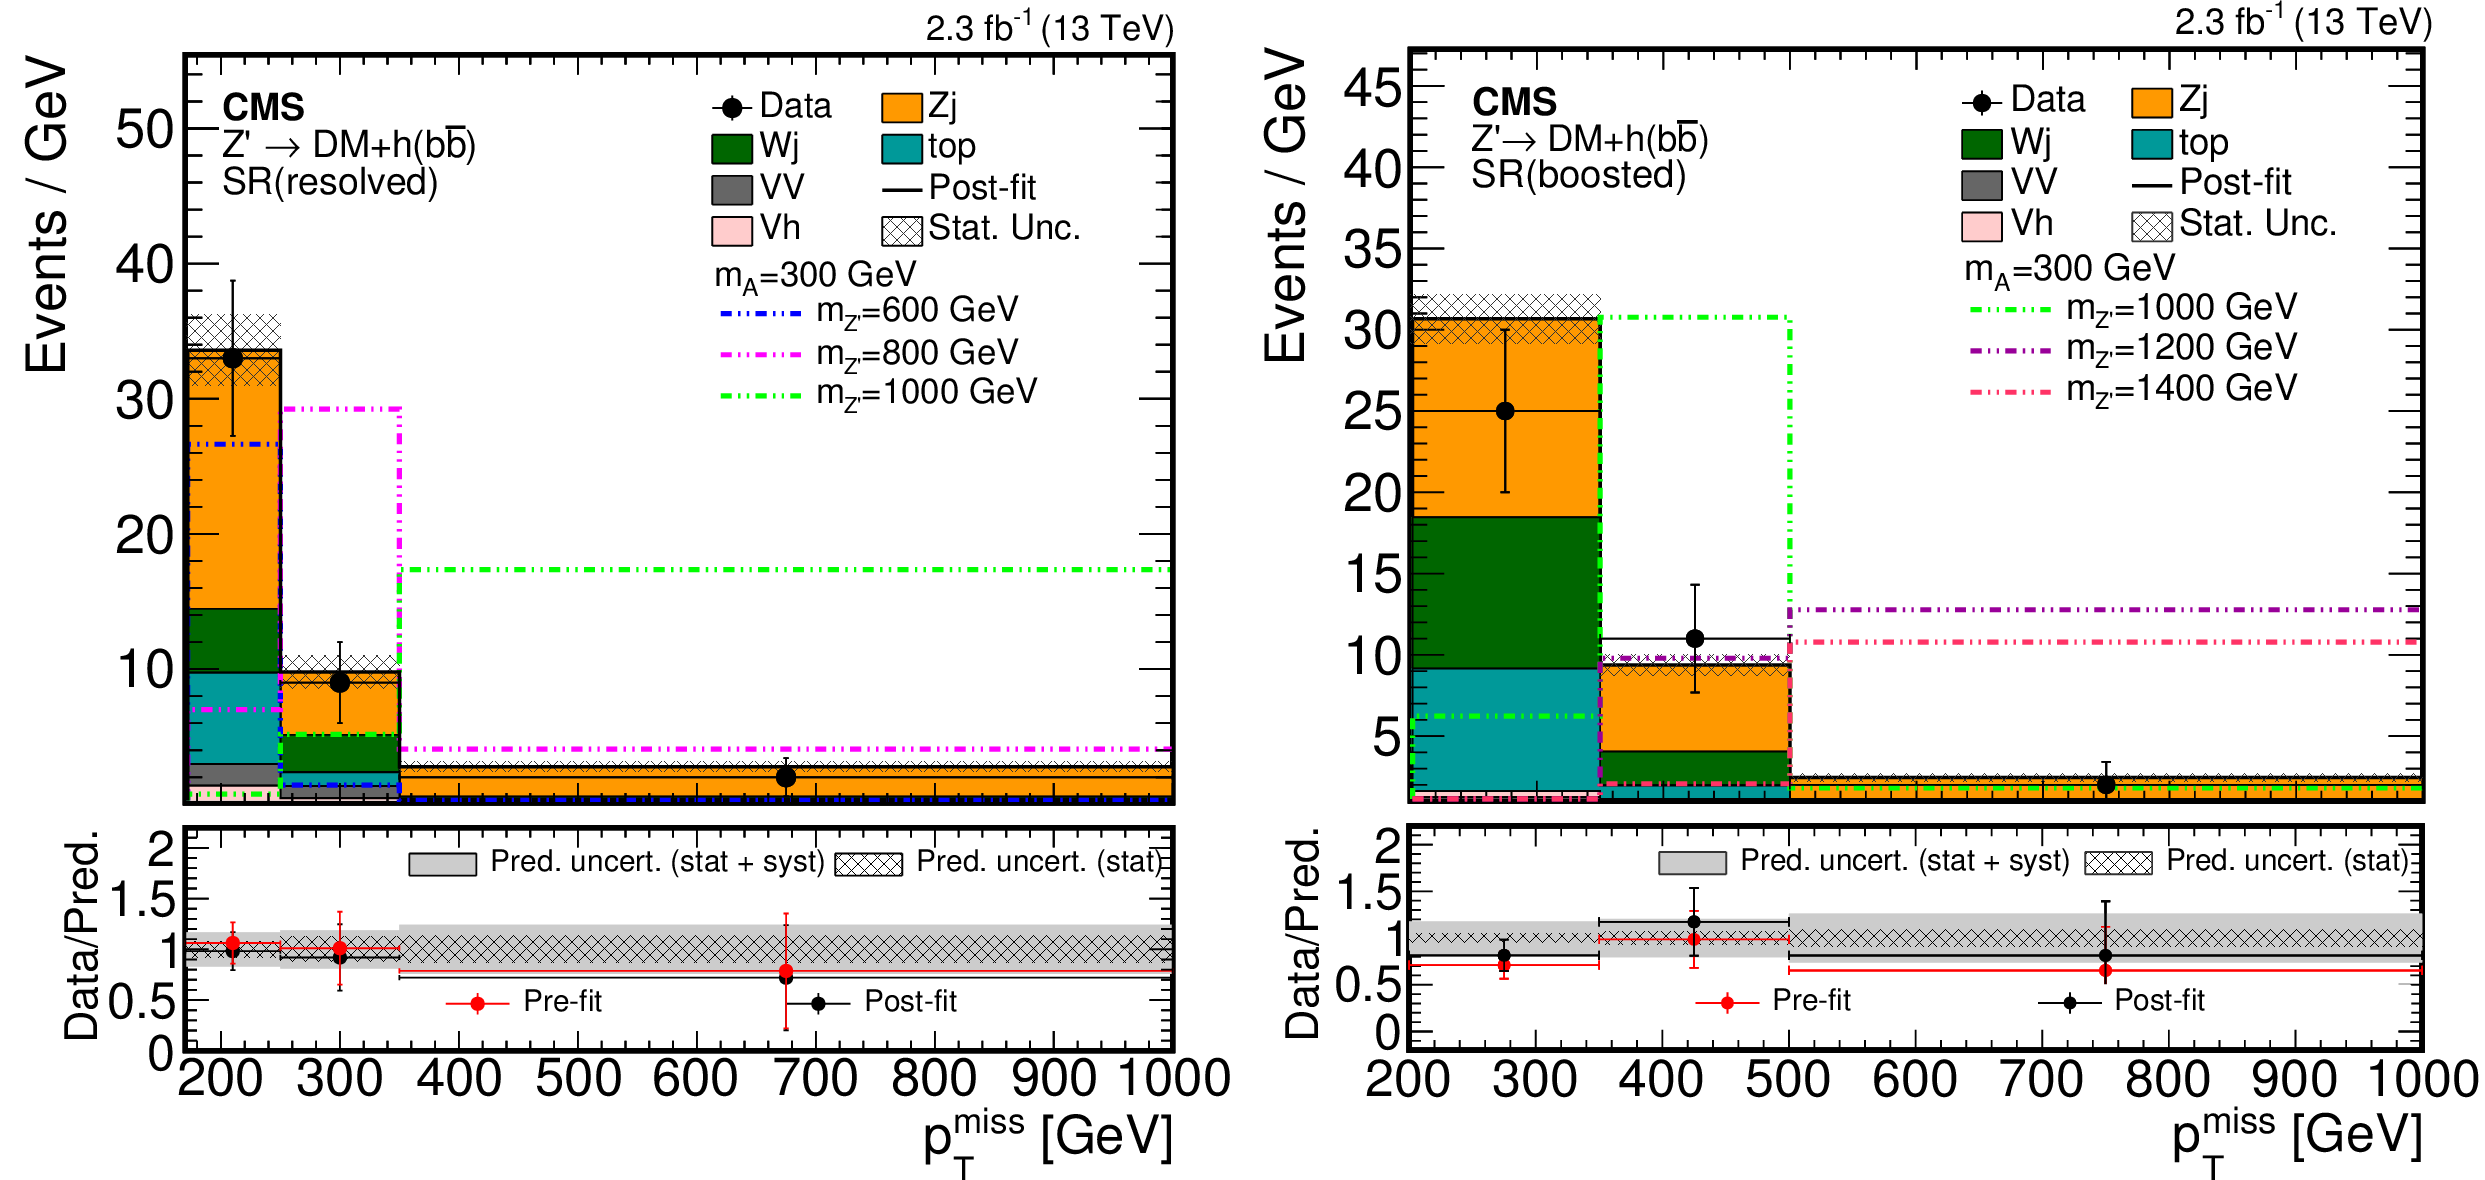
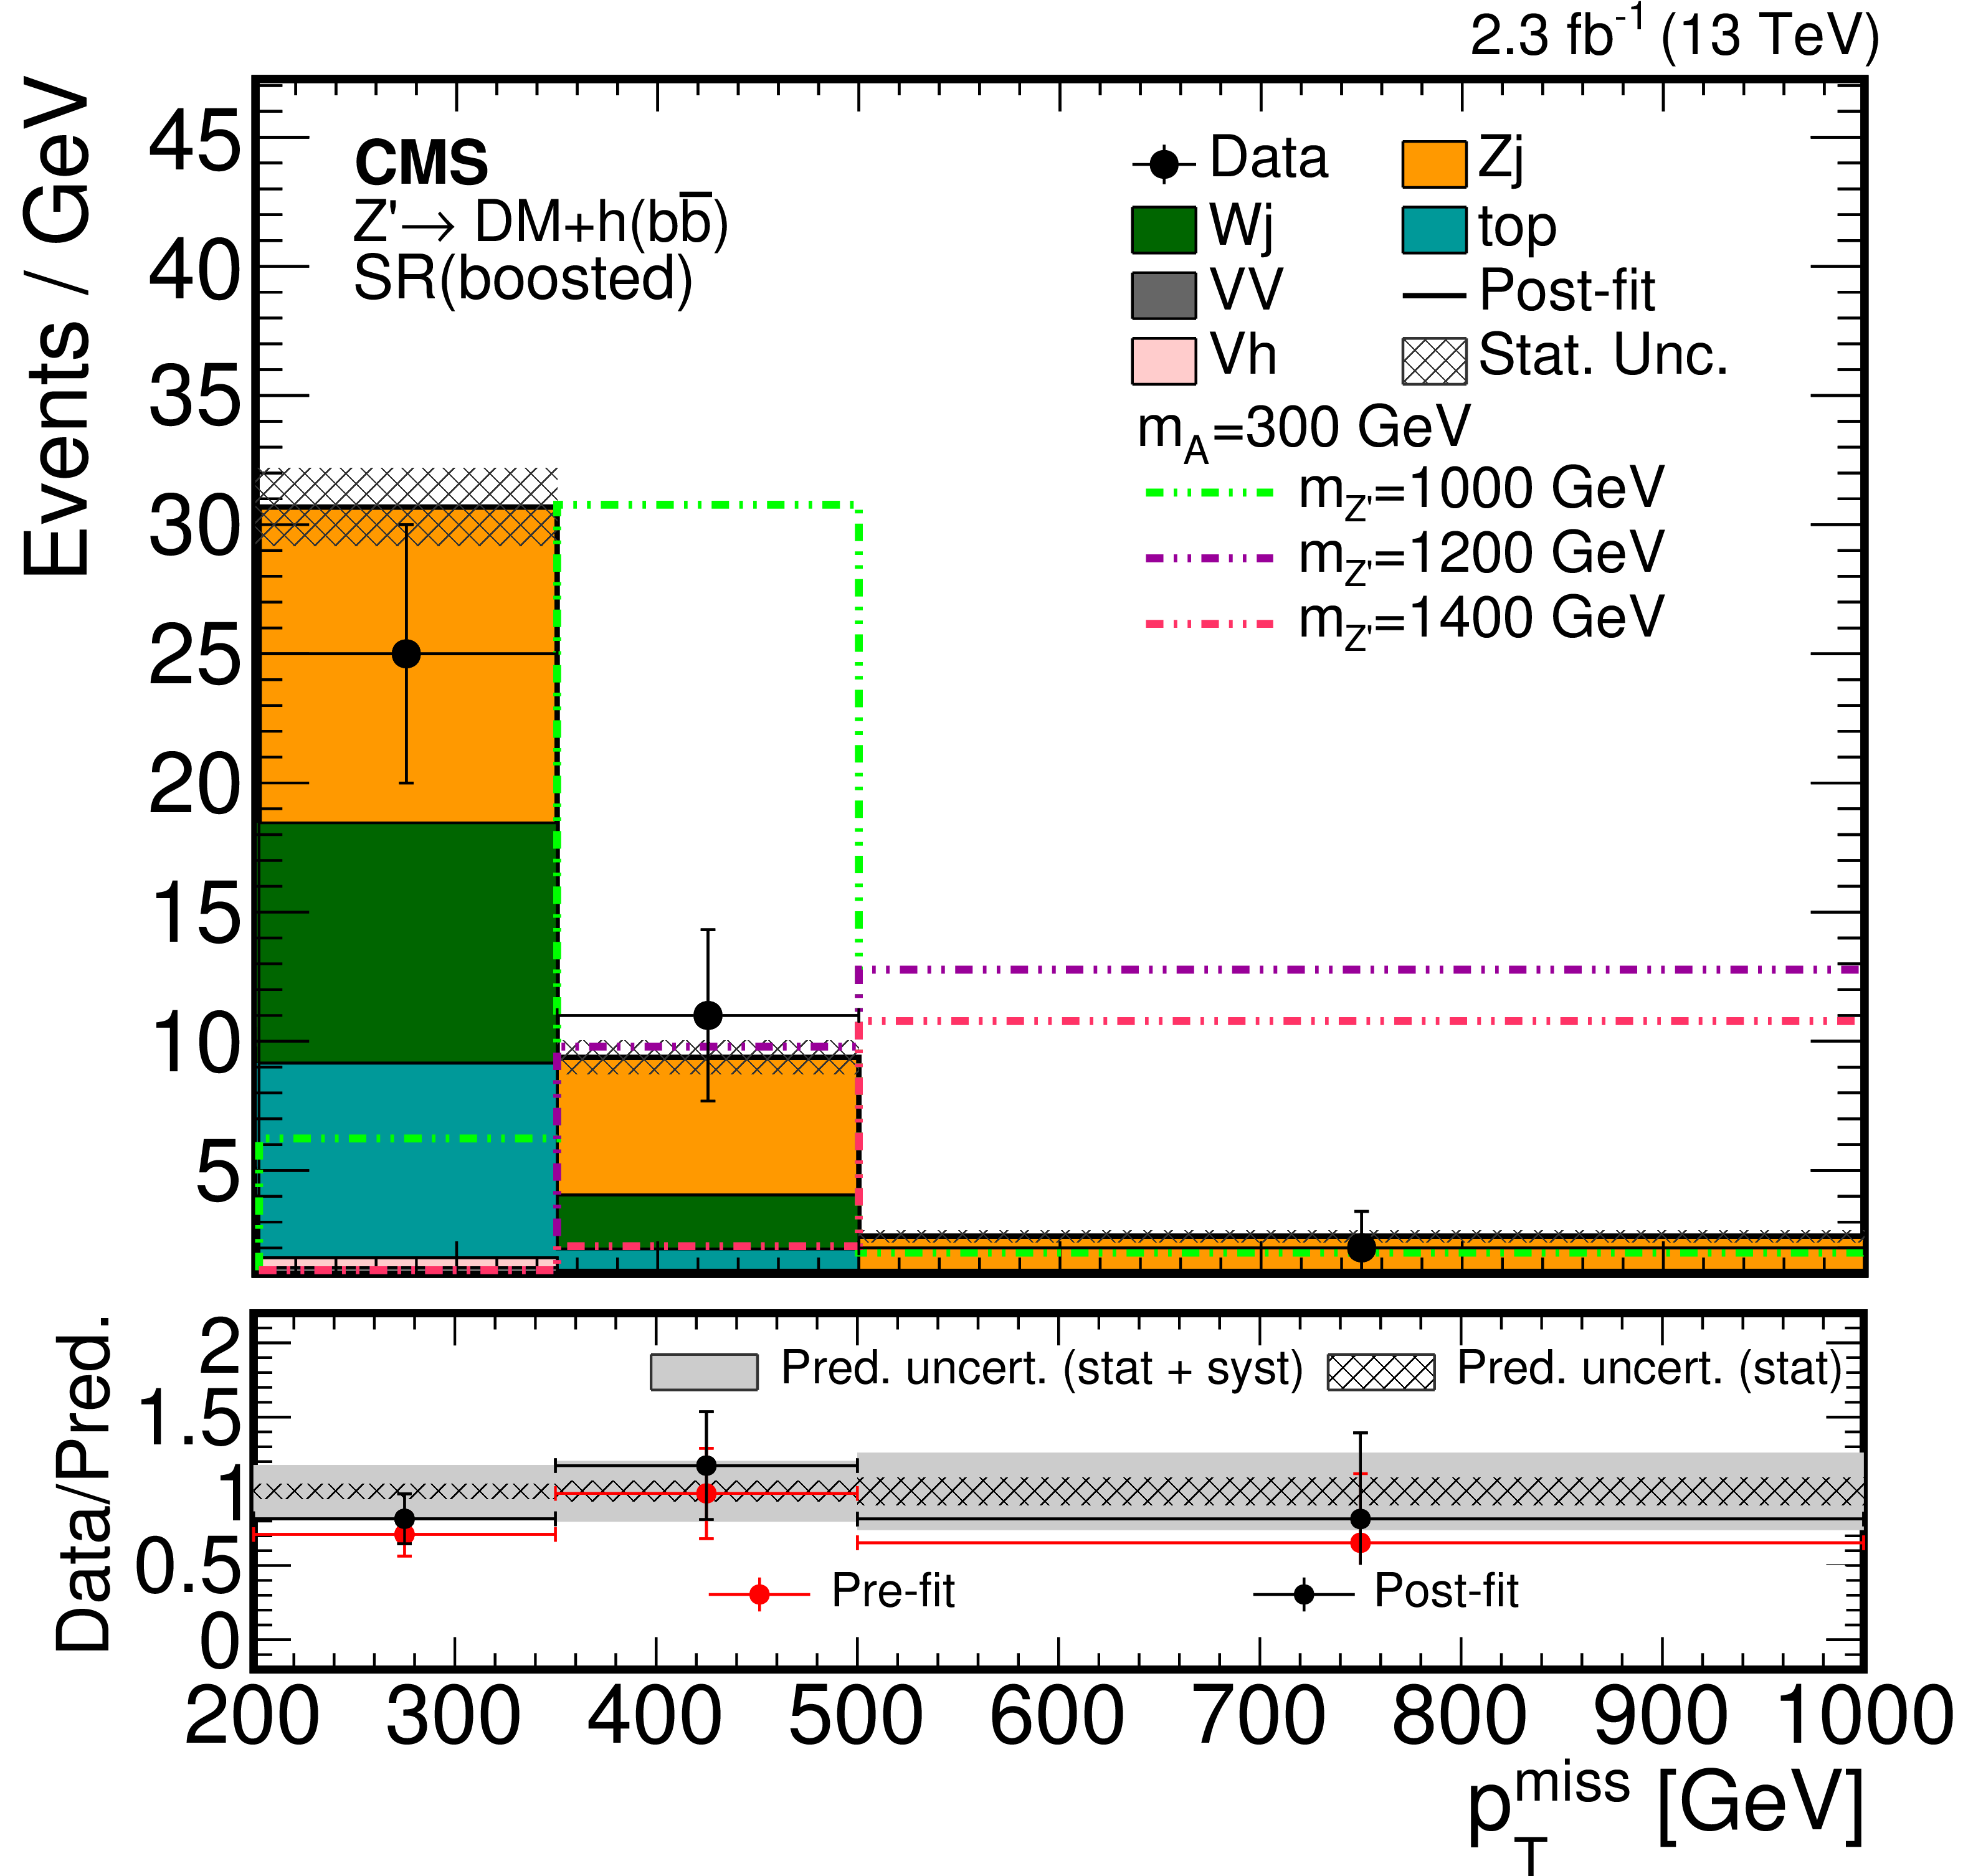
Figure 6:
Post-fit distribution of ${p_{\mathrm {T}}^{\text {miss}}}$ expected from SM backgrounds and observed in data for the resolved (left) and the boosted (right) regimes in the signal region with three different ${m_{\mathrm{Z'}}}$ signal points overlaid. The cross section for the signal model uses ${g_{\mathrm{Z'}}} = $ 0.8. The bottom panels show the data-to-simulation ratios for pre-fit (red markers) and post-fit (black markers) background predictions with a hatched band corresponding to the uncertainty due to the finite size of simulated samples and a gray band that adds the systematic uncertainty onto the post-fit background prediction. The last bin includes all events with $ {p_{\mathrm {T}}^{\text {miss}}} > $ 350 (500) GeV for the resolved (boosted) regime. |
png pdf |
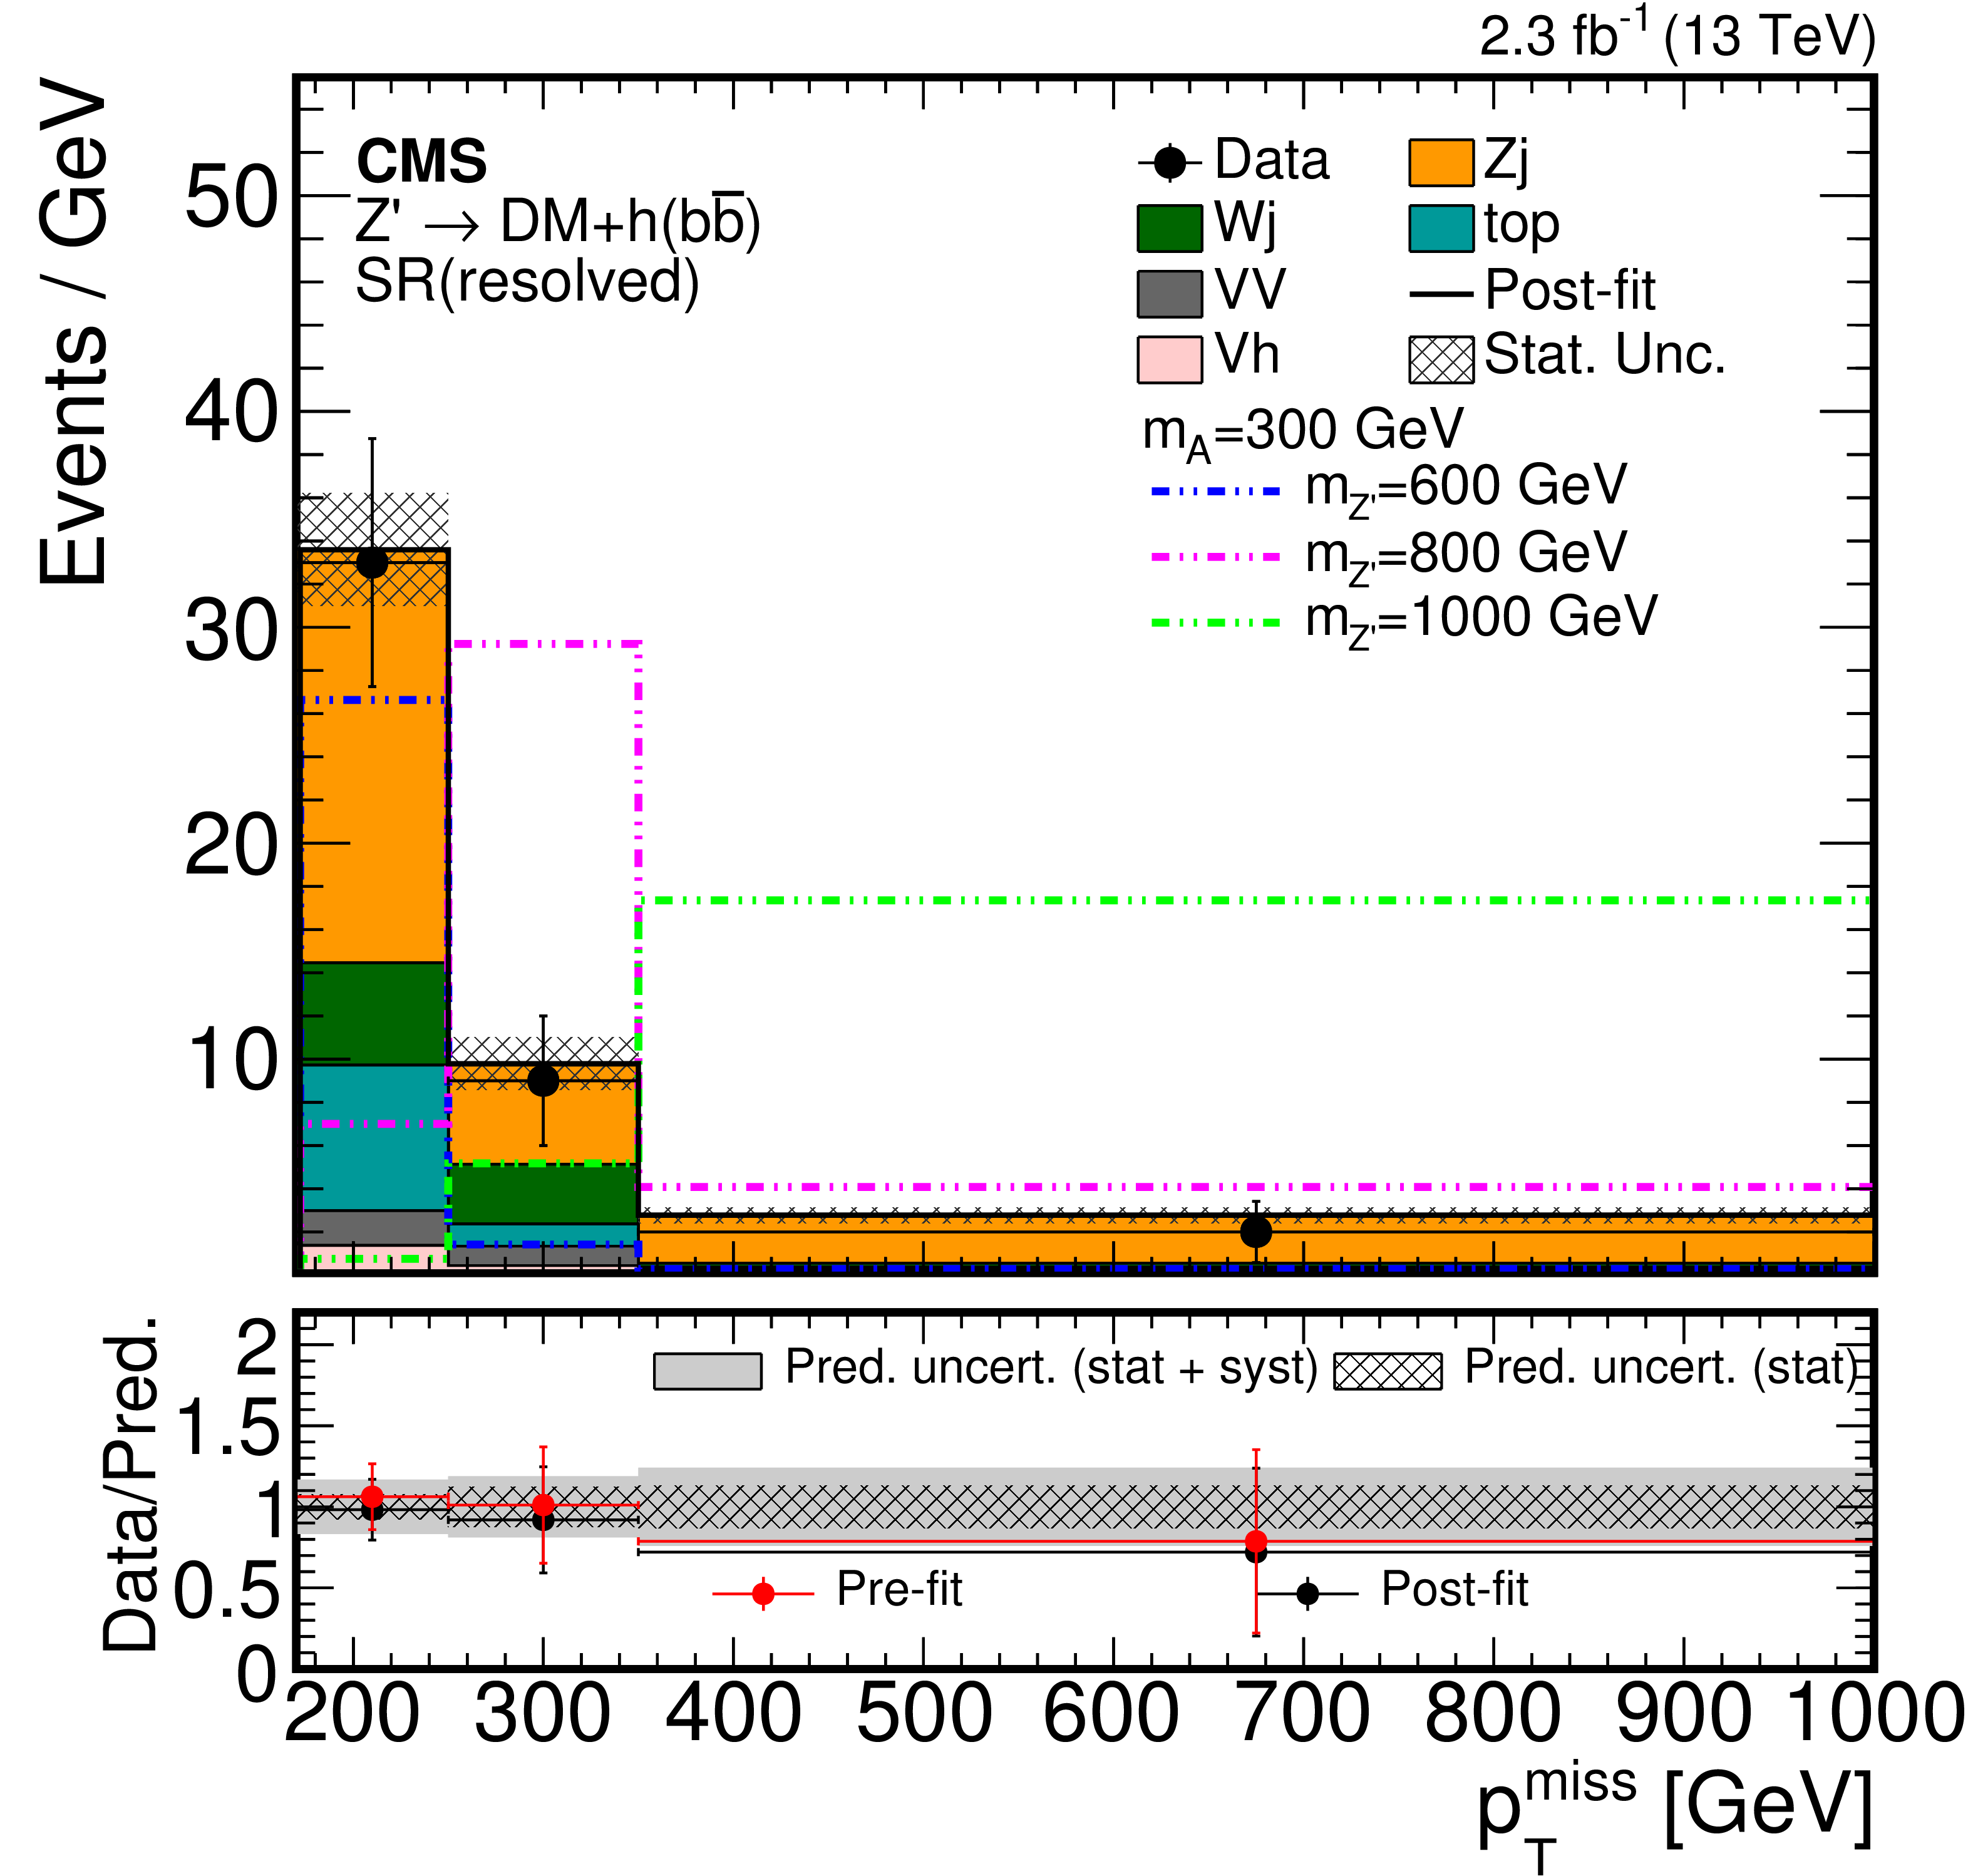
Figure 6-a:
Post-fit distribution of ${p_{\mathrm {T}}^{\text {miss}}}$ expected from SM backgrounds and observed in data for the resolved regime in the signal region with three different ${m_{\mathrm{Z'}}}$ signal points overlaid. The cross section for the signal model uses ${g_{\mathrm{Z'}}} = $ 0.8. The bottom panel shows the data-to-simulation ratios for pre-fit (red markers) and post-fit (black markers) background predictions with a hatched band corresponding to the uncertainty due to the finite size of simulated samples and a gray band that adds the systematic uncertainty onto the post-fit background prediction. The last bin includes all events with $ {p_{\mathrm {T}}^{\text {miss}}} > $ 350 (500) GeV for the resolved (boosted) regime. |
png pdf |
Figure 6-b:
Post-fit distribution of ${p_{\mathrm {T}}^{\text {miss}}}$ expected from SM backgrounds and observed in data for the boosted regime in the signal region with three different ${m_{\mathrm{Z'}}}$ signal points overlaid. The cross section for the signal model uses ${g_{\mathrm{Z'}}} = $ 0.8. The bottom panel shows the data-to-simulation ratios for pre-fit (red markers) and post-fit (black markers) background predictions with a hatched band corresponding to the uncertainty due to the finite size of simulated samples and a gray band that adds the systematic uncertainty onto the post-fit background prediction. The last bin includes all events with $ {p_{\mathrm {T}}^{\text {miss}}} > $ 350 (500) GeV for the resolved (boosted) regime. |

png pdf |
Figure 7:
Distribution of $m_{\gamma \gamma }$ (left) in events passing all selection criteria except the $m_{\gamma \gamma }$ and ${p_{\mathrm {T}}^{\text {miss}}}$ requirement. Distribution of ${p_{\mathrm {T}}^{\text {miss}}}$ (right) for events passing all selection criteria including 120 GeV $ < m_{\gamma \gamma } < $ 130 GeV except ${p_{\mathrm {T}}^{\text {miss}}}$ requirement. For both plots, the product of signal cross section and branching fraction is set to 1 fb and the total simulated background is normalized to the total number of events in data. |

png pdf |
Figure 7-a:
Distribution of $m_{\gamma \gamma }$ in events passing all selection criteria except the $m_{\gamma \gamma }$ and ${p_{\mathrm {T}}^{\text {miss}}}$ requirement. The product of signal cross section and branching fraction is set to 1 fb and the total simulated background is normalized to the total number of events in data. |

png pdf |
Figure 7-b:
Distribution of ${p_{\mathrm {T}}^{\text {miss}}}$ for events passing all selection criteria including 120 GeV $ < m_{\gamma \gamma } < $ 130 GeV except ${p_{\mathrm {T}}^{\text {miss}}}$ requirement. The product of signal cross section and branching fraction is set to 1 fb and the total simulated background is normalized to the total number of events in data. |

png pdf |
Figure 8:
Fit to the diphoton invariant mass distribution in the low-$ {p_{\mathrm {T}}^{\text {miss}}}$ CR in data used to evaluate $\alpha $. The function used is a power law with one free parameter. The uncertainties in the background shapes associated with the statistical uncertainties of the fit are shown by the one and two standard deviation bands. |

png pdf |
Figure 9:
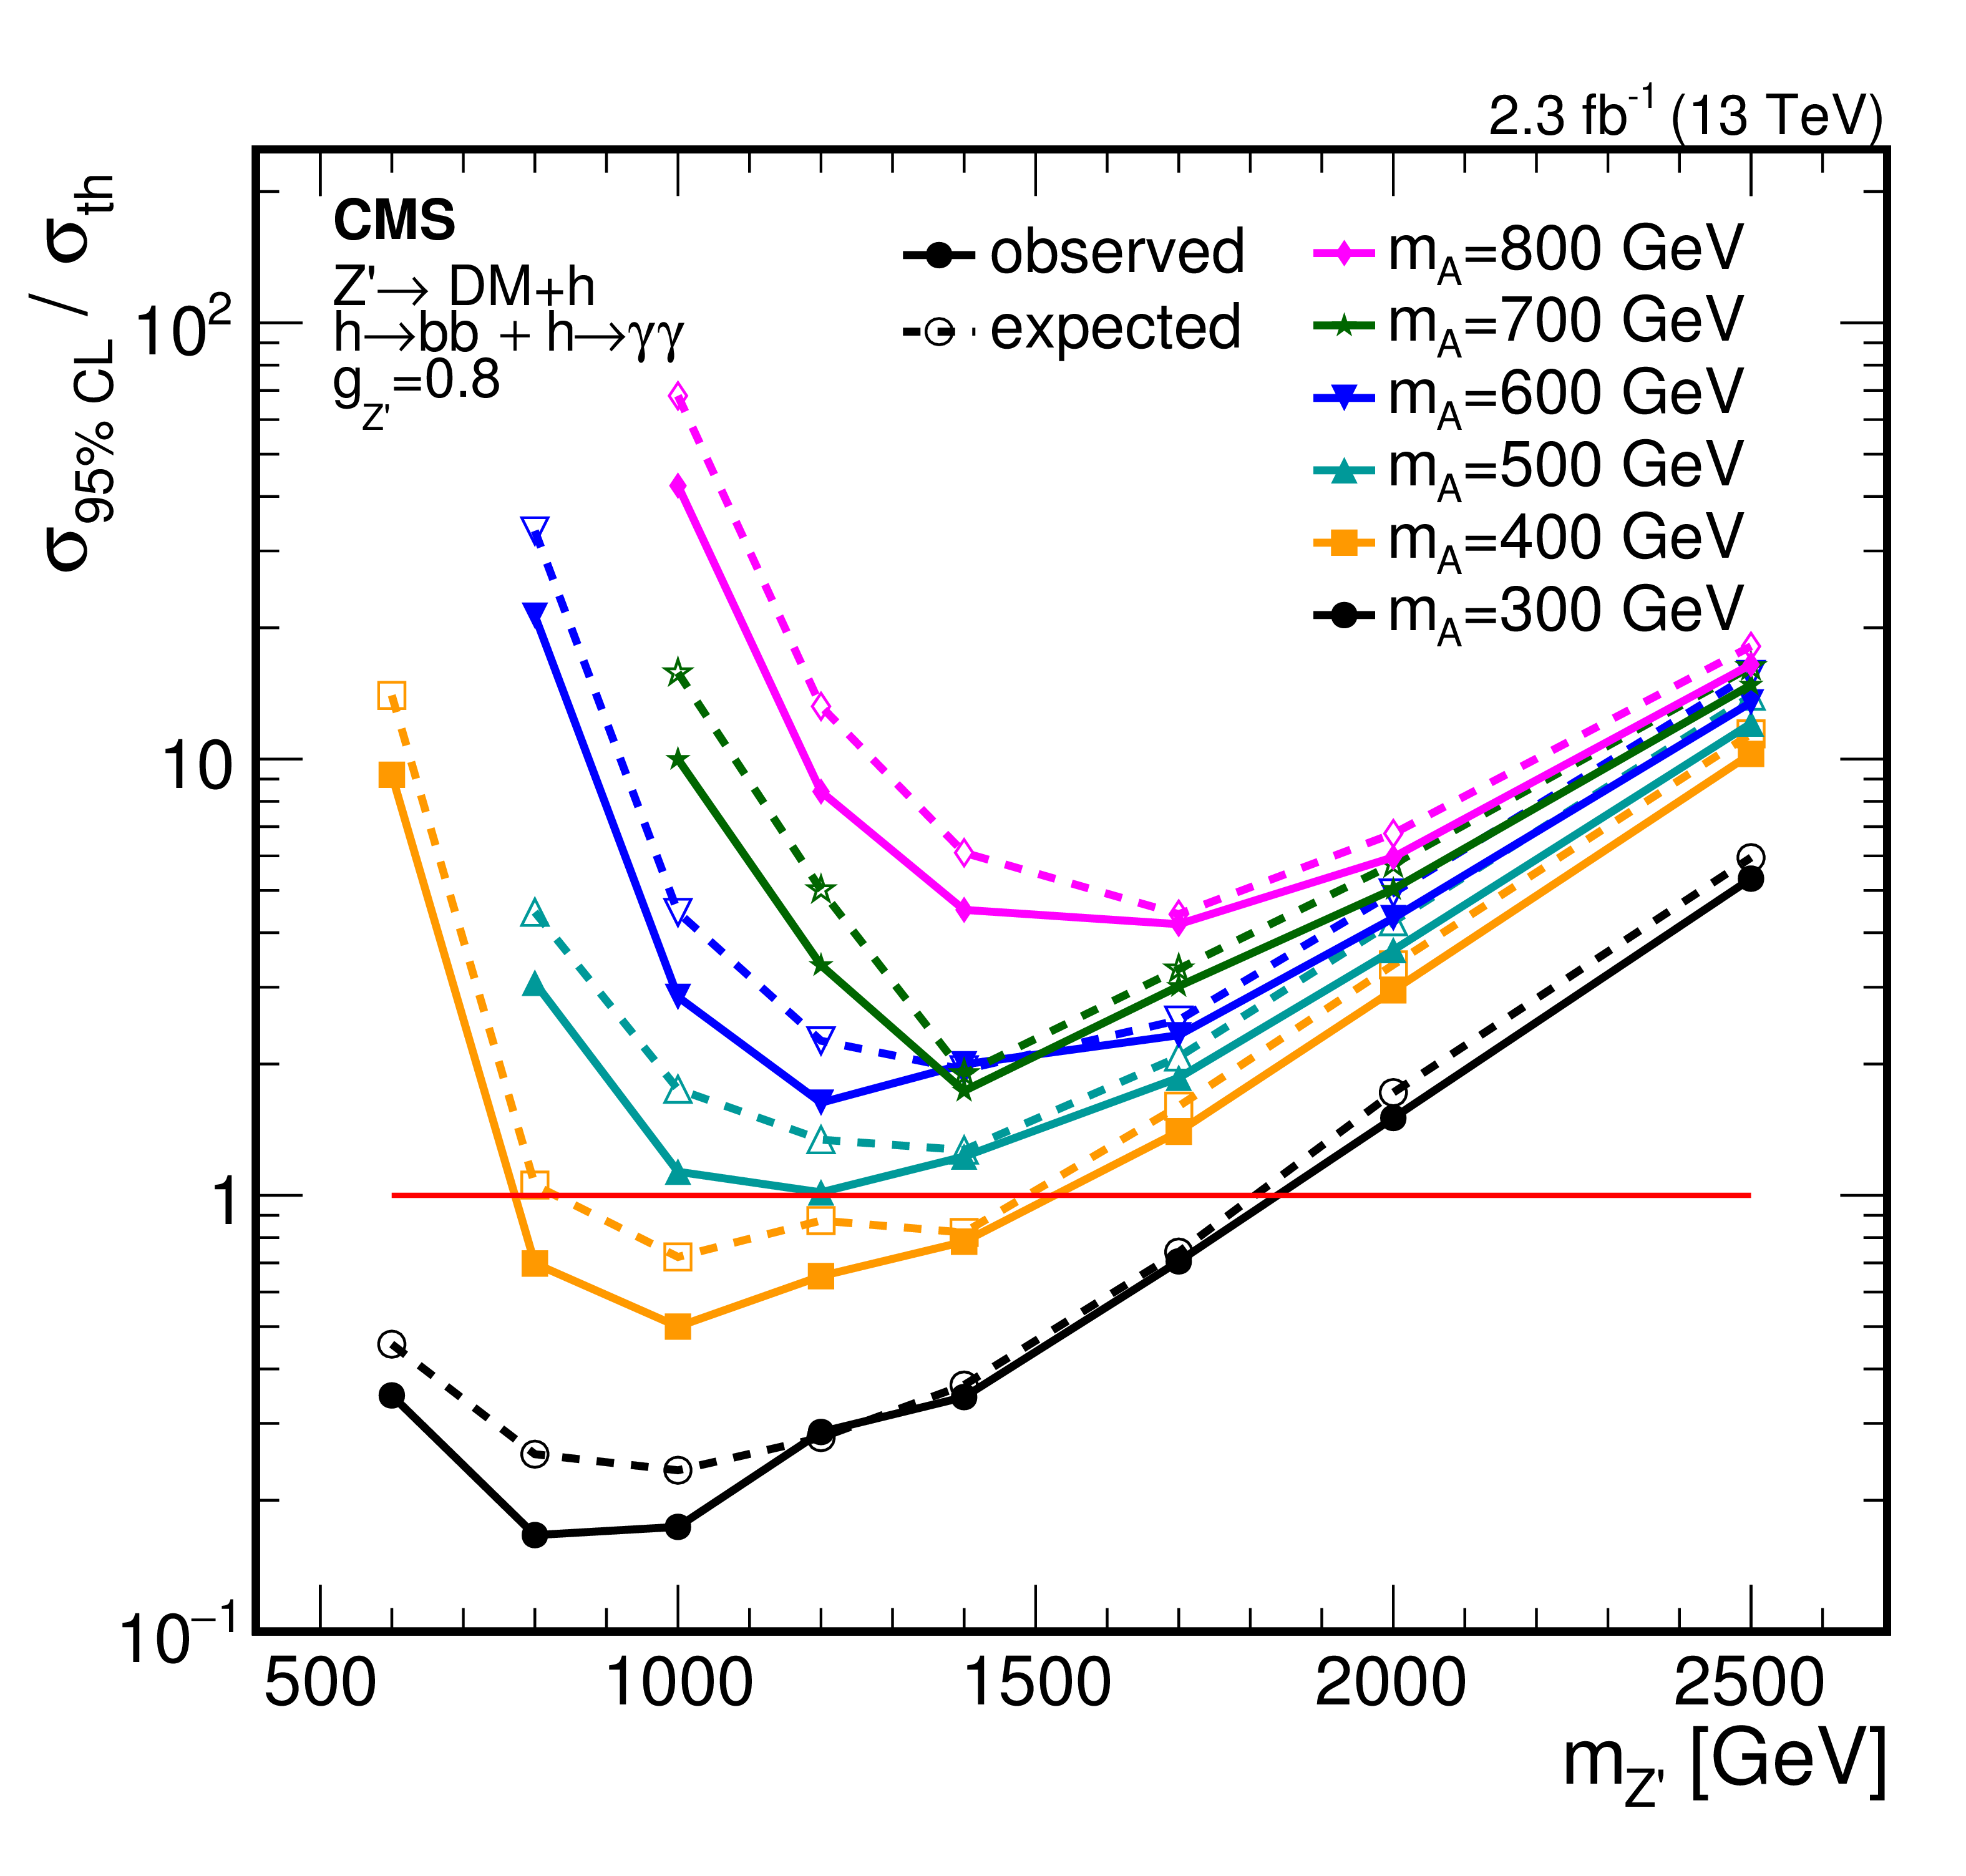
The expected and observed 95% CL limits on dark matter production cross sections for $ {\mathrm{h} \rightarrow \mathrm{ b \bar{b} } } $ and $ {\mathrm{h} \rightarrow \gamma \gamma } $ for ${m_{ {\mathrm {A}} }} = $ 300 GeV (left). The exclusion region is shown for two ${g_{\mathrm{Z'}}}$ values. The dark green and light yellow bands show the 68% and 95% uncertainties on the expected limit. The expected and observed 95% CL limits on the signal strength are shown for ${m_{ {\mathrm {A}} }} = $ 300-800 GeV (right). The theoretical cross section ($\sigma _{\mathrm {th}}$) used for the right hand plot is calculated using ${g_{\mathrm{Z'}}} = $ 0.8. |

png pdf |
Figure 9-a:
The expected and observed 95% CL limits on dark matter production cross sections for $ {\mathrm{h} \rightarrow \mathrm{ b \bar{b} } } $ and $ {\mathrm{h} \rightarrow \gamma \gamma } $ for ${m_{ {\mathrm {A}} }} = $ 300 GeV. The exclusion region is shown for two ${g_{\mathrm{Z'}}}$ values. The dark green and light yellow bands show the 68% and 95% uncertainties on the expected limit. |
png pdf |
Figure 9-b:
The expected and observed 95% CL limits on the signal strength are shown for ${m_{ {\mathrm {A}} }} = $ 300-800 GeV. The theoretical cross section ($\sigma _{\mathrm {th}}$) is calculated using ${g_{\mathrm{Z'}}} = $ 0.8. |
png pdf |
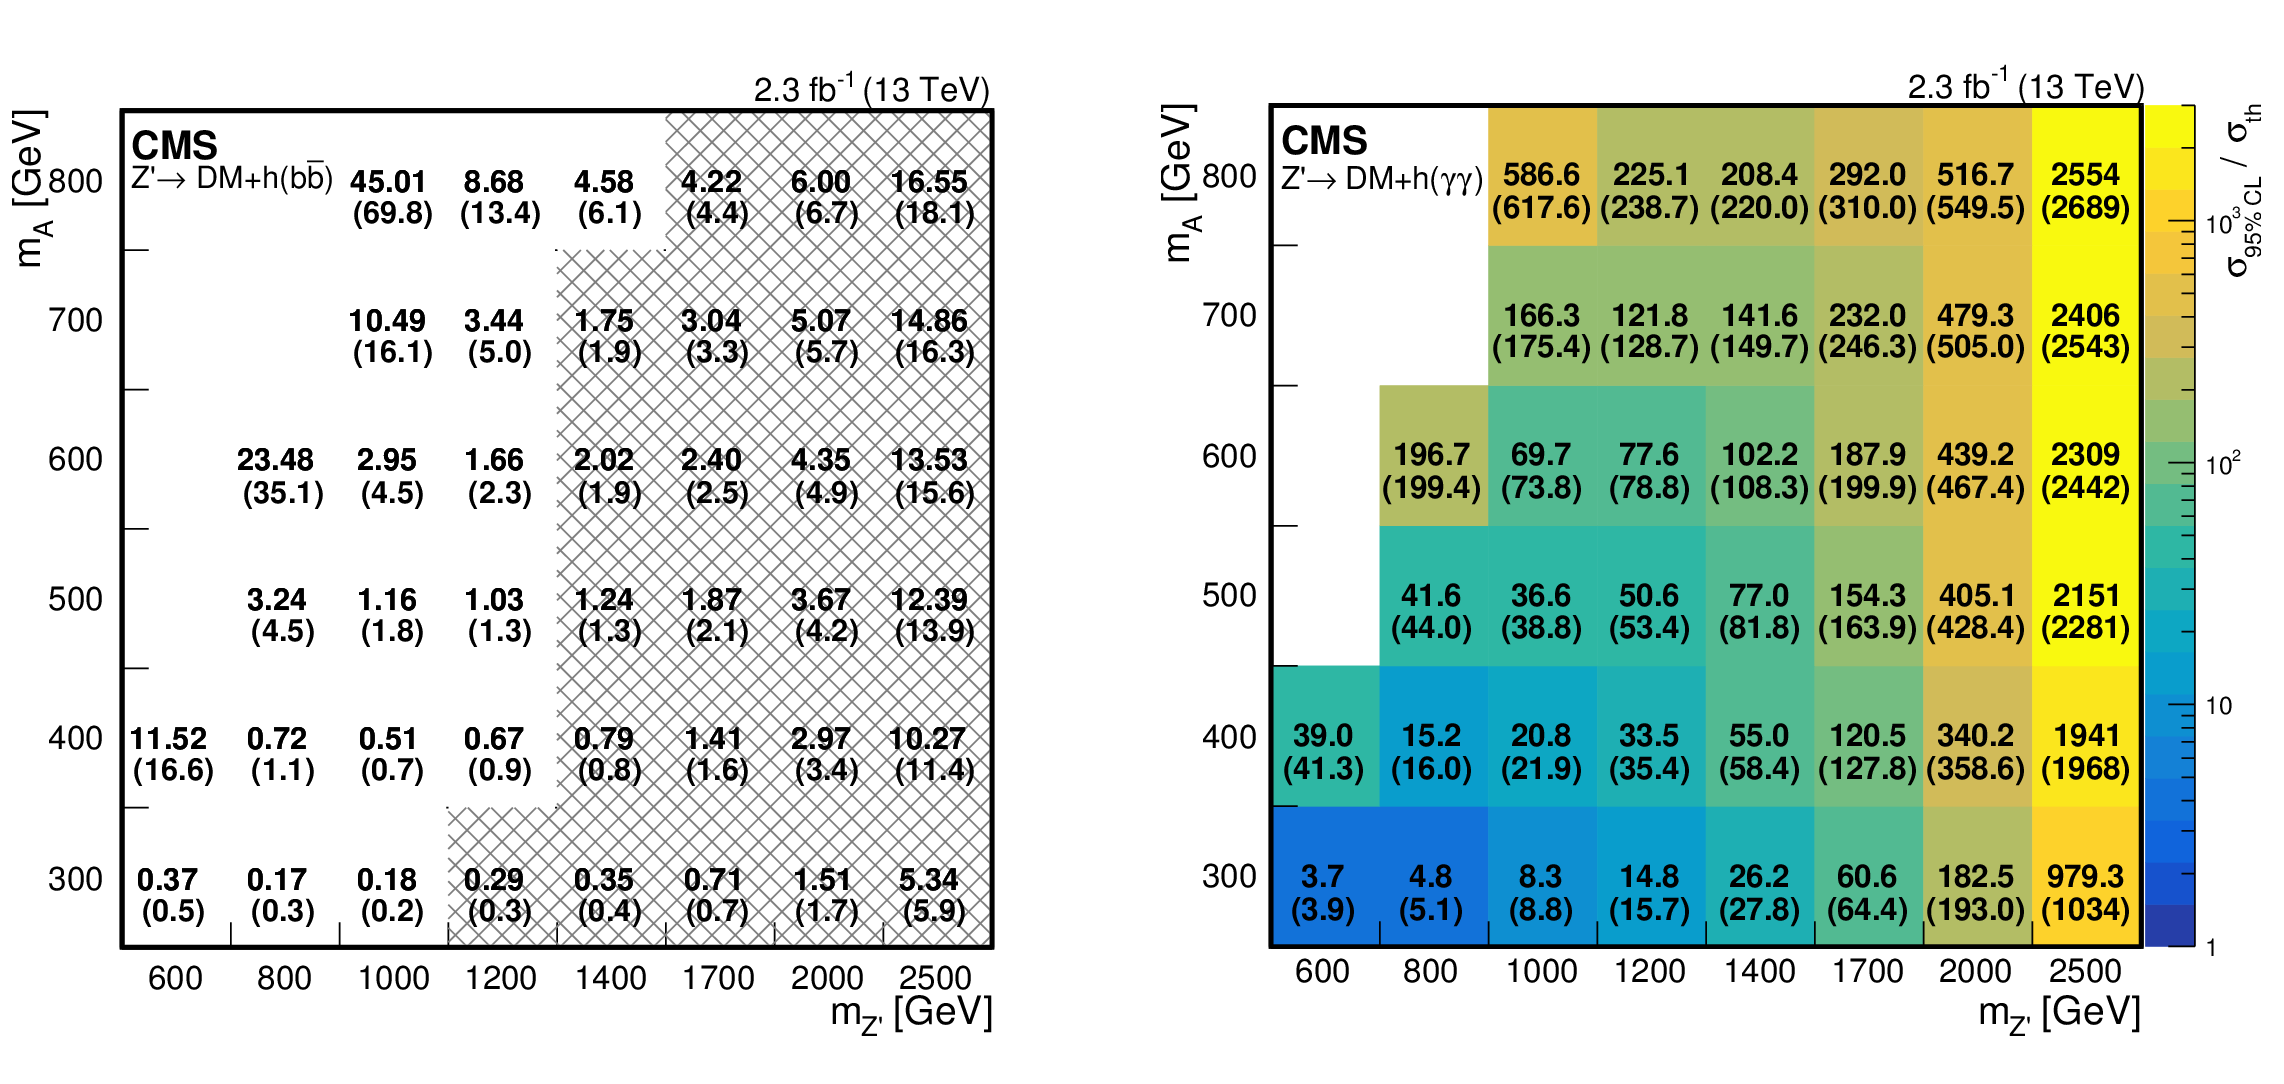
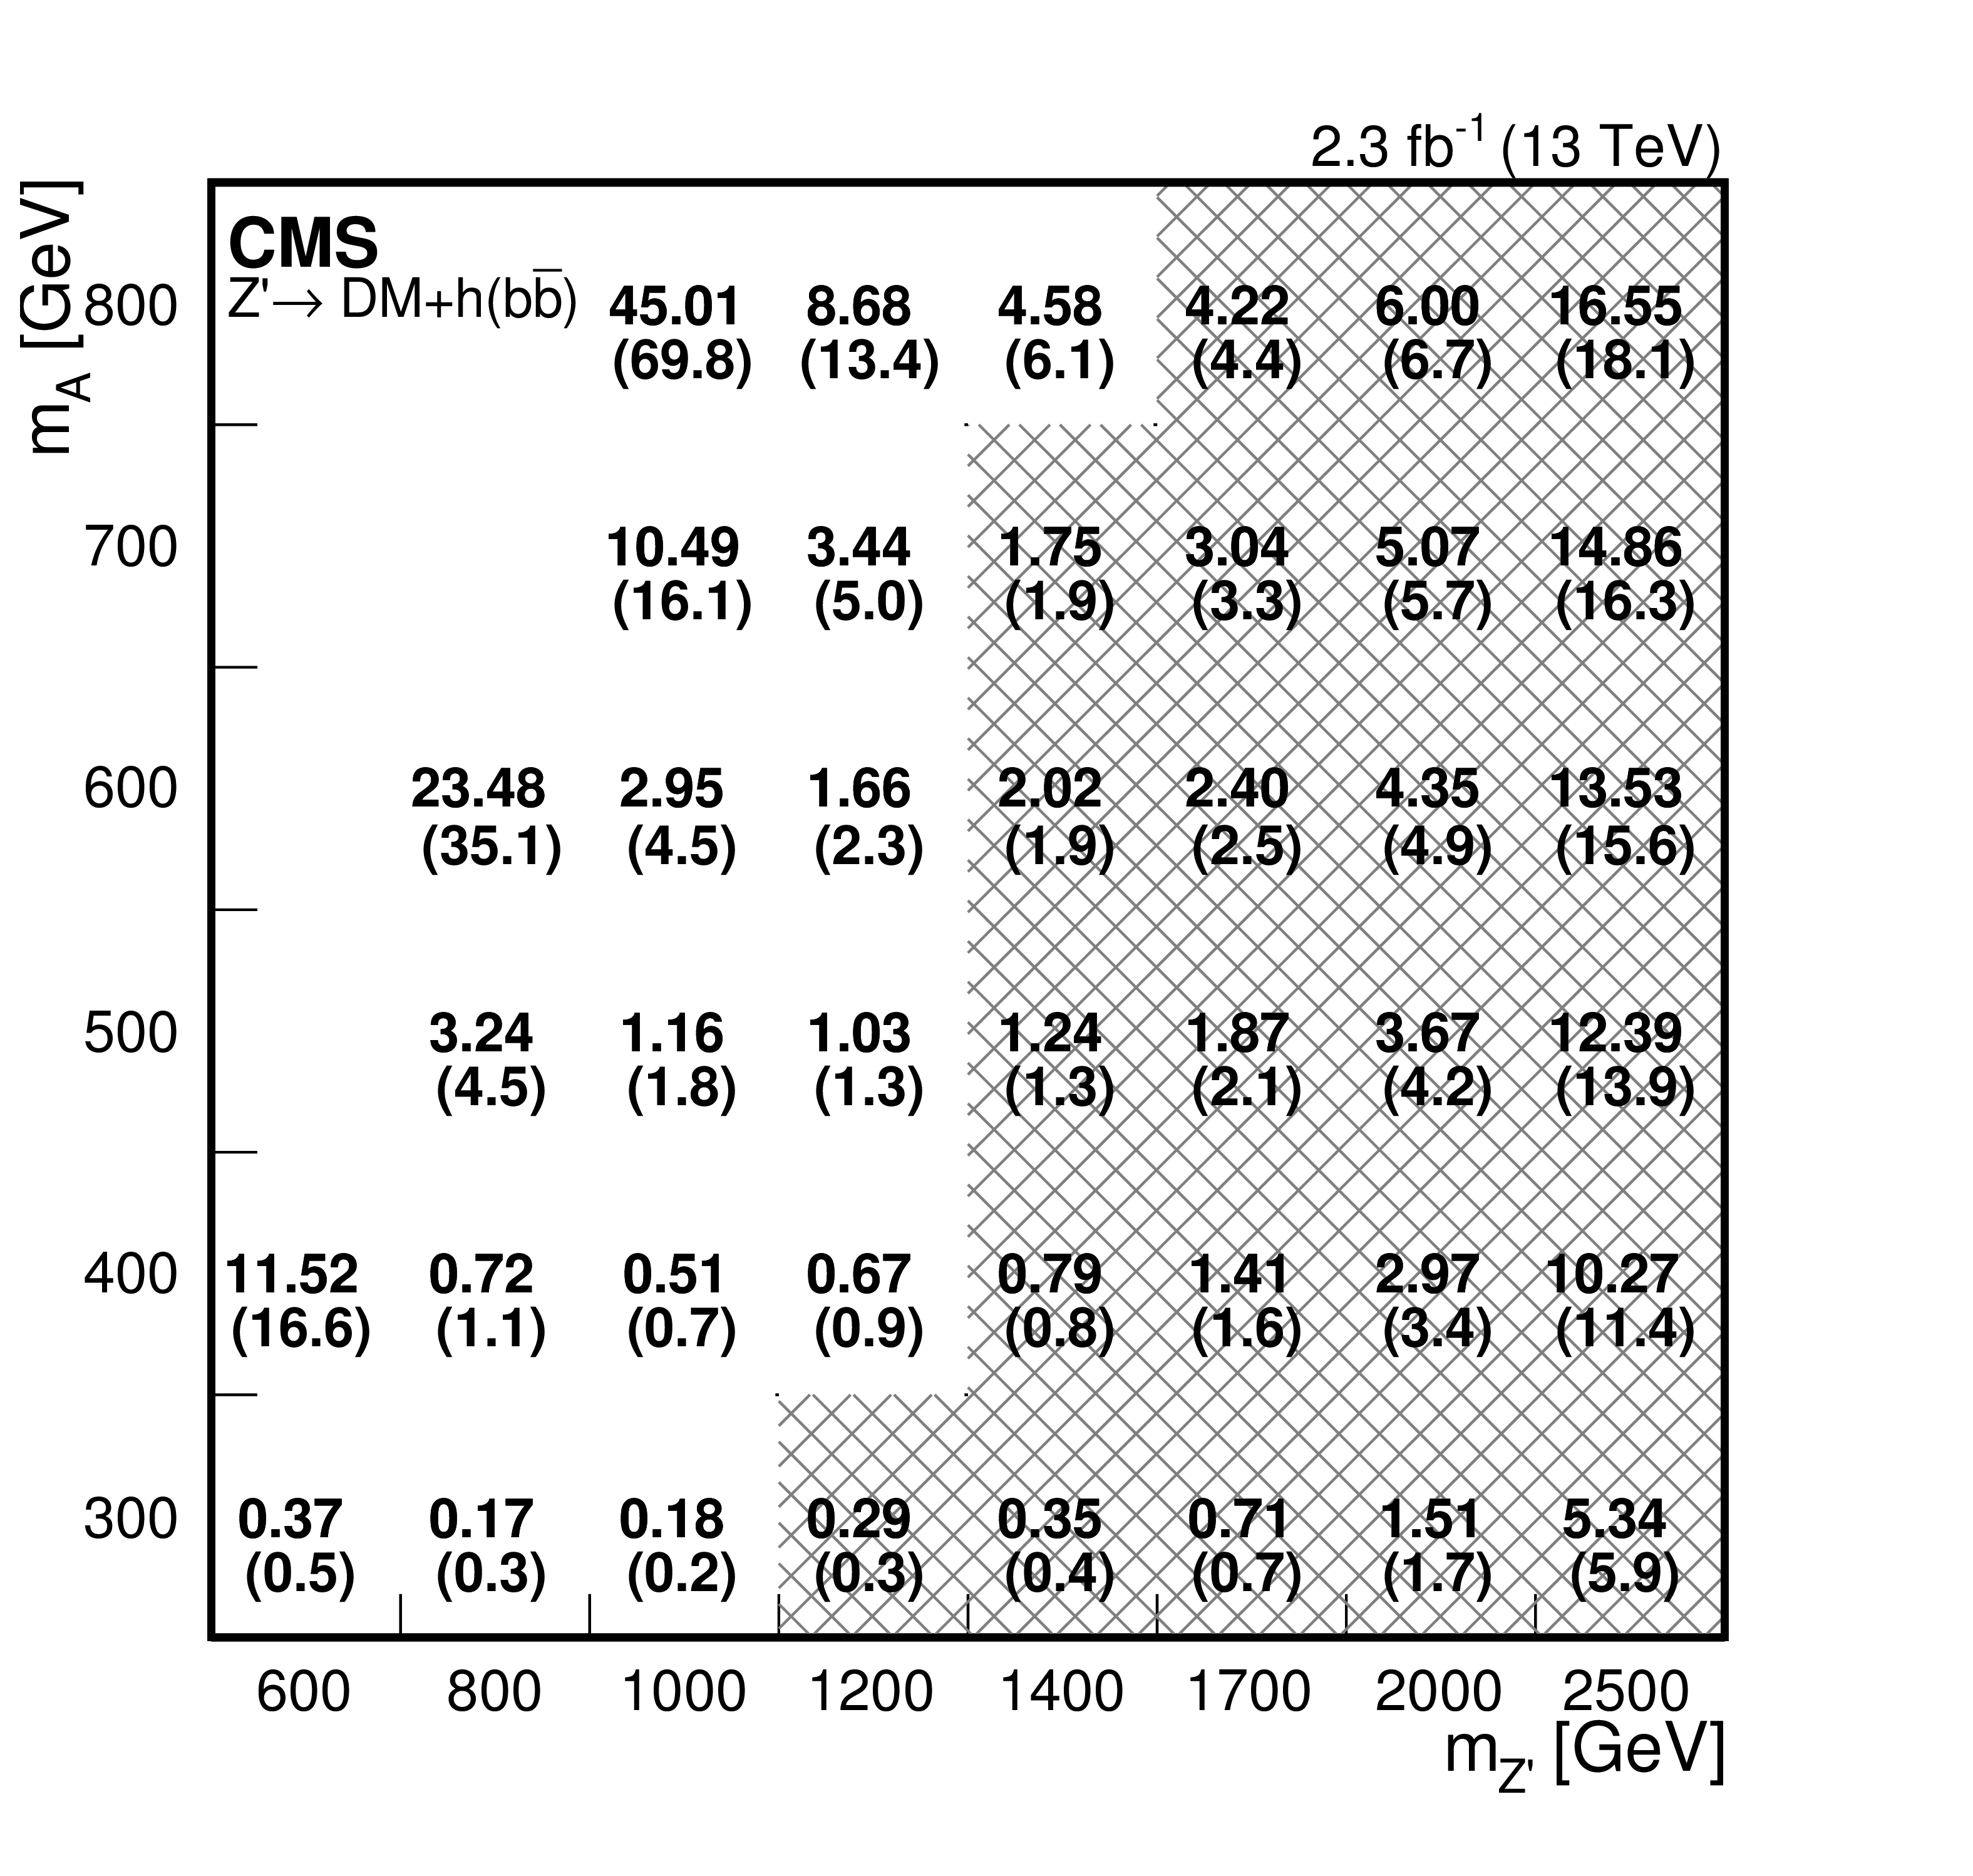
Figure 10:
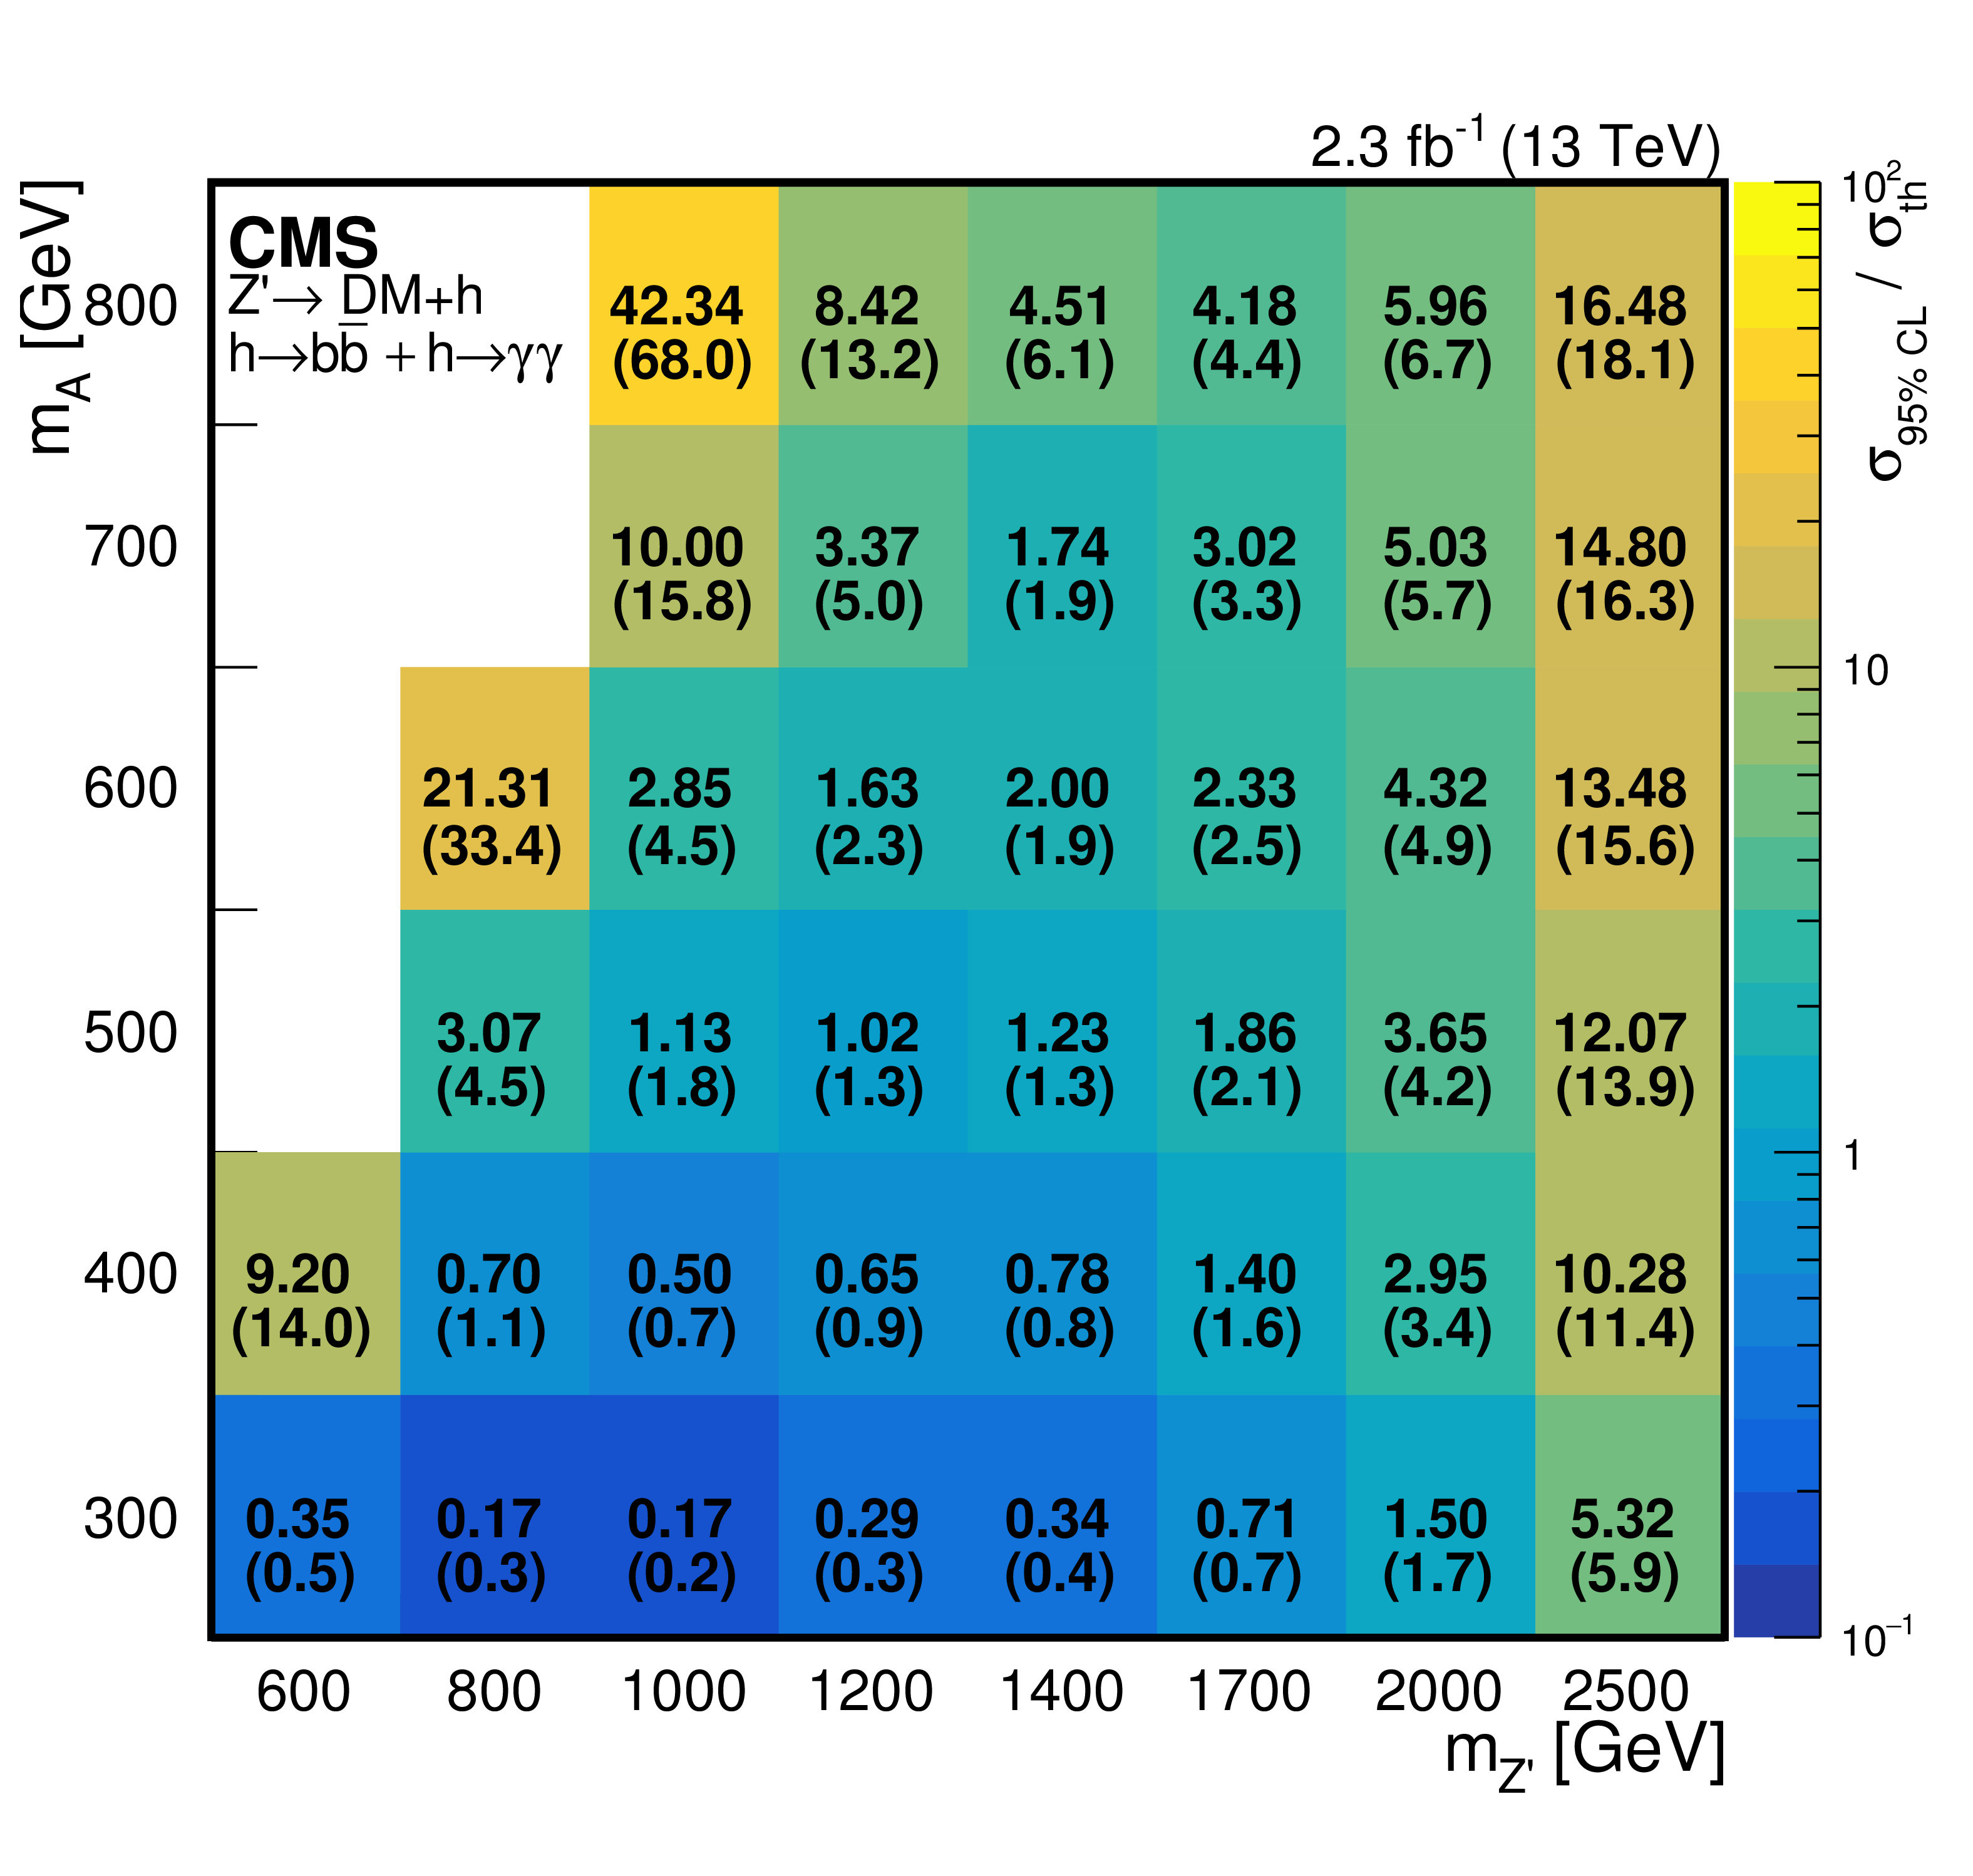
The observed (expected) 95% CL limit on the signal strength for the $ {\mathrm{h} \rightarrow \mathrm{ b \bar{b} } } $ (left) and $ {\mathrm{h} \rightarrow \gamma \gamma } $ (right) decay channels for ${m_{ {\mathrm {A}} }} = $ 300-800 GeV and ${m_{ {\mathrm {A}} }} = $ 600-2500 GeV. The theoretical cross section is calculated using $g_{{\mathrm{Z'}} } = $ 0.8. For $ {\mathrm{h} \rightarrow \mathrm{ b \bar{b} } } $, the results for the resolved analysis are shown with white background whereas the boosted analysis points are shown in black crossed background. |
png pdf |
Figure 10-a:
The observed (expected) 95% CL limit on the signal strength for the $ {\mathrm{h} \rightarrow \mathrm{ b \bar{b} } } $ decay channel for ${m_{ {\mathrm {A}} }} = $ 300-800 GeV and ${m_{ {\mathrm {A}} }} = $ 600-2500 GeV. The theoretical cross section is calculated using $g_{{\mathrm{Z'}} } = $ 0.8. The results for the resolved analysis are shown with white background whereas the boosted analysis points are shown in black crossed background. |

png pdf |
Figure 10-b:
The observed (expected) 95% CL limit on the signal strength for the $ {\mathrm{h} \rightarrow \gamma \gamma } $ decay channel for ${m_{ {\mathrm {A}} }} = $ 300-800 GeV and ${m_{ {\mathrm {A}} }} = $ 600-2500 GeV. The theoretical cross section is calculated using $g_{{\mathrm{Z'}} } = $ 0.8. |
png pdf |
Figure 11:
The observed (expected) 95% CL limit on the signal strength for the combination of $ {\mathrm{h} \rightarrow \gamma \gamma } $ and $ {\mathrm{h} \rightarrow \mathrm{ b \bar{b} } } $ decay channels for ${m_{ {\mathrm {A}} }} = $ 300-800 GeV and ${m_{ {\mathrm {A}} }} = $ 600-2500 GeV. The theoretical cross section is calculated using $g_{{\mathrm{Z'}} } = $ 0.8. |
| Tables | |
png pdf |
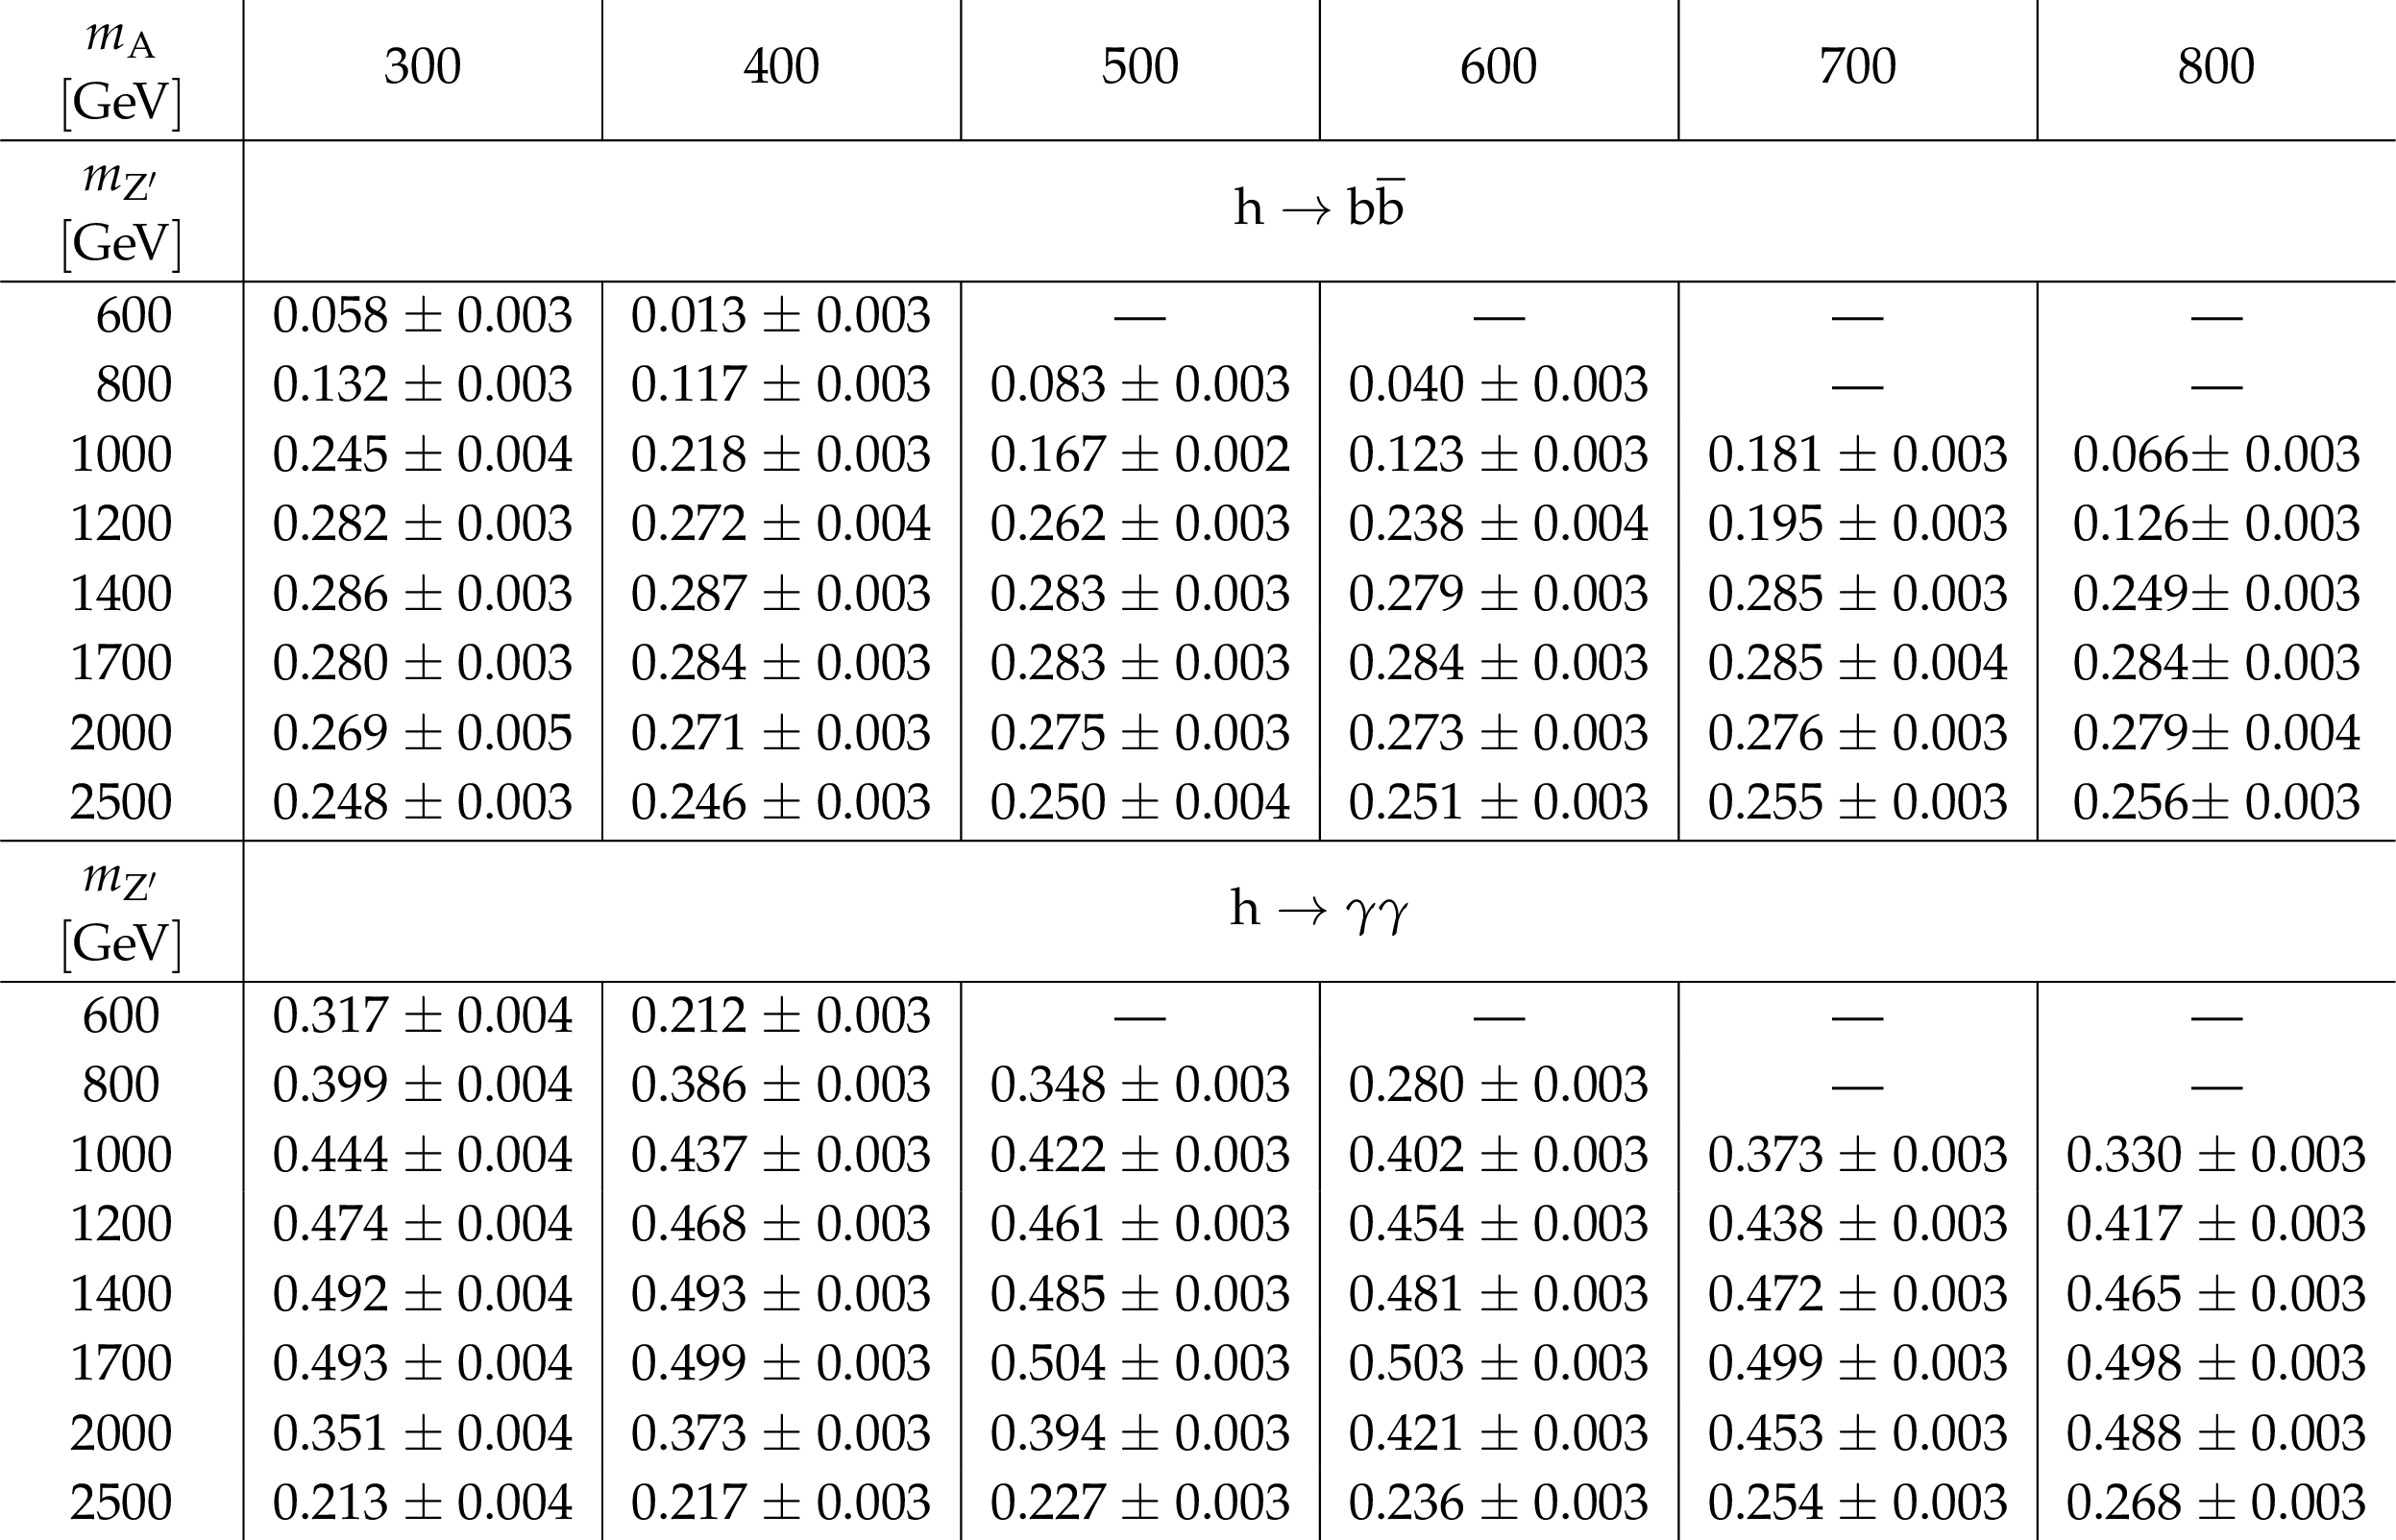
Table 1:
The product of acceptance and efficiency for signal in the SR, after full event selection for the $ {\mathrm{h} \rightarrow \mathrm{ b \bar{b} } } $ (upper) and the $ {\mathrm{h} \rightarrow \gamma \gamma } $ (lower) decay channels. |

png pdf |
Table 2:
Post-fit background event yields and observed numbers of events in data for 2.3 fb$^{-1}$ in both the resolved and the boosted regimes for the $ {\mathrm{h} \rightarrow \mathrm{ b \bar{b} } } $ analysis. The expected numbers of signal events for $m_{\mathrm {A}} = $ 300 GeV, scaled to the nominal cross section with $ {g_{\mathrm{Z'}}} = $ 0.8, are also reported. |
| Summary |
|
A search has been performed for dark matter produced in association with a Higgs boson. The analysis is based on 2.3 fb$^{-1}$ of proton-proton collision data collected by the CMS experiment at $ \sqrt{s} = $ 13 TeV. This analysis focuses on a Z'-2HDM ``simplified model'' through an interaction between a Z' that decays into a pseudoscalar boson A that in turn decays to two dark matter candidates and a CP-even scalar Higgs boson. The particular case studied is where the Higgs boson decays to two b quarks or two photons. No significant deviation is observed from the standard model background. The search is interpreted in terms of dark matter production that places constraints on the parameter space of the Z'-2HDM model. With optimized selections, limits on the signal cross section are calculated for various values of ${m_{\mathrm{ Z'}}}$ and ${m_{\mathrm{A}}} $. For ${m_{\mathrm{A}}} = $ 300 GeV, the observed data exclude the Z' mass range of 600 to 1860 GeV, for ${g_{\mathrm{ Z' }}} =$ 0.8, and 770 to 2040 GeV using the constrained value of ${g_{\mathrm{ Z' }}} $. This is the first result on a search for dark matter produced in association with a Higgs boson that includes constraints on $\mathrm{h} \to \gamma\gamma $ obtained at $ \sqrt{s} = $ 13 TeV. It is also the first to combine results from the ${\mathrm{h} \rightarrow\mathrm{ b }\mathrm{ \bar{b} }} $ and $\mathrm{h} \to \gamma\gamma $ decay channels. |
| References | ||||
| 1 | G. Bertone, D. Hooper, and J. Silk | Particle dark matter: evidence, candidates and constraints | PR 405 (2005) 279 | hep-ph/0404175 |
| 2 | ATLAS Collaboration | Observation of a new particle in the search for the Standard Model Higgs boson with the ATLAS detector at the LHC | PLB 716 (2012) 1 | 1207.7214 |
| 3 | CMS Collaboration | Observation of a new boson at a mass of 125 GeV with the CMS experiment at the LHC | PLB 716 (2012) 30 | CMS-HIG-12-028 1207.7235 |
| 4 | CMS Collaboration | Observation of a new boson with mass near 125 GeV in pp collisions at $ \sqrt{s} = $ 7 and 8 TeV | JHEP 06 (2013) 081 | CMS-HIG-12-036 1303.4571 |
| 5 | A. A. Petrov and W. Shepherd | Searching for dark matter at LHC with mono-Higgs production | PLB 730 (2014) 178 | 1311.1511 |
| 6 | L. Carpenter et al. | Mono-Higgs-boson: A new collider probe of dark matter | PRD 89 (2014) 075017 | 1312.2592 |
| 7 | A. Berlin, T. Lin, and L.-T. Wang | Mono-Higgs detection of dark matter at the LHC | JHEP 06 (2014) 078 | 1402.7074 |
| 8 | ATLAS Collaboration | Search for dark matter produced in association with a Higgs boson decaying to two bottom quarks in $ \rm{pp} $ collisions at $ \sqrt{s} = $ 8 TeV with the ATLAS detector | PRD 93 (2016) 47 | 1510.06218 |
| 9 | ATLAS Collaboration | Search for dark matter in association with a Higgs boson decaying to $ b $-quarks in $ pp $ collisions at $ \sqrt{s} = $ 13 TeV with the ATLAS detector | PLB 765 (2017) 11 | 1609.04572 |
| 10 | ATLAS Collaboration | Search for dark matter in events with missing transverse momentum and a Higgs boson decaying to two photons in $ \rm{pp} $ collisions at $ \sqrt{s} = $ 8 TeV with the ATLAS detector | PRL 115 (2015) 131801 | 1506.01081 |
| 11 | D. Abercrombie et al. | Dark matter benchmark models for early LHC Run-2 searches: report of the ATLAS/CMS dark matter forum | 1507.00966 | |
| 12 | T. D. Lee | A theory of spontaneous T violation | PRD 8 (1973) 1226 | |
| 13 | G. C. Branco et al. | Theory and phenomenology of two-Higgs-doublet models | PR 516 (2012) 1 | 1106.0034 |
| 14 | N. Craig, J. Galloway, and S. Thomas | Searching for signs of the second Higgs doublet | 1305.2424 | |
| 15 | CMS Collaboration | The CMS experiment at the CERN LHC | JINST 3 (2008) S08004 | CMS-00-001 |
| 16 | J. Alwall et al. | The automated computation of tree-level and next-to-leading order differential cross sections, and their matching to parton shower simulations | JHEP 07 (2014) 079 | 1405.0301 |
| 17 | T. Sjostrand et al. | An introduction to PYTHIA 8.2 | CPC 191 (2015) 159 | 1410.3012 |
| 18 | C. Oleari | The POWHEG-BOX | NPPS 205-206 (2010) 36 | 1007.3893 |
| 19 | G. Luisoni, P. Nason, C. Oleari, and F. Tramontano | $ \mathrm{HW^{\pm}/HZ} $ + 0 and 1 jet at NLO with the POWHEG BOX interfaced to GoSam and their merging within MiNLO | JHEP 10 (2013) 083 | 1306.2542 |
| 20 | P. Nason and C. Oleari | NLO Higgs boson production via vector-boson fusion matched with shower in POWHEG | JHEP 02 (2010) 037 | 0911.5299 |
| 21 | P. Nason | A new method for combining NLO QCD with shower Monte Carlo algorithms | JHEP 11 (2004) 040 | hep-ph/0409146 |
| 22 | S. Frixione, P. Nason, and C. Oleari | Matching NLO QCD computations with parton shower simulations: the POWHEG method | JHEP 11 (2007) 070 | 0709.2092 |
| 23 | S. Alioli, P. Nason, C. Oleari, and E. Re | A general framework for implementing NLO calculations in shower Monte Carlo programs: the POWHEG BOX | JHEP 06 (2010) 043 | 1002.2581 |
| 24 | S. Frixione, P. Nason, and G. Ridolfi | A positive-weight next-to-leading-order Monte Carlo for heavy flavour hadroproduction | JHEP 09 (2007) 126 | 0707.3088 |
| 25 | E. Re | Single-top Wt-channel production matched with parton showers using the POWHEG method | EPJC 71 (2011) 1547 | 1009.2450 |
| 26 | CMS Collaboration | Measurement of differential top-quark-pair production cross sections in pp collisions at $ \sqrt{s} = $ 7 TeV | EPJC 73 (2013), no. 3 | CMS-TOP-11-013 1211.2220 |
| 27 | CMS Collaboration | Measurement of the differential cross section for top quark pair production in pp collisions at $ \sqrt{s} = $ 8 TeV | EPJC 75 (2015), no. 11, 542 | CMS-TOP-12-028 1505.04480 |
| 28 | M. L. Mangano, M. Moretti, F. Piccinini, and M. Treccani | Matching matrix elements and shower evolution for top-quark production in hadronic collisions | JHEP 01 (2007) 013 | hep-ph/0611129 |
| 29 | Y. Li and F. Petriello | Combining QCD and electroweak corrections to dilepton production in FEWZ | PRD 86 (2012) 094034 | 1208.5967 |
| 30 | J. H. Kuhn, A. Kulesza, S. Pozzorini, and M. Schulze | Electroweak corrections to hadronic photon production at large transverse momenta | JHEP 03 (2006) 059 | hep-ph/0508253 |
| 31 | S. Kallweit et al. | NLO electroweak automation and precise predictions for W+multijet production at the LHC | JHEP 04 (2015) 012 | 1412.5157 |
| 32 | S. Kallweit et al. | NLO QCD+EW predictions for V+jets including off-shell vector-boson decays and multijet merging | JHEP 04 (2016) 021 | 1511.08692 |
| 33 | P. Nason and G. Zanderighi | $ \mathrm{W}^+\mathrm{W}^- $, $ \mathrm{WZ} $ and $ \mathrm{ZZ} $ production in the POWHEG-BOX-V2 | EPJC 74 (2014) 2702 | 1311.1365 |
| 34 | NNPDF Collaboration | Parton distributions for the LHC Run II | JHEP 04 (2015) 040 | 1410.8849 |
| 35 | P. Skands, S. Carrazza, and J. Rojo | Tuning PYTHIA 8.1: the Monash 2013 tune | EPJC 74 (2014) 3024 | 1404.5630 |
| 36 | CMS Collaboration | Event generator tunes obtained from underlying event and multiparton scattering measurements | EPJC 76 (2016), no. 3, 155 | CMS-GEN-14-001 1512.00815 |
| 37 | M. Bahr et al. | Herwig++ physics and manual | EPJC 58 (2008) 639 | 0803.0883 |
| 38 | S. Gieseke, C. Rohr, and A. Siodmok | Colour reconnections in Herwig++ | EPJC 72 (2012) 2225 | 1206.0041 |
| 39 | M. H. Seymour and A. Siodmok | Constraining MPI models using $ \sigma_{\mathrm{eff}} $ and recent Tevatron and LHC underlying event data | JHEP 10 (2013) 113 | 1307.5015 |
| 40 | GEANT4 Collaboration | GEANT4---a simulation toolkit | NIMA 506 (2003) 250 | |
| 41 | CMS Collaboration | Particle-flow event reconstruction in CMS and performance for jets, taus, and $ E_{\mathrm{T}}^{\text{miss}} $ | CMS-PAS-PFT-09-001 | |
| 42 | CMS Collaboration | Commissioning of the particle-flow event reconstruction with the first LHC collisions recorded in the CMS detector | CDS | |
| 43 | CMS Collaboration | Particle-flow reconstruction and global event description with the CMS detector | Submitted to JINST | CMS-PRF-14-001 1706.04965 |
| 44 | M. Cacciari, G. P. Salam, and G. Soyez | The anti-$ k_t $ jet clustering algorithm | JHEP 04 (2008) 063 | 0802.1189 |
| 45 | M. Cacciari, G. P. Salam and G. Soyez | FastJet user manual | EPJC 72 (2012) 012 | 1111.6097 |
| 46 | S. D. Ellis, C. K. Vermilion, and J. R. Walsh | Techniques for improved heavy particle searches with jet substructure | PRD 80 (2009) 051501 | 0903.5081 |
| 47 | S. D. Ellis, C. K. Vermilion, and J. R. Walsh | Recombination algorithms and jet substructure: pruning as a tool for heavy particle searches | PRD 81 (2010) 094023 | 0912.0033 |
| 48 | CMS Collaboration | Jet energy scale and resolution in the CMS experiment in pp collisions at 8 TeV | Submitted to JINST | CMS-JME-13-004 1607.03663 |
| 49 | CMS Collaboration | Performance of missing energy reconstruction in 13 TeV pp collision data using the CMS detector | CMS-PAS-JME-16-004 | CMS-PAS-JME-16-004 |
| 50 | CMS Collaboration | Identification of b quark jets at the CMS experiment in the LHC Run 2 | CDS | |
| 51 | CMS Collaboration | Identification of b-quark jets with the CMS experiment | JINST 8 (2013) P04013 | CMS-BTV-12-001 1211.4462 |
| 52 | M. Dasgupta, A. Fregoso, S. Marzani, and G. P. Salam | Towards an understanding of jet substructure | JHEP 09 (2013) 029 | 1307.0007 |
| 53 | A. J. Larkoski, S. Marzani, G. Soyez, and J. Thaler | Soft drop | JHEP 05 (2014) 146 | 1402.2657 |
| 54 | CMS Collaboration | CMS physics technical design report, volume II: physics performance | JPG 34 (2007) 995 | |
| 55 | CMS Collaboration | Performance of photon reconstruction and identification with the CMS detector in proton-proton collisions at $ \sqrt{s} = $ 8 TeV | JINST 10 (2015) P08010 | CMS-EGM-14-001 1502.02702 |
| 56 | CMS Collaboration | Performance of electron reconstruction and selection with the CMS detector in proton-proton collisions at $ \sqrt{s} = $ 8 TeV | JINST 10 (2015) P06005 | CMS-EGM-13-001 1502.02701 |
| 57 | CMS Collaboration | Performance of CMS muon reconstruction in pp collision events at $ \sqrt{s} = $ 7 TeV | JINST 7 (2012) P10002 | CMS-MUO-10-004 1206.4071 |
| 58 | CMS Collaboration | Reconstruction and identification of $ \tau $ lepton decays to hadrons and $ \nu_{\tau} $ at CMS | JINST 11 (2016), no. 01, P01019 | CMS-TAU-14-001 1510.07488 |
| 59 | CMS Collaboration | The performance of the CMS muon detector in proton-proton collisions at $ \sqrt{s} = $ 7 TeV at the LHC | JINST 8 (2013) P11002 | CMS-MUO-11-001 1306.6905 |
| 60 | M. Cacciari and G. P. Salam | Pileup subtraction using jet areas | PLB 659 (2008) 119 | |
| 61 | CMS Collaboration | Measurement of differential cross sections for Higgs boson production in the diphoton decay channel in pp collisions at $ \sqrt{s} = $ 8 TeV | EPJC 76 (2016) 13 | CMS-HIG-14-016 1508.07819 |
| 62 | CMS Collaboration | Observation of the diphoton decay of the Higgs boson and measurement of its properties | EPJC 74 (2014) 3076 | CMS-HIG-13-001 1407.0558 |
| 63 | CMS Collaboration | Search for resonant production of high-mass photon pairs in proton-proton collisions at $ \sqrt{s} = $ 8 and 13 TeV | PRL 117 (2016) 051802 | CMS-EXO-16-018 1606.04093 |
| 64 | CMS Collaboration | CMS luminosity measurement for the 2015 data taking period | CMS-PAS-LUM-15-001 | CMS-PAS-LUM-15-001 |
| 65 | CMS Collaboration | Measurements of inclusive W and Z cross sections in pp collisions at $ \sqrt{s} = $ 7 TeV | JHEP 01 (2011) 080 | CMS-EWK-10-002 1012.2466 |
| 66 | J. Butterworth et al. | PDF4LHC recommendations for LHC Run II | JPG 43 (2016) 023001 | 1510.03865 |
| 67 | LHC Higgs Cross Section Working Group Collaboration | Handbook of LHC Higgs cross sections: 3. Higgs properties: report of the LHC Higgs cross section working group | CERN-2013-004, Geneva | 1307.1347 |
| 68 | A. L. Read | Presentation of search results: the $ CL_s $ technique | JPG 28 (2002) 2693 | |
| 69 | T. Junk | Confidence level computation for combining searches with small statistics | NIMA 434 (1999) 435 | hep-ex/9902006 |
| 70 | G. Cowan, K. Cranmer, E. Gross, and O. Vitells | Asymptotic formulae for likelihood-based tests of new physics | EPJC 71 (2011) 1554 | 1007.1727 |
|
|
Compact Muon Solenoid LHC, CERN |
|

|

|

|

|

|