

Compact Muon Solenoid
LHC, CERN
| CMS-EXO-16-026 ; CERN-EP-2017-125 | ||
| Search for a heavy composite Majorana neutrino in the final state with two leptons and two quarks at $ \sqrt{s} = $ 13 TeV | ||
| CMS Collaboration | ||
| 26 June 2017 | ||
| Phys. Lett. B 775 (2017) 315 | ||
| Abstract: A search for physics beyond the standard model in the final state with two same-flavour leptons (electrons or muons) and two quarks produced in proton-proton collisions at $ \sqrt{s} = $ 13 TeV is presented. The data were recorded by the CMS experiment at the CERN LHC and correspond to an integrated luminosity of 2.3 fb$^{-1}$. The observed data are in good agreement with the standard model background prediction. The results of the measurement are interpreted in the framework of a recently proposed model in which a heavy Majorana neutrino, $\textrm{N}_{\ell}$, stems from a composite-fermion scenario. Exclusion limits are set for the first time on the mass of the heavy composite Majorana neutrino, $m_{\textrm{N}_{\ell}}$, and the compositeness scale $\Lambda$. For the case $m_{\textrm{N}_{\ell}} = \Lambda$, the existence of $\textrm{N}_{\textrm{e}}$ ($\textrm{N}_{\mu}$) is excluded for masses up to 4.60 (4.70) TeV at 95% confidence level. | ||
| Links: e-print arXiv:1706.08578 [hep-ex] (PDF) ; CDS record ; inSPIRE record ; HepData record ; CADI line (restricted) ; | ||
| Figures | |
png pdf |
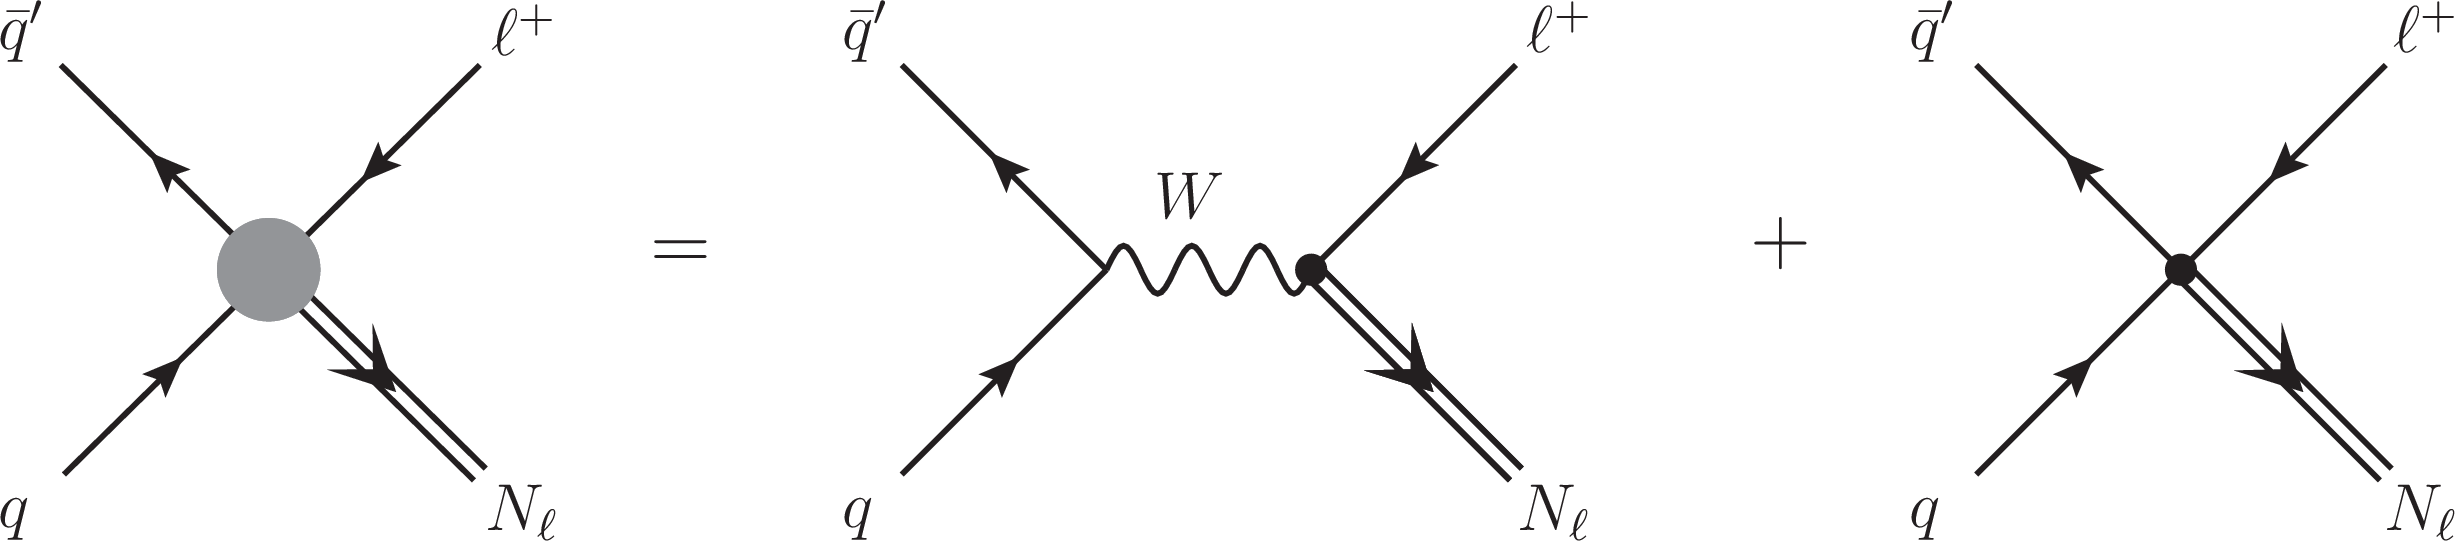
Figure 1:
Leading order diagrams representing heavy composite Majorana neutrino production. The total interaction is the coherent sum of the gauge and contact interactions. Charge-conjugate reactions are implied. See Ref. [11]. |

png pdf |
Figure 2:
Production cross section in pp collisions at $ \sqrt{s} = $ 13 TeV of the heavy composite Majorana neutrino via gauge and contact interactions as a function of Majorana mass at $\Lambda = $ 9 TeV (left) and decay width of the heavy composite Majorana neutrino for $\Lambda = $ 9 TeV as a function of its mass (right). The figures illustrate LO results of calculations based on Ref. [11]. |

png pdf |
Figure 2-a:
Production cross section in pp collisions at $ \sqrt{s} = $ 13 TeV of the heavy composite Majorana neutrino via gauge and contact interactions as a function of Majorana mass at $\Lambda = $ 9 TeV. The figure illustrates LO results of calculations based on Ref. [11]. |
png pdf |
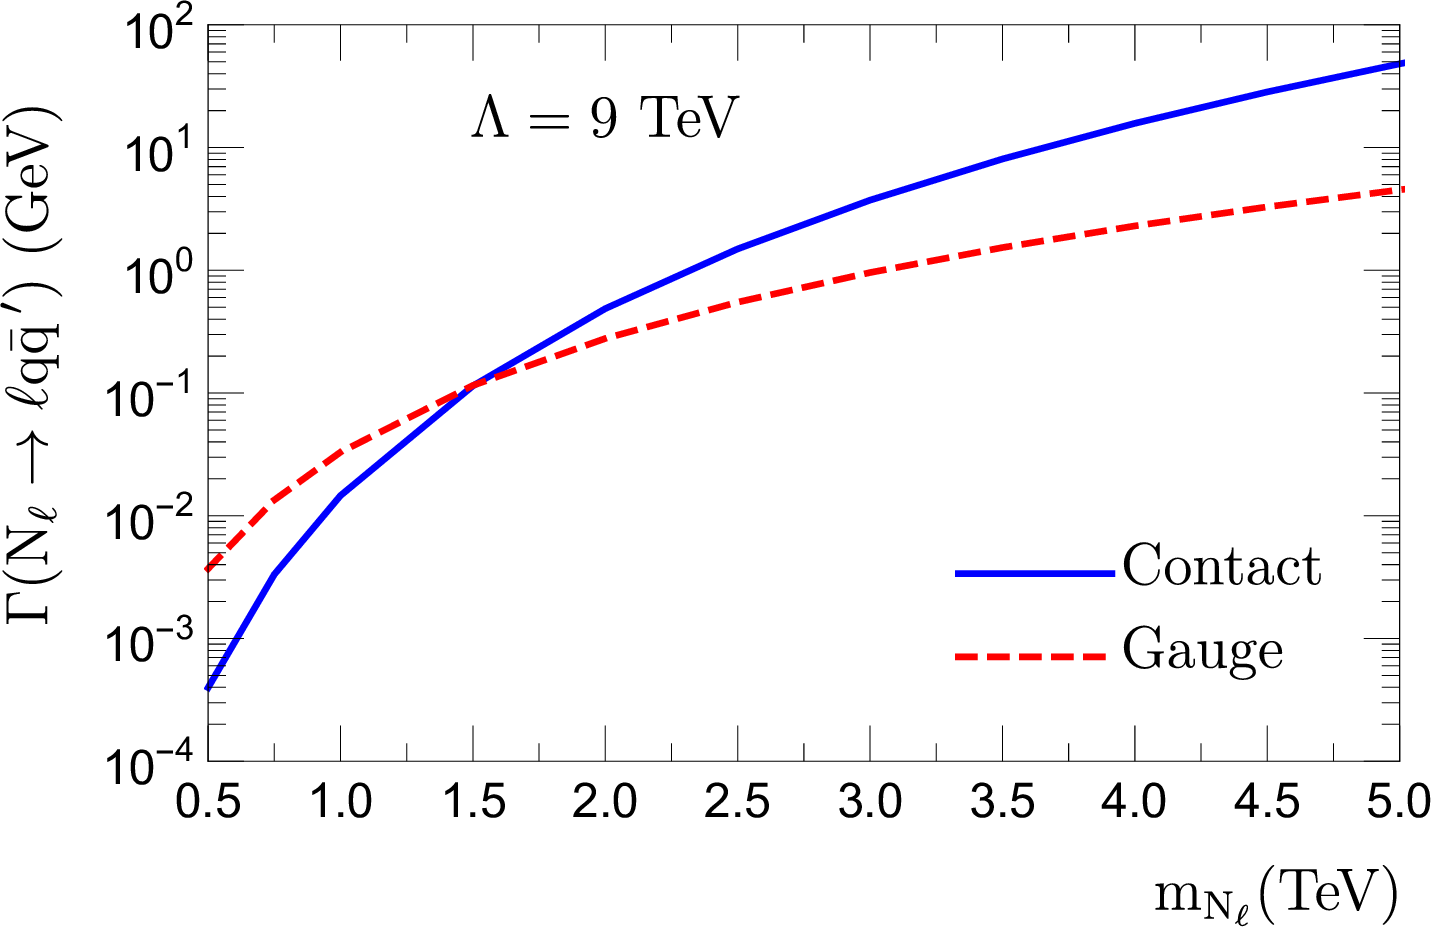
Figure 2-b:
Decay width of the heavy composite Majorana neutrino for $\Lambda = $ 9 TeV as a function of its mass. The figure illustrates LO results of calculations based on Ref. [11]. |
png pdf |
Figure 3:
Data events in the $\textrm {e}\mu \mathrm{ q } \mathrm{ \bar{q} } ^\prime $ control regions used to estimate the $\mathrm{ t \bar{t} } + \textrm {tW}$ contribution in the $\textrm {ee} \mathrm{ q } \mathrm{ \bar{q} } ^\prime $ (left) and $\mu \mu \mathrm{ q } \mathrm{ \bar{q} } ^\prime $ (right) channels, compared to the expectations of the background simulations. |

png pdf |
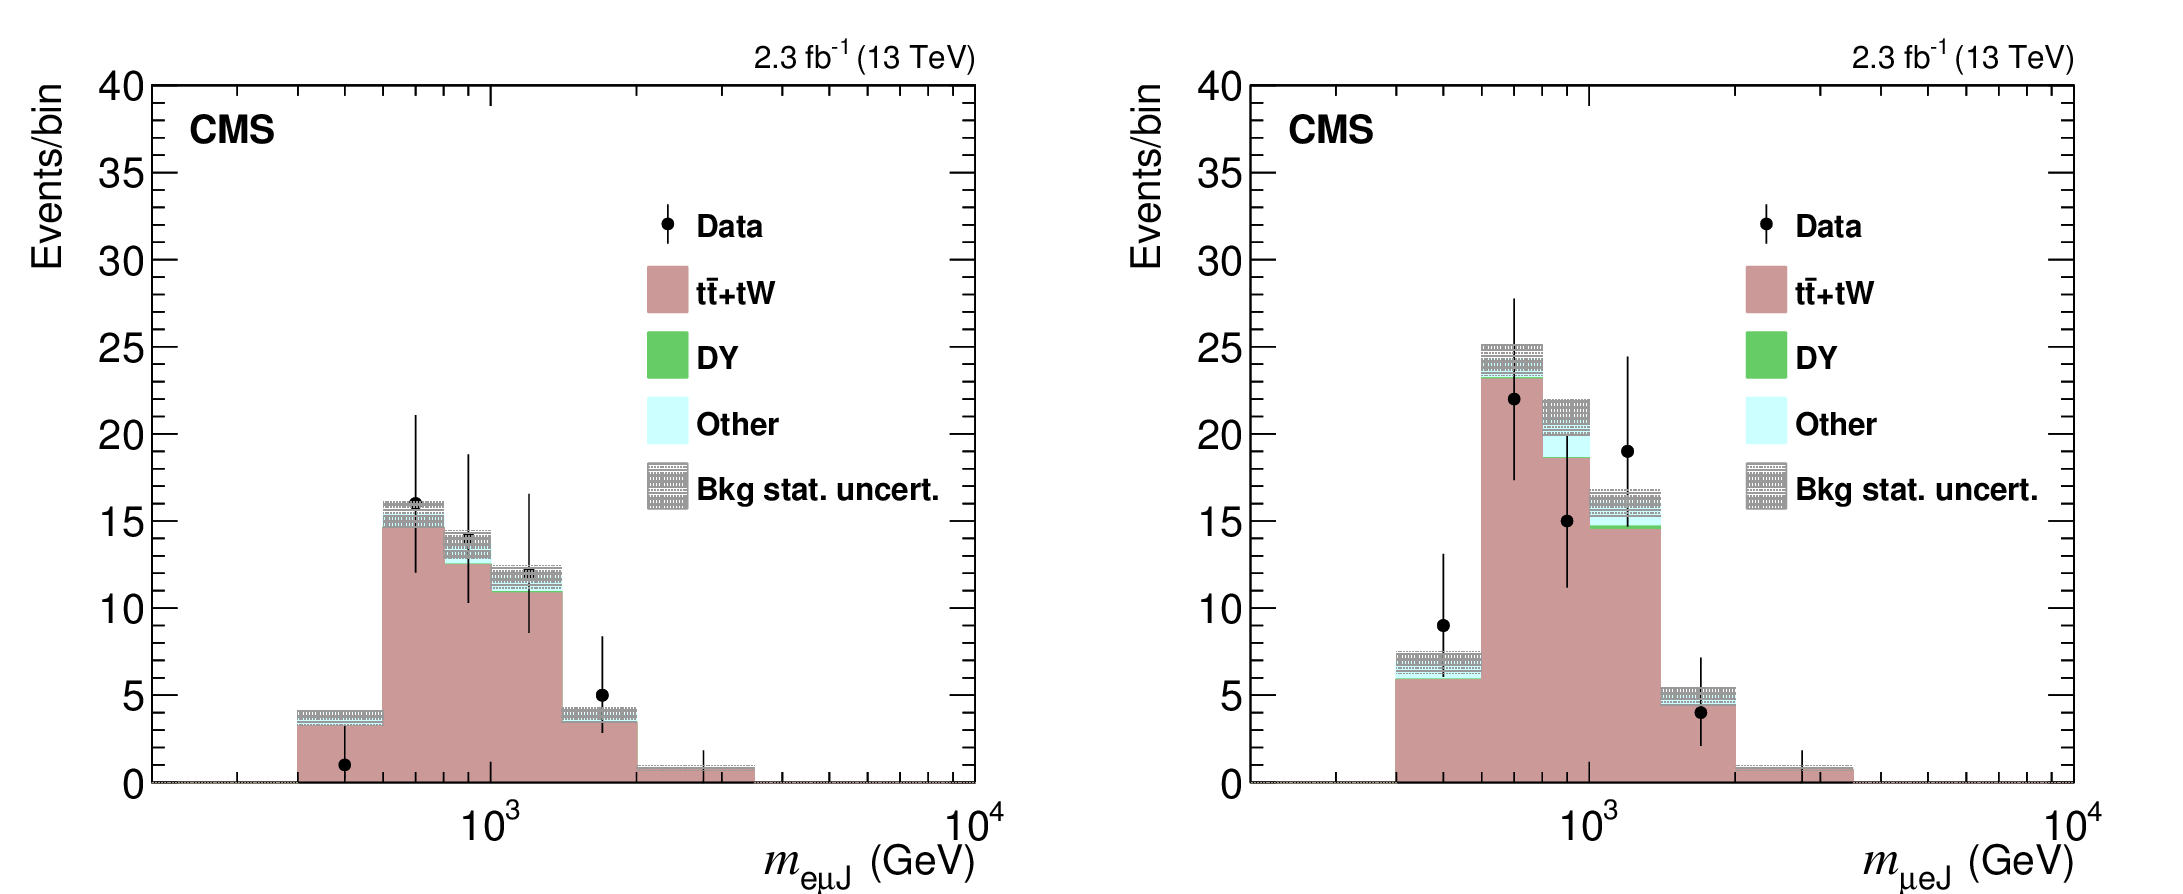
Figure 3-a:
Data events in the $\textrm {e}\mu \mathrm{ q } \mathrm{ \bar{q} } ^\prime $ control regions used to estimate the $\mathrm{ t \bar{t} } + \textrm {tW}$ contribution in the $\textrm {ee} \mathrm{ q } \mathrm{ \bar{q} } ^\prime $ channel, compared to the expectations of the background simulations. |

png pdf |
Figure 3-b:
Data events in the $\textrm {e}\mu \mathrm{ q } \mathrm{ \bar{q} } ^\prime $ control regions used to estimate the $\mathrm{ t \bar{t} } + \textrm {tW}$ contribution in the $\mu \mu \mathrm{ q } \mathrm{ \bar{q} } ^\prime $ channel, compared to the expectations of the background simulations. |

png pdf |
Figure 4:
Distribution of the variable $m_{\ell \ell \mathrm {J}}$ for the data (black points), the estimated SM backgrounds (stacked filled histograms), and the signal (lines) with $\Lambda = $ 9 TeV and masses of $\textrm {N}_{\ell }$ equal to 1.5 and 2.5 TeV , for the $\textrm {ee} \mathrm{ q } \mathrm{ \bar{q} } ^\prime $ (left) and the $\mu \mu \mathrm{ q } \mathrm{ \bar{q} } ^\prime $ (right) channels. The background uncertainties are the combined statistical and systematic uncertainties. |

png pdf |
Figure 4-a:
Distribution of the variable $m_{\ell \ell \mathrm {J}}$ for the data (black points), the estimated SM backgrounds (stacked filled histograms), and the signal (lines) with $\Lambda = $ 9 TeV and masses of $\textrm {N}_{\ell }$ equal to 1.5 and 2.5 TeV , for the $\textrm {ee} \mathrm{ q } \mathrm{ \bar{q} } ^\prime $ channel. The background uncertainties are the combined statistical and systematic uncertainties. |

png pdf |
Figure 4-b:
Distribution of the variable $m_{\ell \ell \mathrm {J}}$ for the data (black points), the estimated SM backgrounds (stacked filled histograms), and the signal (lines) with $\Lambda = $ 9 TeV and masses of $\textrm {N}_{\ell }$ equal to 1.5 and 2.5 TeV , for the $\mu \mu \mathrm{ q } \mathrm{ \bar{q} } ^\prime $ channel. The background uncertainties are the combined statistical and systematic uncertainties. |

png pdf |
Figure 5:
The observed 95% CL upper limits (solid black lines) on $\sigma (\textrm {pp} \rightarrow \ell \textrm {N}_{\ell }) {\cal B}(\textrm {N}_{\ell } \rightarrow \ell \mathrm{ q } \mathrm{ \bar{q} } ^\prime )$, obtained in the analysis of the $\textrm {ee} \mathrm{ q } \mathrm{ \bar{q} } ^\prime $ (left) and the $\mu \mu \mathrm{ q } \mathrm{ \bar{q} } ^\prime $ (right) final states, as a function of the mass of the heavy composite Majorana neutrino, $\textrm {N}_{\ell }$. The corresponding expected limits are shown by the dotted lines, and the bands represent the expected variation of the limit to one and two standard deviation(s). The solid blue curve indicates the theoretical prediction of $\sigma (\textrm {pp} \rightarrow \ell \textrm {N}_{\ell }) {\cal B}(\textrm {N}_{\ell } \rightarrow \ell \mathrm{ q } \mathrm{ \bar{q} } ^\prime )$ for $\Lambda = m_{\textrm {N}_{\ell }}$. The uncertainty in the theoretical prediction is derived by taking into account the factorization and normalization scales. The light red textured curves give the theoretical predictions for three $\Lambda $ values ranging from 6 to 12 TeV in steps of 3 TeV . |

png pdf |
Figure 5-a:
The observed 95% CL upper limits (solid black lines) on $\sigma (\textrm {pp} \rightarrow \ell \textrm {N}_{\ell }) {\cal B}(\textrm {N}_{\ell } \rightarrow \ell \mathrm{ q } \mathrm{ \bar{q} } ^\prime )$, obtained in the analysis of the $\textrm {ee} \mathrm{ q } \mathrm{ \bar{q} } ^\prime $ final state, as a function of the mass of the heavy composite Majorana neutrino, $\textrm {N}_{\ell }$. The corresponding expected limits are shown by the dotted lines, and the bands represent the expected variation of the limit to one and two standard deviation(s). The solid blue curve indicates the theoretical prediction of $\sigma (\textrm {pp} \rightarrow \ell \textrm {N}_{\ell }) {\cal B}(\textrm {N}_{\ell } \rightarrow \ell \mathrm{ q } \mathrm{ \bar{q} } ^\prime )$ for $\Lambda = m_{\textrm {N}_{\ell }}$. The uncertainty in the theoretical prediction is derived by taking into account the factorization and normalization scales. The light red textured curves give the theoretical predictions for three $\Lambda $ values ranging from 6 to 12 TeV in steps of 3 TeV . |

png pdf |
Figure 5-b:
The observed 95% CL upper limits (solid black lines) on $\sigma (\textrm {pp} \rightarrow \ell \textrm {N}_{\ell }) {\cal B}(\textrm {N}_{\ell } \rightarrow \ell \mathrm{ q } \mathrm{ \bar{q} } ^\prime )$, obtained in the analysis of the $\mu \mu \mathrm{ q } \mathrm{ \bar{q} } ^\prime $ final state, as a function of the mass of the heavy composite Majorana neutrino, $\textrm {N}_{\ell }$. The corresponding expected limits are shown by the dotted lines, and the bands represent the expected variation of the limit to one and two standard deviation(s). The solid blue curve indicates the theoretical prediction of $\sigma (\textrm {pp} \rightarrow \ell \textrm {N}_{\ell }) {\cal B}(\textrm {N}_{\ell } \rightarrow \ell \mathrm{ q } \mathrm{ \bar{q} } ^\prime )$ for $\Lambda = m_{\textrm {N}_{\ell }}$. The uncertainty in the theoretical prediction is derived by taking into account the factorization and normalization scales. The light red textured curves give the theoretical predictions for three $\Lambda $ values ranging from 6 to 12 TeV in steps of 3 TeV . |

png pdf |
Figure 6:
The observed 95% CL lower limits (solid black lines) on the compositeness scale $\Lambda $, obtained in the analysis of the $\textrm {ee} \mathrm{ q } \mathrm{ \bar{q} } ^\prime $ (left) and the $\mu \mu \mathrm{ q } \mathrm{ \bar{q} } ^\prime $ (right) final states, as a function of the mass of the heavy composite Majorana neutrino, $\textrm {N}_{\ell }$. The dotted lines represent the corresponding expected limits and the bands, the expected variation to one and two standard deviation(s). The grey zone represents the phase space $\Lambda < M_{\textrm {N}_{\ell }}$, which is not allowed by the model. |

png pdf |
Figure 6-a:
The observed 95% CL lower limits (solid black lines) on the compositeness scale $\Lambda $, obtained in the analysis of the $\textrm {ee} \mathrm{ q } \mathrm{ \bar{q} } ^\prime $ final state, as a function of the mass of the heavy composite Majorana neutrino, $\textrm {N}_{\ell }$. The dotted lines represent the corresponding expected limits and the bands, the expected variation to one and two standard deviation(s). The grey zone represents the phase space $\Lambda < M_{\textrm {N}_{\ell }}$, which is not allowed by the model. |

png pdf |
Figure 6-b:
The observed 95% CL lower limits (solid black lines) on the compositeness scale $\Lambda $, obtained in the analysis of the $\mu \mu \mathrm{ q } \mathrm{ \bar{q} } ^\prime $ final state, as a function of the mass of the heavy composite Majorana neutrino, $\textrm {N}_{\ell }$. The dotted lines represent the corresponding expected limits and the bands, the expected variation to one and two standard deviation(s). The grey zone represents the phase space $\Lambda < M_{\textrm {N}_{\ell }}$, which is not allowed by the model. |
| Tables | |
png pdf |
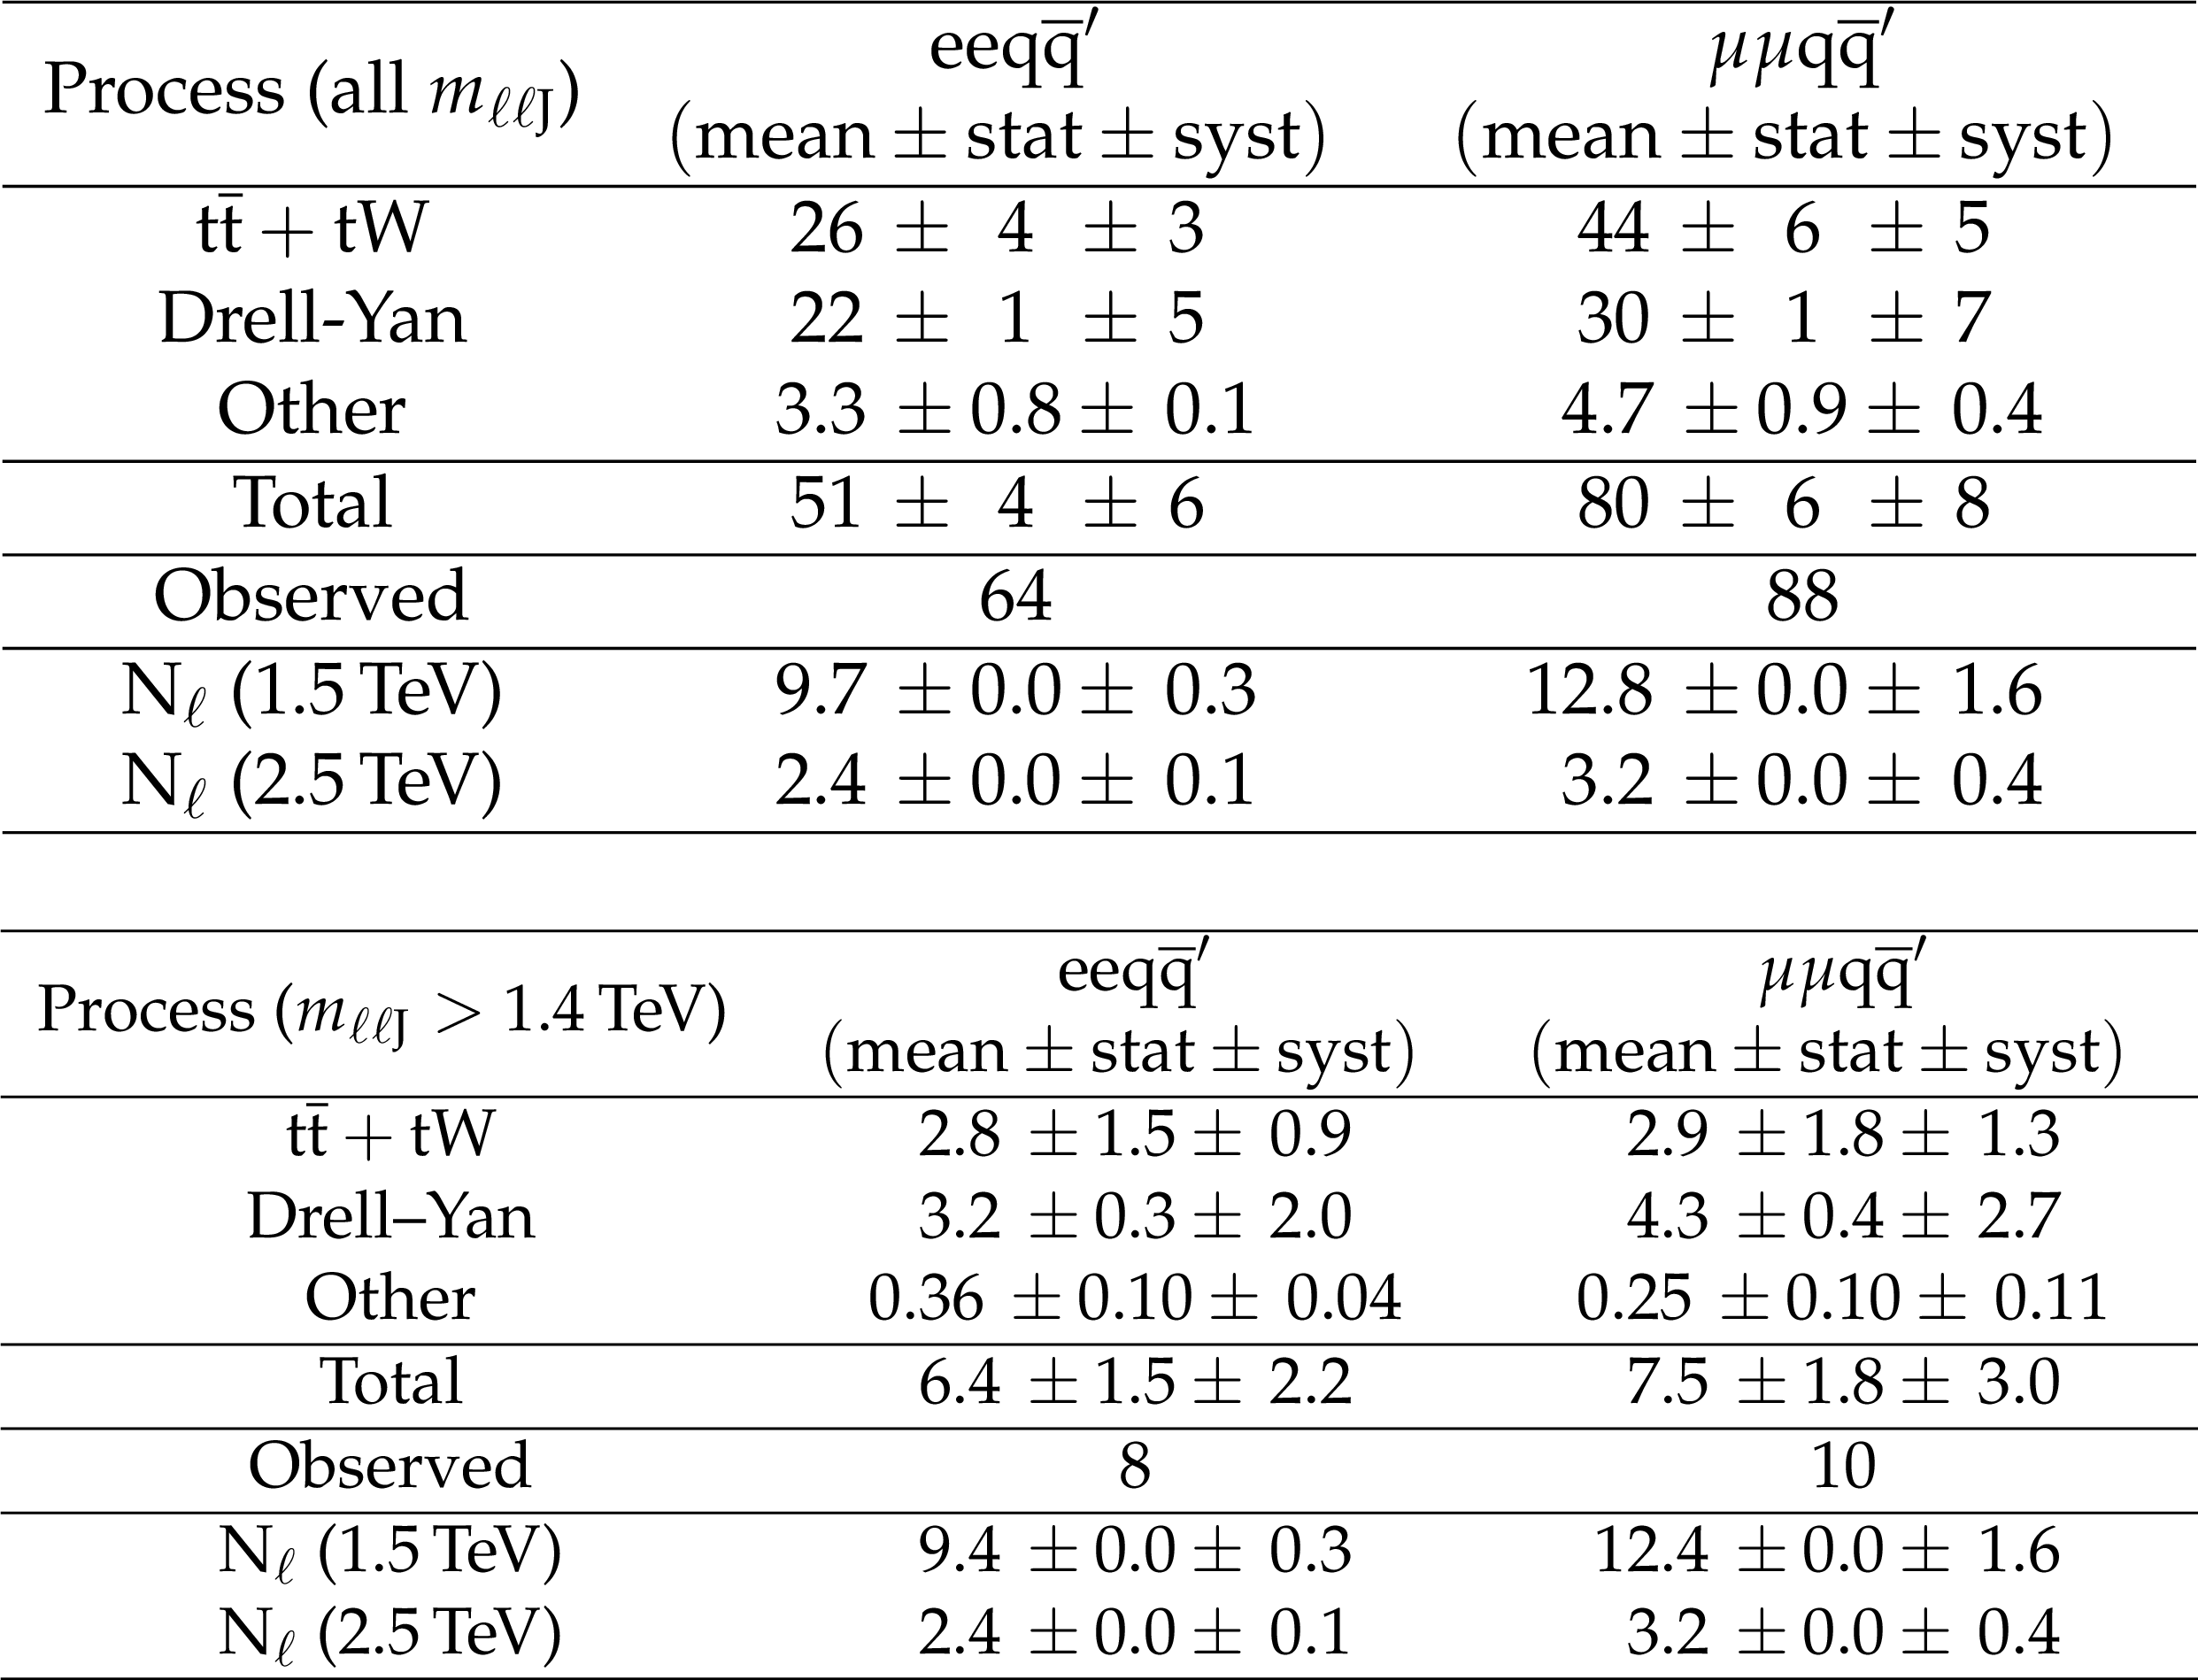
Table 1:
Number of events observed in data are compared to the expected background yields and those of a hypothetical heavy composite Majorana neutrino of mass 1.5 and 2.5 TeV , and $\Lambda = $ 9 TeV , given for all values of $m_{\ell \ell \mathrm {J}}$ (upper table) and for $m_{\ell \ell \mathrm {J}}> $ 1.4 TeV (lower table). The expected signal yields are computed at LO accuracy. The background and signal simulation yields are given with both statistical and systematic uncertainties. Statistical uncertainties given as 0.0 correspond to values much smaller than the systematical uncertainty. |
| Summary |
| A search for physics beyond the standard model has been performed in the framework of a new model [11] predicting a heavy Majorana neutrino, $\textrm{N}_{\ell}$, that originates from a composite-fermion scenario and is produced in association with a matched-flavour charged lepton. The measurement is performed analysing the final state with two leptons and at least one large-radius jet, a signature not previously utilized in searches for heavy neutrinos. The data set used corresponds to an integrated luminosity of 2.3 fb$^{-1}$ collected with the CMS detector at the LHC in pp collisions at $\sqrt{s}= $ 13 TeV. Good agreement between the data and the standard model prediction is observed. Upper limits are set at 95% confidence level both on the product of the cross section $\sigma(\textrm{pp} \rightarrow \ell \textrm{N}_{\ell})$ and the branching fraction ${\cal B}(\textrm{N}_{\ell} \rightarrow \ell \mathrm{ q \bar{q} }^\prime)$, and on the compositeness scale $\Lambda$, as a function of $m_{\textrm{N}_{\ell}}$, $\ell$ being an electron or a muon. For the representative case $\Lambda = m_{\textrm{N}_{\ell}}$, $\textrm{N}_{\textrm{e}}$ masses up to 4.60 TeV and $\textrm{N}_{\mu}$ masses up to 4.70 TeV are excluded. This measurement represents the first search that places constraints on the model described in Ref. [11]. |
| References | ||||
| 1 | J. C. Pati, A. Salam, and J. A. Strathdee | Are quarks composite? | PLB 59 (1975) 265 | |
| 2 | H. Harari | Composite models for quarks and leptons | PR 104 (1984) 159 | |
| 3 | O. W. Greenberg and C. A. Nelson | Composite models of leptons | PRD 10 (1974) 2567 | |
| 4 | H. Terazawa | $ t $-quark mass predicted from a sum rule for lepton and quark masses | PRD 22 (1980) 2921, . [Erratum: \DOI10.1103/PhysRevD.41.3541] | |
| 5 | E. Eichten, K. D. Lane, and M. E. Peskin | New tests for quark and lepton substructure | PRL 50 (1983) 811 | |
| 6 | N. Cabibbo, L. Maiani, and Y. Srivastava | Anomalous Z decays: Excited leptons? | PLB 139 (1984) 459 | |
| 7 | U. Baur, M. Spira, and P. M. Zerwas | Excited quark and lepton production at hadron colliders | PRD 42 (1990) 815 | |
| 8 | O. Panella and Y. N. Srivastava | Bounds on compositeness from neutrinoless double beta decay | PRD 52 (1995) 5308 | hep-ph/9411224 |
| 9 | O. Panella, C. Carimalo, Y. N. Srivastava, and A. Widom | Neutrinoless double beta decay with composite neutrinos | PRD 56 (1997) 5766 | hep-ph/9701251 |
| 10 | O. Panella, C. Carimalo, and Y. N. Srivastava | Production of like sign dileptons in pp collisions through composite Majorana neutrinos | PRD 62 (2000) 015013 | hep-ph/9903253 |
| 11 | S. Biondini and O. Panella | Leptogenesis and composite heavy neutrinos with gauge-mediated interactions | EPJC 77 (2017) 644 | 1707.00844 |
| 12 | R. Leonardi et al. | Hunting for heavy composite Majorana neutrinos at the LHC | EPJC 76 (2016) 593 | 1510.07988 |
| 13 | CMS Collaboration | CMS luminosity measurement for the 2015 data taking period | CMS-PAS-LUM-15-001 | CMS-PAS-LUM-15-001 |
| 14 | ATLAS Collaboration | Search for excited electrons and muons in $ \sqrt{s} = $ 8 TeV proton-proton collisions with the ATLAS detector | New J. Phys. 15 (2013) 093011 | 1308.1364 |
| 15 | CMS Collaboration | Search for excited leptons in proton-proton collisions at $ \sqrt{s} = $ 8 TeV | JHEP 03 (2016) 125 | CMS-EXO-14-015 1511.01407 |
| 16 | ATLAS Collaboration | Search for heavy neutrinos and right-handed $ W $ bosons in events with two leptons and jets in $ pp $ collisions at $ \sqrt{s} = $ 7 TeV with the ATLAS detector | EPJC 72 (2012) 1 | 1203.5420 |
| 17 | ATLAS Collaboration | Search for heavy Majorana neutrinos with the ATLAS detector in $ pp $ collisions at $ \sqrt{s} = $ 8 TeV | JHEP 07 (2015) 162 | 1506.06020 |
| 18 | CMS Collaboration | Search for heavy neutrinos and W bosons with right-handed couplings in proton-proton collisions at $ \sqrt{s} = $ 8 TeV | EPJC 74 (2014) 1 | CMS-EXO-13-008 1407.3683 |
| 19 | CMS Collaboration | Search for heavy Majorana neutrinos in $ \mu^\pm\mu^\pm $+jets events in proton-proton collisions at $ \sqrt{s} = $ 8 TeV | PLB 748 (2015) 144 | CMS-EXO-12-057 1501.05566 |
| 20 | CMS Collaboration | Search for heavy Majorana neutrinos in $ \textrm{e}^\pm \textrm{e}^\pm $+jets and $ \textrm{e}^\pm\mu^\pm $+jets events in proton-proton collisions at $ \sqrt{s} = $ 8 TeV | JHEP 04 (2016) 169 | CMS-EXO-14-014 1603.02248 |
| 21 | CMS Collaboration | Search for heavy neutrinos and third-generation leptoquarks in final states with two hadronically decaying $ \tau $ leptons and two jets in proton-proton collisions at $ \sqrt{s} = $ 13 TeV | JHEP 03 (2017) 77 | CMS-EXO-16-016 1612.01190 |
| 22 | CMS Collaboration | The CMS experiment at the CERN LHC | JINST 3 (2008) S08004 | CMS-00-001 |
| 23 | A. Belyaev, N. D. Christensen, and A. Pukhov | CalcHEP 3.4 for collider physics within and beyond the Standard Model | CPC 184 (2013) 1729 | 1207.6082 |
| 24 | P. Nason | A new method for combining NLO QCD with shower Monte Carlo algorithms | JHEP 11 (2004) 040 | hep-ph/0409146 |
| 25 | S. Frixione, P. Nason, and C. Oleari | Matching NLO QCD computations with parton shower simulations: the POWHEG method | JHEP 11 (2007) 070 | 0709.2092 |
| 26 | S. Alioli, P. Nason, C. Oleari, and E. Re | A general framework for implementing NLO calculations in shower Monte Carlo programs: the POWHEG BOX | JHEP 06 (2010) 043 | 1002.2581 |
| 27 | J. Alwall et al. | The automated computation of tree-level and next-to-leading order differential cross sections, and their matching to parton shower simulations | JHEP 07 (2014) 079 | 1405.0301 |
| 28 | T. Sjostrand et al. | An introduction to PYTHIA 8.2 | CPC 191 (2015) 159 | 1410.3012 |
| 29 | NNPDF Collaboration | Parton distributions for the LHC Run II | JHEP 04 (2015) 040 | 1410.8849 |
| 30 | CMS Collaboration | Event generator tunes obtained from underlying event and multiparton scattering measurements | EPJC 76 (2016) 155 | CMS-GEN-14-001 1512.00815 |
| 31 | GEANT4 Collaboration | GEANT4---a simulation toolkit | NIMA 506 (2003) 250 | |
| 32 | CMS Collaboration | Performance of electron reconstruction and selection with the CMS detector in proton-proton collisions at $ \sqrt{s} = $ 8 TeV | JINST 10 (2015) P06005 | CMS-EGM-13-001 1502.02701 |
| 33 | CMS Collaboration | Performance of CMS muon reconstruction in pp collision events at $ \sqrt{s} = $ 7 TeV | JINST 7 (2012) P10002 | CMS-MUO-10-004 1206.4071 |
| 34 | M. Cacciari, G. P. Salam, and G. Soyez | FastJet user manual | EPJC 72 (2012) 1896 | 1111.6097 |
| 35 | M. Cacciari and G. P. Salam | Dispelling the $ N^3 $ myth for the $ k_t $ jet-finder | PLB 641 (2006) 57 | hep-ph/0512210 |
| 36 | CMS Collaboration | Particle-flow reconstruction and global event description with the CMS detector | JINST 12 (2017) P10003 | CMS-PRF-14-001 1706.04965 |
| 37 | CMS Collaboration | Search for narrow resonances in dilepton mass spectra in proton-proton collisions at $ \sqrt{s} = $ 13 TeV and combination with 8 TeV data | PLB 768 (2017) 57 | CMS-EXO-15-005 1609.05391 |
| 38 | J. Butterworth et al. | PDF4LHC recommendations for LHC Run II | JPG 43 (2016) 023001 | 1510.03865 |
| 39 | A. L. Read | Presentation of search results: the $ \rm CL_s $ technique | JPG 28 (2002) 2693 | |
| 40 | T. Junk | Confidence level computation for combining searches with small statistics | NIMA 434 (1999) 435 | hep-ex/9902006 |
|
|
Compact Muon Solenoid LHC, CERN |
|

|

|

|

|

|