

Compact Muon Solenoid
LHC, CERN
| CMS-EXO-16-033 ; CERN-EP-2018-020 | ||
| Search for high-mass resonances in final states with a lepton and missing transverse momentum at $\sqrt{s} = $ 13 TeV | ||
| CMS Collaboration | ||
| 29 March 2018 | ||
| JHEP 06 (2018) 128 | ||
| Abstract: A search for new high-mass resonances in proton-proton collisions having final states with an electron or muon and missing transverse momentum is presented. The analysis uses proton-proton collision data collected in 2016 with the CMS detector at the LHC at a center-of-mass energy of 13 TeV, corresponding to an integrated luminosity of 35.9 fb$^{-1}$. The transverse mass distribution of the charged lepton-neutrino system is used as the discriminating variable. No significant deviation from the standard model prediction is found. The best limit, from the combination of electron and muon channels, is 5.2 TeV at 95% confidence level for the mass of a W' boson with the same couplings as those of the standard model W boson. Exclusion limits of 2.9 TeV are set on the inverse radius of the extra dimension in the framework of split universal extra dimensions. In addition, model-independent limits are set on the production cross section and coupling strength of W' bosons decaying into this final state. An interpretation is also made in the context of an R parity violating supersymmetric model with a slepton as a mediator and flavor violating decay. | ||
| Links: e-print arXiv:1803.11133 [hep-ex] (PDF) ; CDS record ; inSPIRE record ; CADI line (restricted) ; | ||
| Figures | |

png pdf |
Figure 1:
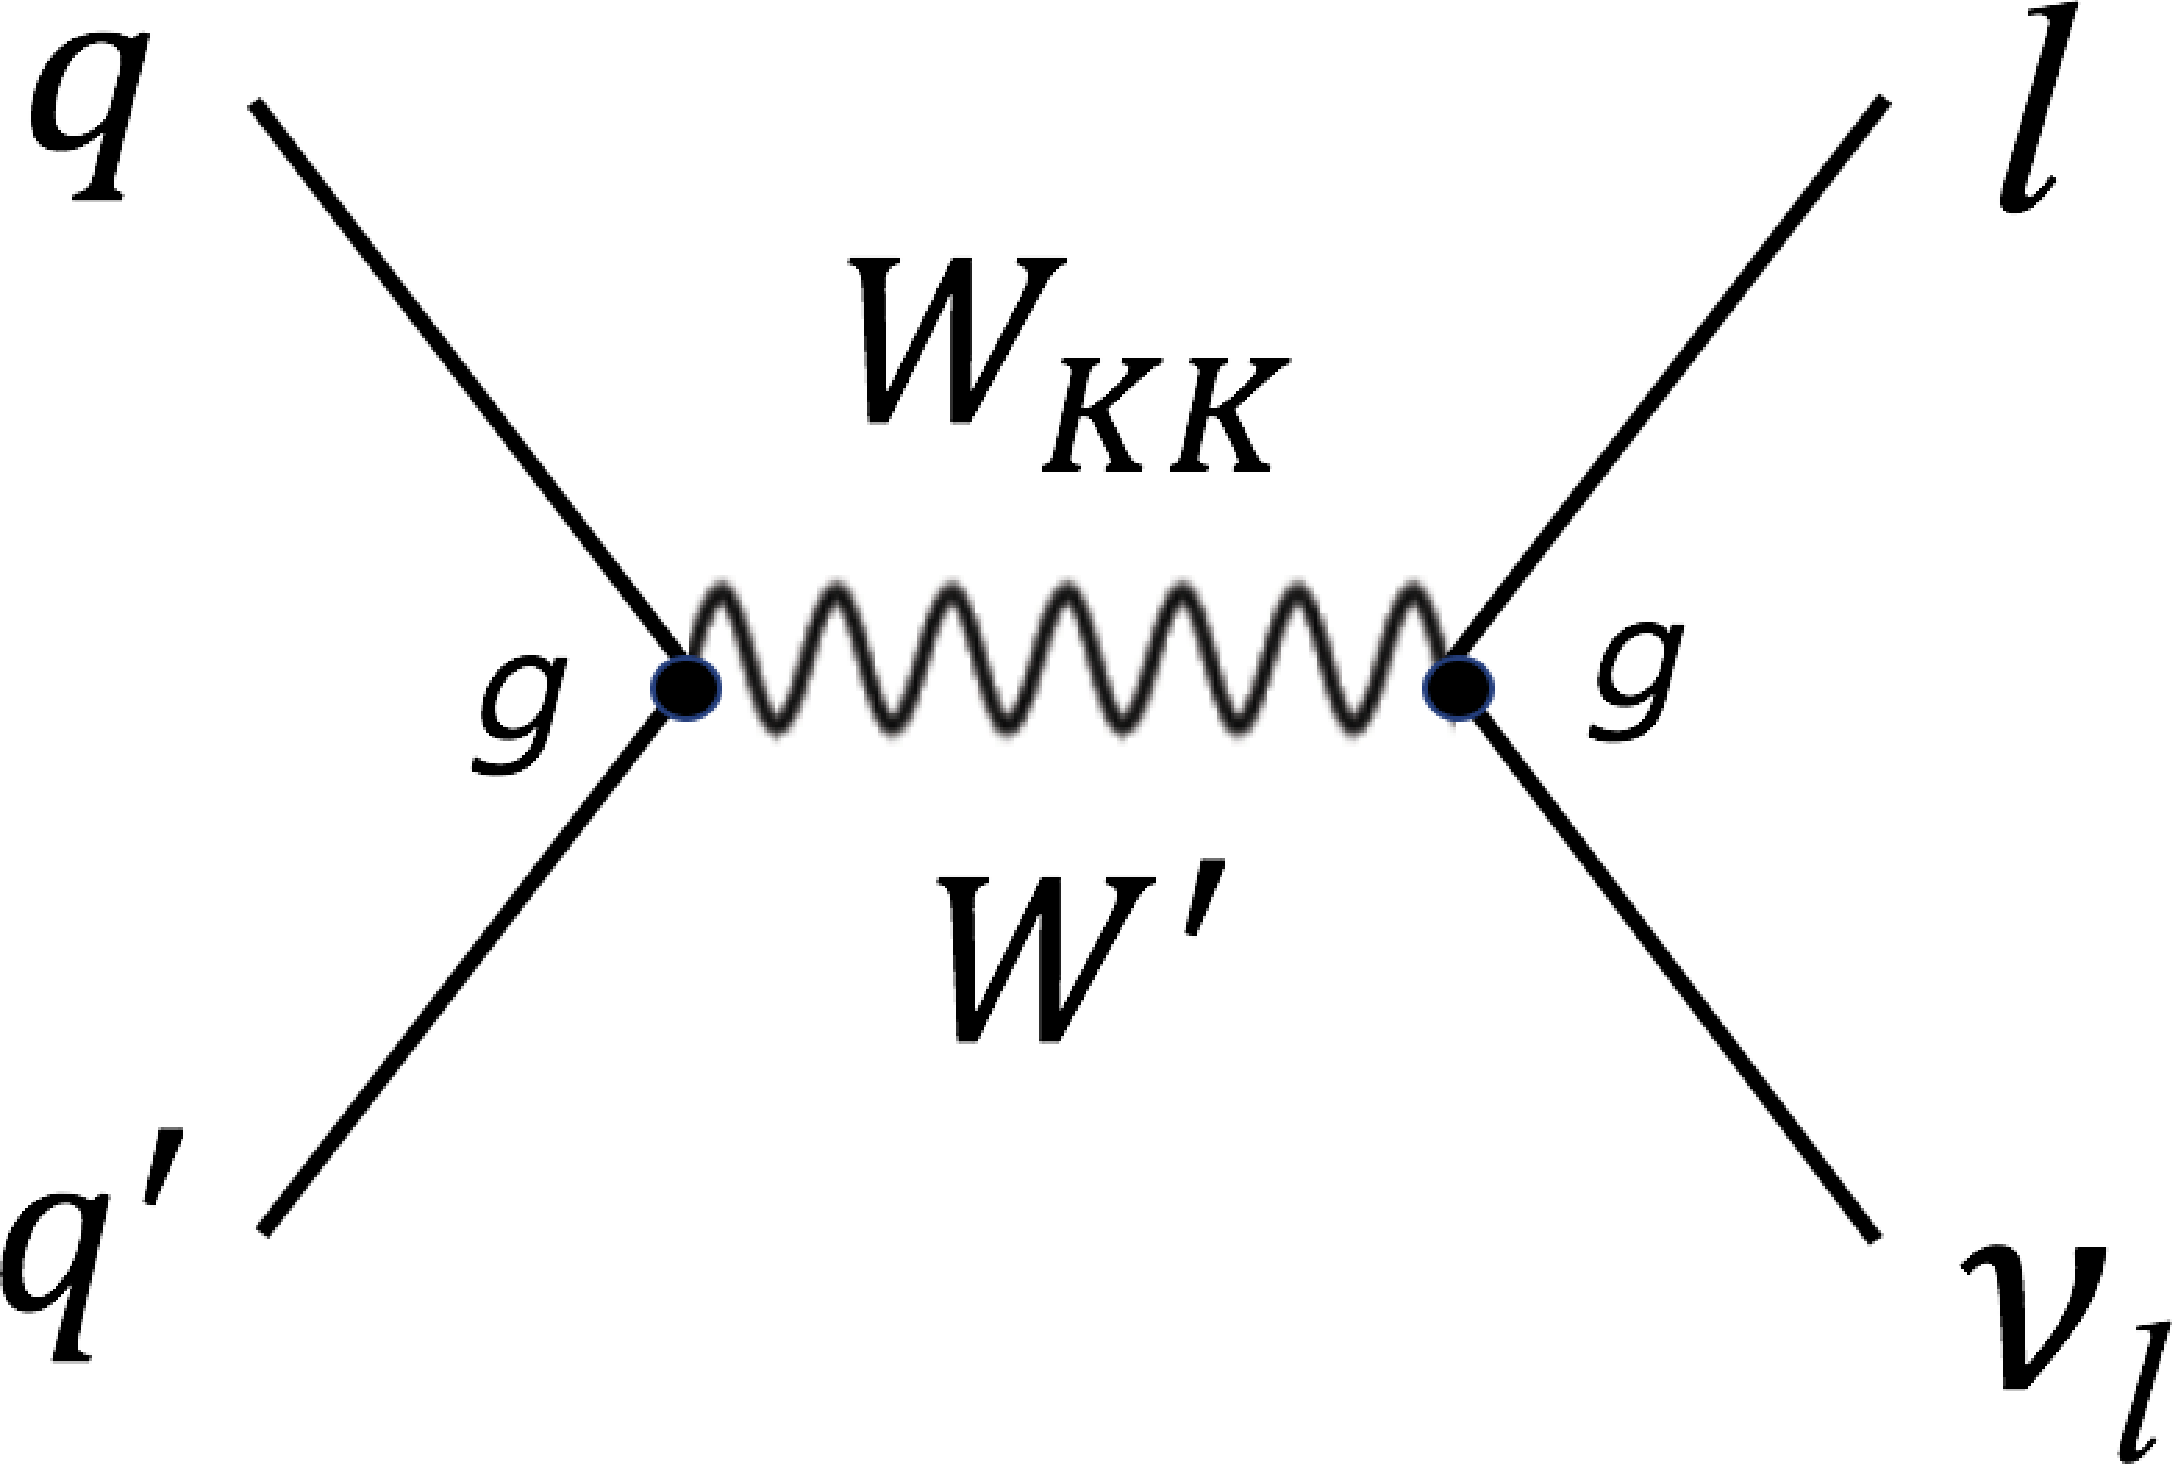
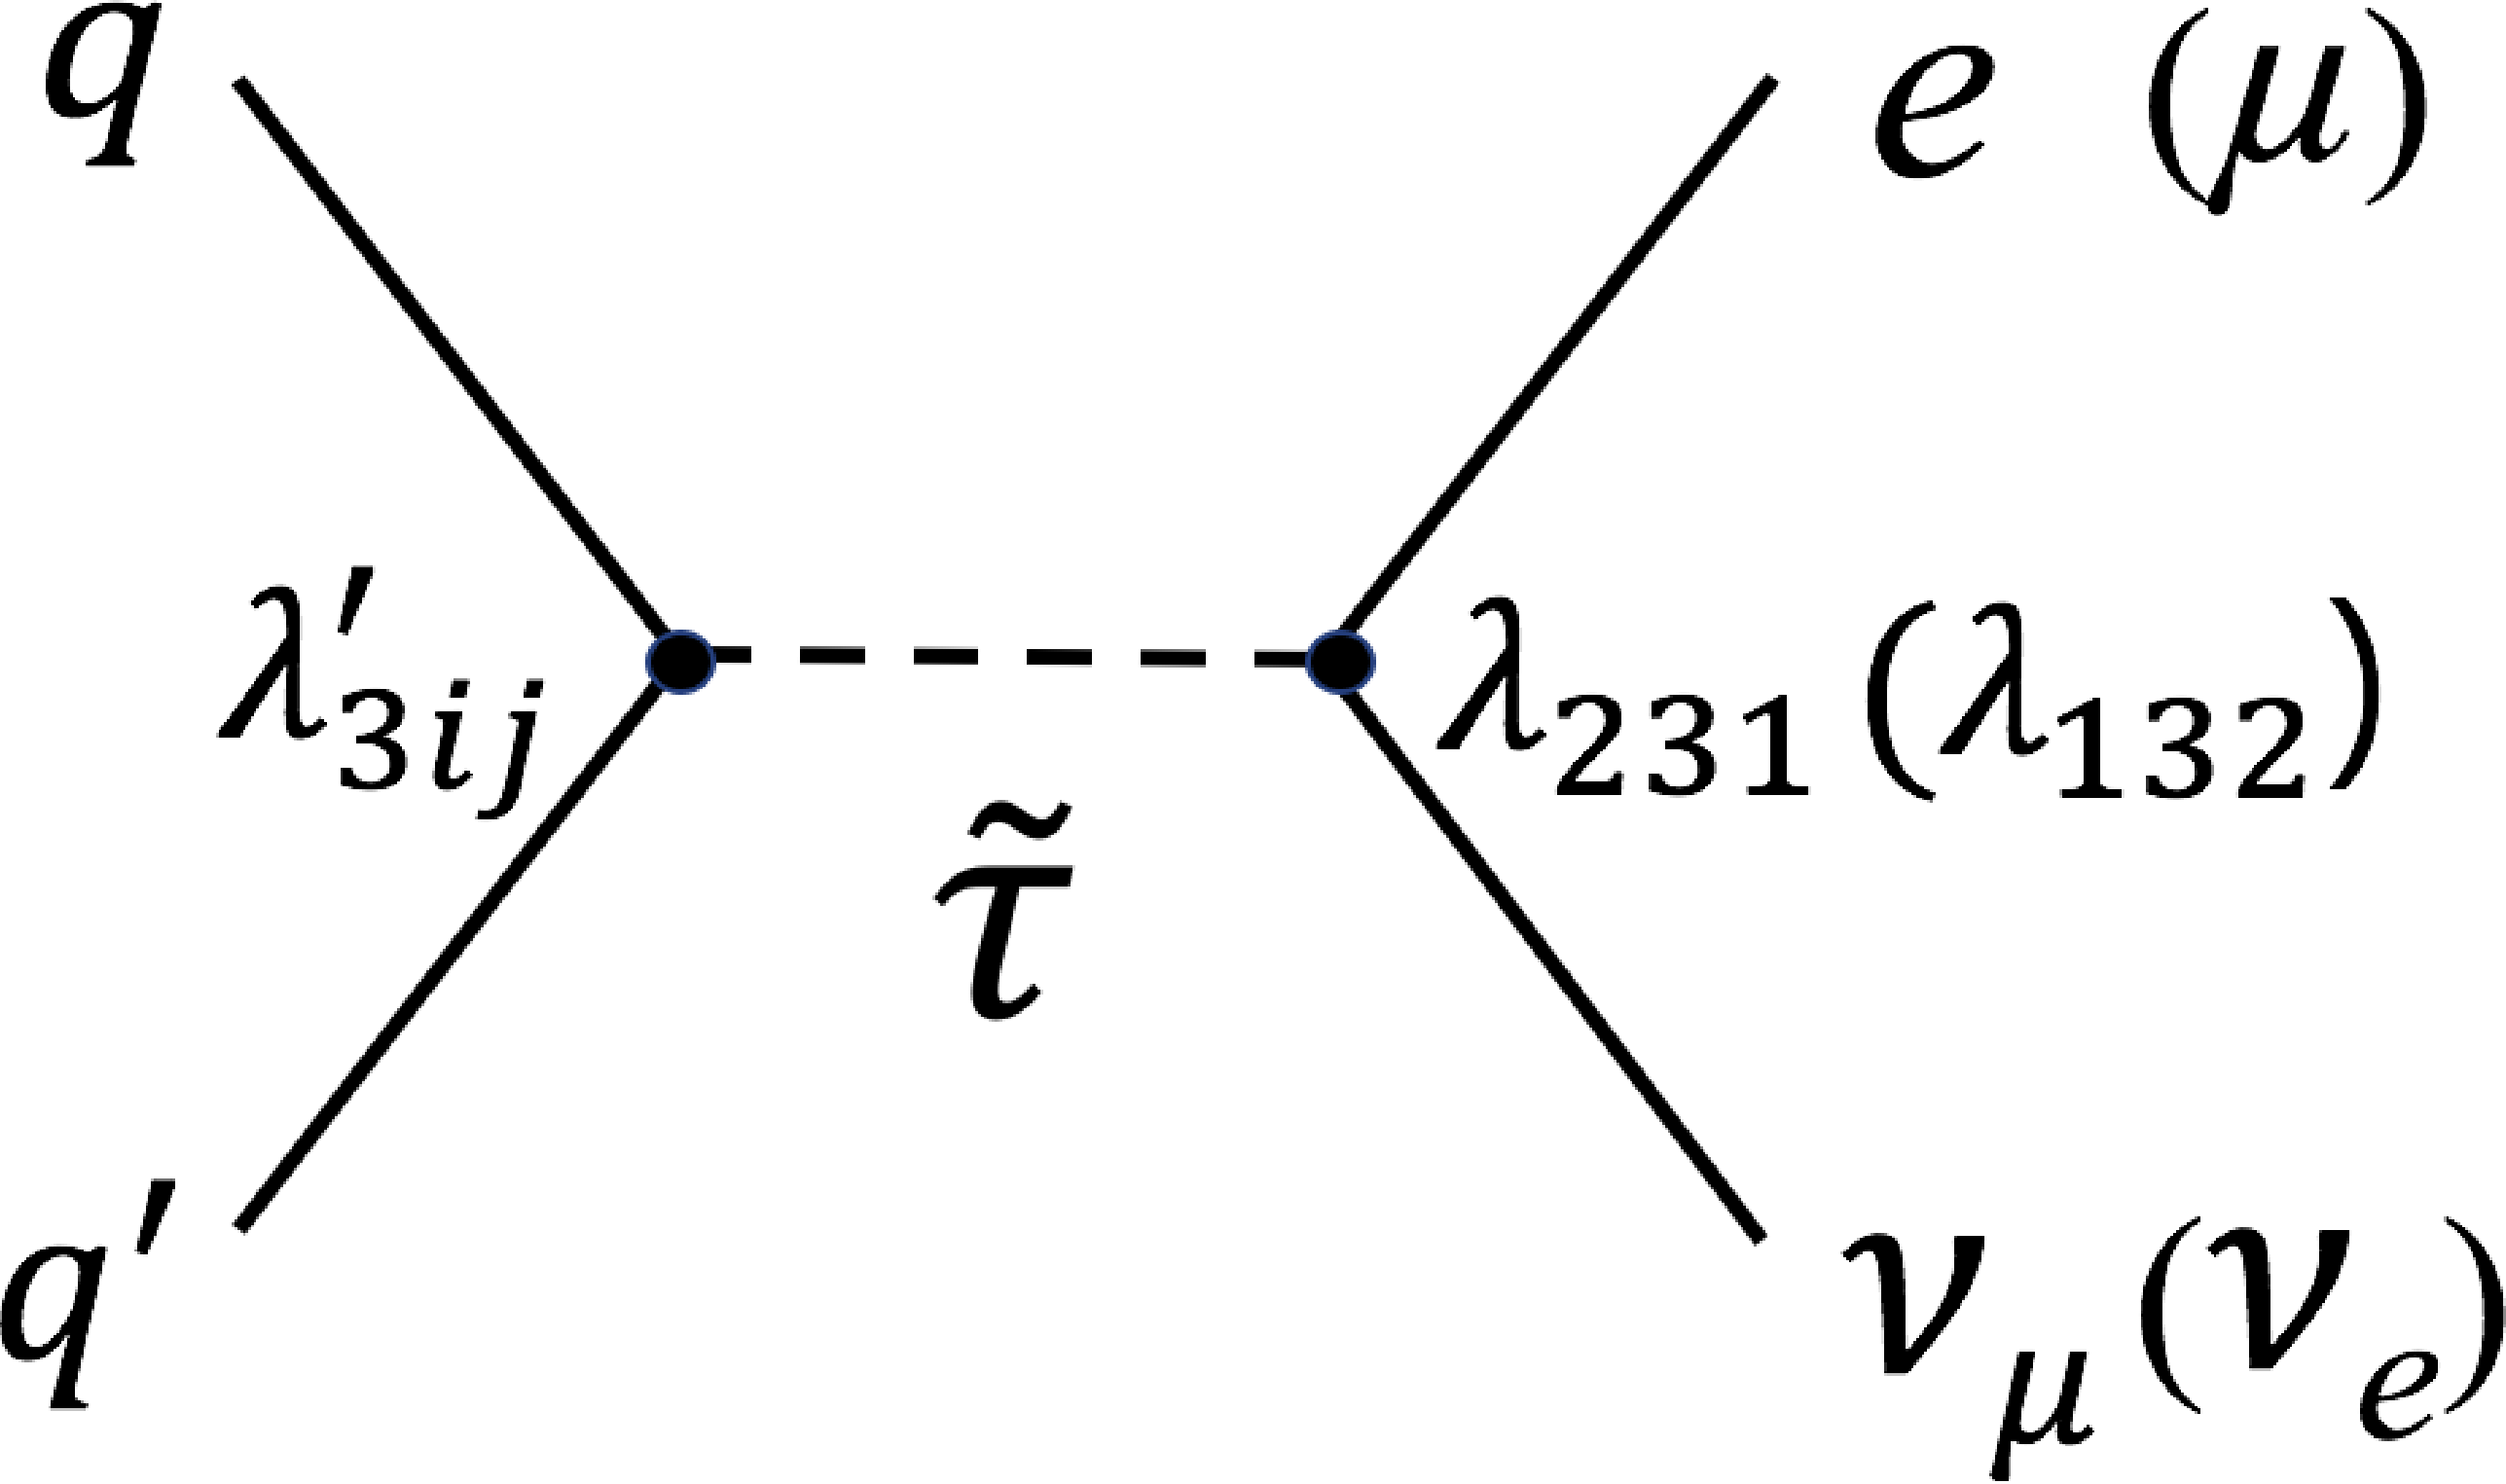
Production and decay of a new heavy boson, an SSM W' or a $ {{\mathrm {W}}_{\mathrm {KK}}} $ (left). The coupling strength, $g$, may vary. In RPV SUSY, a tau slepton ($ {\tilde{\tau}} $) could also act as a mediator (right) with corresponding $\lambda $ couplings for the decay that are different for the two final states, denoted by $\lambda _{231}$ and $\lambda _{132}$ for the electron and muon final states, respectively. |
png pdf |
Figure 1-a:
Production and decay of a new heavy boson, an SSM W' or a $ {{\mathrm {W}}_{\mathrm {KK}}} $. The coupling strength, $g$, may vary. |
png pdf |
Figure 1-b :
In RPV SUSY, a tau slepton ($ {\tilde{\tau}} $) could also act as a mediator with corresponding $\lambda $ couplings for the decay that are different for the two final states, denoted by $\lambda _{231}$ and $\lambda _{132}$ for the electron and muon final states, respectively. |

png pdf |
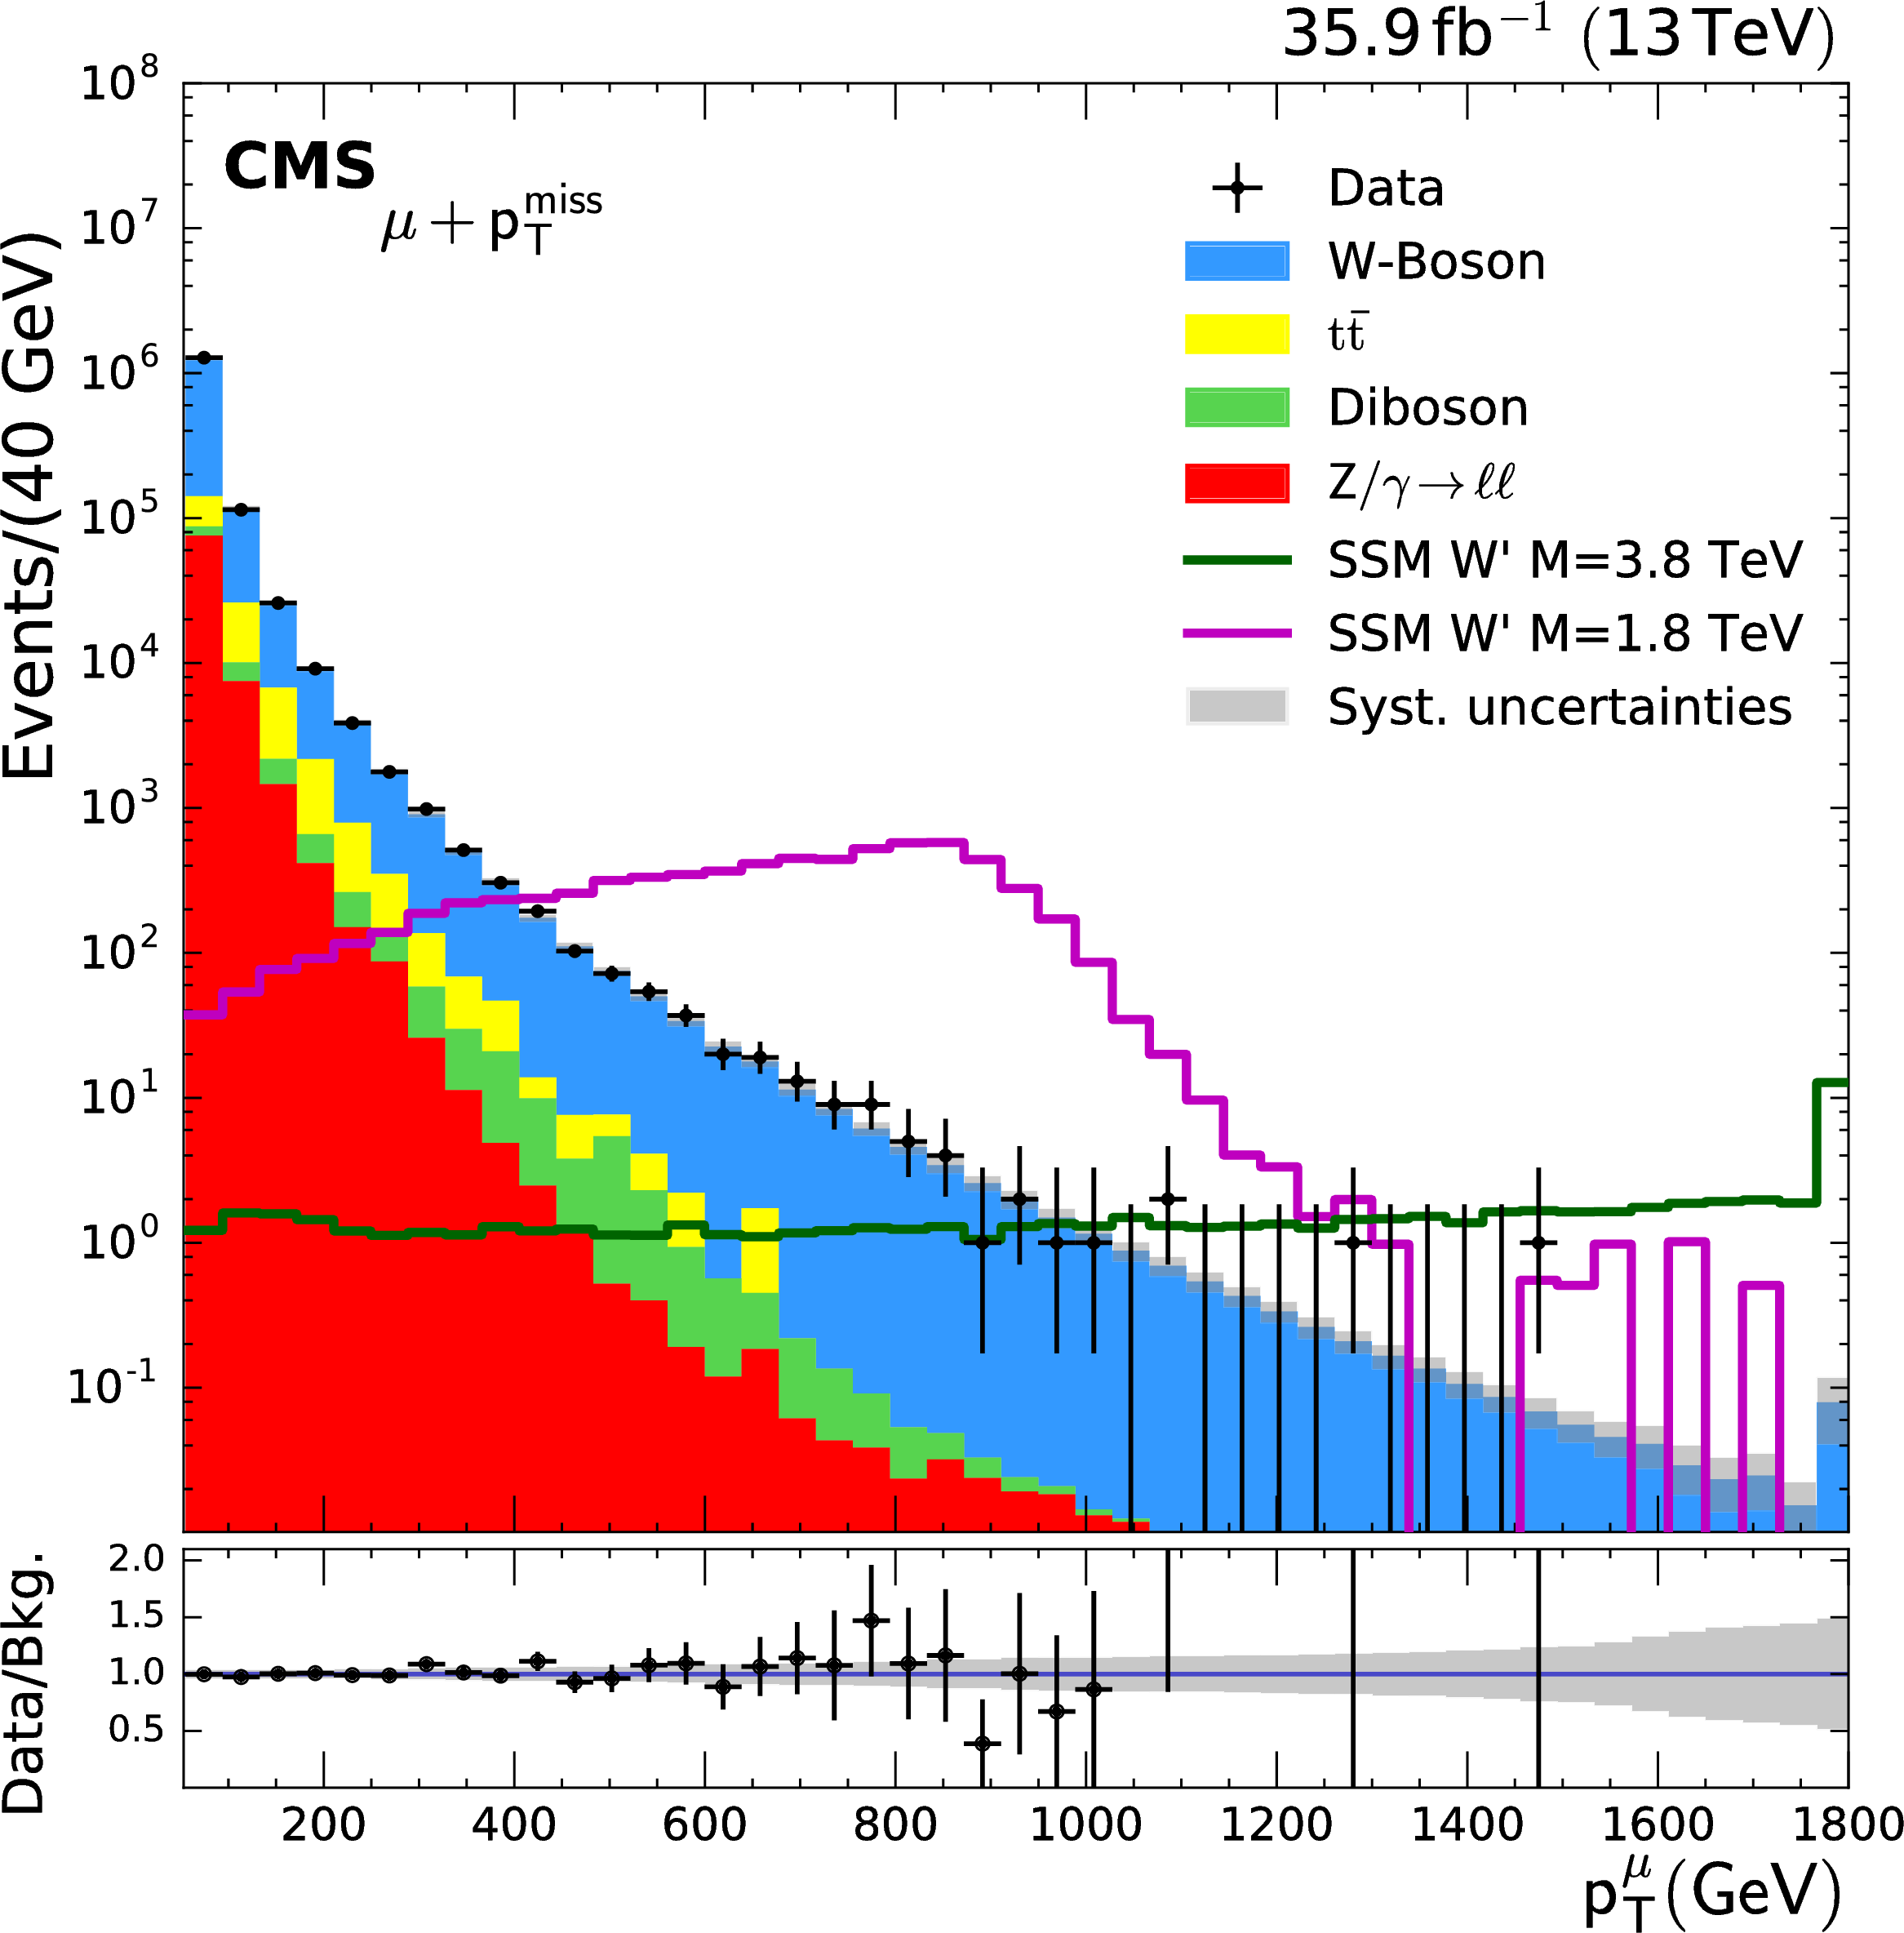
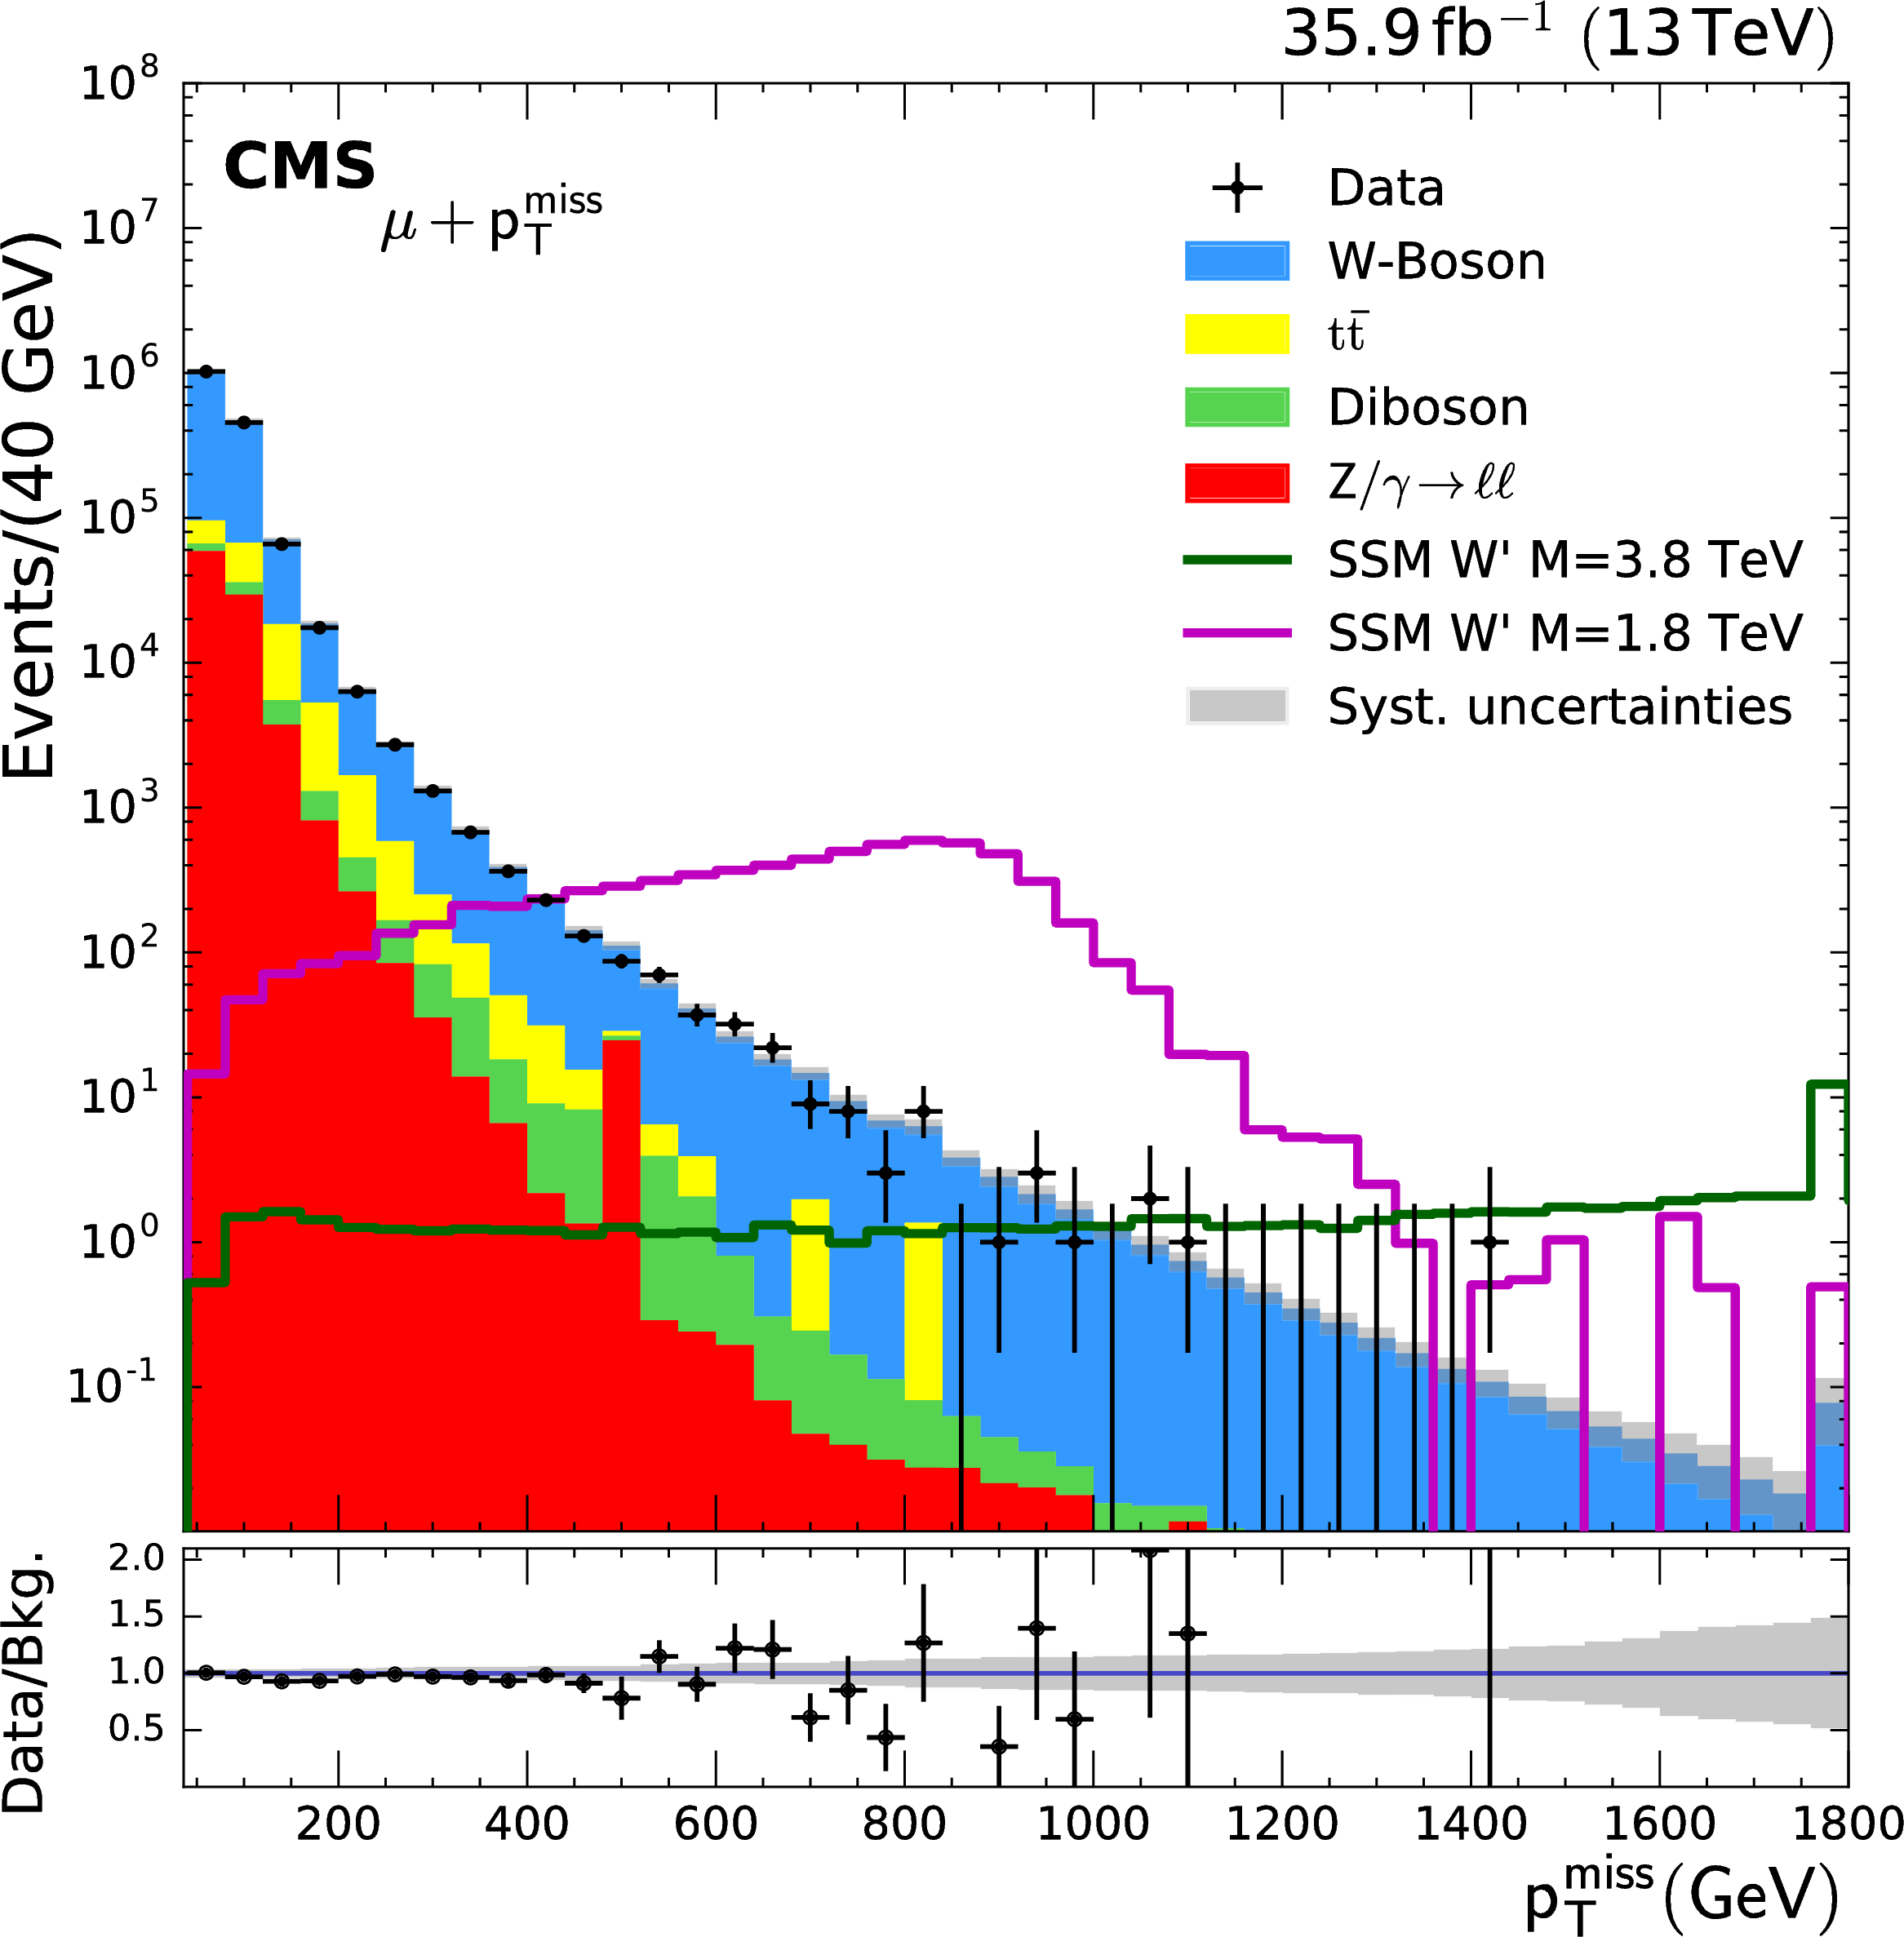
Figure 2:
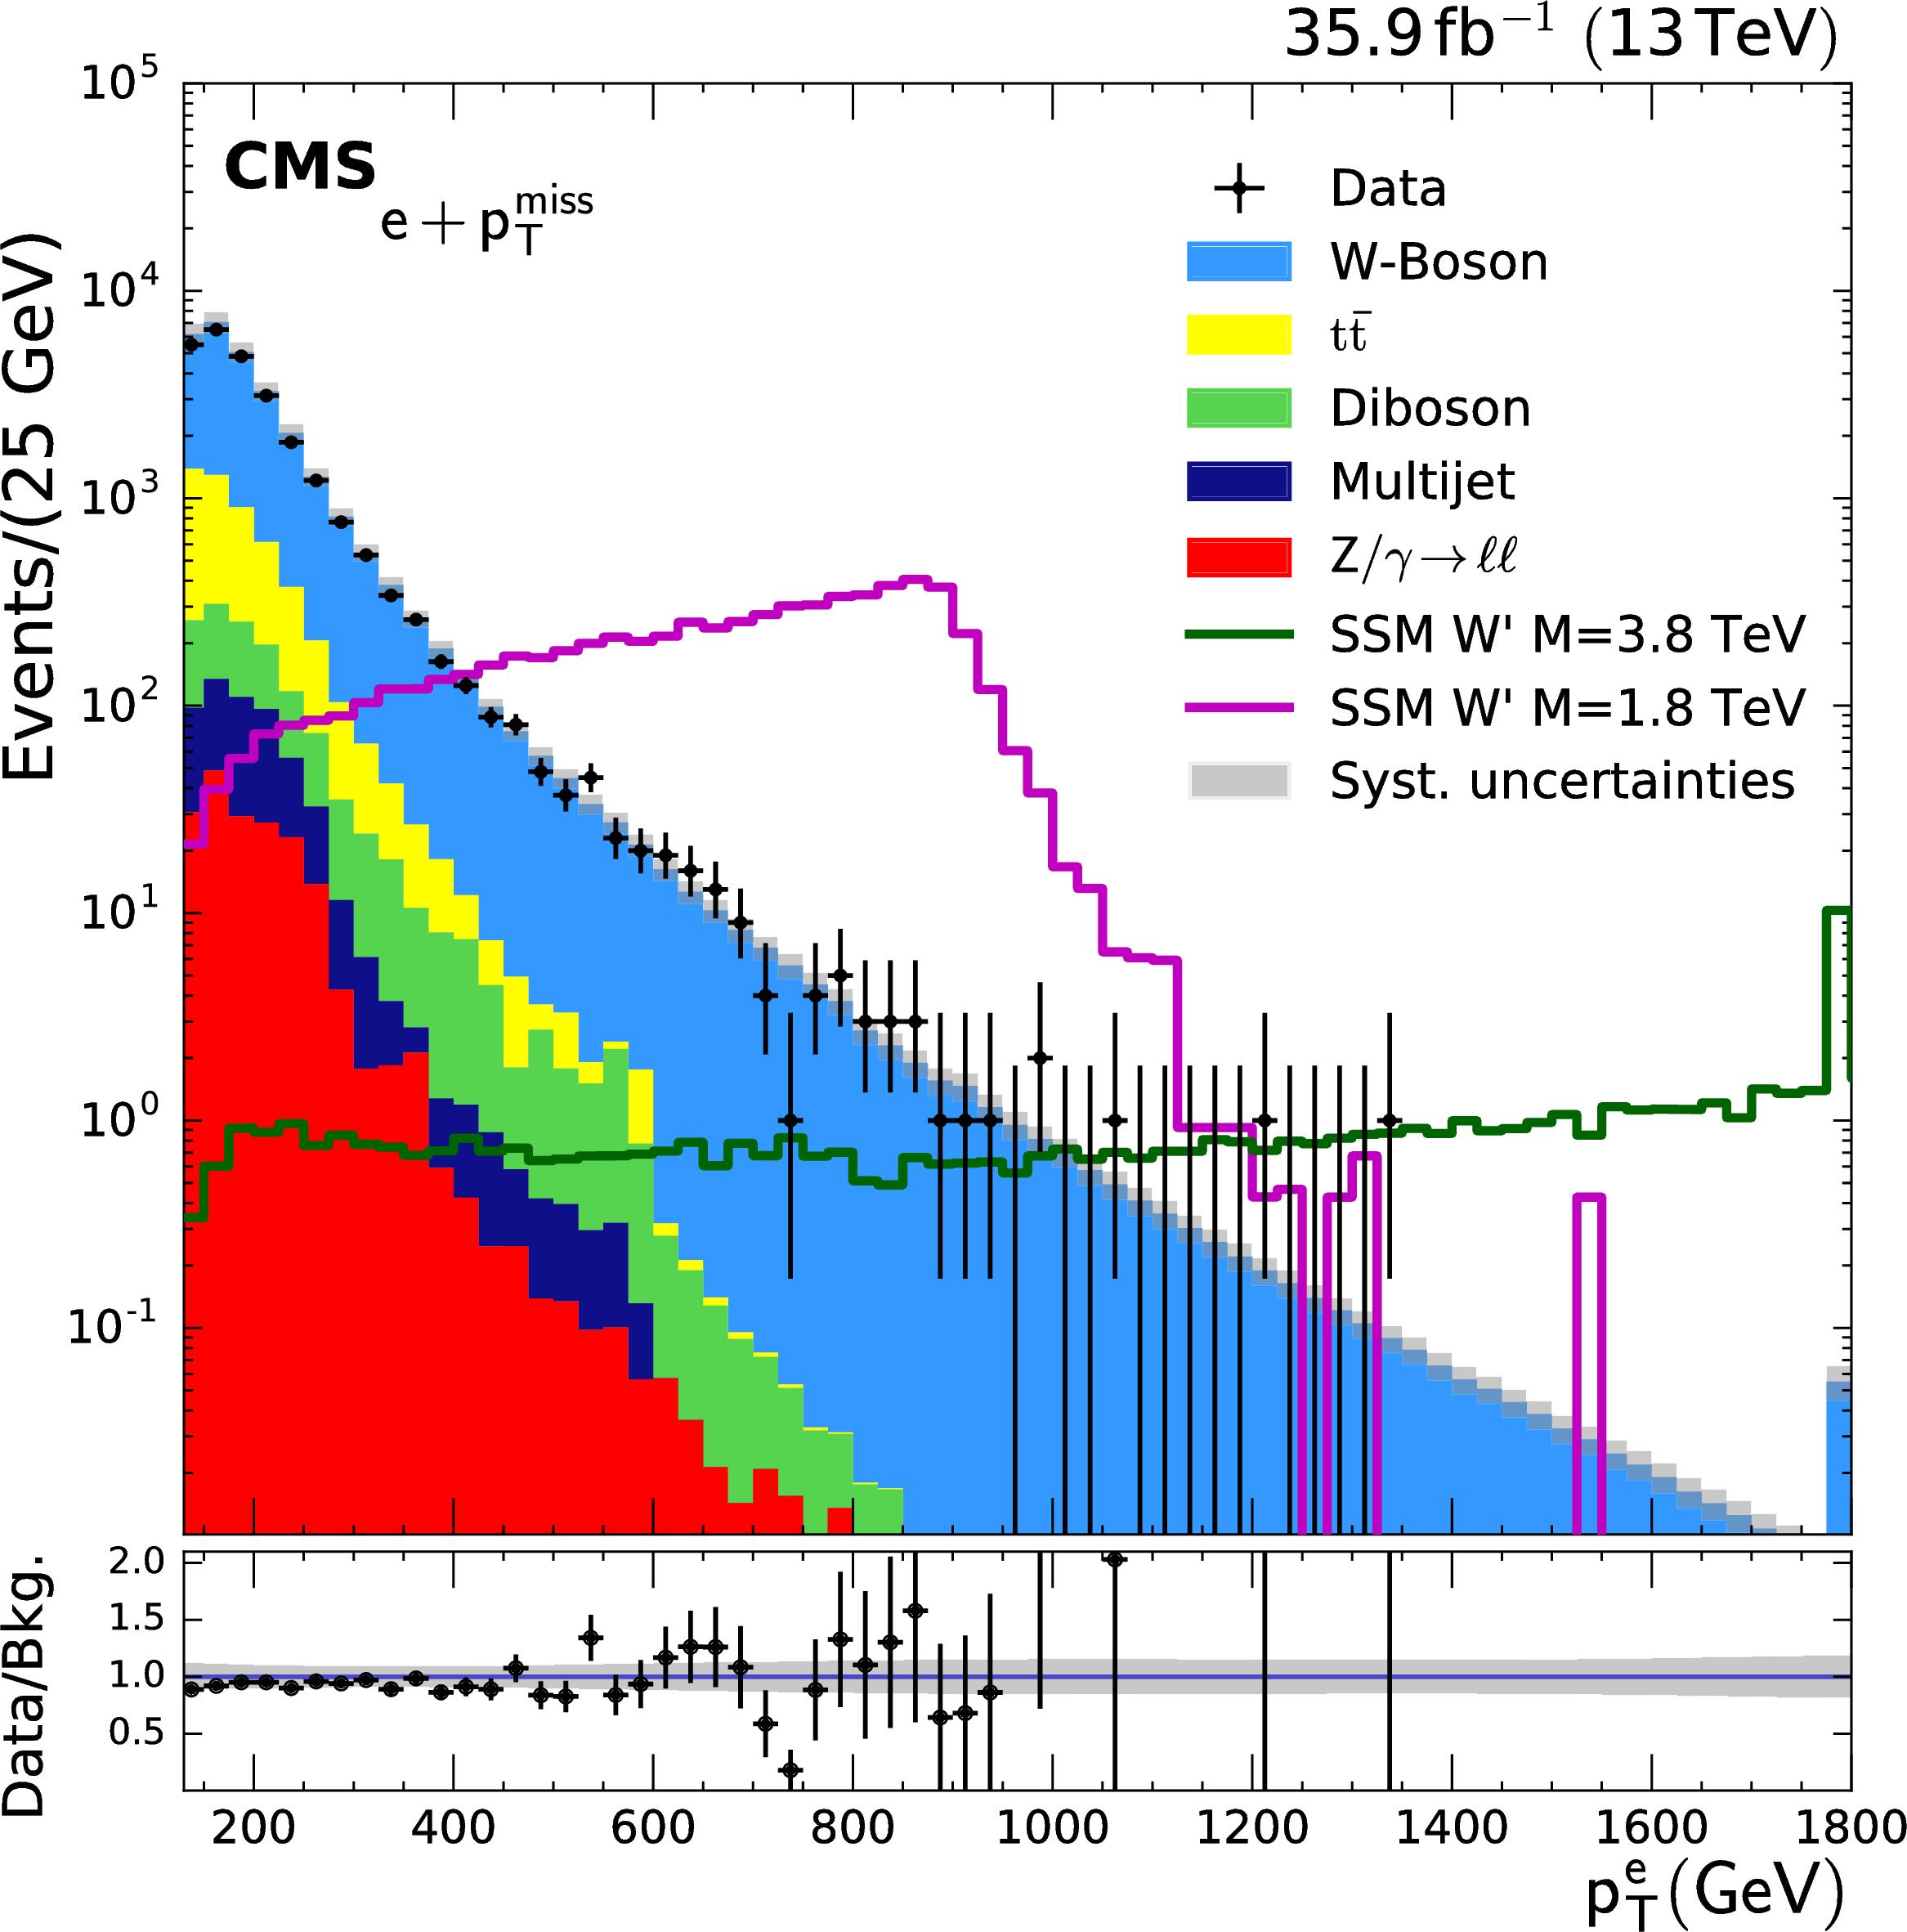
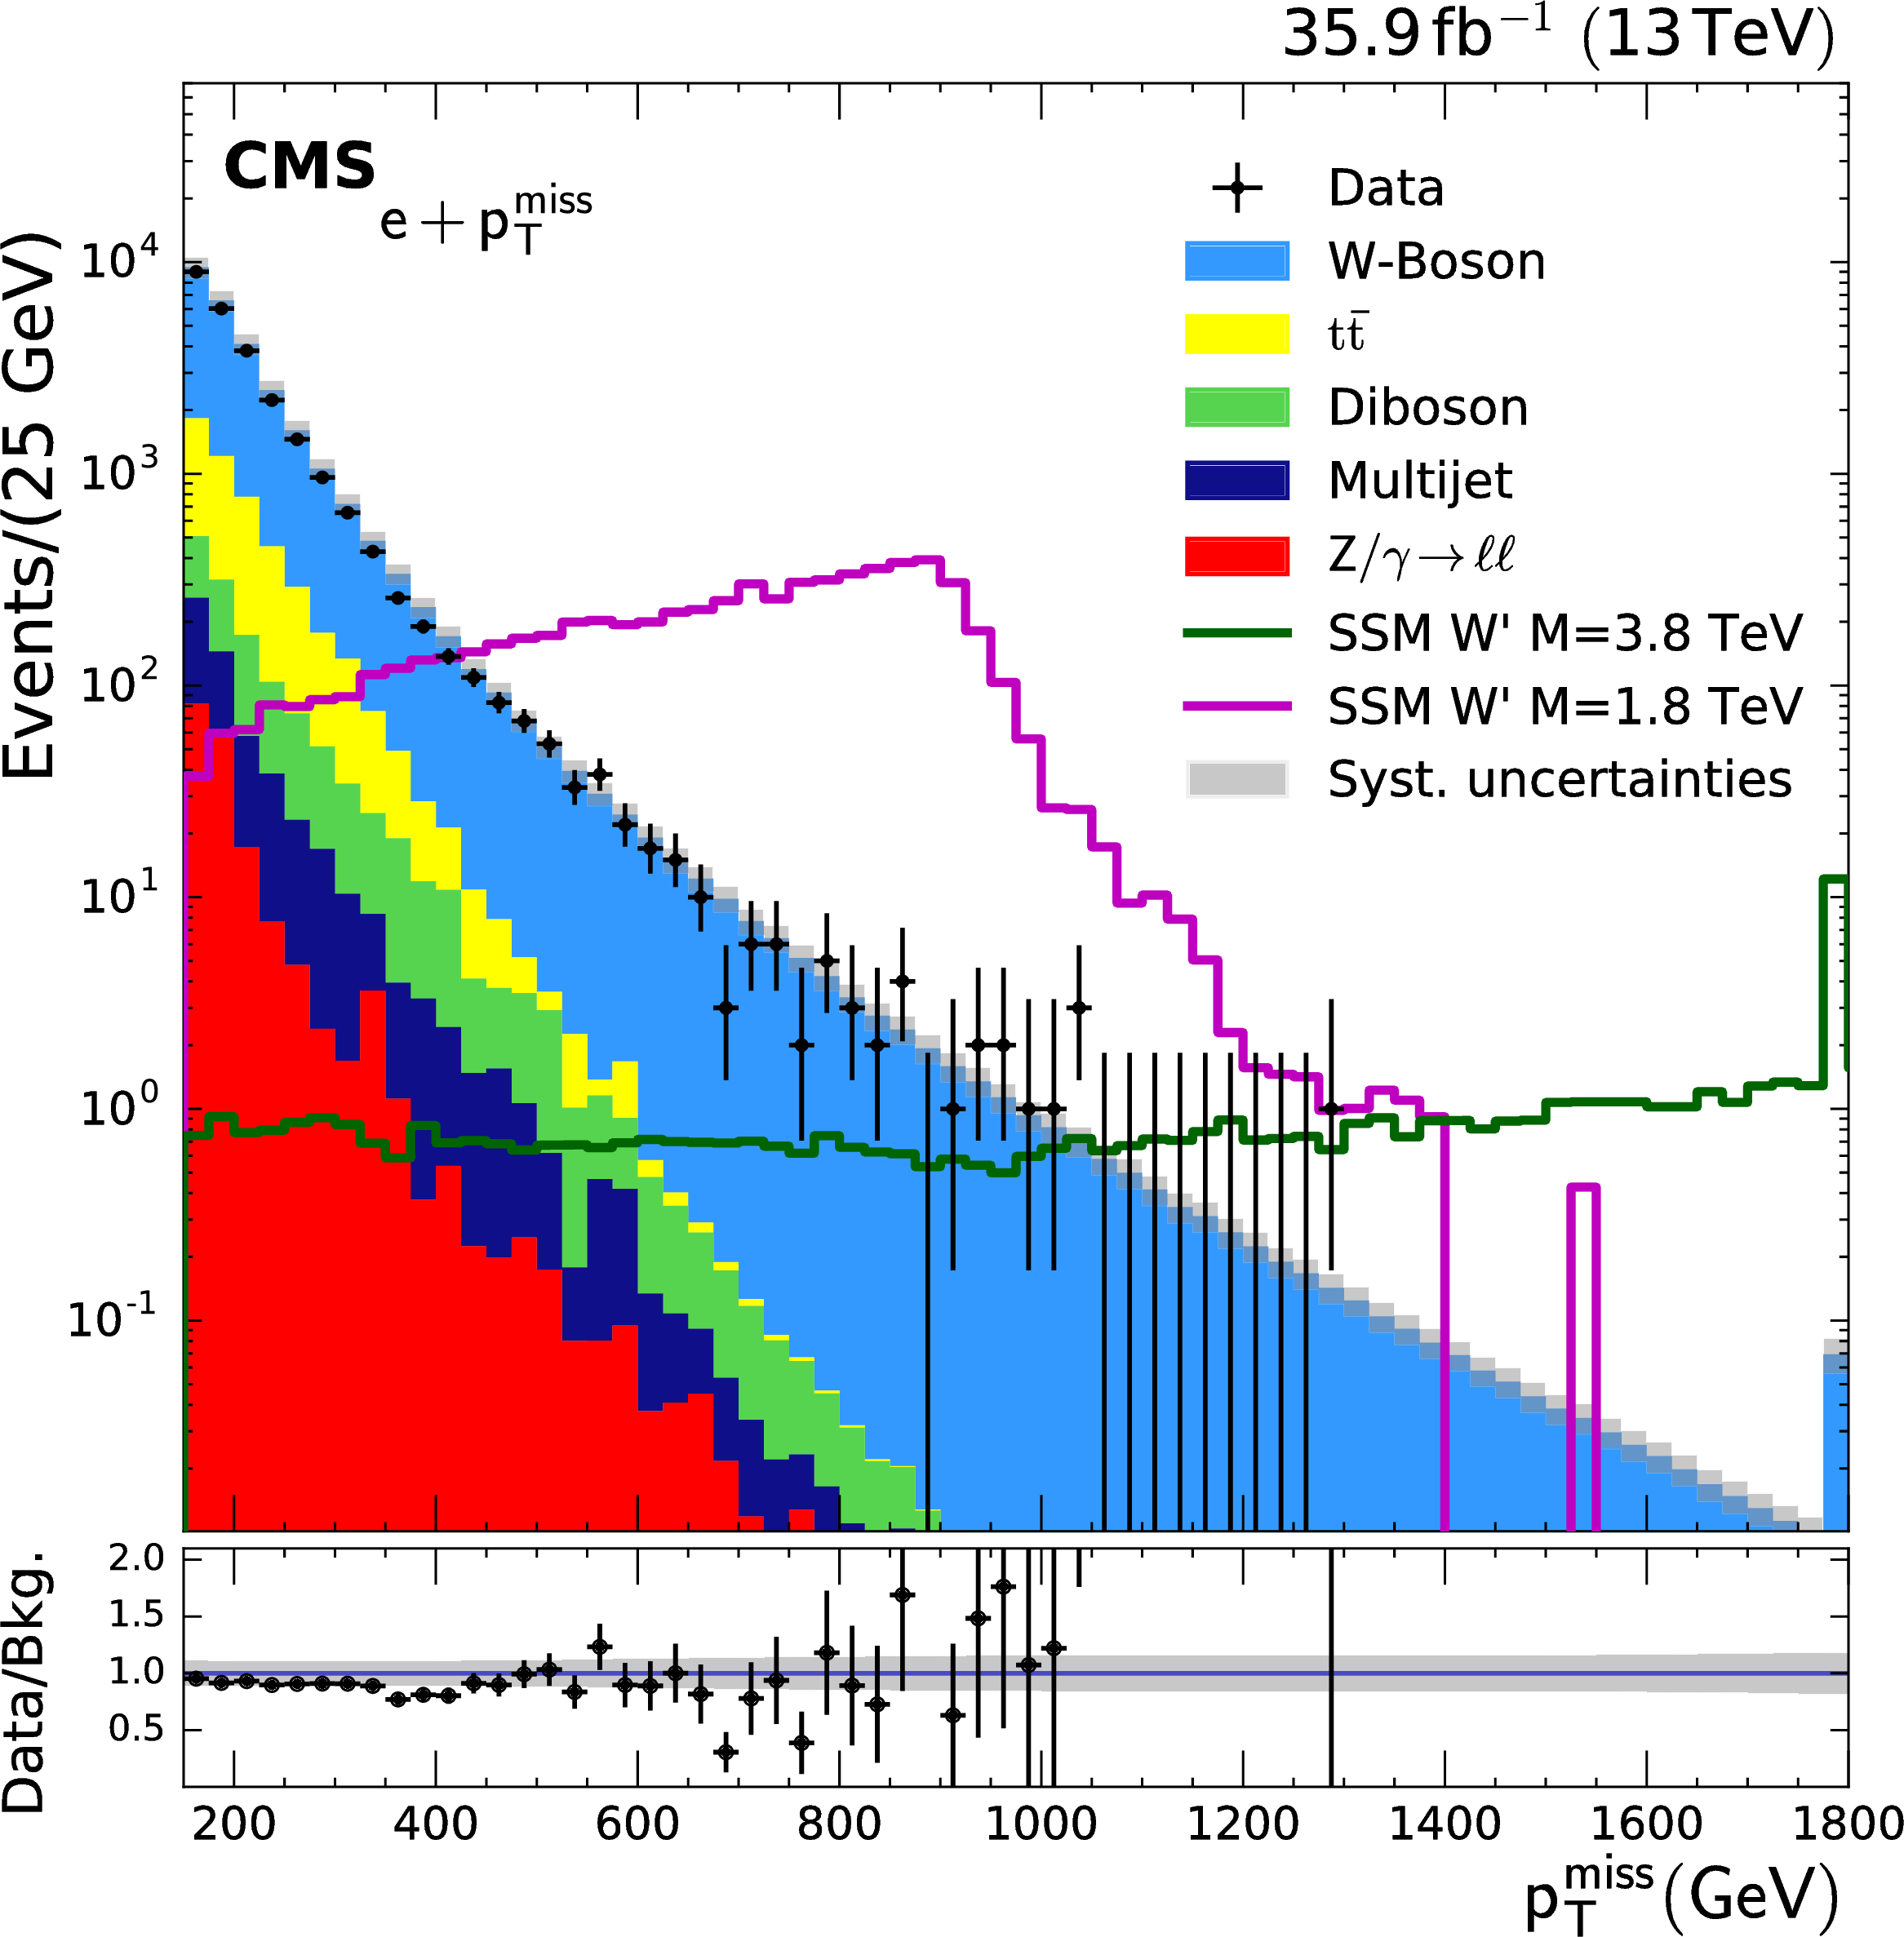
Distributions in $ {p_{\mathrm {T}}} $ (left) and ${{p_{\mathrm {T}}} ^\text {miss}}$ (right), for the electron (upper row) and muon (lower row) for data and for expected SM backgrounds, after applying complete selection criteria. The QCD multijet background in the electron channel is derived from data. The background labelled as "diboson" includes WW, ZZ, and WZ contributions. Also shown are SSM W' signal examples for the two indicated masses. The last bin shows the total overflow. The lower panel shows the ratio of data to prediction and the shaded band includes the systematic uncertainties. |
png pdf |
Figure 2-a:
Distribution in $ {p_{\mathrm {T}}} $, for the electron for data and for expected SM backgrounds, after applying complete selection criteria. The QCD multijet background in the electron channel is derived from data. The background labelled as "diboson" includes WW, ZZ, and WZ contributions. Also shown are SSM W' signal examples for the two indicated masses. The last bin shows the total overflow. The lower panel shows the ratio of data to prediction and the shaded band includes the systematic uncertainties. |
png pdf |
Figure 2-b:
Distribution in ${{p_{\mathrm {T}}} ^\text {miss}}$, for the electron for data and for expected SM backgrounds, after applying complete selection criteria. The QCD multijet background in the electron channel is derived from data. The background labelled as "diboson" includes WW, ZZ, and WZ contributions. Also shown are SSM W' signal examples for the two indicated masses. The last bin shows the total overflow. The lower panel shows the ratio of data to prediction and the shaded band includes the systematic uncertainties. |
png pdf |
Figure 2-c:
Distribution in $ {p_{\mathrm {T}}} $, for the muon for data and for expected SM backgrounds, after applying complete selection criteria. The QCD multijet background in the electron channel is derived from data. The background labelled as "diboson" includes WW, ZZ, and WZ contributions. Also shown are SSM W' signal examples for the two indicated masses. The last bin shows the total overflow. The lower panel shows the ratio of data to prediction and the shaded band includes the systematic uncertainties. |
png pdf |
Figure 2-d:
Distribution in ${{p_{\mathrm {T}}} ^\text {miss}}$, for the muon for data and for expected SM backgrounds, after applying complete selection criteria. The QCD multijet background in the electron channel is derived from data. The background labelled as "diboson" includes WW, ZZ, and WZ contributions. Also shown are SSM W' signal examples for the two indicated masses. The last bin shows the total overflow. The lower panel shows the ratio of data to prediction and the shaded band includes the systematic uncertainties. |
png pdf |
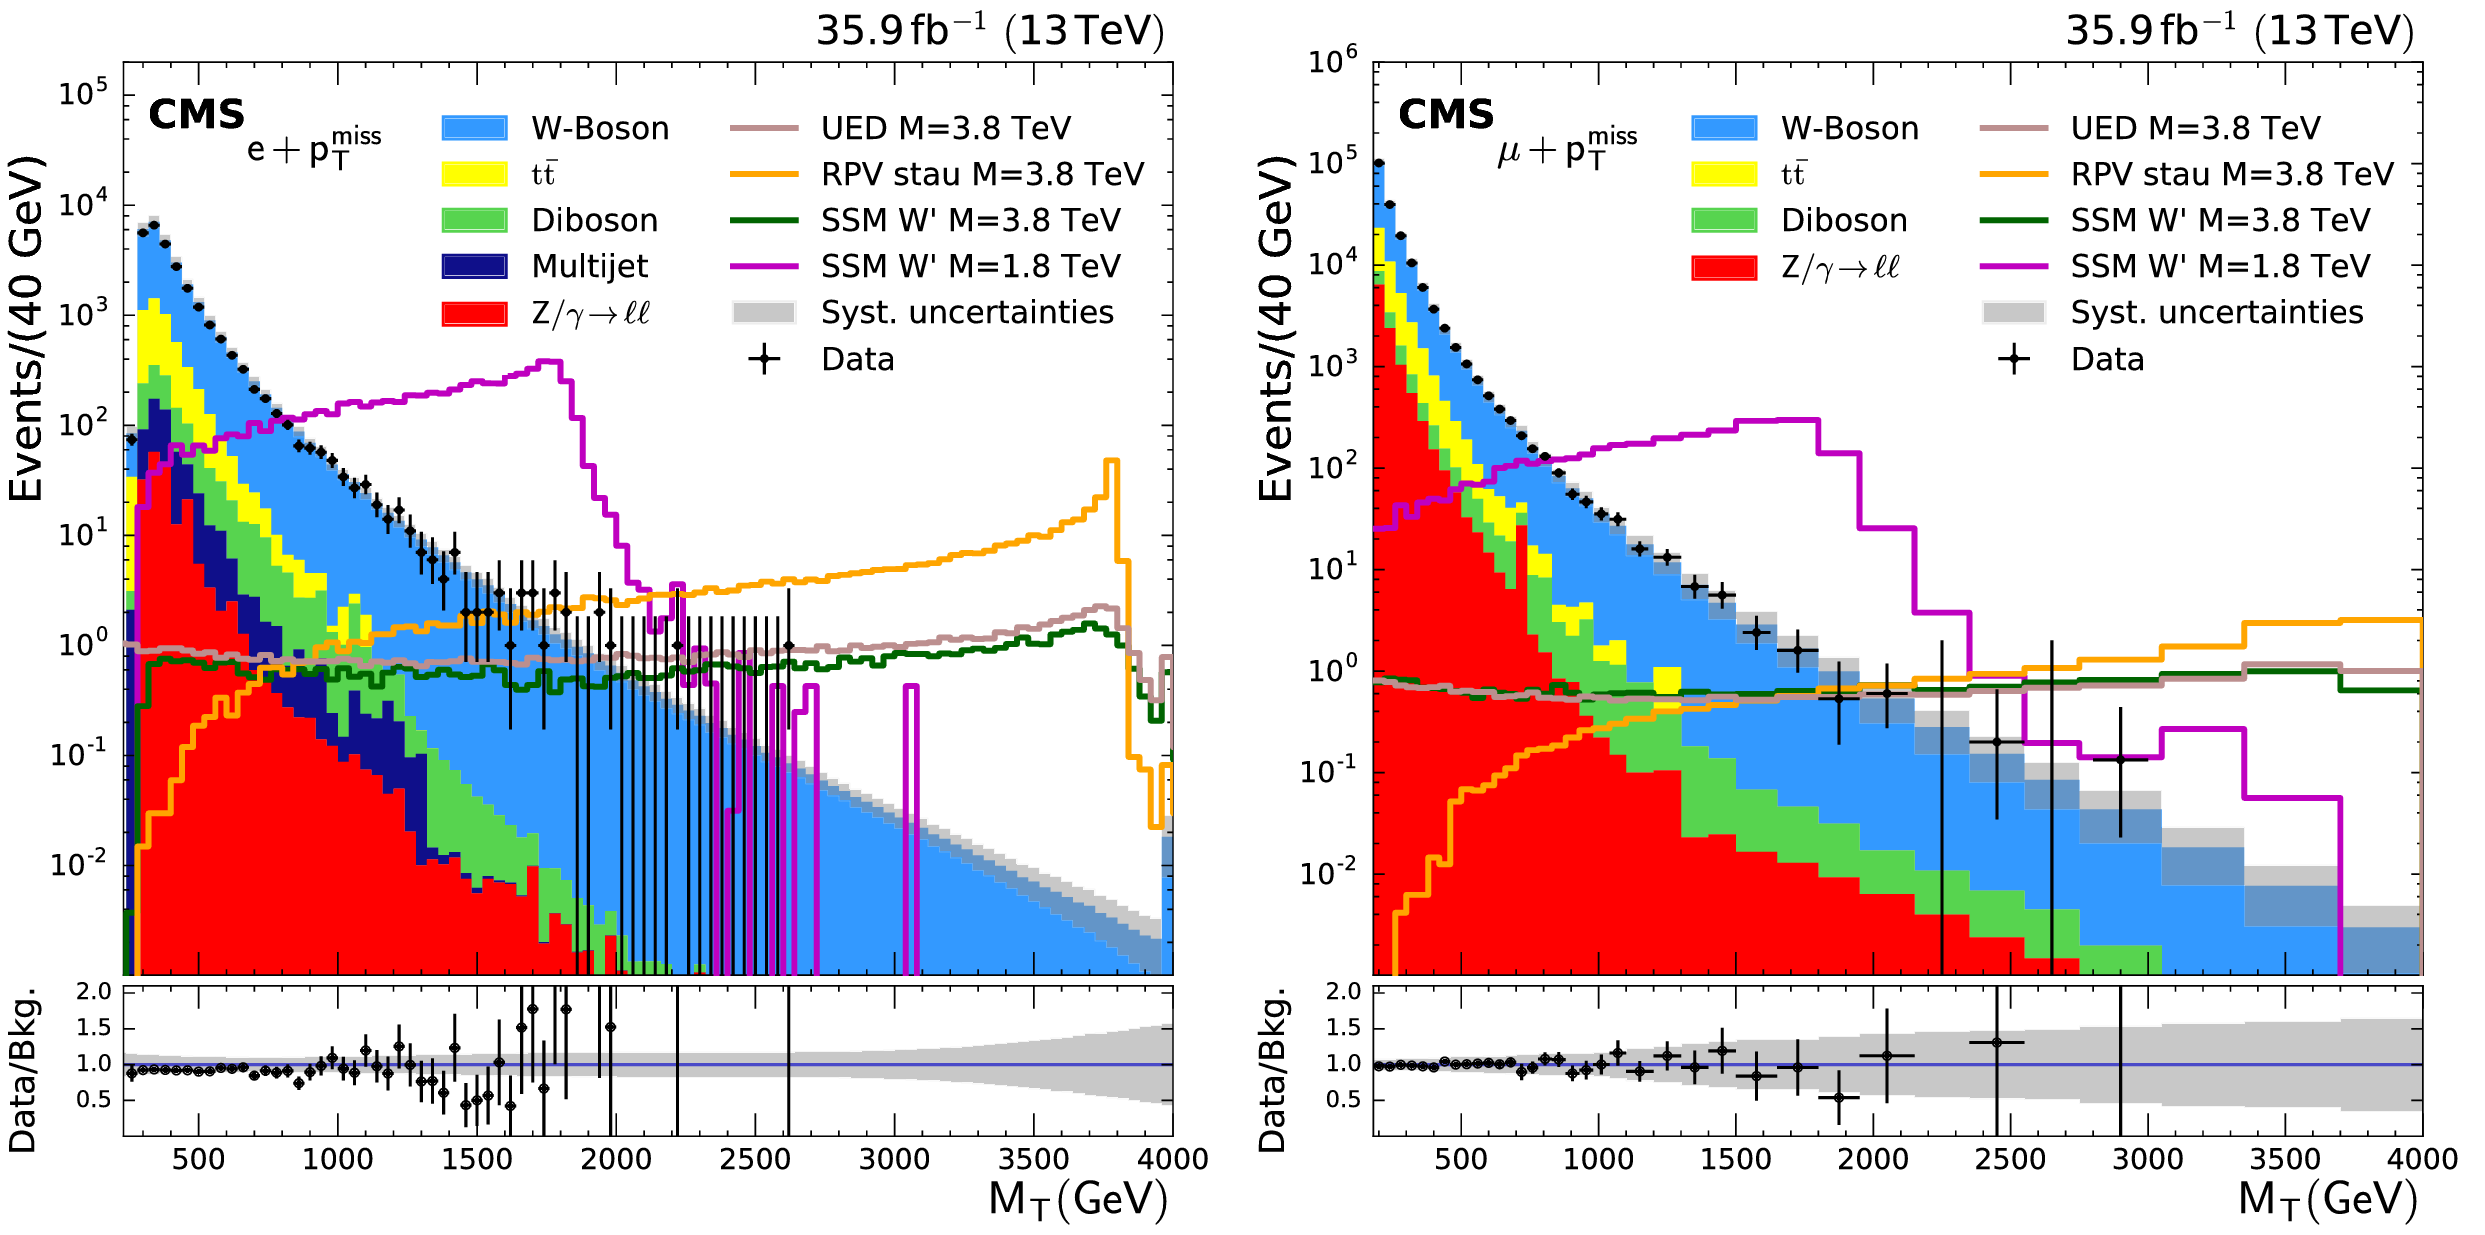
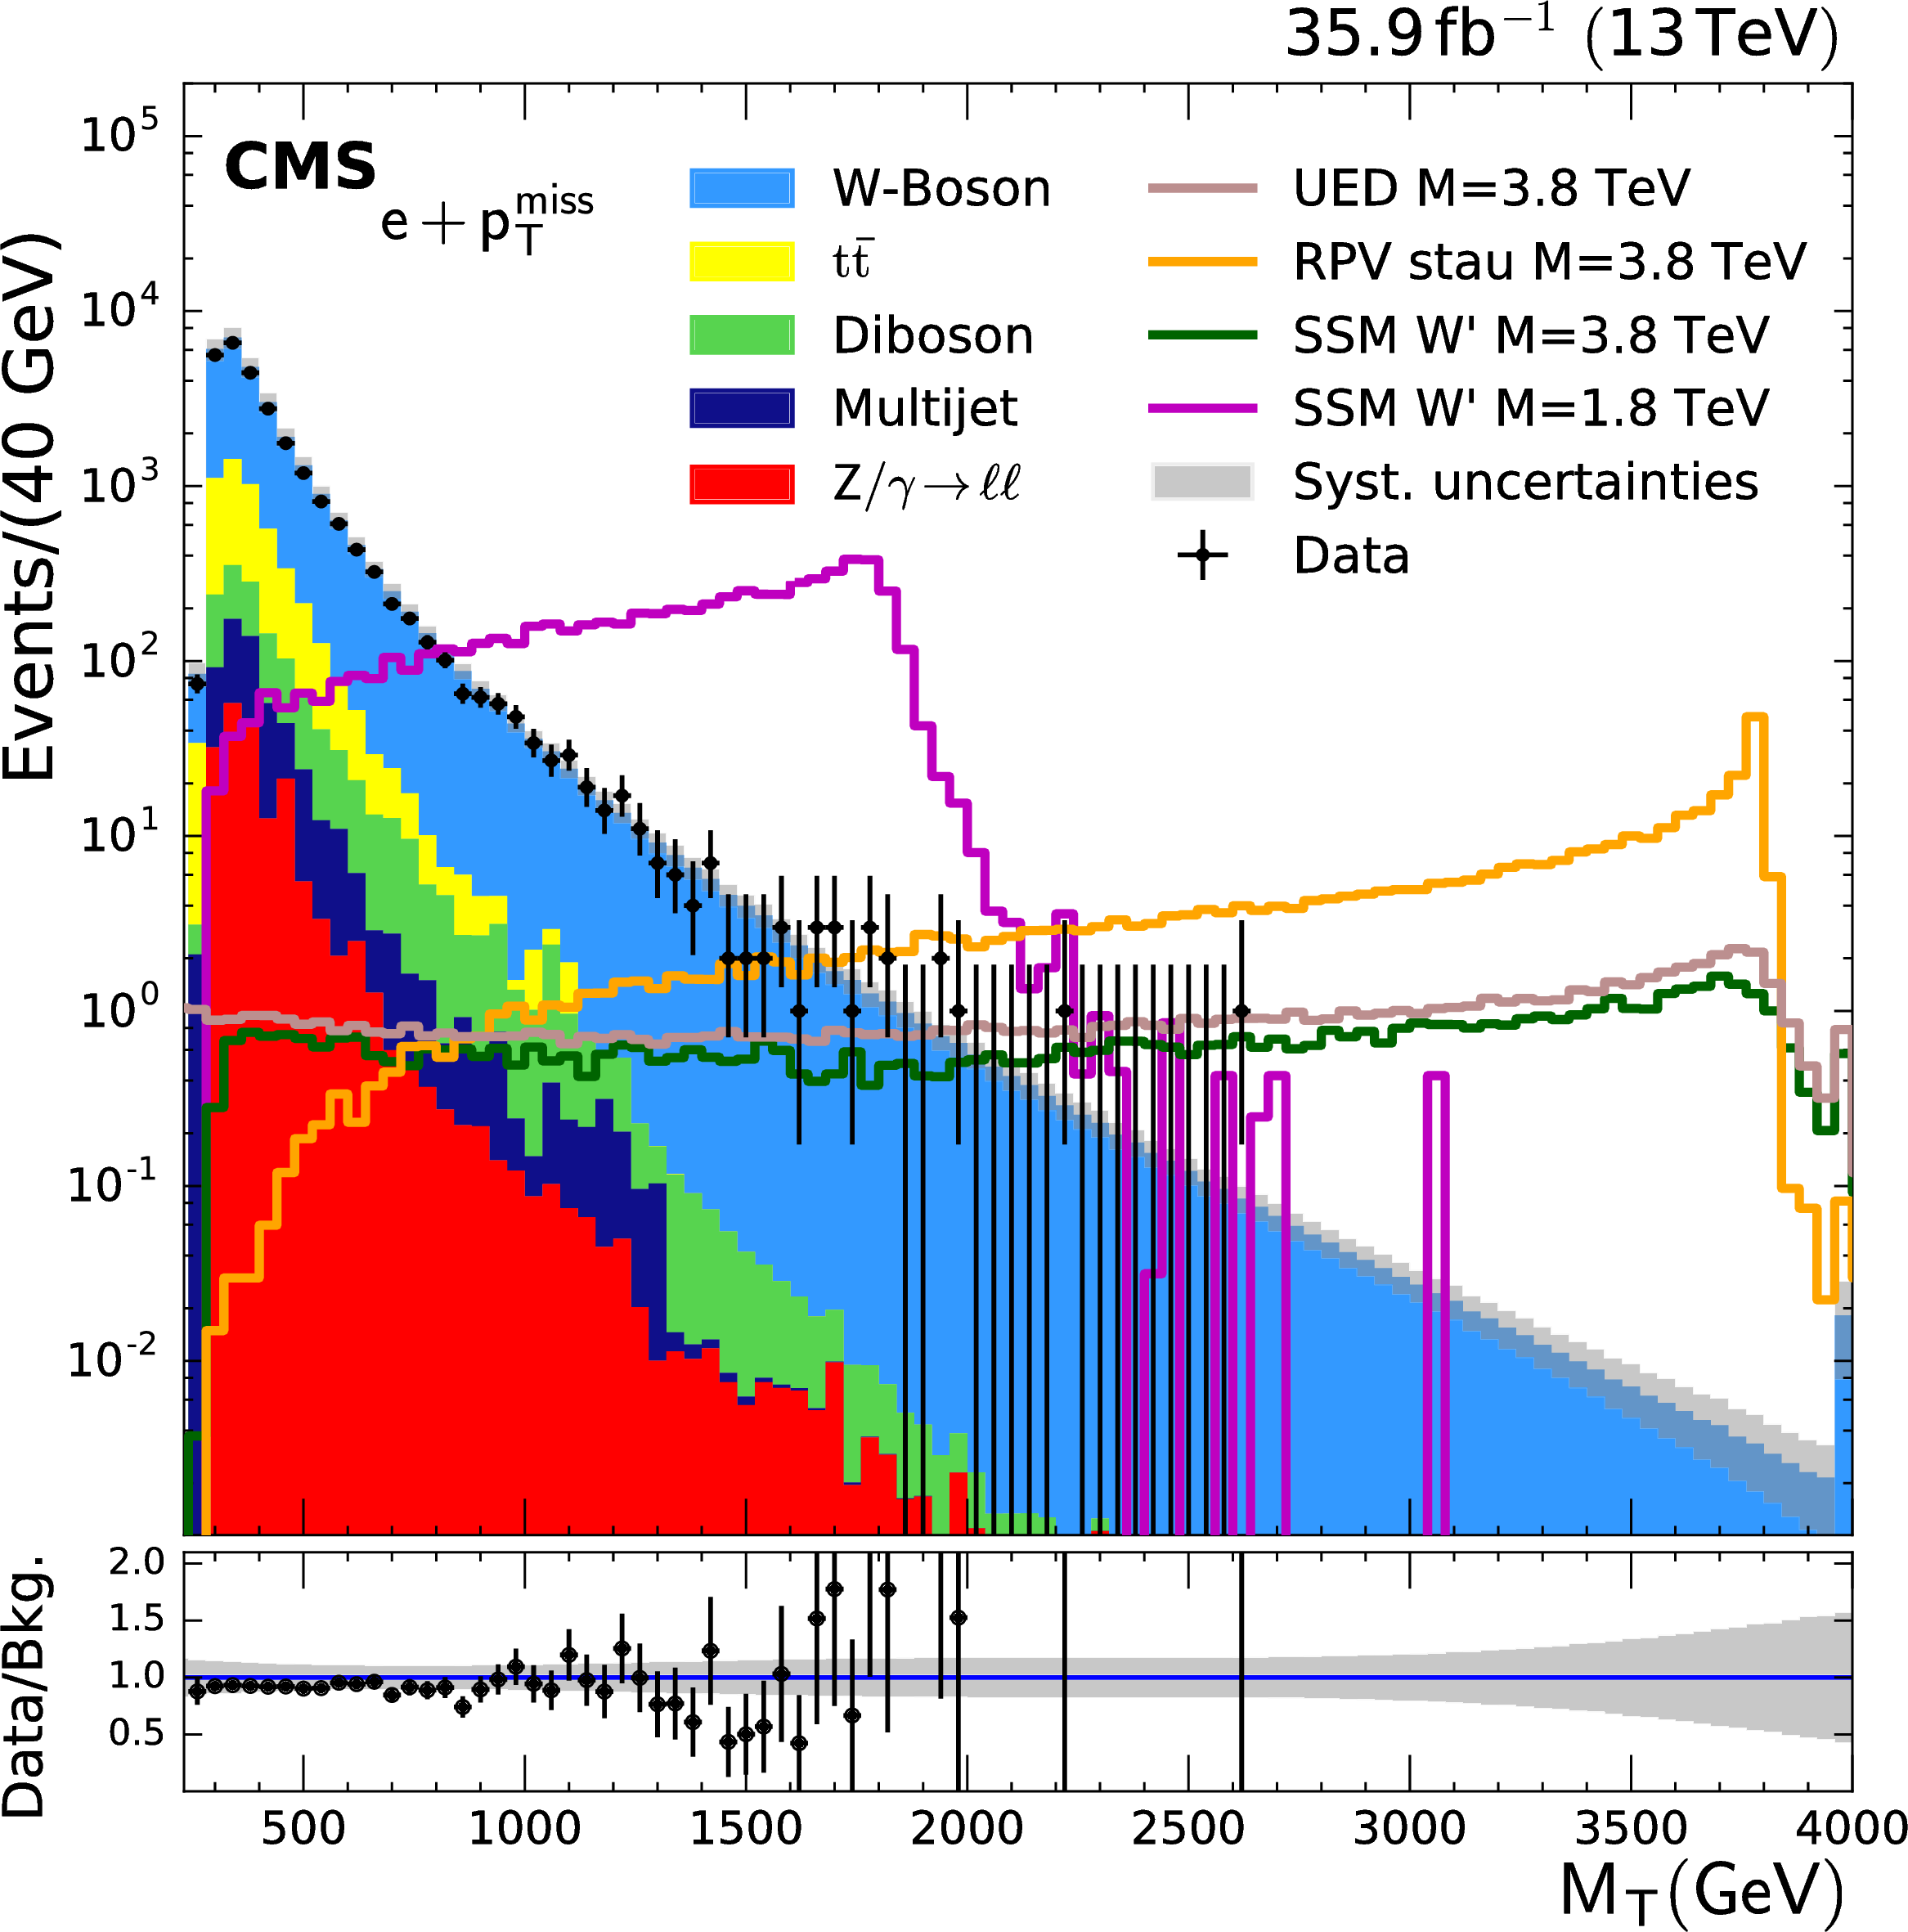
Figure 3:
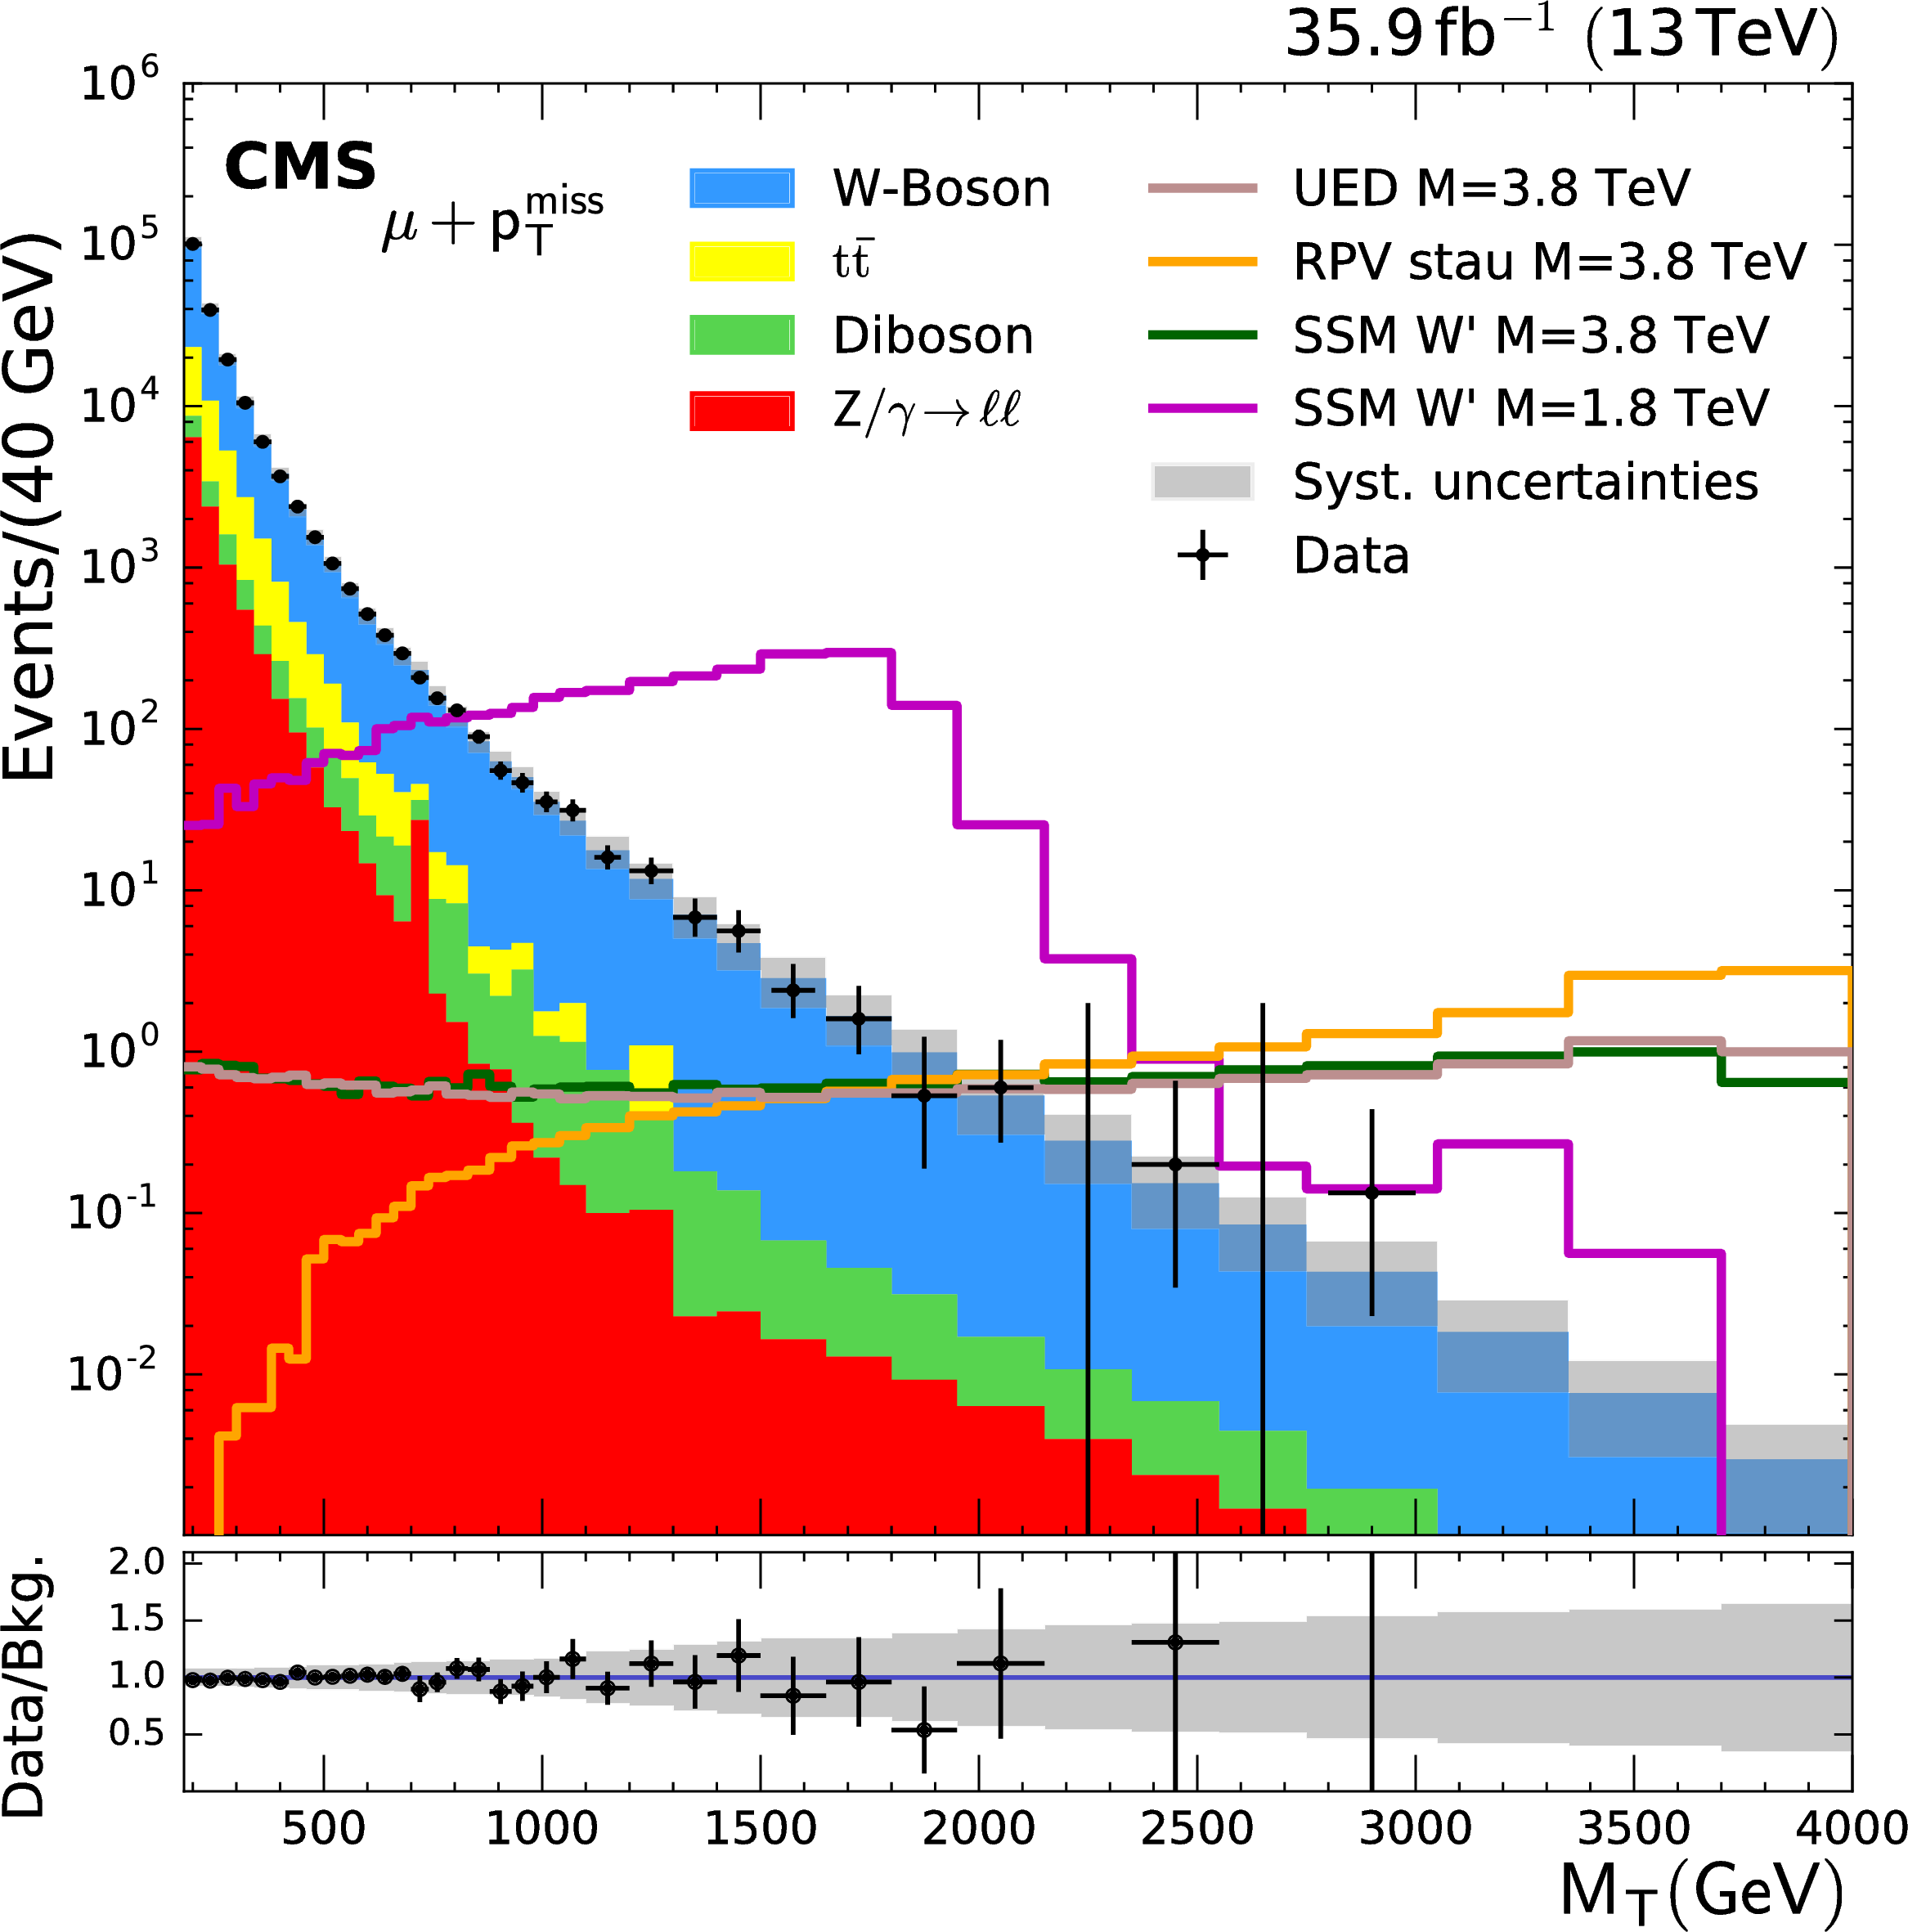
Observed $ {M_\mathrm {T}} $ distributions for the electron (left) and muon (right) channels after all selections. Signal examples for W' masses of 1.8 and 3.8 TeV, including detector simulation, are shown in both channels. In addition, signal examples for RPV SUSY and split-UED are depicted. The lower panel shows the ratio of data to prediction and the hatched band includes the systematic uncertainties. The last bin shows the total overflow. |
png pdf |
Figure 3-a:
Observed $ {M_\mathrm {T}} $ distribution for the electron channel after all selections. Signal examples for W' masses of 1.8 and 3.8 TeV, including detector simulation, are shown in both channels. In addition, signal examples for RPV SUSY and split-UED are depicted. The lower panel shows the ratio of data to prediction and the hatched band includes the systematic uncertainties. The last bin shows the total overflow. |
png pdf |
Figure 3-b:
Observed $ {M_\mathrm {T}} $ distribution for the muon channel after all selections. Signal examples for W' masses of 1.8 and 3.8 TeV, including detector simulation, are shown in both channels. In addition, signal examples for RPV SUSY and split-UED are depicted. The lower panel shows the ratio of data to prediction and the hatched band includes the systematic uncertainties. The last bin shows the total overflow. |
png pdf |
Figure 4:
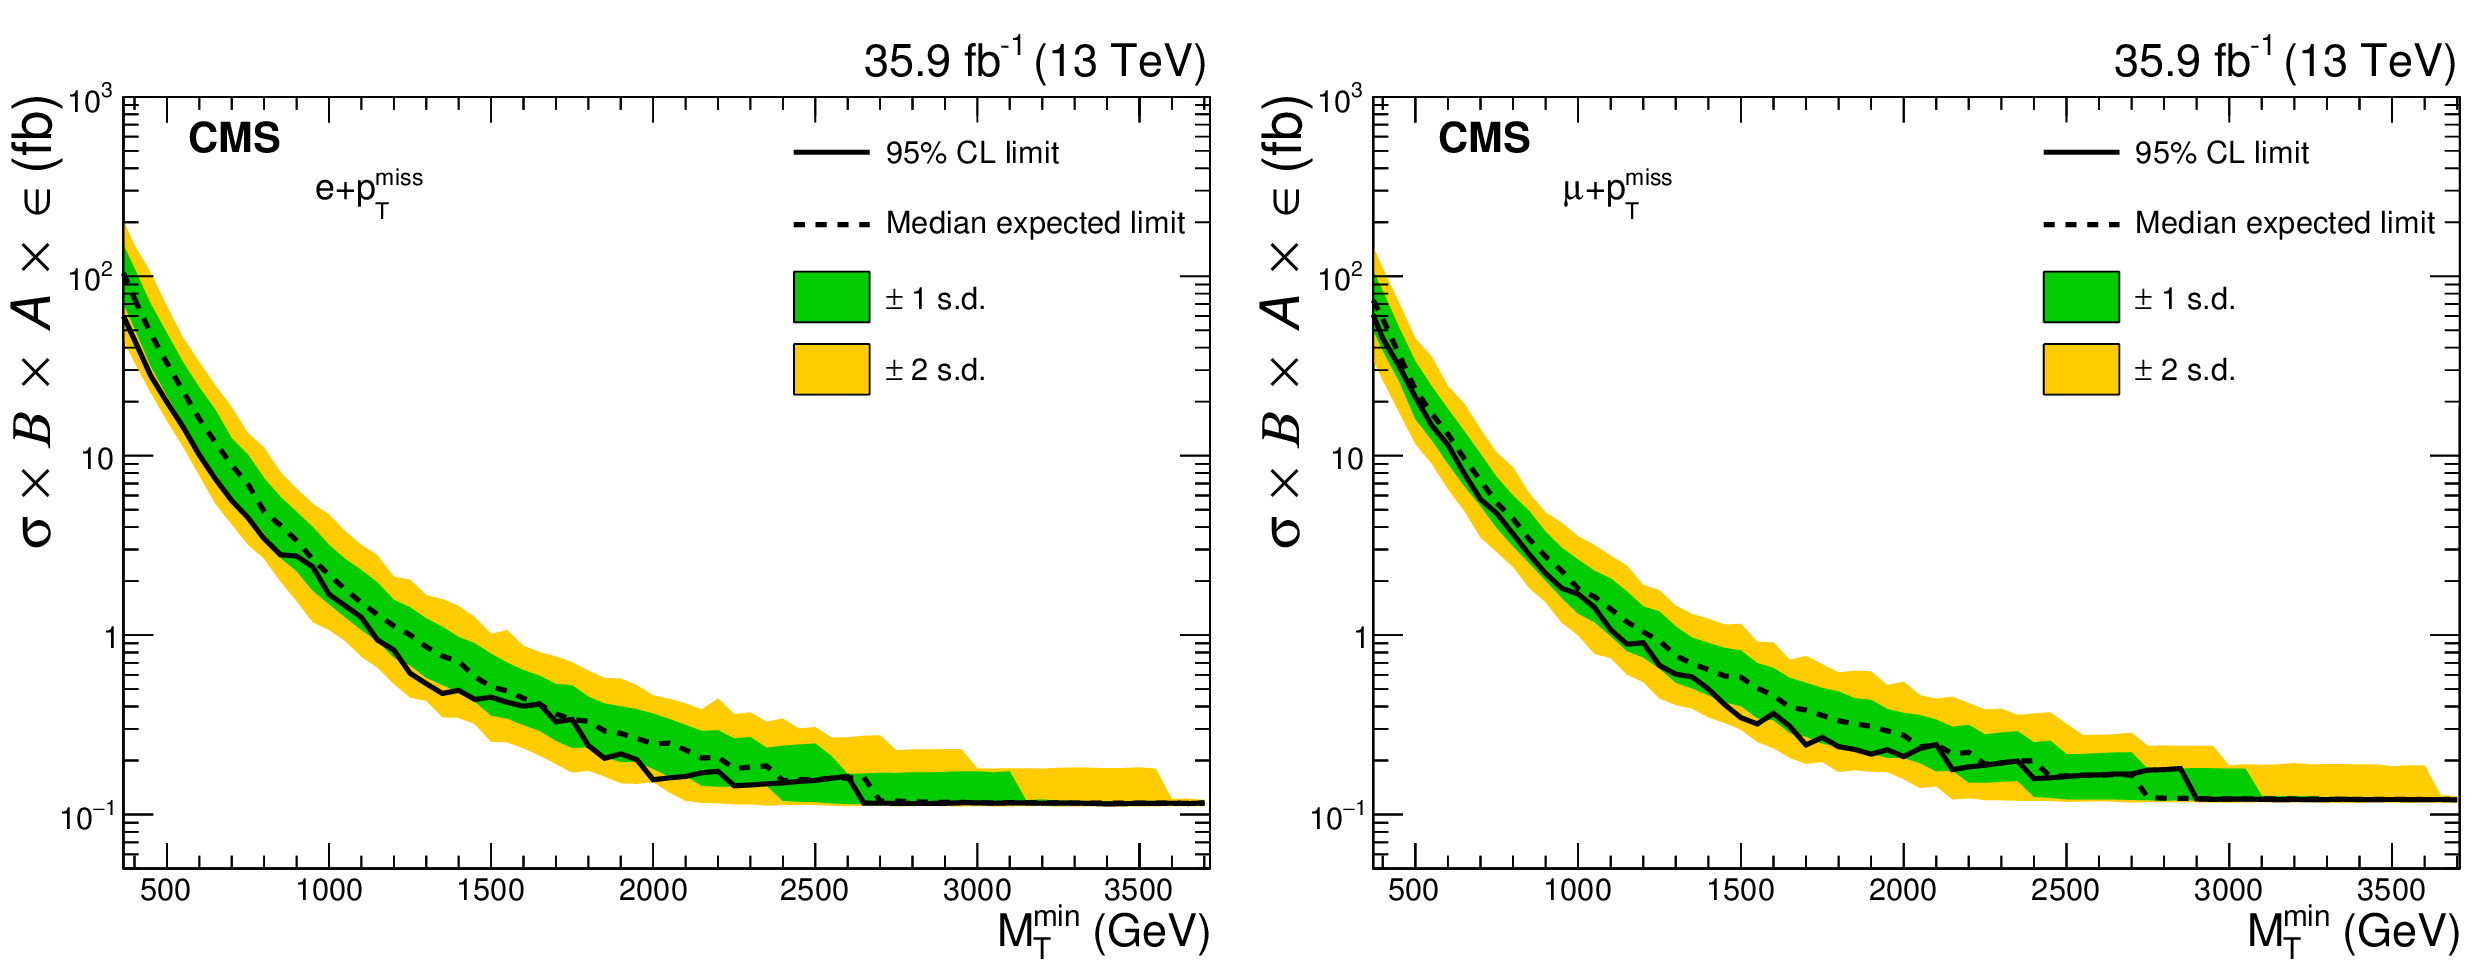
Cross section upper limits at 95% CL on the effective cross section $\sigma ({\mathrm {W}'}) \, \mathcal {B}({\mathrm {W}'} \to \ell \nu) \, A \, \epsilon $ above a threshold $ {M_\mathrm {T}^\mathrm {min}} $ for the individual electron (left) and muon (right) channels. Shown are the observed limit (solid line), expected limit (dashed line), and the expected limit $\pm $1 and $\pm $2 standard deviation (s.d.) intervals. |
png pdf |
Figure 4-a:
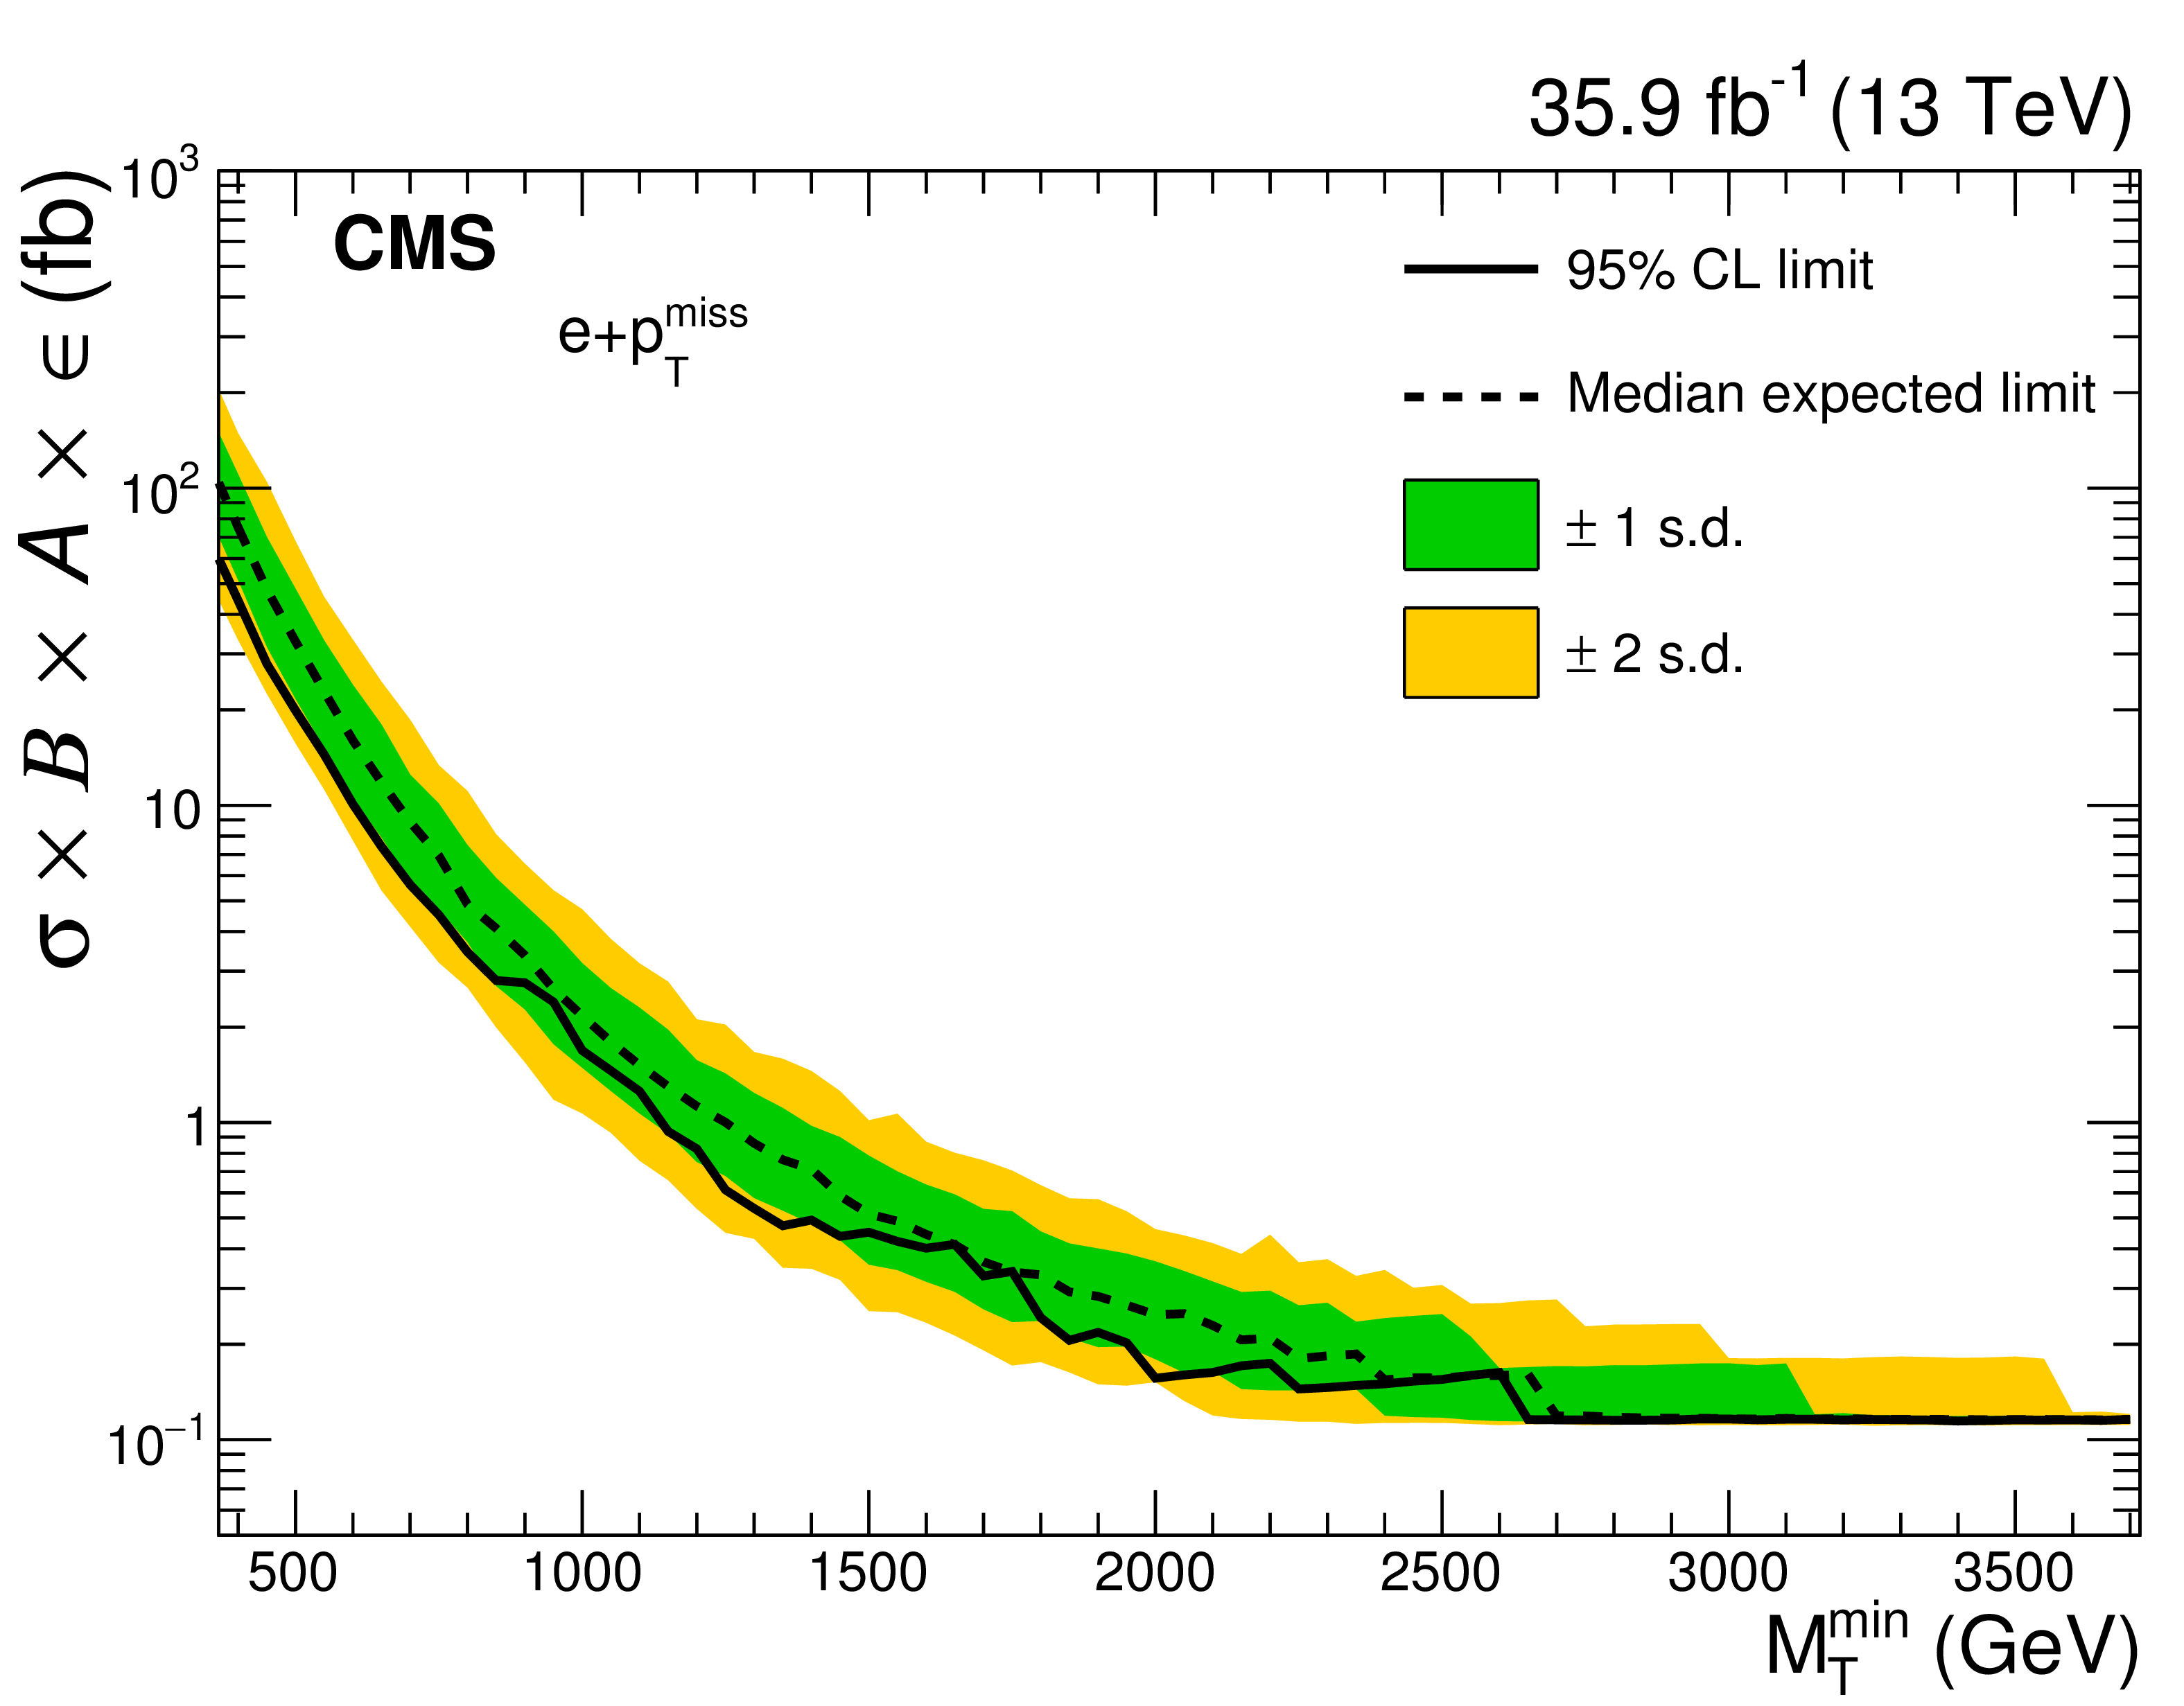
Cross section upper limits at 95% CL on the effective cross section $\sigma ({\mathrm {W}'}) \, \mathcal {B}({\mathrm {W}'} \to \ell \nu) \, A \, \epsilon $ above a threshold $ {M_\mathrm {T}^\mathrm {min}} $ for the electron channel. Shown are the observed limit (solid line), expected limit (dashed line), and the expected limit $\pm $1 and $\pm $2 standard deviation (s.d.) intervals. |
png pdf |
Figure 4-b:
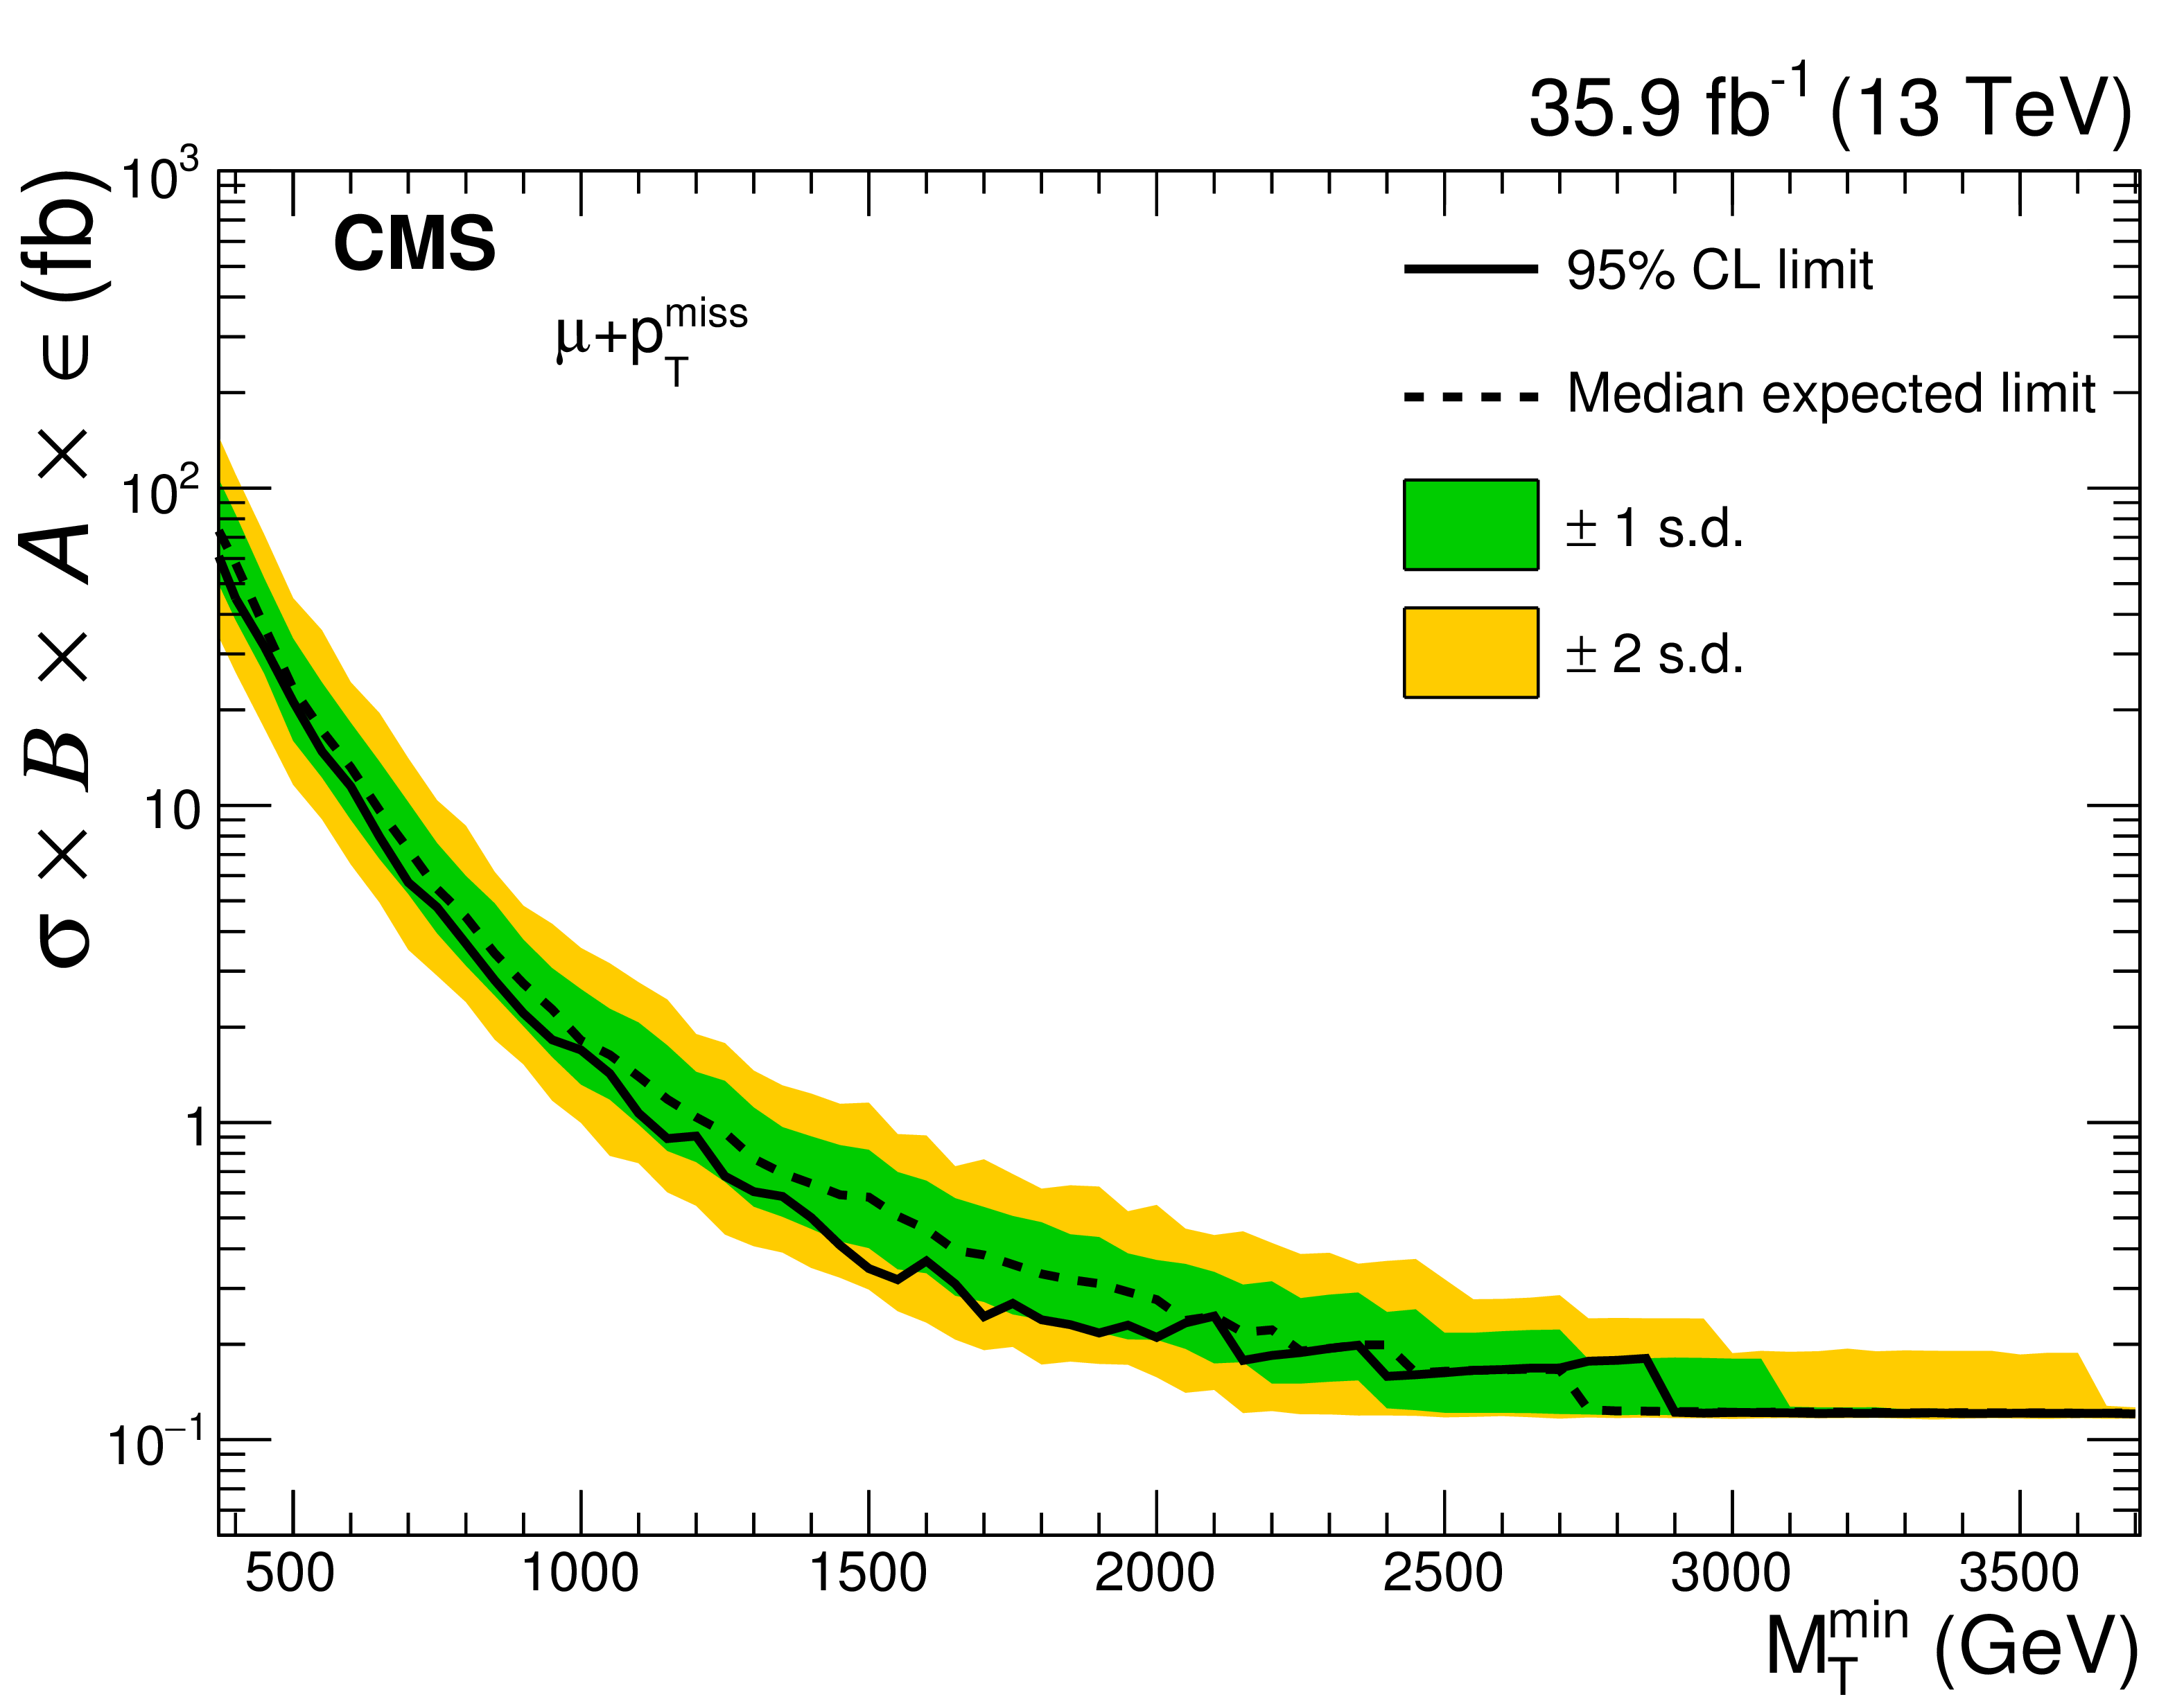
Cross section upper limits at 95% CL on the effective cross section $\sigma ({\mathrm {W}'}) \, \mathcal {B}({\mathrm {W}'} \to \ell \nu) \, A \, \epsilon $ above a threshold $ {M_\mathrm {T}^\mathrm {min}} $ for the muon channel. Shown are the observed limit (solid line), expected limit (dashed line), and the expected limit $\pm $1 and $\pm $2 standard deviation (s.d.) intervals. |
png pdf |
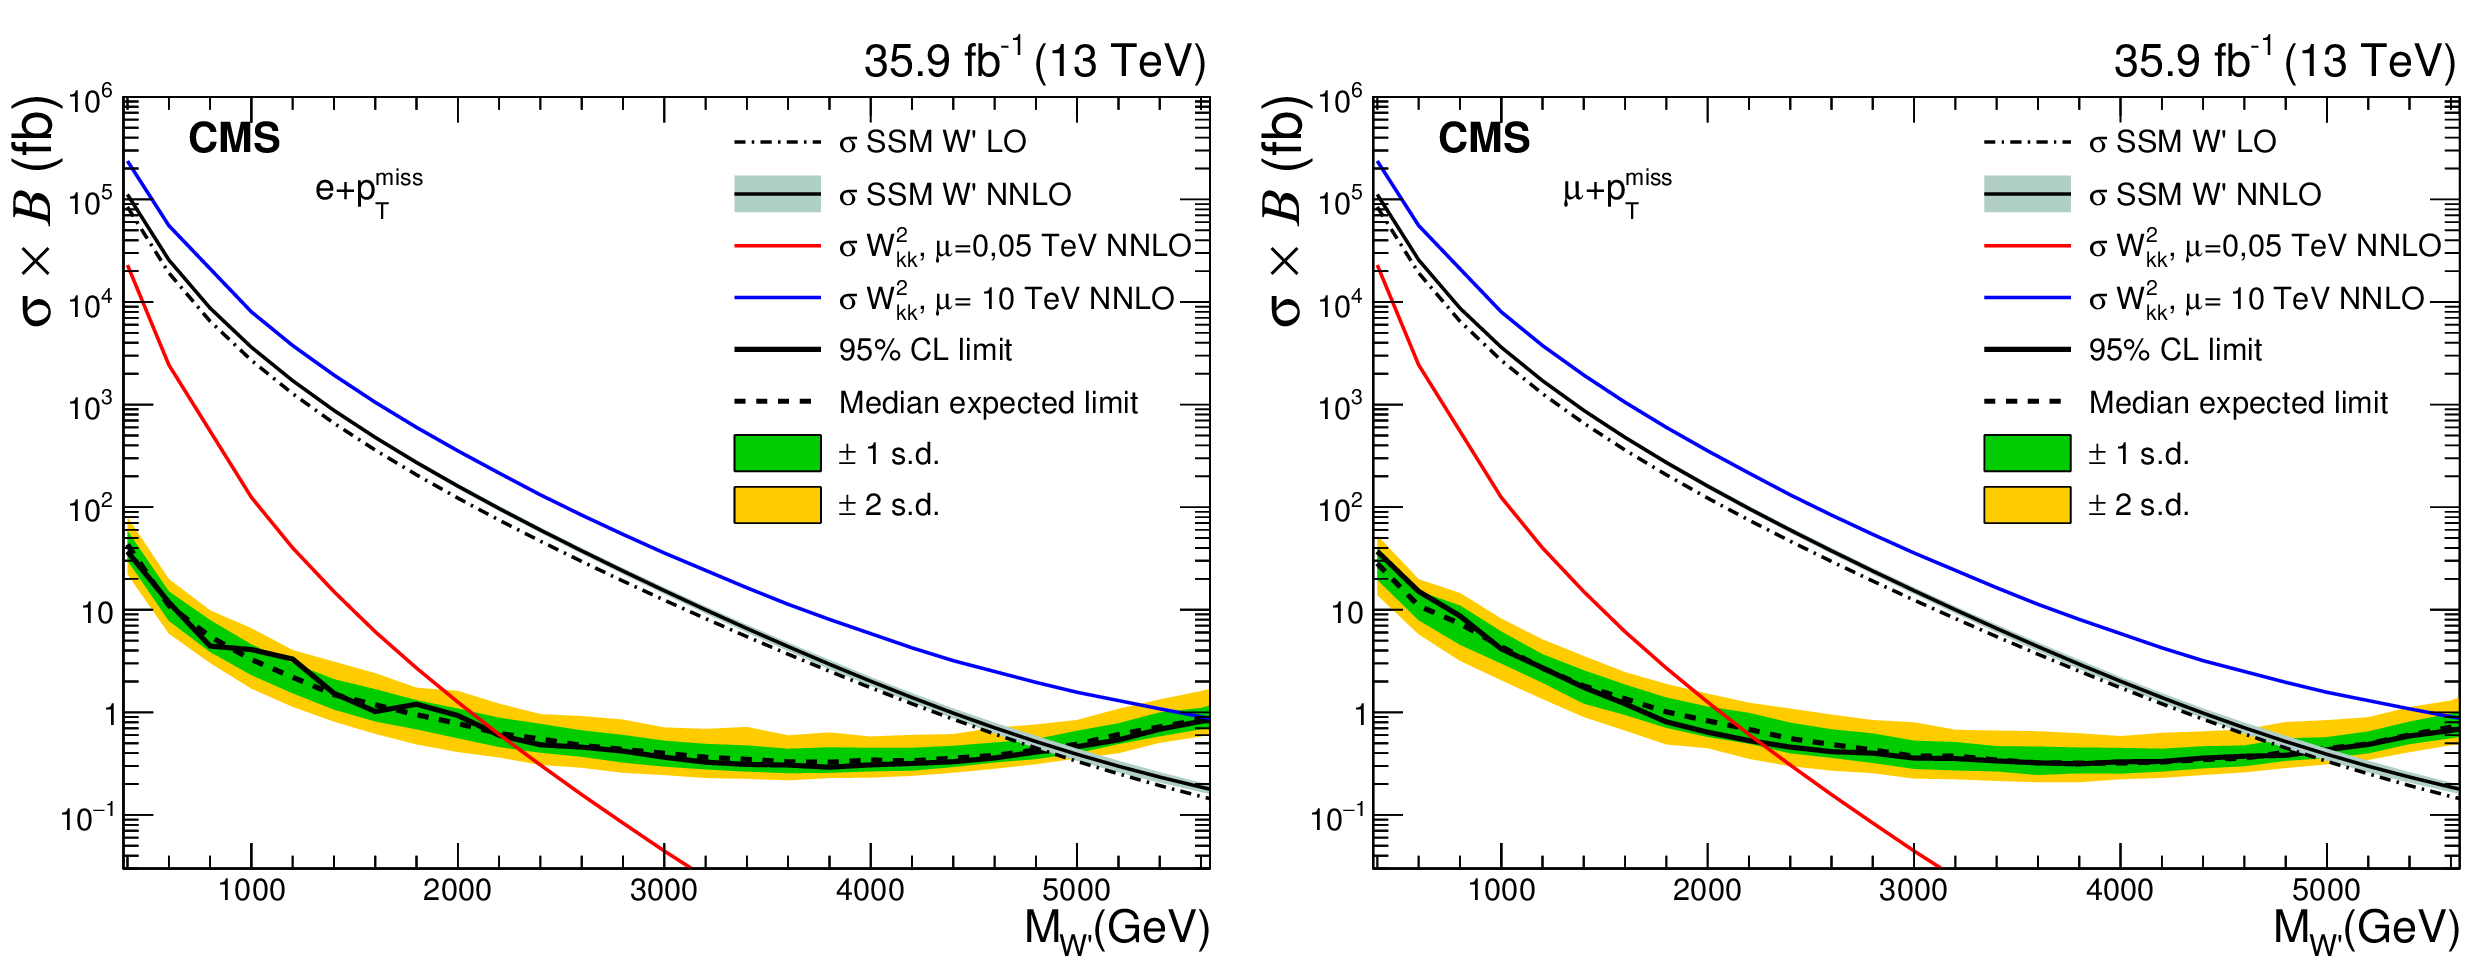
Figure 5:
Expected (dashed line) and observed (solid line) 95% CL limits in the SSM interpretation for the electron (left) and muon (right) channels. The shaded bands represent the one and two standard deviation (s.d.) uncertainty bands. Also shown are theoretical cross sections for the SSM benchmark model (black with a grey band for the PDF uncertainties) and split-UED (red and blue solid lines) interpretations. |
png pdf |
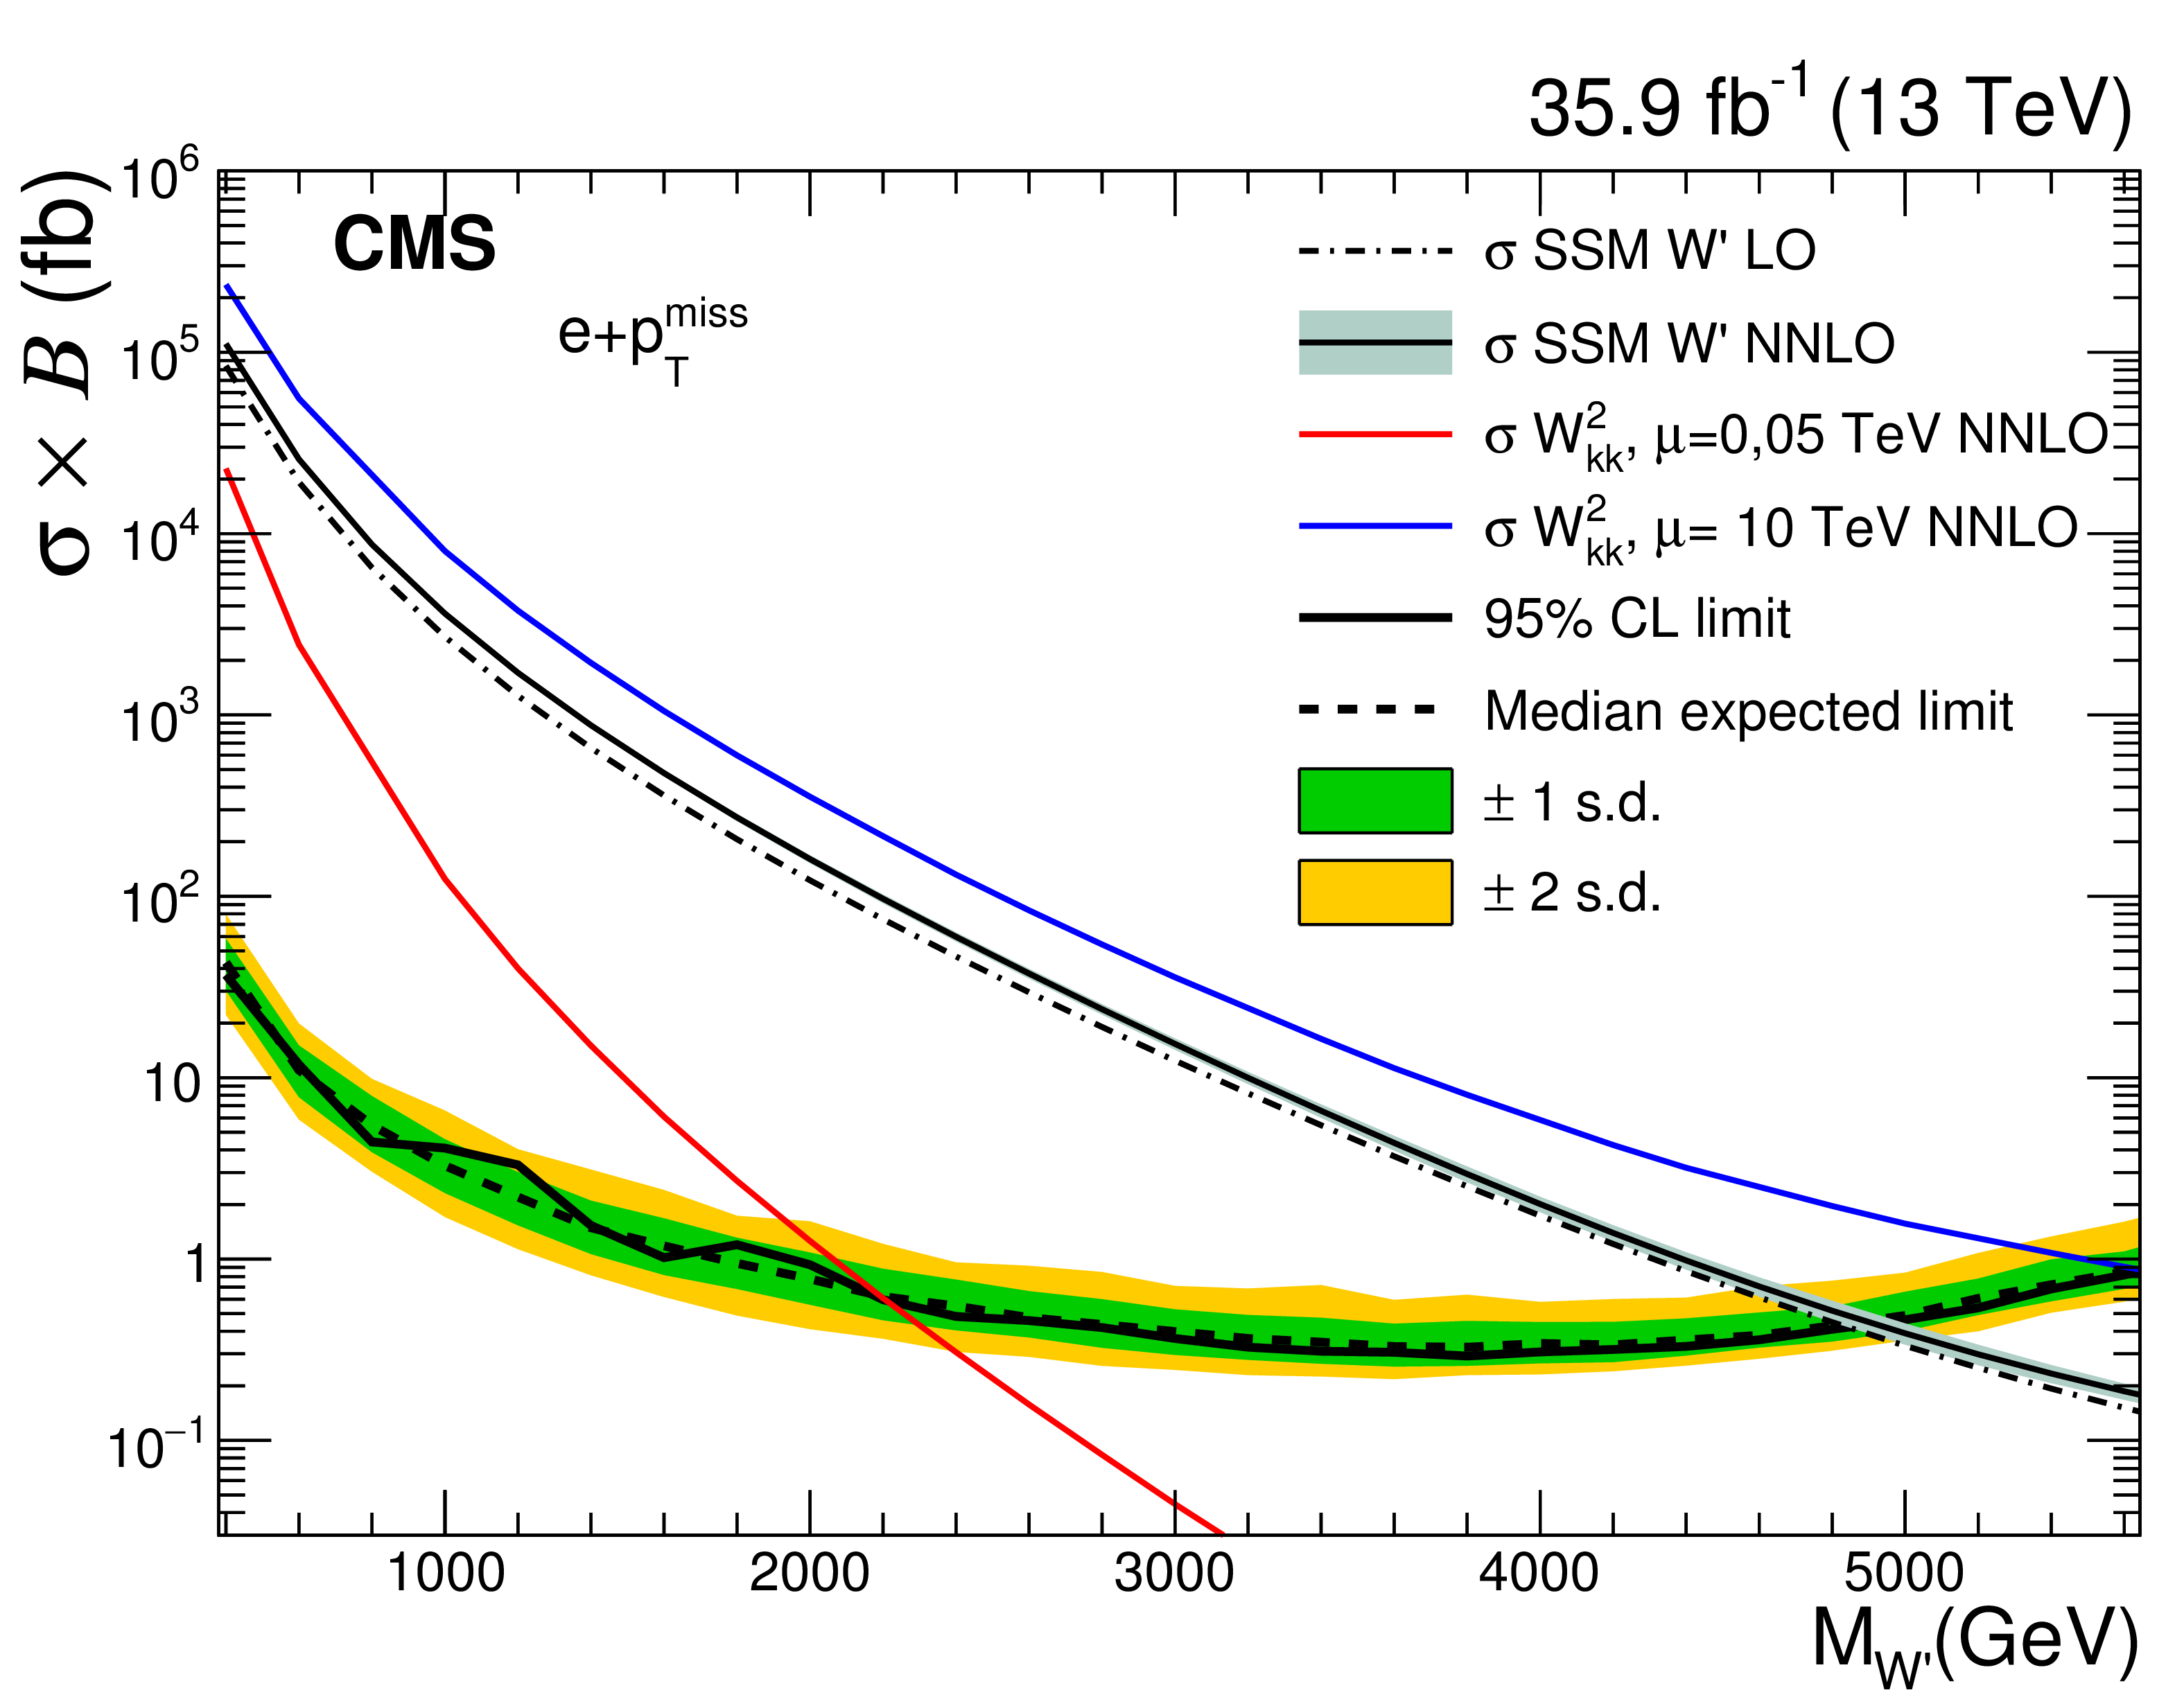
Figure 5-a:
Expected (dashed line) and observed (solid line) 95% CL limits in the SSM interpretation for the electron muon channel. The shaded bands represent the one and two standard deviation (s.d.) uncertainty bands. Also shown are theoretical cross sections for the SSM benchmark model (black with a grey band for the PDF uncertainties) and split-UED (red and blue solid lines) interpretations. |
png pdf |
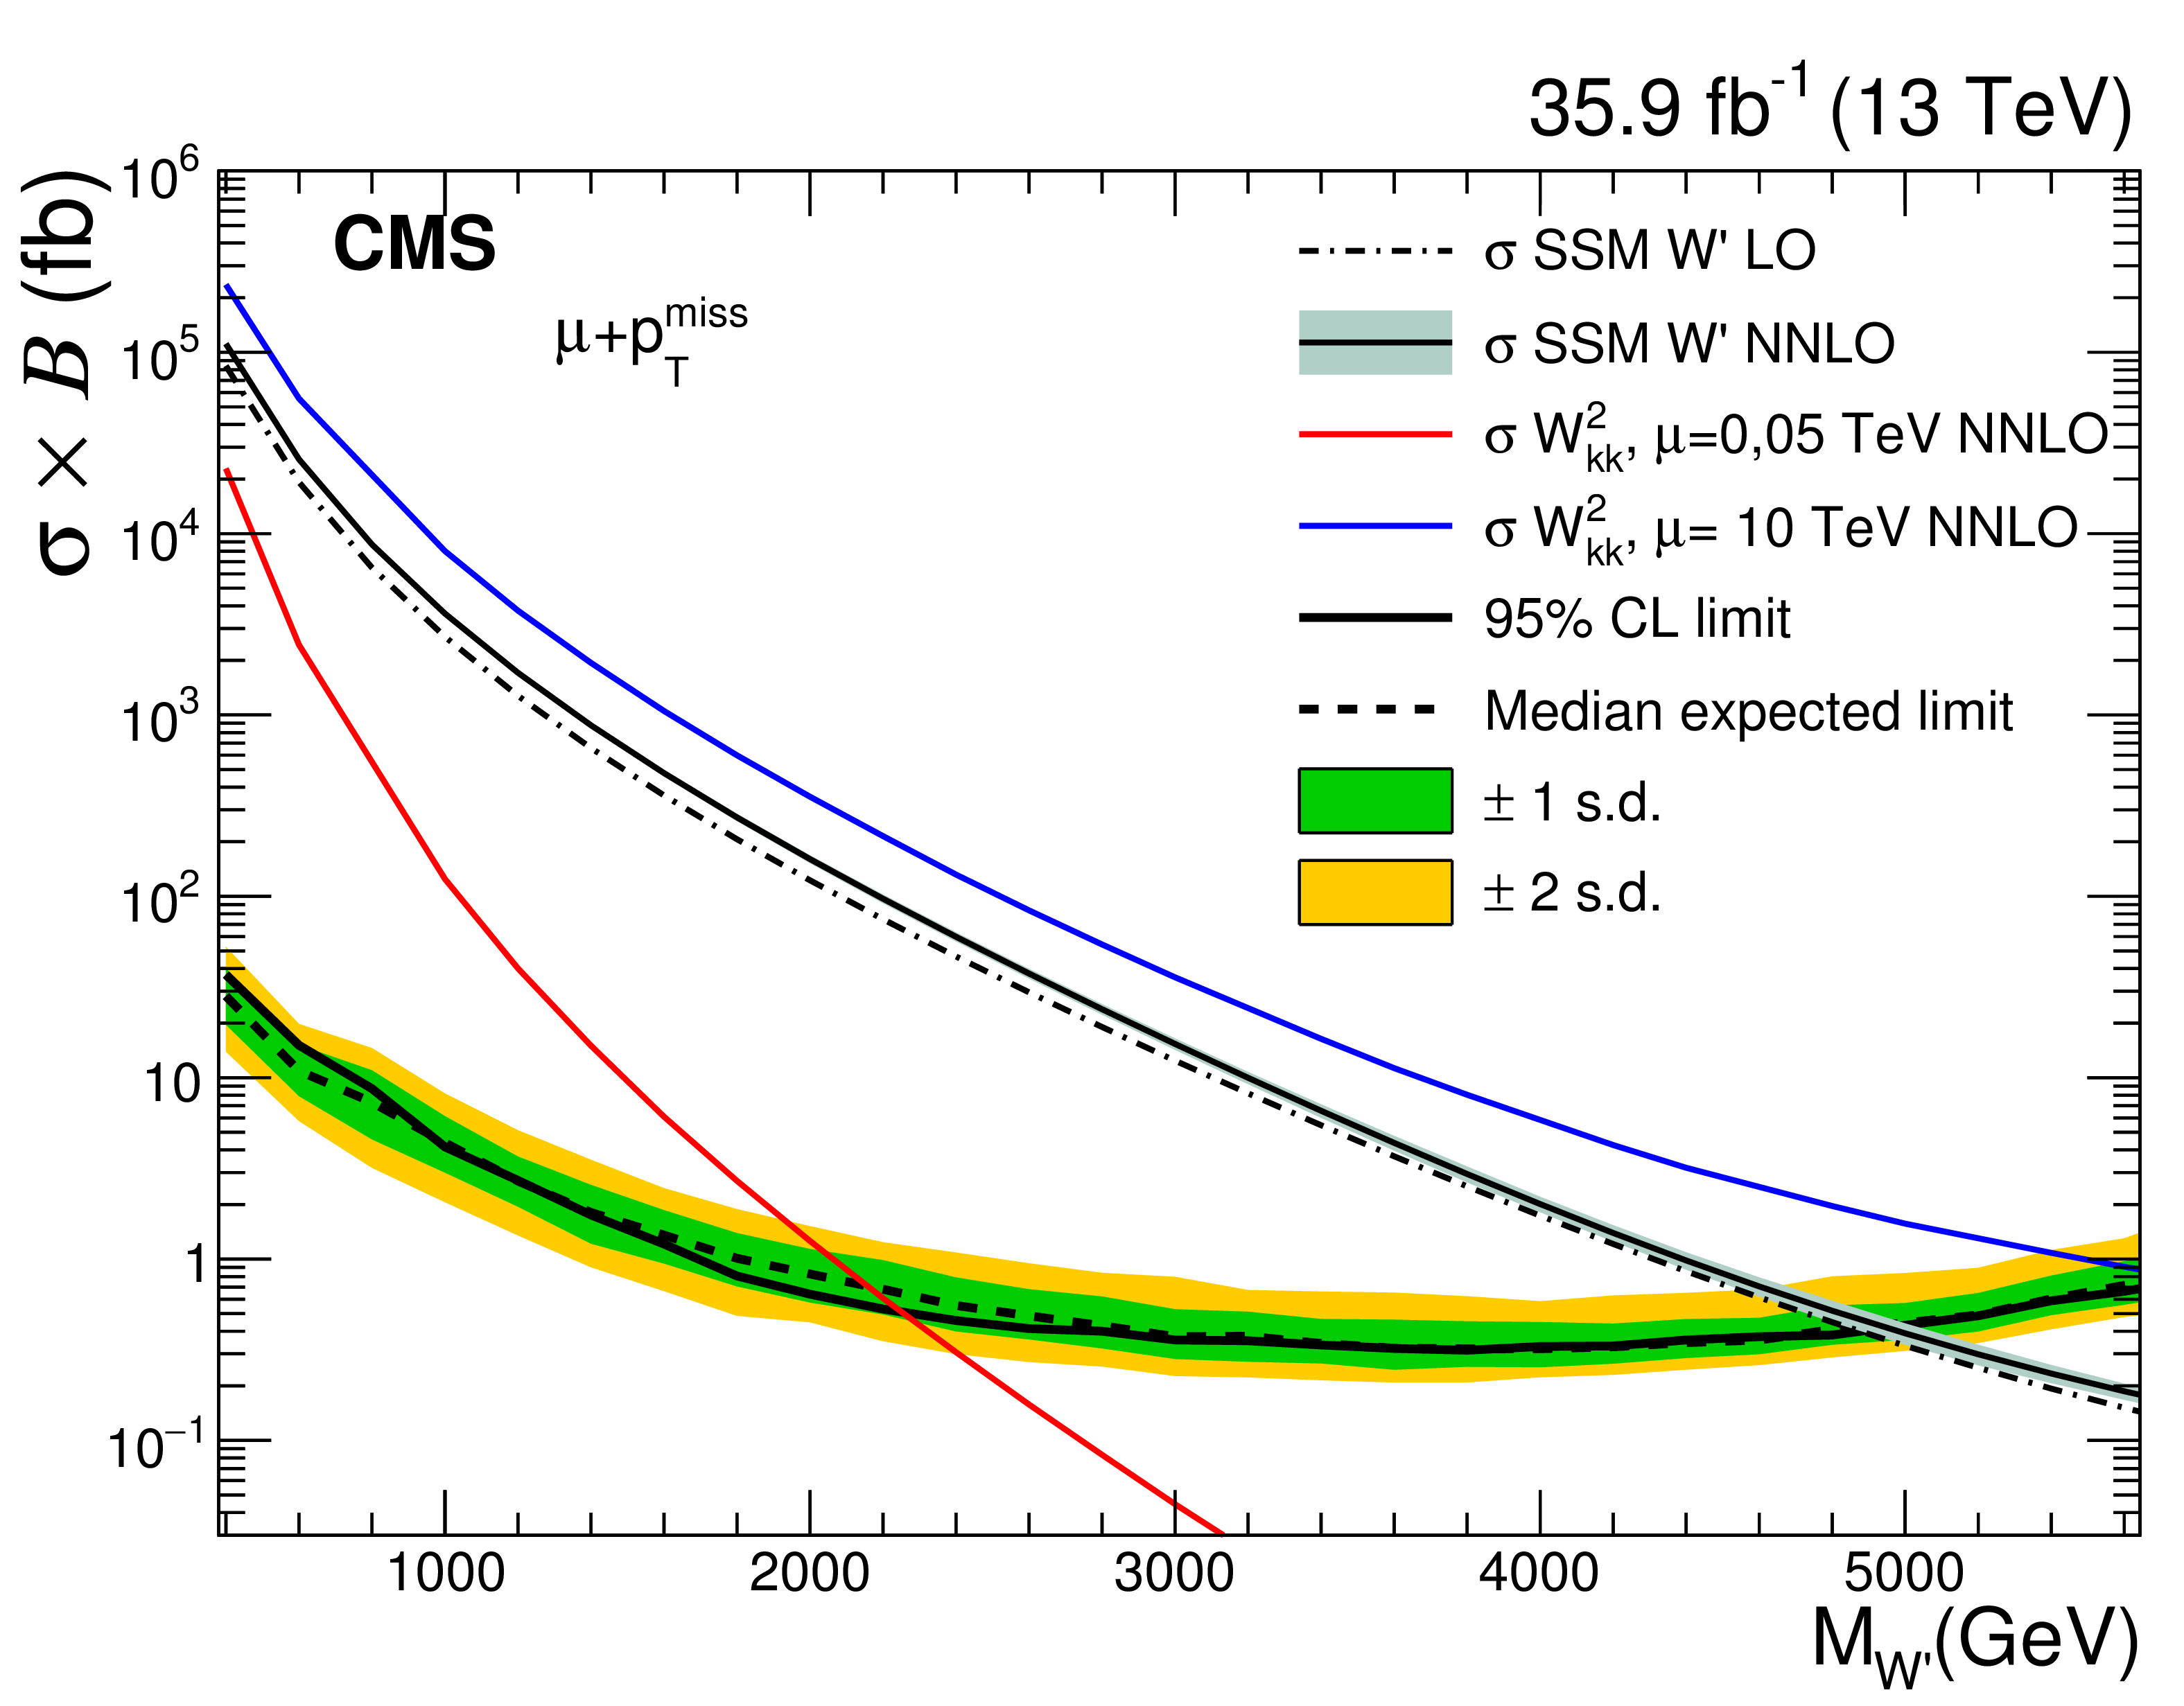
Figure 5-b:
Expected (dashed line) and observed (solid line) 95% CL limits in the SSM interpretation for the electron muon channel. The shaded bands represent the one and two standard deviation (s.d.) uncertainty bands. Also shown are theoretical cross sections for the SSM benchmark model (black with a grey band for the PDF uncertainties) and split-UED (red and blue solid lines) interpretations. |
png pdf |
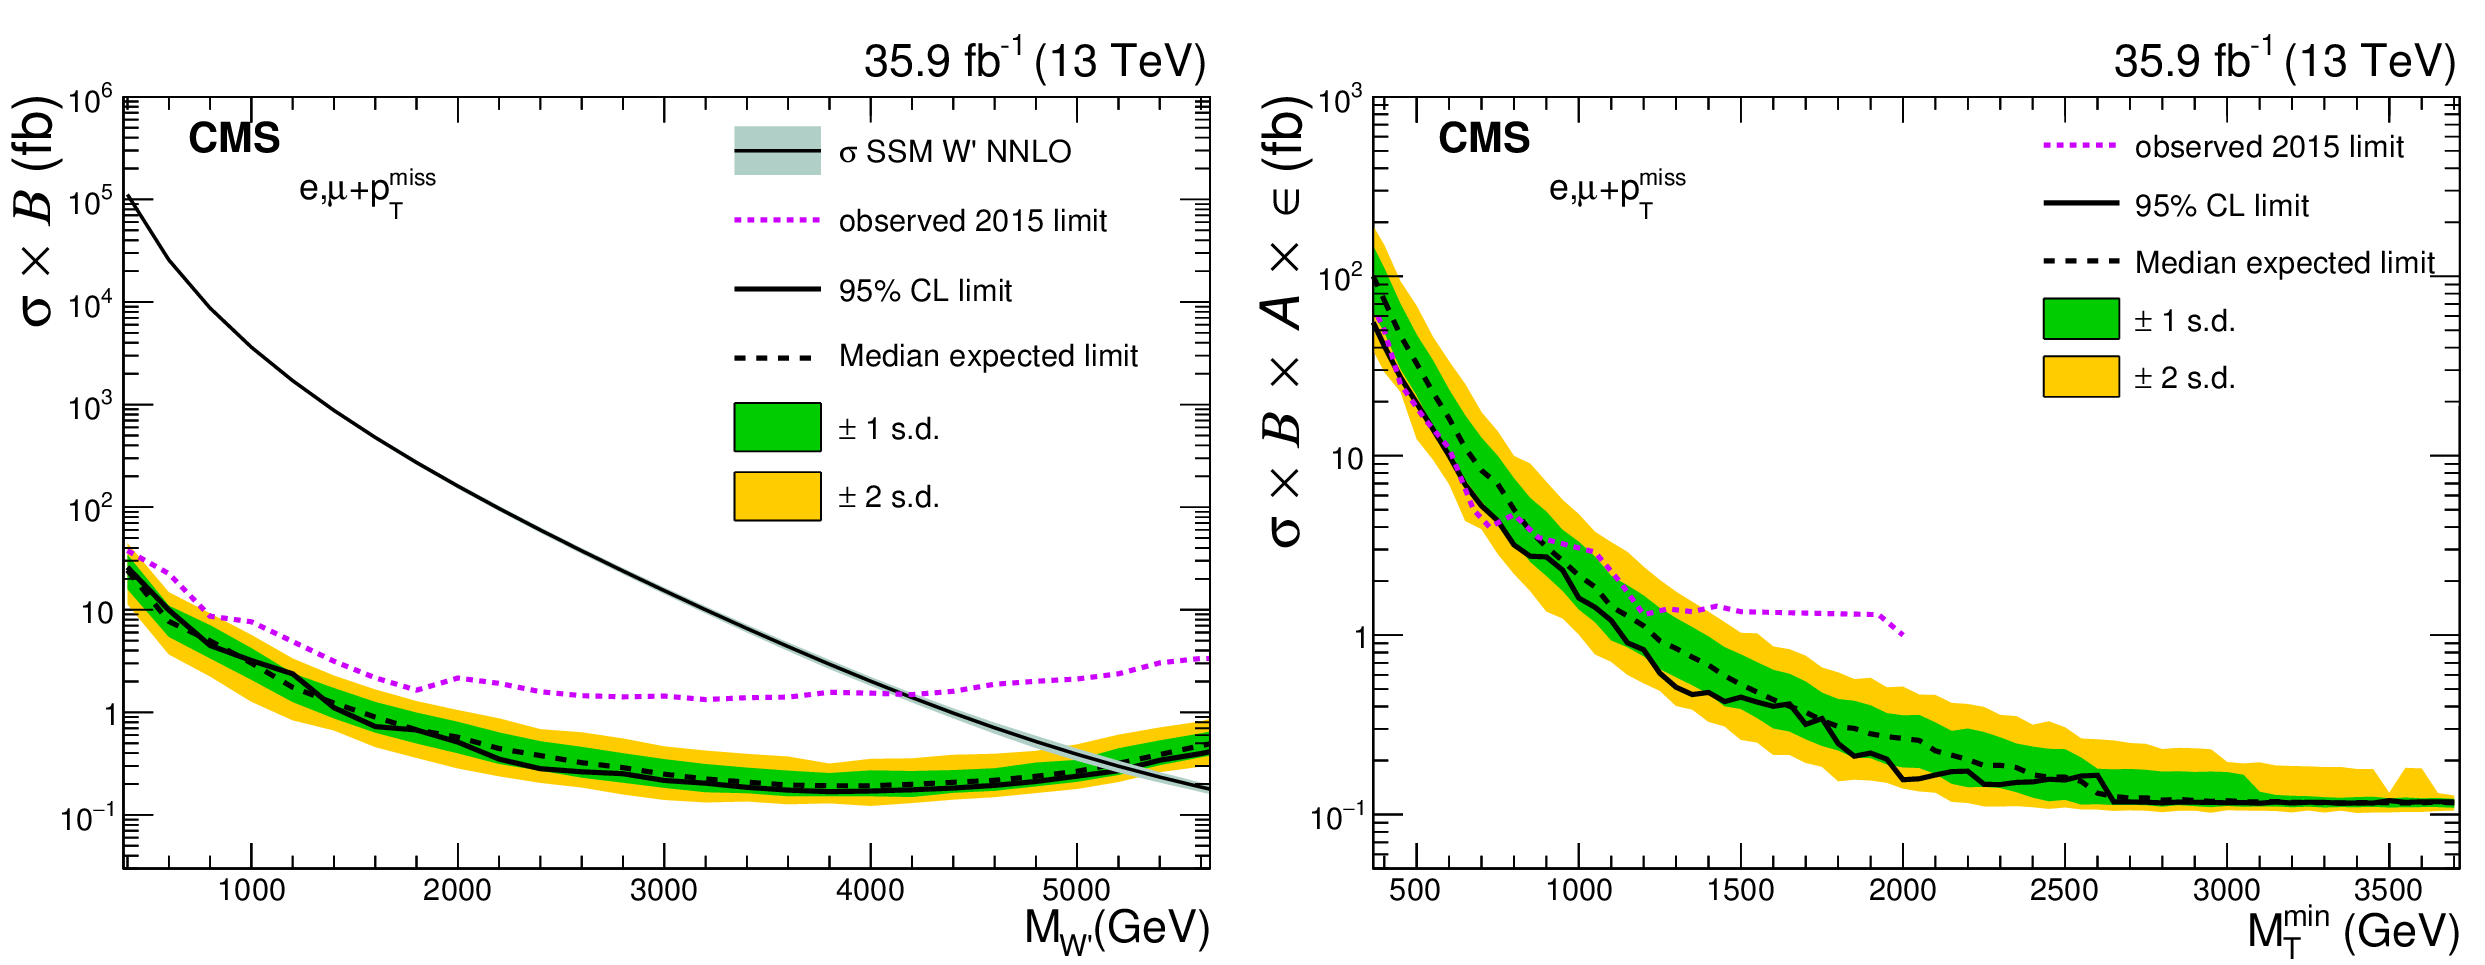
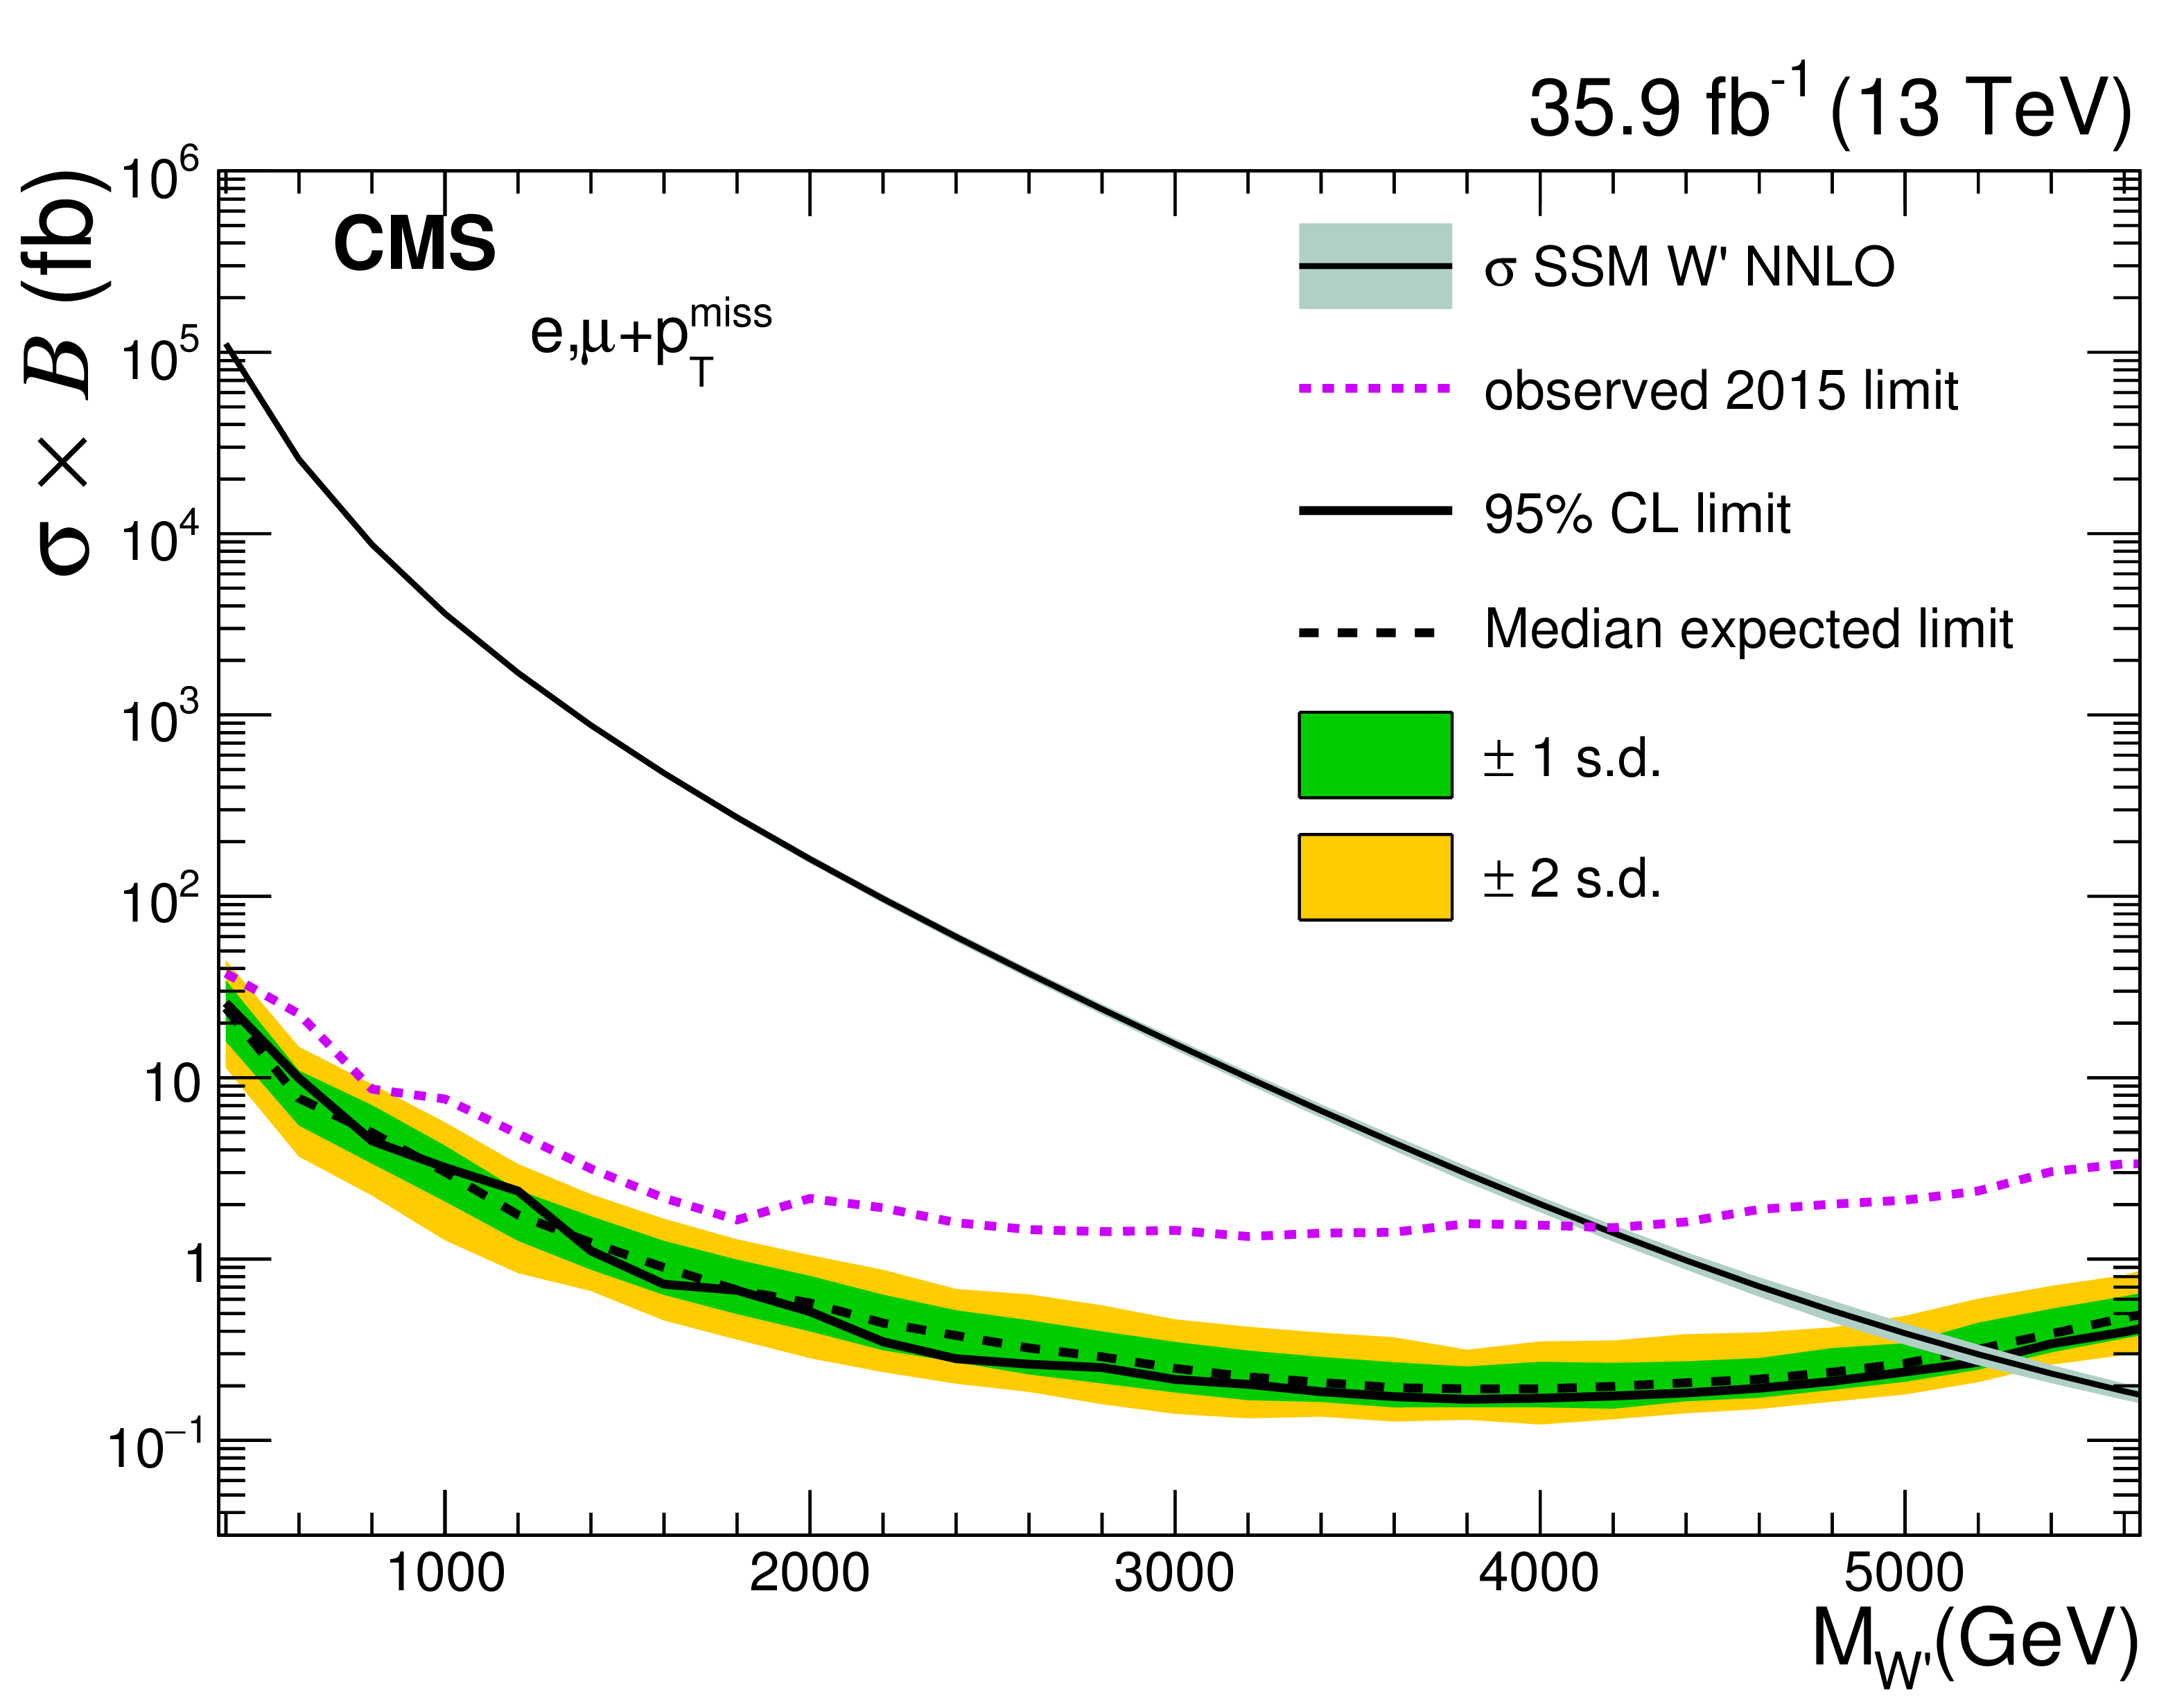
Figure 6:
Expected (dashed line) and observed (solid line) 95% CL limits on the product of the cross section and branching fraction, in the SSM W' model (left) and the model-independent interpretation (right). Shown are the combination of the electron and muon channels, with the shaded bands corresponding to one and two standard deviations (s.d.). For comparison, the results from Ref. [9] for the regions investigated in 2015 are shown as dotted lines. |
png pdf |
Figure 6-a:
Expected (dashed line) and observed (solid line) 95% CL limits on the product of the cross section and branching fraction, in the SSM W' model. Shown are the combination of the electron and muon channels, with the shaded bands corresponding to one and two standard deviations (s.d.). For comparison, the results from Ref. [9] for the regions investigated in 2015 are shown as dotted lines. |

png pdf |
Figure 6-b:
Expected (dashed line) and observed (solid line) 95% CL limits on the product of the cross section and branching fraction, in the model-independent interpretation. Shown are the combination of the electron and muon channels, with the shaded bands corresponding to one and two standard deviations (s.d.). For comparison, the results from Ref. [9] for the regions investigated in 2015 are shown as dotted lines. |
png pdf |
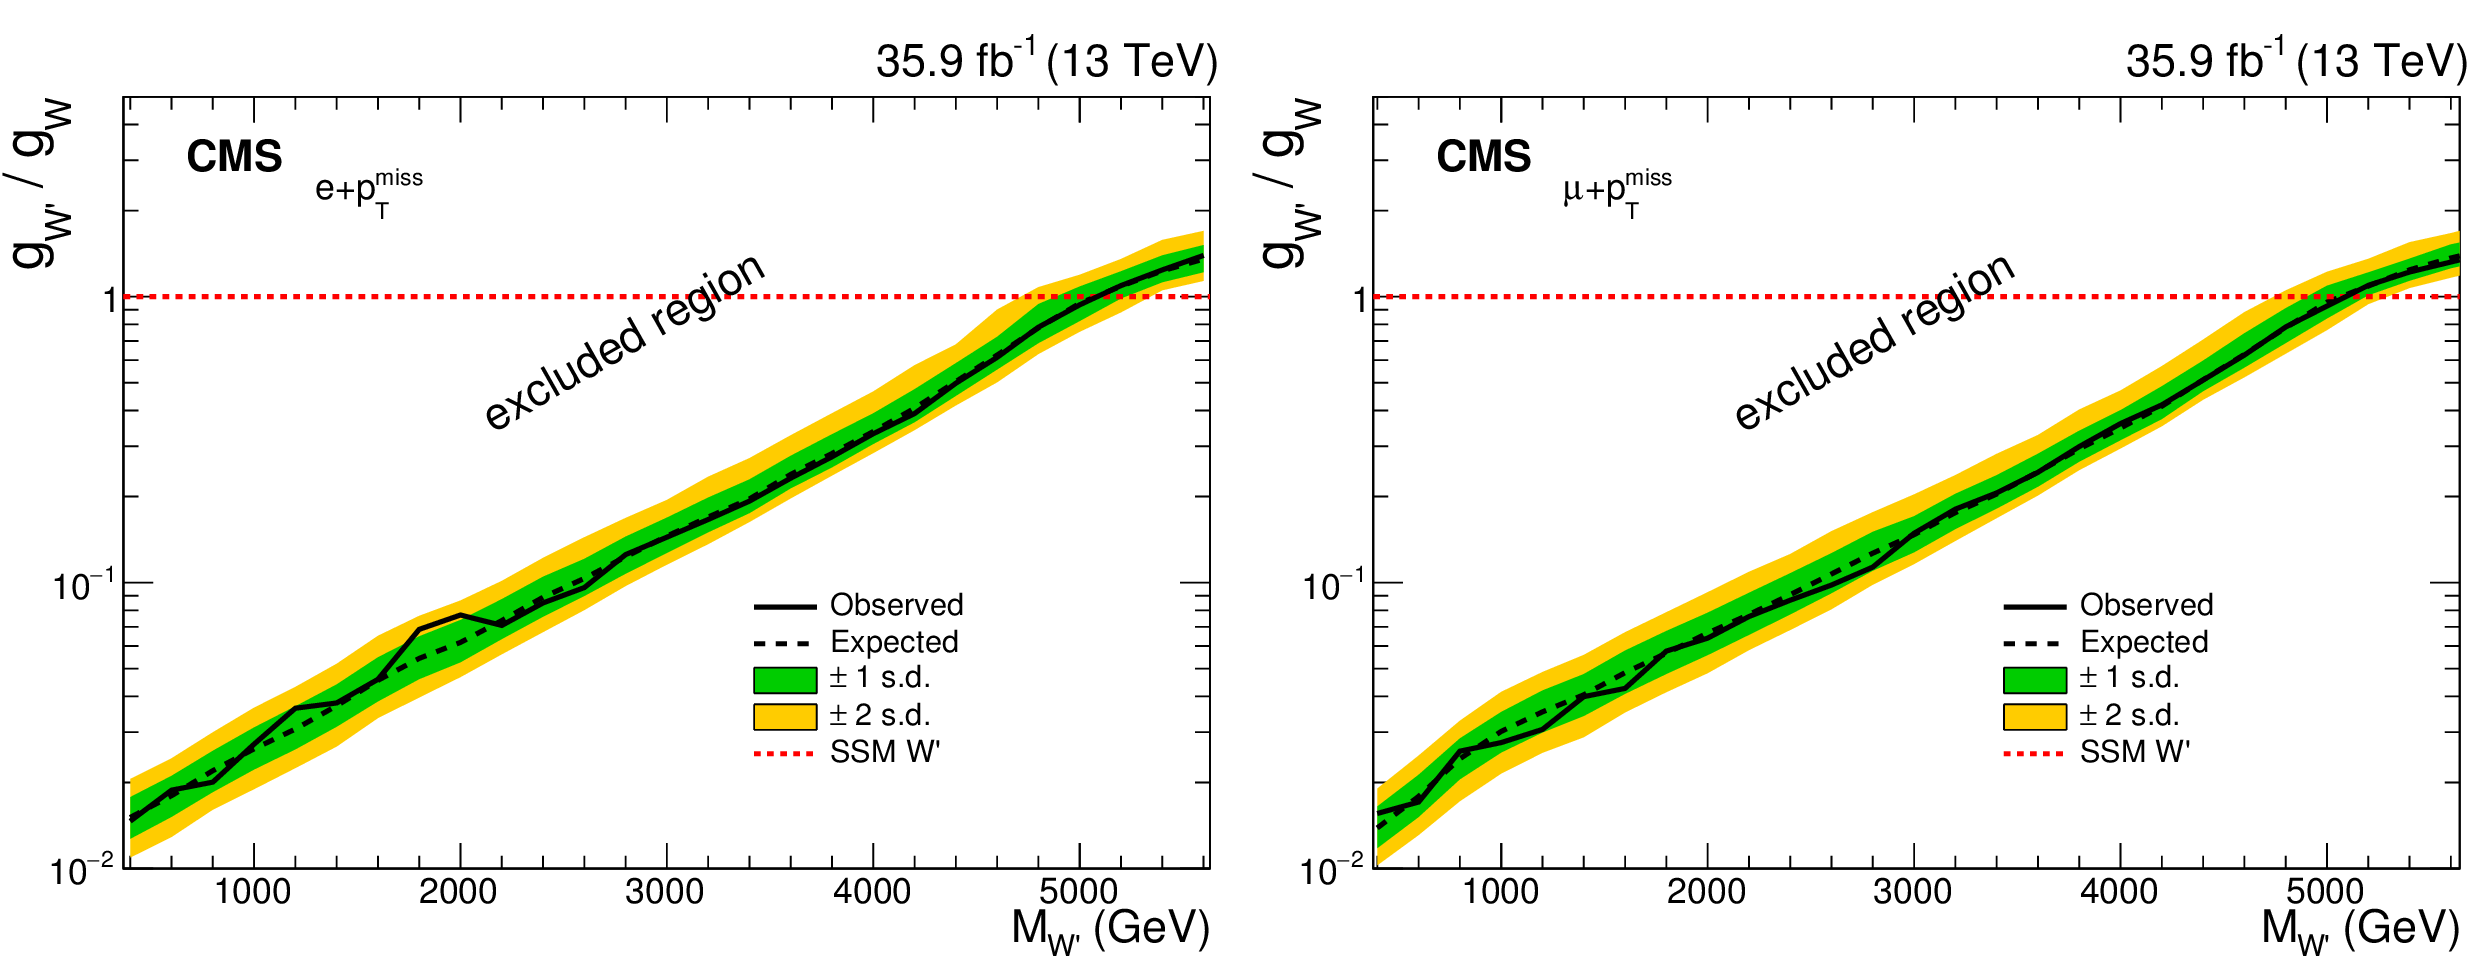
Figure 7:
Expected (dashed line) and observed (solid line) 95% CL limits on the coupling strength $g_{{\mathrm {W}'}}/g_{{\mathrm {W}}}$ as a function of the W' mass, for the electron (left) and muon (right) channels. The area above the limit line is excluded. The shaded bands represent the one and two standard deviation (s.d.) uncertainty bands. The SSM W' couplings are shown as a dotted line. |
png pdf |
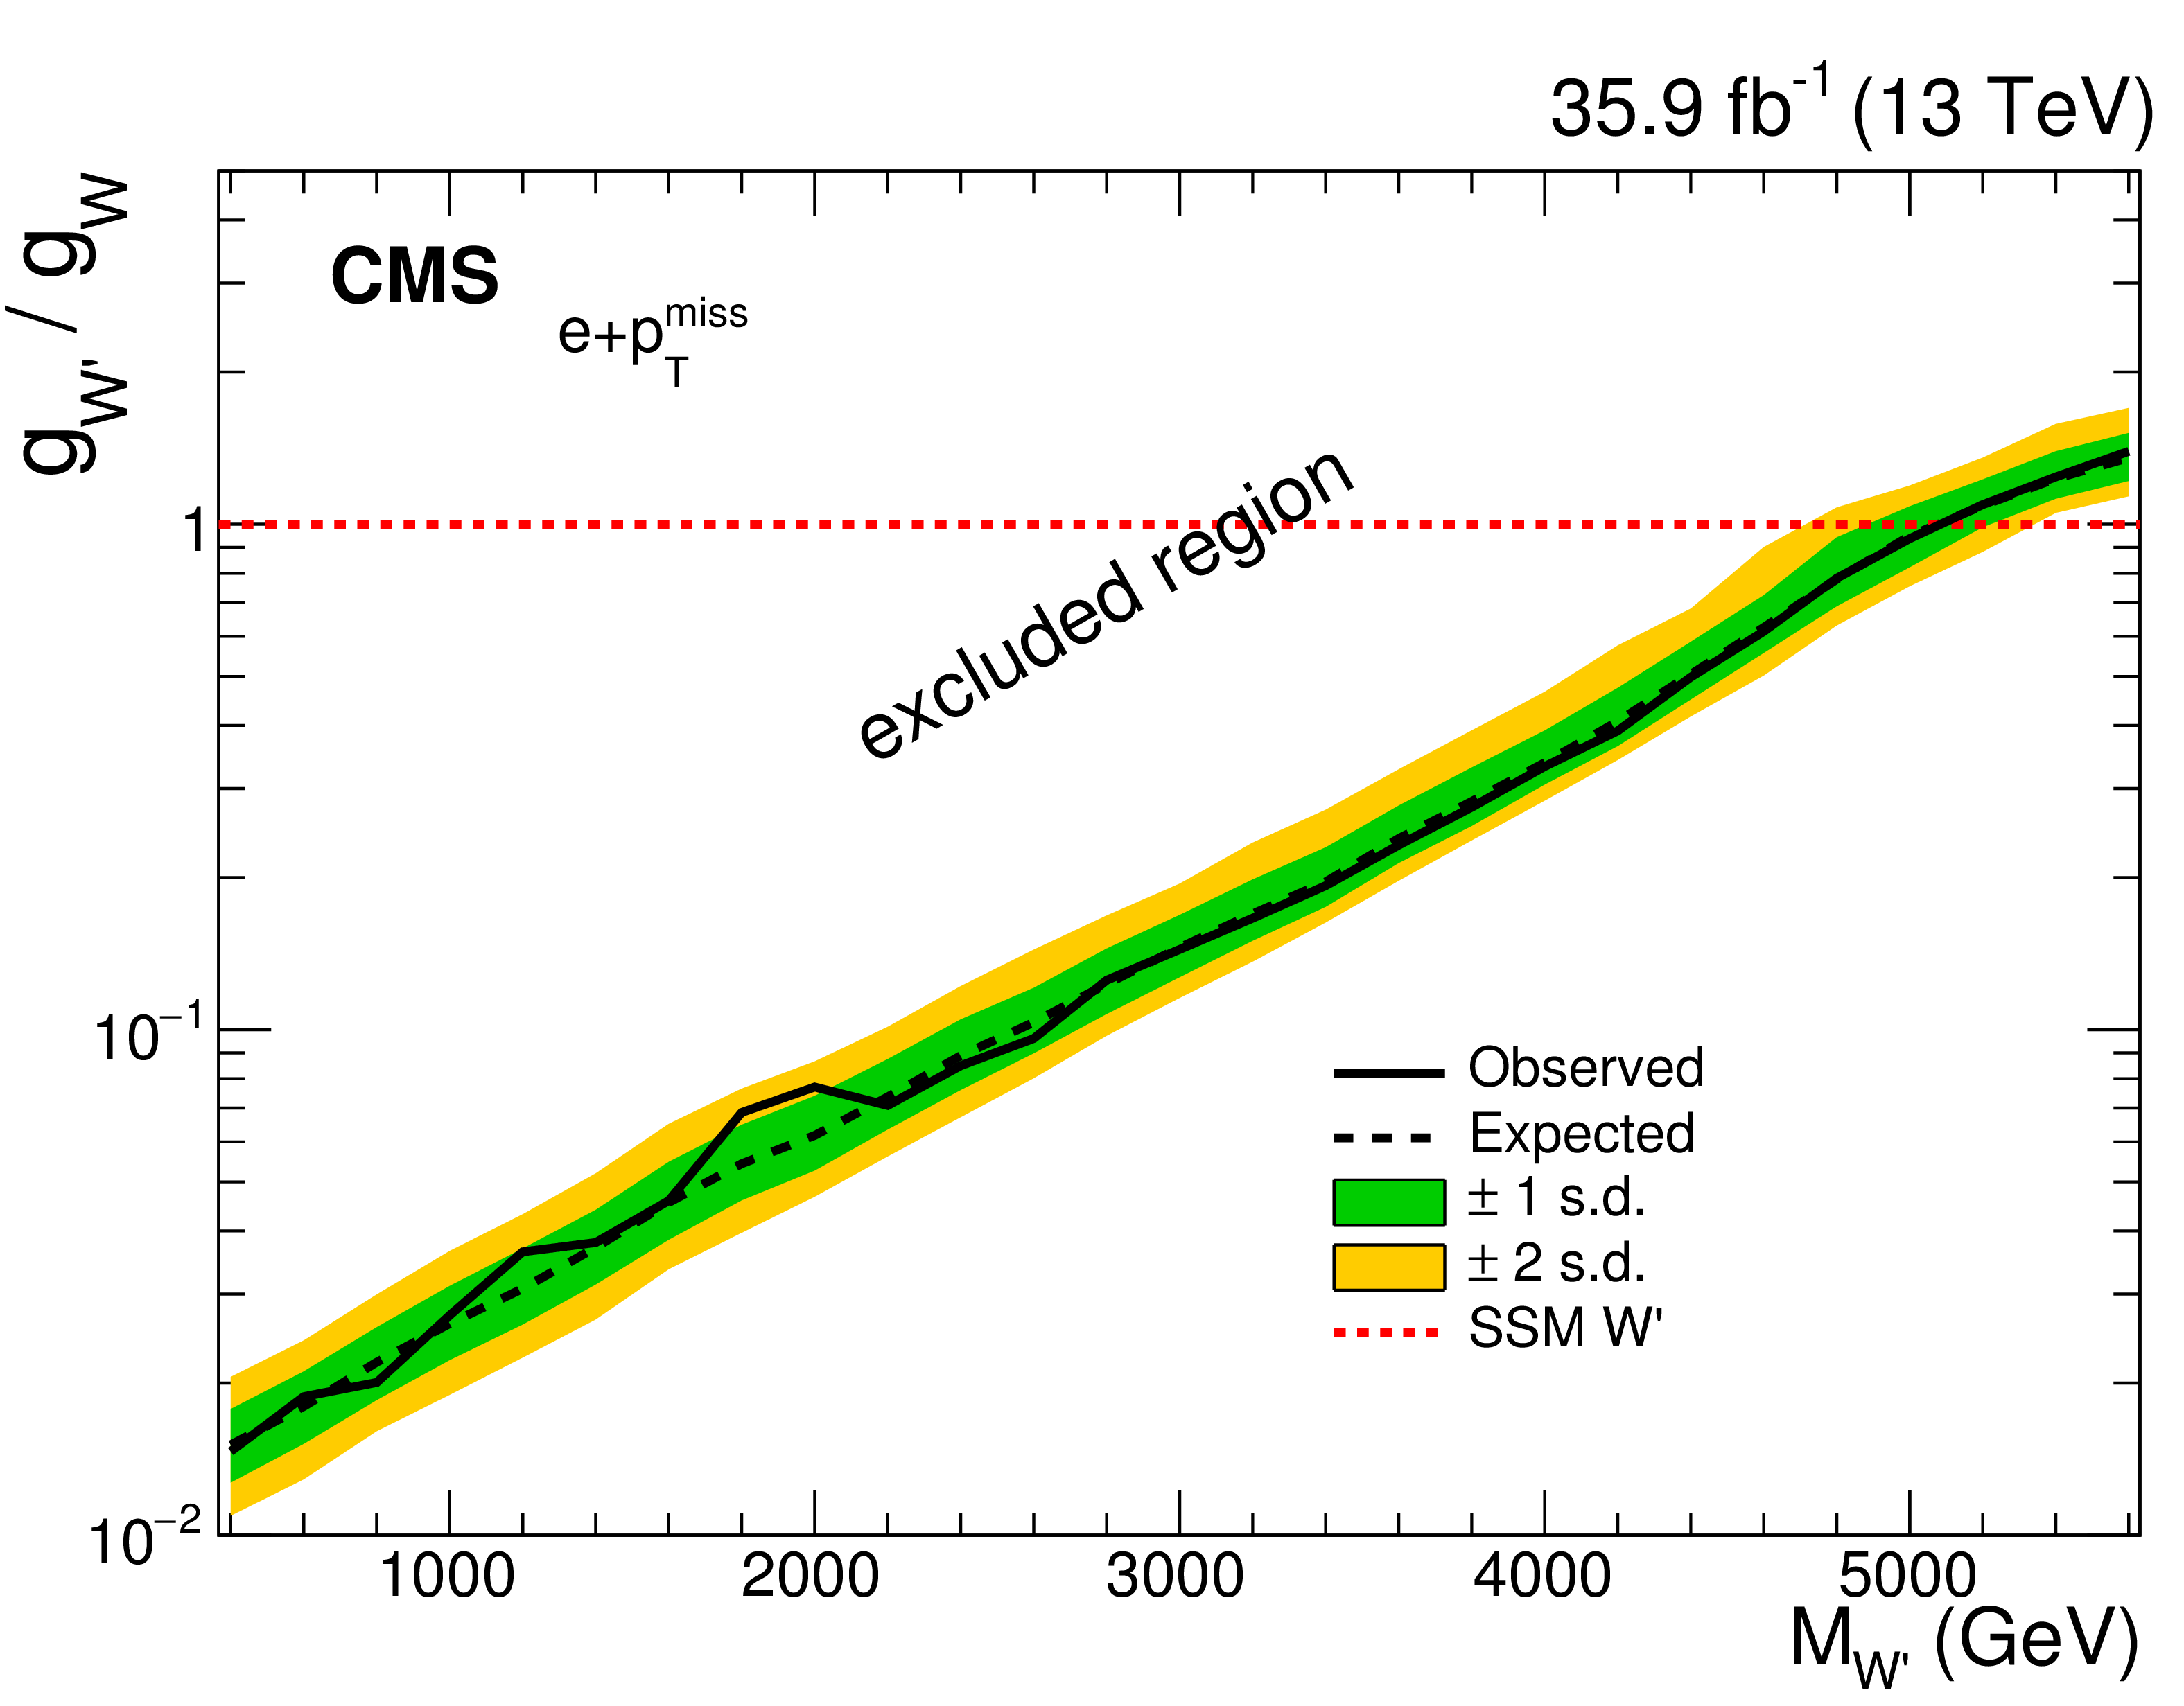
Figure 7-a:
Expected (dashed line) and observed (solid line) 95% CL limits on the coupling strength $g_{{\mathrm {W}'}}/g_{{\mathrm {W}}}$ as a function of the W' mass, for the electron channel. The area above the limit line is excluded. The shaded bands represent the one and two standard deviation (s.d.) uncertainty bands. The SSM W' couplings are shown as a dotted line. |
png pdf |
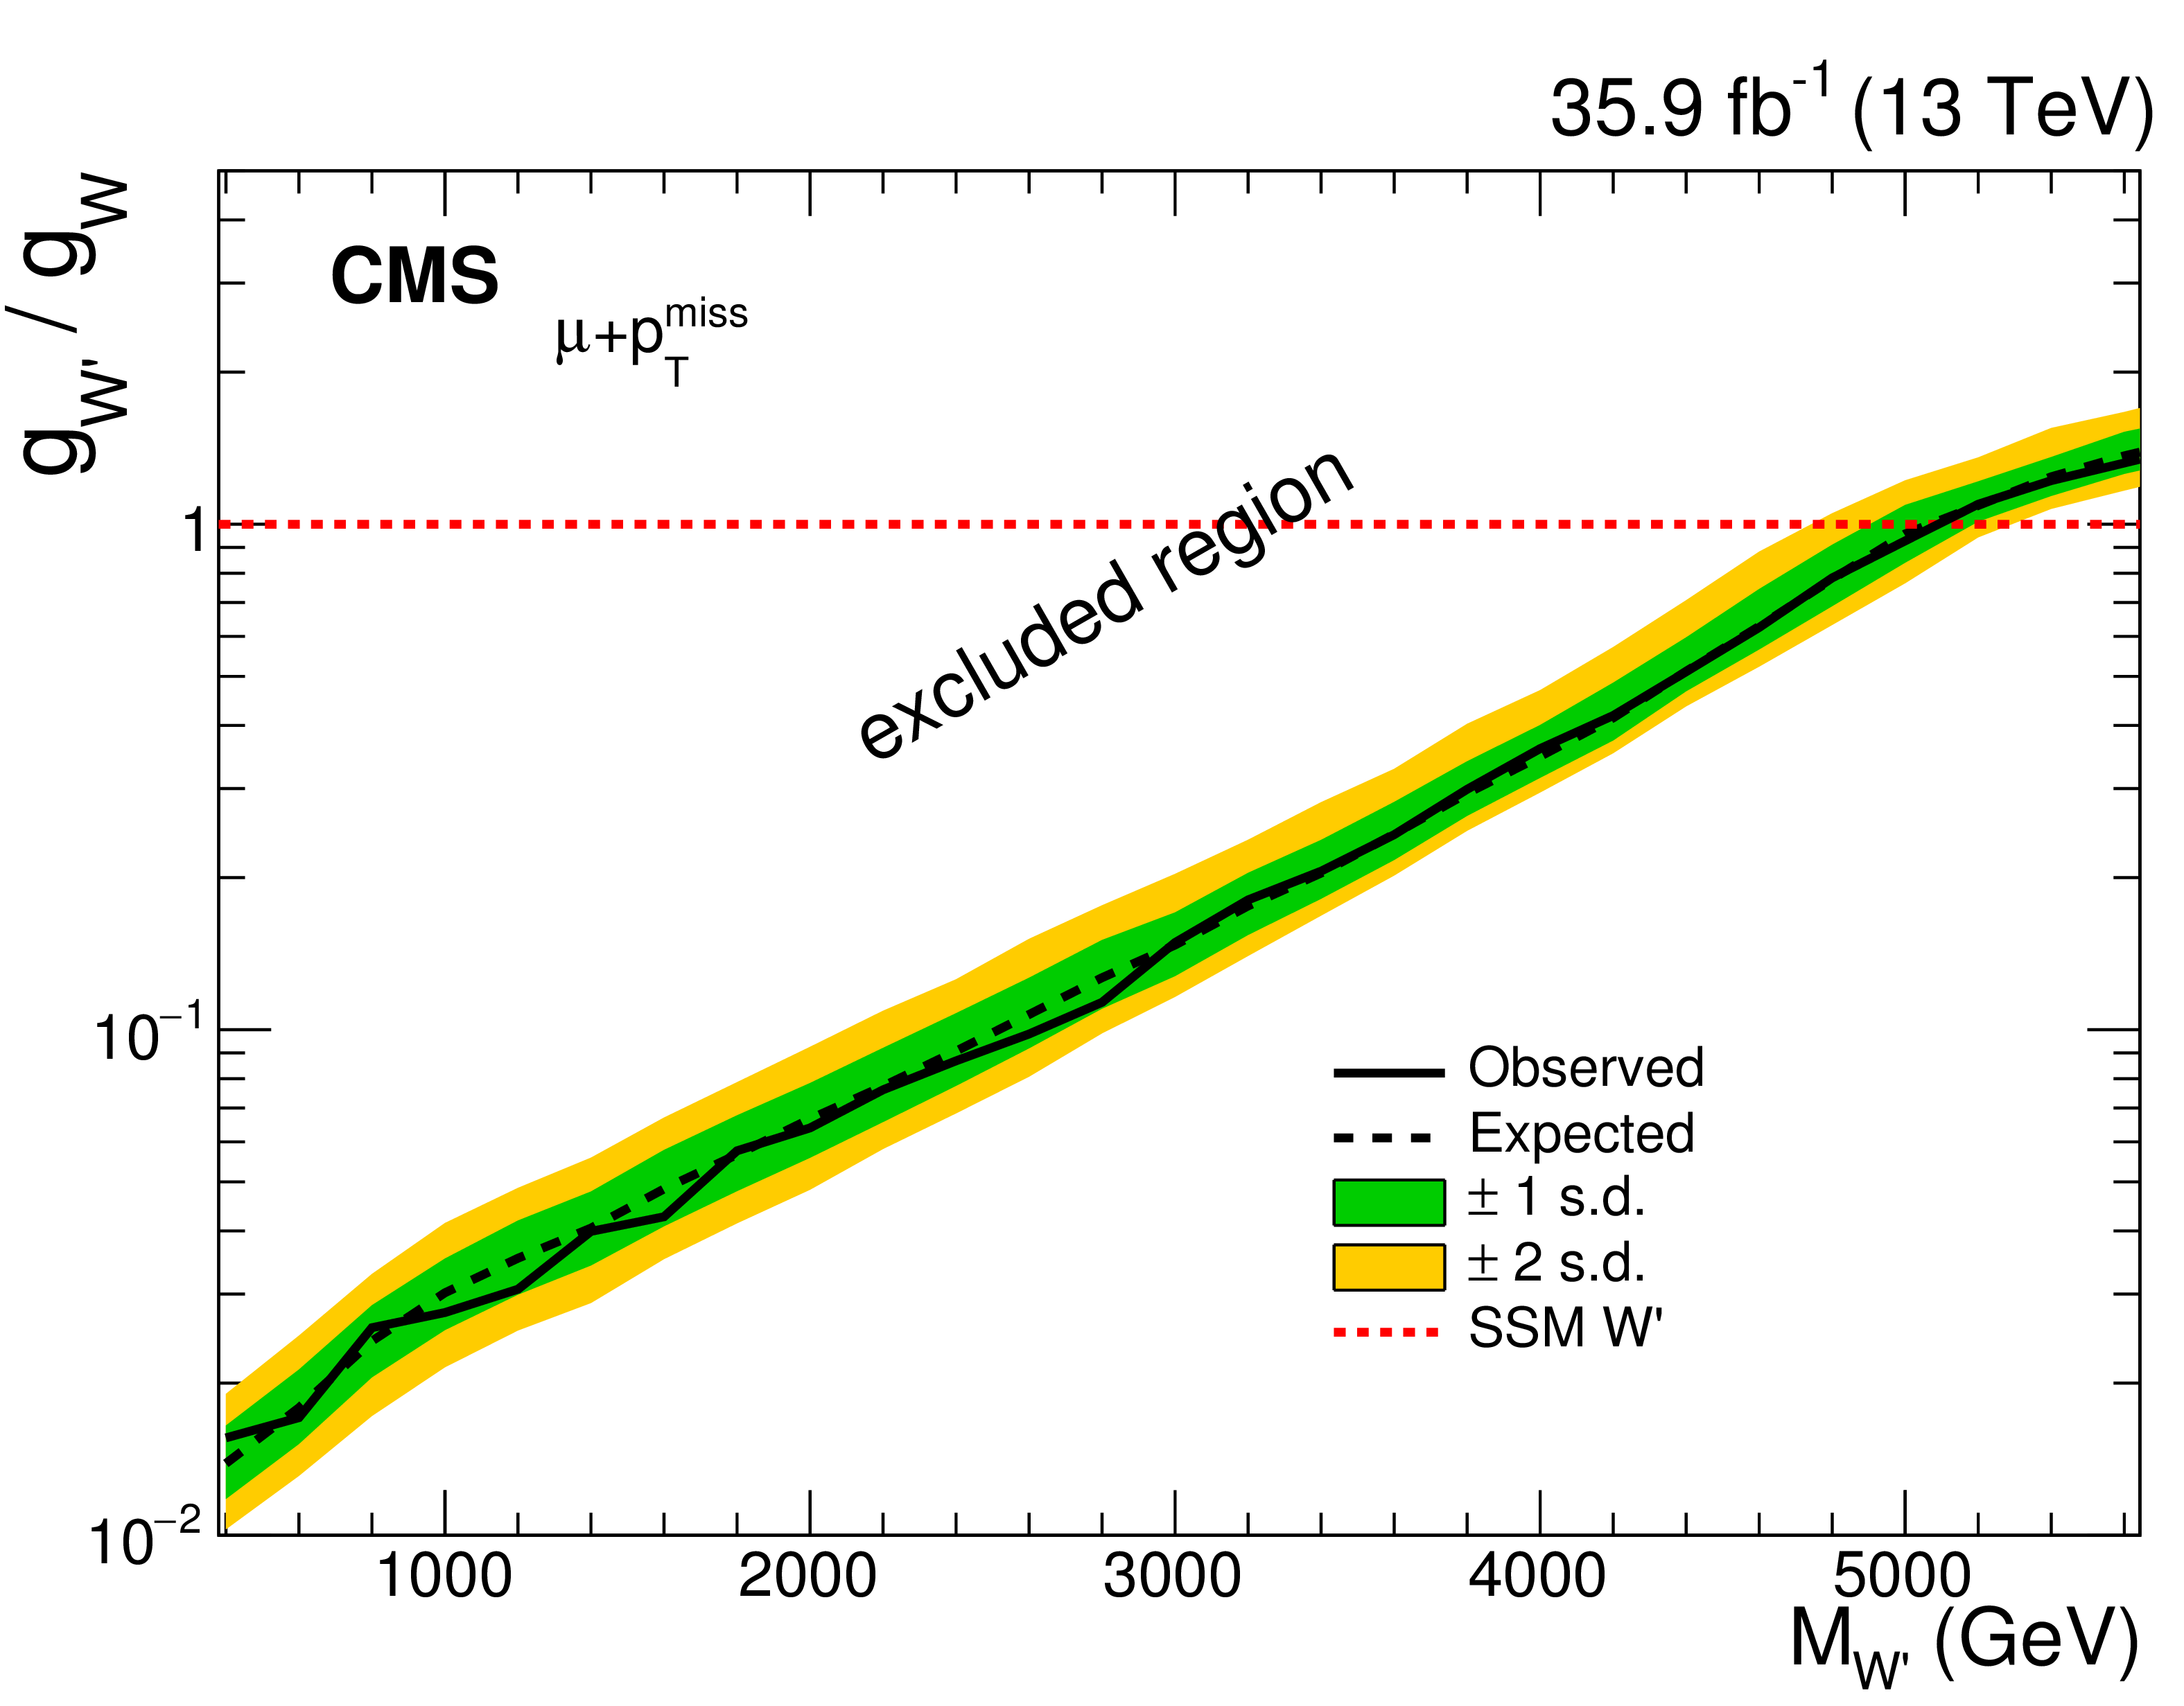
Figure 7-b:
Expected (dashed line) and observed (solid line) 95% CL limits on the coupling strength $g_{{\mathrm {W}'}}/g_{{\mathrm {W}}}$ as a function of the W' mass, for the muon channel. The area above the limit line is excluded. The shaded bands represent the one and two standard deviation (s.d.) uncertainty bands. The SSM W' couplings are shown as a dotted line. |
png pdf |
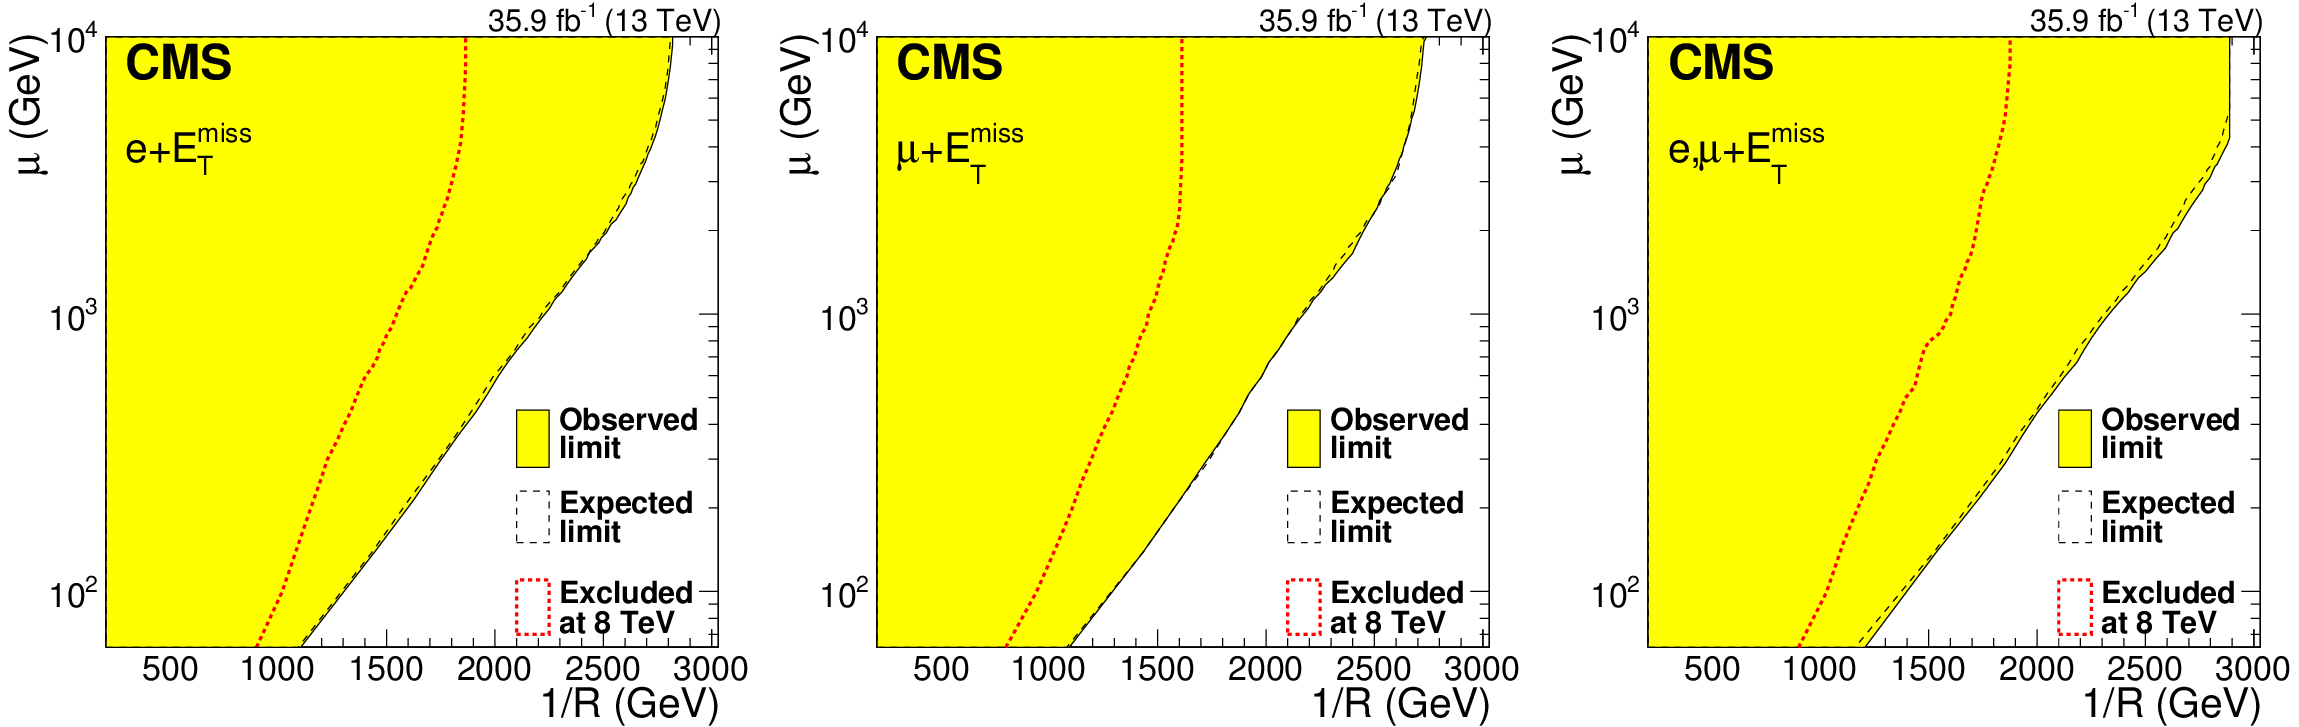
Figure 8:
Exclusion limit in the plane ($\mu $, 1/R) for the split-UED interpretation for the $n=2$ case in the electron (left) and muon (middle) channels, respectively. On the right, the result for the combination of both channels is shown. The expected limit is depicted as a dashed line and the experimentally excluded region as a solid black line (filled as a yellow area). For comparison, the 8 TeV result from Ref. [8] is given as a red, dotted line. |

png pdf |
Figure 8-a:
Exclusion limit in the plane ($\mu $, 1/R) for the split-UED interpretation for the $n=2$ case in the electron channel. The expected limit is depicted as a dashed line and the experimentally excluded region as a solid black line (filled as a yellow area). For comparison, the 8 TeV result from Ref. [8] is given as a red, dotted line. |
png pdf |
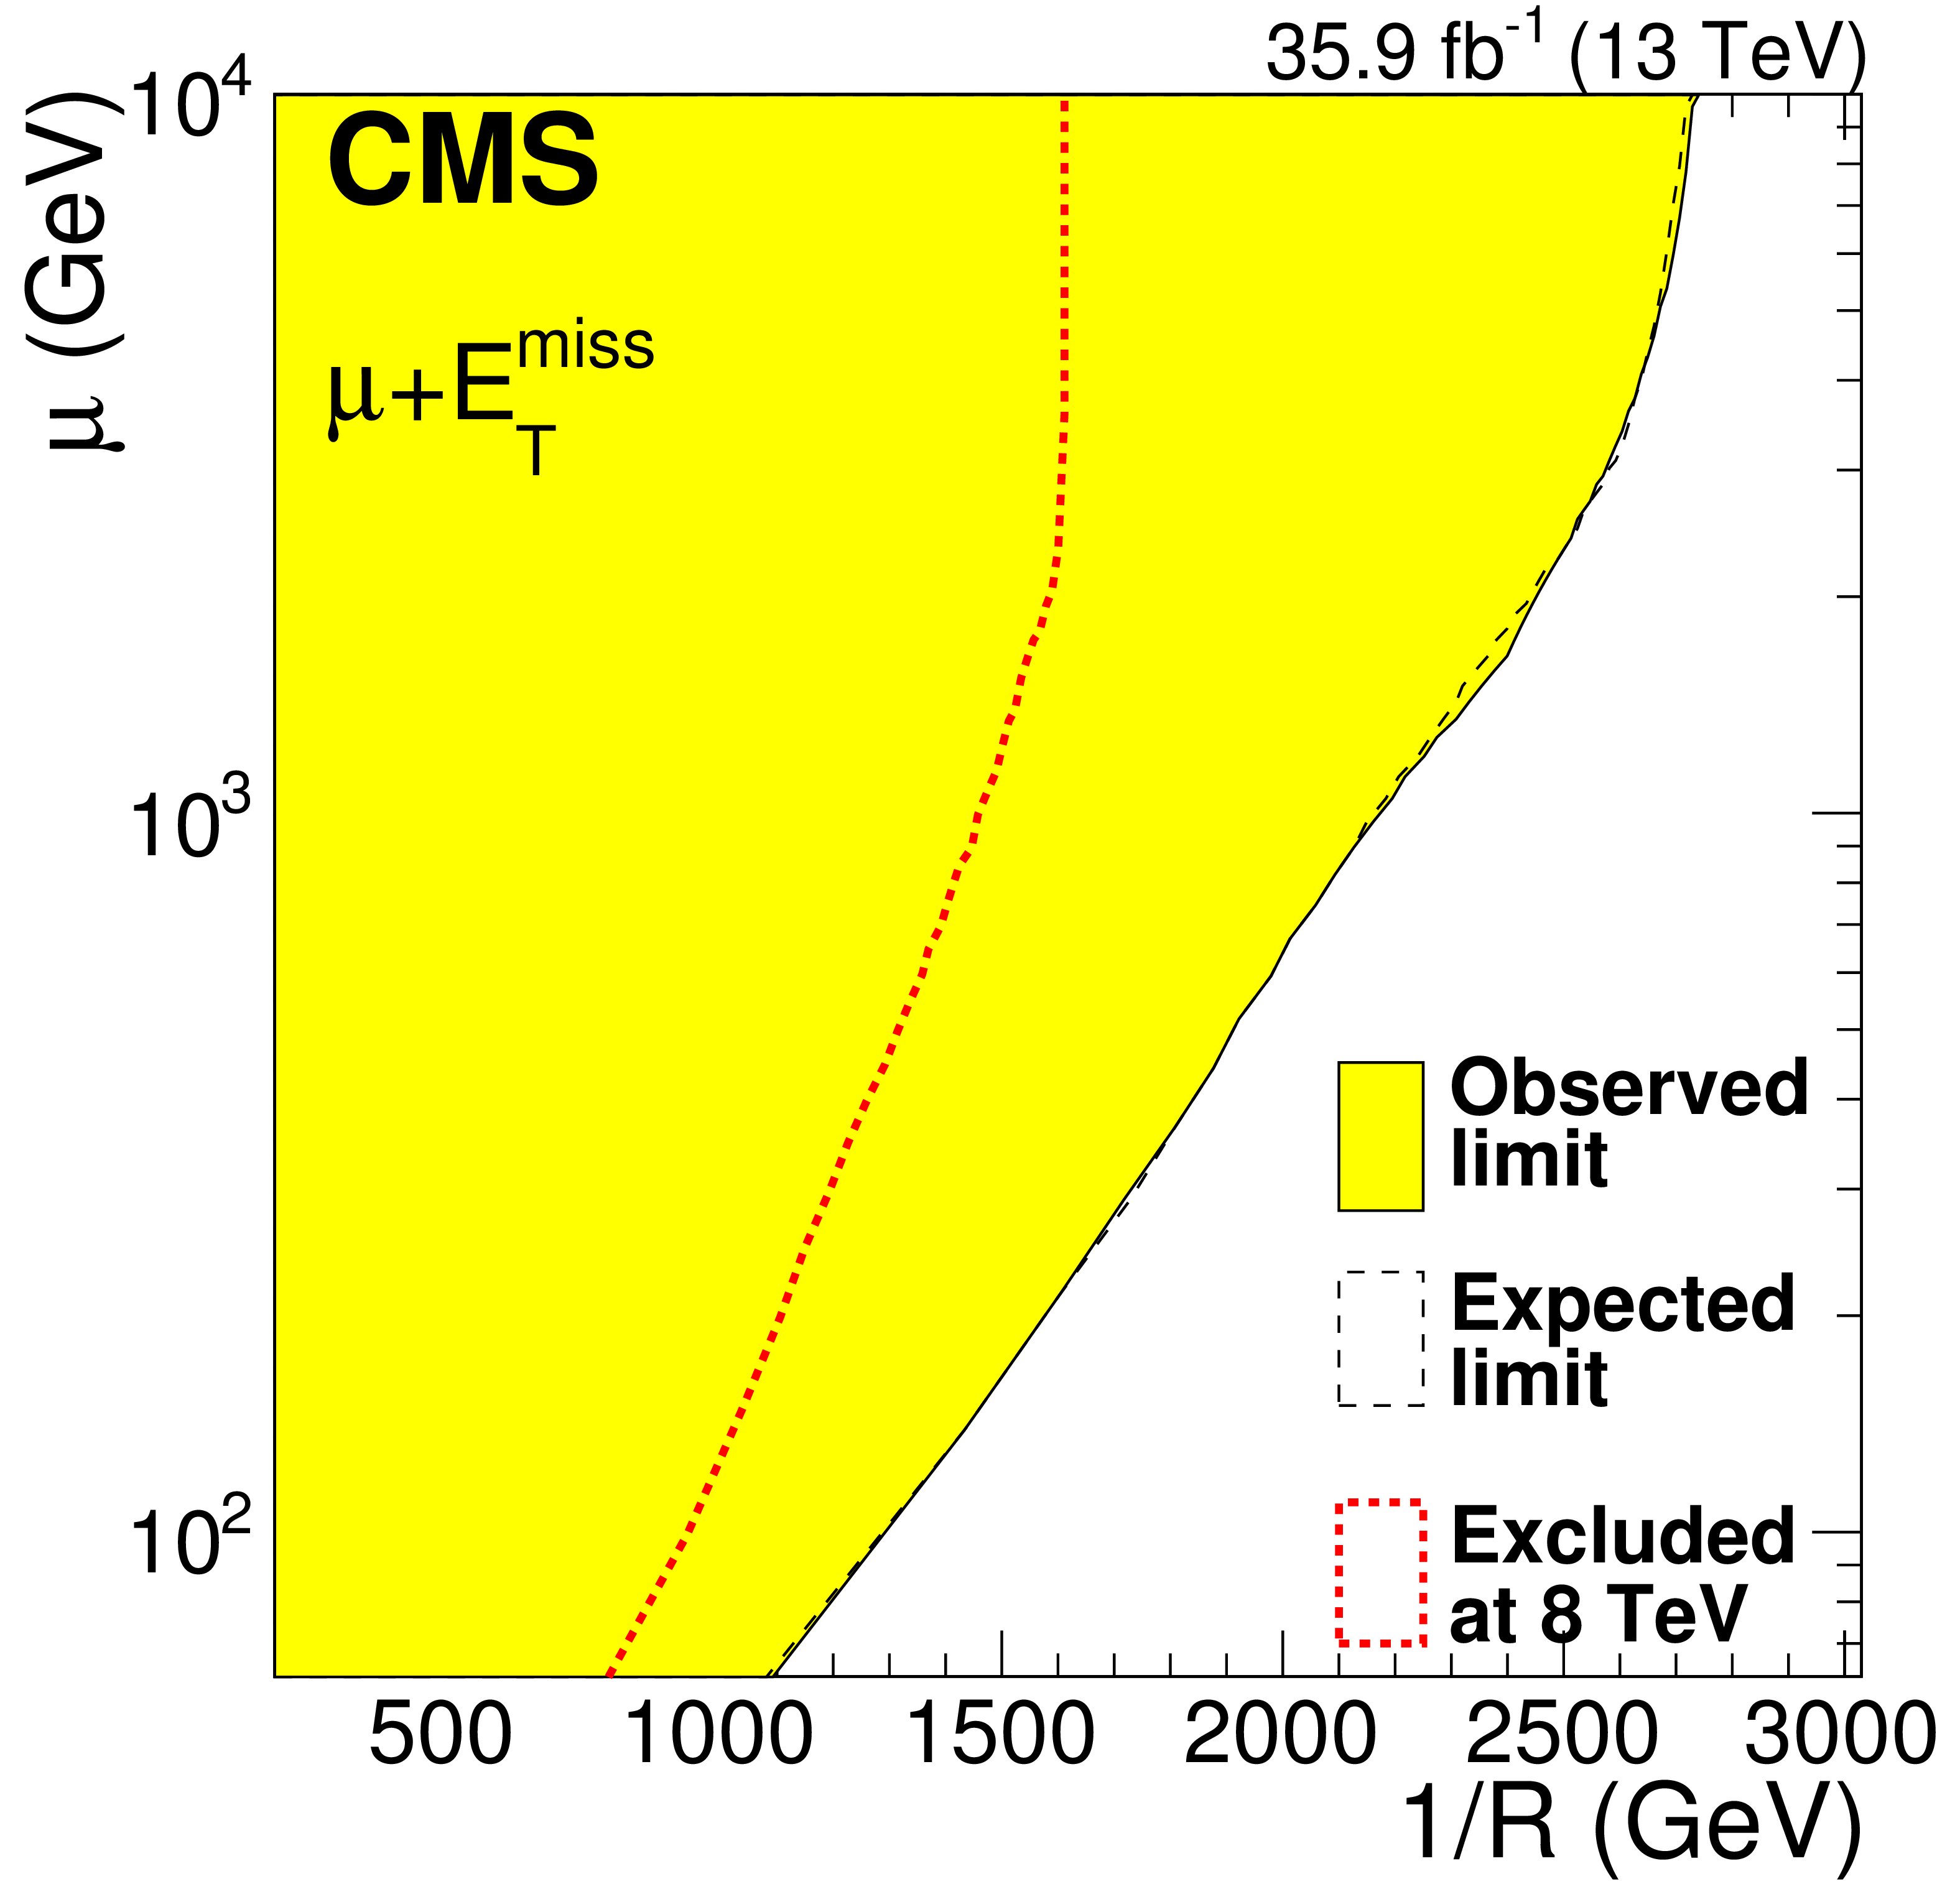
Figure 8-b:
Exclusion limit in the plane ($\mu $, 1/R) for the split-UED interpretation for the $n=2$ case in the muon channel. The expected limit is depicted as a dashed line and the experimentally excluded region as a solid black line (filled as a yellow area). For comparison, the 8 TeV result from Ref. [8] is given as a red, dotted line. |
png pdf |
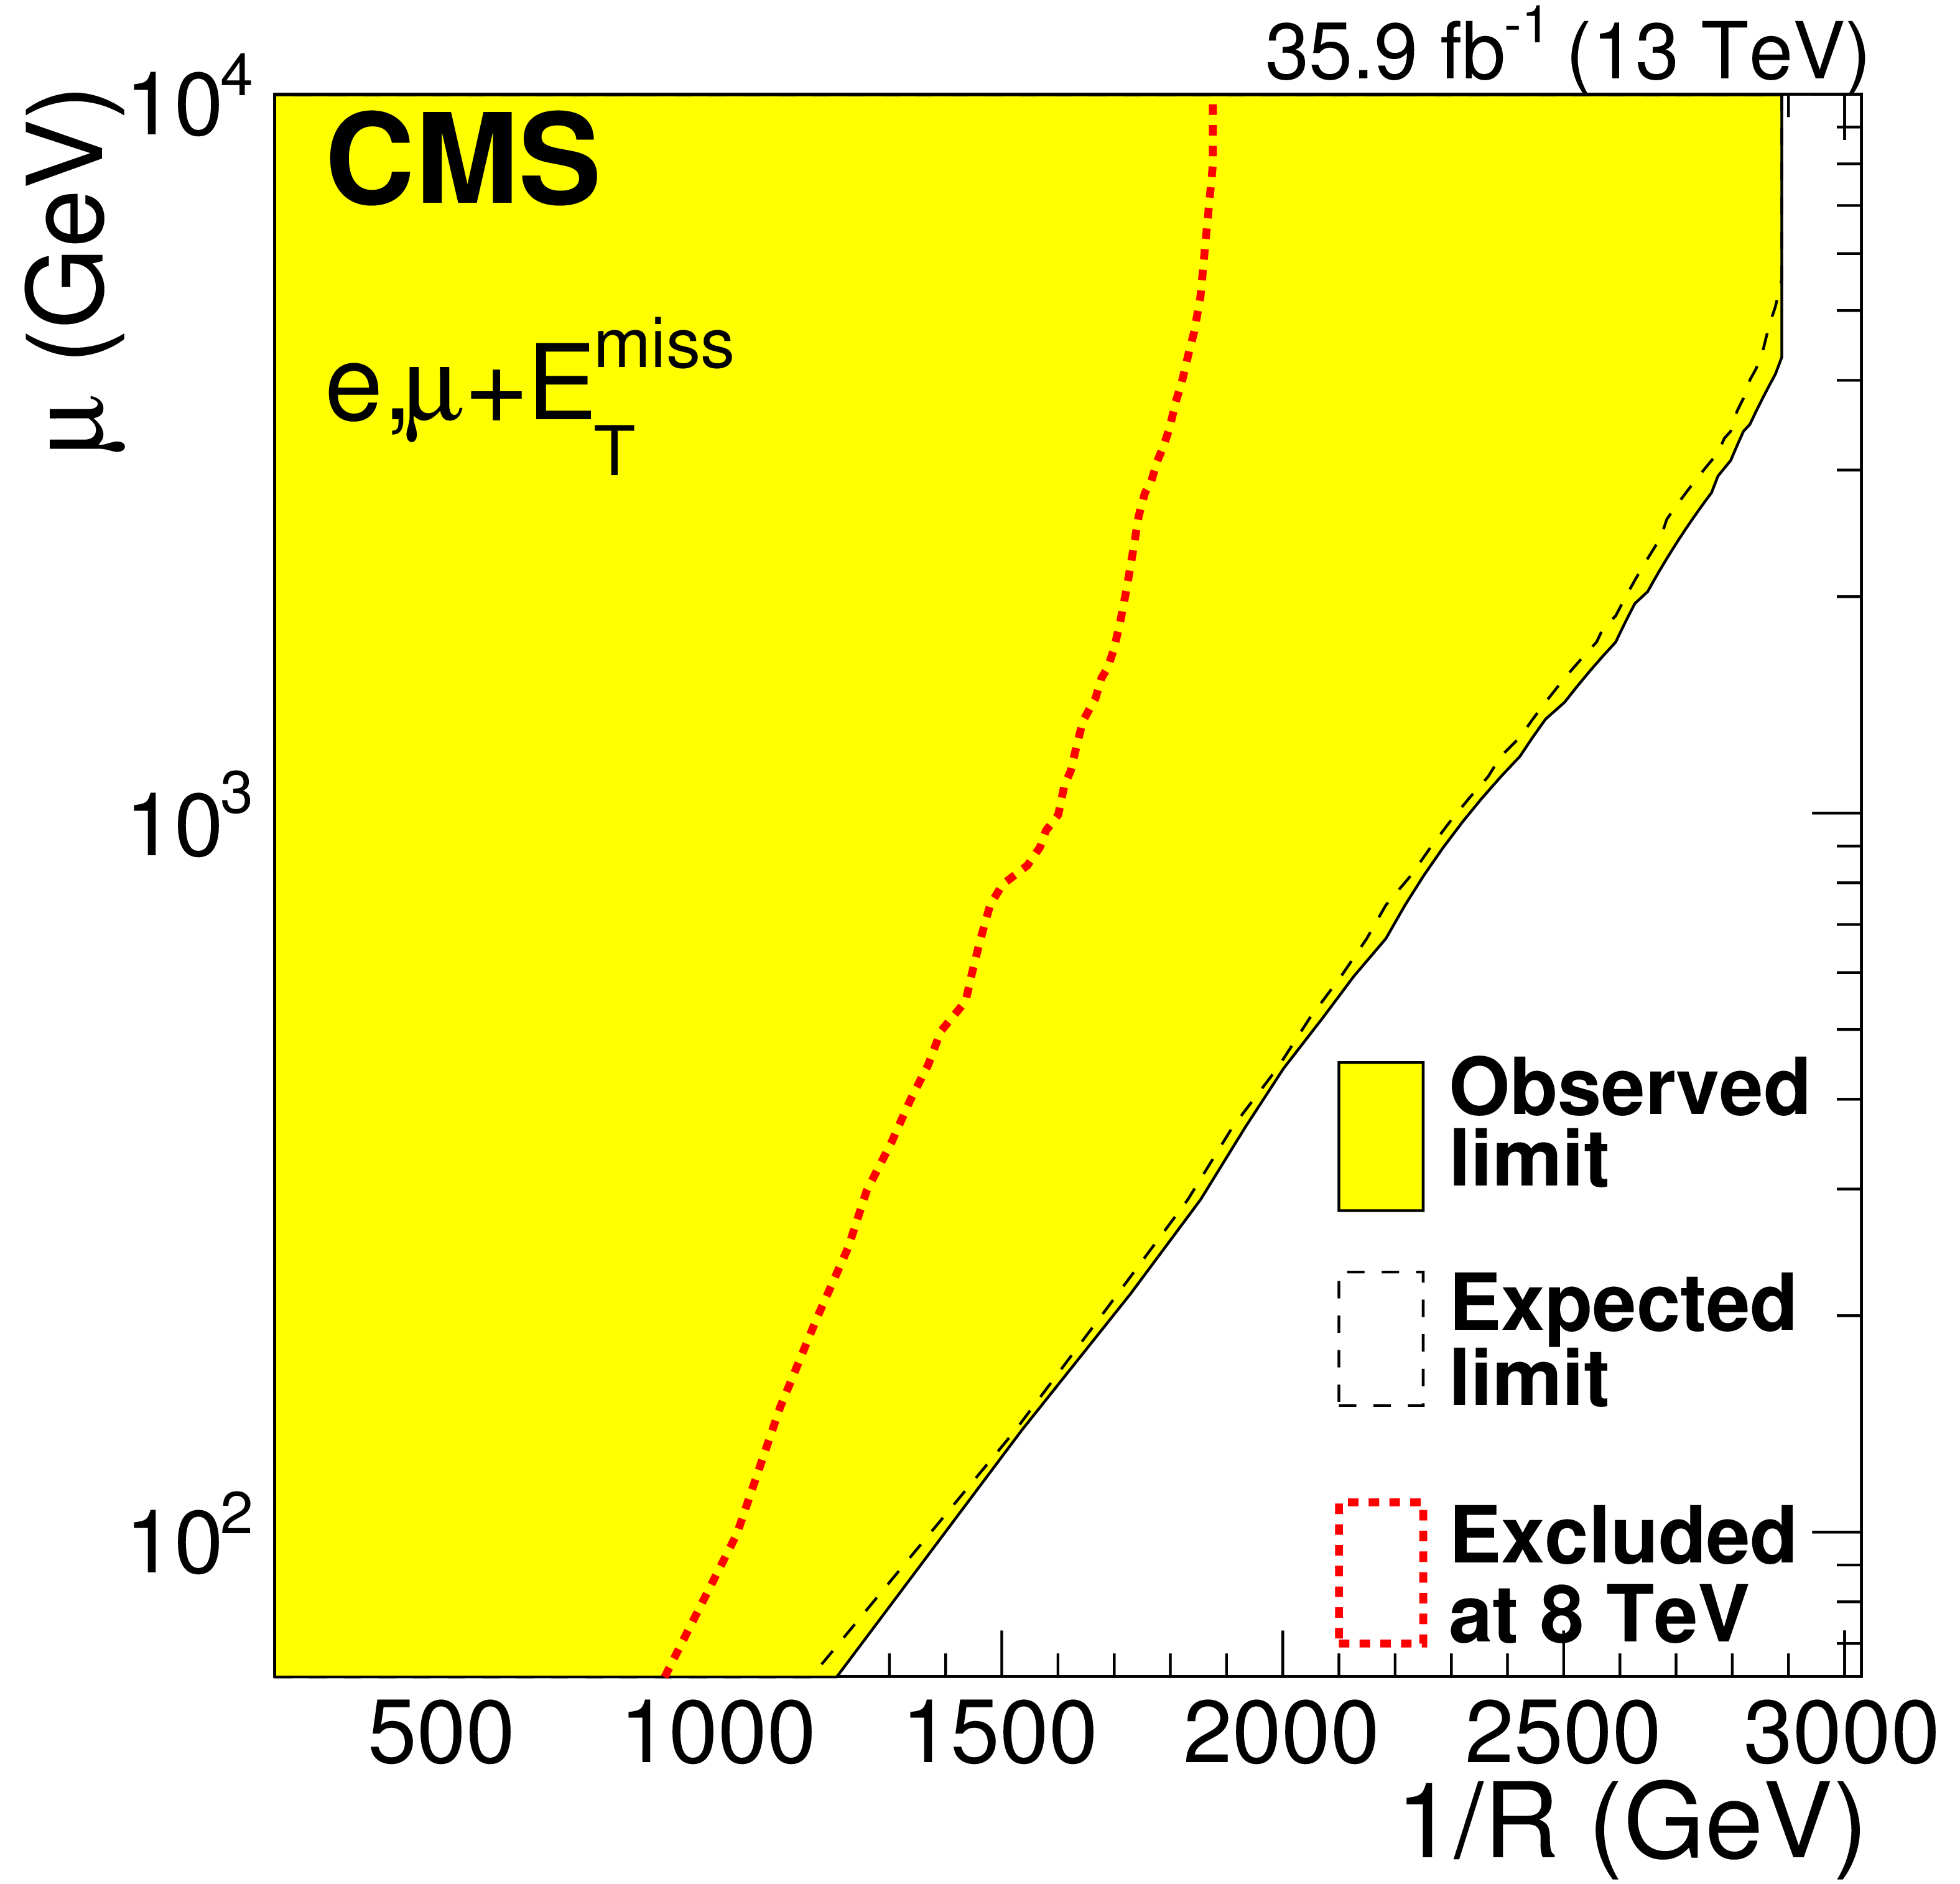
Figure 8-c:
Exclusion limit in the plane ($\mu $, 1/R) for the split-UED interpretation for the $n=2$ case in the combination of both electron and muon channels. The expected limit is depicted as a dashed line and the experimentally excluded region as a solid black line (filled as a yellow area). For comparison, the 8 TeV result from Ref. [8] is given as a red, dotted line. |
png pdf |
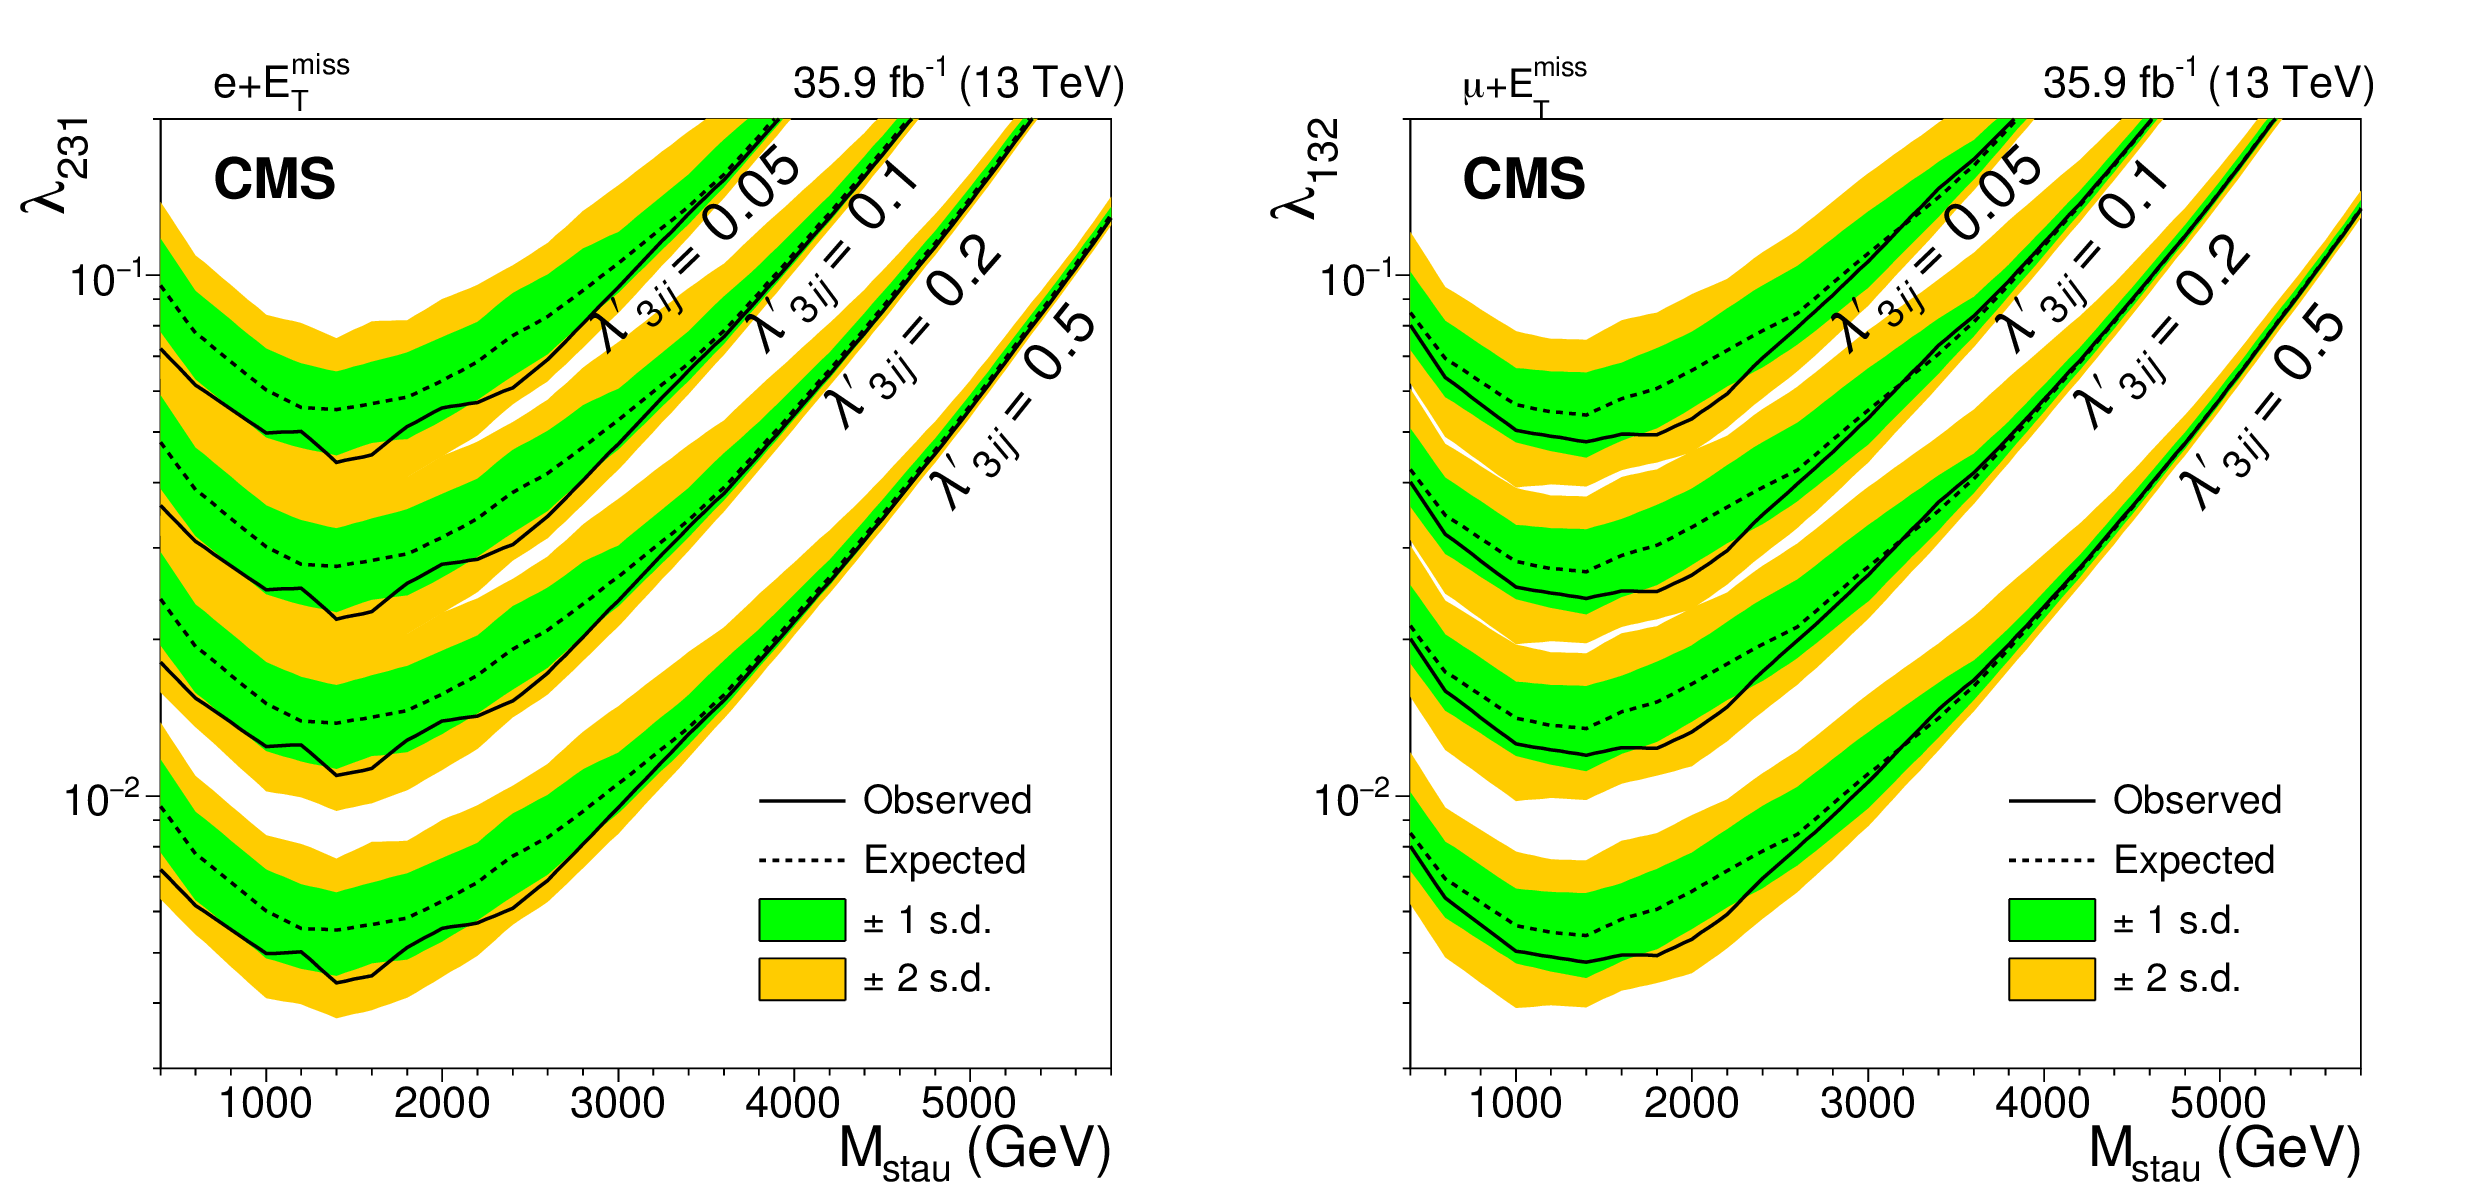
Figure 9:
Observed (solid line) and expected (dashed line) exclusion limits for different couplings in the model with a $\tau $ slepton as a mediator. The couplings $\lambda ^{'}_{3ij}$, $\lambda _{231}$, and $\lambda _{132}$ are defined in Fig. 1. Results are shown for the final states consisting of $ {\mathrm {e}}+\nu _{\mu}$ on the left and $\mu +\nu _{{\mathrm {e}}}$ on the right. |

png pdf |
Figure 9-a:
Observed (solid line) and expected (dashed line) exclusion limits for different couplings in the model with a $\tau $ slepton as a mediator. The couplings $\lambda ^{'}_{3ij}$, $\lambda _{231}$, and $\lambda _{132}$ are defined in Fig. 1. Results are shown for the final states consisting of $ {\mathrm {e}}+\nu _{\mu}$. |

png pdf |
Figure 9-b:
Observed (solid line) and expected (dashed line) exclusion limits for different couplings in the model with a $\tau $ slepton as a mediator. The couplings $\lambda ^{'}_{3ij}$, $\lambda _{231}$, and $\lambda _{132}$ are defined in Fig. 1. Results are shown for the final states consisting of $\mu +\nu _{{\mathrm {e}}}$. |
| Tables | |

png pdf |
Table 1:
Expected and observed numbers of signal and background events, for a selected set of $ {M_\mathrm {T}} $ thresholds. Also shown are the total systematic uncertainties in the estimate of the event numbers. The signal yields are based on NNLO cross sections. |
| Summary |
|
A search for high-mass resonances in the lepton plus the missing transverse momentum final state in proton-proton collisions at $\sqrt{s} = $ 13 TeV has been performed, using a data sample corresponding to an integrated luminosity of 35.9 fb$^{-1}$. No evidence for new physics is observed when examining the transverse mass distributions in the electron and muon channels. These observations are interpreted as 95% confidence limits on the parameters of several models. The exclusion limits on a sequential standard model-like W' are calculated to be 4.9 (4.9) TeV in the individual electron (muon) channels. A combination of both channels increases the limit to 5.2 TeV, assuming standard model couplings. Additionally, variations in the coupling strength are studied and couplings above 2 $\times 10^{-2}$ are excluded for low W' masses. These results are also applied to the split universal extra dimension model, and the inverse radius of the extra dimension $1/R$ is constrained by this analysis to be above 2.9 TeV. These results are presented in a model-independent form, making possible their interpretation in a number of other models. An example of this application is given using a supersymmetric model with R-parity violation, and a tau slepton mediator with flavor-violating decays into either $\mathrm{e}+\nu_{\mu}$ or $\mu+\nu_{\mathrm{e}}$. Limits on the coupling strengths at the decay vertex have been derived as a function of the mediator mass, for various values of the coupling at the production vertex $\lambda^{'}_{3ij}$. |
| References | ||||
| 1 | K. Hsieh, K. Schmitz, J.-H. Yu, and C. P. Yuan | Global analysis of general SU(2) x SU(2) x U(1) models with precision data | PRD 82 (2010) 035011 | 1003.3482 |
| 2 | N. Arkani-Hamed, S. Dimopoulos, and G. R. Dvali | The hierarchy problem and new dimensions at a millimeter | PLB 429 (1998) 263 | hep-ph/9803315 |
| 3 | T. Appelquist, H.-C. Cheng, and B. A. Dobrescu | Bounds on universal extra dimensions | PRD 64 (2001) 035002 | hep-ph/0012100 |
| 4 | G. Altarelli, B. Mele, and M. Ruiz-Altaba | Searching for new heavy vector bosons in $ p \bar{p} $ colliders | Z. Phys. C 45 (1989) 109, .[Erratum: Z. Phys.C47, 676(1990)] | |
| 5 | H. K. Dreiner and T. Stefaniak | Bounds on R-parity violation from resonant slepton production at the LHC | PRD 86 (2012) 055010 | 1201.5014 |
| 6 | G. R. Farrar and P. Fayet | Phenomenology of the production, decay, and detection of new hadronic states associated with Supersymmetry | PLB 76 (1978) 575 | |
| 7 | K. Kong, S. C. Park, and T. G. Rizzo | Collider phenomenology with Split-UED | JHEP 04 (2010) 081 | 1002.0602 |
| 8 | CMS Collaboration | Search for physics beyond the standard model in final states with a lepton and missing transverse energy in proton-proton collisions at $ \sqrt{s}= $ 8 TeV | PRD 91 (2015) 092005 | CMS-EXO-12-060 1408.2745 |
| 9 | CMS Collaboration | Search for heavy gauge W' boson in events with an energetic lepton and large missing transverse momentum at $ \sqrt{s} = $ 13 TeV | PLB 770 (2017) 278 | CMS-EXO-15-006 1612.09274 |
| 10 | ATLAS Collaboration | Search for new particles in events with one lepton and missing transverse momentum in pp collisions at $ \sqrt{s} = $ 8 TeV with the ATLAS detector | JHEP 09 (2014) 037 | 1407.7494 |
| 11 | ATLAS Collaboration | Search for a new heavy gauge boson resonance decaying into a lepton and missing transverse momentum in 36 fb$ ^{-1} $ of pp collisions at $ \sqrt{s} = $ 13 TeV with the ATLAS experiment | Submitted to \it EPJC | 1706.04786 |
| 12 | CMS Collaboration | Performance of photon reconstruction and identification with the CMS detector in proton-proton collisions at $ \sqrt{s} = $ 8 TeV | JINST 10 (2015) P08010 | CMS-EGM-14-001 1502.02702 |
| 13 | CMS Collaboration | Search for heavy narrow dilepton resonances in pp collisions at $ \sqrt{s}= $ 7 TeV and $ \sqrt{s}= $ 8 TeV | PLB 720 (2013) 63 | CMS-EXO-12-015 1212.6175 |
| 14 | CMS Collaboration | Performance of CMS muon reconstruction in pp collision events at $ \sqrt{s} = $ 13 TeV | ||
| 15 | M. Cacciari, G. P. Salam, and G. Soyez | The anti-$ {k_{\mathrm{T}}} $ jet clustering algorithm | JHEP 04 (2008) 063 | 0802.1189 |
| 16 | M. Cacciari, G. P. Salam, and G. Soyez | FastJet user manual | EPJC 72 (2012) 1896 | 1111.6097 |
| 17 | CMS Collaboration | The CMS trigger system | JINST 12 (2017) P01020 | CMS-TRG-12-001 1609.02366 |
| 18 | CMS Collaboration | The CMS experiment at the CERN LHC | JINST 3 (2008) S08004 | CMS-00-001 |
| 19 | S. Agostinelli et al. | $ GEANT4--a $ simulation toolkit | NIMA 506 (2003) 250 | |
| 20 | D0 Collaboration | Search for $ \mathrm{W'} $ boson resonances decaying to a top quark and a bottom quark | PRL 100 (2008) 211803 | 0803.3256 |
| 21 | CMS Collaboration | Search for heavy resonances decaying to a top quark and a bottom quark in the lepton+jets final state in proton-proton collisions at 13 TeV | PLB 777 (2018) 39 | CMS-B2G-17-010 1708.08539 |
| 22 | ATLAS Collaboration | Search for $ \mathrm{W'} \to $ tb $ \to $ qqbb decays in $ pp $ collisions at $ \sqrt{s} = $ 8 TeV with the ATLAS detector | EPJC 75 (2015) 165 | 1408.0886 |
| 23 | CMS Collaboration | Search for new resonances decaying via WZ to leptons in proton-proton collisions at $ \sqrt{s}= $ 8 TeV | PLB 740 (2014) 83 | CMS-EXO-12-025 1407.3476 |
| 24 | CMS Collaboration | Search for massive resonances decaying into WW, WZ or ZZ bosons in proton-proton collisions at $ \sqrt{s}= $ 13 TeV | JHEP 03 (2017) 162 | CMS-B2G-16-004 1612.09159 |
| 25 | T. Sjostrand et al. | An introduction to PYTHIA 8.2 | Comp. Phys. Comm. 191 (2015) 159 | 1410.3012 |
| 26 | NNPDF Collaboration | Impact of heavy quark masses on parton distributions and LHC phenomenology | NPB 849 (2011) 296 | 1101.1300 |
| 27 | R. D. Ball et al. | Parton distributions with LHC data | NPB 867 (2013) 244 | 1207.1303 |
| 28 | P. Skands, S. Carrazza, and J. Rojo | Tuning PYTHIA 8.1: the Monash 2013 Tune | EPJC 74 (2014) 3024 | 1404.5630 |
| 29 | R. Gavin, Y. Li, F. Petriello, and S. Quackenbush | FEWZ 2.0: A code for hadronic Z production at next-to-next-to-leading order | CPC 182 (2011) 2388 | 1011.3540 |
| 30 | Y. Li and F. Petriello | Combining QCD and electroweak corrections to dilepton production in FEWZ | PRD 86 (2012) 094034 | 1208.5967 |
| 31 | J. Alwall et al. | MadGraph 5: going beyond | JHEP 06 (2011) 128 | 1106.0522 |
| 32 | C.-R. Chen et al. | Dark matter and collider phenomenology of split-UED | JHEP 09 (2009) 078 | 0903.1971 |
| 33 | CMS Collaboration | Particle-flow reconstruction and global event description with the CMS detector | JINST 12 (2017) P10003 | CMS-PRF-14-001 1706.04965 |
| 34 | CMS Collaboration | Performance of missing energy reconstruction in 13 TeV pp collision data using the CMS detector | ||
| 35 | CMS Collaboration | Missing transverse energy performance of the CMS detector | JINST 6 (2011) P09001 | CMS-JME-10-009 1106.5048 |
| 36 | CMS Collaboration | Search for narrow resonances in dilepton mass spectra in proton-proton collisions at $ \sqrt{s}= $ 13 TeV and combination with $ \sqrt{s} = $ 8 TeV data | PLB 768 (2017) 57 | CMS-EXO-15-005 1609.05391 |
| 37 | CMS Collaboration | Performance of electron reconstruction and selection with the CMS detector in proton-proton collisions at $ \sqrt{s} = $ 8 TeV | JINST 10 (2015) P06005 | CMS-EGM-13-001 1502.02701 |
| 38 | CMS Collaboration | Performance of CMS muon reconstruction in pp collision events at $ \sqrt{s} = $ 7 TeV | JINST 7 (2012) P10002 | CMS-MUO-10-004 1206.4071 |
| 39 | CMS Collaboration | Measurement of the Inclusive W and Z Production Cross Sections in $ pp $ Collisions at $ \sqrt{s}= $ 7 TeV | JHEP 10 (2011) 132 | CMS-EWK-10-005 1107.4789 |
| 40 | CMS Collaboration | Identification of heavy-flavour jets with the CMS detector in pp collisions at 13 TeV | Submitted to \it JINST | CMS-BTV-16-002 1712.07158 |
| 41 | J. Alwall et al. | The automated computation of tree-level and next-to-leading order differential cross sections, and their matching to parton shower simulations | JHEP 07 (2014) 079 | 1405.0301 |
| 42 | NNPDF Collaboration | Parton distributions from high-precision collider data | EPJC 77 (2017), no. 10, 663 | 1706.00428 |
| 43 | S. G. Bondarenko and A. A. Sapronov | NLO EW and QCD proton-proton cross section calculations with mcsanc-v1.01 | Comp. Phys. Comm. 184 (2013) 2343 | 1301.3687 |
| 44 | P. Nason | A new method for combining NLO QCD with shower Monte Carlo algorithms | JHEP 11 (2004) 040 | hep-ph/0409146 |
| 45 | S. Frixione, P. Nason, and C. Oleari | Matching NLO QCD computations with parton shower simulations: the POWHEG method | JHEP 11 (2007) 070 | 0709.2092 |
| 46 | S. Alioli, P. Nason, C. Oleari, and E. Re | A general framework for implementing NLO calculations in shower Monte Carlo programs: the POWHEG BOX | JHEP 06 (2010) 043 | 1002.2581 |
| 47 | E. Re | Single-top W$ \itt-channel $ production matched with parton showers using the POWHEG method | EPJC 71 (2011) 1547 | 1009.2450 |
| 48 | M. Czakon, P. Fiedler, and A. Mitov | Total top-quark pair-production cross section at hadron colliders through $ O(\alpha^{4}_{S}) $ | PRL 110 (2013) 252004 | 1303.6254 |
| 49 | T. Gehrmann et al. | $ {W^+W^-} $ production at hadron colliders in next to next to leading order QCD | PRL 113 (2014) 212001 | 1408.5243 |
| 50 | F. Cascioli et al. | ZZ production at hadron colliders in NNLO QCD | PLB 735 (2014) 311 | 1405.2219 |
| 51 | J. M. Campbell, R. K. Ellis, and C. Williams | Vector boson pair production at the LHC | JHEP 07 (2011) 018 | 1105.0020 |
| 52 | J. Alwall et al. | Comparative study of various algorithms for the merging of parton showers and matrix elements in hadronic collisions | EPJC 53 (2008) 473 | 0706.2569 |
| 53 | CMS Collaboration | Energy calibration and resolution of the CMS electromagnetic calorimeter in pp collisions at $ \sqrt{s} = $ 7 TeV | JINST 8 (2013) P09009 | CMS-EGM-11-001 1306.2016 |
| 54 | J. Butterworth et al. | PDF4LHC recommendations for LHC Run II | JPG 43 (2016) 023001 | 1510.03865 |
| 55 | CMS Collaboration | CMS luminosity measurement for the 2016 data taking period | ||
| 56 | Particle Data Group, C. C. Patrignani et al. | Review of particle physics | CPC 40 (2016), no. 10, 100001 | |
|
|
Compact Muon Solenoid LHC, CERN |
|

|

|

|

|

|