

Compact Muon Solenoid
LHC, CERN
| CMS-EXO-16-053 ; CERN-EP-2018-248 | ||
| Search for new physics in final states with a single photon and missing transverse momentum in proton-proton collisions at $\sqrt{s} = $ 13 TeV | ||
| CMS Collaboration | ||
| 29 September 2018 | ||
| JHEP 02 (2019) 074 | ||
| Abstract: A search is conducted for new physics in final states containing a photon and missing transverse momentum in proton-proton collisions at $\sqrt{s} = $ 13 TeV, using the data collected in 2016 by the CMS experiment at the LHC, corresponding to an integrated luminosity of 35.9 fb$^{-1}$. No deviations from the predictions of the standard model are observed. The results are interpreted in the context of dark matter production and models containing extra spatial dimensions, and limits on new physics parameters are calculated at 95% confidence level. For the two simplified dark matter production models considered, the observed (expected) lower limits on the mediator masses are both 950 (1150) GeV for 1 GeV dark matter mass. For an effective electroweak-dark matter contact interaction, the observed (expected) lower limit on the suppression parameter $\Lambda$ is 850 (950) GeV. Values of the effective Planck scale up to 2.85-2.90 TeV are excluded for between 3 and 6 extra spatial dimensions. | ||
| Links: e-print arXiv:1810.00196 [hep-ex] (PDF) ; CDS record ; inSPIRE record ; CADI line (restricted) ; | ||
| Figures | |

png pdf |
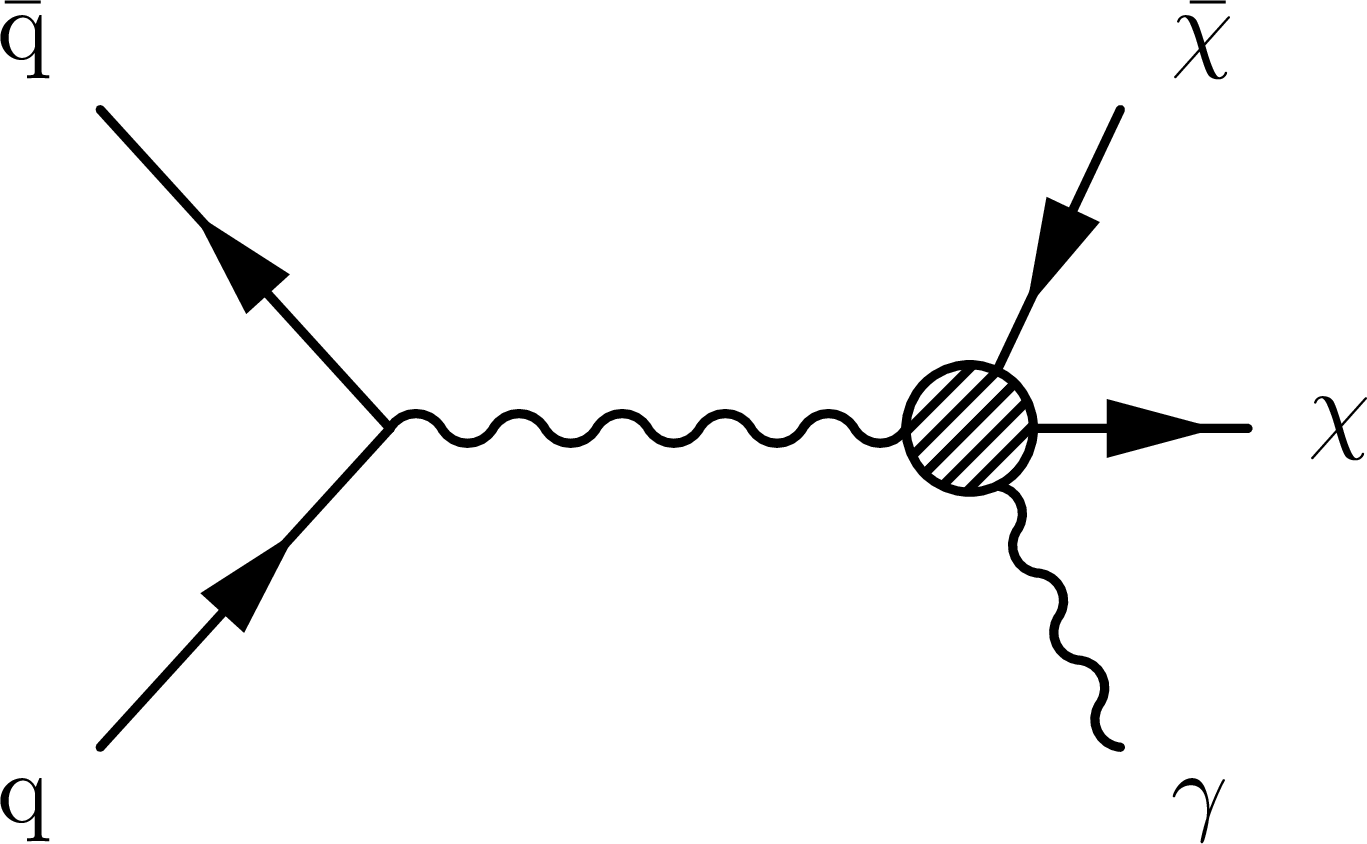
Figure 1:
Leading order diagrams of the simplified DM model (left), EWK-DM effective interaction (center), and graviton (G) production in the ADD model (right), with a final state of a photon and large ${{p_{\mathrm {T}}} ^\text {miss}}$. Particles $\chi $ and $\overline {\chi}$ are the dark matter and its antiparticle, and $\Phi $ in the simplified DM model represents a vector or axial-vector mediator. |

png pdf |
Figure 1-a:
Leading order diagram of the simplified DM model, with a final state of a photon and large ${{p_{\mathrm {T}}} ^\text {miss}}$. Particles $\chi $ and $\overline {\chi}$ are the dark matter and its antiparticle, and $\Phi $ in the simplified DM model represents a vector or axial-vector mediator. |
png pdf |
Figure 1-b:
Leading order diagram of the EWK-DM effective interaction, with a final state of a photon and large ${{p_{\mathrm {T}}} ^\text {miss}}$. Particles $\chi $ and $\overline {\chi}$ are the dark matter and its antiparticle. |

png pdf |
Figure 1-c:
Leading order diagram of the graviton (G) production in the ADD, with a final state of a photon and large ${{p_{\mathrm {T}}} ^\text {miss}}$. |

png pdf |
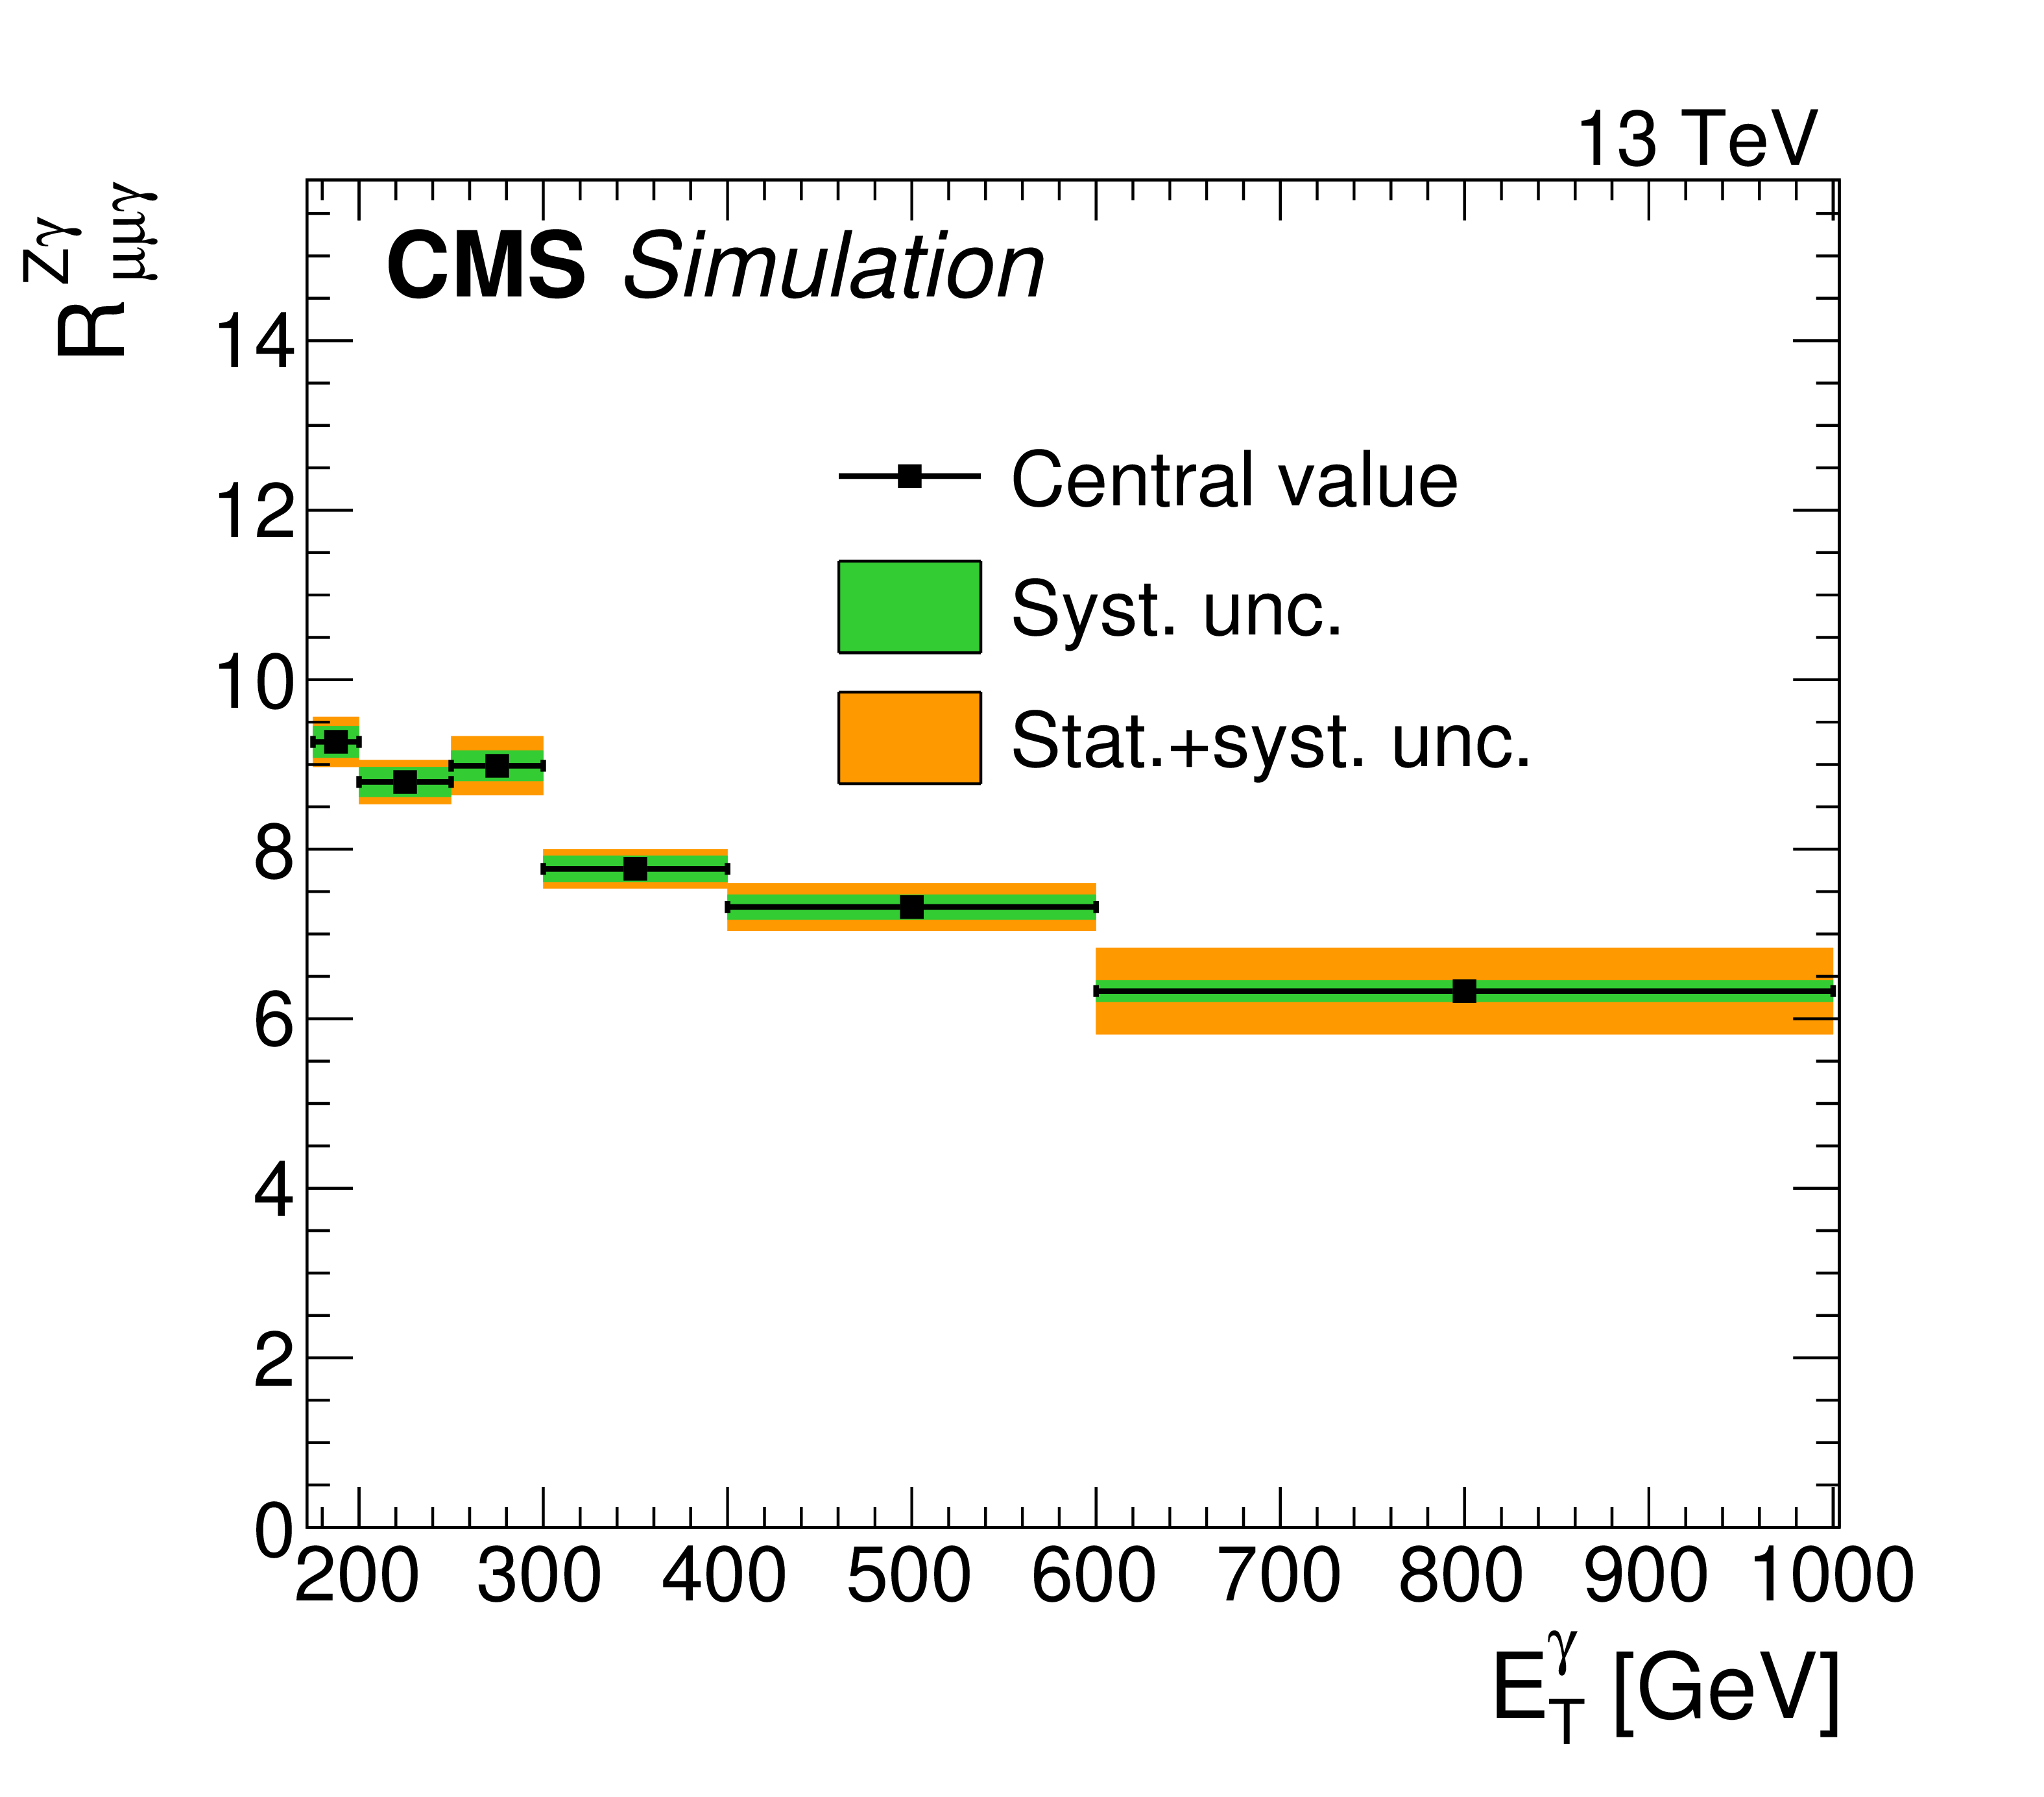
Figure 2:
Transfer factors $R^{\mathrm{Z}\gamma}_{\mathrm{ee\gamma}}$ (left) and $R^{\mathrm{Z}\gamma}_{\mu\mu\gamma}$ (right). The uncertainty bands in green (inner) and orange (outer) show the systematic uncertainty, and the combination of systematic and statistical uncertainty arising from limited MC sample size, respectively. The systematic uncertainties considered are the uncertainties in the data-to-simulation correction factors $\rho $ for the lepton identification efficiencies. Simulated ${{\mathrm {Z}} (\to \ell \overline {\ell}){+} {\gamma}}$ events are generated in two samples, one with generated ${E_{\mathrm {T}}^{{\gamma}}} $ required to be greater than 300 GeV, and one with a looser restriction. The ${E_{\mathrm {T}}^{{\gamma}}} $ bin centred at 270 GeV is close to the boundary between the two samples, where there are fewer generated events. The relatively large statistical fluctuation visible in the third bin of the right-hand figure results from this. |

png pdf |
Figure 2-a:
Transfer factor $R^{\mathrm{Z}\gamma}_{\mathrm{ee\gamma}}$. The uncertainty bands in green (inner) and orange (outer) show the systematic uncertainty, and the combination of systematic and statistical uncertainty arising from limited MC sample size, respectively. The systematic uncertainties considered are the uncertainties in the data-to-simulation correction factors $\rho $ for the lepton identification efficiencies.Simulated ${{\mathrm {Z}} (\to \ell \overline {\ell}){+} {\gamma}}$ events are generated in two samples, one with generated ${E_{\mathrm {T}}^{{\gamma}}} $ required to be greater than 300 GeV, and one with a looser restriction. |
png pdf |
Figure 2-b:
Transfer factor $R^{\mathrm{Z}\gamma}_{\mu\mu\gamma}$. The uncertainty bands in green (inner) and orange (outer) show the systematic uncertainty, and the combination of systematic and statistical uncertainty arising from limited MC sample size, respectively. The systematic uncertainties considered are the uncertainties in the data-to-simulation correction factors $\rho $ for the lepton identification efficiencies. Simulated ${{\mathrm {Z}} (\to \ell \overline {\ell}){+} {\gamma}}$ events are generated in two samples, one with generated ${E_{\mathrm {T}}^{{\gamma}}} $ required to be greater than 300 GeV, and one with a looser restriction. The ${E_{\mathrm {T}}^{{\gamma}}} $ bin centred at 270 GeV is close to the boundary between the two samples, where there are fewer generated events. The relatively large statistical fluctuation visible in the third bin results from this. |

png pdf |
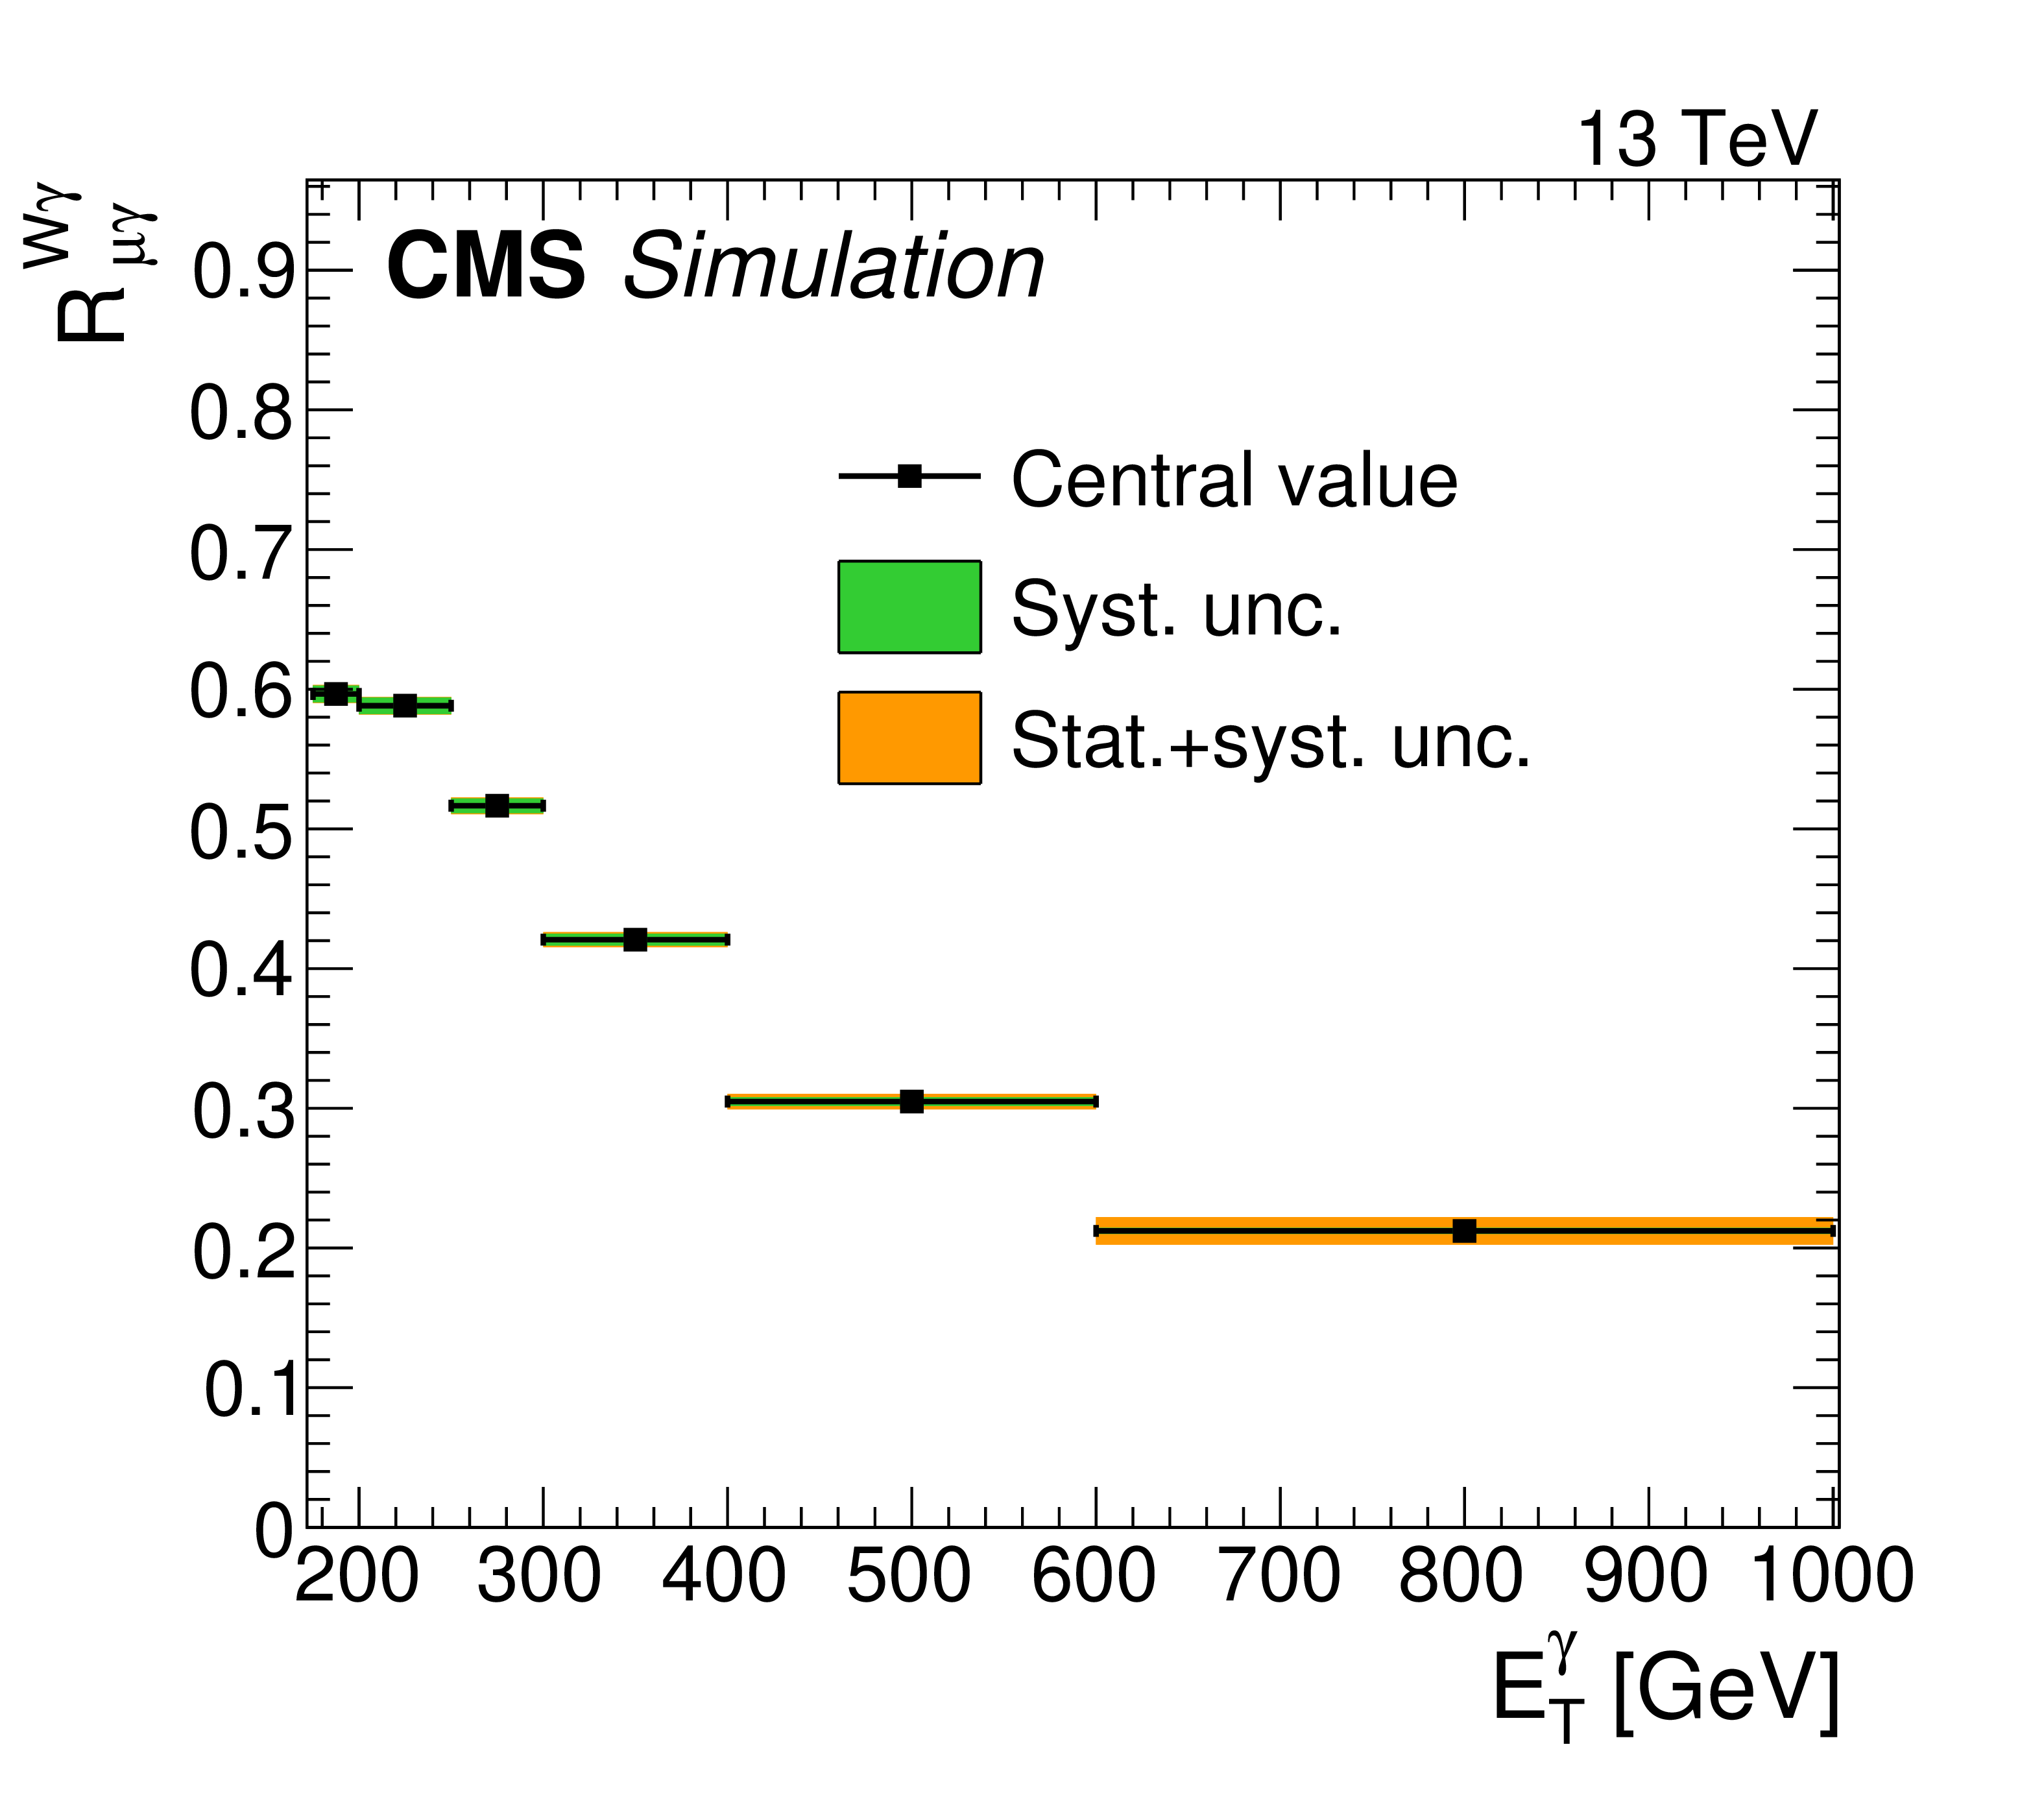
Figure 3:
Transfer factors $R^{\mathrm{W}\gamma}_{\mathrm{e\gamma}}$ (left) and $R^{\mathrm{W}\gamma}_{\mu\gamma}$ (right). The uncertainty bands in green (inner) and orange (outer) show the systematic uncertainty, and the combination of systematic and statistical uncertainty arising from limited MC sample size, respectively. The systematic uncertainties considered are the uncertainties in the data-to-simulation correction factors $\rho $ for the lepton identification efficiencies. |

png pdf |
Figure 3-a:
Transfer factor $R^{\mathrm{W}\gamma}_{\mathrm{e\gamma}}$. The uncertainty bands in green (inner) and orange (outer) show the systematic uncertainty, and the combination of systematic and statistical uncertainty arising from limited MC sample size, respectively. The systematic uncertainties considered are the uncertainties in the data-to-simulation correction factors $\rho $ for the lepton identification efficiencies. |
png pdf |
Figure 3-b:
Transfer factor $R^{\mathrm{W}\gamma}_{\mu\gamma}$. The uncertainty bands in green (inner) and orange (outer) show the systematic uncertainty, and the combination of systematic and statistical uncertainty arising from limited MC sample size, respectively. The systematic uncertainties considered are the uncertainties in the data-to-simulation correction factors $\rho $ for the lepton identification efficiencies. |
png pdf |
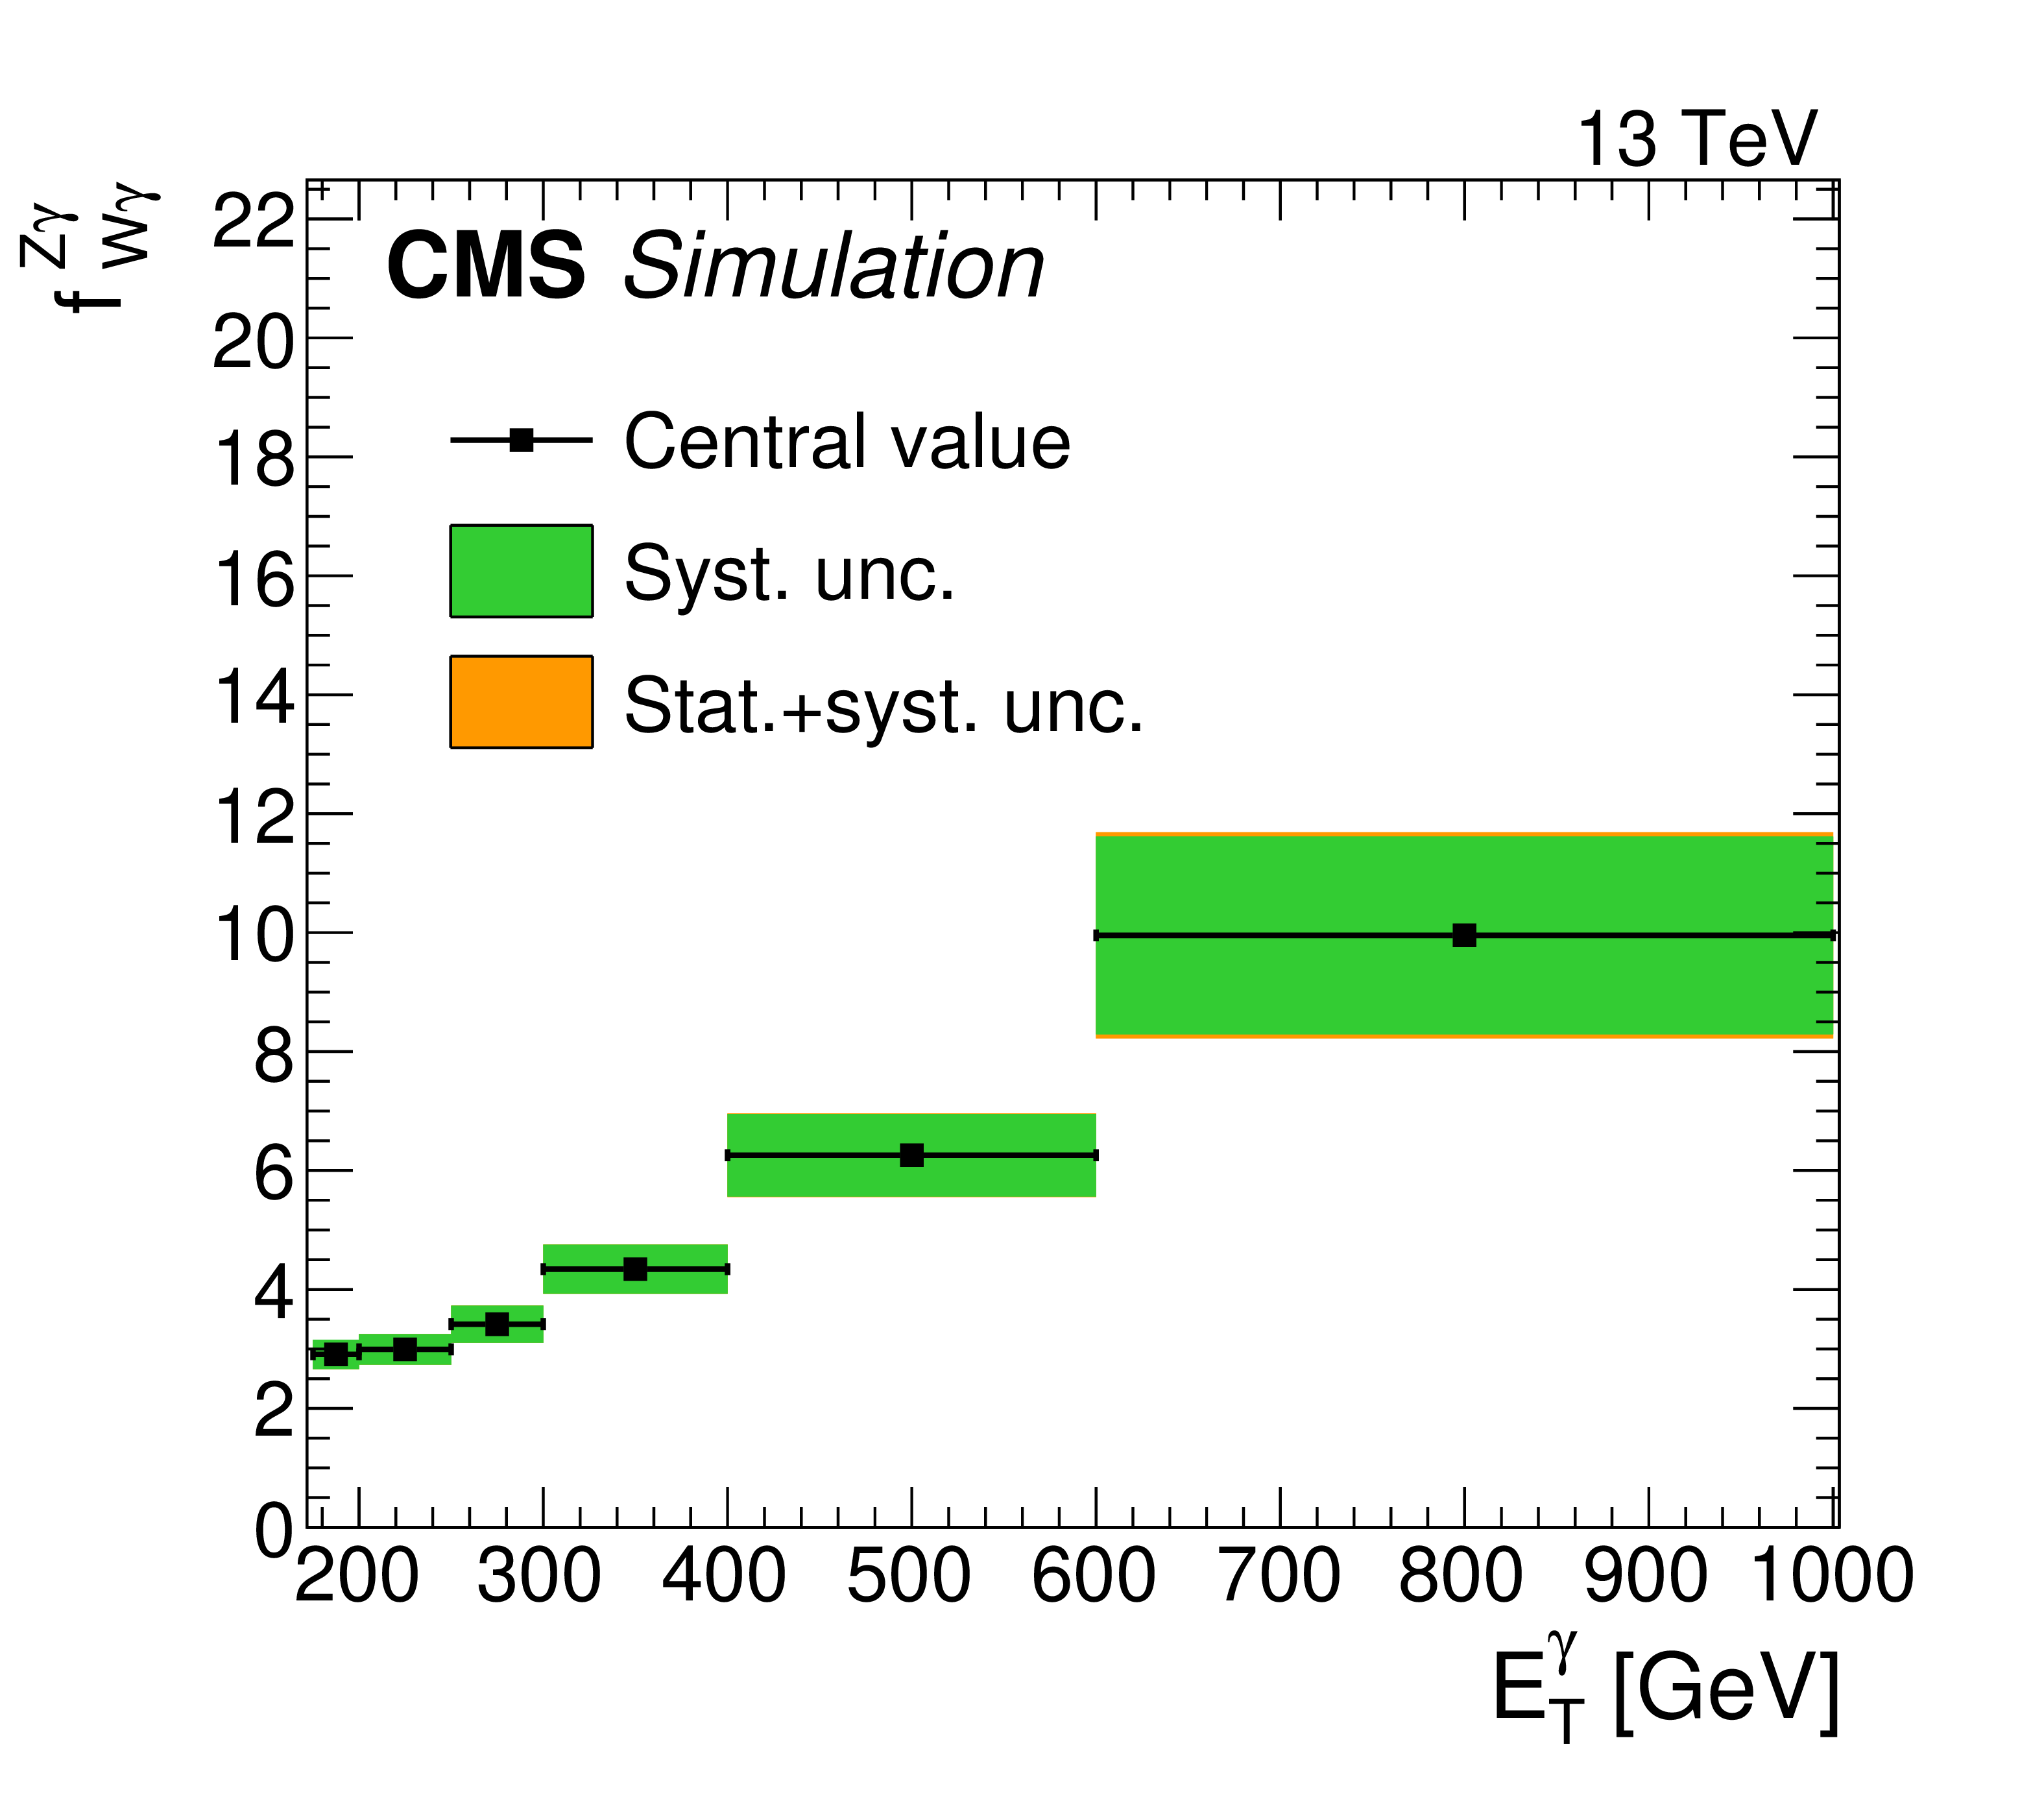
Figure 4:
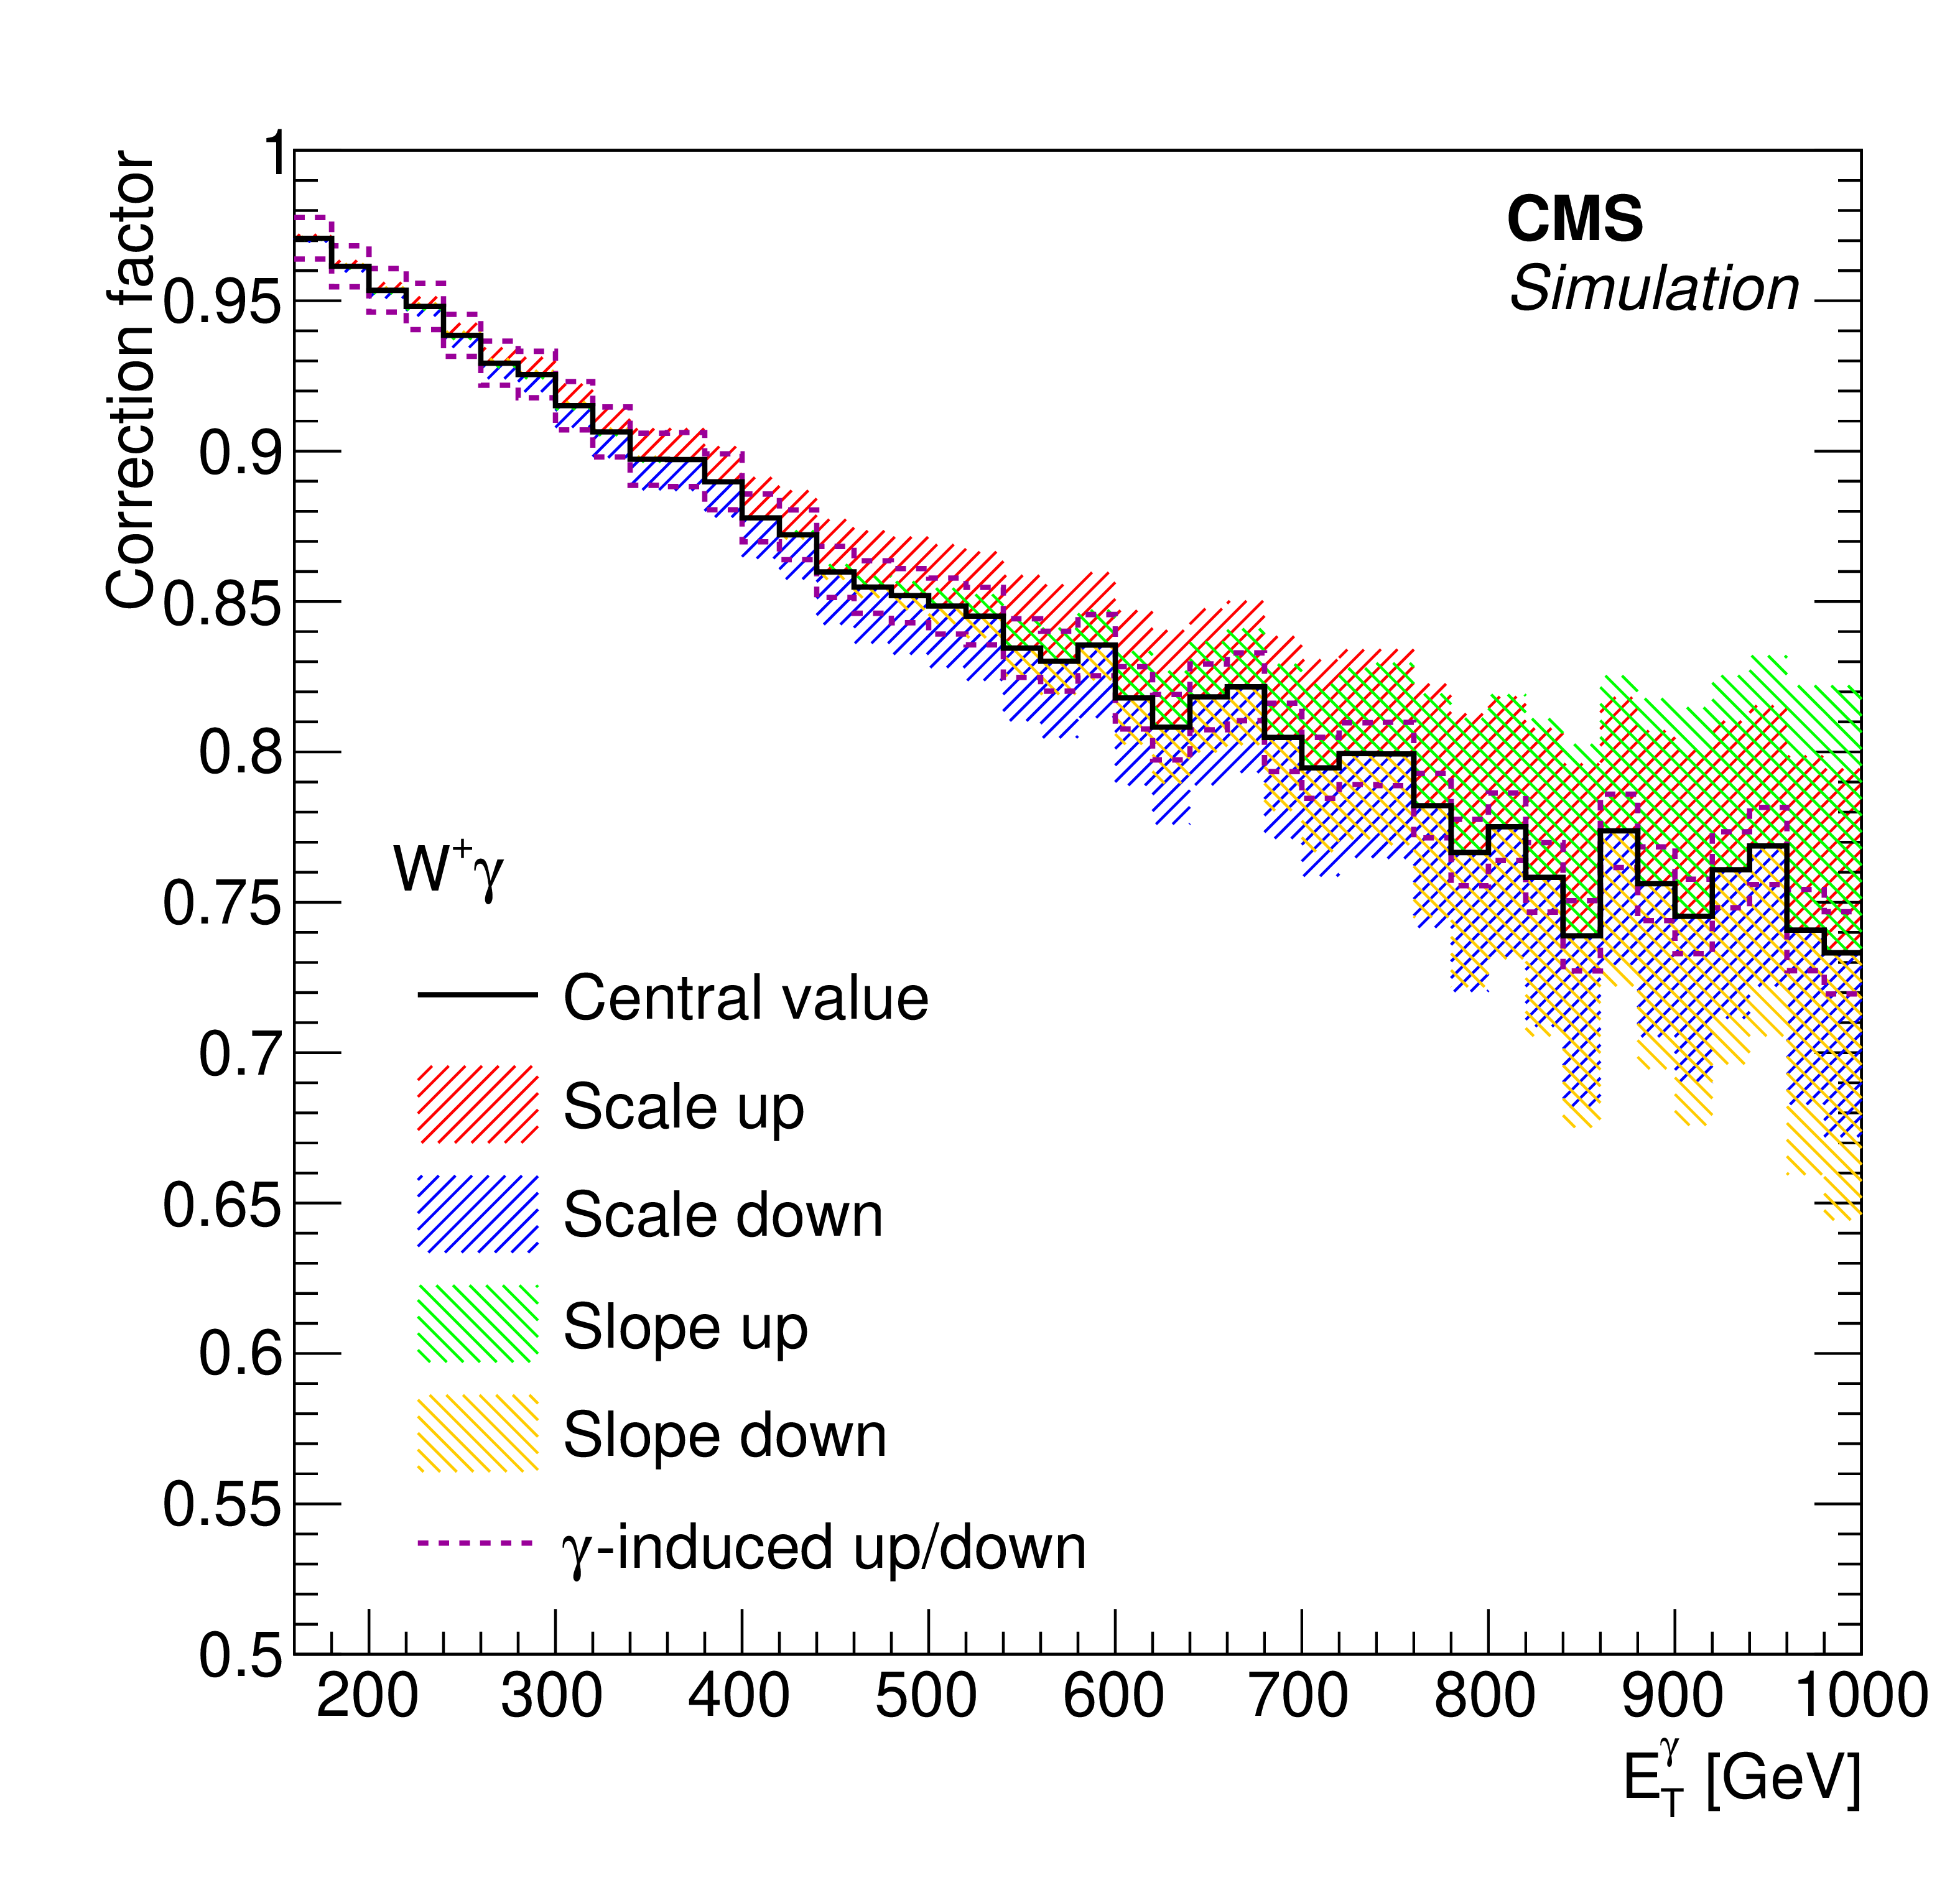
Transfer factor $f^{\mathrm{Z}\gamma}_{\mathrm{W}\gamma}$. The uncertainty bands in green (inner) and orange (outer) show the systematic uncertainty, and the combination of systematic and statistical uncertainty arising from limited MC sample size, respectively. The systematic uncertainties considered are the uncertainties from higher-order theoretical corrections. |

png pdf |
Figure 5:
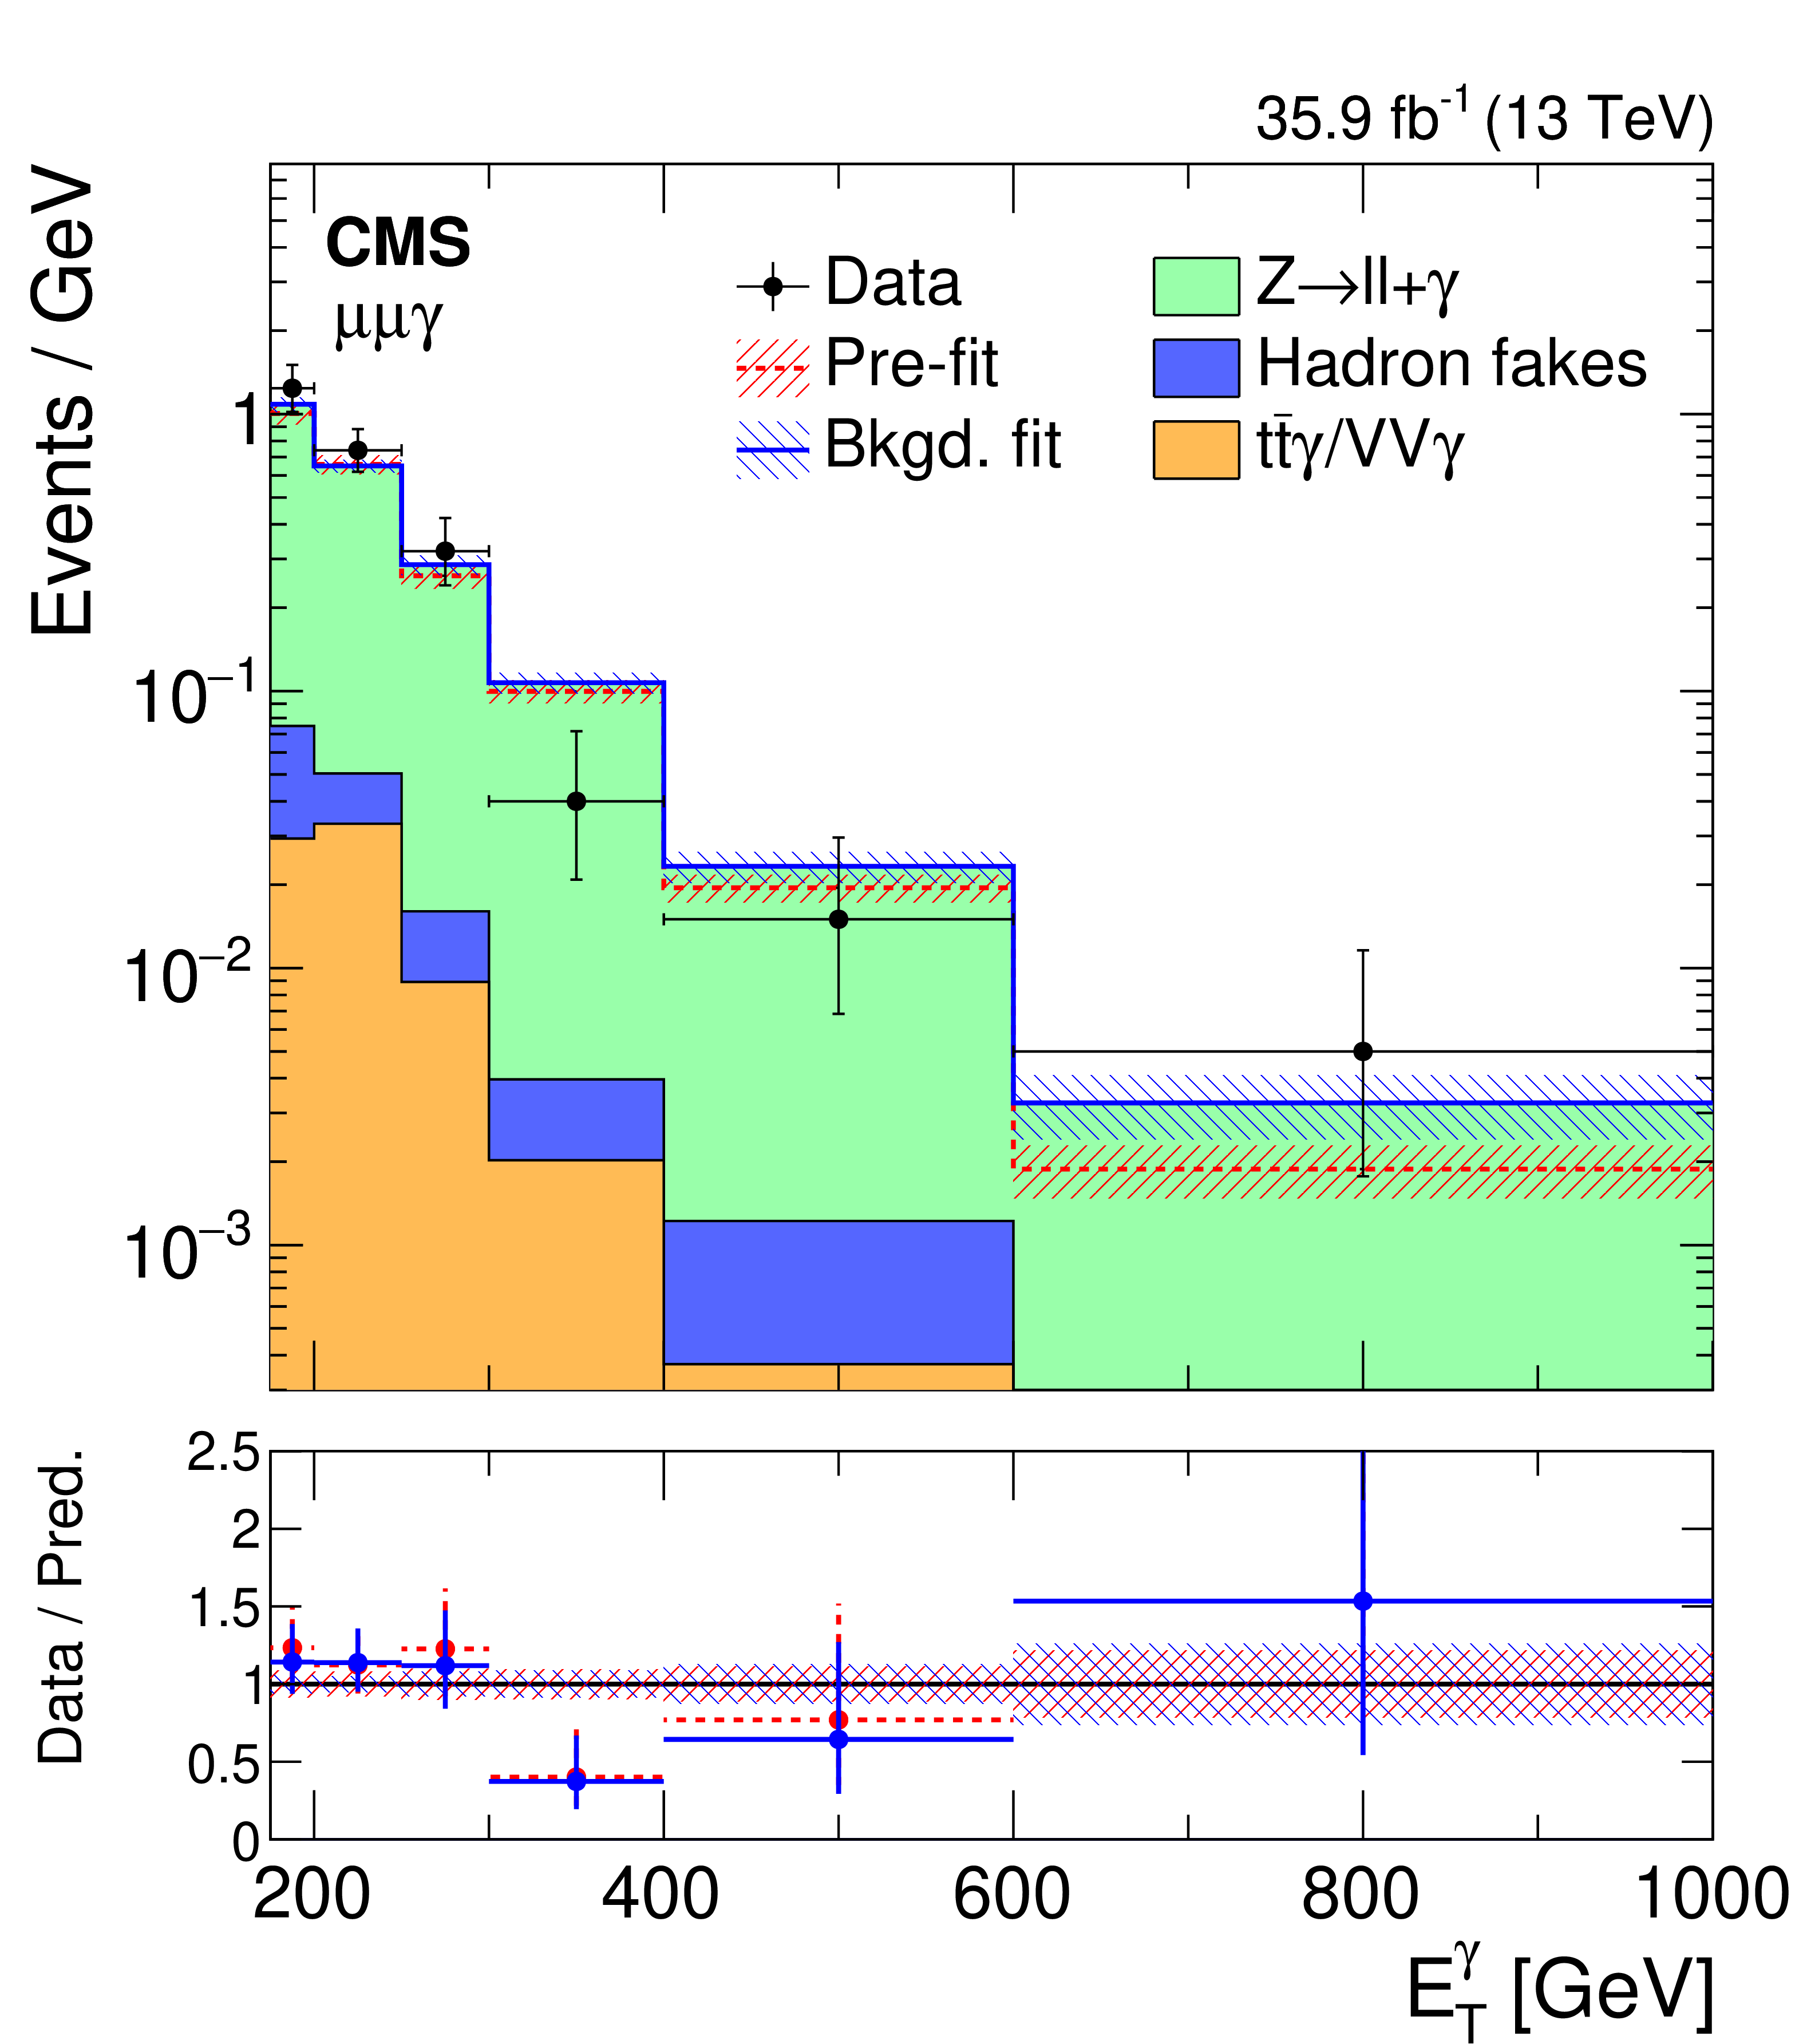
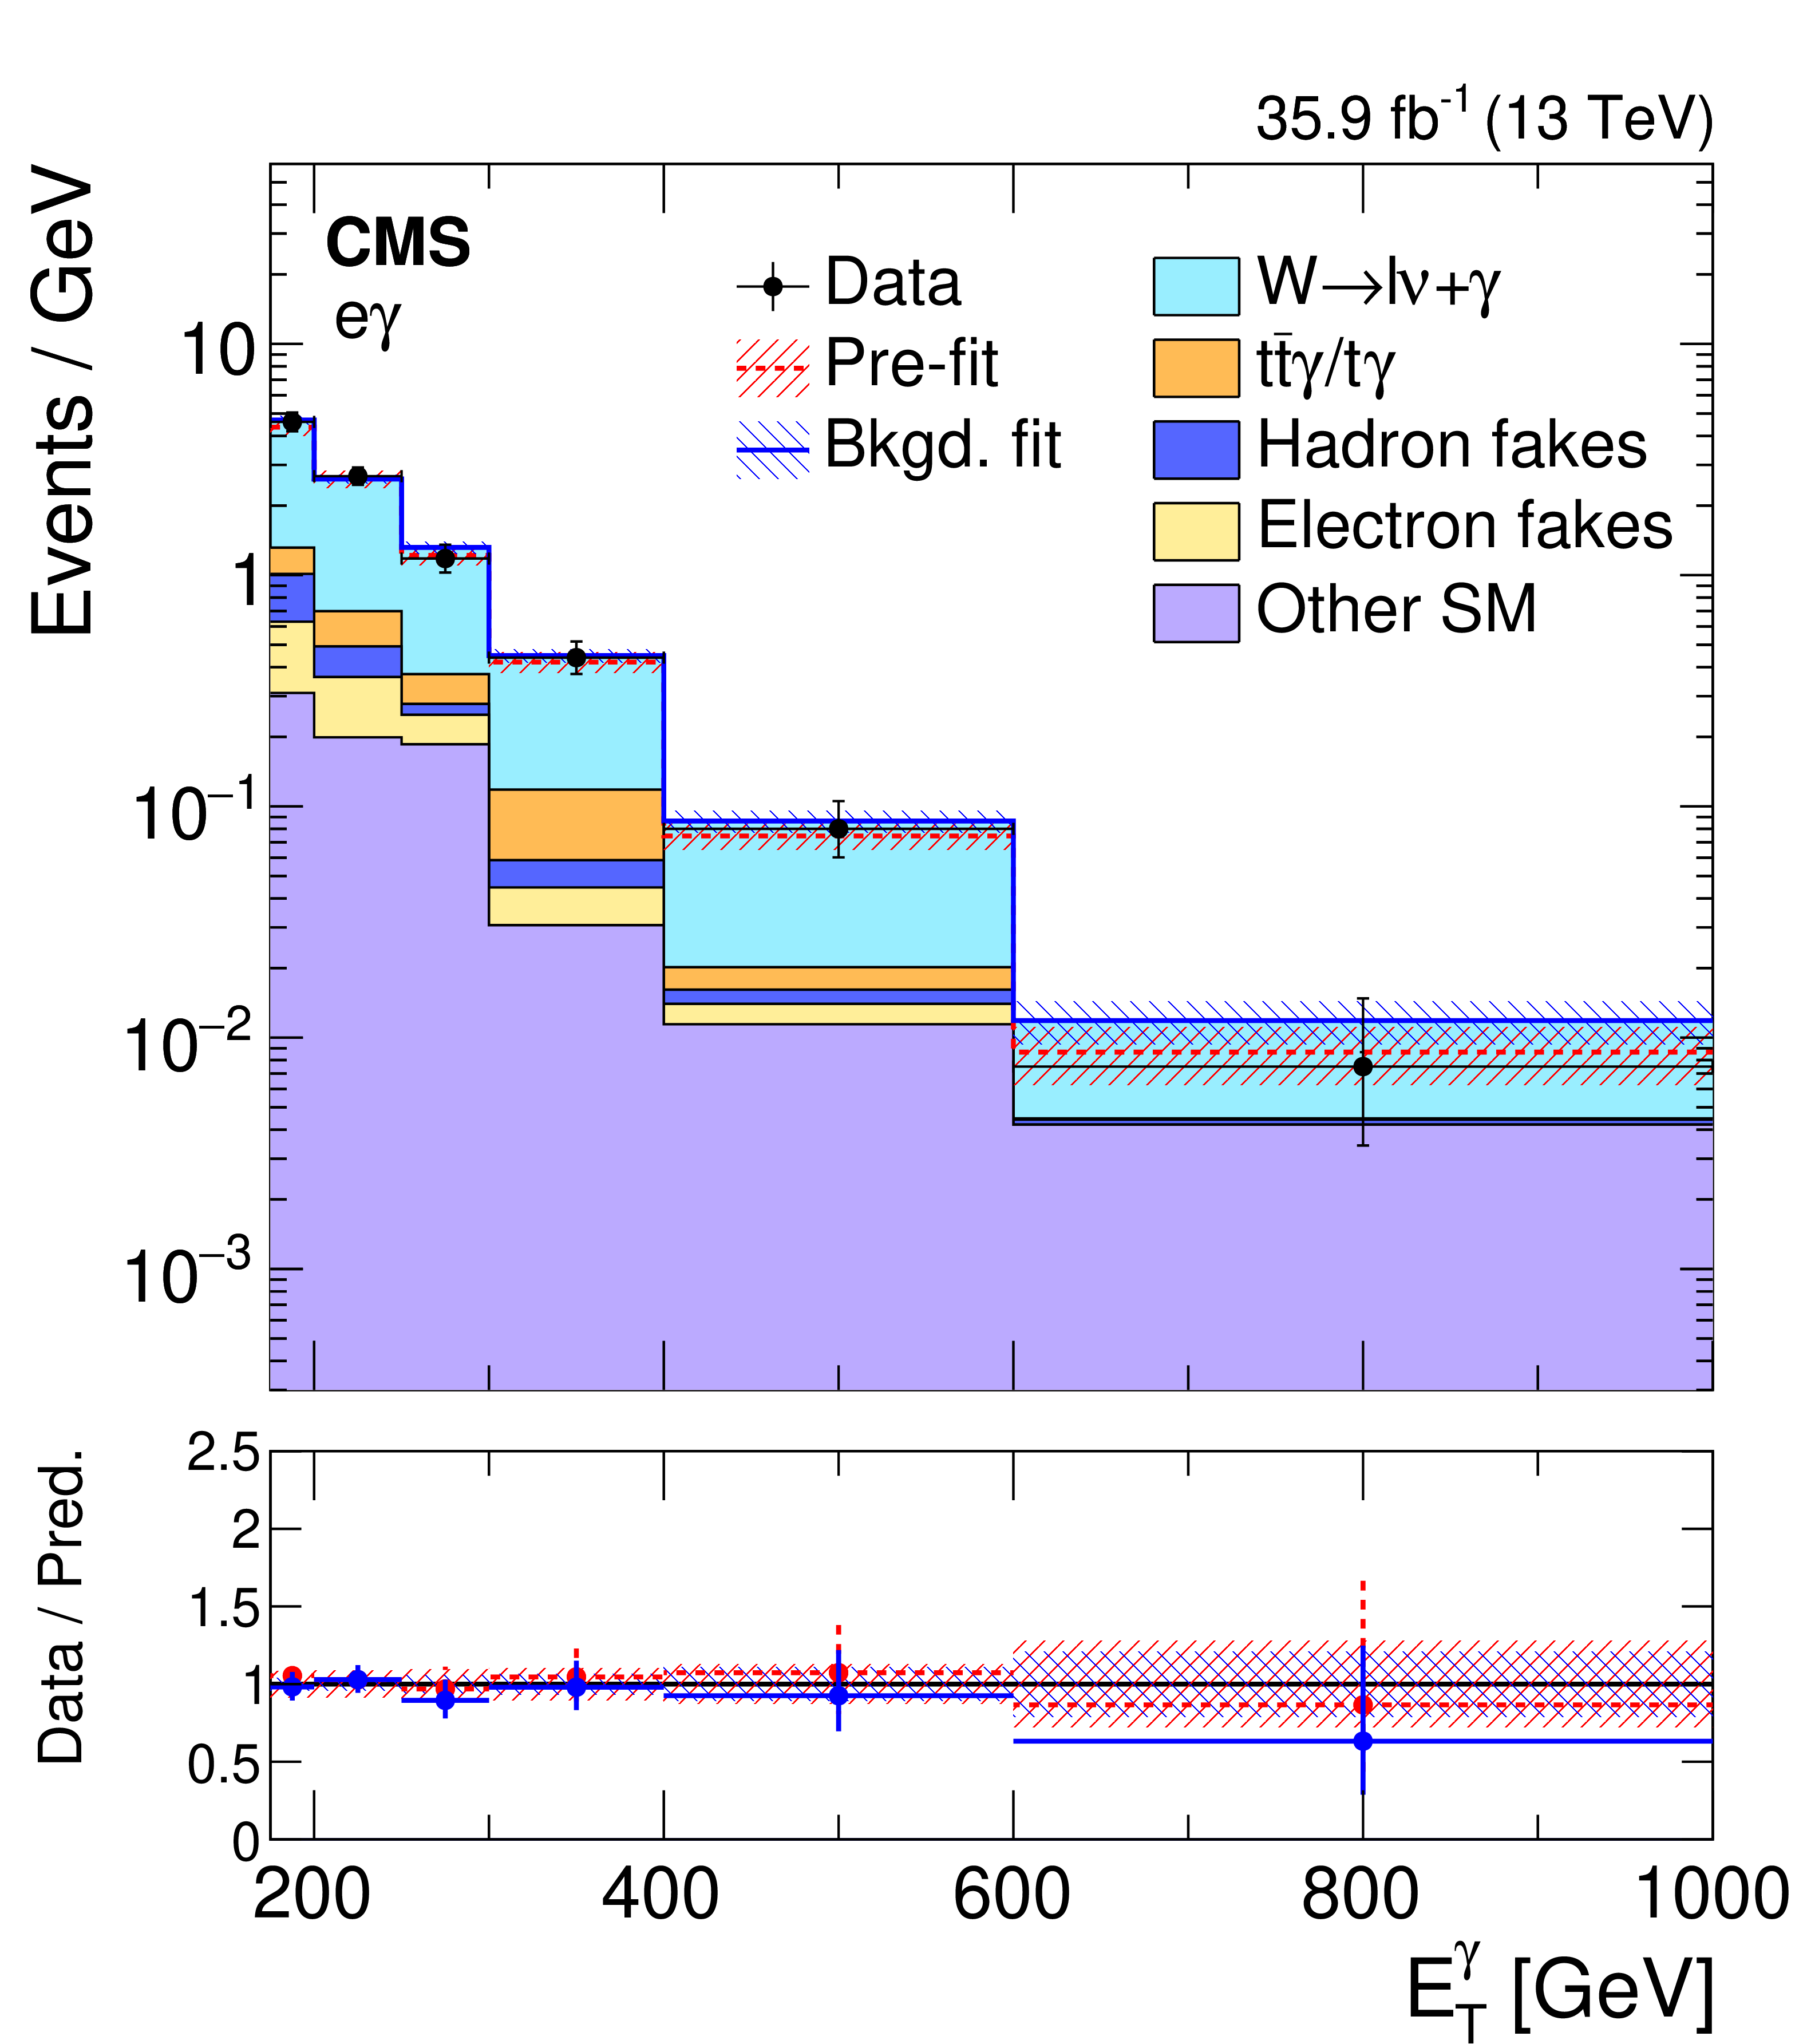
Comparison between data and MC simulation in the four control regions: ${\mathrm {e}} {\mathrm {e}} {\gamma}$ (upper left), ${{\mu}} {{\mu}} {\gamma}$ (upper right), ${\mathrm {e}} {\gamma}$ (lower left), ${{\mu}} {\gamma}$ (lower right) before and after performing the simultaneous fit across all the control samples and signal region, and assuming absence of any signal. The last bin of the distribution includes all events with ${E_{\mathrm {T}}^{{\gamma}}} > $ 1000 GeV. The ratios of data with the pre-fit background prediction (red dashed) and post-fit background prediction (blue solid) are shown in the lower panels. The bands in the lower panels show the post-fit uncertainty after combining all the systematic uncertainties. |

png pdf |
Figure 5-a:
Comparison between data and MC simulation in the ${\mathrm {e}} {\mathrm {e}} {\gamma}$ control region, before and after performing the simultaneous fit across all the control samples and signal region, and assuming absence of any signal. The last bin of the distribution includes all events with ${E_{\mathrm {T}}^{{\gamma}}} > $ 1000 GeV. The ratios of data with the pre-fit background prediction (red dashed) and post-fit background prediction (blue solid) are shown in the lower panels. The bands in the lower panels show the post-fit uncertainty after combining all the systematic uncertainties. |
png pdf |
Figure 5-b:
Comparison between data and MC simulation in the ${{\mu}} {{\mu}} {\gamma}$ control region, before and after performing the simultaneous fit across all the control samples and signal region, and assuming absence of any signal. The last bin of the distribution includes all events with ${E_{\mathrm {T}}^{{\gamma}}} > $ 1000 GeV. The ratios of data with the pre-fit background prediction (red dashed) and post-fit background prediction (blue solid) are shown in the lower panels. The bands in the lower panels show the post-fit uncertainty after combining all the systematic uncertainties. |
png pdf |
Figure 5-c:
Comparison between data and MC simulation in the ${\mathrm {e}} {\gamma}$ control region, before and after performing the simultaneous fit across all the control samples and signal region, and assuming absence of any signal. The last bin of the distribution includes all events with ${E_{\mathrm {T}}^{{\gamma}}} > $ 1000 GeV. The ratios of data with the pre-fit background prediction (red dashed) and post-fit background prediction (blue solid) are shown in the lower panels. The bands in the lower panels show the post-fit uncertainty after combining all the systematic uncertainties. |

png pdf |
Figure 5-d:
Comparison between data and MC simulation in the ${{\mu}} {\gamma}$ control region, before and after performing the simultaneous fit across all the control samples and signal region, and assuming absence of any signal. The last bin of the distribution includes all events with ${E_{\mathrm {T}}^{{\gamma}}} > $ 1000 GeV. The ratios of data with the pre-fit background prediction (red dashed) and post-fit background prediction (blue solid) are shown in the lower panels. The bands in the lower panels show the post-fit uncertainty after combining all the systematic uncertainties. |
png pdf |
Figure 6:
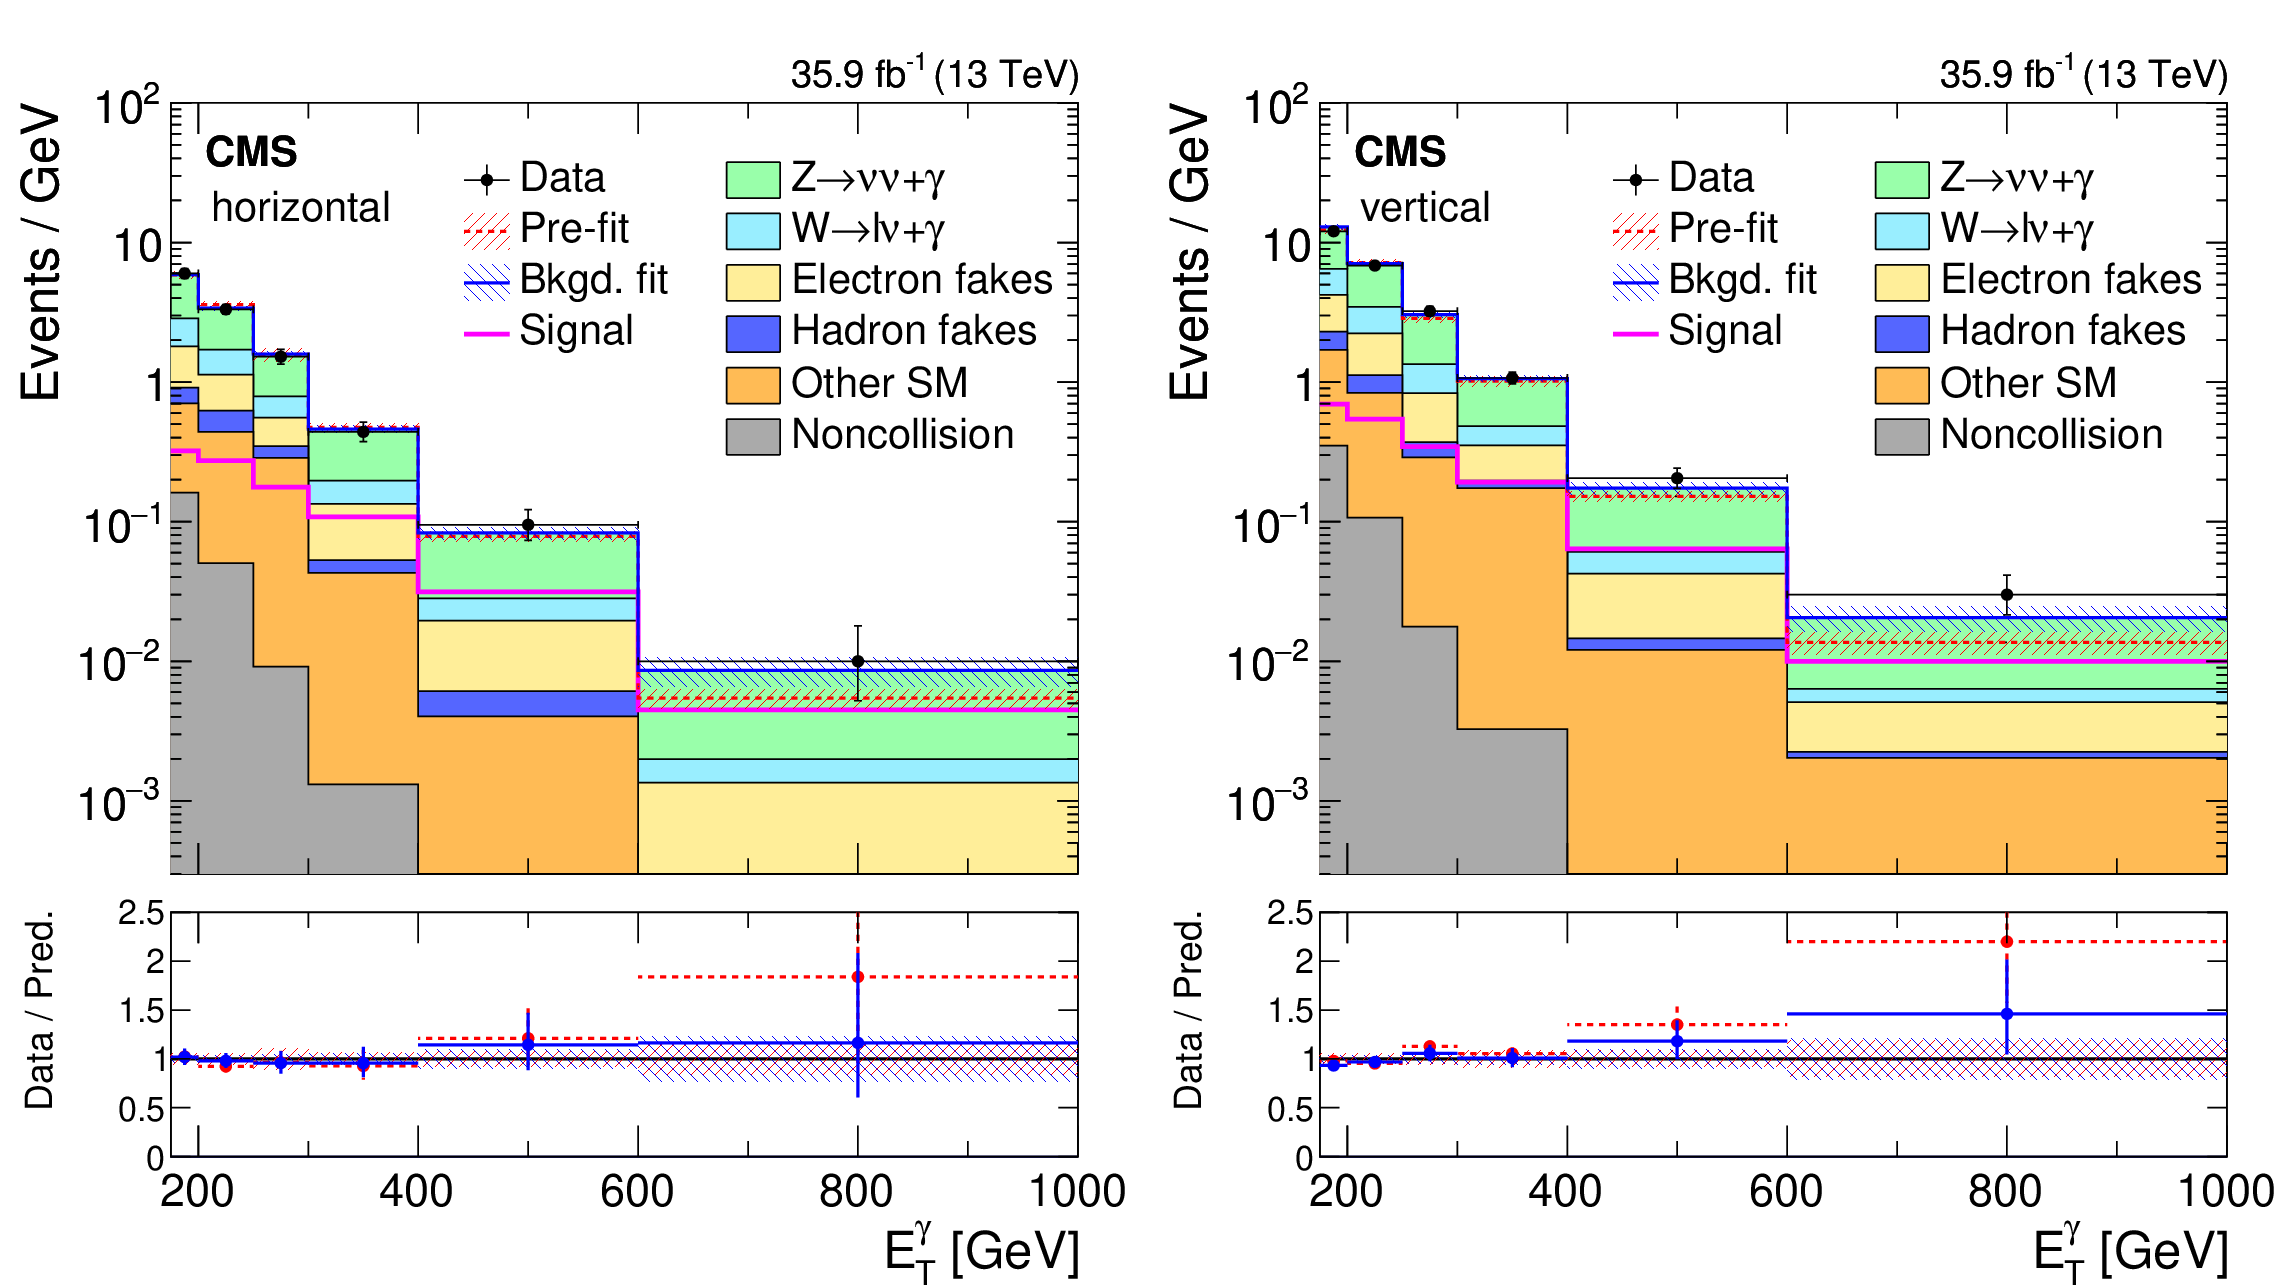
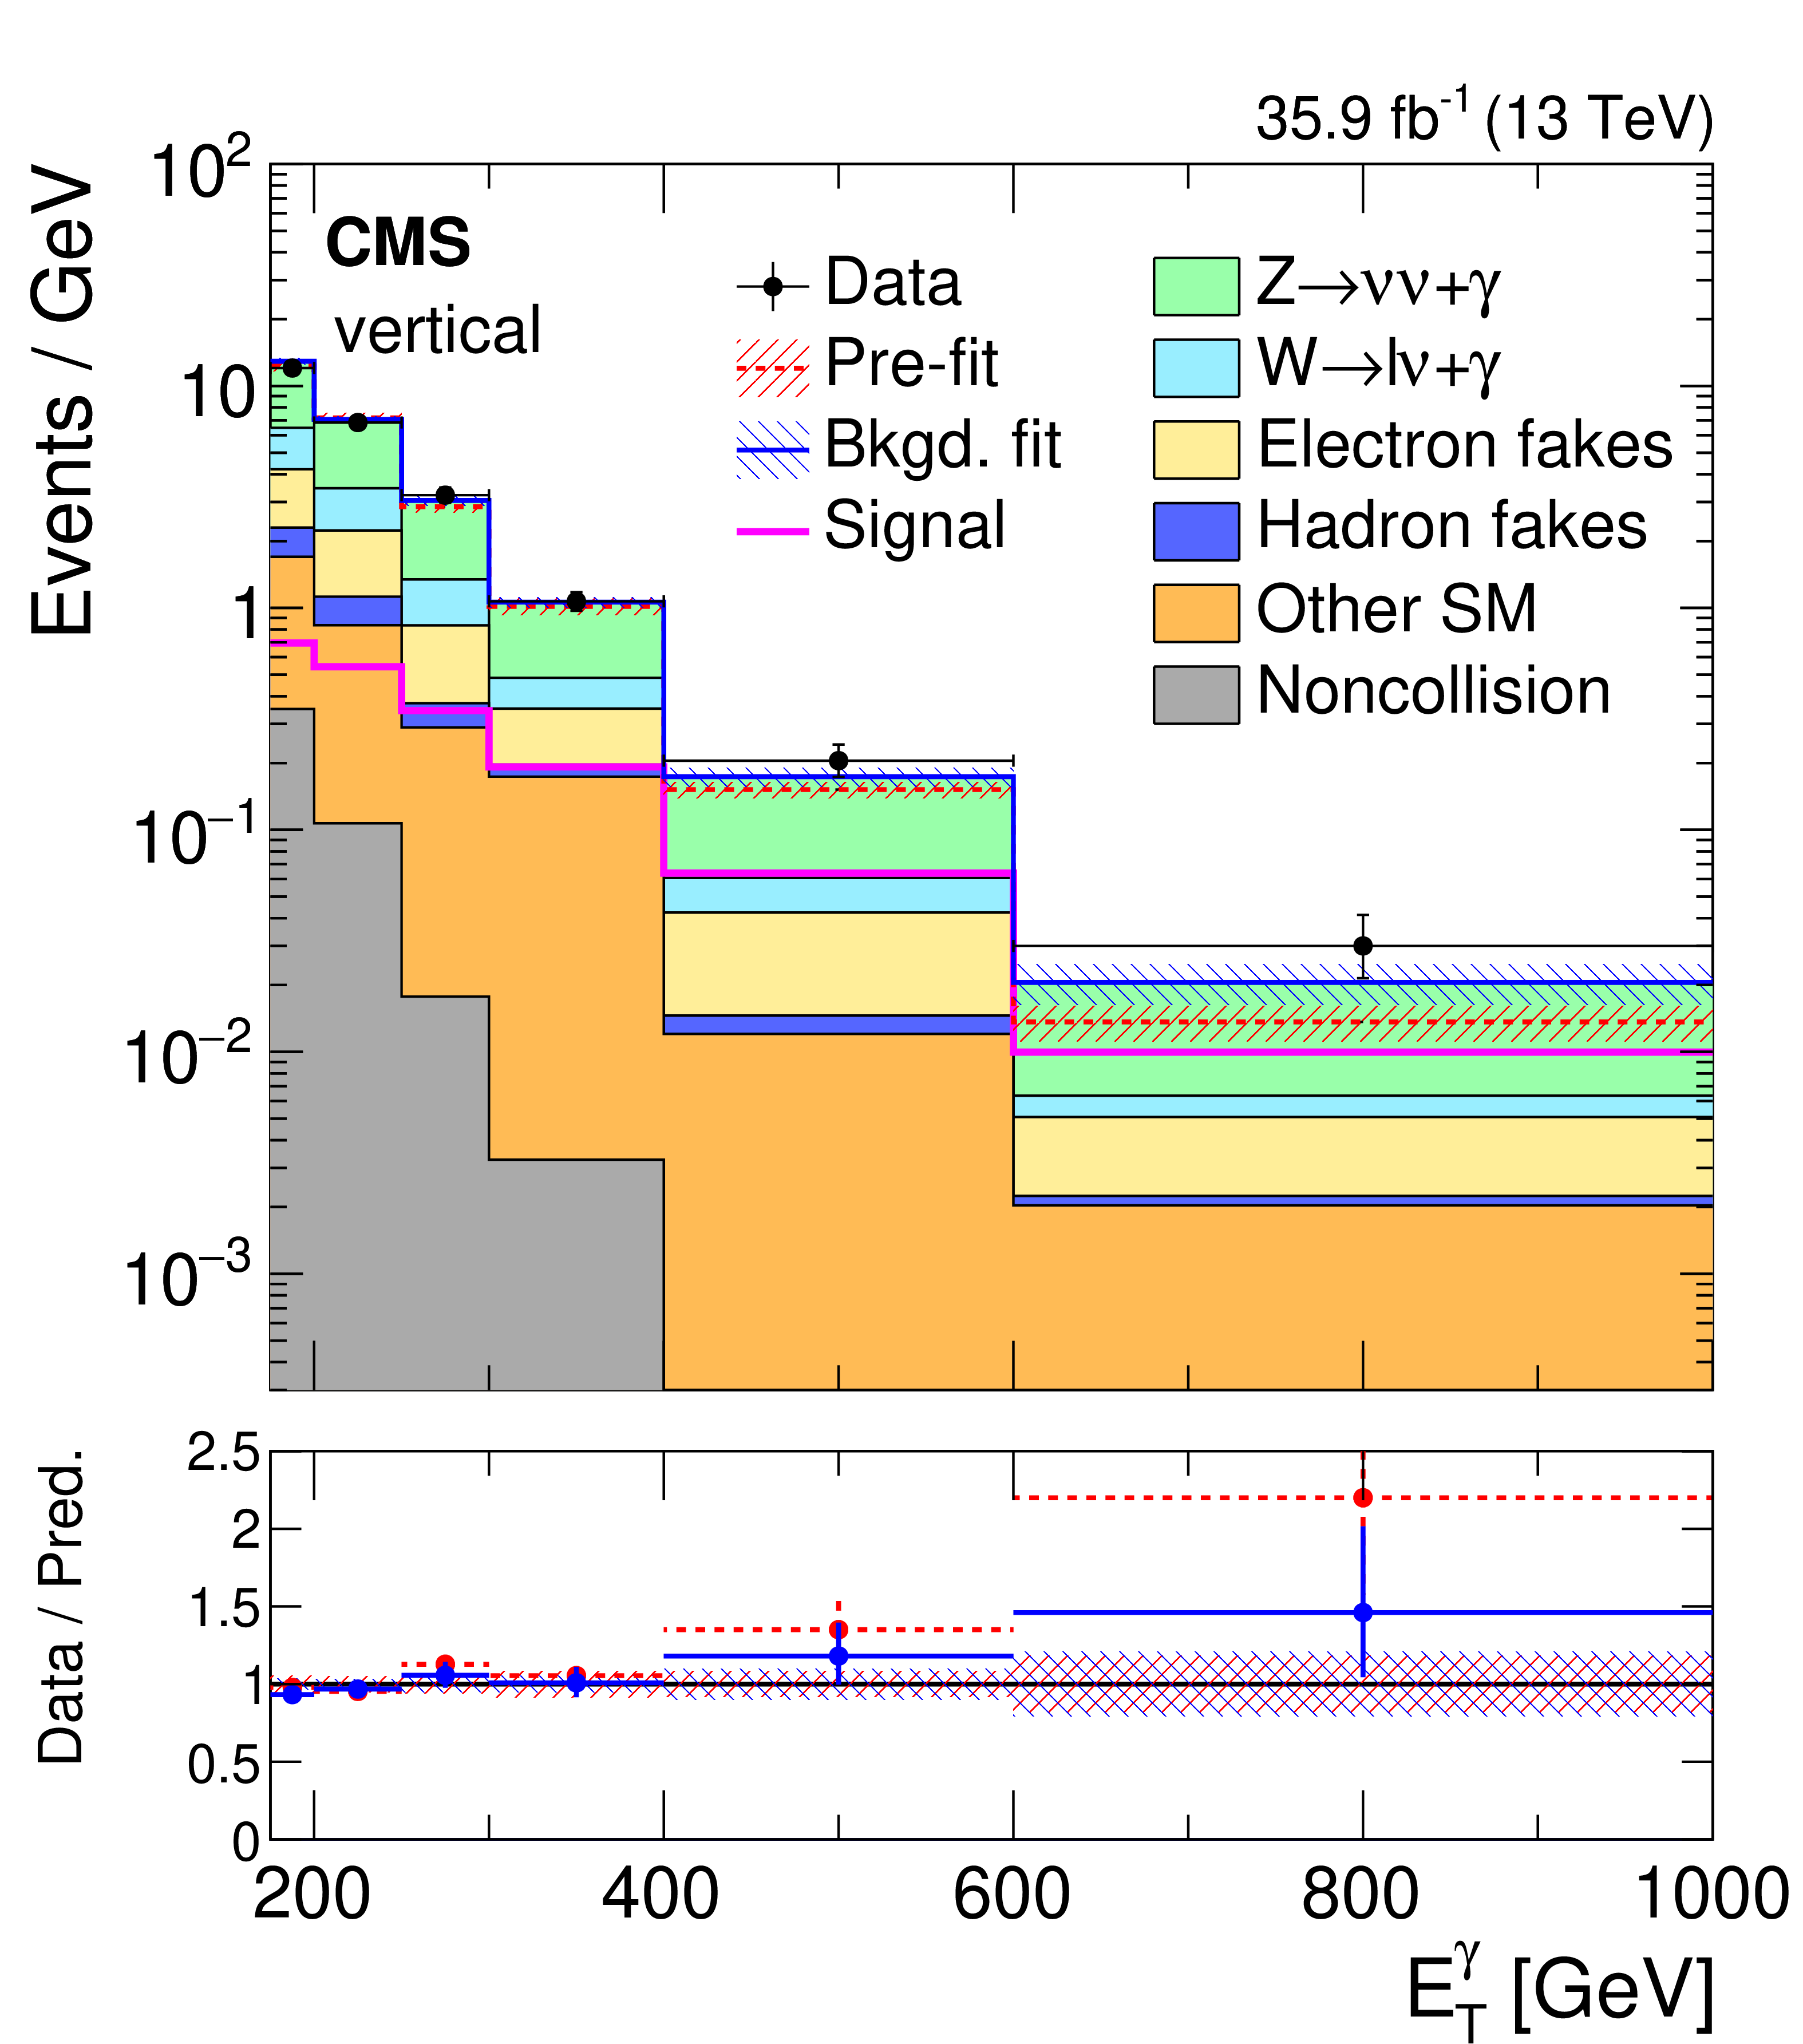
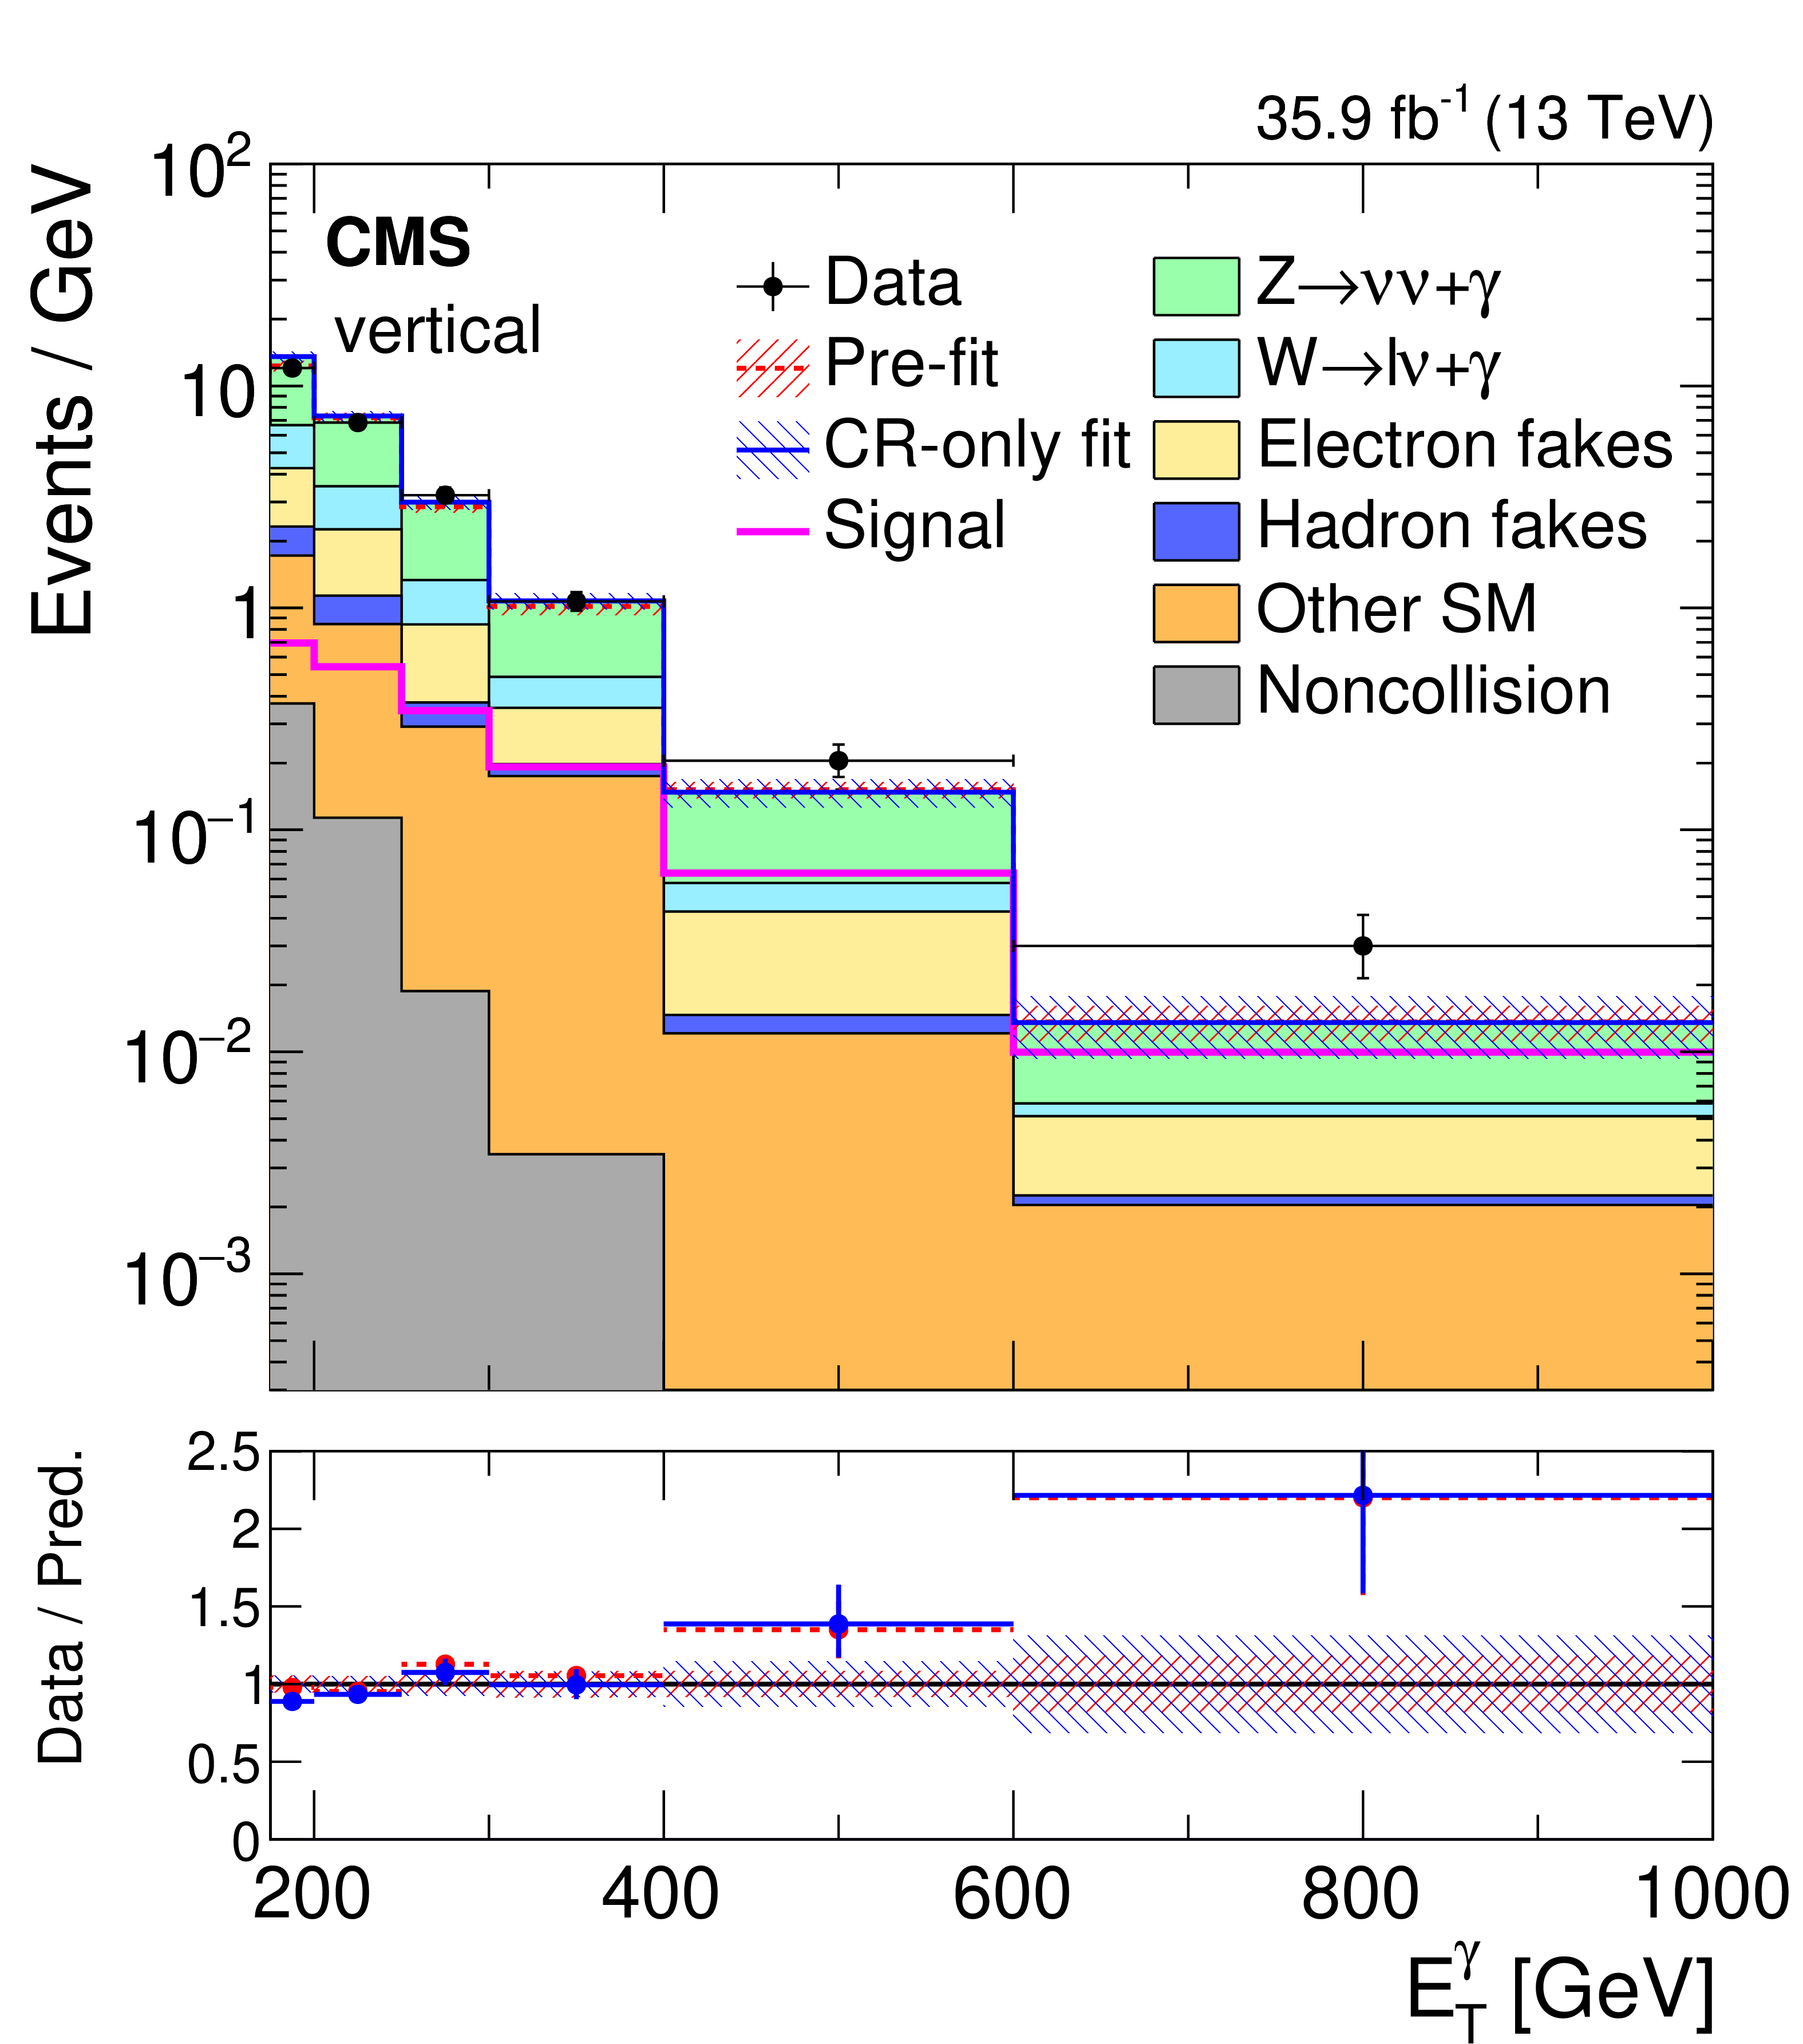
Observed ${E_{\mathrm {T}}^{{\gamma}}}$ distributions in the horizontal (left) and vertical (right) signal regions compared with the post-fit background expectations for various SM processes. The last bin of the distribution includes all events with $ {E_{\mathrm {T}}^{{\gamma}}} > $ 1000 GeV. The expected background distributions are evaluated after performing a combined fit to the data in all the control samples and the signal region. The ratios of data with the pre-fit background prediction (red dashed) and post-fit background prediction (blue solid) are shown in the lower panels. The bands in the lower panels show the post-fit uncertainty after combining all the systematic uncertainties. The expected signal distribution from a 1 TeV vector mediator decaying to 1 GeV DM particles is overlaid. |

png pdf |
Figure 6-a:
Observed ${E_{\mathrm {T}}^{{\gamma}}}$ distribution in the horizontal signal region compared with the post-fit background expectations for various SM processes. The last bin of the distribution includes all events with $ {E_{\mathrm {T}}^{{\gamma}}} > $ 1000 GeV. The expected background distributions are evaluated after performing a combined fit to the data in all the control samples and the signal region. The ratios of data with the pre-fit background prediction (red dashed) and post-fit background prediction (blue solid) are shown in the lower panel. The bands in the lower panel show the post-fit uncertainty after combining all the systematic uncertainties. The expected signal distribution from a 1 TeV vector mediator decaying to 1 GeV DM particles is overlaid. |
png pdf |
Figure 6-b:
Observed ${E_{\mathrm {T}}^{{\gamma}}}$ distribution in the vertical signal region compared with the post-fit background expectations for various SM processes. The last bin of the distribution includes all events with $ {E_{\mathrm {T}}^{{\gamma}}} > $ 1000 GeV. The expected background distributions are evaluated after performing a combined fit to the data in all the control samples and the signal region. The ratios of data with the pre-fit background prediction (red dashed) and post-fit background prediction (blue solid) are shown in the lower panel. The bands in the lower panel show the post-fit uncertainty after combining all the systematic uncertainties. The expected signal distribution from a 1 TeV vector mediator decaying to 1 GeV DM particles is overlaid. |
png pdf |
Figure 7:
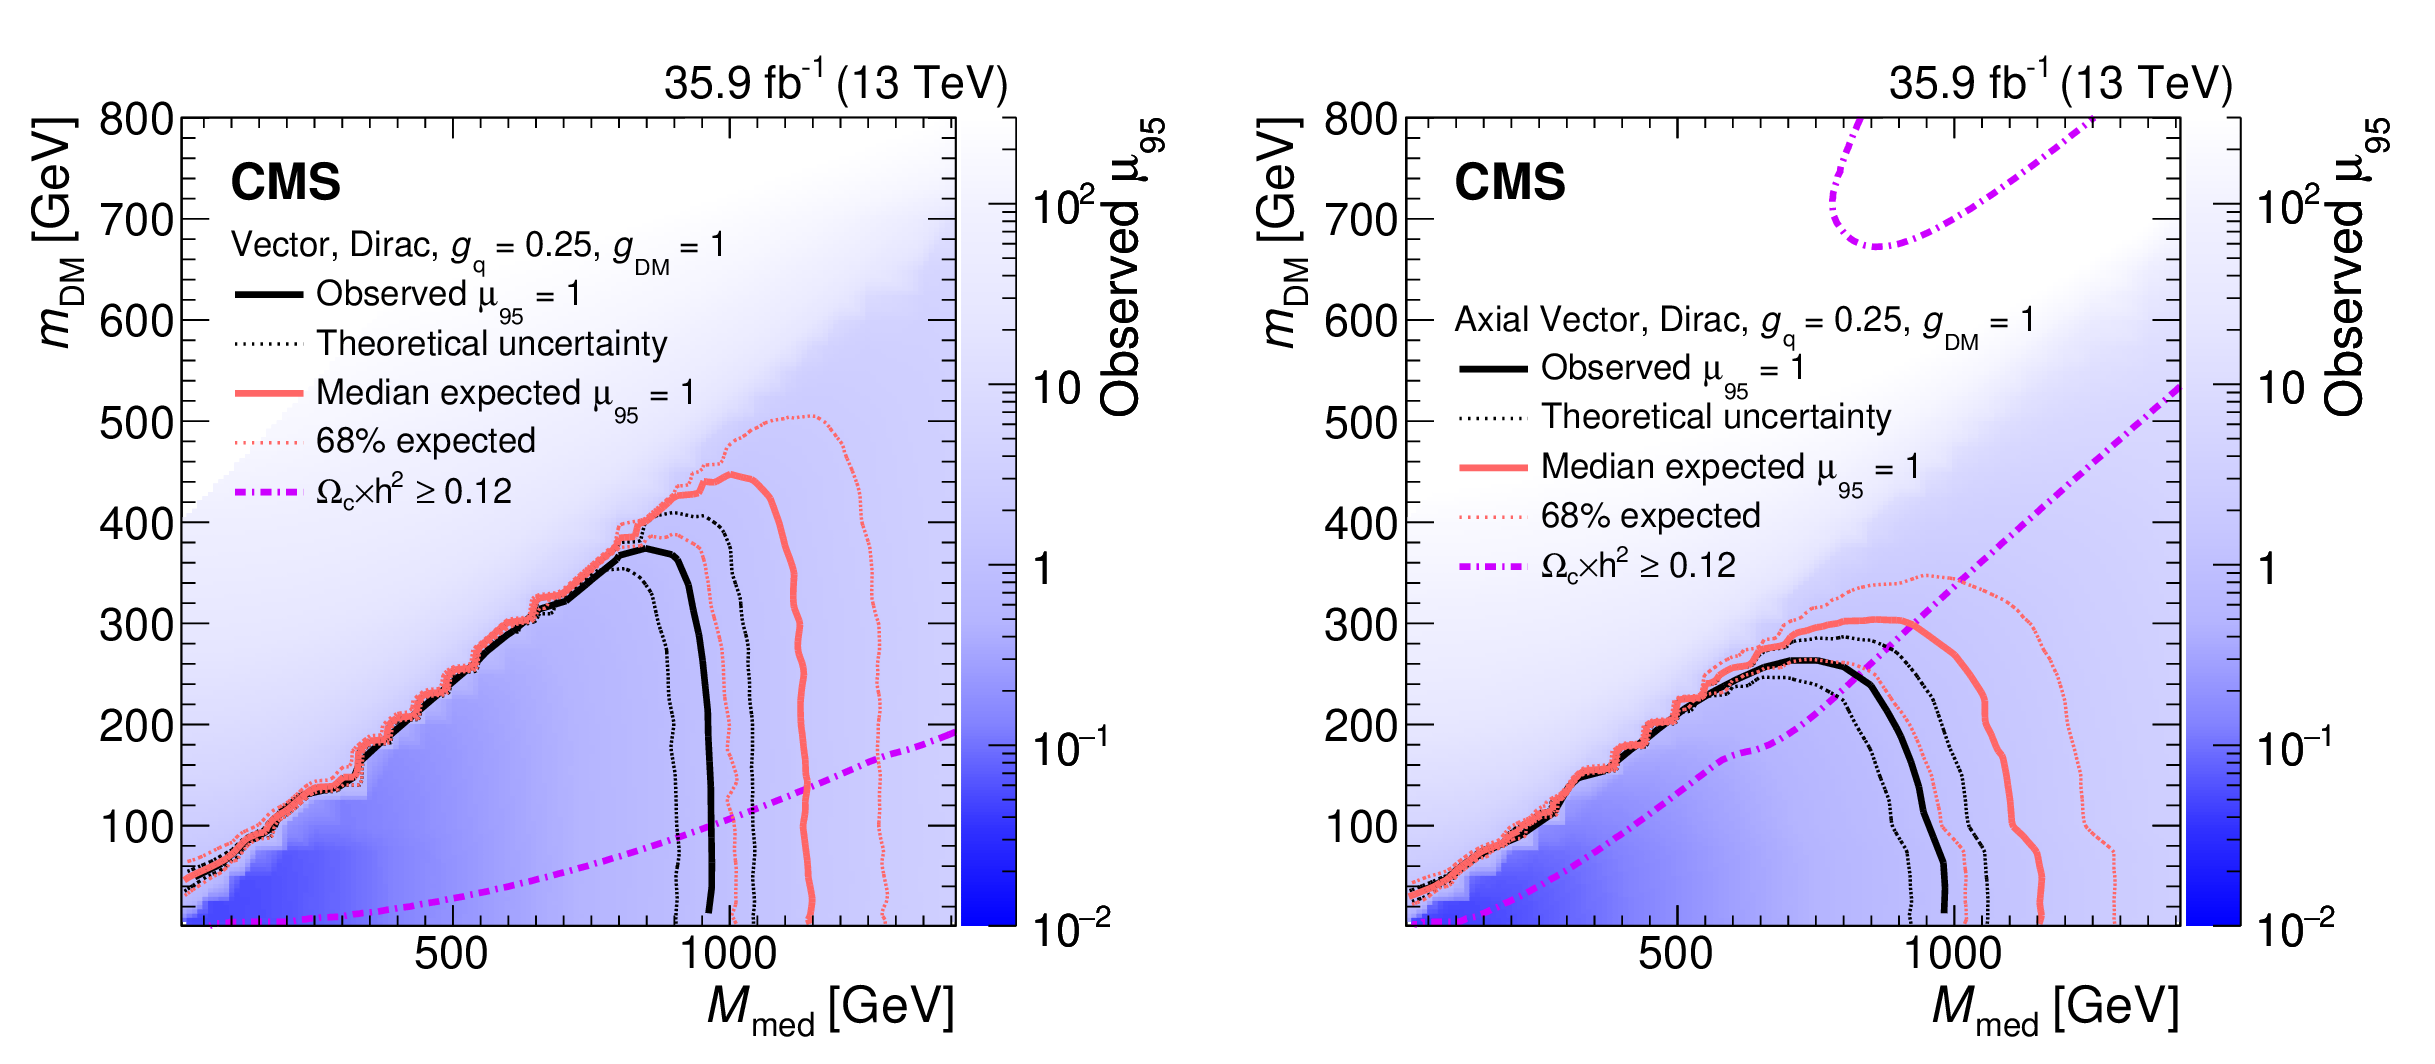
The ratio of 95% CL upper cross section limits to the theoretical cross section ($\mu _{95}$), for DM simplified models with vector (left) and axial-vector (right) mediators, assuming $ g_{\mathrm{q}}=$ 0.25 and $ g_{\mathrm{DM}}=$ 1. Expected $\mu _{95} = $ 1 contours are overlaid in red. The region under the observed contour is excluded. For DM simplified model parameters in the region below the lower violet dot-dash contour, and also above the corresponding upper contour in the right hand plot, cosmological DM abundance exceeds the density observed by the Planck satellite experiment. |

png pdf |
Figure 7-a:
The ratio of 95% CL upper cross section limits to the theoretical cross section ($\mu _{95}$), for DM simplified models with vector (left) and axial-vector (right) mediators, assuming $ g_{\mathrm{q}}=$ 0.25 and $ g_{\mathrm{DM}}=$ 1. Expected $\mu _{95} = $ 1 contours are overlaid in red. The region under the observed contour is excluded. For DM simplified model parameters in the region below the lower violet dot-dash contour, and also above the corresponding upper contour in the right hand plot, cosmological DM abundance exceeds the density observed by the Planck satellite experiment. |
png pdf |
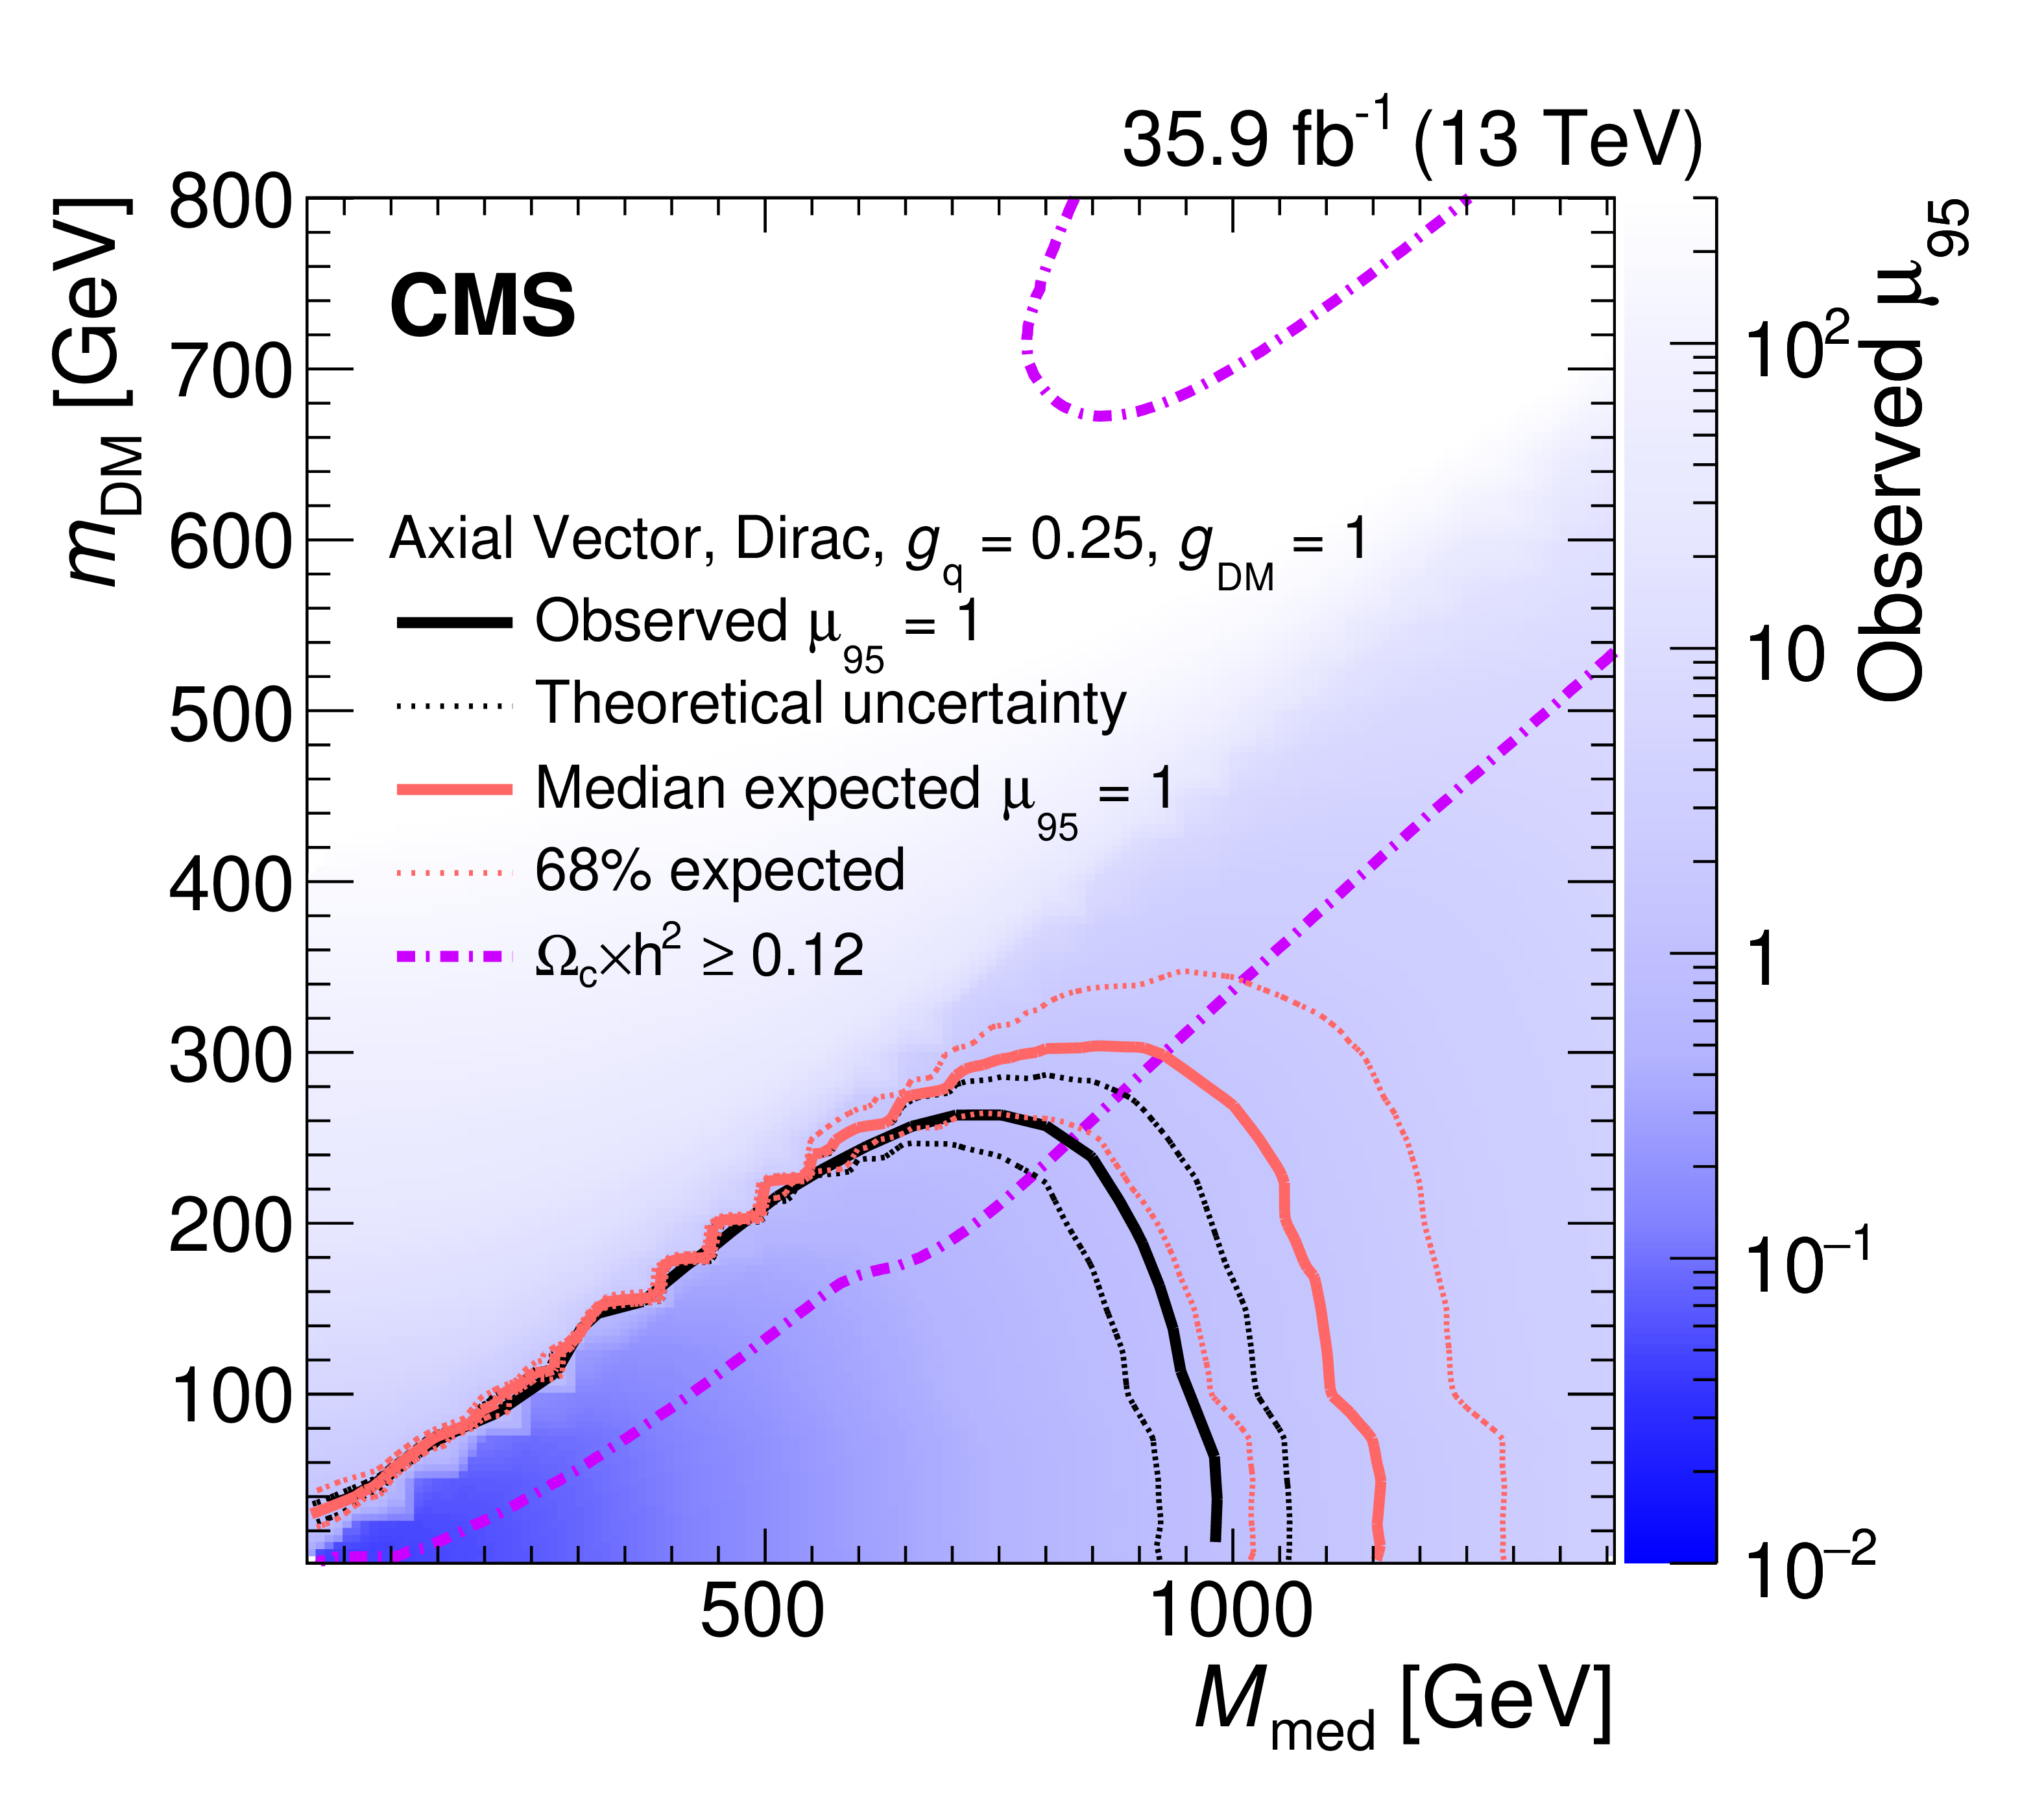
Figure 7-b:
The ratio of 95% CL upper cross section limits to the theoretical cross section ($\mu _{95}$), for DM simplified models with vector (left) and axial-vector (right) mediators, assuming $ g_{\mathrm{q}}=$ 0.25 and $ g_{\mathrm{DM}}=$ 1. Expected $\mu _{95} = $ 1 contours are overlaid in red. The region under the observed contour is excluded. For DM simplified model parameters in the region below the lower violet dot-dash contour, and also above the corresponding upper contour in the right hand plot, cosmological DM abundance exceeds the density observed by the Planck satellite experiment. |

png pdf |
Figure 8:
The 90% CL exclusion limits on the $\chi $-nucleon spin-independent (left) and spin-dependent (right) scattering cross sections involving vector and axial-vector operators, respectively, as a function of the ${m_{\text {DM}}}$. Simplified model DM parameters of $ g_{\mathrm{q}}=$ 0.25 and $ g_{\mathrm{DM}}=$ 1 are assumed. The region to the upper left of the contour is excluded. On the plots, the median expected 90% CL curve overlaps the observed 90% CL curve. Also shown are corresponding exclusion contours, where regions above the curves are excluded, from the recent results by CDMSLite [42], LUX [43], PandaX-II [44], XENON1T [45], CRESST-II [46], PICO-60 [47], IceCube [48], PICASSO [49] and Super-Kamiokande [50] Collaborations. |
png pdf |
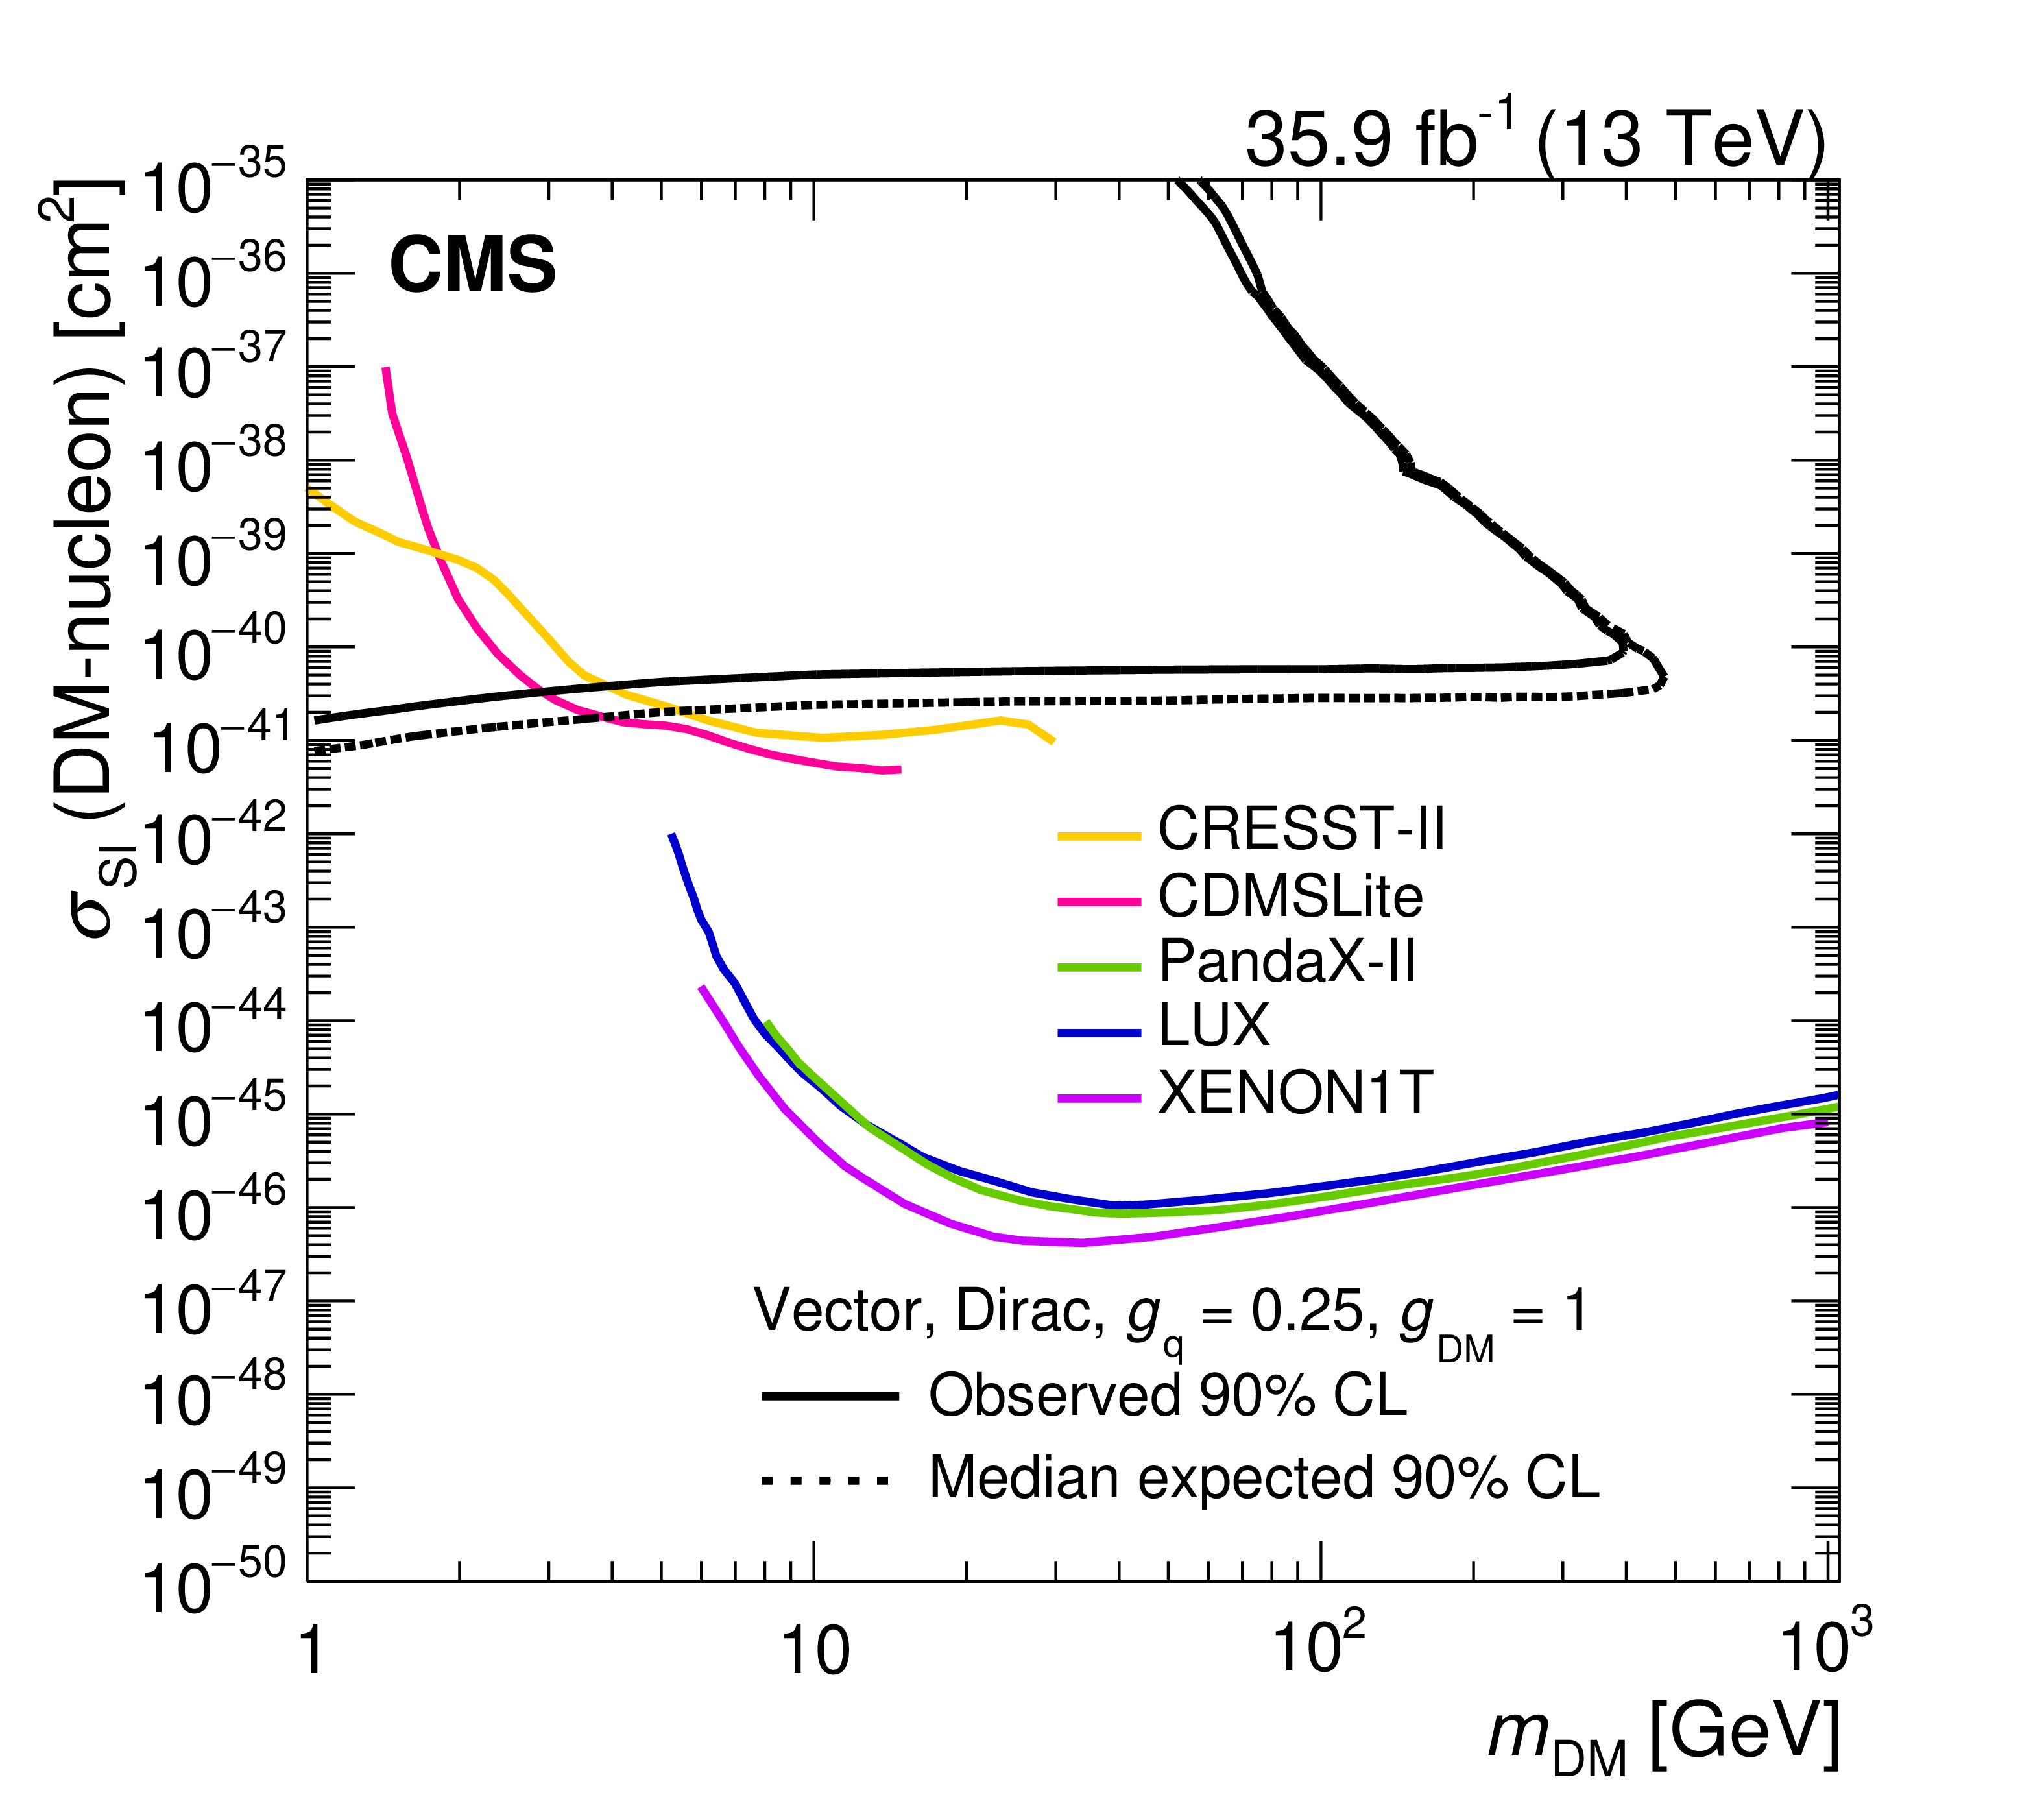
Figure 8-a:
The 90% CL exclusion limits on the $\chi $-nucleon spin-independent scattering cross section involving vector operators, as a function of the ${m_{\text {DM}}}$. Simplified model DM parameters of $ g_{\mathrm{q}}=$ 0.25 and $ g_{\mathrm{DM}}=$ 1 are assumed. The region to the upper left of the contour is excluded. The median expected 90% CL curve overlaps the observed 90% CL curve. Also shown are corresponding exclusion contours, where regions above the curves are excluded, from the recent results by CDMSLite [42], LUX [43], PandaX-II [44], XENON1T [45], and CRESST-II [46] Collaborations. |
png pdf |
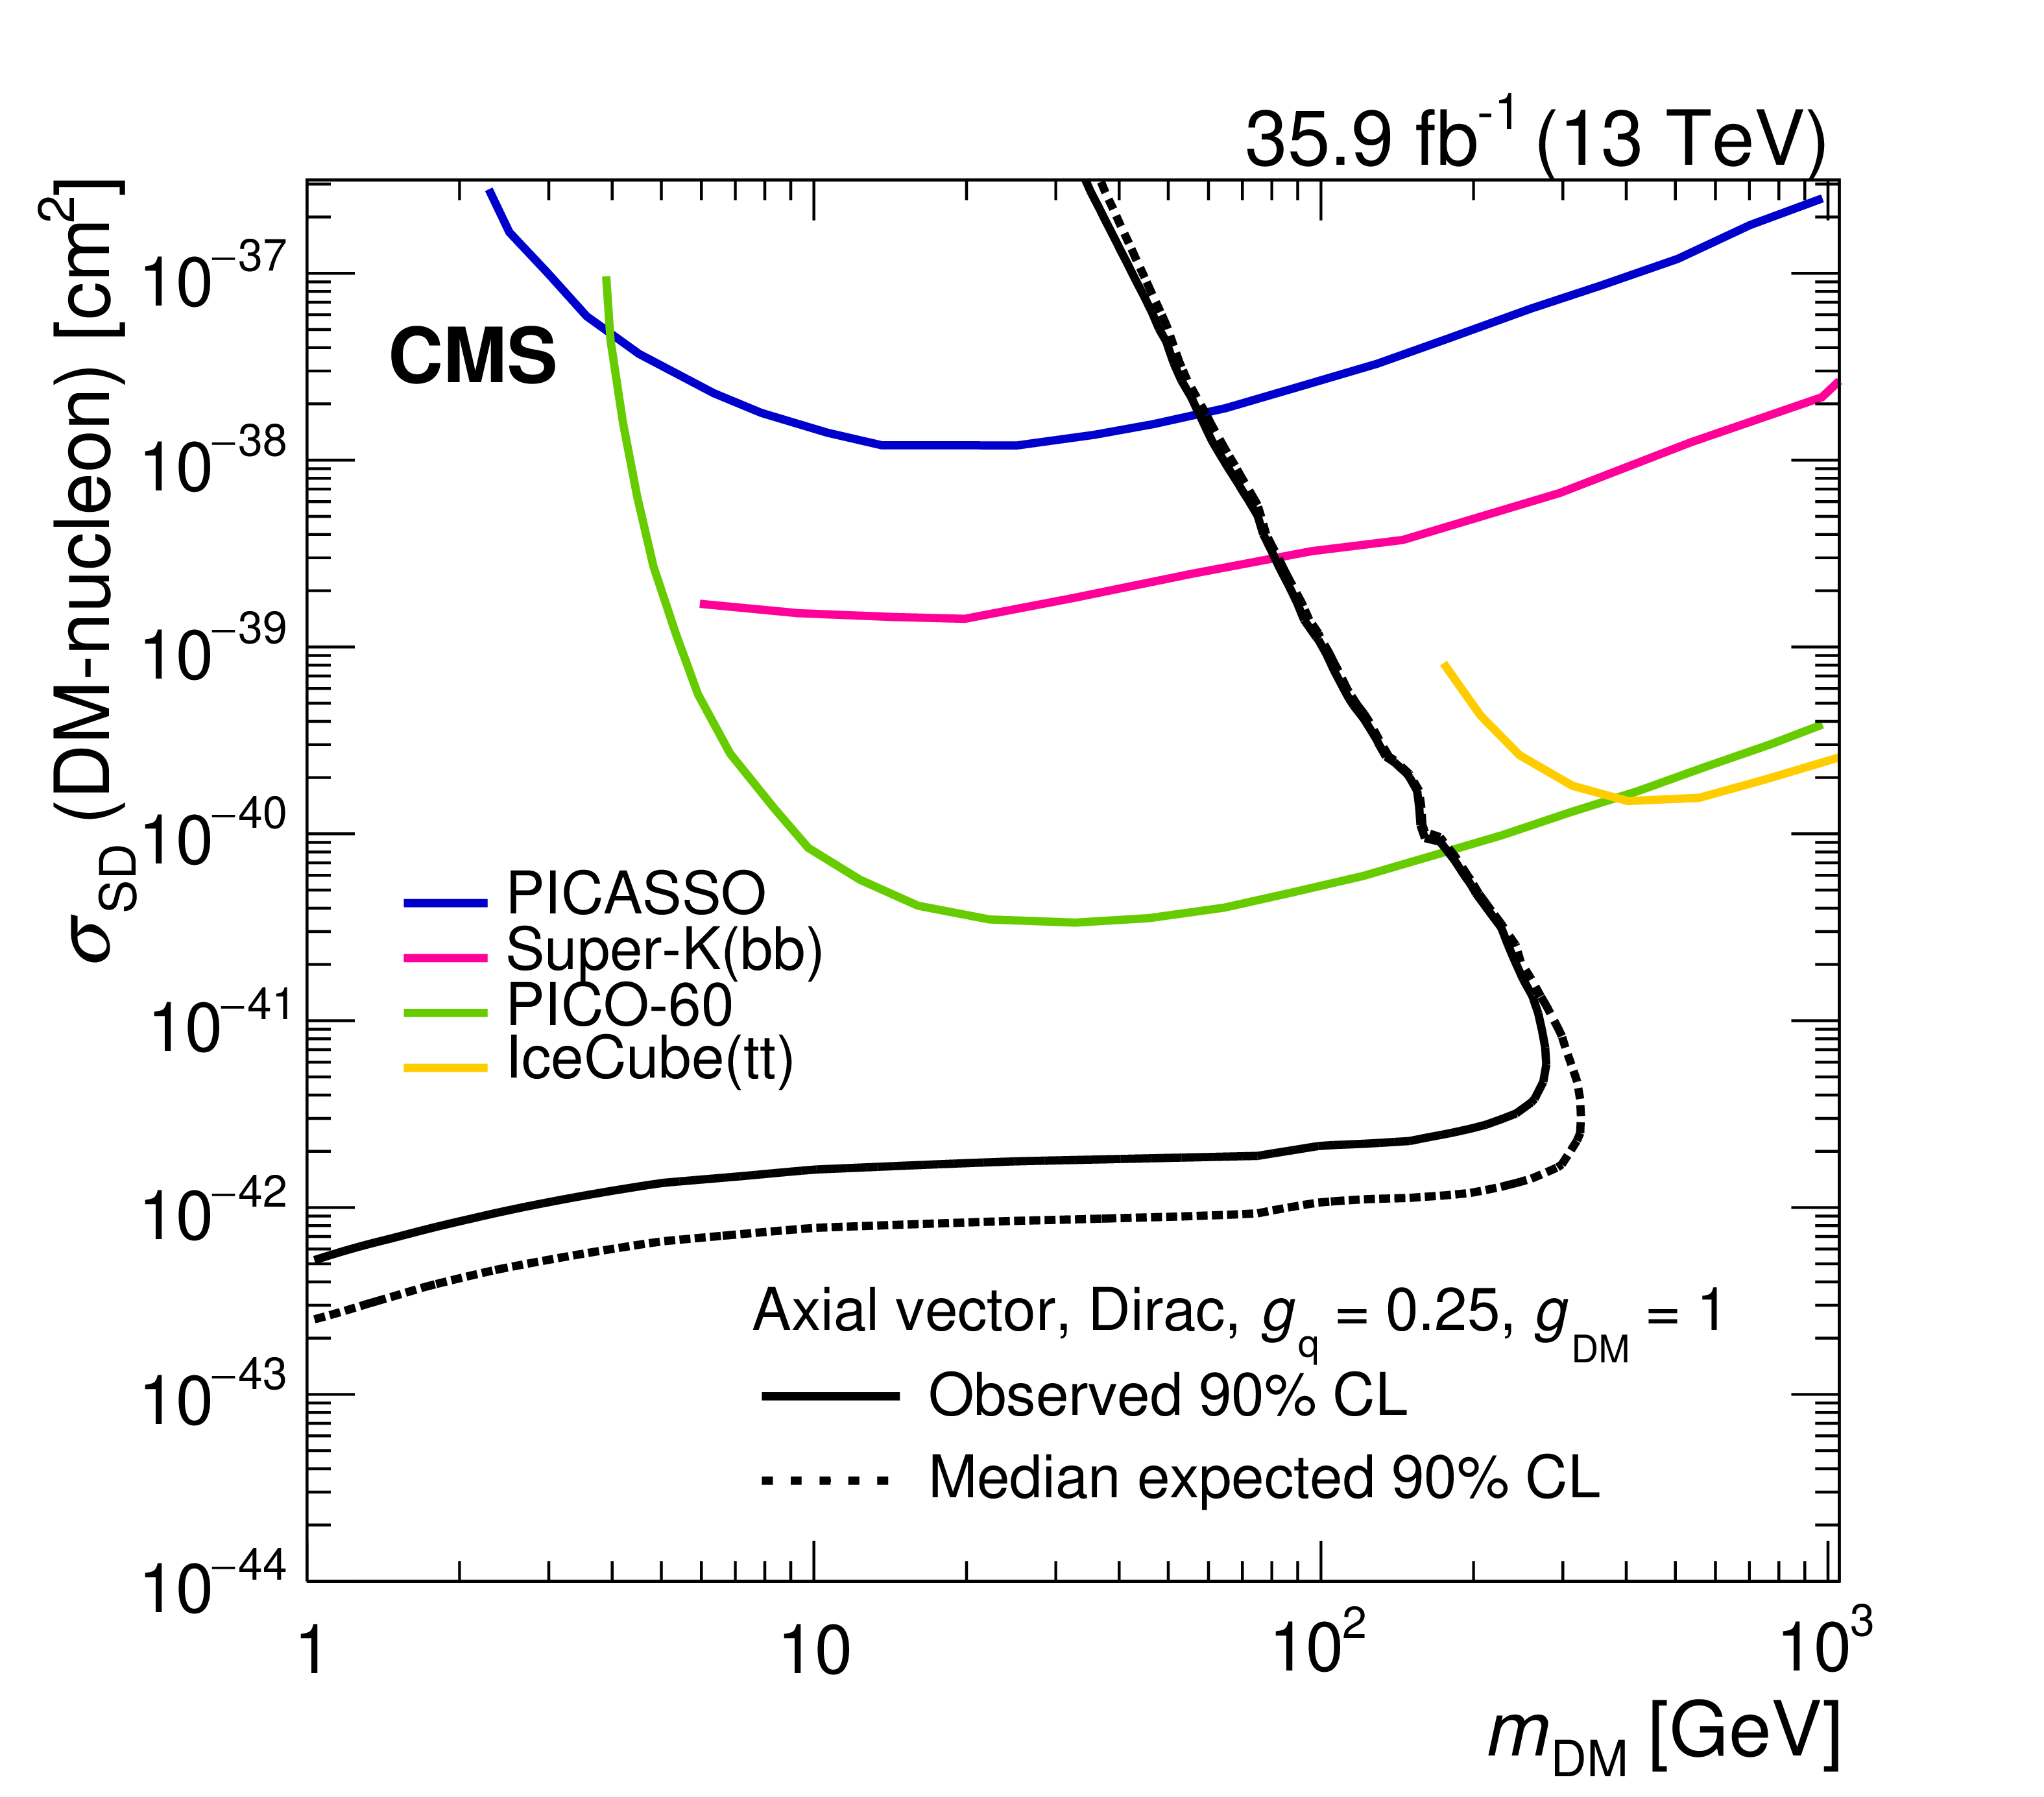
Figure 8-b:
The 90% CL exclusion limits on the $\chi $-nucleon spin-dependent scattering cross section involving axial-vector operators, as a function of the ${m_{\text {DM}}}$. Simplified model DM parameters of $ g_{\mathrm{q}}=$ 0.25 and $ g_{\mathrm{DM}}=$ 1 are assumed. The region to the upper left of the contour is excluded. The median expected 90% CL curve overlaps the observed 90% CL curve. Also shown are corresponding exclusion contours, where regions above the curves are excluded, from the recent results by PICO-60 [47], IceCube [48], PICASSO [49] and Super-Kamiokande [50] Collaborations. |
png pdf |
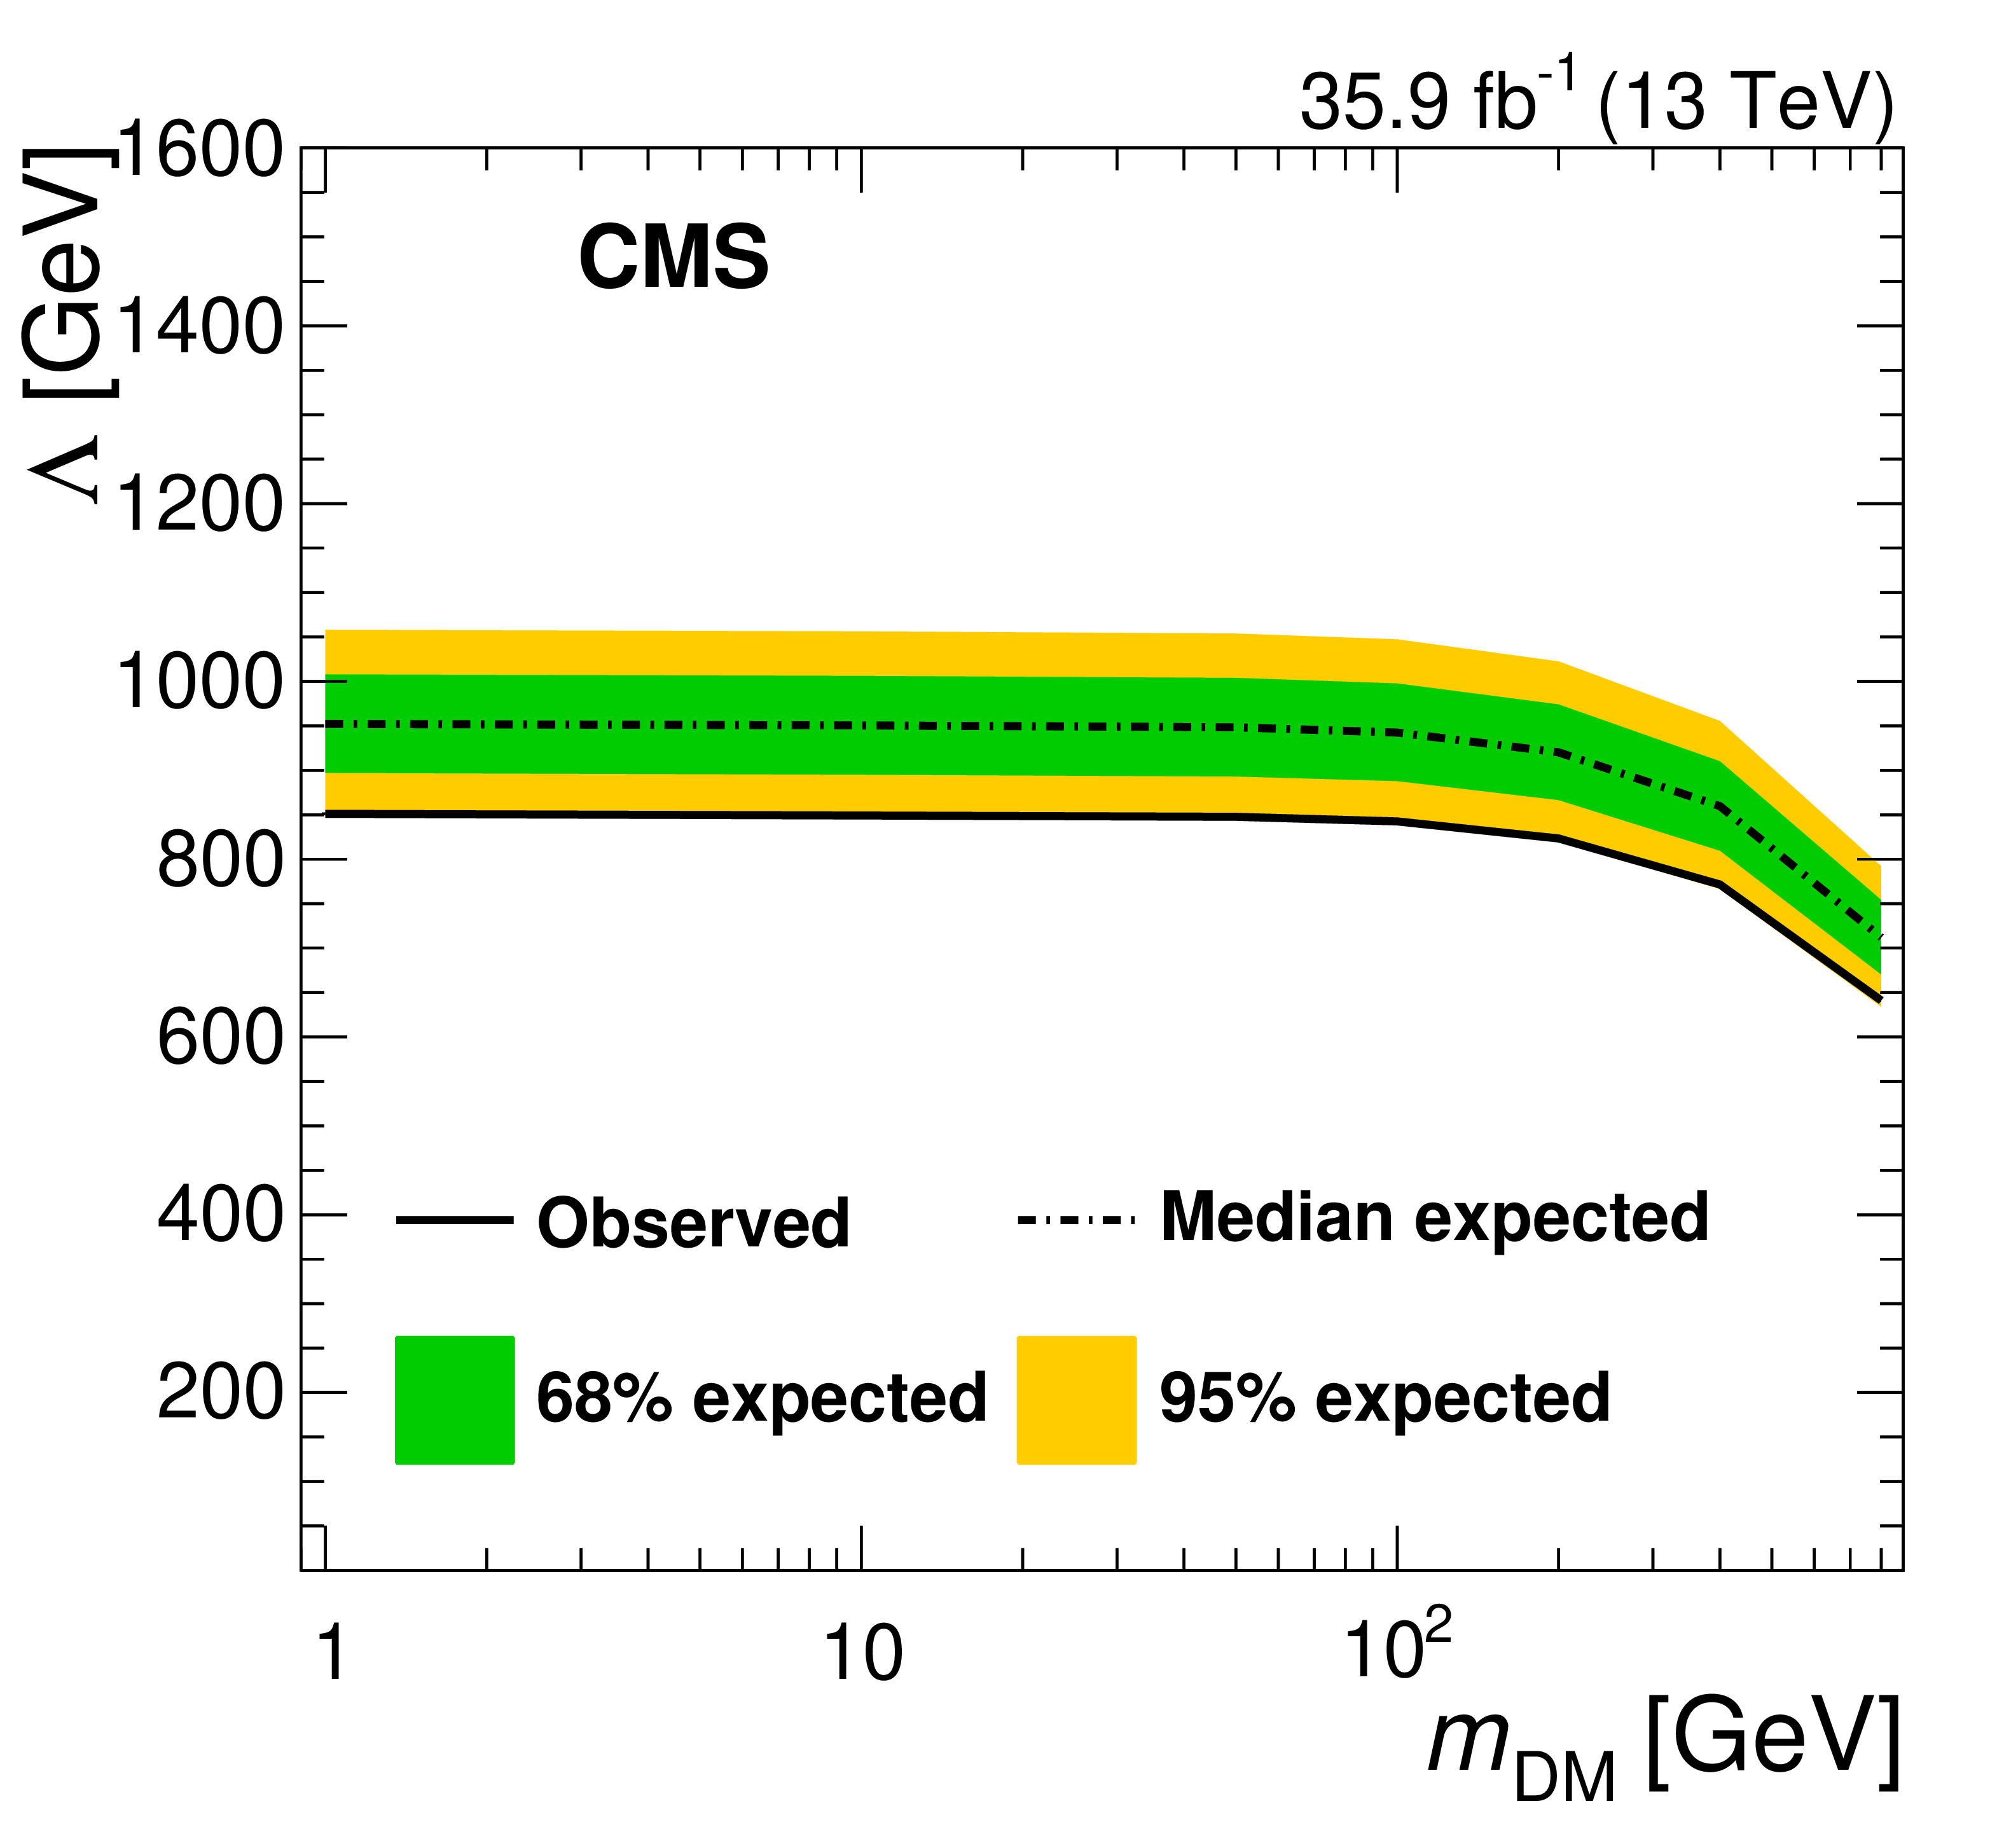
Figure 9:
The 95% CL observed and expected lower limits on $\Lambda $ for an effective EWK-DM contact interaction, as a function of dark matter mass ${m_{\text {DM}}}$. |
png pdf |
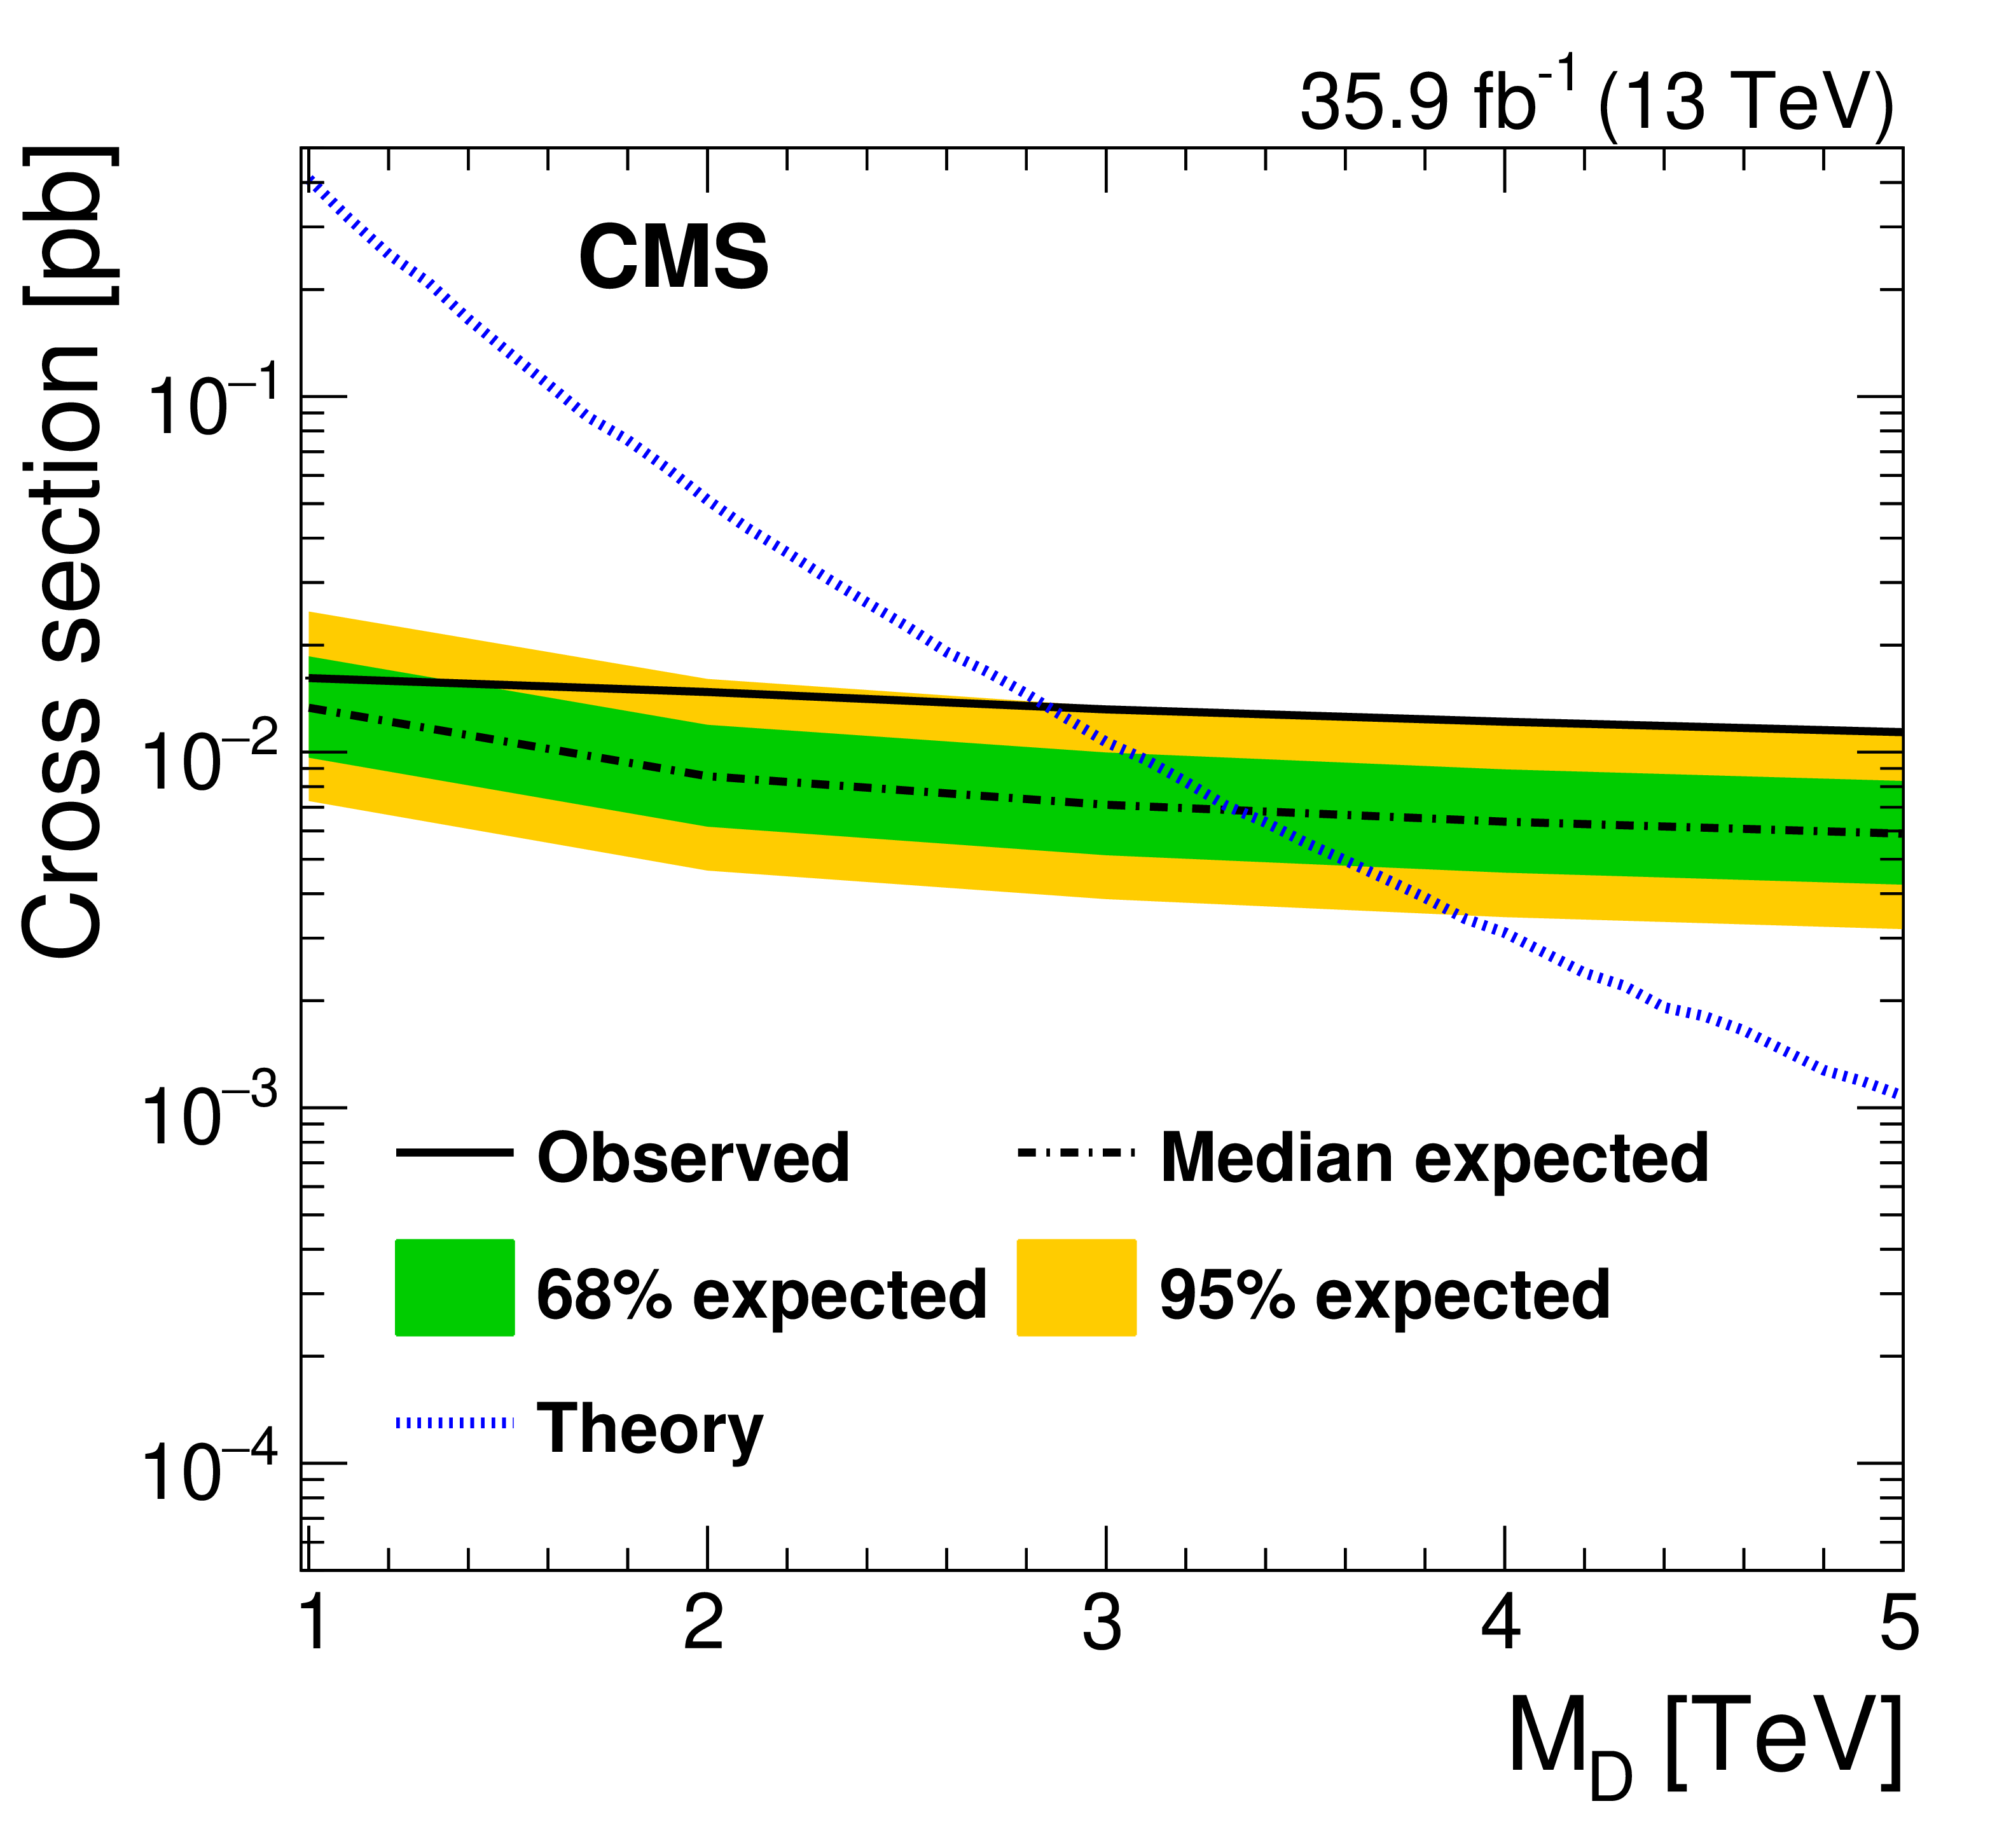
Figure 10:
The 95% CL upper limits on the ADD graviton production cross section as a function of ${M_\mathrm {D}}$, for $n=3$ extra dimensions. |

png pdf |
Figure 11:
Lower limit on ${M_\mathrm {D}}$ as a function of $n$, the number of ADD extra dimensions. |
png pdf |
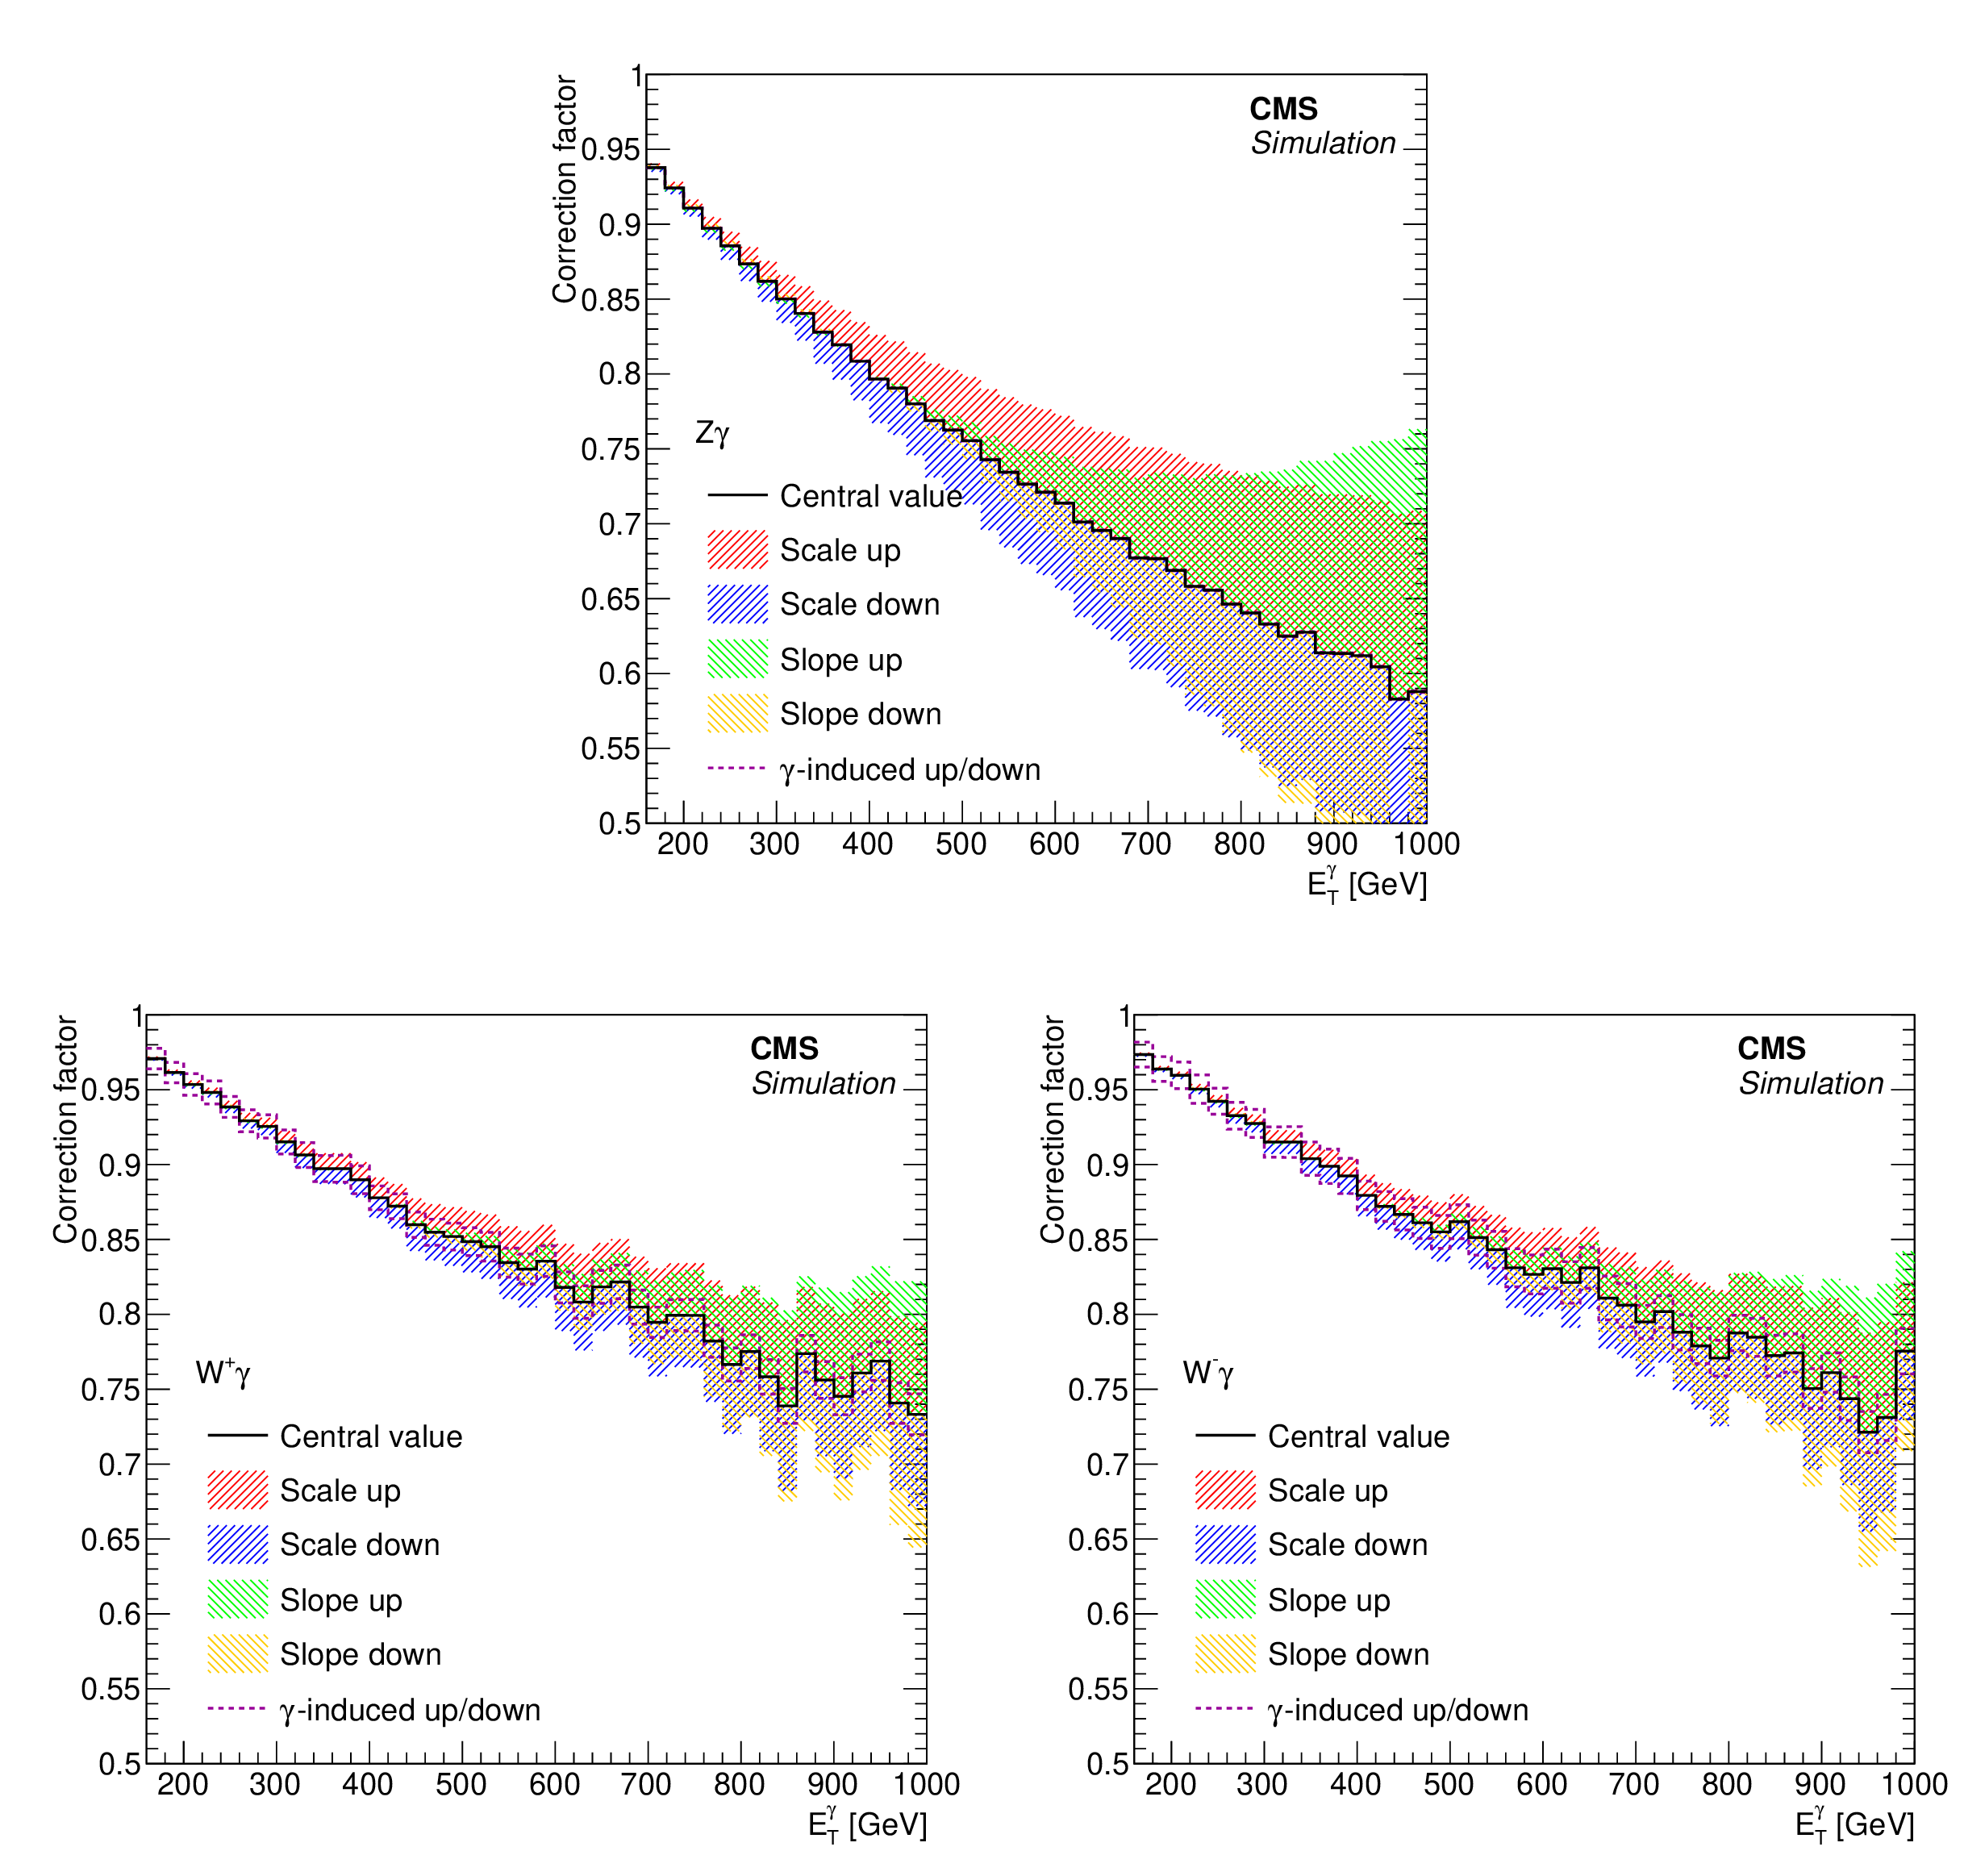
Figure 12:
Electroweak NLO cross section corrections as a function of photon ${p_{\mathrm {T}}}$ for ${\mathrm {Z}} (\to {\nu} {\overline {\nu}})$+${\gamma}$ (top), $ {\mathrm {W}}^{+}$+ ${\gamma}$ (bottom left), and $ {\mathrm {W}}^{-}+ {\gamma}$ (bottom right) processes, overlaid with uncertainty bands. See text for descriptions of the individual components of the uncertainty. Uncertainty due to ${\gamma}$-induced production is negligible in ${\mathrm {Z}} (\to {\nu} {\overline {\nu}})$+$ {\gamma}$ production. |
png pdf |
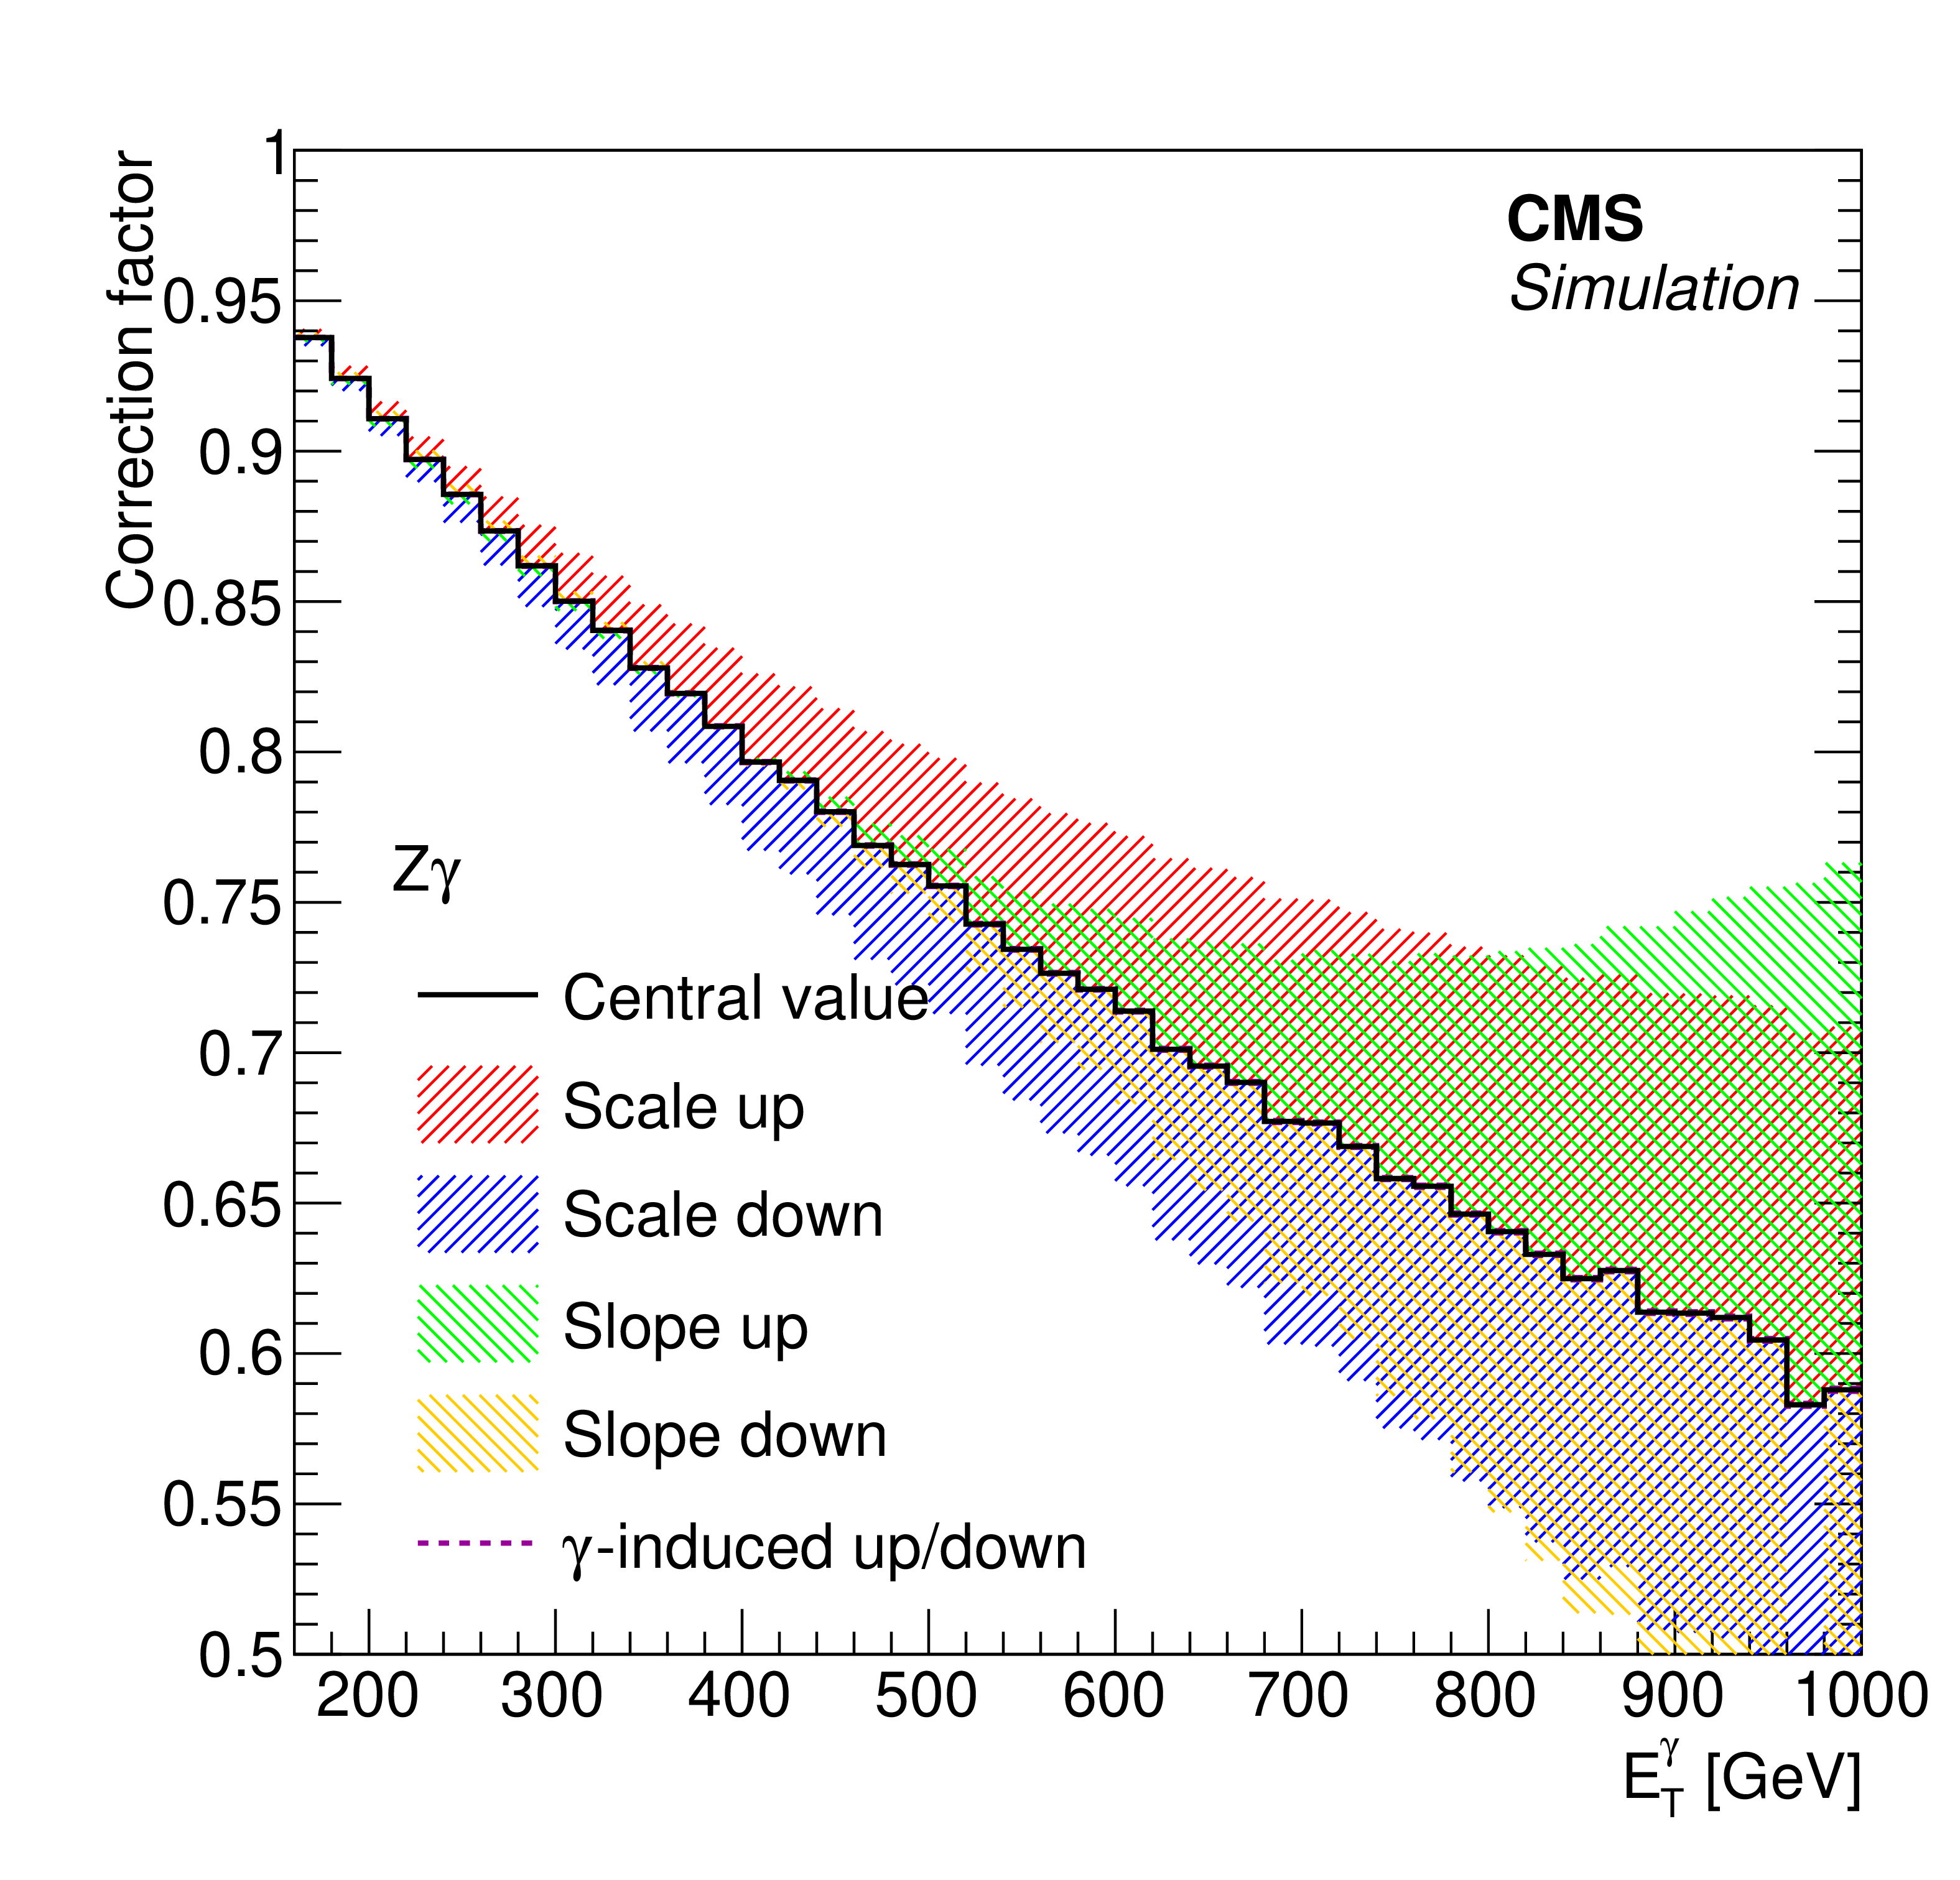
Figure 12-a:
Electroweak NLO cross section corrections as a function of photon ${p_{\mathrm {T}}}$ for the ${\mathrm {Z}} (\to {\nu} {\overline {\nu}})$+${\gamma}$ process, overlaid with uncertainty bands. See text for descriptions of the individual components of the uncertainty. Uncertainty due to ${\gamma}$-induced production is negligible in ${\mathrm {Z}} (\to {\nu} {\overline {\nu}})$+$ {\gamma}$ production. |
png pdf |
Figure 12-b:
Electroweak NLO cross section corrections as a function of photon ${p_{\mathrm {T}}}$ for the $ {\mathrm {W}}^{+}$+ ${\gamma}$ process, overlaid with uncertainty bands. See text for descriptions of the individual components of the uncertainty. Uncertainty due to ${\gamma}$-induced production is negligible in ${\mathrm {Z}} (\to {\nu} {\overline {\nu}})$+$ {\gamma}$ production. |

png pdf |
Figure 12-c:
Electroweak NLO cross section corrections as a function of photon ${p_{\mathrm {T}}}$ for the $ {\mathrm {W}}^{-}+ {\gamma}$ process, overlaid with uncertainty bands. See text for descriptions of the individual components of the uncertainty. Uncertainty due to ${\gamma}$-induced production is negligible in ${\mathrm {Z}} (\to {\nu} {\overline {\nu}})$+$ {\gamma}$ production. |

png pdf |
Figure 13:
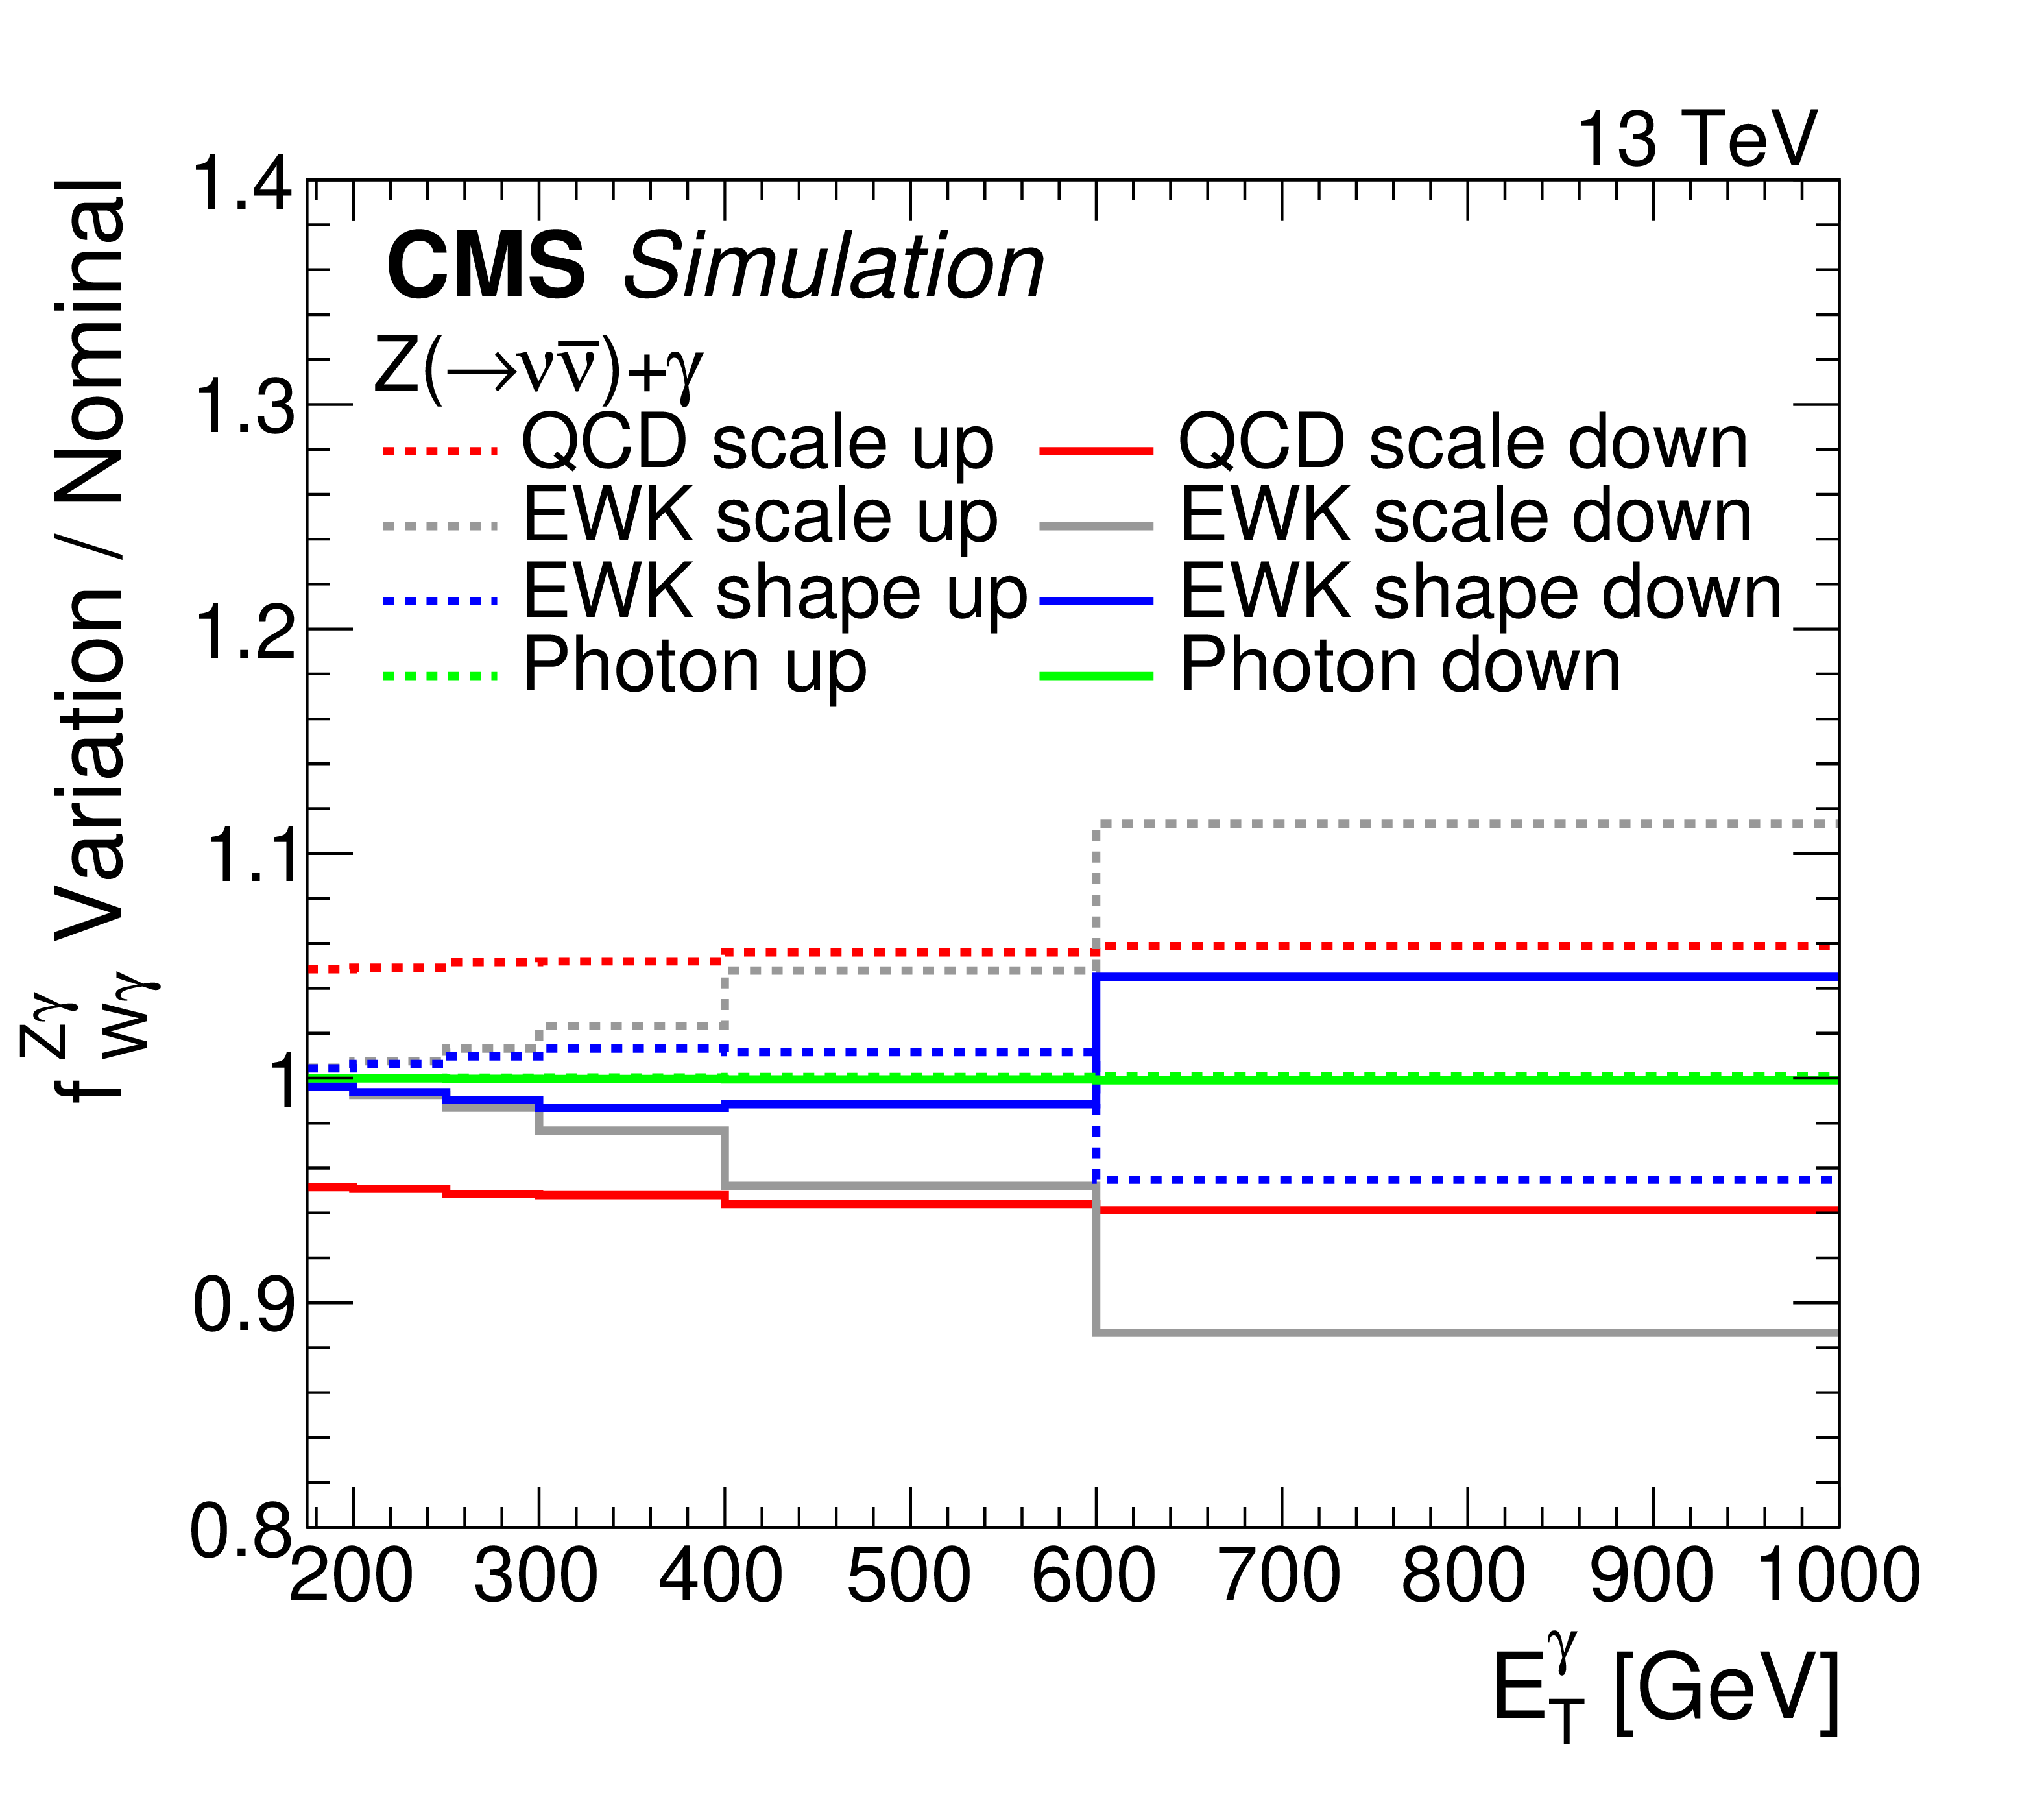
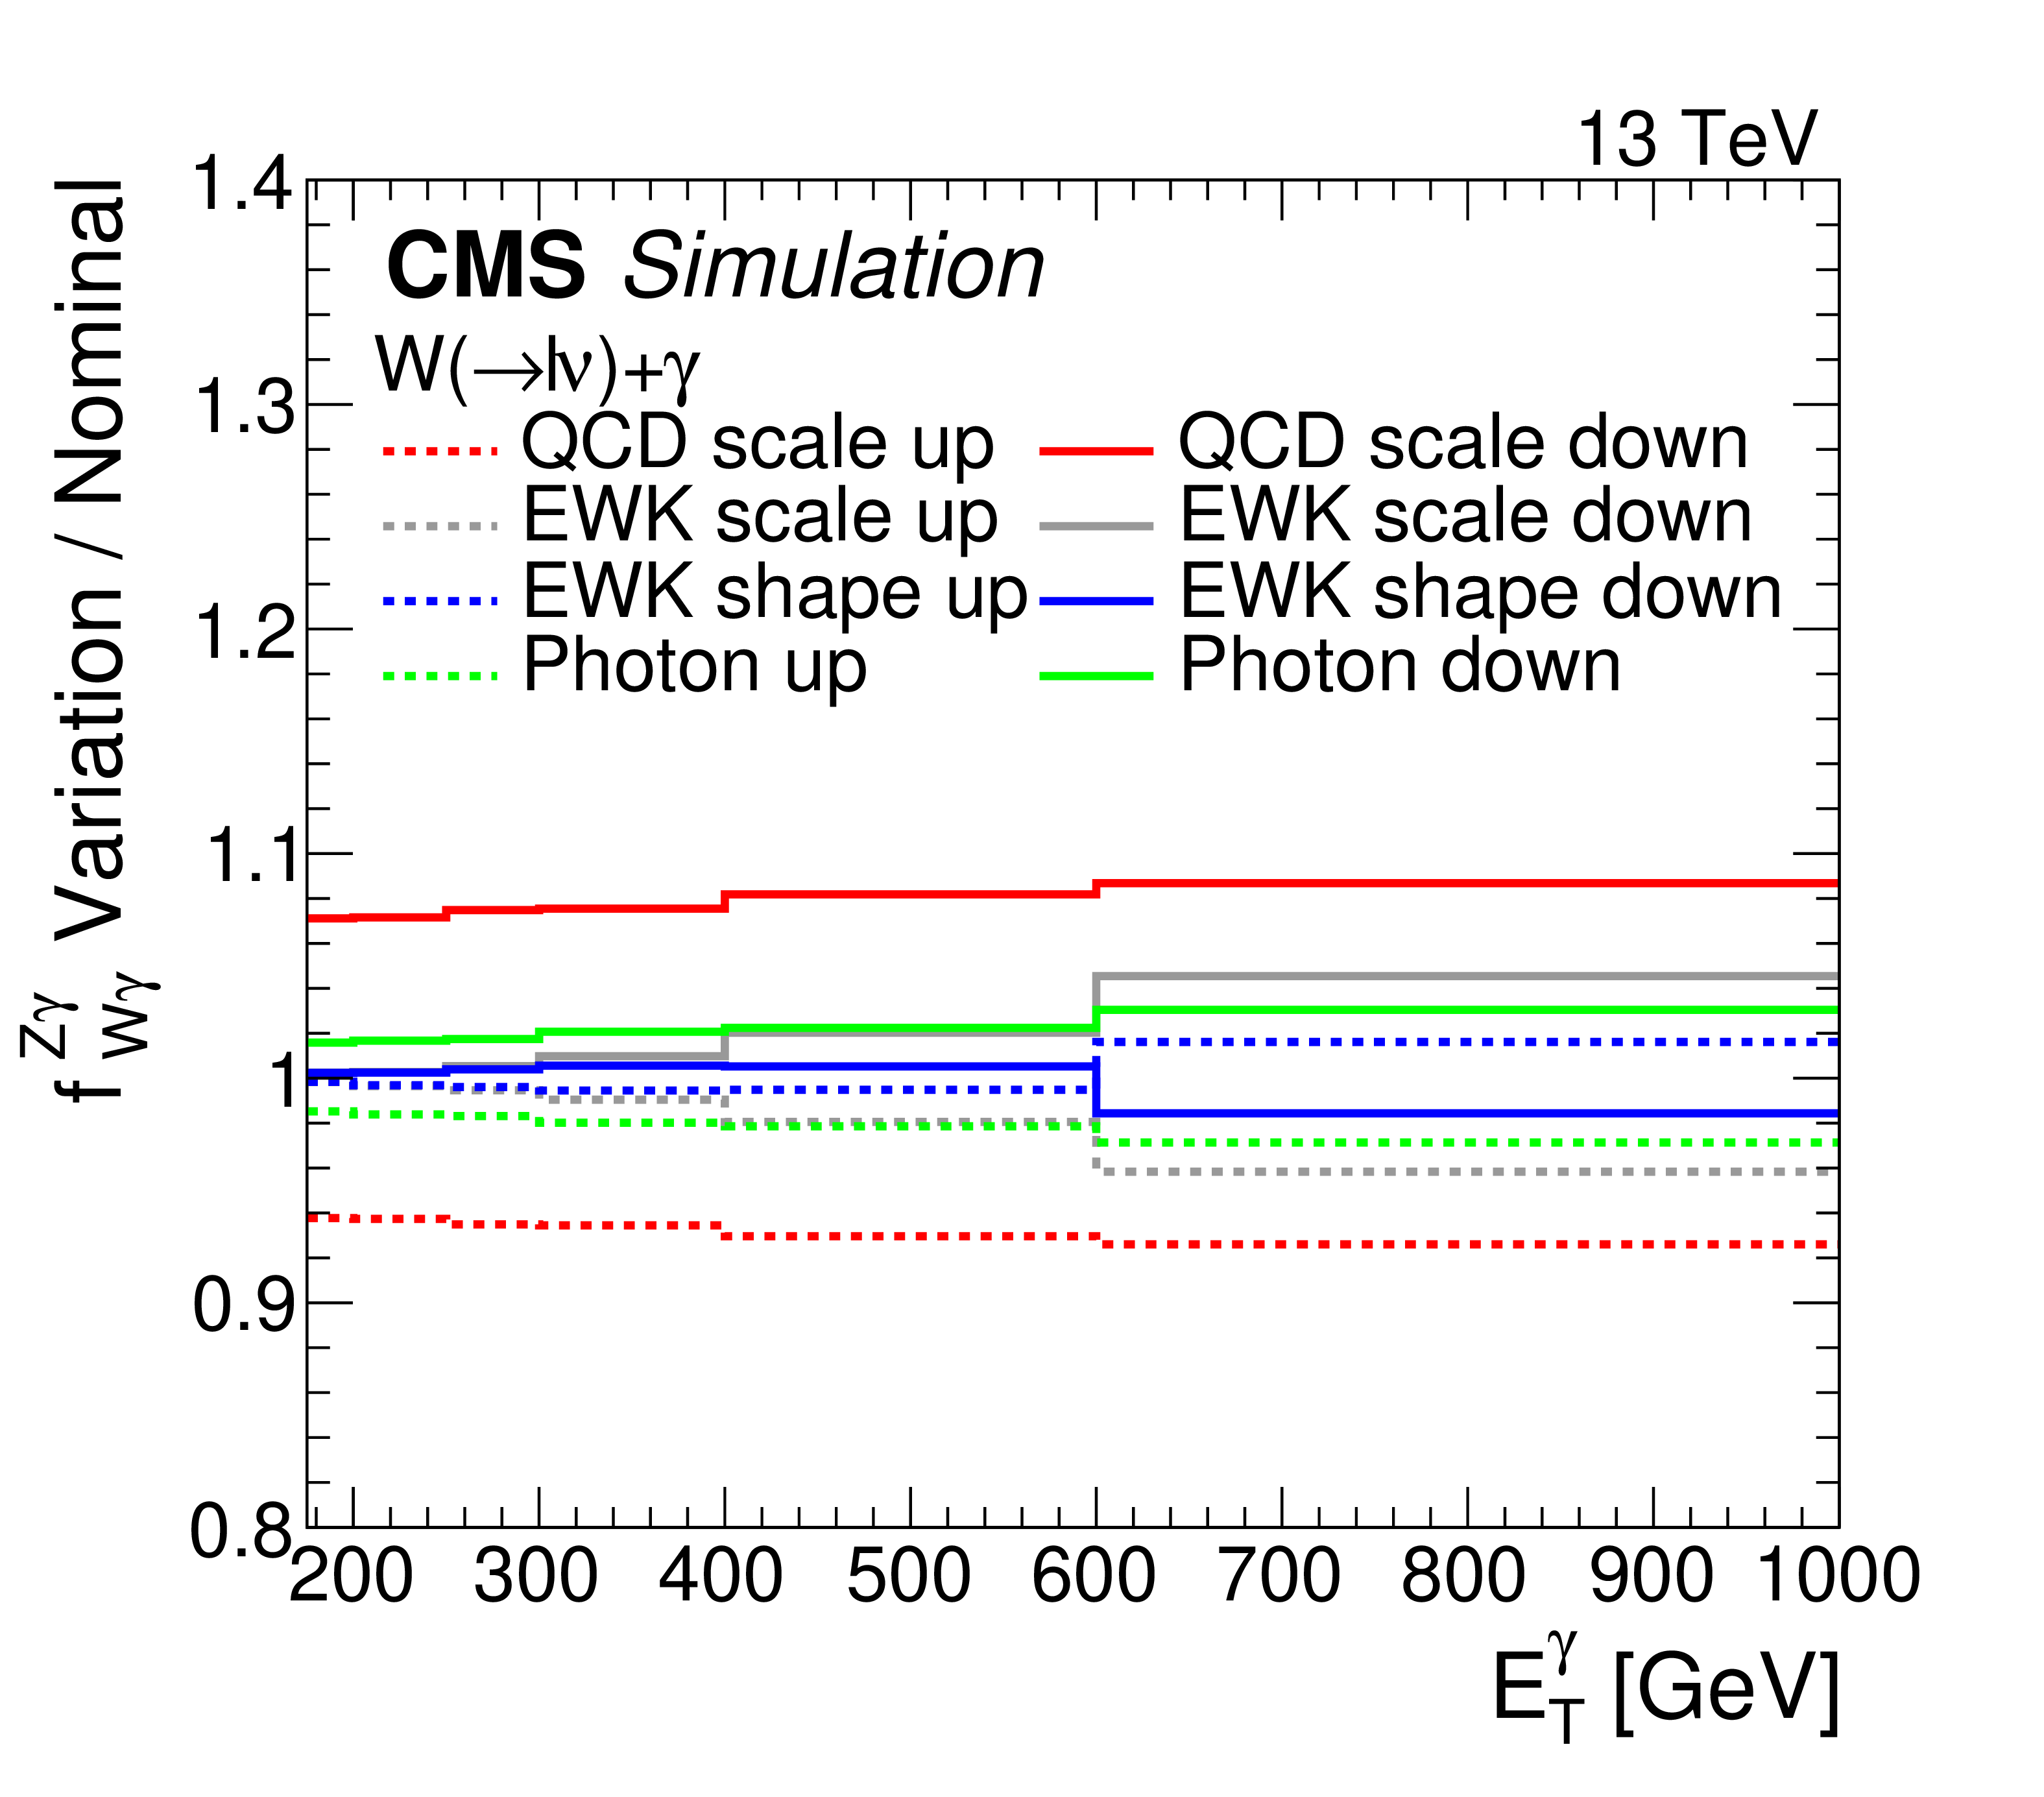
Systematic uncertainty in the transfer factors for ${\mathrm {Z}} (\to {\nu} {\overline {\nu}})$+$ {\gamma}$ (left) and ${\mathrm {W}}(\to \ell {\nu})$+$ {\gamma}$ (right). The last bin includes all events with ${E_{\mathrm {T}}^{{\gamma}}} > $ 1000 GeV. |
png pdf |
Figure 13-a:
Systematic uncertainty in the transfer factors for ${\mathrm {Z}} (\to {\nu} {\overline {\nu}})$+$ {\gamma}$. ${\mathrm {W}}(\to \ell {\nu})$+$ {\gamma}$. The last bin includes all events with ${E_{\mathrm {T}}^{{\gamma}}} > $ 1000 GeV. |
png pdf |
Figure 13-b:
Systematic uncertainty in the transfer factors for ${\mathrm {Z}} (\to {\nu} {\overline {\nu}})$+$ {\gamma}$. ${\mathrm {W}}(\to \ell {\nu})$+$ {\gamma}$. The last bin includes all events with ${E_{\mathrm {T}}^{{\gamma}}} > $ 1000 GeV. |

png pdf |
Figure 14:
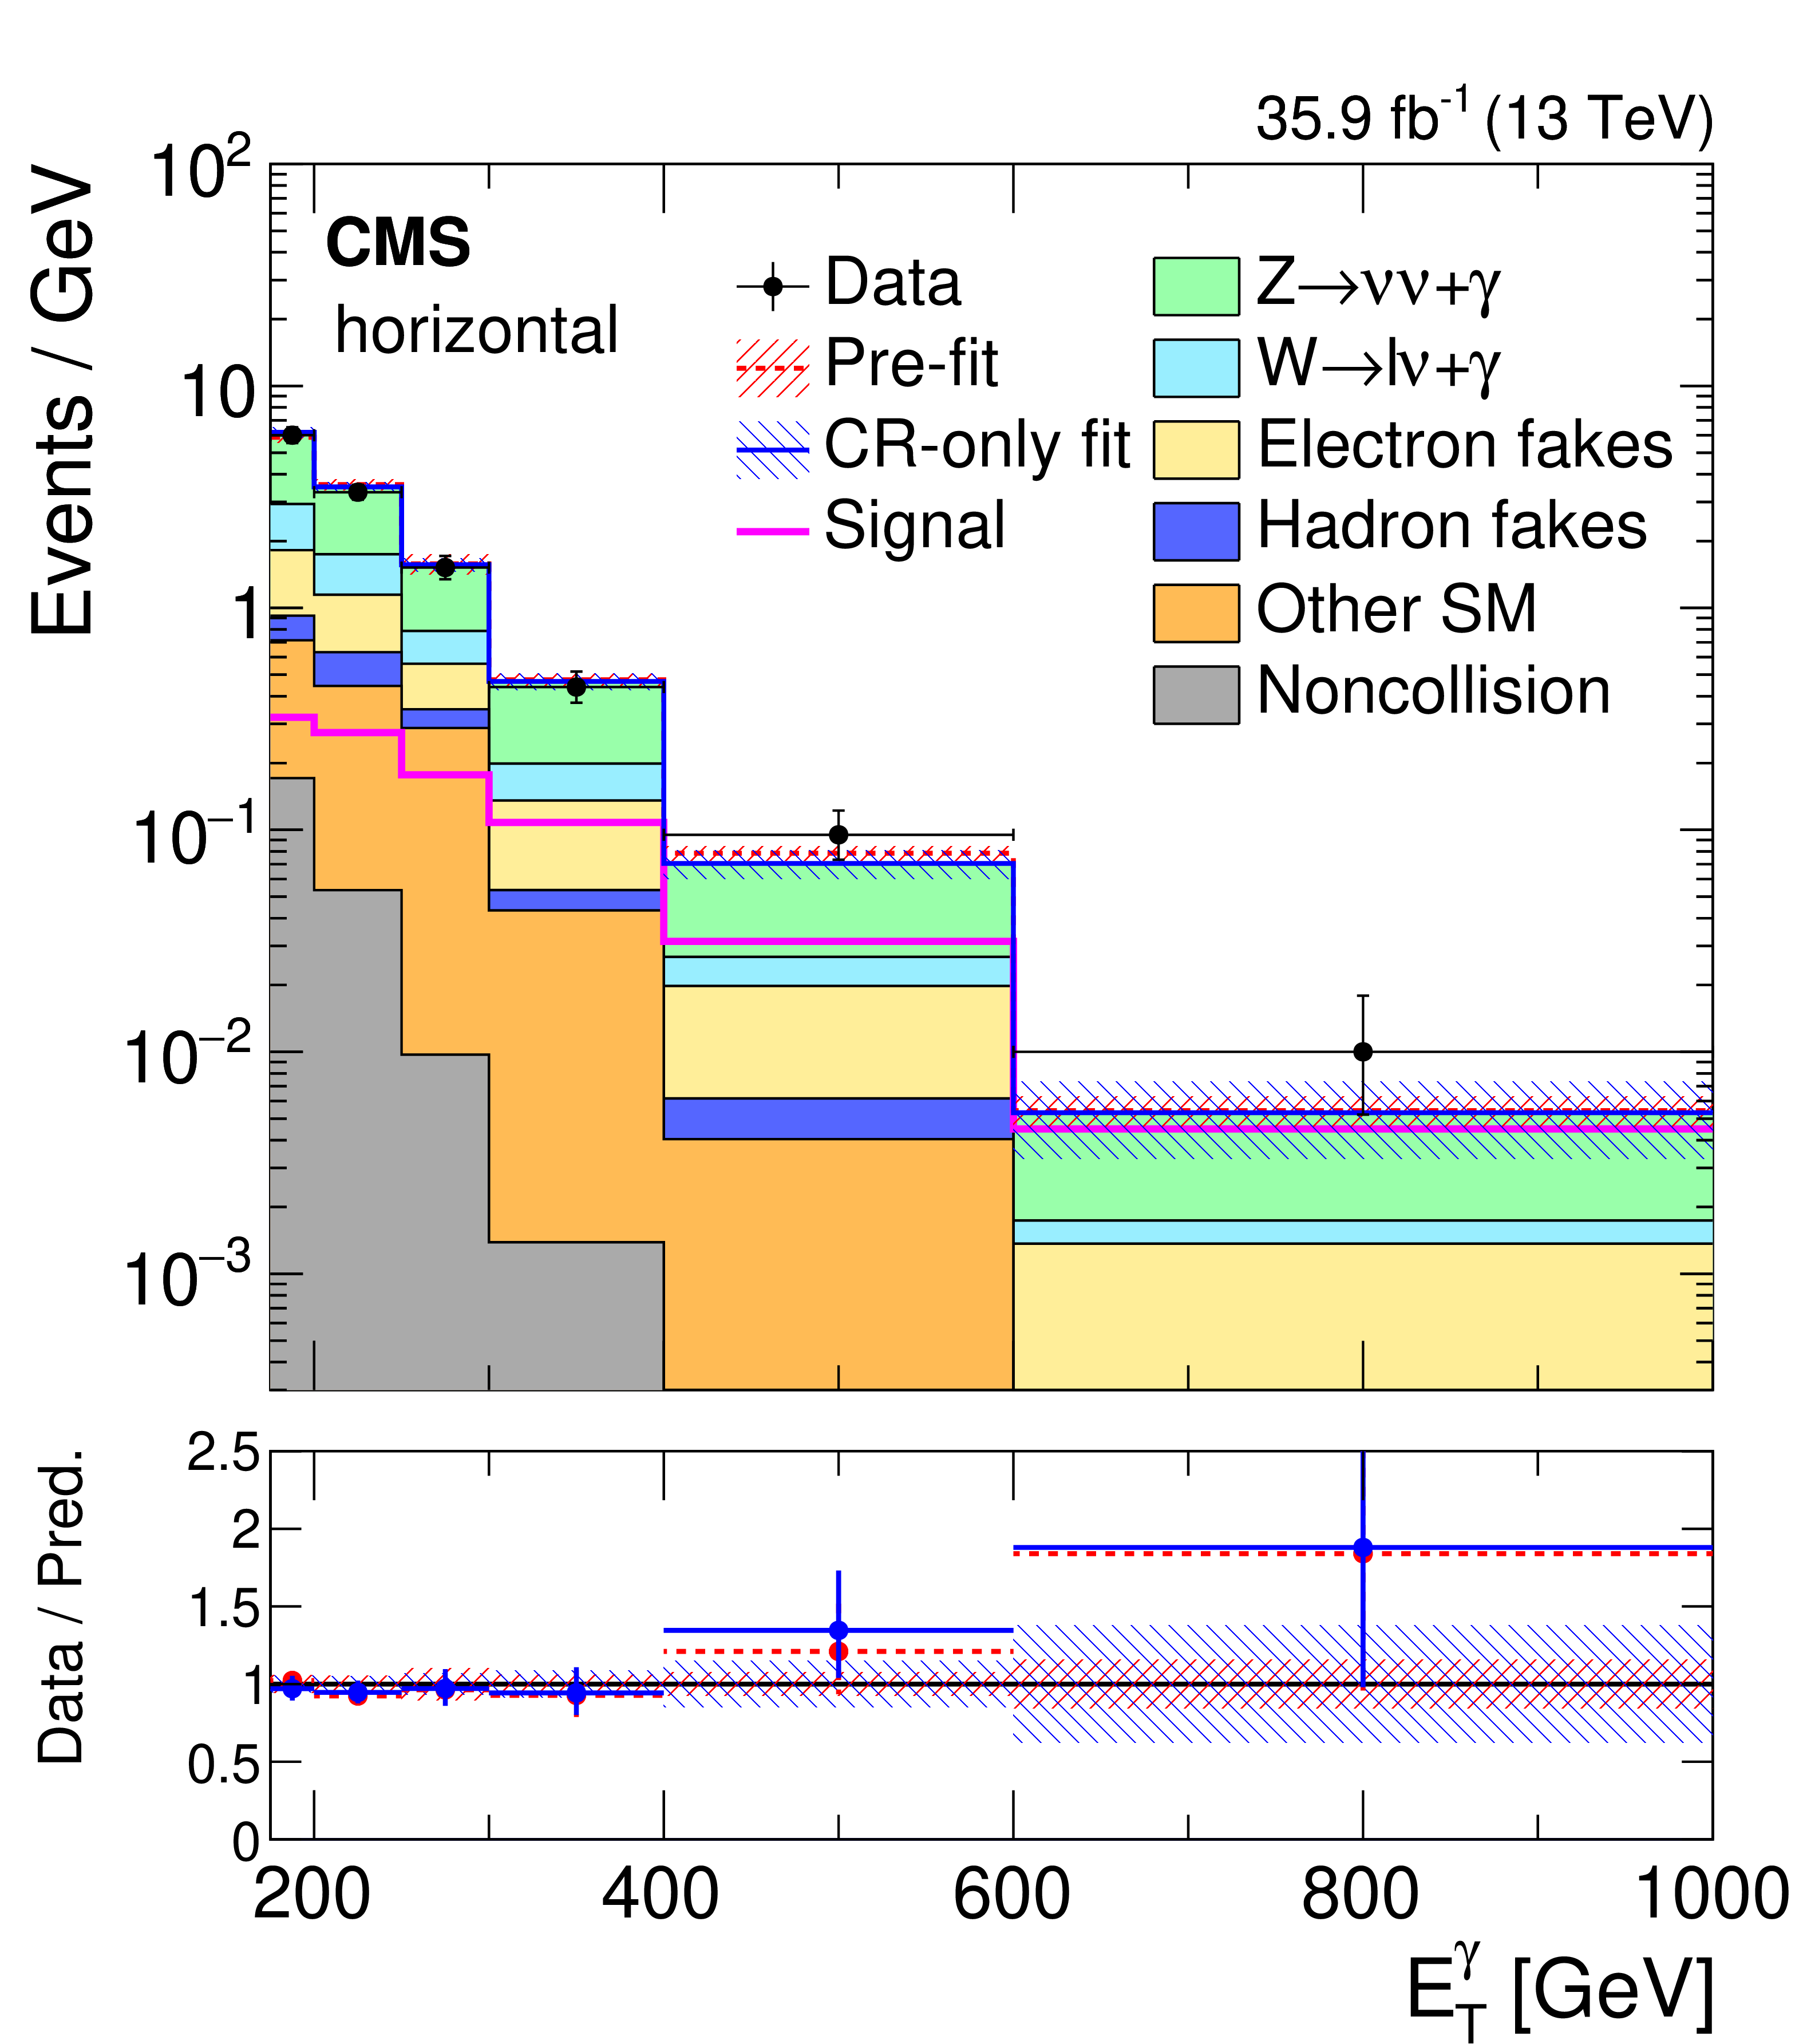
Observed ${E_{\mathrm {T}}^{{\gamma}}}$ distribution in the horizontal (left) and vertical (right) signal regions compared with the post-fit background expectations for various SM processes. The last bin includes all events with $ {E_{\mathrm {T}}^{{\gamma}}} > $ 1000 GeV. The expected background distributions are evaluated after performing a combined fit to the data in all the control samples, not including the signal region. |
png pdf |
Figure 14-a:
Observed ${E_{\mathrm {T}}^{{\gamma}}}$ distribution in the horizontal signal region compared with the post-fit background expectations for various SM processes. The last bin includes all events with $ {E_{\mathrm {T}}^{{\gamma}}} > $ 1000 GeV. The expected background distributions are evaluated after performing a combined fit to the data in all the control samples, not including the signal region. |
png pdf |
Figure 14-b:
Observed ${E_{\mathrm {T}}^{{\gamma}}}$ distribution in the vertical signal region compared with the post-fit background expectations for various SM processes. The last bin includes all events with $ {E_{\mathrm {T}}^{{\gamma}}} > $ 1000 GeV. The expected background distributions are evaluated after performing a combined fit to the data in all the control samples, not including the signal region. |

png pdf |
Figure 15:
Covariances between the predicted background yields in all the ${E_{\mathrm {T}}^{{\gamma}}}$ bins of the horizontal and vertical signal regions. The bin labels specify which signal region the bin belongs to and what number bin it is for that region. |
| Tables | |
png pdf |
Table 1:
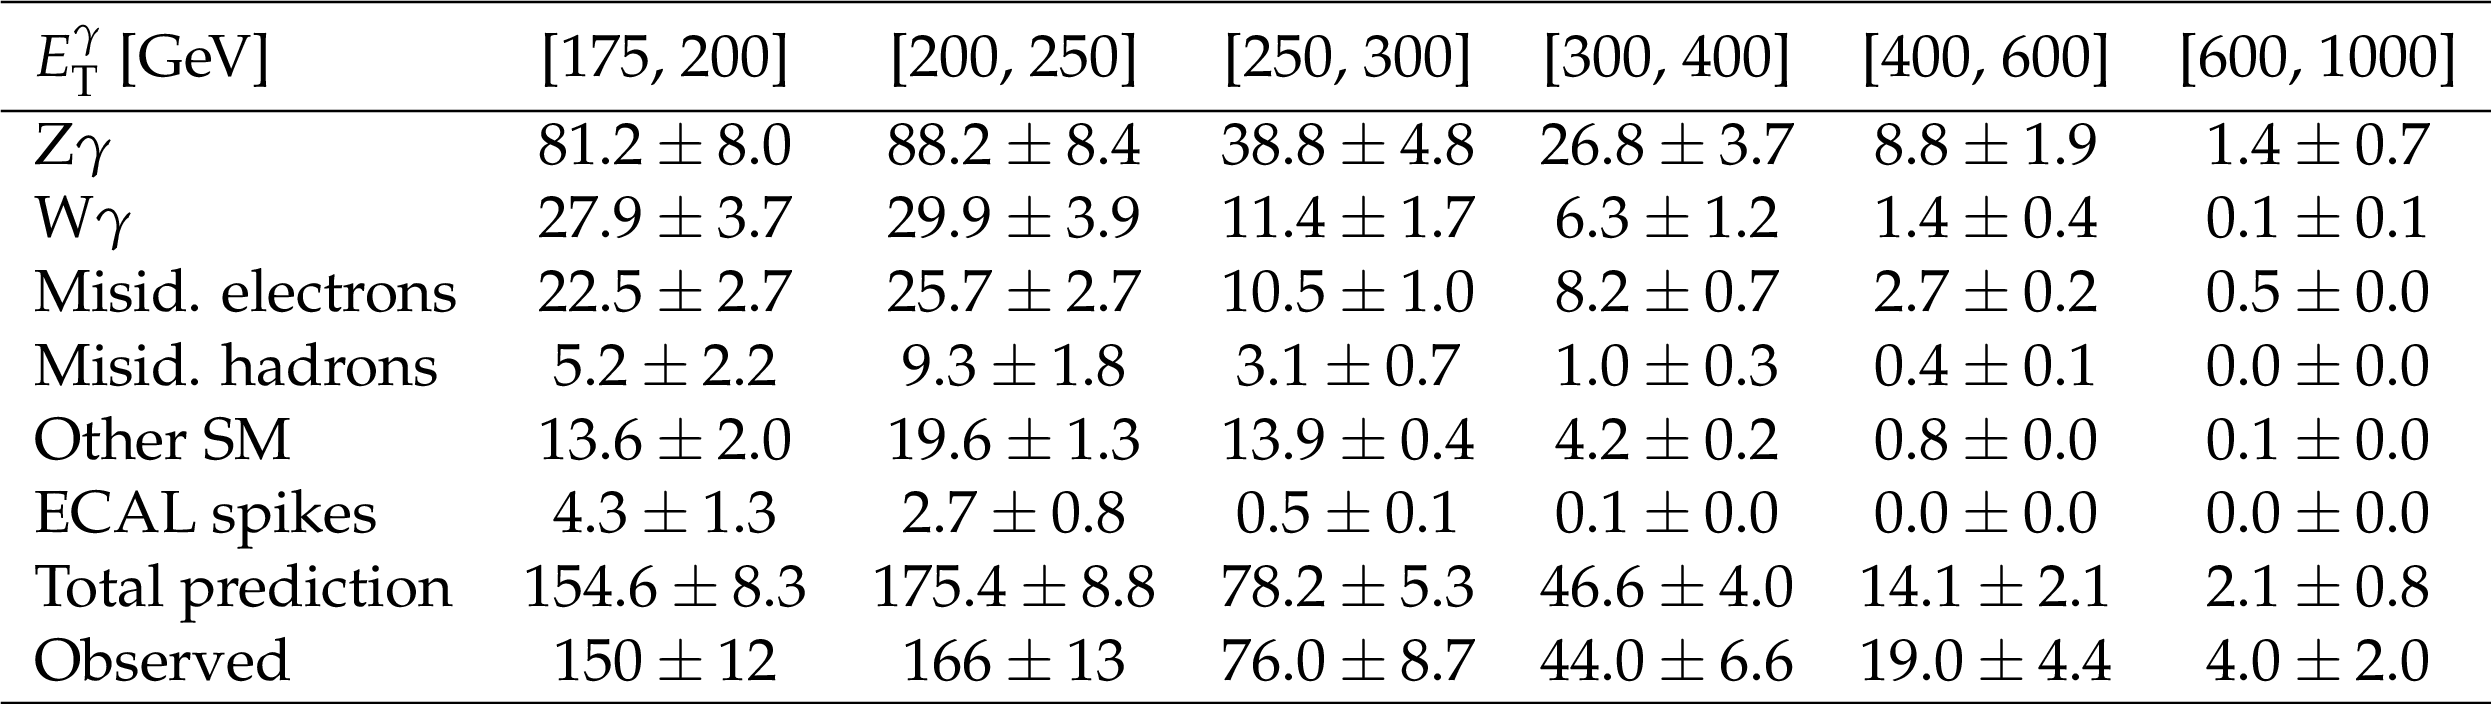
Expected event yields in each ${E_{\mathrm {T}}^{{\gamma}}}$ bin for various background processes in the horizontal signal region. The background yields and the corresponding uncertainties are obtained after performing a combined fit to data in all the control samples, excluding data in the signal region. The observed event yields in the horizontal signal region are also reported. |
png pdf |
Table 2:
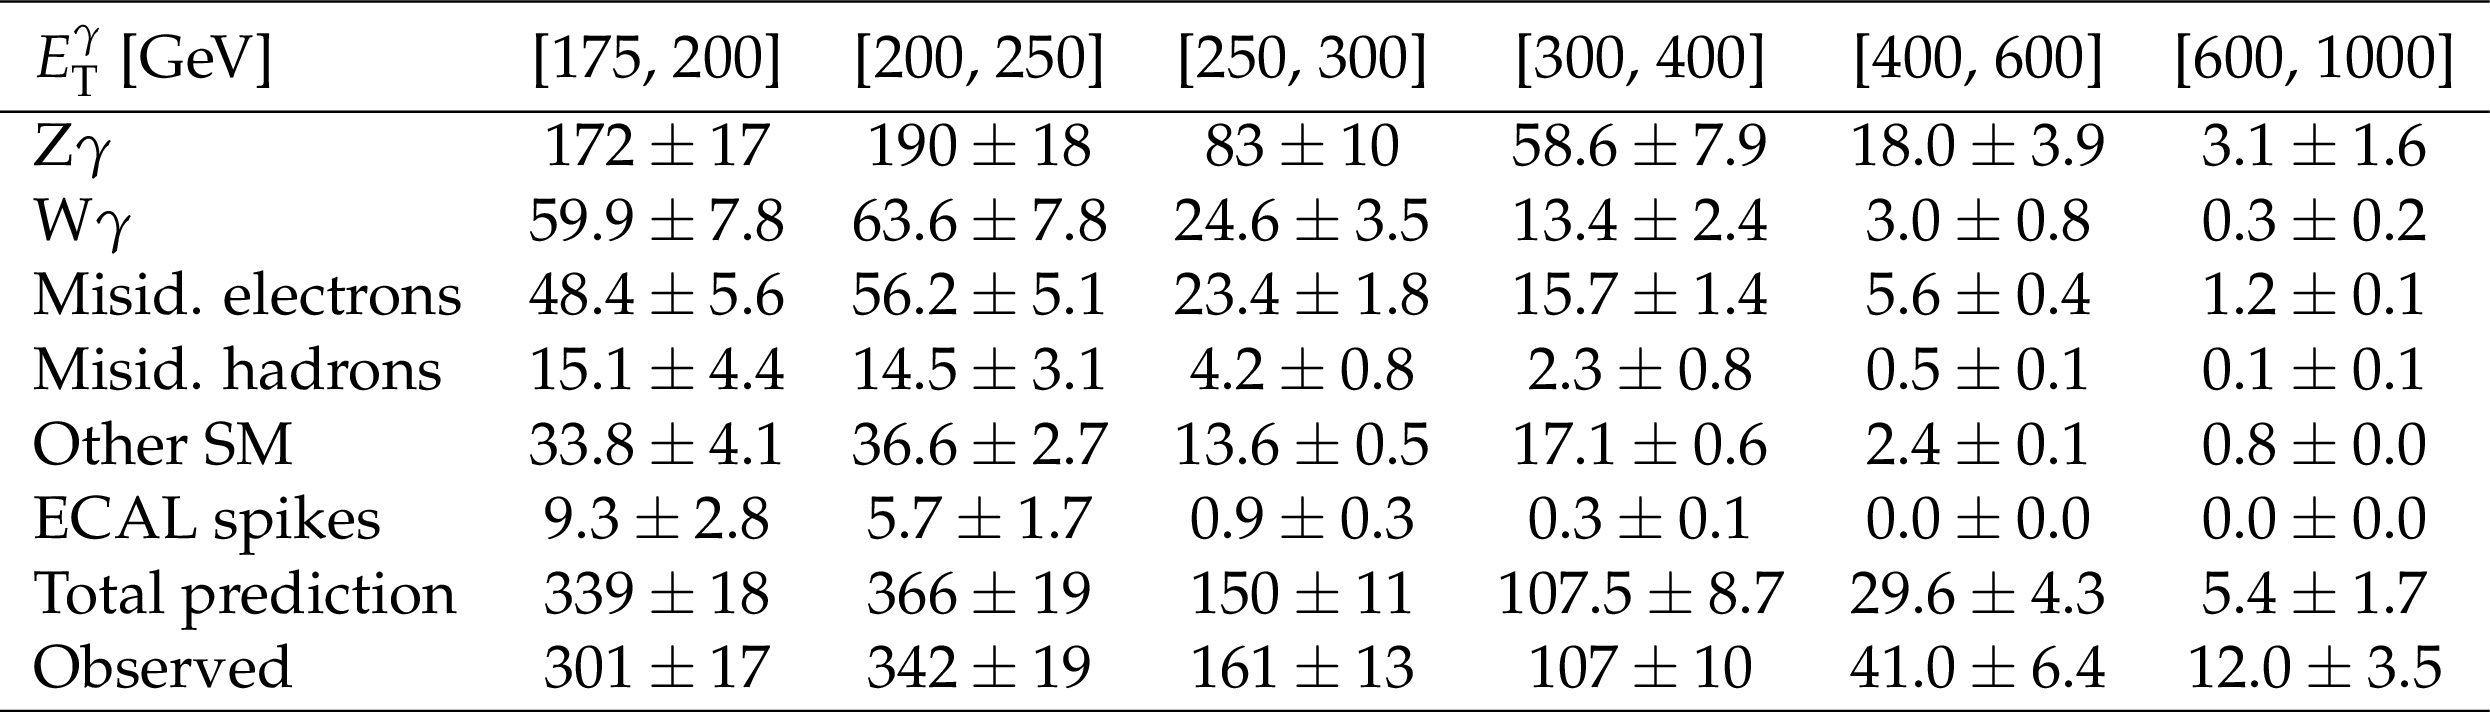
Expected event yields in each ${E_{\mathrm {T}}^{{\gamma}}}$ bin for various background processes in the vertical signal region. The background yields and the corresponding uncertainties are obtained after performing a combined fit to data in all the control samples, excluding data in the signal regions. The observed event yields in the vertical signal region are also reported. |

png pdf |
Table 3:
The 95% CL observed and expected lower limits on ${M_\mathrm {D}}$ as a function of $n$, the number of ADD extra dimensions. |
png pdf |
Table 4:
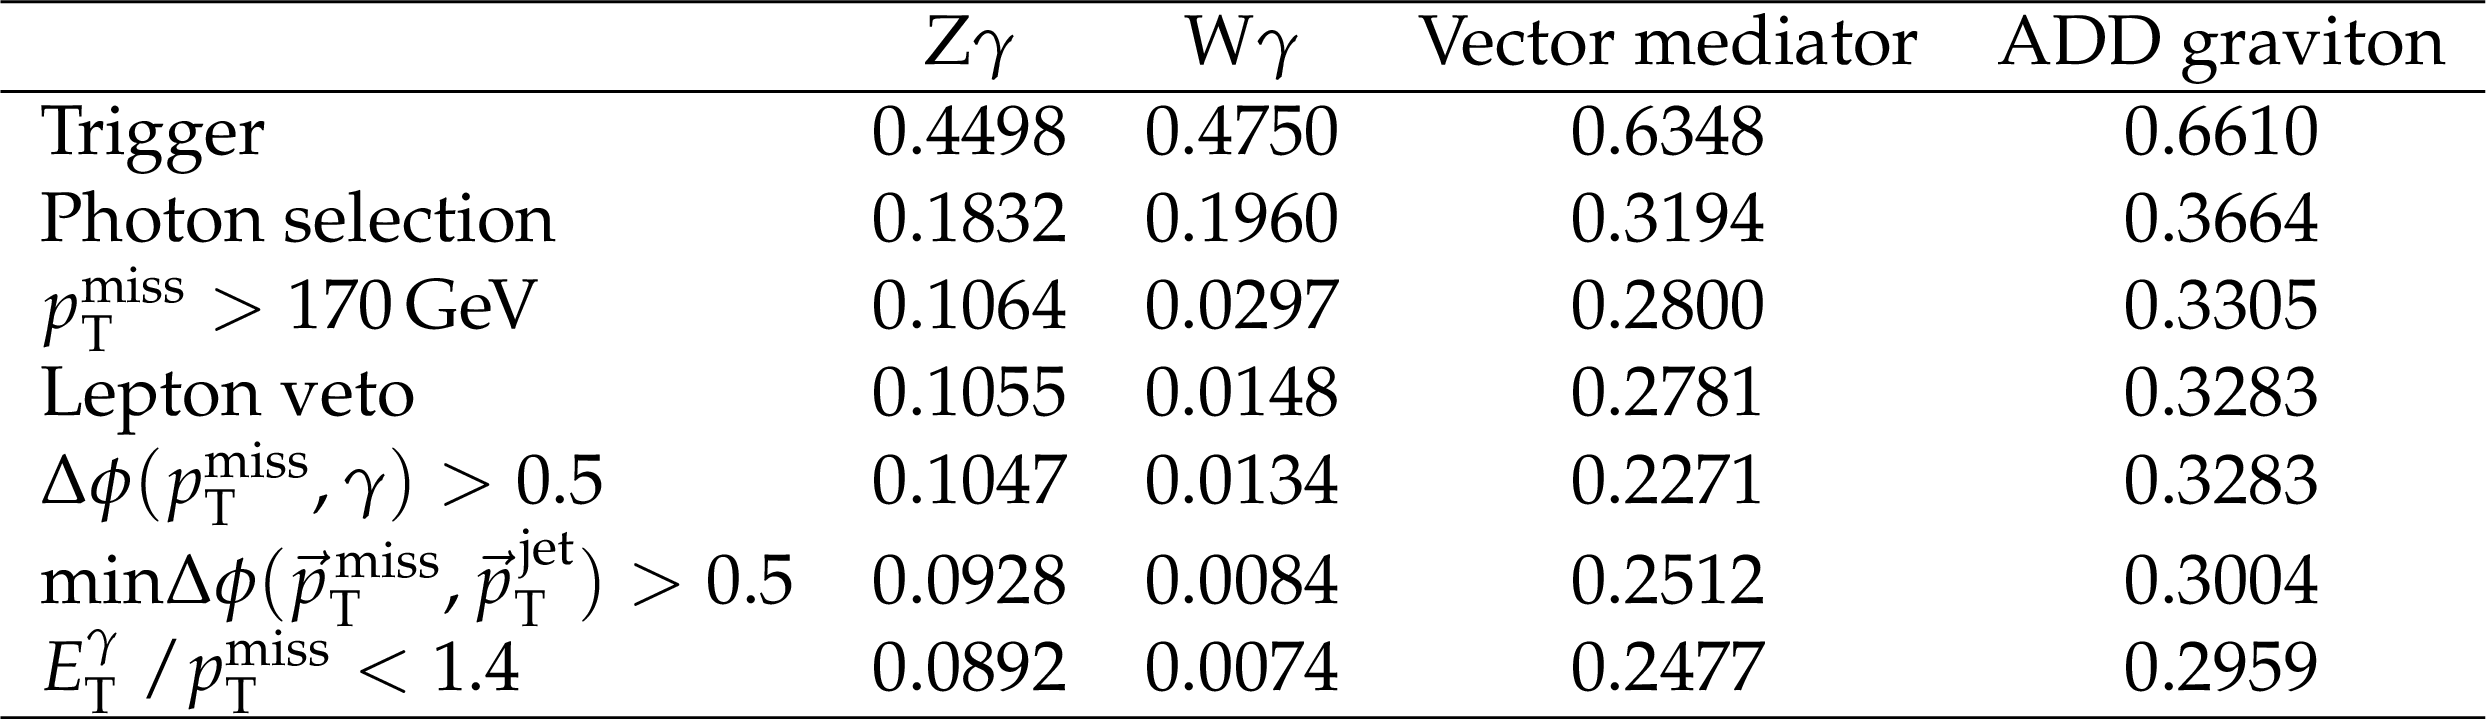
Step-by-step efficiencies of various selections for irreducible $ {\mathrm {Z}} {\gamma}$ and $ {\mathrm {W}} {\gamma}$ processes as well as two representative signal models: a 1 TeV vector mediator decaying to 1 GeV DM particles and an ADD graviton model with 8 extra dimensions and $ {M_\mathrm {D}} = $ 3 TeV. The statistical uncertainties on these values are generally on the order of half a percent. |
| Summary |
| Proton-proton collisions producing a high transverse momentum photon and large missing transverse momentum have been investigated to search for new phenomena, using a data set corresponding to 35.9 fb$^{-1}$ of integrated luminosity recorded at $\sqrt{s} = $ 13 TeV at the LHC. An analysis strategy of performing a simultaneous fit to multiple signal and control regions is employed on this final state for the first time, enhancing the sensitivity to potential signal events. No deviations from the standard model predictions are observed. For the simplified dark matter production models considered, the observed (expected) lower limit on the mediator mass is 950 (1150) GeV in both cases for 1 GeV dark matter mass. For an effective electroweak-dark matter contact interaction, the observed (expected) lower limit on the suppression parameter $\Lambda$ is 850 (950) GeV. For the model with extra spatial dimensions, values of the effective Planck scale $ {M_\mathrm{D}} $ up to 2.85-2.90 TeV are excluded for between 3 and 6 extra dimensions. These limits on $\Lambda$ and $ {M_\mathrm{D}} $ are the most sensitive monophoton limits to date. |
| References | ||||
| 1 | M. Beltran et al. | Maverick dark matter at colliders | JHEP 09 (2010) 037 | 1002.4137 |
| 2 | J. Goodman et al. | Constraints on dark matter from colliders | PRD 82 (2010) 116010 | 1008.1783 |
| 3 | P. J. Fox, R. Harnik, J. Kopp, and Y. Tsai | Missing energy signatures of dark matter at the LHC | PRD 85 (2012) 056011 | 1109.4398 |
| 4 | D. Abercrombie et al. | Dark matter benchmark models for early LHC Run-2 searches: Report of the ATLAS/CMS Dark Matter Forum | 1507.00966 | |
| 5 | G. Busoni et al. | Recommendations on presenting LHC searches for missing transverse energy signals using simplified $ s $-channel models of dark matter | 1603.04156 | |
| 6 | A. Nelson et al. | Confronting the Fermi line with LHC data: An effective theory of dark matter interaction with photons | PRD 89 (2014) 056011 | 1307.5064 |
| 7 | N. Arkani-Hamed, S. Dimopoulos, and G. Dvali | The hierarchy problem and new dimensions at a millimeter | PLB 429 (1998) 263 | hep-ph/9803315 |
| 8 | N. Arkani-Hamed, S. Dimopoulos, and G. Dvali | Phenomenology, astrophysics, and cosmology of theories with submillimeter dimensions and TeV scale quantum gravity | PRD 59 (1999) 086004 | |
| 9 | S. Orfanelli et al. | A novel beam halo monitor for the CMS experiment at the LHC | JINST 10 (2015) P11011 | |
| 10 | D. A. Petyt and the CMS collaboration | Mitigation of anomalous APD signals in the CMS electromagnetic calorimeter | J. Phys.: Conf. Series 404 (2012) 012043 | |
| 11 | ATLAS Collaboration | Search for dark matter at $ \sqrt{s} = $ 13 TeV in final states containing an energetic photon and large missing transverse momentum with the ATLAS detector | EPJC 77 (2017) 393 | 1704.03848 |
| 12 | CMS Collaboration | Search for new physics in the monophoton final state in proton-proton collisions at $ \sqrt{s} = $ 13 TeV | JHEP 10 (2017) 073 | CMS-EXO-16-039 1706.03794 |
| 13 | CMS Collaboration | The CMS trigger system | JINST 12 (2017) P01020 | CMS-TRG-12-001 1609.02366 |
| 14 | CMS Collaboration | The CMS experiment at the CERN LHC | JINST 3 (2008) S08004 | CMS-00-001 |
| 15 | CMS Collaboration | Particle-flow reconstruction and global event description with the CMS detector | JINST 12 (2017) P10003 | CMS-PRF-14-001 1706.04965 |
| 16 | CMS Collaboration | Description and performance of track and primary-vertex reconstruction with the CMS tracker | JINST 9 (2014) P10009 | CMS-TRK-11-001 1405.6569 |
| 17 | M. Cacciari, G. P. Salam, and G. Soyez | The anti-$ {k_{\mathrm{T}}} $ jet clustering algorithm | JHEP 04 (2008) 063 | 0802.1189 |
| 18 | M. Cacciari, G. P. Salam, and G. Soyez | FastJet user manual | EPJC 72 (2012) 1896 | 1111.6097 |
| 19 | CMS Collaboration | Jet energy scale and resolution in the CMS experiment in pp collisions at 8 TeV | JINST 12 (2017) P02014 | CMS-JME-13-004 1607.03663 |
| 20 | W. Adam, R. Fruhwirth, A. Strandlie, and T. Todorov | Reconstruction of electrons with the Gaussian-sum filter in the CMS tracker at the LHC | JPG 31 (2005) N9 | |
| 21 | CMS Collaboration | Performance of electron reconstruction and selection with the CMS detector in proton-proton collisions at $ \sqrt{s} = $ 8 TeV | JINST 10 (2015) P06005 | CMS-EGM-13-001 1502.02701 |
| 22 | CMS Collaboration | CMS luminosity measurements for the 2016 data taking period | CMS-PAS-LUM-17-001 | CMS-PAS-LUM-17-001 |
| 23 | CMS Collaboration | Performance of photon reconstruction and identification with the CMS detector in proton-proton collisions at $ \sqrt{s} = $ 8 TeV | JINST 10 (2015) P08010 | CMS-EGM-14-001 1502.02702 |
| 24 | NNPDF Collaboration | Parton distributions for the LHC Run II | JHEP 04 (2015) 040 | 1410.8849 |
| 25 | J. Alwall et al. | The automated computation of tree-level and next-to-leading order differential cross sections, and their matching to parton shower simulations | JHEP 07 (2014) 079 | 1405.0301 |
| 26 | CMS Collaboration | Event generator tunes obtained from underlying event and multiparton scattering measurements | EPJC 76 (2016) 155 | CMS-GEN-14-001 1512.00815 |
| 27 | GEANT4 Collaboration | GEANT4--a simulation toolkit | NIMA 506 (2003) 250 | |
| 28 | J. Allison et al. | GEANT4developments and applications | IEEE Trans. Nucl. Sci 53 (2006) 270 | |
| 29 | S. Catani, D. de Florian, G. Ferrera, and M. Grazzini | Vector boson production at hadron colliders: transverse-momentum resummation and leptonic decay | JHEP 12 (2015) 047 | 1507.06937 |
| 30 | A. Denner, S. Dittmaier, M. Hecht, and C. Pasold | NLO QCD and electroweak corrections to $ W{+}\gamma $ production with leptonic $ W $-boson decays | JHEP 04 (2015) 018 | 1412.7421 |
| 31 | A. Denner, S. Dittmaier, M. Hecht, and C. Pasold | NLO QCD and electroweak corrections to $ Z{+}\gamma $ production with leptonic $ Z $-boson decays | JHEP 02 (2016) 057 | 1510.08742 |
| 32 | A. V. Manohar, P. Nason, G. P. Salam, and G. Zanderighi | The photon content of the proton | JHEP 12 (2017) 046 | 1708.01256 |
| 33 | J. M. Lindert et al. | Precise predictions for V+jets dark matter backgrounds | EPJC 77 (2017) 829 | 1705.04664 |
| 34 | CMS Collaboration | Measurement of the inclusive $ W $ and $ Z $ production cross sections in pp collisions at $ \sqrt{s} = $ 7 TeV with the CMS experiment | JHEP 10 (2011) 132 | CMS-EWK-10-005 1107.4789 |
| 35 | CMS Collaboration | Search for resonant production of high-mass photon pairs in proton-proton collisions at $ \sqrt{s} = $ 8 and 13 TeV | PRL 117 (2016) 051802 | CMS-EXO-16-018 1606.04093 |
| 36 | CMS Collaboration | Simplified likelihood for the re-interpretation of public CMS results | CDS | |
| 37 | T. Junk | Confidence level computation for combining searches with small statistics | NIMA 434 (1999) 435 | hep-ex/9902006 |
| 38 | A. L. Read | Presentation of search results: The CLs technique | JPG 28 (2002) 2693 | |
| 39 | G. Cowan, K. Cranmer, E. Gross, and O. Vitells | Asymptotic formulae for likelihood-based tests of new physics | EPJC 71 (2011) 1554 | 1007.1727 |
| 40 | Planck Collaboration | Planck 2015 results. XIII. Cosmological parameters | Astron. Astrophys. 594 (2016) A13 | 1502.01589 |
| 41 | M. Backovi\' c, K. Kong, and M. McCaskey | MadDM v.1.0: Computation of dark matter relic abundance using MadGraph5 | Phys. Dark Univ. 5-6 (2014) 18 | 1308.4955 |
| 42 | SuperCDMS Collaboration | New results from the search for low-mass weakly interacting massive particles with the CDMS low ionization threshold experiment | PRL 116 (2016) 071301 | 1509.02448 |
| 43 | LUX Collaboration | Results from a search for dark matter in the complete LUX exposure | PRL 118 (2017) 021303 | 1608.07648 |
| 44 | PandaX-II Collaboration | Dark matter results from 54-ton-day exposure of PandaX-II experiment | PRL 119 (2017) 181302 | 1708.06917 |
| 45 | E. Aprile et al. | Dark matter search results from a one $ \text{Tonne}\times\text{Year} $ exposure of XENON1T | 1805.12562 | |
| 46 | CRESST Collaboration | Results on light dark matter particles with a low-threshold CRESST-II detector | EPJC 76 (2016) 25 | 1509.01515 |
| 47 | PICO Collaboration | Dark matter search results from the PICO-60 $ \mathrm{C}_{3}\mathrm{F}_{8} $ bubble chamber | PRL 118 (2017) 251301 | 1702.07666 |
| 48 | IceCube Collaboration | Improved limits on dark matter annihilation in the Sun with the 79-string IceCube detector and implications for supersymmetry | J. Cosm. Astro. Phys. 04 (2016) 022 | 1601.00653 |
| 49 | E. Behnke et al. | Final results of the PICASSO dark matter search experiment | Astropart. Phys. 90 (2017) 85 | 1611.01499 |
| 50 | Super-Kamiokande Collaboration | Search for neutrinos from annihilation of captured low-mass dark matter particles in the Sun by Super-Kamiokande | PRL 114 (2015) 141301 | 1503.04858 |
|
|
Compact Muon Solenoid LHC, CERN |
|

|

|

|

|

|