

Compact Muon Solenoid
LHC, CERN
| CMS-EXO-17-017 ; CERN-EP-2018-219 | ||
| Search for physics beyond the standard model in high-mass diphoton events from proton-proton collisions at $\sqrt{s} = $ 13 TeV | ||
| CMS Collaboration | ||
| 1 September 2018 | ||
| Phys. Rev. D 98 (2018) 092001 | ||
| Abstract: A search for physics beyond the standard model is performed using a sample of high-mass diphoton events produced in proton-proton collisions at $\sqrt{s} = $ 13 TeV. The data sample was collected in 2016 with the CMS detector at the LHC and corresponds to an integrated luminosity of 35.9 fb$^{-1}$. The search is performed for both resonant and nonresonant new physics signatures. At 95% confidence level, lower limits on the mass of the first Kaluza-Klein excitation of the graviton in the Randall-Sundrum warped extra-dimensional model are determined to be in the range of 2.3 to 4.6 TeV, for values of the associated coupling parameter between 0.01 and 0.2. Lower limits on the production of scalar resonances and model-independent cross section upper limits are also provided. For the large extra-dimensional model of Arkani-Hamed, Dimopoulos, and Dvali, lower limits are set on the string mass scale $ {M_{\mathrm{S}}} $ ranging from 5.6 to 9.7 TeV, depending on the model parameters. The first exclusion limits are set in the two-dimensional parameter space of a continuum clockwork model. | ||
| Links: e-print arXiv:1809.00327 [hep-ex] (PDF) ; CDS record ; inSPIRE record ; CADI line (restricted) ; | ||
| Figures & Tables | Summary | Additional Figures | References | CMS Publications |
|---|
| Figures | |
png pdf |
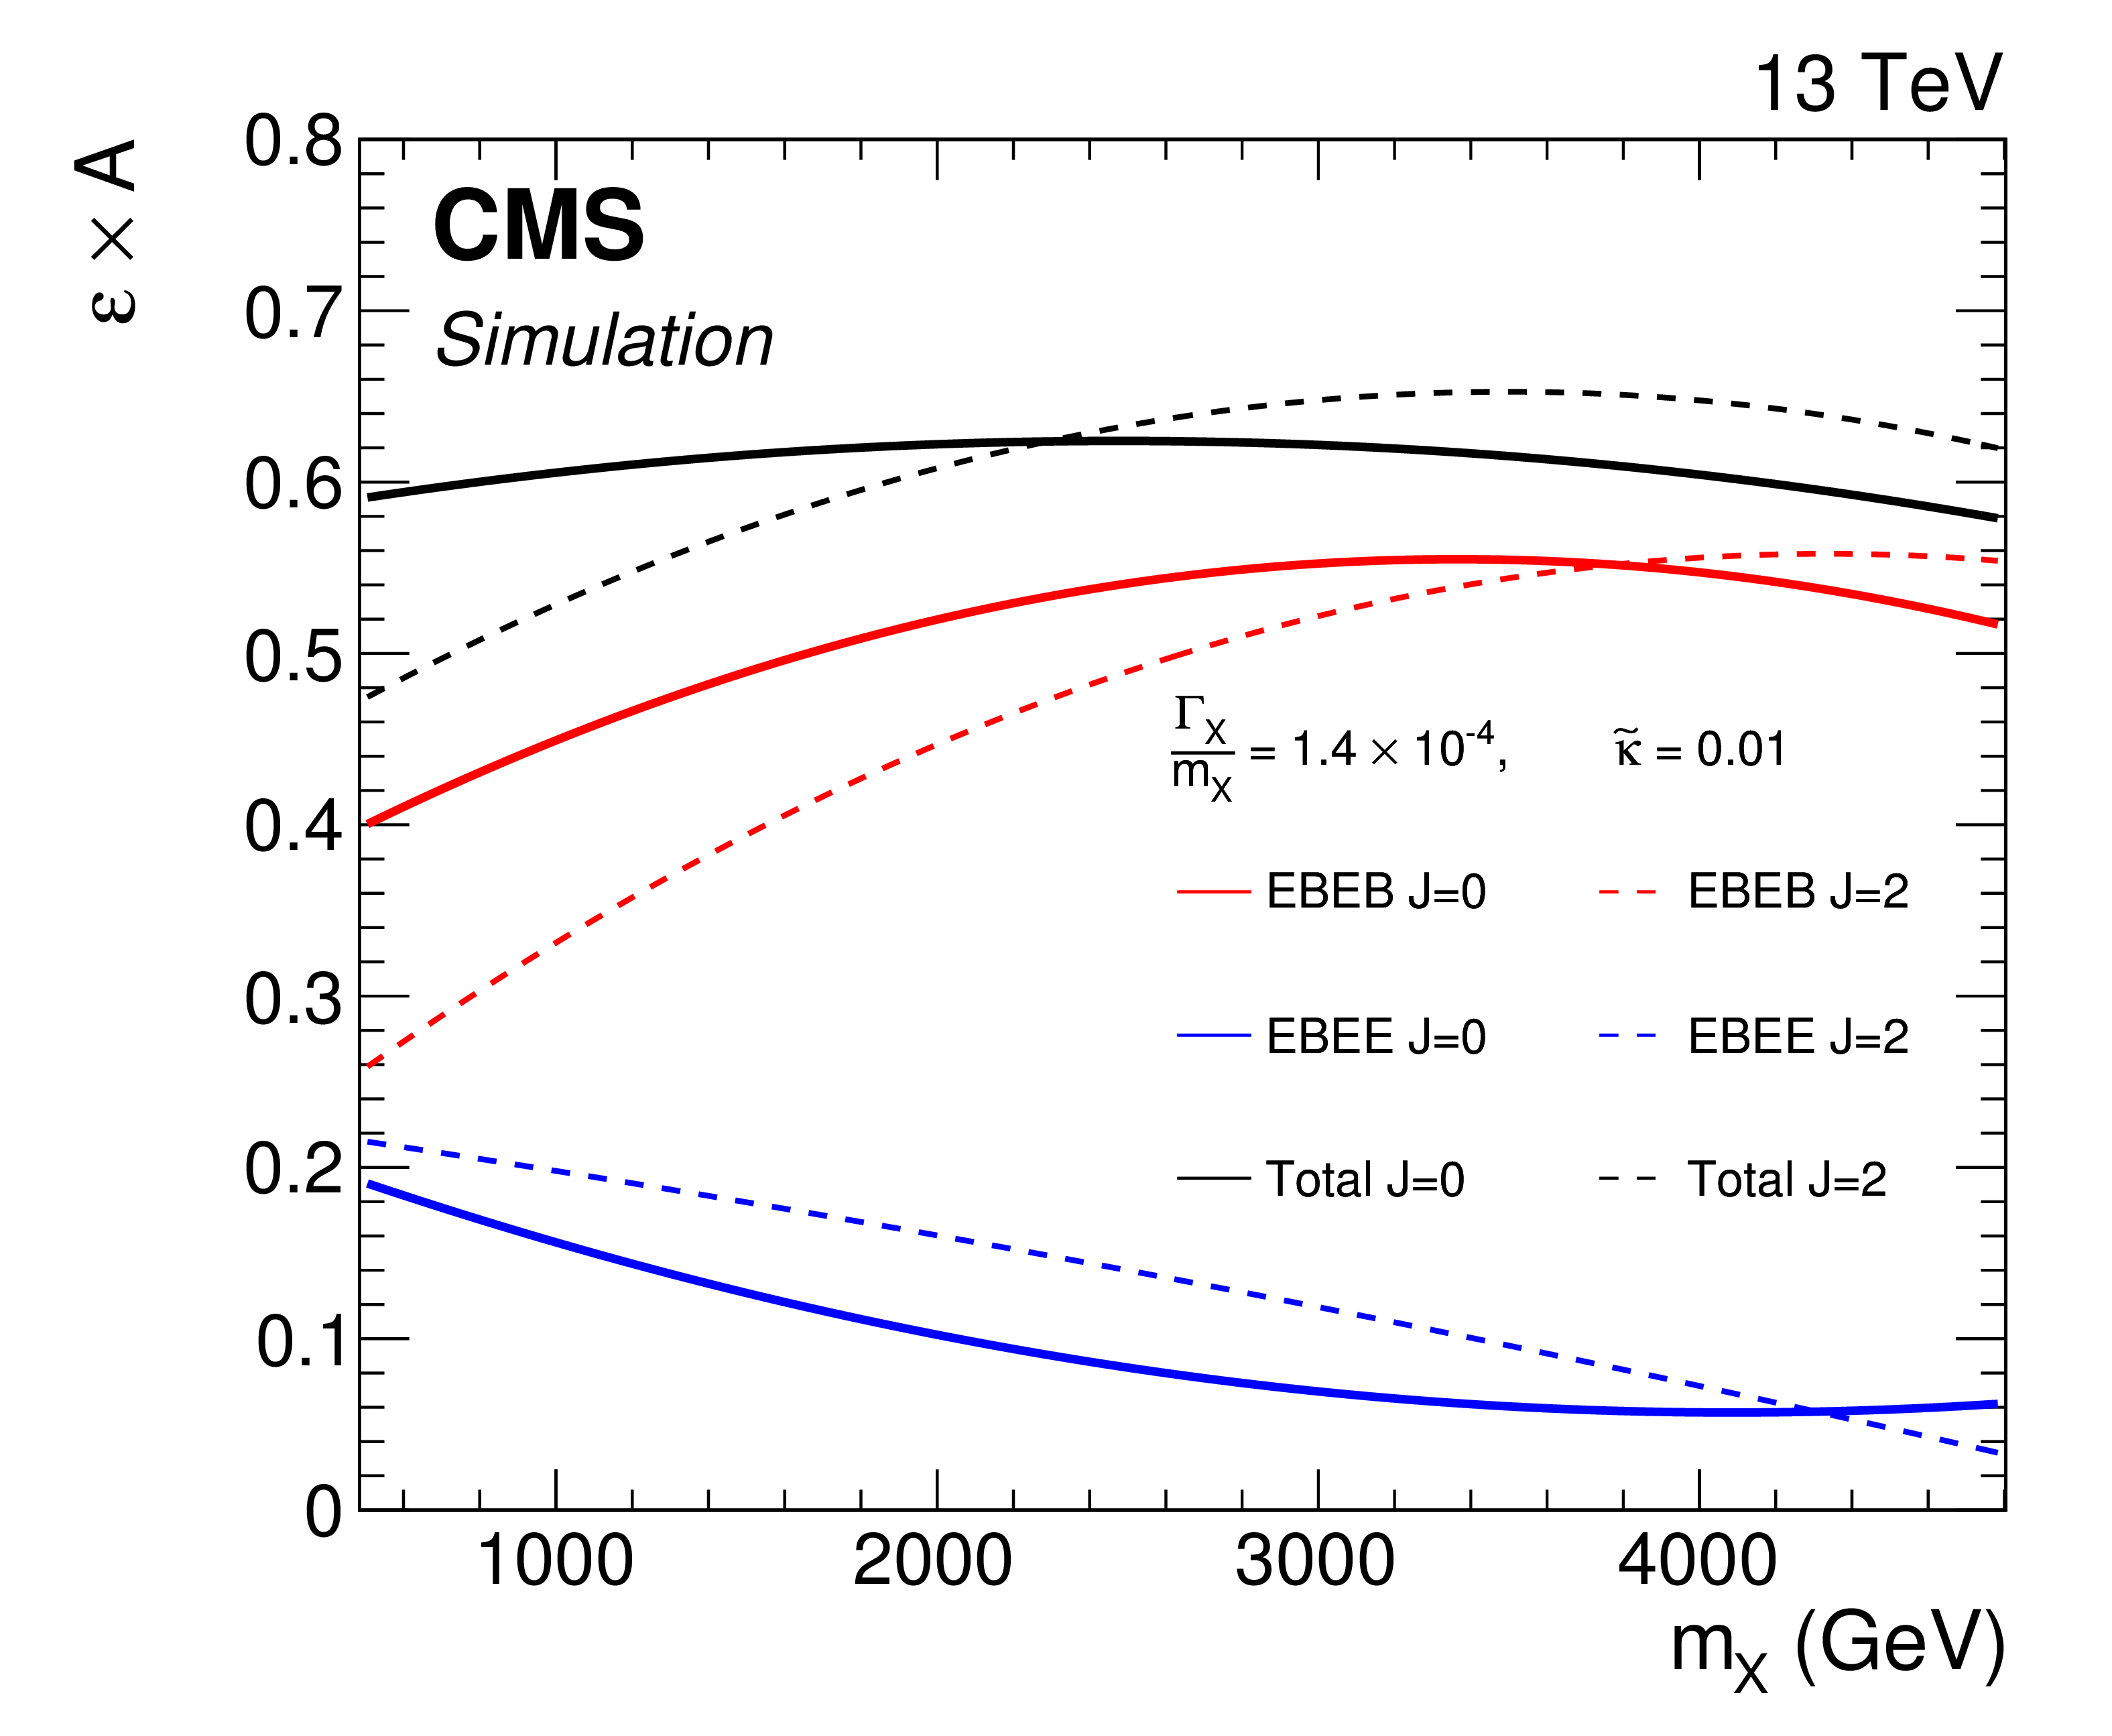
Figure 1:
The product of the event selection efficiency ($\varepsilon $) and the detector acceptance (A) is shown as a function of signal resonance mass $ {m_{\mathrm {X}}} $ for the $ {{\Gamma _{\mathrm {X}}} / {m_{\mathrm {X}}}} = 1.4\times 10^{-4}$ signal width hypothesis. The total (black), EBEB (red), and EBEE (blue) curves are shown for the spin (J) hypotheses $\mathrm {J}=$ 0 (solid) and $\mathrm {J}= $ 2 (dashed). |
png pdf |
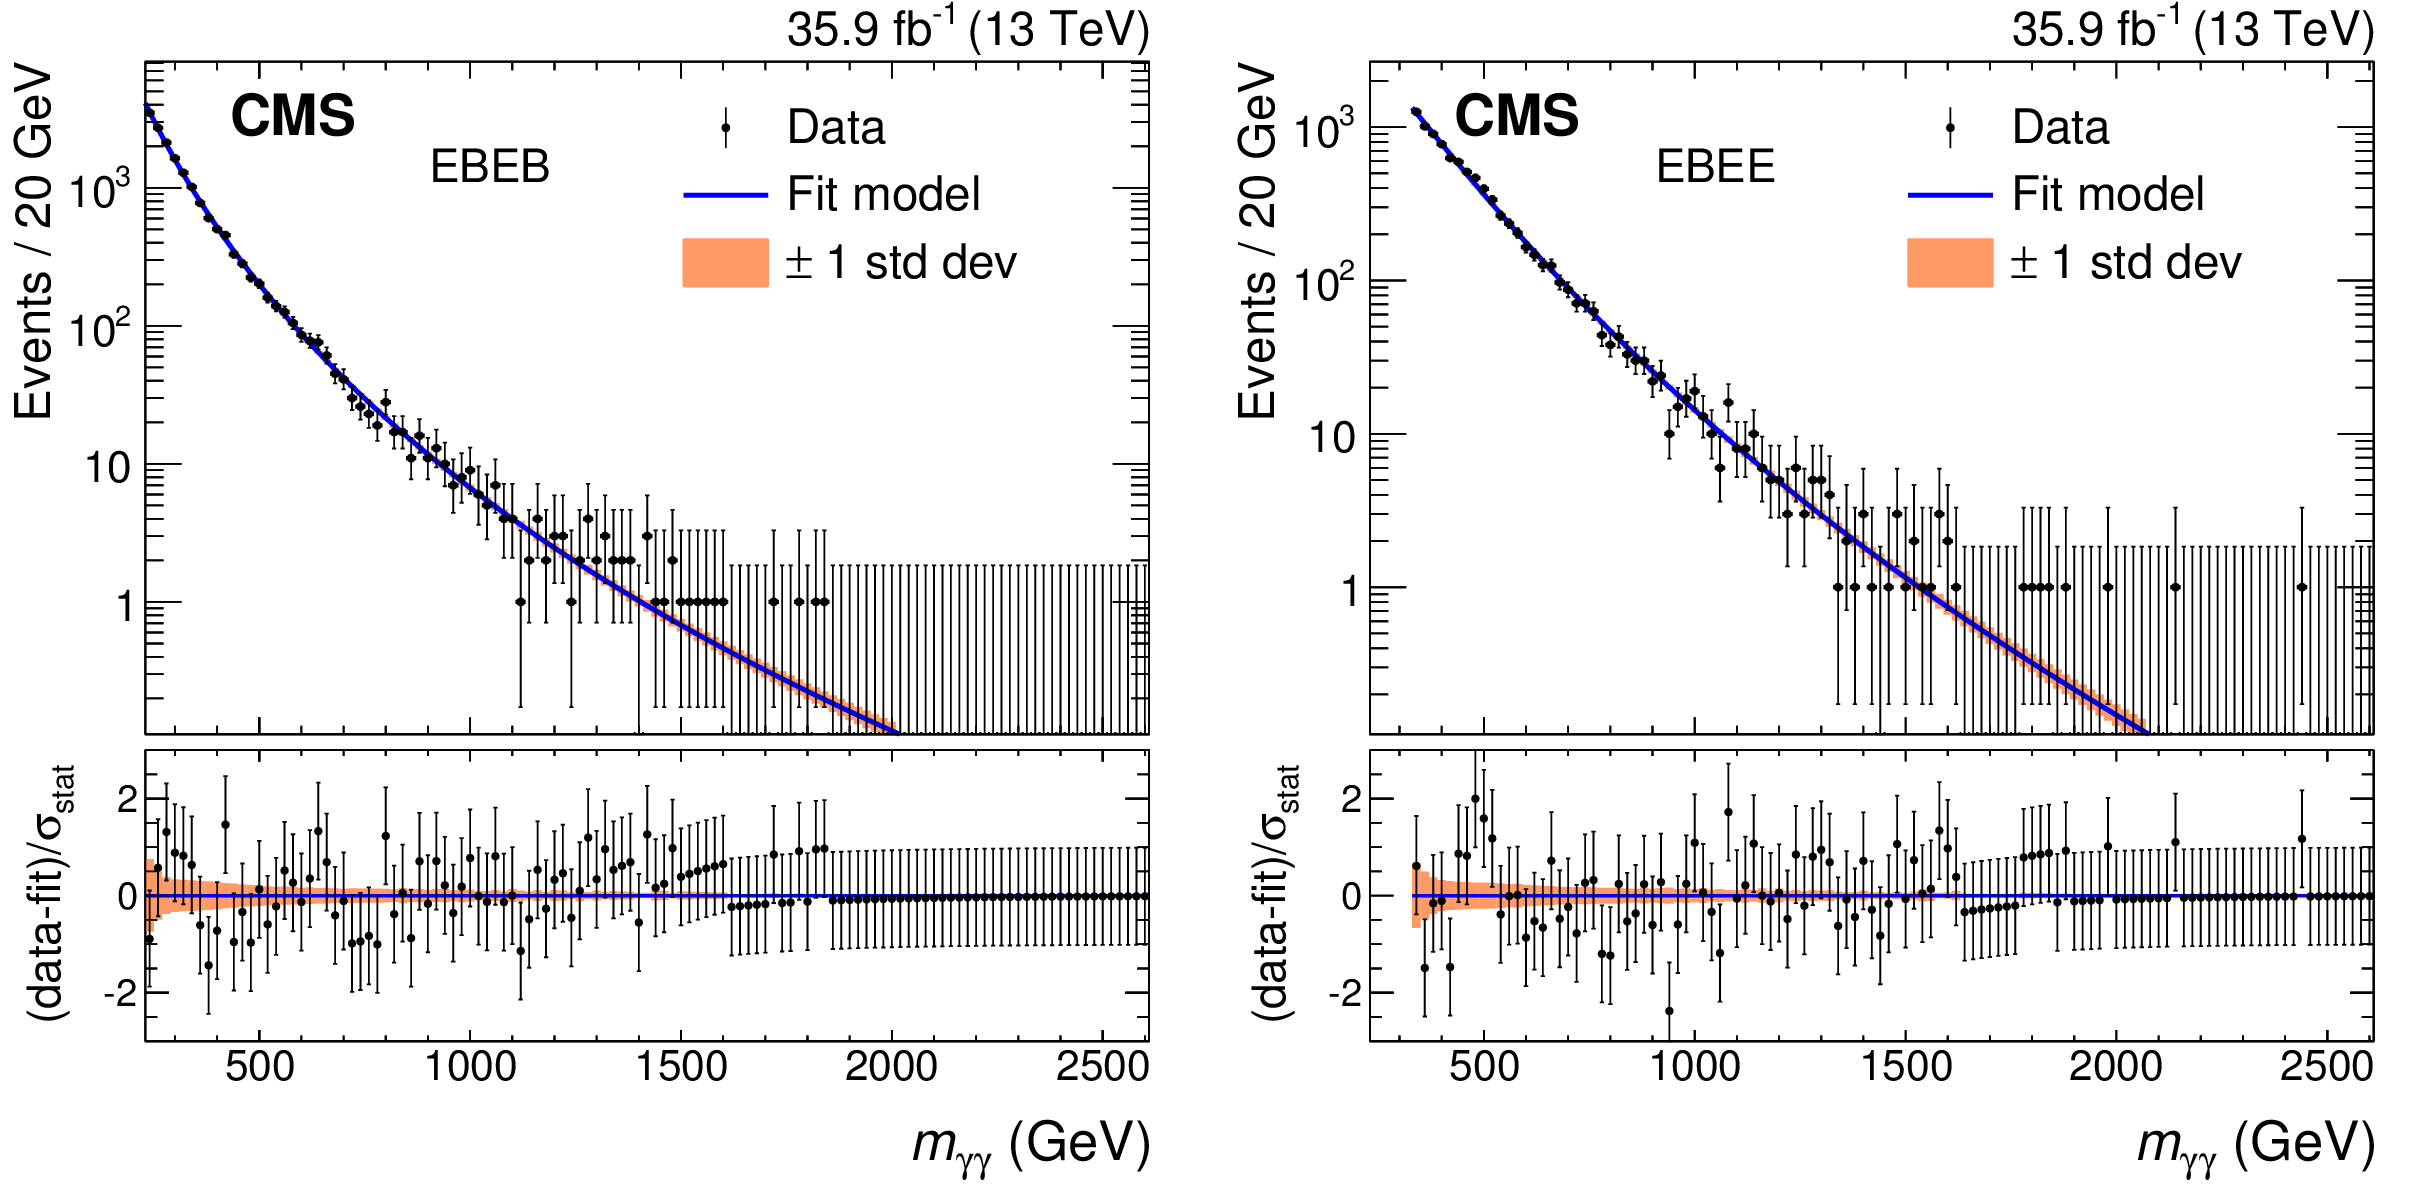
Figure 2:
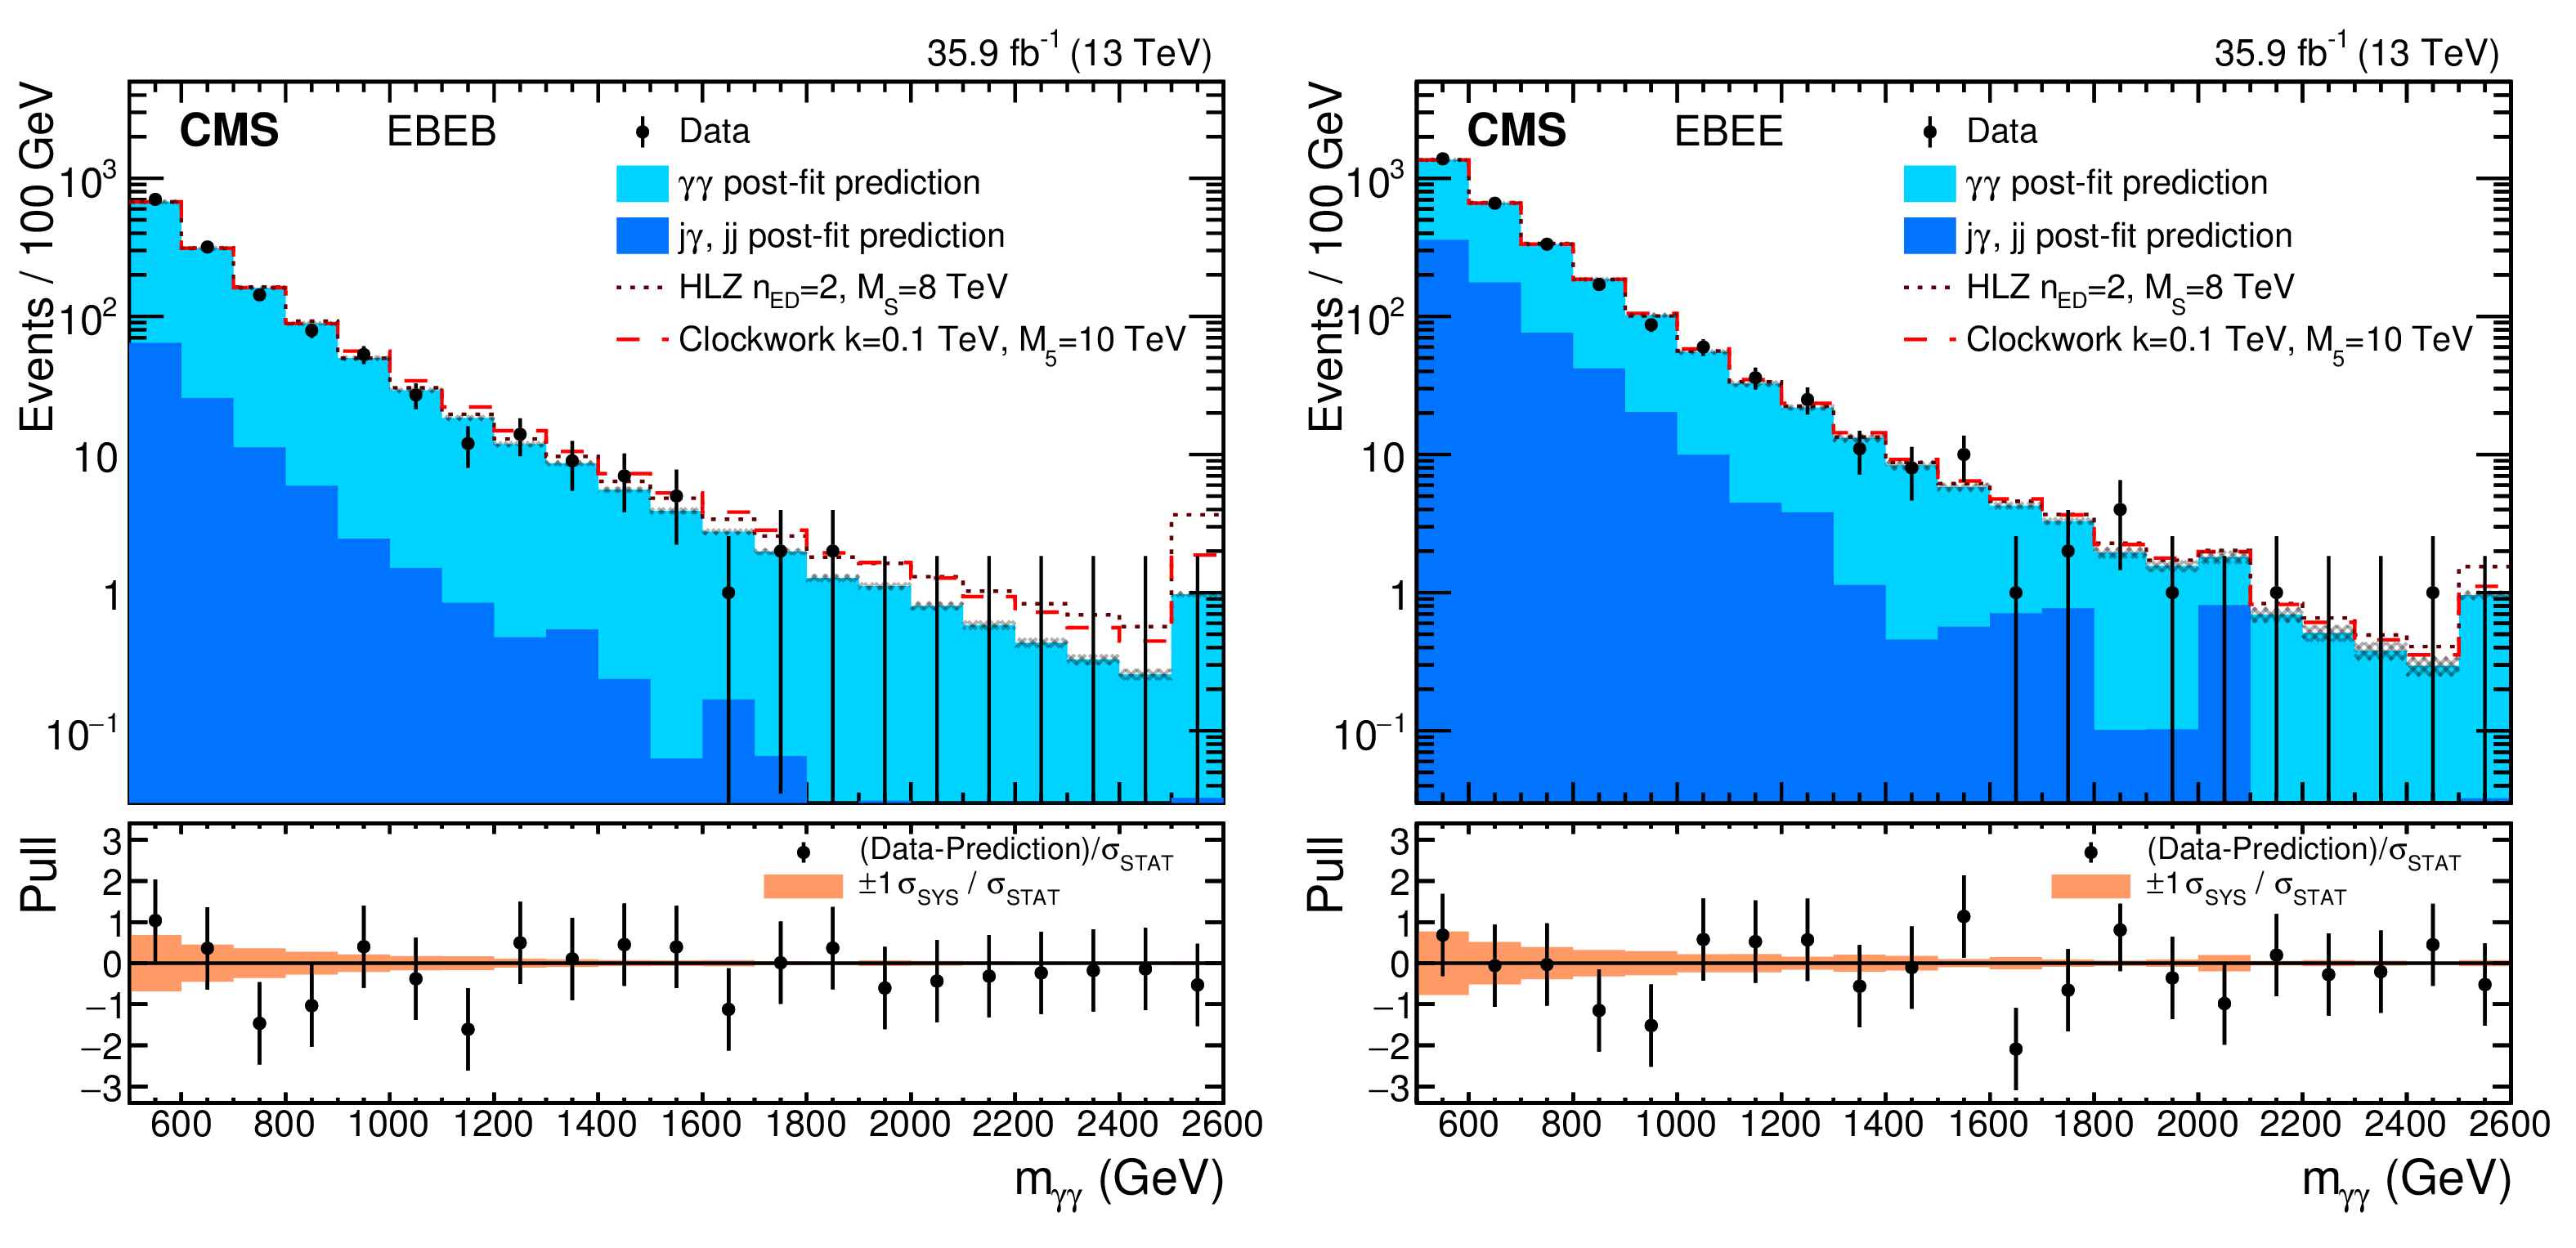
Observed diphoton invariant mass spectra for the EBEB (left) and EBEE (right) categories. Also shown are the results of a likelihood fit to the background-only hypothesis. The shaded region shows the one standard deviation uncertainty band associated with the fit, reflecting the statistical uncertainty of the data. The lower panels show the difference between the data and fit, divided by the statistical uncertainty in the data points. |
png pdf |
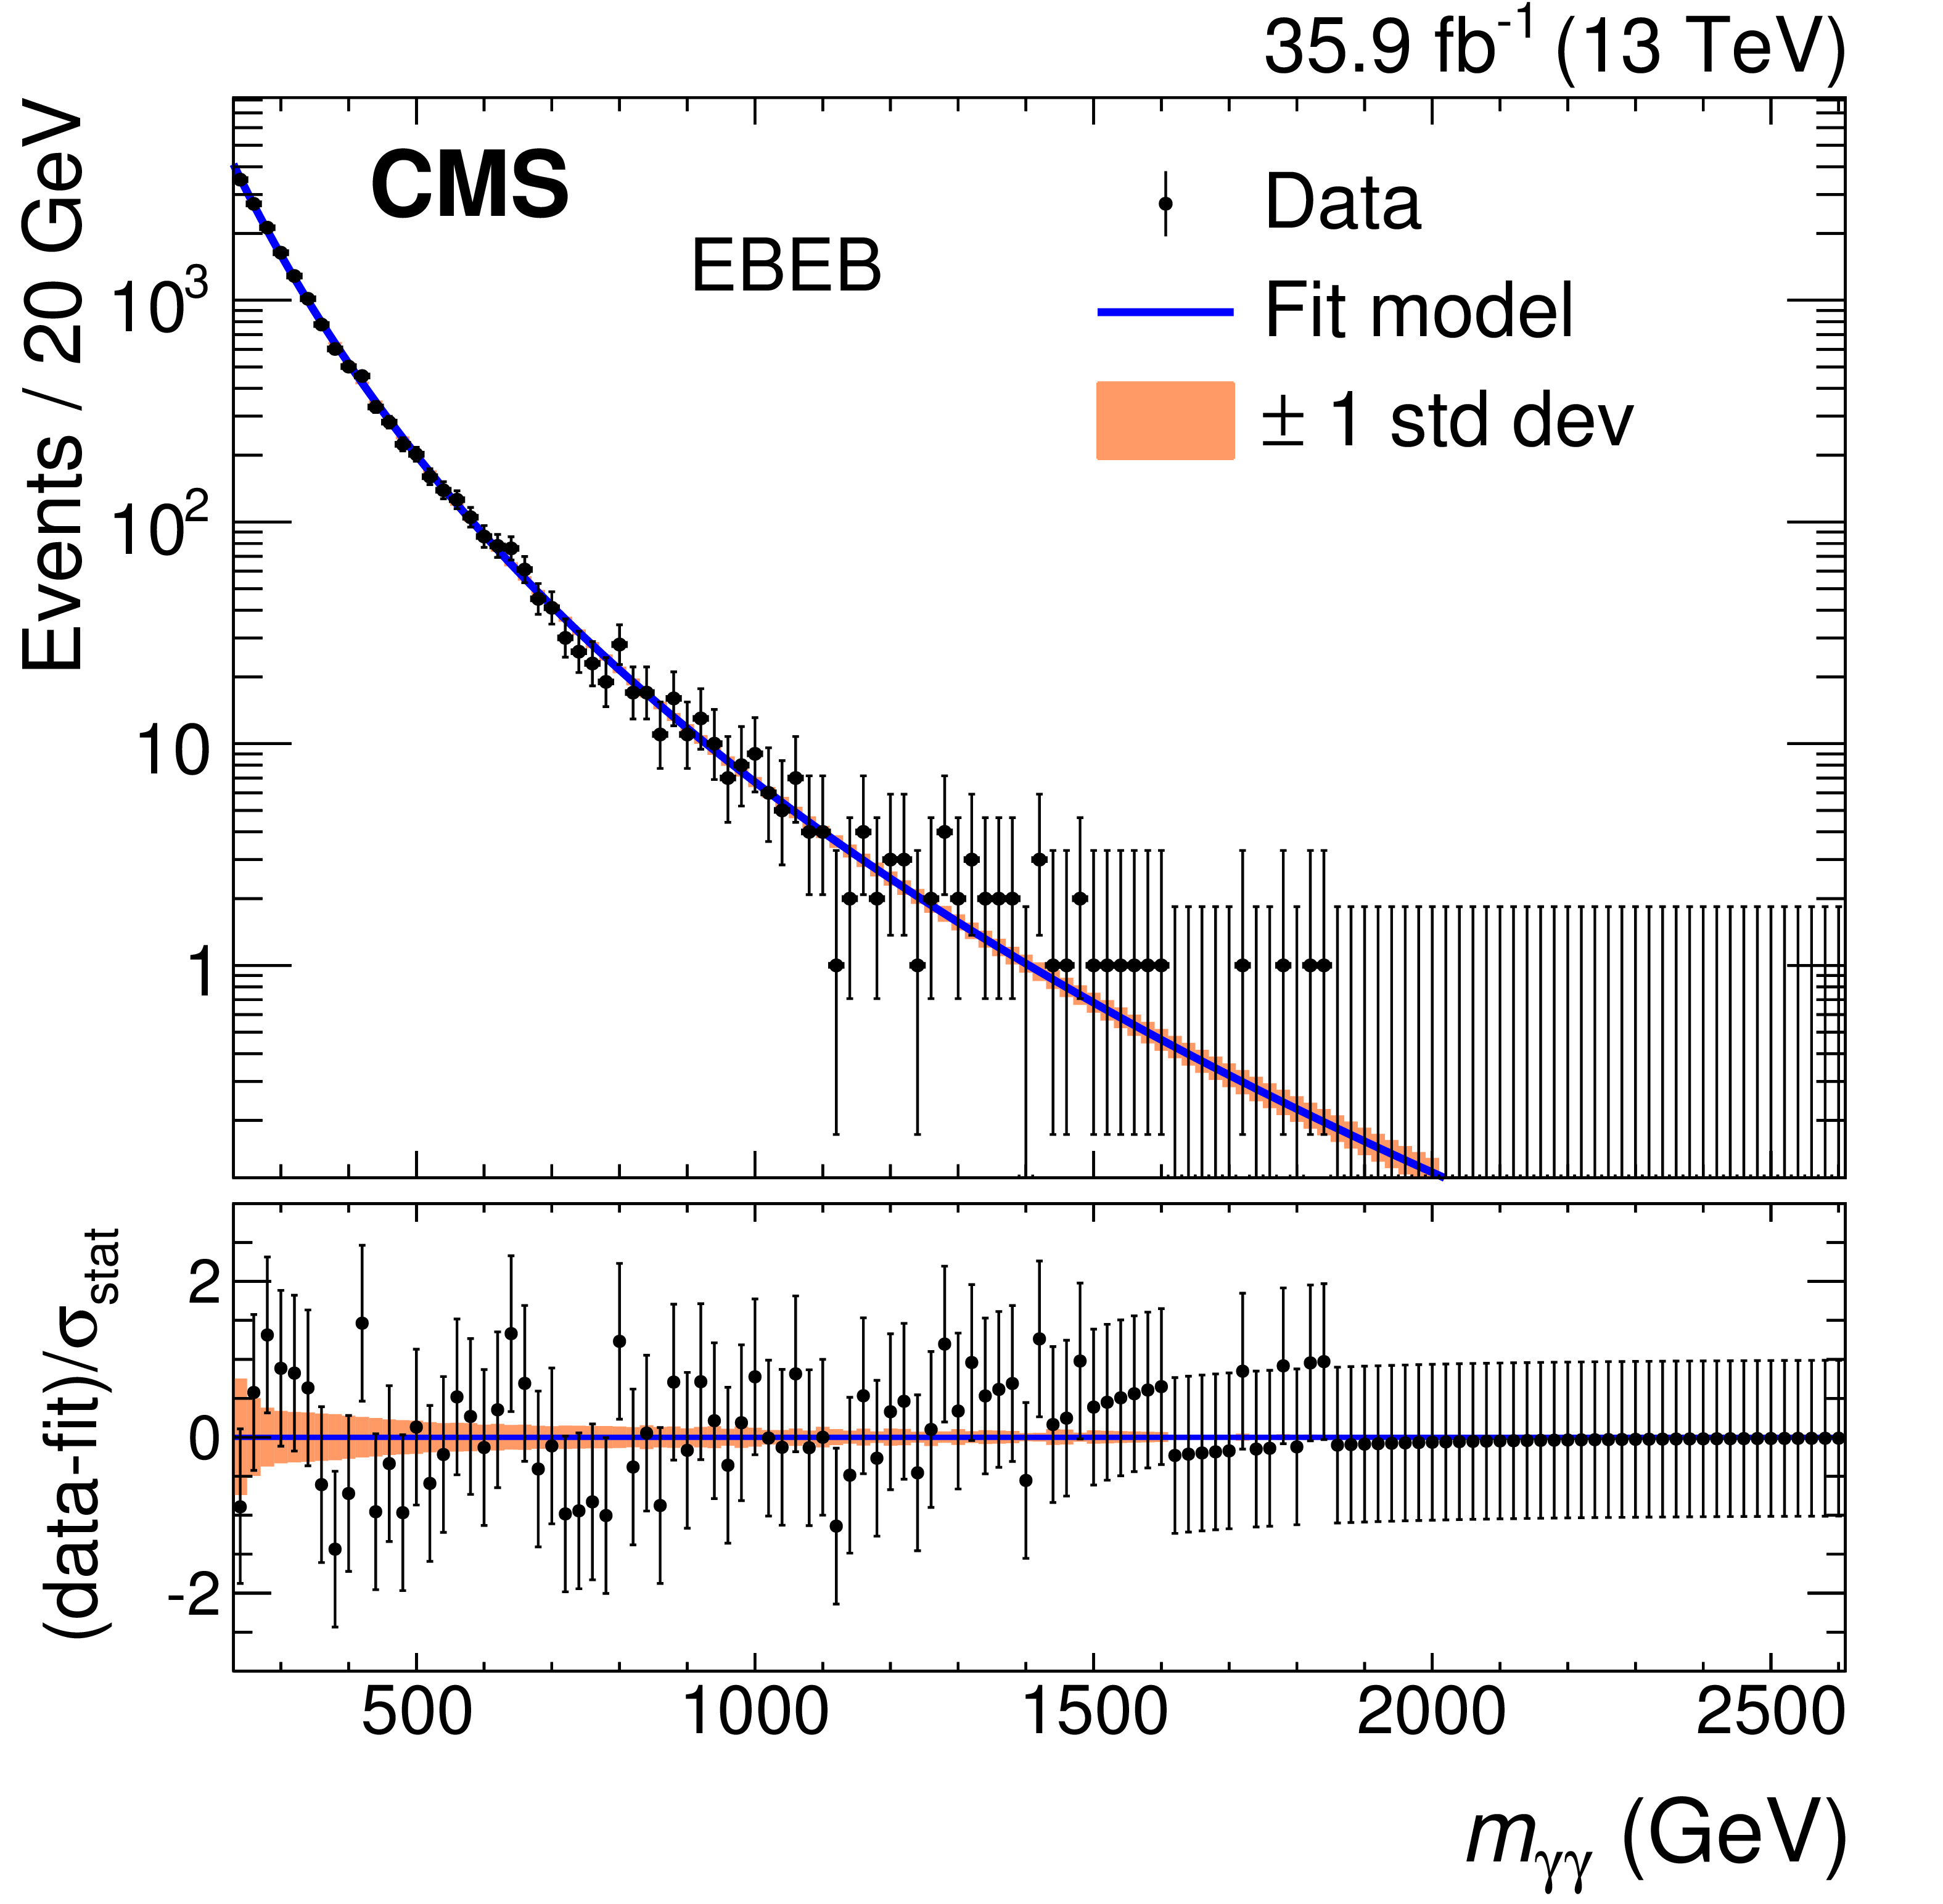
Figure 2-a:
Observed diphoton invariant mass spectrum for the EBEB category. Also shown are the results of a likelihood fit to the background-only hypothesis. The shaded region shows the one standard deviation uncertainty band associated with the fit, reflecting the statistical uncertainty of the data. The lower panel shows the difference between the data and fit, divided by the statistical uncertainty in the data points. |
png pdf |
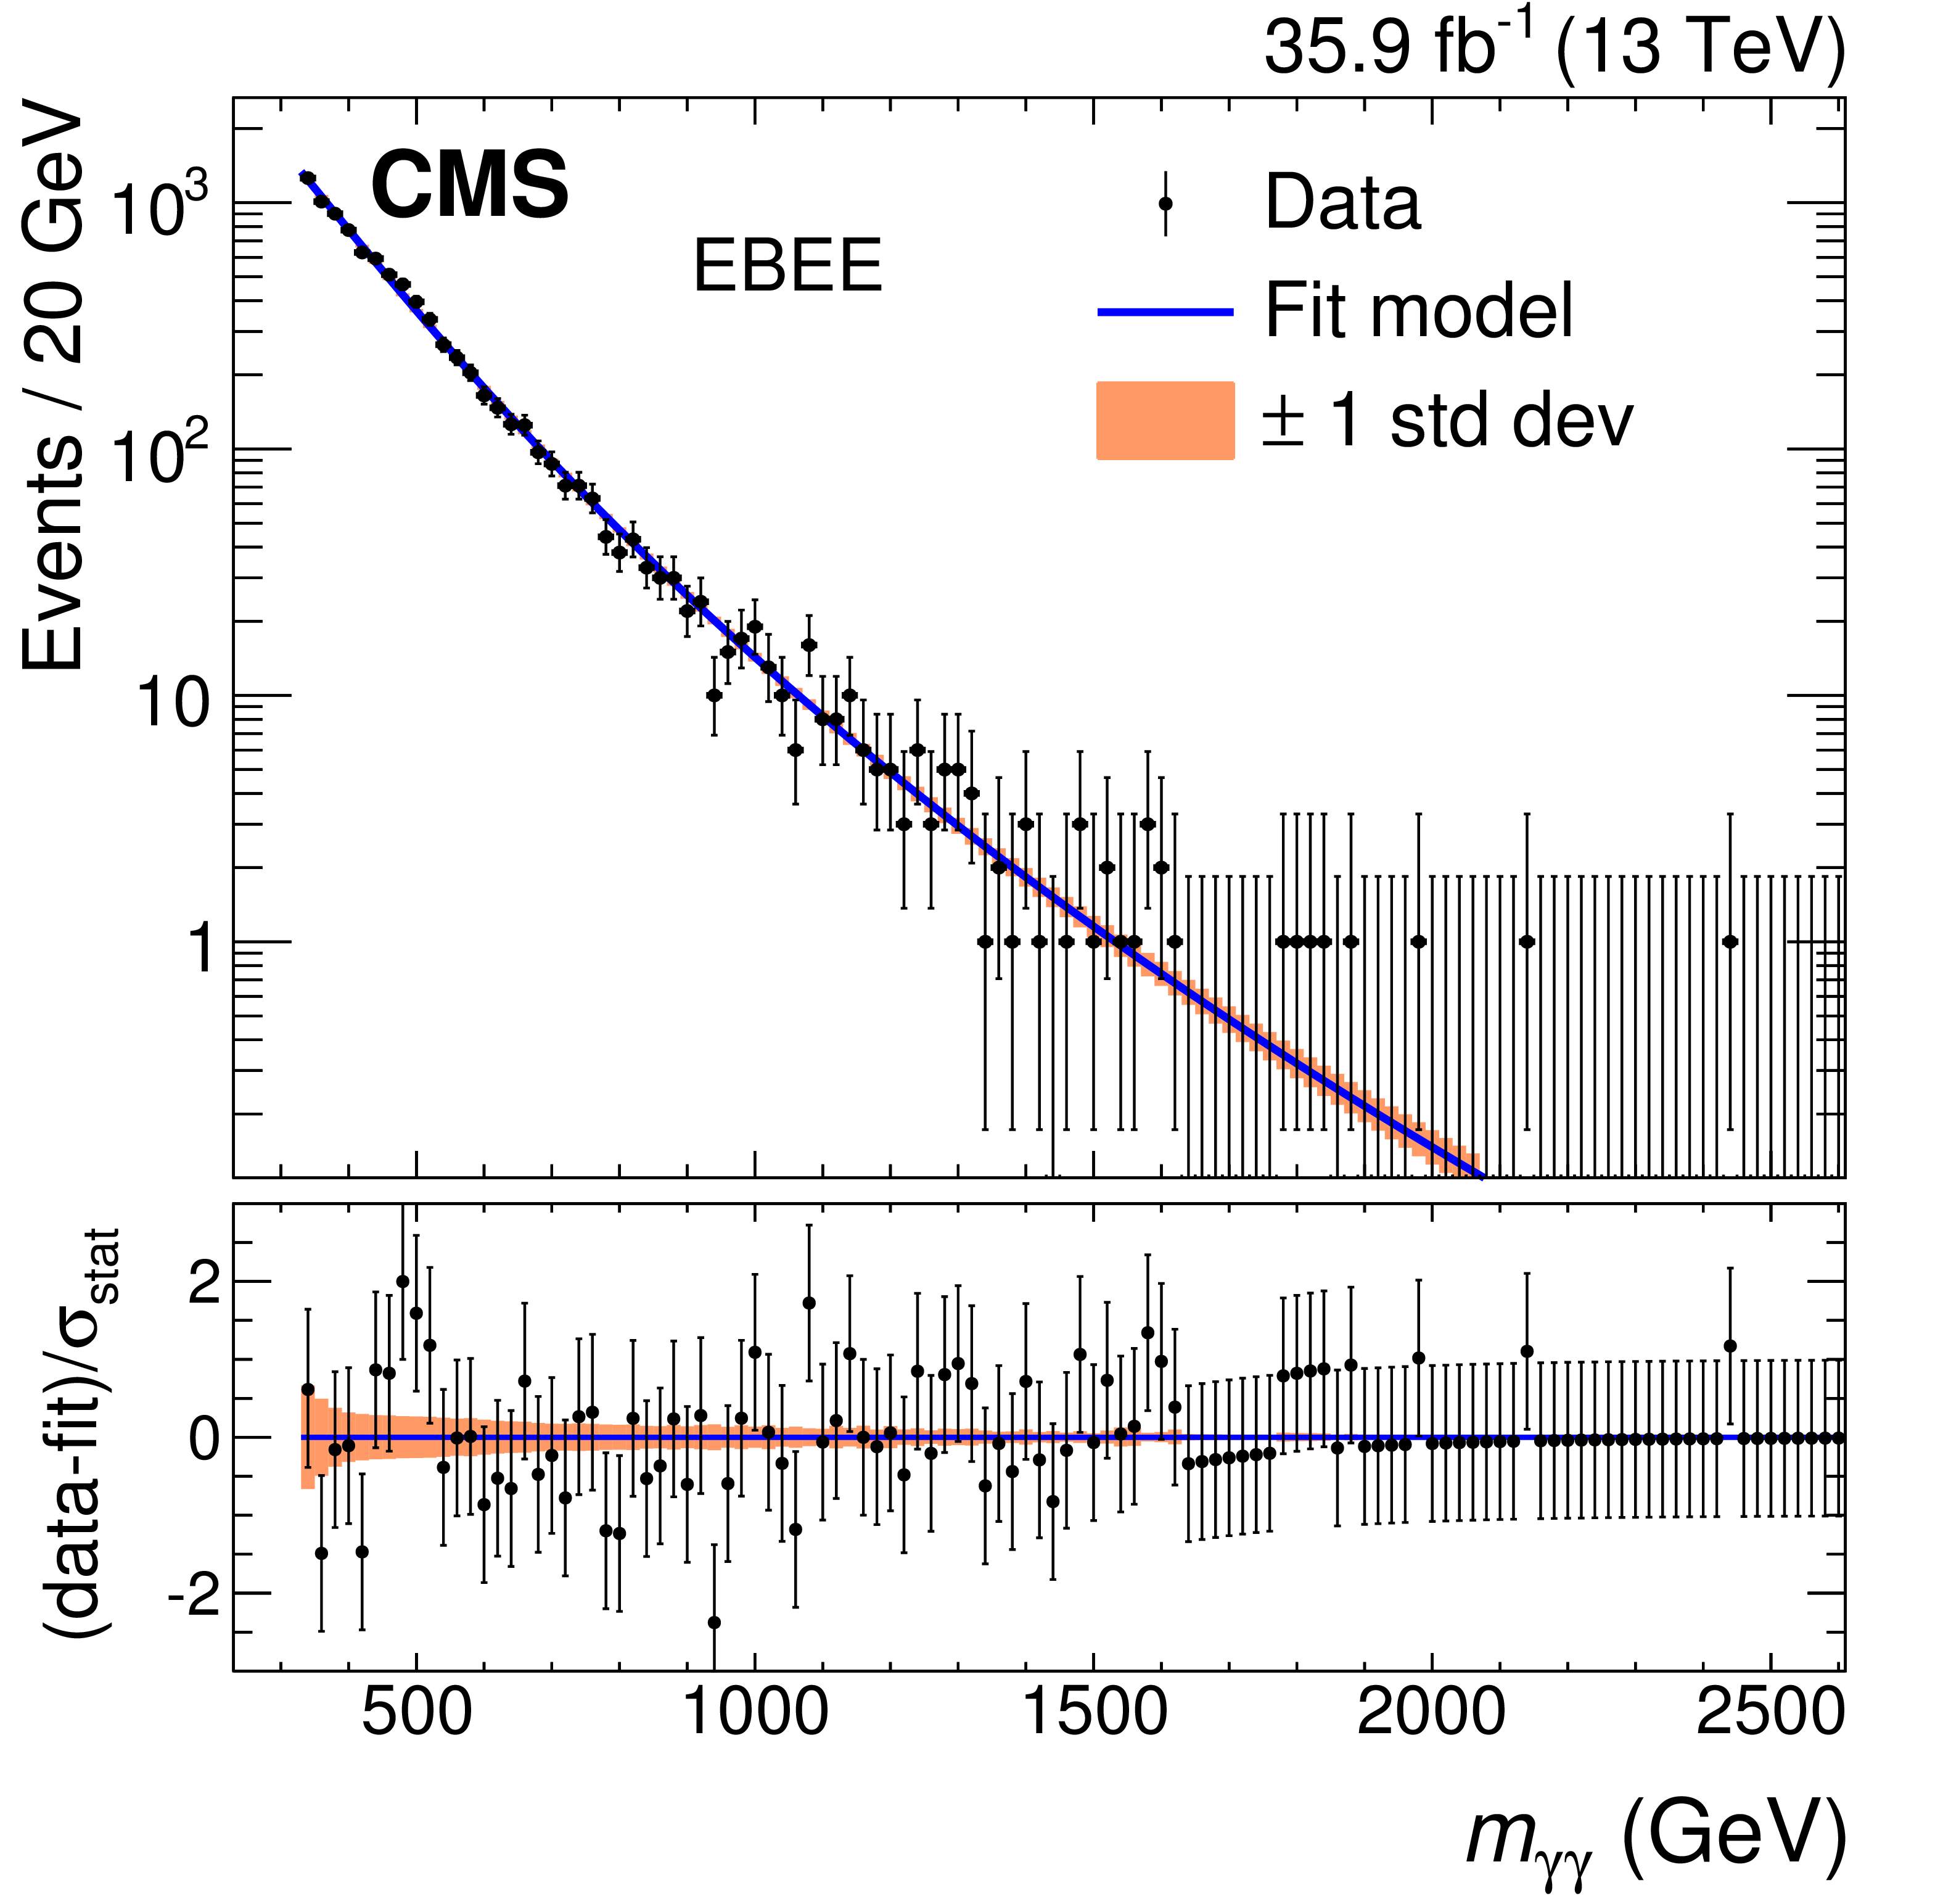
Figure 2-b:
Observed diphoton invariant mass spectrum for the EBEE category. Also shown are the results of a likelihood fit to the background-only hypothesis. The shaded region shows the one standard deviation uncertainty band associated with the fit, reflecting the statistical uncertainty of the data. The lower panel shows the difference between the data and fit, divided by the statistical uncertainty in the data points. |
png pdf |
Figure 3:
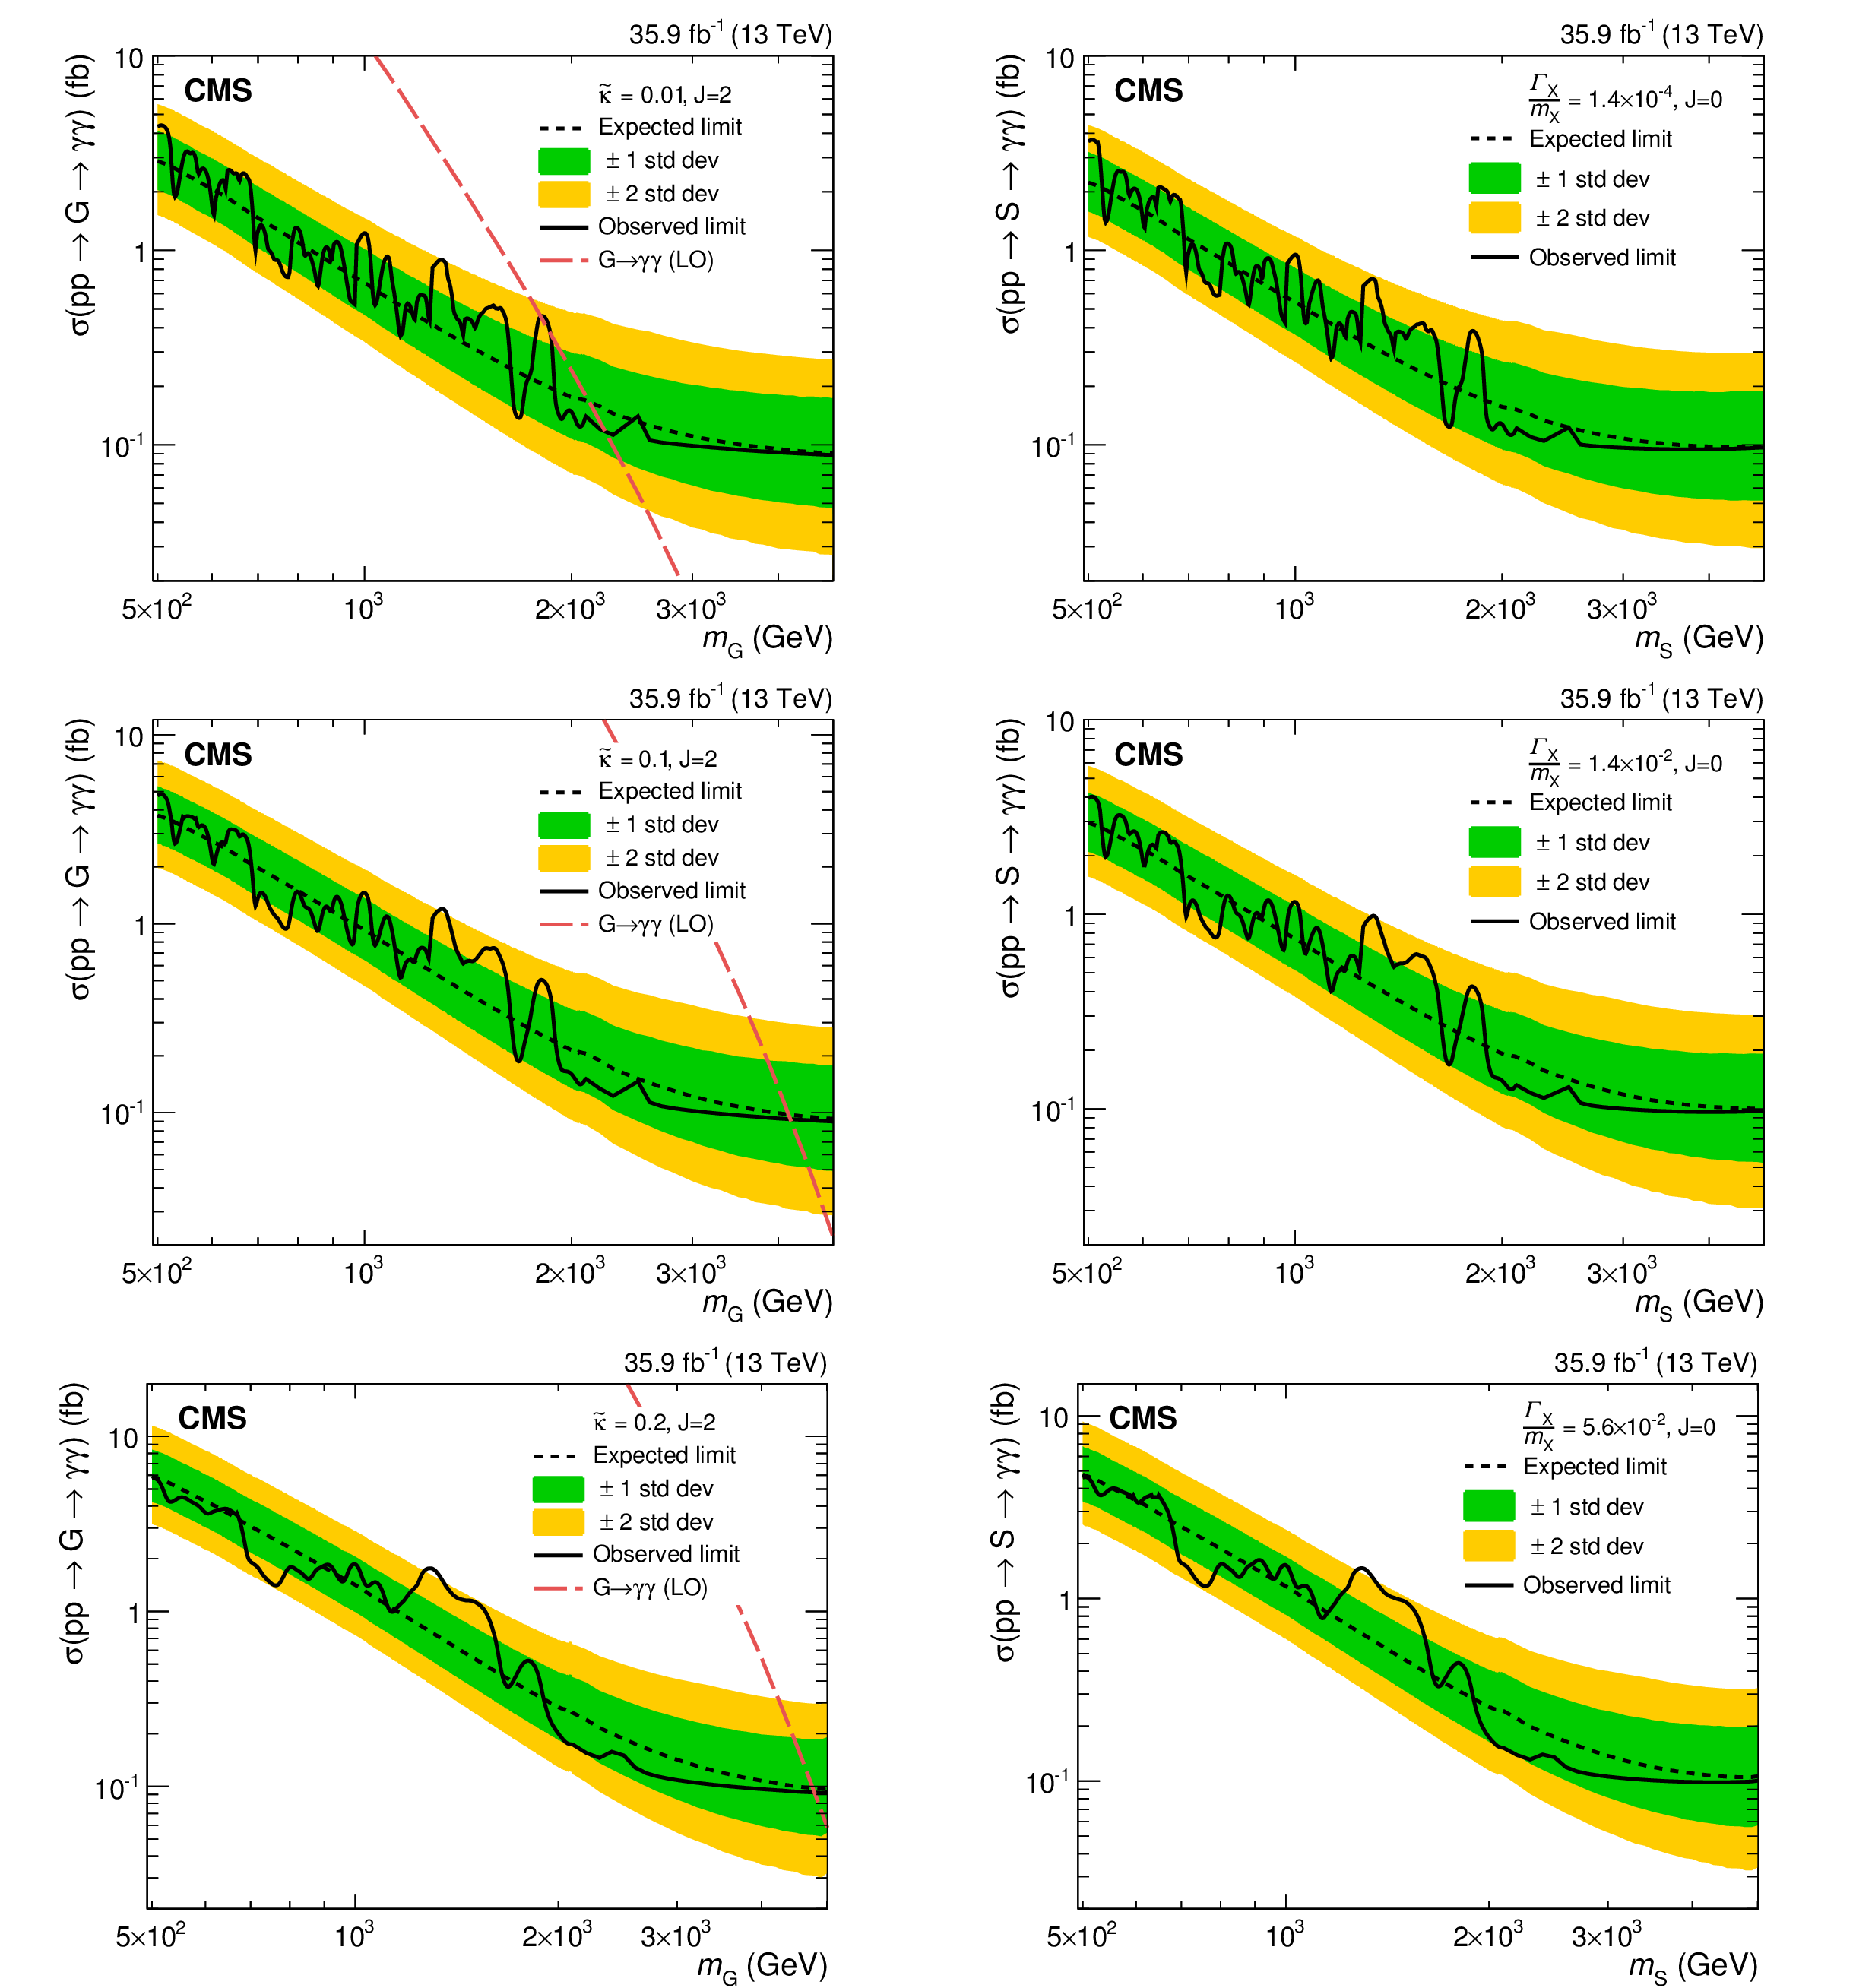
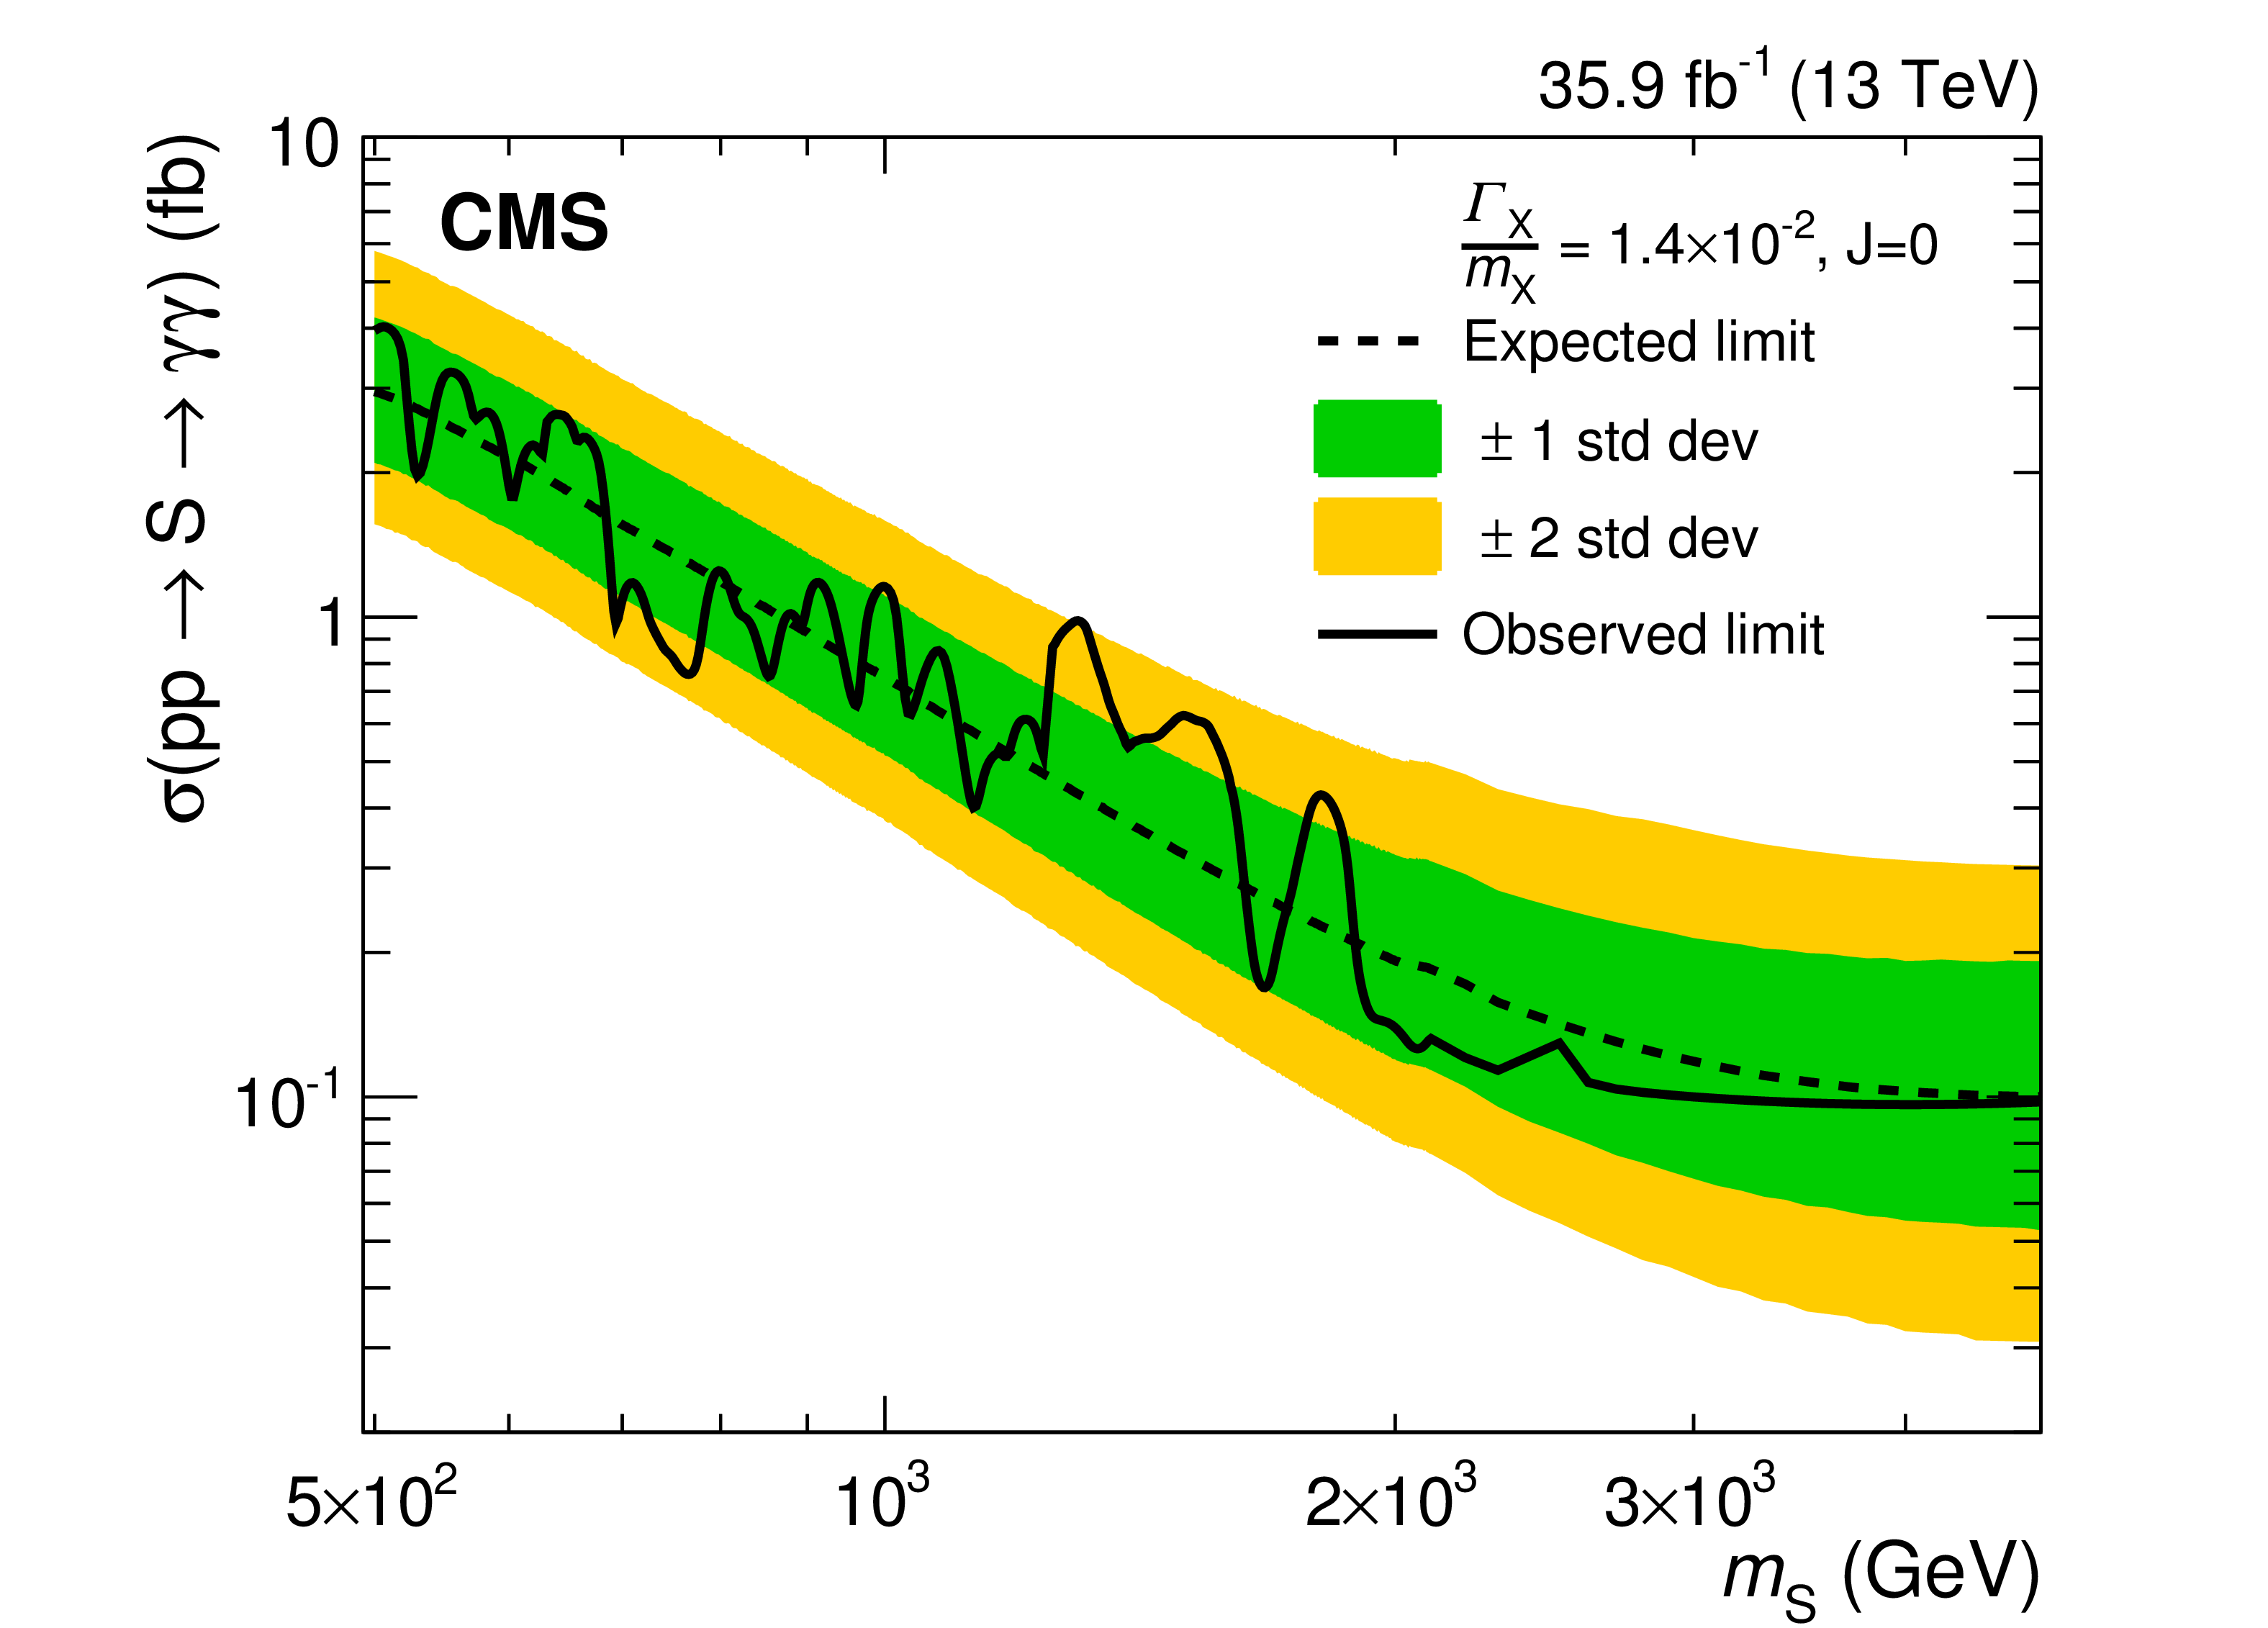
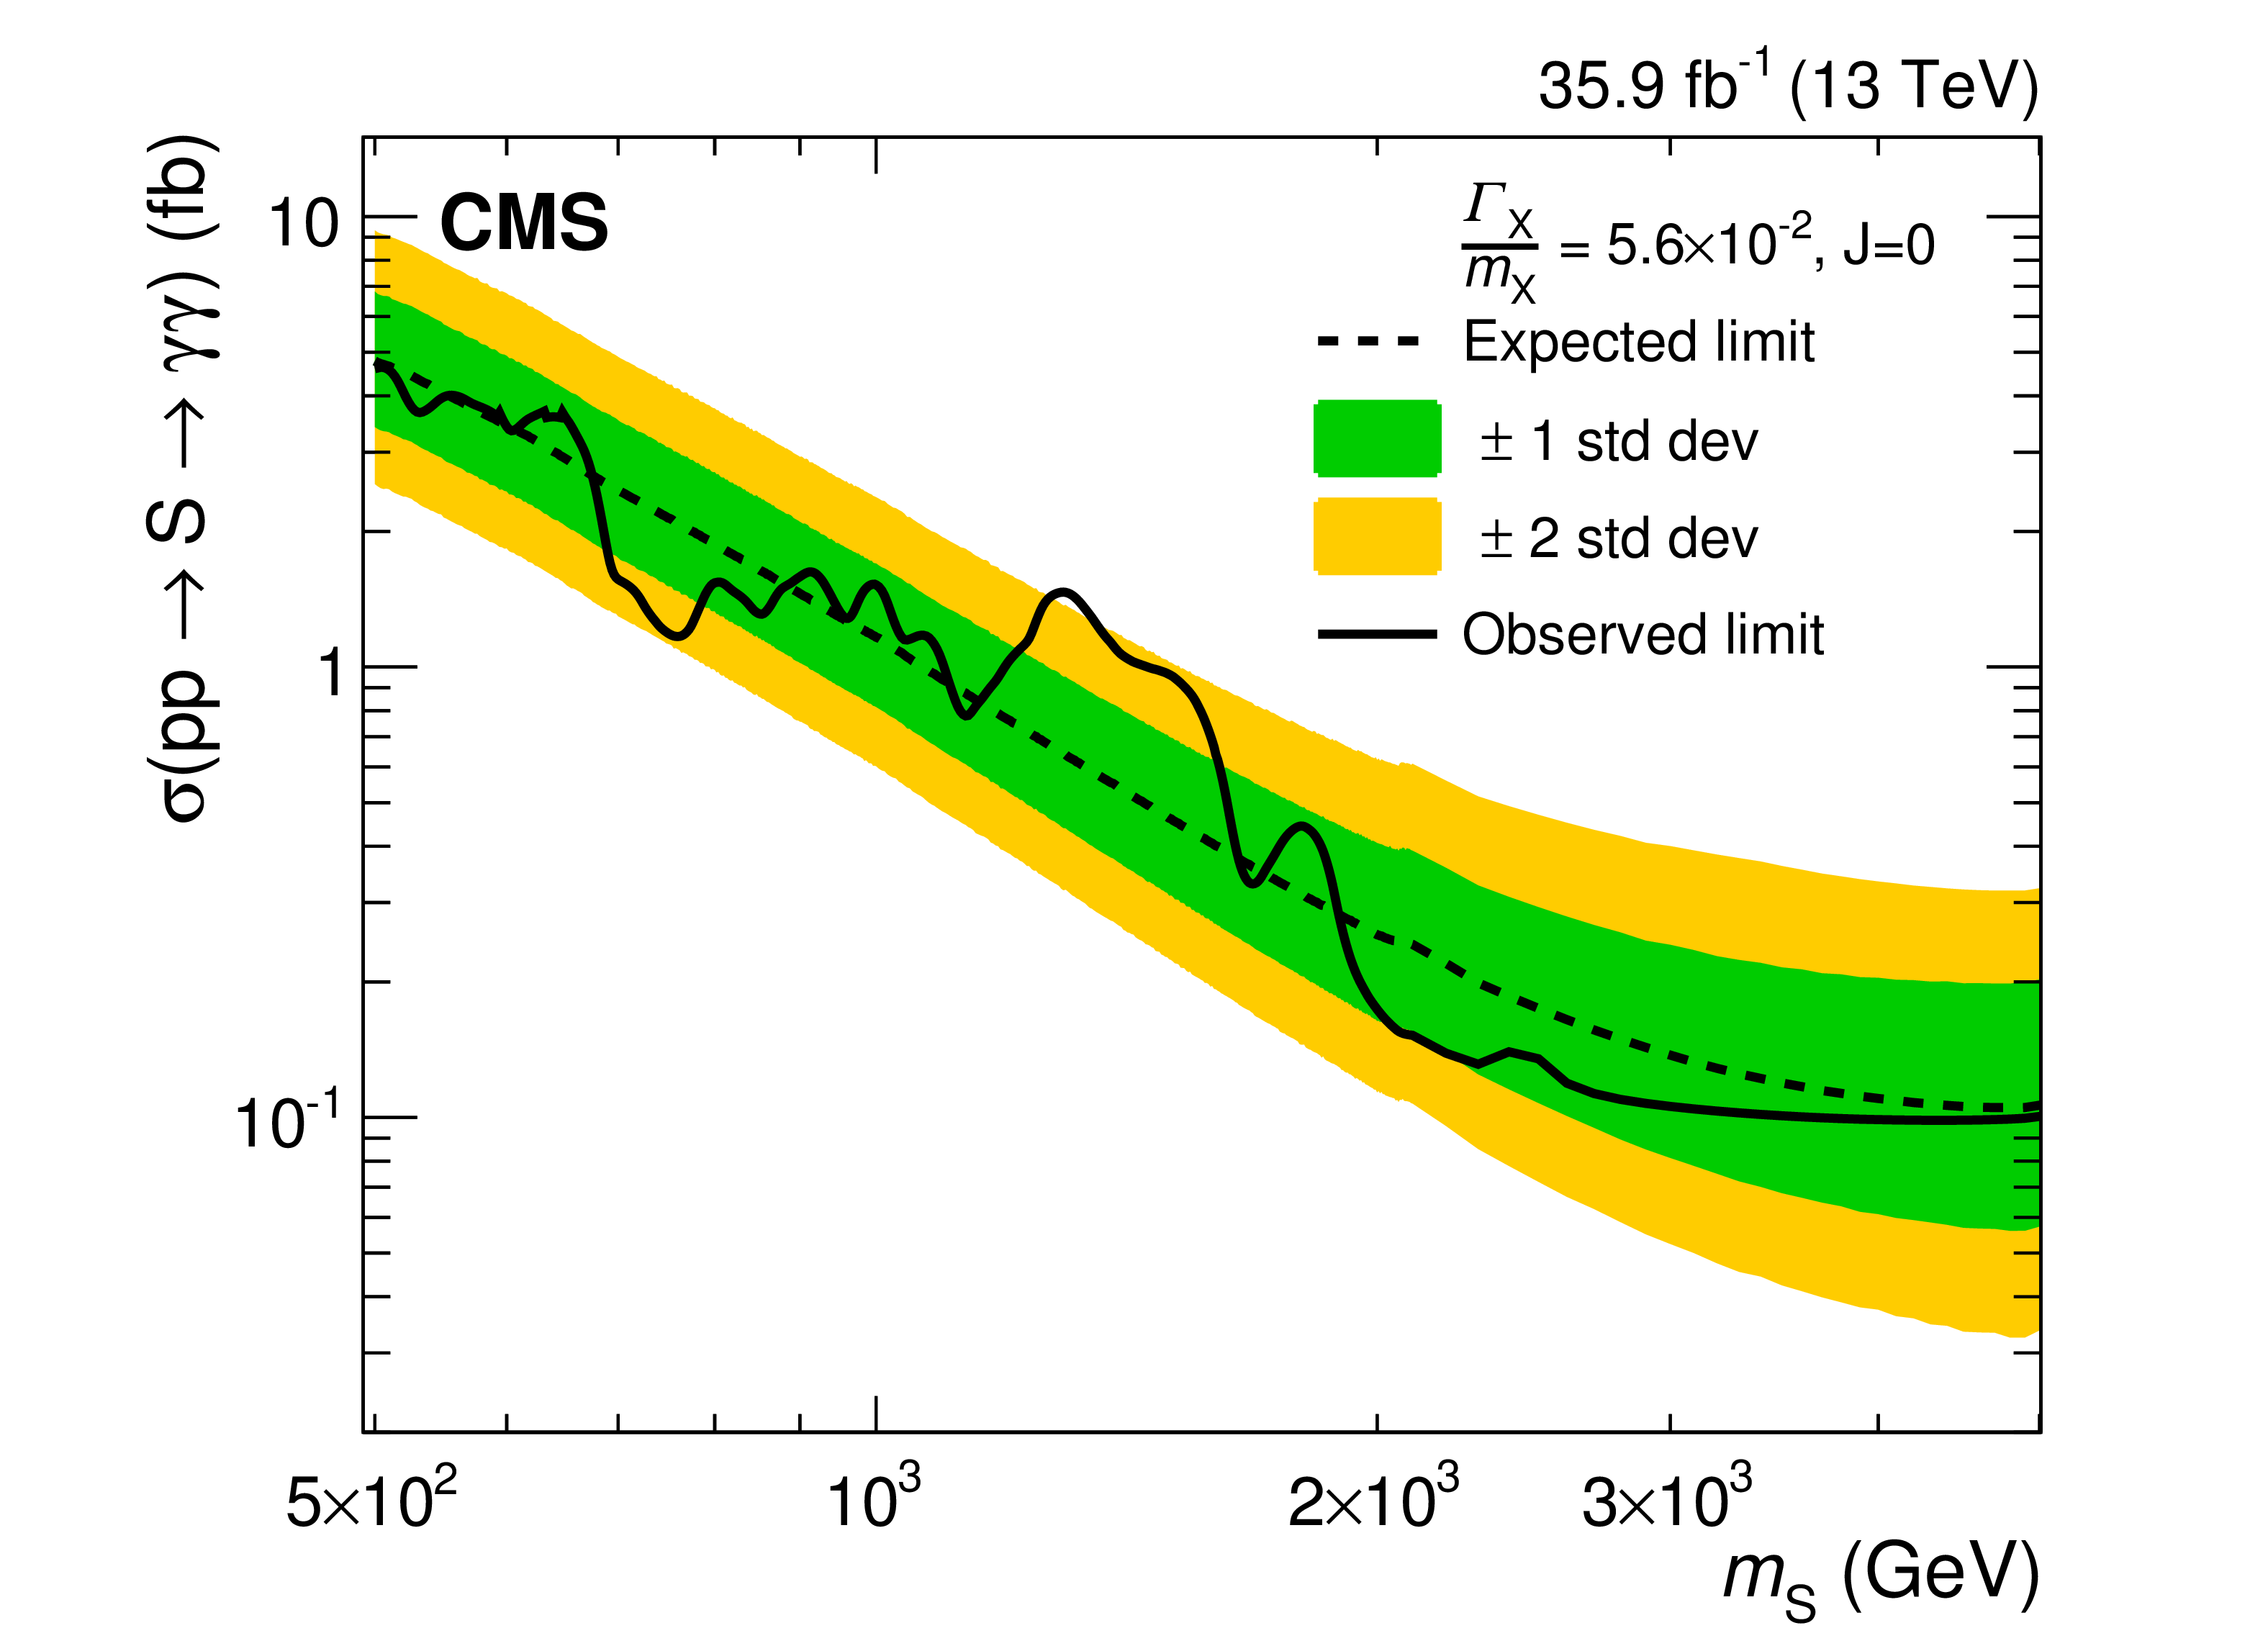
Expected and observed 95% CL upper limits on the production cross section for RS gravitons of mass $ {m_\mathrm {{\mathrm {G}}}} $ and three values of ${\tilde{k}}$ (left) and for spin-0 resonances of mass $ {m_{\mathrm {S}}} $ produced via gluon fusion for the three width hypotheses (right). The shaded bands represent the 1 and 2 standard deviation uncertainty in the expected limit. |
png pdf |
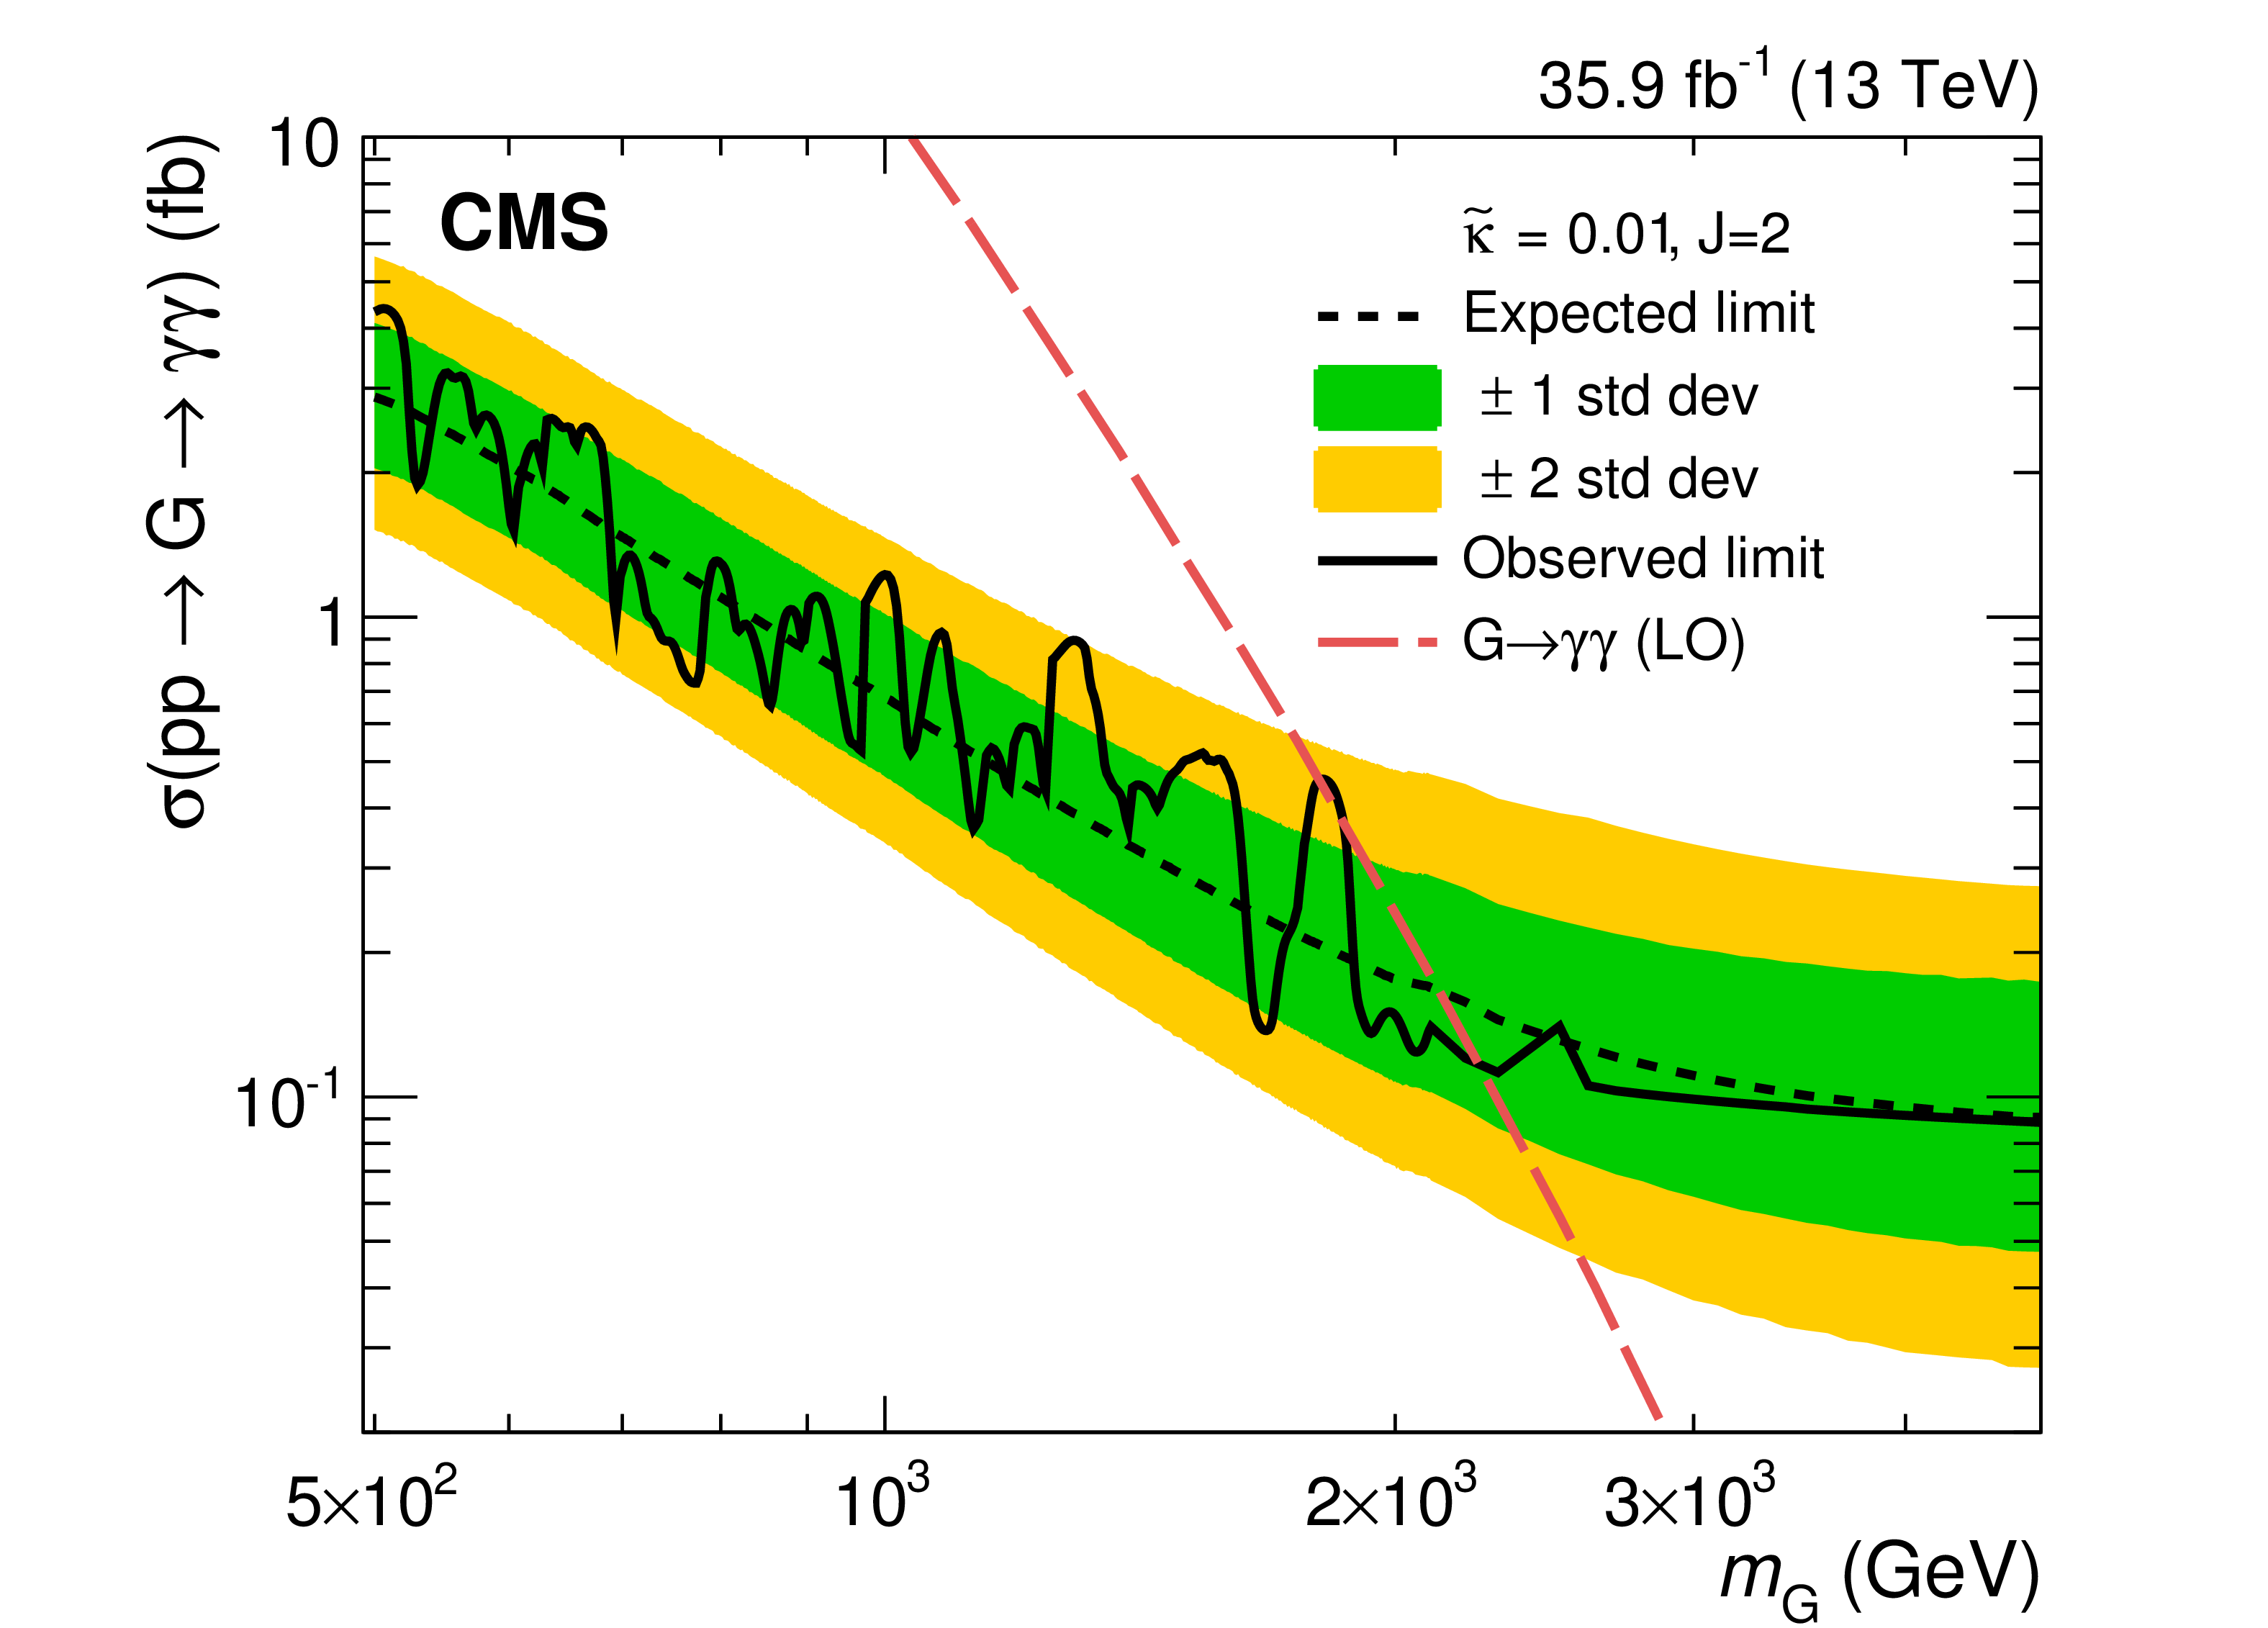
Figure 3-a:
Expected and observed 95% CL upper limits on the production cross section for RS gravitons of mass $ {m_\mathrm {{\mathrm {G}}}} $ and ${\tilde{k}} = $ 0.01. The shaded bands represent the 1 and 2 standard deviation uncertainty in the expected limit. |
png pdf |
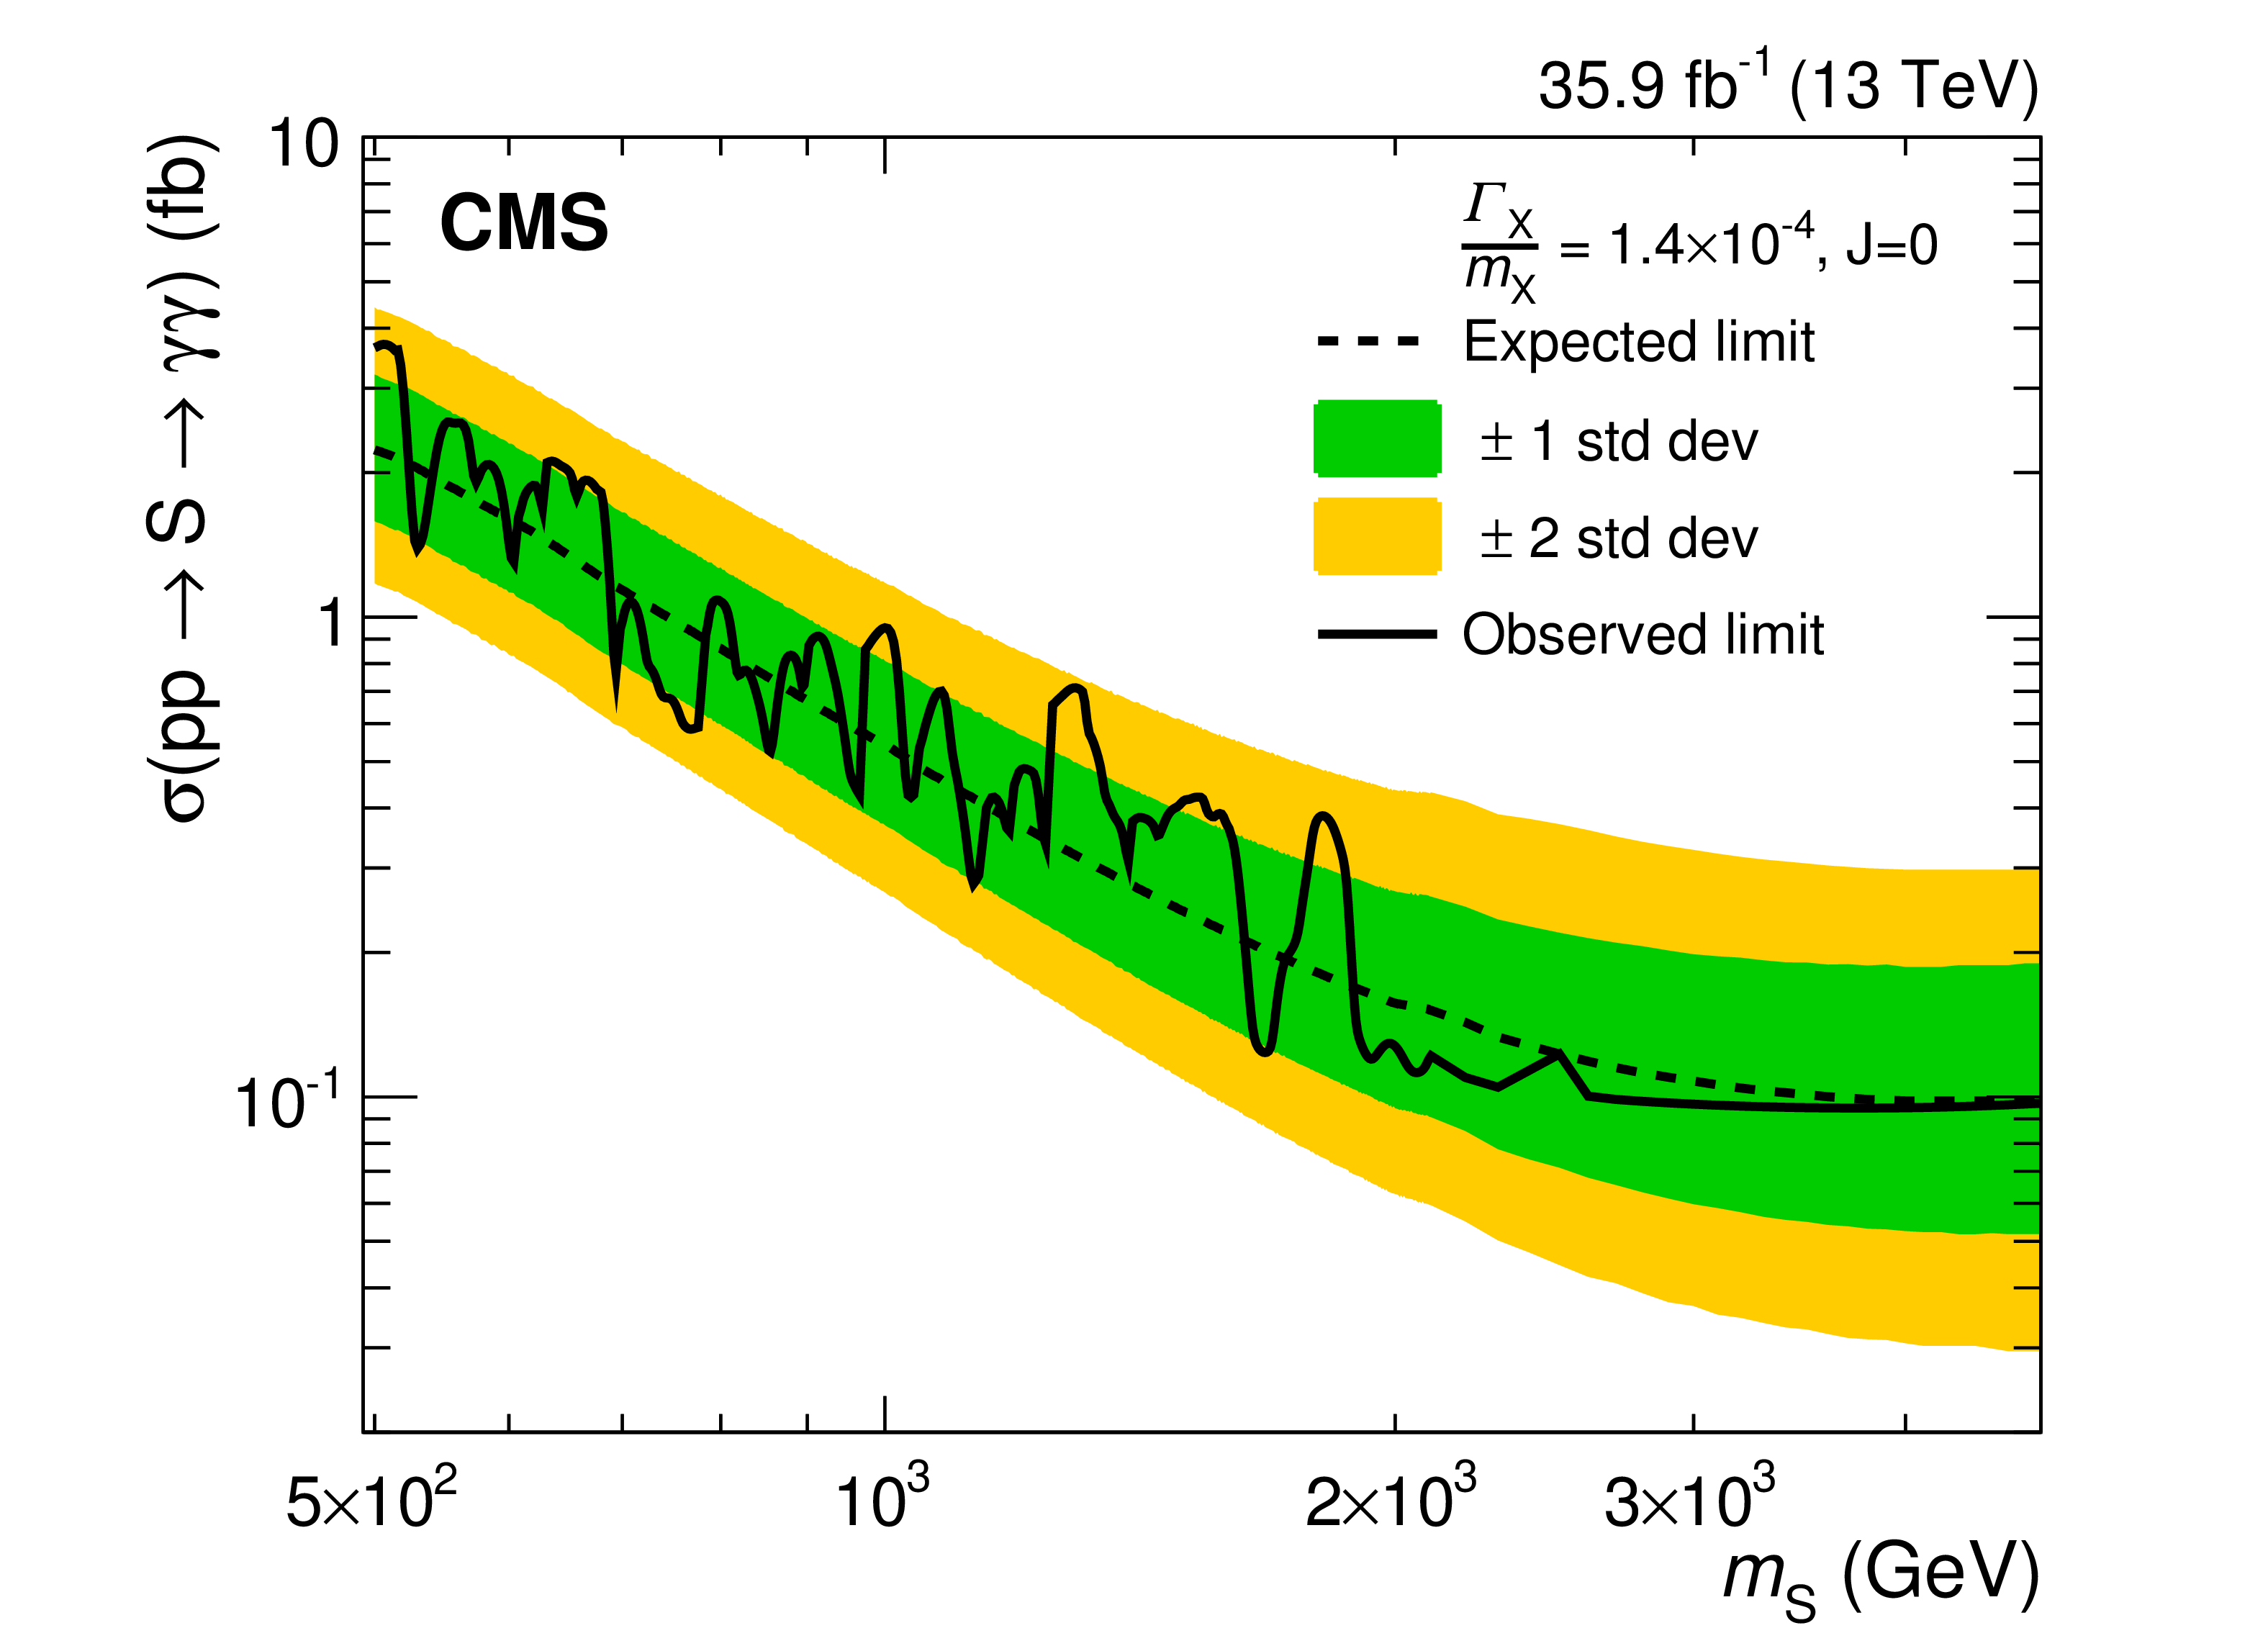
Figure 3-b:
Expected and observed 95% CL upper limits on the production cross section for spin-0 resonances of mass $ {m_{\mathrm {S}}} $ produced via gluon fusion for $\Gamma_{\mathrm{X}}/m_{\mathrm{X}} = 1.4 {\times} 10^{-4} $. The shaded bands represent the 1 and 2 standard deviation uncertainty in the expected limit. |
png pdf |
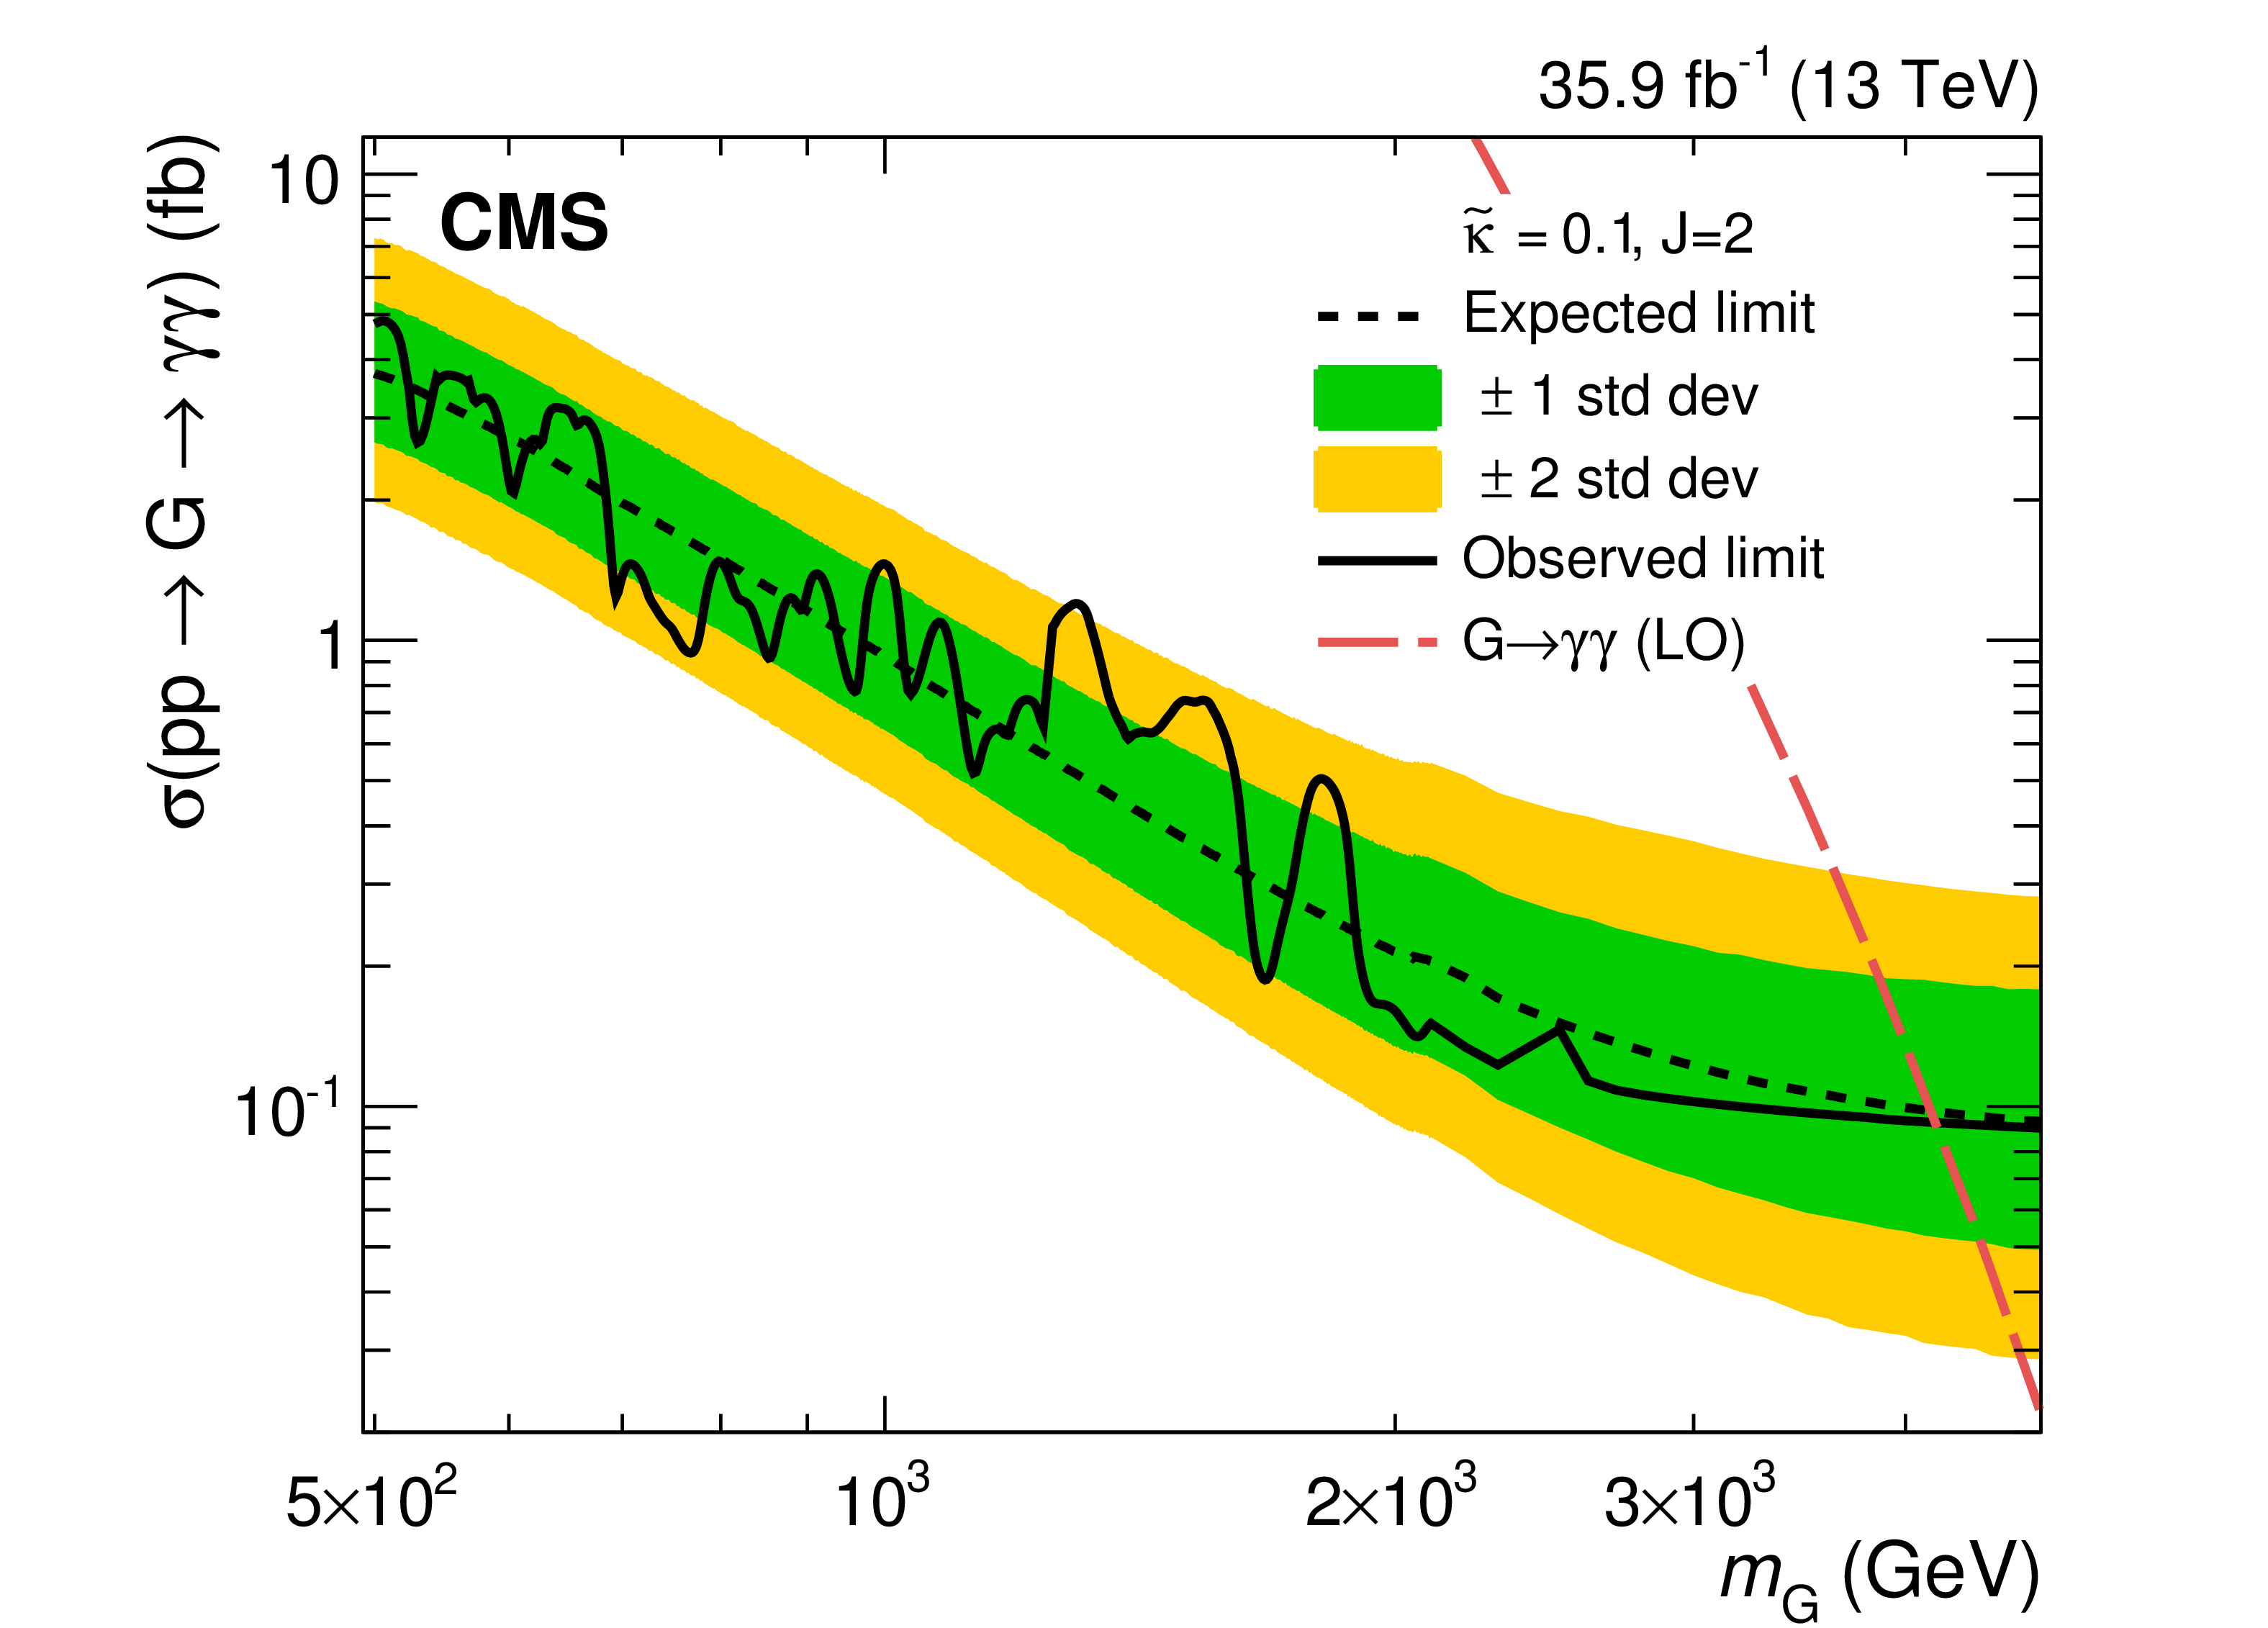
Figure 3-c:
Expected and observed 95% CL upper limits on the production cross section for RS gravitons of mass $ {m_\mathrm {{\mathrm {G}}}} $ and ${\tilde{k}} = $ 0.1. The shaded bands represent the 1 and 2 standard deviation uncertainty in the expected limit. |
png pdf |
Figure 3-d:
Expected and observed 95% CL upper limits on the production cross section for spin-0 resonances of mass $ {m_{\mathrm {S}}} $ produced via gluon fusion for $\Gamma_{\mathrm{X}}/m_{\mathrm{X}} = 1.4 {\times} 10^{-2} $. The shaded bands represent the 1 and 2 standard deviation uncertainty in the expected limit. |

png pdf |
Figure 3-e:
Expected and observed 95% CL upper limits on the production cross section for RS gravitons of mass $ {m_\mathrm {{\mathrm {G}}}} $ and ${\tilde{k}} = $ 0.2. The shaded bands represent the 1 and 2 standard deviation uncertainty in the expected limit. |
png pdf |
Figure 3-f:
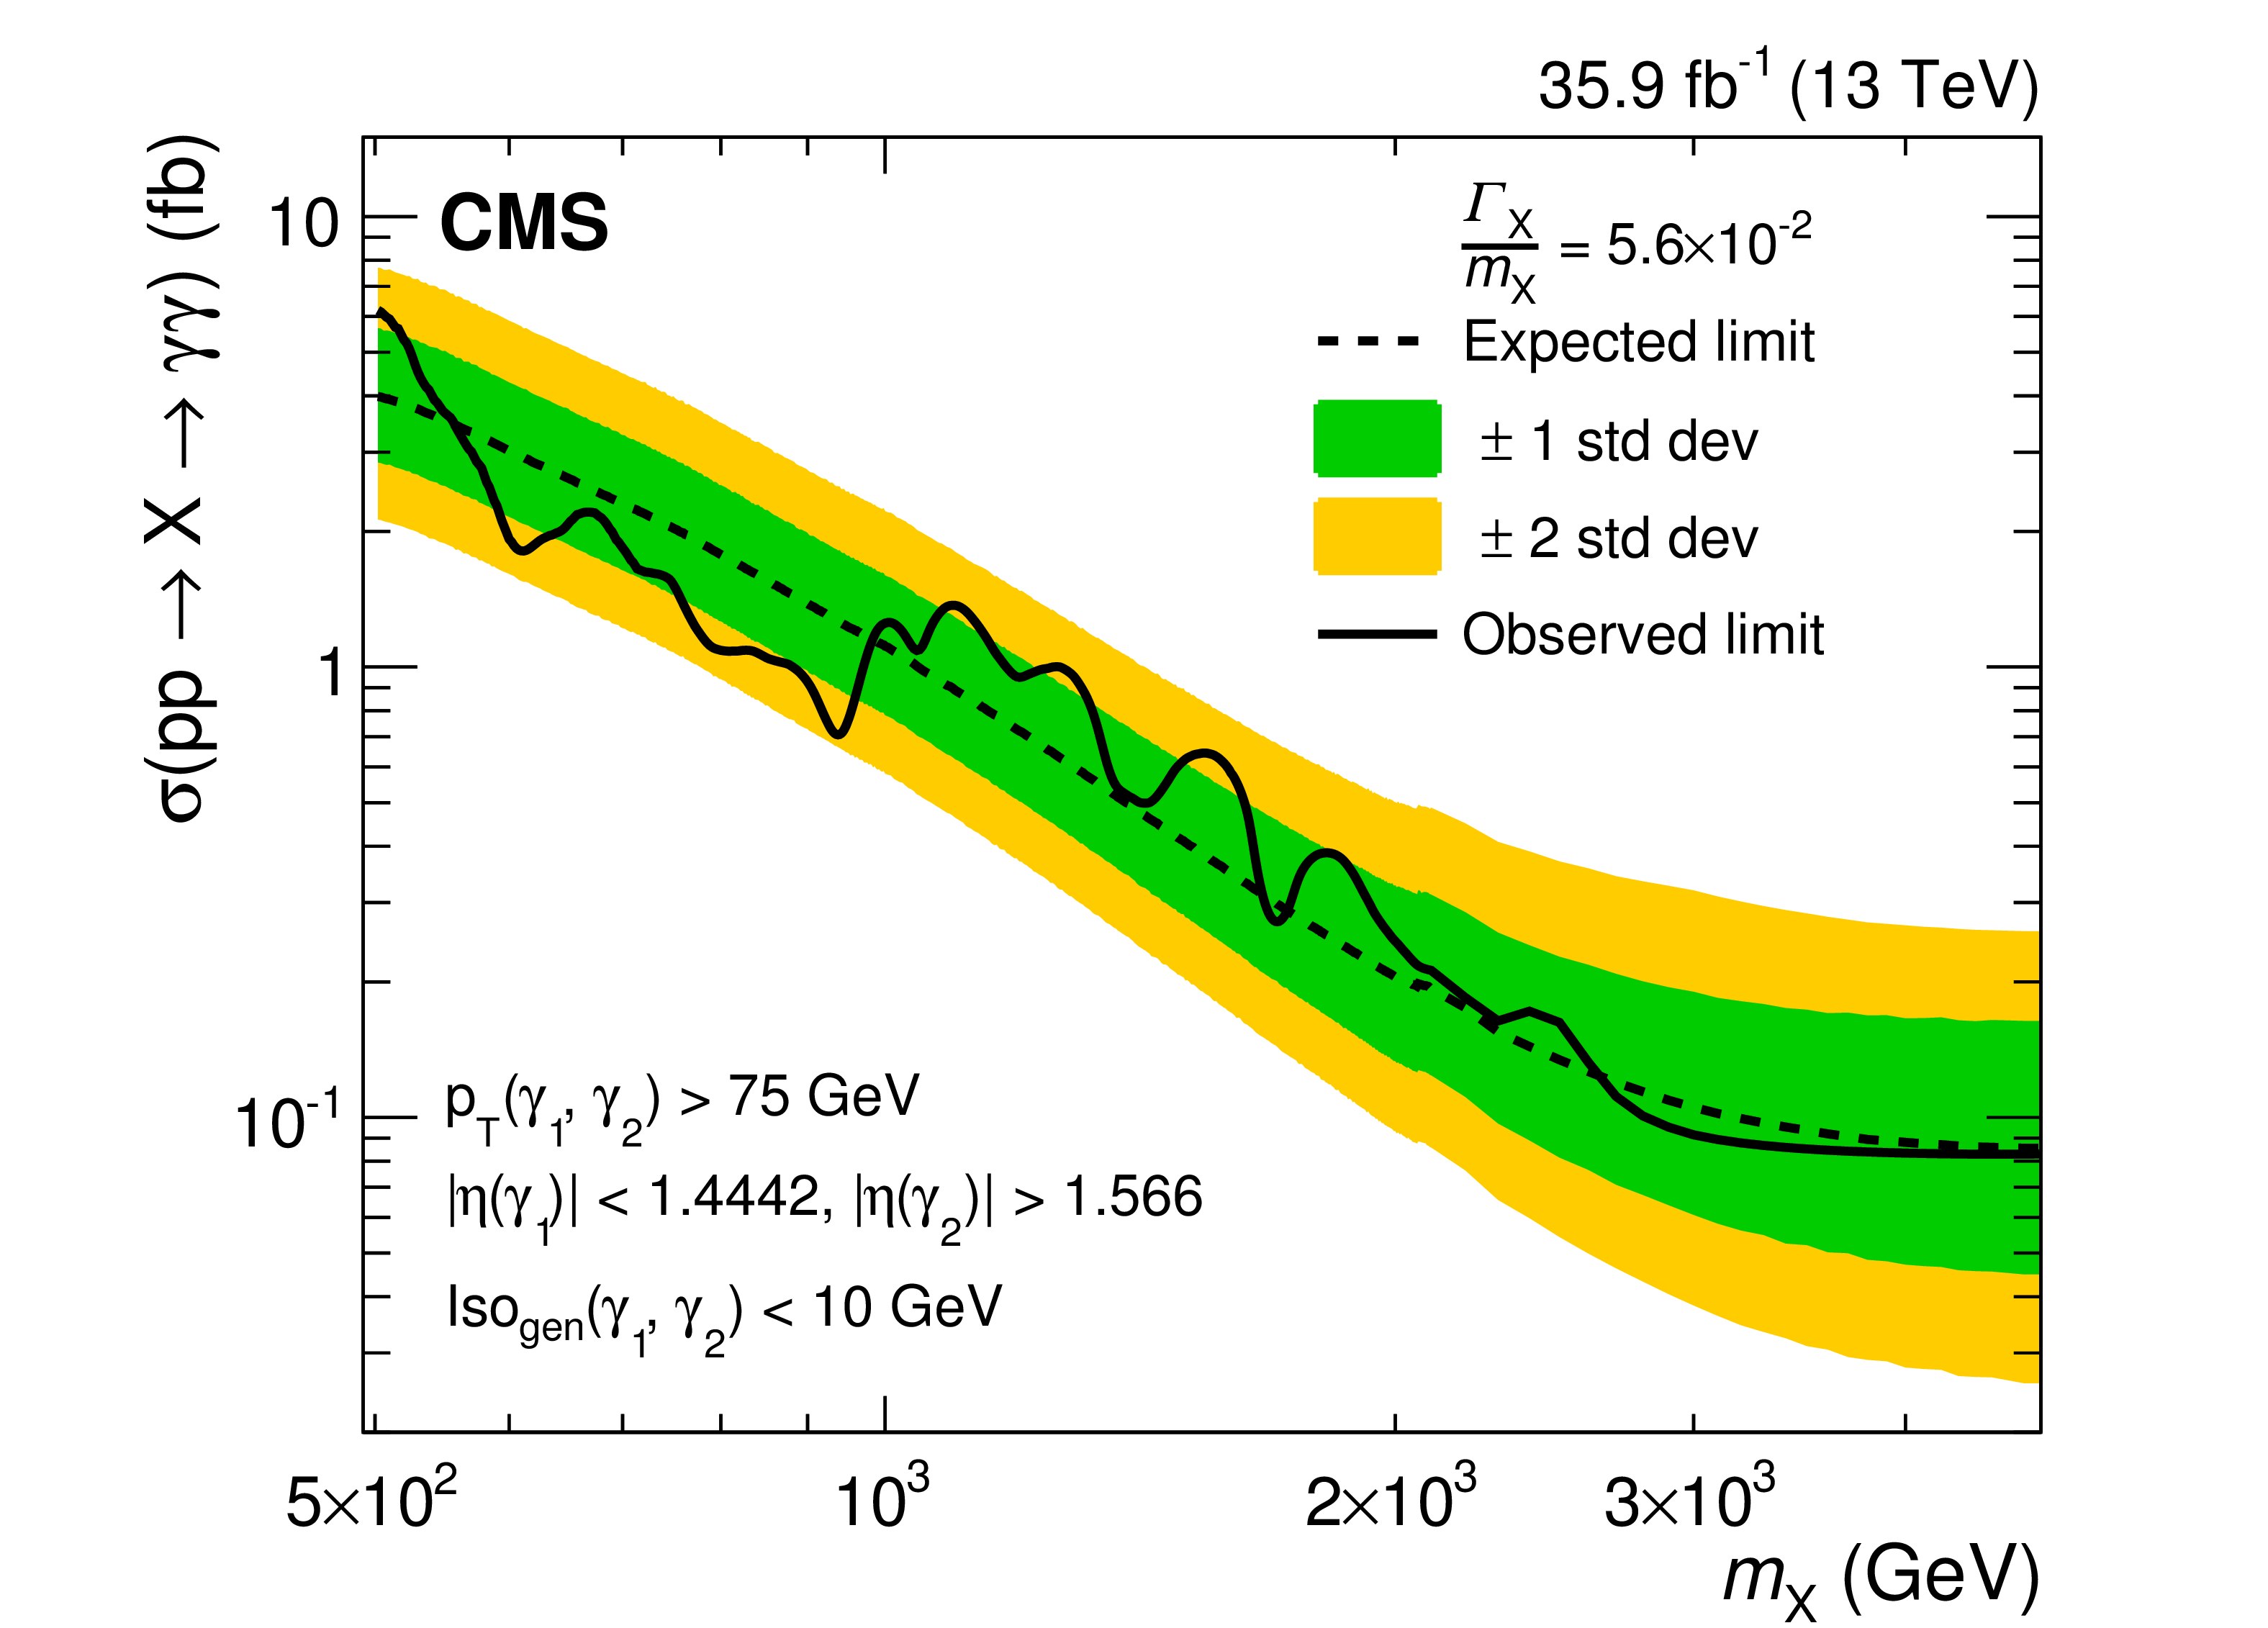
Expected and observed 95% CL upper limits on the production cross section for spin-0 resonances of mass $ {m_{\mathrm {S}}} $ produced via gluon fusion for $\Gamma_{\mathrm{X}}/m_{\mathrm{X}} = 5.6 {\times} 10^{-2}$. The shaded bands represent the 1 and 2 standard deviation uncertainty in the expected limit. |

png pdf |
Figure 4:
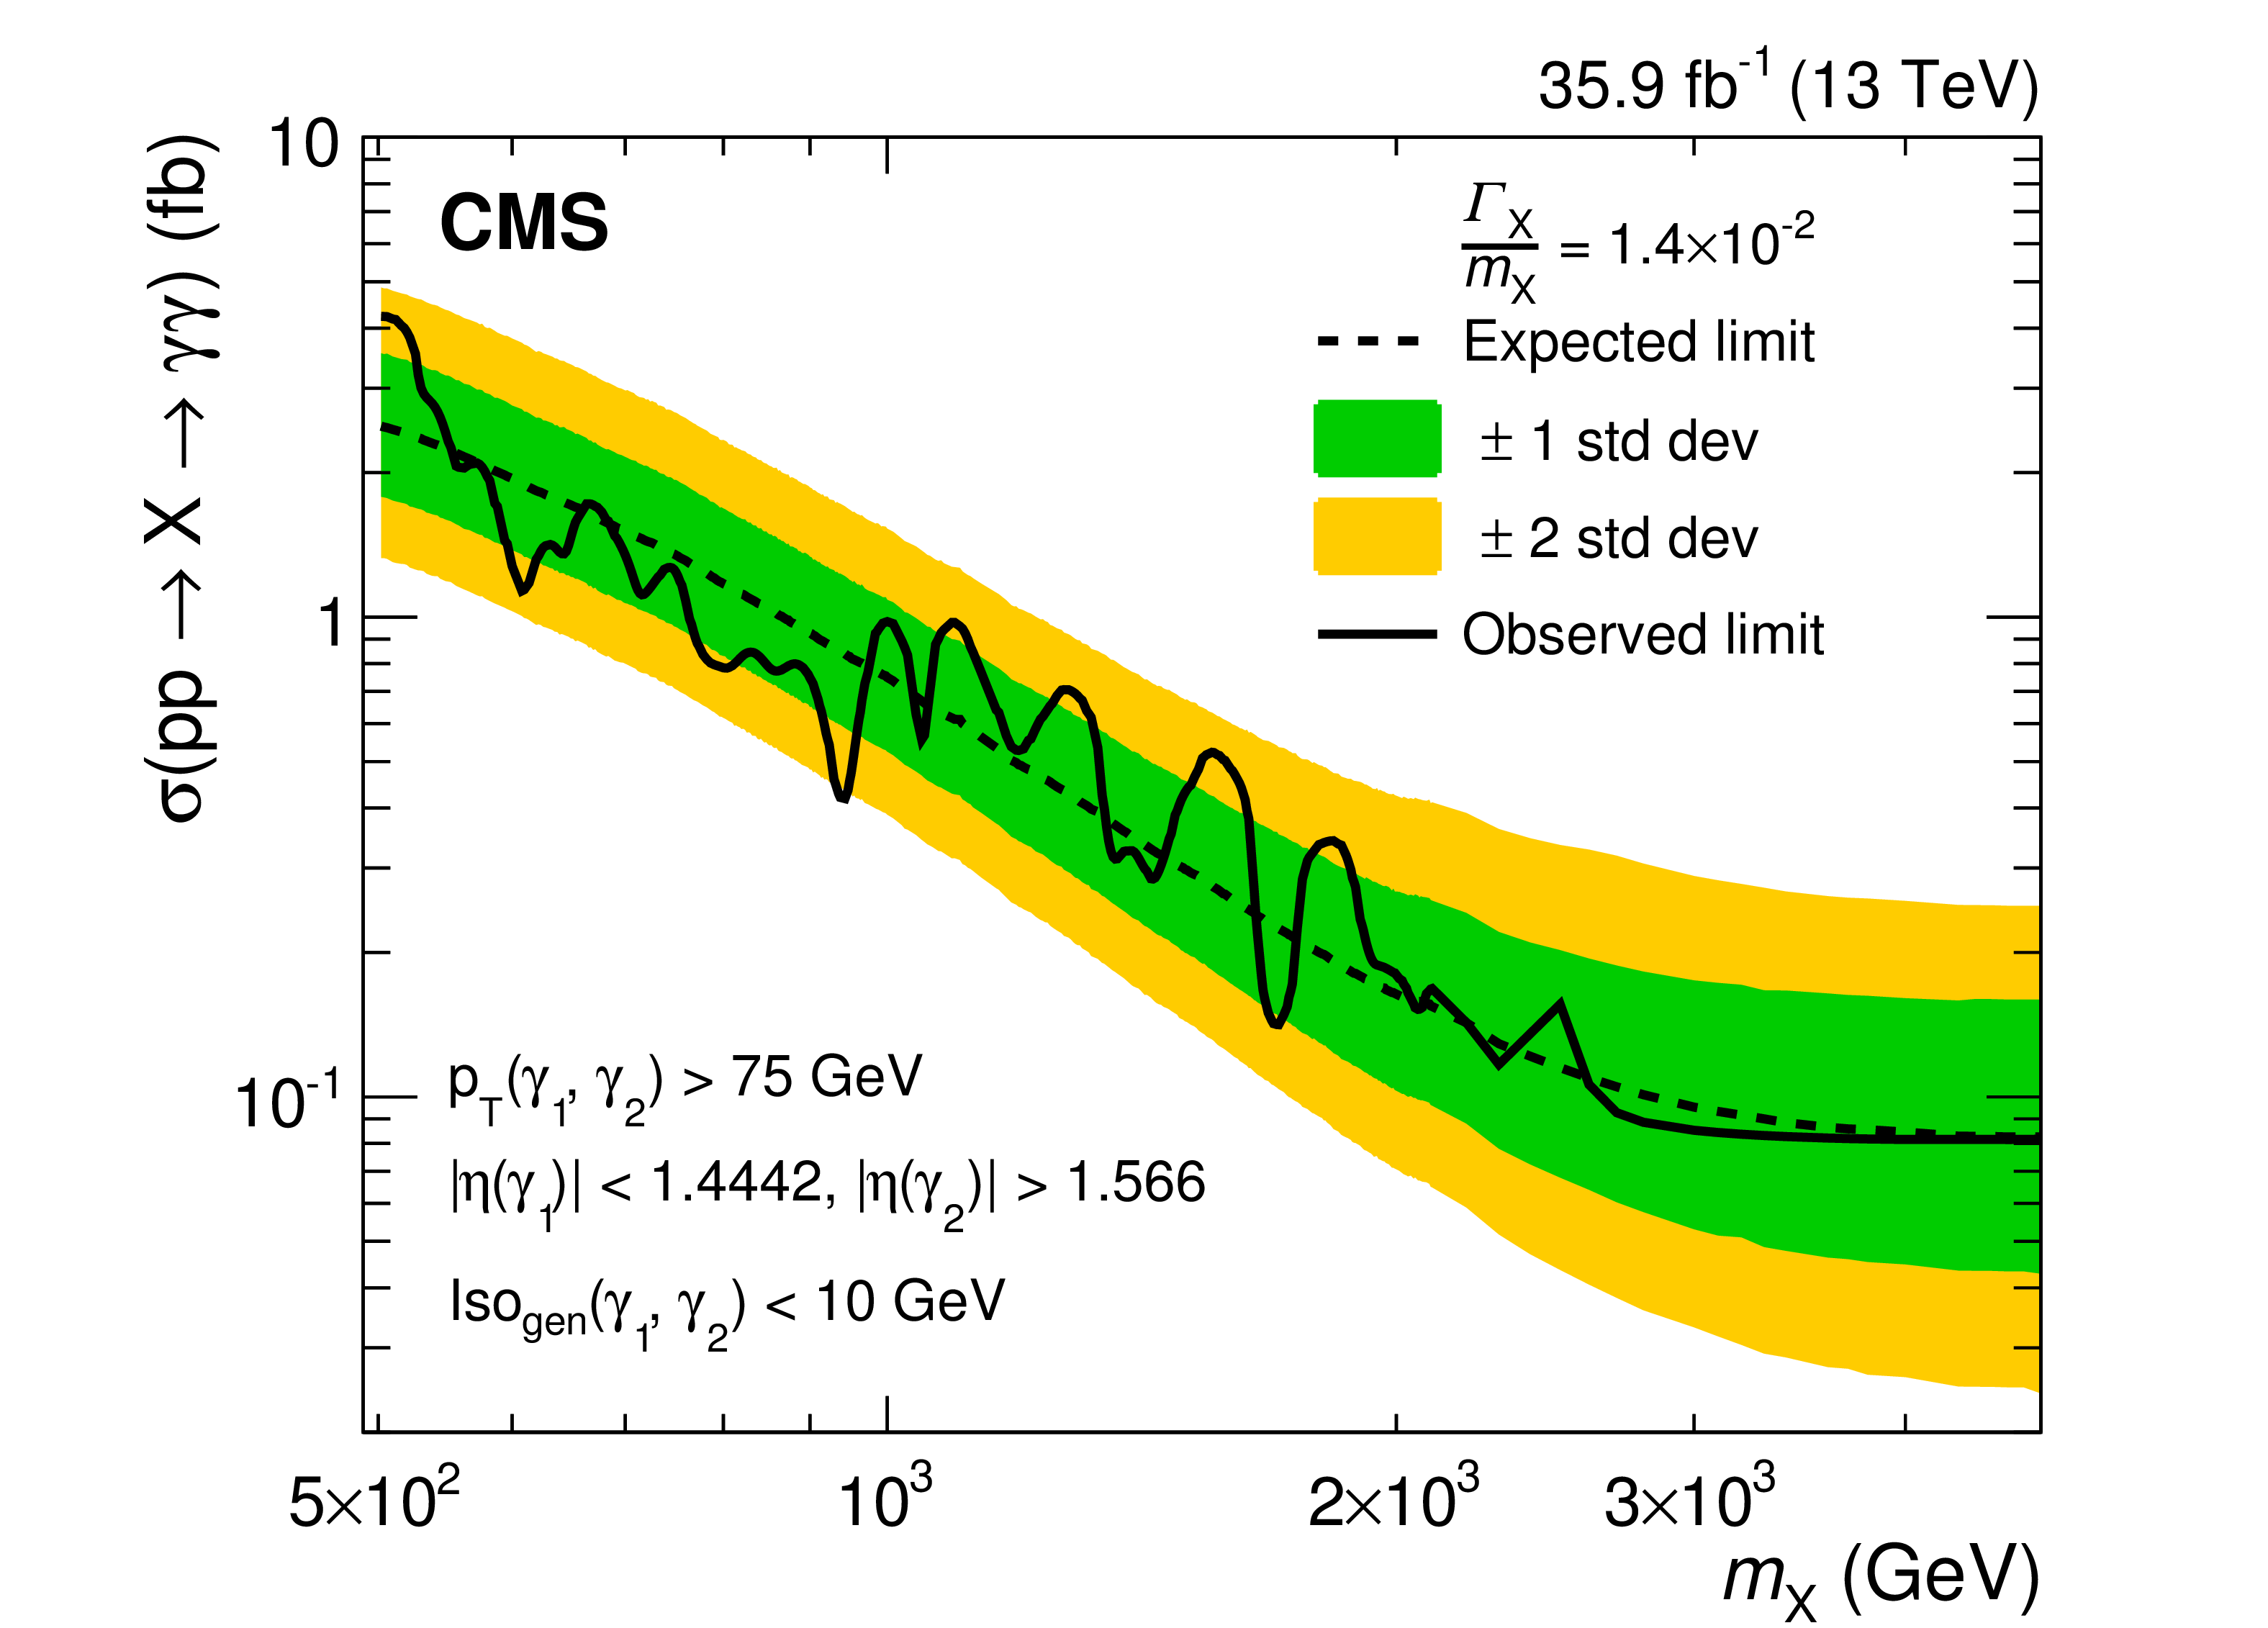
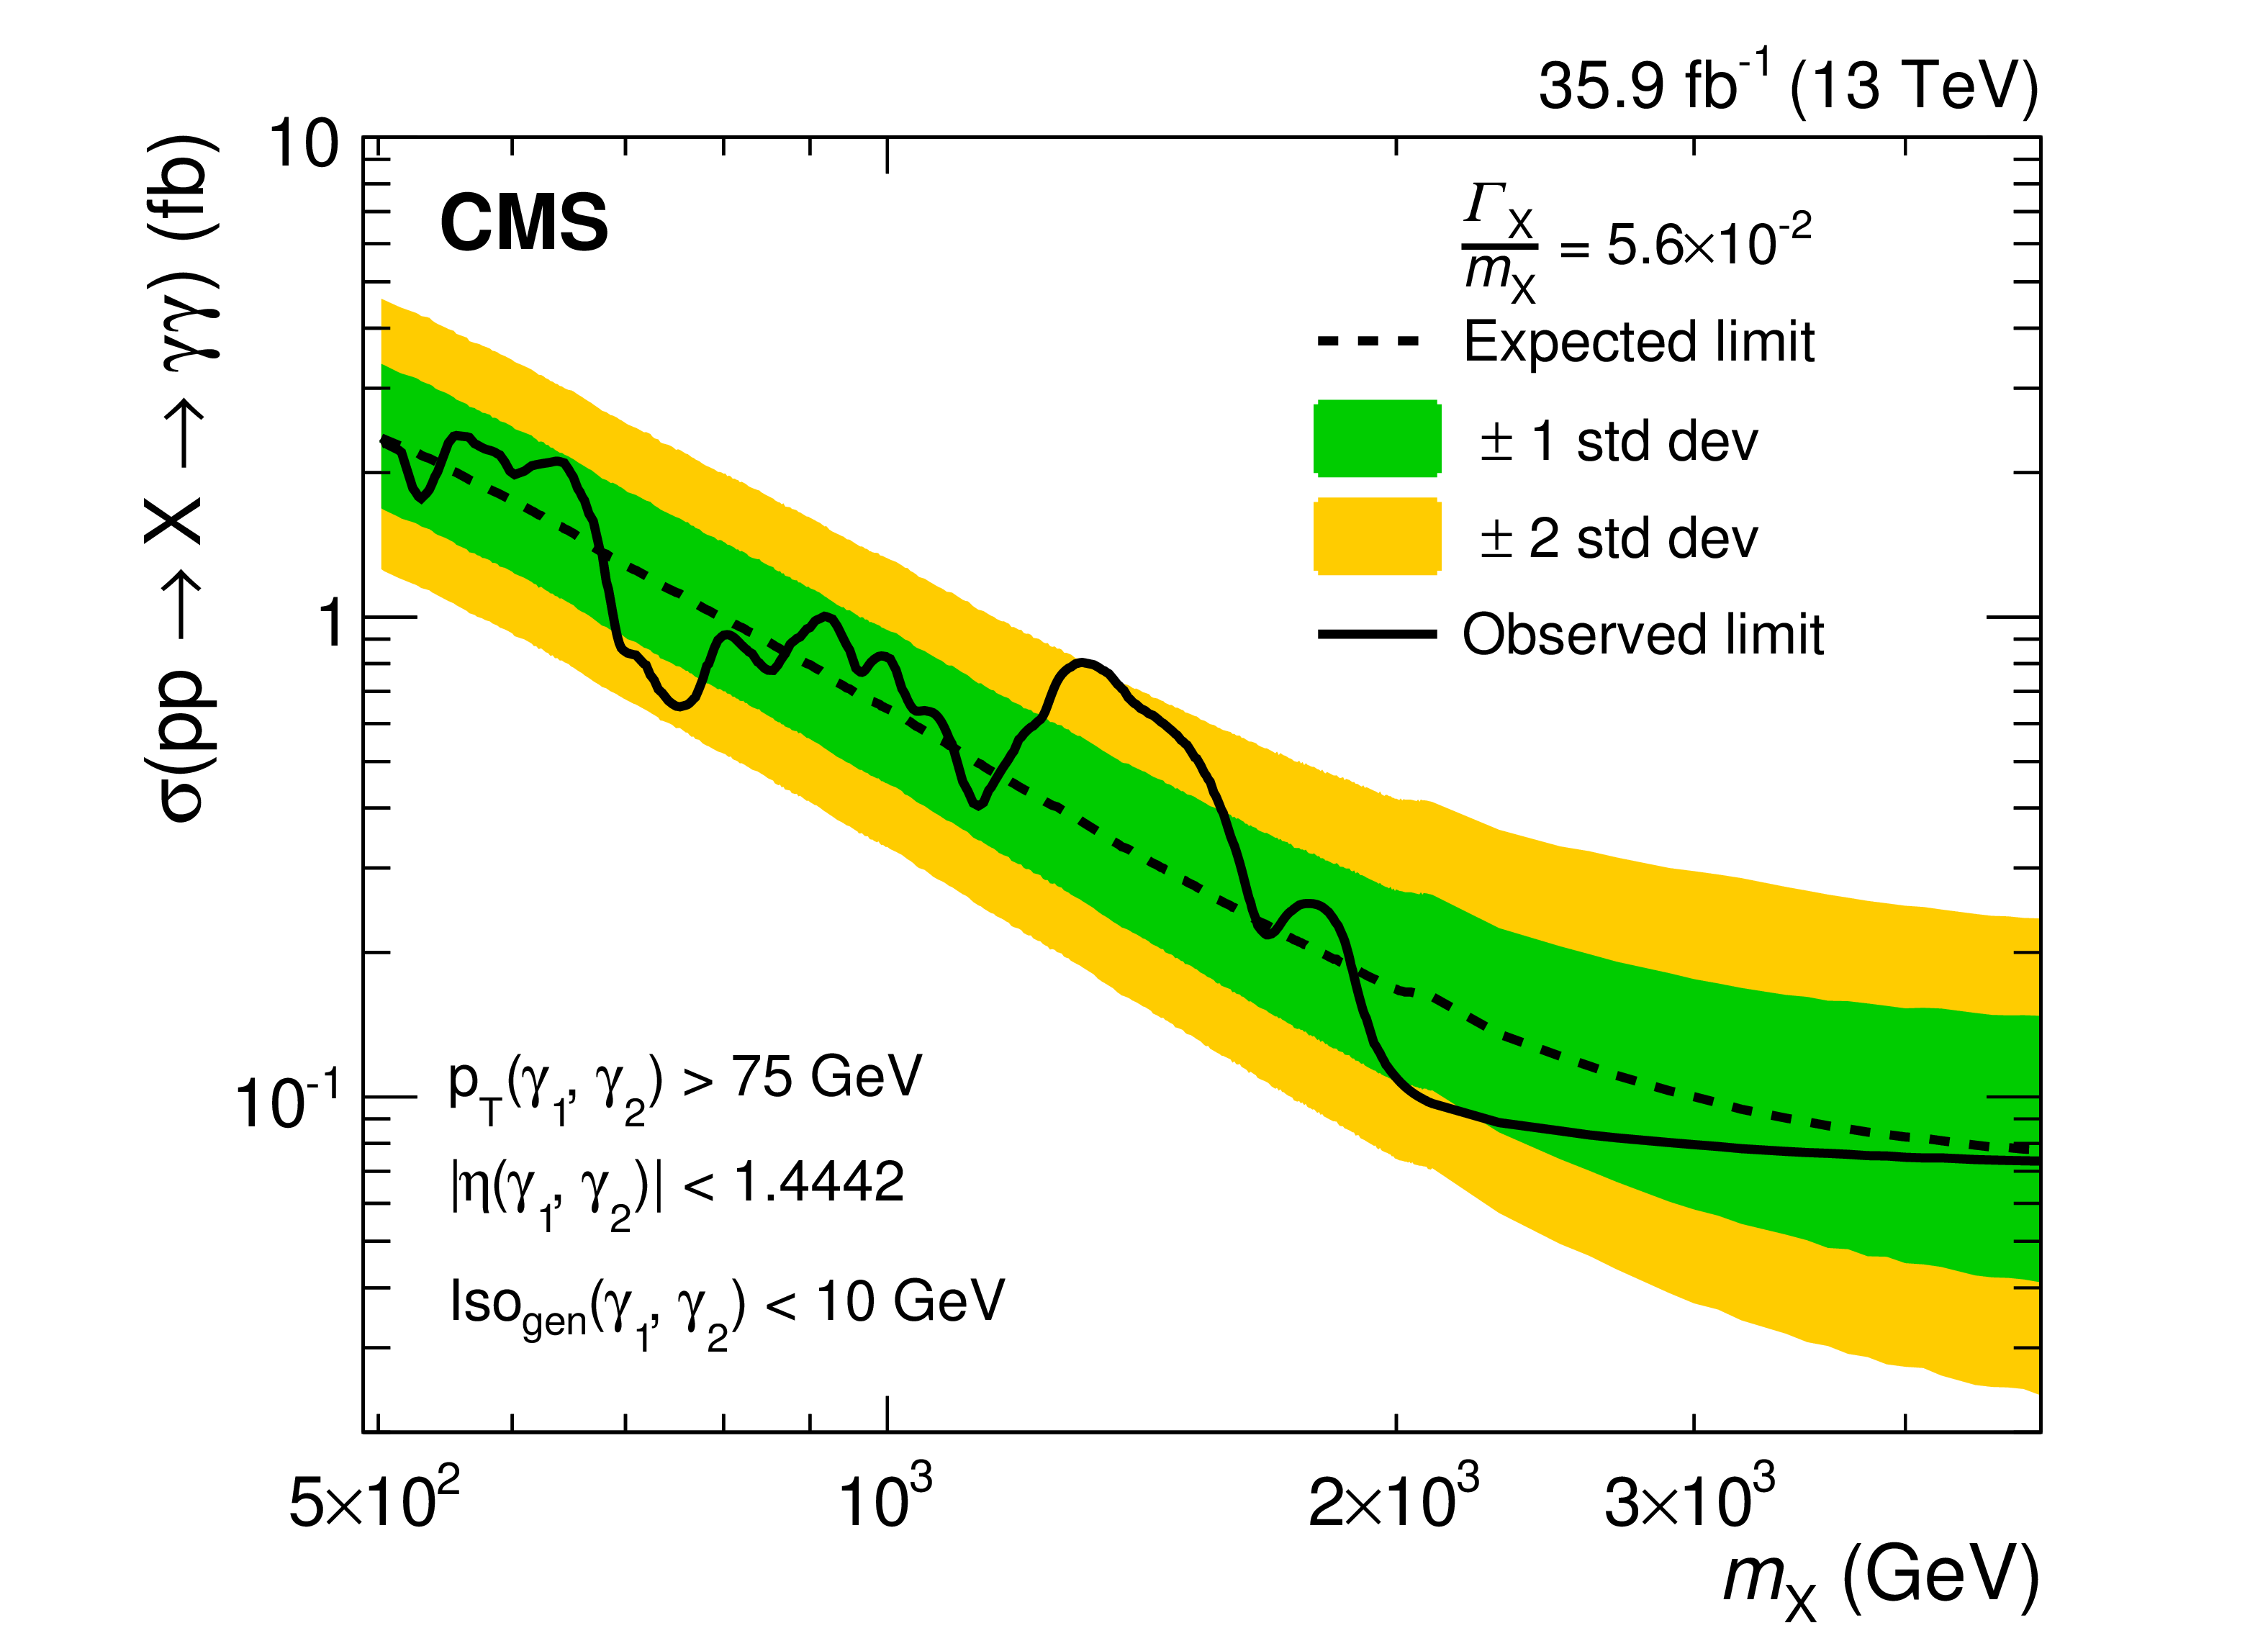
Expected and observed 95% CL upper limits on the fiducial cross section for the resonant $ {\mathrm {p}} {\mathrm {p}}\to \gamma \gamma $ process. Shown are the results in the EBEB (left) and EBEE (right) categories for the three width hypotheses. The shaded bands represent the 1 and 2 standard deviation uncertainty in the expected limit. |

png pdf |
Figure 4-a:
Expected and observed 95% CL upper limits on the fiducial cross section for the resonant $ {\mathrm {p}} {\mathrm {p}}\to \gamma \gamma $ process. Shown are the results in the EBEB category for $\Gamma_{\mathrm{X}}/m_{\mathrm{X}} = 1.4 {\times} 10^{-4}$. The shaded bands represent the 1 and 2 standard deviation uncertainty in the expected limit. |

png pdf |
Figure 4-b:
Expected and observed 95% CL upper limits on the fiducial cross section for the resonant $ {\mathrm {p}} {\mathrm {p}}\to \gamma \gamma $ process. Shown are the results in the EBEE category for $\Gamma_{\mathrm{X}}/m_{\mathrm{X}} = 1.4 {\times} 10^{-4}$. The shaded bands represent the 1 and 2 standard deviation uncertainty in the expected limit. |

png pdf |
Figure 4-c:
Expected and observed 95% CL upper limits on the fiducial cross section for the resonant $ {\mathrm {p}} {\mathrm {p}}\to \gamma \gamma $ process. Shown are the results in the EBEB category for $\Gamma_{\mathrm{X}}/m_{\mathrm{X}} = 1.4 {\times} 10^{-2}$. The shaded bands represent the 1 and 2 standard deviation uncertainty in the expected limit. |
png pdf |
Figure 4-d:
Expected and observed 95% CL upper limits on the fiducial cross section for the resonant $ {\mathrm {p}} {\mathrm {p}}\to \gamma \gamma $ process. Shown are the results in the EBEE category for $\Gamma_{\mathrm{X}}/m_{\mathrm{X}} = 1.4 {\times} 10^{-2}$. The shaded bands represent the 1 and 2 standard deviation uncertainty in the expected limit. |
png pdf |
Figure 4-e:
Expected and observed 95% CL upper limits on the fiducial cross section for the resonant $ {\mathrm {p}} {\mathrm {p}}\to \gamma \gamma $ process. Shown are the results in the EBEB category for $\Gamma_{\mathrm{X}}/m_{\mathrm{X}} = 5.6 {\times} 10^{-2}$. The shaded bands represent the 1 and 2 standard deviation uncertainty in the expected limit. |
png pdf |
Figure 4-f:
Expected and observed 95% CL upper limits on the fiducial cross section for the resonant $ {\mathrm {p}} {\mathrm {p}}\to \gamma \gamma $ process. Shown are the results in the EBEE category for $\Gamma_{\mathrm{X}}/m_{\mathrm{X}} = 5.6 {\times} 10^{-2}$. The shaded bands represent the 1 and 2 standard deviation uncertainty in the expected limit. |

png pdf |
Figure 5:
The diphoton invariant mass distributions in the EBEB (left) and EBEE (right) categories for the SM diphoton background prediction and the fake background measurement compared to the data. The last bin includes the overflow. The error bars on the points indicate the statistical uncertainty. The upper (lower) plots show the pre-fit (post-fit) background estimates. The hatched bands indicate the total pre- or post-fit systematic uncertainties. Invariant mass distributions from two signal scenarios are superimposed on the lower plots. The bottom panels show the pull distributions, indicating the difference between the data and background prediction, divided by the uncertainty in the background, with error bars representing the statistical uncertainty and shaded bands showing the one standard deviation systematic uncertainty, normalized by the statistical uncertainty. |

png pdf |
Figure 5-a:
The diphoton invariant mass distributions in the EBEB (left) and EBEE (right) categories for the SM diphoton pre-fit background prediction and the fake background measurement compared to the data. The last bin includes the overflow. The error bars on the points indicate the statistical uncertainty. The hatched band indicates the total systematic uncertainties. The bottom panels show the pull distributions, indicating the difference between the data and background prediction, divided by the uncertainty in the background, with error bars representing the statistical uncertainty and shaded bands showing the one standard deviation systematic uncertainty, normalized by the statistical uncertainty. |
png pdf |
Figure 5-b:
The diphoton invariant mass distributions in the EBEB (left) and EBEE (right) categories for the SM diphoton post-fit background prediction and the fake background measurement compared to the data. The last bin includes the overflow. The error bars on the points indicate the statistical uncertainty. The hatched bands indicate the total systematic uncertainties. Invariant mass distributions from two signal scenarios are superimposed on the plots. The bottom panels show the pull distributions, indicating the difference between the data and background prediction, divided by the uncertainty in the background, with error bars representing the statistical uncertainty and shaded bands showing the one standard deviation systematic uncertainty, normalized by the statistical uncertainty. |

png pdf |
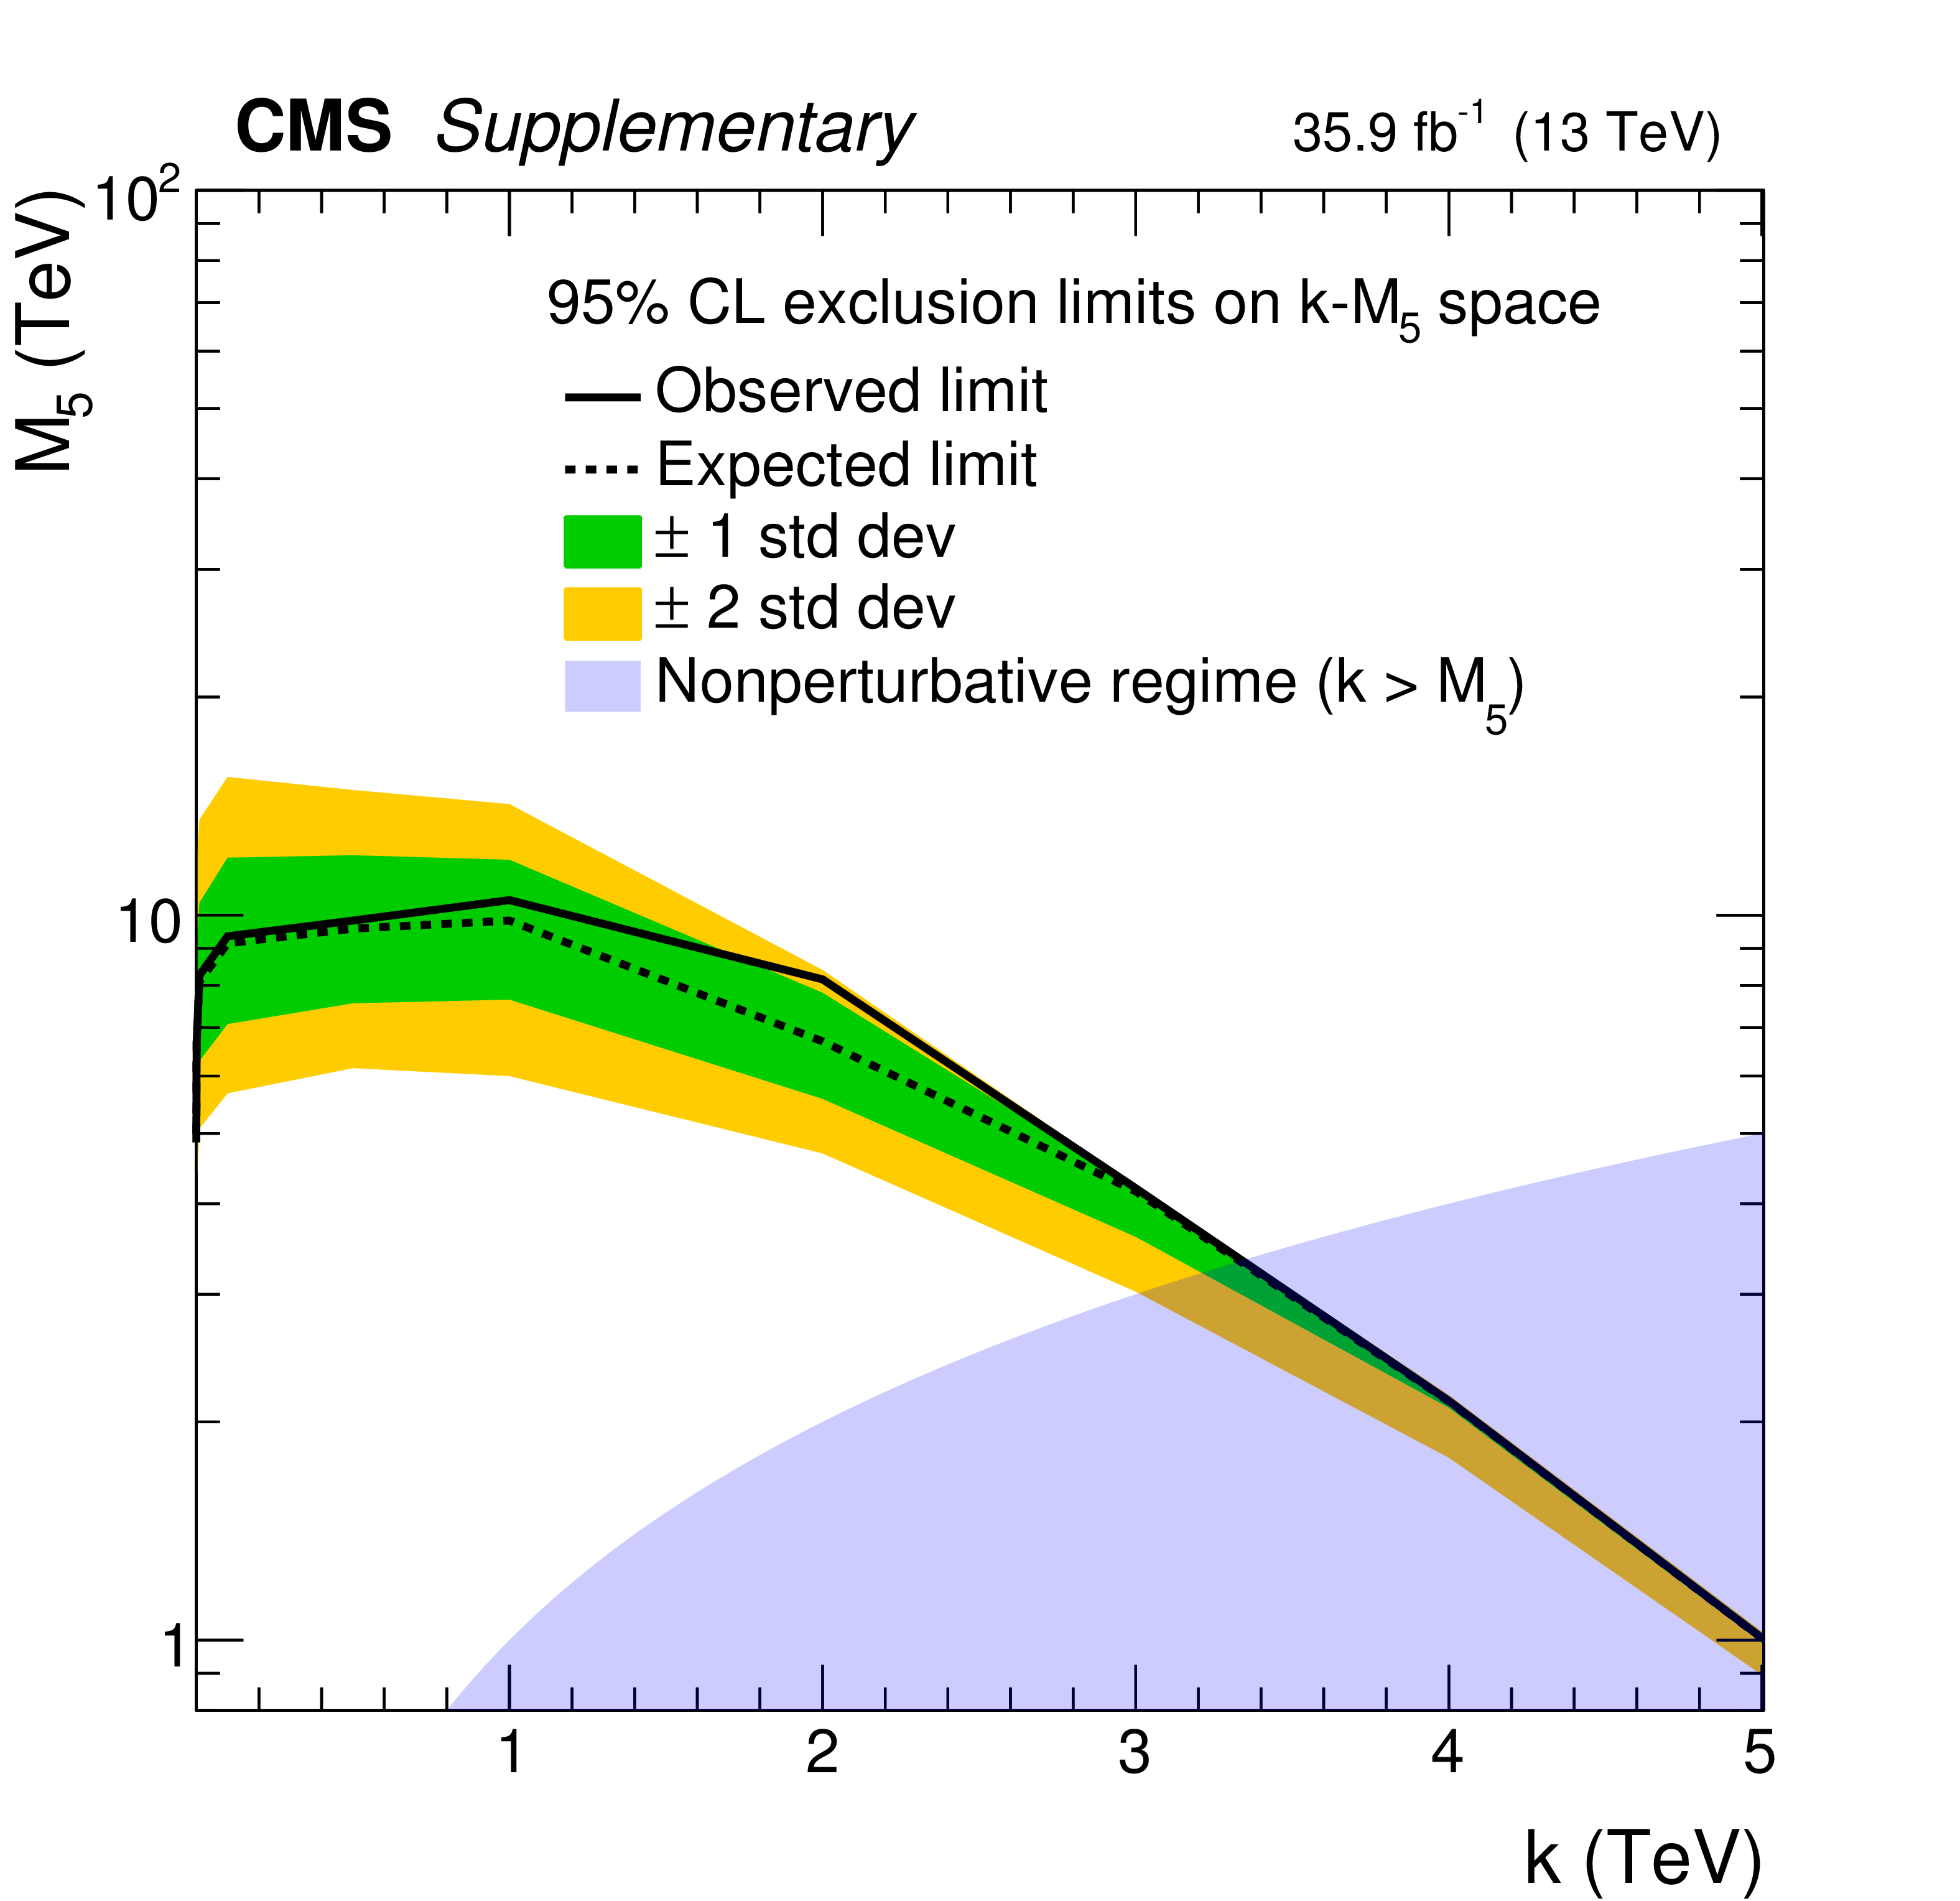
Figure 6:
The 95% CL exclusion limits for the continuous graviton model in the clockwork framework over the $k$-$M_5$ parameter space. The shaded bands represent the 1 and 2 standard deviation uncertainty in the expected limit. The shaded region with $k > M_5$ denotes the area where the theory becomes nonperturbative. |
| Tables | |
png pdf |
Table 1:
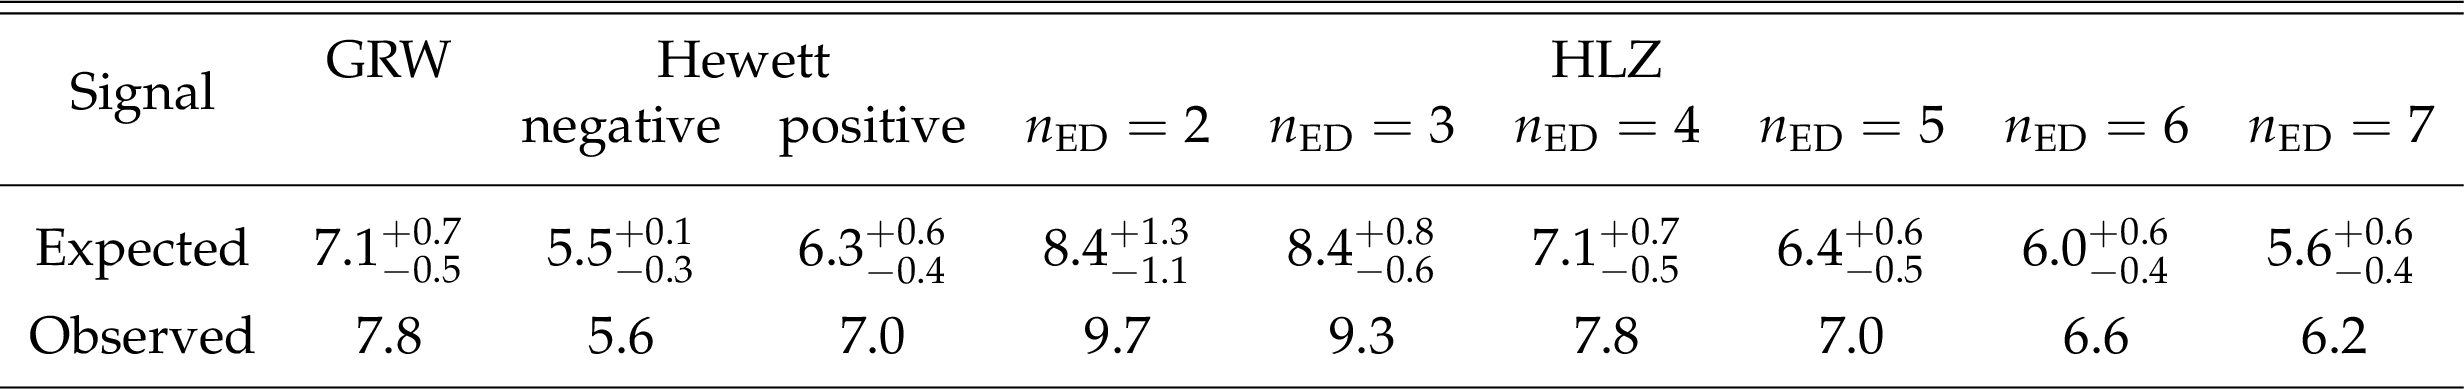
Exclusion lower limits obtained on the mass scale $ {M_{\mathrm {S}}} $ (in units of TeV) for various conventions used in the calculation of the ADD large extra dimensional scenario, as described in Section 4. The total asymmetric uncertainties are shown on the expected limits. |
| Summary |
|
A search has been performed for physics beyond the standard model in high-mass diphoton events from proton-proton collisions at a center-of-mass energy of 13 TeV. The data used correspond to an integrated luminosity of 35.9 fb$^{-1}$ collected by the CMS detector in 2016. A resonant peak in the diphoton invariant mass spectrum could indicate the existence of a new scalar particle, such as a heavy Higgs boson, or of a Kaluza-Klein excitation of the graviton in the Randall-Sundrum model of warped extra dimensions. A nonresonant excess could be a signature of large extra dimensions, in the scenario by Arkani-Hamed, Dimopoulos, and Dvali, or a continuum clockwork model. The data are found to be in agreement with the predicted background from standard model sources, and no evidence for new physics is seen. Masses below 2.3-4.6 TeV are excluded at 95% confidence level for the excited state of the Randall-Sundrum graviton, for a coupling parameter in the range 0.01 $ < \tilde{k} < $ 0.2. Limits are also set on the production of scalar resonances, and model-independent cross section limits have been extracted as a function of diphoton invariant mass for any resonant $\gamma \gamma$ production process. These results extend the sensitivity of the previous search performed by the CMS experiment [19] and are compatible with those reported by the ATLAS Collaboration in Ref. [18]. In the large extra-dimensional model of Arkani-Hamed, Dimopoulos, and Dvali, exclusion limits on the string mass scale are set in the range 5.6 $ < {M_{\mathrm{S}}} < $ 9.7 TeV, depending on the specific model convention. These results extend the current best lower limits on $ {M_{\mathrm{S}}} $ from the diphoton channel as presented in Ref. [18]. Additionally, the first exclusion limits are set in the two-dimensional parameter space of a continuum clockwork model. |
| Additional Figures | |
png pdf |
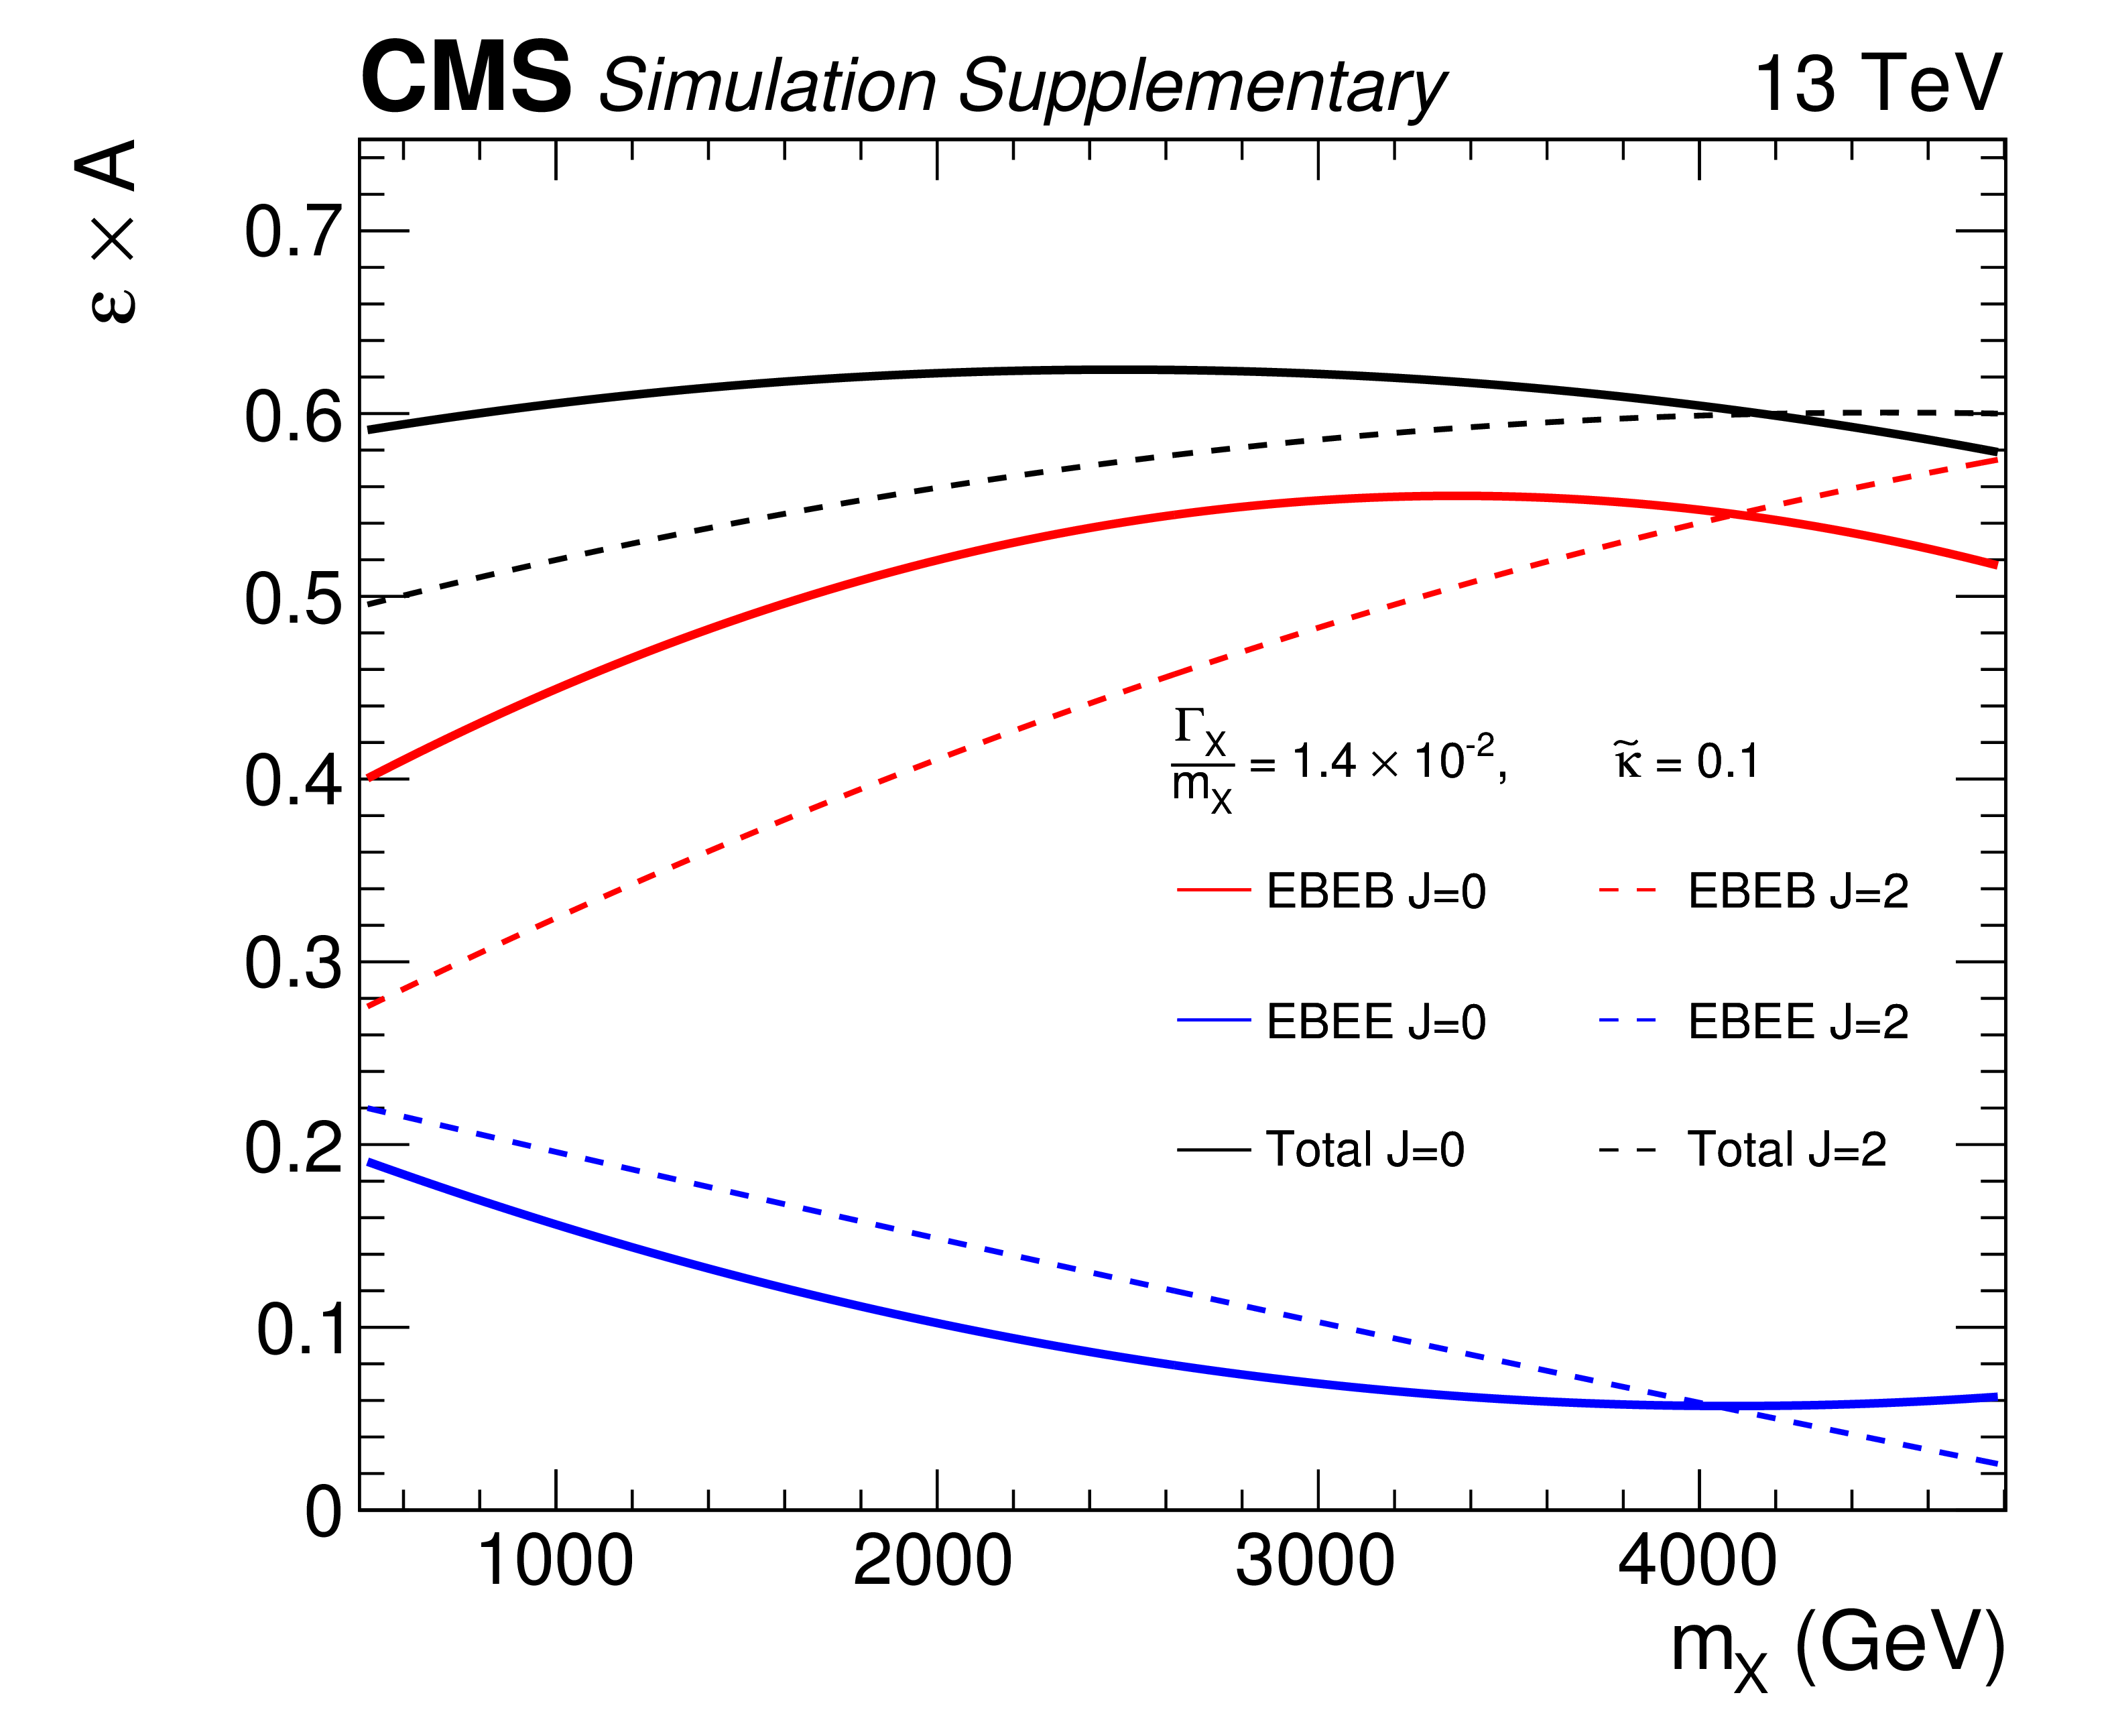
Additional Figure 1:
The product of the event selection efficiency ($\varepsilon $) and the detector acceptance (A) is shown as a function of signal resonance mass $m_{\mathrm {X}}$ for the $\Gamma _{\mathrm {X}}/ m_{\mathrm {X}} = 1.4\times 10^{-2}$ signal width hypothesis. The total (black), EBEB (red), and EBEE (blue) curves are shown for the spin (J) hypotheses $\mathrm {J}=$ 0 (solid) and $\mathrm {J}=$ 2 (dashed). |
png pdf |
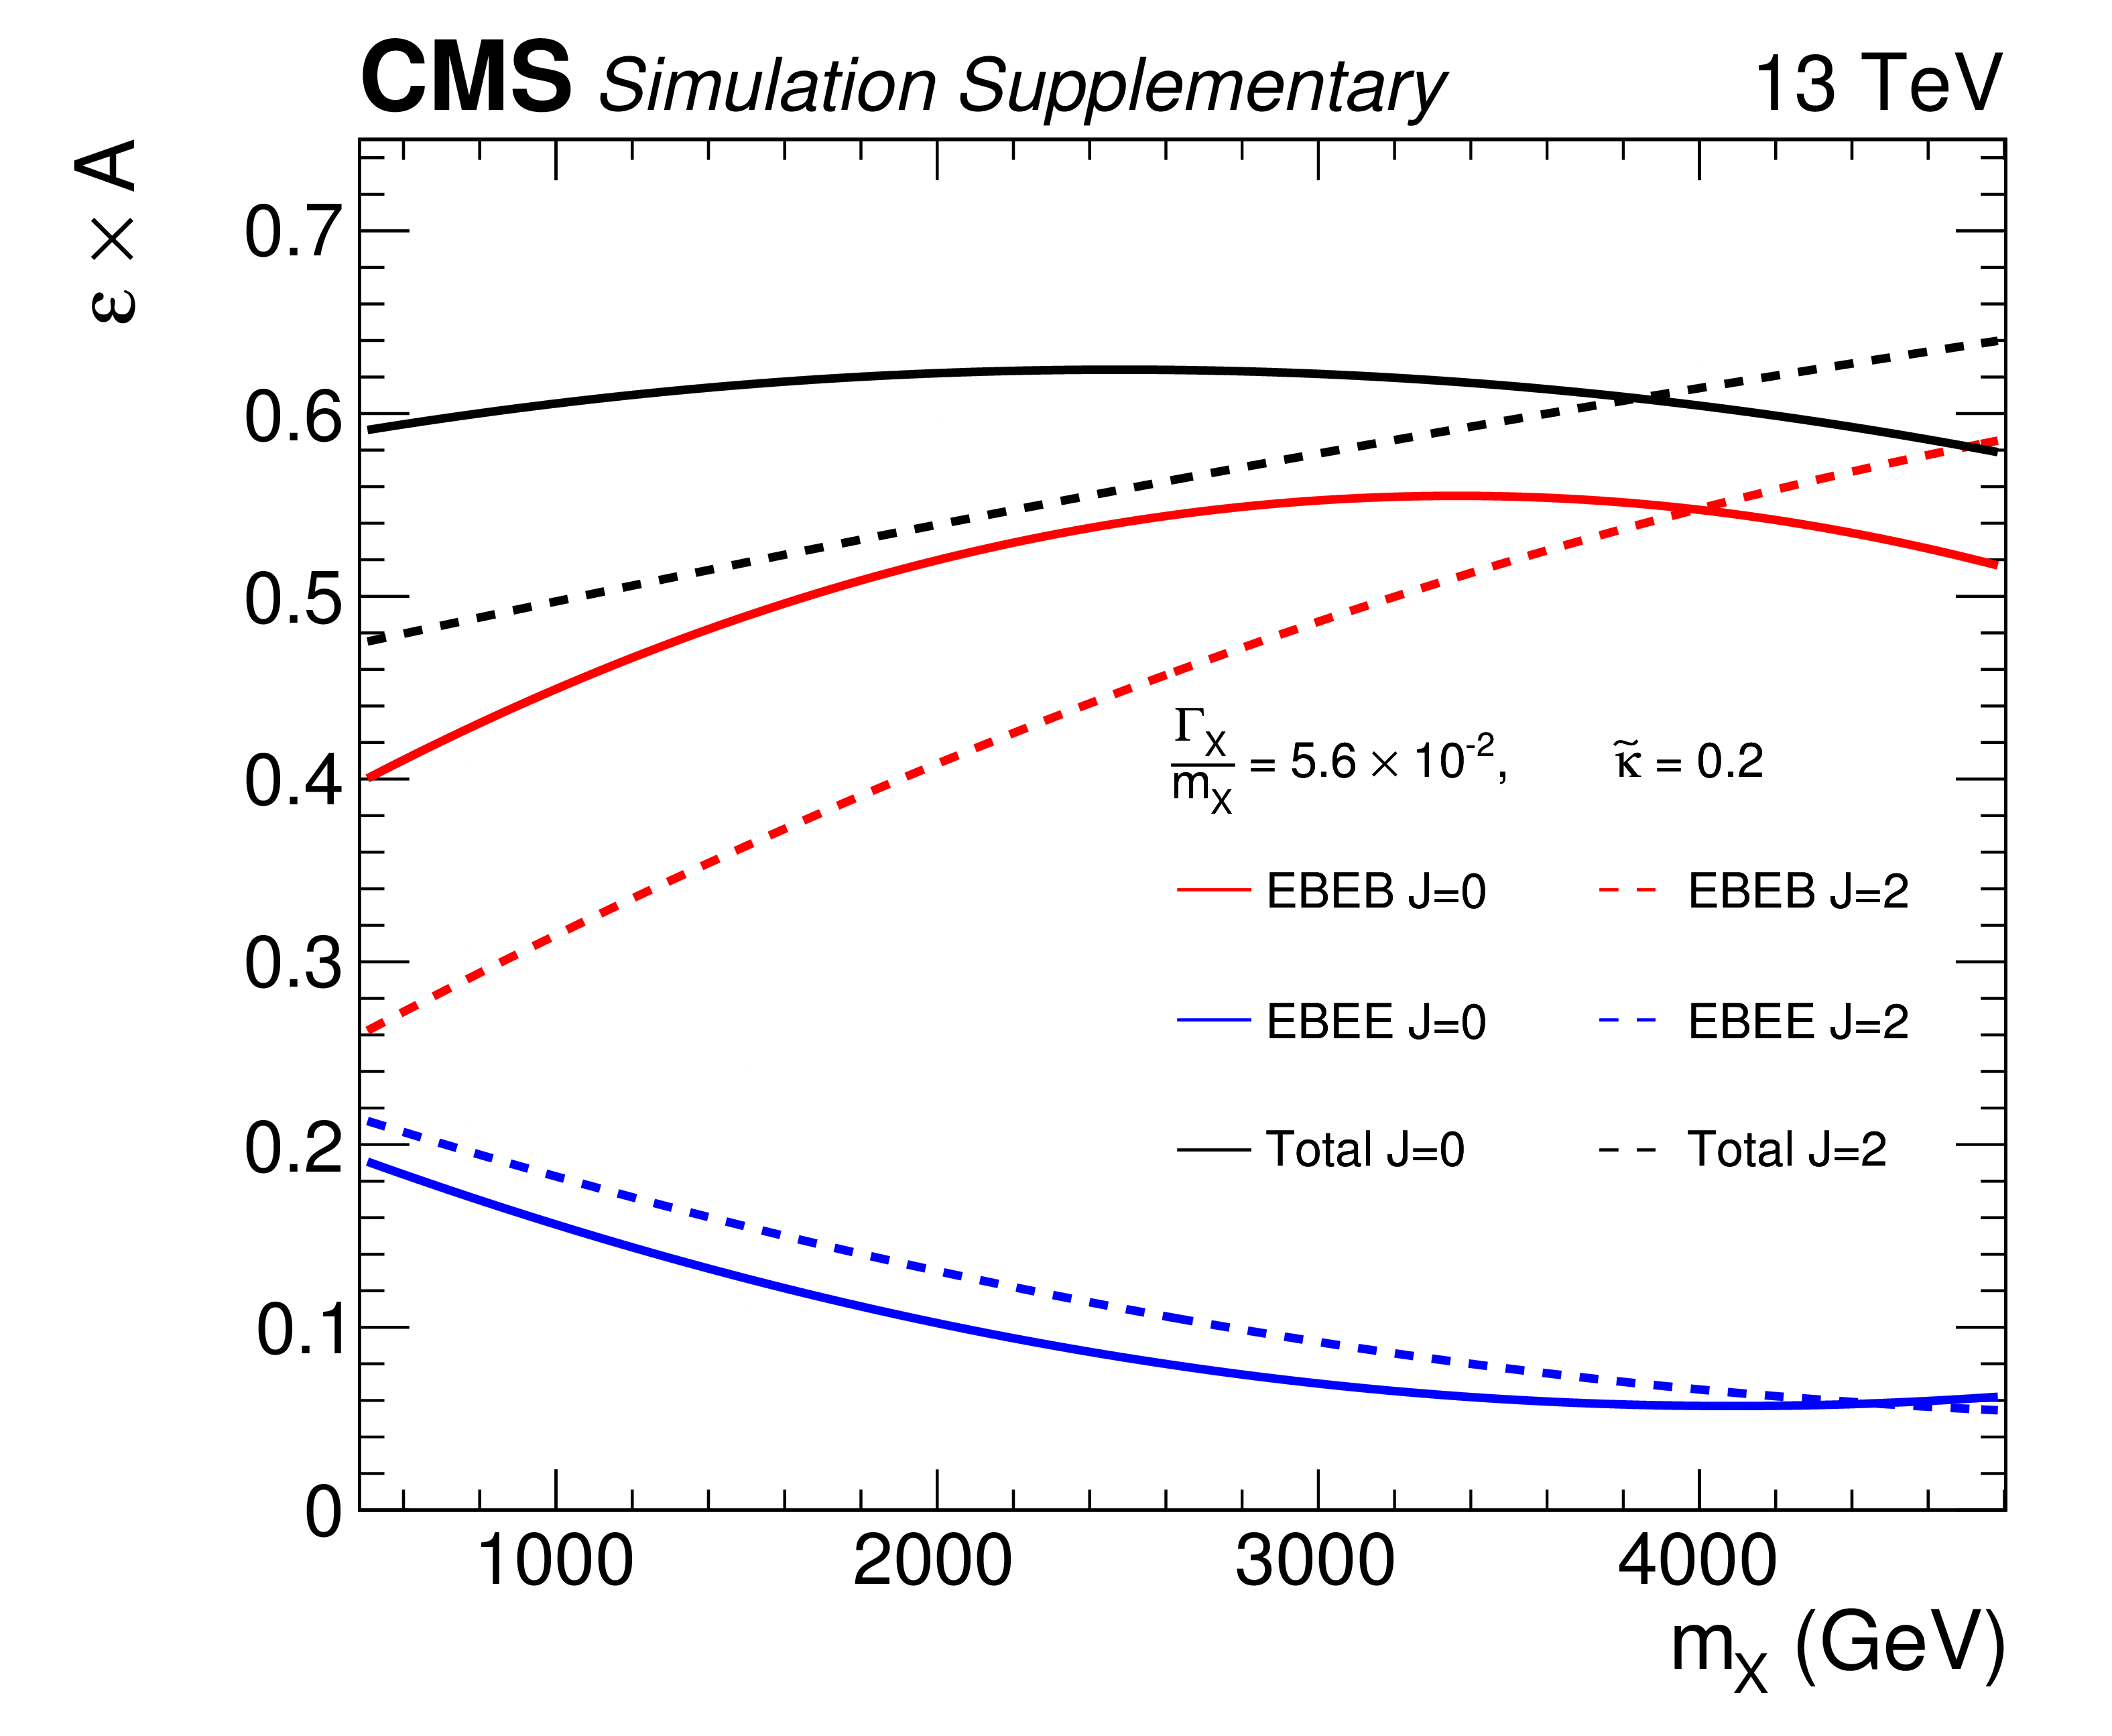
Additional Figure 2:
The product of the event selection efficiency ($\varepsilon $) and the detector acceptance (A) is shown as a function of signal resonance mass $m_{\mathrm {X}}$ for the $\Gamma _{\mathrm {X}}/ m_{\mathrm {X}} = 5.6\times 10^{-2}$ signal width hypothesis. The total (black), EBEB (red), and EBEE (blue) curves are shown for the spin (J) hypotheses $\mathrm {J}=$ 0 (solid) and $\mathrm {J}=$ 2 (dashed). |
png pdf |
Additional Figure 3:
The 95% CL exclusion limits for the continuous graviton model in the clockwork framework over the $k$-$M_5$ parameter space using a linear $k$-axis scale. The shaded bands represent the 1 and 2 standard deviation uncertainty in the expected limit. The shaded region with $k > M_5$ denotes the area where the theory becomes nonperturbative. |
png pdf |
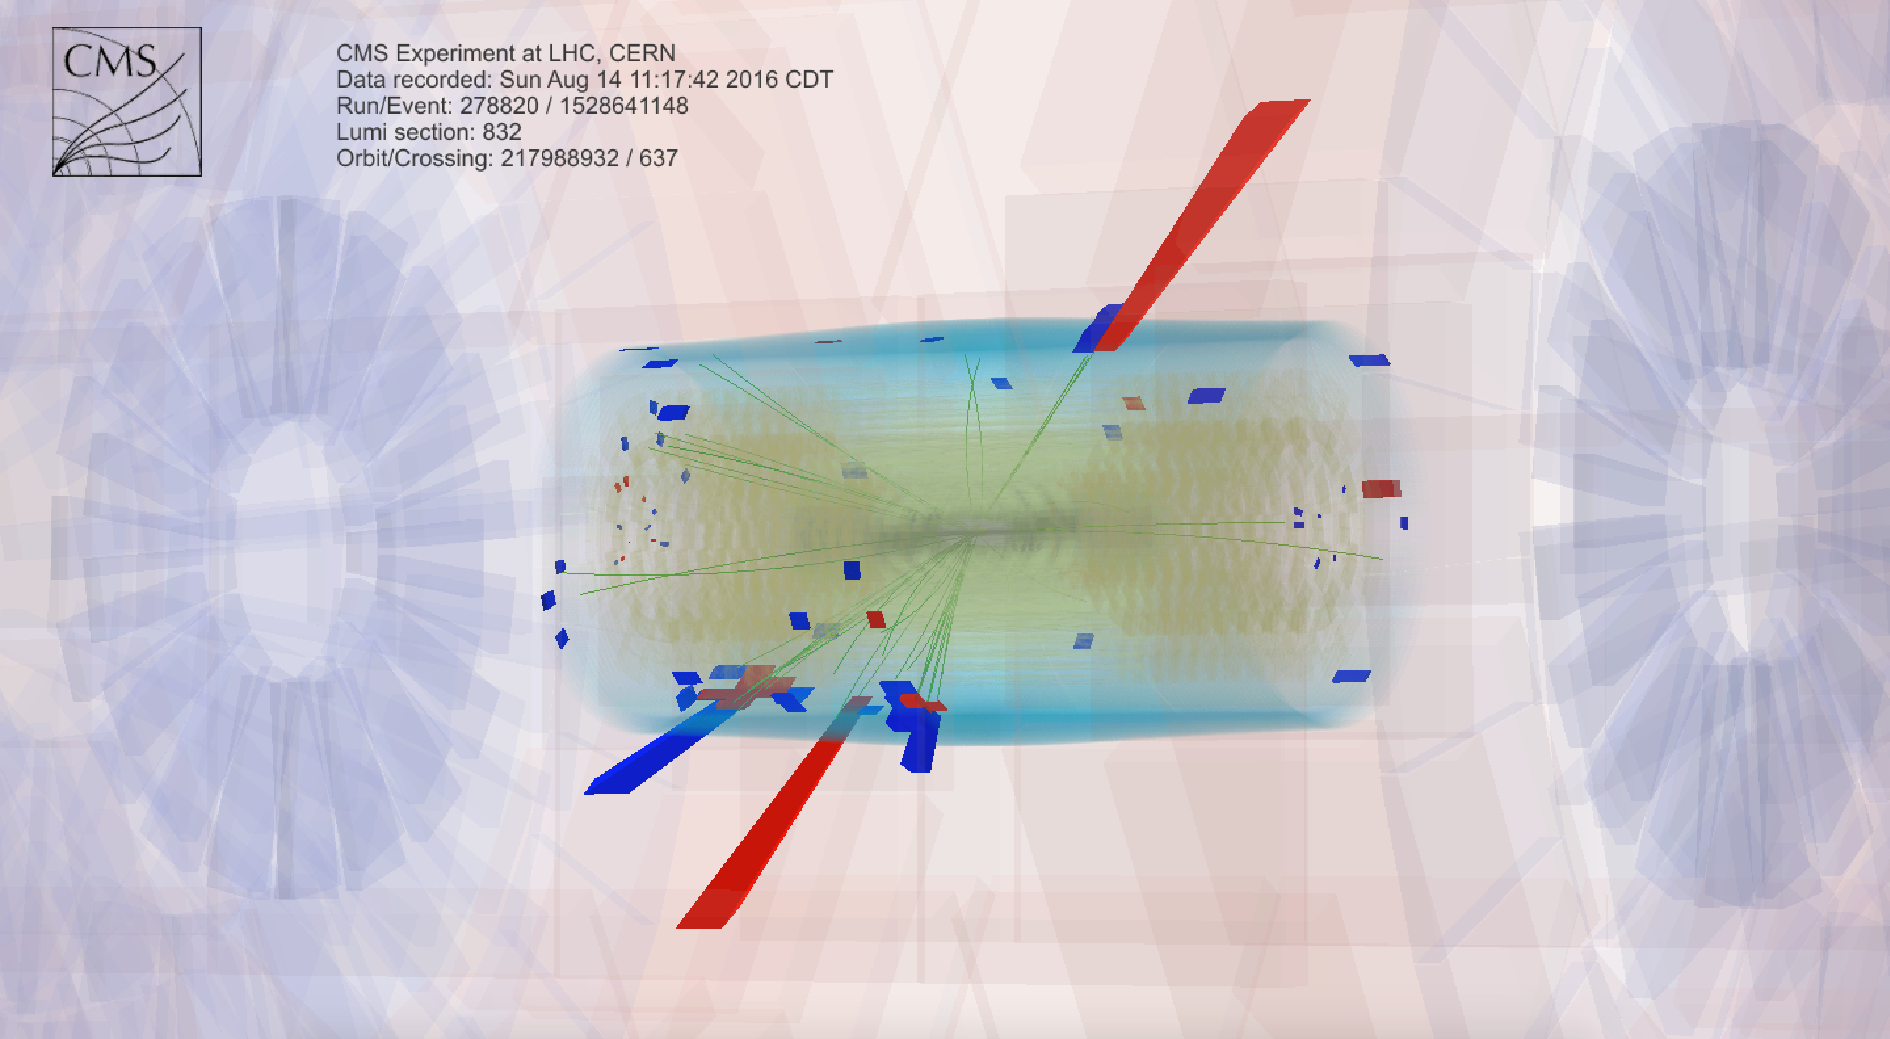
Additional Figure 4:
An event display of the highest invariant mass diphoton event recorded in 2016 at 1840 GeV in the EBEB category. The two photons are represented by the red ECAL energy deposits. |
png pdf |
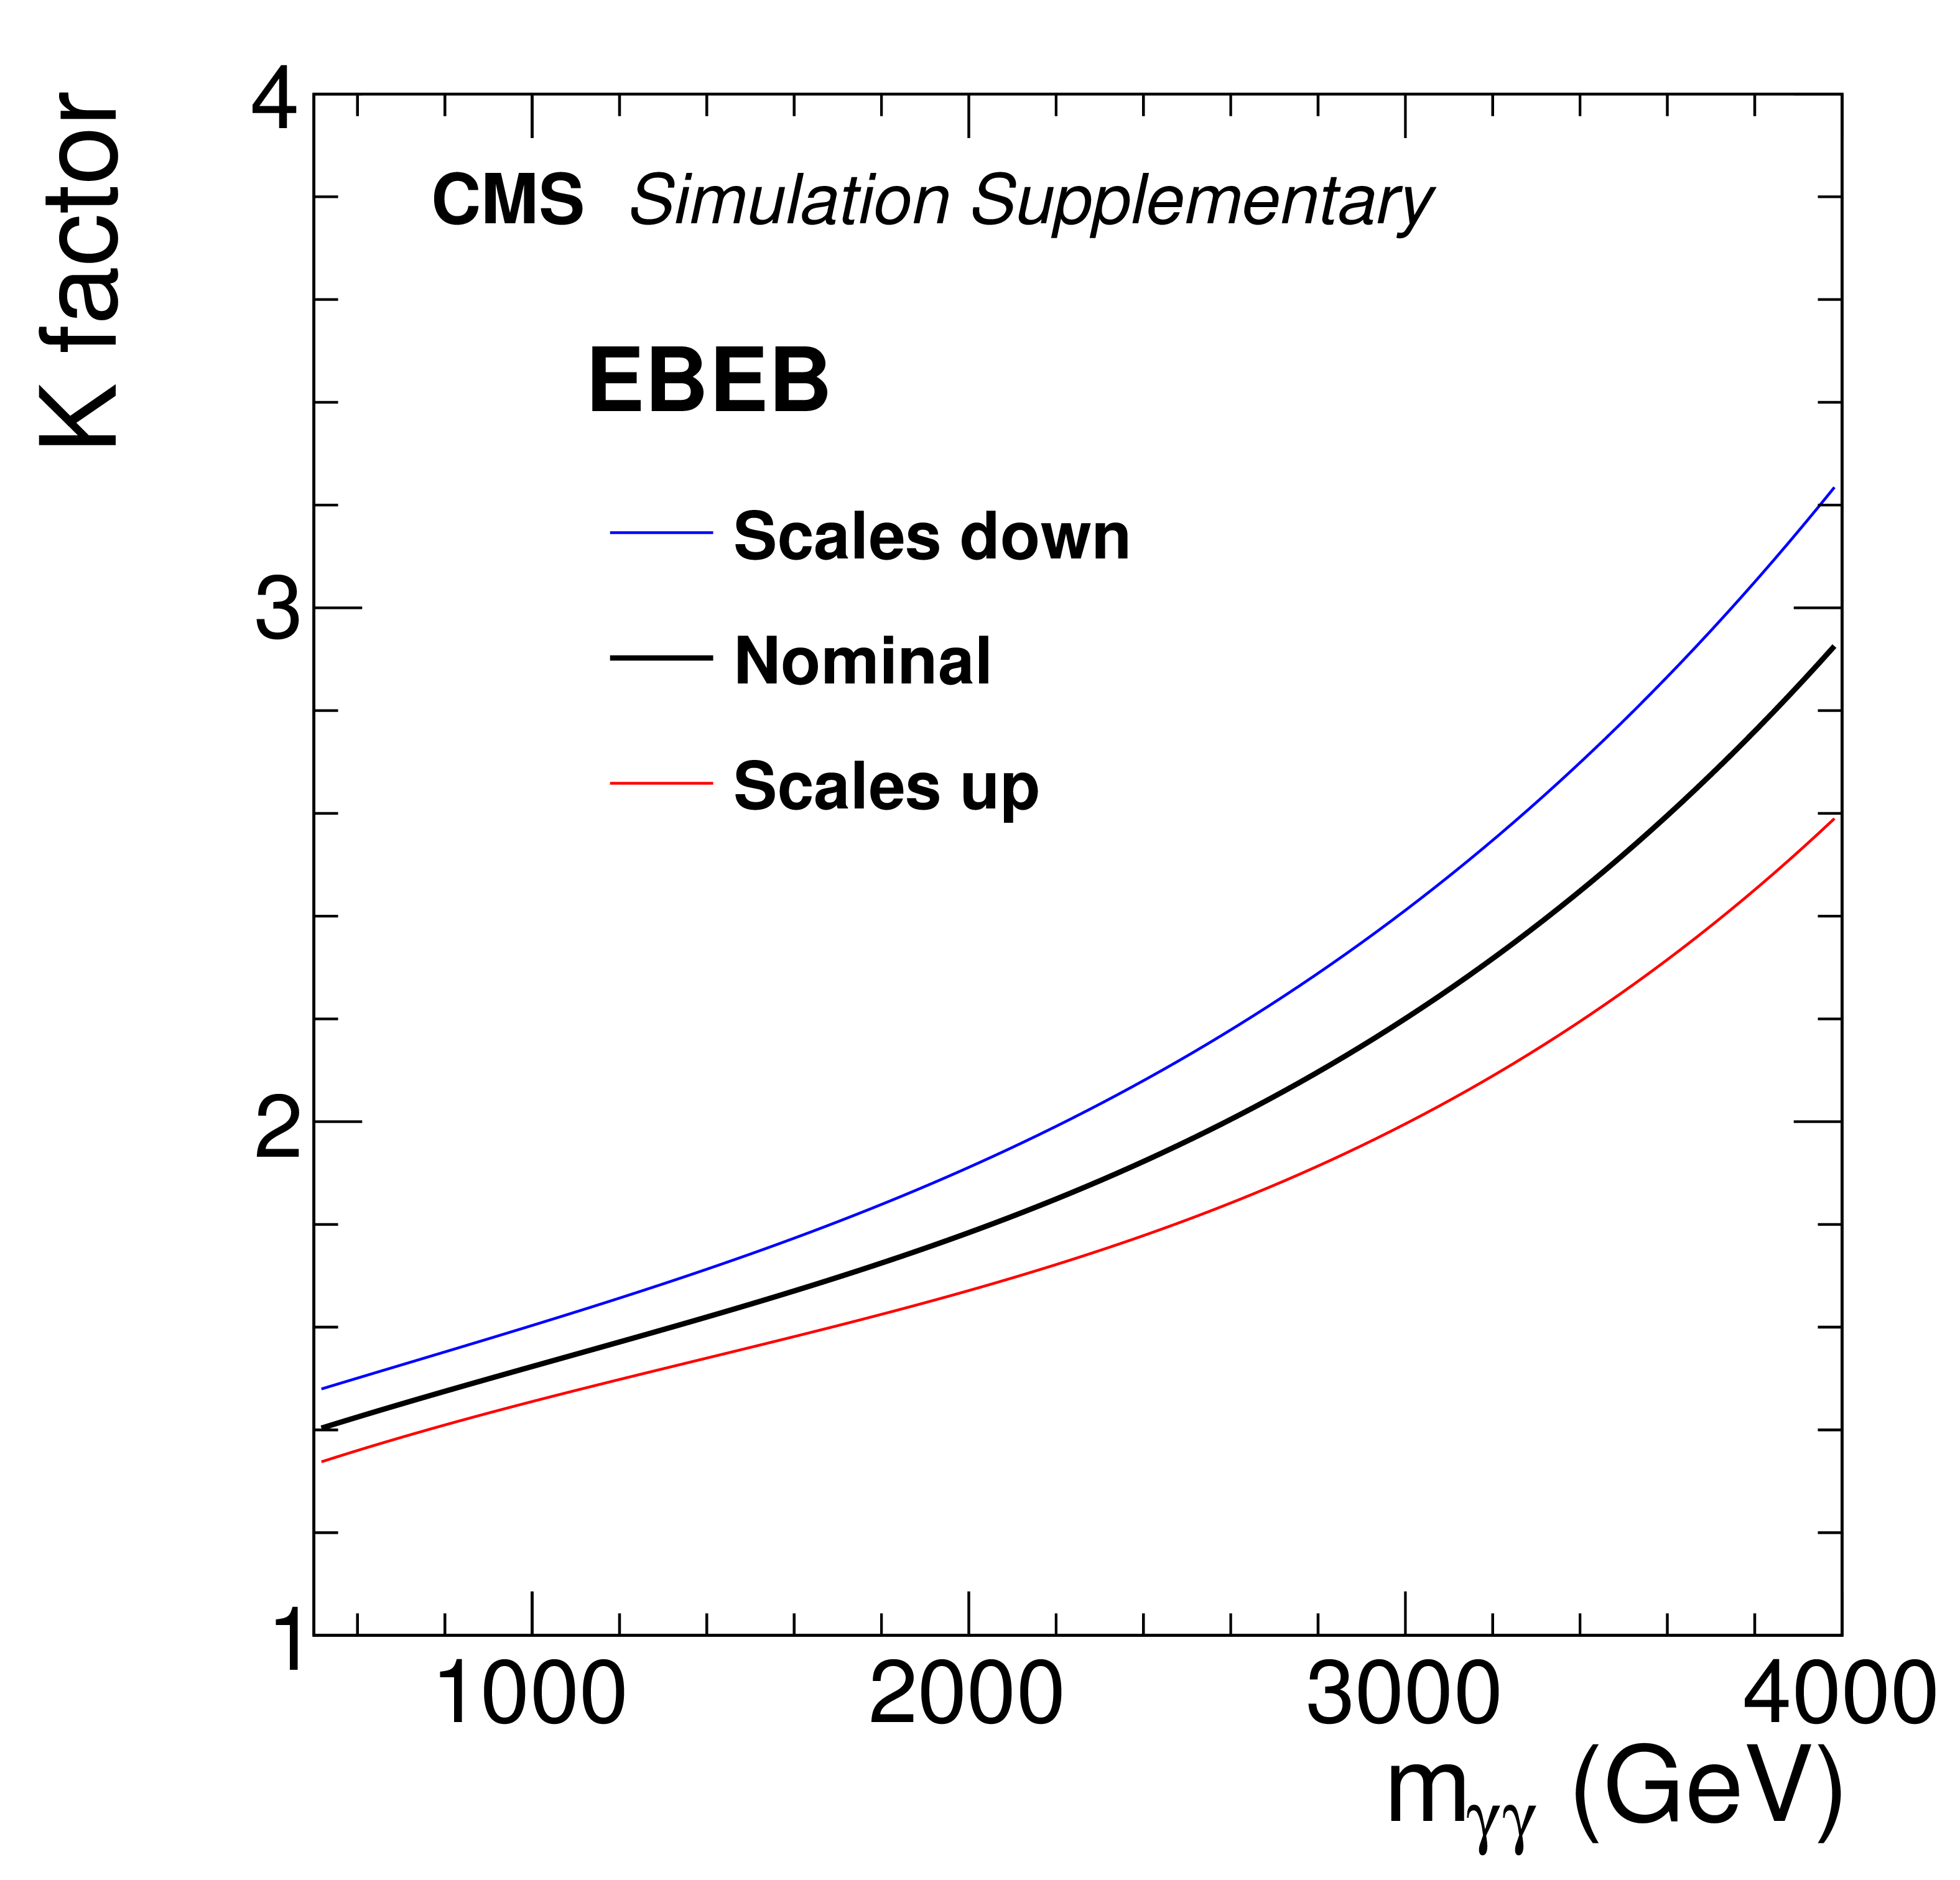
Additional Figure 5:
The $K$ factor as a function of $m_{\gamma \gamma}$ in the EBEB category. The $K$ factor is defined as the ratio of the predicted MCFM NNLO $ {\mathrm {p}} {\mathrm {p}}\to \gamma \gamma $ cross section to that of SHERPA. The renormalization and factorization scales have been set to $m_{\gamma \gamma}$ (black) and varied simultaneously by factors of 0.5 (blue) and 2.0 (red). |

png pdf |
Additional Figure 6:
The $K$ factor as a function of $m_{\gamma \gamma}$ in the EBEE category. The $K$ factor is defined as the ratio of the predicted MCFM NNLO $ {\mathrm {p}} {\mathrm {p}}\to \gamma \gamma $ cross section to that of SHERPA. The renormalization and factorization scales have been set to $m_{\gamma \gamma}$ (black) and varied simultaneously by factors of 0.5 (blue) and 2.0 (red). |
| References | ||||
| 1 | E. Witten | Dynamical breaking of supersymmetry | NPB 188 (1981) 513 | |
| 2 | S. Dimopoulos and H. Georgi | Softly broken supersymmetry and SU(5) | NPB 193 (1981) 150 | |
| 3 | N. Arkani-Hamed, S. Dimopoulos, and G. R. Dvali | The hierarchy problem and new dimensions at a millimeter | PLB 429 (1998) 263 | hep-ph/9803315 |
| 4 | I. Antoniadis, N. Arkani-Hamed, S. Dimopoulos, and G. R. Dvali | New dimensions at a millimeter to a fermi and superstrings at a TeV | PLB 436 (1998) 257 | hep-ph/9804398 |
| 5 | N. Arkani-Hamed, S. Dimopoulos, and G. R. Dvali | Phenomenology, astrophysics and cosmology of theories with submillimeter dimensions and TeV scale quantum gravity | PRD 59 (1999) 086004 | hep-ph/9807344 |
| 6 | L. Randall and R. Sundrum | A large mass hierarchy from a small extra dimension | PRL 83 (1999) 3370 | hep-ph/9905221 |
| 7 | L. Randall and R. Sundrum | An alternative to compactification | PRL 83 (1999) 4690 | hep-th/9906064 |
| 8 | G. F. Giudice and M. McCullough | A clockwork theory | JHEP 02 (2017) 036 | 1610.07962 |
| 9 | I. Antoniadis, S. Dimopoulos, and A. Giveon | Little string theory at a TeV | JHEP 05 (2001) 055 | hep-th/0103033 |
| 10 | I. Antoniadis, A. Arvanitaki, S. Dimopoulos, and A. Giveon | Phenomenology of TeV little string theory from holography | PRL 108 (2012) 081602 | 1102.4043 |
| 11 | K. Choi and S. H. Im | Realizing the relaxion from multiple axions and its UV completion with high scale supersymmetry | JHEP 01 (2016) 149 | 1511.00132 |
| 12 | D. E. Kaplan and R. Rattazzi | Large field excursions and approximate discrete symmetries from a clockwork axion | PRD 93 (2016) 085007 | 1511.01827 |
| 13 | M. Baryakhtar | Graviton phenomenology of linear dilaton geometries | PRD 85 (2012) 125019 | 1202.6674 |
| 14 | G. F. Giudice et al. | Clockwork/linear dilaton: structure and phenomenology | JHEP 06 (2018) 009 | 1711.08437 |
| 15 | G. C. Branco et al. | Theory and phenomenology of two-Higgs-doublet models | PR 516 (2012) 1 | 1106.0034 |
| 16 | T. D. Lee | A theory of spontaneous $ T $ violation | PRD 8 (1973) 1226 | |
| 17 | N. Craig, J. Galloway, and S. Thomas | Searching for signs of the second Higgs doublet | 1305.2424 | |
| 18 | ATLAS Collaboration | Search for new phenomena in high-mass diphoton final states using 37 fb$^{-1}$ of proton--proton collisions collected at $ \sqrt{s}= $ 13 TeV with the ATLAS detector | PLB 775 (2017) 105 | 1707.04147 |
| 19 | CMS Collaboration | Search for high-mass diphoton resonances in proton-proton collisions at 13 TeV and combination with 8 TeV search | PLB 767 (2017) 147 | CMS-EXO-16-027 1609.02507 |
| 20 | ATLAS Collaboration | Search for resonances in diphoton events at $ \sqrt{s} = $ 13 TeV with the ATLAS detector | JHEP 09 (2016) 001 | 1606.03833 |
| 21 | CMS Collaboration | Search for resonant production of high-mass photon pairs in proton-proton collisions at $ \sqrt{s}= $ 8 and 13 TeV | PRL 117 (2016) 051802 | CMS-EXO-16-018 1606.04093 |
| 22 | ATLAS Collaboration | Search for high-mass diphoton resonances in pp collisions at $ \sqrt{s}= $ 8 TeV with the ATLAS detector | PRD 92 (2015) 032004 | 1504.05511 |
| 23 | CMS Collaboration | Search for diphoton resonances in the mass range from 150 to 850 GeV in pp collisions at $ \sqrt{s} = $ 8 TeV | PLB 750 (2015) 494 | CMS-HIG-14-006 1506.02301 |
| 24 | ATLAS Collaboration | Search for extra dimensions in diphoton events using proton-proton collisions recorded at $ \sqrt{s}= $ 7 TeV with the ATLAS detector at the LHC | New J. Phys. 15 (2013) 043007 | 1210.8389 |
| 25 | CMS Collaboration | Search for signatures of extra dimensions in the diphoton mass spectrum at the Large Hadron Collider | PRL 108 (2012) 111801 | CMS-EXO-11-038 1112.0688 |
| 26 | CDF Collaboration | Search for new dielectron resonances and Randall-Sundrum gravitons at the Collider Detector at Fermilab | PRL 107 (2011) 051801 | 1103.4650 |
| 27 | D0 Collaboration | Search for Randall-Sundrum gravitons in the dielectron and diphoton final states with 5.4 fb$^{-1}$ of data from $ {\mathrm{p}}\mathrm{\bar{p}} $ collisions at $ \sqrt{s}= $ 1.96 TeV | PRL 104 (2010) 241802 | 1004.1826 |
| 28 | CMS Collaboration | Performance of photon reconstruction and identification with the CMS detector in proton-proton collisions at $ \sqrt{s} = $ 8 TeV | JINST 10 (2015) P08010 | CMS-EGM-14-001 1502.02702 |
| 29 | CMS Collaboration | The CMS trigger system | JINST 12 (2017) P01020 | CMS-TRG-12-001 1609.02366 |
| 30 | CMS Collaboration | The CMS experiment at the CERN LHC | JINST 3 (2008) S08004 | CMS-00-001 |
| 31 | CMS Collaboration | Particle-flow reconstruction and global event description with the CMS detector | JINST 12 (2017) P10003 | CMS-PRF-14-001 1706.04965 |
| 32 | CMS Collaboration | Observation of the diphoton decay of the Higgs boson and measurement of its properties | EPJC 74 (2014) 3076 | CMS-HIG-13-001 1407.0558 |
| 33 | CMS Collaboration | Measurements of Higgs boson properties in the diphoton decay channel in proton-proton collisions at $ \sqrt{s} = $ 13 TeV | Submitted to \it JHEP | CMS-HIG-16-040 1804.02716 |
| 34 | T. Gleisberg et al. | Event generation with SHERPA 1.1 | JHEP 02 (2009) 007 | 0811.4622 |
| 35 | H.-L. Lai et al. | New parton distributions for collider physics | PRD 82 (2010) 074024 | 1007.2241 |
| 36 | J. Gao et al. | CT10 next-to-next-to-leading order global analysis of QCD | PRD 89 (2014) 033009 | 1302.6246 |
| 37 | T. Gleisberg et al. | Helicity formalism for spin-2 particles | JHEP 09 (2003) 001 | hep-ph/0306182 |
| 38 | G. F. Giudice, R. Rattazzi, and J. D. Wells | Quantum gravity and extra dimensions at high-energy colliders | NPB 544 (1999) 3 | hep-ph/9811291 |
| 39 | T. Han, J. D. Lykken, and R.-J. Zhang | On Kaluza-Klein states from large extra dimensions | PRD 59 (1999) 105006 | hep-ph/9811350 |
| 40 | J. L. Hewett | Indirect collider signals for extra dimensions | PRL 82 (1999) 4765 | hep-ph/9811356 |
| 41 | GEANT4 Collaboration | GEANT4---a simulation toolkit | NIMA 506 (2003) 250 | |
| 42 | T. Sjostrand et al. | An introduction to PYTHIA 8.2 | CPC 191 (2015) 159 | 1410.3012 |
| 43 | NNPDF Collaboration | Parton distributions with LHC data | NPB 867 (2013) 244 | 1207.1303 |
| 44 | CMS Collaboration | Event generator tunes obtained from underlying event and multiparton scattering measurements | EPJC 76 (2016) 155 | CMS-GEN-14-001 1512.00815 |
| 45 | S. Hoeche, S. Schumann, and F. Siegert | Hard photon production and matrix-element parton-shower merging | PRD 81 (2010) 034026 | 0912.3501 |
| 46 | J. M. Campbell, R. K. Ellis, Y. Li, and C. Williams | Predictions for diphoton production at the LHC through NNLO in QCD | JHEP 07 (2016) 148 | 1603.02663 |
| 47 | T. Binoth, J. P. Guillet, E. Pilon, and M. Werlen | A full next-to-leading order study of direct photon pair production in hadronic collisions | EPJC 16 (2000) 311 | hep-ph/9911340 |
| 48 | CMS Collaboration | CMS luminosity measurements for the 2016 data taking period | CMS-PAS-LUM-17-001 | CMS-PAS-LUM-17-001 |
| 49 | A. D. Martin, W. J. Stirling, R. S. Thorne, and G. Watt | Parton distributions for the LHC | EPJC 63 (2009) 189 | 0901.0002 |
| 50 | S. Alekhin et al. | The PDF4LHC Working Group Interim Report | 1101.0536 | |
| 51 | M. Botje et al. | The PDF4LHC Working Group Interim Recommendations | 1101.0538 | |
| 52 | T. Junk | Confidence level computation for combining searches with small statistics | NIMA 434 (1999) 435 | hep-ex/9902006 |
| 53 | A. L. Read | Presentation of search results: The CLs technique | JPG 28 (2002) 2693 | |
| 54 | ATLAS and CMS Collaborations | Procedure for the LHC Higgs boson search combination in Summer 2011 | CMS-NOTE-2011-005 | |
| 55 | G. Cowan, K. Cranmer, E. Gross, and O. Vitells | Asymptotic formulae for likelihood-based tests of new physics | EPJC 71 (2011) 1554 | 1007.1727 |
| 56 | N. Metropolis et al. | Equation of state calculations by fast computing machines | J. Chem. Phys. 21 (1953) 1087 | |
|
|
Compact Muon Solenoid LHC, CERN |
|

|

|

|

|

|