

Compact Muon Solenoid
LHC, CERN
| CMS-EXO-17-018 ; CERN-EP-2018-203 | ||
| Search for long-lived particles with displaced vertices in multijet events in proton-proton collisions at $\sqrt{s}= $ 13 TeV | ||
| CMS Collaboration | ||
| 9 August 2018 | ||
| Phys. Rev. D 98 (2018) 092011 | ||
| Abstract: Results are reported from a search for long-lived particles in proton-proton collisions at $\sqrt{s} = $ 13 TeV delivered by the CERN LHC and collected by the CMS experiment. The data sample, which was recorded during 2015 and 2016, corresponds to an integrated luminosity of 38.5 fb$^{-1}$. This search uses benchmark signal models in which long-lived particles are pair-produced and each decays into two or more quarks, leading to a signal with multiple jets and two displaced vertices composed of many tracks. No events with two well-separated high-track-multiplicity vertices are observed. Upper limits are placed on models of $R$-parity violating supersymmetry in which the long-lived particles are neutralinos or gluinos decaying solely into multijet final states or top squarks decaying solely into dijet final states. For neutralino, gluino, or top squark masses between 800 and 2600 GeV and mean proper decay lengths between 1 and 40 mm, the analysis excludes cross sections above 0.3 fb at 95% confidence level. Gluino and top squark masses are excluded below 2200 and 1400 GeV, respectively, for mean proper decay lengths between 0.6 and 80 mm. A method is provided for extending the results to other models with pair-produced long-lived particles. | ||
| Links: e-print arXiv:1808.03078 [hep-ex] (PDF) ; CDS record ; inSPIRE record ; HepData record ; CADI line (restricted) ; | ||
| Figures | |

png pdf |
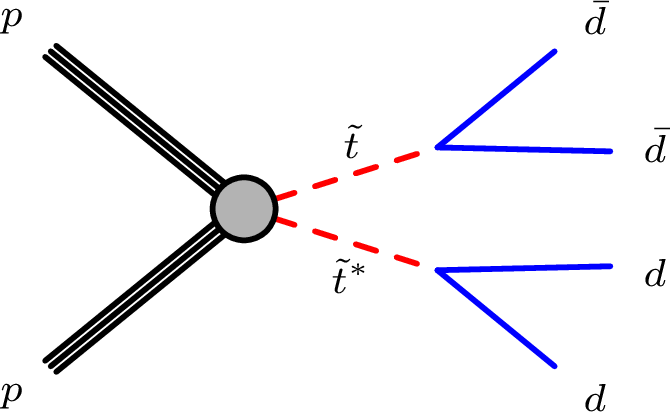
Figure 1:
Diagrams for the multijet (left) and dijet (right) benchmark signal models used in this analysis. In the multijet signal model, long-lived neutralinos ($\tilde{\chi}_0$) or gluinos ($\tilde{\mathrm{g}}$) decay into top, bottom, and strange antiquarks, via a virtual top squark ($\tilde{\mathrm{t}}$). In the dijet signal model, long-lived top squarks decay into two down antiquarks. The charge conjugate processes are also considered. |

png pdf |
Figure 1-a:
Diagram for the multijet dijet benchmark signal model used in this analysis. Long-lived neutralinos ($\tilde{\chi}_0$) or gluinos ($\tilde{\mathrm{g}}$) decay into top, bottom, and strange antiquarks, via a virtual top squark ($\tilde{\mathrm{t}}$). The charge conjugate processes are also considered. |
png pdf |
Figure 1-b:
Diagram for the multijet dijet benchmark signal model used in this analysis. Long-lived top squarks decay into two down antiquarks. The charge conjugate processes are also considered. |
png pdf |
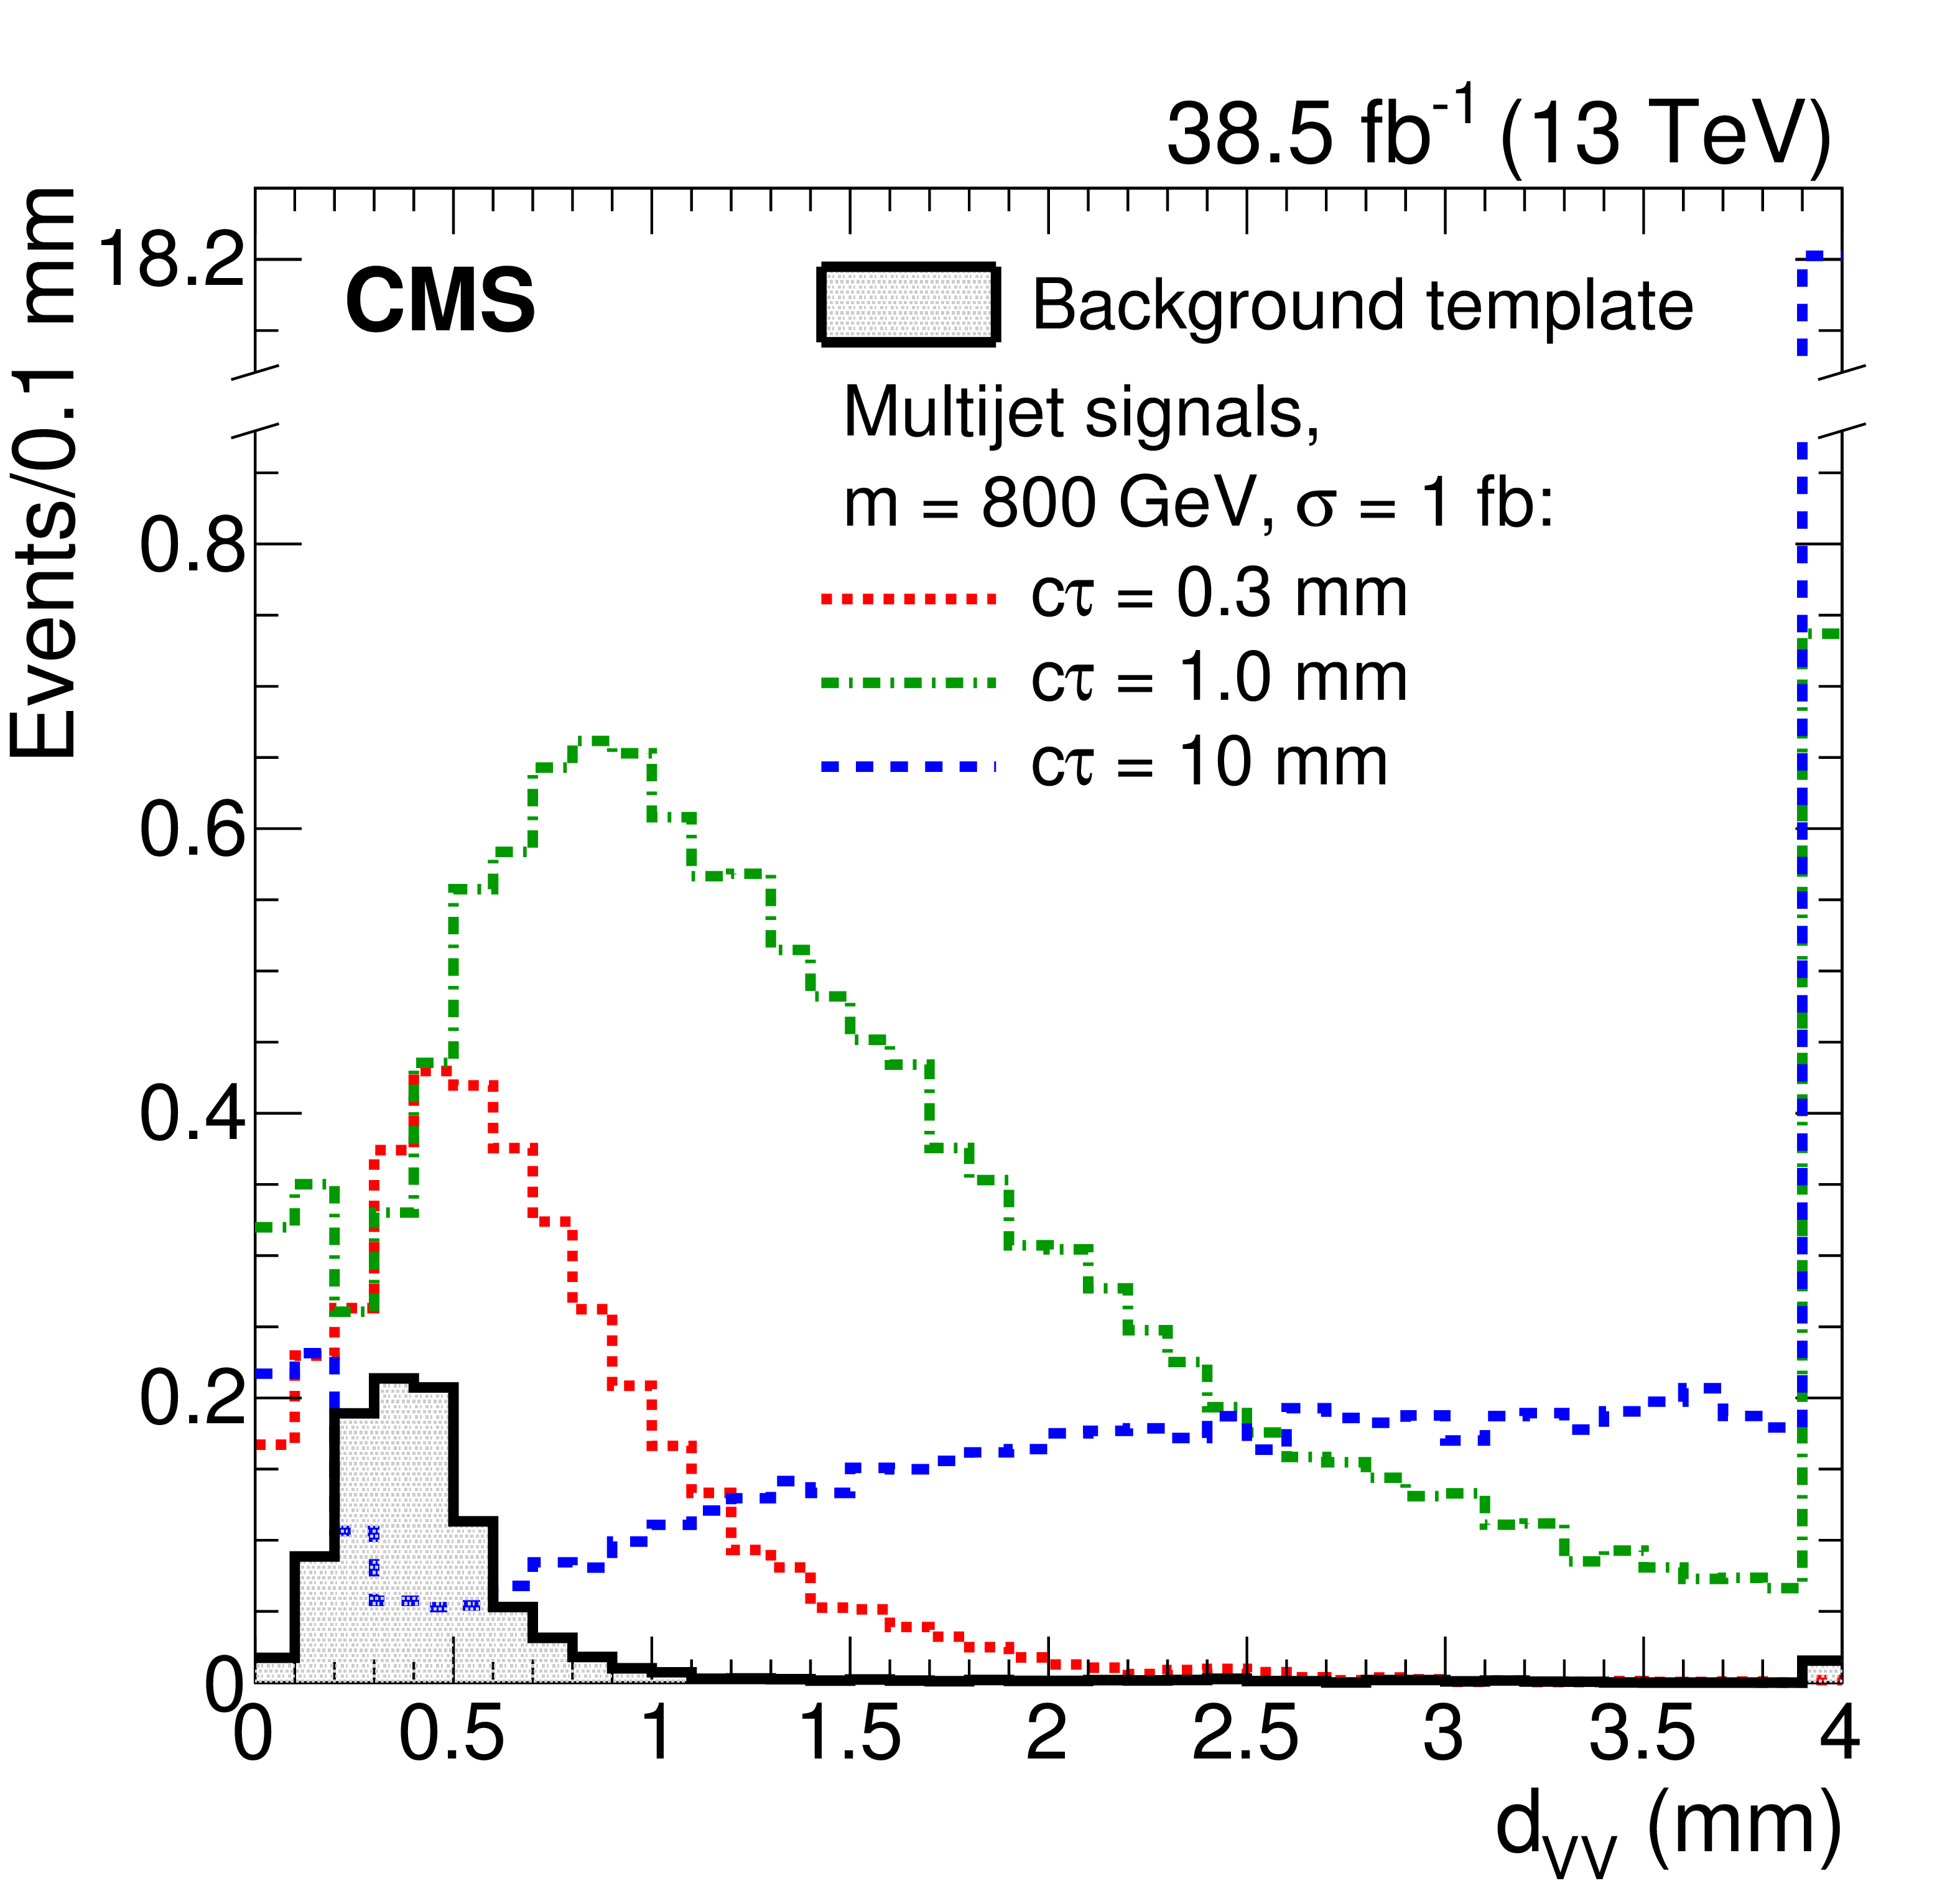
Figure 2:
Distribution of the distance between vertices in the $x$-$y$ plane, ${d_{\mathrm {VV}}}$, for simulated multijet signals with $m = $ 800 GeV, production cross section 1 fb, and $c\tau = $ 0.3, 1.0, and 10 mm, with the background template overlaid. All vertex and event selection criteria have been applied. The last bin includes the overflow events. |

png pdf |
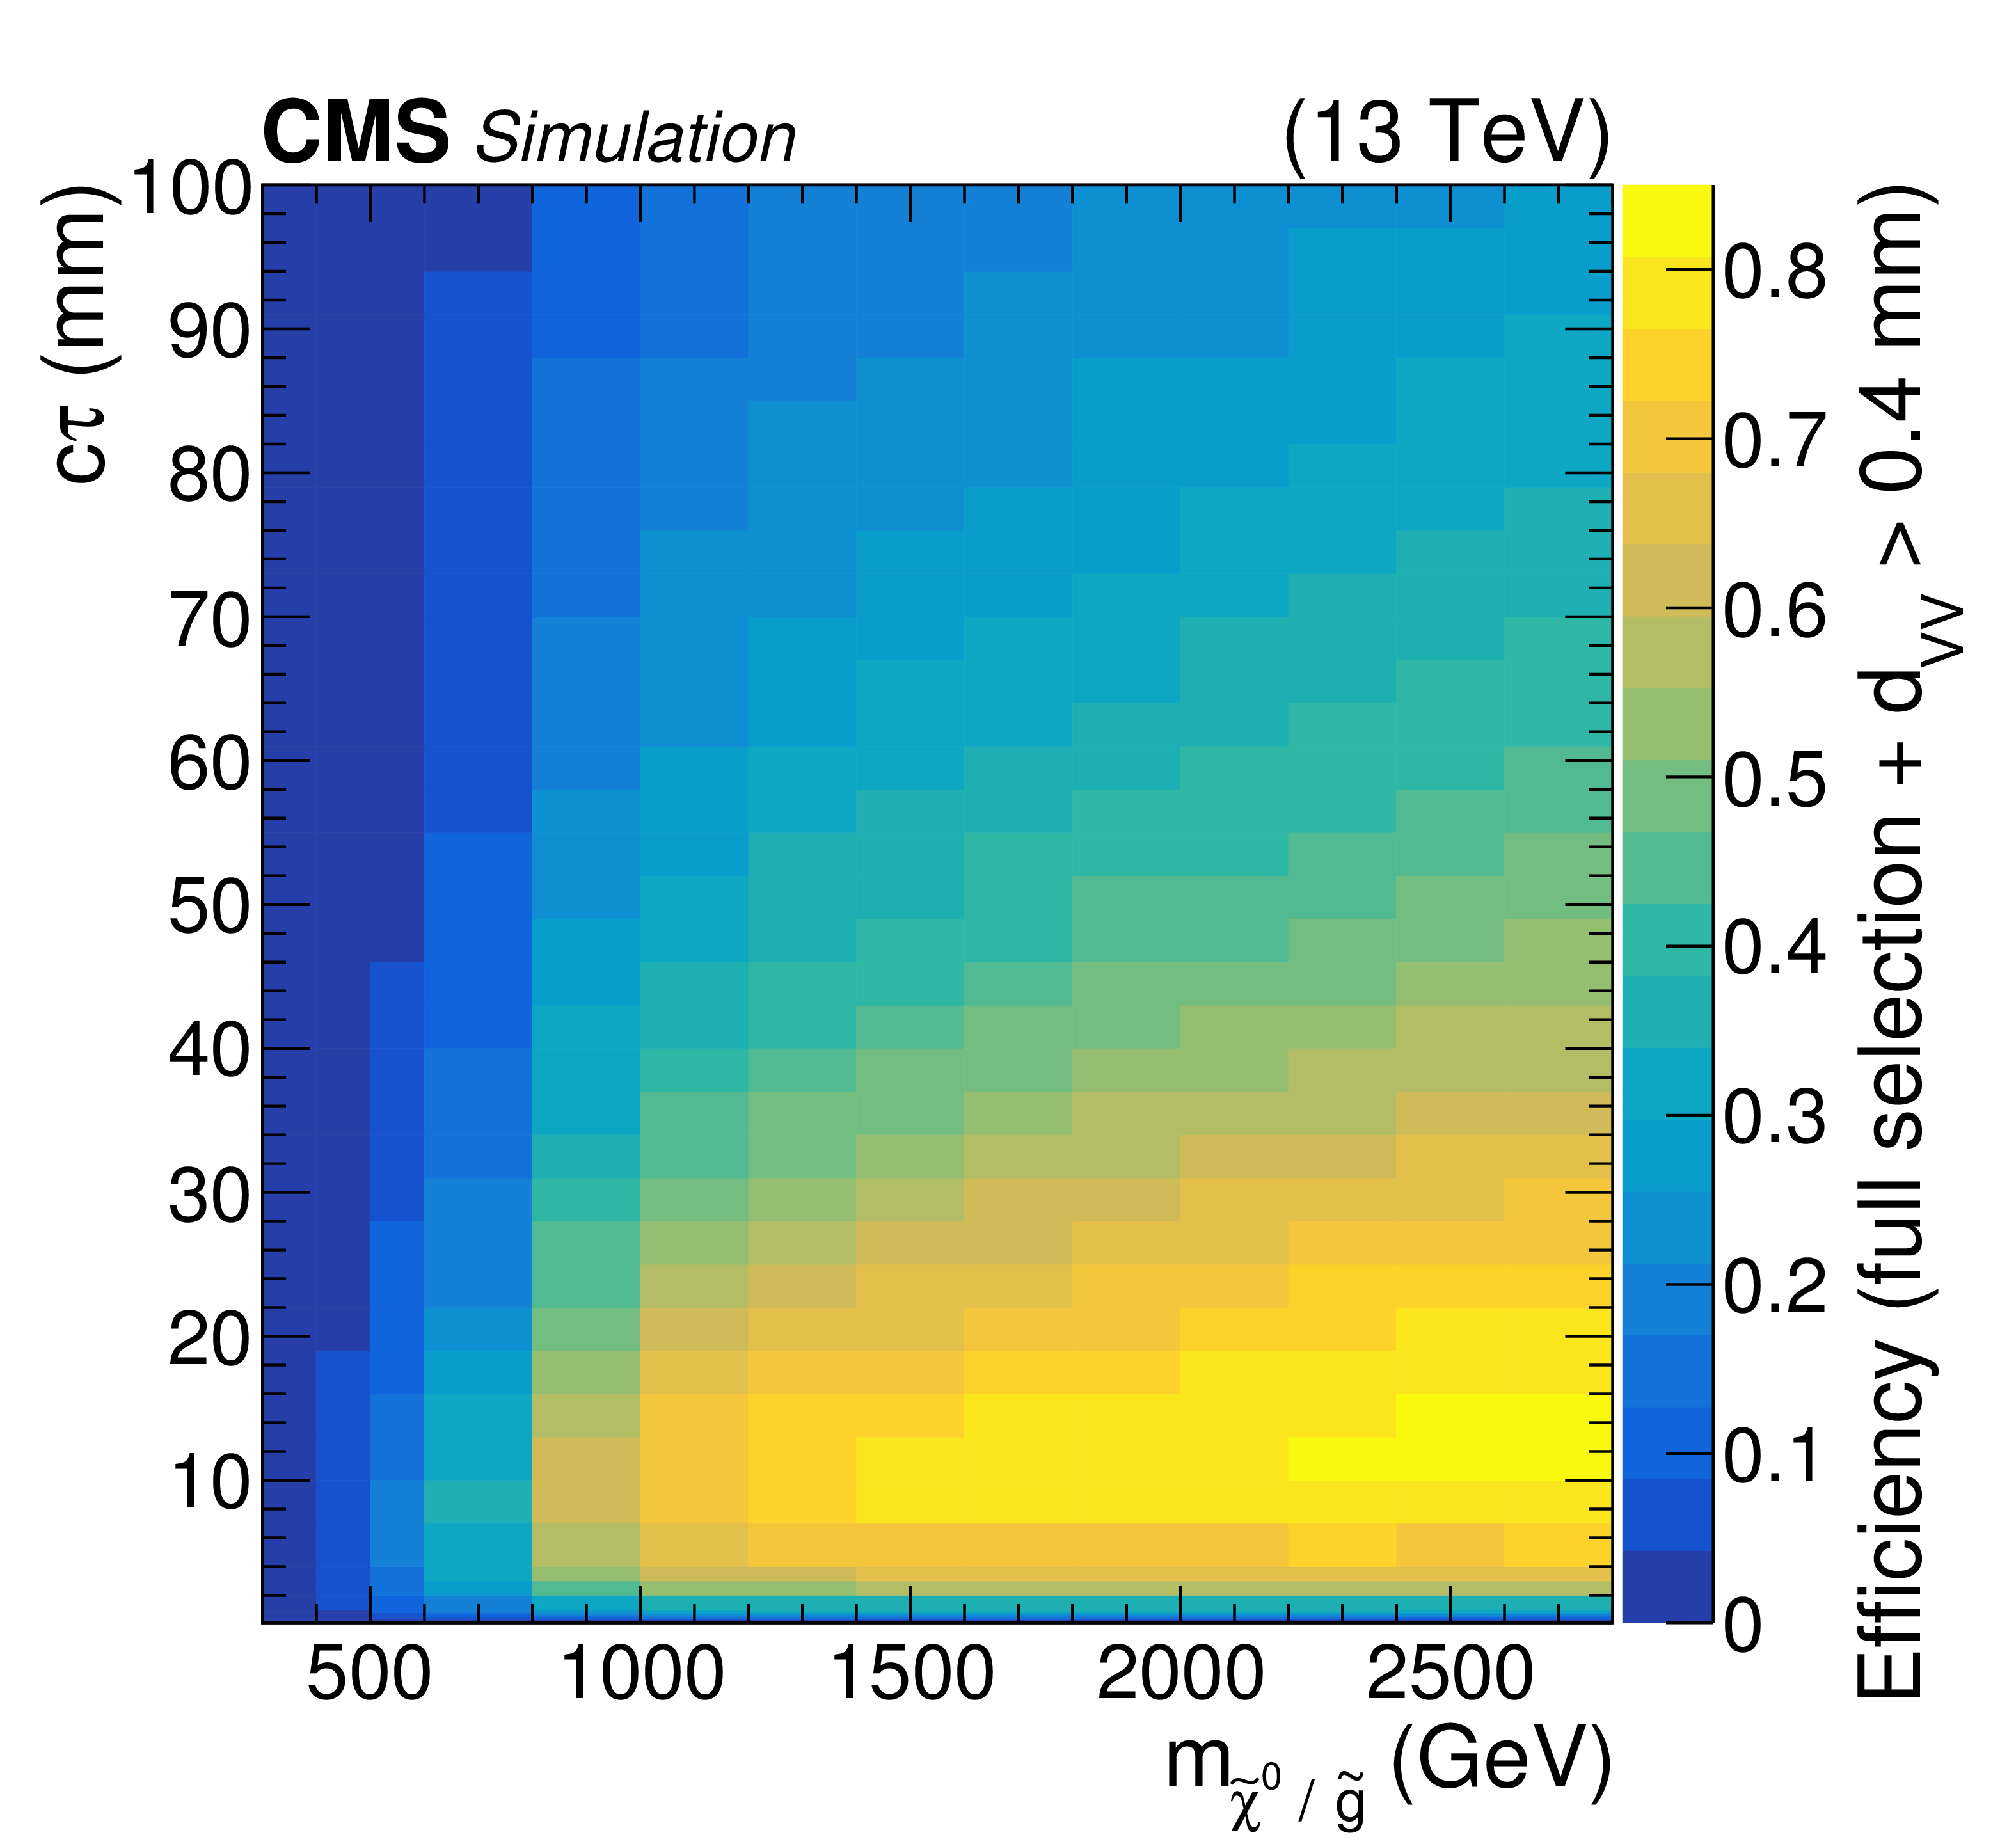
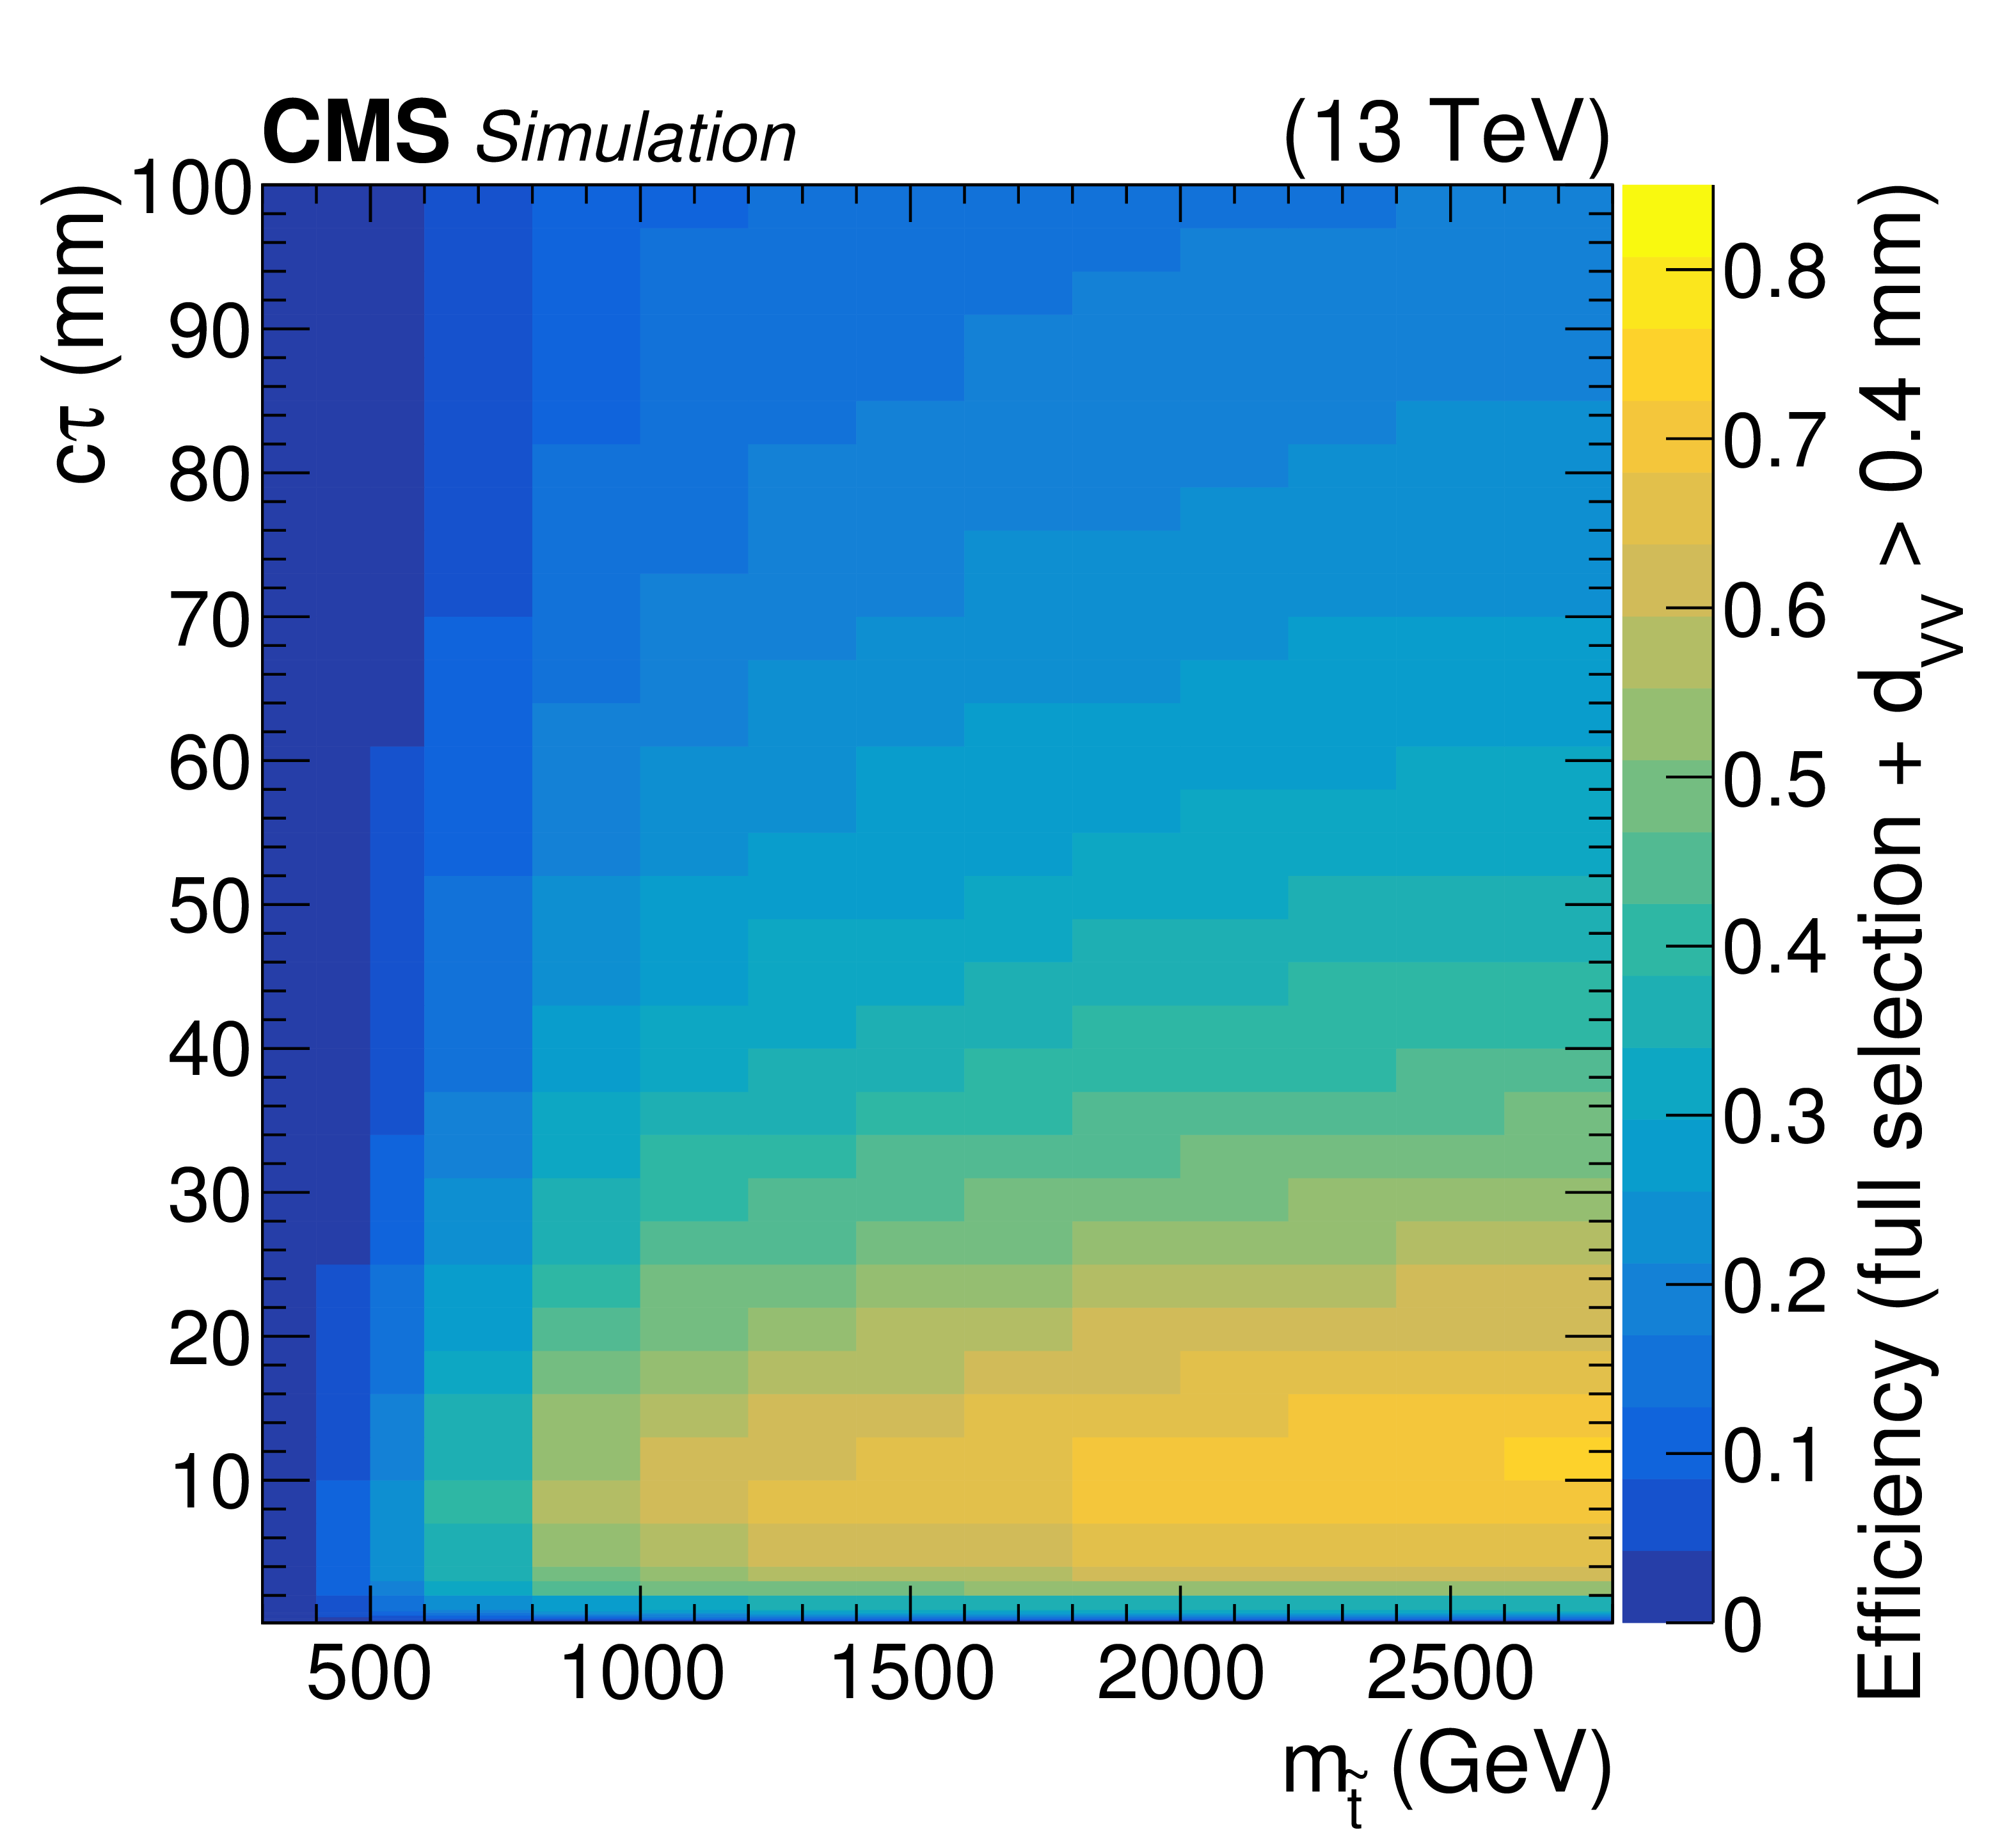
Figure 3:
Signal efficiency as a function of signal mass and lifetime, for the multijet (left) and dijet (right) signal samples. All vertex and event selection criteria have been applied, as well as the requirement $ {d_{\mathrm {VV}}} > $ 0.4 mm. |
png pdf |
Figure 3-a:
Signal efficiency as a function of signal mass and lifetime, for the multijet signal sample. All vertex and event selection criteria have been applied, as well as the requirement $ {d_{\mathrm {VV}}} > $ 0.4 mm. |
png pdf |
Figure 3-b:
Signal efficiency as a function of signal mass and lifetime, for the dijet signal sample. All vertex and event selection criteria have been applied, as well as the requirement $ {d_{\mathrm {VV}}} > $ 0.4 mm. |
png pdf |
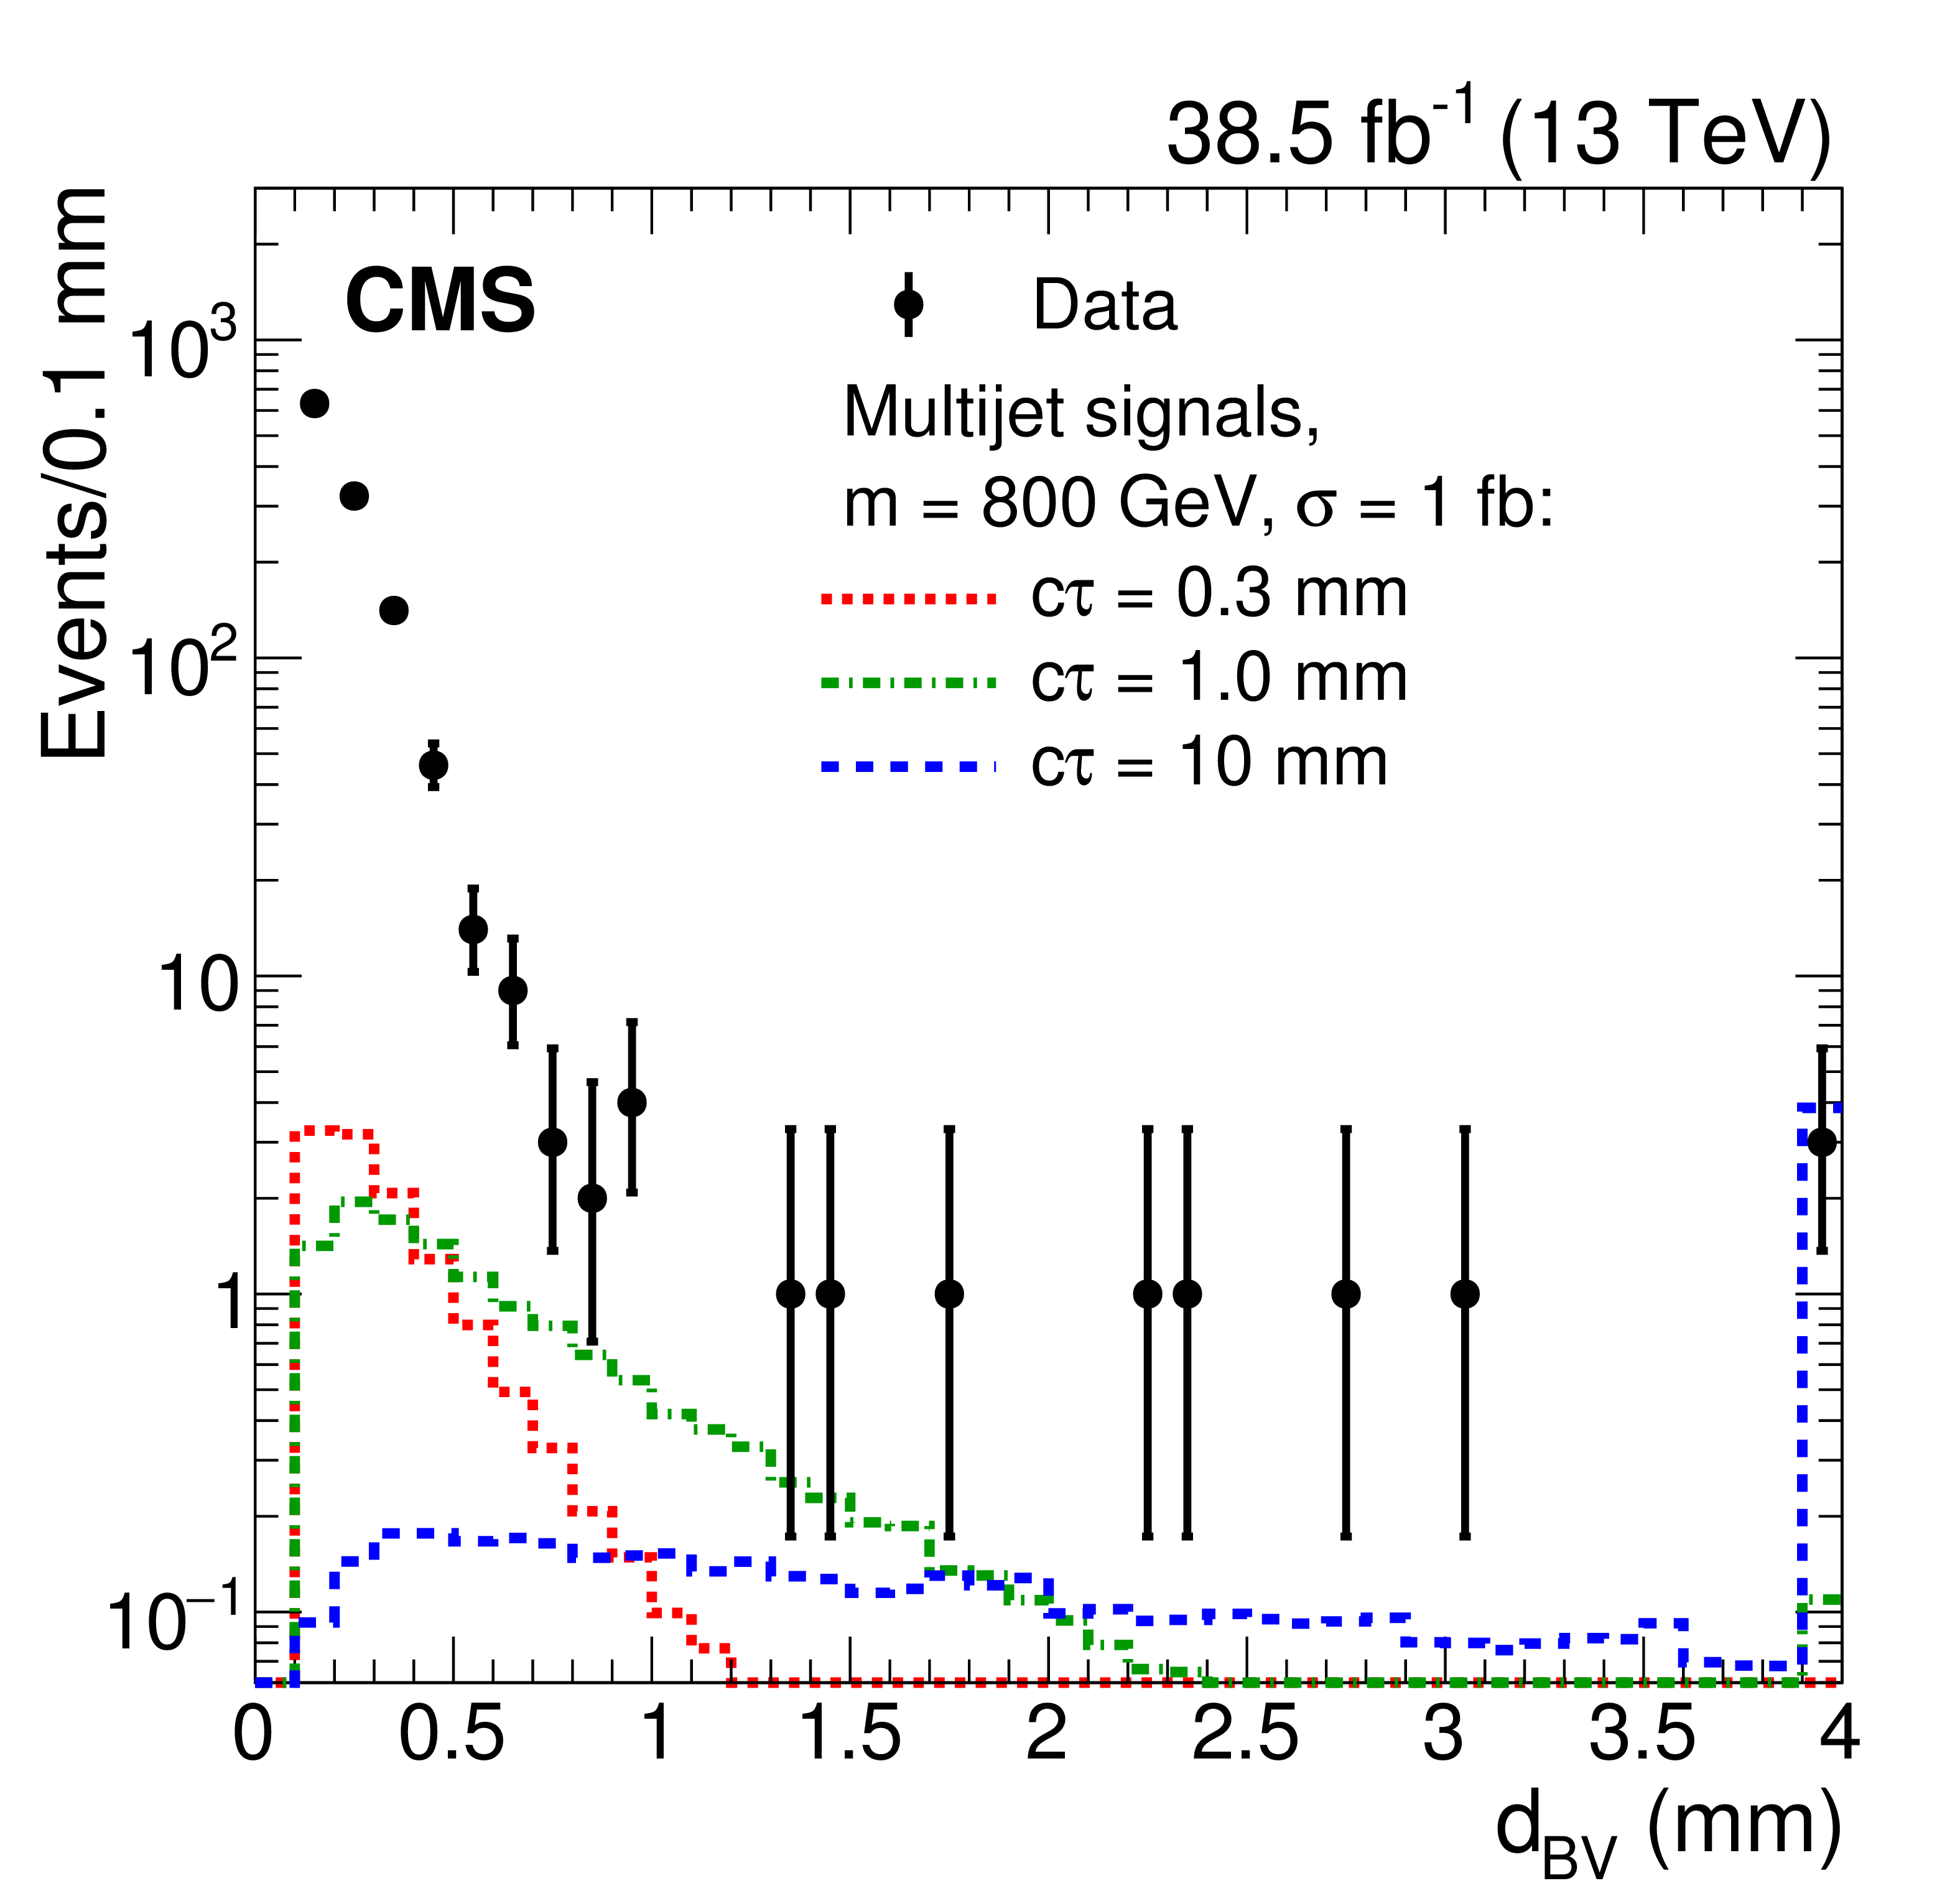
Figure 4:
Distribution of ${d_{\mathrm {BV}}}$ in $\geq $5-track one-vertex events for data and simulated multijet signals with $m = $ 800 GeV, production cross section 1 fb, and $c\tau = $ 0.3, 1.0, and 10 mm. Event preselection and vertex selection criteria have been applied. The last bin includes the overflow events. |
png pdf |
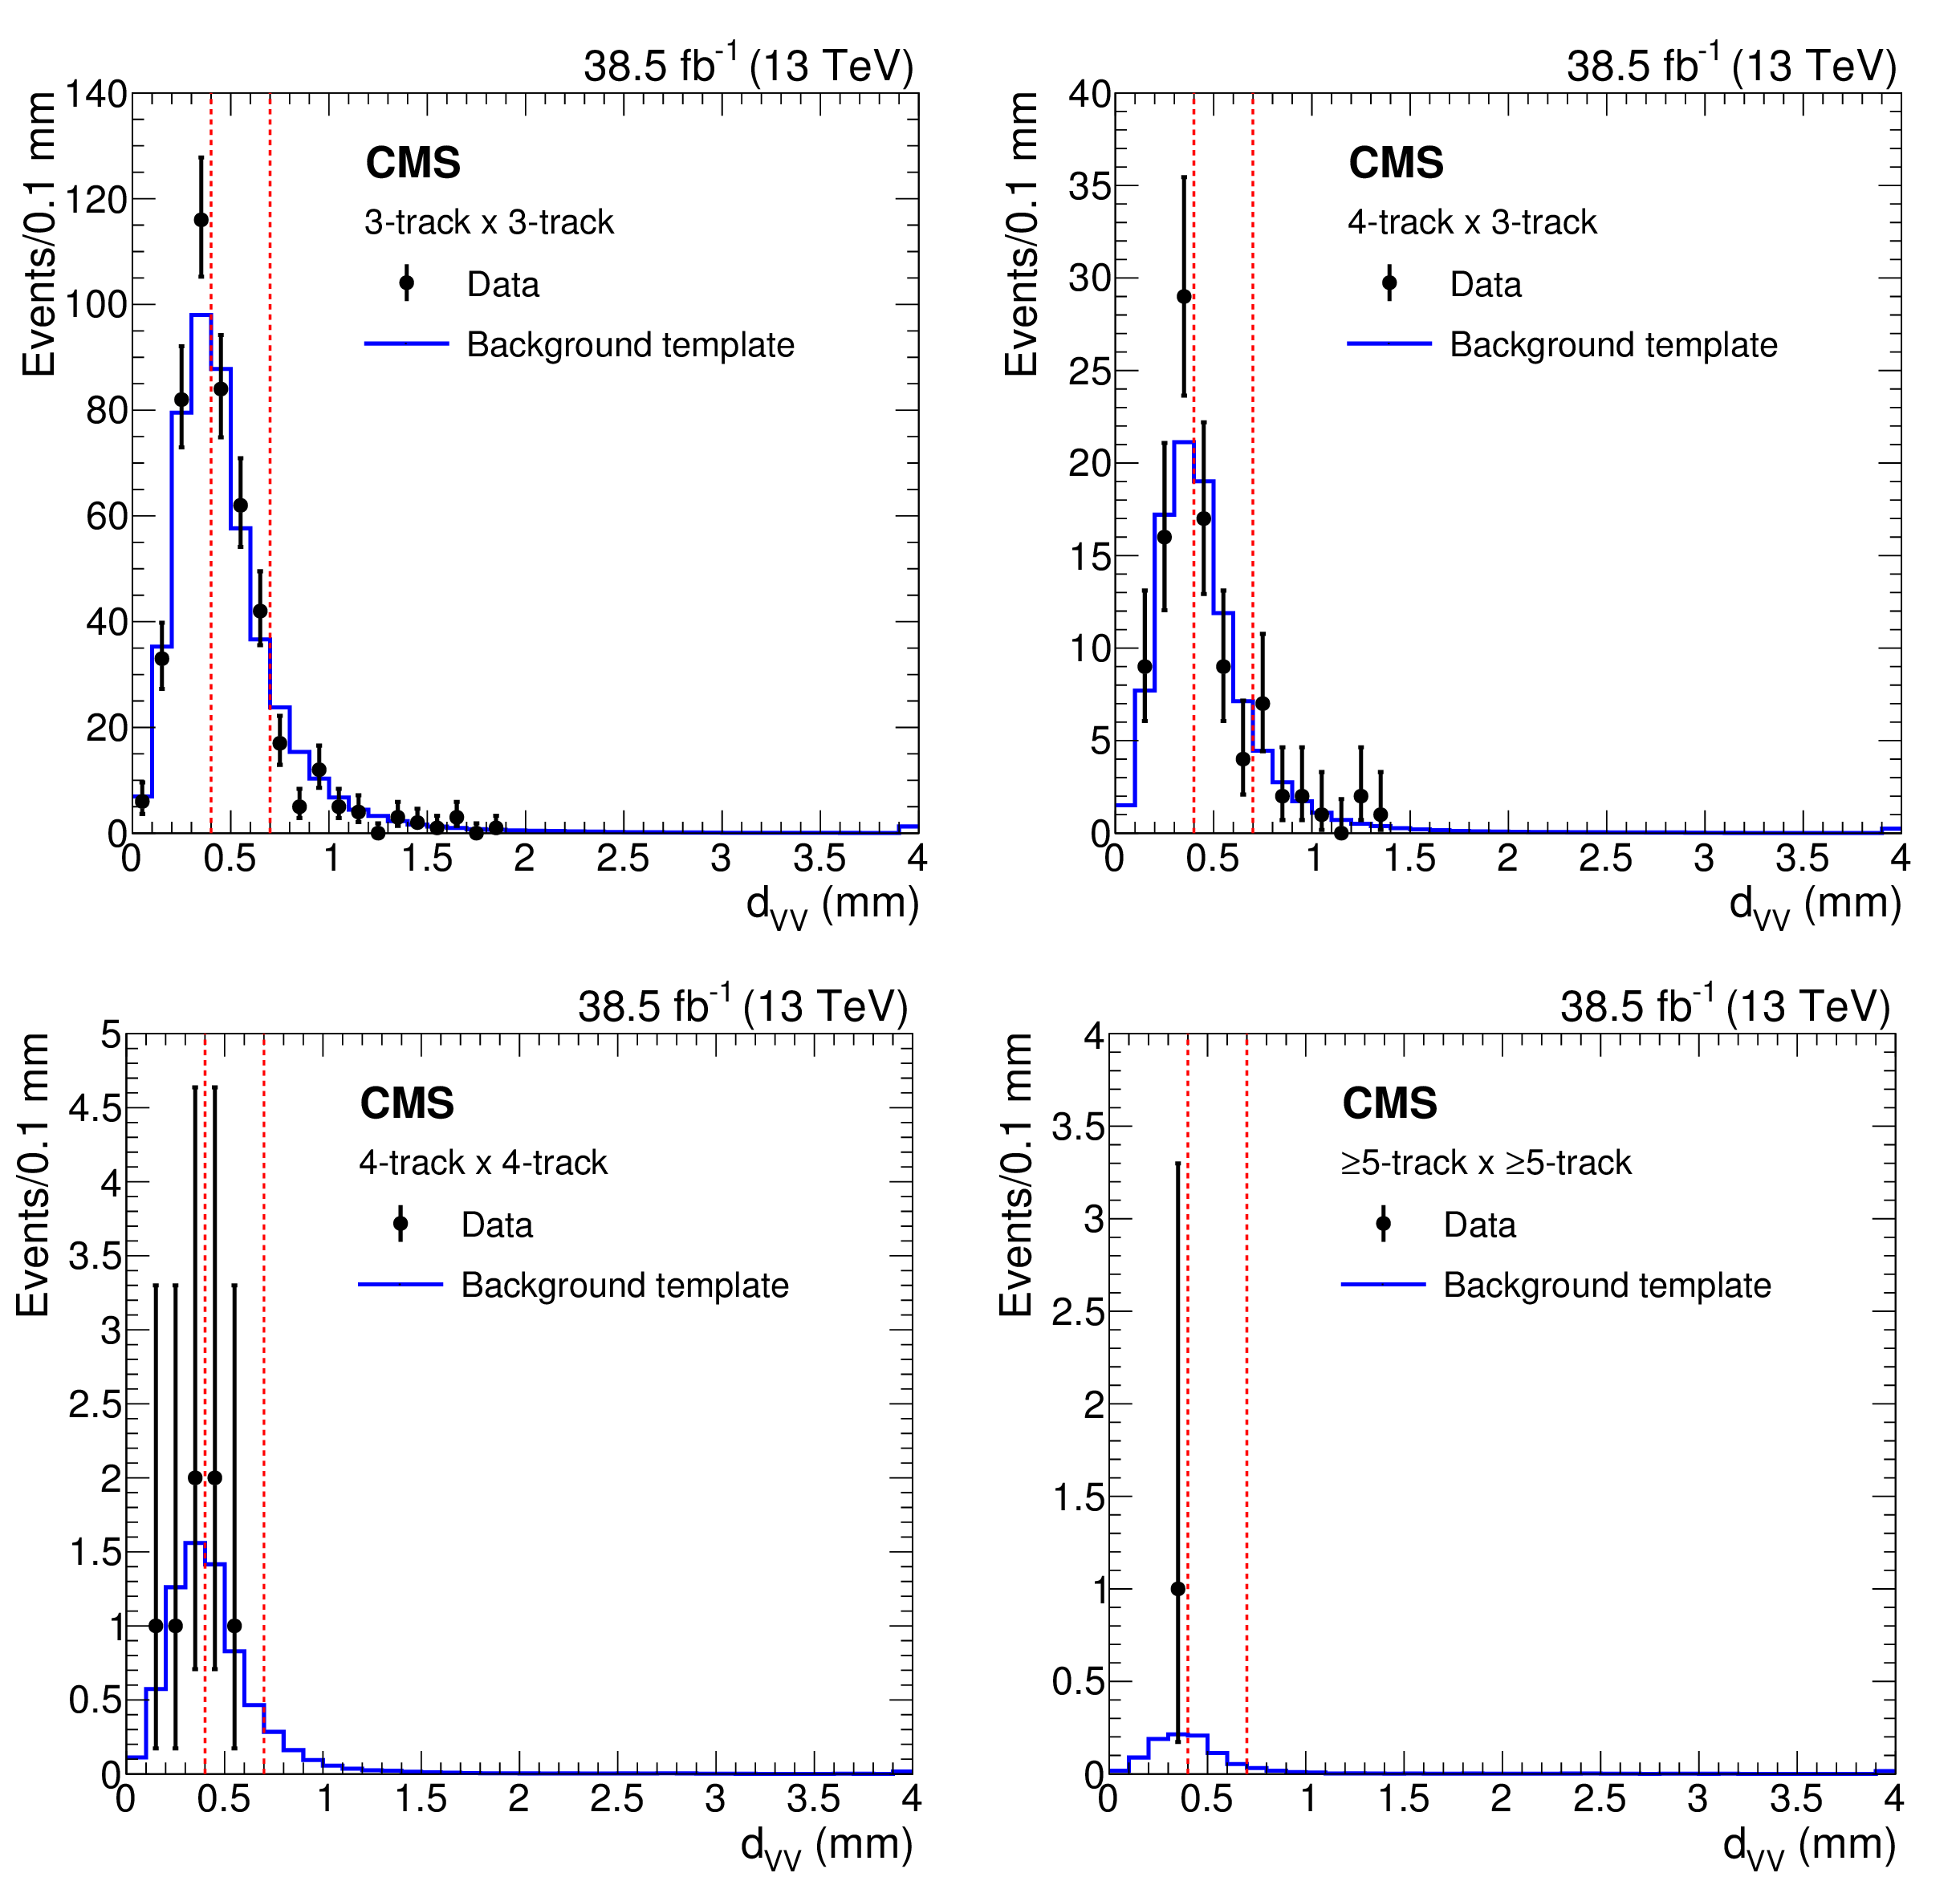
Figure 5:
Distribution of the distance between vertices in the $x$-$y$ plane in two-vertex events. The points show the data (${d_{\mathrm {VV}}}$), and the solid lines show the background template (${d_{\mathrm {VV}}^{\,\mathrm {C}}}$) normalized to the data, for events with two 3-track vertices (upper left), one 4-track vertex and one 3-track vertex (upper right), two 4-track vertices (lower left), and two $\geq $5-track vertices (lower right). In each plot, the last bin includes the overflow events. The dotted lines indicate the boundaries between the three bins used in the fit. |
png pdf |
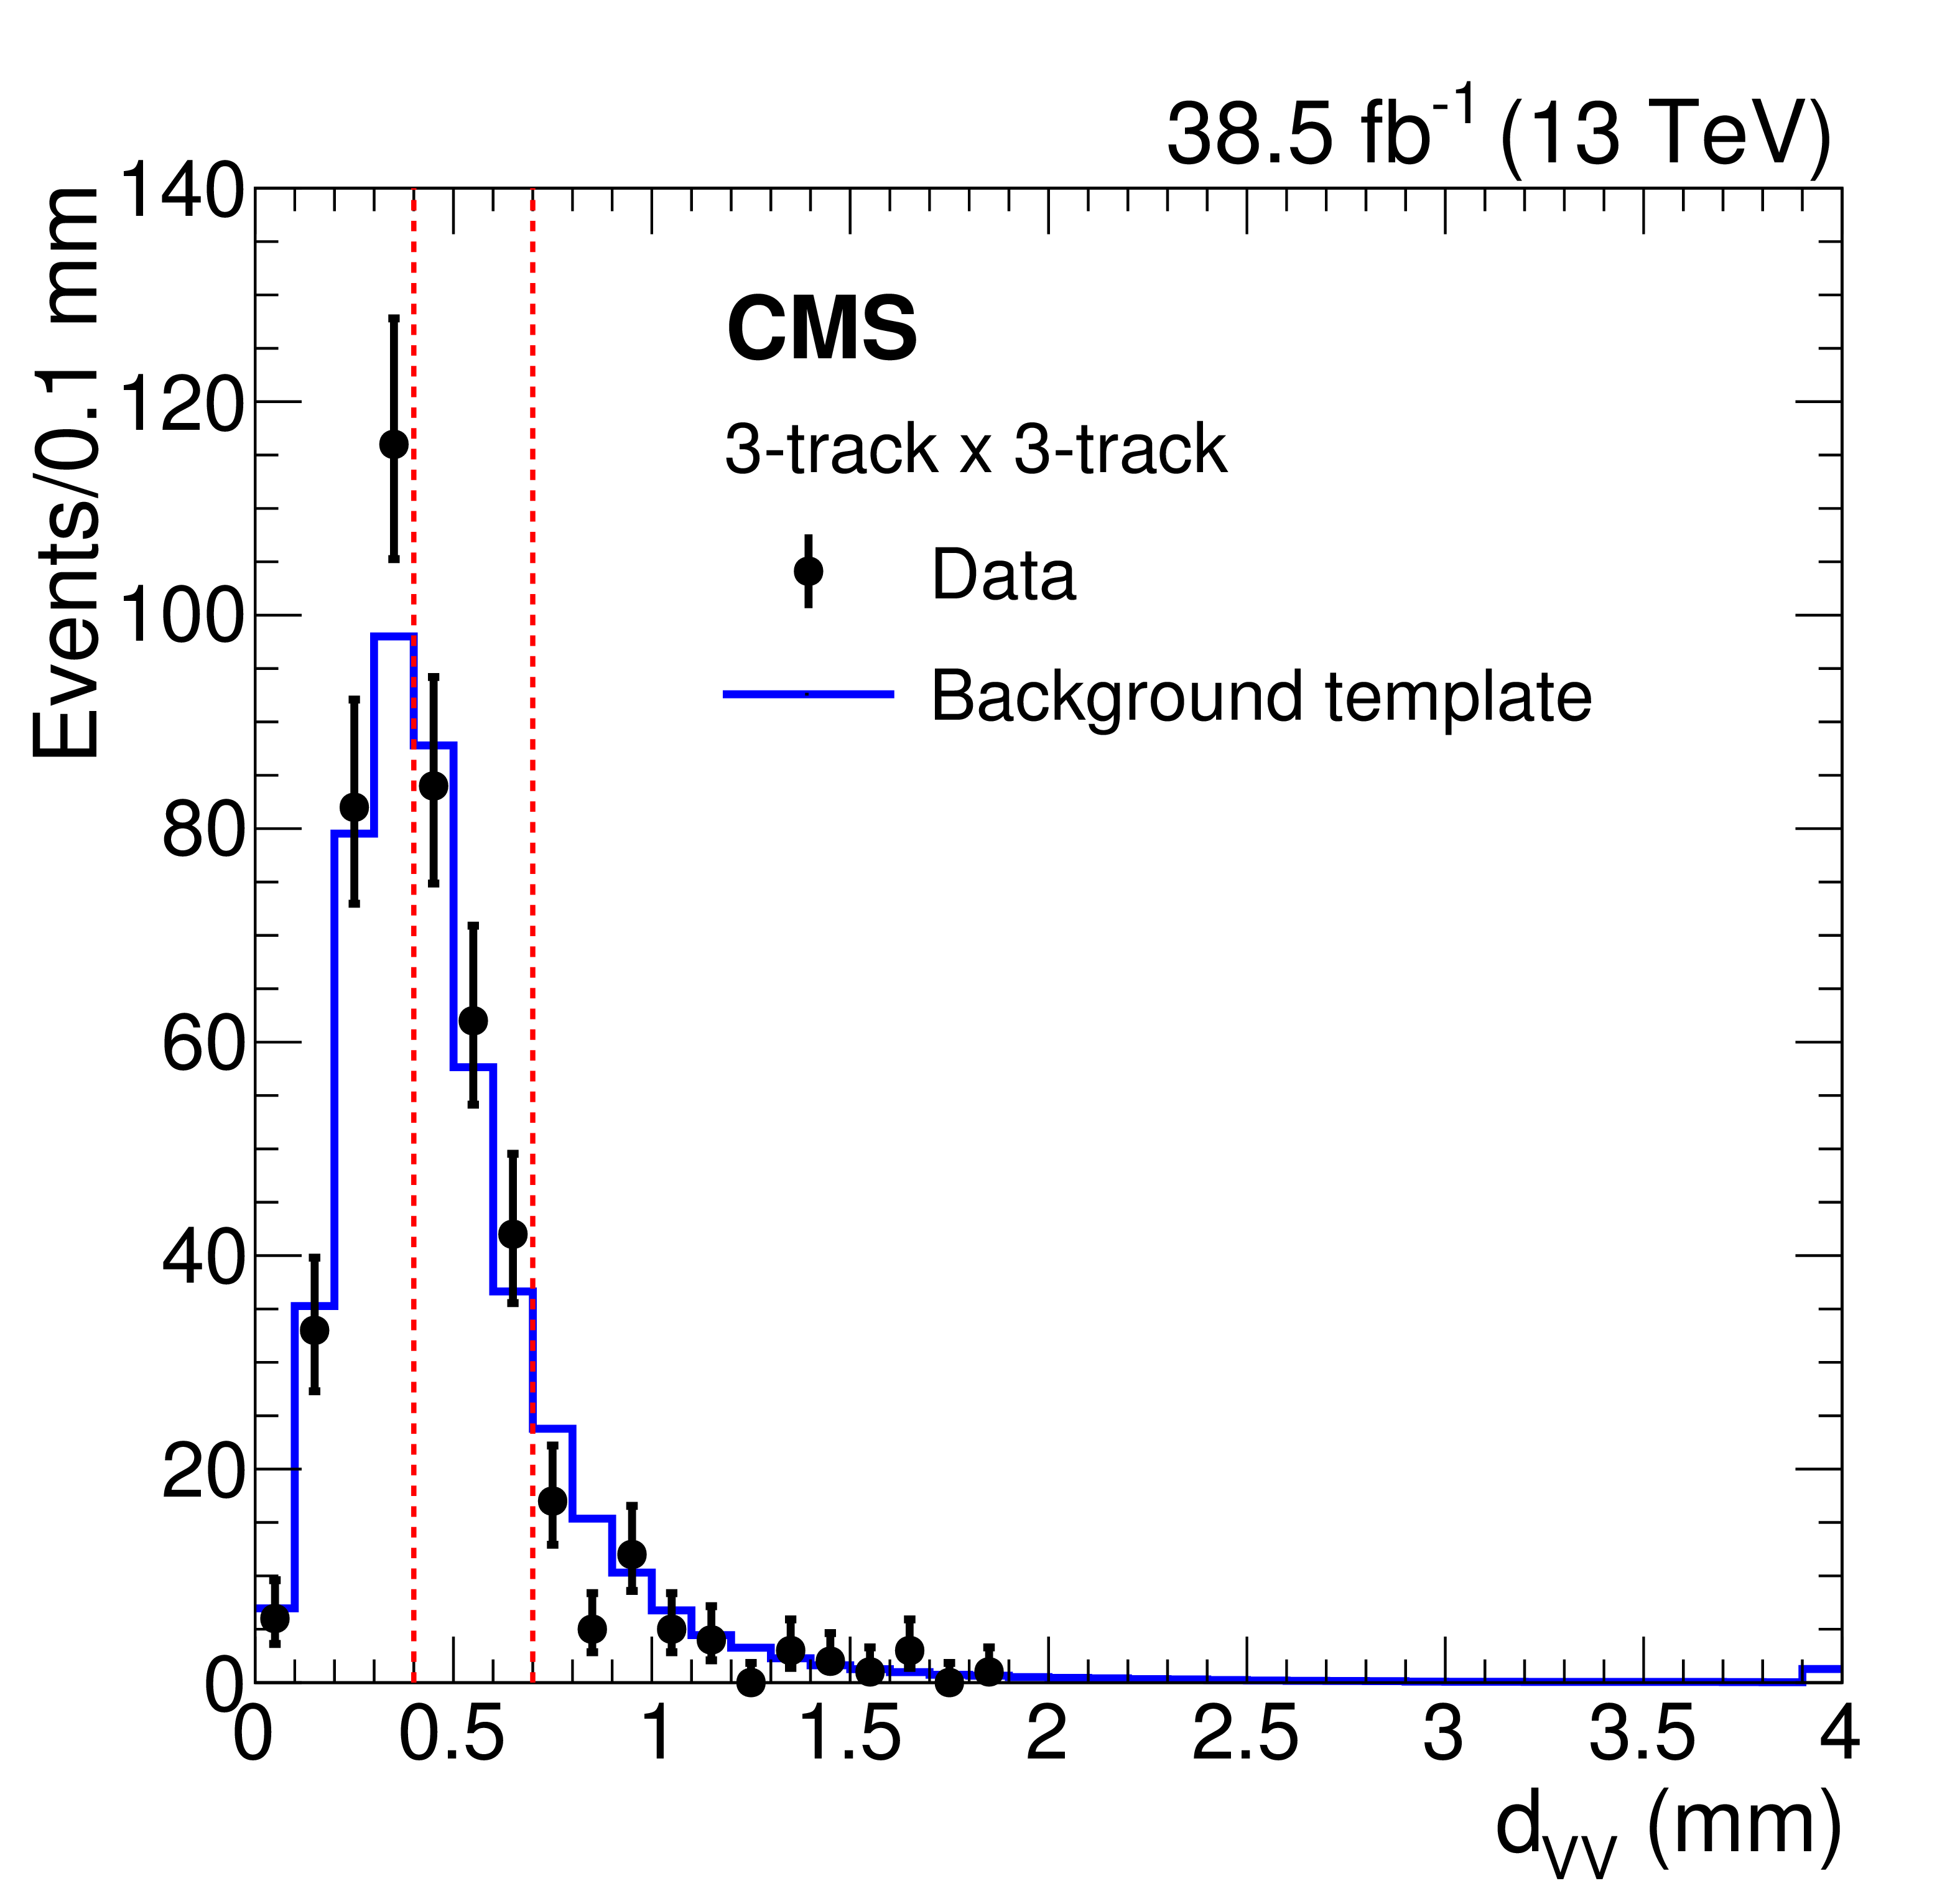
Figure 5-a:
Distribution of the distance between vertices in the $x$-$y$ plane in two-vertex events. The points show the data (${d_{\mathrm {VV}}}$), and the solid lines show the background template (${d_{\mathrm {VV}}^{\,\mathrm {C}}}$) normalized to the data, for events with two 3-track vertices. The last bin includes the overflow events. The dotted lines indicate the boundary between the three bins used in the fit. |

png pdf |
Figure 5-b:
Distribution of the distance between vertices in the $x$-$y$ plane in two-vertex events. The points show the data (${d_{\mathrm {VV}}}$), and the solid lines show the background template (${d_{\mathrm {VV}}^{\,\mathrm {C}}}$) normalized to the data, for events with one 4-track vertex and one 3-track vertex. The last bin includes the overflow events. The dotted lines indicate the boundary between the three bins used in the fit. |

png pdf |
Figure 5-c:
Distribution of the distance between vertices in the $x$-$y$ plane in two-vertex events. The points show the data (${d_{\mathrm {VV}}}$), and the solid lines show the background template (${d_{\mathrm {VV}}^{\,\mathrm {C}}}$) normalized to the data, for events with two 4-track vertices. The last bin includes the overflow events. The dotted lines indicate the boundary between the three bins used in the fit. |

png pdf |
Figure 5-d:
Distribution of the distance between vertices in the $x$-$y$ plane in two-vertex events. The points show the data (${d_{\mathrm {VV}}}$), and the solid lines show the background template (${d_{\mathrm {VV}}^{\,\mathrm {C}}}$) normalized to the data, for events with two $\geq $5-track. The last bin includes the overflow events. The dotted lines indicate the boundary between the three bins used in the fit. |
png pdf |
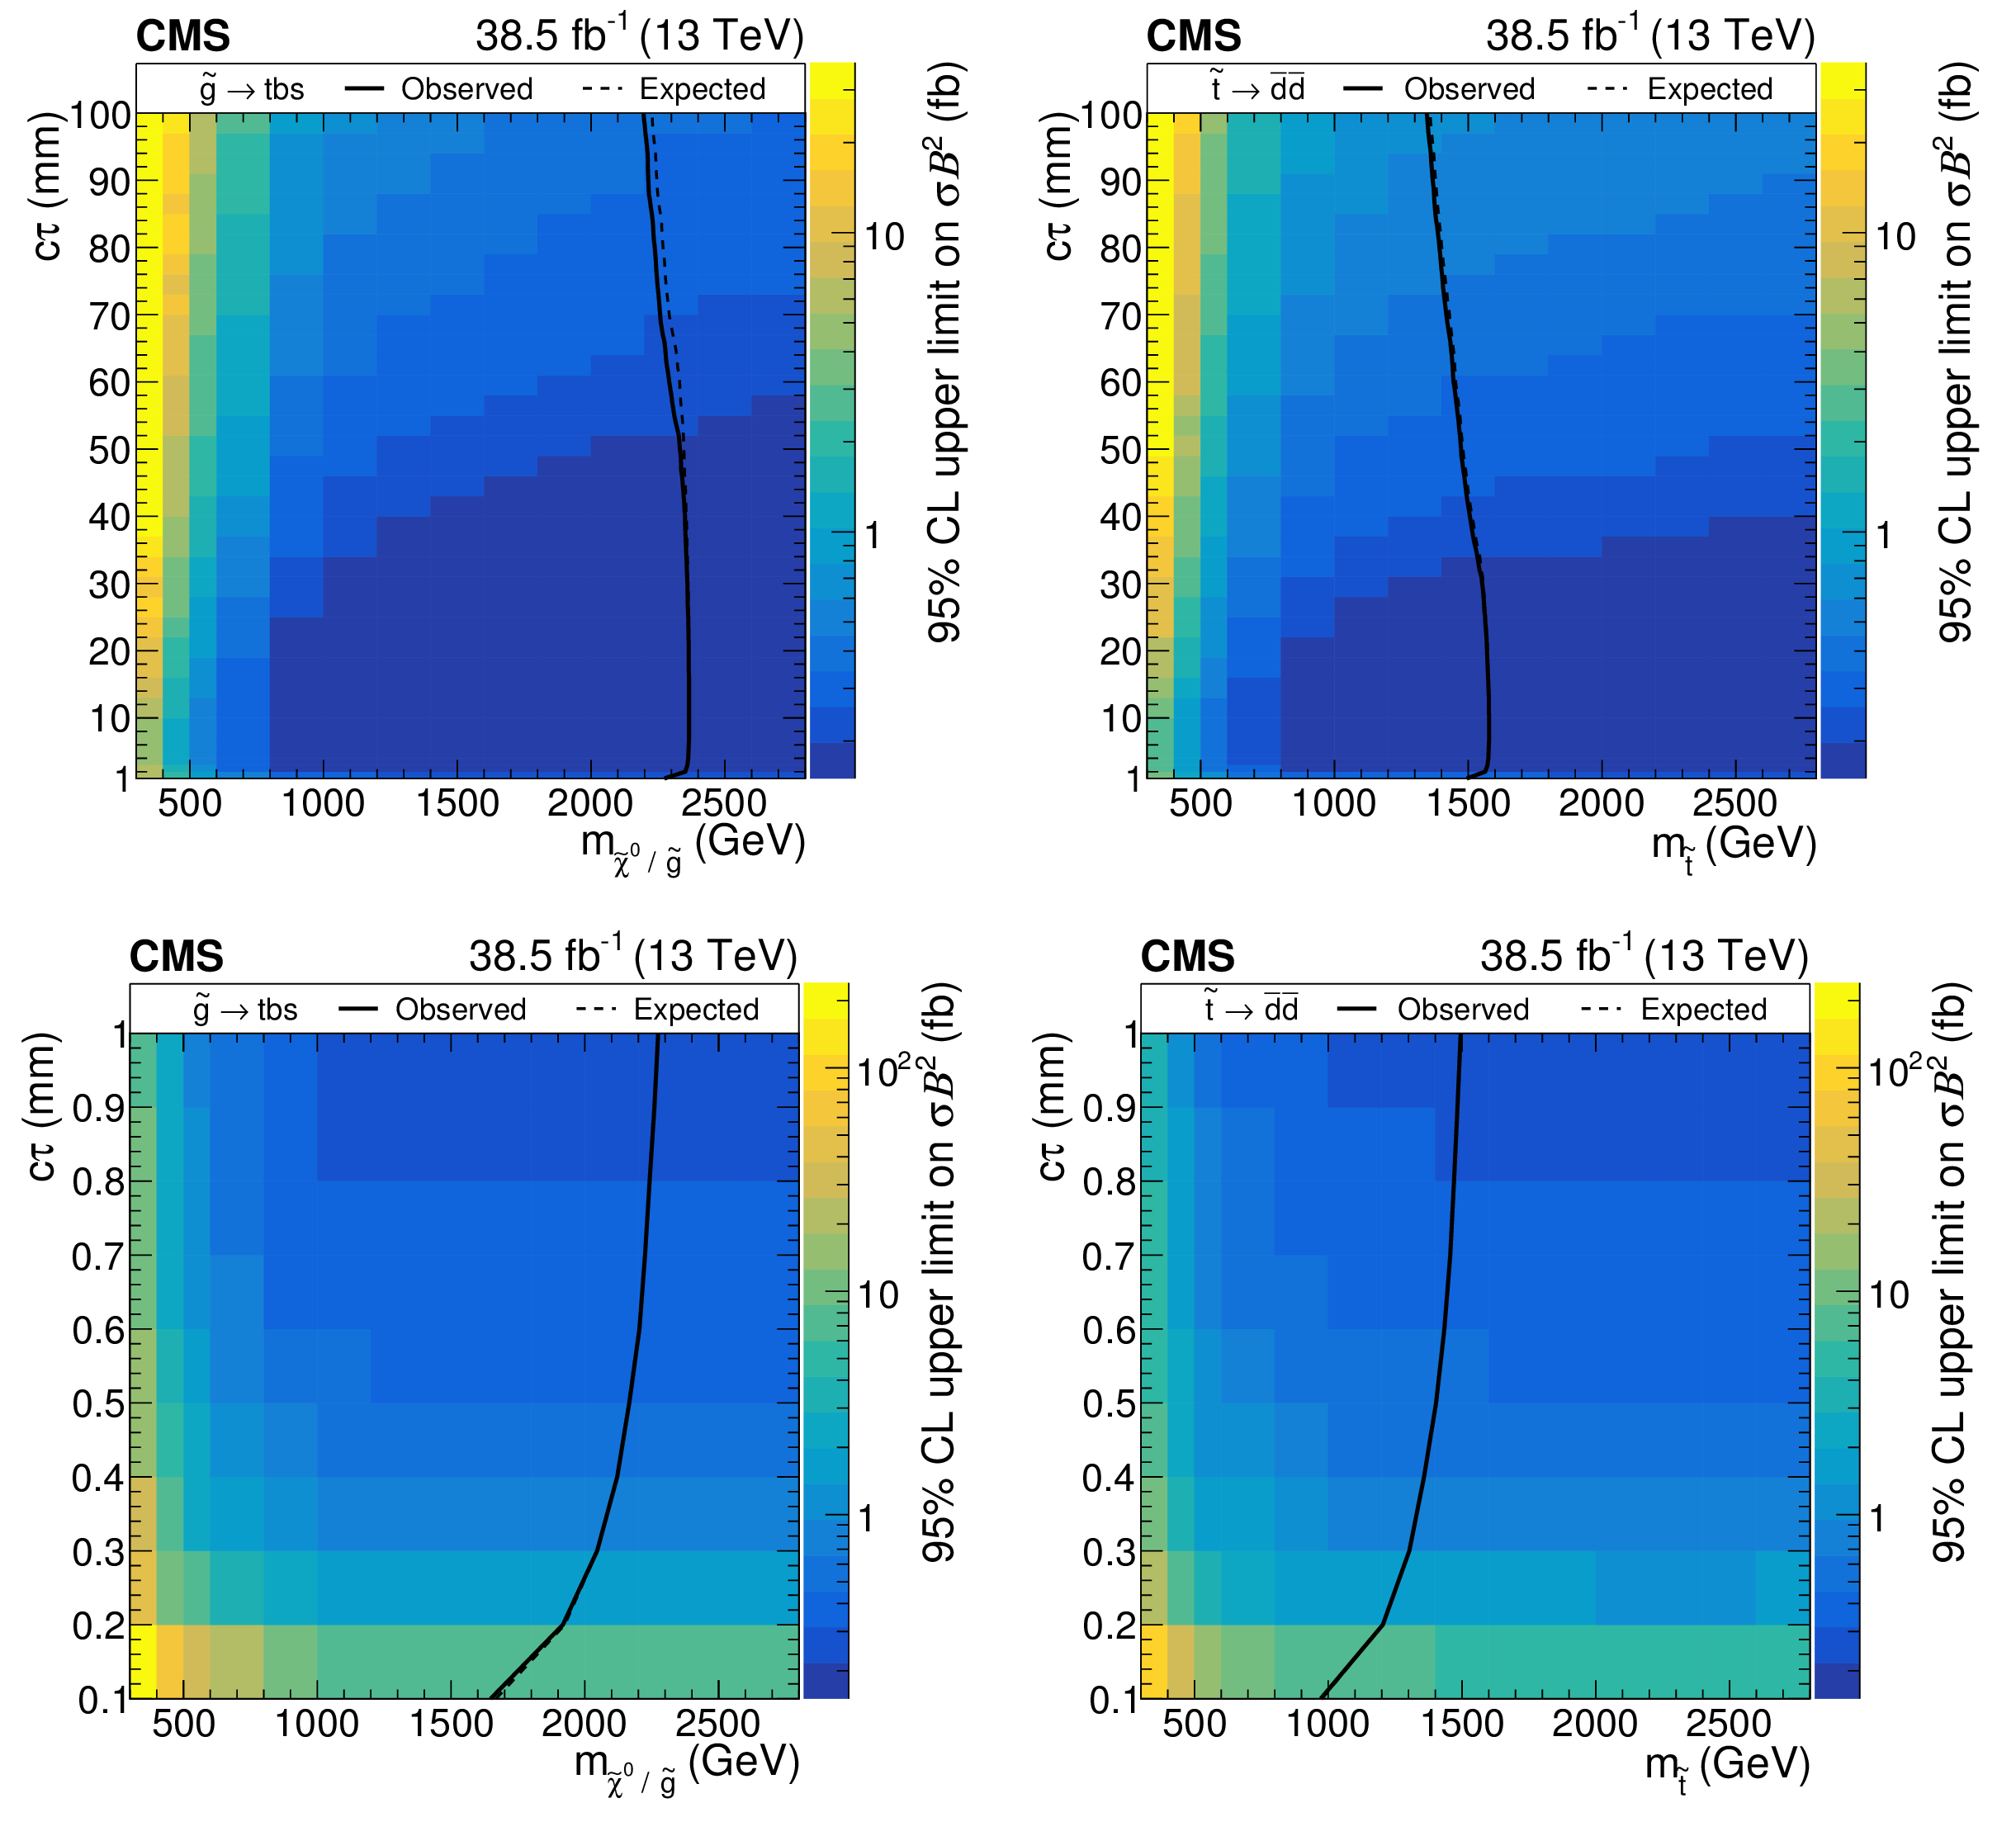
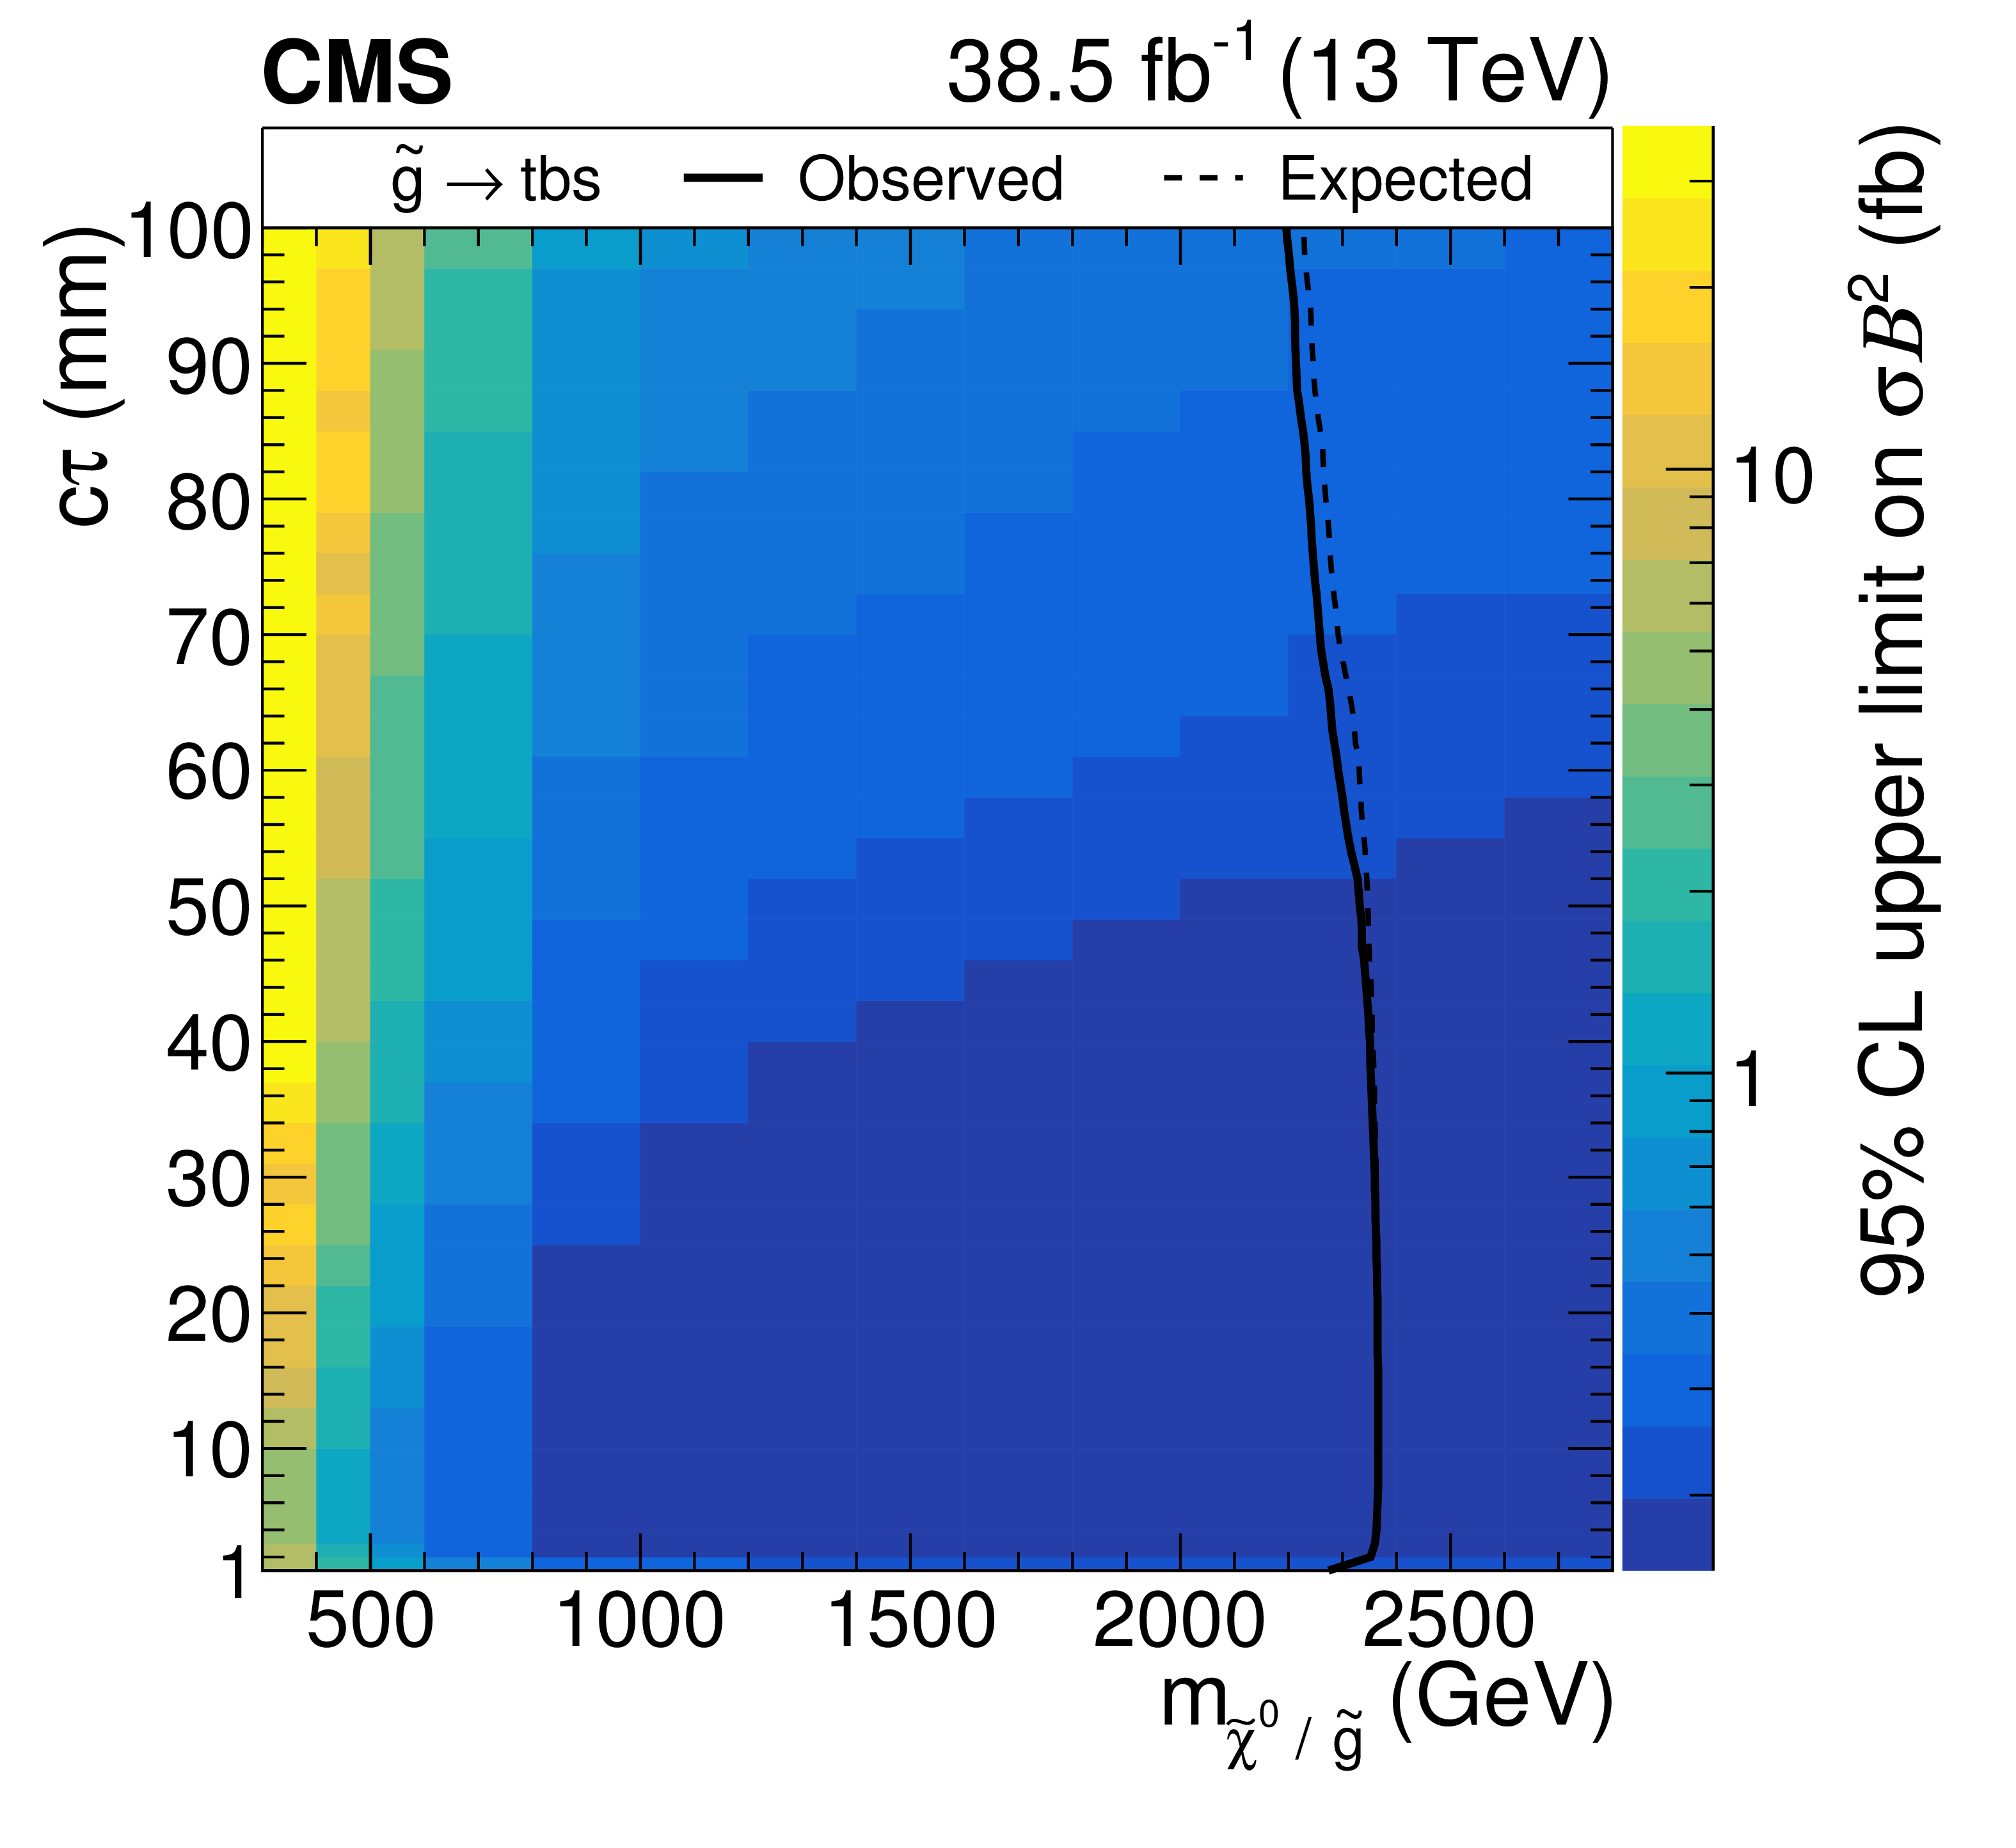
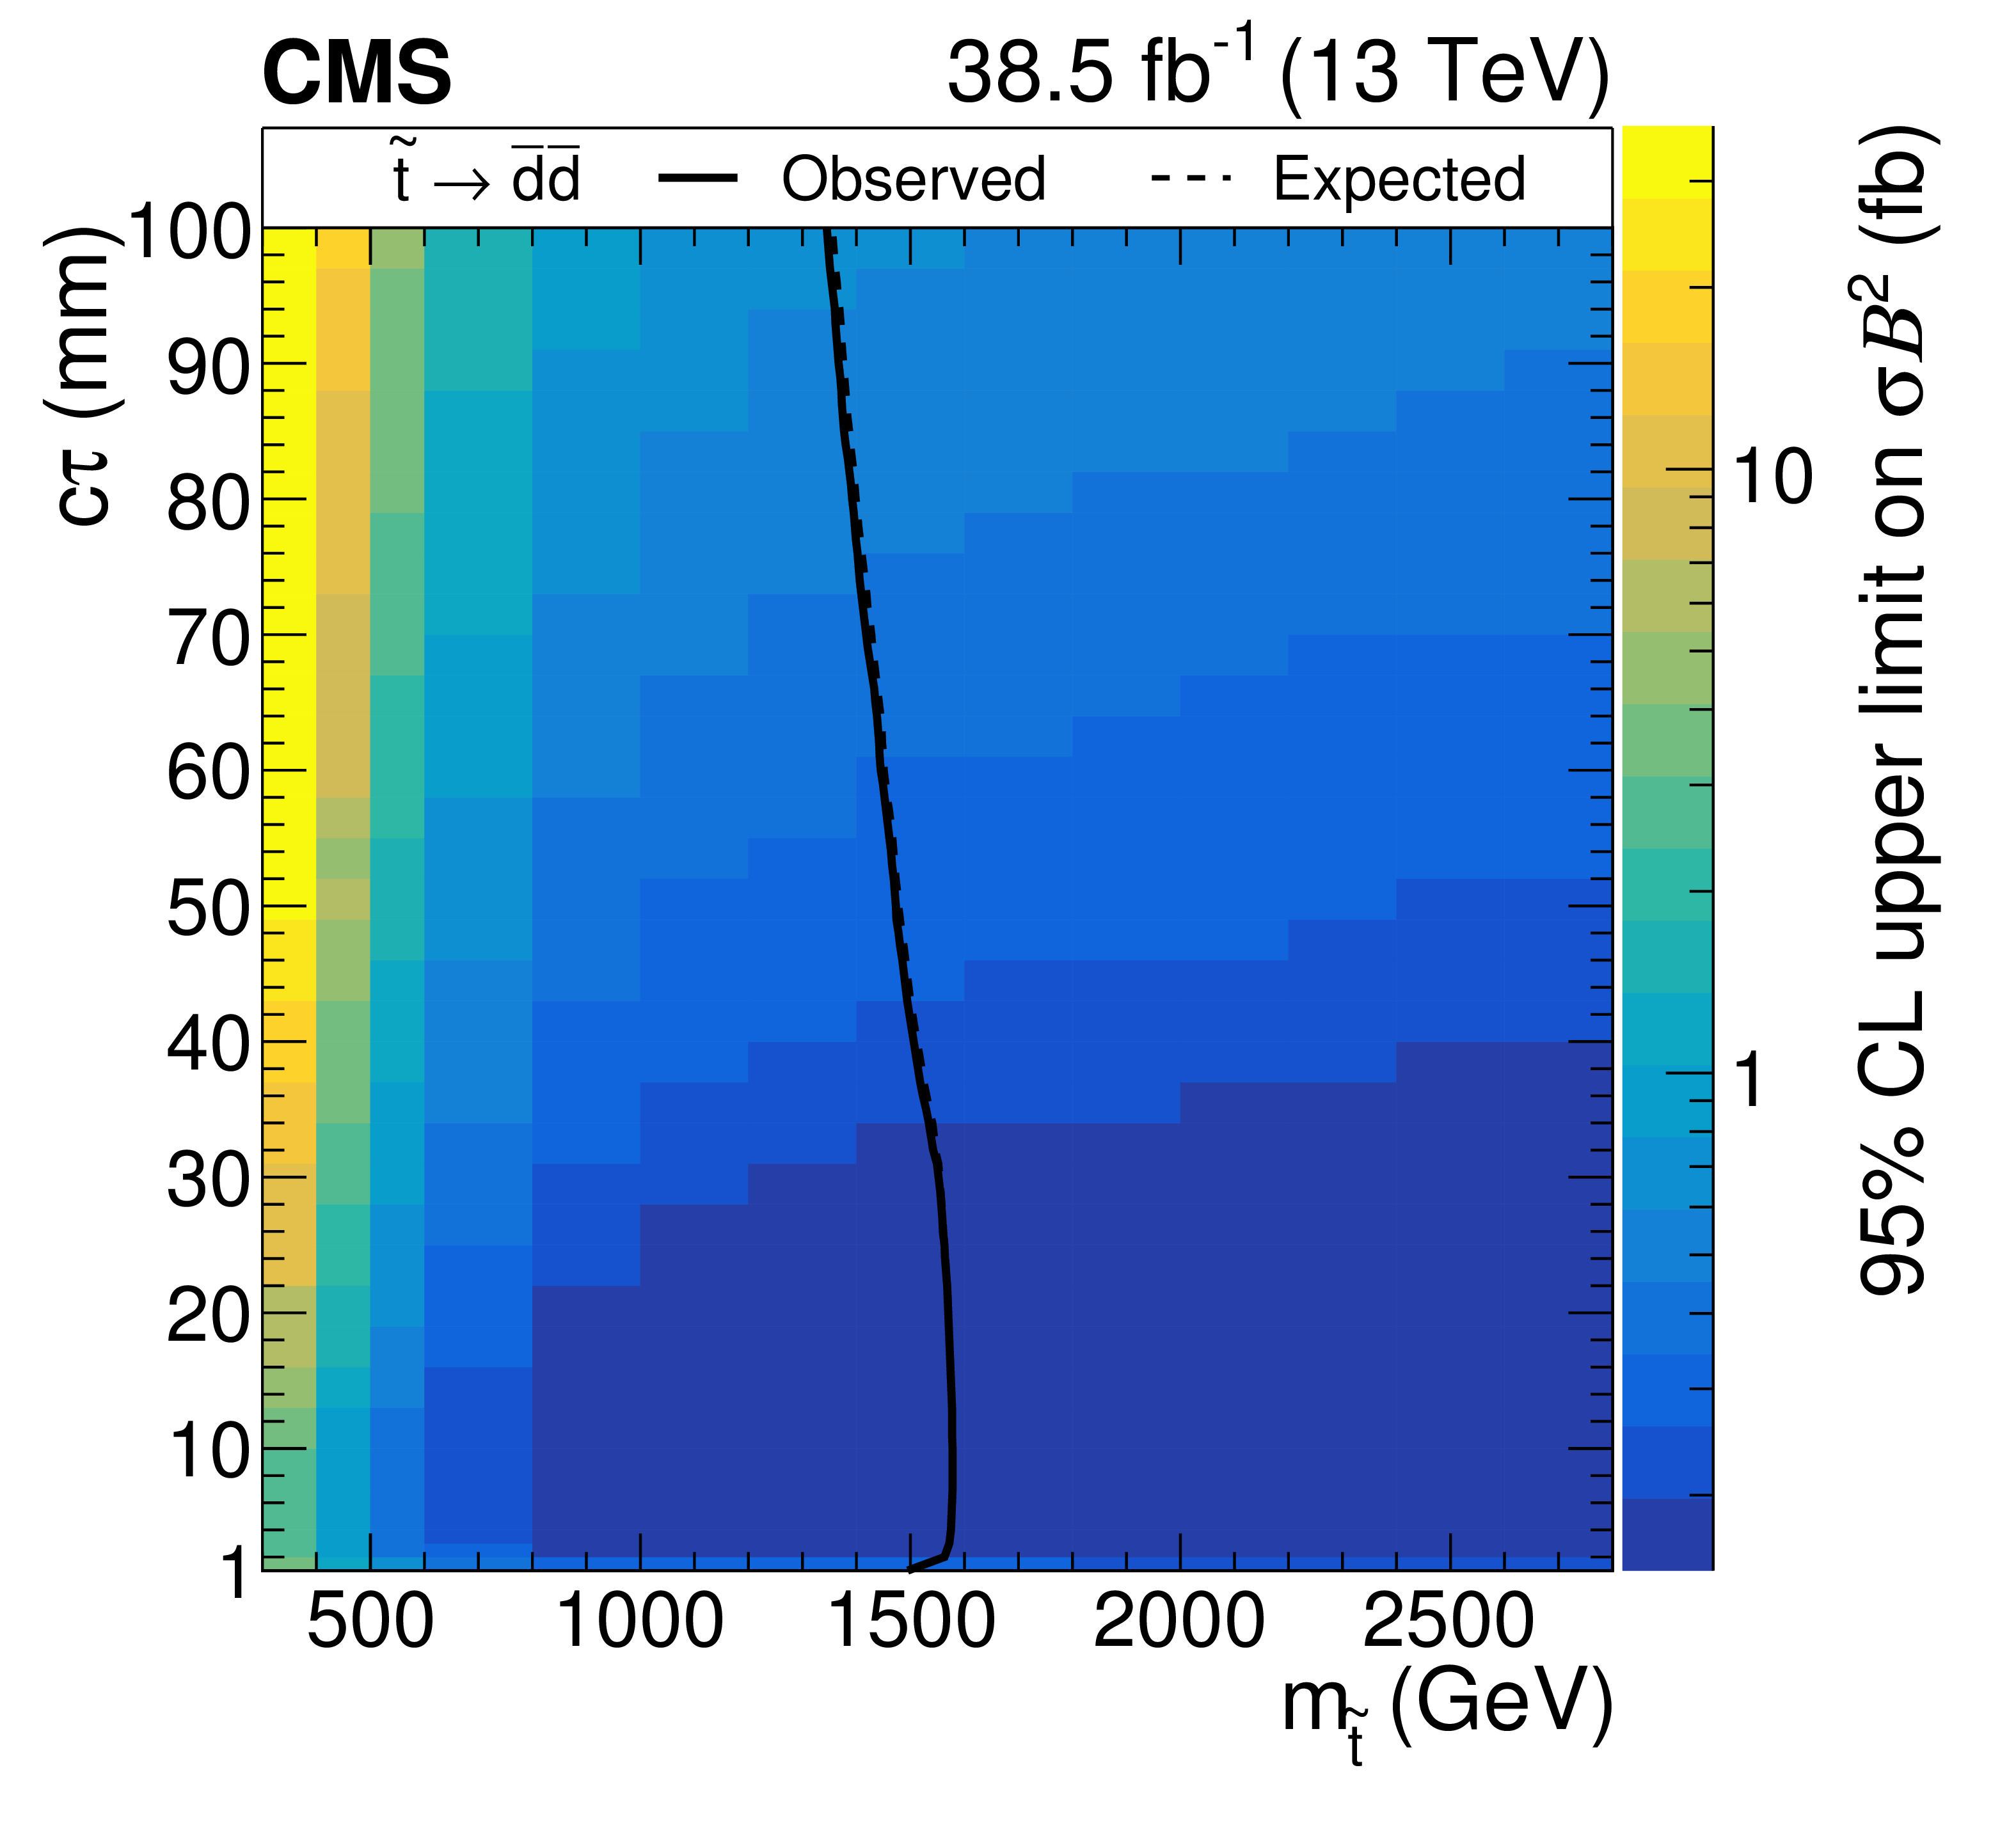
Figure 6:
Observed 95% CL upper limits on $\sigma \mathcal {B}^2$ for the multijet (left) and dijet (right) signals as a function of mass and mean proper decay length. The upper plots span $c\tau $ from 1 to 100 mm, and the lower plots span $c\tau $ from 0.1 to 1 mm. The overlaid mass exclusion curves assume gluino pair production cross sections for the multijet signals and top squark pair production cross sections for the dijet signals, and 100% branching fraction. |
png pdf |
Figure 6-a:
Observed 95% CL upper limits on $\sigma \mathcal {B}^2$ for the multijet signal as a function of mass and mean proper decay length. The plot spans $c\tau $ from 1 to 100 mm. The overlaid mass exclusion curves assumes gluino pair production cross sections and 100% branching fraction. |
png pdf |
Figure 6-b:
Observed 95% CL upper limits on $\sigma \mathcal {B}^2$ for the dijet signal as a function of mass and mean proper decay length. |

png pdf |
Figure 6-c:
Observed 95% CL upper limits on $\sigma \mathcal {B}^2$ for the multijet signal as a function of mass and mean proper decay length. The plot spans $c\tau $ from 0.1 to 1 mm. The overlaid mass exclusion curves assumes gluino pair production cross sections and 100% branching fraction. |
png pdf |
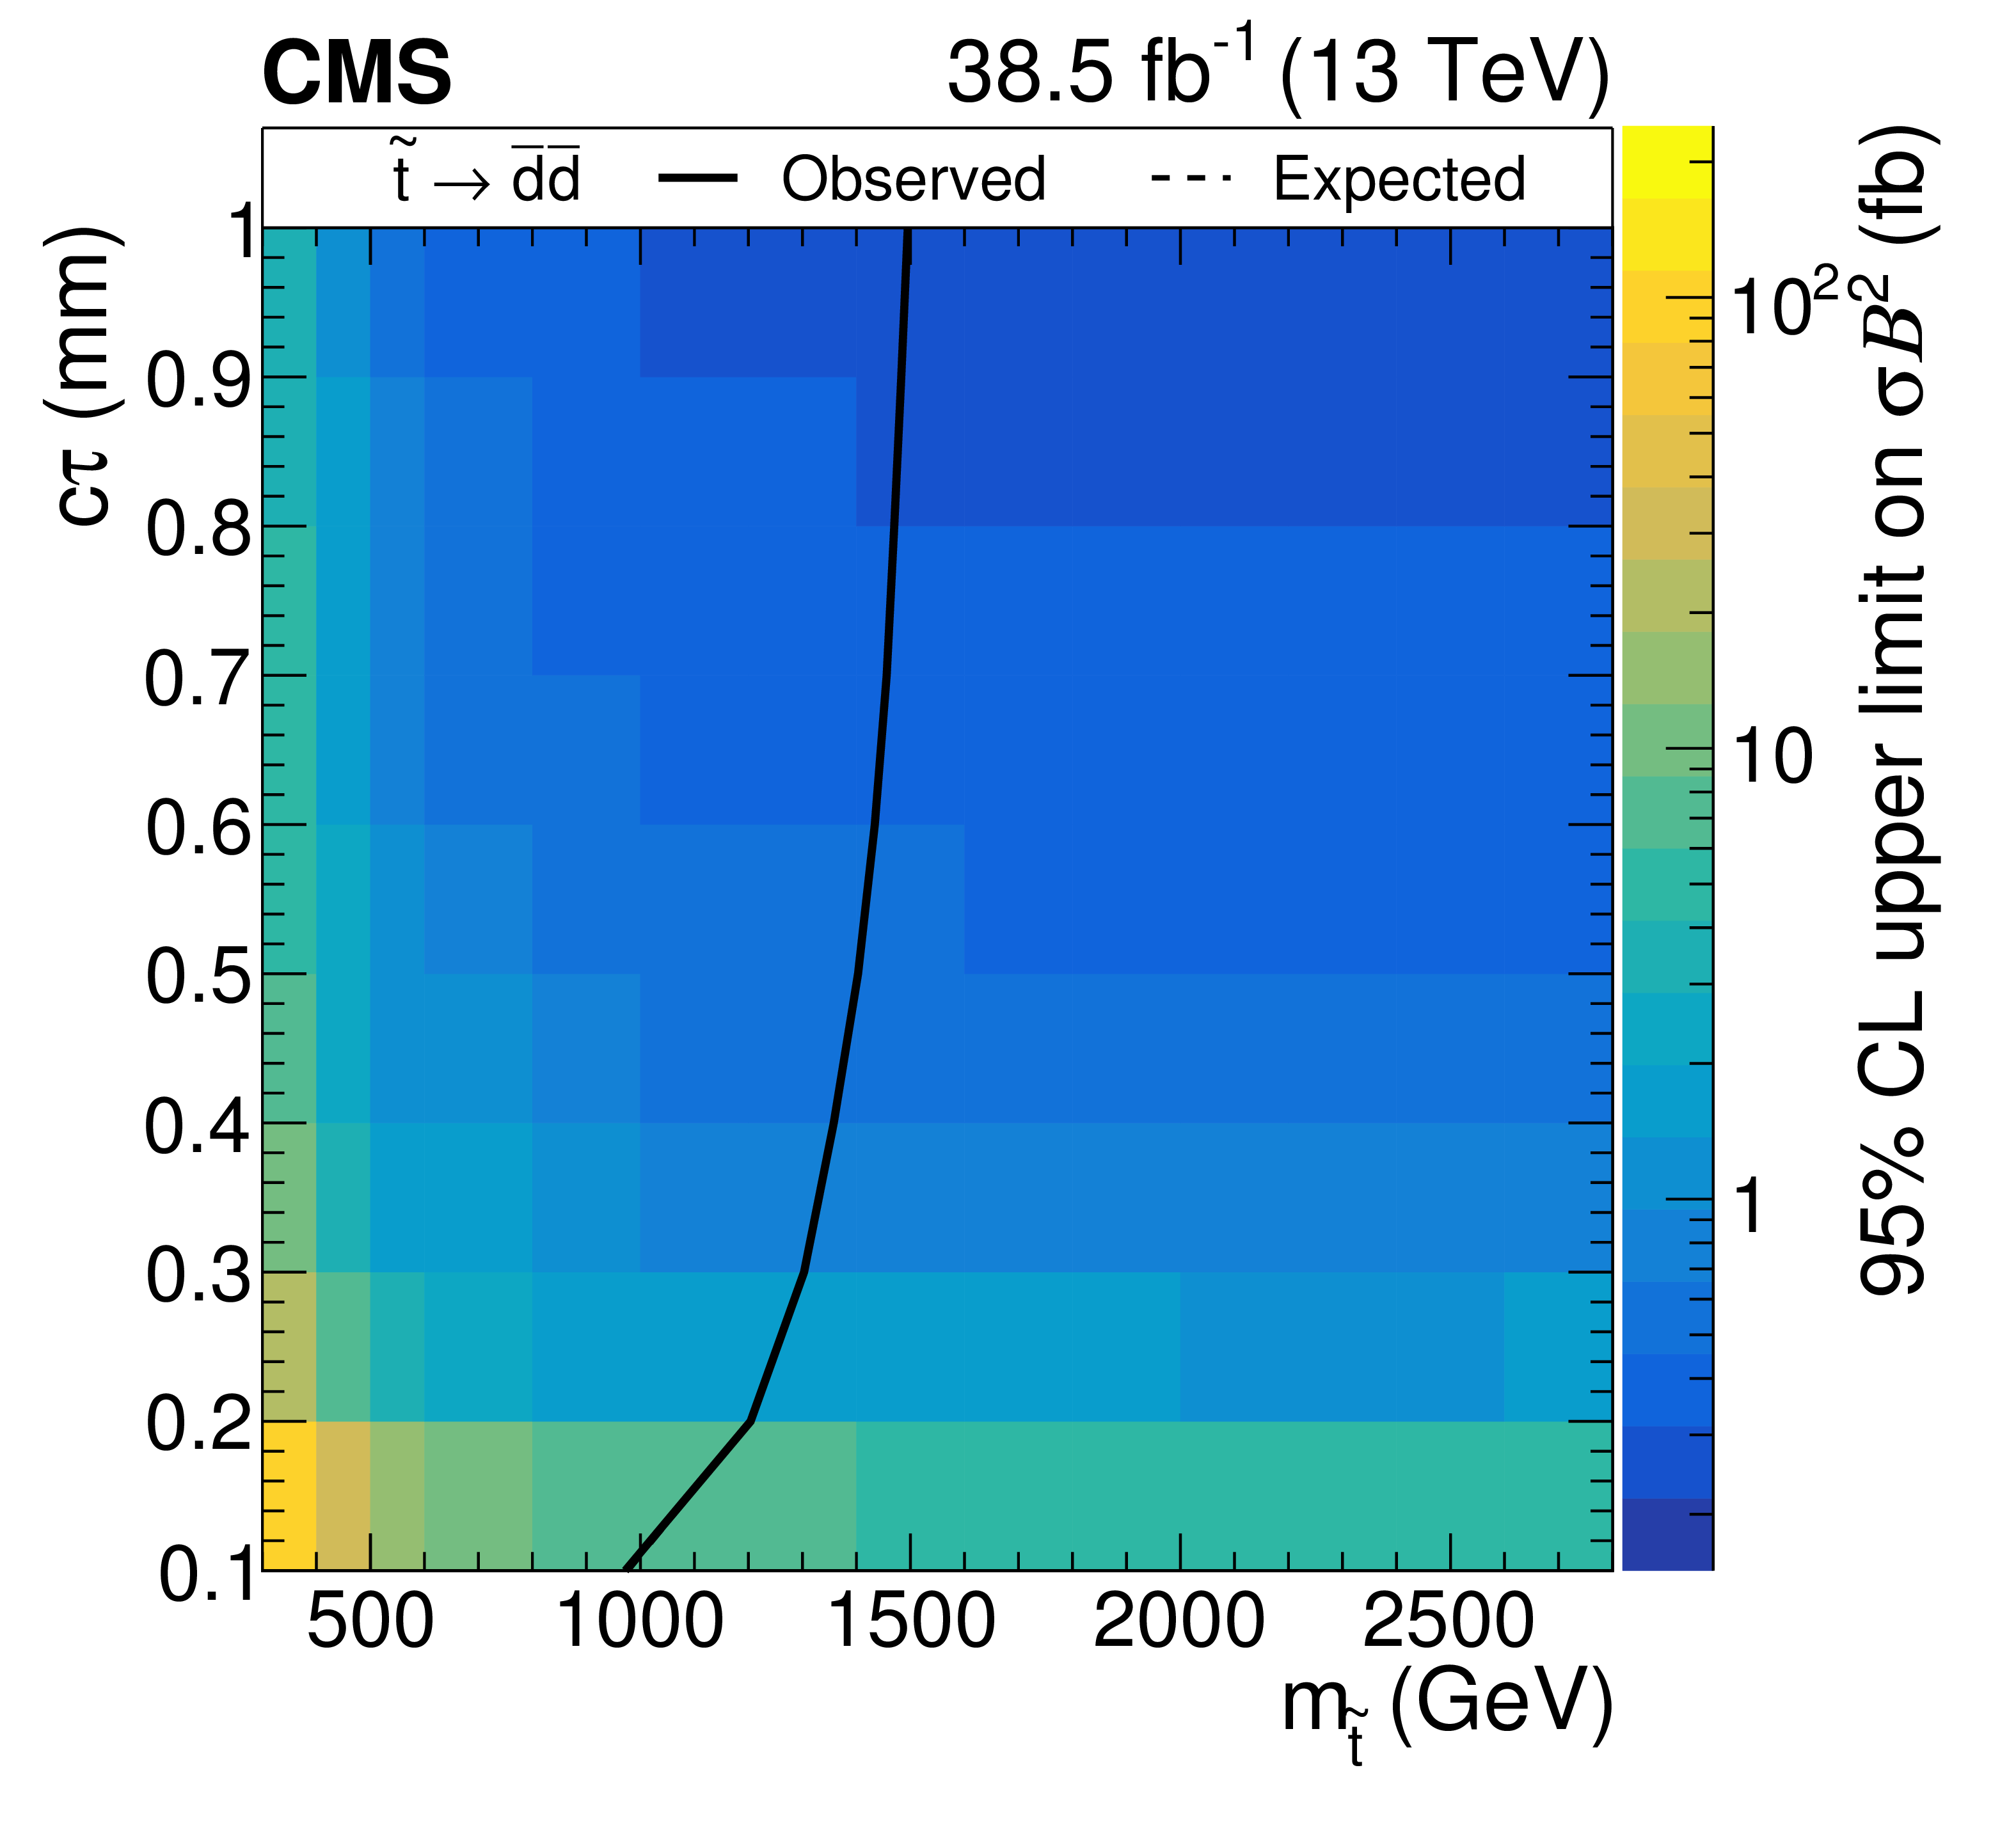
Figure 6-d:
Observed 95% CL upper limits on $\sigma \mathcal {B}^2$ for the dijet signal as a function of mass and mean proper decay length. The plot spans $c\tau $ from 0.1 to 1 mm. The overlaid mass exclusion curves assumes top squark pair production cross sections and 100% branching fraction. |
png pdf |
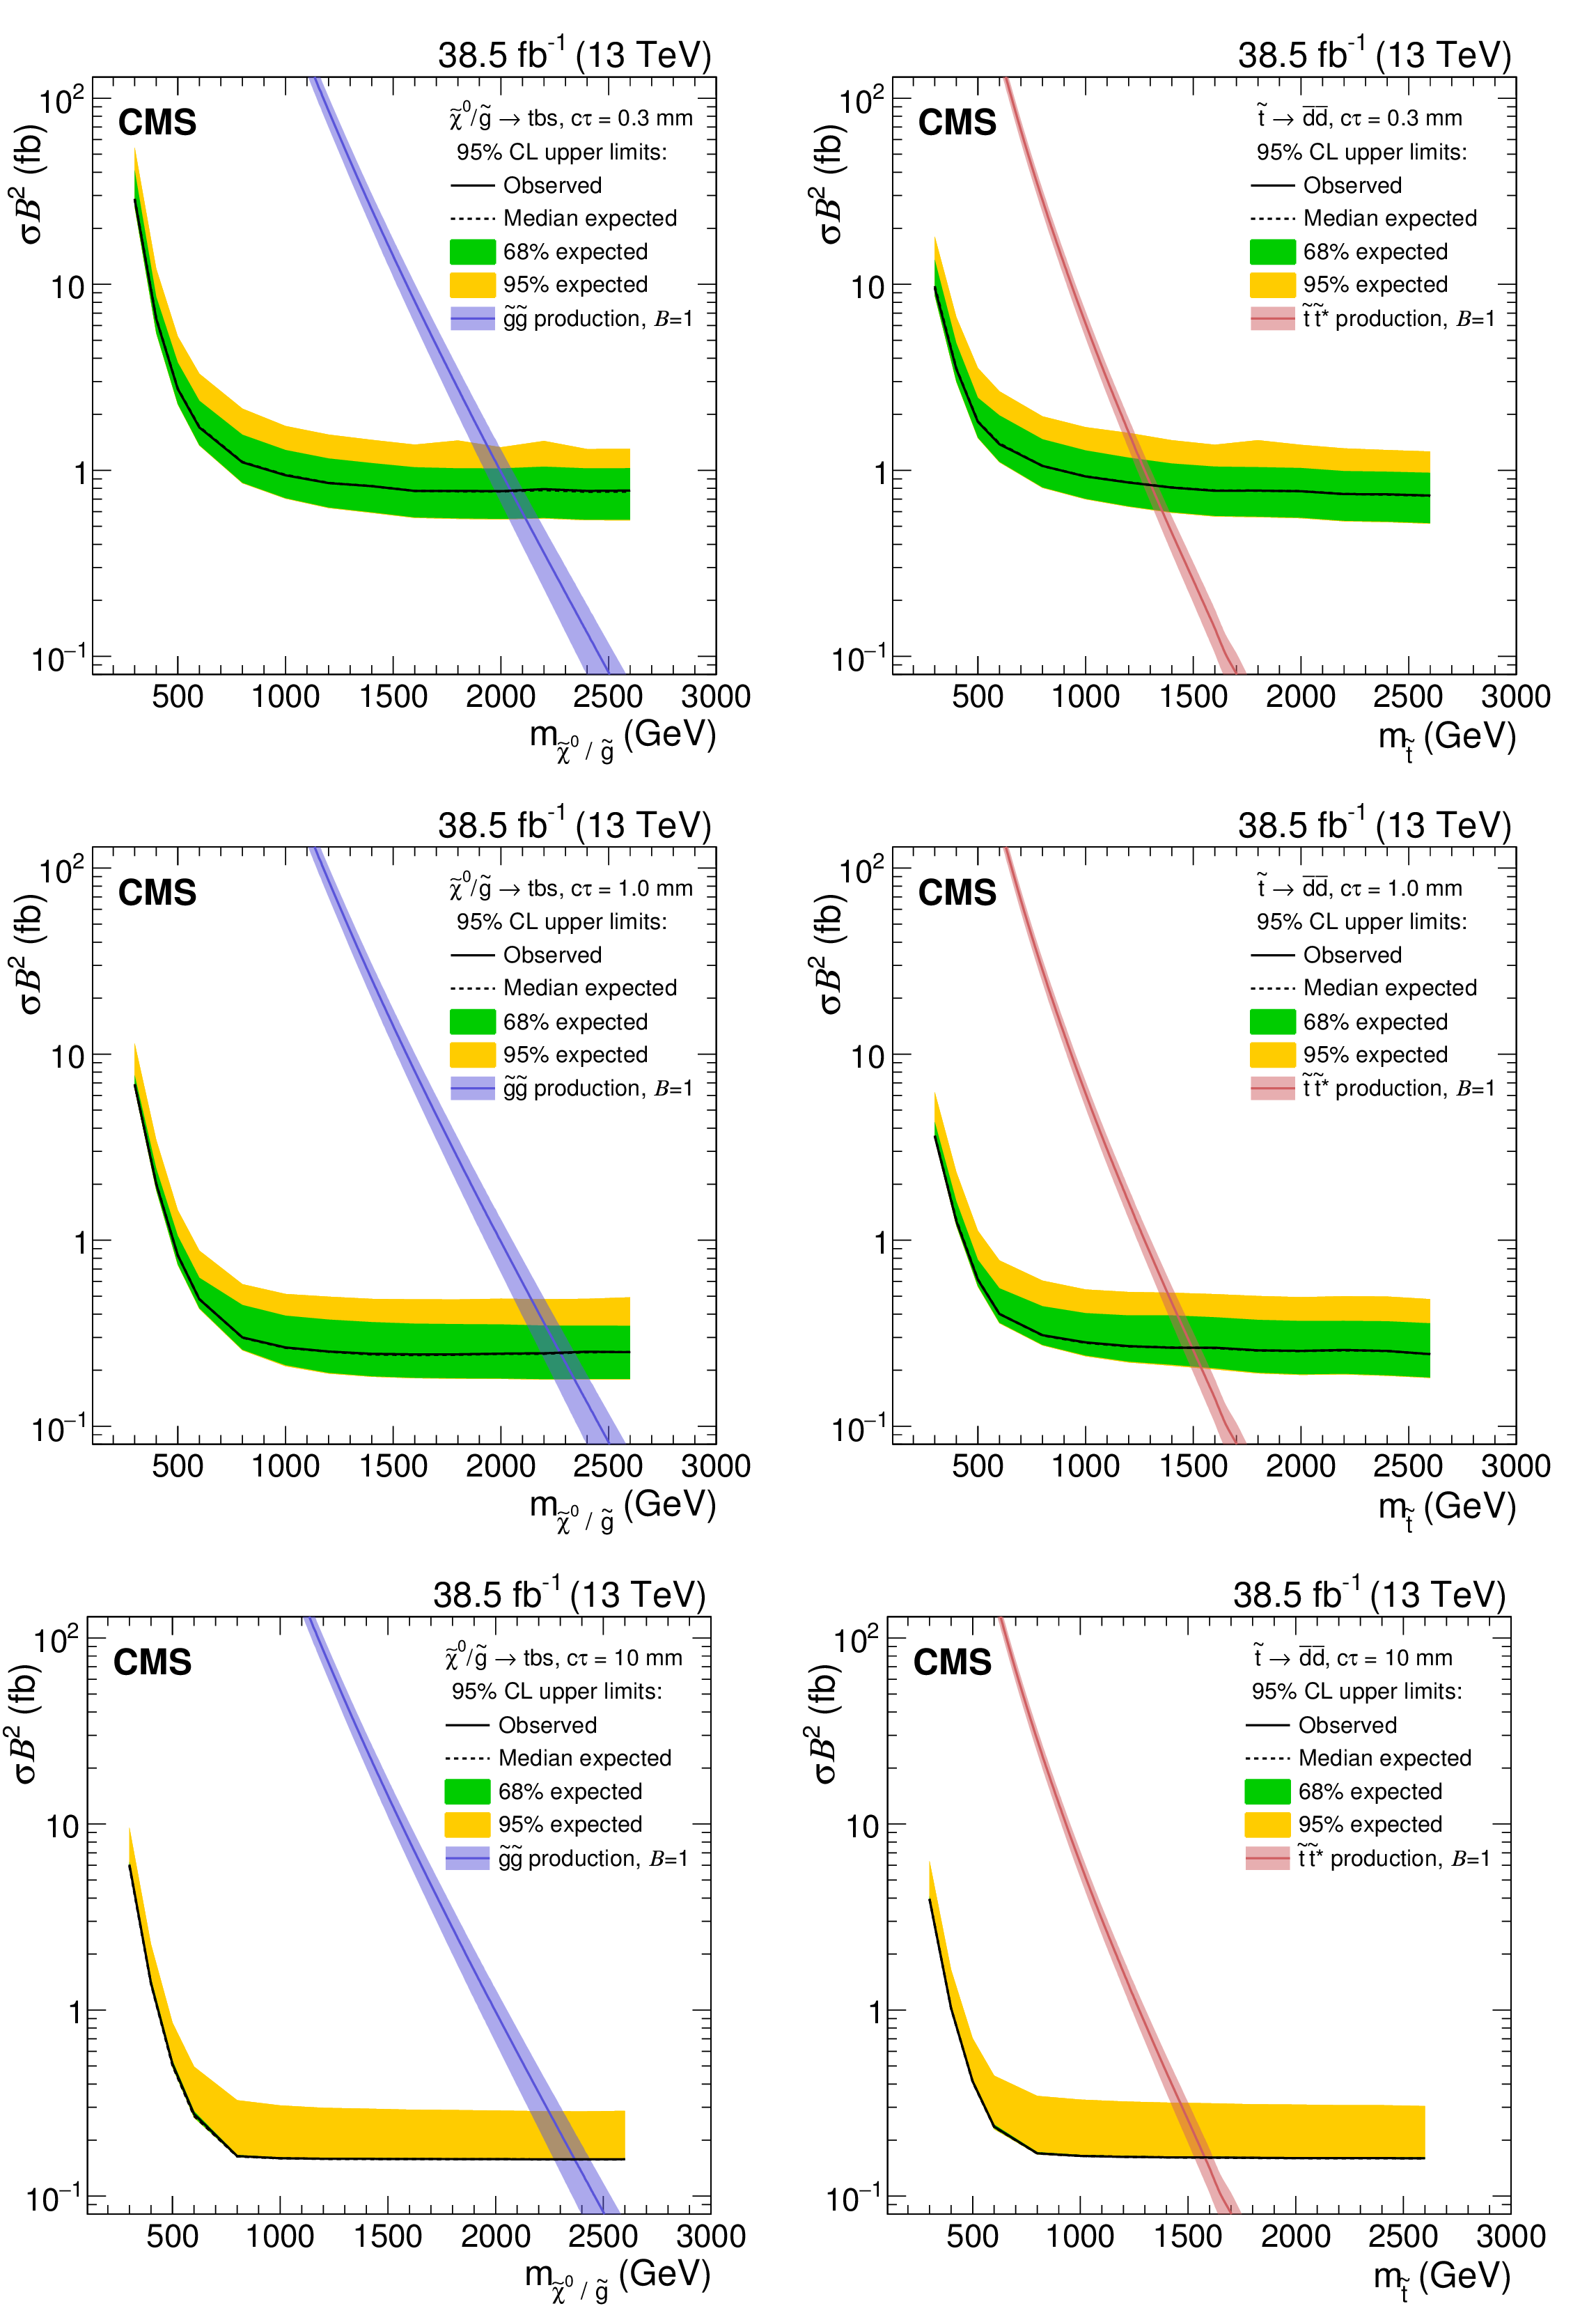
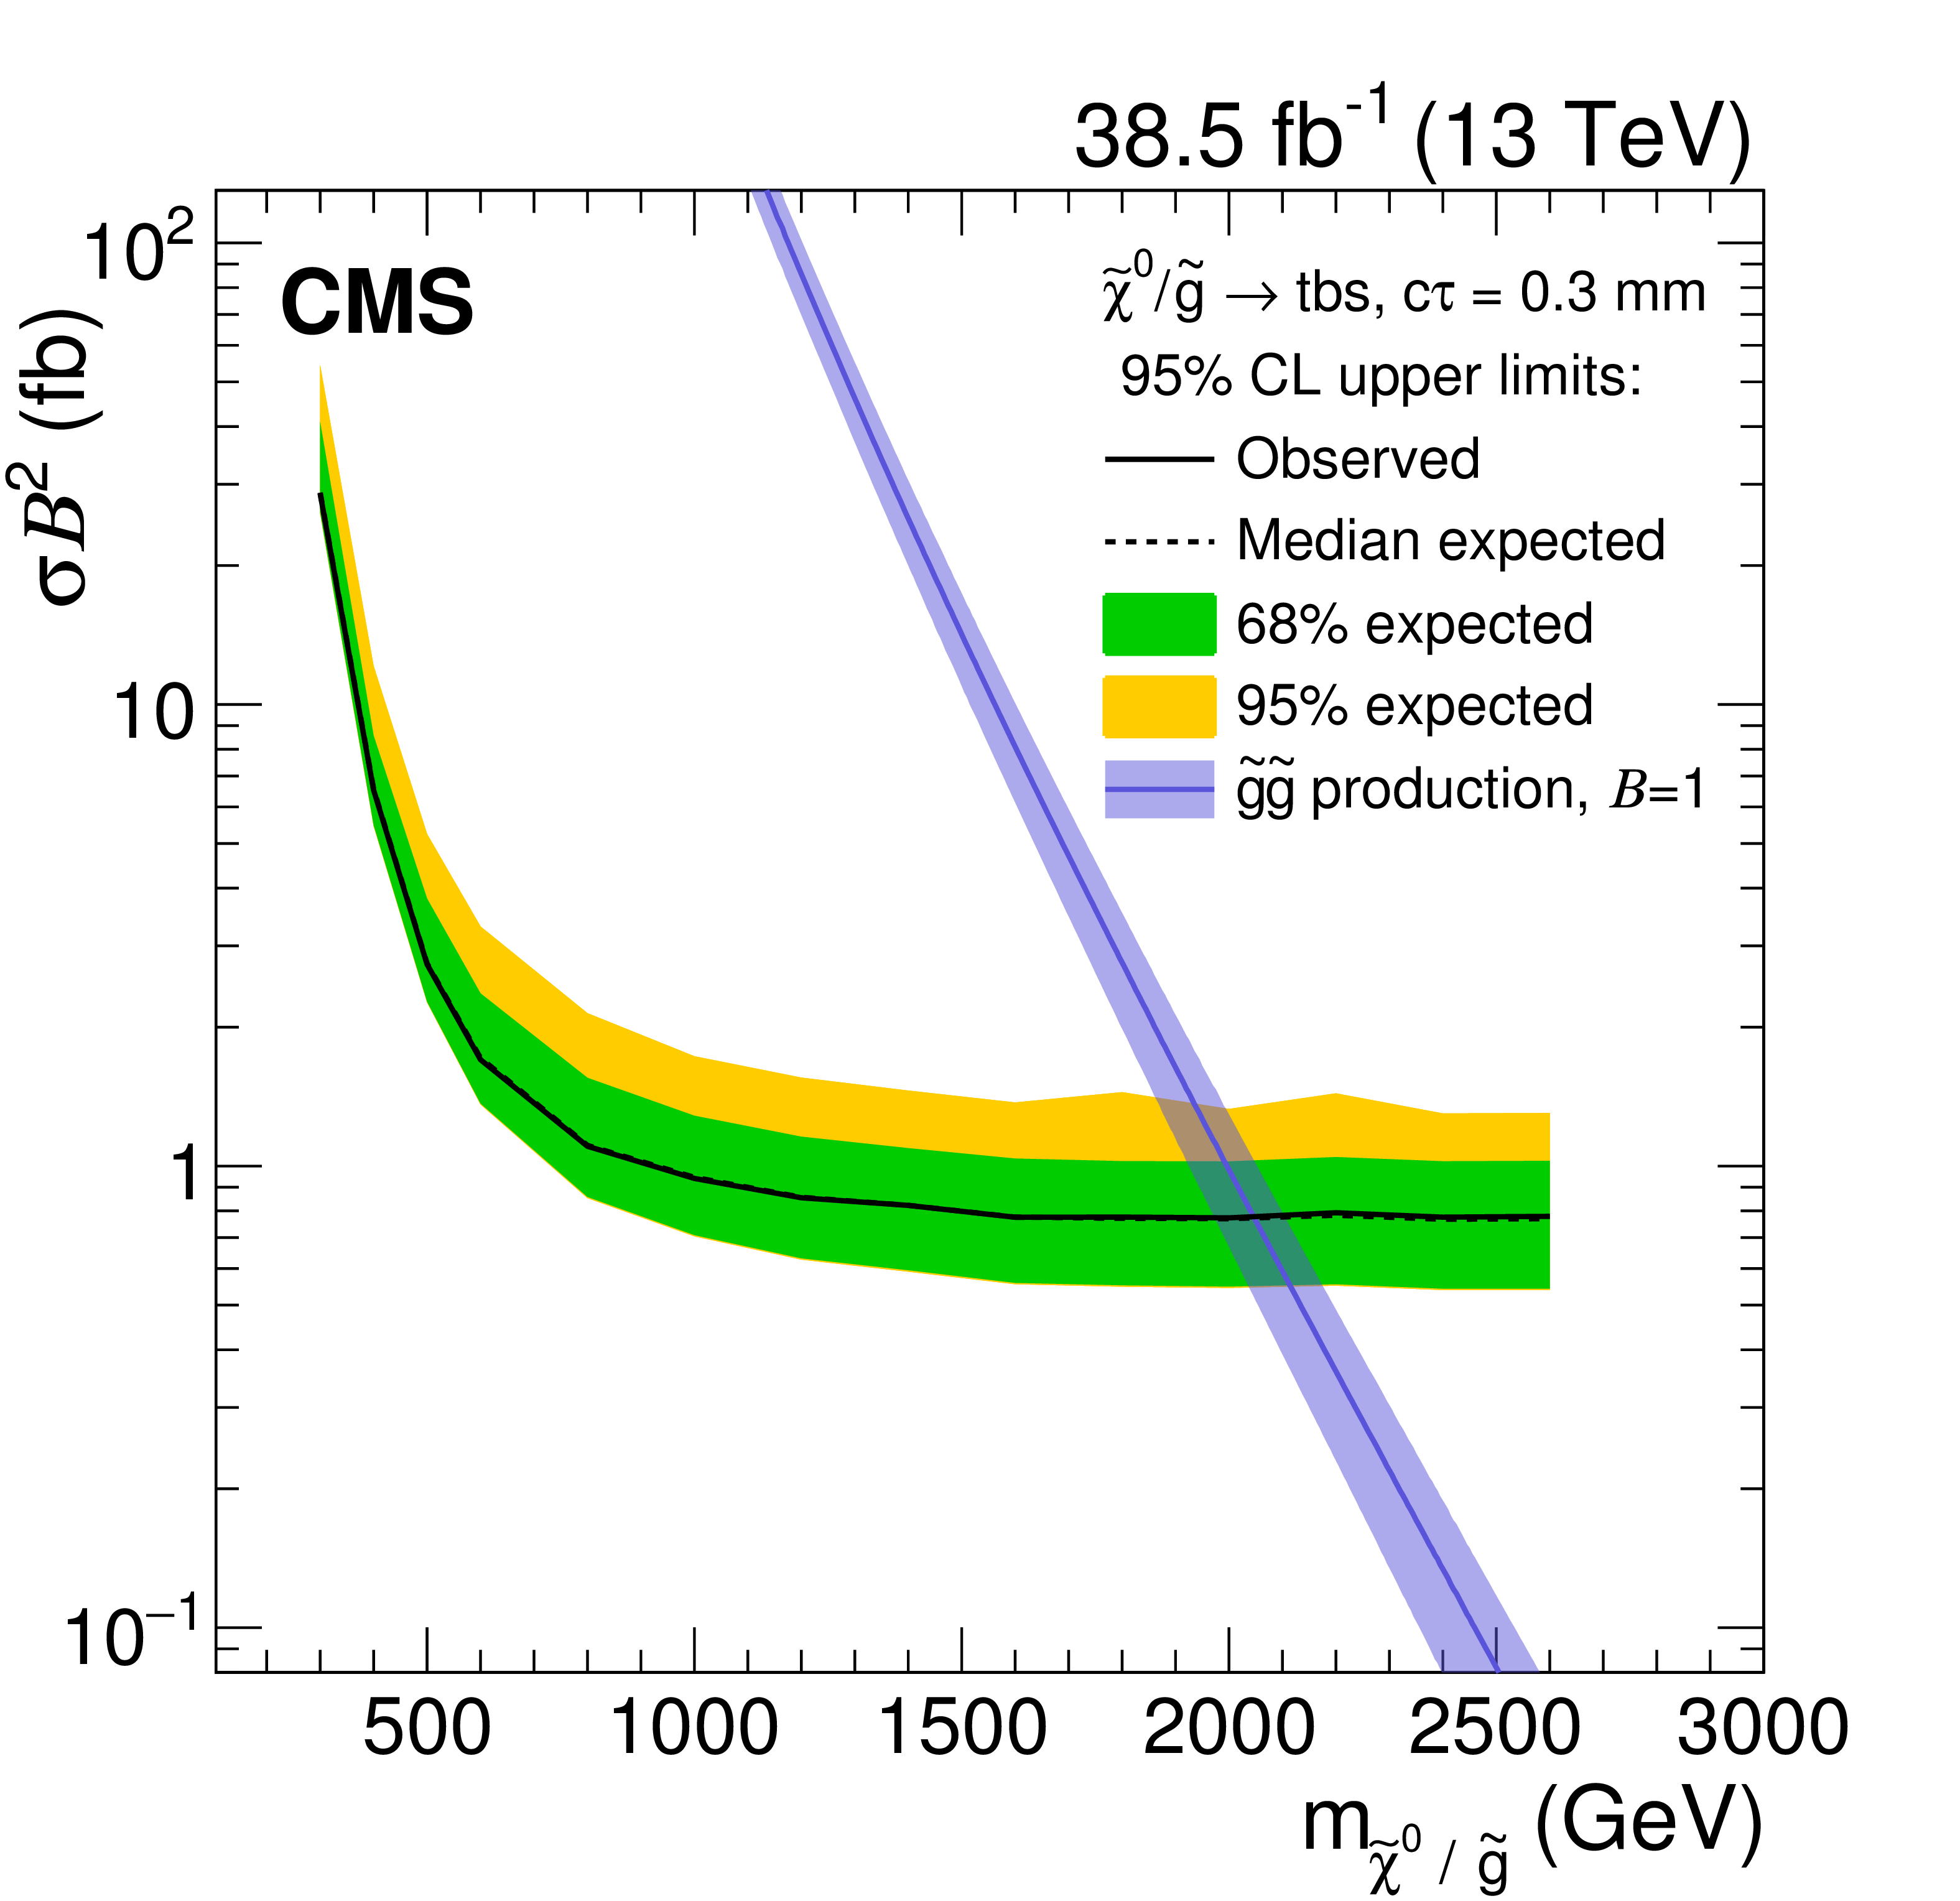
Figure 7:
Observed and expected 95% CL upper limits on $\sigma \mathcal {B}^2$ for the multijet (left) and dijet (right) signals, as a function of mass for a fixed $c\tau $ of 0.3 mm (upper), 1.0 mm (middle), and 10 mm (lower). The gluino pair production cross section is overlaid for the multijet signals, and the top squark pair production cross section is overlaid for the dijet signals. The uncertainties in the theoretical cross sections include those due to the renormalization and factorization scales, and the parton distribution functions. |
png pdf |
Figure 7-a:
Observed and expected 95% CL upper limits on $\sigma \mathcal {B}^2$ for the multijet signal, as a function of mass for a fixed $c\tau $ of 0.3 mm. The gluino pair production cross section is overlaid. The uncertainties in the theoretical cross sections include those due to the renormalization and factorization scales, and the parton distribution functions. |
png pdf |
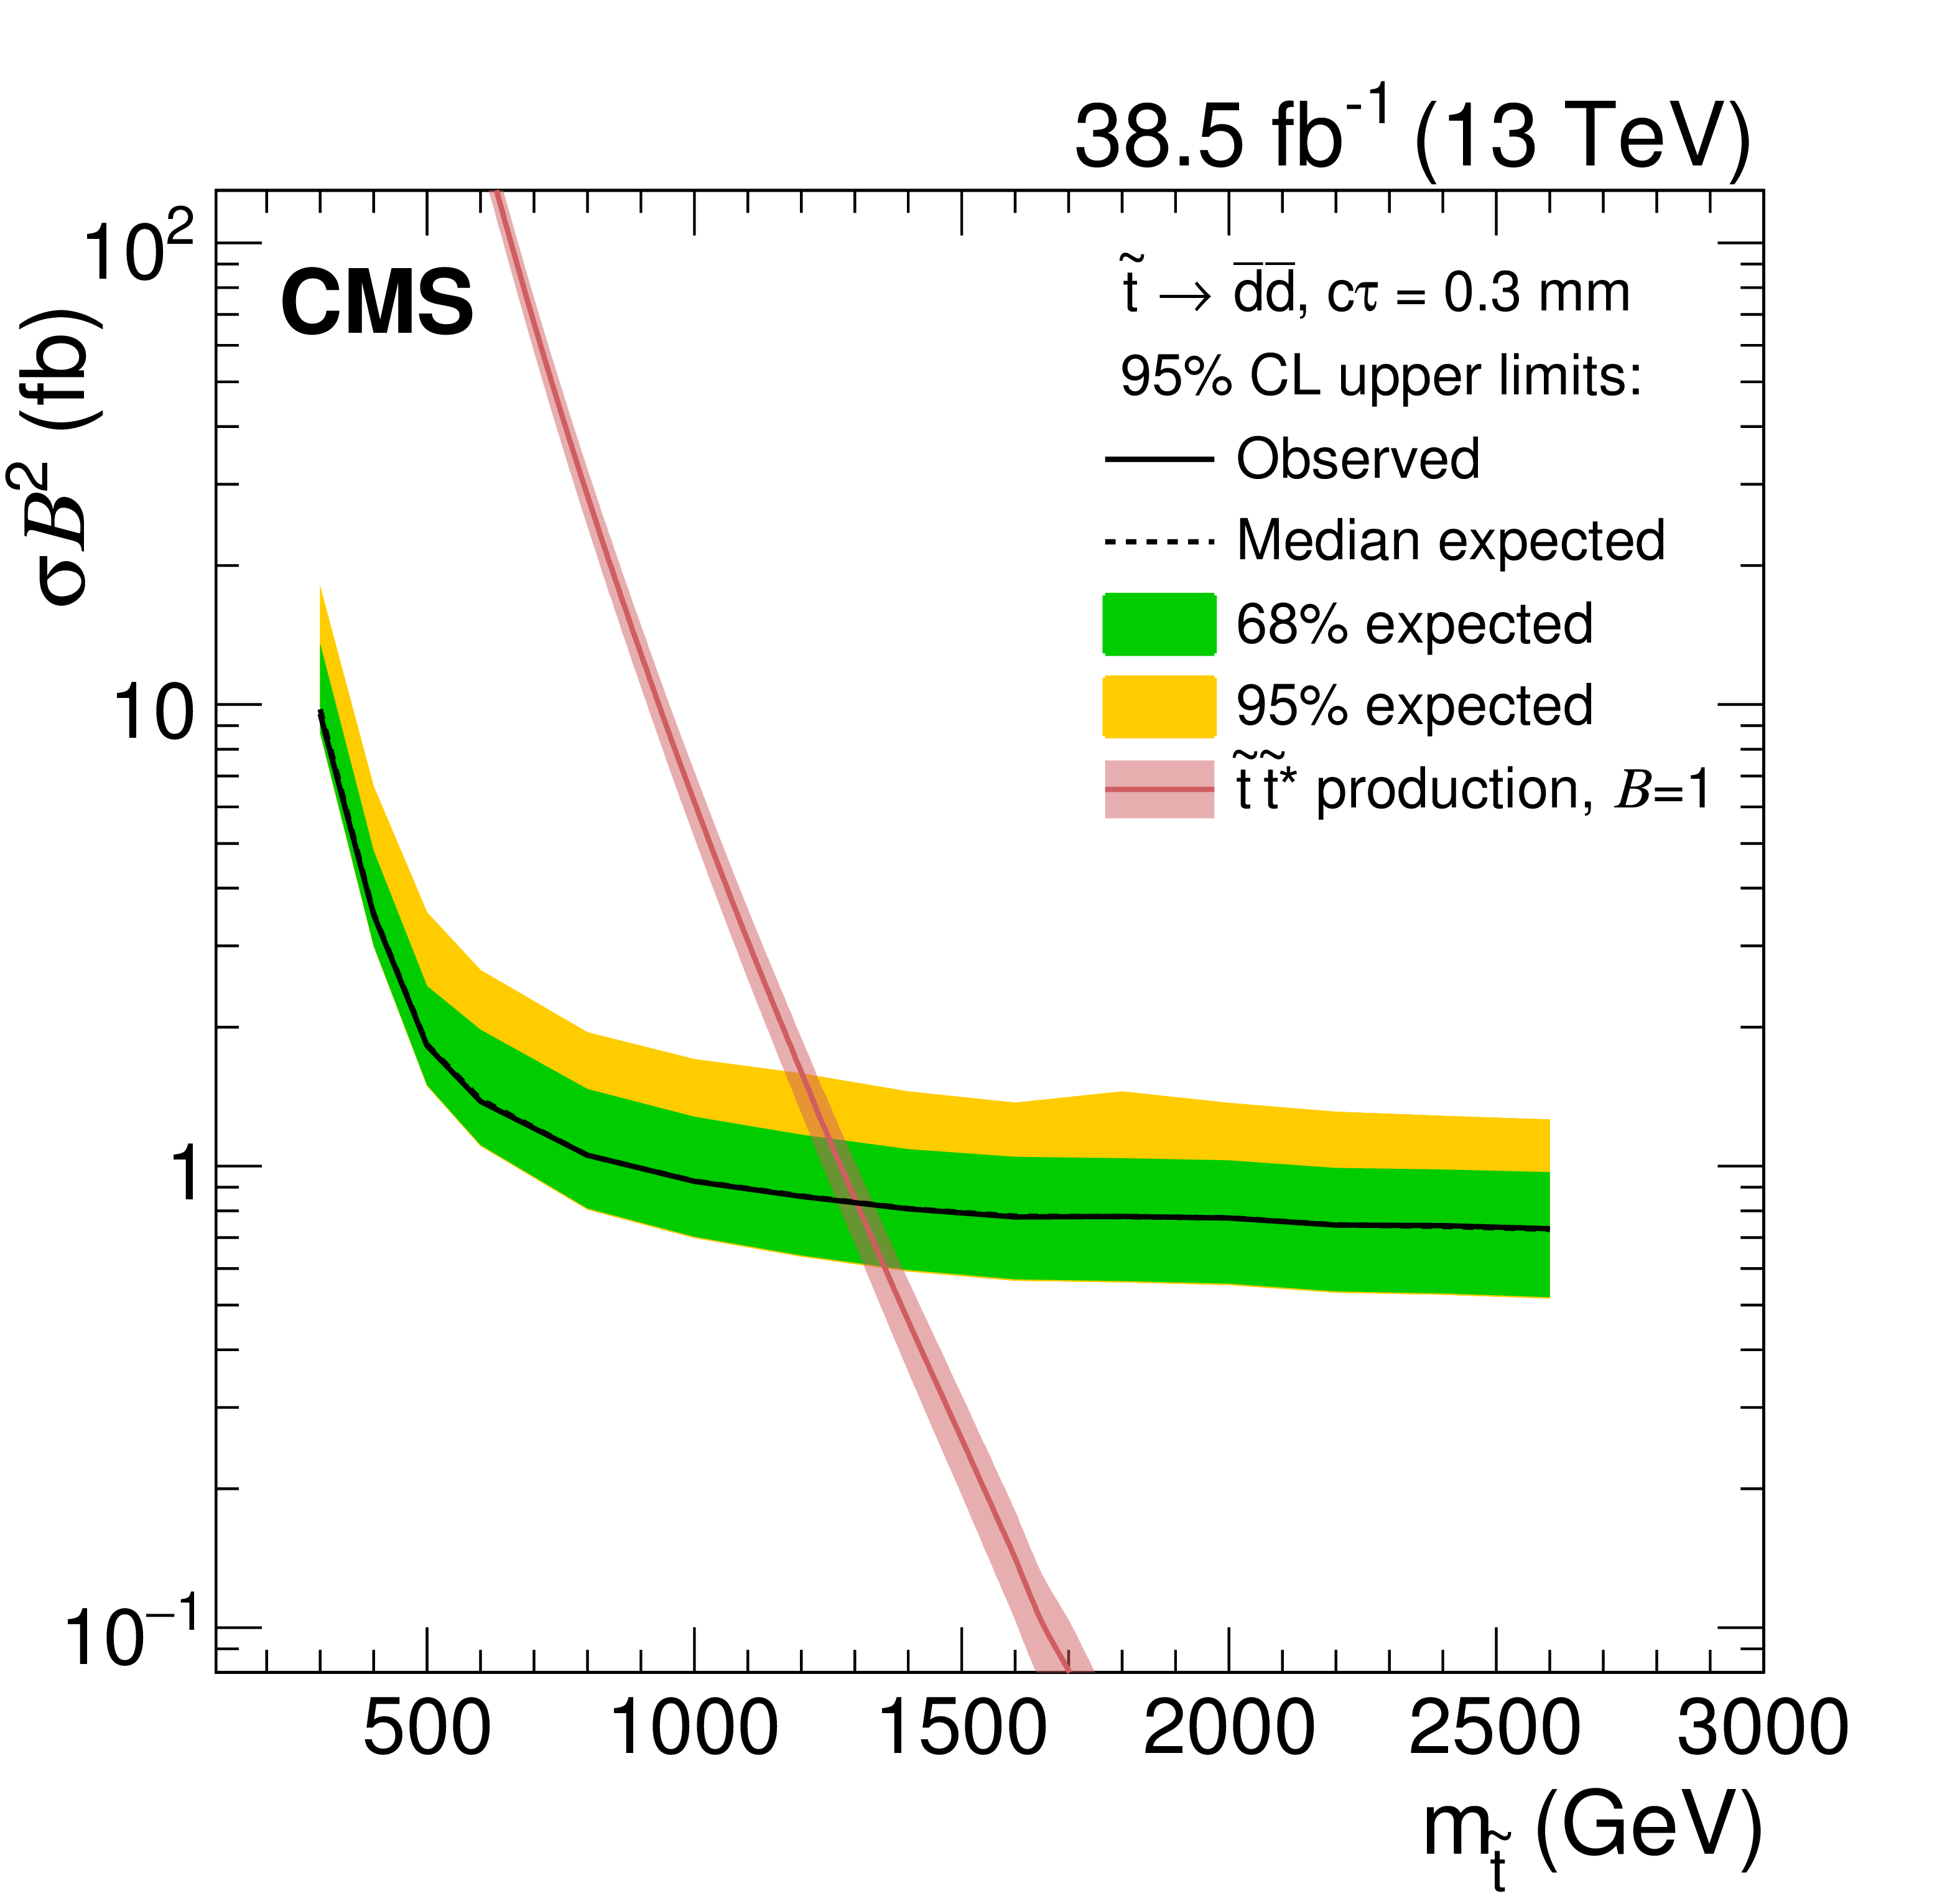
Figure 7-b:
Observed and expected 95% CL upper limits on $\sigma \mathcal {B}^2$ for the dijet signal, as a function of mass for a fixed $c\tau $ of 0.3 mm. The top squark pair production cross section is overlaid. The uncertainties in the theoretical cross sections include those due to the renormalization and factorization scales, and the parton distribution functions. |

png pdf |
Figure 7-c:
Observed and expected 95% CL upper limits on $\sigma \mathcal {B}^2$ for the multijet signal, as a function of mass for a fixed $c\tau $ of 1.0 mm. The gluino pair production cross section is overlaid. The uncertainties in the theoretical cross sections include those due to the renormalization and factorization scales, and the parton distribution functions. |
png pdf |
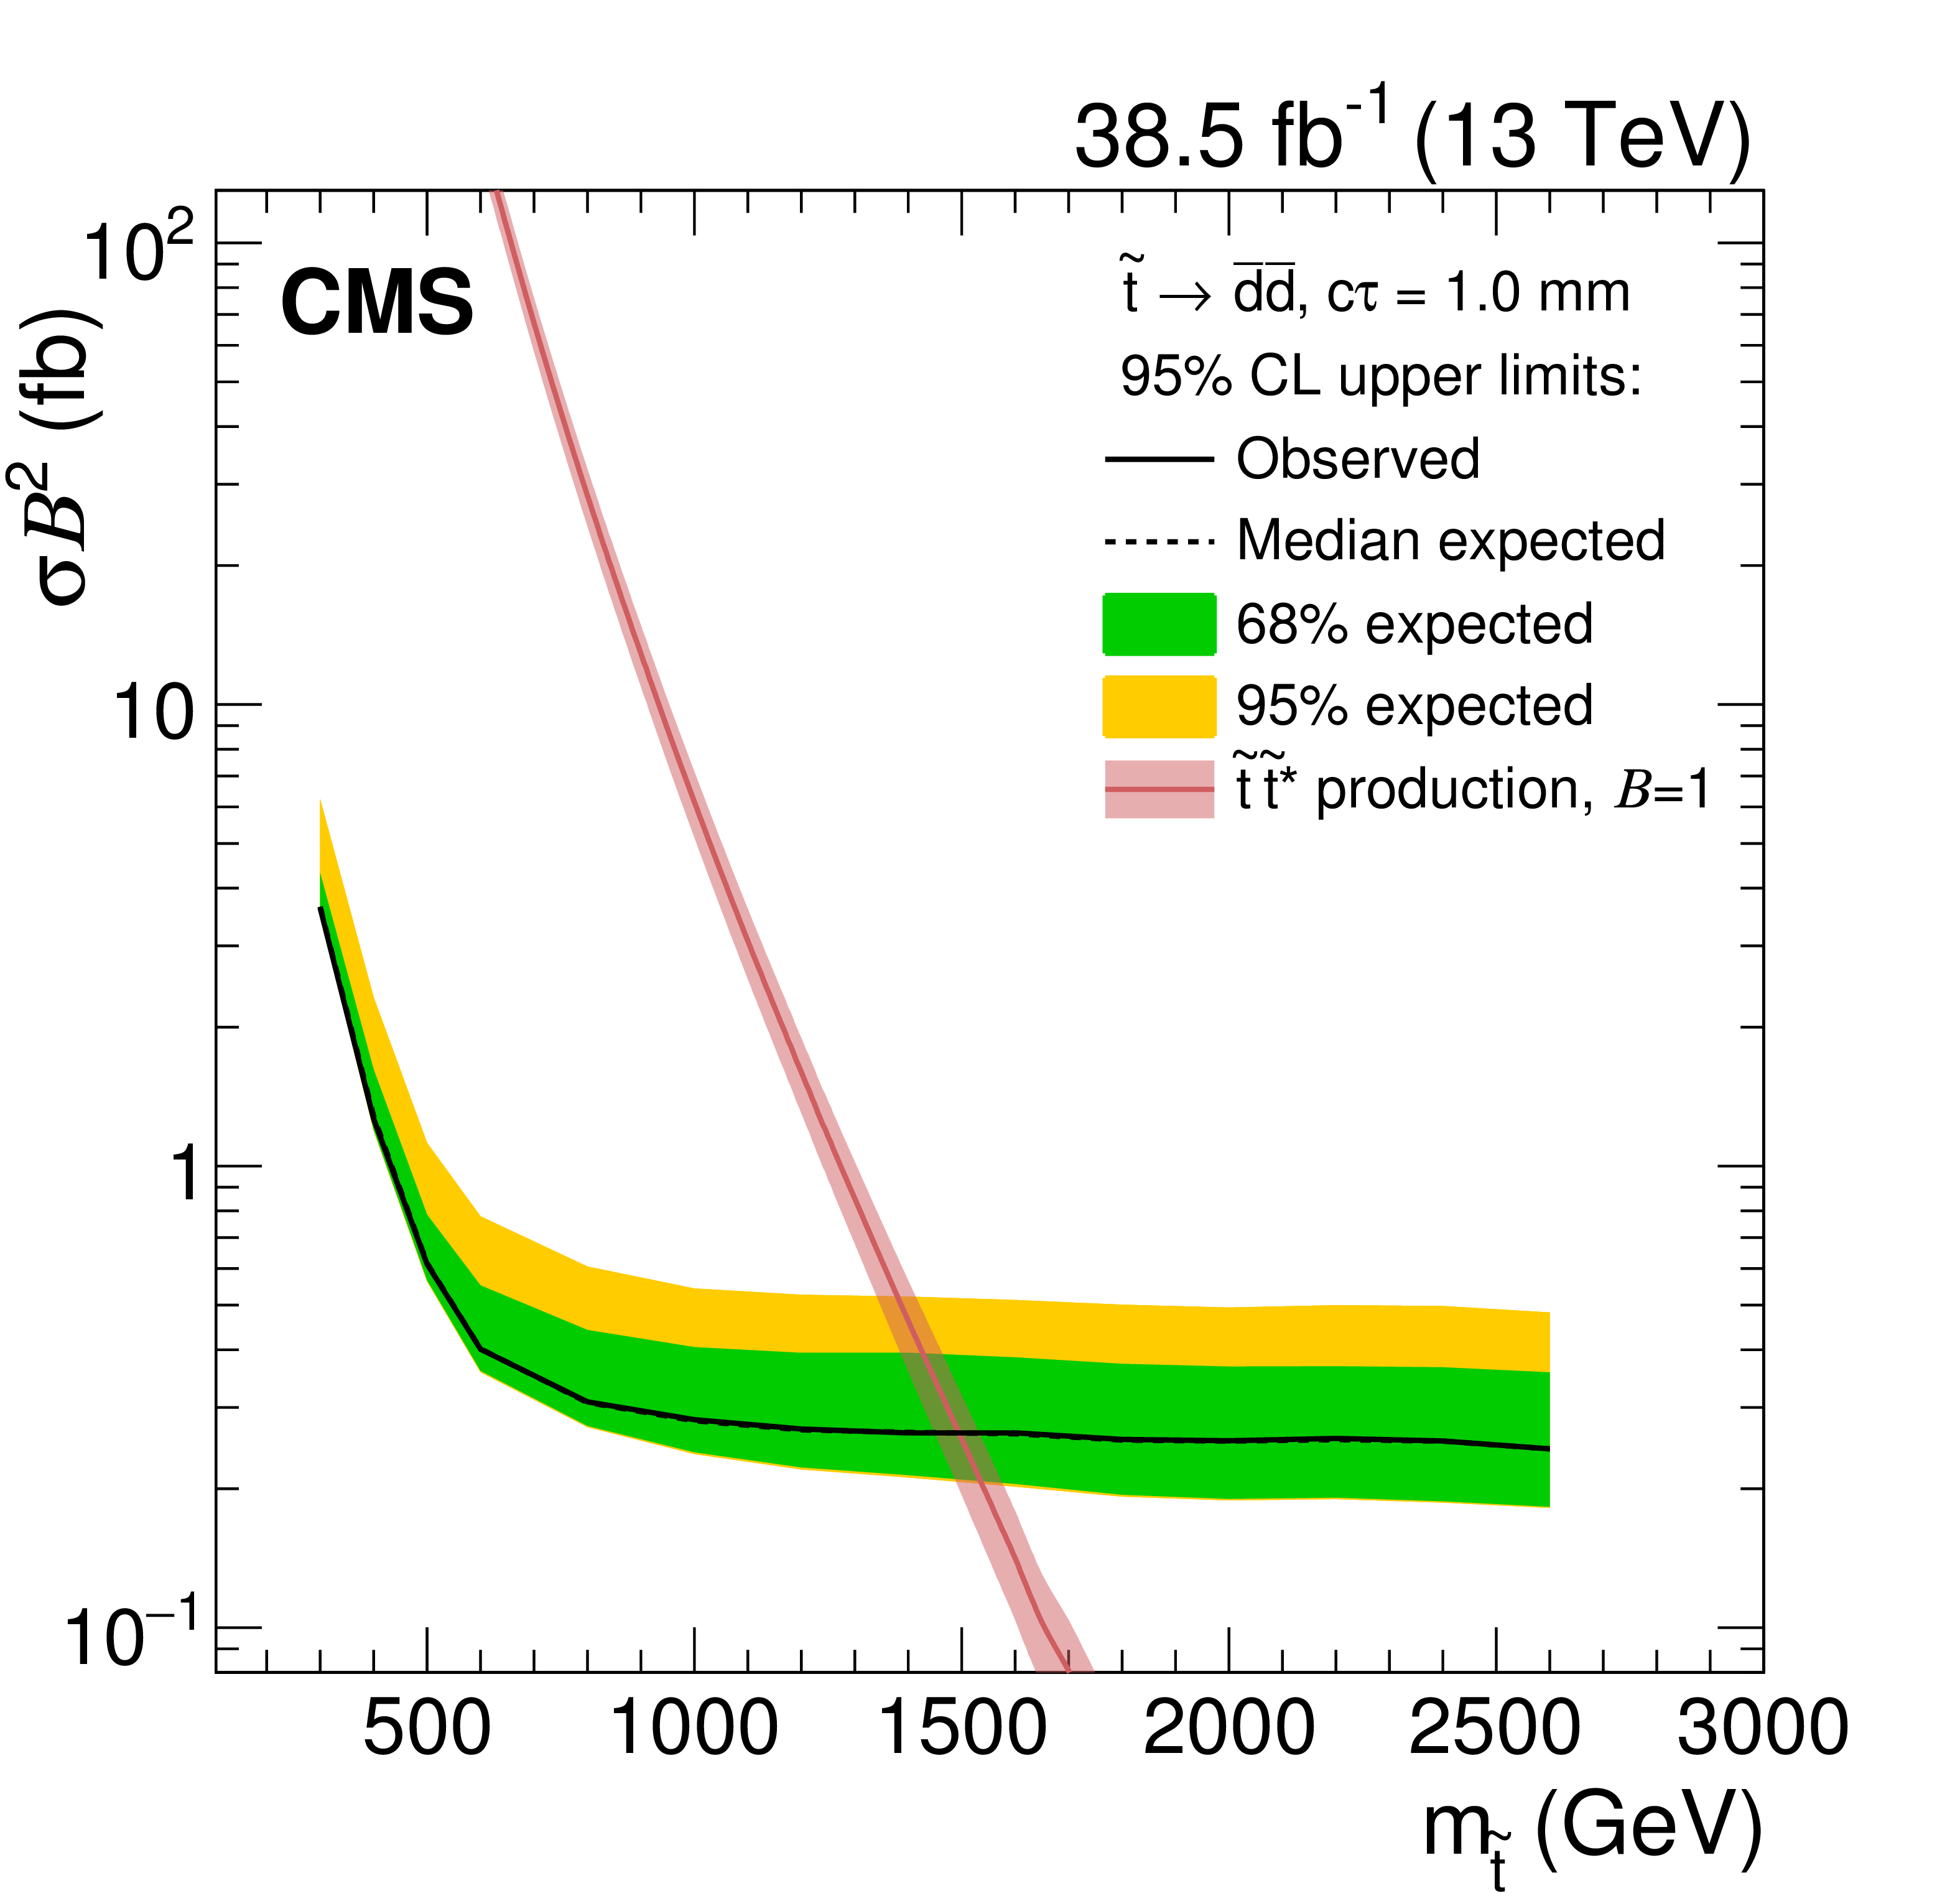
Figure 7-d:
Observed and expected 95% CL upper limits on $\sigma \mathcal {B}^2$ for the dijet signal, as a function of mass for a fixed $c\tau $ of 1.0 mm. The top squark pair production cross section is overlaid. The uncertainties in the theoretical cross sections include those due to the renormalization and factorization scales, and the parton distribution functions. |
png pdf |
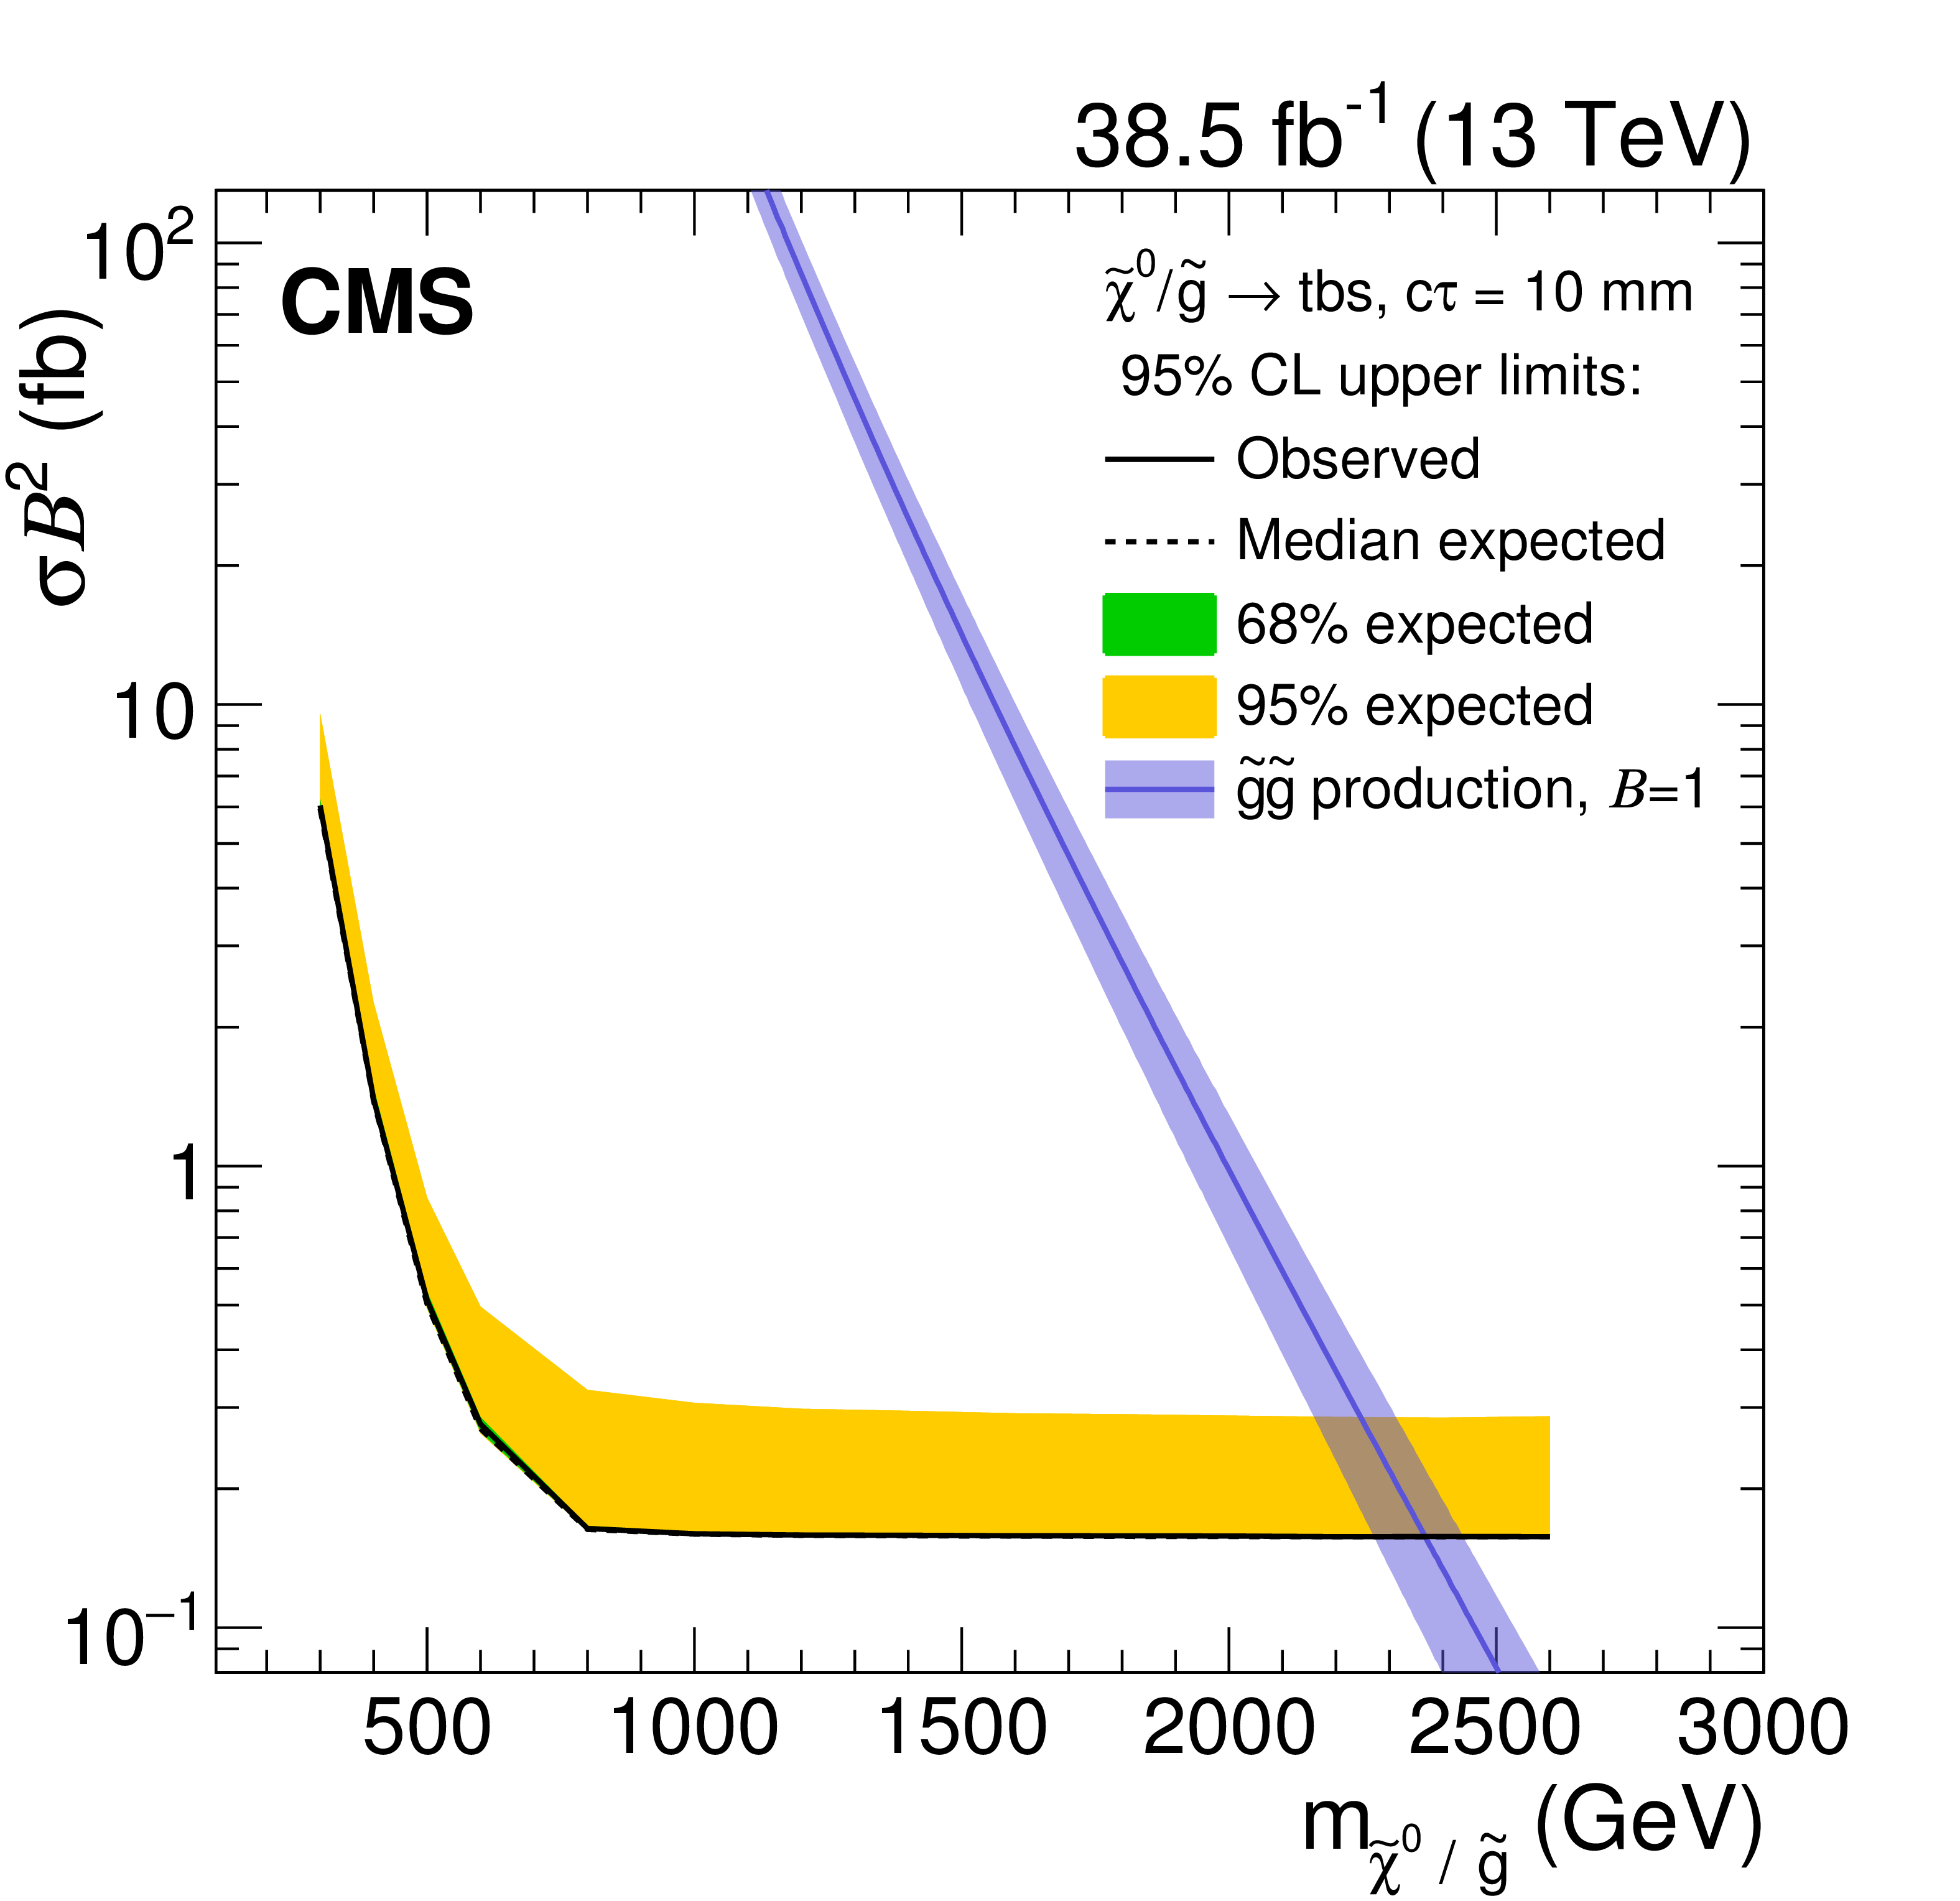
Figure 7-e:
Observed and expected 95% CL upper limits on $\sigma \mathcal {B}^2$ for the multijet signal, as a function of mass for a fixed $c\tau $ of 10 mm. The gluino pair production cross section is overlaid. The uncertainties in the theoretical cross sections include those due to the renormalization and factorization scales, and the parton distribution functions. |
png pdf |
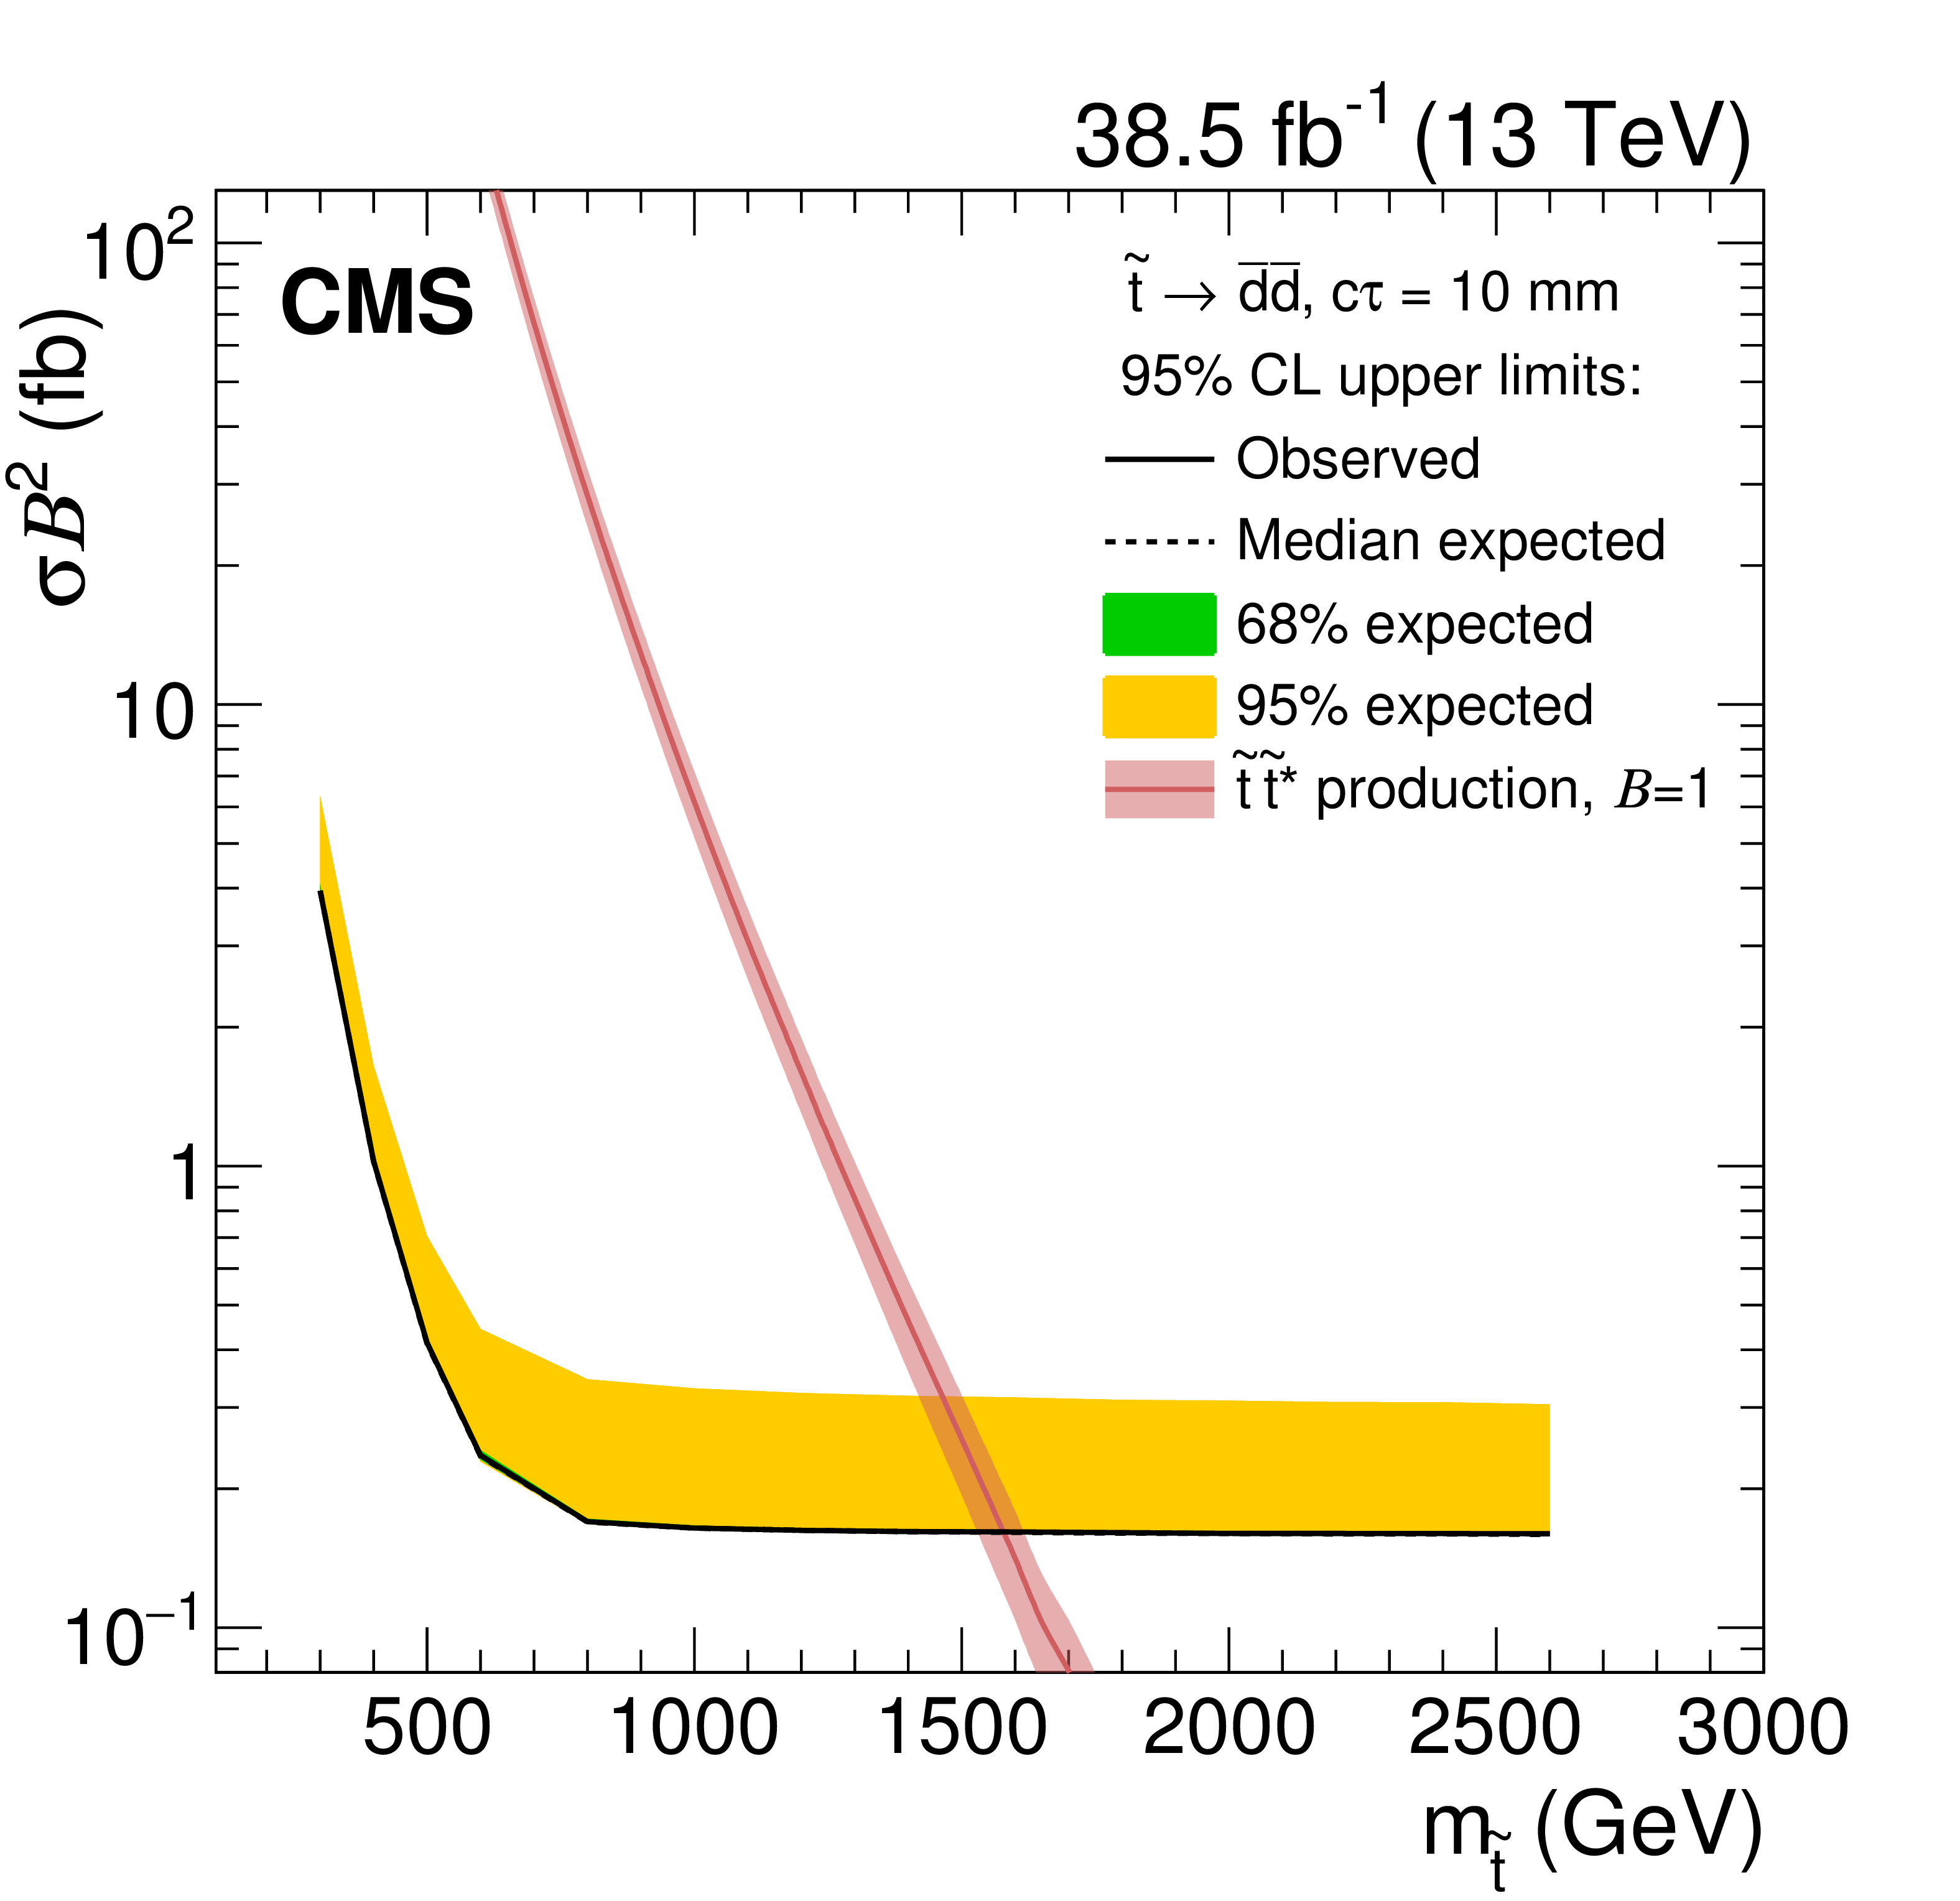
Figure 7-f:
Observed and expected 95% CL upper limits on $\sigma \mathcal {B}^2$ for the dijet signal, as a function of mass for a fixed $c\tau $ of 10 mm. The top squark pair production cross section is overlaid. The uncertainties in the theoretical cross sections include those due to the renormalization and factorization scales, and the parton distribution functions. |

png pdf |
Figure 8:
Observed and expected 95% CL upper limits on $\sigma \mathcal {B}^2$ for the multijet (left) and dijet (right) signals, as a function of $c\tau $ for a fixed mass of 800 GeV (upper), 1600 GeV (middle), and 2400 GeV (lower). |
png pdf |
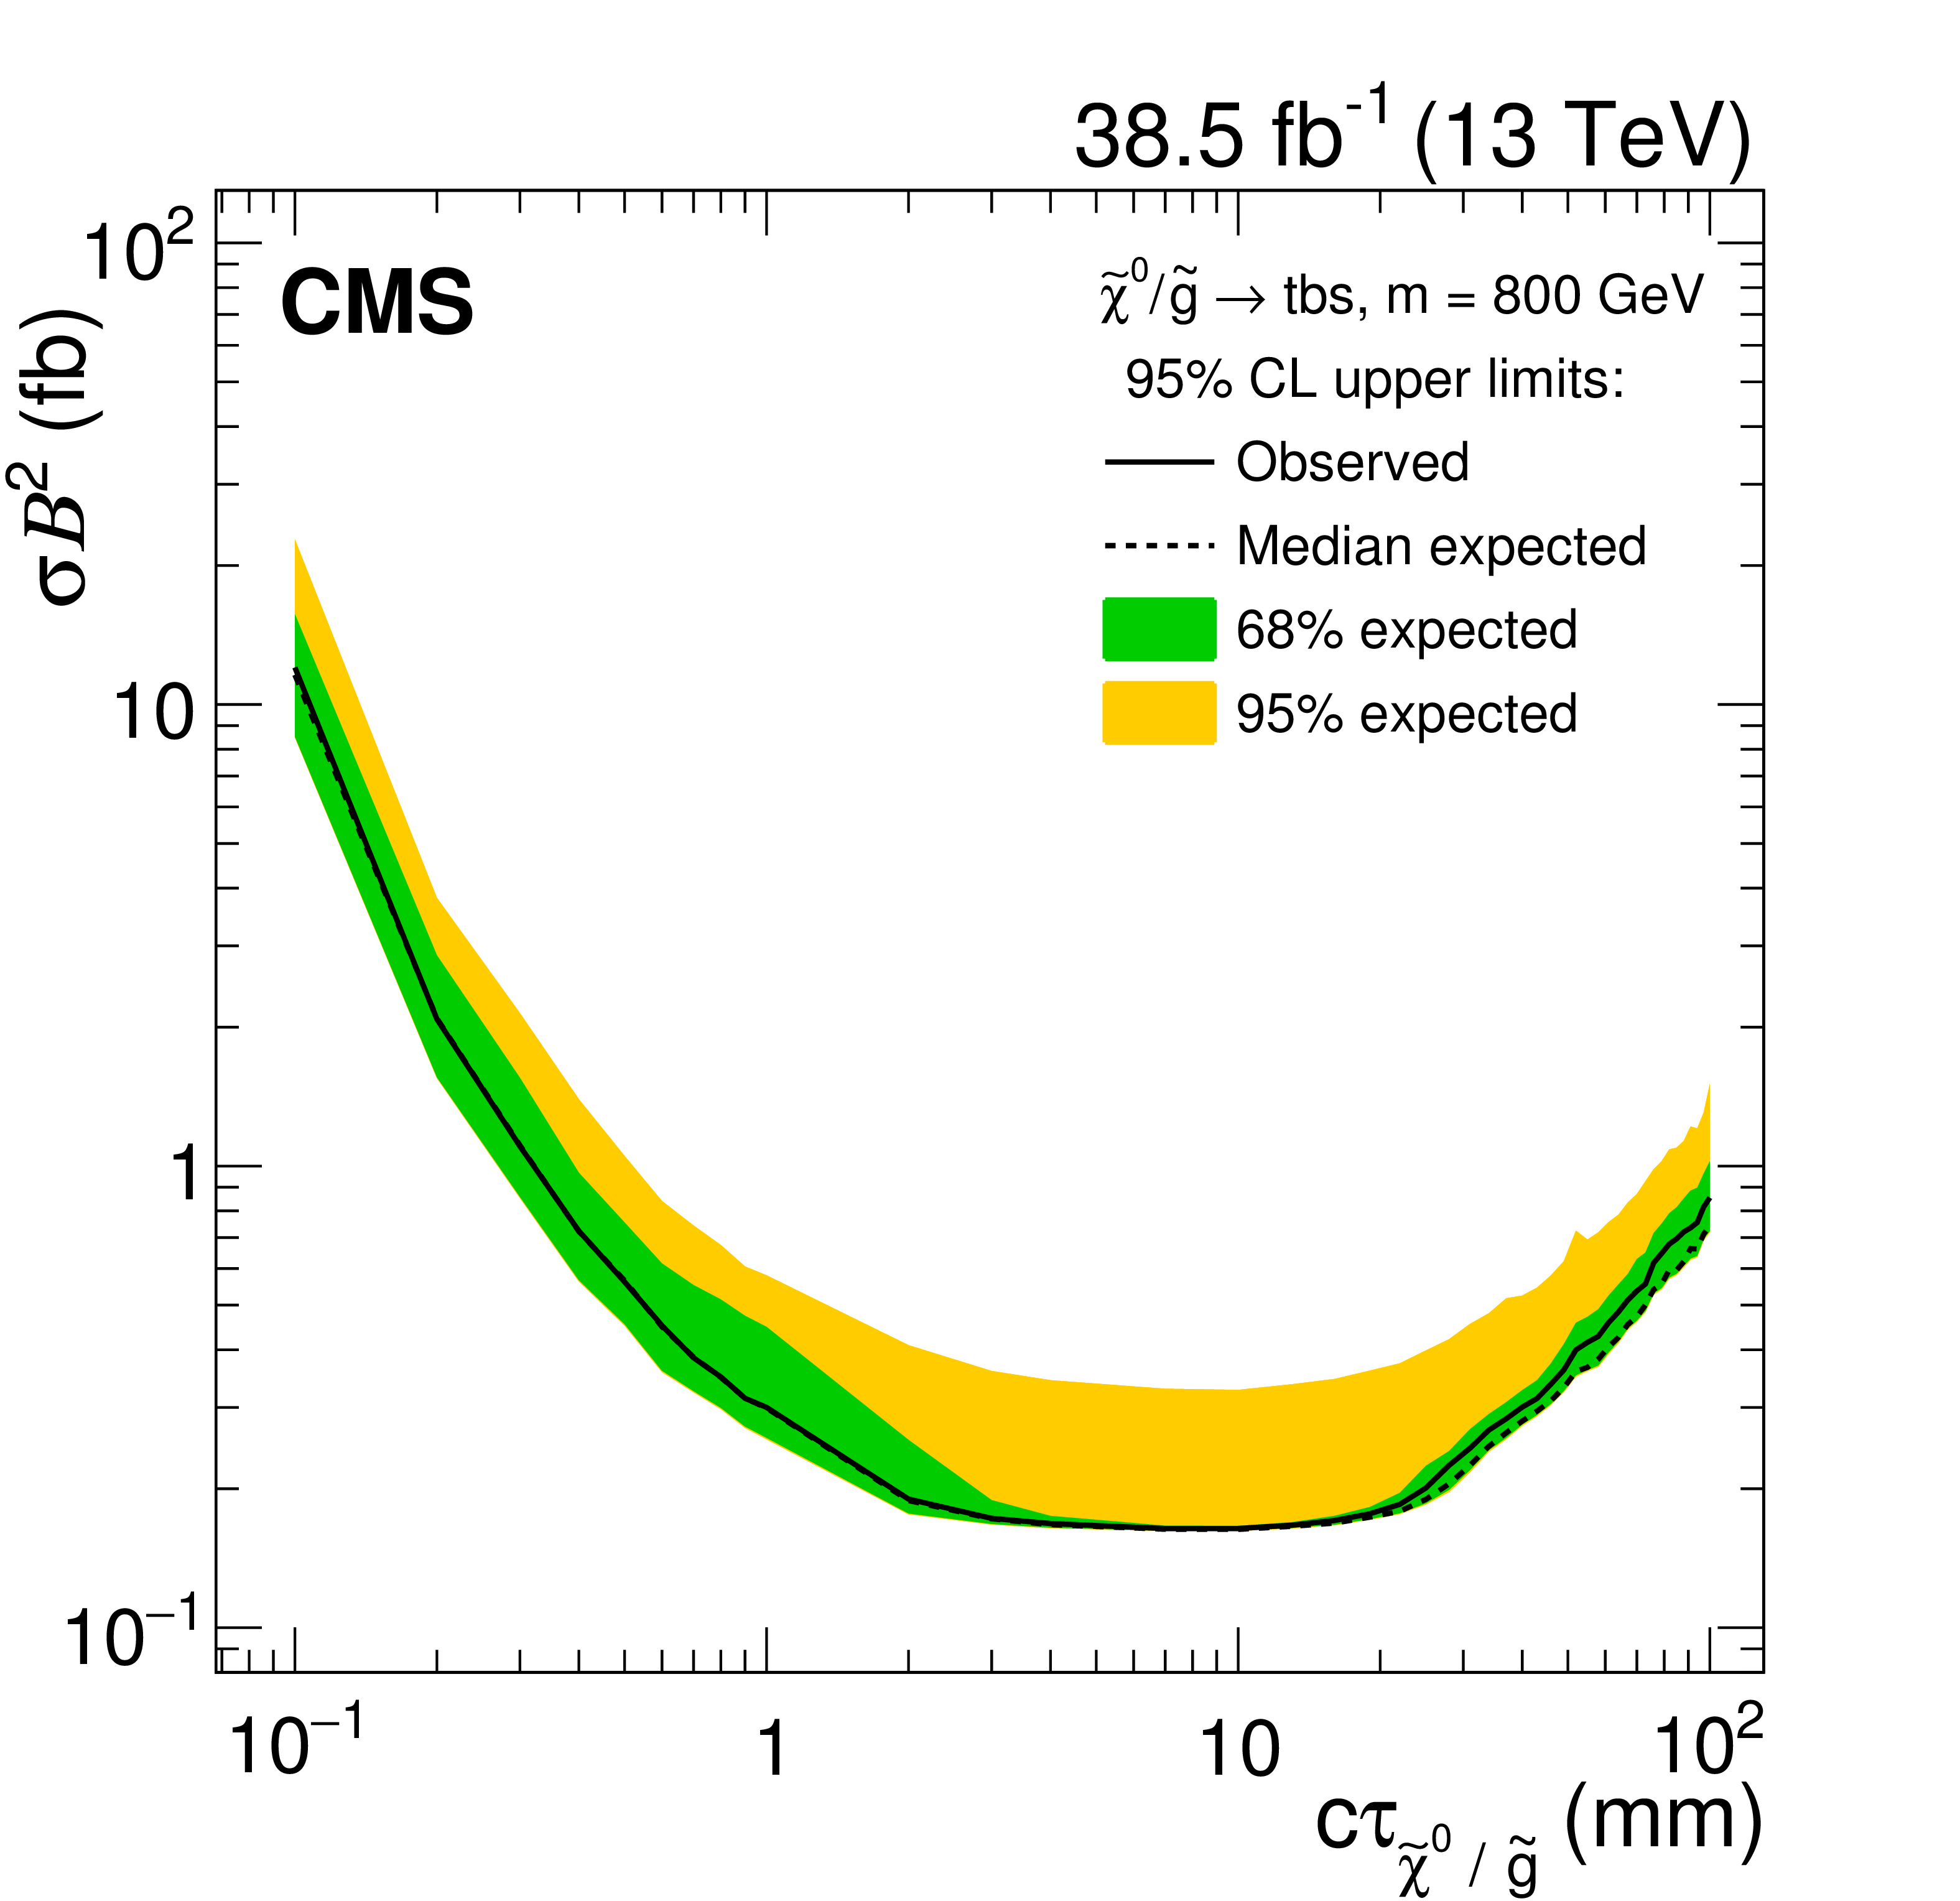
Figure 8-a:
Observed and expected 95% CL upper limits on $\sigma \mathcal {B}^2$ for the multijet signal, as a function of $c\tau $ for a fixed mass of 800 GeV. |

png pdf |
Figure 8-b:
Observed and expected 95% CL upper limits on $\sigma \mathcal {B}^2$ for the dijet signal, as a function of $c\tau $ for a fixed mass of 800 GeV. |
png pdf |
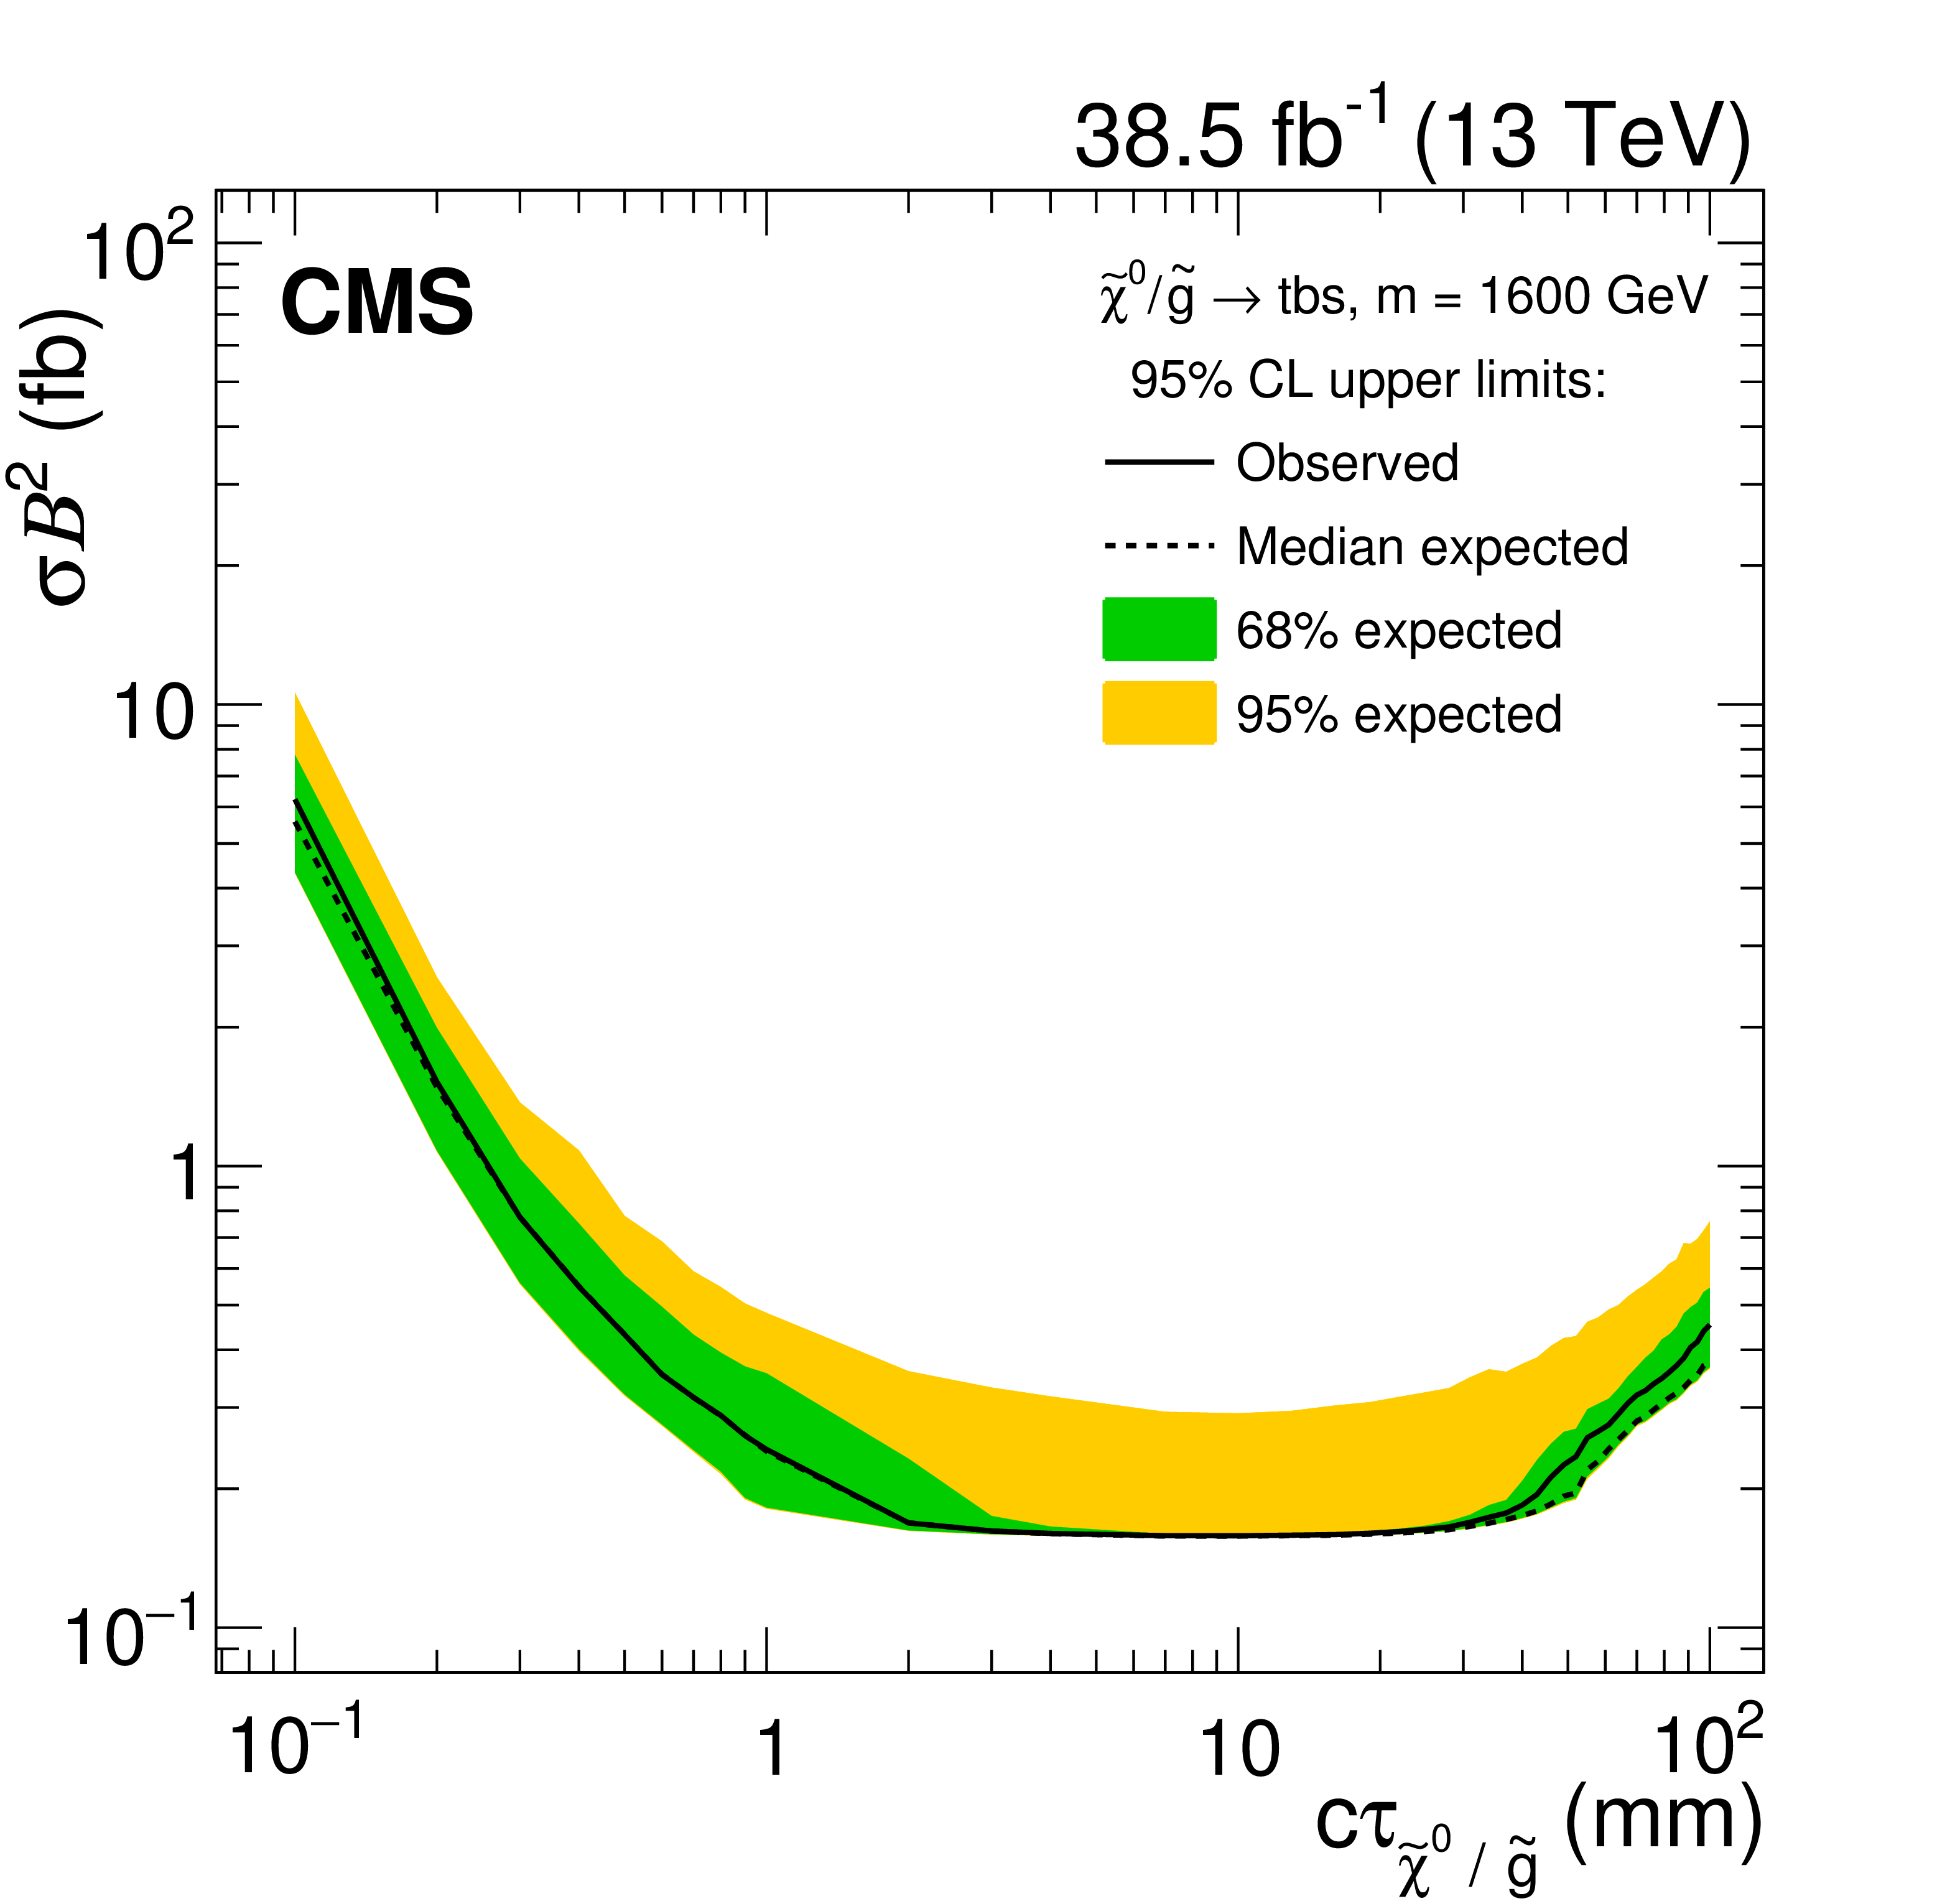
Figure 8-c:
Observed and expected 95% CL upper limits on $\sigma \mathcal {B}^2$ for the multijet signal, as a function of $c\tau $ for a fixed mass of 1600 GeV. |

png pdf |
Figure 8-d:
Observed and expected 95% CL upper limits on $\sigma \mathcal {B}^2$ for the dijet signal, as a function of $c\tau $ for a fixed mass of 1600 GeV. |
png pdf |
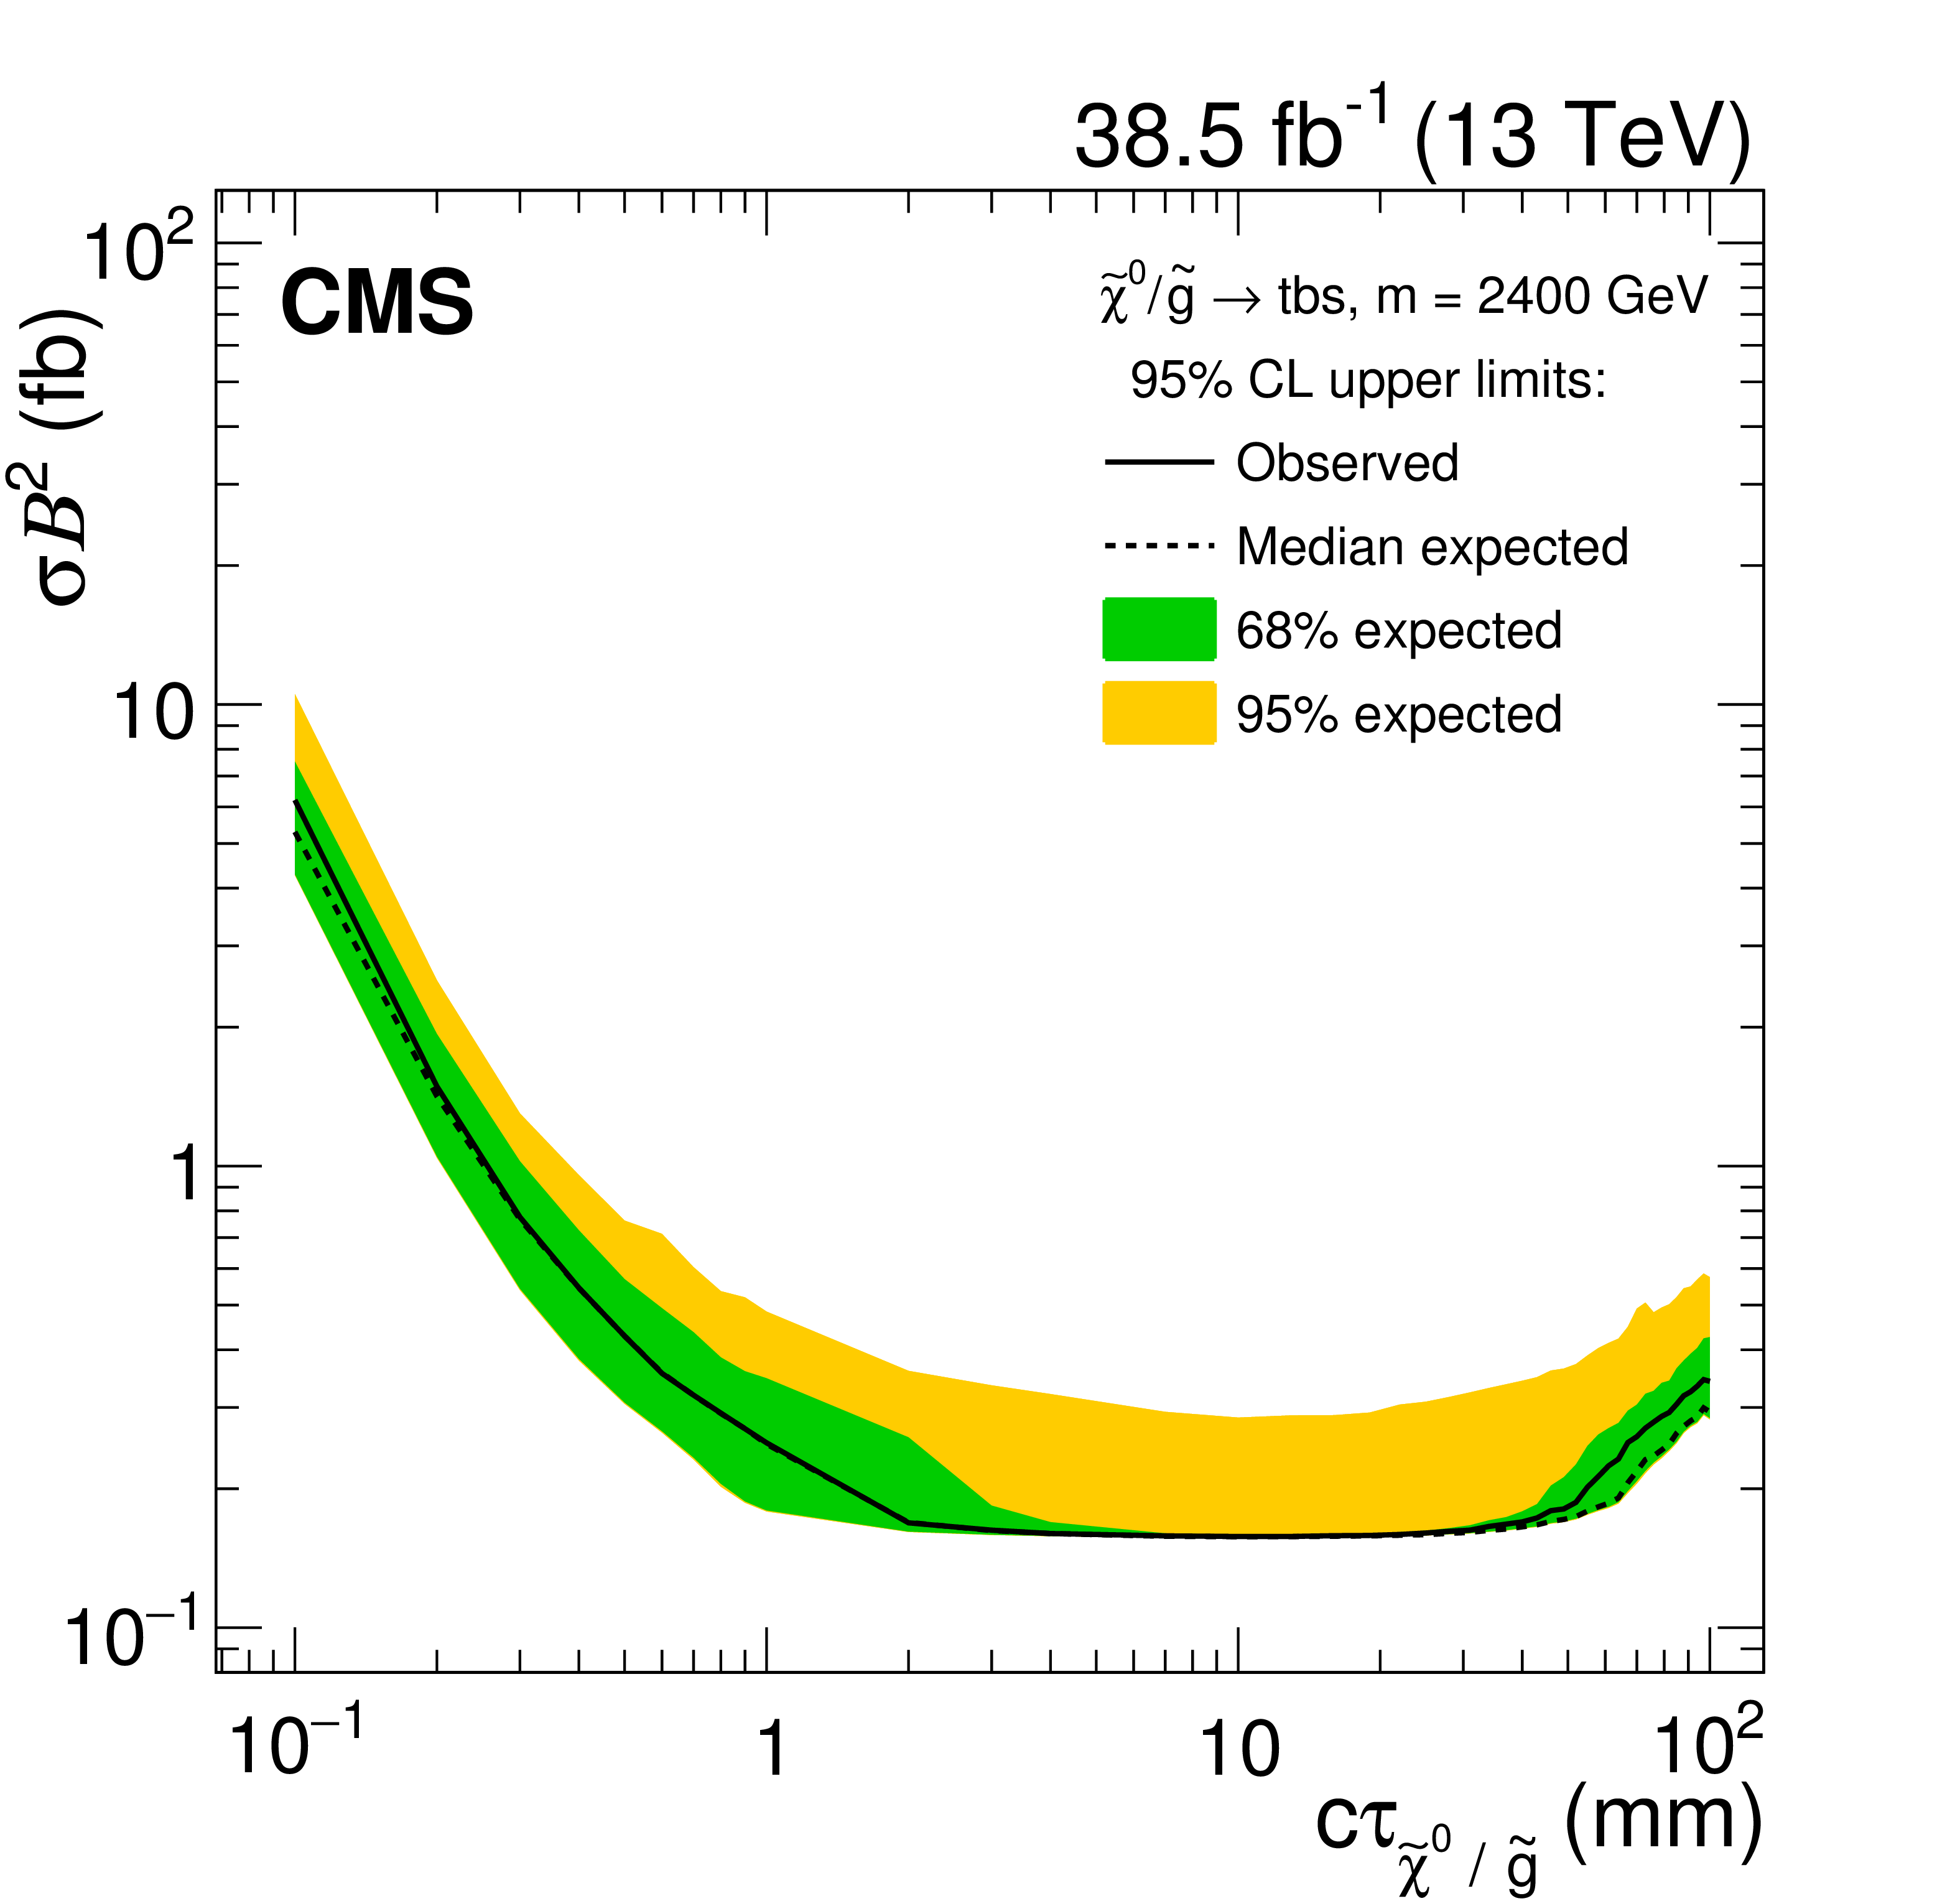
Figure 8-e:
Observed and expected 95% CL upper limits on $\sigma \mathcal {B}^2$ for the multijet signal, as a function of $c\tau $ for a fixed mass of 2400 GeV. |

png pdf |
Figure 8-f:
Observed and expected 95% CL upper limits on $\sigma \mathcal {B}^2$ for the dijet signal, as a function of $c\tau $ for a fixed mass of 2400 GeV. |
| Tables | |
png pdf |
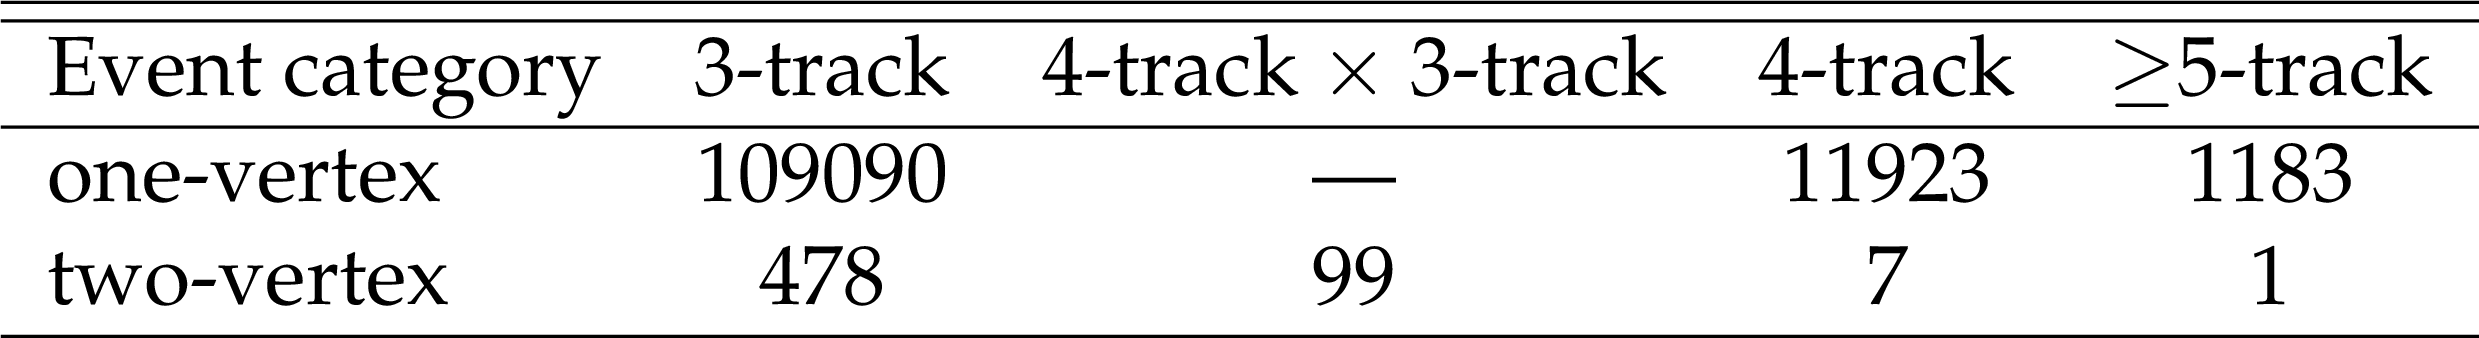
Table 1:
Event yields in data. The "one-vertex'' events have exactly one vertex with the specified number of tracks, and the "two-vertex'' events have two or more vertices each with the specified number of tracks. The control samples are composed of the events with 3-track and 4-track vertices, the background template is constructed using the $\geq $5-track one-vertex events, and the signal region consists of the $\geq $5-track two-vertex events. |

png pdf |
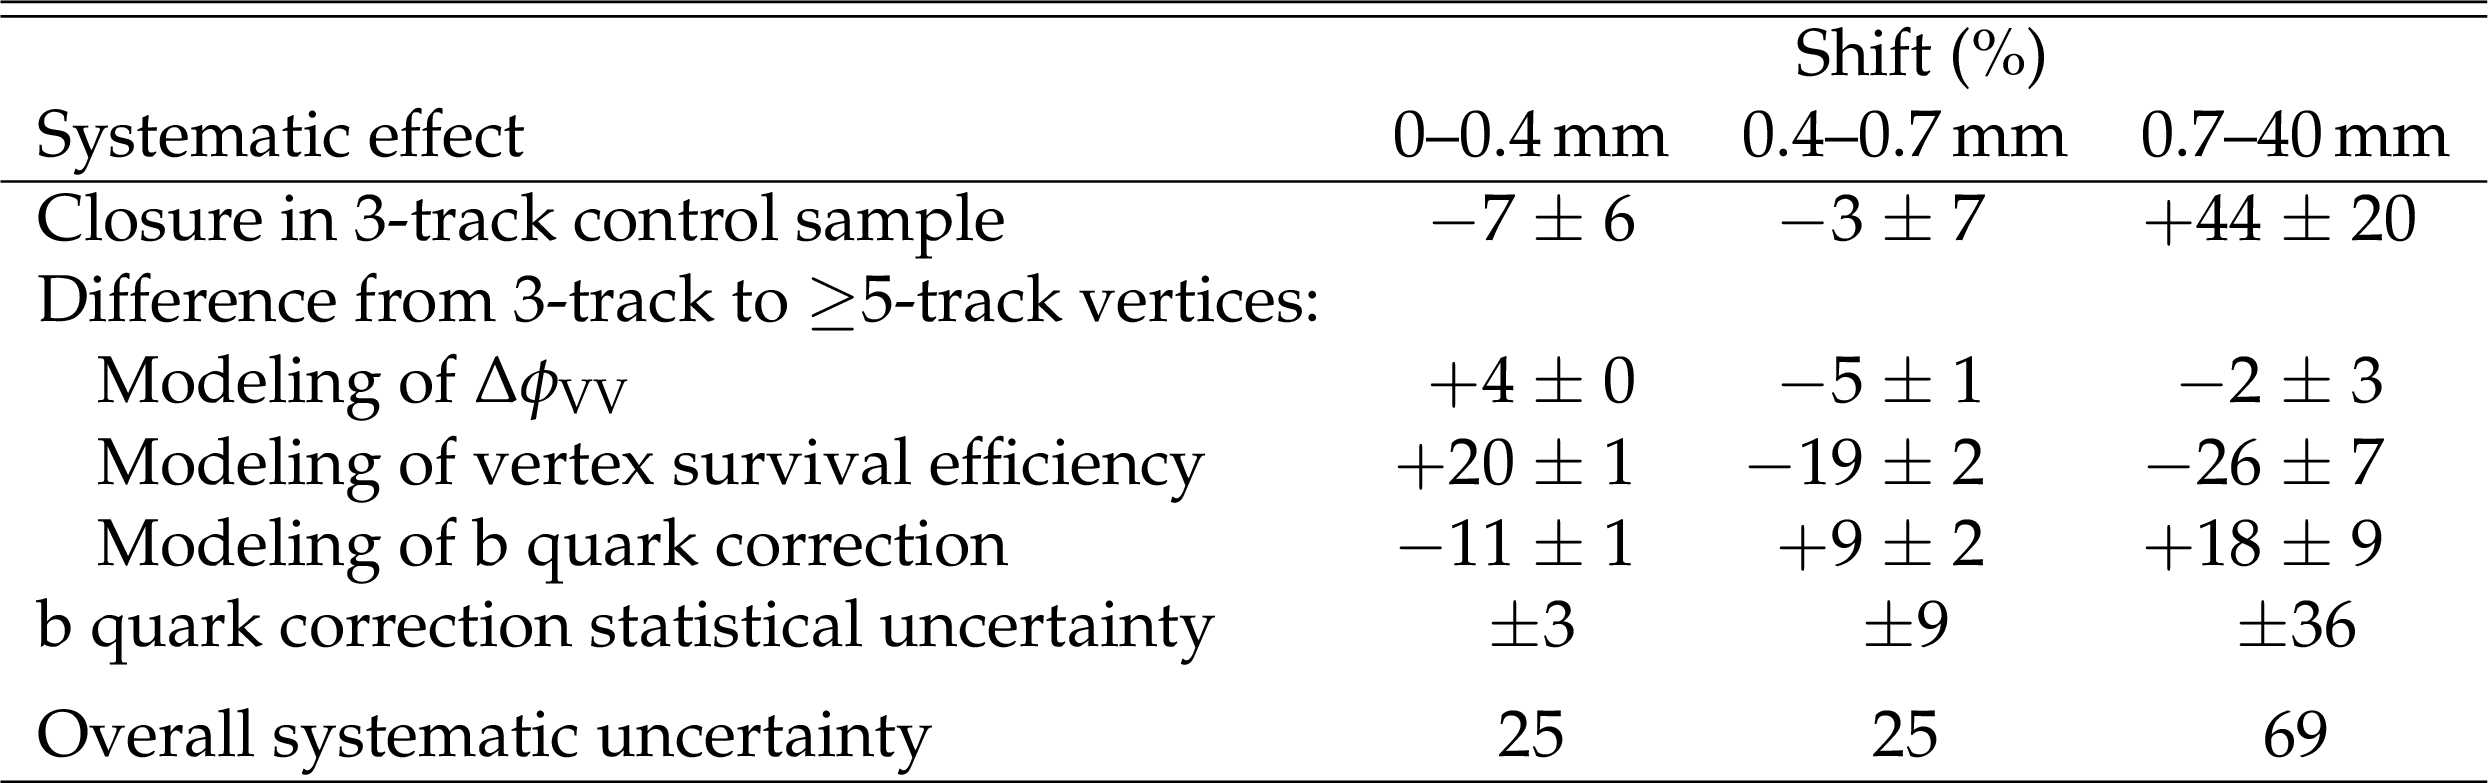
Table 2:
Systematic uncertainties in the signal efficiency. The overall uncertainty is the sum in quadrature of the individual uncertainties, assuming no correlations. |
png pdf |
Table 3:
Systematic shifts in the background prediction in each ${d_{\mathrm {VV}}^{\,\mathrm {C}}}$ bin arising from varying the construction of the ${d_{\mathrm {VV}}^{\,\mathrm {C}}}$ template. The overall systematic uncertainty is the sum in quadrature of the shifts and their statistical uncertainties, assuming no correlations among the sources. |
png pdf |
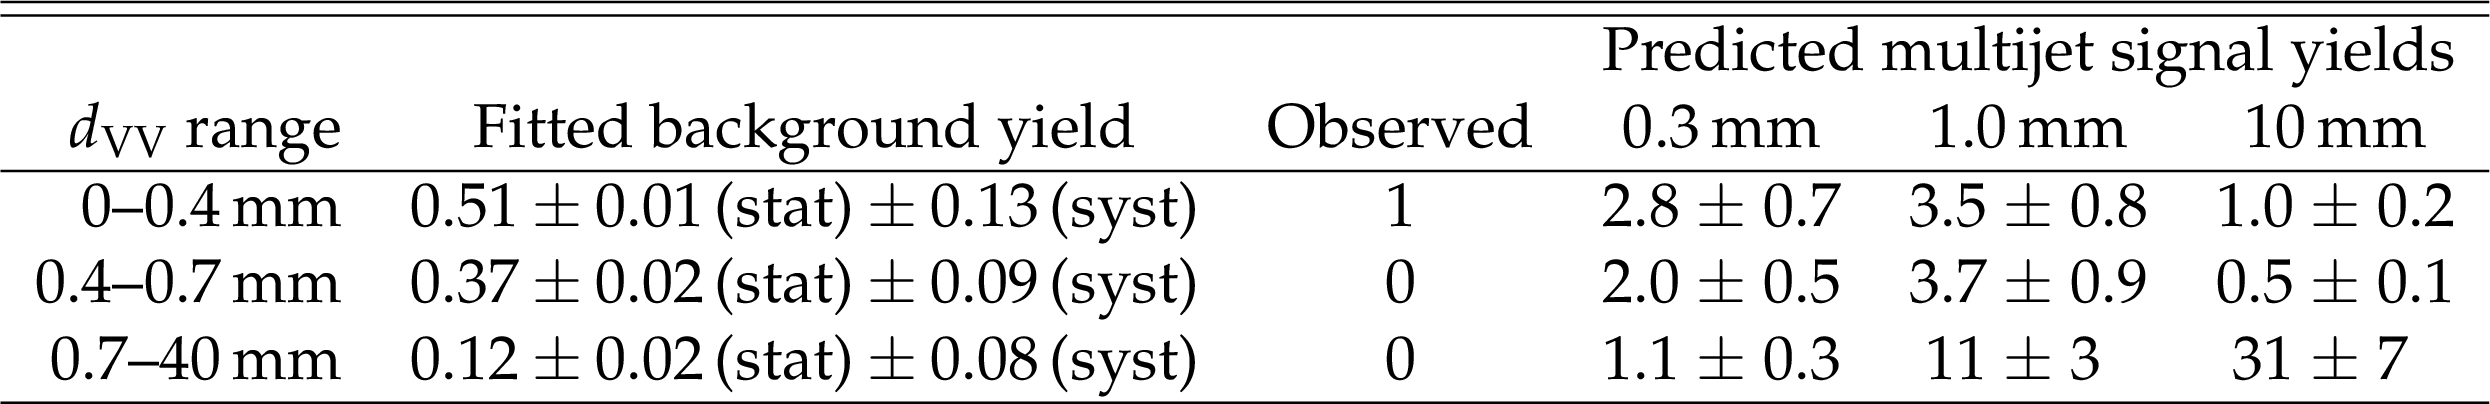
Table 4:
For each ${d_{\mathrm {VV}}}$ bin in $\geq $5-track two-vertex events: the predicted background yield from the background-only fit, the observed yield, and the predicted signal yields for simulated multijet signals with $m = $ 2000 GeV, production cross section 1 fb, and $c\tau = $ 0.3, 1.0, and 10 mm. The systematic uncertainties in the predicted background yields reflect the fractional systematic uncertainties given in Table 3, and the uncertainties in the predicted signal yields reflect the fractional systematic uncertainty given in Table 2. |
| Summary |
| A search for long-lived particles decaying into multijet final states has been performed using proton-proton collision events collected with the CMS detector at a center-of-mass-energy of 13 TeV in 2015 and 2016. The data sample corresponds to an integrated luminosity of 38.5 fb$^{-1}$. No excess yield above the prediction from standard model processes is observed. At 95% confidence level, upper limits are placed for models of $R$-parity violating supersymmetry in which the long-lived particles are neutralinos or gluinos decaying solely into multijet final states or top squarks decaying solely into dijet final states. The data exclude cross sections above approximately 0.3 fb for particles with masses between 800 and 2600 GeV and mean proper decay lengths between 1 and 40 mm. For mean proper decay lengths between 0.6 and 80 mm, gluino masses below 2200 GeV and top squark masses below 1400 GeV are excluded. While the search specifically addresses two models of $R$-parity violating supersymmetry, the results are relevant to other models in which long-lived particles decay to final states with multiple tracks, and a method to extend the search to other signal models is provided. For the models considered, the results provide the most restrictive bounds to date on the production and decay of pairs of long-lived particles with mean proper decay lengths between 0.1 and 100 mm. |
| References | ||||
| 1 | R. Barbier et al. | $ R $-parity violating supersymmetry | PR 420 (2005) 1 | hep-ph/0406039 |
| 2 | J. L. Hewett, B. Lillie, M. Masip, and T. G. Rizzo | Signatures of long-lived gluinos in split supersymmetry | JHEP 09 (2004) 070 | hep-ph/0408248 |
| 3 | M. J. Strassler and K. M. Zurek | Echoes of a hidden valley at hadron colliders | PLB 651 (2007) 374 | hep-ph/0604261 |
| 4 | Y. Cui and B. Shuve | Probing baryogenesis with displaced vertices at the LHC | JHEP 02 (2015) 049 | 1409.6729 |
| 5 | C. Cs\'aki, Y. Grossman, and B. Heidenreich | Minimal flavor violation supersymmetry: a natural theory for $ R $-parity violation | PRD 85 (2012) 095009 | 1111.1239 |
| 6 | C. Cs\'aki et al. | Phenomenology of a long-lived LSP with $ R $-parity violation | JHEP 08 (2015) 016 | 1505.00784 |
| 7 | CMS Collaboration | Search for $ R $-parity violating supersymmetry with displaced vertices in proton-proton collisions at $ \sqrt{s} = $ 8 TeV | PRD 95 (2017) 012009 | CMS-SUS-14-020 1610.05133 |
| 8 | ATLAS Collaboration | Search for long-lived, massive particles in events with displaced vertices and missing transverse momentum in $ \sqrt{s} = $ 13 TeV pp collisions with the ATLAS detector | PRD 97 (2018) 052012 | 1710.04901 |
| 9 | CMS Collaboration | Search for long-lived neutral particles decaying to quark-antiquark pairs in proton-proton collisions at $ \sqrt{s} = $ 8 TeV | PRD 91 (2015) 012007 | CMS-EXO-12-038 1411.6530 |
| 10 | ATLAS Collaboration | Search for pair-produced long-lived neutral particles decaying in the ATLAS hadronic calorimeter in pp collisions at $ \sqrt{s} = $ 8 TeV | PLB 743 (2015) 15 | 1501.04020 |
| 11 | ATLAS Collaboration | Search for long-lived, weakly interacting particles that decay to displaced hadronic jets in proton-proton collisions at $ \sqrt{s} = $ 8 TeV with the ATLAS detector | PRD 92 (2015) 012010 | 1504.03634 |
| 12 | CMS Collaboration | Search for new long-lived particles at $ \sqrt{s} = $ 13 TeV | PLB 780 (2018) 432 | CMS-EXO-16-003 1711.09120 |
| 13 | CMS Collaboration | Search for displaced supersymmetry in events with an electron and a muon with large impact parameters | PRL 114 (2015) 061801 | CMS-B2G-12-024 1409.4789 |
| 14 | CMS Collaboration | Search for long-lived particles that decay into final states containing two electrons or two muons in proton-proton collisions at $ \sqrt{s} = $ 8 TeV | PRD 91 (2015) 052012 | CMS-EXO-12-037 1411.6977 |
| 15 | ATLAS Collaboration | Search for nonpointing and delayed photons in the diphoton and missing transverse momentum final state in 8 TeV pp collisions at the LHC using the ATLAS detector | PRD 90 (2014) 112005 | 1409.5542 |
| 16 | ATLAS Collaboration | Search for long-lived neutral particles decaying into lepton jets in proton-proton collisions at $ \sqrt{s} = $ 8 TeV with the ATLAS detector | JHEP 11 (2014) 088 | 1409.0746 |
| 17 | CMS Collaboration | The CMS experiment at the CERN LHC | JINST 3 (2008) S08004 | CMS-00-001 |
| 18 | CMS Collaboration | Description and performance of track and primary-vertex reconstruction with the CMS tracker | JINST 9 (2014) P10009 | CMS-TRK-11-001 1405.6569 |
| 19 | CMS Collaboration | Particle-flow reconstruction and global event description with the CMS detector | JINST 12 (2017) P10003 | CMS-PRF-14-001 1706.04965 |
| 20 | M. Cacciari, G. P. Salam, and G. Soyez | The anti-$ {k_{\mathrm{T}}} $ jet clustering algorithm | JHEP 04 (2008) 063 | 0802.1189 |
| 21 | M. Cacciari, G. P. Salam, and G. Soyez | FastJet user manual | EPJC 72 (2012) 1896 | 1111.6097 |
| 22 | CMS Collaboration | The CMS trigger system | JINST 12 (2017) P01020 | CMS-TRG-12-001 1609.02366 |
| 23 | T. Sjostrand et al. | An introduction to PYTHIA 8.2 | CPC 191 (2015) 159 | 1410.3012 |
| 24 | NNPDF Collaboration | Parton distributions with QED corrections | NPB 877 (2013) 290 | 1308.0598 |
| 25 | J. Alwall et al. | The automated computation of tree-level and next-to-leading order differential cross sections, and their matching to parton shower simulations | JHEP 07 (2014) 079 | 1405.0301 |
| 26 | NNPDF Collaboration | Parton distributions for the LHC Run II | JHEP 04 (2015) 040 | 1410.8849 |
| 27 | CMS Collaboration | Event generator tunes obtained from underlying event and multiparton scattering measurements | EPJC 76 (2016) 155 | CMS-GEN-14-001 1512.00815 |
| 28 | CMS Collaboration | Investigations of the impact of the parton shower tuning in Pythia 8 in the modelling of $ \mathrm{t\overline{t}} $ at $ \sqrt{s}= $ 8 and 13 TeV | CMS-PAS-TOP-16-021 | CMS-PAS-TOP-16-021 |
| 29 | GEANT4 Collaboration | GEANT4--a simulation toolkit | NIMA 506 (2003) 250 | |
| 30 | R. Fruhwirth | Application of Kalman filtering to track and vertex fitting | NIMA 262 (1987) 444 | |
| 31 | CMS Collaboration | Jet energy scale and resolution in the CMS experiment in pp collisions at 8 TeV | JINST 12 (2017) P02014 | CMS-JME-13-004 1607.03663 |
| 32 | CMS Collaboration | CMS luminosity measurement for the 2015 data-taking period | CMS-PAS-LUM-15-001 | CMS-PAS-LUM-15-001 |
| 33 | CMS Collaboration | CMS luminosity measurements for the 2016 data-taking period | CMS-PAS-LUM-17-001 | CMS-PAS-LUM-17-001 |
| 34 | R. J. Barlow | Extended maximum likelihood | NIMA 297 (1990) 496 | |
| 35 | G. Cowan | Statistics | Ch. 39 in Particle Data Group, C. Patrignani et al., CPC 40 (2016) 100001 | |
| 36 | C. Borschensky et al. | Squark and gluino production cross sections in pp collisions at $ \sqrt{s}= $ 13, 14, 33 and 100 TeV | EPJC 74 (2014) 3174 | 1407.5066 |
|
|
Compact Muon Solenoid LHC, CERN |
|

|

|

|

|

|