

Compact Muon Solenoid
LHC, CERN
| CMS-EXO-17-023 ; CERN-EP-2018-093 | ||
| Search for black holes and sphalerons in high-multiplicity final states in proton-proton collisions at $\sqrt{s} = $ 13 TeV | ||
| CMS Collaboration | ||
| 15 May 2018 | ||
| JHEP 11 (2018) 042 | ||
| Abstract: A search in energetic, high-multiplicity final states for evidence of physics beyond the standard model, such as black holes, string balls, and electroweak sphalerons, is presented. The data sample corresponds to an integrated luminosity of 35.9 fb$^{-1}$ collected with the CMS experiment at the LHC in proton-proton collisions at a center-of-mass energy of 13 TeV in 2016. Standard model backgrounds, dominated by multijet production, are determined from control regions in data without any reliance on simulation. No evidence for excesses above the predicted background is observed. Model-independent 95% confidence level upper limits on the cross section of beyond the standard model signals in these final states are set and further interpreted in terms of limits on semiclassical black hole, string ball, and sphaleron production. In the context of models with large extra dimensions, semiclassical black holes with minimum masses as high as 10.1 TeV and string balls with masses as high as 9.5 TeV are excluded by this search. Results of the first dedicated search for electroweak sphalerons are presented. An upper limit of 0.021 is set on the fraction of all quark-quark interactions above the nominal threshold energy of 9 TeV resulting in the sphaleron transition.We dedicate this paper to the memory of Prof. Stephen William Hawking, on whose transformative ideas much of this work relies. | ||
| Links: e-print arXiv:1805.06013 [hep-ex] (PDF) ; CDS record ; inSPIRE record ; CADI line (restricted) ; | ||
| Figures | |

png pdf |
Figure 1:
Observed final-state particle multiplicity $N$ distributions for $ {{N_\mathrm {CS}}} =$ $\pm$1 sphaleron transitions resulting in 10, 12, and 14 parton-level final-state multiplicities. The relative numbers of events in the histograms are proportional to the relative probabilities of these three parton-level configurations. |

png pdf |
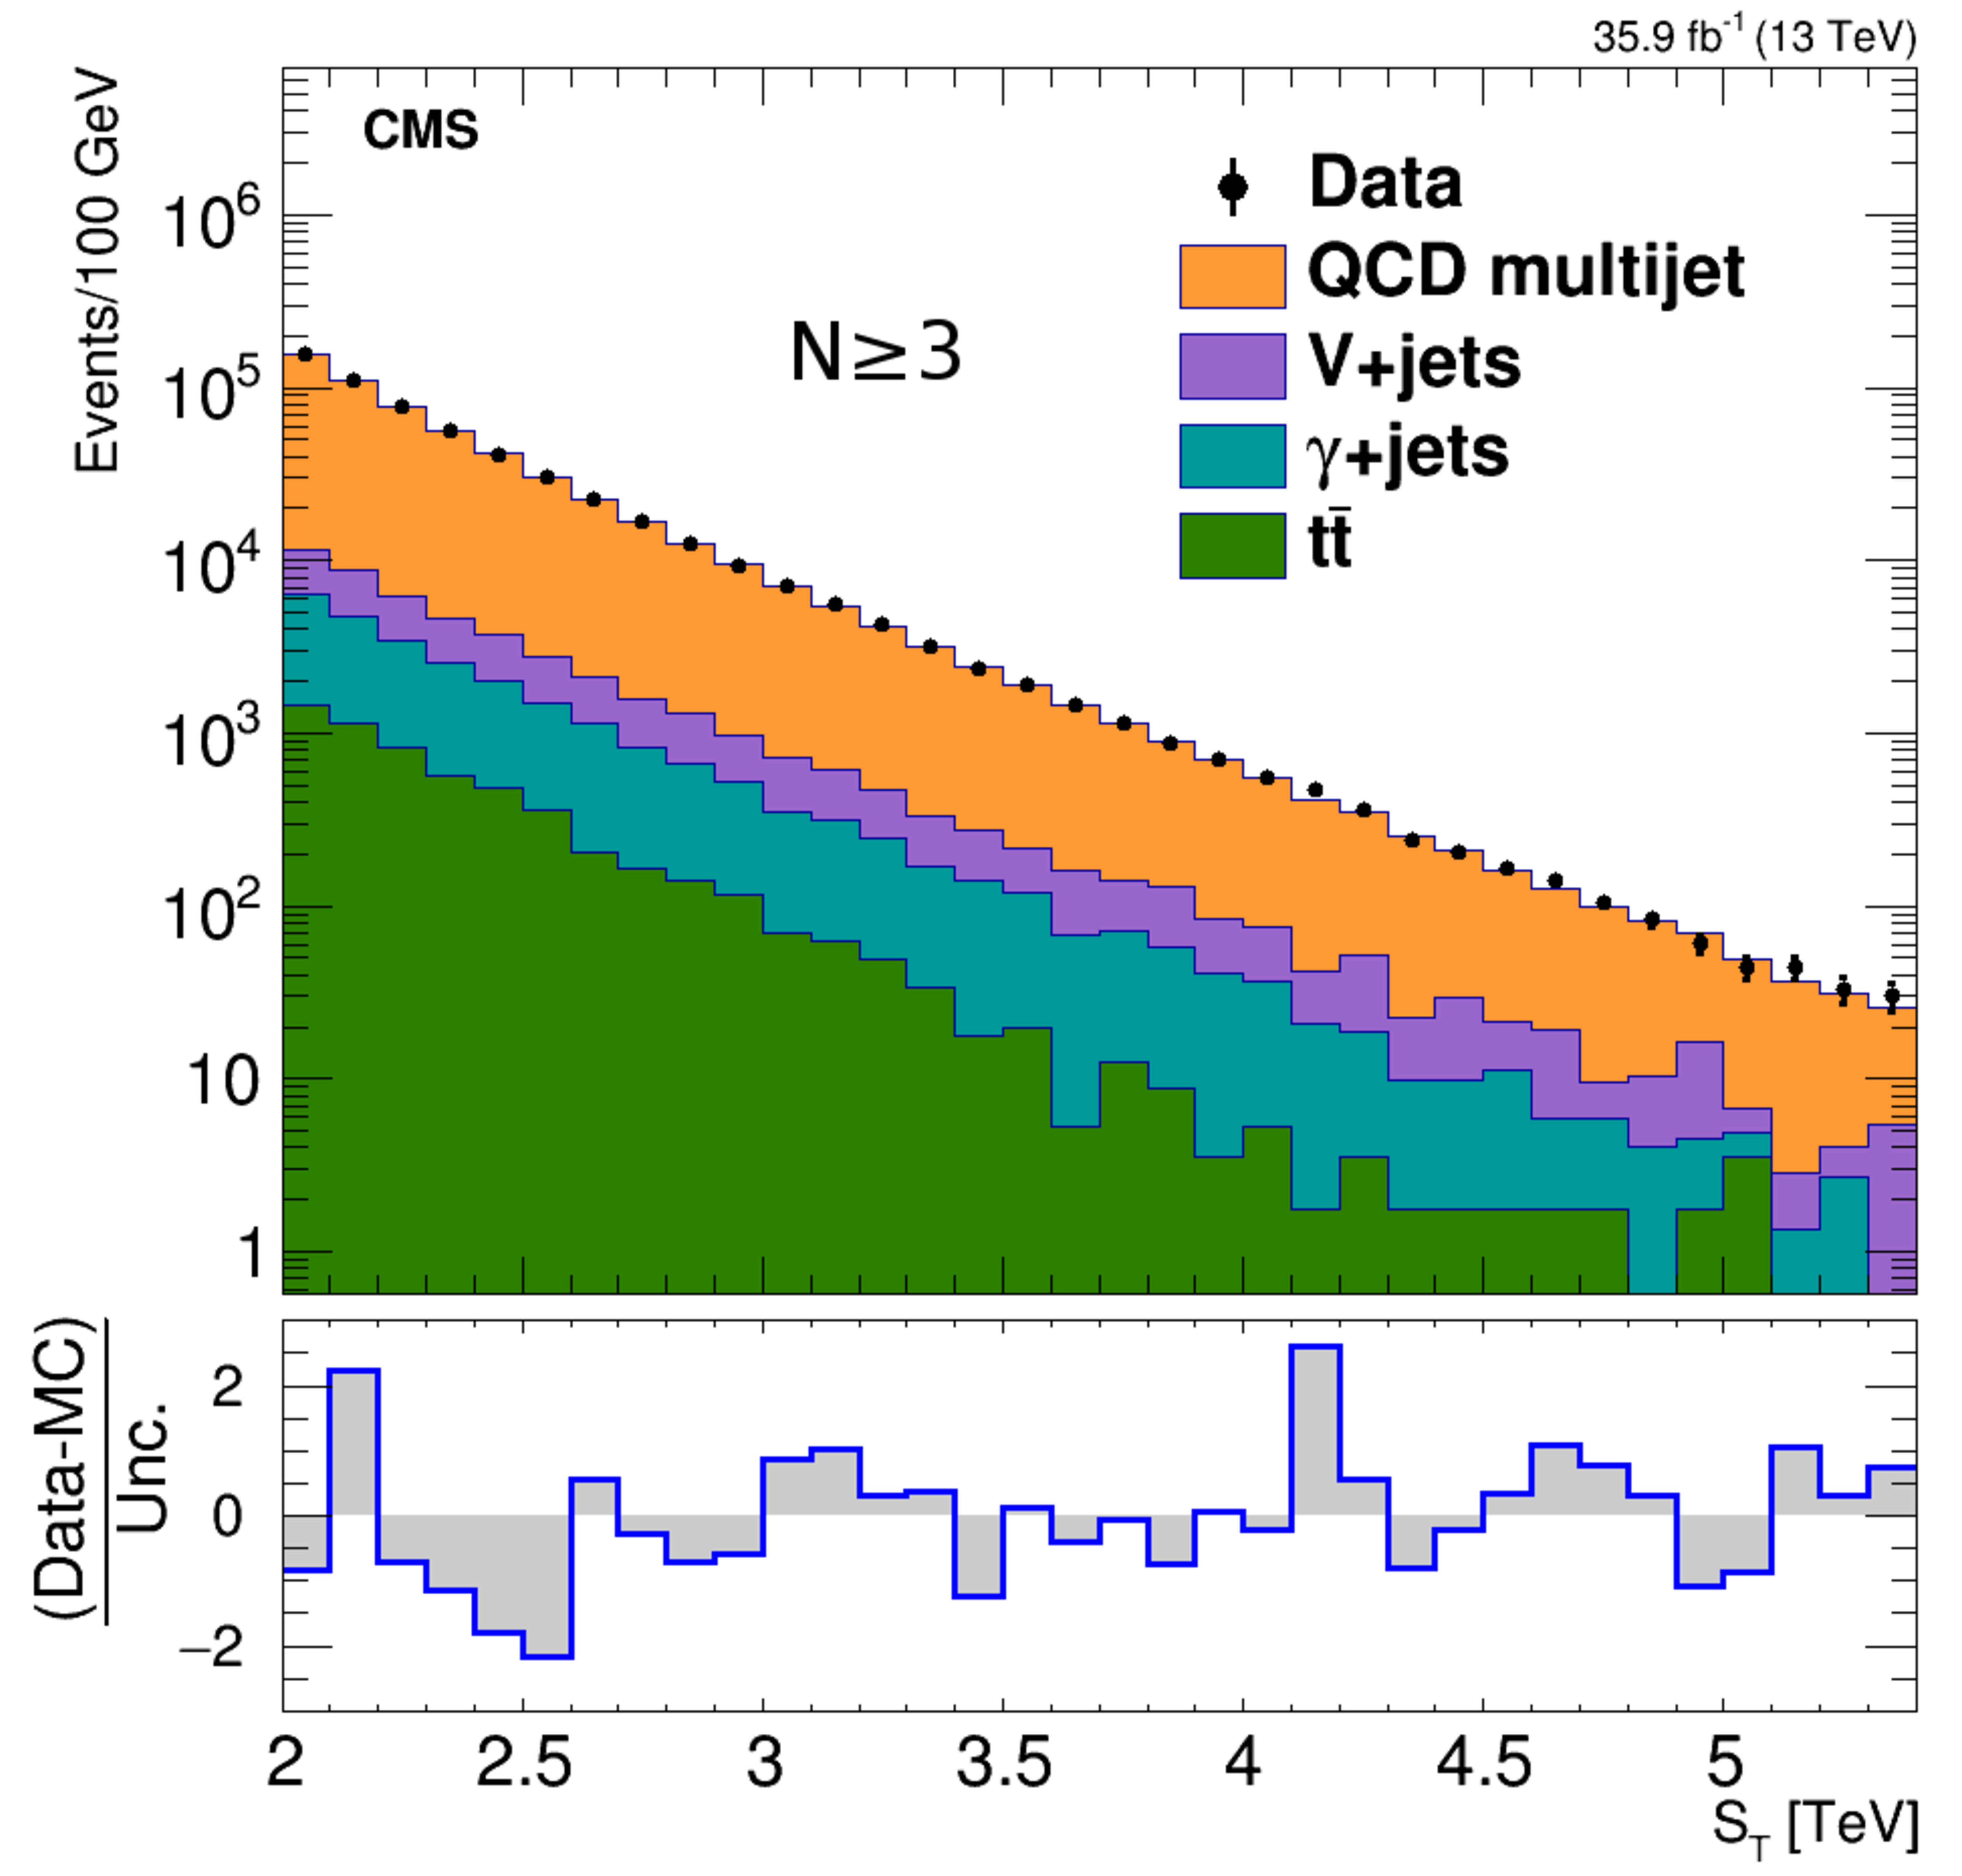
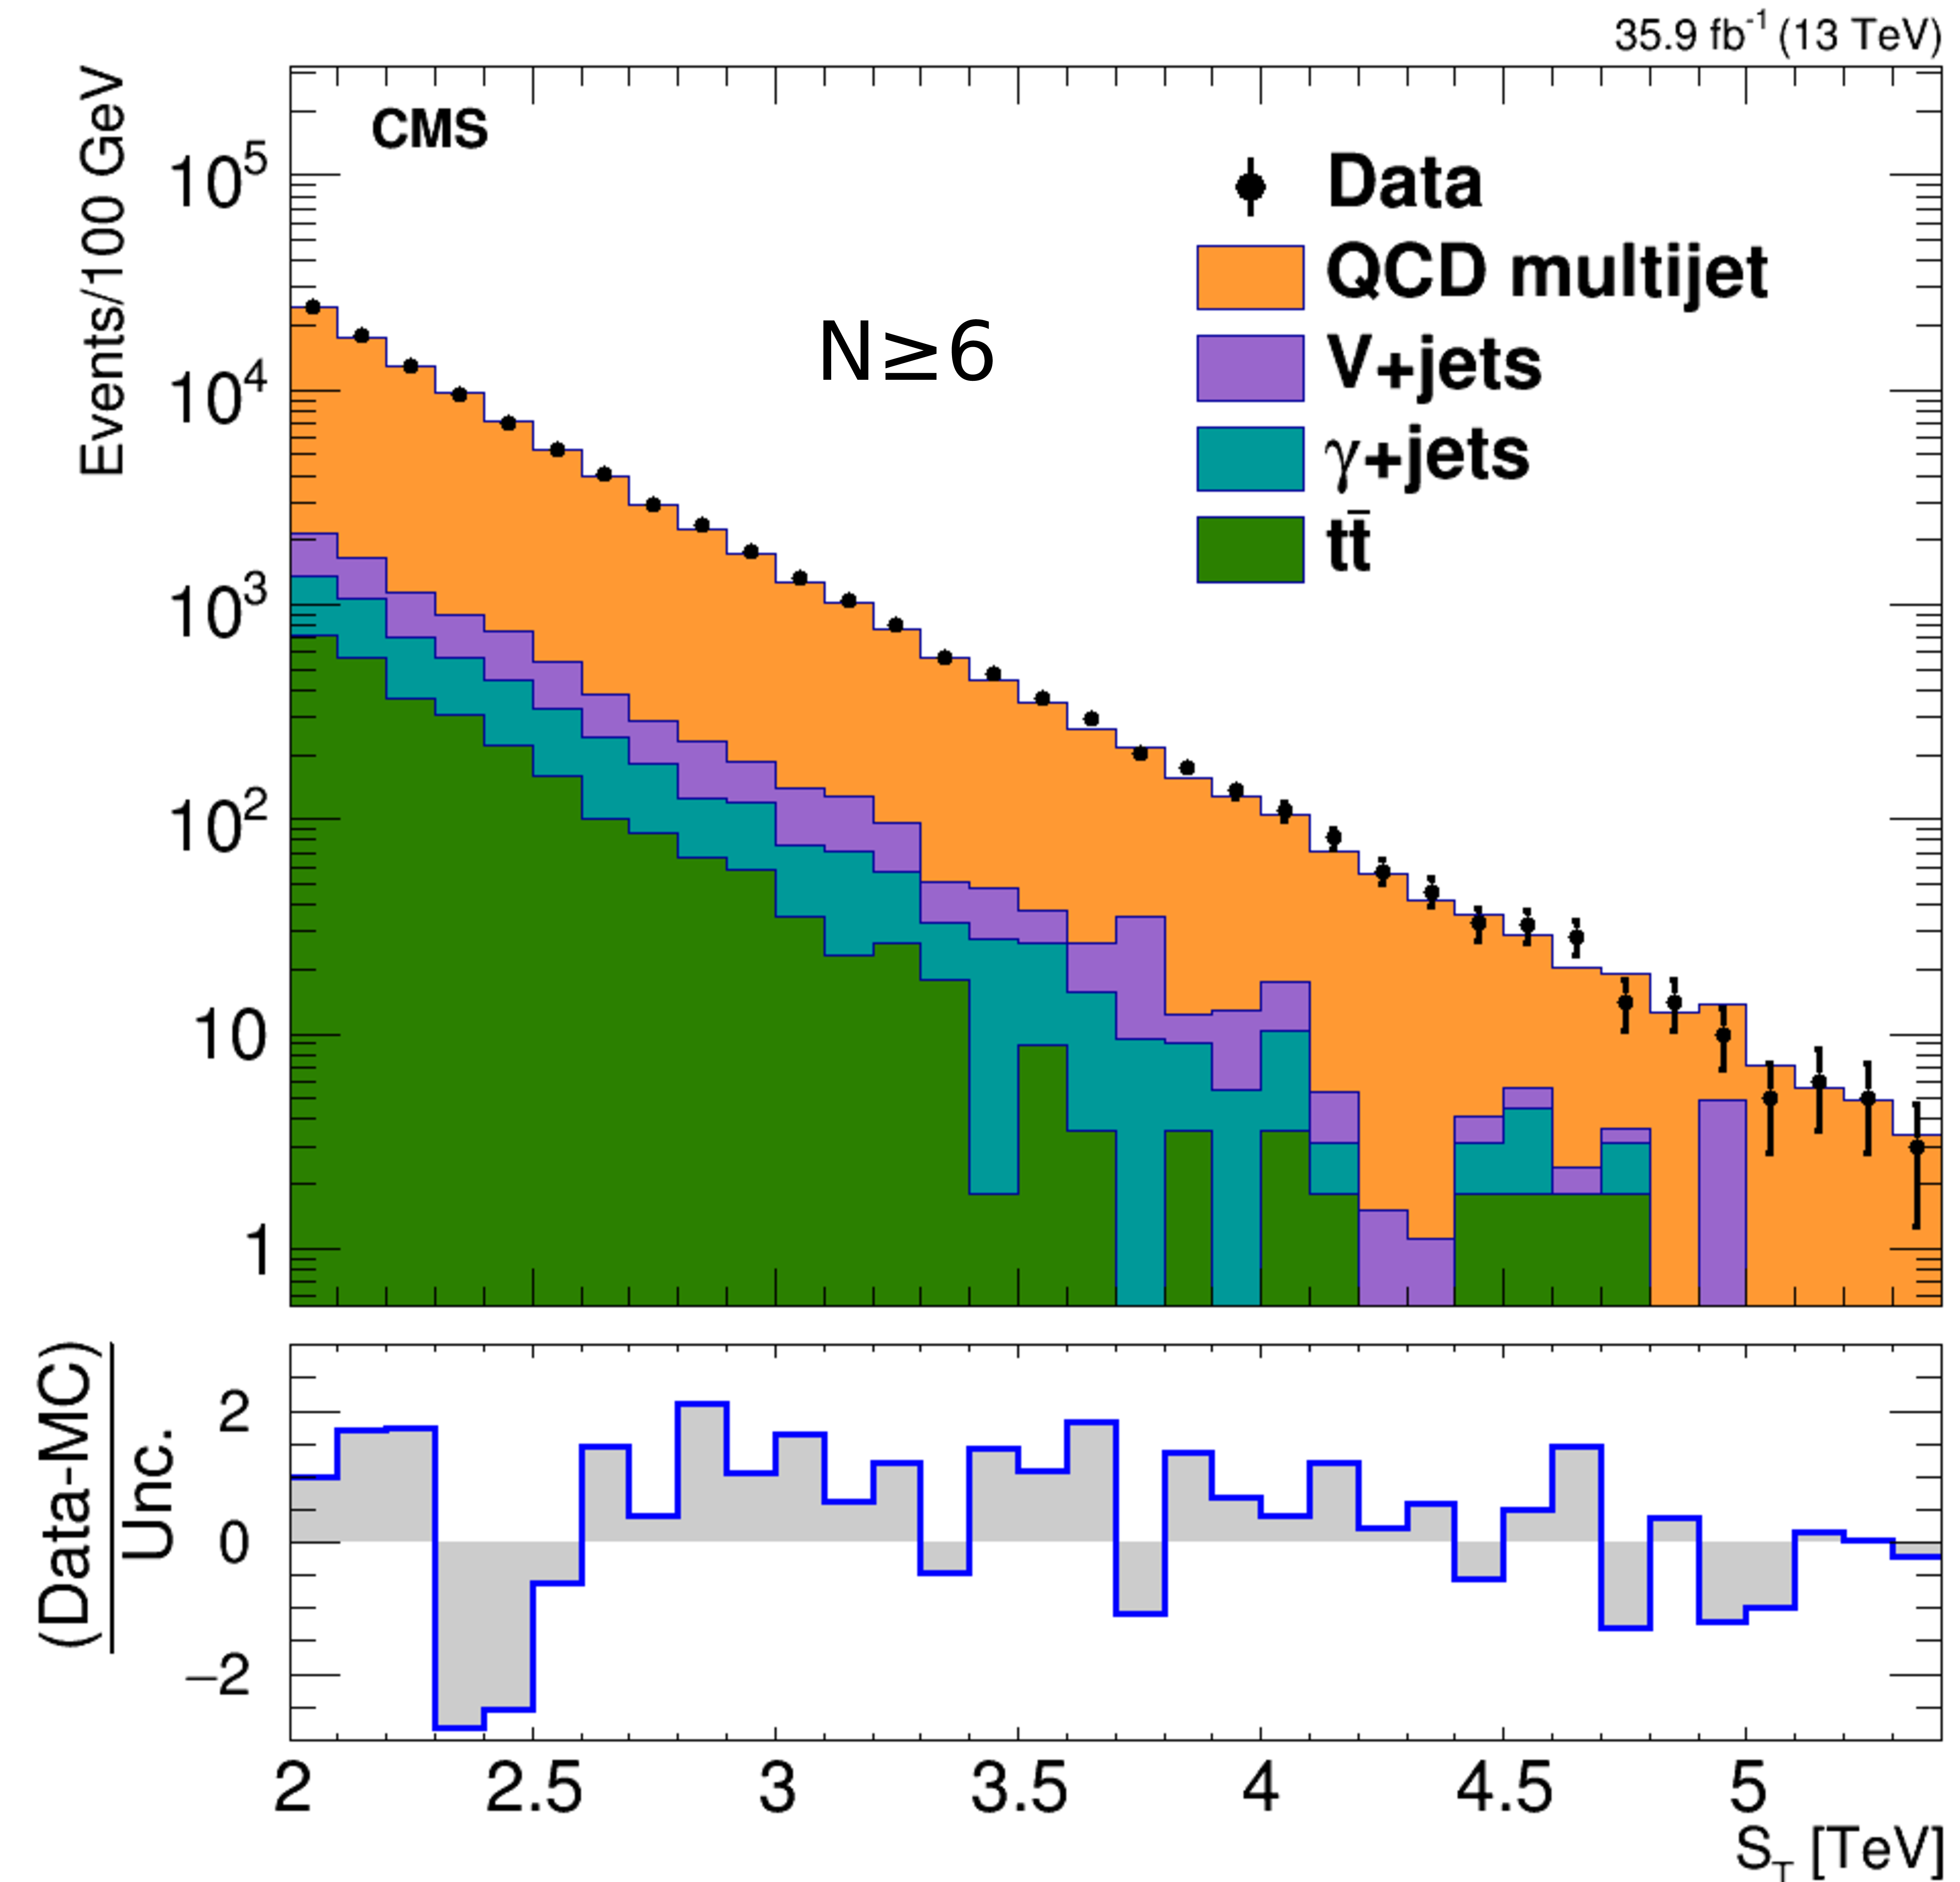
Figure 2:
The ${{S_\mathrm {T}}}$ distribution in data for inclusive multiplicities of (left) $N \ge $ 3 and (right) $N \ge $ 6, compared with the normalized background prediction from simulation, illustrating the relative contributions of major backgrounds. |
png pdf |
Figure 2-a:
The ${{S_\mathrm {T}}}$ distribution in data for inclusive multiplicities of $N \ge $ 3, compared with the normalized background prediction from simulation, illustrating the relative contributions of major backgrounds. |
png pdf |
Figure 2-b:
The ${{S_\mathrm {T}}}$ distribution in data for inclusive multiplicities of $N \ge $ 6, compared with the normalized background prediction from simulation, illustrating the relative contributions of major backgrounds. |

png pdf |
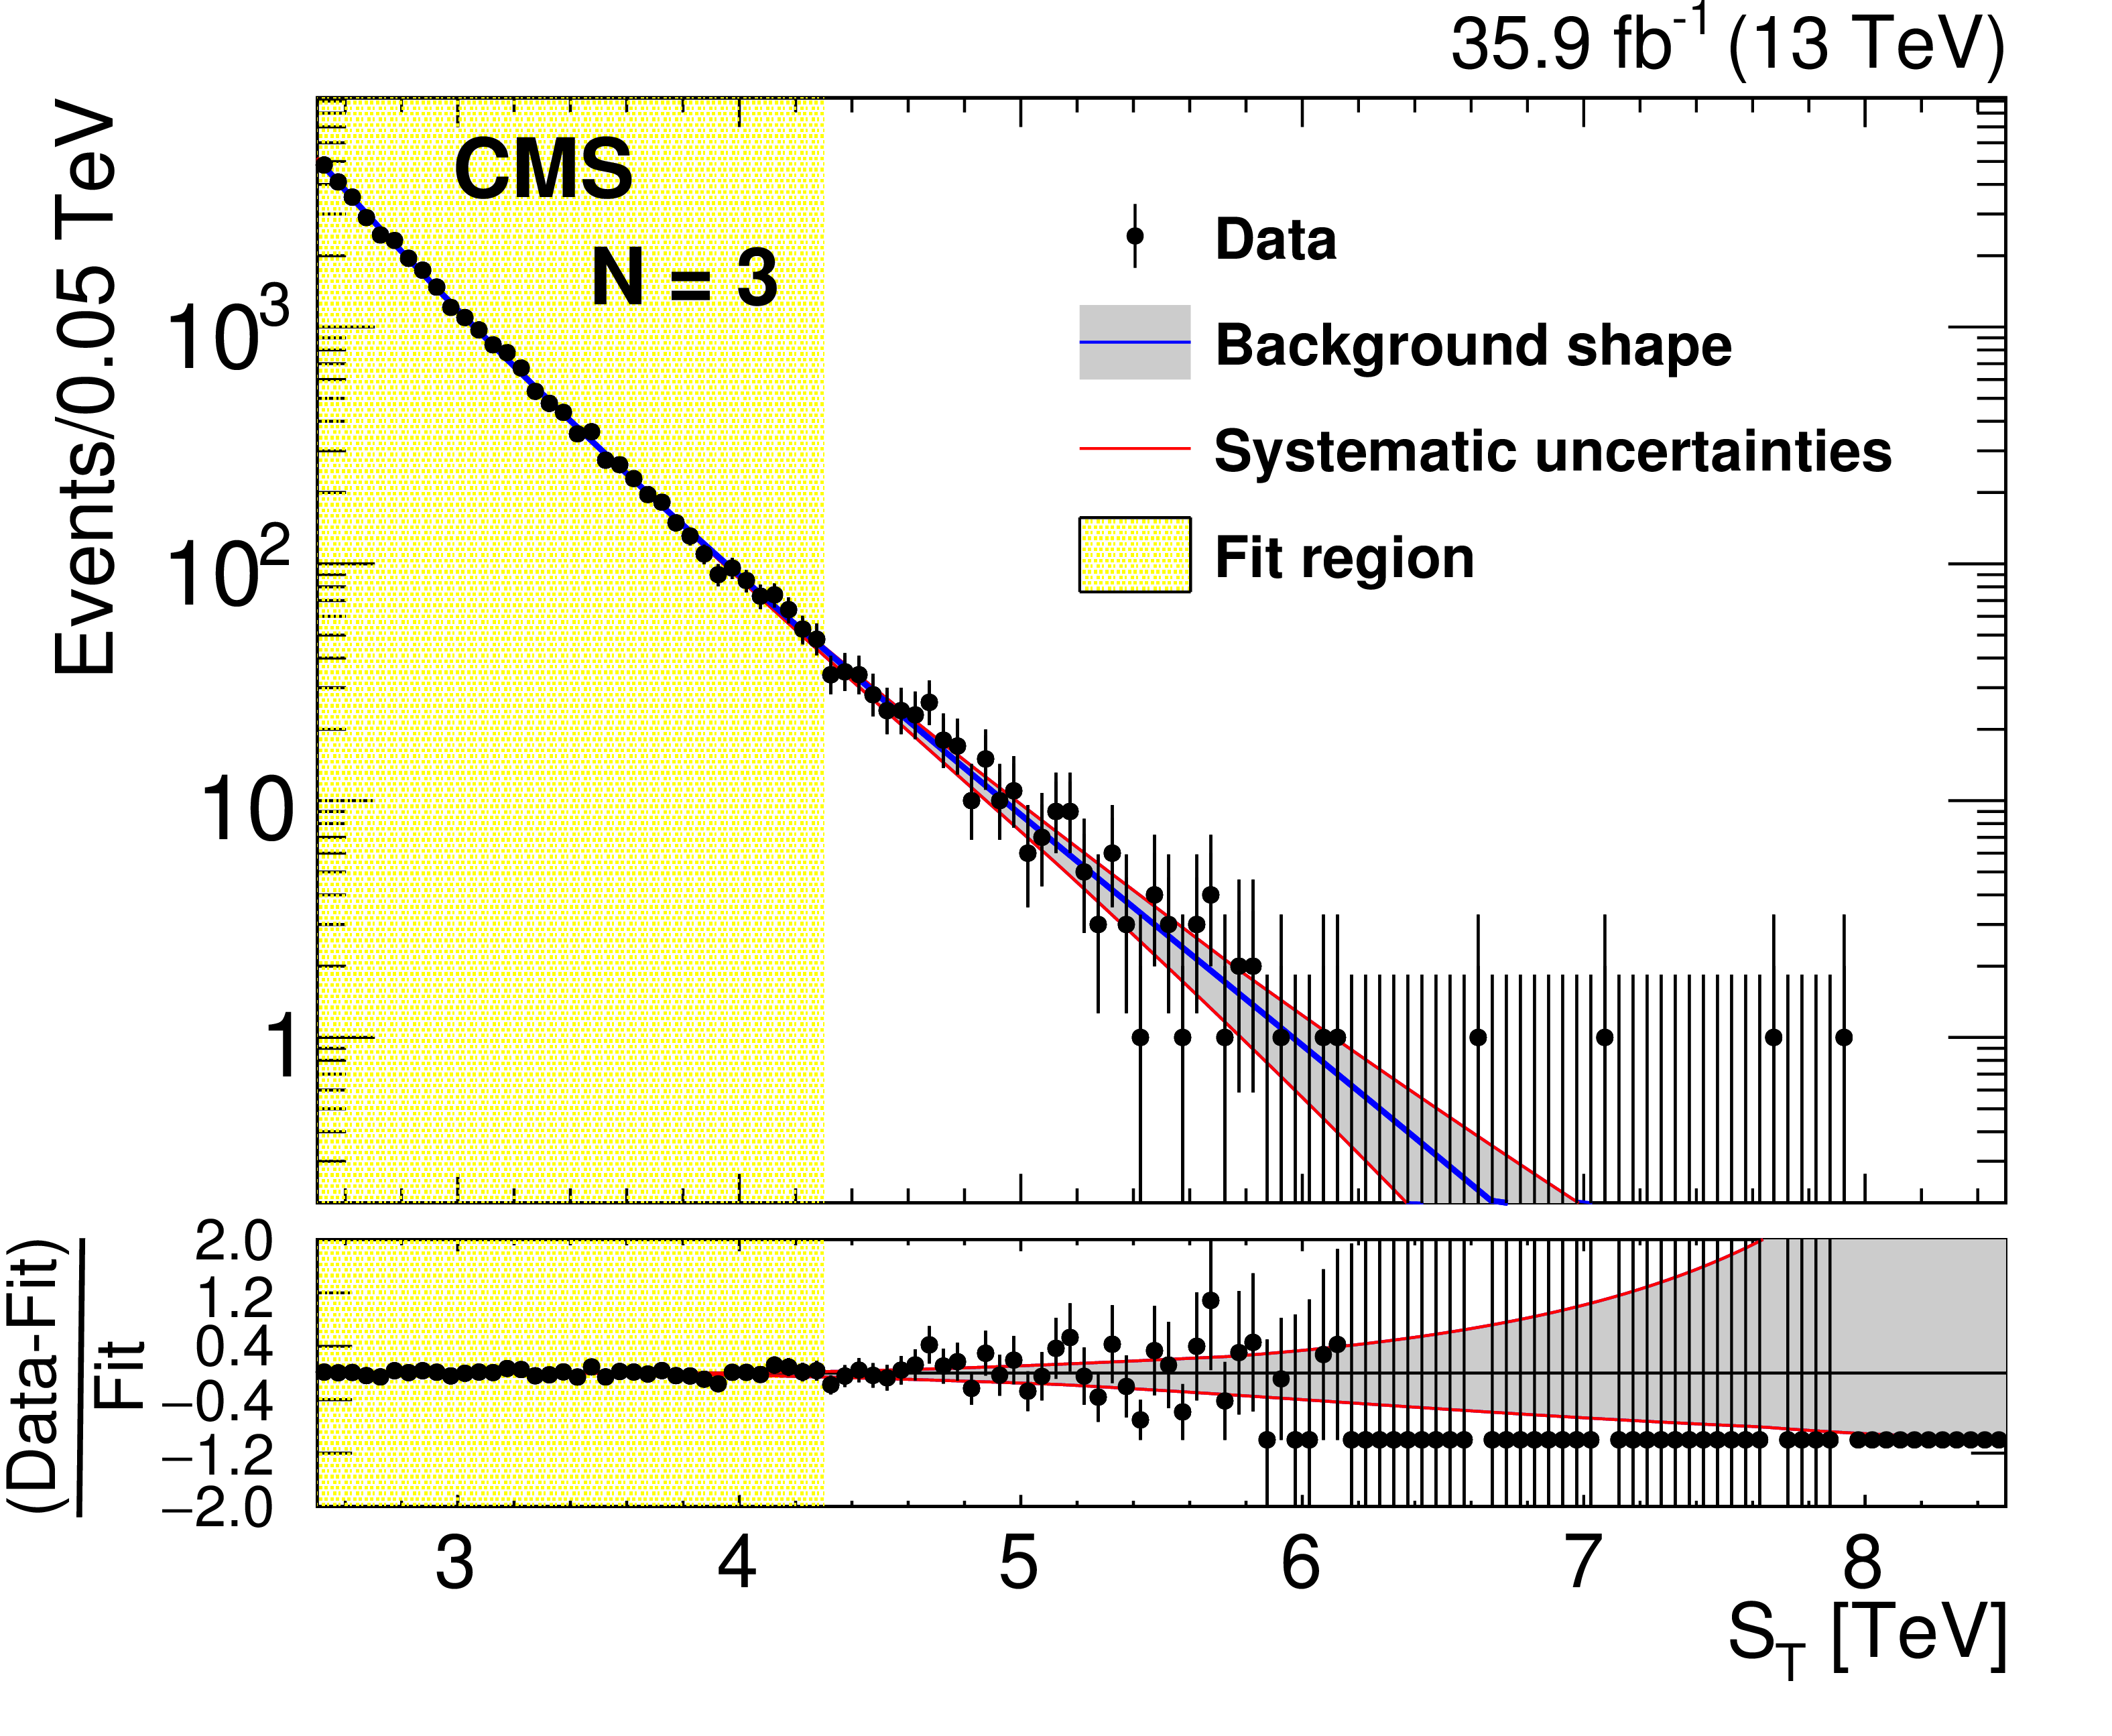
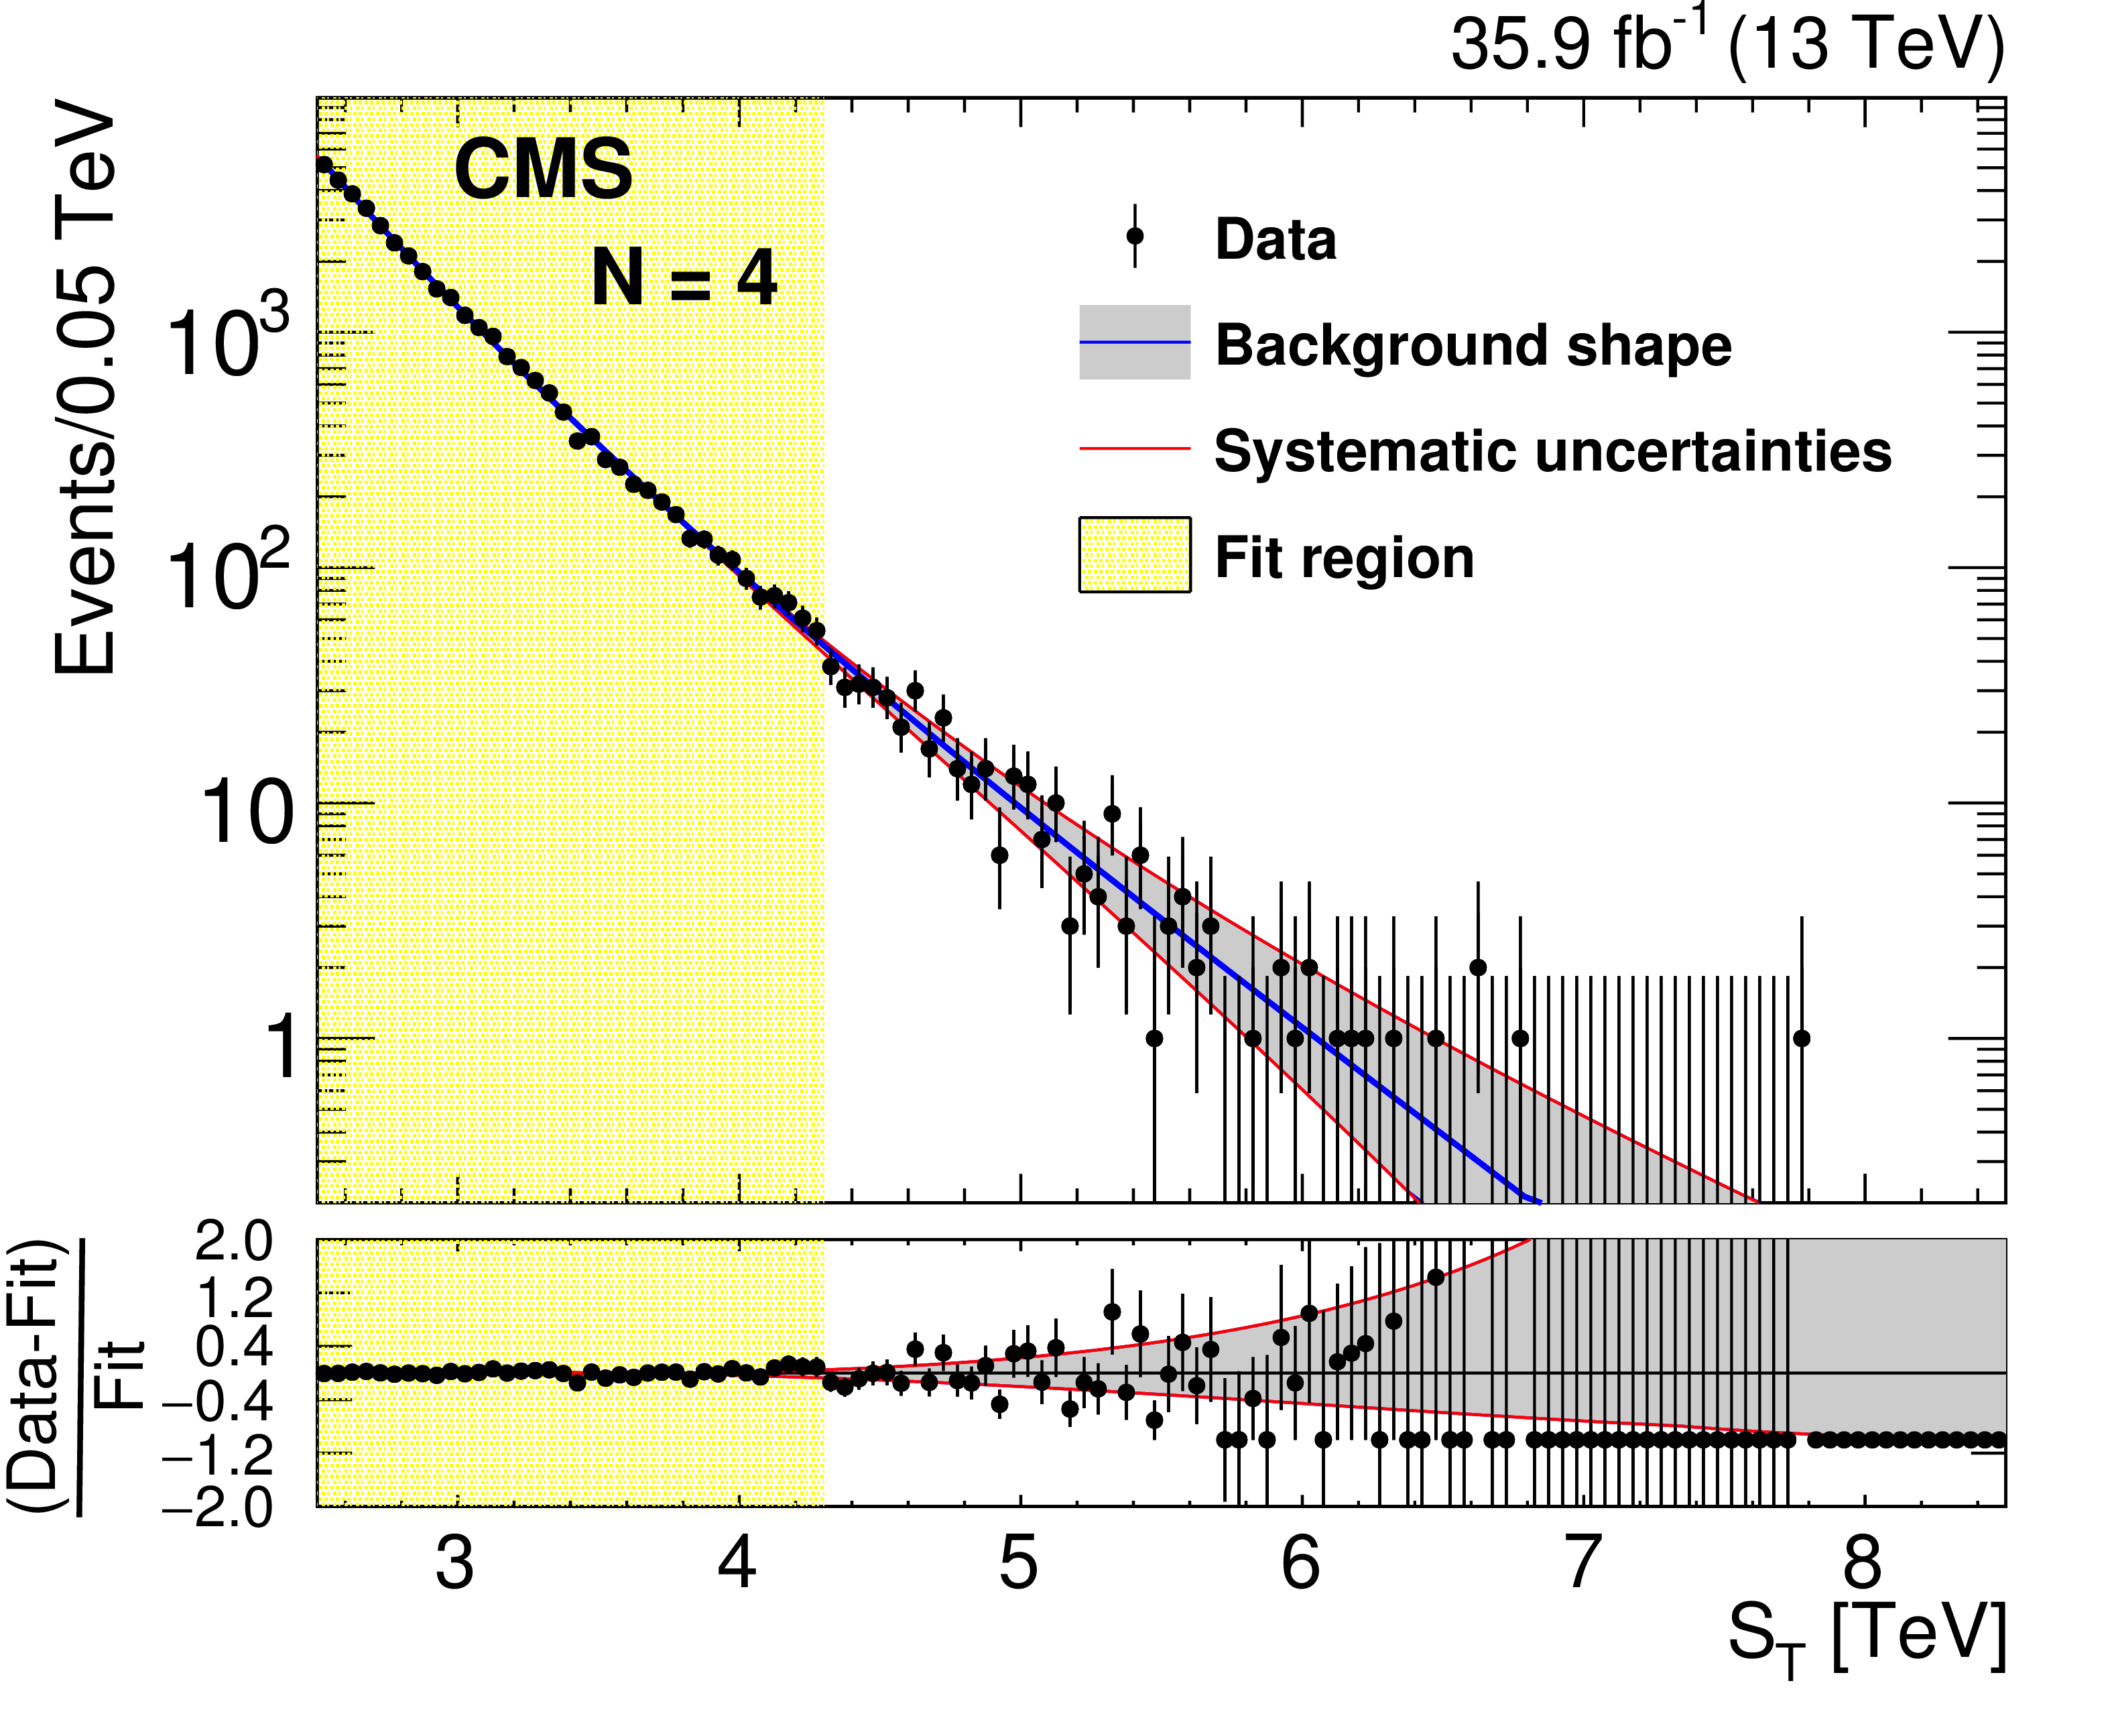
Figure 3:
The results of the fit to data with $N = $ 3 (left) and $N= $ 4 (right), after discarding the functions that fail to monotonically decrease up to $ {{S_\mathrm {T}}} = $ 13 TeV. The description of the best fit function and the envelope are given in the main text. |
png pdf |
Figure 3-a:
The results of the fit to data with $N = $ 3, after discarding the functions that fail to monotonically decrease up to $ {{S_\mathrm {T}}} = $ 13 TeV. The description of the best fit function and the envelope are given in the main text. |
png pdf |
Figure 3-b:
The results of the fit to data with $N= $ 4, after discarding the functions that fail to monotonically decrease up to $ {{S_\mathrm {T}}} = $ 13 TeV. The description of the best fit function and the envelope are given in the main text. |

png pdf |
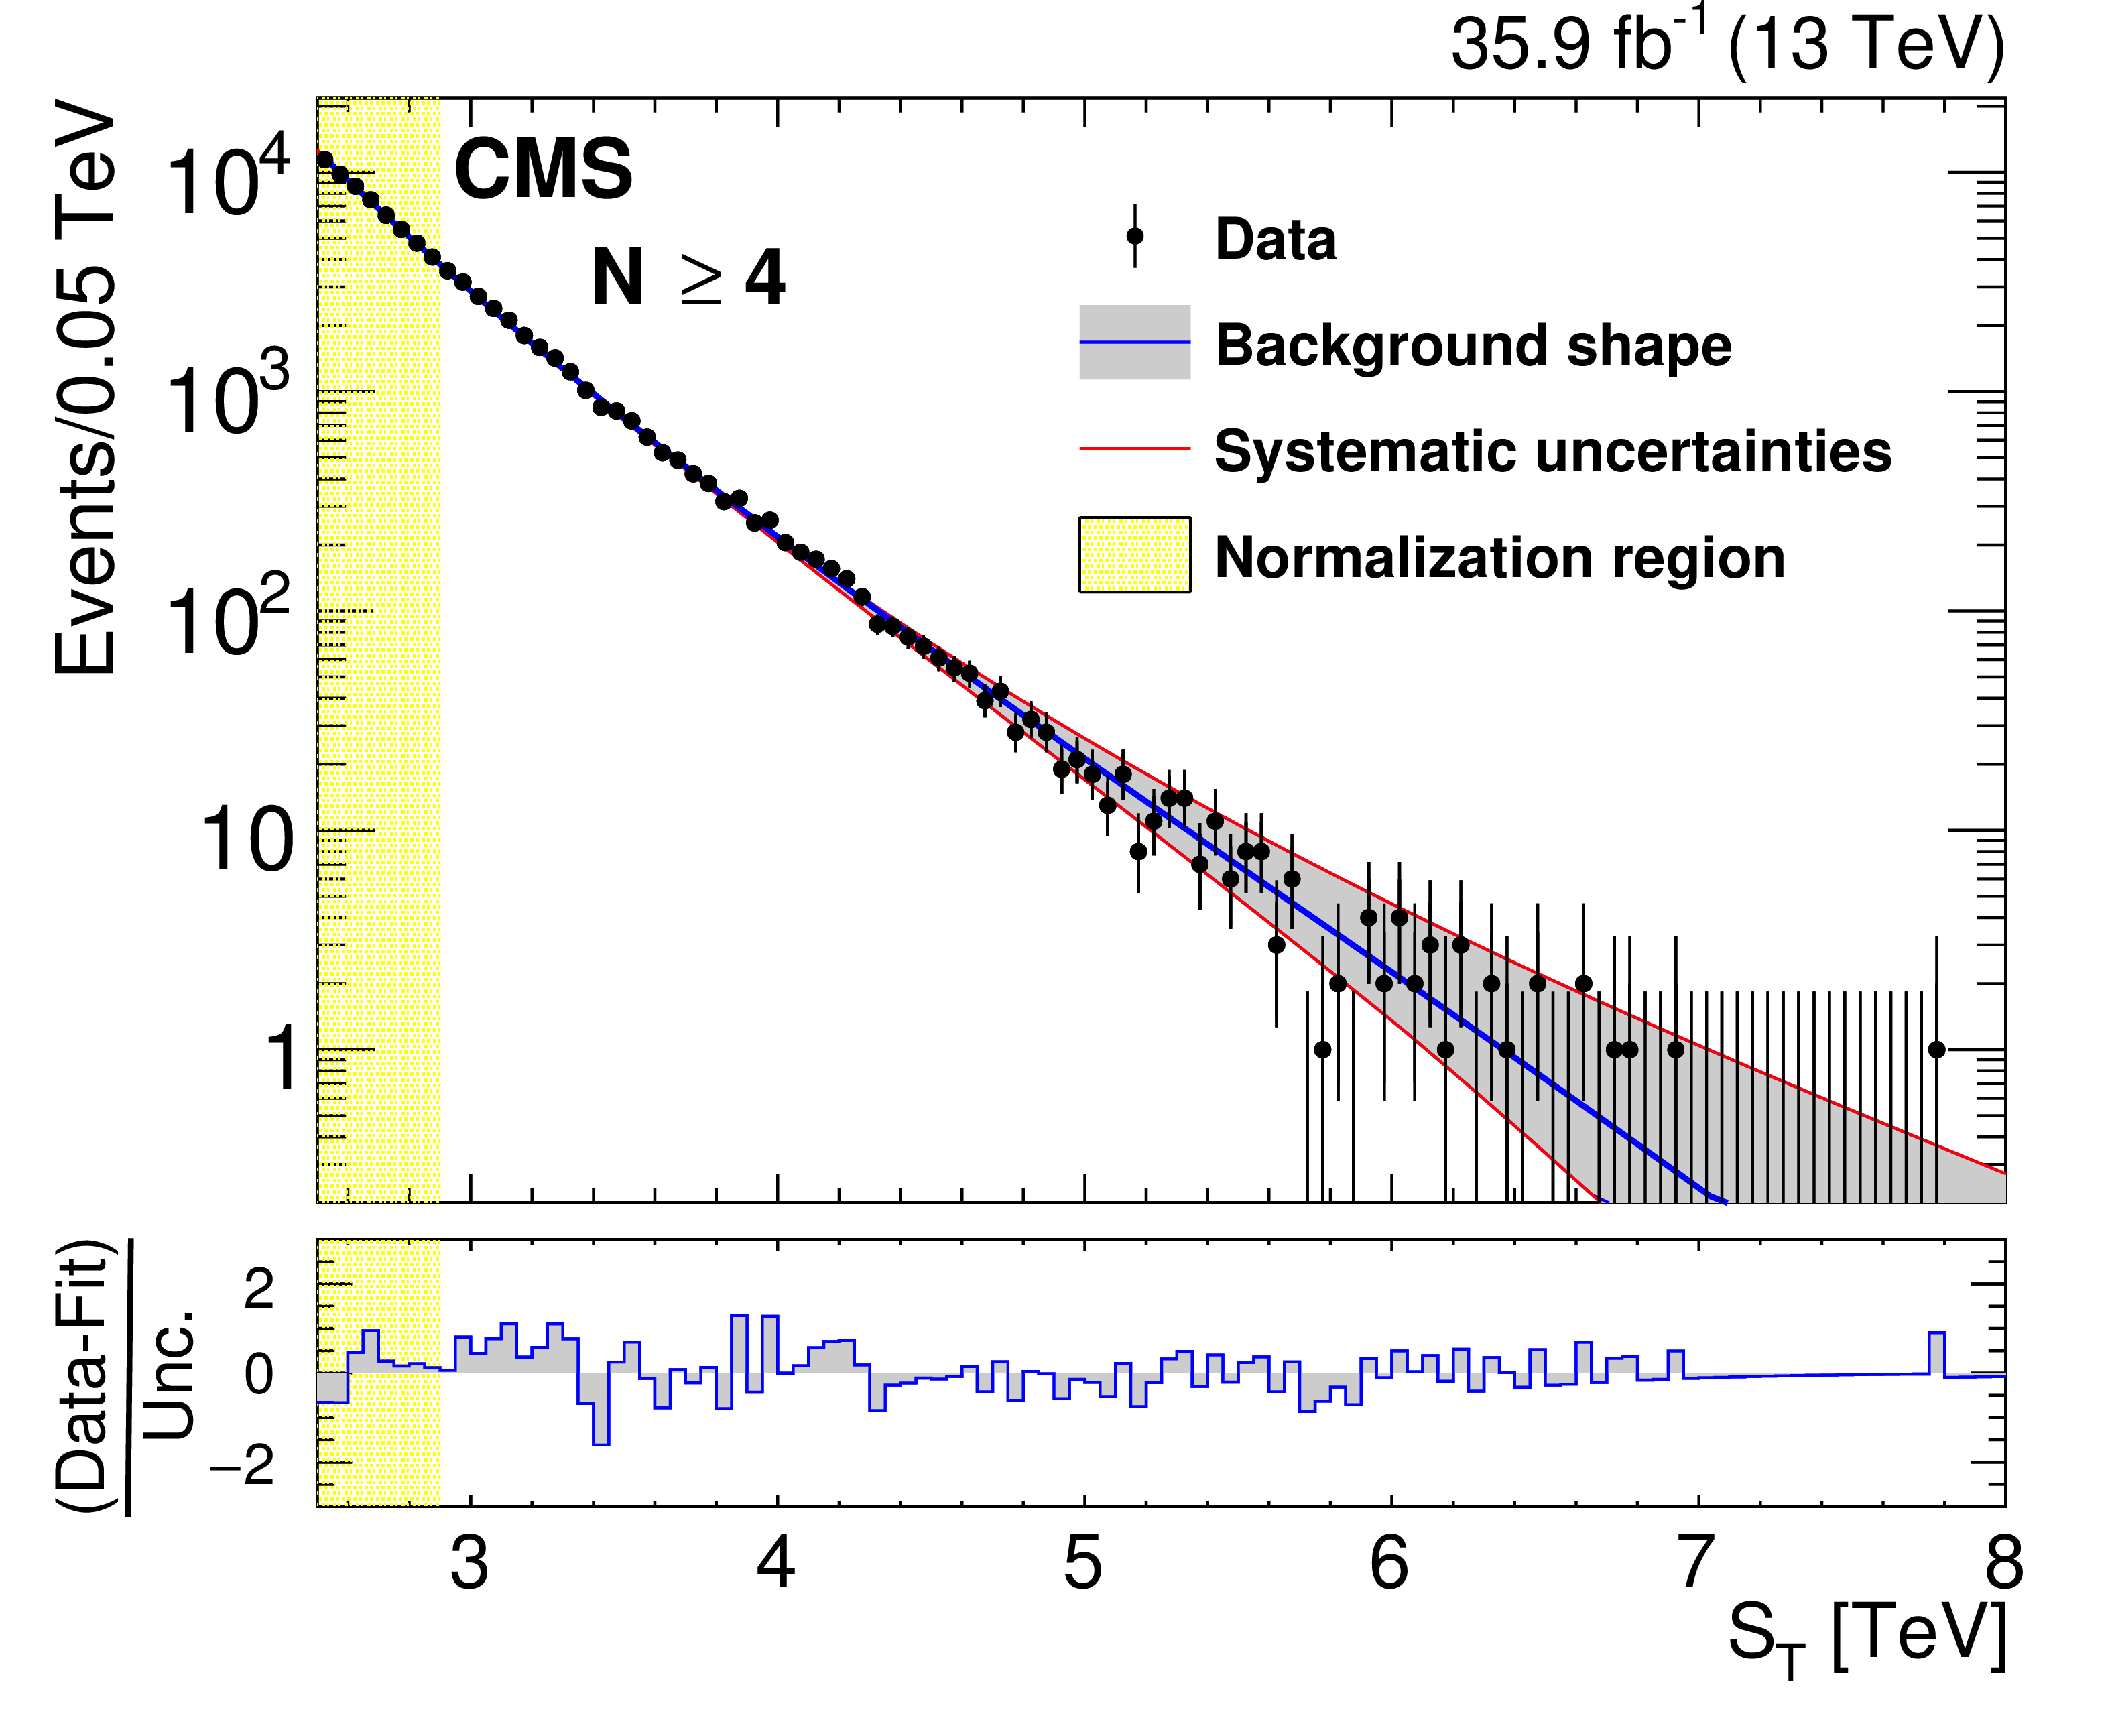
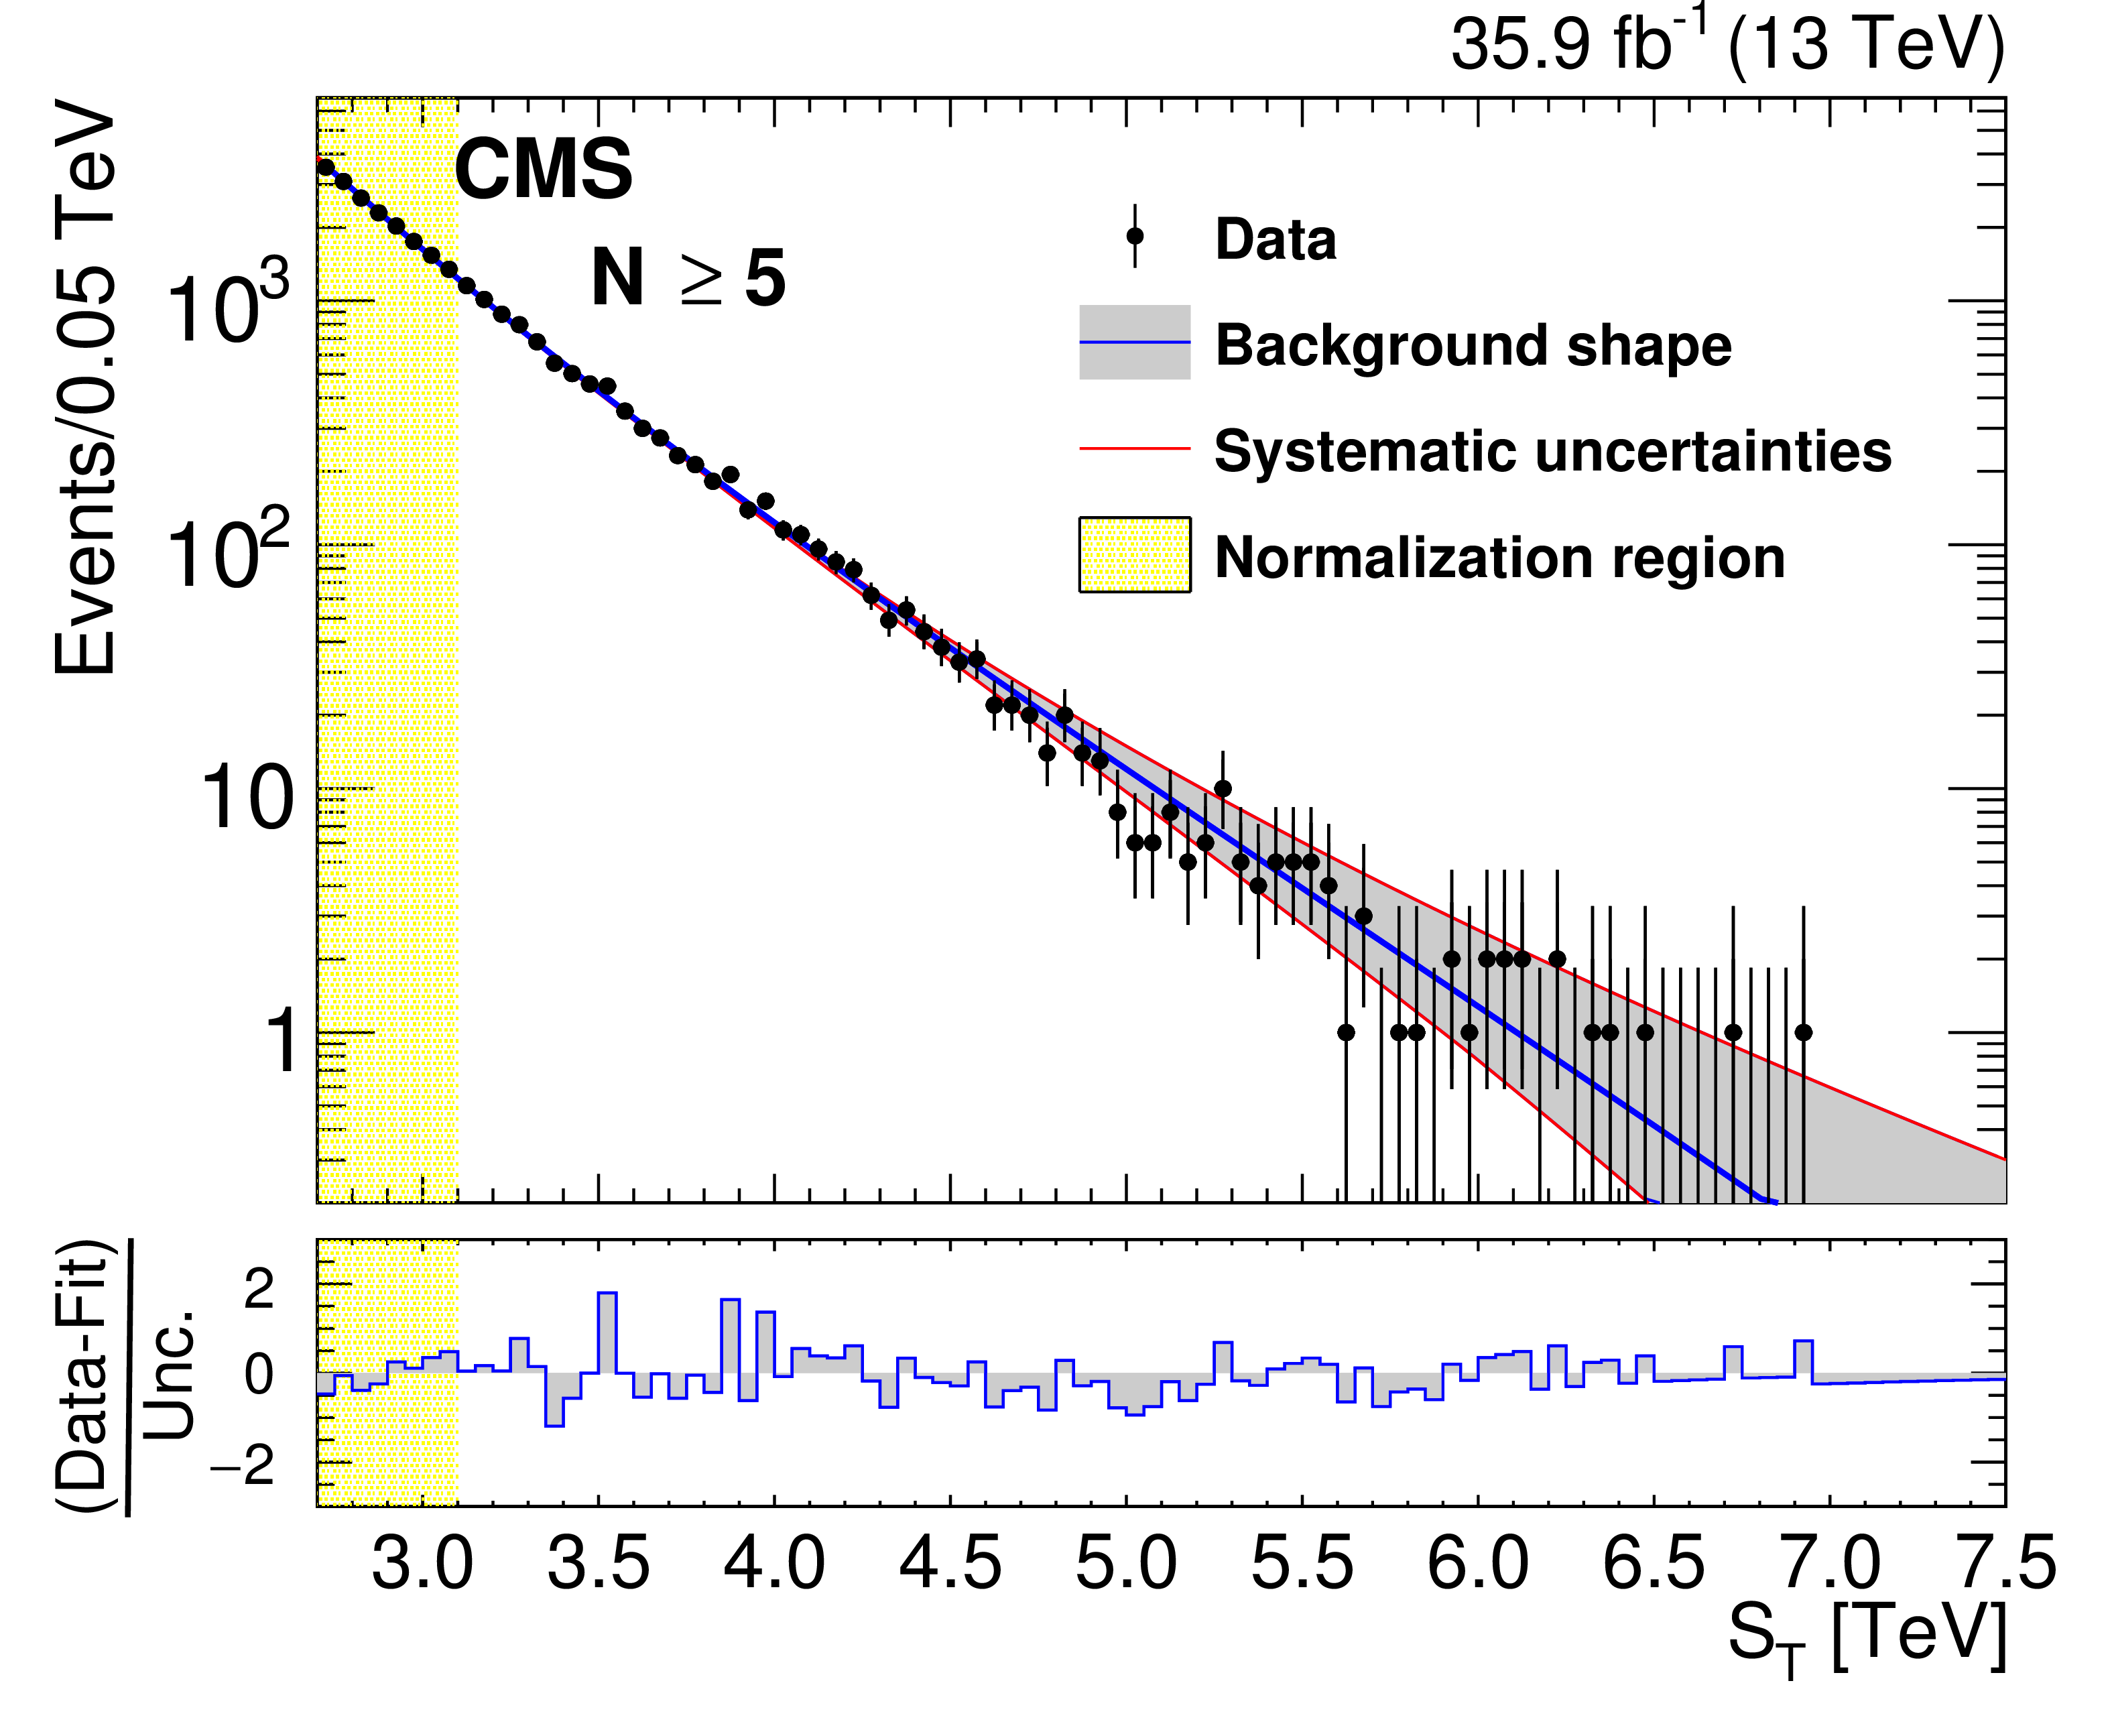
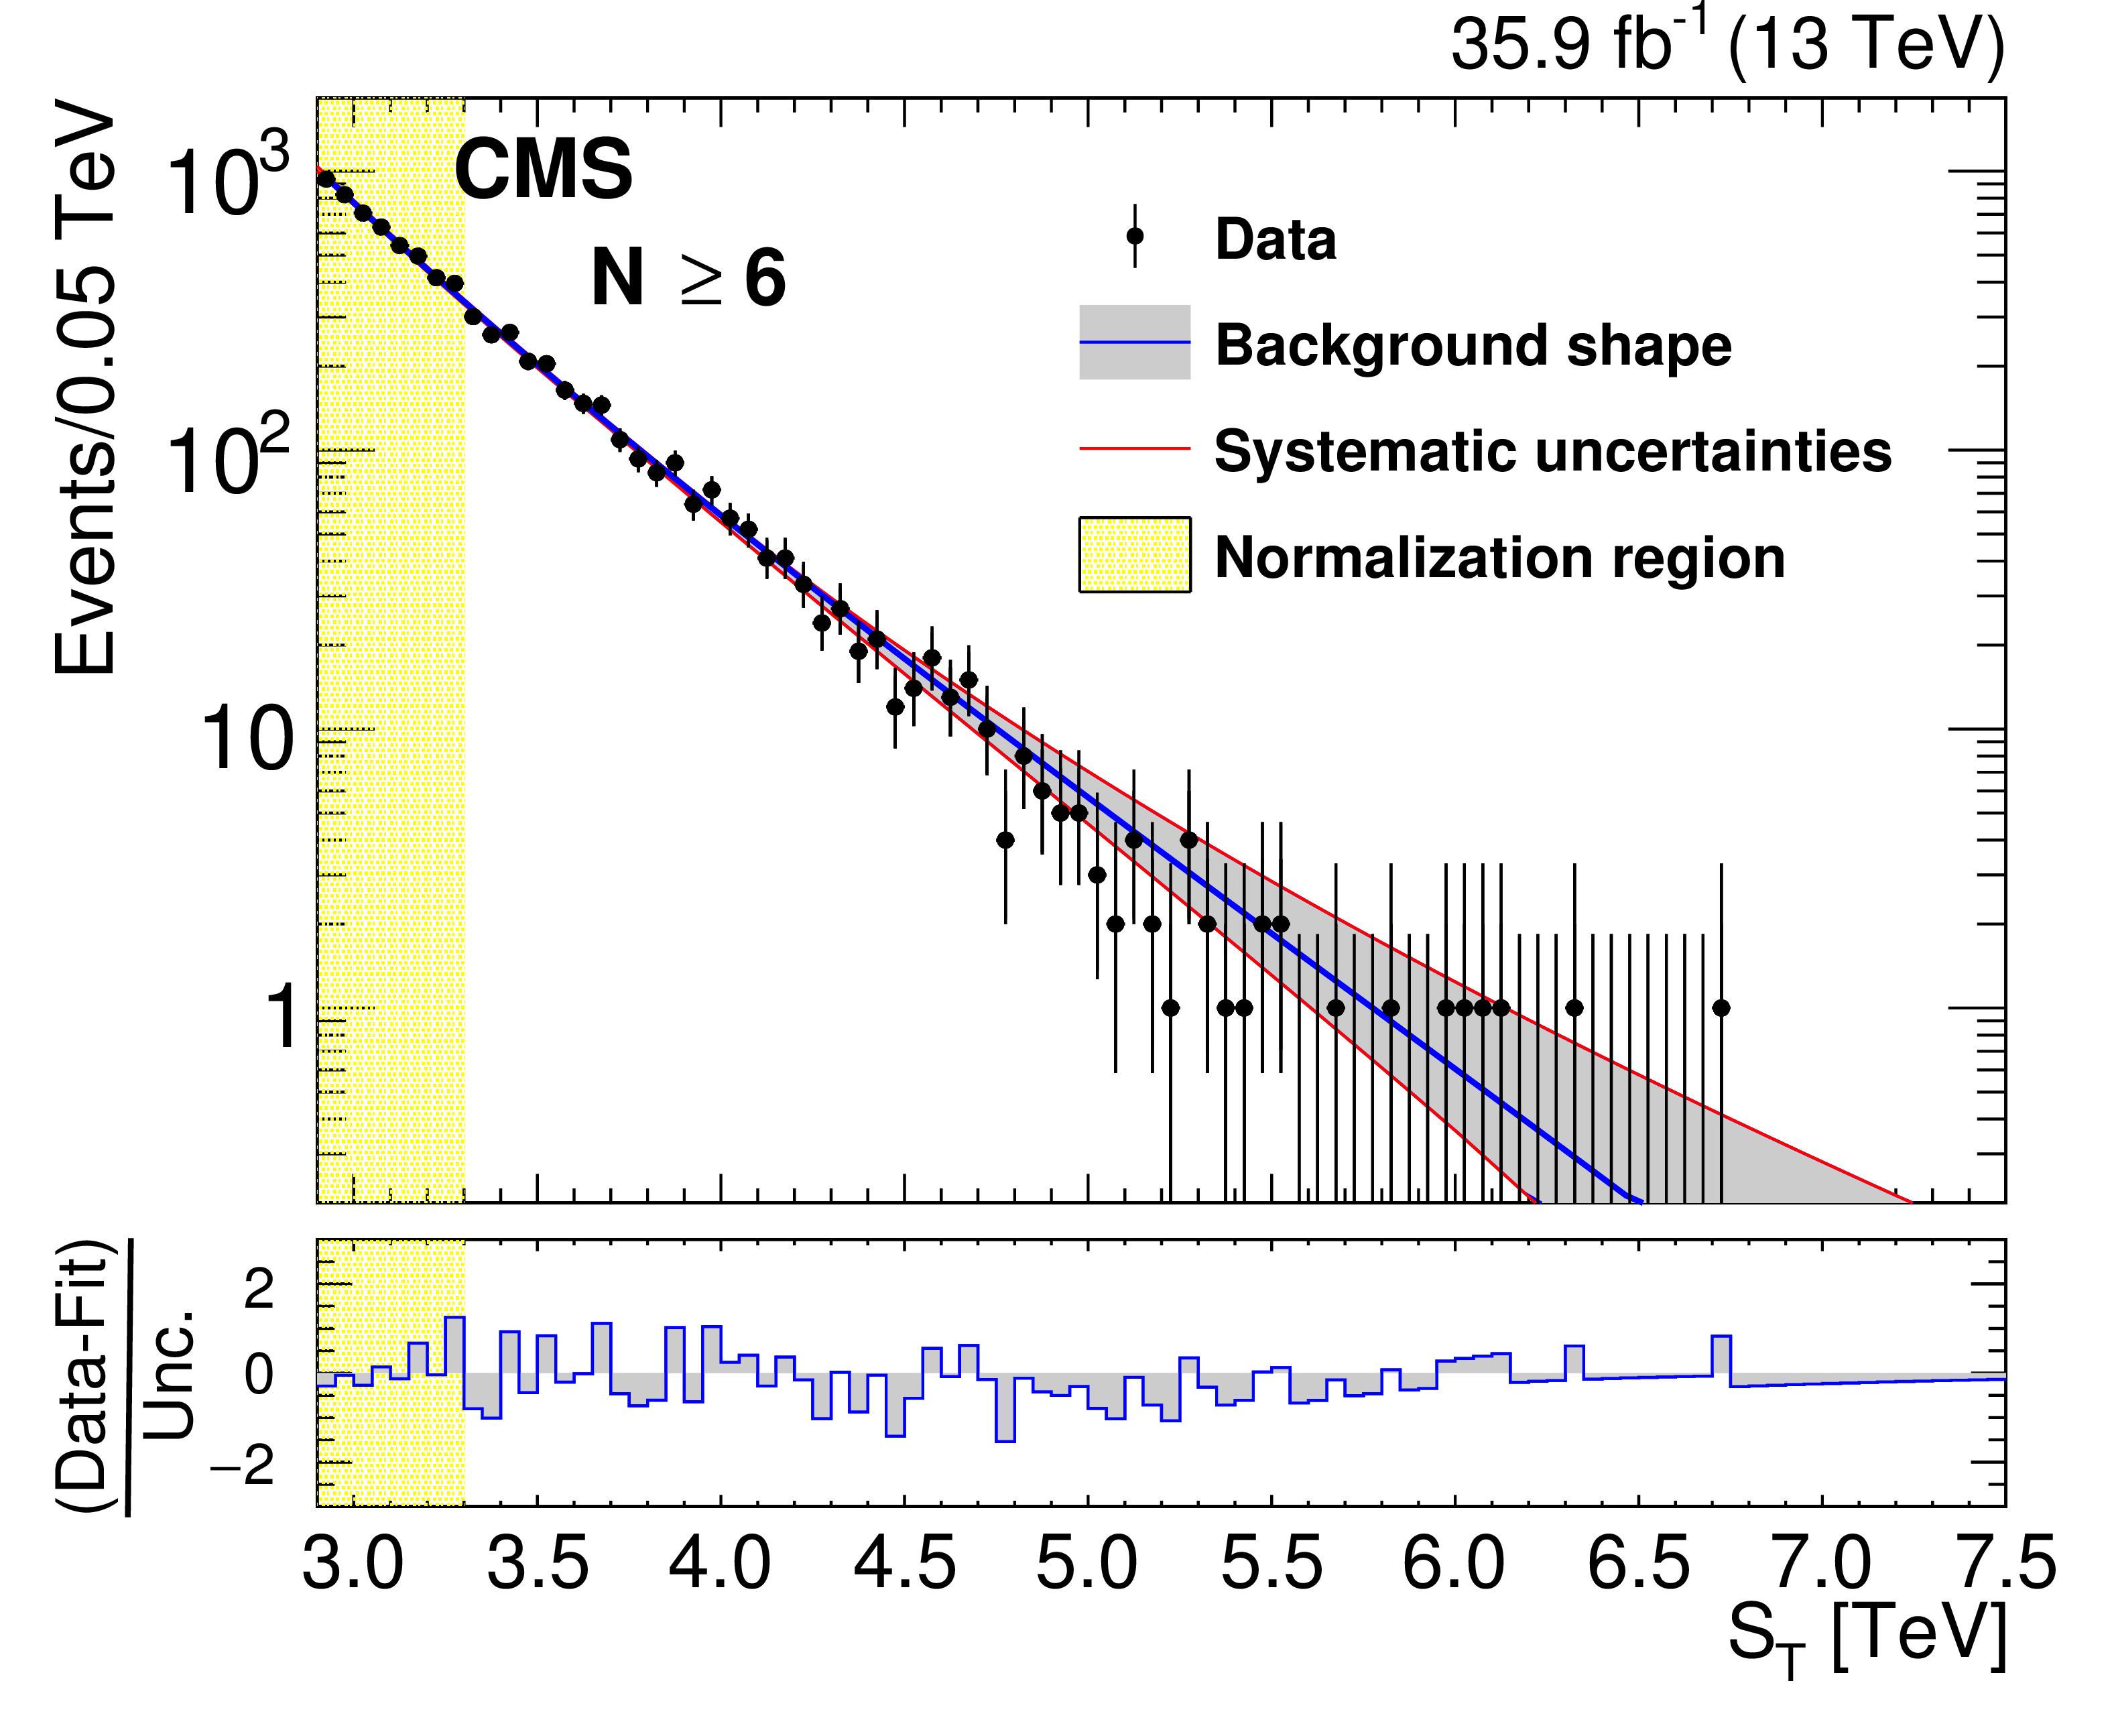
Figure 4:
The background predictions after the normalization for inclusive multiplicities $N \ge $ 3, ..., 6 (left to right, upper to lower). The gray band shows the background shape uncertainty alone and the red lines also include the normalization uncertainty. The bottom panels show the difference between the data and the background prediction from the fit, divided by the overall uncertainty, which includes the statistical uncertainty of data as well as the shape and normalization uncertainties in the background prediction, added in quadrature. |

png pdf |
Figure 4-a:
The background prediction after the normalization for inclusive multiplicities $N \ge $ 3. The gray band shows the background shape uncertainty alone and the red lines also include the normalization uncertainty. The bottom panel shows the difference between the data and the background prediction from the fit, divided by the overall uncertainty, which includes the statistical uncertainty of data as well as the shape and normalization uncertainties in the background prediction, added in quadrature. |
png pdf |
Figure 4-b:
The background prediction after the normalization for inclusive multiplicities $N \ge $ 4. The gray band shows the background shape uncertainty alone and the red lines also include the normalization uncertainty. The bottom panel shows the difference between the data and the background prediction from the fit, divided by the overall uncertainty, which includes the statistical uncertainty of data as well as the shape and normalization uncertainties in the background prediction, added in quadrature. |
png pdf |
Figure 4-c:
The background prediction after the normalization for inclusive multiplicities $N \ge $ 5. The gray band shows the background shape uncertainty alone and the red lines also include the normalization uncertainty. The bottom panel shows the difference between the data and the background prediction from the fit, divided by the overall uncertainty, which includes the statistical uncertainty of data as well as the shape and normalization uncertainties in the background prediction, added in quadrature. |
png pdf |
Figure 4-d:
The background prediction after the normalization for inclusive multiplicities $N \ge $ 6. The gray band shows the background shape uncertainty alone and the red lines also include the normalization uncertainty. The bottom panel shows the difference between the data and the background prediction from the fit, divided by the overall uncertainty, which includes the statistical uncertainty of data as well as the shape and normalization uncertainties in the background prediction, added in quadrature. |
png pdf |
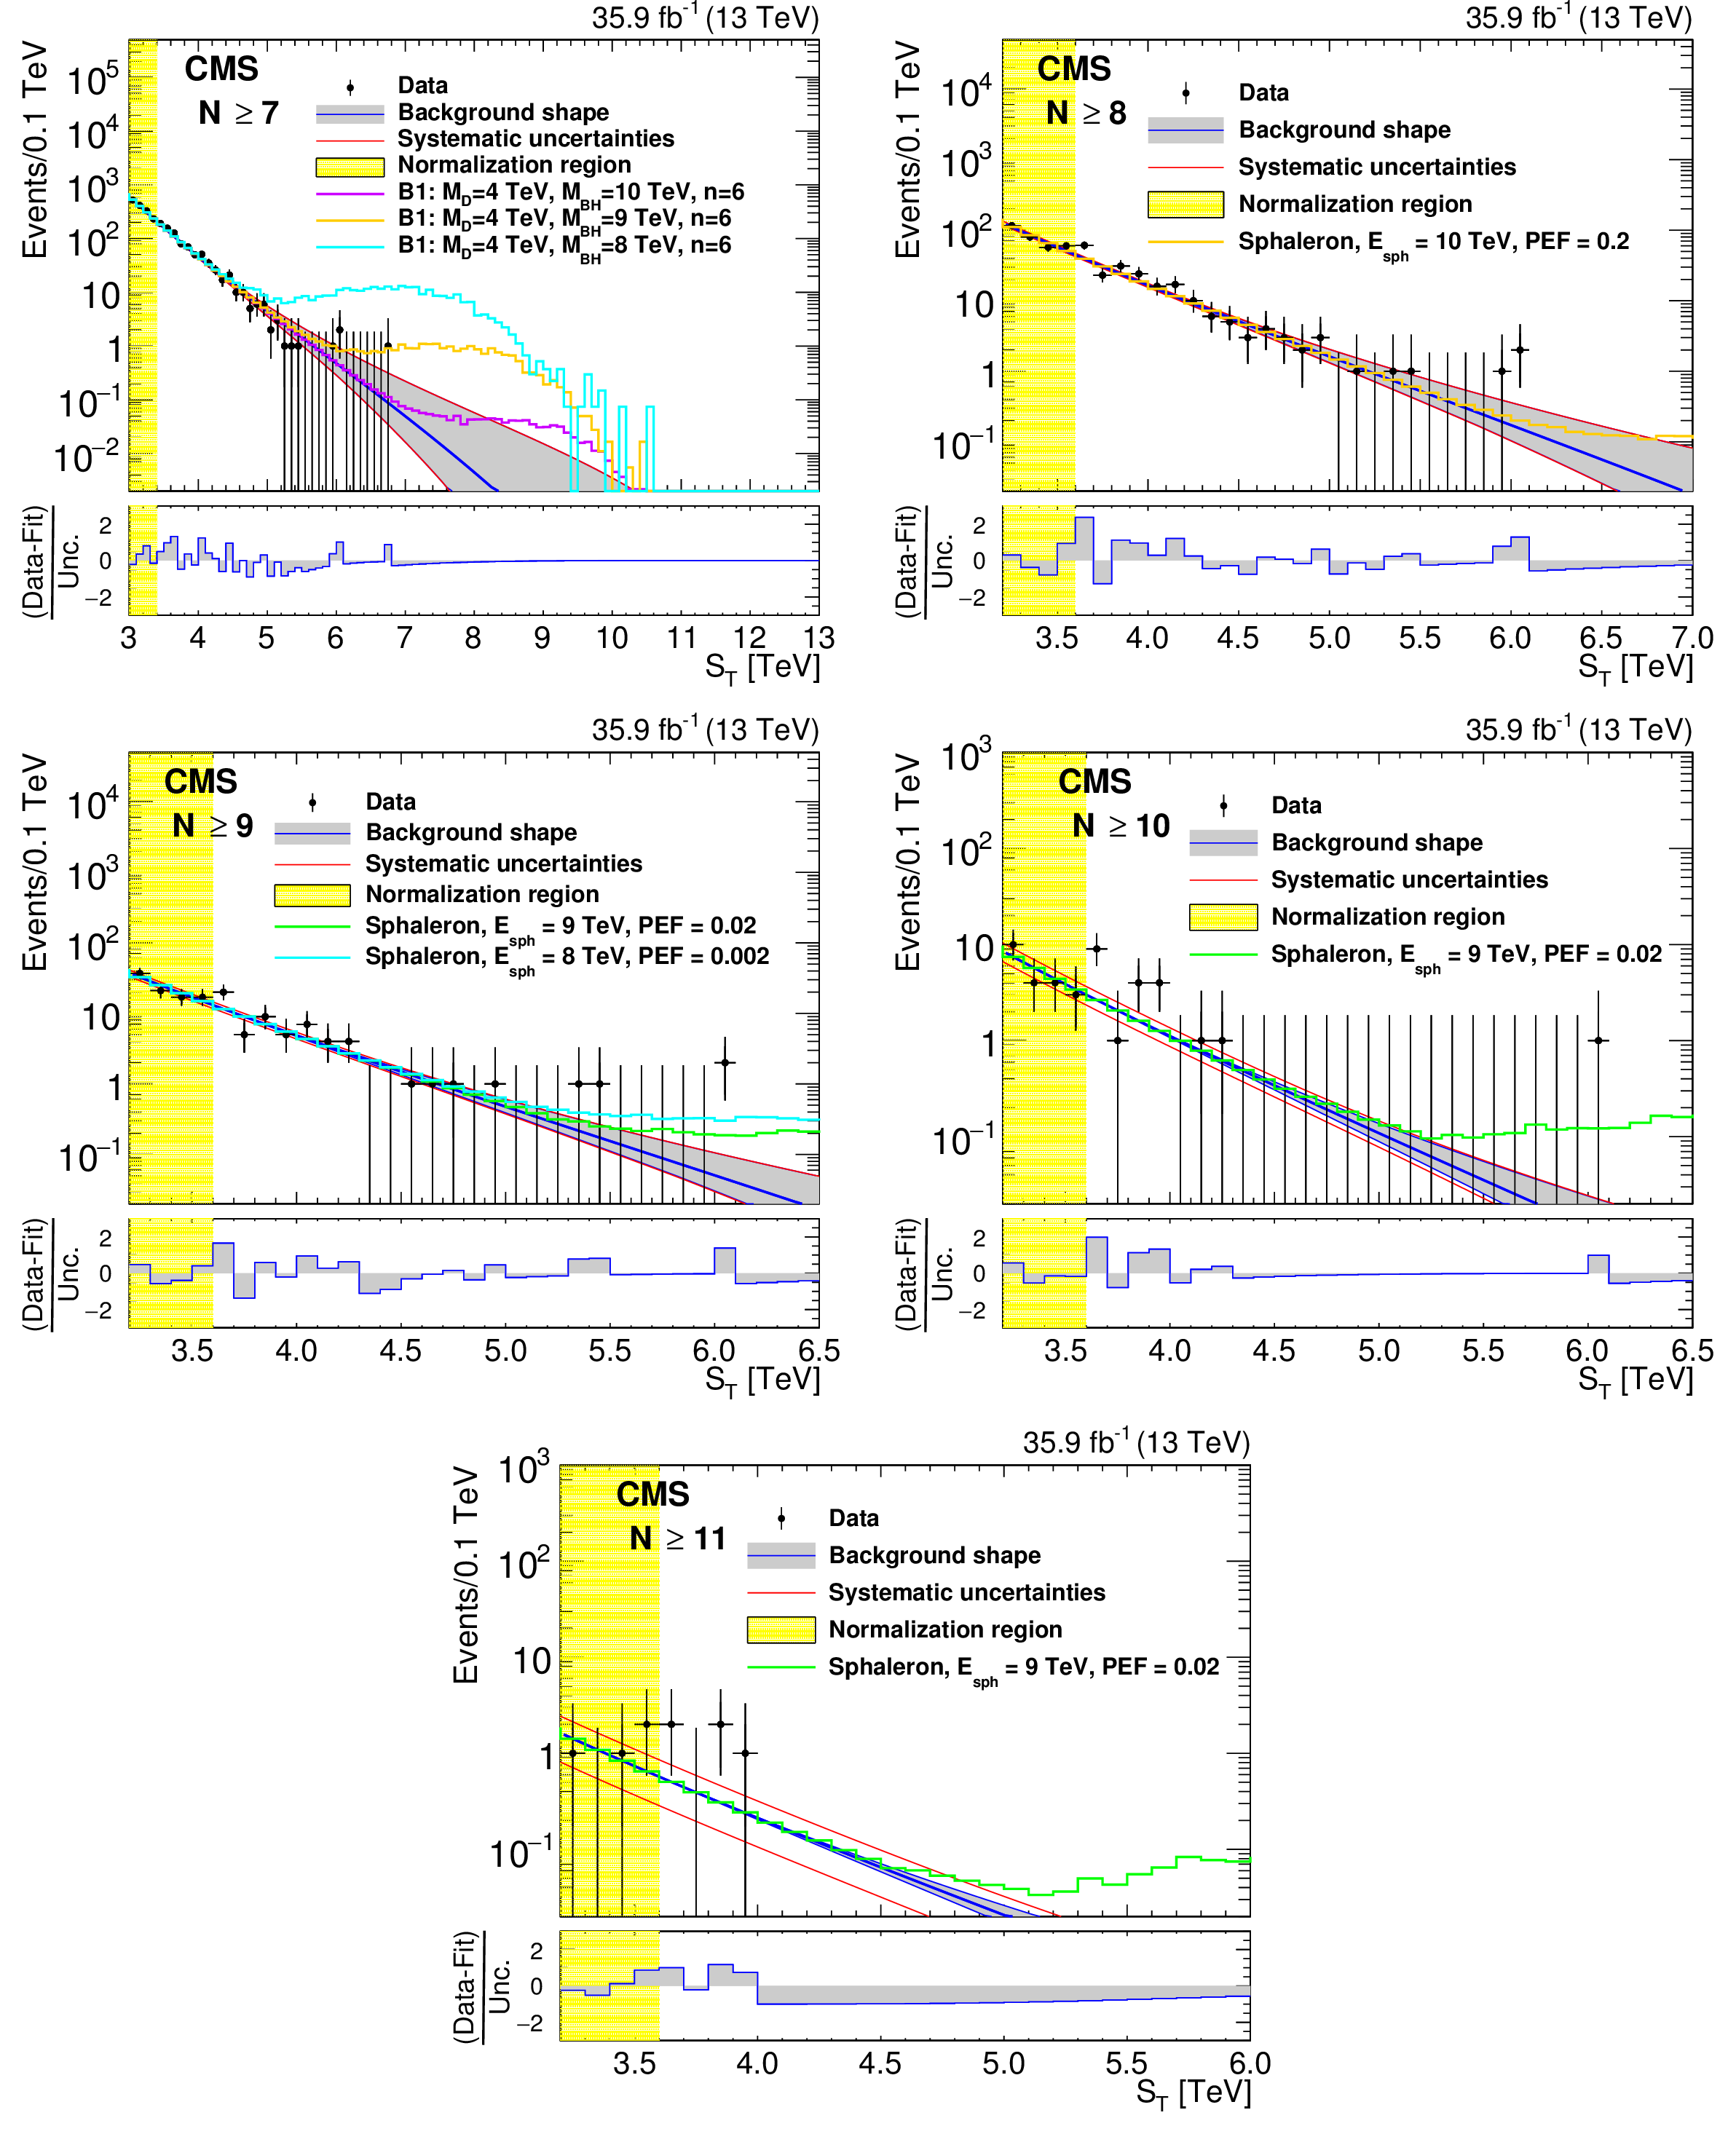
Figure 5:
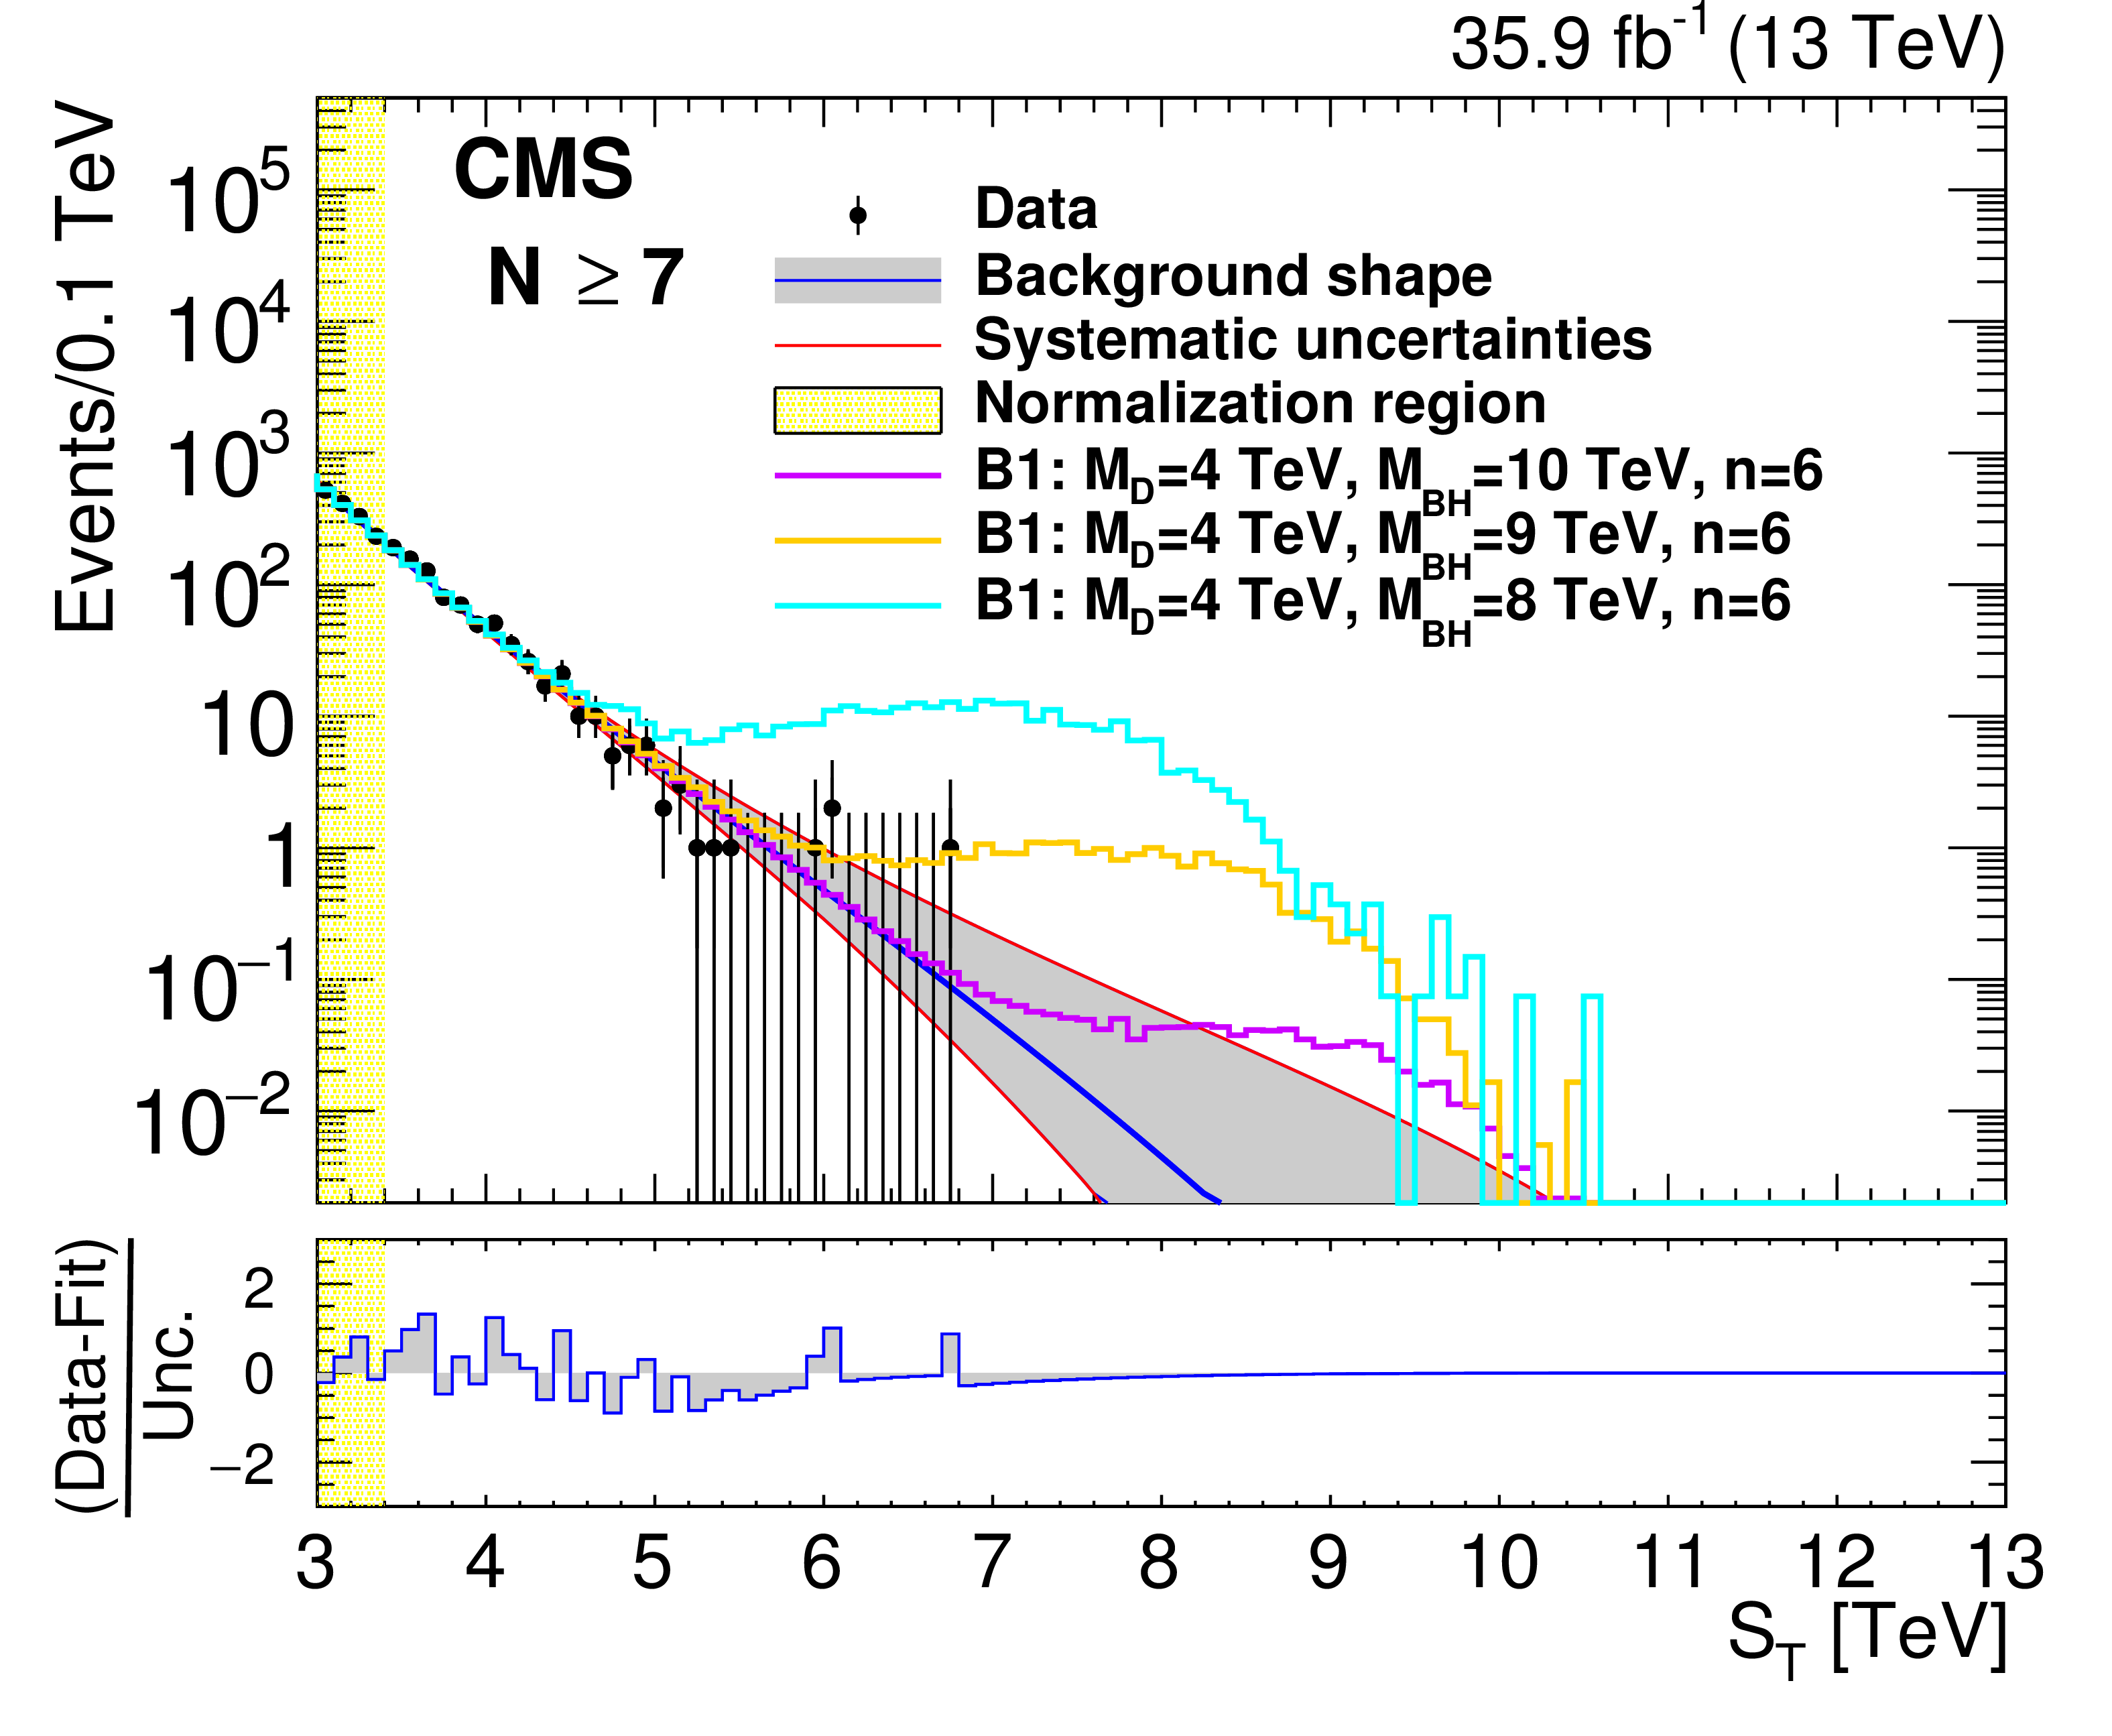
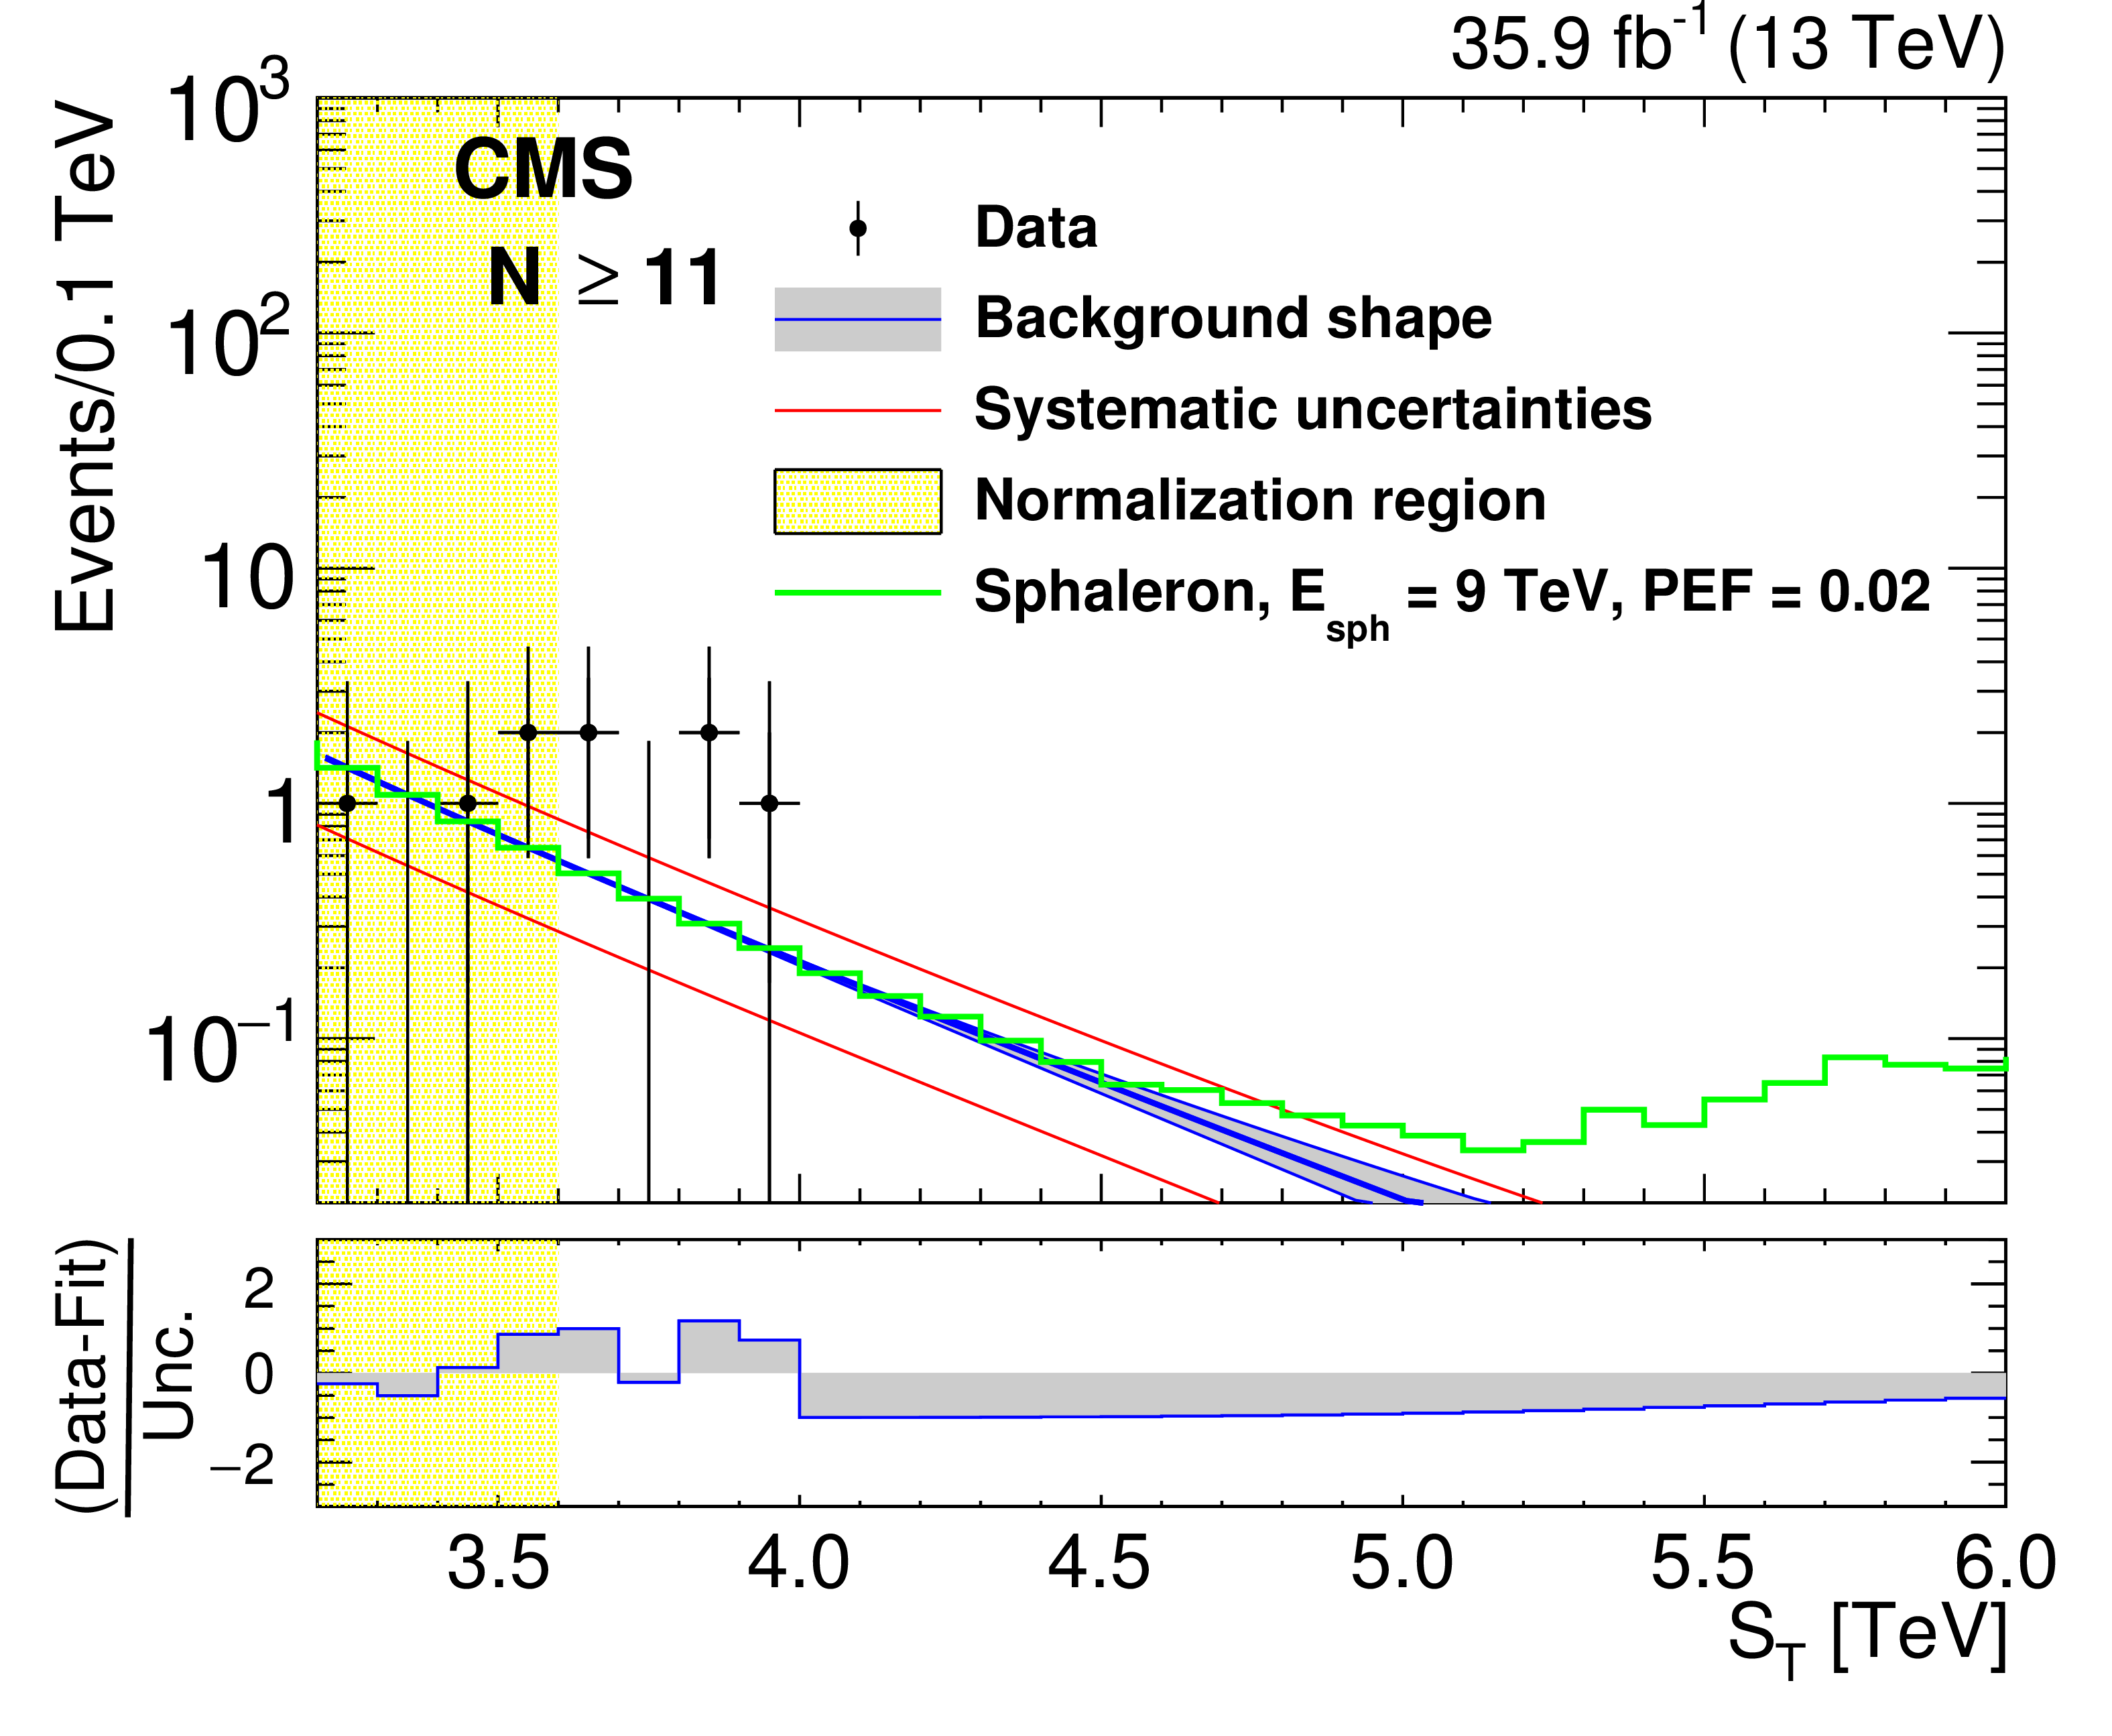
The background predictions after normalization for inclusive multiplicities of $ N \ge $ 7, ..., 11 (left to right, upper to lower). The gray band shows the shape uncertainty and the red lines also include the normalization uncertainty. The bottom panels show the difference between the data and the background prediction from the fit, divided by the overall uncertainty, which includes the statistical uncertainty of data as well as the shape and normalization uncertainties in the background prediction, added in quadrature. The $N \ge $ 7 ($N \ge $ 8, ..., 11) distributions also show contributions from benchmark BH (sphaleron) signals added to the expected background. |
png pdf |
Figure 5-a:
The background predictions after normalization for inclusive multiplicities of $ N \ge $ 7. The gray band shows the shape uncertainty and the red lines also include the normalization uncertainty. The bottom panel shows the difference between the data and the background prediction from the fit, divided by the overall uncertainty, which includes the statistical uncertainty of data as well as the shape and normalization uncertainties in the background prediction, added in quadrature. The $N \ge $ 7 distribution also shows contributions from benchmark BH (sphaleron) signals added to the expected background. |
png pdf |
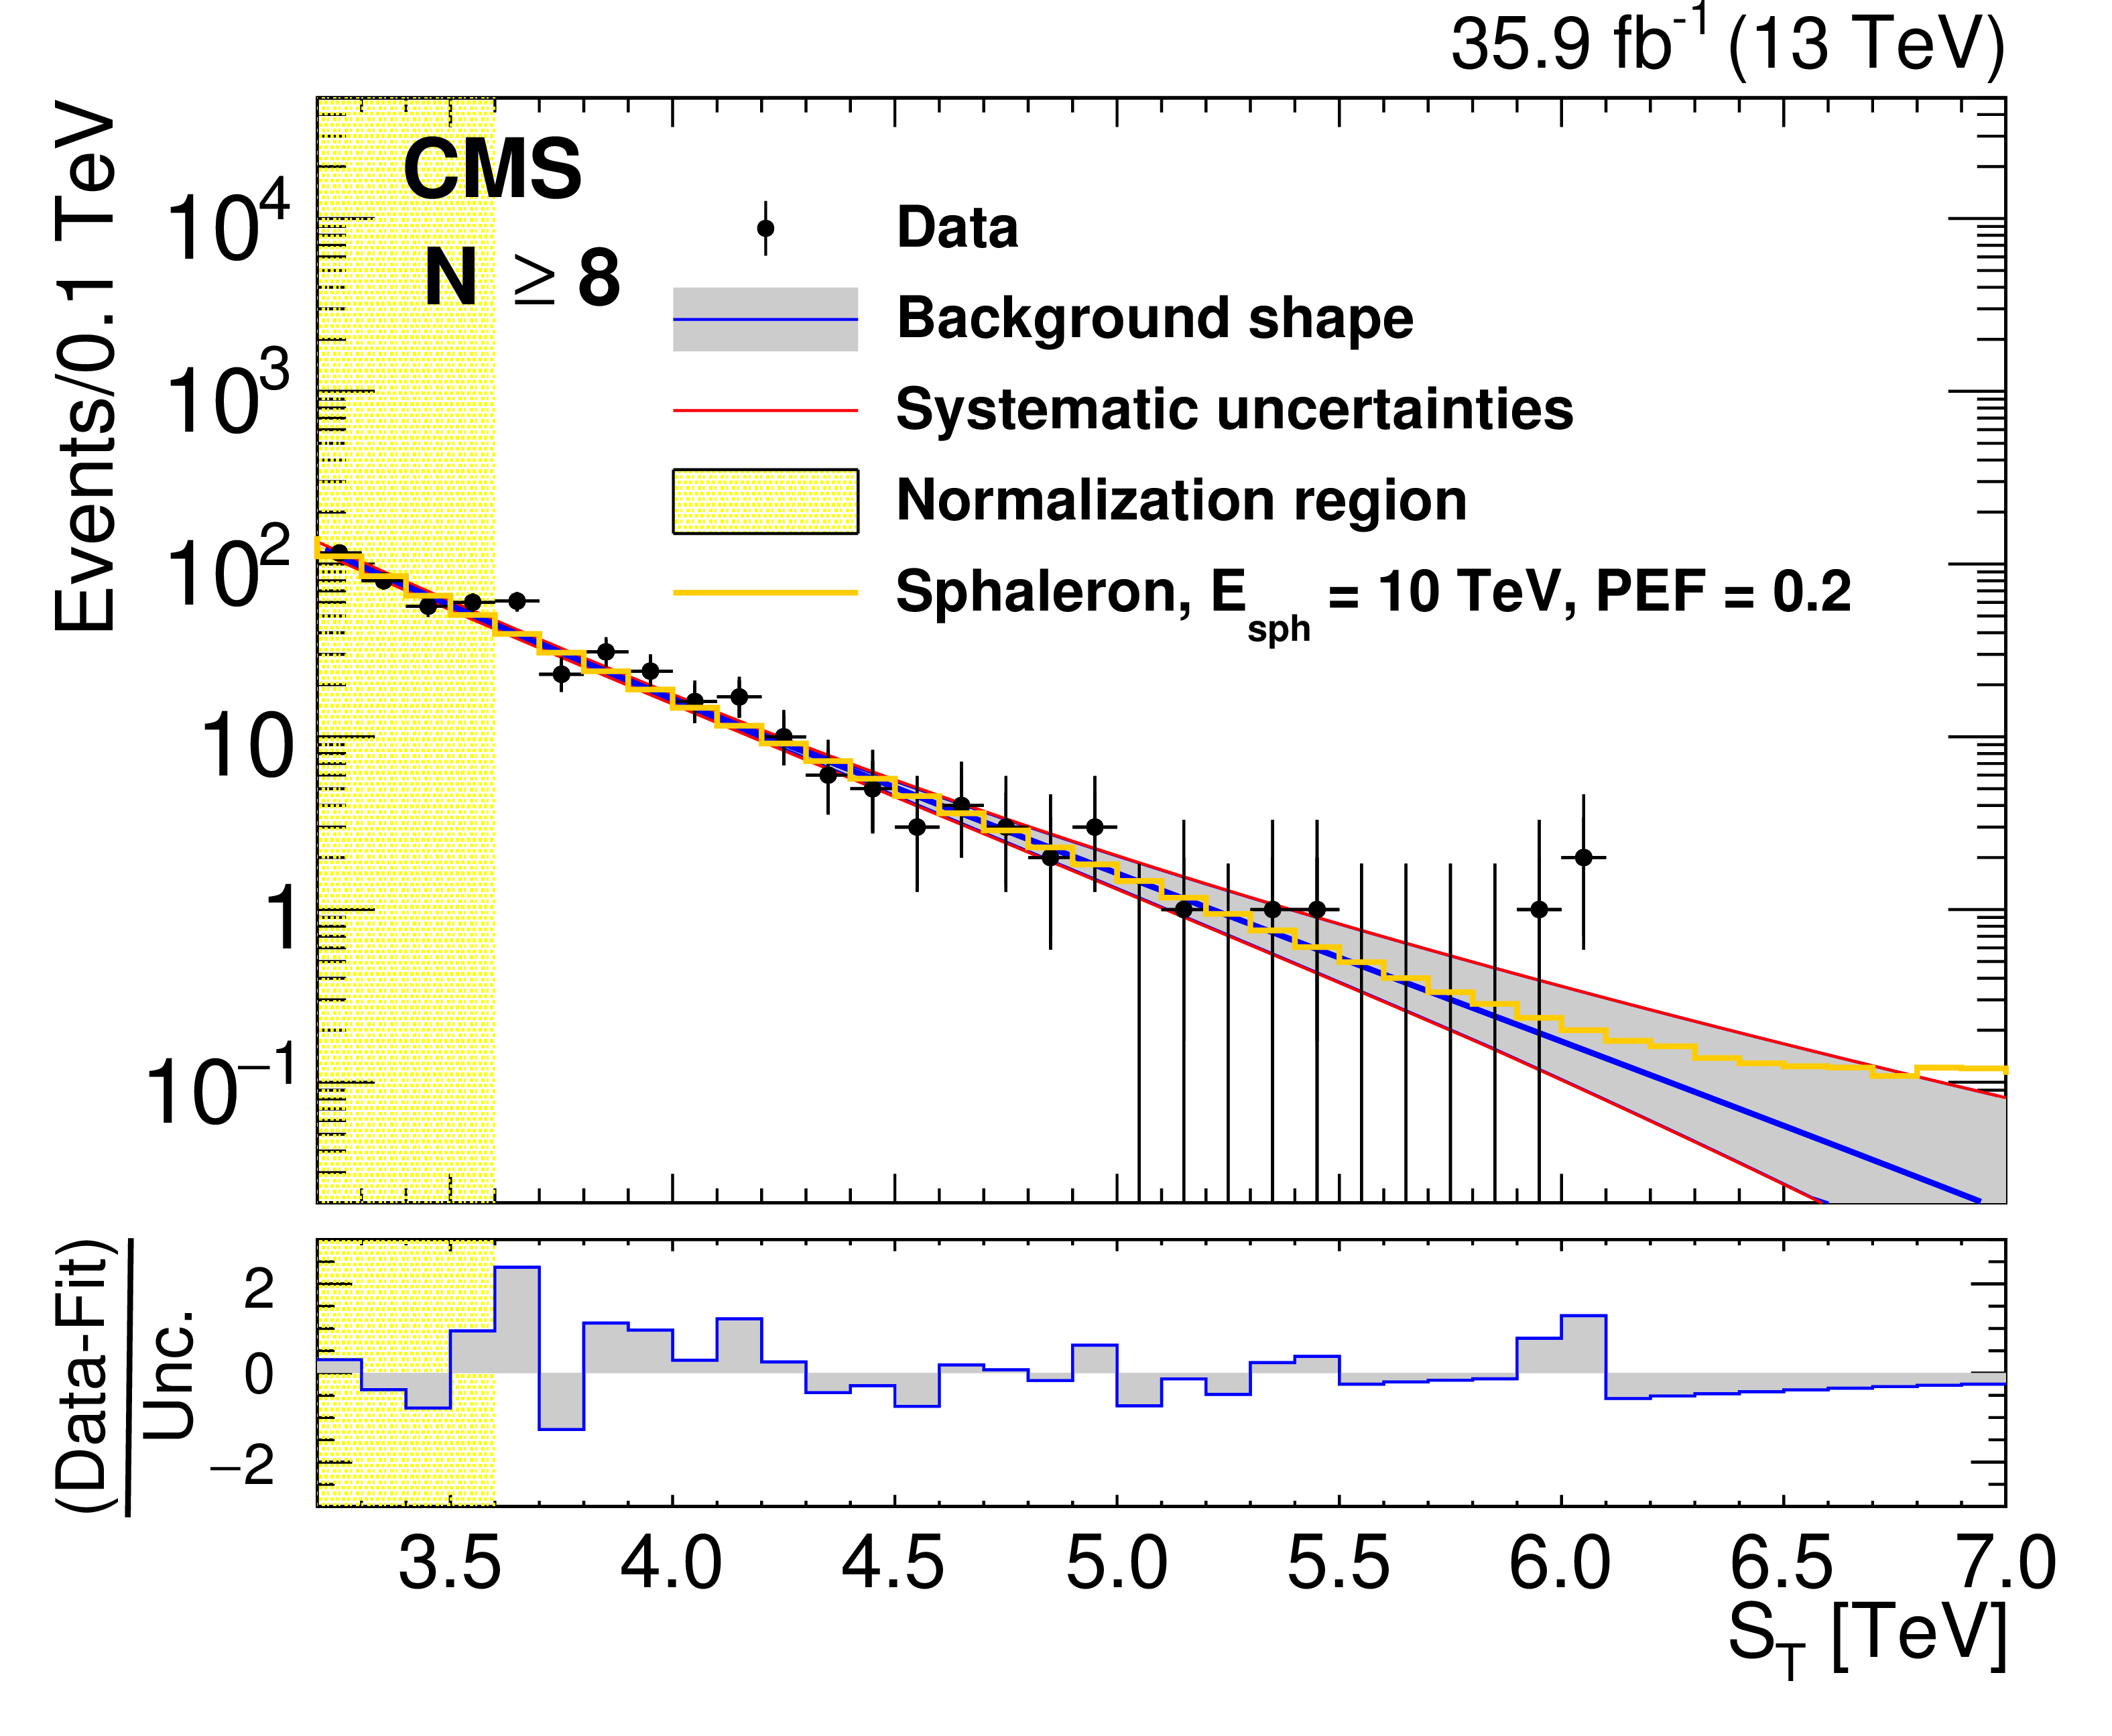
Figure 5-b:
The background predictions after normalization for inclusive multiplicities of $ N \ge $ 8. The gray band shows the shape uncertainty and the red lines also include the normalization uncertainty. The bottom panel shows the difference between the data and the background prediction from the fit, divided by the overall uncertainty, which includes the statistical uncertainty of data as well as the shape and normalization uncertainties in the background prediction, added in quadrature. The $N \ge $ 8 distribution also shows contributions from benchmark BH (sphaleron) signals added to the expected background. |
png pdf |
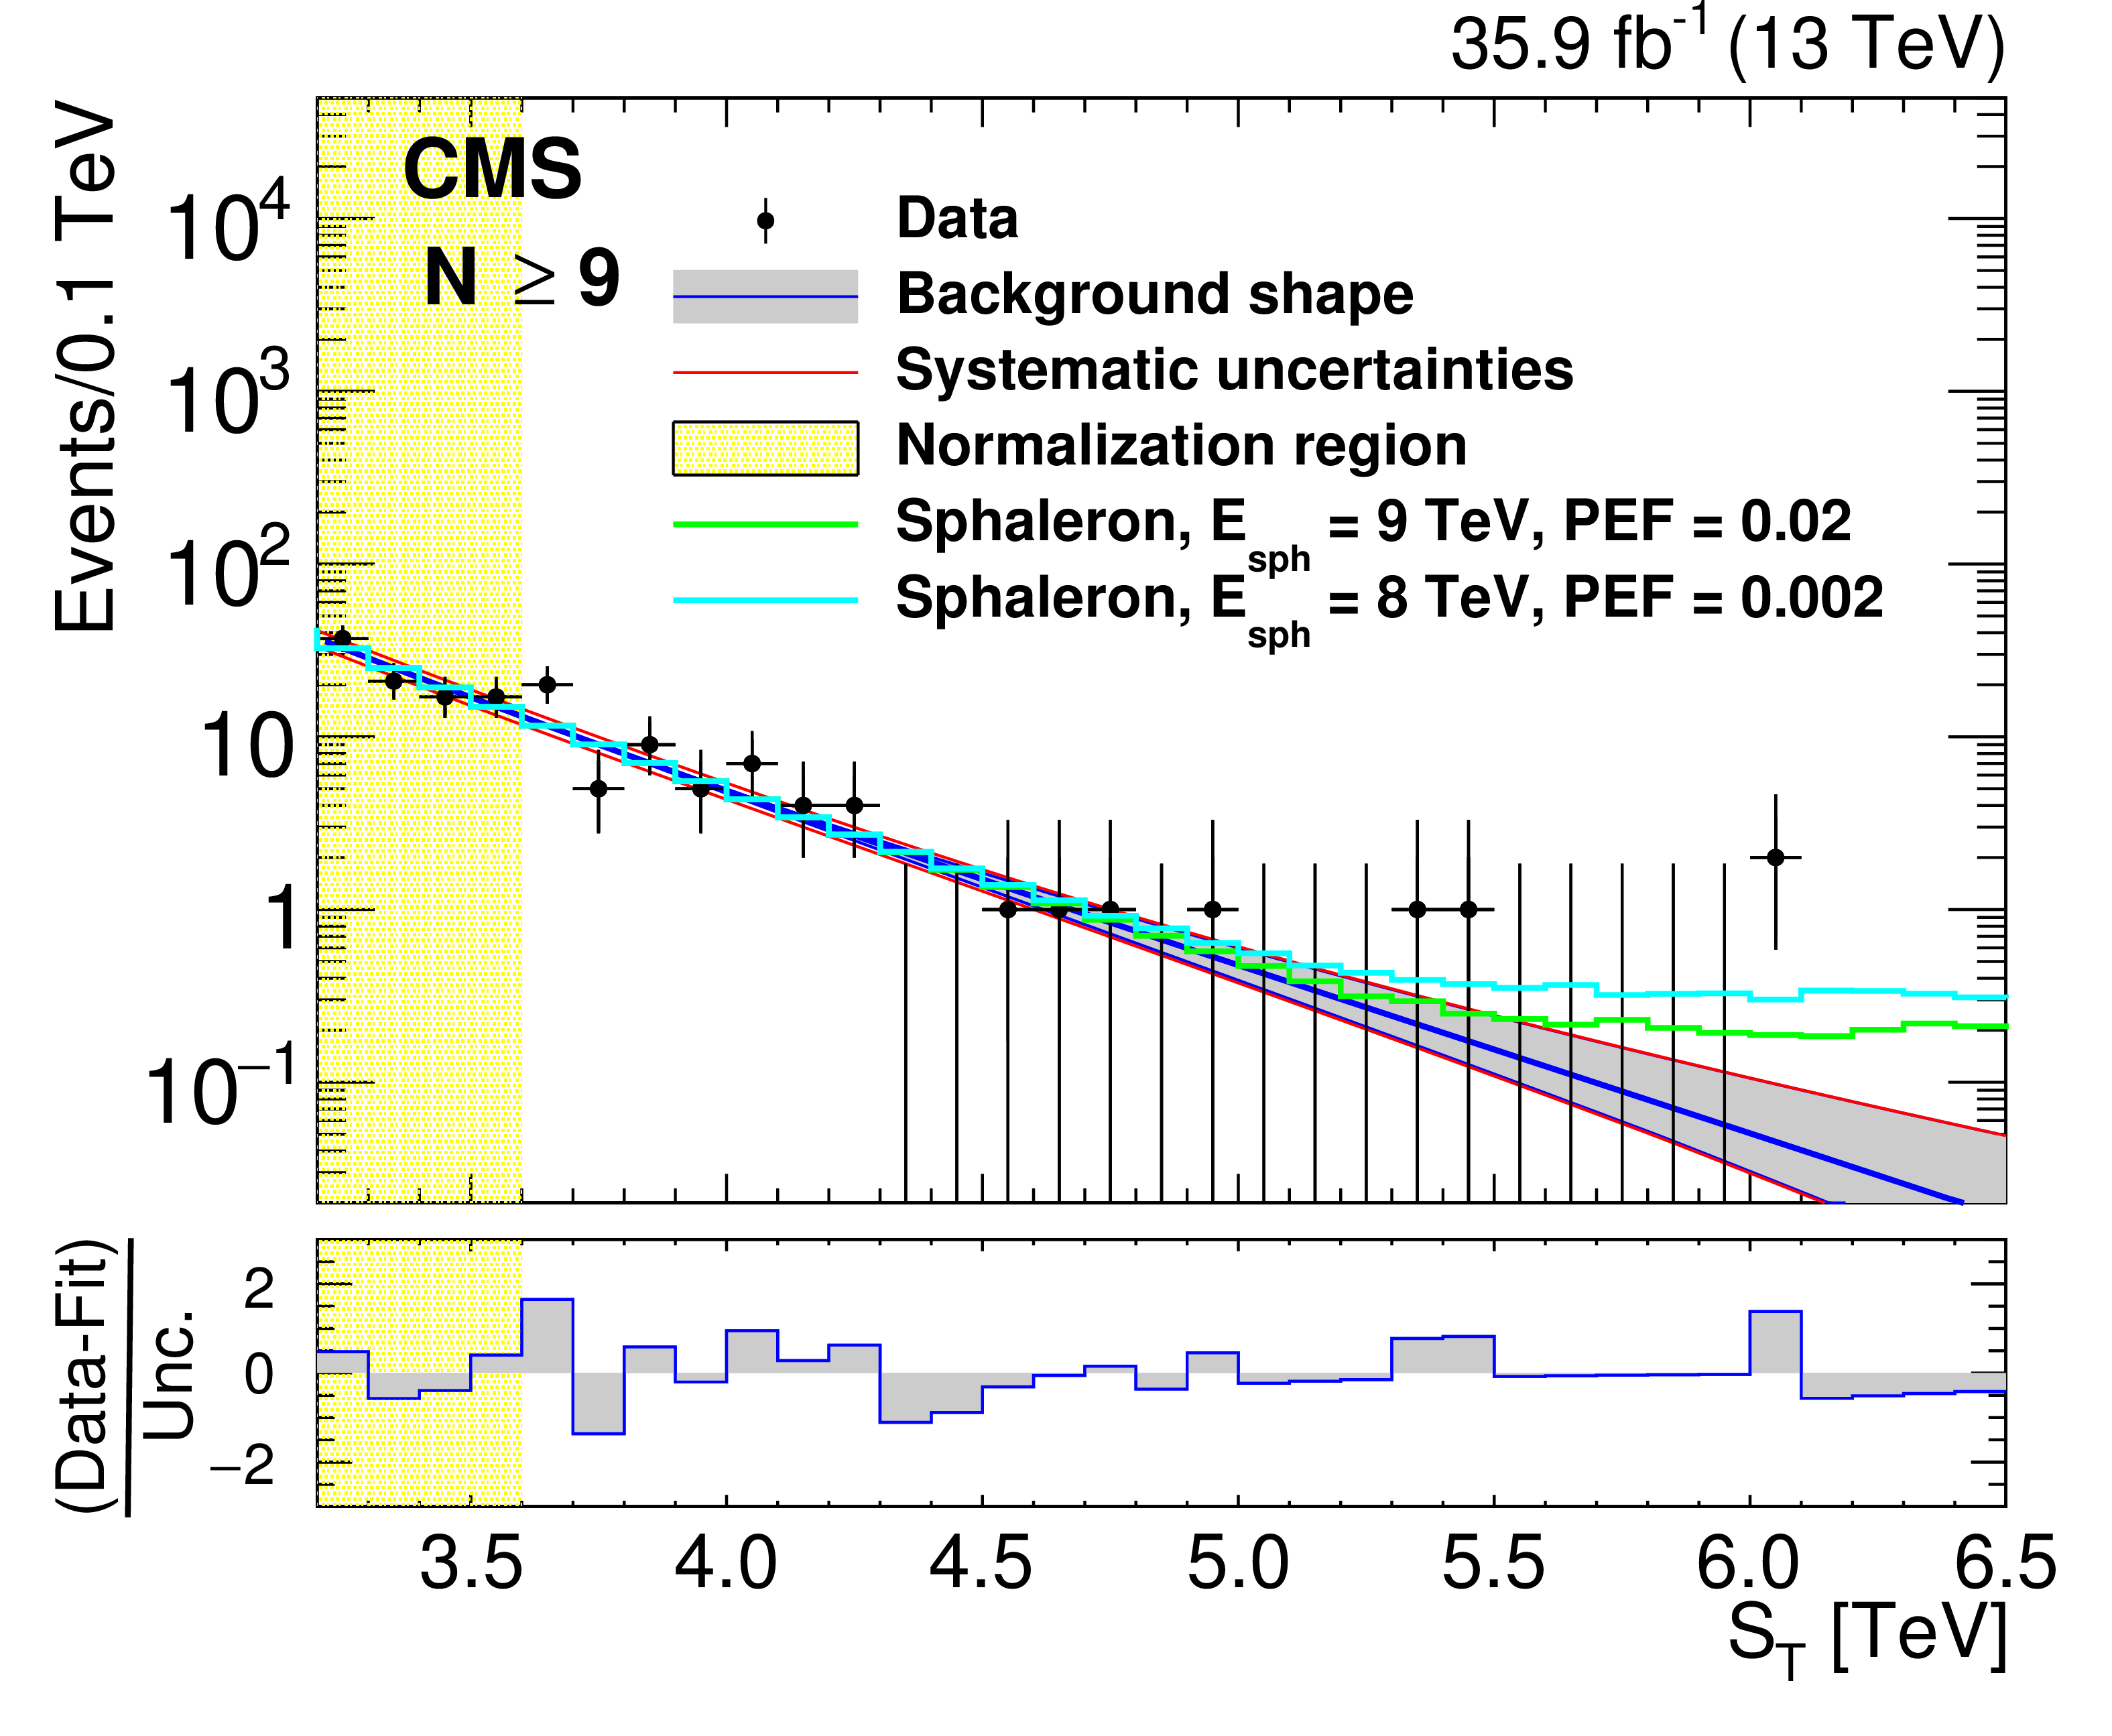
Figure 5-c:
The background predictions after normalization for inclusive multiplicities of $ N \ge $ 9. The gray band shows the shape uncertainty and the red lines also include the normalization uncertainty. The bottom panel shows the difference between the data and the background prediction from the fit, divided by the overall uncertainty, which includes the statistical uncertainty of data as well as the shape and normalization uncertainties in the background prediction, added in quadrature. The $N \ge $ 9 distribution also shows contributions from benchmark BH (sphaleron) signals added to the expected background. |
png pdf |
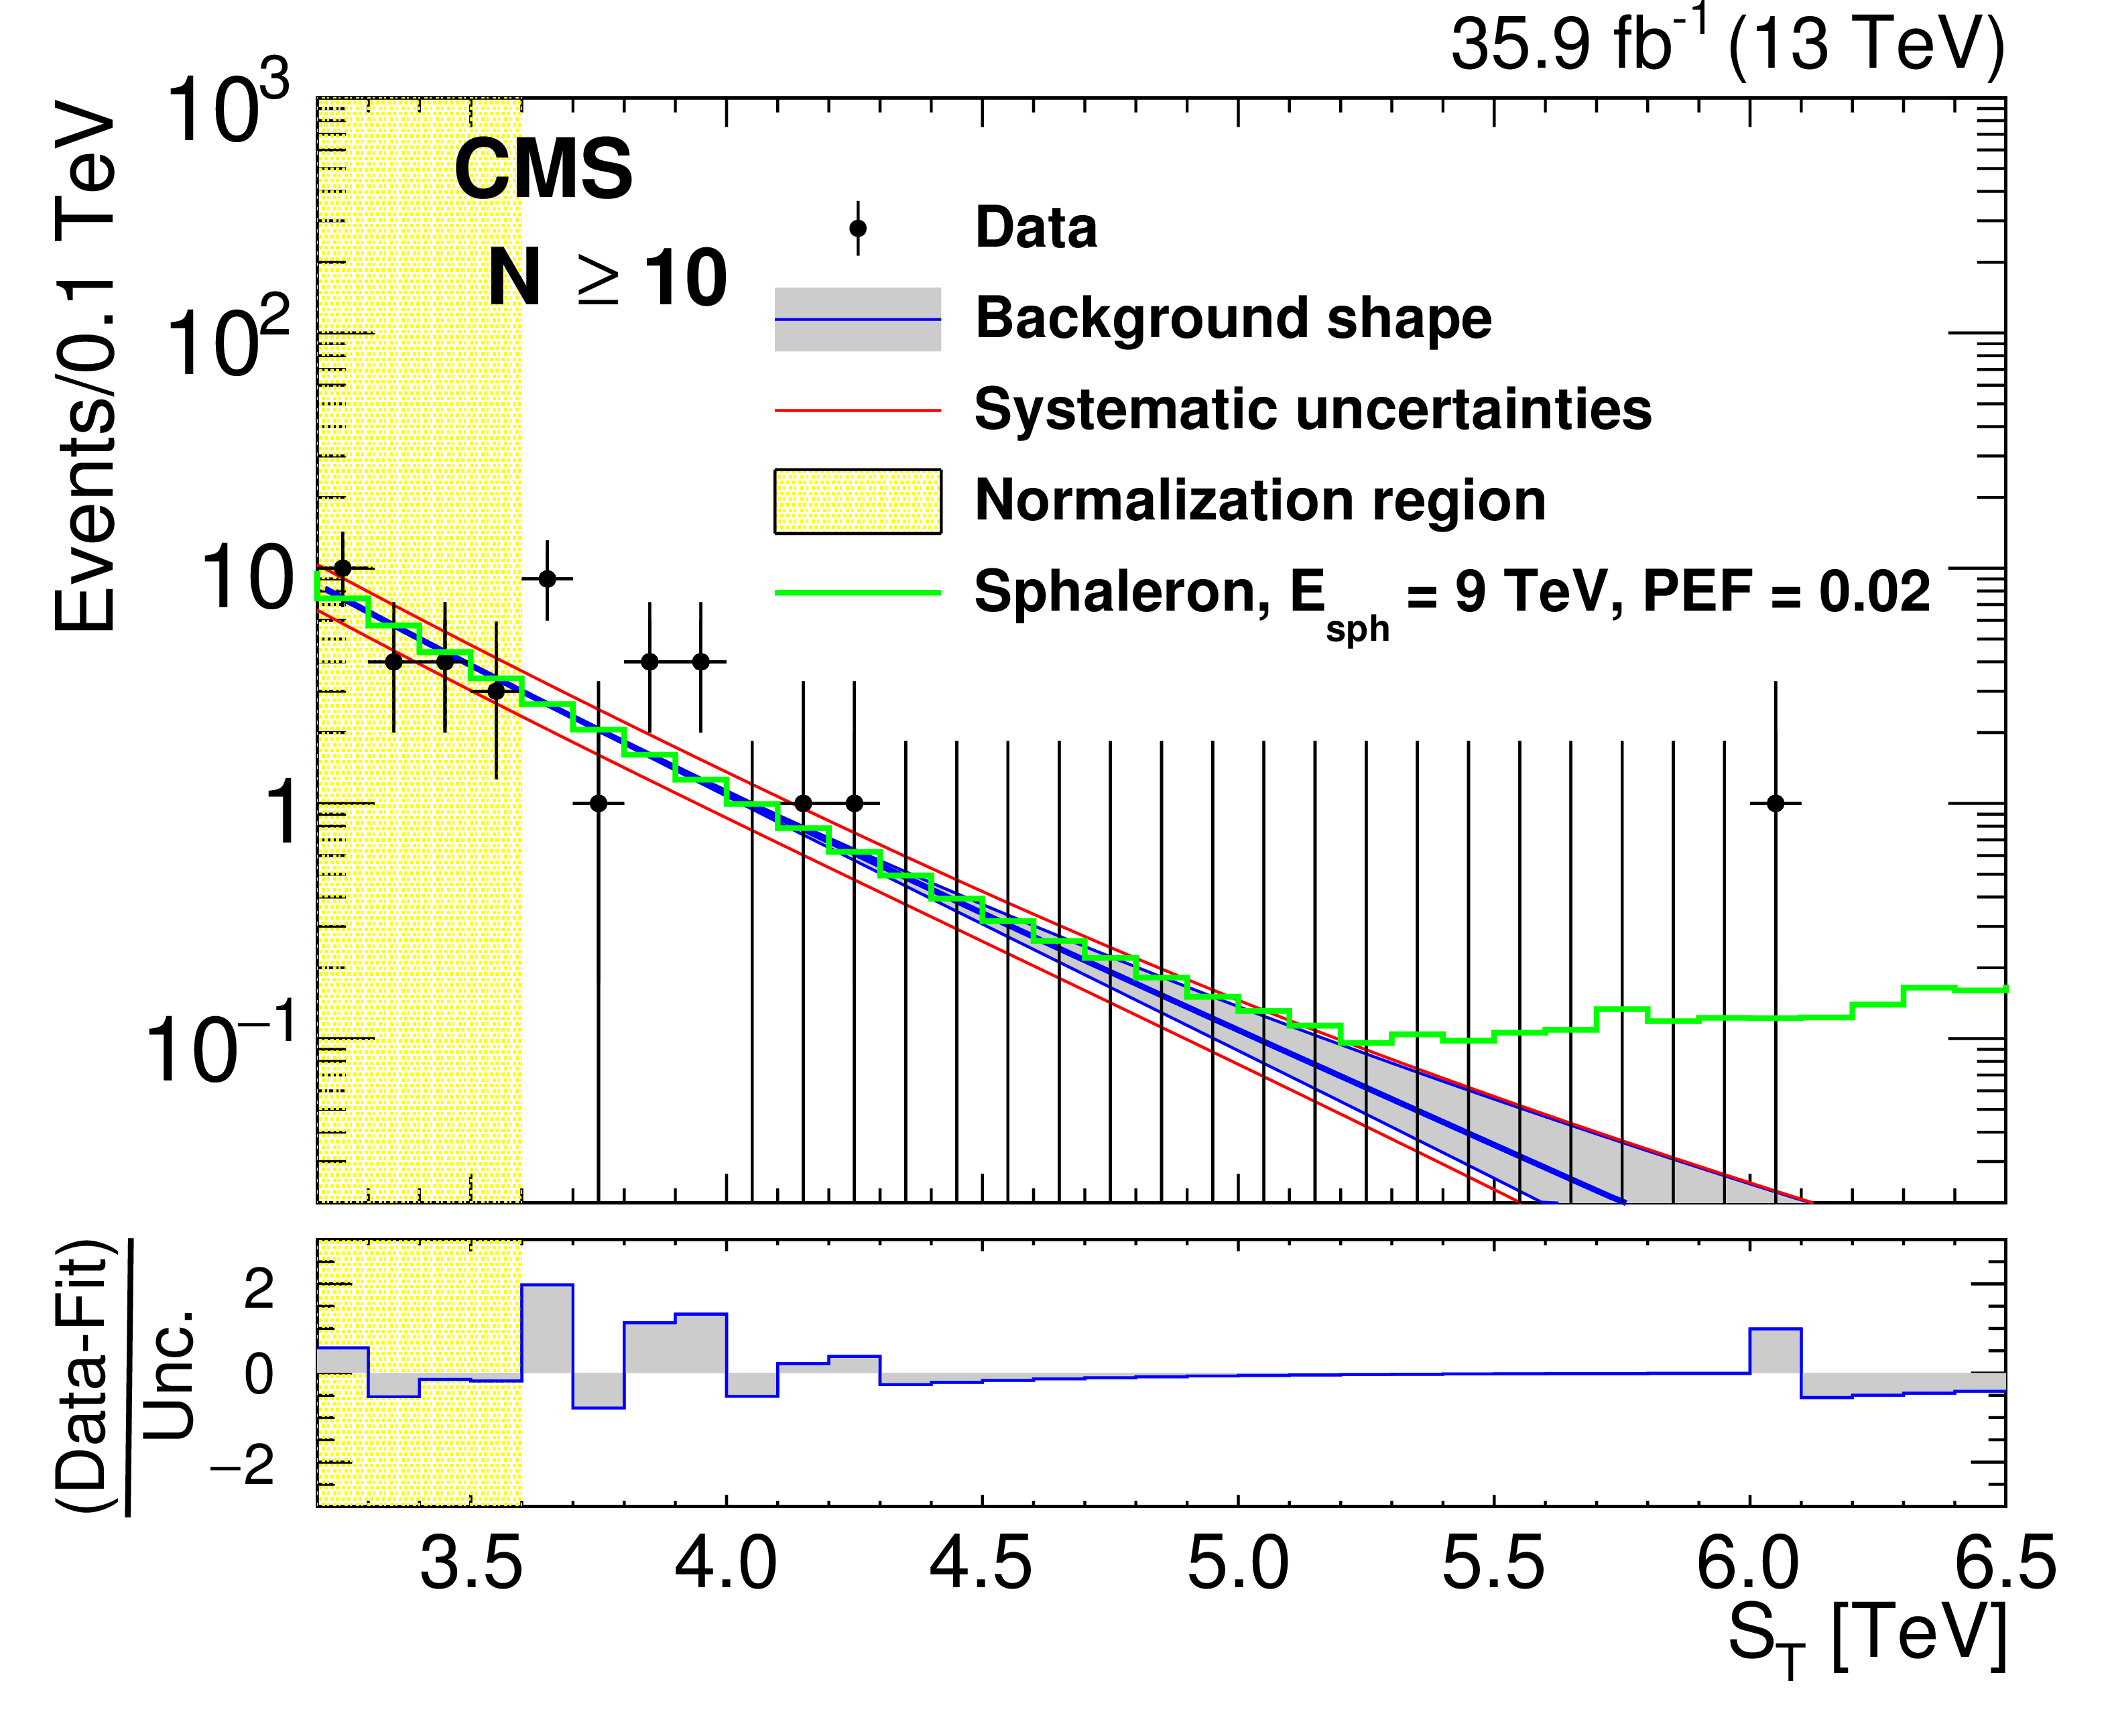
Figure 5-d:
The background predictions after normalization for inclusive multiplicities of $ N \ge $ 10. The gray band shows the shape uncertainty and the red lines also include the normalization uncertainty. The bottom panel shows the difference between the data and the background prediction from the fit, divided by the overall uncertainty, which includes the statistical uncertainty of data as well as the shape and normalization uncertainties in the background prediction, added in quadrature. The $N \ge $ 10 distribution also shows contributions from benchmark BH (sphaleron) signals added to the expected background. |
png pdf |
Figure 5-e:
The background predictions after normalization for inclusive multiplicities of $ N \ge $ 11. The gray band shows the shape uncertainty and the red lines also include the normalization uncertainty. The bottom panel shows the difference between the data and the background prediction from the fit, divided by the overall uncertainty, which includes the statistical uncertainty of data as well as the shape and normalization uncertainties in the background prediction, added in quadrature. The $N \ge $ 11 distribution also shows contributions from benchmark BH (sphaleron) signals added to the expected background. |

png pdf |
Figure 6:
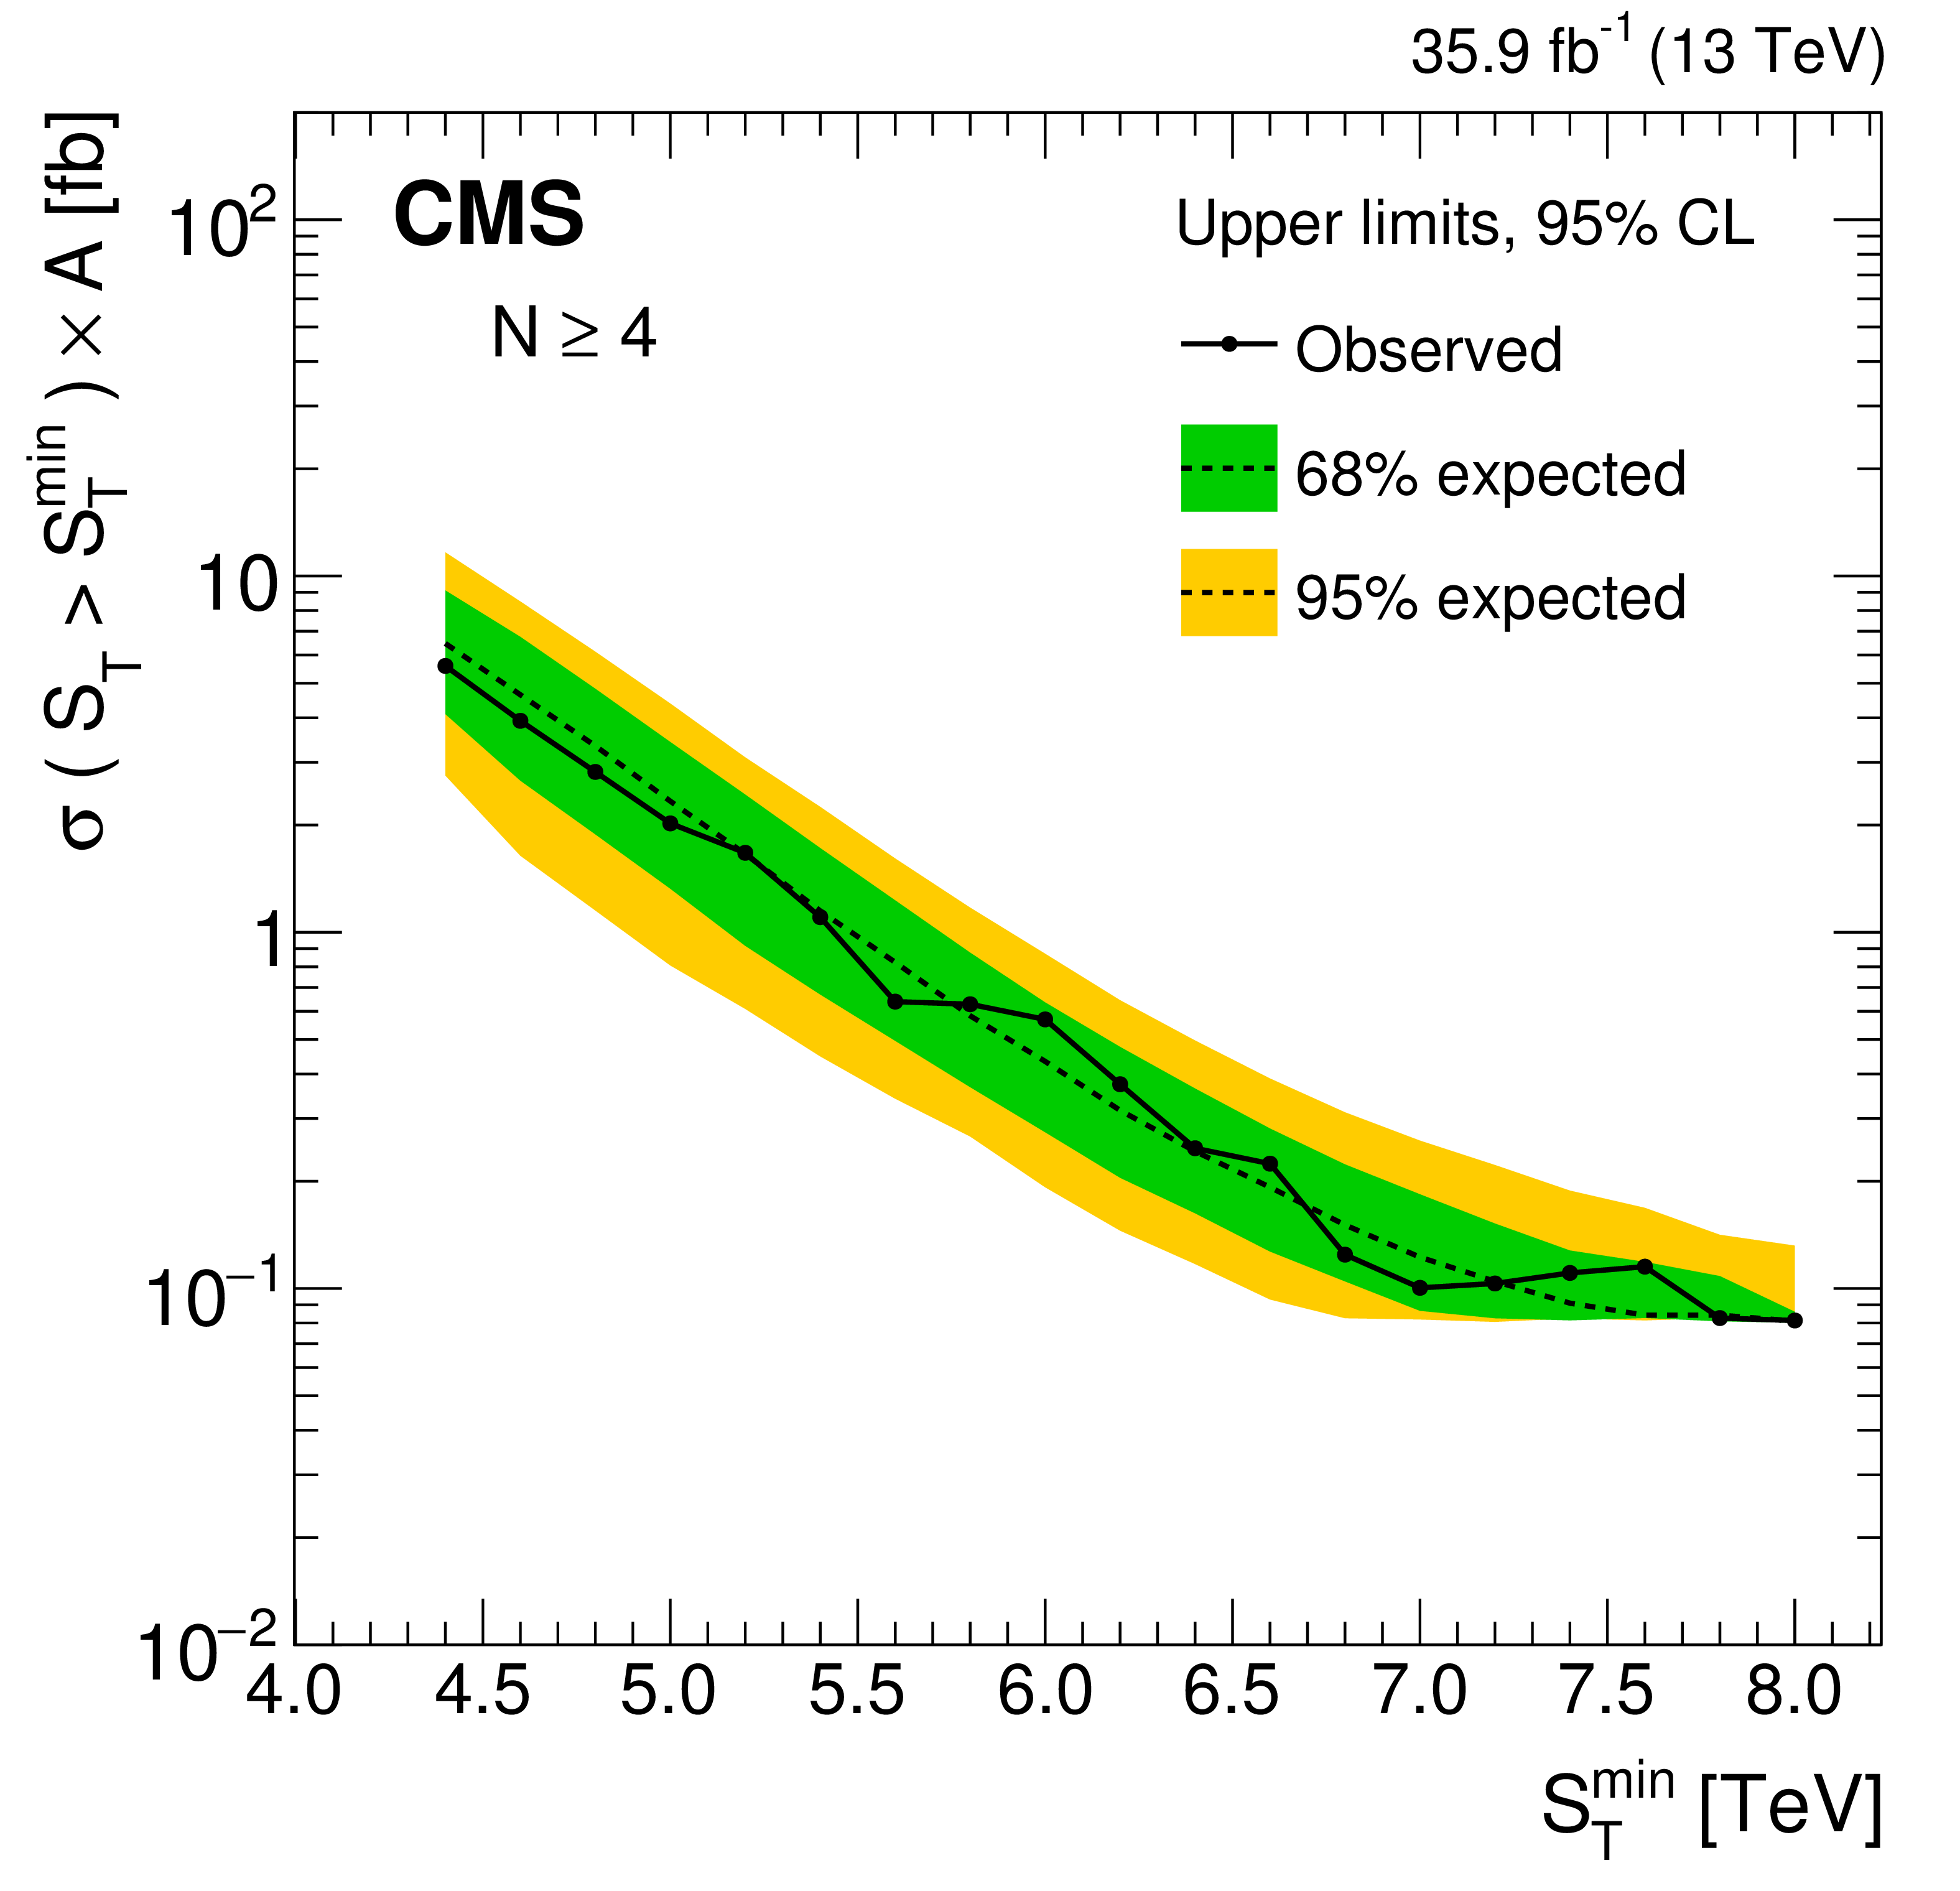
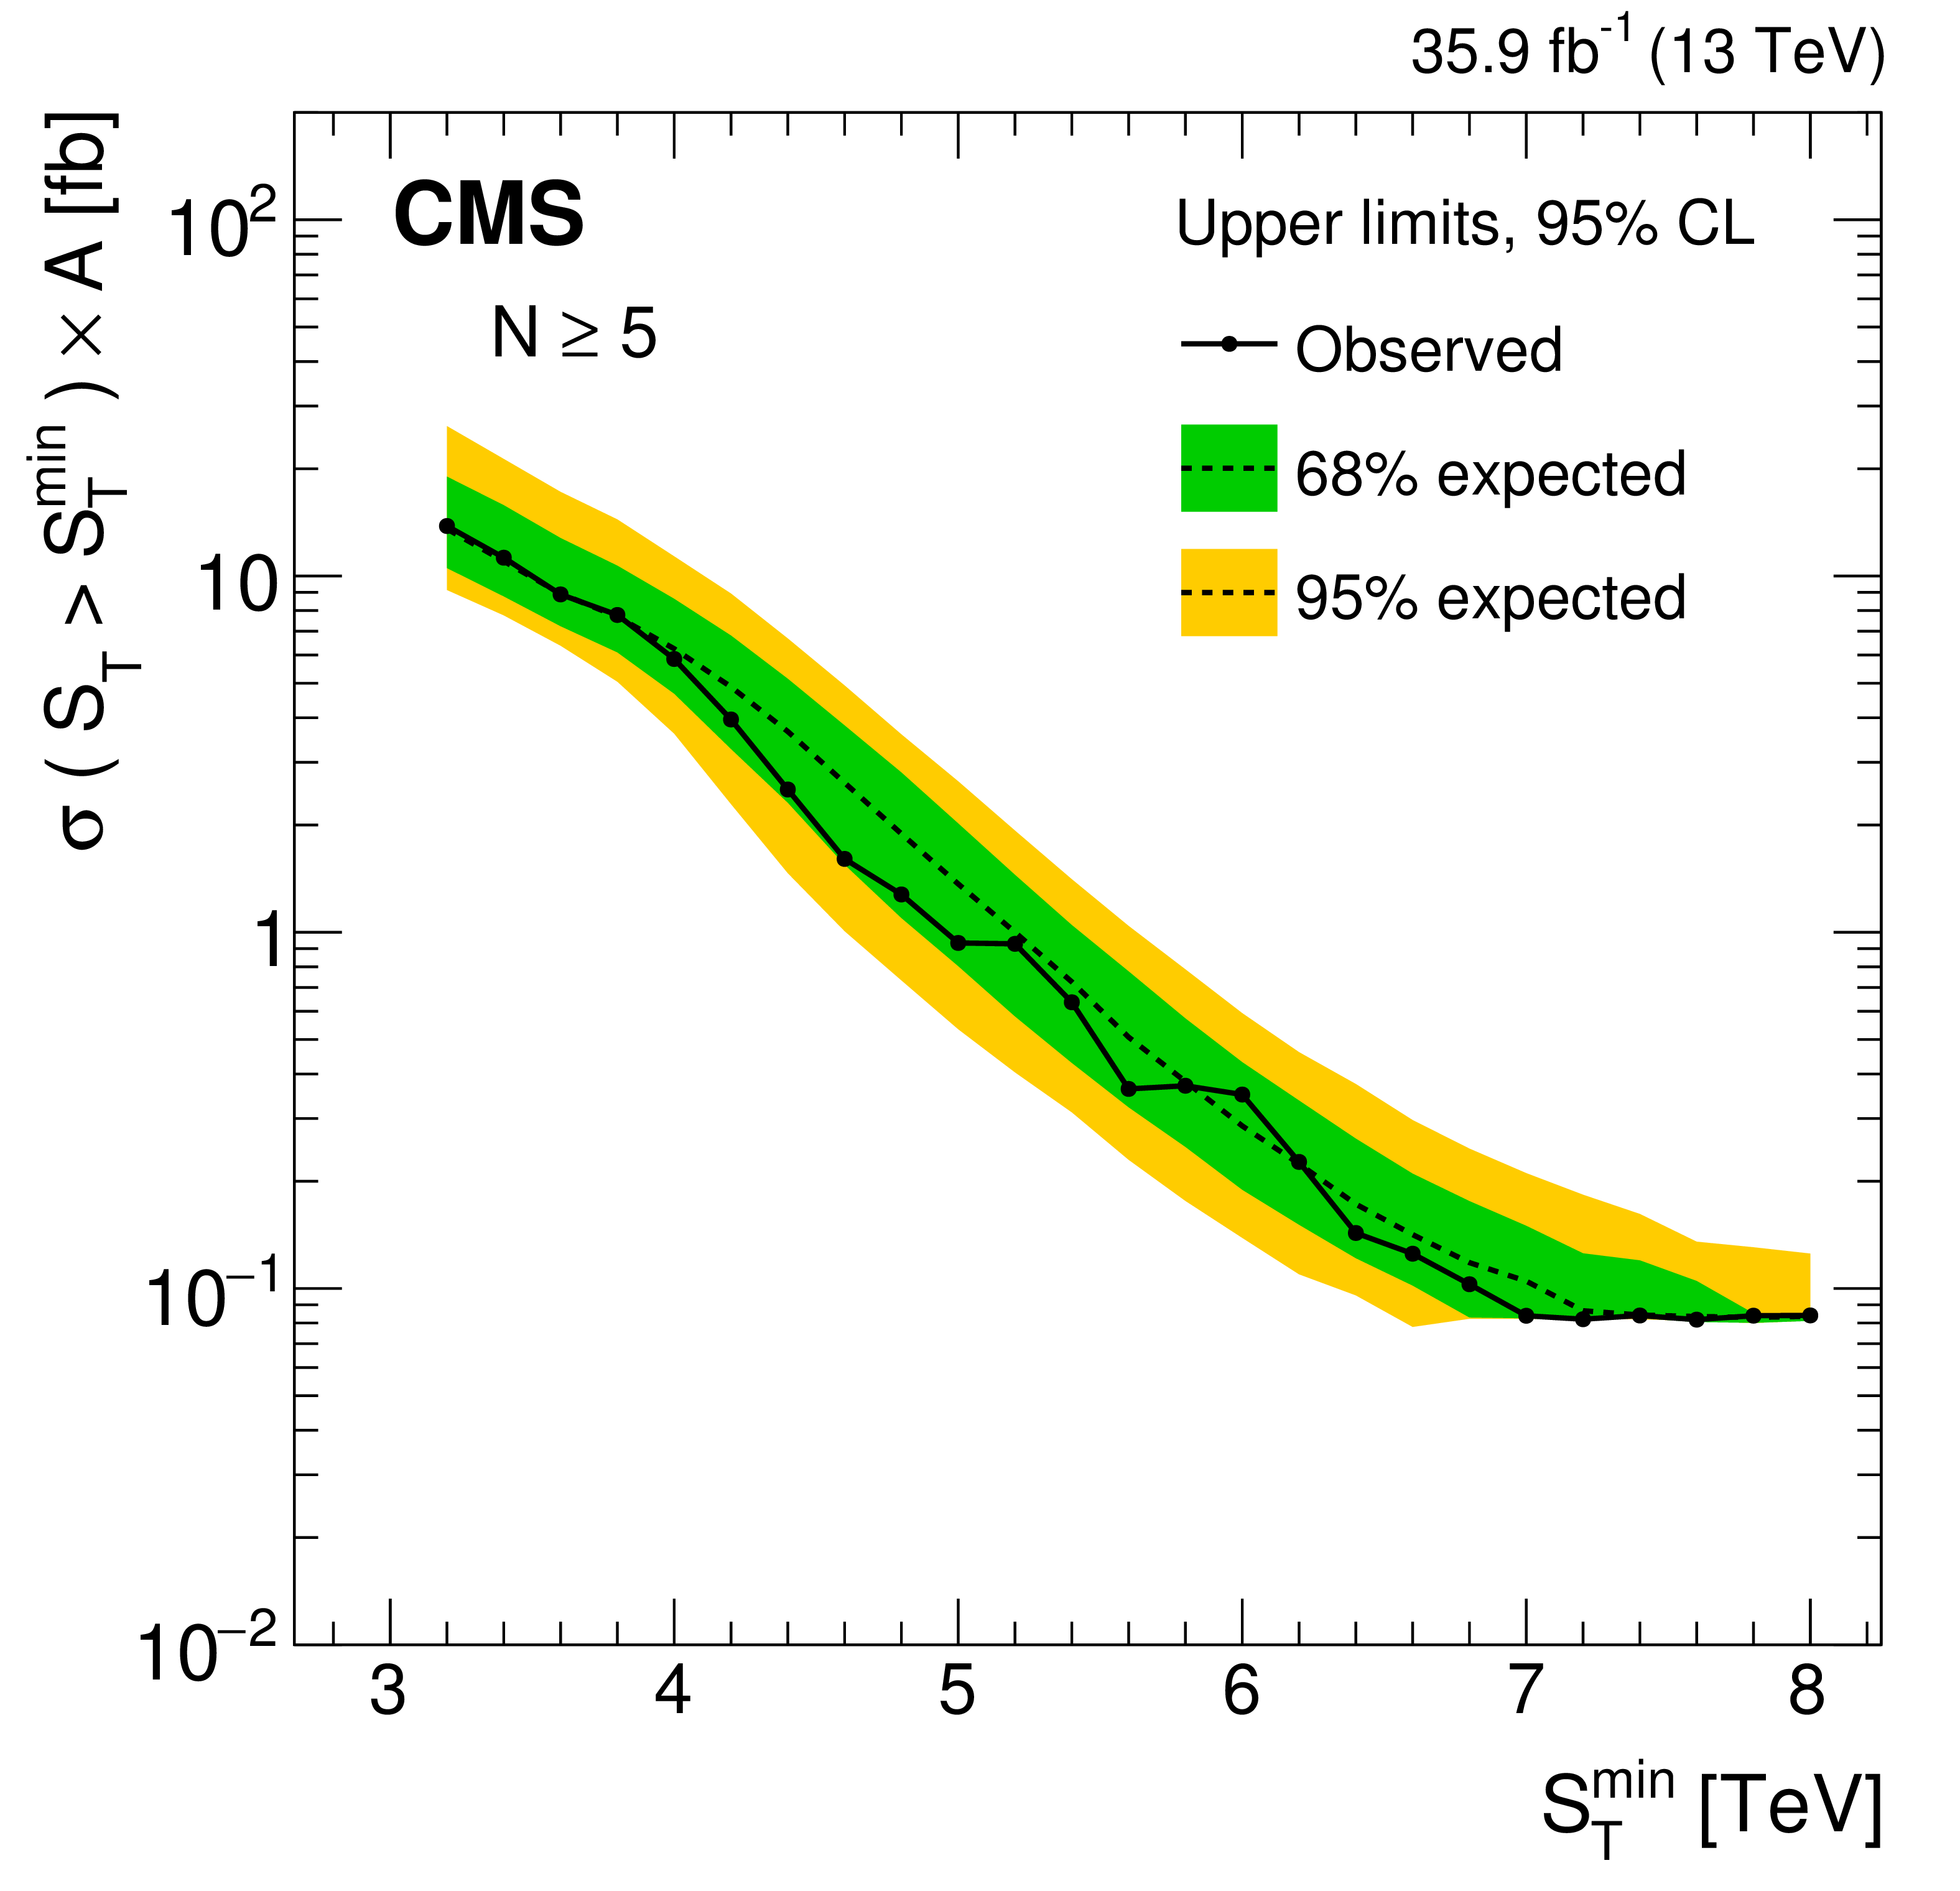
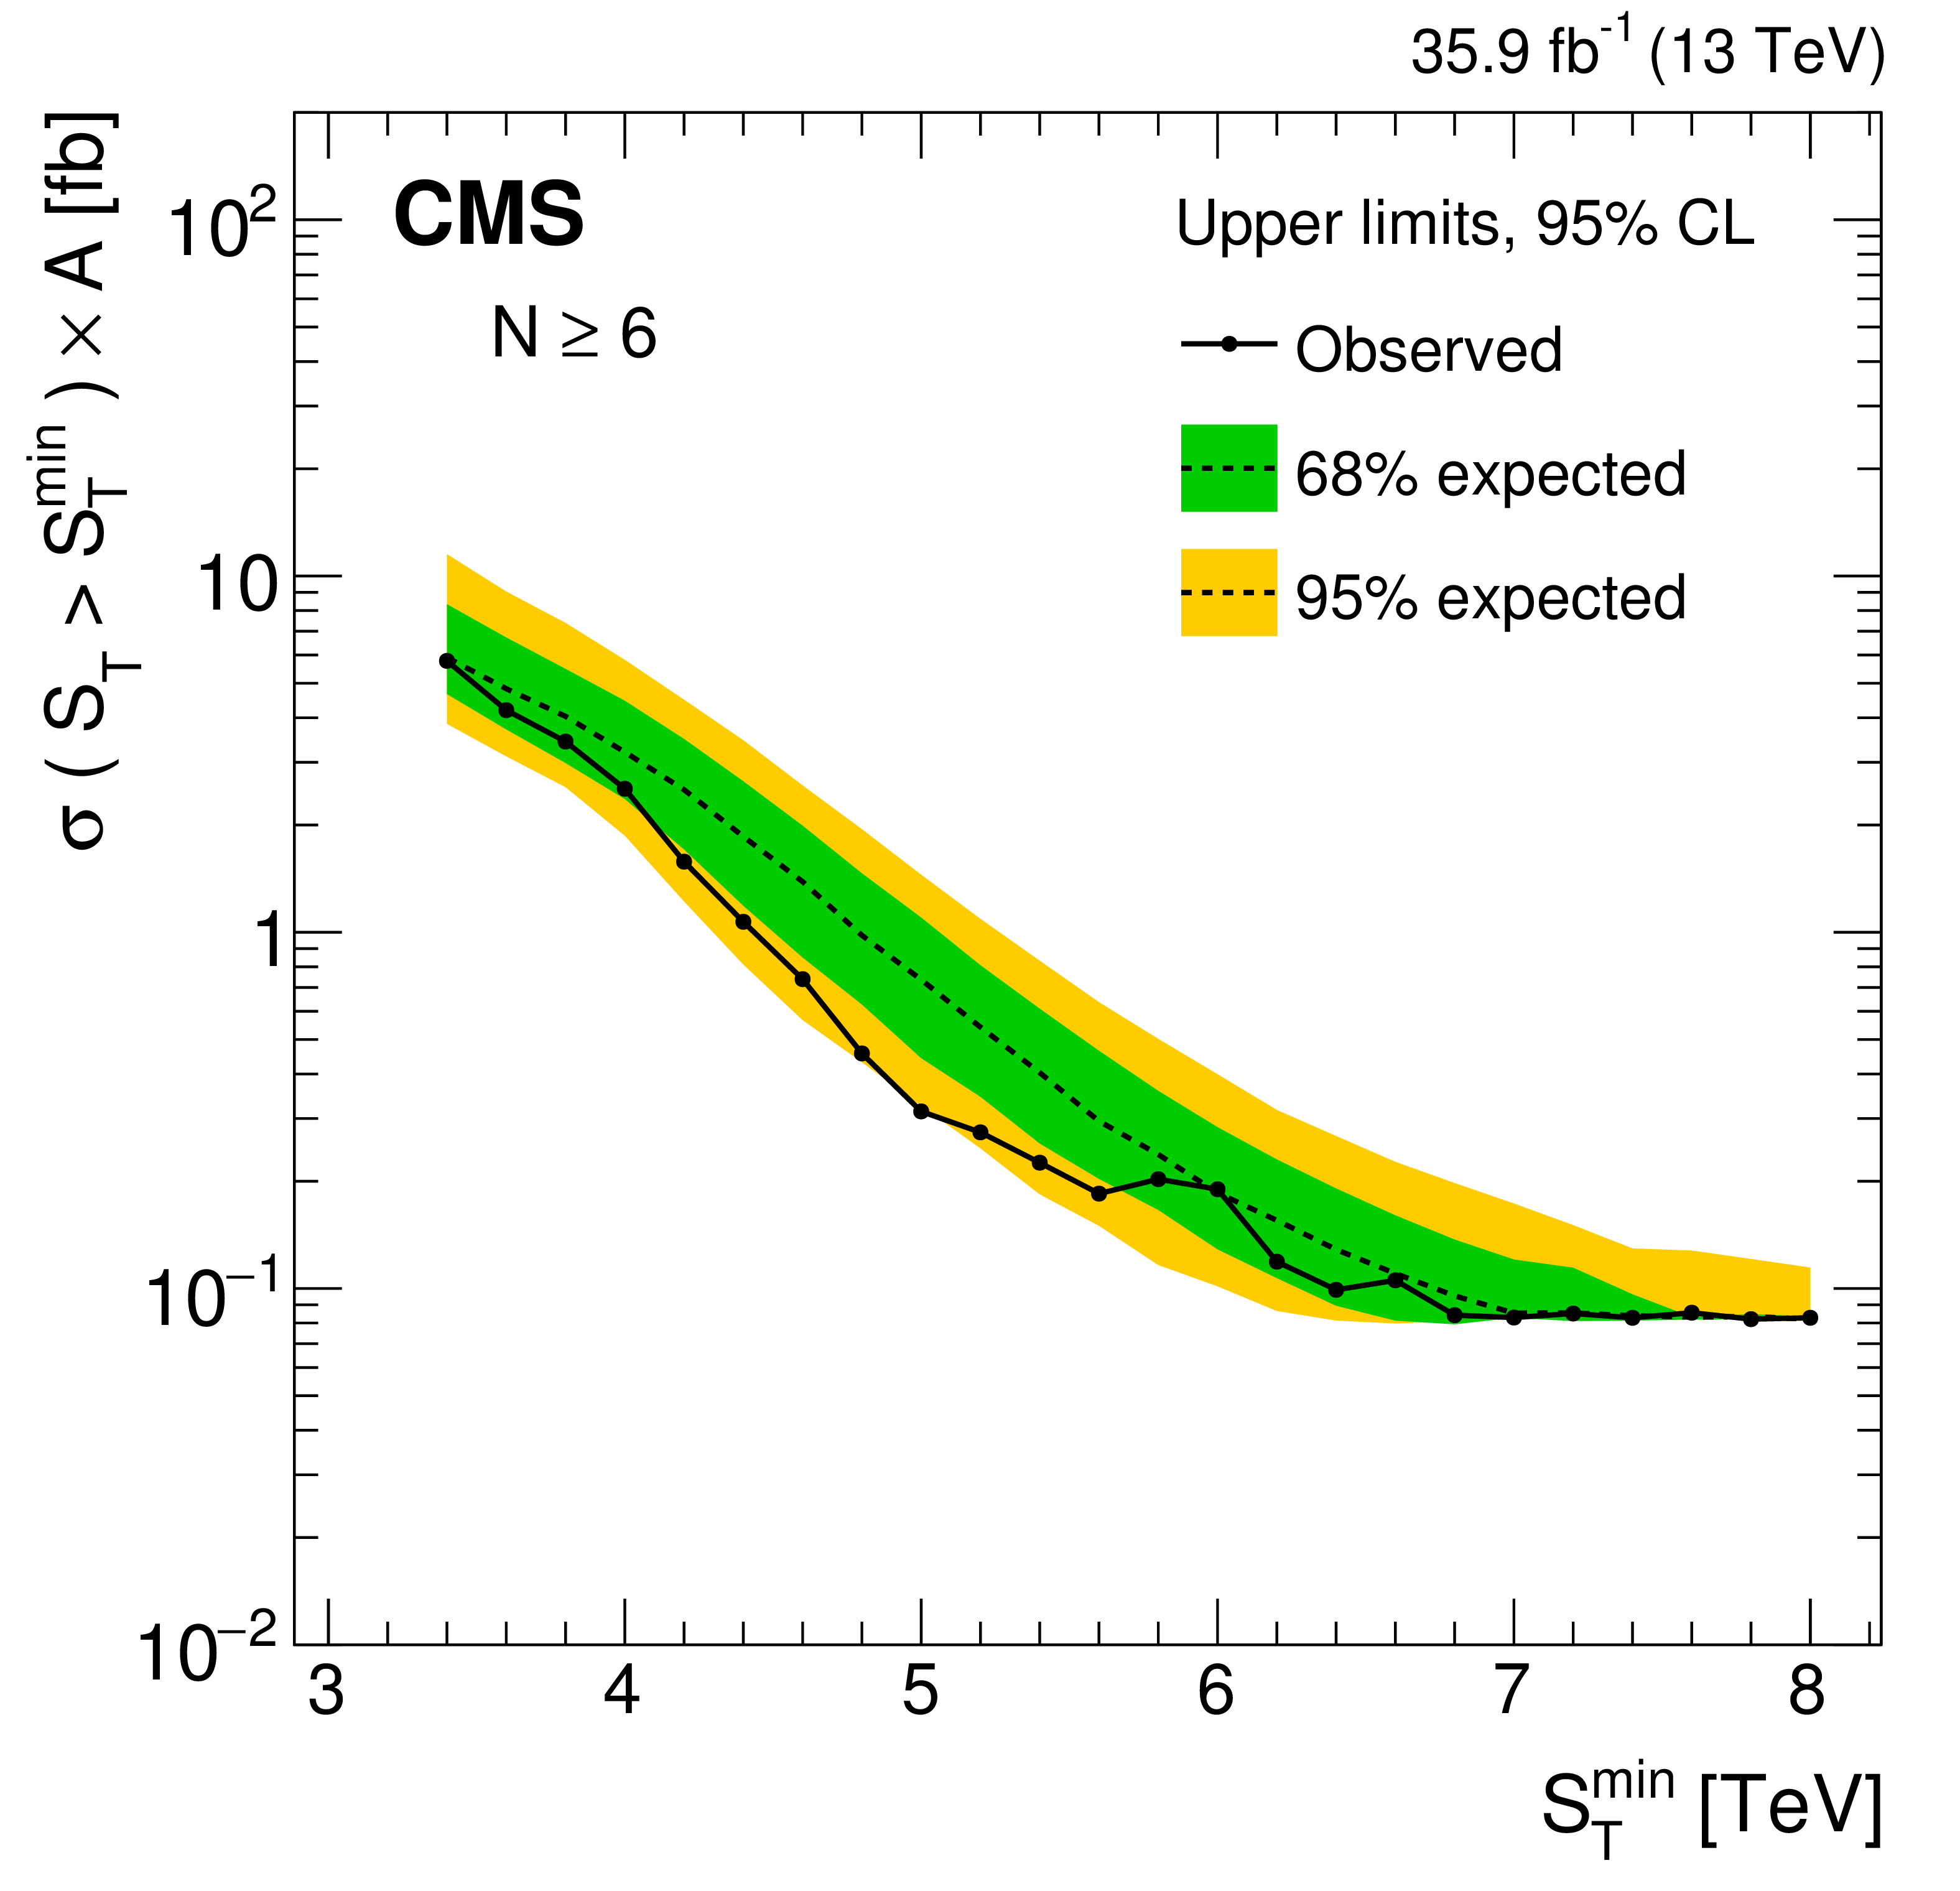
Model-independent upper limits on the cross section times acceptance for four sets of inclusive multiplicity thresholds, $N \ge $ 3, ..., 6 (left to right, upper to lower). Observed (expected) limits are shown as the black solid (dotted) lines. The green (yellow) band represents the $ \pm $1 ($ \pm $2 ) standard deviation uncertainty in the expected limit. |

png pdf |
Figure 6-a:
Model-independent upper limits on the cross section times acceptance for four sets of inclusive multiplicity thresholds, $N \ge $ 3. Observed (expected) limits are shown as the black solid (dotted) lines. The green (yellow) band represents the $ \pm $1 ($ \pm $2 ) standard deviation uncertainty in the expected limit. |
png pdf |
Figure 6-b:
Model-independent upper limits on the cross section times acceptance for four sets of inclusive multiplicity thresholds, $N \ge $ 4. Observed (expected) limits are shown as the black solid (dotted) lines. The green (yellow) band represents the $ \pm $1 ($ \pm $2 ) standard deviation uncertainty in the expected limit. |
png pdf |
Figure 6-c:
Model-independent upper limits on the cross section times acceptance for four sets of inclusive multiplicity thresholds, $N \ge $ 5. Observed (expected) limits are shown as the black solid (dotted) lines. The green (yellow) band represents the $ \pm $1 ($ \pm $2 ) standard deviation uncertainty in the expected limit. |
png pdf |
Figure 6-d:
Model-independent upper limits on the cross section times acceptance for four sets of inclusive multiplicity thresholds, $N \ge $ 6. Observed (expected) limits are shown as the black solid (dotted) lines. The green (yellow) band represents the $ \pm $1 ($ \pm $2 ) standard deviation uncertainty in the expected limit. |
png pdf |
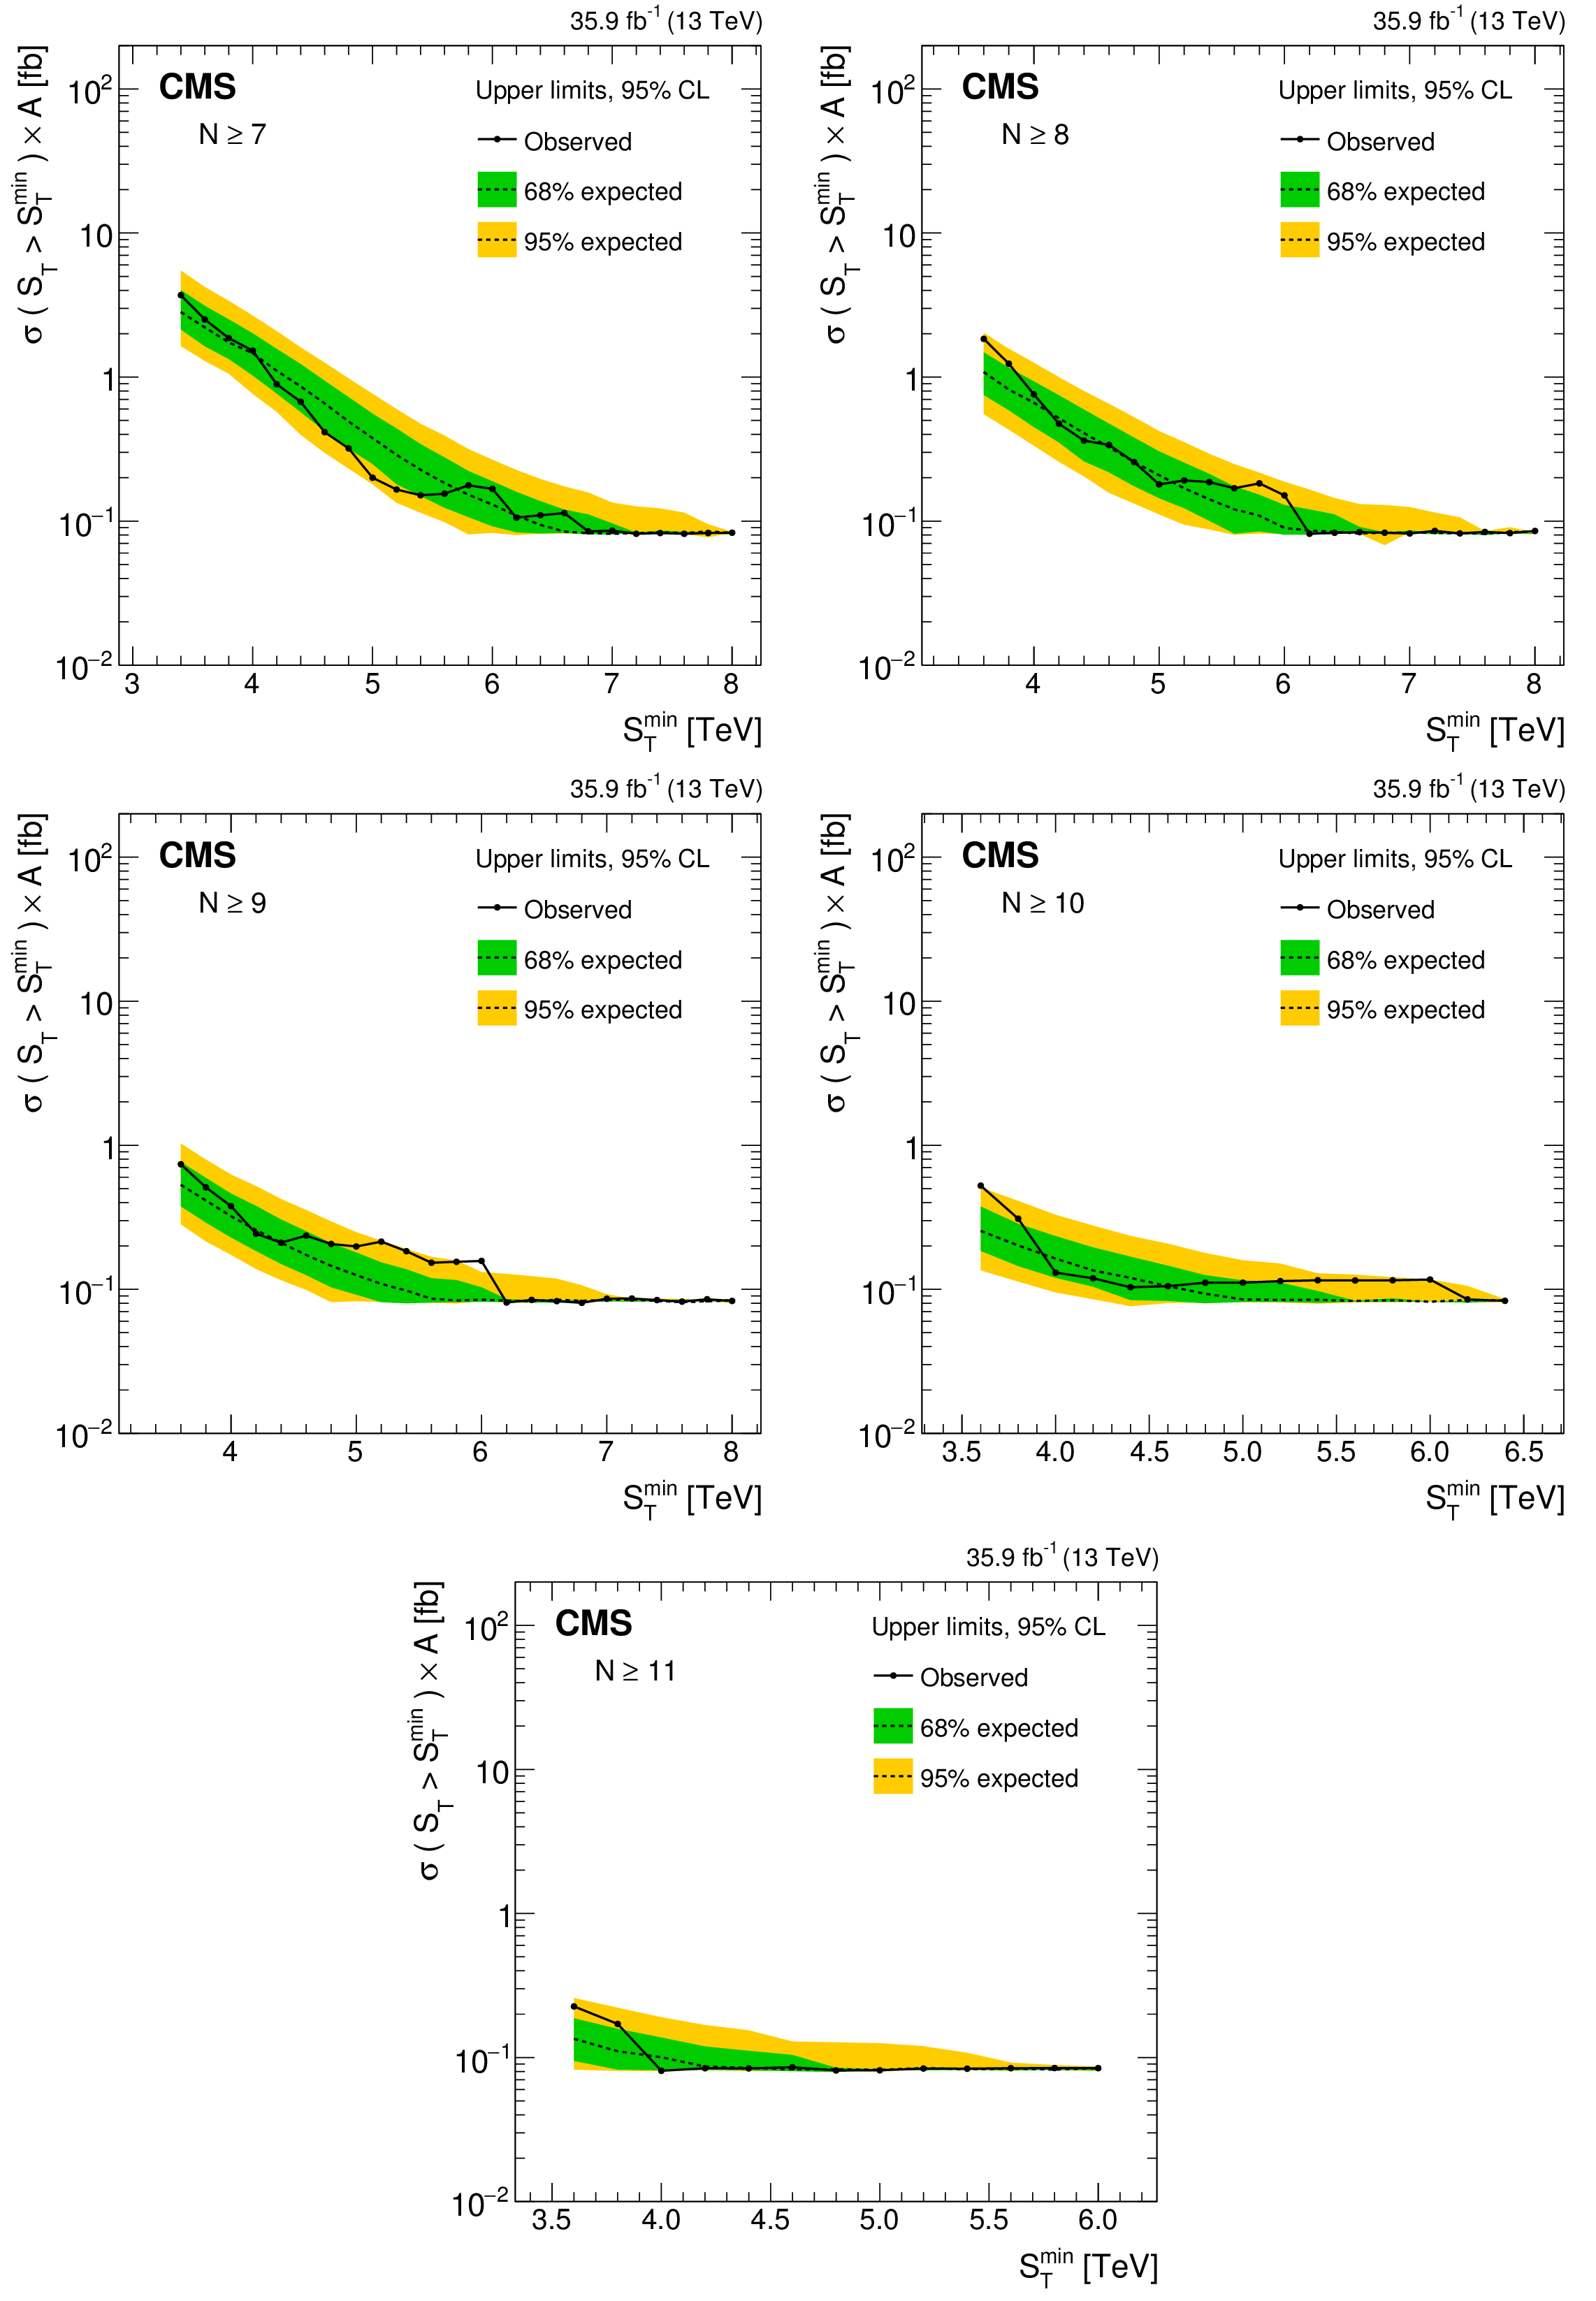
Figure 7:
Model-independent upper limits on the cross section times acceptance for five sets of inclusive multiplicity thresholds, $N \ge $ 7, ..., 11 (left to right, upper to lower). Observed (expected) limits are shown as the black solid (dotted) lines. The green (yellow) band represents the $ \pm $1 ($ \pm $2) standard deviation uncertainty in the expected limit. |
png pdf |
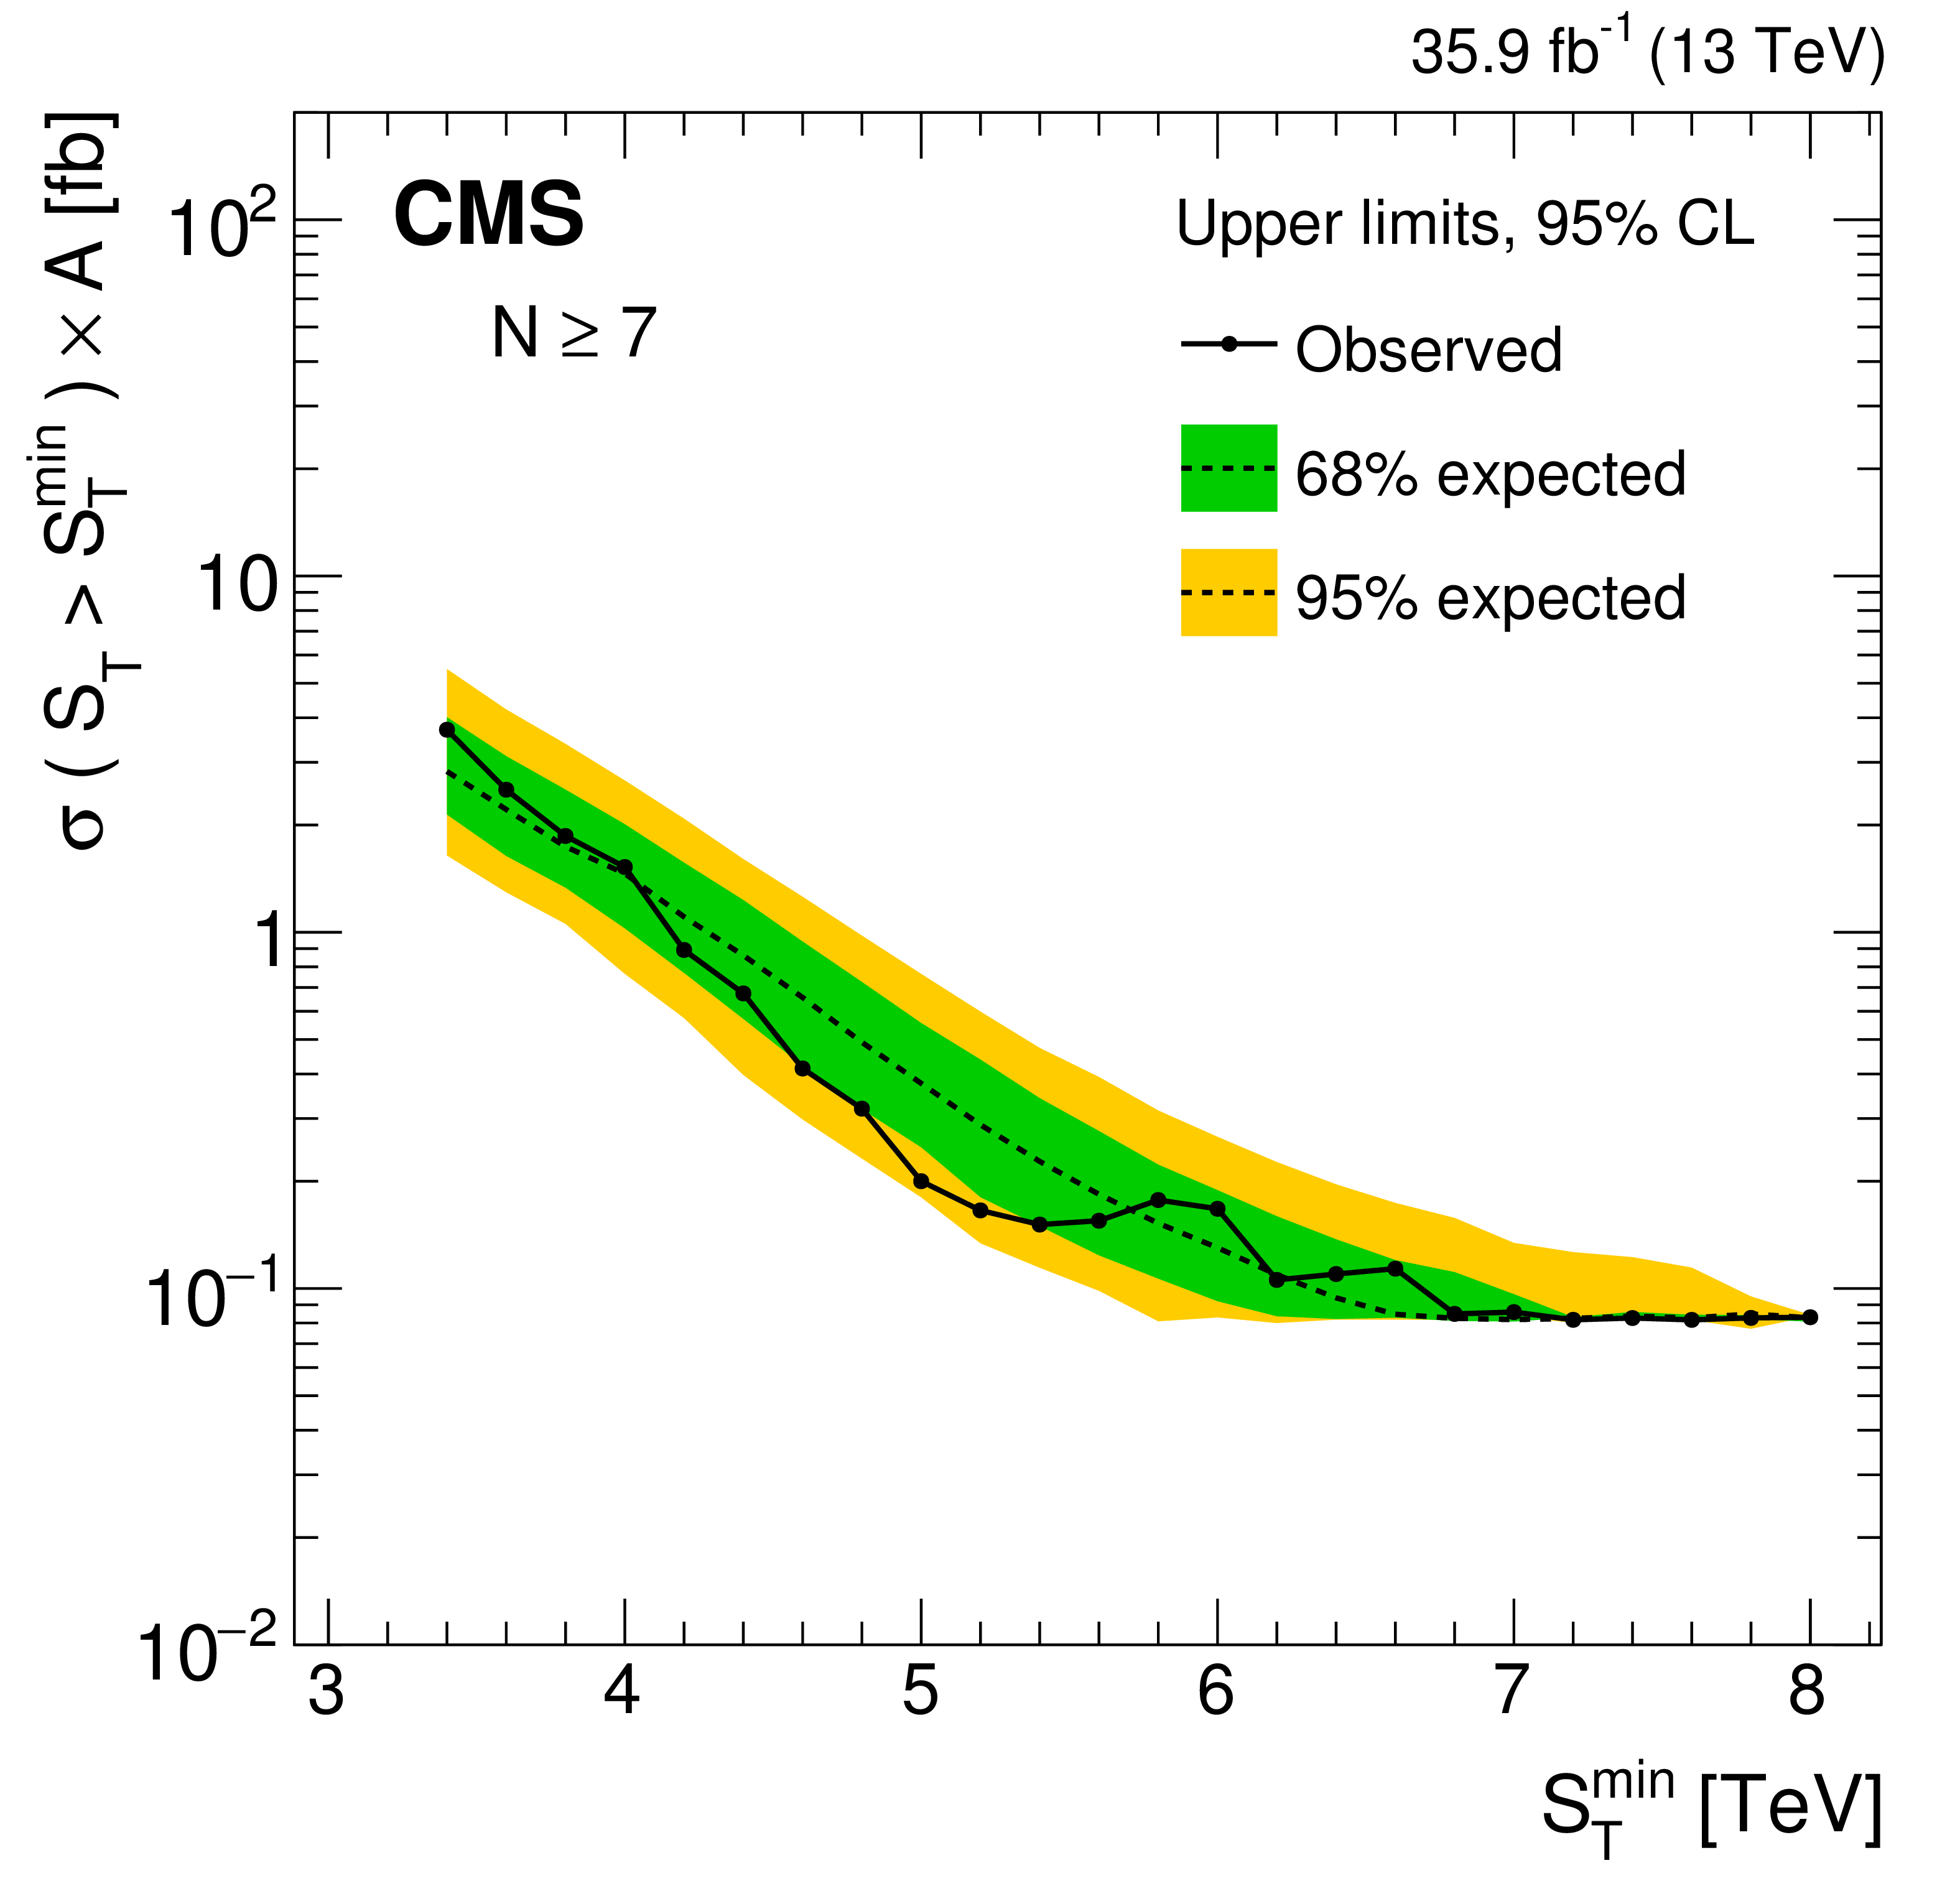
Figure 7-a:
Model-independent upper limits on the cross section times acceptance for five sets of inclusive multiplicity thresholds, $N \ge $ 7. Observed (expected) limits are shown as the black solid (dotted) lines. The green (yellow) band represents the $ \pm $1 ($ \pm $2) standard deviation uncertainty in the expected limit. |
png pdf |
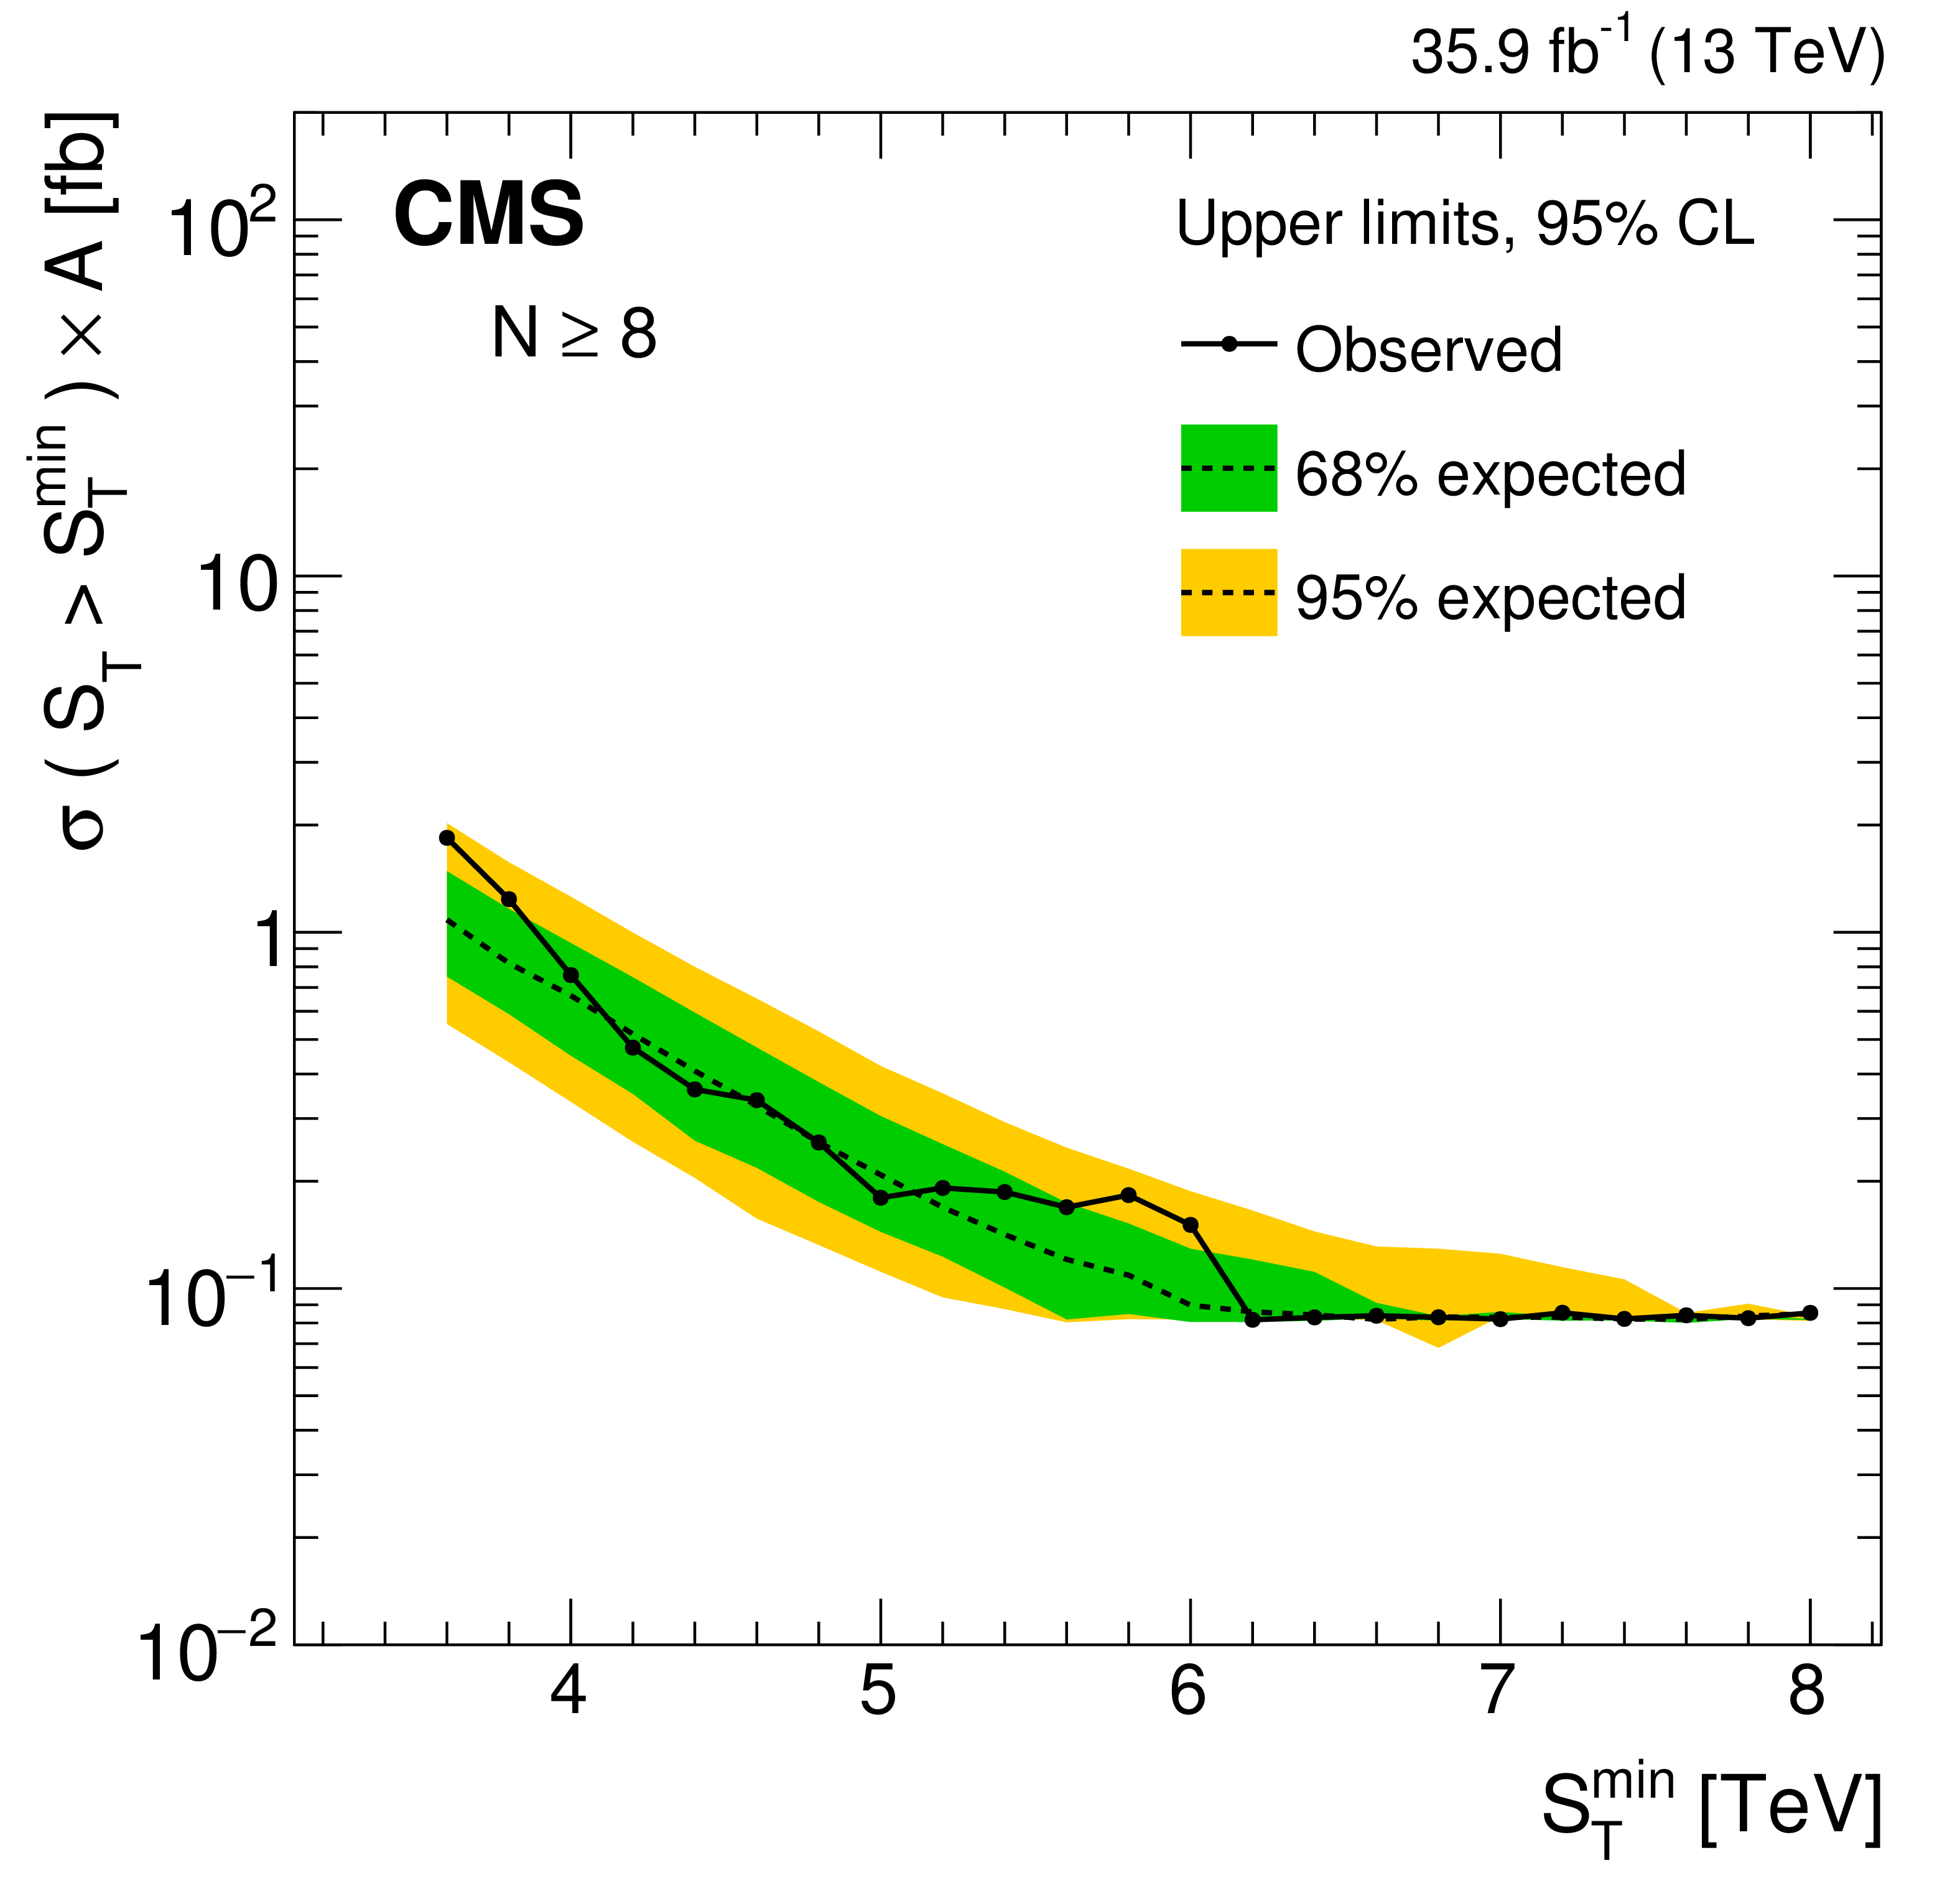
Figure 7-b:
Model-independent upper limits on the cross section times acceptance for five sets of inclusive multiplicity thresholds, $N \ge $ 8. Observed (expected) limits are shown as the black solid (dotted) lines. The green (yellow) band represents the $ \pm $1 ($ \pm $2) standard deviation uncertainty in the expected limit. |
png pdf |
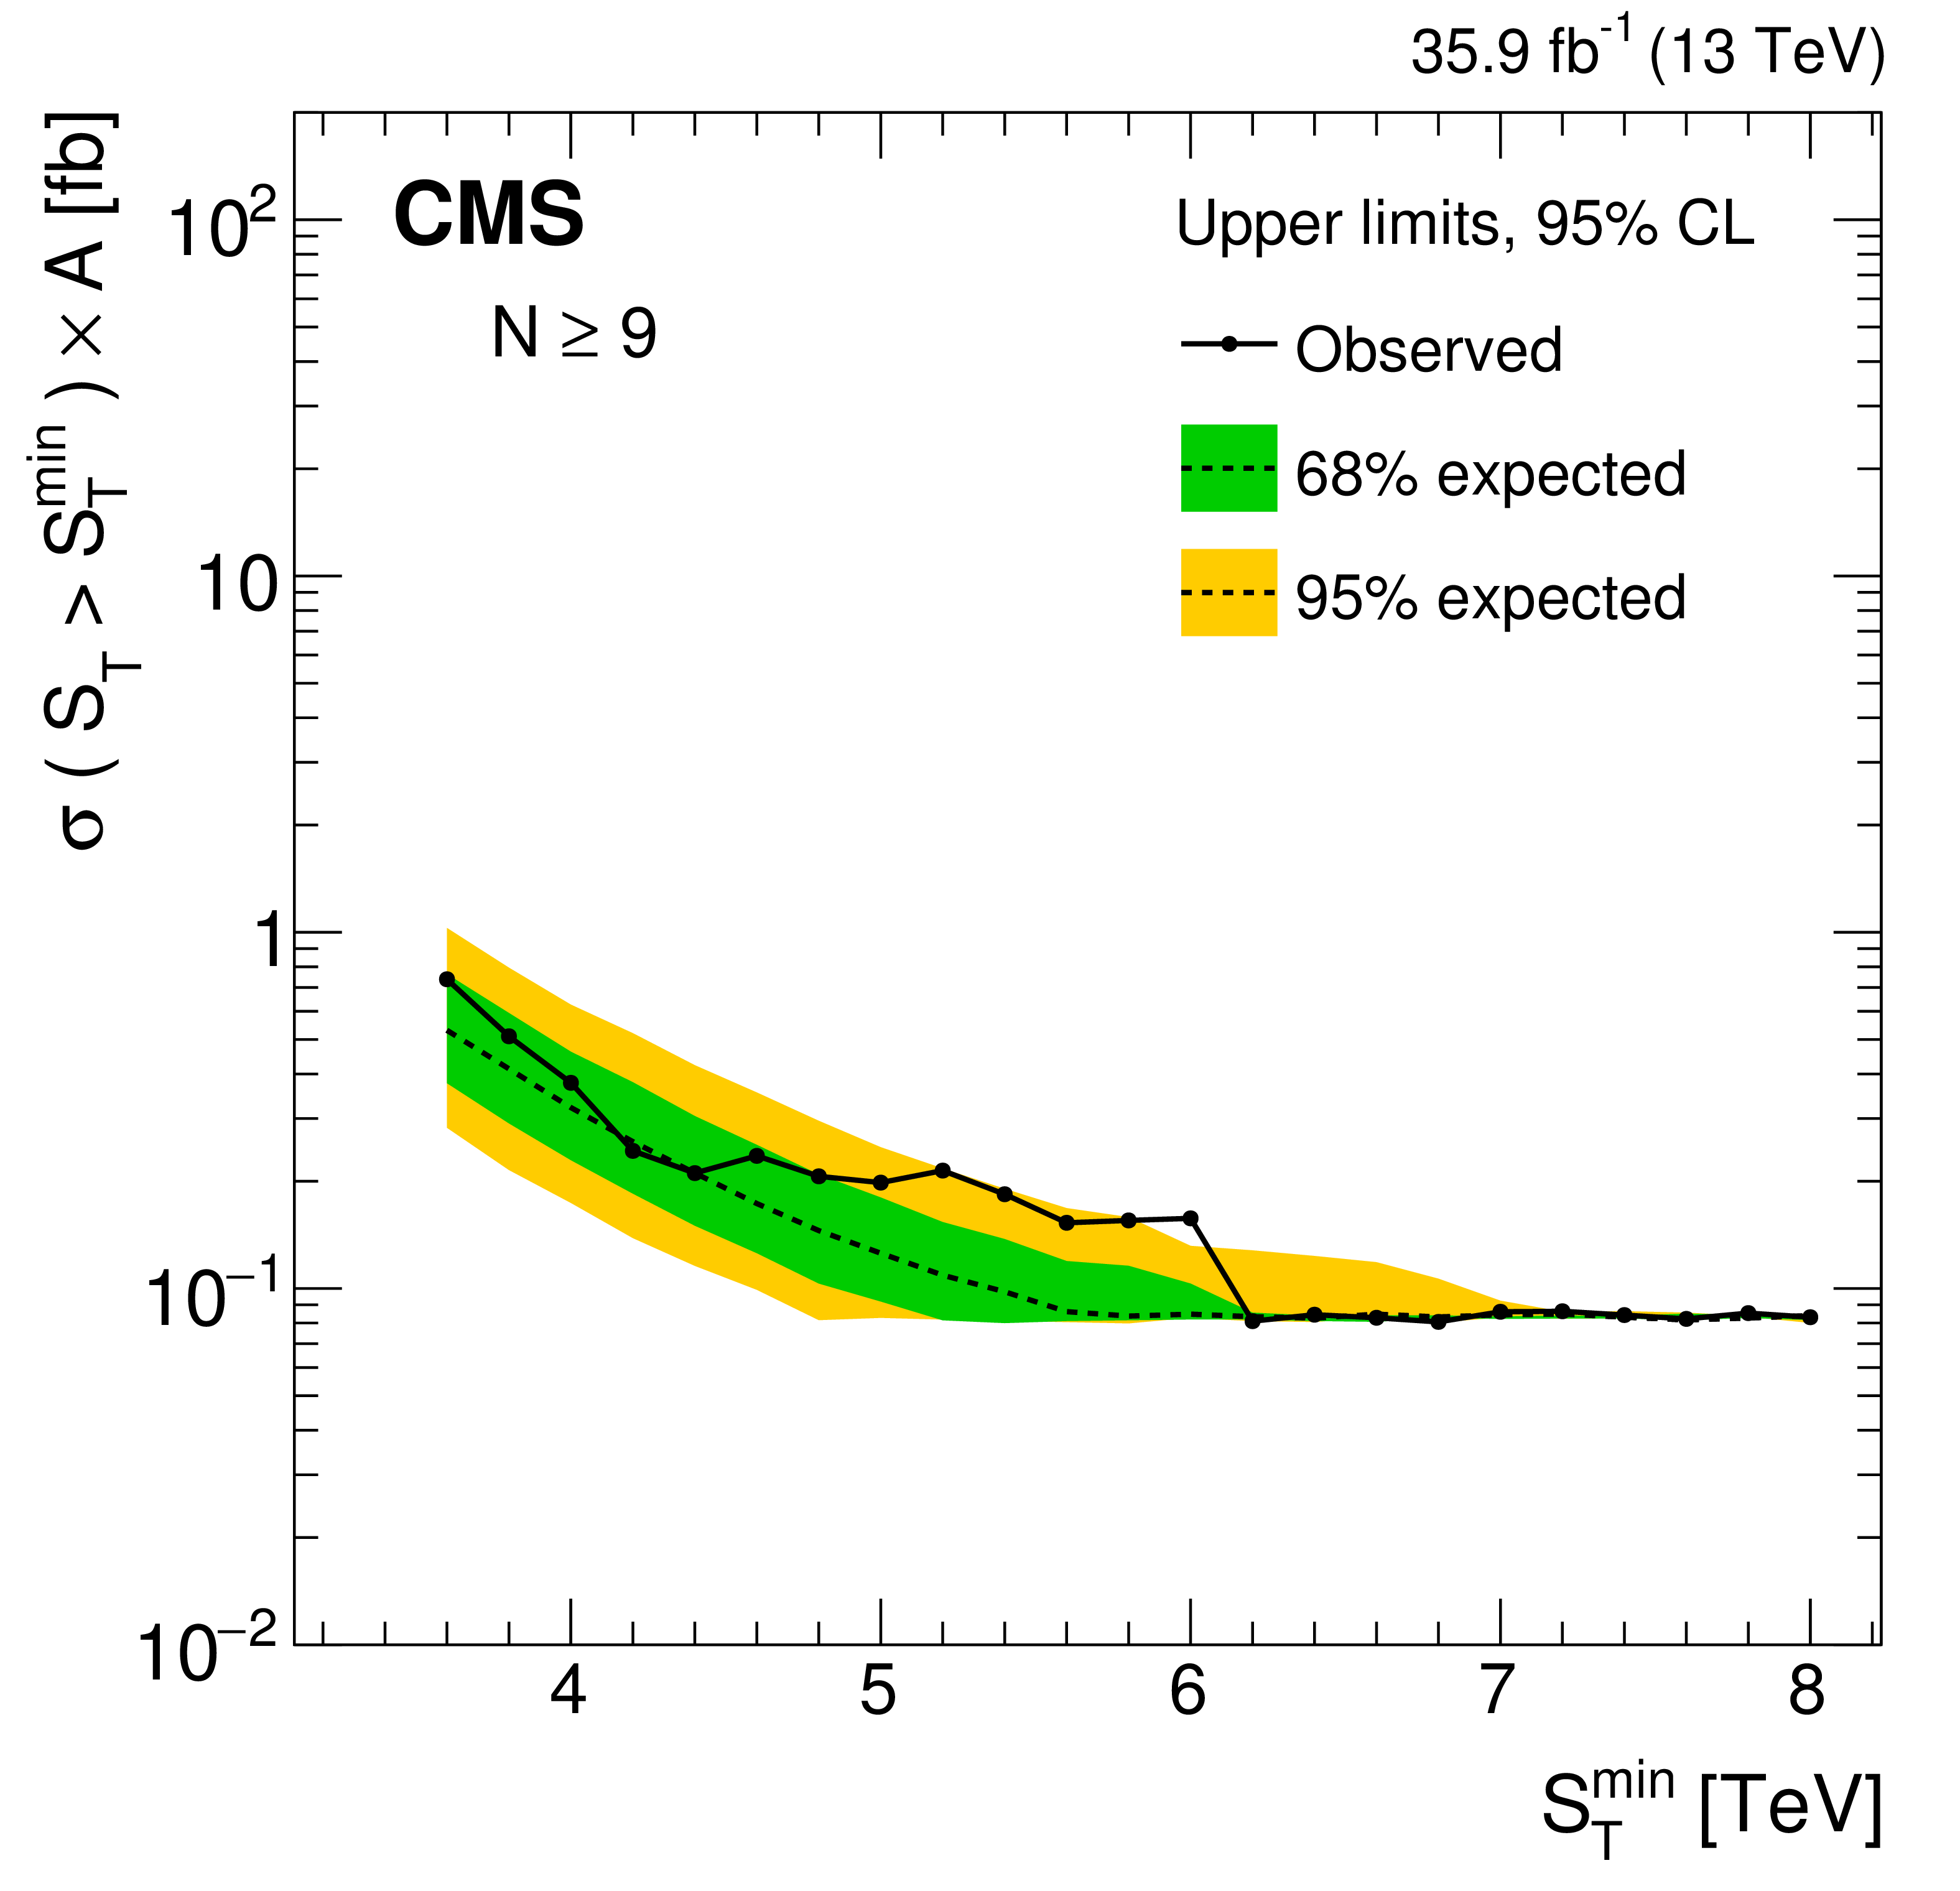
Figure 7-c:
Model-independent upper limits on the cross section times acceptance for five sets of inclusive multiplicity thresholds, $N \ge $ 9. Observed (expected) limits are shown as the black solid (dotted) lines. The green (yellow) band represents the $ \pm $1 ($ \pm $2) standard deviation uncertainty in the expected limit. |
png pdf |
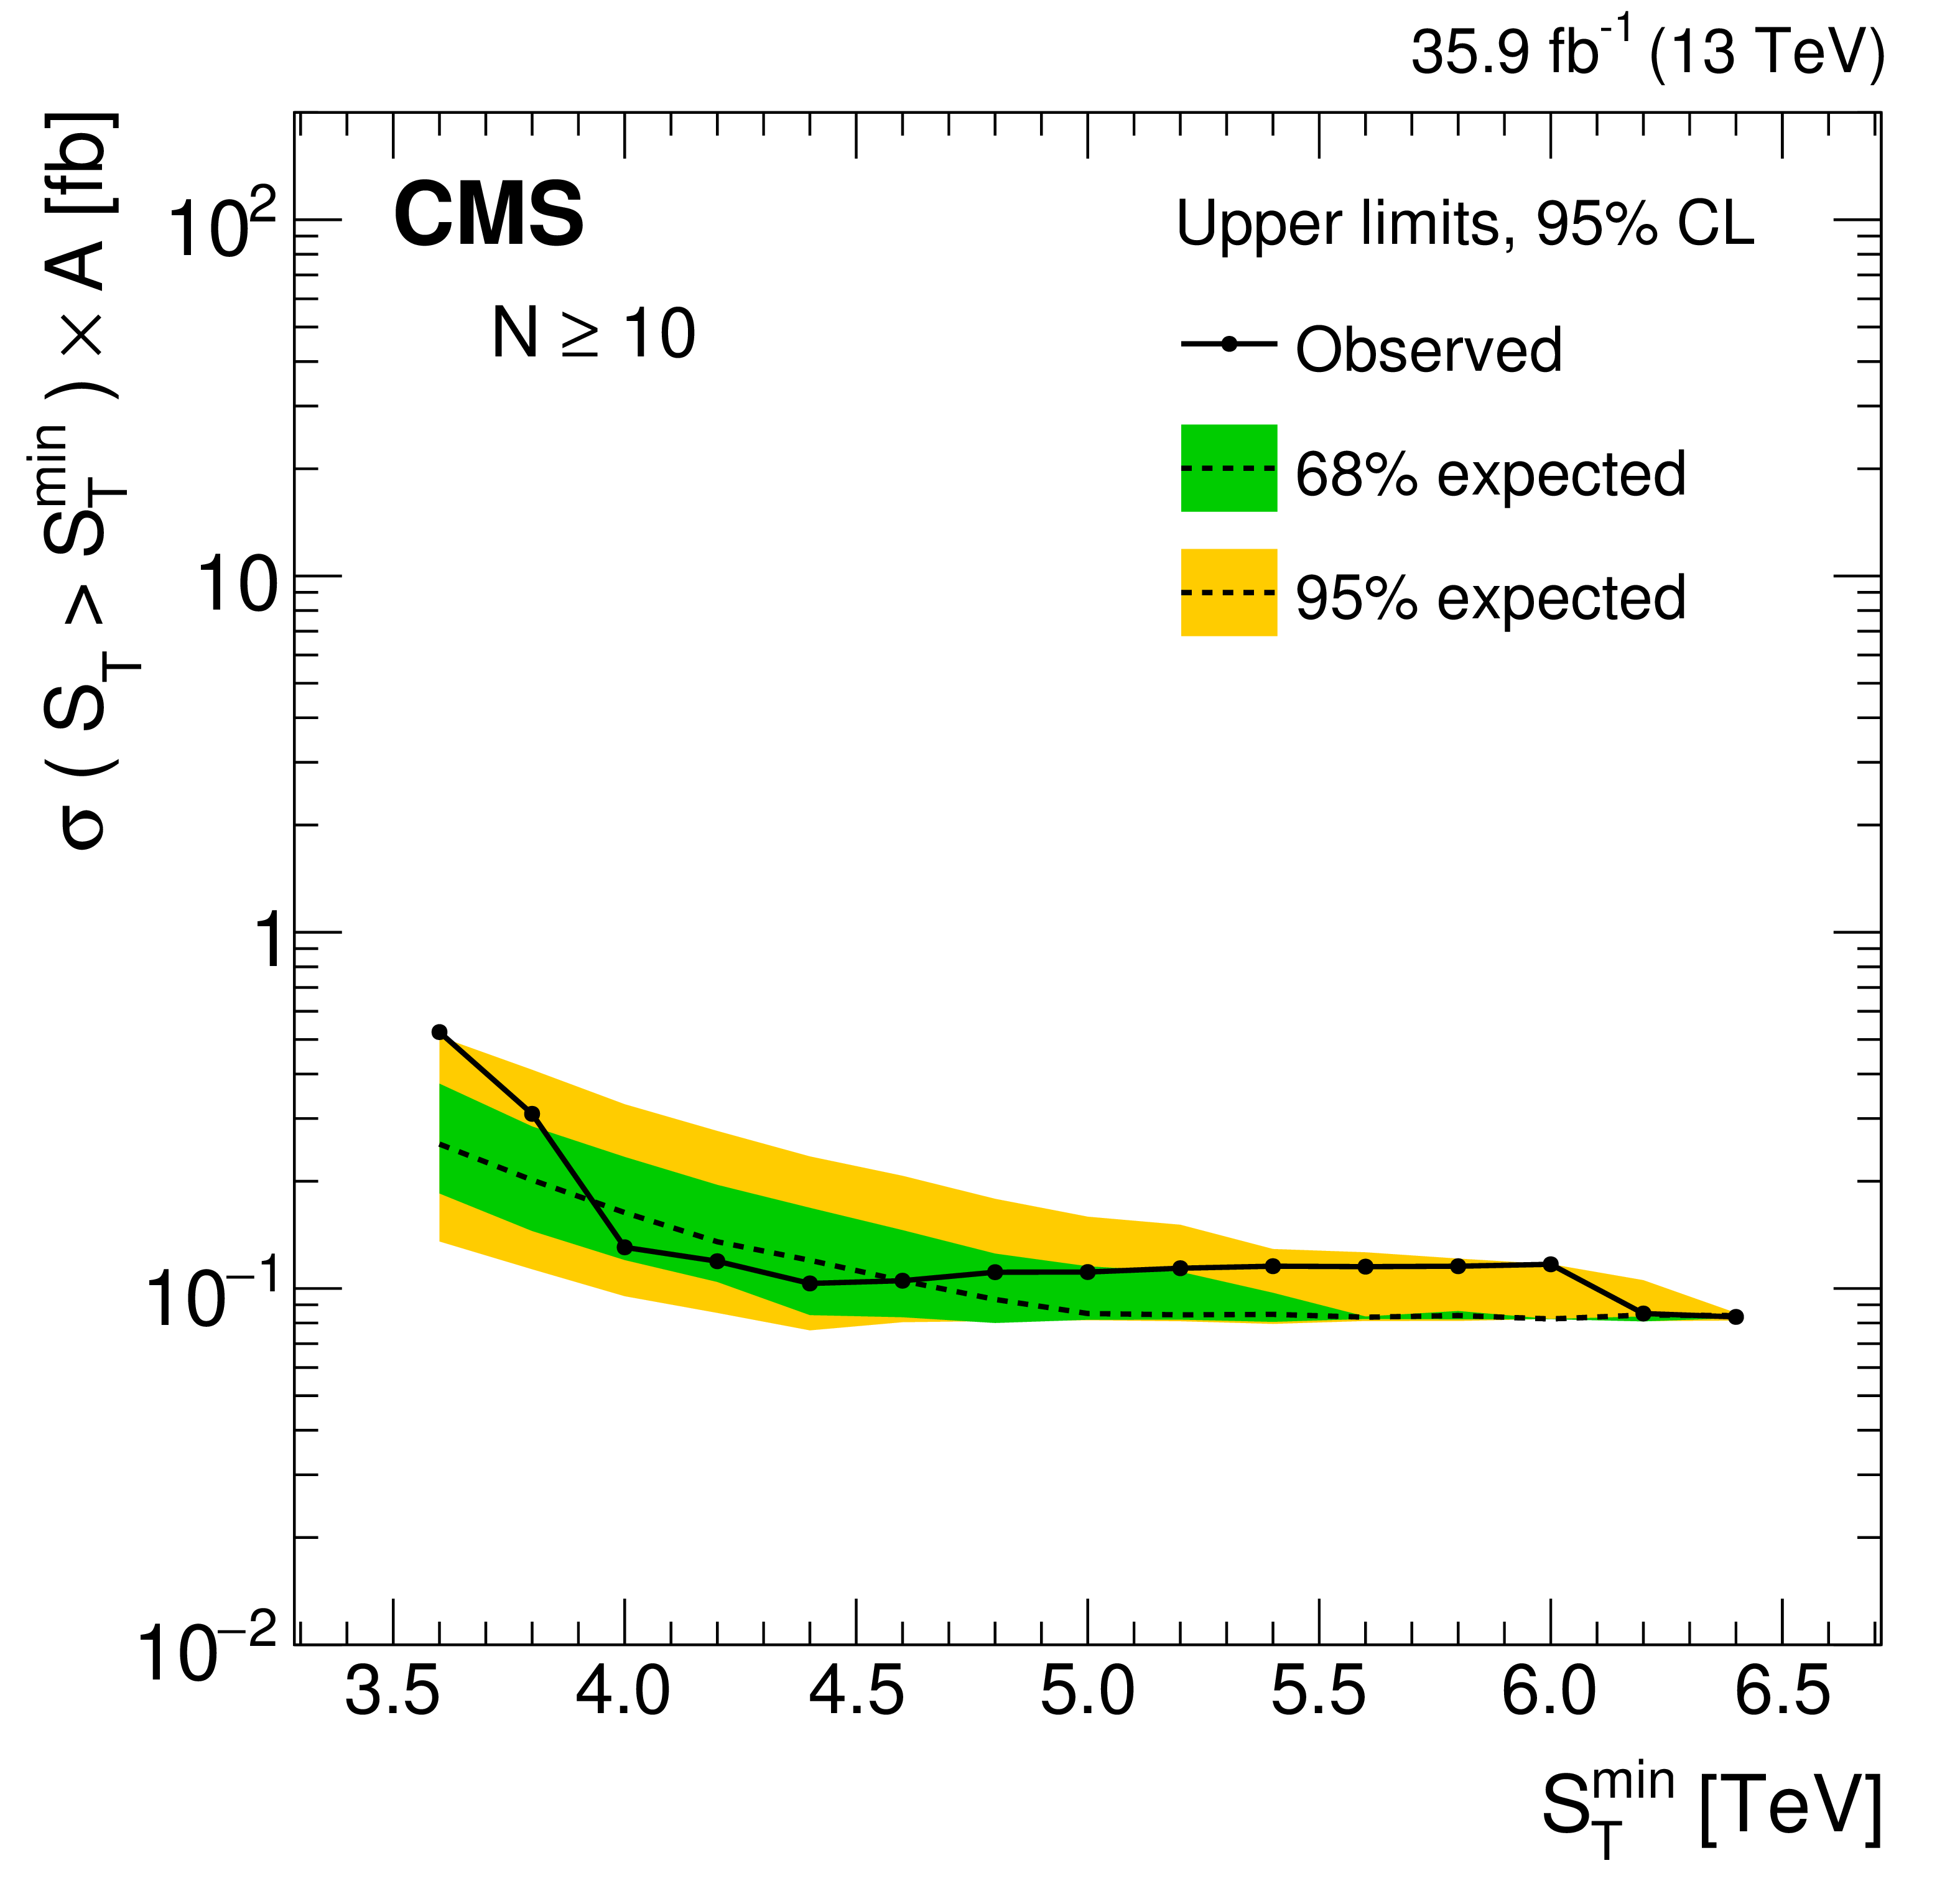
Figure 7-d:
Model-independent upper limits on the cross section times acceptance for five sets of inclusive multiplicity thresholds, $N \ge $ 10. Observed (expected) limits are shown as the black solid (dotted) lines. The green (yellow) band represents the $ \pm $1 ($ \pm $2) standard deviation uncertainty in the expected limit. |
png pdf |
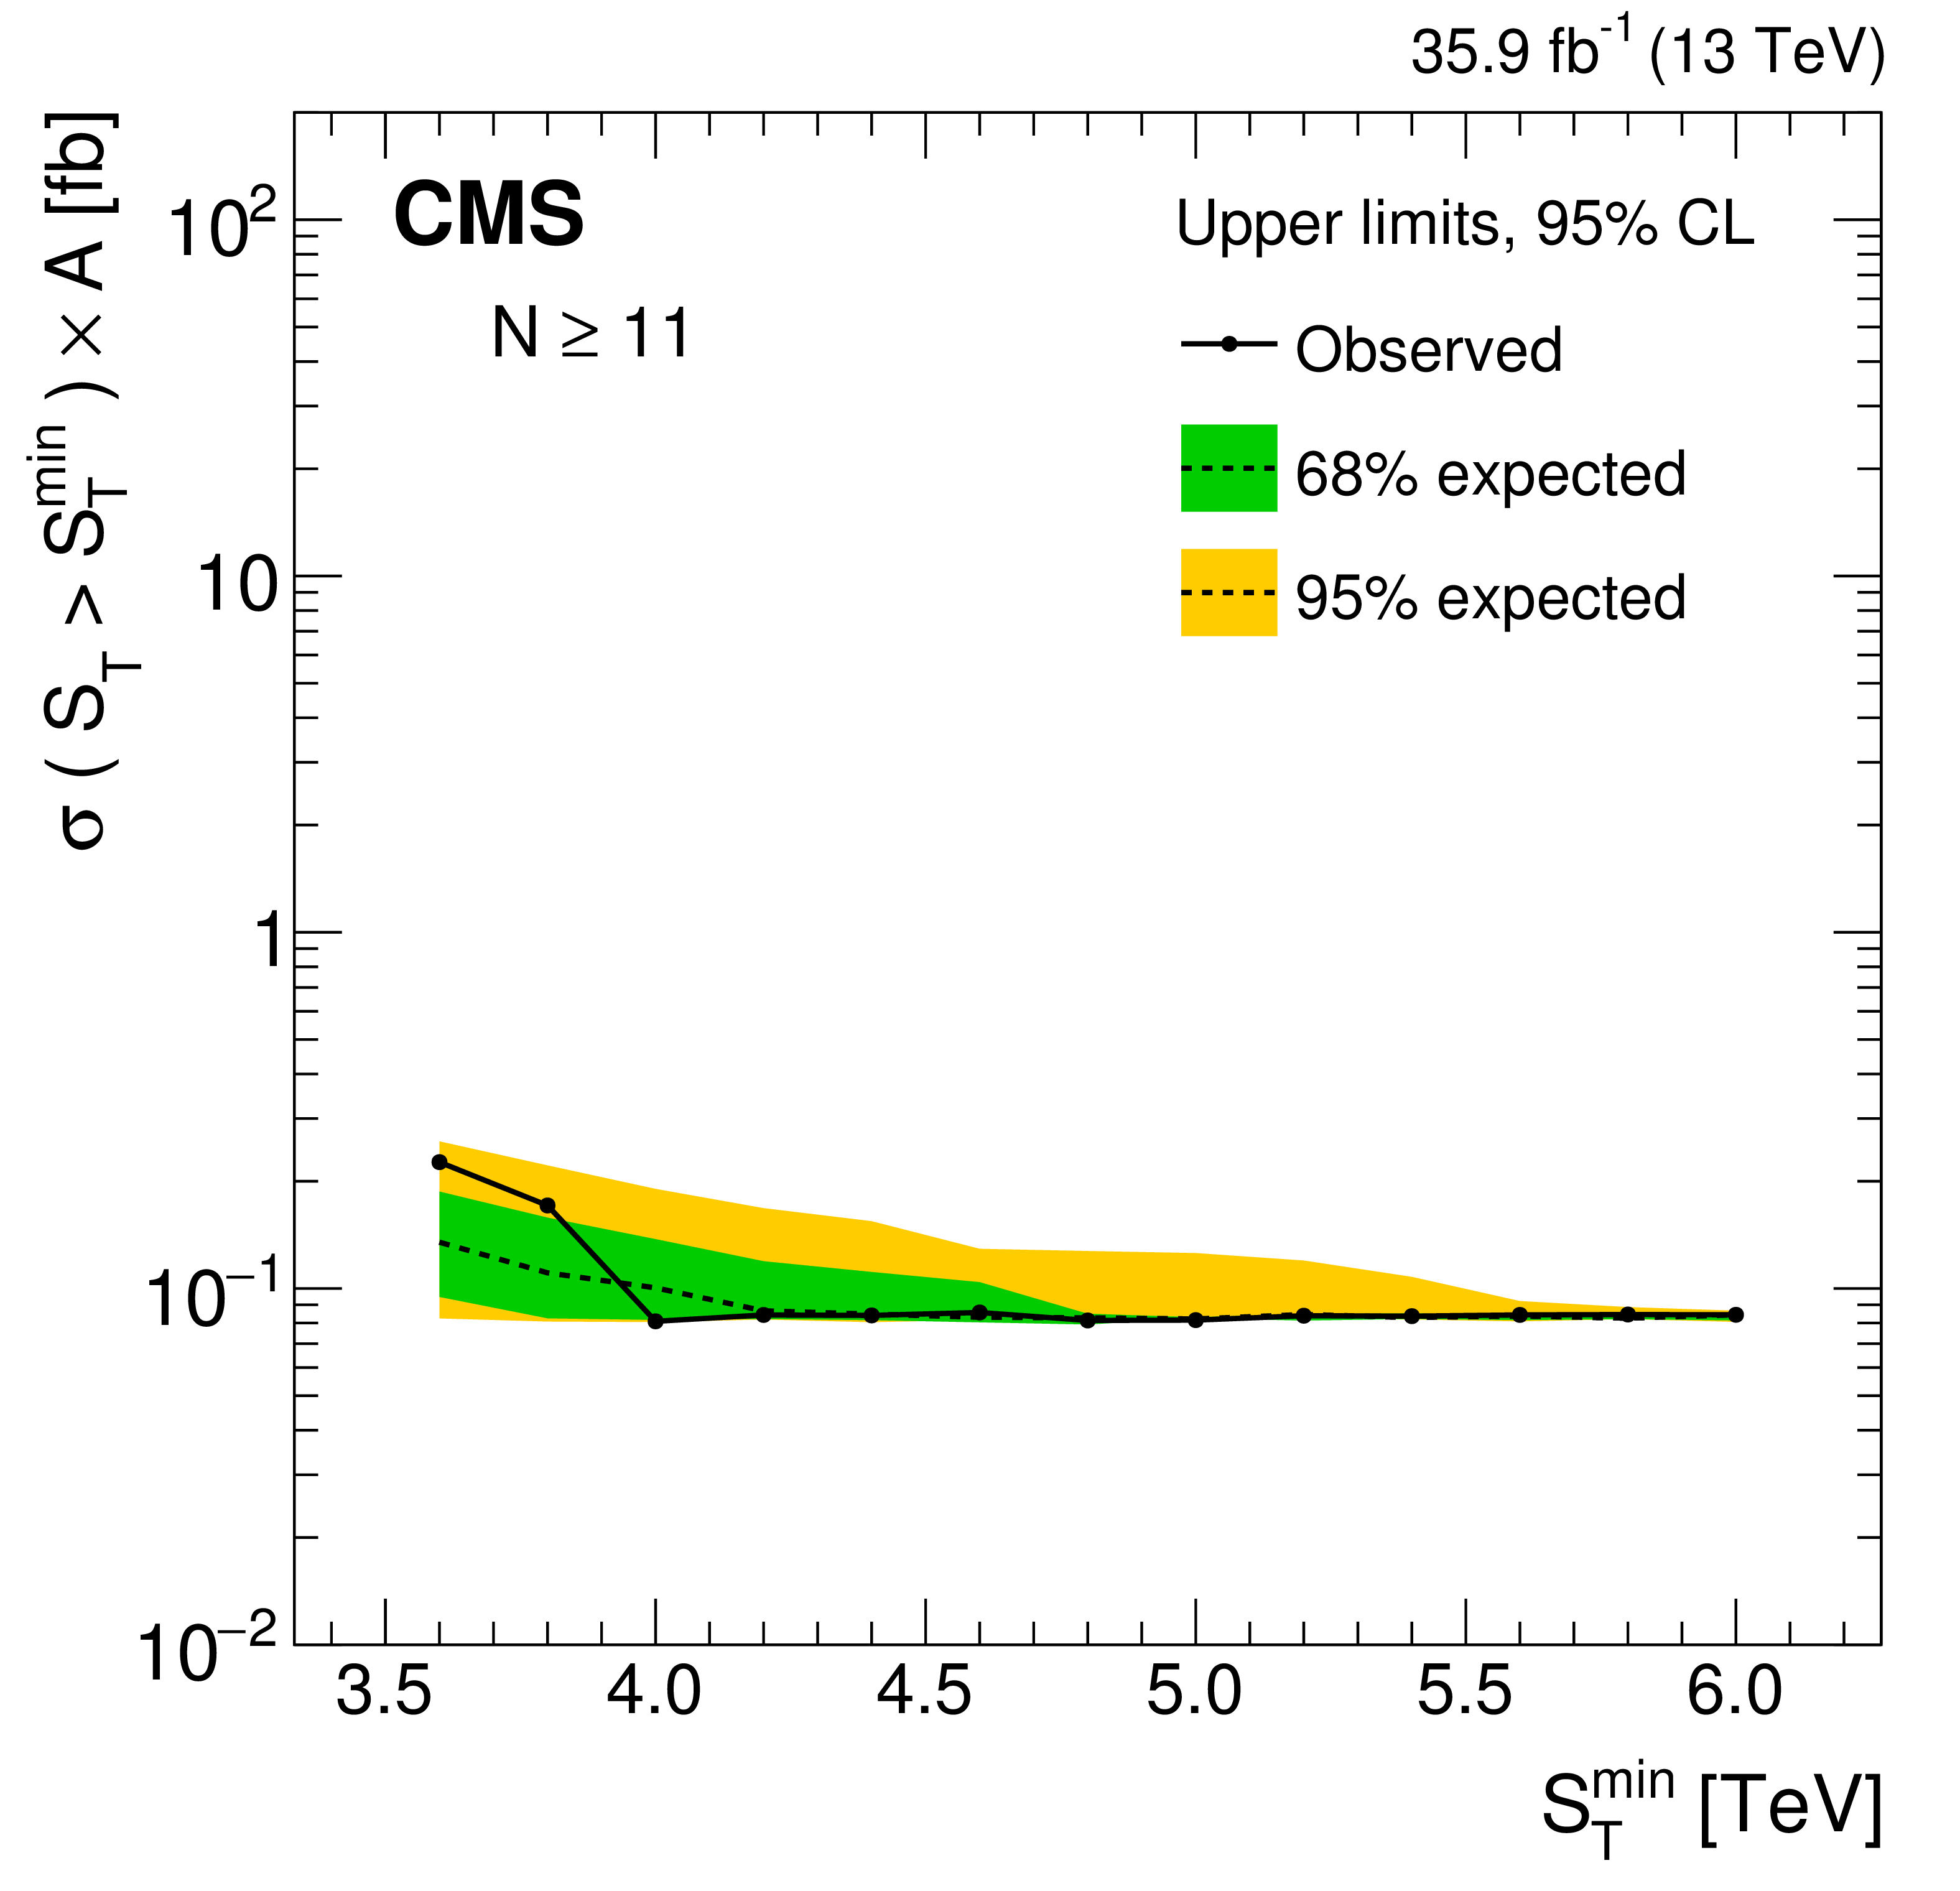
Figure 7-e:
Model-independent upper limits on the cross section times acceptance for five sets of inclusive multiplicity thresholds, $N \ge $ 11. Observed (expected) limits are shown as the black solid (dotted) lines. The green (yellow) band represents the $ \pm $1 ($ \pm $2) standard deviation uncertainty in the expected limit. |
png pdf |
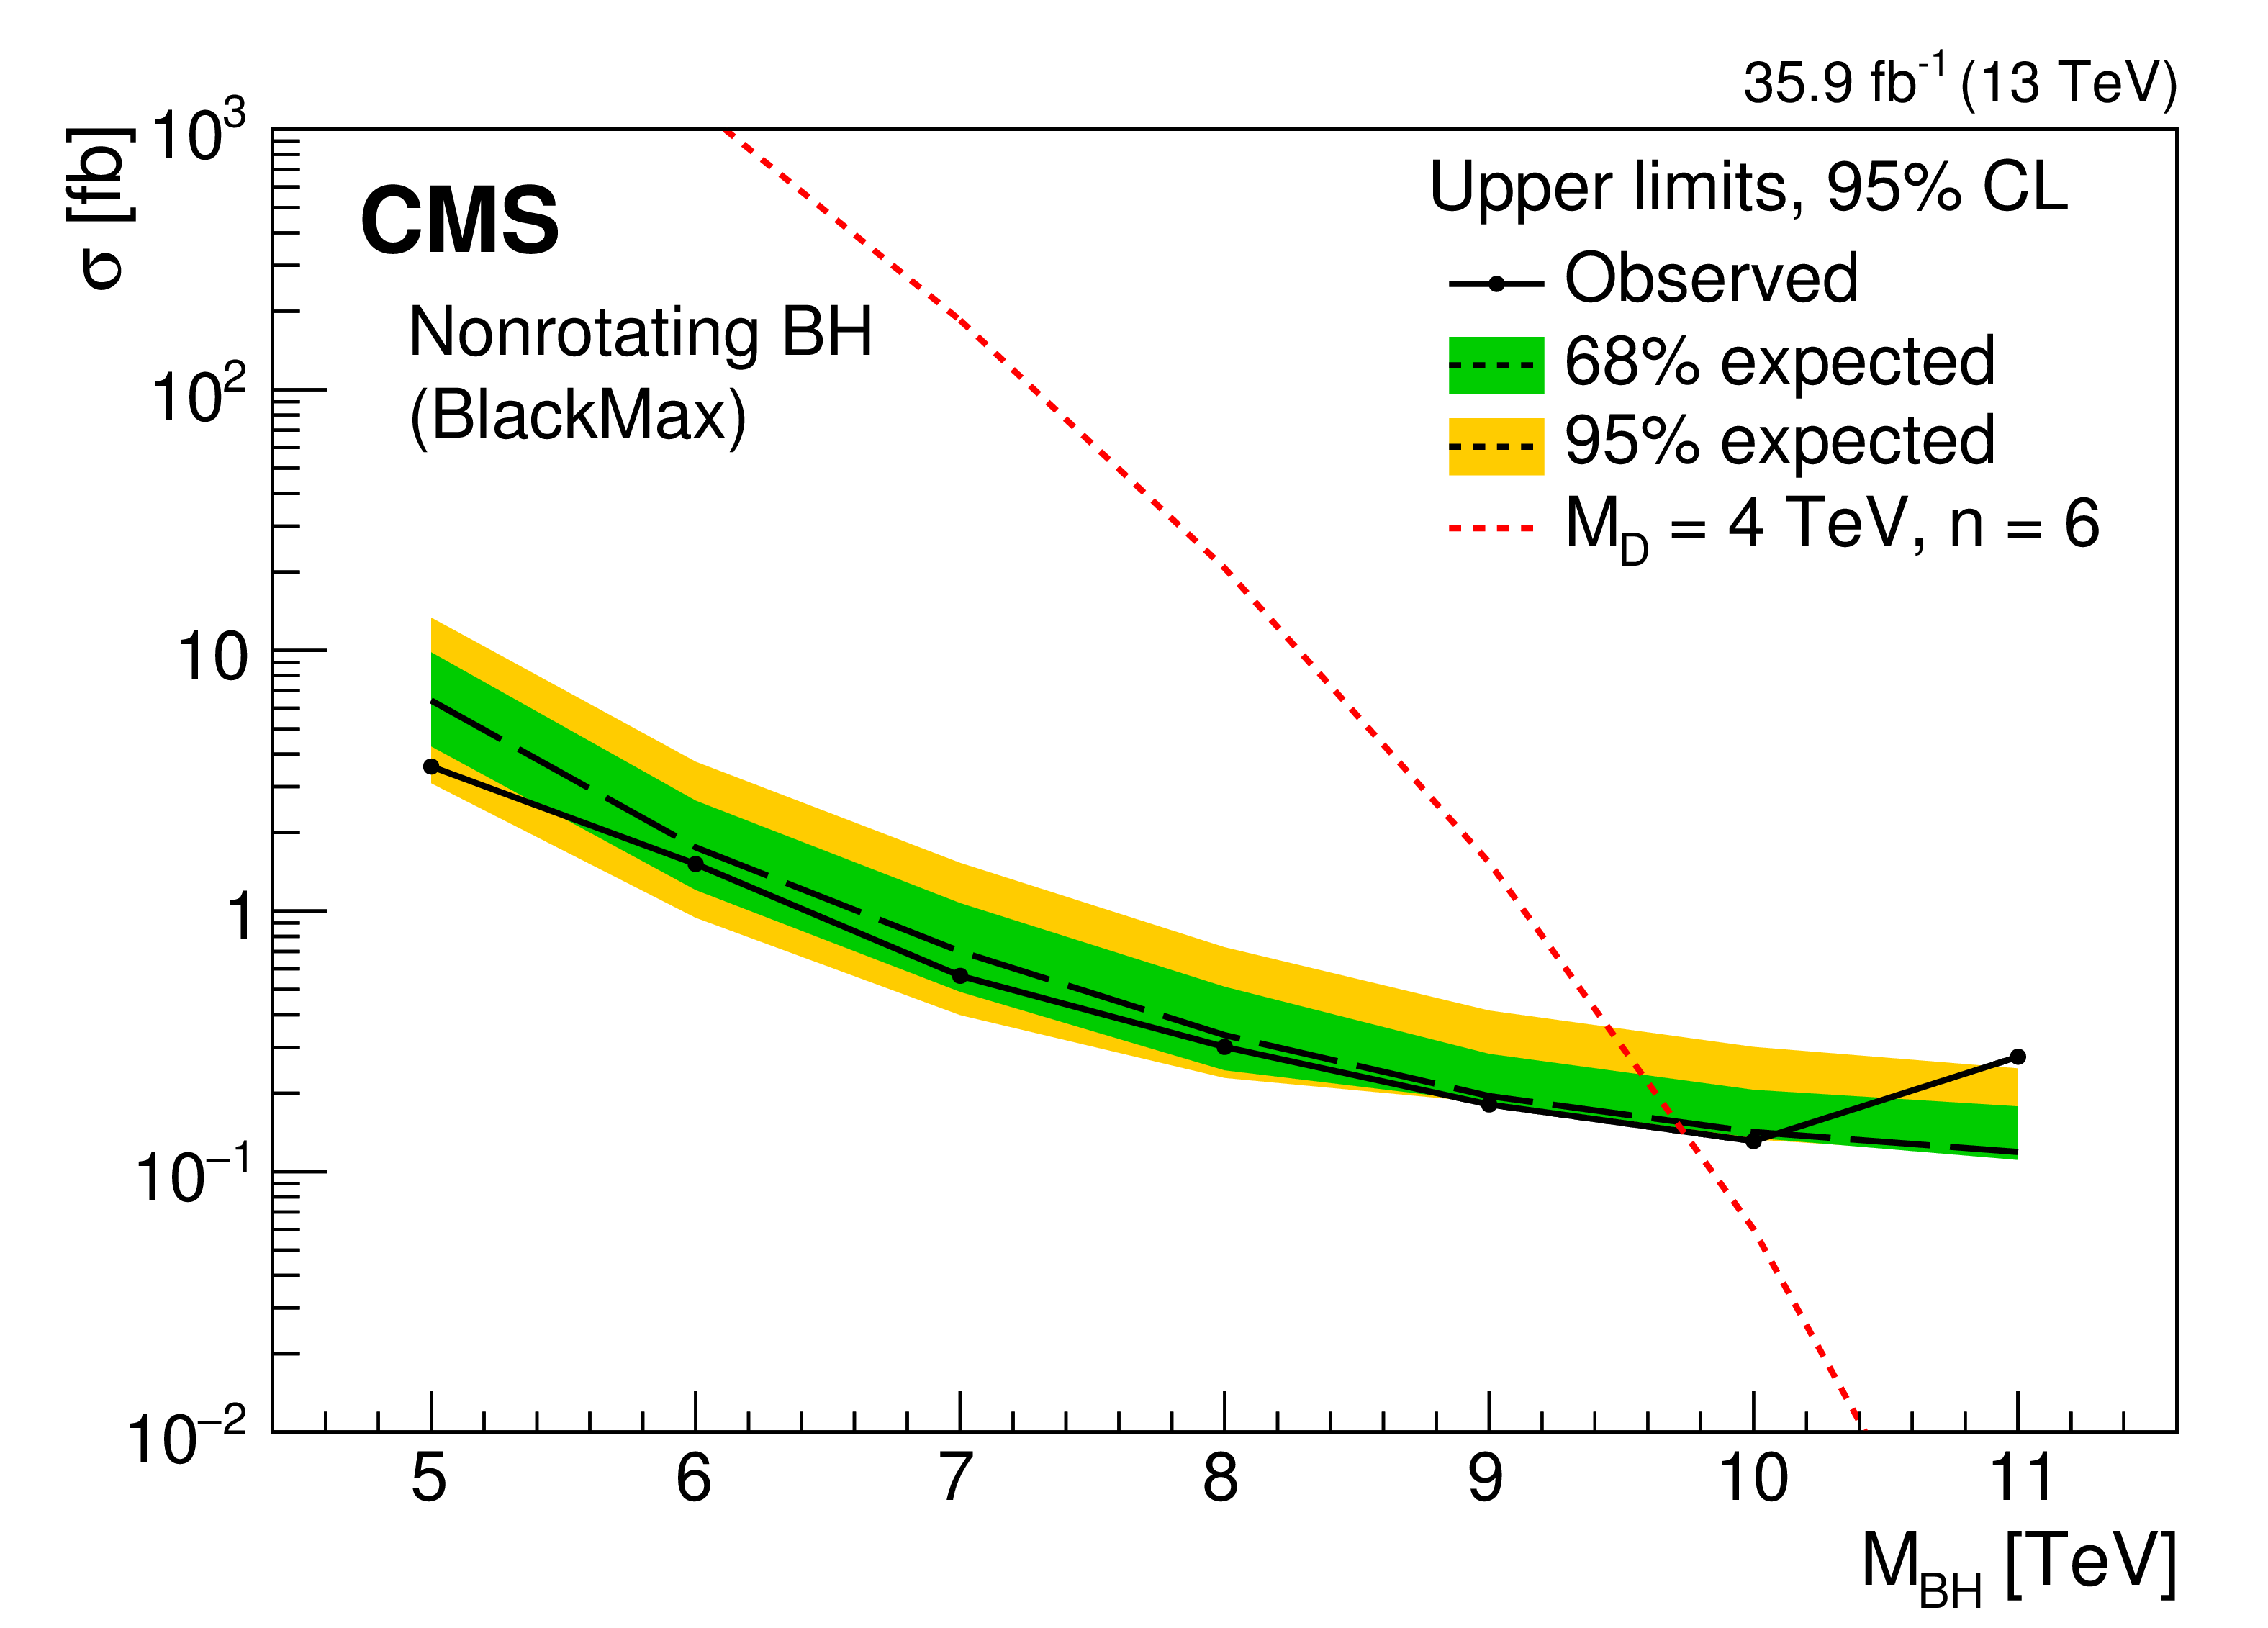
Figure 8:
Example of a model-specific limit on ${{M_\mathrm {BH}^\text {min}}}$ for a semiclassical nonrotating BH model (BlackMax point B1) with $ {{M_\mathrm {D}}} = $ 4 TeV $ {{n_\mathrm {ED}}} =$ 6, as a function of ${{M_\mathrm {BH}^\text {min}}}$. The 95% CL upper exclusion limit on the signal cross section for each ${{M_\mathrm {BH}^\text {min}}}$ value is obtained at the optimal $({{N^\mathrm {min}}}$,$ {{S_\mathrm {T}^\text {min}}})$ point, which ranges from (7,5.0 TeV) for $ {{M_\mathrm {BH}^\text {min}}} = $ 5 TeV to (3,7.6 TeV) for $ {{M_\mathrm {BH}^\text {min}}} = $ 11 TeV. Also shown with a dashed line are the theoretical cross sections corresponding to these optimal points. The green (yellow) band represents the $ \pm $1 ($ \pm $2) standard deviation uncertainty in the expected limit. |
png pdf |
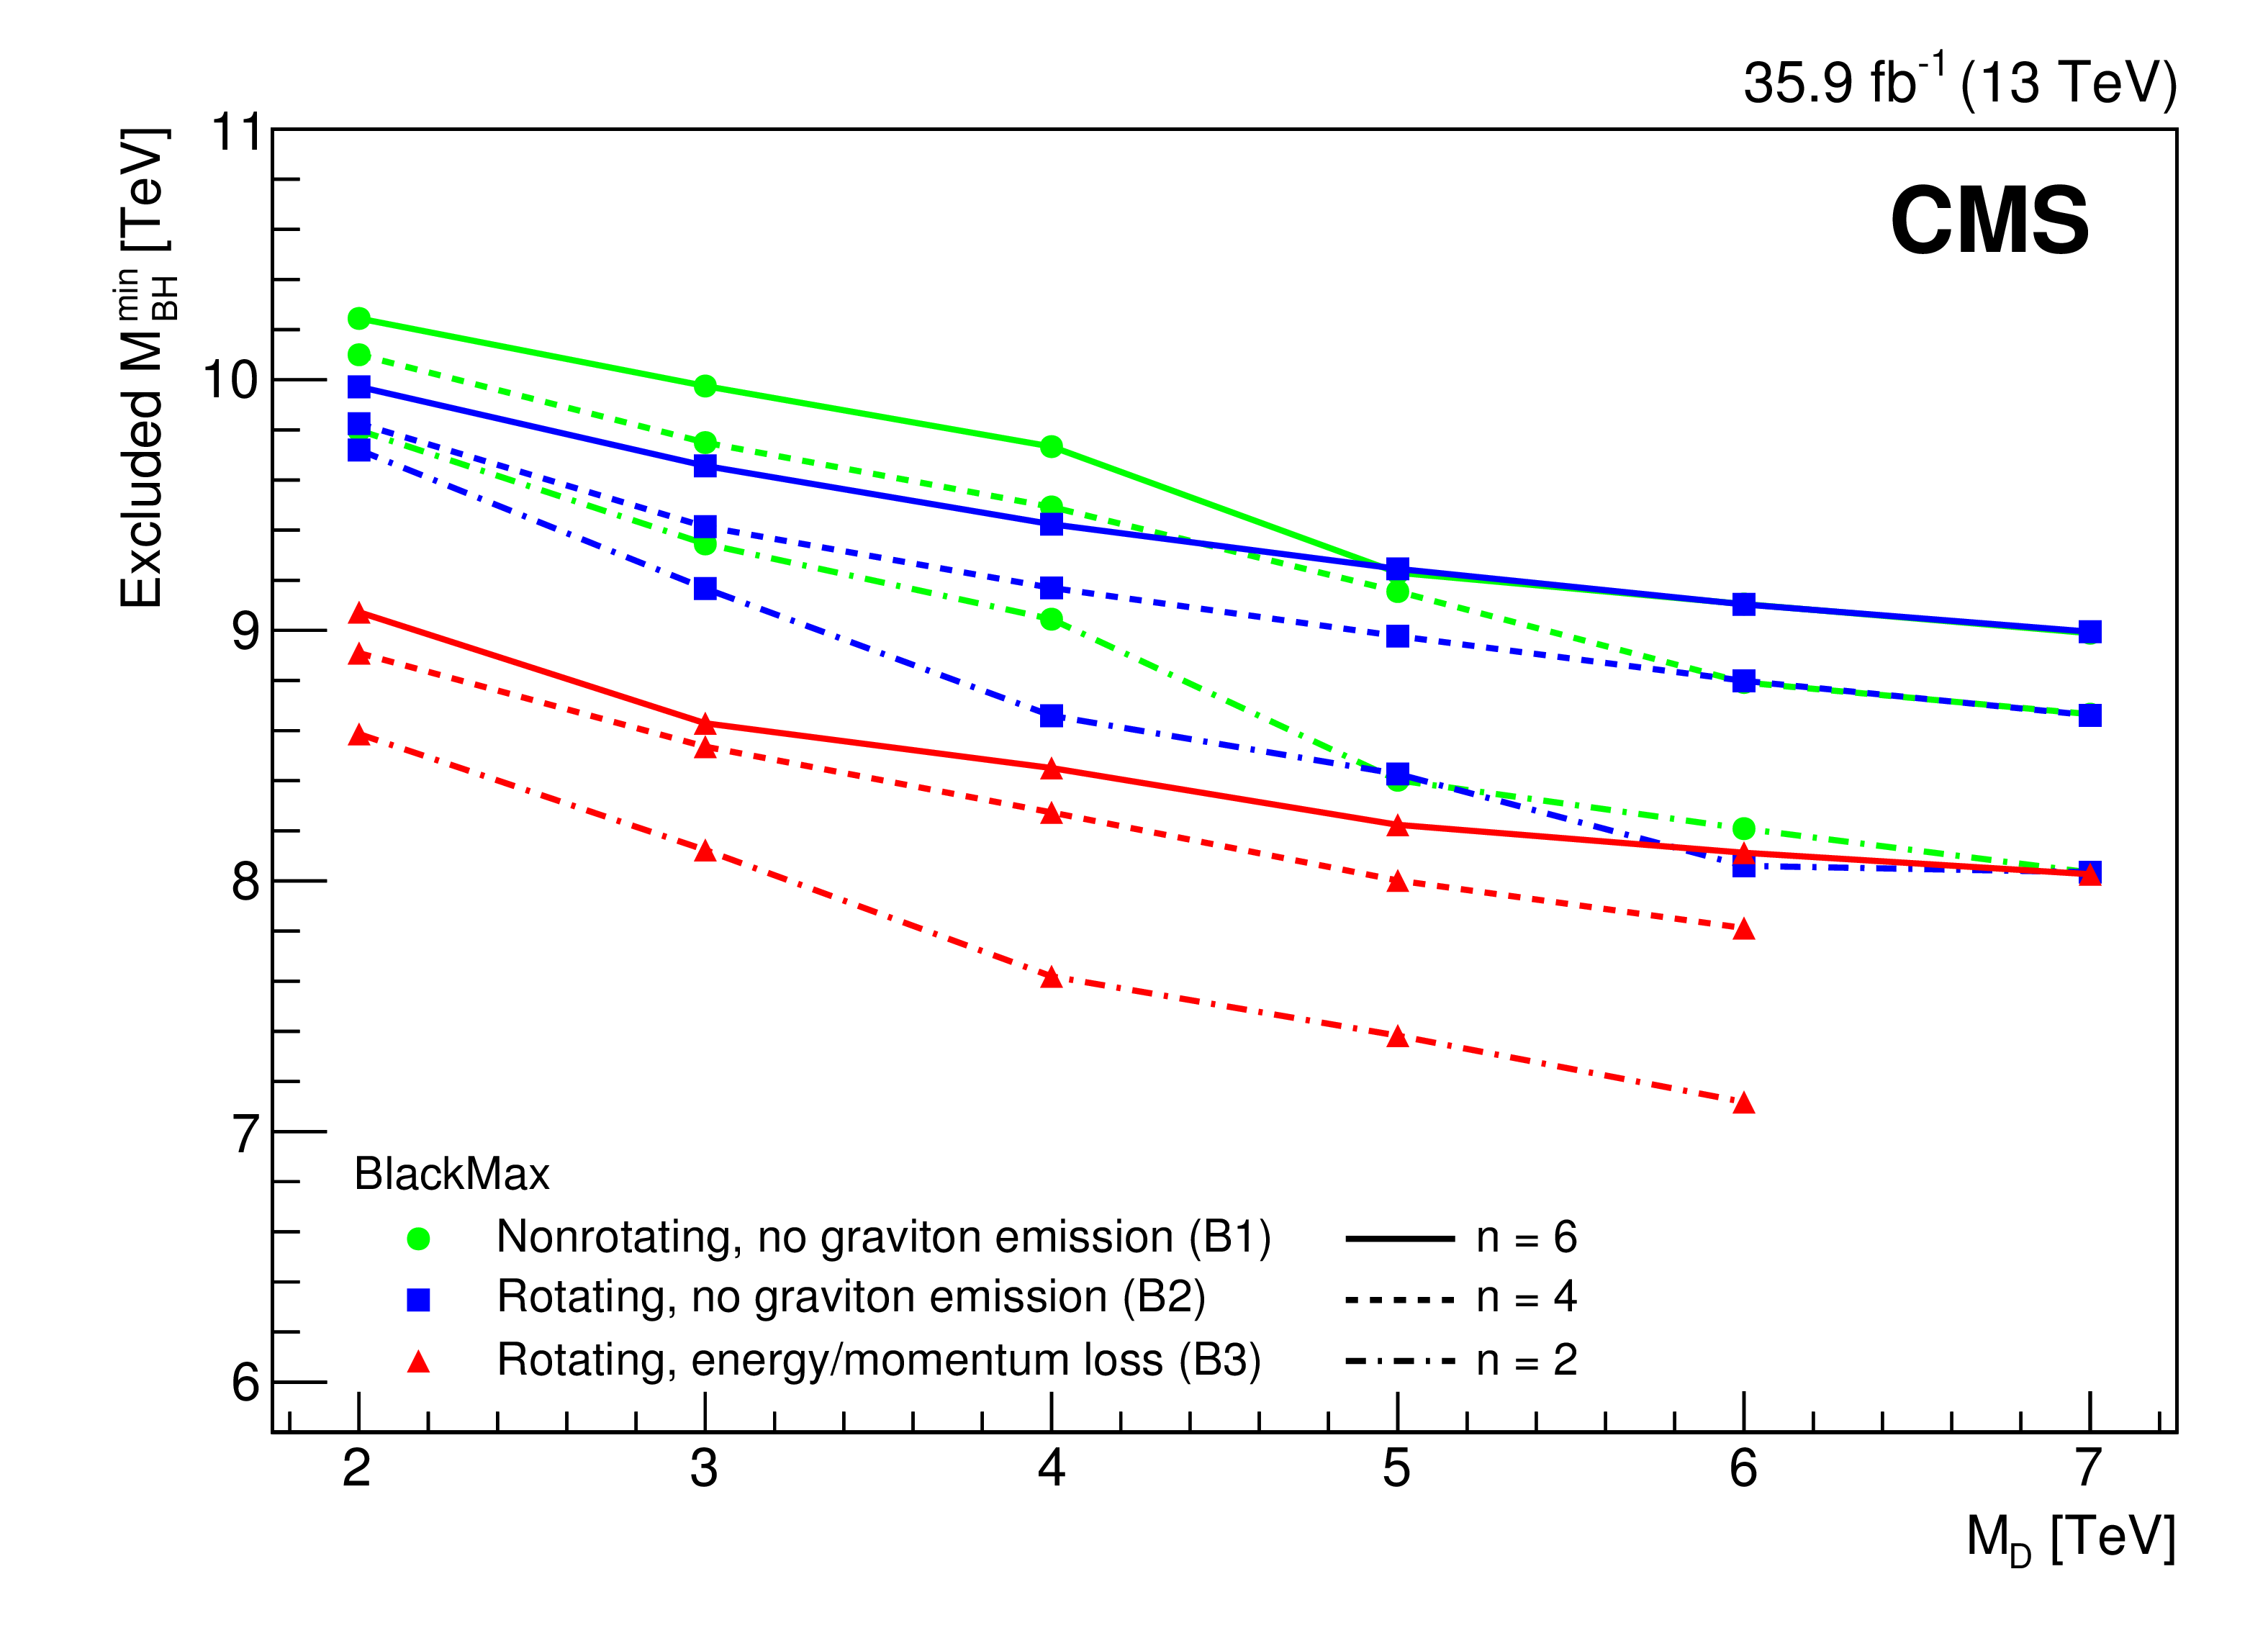
Figure 9:
The observed 95% CL lower limits on ${{M_\mathrm {BH}^\text {min}}}$ as a function of ${{M_\mathrm {D}}}$ at different $n$ for the models B1-B3 generated with BlackMax. |
png pdf |
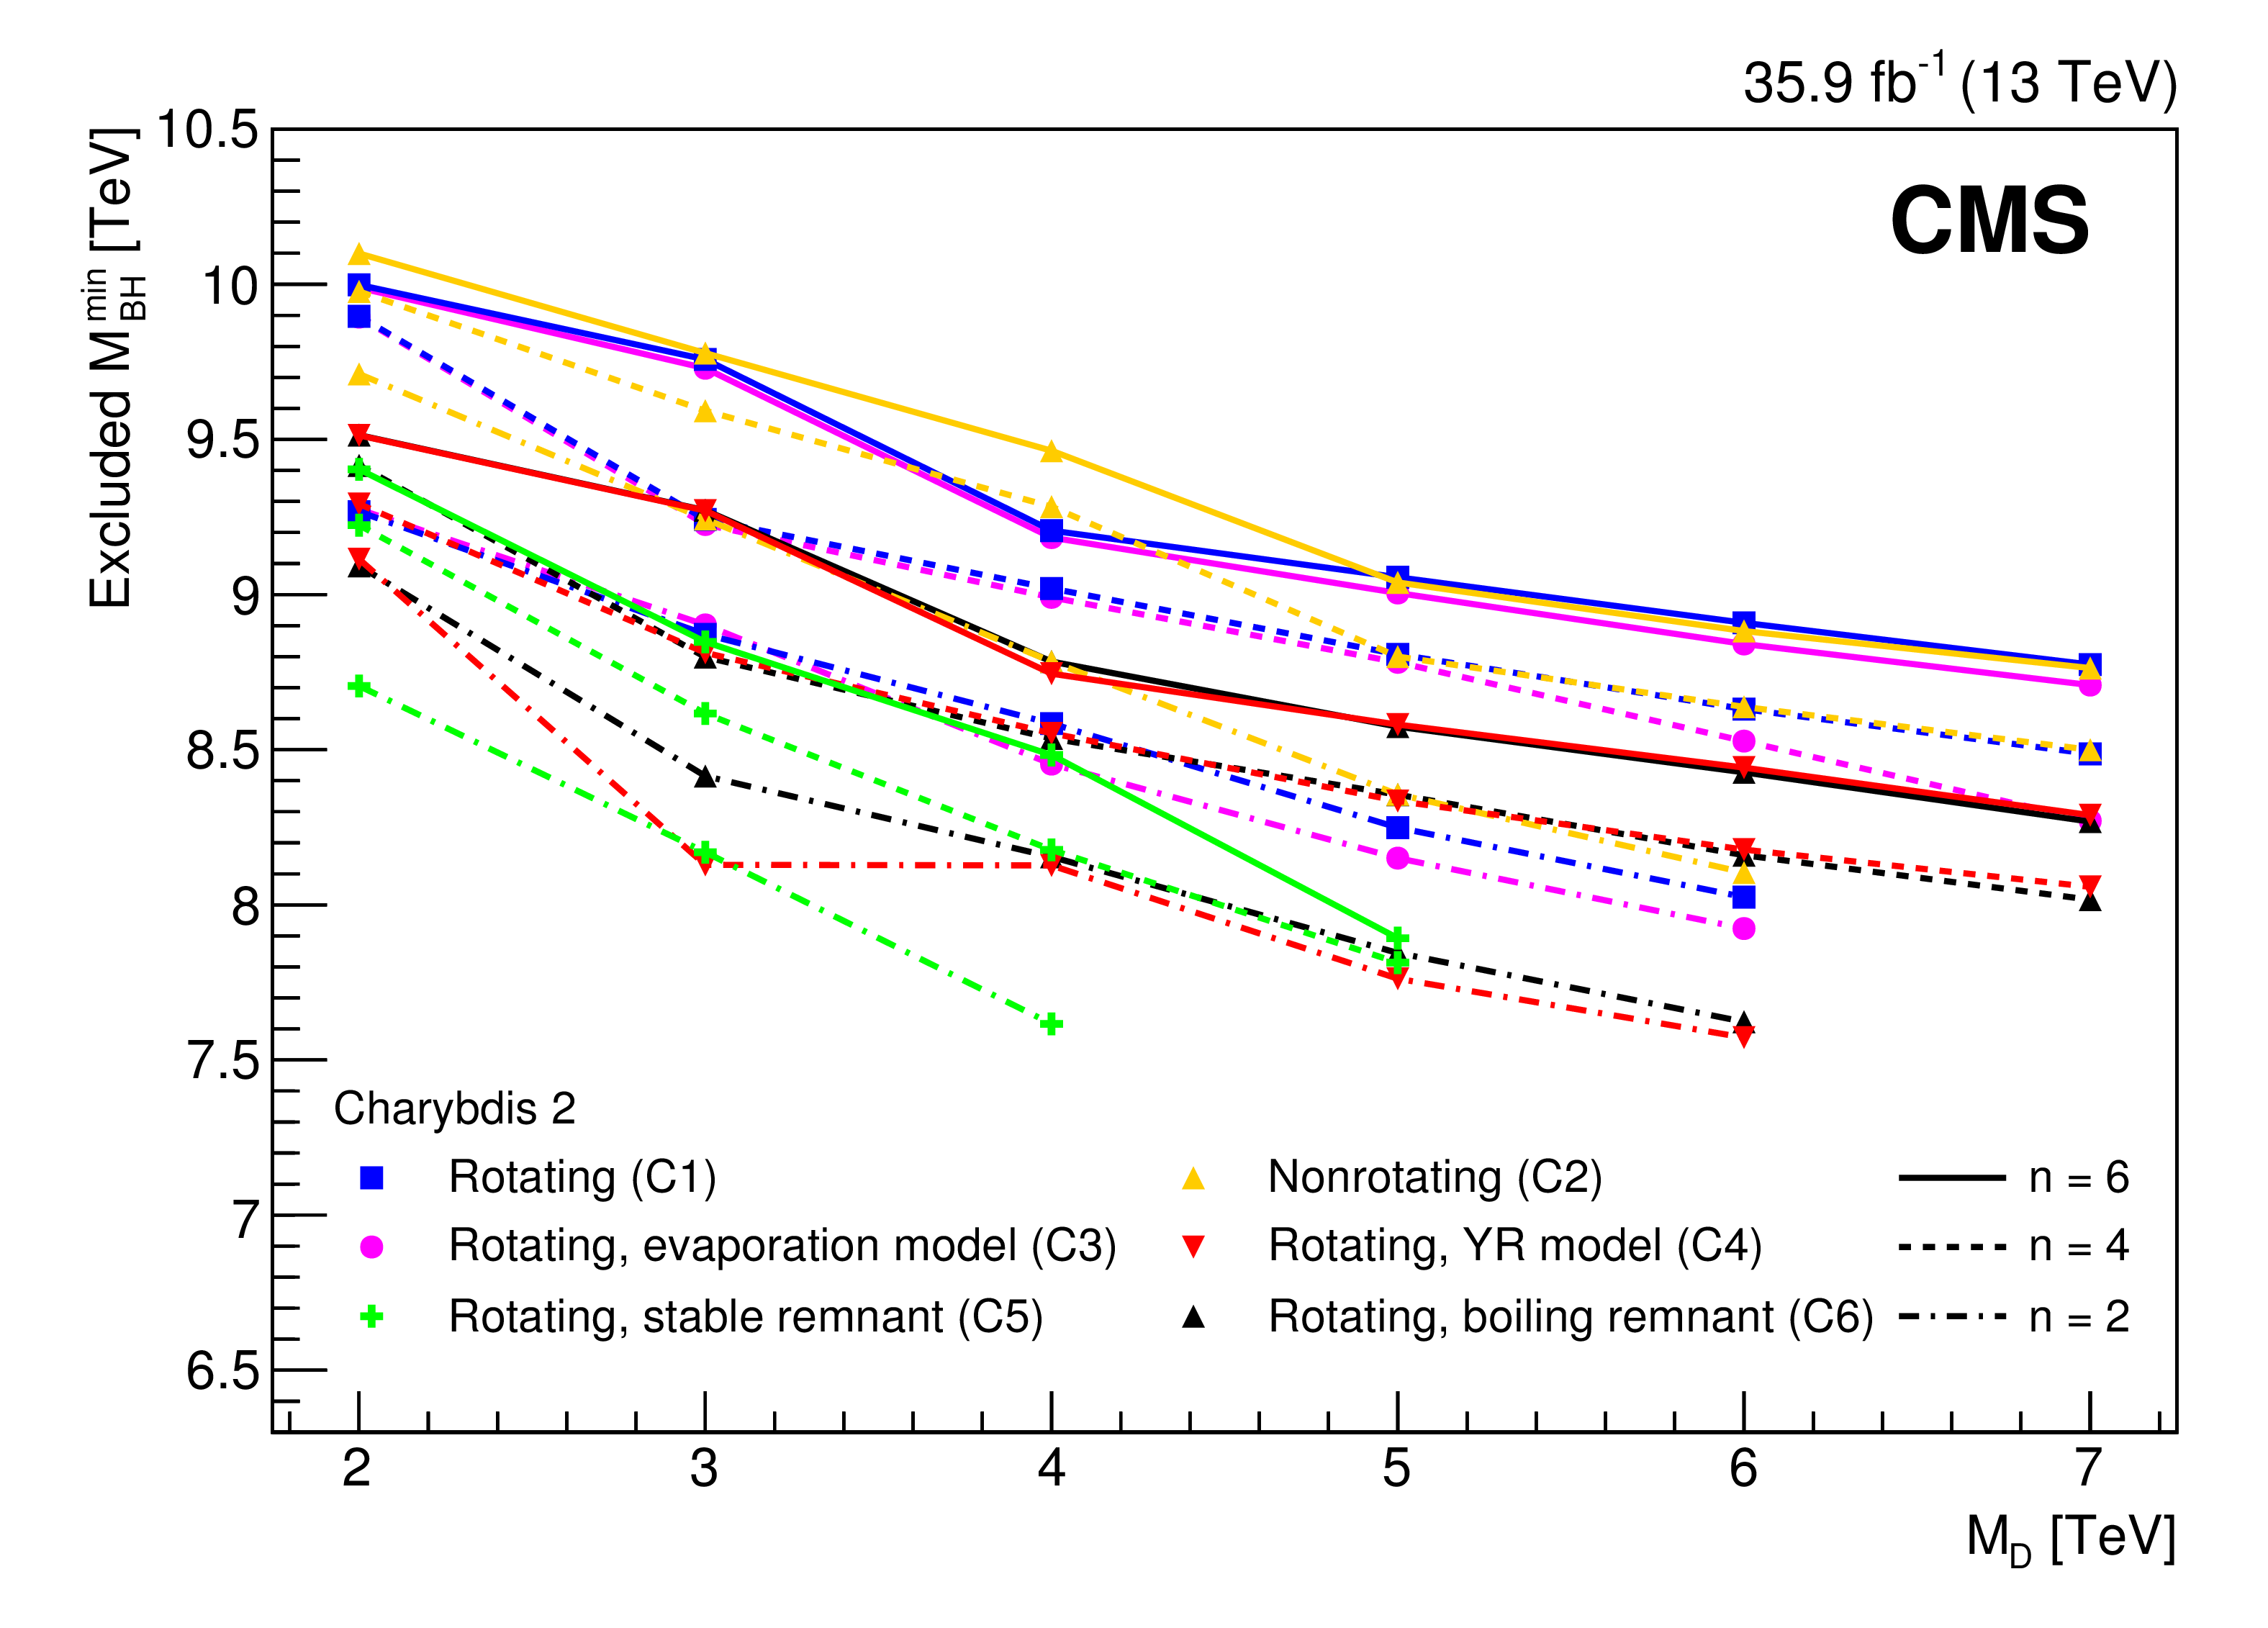
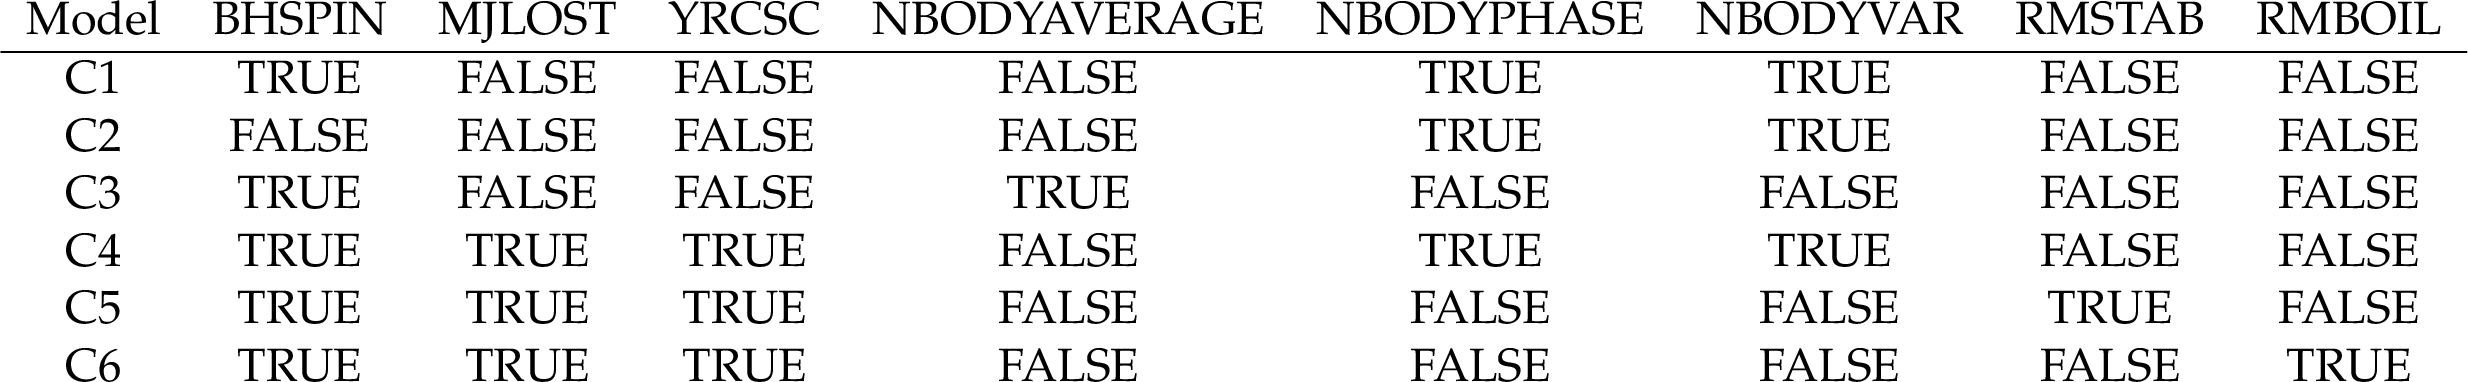
Figure 10:
The 95% observed CL lower limits on ${{M_\mathrm {BH}^\text {min}}}$ as a function of ${{M_\mathrm {D}}}$ at different $n$ for the models C1-C6 generated with Charybdis 2. |

png pdf |
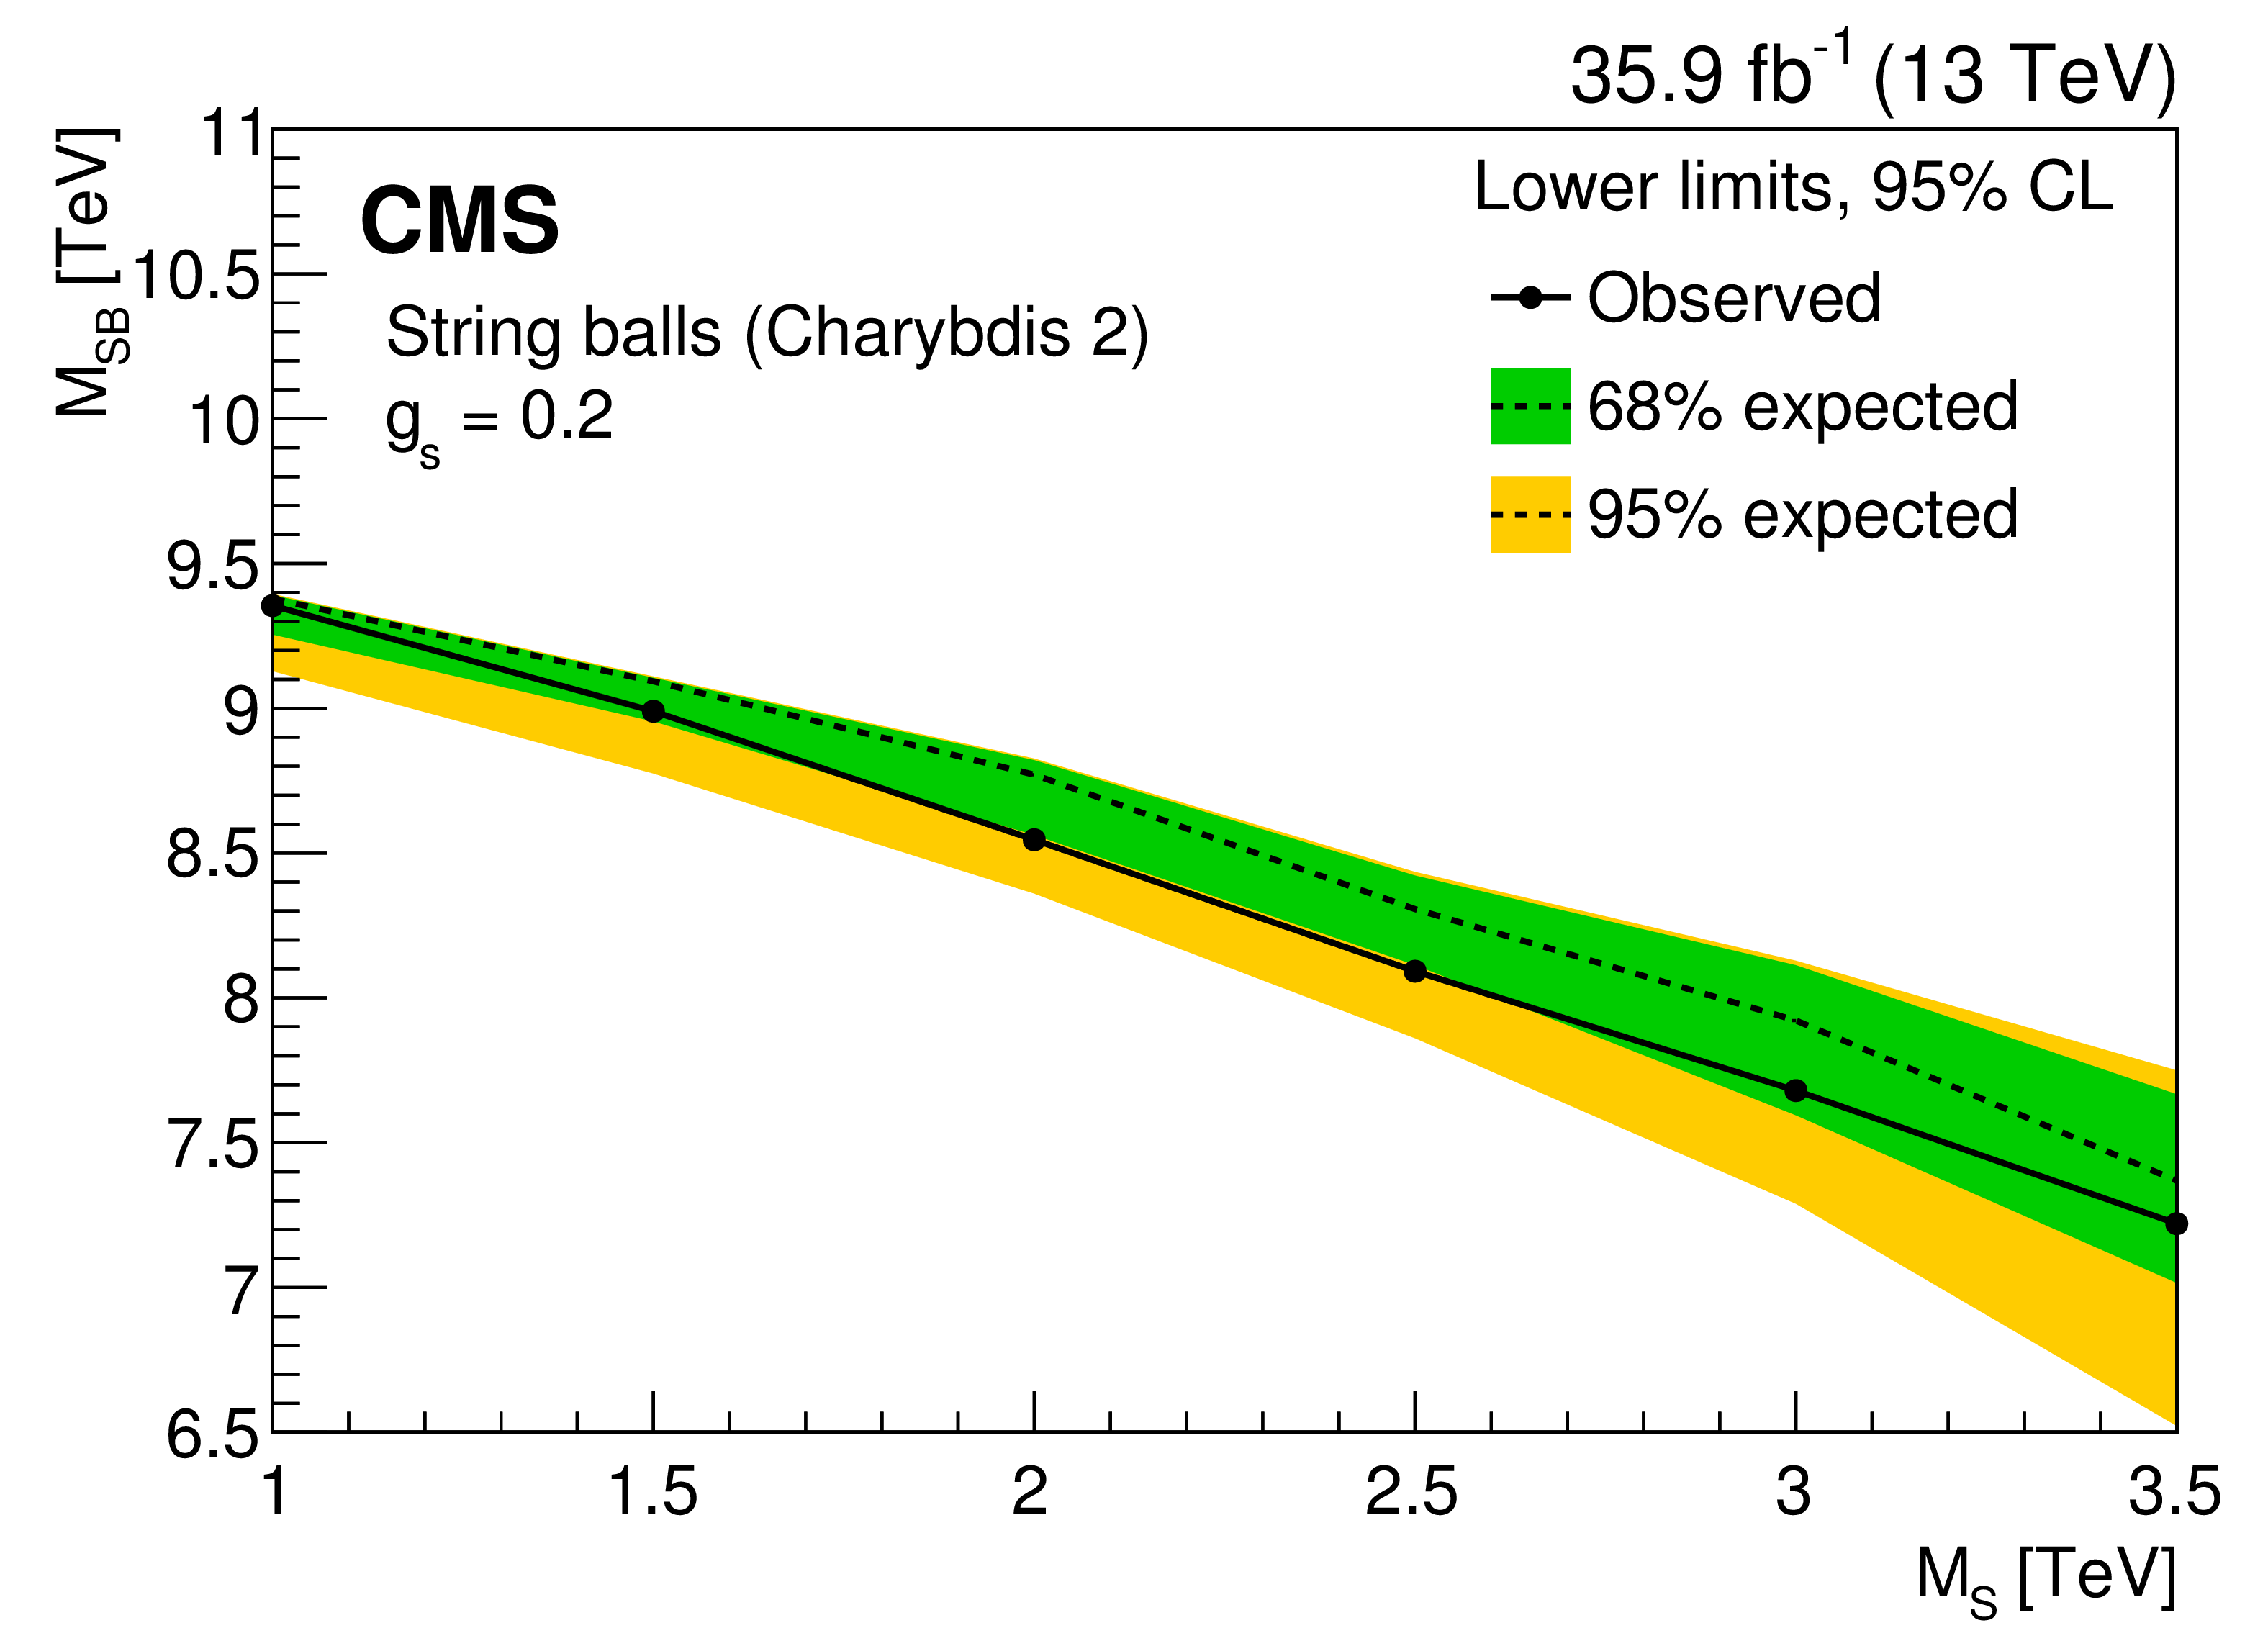
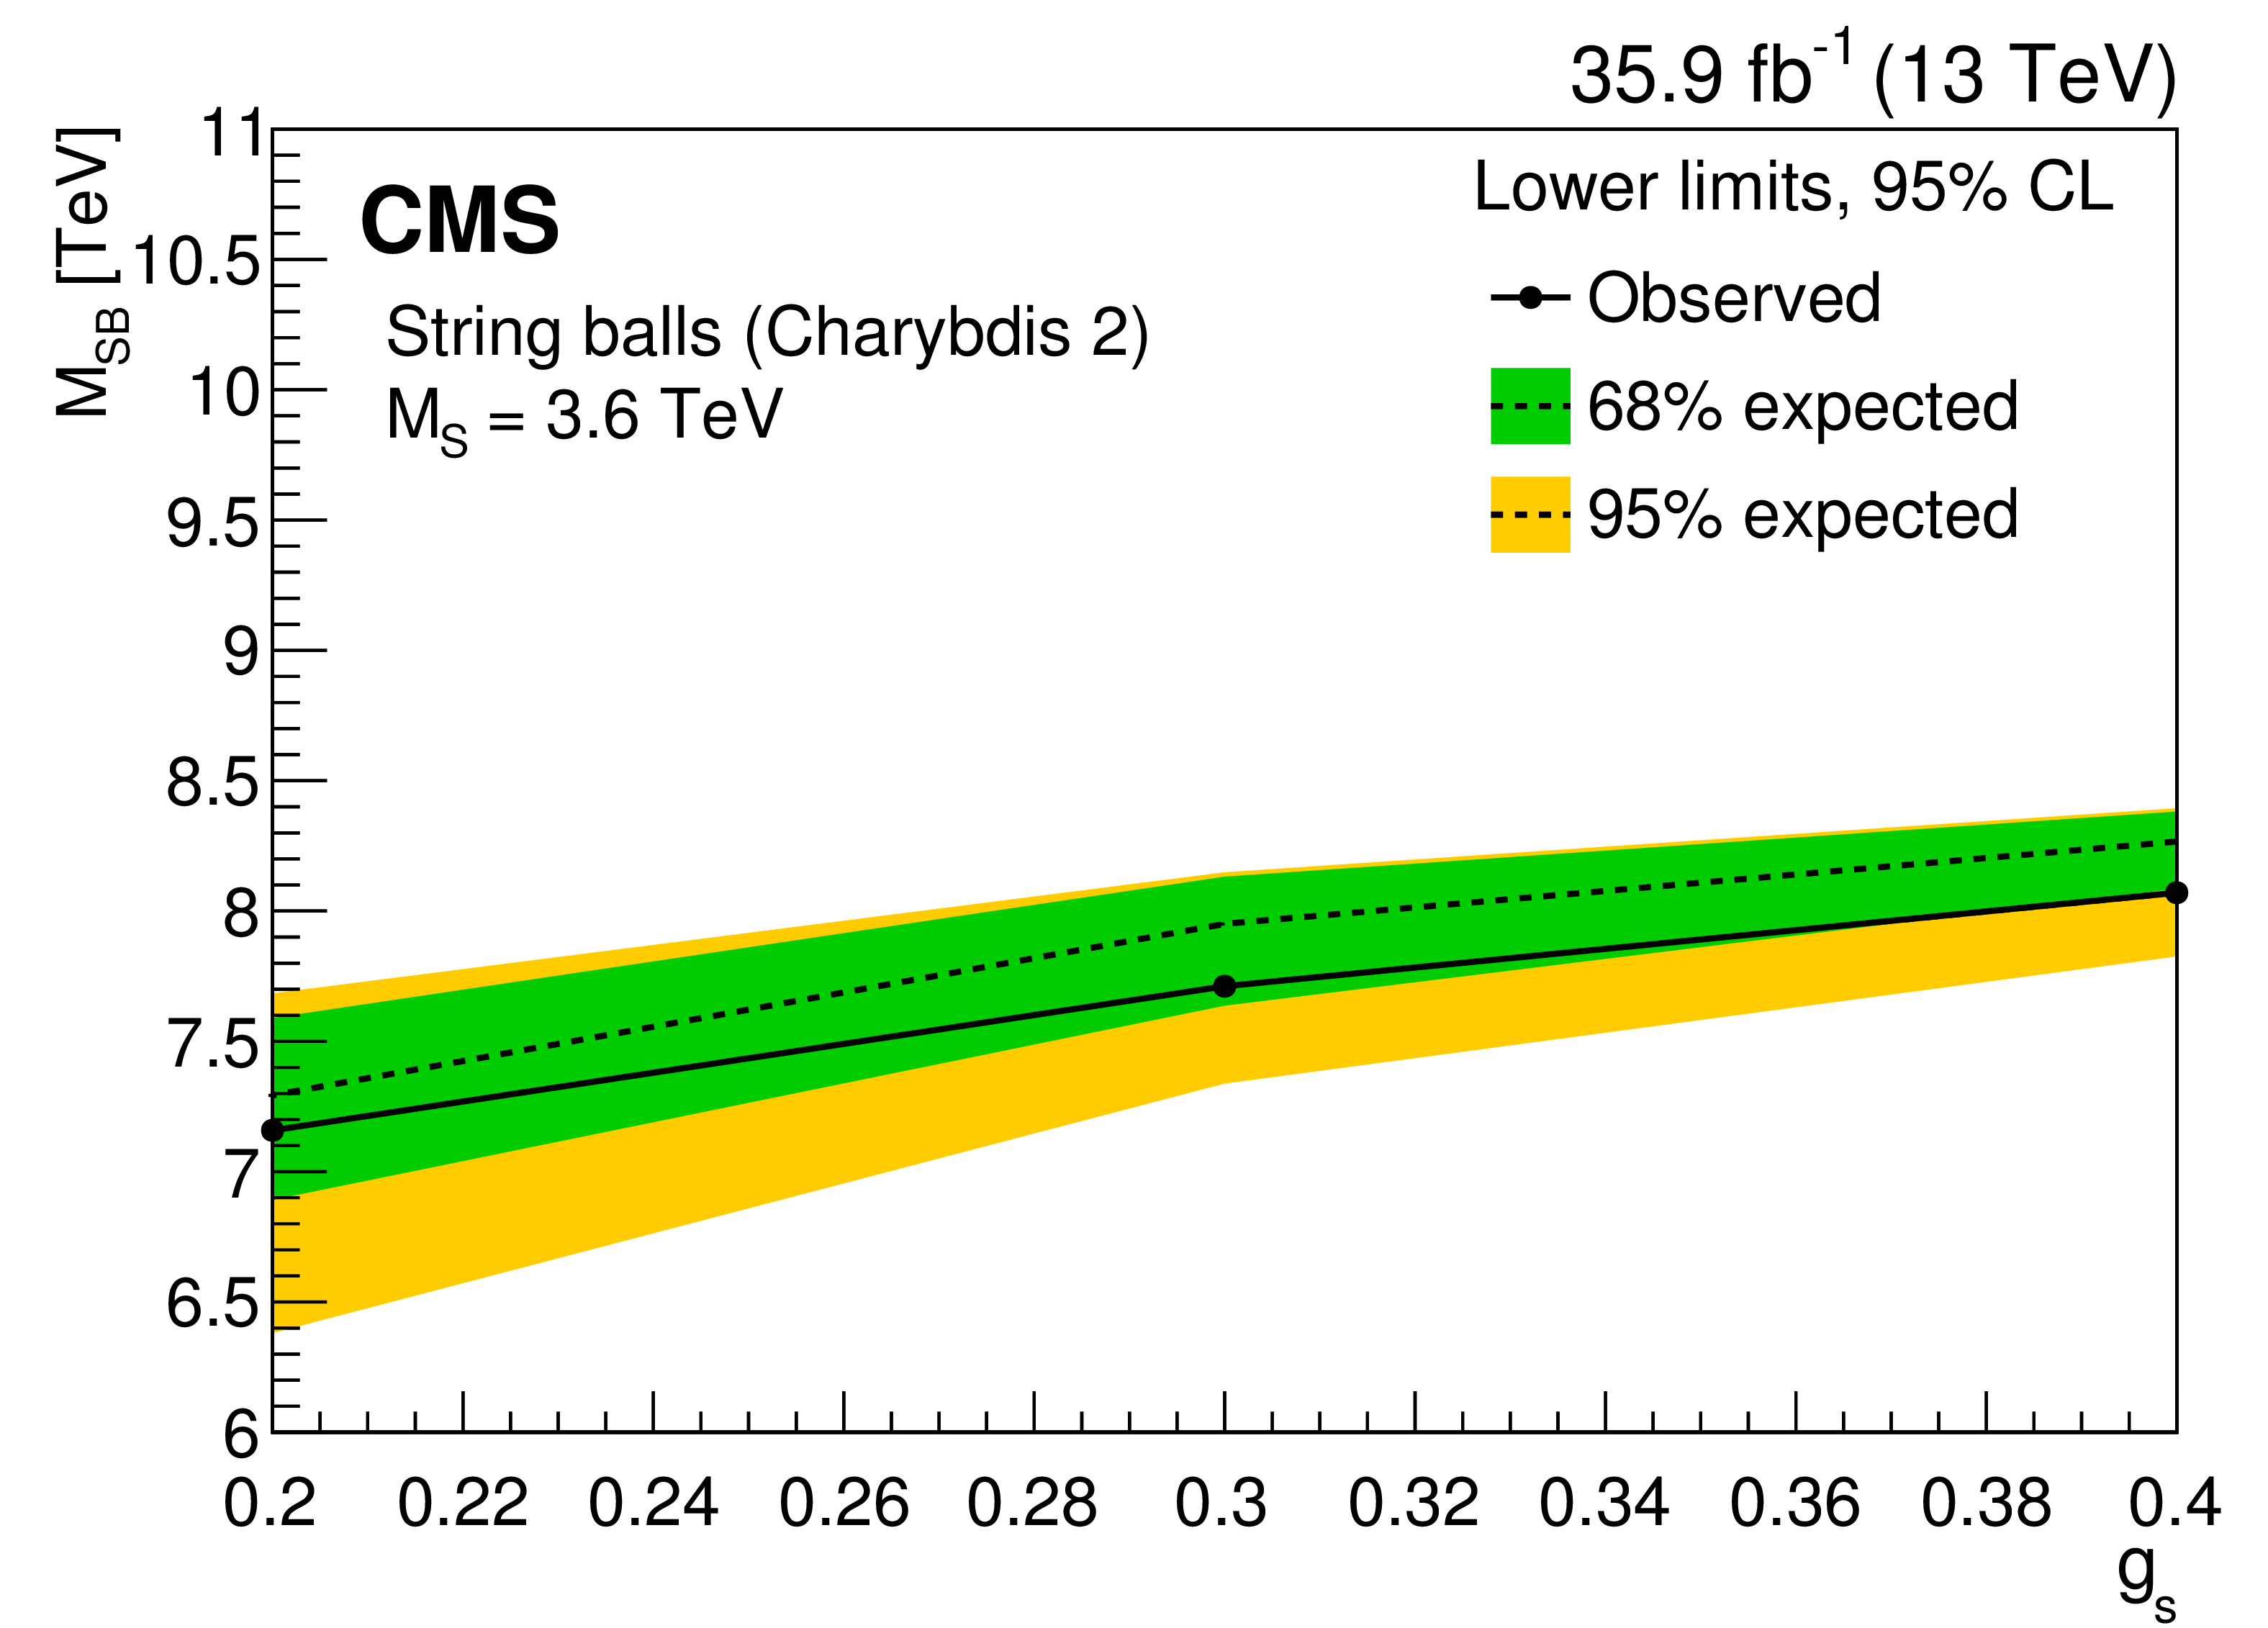
Figure 11:
The 95% CL lower limits on a string ball mass as a function of the string coupling ${{g_\mathrm {S}}}$ for a fixed value of the string scale $ {{M_\mathrm {S}}} = $ 3.6 TeV (left) and as a function of the string scale ${{M_\mathrm {S}}}$ for a fixed value of the string coupling $ {{g_\mathrm {S}}} = 0.2$ (right). The green (yellow) band represents the $ \pm $1 ($ \pm $2) standard deviation uncertainty in the expected limit. The area below the solid curve is excluded by this search. |
png pdf |
Figure 11-a:
The 95% CL lower limits on a string ball mass as a function of the string coupling ${{g_\mathrm {S}}}$ for a fixed value of the string scale $ {{M_\mathrm {S}}} = $ 3.6 TeV. The green (yellow) band represents the $ \pm $1 ($ \pm $2) standard deviation uncertainty in the expected limit. The area below the solid curve is excluded by this search. |
png pdf |
Figure 11-b:
The 95% CL lower limits on a string ball mass as a function of the string scale ${{M_\mathrm {S}}}$ for a fixed value of the string coupling $ {{g_\mathrm {S}}} = 0.2$. The green (yellow) band represents the $ \pm $1 ($ \pm $2) standard deviation uncertainty in the expected limit. The area below the solid curve is excluded by this search. |
png pdf |
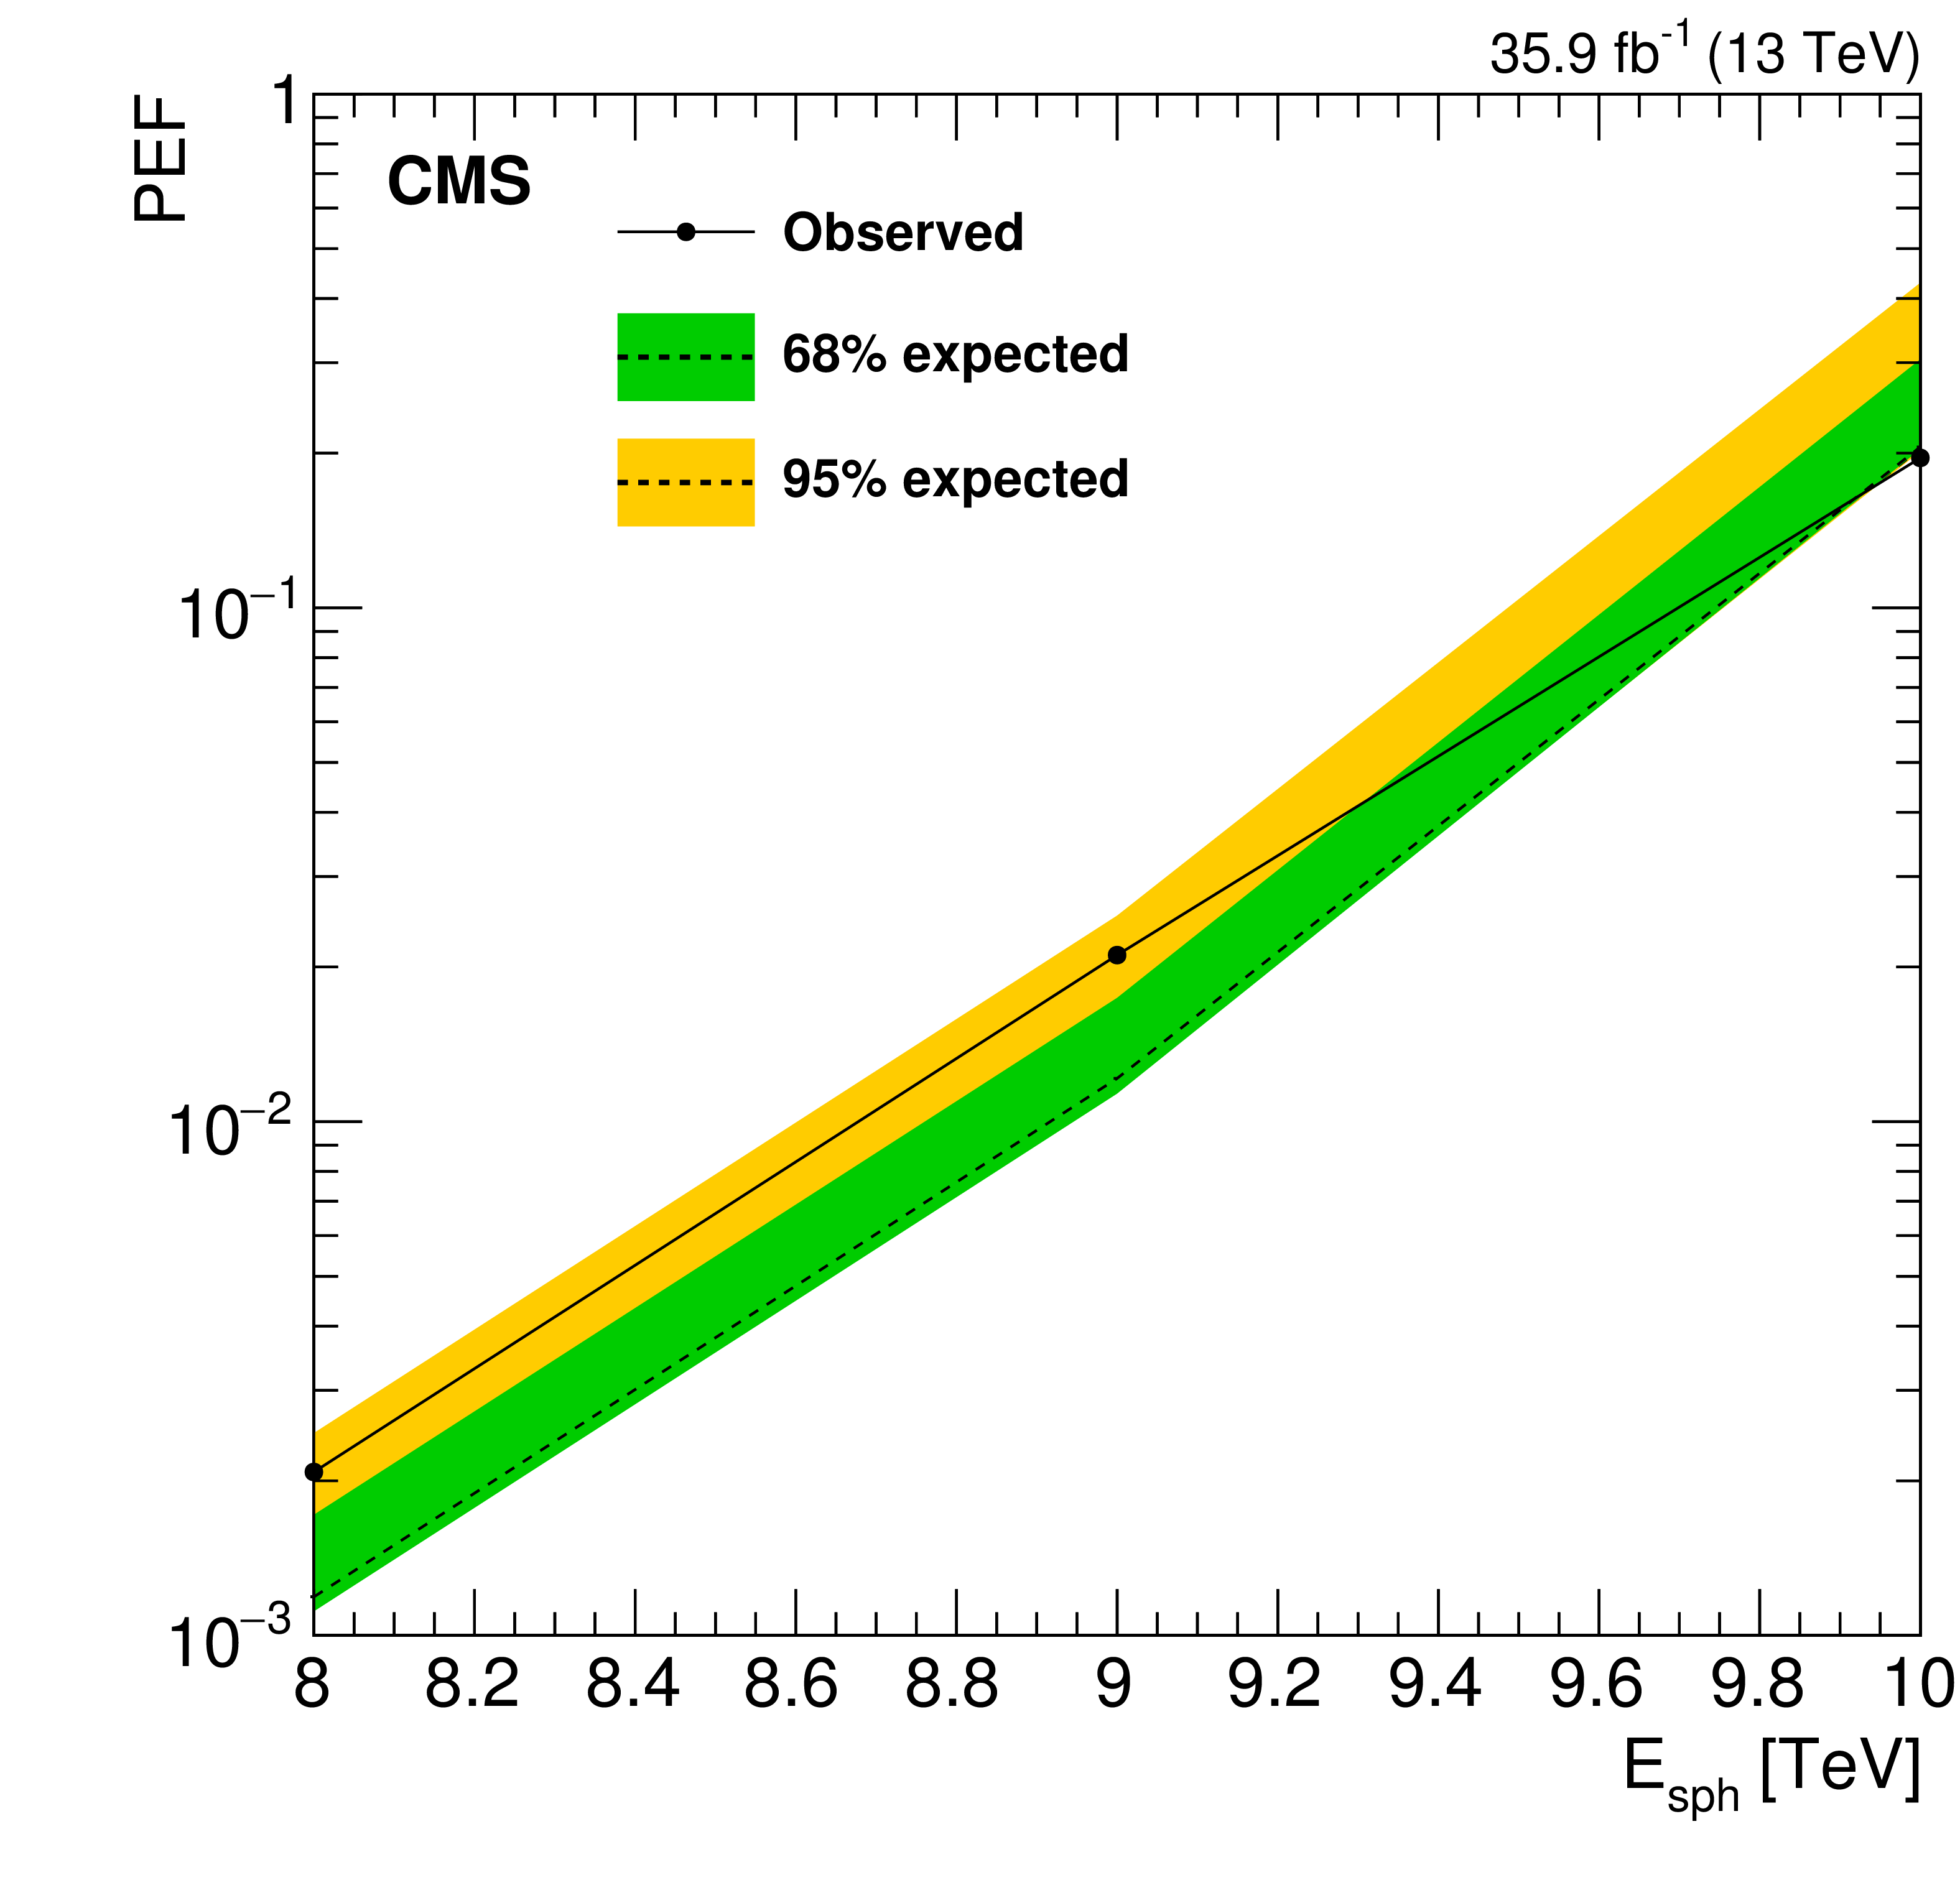
Figure 12:
Observed (solid curve) and expected (dashed black curve) 95% CL upper limit on the pre-exponential factor PEF of the sphaleron production as a function of ${{E_\mathrm {sph}}}$. The green (yellow) band represents the $ \pm $1 ($ \pm $2) standard deviation uncertainty in the expected limit. The area above the solid curve is excluded by this search. |
| Tables | |

png pdf |
Table 1:
Generator settings used for BlackMax signal sample generation. |
png pdf |
Table 2:
Generator settings used for Charybdis 2 signal sample generation. |
png pdf |
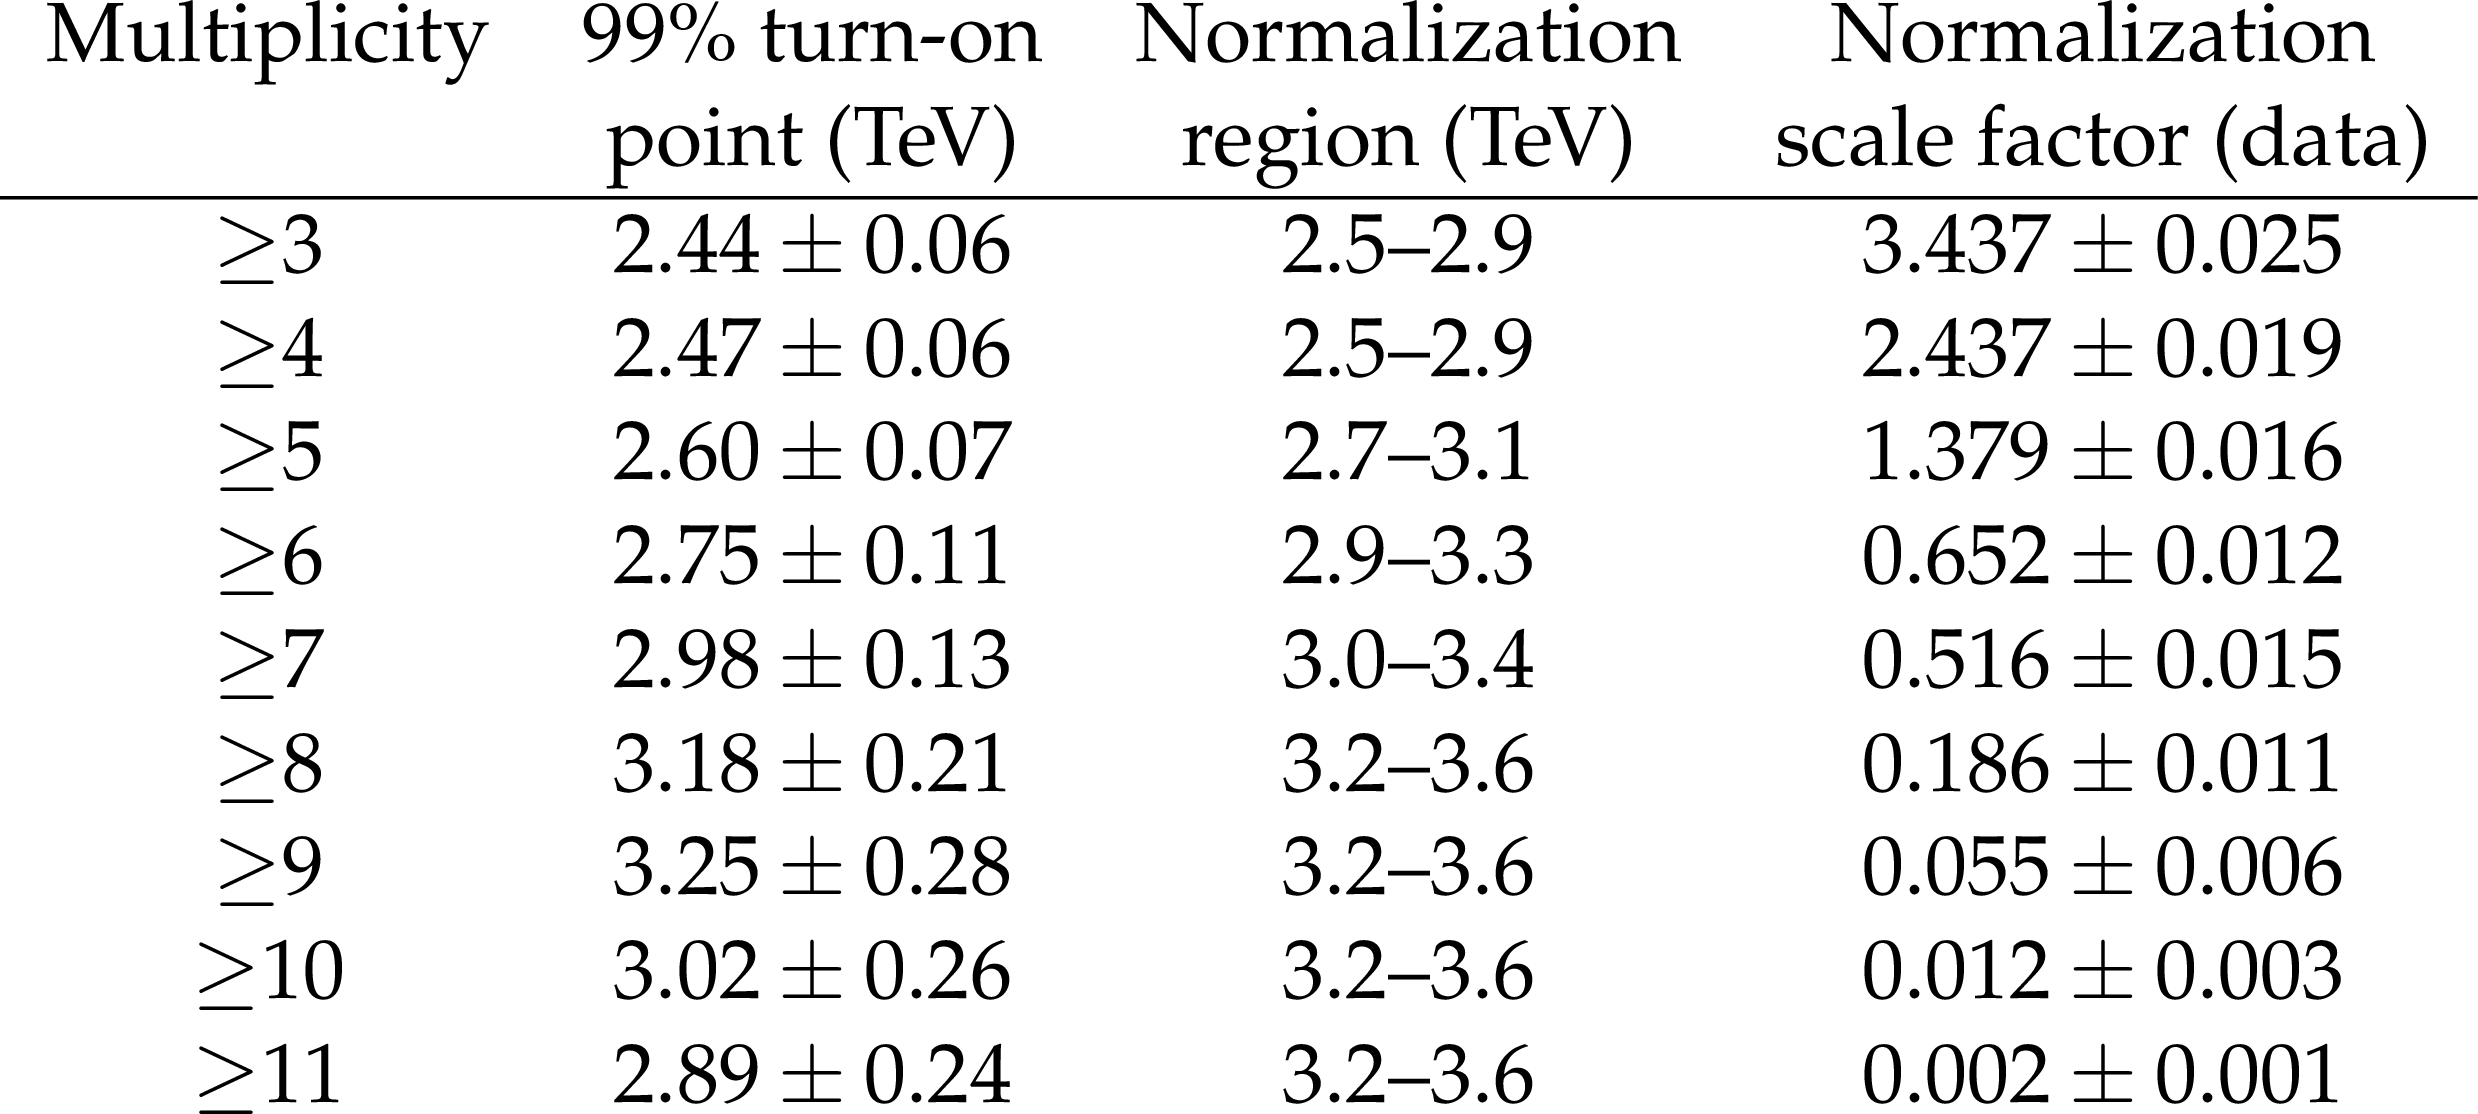
Table 3:
The ${{S_\mathrm {T}}}$ invariance thresholds from fits to simulated QCD multijet background spectra, normalization region definitions, and normalization scale factors in data for different inclusive multiplicities. |
png pdf |
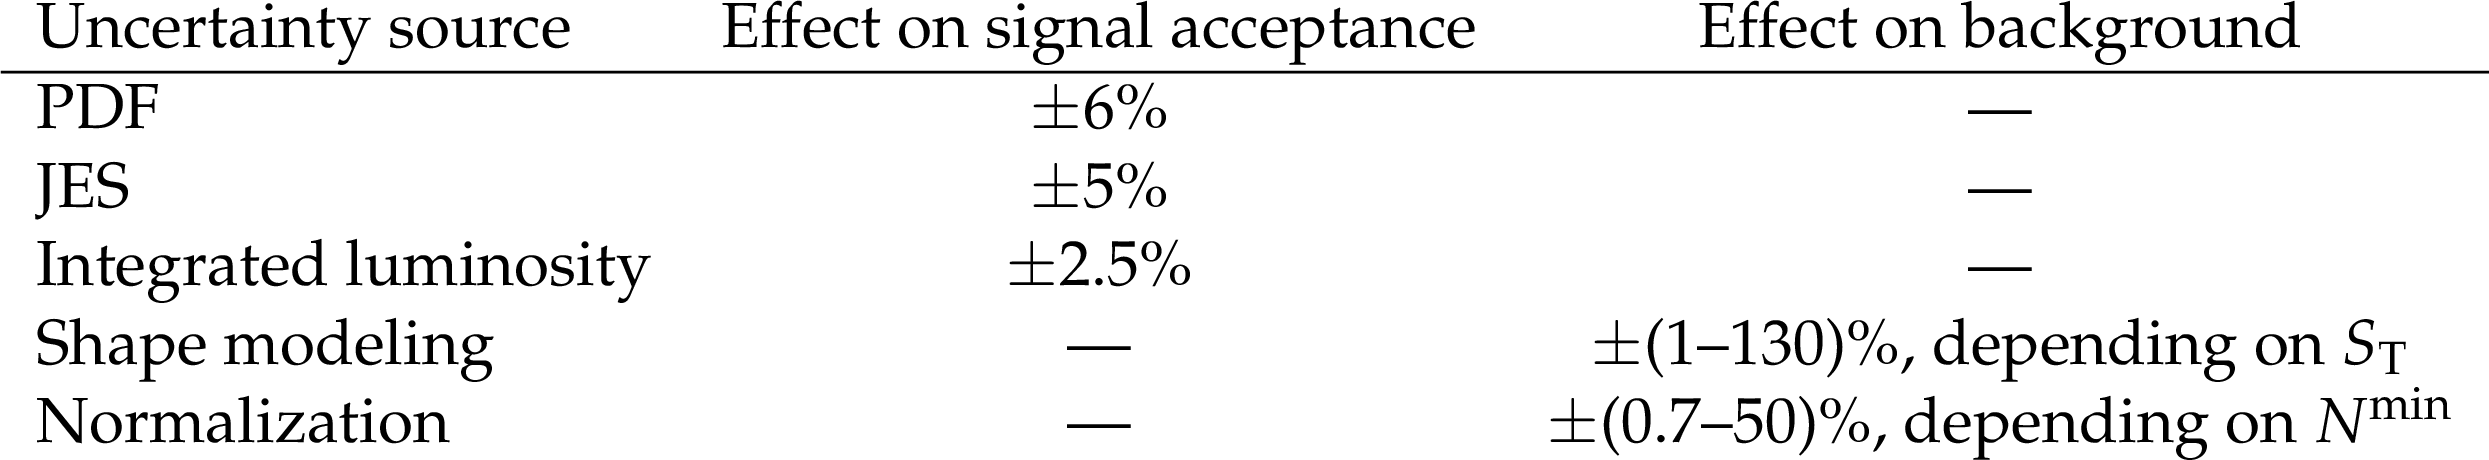
Table 4:
Summary of systematic uncertainties in the signal acceptance and the background estimate. |
| Summary |
| A search has been presented for generic signals of beyond the standard model physics resulting in energetic multi-object final states, such as would be produced by semiclassical black holes, string balls, and electroweak sphalerons. The search was based on proton-proton collision data at a center-of-mass energy of 13 TeV, collected with the CMS detector in 2016 and corresponding to an integrated luminosity of 35.9 fb$^{-1}$. The background, dominated by QCD multijet production, is determined solely from low-multiplicity samples in data. Comparing the distribution of the total transverse momentum ${{S_\mathrm{T}}}$ of the final-state objects in data with that expected from the backgrounds, we set 95% confidence level model-independent upper limits on the product of the production cross section and acceptance for such final states, as a function of the minimum ${{S_\mathrm{T}}}$ for minimum final-state multiplicities between 3 and 11. These limits reach 0.08 fb at high ${{S_\mathrm{T}}}$ thresholds. By calculating the acceptance values for benchmark black hole, string ball, and sphaleron signal models, we convert these model-independent limits into lower limits on the minimum semiclassical black hole mass and string ball mass. The limits extend as high as 10.1 TeV, thus improving significantly on previous results. We have also set the first experimental upper limit on the electroweak sphaleron pre-exponential factor of 0.021 for the sphaleron transition energy of 9 TeV. |
| References | ||||
| 1 | S. L. Glashow | Partial symmetries of weak interactions | NP 22 (1961) 579 | |
| 2 | S. Weinberg | A model of leptons | PRL 19 (1967) 1264 | |
| 3 | A. Salam | Weak and electromagnetic interactions | in Elementary particle physics: relativistic groups and analyticity, N. Svartholm, ed., p. 367 Almqvist \& Wiksell, Stockholm, 1968 Proceedings of the eighth Nobel symposium | |
| 4 | P. Ramond | Dual theory for free fermions | PRD 3 (1971) 2415 | |
| 5 | Y. A. Gol'fand and E. P. Likhtman | Extension of the algebra of Poincar$ \'e $ group generators and violation of P invariance | JEPTL 13 (1971)323 | |
| 6 | A. Neveu and J. H. Schwarz | Factorizable dual model of pions | NPB 31 (1971) 86 | |
| 7 | D. V. Volkov and V. P. Akulov | Possible universal neutrino interaction | JEPTL 16 (1972)438 | |
| 8 | J. Wess and B. Zumino | A Lagrangian model invariant under supergauge transformations | PLB 49 (1974) 52 | |
| 9 | J. Wess and B. Zumino | Supergauge transformations in four dimensions | NPB 70 (1974) 39 | |
| 10 | P. Fayet | Supergauge invariant extension of the Higgs mechanism and a model for the electron and its neutrino | NPB 90 (1975) 104 | |
| 11 | H. P. Nilles | Supersymmetry, supergravity and particle physics | Phys. Rep. 110 (1984) 1 | |
| 12 | G. R. Farrar and P. Fayet | Phenomenology of the production, decay, and detection of new hadronic states associated with supersymmetry | PLB 76 (1978) 575 | |
| 13 | N. Arkani-Hamed, S. Dimopoulos, and G. R. Dvali | The hierarchy problem and new dimensions at a millimeter | PLB 429 (1998) 263 | hep-ph/9803315 |
| 14 | I. Antoniadis, N. Arkani-Hamed, S. Dimopoulos, and G. R. Dvali | New dimensions at a millimeter to a fermi and superstrings at a TeV | PLB 436 (1998) 257 | hep-ph/9804398 |
| 15 | N. Arkani-Hamed, S. Dimopoulos, and G. R. Dvali | Phenomenology, astrophysics and cosmology of theories with submillimeter dimensions and TeV scale quantum gravity | PRD 59 (1999) 086004 | hep-ph/9807344 |
| 16 | L. Randall and R. Sundrum | A large mass hierarchy from a small extra dimension | PRL 83 (1999) 3370 | hep-ph/9905221 |
| 17 | L. Randall and R. Sundrum | An alternative to compactification | PRL 83 (1999) 4690 | hep-th/9906064 |
| 18 | ATLAS Collaboration | Observation of a new particle in the search for the standard model Higgs boson with the ATLAS detector at the LHC | PLB 716 (2012) 1 | 1207.7214 |
| 19 | CMS Collaboration | Observation of a new boson at a mass of 125 GeV with the CMS experiment at the LHC | PLB 716 (2012) 30 | CMS-HIG-12-028 1207.7235 |
| 20 | CMS Collaboration | Observation of a new boson with mass near 125 GeV in pp collisions at $ \sqrt{s} = $ 7 and 8 TeV | JHEP 06 (2013) 081 | CMS-HIG-12-036 1303.4571 |
| 21 | ATLAS and CMS Collaboration | Combined measurement of the Higgs boson mass in $ pp $ collisions at $ \sqrt{s}= $ 7 and 8 TeV with the ATLAS and CMS experiments | PRL 114 (2015) 191803 | 1503.07589 |
| 22 | CMS Collaboration | Measurements of properties of the Higgs boson decaying into the four-lepton final state in pp collisions at $ \sqrt{s}= $ 13 TeV | JHEP 11 (2017) 047 | CMS-HIG-16-041 1706.09936 |
| 23 | R. Barbieri and G. F. Giudice | Upper bounds on supersymmetric particle masses | NPB 306 (1988) 63 | |
| 24 | S. Dimopoulos and L. Susskind | Mass without scalars | NPB 155 (1979) 237 | |
| 25 | S. Dimopoulos and G. L. Landsberg | Black holes at the LHC | PRL 87 (2001) 161602 | hep-ph/0106295 |
| 26 | S. B. Giddings and S. D. Thomas | High energy colliders as black hole factories: the end of short distance physics | PRD 65 (2002) 056010 | hep-ph/0106219 |
| 27 | S. W. Hawking | Particle creation by black holes | Commun. Math. Phys. 43 (1975) 199, .[Erratum: \DOI10.1007/BF01608497] | |
| 28 | X. Calmet, W. Gong, and S. D. H. Hsu | Colorful quantum black holes at the LHC | PLB 668 (2008) 20 | 0806.4605 |
| 29 | D. M. Gingrich | Quantum black holes with charge, color and spin at the LHC | JPG 37 (2010) 105008 | 0912.0826 |
| 30 | D. M. Gingrich | Monte Carlo event generator for black hole production and decay in proton--proton collisions -- QBH version 1.02 | CPC 181 (2010) 1917 | 0911.5370 |
| 31 | S. Dimopoulos and R. Emparan | String balls at the LHC and beyond | PLB 526 (2002) 393 | hep-ph/0108060 |
| 32 | R. Hagedorn | Statistical thermodynamics of strong interactions at high-energies | Nuovo Cim. Suppl. 3 (1965)147 | |
| 33 | G. Landsberg | Black holes at the Large Hadron Collider | Fundam. Theor. Phys. 178 (2015) 267 | |
| 34 | ATLAS Collaboration | Search for strong gravity in multijet final states produced in pp collisions at $ \sqrt{s} = $ 13 TeV using the ATLAS detector at the LHC | JHEP 03 (2016) 026 | 1512.02586 |
| 35 | ATLAS Collaboration | Search for TeV-scale gravity signatures in high-mass final states with leptons and jets with the ATLAS detector at $ \sqrt{s}= $ 13 TeV | PLB 760 (2016) 520 | 1606.02265 |
| 36 | CMS Collaboration | Search for black holes in high-multiplicity final states in proton-proton collisions at $ \sqrt{s}= $ 13 TeV | PLB 774 (2017) 279 | CMS-EXO-15-007 1705.01403 |
| 37 | ATLAS Collaboration | Search for new phenomena in dijet mass and angular distributions from $ pp $ collisions at $ \sqrt{s}= $ 13 TeV with the ATLAS detector | PLB 754 (2016) 302 | 1512.01530 |
| 38 | ATLAS Collaboration | Search for new phenomena with photon+jet events in proton-proton collisions at $ \sqrt{s}= $ 13 TeV with the ATLAS detector | JHEP 03 (2016) 041 | 1512.05910 |
| 39 | CMS Collaboration | Search for new physics with dijet angular distributions in proton-proton collisions at $ \sqrt{s}= $ 13 TeV | JHEP 07 (2017) 013 | CMS-EXO-15-009 1703.09986 |
| 40 | ATLAS Collaboration | Search for new phenomena in dijet events using 37 fb$ ^{-1} $ of $ pp $ collision data collected at $ \sqrt{s}= $ 13 TeV with the ATLAS detector | PRD 96 (2017) 052004 | 1703.09127 |
| 41 | ATLAS Collaboration | Search for new phenomena in high-mass final states with a photon and a jet from $ pp $ collisions at $ \sqrt{s} = $ 13 TeV with the ATLAS detector | EPJC 78 (2018) 102 | 1709.10440 |
| 42 | CMS Collaboration | Search for lepton-flavor violating decays of heavy resonances and quantum black holes to e$ \mu $ final states in proton-proton collisions at $ \sqrt{s}= $ 13 TeV | Submitted to JHEP | CMS-EXO-16-058 1802.01122 |
| 43 | G. 't Hooft | Symmetry breaking through Bell-Jackiw anomalies | PRL 37 (1976) 8 | |
| 44 | F. R. Klinkhamer and N. S. Manton | A saddle-point solution in the Weinberg-Salam theory | PRD 30 (1984) 2212 | |
| 45 | M. Trodden | Electroweak baryogenesis | Rev. Mod. Phys. 71 (1999) 1463 | |
| 46 | S.-S. Chern and J. Simons | Characteristic forms and geometric invariants | Annals Math. 99 (1974) 48 | |
| 47 | S. H. H. Tye and S. S. C. Wong | Bloch wave function for the periodic sphaleron potential and unsuppressed baryon and lepton number violating processes | PRD 92 (2015) 045005 | 1505.03690 |
| 48 | J. Ellis and K. Sakurai | Search for sphalerons in proton-proton collisions | JHEP 04 (2016) 086 | 1601.03654 |
| 49 | C. Bravo and J. Hauser | BaryoGEN, a Monte Carlo generator for sphaleron-induced transitions in proton-proton collisions | Submitted to JHEP | 1805.02786 |
| 50 | E. W. Kolb and M. S. Turner | The Early Universe | Addison Wesley, 1990 Frontiers in Physics (69) | |
| 51 | CMS Collaboration | The CMS trigger system | JINST 12 (2017) P01020 | CMS-TRG-12-001 1609.02366 |
| 52 | CMS Collaboration | The CMS experiment at the CERN LHC | JINST 3 (2008) S08004 | CMS-00-001 |
| 53 | CMS Collaboration | Particle-flow reconstruction and global event description with the CMS detector | JINST 12 (2017) P10003 | CMS-PRF-14-001 1706.04965 |
| 54 | M. Cacciari, G. P. Salam, and G. Soyez | The anti-$ {k_{\mathrm{T}}} $ jet clustering algorithm | JHEP 04 (2008) 063 | 0802.1189 |
| 55 | M. Cacciari, G. P. Salam, and G. Soyez | FastJet user manual | EPJC 72 (2012) 1896 | 1111.6097 |
| 56 | CMS Collaboration | Jet energy scale and resolution in the CMS experiment in pp collisions at 8 TeV | JINST 12 (2017) P02014 | CMS-JME-13-004 1607.03663 |
| 57 | CMS Collaboration | Performance of the CMS muon detector and muon reconstruction with proton-proton collisions at $ \sqrt{s}= $ 13 TeV | Submitted to JINST | CMS-MUO-16-001 1804.04528 |
| 58 | CMS Collaboration | Jet algorithms performance in 13 TeV data | CMS-PAS-JME-16-003 | CMS-PAS-JME-16-003 |
| 59 | CMS Collaboration | Performance of electron reconstruction and selection with the CMS detector in proton-proton collisions at $ \sqrt{s} = $ 8 TeV | JINST 10 (2015) P06005 | CMS-EGM-13-001 1502.02701 |
| 60 | CMS Collaboration | Performance of photon reconstruction and identification with the CMS detector in proton-proton collisions at $ \sqrt{s} = $ 8 TeV | JINST 10 (2015) P08010 | CMS-EGM-14-001 1502.02702 |
| 61 | M. Cacciari and G. P. Salam | Pileup subtraction using jet areas | PLB 659 (2008) 119 | 0707.1378 |
| 62 | CMS Collaboration | Search for microscopic black hole signatures at the Large Hadron Collider | PLB 697 (2011) 434 | CMS-EXO-10-017 1012.3375 |
| 63 | CMS Collaboration | Search for microscopic black holes in $ pp $ collisions at $ \sqrt{s}= $ 7 TeV | JHEP 04 (2012) 061 | CMS-EXO-11-071 1202.6396 |
| 64 | CMS Collaboration | Search for microscopic black holes in pp collisions at $ \sqrt{s} = $ 8 TeV | JHEP 07 (2013) 178 | CMS-EXO-12-009 1303.5338 |
| 65 | ATLAS Collaboration | Search for TeV-scale gravity signatures in final states with leptons and jets with the ATLAS detector at $ \sqrt{s}= $ 7 TeV | PLB 716 (2013) 122 | 1204.4646 |
| 66 | ATLAS Collaboration | Search for microscopic black holes and string balls in final states with leptons and jets with the ATLAS detector at $ \sqrt{s} = $ 8 TeV | JHEP 08 (2014) 103 | 1405.4254 |
| 67 | CMS Collaboration | Search for stealth supersymmetry in events with jets, either photons or leptons, and low missing transverse momentum in pp collisions at 8 TeV | PLB 743 (2015) 503 | CMS-SUS-14-009 1411.7255 |
| 68 | CMS Collaboration | Search for new physics in events with high jet multiplicity and low missing transverse momentum in proton-proton collisions at $ \sqrt{s} = $ 8 TeV | PLB 770 (2017) 257 | CMS-EXO-13-001 1608.01224 |
| 69 | D.-C. Dai et al. | BlackMax: a black-hole event generator with rotation, recoil, split branes, and brane tension | PRD 77 (2008) 076007 | 0711.3012 |
| 70 | C. M. Harris, P. Richardson, and B. R. Webber | CHARYBDIS: a black hole event generator | JHEP 08 (2003) 033 | hep-ph/0307305 |
| 71 | J. A. Frost et al. | Phenomenology of production and decay of spinning extra- dimensional black holes at hadron colliders | JHEP 10 (2009) 014 | 0904.0979 |
| 72 | H. Yoshino and V. S. Rychkov | Improved analysis of black hole formation in high-energy particle collisions | PRD 71 (2005) 104028 | hep-th/0503171 |
| 73 | A. D. Martin, W. J. Stirling, R. S. Thorne, and G. Watt | Parton distributions for the LHC | EPJC 63 (2009) 189 | 0901.0002 |
| 74 | A. D. Martin, W. J. Stirling, R. S. Thorne, and G. Watt | Heavy-quark mass dependence in global PDF analyses and 3- and 4-flavour parton distributions | EPJC 70 (2010) 51 | 1007.2624 |
| 75 | NNPDF Collaboration | Parton distributions with LHC data | NPB 867 (2013) 244 | 1207.1303 |
| 76 | H.-L. Lai et al. | New parton distributions for collider physics | PRD 82 (2010) 074024 | 1007.2241 |
| 77 | J. Alwall et al. | The automated computation of tree-level and next-to-leading order differential cross sections, and their matching to parton shower simulations | JHEP 07 (2014) 079 | 1405.0301 |
| 78 | T. Sjostrand et al. | An introduction to PYTHIA 8.2 | CPC 191 (2015) 159 | 1410.3012 |
| 79 | CMS Collaboration | Event generator tunes obtained from underlying event and multiparton scattering measurements | EPJC 76 (2016) 155 | CMS-GEN-14-001 1512.00815 |
| 80 | GEANT4 Collaboration | $ GEANT4--a $ simulation toolkit | NIMA 506 (2003) 250 | |
| 81 | R. A. Fisher | On the interpretation of $ \chi^2 $ from contingency tables, and the calculation of $ p $ | J. Roy. Stat. Soc. 85 (1922) 87 | |
| 82 | S. Alekhin et al. | The PDF4LHC working group interim report | 1101.0536 | |
| 83 | M. Botje et al. | The PDF4LHC working group interim recommendations | 1101.0538 | |
| 84 | CTEQ Collaboration | Implications of CTEQ global analysis for collider observables | PRD 78 (2008) 013004 | 0802.0007 |
| 85 | CMS Collaboration | CMS luminosity measurements for the 2016 data taking period | CMS-PAS-LUM-17-001 | CMS-PAS-LUM-17-001 |
| 86 | T. Junk | Confidence level computation for combining searches with small statistics | NIMA 434 (1999) 435 | hep-ex/9902006 |
| 87 | A. L. Read | Presentation of search results: the CL$ _s $ technique | JPG 28 (2002) 2693 | |
| 88 | ATLAS and CMS Collaborations | Procedure for the LHC Higgs boson search combination in Summer 2011 | ATL-PHYS-PUB-2011-011, CMS NOTE-2011/005 | |
| 89 | G. Cowan, K. Cranmer, E. Gross, and O. Vitells | Asymptotic formulae for likelihood-based tests of new physics | EPJC 71 (2011) 1554 | 1007.1727 |
|
|
Compact Muon Solenoid LHC, CERN |
|

|

|

|

|

|