

Compact Muon Solenoid
LHC, CERN
| CMS-FSQ-12-033 ; TOTEM-2020-001 ; CERN-EP-2019-260 | ||
| Measurement of single-diffractive dijet production in proton-proton collisions at $\sqrt{s} = $ 8 TeV with the CMS and TOTEM experiments | ||
| CMS Collaboration | ||
| 27 February 2020 | ||
| Eur. Phys. J. C 80 (2020) 1164 [Erratum] | ||
| Abstract: Measurements are presented of the single-diffractive dijet cross section and the diffractive cross section as a function of the proton fractional momentum loss $\xi$ and the four-momentum transfer squared $t$. Both processes ${\mathrm{p}}{\mathrm{p}} \to {\mathrm{p}}\mathrm{X}$ and ${\mathrm{p}}{\mathrm{p}} \to \mathrm{X}{\mathrm{p}}$, ie with the proton scattering to either side of the interaction point, are measured, where $\mathrm{X}$ includes at least two jets; the results of the two processes are averaged. The analyses are based on data collected simultaneously with the CMS and TOTEM detectors at the LHC in proton-proton collisions at $\sqrt{s} = $ 8 TeV during a dedicated run with $\beta^{\ast} = $ 90 m at low instantaneous luminosity and correspond to an integrated luminosity of 37.5 nb$^{-1}$ . The single-diffractive dijet cross section $\sigma^{{\mathrm{p}}\mathrm{X}}_{\mathrm{jj}}$, in the kinematic region $\xi < $ 0.1, 0.03 $ < |t| < $ 1 GeV$^2$, with at least two jets with transverse momentum ${p_{\mathrm{T}}} > $ 40 GeV, and pseudorapidity $|{\eta}| < $ 4.4, is 21.7 $\pm$ 0.9 (stat) $^{+3.0}_{-3.3}$ (syst) $\pm$ 0.9 (lumi) nb. The ratio of the single-diffractive to inclusive dijet yields, normalised per unit of $\xi$, is presented as a function of $x$, the longitudinal momentum fraction of the proton carried by the struck parton. The ratio in the kinematic region defined above, for $x$ values in the range $-2.9 \leq \log_{10} x \leq -1.6$, is $R = (\sigma^{{\mathrm{p}}\mathrm{X}}_{\mathrm{jj}}/\Delta\xi)/\sigma_{\mathrm{jj}} = $ 0.025 $\pm$ 0.001 (stat) $\pm$ 0.003 (syst), where $\sigma^{{\mathrm{p}}\mathrm{X}}_{\mathrm{jj}}$ and $\sigma_{\mathrm{jj}}$ are the single-diffractive and inclusive dijet cross sections, respectively. The results are compared with predictions from models of diffractive and nondiffractive interactions. Monte Carlo predictions based on the HERA diffractive parton distribution functions agree well with the data when corrected for the effect of soft rescattering between the spectator partons. We dedicate this paper to the memory of our colleague and friend Sasha Proskuryakov, who started this analysis but passed away before it was completed. His contribution to the study of diffractive processes at CMS is invaluable. | ||
| Links: e-print arXiv:2002.12146 [hep-ex] (PDF) ; CDS record ; inSPIRE record ; HepData record ; CADI line (restricted) ; | ||
| Figures | |
png pdf |
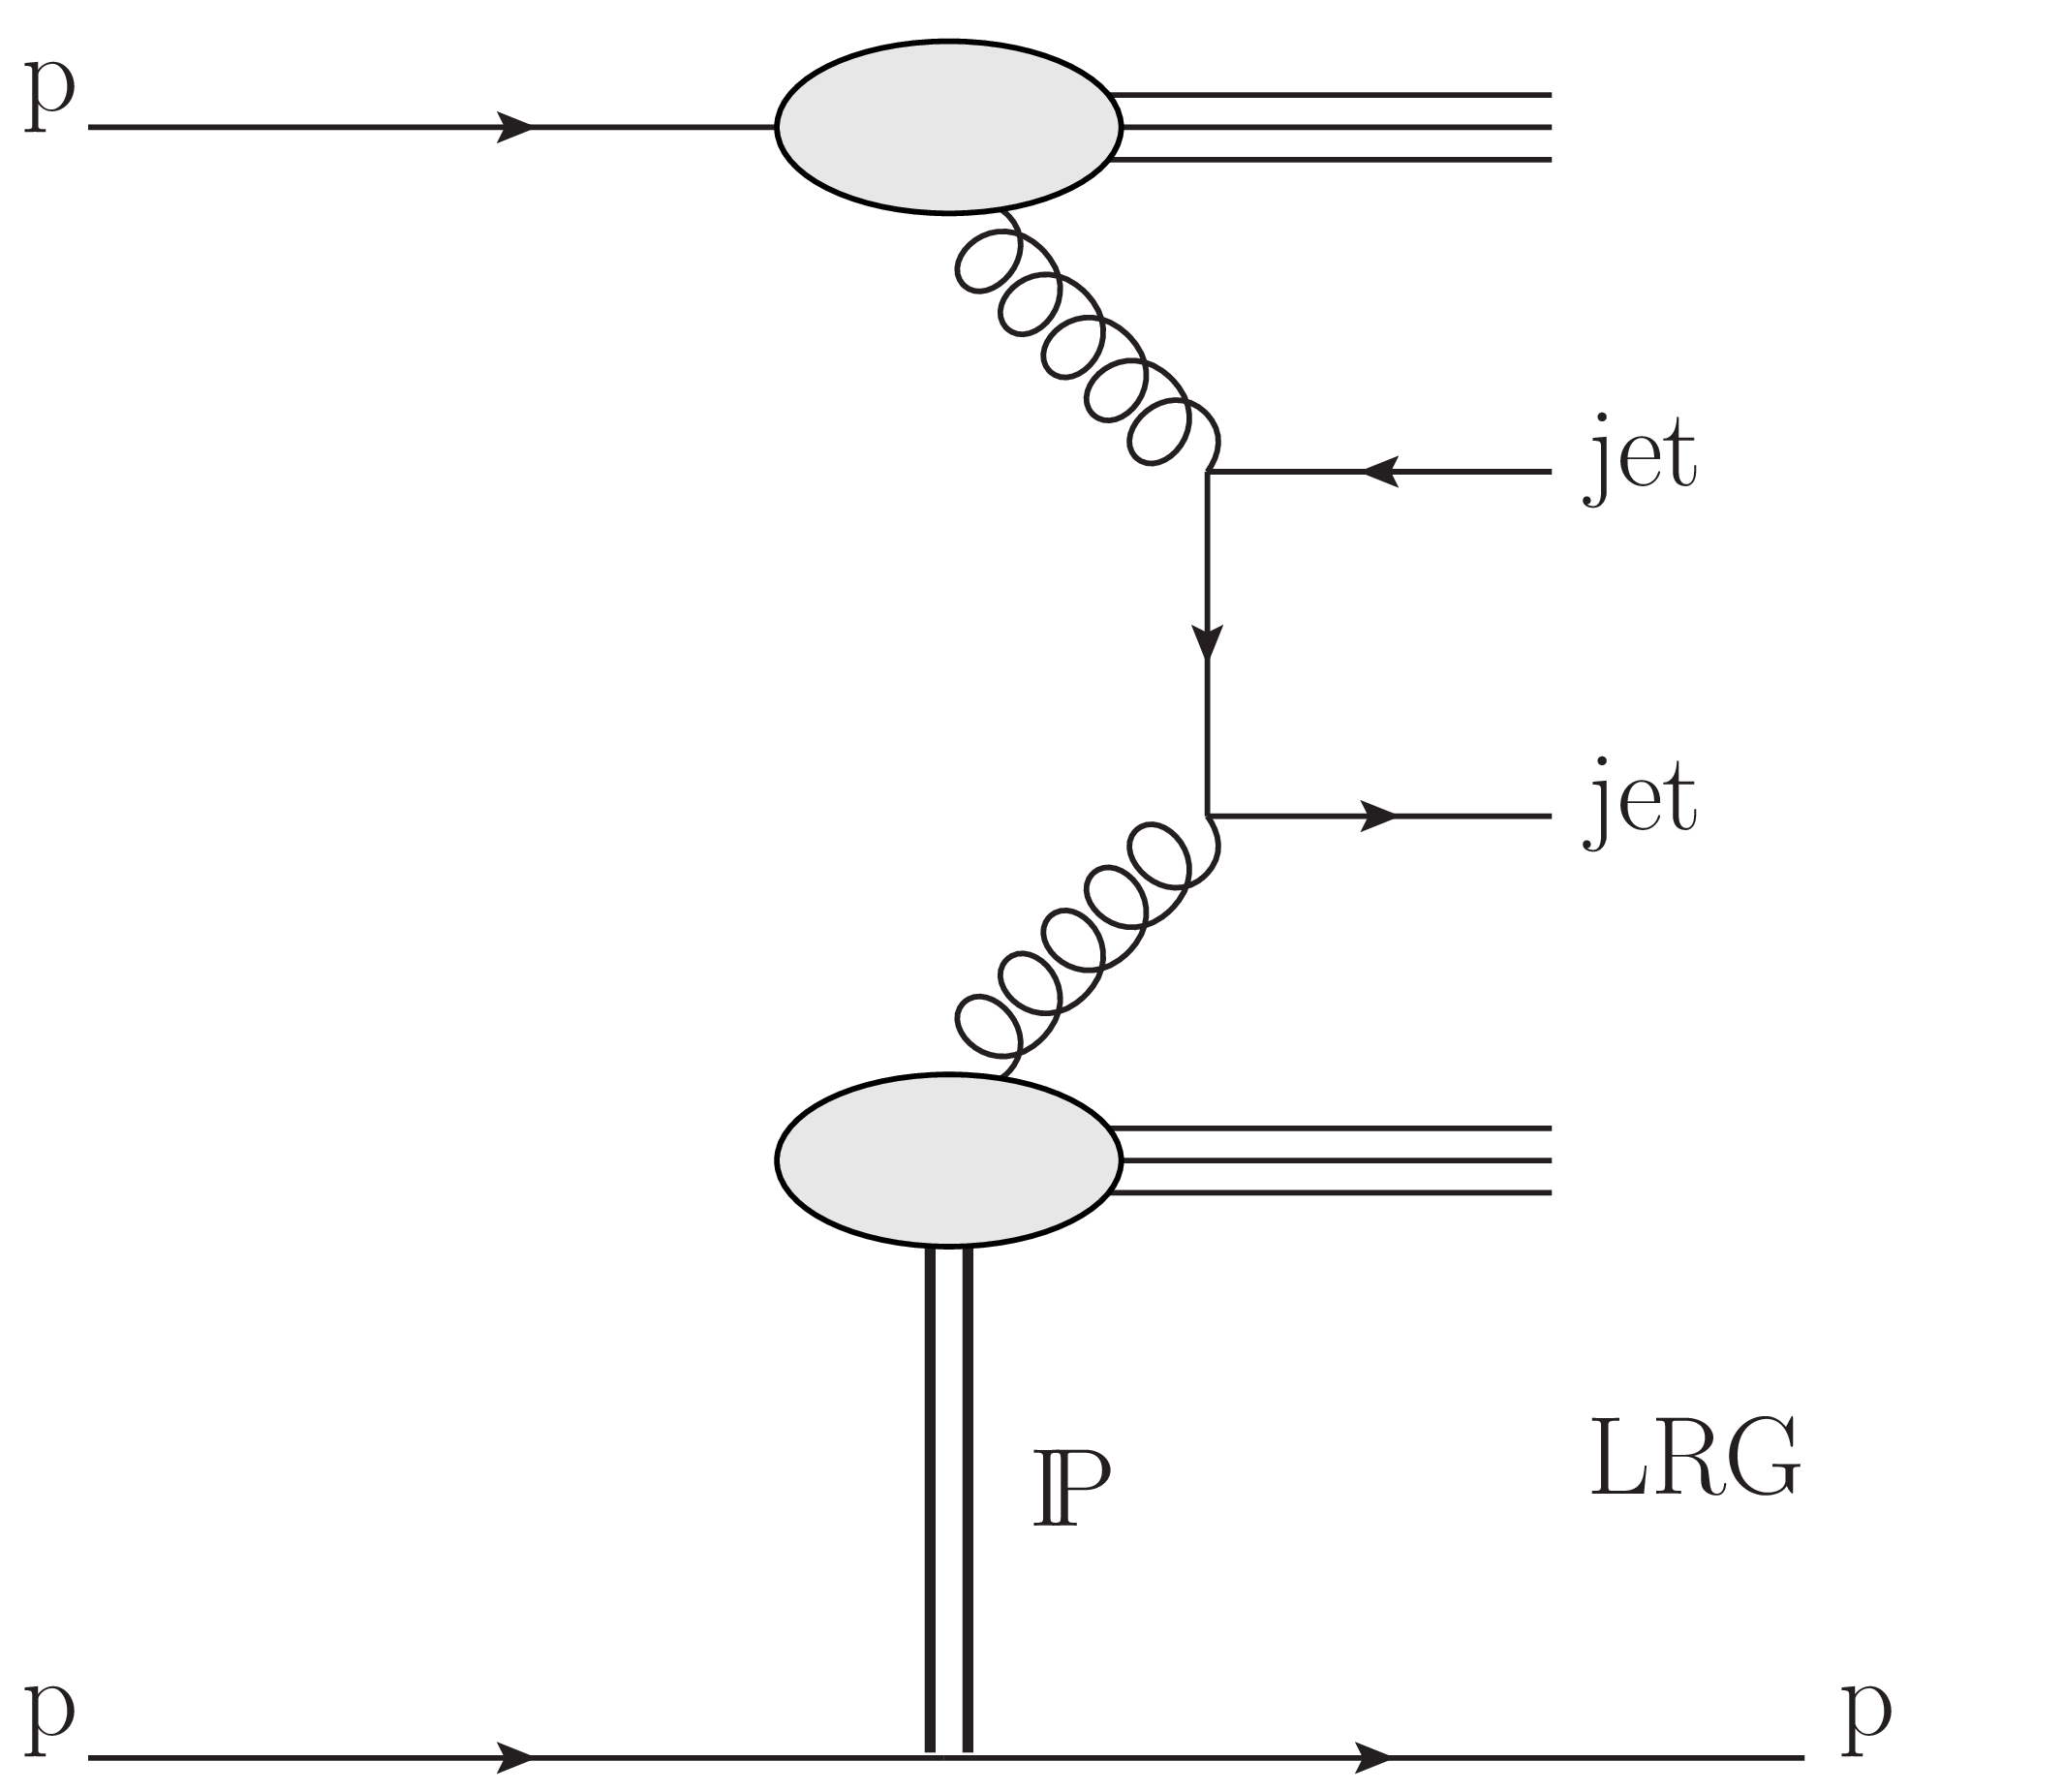
Figure 1:
Schematic diagram of single-diffractive dijet production. The exchange of a virtual object with the vacuum quantum numbers (i.e. a Pomeron) is indicated by the symbol P. The diagram shows an example of the $\mathrm{g} \mathrm{g} \to \text {dijet}$ hard scattering process; the $\mathrm{q} \mathrm{q} $ and $\mathrm{g} \mathrm{q} $ initial states also contribute. |

png pdf |
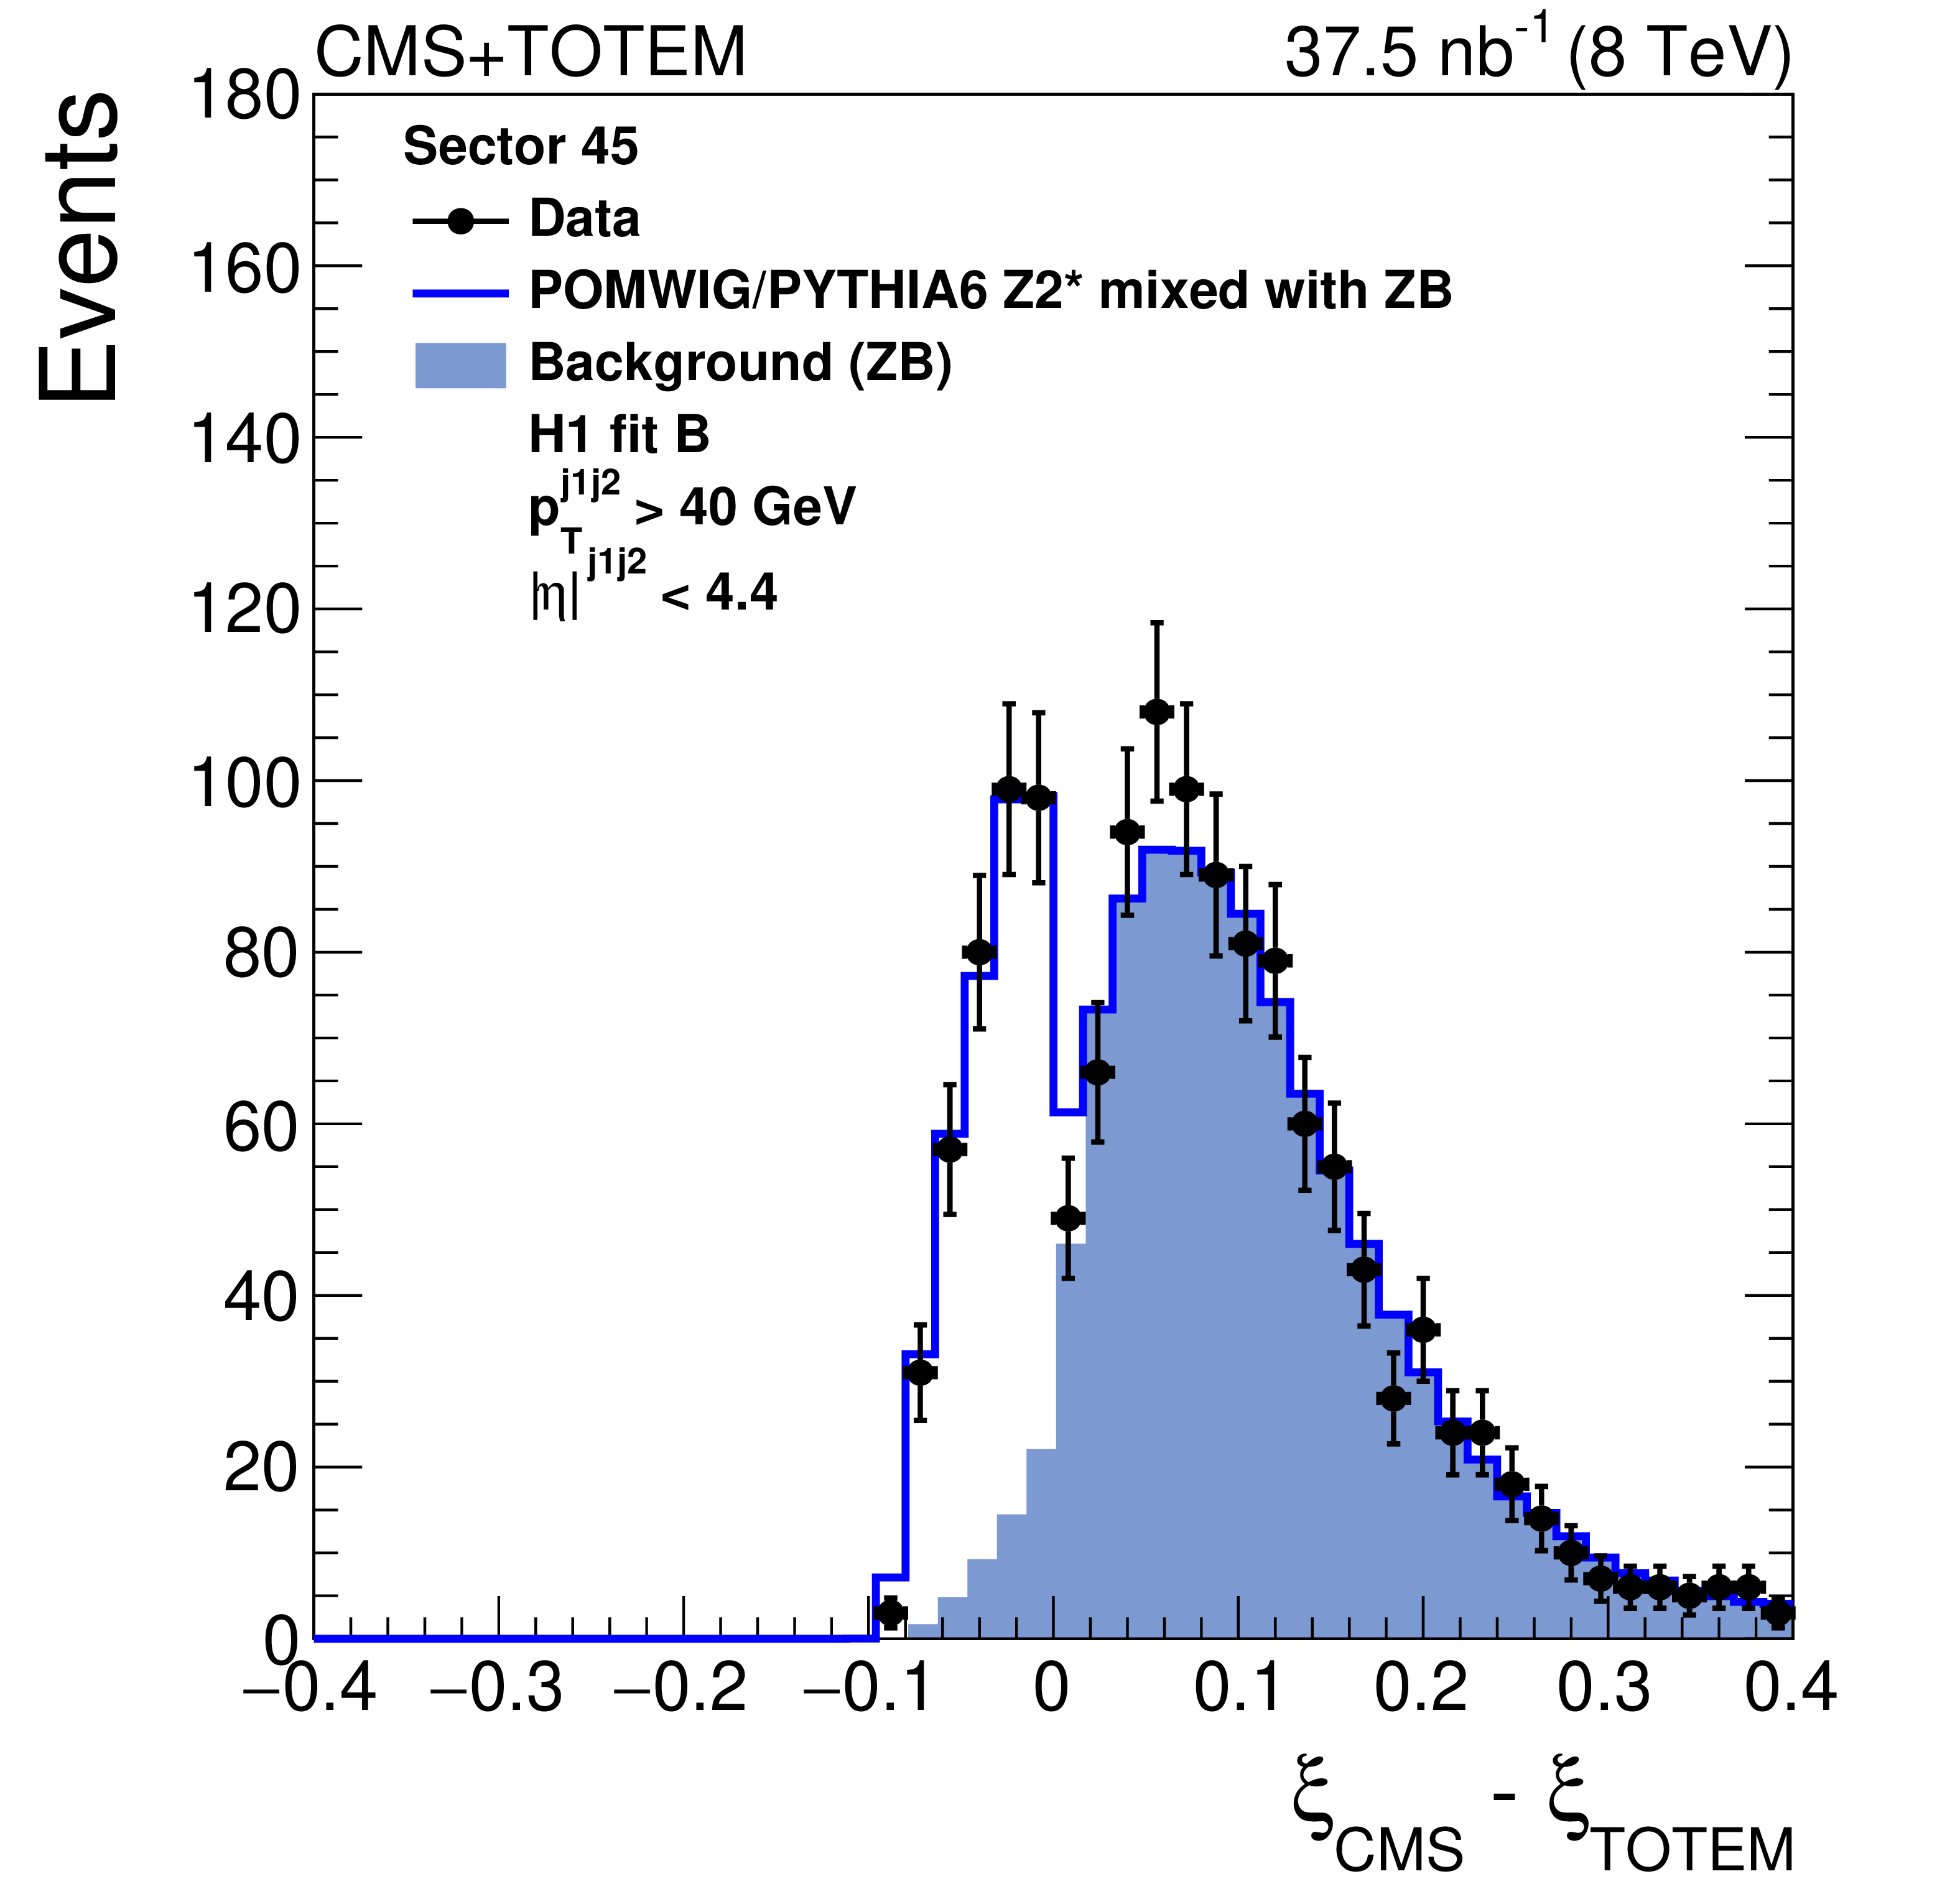
Figure 2:
Distribution of $\xi _{\text {CMS}} - \xi _{\text {TOTEM}}$ for events with a reconstructed proton in sector 45 (left) and sector 56 (right). The data are indicated by solid circles. The blue histogram is the mixture of POMWIG or PYTHIA6 and zero bias (ZB) data events described in the text. An event with a proton measured in the RPs contributes to the open histogram (signal) if the proton originates from the MC sample, or to the filled histogram (background) if it originates from the ZB sample. |
png pdf |
Figure 2-a:
Distribution of $\xi _{\text {CMS}} - \xi _{\text {TOTEM}}$ for events with a reconstructed proton in sector 45. The data are indicated by solid circles. The blue histogram is the mixture of POMWIG or PYTHIA6 and zero bias (ZB) data events described in the text. An event with a proton measured in the RPs contributes to the open histogram (signal) if the proton originates from the MC sample, or to the filled histogram (background) if it originates from the ZB sample. |

png pdf |
Figure 2-b:
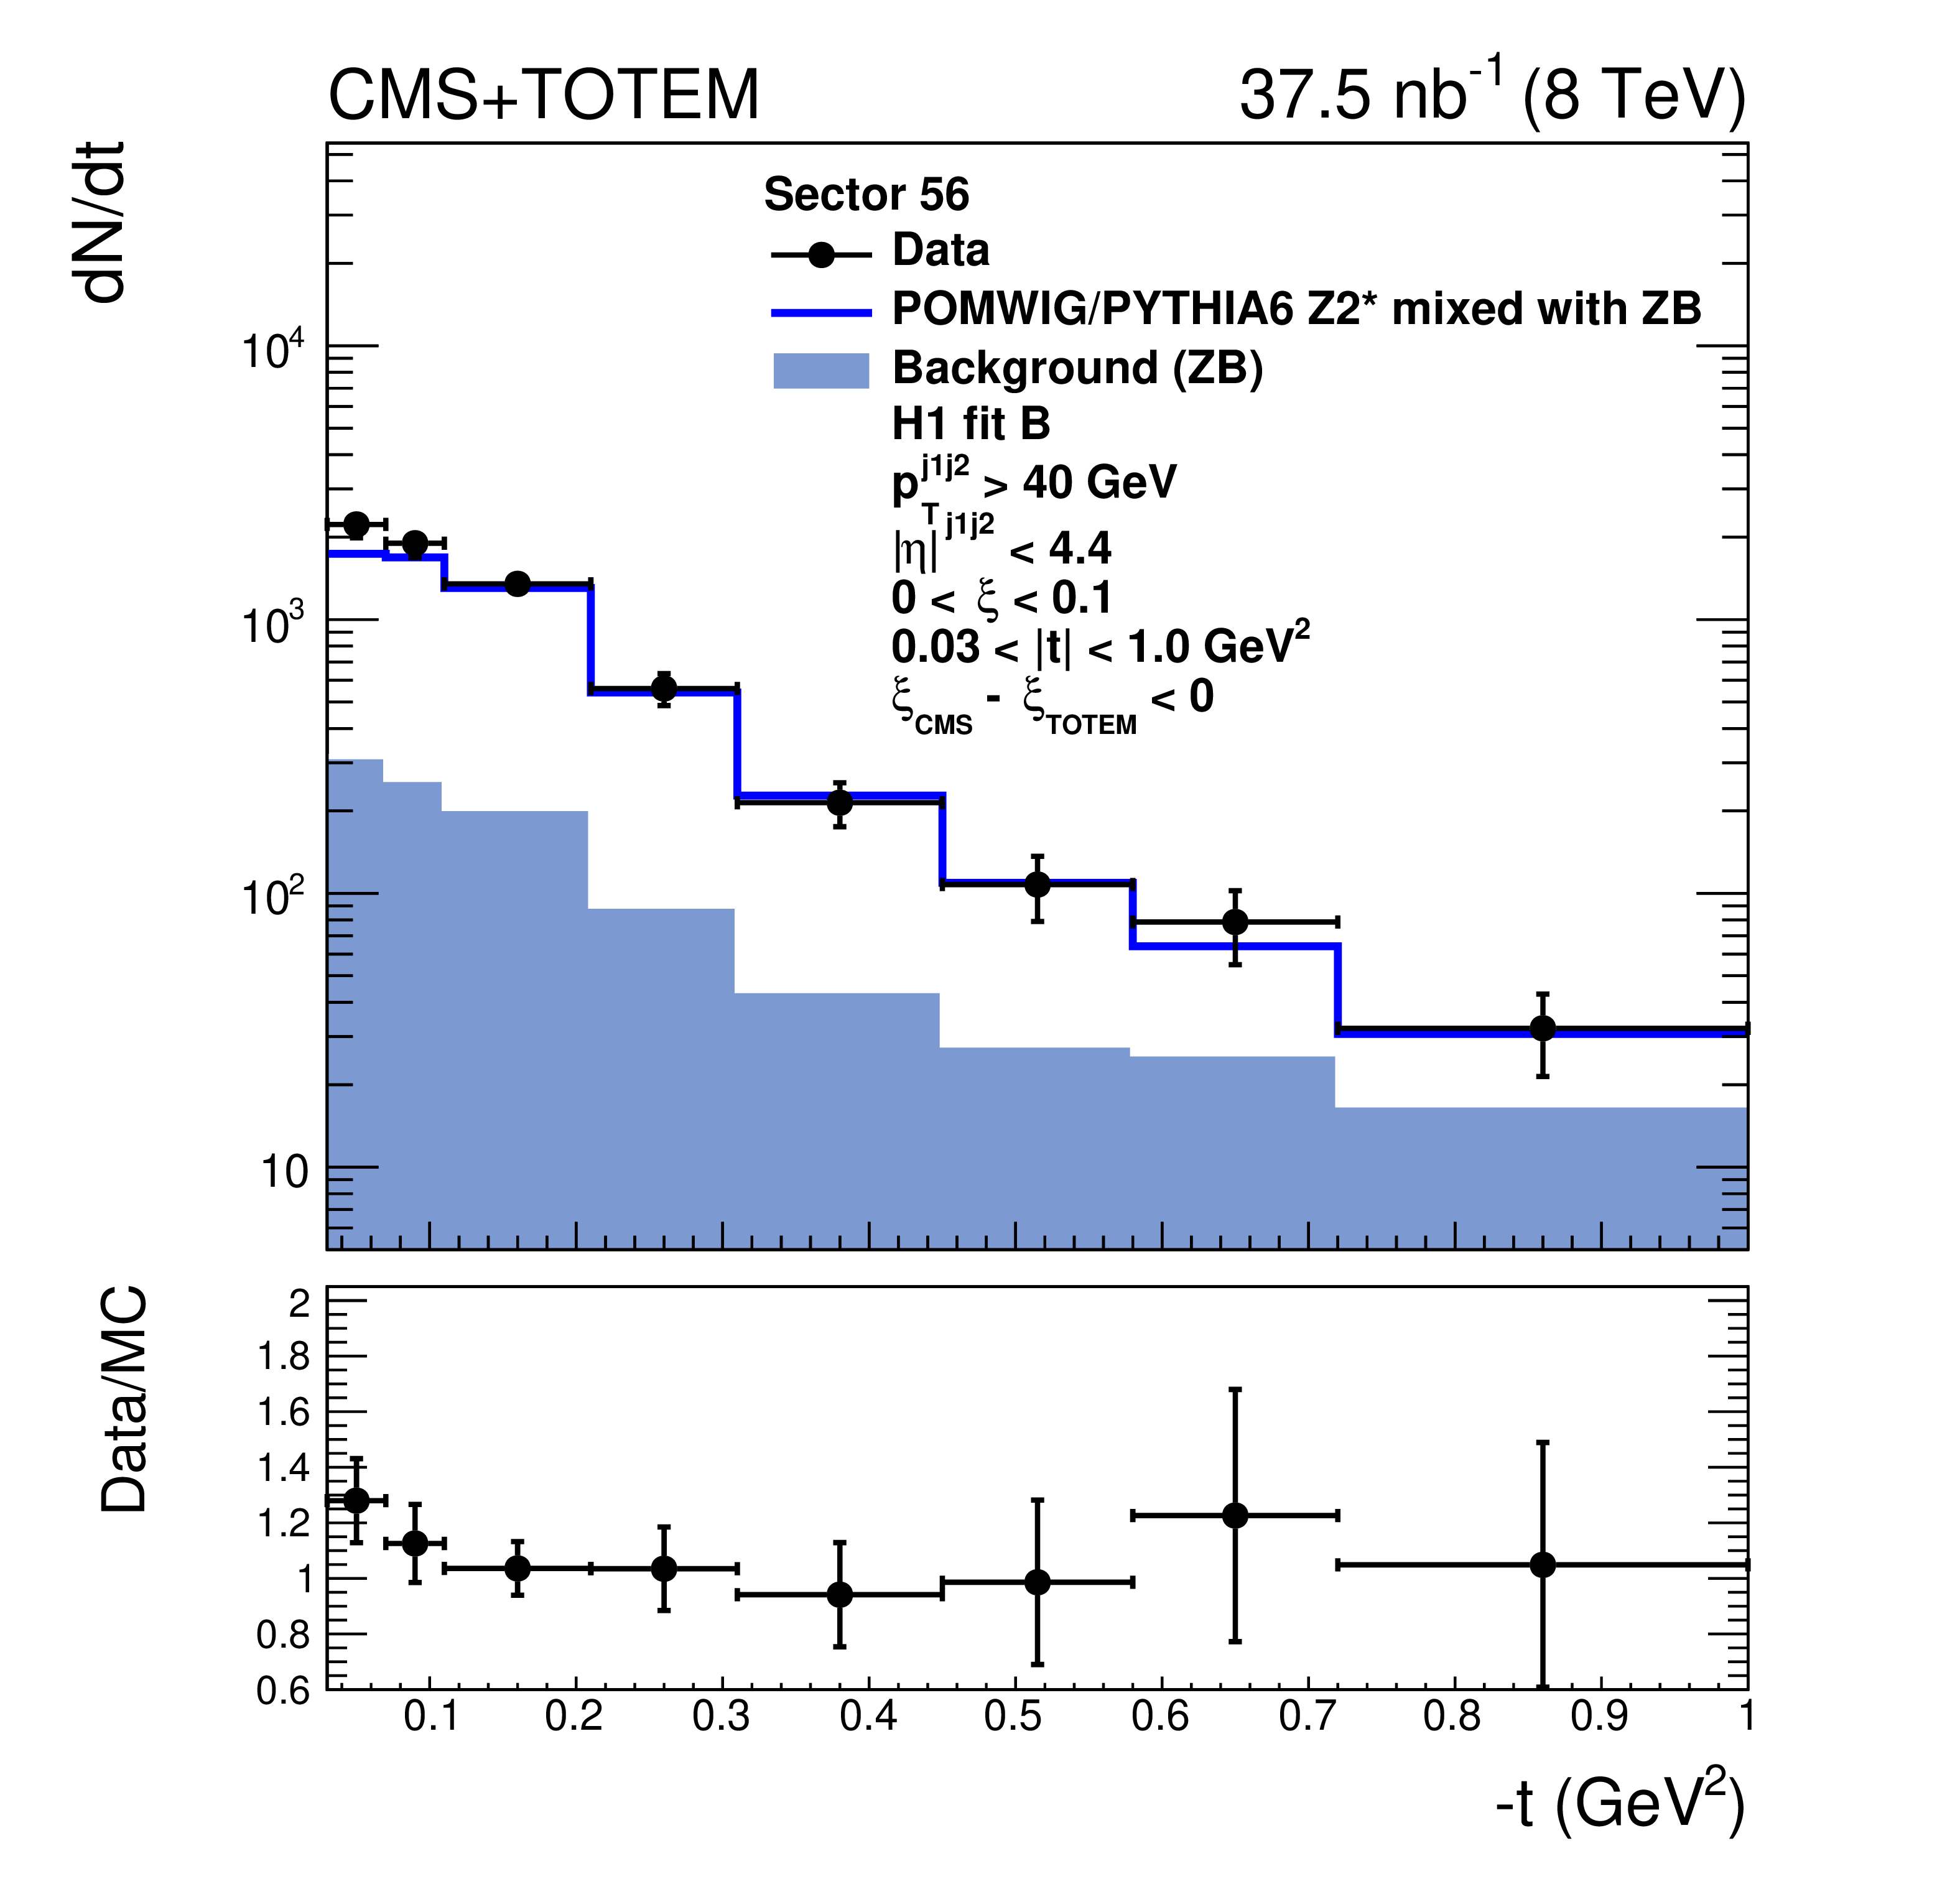
Distribution of $\xi _{\text {CMS}} - \xi _{\text {TOTEM}}$ for events with a reconstructed proton in sector 56. The data are indicated by solid circles. The blue histogram is the mixture of POMWIG or PYTHIA6 and zero bias (ZB) data events described in the text. An event with a proton measured in the RPs contributes to the open histogram (signal) if the proton originates from the MC sample, or to the filled histogram (background) if it originates from the ZB sample. |
png pdf |
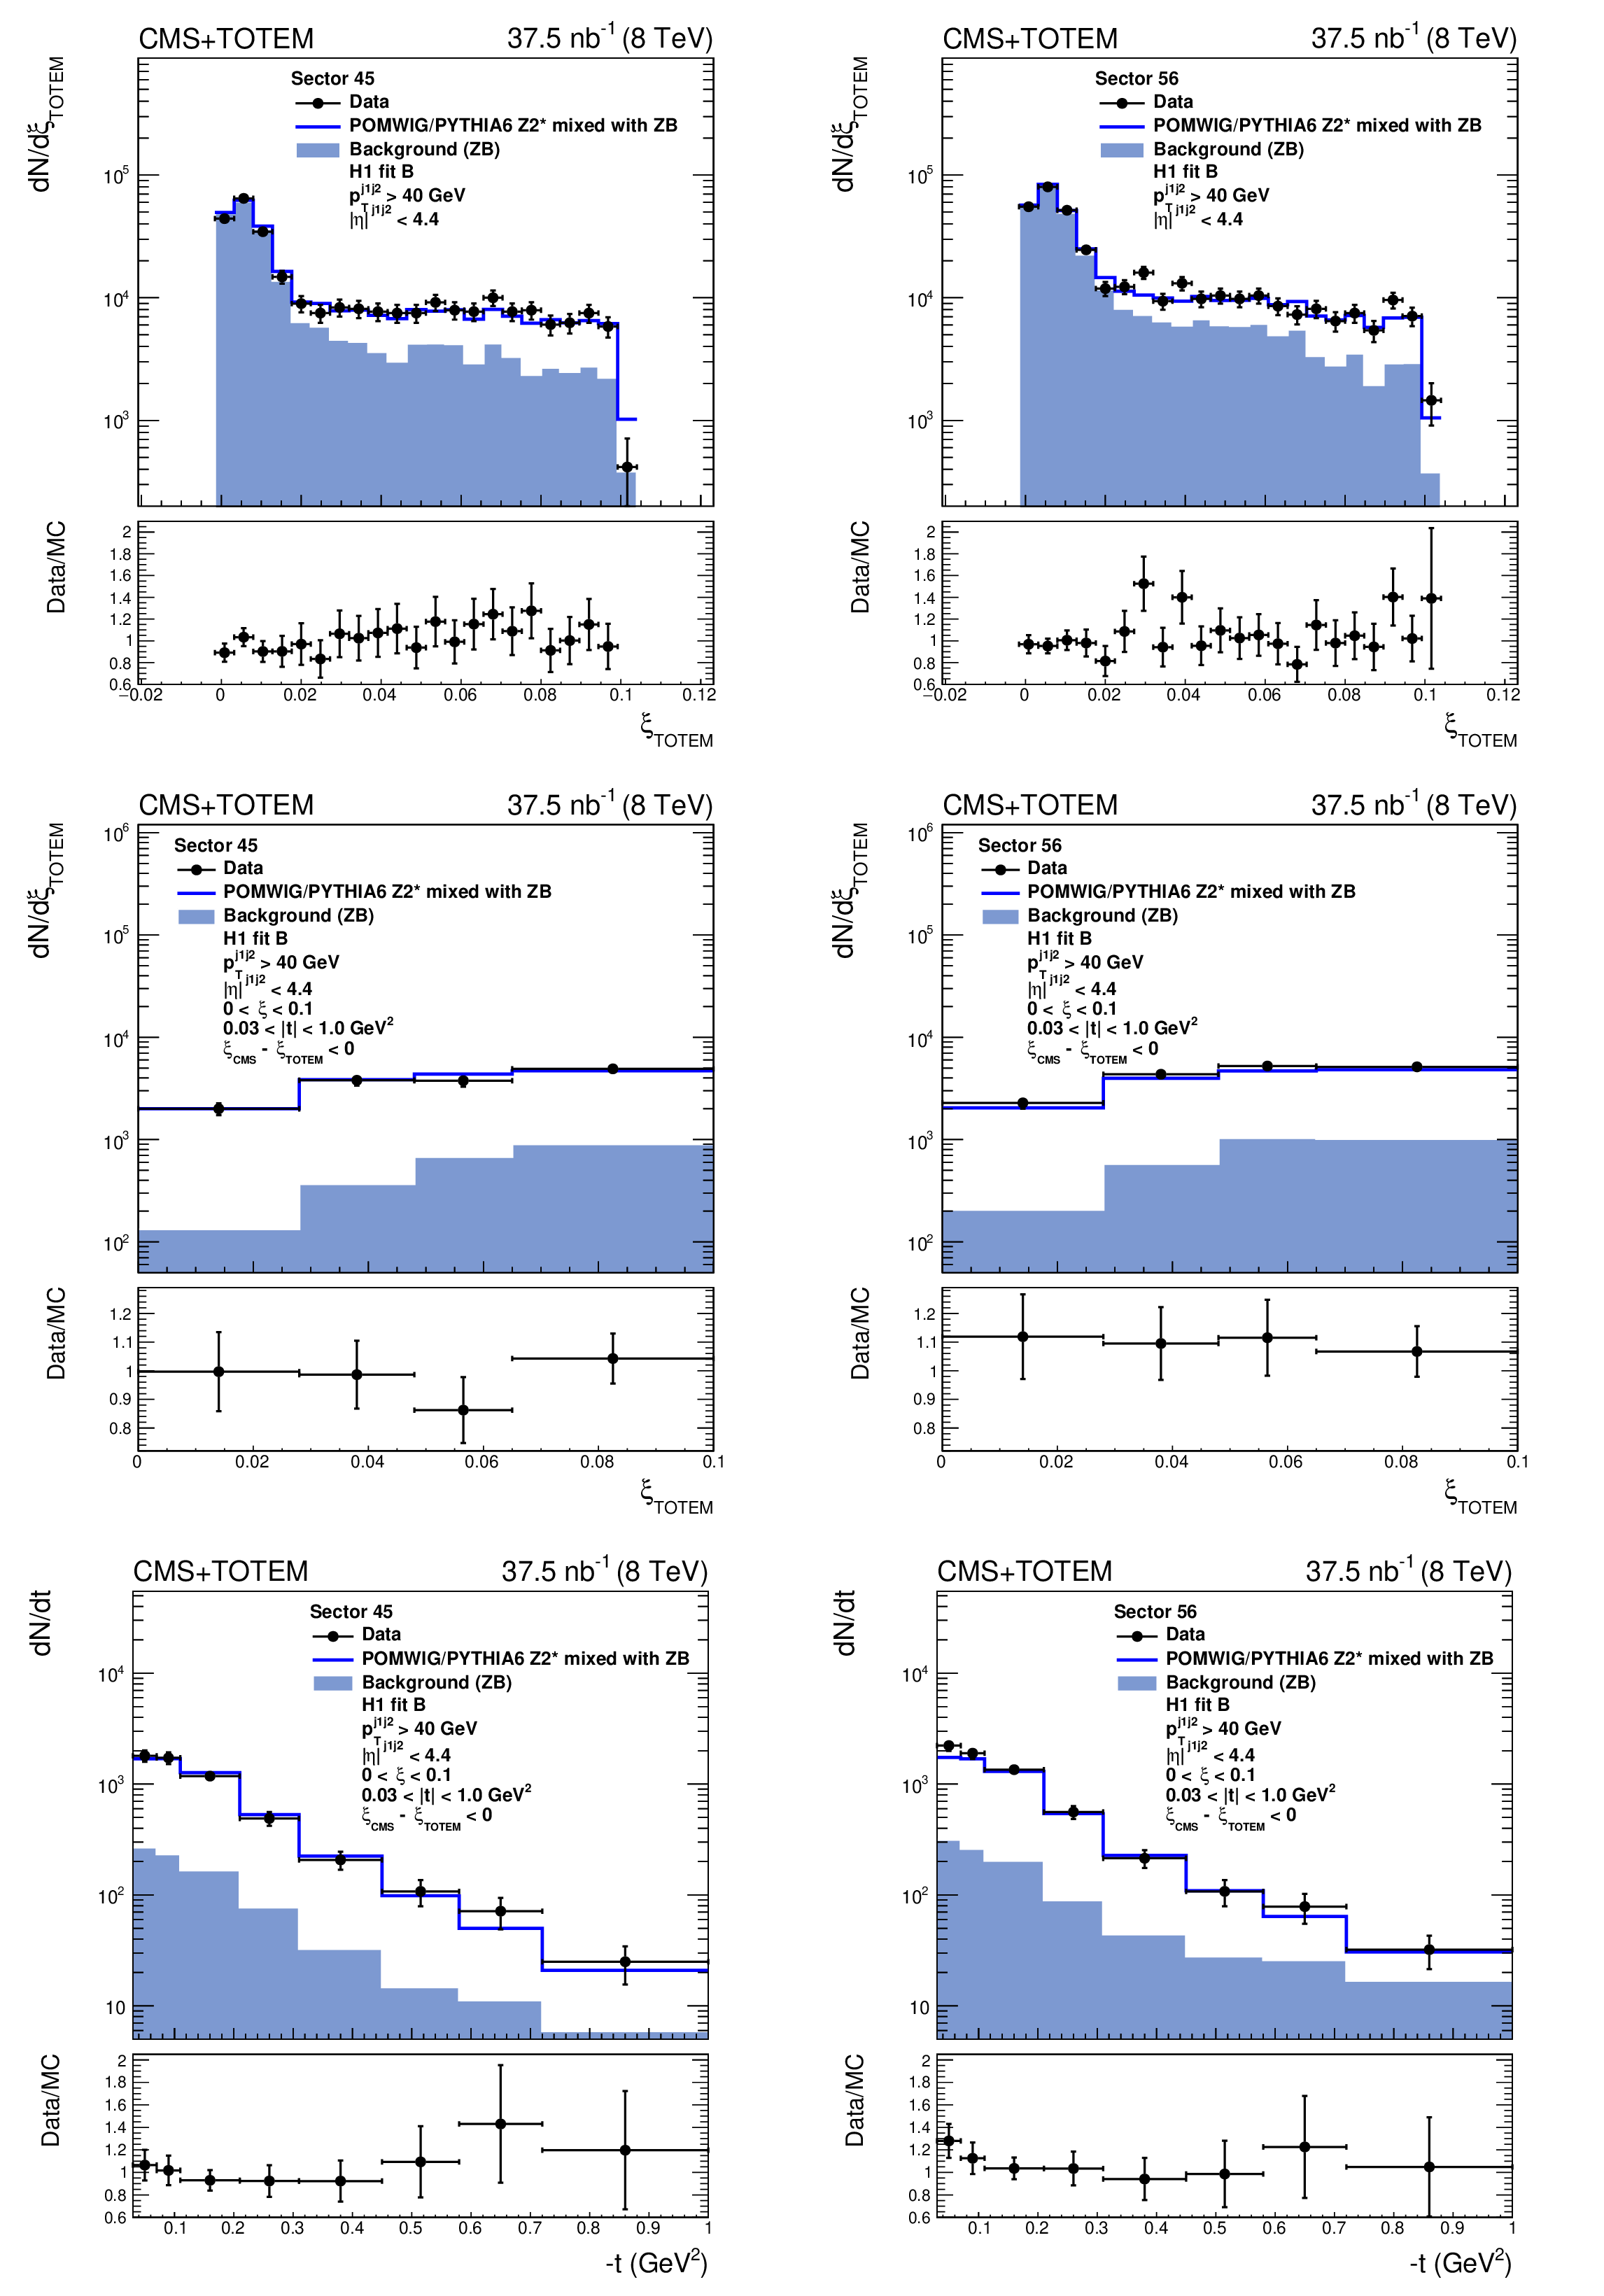
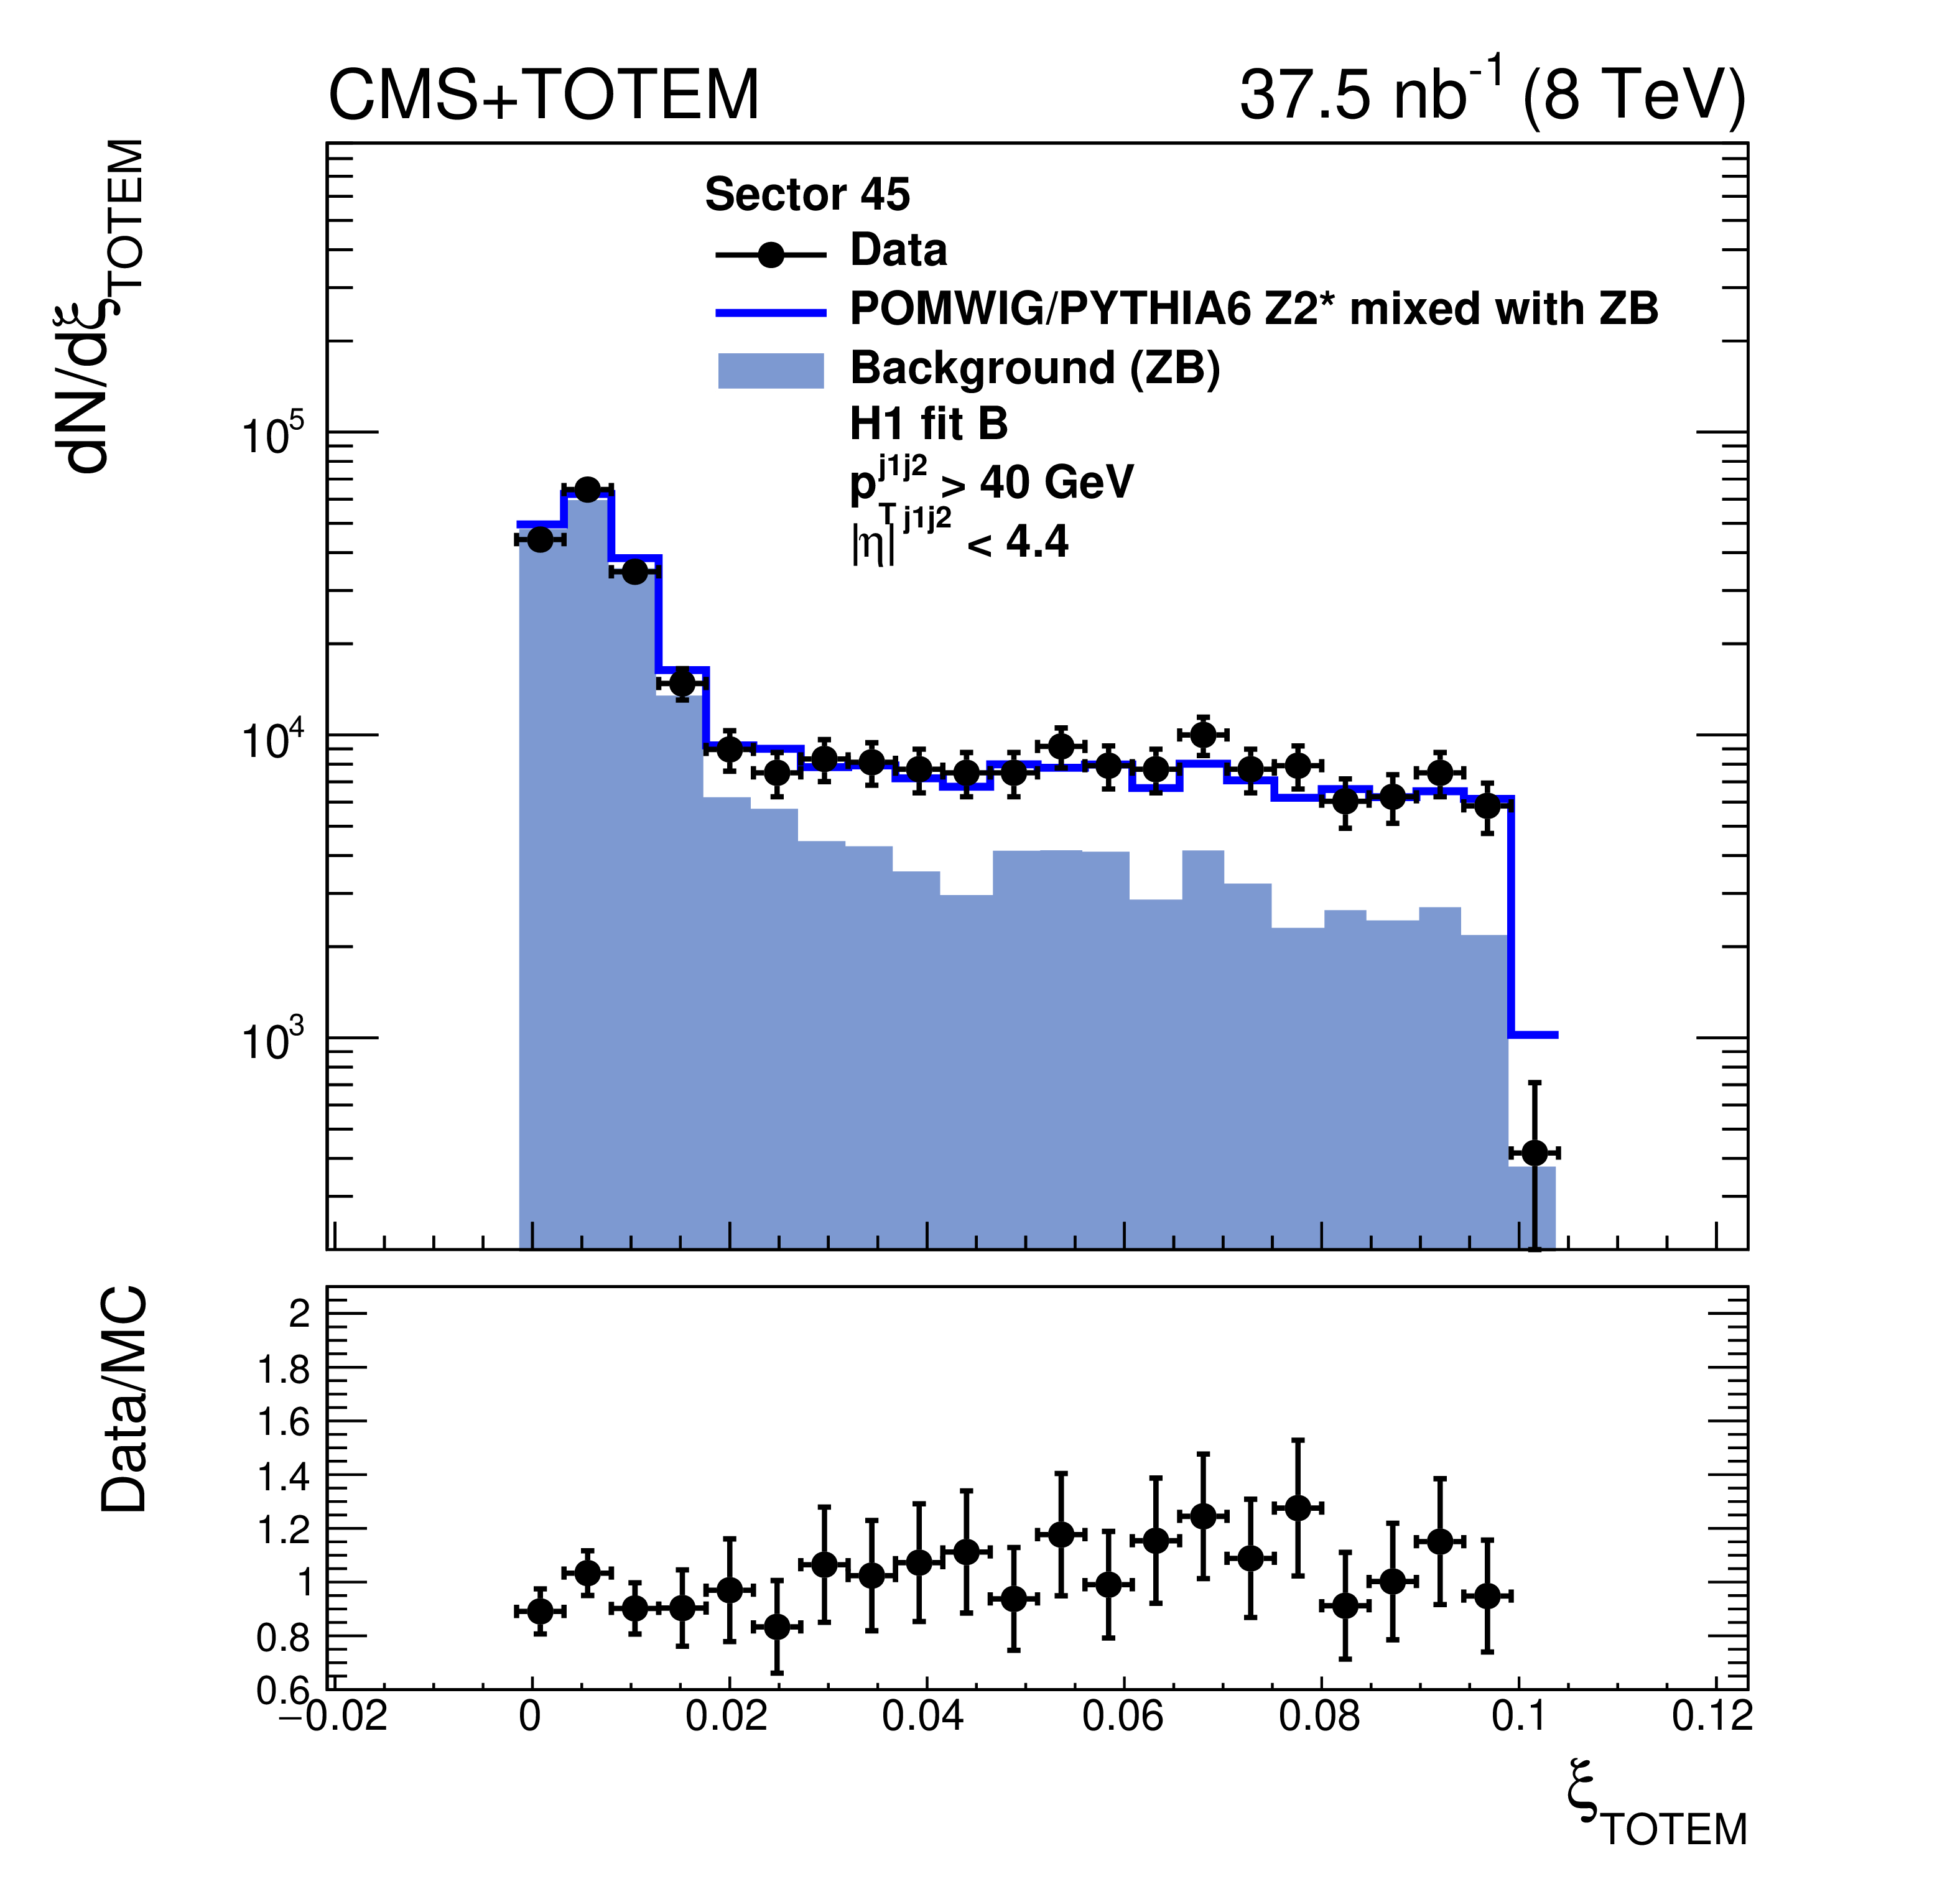
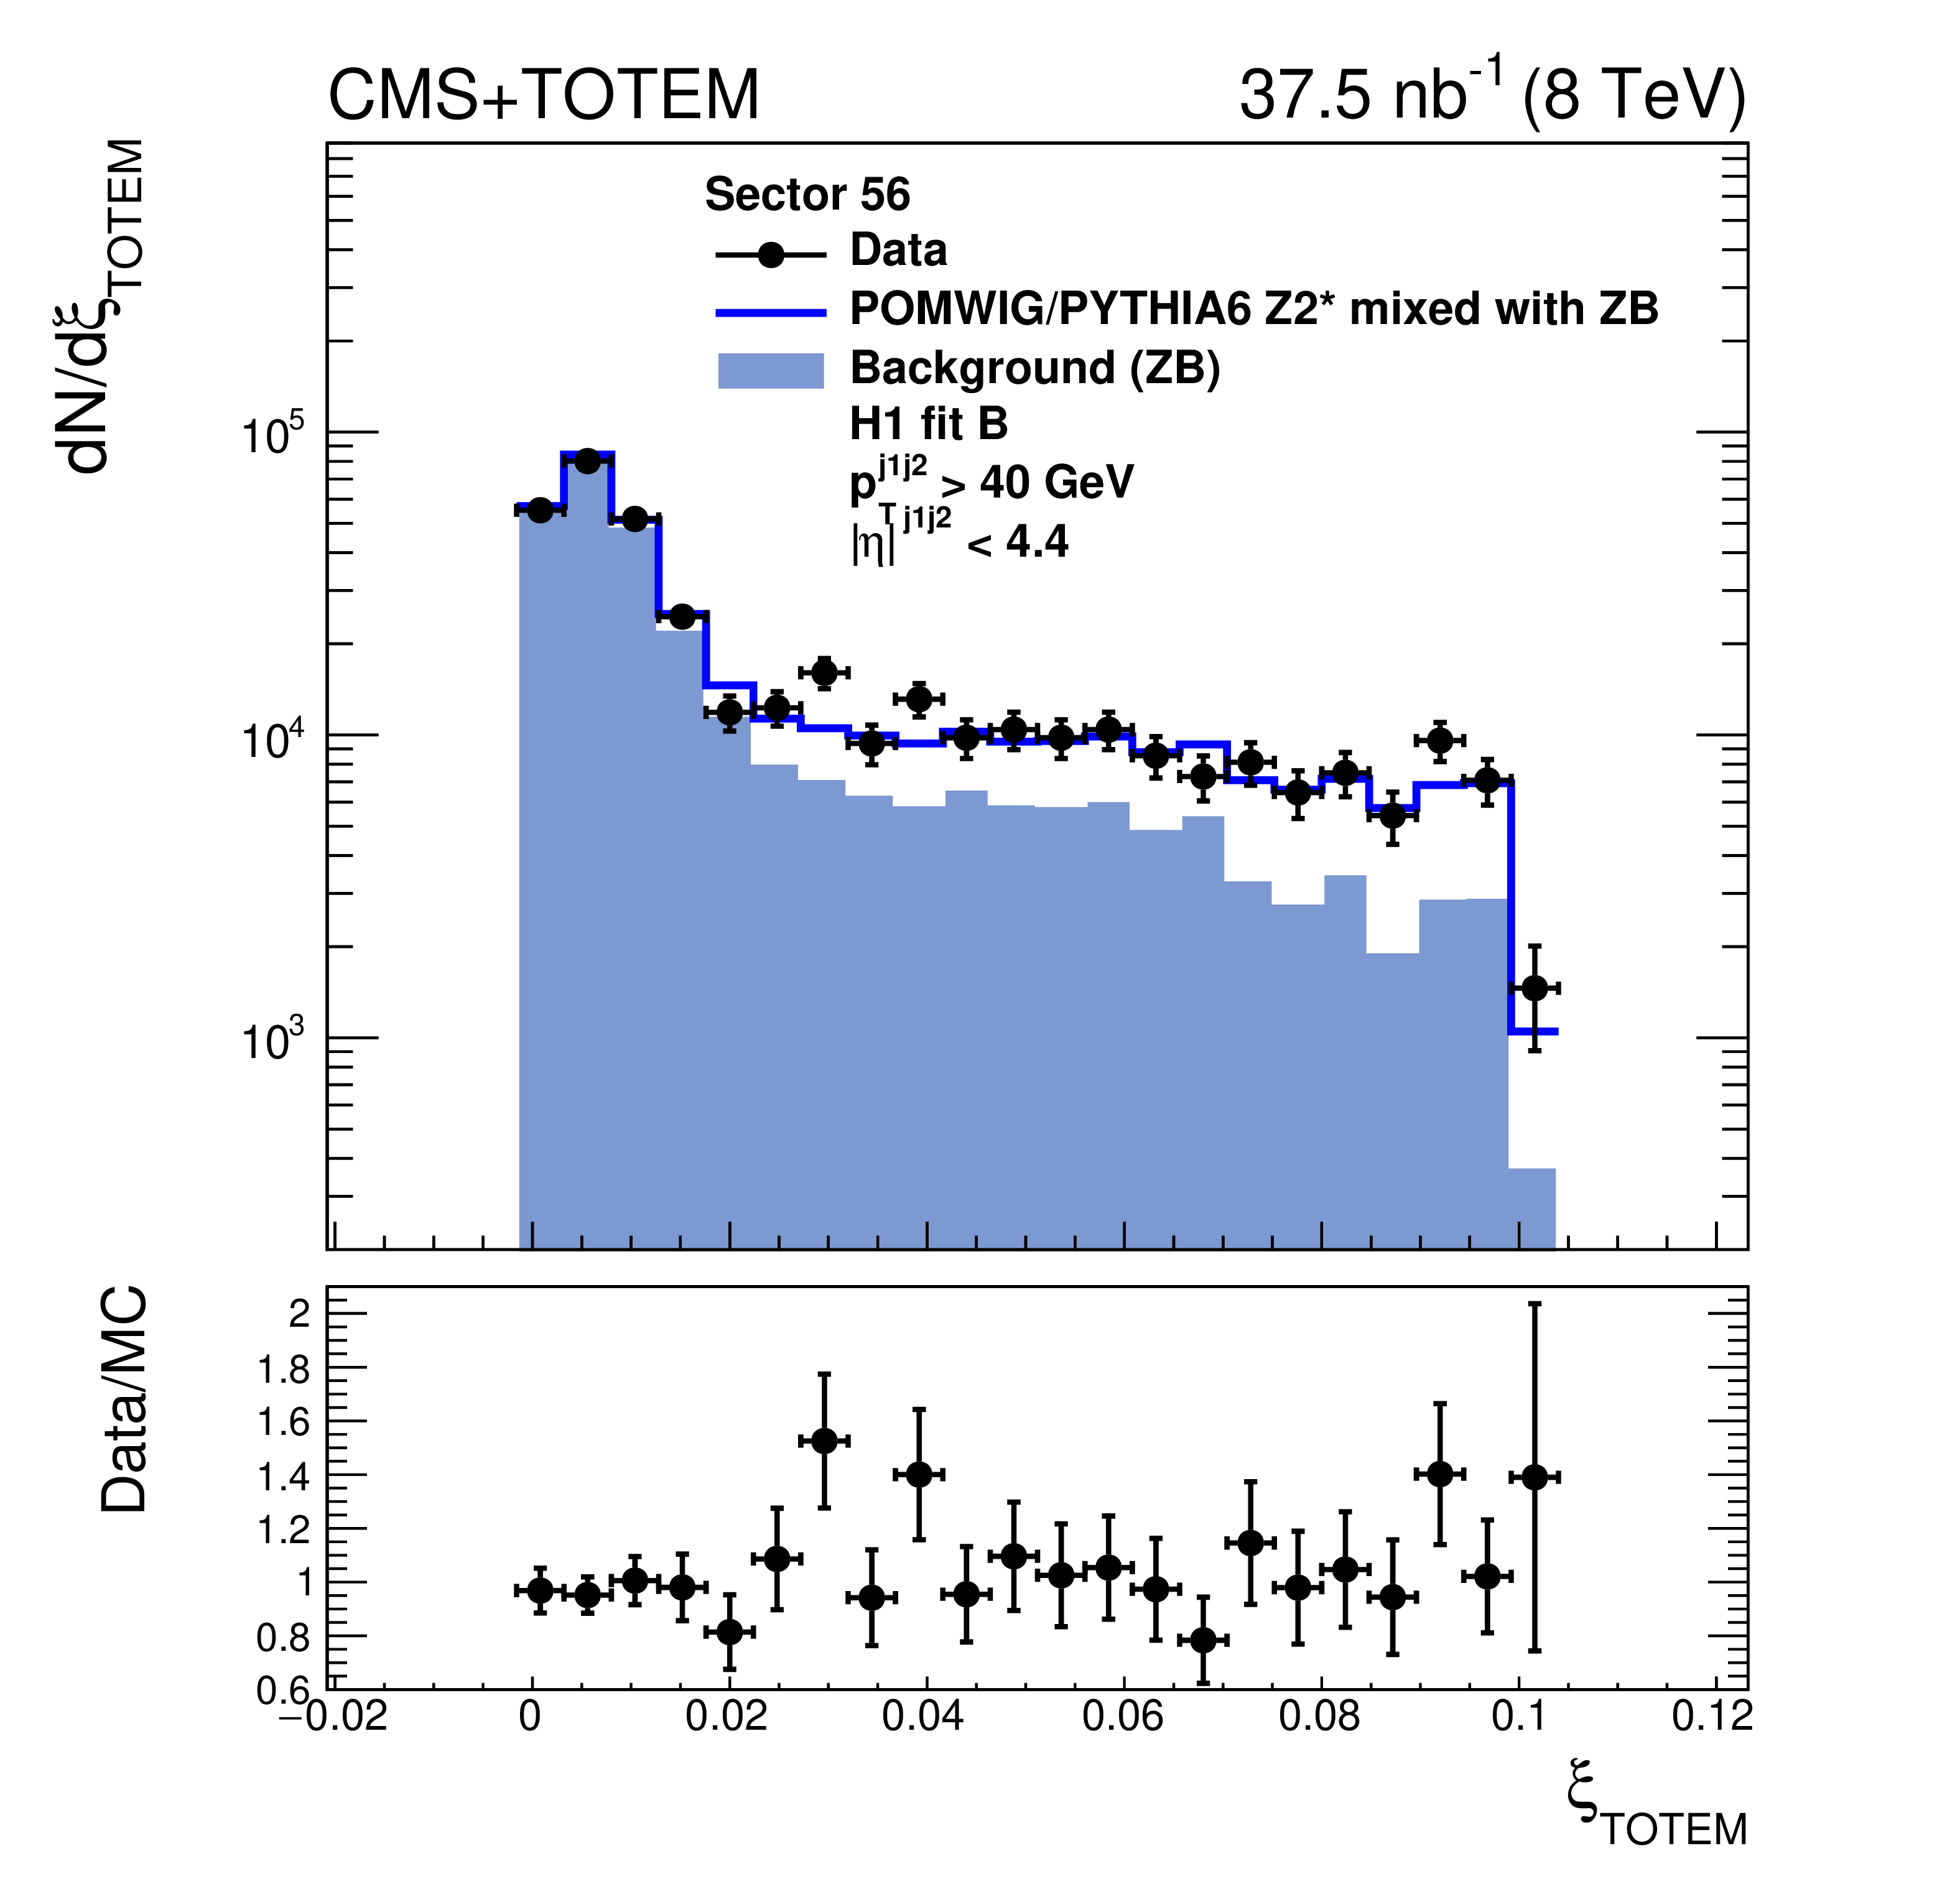
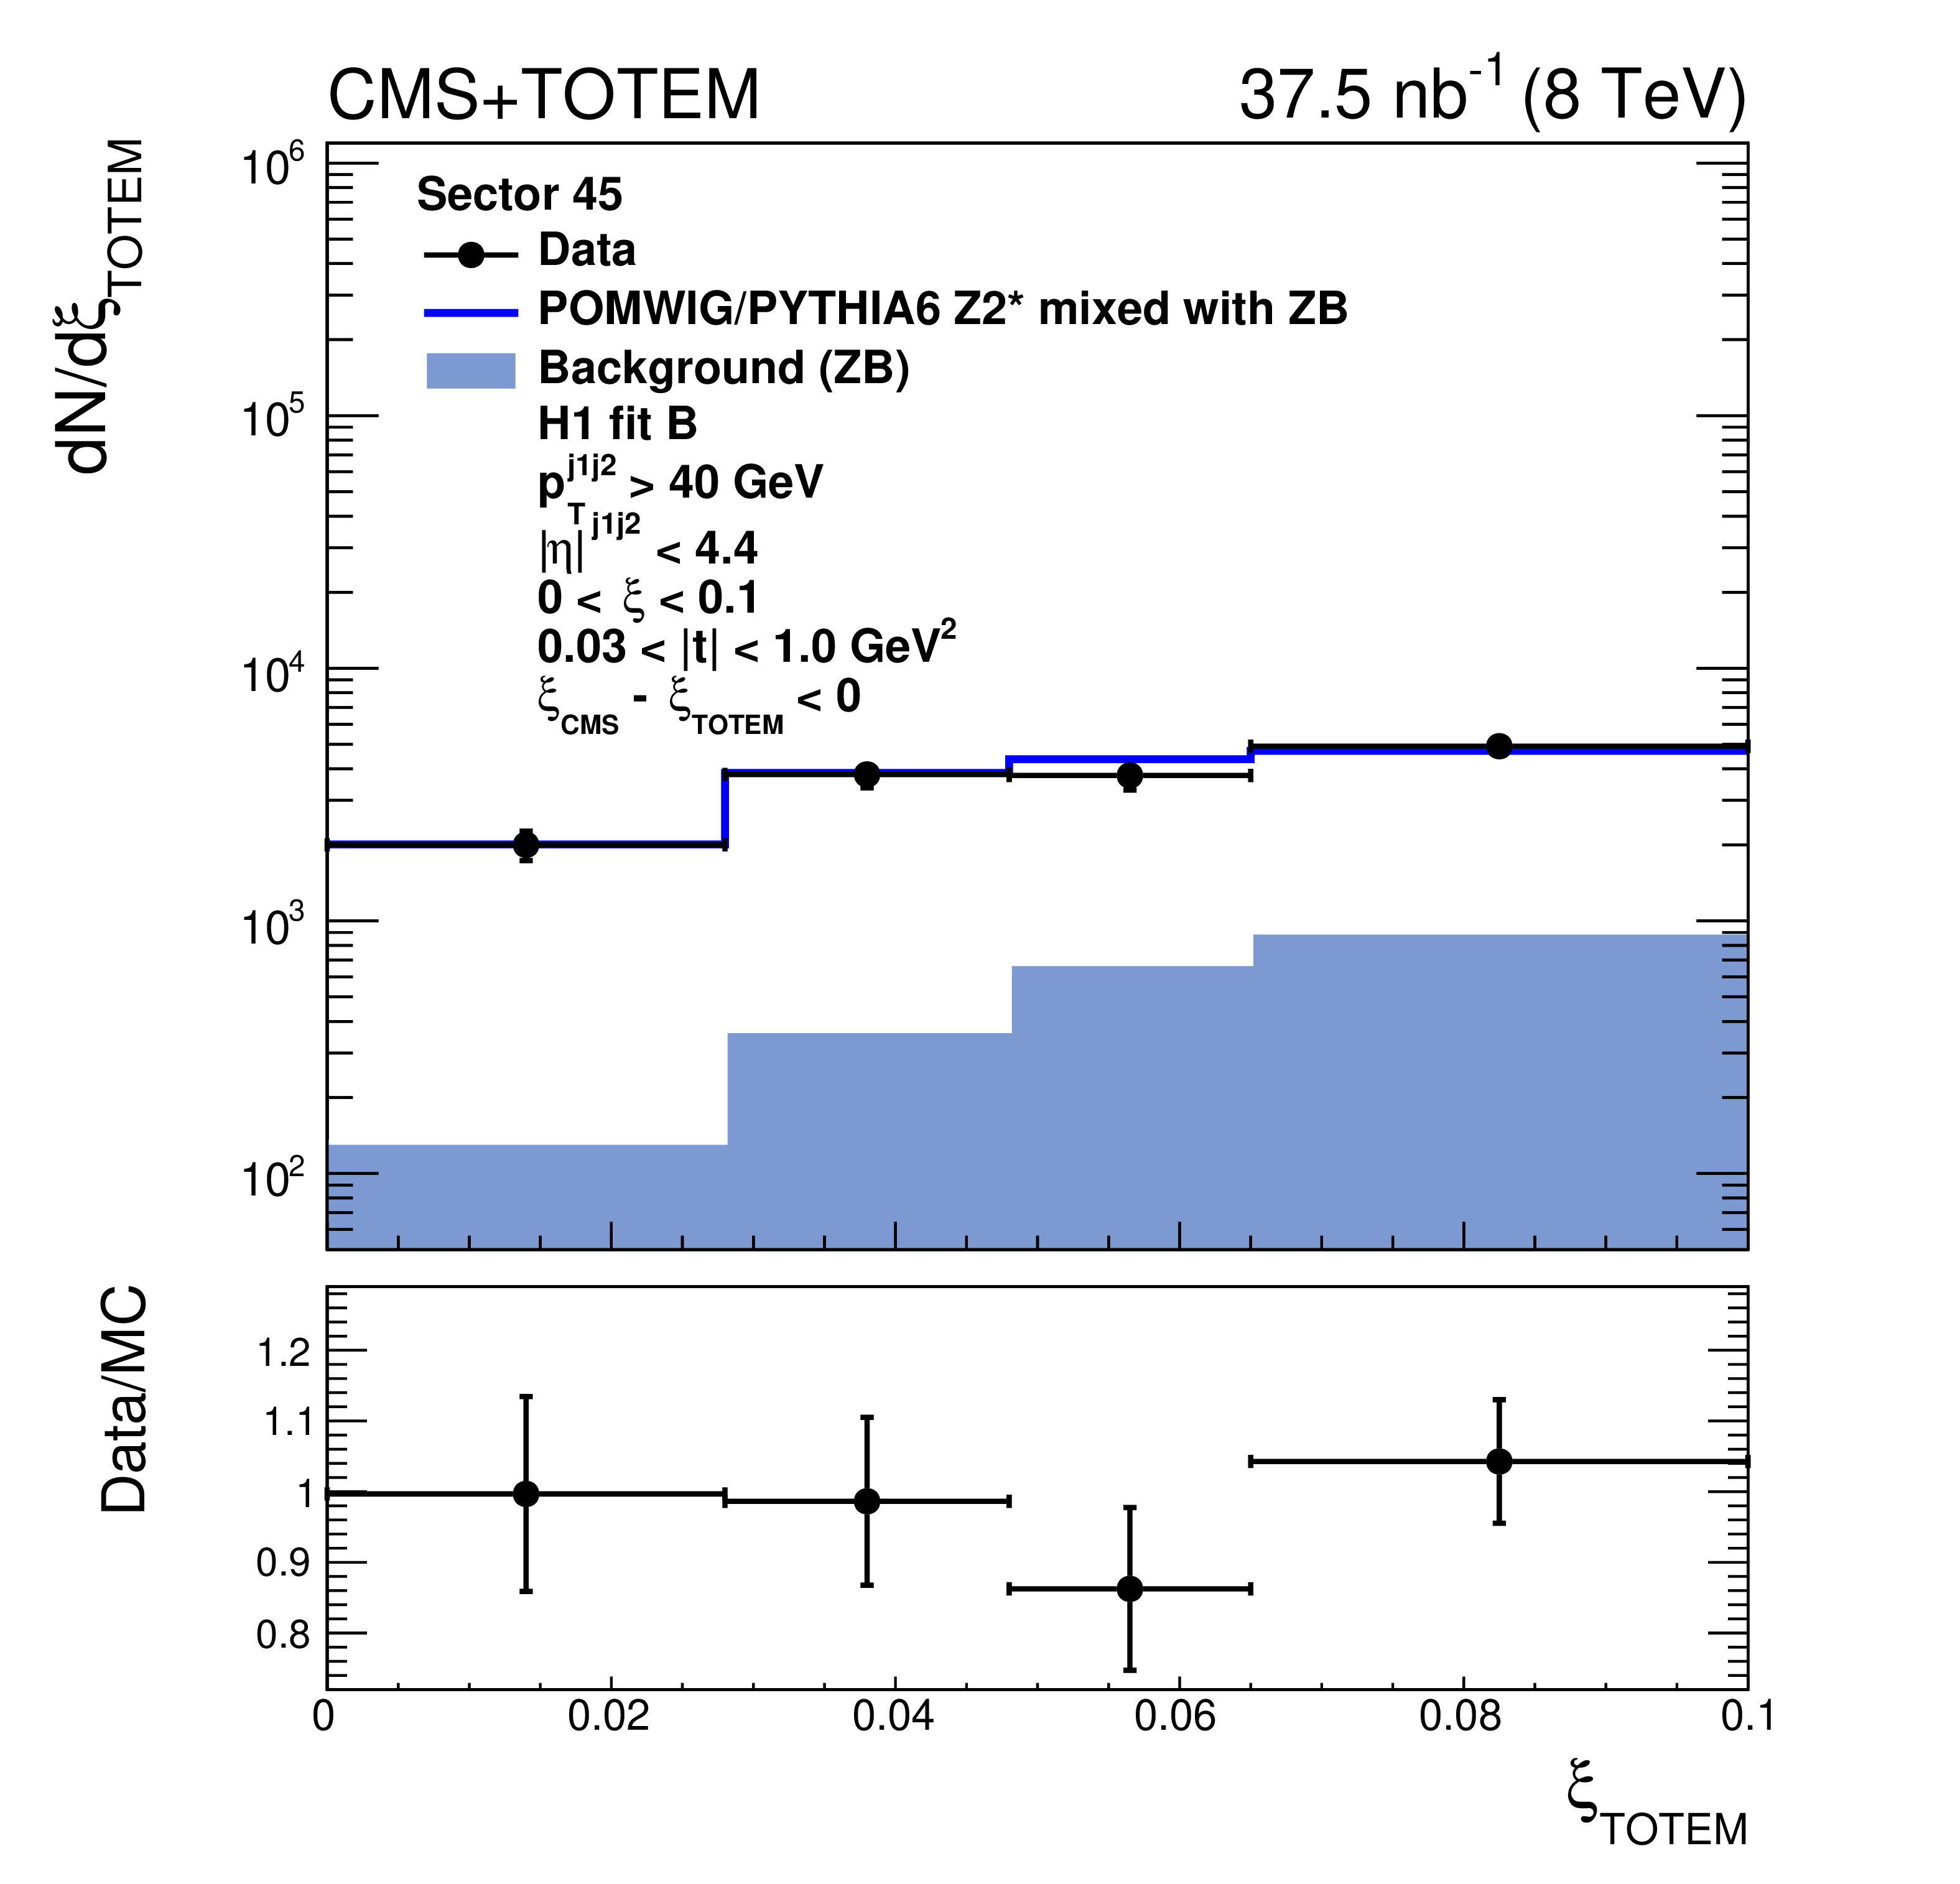
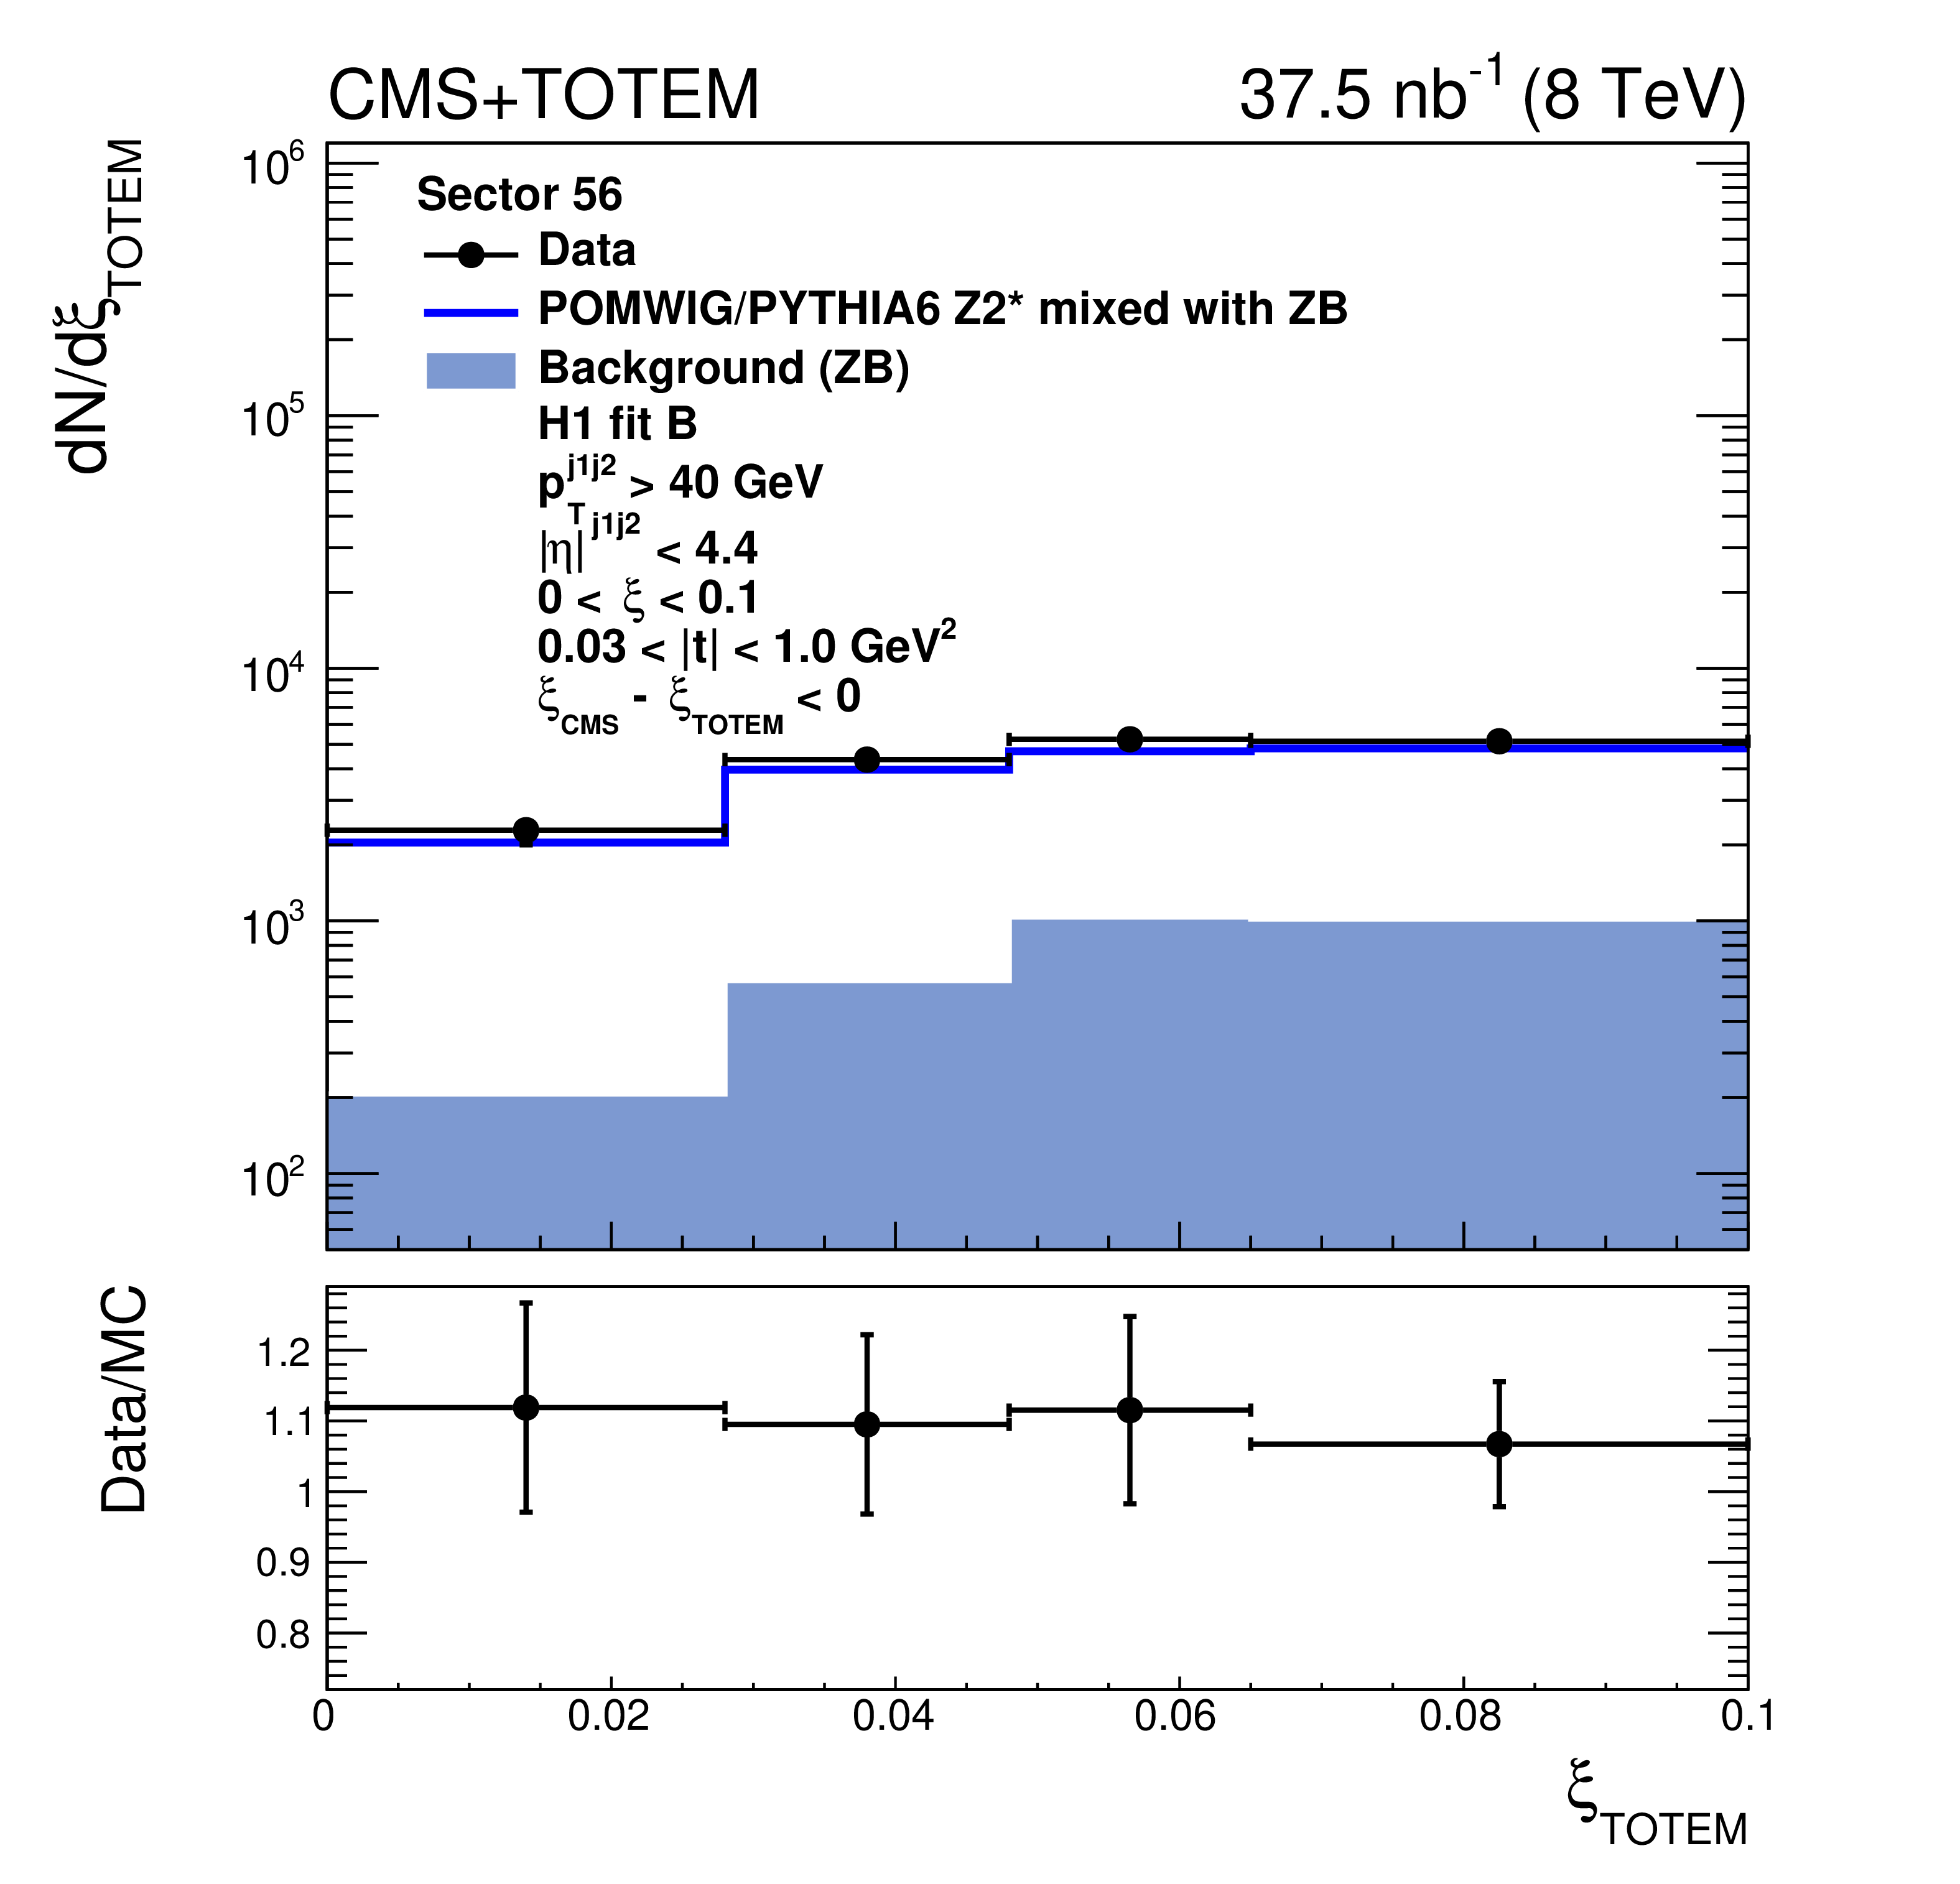
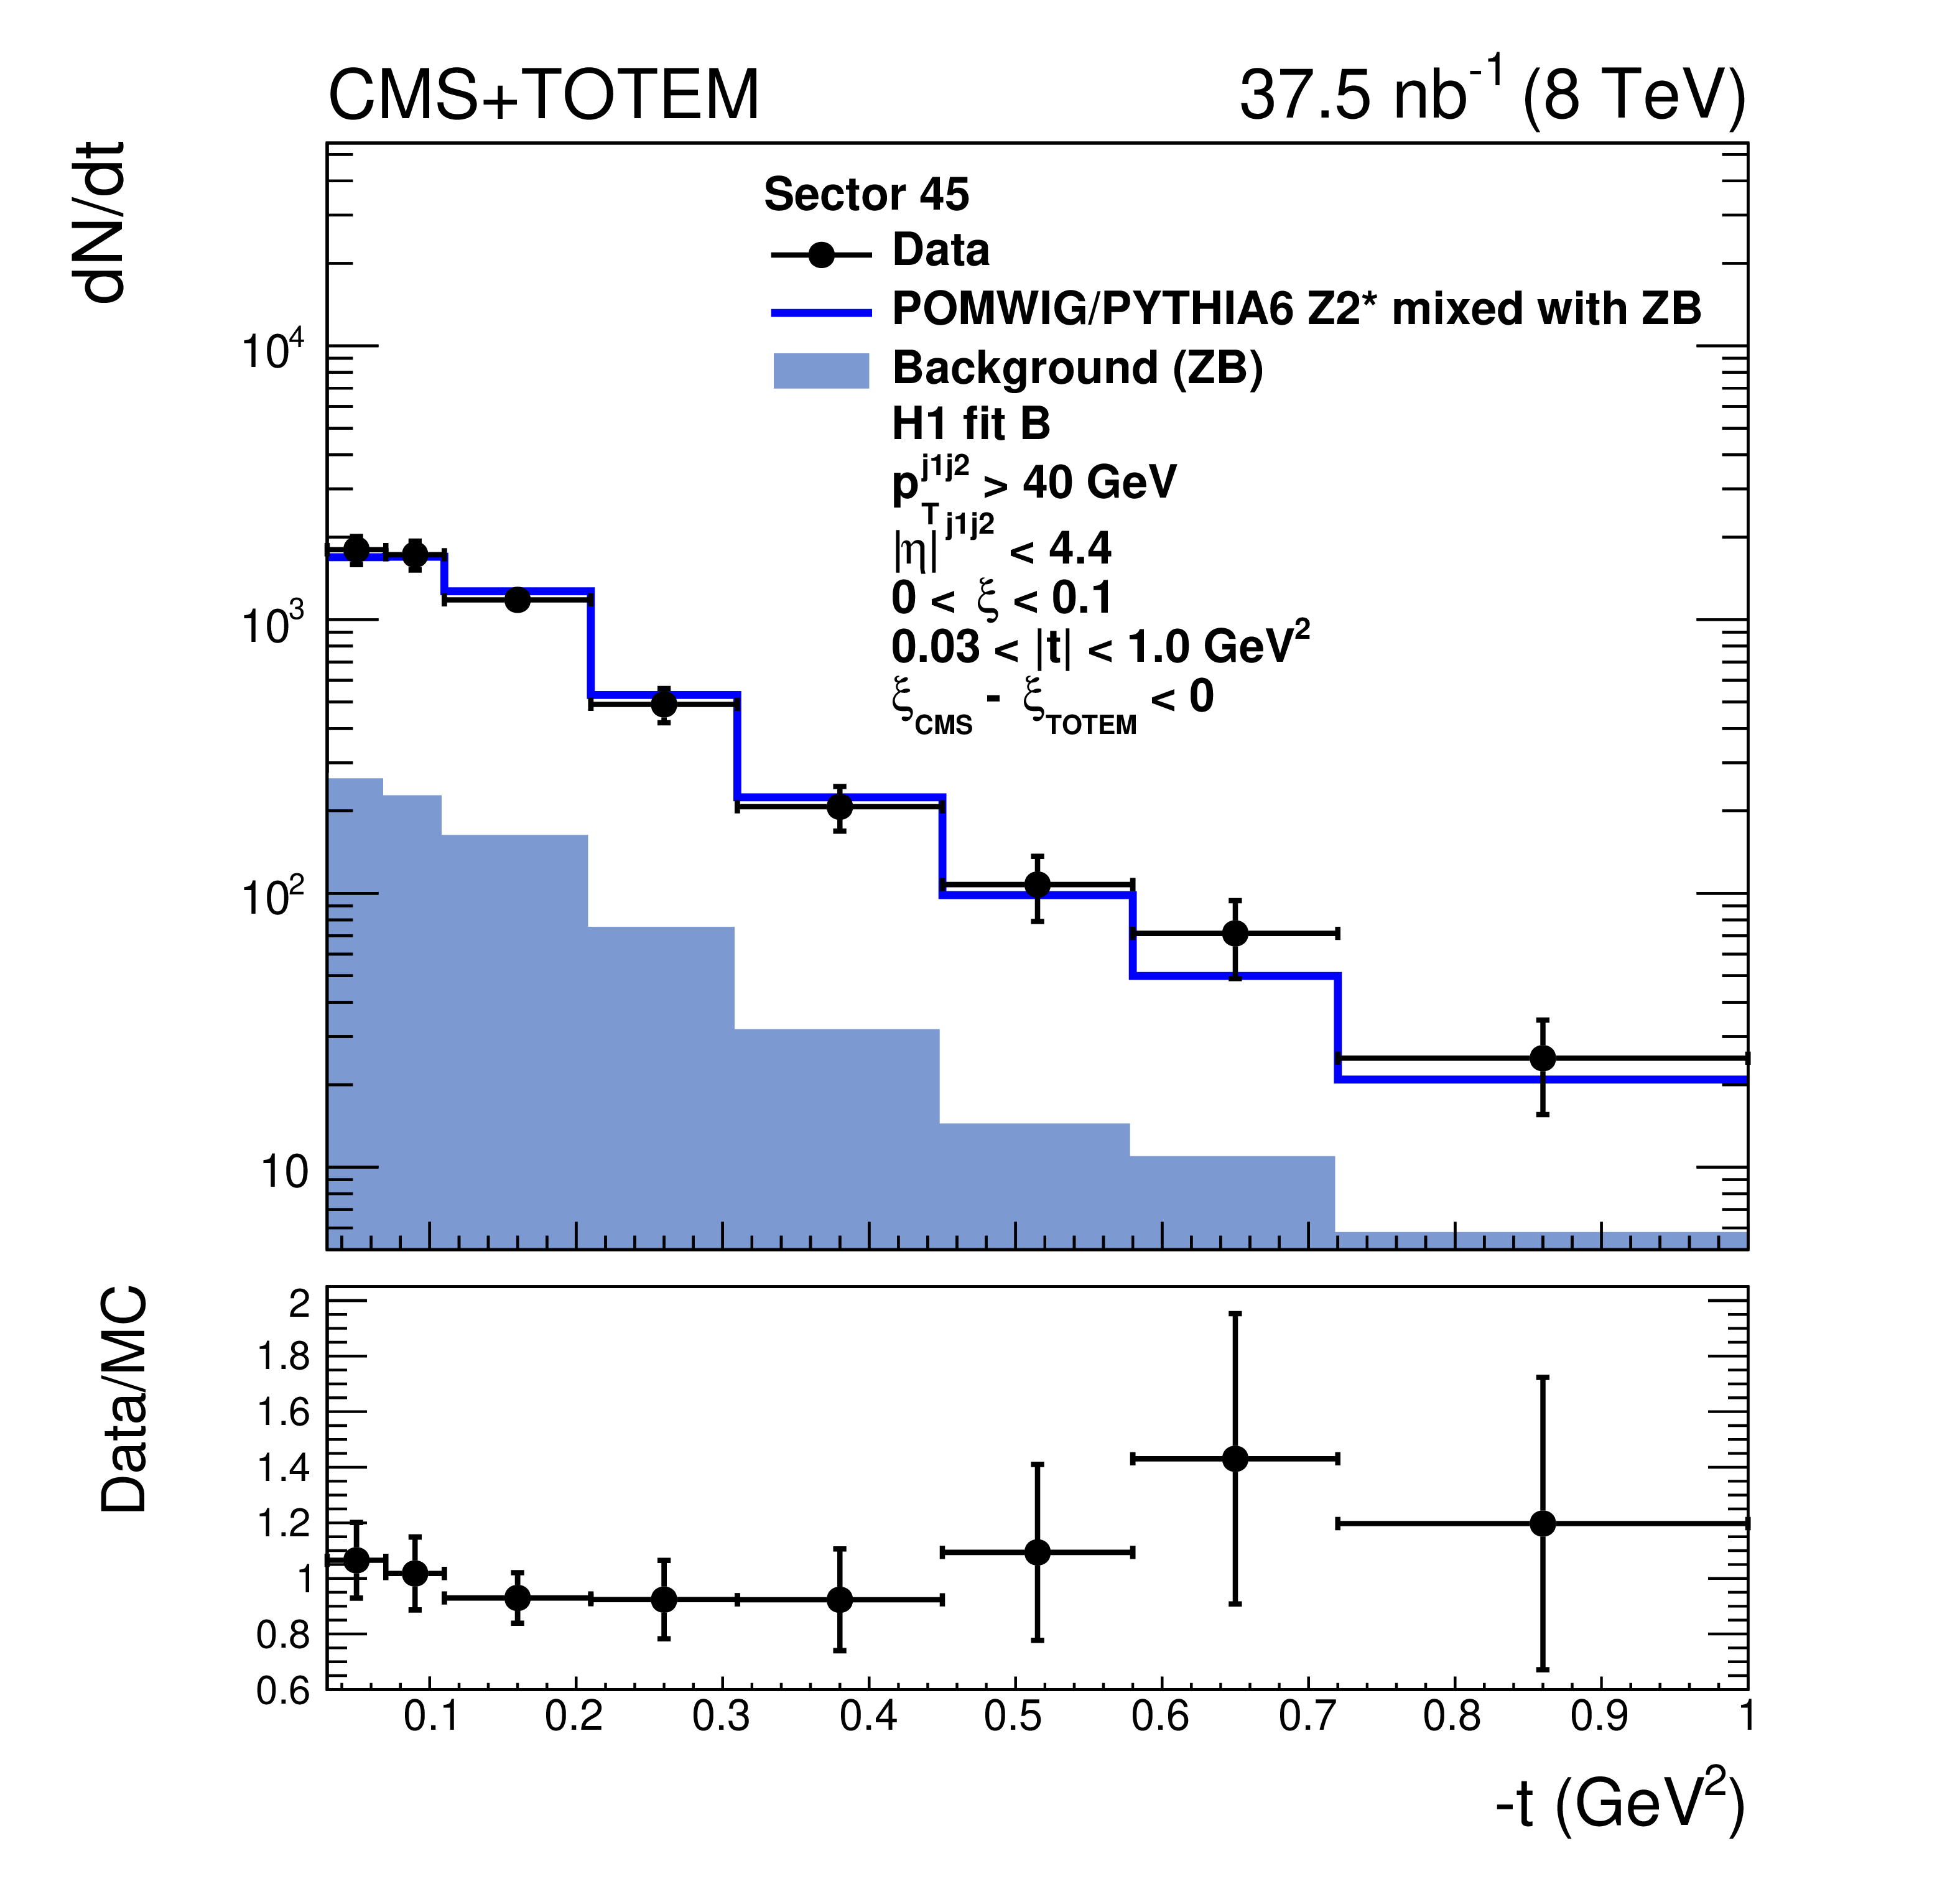
Figure 3:
Distribution of $\xi _{\text {{TOTEM}}}$ before (upper) and after (middle) the $\xi _{\text {CMS}} - \xi _{\text {{TOTEM}}}$ requirement and distribution of $t$ after the $\xi _{\text {CMS}} - \xi _{\text {{TOTEM}}}$ requirement (lower) for events in which the proton is detected in sector 45 (left) and sector 56 (right). The data are indicated by solid circles. The blue histogram is the mixture of POMWIG or PYTHIA6 and zero bias (ZB) data events described in the text. An event with the proton measured in the RPs contributes to the open histogram (signal) if the proton originates from the MC sample, or to the filled histogram (background) if it originates from the ZB sample. |
png pdf |
Figure 3-a:
Distribution of $\xi _{\text {{TOTEM}}}$ before afterthe $\xi _{\text {CMS}} - \xi _{\text {{TOTEM}}}$ requirement for events in which the proton is detected in sector 45. The data are indicated by solid circles. The blue histogram is the mixture of POMWIG or PYTHIA6 and zero bias (ZB) data events described in the text. An event with the proton measured in the RPs contributes to the open histogram (signal) if the proton originates from the MC sample, or to the filled histogram (background) if it originates from the ZB sample. |
png pdf |
Figure 3-b:
Distribution of $\xi _{\text {{TOTEM}}}$ before afterthe $\xi _{\text {CMS}} - \xi _{\text {{TOTEM}}}$ requirement for events in which the proton is detected in sector 56. The data are indicated by solid circles. The blue histogram is the mixture of POMWIG or PYTHIA6 and zero bias (ZB) data events described in the text. An event with the proton measured in the RPs contributes to the open histogram (signal) if the proton originates from the MC sample, or to the filled histogram (background) if it originates from the ZB sample. |
png pdf |
Figure 3-c:
Distribution of $\xi _{\text {{TOTEM}}}$ before afterthe $\xi _{\text {CMS}} - \xi _{\text {{TOTEM}}}$ requirement for events in which the proton is detected in sector 45. The data are indicated by solid circles. The blue histogram is the mixture of POMWIG or PYTHIA6 and zero bias (ZB) data events described in the text. An event with the proton measured in the RPs contributes to the open histogram (signal) if the proton originates from the MC sample, or to the filled histogram (background) if it originates from the ZB sample. |
png pdf |
Figure 3-d:
Distribution of $\xi _{\text {{TOTEM}}}$ before afterthe $\xi _{\text {CMS}} - \xi _{\text {{TOTEM}}}$ requirement for events in which the proton is detected in sector 56. The data are indicated by solid circles. The blue histogram is the mixture of POMWIG or PYTHIA6 and zero bias (ZB) data events described in the text. An event with the proton measured in the RPs contributes to the open histogram (signal) if the proton originates from the MC sample, or to the filled histogram (background) if it originates from the ZB sample. |
png pdf |
Figure 3-e:
Distribution of $t$ after the $\xi _{\text {CMS}} - \xi _{\text {{TOTEM}}}$ requirement for events in which the proton is detected in sector 45. The data are indicated by solid circles. The blue histogram is the mixture of POMWIG or PYTHIA6 and zero bias (ZB) data events described in the text. An event with the proton measured in the RPs contributes to the open histogram (signal) if the proton originates from the MC sample, or to the filled histogram (background) if it originates from the ZB sample. |
png pdf |
Figure 3-f:
Distribution of $t$ after the $\xi _{\text {CMS}} - \xi _{\text {{TOTEM}}}$ requirement for events in which the proton is detected in sector 56. The data are indicated by solid circles. The blue histogram is the mixture of POMWIG or PYTHIA6 and zero bias (ZB) data events described in the text. An event with the proton measured in the RPs contributes to the open histogram (signal) if the proton originates from the MC sample, or to the filled histogram (background) if it originates from the ZB sample. |
png pdf |
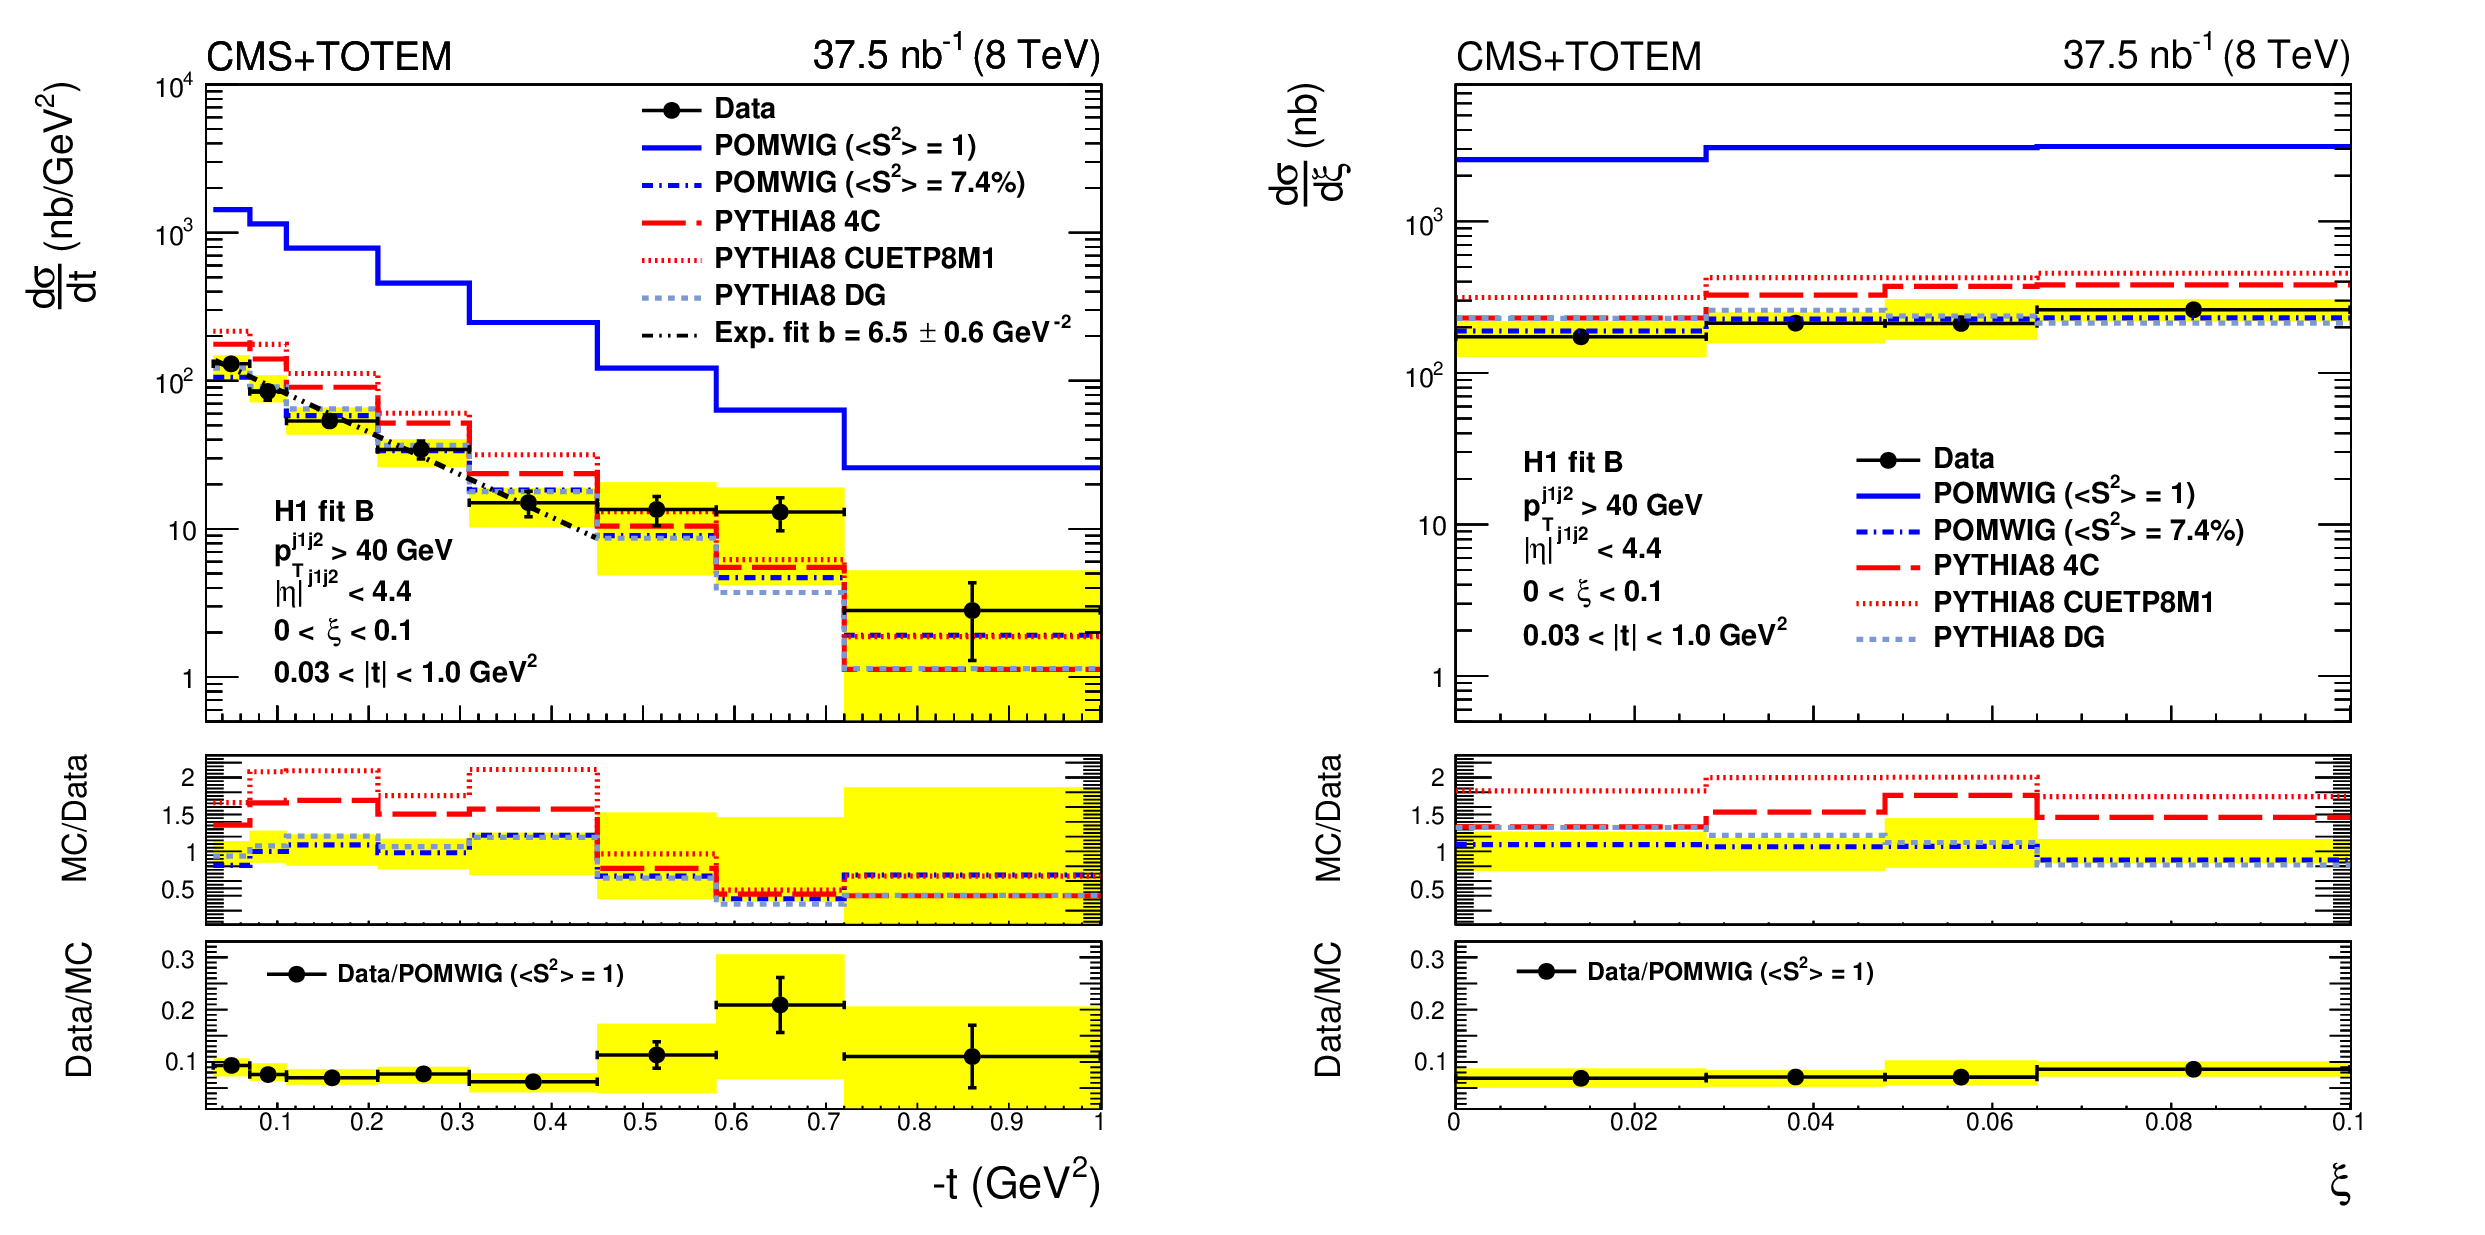
Figure 4:
Differential cross section as a function of $t$ (left) and as a function of $\xi $ (right) for single-diffractive dijet production, compared to the predictions from POMWIG, PYTHIA8 4C, PYTHIA8 CUETP8M1, and PYTHIA8 DG. The POMWIG prediction is shown with no correction for the rapidity gap survival probability ($< S^{2} > = $ 1) and with a correction of $< S^{2} > = $ 7.4%. The vertical bars indicate the statistical uncertainties and the yellow band indicates the total systematic uncertainty. The average of the results for events in which the proton is detected on either side of the interaction point is shown. The ratio between the data and the POMWIG prediction, when no correction for the rapidity gap survival probability is applied, is shown in the bottom. |
png pdf |
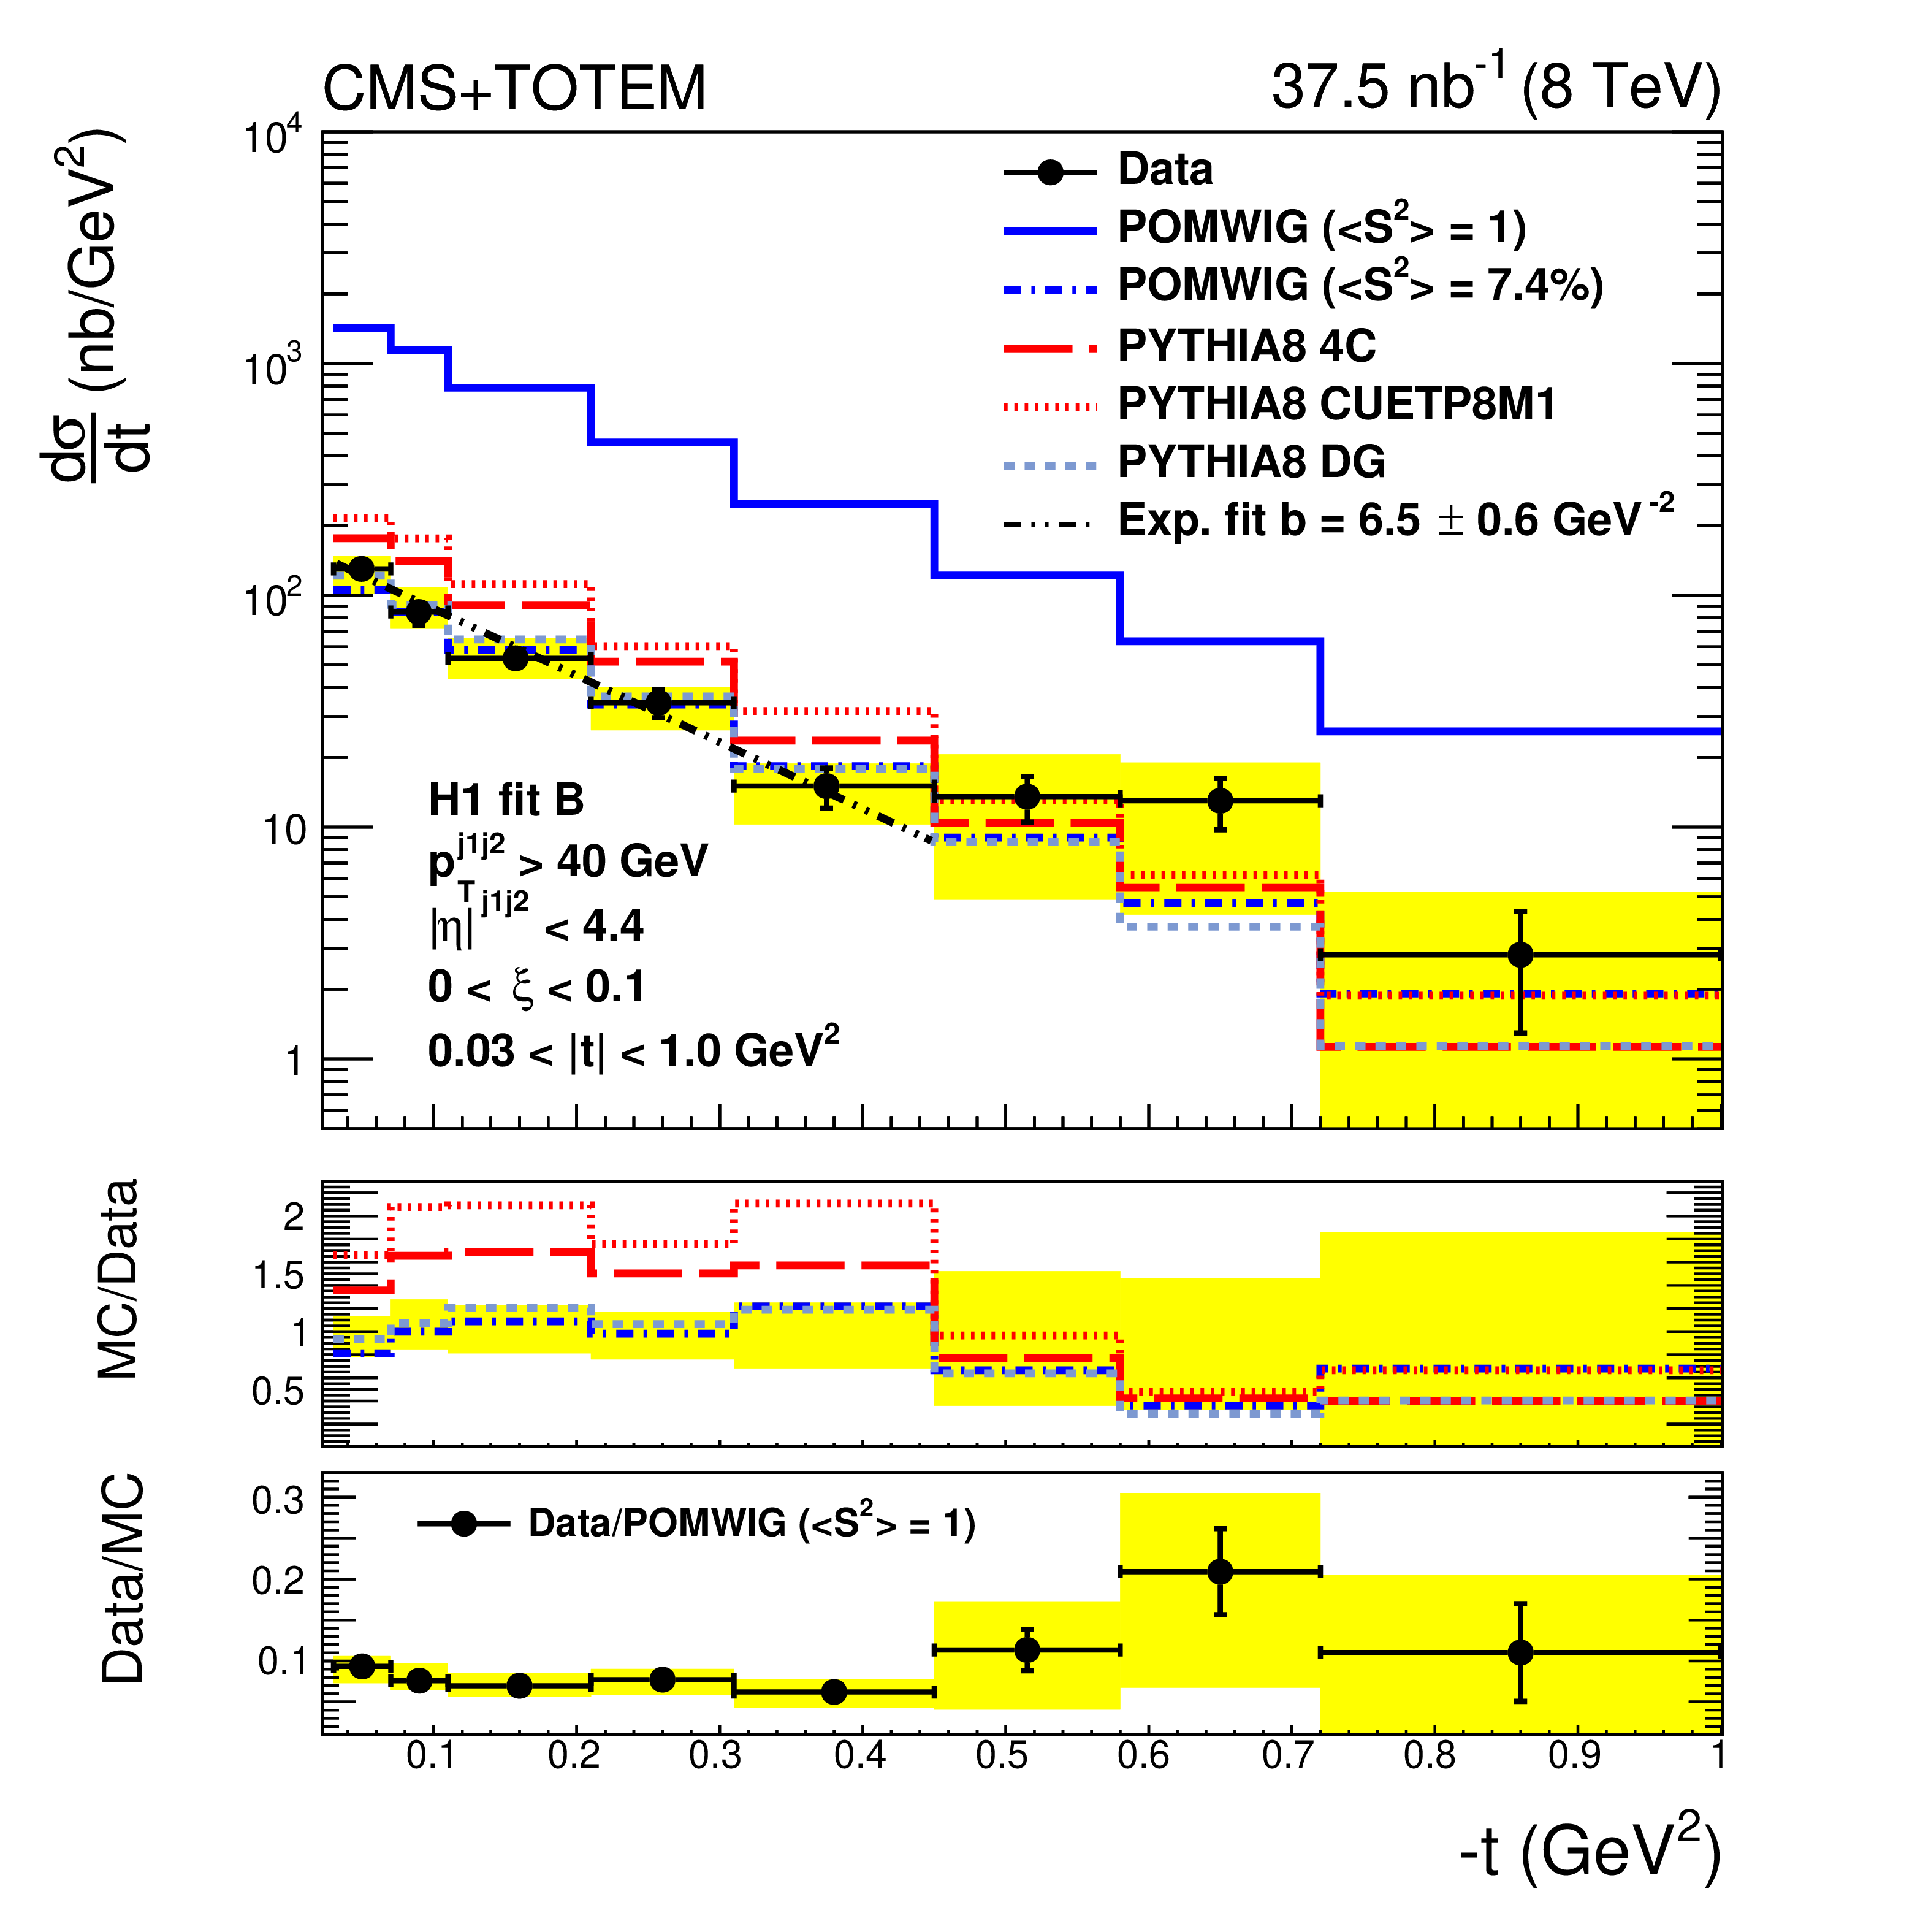
Figure 4-a:
Differential cross section as a function of $t$ for single-diffractive dijet production, compared to the predictions from POMWIG, PYTHIA8 4C, PYTHIA8 CUETP8M1, and PYTHIA8 DG. The POMWIG prediction is shown with no correction for the rapidity gap survival probability ($< S^{2} > = $ 1) and with a correction of $< S^{2} > = $ 7.4%. The vertical bars indicate the statistical uncertainties and the yellow band indicates the total systematic uncertainty. The average of the results for events in which the proton is detected on either side of the interaction point is shown. The ratio between the data and the POMWIG prediction, when no correction for the rapidity gap survival probability is applied, is shown in the bottom. |
png pdf |
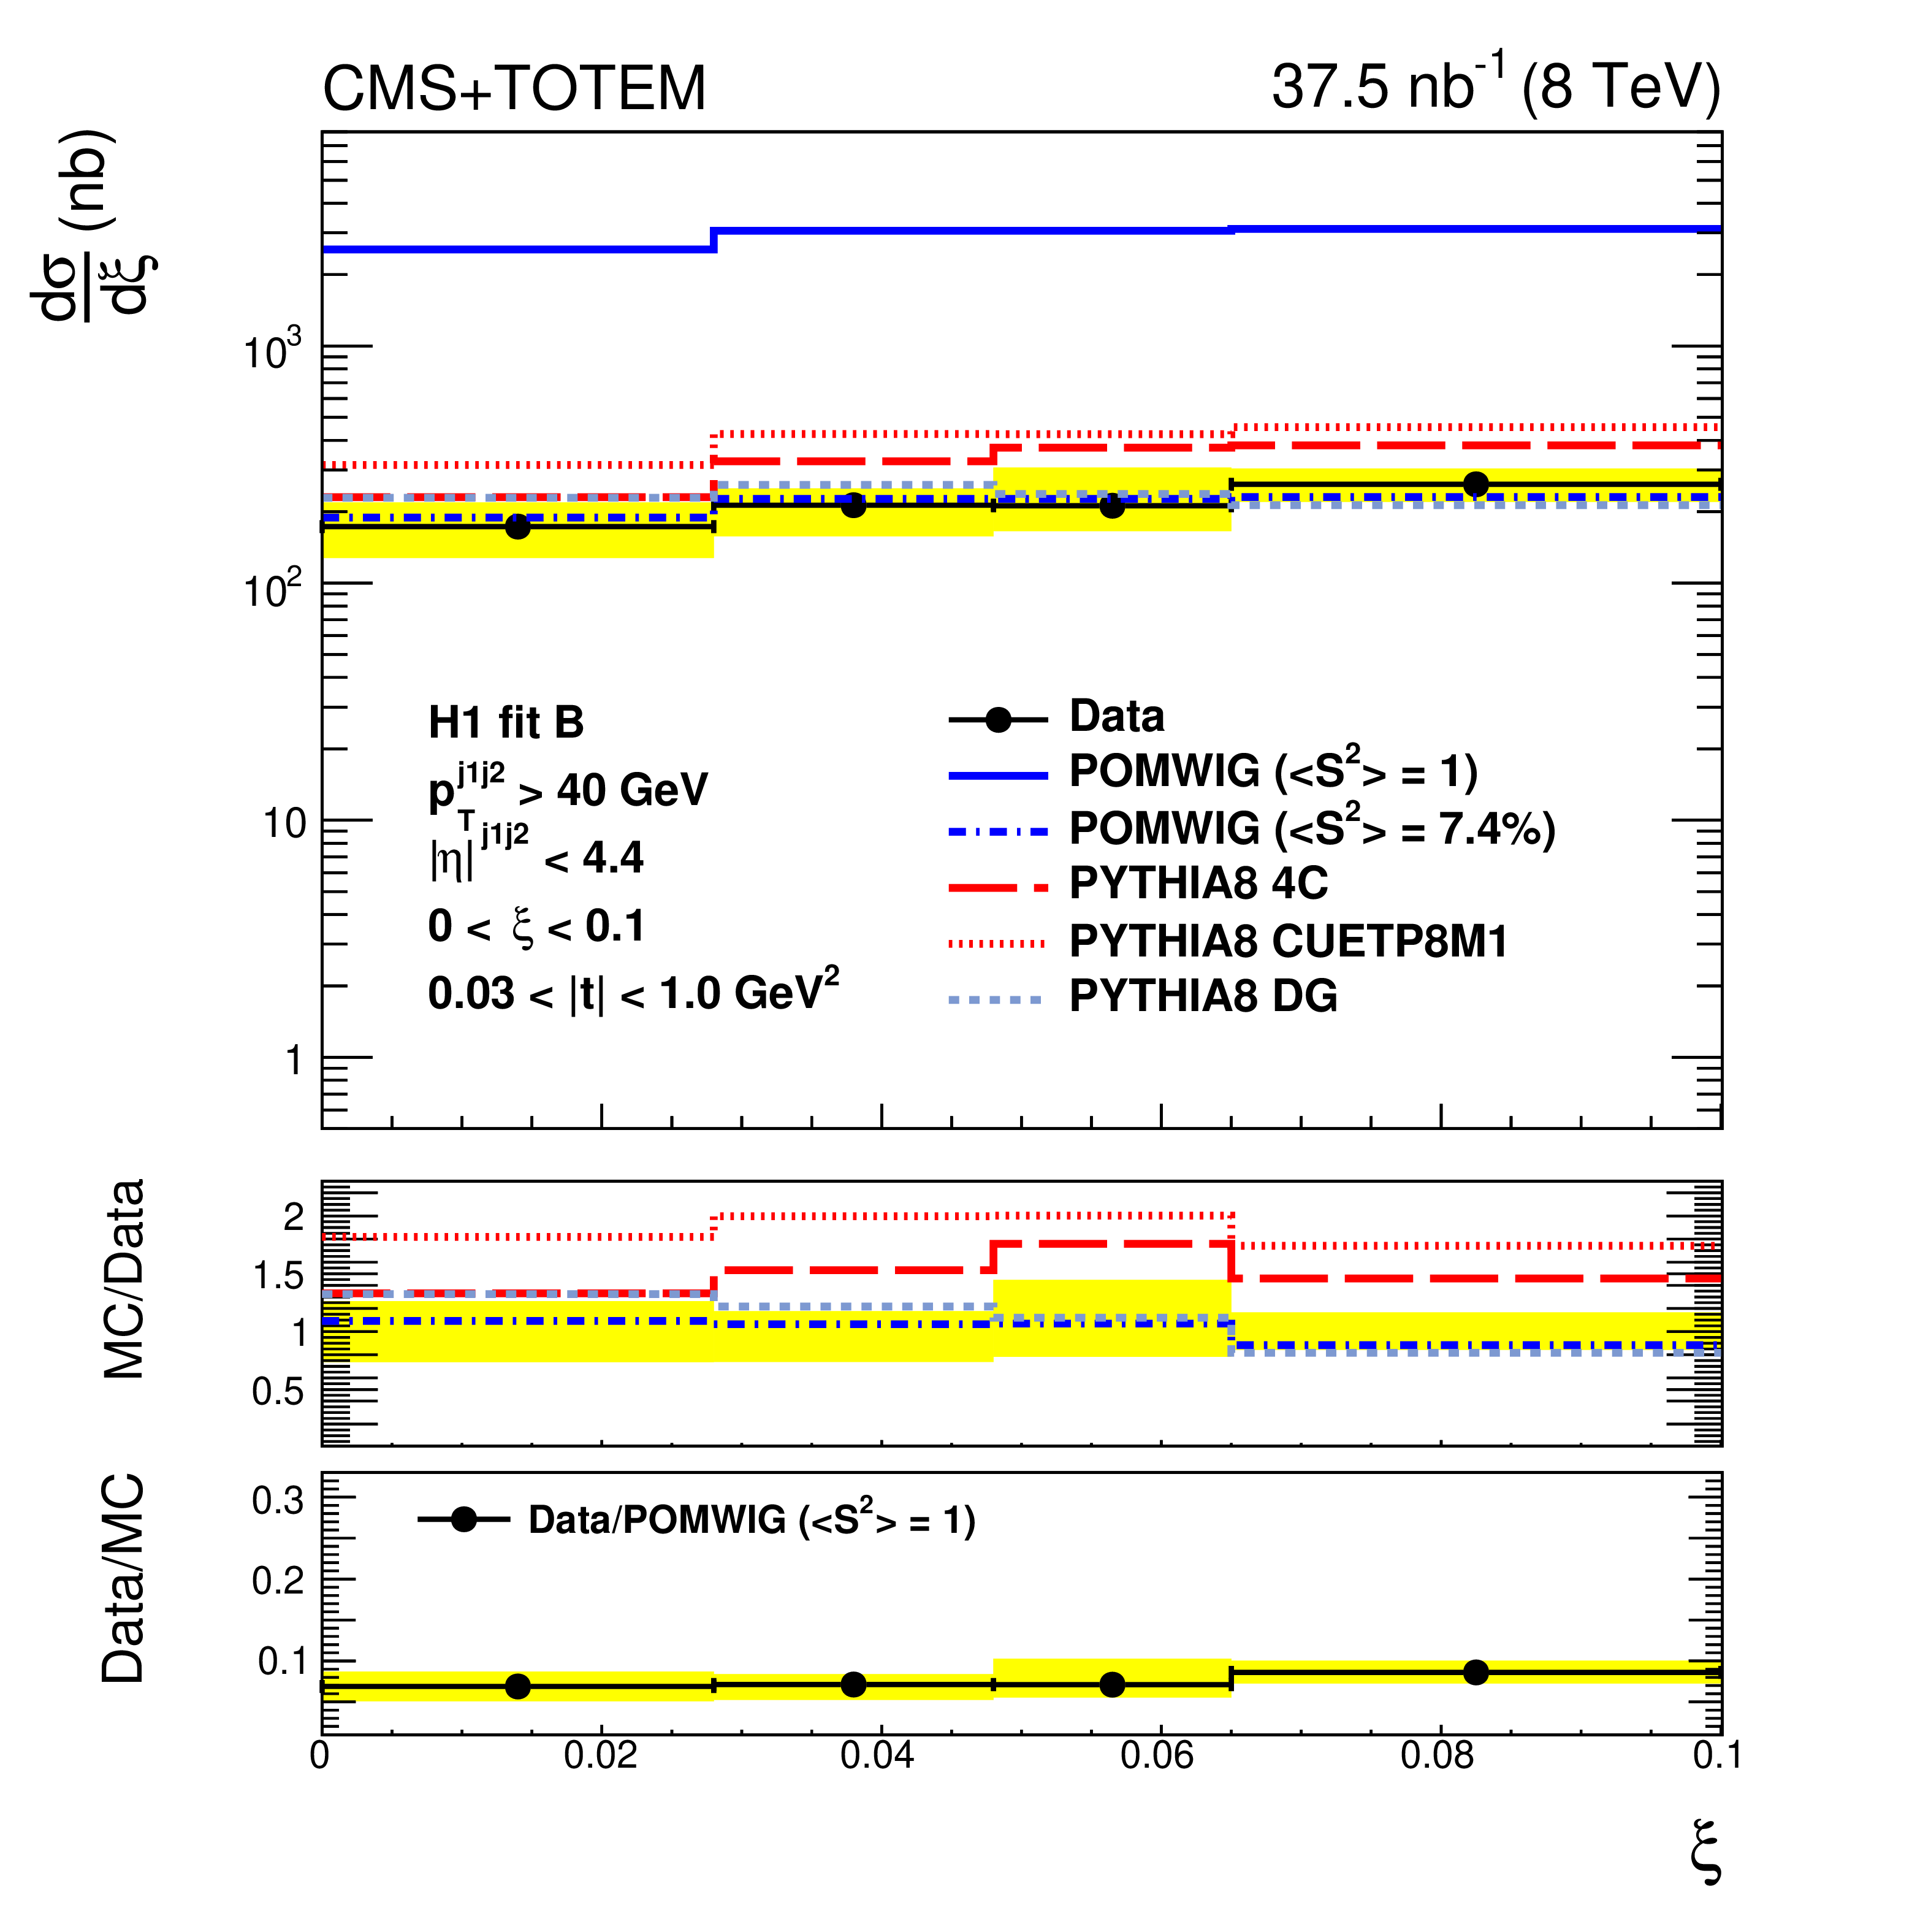
Figure 4-b:
Differential cross section as a function of $\xi $ for single-diffractive dijet production, compared to the predictions from POMWIG, PYTHIA8 4C, PYTHIA8 CUETP8M1, and PYTHIA8 DG. The POMWIG prediction is shown with no correction for the rapidity gap survival probability ($< S^{2} > = $ 1) and with a correction of $< S^{2} > = $ 7.4%. The vertical bars indicate the statistical uncertainties and the yellow band indicates the total systematic uncertainty. The average of the results for events in which the proton is detected on either side of the interaction point is shown. The ratio between the data and the POMWIG prediction, when no correction for the rapidity gap survival probability is applied, is shown in the bottom. |

png pdf |
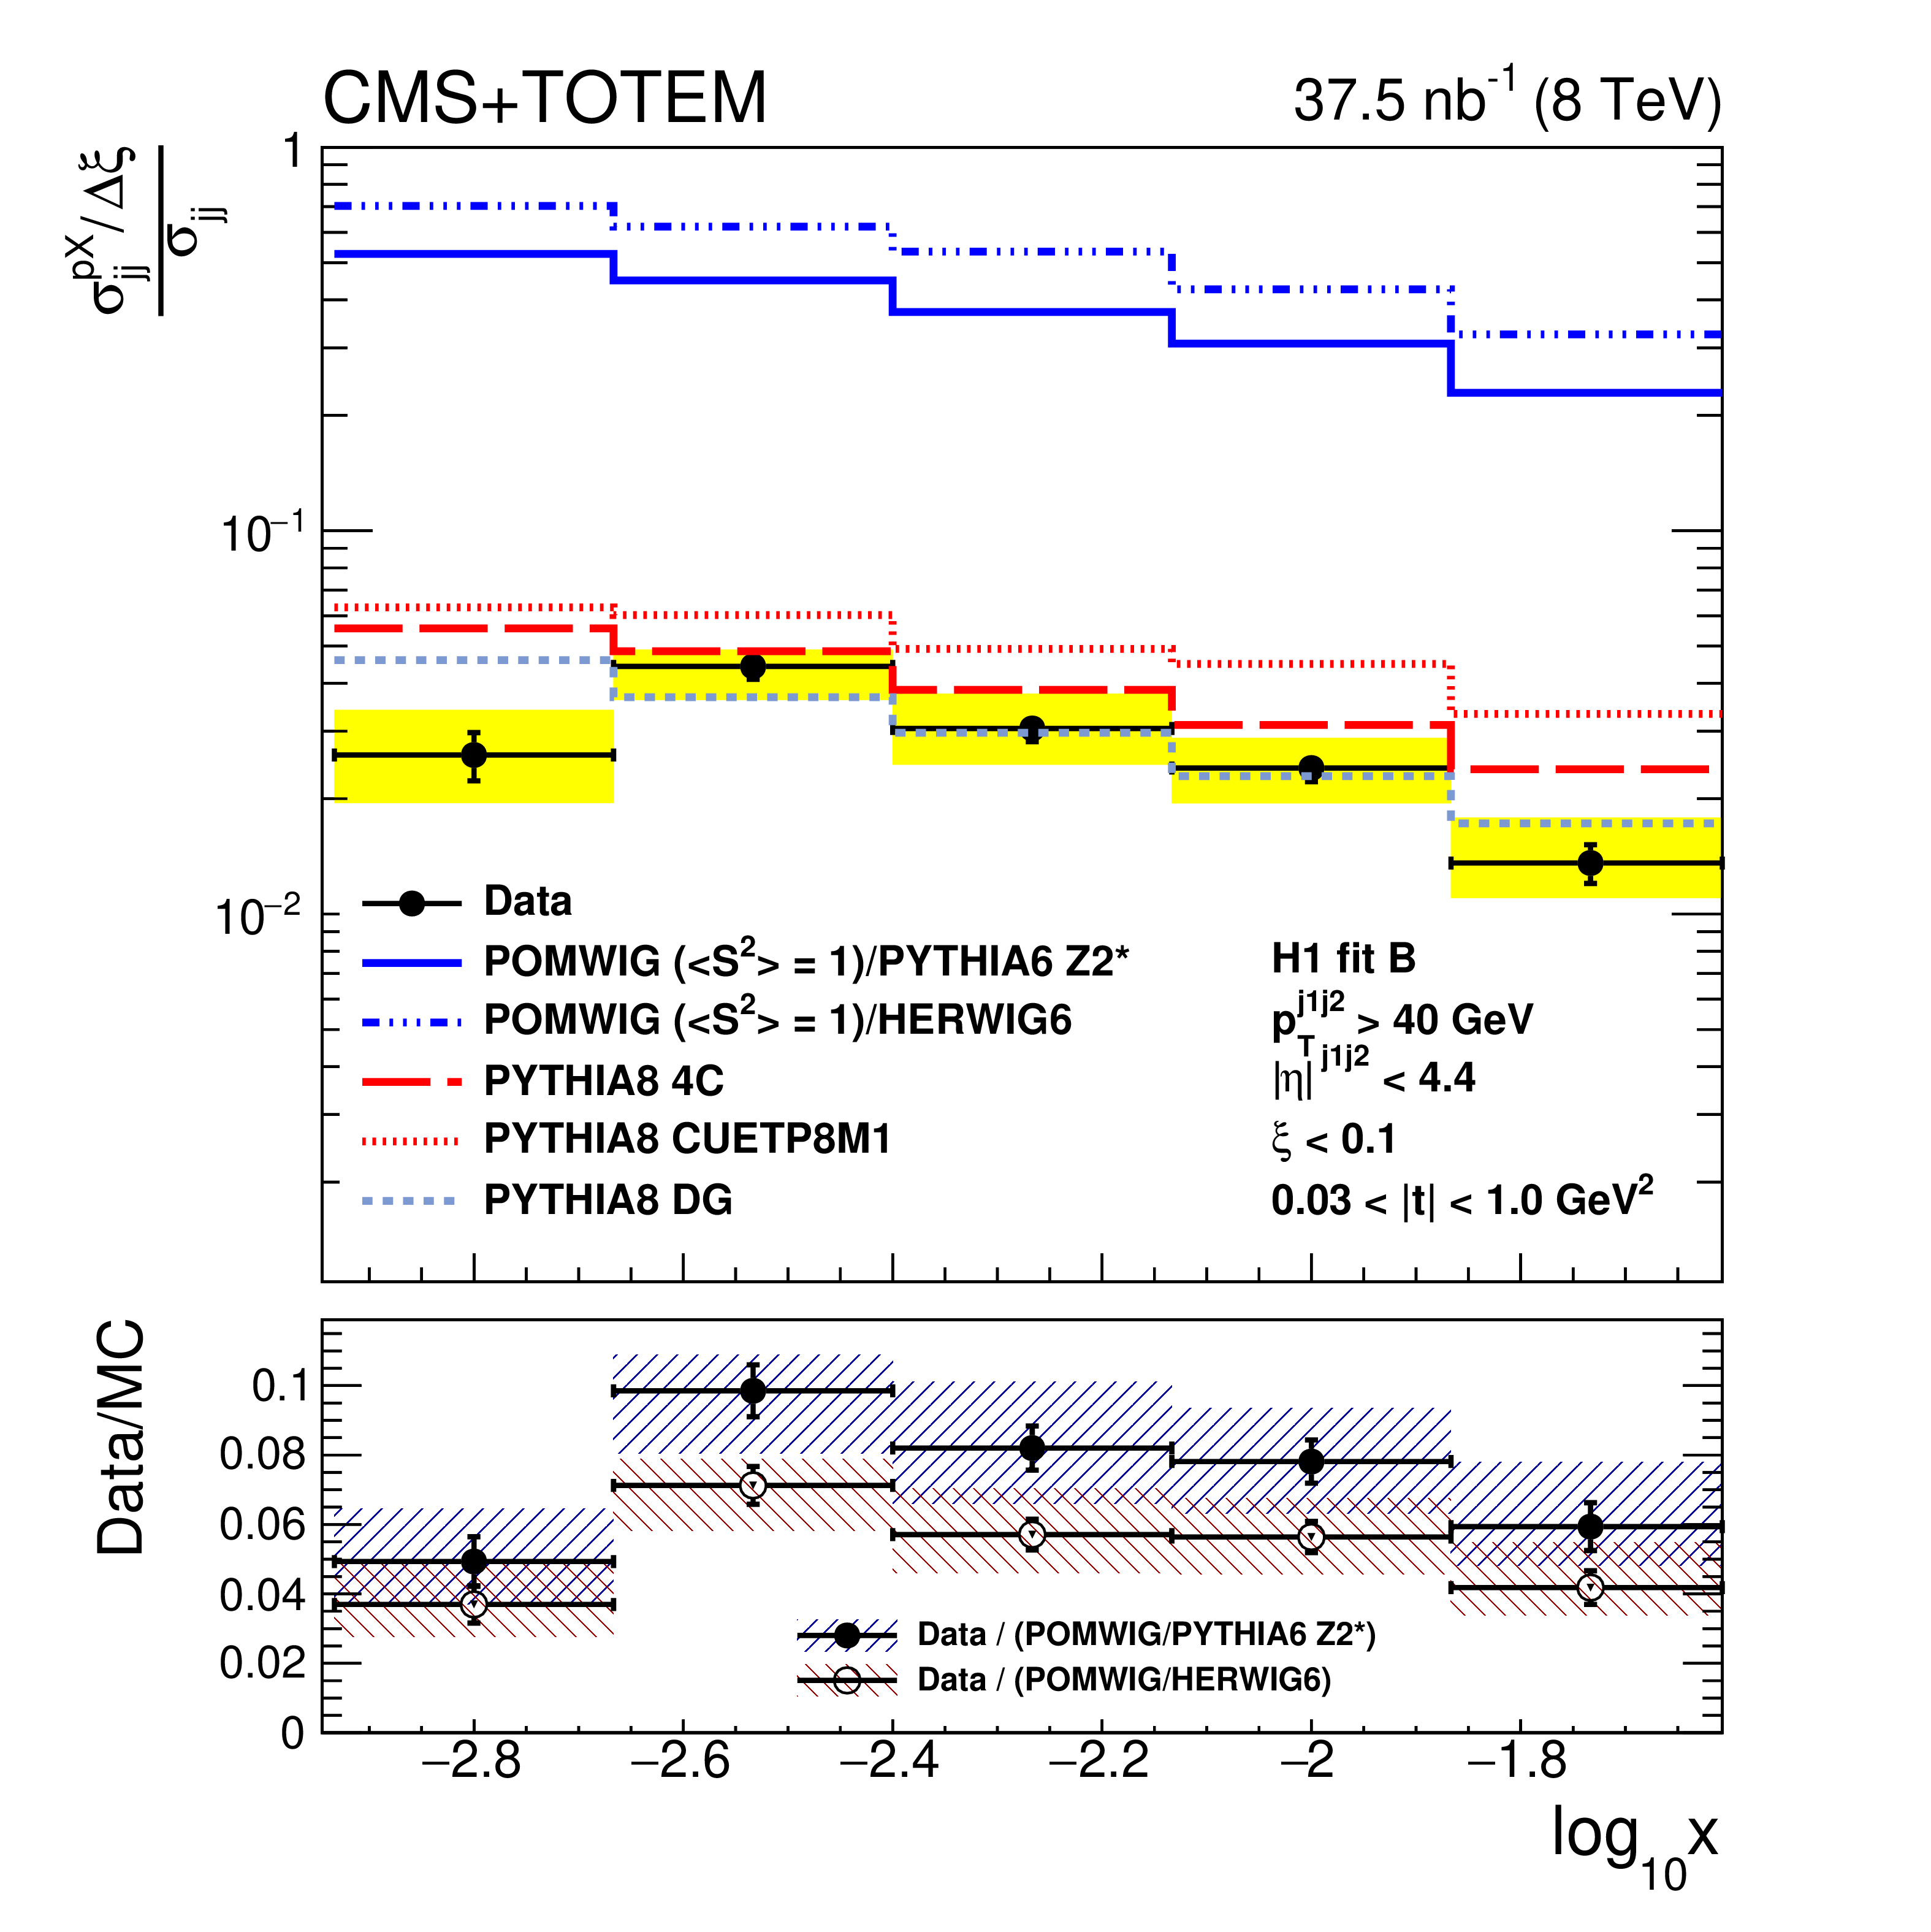
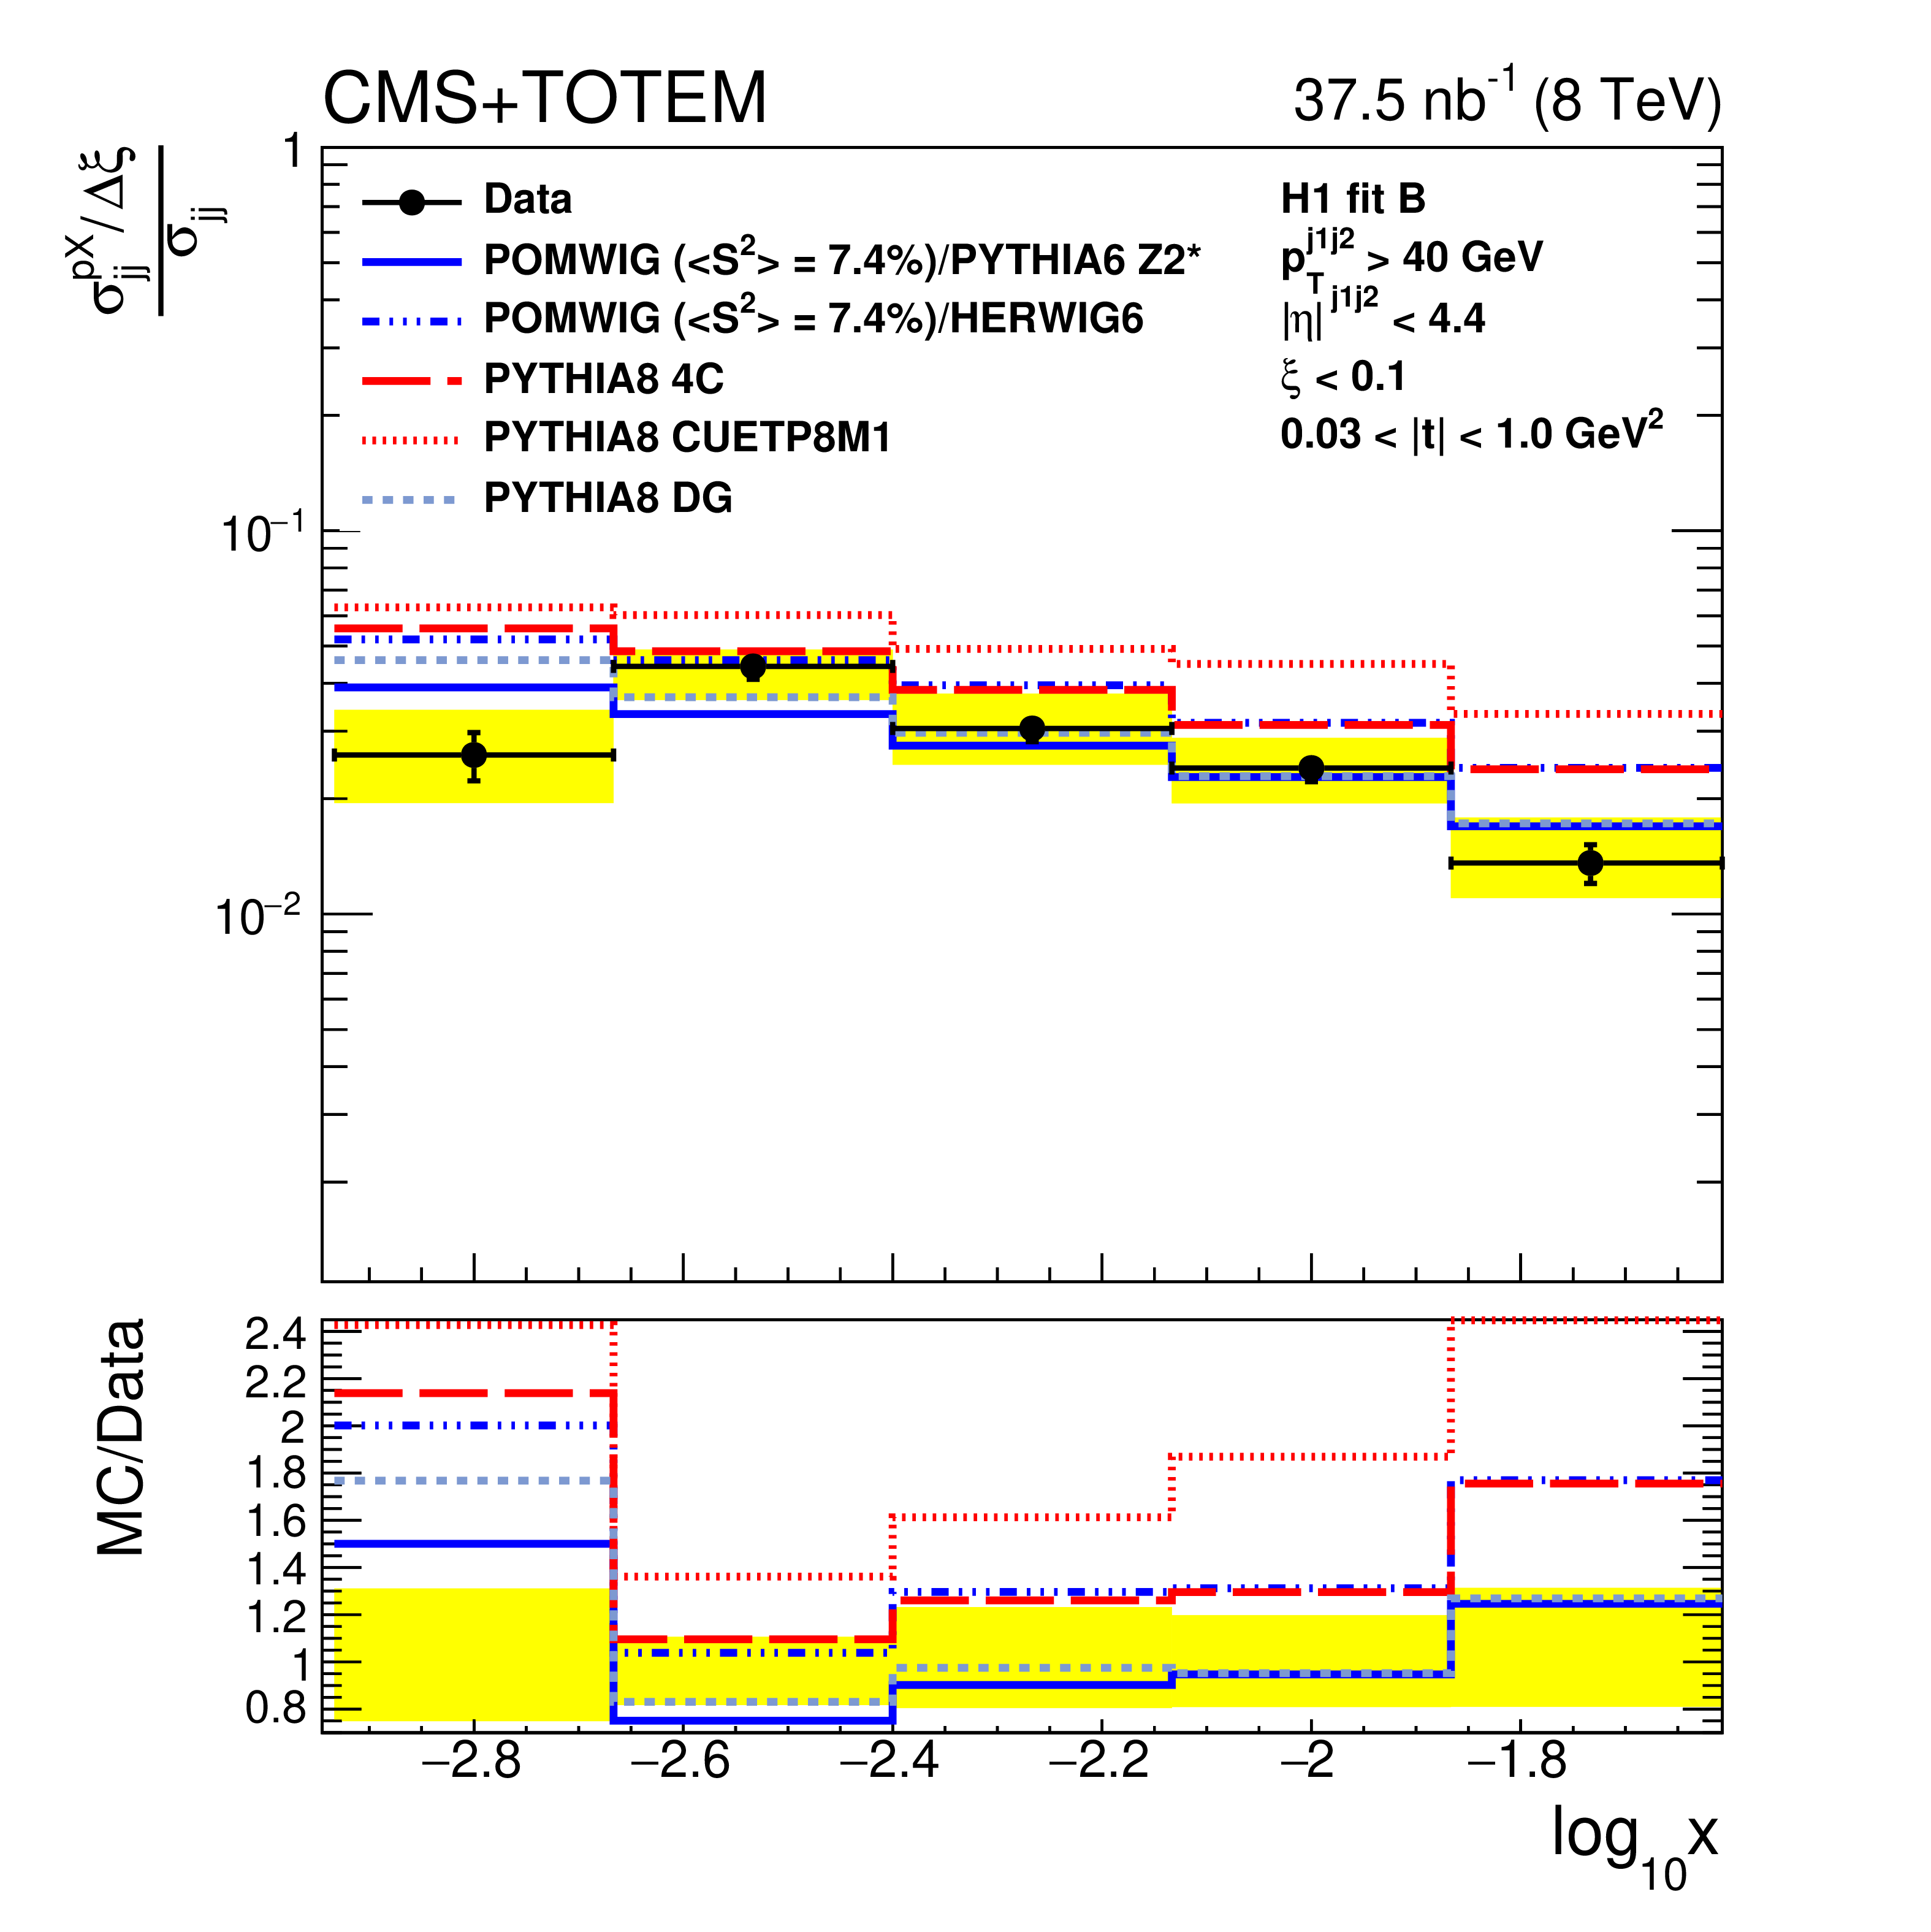
Figure 5:
Ratio per unit of $\xi $ of the single-diffractive and inclusive dijet cross sections in the region given by $\xi < $ 0.1 and 0.03 $ < {| t |} < $ 1 GeV$ ^2$, compared to the predictions from the different models for the ratio between the single-diffractive and nondiffractive cross sections. The POMWIG prediction is shown with no correction for the rapidity gap survival probability ($< S^{2} > = $ 1) (left) and with a correction of $< S^{2} > = $ 7.4% (right). The vertical bars indicate the statistical uncertainties and the yellow band indicates the total systematic uncertainty. The average of the results for events in which the proton is detected on either side of the interaction point is shown. The ratio between the data and the POMWIG prediction using PYTHIA6 or HERWIG6 as the nondiffractive contribution, when no correction for the rapidity gap survival probability is applied, is shown in the bottom of the left panel. |
png pdf |
Figure 5-a:
Ratio per unit of $\xi $ of the single-diffractive and inclusive dijet cross sections in the region given by $\xi < $ 0.1 and 0.03 $ < {| t |} < $ 1 GeV$ ^2$, compared to the predictions from the different models for the ratio between the single-diffractive and nondiffractive cross sections. The POMWIG prediction is shown with no correction for the rapidity gap survival probability ($< S^{2} > = $ 1). The vertical bars indicate the statistical uncertainties and the yellow band indicates the total systematic uncertainty. The average of the results for events in which the proton is detected on either side of the interaction point is shown. The ratio between the data and the POMWIG prediction using PYTHIA6 or HERWIG6 as the nondiffractive contribution, when no correction for the rapidity gap survival probability is applied, is shown in the bottom. |
png pdf |
Figure 5-b:
Ratio per unit of $\xi $ of the single-diffractive and inclusive dijet cross sections in the region given by $\xi < $ 0.1 and 0.03 $ < {| t |} < $ 1 GeV$ ^2$, compared to the predictions from the different models for the ratio between the single-diffractive and nondiffractive cross sections. The POMWIG prediction is shown with a correction for the rapidity gap survival probability of $< S^{2} > = $ 7.4%. The vertical bars indicate the statistical uncertainties and the yellow band indicates the total systematic uncertainty. The average of the results for events in which the proton is detected on either side of the interaction point is shown. |
png pdf |
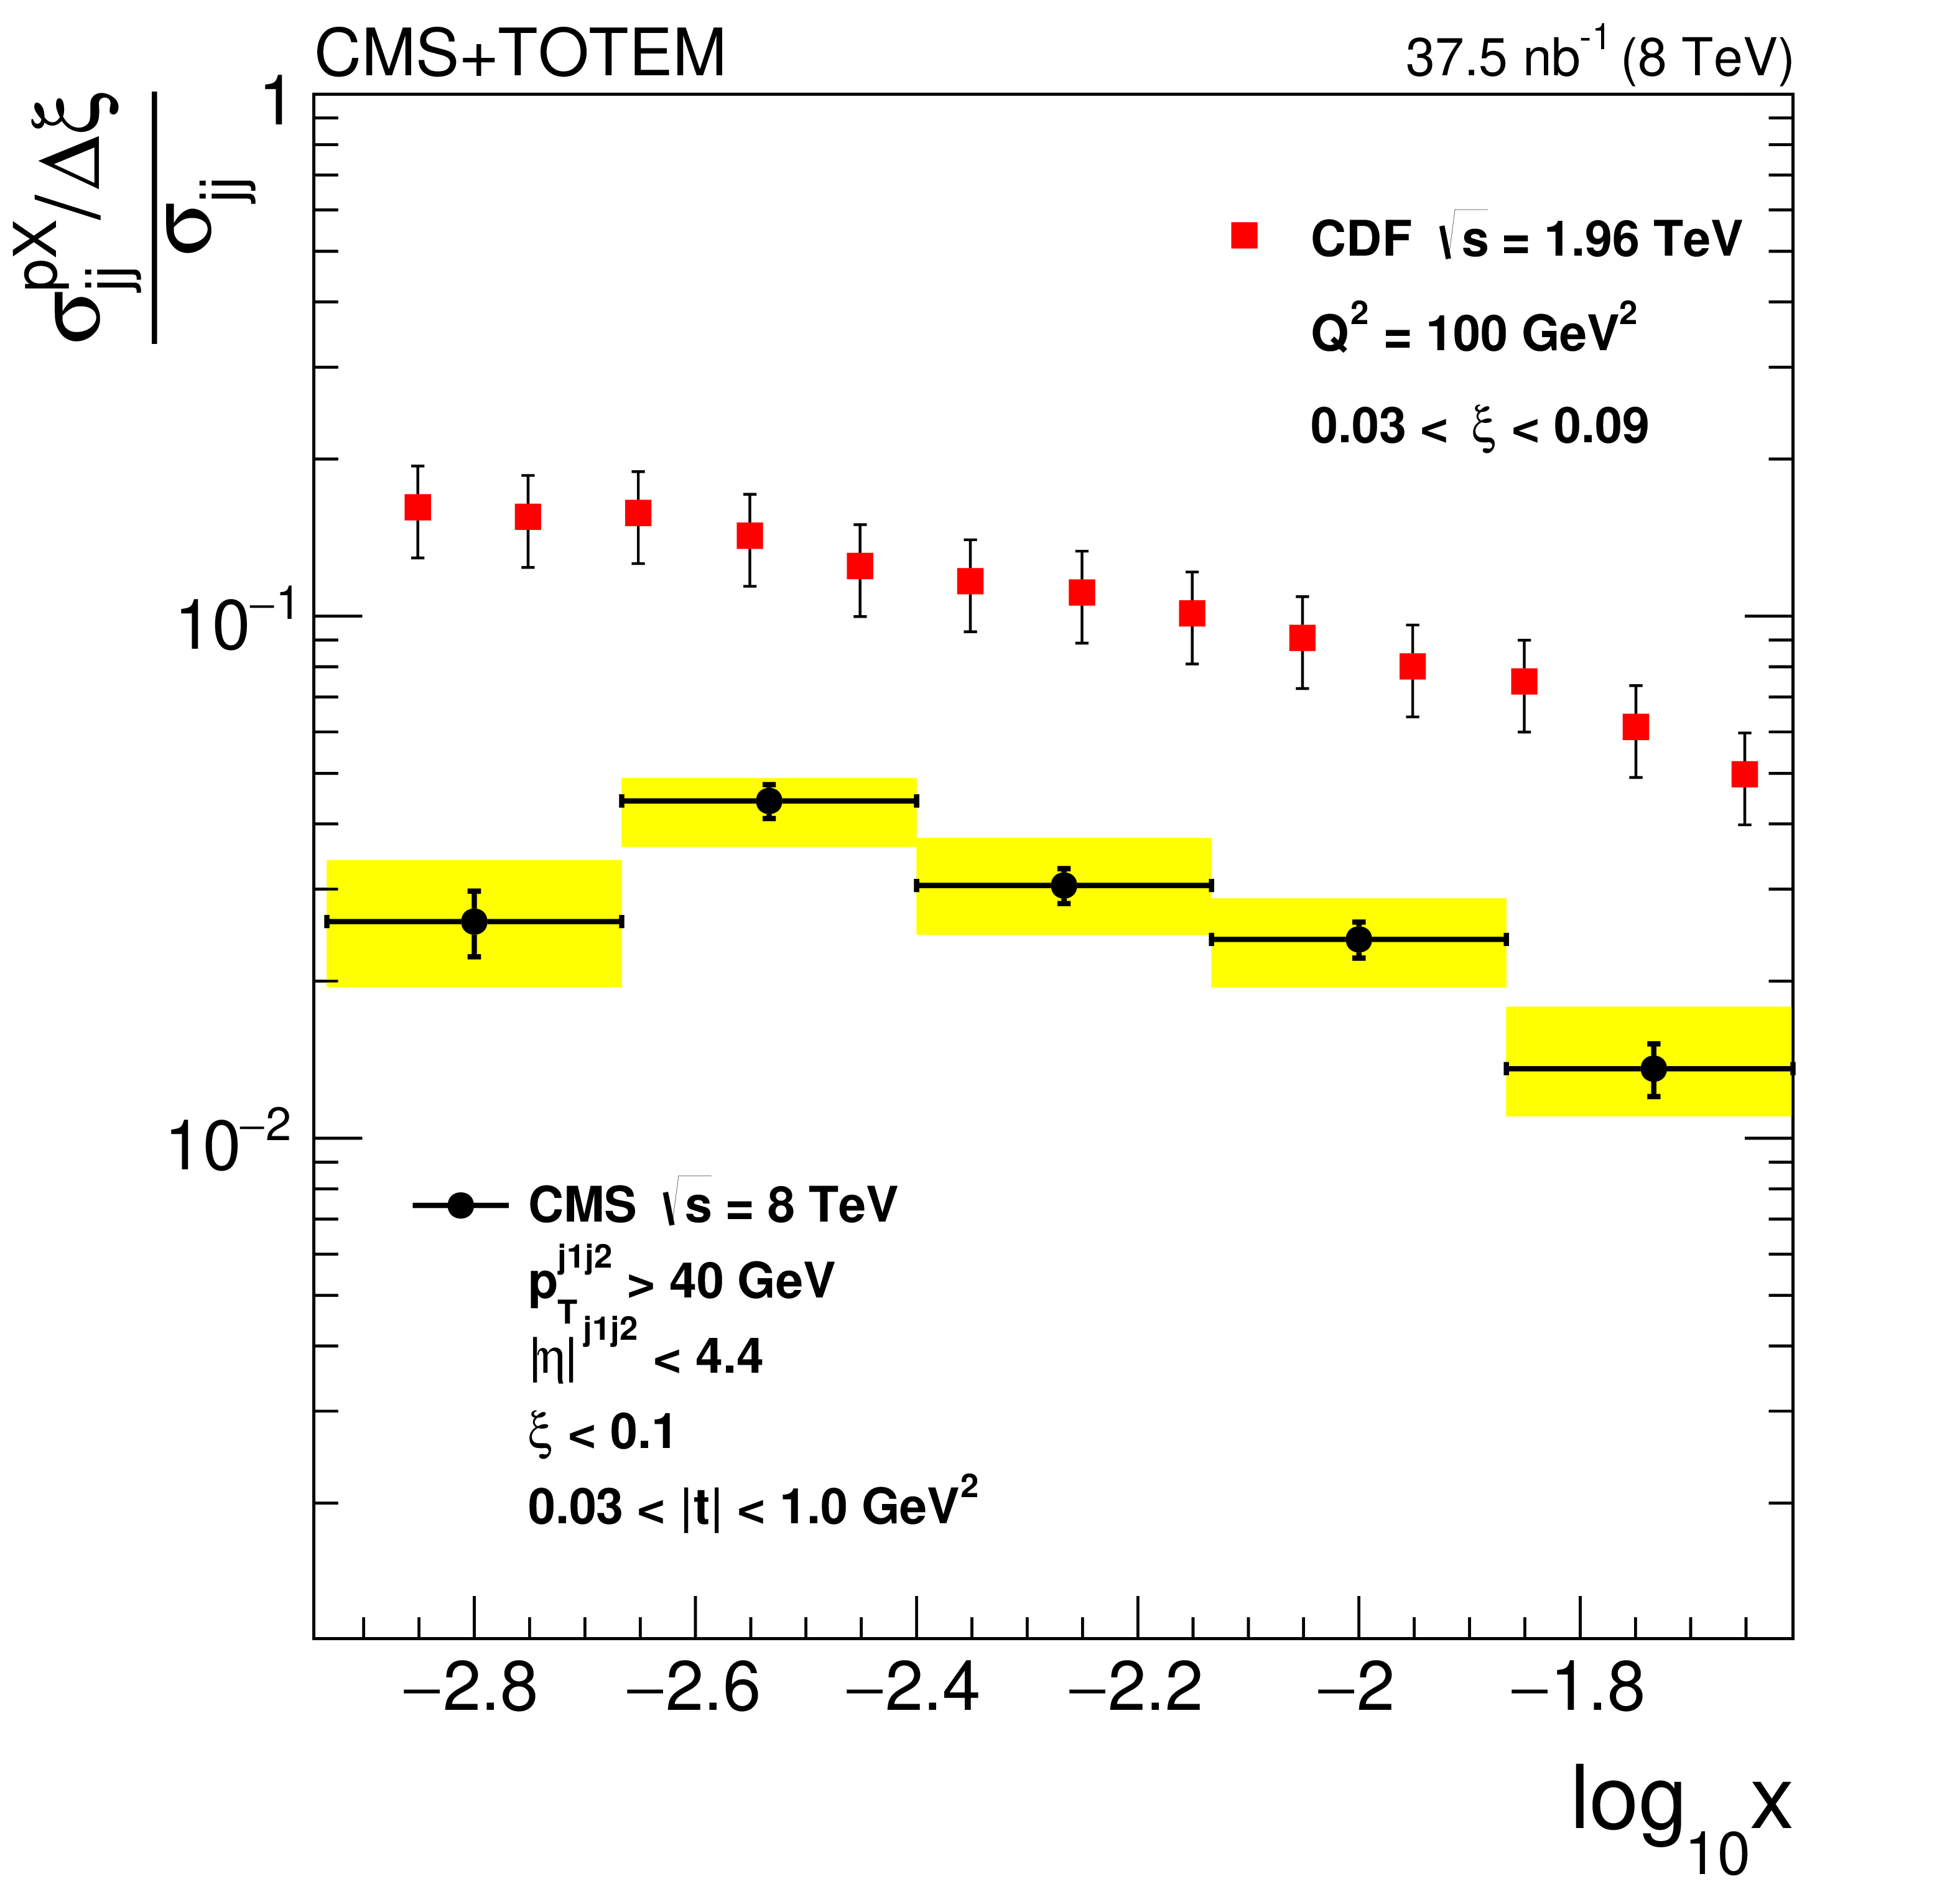
Figure 6:
Ratio per unit of $\xi $ of the single-diffractive and inclusive dijet cross sections in the kinematic region given by $\xi < $ 0.1 and 0.03 $ < {| t |} < $ 1 GeV$^2$. The vertical bars indicate the statistical uncertainties and the yellow band indicates the total systematic uncertainty. The red squares represent the results obtained by CDF at $\sqrt {s} = $ 1.96 TeV for jets with $Q^2 \approx $ 100 GeV$ ^2$ and $ {| \eta |} < $ 2.5, with 0.03 $ < \xi < $ 0.09. |
| Tables | |
png pdf |
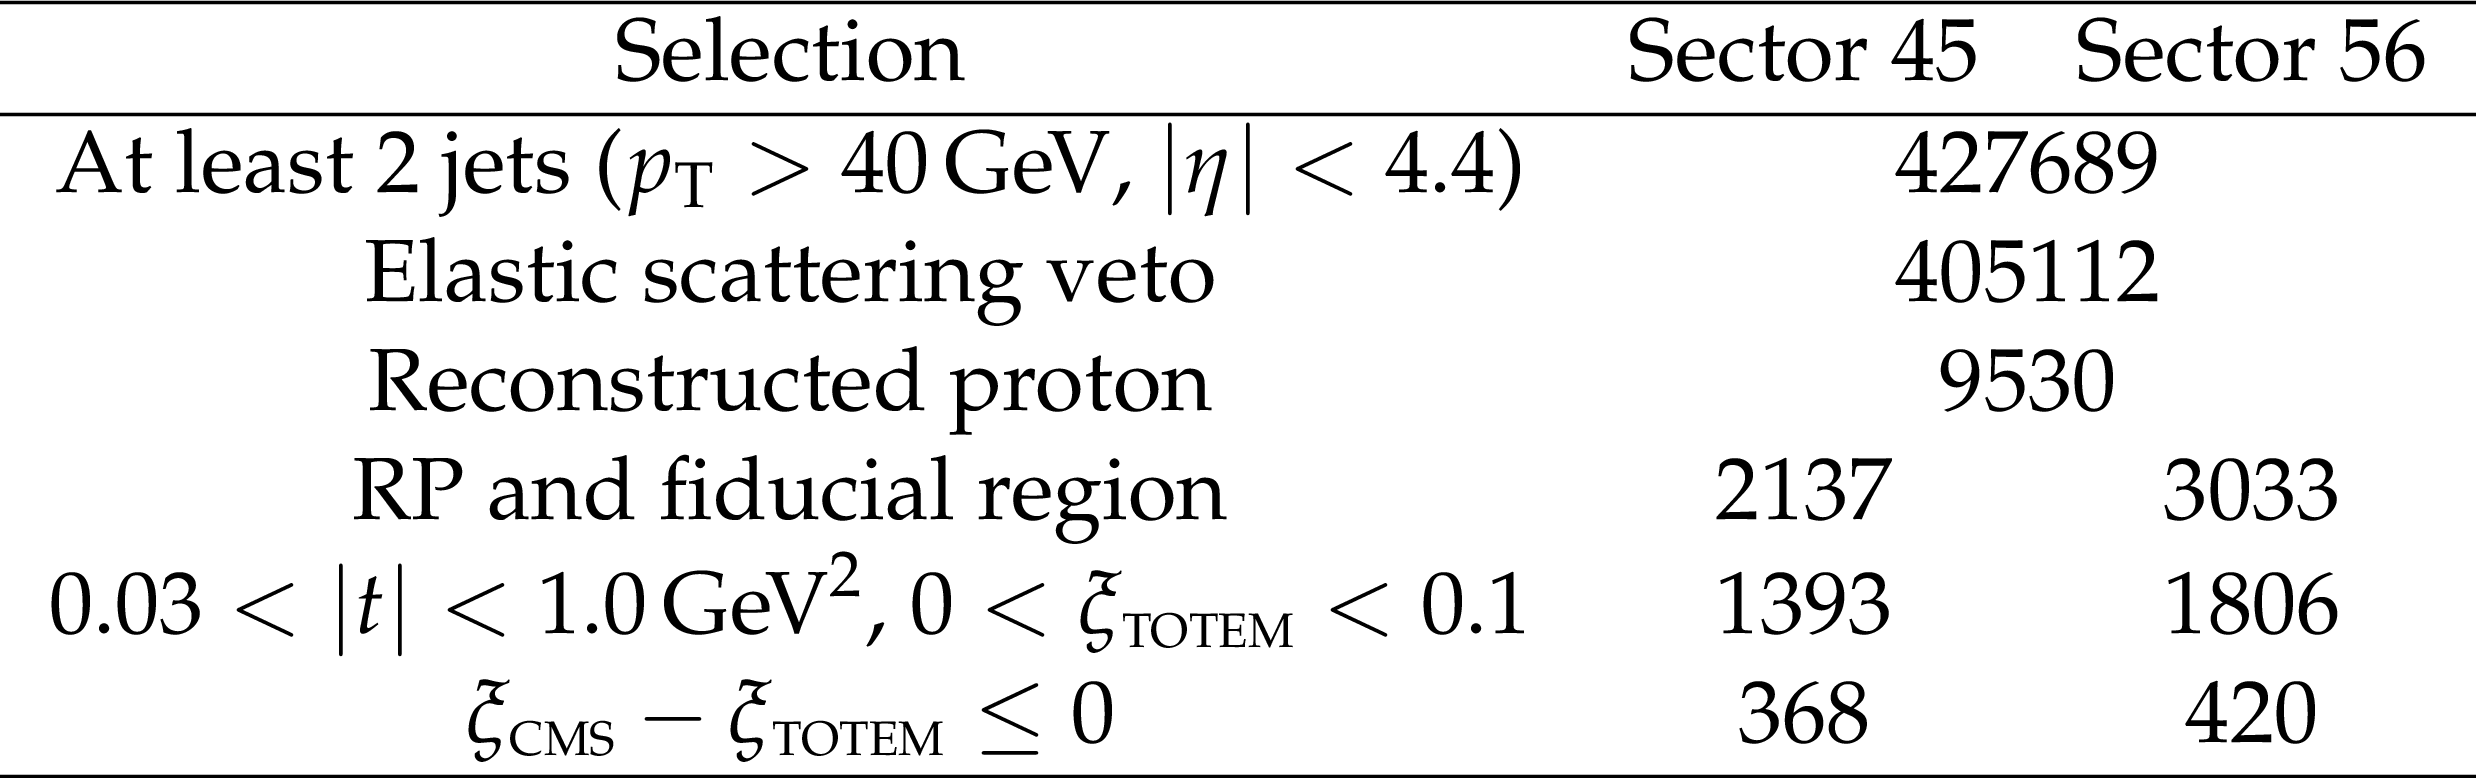
Table 1:
Number of events after each selection. |
png pdf |
Table 2:
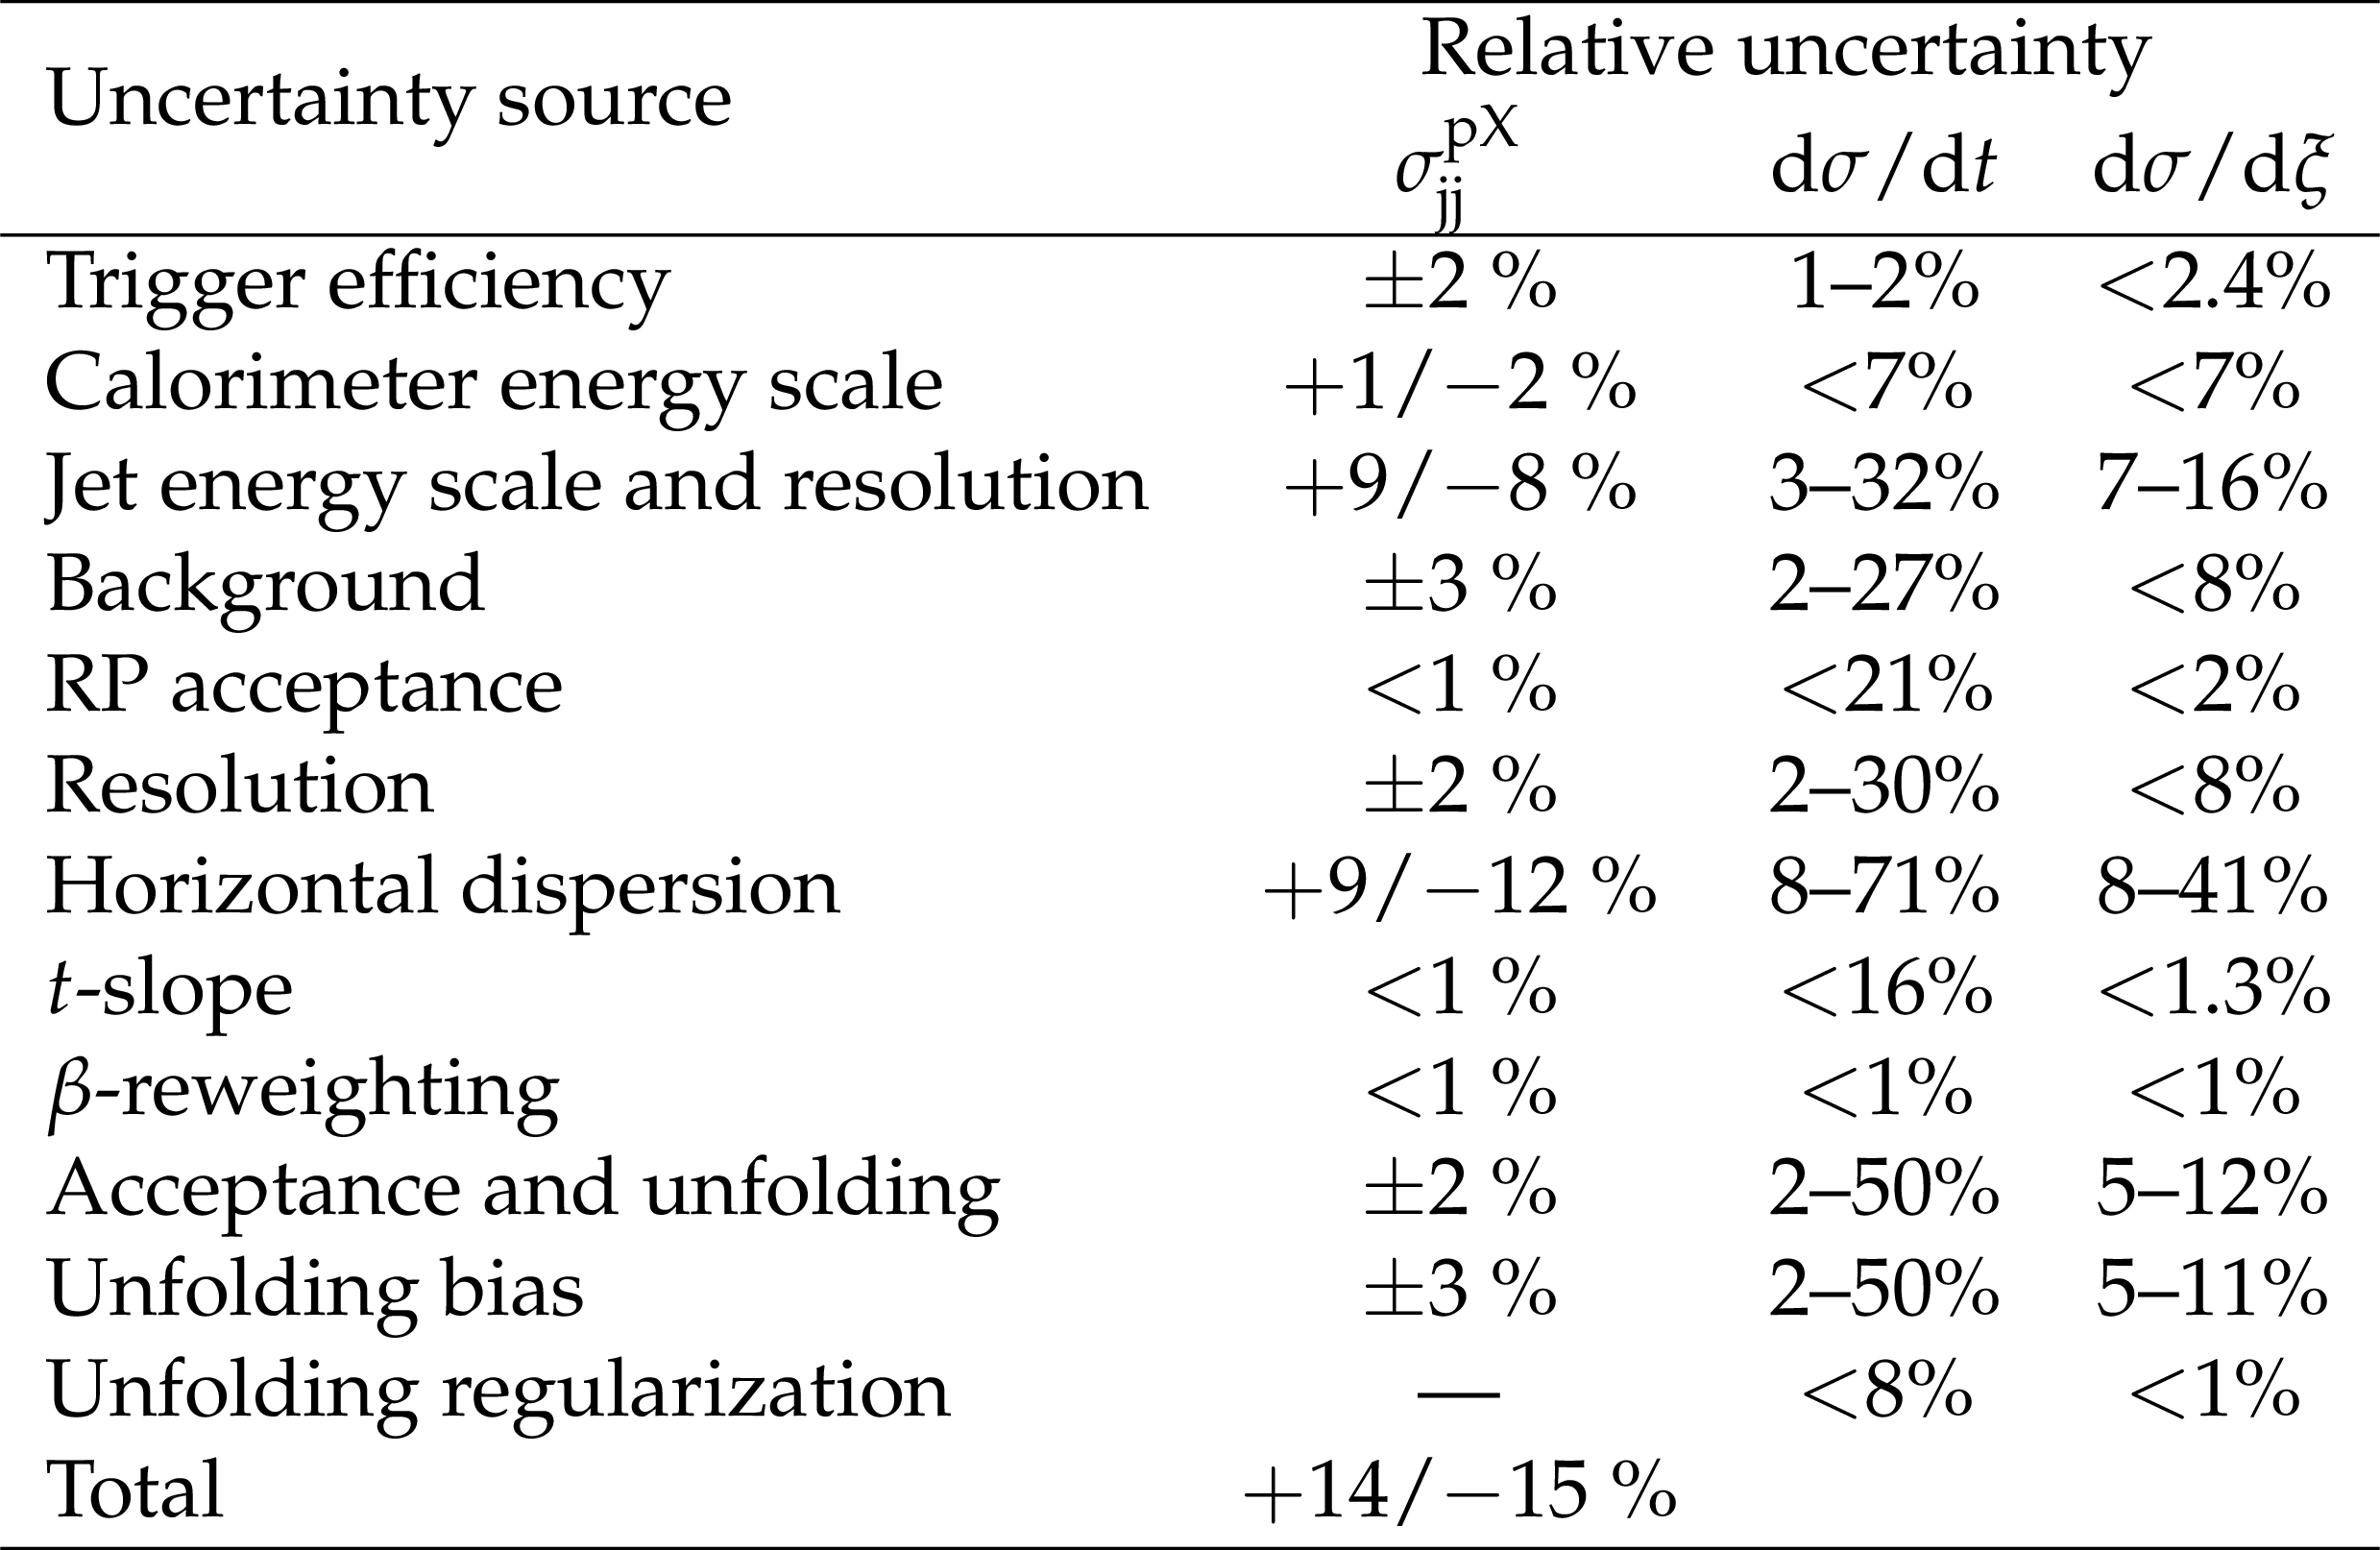
Individual contributions to the systematic uncertainties in the measurement of the single-diffractive dijet production cross section in the kinematic region $ {p_{\mathrm {T}}} > $ 40 GeV, $ {| \eta |} < $ 4.4, $\xi < $ 0.1, and 0.03 $ < {| t |} < 1 GeV ^2$. The total uncertainty is the quadratic sum of the individual contributions. The uncertainty of the integrated luminosity is not shown. The minimum relative uncertainty is not shown when it is below 1%. |
png pdf |
Table 3:
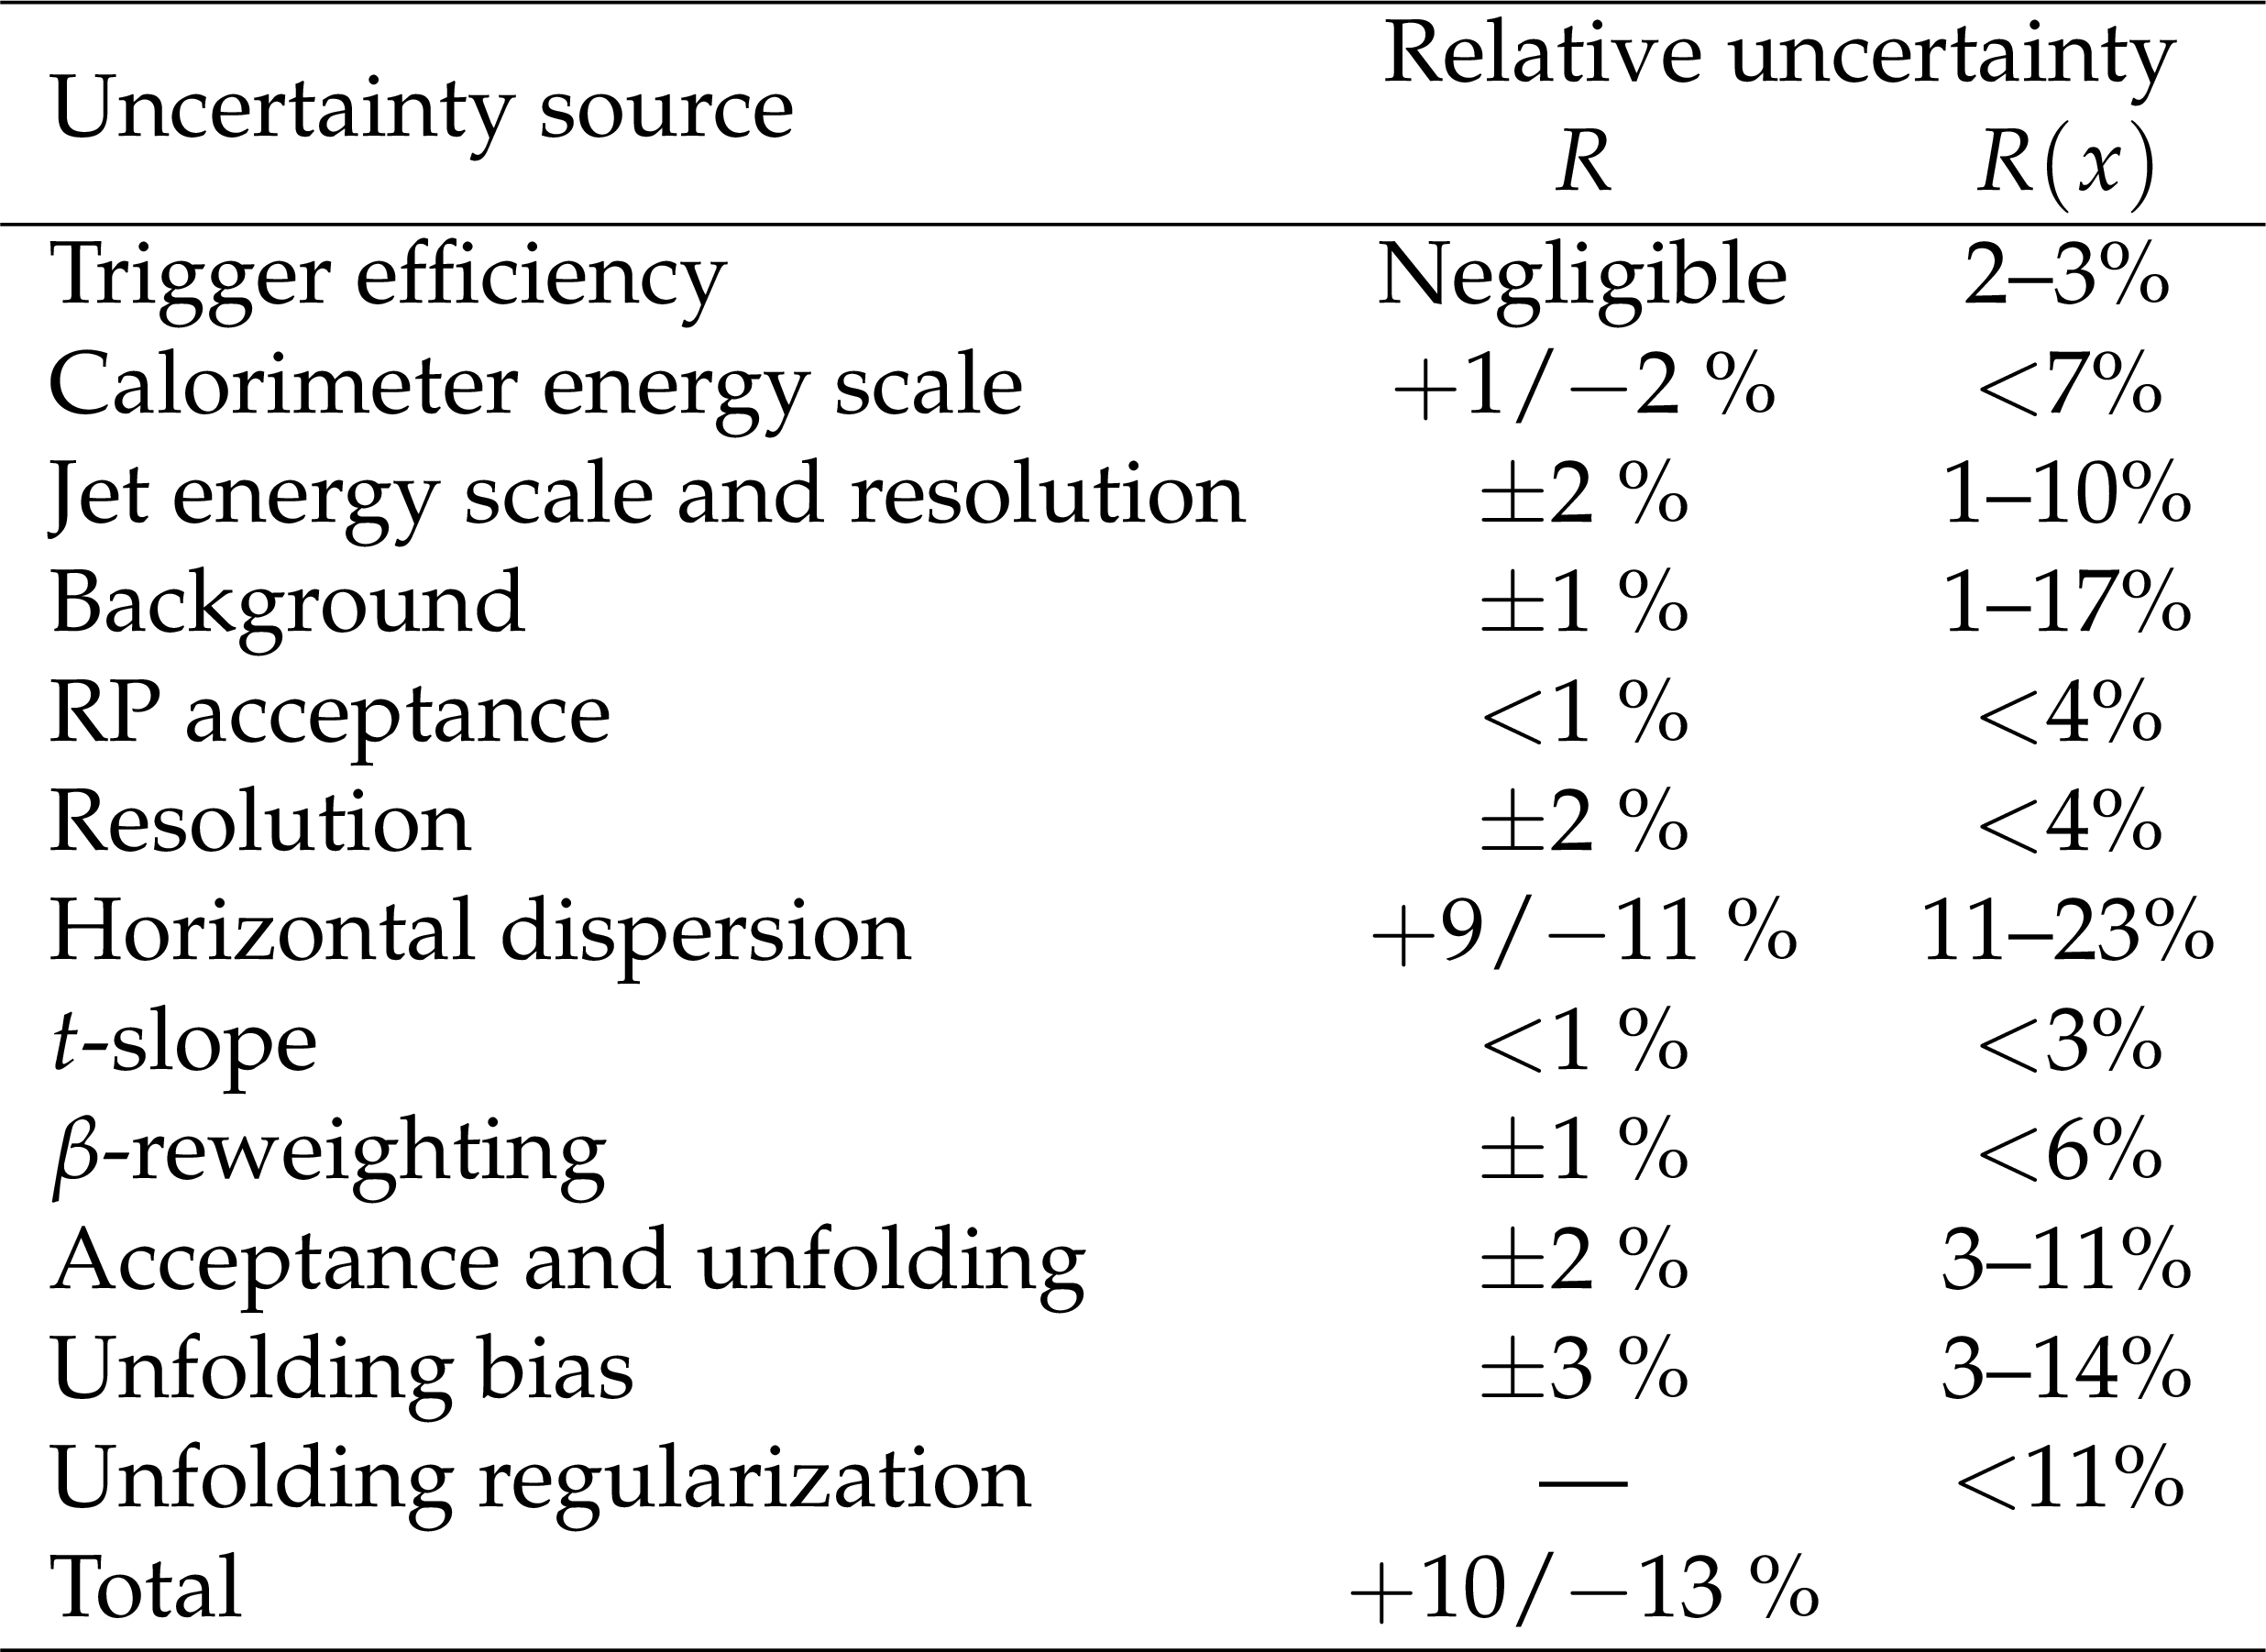
Individual contributions to the systematic uncertainty in the measurement of the single-diffractive to inclusive dijet yields ratio in the kinematic region $ {p_{\mathrm {T}}} > $ 40 GeV, $ {| \eta |} < $ 4.4, $\xi < $ 0.1, 0.03 $ < {| t |} < 1 GeV ^2$, and $-2.9 \leq \log_{10} x \leq -1.6$. The total uncertainty is the quadratic sum of the individual contributions. The minimum relative uncertainty is not shown when it is below 1%. |
| Summary |
|
The differential cross section for single-diffractive dijet production in proton-proton (pp) collisions at $\sqrt{s} = $ 8 TeV has been measured as a function of the proton fractional momentum loss $\xi$ and the squared four momentum transfer $t$, using the CMS and TOTEM detectors. The data, corresponding to an integrated luminosity of 37.5 nb$^{-1}$, were collected using a nonstandard optics configuration with $\beta^* = $ 90 m. The processes considered are ${\mathrm{p}}{\mathrm{p}} \to {\mathrm{p}}\mathrm{X}$ or ${\mathrm{p}}{\mathrm{p}} \to \mathrm{X}{\mathrm{p}}$, with $\mathrm{X}$ including a system of two jets, in the kinematic region $\xi < $ 0.1 and 0.03 $ < |t| < $ 1.0 GeV$^2$. The two jets have transverse momentum ${p_{\mathrm{T}}} > $ 40 GeV and pseudorapidity $|{\eta}| < $ 4.4. The integrated cross section in this kinematic region is $\sigma^{{\mathrm{p}}\mathrm{X}}_\mathrm{jj} = $ 21.7 $\pm$ 0.9 (stat) $^{+3.0}_{-3.3}$ (syst) $\pm$ 0.9 (lumi) nb; it is the average of the cross sections when the proton scatters to either side of the interaction point. The exponential slope of the cross section as a function of $t$ is $b = $ 6.5 $\pm$ 0.6 (stat) $^{+1.0}_{-0.8}$ (syst) GeV$^{-2}$. This is the first measurement of hard diffraction with a measured proton at the LHC. The data are compared with the predictions of different models. After applying a normalisation shift ascribed to the rapidity gap survival probability, POMWIG agrees well with the data. The PYTHIA8 dynamic gap model describes the data well, both in shape and normalisation. In this model the effects of the rapidity gap survival probability are simulated within the framework of multiparton interactions. The PYTHIA8 dynamic gap model is the only calculation that predicts the cross section normalisation without an additional correction. The ratios of the measured single-diffractive cross section to those predicted by POMWIG and PYTHIA8 give estimates of the rapidity gap survival probability. After accounting for the correction of the dPDF normalisation due to proton dissociation, the value of $< S^{2} >$ is (9 $\pm$ 2)% when using POMWIG as the reference cross section value, with a similar result when PYTHIA8 is used. The ratio of the single-diffractive to inclusive dijet cross section has been measured as a function of the parton momentum fraction $x$. The ratio is lower than that observed at CDF at a smaller centre-of-mass energy. In the region ${p_{\mathrm{T}}} > $ 40 GeV, $|{\eta}| < $ 4.4, $\xi < $ 0.1, 0.03 $ < |t| < $ 1.0 GeV$^2$, and $-2.9 \leq \log_{10} x \leq -1.6$, the ratio, normalised per unit $\xi$, is $R = (\sigma^{{\mathrm{p}}\mathrm{X}}_{\mathrm{jj}}/\Delta\xi)/\sigma_{\mathrm{jj}} = $ 0.025 $\pm$ 0.001 (stat) $\pm$ 0.003 (syst). |
| References | ||||
| 1 | P. D. B. Collins | An Introduction to Regge Theory and High-Energy Physics | Cambridge Monographs on Mathematical Physics. Cambridge Univ. Press, Cambridge, UK, 2009 ISBN 9780521110358 | |
| 2 | H1 Collaboration | Measurement and QCD analysis of the diffractive deep-inelastic scattering cross section at HERA | EPJC 48 (2006) 715 | hep-ex/0606004 |
| 3 | H1 Collaboration | Diffractive deep-inelastic scattering with a leading proton at HERA | EPJC 48 (2006) 749 | hep-ex/0606003 |
| 4 | ZEUS Collaboration | Deep inelastic scattering with leading protons or large rapidity gaps at HERA | NPB 816 (2009) 1 | 0812.2003 |
| 5 | ZEUS Collaboration | A QCD analysis of ZEUS diffractive data | NPB 831 (2010) 1 | 0911.4119 |
| 6 | UA8 Collaboration | Evidence for a super-hard pomeron structure | PLB 297 (1992) 417 | |
| 7 | CDF Collaboration | Measurement of diffractive dijet production at the Fermilab Tevatron | PRL 79 (1997) 2636 | |
| 8 | D0 Collaboration | Hard single diffraction in $ \mathrm{\bar{p}}{\mathrm{p}} $ collisions at $ \sqrt{s} = $ 630 and 1800 GeV | PLB 531 (2002) 52 | hep-ex/9912061 |
| 9 | CDF Collaboration | Diffractive dijets with a leading antiproton in $ \mathrm{\bar{p}}{\mathrm{p}} $ collisions at $ \sqrt{s} = $ 1800 GeV | PRL 84 (2000) 5043 | |
| 10 | CDF Collaboration | Diffractive dijet production in $ \mathrm{\bar{p}}{\mathrm{p}} $ collisions at $ \sqrt{s} = $ 1.96 TeV | PRD 86 (2012) 032009 | 1206.3955 |
| 11 | CDF Collaboration | Diffractive dijet production at $ \sqrt{s} = $ 630 and $ \sqrt{s} = $ 1800 GeV at the Fermilab Tevatron | PRL 88 (2002) 151802 | hep-ex/0109025 |
| 12 | CMS Collaboration | Observation of a diffractive contribution to dijet production in proton-proton collisions at $ \sqrt{s}= $ 7 TeV | PRD 87 (2013) 012006 | CMS-FWD-10-004 1209.1805 |
| 13 | ATLAS Collaboration | Dijet production in $ \sqrt{s} = $ 7 TeV pp collisions with large rapidity gaps at the ATLAS experiment | PLB 754 (2016) 214 | 1511.00502 |
| 14 | H1 Collaboration | Diffractive dijet photoproduction in ep collisions at HERA | EPJC 70 (2010) 15 | 1006.0946 |
| 15 | L. Trentadue and G. Veneziano | Fracture functions. An improved description of inclusive hard processes in QCD | PLB 323 (1994) 201 | |
| 16 | J. C. Collins | Proof of factorization for diffractive hard scattering | PRD 57 (1998) 3051 | hep-ph/9709499 |
| 17 | M. Grazzini, L. Trentadue, and G. Veneziano | Fracture functions from cut vertices | NPB 519 (1998) 394 | hep-ph/9709452 |
| 18 | J. D. Bjorken | Rapidity gaps and jets as a new-physics signature in very high-energy hadron-hadron collisions | PRD 47 (1993) 101 | |
| 19 | CMS Collaboration | Particle-flow reconstruction and global event description with the CMS detector | JINST 12 (2017) P10003 | CMS-PRF-14-001 1706.04965 |
| 20 | M. Cacciari, G. P. Salam, and G. Soyez | The anti-$ {k_{\mathrm{T}}} $ jet clustering algorithm | JHEP 04 (2008) 063 | 0802.1189 |
| 21 | M. Cacciari, G. P. Salam, and G. Soyez | FastJet user manual | EPJC 72 (2012) 1896 | 1111.6097 |
| 22 | CMS Collaboration | Jet energy scale and resolution in the CMS experiment in $ {\mathrm{p}}{\mathrm{p}} $ collisions at 8 TeV | JINST 12 (2017) P02014 | CMS-JME-13-004 1607.03663 |
| 23 | CMS Collaboration | Identification and filtering of uncharacteristic noise in the CMS hadron calorimeter | JINST 5 (2010) T03014 | CMS-CFT-09-019 0911.4881 |
| 24 | CMS Collaboration | The CMS experiment at the CERN LHC | JINST 3 (2008) S08004 | CMS-00-001 |
| 25 | TOTEM Collaboration | The TOTEM experiment at the CERN Large Hadron Collider | JINST 3 (2008) S08007 | |
| 26 | TOTEM Collaboration | Performance of the TOTEM detectors at the LHC | Int. J. Mod. Phys. A 28 (2013) 1330046 | 1310.2908 |
| 27 | TOTEM Collaboration | LHC optics measurement with proton tracks detected by the roman pots of the TOTEM experiment | New J. Phys. 16 (2014) 103041 | 1406.0546 |
| 28 | H. Niewiadomski | Reconstruction of protons in the TOTEM roman pot detectors at the LHC | PhD thesis, University of Manchester, 2008\textttcds.cern.ch/record/1131825 | |
| 29 | TOTEM Collaboration | Evidence for non-exponential elastic proton-proton differential cross-section at low $ |t| $ and $ \sqrt{s} = $ 8 TeV by TOTEM | NPB 899 (2015) 527 | 1503.08111 |
| 30 | T. Sjostrand, S. Mrenna, and P. Skands | PYTHIA 6.4 physics and manual | JHEP 05 (2006) 026 | hep-ph/0603175 |
| 31 | T. Sjostrand, S. Mrenna, and P. Skands | A brief introduction to PYTHIA 8.1 | CPC 178 (2008) 852 | 0710.3820 |
| 32 | G. Corcella et al. | HERWIG 6: An event generator for hadron emission reactions with interfering gluons (including supersymmetric processes) | JHEP 01 (2001) 010 | hep-ph/0011363 |
| 33 | R. Field | Early LHC underlying event data - findings and surprises | in Hadron collider physics. Proceedings, 22nd Conference, HCP 2010, Toronto, Canada, August 23-27, 2010 2010 | 1010.3558 |
| 34 | R. Corke and T. Sjostrand | Interleaved parton showers and tuning prospects | JHEP 03 (2011) 032 | 1011.1759 |
| 35 | CMS Collaboration | Event generator tunes obtained from underlying event and multiparton scattering measurements | EPJC 76 (2016) 155 | CMS-GEN-14-001 1512.00815 |
| 36 | B. Cox and J. Forshaw | Pomwig: Herwig for diffractive interactions | CPC 144 (2002) 104 | hep-ph/0010303 |
| 37 | S. Navin | Diffraction in PYTHIA | 1005.3894 | |
| 38 | C. O. Rasmussen and T. Sjostrand | Hard diffraction with dynamic gap survival | JHEP 02 (2016) 142 | 1512.05525 |
| 39 | CMS and TOTEM Collaboration | Measurement of pseudorapidity distributions of charged particles in proton-proton collisions at $ \sqrt{s} = $ 8 TeV by the CMS and TOTEM experiments | EPJC 74 (2014) 3053 | 1405.0722 |
| 40 | CMS Collaboration | Measurement of charged particle spectra in minimum-bias events from proton-proton collisions at $ \sqrt{s}= $ 13 TeV | EPJC 78 (2018) 697 | CMS-FSQ-16-011 1806.11245 |
| 41 | GEANT4 Collaboration | GEANT4--a simulation toolkit | NIMA 506 (2003) 250 | |
| 42 | CMS Collaboration | The CMS trigger system | JINST 12 (2017) P01020 | CMS-TRG-12-001 1609.02366 |
| 43 | G. D'Agostini | A multidimensional unfolding method based on Bayes' theorem | NIMA 362 (1995) 487 | |
| 44 | CMS Collaboration | Measurement of energy flow at large pseudorapidities in $ {\mathrm{p}}{\mathrm{p}} $ collisions at $ \sqrt{s} = $ 0.9 and 7 TeV | JHEP 11 (2011) 148 | CMS-FWD-10-011 1110.0211 |
|
|
Compact Muon Solenoid LHC, CERN |
|

|

|

|

|

|