

Compact Muon Solenoid
LHC, CERN
| CMS-FSQ-13-004 ; CERN-EP-2021-173 | ||
| Study of dijet events with large rapidity separation in proton-proton collisions at $\sqrt{s} = $ 2.76 TeV | ||
| CMS Collaboration | ||
| 8 November 2021 | ||
| JHEP 03 (2022) 189 | ||
| Abstract: The cross sections for inclusive and Mueller-Navelet dijet production are measured as a function of the rapidity separation between the jets in proton-proton collisions at $\sqrt{s} = $ 2.76 TeV for jets with transverse momentum ${p_{\mathrm{T}}} > $ 35 GeV and rapidity $| y | < $ 4.7. Various dijet production cross section ratios are also measured. A veto on additional jets with ${p_{\mathrm{T}}} > $ 20 GeV is introduced to improve the sensitivity to the effects of the Balitsky-Fadin-Kuraev-Lipatov (BFKL) evolution. The measurement is compared with the predictions of various Monte Carlo models based on leading-order and next-to-leading-order calculations including the Dokshitzer-Gribov-Lipatov-Altarelli-Parisi leading-logarithm (LL) parton shower as well as the LL BFKL resummation. | ||
| Links: e-print arXiv:2111.04605 [hep-ex] (PDF) ; CDS record ; inSPIRE record ; HepData record ; CADI line (restricted) ; | ||
| Figures | |

png pdf |
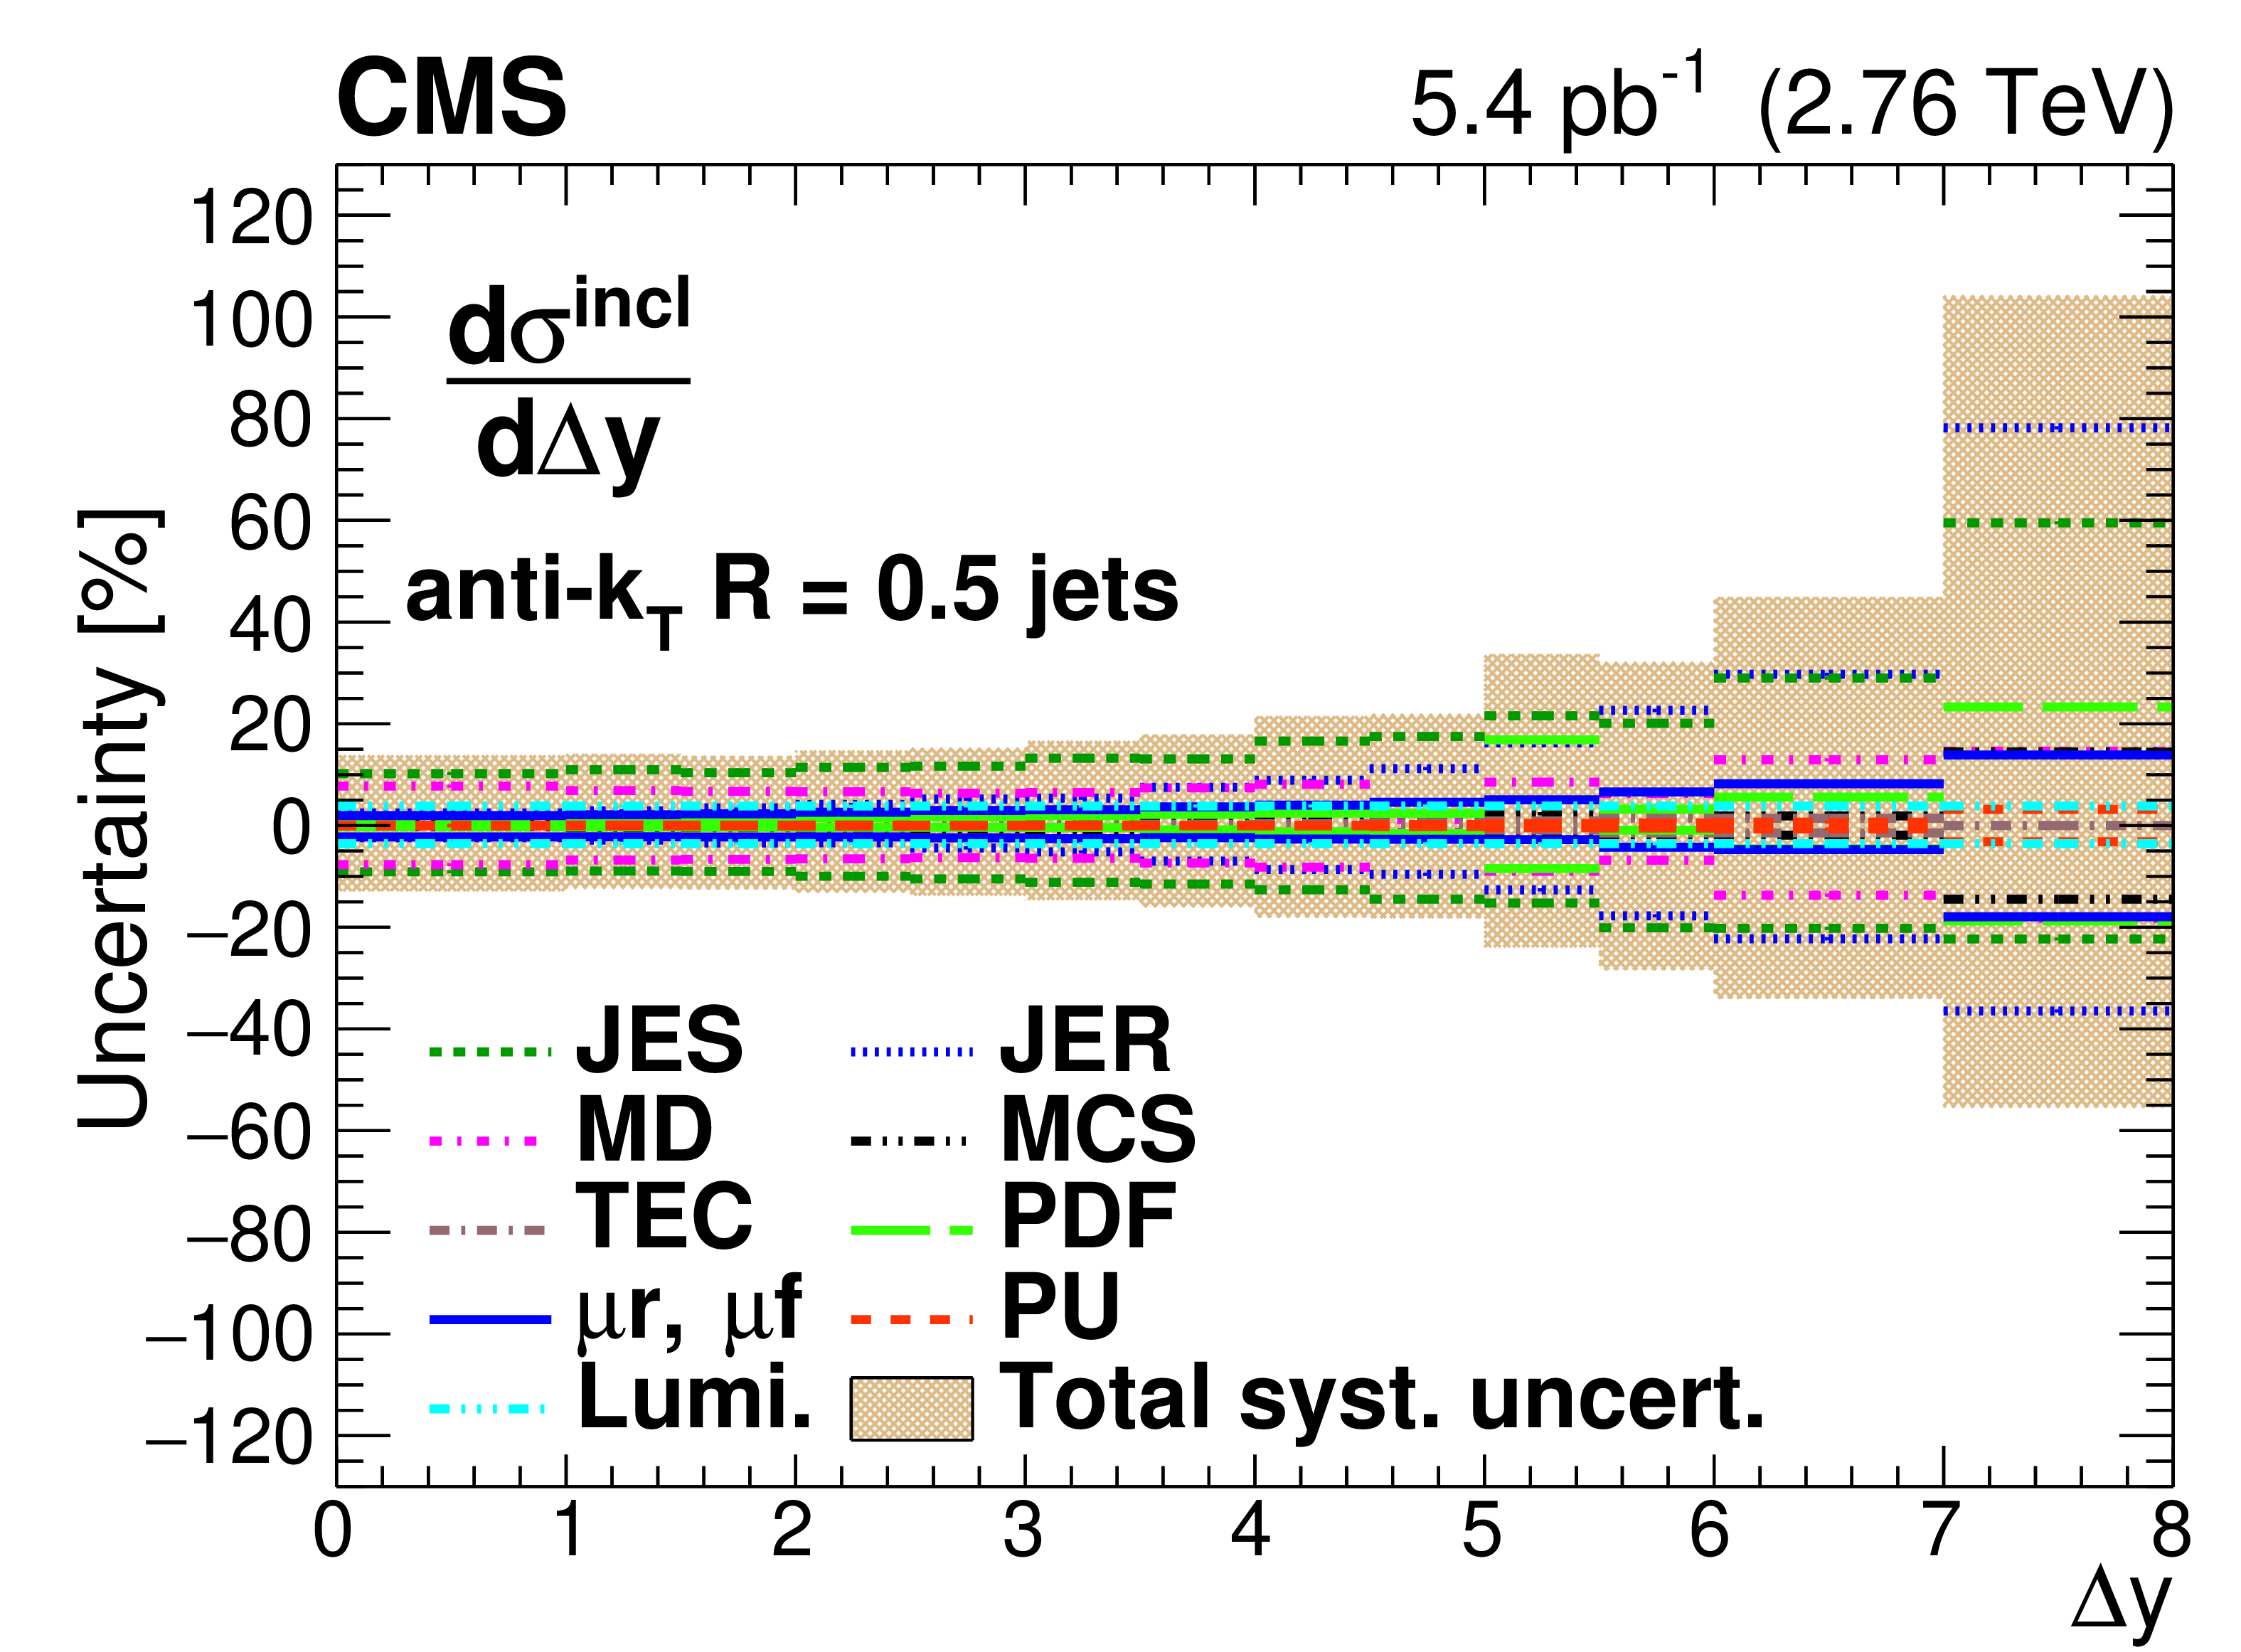
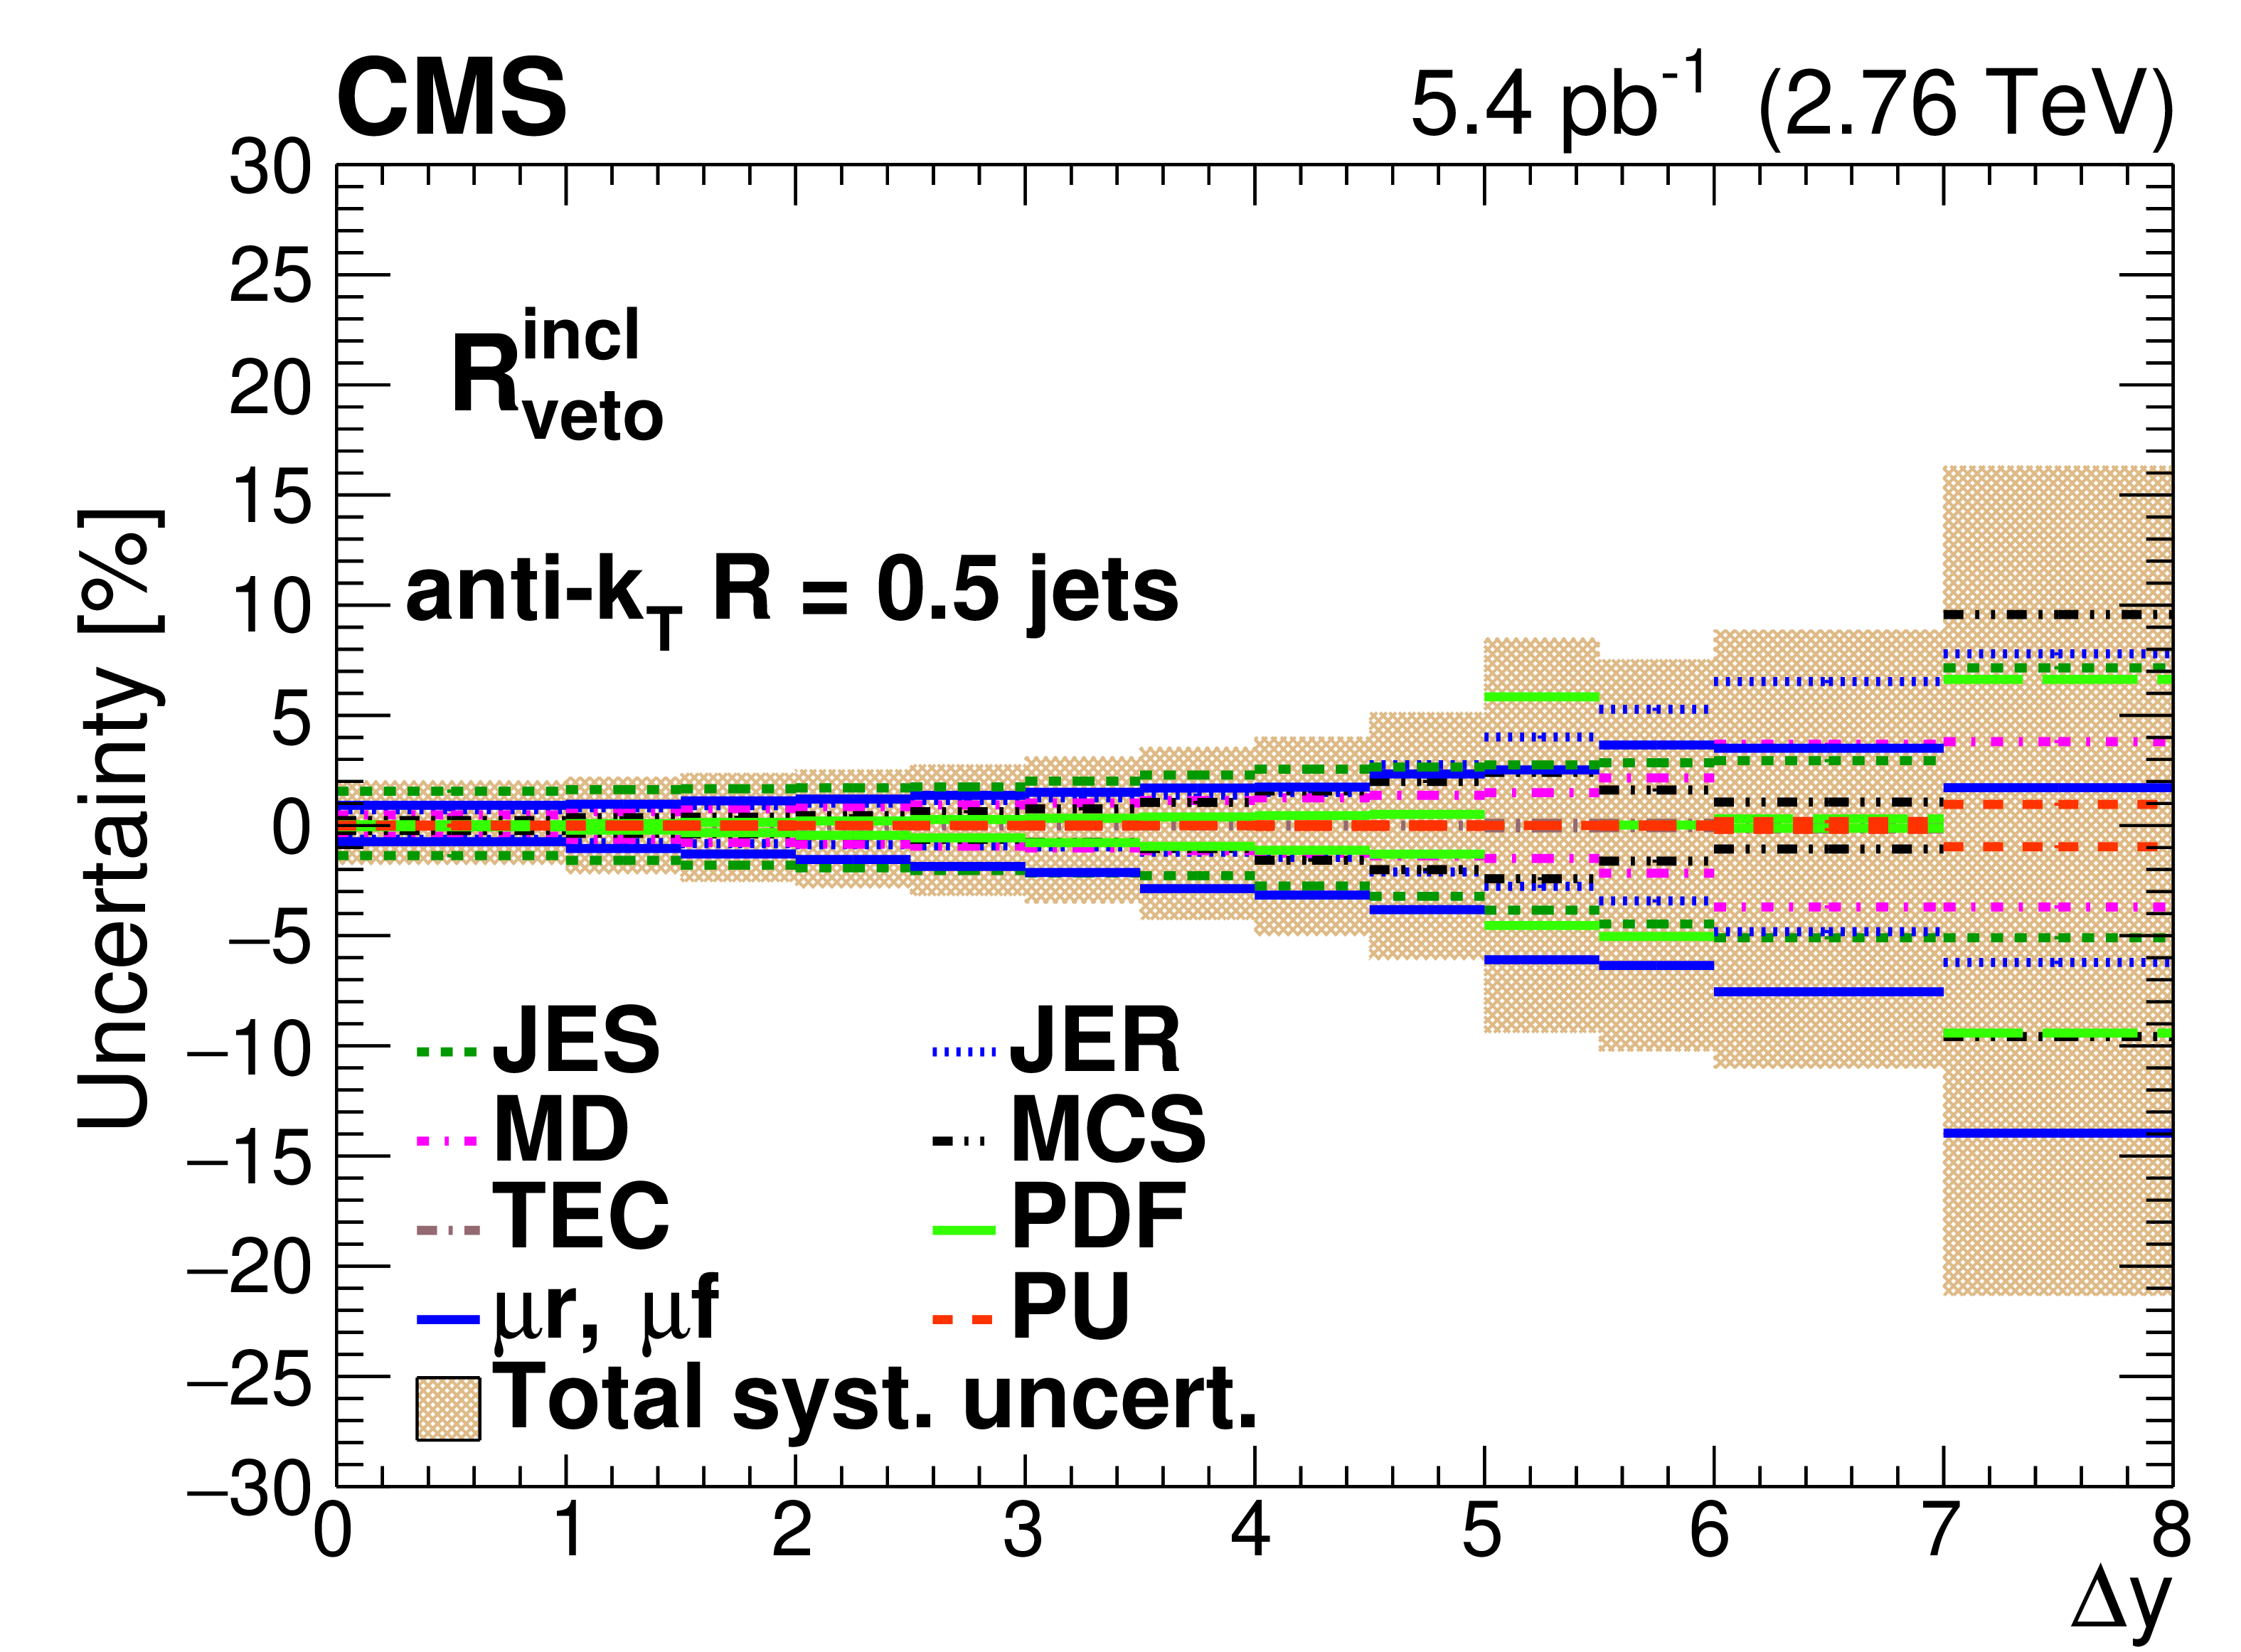
Figure 1:
Summary of the systematic uncertainties on the cross sections $ {\mathrm {d} {\sigma ^{\text {incl}}} /\mathrm {d} {\Delta y}}$ (upper left) and $ {\mathrm {d} {\sigma ^{\mathrm {MN}}} /\mathrm {d} {\Delta y}}$ (upper right), as well as the ratios $ {R^{\text {incl}}} $ (middle left), $ {R^{\mathrm {MN}}} $ (middle right), $ {R^{\text {incl}}_{\text {veto}}} $ (lower left), and $ {R^{\mathrm {MN}}_{\text {veto}}} $ (lower right). The various contributions are indicated by the lines and the total uncertainty is shown with a band. |
png pdf |
Figure 1-a:
Summary of the systematic uncertainties on the $ {\mathrm {d} {\sigma ^{\text {incl}}} /\mathrm {d} {\Delta y}}$ cross section. The various contributions are indicated by the lines and the total uncertainty is shown with a band. |
png pdf |
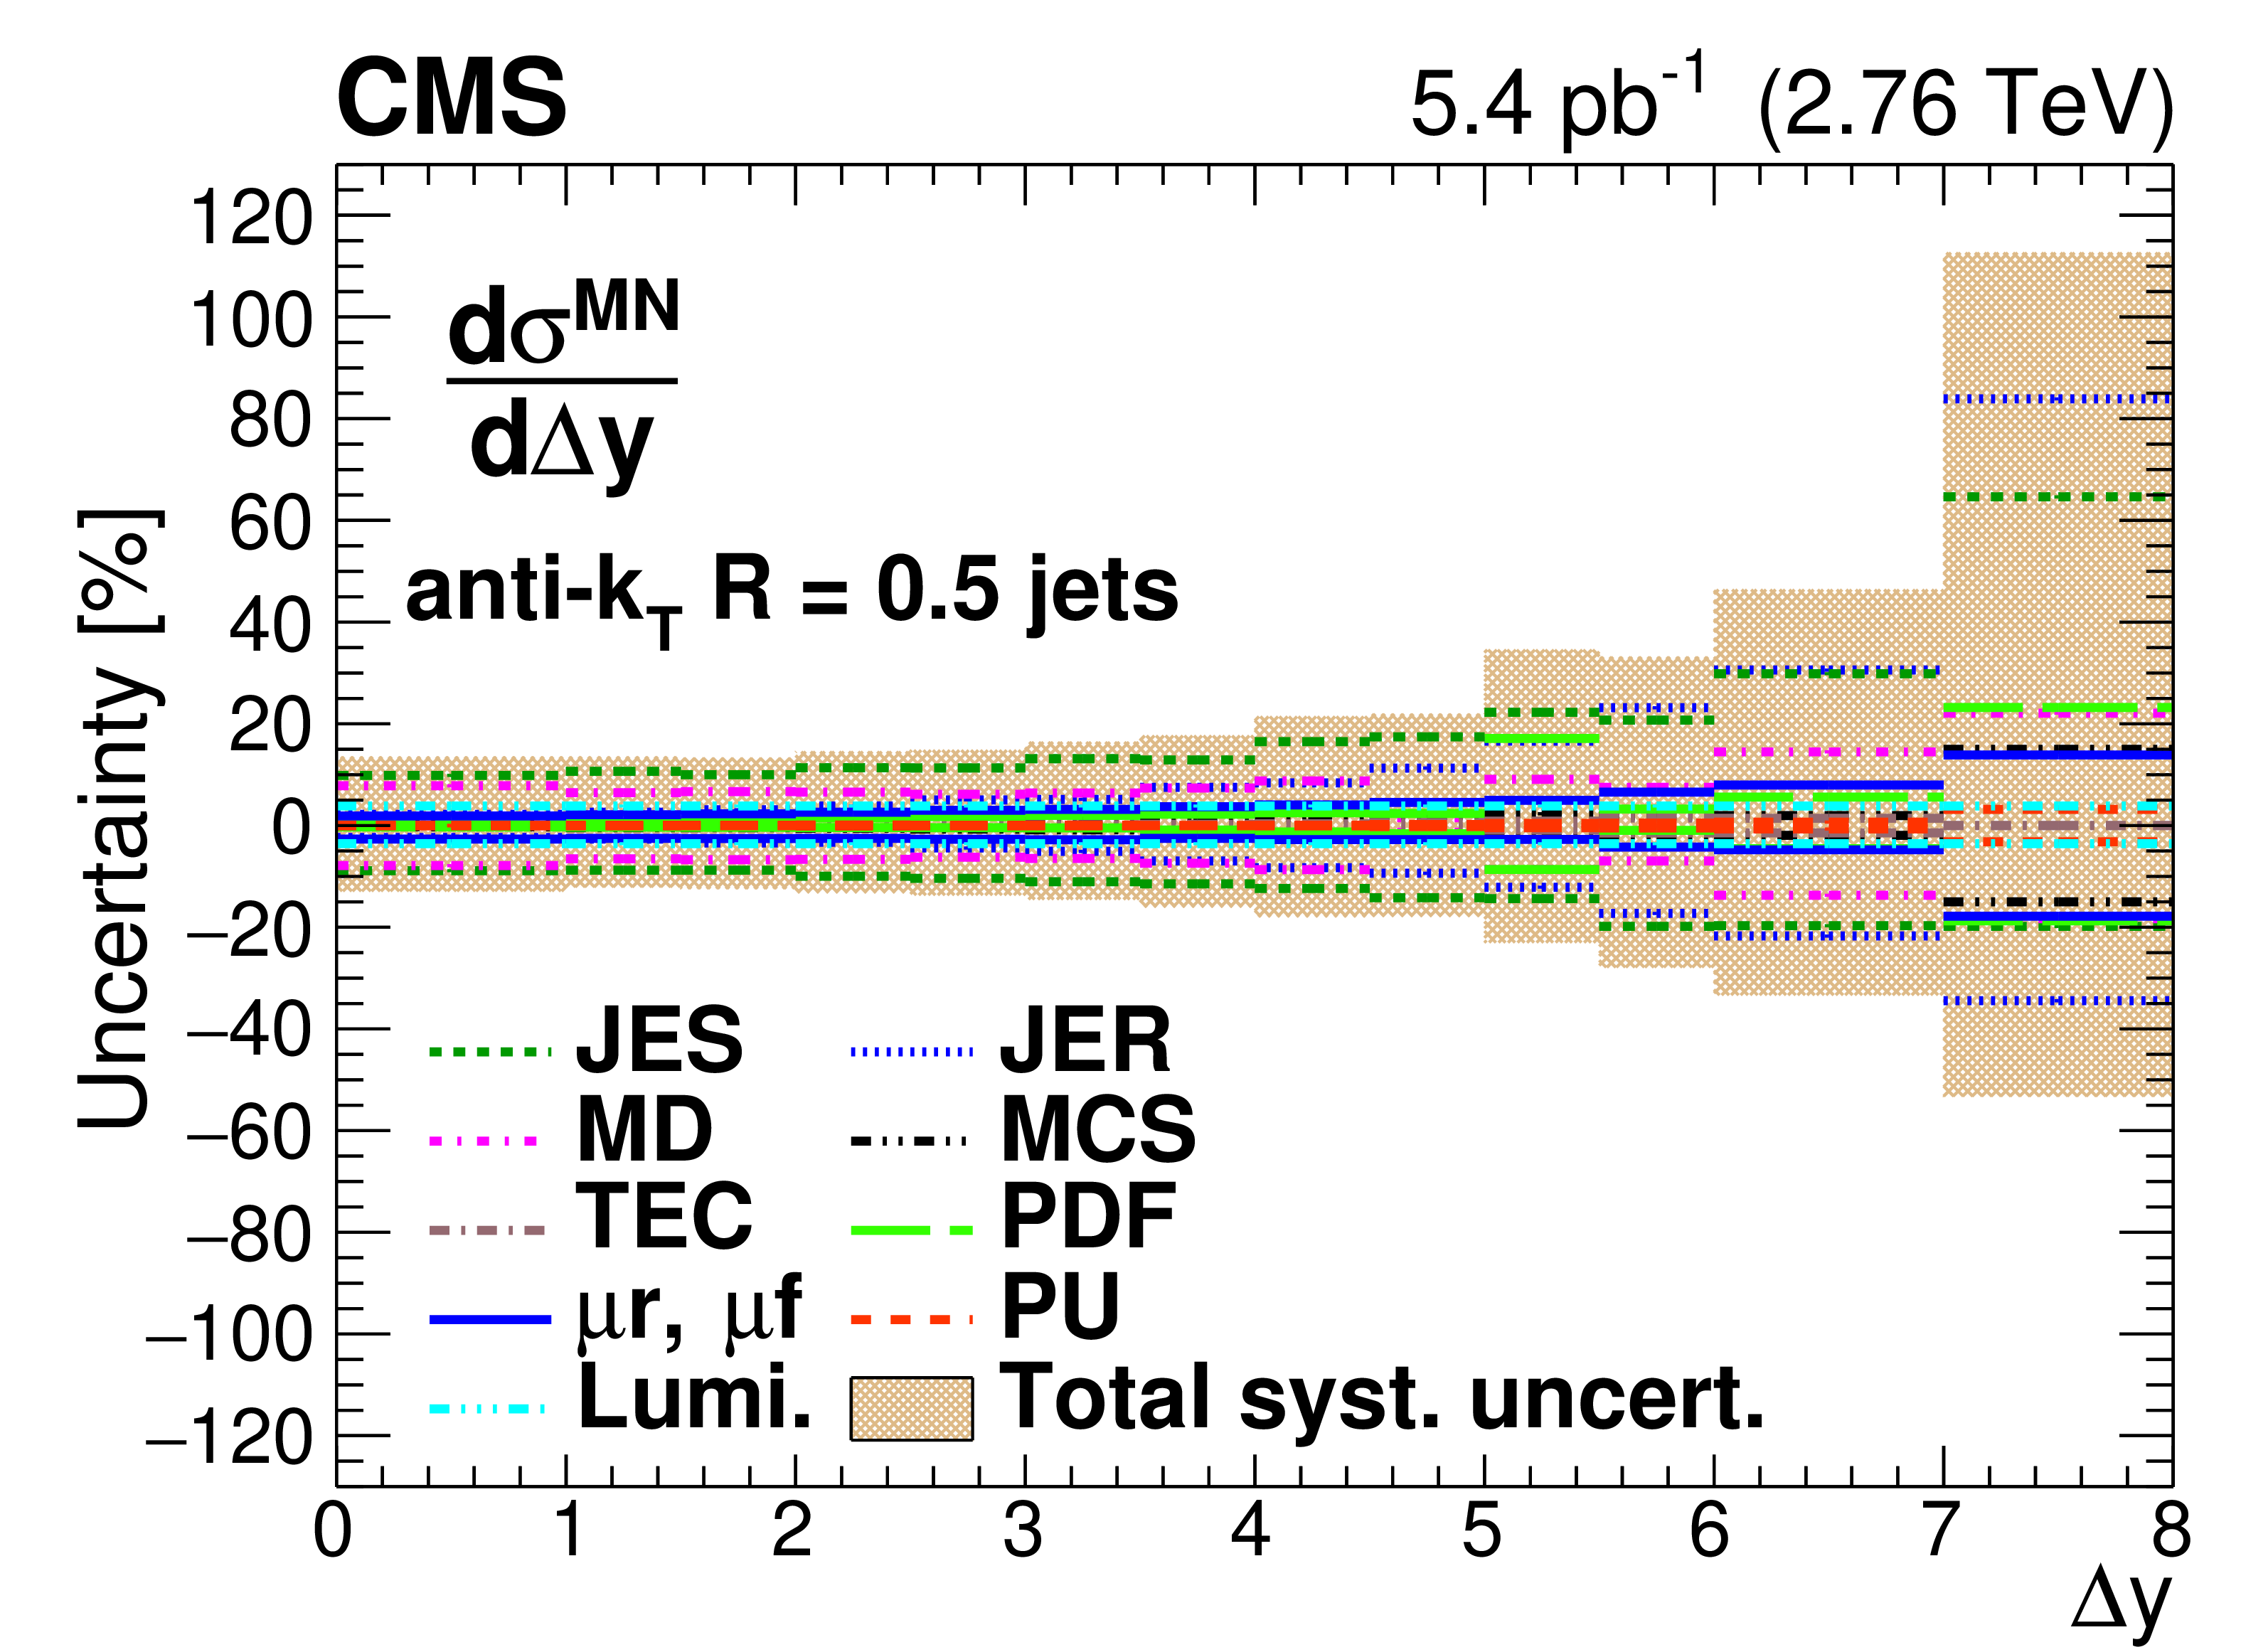
Figure 1-b:
Summary of the systematic uncertainties on the $ {\mathrm {d} {\sigma ^{\mathrm {MN}}} /\mathrm {d} {\Delta y}}$ cross section. The various contributions are indicated by the lines and the total uncertainty is shown with a band. |
png pdf |
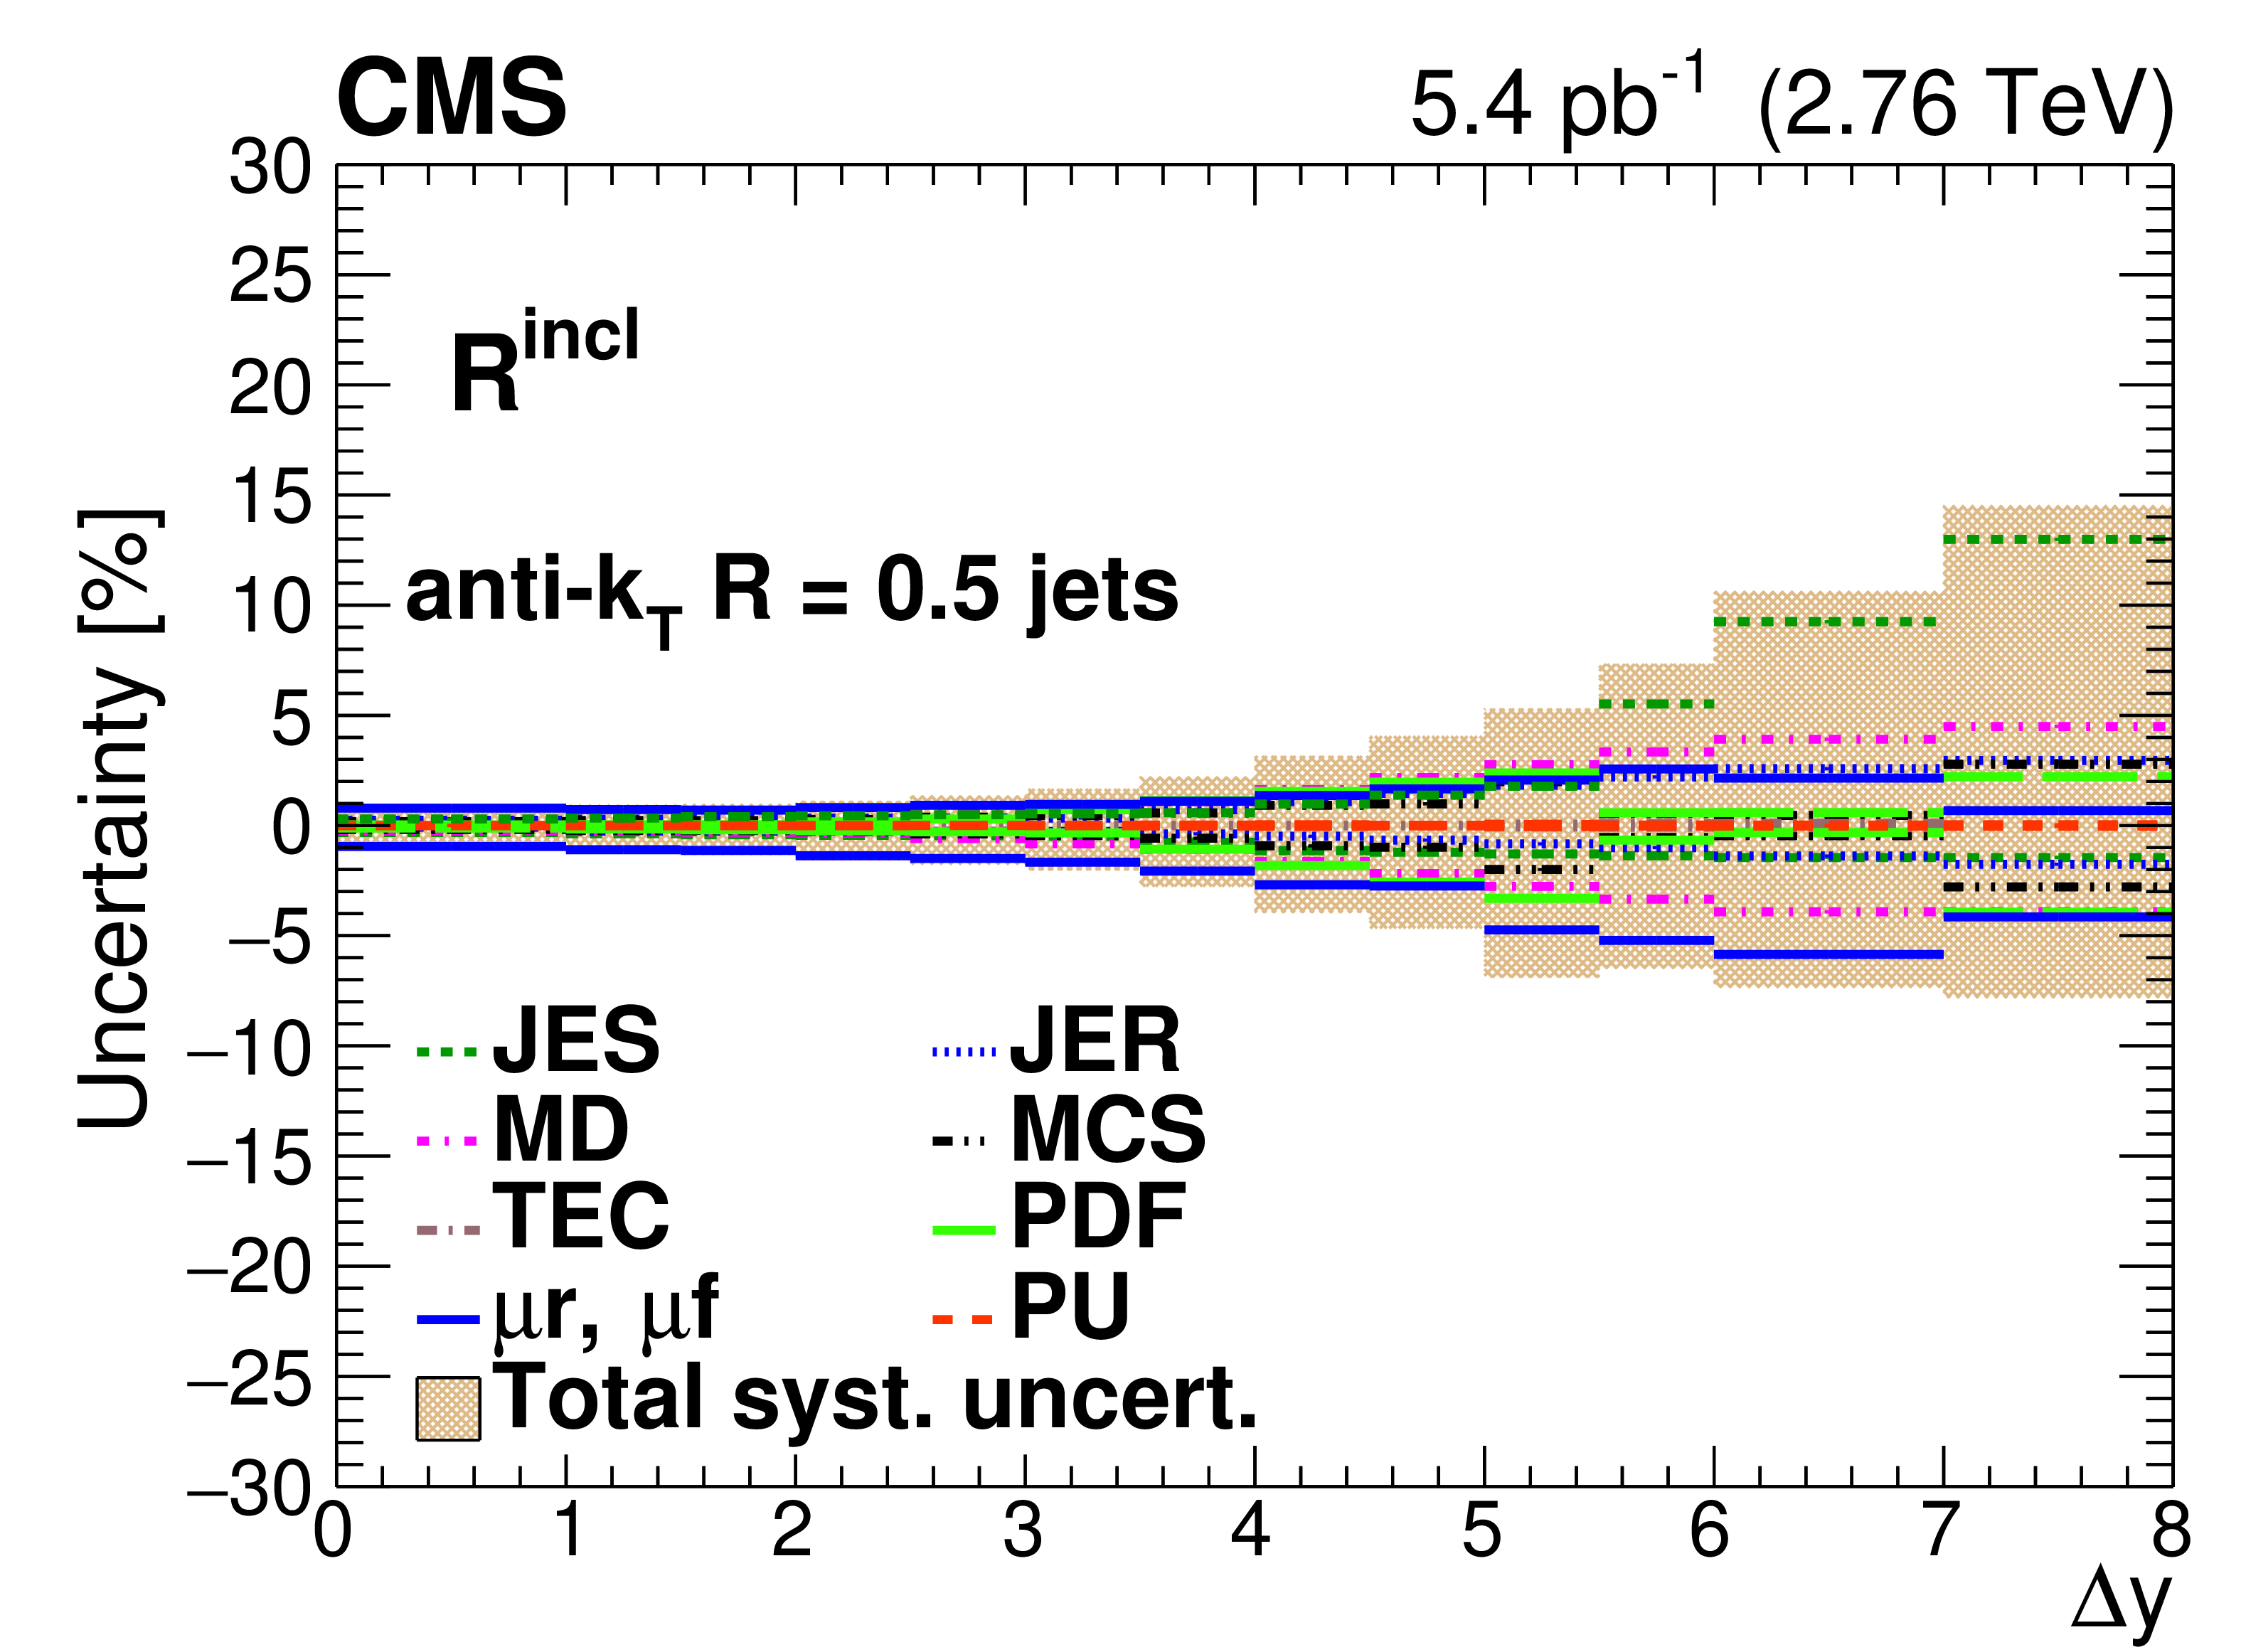
Figure 1-c:
Summary of the systematic uncertainties on the $ {R^{\text {incl}}} $ ratio. The various contributions are indicated by the lines and the total uncertainty is shown with a band. |
png pdf |
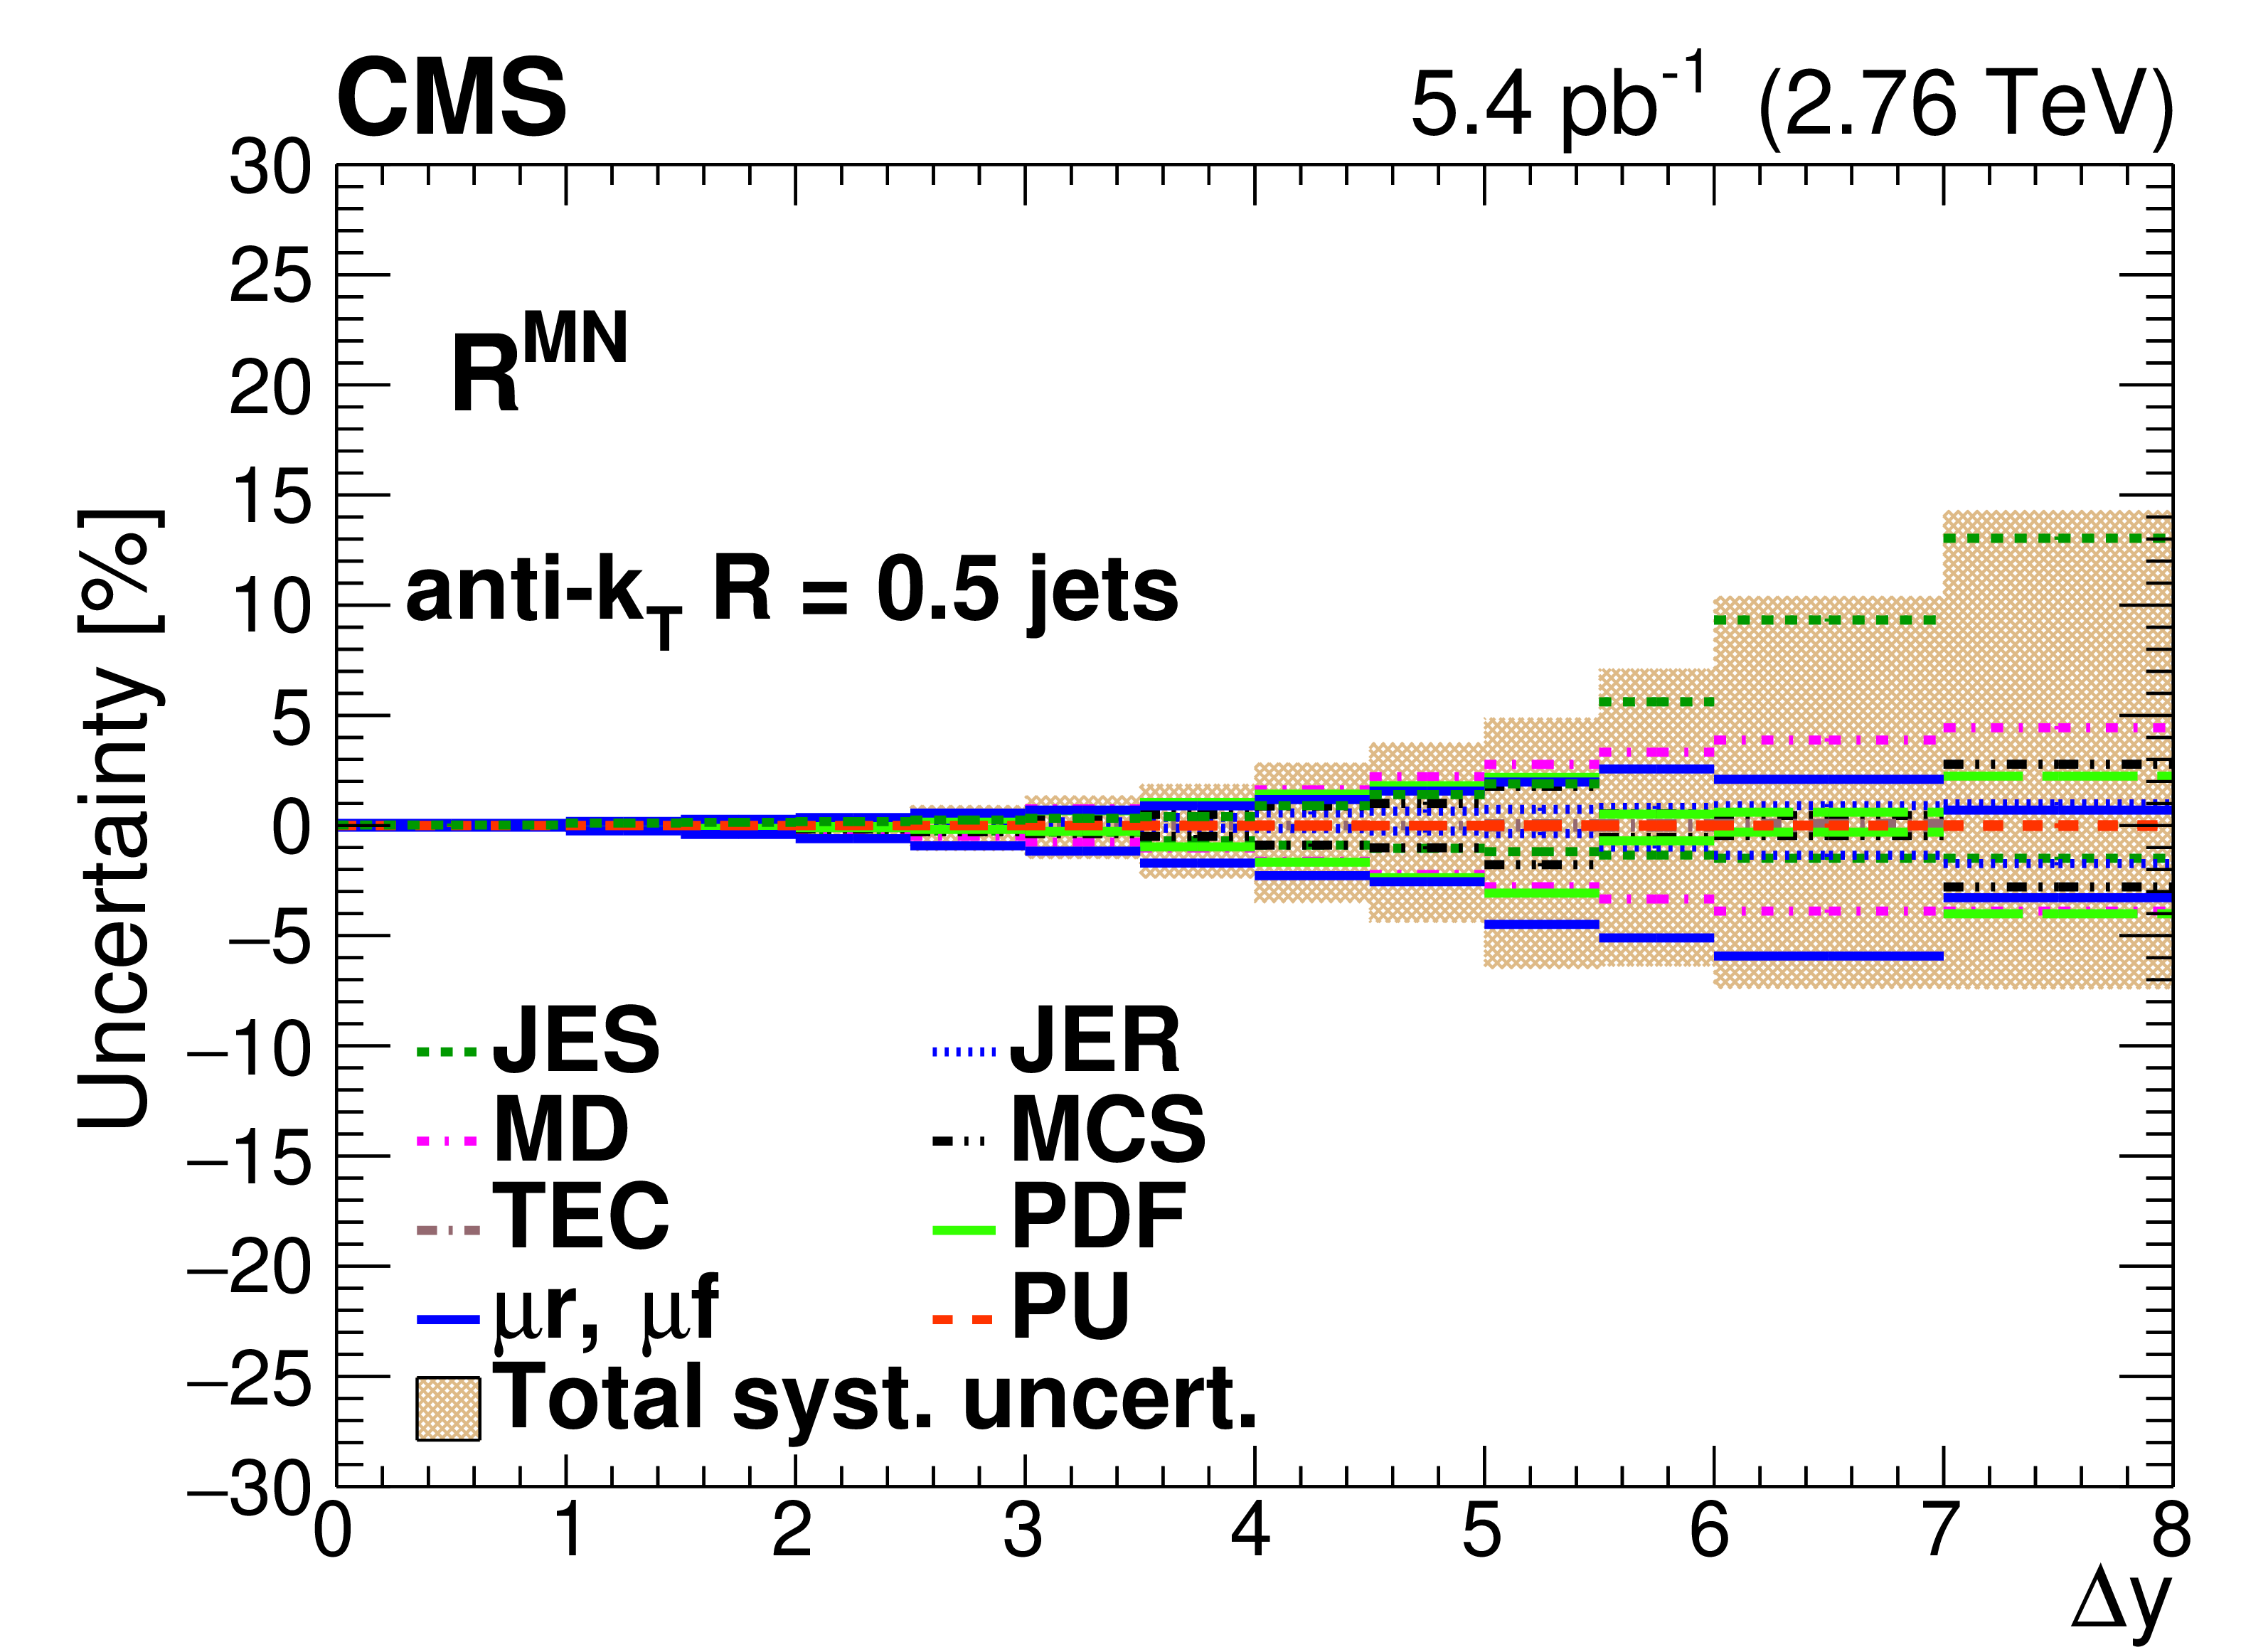
Figure 1-d:
Summary of the systematic uncertainties on the $ {R^{\mathrm {MN}}} $ ratio. The various contributions are indicated by the lines and the total uncertainty is shown with a band. |
png pdf |
Figure 1-e:
Summary of the systematic uncertainties on the $ {R^{\text {incl}}_{\text {veto}}} $ ratio. The various contributions are indicated by the lines and the total uncertainty is shown with a band. |
png pdf |
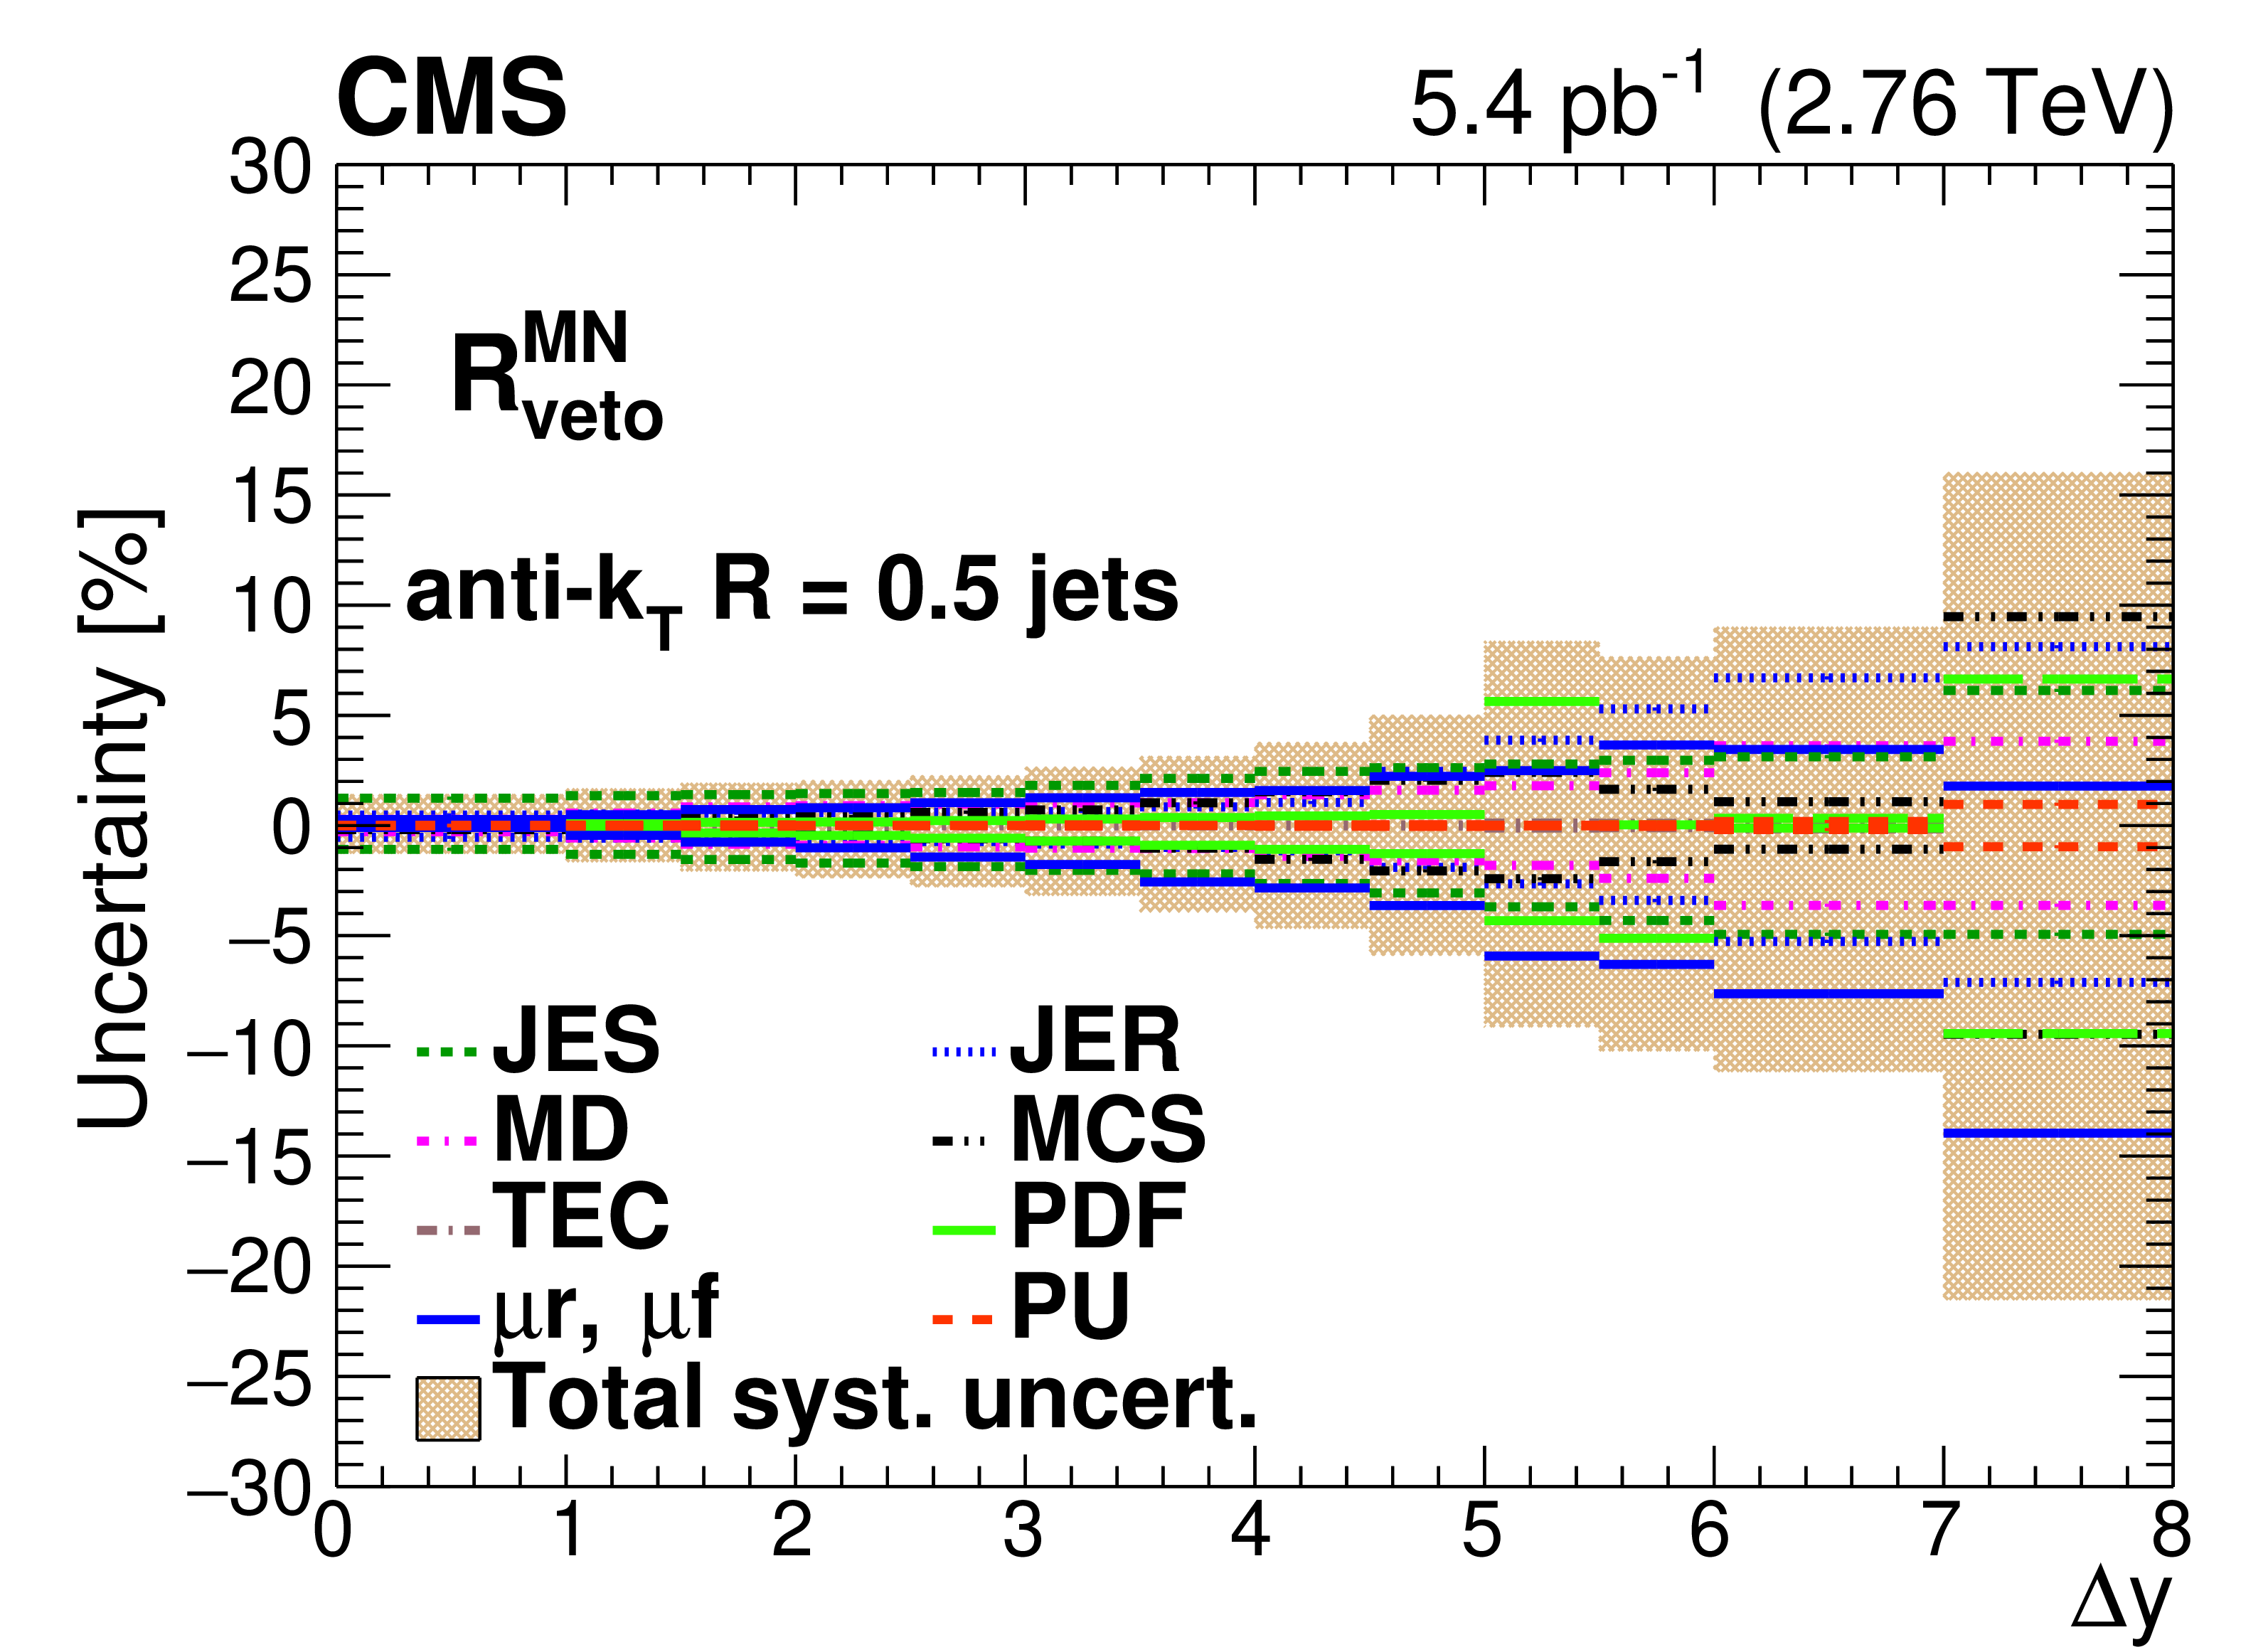
Figure 1-f:
Summary of the systematic uncertainties on the $ {R^{\mathrm {MN}}_{\text {veto}}}$ ratio. The various contributions are indicated by the lines and the total uncertainty is shown with a band. |

png pdf |
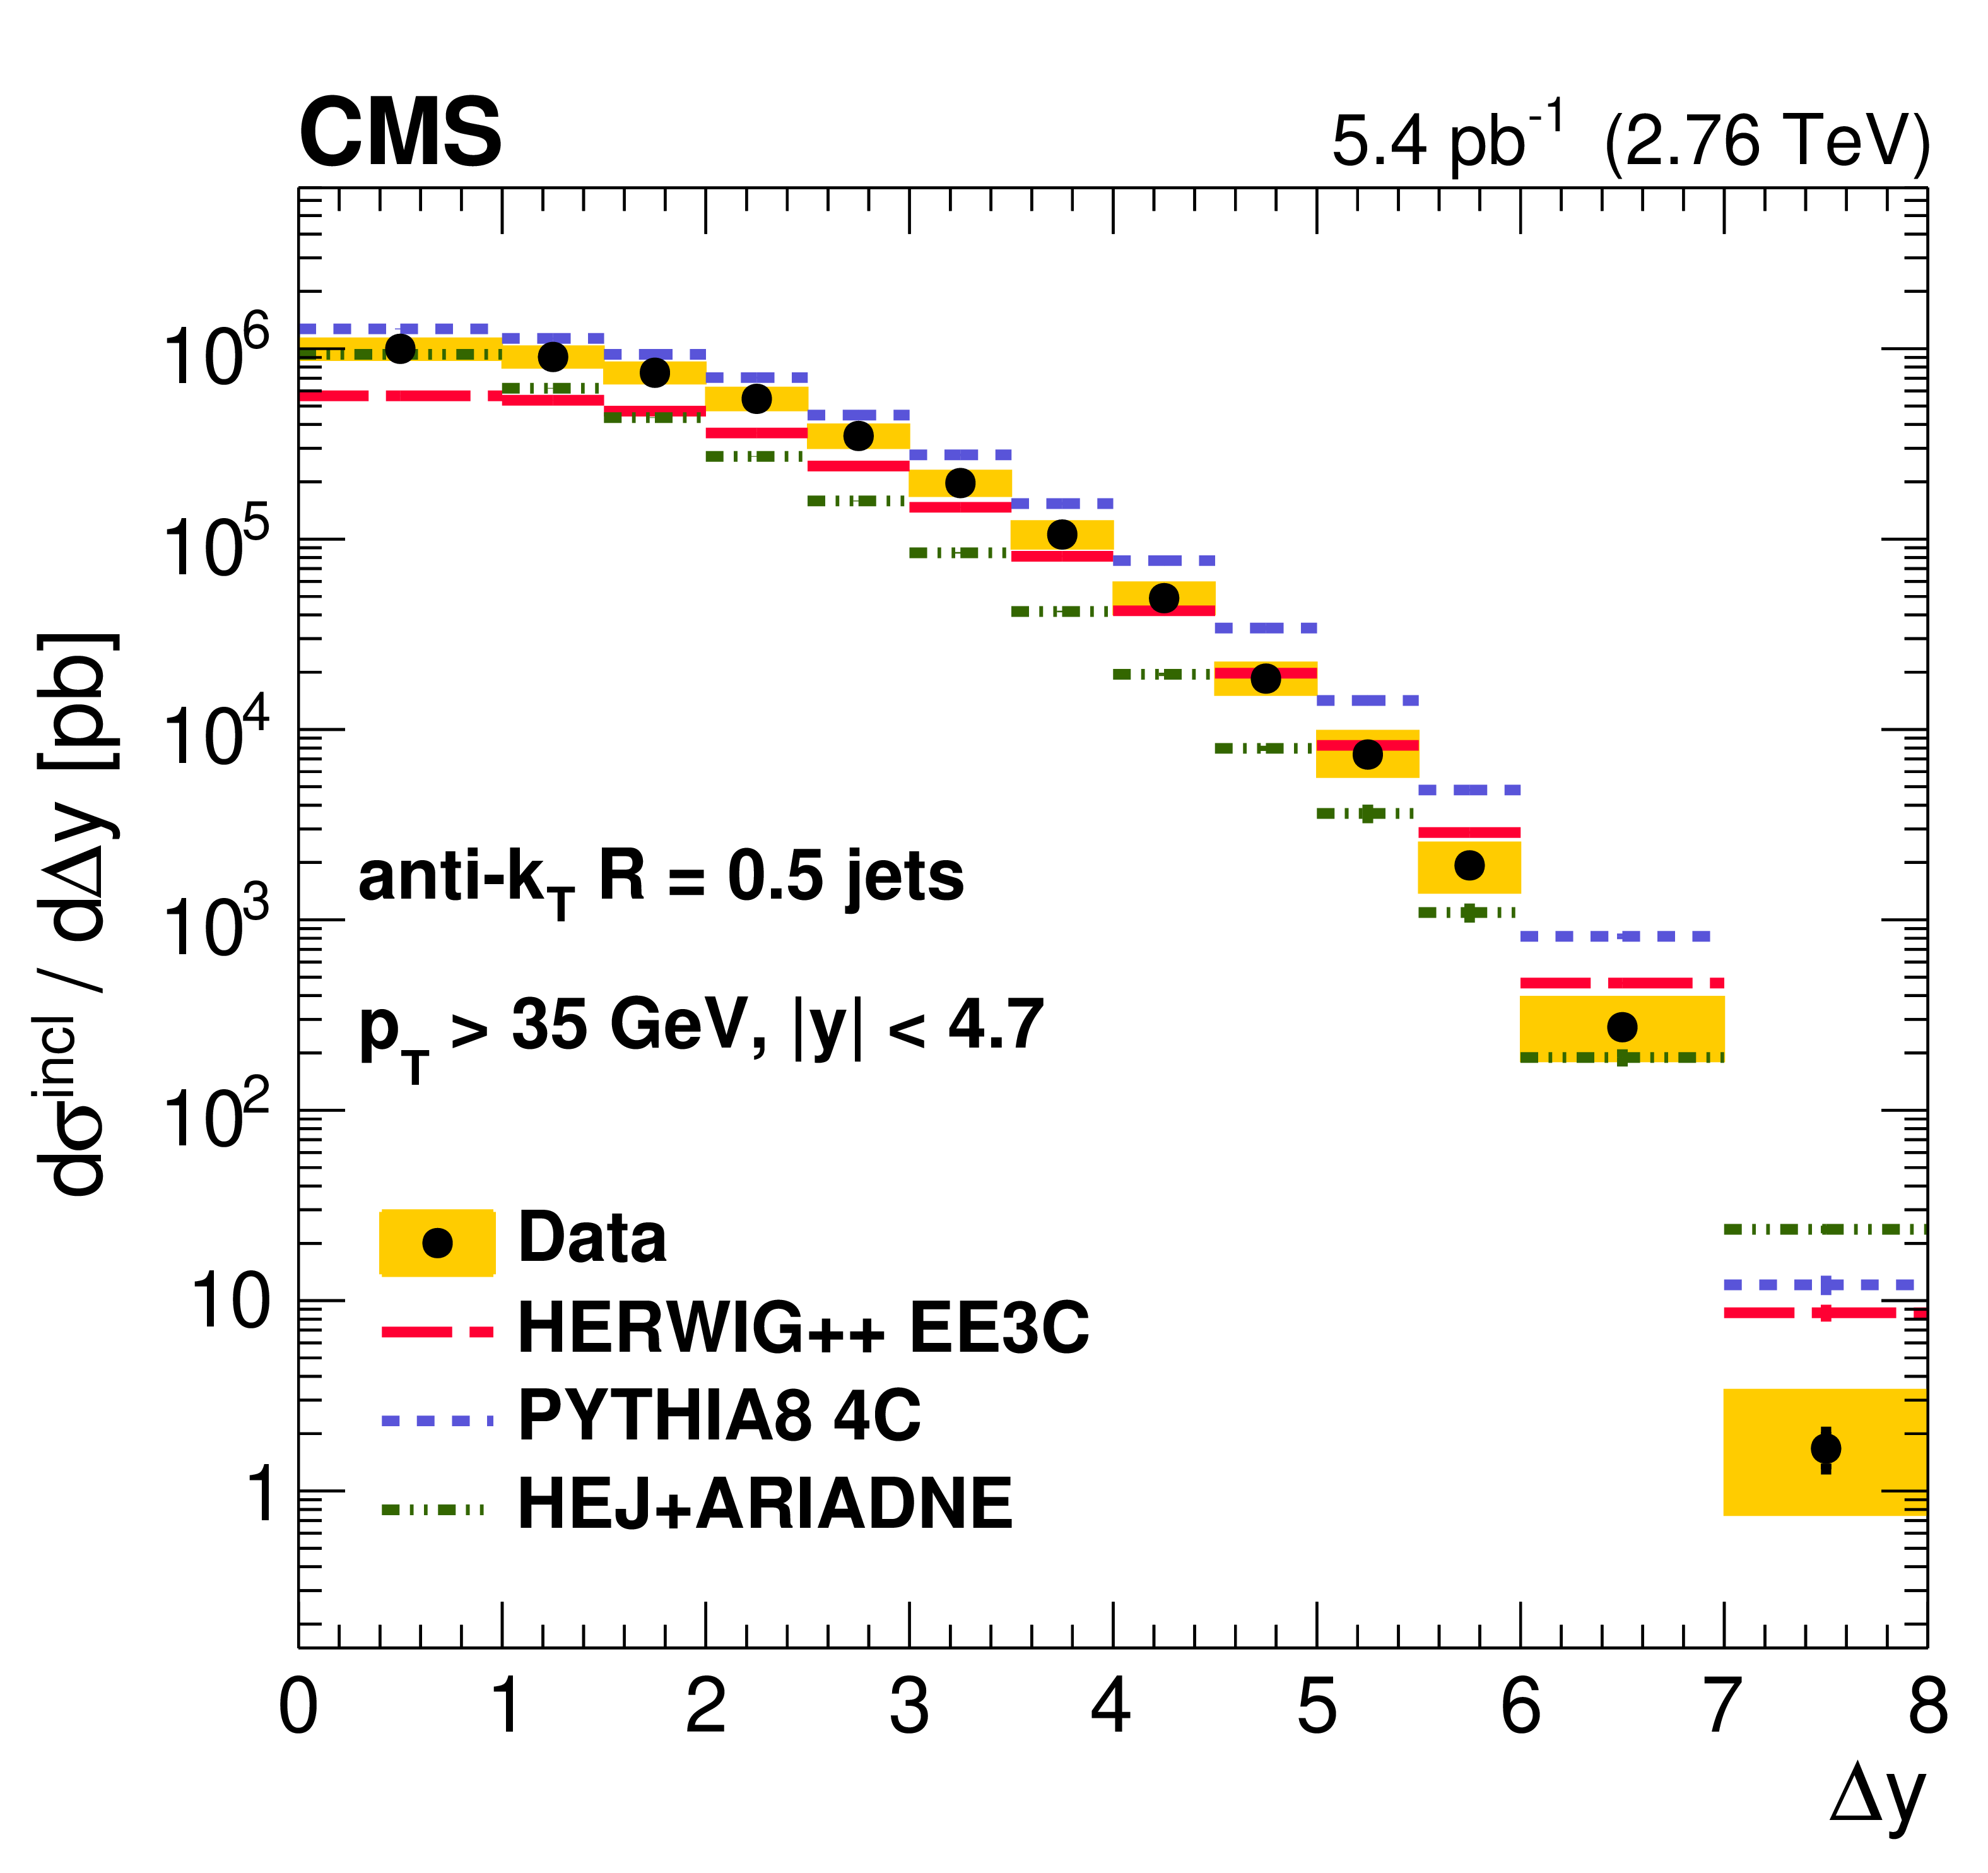
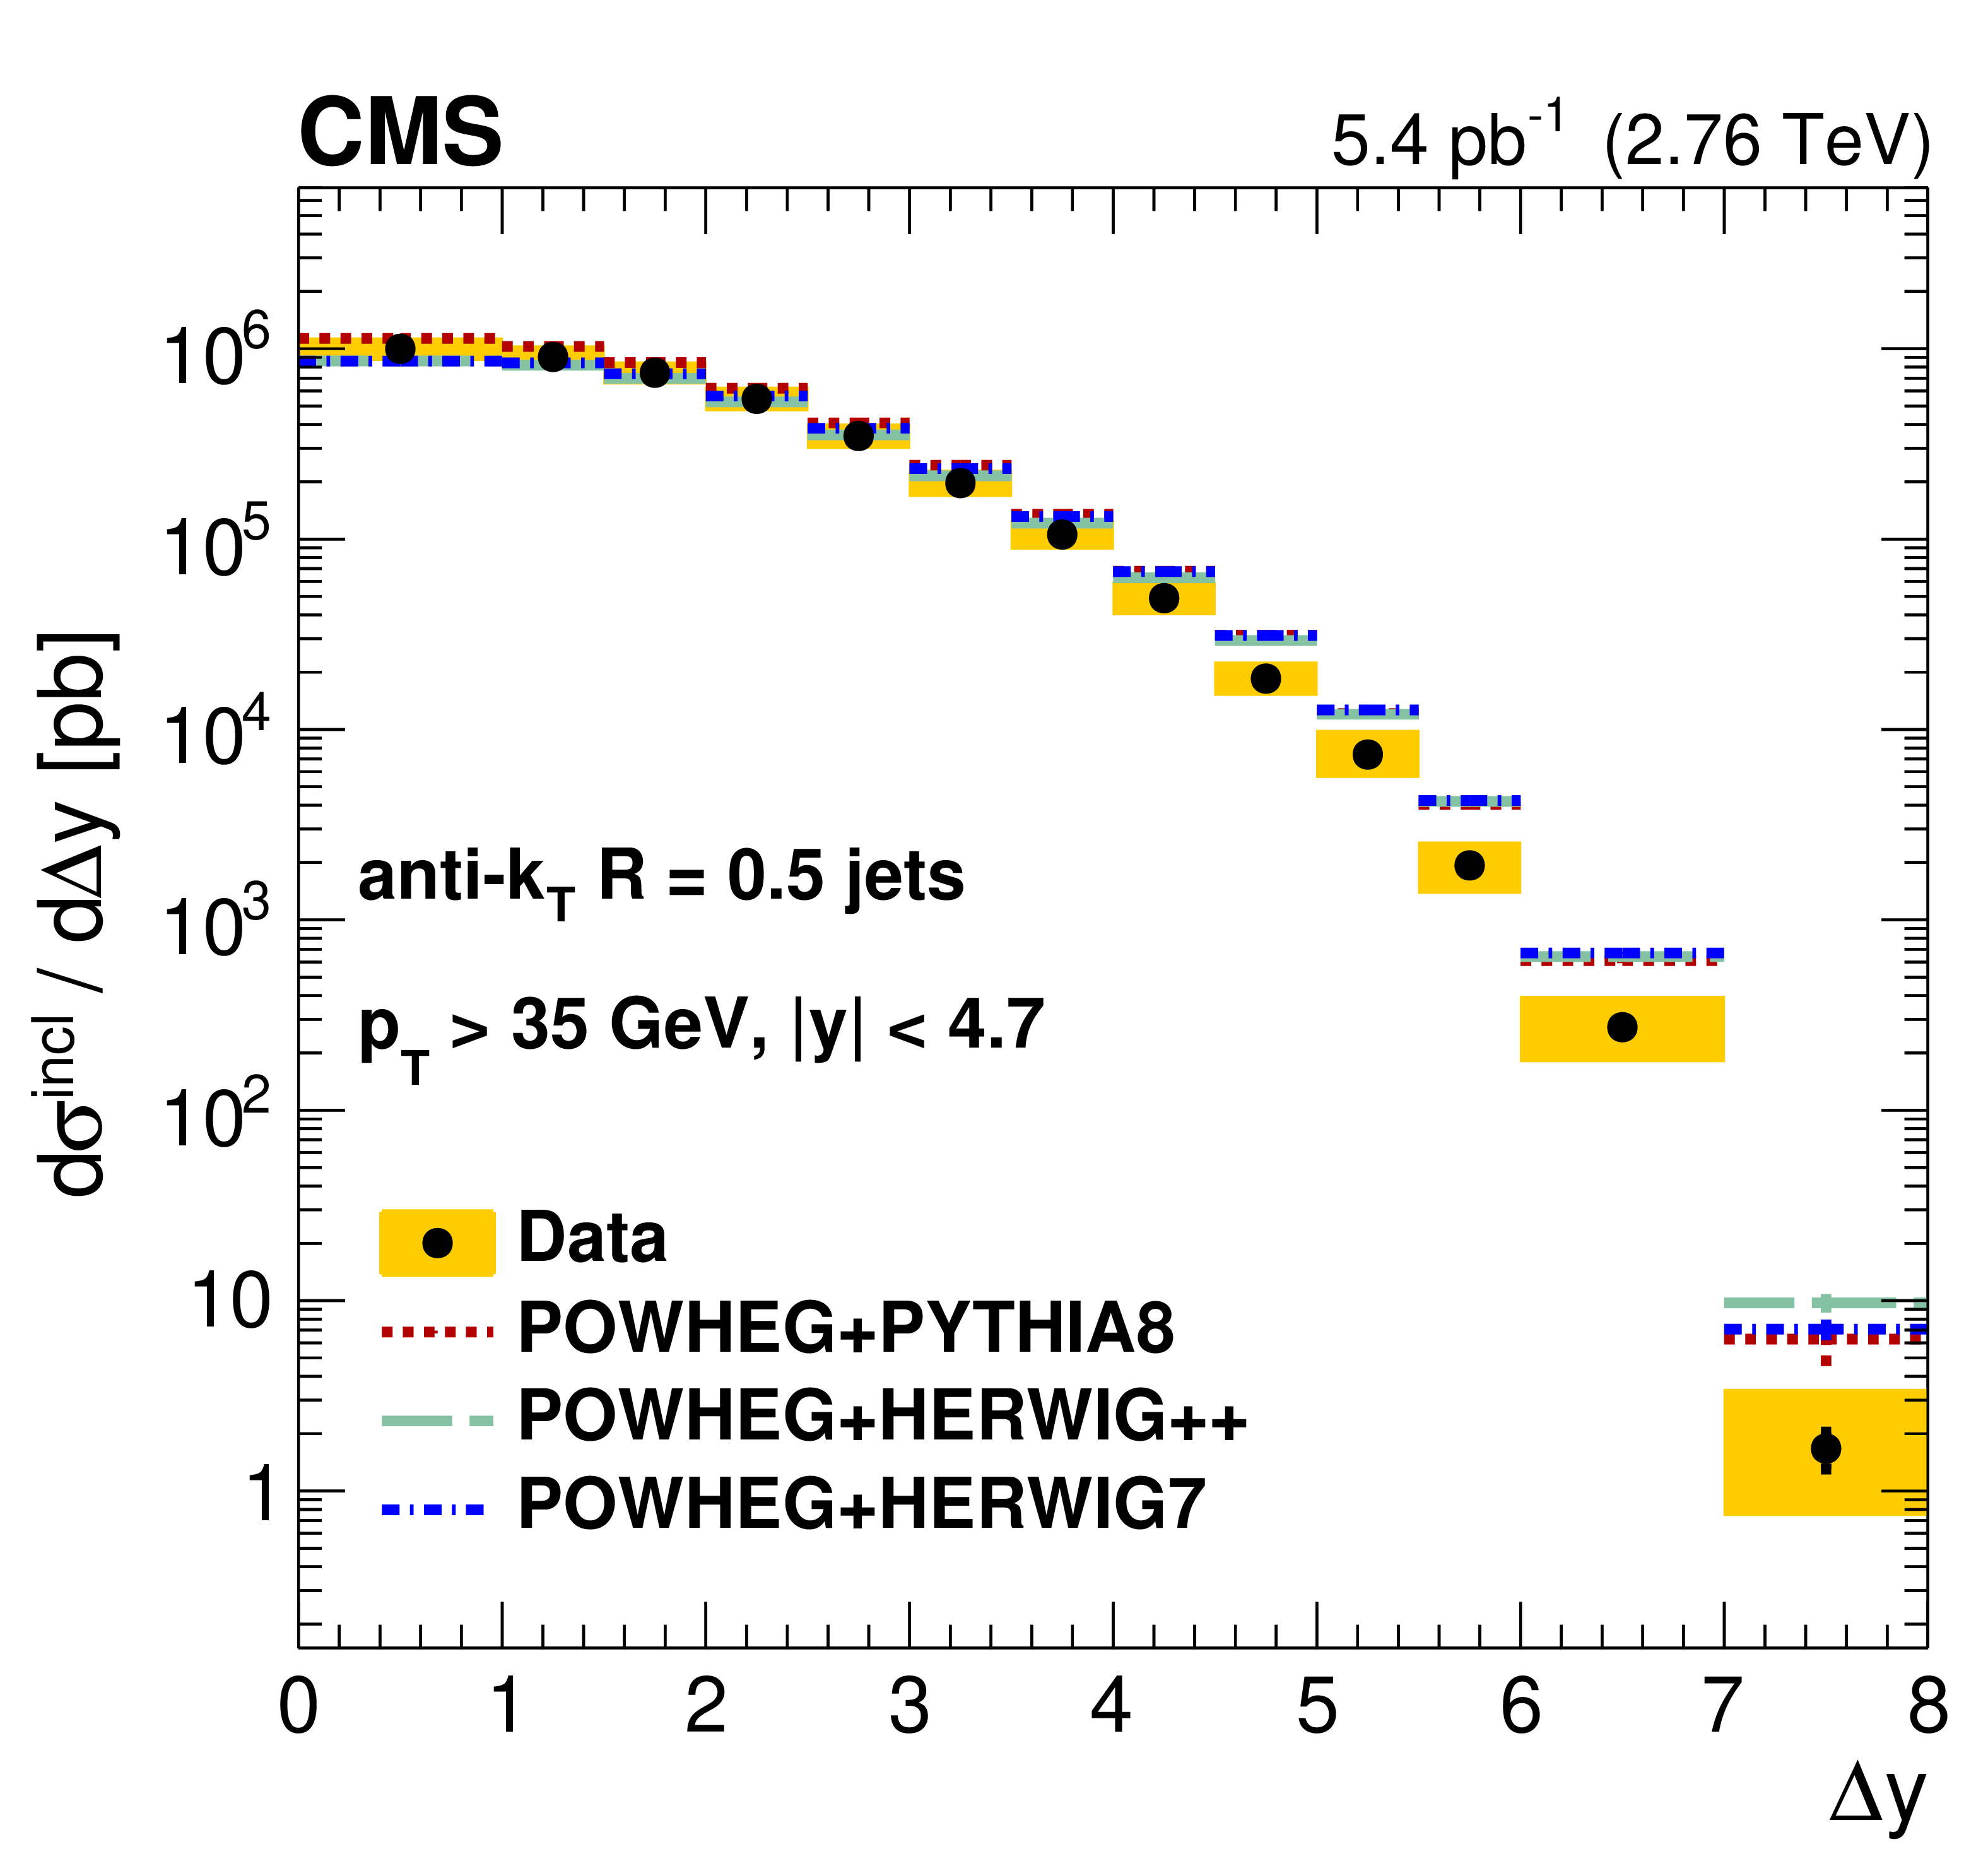
Figure 2:
Differential cross section $ {\mathrm {d} {\sigma ^{\text {incl}}} /\mathrm {d} {\Delta y}}$ for inclusive dijet production. The upper and lower rows present the comparison with different MC models. The plots on the left present the cross sections and those on the right the ratio of theory to data. The systematic uncertainties are indicated by the shaded bands and the statistical uncertainties by the vertical bars. |
png pdf |
Figure 2-a:
Differential cross section $ {\mathrm {d} {\sigma ^{\text {incl}}} /\mathrm {d} {\Delta y}}$ for inclusive dijet production, compared with different MC models. The systematic uncertainties are indicated by the shaded bands and the statistical uncertainties by the vertical bars. |

png pdf |
Figure 2-b:
Differential cross section $ {\mathrm {d} {\sigma ^{\text {incl}}} /\mathrm {d} {\Delta y}}$ for inclusive dijet production, compared with different MC models. The plot presents the ratio of theory to data. The systematic uncertainties are indicated by the shaded bands and the statistical uncertainties by the vertical bars. |
png pdf |
Figure 2-c:
Differential cross section $ {\mathrm {d} {\sigma ^{\text {incl}}} /\mathrm {d} {\Delta y}}$ for inclusive dijet production, compared with different MC models. The systematic uncertainties are indicated by the shaded bands and the statistical uncertainties by the vertical bars. |

png pdf |
Figure 2-d:
Differential cross section $ {\mathrm {d} {\sigma ^{\text {incl}}} /\mathrm {d} {\Delta y}}$ for inclusive dijet production, compared with different MC models. The plot presents the ratio of theory to data. The systematic uncertainties are indicated by the shaded bands and the statistical uncertainties by the vertical bars. |

png pdf |
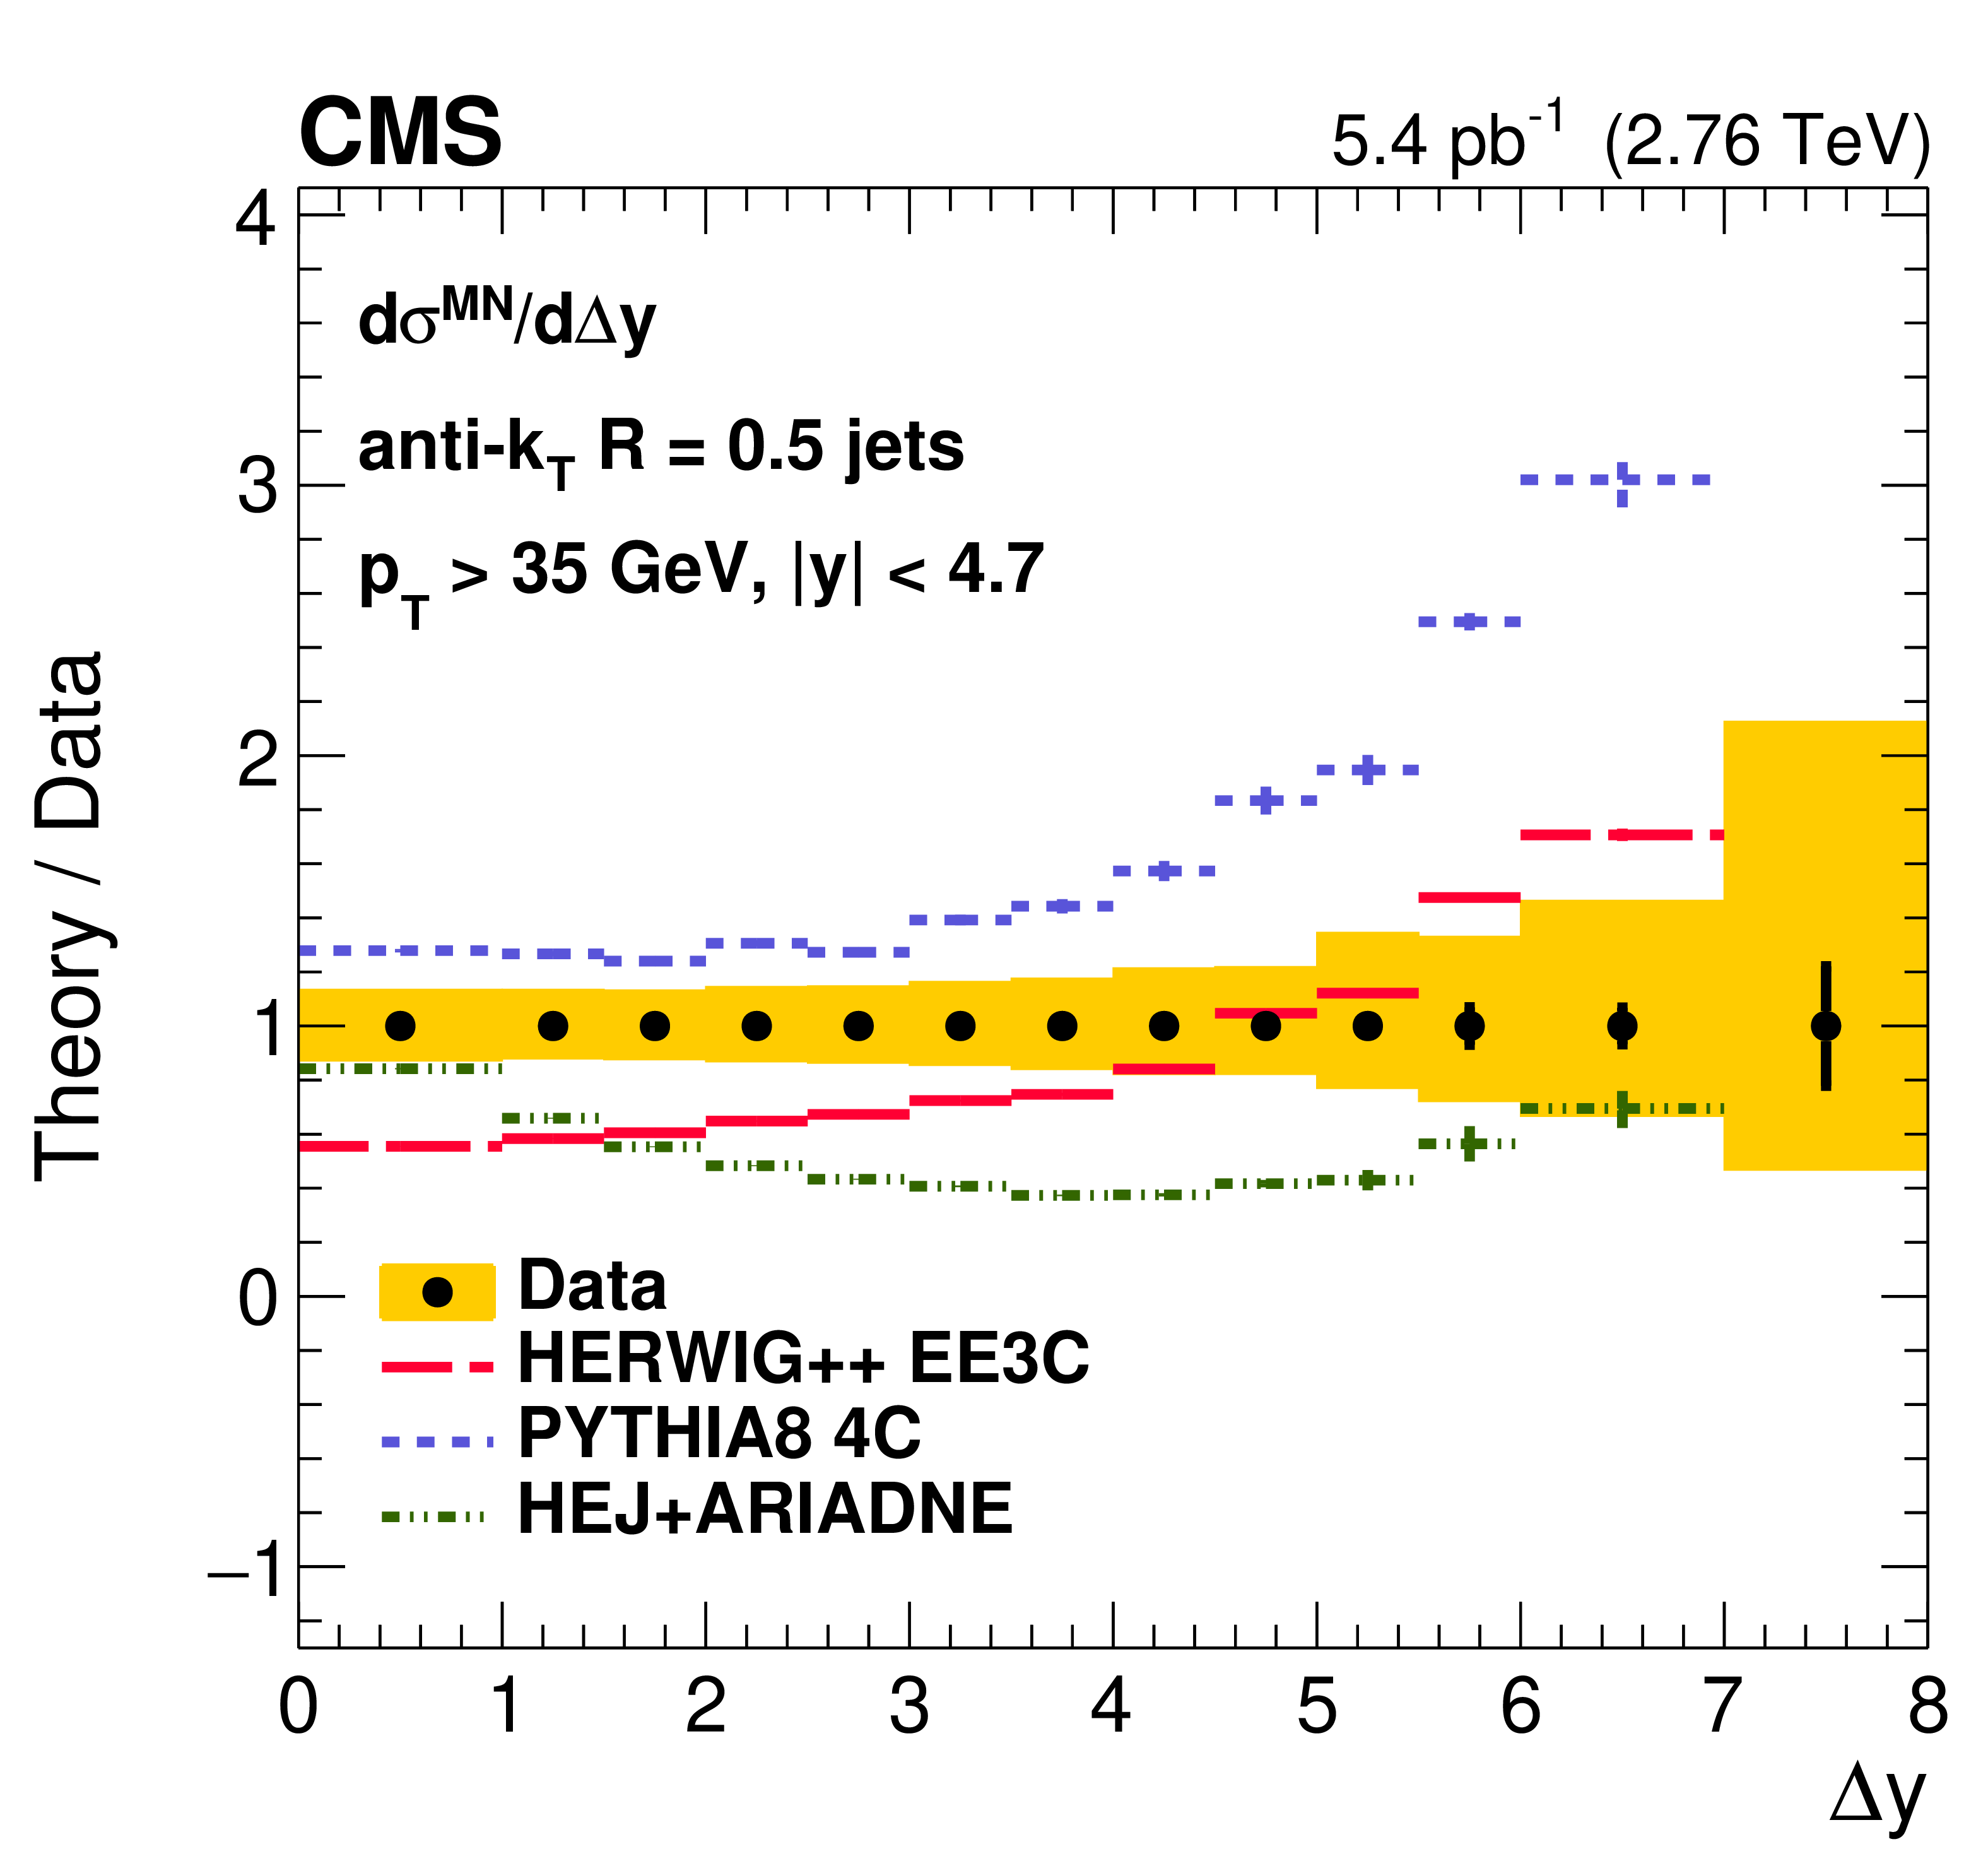
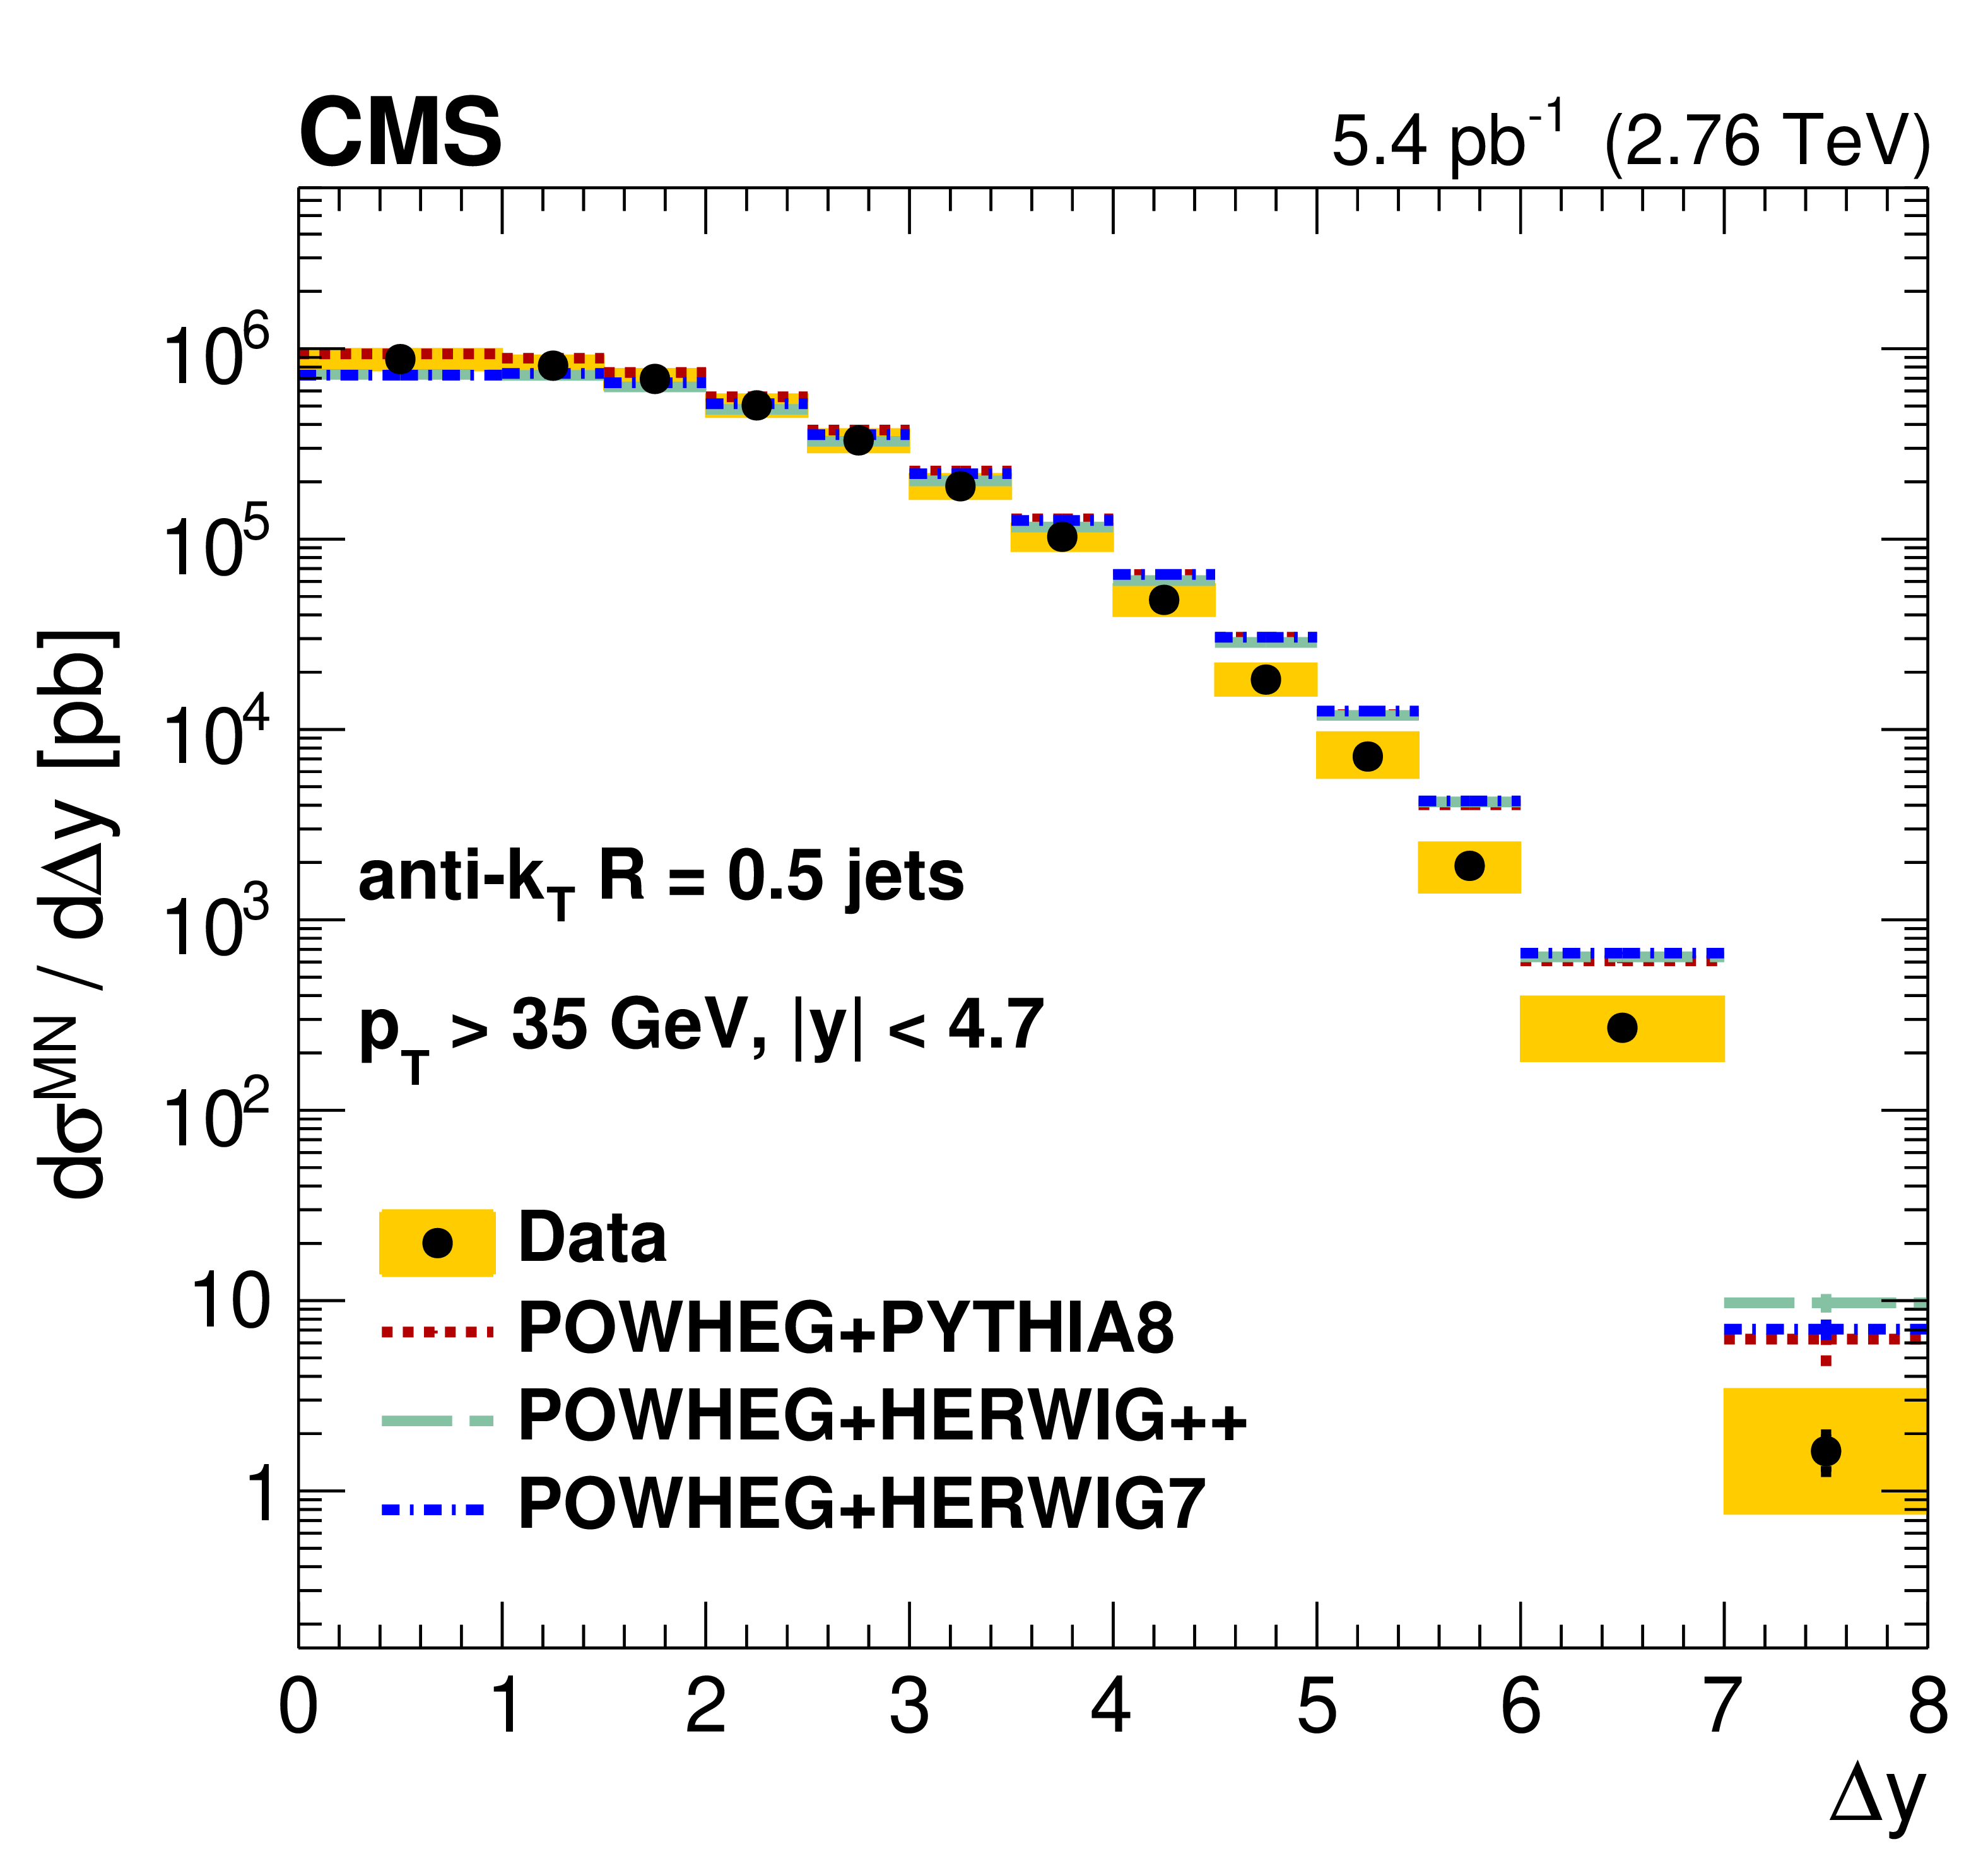
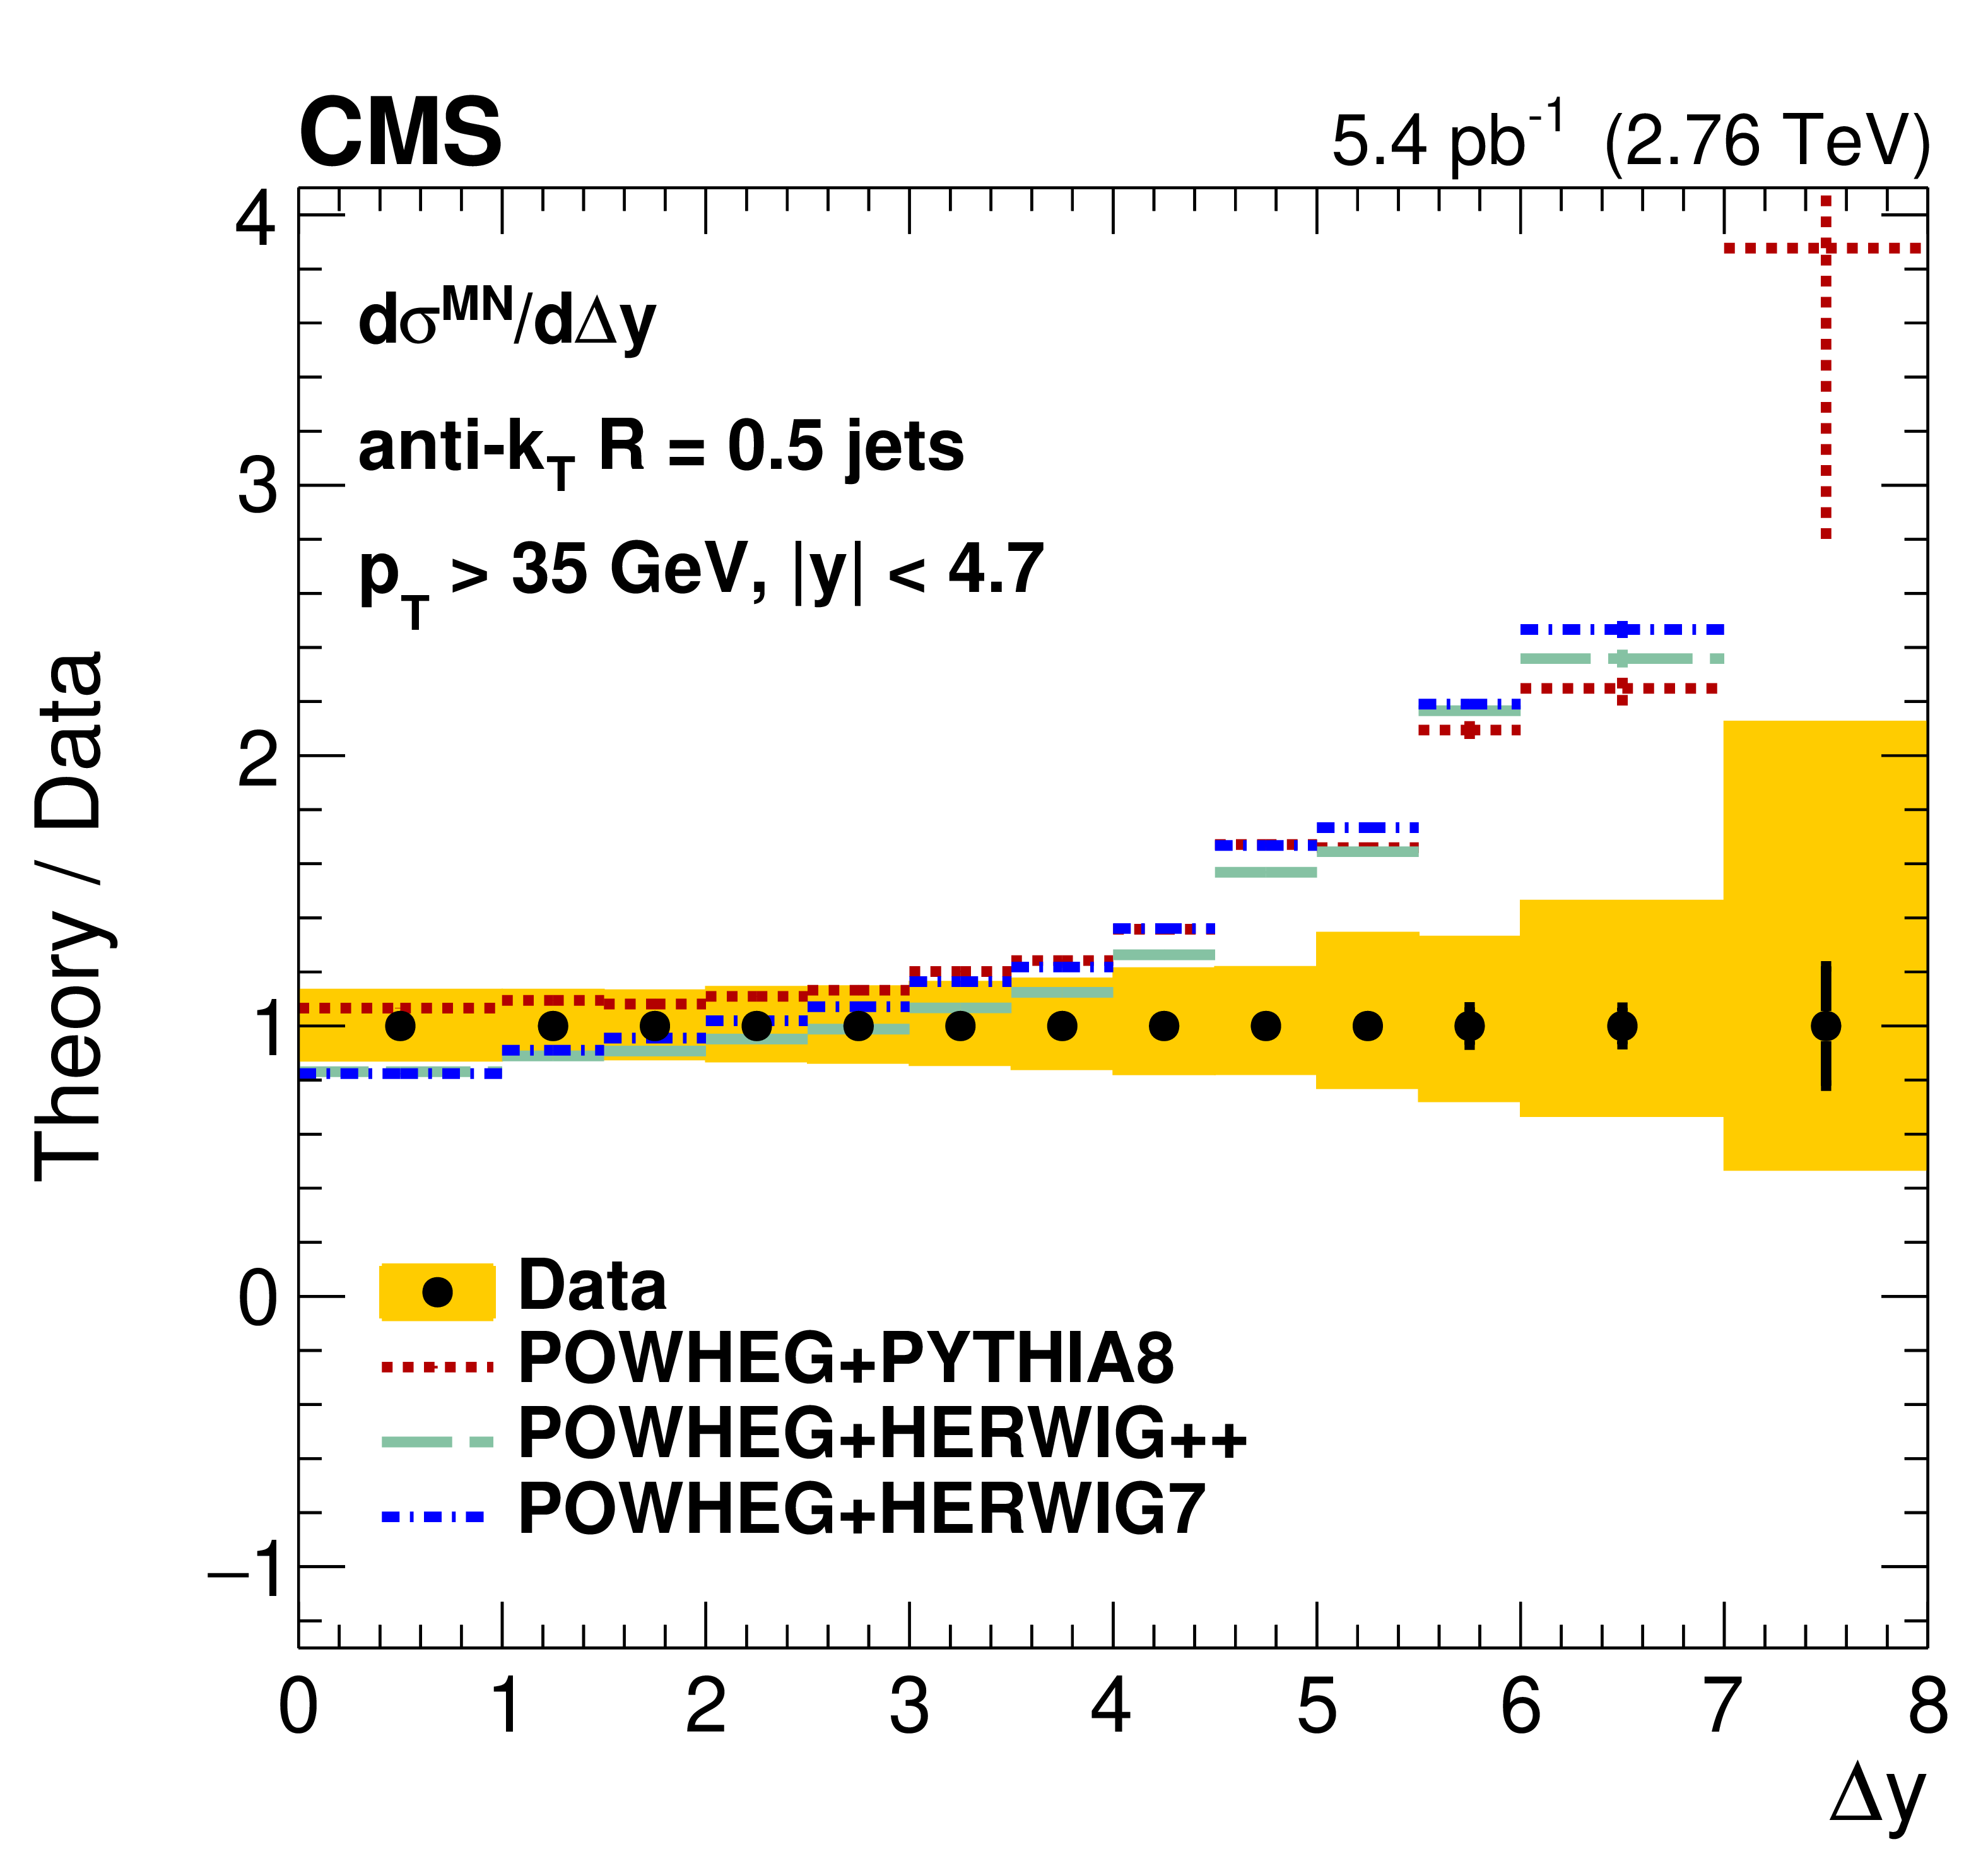
Figure 3:
Differential cross section $ {\mathrm {d} {\sigma ^{\mathrm {MN}}} /\mathrm {d} {\Delta y}}$ for MN dijet production. The upper and lower rows present the comparison with different MC models. The plots on the left present the cross sections and those on the right the ratio of theory to data. The systematic uncertainties are indicated by the shaded bands and the statistical uncertainties by the vertical bars. |

png pdf |
Figure 3-a:
Differential cross section $ {\mathrm {d} {\sigma ^{\mathrm {MN}}} /\mathrm {d} {\Delta y}}$ for MN dijet production, compared with different MC models. The systematic uncertainties are indicated by the shaded bands and the statistical uncertainties by the vertical bars. |
png pdf |
Figure 3-b:
Differential cross section $ {\mathrm {d} {\sigma ^{\mathrm {MN}}} /\mathrm {d} {\Delta y}}$ for MN dijet production, compared with different MC models. The plots presents the ratio of theory to data. The systematic uncertainties are indicated by the shaded bands and the statistical uncertainties by the vertical bars. |
png pdf |
Figure 3-c:
Differential cross section $ {\mathrm {d} {\sigma ^{\mathrm {MN}}} /\mathrm {d} {\Delta y}}$ for MN dijet production, compared with different MC models. The systematic uncertainties are indicated by the shaded bands and the statistical uncertainties by the vertical bars. |
png pdf |
Figure 3-d:
Differential cross section $ {\mathrm {d} {\sigma ^{\mathrm {MN}}} /\mathrm {d} {\Delta y}}$ for MN dijet production, compared with different MC models. The plots presents the ratio of theory to data. The systematic uncertainties are indicated by the shaded bands and the statistical uncertainties by the vertical bars. |
png pdf |
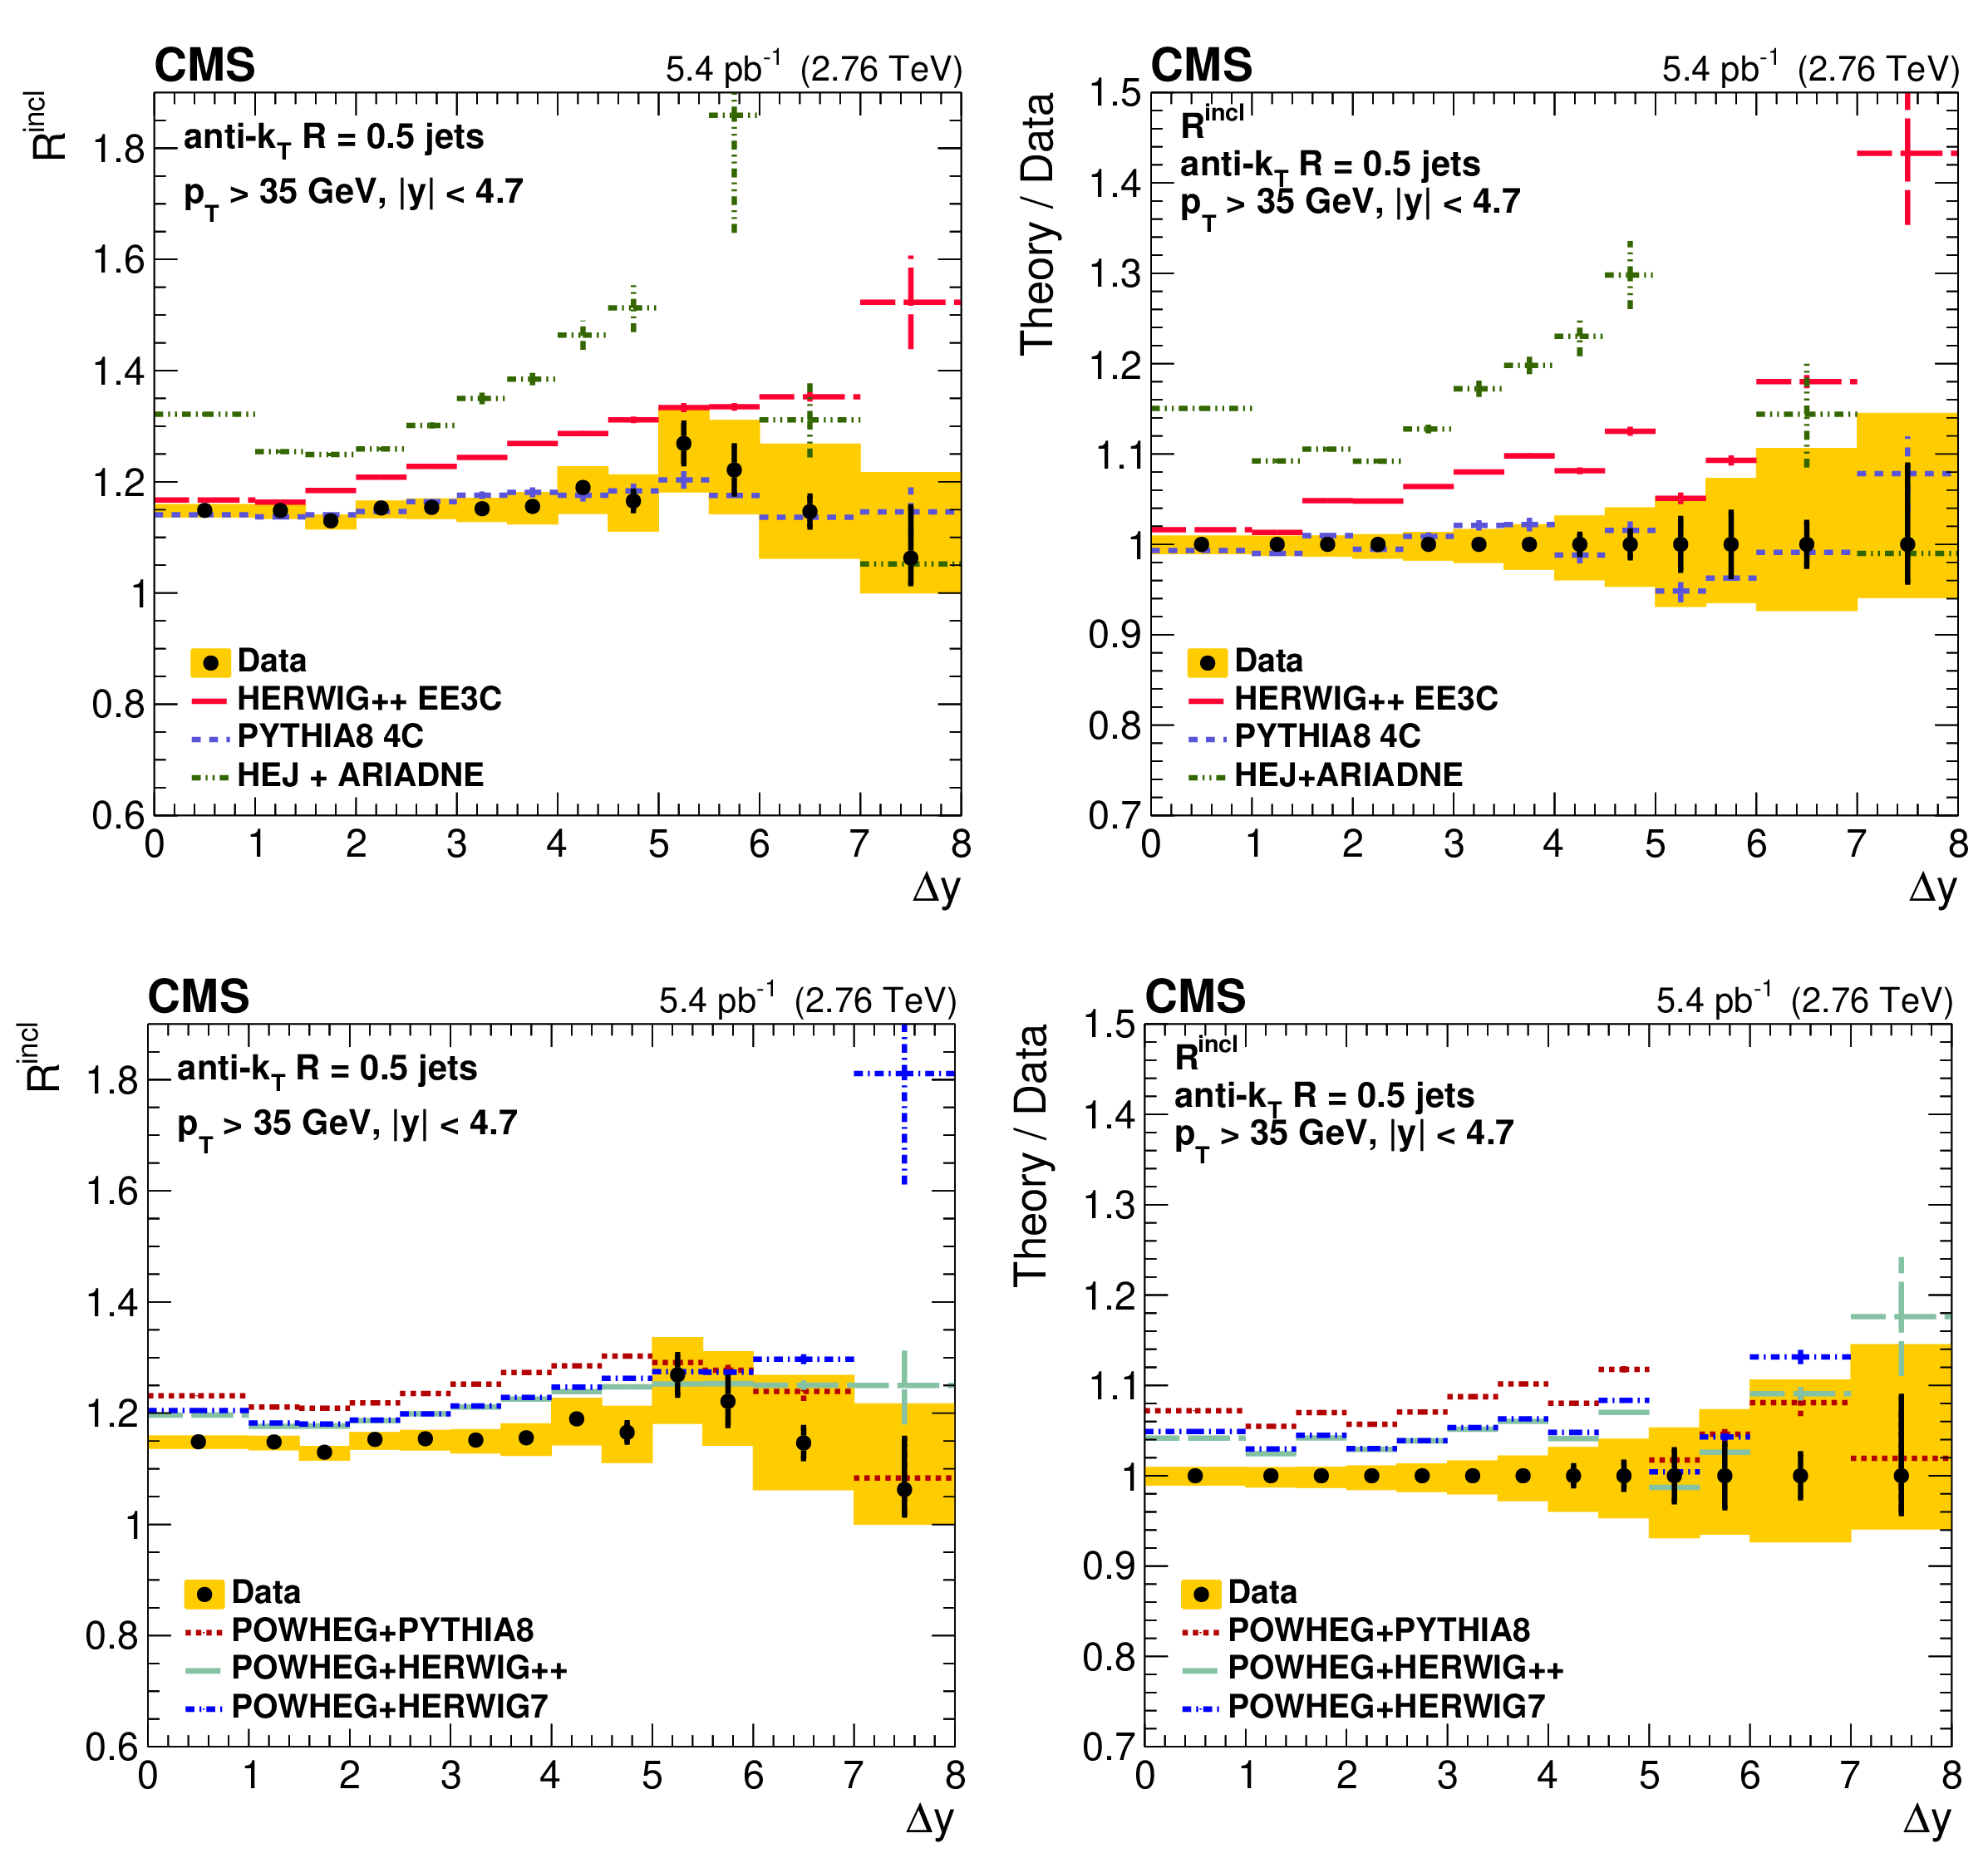
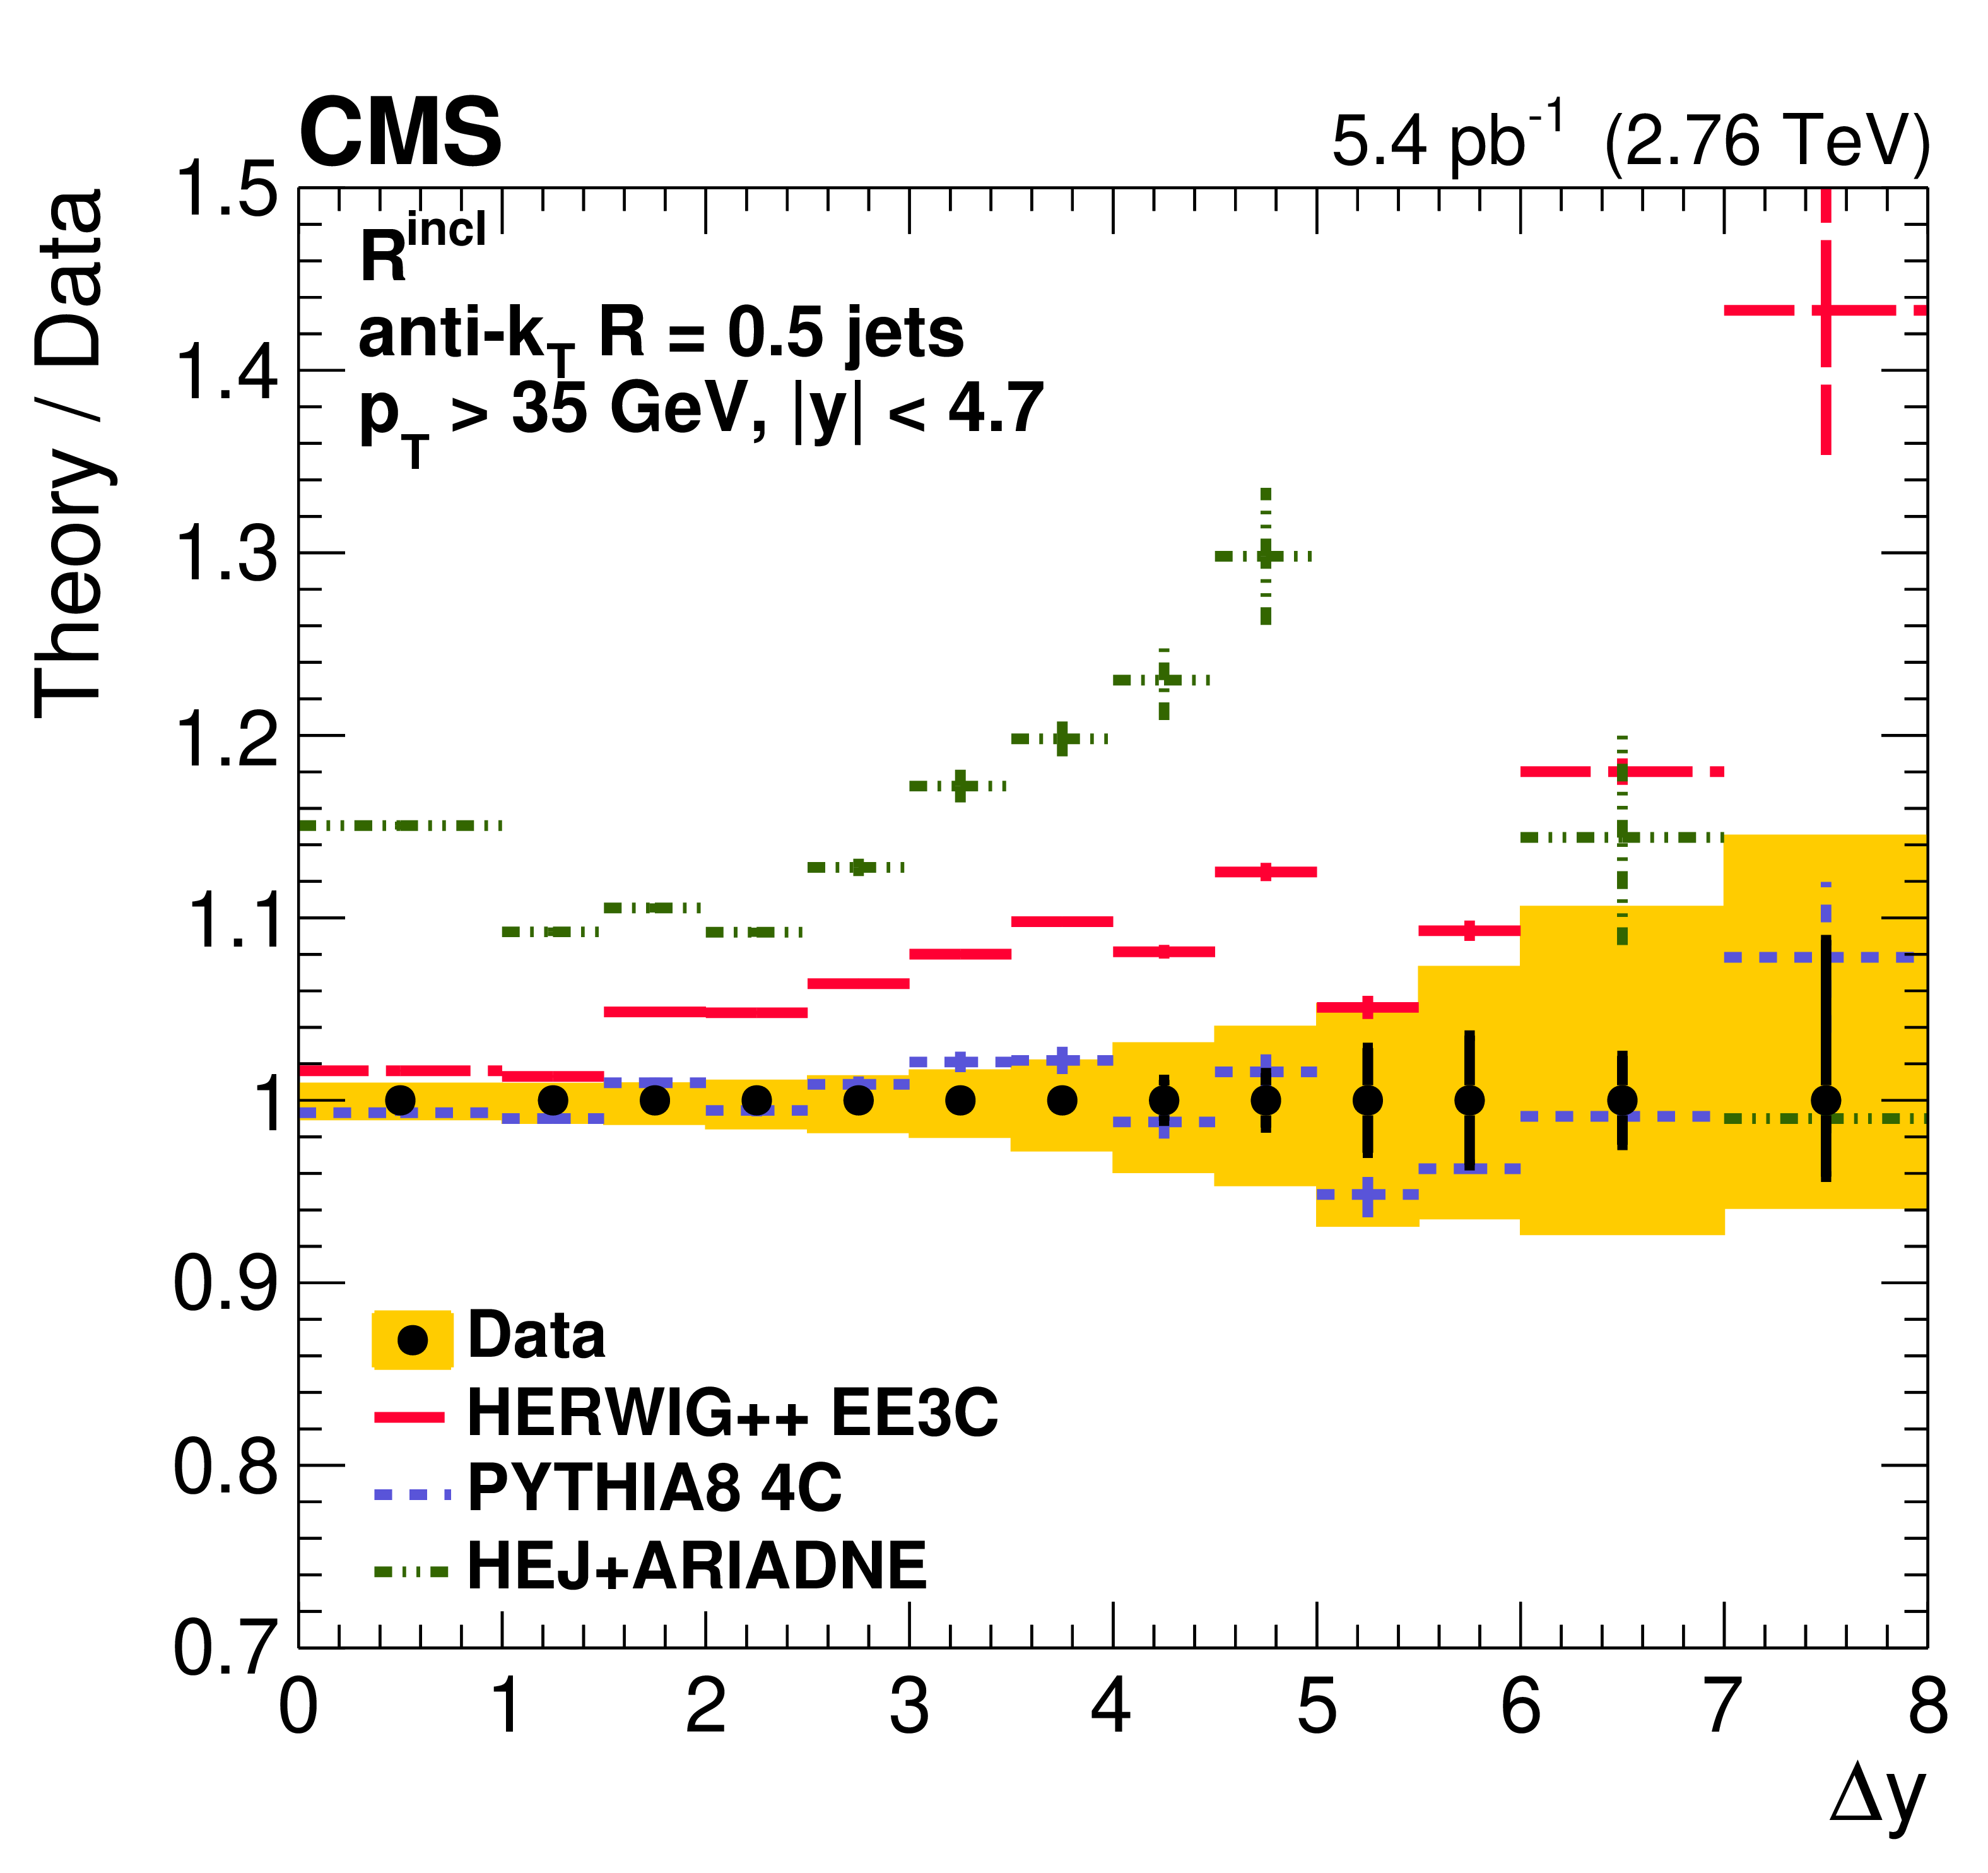
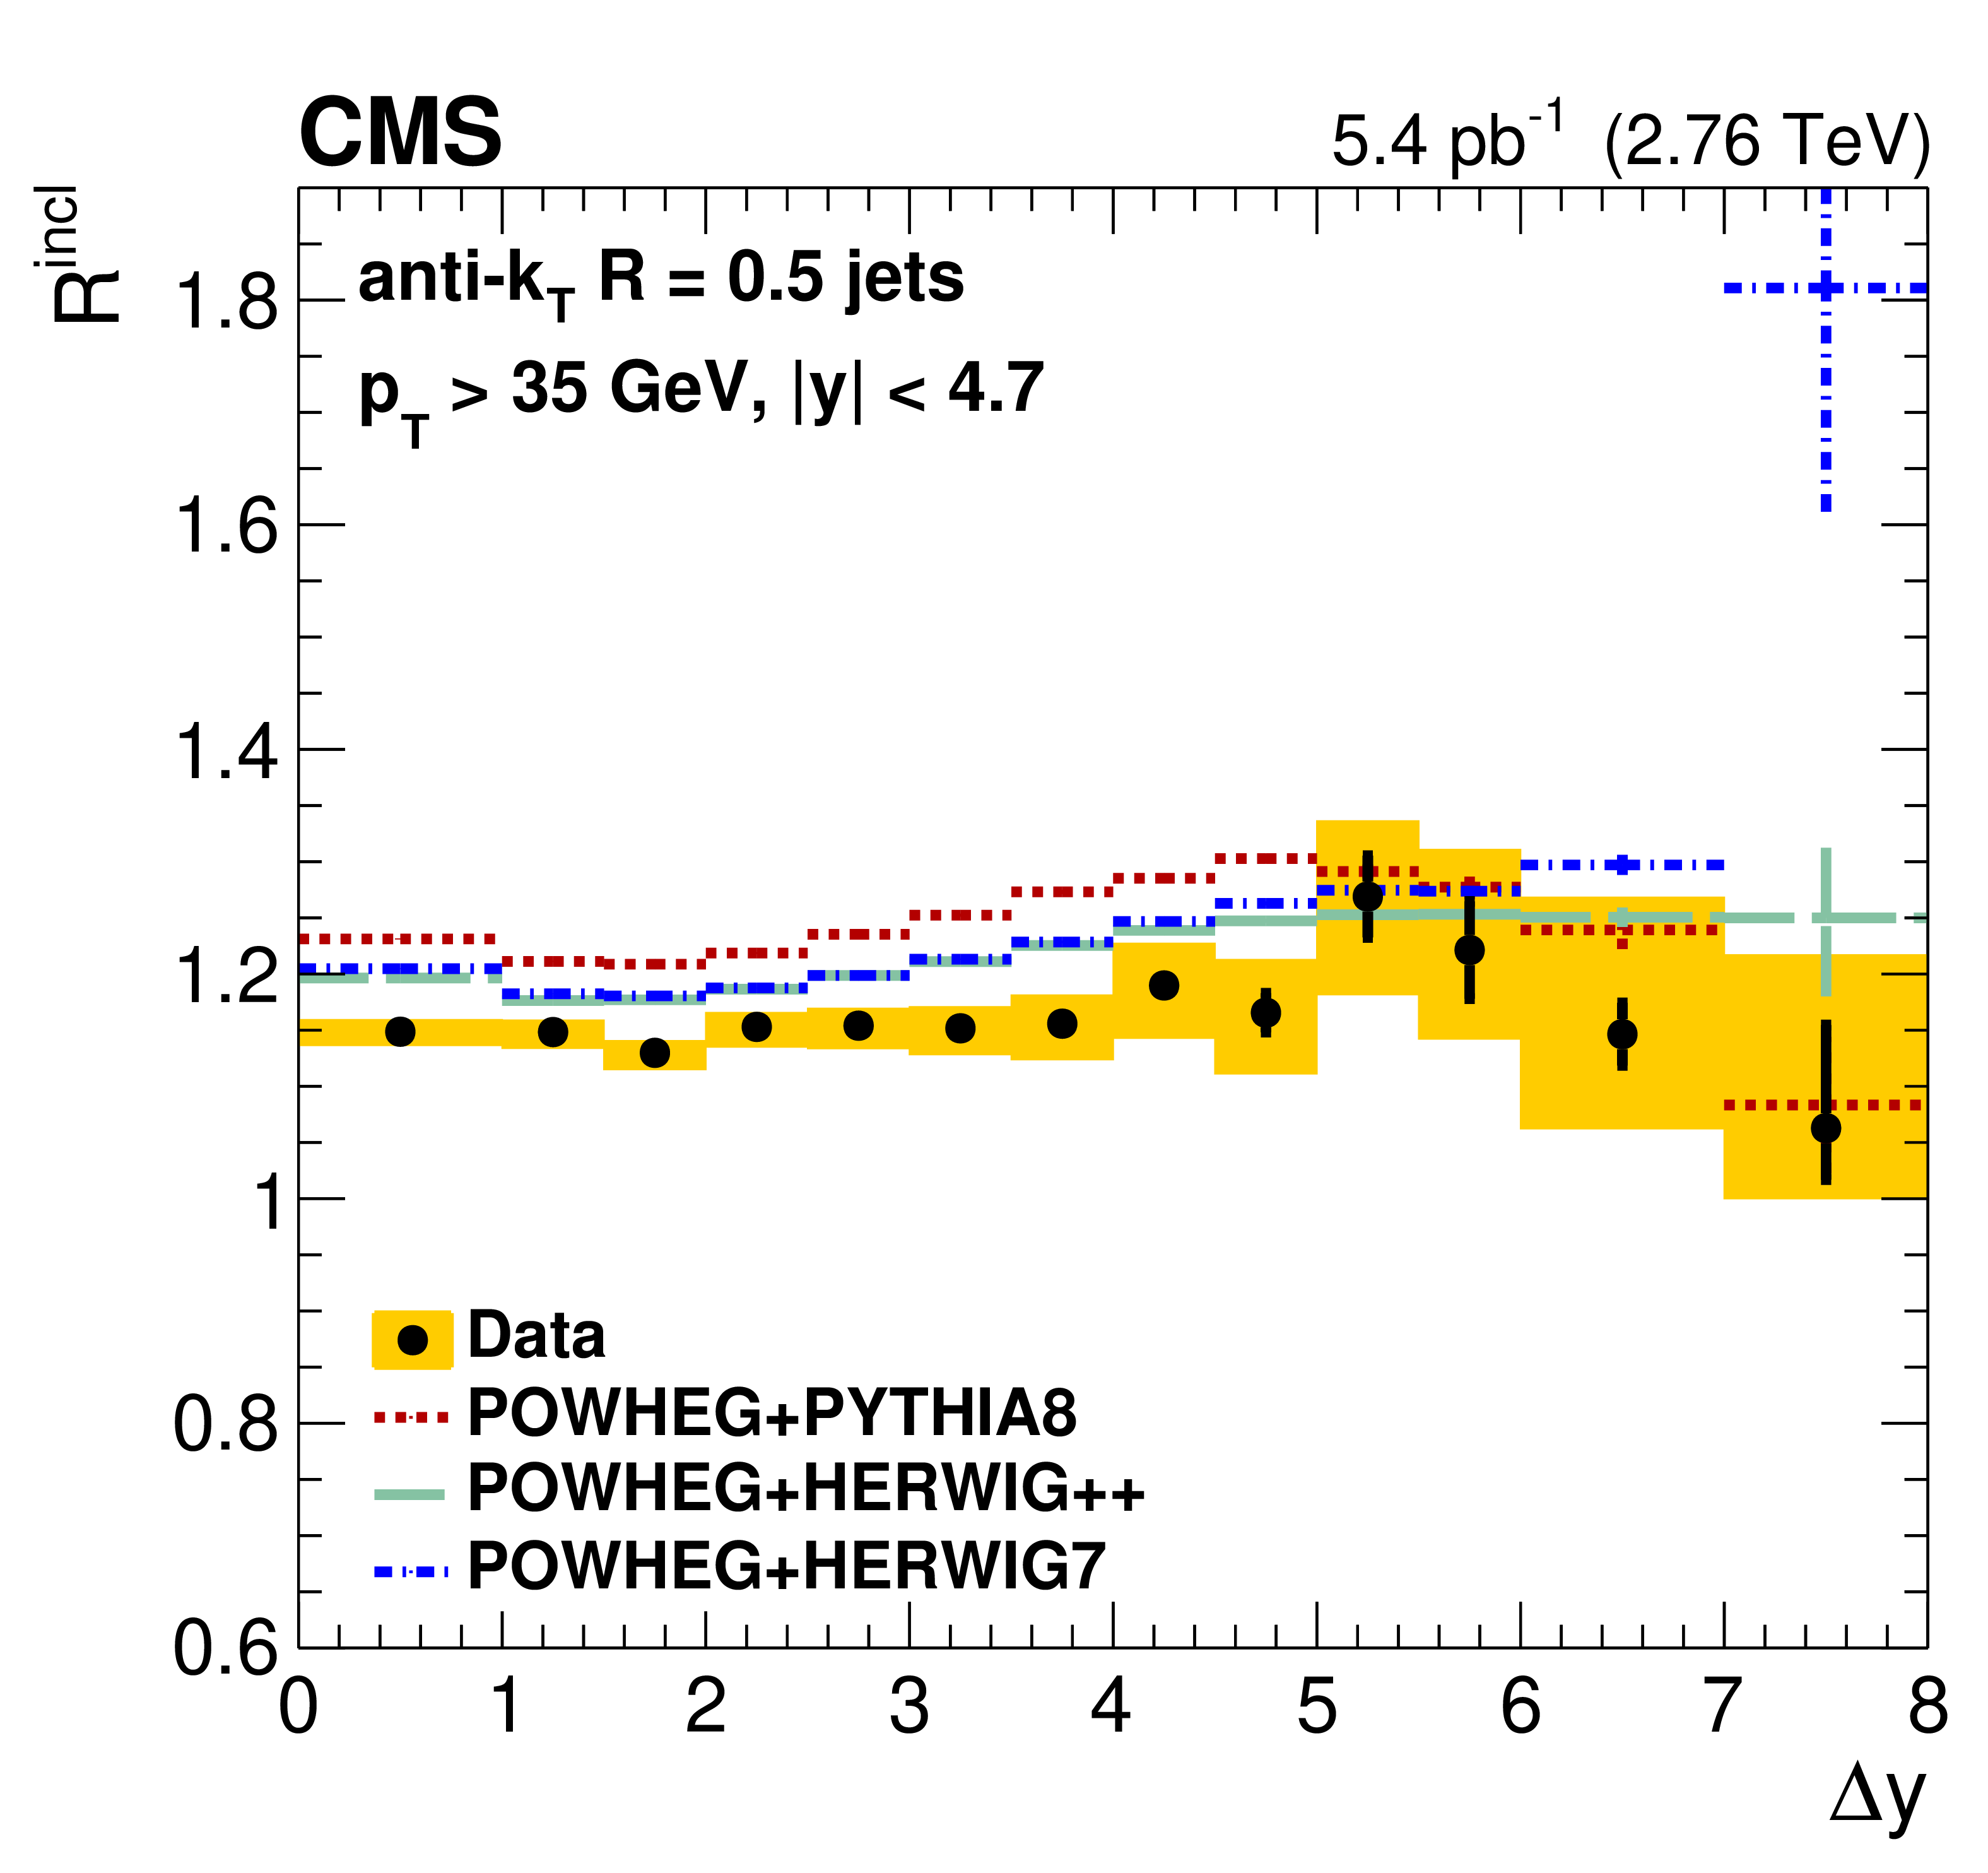
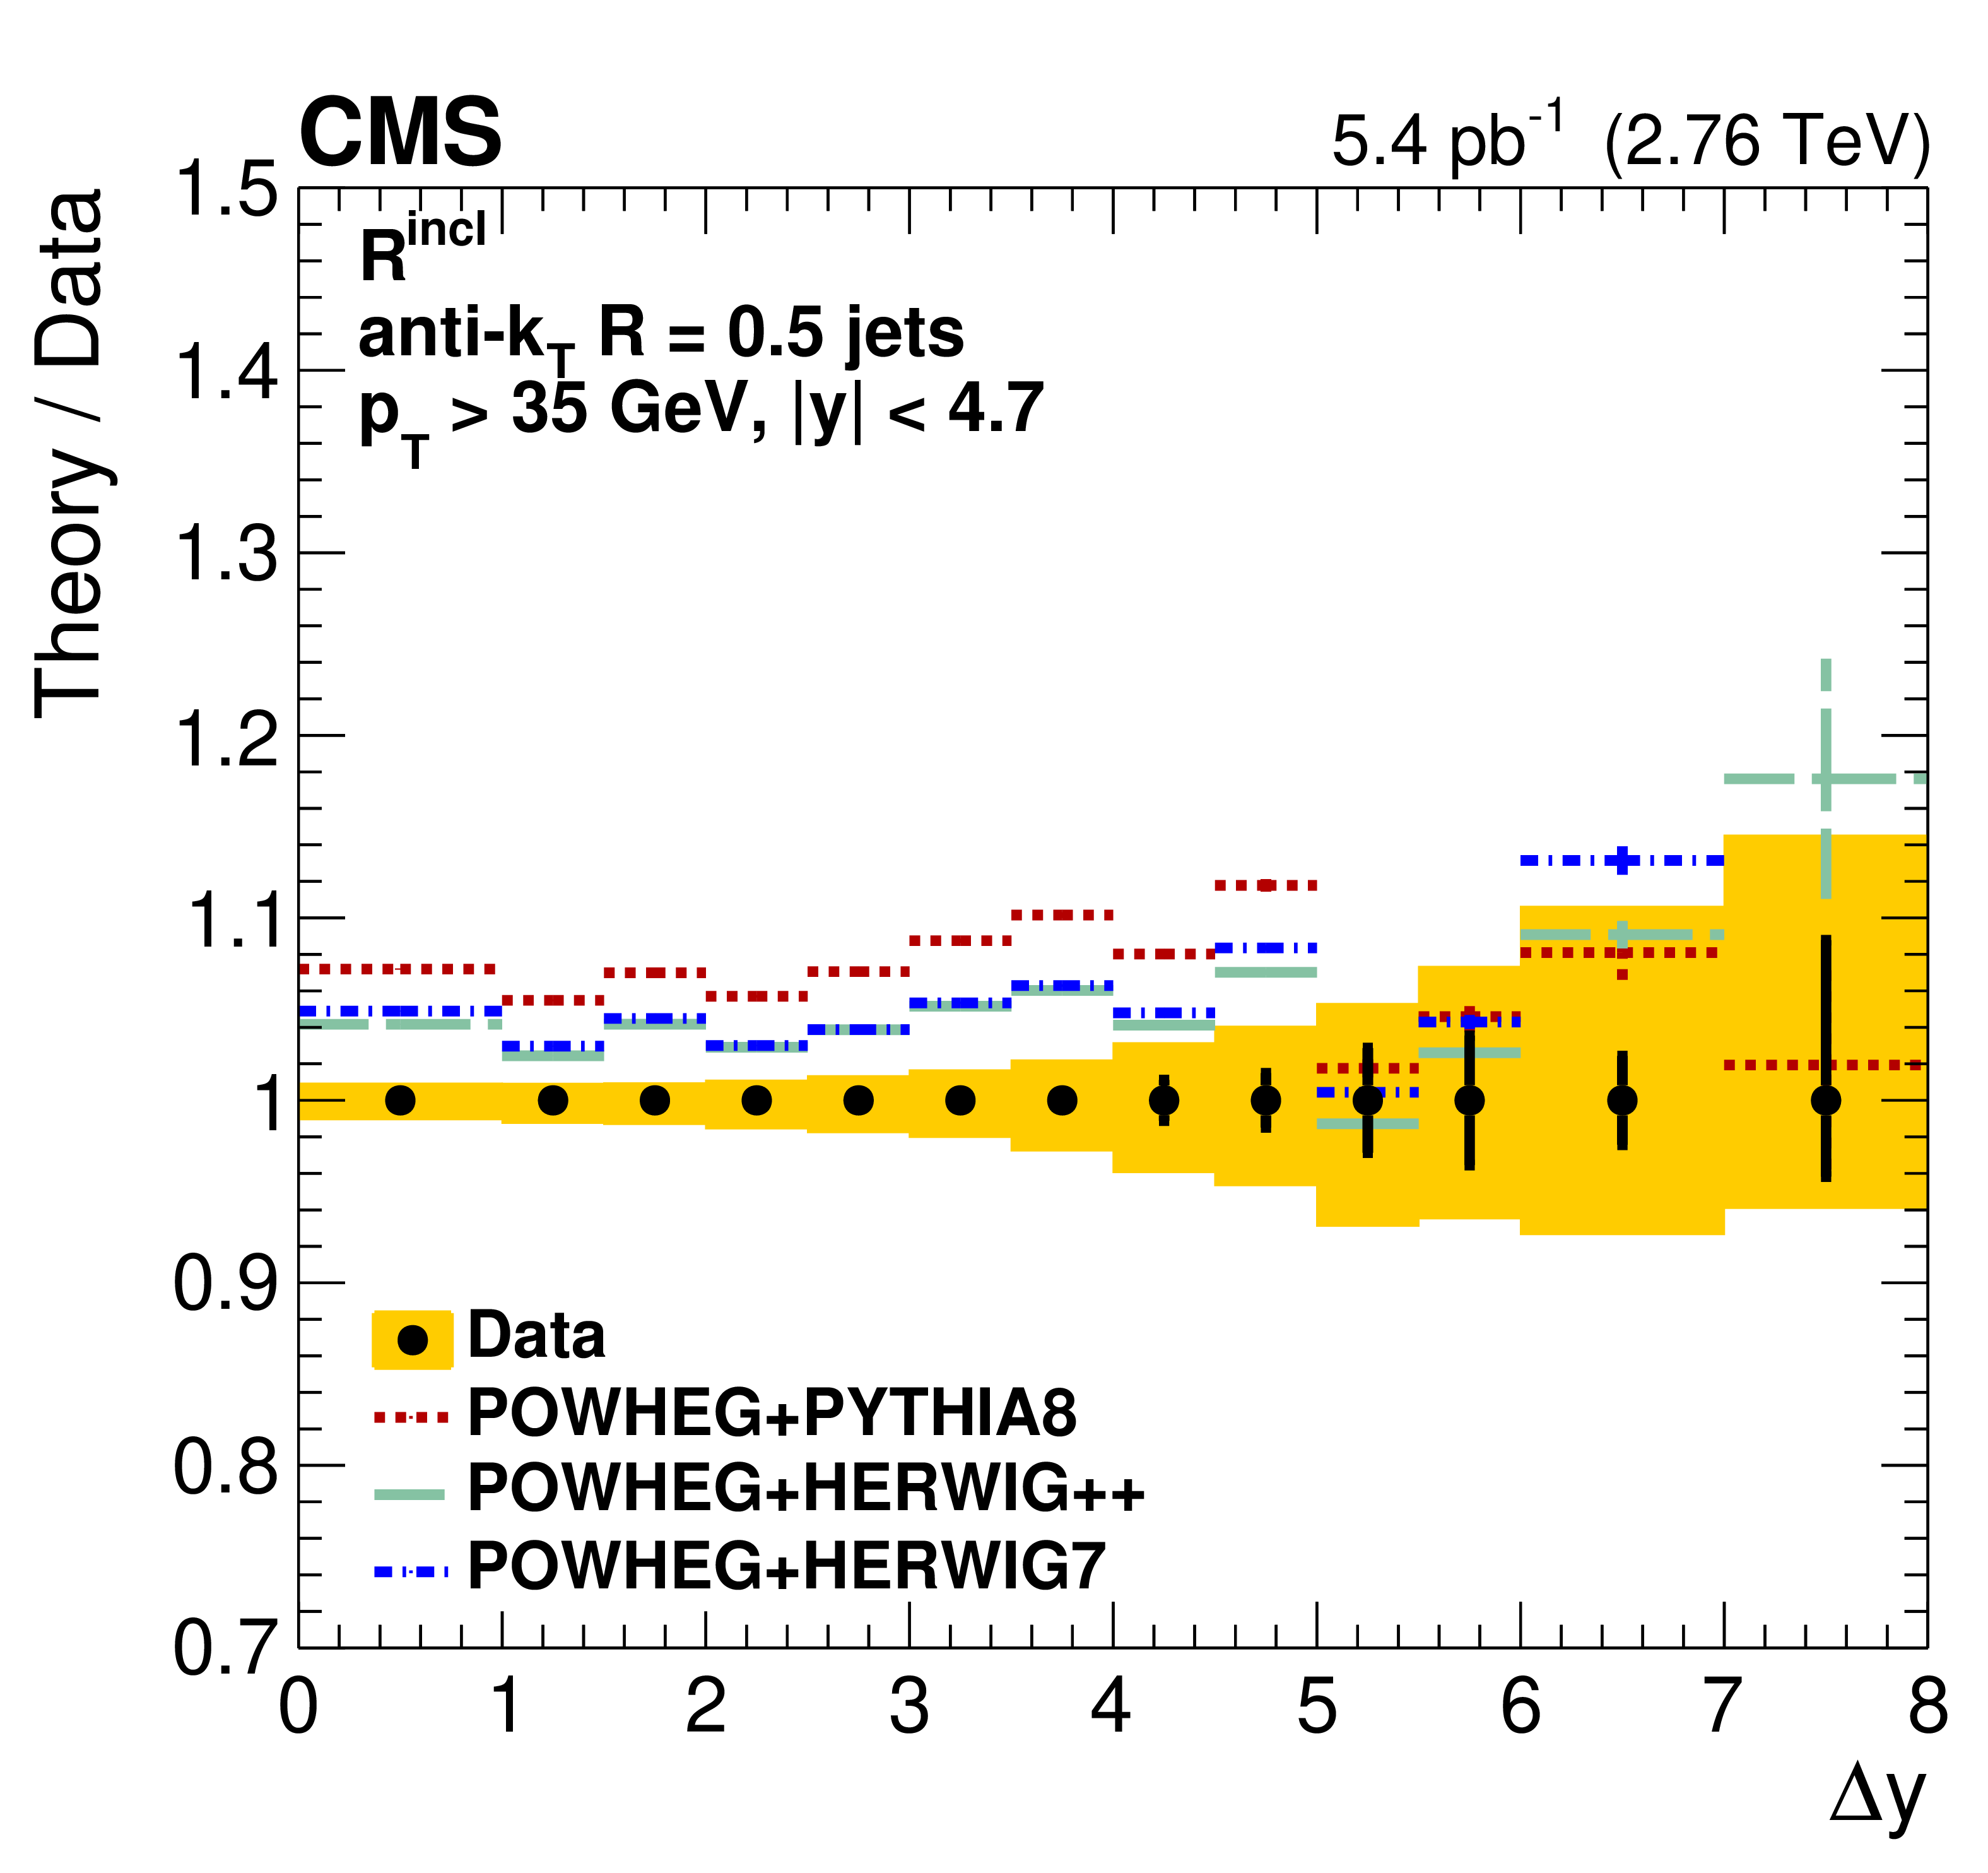
Figure 4:
Ratio ${R^{\text {incl}}}$ of the cross sections for inclusive to "exclusive" dijet production. The upper and lower rows present the comparison with different MC models. The plots on the left present the ratio ${R^{\text {incl}}}$ and those on the right the ratio of theory to data. The systematic uncertainties are indicated by the shaded bands and the statistical uncertainties by the vertical bars. |

png pdf |
Figure 4-a:
Ratio ${R^{\text {incl}}}$ of the cross sections for inclusive to "exclusive" dijet production, compared with different MC models. The systematic uncertainties are indicated by the shaded bands and the statistical uncertainties by the vertical bars. |
png pdf |
Figure 4-b:
Ratio ${R^{\text {incl}}}$ of the cross sections for inclusive to "exclusive" dijet production, compared with different MC models. The plot presents the ratio of theory to data. The systematic uncertainties are indicated by the shaded bands and the statistical uncertainties by the vertical bars. |
png pdf |
Figure 4-c:
Ratio ${R^{\text {incl}}}$ of the cross sections for inclusive to "exclusive" dijet production, compared with different MC models. The systematic uncertainties are indicated by the shaded bands and the statistical uncertainties by the vertical bars. |
png pdf |
Figure 4-d:
Ratio ${R^{\text {incl}}}$ of the cross sections for inclusive to "exclusive" dijet production, compared with different MC models. The plot presents the ratio of theory to data. The systematic uncertainties are indicated by the shaded bands and the statistical uncertainties by the vertical bars. |

png pdf |
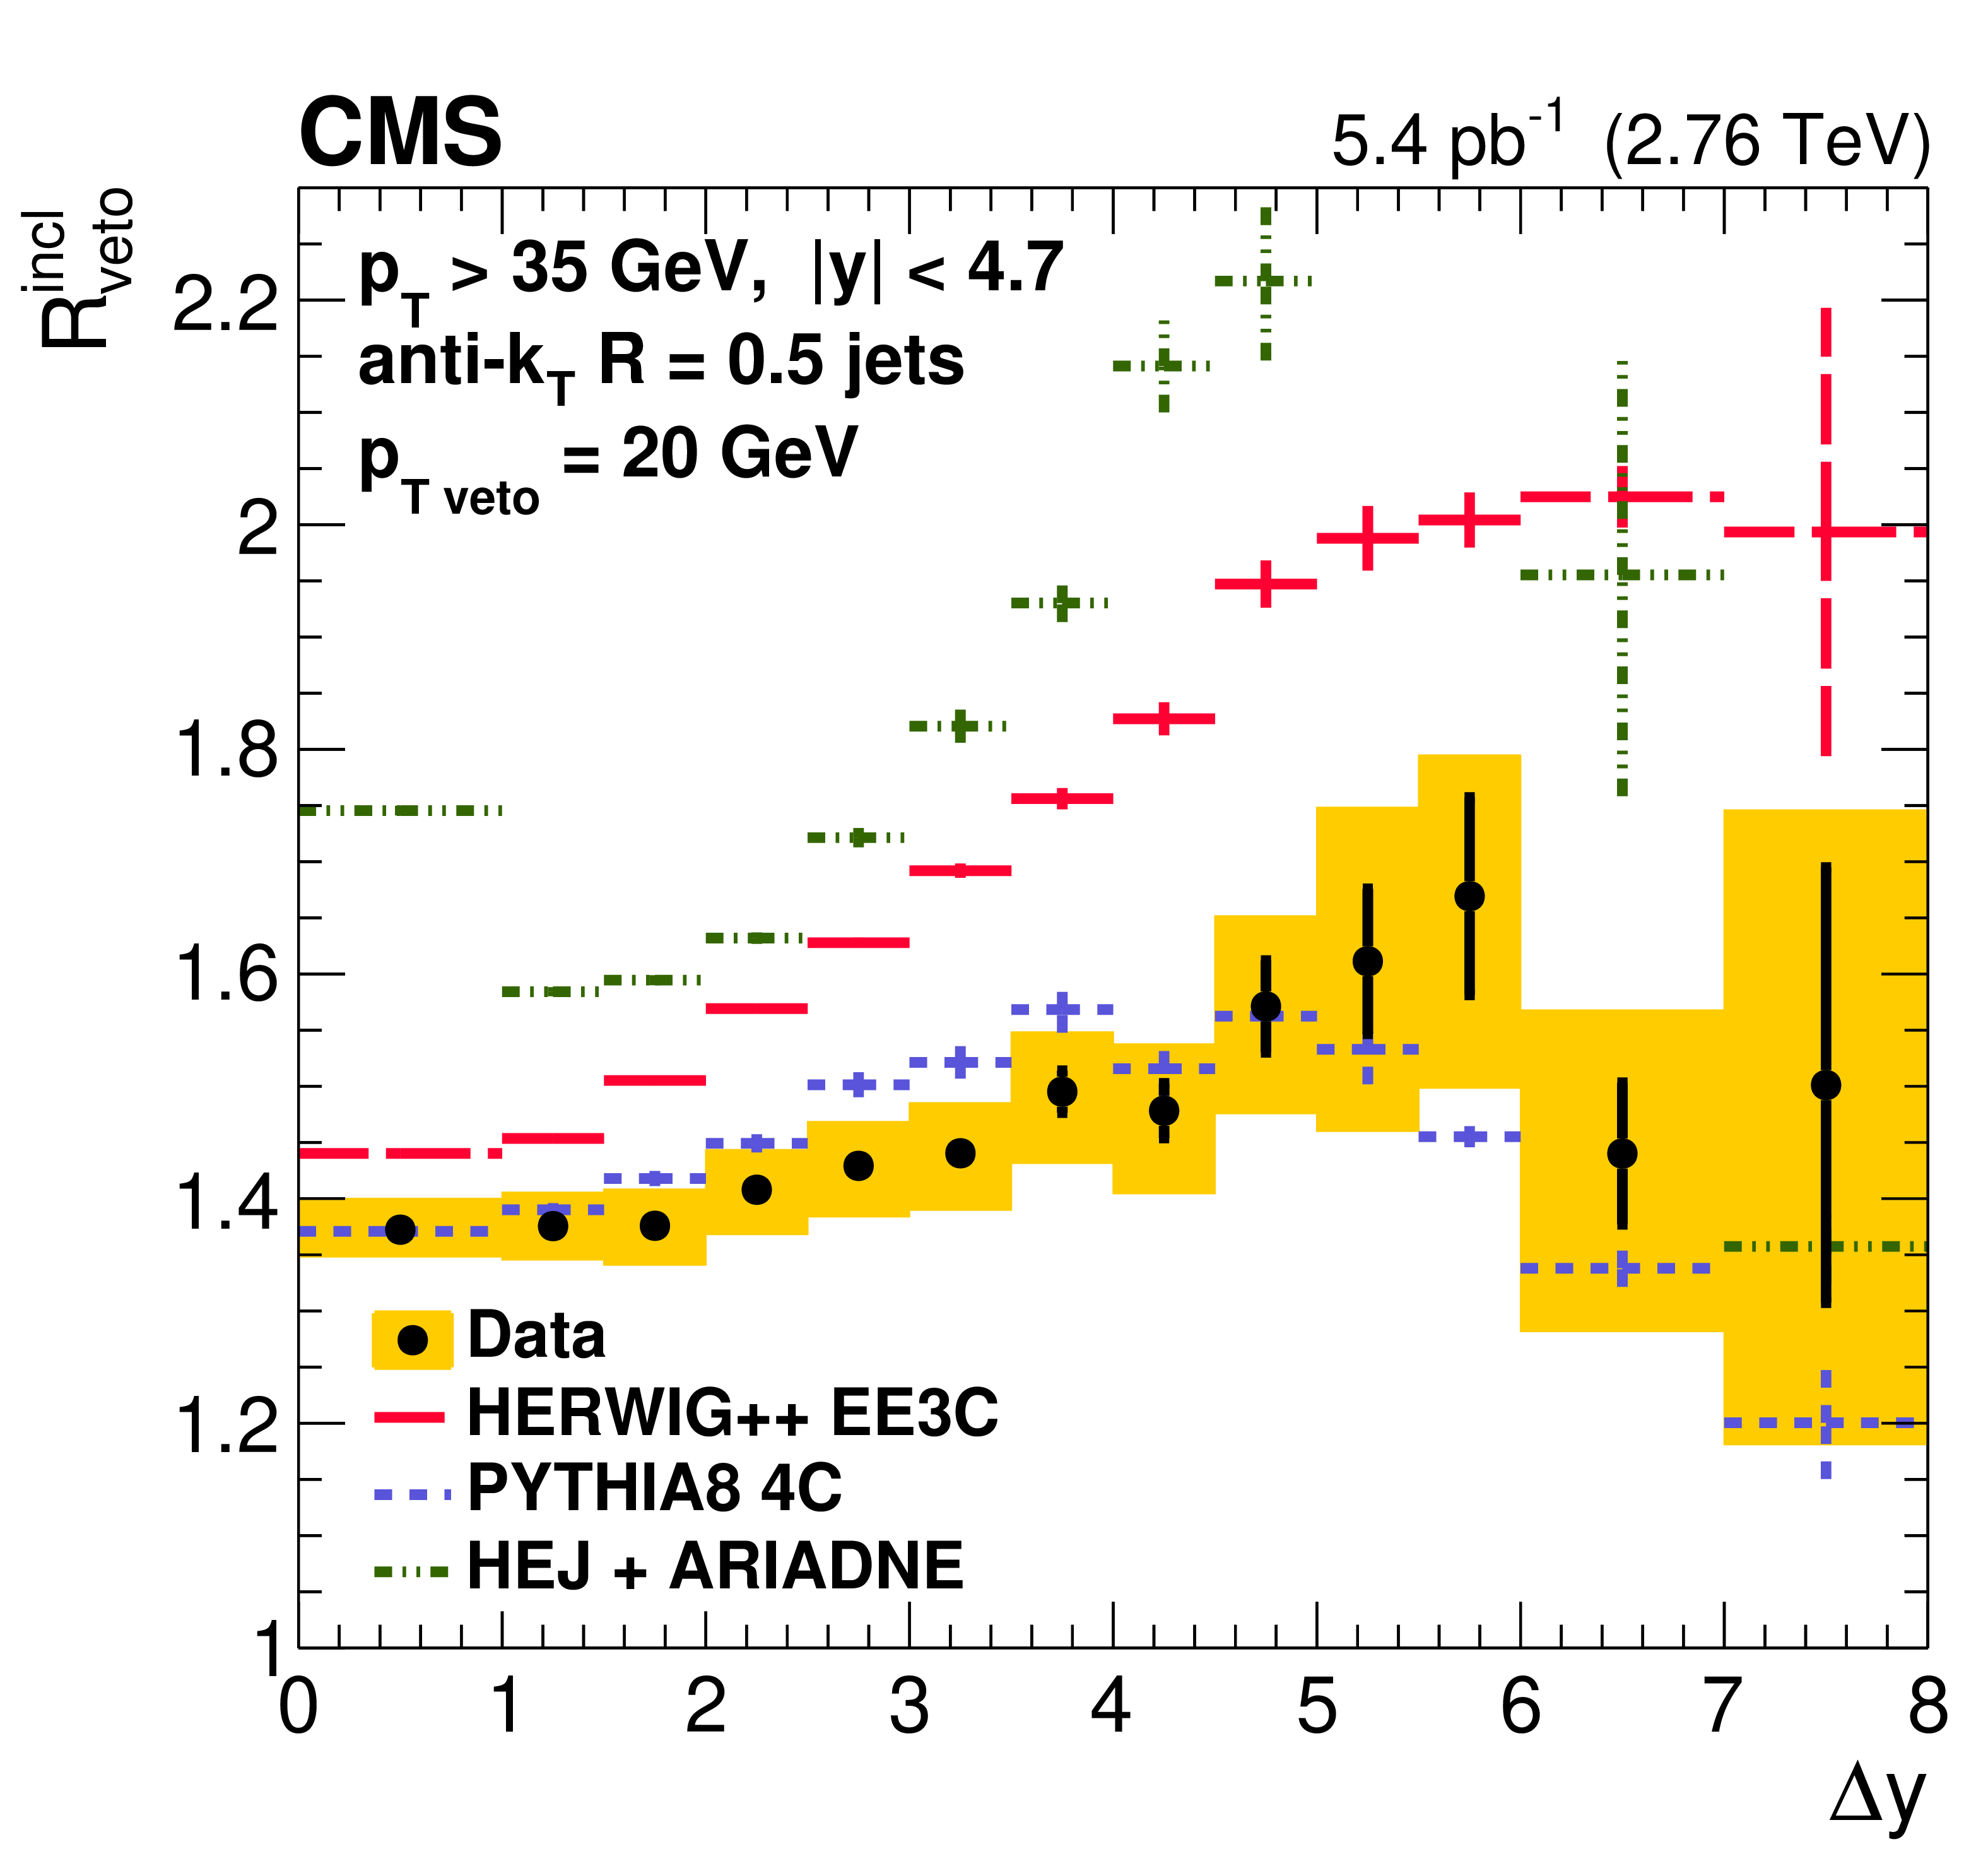
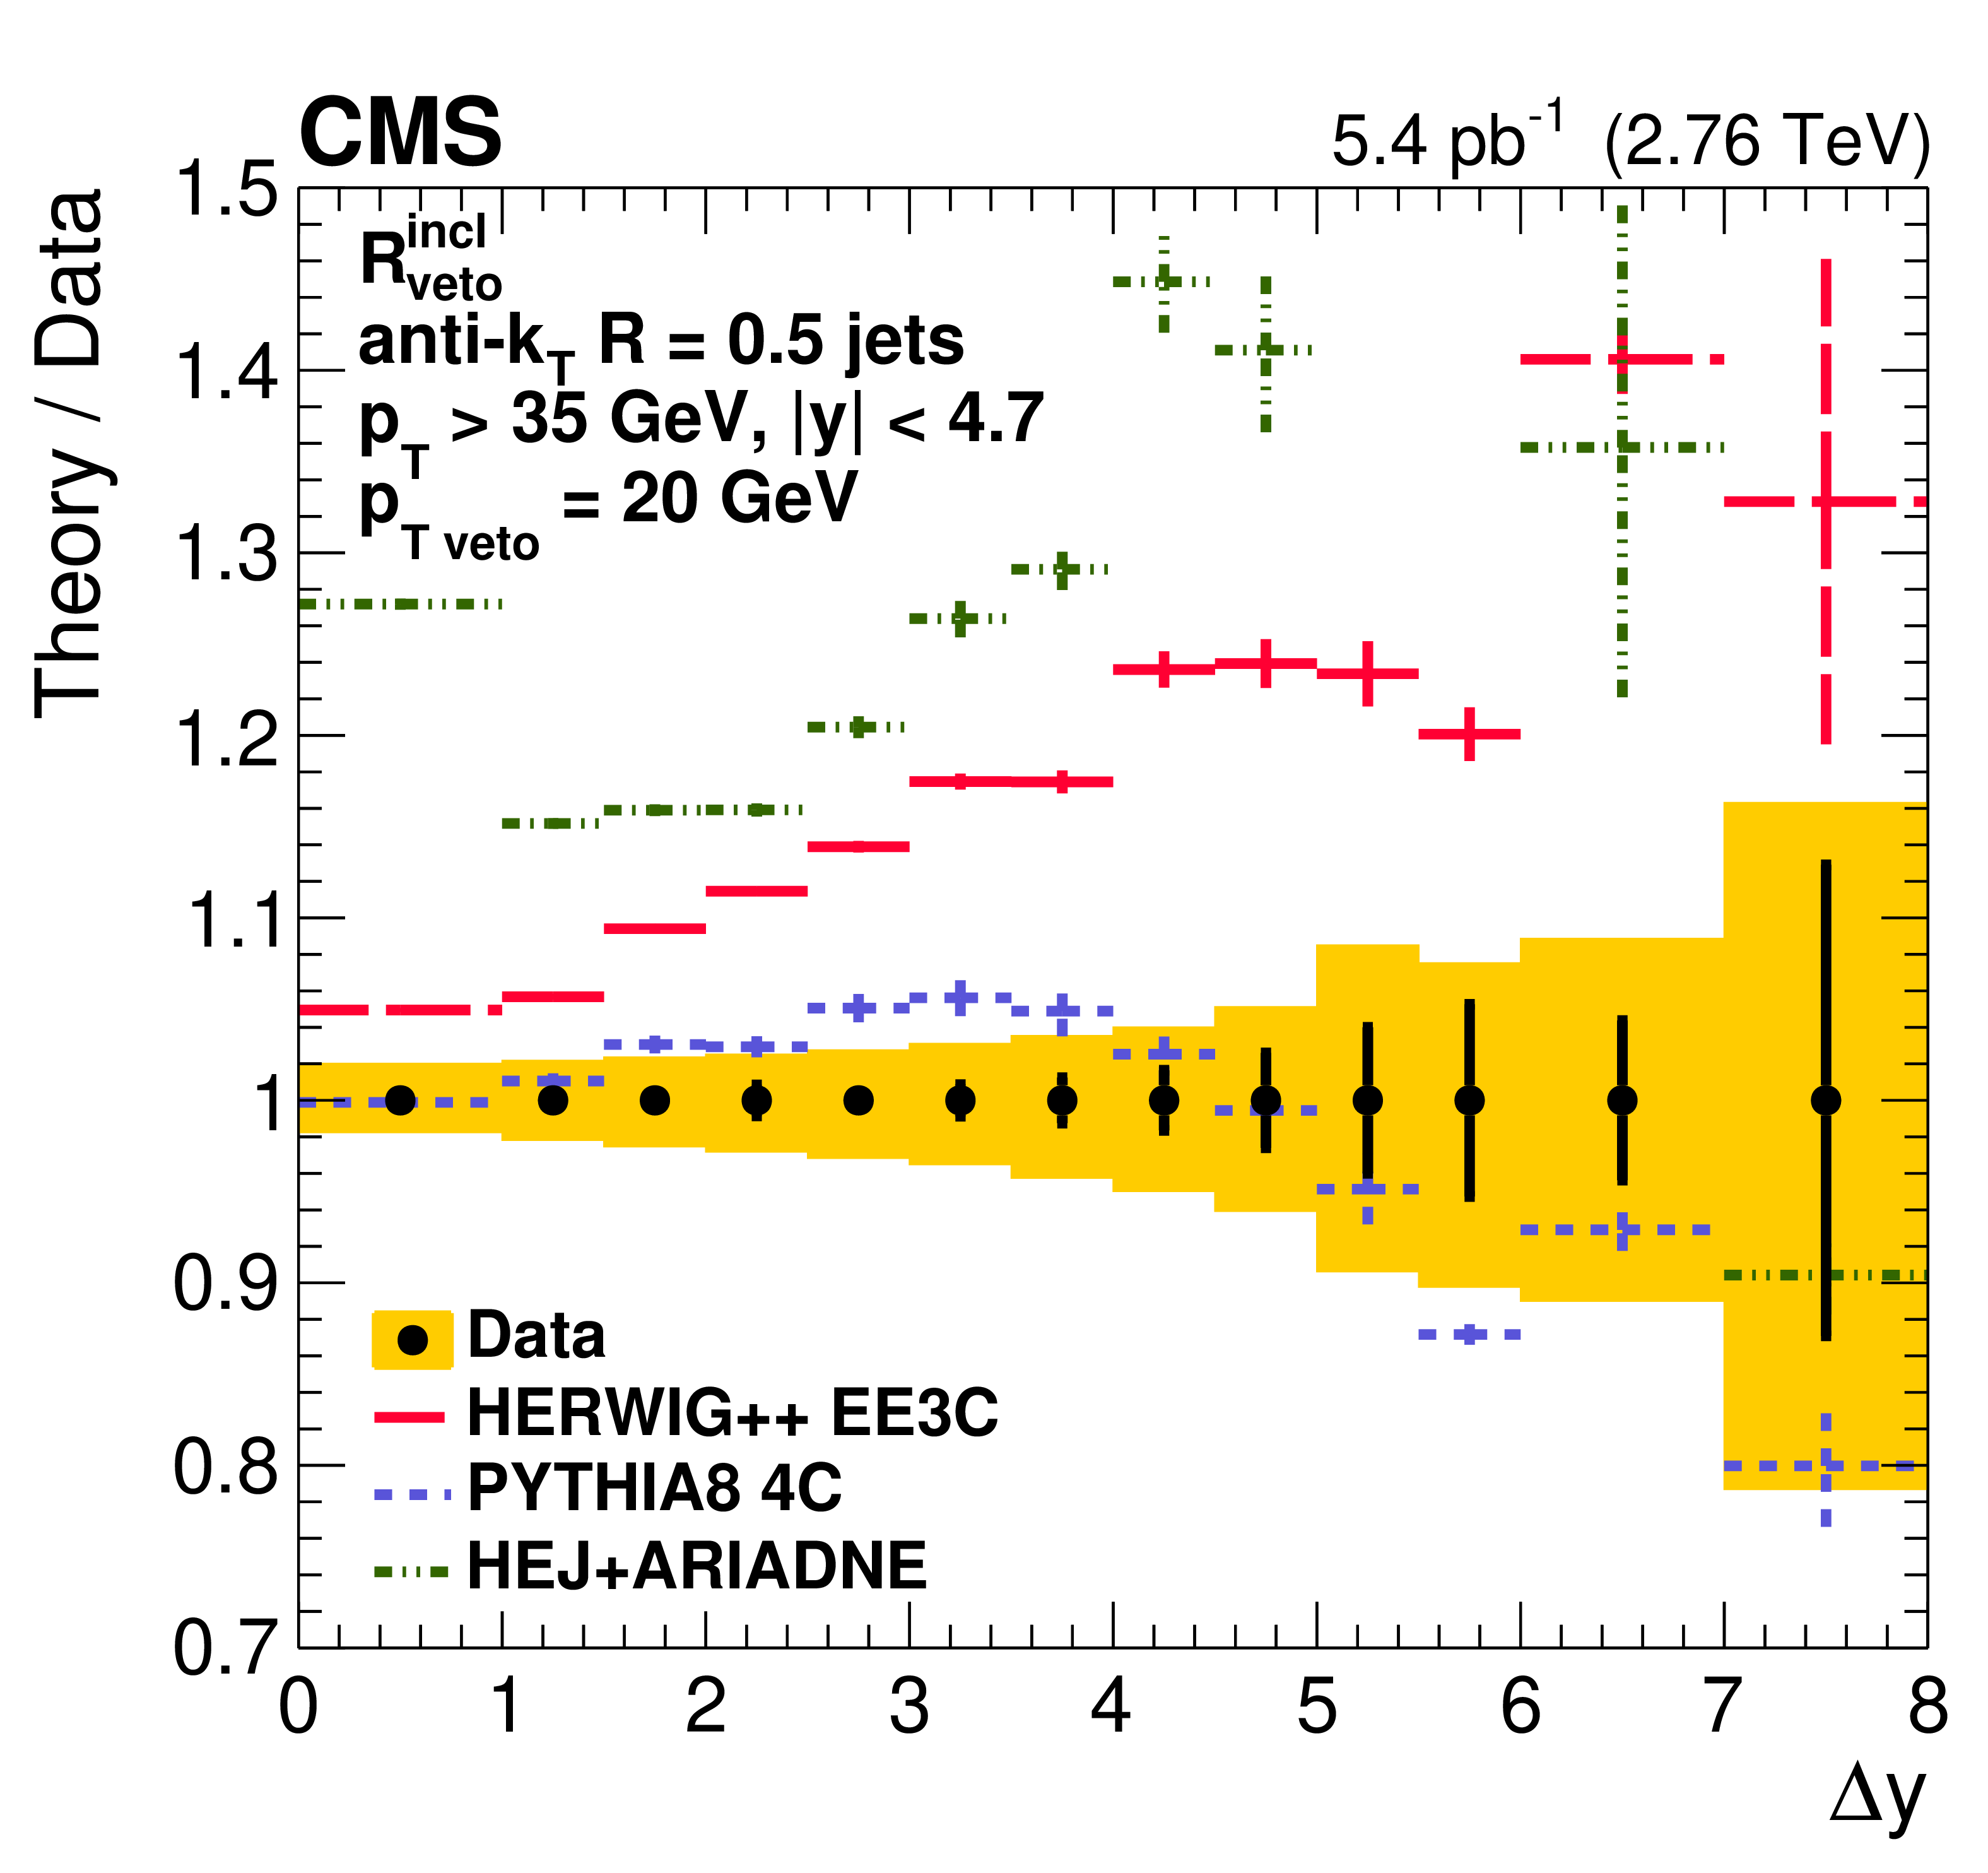
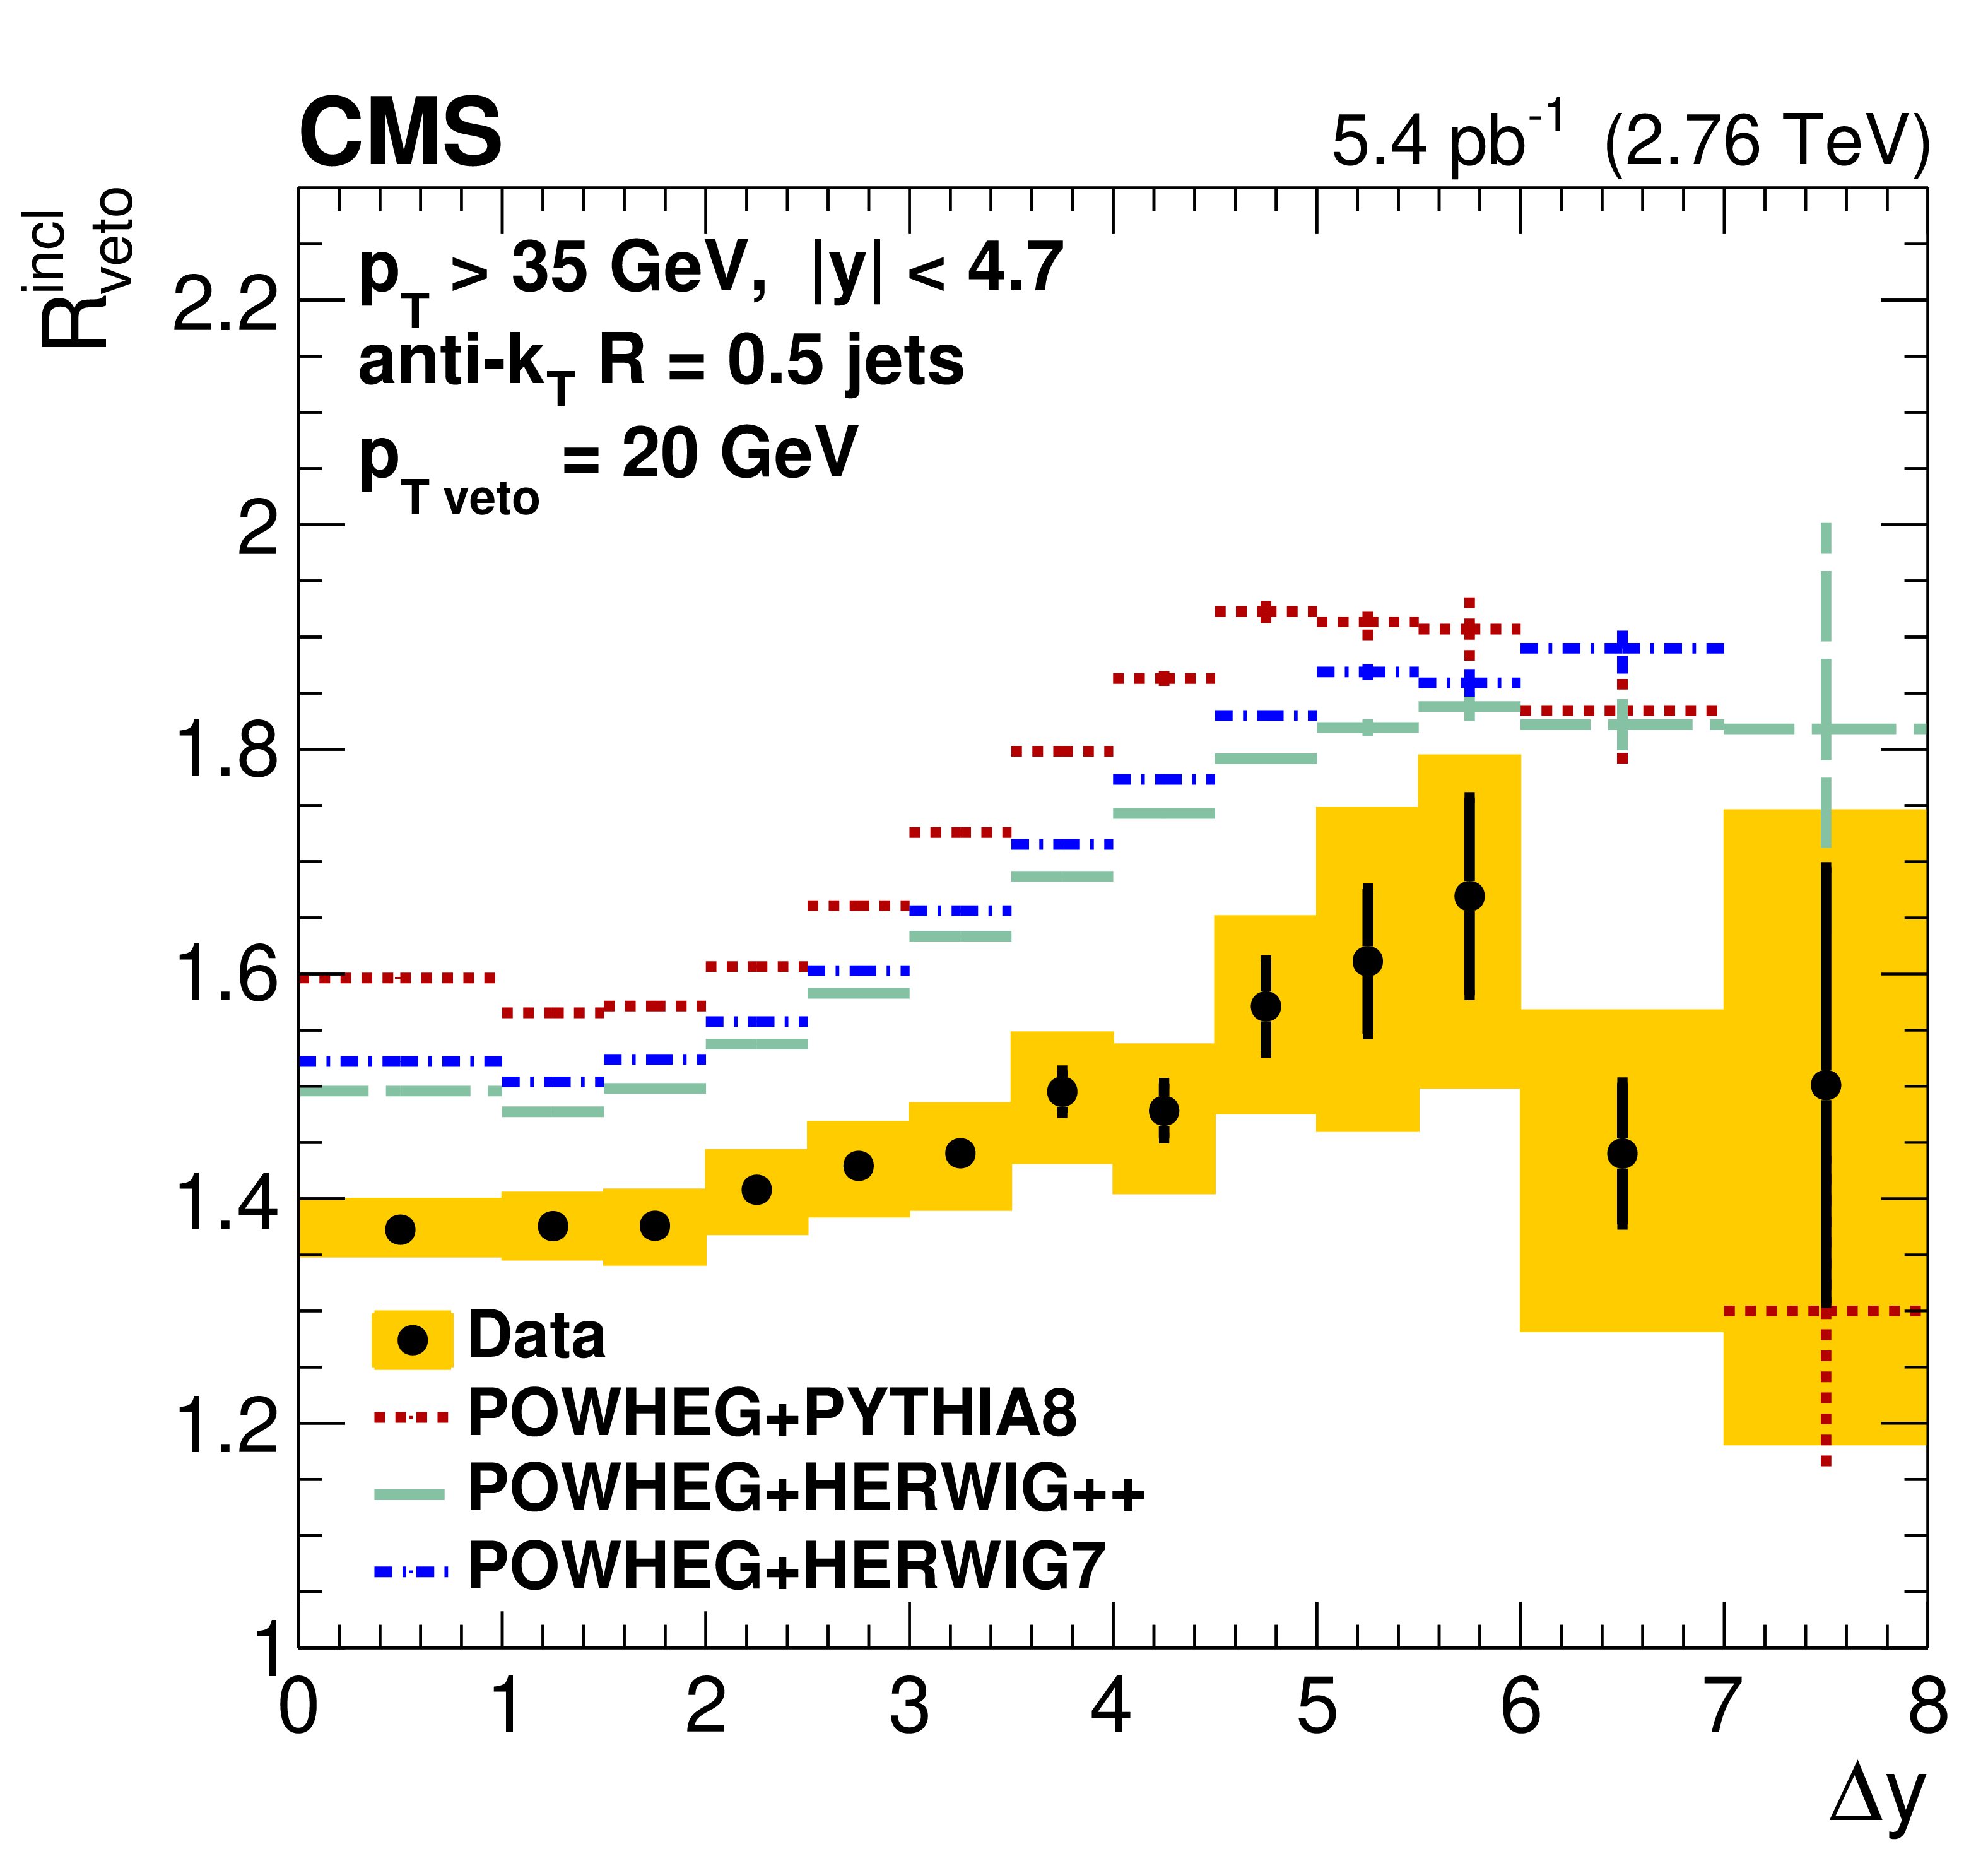
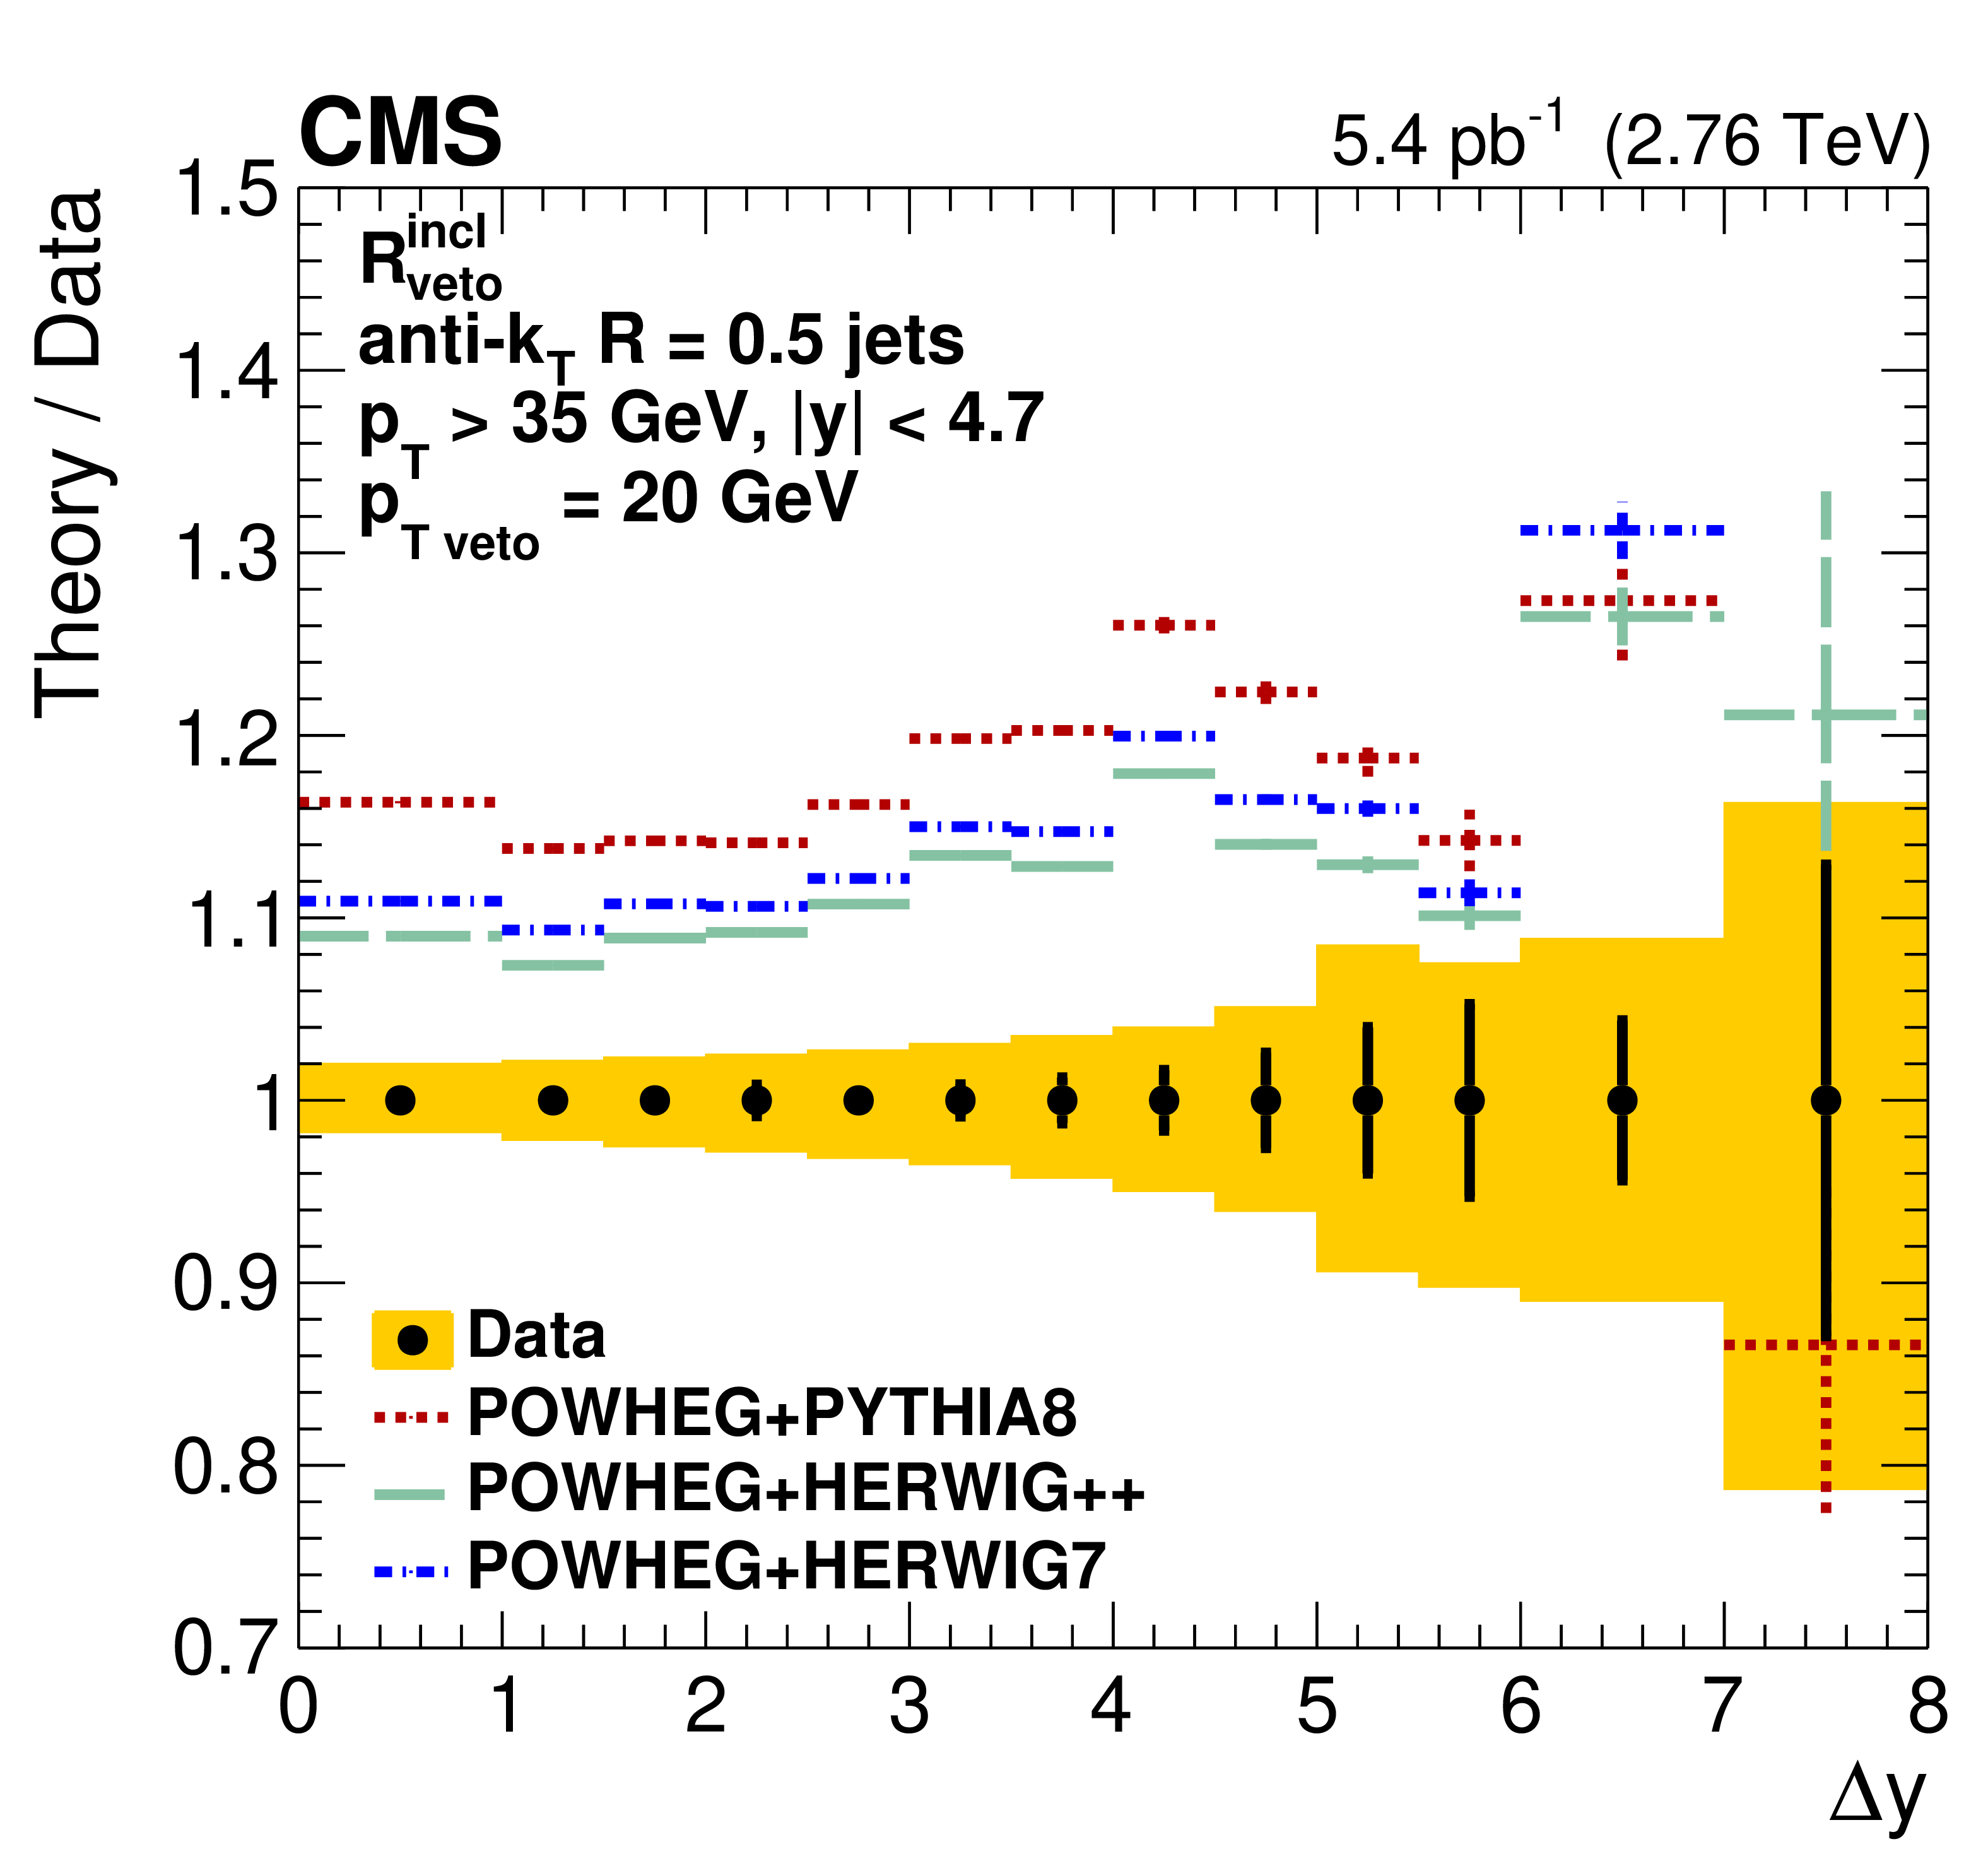
Figure 5:
Ratio ${R^{\text {incl}}_{\text {veto}}}$ of the cross sections for inclusive to "exclusive" with veto dijet production. The upper and lower rows present the comparison with different MC models. The plots on the left present the ratio ${R^{\text {incl}}_{\text {veto}}}$ and those on the right the ratio of theory to data. The systematic uncertainties are indicated by the shaded bands and the statistical uncertainties by the vertical bars. |
png pdf |
Figure 5-a:
Ratio ${R^{\text {incl}}_{\text {veto}}}$ of the cross sections for inclusive to "exclusive" with veto dijet production, compared with different MC models. The systematic uncertainties are indicated by the shaded bands and the statistical uncertainties by the vertical bars. |
png pdf |
Figure 5-b:
Ratio ${R^{\text {incl}}_{\text {veto}}}$ of the cross sections for inclusive to "exclusive" with veto dijet production, compared with different MC models. The plot presents the ratio of theory to data. The systematic uncertainties are indicated by the shaded bands and the statistical uncertainties by the vertical bars. |
png pdf |
Figure 5-c:
Ratio ${R^{\text {incl}}_{\text {veto}}}$ of the cross sections for inclusive to "exclusive" with veto dijet production, compared with different MC models. The systematic uncertainties are indicated by the shaded bands and the statistical uncertainties by the vertical bars. |
png pdf |
Figure 5-d:
Ratio ${R^{\text {incl}}_{\text {veto}}}$ of the cross sections for inclusive to "exclusive" with veto dijet production, compared with different MC models. The plot presents the ratio of theory to data. The systematic uncertainties are indicated by the shaded bands and the statistical uncertainties by the vertical bars. |
png pdf |
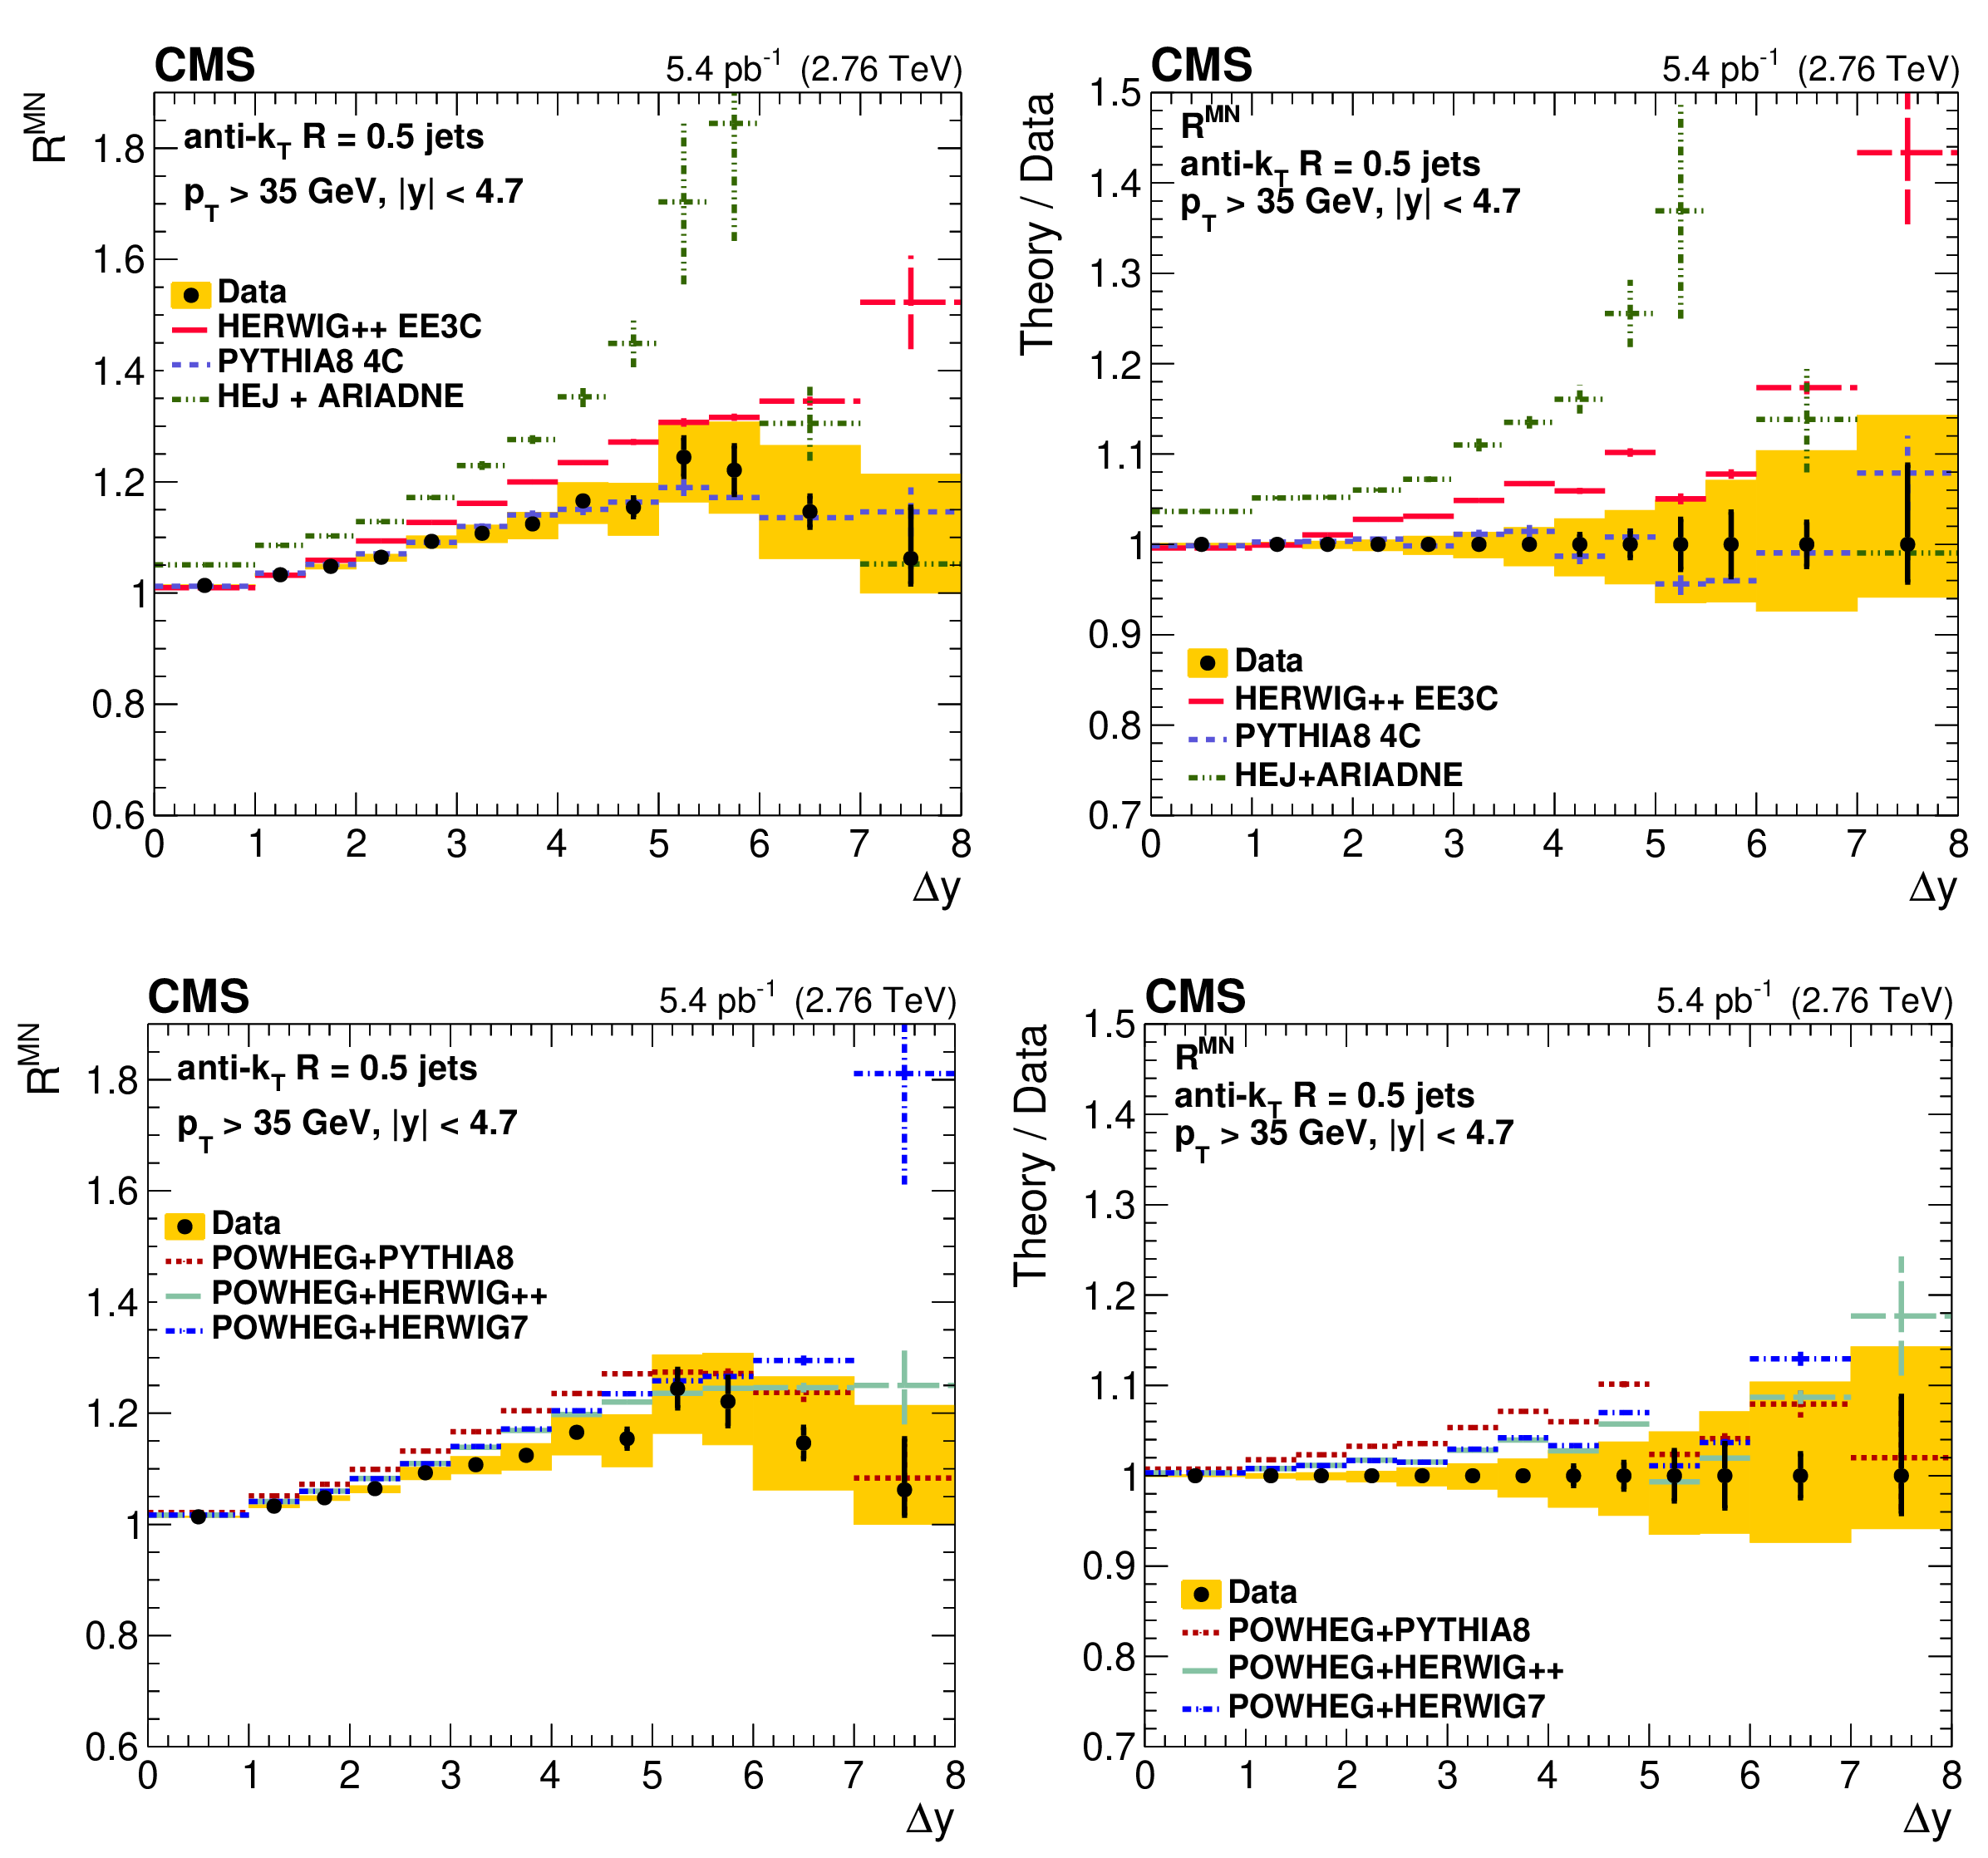
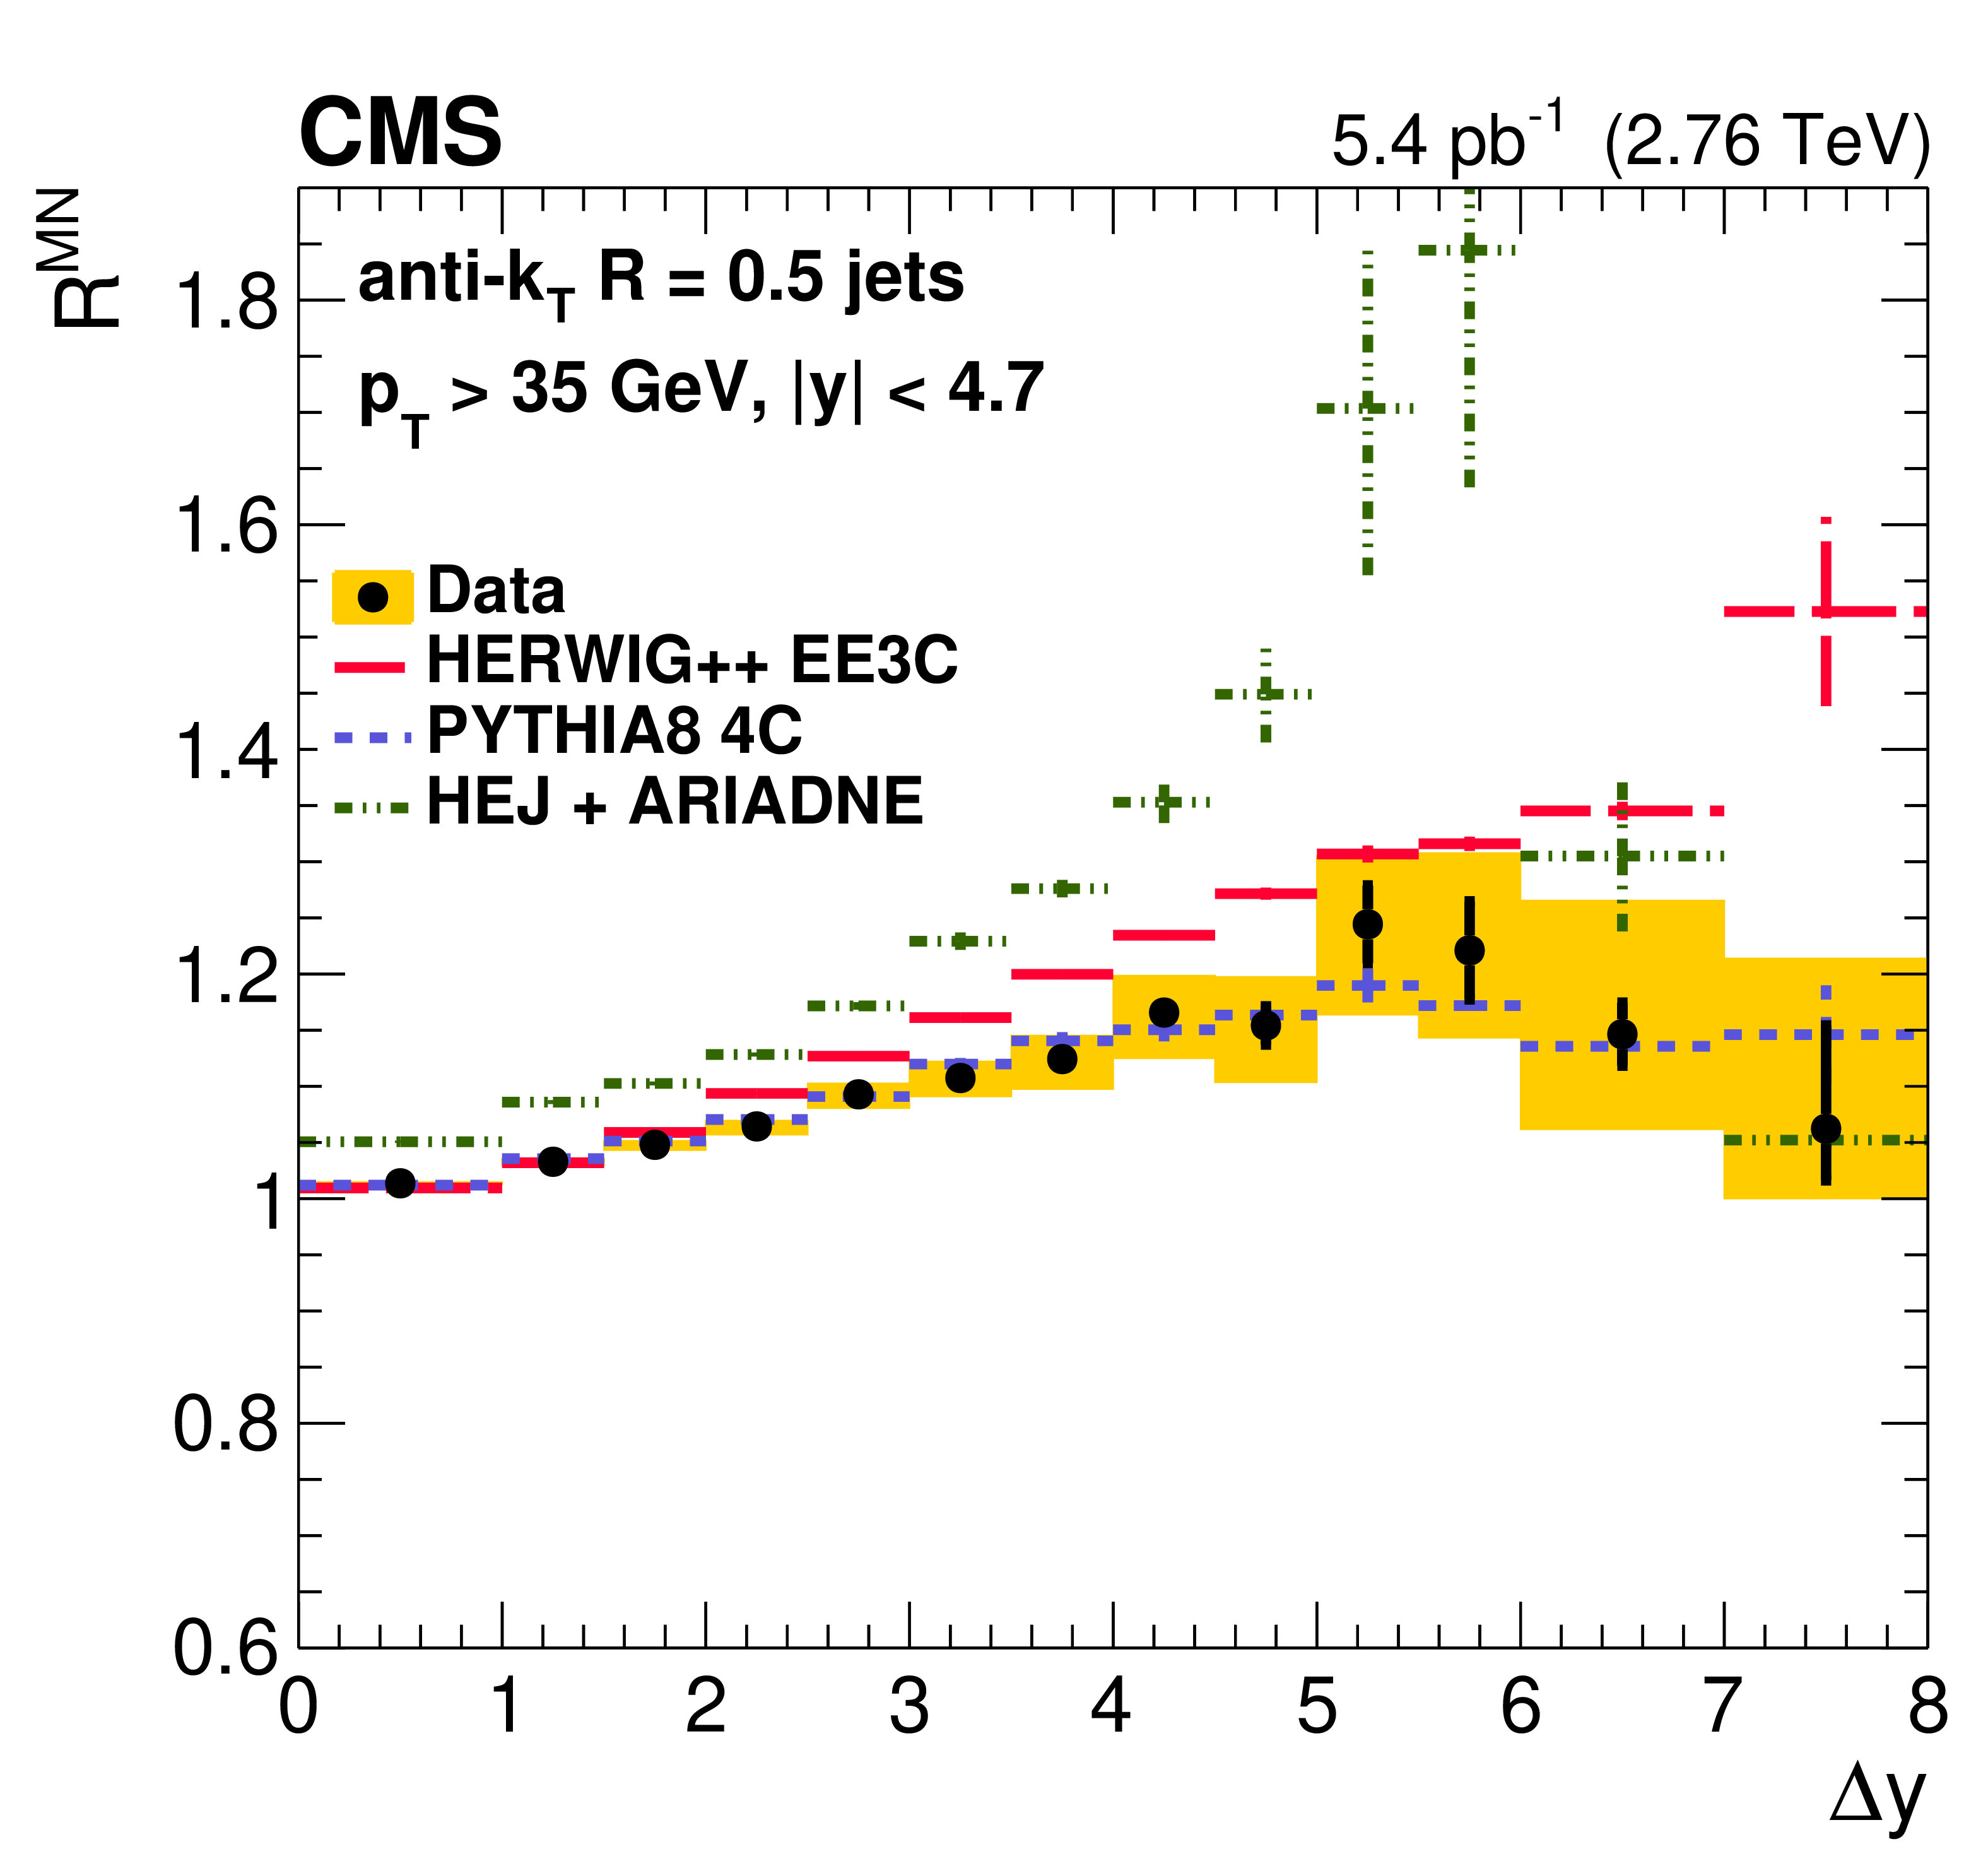
Figure 6:
Ratio ${R^{\mathrm {MN}}}$ of the cross sections for MN to "exclusive" dijet production. The upper and lower rows present the comparison with different MC models. The plots on the left present the ratio ${R^{\mathrm {MN}}}$ and those on the right the ratio of theory to data. The systematic uncertainties are indicated by the shaded bands and the statistical uncertainties by the vertical bars. |
png pdf |
Figure 6-a:
Ratio ${R^{\mathrm {MN}}}$ of the cross sections for MN to "exclusive" dijet production, compared with different MC models. The systematic uncertainties are indicated by the shaded bands and the statistical uncertainties by the vertical bars. |
png pdf |
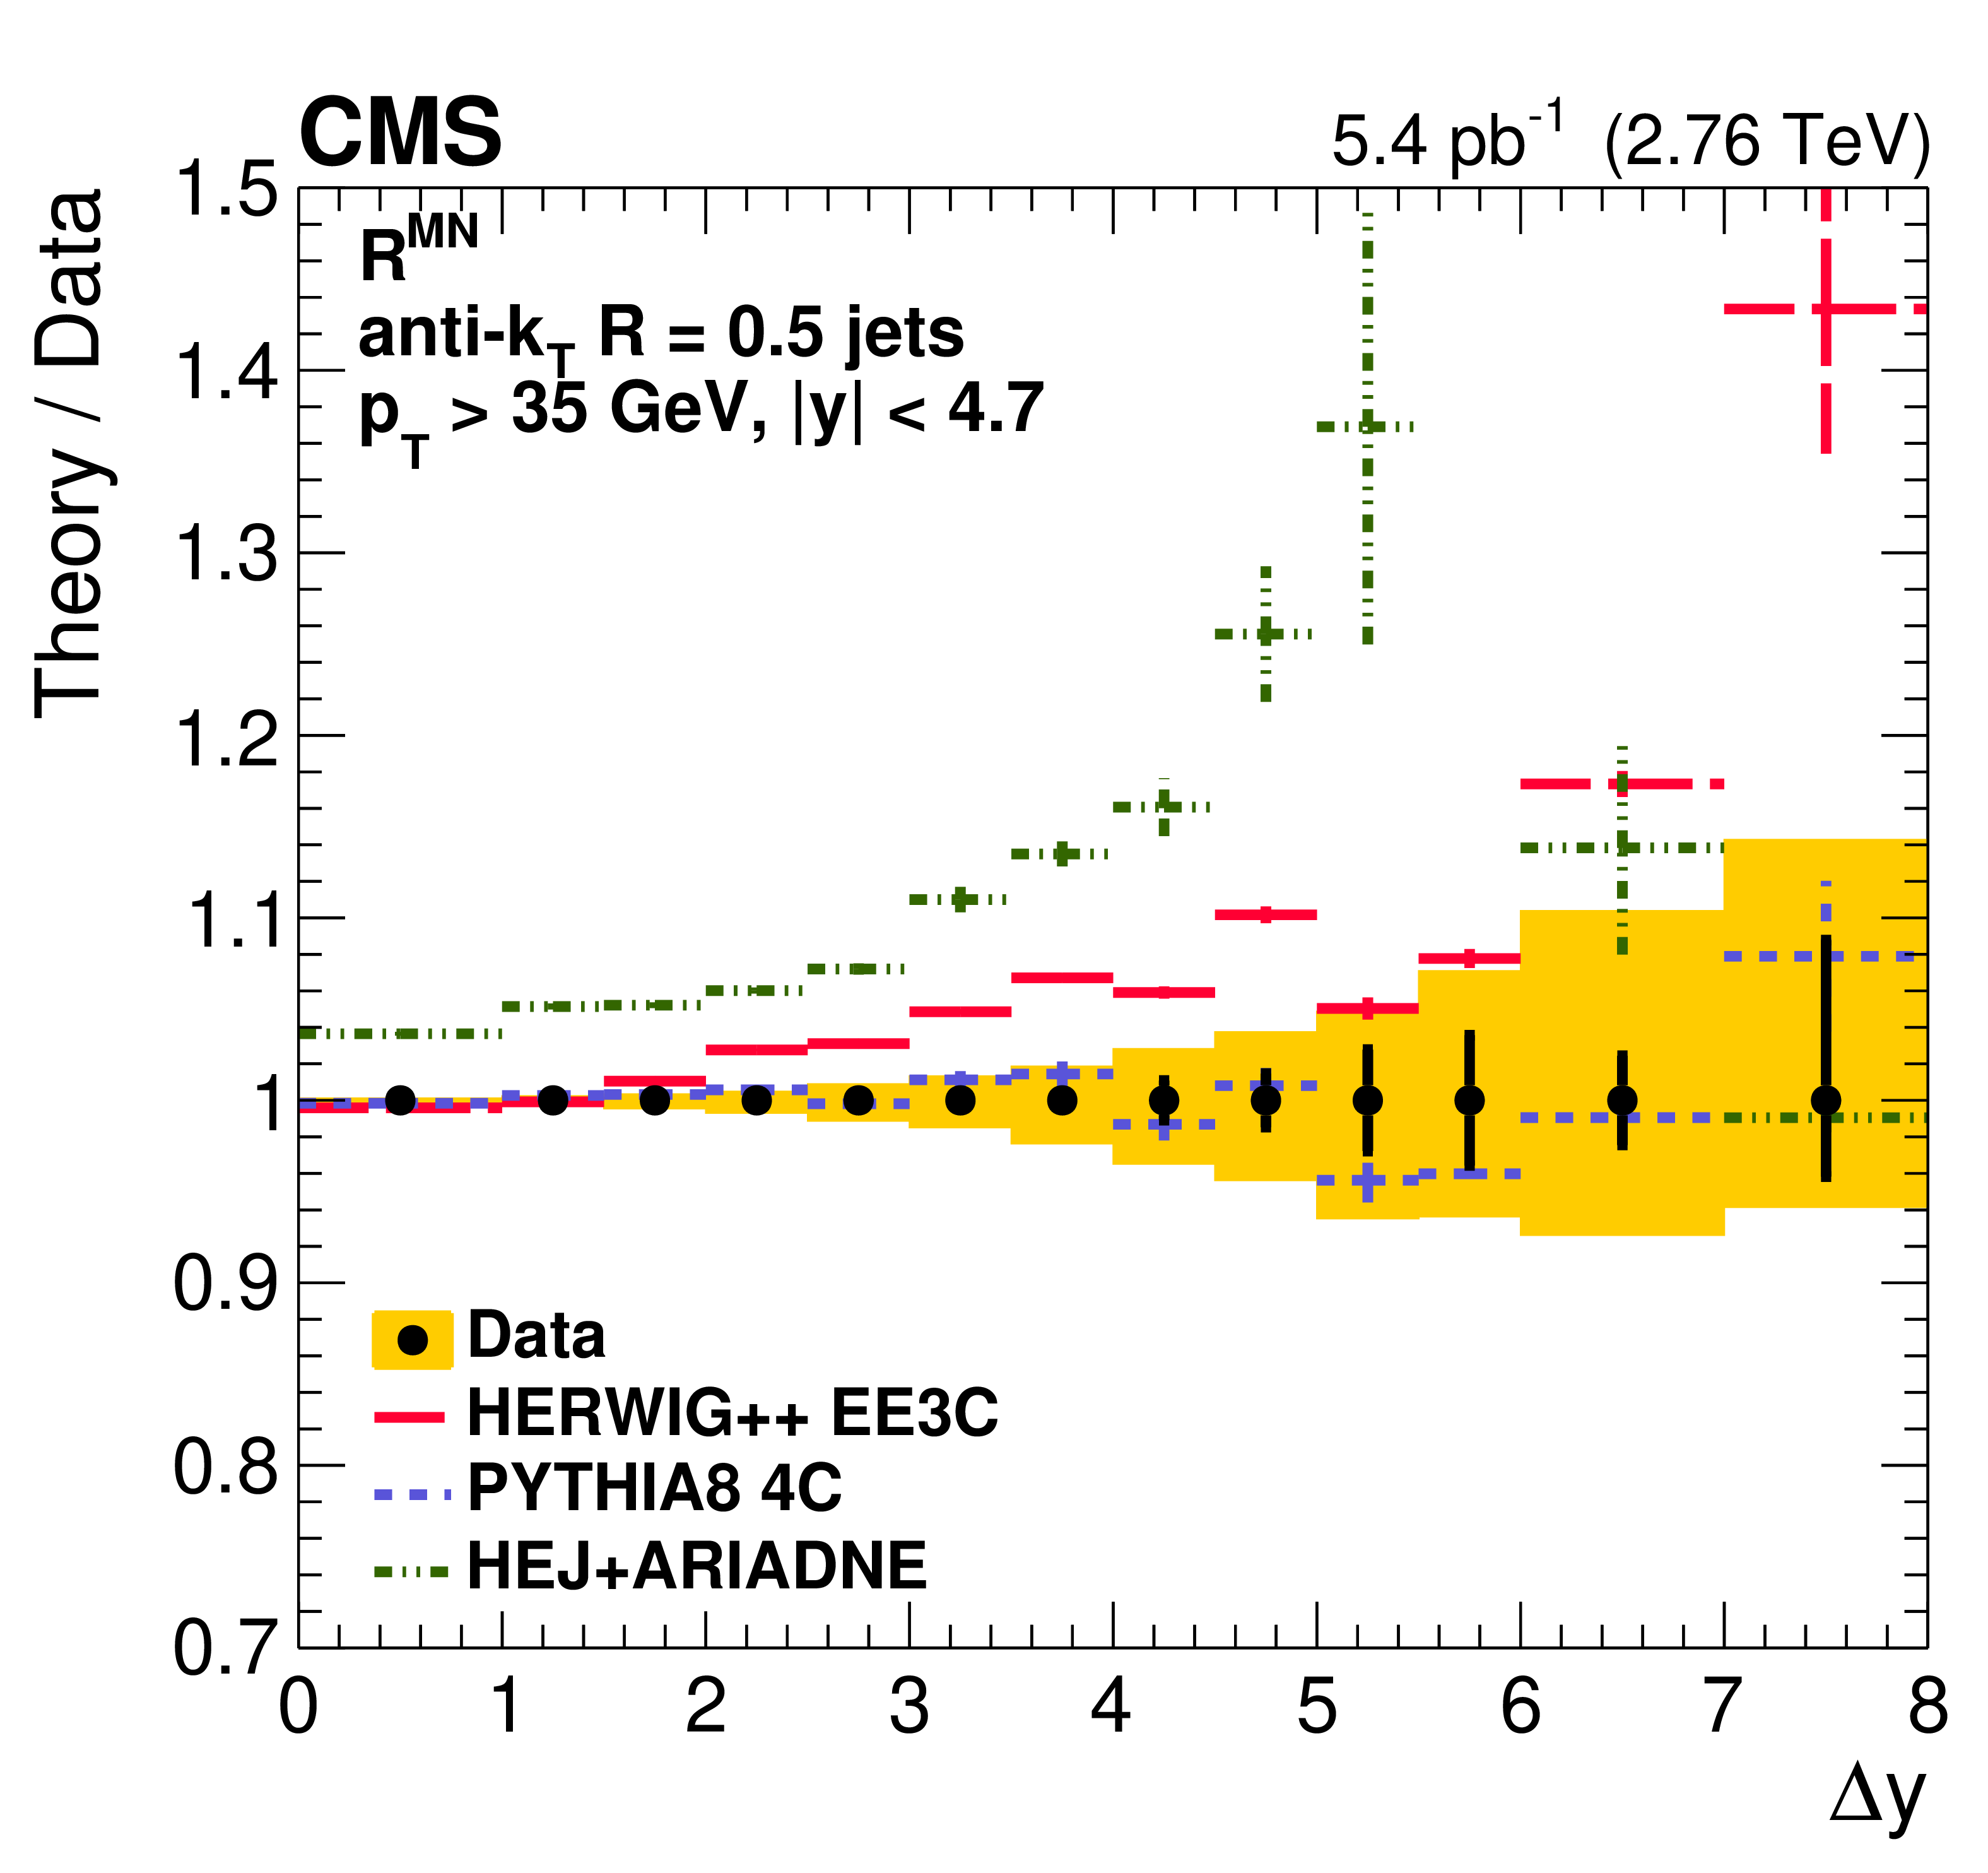
Figure 6-b:
Ratio ${R^{\mathrm {MN}}}$ of the cross sections for MN to "exclusive" dijet production, compared with different MC models. The plot presents the ratio of theory to data. The systematic uncertainties are indicated by the shaded bands and the statistical uncertainties by the vertical bars. |

png pdf |
Figure 6-c:
Ratio ${R^{\mathrm {MN}}}$ of the cross sections for MN to "exclusive" dijet production, compared with different MC models. The systematic uncertainties are indicated by the shaded bands and the statistical uncertainties by the vertical bars. |
png pdf |
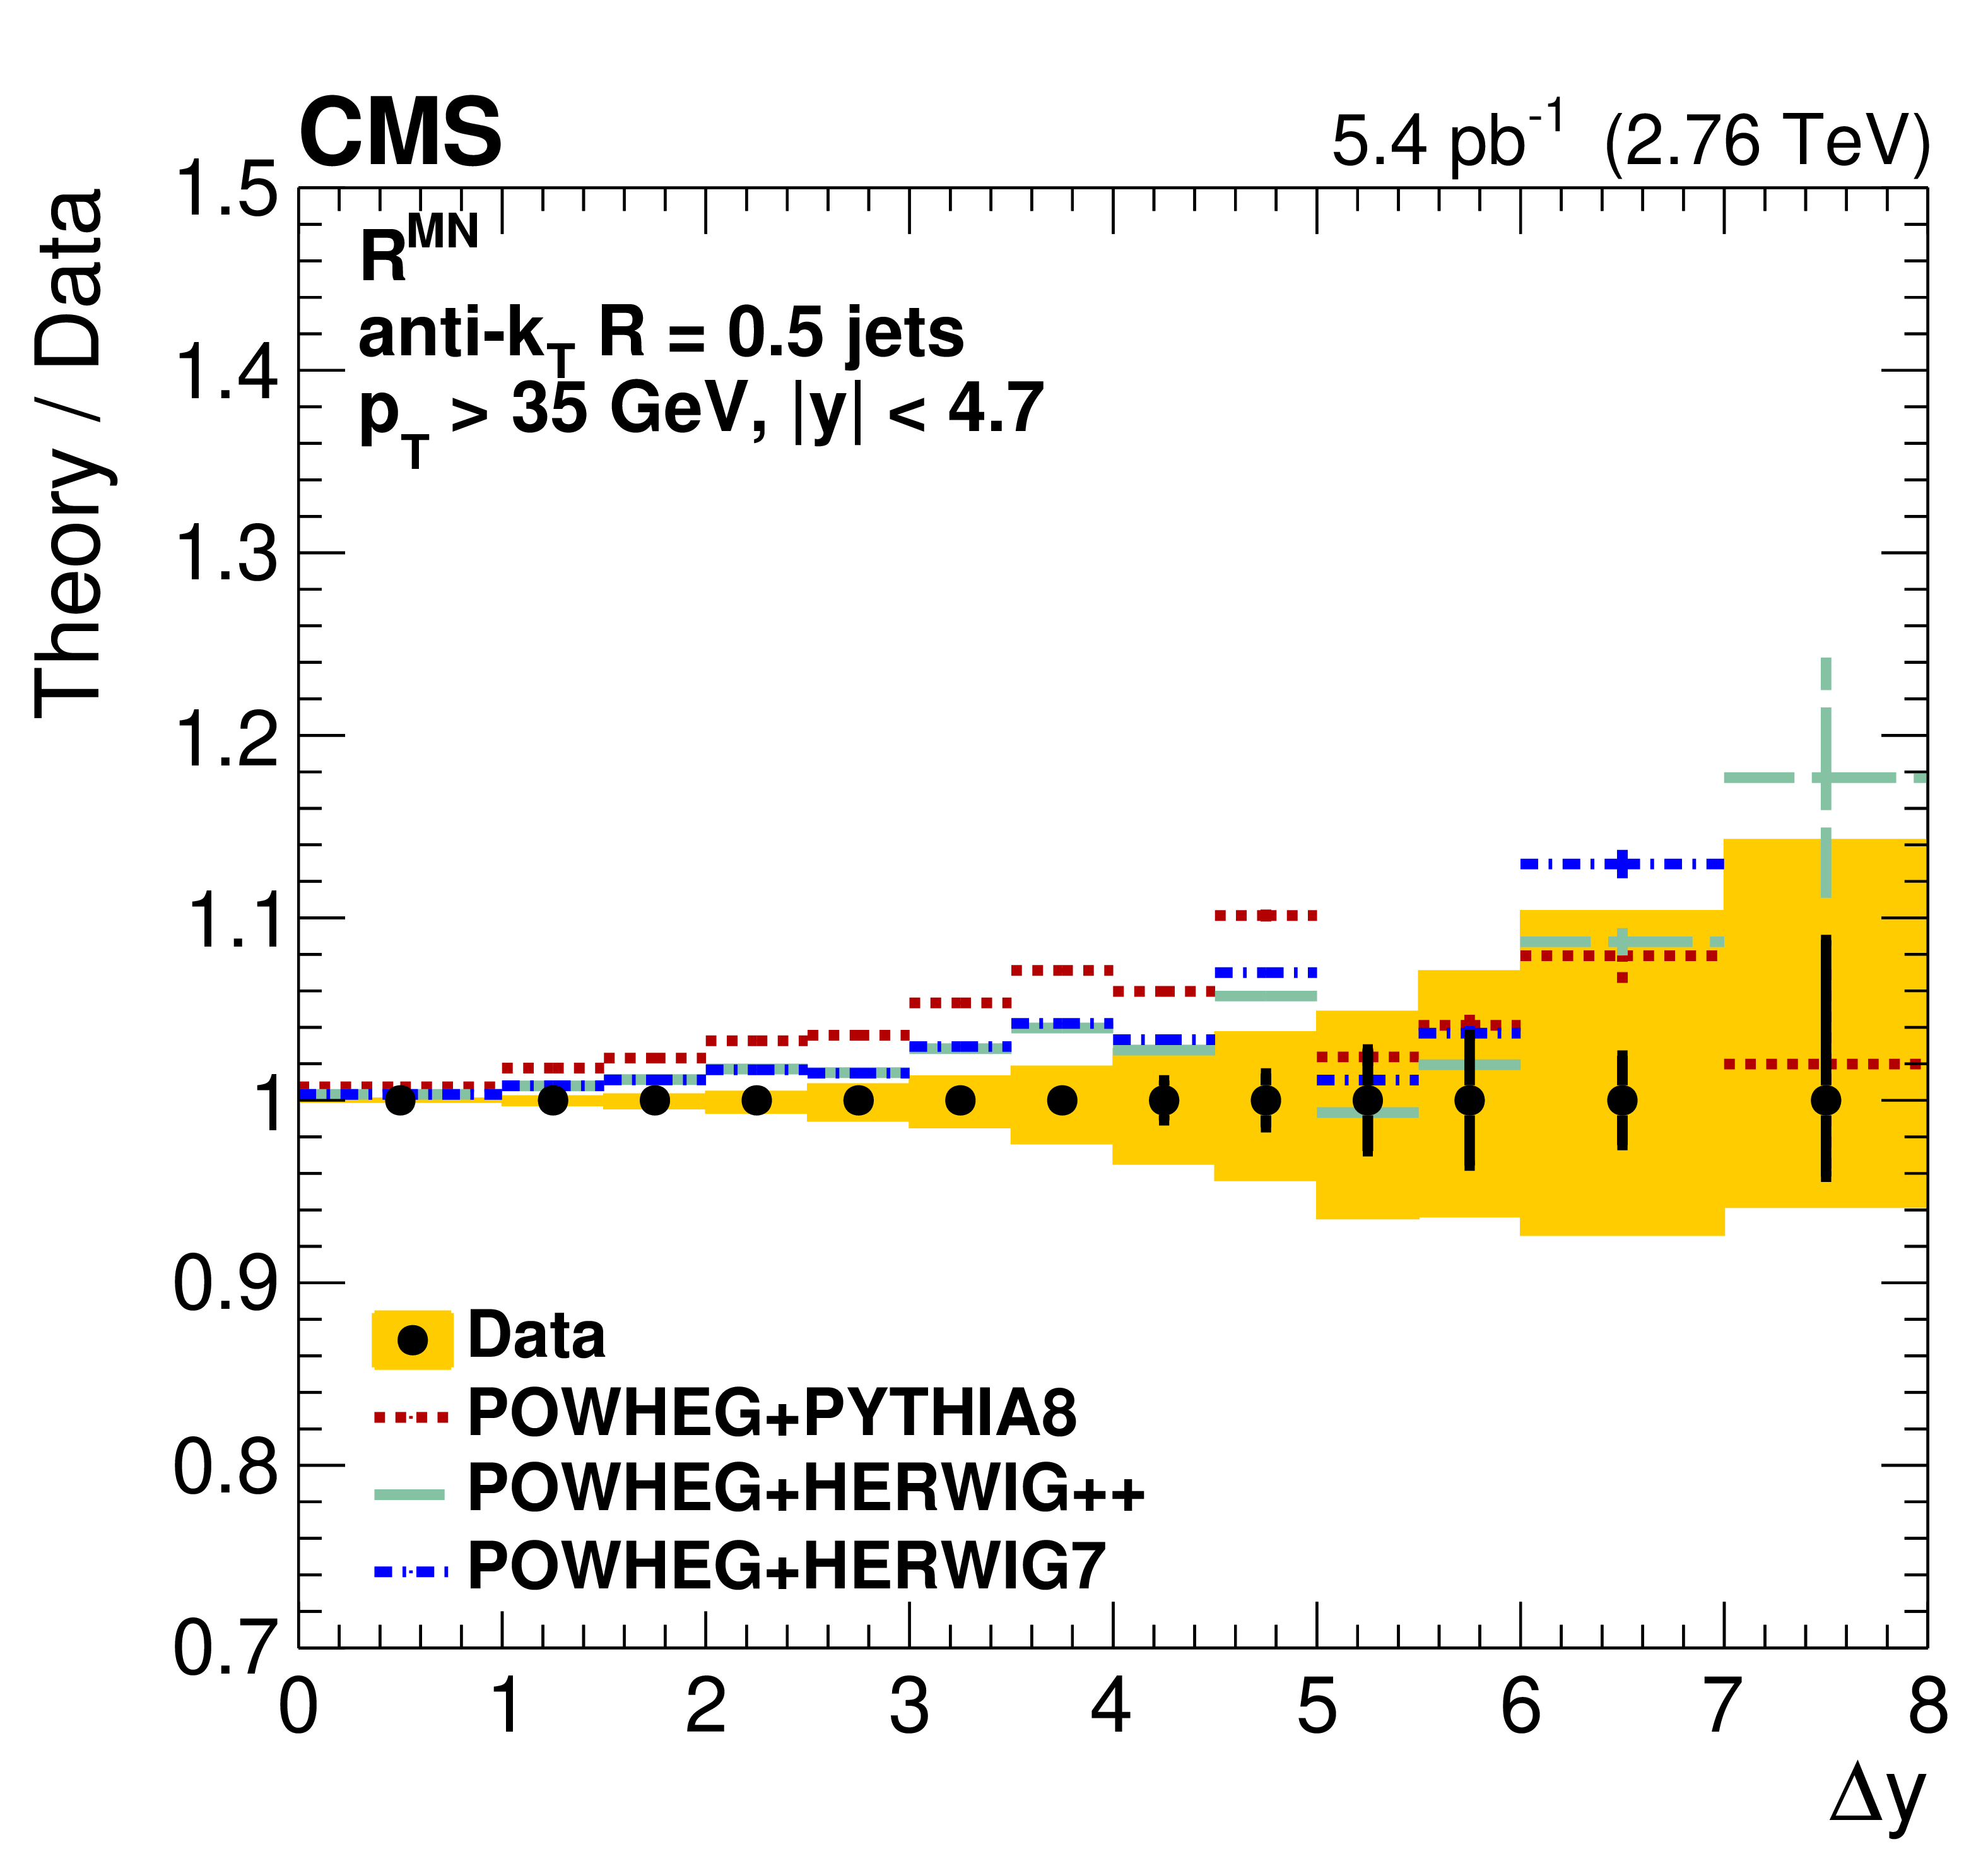
Figure 6-d:
Ratio ${R^{\mathrm {MN}}}$ of the cross sections for MN to "exclusive" dijet production, compared with different MC models. The plot presents the ratio of theory to data. The systematic uncertainties are indicated by the shaded bands and the statistical uncertainties by the vertical bars. |
png pdf |
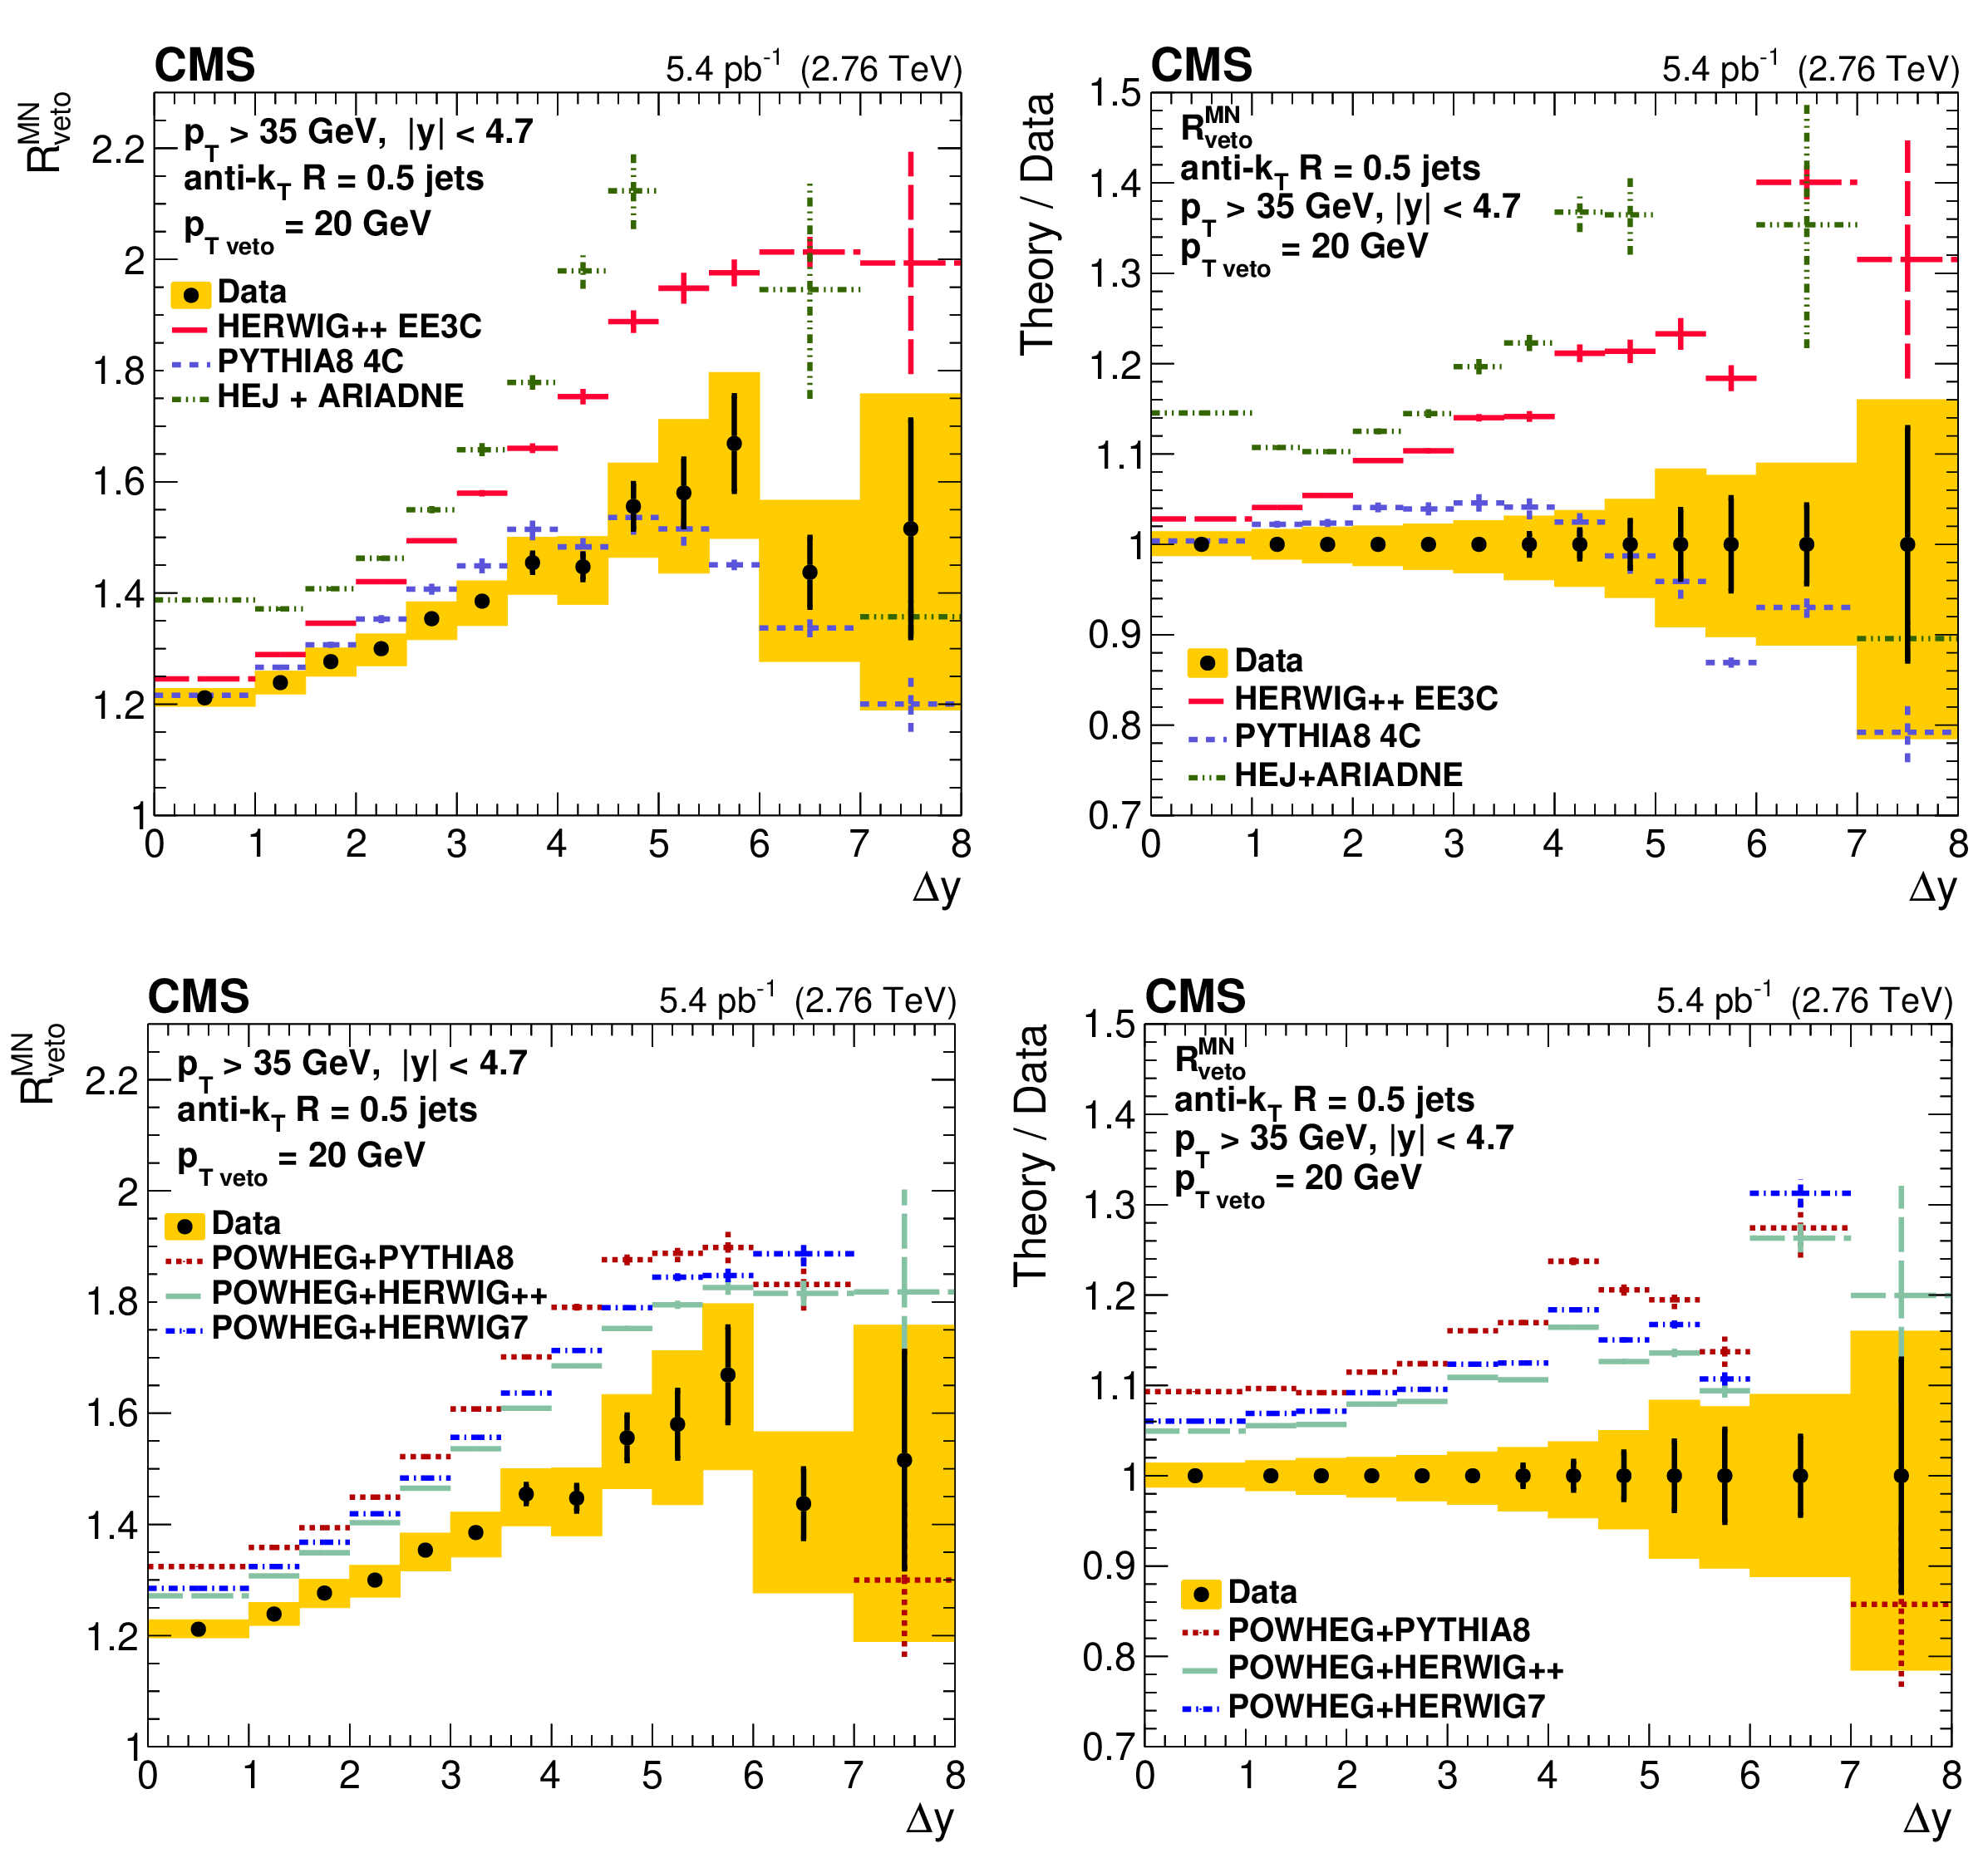
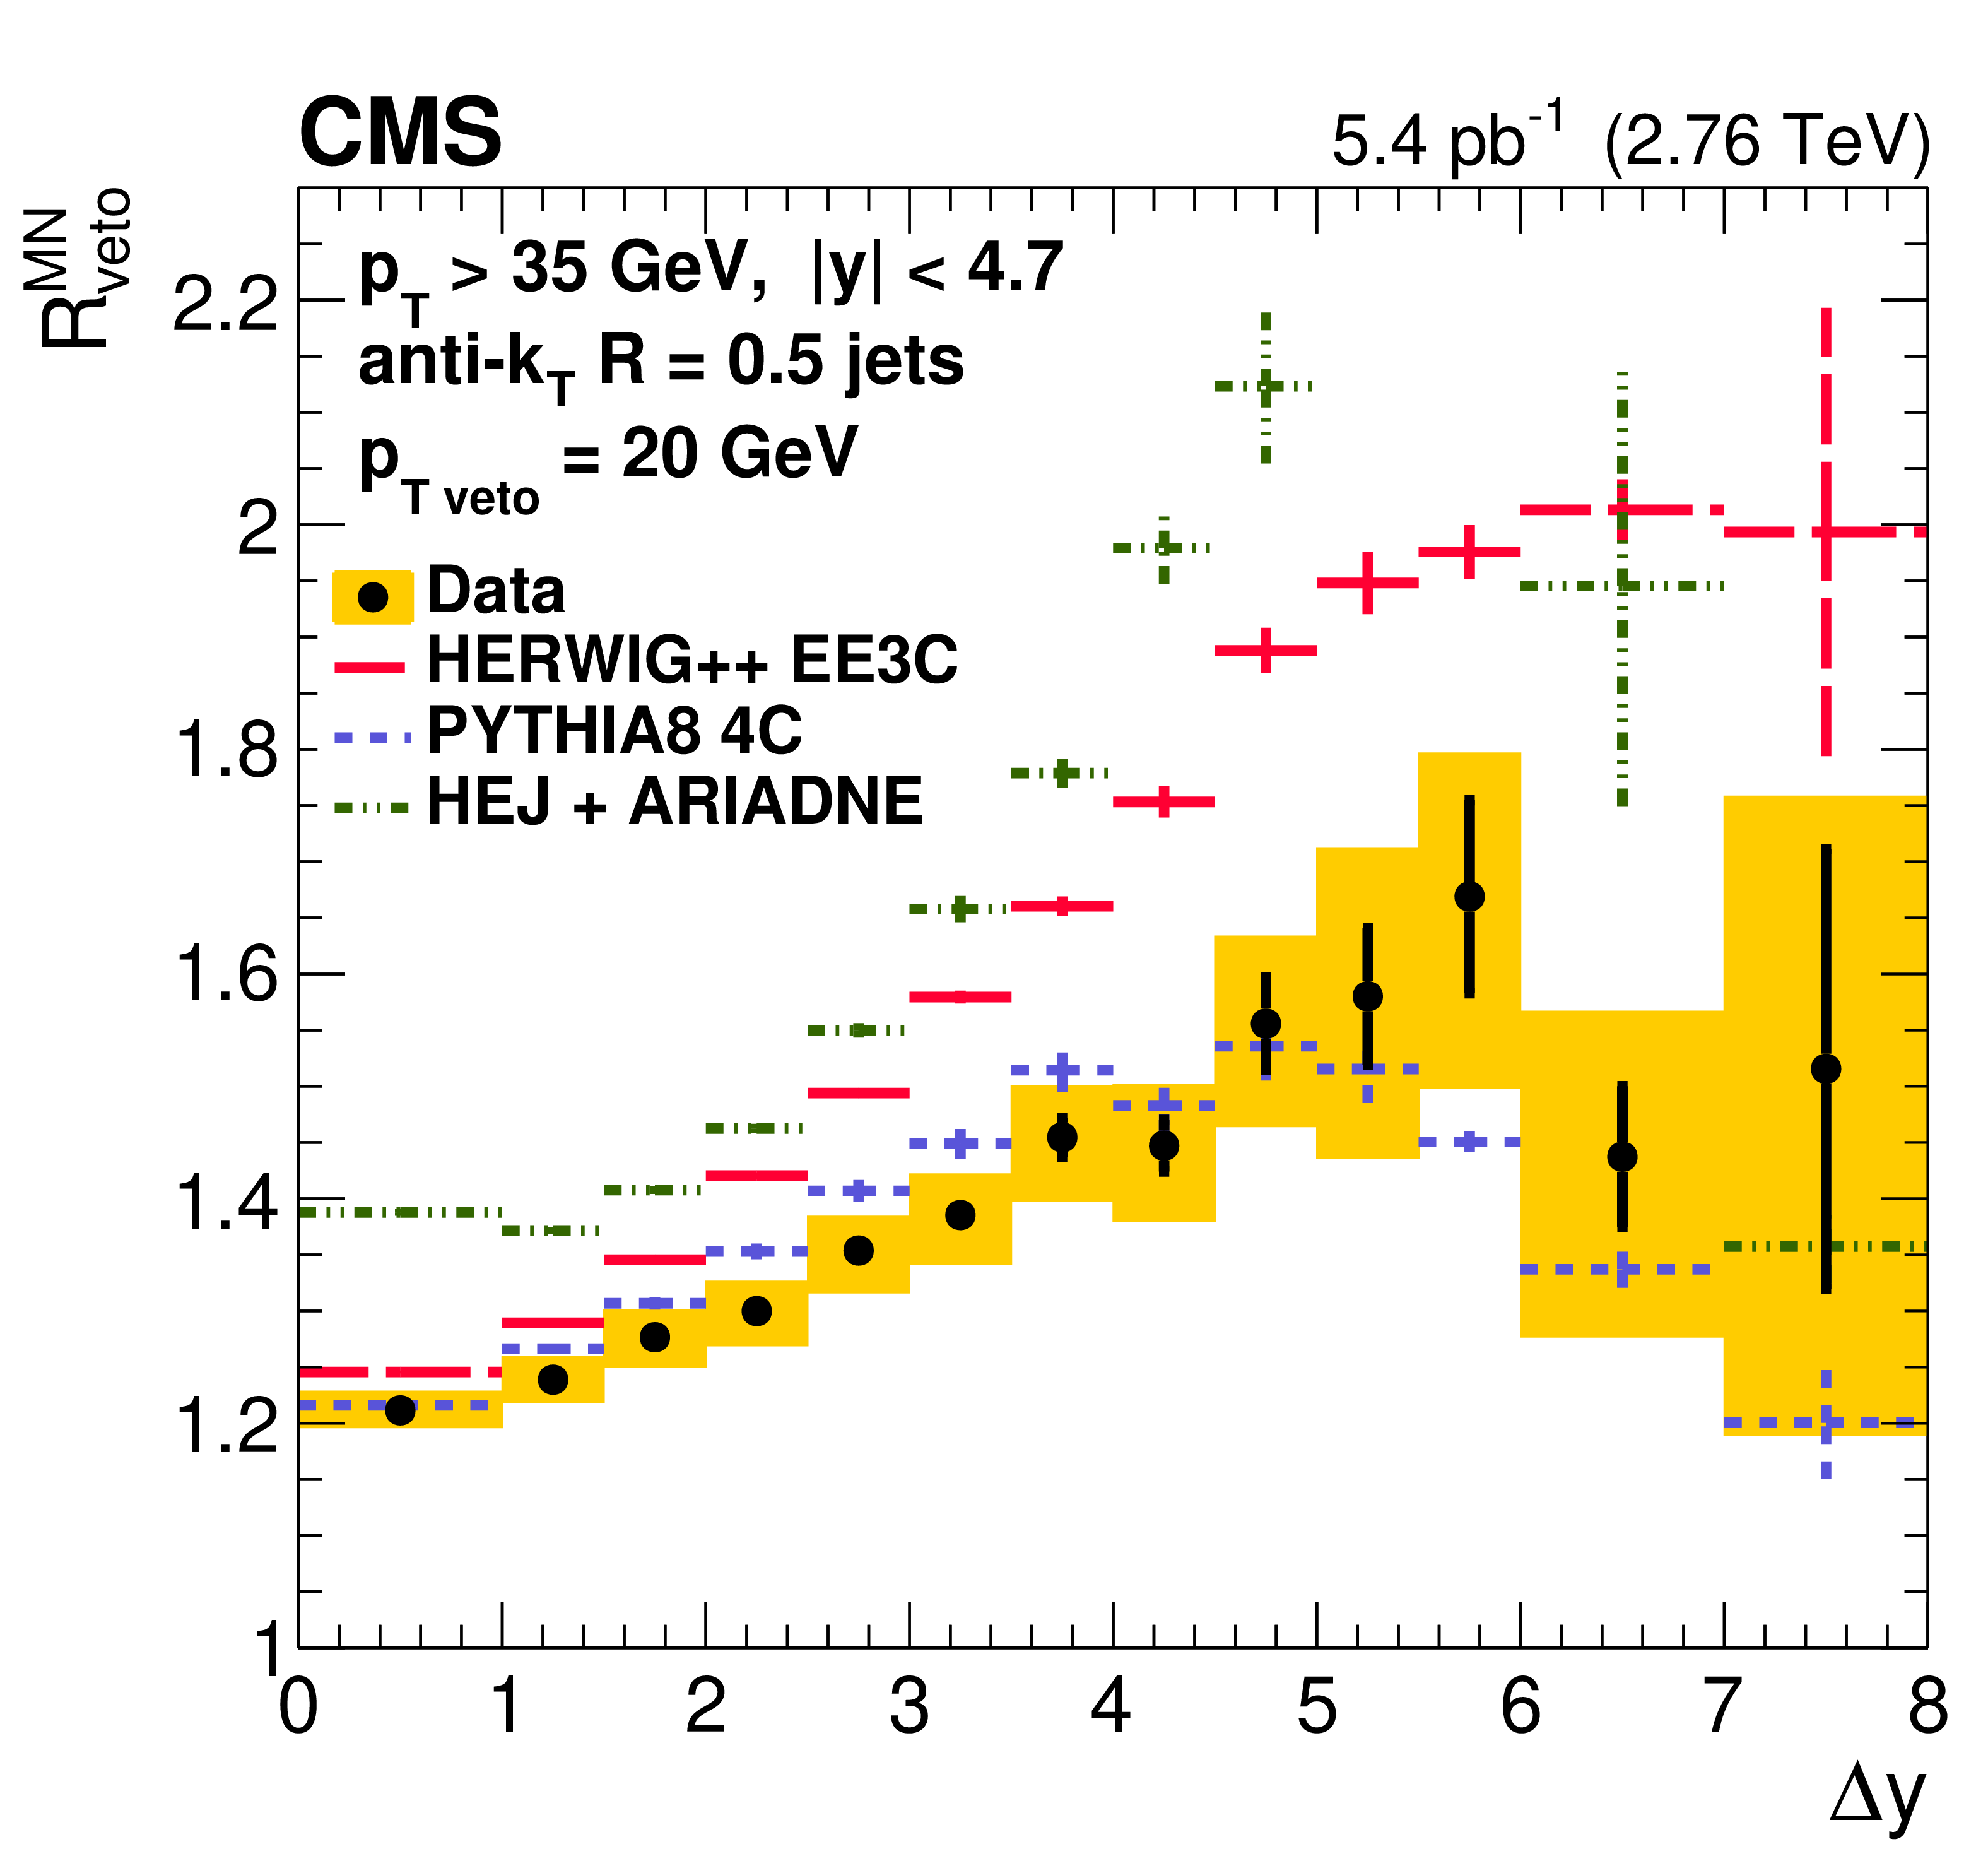
Figure 7:
Ratio ${R^{\mathrm {MN}}_{\text {veto}}}$ of the cross sections for MN to "exclusive" with veto dijet production. The upper and lower rows present the comparison with different MC models. The plots on the left present the ratio ${R^{\mathrm {MN}}_{\text {veto}}}$ and those on the right the ratio of theory to data. The systematic uncertainties are indicated by the shaded bands and the statistical uncertainties by the vertical bars. |
png pdf |
Figure 7-a:
Ratio ${R^{\mathrm {MN}}_{\text {veto}}}$ of the cross sections for MN to "exclusive" with veto dijet production, compared with different MC models. The systematic uncertainties are indicated by the shaded bands and the statistical uncertainties by the vertical bars. |
png pdf |
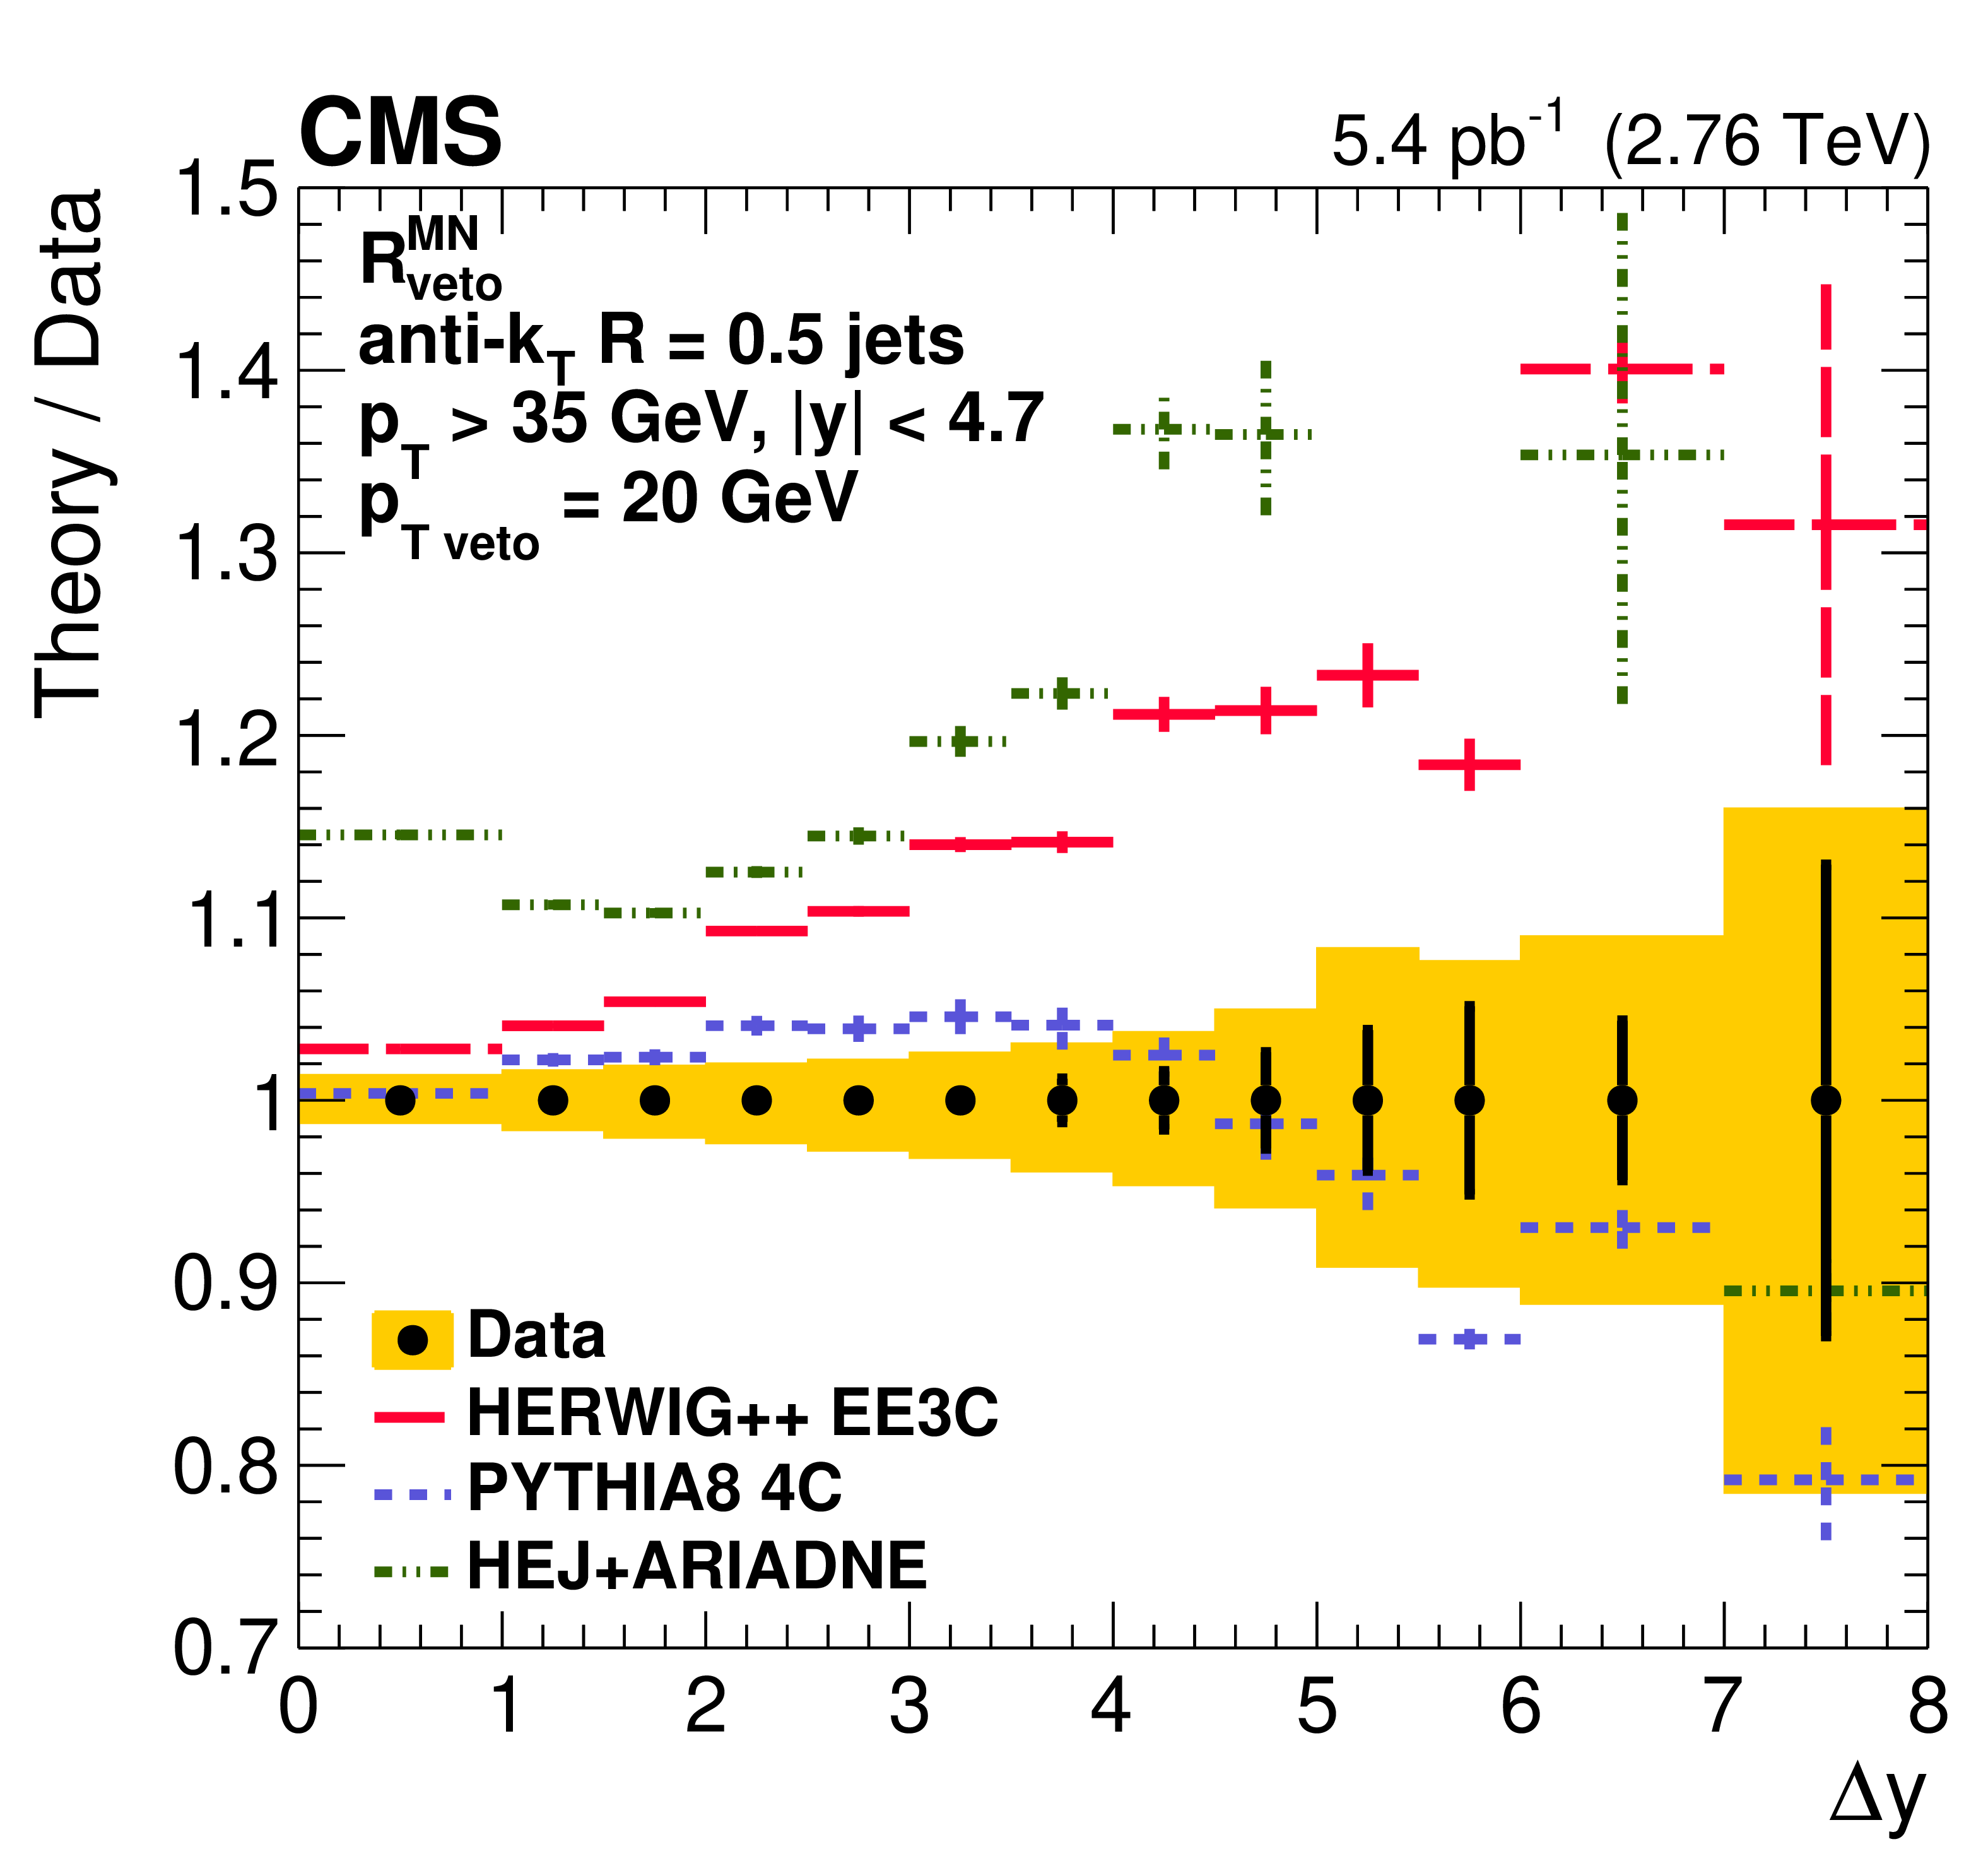
Figure 7-b:
Ratio ${R^{\mathrm {MN}}_{\text {veto}}}$ of the cross sections for MN to "exclusive" with veto dijet production, compared with different MC models. The plot presents the ratio of theory to data. The systematic uncertainties are indicated by the shaded bands and the statistical uncertainties by the vertical bars. |

png pdf |
Figure 7-c:
Ratio ${R^{\mathrm {MN}}_{\text {veto}}}$ of the cross sections for MN to "exclusive" with veto dijet production, compared with different MC models. The systematic uncertainties are indicated by the shaded bands and the statistical uncertainties by the vertical bars. |
png pdf |
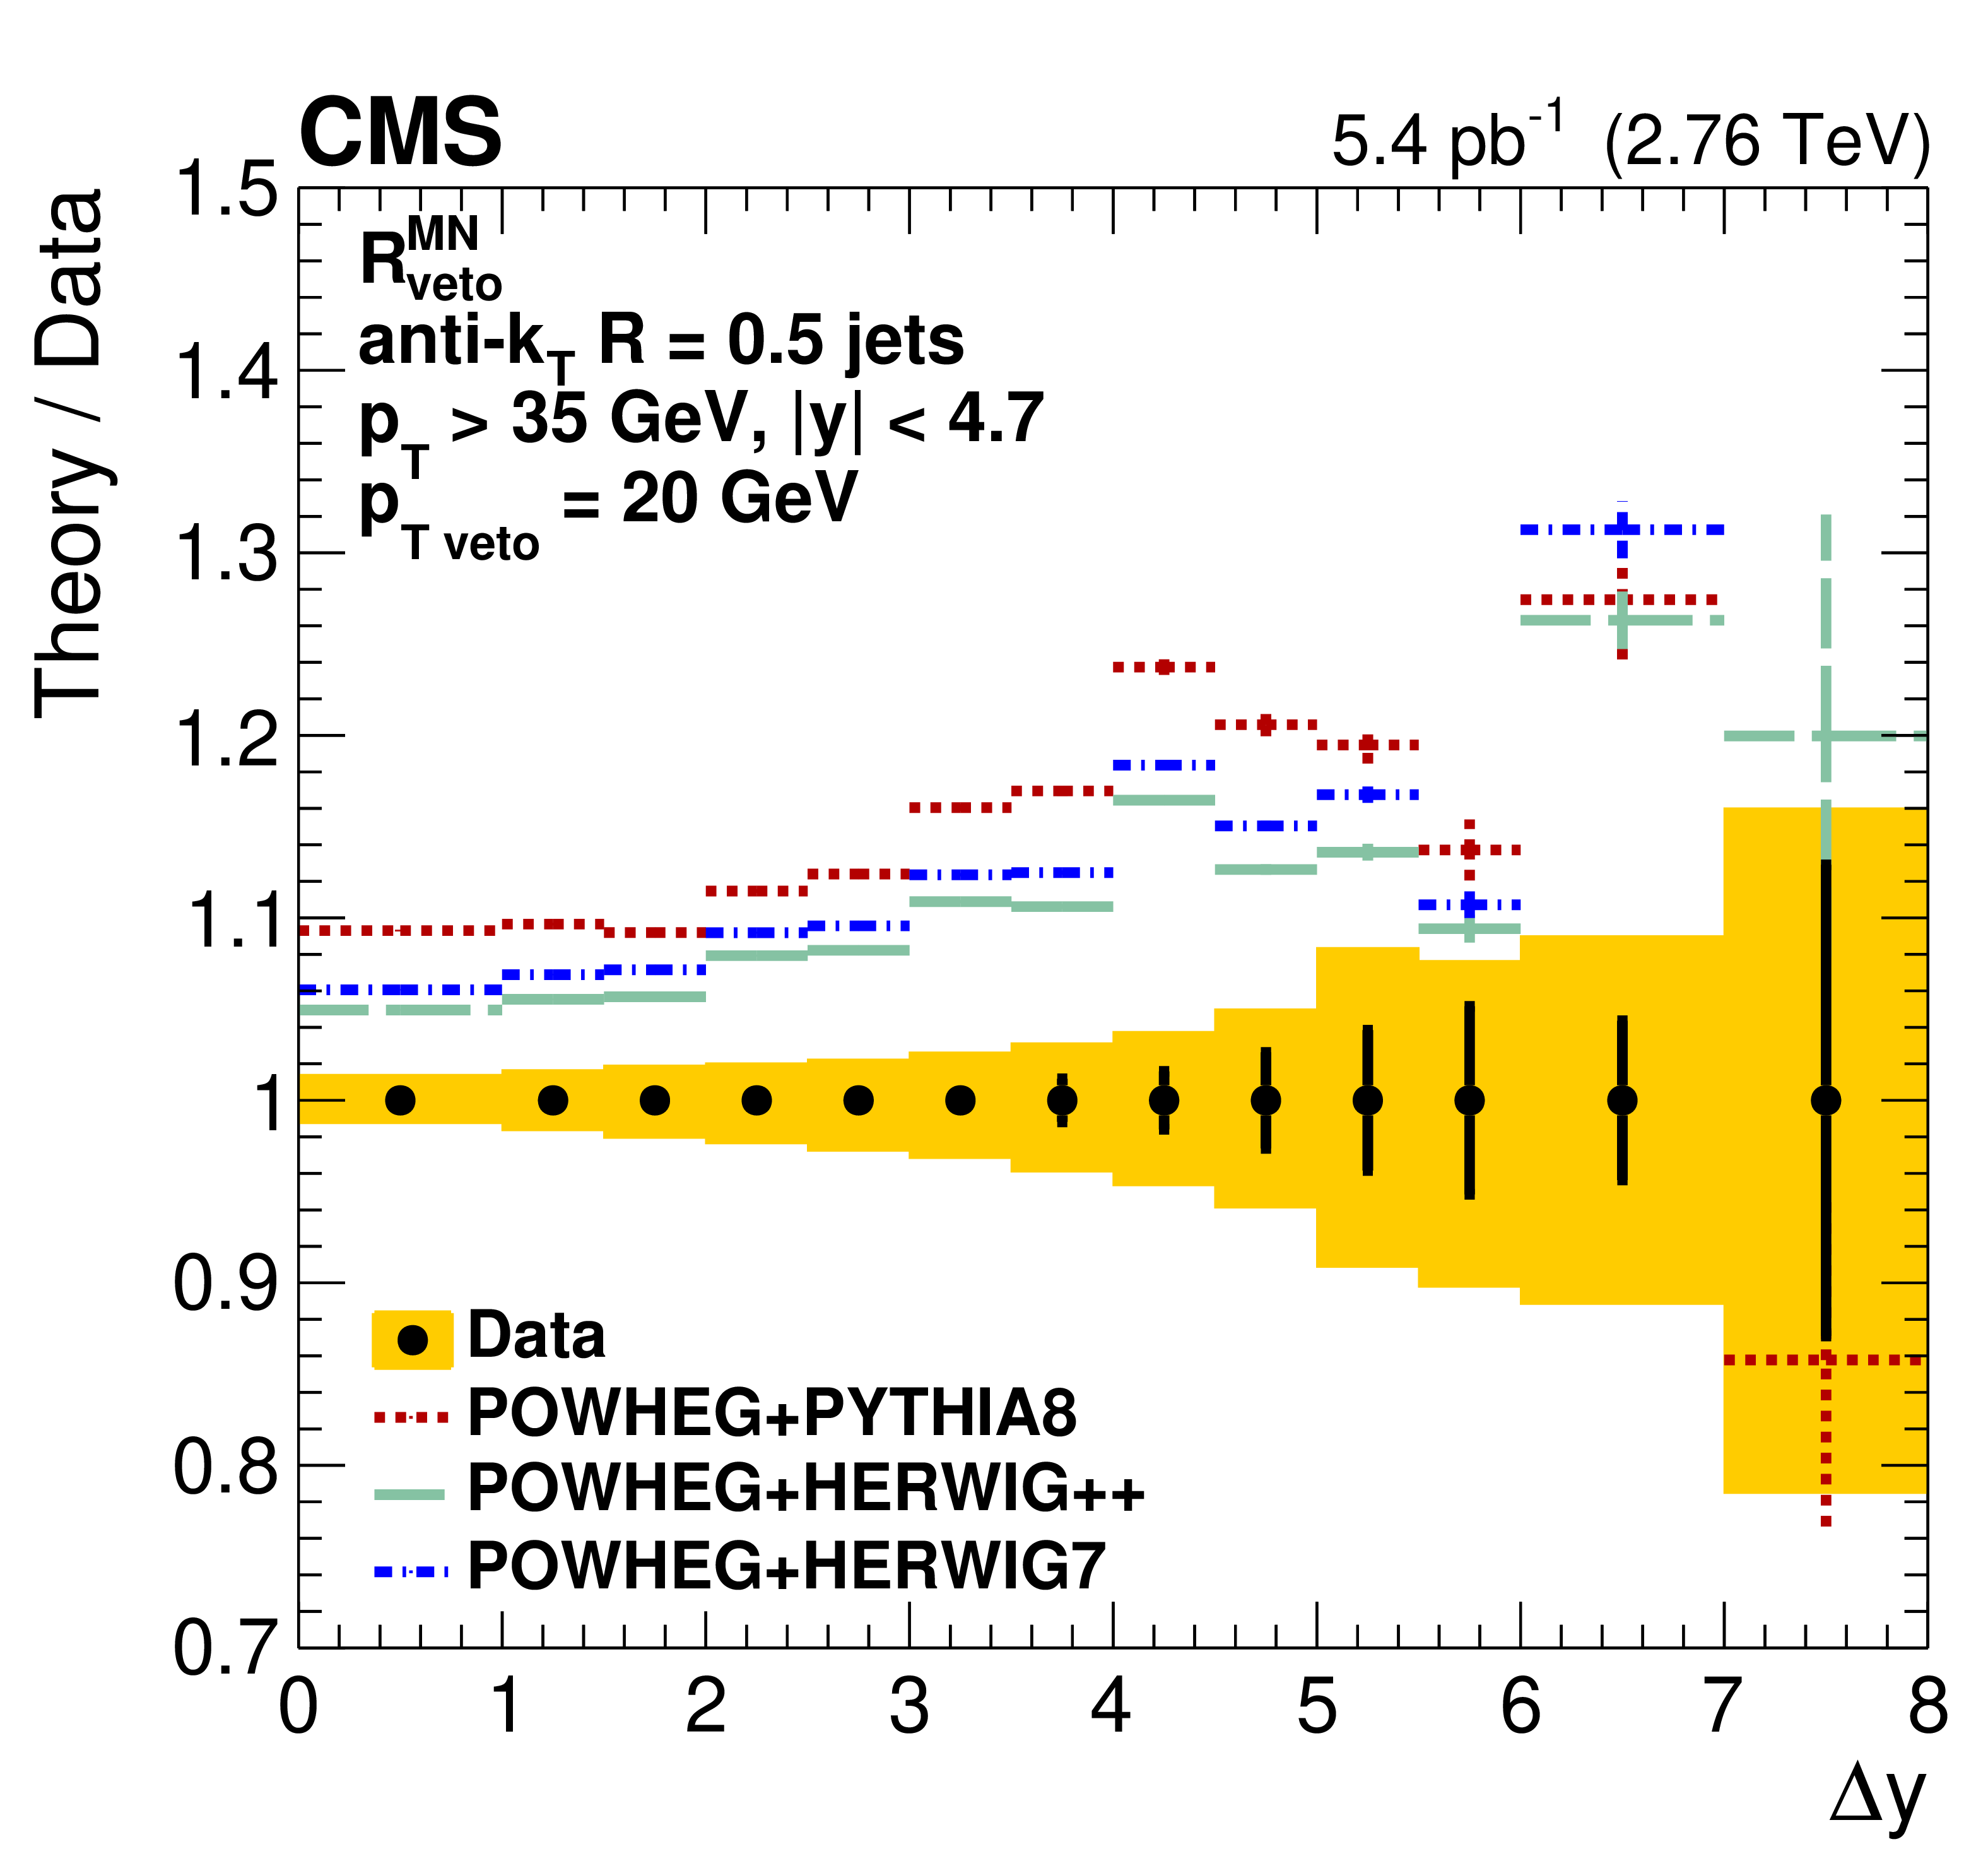
Figure 7-d:
Ratio ${R^{\mathrm {MN}}_{\text {veto}}}$ of the cross sections for MN to "exclusive" with veto dijet production, compared with different MC models. The plot presents the ratio of theory to data. The systematic uncertainties are indicated by the shaded bands and the statistical uncertainties by the vertical bars. |
png pdf |
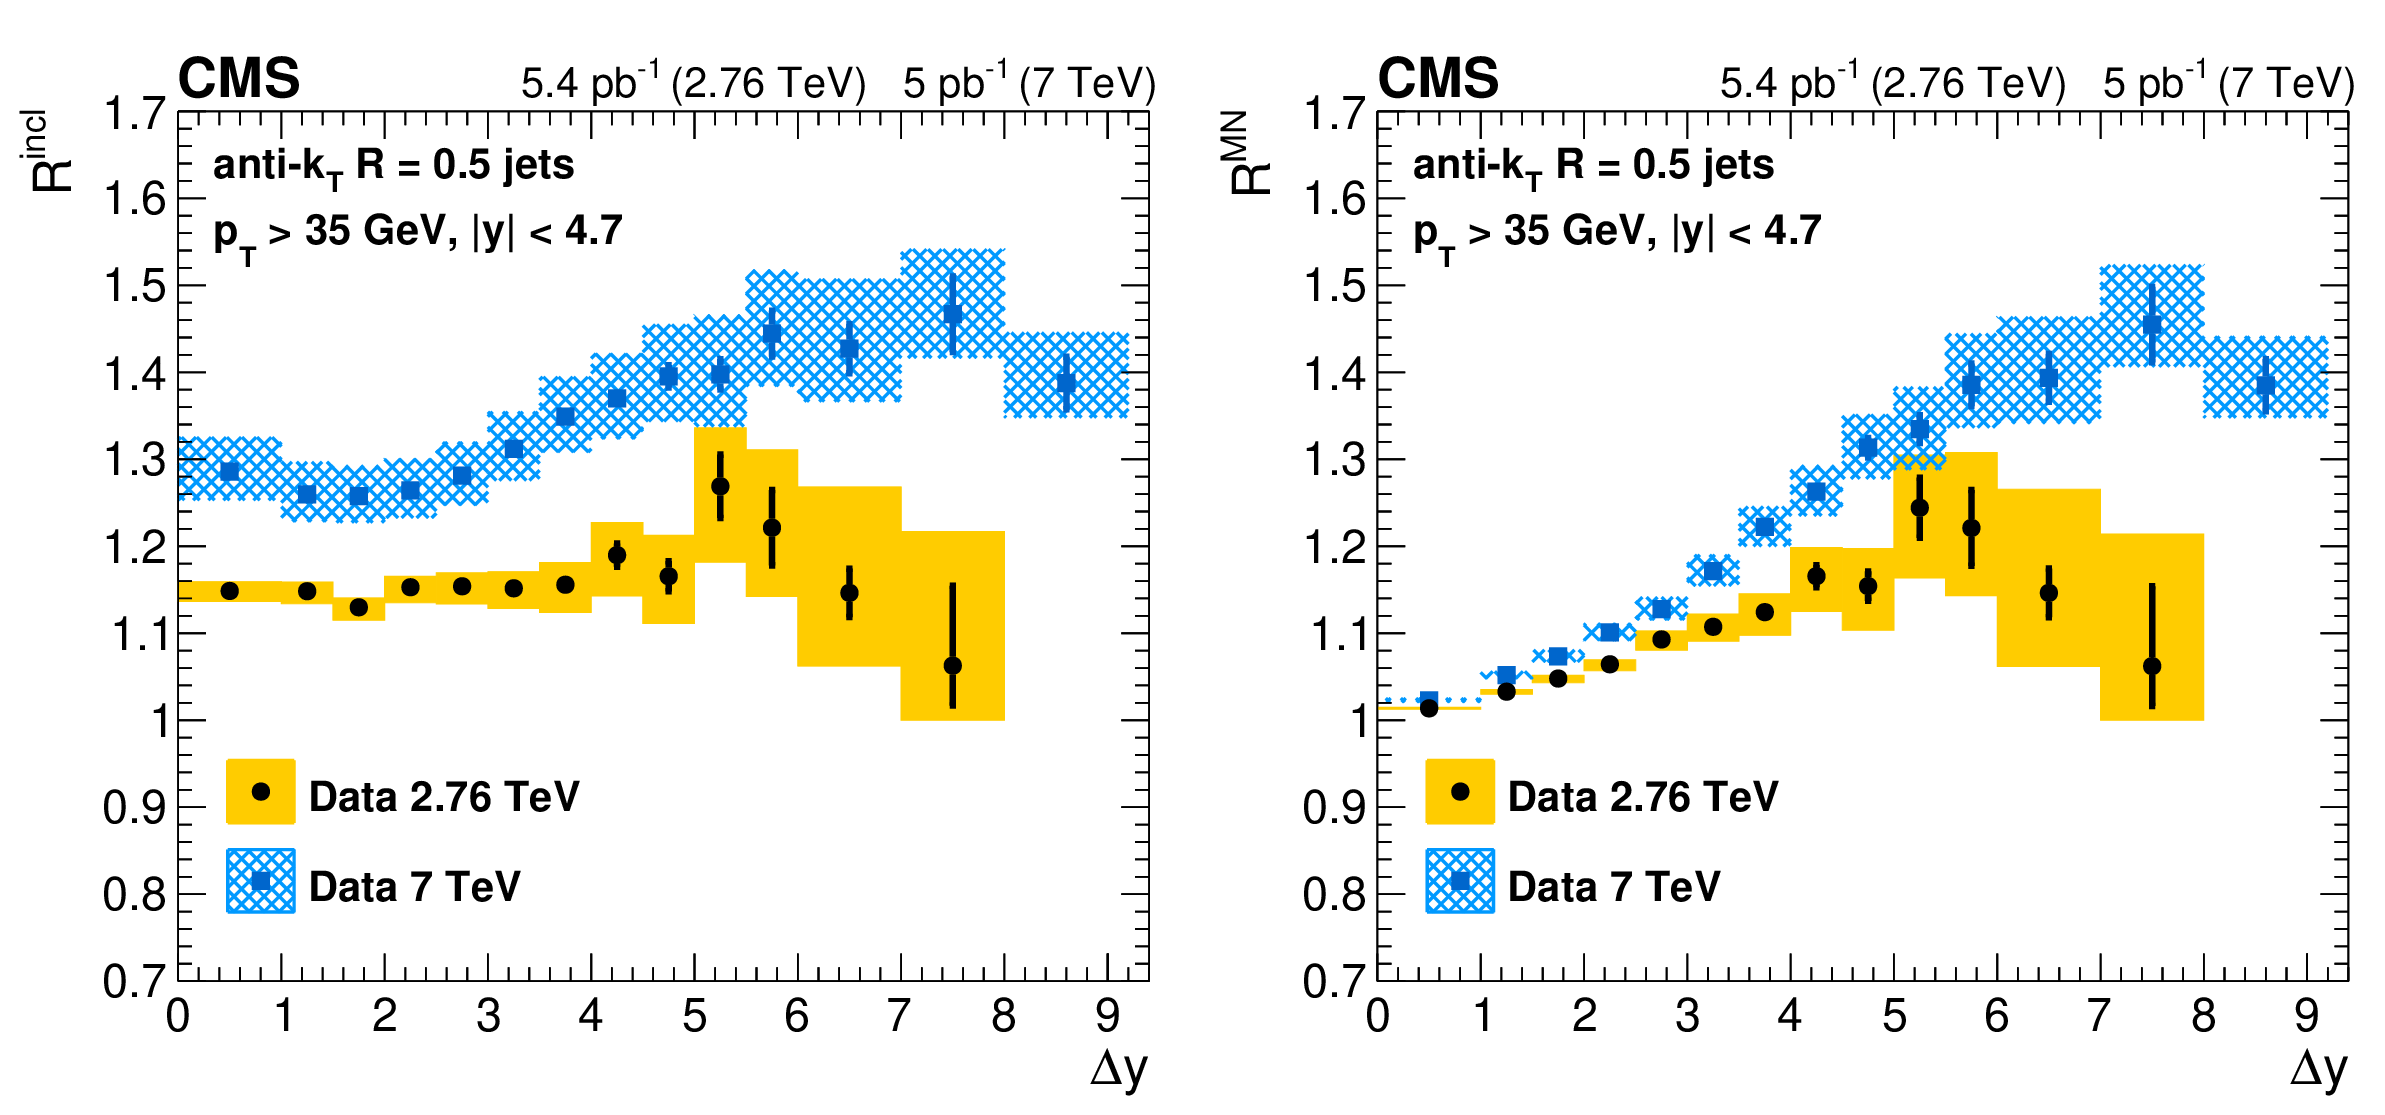
Figure 8:
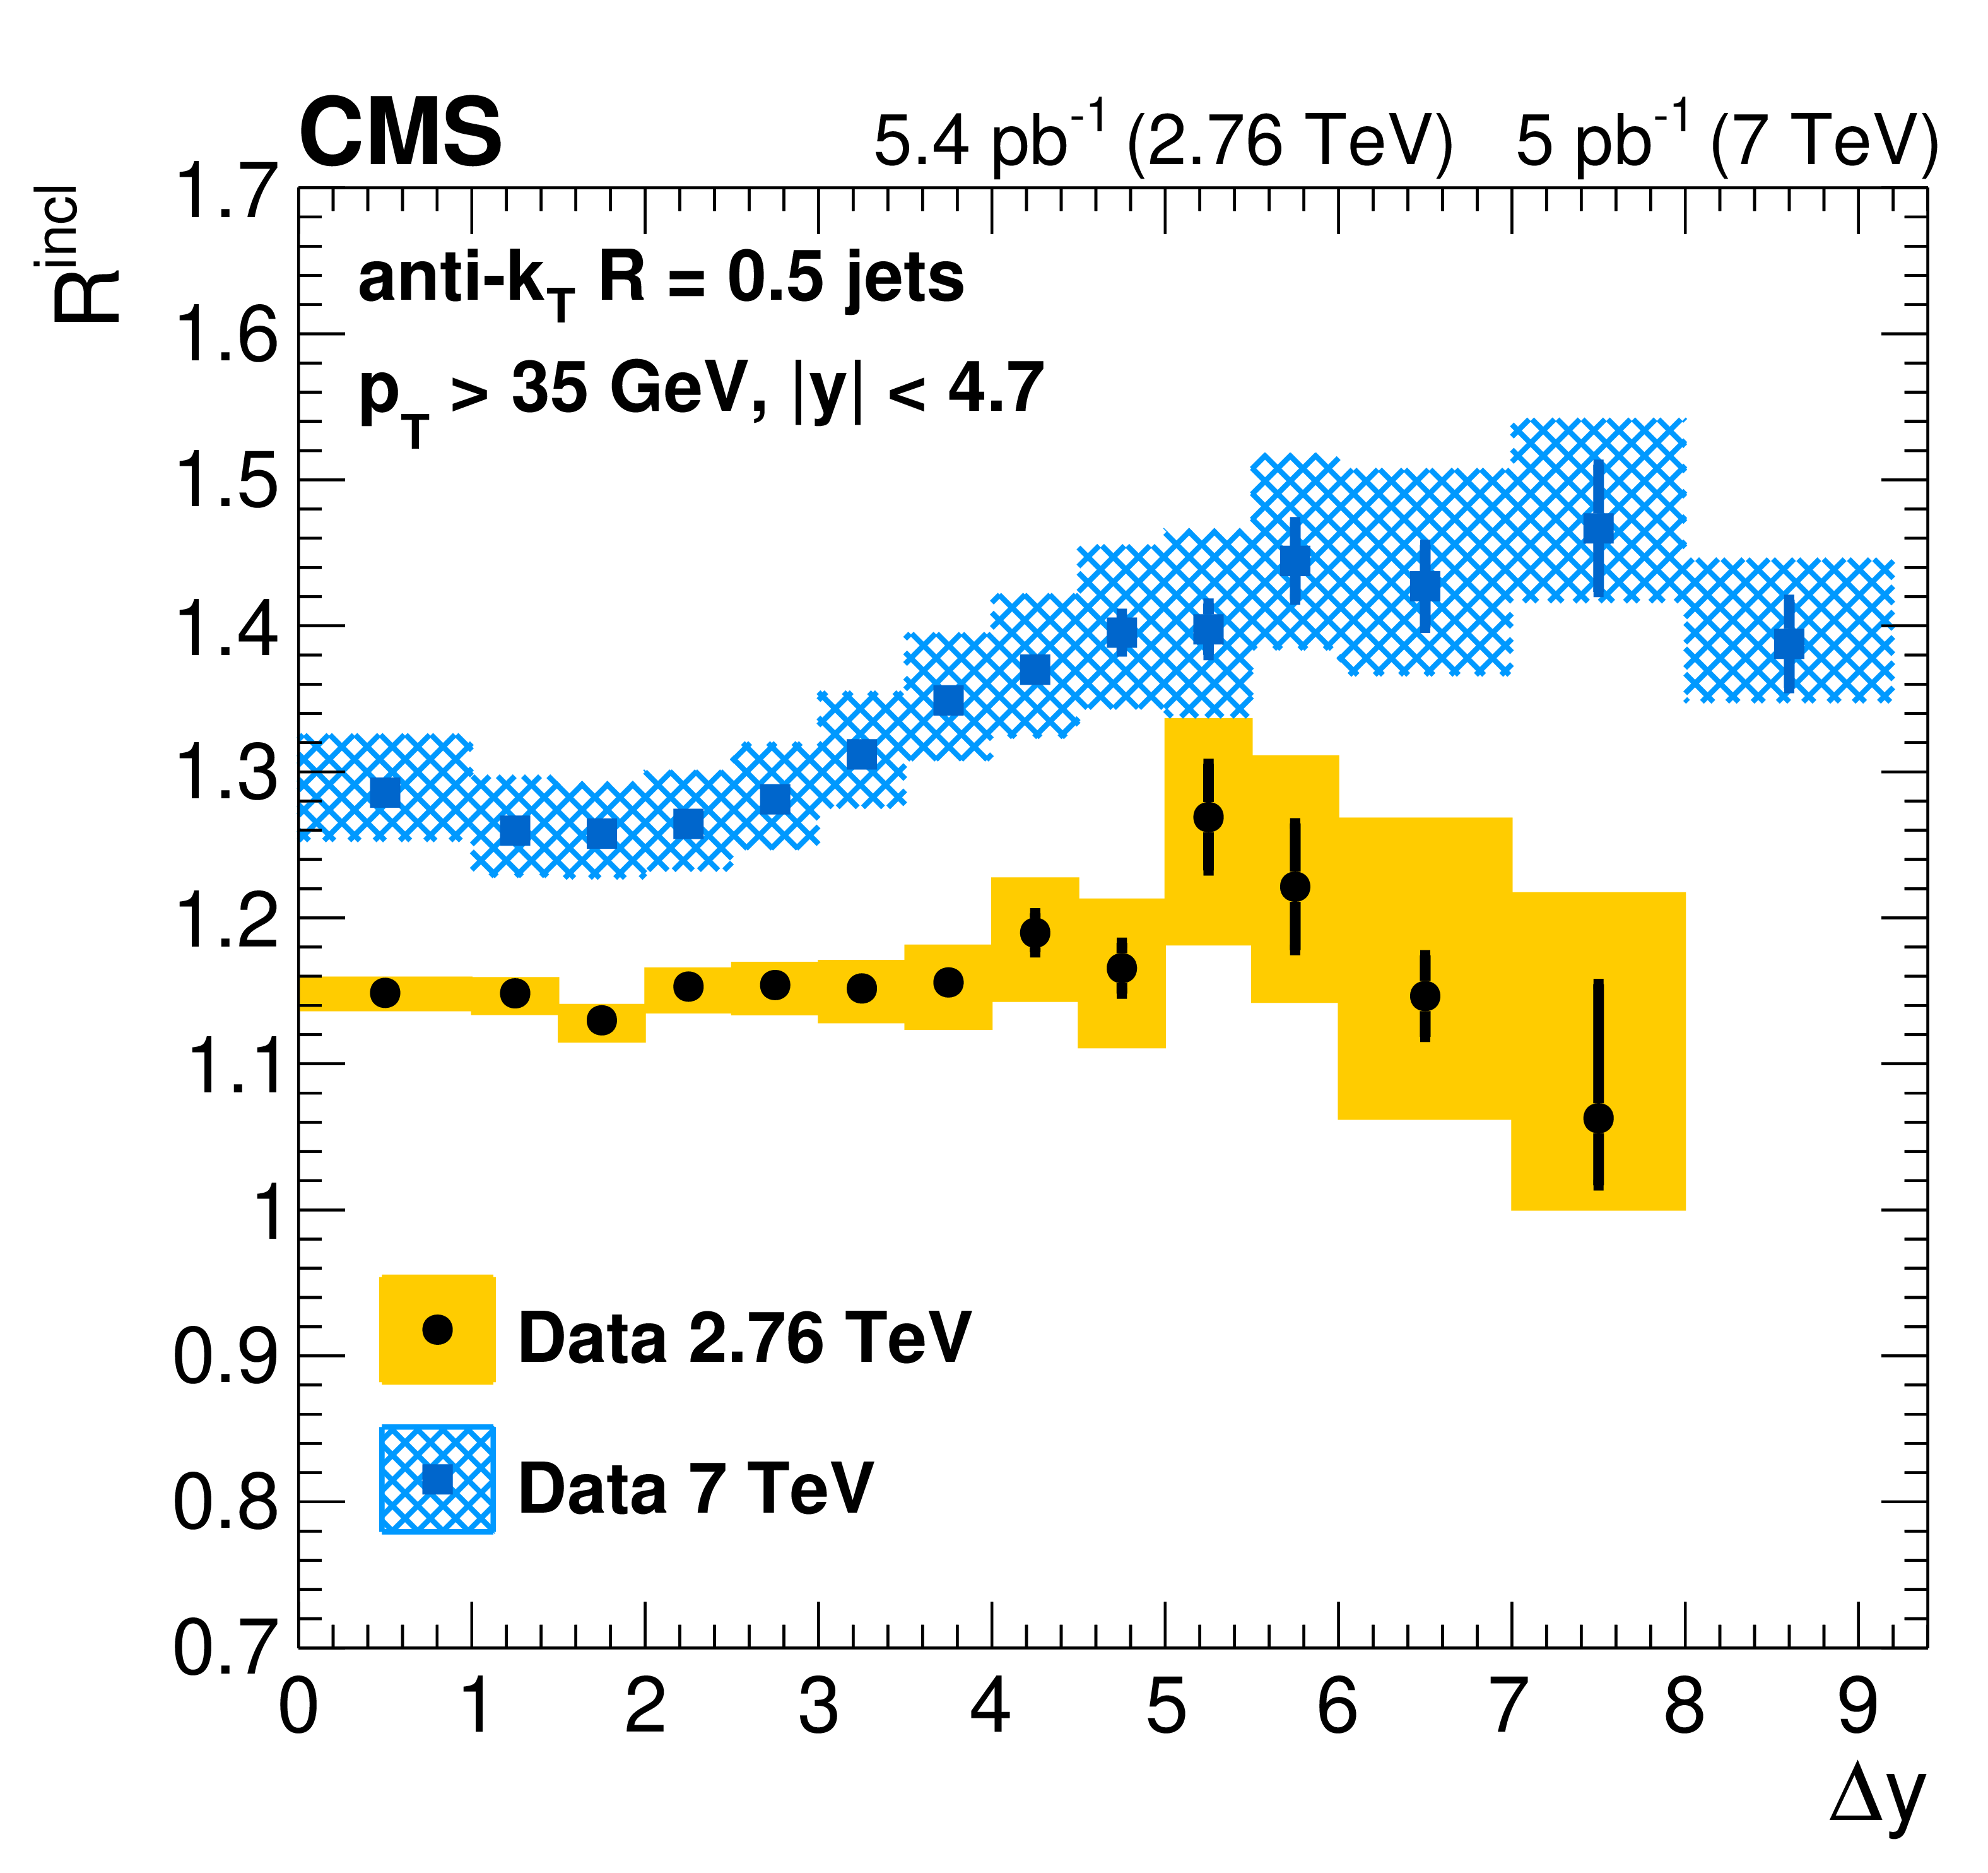
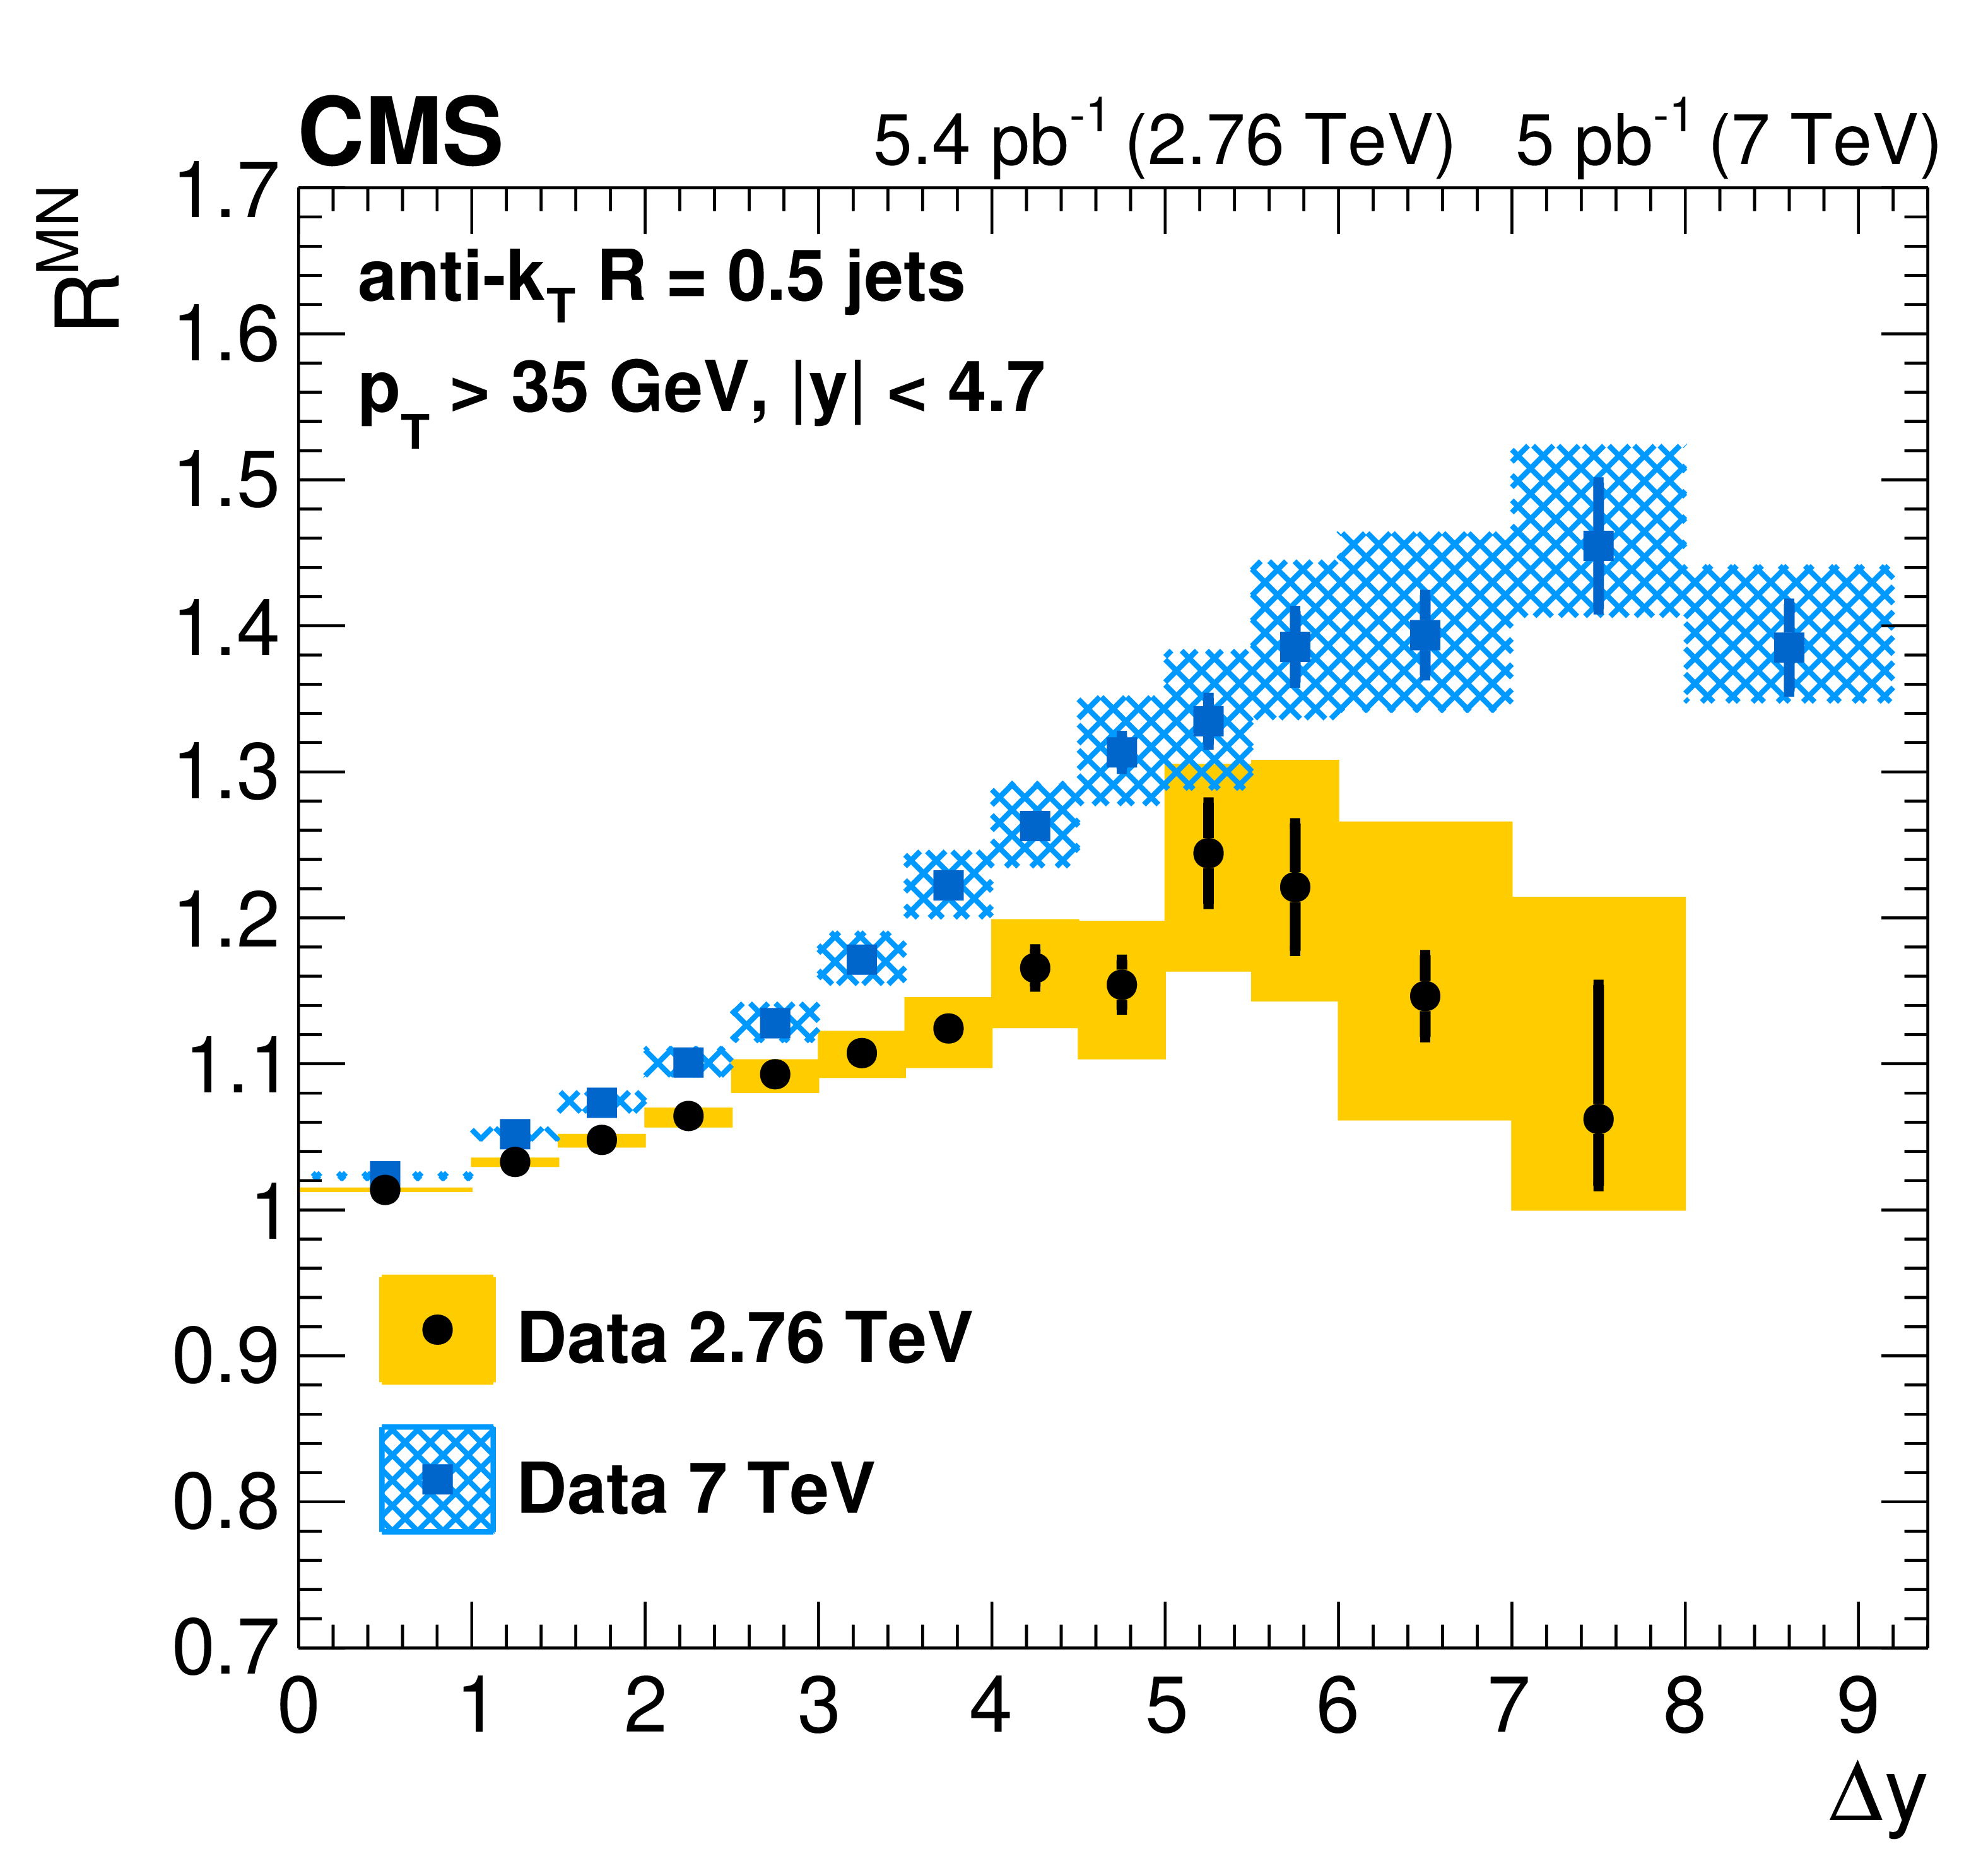
Ratios ${R^{\text {incl}}}$ (left) and ${R^{\mathrm {MN}}}$ (right) of the cross sections for inclusive (left) and MN (right) and "exclusive" dijet production, measured at 2.76 TeV and 7 TeV [21] collision energies. The systematic uncertainties are indicated by the shaded bands and the statistical uncertainties by the vertical bars. |
png pdf |
Figure 8-a:
Ratio ${R^{\text {incl}}}$ of the cross sections for inclusive and "exclusive" dijet production, measured at 2.76 TeV and 7 TeV [21] collision energies. The systematic uncertainties are indicated by the shaded bands and the statistical uncertainties by the vertical bars. |
png pdf |
Figure 8-b:
Ratio ${R^{\mathrm {MN}}}$ of the cross sections for MN and "exclusive" dijet production, measured at 2.76 TeV and 7 TeV [21] collision energies. The systematic uncertainties are indicated by the shaded bands and the statistical uncertainties by the vertical bars. |
| Tables | |
png pdf |
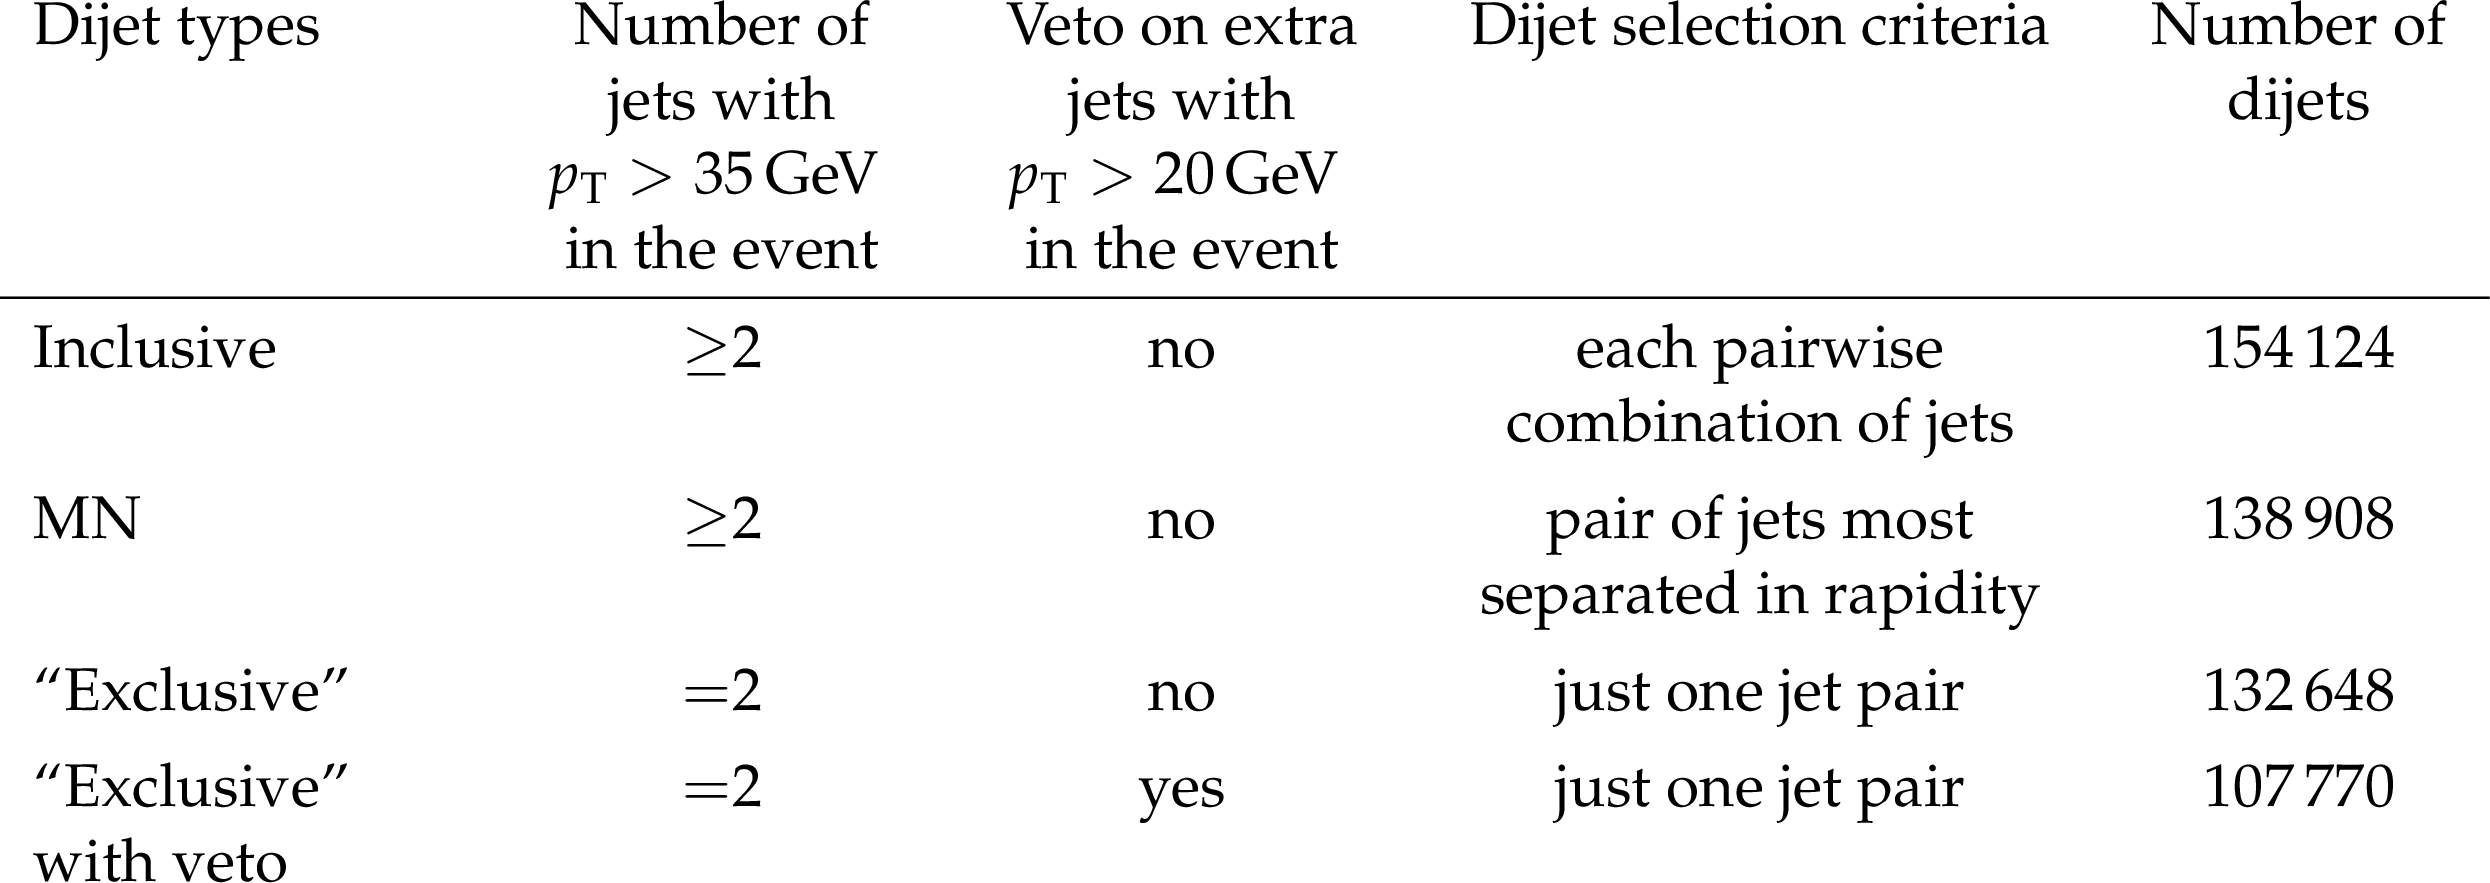
Table 1:
Event definitions for cross section measurements. |
| Summary |
|
A study of dijet events with large rapidity separation ${\Delta y}$ between the jets has been performed using proton-proton collision data at $\sqrt{s} = $ 2.76 TeV, collected by the CMS experiment in 2013 with an integrated luminosity of 5.4 pb$^{-1}$. The cross sections for Mueller-Navelet and inclusive dijet event production, as well as their ratios to "exclusive", and "exclusive" with veto, dijet event production, are measured up to ${\Delta y} \leq $ 8.0 between the jets. None of the Dokshitzer-Gribov-Lipatov-Altarelli-Parisi (DGLAP)-based Monte Carlo generators using leading-order (LO) or next-to-LO (NLO) calculations can provide a complete description of all measured cross sections and their ratios. The dijet ratio with extra jet veto cannot be described by the LO or NLO DGLAP-based generators. To compare the present results with the Balitsky-Fadin-Kuraev-Lipatov approach, calculations at the next-to-leading-logarithm level are needed. The present results at $\sqrt{s} = $ 2.76 TeV can be used along with data at higher energies to reveal possible effects beyond the DGLAP approach to make more definite conclusions. Tabulated results are provided in the HEPData record for this analysis [53]. |
| References | ||||
| 1 | V. N. Gribov and L. N. Lipatov | Deep inelastic e p scattering in perturbation theory | Sov. J. NP 15 (1972)438 | |
| 2 | V. N. Gribov and L. N. Lipatov | e$^{+}$e$^{-}$ pair annihilation and deep inelastic ep scattering in perturbation theory | Sov. J. NP 15 (1972)675 | |
| 3 | L. N. Lipatov | The parton model and perturbation theory | Sov. J. NP 20 (1975)94 | |
| 4 | G. Altarelli and G. Parisi | Asymptotic freedom in parton language | NPB 126 (1977) 298 | |
| 5 | Y. L. Dokshitzer | Calculation of the structure functions for deep inelastic scattering and e$^{+}$e$^{-}$ annihilation by perturbation theory in quantum chromodynamics. | Sov. Phys. JETP 46 (1977)641 | |
| 6 | E. A. Kuraev, L. N. Lipatov, and V. S. Fadin | Multi-Reggeon processes in the Yang-Mills theory | Sov. Phys. JETP 44 (1976)443 | |
| 7 | E. A. Kuraev, L. N. Lipatov, and V. S. Fadin | The Pomeranchuk singularity in nonabelian gauge theories | Sov. Phys. JETP 45 (1977)199 | |
| 8 | I. I. Balitsky and L. N. Lipatov | The Pomeranchuk singularity in quantum chromodynamics | Sov. J. NP 28 (1978)822 | |
| 9 | A. H. Mueller and H. Navelet | An inclusive minijet cross section and the bare pomeron in QCD | NPB 282 (1987) 727 | |
| 10 | V. T. Kim and G. B. Pivovarov | BFKL QCD pomeron in high energy hadron collisions: inclusive dijet production | PRD 53 (1996) 6 | hep-ph/9506381 |
| 11 | V. B. Gavrilov et al. | Forward dijets with wide rapidity separation in pp-collisions at LHC and Tevatron: dijet ratios and azimuthal decorrelations | NPB Proc. Suppl. 245 (2013) 153 | |
| 12 | D0 Collaboration | Probing BFKL dynamics in the dijet cross section at large rapidity intervals in $ {\mathrm{p}}\bar{{\mathrm{p}}} $ collisions at $ \sqrt{s} = $ 1800 GeV and 630 GeV | PRL 84 (2000) 5722 | hep-ex/9912032 |
| 13 | D0 Collaboration | The azimuthal decorrelation of jets widely separated in rapidity | PRL 77 (1996) 595 | hep-ex/9603010 |
| 14 | D0 Collaboration | Probing hard color-singlet exchange in $ {\mathrm{p}}\bar{{\mathrm{p}}} $ collisions at $ \sqrt{s} = $ 630 GeV and 1800 GeV | PLB 440 (1998) 189 | hep-ex/9809016 |
| 15 | A. Ekstedt, R. Enberg, and G. Ingelman | Hard color singlet BFKL exchange and gaps between jets at the LHC | 2017 | 1703.10919 |
| 16 | R. Enberg, G. Ingelman, and L. Motyka | Hard colour singlet exchange and gaps between jets at the Tevatron | PLB 524 (2002) 273 | hep-ph/0111090 |
| 17 | CDF Collaboration | Dijet production by color-singlet exchange at the Fermilab Tevatron | PRL 80 (1998) 1156 | |
| 18 | ATLAS Collaboration | Measurement of dijet production with a veto on additional central jet activity in pp collisions at $ \sqrt{s} = $ 7 TeV using the ATLAS detector | JHEP 09 (2011) 053 | 1107.1641 |
| 19 | ATLAS Collaboration | Measurements of jet vetoes and azimuthal decorrelations in dijet events produced in pp collisions at $ \sqrt{s} = $ 7 TeV using the ATLAS detector | EPJC 74 (2014) 3117 | 1407.5756 |
| 20 | CMS Collaboration | Measurement of the inclusive production cross sections for forward jets and for dijet events with one forward and one central jet in pp collisions at $ \sqrt{s} = $ 7 TeV | JHEP 06 (2012) 036 | CMS-FWD-11-002 1202.0704 |
| 21 | CMS Collaboration | Ratios of dijet production cross sections as a function of the absolute difference in rapidity between jets in proton-proton collisions at $ \sqrt{s} = $ 7 TeV | EPJC 72 (2012) 2216 | CMS-FWD-10-014 1204.0696 |
| 22 | CMS Collaboration | Azimuthal decorrelation of jets widely separated in rapidity in pp collisions at $ \sqrt{s} = $ 7 TeV | JHEP 08 (2016) 139 | CMS-FSQ-12-002 1601.06713 |
| 23 | J. R. Andersen and J. M. Smillie | Multiple jets at the LHC with high energy jets | JHEP 06 (2011) 010 | 1101.5394 |
| 24 | L. Lonnblad | ARIADNE version 4: a program for simulation of QCD cascades implementing the colour dipole model | CPC 71 (1992) 15 | |
| 25 | S. Alioli et al. | Jet pair production in POWHEG | JHEP 04 (2011) 081 | 1012.3380 |
| 26 | T. Sjostrand, S. Mrenna, and P. Skands | A brief introduction to PYTHIA 8.1 | CPC 178 (2008) 852 | 0710.3820 |
| 27 | G. Corcella et al. | HERWIG 6: an event generator for hadron emission reactions with interfering gluons (including supersymmetric processes) | JHEP 01 (2001) 010 | |
| 28 | M. Bahr et al. | Herwig++ physics and manual | EPJC 58 (2008) 639 | 0803.0883 |
| 29 | B. Ducloué, L. Szymanowski, and S. Wallon | Evidence for high energy resummation effects in Mueller-Navelet jets at the LHC | PRL 112 (2014) 082003 | 1309.3229 |
| 30 | CMS Collaboration | Study of dijet events with a large rapidity gap between the two leading jets in pp collisions at $ \sqrt{s} = $ 7 TeV | EPJC 78 (2018) 242 | CMS-FSQ-12-001 1710.02586 |
| 31 | TOTEM and CMS Collaborations | Hard color-singlet exchange in dijet events in proton-proton collisions at $ \sqrt{s} = $ 13 TeV | PRD 104 (2021) 032009 | 2102.06945 |
| 32 | CMS Collaboration | The CMS trigger system | JINST 12 (2017) P01020 | CMS-TRG-12-001 1609.02366 |
| 33 | CMS Collaboration | The CMS experiment at the CERN LHC | JINST 3 (2008) S08004 | CMS-00-001 |
| 34 | CMS Collaboration | Particle-flow reconstruction and global event description with the CMS detector | JINST 12 (2017) P10003 | CMS-PRF-14-001 1706.04965 |
| 35 | M. Cacciari, G. P. Salam, and G. Soyez | The anti-$ {k_{\mathrm{T}}} $ jet clustering algorithm | JHEP 04 (2008) 063 | 0802.1189 |
| 36 | M. Cacciari, G. P. Salam, and G. Soyez | FastJet user manual | EPJC 72 (2012) 1896 | 1111.6097 |
| 37 | CMS Collaboration | Pileup mitigation at CMS in 13 TeV data | JINST 15 (2020) P09018 | CMS-JME-18-001 2003.00503 |
| 38 | CMS Collaboration | Jet energy scale and resolution in the CMS experiment in pp collisions at 8 TeV | JINST 12 (2017) P02014 | CMS-JME-13-004 1607.03663 |
| 39 | CMS Collaboration | Description and performance of track and primary-vertex reconstruction with the CMS tracker | JINST 9 (2014) P10009 | CMS-TRK-11-001 1405.6569 |
| 40 | R. Corke and T. Sjostrand | Interleaved parton showers and tuning prospects | JHEP 03 (2011) 032 | 1011.1759 |
| 41 | S. Gieseke et al. | Herwig++ 2.5 release note | 1102.1672 | |
| 42 | J. Bellm et al. | Herwig 7.0/Herwig++ 3.0 release note | EPJC 76 (2016) 196 | 1512.01178 |
| 43 | GEANT4 Collaboration | GEANT4: a simulation toolkit | NIMA 506 (2003) 250 | |
| 44 | CMS Collaboration | Determination of jet energy calibration and transverse momentum resolution in CMS | JINST 6 (2011) P11002 | CMS-JME-10-011 1107.4277 |
| 45 | S. Schmitt | TUnfold: an algorithm for correcting migration effects in high energy physics | JINST 7 (2012) T10003 | 1205.6201 |
| 46 | J. Pumplin et al. | New generation of parton distributions with uncertainties from global QCD analysis | JHEP 07 (2002) 012 | hep-ph/0201195 |
| 47 | J. Butterworth et al. | PDF4LHC recommendations for LHC Run II | JPG 43 (2016) 023001 | 1510.03865 |
| 48 | NNPDF Collaboration | Parton distributions for the LHC Run II | JHEP 04 (2015) 040 | 1410.8849 |
| 49 | S. Dulat et al. | New parton distribution functions from a global analysis of quantum chromodynamics | PRD 93 (2016) 033006 | 1506.07443 |
| 50 | L. A. Harland-Lang, A. D. Martin, P. Motylinski, and R. S. Thorne | Parton distributions in the LHC era: MMHT 2014 PDFs | EPJC 75 (2015) 204 | 1412.3989 |
| 51 | A. Buckley et al. | LHAPDF6: parton density access in the LHC precision era | EPJC 75 (2015) 132 | 1412.7420 |
| 52 | CMS Collaboration | Luminosity calibration for the 2013 proton-lead and proton-proton data taking | CMS-PAS-LUM-13-002 | CMS-PAS-LUM-13-002 |
| 53 | S. J. Brodsky et al. | The QCD pomeron with optimal renormalization | JEPTL 70 (1999) 155 | hep-ph/9901229 |
| 54 | CMS Collaboration | HEPData record for this analysis | link | |
|
|
Compact Muon Solenoid LHC, CERN |
|

|

|

|

|

|