

Compact Muon Solenoid
LHC, CERN
| CMS-MUO-19-001 ; CERN-EP-2021-013 | ||
| Performance of the CMS muon trigger system in proton-proton collisions at $\sqrt{s} = $ 13 TeV | ||
| CMS Collaboration | ||
| 9 February 2021 | ||
| JINST 16 (2021) P07001 | ||
| Abstract: The muon trigger system of the CMS experiment uses a combination of hardware and software to identify events containing a muon. During Run 2 (covering 2015-2018) the LHC achieved instantaneous luminosities as high as 2 $\times $ 10$^{34}$ cm$^{-2}$s$^{-1}$ while delivering proton-proton collisions at $\sqrt{s} = $ 13 TeV. The challenge for the trigger system of the CMS experiment is to reduce the registered event rate from about 40 MHz to about 1 kHz. Significant improvements important for the success of the CMS physics program have been made to the muon trigger system via improved muon reconstruction and identification algorithms since the end of Run 1 and throughout the Run 2 data-taking period. The new algorithms maintain the acceptance of the muon triggers at the same or even lower rate throughout the data-taking period despite the increasing number of additional proton-proton interactions in each LHC bunch crossing. In this paper, the algorithms used in 2015 and 2016 and their improvements throughout 2017 and 2018 are described. Measurements of the CMS muon trigger performance for this data-taking period are presented, including efficiencies, transverse momentum resolution, trigger rates, and the purity of the selected muon sample. This paper focuses on the single- and double-muon triggers with the lowest sustainable transverse momentum thresholds used by CMS. The efficiency is measured in a transverse momentum range from 8 to several hundred GeV. | ||
| Links: e-print arXiv:2102.04790 [hep-ex] (PDF) ; CDS record ; inSPIRE record ; CADI line (restricted) ; | ||
| Figures | |
png pdf |
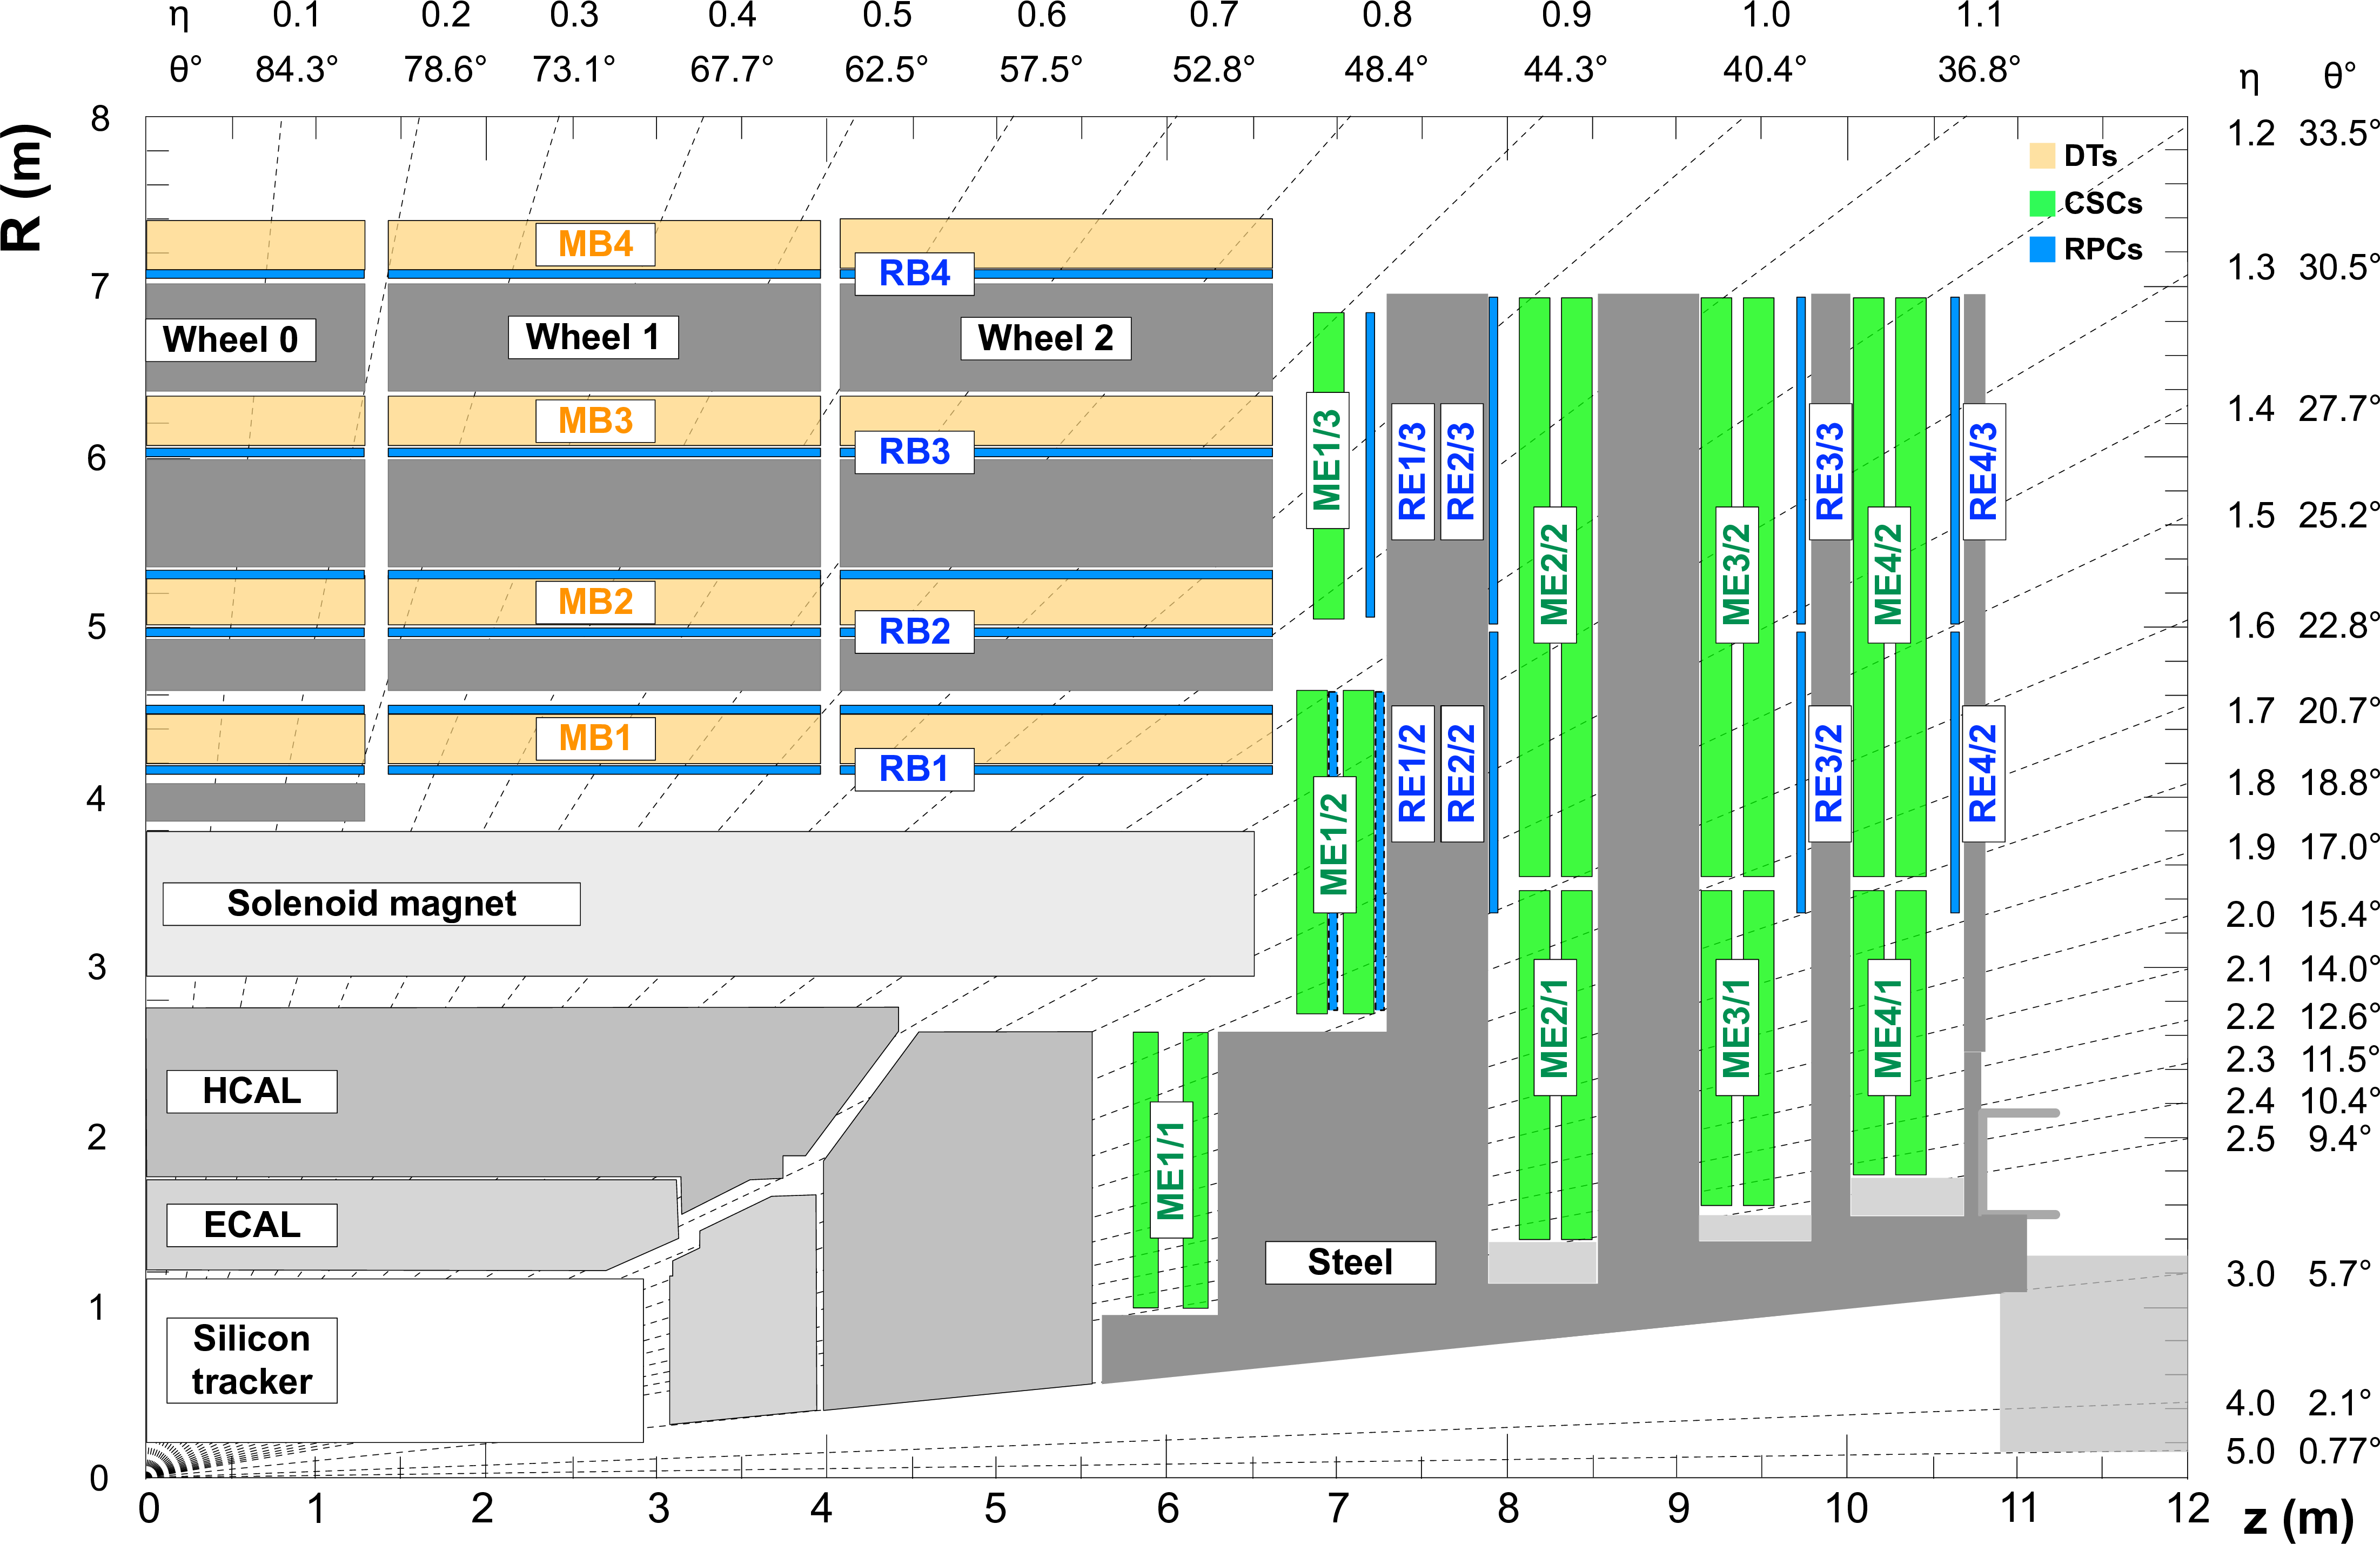
Figure 1:
$R$-$z$ quadrant of the CMS detector during Run 2. The proton beams travel along the $z$ axis and cross at the interaction point (0,0). The three CMS muon subdetectors typically have four stations: DT in yellow, labeled MB; CSC in green, labeled ME; and RPC in blue, labeled RB or RE. |
png pdf |
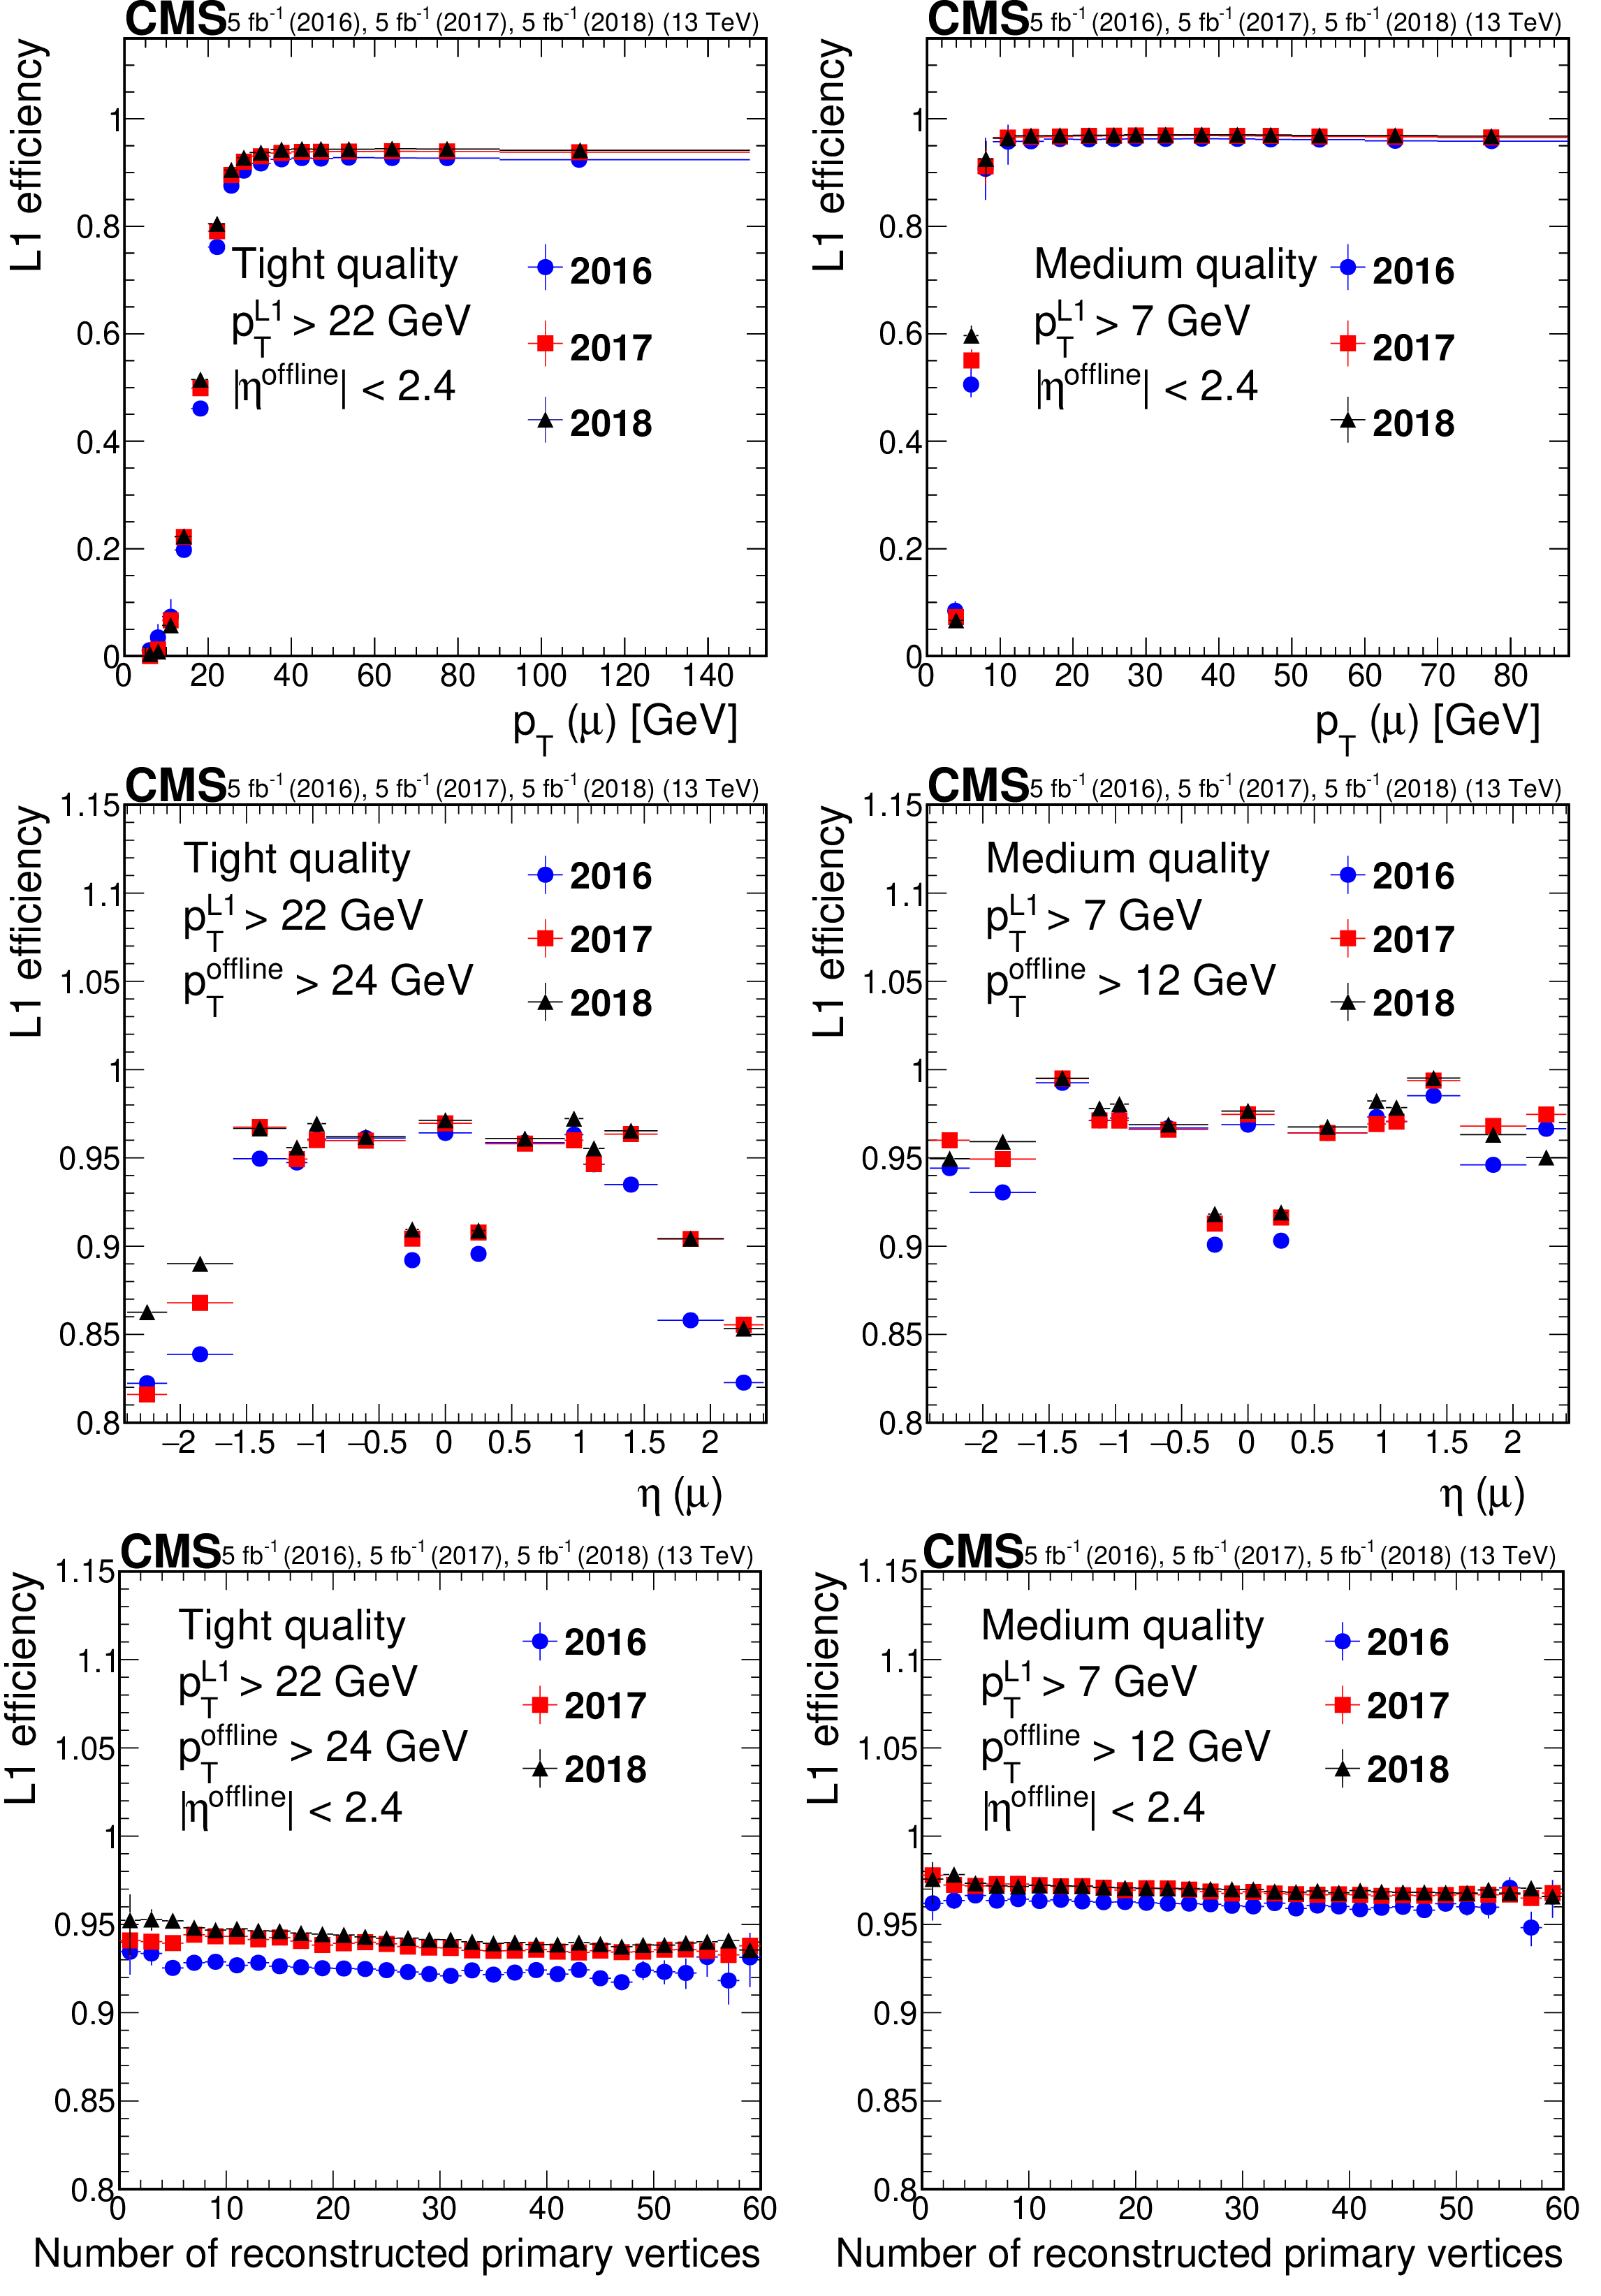
Figure 2:
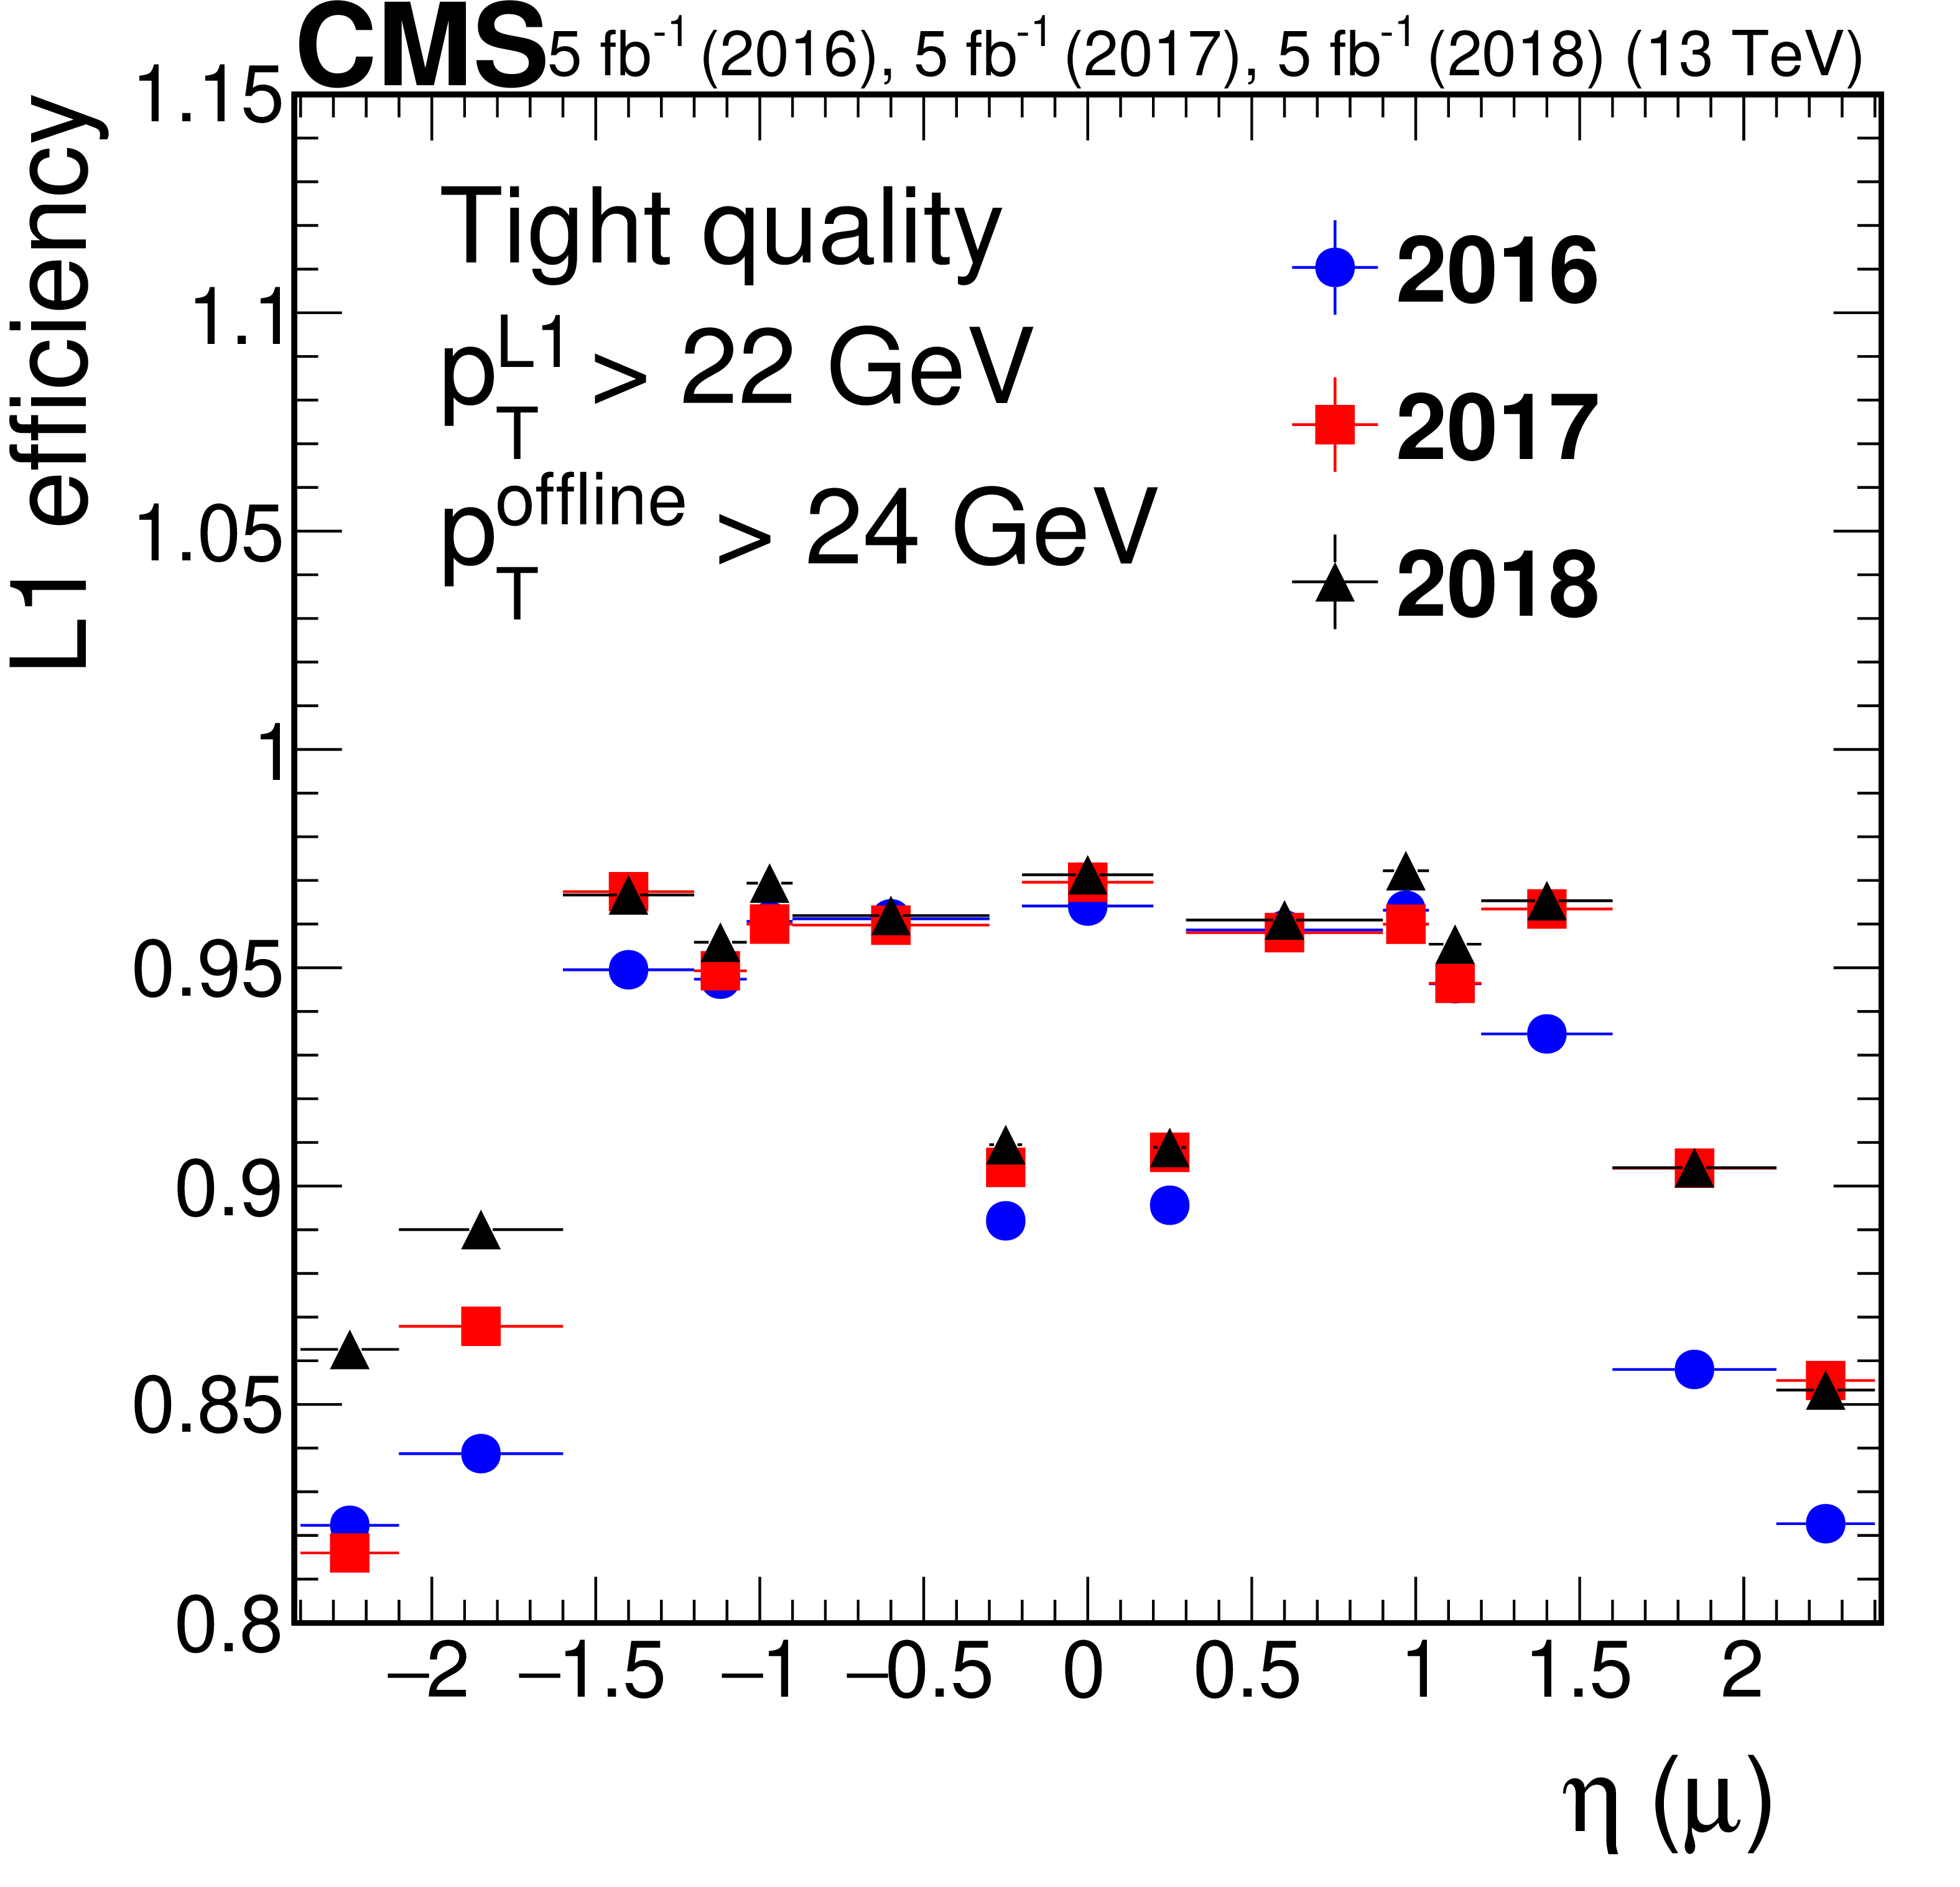
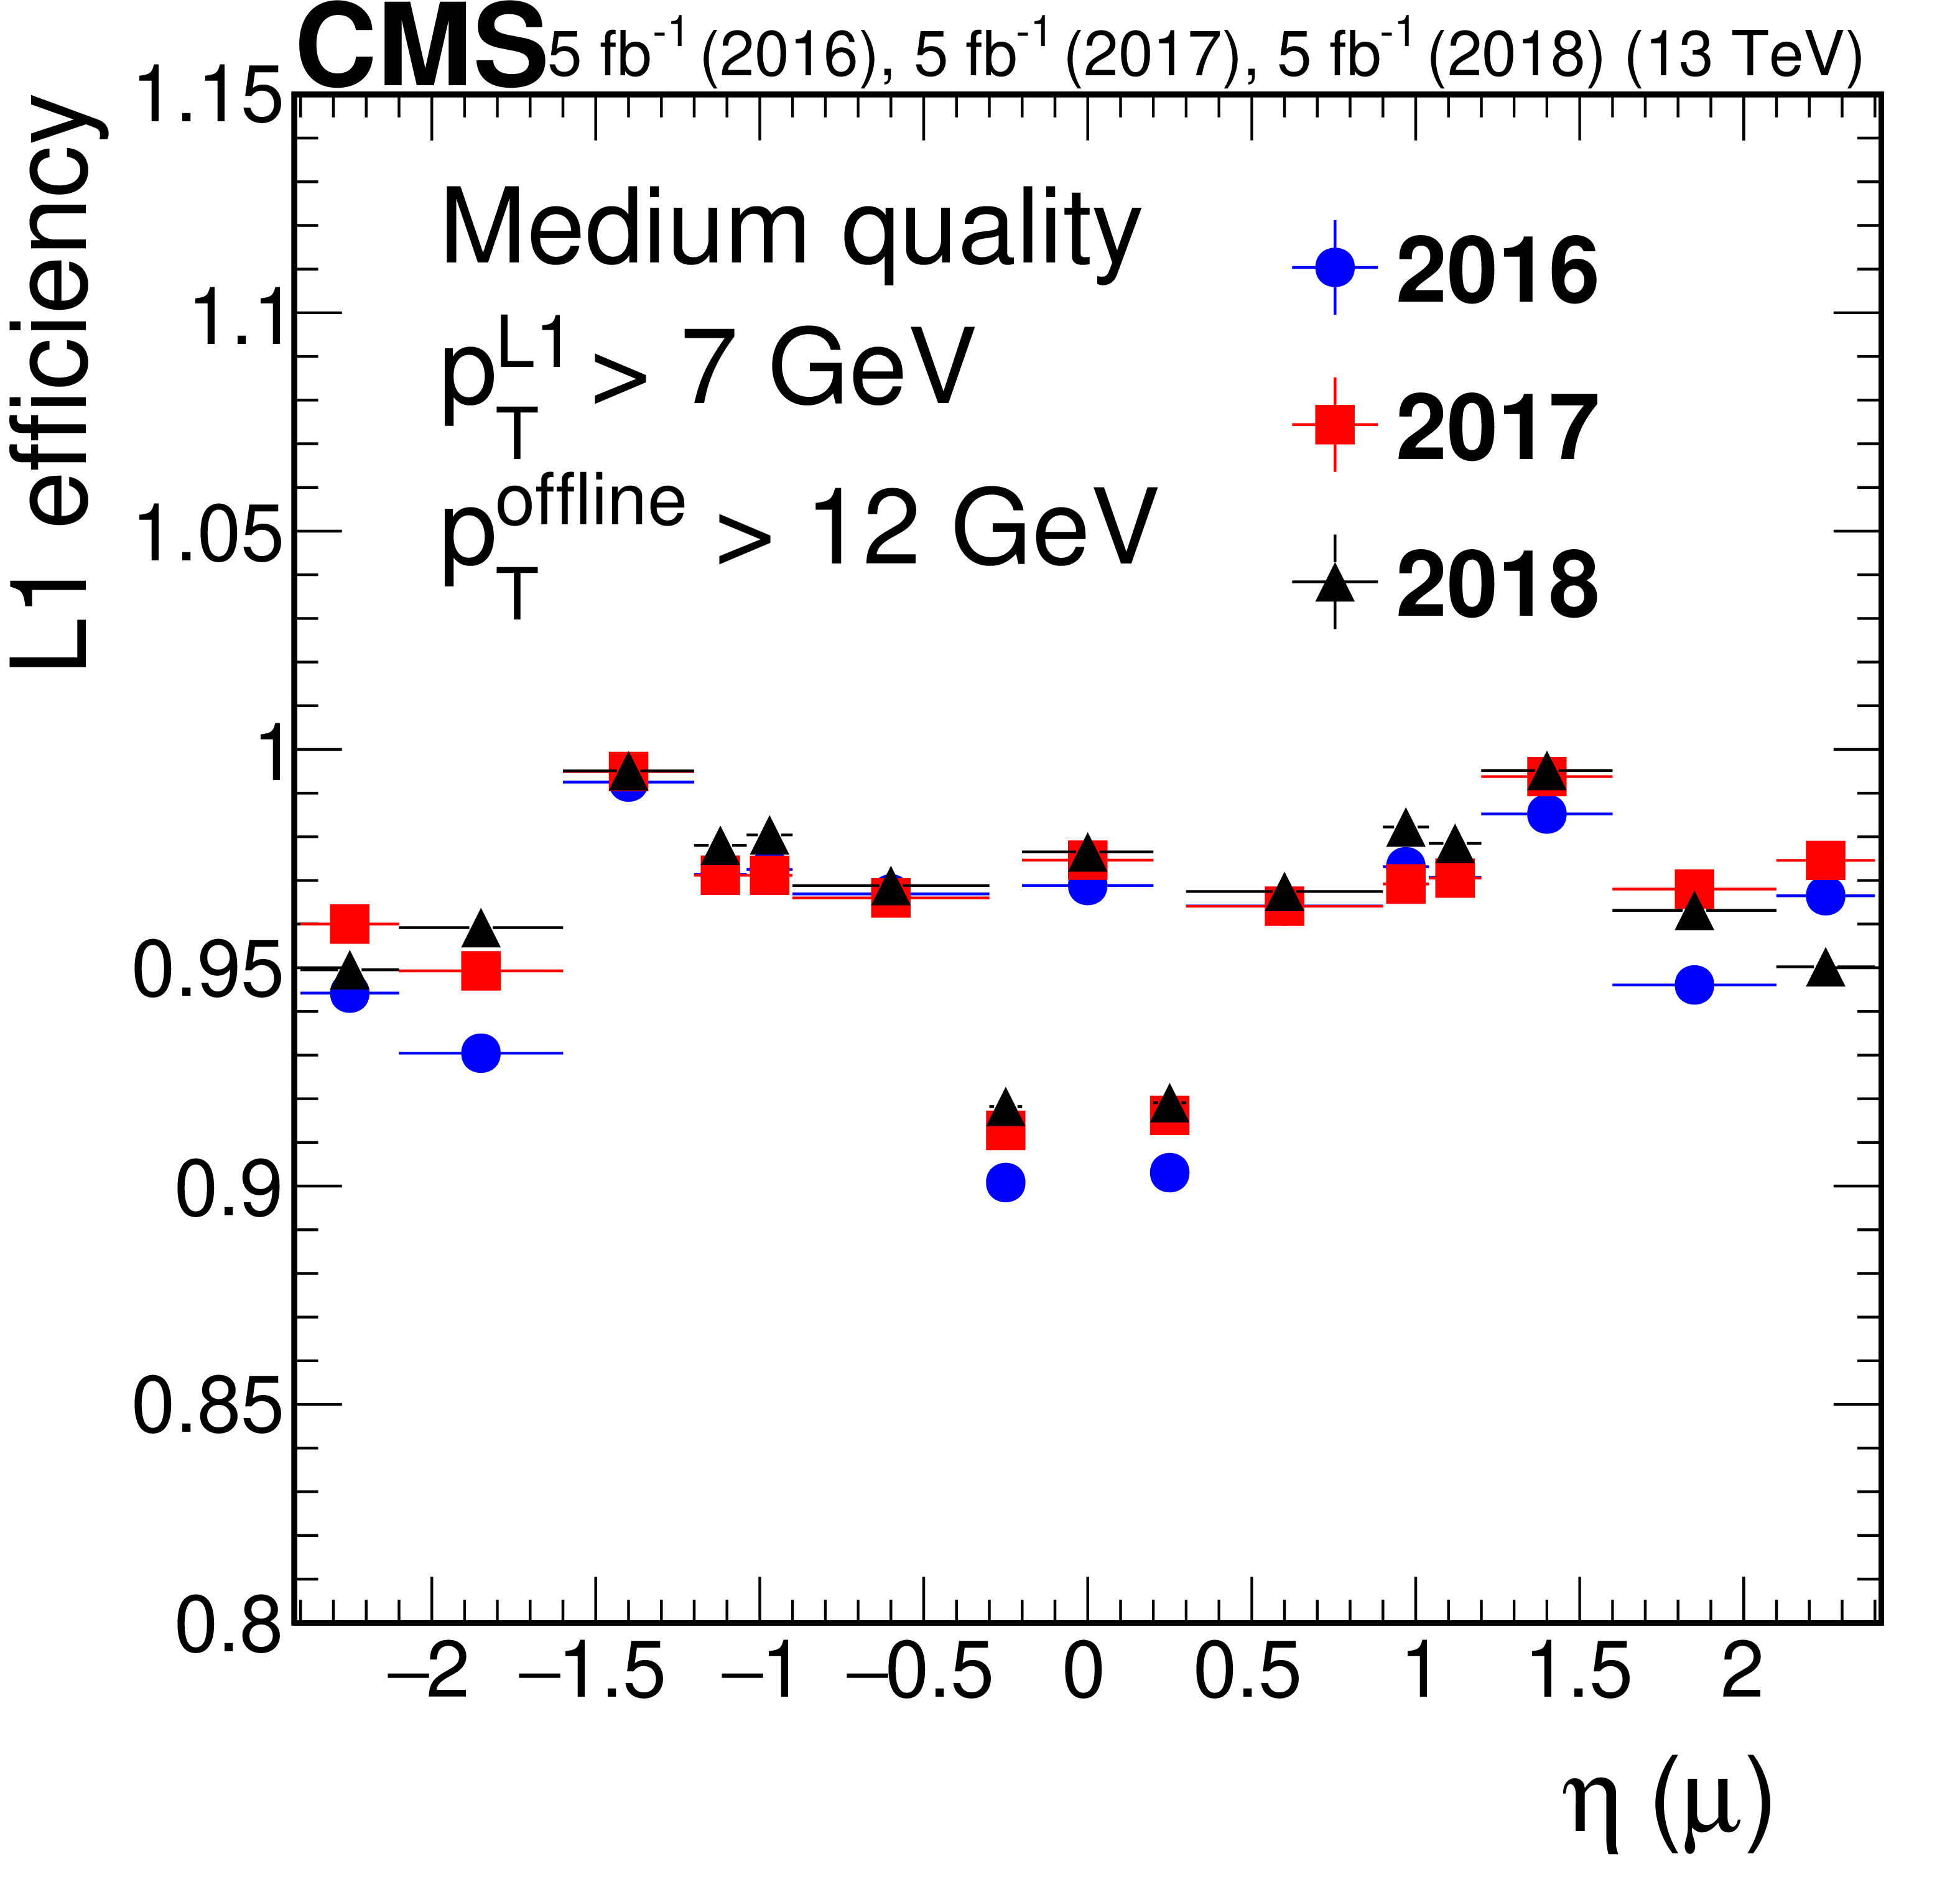
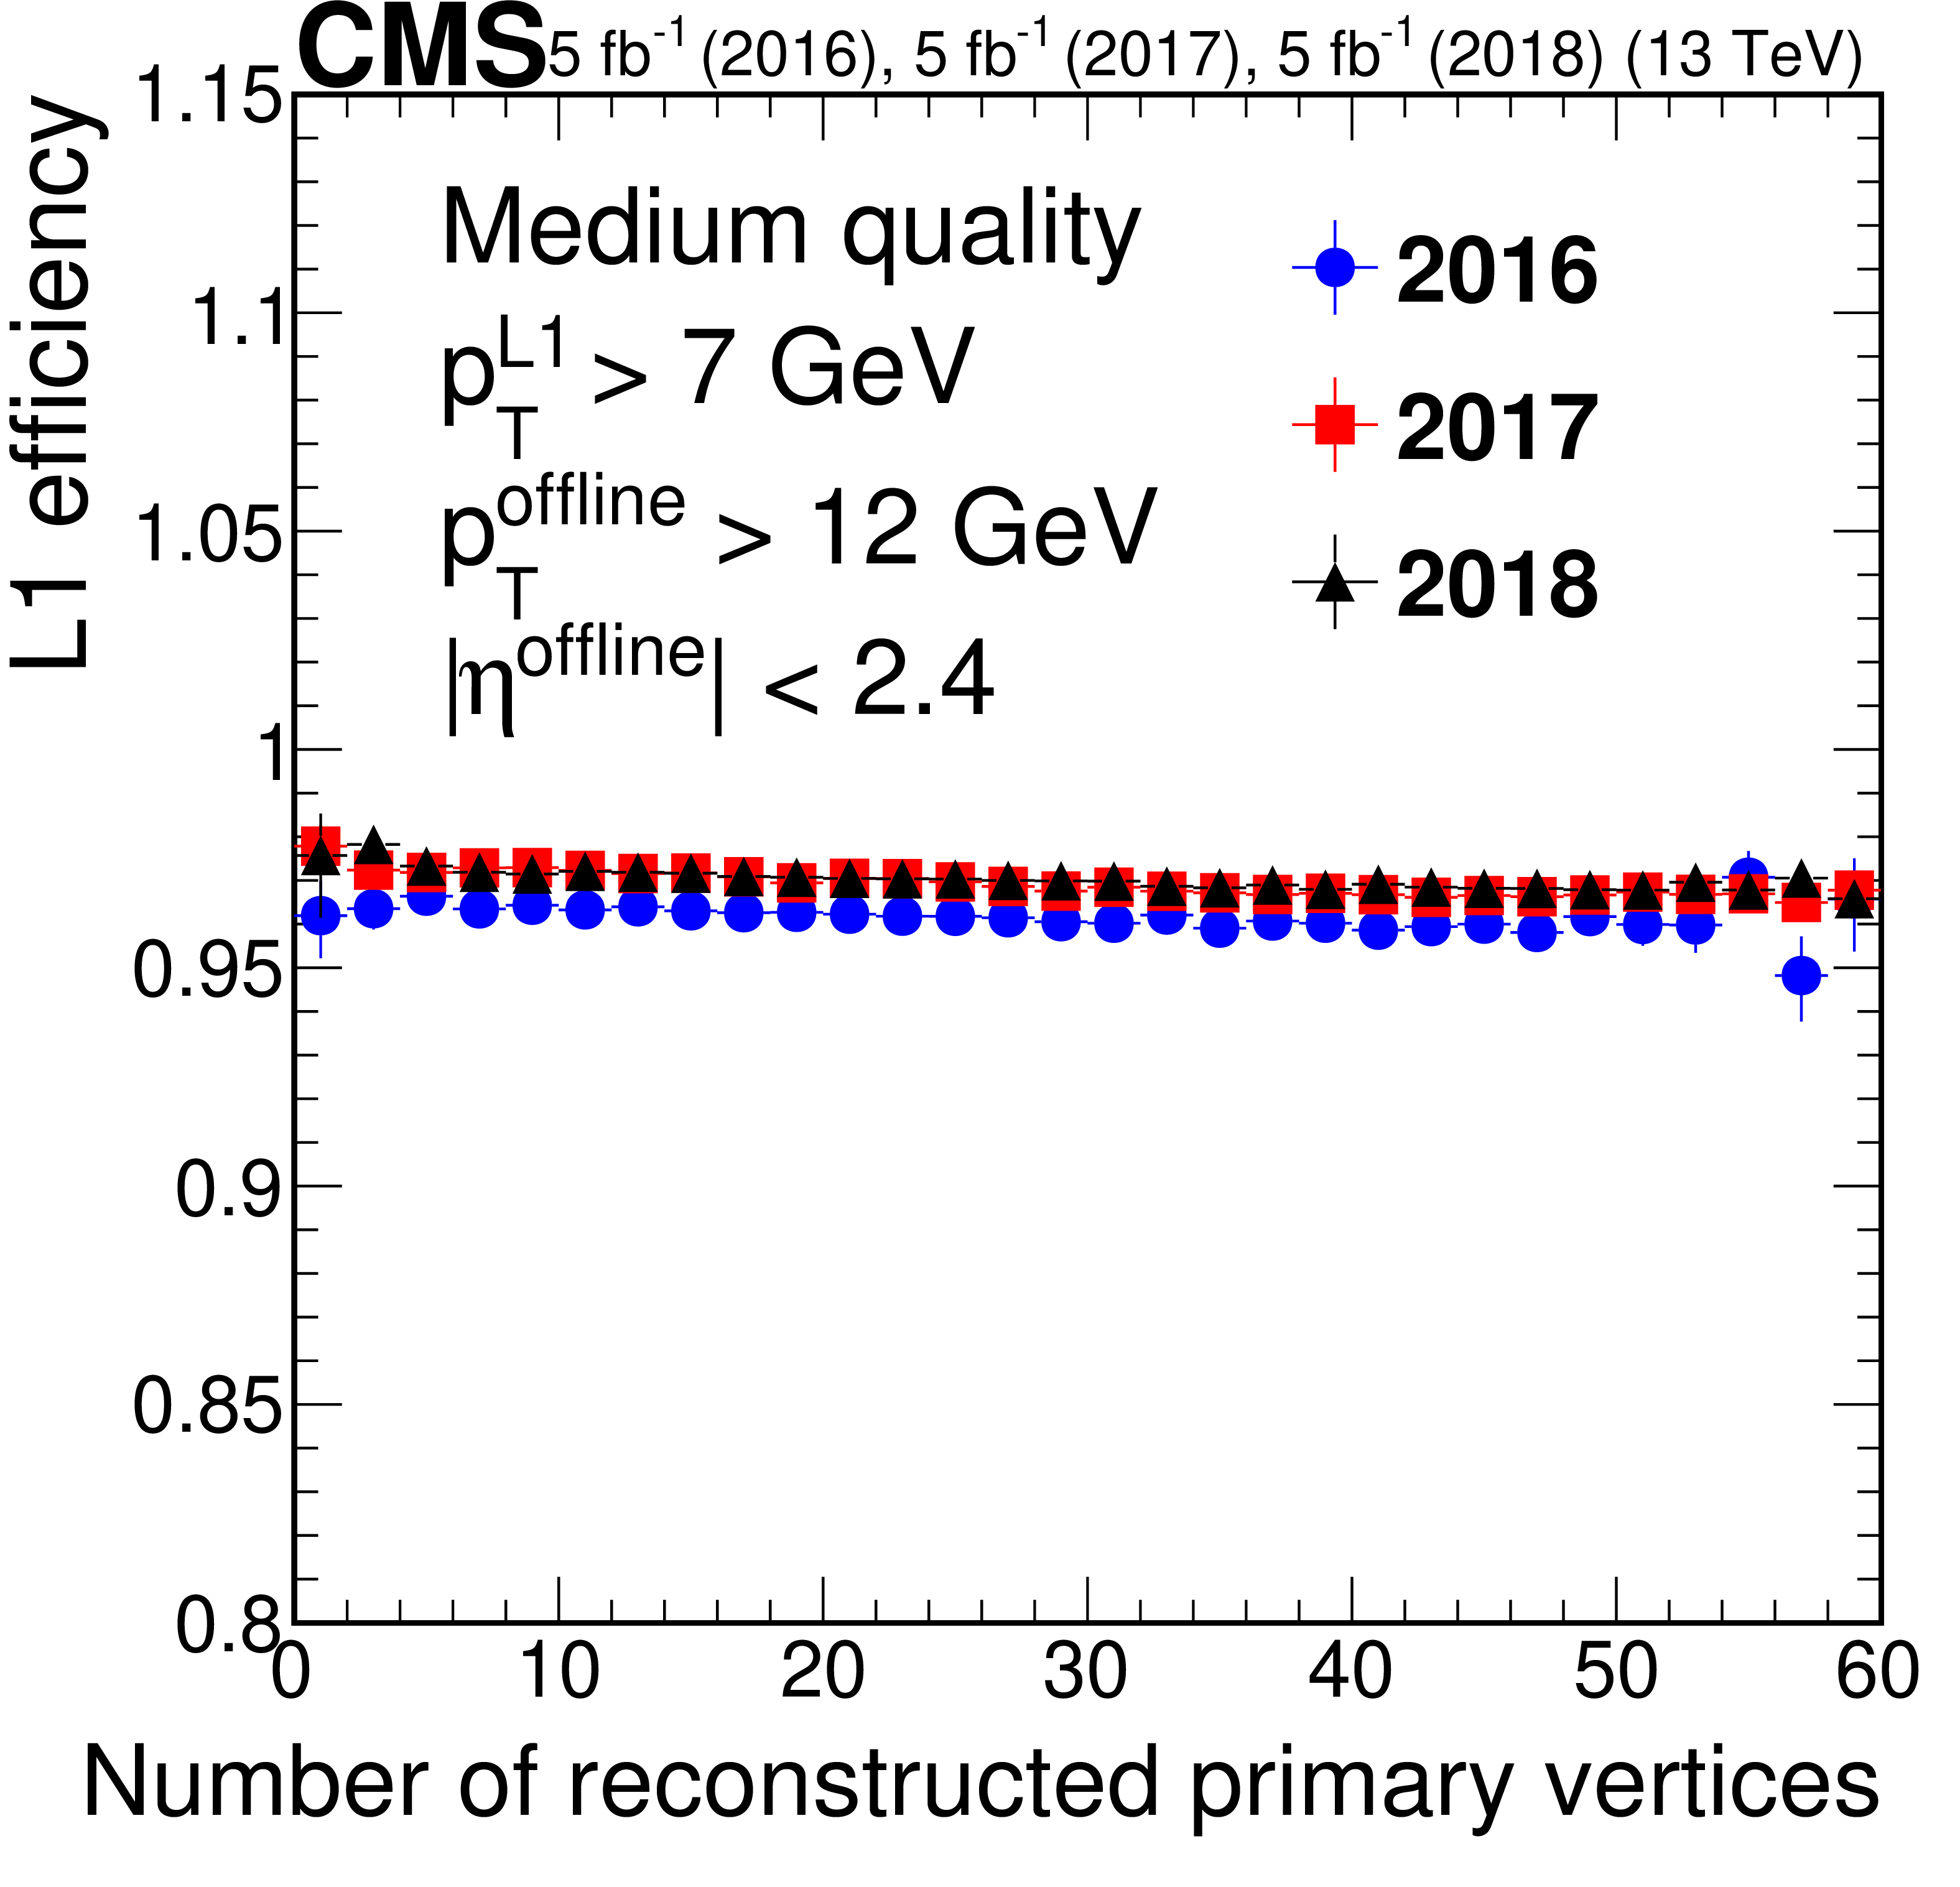
Efficiency of the L1 muon trigger requiring the tight (left) and medium (right) quality criteria as required in single-muon and double-muon seeds, respectively, for $\mathrm{Z} \to \mu \mu $ events, as a function of ${p_{\mathrm {T}}}$ (upper row), muon $\eta $ (middle row), and number of primary vertices (lower row). The efficiency for 2016 data is shown in blue circles, for 2017 data in red squares, and for 2018 data in black triangles. Only statistical uncertainties are shown. |
png pdf |
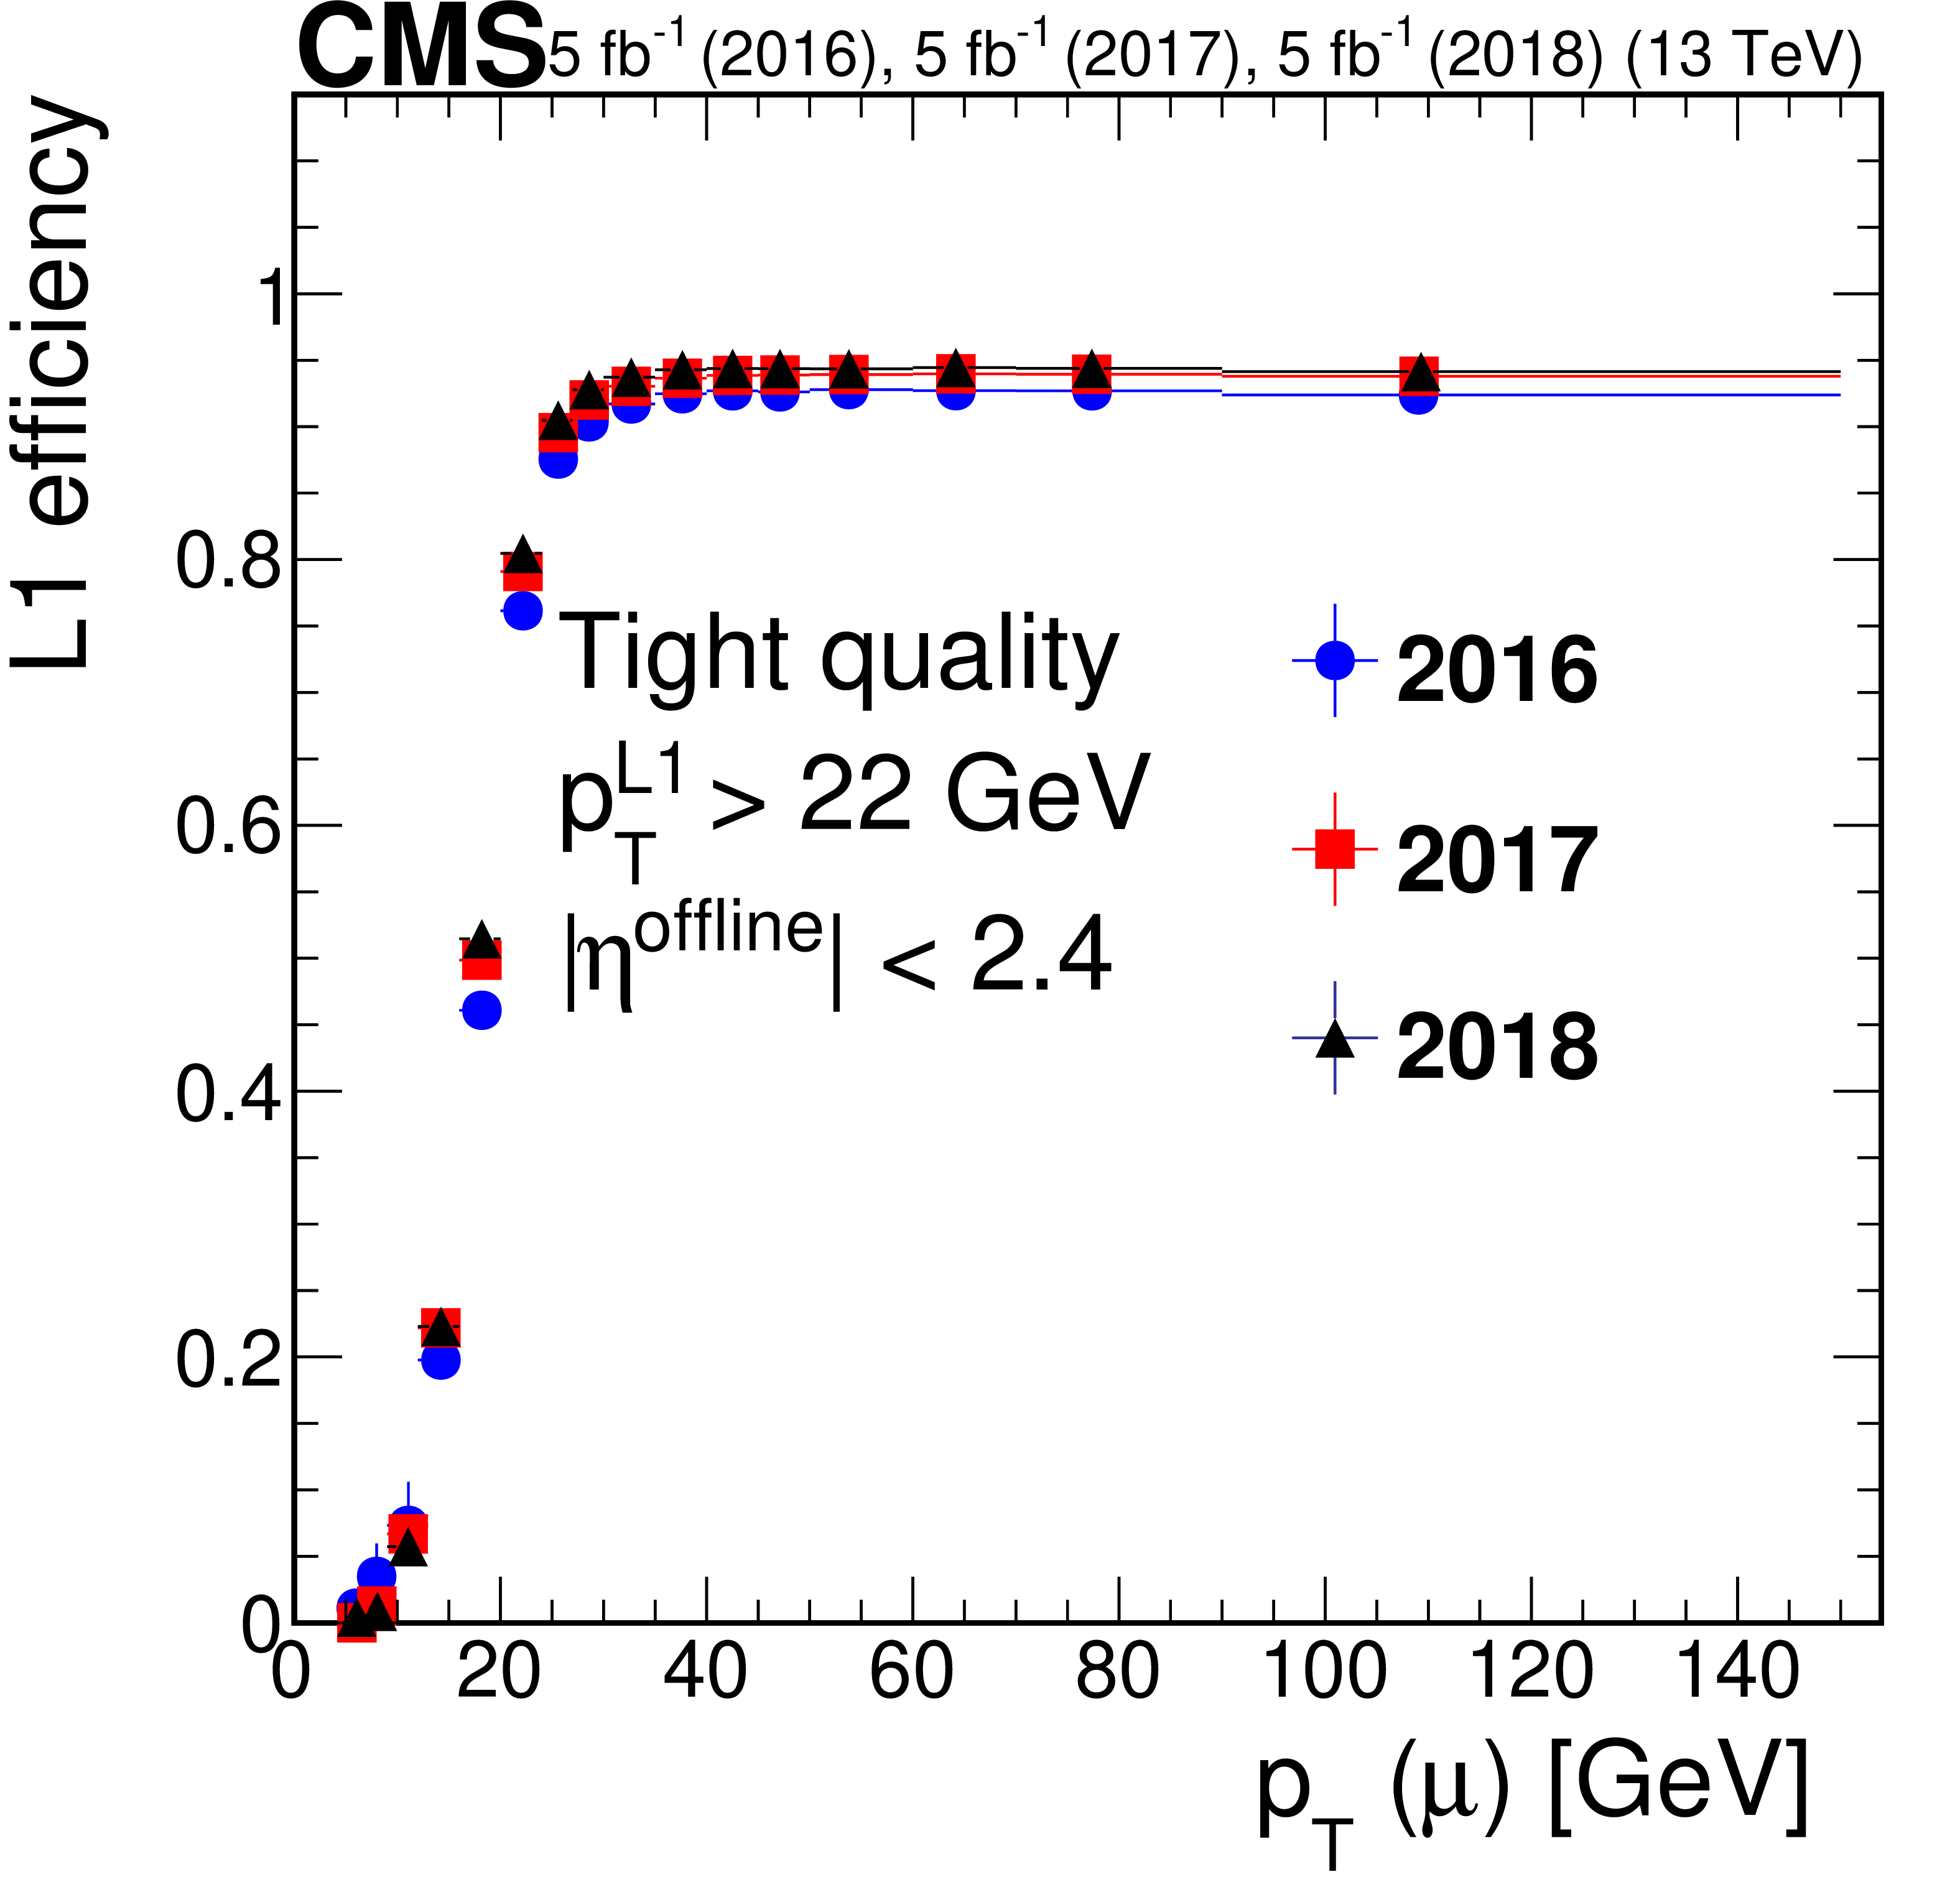
Figure 2-a:
Efficiency of the L1 muon trigger requiring the tight quality criteria as required in single-muon and double-muon seeds, respectively, for $\mathrm{Z} \to \mu \mu $ events, as a function of ${p_{\mathrm {T}}}$. The efficiency for 2016 data is shown in blue circles, for 2017 data in red squares, and for 2018 data in black triangles. Only statistical uncertainties are shown. |
png pdf |
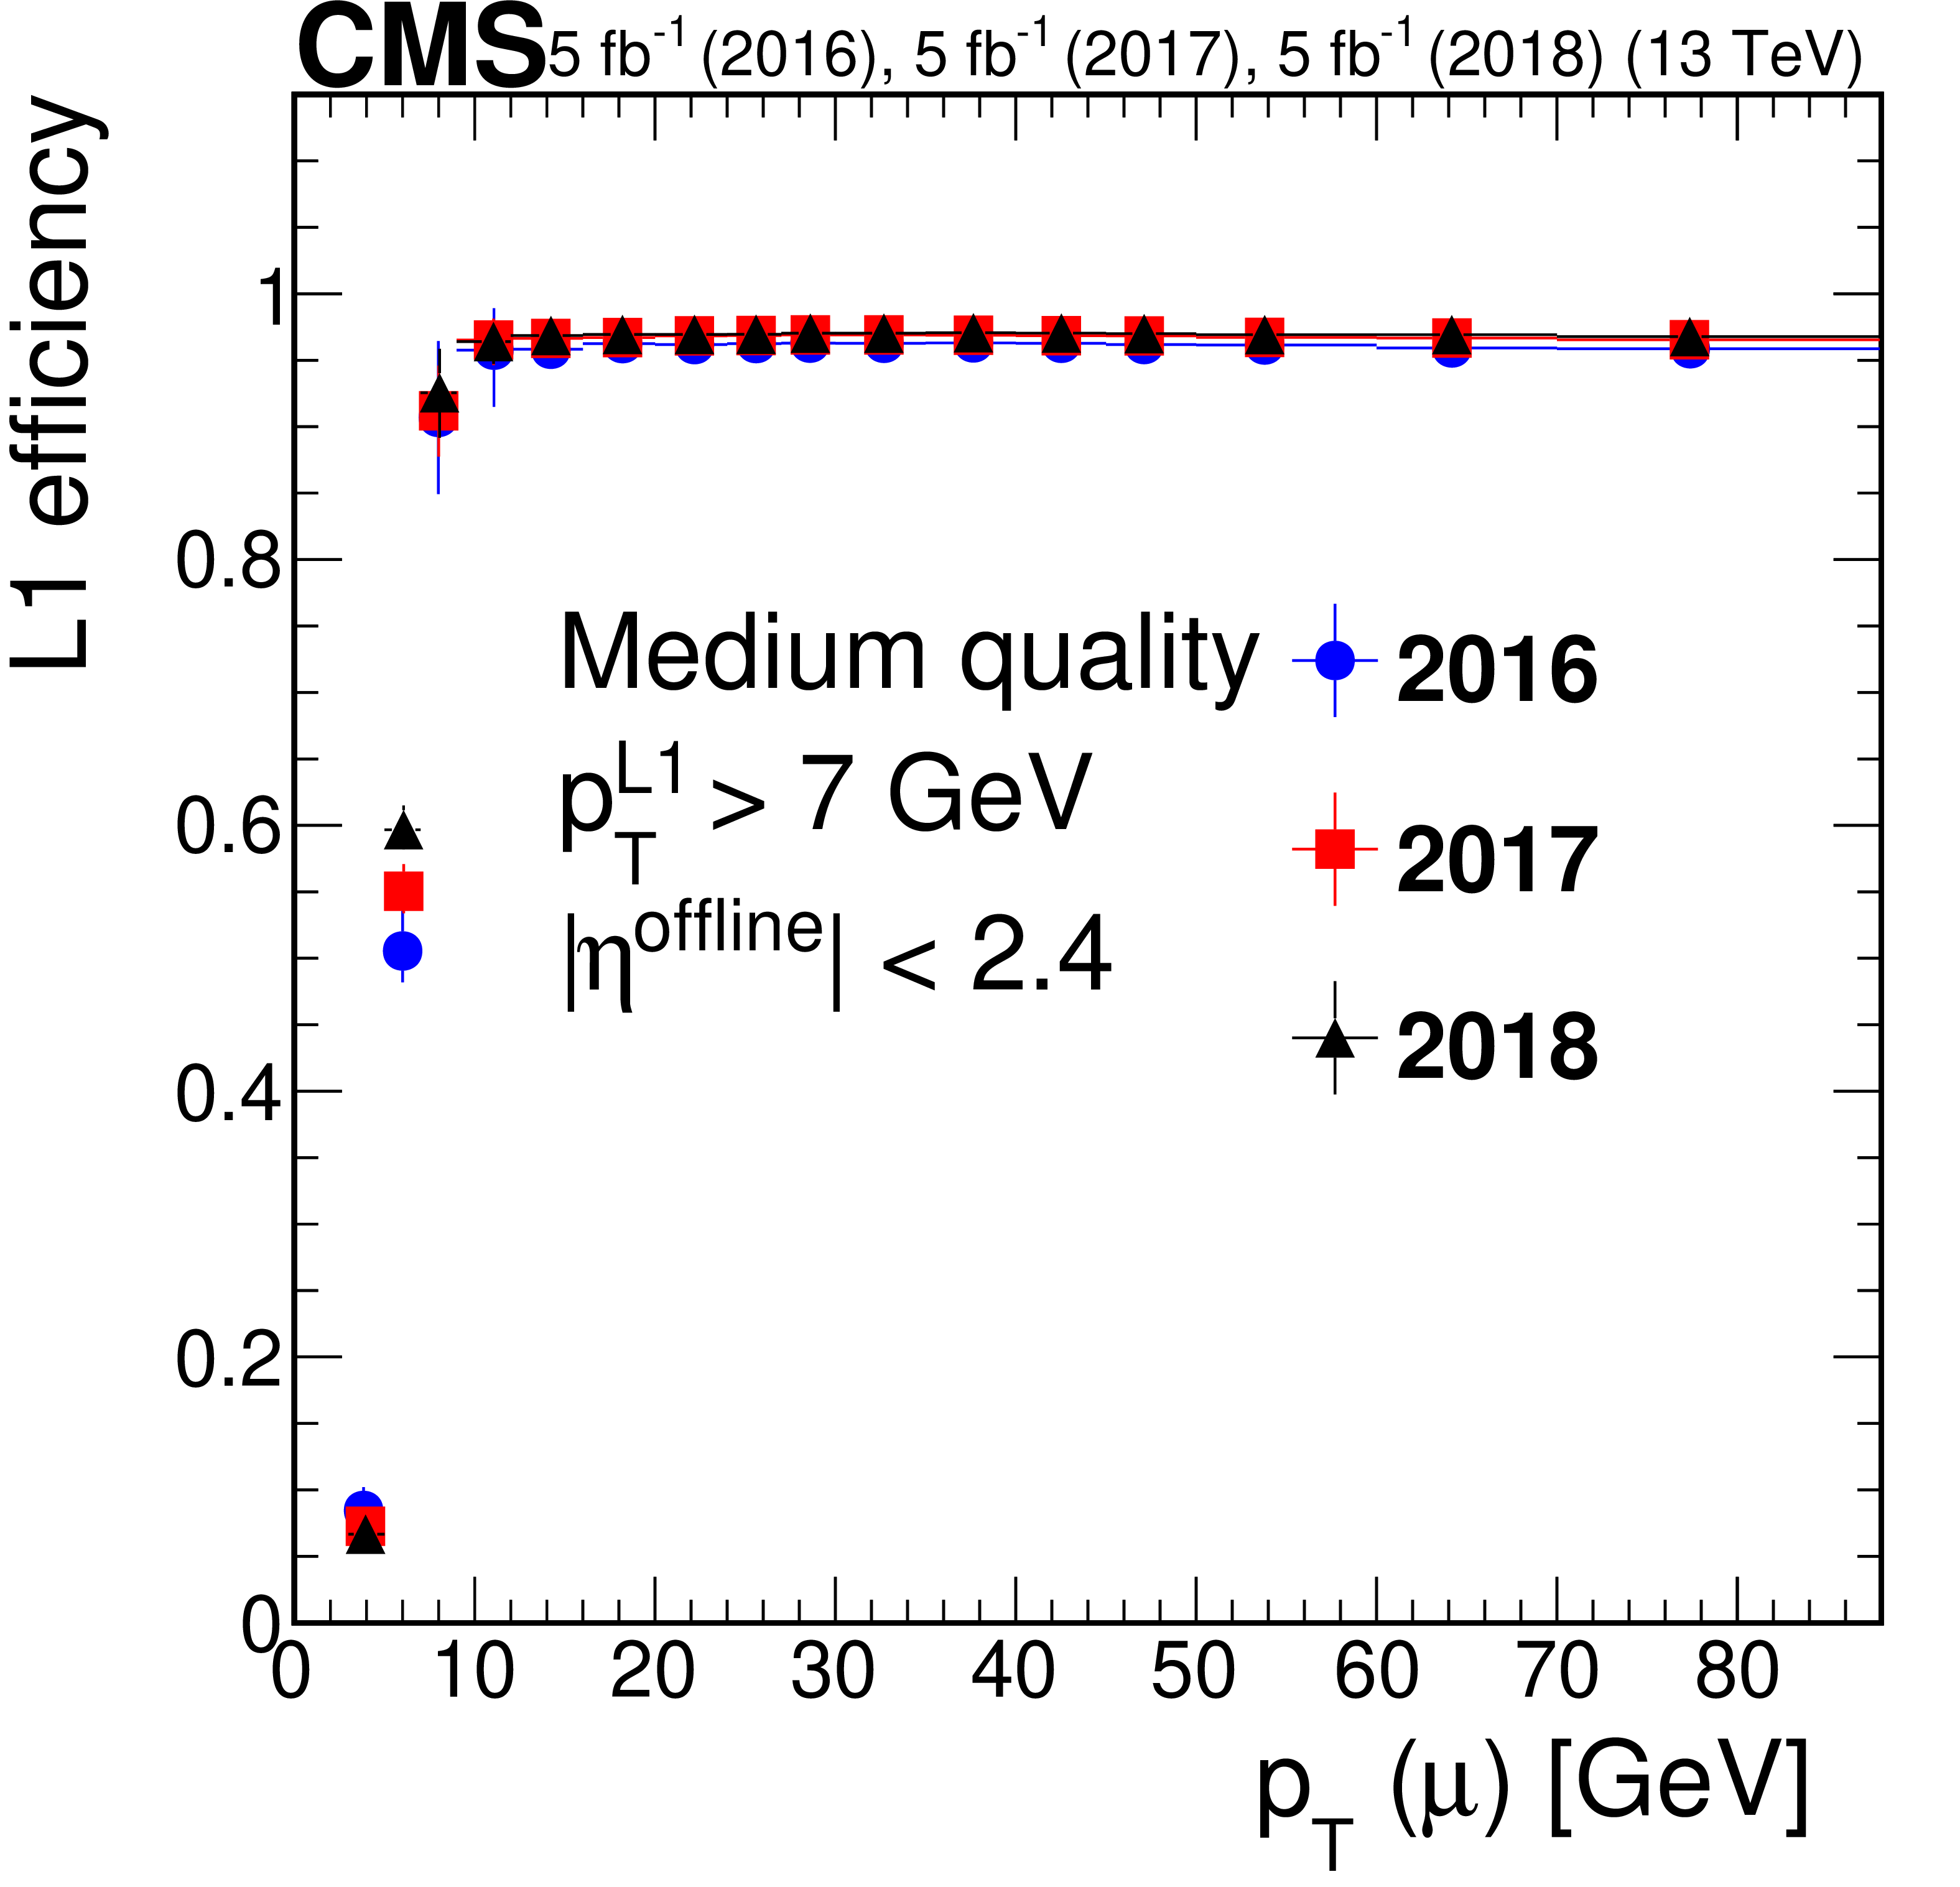
Figure 2-b:
Efficiency of the L1 muon trigger requiring the medium quality criteria as required in single-muon and double-muon seeds, respectively, for $\mathrm{Z} \to \mu \mu $ events, as a function of ${p_{\mathrm {T}}}$. The efficiency for 2016 data is shown in blue circles, for 2017 data in red squares, and for 2018 data in black triangles. Only statistical uncertainties are shown. |
png pdf |
Figure 2-c:
Efficiency of the L1 muon trigger requiring the tight quality criteria as required in single-muon and double-muon seeds, respectively, for $\mathrm{Z} \to \mu \mu $ events, as a function of muon $\eta $. The efficiency for 2016 data is shown in blue circles, for 2017 data in red squares, and for 2018 data in black triangles. Only statistical uncertainties are shown. |
png pdf |
Figure 2-d:
Efficiency of the L1 muon trigger requiring the medium quality criteria as required in single-muon and double-muon seeds, respectively, for $\mathrm{Z} \to \mu \mu $ events, as a function of muon $\eta $. The efficiency for 2016 data is shown in blue circles, for 2017 data in red squares, and for 2018 data in black triangles. Only statistical uncertainties are shown. |

png pdf |
Figure 2-e:
Efficiency of the L1 muon trigger requiring the tight quality criteria as required in single-muon and double-muon seeds, respectively, for $\mathrm{Z} \to \mu \mu $ events, as a function of the number of primary vertices. The efficiency for 2016 data is shown in blue circles, for 2017 data in red squares, and for 2018 data in black triangles. Only statistical uncertainties are shown. |
png pdf |
Figure 2-f:
Efficiency of the L1 muon trigger requiring the medium quality criteria as required in single-muon and double-muon seeds, respectively, for $\mathrm{Z} \to \mu \mu $ events, as a function of the number of primary vertices. The efficiency for 2016 data is shown in blue circles, for 2017 data in red squares, and for 2018 data in black triangles. Only statistical uncertainties are shown. |

png pdf |
Figure 3:
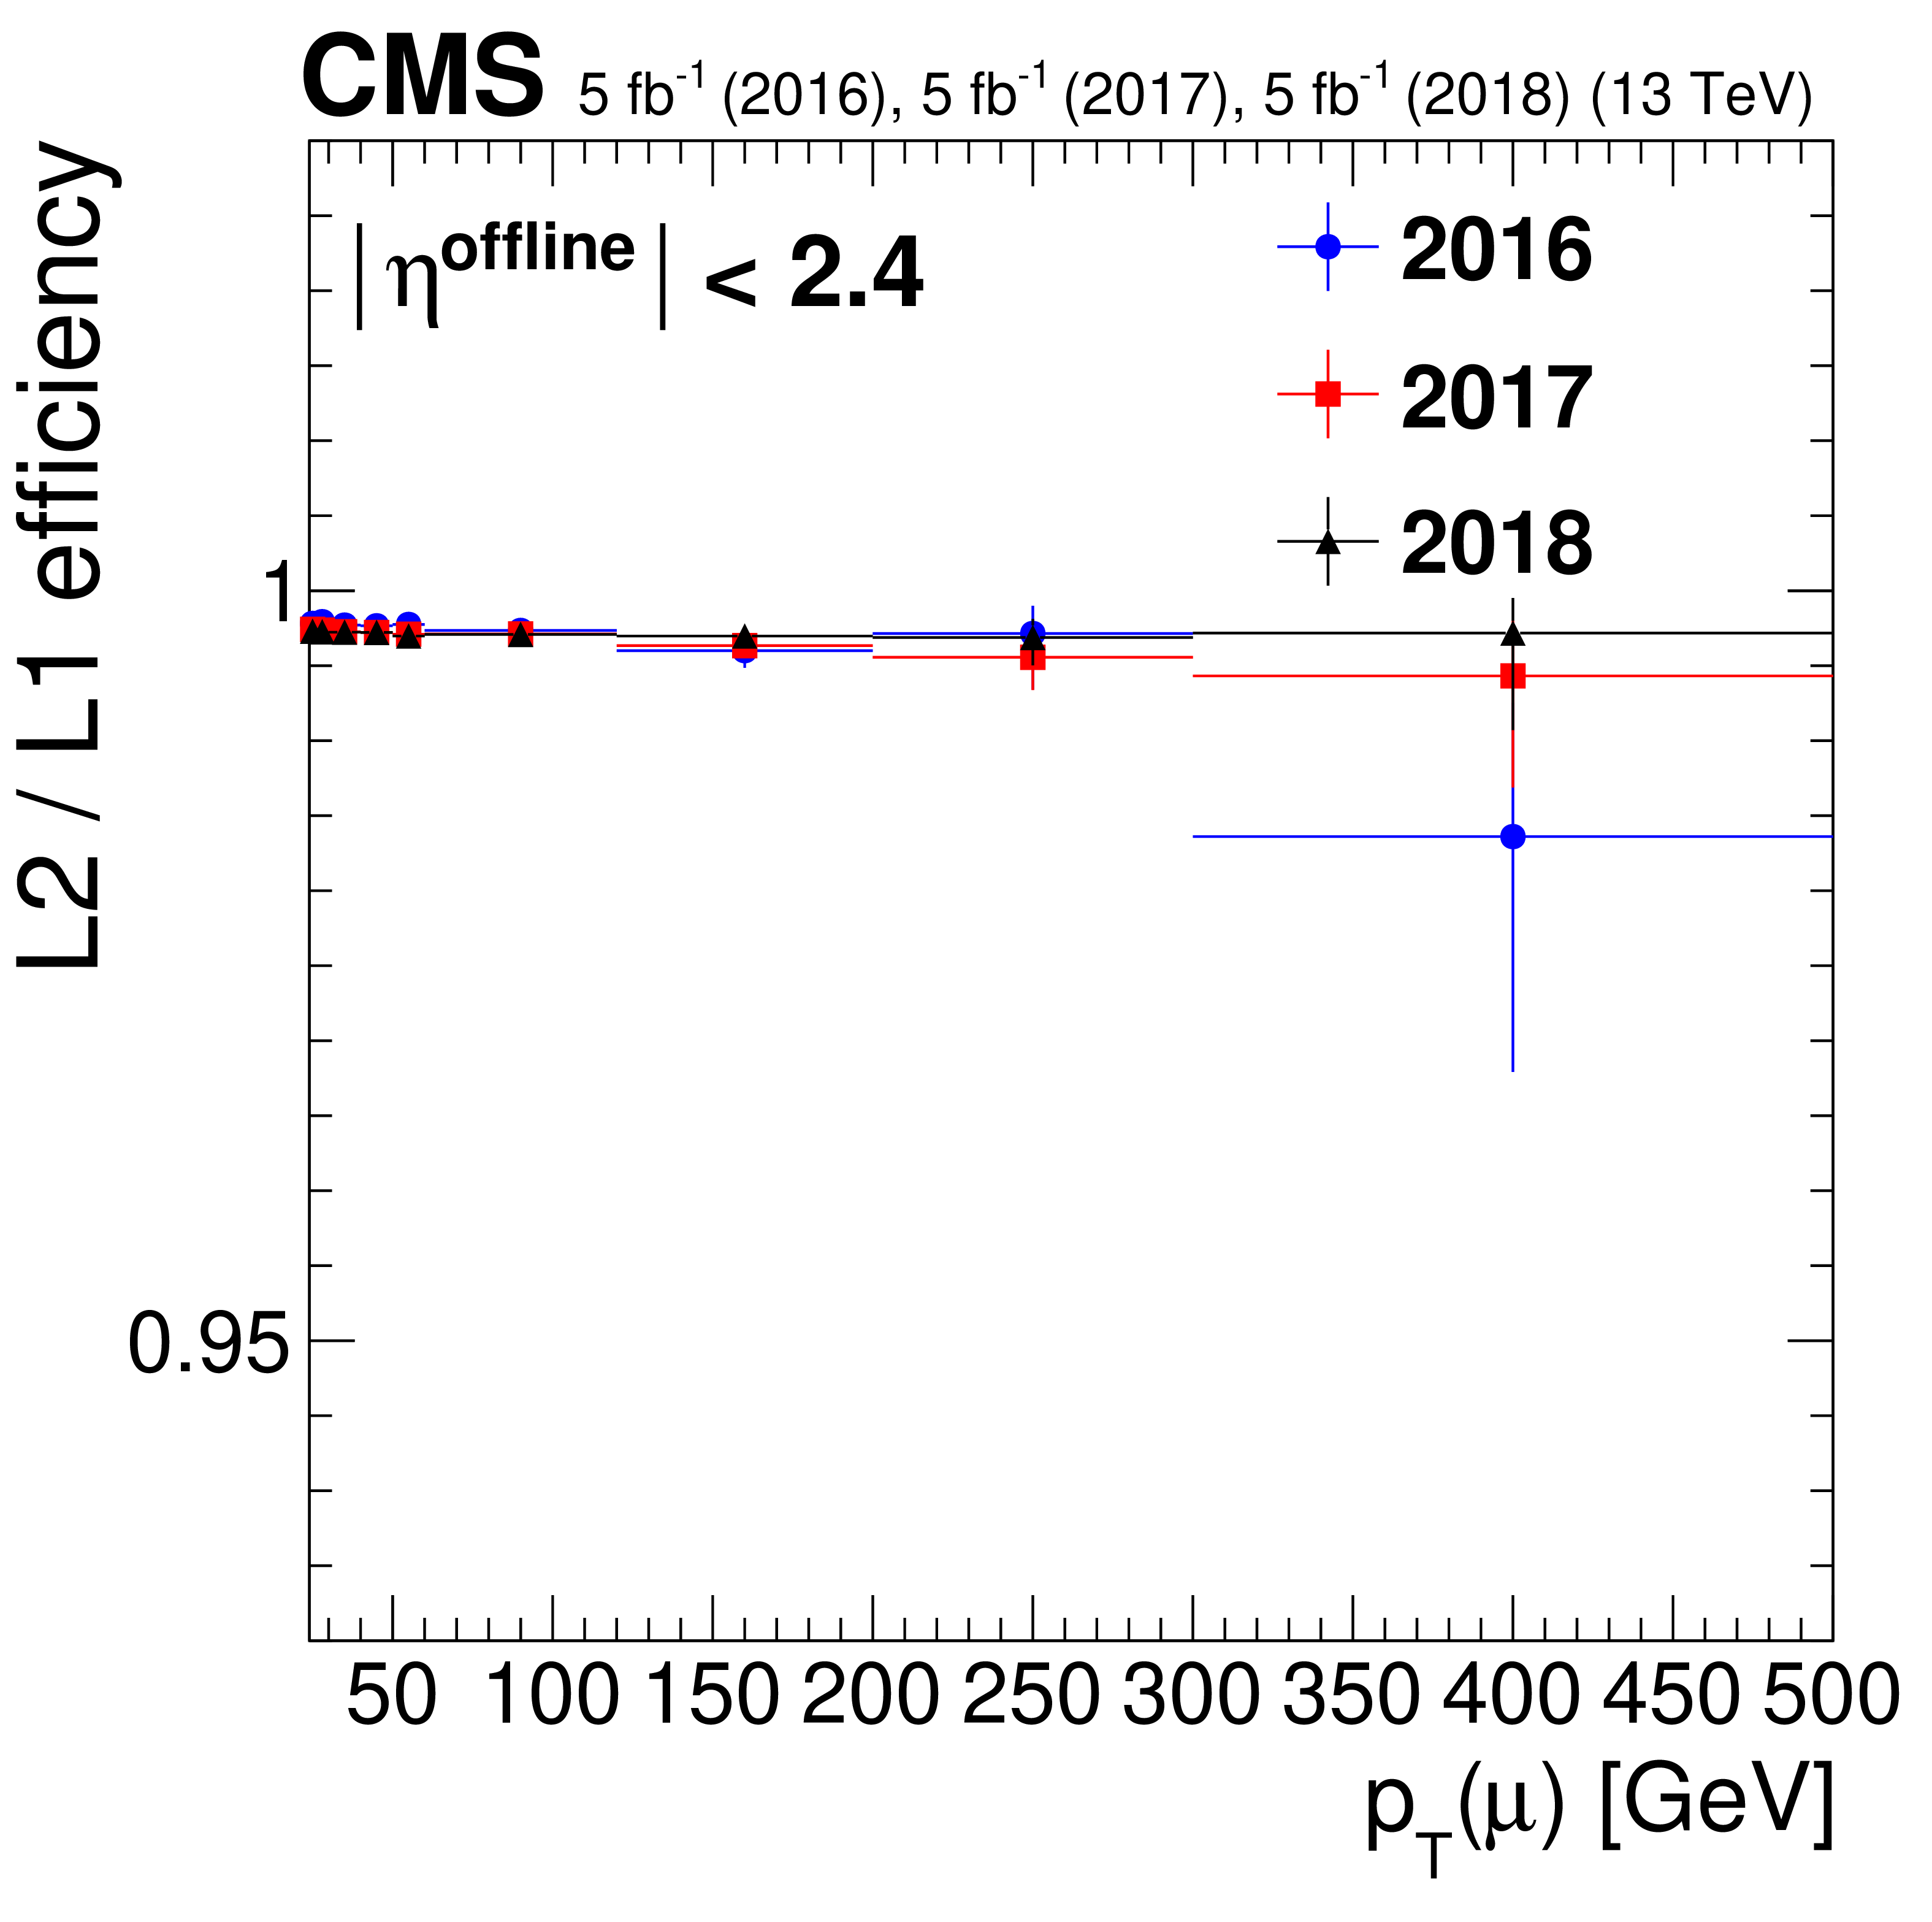
Efficiency of the L2 reconstruction with respect to L1 muons ($ {p_{\mathrm {T}}} > $ 22 GeV and "tight'' quality) as a function of ${p_{\mathrm {T}}}$ (upper left) and $\eta $ (upper right) of the probe muons. The dependence with the number of primary vertices is also shown (lower middle). The efficiency for 2016 data is shown in blue circles, for 2017 data in red squares, and for 2018 data in black triangles. Only statistical uncertainties are shown. |
png pdf |
Figure 3-a:
Efficiency of the L2 reconstruction with respect to L1 muons ($ {p_{\mathrm {T}}} > $ 22 GeV and "tight'' quality) as a function of ${p_{\mathrm {T}}}$ of the probe muons. The efficiency for 2016 data is shown in blue circles, for 2017 data in red squares, and for 2018 data in black triangles. Only statistical uncertainties are shown. |
png pdf |
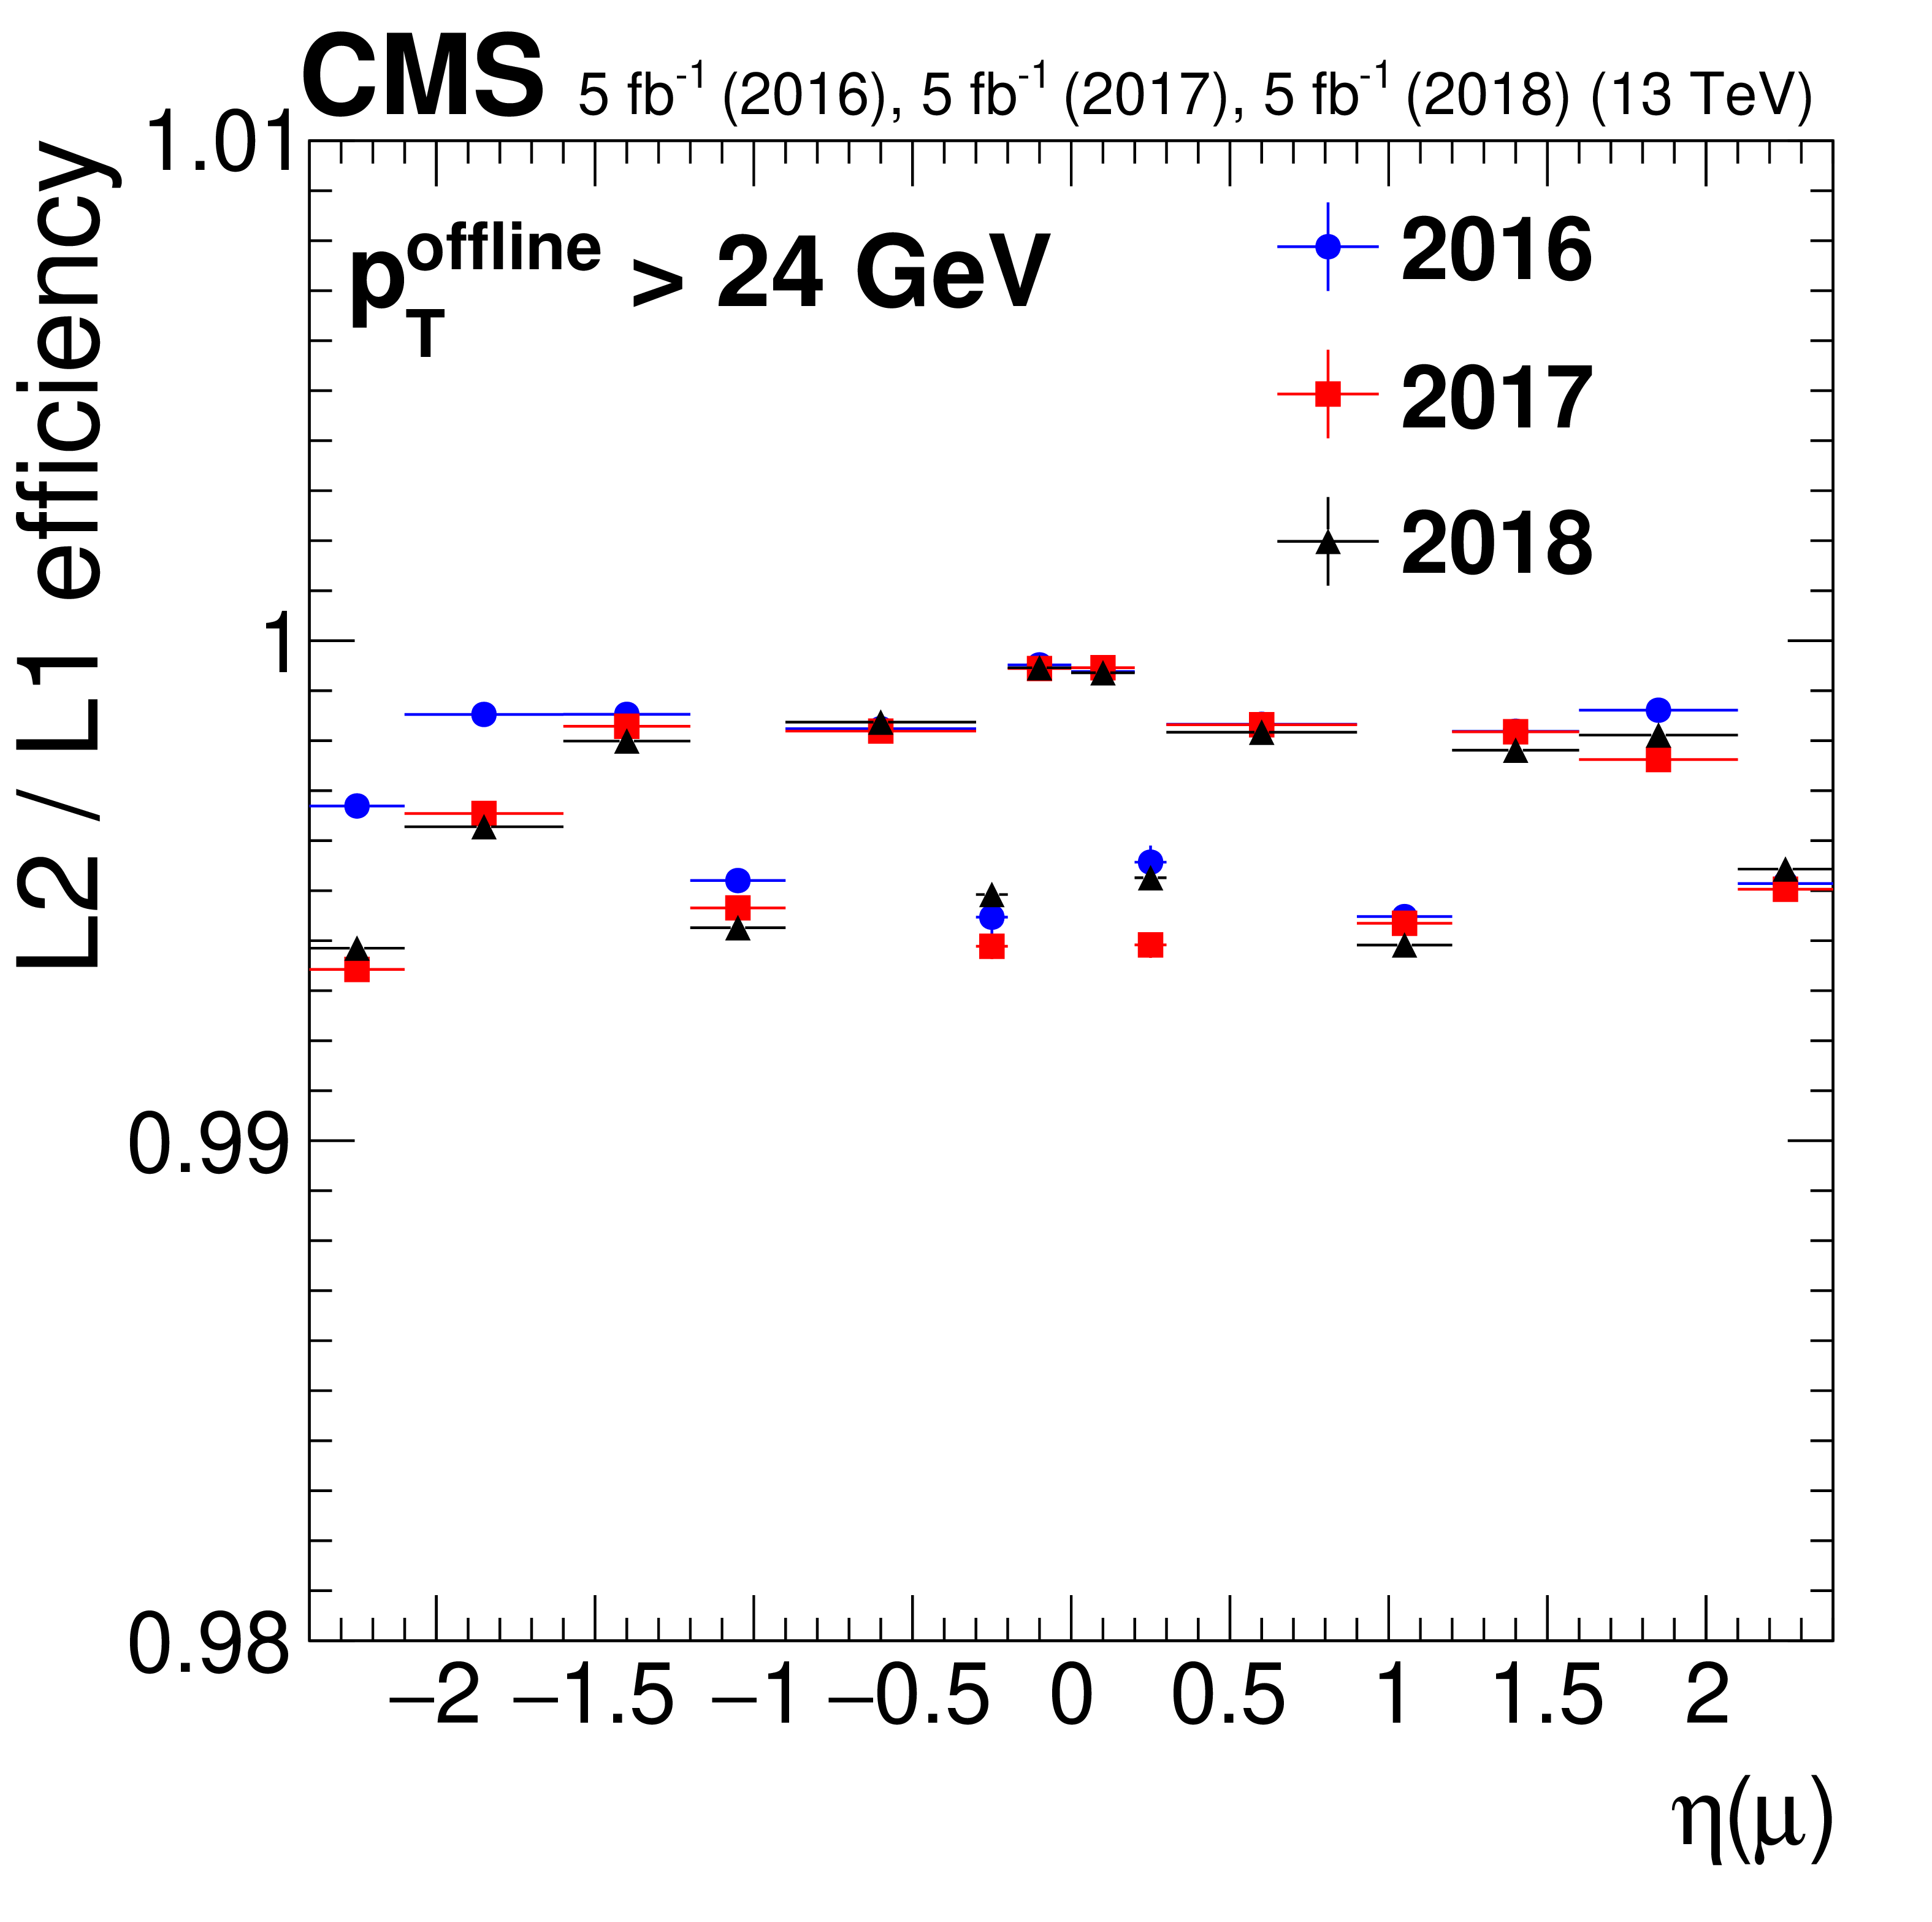
Figure 3-b:
Efficiency of the L2 reconstruction with respect to L1 muons ($ {p_{\mathrm {T}}} > $ 22 GeV and "tight'' quality) as a function of $\eta $ of the probe muons. The efficiency for 2016 data is shown in blue circles, for 2017 data in red squares, and for 2018 data in black triangles. Only statistical uncertainties are shown. |
png pdf |
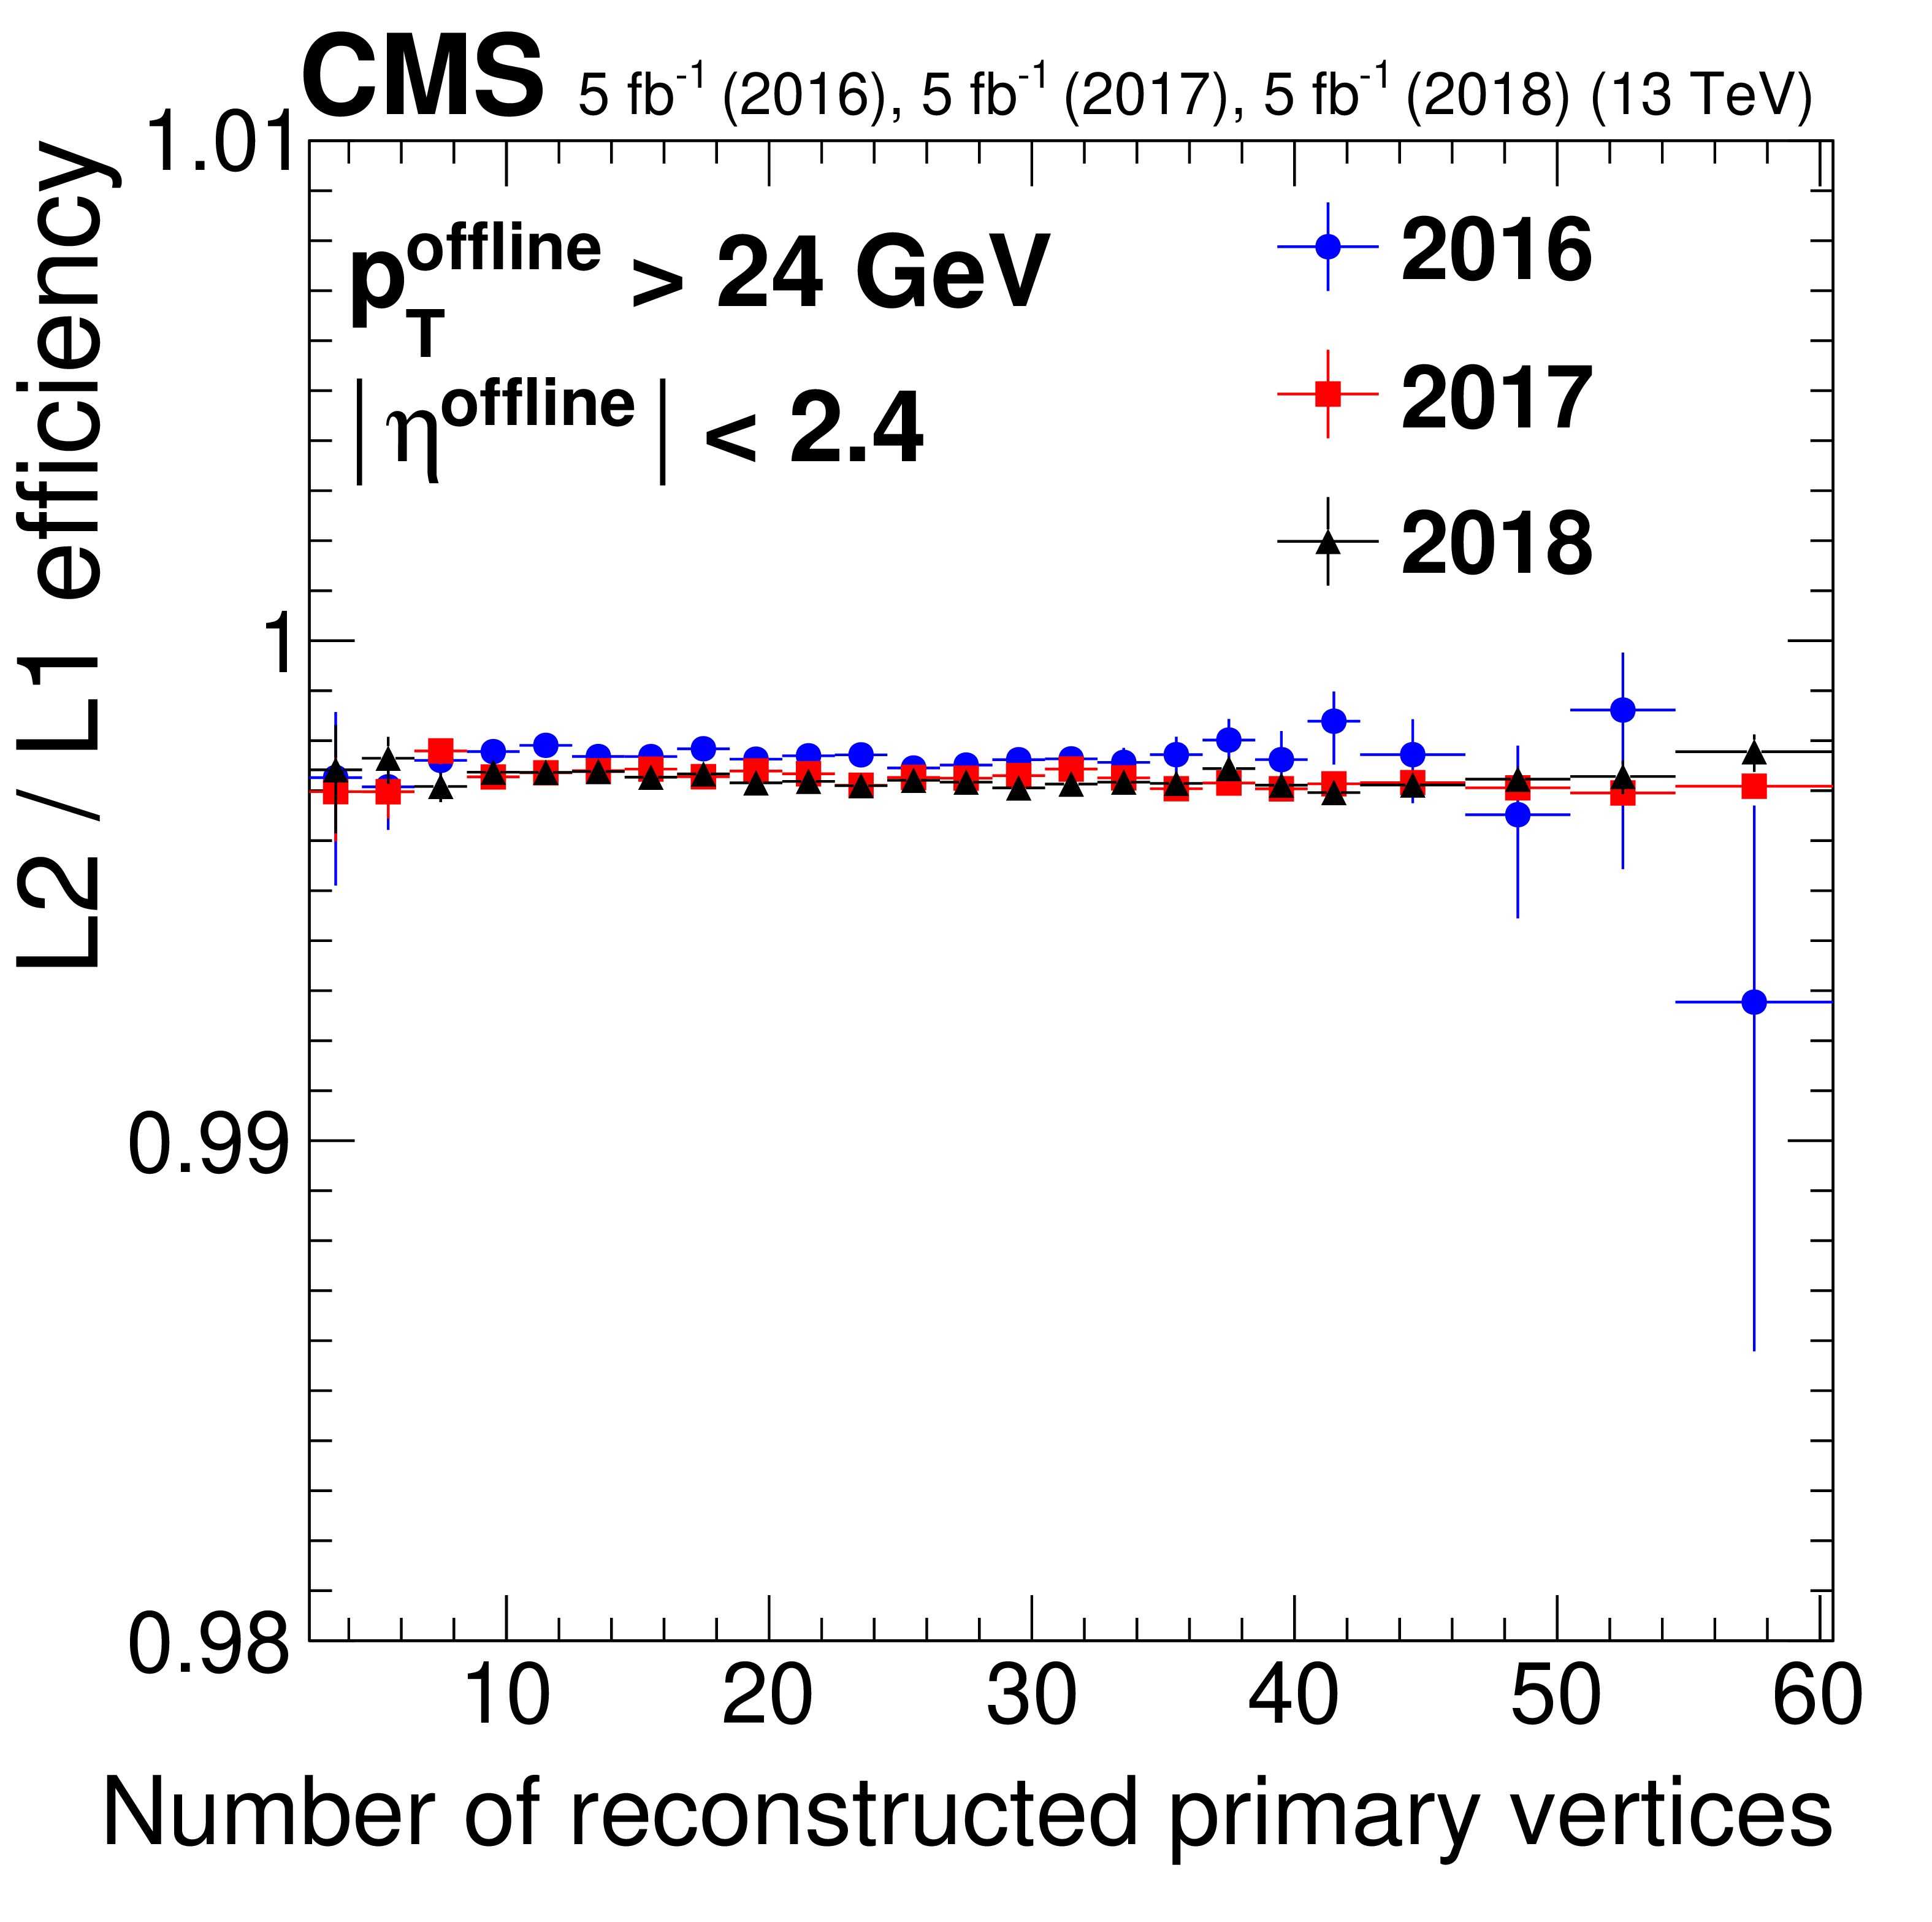
Figure 3-c:
Efficiency of the L2 reconstruction with respect to L1 muons ($ {p_{\mathrm {T}}} > $ 22 GeV and "tight'' quality) as a function of the number of primary vertices. The efficiency for 2016 data is shown in blue circles, for 2017 data in red squares, and for 2018 data in black triangles. Only statistical uncertainties are shown. |
png pdf |
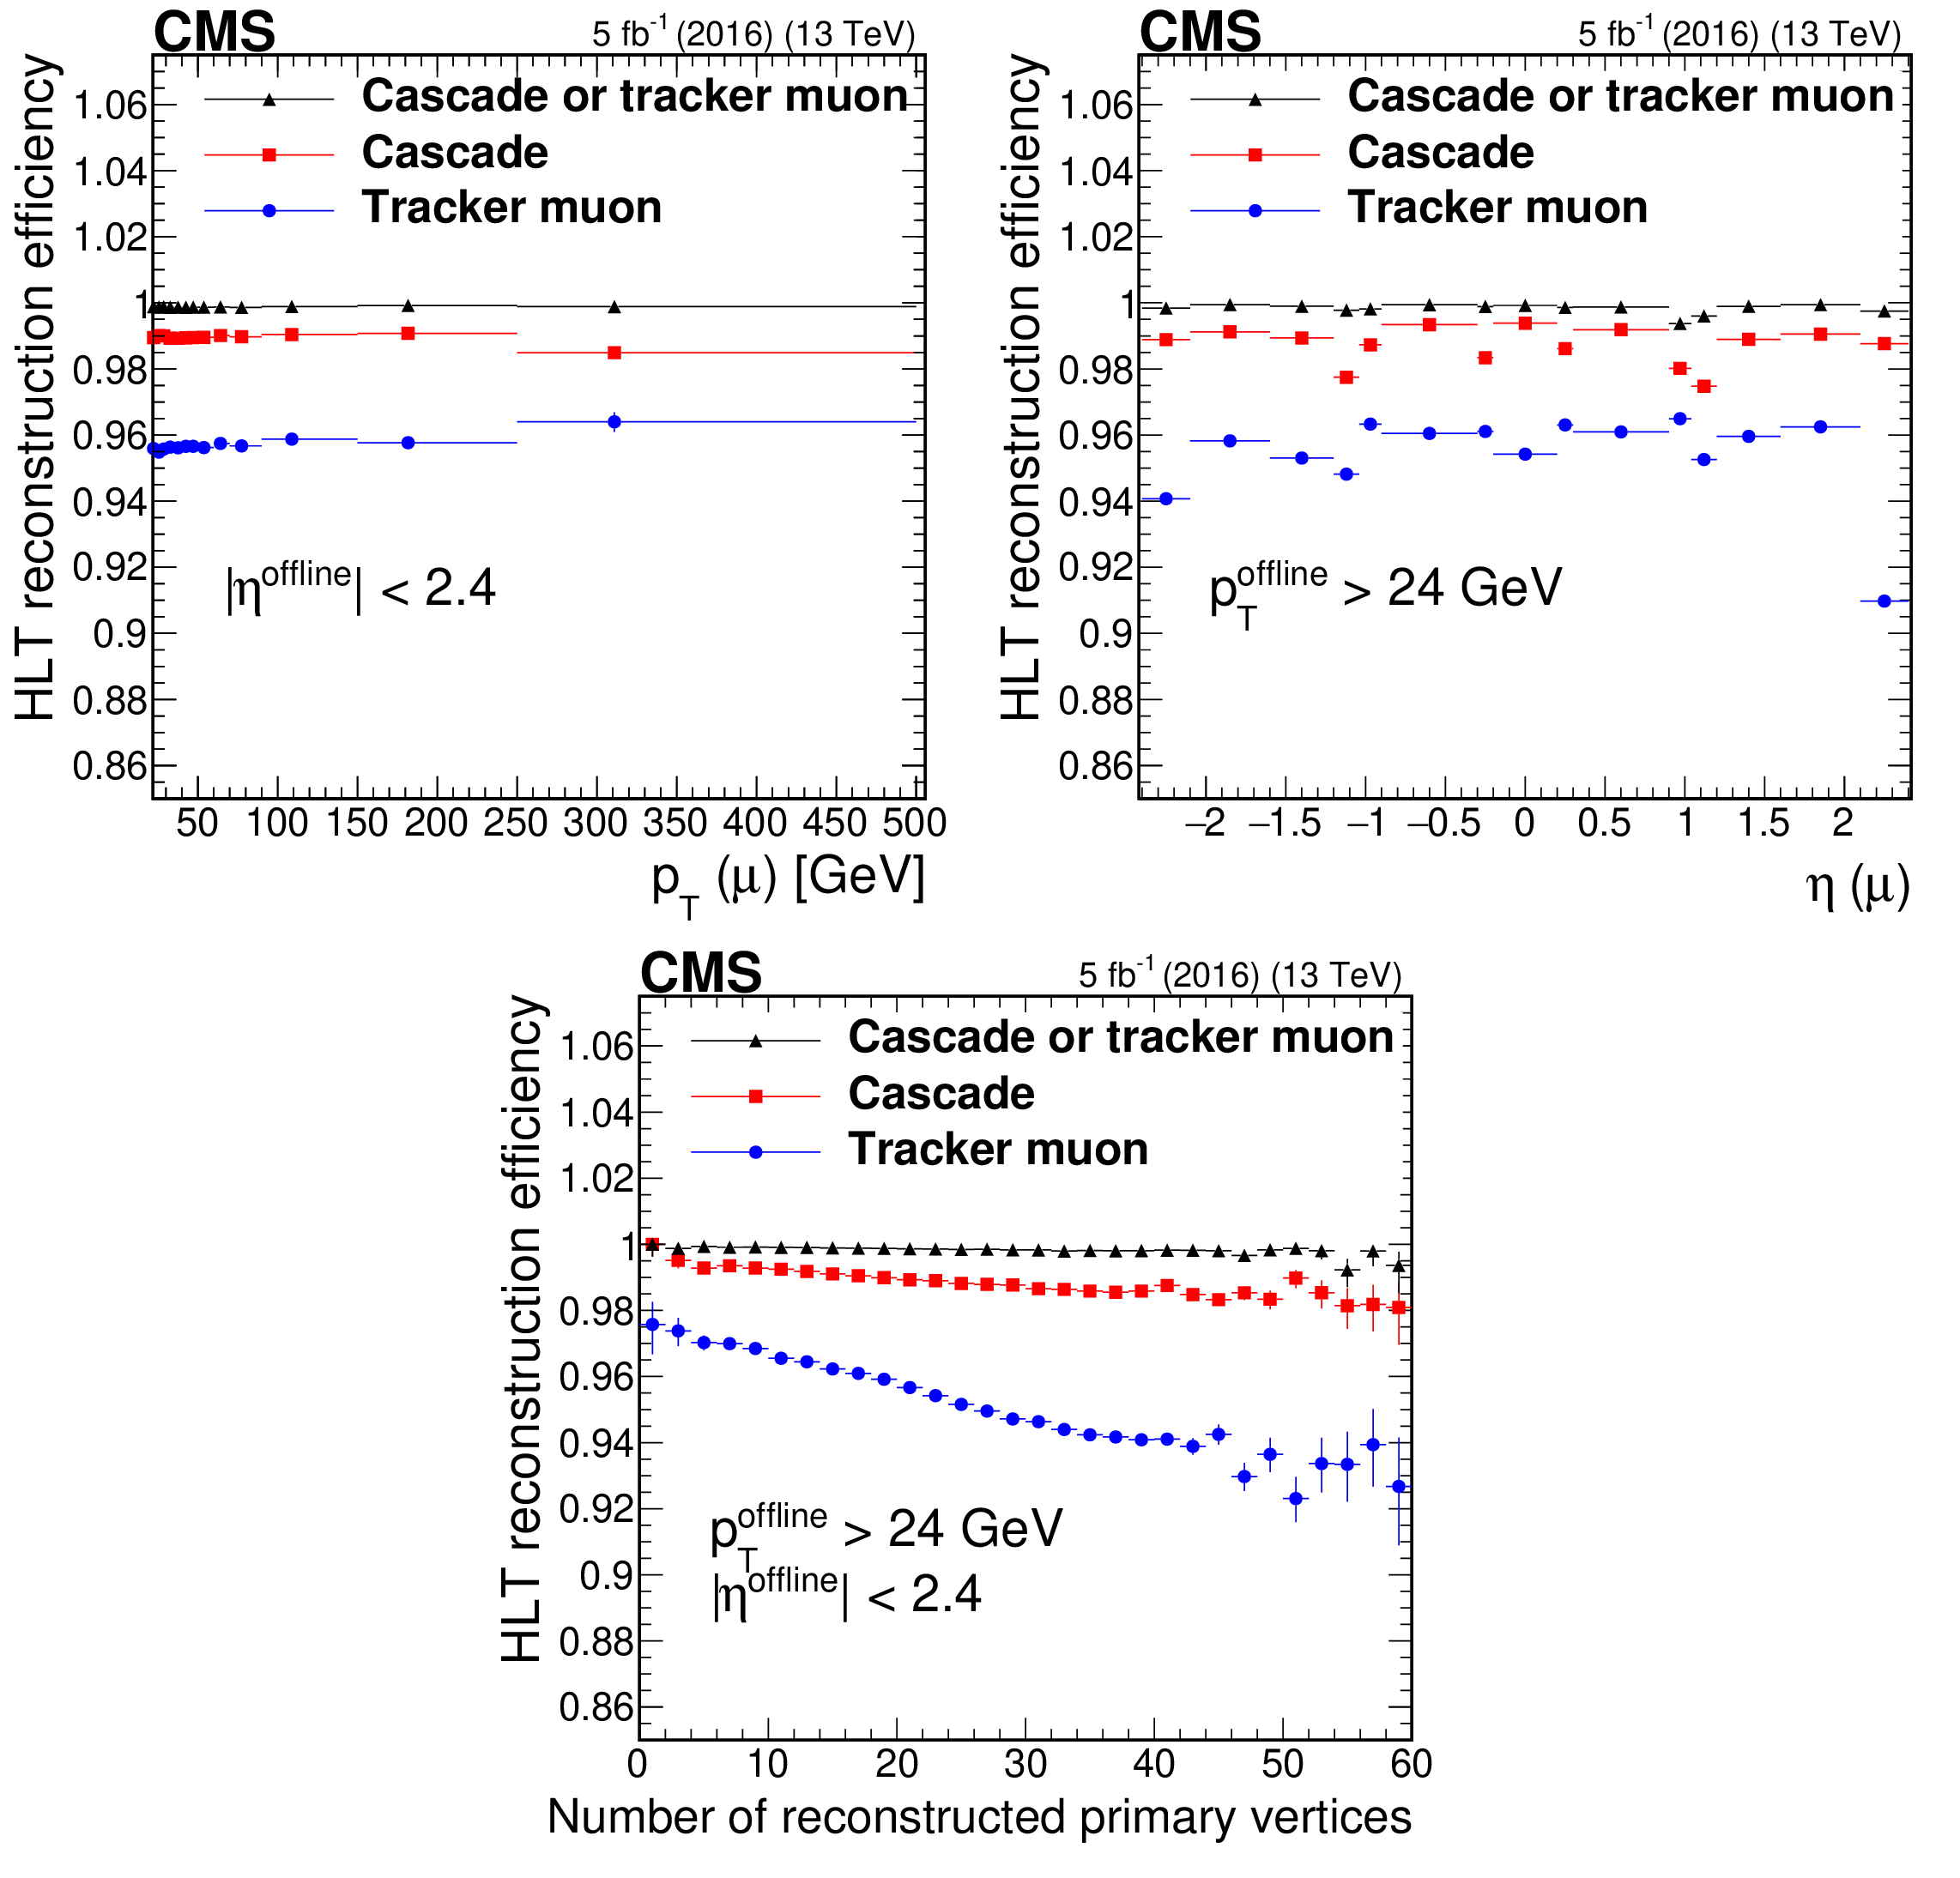
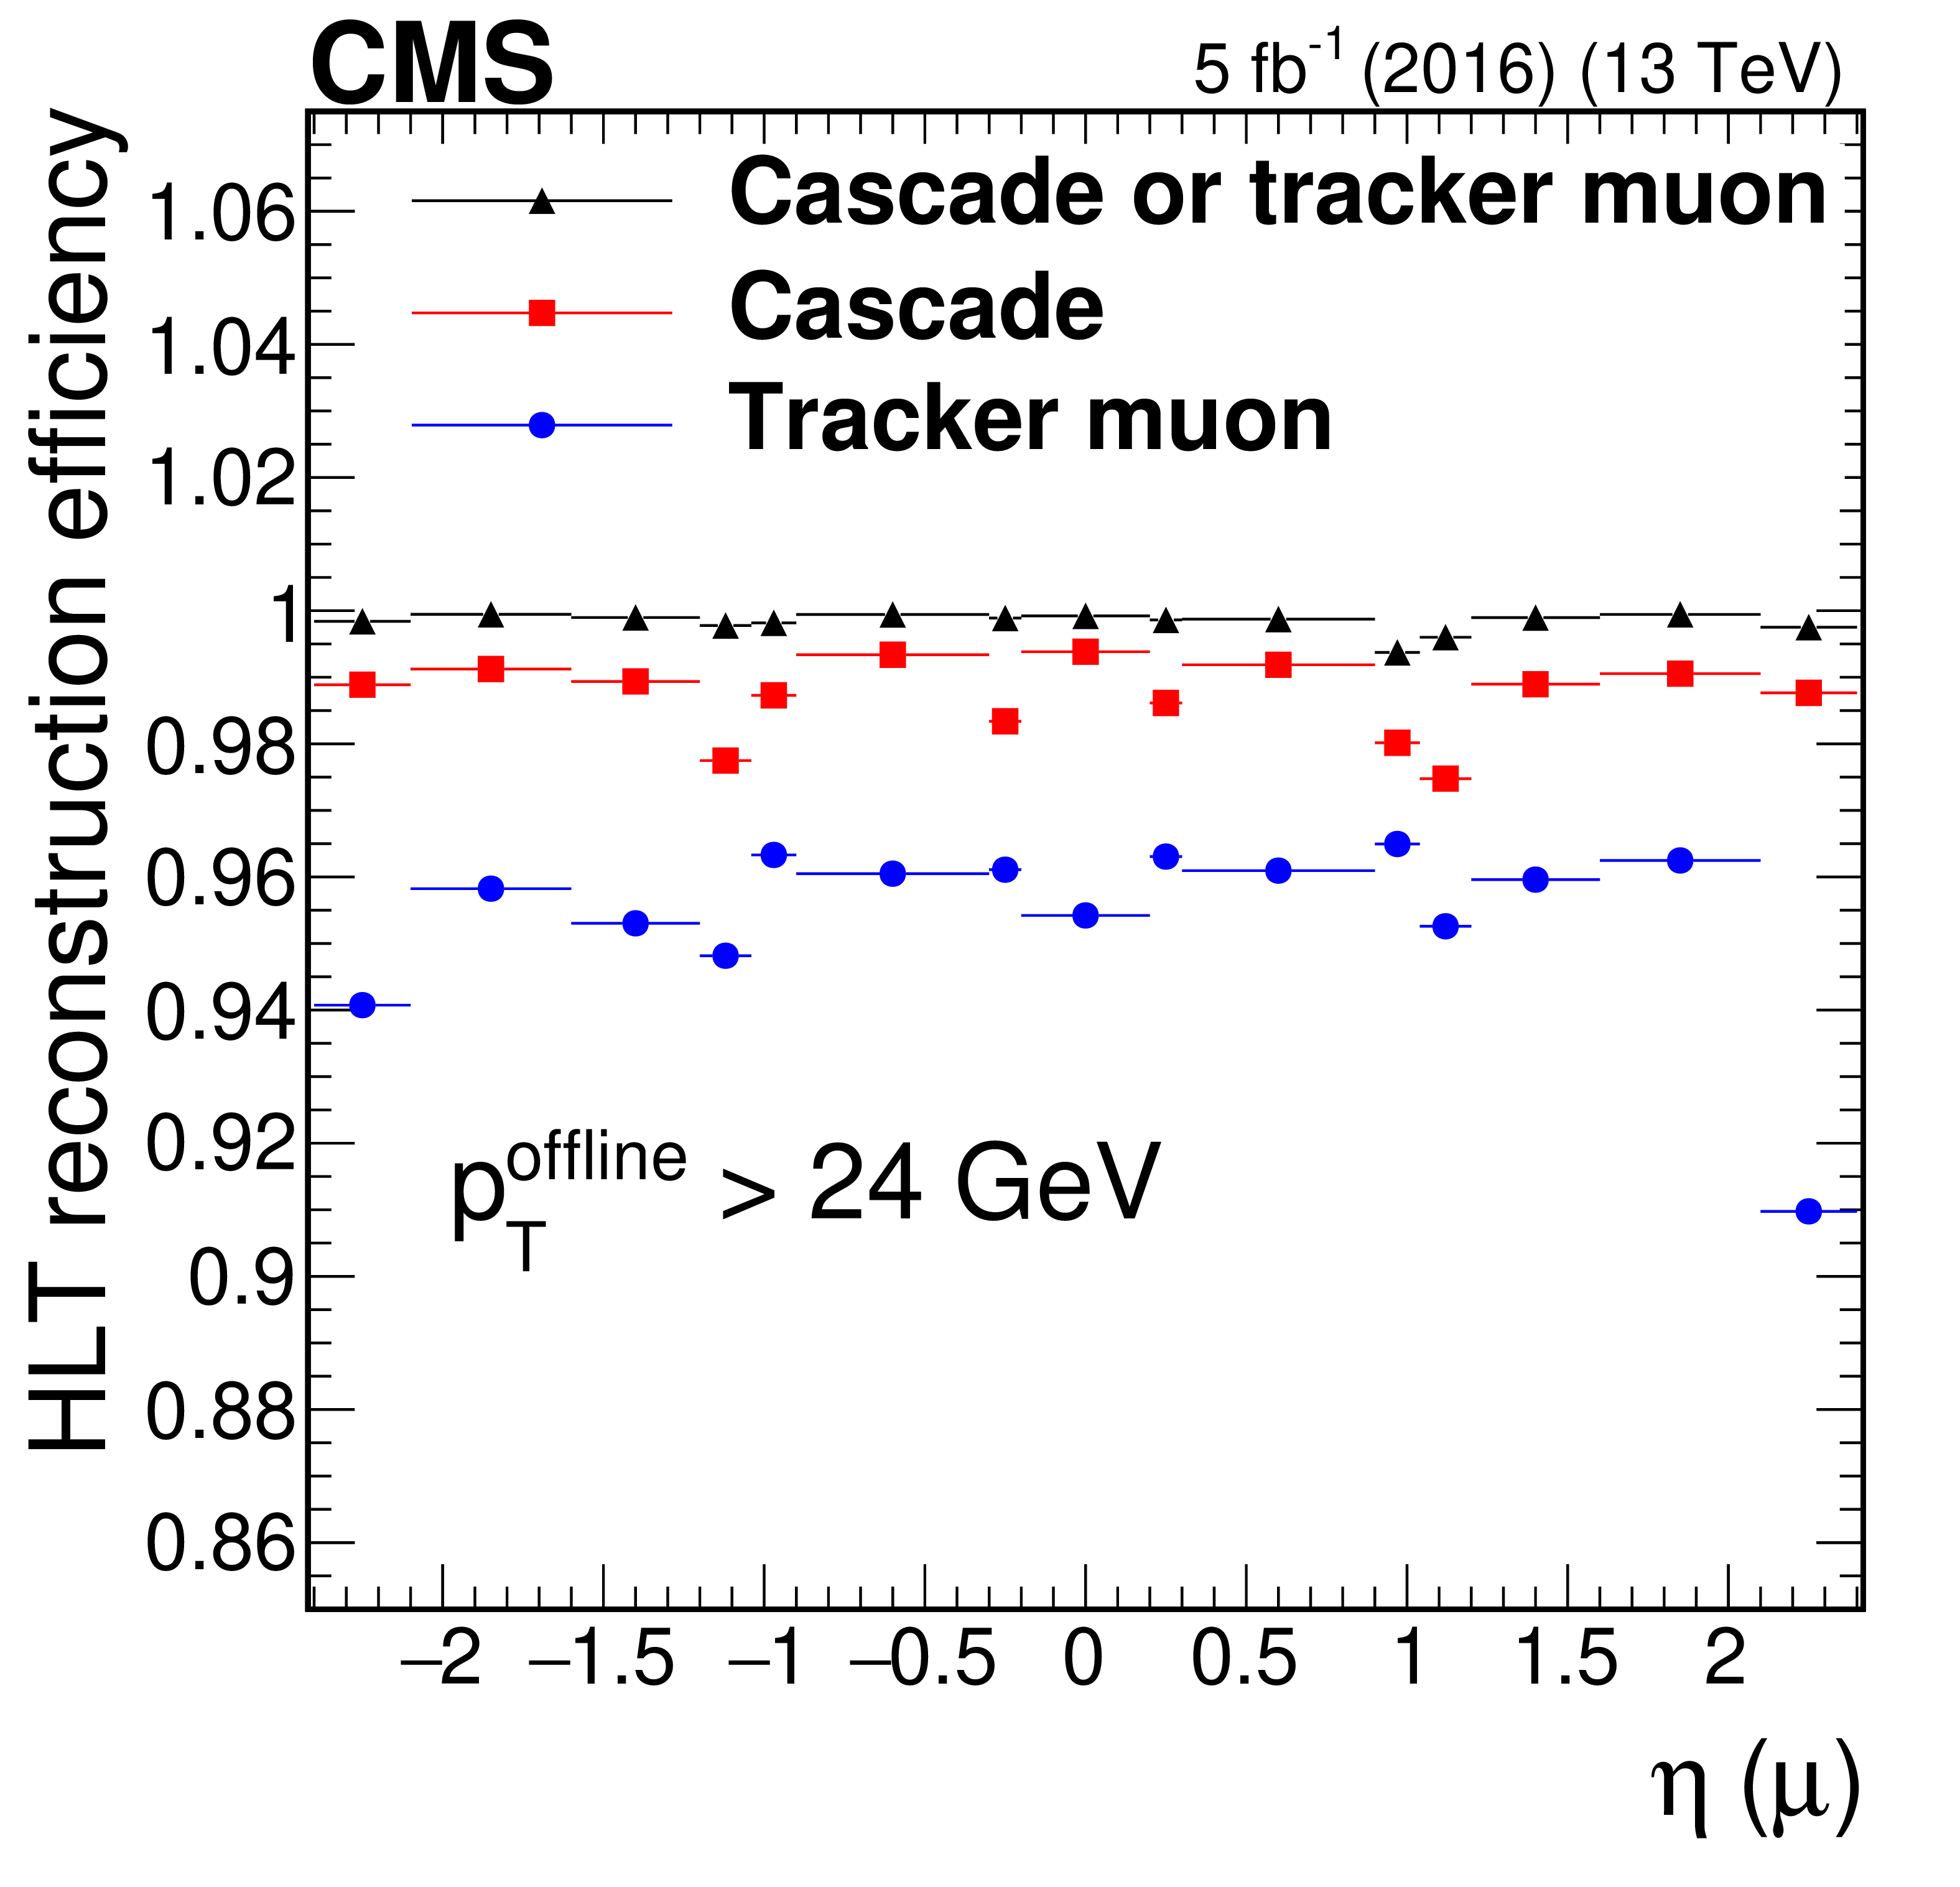
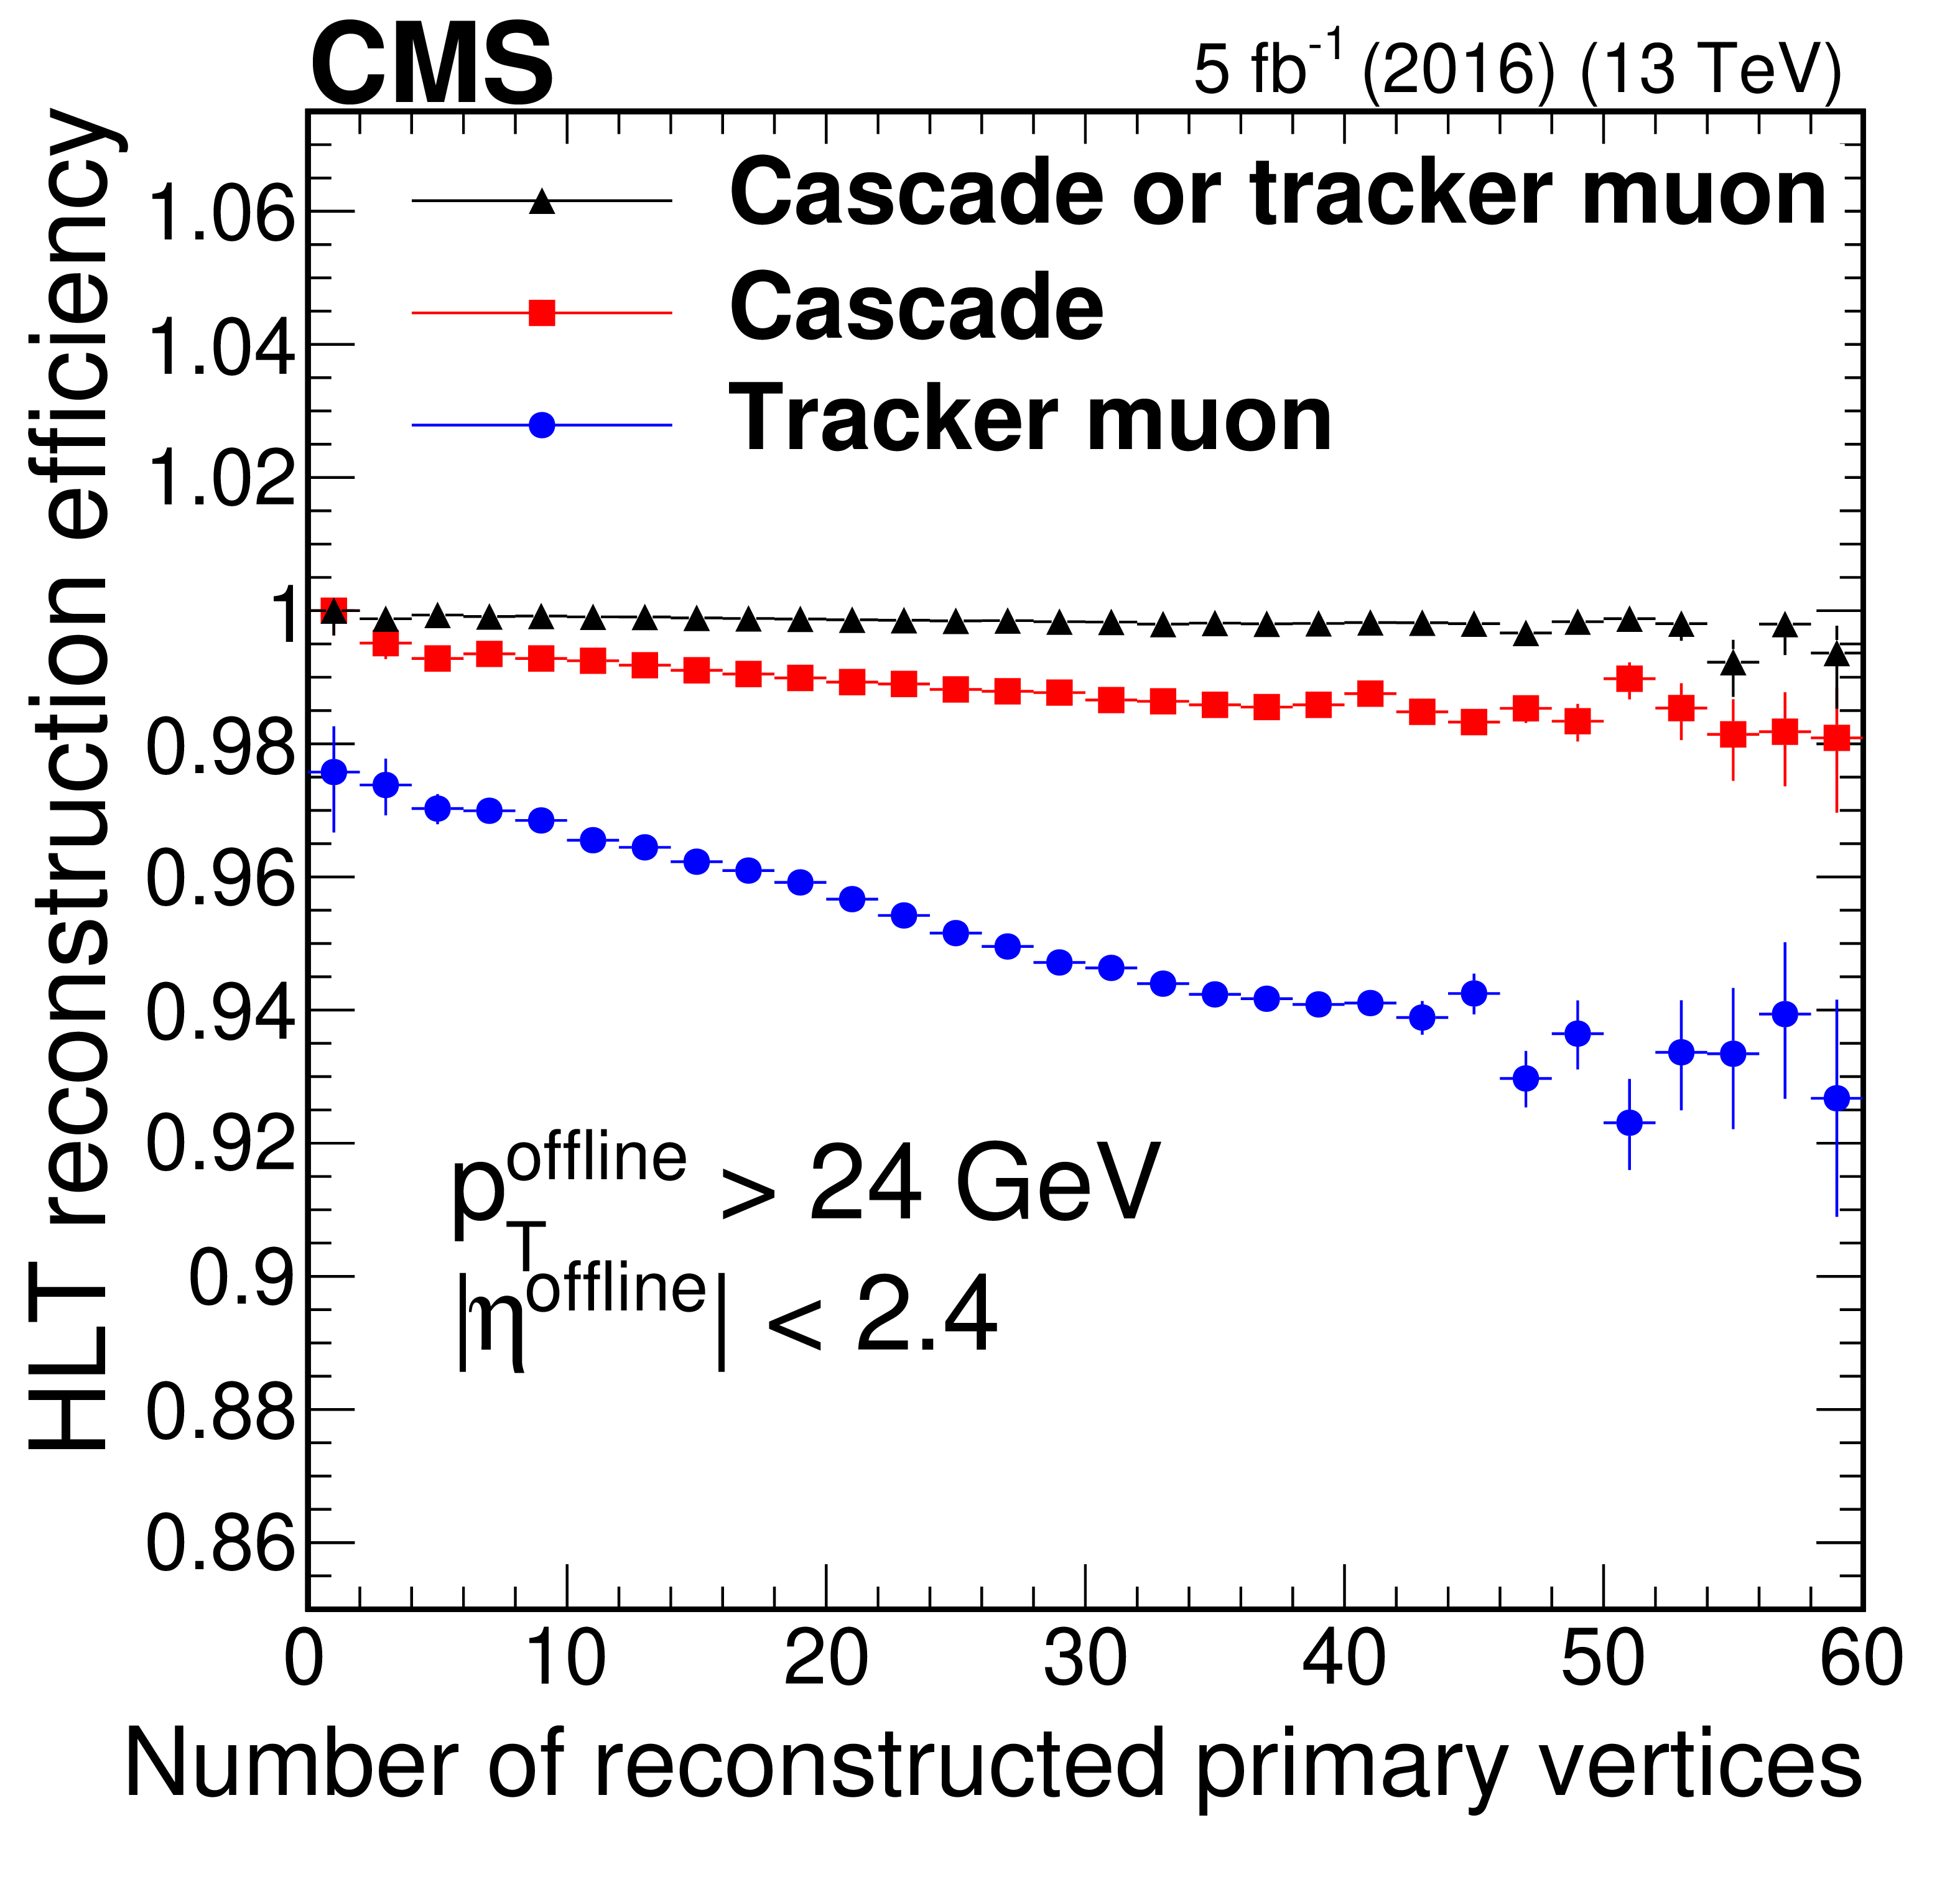
Figure 4:
Efficiency of the cascade and tracker muon L3 reconstruction algorithms, as well as the logical OR between the two, measured in data events as a function of ${p_{\mathrm {T}}}$ (upper left), muon $\eta $ (upper right), and the number of reconstructed primary vertices (lower middle). Only statistical uncertainties are shown. |
png pdf |
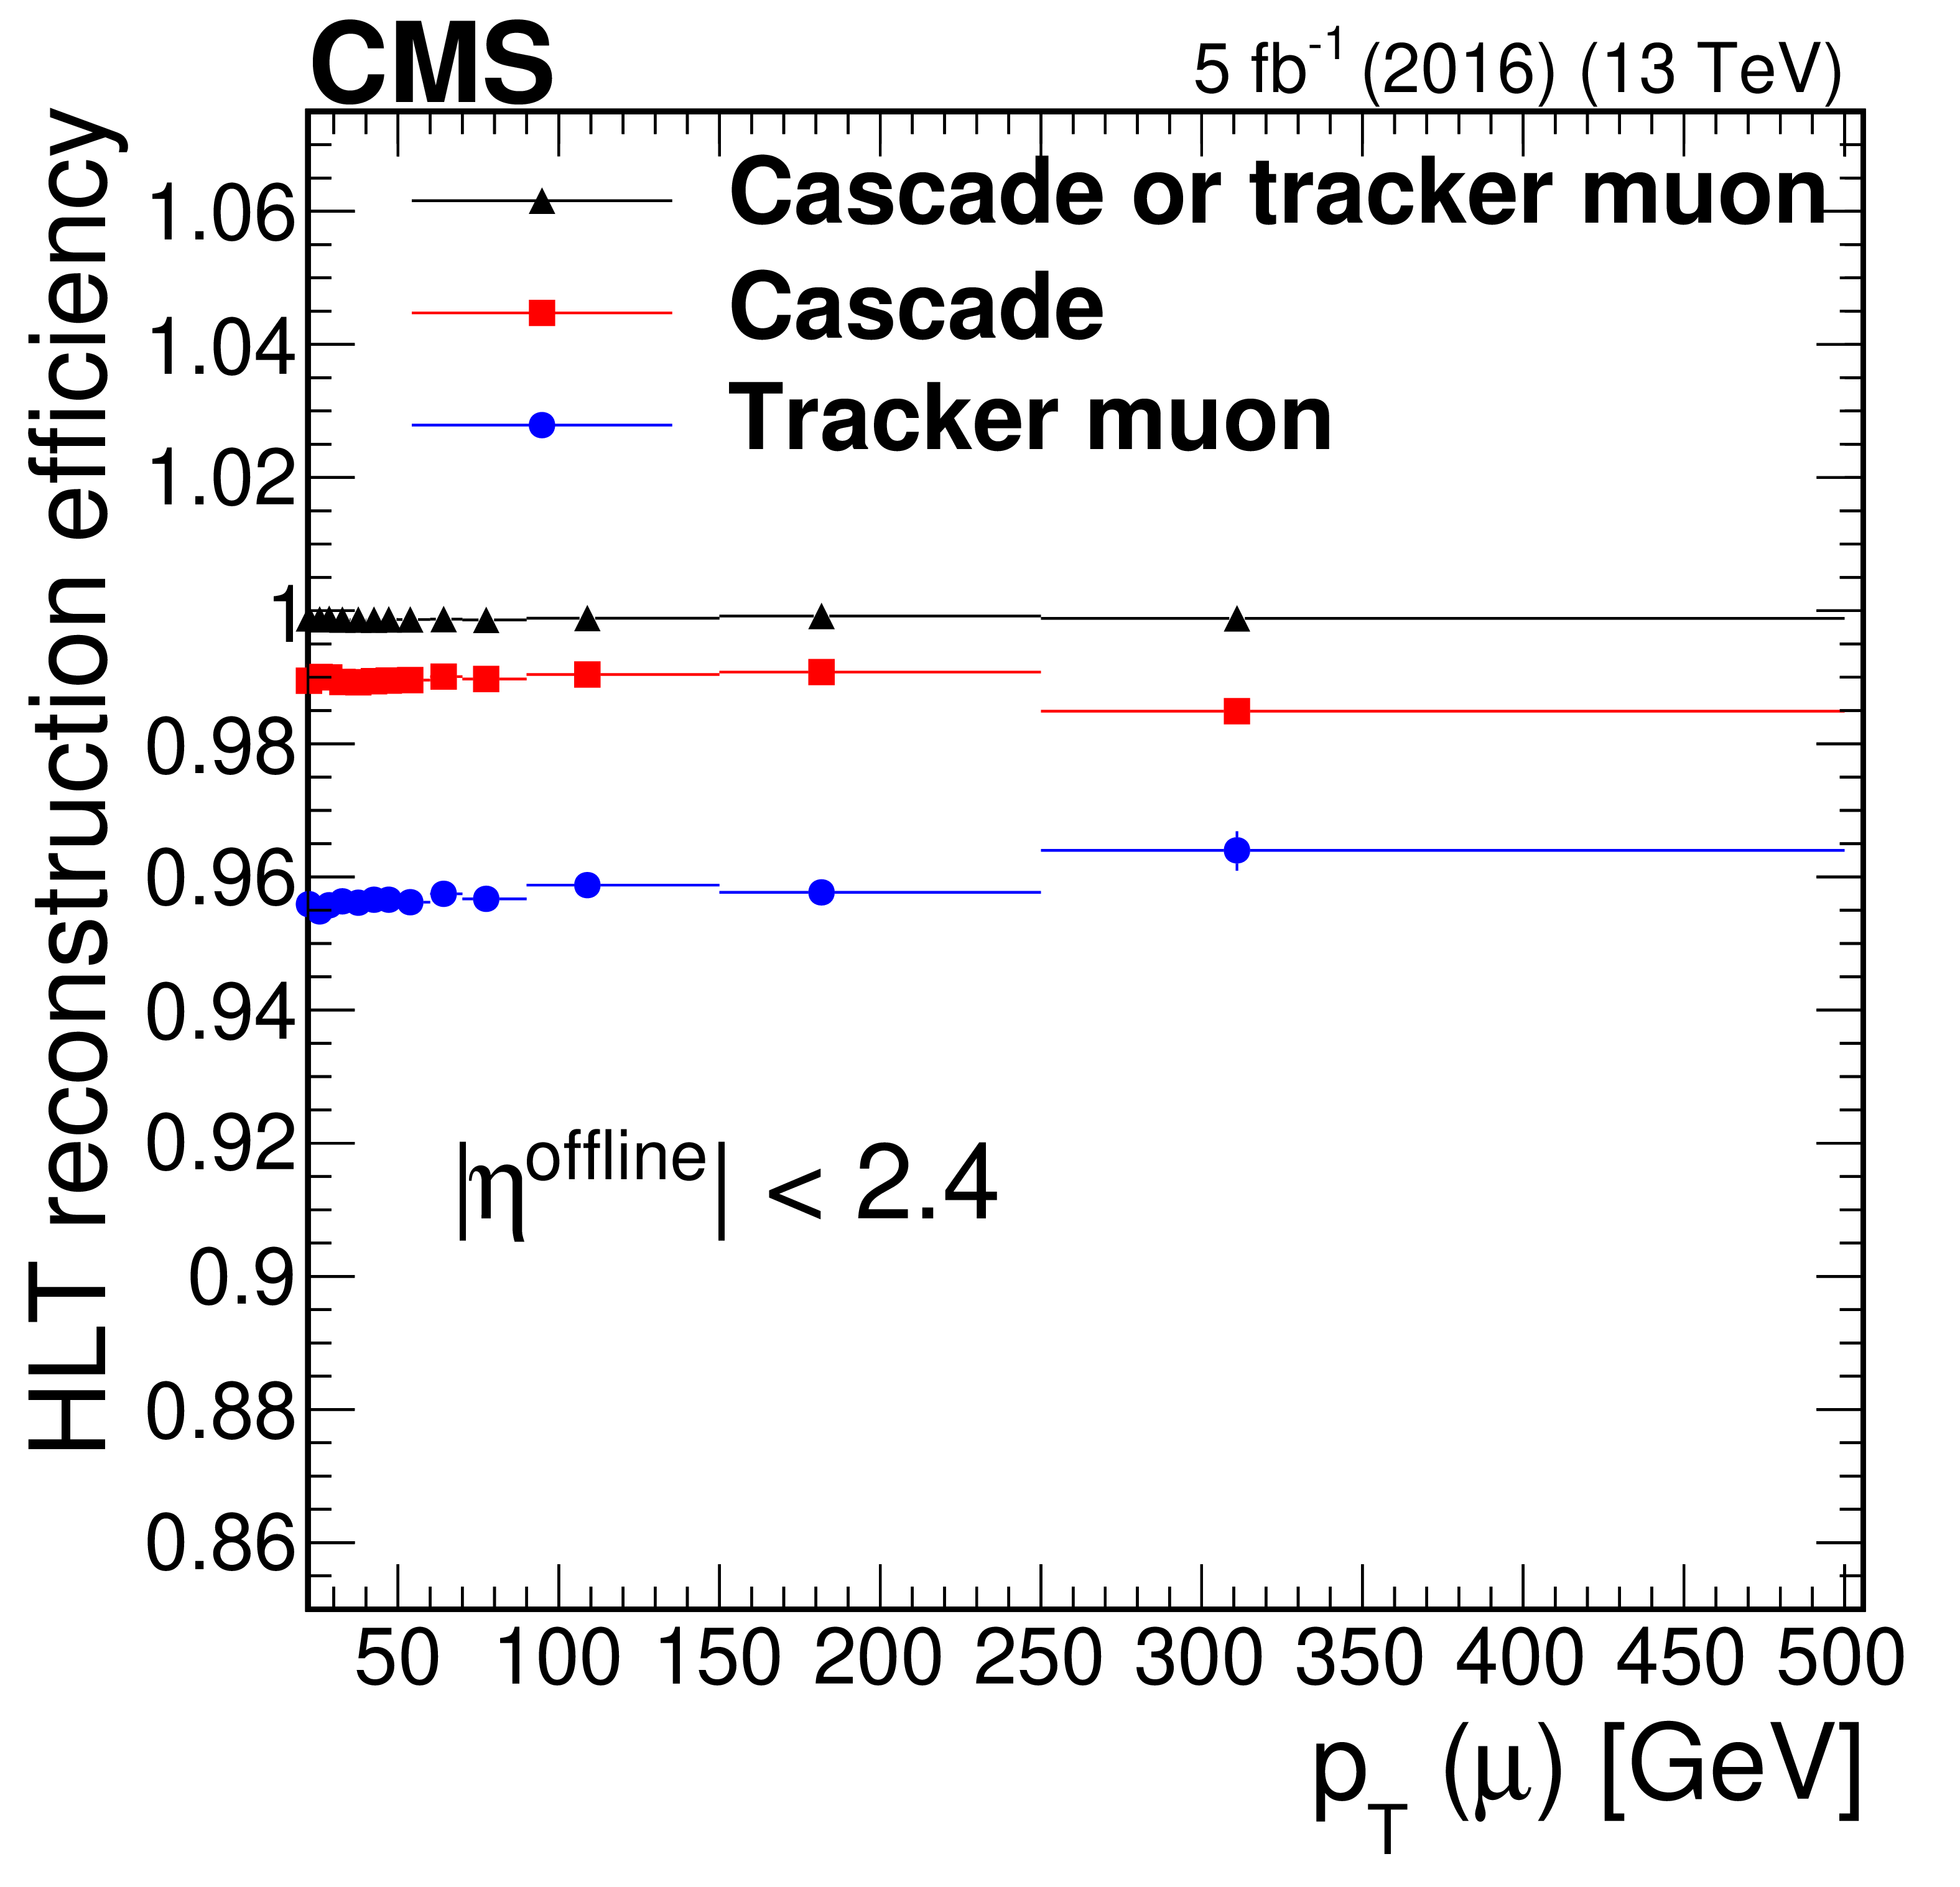
Figure 4-a:
Efficiency of the cascade and tracker muon L3 reconstruction algorithms, as well as the logical OR between the two, measured in data events as a function of ${p_{\mathrm {T}}}$. Only statistical uncertainties are shown. |
png pdf |
Figure 4-b:
Efficiency of the cascade and tracker muon L3 reconstruction algorithms, as well as the logical OR between the two, measured in data events as a function of muon $\eta $. Only statistical uncertainties are shown. |
png pdf |
Figure 4-c:
Efficiency of the cascade and tracker muon L3 reconstruction algorithms, as well as the logical OR between the two, measured in data events as a function of the number of reconstructed primary vertices. Only statistical uncertainties are shown. |

png pdf |
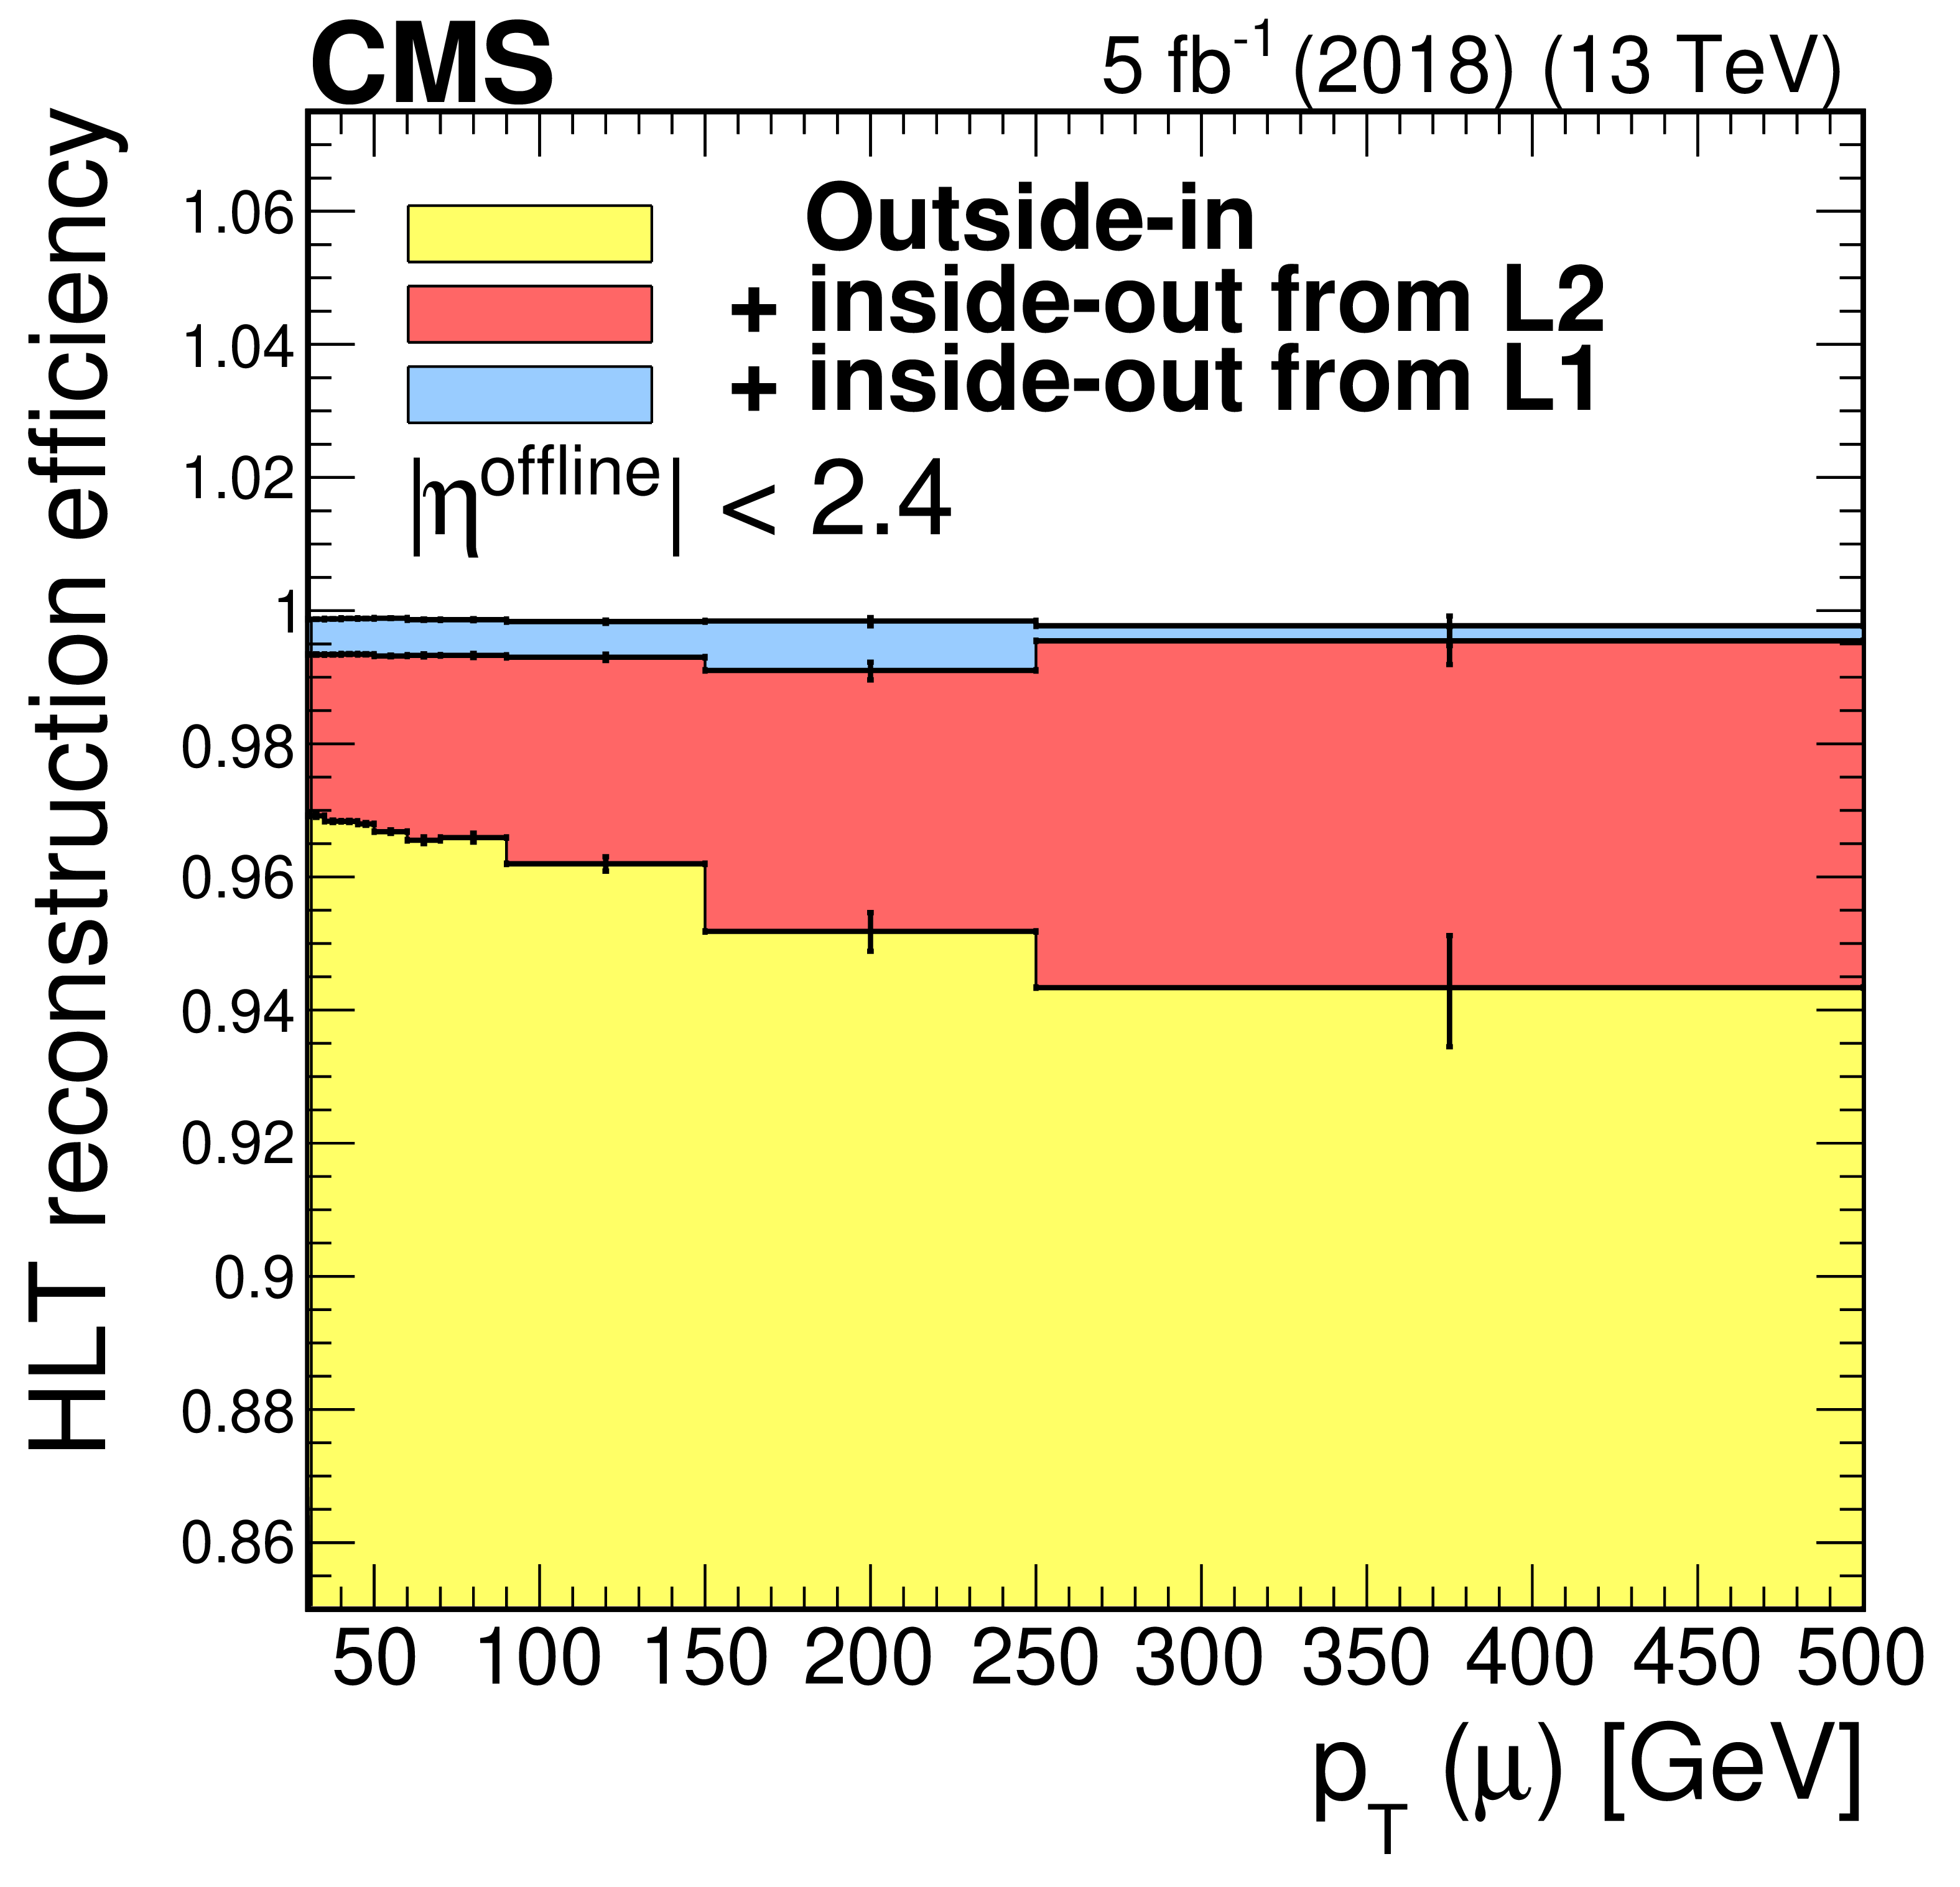
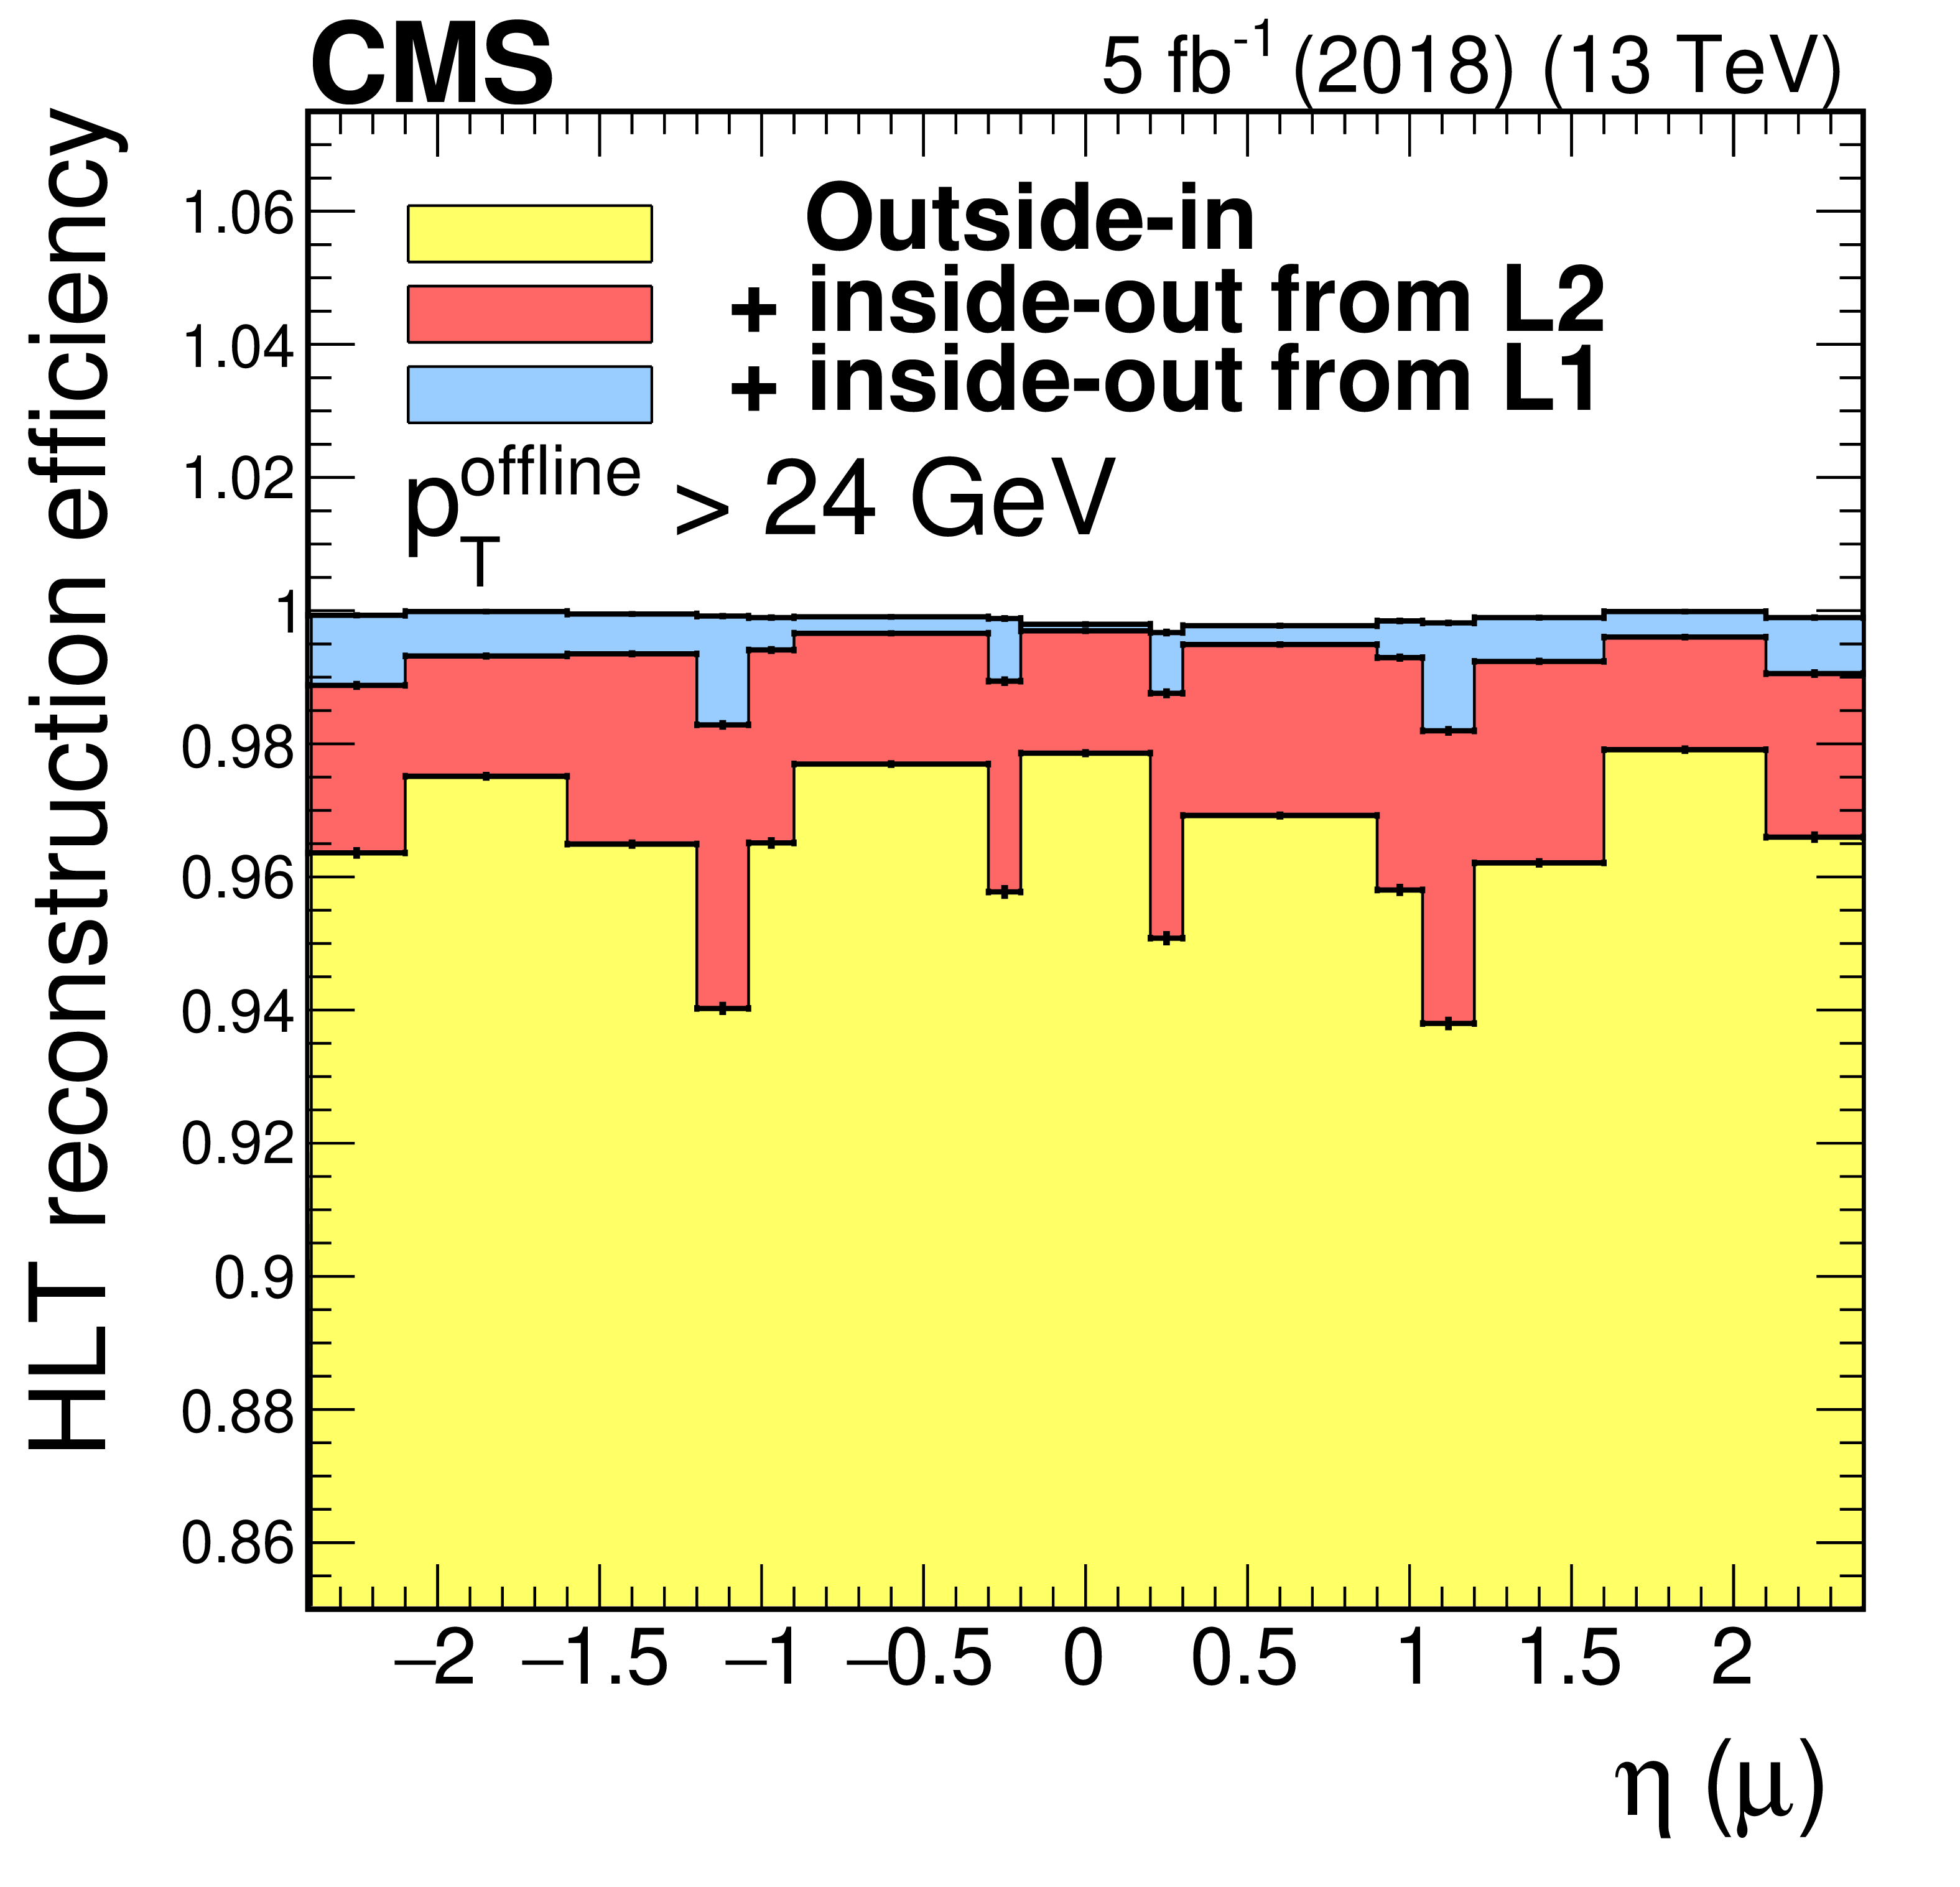
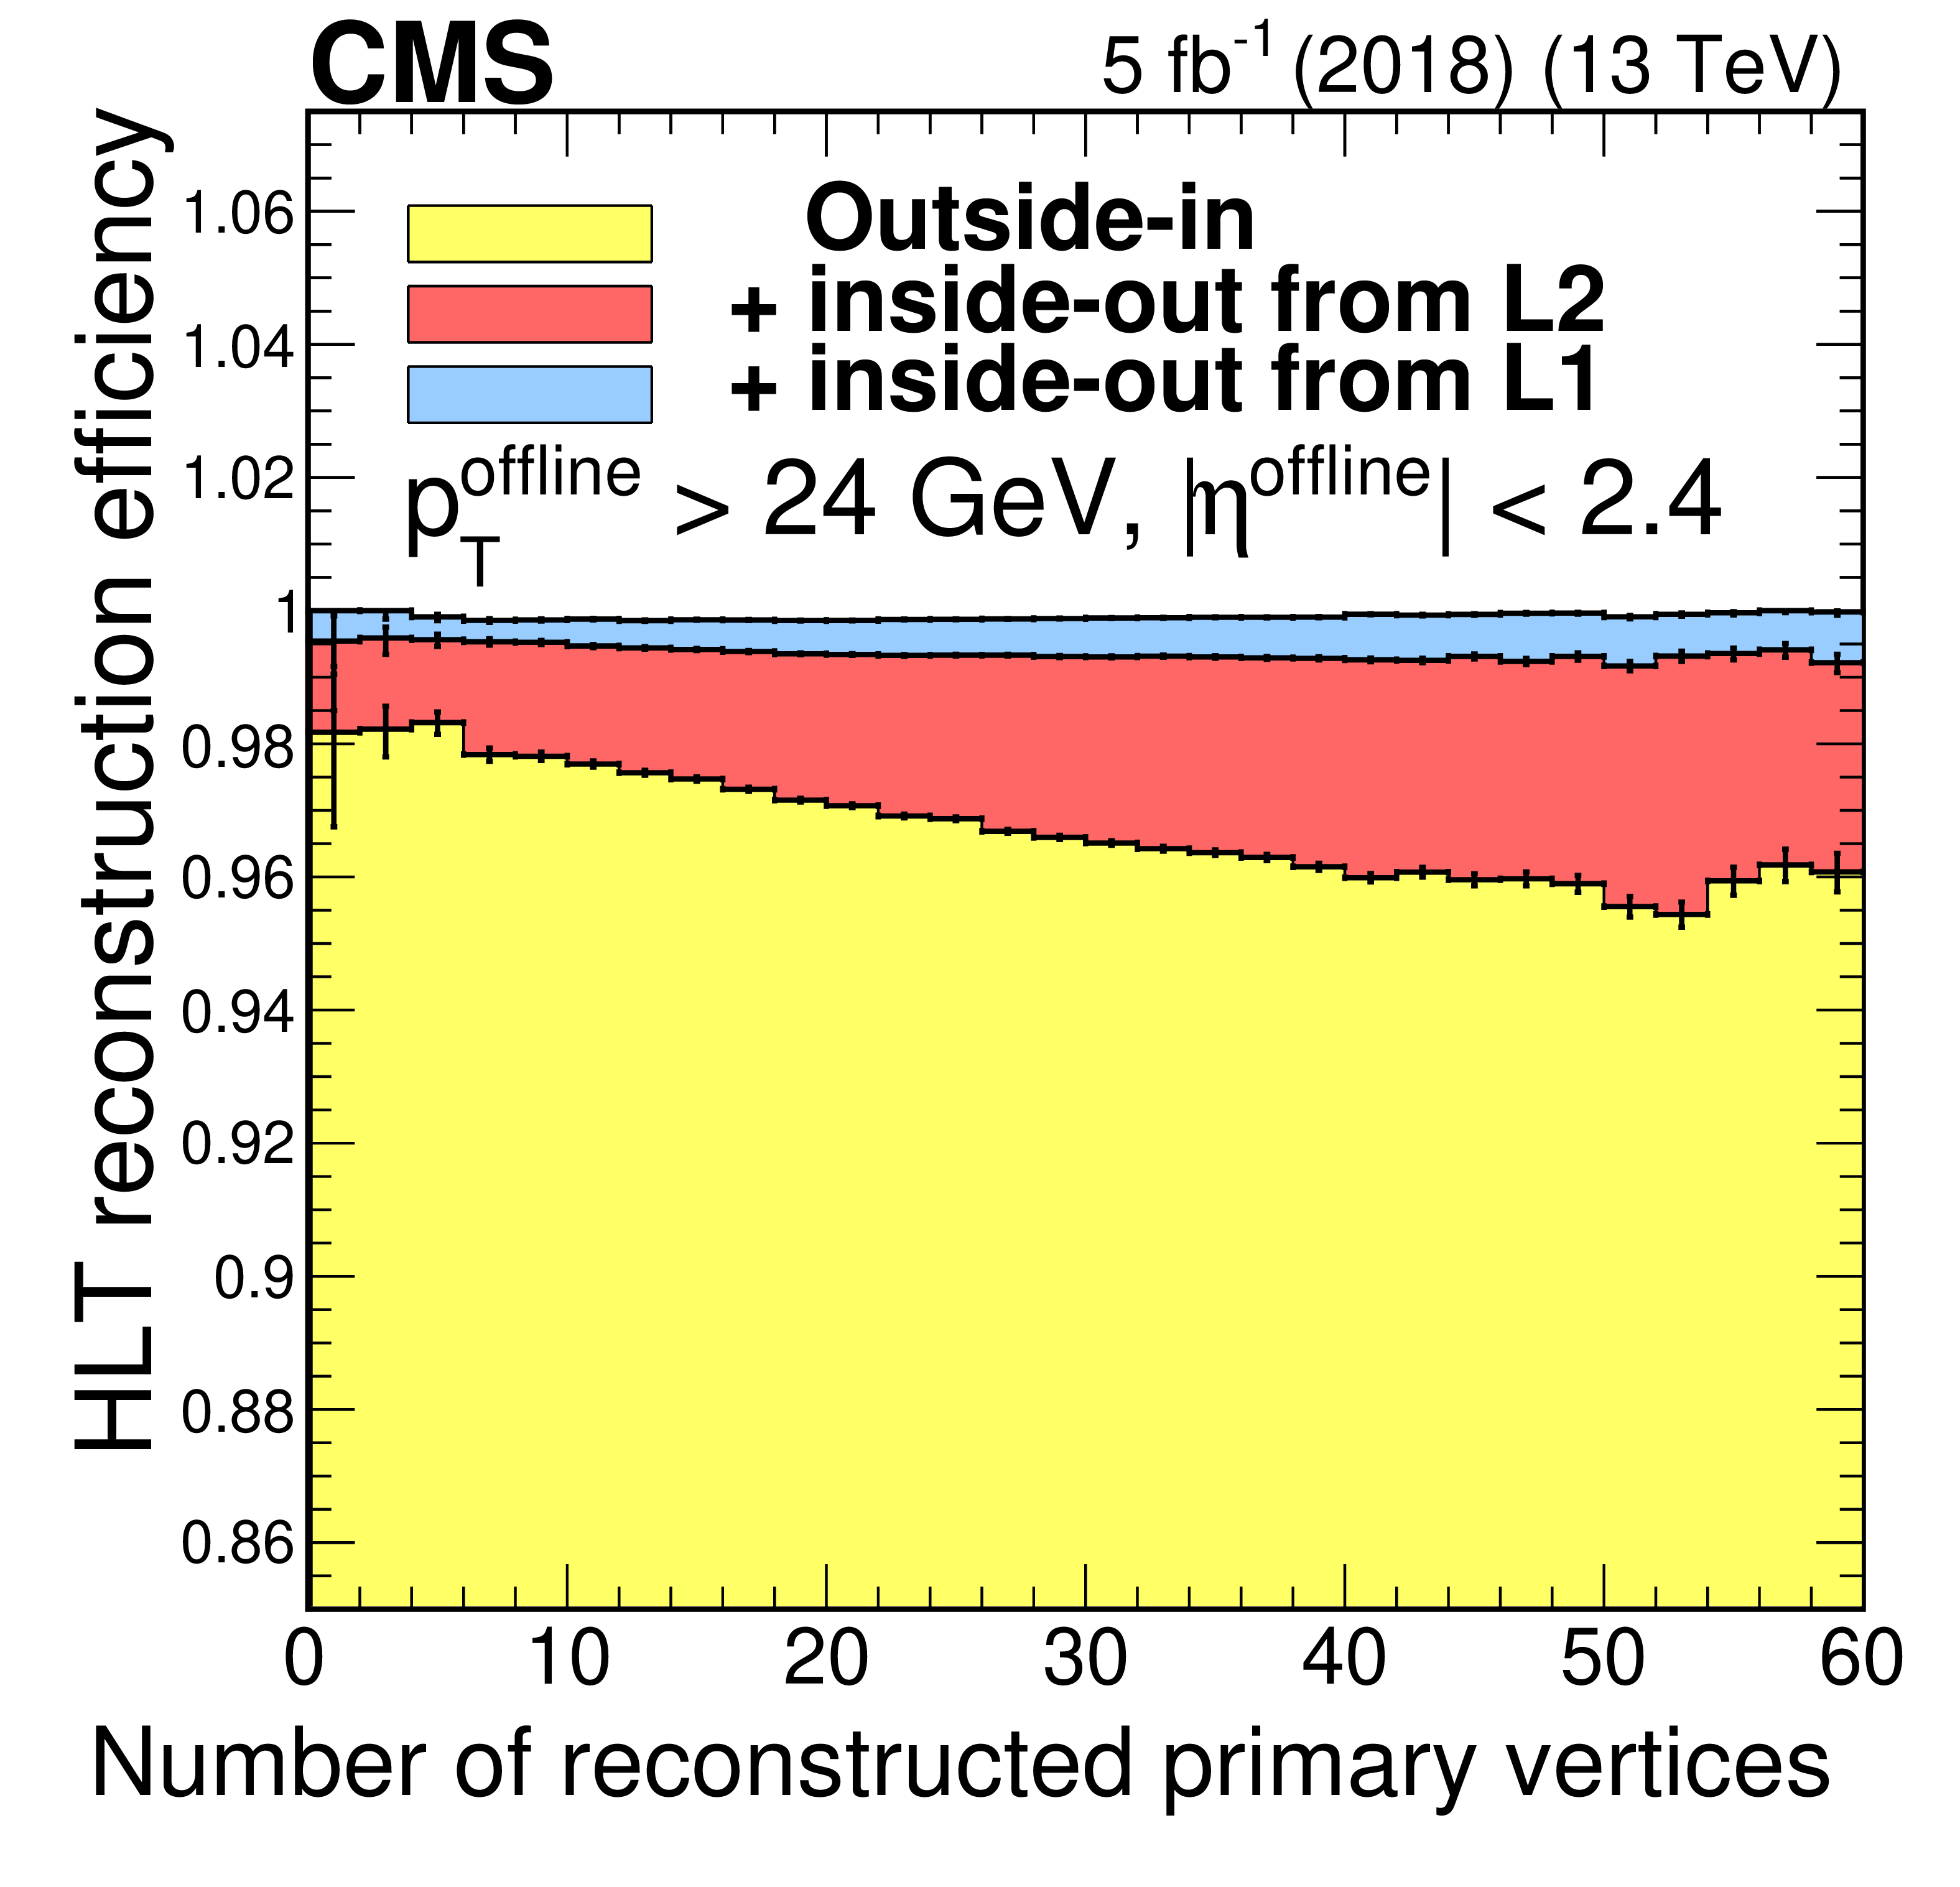
Figure 5:
Efficiency of the iterative algorithm as a function of ${p_{\mathrm {T}}}$ (upper left), muon $\eta $ (upper right), and the number of reconstructed primary vertices (lower middle). The efficiency contribution from the different iterations are shown as stacked histograms. Only statistical uncertainties are shown. |
png pdf |
Figure 5-a:
Efficiency of the iterative algorithm as a function of ${p_{\mathrm {T}}}$. The efficiency contribution from the different iterations are shown as stacked histograms. Only statistical uncertainties are shown. |
png pdf |
Figure 5-b:
Efficiency of the iterative algorithm as a function of muon $\eta $. The efficiency contribution from the different iterations are shown as stacked histograms. Only statistical uncertainties are shown. |
png pdf |
Figure 5-c:
Efficiency of the iterative algorithm as a function of the number of reconstructed primary vertices. The efficiency contribution from the different iterations are shown as stacked histograms. Only statistical uncertainties are shown. |
png pdf |
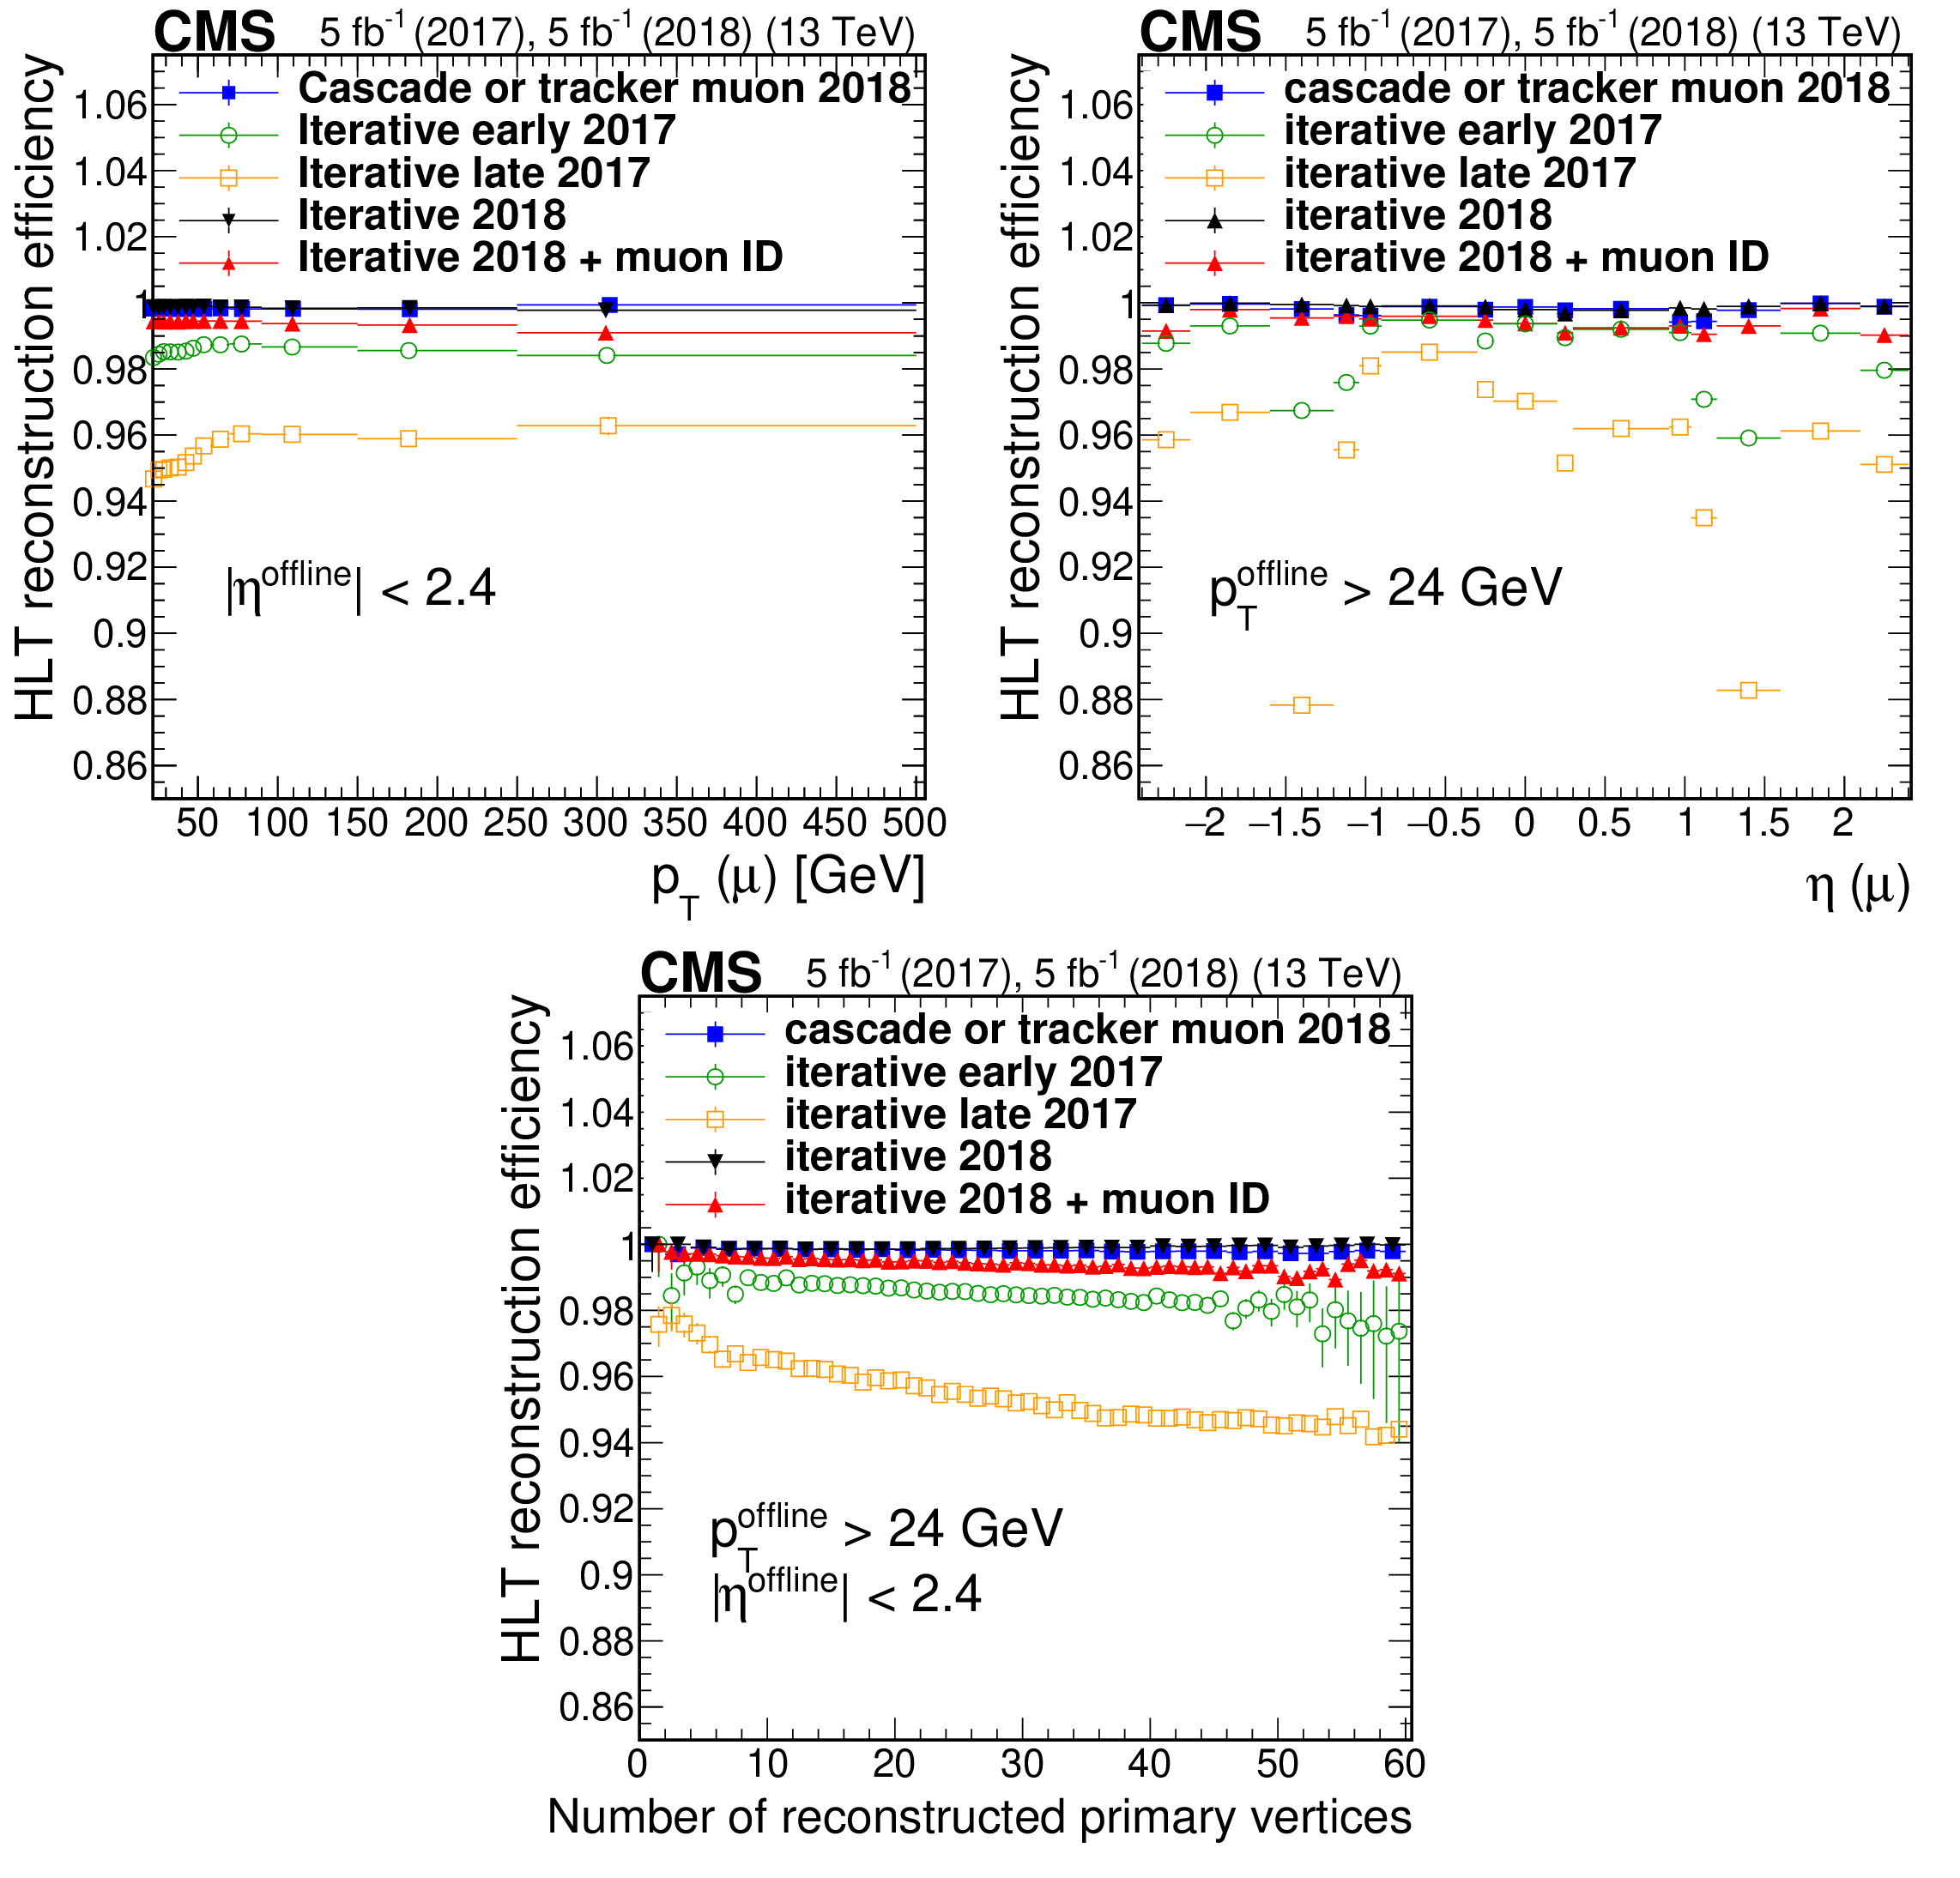
Figure 6:
Efficiency of the iterative algorithm compared with the logical OR of the cascade and tracker muon reconstruction measured in data events as a function of ${p_{\mathrm {T}}}$ (upper left), muon $\eta $ (upper right), and the number of reconstructed vertices (lower middle). Only statistical uncertainties are shown. |
png pdf |
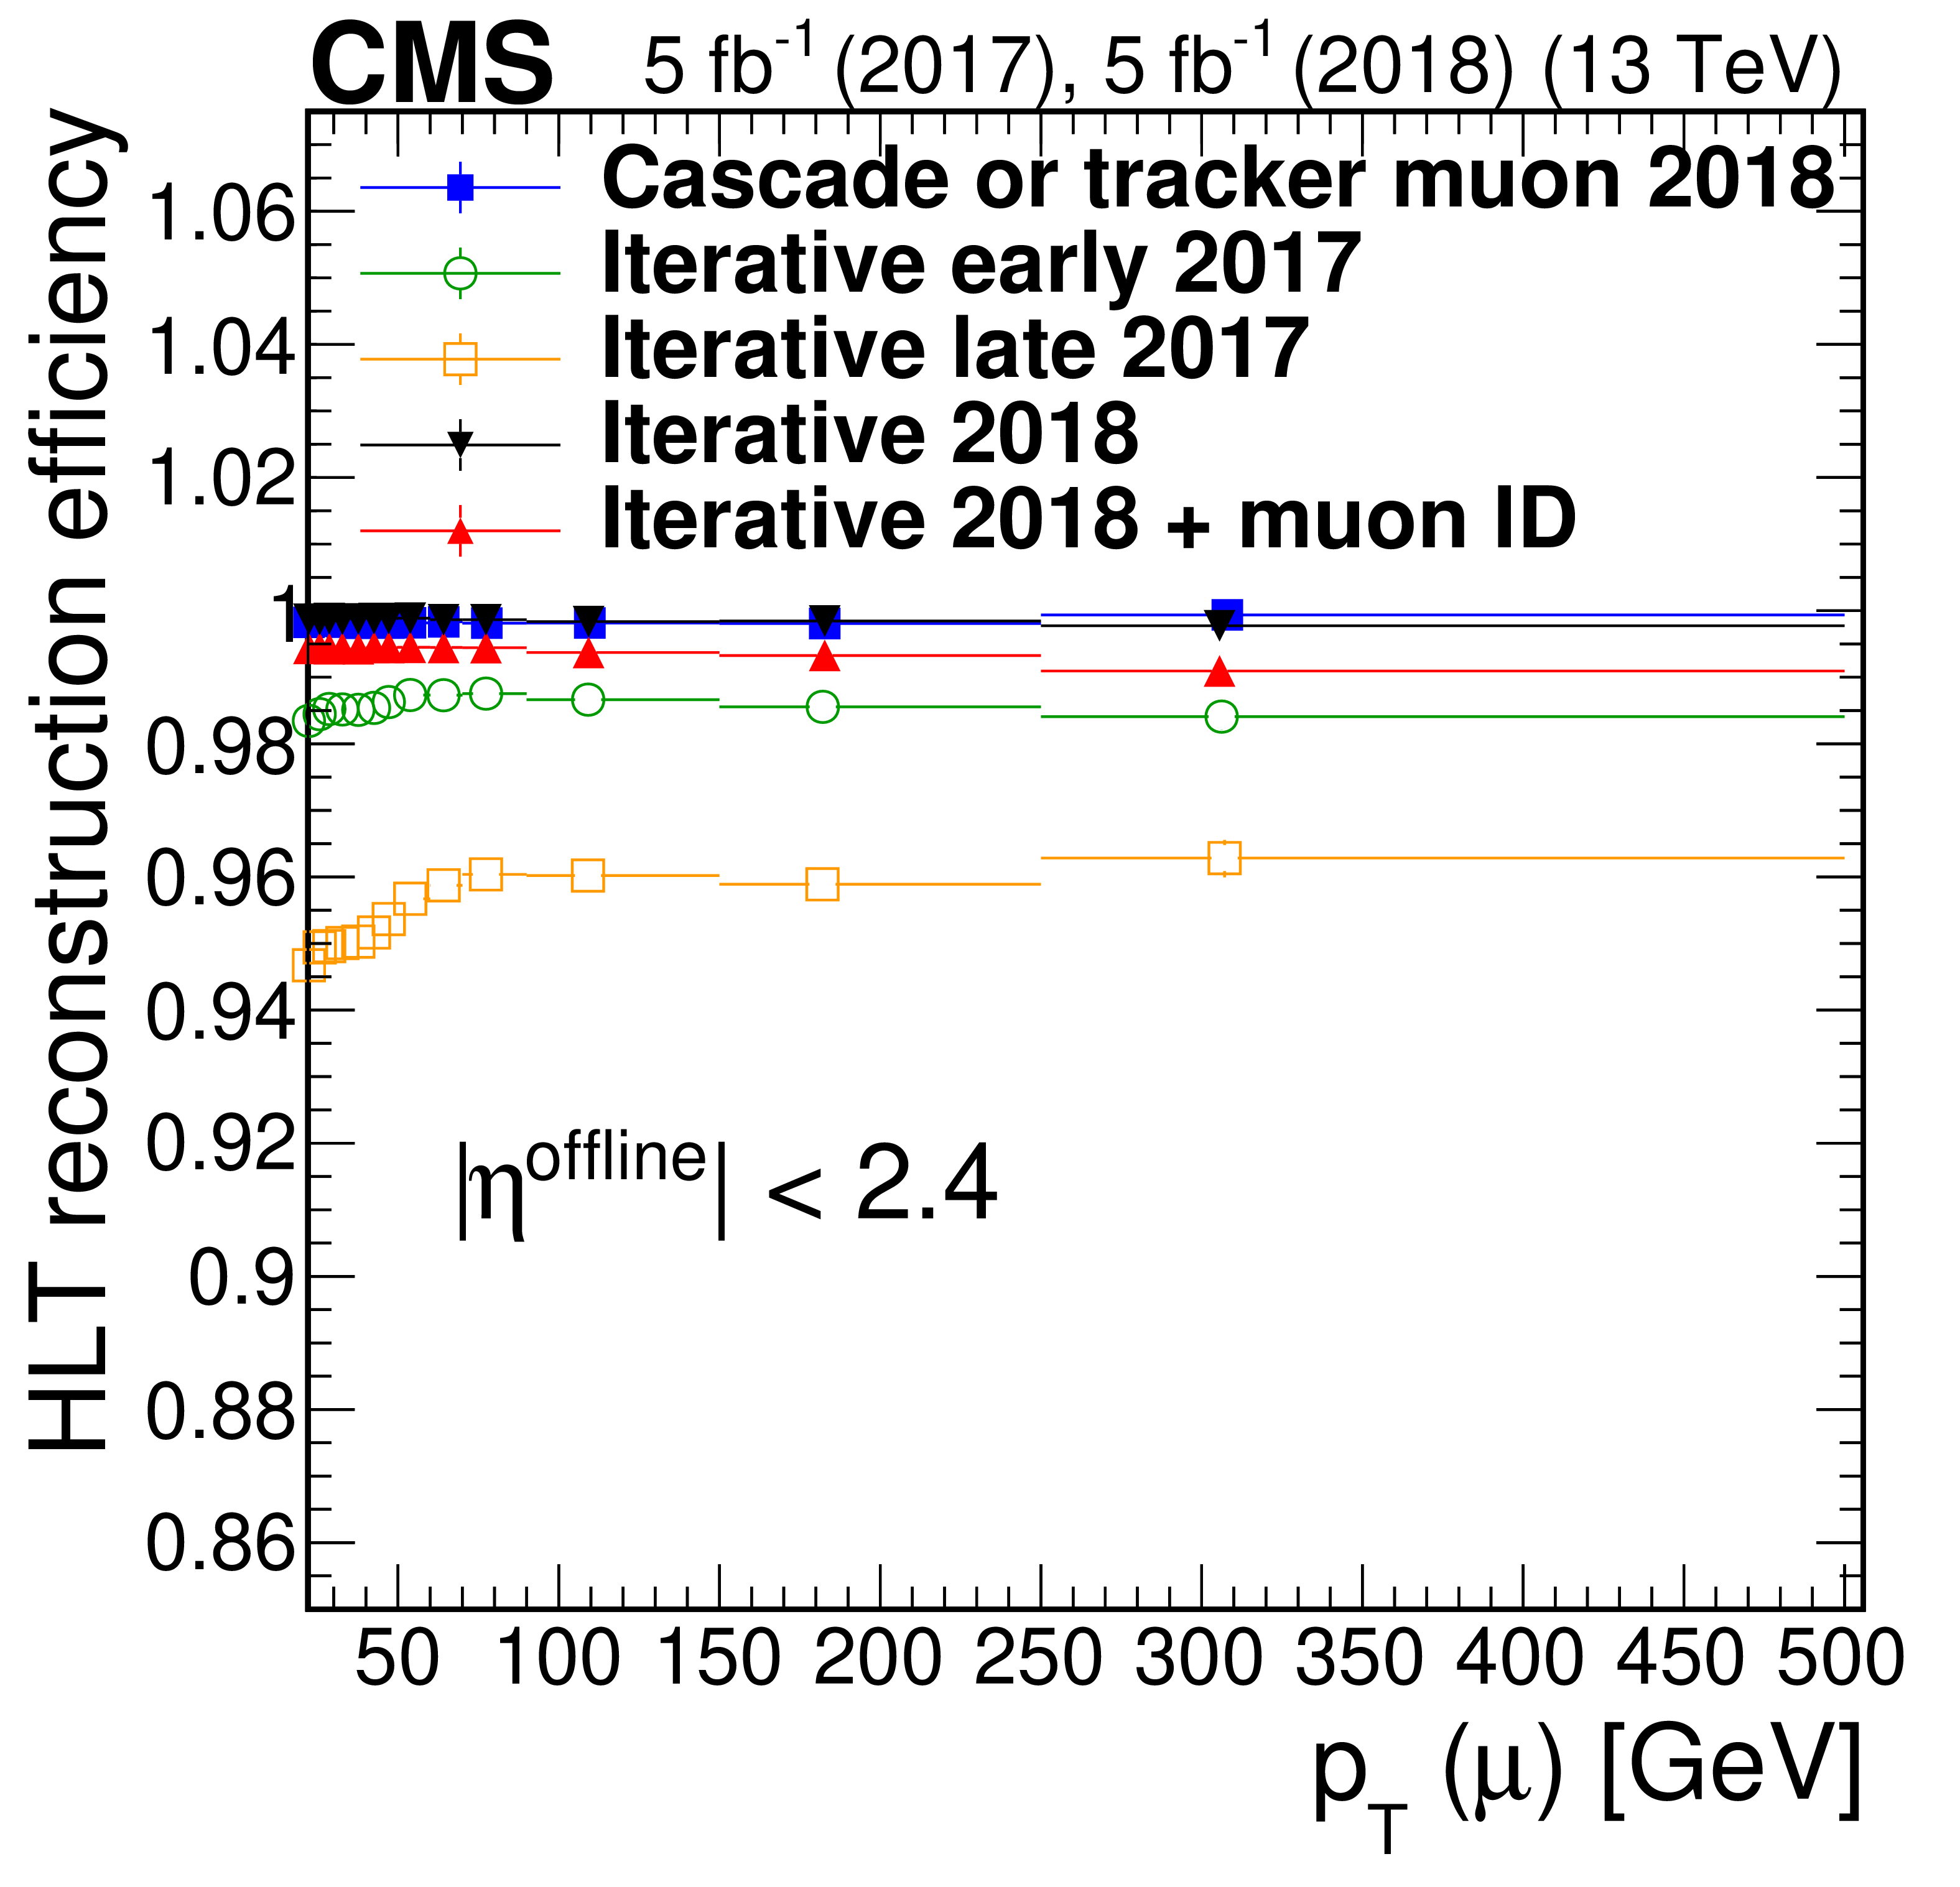
Figure 6-a:
Efficiency of the iterative algorithm compared with the logical OR of the cascade and tracker muon reconstruction measured in data events as a function of ${p_{\mathrm {T}}}$. Only statistical uncertainties are shown. |
png pdf |
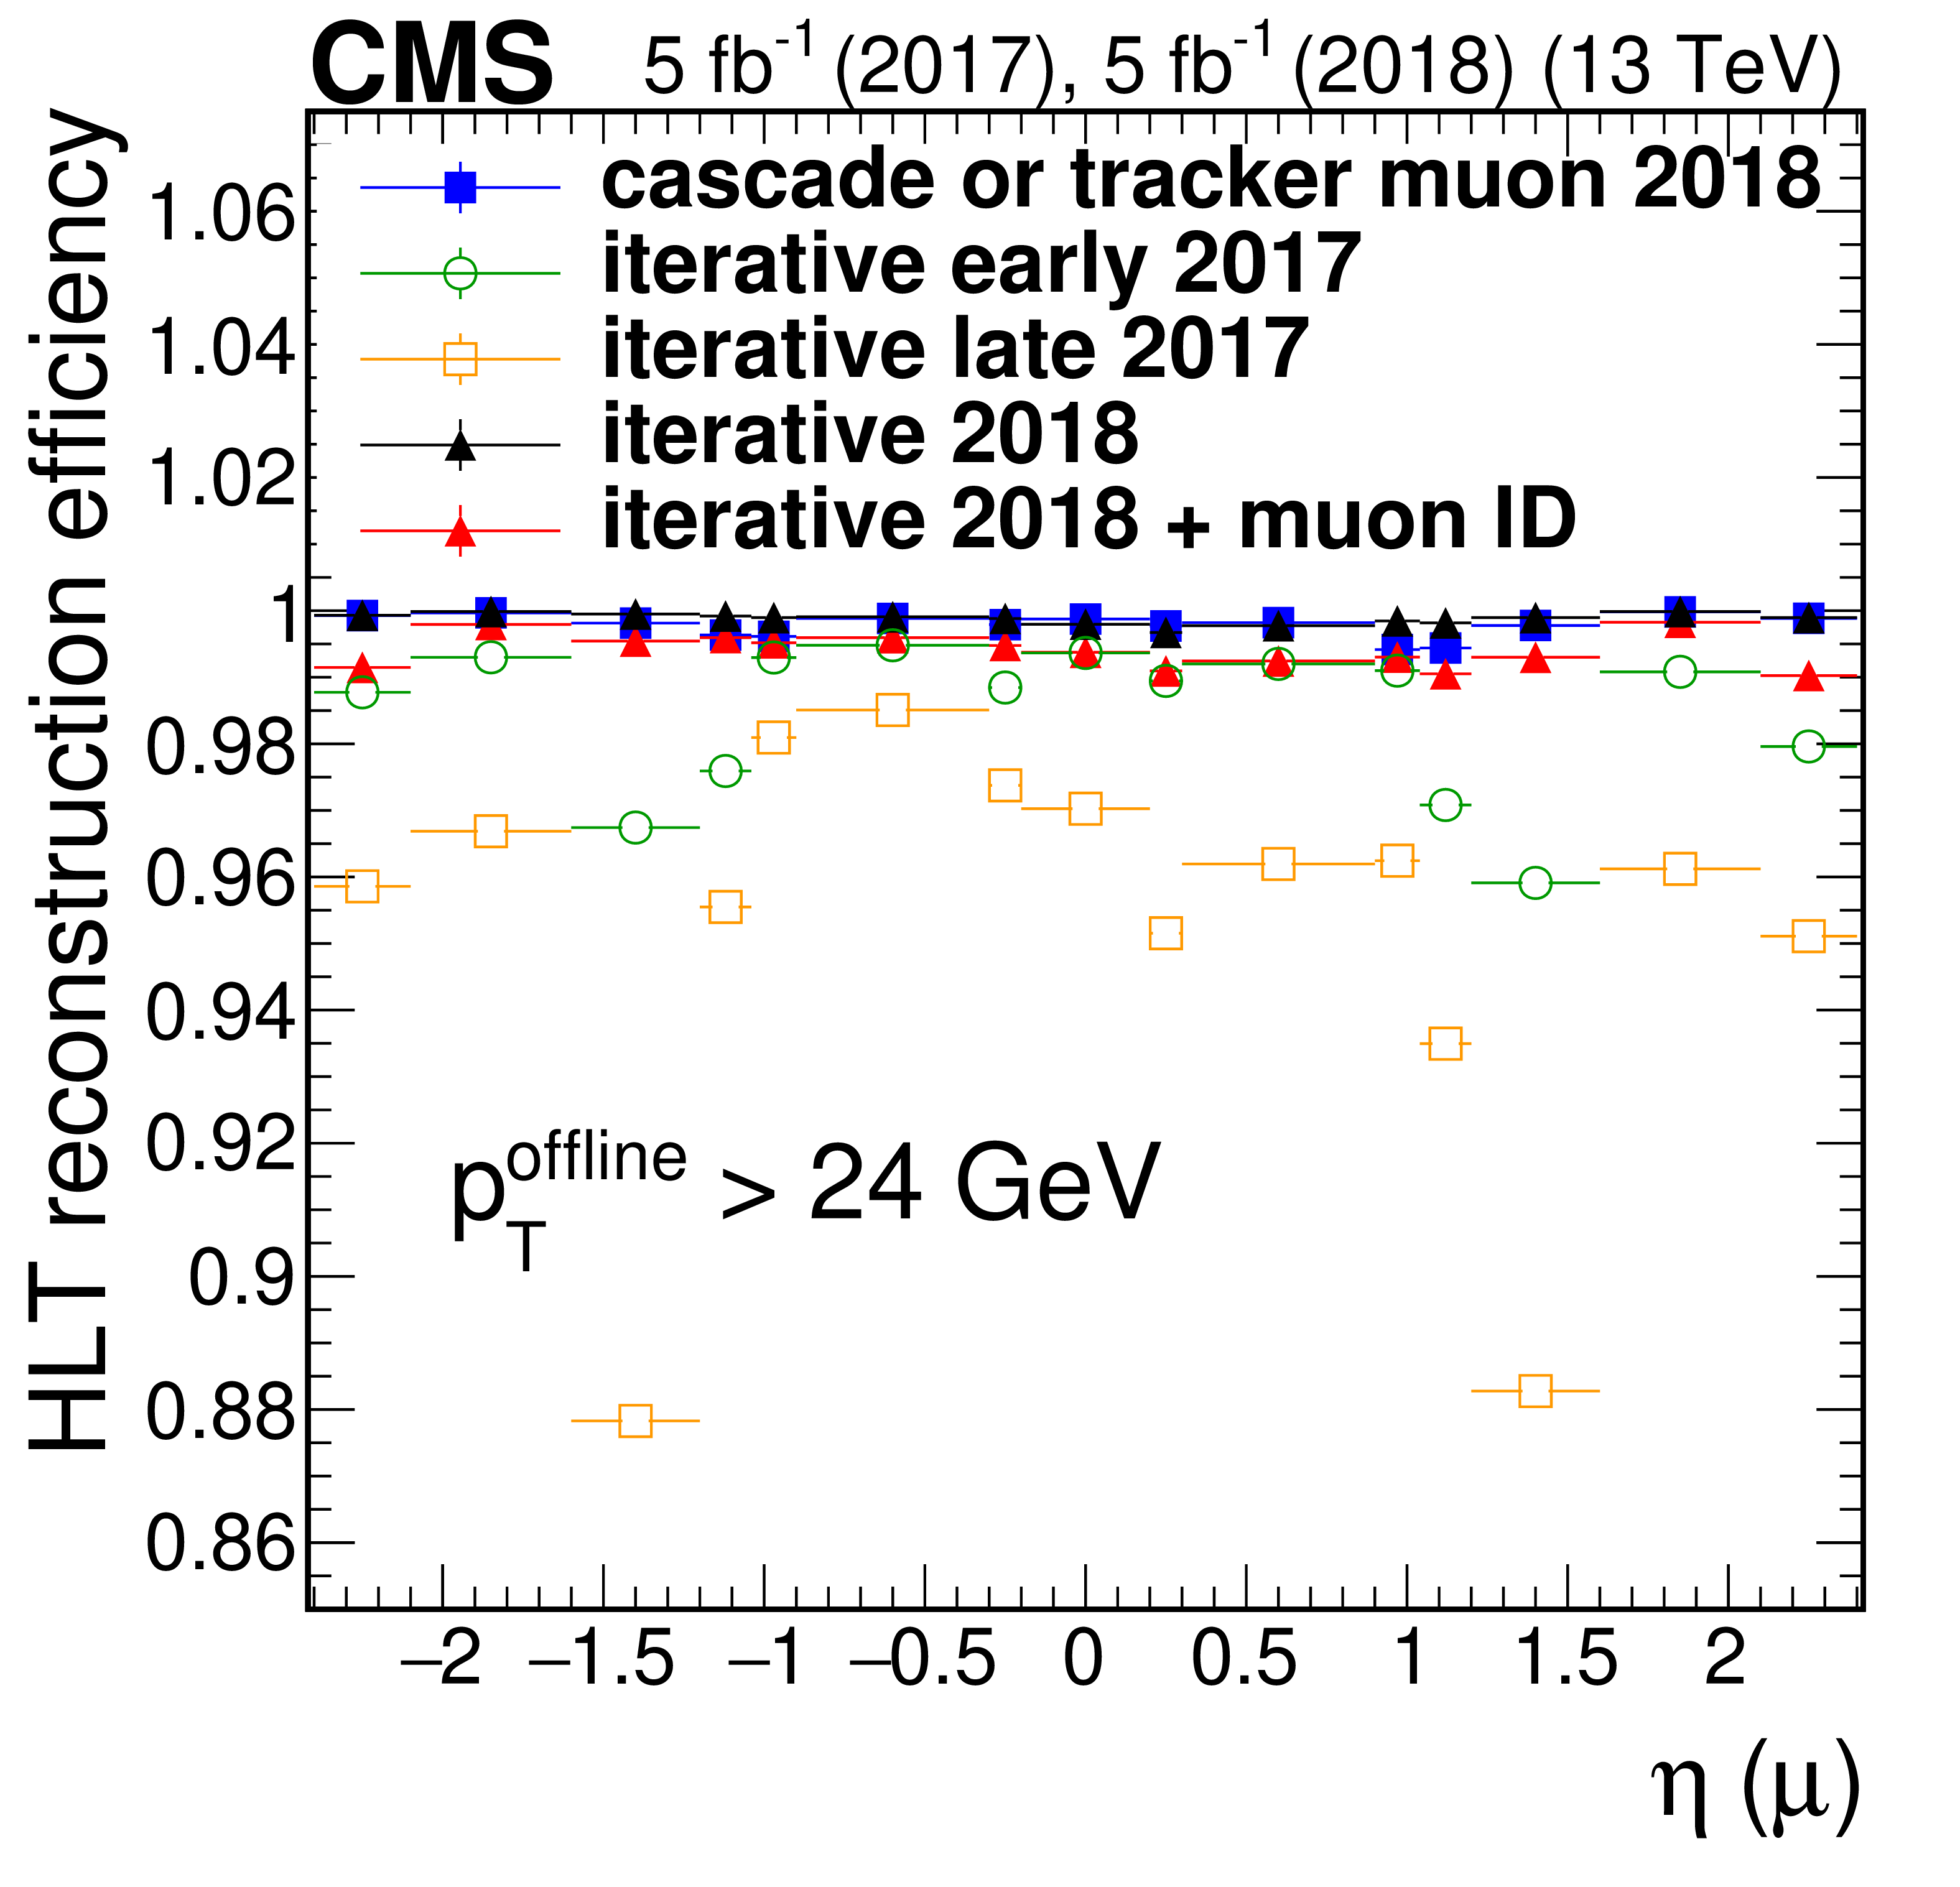
Figure 6-b:
Efficiency of the iterative algorithm compared with the logical OR of the cascade and tracker muon reconstruction measured in data events as a function of muon $\eta $. Only statistical uncertainties are shown. |

png pdf |
Figure 6-c:
Efficiency of the iterative algorithm compared with the logical OR of the cascade and tracker muon reconstruction measured in data events as a function of the number of reconstructed vertices. Only statistical uncertainties are shown. |
png pdf |
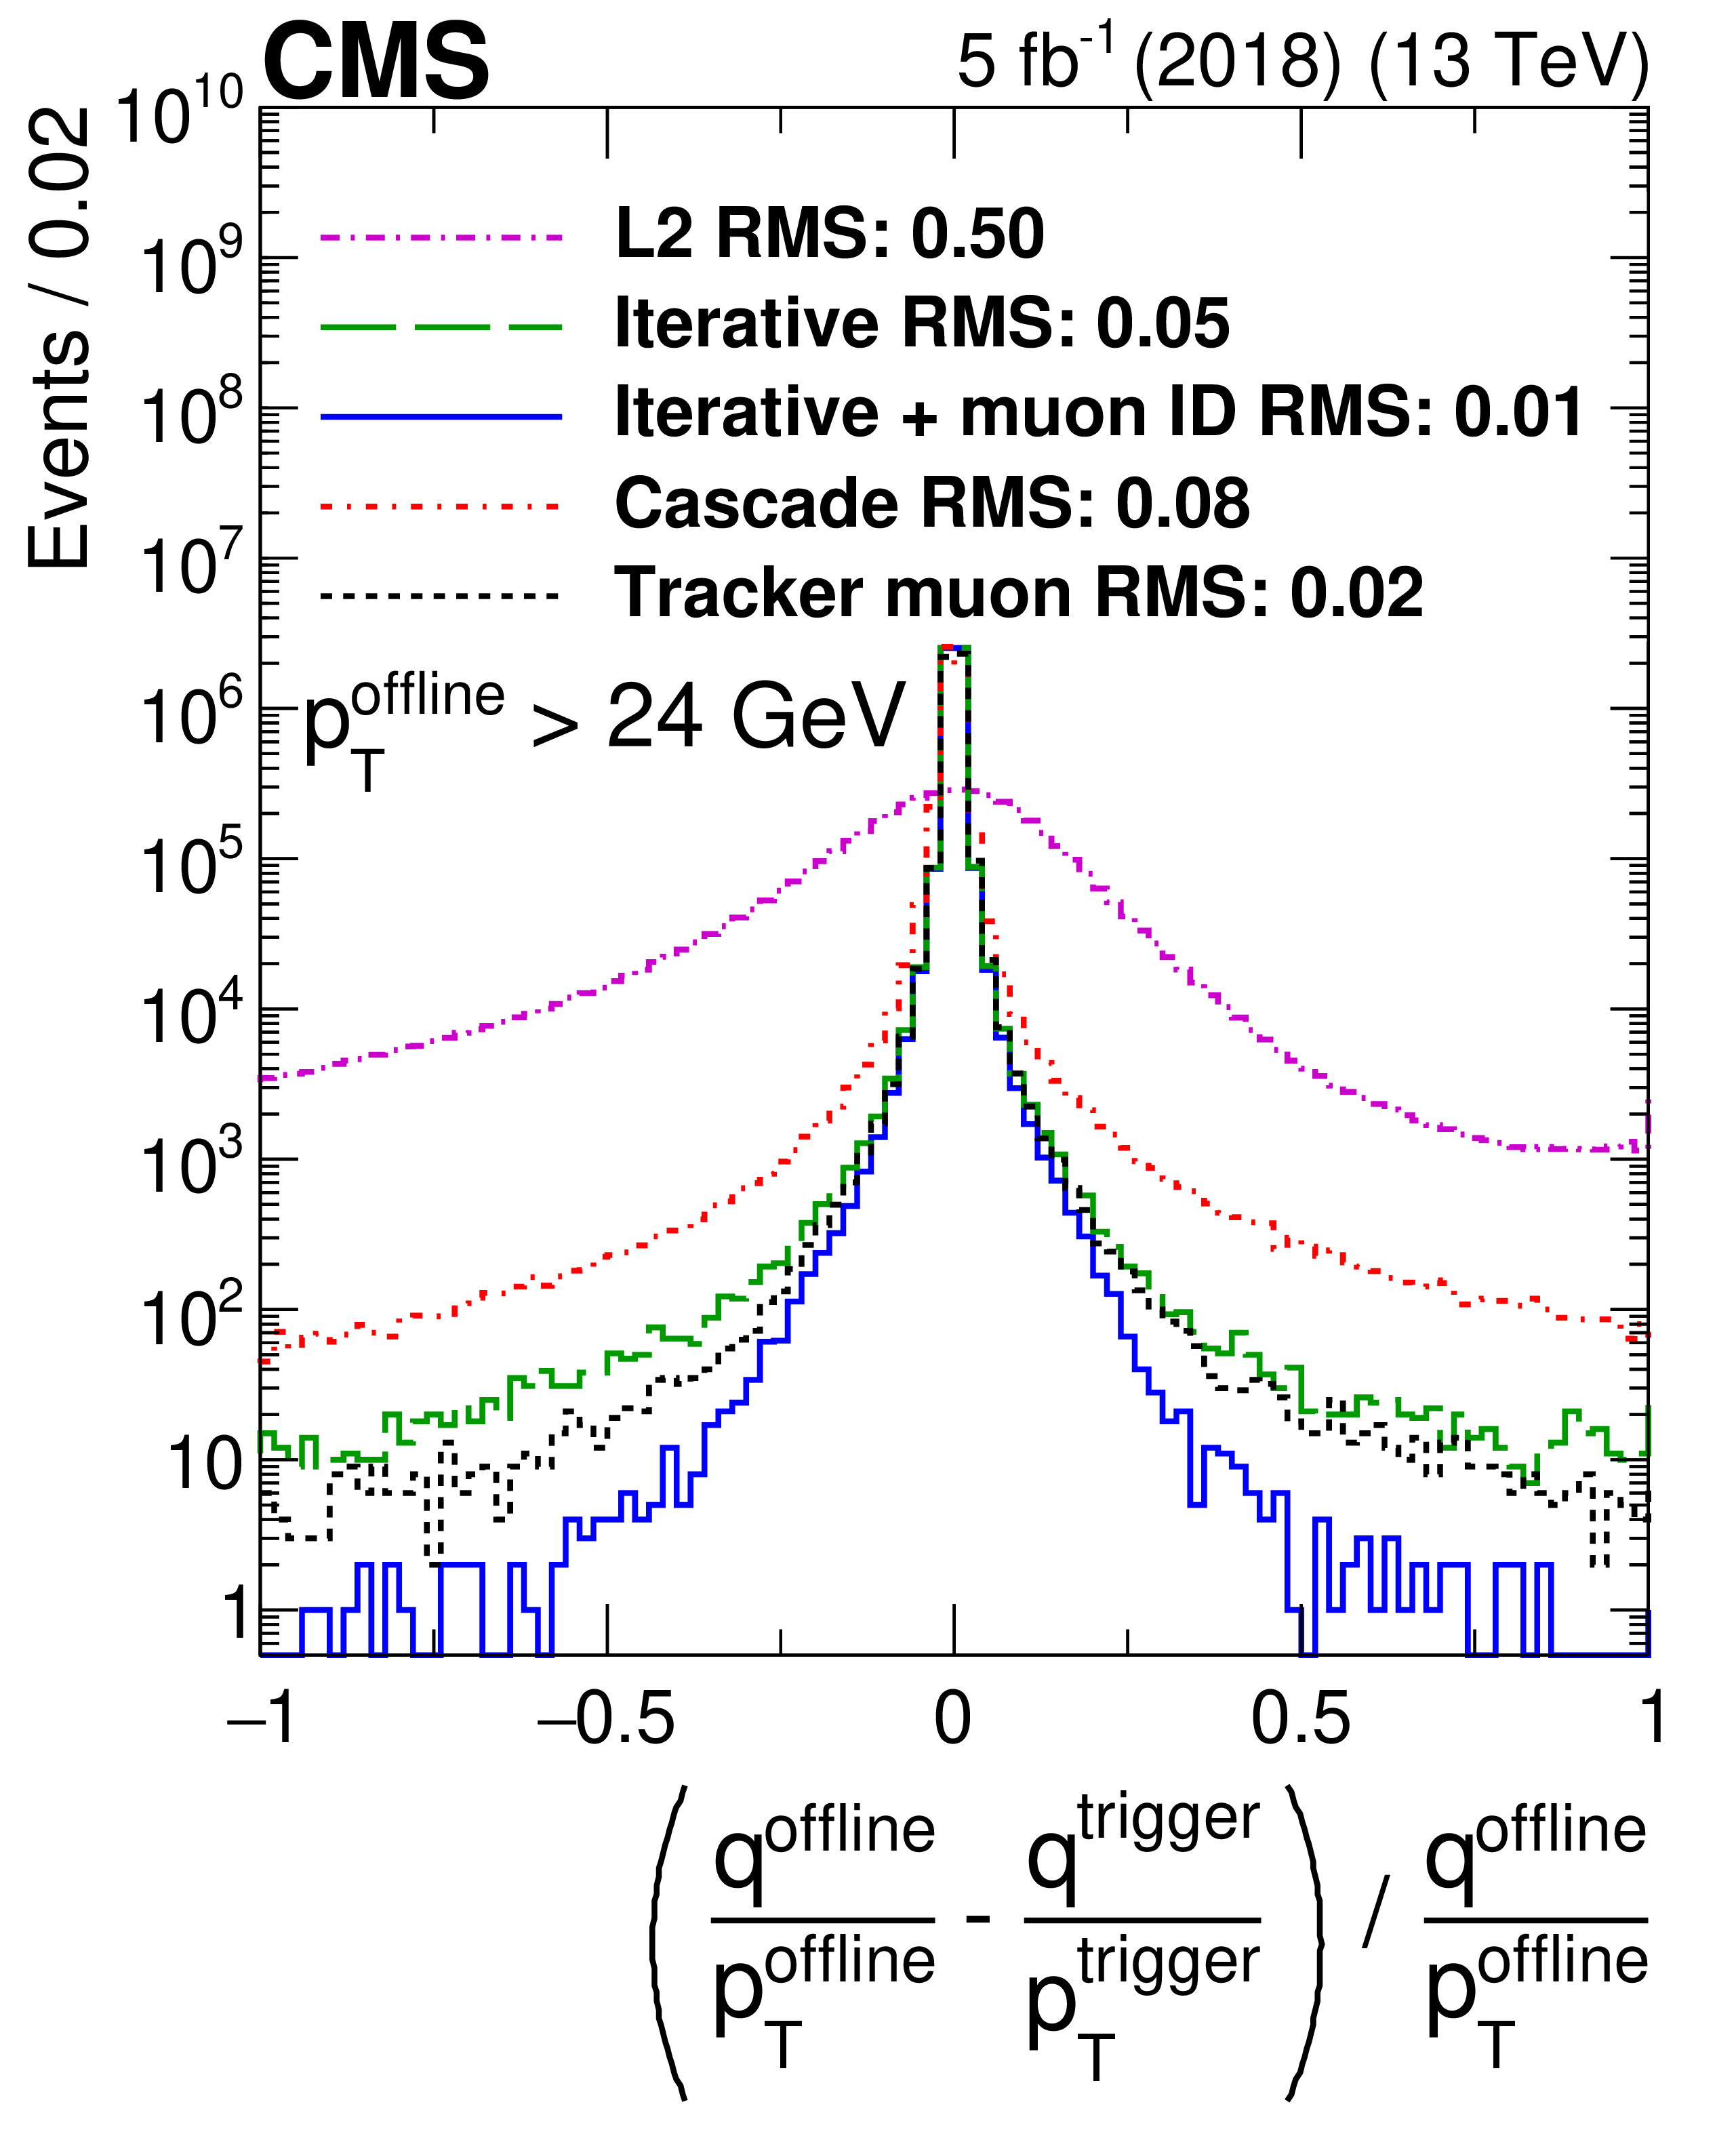
Figure 7:
The $q/ {p_{\mathrm {T}}}$ residual distributions inclusive in $\eta $ and ${p_{\mathrm {T}}}$ for all different HLT muon reconstruction algorithms used in 2018. Only statistical uncertainties are shown. |

png pdf |
Figure 8:
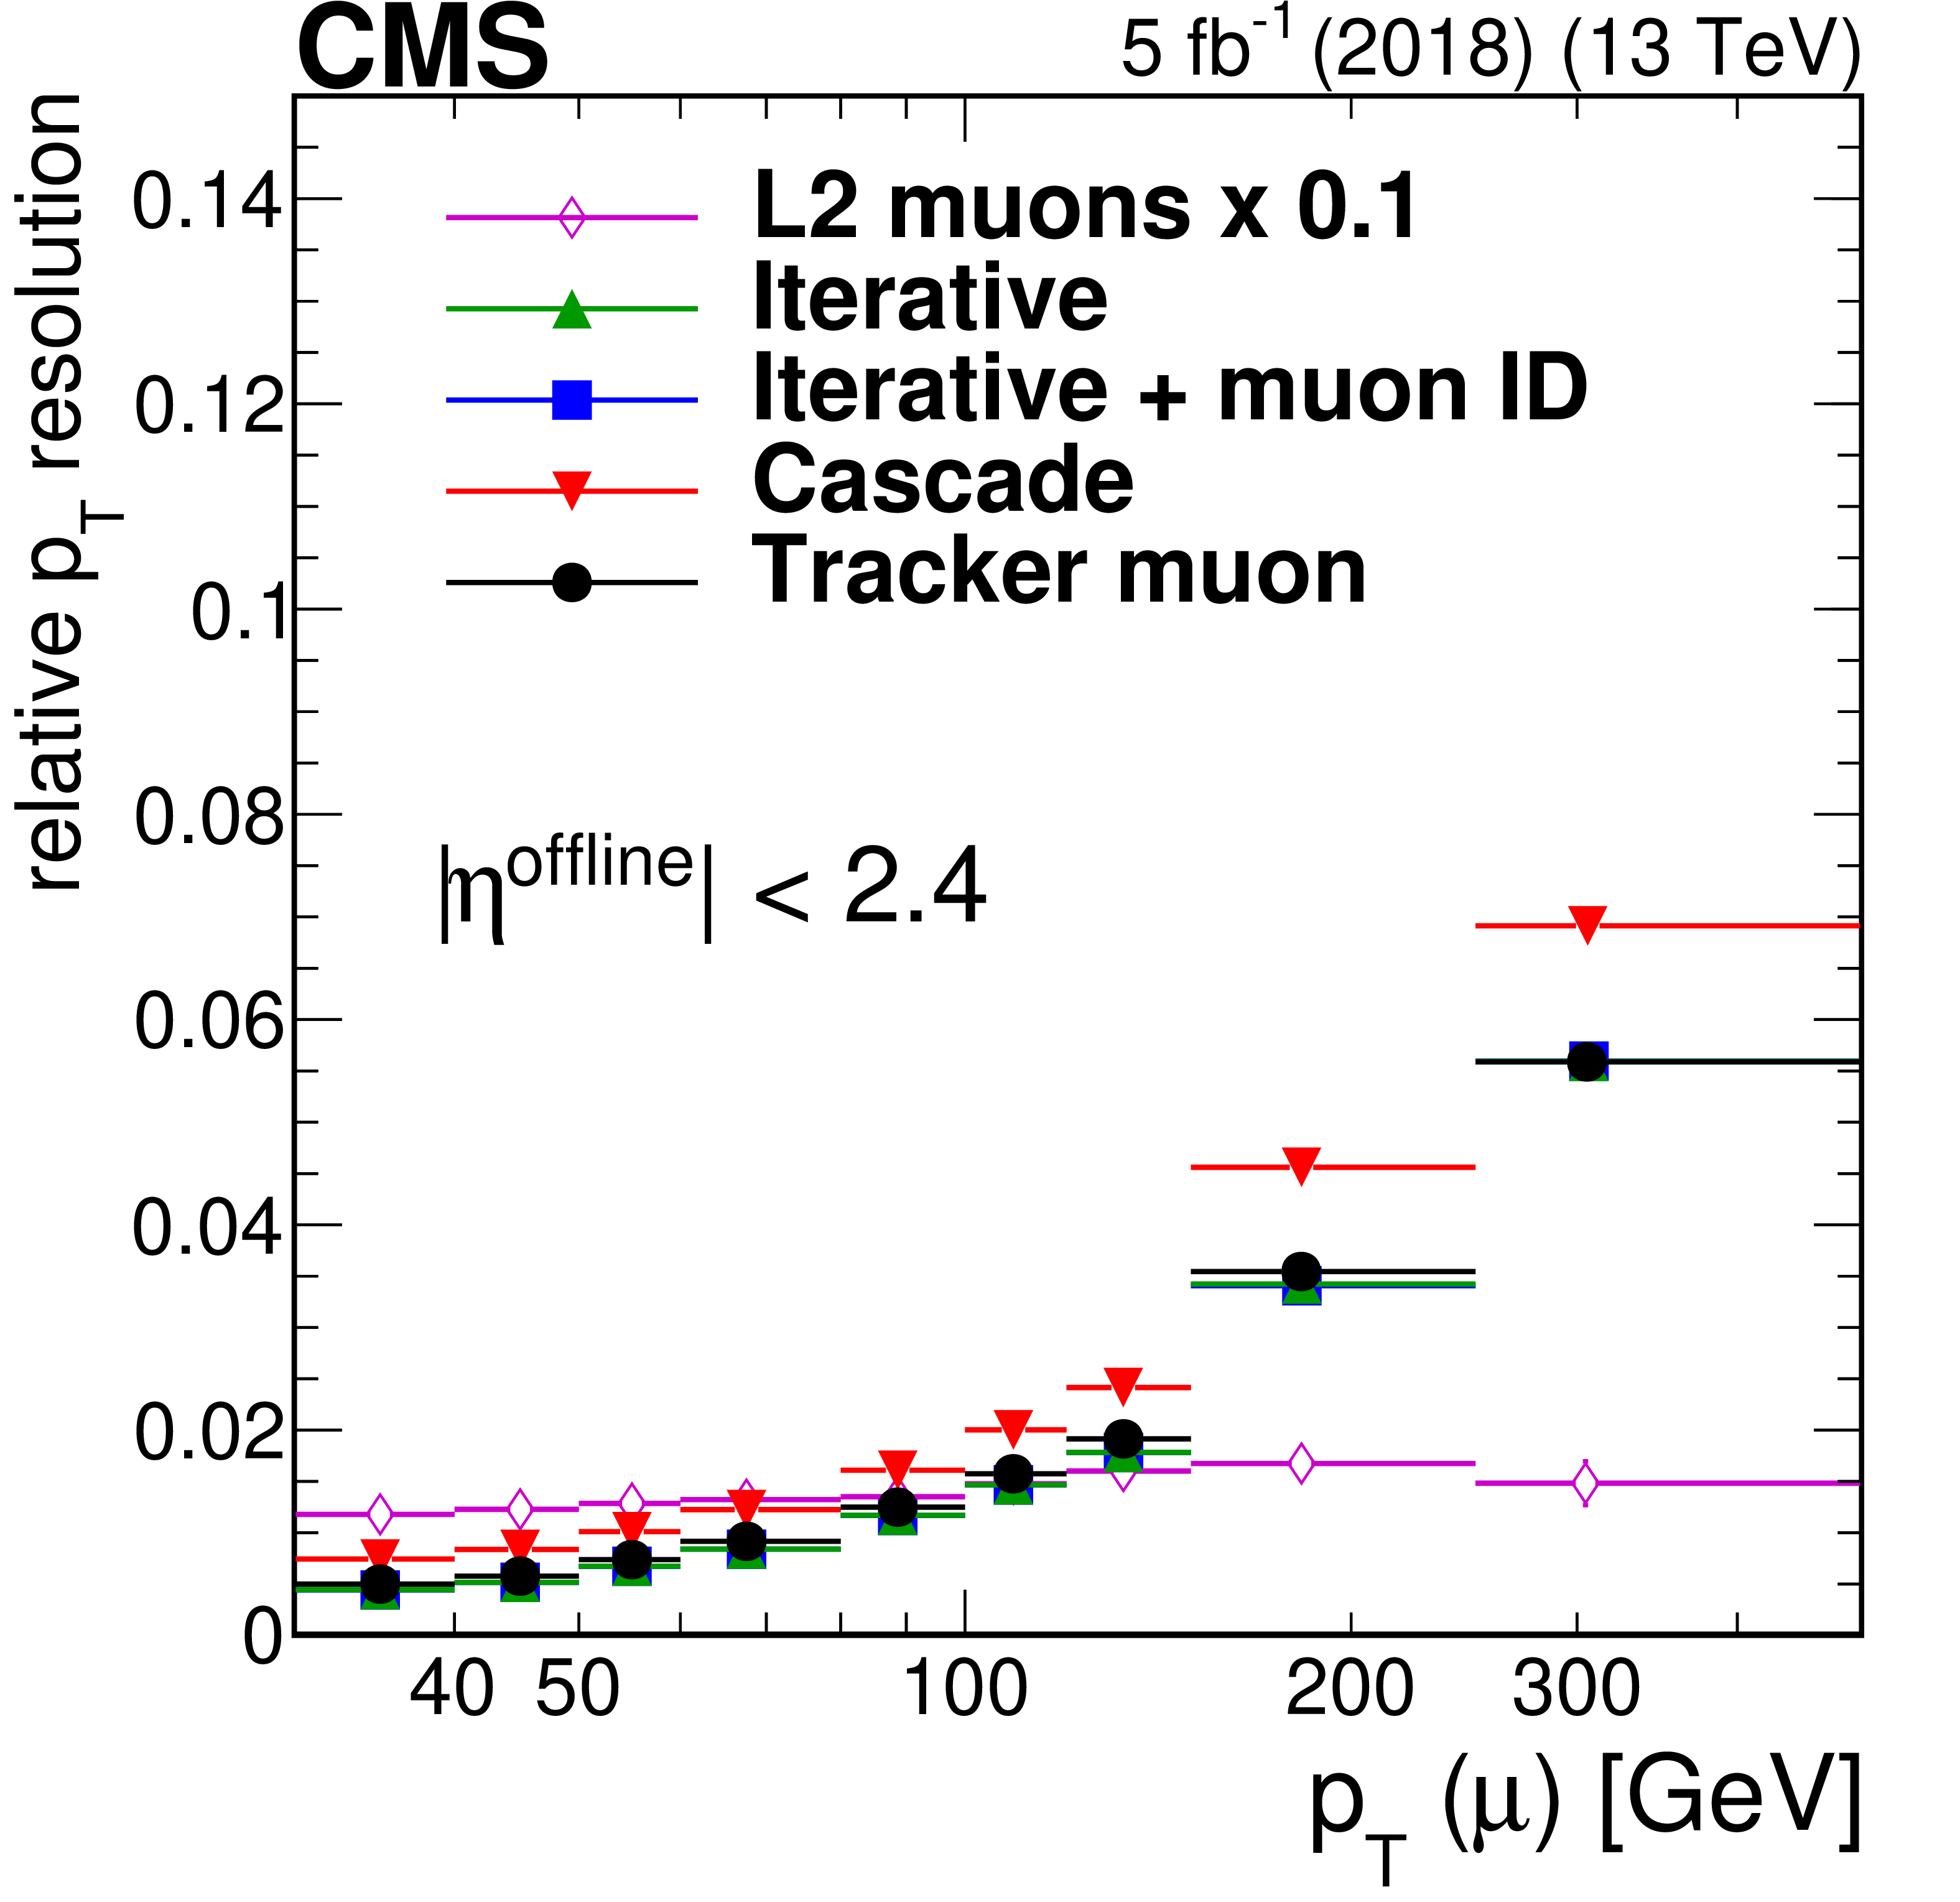
Resolution (standard deviations) of the $q/ {p_{\mathrm {T}}}$ residual distributions as a function of ${p_{\mathrm {T}}}$ (left) and $\eta $ (right) for all different HLT muon reconstruction algorithms used in 2018. Only statistical uncertainties are shown. |
png pdf |
Figure 8-a:
Resolution (standard deviations) of the $q/ {p_{\mathrm {T}}}$ residual distributions as a function of ${p_{\mathrm {T}}}$ for all different HLT muon reconstruction algorithms used in 2018. Only statistical uncertainties are shown. |

png pdf |
Figure 8-b:
Resolution (standard deviations) of the $q/ {p_{\mathrm {T}}}$ residual distributions as a function of $\eta $ for all different HLT muon reconstruction algorithms used in 2018. Only statistical uncertainties are shown. |

png pdf |
Figure 9:
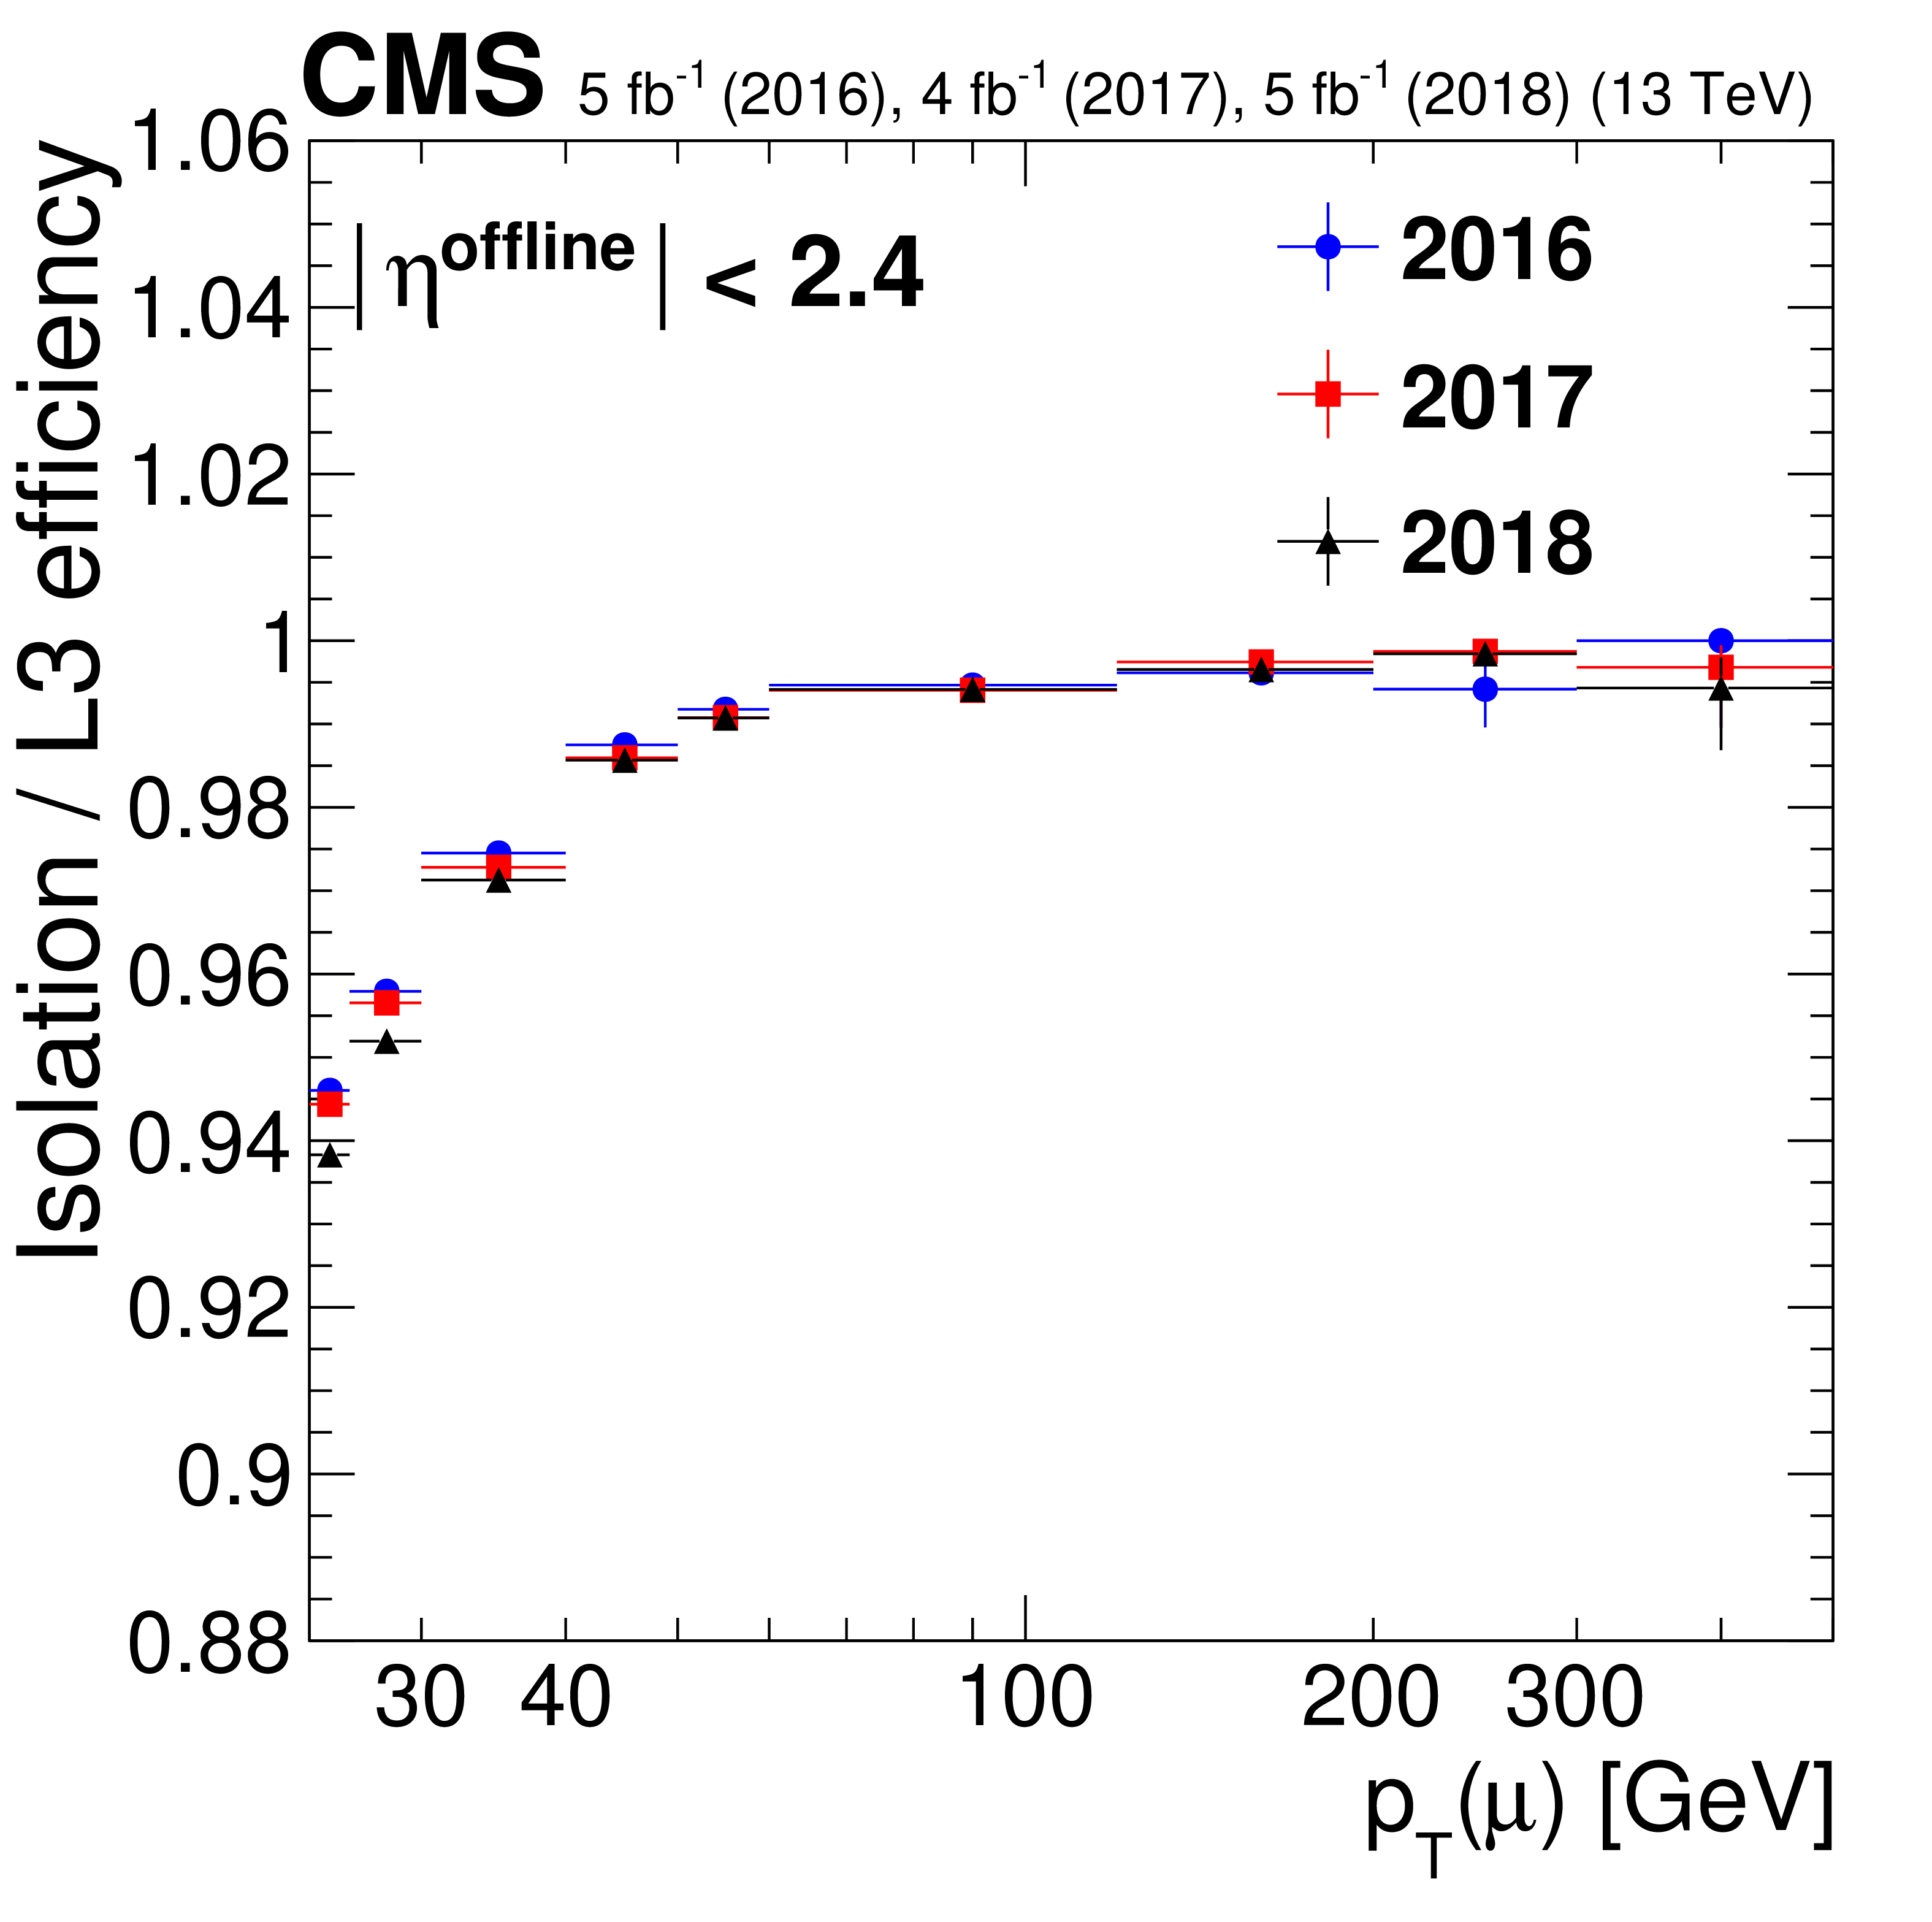
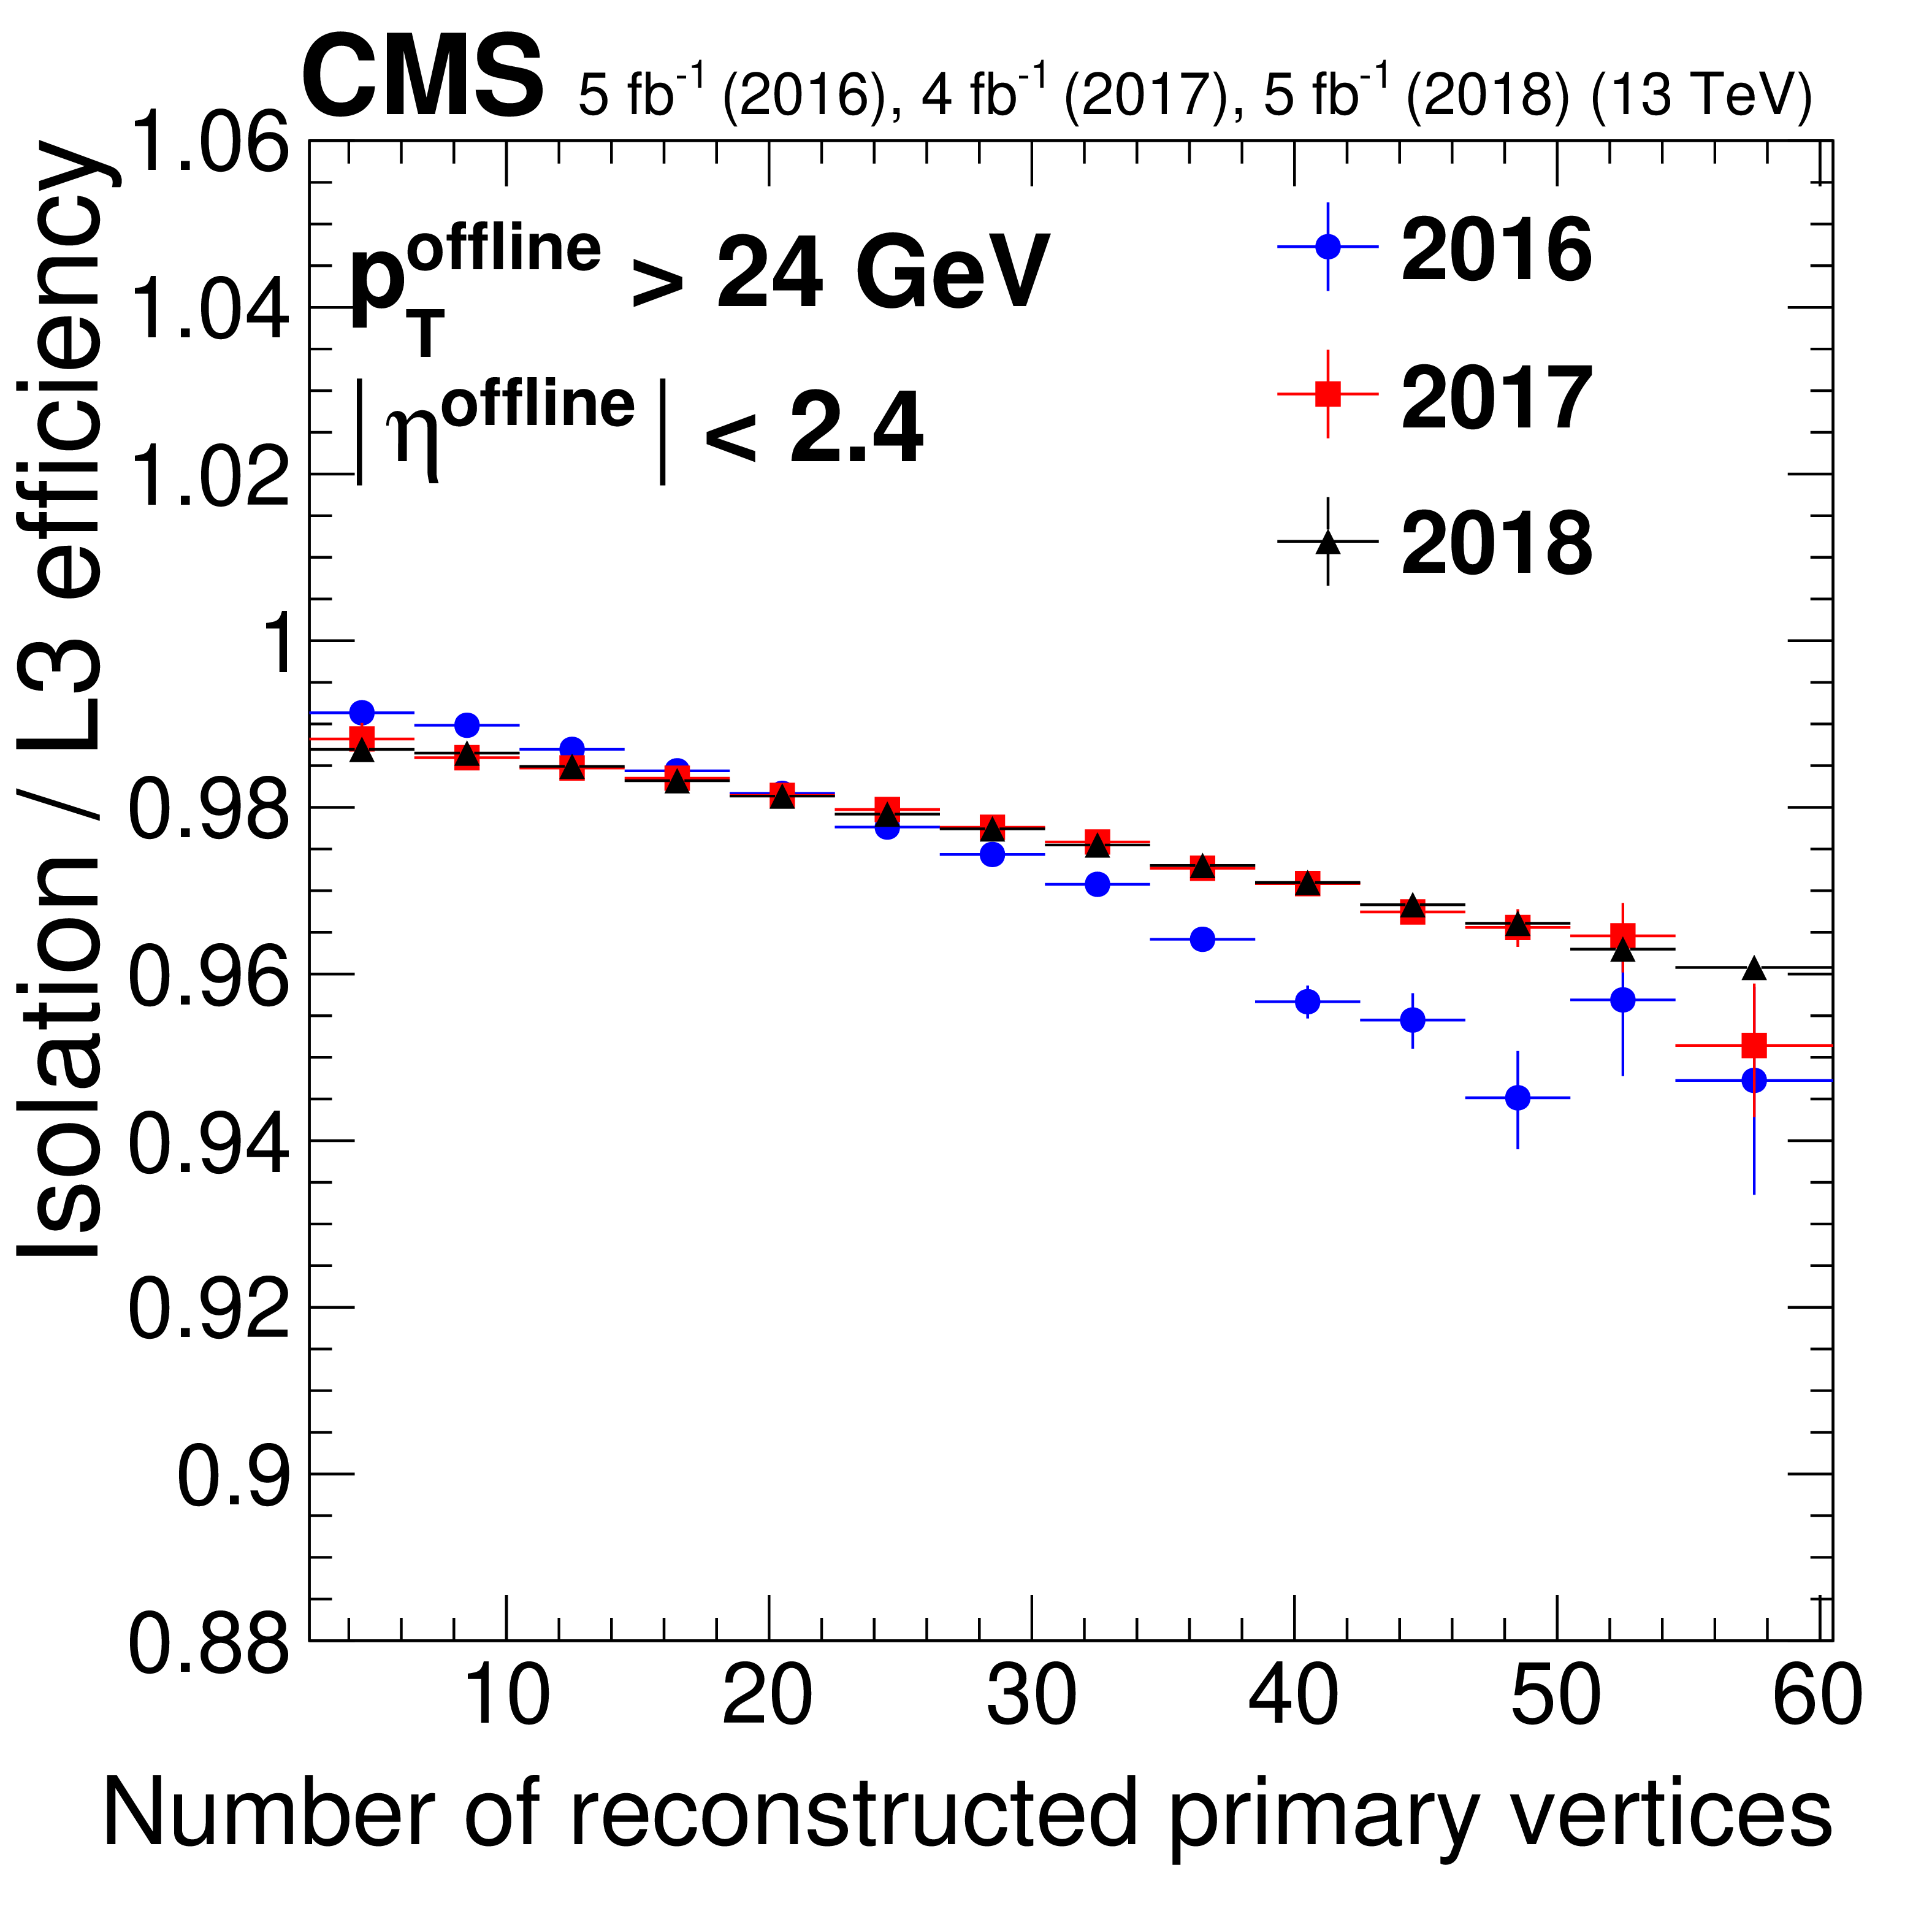
Isolation efficiency as a function of muon ${p_{\mathrm {T}}}$ (upper left)), $\eta $ (upper right), and the number of reconstructed vertices (lower middle) during the Run 2 data taking. Only statistical uncertainties are shown. |
png pdf |
Figure 9-a:
Isolation efficiency as a function of muon ${p_{\mathrm {T}}}$ during the Run 2 data taking. Only statistical uncertainties are shown. |

png pdf |
Figure 9-b:
Isolation efficiency as a function of muon $\eta $ during the Run 2 data taking. Only statistical uncertainties are shown. |
png pdf |
Figure 9-c:
Isolation efficiency as a function of the number of reconstructed vertices during the Run 2 data taking. Only statistical uncertainties are shown. |
png pdf |
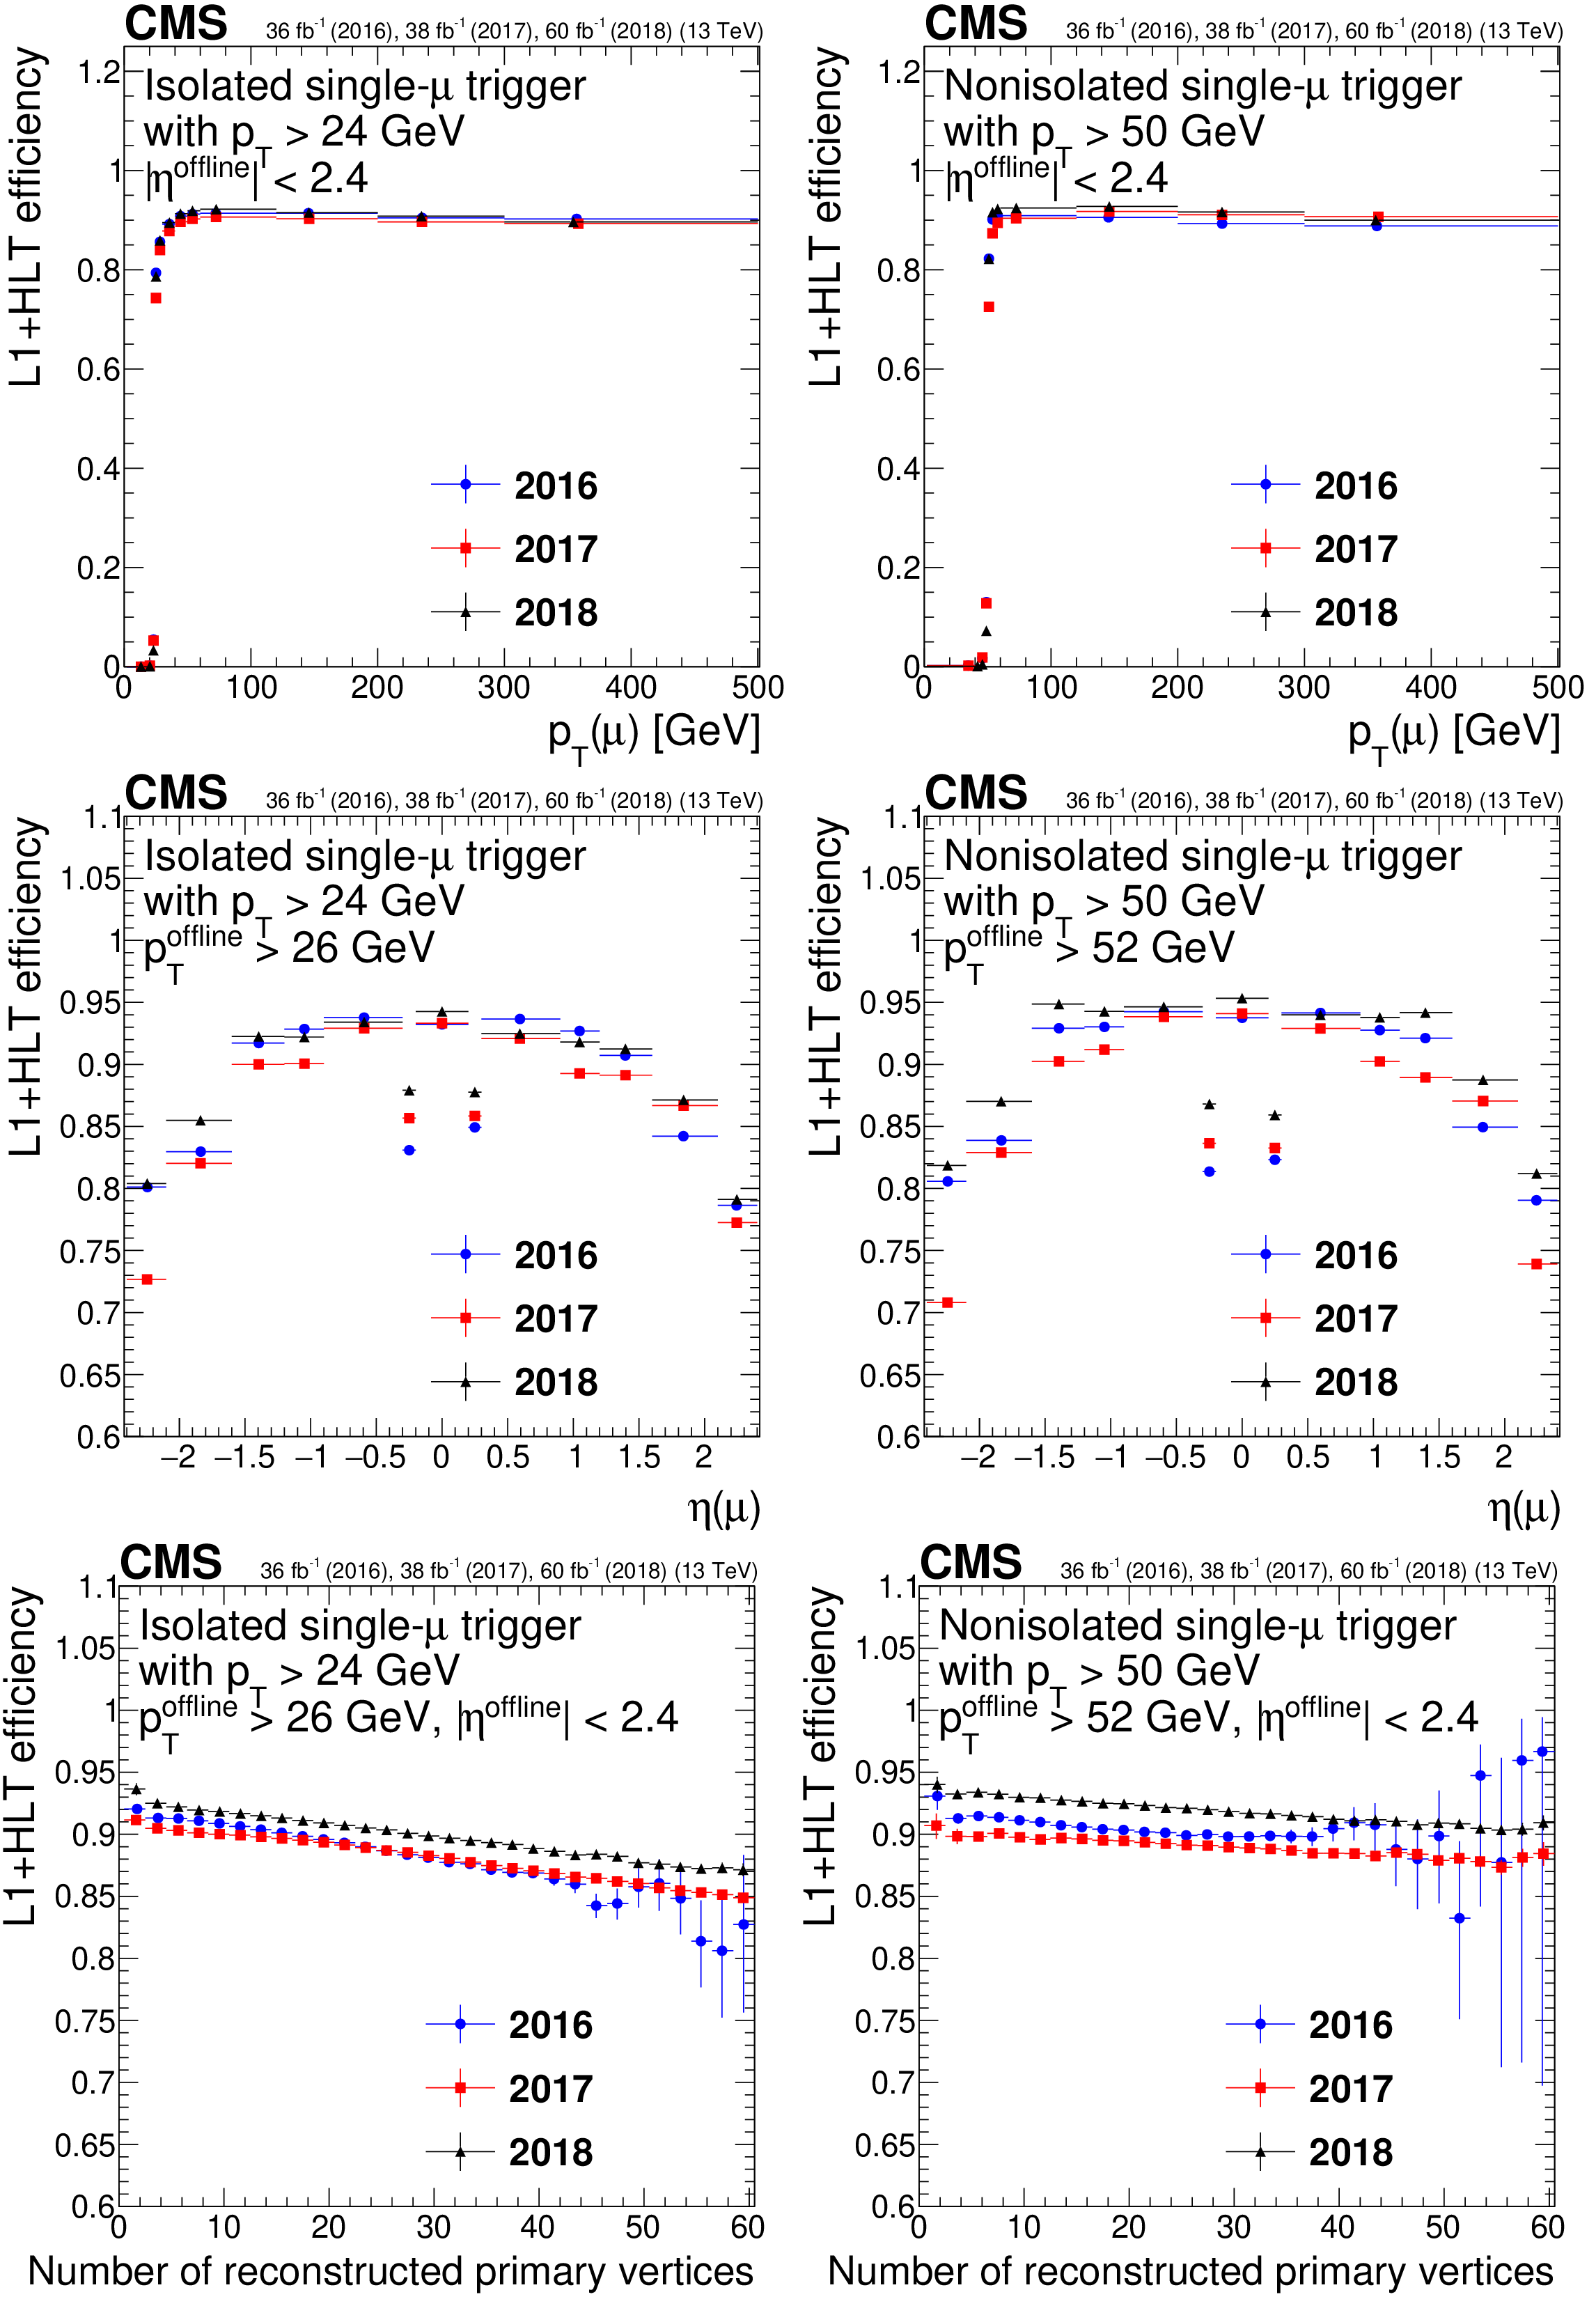
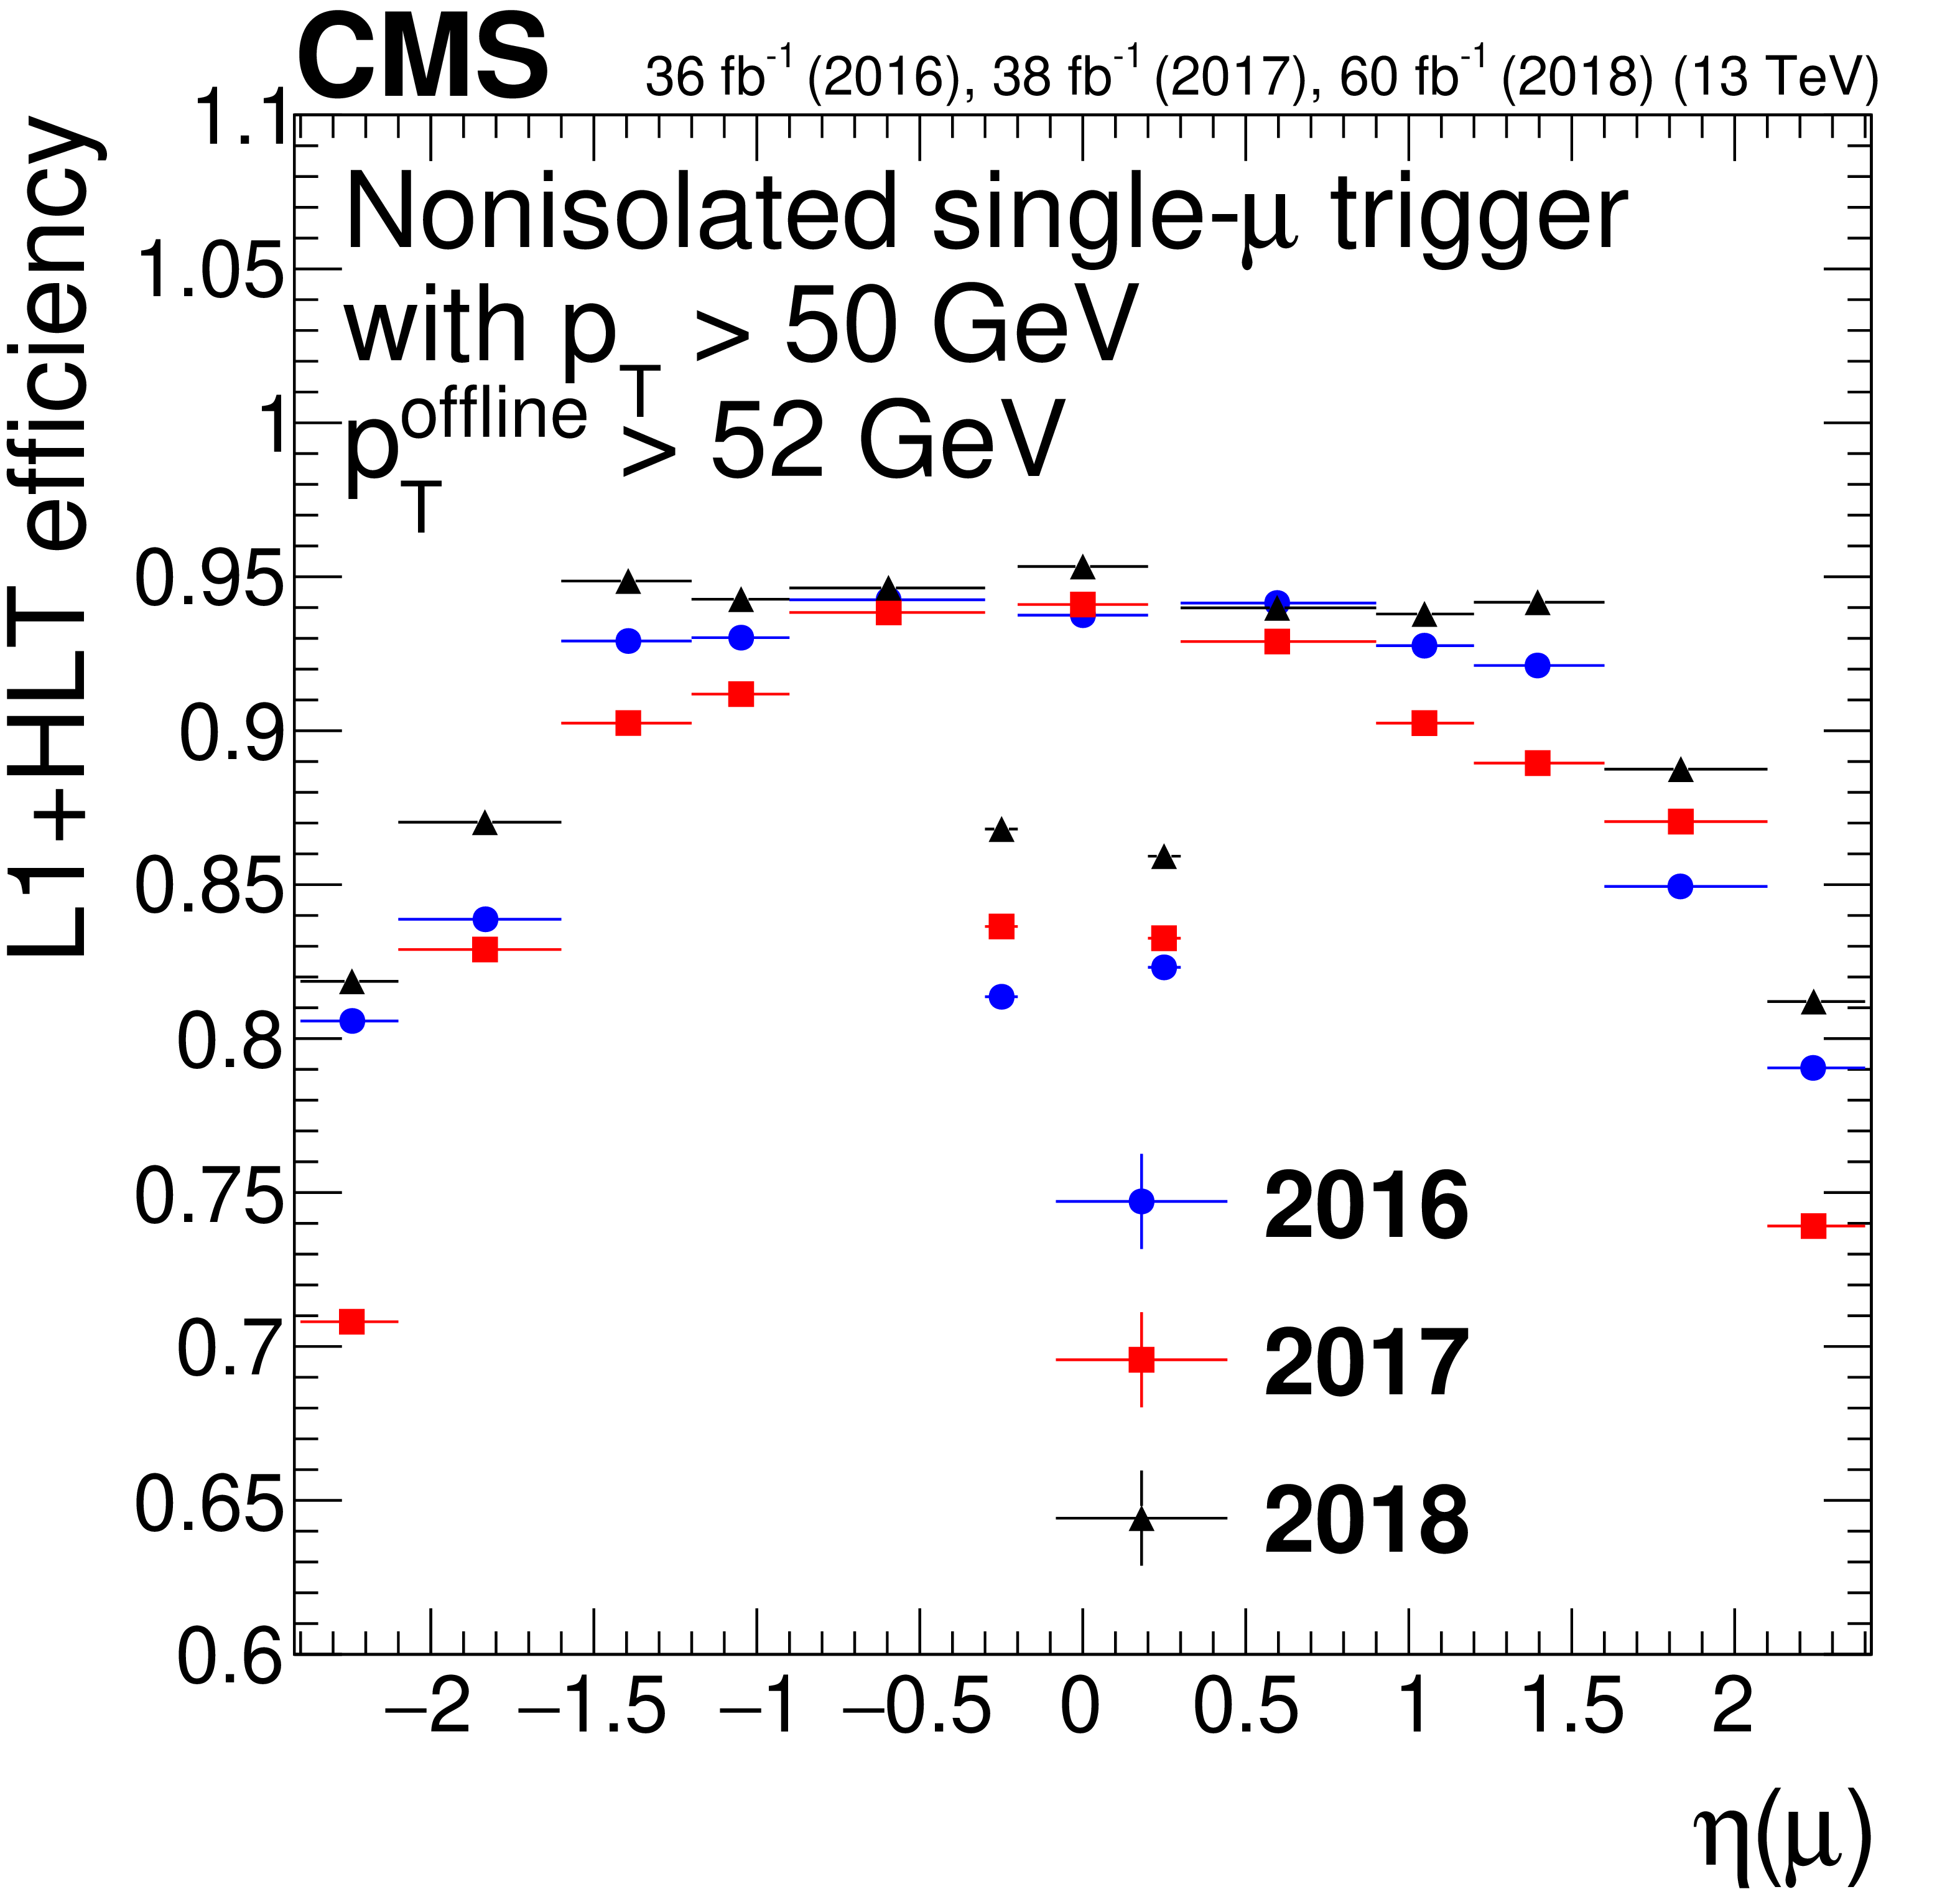
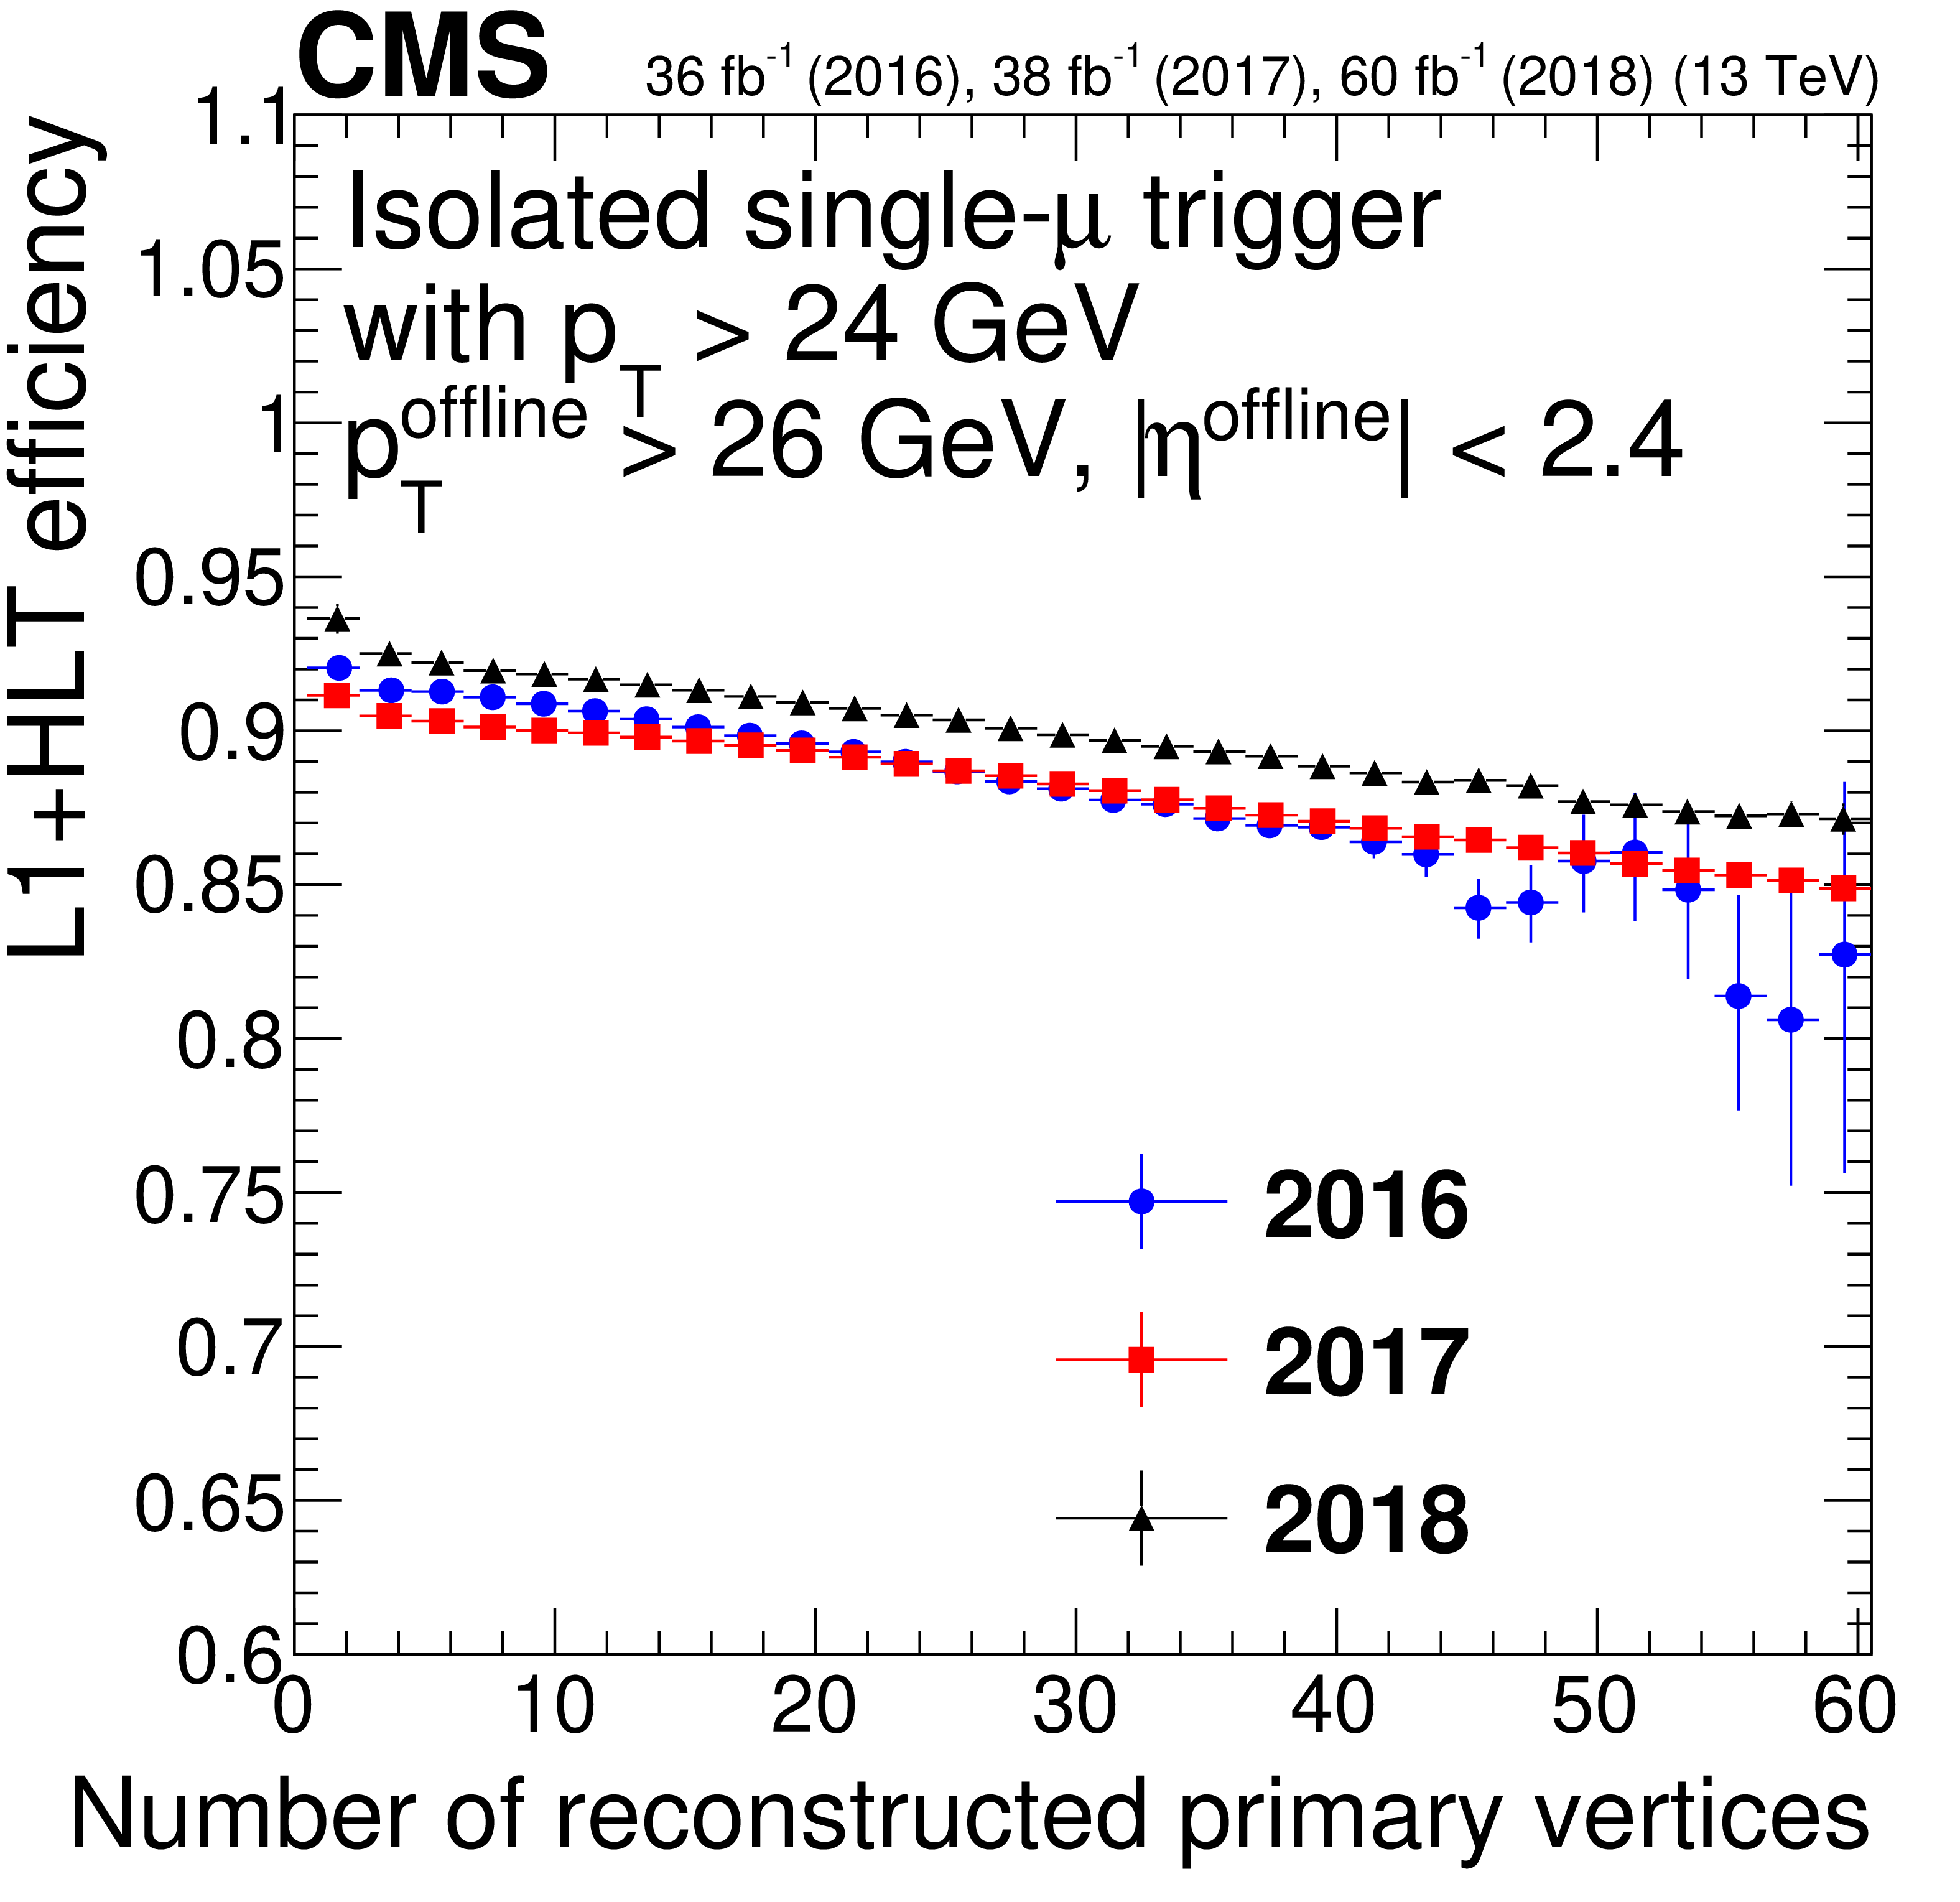
Figure 10:
Single-muon trigger efficiency for IsoMu24 (left) and Mu50 (right), as a function of muon ${p_{\mathrm {T}}}$ (upper row), $\eta $ (middle row), and the number of reconstructed vertices (lower row). Only statistical uncertainties are shown. |
png pdf |
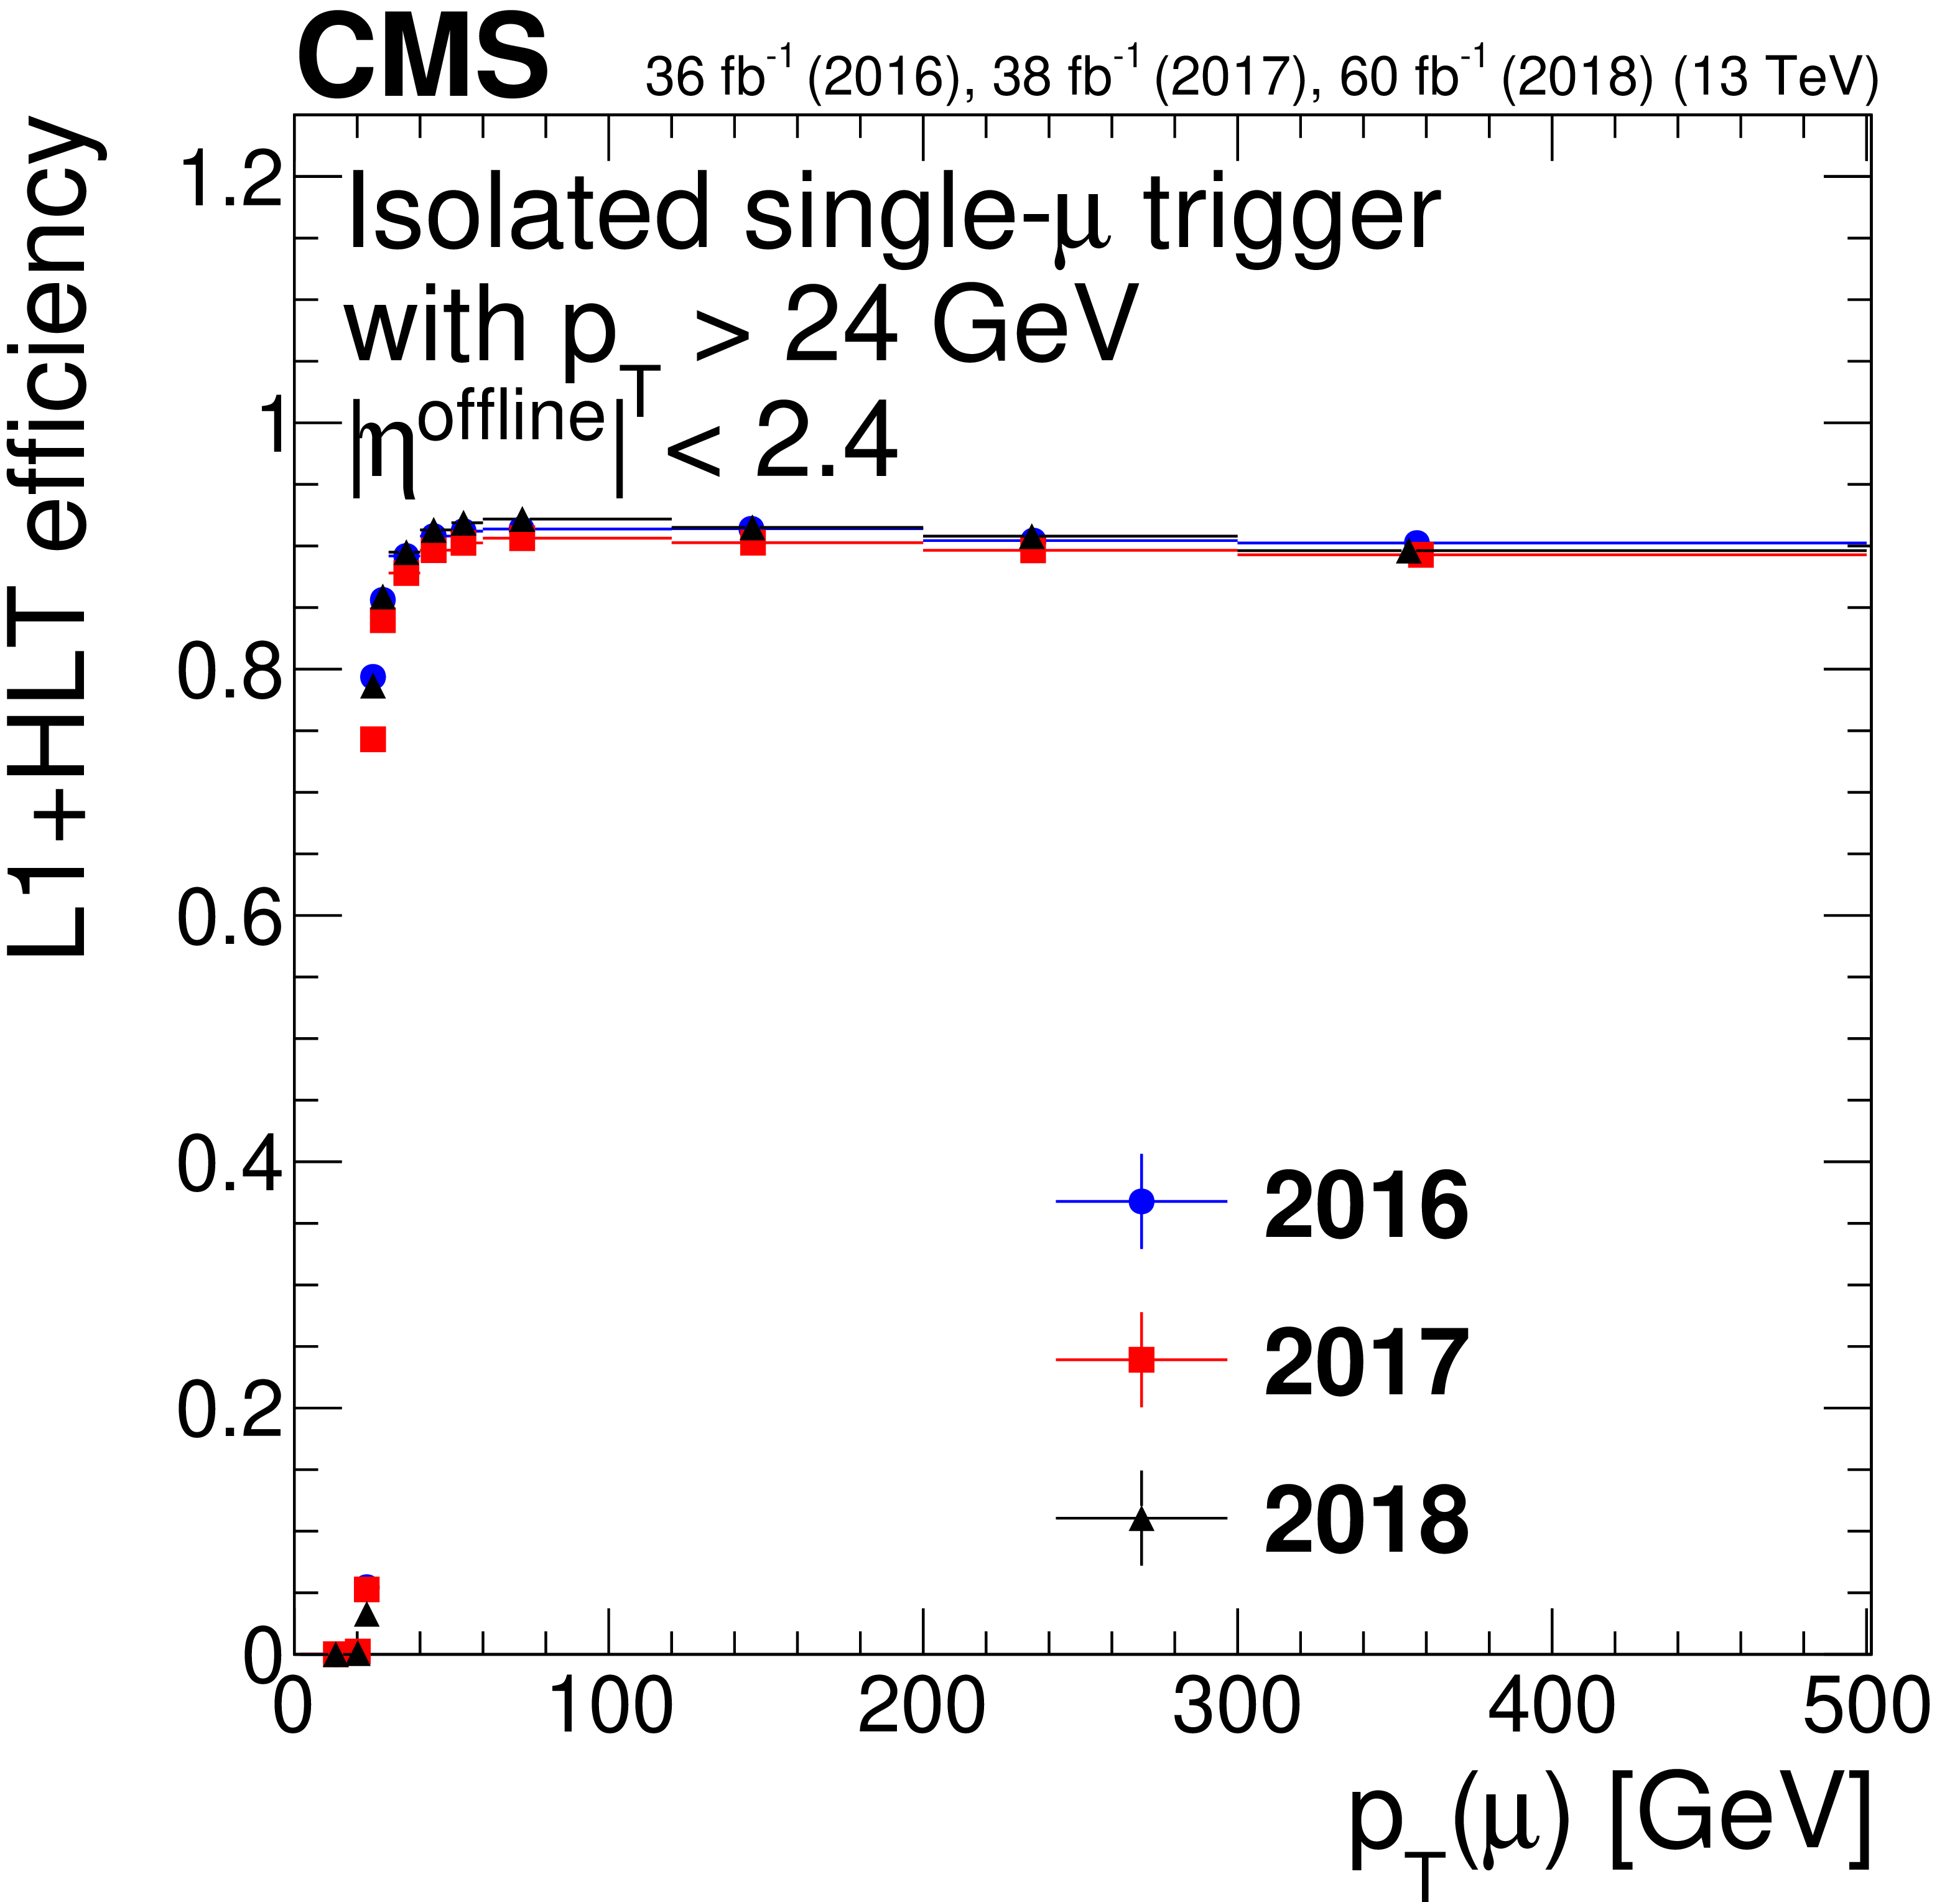
Figure 10-a:
Single-muon trigger efficiency for IsoMu24, as a function of muon ${p_{\mathrm {T}}}$. Only statistical uncertainties are shown. |
png pdf |
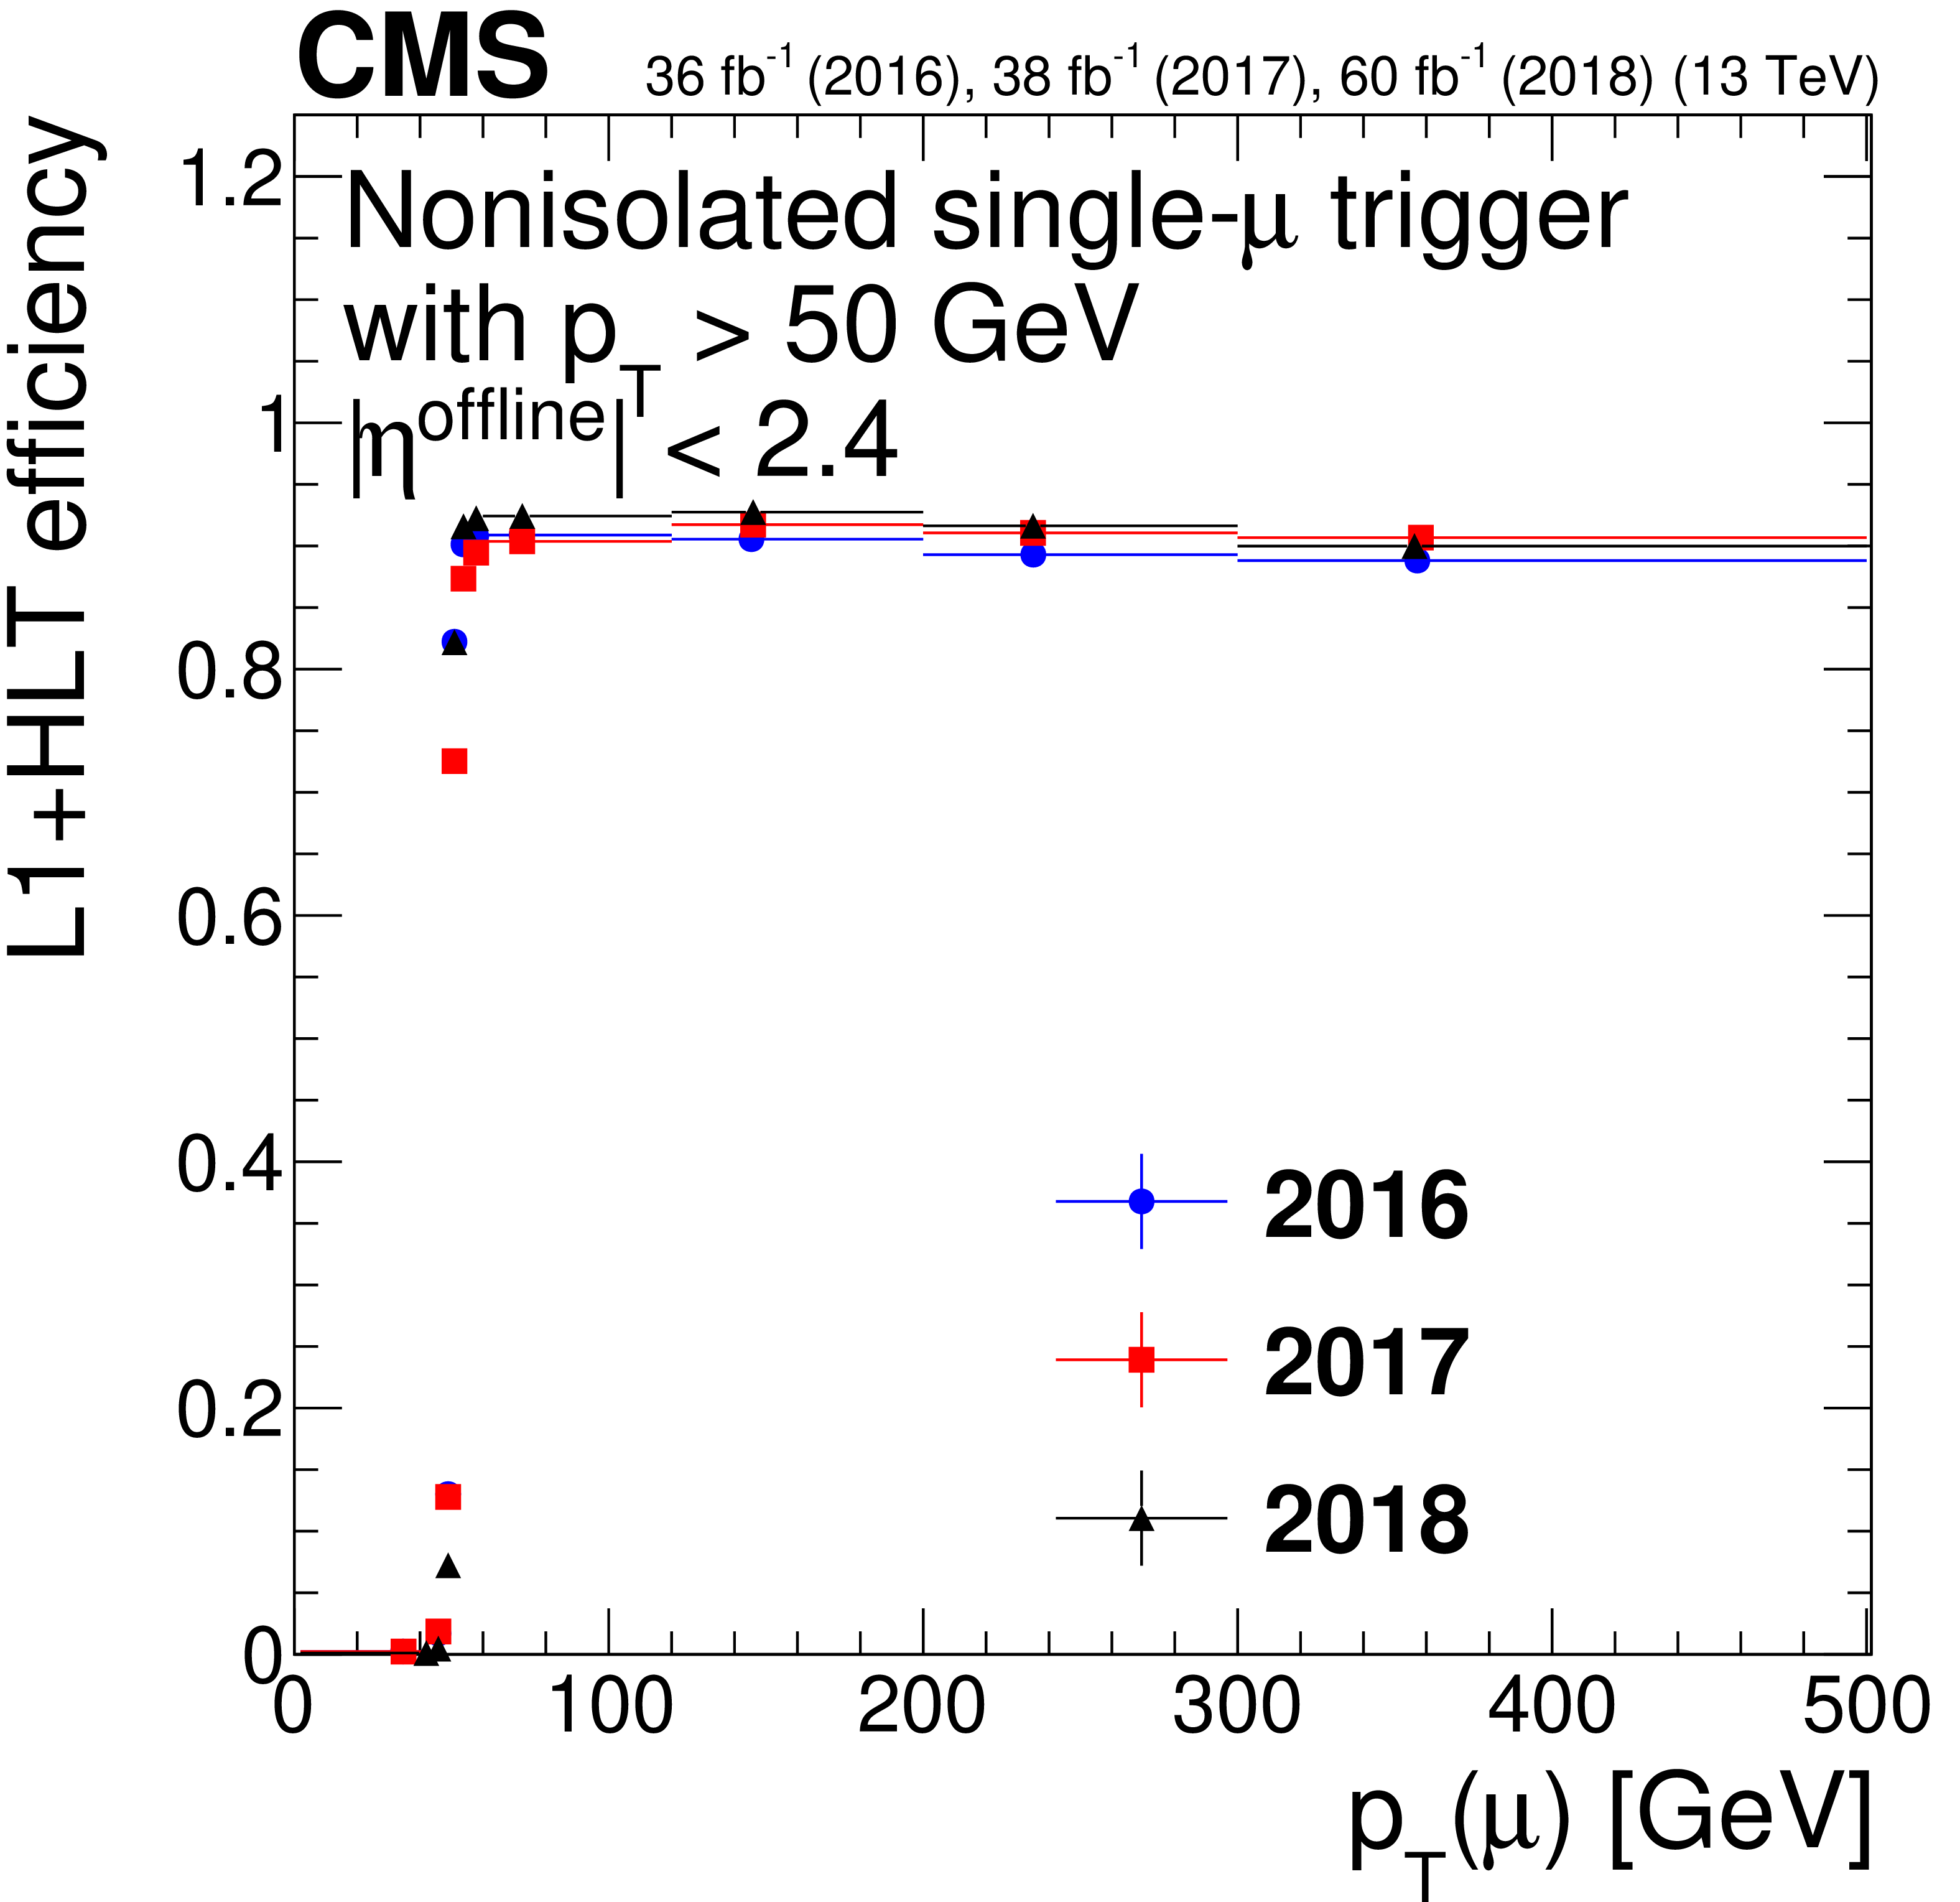
Figure 10-b:
Single-muon trigger efficiency for Mu50, as a function of muon ${p_{\mathrm {T}}}$. Only statistical uncertainties are shown. |
png pdf |
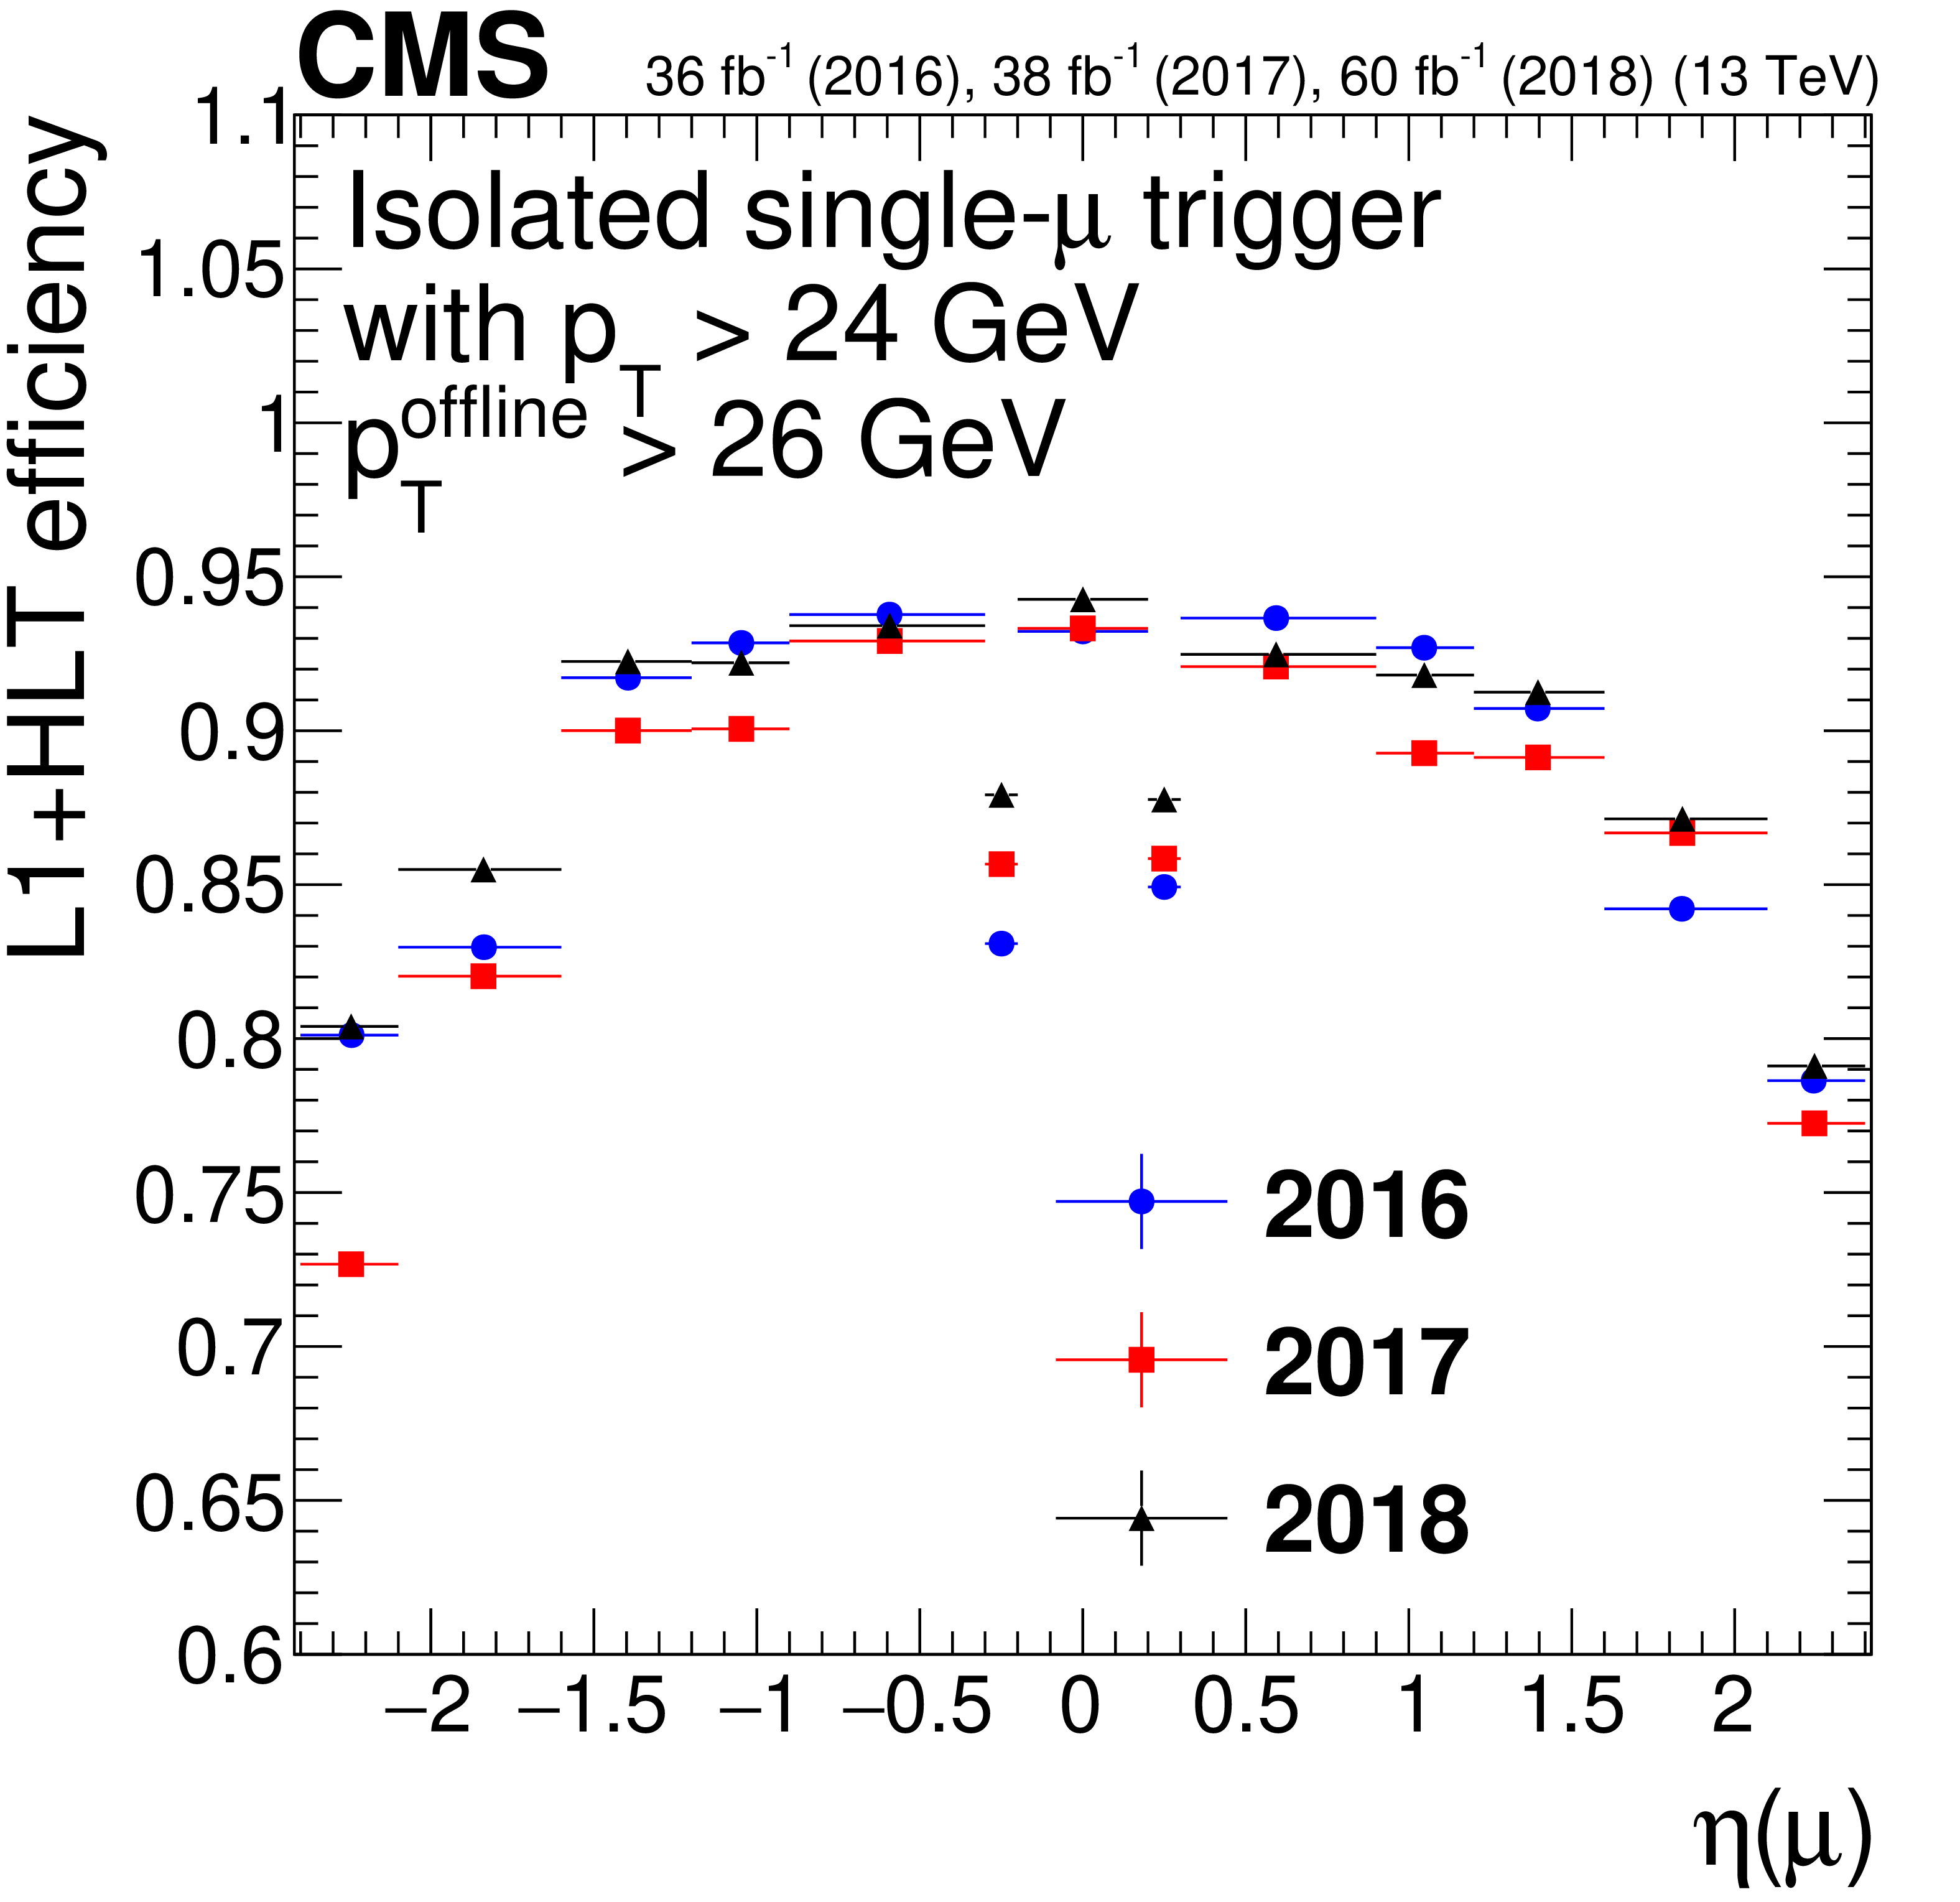
Figure 10-c:
Single-muon trigger efficiency for IsoMu24, as a function of muon $\eta $. Only statistical uncertainties are shown. |
png pdf |
Figure 10-d:
Single-muon trigger efficiency for Mu50, as a function of muon $\eta $. Only statistical uncertainties are shown. |
png pdf |
Figure 10-e:
Single-muon trigger efficiency for IsoMu24, as a function of the number of reconstructed vertices. Only statistical uncertainties are shown. |

png pdf |
Figure 10-f:
Single-muon trigger efficiency for Mu50, as a function of the number of reconstructed vertices. Only statistical uncertainties are shown. |

png pdf |
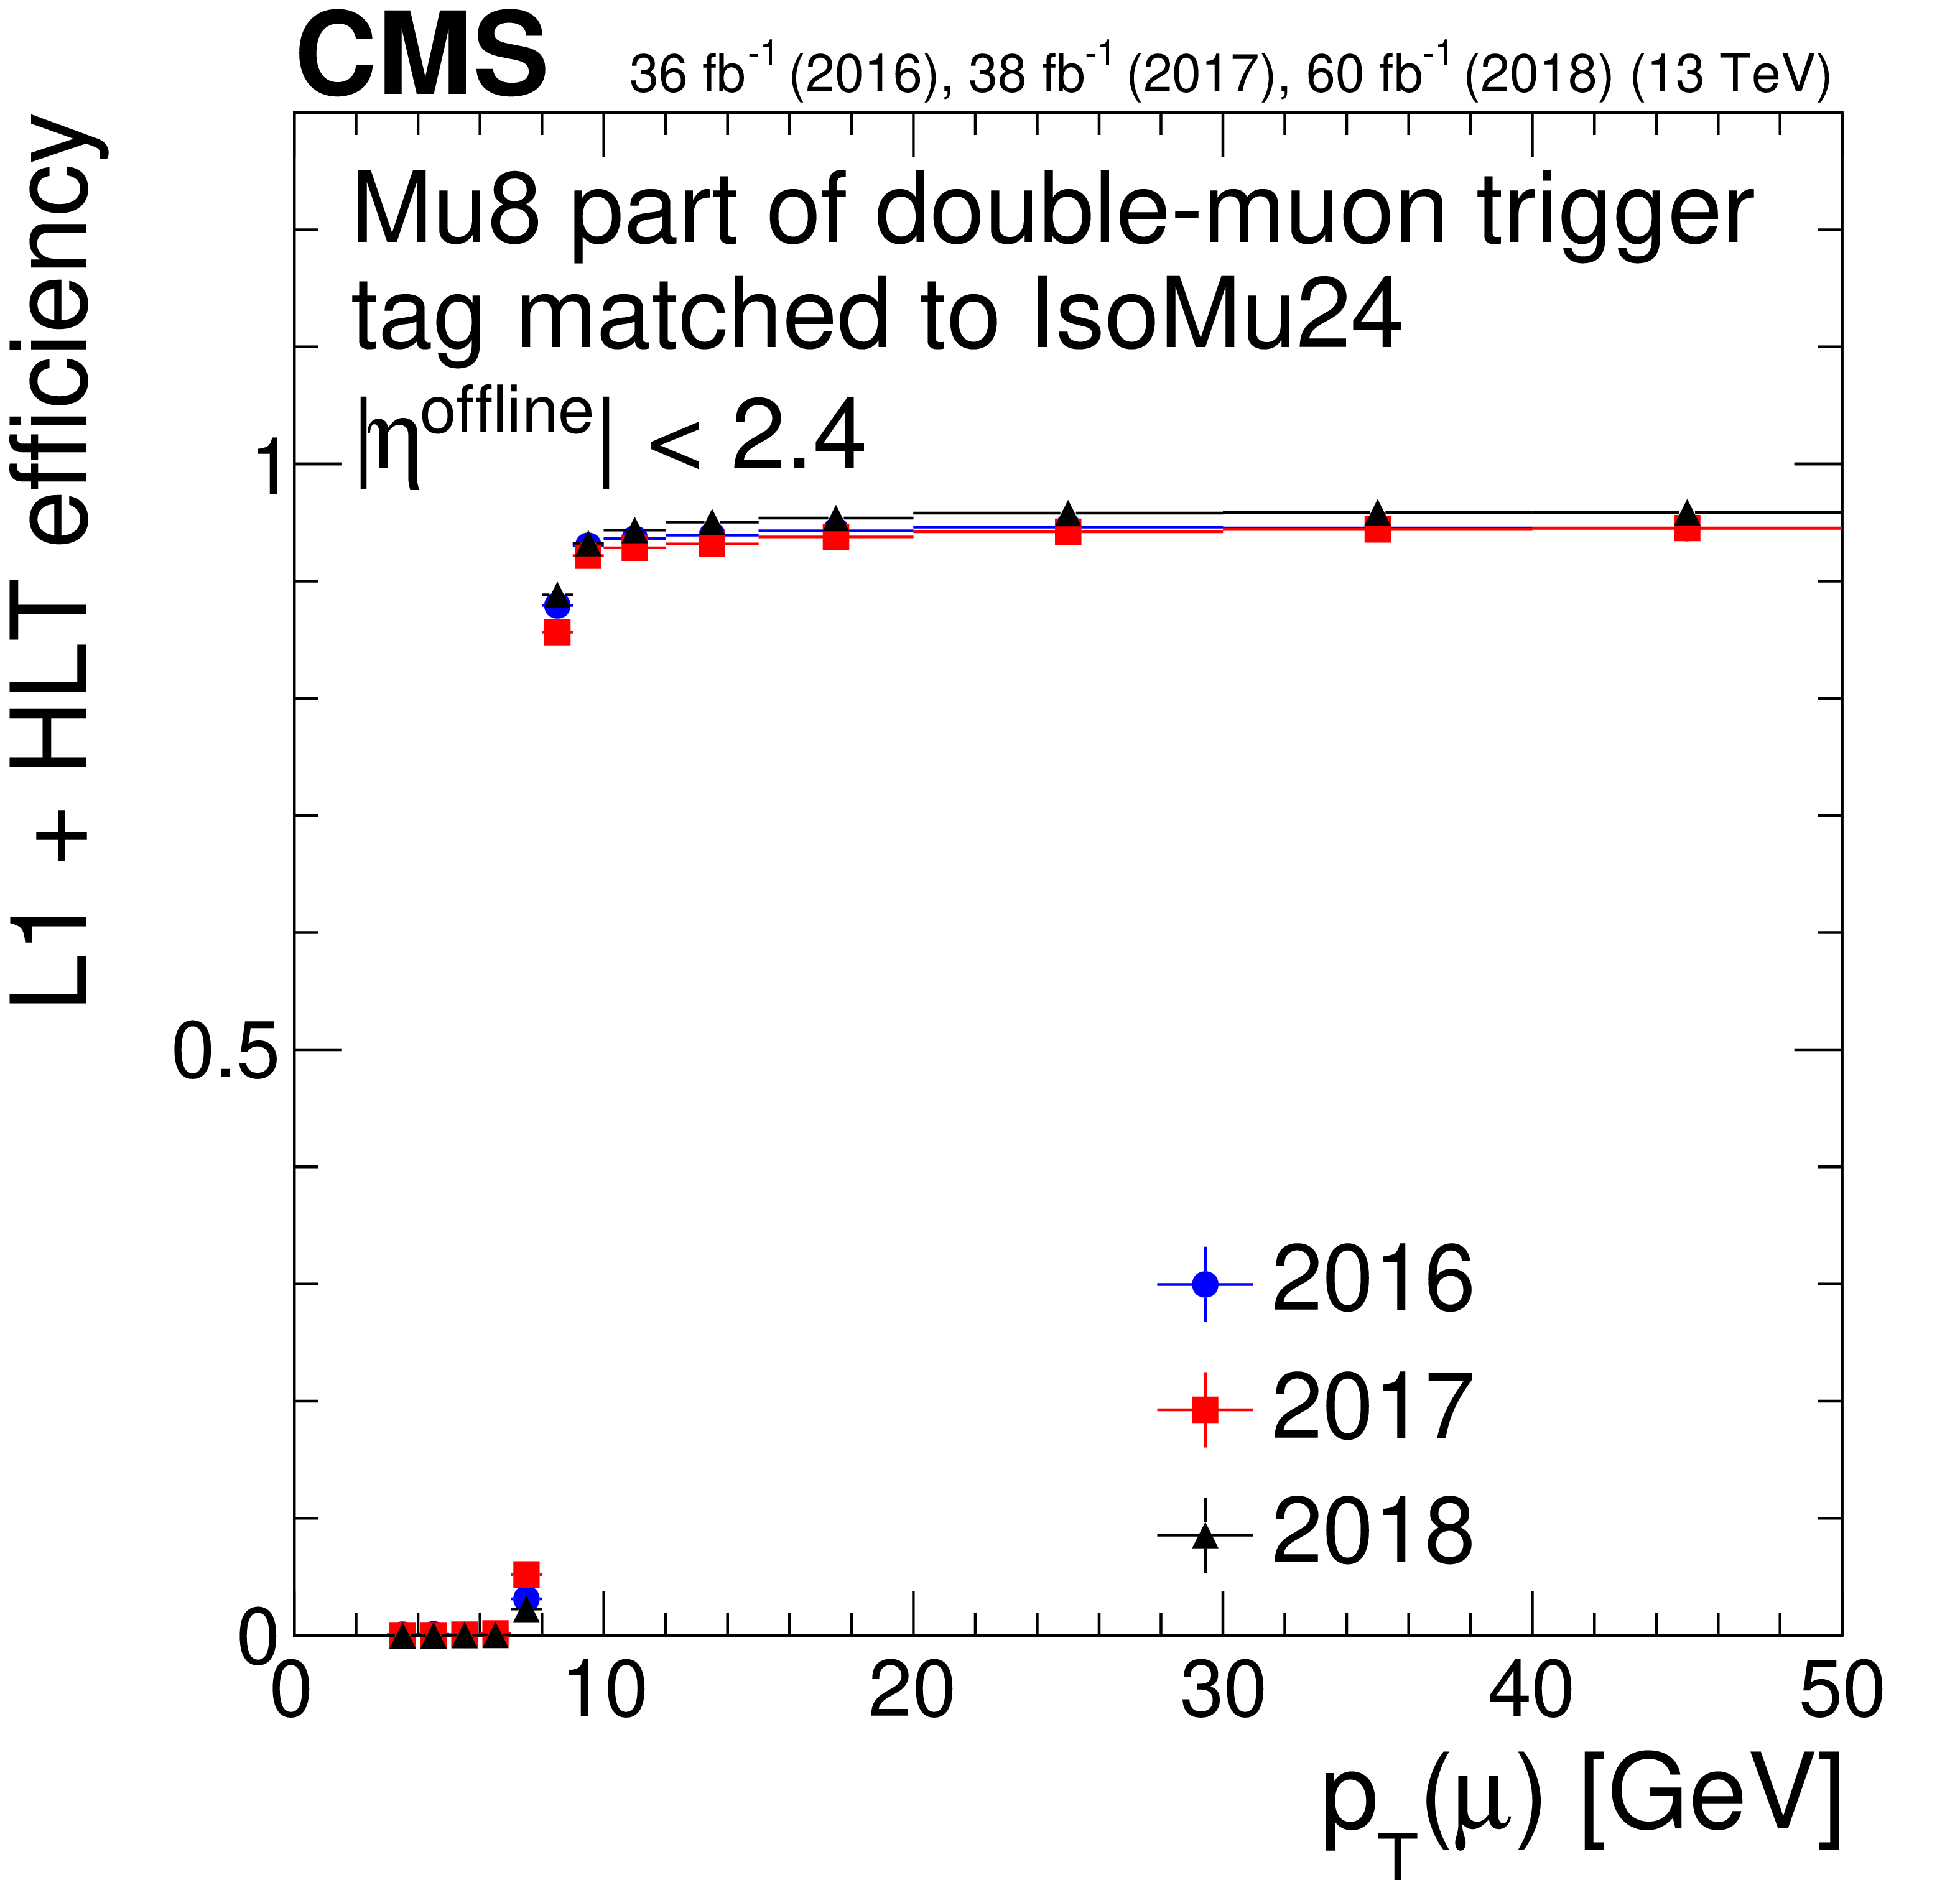
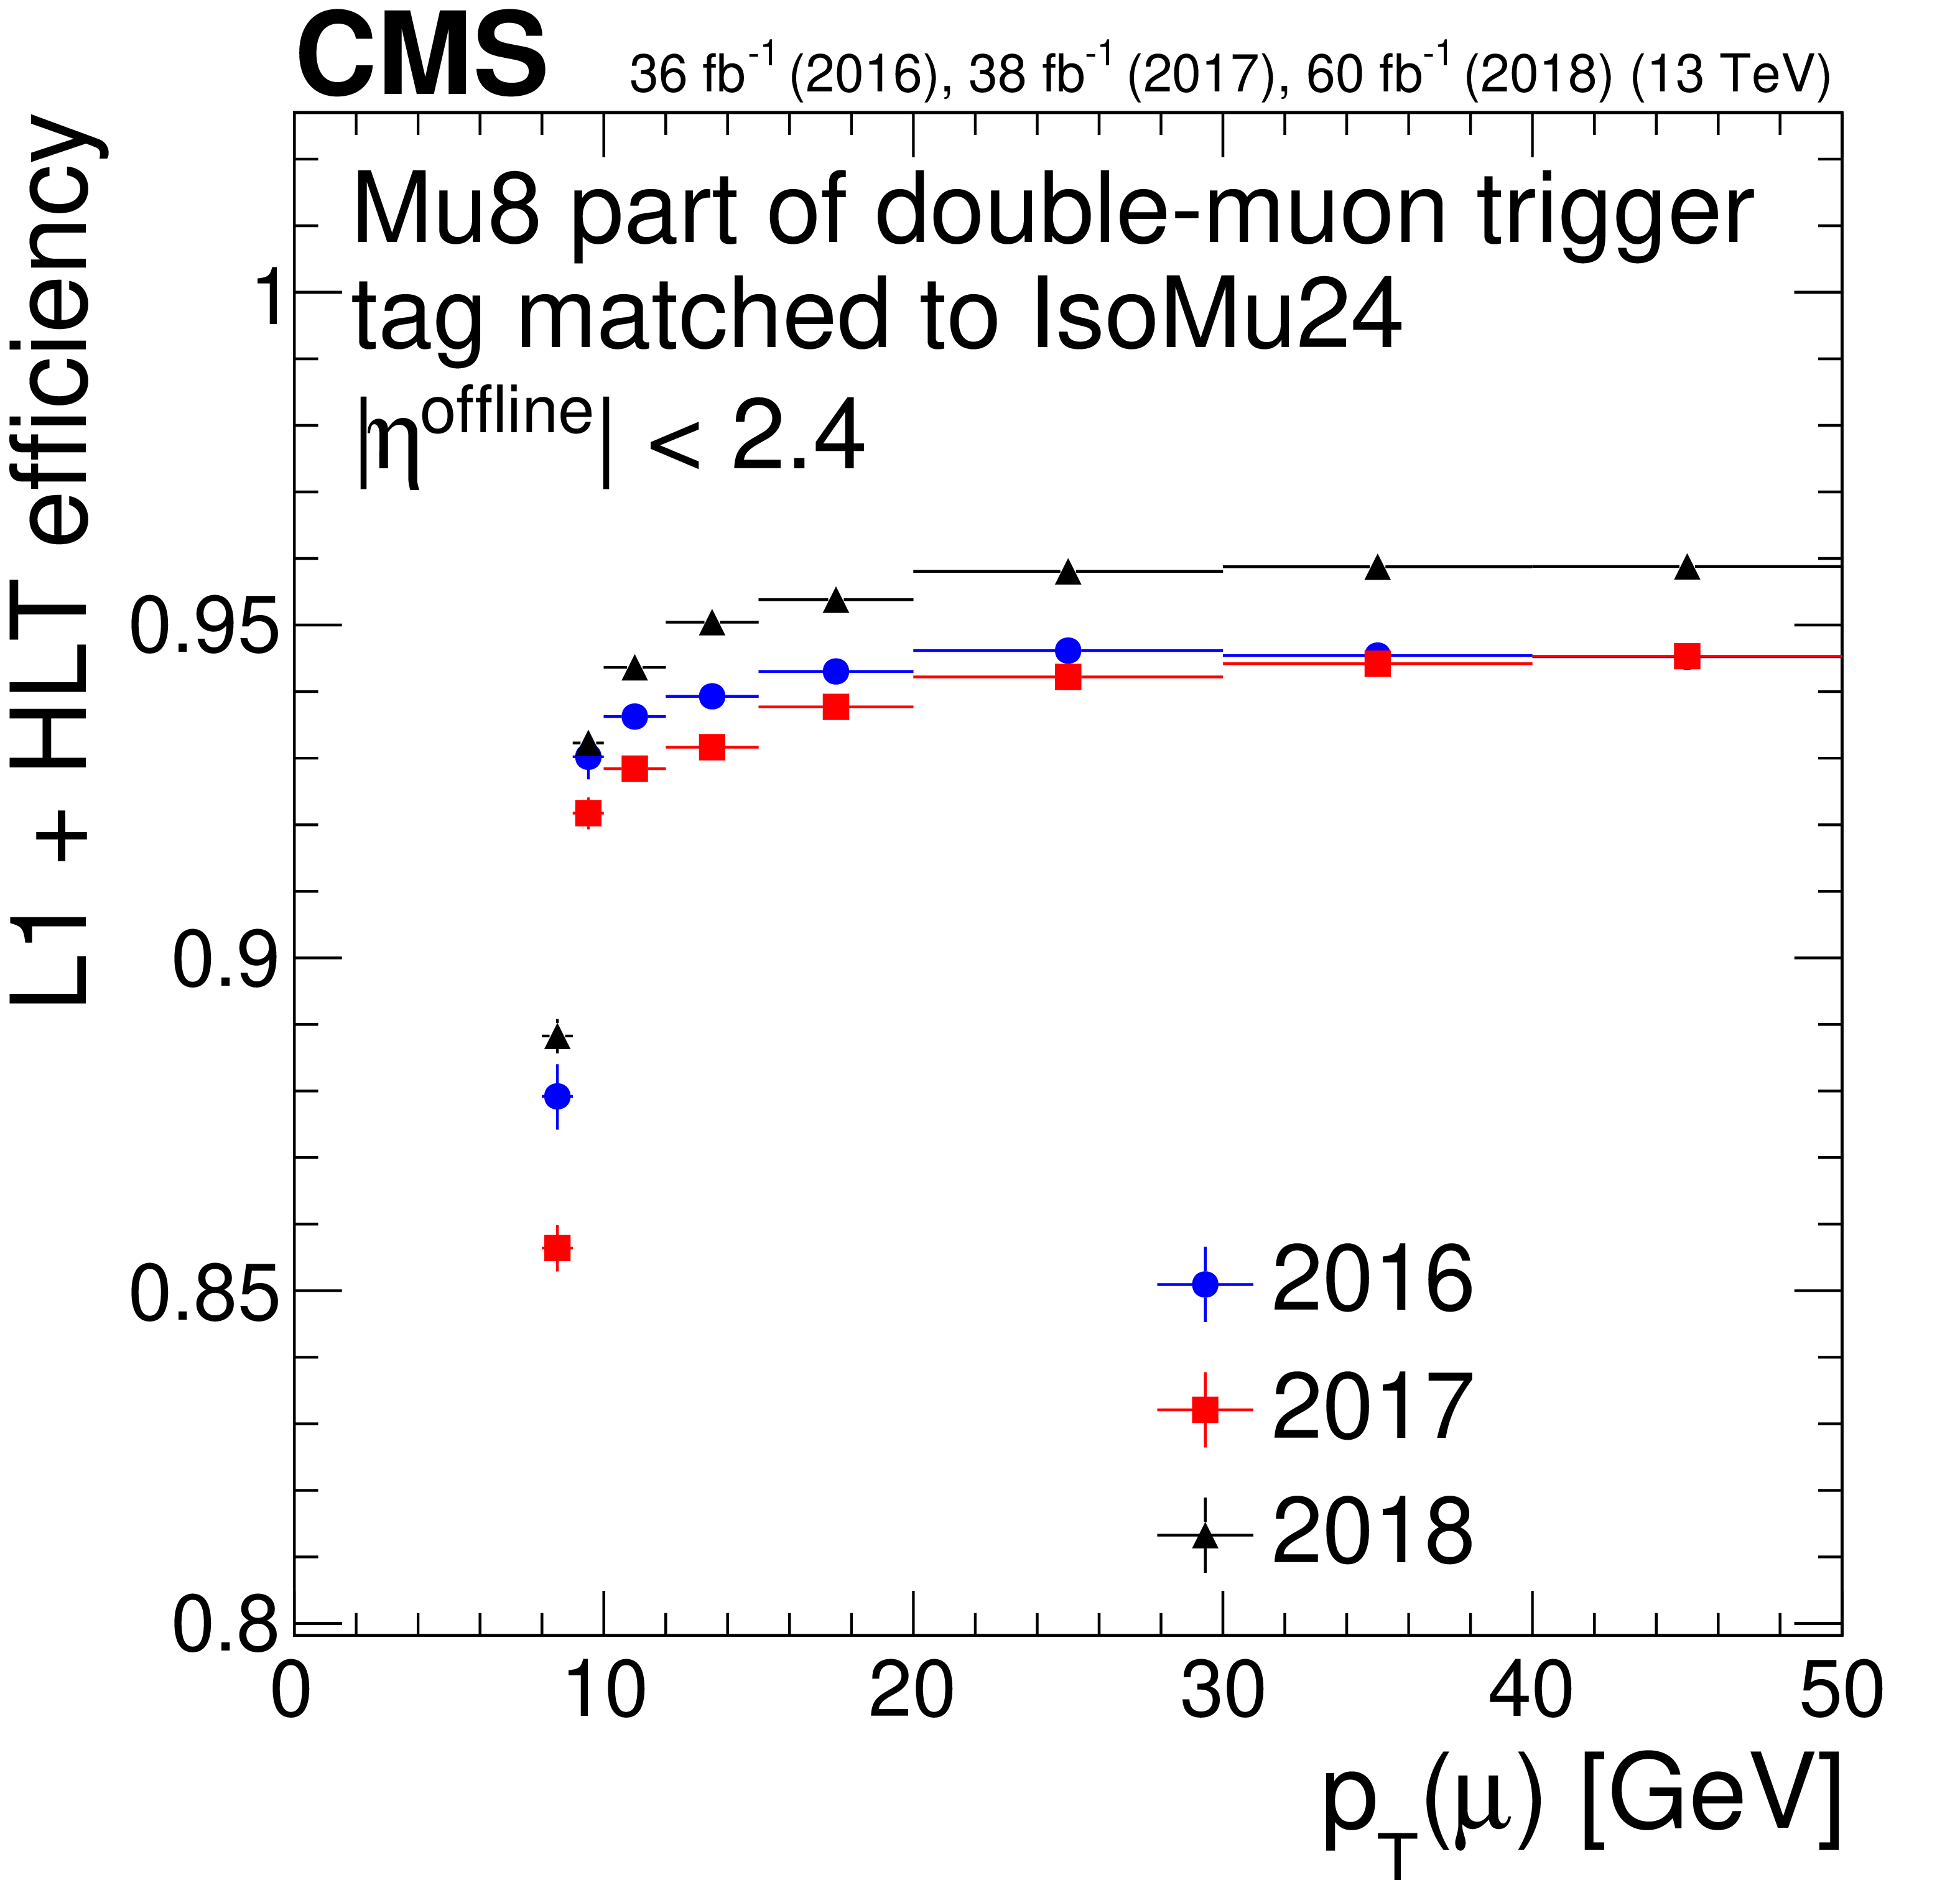
Figure 11:
Trigger efficiency for the lower-${p_{\mathrm {T}}}$ muon in double-muon triggers with respect to offline muons for 2016, 2017, and 2018. The right plot is the zoomed version of the left plot. Only statistical uncertainties are shown. |
png pdf |
Figure 11-a:
Trigger efficiency for the lower-${p_{\mathrm {T}}}$ muon in double-muon triggers with respect to offline muons for 2016, 2017, and 2018. Only statistical uncertainties are shown. |
png pdf |
Figure 11-b:
Trigger efficiency for the lower-${p_{\mathrm {T}}}$ muon in double-muon triggers with respect to offline muons for 2016, 2017, and 2018. Only statistical uncertainties are shown. |
png pdf |
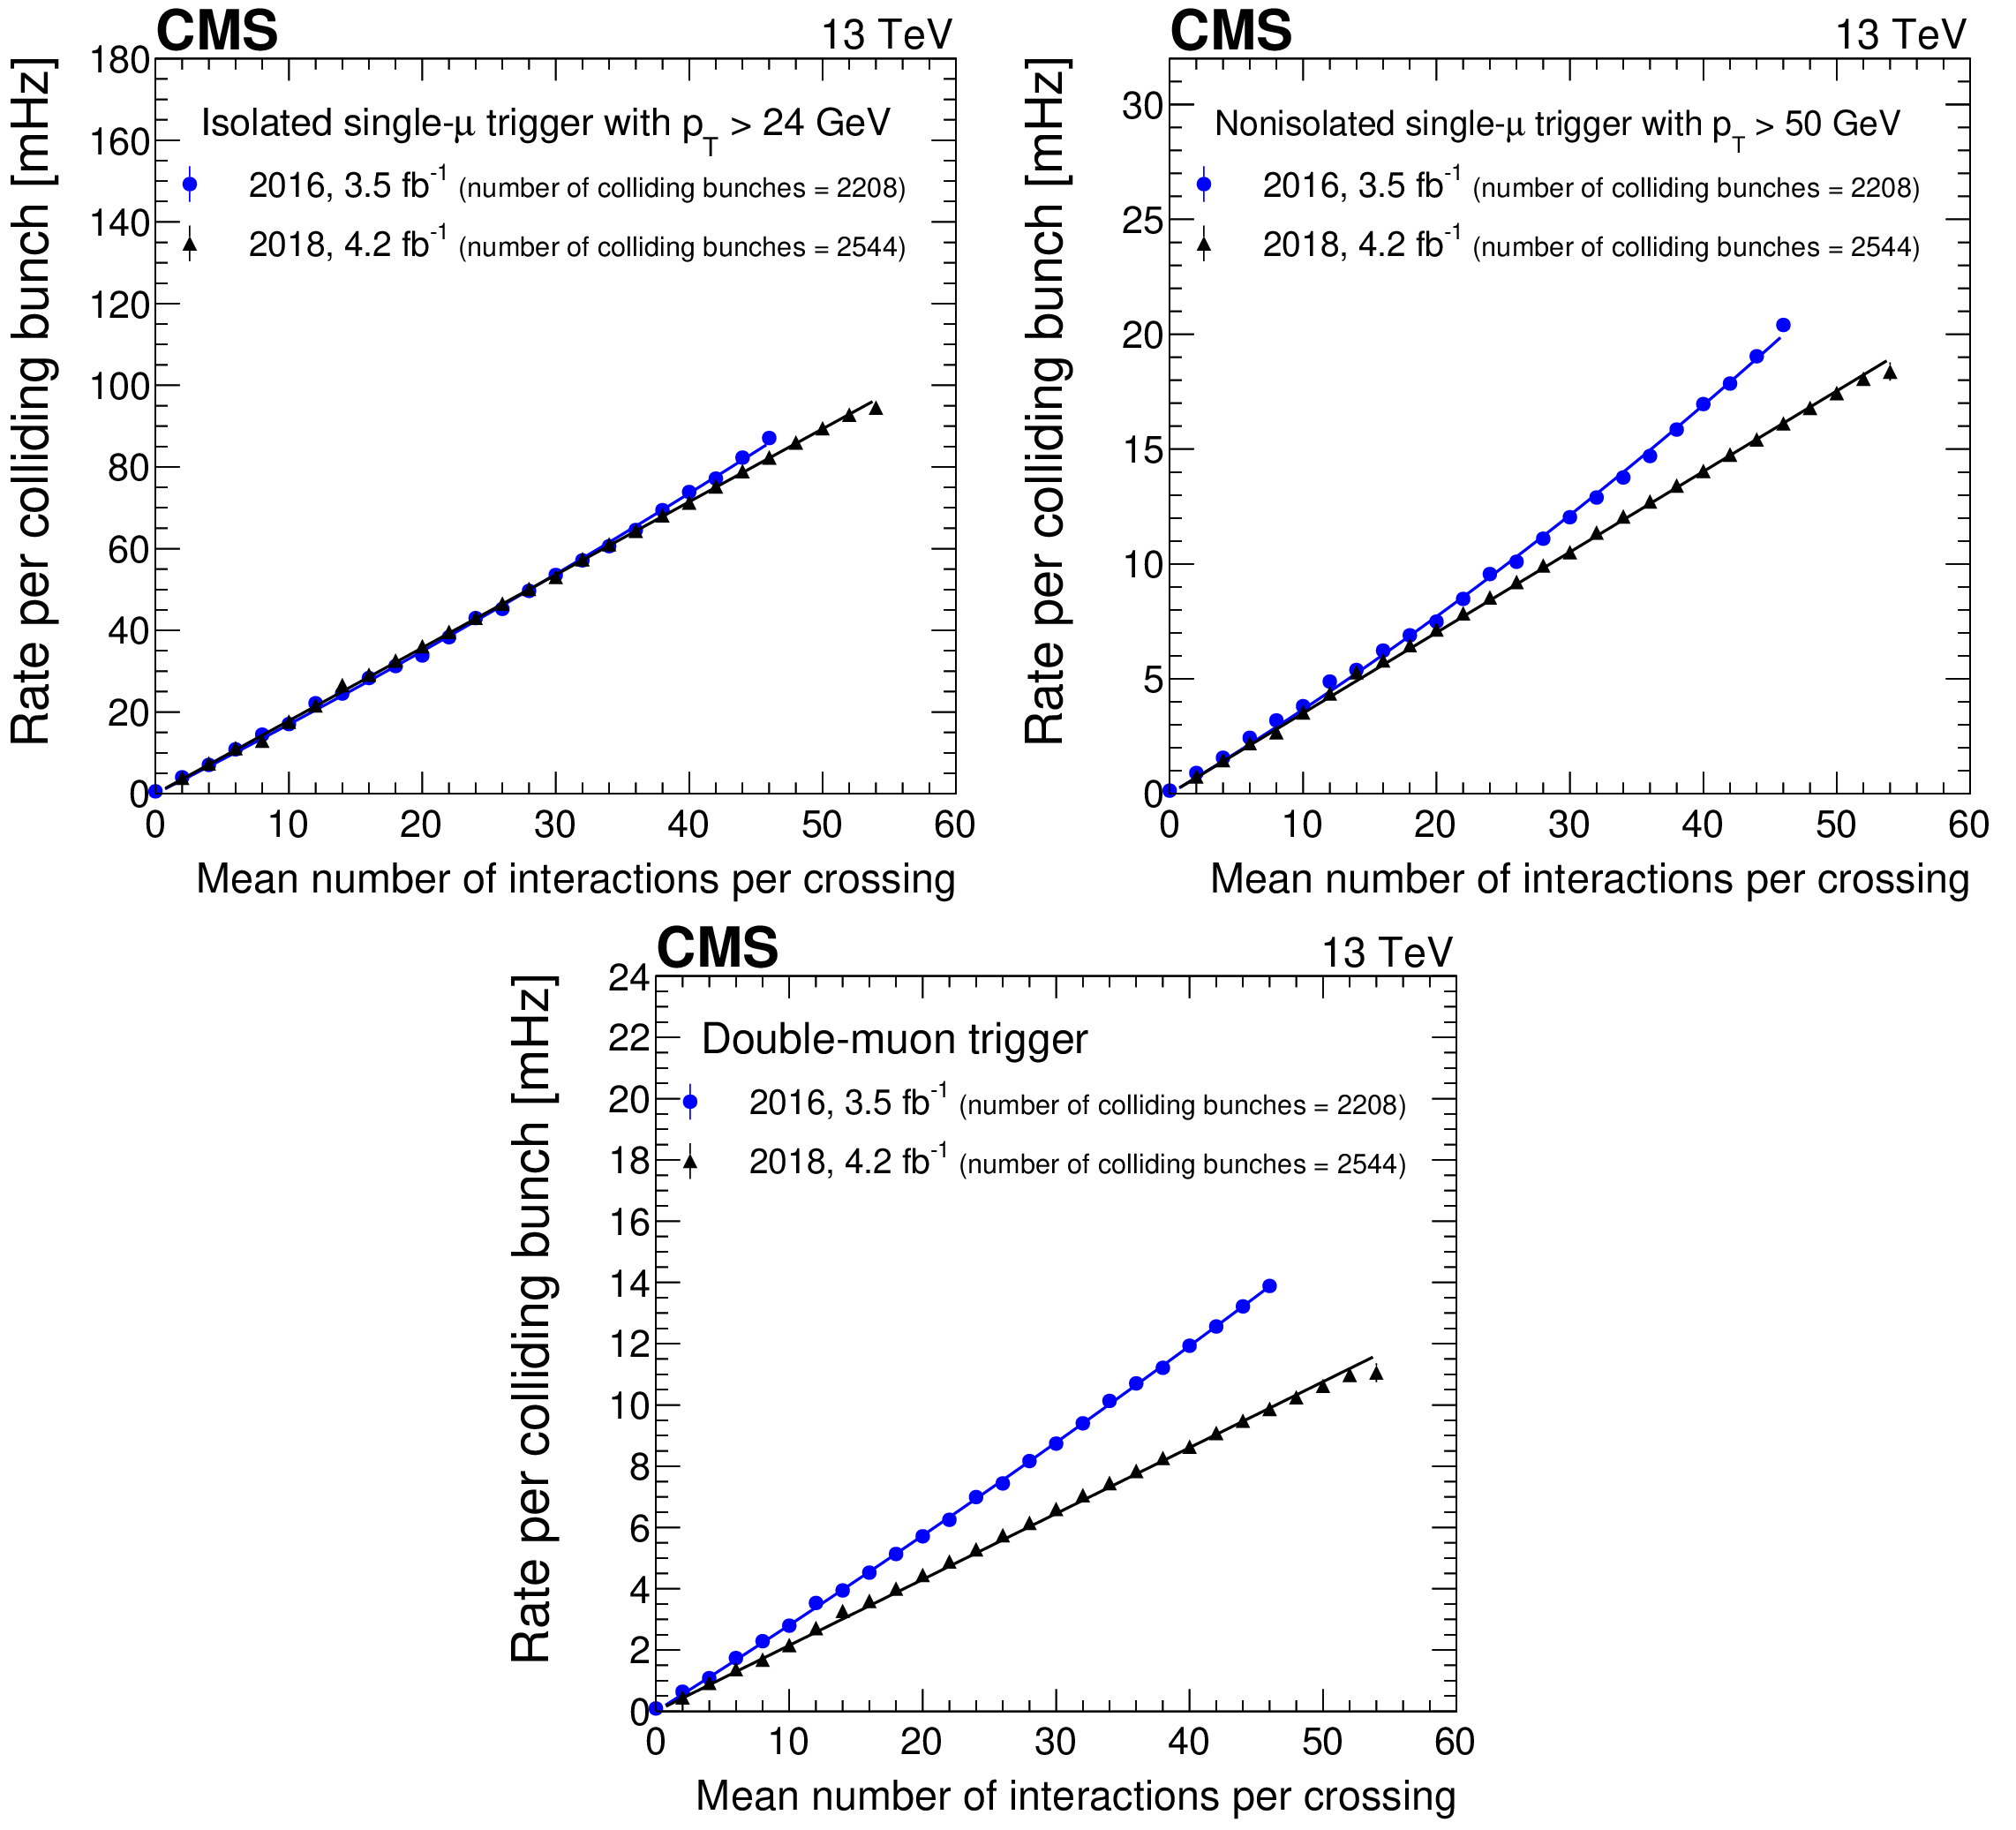
Figure 12:
Dependence of the trigger rate per colliding bunch on the mean number of interactions per bunch crossing for the isolated (upper left) and nonisolated (upper right) single-muon triggers as well as the double-muon trigger (lower middle), comparing the 2016 and 2018 trigger configurations. Quadratic (linear) fits to the 2016 (2018) data points are shown as colored lines. Only statistical uncertainties are shown. |
png pdf |
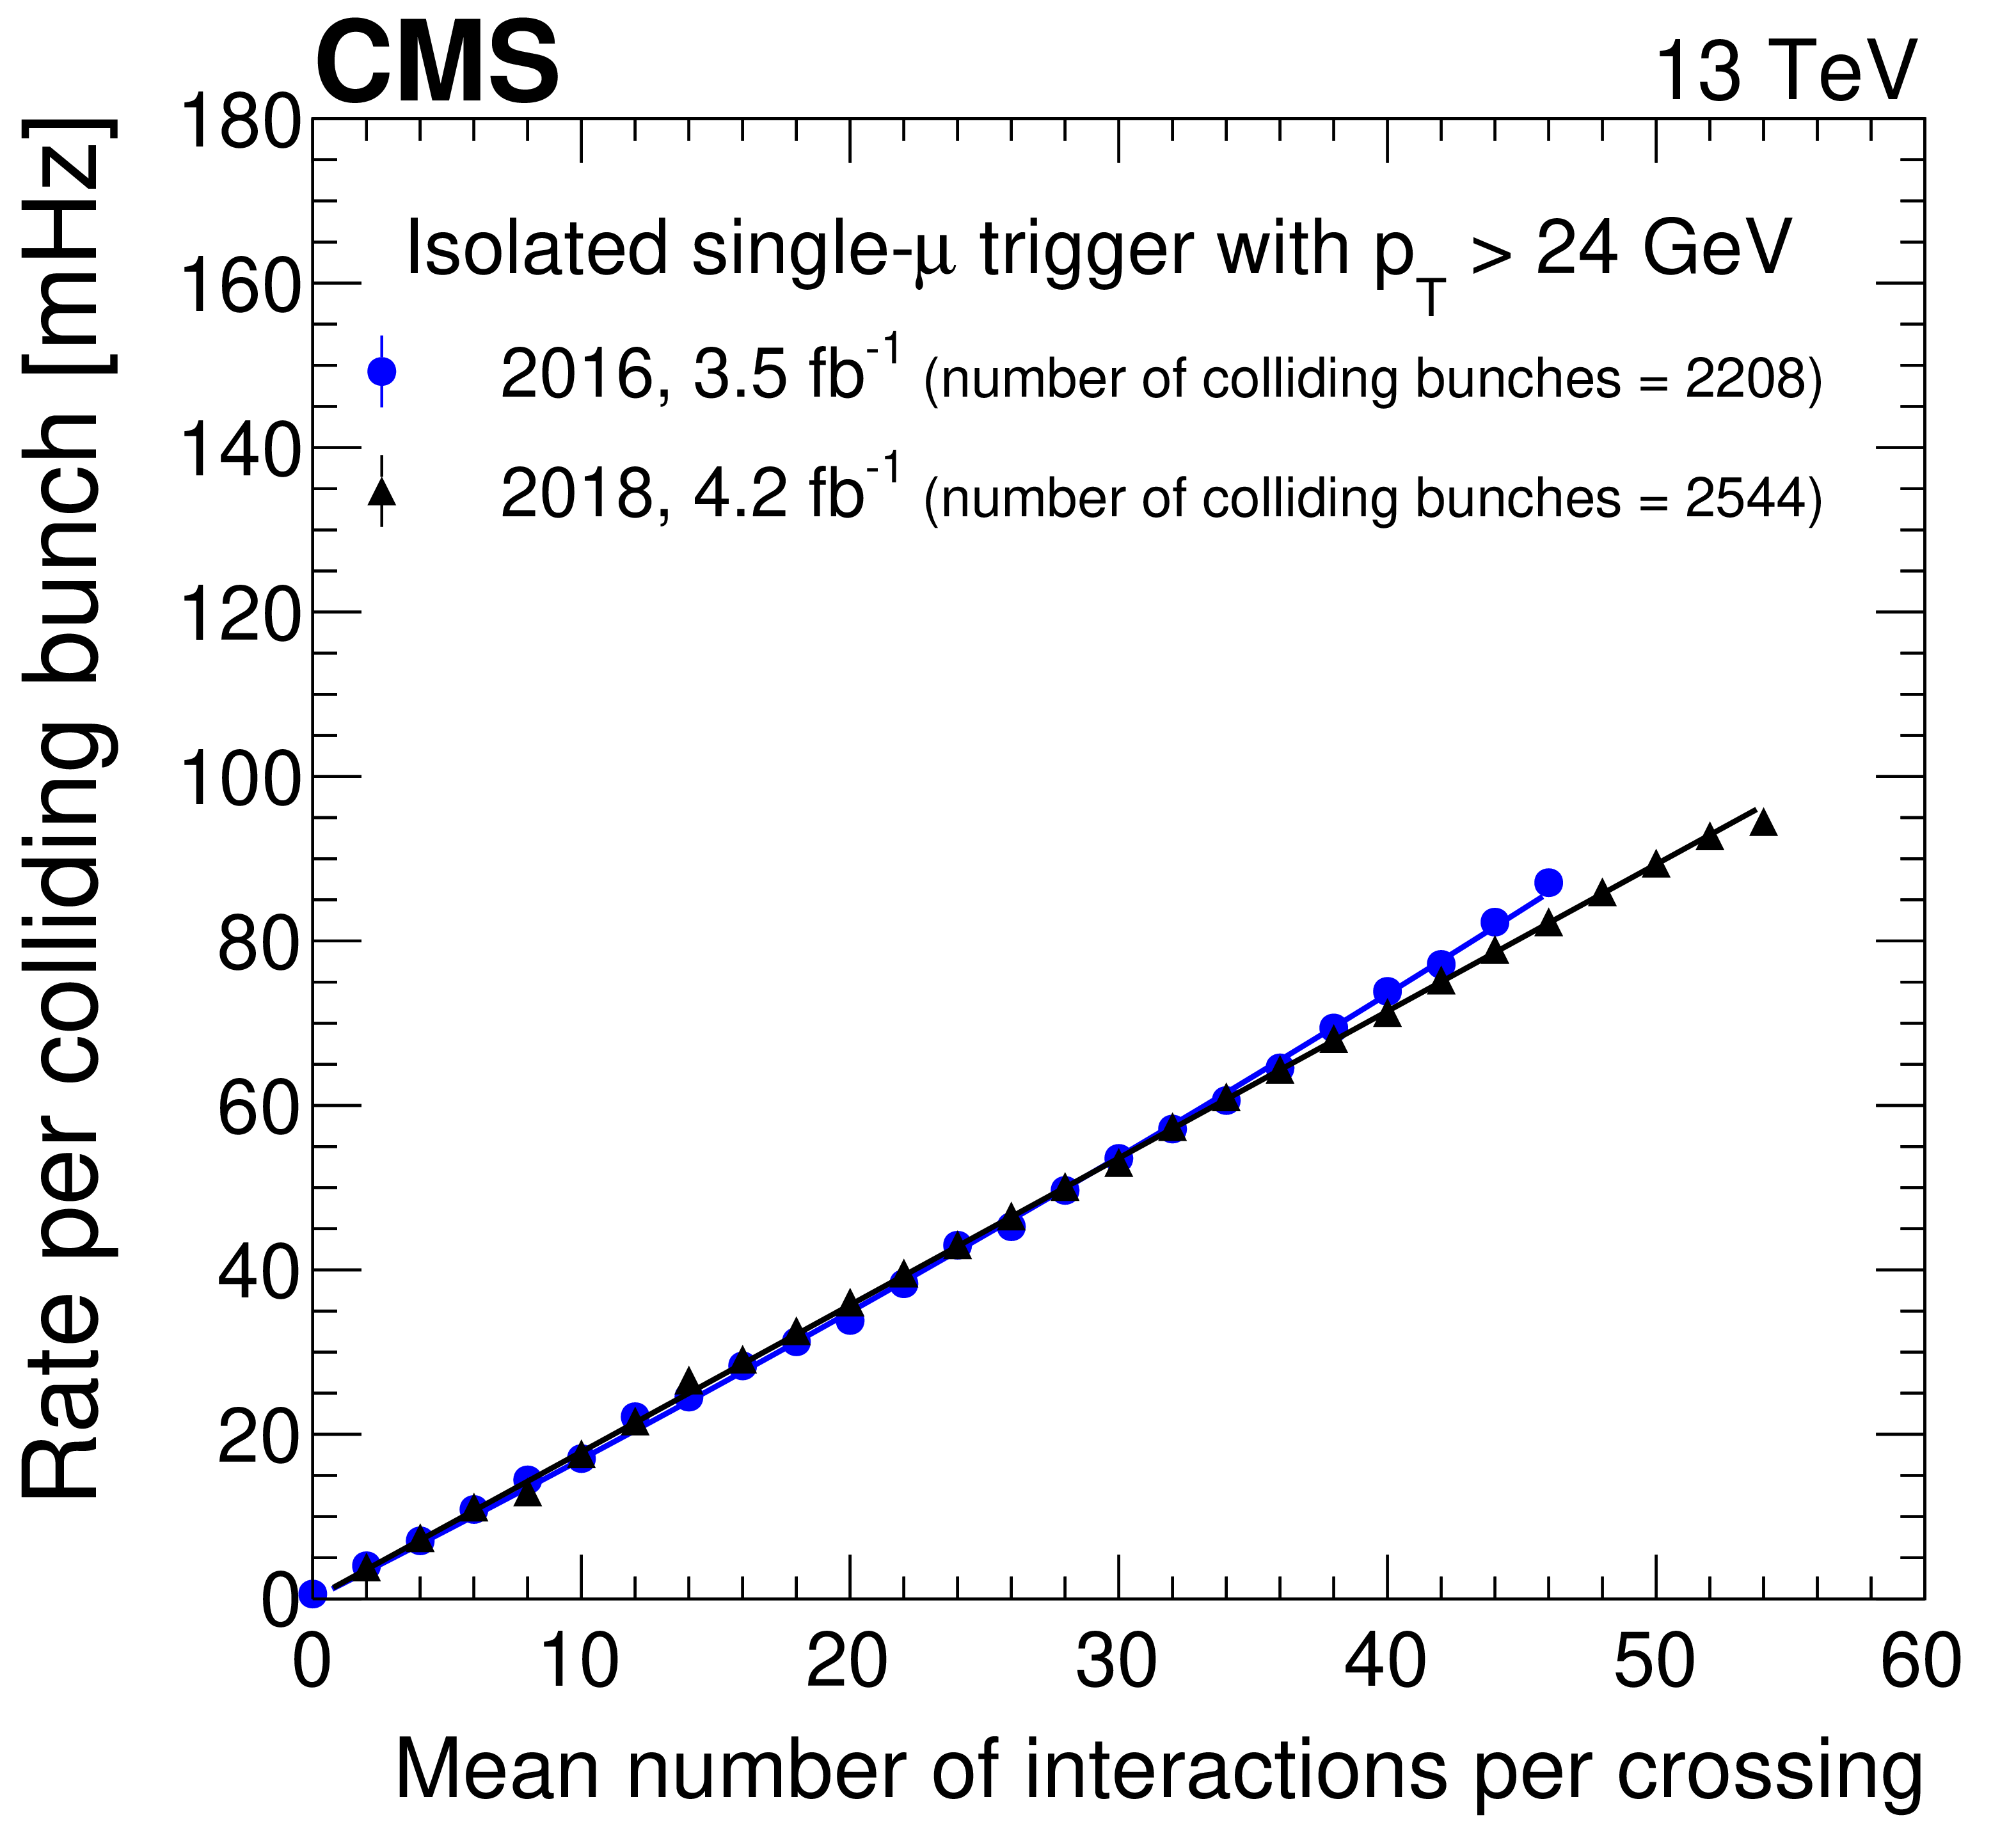
Figure 12-a:
Dependence of the trigger rate per colliding bunch on the mean number of interactions per bunch crossing for the isolated single-muon trigger, comparing the 2016 and 2018 trigger configurations. Quadratic (linear) fits to the 2016 (2018) data points are shown as colored lines. Only statistical uncertainties are shown. |
png pdf |
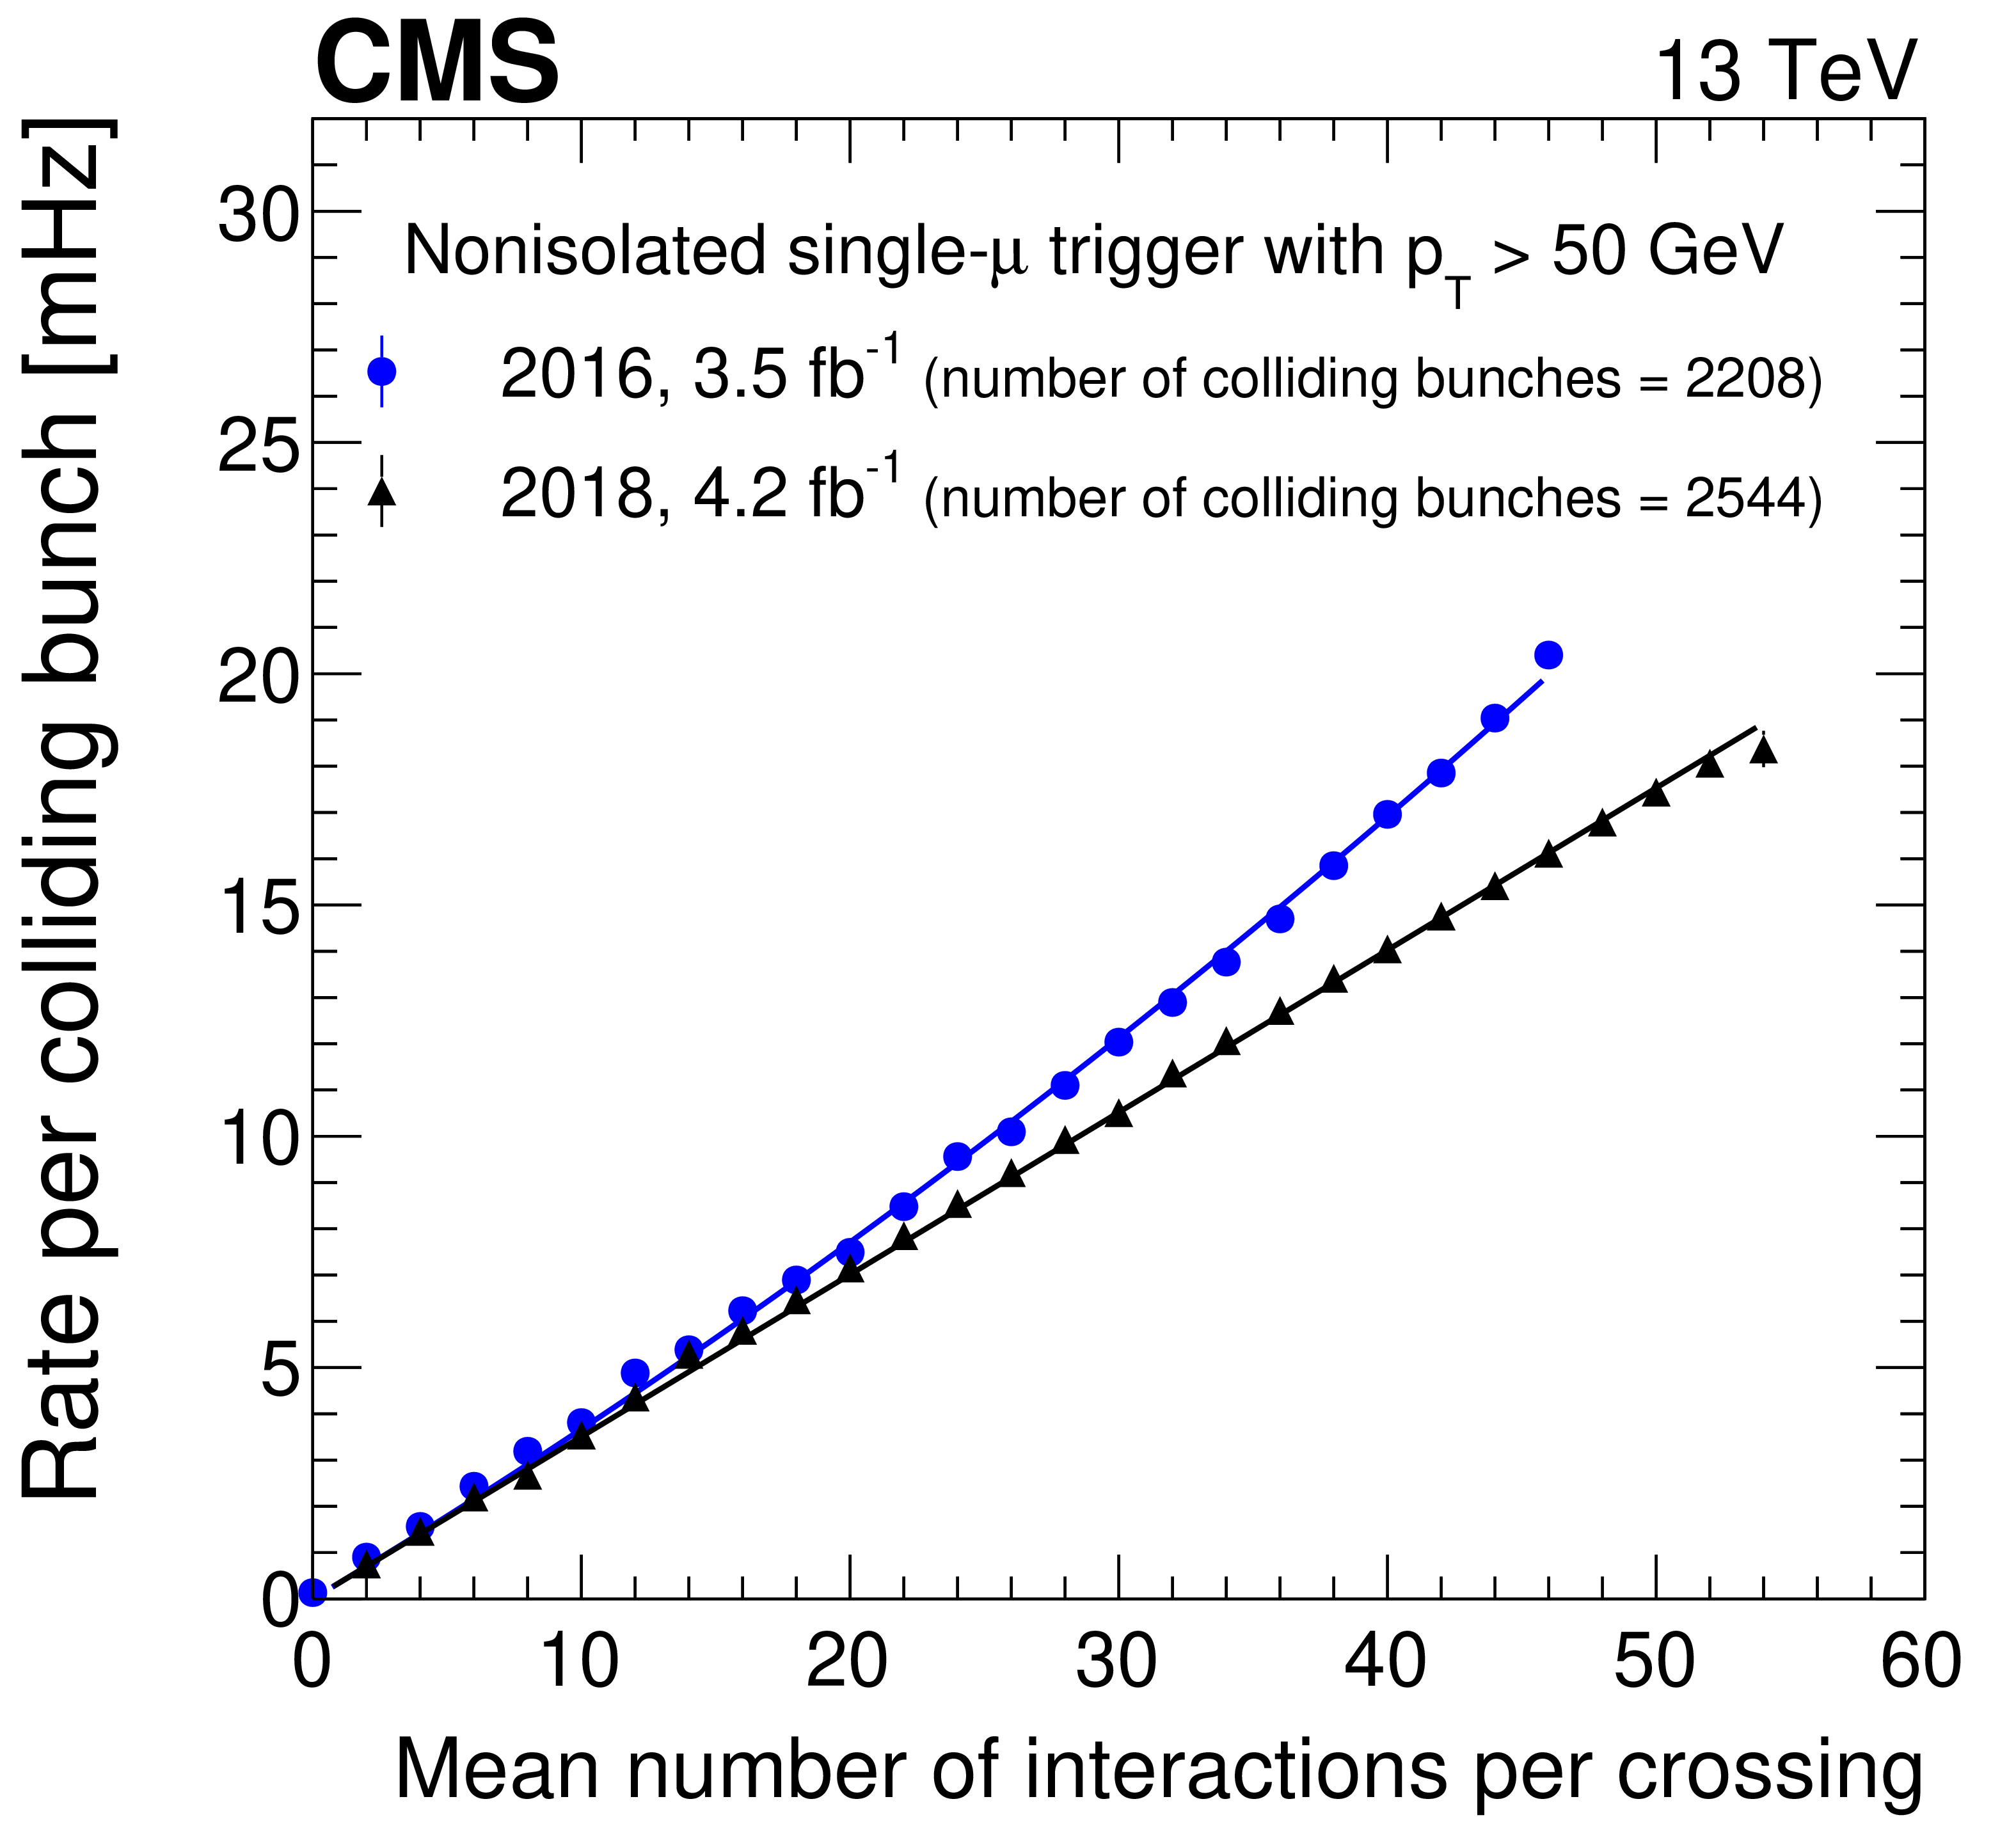
Figure 12-b:
Dependence of the trigger rate per colliding bunch on the mean number of interactions per bunch crossing for the nonisolated single-muon trigger, comparing the 2016 and 2018 trigger configurations. Quadratic (linear) fits to the 2016 (2018) data points are shown as colored lines. Only statistical uncertainties are shown. |

png pdf |
Figure 12-c:
Dependence of the trigger rate per colliding bunch on the mean number of interactions per bunch crossing for the double-muon trigger, comparing the 2016 and 2018 trigger configurations. Quadratic (linear) fits to the 2016 (2018) data points are shown as colored lines. Only statistical uncertainties are shown. |

png pdf |
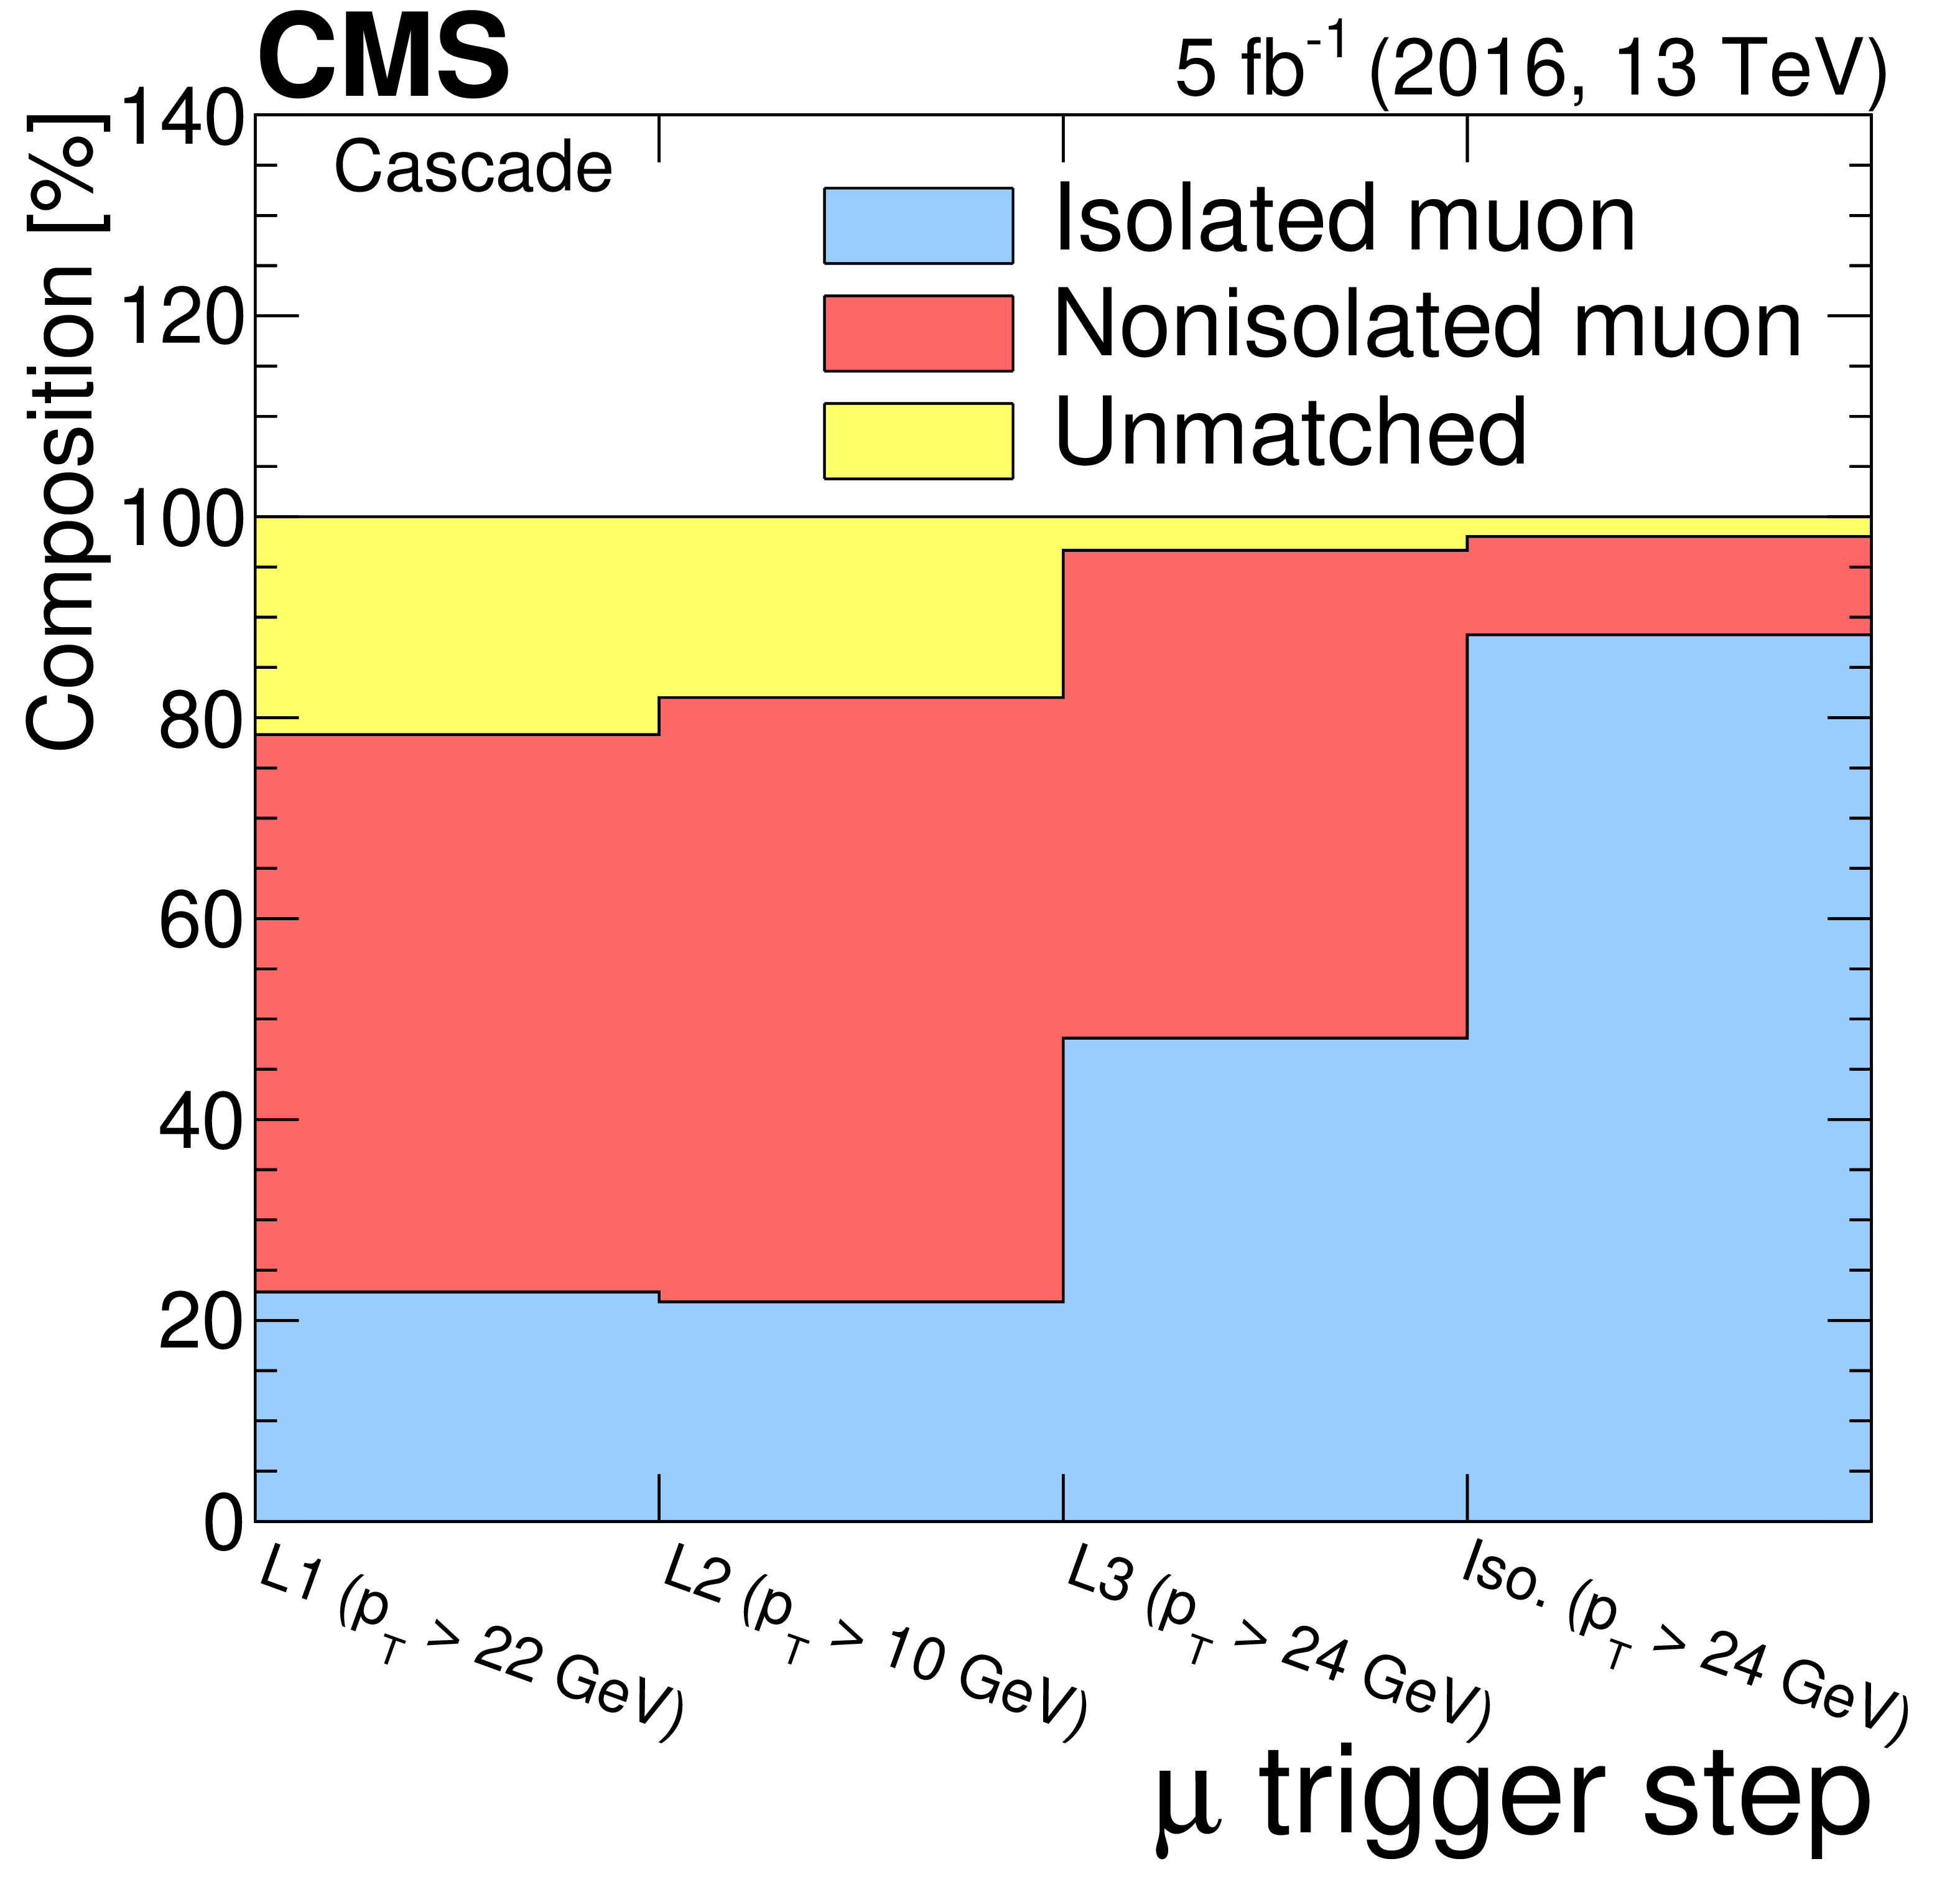
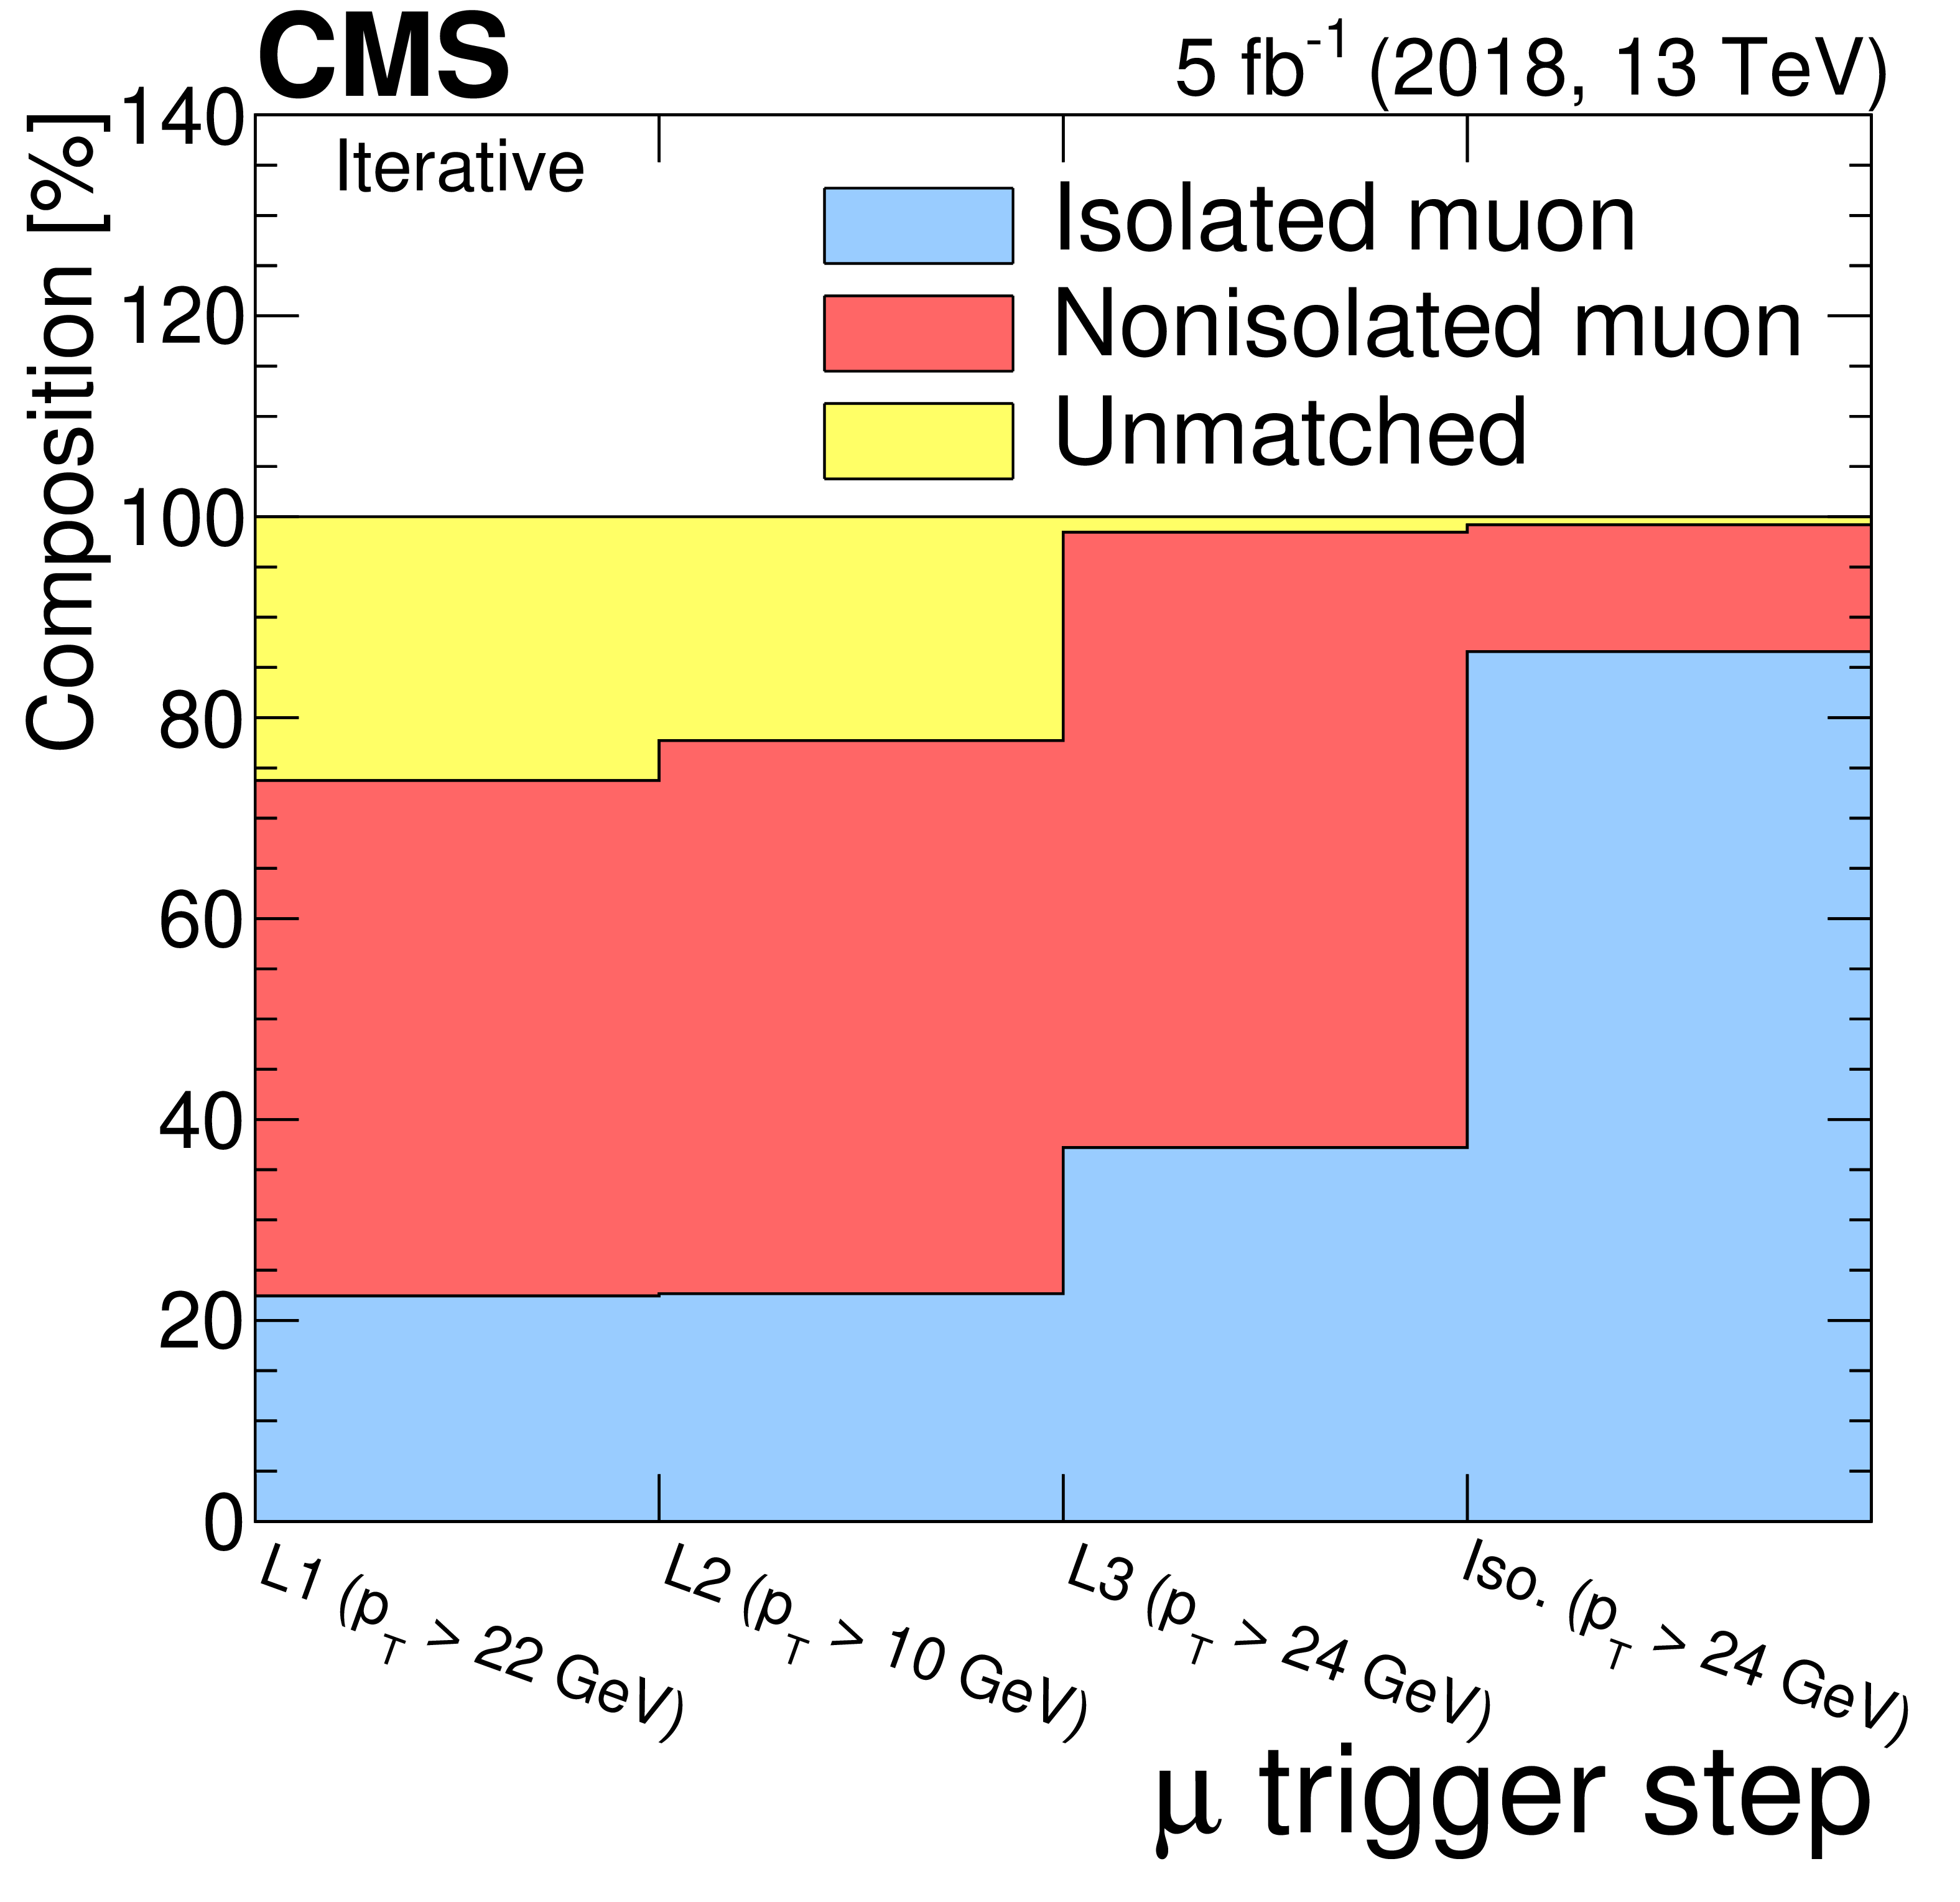
Figure 13:
The composition of the selected muon sample for the 2016 (left) and 2018 (right) data. |
png pdf |
Figure 13-a:
The composition of the selected muon sample for the 2016 data. |
png pdf |
Figure 13-b:
The composition of the selected muon sample for the 2018 data. |

png pdf |
Figure 14:
Cumulative average processing time of each of the trigger reconstruction steps for the IsoMu24 trigger. |

png pdf |
Figure 15:
Average processing time of the full trigger for the IsoMu24 (filled symbols) and the Mu50 trigger (open symbols) as a function of pileup. The processing time for the combination of cascade and tracker muon measured in 2016 data is shown in blue circles, while they are shown in red squares and black triangles for the iterative algorithm measured in 2017 and 2018 data. Only statistical uncertainties are shown. |
| Tables | |
png pdf |
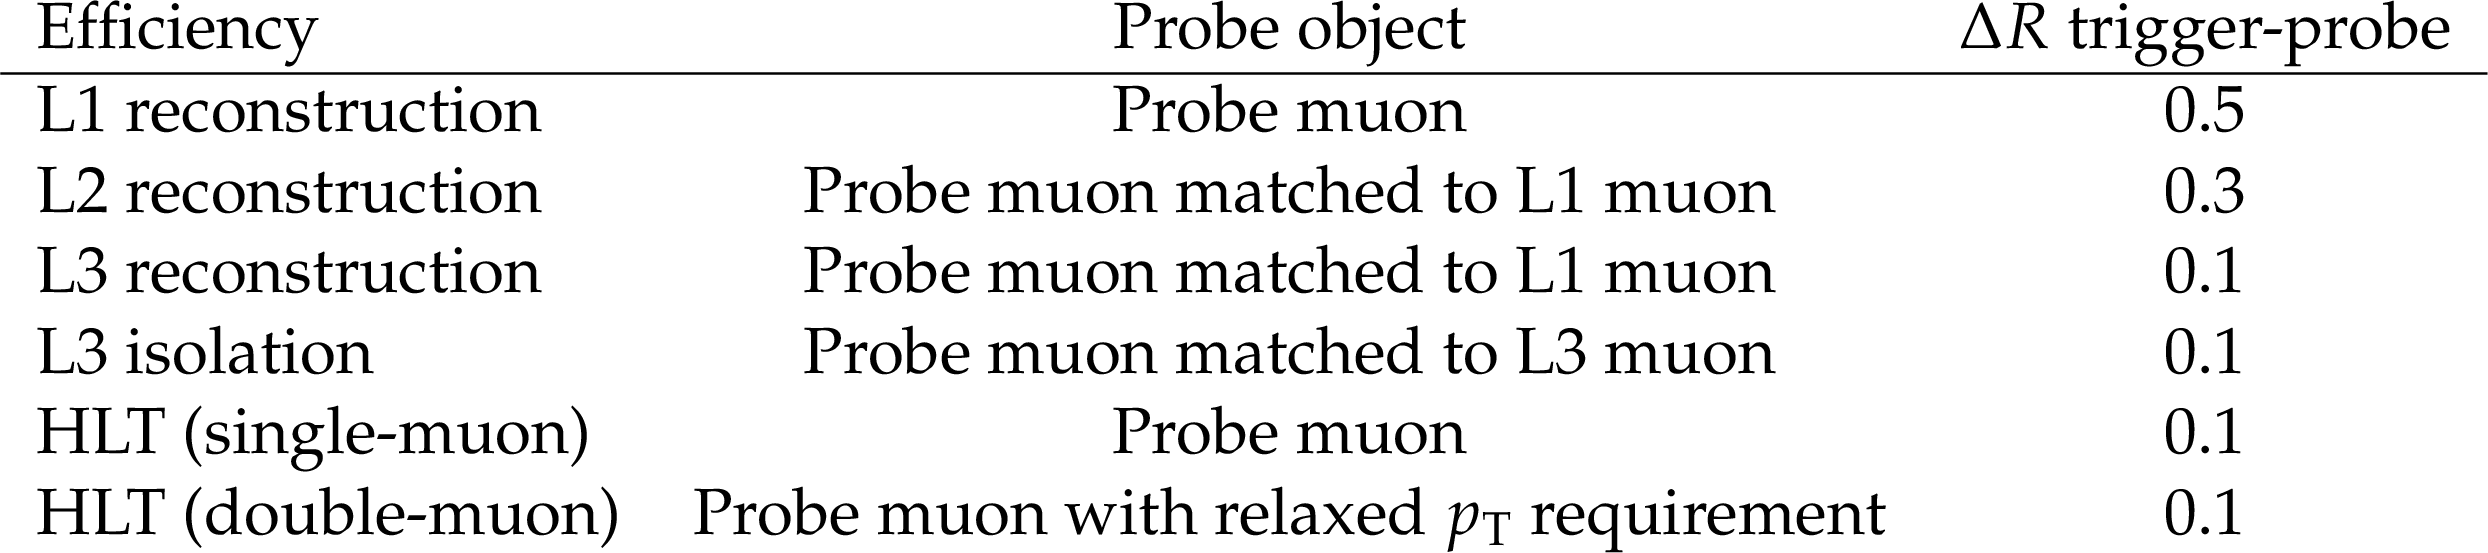
Table 1:
Parameters of the tag-and-probe method used in this paper. $\Delta R$ is the maximum allowed angular separation between the tag muon and the probe muon. |
png pdf |
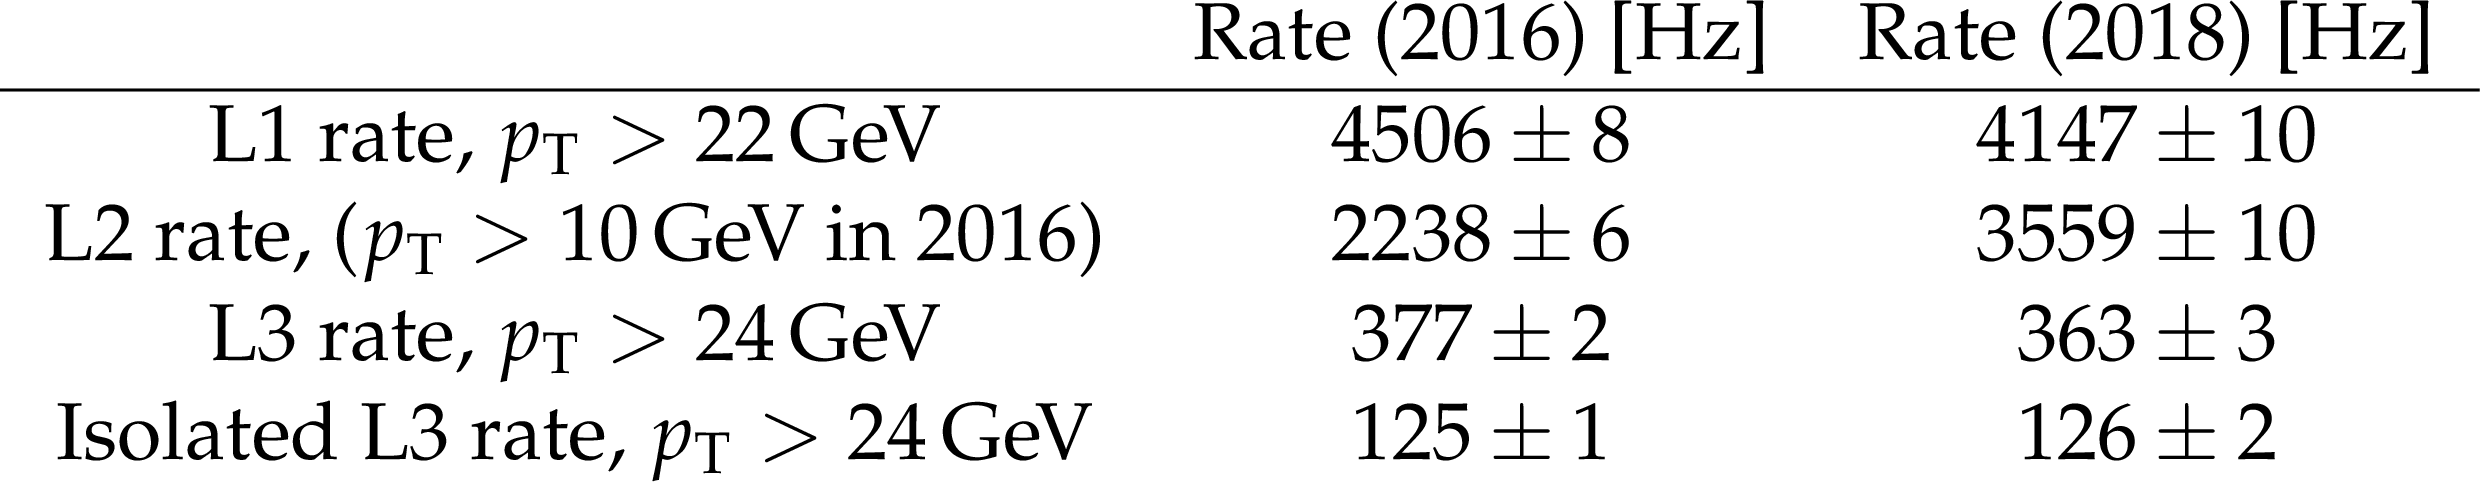
Table 2:
Rates for the 2016 and 2018 trigger strategies. The rates are measured in the 2016 and 2018 data sets, respectively, and then scaled to an instantaneous luminosity of 10$^{34}$ cm$^{-2}$s$^{-1}$. Only statistical uncertainties are considered for each measurement. |
png pdf |
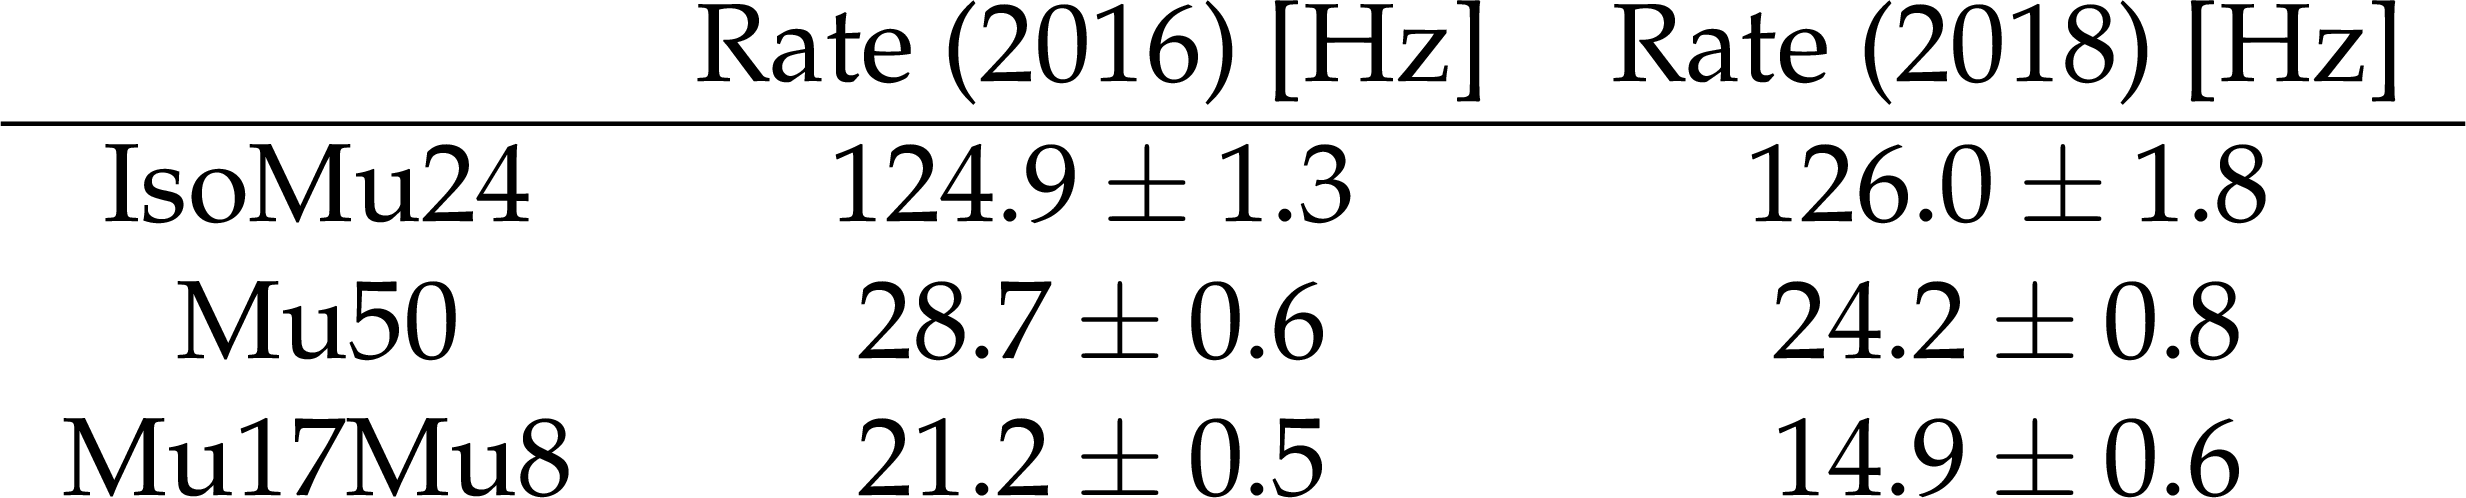
Table 3:
Rates for the 2016 and 2018 trigger strategies. The rates are measured in the 2016 and 2018 data sets, respectively, and then scaled to an instantaneous luminosity of 10$^{34}$ cm$^{-2}$s$^{-1}$. Only statistical uncertainties are considered for each measurement. |
png pdf |
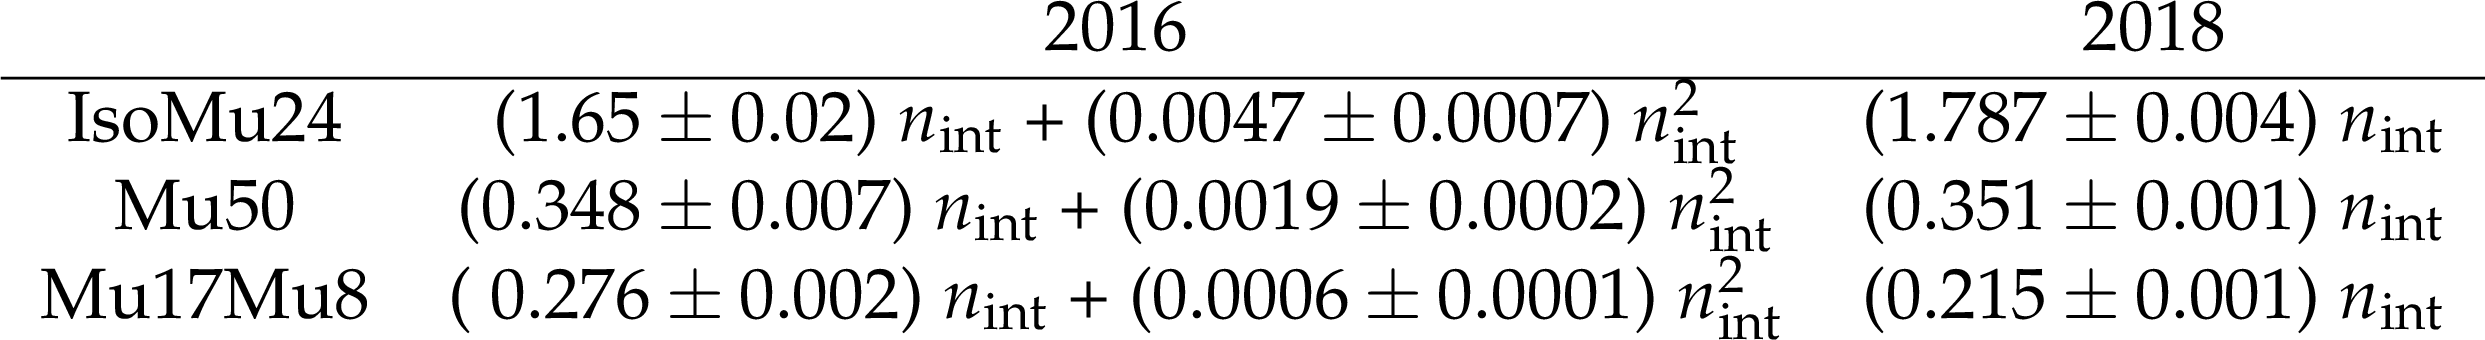
Table 4:
Increase of the trigger rate as a function of the number of pp interactions in an event ($n_{\mathrm {int}}$) in units of mHz/interaction, parametrized with 2nd and 1st order polynomials, respectively, for 2016 and 2018. |
| Summary |
| To maintain the excellent performance of the CMS muon trigger system in the much harsher running conditions of LHC Run 2, especially the high-pileup environment in 2017 and 2018, the reconstruction algorithms and identification criteria for muons in the high-level trigger system were continually improved during the Run 2 data-taking period. In particular, the algorithm used to reconstruct muon tracks in the inner tracker was improved in several steps during the 2017 and 2018 data-taking periods. Upgrades to the hardware-based Level-1 trigger further improved the trigger efficiency for muons. This facilitated an increase in the purity of the selected muon sample by introducing muon identification criteria in the high-level trigger system, while maintaining, or even slightly improving, the overall efficiency. The plateau efficiency for both isolated and nonisolated single muons above the transverse momentum threshold is around 90%. Compared with previous versions of the algorithm, a significant improvement in the momentum resolution is achieved. For triggers without an isolation requirement, a reduction in trigger rate of 10% for the same trigger threshold and instantaneous luminosity is observed compared with the beginning of Run 2. Because these improvements come at a cost of increased processing time needed to run the algorithms, this leaves room for further optimization for the upcoming LHC Run 3 with the goal to maintain the excellent physics performance while improving algorithmic efficiency. |
| References | ||||
| 1 | CMS Collaboration | The CMS trigger system | JINST 12 (2017) P01020 | CMS-TRG-12-001 1609.02366 |
| 2 | CMS Collaboration | CMS technical design report for the pixel detector upgrade | CDS | |
| 3 | CMS Collaboration | Performance of the CMS muon detector and muon reconstruction with proton-proton collisions at $ \sqrt{s}= $ 13 TeV | JINST 13 (2018) P06015 | CMS-MUO-16-001 1804.04528 |
| 4 | CMS Collaboration | Performance of the CMS Level-1 trigger in proton-proton collisions at $ \sqrt{s} = $ 13 TeV | JINST 15 (2020) P10017 | CMS-TRG-17-001 2006.10165 |
| 5 | CMS Collaboration | Performance of the reconstruction and identification of high-momentum muons in proton-proton collisions at $ \sqrt{s} = $ 13 TeV | JINST 15 (2020) P02027 | CMS-MUO-17-001 1912.03516 |
| 6 | CMS Collaboration | The CMS experiment at the CERN LHC | JINST 3 (2008) S08004 | CMS-00-001 |
| 7 | CMS Collaboration | Description and performance of track and primary-vertex reconstruction with the CMS tracker | JINST 9 (2014) P10009 | CMS-TRK-11-001 1405.6569 |
| 8 | CMS Collaboration | Track impact parameter resolution in the 2017 dataset with the CMS phase-1 pixel detector | CDS | |
| 9 | CMS Collaboration | The performance of the CMS muon detector in proton-proton collisions at $ \sqrt{s} = $ 7 TeV at the LHC | JINST 8 (2013) P11002 | CMS-MUO-11-001 1306.6905 |
| 10 | F. Faccio, S. Michelis, and G. Ripamonti | Failure of FEAST2.1-based modules in the CMS pixel detector system (physics run 2017) | technical report, CERN | |
| 11 | CMS Collaboration | Measurement of the inclusive W and Z production cross sections in pp collisions at $ \sqrt{s}= $ 7 TeV with the CMS experiment | JHEP 10 (2011) 132 | CMS-EWK-10-005 1107.4789 |
| 12 | CMS Collaboration | CMS technical design report for the Level-1 trigger upgrade | CDS | |
| 13 | CMS Collaboration | CMS physics: technical design report volume 1: Detector performance and software | CDS | |
| 14 | CMS Collaboration | Performance of CMS muon reconstruction in cosmic-ray events | JINST 5 (2010) T03022 | CMS-CFT-09-014 0911.4994 |
| 15 | CMS Collaboration | Performance of CMS muon reconstruction in pp collision events at $ \sqrt{s}= $ 7 TeV | JINST 7 (2012) P10002 | CMS-MUO-10-004 1206.4071 |
| 16 | R. Fruhwirth | Application of Kalman filtering to track and vertex fitting | NIMA 262 (1987) 444 | |
| 17 | F. Pantaleo | New track seeding techniques for the CMS experiment | PhD thesis, Hamburg University, 2017 CERN-THESIS-2017-028 | |
| 18 | M. J. Oreglia | A study of the reactions $\psi' \to \gamma\gamma \psi$ | PhD thesis, Stanford University, 1980 SLAC Report SLAC-R-236, see Appendix D | |
| 19 | CMS Collaboration | Particle-flow reconstruction and global event description with the CMS detector | JINST 12 (2017) P10003 | CMS-PRF-14-001 1706.04965 |
| 20 | CMS Collaboration | Search for physics beyond the standard model in dilepton mass spectra in proton-proton collisions at $ \sqrt{s}= $ 8 TeV | JHEP 04 (2015) 025 | CMS-EXO-12-061 1412.6302 |
|
|
Compact Muon Solenoid LHC, CERN |
|

|

|

|

|

|