

Compact Muon Solenoid
LHC, CERN
| CMS-SMP-16-017 ; CERN-EP-2017-177 | ||
| Measurements of the ${\mathrm{p}}{\mathrm{p}}\to \mathrm{Z}\mathrm{Z}$ production cross section and the $\mathrm{Z} \to 4\ell$ branching fraction, and constraints on anomalous triple gauge couplings at $\sqrt{s} = $ 13 TeV | ||
| CMS Collaboration | ||
| 25 September 2017 | ||
| Eur. Phys. J. C 78 (2018) 165 [Erratum] | ||
| Abstract: Four-lepton production in proton-proton collisions, ${\mathrm{p}}{\mathrm{p}} \to (\mathrm{Z} / \gamma^*)(\mathrm{Z} /\gamma^*) \to 4\ell$, where $\ell = $ e or $\mu$, is studied at a center-of-mass energy of 13 TeV with the CMS detector at the LHC. The data sample corresponds to an integrated luminosity of 35.9 fb$^{-1}$. The ZZ production cross section, $\sigma({\mathrm{p}}{\mathrm{p}} \to \mathrm{Z}\mathrm{Z}) = $ 17.2 $\pm$ 0.5 (stat) $\pm$ 0.7 (syst) $\pm$ 0.4 (theo) $\pm$ 0.4 (lumi) pb, measured using events with two opposite-sign, same-flavor lepton pairs produced in the mass region 60 $ < m_{\ell^+\ell^-} < $ 120 GeV, is consistent with standard model predictions. Differential cross sections are measured and are well described by the theoretical predictions. The Z boson branching fraction to four leptons is measured to be $\mathcal{B}(\mathrm{Z} \to 4\ell) = $ 4.8 $\pm$ 0.2 (stat) $\pm$ 0.2 (syst) $\pm$ 0.1 (theo) $\pm$ 0.1 (lumi) $ \times 10^{-6}$ for events with a four-lepton invariant mass in the range 80 $ < m_{4\ell} < $ 100 GeV and a dilepton mass $m_{\ell\ell} > $ 4 GeV for all opposite-sign, same-flavor lepton pairs. The results agree with standard model predictions. The invariant mass distribution of the four-lepton system is used to set limits on anomalous ZZZ and ZZ$\gamma$ couplings at 95% confidence level: $-0.0012 < f_4^\mathrm{Z} < 0.0010$, $-0.0010 < f_5^\mathrm{Z} < 0.0013$, $-0.0012 < f_4^{\gamma} < 0.0013$, $-0.0012 < f_5^{\gamma} < 0.0013$. | ||
| Links: e-print arXiv:1709.08601 [hep-ex] (PDF) ; CDS record ; inSPIRE record ; HepData record ; CADI line (restricted) ; | ||
| Figures | |

png pdf |
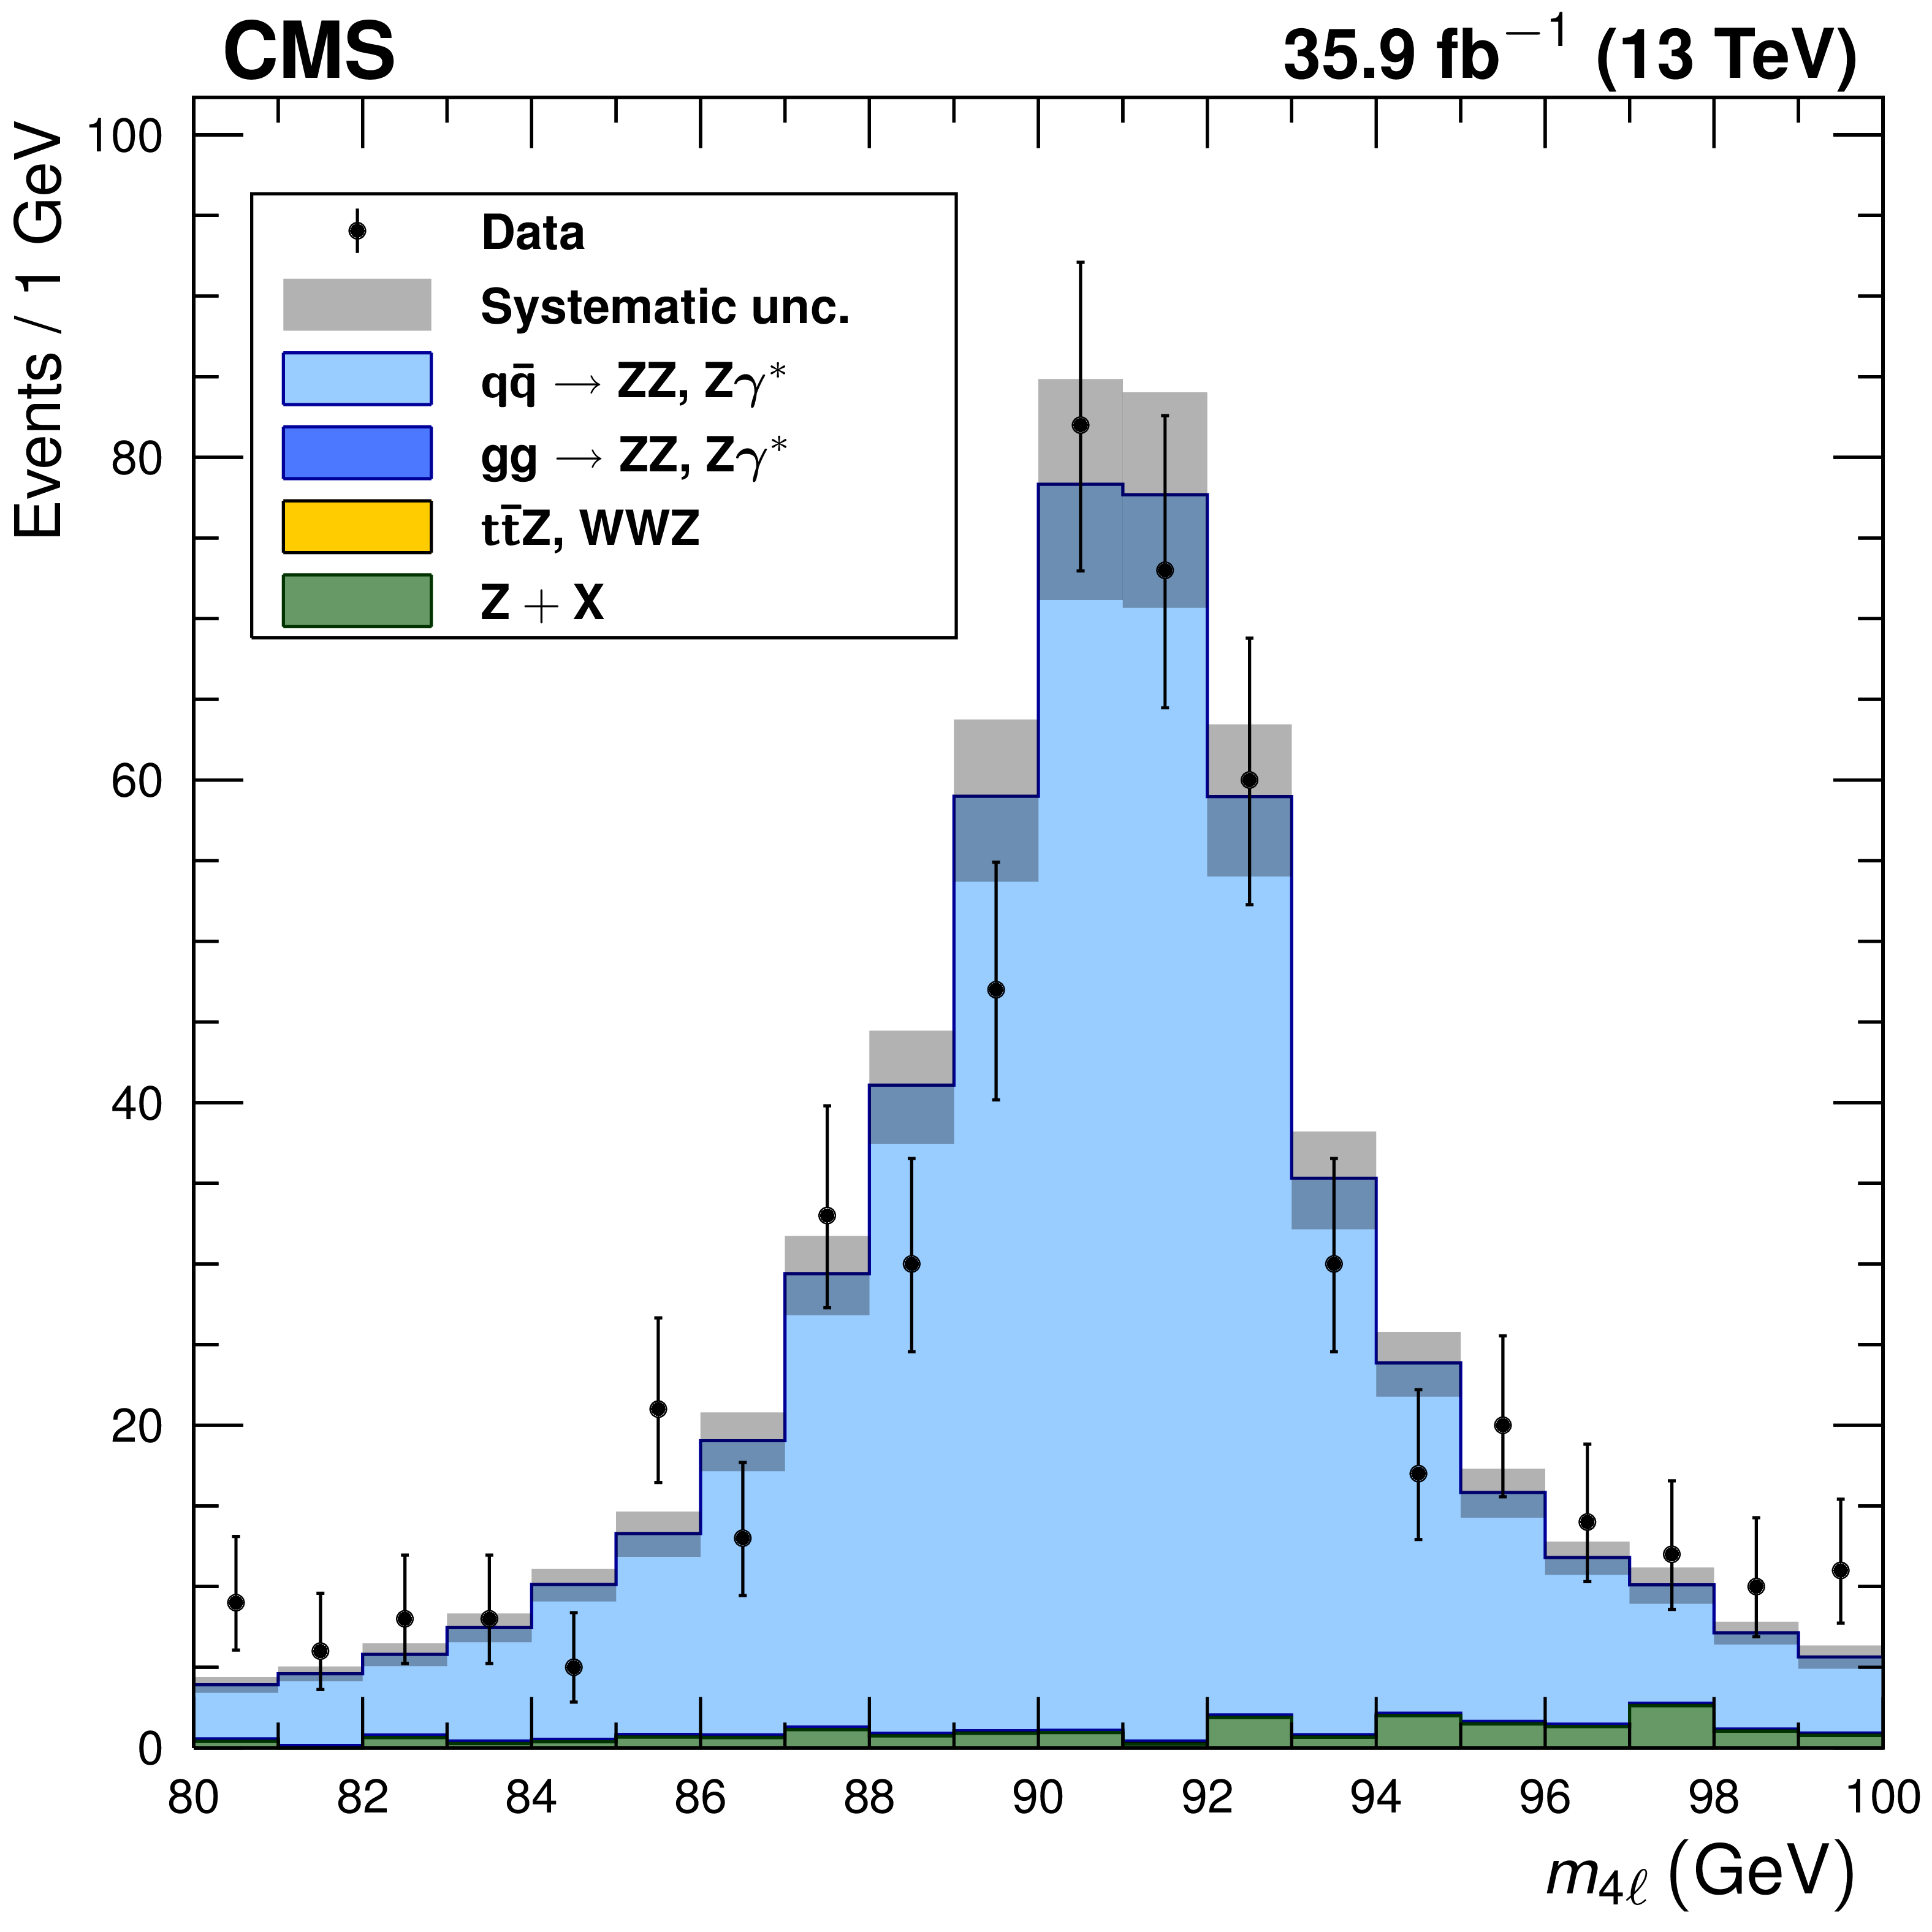
Figure 1:
Distributions of (left) the four-lepton invariant mass $m_{{4\ell}}$ and (right) the invariant mass of the dilepton candidates in all $\mathrm{Z} /\gamma ^* $ bosons in selected four-lepton events. Both selected dilepton candidates are included in each event. In the $m_{{4\ell}}$ distribution, bin contents are normalized to a bin width of 25 GeV ; horizontal bars on the data points show the range of the corresponding bin. Points represent the data, while filled histograms represent the SM prediction and background estimate. Vertical bars on the data points show their statistical uncertainty. Shaded grey regions around the predicted yield represent combined statistical, systematic, theoretical, and integrated luminosity uncertainties. |

png pdf |
Figure 1-a:
Distribution of the four-lepton invariant mass $m_{{4\ell}}$ in selected four-lepton events. Both selected dilepton candidates are included in each event. Bin contents are normalized to a bin width of 25 GeV ; horizontal bars on the data points show the range of the corresponding bin. Points represent the data, while filled histograms represent the SM prediction and background estimate. Vertical bars on the data points show their statistical uncertainty. Shaded grey regions around the predicted yield represent combined statistical, systematic, theoretical, and integrated luminosity uncertainties. |

png pdf |
Figure 1-b:
Distribution of the invariant mass of the dilepton candidates in all $\mathrm{Z} /\gamma ^* $ bosons in selected four-lepton events. Both selected dilepton candidates are included in each event. Points represent the data, while filled histograms represent the SM prediction and background estimate. Vertical bars on the data points show their statistical uncertainty. Shaded grey regions around the predicted yield represent combined statistical, systematic, theoretical, and integrated luminosity uncertainties. |

png pdf |
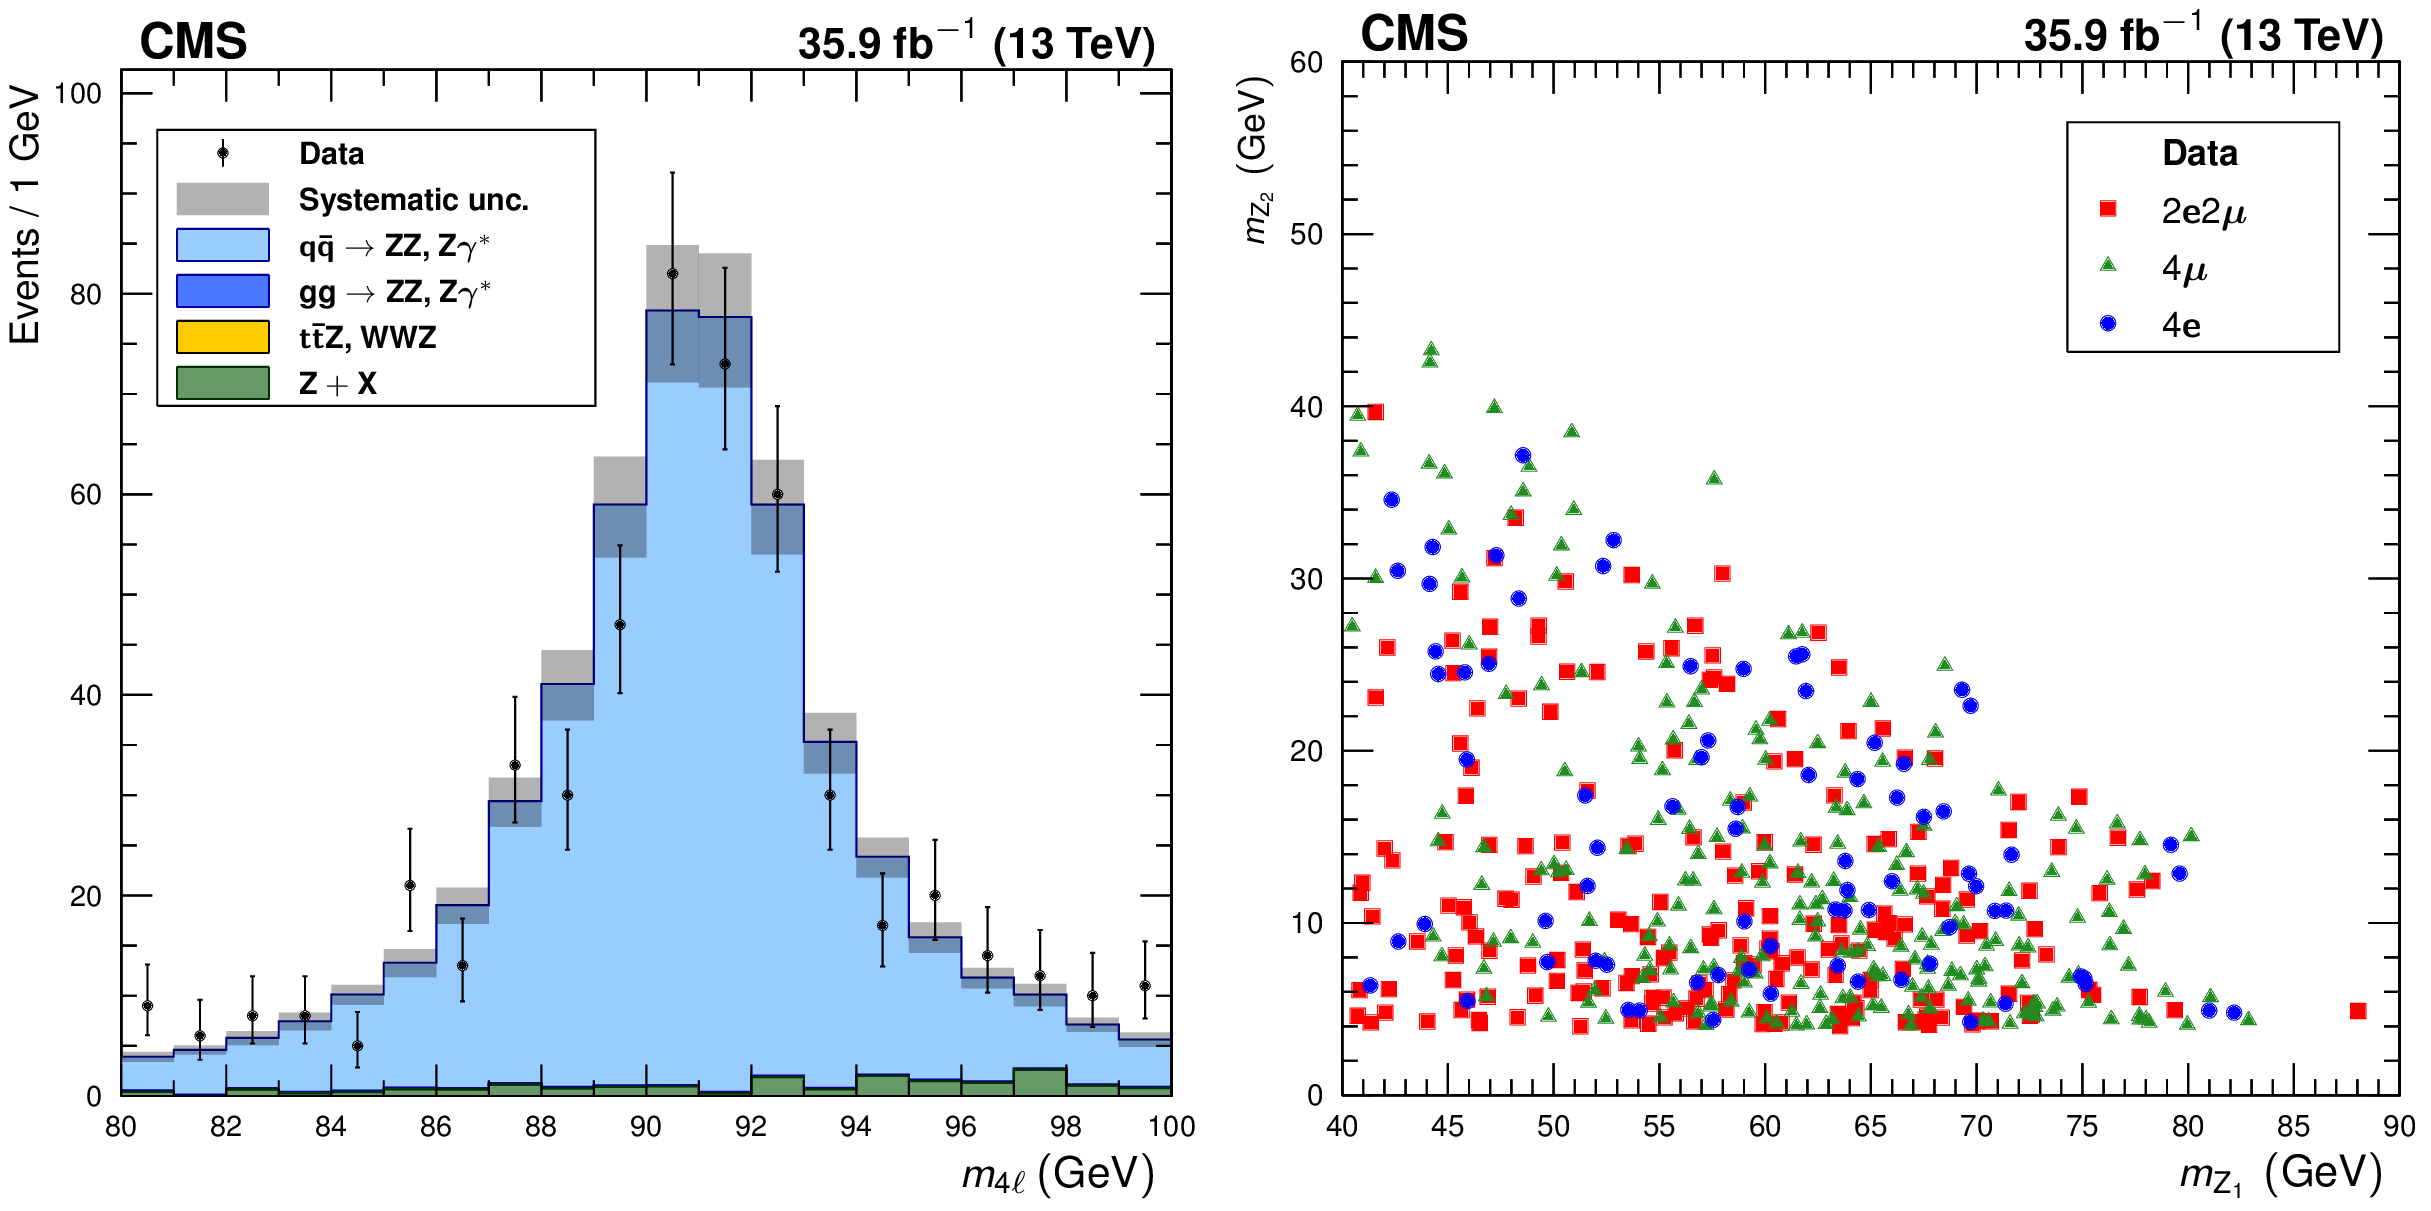
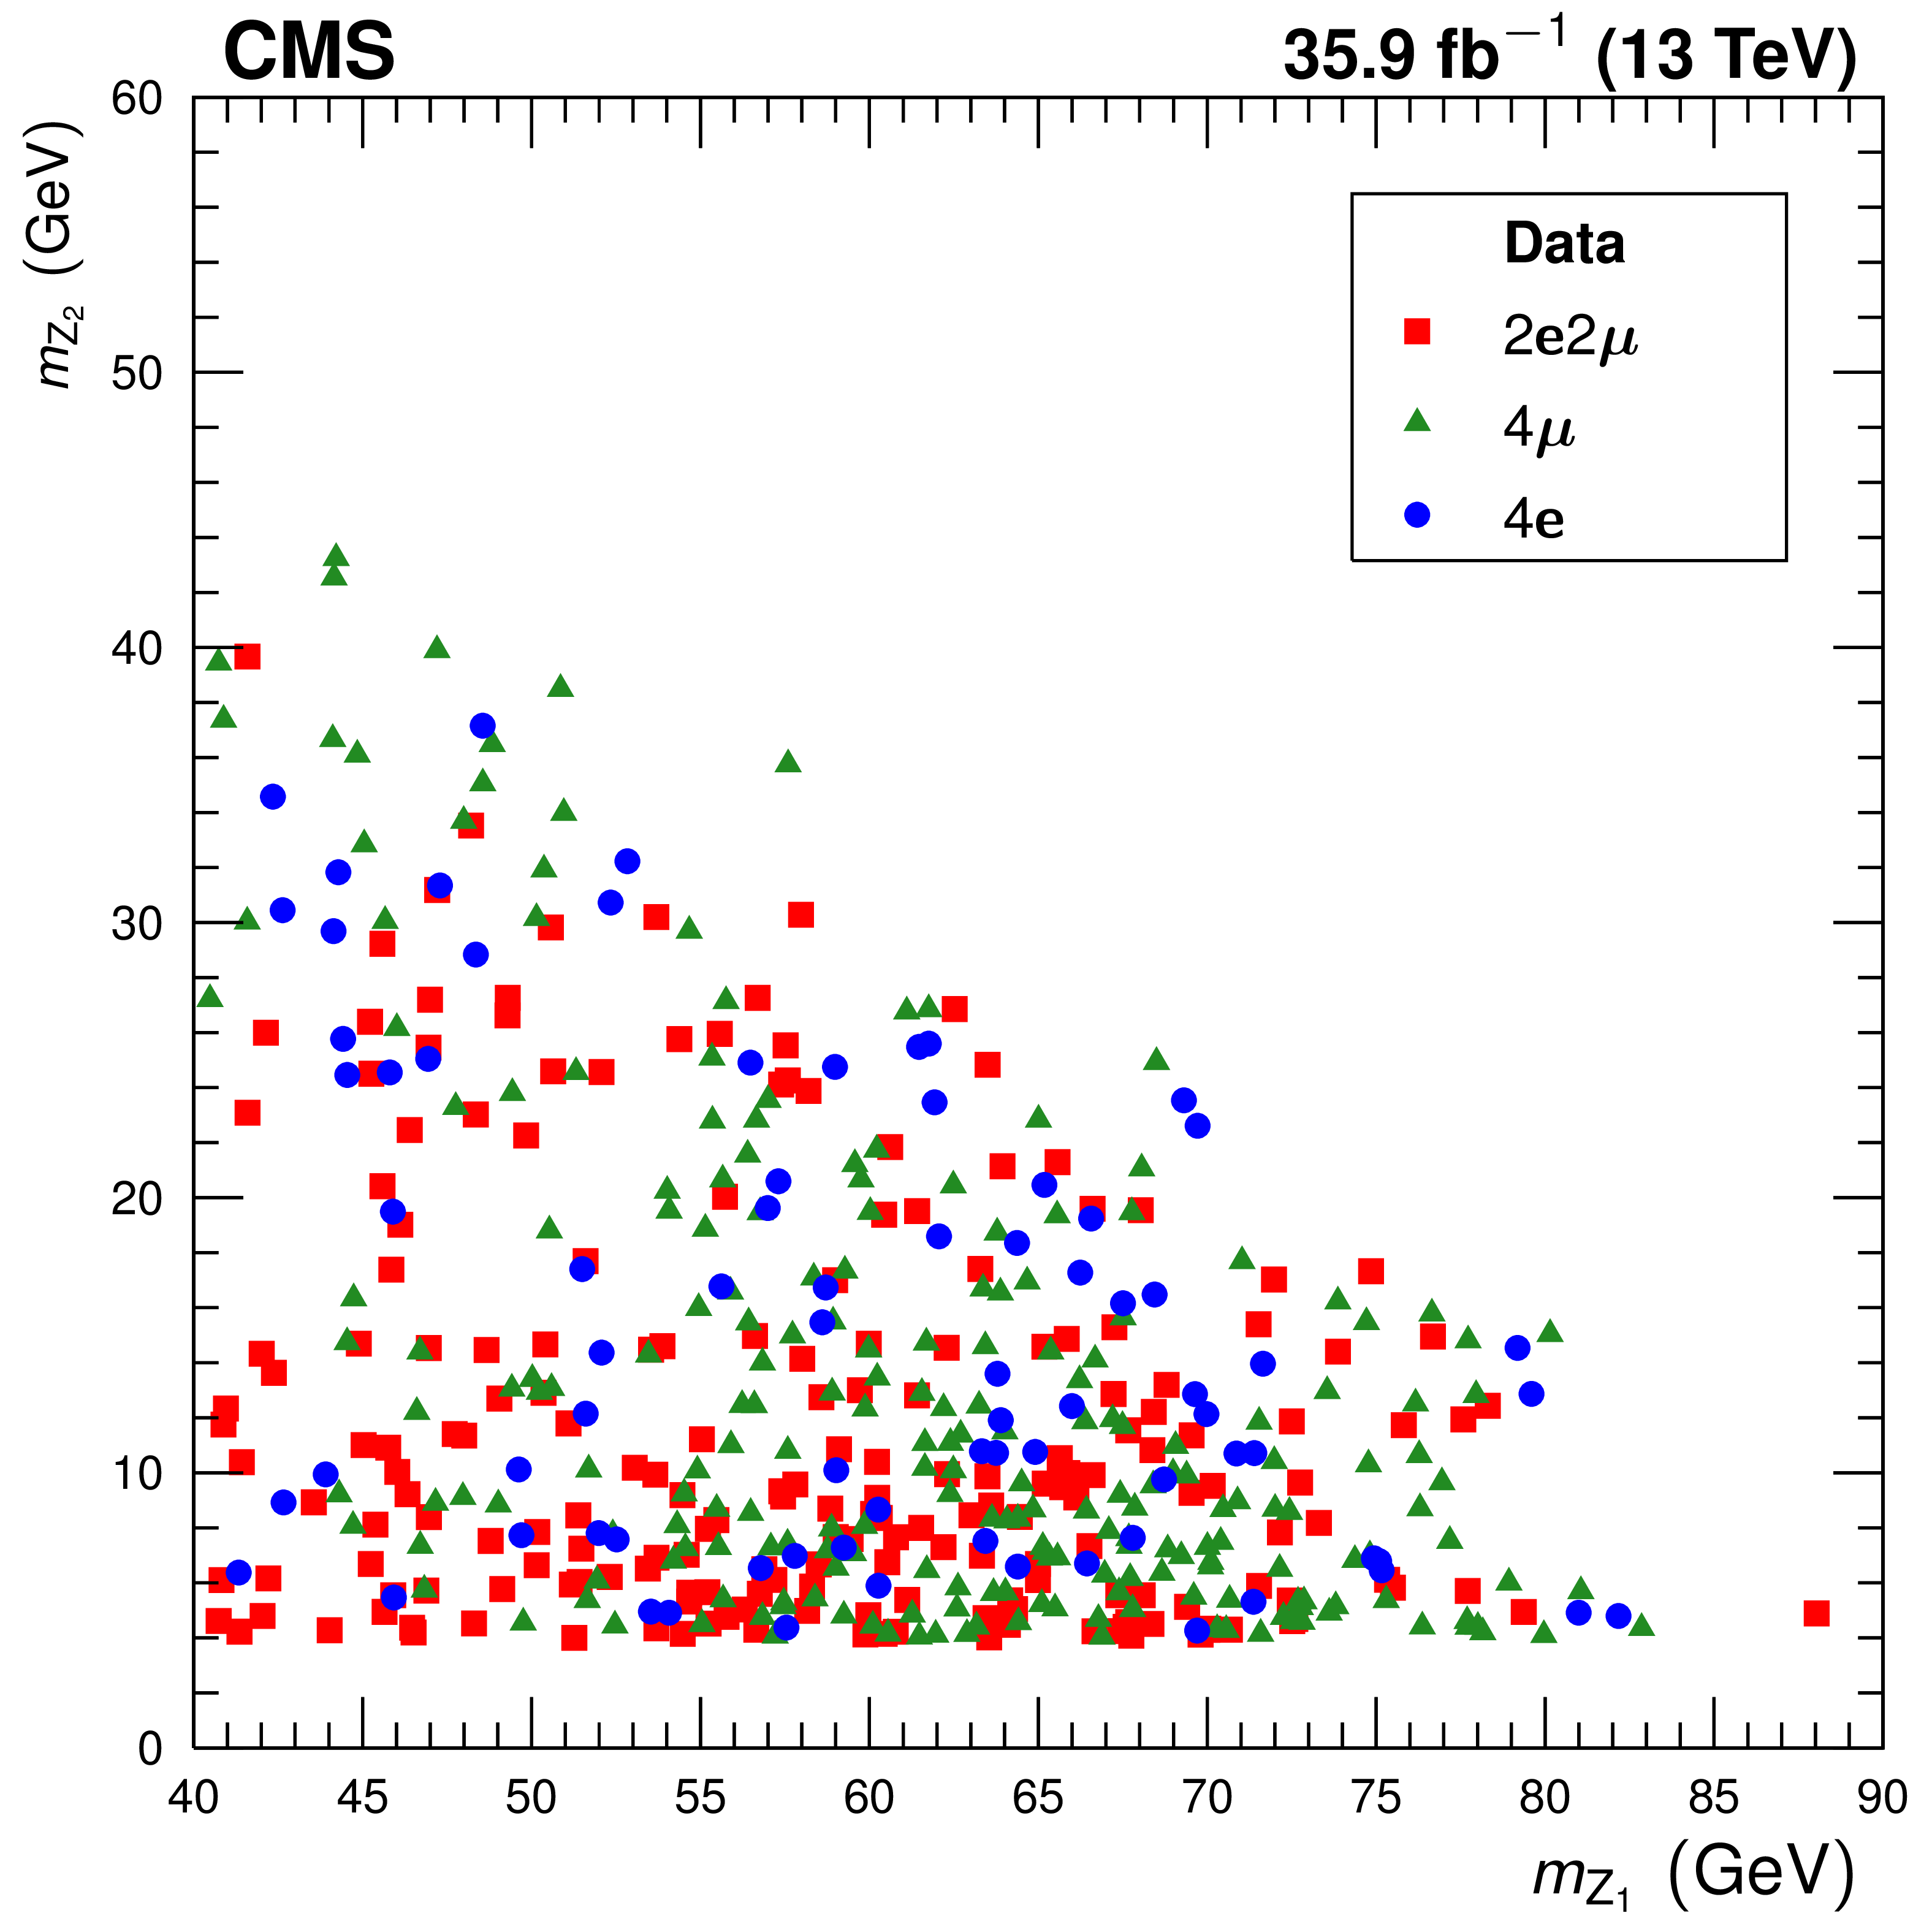
Figure 2:
(Left): the distribution of the reconstructed mass of $\mathrm{Z} _1$, the dilepton candidate closer to the nominal Z boson mass. Points represent the data, while filled histograms represent the SM prediction and background estimate. Vertical bars on the data points show their statistical uncertainty. Shaded grey regions around the predicted yield represent combined statistical, systematic, theoretical, and integrated luminosity uncertainties. (Right): the reconstructed $m_{\mathrm{Z} _2}$ plotted against the reconstructed $m_{\mathrm{Z} _1}$ in data events, with distinctive markers for each final state. For readability, only every fourth event is plotted. |

png pdf |
Figure 2-a:
The distribution of the reconstructed mass of $\mathrm{Z} _1$, the dilepton candidate closer to the nominal Z boson mass. Points represent the data, while filled histograms represent the SM prediction and background estimate. Vertical bars on the data points show their statistical uncertainty. Shaded grey regions around the predicted yield represent combined statistical, systematic, theoretical, and integrated luminosity uncertainties. |

png pdf |
Figure 2-b:
The reconstructed $m_{\mathrm{Z} _2}$ plotted against the reconstructed $m_{\mathrm{Z} _1}$ in data events, with distinctive markers for each final state. For readability, only every fourth event is plotted. |
png pdf |
Figure 3:
(Left): the distribution of the reconstructed four-lepton mass $m_{{4\ell}}$ for events selected with 80 $ < m_{{4\ell}} < $ 100 GeV. Points represent the data, while filled histograms represent the SM prediction and background estimate. Vertical bars on the data points show their statistical uncertainty. Shaded grey regions around the predicted yield represent combined statistical, systematic, theoretical, and integrated luminosity uncertainties. (Right): the reconstructed $m_{\mathrm{Z} _2}$ plotted against the reconstructed $m_{\mathrm{Z} _1}$ for all data events selected with $m_{{4\ell}}$ between 80 and 100 GeV, with distinctive markers for each final state. |
png pdf |
Figure 3-a:
The distribution of the reconstructed four-lepton mass $m_{{4\ell}}$ for events selected with 80 $ < m_{{4\ell}} < $ 100 GeV. Points represent the data, while filled histograms represent the SM prediction and background estimate. Vertical bars on the data points show their statistical uncertainty. Shaded grey regions around the predicted yield represent combined statistical, systematic, theoretical, and integrated luminosity uncertainties. |
png pdf |
Figure 3-b:
The reconstructed $m_{\mathrm{Z} _2}$ plotted against the reconstructed $m_{\mathrm{Z} _1}$ for all data events selected with $m_{{4\ell}}$ between 80 and 100 GeV, with distinctive markers for each final state. |

png pdf |
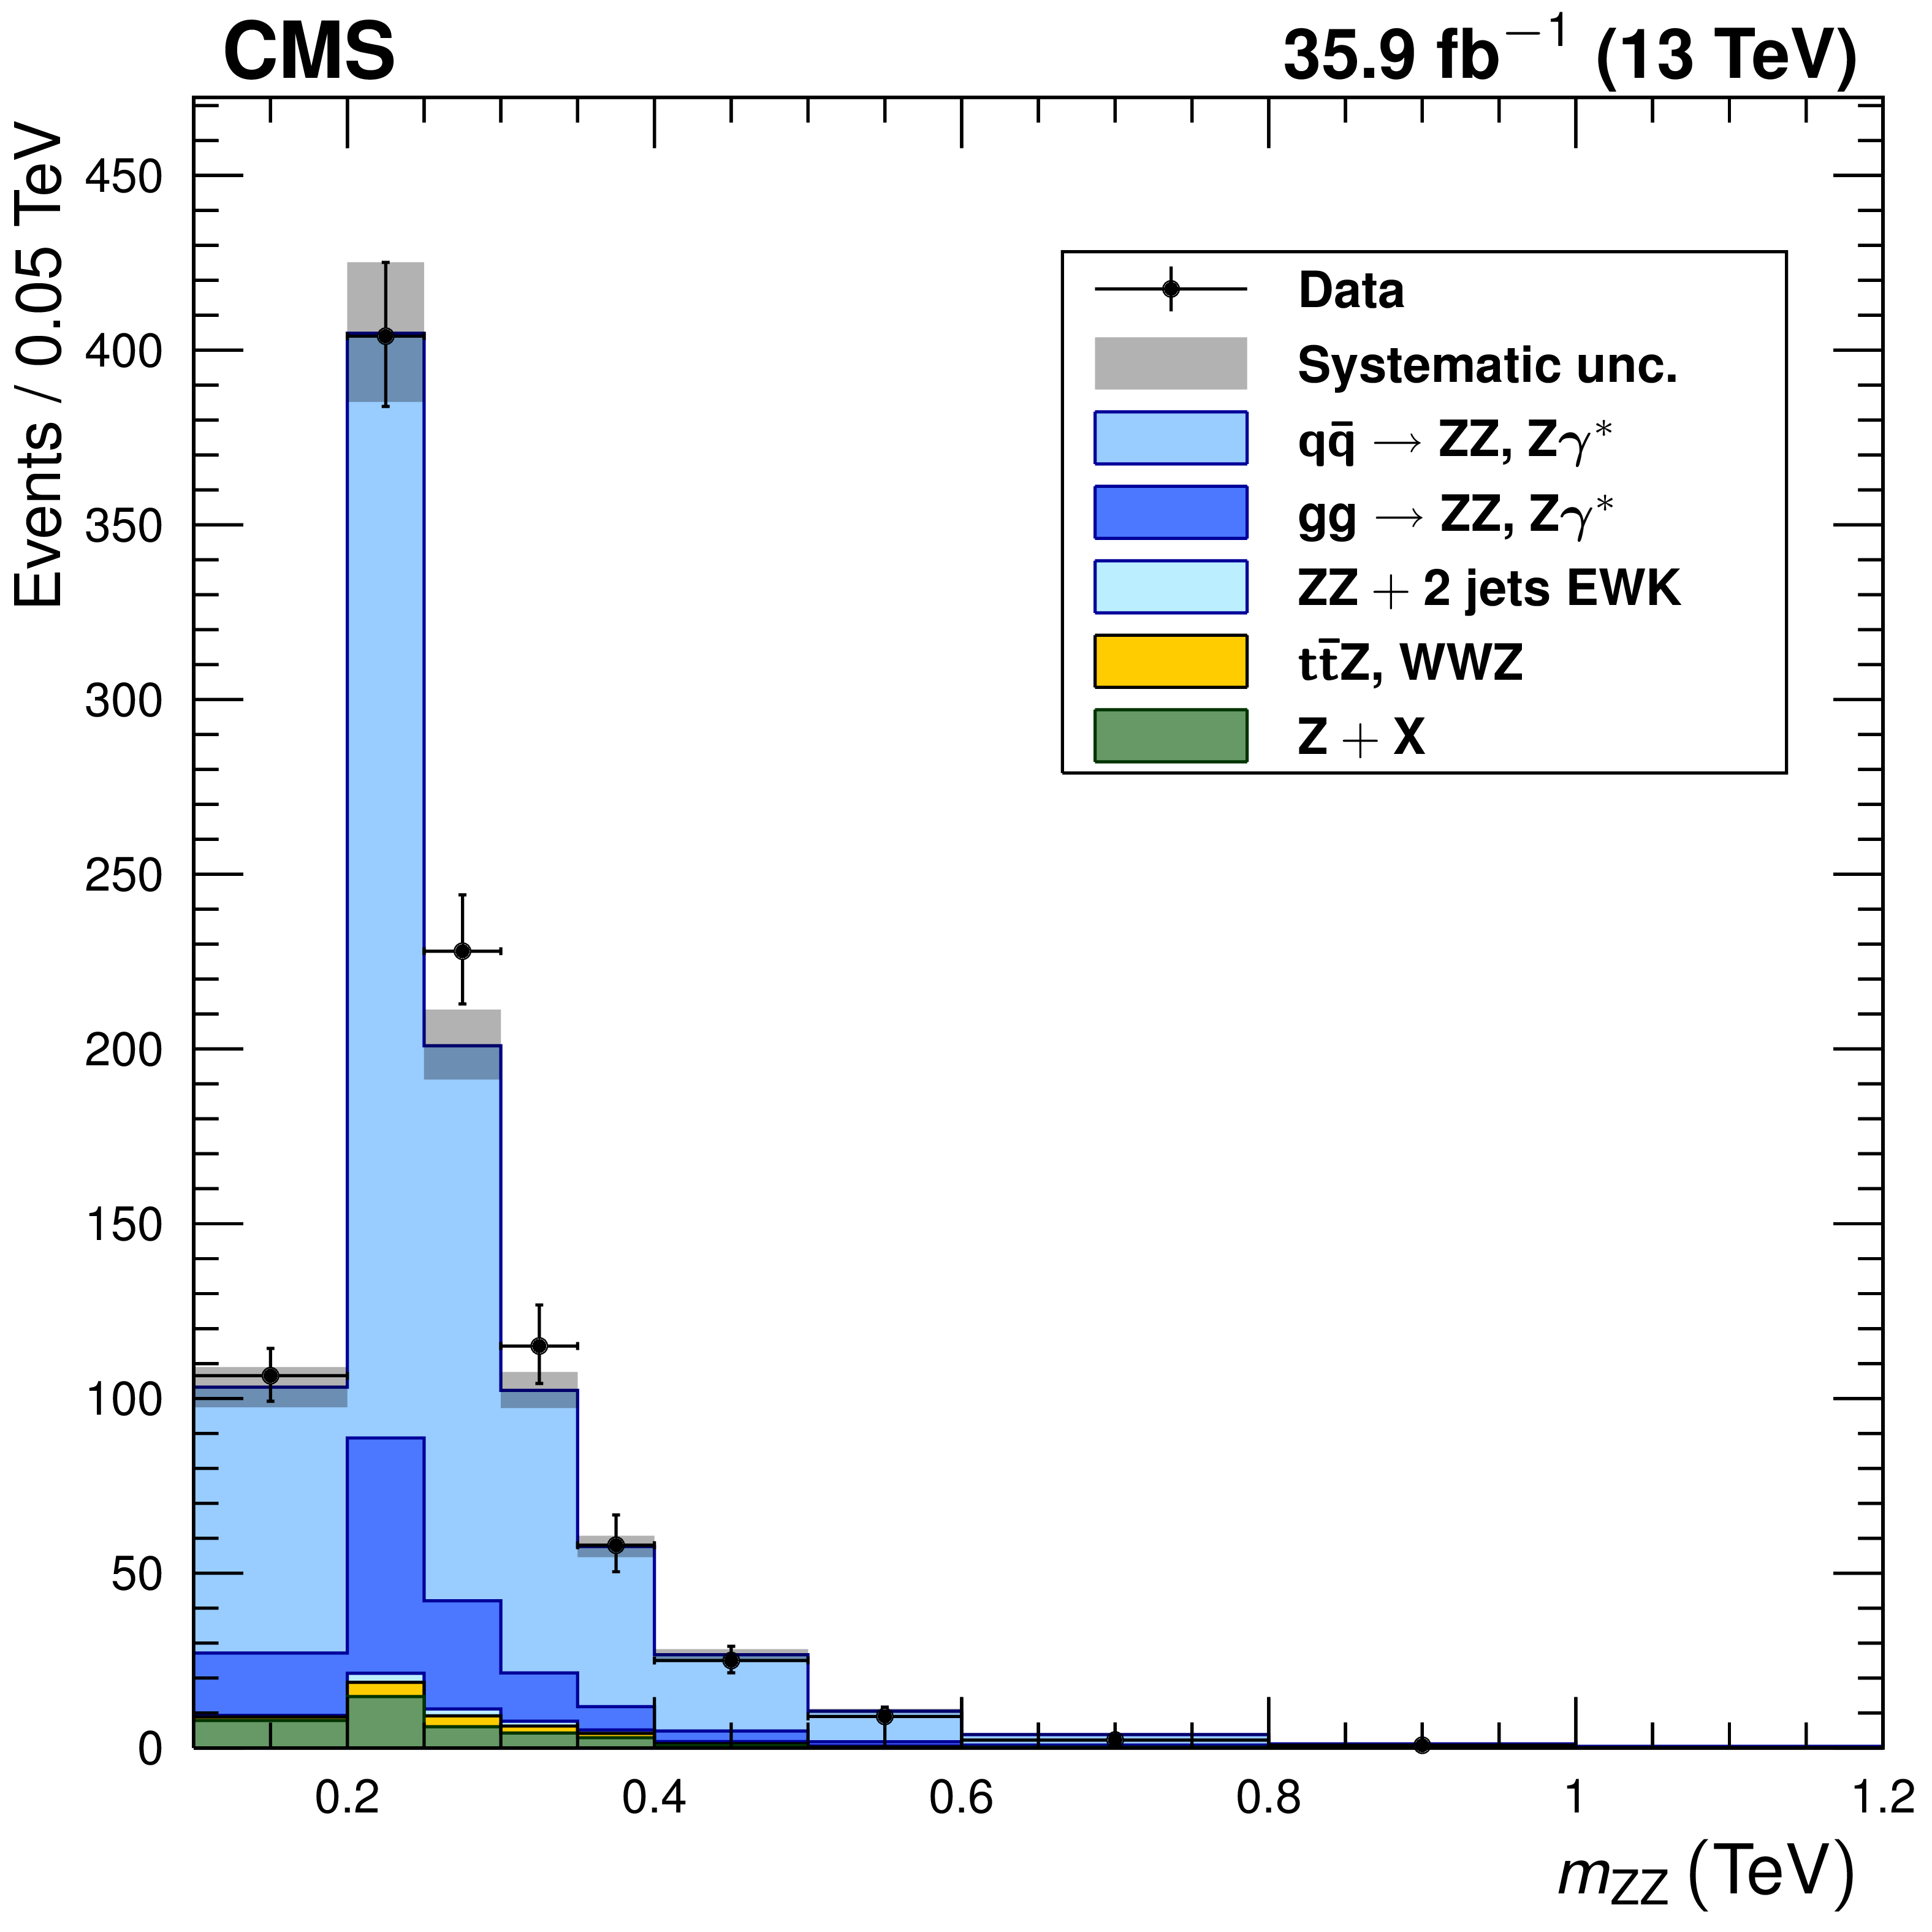
Figure 4:
Distributions of (left) the four-lepton invariant mass $m_{{\mathrm{Z} \mathrm{Z}}}$ and (right) dilepton candidate mass for four-lepton events selected with both Z bosons on-shell. Points represent the data, while filled histograms represent the SM prediction and background estimate. Vertical bars on the data points show their statistical uncertainty. Shaded grey regions around the predicted yield represent combined statistical, systematic, theoretical, and integrated luminosity uncertainties. In the $m_{{\mathrm{Z} \mathrm{Z}}}$ distribution, bin contents are normalized to the bin widths, using a unit bin size of 50 GeV ; horizontal bars on the data points show the range of the corresponding bin. |
png pdf |
Figure 4-a:
Distribution of the four-lepton invariant mass $m_{{\mathrm{Z} \mathrm{Z}}}$ for four-lepton events selected with both Z bosons on-shell. Points represent the data, while filled histograms represent the SM prediction and background estimate. Vertical bars on the data points show their statistical uncertainty. Shaded grey regions around the predicted yield represent combined statistical, systematic, theoretical, and integrated luminosity uncertainties. Bin contents are normalized to the bin widths, using a unit bin size of 50 GeV ; horizontal bars on the data points show the range of the corresponding bin. |

png pdf |
Figure 4-b:
Distribution of dilepton candidate masses for four-lepton events selected with both Z bosons on-shell. Points represent the data, while filled histograms represent the SM prediction and background estimate. Vertical bars on the data points show their statistical uncertainty. Shaded grey regions around the predicted yield represent combined statistical, systematic, theoretical, and integrated luminosity uncertainties. |

png pdf |
Figure 5:
The total ZZ cross section as a function of the proton-proton center-of-mass energy. Results from the CMS and ATLAS experiments are compared to predictions from matrix at NNLO in QCD, and mcfm at NLO in QCD. The mcfm prediction also includes gluon-gluon initiated production at LO in QCD. Both predictions use NNPDF3.0 PDF sets and fixed scales $\mu _\mathrm {F} = \mu _\mathrm {R} = m_\mathrm{Z} $. Details of the calculations and uncertainties are given in the text. The ATLAS measurements were performed with a Z boson mass window of 66-116 GeV, and are corrected for the resulting 1.6% difference. Measurements at the same center-of-mass energy are shifted slightly along the horizontal axis for clarity. |

png pdf |
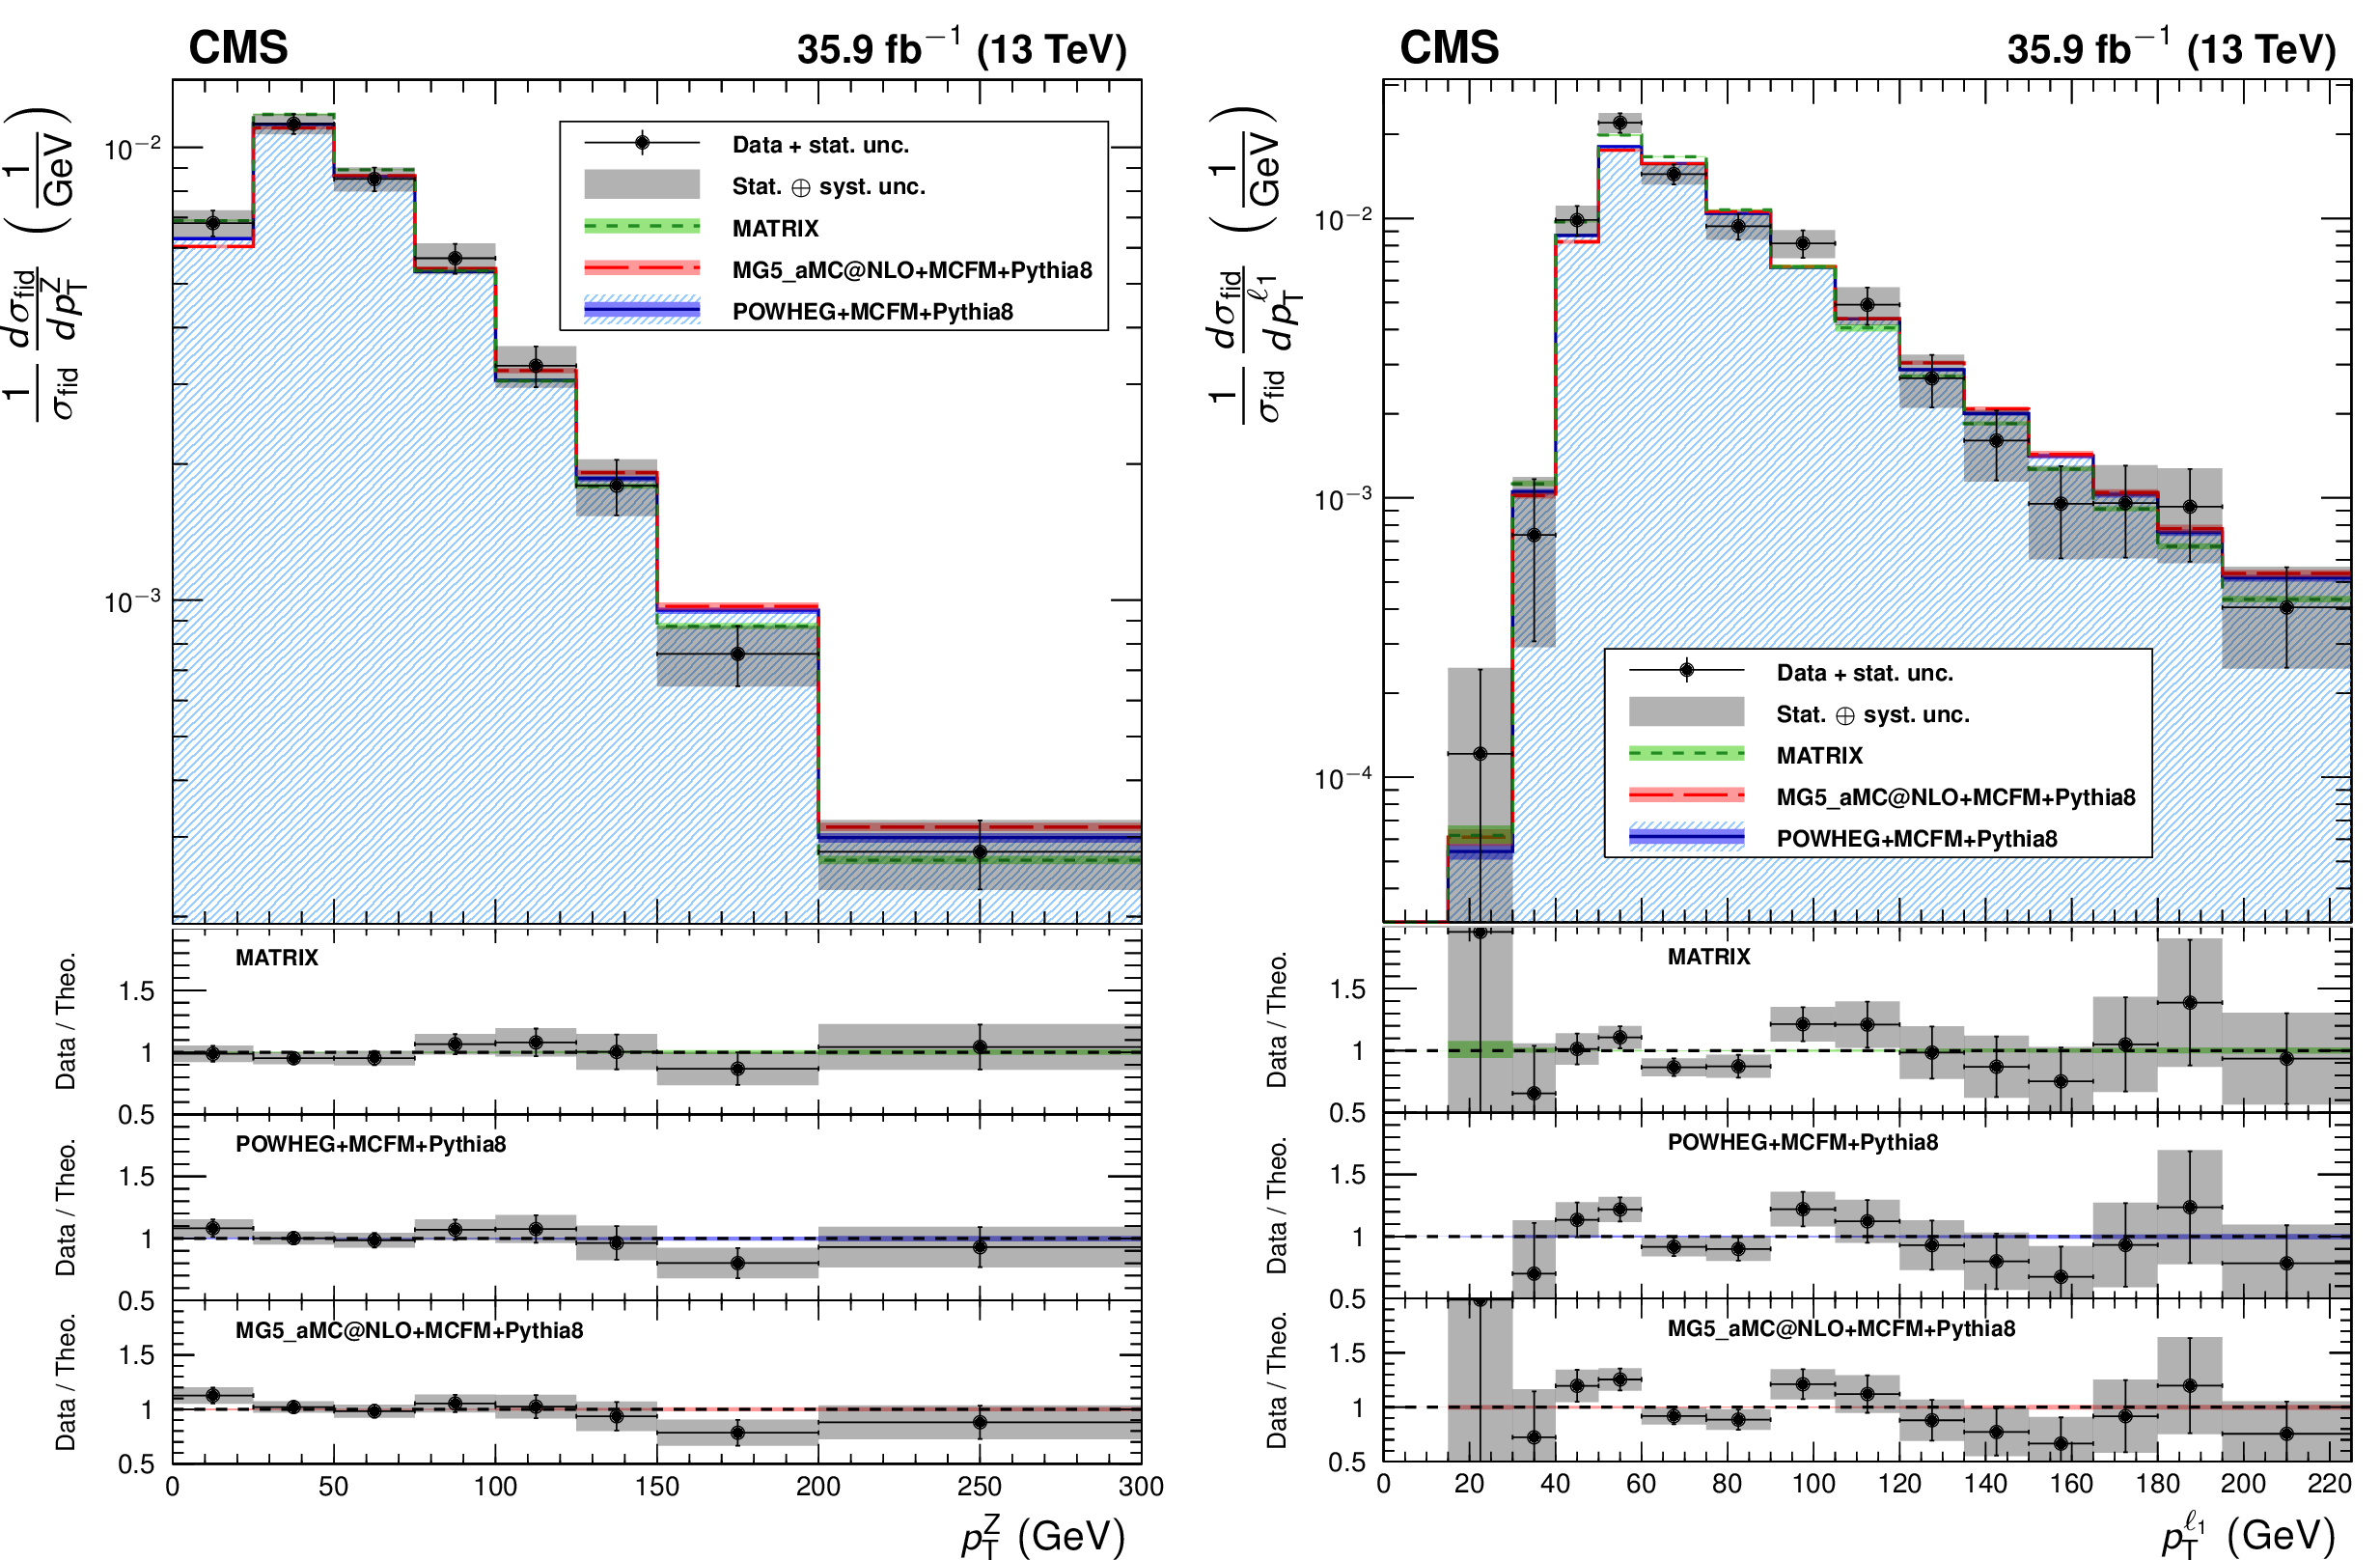
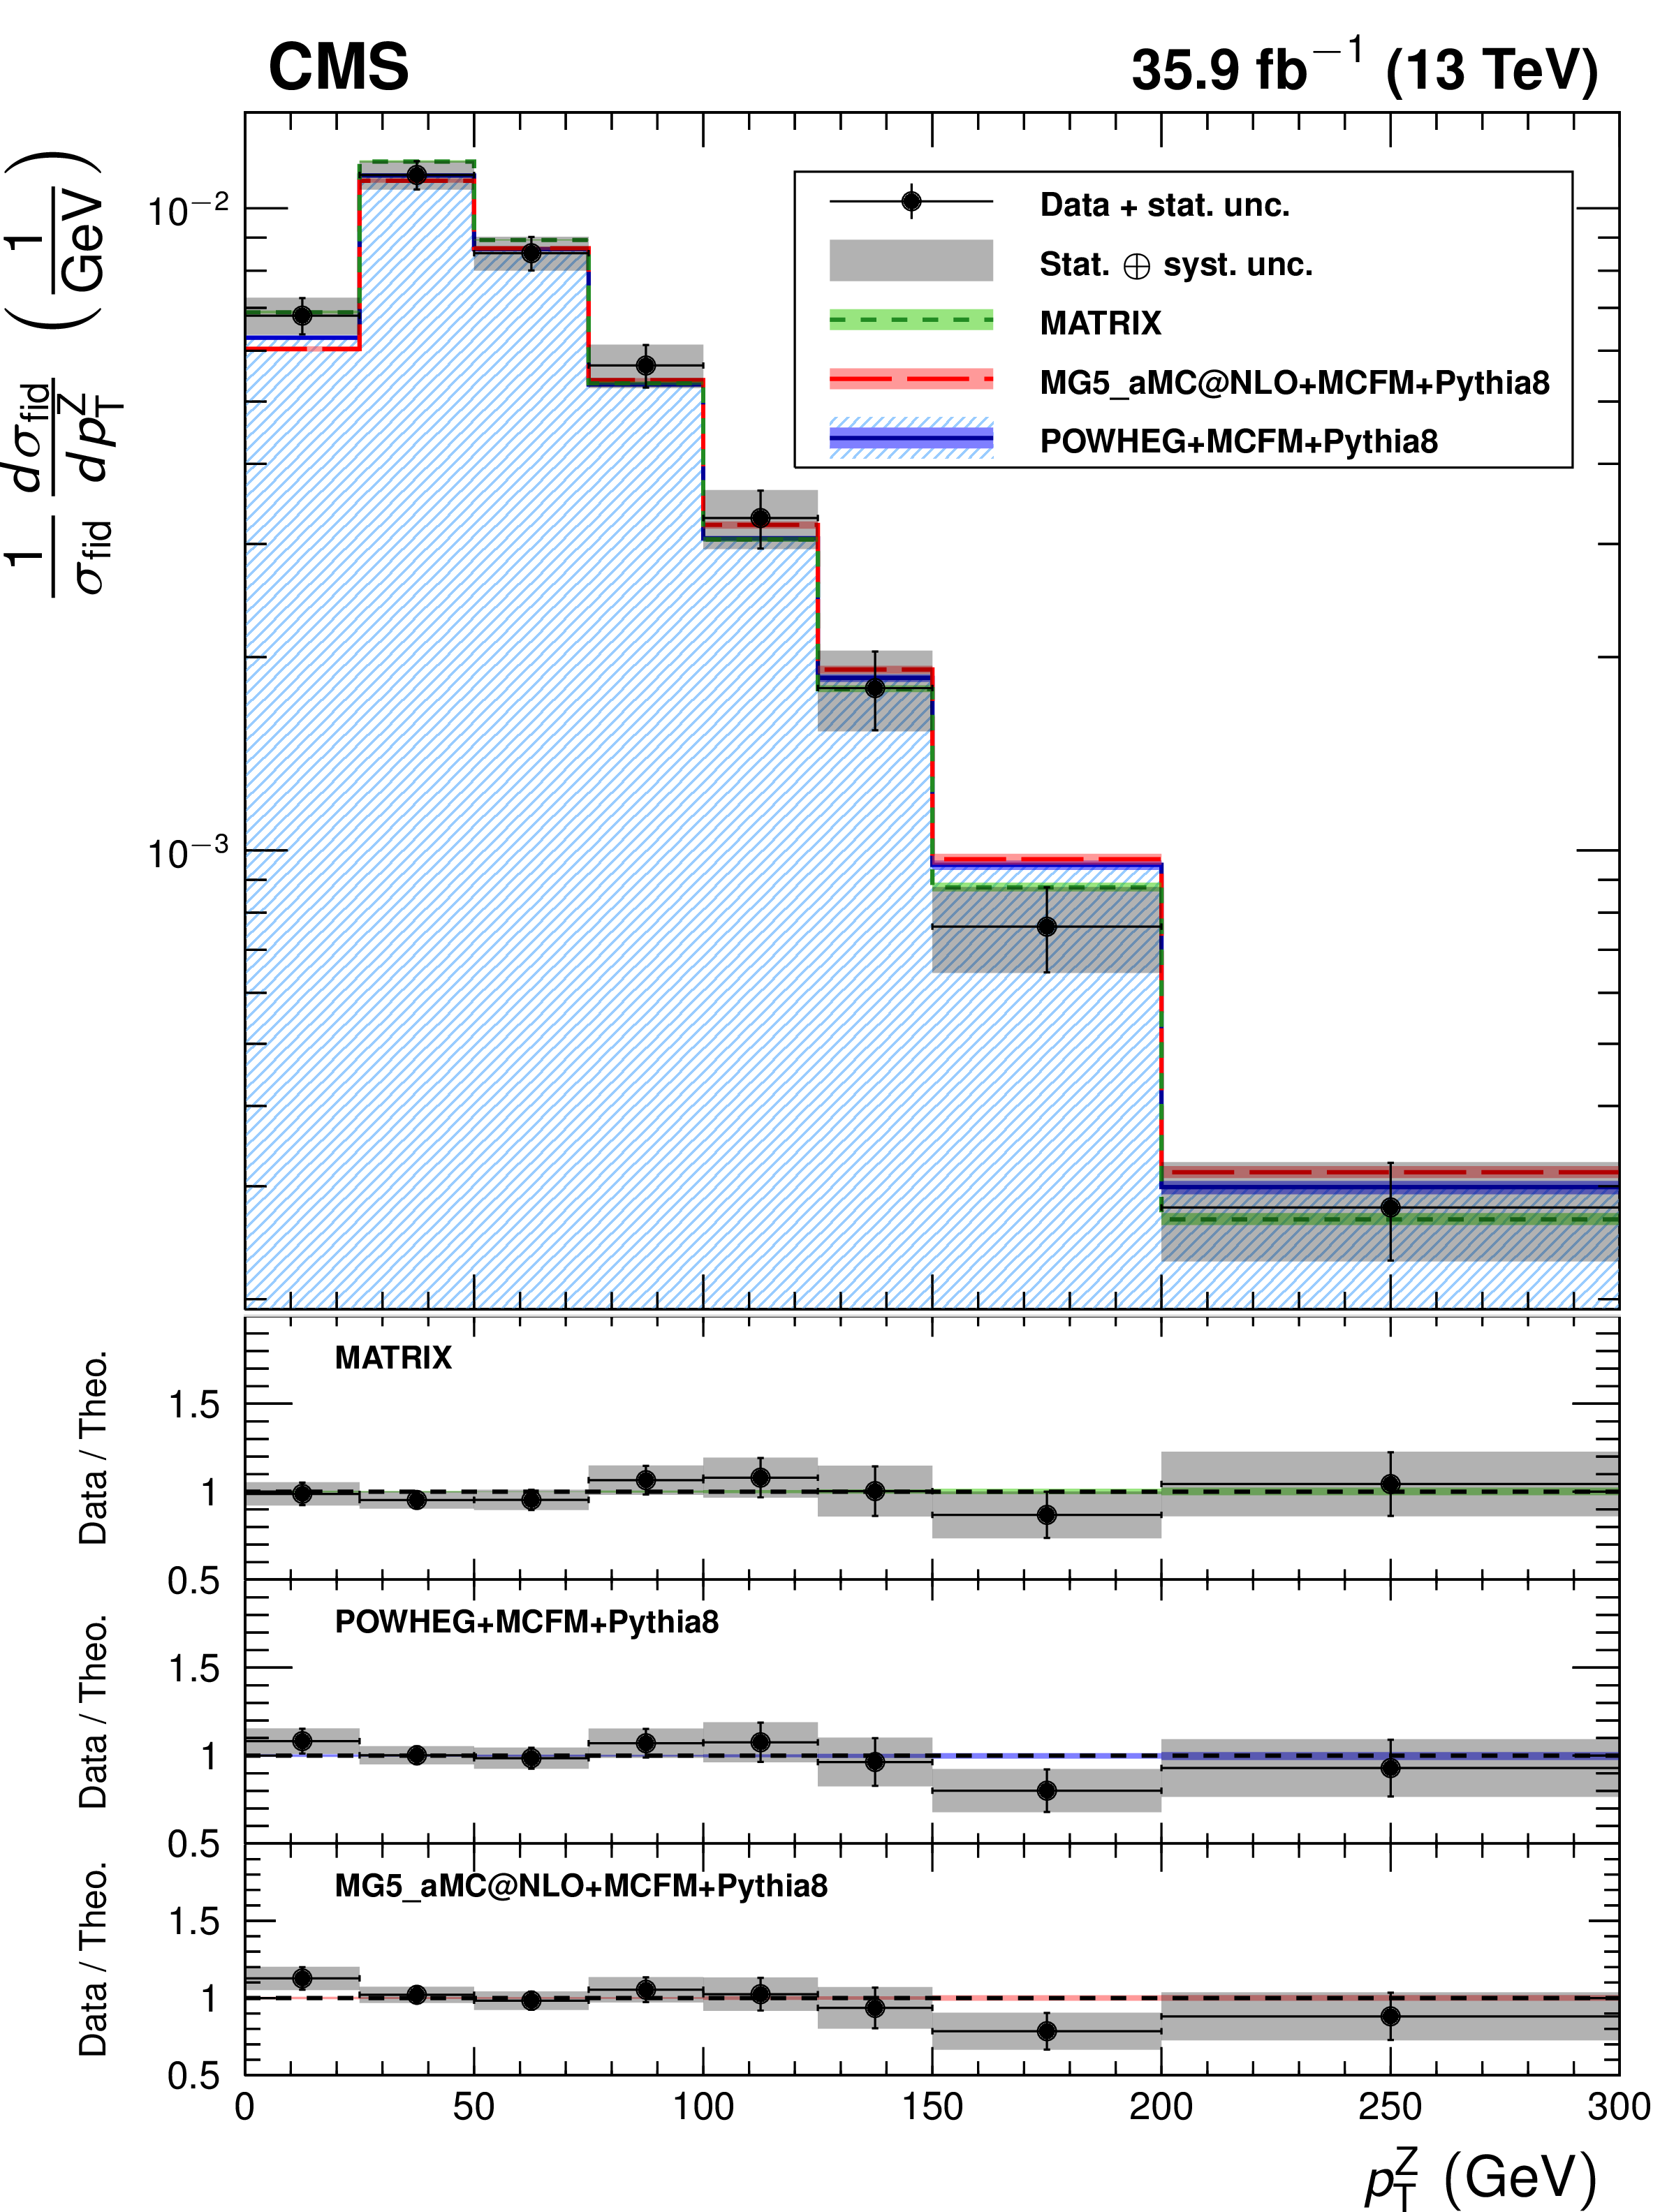
Figure 6:
Differential cross sections normalized to the fiducial cross section for the combined 4e, 4$\mu $, and 2e2$\mu $ decay channels as a function of mass (left) and $ {p_{\mathrm {T}}} $ (right) of the ZZ system. Points represent the unfolded data; the solid, dashed, and dotted histograms represent the POWHEG+MCFM, MadGraph 5\_aMC@NLO+MCFM, and matrix predictions for ZZ signal, respectively, and the bands around the predictions reflect their combined statistical, scale, and PDF uncertainties. PYTHIA v8 was used for parton showering, hadronization, and underlying event simulation in the POWHEG, MadGraph 5\_aMC@NLO, and MCFM samples. The lower part of each plot represents the ratio of the measured cross section to the theoretical distributions. The shaded grey areas around the points represent the sum in quadrature of the statistical and systematic uncertainties, while the crosses represent the statistical uncertainties only. |

png pdf |
Figure 6-a:
Differential cross section normalized to the fiducial cross section for the combined 4e, 4$\mu $, and 2e2$\mu $ decay channels as a function of the mass of the ZZ system. Points represent the unfolded data; the solid, dashed, and dotted histograms represent the POWHEG+MCFM, MadGraph 5_aMC@NLO+MCFM, and matrix predictions for ZZ signal, respectively, and the bands around the predictions reflect their combined statistical, scale, and PDF uncertainties. PYTHIA v8 was used for parton showering, hadronization, and underlying event simulation in the POWHEG, MadGraph 5_aMC@NLO, and MCFM samples. The lower part of the plot represents the ratio of the measured cross section to the theoretical distributions. The shaded grey areas around the points represent the sum in quadrature of the statistical and systematic uncertainties, while the crosses represent the statistical uncertainties only. |
png pdf |
Figure 6-b:
Differential cross section normalized to the fiducial cross section for the combined 4e, 4$\mu $, and 2e2$\mu $ decay channels as a function of the $ {p_{\mathrm {T}}} $ of the ZZ system. Points represent the unfolded data; the solid, dashed, and dotted histograms represent the POWHEG+MCFM, MadGraph 5_aMC@NLO+MCFM, and matrix predictions for ZZ signal, respectively, and the bands around the predictions reflect their combined statistical, scale, and PDF uncertainties. PYTHIA v8 was used for parton showering, hadronization, and underlying event simulation in the POWHEG, MadGraph 5_aMC@NLO, and MCFM samples. The lower part of the plot represents the ratio of the measured cross section to the theoretical distributions. The shaded grey areas around the points represent the sum in quadrature of the statistical and systematic uncertainties, while the crosses represent the statistical uncertainties only. |
png pdf |
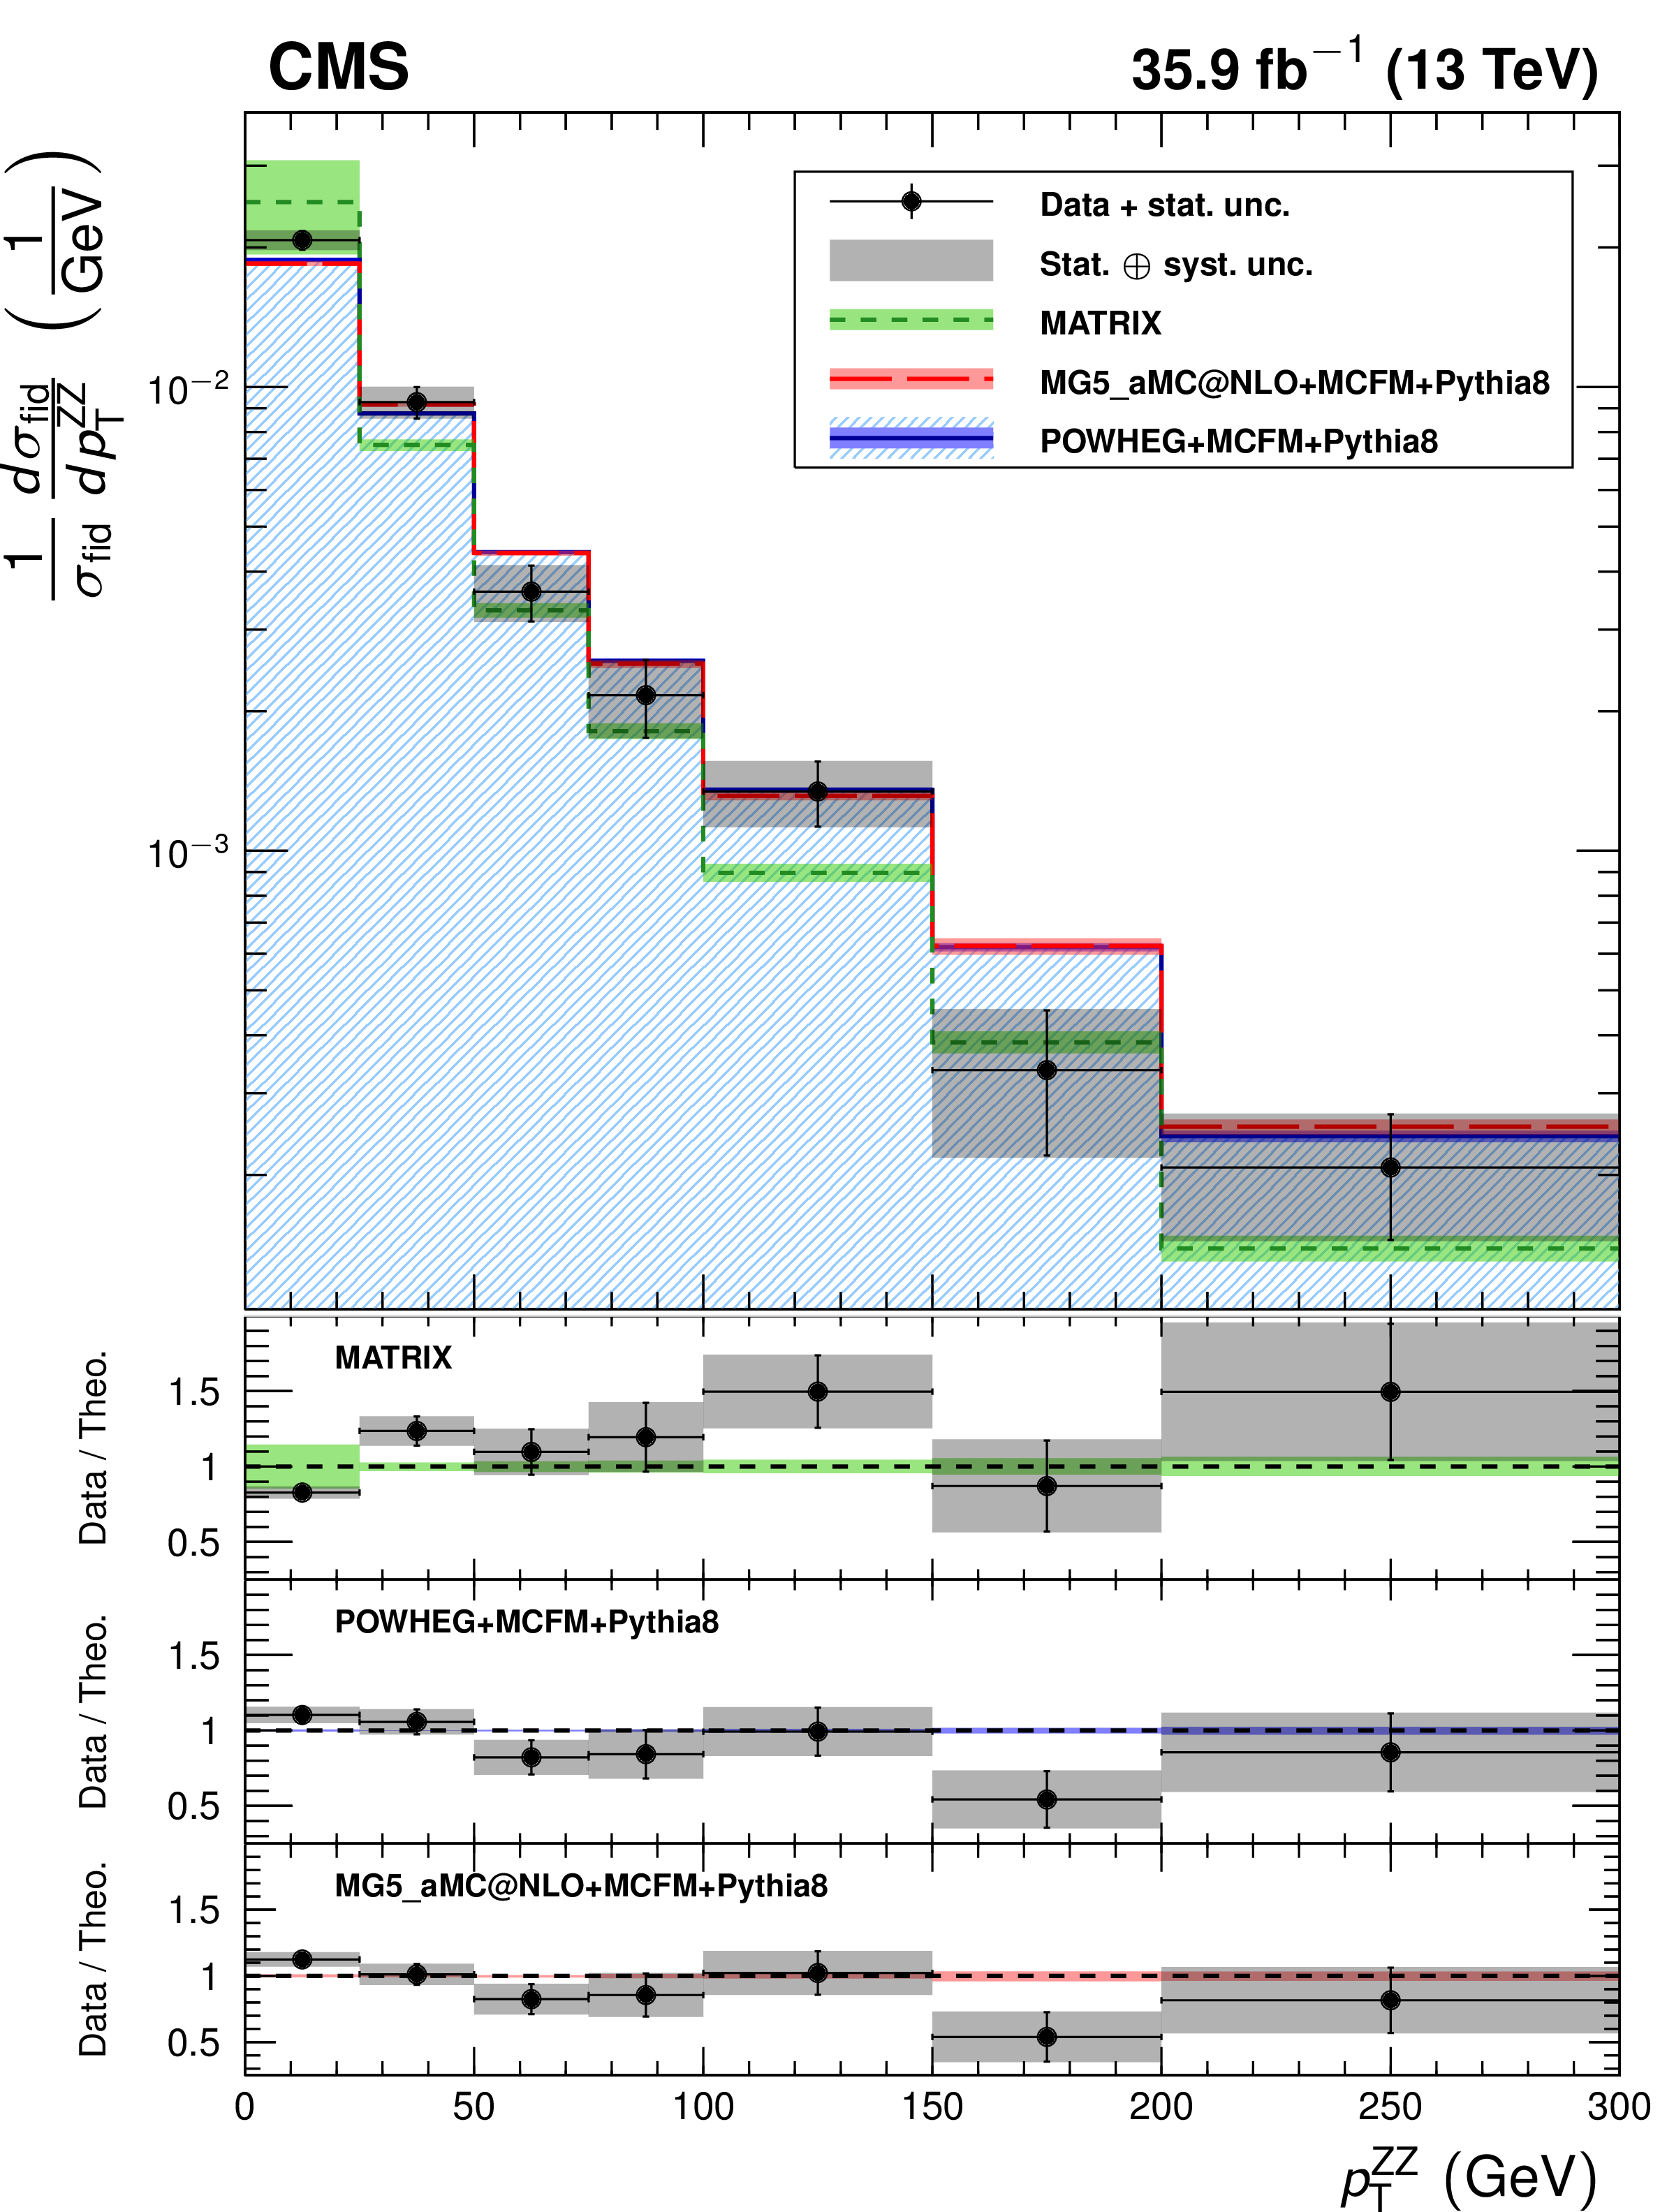
Figure 7:
Normalized ZZ differential cross sections as a function of the $ {p_{\mathrm {T}}} $ of (left) all Z bosons and (right) the leading lepton in ZZ events. Other details are as described in the caption of Fig. 6. |
png pdf |
Figure 7-a:
Normalized ZZ differential cross section as a function of the $ {p_{\mathrm {T}}} $ of all Z bosons in ZZ events. Other details are as described in the caption of Fig. 6. |

png pdf |
Figure 7-b:
Normalized ZZ differential cross section as a function of the $ {p_{\mathrm {T}}} $ of the leading lepton in ZZ events. Other details are as described in the caption of Fig. 6. |
png pdf |
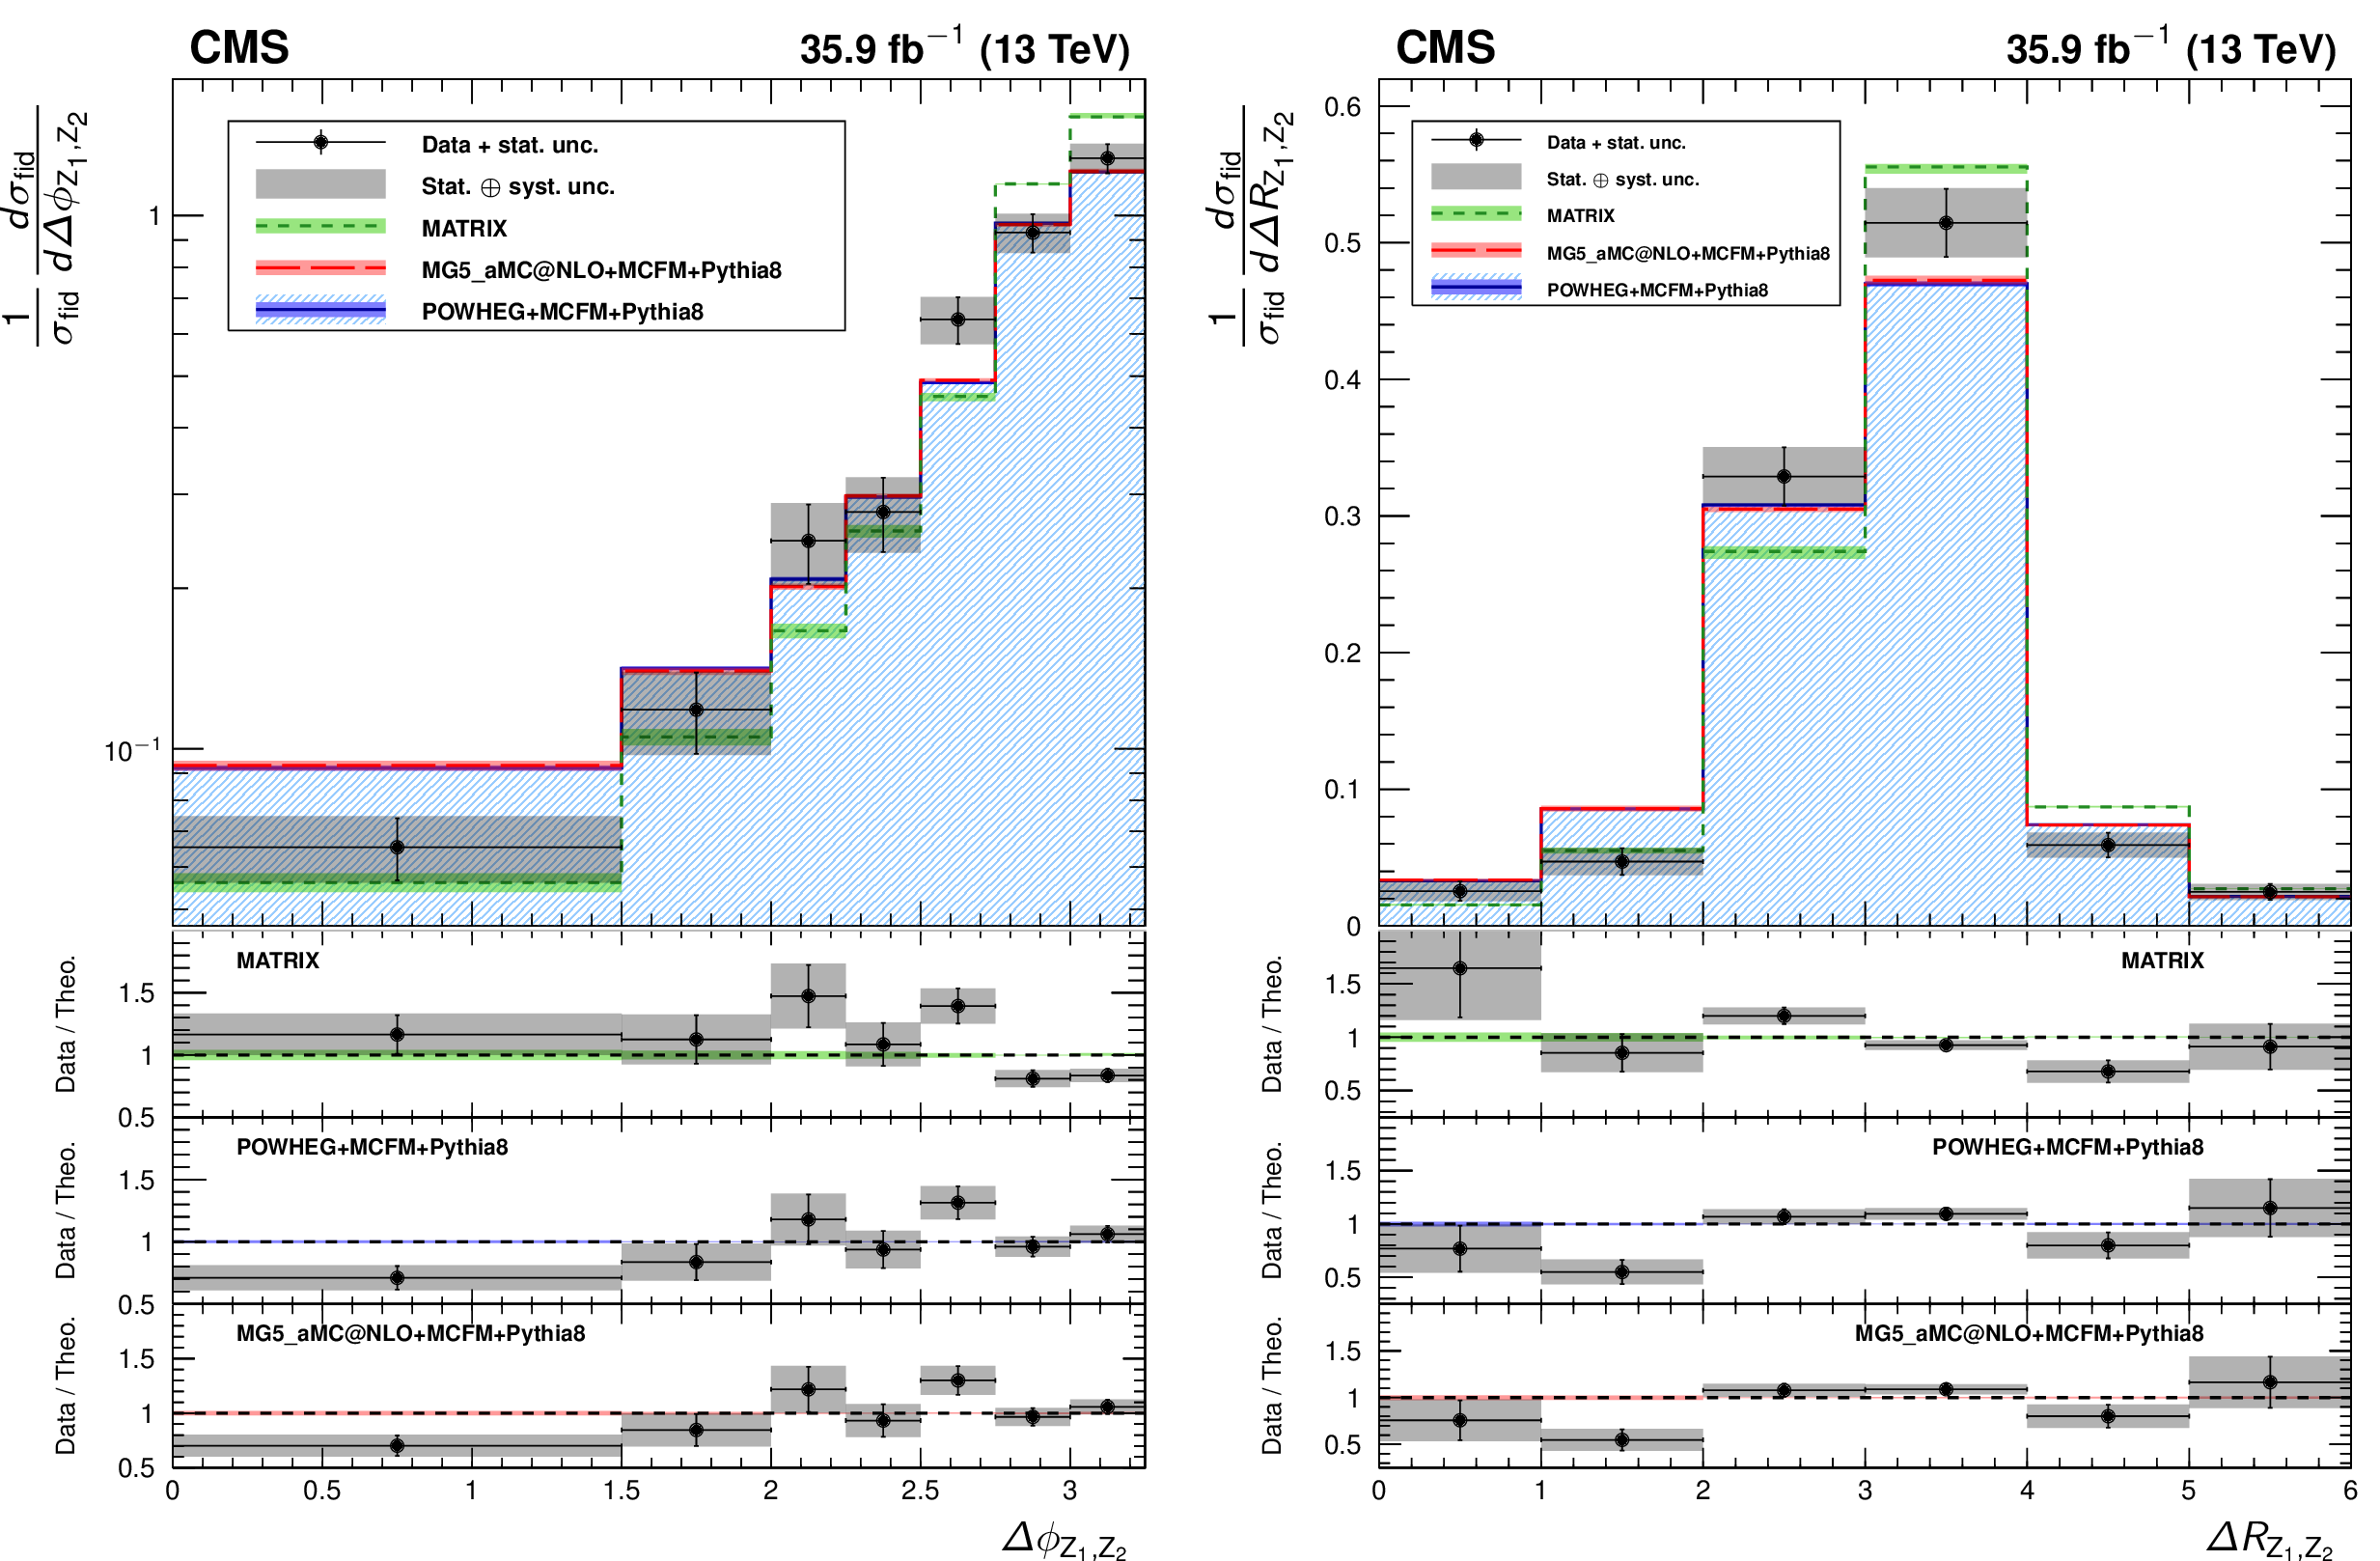
Figure 8:
Normalized ZZ differential cross sections as a function of (left) the azimuthal separation of the two Z bosons and (right) $\Delta R$ between the $\mathrm{Z} $-bosons. Other details are as described in the caption of Fig. 6. |
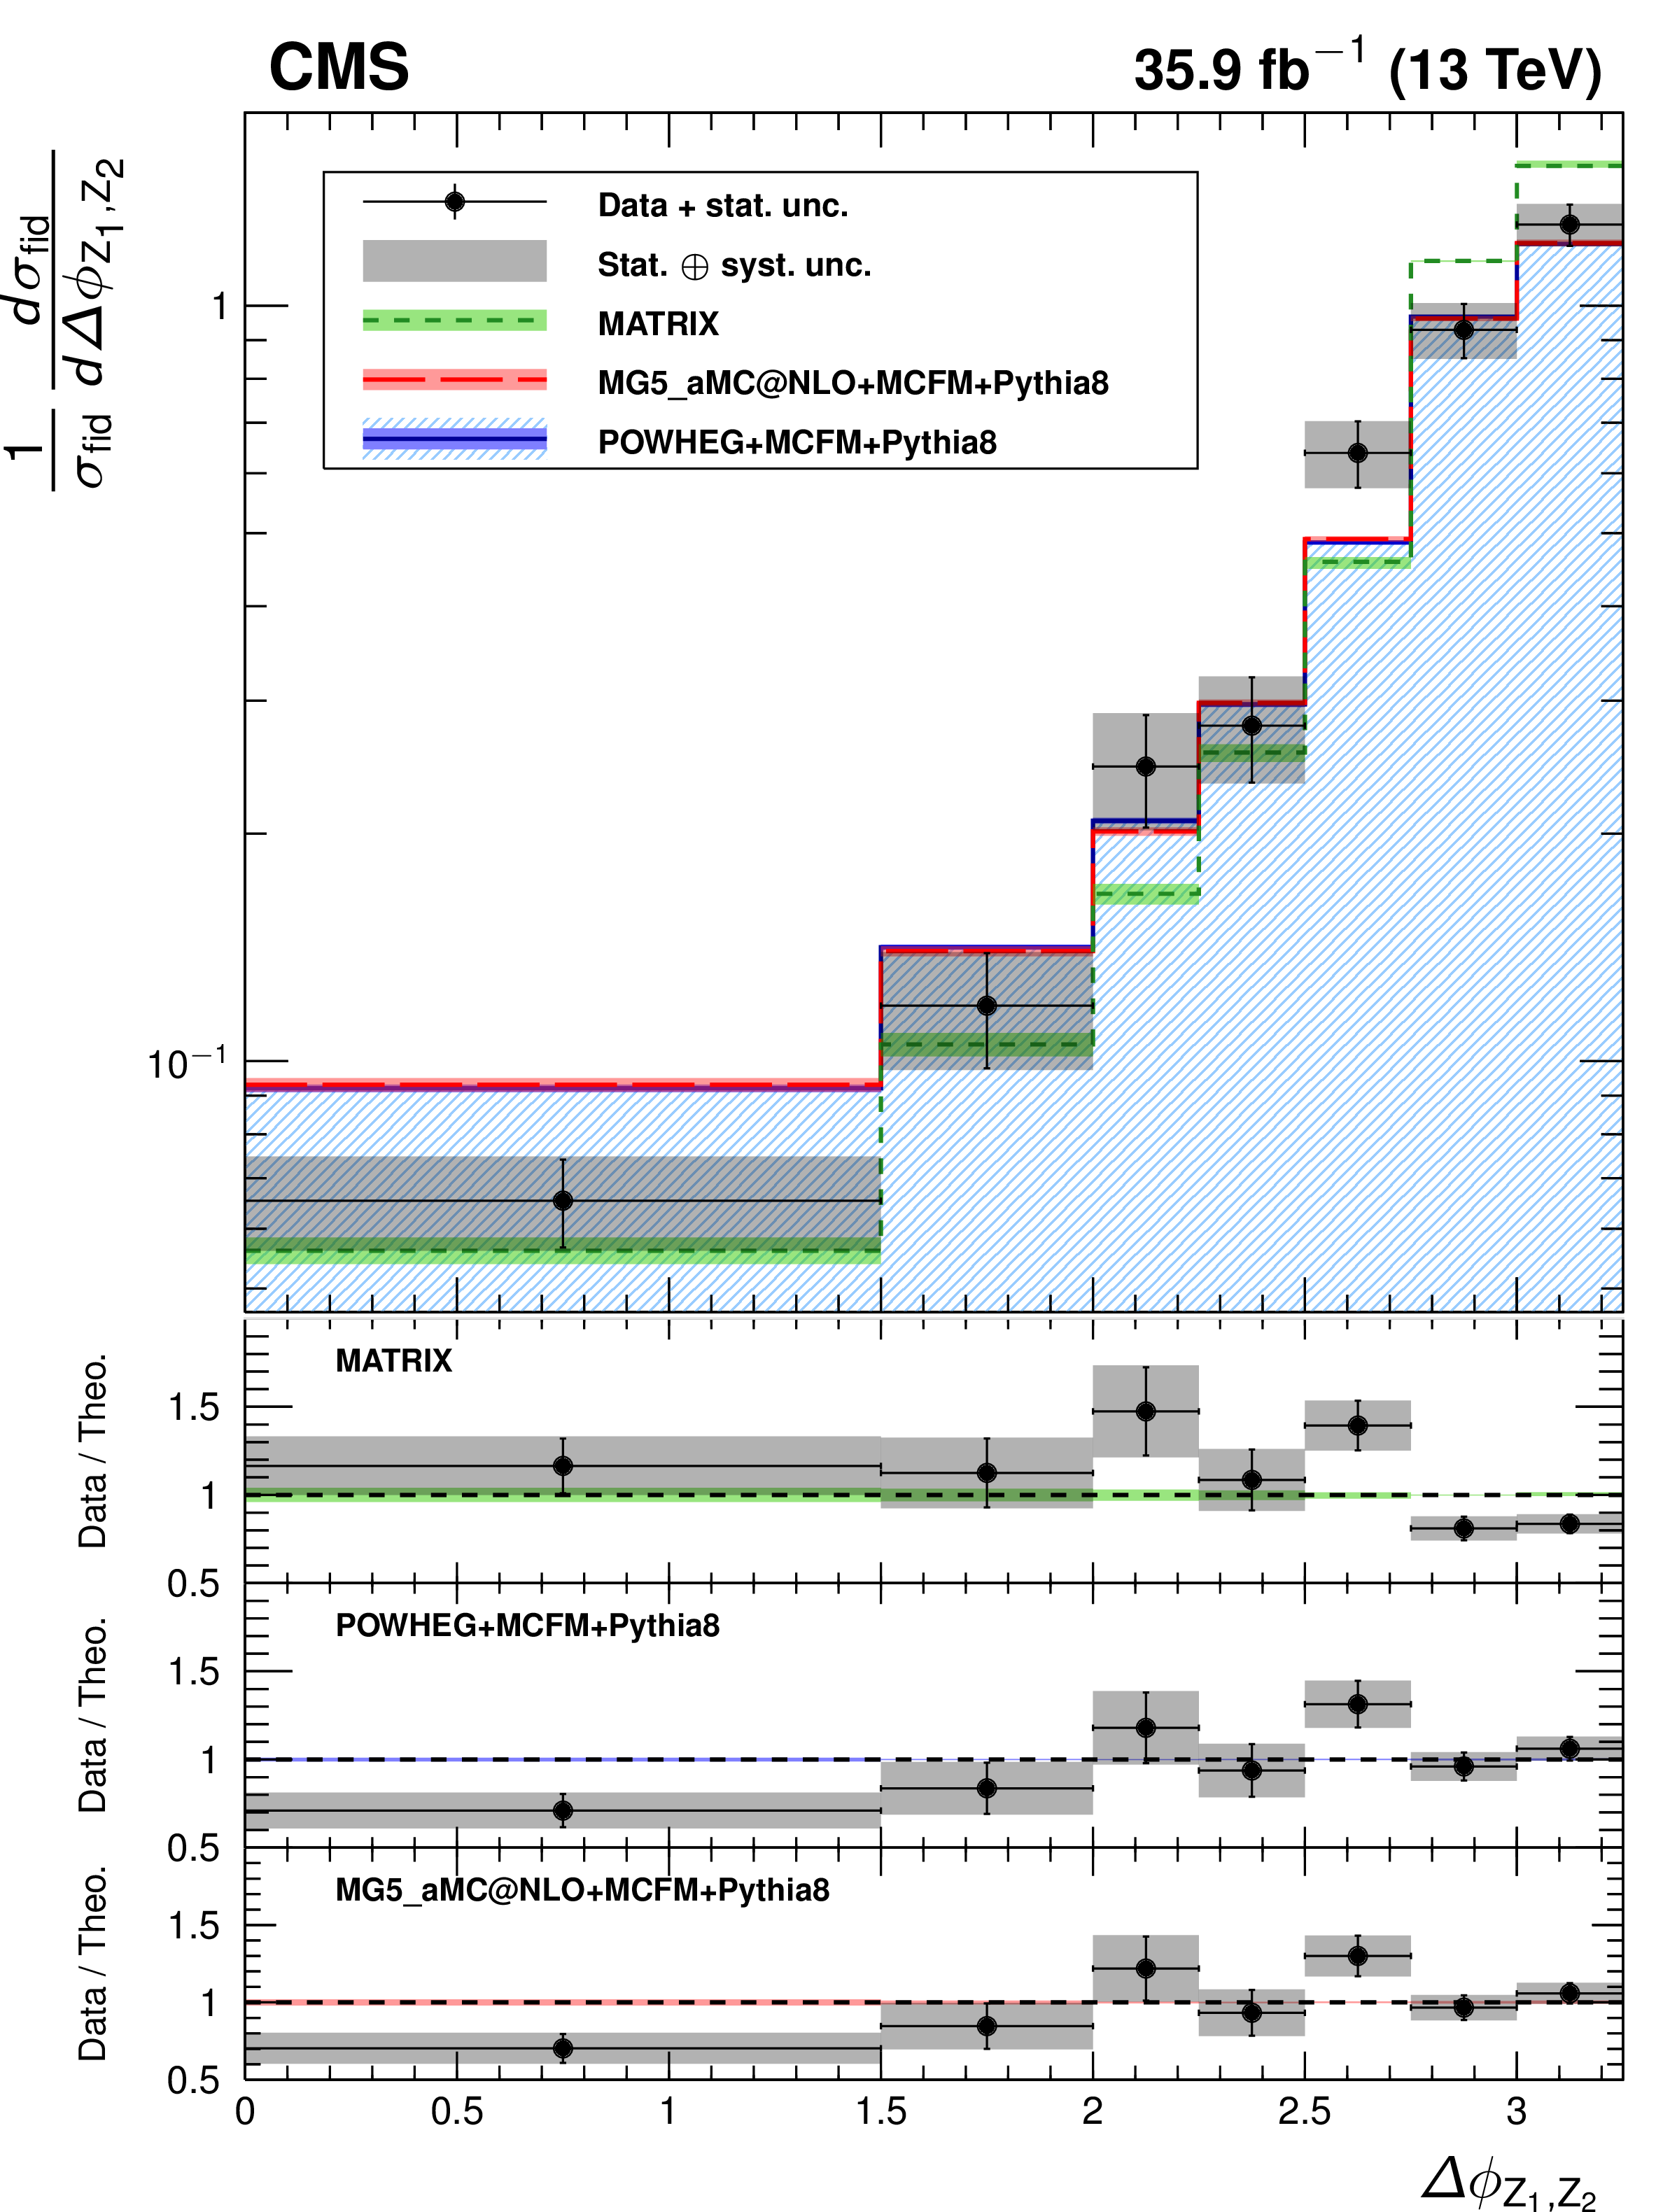
png pdf |
Figure 8-a:
Normalized ZZ differential cross sections as a function of the azimuthal separation of the two Z bosons. Other details are as described in the caption of Fig. 6. |
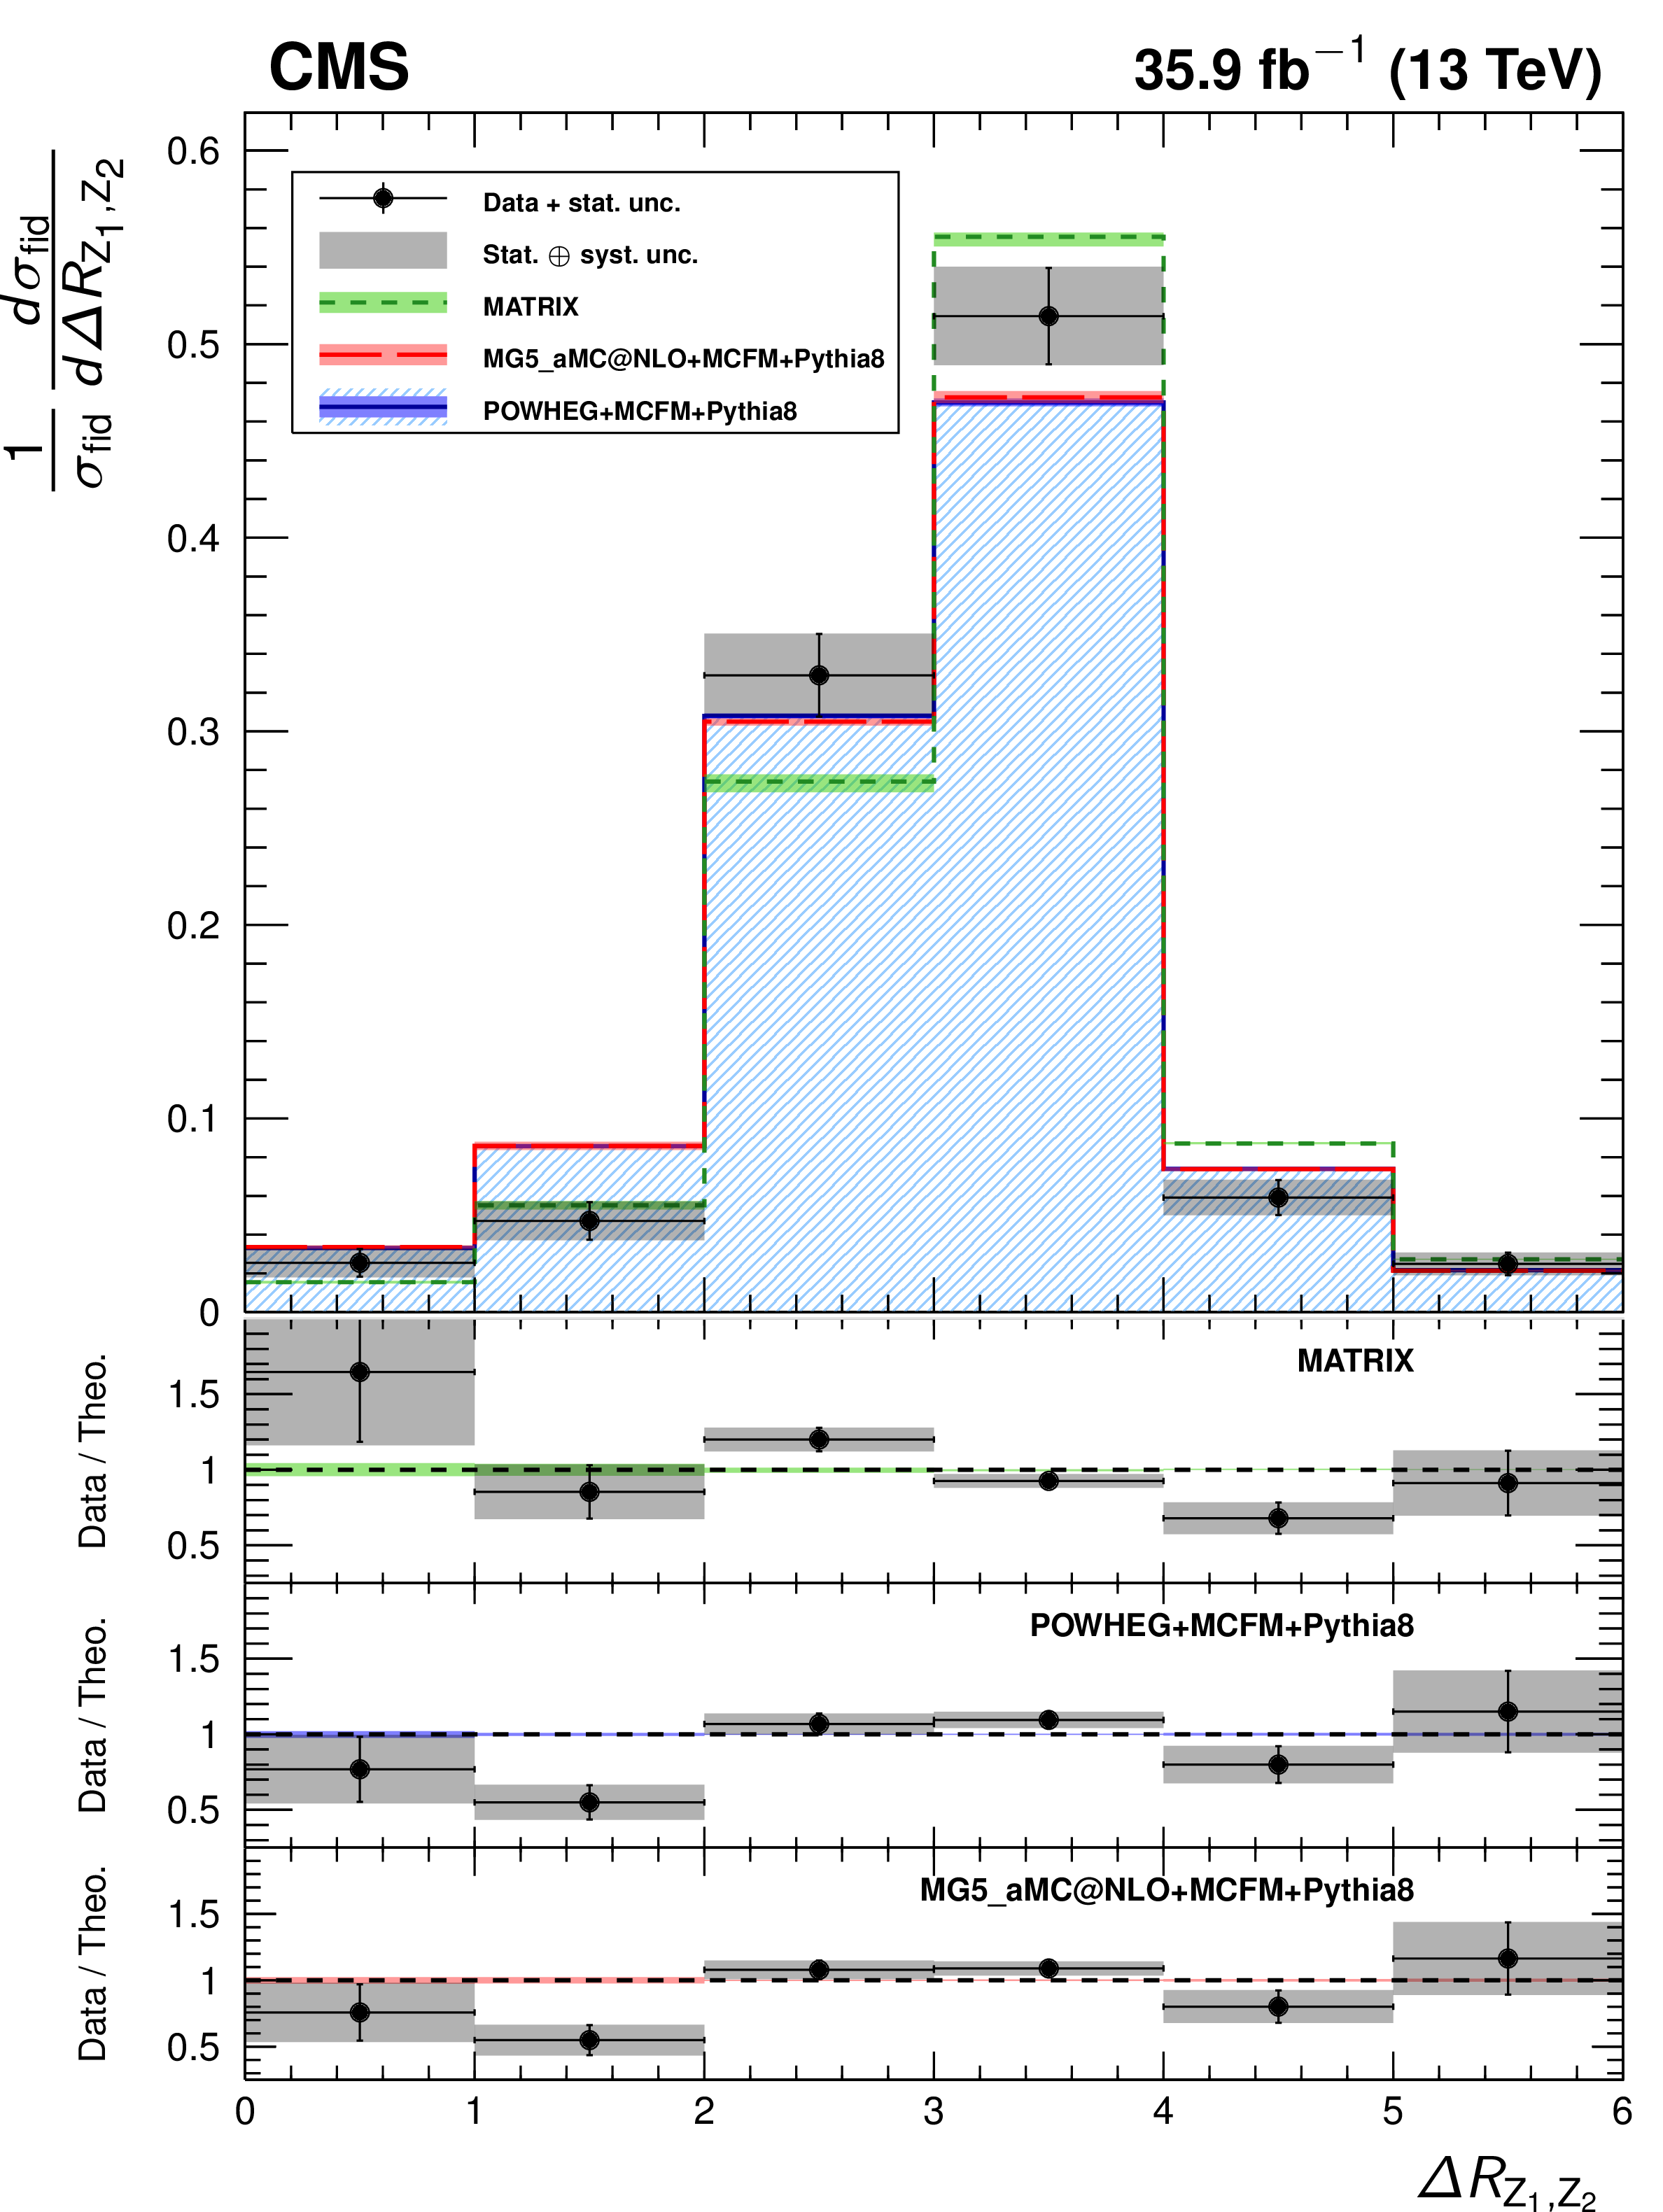
png pdf |
Figure 8-b:
Normalized ZZ differential cross sections as a function of the azimuthal separation of $\Delta R$ between the $\mathrm{Z} $-bosons. Other details are as described in the caption of Fig. 6. |
png pdf |
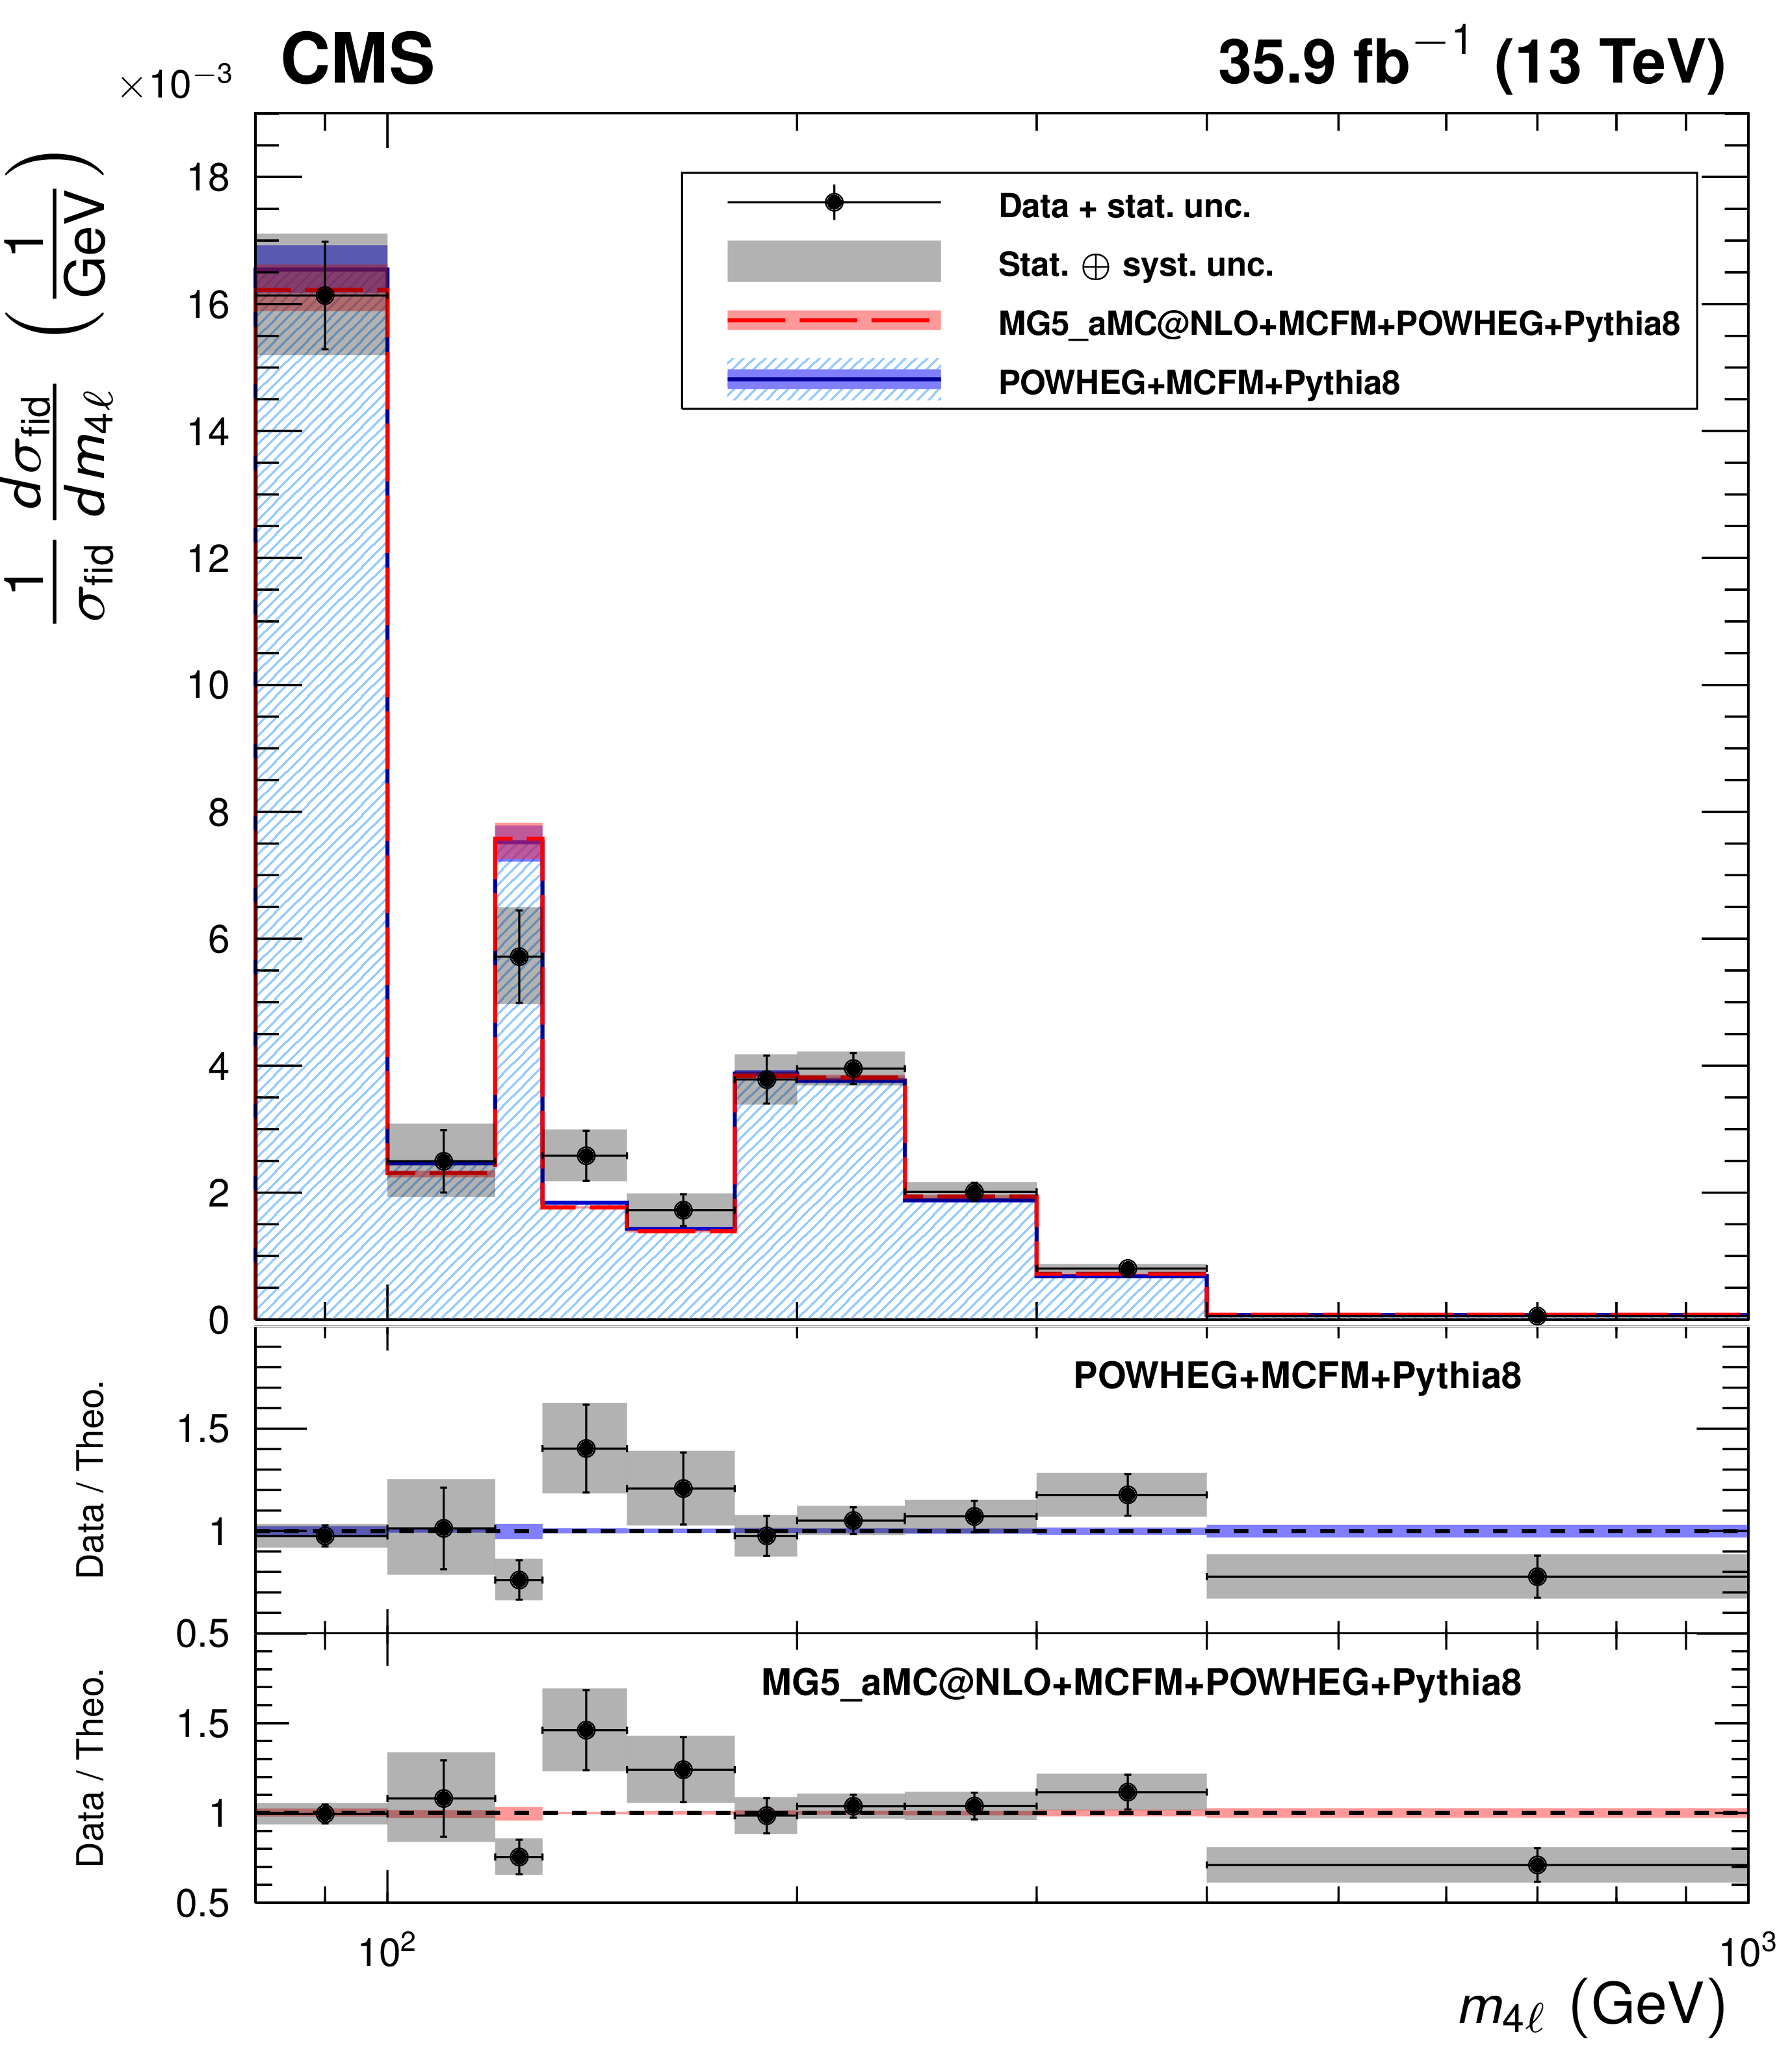
Figure 9:
The normalized differential four-lepton cross section as a function of the four-lepton mass, subject only to the common requirements of Table 4. SM $\mathrm{g} \mathrm{g} \to \mathrm{H} \to \mathrm{Z} \mathrm{Z} ^* $ production is included, simulated with POWHEG. Other details are as described in the caption of Fig. 6. |
png pdf |
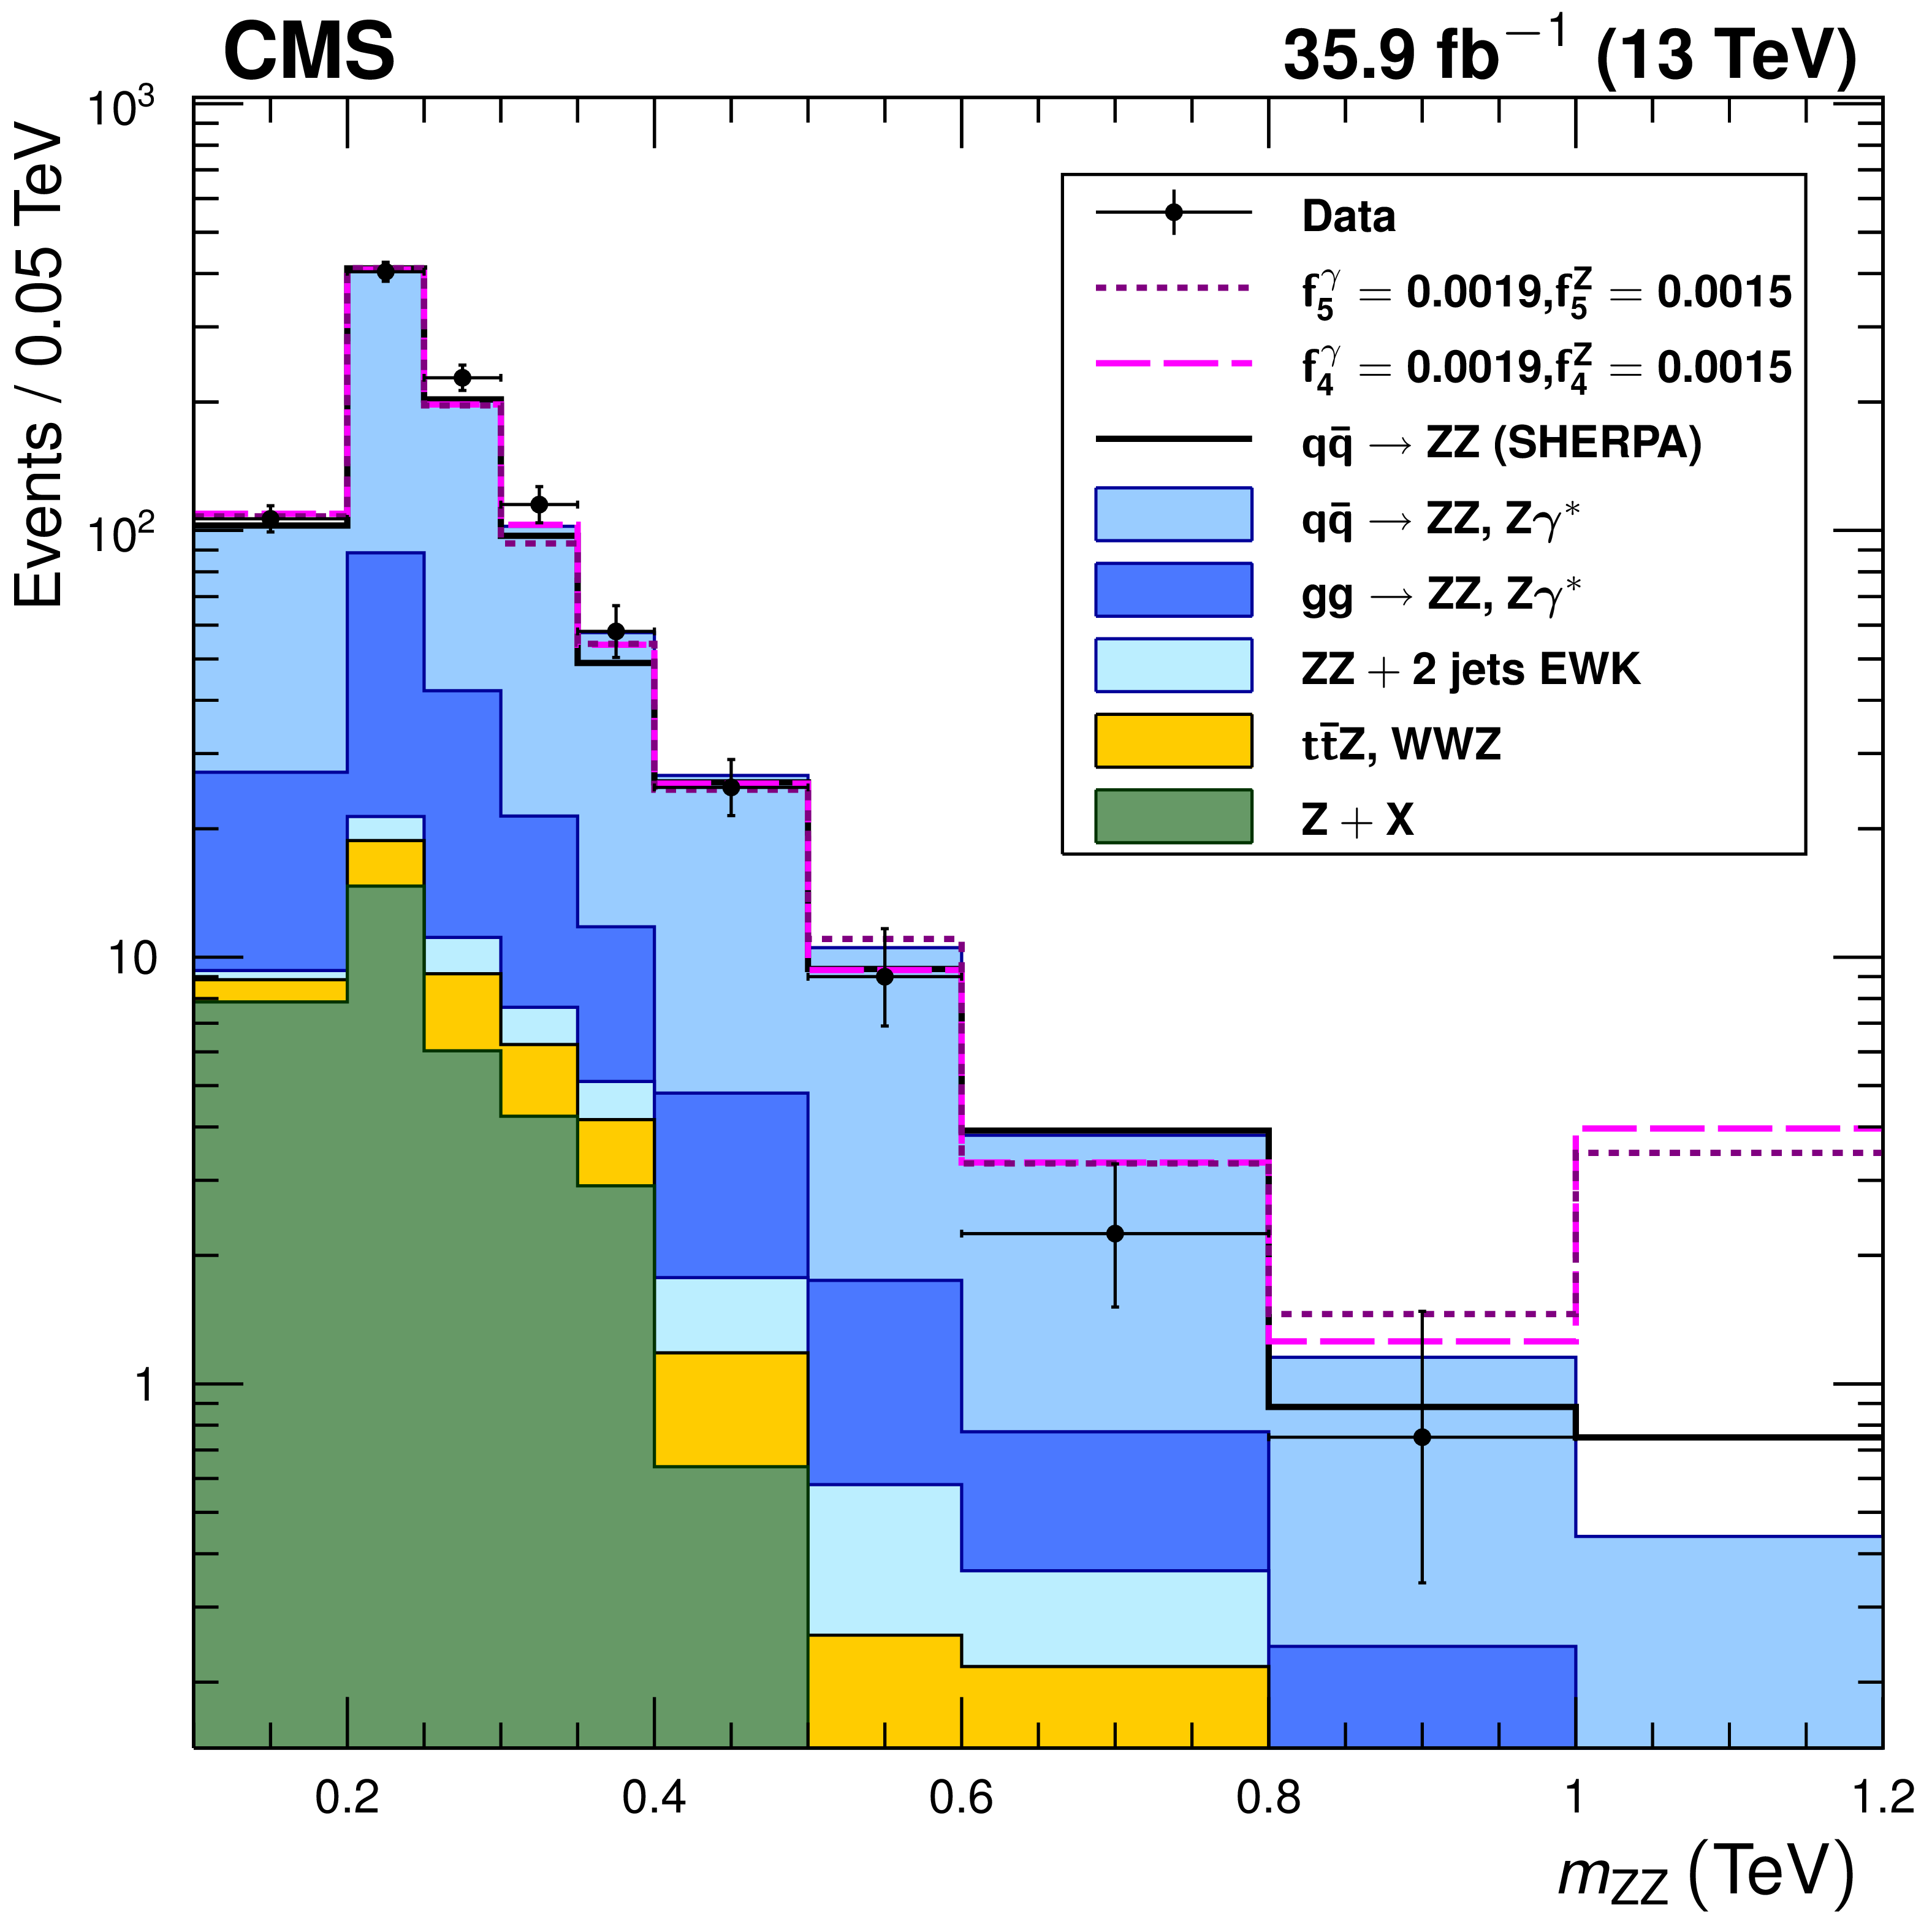
Figure 10:
Distribution of the four-lepton reconstructed mass for the combined 4e, 4$\mu $, and 2e2$\mu $ channels. Points represent the data, the filled histograms represent the SM expected yield including signal and irreducible background predictions from simulation and the data-driven background estimate. Unfilled histograms represent examples of aTGC signal predictions (dashed), and the SHERPA SM prediction (solid), included to illustrate the expected shape differences between the SHERPA and POWHEG predictions. Vertical bars on the data points show their statistical uncertainty. The SHERPA distributions are normalized such that the SM sample has the same total yield as the POWHEG sample predicts. Bin contents are normalized to the bin widths, using a unit bin size of 50 GeV ; horizontal bars on the data points show the range of the corresponding bin. The last bin includes the "overflow'' contribution from events at masses above 1.2 TeV. |

png pdf |
Figure 11:
Two-dimensional observed 95% CL limits (solid contour) and expected 68 and 95% CL limits (dashed contour) on the ZZZ and ZZ$ \gamma $ aTGCs. The left (right) plot shows the exclusion contour in the $f_{4(5)}^\mathrm{Z}, f_{4(5)}^\gamma $ parameter planes. The values of couplings outside of contours are excluded at the corresponding confidence level. The solid dot is the point at which the likelihood is at its maximum. The solid lines at the center show the observed one-dimensional 95% CL limits for $f_{4,5}^\gamma $ (horizontal) and $f_{4,5}^\mathrm{Z} $ (vertical). No form factor is used. |
png pdf |
Figure 11-a:
Two-dimensional observed 95% CL limits (solid contour) and expected 68 and 95% CL limits (dashed contour) on the ZZZ and ZZ$ \gamma $ aTGCs. The plot shows the exclusion contour in the $f_{4}^\mathrm{Z}, f_{4}^\gamma $ parameter planes. The values of couplings outside of contours are excluded at the corresponding confidence level. The solid dot is the point at which the likelihood is at its maximum. The solid lines at the center show the observed one-dimensional 95% CL limits for $f_{4}^\gamma $ (horizontal) and $f_{4}^\mathrm{Z} $ (vertical). No form factor is used. |

png pdf |
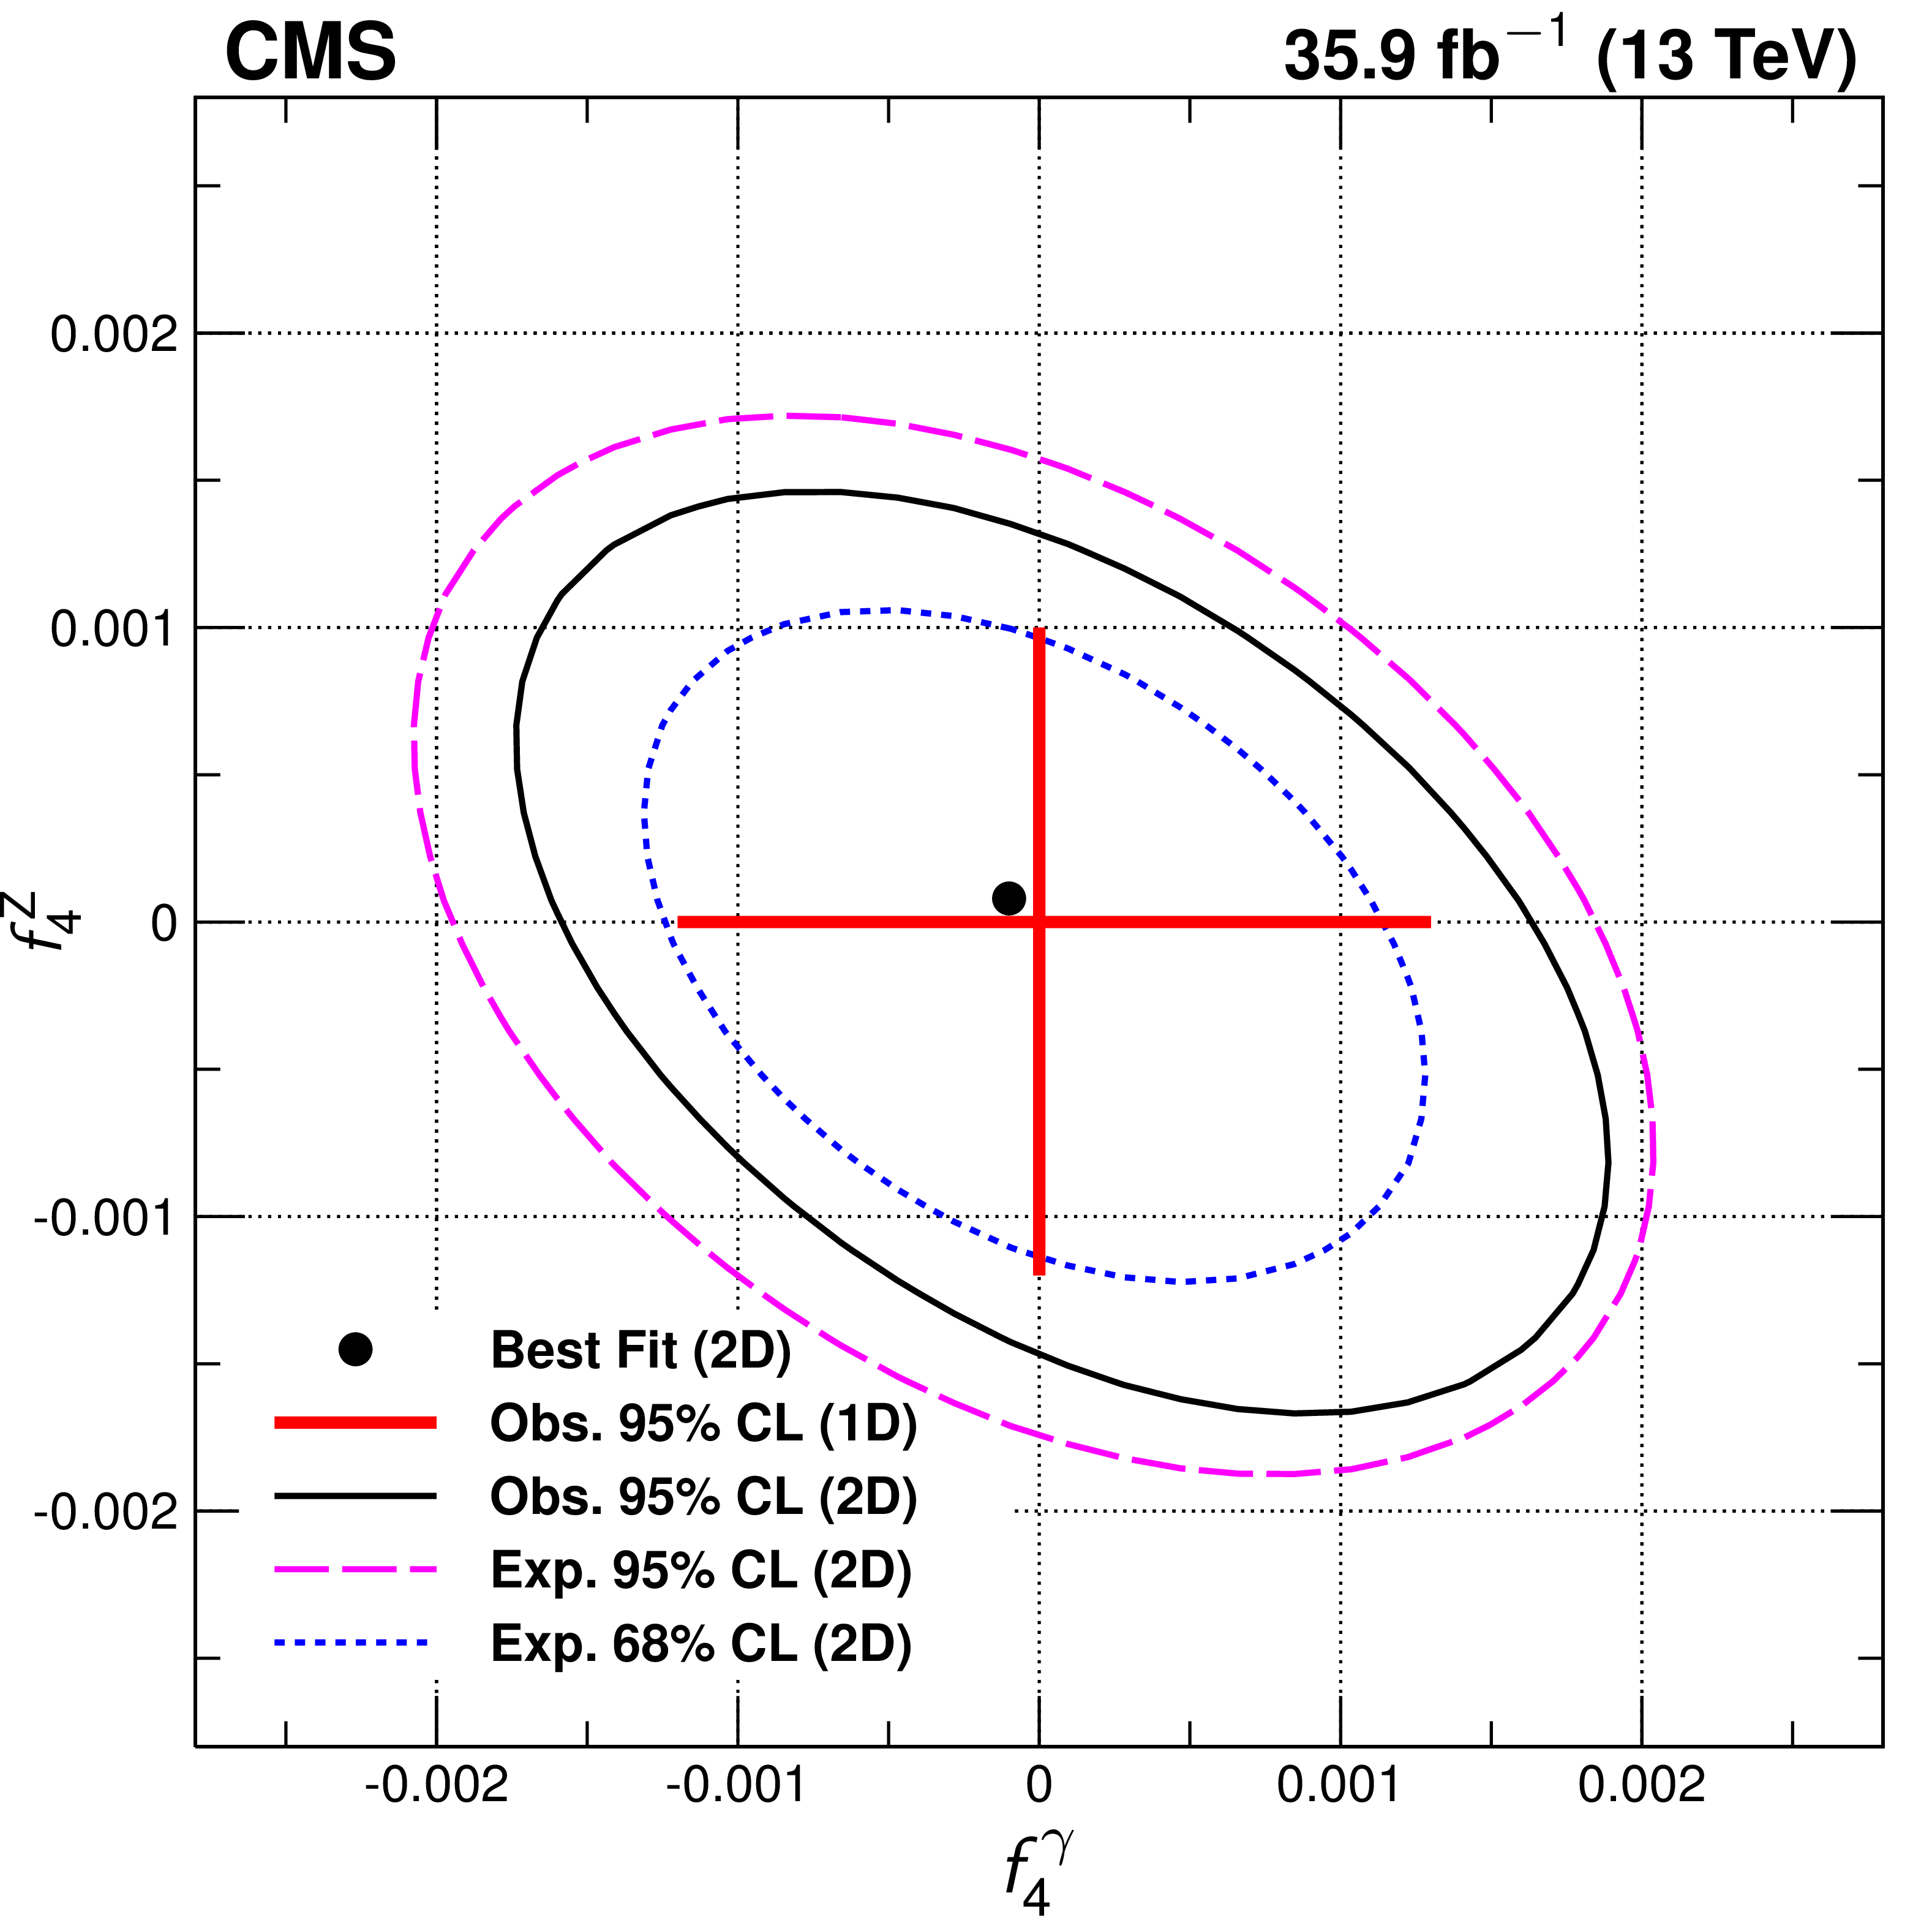
Figure 11-b:
Two-dimensional observed 95% CL limits (solid contour) and expected 68 and 95% CL limits (dashed contour) on the ZZZ and ZZ$ \gamma $ aTGCs. The plot shows the exclusion contour in the $f_{5}^\mathrm{Z}, f_{5}^\gamma $ parameter planes. The values of couplings outside of contours are excluded at the corresponding confidence level. The solid dot is the point at which the likelihood is at its maximum. The solid lines at the center show the observed one-dimensional 95% CL limits for $f_{5}^\gamma $ (horizontal) and $f_{5}^\mathrm{Z} $ (vertical). No form factor is used. |

png pdf |
Figure 12:
Expected and observed one-dimensional limits on the four aTGC parameters, as a function of an upper cutoff on the invariant mass of the four-lepton system. No form factor is used. |
png pdf |
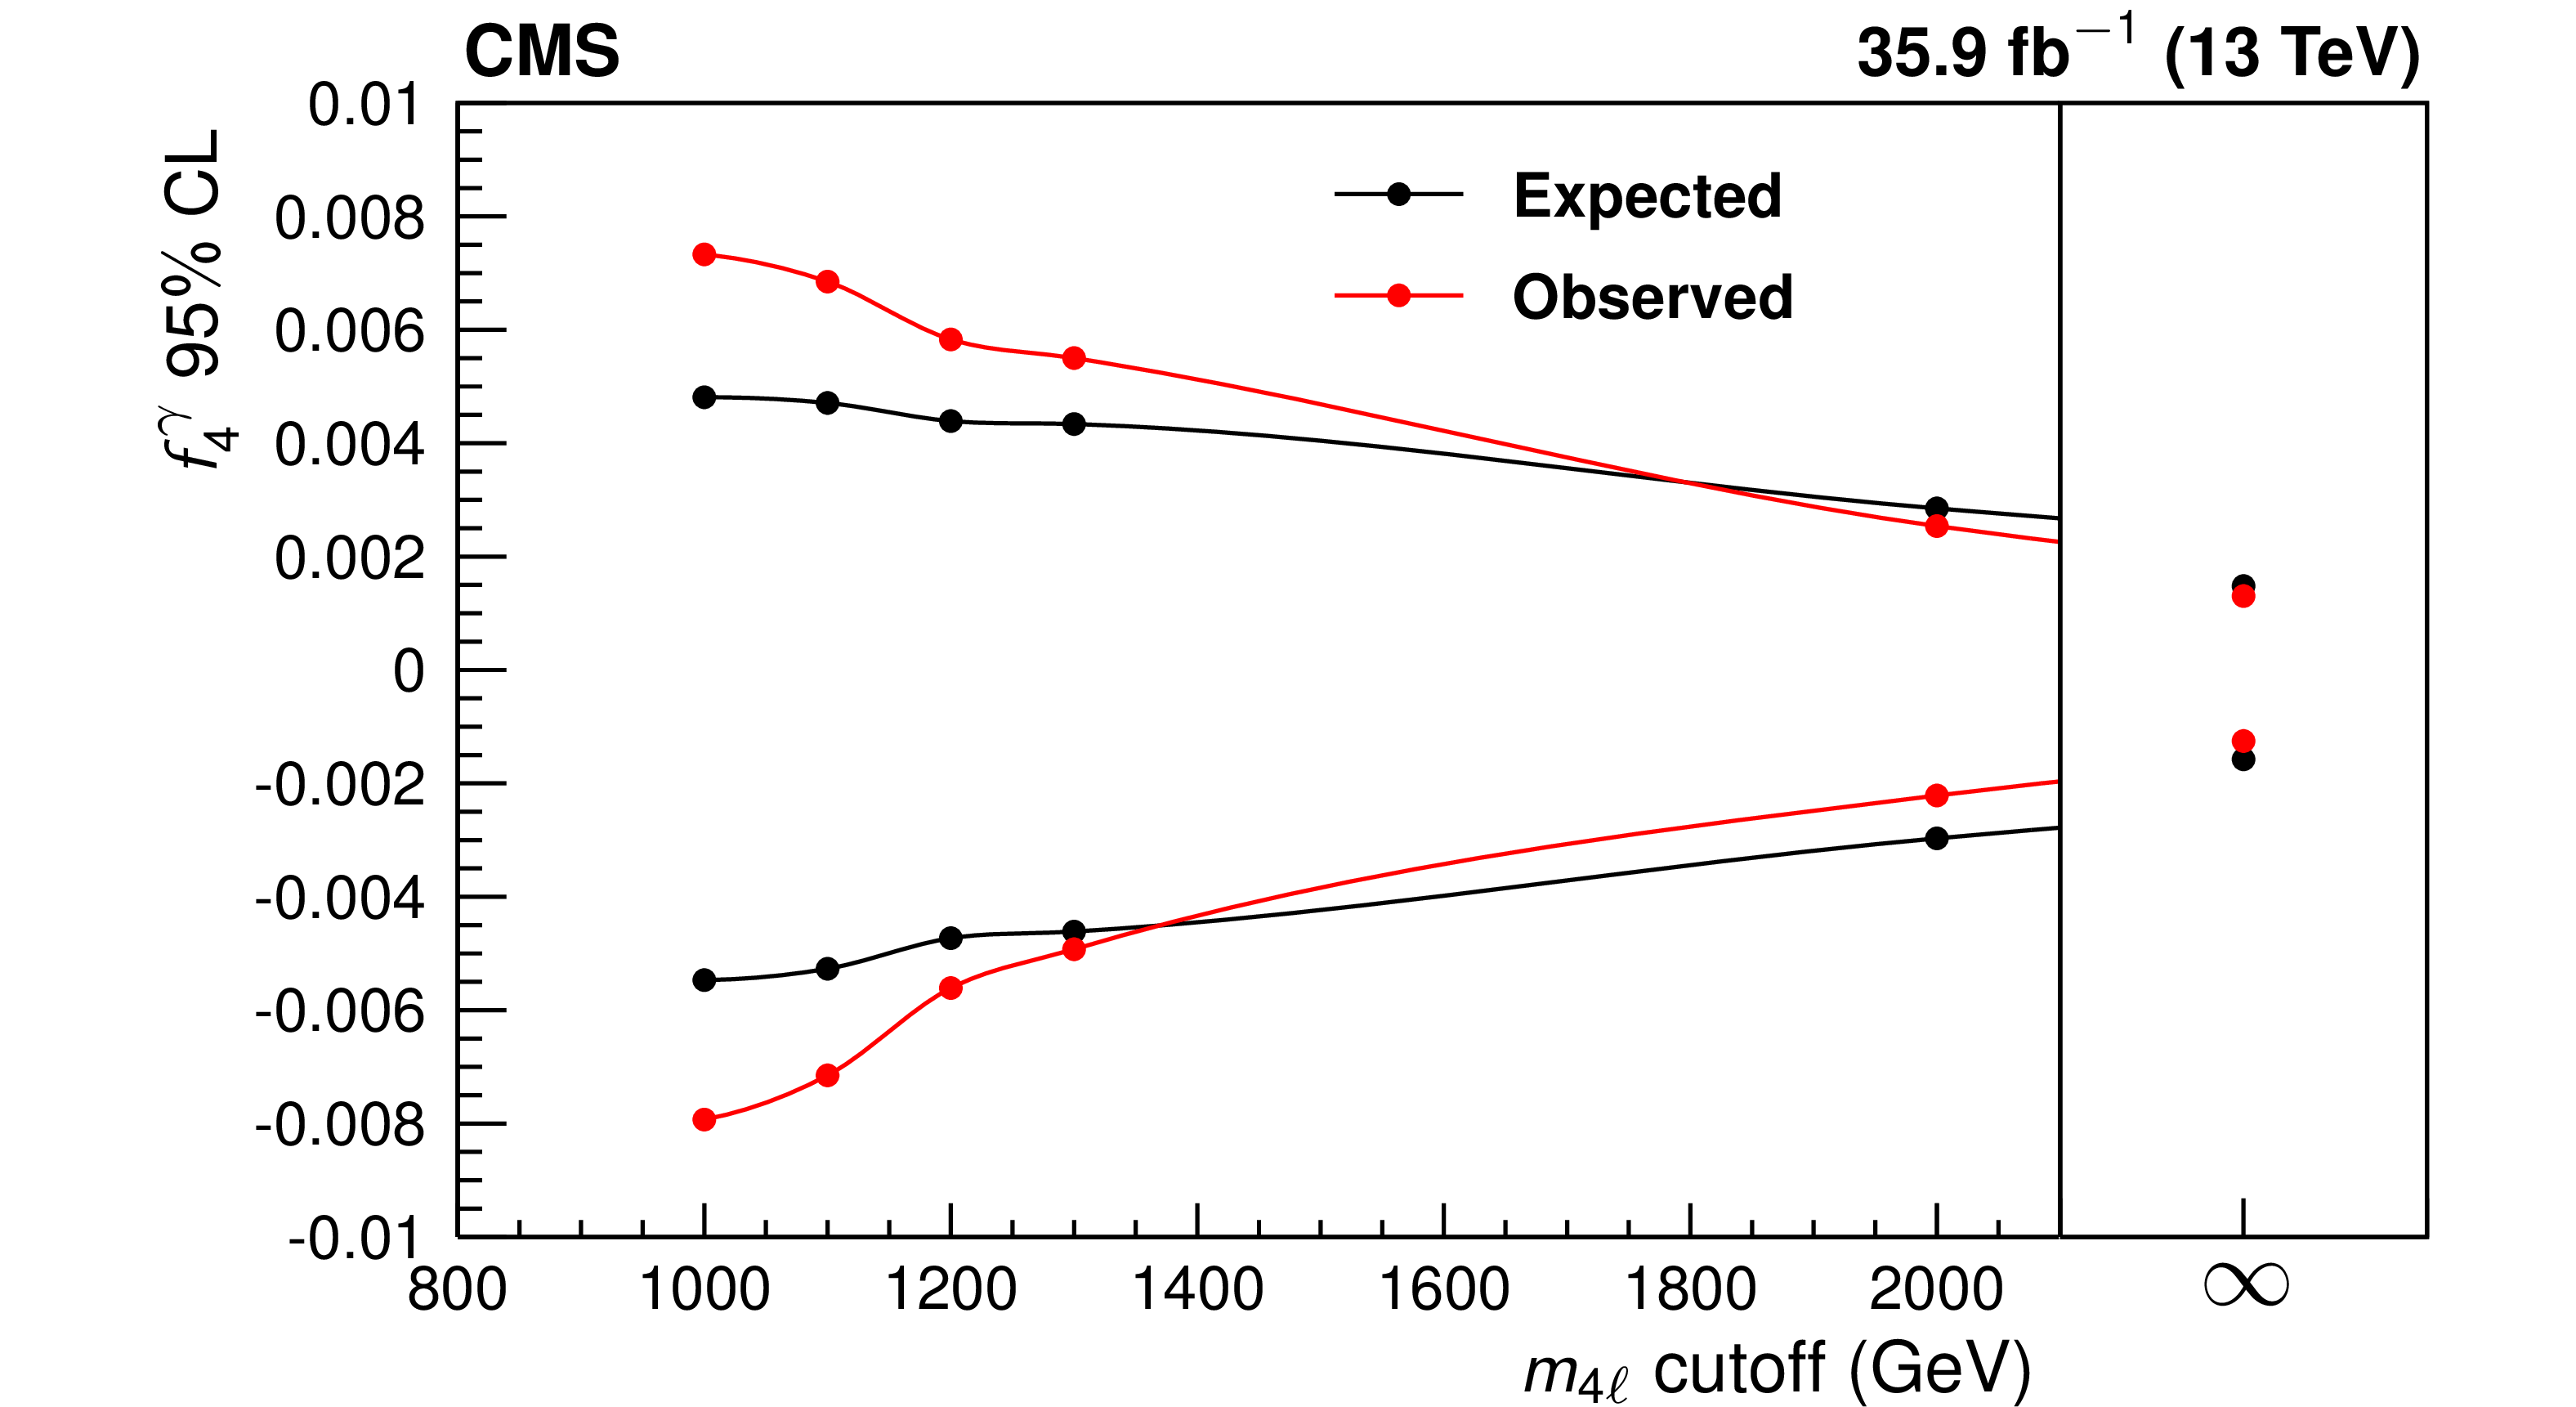
Figure 12-a:
Expected and observed one-dimensional limits on the $f_{4}^\gamma $ aTGC parameters, as a function of an upper cutoff on the invariant mass of the four-lepton system. No form factor is used. |
png pdf |
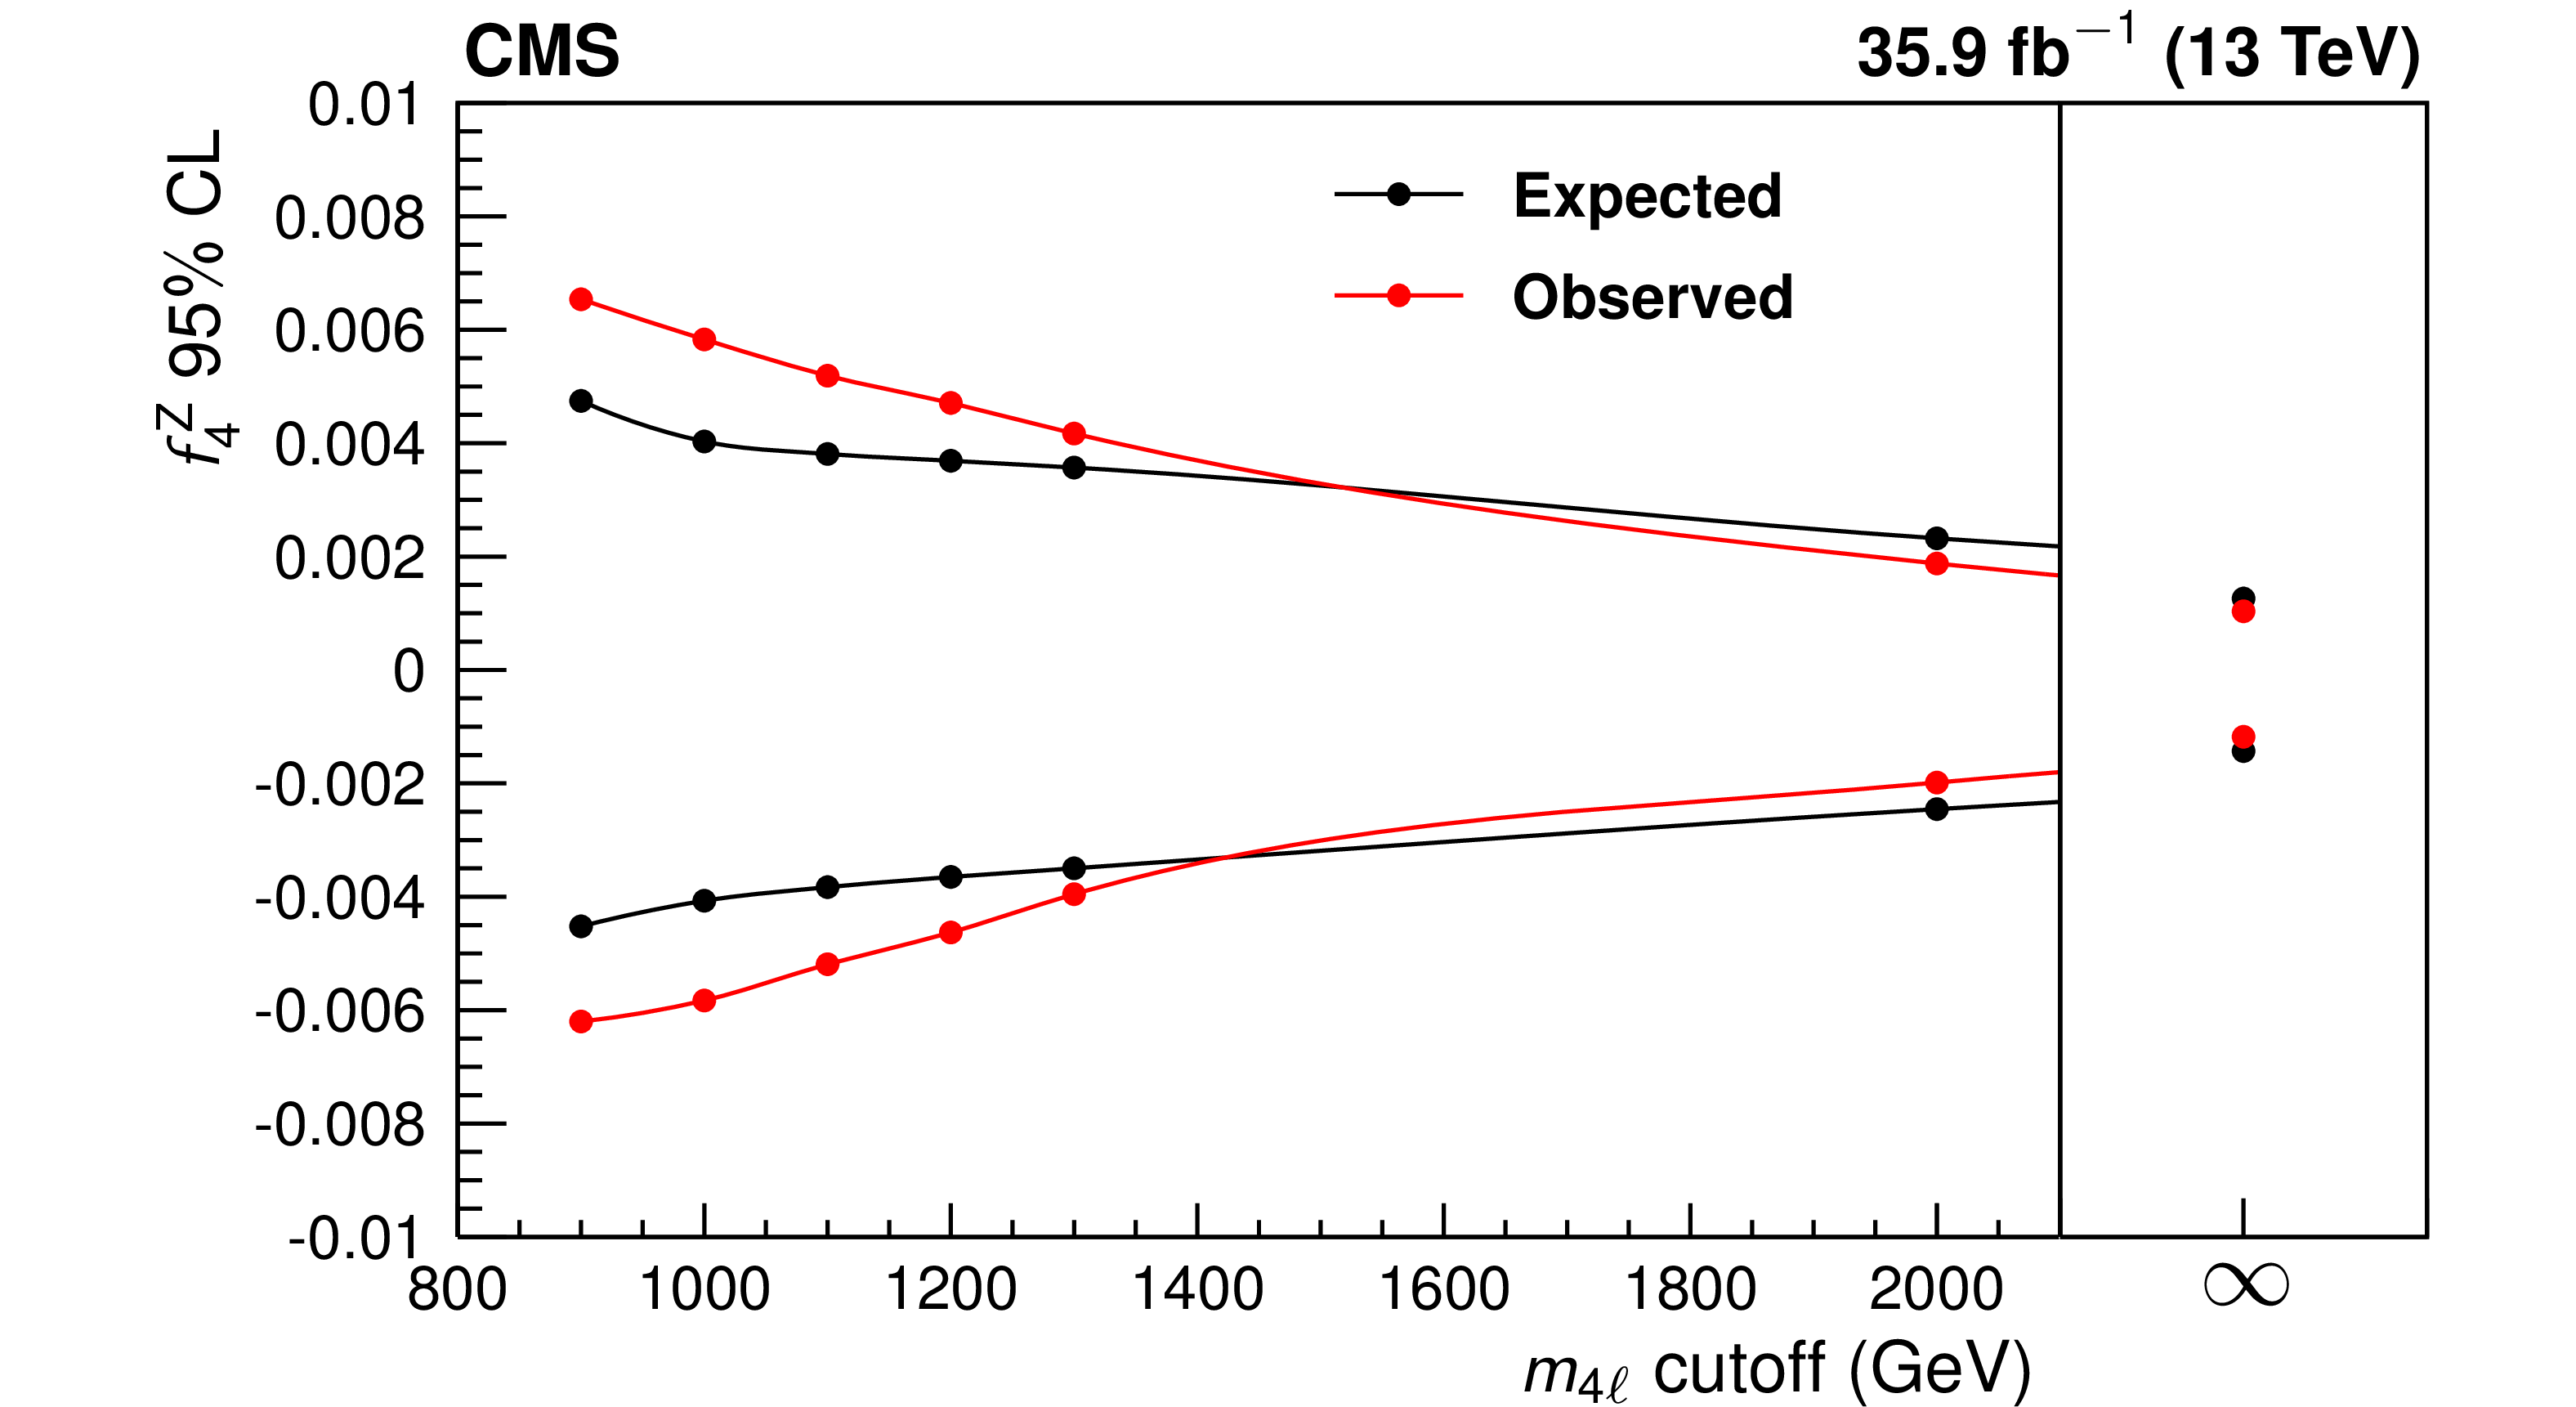
Figure 12-b:
Expected and observed one-dimensional limits on the $f_{4}^\mathrm{Z}$ aTGC parameters, as a function of an upper cutoff on the invariant mass of the four-lepton system. No form factor is used. |

png pdf |
Figure 12-c:
Expected and observed one-dimensional limits on the $f_{5}^\gamma $ aTGC parameters, as a function of an upper cutoff on the invariant mass of the four-lepton system. No form factor is used. |

png pdf |
Figure 12-d:
Expected and observed one-dimensional limits on the $f_{5}^\mathrm{Z}$ aTGC parameters, as a function of an upper cutoff on the invariant mass of the four-lepton system. No form factor is used. |
| Tables | |
png pdf |
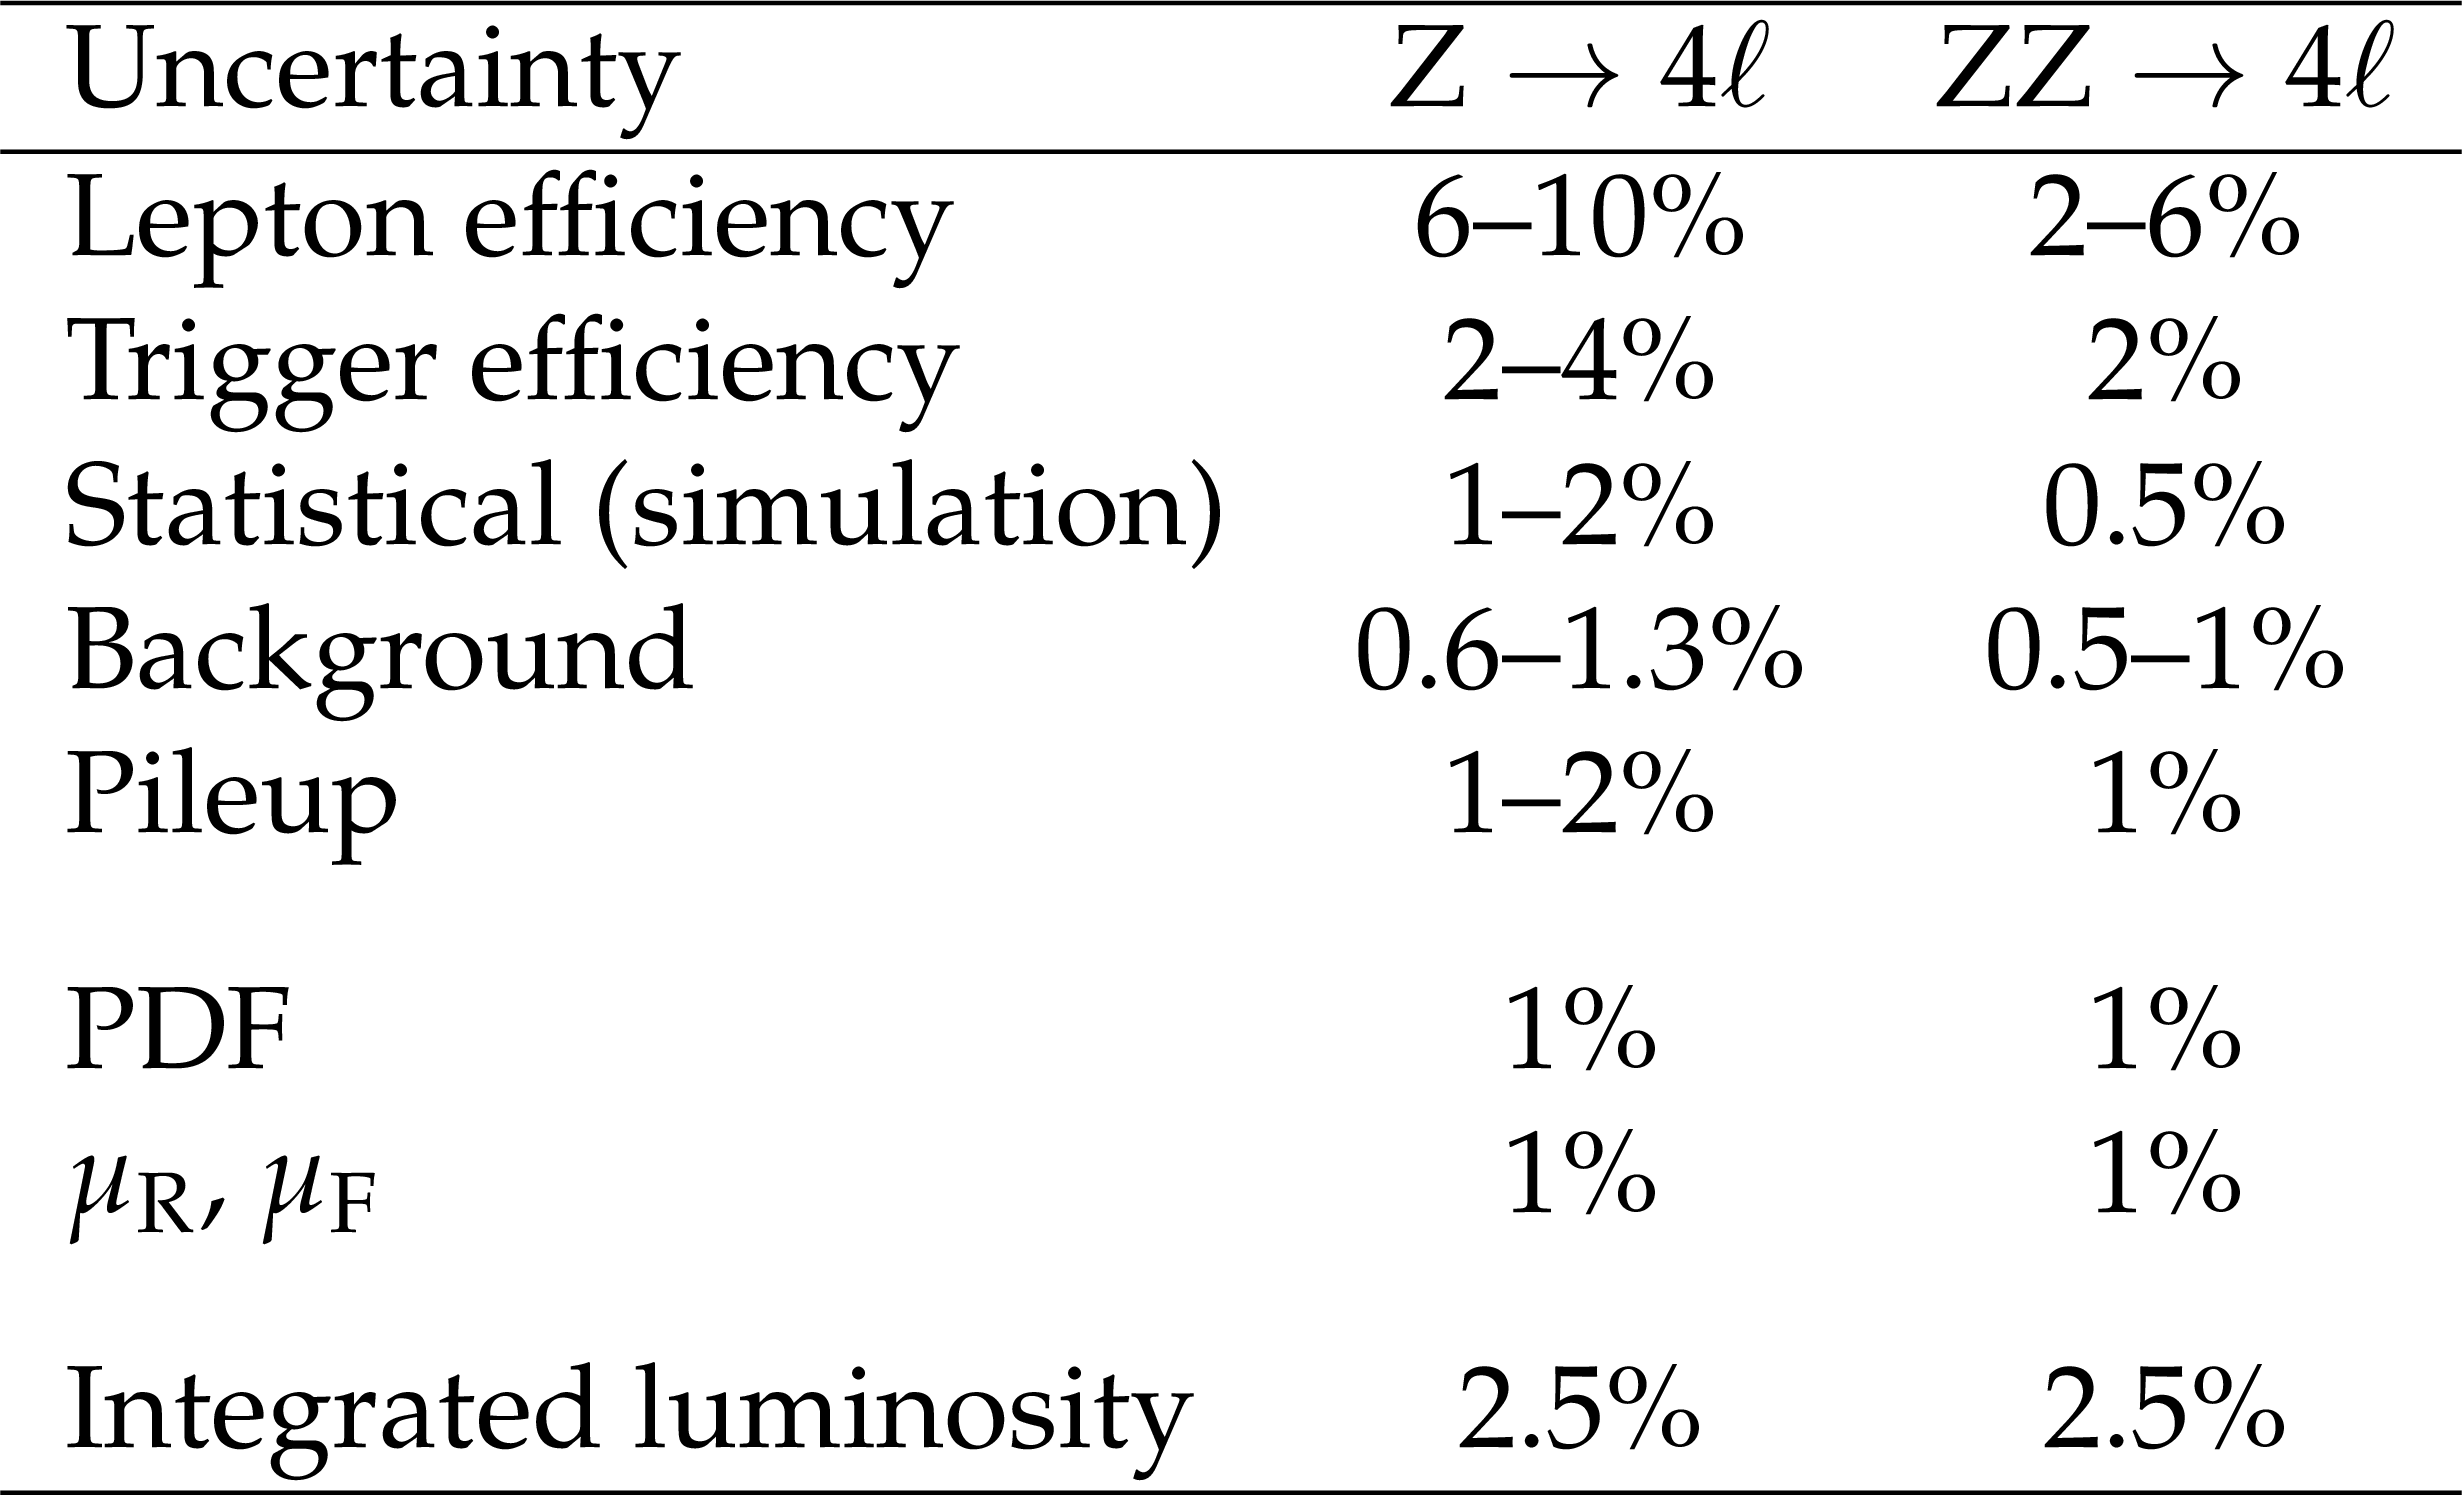
Table 1:
The contributions of each source of systematic uncertainty in the cross section measurements. The integrated luminosity uncertainty, and the PDF and scale uncertainties, are considered separately. All other uncertainties are added in quadrature into a single systematic uncertainty. Uncertainties that vary by decay channel are listed as a range. |
png pdf |
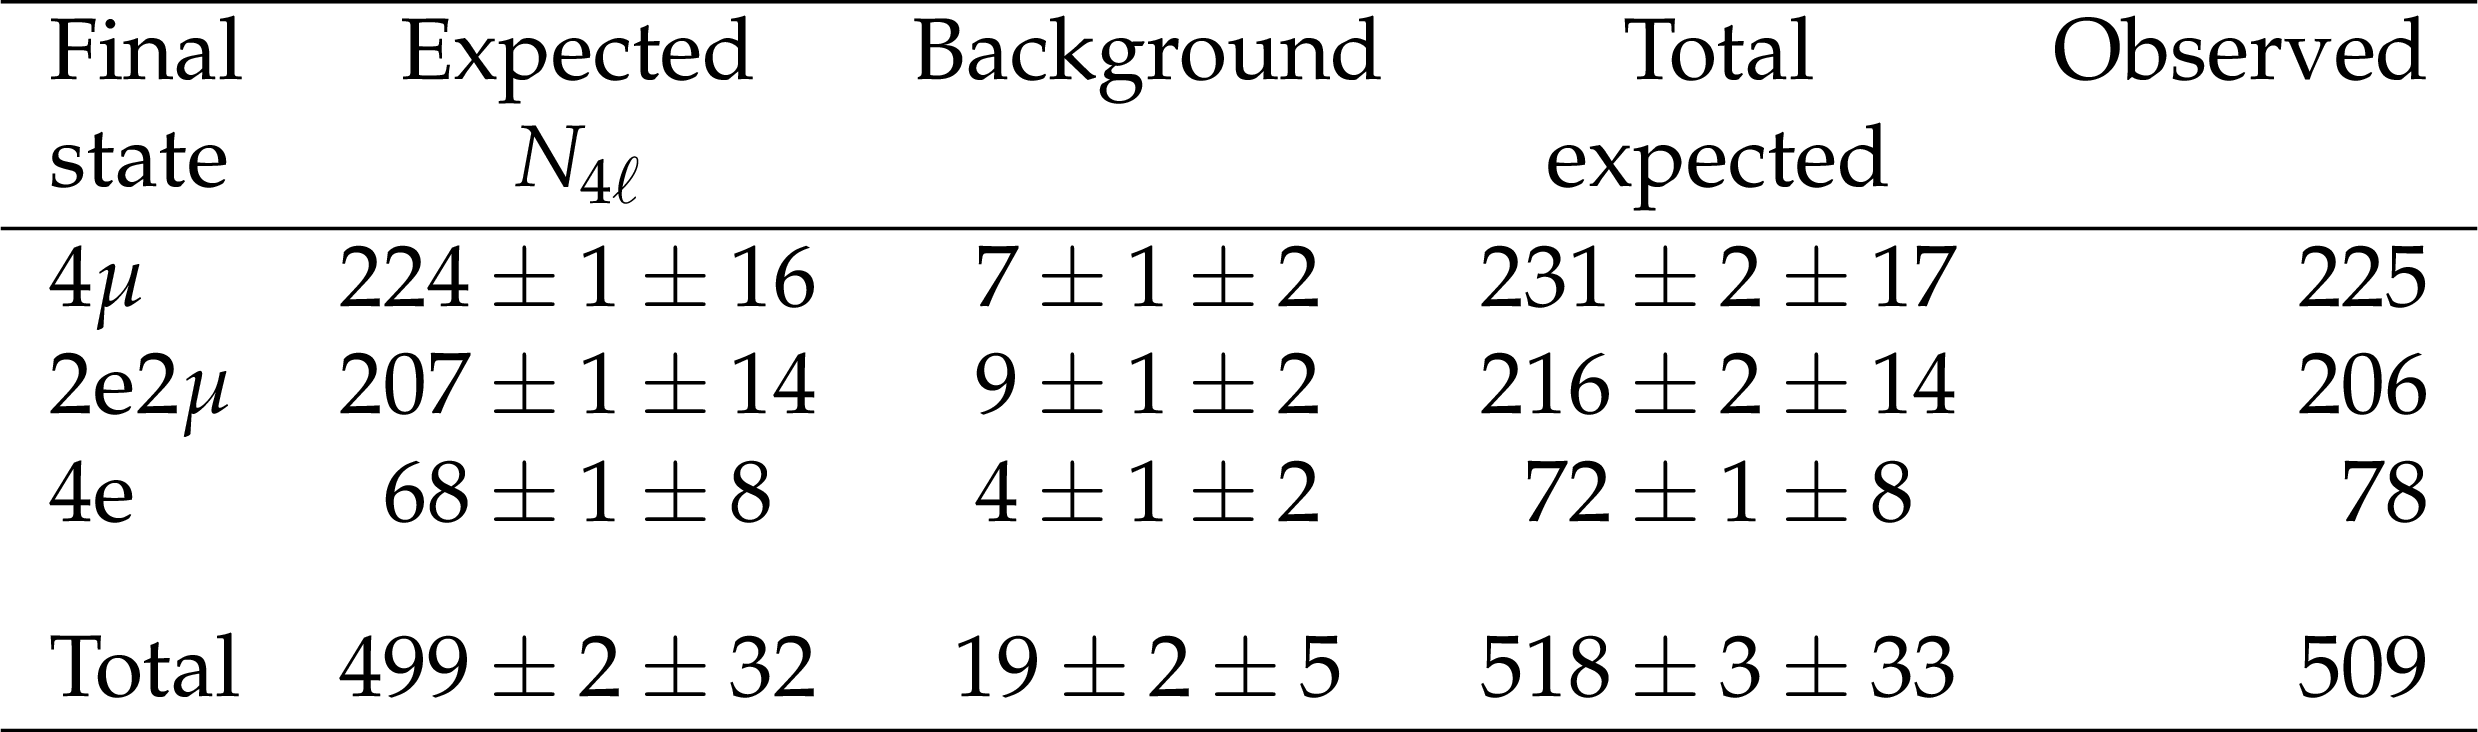
Table 2:
The observed and expected yields of four-lepton events in the mass region 80 $ < m_{{4\ell}} < $ 100 GeV and estimated yields of background events, shown for each final state and summed in the total expected yield. The first uncertainty is statistical, the second one is systematic. The systematic uncertainties do not include the uncertainty in the integrated luminosity. |

png pdf |
Table 3:
The observed and expected yields of ZZ events, and estimated yields of background events, shown for each final state and summed in the total expected yield. The first uncertainty is statistical, the second one is systematic. The systematic uncertainties do not include the uncertainty in the integrated luminosity. |

png pdf |
Table 4:
Fiducial definitions for the reported cross sections. The common requirements are applied for both measurements. |
| Summary |
| A series of measurements of four-lepton final states in proton-proton collisions at $\sqrt{s} = $ 13 TeV have been performed with the CMS detector at the CERN LHC. The measured $\mathrm{pp} \to \mathrm{ZZ} $ cross section is $\sigma({\mathrm{p}}{\mathrm{p}} \to \mathrm{Z}\mathrm{Z}) = $ 17.2 $\pm$ 0.5 (stat) $\pm$ 0.7 (syst) $\pm$ 0.4 (theo) $\pm$ 0.4 (lumi) pb for Z boson masses in the range 60 $ < m_{\mathrm{Z}} < $ 120 GeV. The measured branching fraction for Z boson decays to four leptons is $\mathcal{B}(\mathrm{Z} \to {4\ell} ) = $ 4.8 $\pm$ 0.2 (stat) $\pm$ 0.2 (syst) $\pm$ 0.1 (theo) $\pm$ 0.1 (lumi) $\times 10^{-6}$ for four-lepton mass in the range 80 $ < m_{{4\ell} } < $ 100 GeV and dilepton mass $m_{\ell\ell} > $ 4 GeV for all oppositely charged same-flavor lepton pairs. Normalized differential cross sections were also measured. All results agree well with the SM predictions. Improved limits on anomalous ZZZ and ZZ$ \gamma$ triple gauge couplings were established, the most stringent to date by approximately a factor of two. |
| References | ||||
| 1 | G. J. Gounaris, J. Layssac, and F. M. Renard | New and standard physics contributions to anomalous Z and $ \gamma $ self-couplings | PRD 62 (2000) 073013 | hep-ph/0003143 |
| 2 | K. Hagiwara, R. D. Peccei, and D. Zeppenfeld | Probing the weak boson sector in $ \mathrm{e^{+}}\mathrm{e^{-}} \to \mathrm{W^{+}}\mathrm{W^{-}} $ | NPB 282 (1987) 253 | |
| 3 | CMS Collaboration | Measurement of the ZZ production cross section and search for anomalous couplings in $ 2\ell 2\ell' $ final states in pp collisions at $ \sqrt{s} = $ 7 TeV | JHEP 01 (2013) 063 | CMS-SMP-12-007 1211.4890 |
| 4 | CMS Collaboration | Measurement of the $ pp \to \mathrm{ZZ} $ production cross section and constraints on anomalous triple gauge couplings in four-lepton final states at $ \sqrt{s} = $ 8 TeV | PLB 740 (2015) 250 | CMS-SMP-13-005 1406.0113 |
| 5 | CMS Collaboration | Measurements of the ZZ production cross sections in the $ 2\ell2\nu $ channel in proton-proton collisions at $ \sqrt{s} = $ 7 and 8 TeV and combined constraints on triple gauge couplings | EPJC 75 (2015) 511 | CMS-SMP-12-016 1503.05467 |
| 6 | CMS Collaboration | Measurement of the ZZ production cross section and Z $ \to \ell^+\ell^-\ell^{\prime+}\ell^{\prime-} $ branching fraction in pp collisions at $ \sqrt{s} = $ 13 TeV | PLB 763 (2016) 280 | CMS-SMP-16-001 1607.08834 |
| 7 | ATLAS Collaboration | Measurement of ZZ production in pp collisions at $ \sqrt{s} = $ 7 TeV and limits on anomalous ZZZ and ZZ$\gamma $ couplings with the ATLAS detector | JHEP 03 (2013) 128 | 1211.6096 |
| 8 | ATLAS Collaboration | Measurements of four-lepton production in pp collisions at $ \sqrt{s} = $ 8 TeV with the ATLAS detector | PLB 753 (2016) 552 | 1509.07844 |
| 9 | ATLAS Collaboration | Measurement of the ZZ production cross section in pp collisions at $ \sqrt{s} = $ 13 TeV with the ATLAS detector | PRL 116 (2016) 101801 | 1512.05314 |
| 10 | F. Cascioli et al. | ZZ production at hadron colliders in NNLO QCD | PLB 735 (2014) 311 | 1405.2219 |
| 11 | ATLAS Collaboration | Measurement of the ZZ production cross section in proton-proton collisions at $ \sqrt{s} = $ 8 TeV using the ZZ $\to \ell^{-}\ell^{+}\ell^{\prime -}\ell^{\prime +} $ and ZZ $ \to \ell^-\ell^+ \nu \bar{\nu} $ channels with the ATLAS detector | JHEP 01 (2017) 099 | 1610.07585 |
| 12 | ALEPH Collaboration | Study of the four fermion final state at the Z resonance | Z. Phys. C 66 (1995) 3 | |
| 13 | CMS Collaboration | Observation of Z decays to four leptons with the CMS detector at the LHC | JHEP 12 (2012) 034 | CMS-SMP-12-009 1210.3844 |
| 14 | ATLAS Collaboration | Measurements of four-lepton production at the Z resonance in pp collisions at $ \sqrt{s} = $ 7 and 8 TeV with ATLAS | PRL 112 (2014) 231806 | 1403.5657 |
| 15 | CMS Collaboration | Measurements of properties of the Higgs boson decaying into the four-lepton final state in pp collisions at $ \sqrt{s} = $ 13 TeV | Submitted to JHEP | CMS-HIG-16-041 1706.09936 |
| 16 | CMS Collaboration | The CMS experiment at the CERN LHC | JINST 3 (2008) S08004 | CMS-00-001 |
| 17 | CMS Collaboration | Performance of electron reconstruction and selection with the CMS detector in proton-proton collisions at $ \sqrt{s} = $ 8 TeV | JINST 10 (2015) P06005 | CMS-EGM-13-001 1502.02701 |
| 18 | CMS Collaboration | Performance of CMS muon reconstruction in pp collision events at $ \sqrt{s} = $ 7 TeV | JINST 7 (2012) P10002 | CMS-MUO-10-004 1206.4071 |
| 19 | S. Alioli, P. Nason, C. Oleari, and E. Re | NLO vector-boson production matched with shower in POWHEG | JHEP 07 (2008) 060 | 0805.4802 |
| 20 | P. Nason | A new method for combining NLO QCD with shower Monte Carlo algorithms | JHEP 11 (2004) 040 | hep-ph/0409146 |
| 21 | S. Frixione, P. Nason, and C. Oleari | Matching NLO QCD computations with parton shower simulations: the POWHEG method | JHEP 11 (2007) 070 | 0709.2092 |
| 22 | S. Alioli, P. Nason, C. Oleari, and E. Re | A general framework for implementing NLO calculations in shower Monte Carlo programs: the POWHEG BOX | JHEP 06 (2010) 043 | 1002.2581 |
| 23 | T. Melia, P. Nason, R. Rontsch, and G. Zanderighi | W$^+$W$^-$, WZ and ZZ production in the POWHEG BOX | JHEP 11 (2011) 078 | 1107.5051 |
| 24 | J. M. Campbell and R. K. Ellis | MCFM for the Tevatron and the LHC | NPB Proc. Suppl. 10 (2010) 205 | 1007.3492 |
| 25 | F. Caola, K. Melnikov, R. Rontsch, and L. Tancredi | QCD corrections to ZZ production in gluon fusion at the LHC | PRD 92 (2015) 094028 | 1509.06734 |
| 26 | A. Ballestrero et al. | PHANTOM: A Monte Carlo event generator for six parton final states at high energy colliders | CPC 180 (2009) 401 | 0801.3359 |
| 27 | Y. Gao et al. | Spin determination of single-produced resonances at hadron colliders | PRD 81 (2010) 075022 | 1001.3396 |
| 28 | S. Bolognesi et al. | Spin and parity of a single-produced resonance at the LHC | PRD 86 (2012) 095031 | 1208.4018 |
| 29 | I. Anderson et al. | Constraining anomalous HVV interactions at proton and lepton colliders | PRD 89 (2014) 035007 | 1309.4819 |
| 30 | J. Alwall et al. | The automated computation of tree-level and next-to-leading order differential cross sections, and their matching to parton shower simulations | JHEP 07 (2014) 079 | 1405.0301 |
| 31 | T. Gleisberg et al. | Event generation with SHERPA 1.1 | JHEP 02 (2009) 007 | 0811.4622 |
| 32 | T. Sjostrand, S. Mrenna, and P. Skands | PYTHIA 6.4 physics and manual | JHEP 05 (2006) 026 | hep-ph/0603175 |
| 33 | T. Sjostrand et al. | An introduction to PYTHIA 8.2 | CPC 191 (2015) 159 | 1410.3012 |
| 34 | CMS Collaboration | Event generator tunes obtained from underlying event and multiparton scattering measurements | EPJC 76 (2016) 155 | CMS-GEN-14-001 1512.00815 |
| 35 | NNPDF Collaboration | Parton distributions for the LHC run II | JHEP 04 (2015) 040 | 1410.8849 |
| 36 | GEANT4 Collaboration | GEANT4---a simulation toolkit | NIMA 506 (2003) 250 | |
| 37 | CMS Collaboration | Particle-flow reconstruction and global event description with the CMS detector | Accepted by JINST | CMS-PRF-14-001 1706.04965 |
| 38 | M. Cacciari, G. P. Salam, and G. Soyez | The Anti-$ k_t $ jet clustering algorithm | JHEP 04 (2008) 063 | 0802.1189 |
| 39 | M. Cacciari, G. P. Salam, and G. Soyez | FastJet user manual | EPJC 72 (2012) 1896 | 1111.6097 |
| 40 | CMS Collaboration | Technical proposal for the phase-II upgrade of the Compact Muon Solenoid | CMS-PAS-JME-16-004 | CMS-PAS-JME-16-004 |
| 41 | M. Cacciari and G. P. Salam | Pileup subtraction using jet areas | PLB 659 (2008) 119 | 0707.1378 |
| 42 | CMS Collaboration | Measurement of the inclusive W and Z production cross sections in pp collisions at $ \sqrt{s} = $ 7 TeV | JHEP 10 (2011) 132 | CMS-EWK-10-005 1107.4789 |
| 43 | CMS Collaboration | The CMS trigger system | JINST 12 (2017) P01020 | CMS-TRG-12-001 1609.02366 |
| 44 | CMS Collaboration | Measurement of the properties of a Higgs boson in the four-lepton final state | PRD 89 (2014) 092007 | CMS-HIG-13-002 1312.5353 |
| 45 | Particle Data Group, C. Patrignani et al. | Review of particle physics | Chin. Phys\ C 40 (2016) 100001 | |
| 46 | J. Butterworth et al. | PDF4LHC recommendations for LHC Run II | JPG 43 (2016) 023001 | 1510.03865 |
| 47 | CMS Collaboration | CMS luminosity measurements for the 2016 data taking period | CMS-PAS-LUM-17-001 | CMS-PAS-LUM-17-001 |
| 48 | ATLAS and CMS Collaborations | Combined measurement of the Higgs boson mass in pp collisions at $ \sqrt{s} = $ 7 and 8 TeV with the ATLAS and CMS experiments | PRL 114 (2015) 191803 | 1503.07589 |
| 49 | R. Gavin, Y. Li, F. Petriello, and S. Quackenbush | FEWZ~2.0: A code for hadronic Z production at next-to-next-to-leading order | CPC 182 (2011) 2388 | 1011.3540 |
| 50 | M. Grazzini, S. Kallweit, and D. Rathlev | ZZ production at the LHC: fiducial cross sections and distributions in NNLO QCD | PLB 750 (2015) 407 | 1507.06257 |
| 51 | G. D'Agostini | A multidimensional unfolding method based on Bayes' theorem | NIMA 362 (1995) 487 | |
| 52 | T. Adye | Unfolding algorithms and tests using RooUnfold | in Proceedings, PHYSTAT 2011 Workshop on Statistical Issues Related to Discovery Claims in Search Experiments and Unfolding, H. Prosper and L. Lyons, eds., CERN | 1105.1160 |
| 53 | S. S. Wilks | The large-sample distribution of the likelihood ratio for testing composite hypotheses | Annals Math. Statist. 9 (1938) 60 | |
| 54 | G. Cowan, K. Cranmer, E. Gross, and O. Vitells | Asymptotic formulae for likelihood-based tests of new physics | EPJC 71 (2011) 1554 | 1007.1727 |
|
|
Compact Muon Solenoid LHC, CERN |
|

|

|

|

|

|