

Compact Muon Solenoid
LHC, CERN
| CMS-SUS-13-023 ; CERN-EP-2016-040 | ||
| Search for direct pair production of supersymmetric top quarks decaying to all-hadronic final states in pp collisions at $\sqrt{s} =$ 8 TeV | ||
| CMS Collaboration | ||
| 2 March 2016 | ||
| Eur. Phys. J. C 76 (2016) 460 | ||
| Abstract: Results are reported from a search for the pair production of top squarks, the supersymmetric partners of top quarks, in final states with jets and missing transverse momentum. The data sample used in this search was collected by the CMS detector and corresponds to an integrated luminosity of 18.9 fb$^{-1}$ of proton-proton collisions at a centre-of-mass energy of 8 TeV produced by the LHC. The search features novel background suppression and prediction methods, including a dedicated top quark pair reconstruction algorithm. The data are found to be in agreement with the predicted backgrounds. Exclusion limits are set in simplified supersymmetry models with the top squark decaying to jets and an undetected neutralino, either through an on-shell top quark or through a bottom quark and chargino. Models with the top squark decaying via an on-shell top quark are excluded for top squark masses up to 755 GeV in the case of neutralino masses below 200 GeV. For decays via a chargino, top squark masses up to 620 GeV are excluded, depending on the masses of the chargino and neutralino. | ||
| Links: e-print arXiv:1603.00765 [hep-ex] (PDF) ; CDS record ; inSPIRE record ; CADI line (restricted) ; | ||
| Figures | |
png pdf |
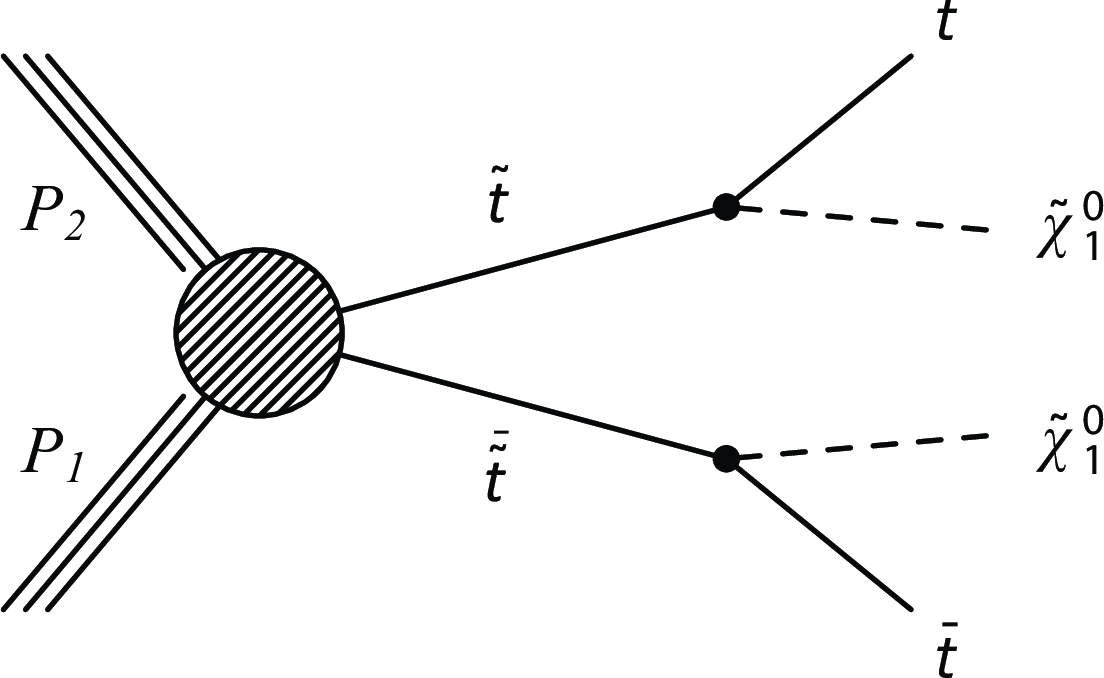
Figure 1-a:
Diagrams representing the two simplified models of direct top squark pair production considered in this study: T2tt with top squark decay via an on-shell top quark (a) and T2bW with top squark decay via a chargino (b). |
png pdf |
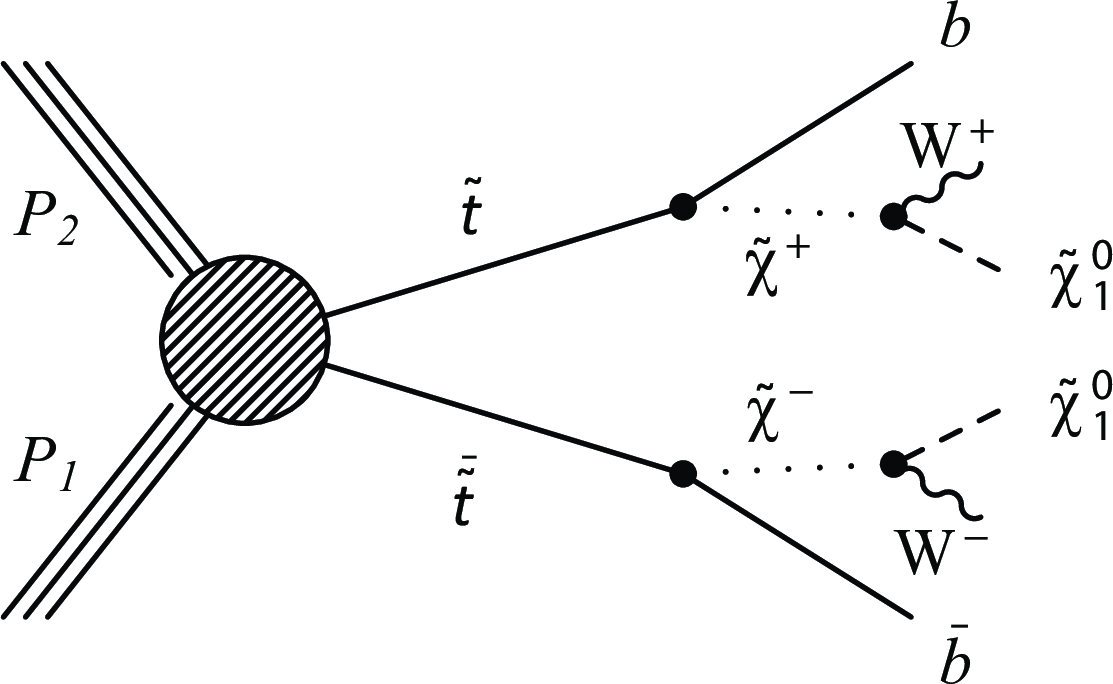
Figure 1-b:
Diagrams representing the two simplified models of direct top squark pair production considered in this study: T2tt with top squark decay via an on-shell top quark (a) and T2bW with top squark decay via a chargino (b). |

png pdf |
Figure 2-a:
Efficiency as a function of generator level $ {p_{\mathrm {T}}} $ for picky jet clustering and CORRAL top quark pair reconstruction in all-hadronic T2tt events with $ {m_{\tilde{ \mathrm{t} } }} =$ 600 GeV and $ {m_{\tilde{\chi}^0_1 }} =$ 50 GeV. a: The efficiency to correctly cluster final state particles from each W boson and top quark decay into two and three picky jets, respectively, as a function of particle (top quark or W boson) $ {p_{\mathrm {T}}} $. b: The efficiency at each stage of the corral algorithm to reconstruct a hadronically decaying top quark pair as a function of the average $ {p_{\mathrm {T}}} $ of the two top quarks. They are the efficiency to correctly cluster the final state particles from top quark decays into six picky jets, labelled ``Picky jet clustering''; the efficiency to both carry out picky jet clustering and reconstruct the top quark pair with these six picky jets, labelled ``Top pair reconstruction''; and finally the efficiency to carry out picky jet clustering, top pair reconstruction, and then correctly select the reconstructed top quark pair for use in the analysis, labelled ``Correct pair selection''. |
png pdf |
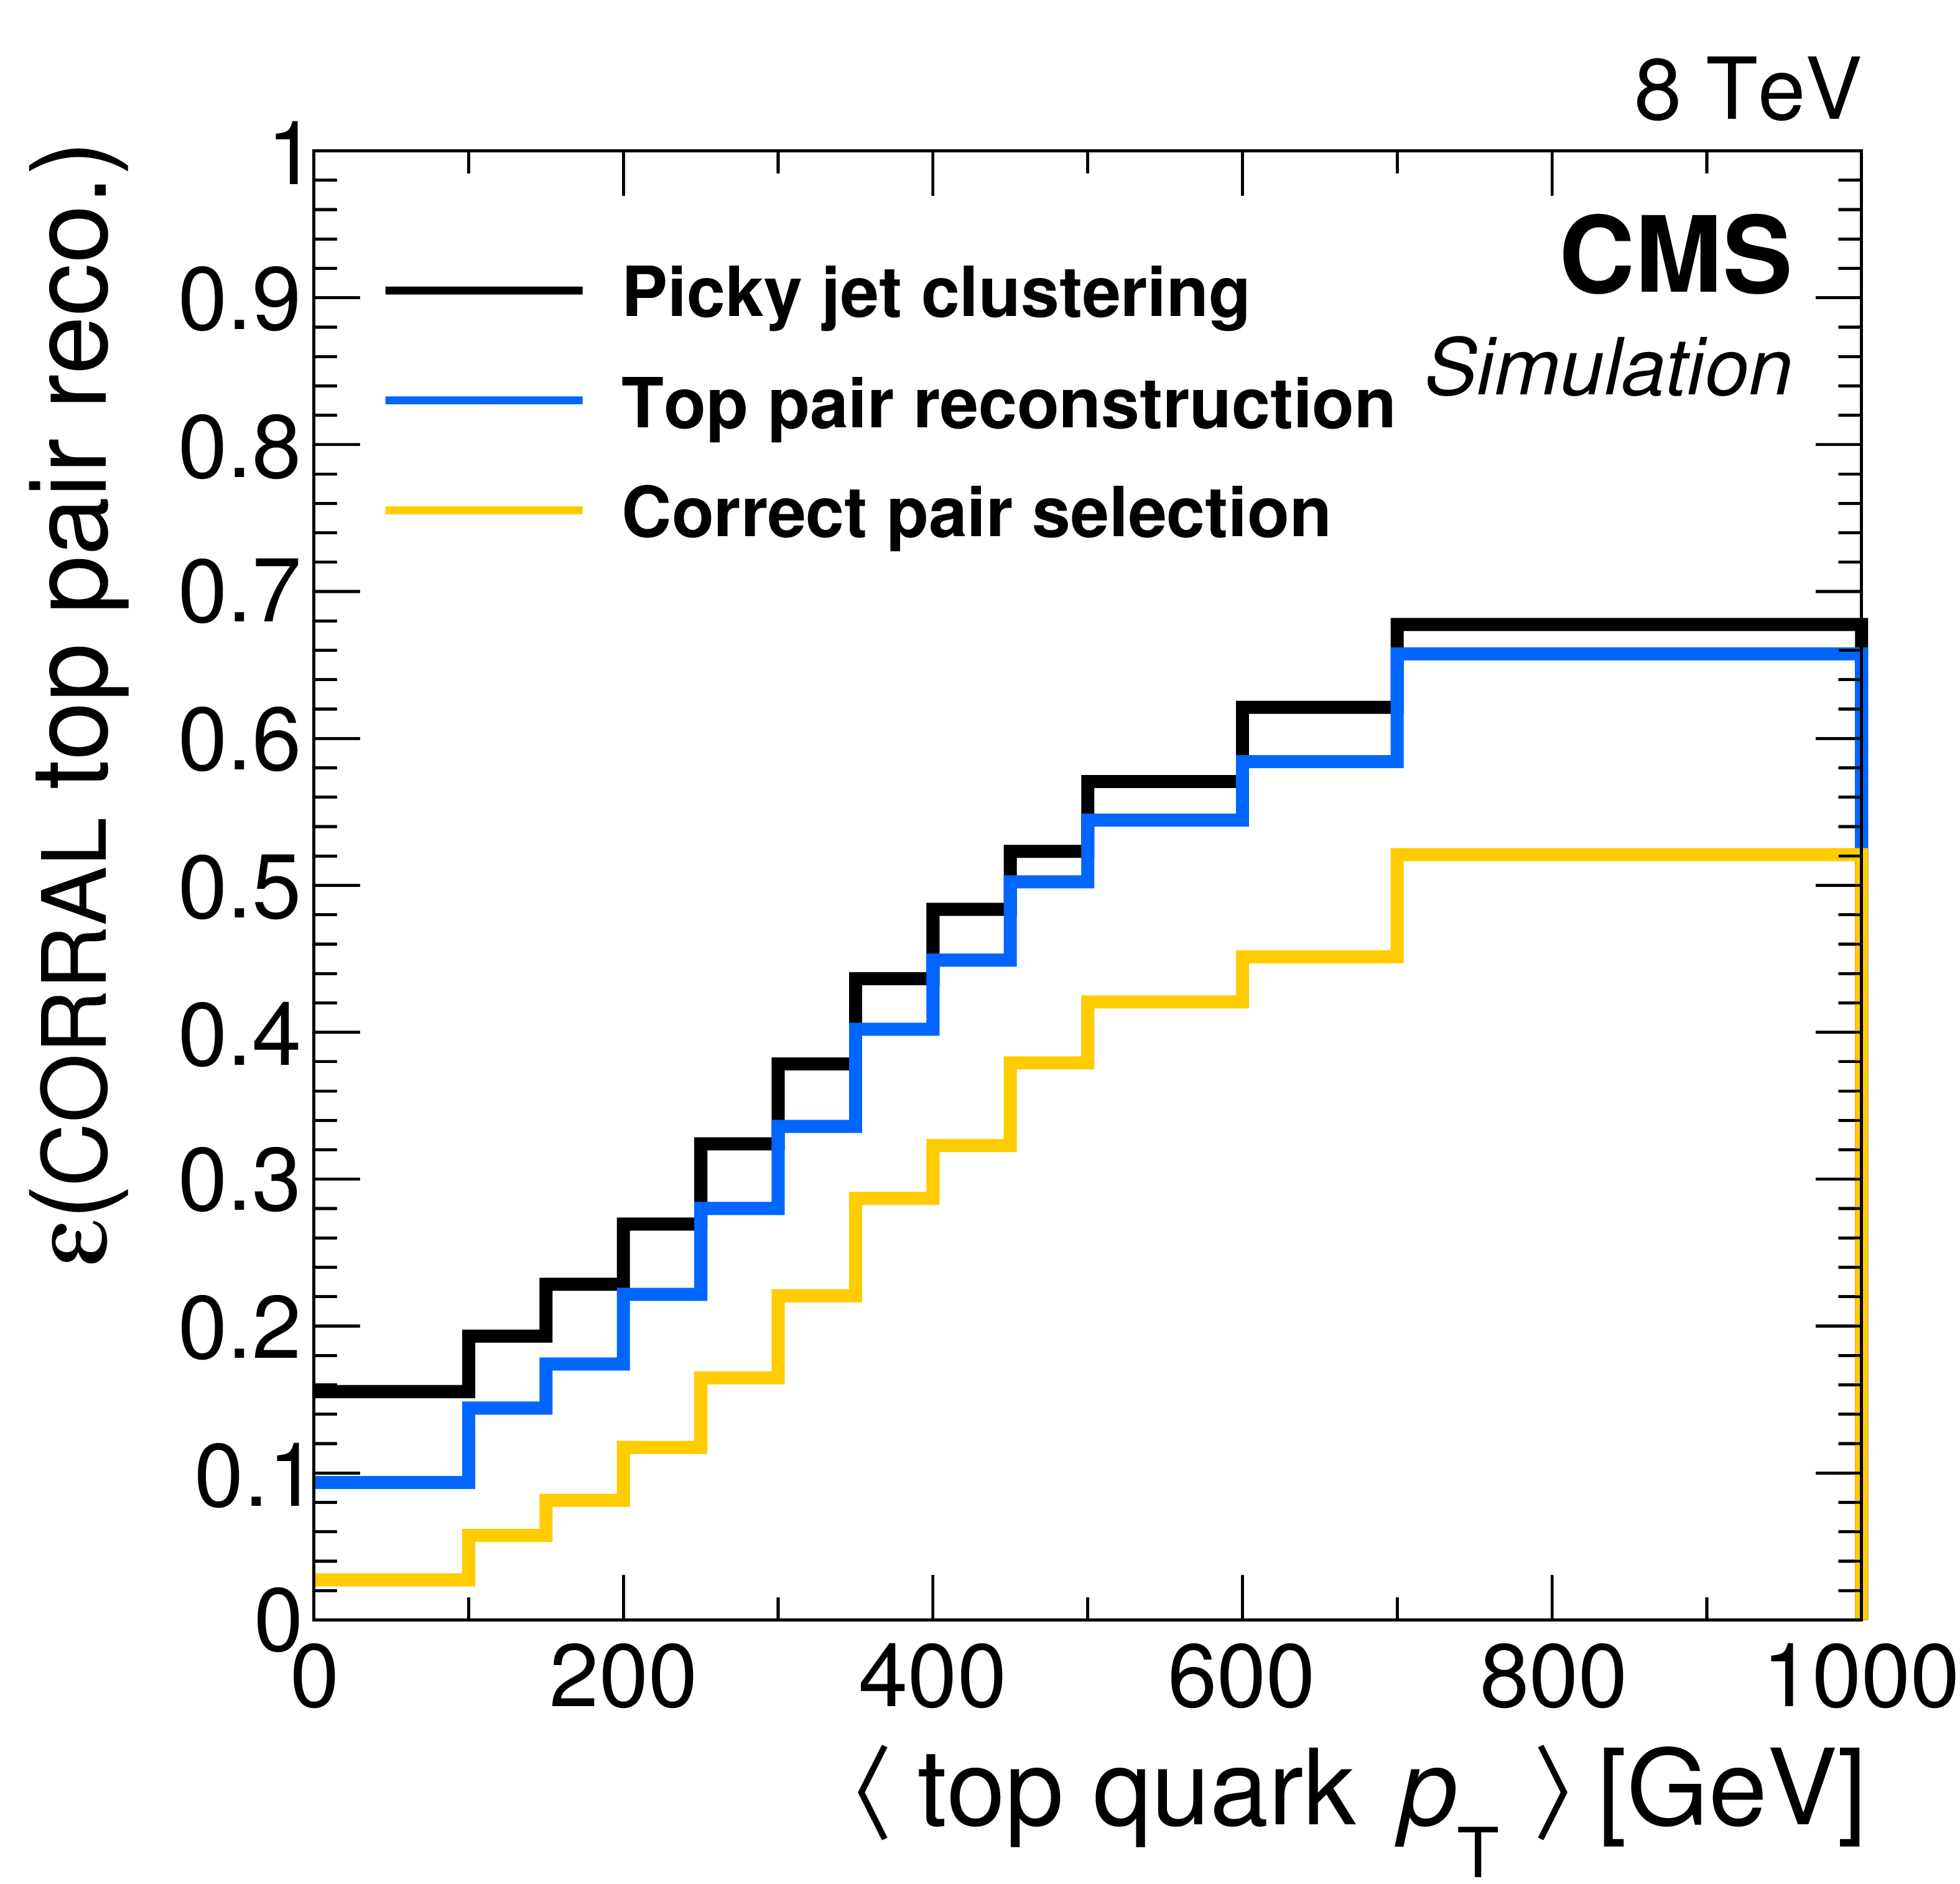
Figure 2-b:
Efficiency as a function of generator level $ {p_{\mathrm {T}}} $ for picky jet clustering and CORRAL top quark pair reconstruction in all-hadronic T2tt events with $ {m_{\tilde{ \mathrm{t} } }} =$ 600 GeV and $ {m_{\tilde{\chi}^0_1 }} =$ 50 GeV. a: The efficiency to correctly cluster final state particles from each W boson and top quark decay into two and three picky jets, respectively, as a function of particle (top quark or W boson) $ {p_{\mathrm {T}}} $. b: The efficiency at each stage of the corral algorithm to reconstruct a hadronically decaying top quark pair as a function of the average $ {p_{\mathrm {T}}} $ of the two top quarks. They are the efficiency to correctly cluster the final state particles from top quark decays into six picky jets, labelled ``Picky jet clustering''; the efficiency to both carry out picky jet clustering and reconstruct the top quark pair with these six picky jets, labelled ``Top pair reconstruction''; and finally the efficiency to carry out picky jet clustering, top pair reconstruction, and then correctly select the reconstructed top quark pair for use in the analysis, labelled ``Correct pair selection''. |
png pdf |
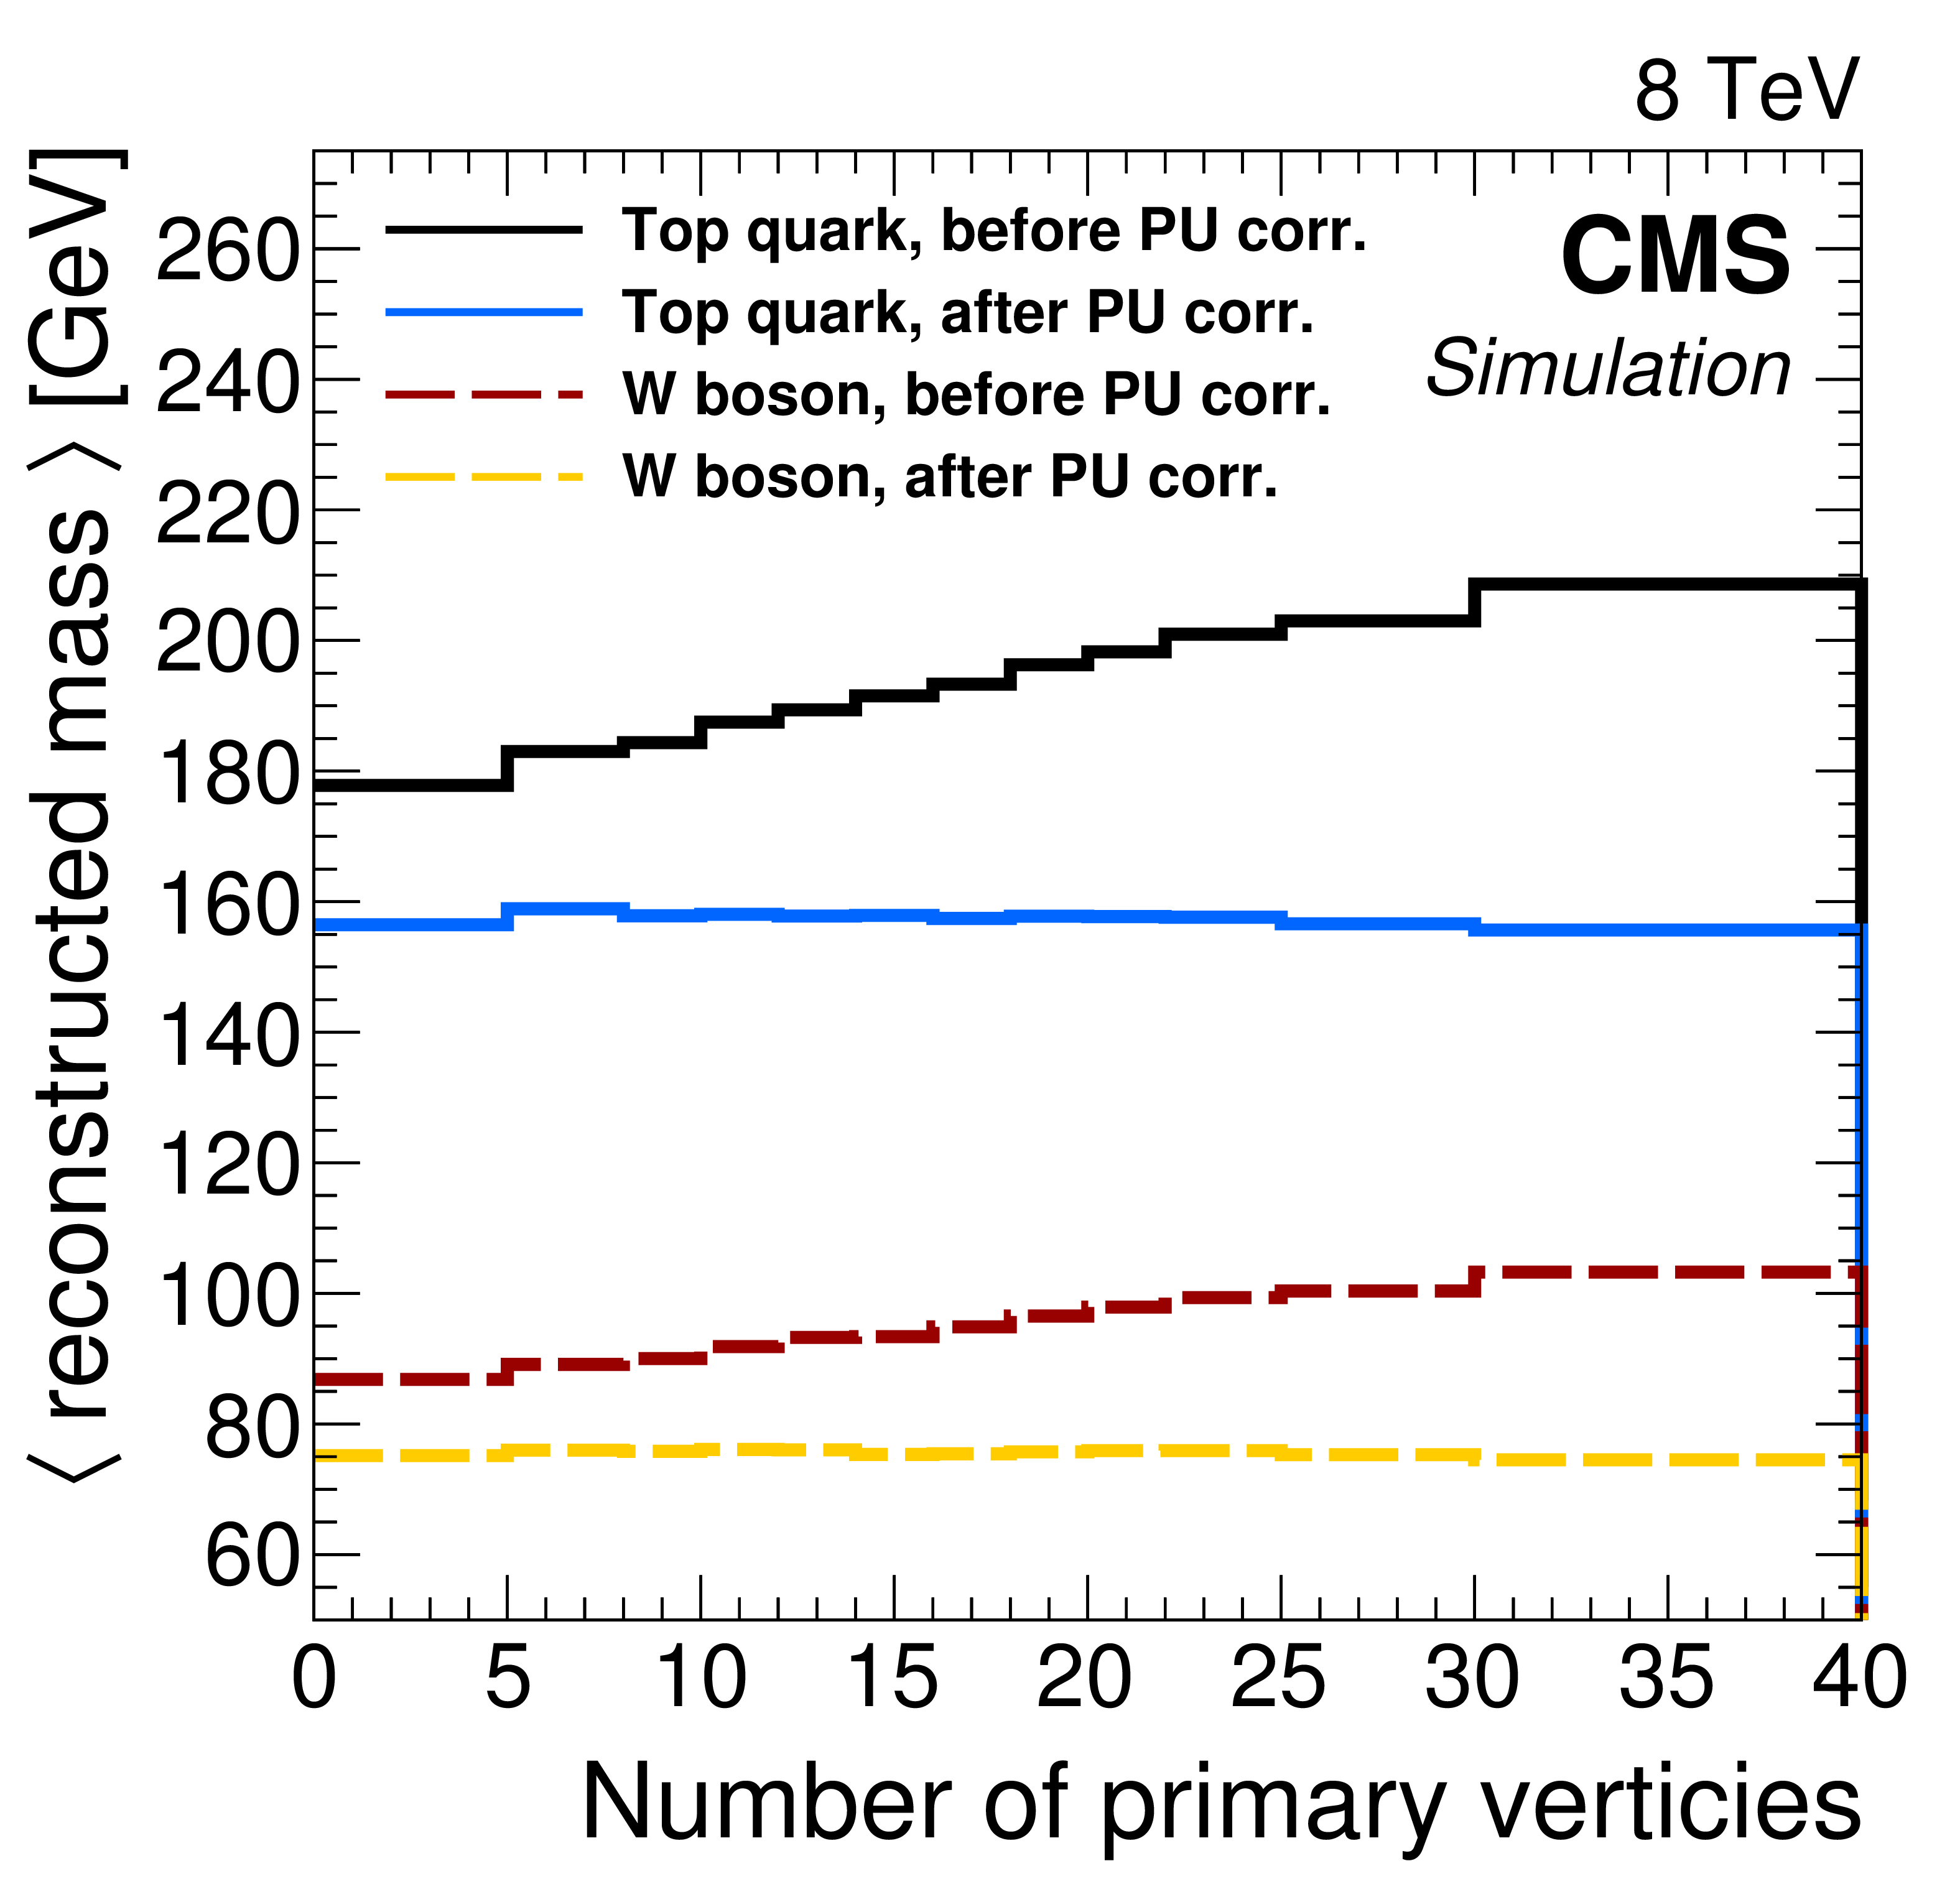
Figure 3:
Masses of the top quarks and W bosons reconstructed with picky jets that are matched at particle level in simulation, as discussed in the text, in all-hadronic T2tt events with $ {m_{\tilde{ \mathrm{t} } }} =$ 600 GeV and $ {m_{\tilde{\chi}^0_1 }} =$ 50 GeV. The labels ``before PU corr.'' and ``after PU corr.'' refer to results obtained before and after application of the trimming procedure used to correct for pileup effects. |
png pdf |
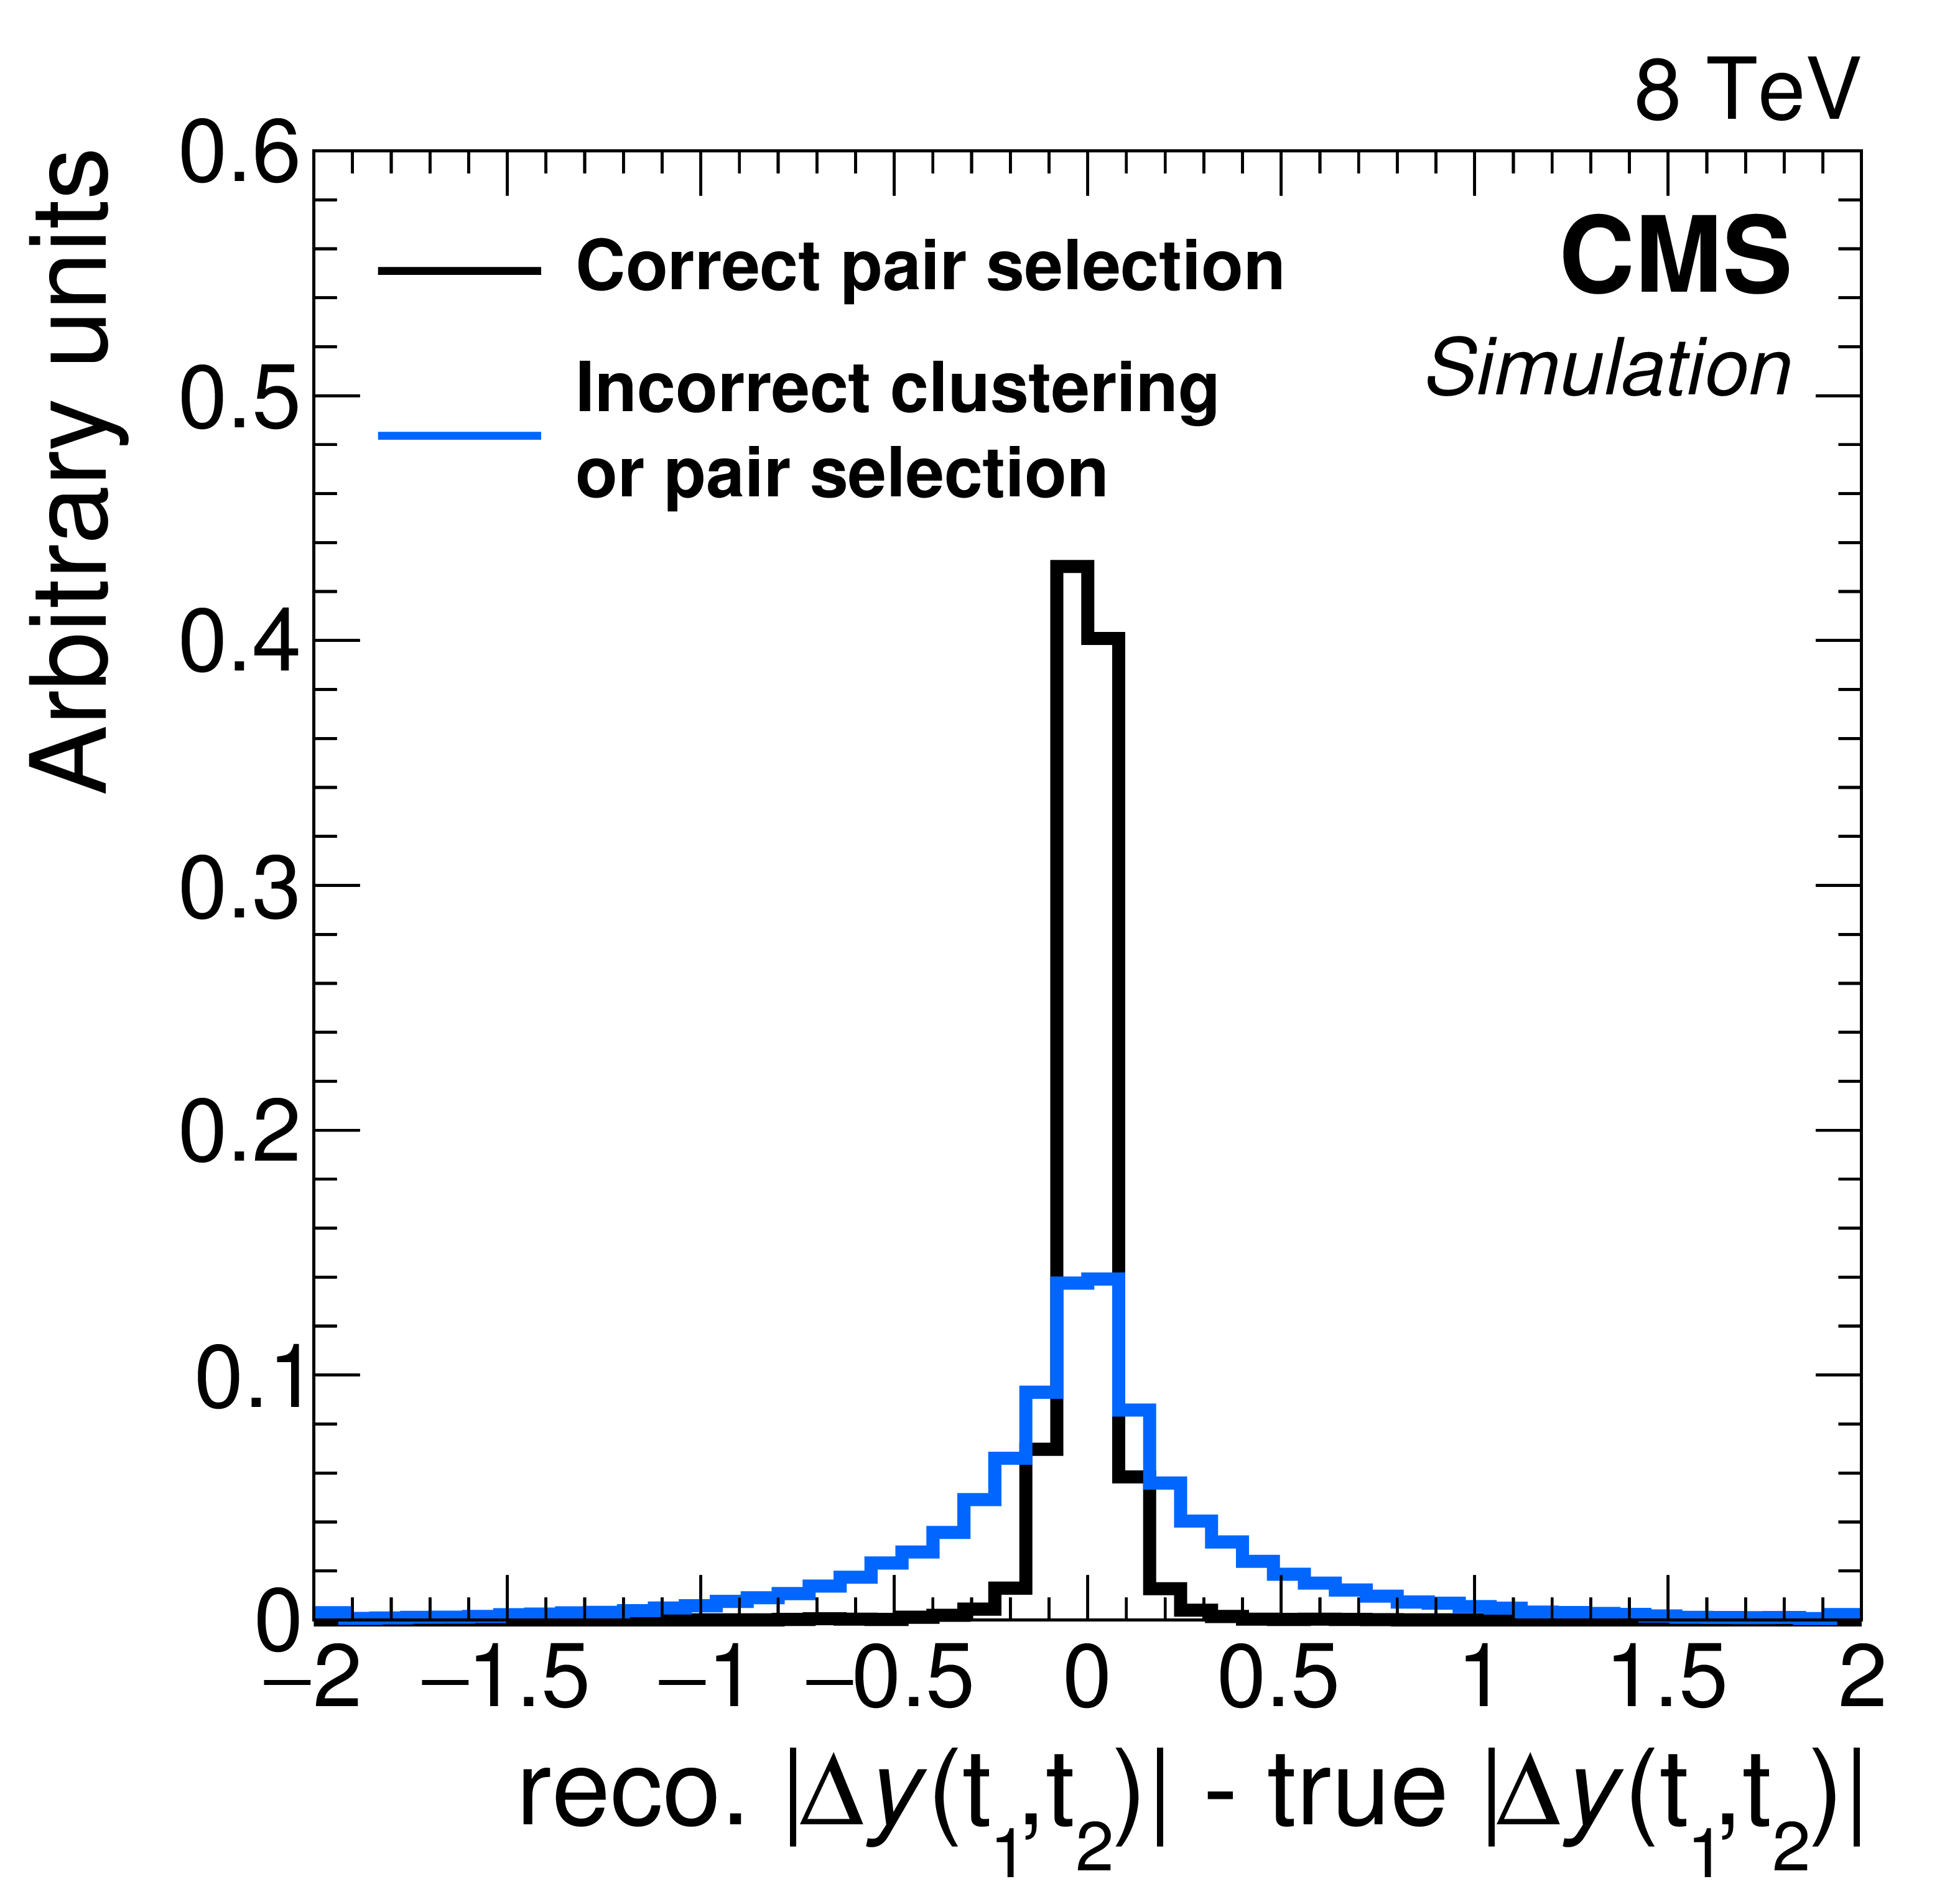
Figure 4-a:
Properties of the reconstructed top quark pair used in the analysis are compared to their true properties in all-hadronic T2tt events with $ {m_{\tilde{ \mathrm{t} } }} =$ 600 GeV and $ {m_{\tilde{\chi}^0_1 }} =$ 50 GeV. The label ``Correct pair selection'' corresponds to events in which the two top quark decays are each resolved into three distinct picky jets and these jets are used to reconstruct the two top quarks. The label ``Incorrect clustering or pair selection'' is used for all other events. The two figures (a,b) show comparisons of the angular separation between the two top quarks in rapidity, $y\equiv -(1/2)\ln[(E+p_z)/(E-p_z)]$, and azimuthal angle $\phi $. The figure (c) compares the relative $ {p_{\mathrm {T}}} $ of the two top quarks. In all cases, $\mathrm{t} _1$ refers to the top quark with the highest $ {p_{\mathrm {T}}} $. |
png pdf |
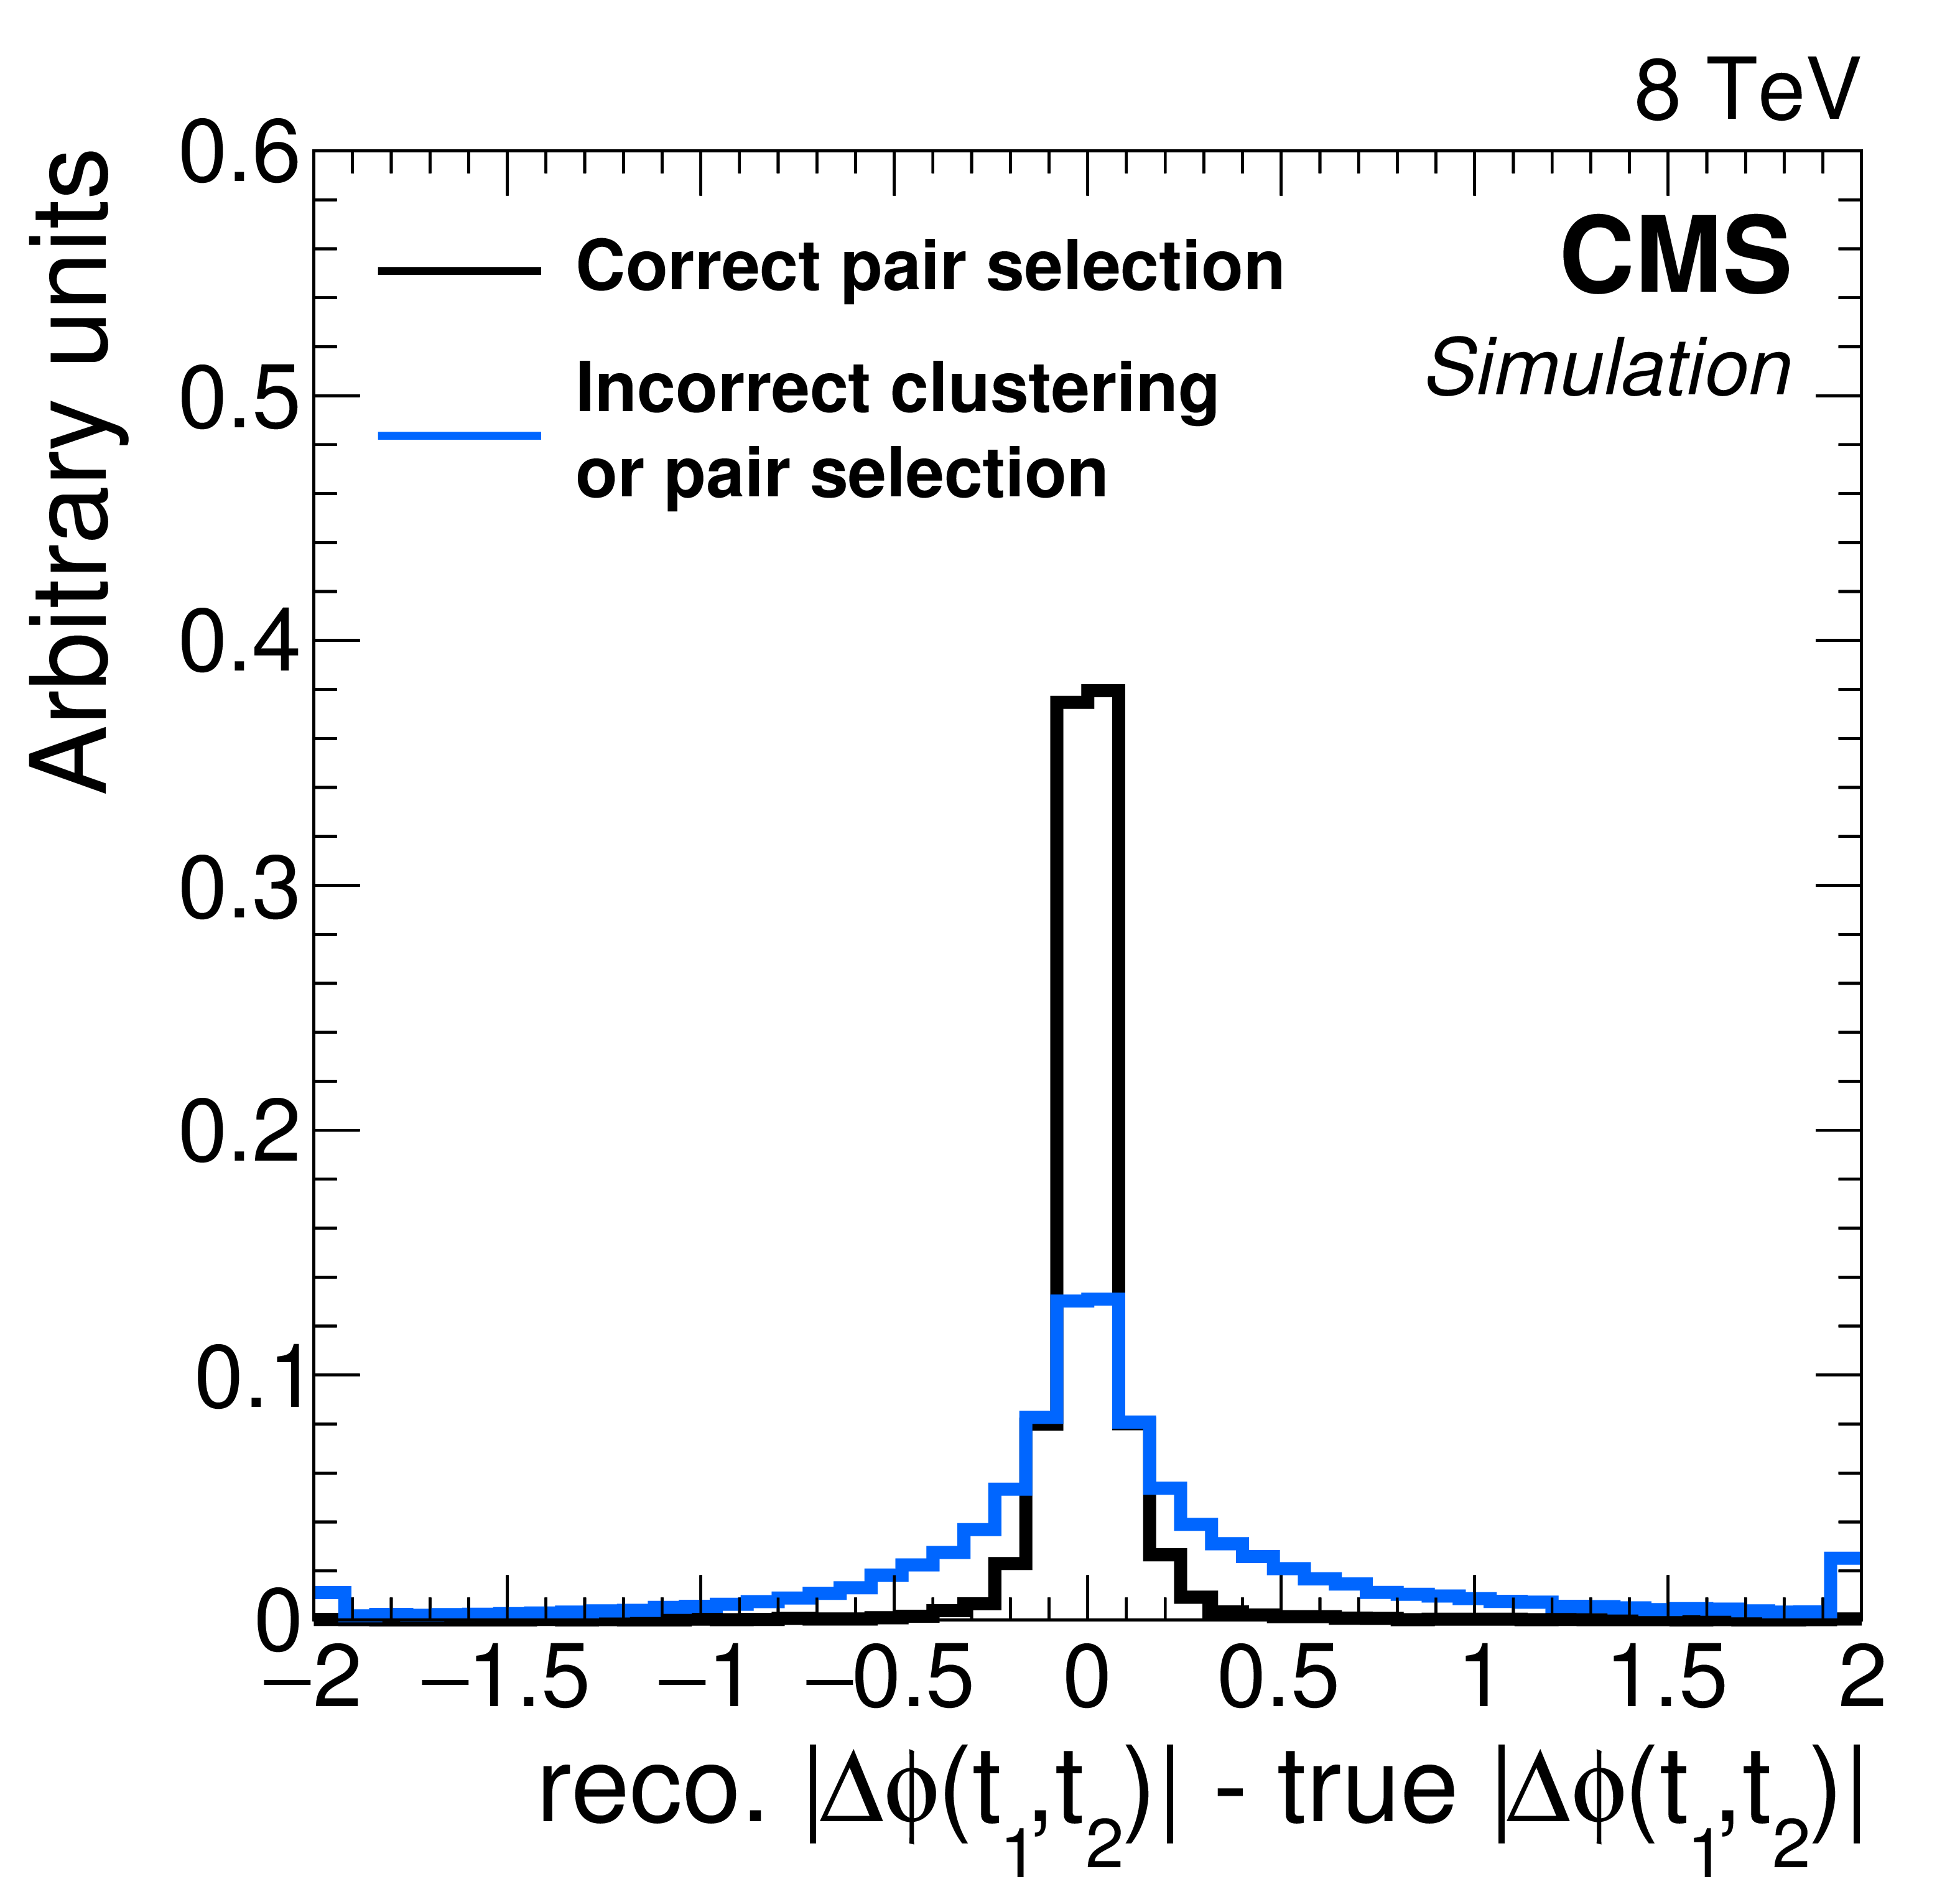
Figure 4-b:
Properties of the reconstructed top quark pair used in the analysis are compared to their true properties in all-hadronic T2tt events with $ {m_{\tilde{ \mathrm{t} } }} =$ 600 GeV and $ {m_{\tilde{\chi}^0_1 }} =$ 50 GeV. The label ``Correct pair selection'' corresponds to events in which the two top quark decays are each resolved into three distinct picky jets and these jets are used to reconstruct the two top quarks. The label ``Incorrect clustering or pair selection'' is used for all other events. The two figures (a,b) show comparisons of the angular separation between the two top quarks in rapidity, $y\equiv -(1/2)\ln[(E+p_z)/(E-p_z)]$, and azimuthal angle $\phi $. The figure (c) compares the relative $ {p_{\mathrm {T}}} $ of the two top quarks. In all cases, $\mathrm{t} _1$ refers to the top quark with the highest $ {p_{\mathrm {T}}} $. |
png pdf |
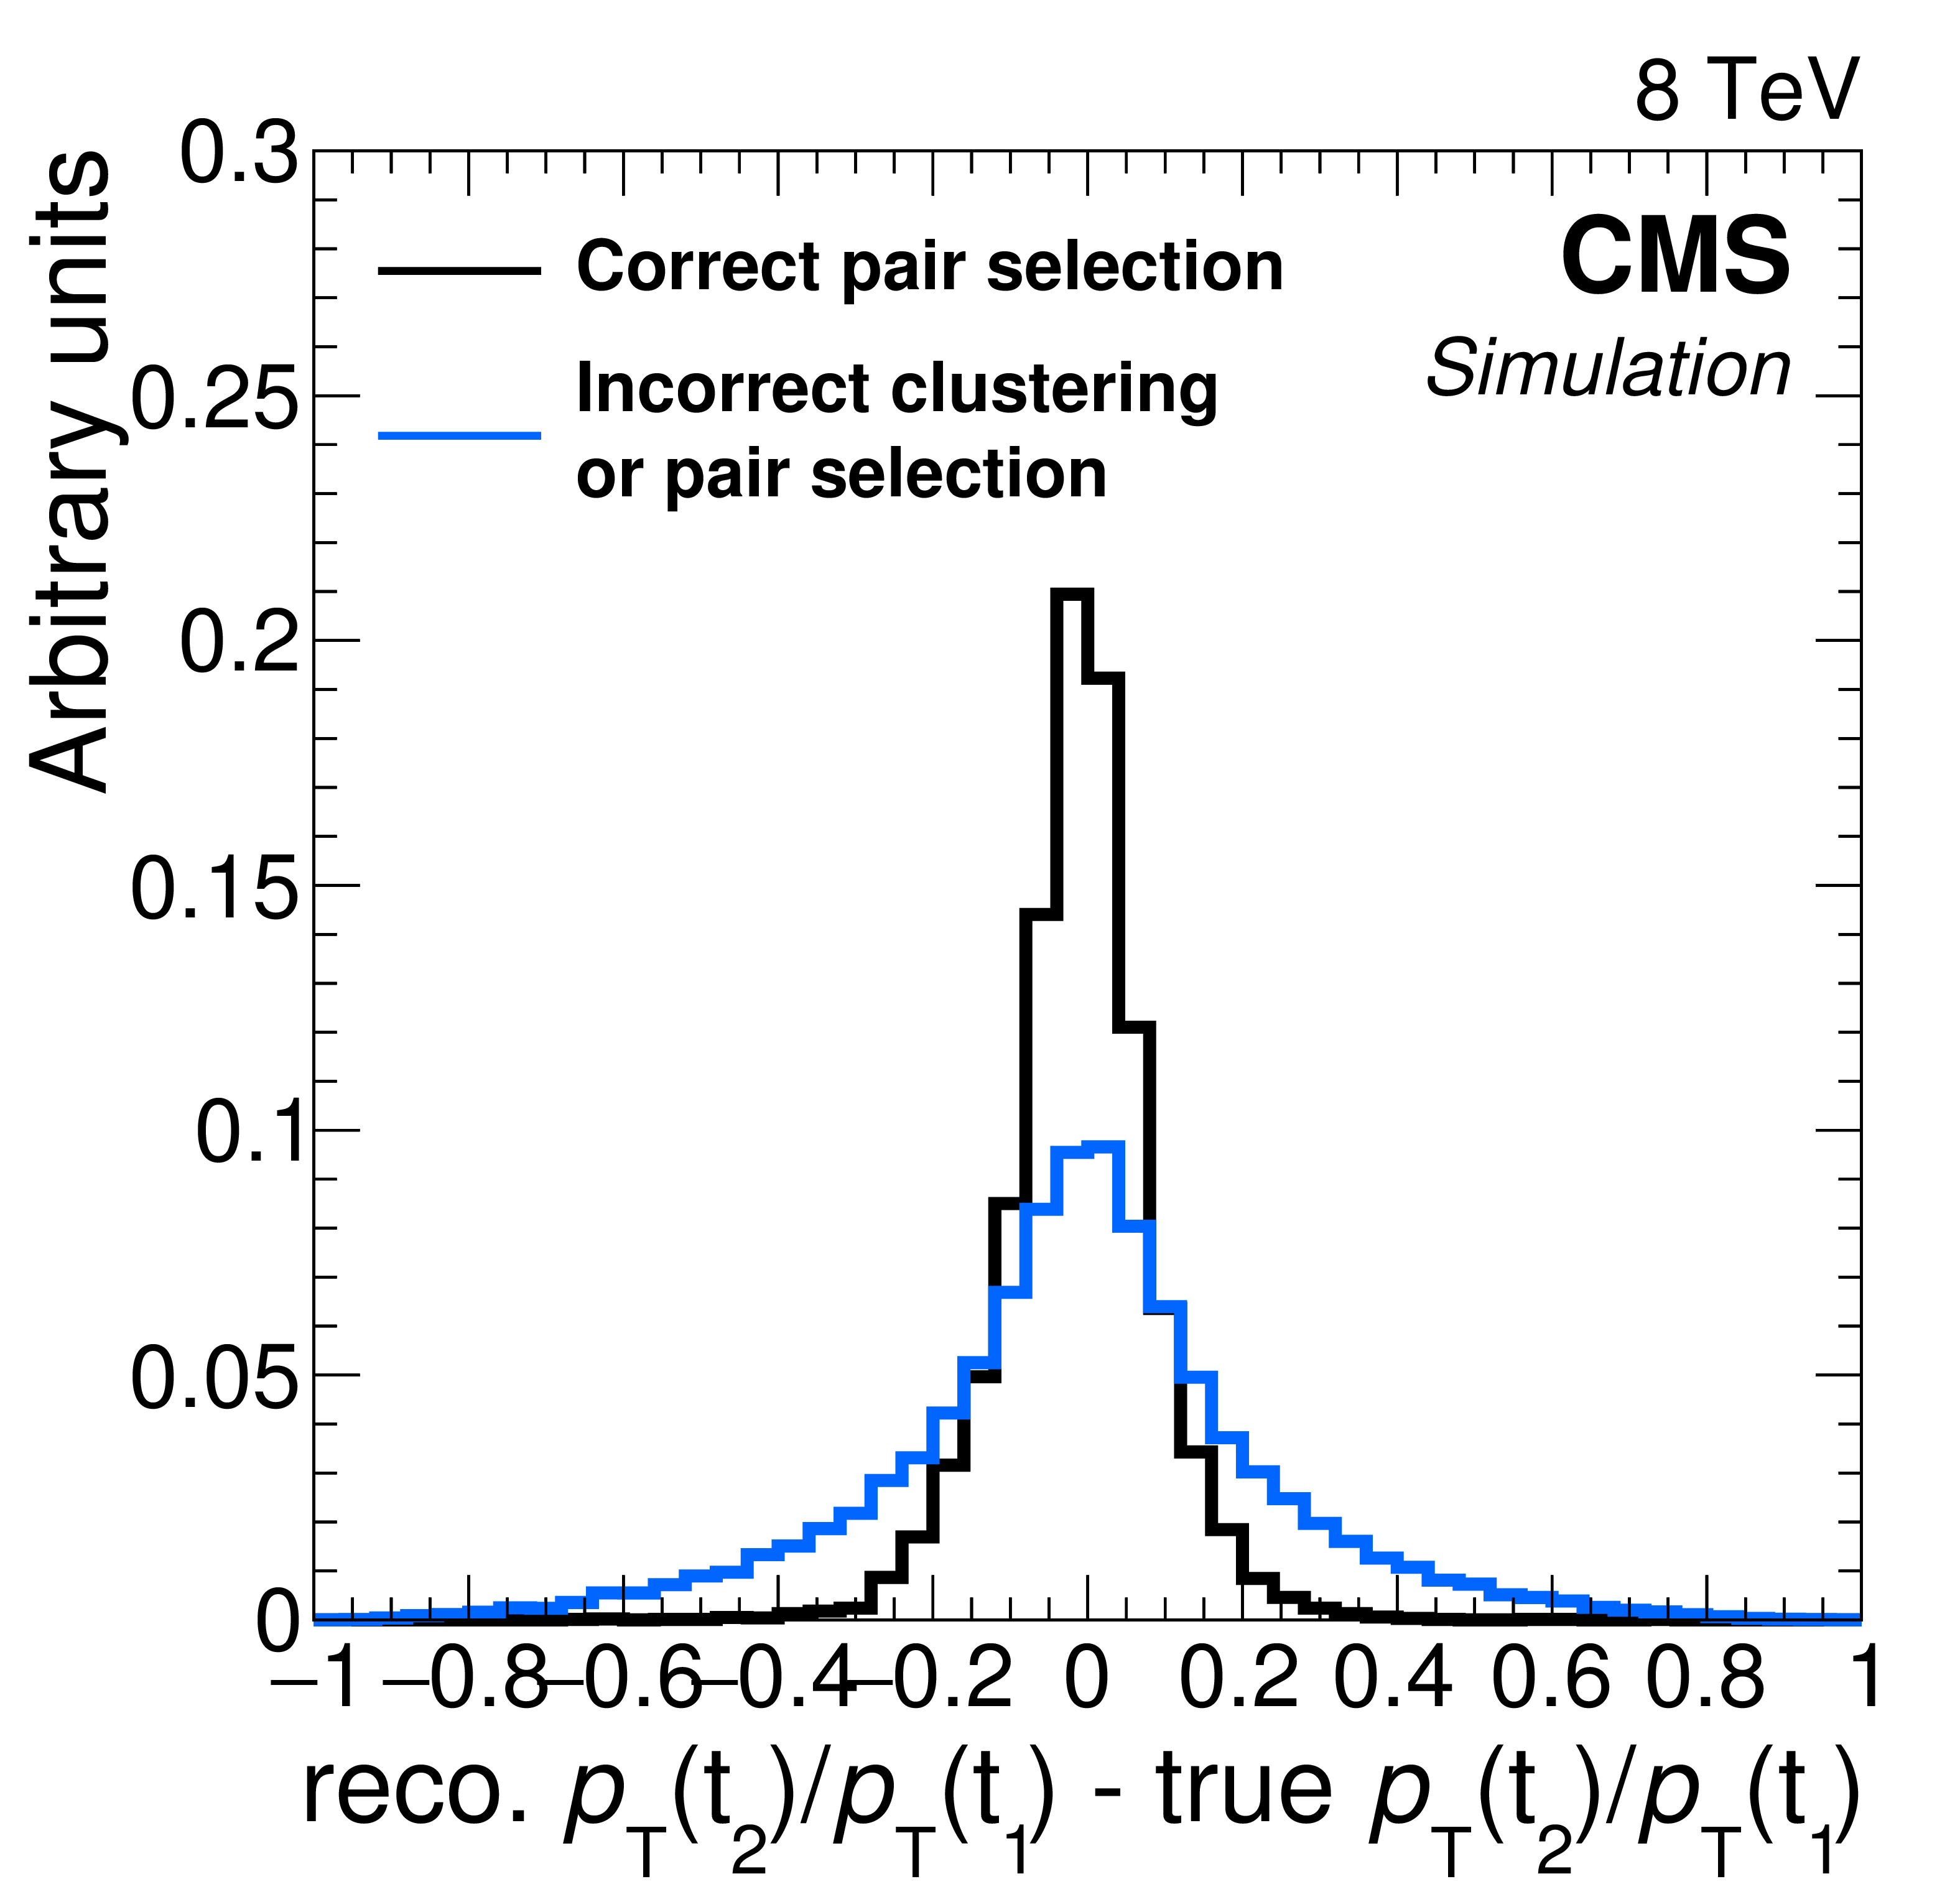
Figure 4-c:
Properties of the reconstructed top quark pair used in the analysis are compared to their true properties in all-hadronic T2tt events with $ {m_{\tilde{ \mathrm{t} } }} =$ 600 GeV and $ {m_{\tilde{\chi}^0_1 }} =$ 50 GeV. The label ``Correct pair selection'' corresponds to events in which the two top quark decays are each resolved into three distinct picky jets and these jets are used to reconstruct the two top quarks. The label ``Incorrect clustering or pair selection'' is used for all other events. The two figures (a,b) show comparisons of the angular separation between the two top quarks in rapidity, $y\equiv -(1/2)\ln[(E+p_z)/(E-p_z)]$, and azimuthal angle $\phi $. The figure (c) compares the relative $ {p_{\mathrm {T}}} $ of the two top quarks. In all cases, $\mathrm{t} _1$ refers to the top quark with the highest $ {p_{\mathrm {T}}} $. |
png pdf |
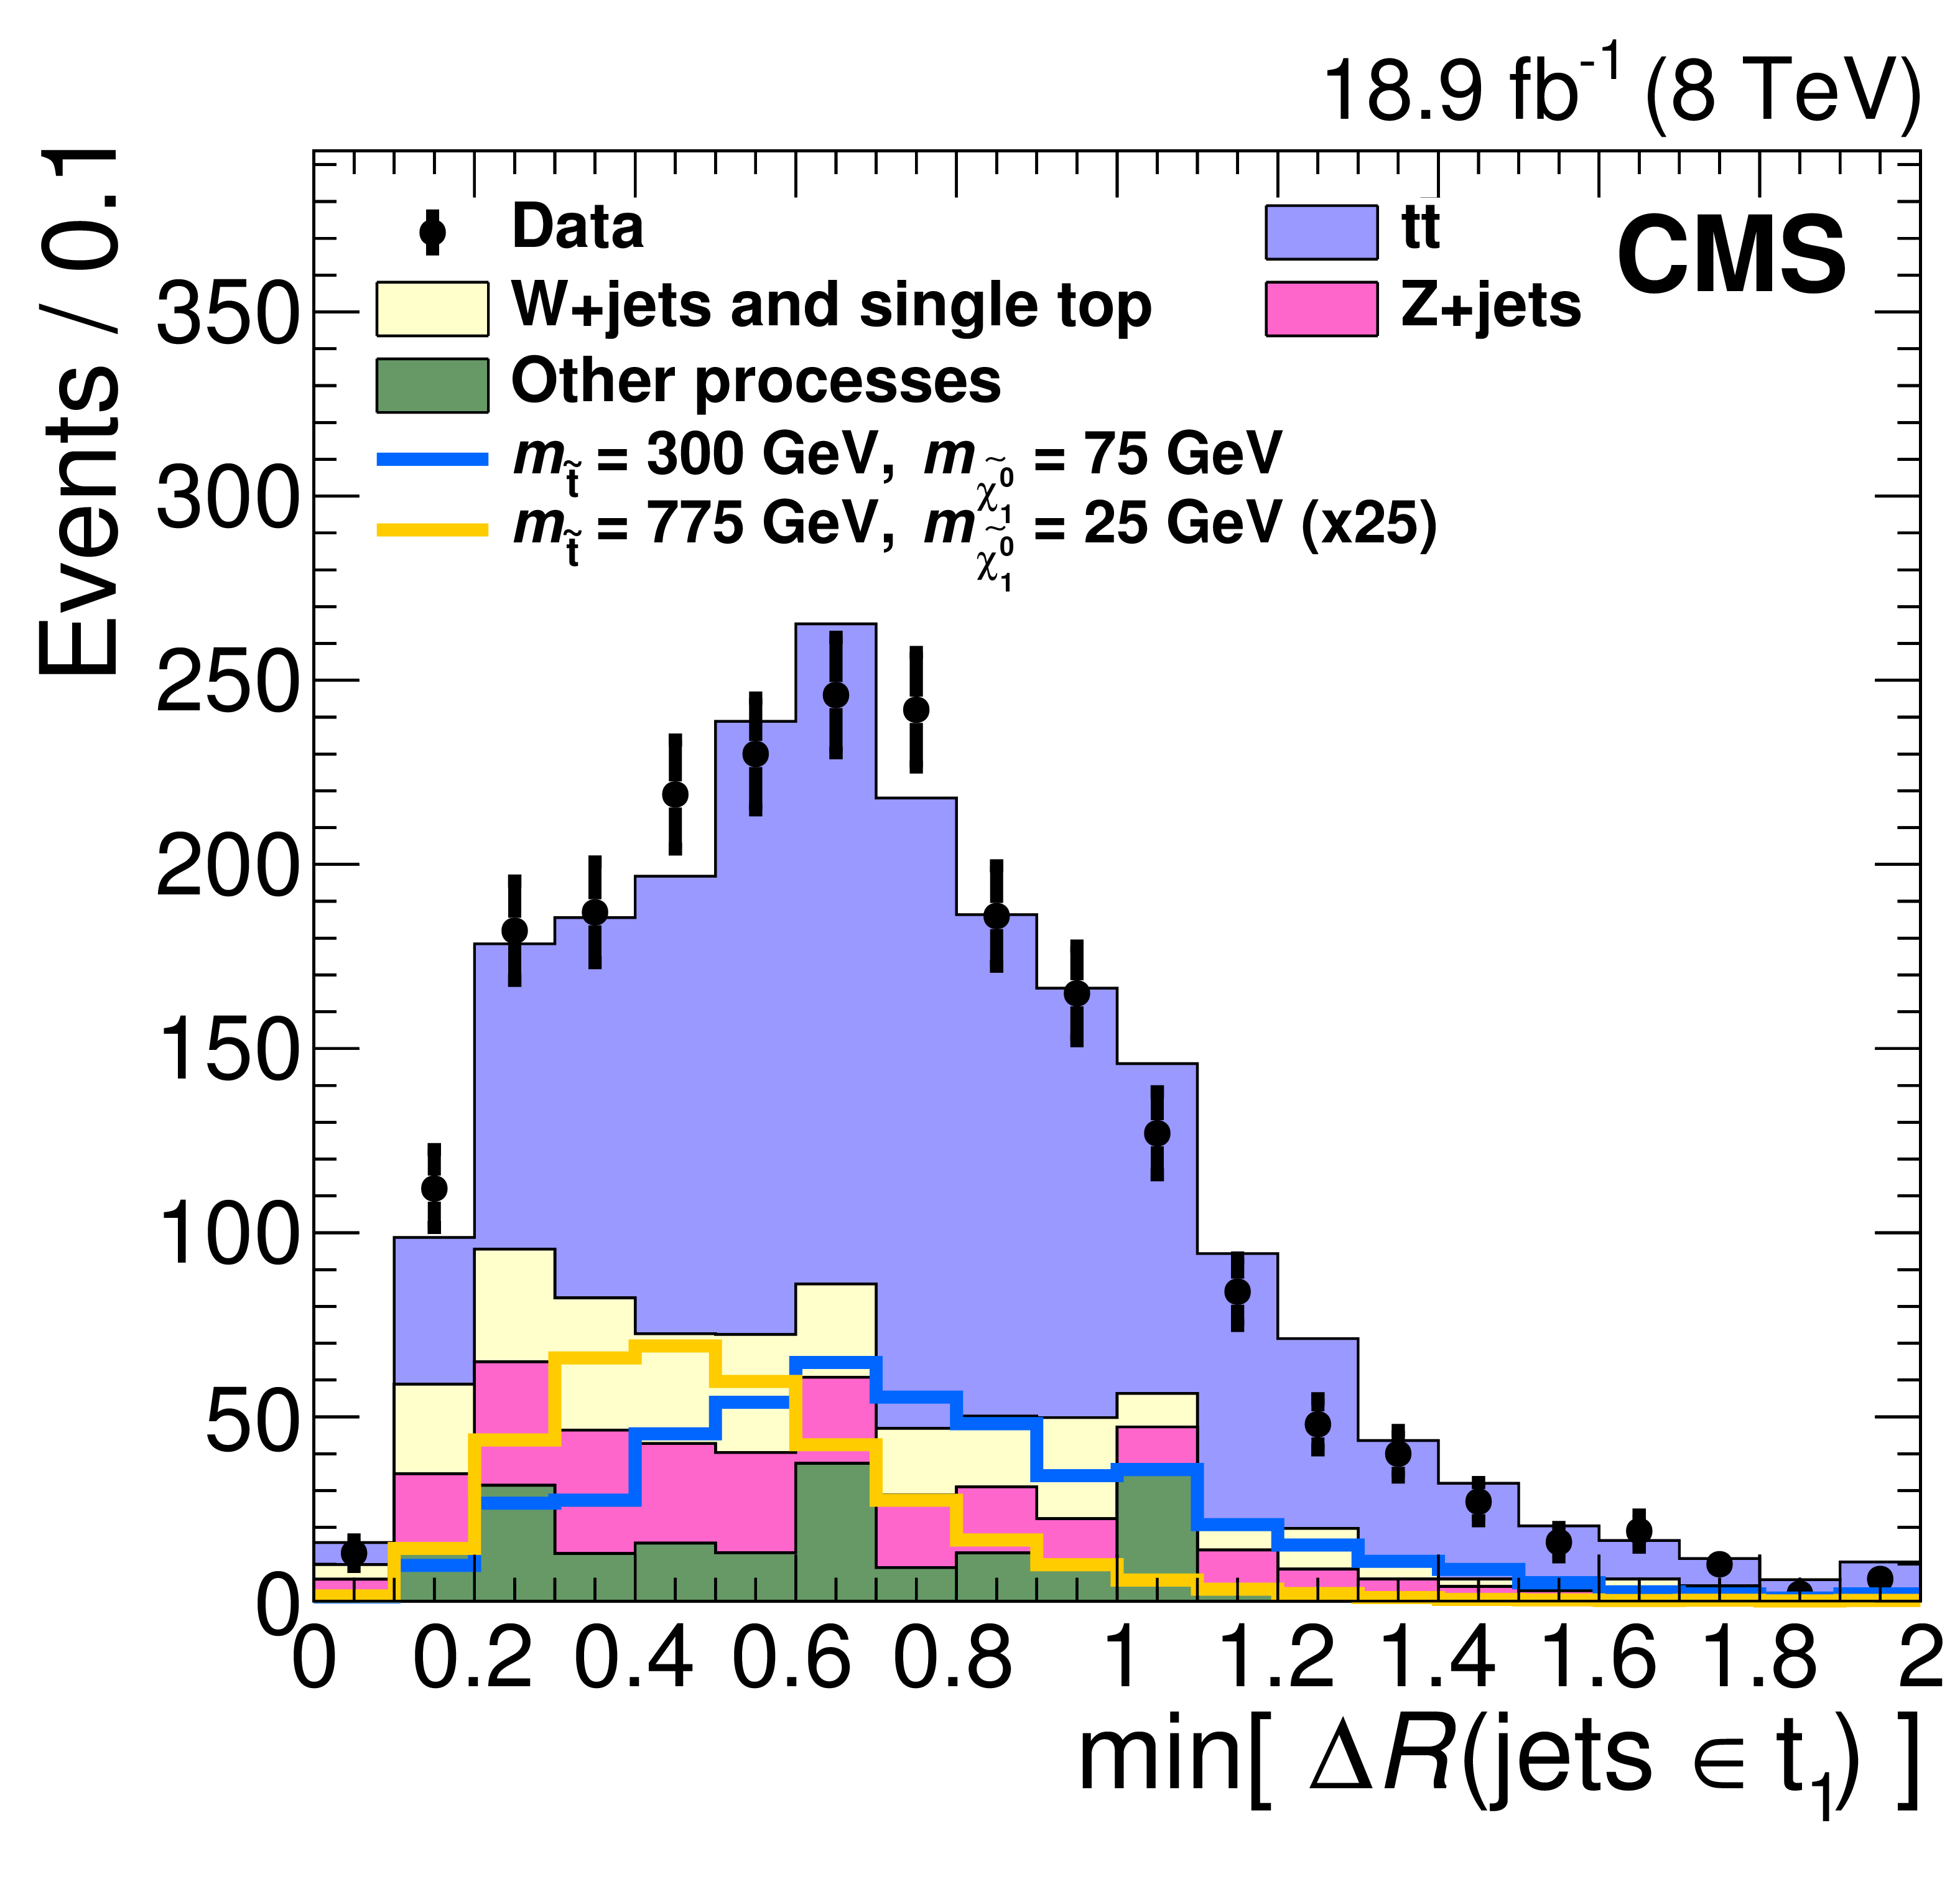
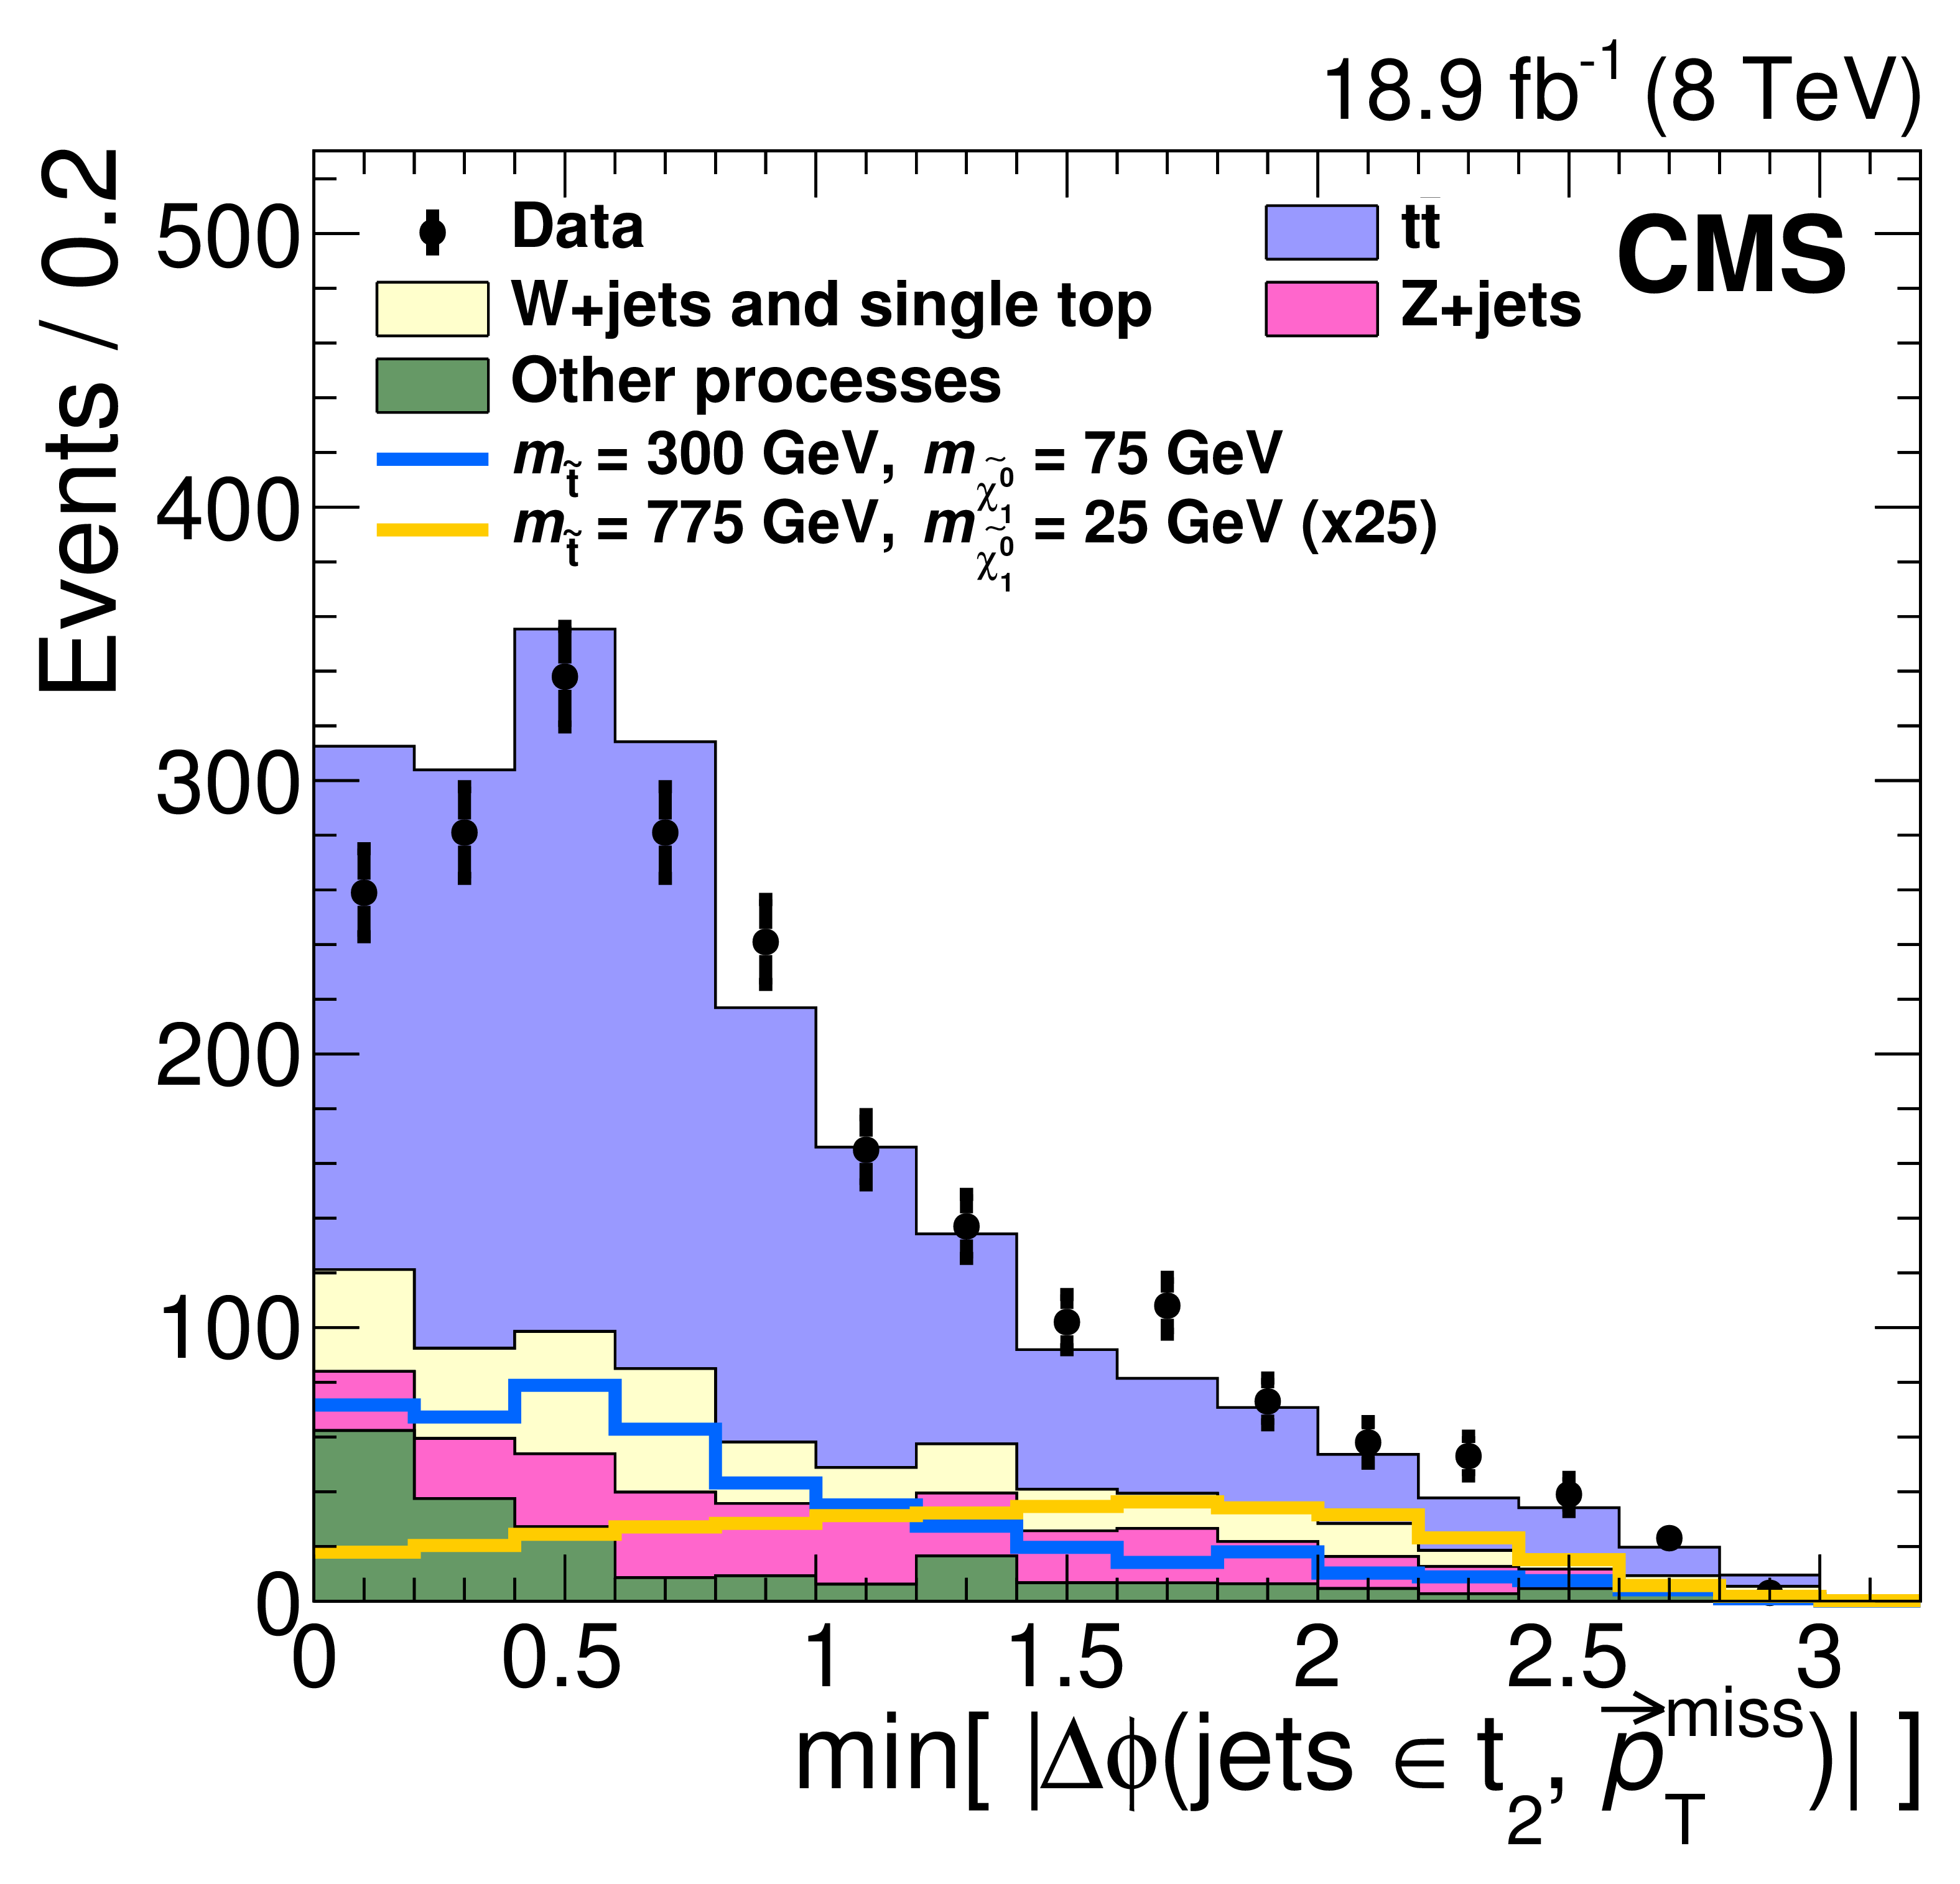
Figure 5-a:
Distributions of properties of reconstructed top quark pairs for data together with signal and background MC data samples after the baseline selection for two choices of $ {m_{\tilde{ \mathrm{t} } }} $ and $ {m_{\tilde{\chi}^0_1 }} $. For the case $ {m_{\tilde{ \mathrm{t} } }} =$ 775 GeV, $ {m_{\tilde{\chi}^0_1 }} =$ 25 GeV the expected signal is multiplied by a factor of 25. The plot (a) shows the minimum separation in the $\eta $-$\phi $ plane between any two jets in the leading reconstructed top quark, defined as the one with the highest discriminator value, while the plot (b) shows the separation in $\phi $ between ${{\vec{p}}_{\mathrm {T}}^{\text {miss}}} $ and the jet in the sub-leading reconstructed top quark for which this separation is the smallest. Both variables are inputs to the T2tt search region BDT discriminators, which are described in Section 6. |
png pdf |
Figure 5-b:
Distributions of properties of reconstructed top quark pairs for data together with signal and background MC data samples after the baseline selection for two choices of $ {m_{\tilde{ \mathrm{t} } }} $ and $ {m_{\tilde{\chi}^0_1 }} $. For the case $ {m_{\tilde{ \mathrm{t} } }} =$ 775 GeV, $ {m_{\tilde{\chi}^0_1 }} =$ 25 GeV the expected signal is multiplied by a factor of 25. The plot (a) shows the minimum separation in the $\eta $-$\phi $ plane between any two jets in the leading reconstructed top quark, defined as the one with the highest discriminator value, while the plot (b) shows the separation in $\phi $ between ${{\vec{p}}_{\mathrm {T}}^{\text {miss}}} $ and the jet in the sub-leading reconstructed top quark for which this separation is the smallest. Both variables are inputs to the T2tt search region BDT discriminators, which are described in Section 6. |
png pdf |
Figure 6-a:
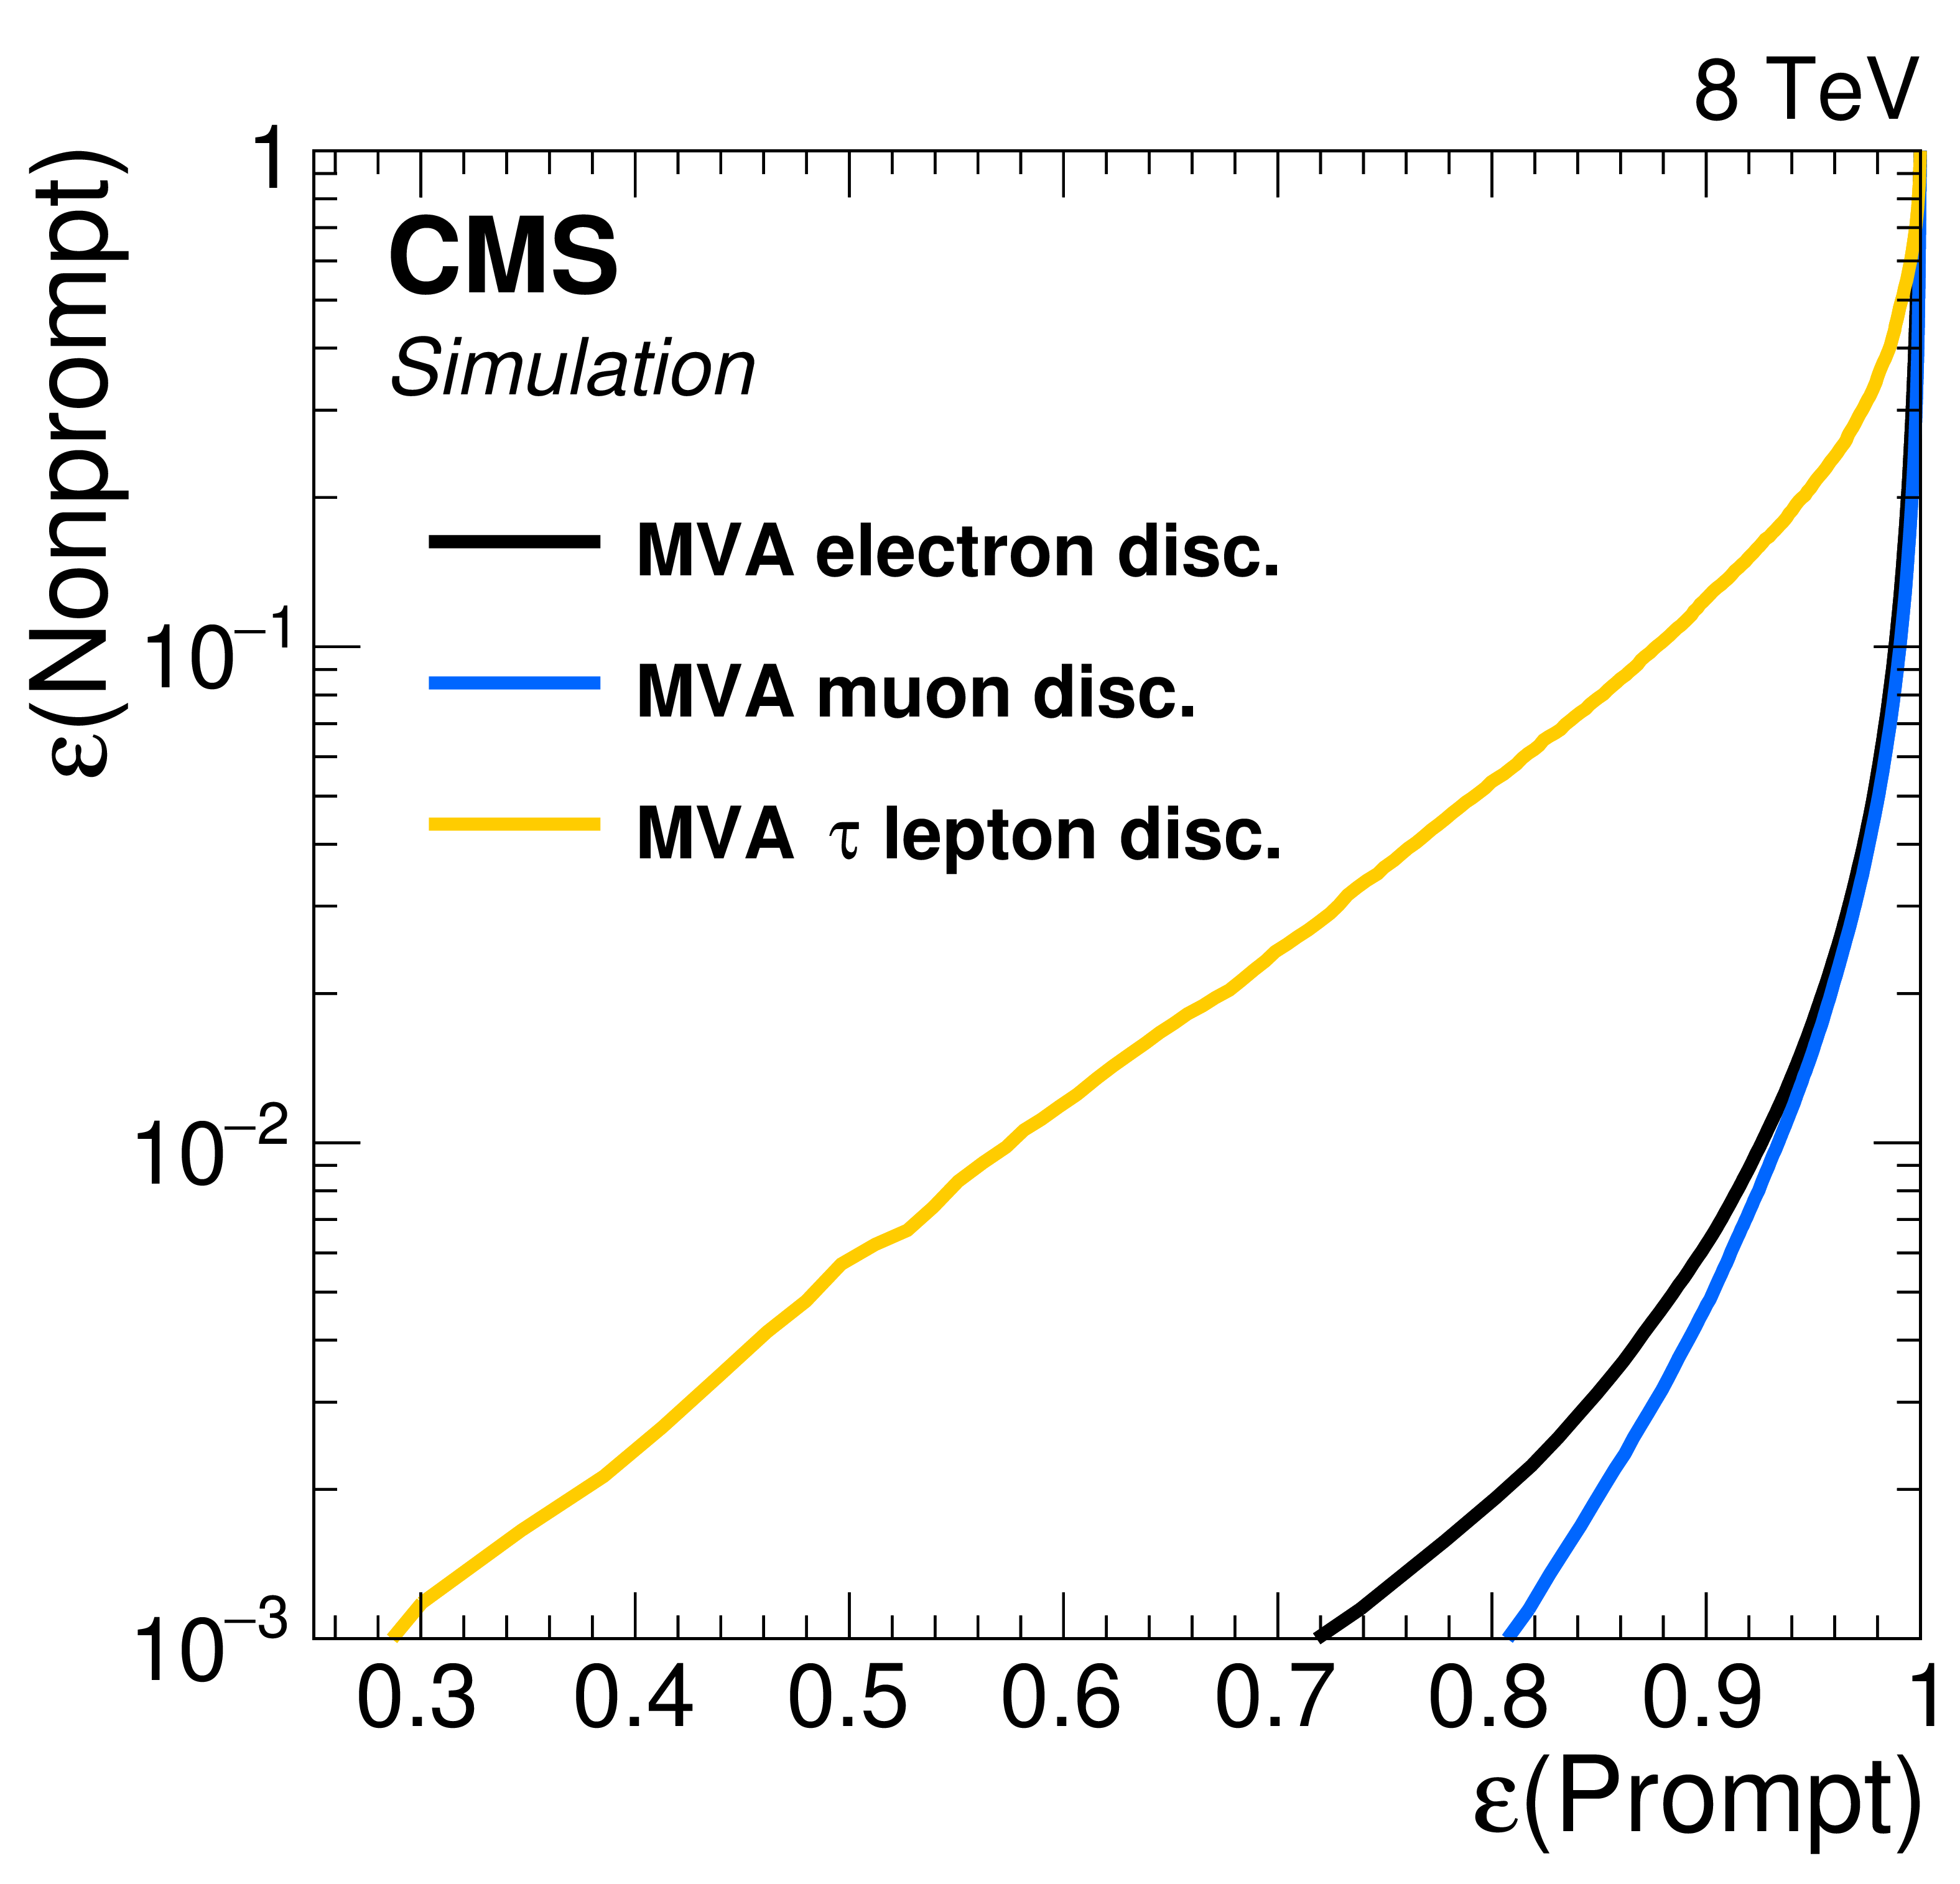
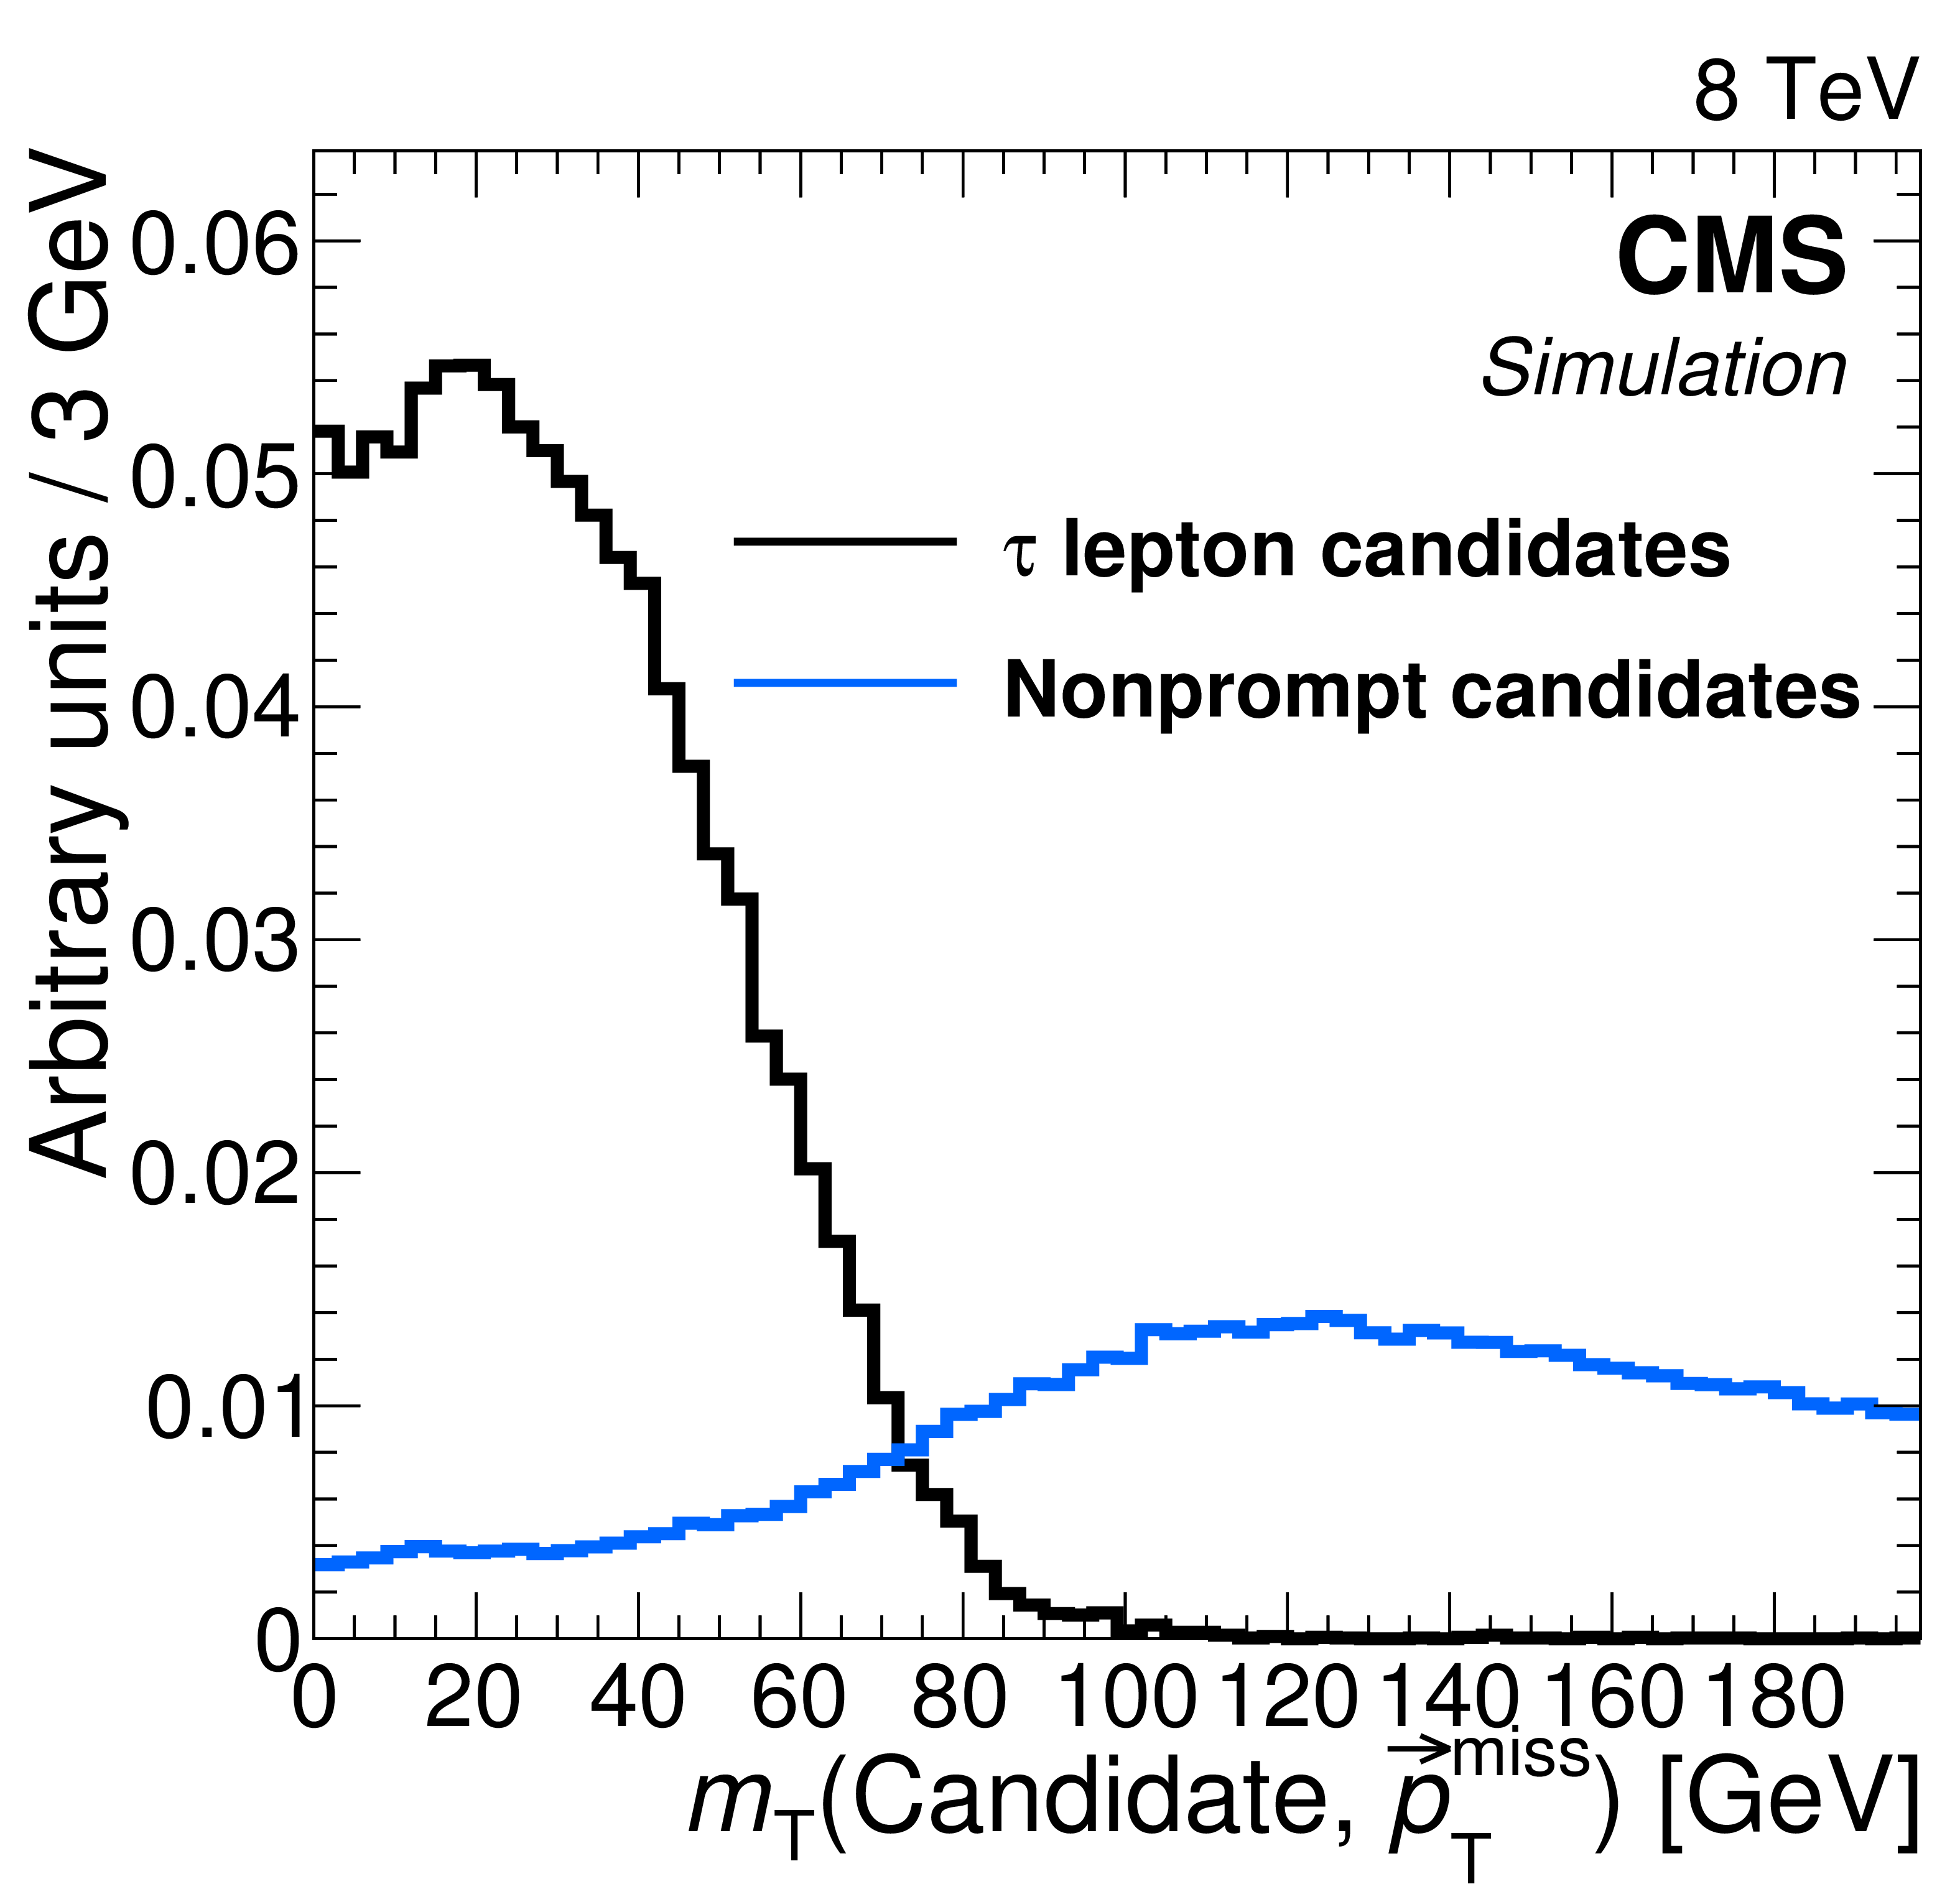
a: Selection efficiency for non-prompt leptons versus that for prompt leptons. The curves are produced by varying BDT discriminator values for electrons, muons, and taus. Prompt leptons are those matched to lepton candidates in semileptonic $ {\mathrm{t} \mathrm{\bar{t}} } $ events whereas non-prompt leptons are those that are matched to lepton candidates in all-hadronic $ {\mathrm{t} \mathrm{\bar{t}} } $ in the case of electrons and muons, or all-hadronic T2tt signal events in the case of $\tau $ leptons. b: The $ {m_{\mathrm {T}}} $ calculated from $ {{\vec{p}}_{\mathrm {T}}^{\text {miss}}} $ and the momentum of the visible $\tau $ lepton decay products, for $\tau $ lepton candidates matched to $\tau $ lepton decays in semileptonic $ {\mathrm{t} \mathrm{\bar{t}} } $ events, and all $\tau $ lepton candidates in a simulated all-hadronic T2tt signal sample ($ {m_{\tilde{ \mathrm{t} } }} =$ 620 GeV, $ {m_{\tilde{\chi}^0_1 }} =$ 40 GeV). |
png pdf |
Figure 6-b:
a: Selection efficiency for non-prompt leptons versus that for prompt leptons. The curves are produced by varying BDT discriminator values for electrons, muons, and taus. Prompt leptons are those matched to lepton candidates in semileptonic $ {\mathrm{t} \mathrm{\bar{t}} } $ events whereas non-prompt leptons are those that are matched to lepton candidates in all-hadronic $ {\mathrm{t} \mathrm{\bar{t}} } $ in the case of electrons and muons, or all-hadronic T2tt signal events in the case of $\tau $ leptons. b: The $ {m_{\mathrm {T}}} $ calculated from $ {{\vec{p}}_{\mathrm {T}}^{\text {miss}}} $ and the momentum of the visible $\tau $ lepton decay products, for $\tau $ lepton candidates matched to $\tau $ lepton decays in semileptonic $ {\mathrm{t} \mathrm{\bar{t}} } $ events, and all $\tau $ lepton candidates in a simulated all-hadronic T2tt signal sample ($ {m_{\tilde{ \mathrm{t} } }} =$ 620 GeV, $ {m_{\tilde{\chi}^0_1 }} =$ 40 GeV). |
png pdf |
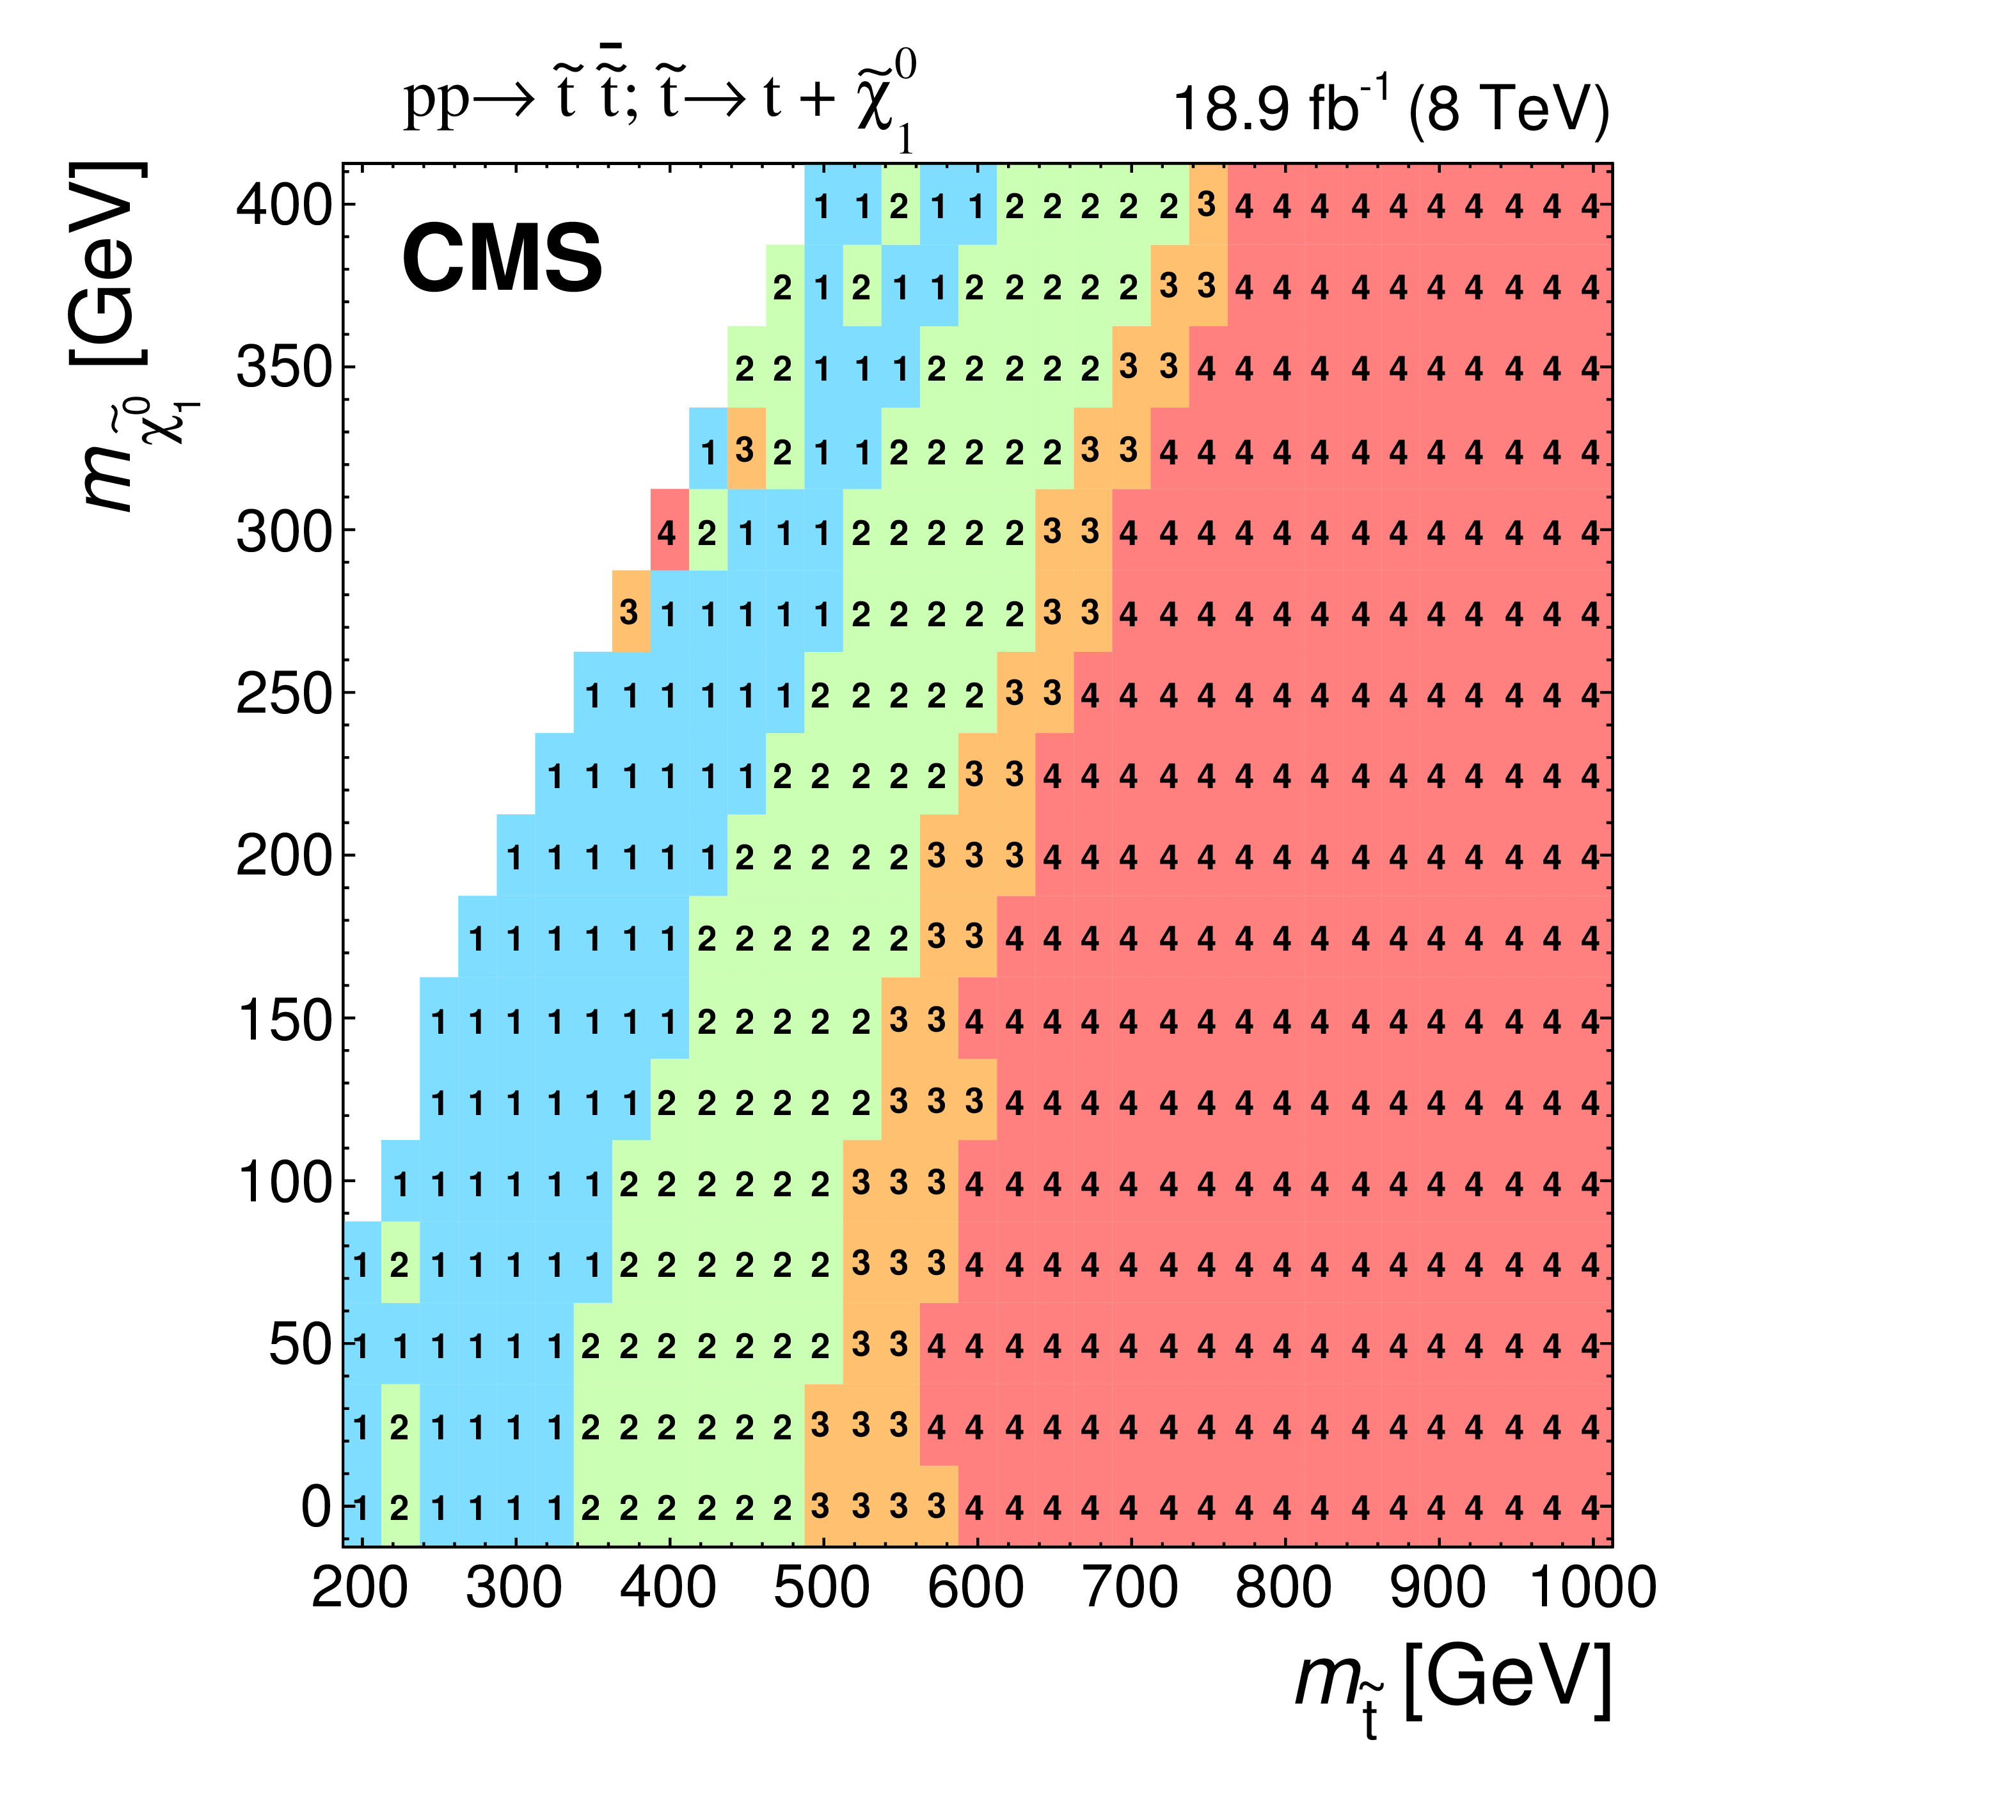
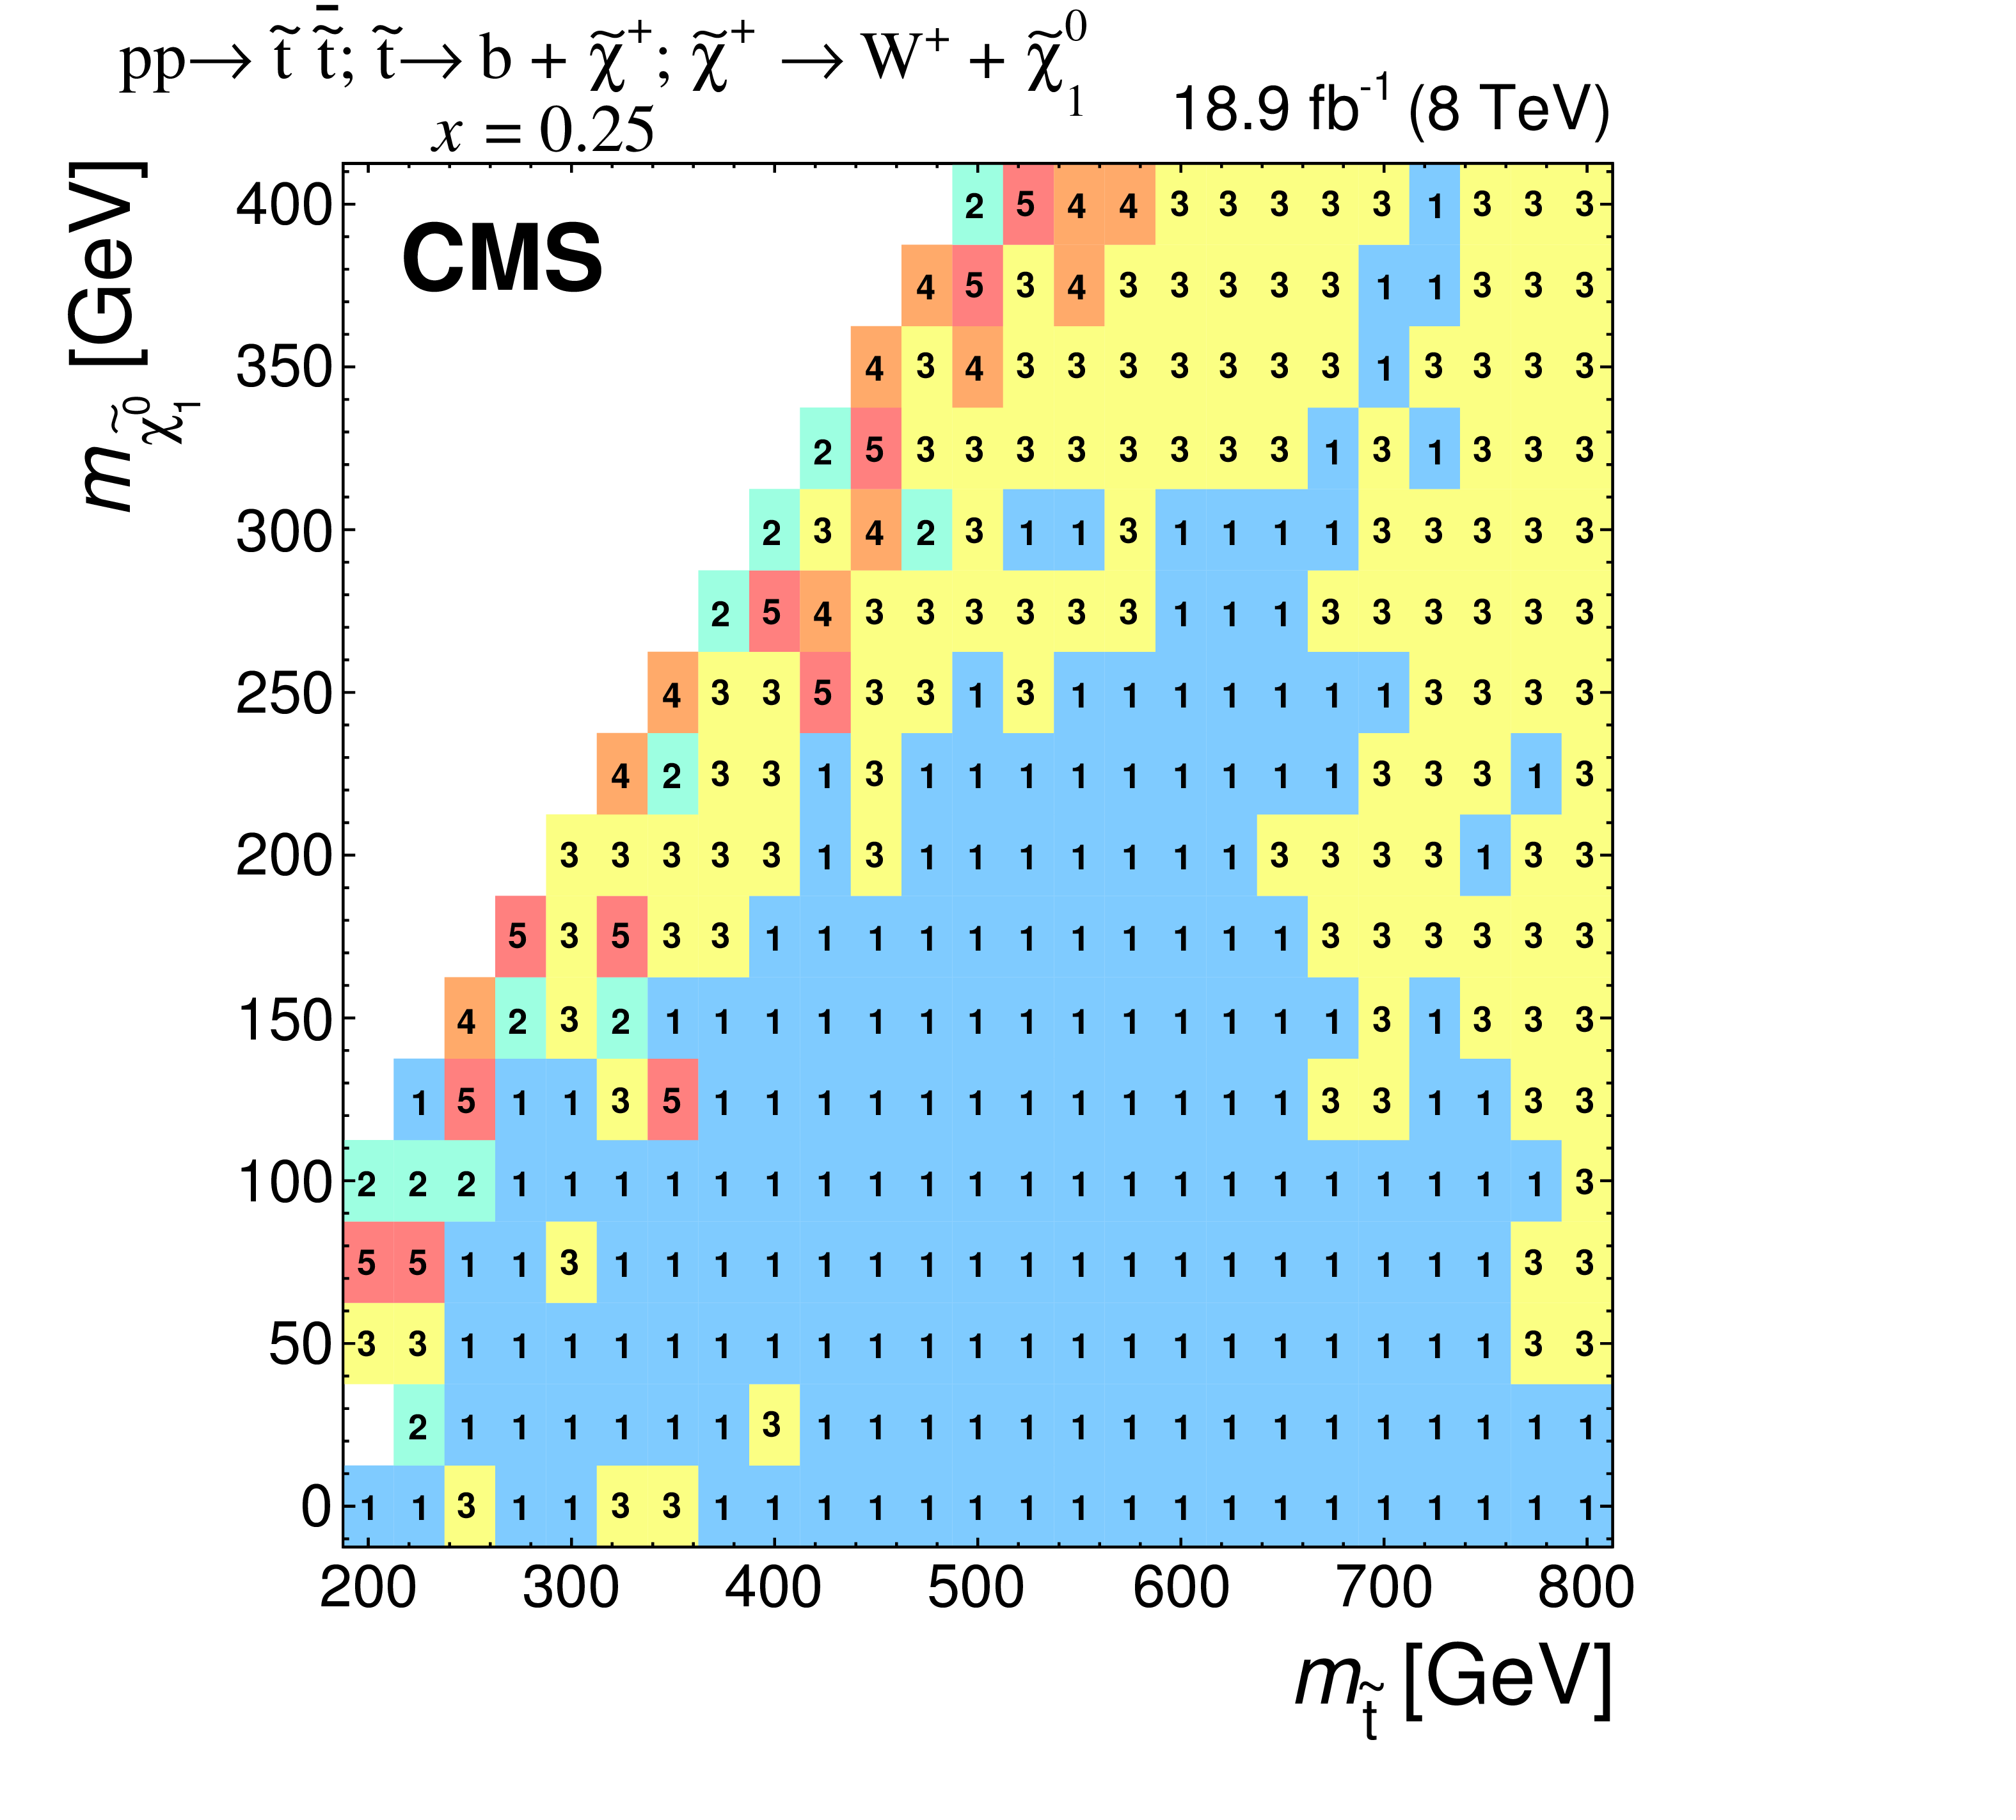
Figure 7-a:
Search regions providing the most stringent limits in the $ {m_{\tilde{ \mathrm{t} } }} $-$ {m_{\tilde{\chi}^0_1 }} $ plane in the T2tt signal topology (a) and the T2bW signal topologies for mass splitting parameter values $x =$ 0.25, 0.50, 0.75. The T2tt\_LM, T2tt\_MM, T2tt\_HM, and T2tt\_VHM search regions are numbered 1, 2, 3, and 4, respectively. The T2bW\_LX, T2bW\_LM, T2bW\_MXHM, T2bW\_VHM, and T2bW\_HXHM search regions are numbered 1, 2, 3, 4, and 5 respectively. In regions with $ {m_{\tilde{\chi}^0_1 }} $ similar to $ {m_{\tilde{ \mathrm{t} } }} $, the different search regions can have similar sensitivity, which leads to the fluctuations in choice of search regions in neighboring bins that is seen in some areas. |
png pdf |
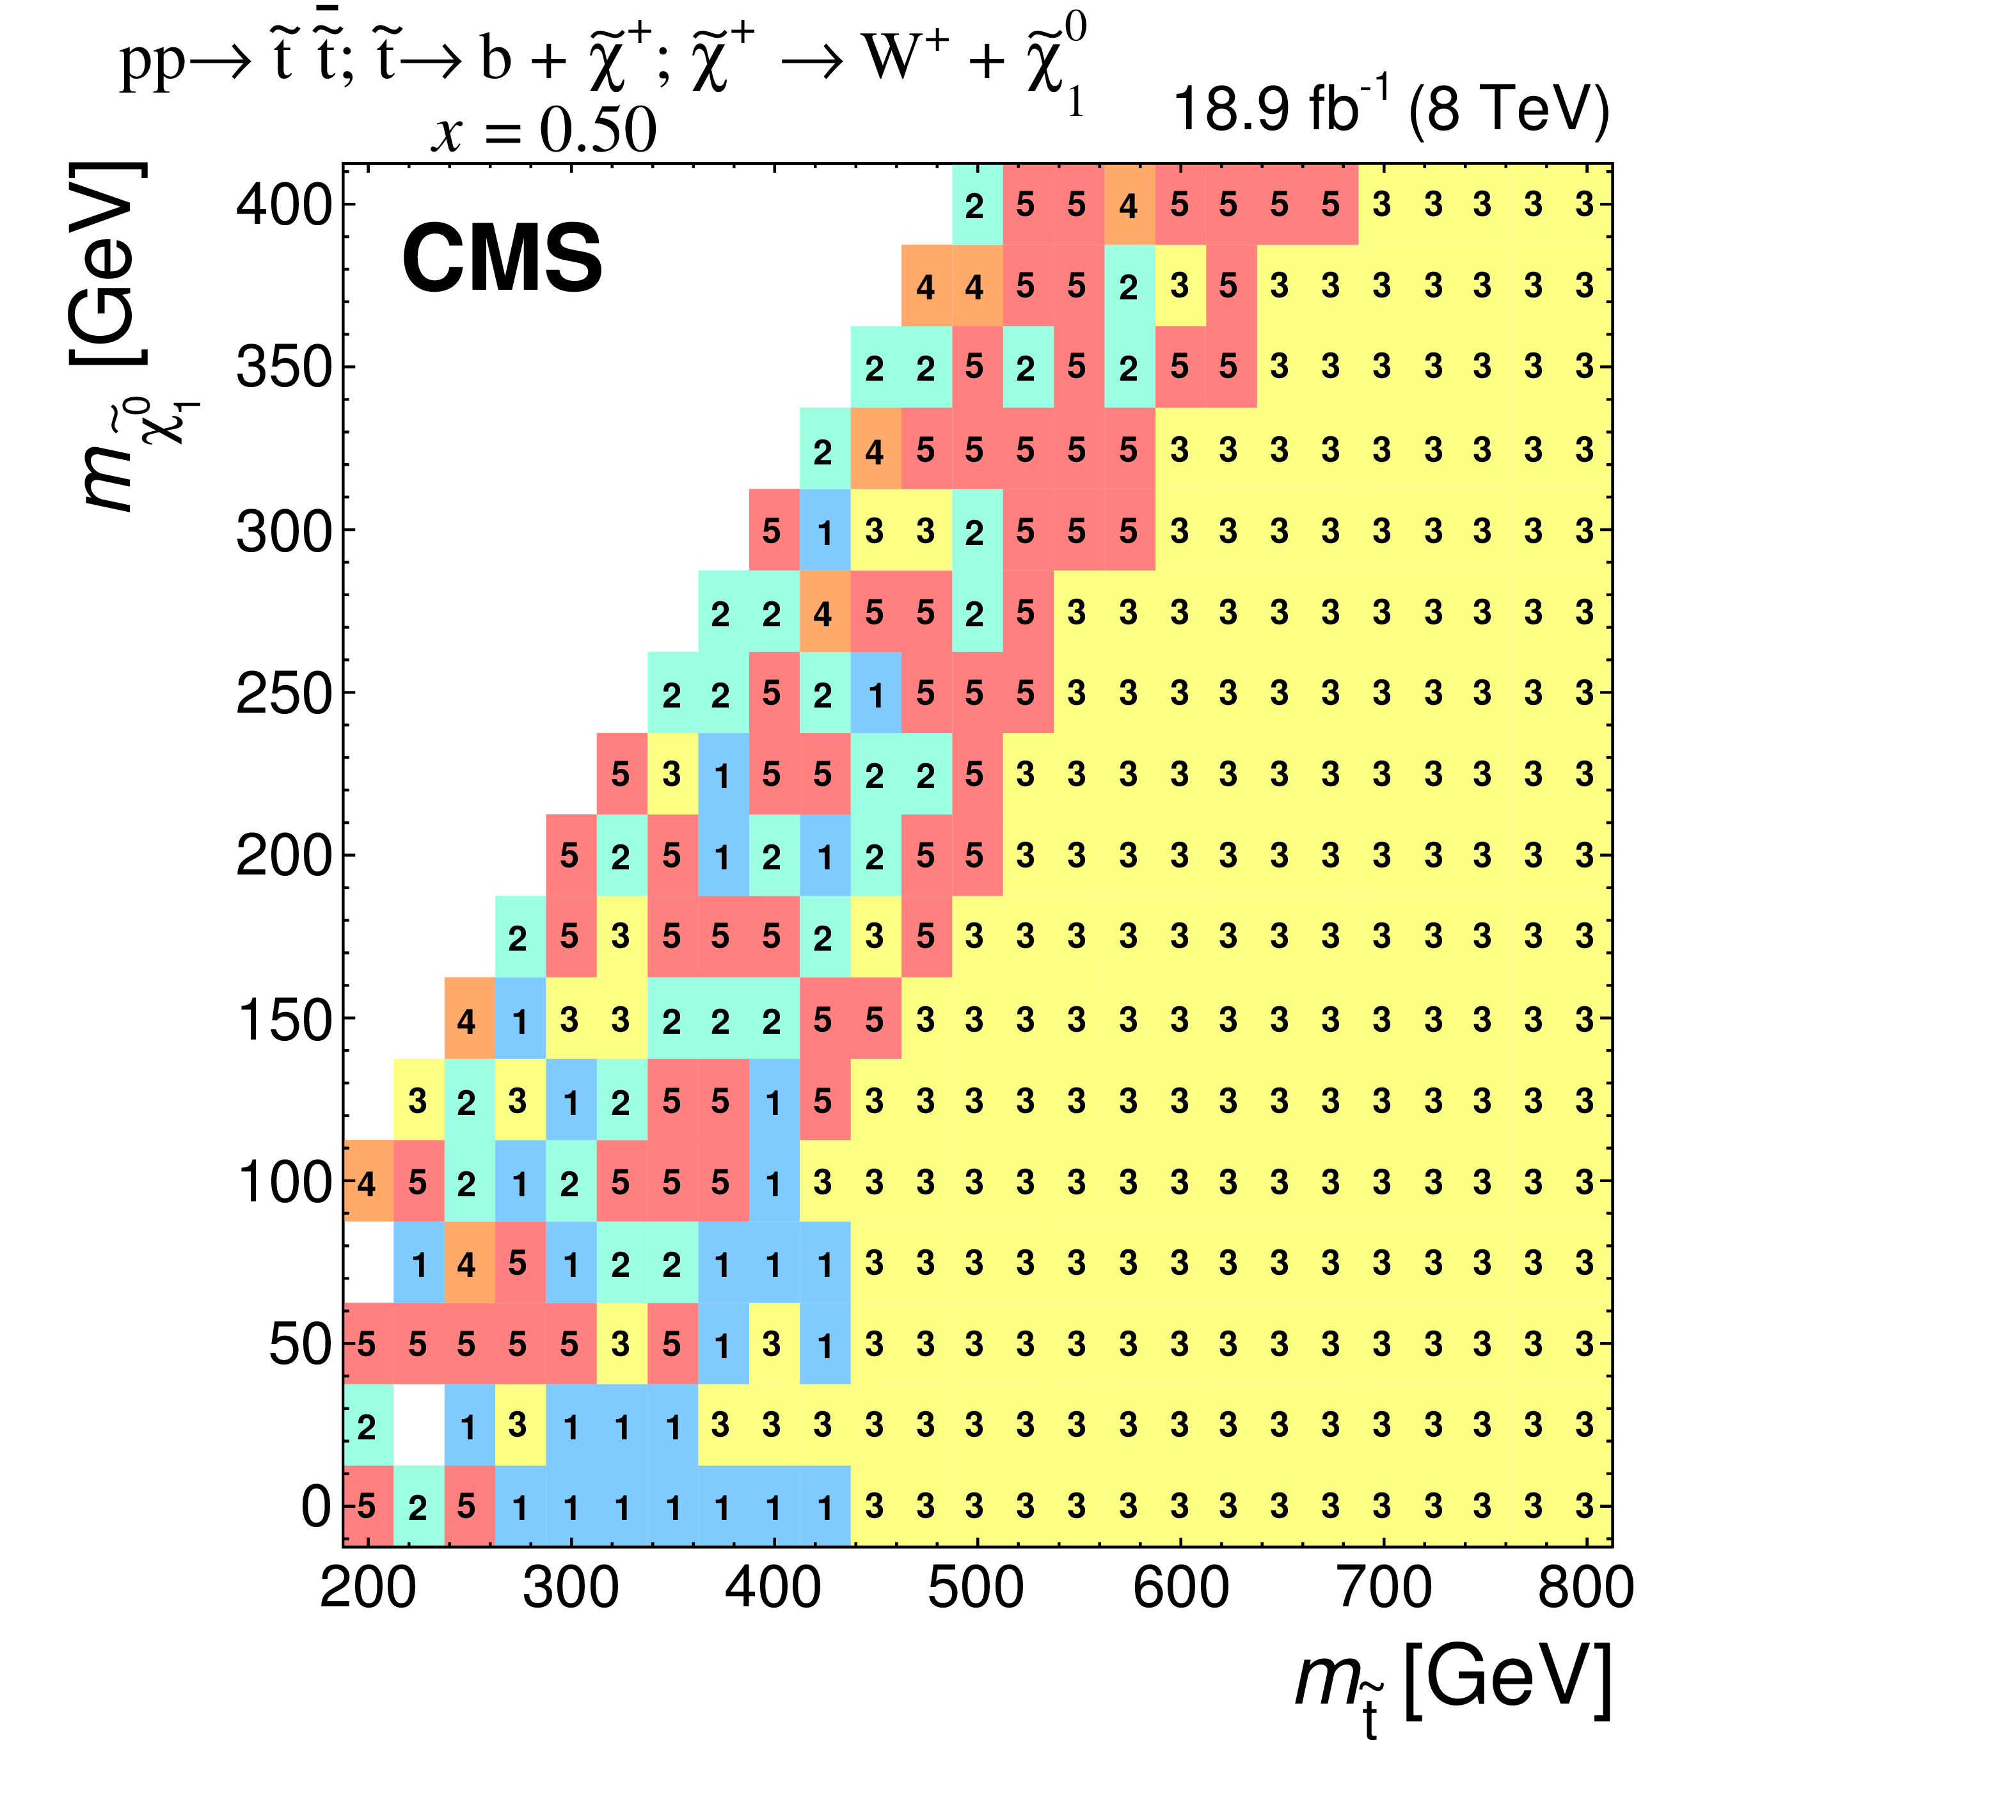
Figure 7-b:
Search regions providing the most stringent limits in the $ {m_{\tilde{ \mathrm{t} } }} $-$ {m_{\tilde{\chi}^0_1 }} $ plane in the T2tt signal topology (a) and the T2bW signal topologies for mass splitting parameter values $x =$ 0.25, 0.50, 0.75. The T2tt\_LM, T2tt\_MM, T2tt\_HM, and T2tt\_VHM search regions are numbered 1, 2, 3, and 4, respectively. The T2bW\_LX, T2bW\_LM, T2bW\_MXHM, T2bW\_VHM, and T2bW\_HXHM search regions are numbered 1, 2, 3, 4, and 5 respectively. In regions with $ {m_{\tilde{\chi}^0_1 }} $ similar to $ {m_{\tilde{ \mathrm{t} } }} $, the different search regions can have similar sensitivity, which leads to the fluctuations in choice of search regions in neighboring bins that is seen in some areas. |
png pdf |
Figure 7-c:
Search regions providing the most stringent limits in the $ {m_{\tilde{ \mathrm{t} } }} $-$ {m_{\tilde{\chi}^0_1 }} $ plane in the T2tt signal topology (a) and the T2bW signal topologies for mass splitting parameter values $x =$ 0.25, 0.50, 0.75. The T2tt\_LM, T2tt\_MM, T2tt\_HM, and T2tt\_VHM search regions are numbered 1, 2, 3, and 4, respectively. The T2bW\_LX, T2bW\_LM, T2bW\_MXHM, T2bW\_VHM, and T2bW\_HXHM search regions are numbered 1, 2, 3, 4, and 5 respectively. In regions with $ {m_{\tilde{\chi}^0_1 }} $ similar to $ {m_{\tilde{ \mathrm{t} } }} $, the different search regions can have similar sensitivity, which leads to the fluctuations in choice of search regions in neighboring bins that is seen in some areas. |

png pdf |
Figure 7-d:
Search regions providing the most stringent limits in the $ {m_{\tilde{ \mathrm{t} } }} $-$ {m_{\tilde{\chi}^0_1 }} $ plane in the T2tt signal topology (a) and the T2bW signal topologies for mass splitting parameter values $x =$ 0.25, 0.50, 0.75. The T2tt\_LM, T2tt\_MM, T2tt\_HM, and T2tt\_VHM search regions are numbered 1, 2, 3, and 4, respectively. The T2bW\_LX, T2bW\_LM, T2bW\_MXHM, T2bW\_VHM, and T2bW\_HXHM search regions are numbered 1, 2, 3, 4, and 5 respectively. In regions with $ {m_{\tilde{\chi}^0_1 }} $ similar to $ {m_{\tilde{ \mathrm{t} } }} $, the different search regions can have similar sensitivity, which leads to the fluctuations in choice of search regions in neighboring bins that is seen in some areas. |
png pdf |
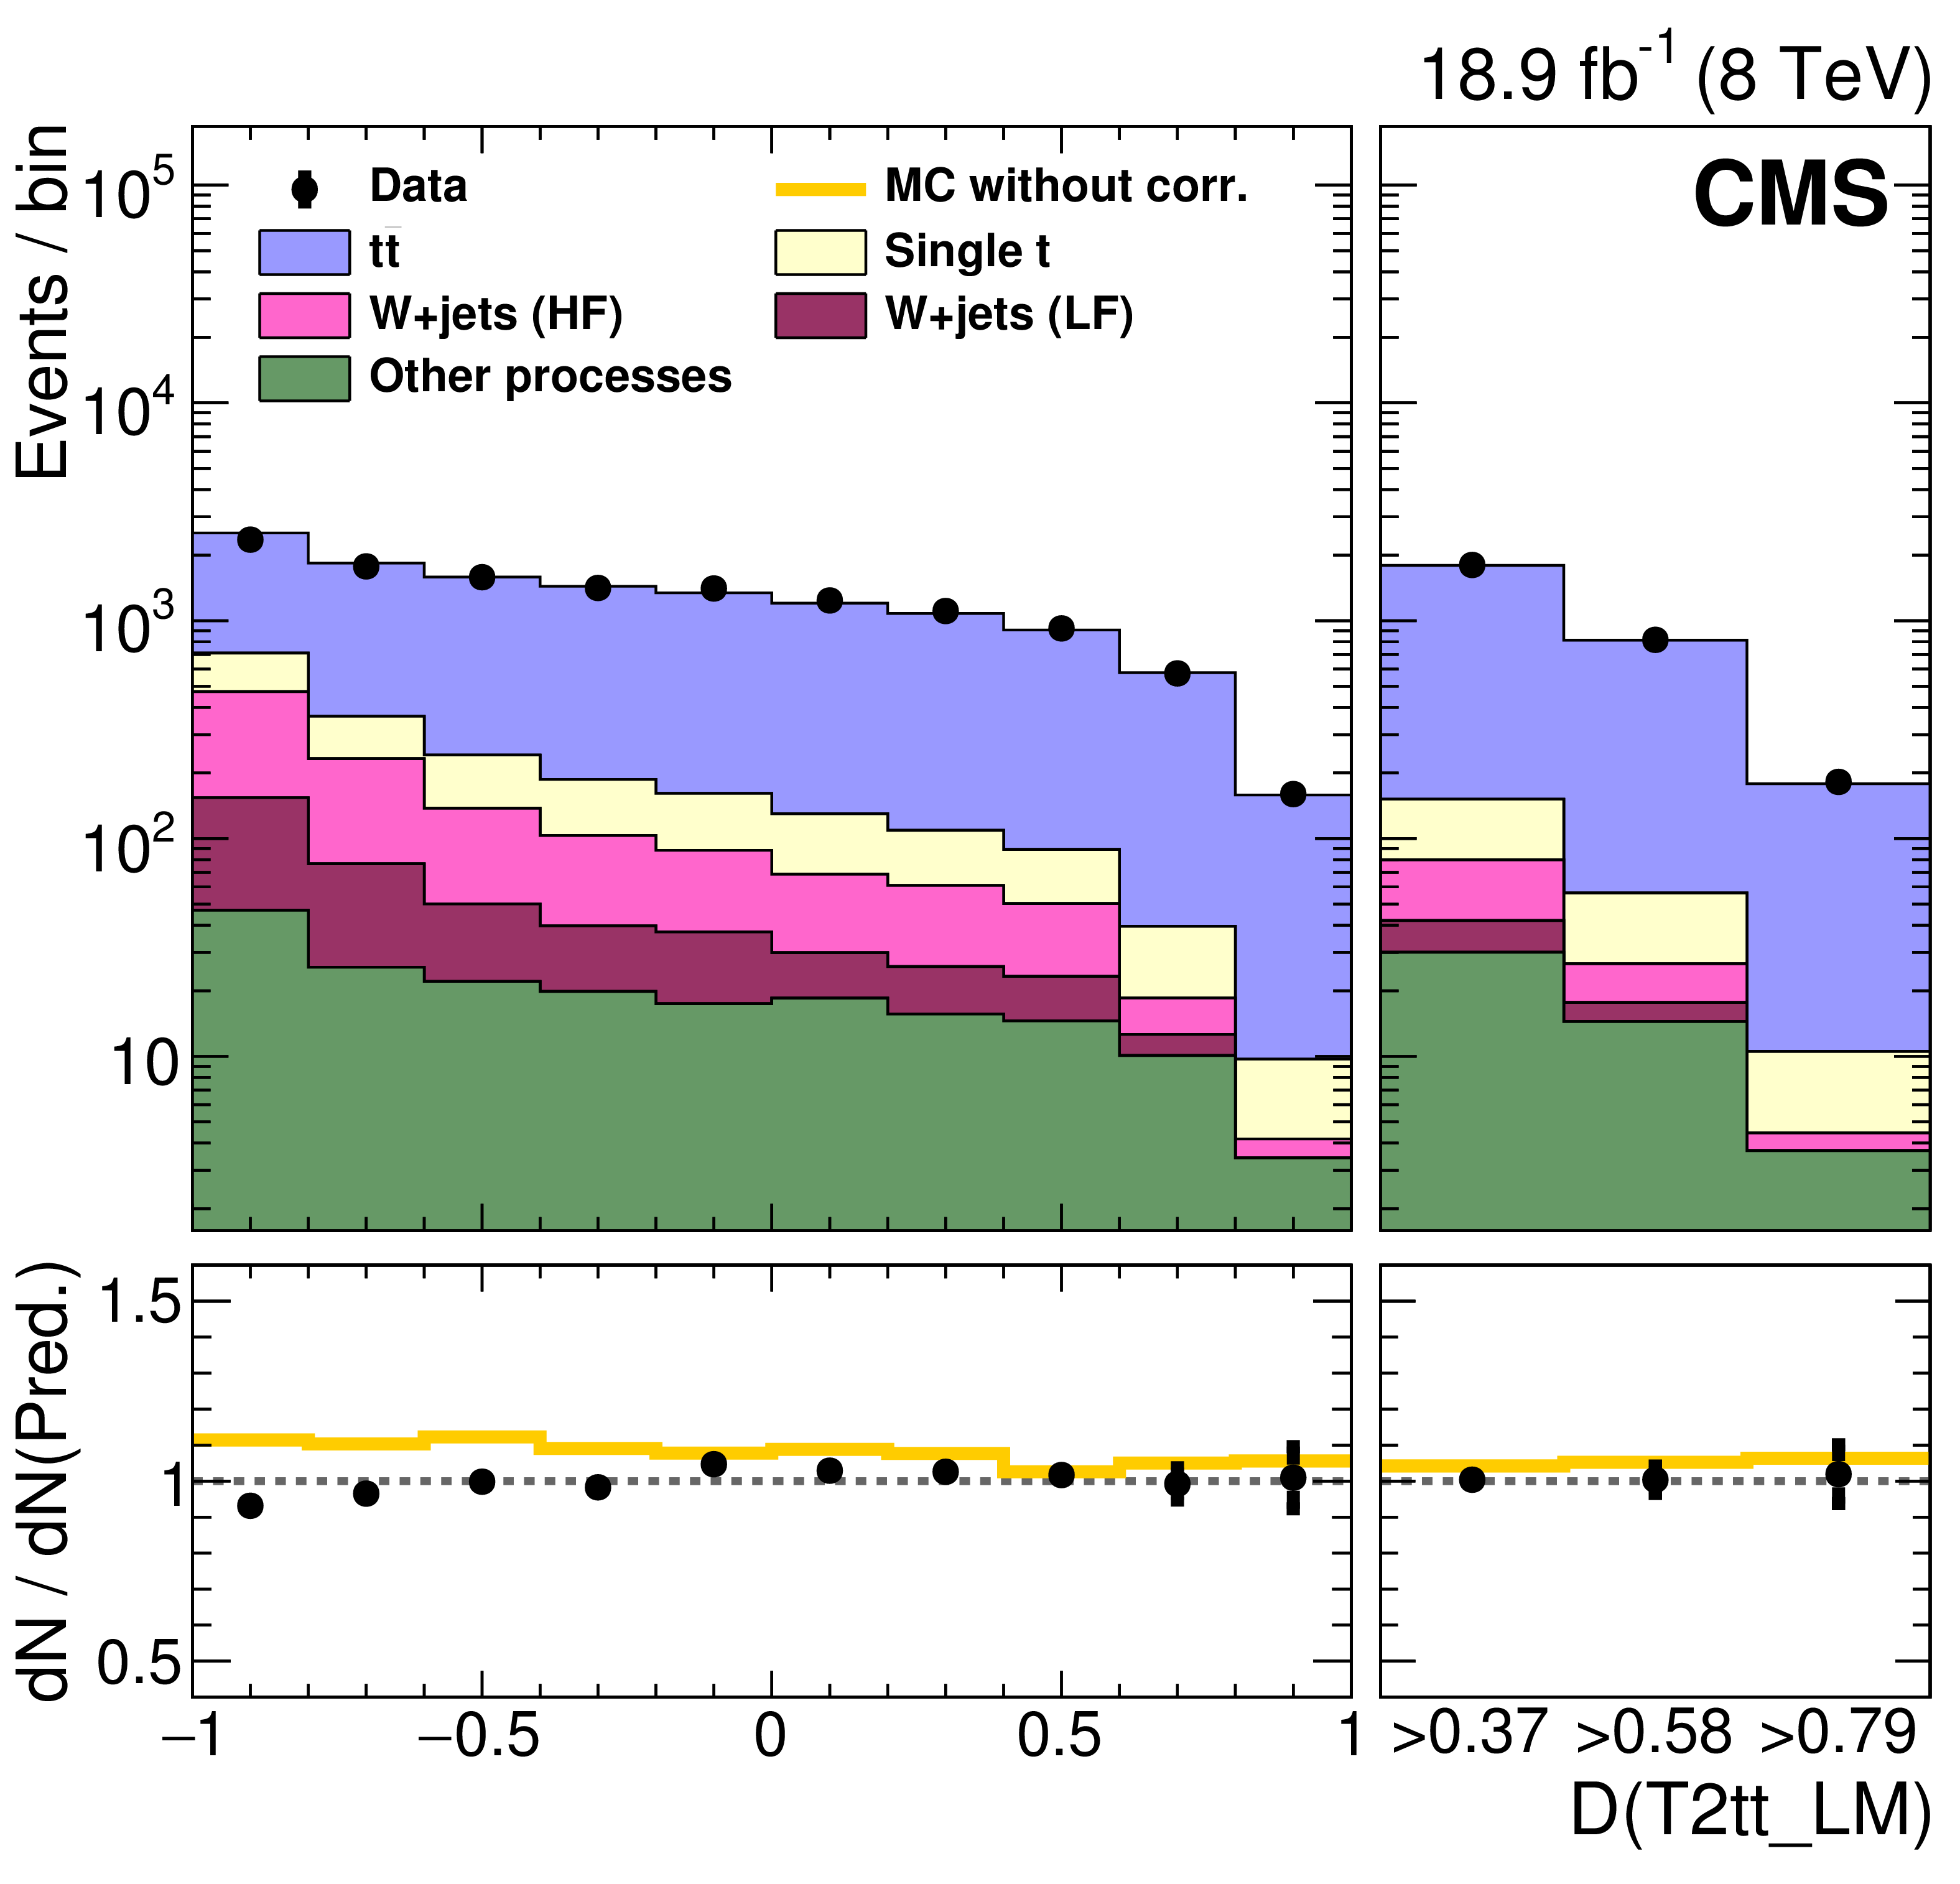
Figure 8-a:
Comparisons of BDT discriminator (D) outputs for data and corrected MC simulation for the 1$\ell $ closure samples, with leptons removed, for the four T2tt validation regions. The three bins at the far right in each plot are used to validate the MC performance in the signal region and its two extensions. The points with error bars represent the event yields in data. The histogram labelled ``MC without corr." in the bottom pane of each figure plots the ratio whose numerator is the total MC event count before corrections and whose denominator is the event count for the corrected MC shown in the upper pane. The other histograms indicate the contributions of the various background processes. The ``LF'' and ``HF'' labels denote the subsets of the W+jets process in which the boson is produced in association with light and heavy flavour (b) quark jets, respectively. |

png pdf |
Figure 8-b:
Comparisons of BDT discriminator (D) outputs for data and corrected MC simulation for the 1$\ell $ closure samples, with leptons removed, for the four T2tt validation regions. The three bins at the far right in each plot are used to validate the MC performance in the signal region and its two extensions. The points with error bars represent the event yields in data. The histogram labelled ``MC without corr." in the bottom pane of each figure plots the ratio whose numerator is the total MC event count before corrections and whose denominator is the event count for the corrected MC shown in the upper pane. The other histograms indicate the contributions of the various background processes. The ``LF'' and ``HF'' labels denote the subsets of the W+jets process in which the boson is produced in association with light and heavy flavour (b) quark jets, respectively. |
png pdf |
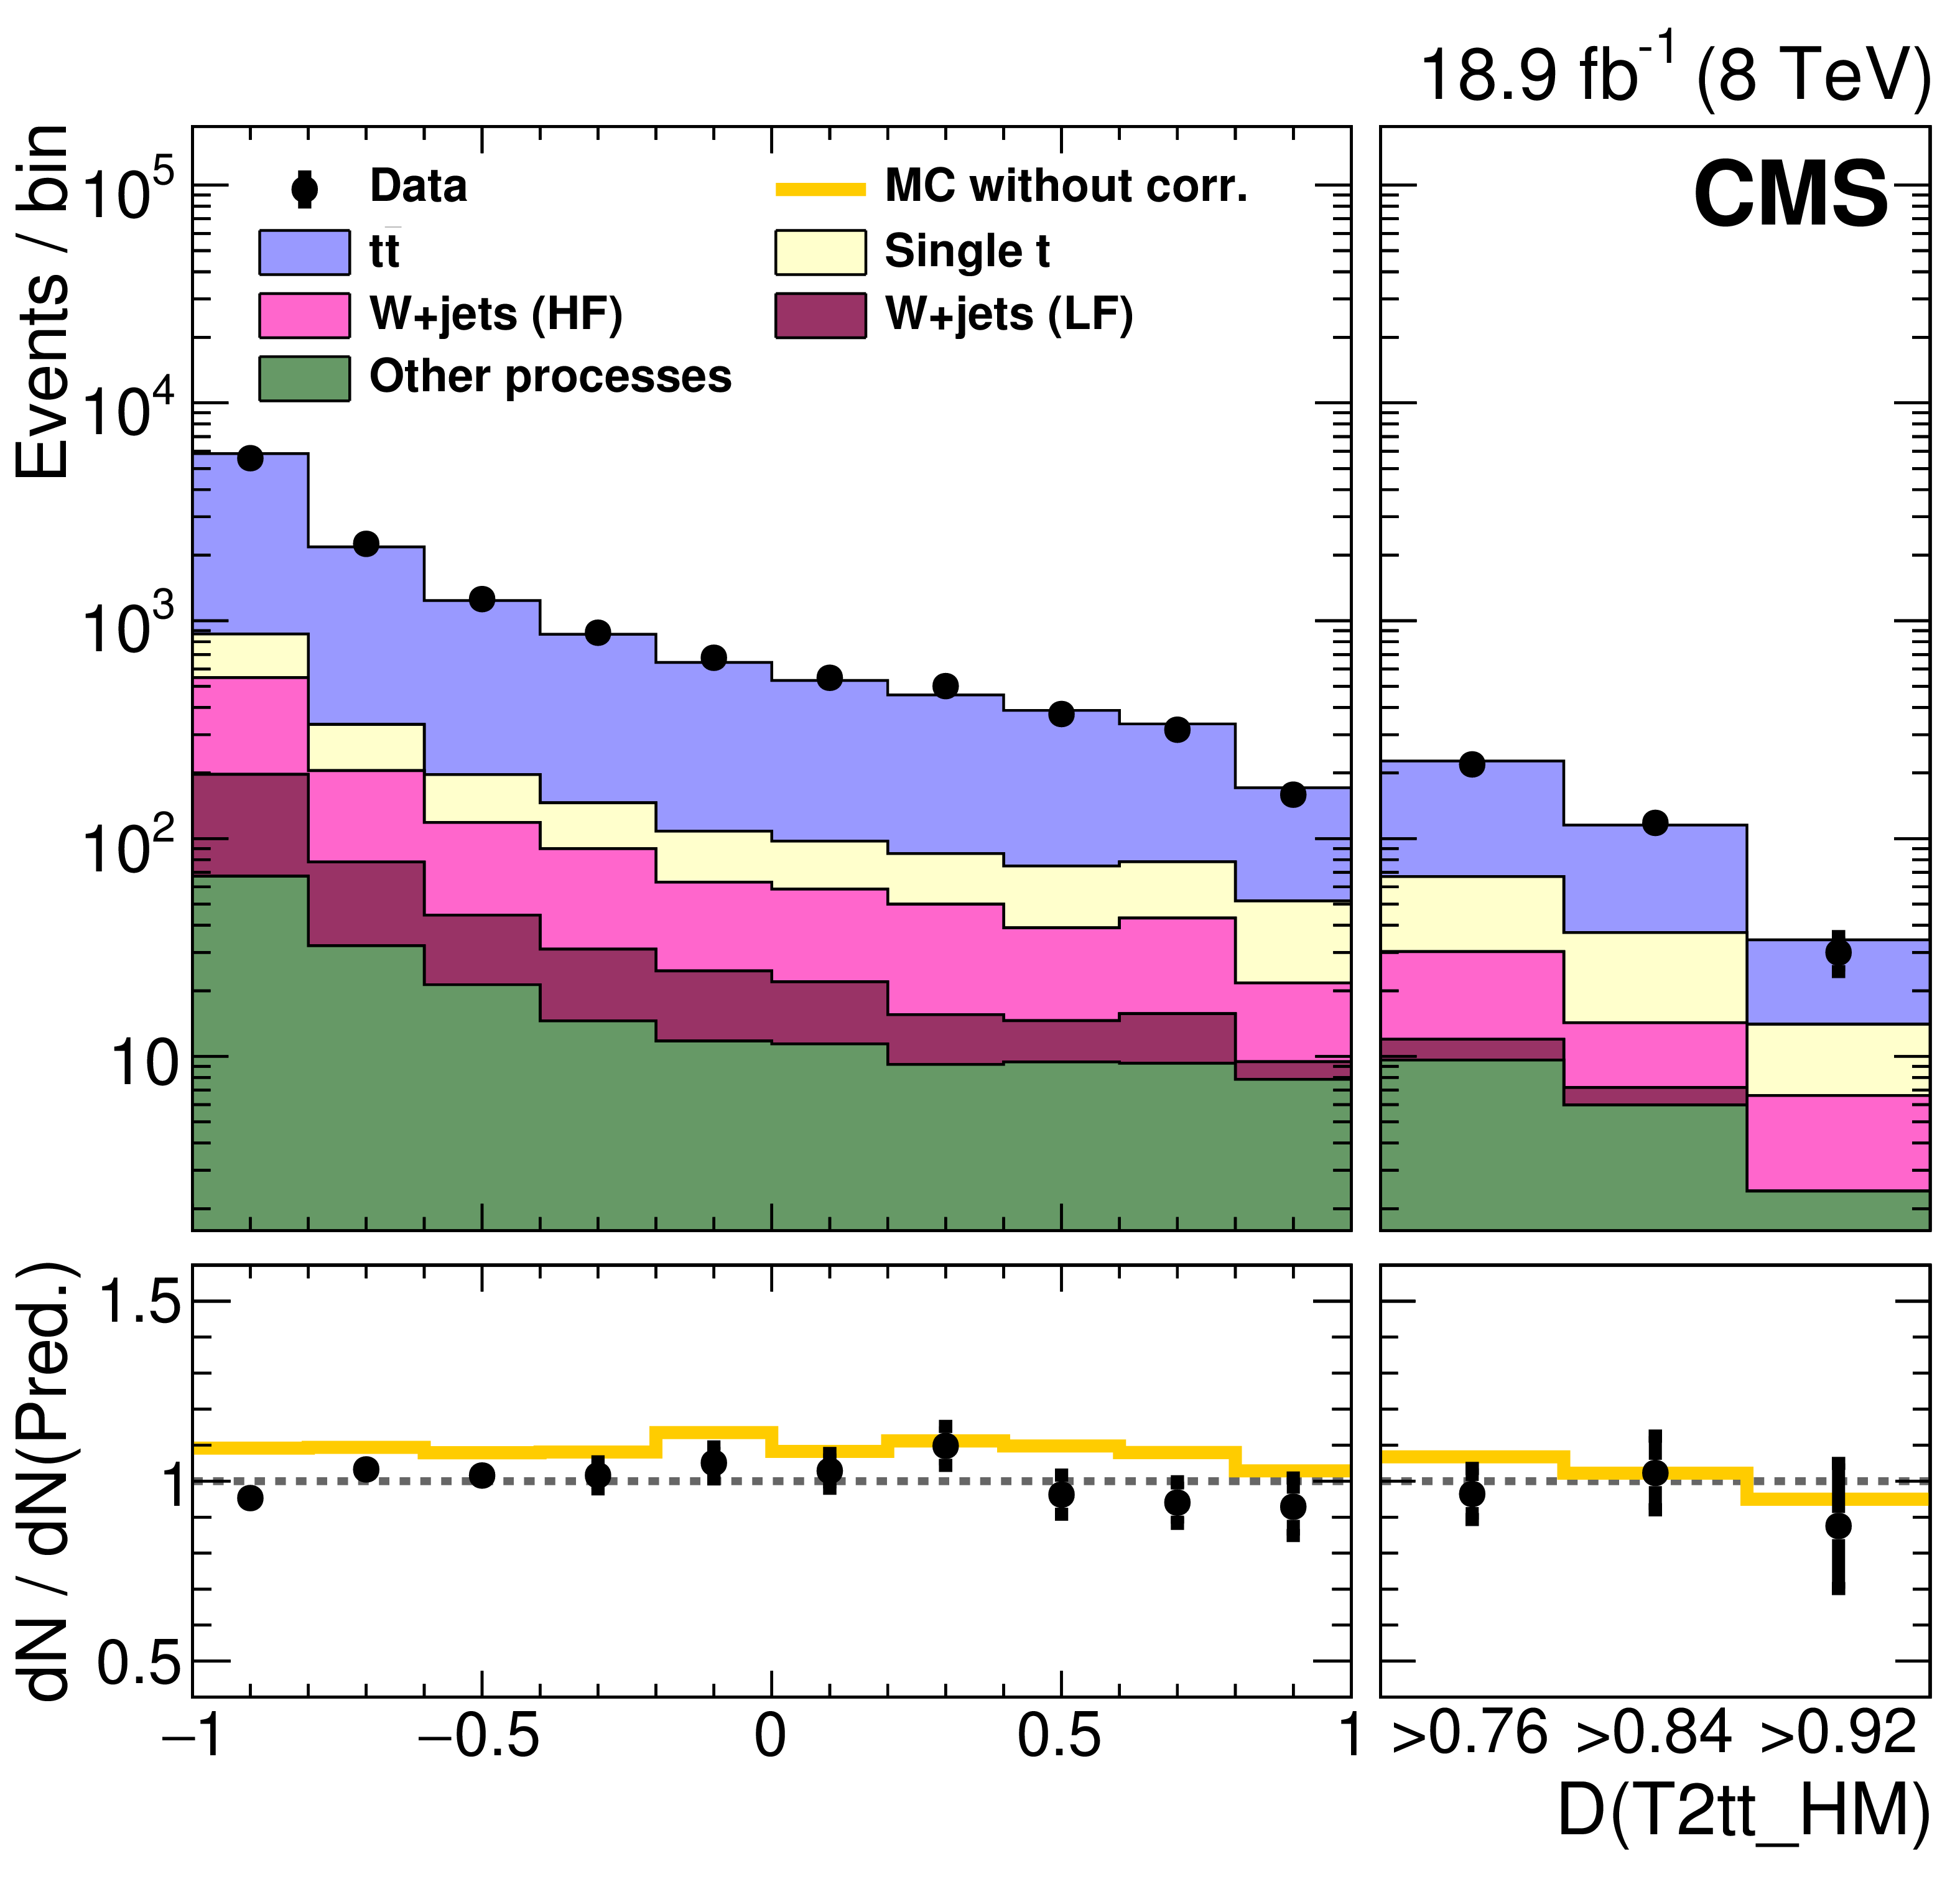
Figure 8-c:
Comparisons of BDT discriminator (D) outputs for data and corrected MC simulation for the 1$\ell $ closure samples, with leptons removed, for the four T2tt validation regions. The three bins at the far right in each plot are used to validate the MC performance in the signal region and its two extensions. The points with error bars represent the event yields in data. The histogram labelled ``MC without corr." in the bottom pane of each figure plots the ratio whose numerator is the total MC event count before corrections and whose denominator is the event count for the corrected MC shown in the upper pane. The other histograms indicate the contributions of the various background processes. The ``LF'' and ``HF'' labels denote the subsets of the W+jets process in which the boson is produced in association with light and heavy flavour (b) quark jets, respectively. |
png pdf |
Figure 8-d:
Comparisons of BDT discriminator (D) outputs for data and corrected MC simulation for the 1$\ell $ closure samples, with leptons removed, for the four T2tt validation regions. The three bins at the far right in each plot are used to validate the MC performance in the signal region and its two extensions. The points with error bars represent the event yields in data. The histogram labelled ``MC without corr." in the bottom pane of each figure plots the ratio whose numerator is the total MC event count before corrections and whose denominator is the event count for the corrected MC shown in the upper pane. The other histograms indicate the contributions of the various background processes. The ``LF'' and ``HF'' labels denote the subsets of the W+jets process in which the boson is produced in association with light and heavy flavour (b) quark jets, respectively. |
png pdf |
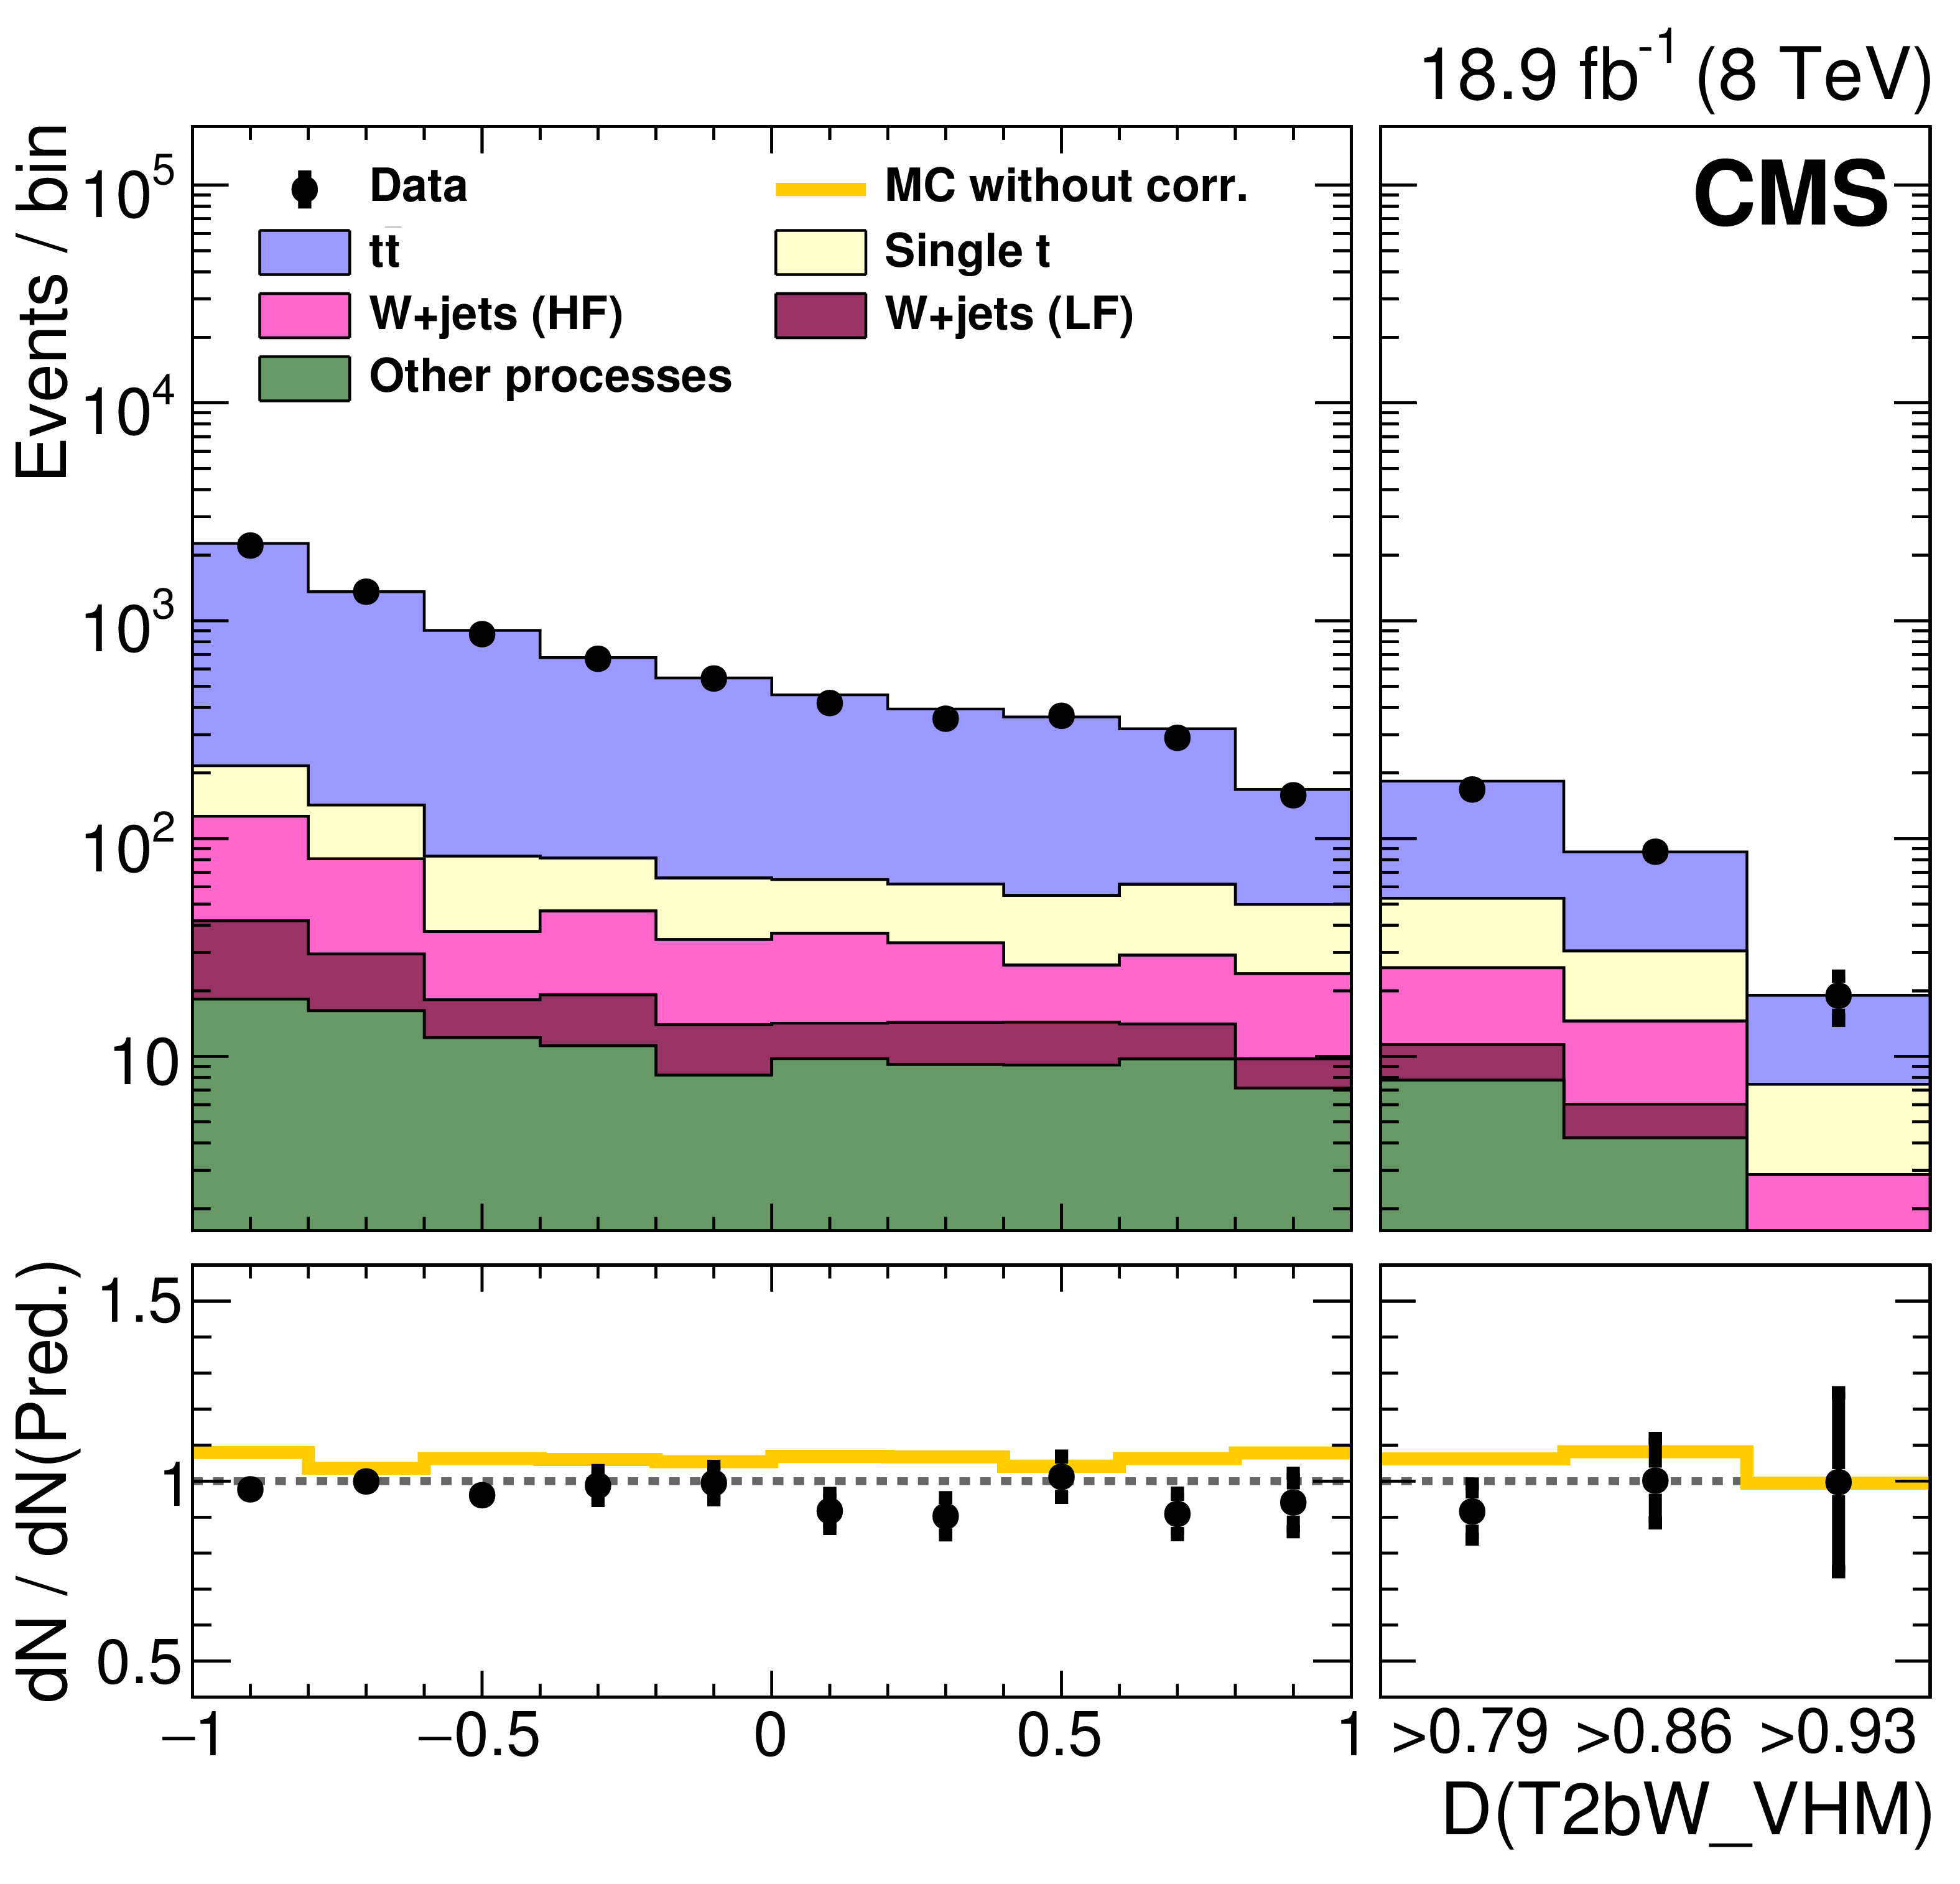
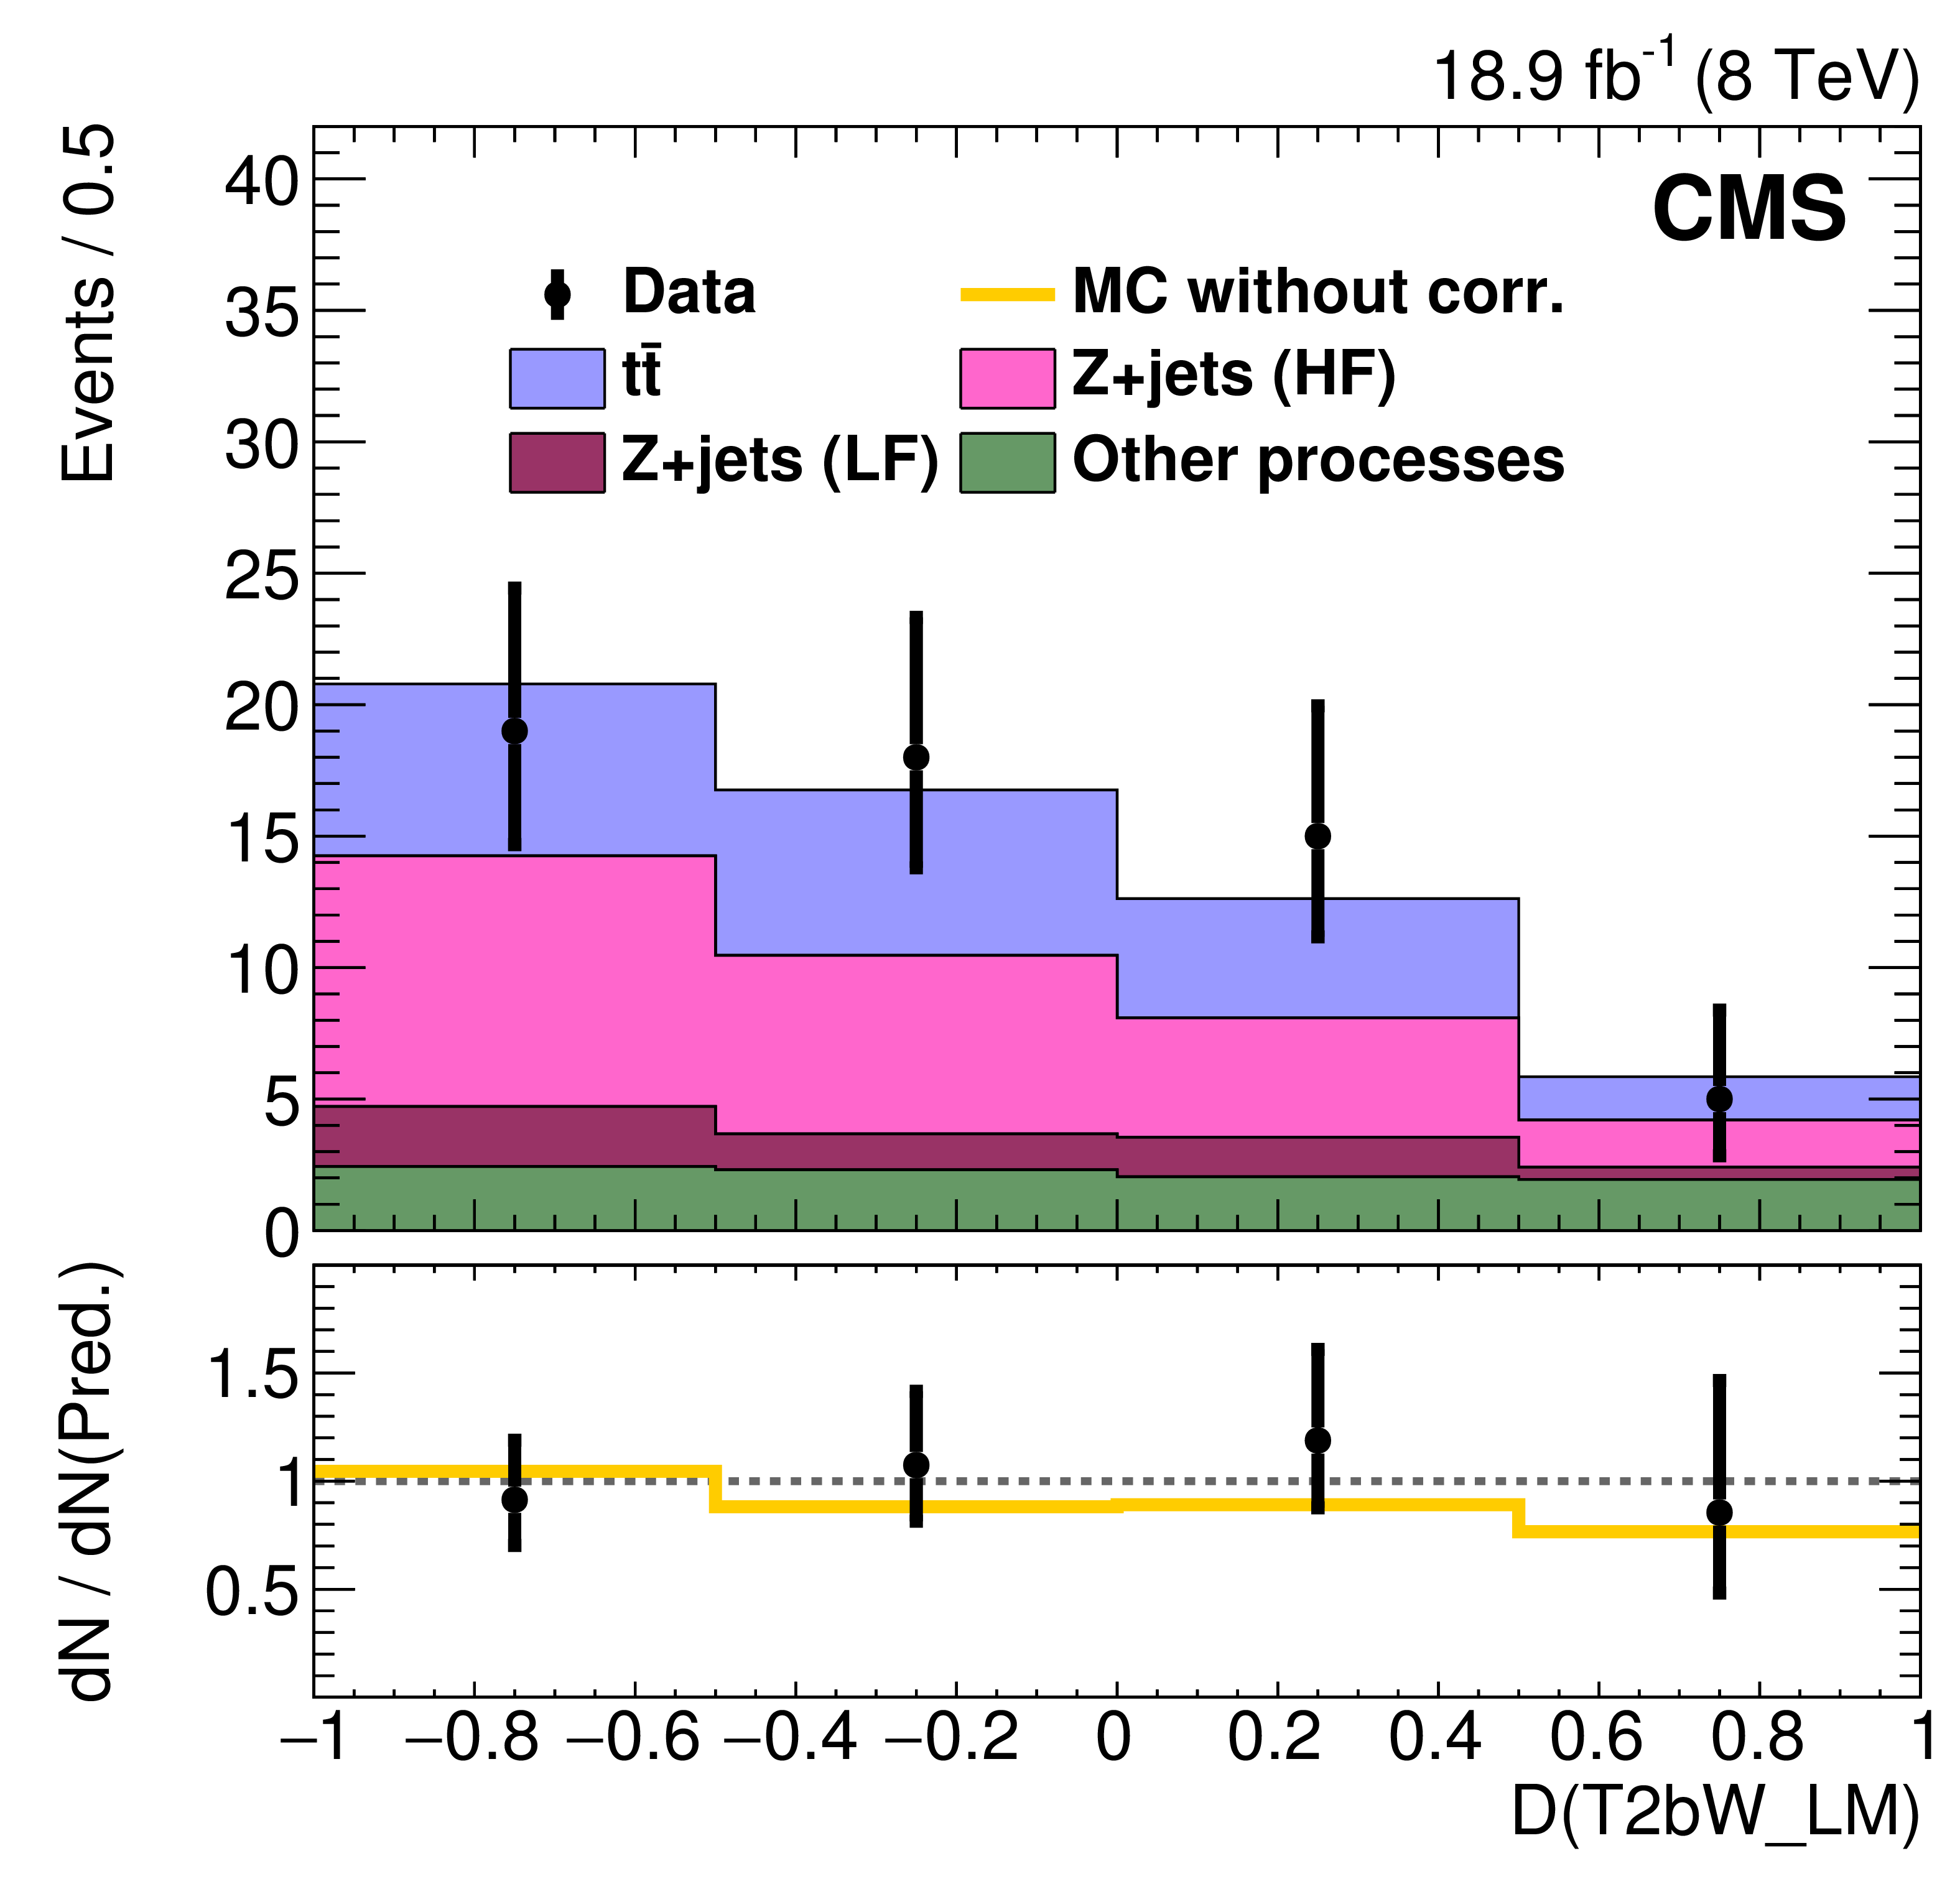
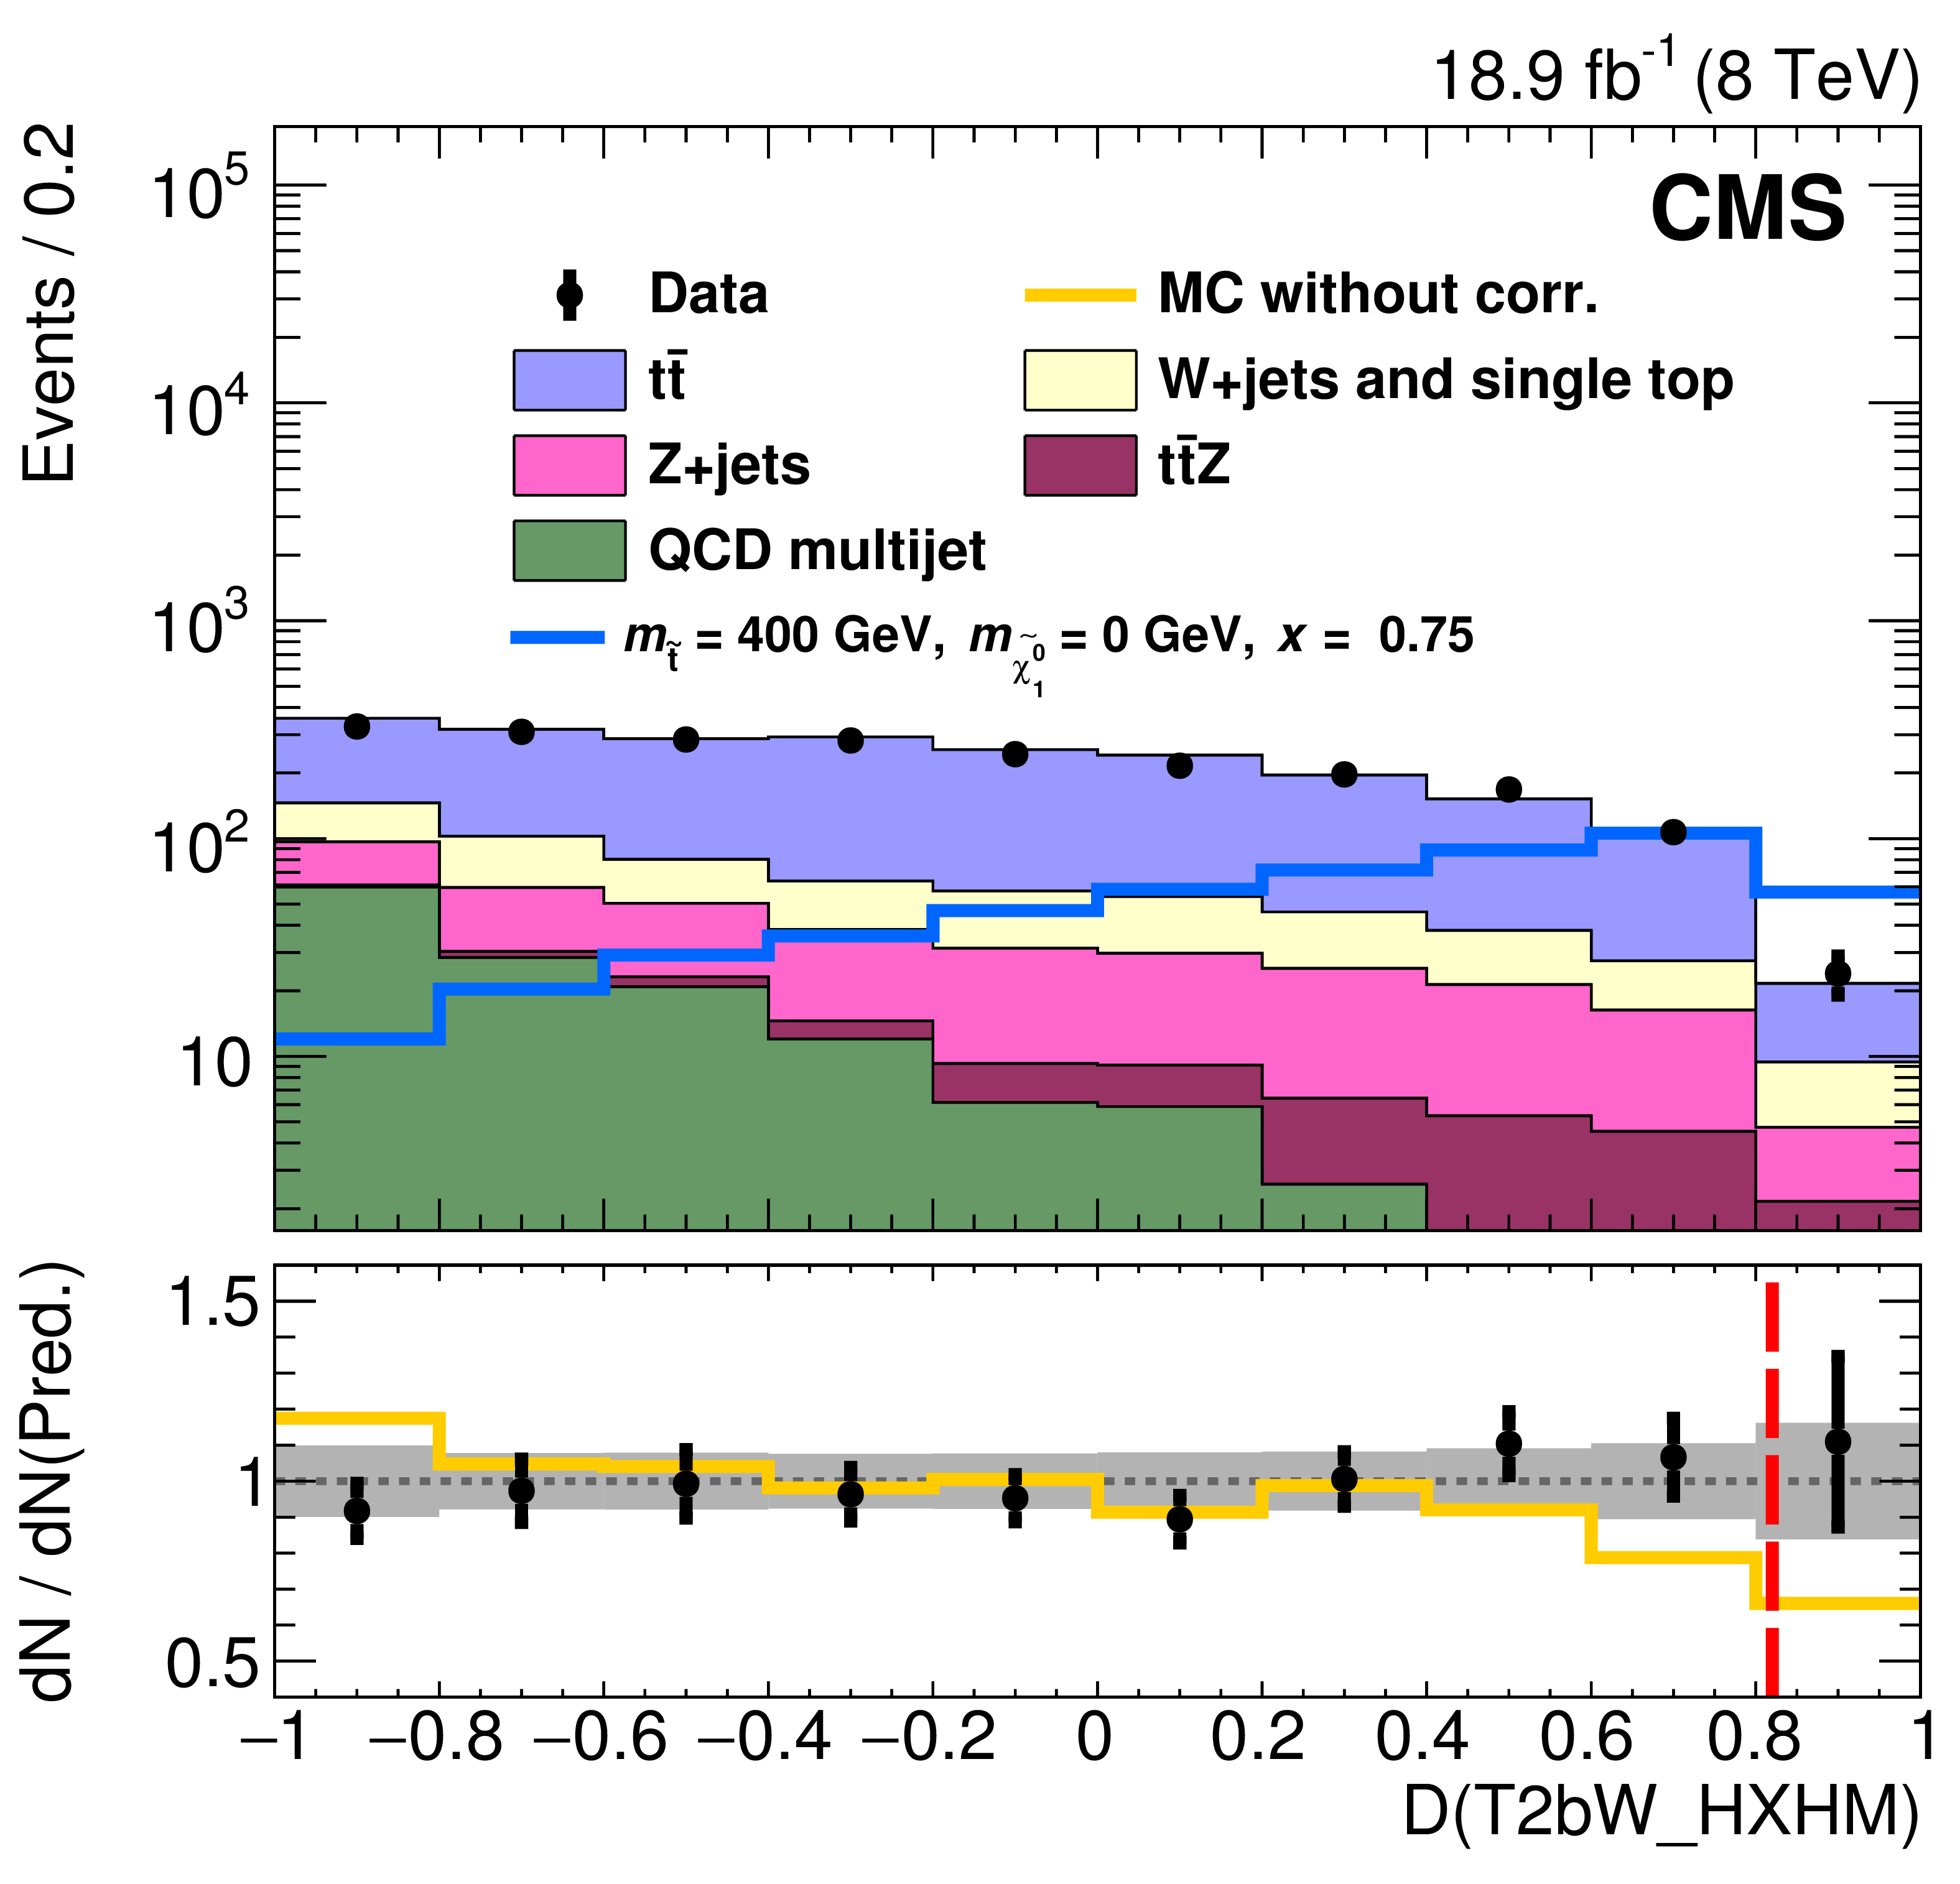
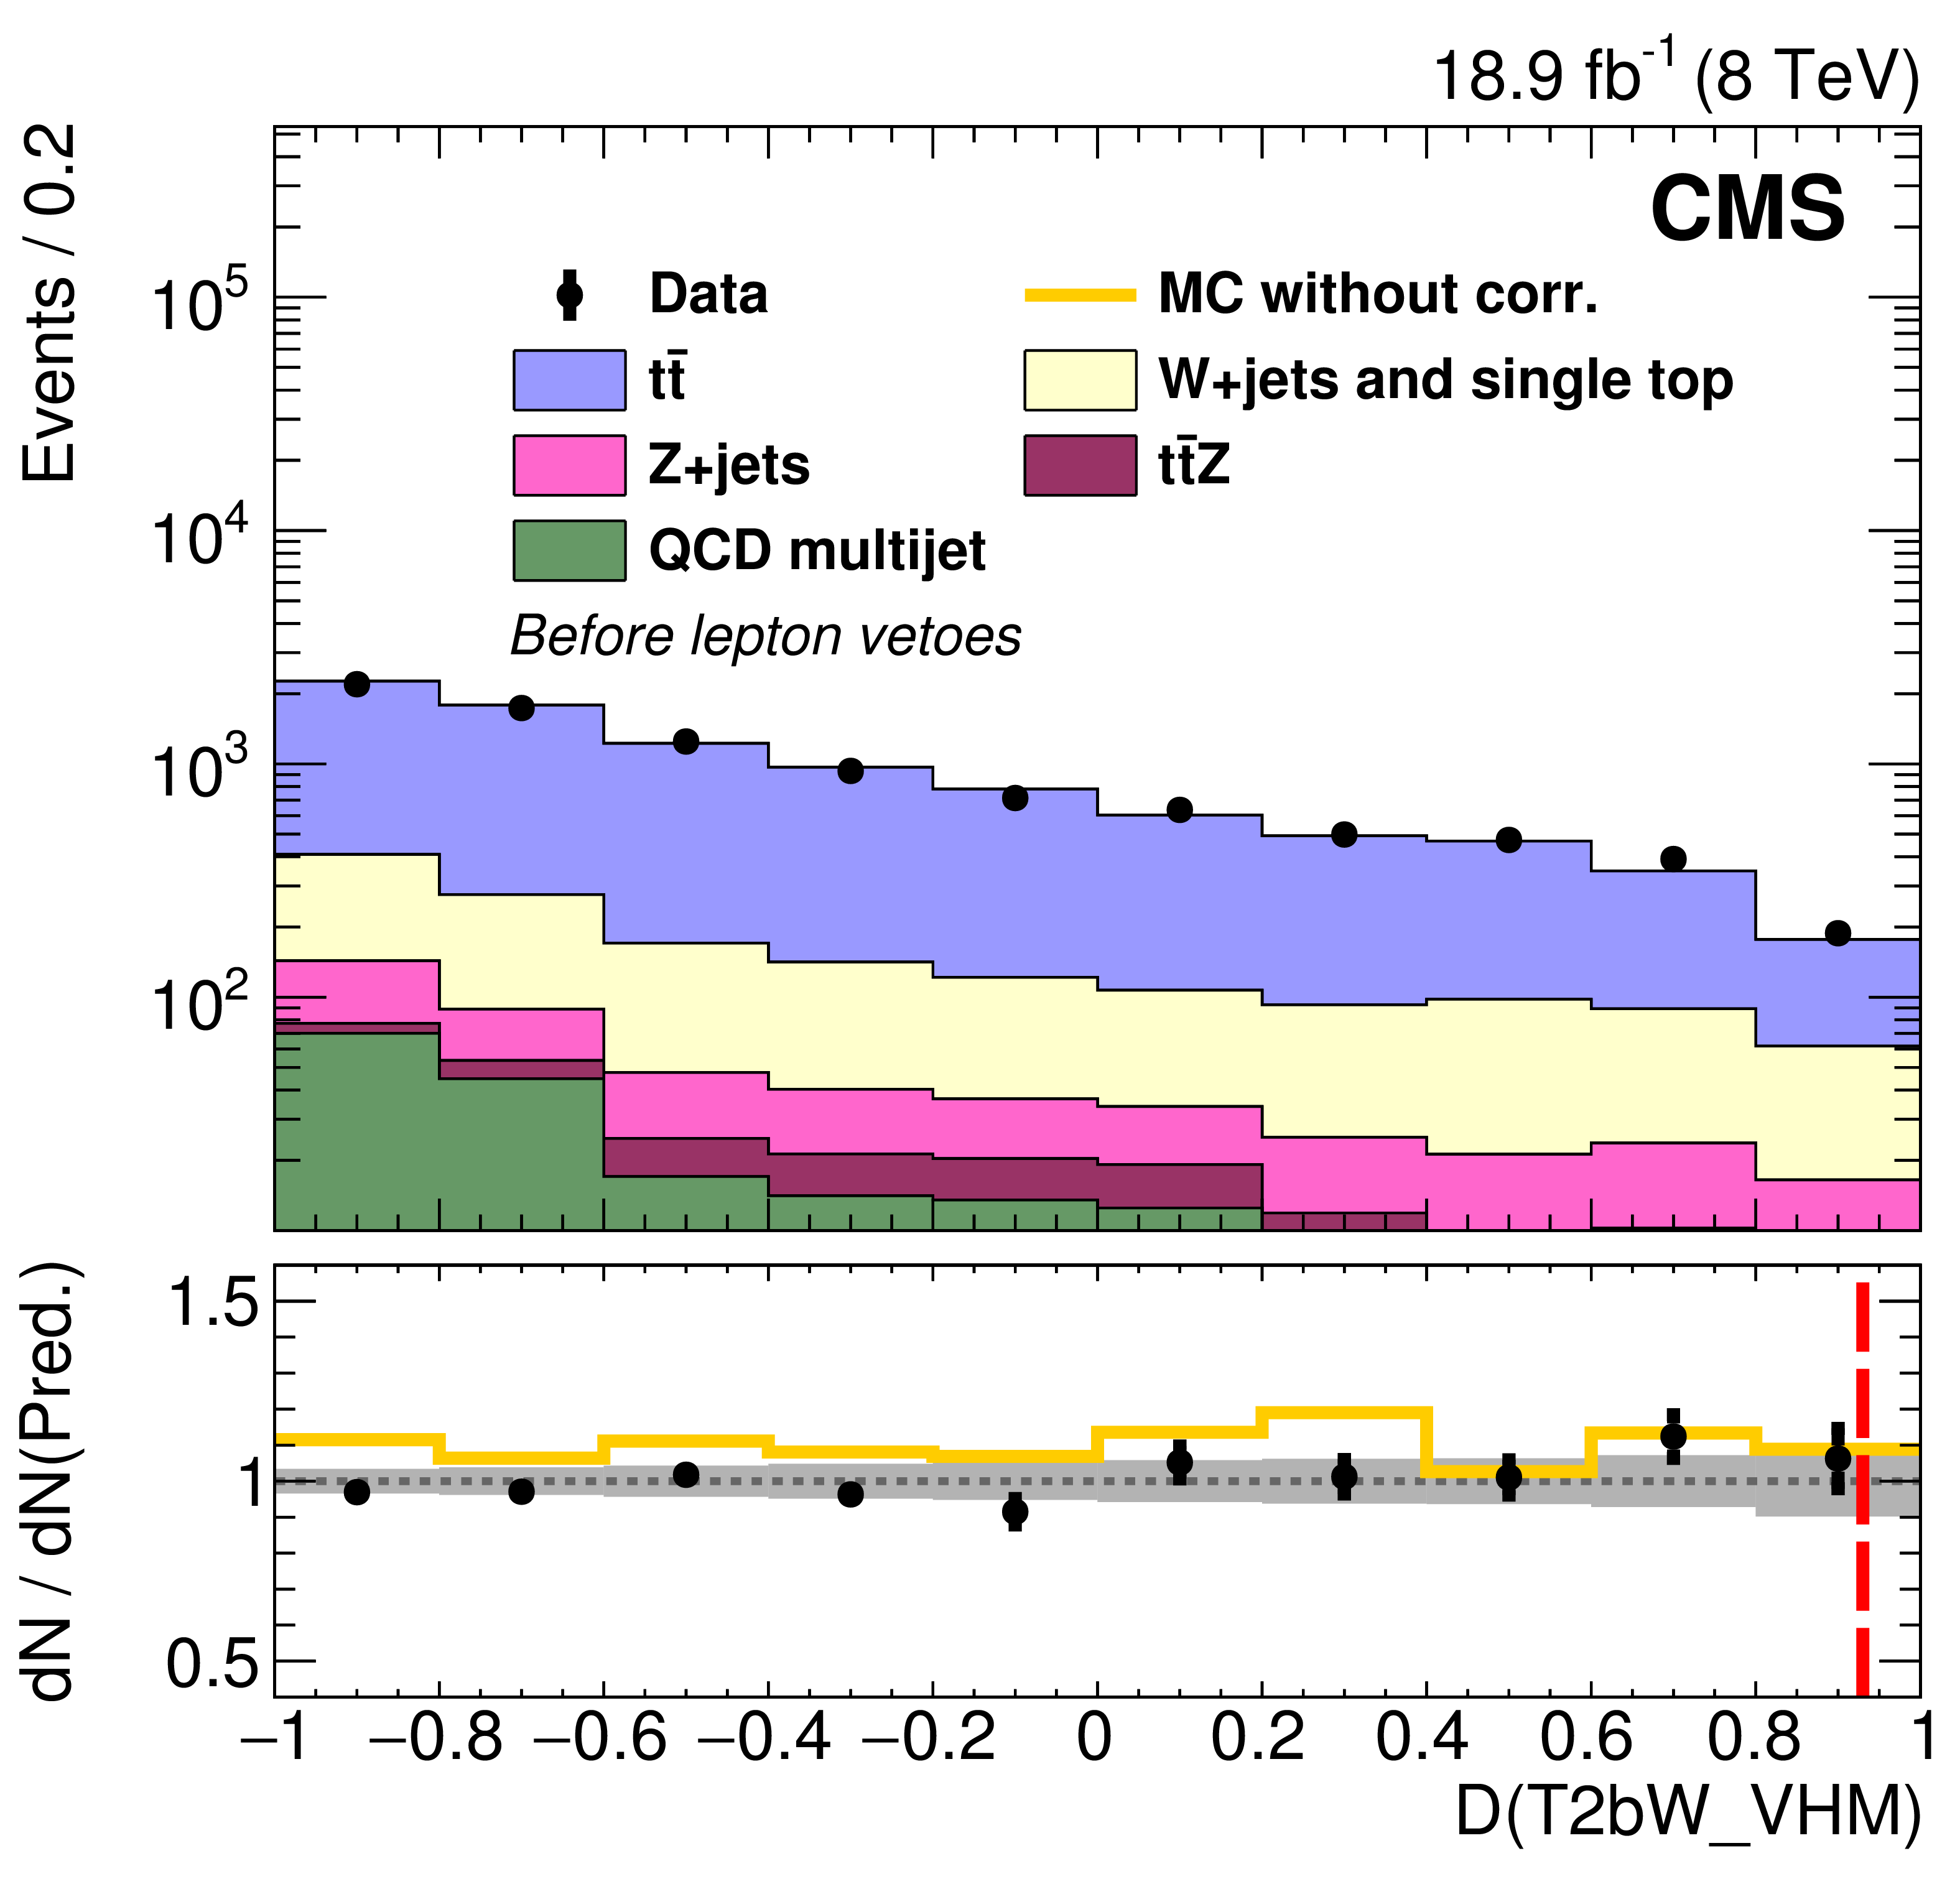
Figure 9-a:
Comparisons of BDT discriminator (D) outputs for data and corrected MC simulation for the 1$\ell $ closure samples, with leptons removed, for the five T2bW validation regions. The three bins at the far right in each plot are used to validate the MC performance in the signal region and its two extensions. The points with error bars represent the event yields in data. The histogram labelled ``MC without corr." in the bottom pane of each figure plots the ratio whose numerator is the total MC event count before corrections and whose denominator is the event count for the corrected MC shown in the upper pane. The other histograms indicate the contributions of the various background processes. The ``LF'' and ``HF'' labels denote the subsets of the W+jets process in which the boson is produced in association with light and heavy flavour (b) quark jets, respectively. |
png pdf |
Figure 9-b:
Comparisons of BDT discriminator (D) outputs for data and corrected MC simulation for the 1$\ell $ closure samples, with leptons removed, for the five T2bW validation regions. The three bins at the far right in each plot are used to validate the MC performance in the signal region and its two extensions. The points with error bars represent the event yields in data. The histogram labelled ``MC without corr." in the bottom pane of each figure plots the ratio whose numerator is the total MC event count before corrections and whose denominator is the event count for the corrected MC shown in the upper pane. The other histograms indicate the contributions of the various background processes. The ``LF'' and ``HF'' labels denote the subsets of the W+jets process in which the boson is produced in association with light and heavy flavour (b) quark jets, respectively. |
png pdf |
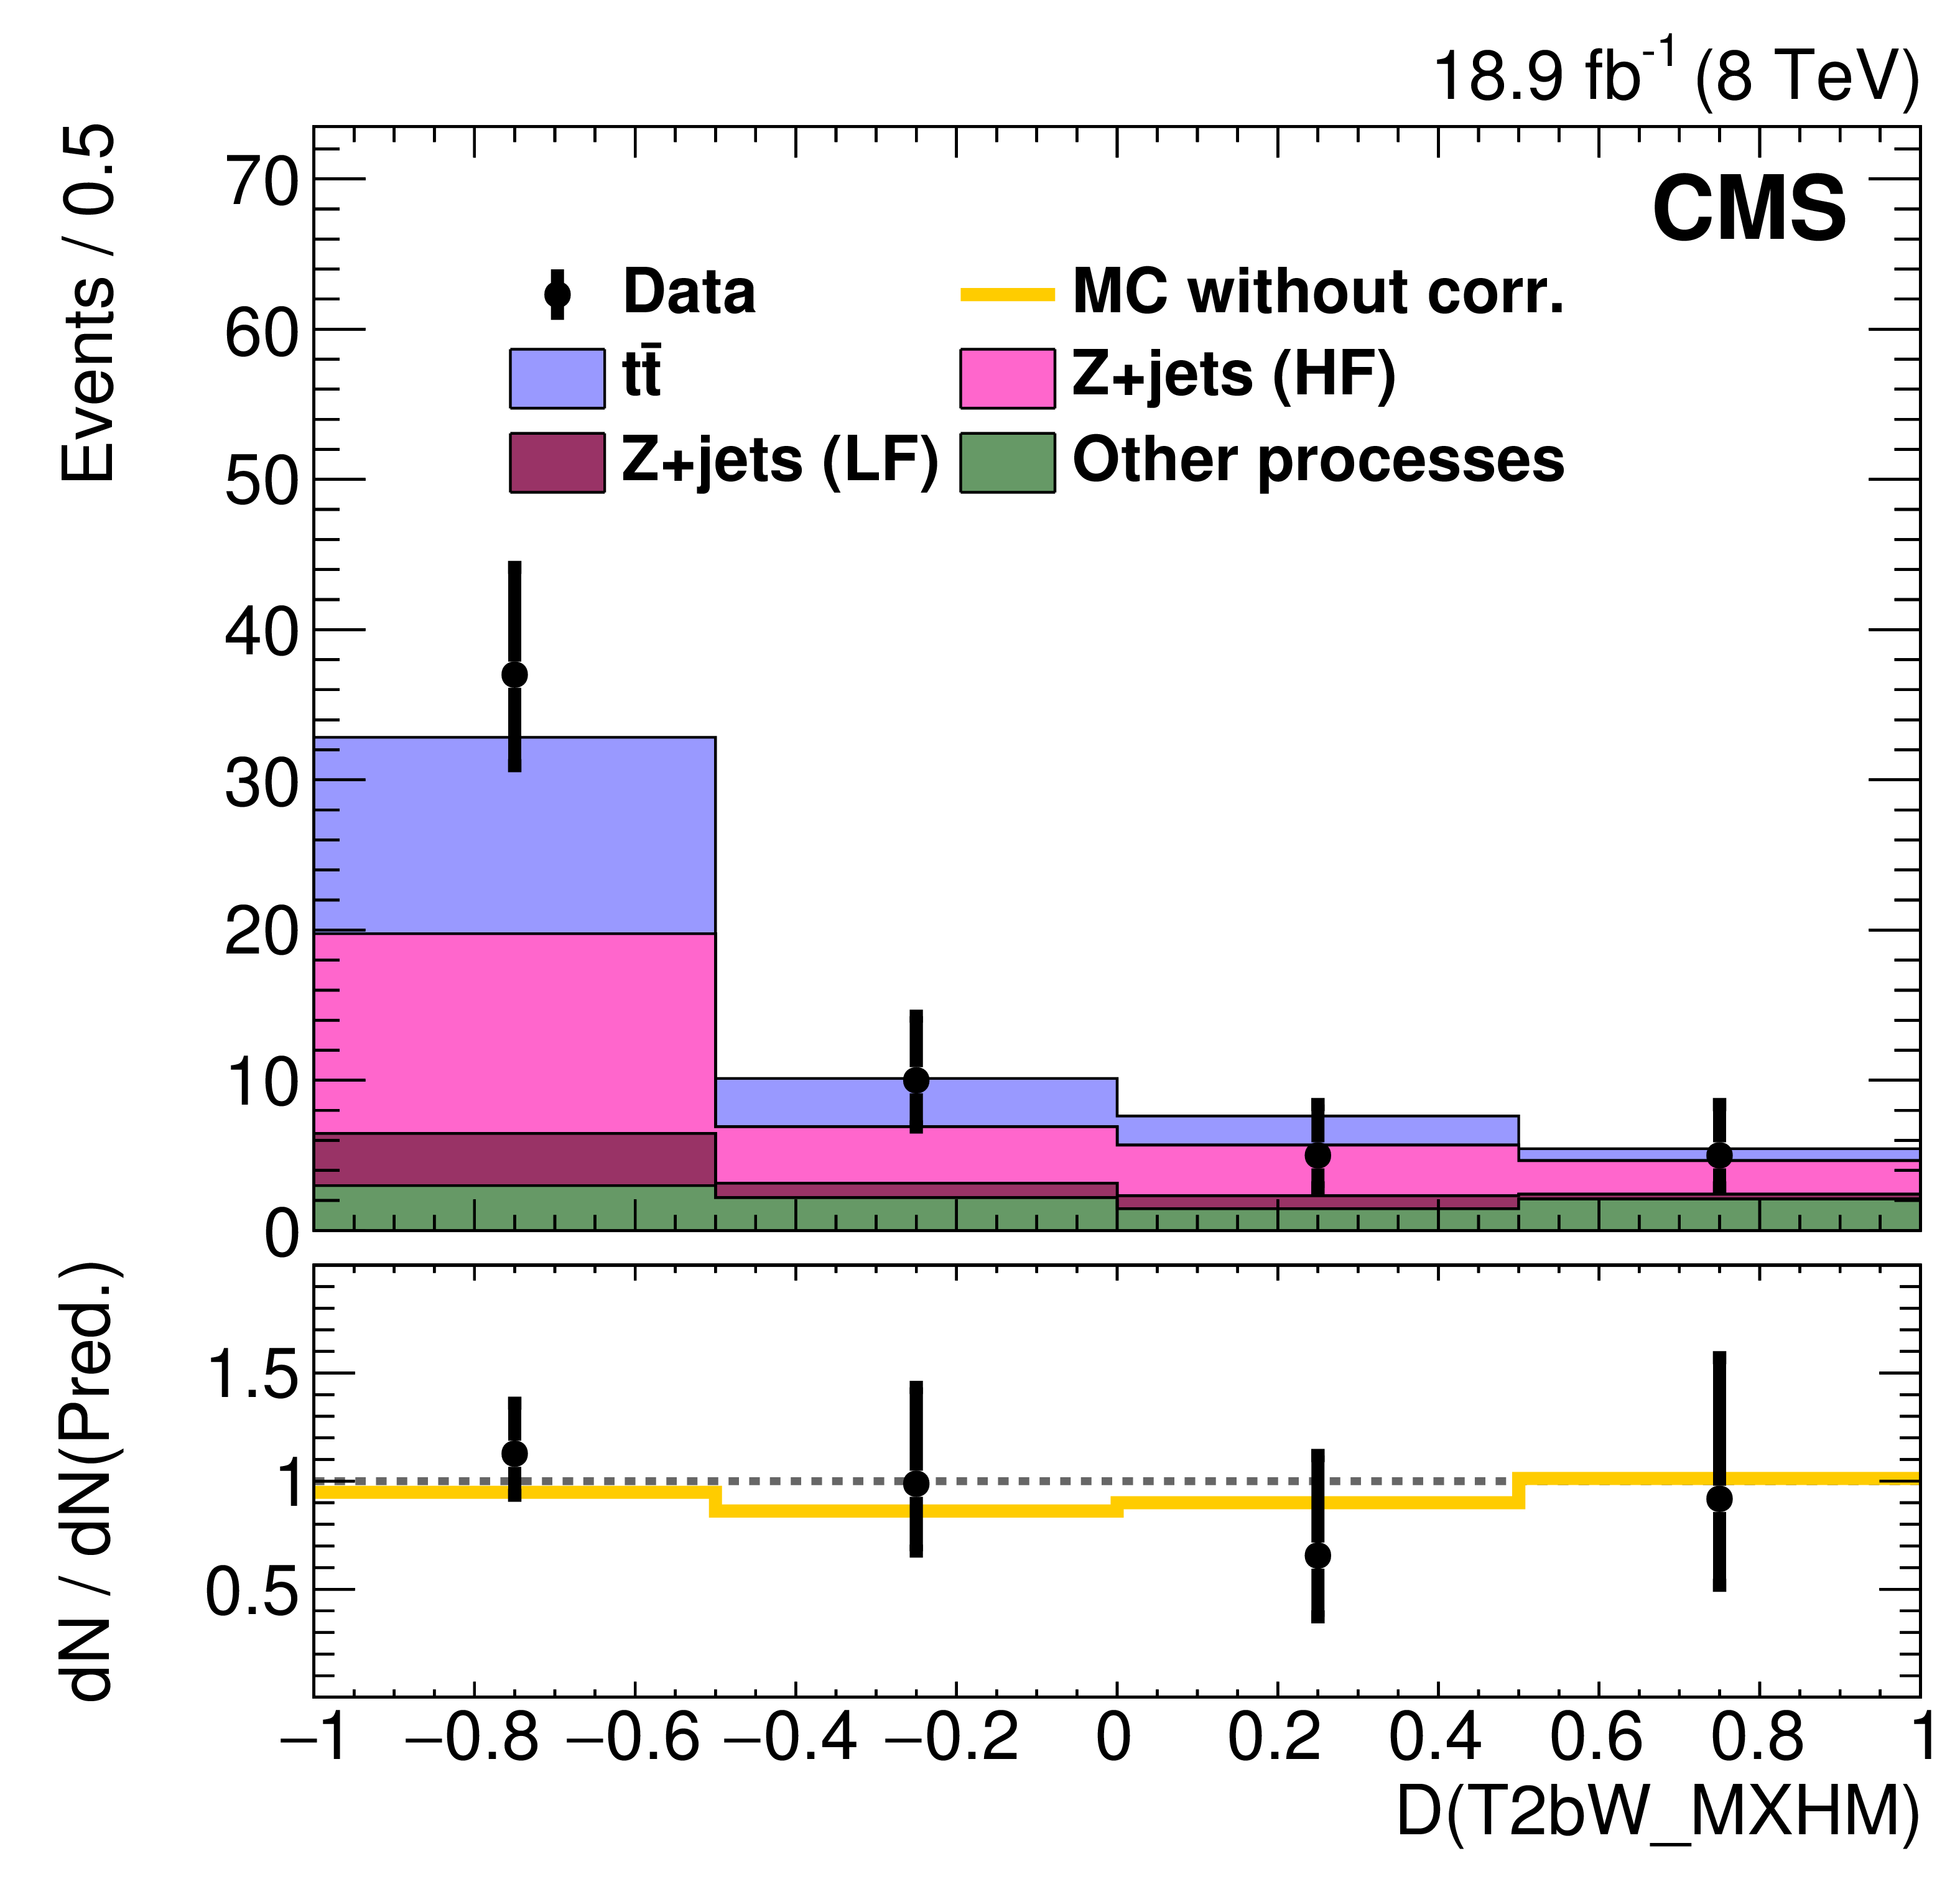
Figure 9-c:
Comparisons of BDT discriminator (D) outputs for data and corrected MC simulation for the 1$\ell $ closure samples, with leptons removed, for the five T2bW validation regions. The three bins at the far right in each plot are used to validate the MC performance in the signal region and its two extensions. The points with error bars represent the event yields in data. The histogram labelled ``MC without corr." in the bottom pane of each figure plots the ratio whose numerator is the total MC event count before corrections and whose denominator is the event count for the corrected MC shown in the upper pane. The other histograms indicate the contributions of the various background processes. The ``LF'' and ``HF'' labels denote the subsets of the W+jets process in which the boson is produced in association with light and heavy flavour (b) quark jets, respectively. |

png pdf |
Figure 9-d:
Comparisons of BDT discriminator (D) outputs for data and corrected MC simulation for the 1$\ell $ closure samples, with leptons removed, for the five T2bW validation regions. The three bins at the far right in each plot are used to validate the MC performance in the signal region and its two extensions. The points with error bars represent the event yields in data. The histogram labelled ``MC without corr." in the bottom pane of each figure plots the ratio whose numerator is the total MC event count before corrections and whose denominator is the event count for the corrected MC shown in the upper pane. The other histograms indicate the contributions of the various background processes. The ``LF'' and ``HF'' labels denote the subsets of the W+jets process in which the boson is produced in association with light and heavy flavour (b) quark jets, respectively. |
png pdf |
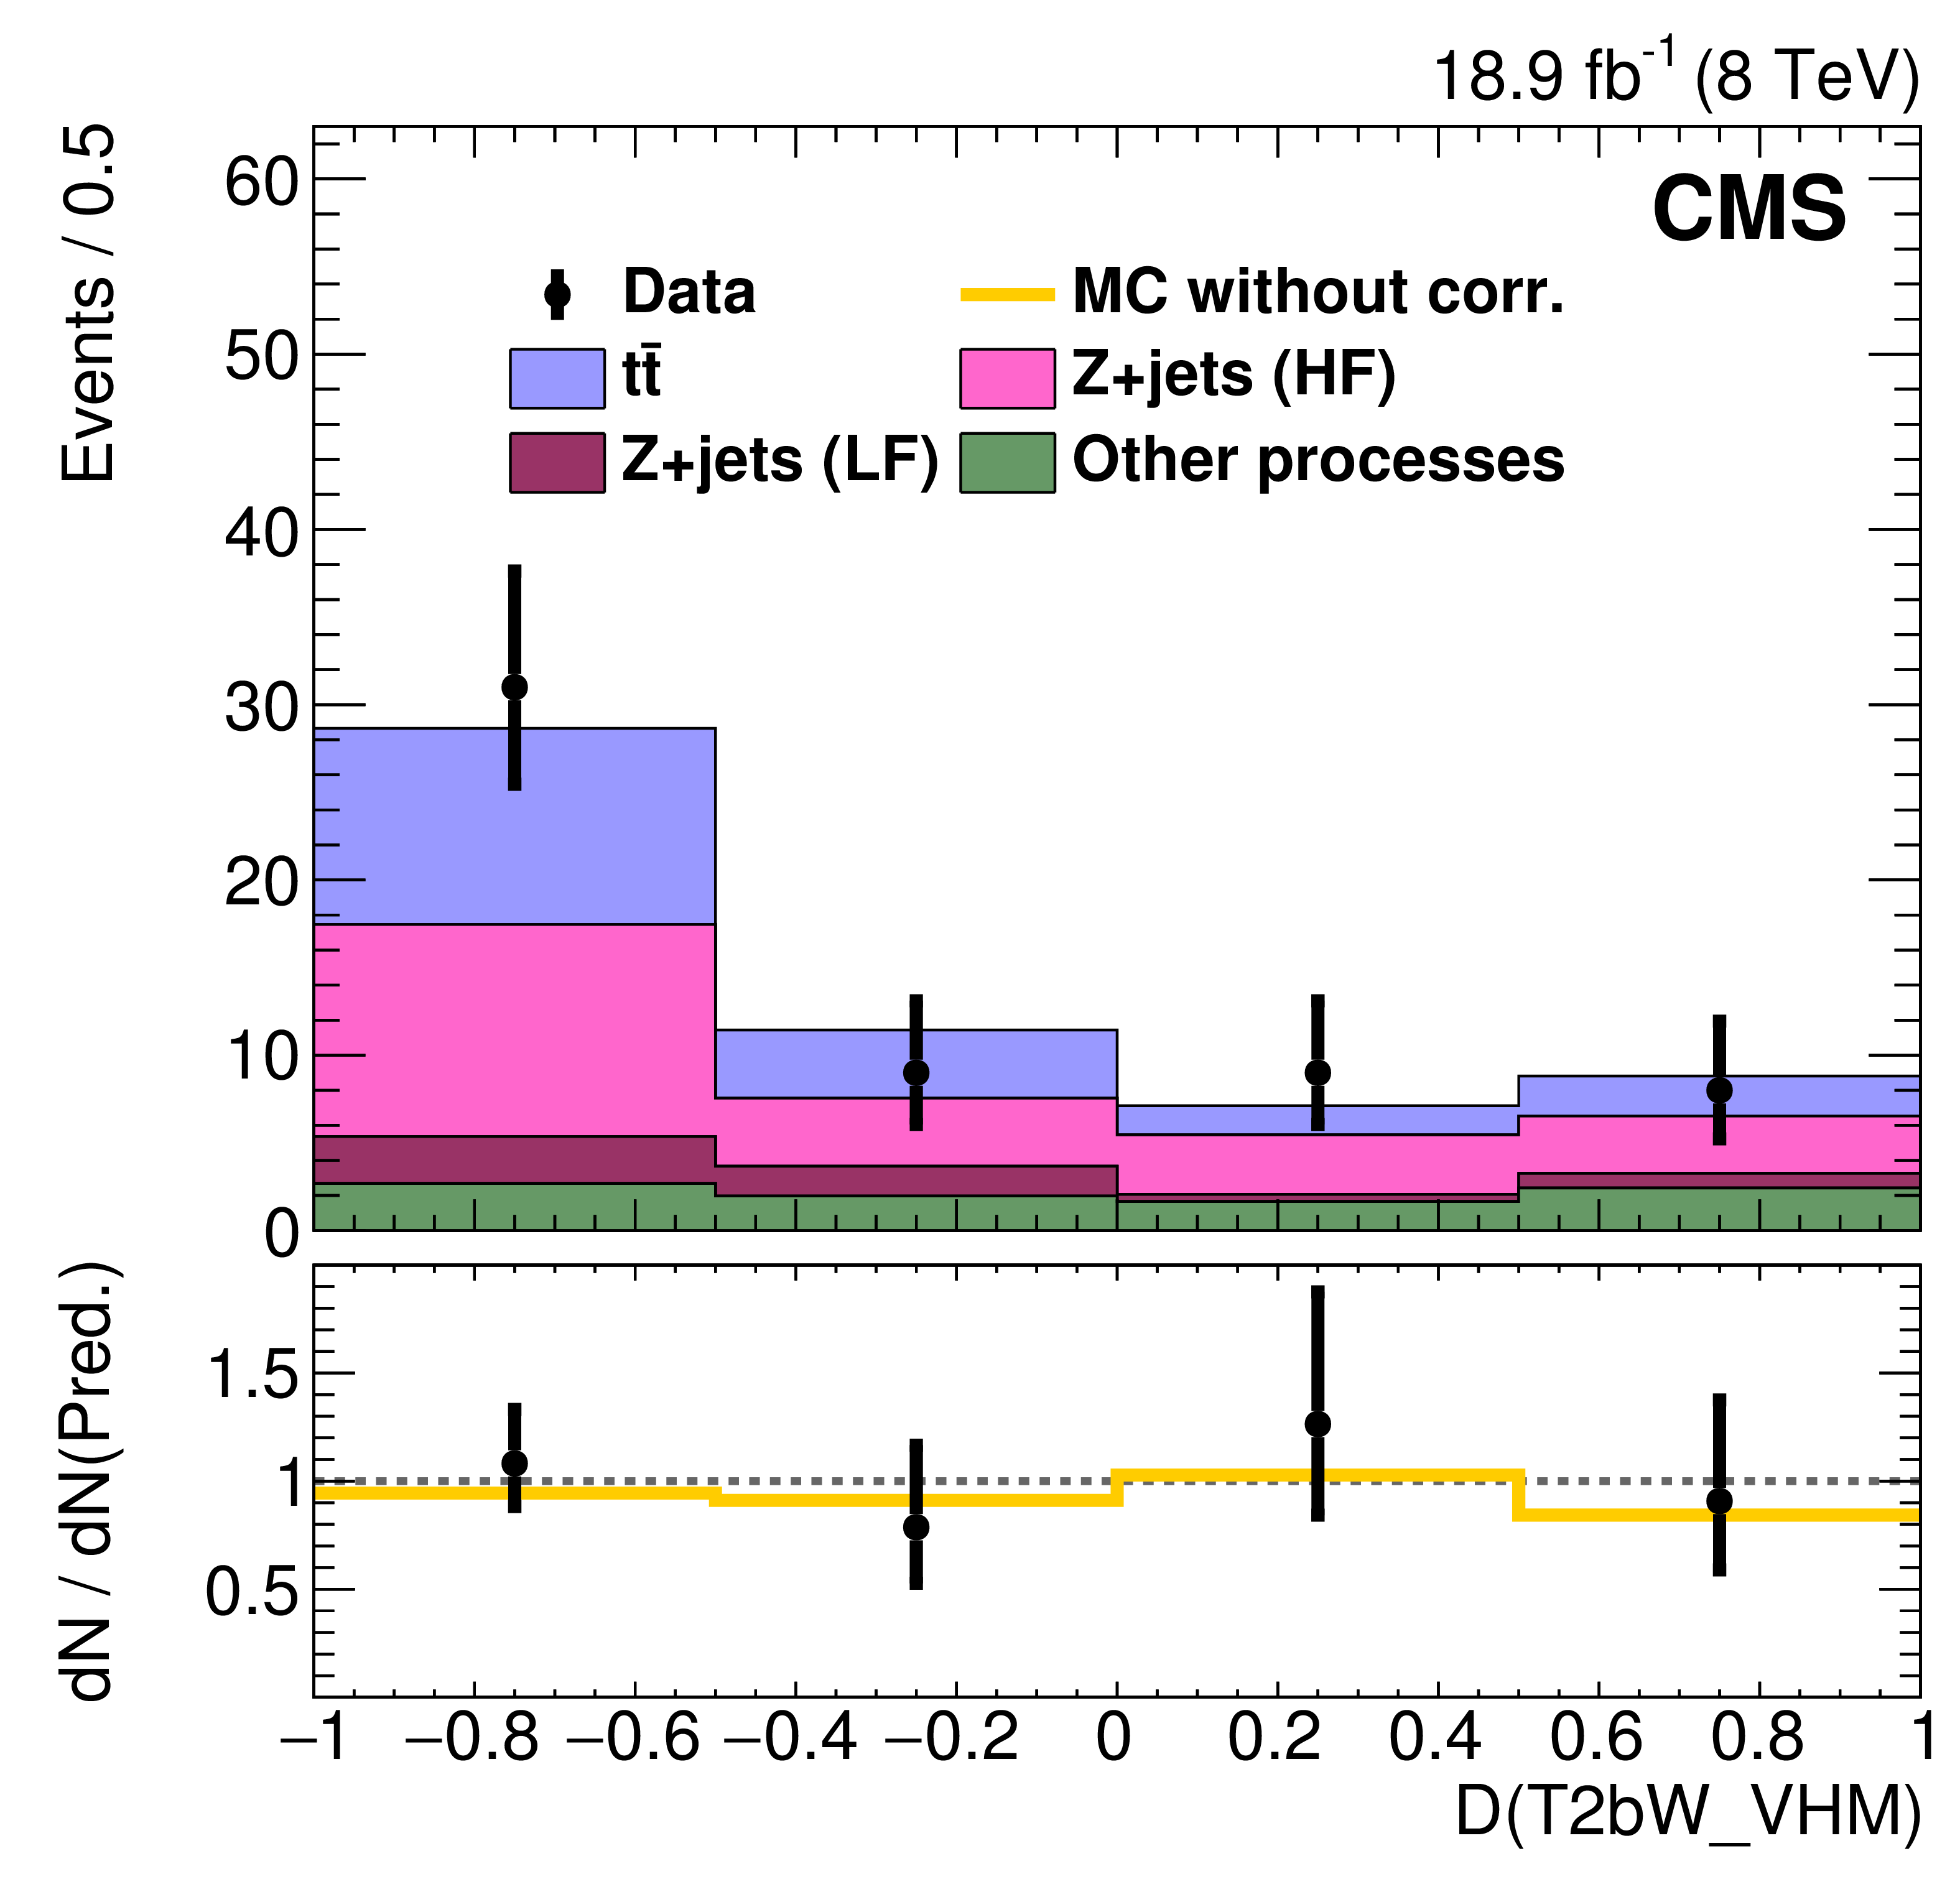
Figure 9-e:
Comparisons of BDT discriminator (D) outputs for data and corrected MC simulation for the 1$\ell $ closure samples, with leptons removed, for the five T2bW validation regions. The three bins at the far right in each plot are used to validate the MC performance in the signal region and its two extensions. The points with error bars represent the event yields in data. The histogram labelled ``MC without corr." in the bottom pane of each figure plots the ratio whose numerator is the total MC event count before corrections and whose denominator is the event count for the corrected MC shown in the upper pane. The other histograms indicate the contributions of the various background processes. The ``LF'' and ``HF'' labels denote the subsets of the W+jets process in which the boson is produced in association with light and heavy flavour (b) quark jets, respectively. |

png pdf |
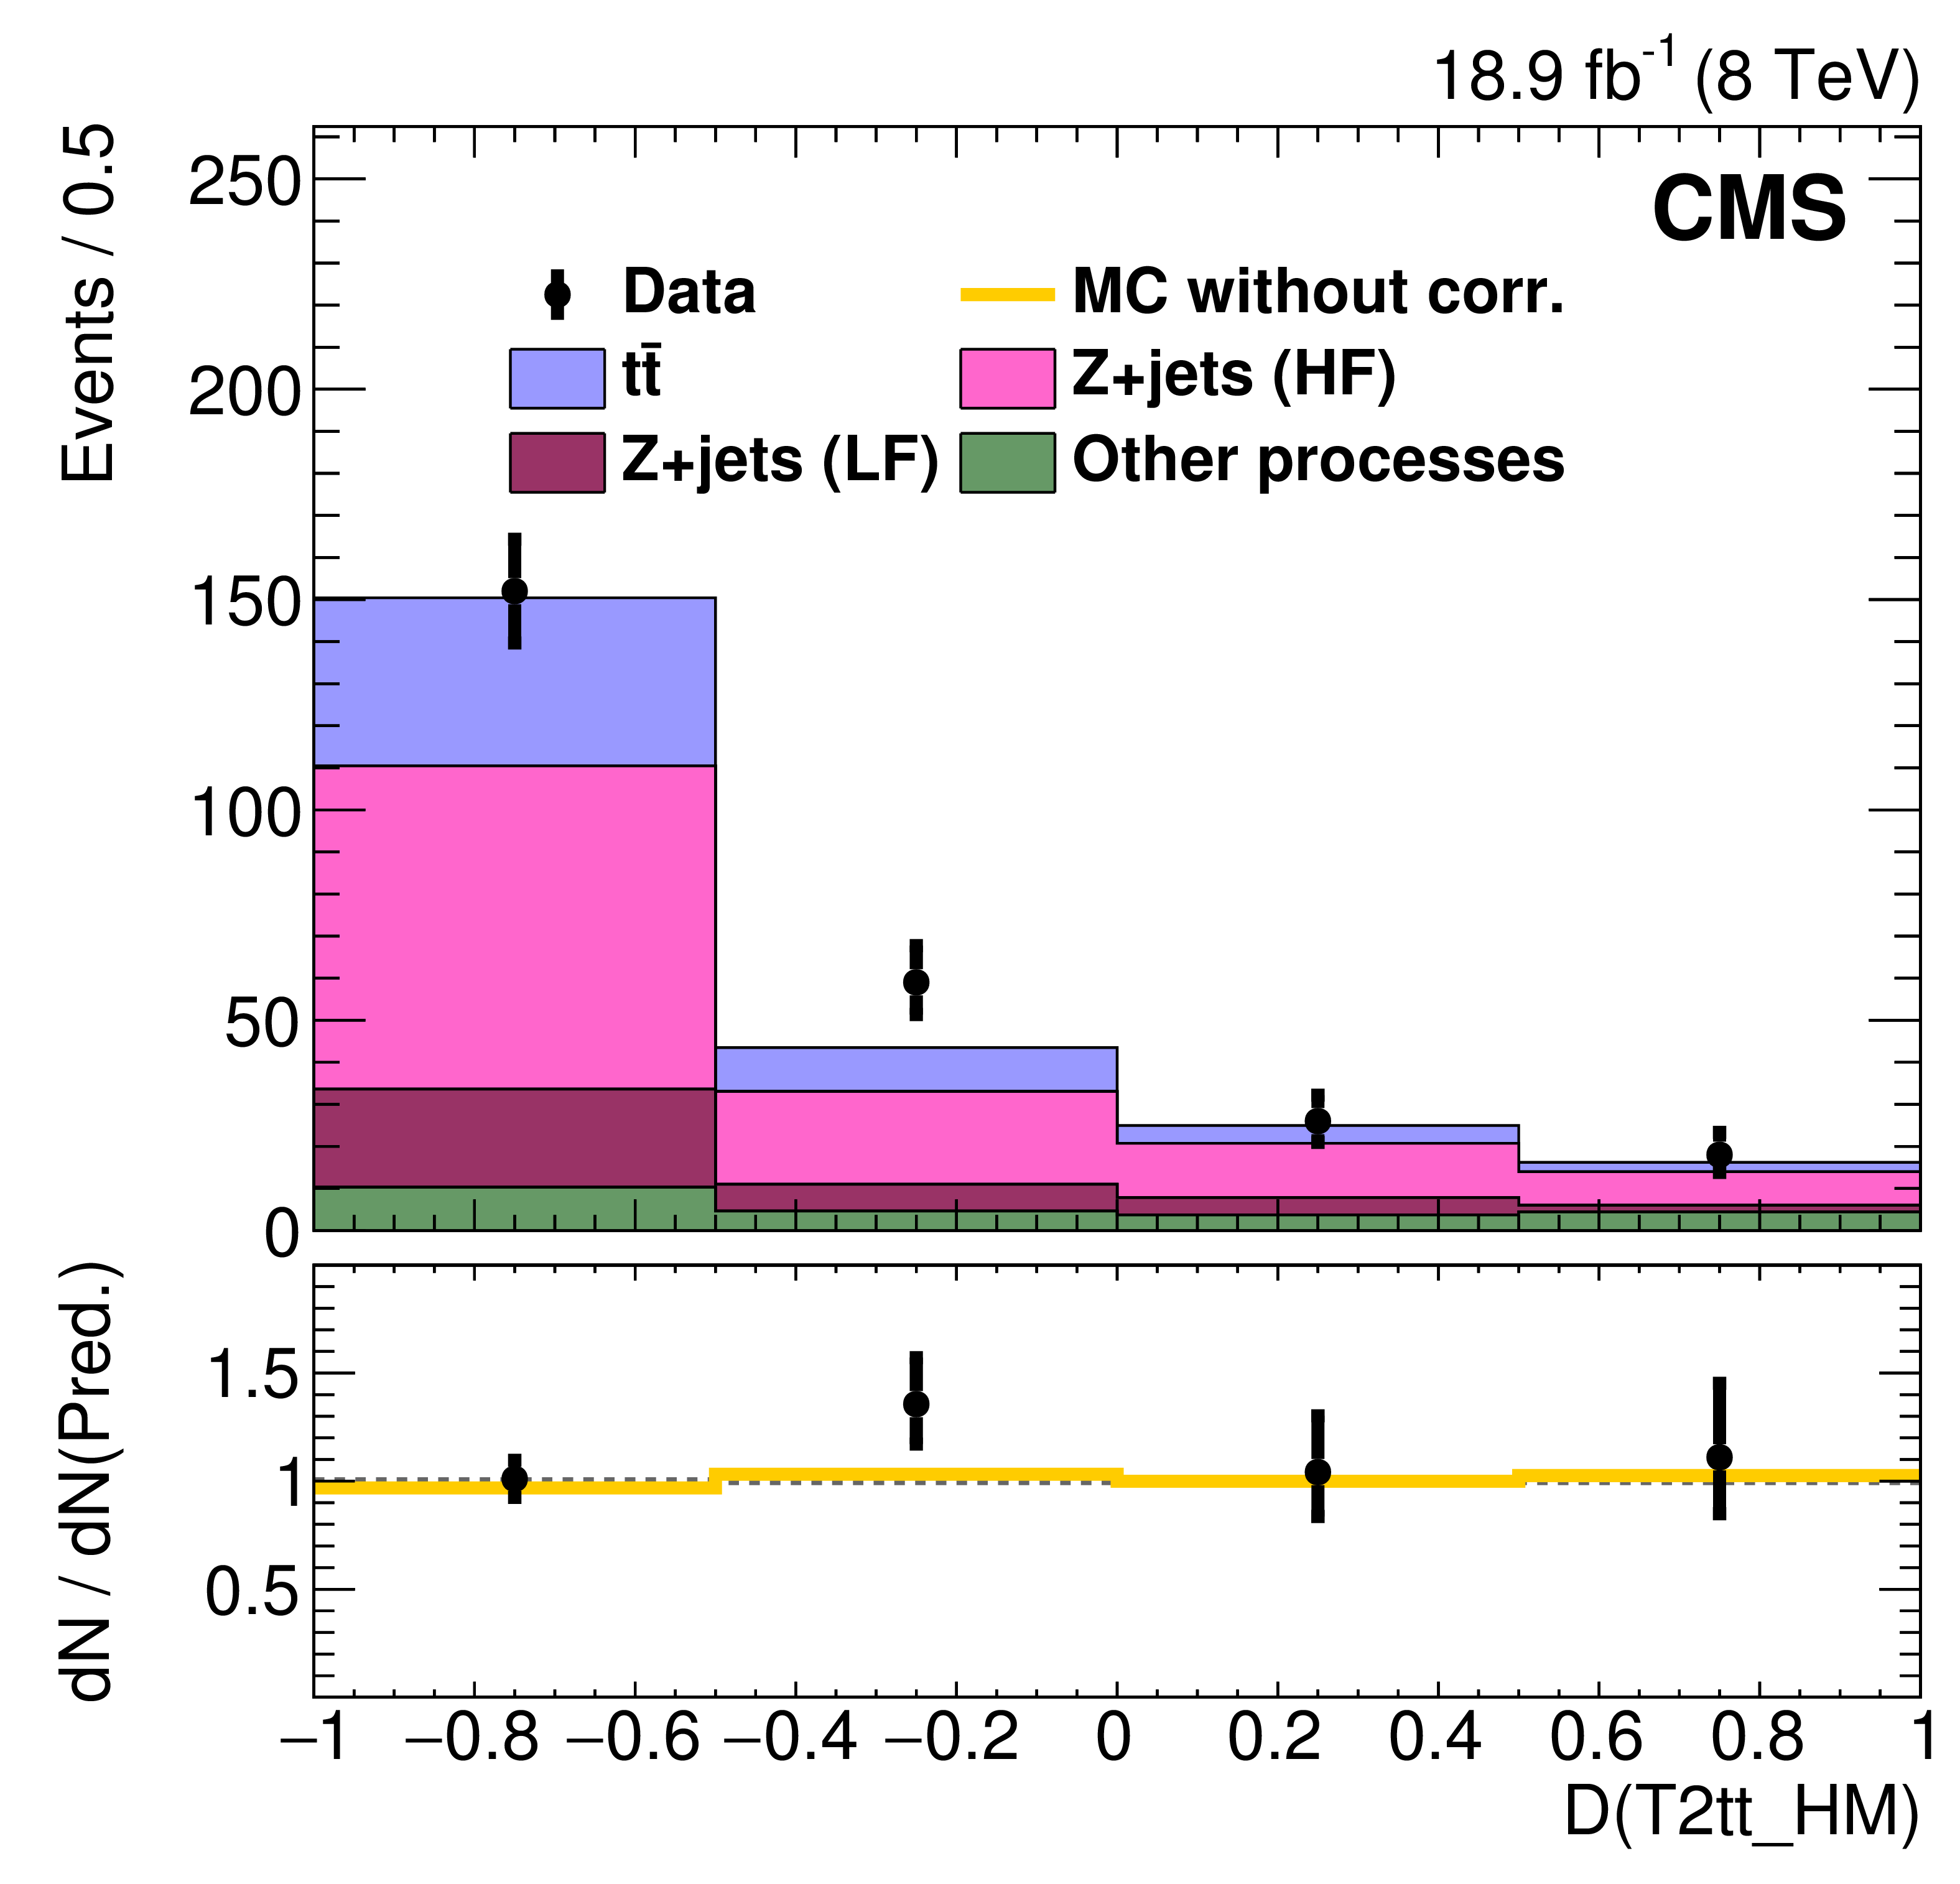
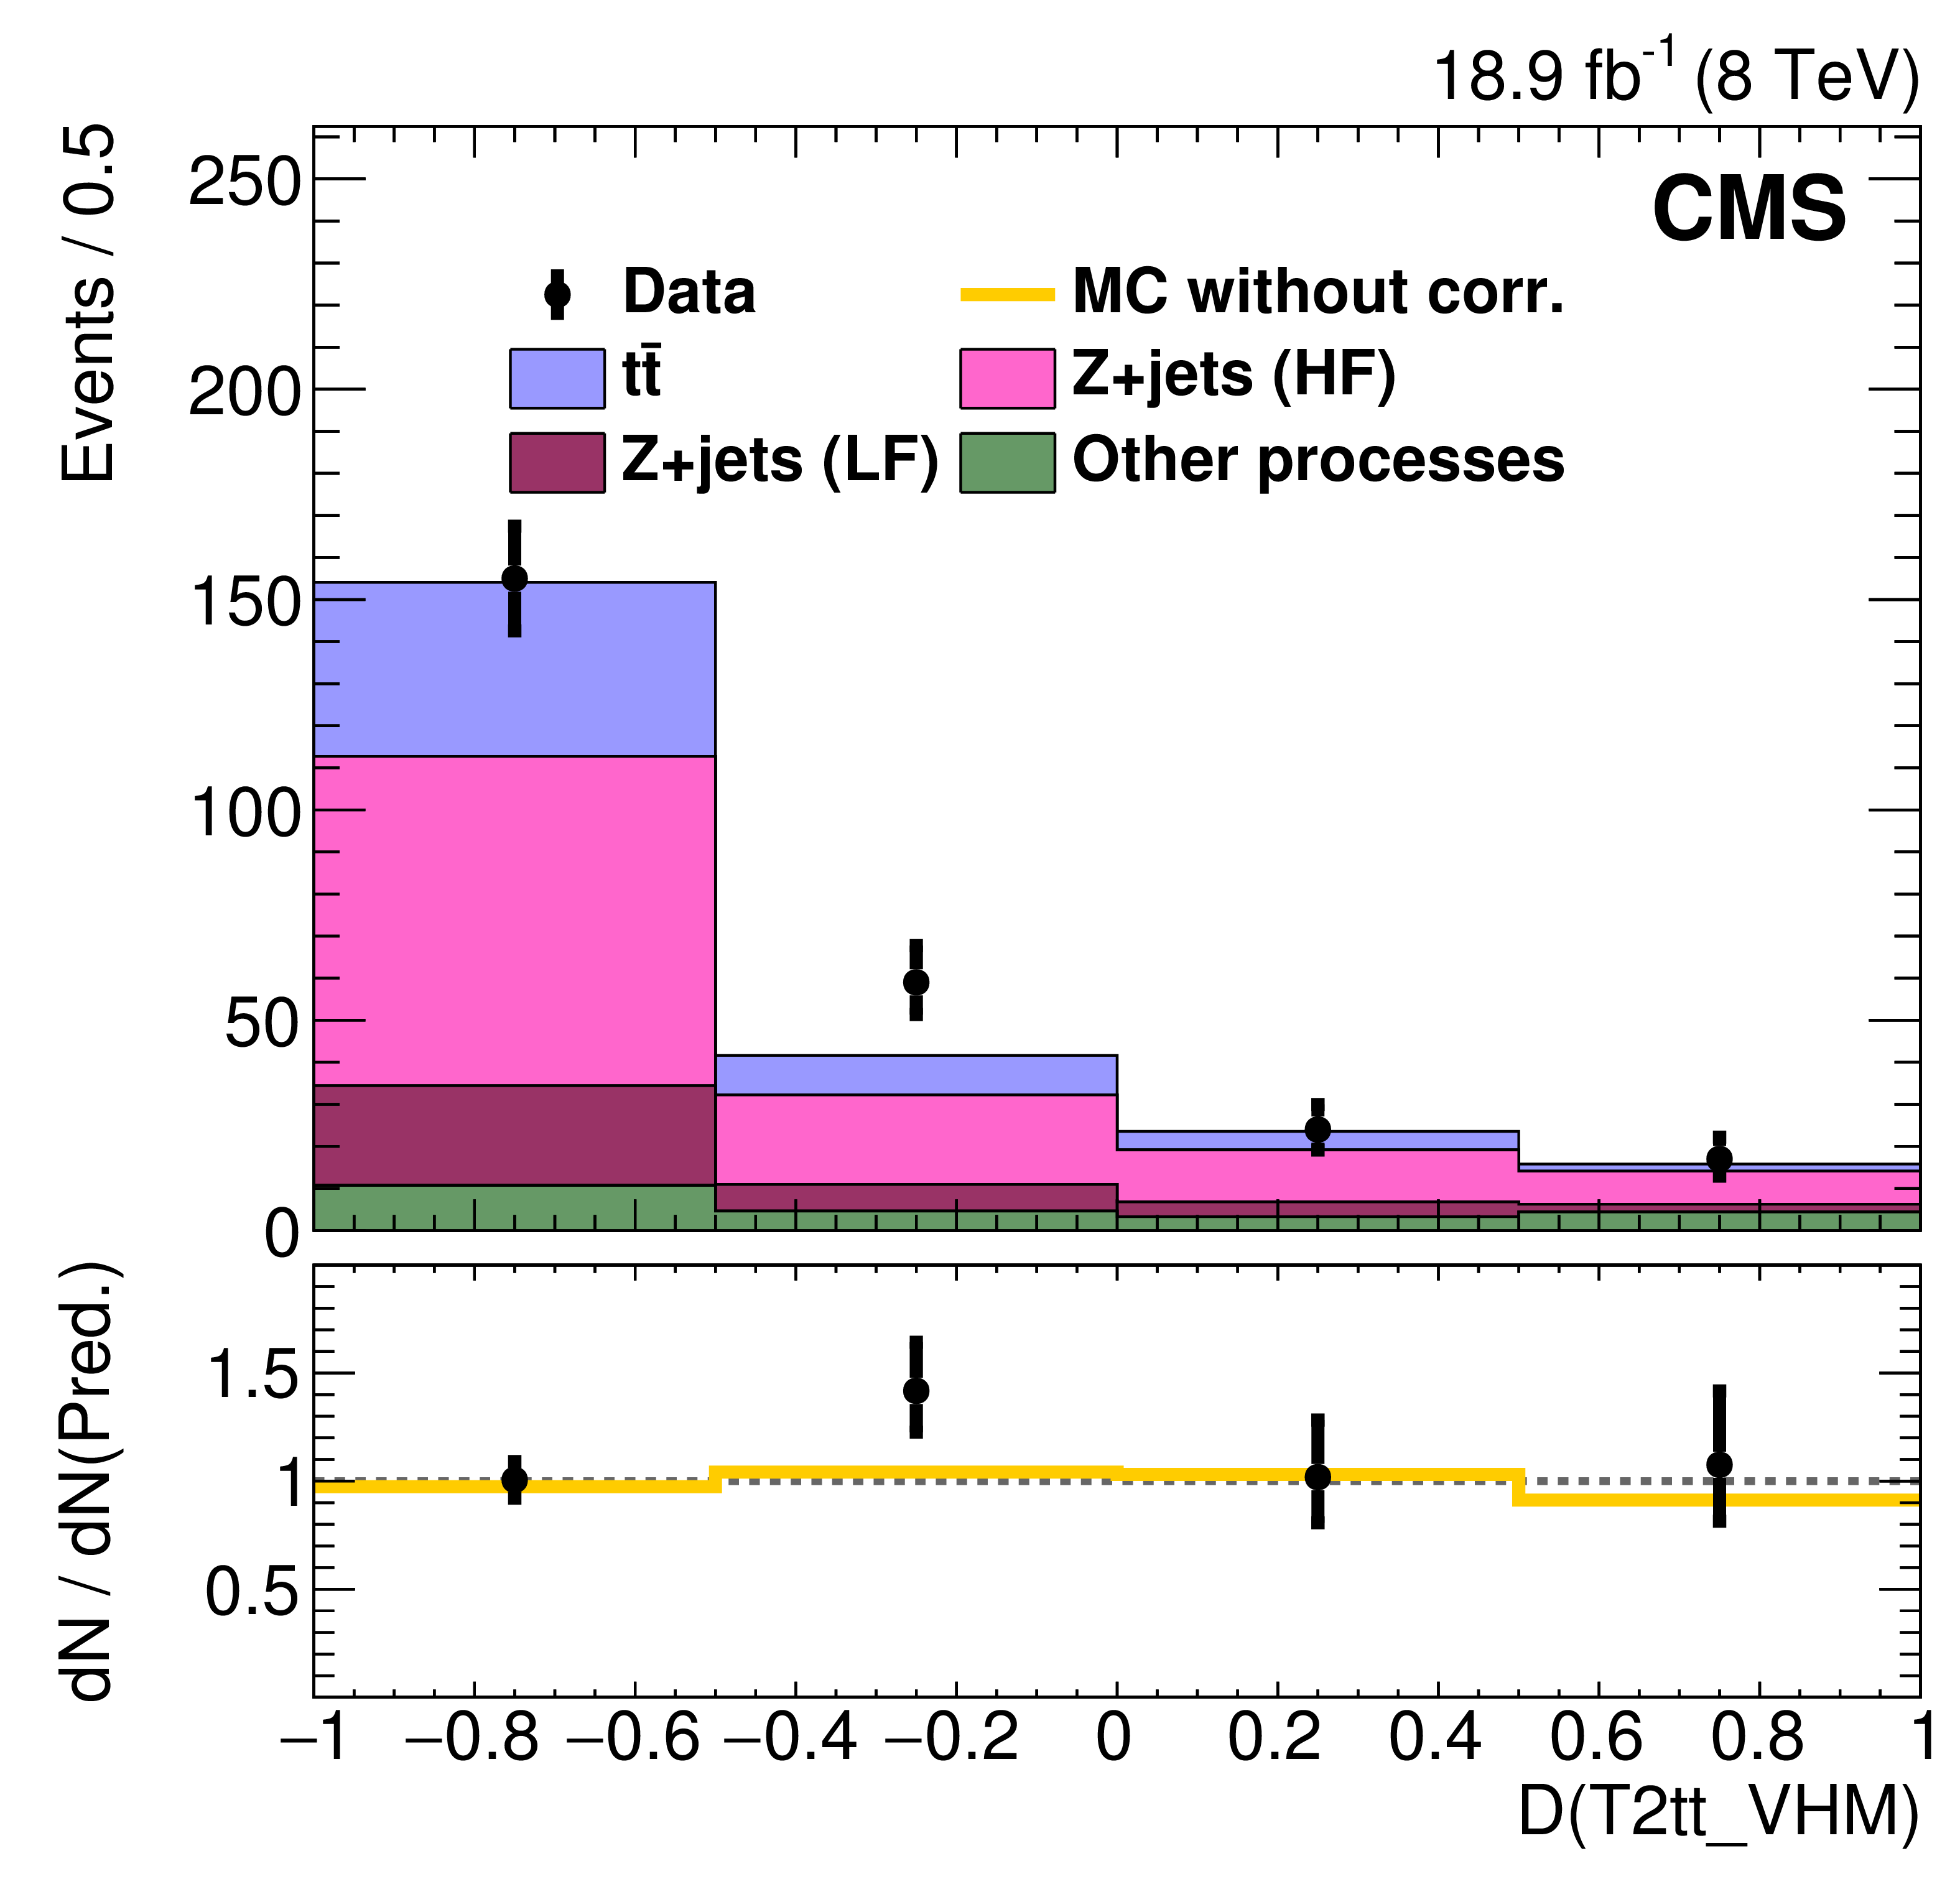
Figure 10-a:
Comparisons of BDT discriminator (D) outputs for data and corrected MC simulation for the 2$\ell $ closure samples, with leptons removed. All four T2tt validation regions are plotted. The points with error bars represent the event yields in data. The histogram labelled ``MC without corr." in the bottom pane of each figure plots the ratio whose numerator is the total MC event count before corrections and whose denominator is the event count for the corrected MC shown in the upper pane. The other histograms provide the contributions of the various background processes. The ``LF'' and ``HF'' labels denote the subsets of the Z+jets process in which the boson is produced in association with light and heavy flavour (b) quark jets, respectively. |

png pdf |
Figure 10-b:
Comparisons of BDT discriminator (D) outputs for data and corrected MC simulation for the 2$\ell $ closure samples, with leptons removed. All four T2tt validation regions are plotted. The points with error bars represent the event yields in data. The histogram labelled ``MC without corr." in the bottom pane of each figure plots the ratio whose numerator is the total MC event count before corrections and whose denominator is the event count for the corrected MC shown in the upper pane. The other histograms provide the contributions of the various background processes. The ``LF'' and ``HF'' labels denote the subsets of the Z+jets process in which the boson is produced in association with light and heavy flavour (b) quark jets, respectively. |
png pdf |
Figure 10-c:
Comparisons of BDT discriminator (D) outputs for data and corrected MC simulation for the 2$\ell $ closure samples, with leptons removed. All four T2tt validation regions are plotted. The points with error bars represent the event yields in data. The histogram labelled ``MC without corr." in the bottom pane of each figure plots the ratio whose numerator is the total MC event count before corrections and whose denominator is the event count for the corrected MC shown in the upper pane. The other histograms provide the contributions of the various background processes. The ``LF'' and ``HF'' labels denote the subsets of the Z+jets process in which the boson is produced in association with light and heavy flavour (b) quark jets, respectively. |
png pdf |
Figure 10-d:
Comparisons of BDT discriminator (D) outputs for data and corrected MC simulation for the 2$\ell $ closure samples, with leptons removed. All four T2tt validation regions are plotted. The points with error bars represent the event yields in data. The histogram labelled ``MC without corr." in the bottom pane of each figure plots the ratio whose numerator is the total MC event count before corrections and whose denominator is the event count for the corrected MC shown in the upper pane. The other histograms provide the contributions of the various background processes. The ``LF'' and ``HF'' labels denote the subsets of the Z+jets process in which the boson is produced in association with light and heavy flavour (b) quark jets, respectively. |
png pdf |
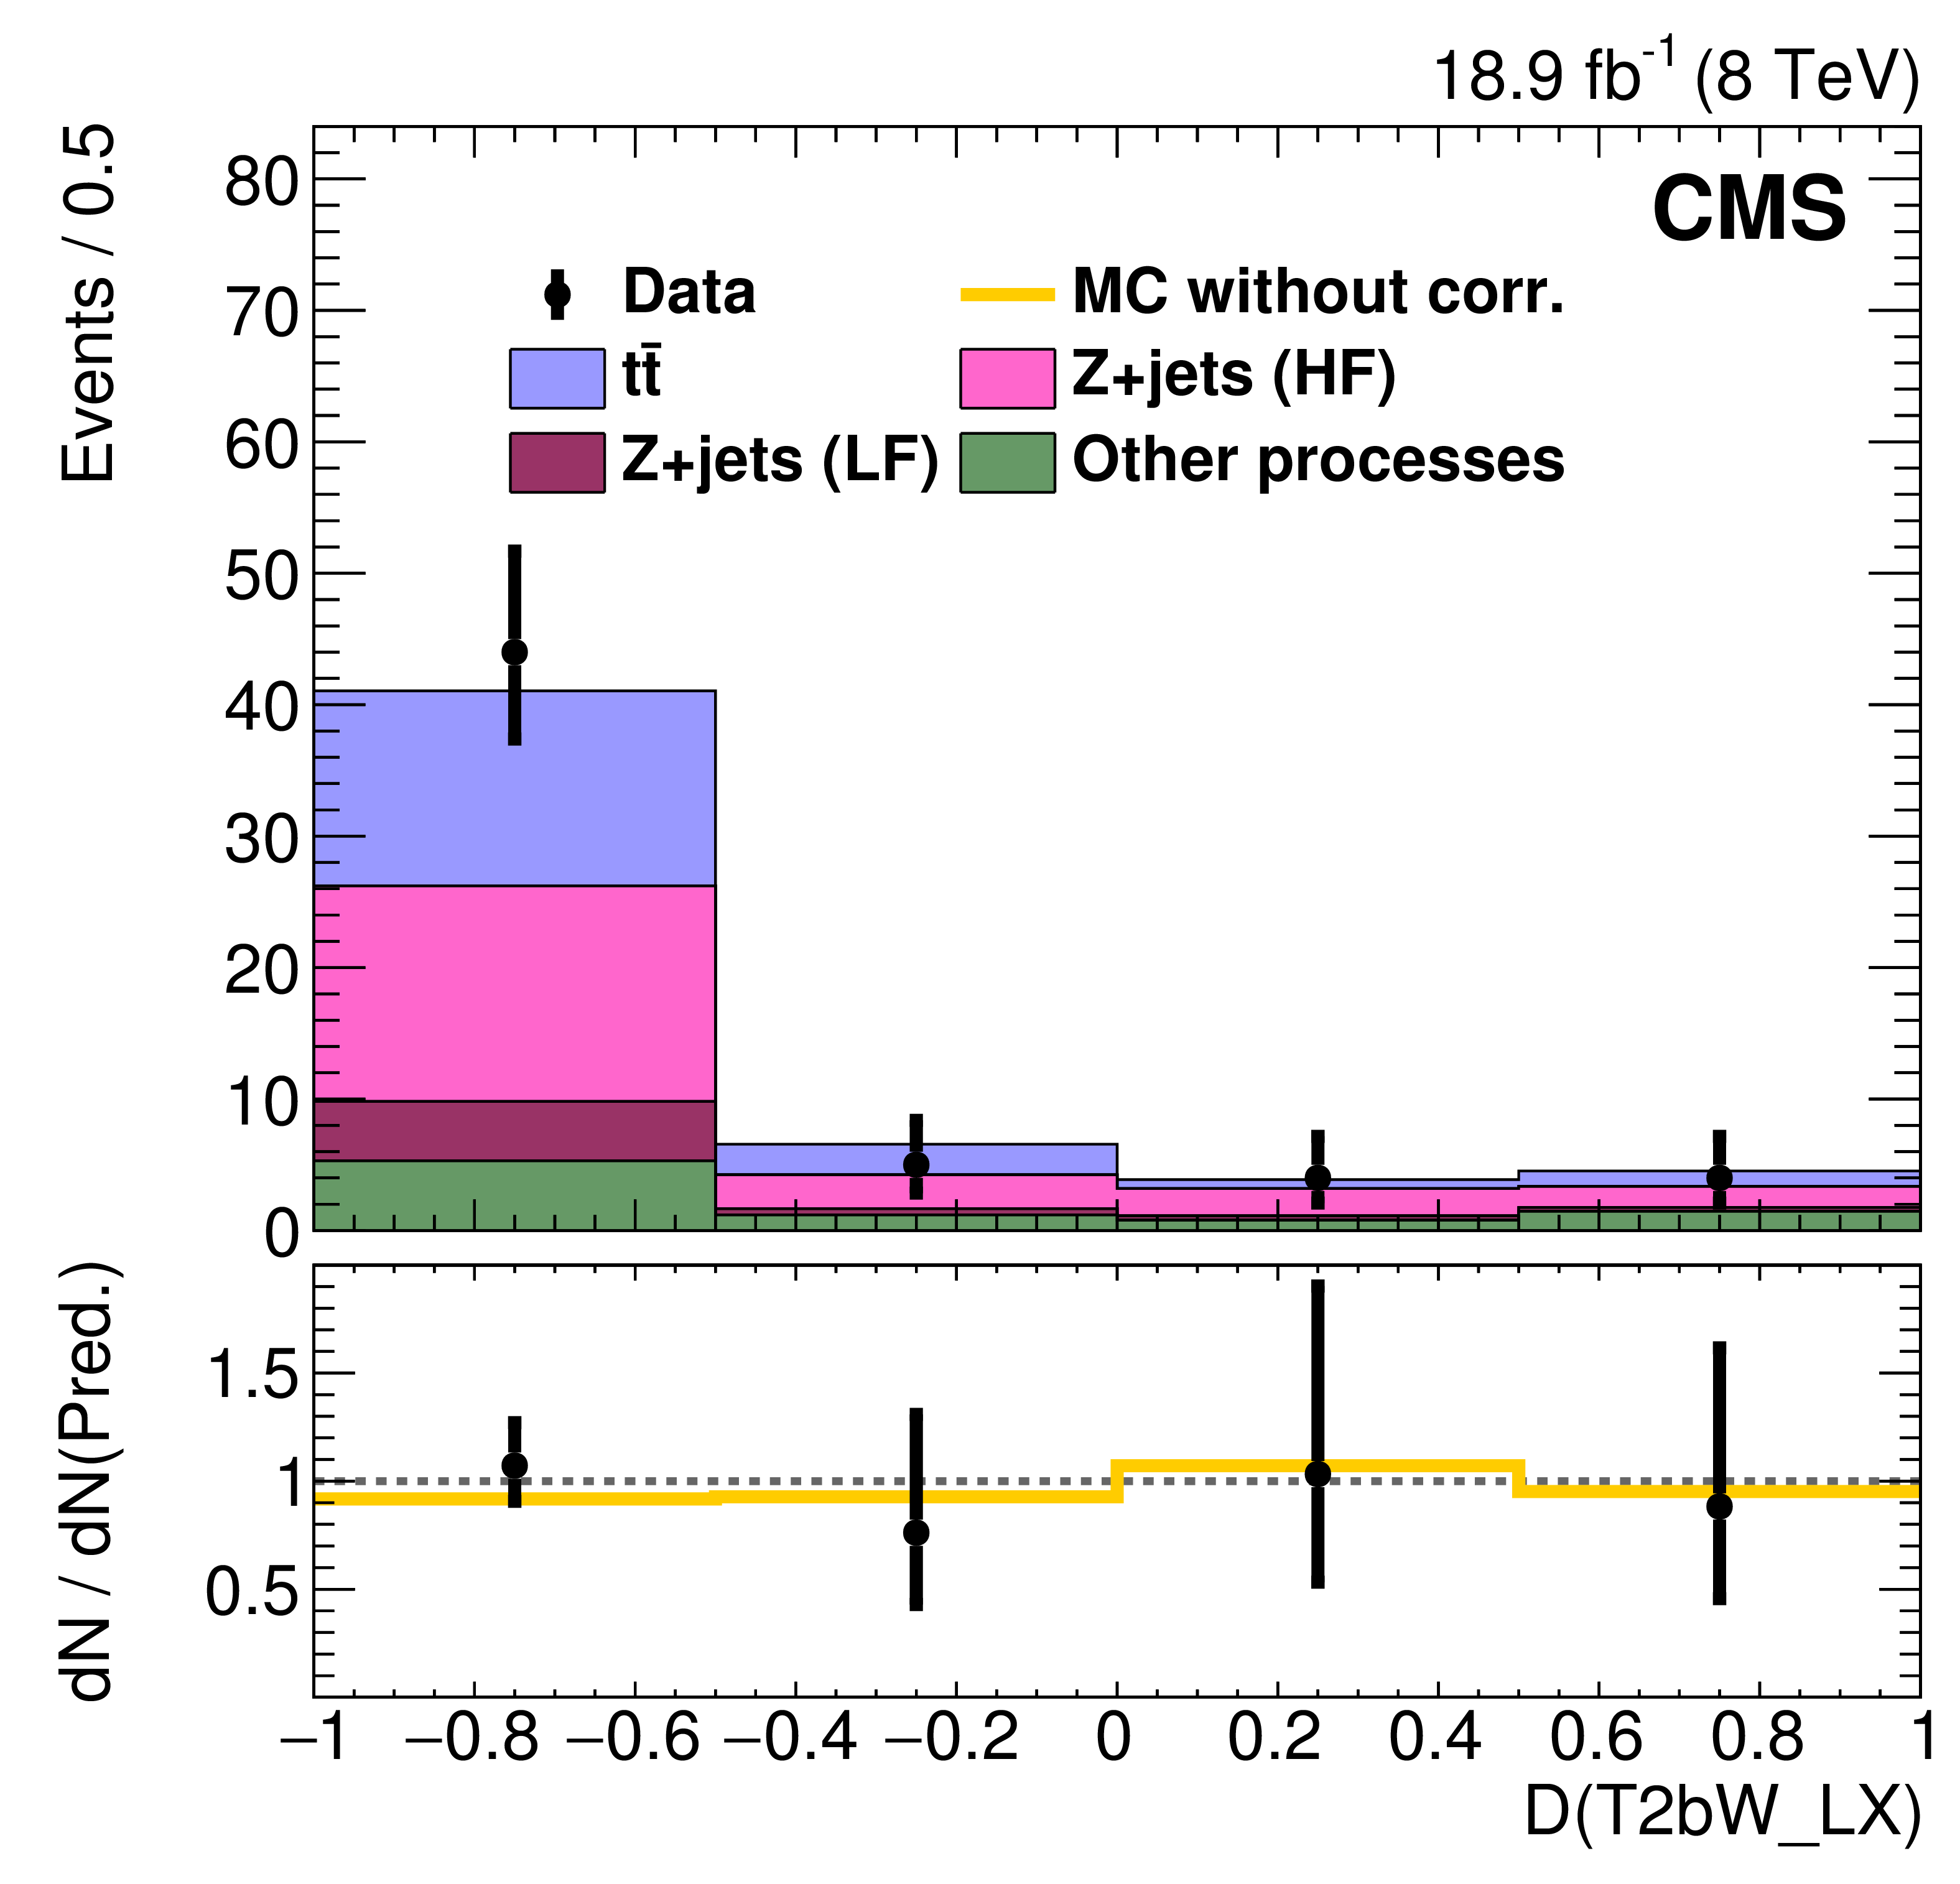
Figure 11-a:
Comparisons of BDT discriminator (D) outputs for data and corrected MC simulation for the 2$\ell $ closure samples, with leptons removed. All five T2bW validation regions are plotted. The points with error bars represent the event yields in data. The histogram labelled ``MC without corr." in the bottom pane of each figure plots the ratio whose numerator is the total MC event count before corrections and whose denominator is the event count for the corrected MC shown in the upper pane. The other histograms provide the contributions of the various background processes. The ``LF'' and ``HF'' labels denote the subsets of the Z+jets process in which the boson is produced in association with light and heavy flavour (b) quark jets, respectively. |
png pdf |
Figure 11-b:
Comparisons of BDT discriminator (D) outputs for data and corrected MC simulation for the 2$\ell $ closure samples, with leptons removed. All five T2bW validation regions are plotted. The points with error bars represent the event yields in data. The histogram labelled ``MC without corr." in the bottom pane of each figure plots the ratio whose numerator is the total MC event count before corrections and whose denominator is the event count for the corrected MC shown in the upper pane. The other histograms provide the contributions of the various background processes. The ``LF'' and ``HF'' labels denote the subsets of the Z+jets process in which the boson is produced in association with light and heavy flavour (b) quark jets, respectively. |
png pdf |
Figure 11-c:
Comparisons of BDT discriminator (D) outputs for data and corrected MC simulation for the 2$\ell $ closure samples, with leptons removed. All five T2bW validation regions are plotted. The points with error bars represent the event yields in data. The histogram labelled ``MC without corr." in the bottom pane of each figure plots the ratio whose numerator is the total MC event count before corrections and whose denominator is the event count for the corrected MC shown in the upper pane. The other histograms provide the contributions of the various background processes. The ``LF'' and ``HF'' labels denote the subsets of the Z+jets process in which the boson is produced in association with light and heavy flavour (b) quark jets, respectively. |

png pdf |
Figure 11-d:
Comparisons of BDT discriminator (D) outputs for data and corrected MC simulation for the 2$\ell $ closure samples, with leptons removed. All five T2bW validation regions are plotted. The points with error bars represent the event yields in data. The histogram labelled ``MC without corr." in the bottom pane of each figure plots the ratio whose numerator is the total MC event count before corrections and whose denominator is the event count for the corrected MC shown in the upper pane. The other histograms provide the contributions of the various background processes. The ``LF'' and ``HF'' labels denote the subsets of the Z+jets process in which the boson is produced in association with light and heavy flavour (b) quark jets, respectively. |
png pdf |
Figure 11-e:
Comparisons of BDT discriminator (D) outputs for data and corrected MC simulation for the 2$\ell $ closure samples, with leptons removed. All five T2bW validation regions are plotted. The points with error bars represent the event yields in data. The histogram labelled ``MC without corr." in the bottom pane of each figure plots the ratio whose numerator is the total MC event count before corrections and whose denominator is the event count for the corrected MC shown in the upper pane. The other histograms provide the contributions of the various background processes. The ``LF'' and ``HF'' labels denote the subsets of the Z+jets process in which the boson is produced in association with light and heavy flavour (b) quark jets, respectively. |
png pdf |
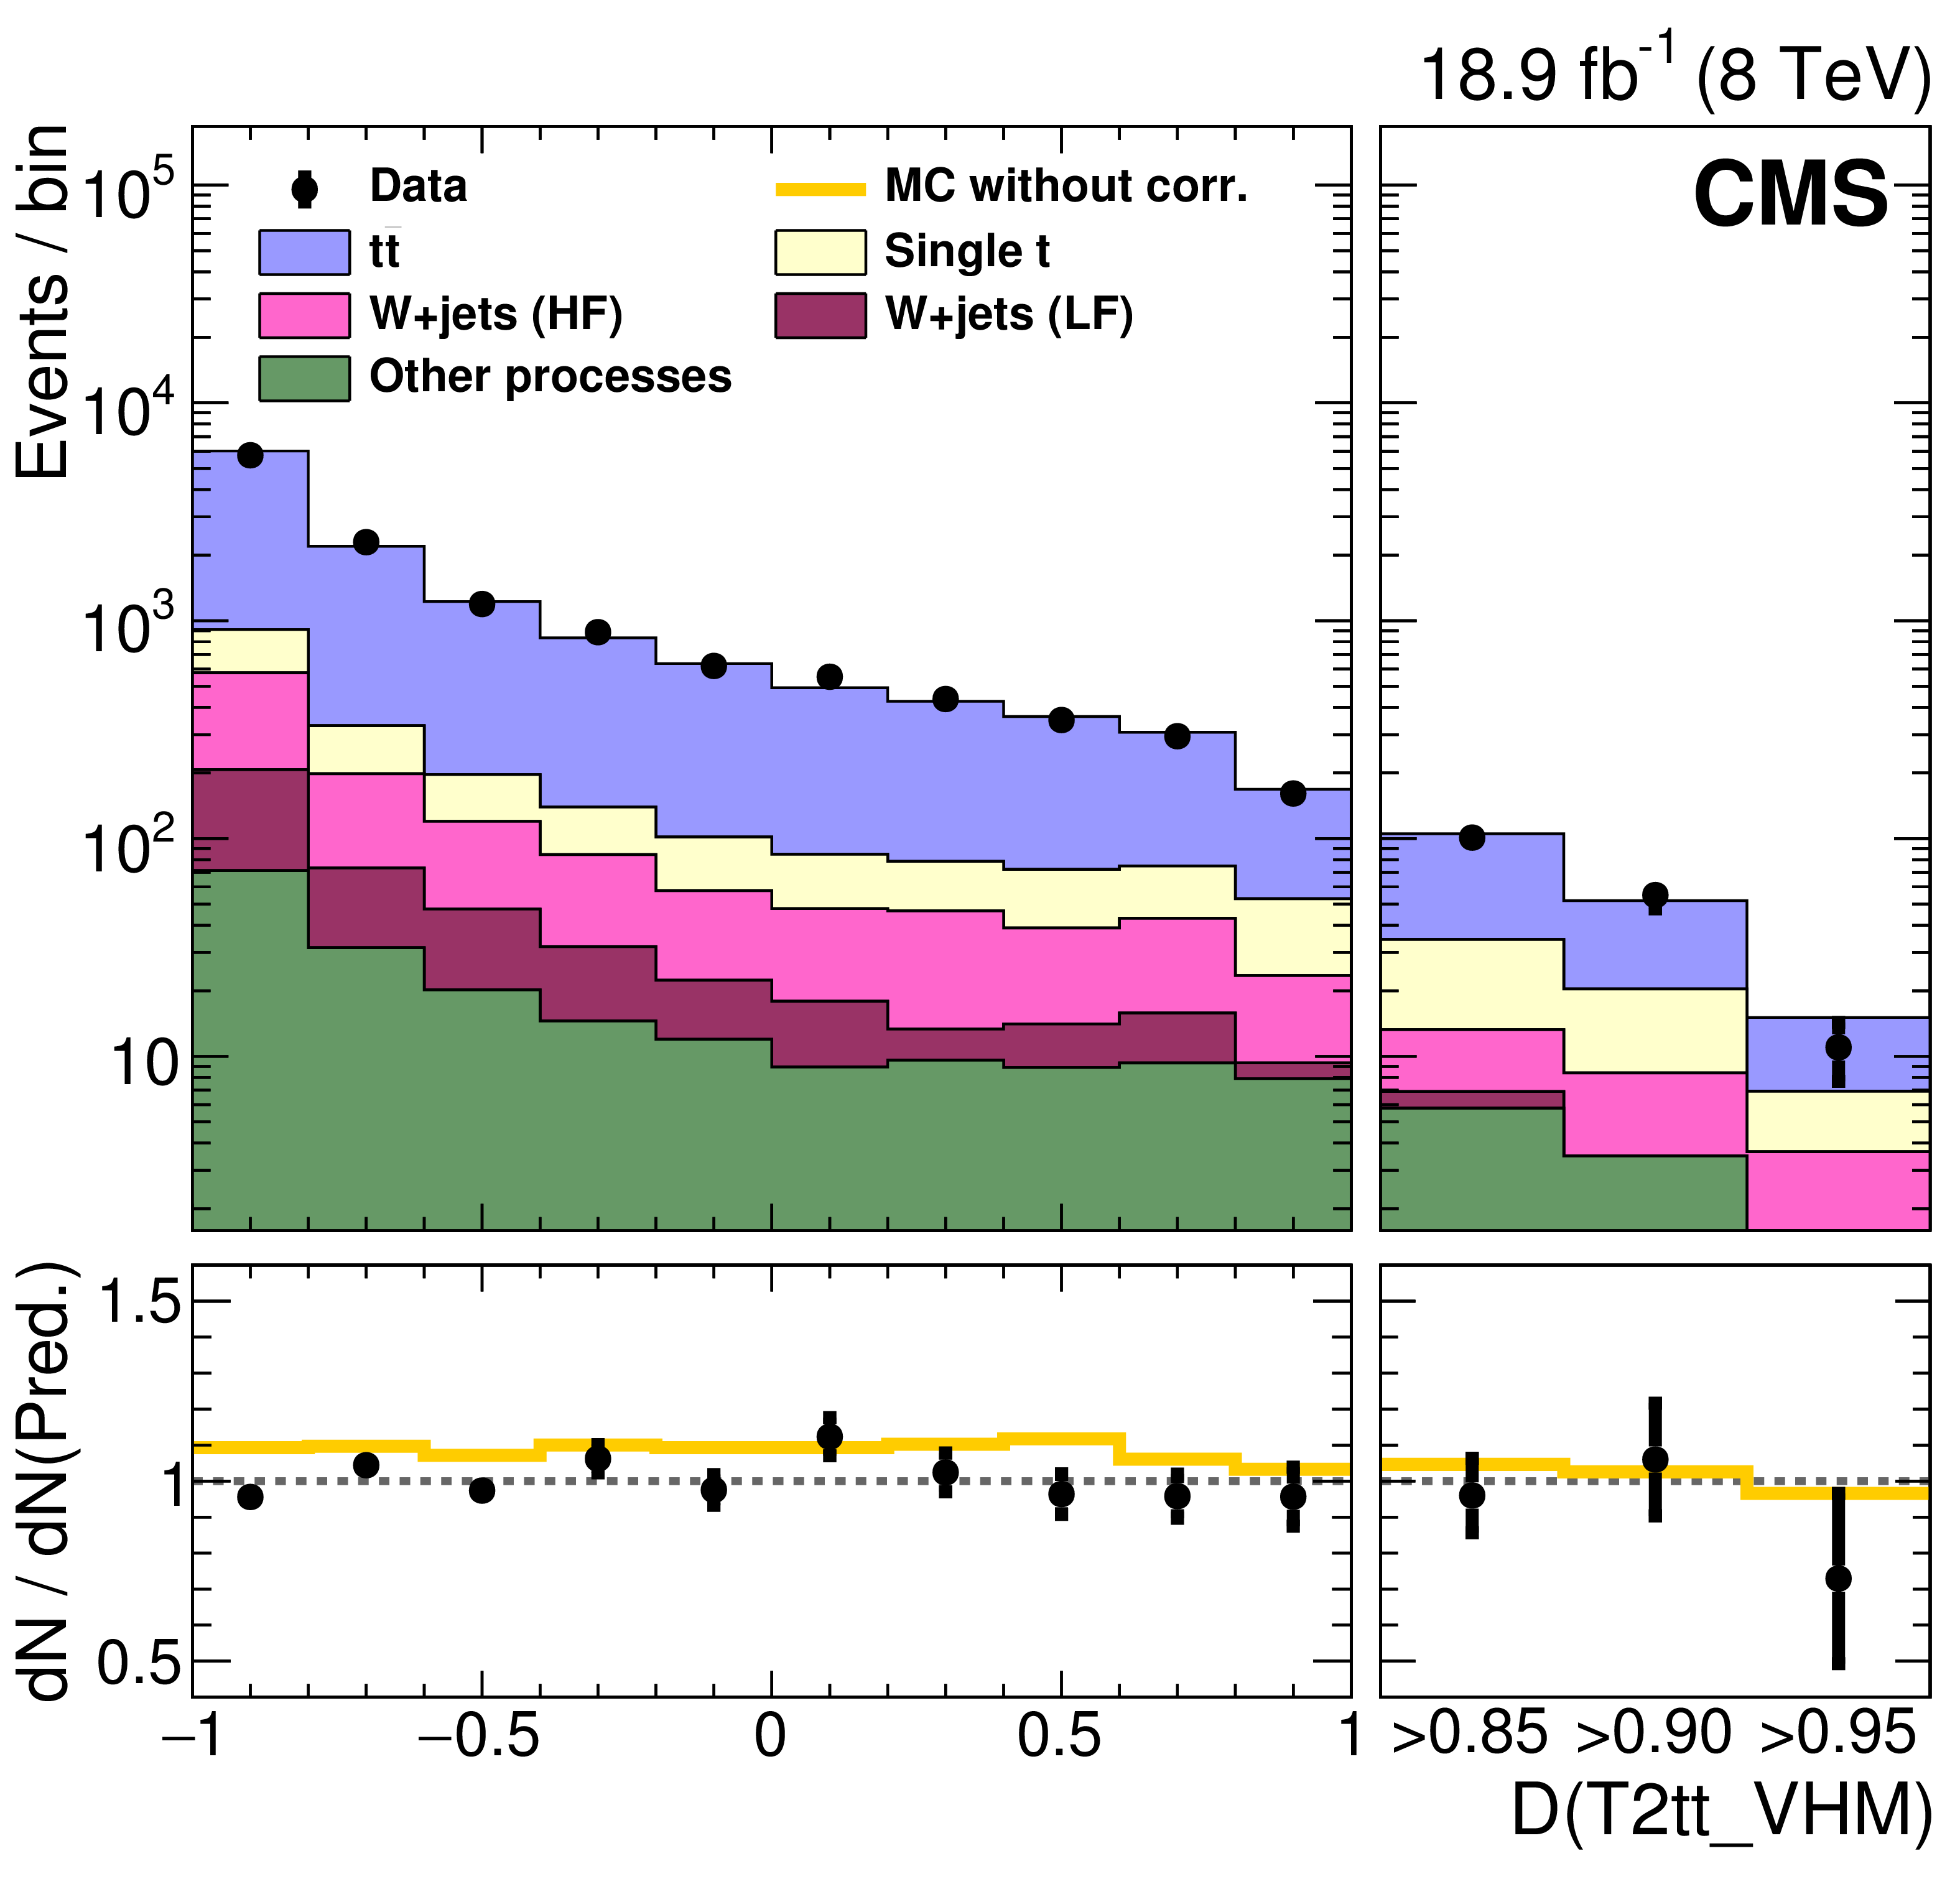
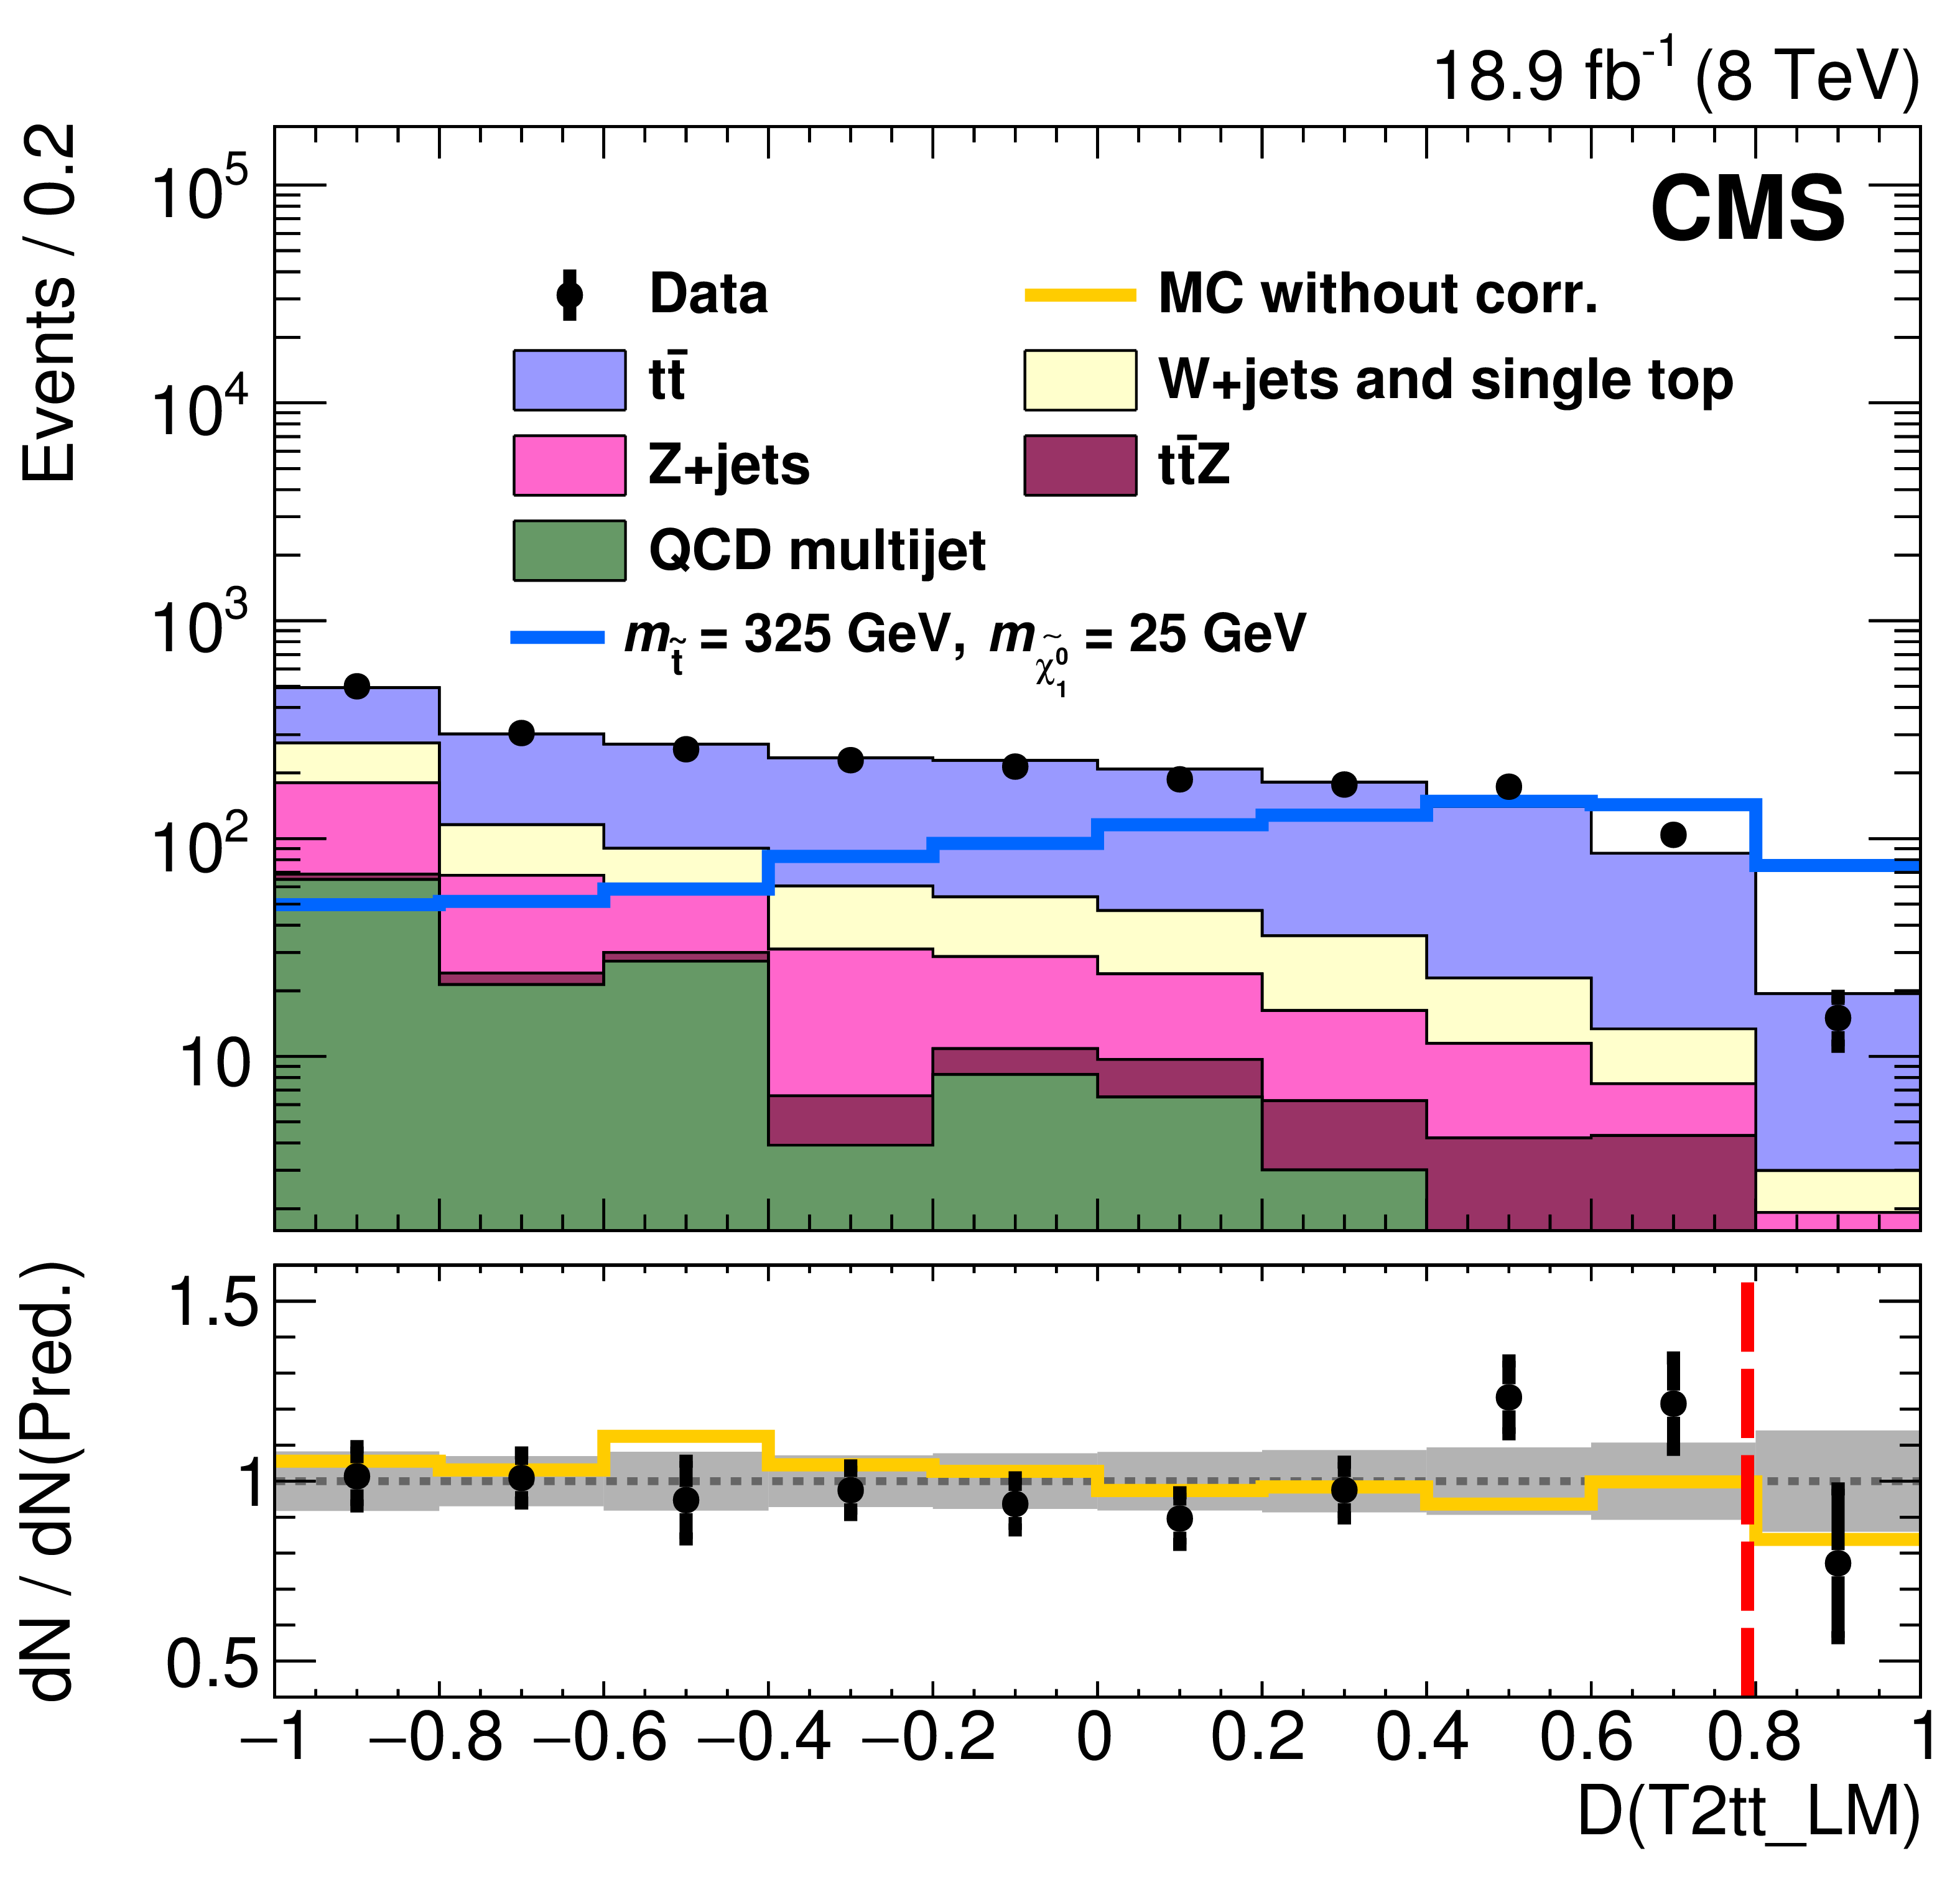
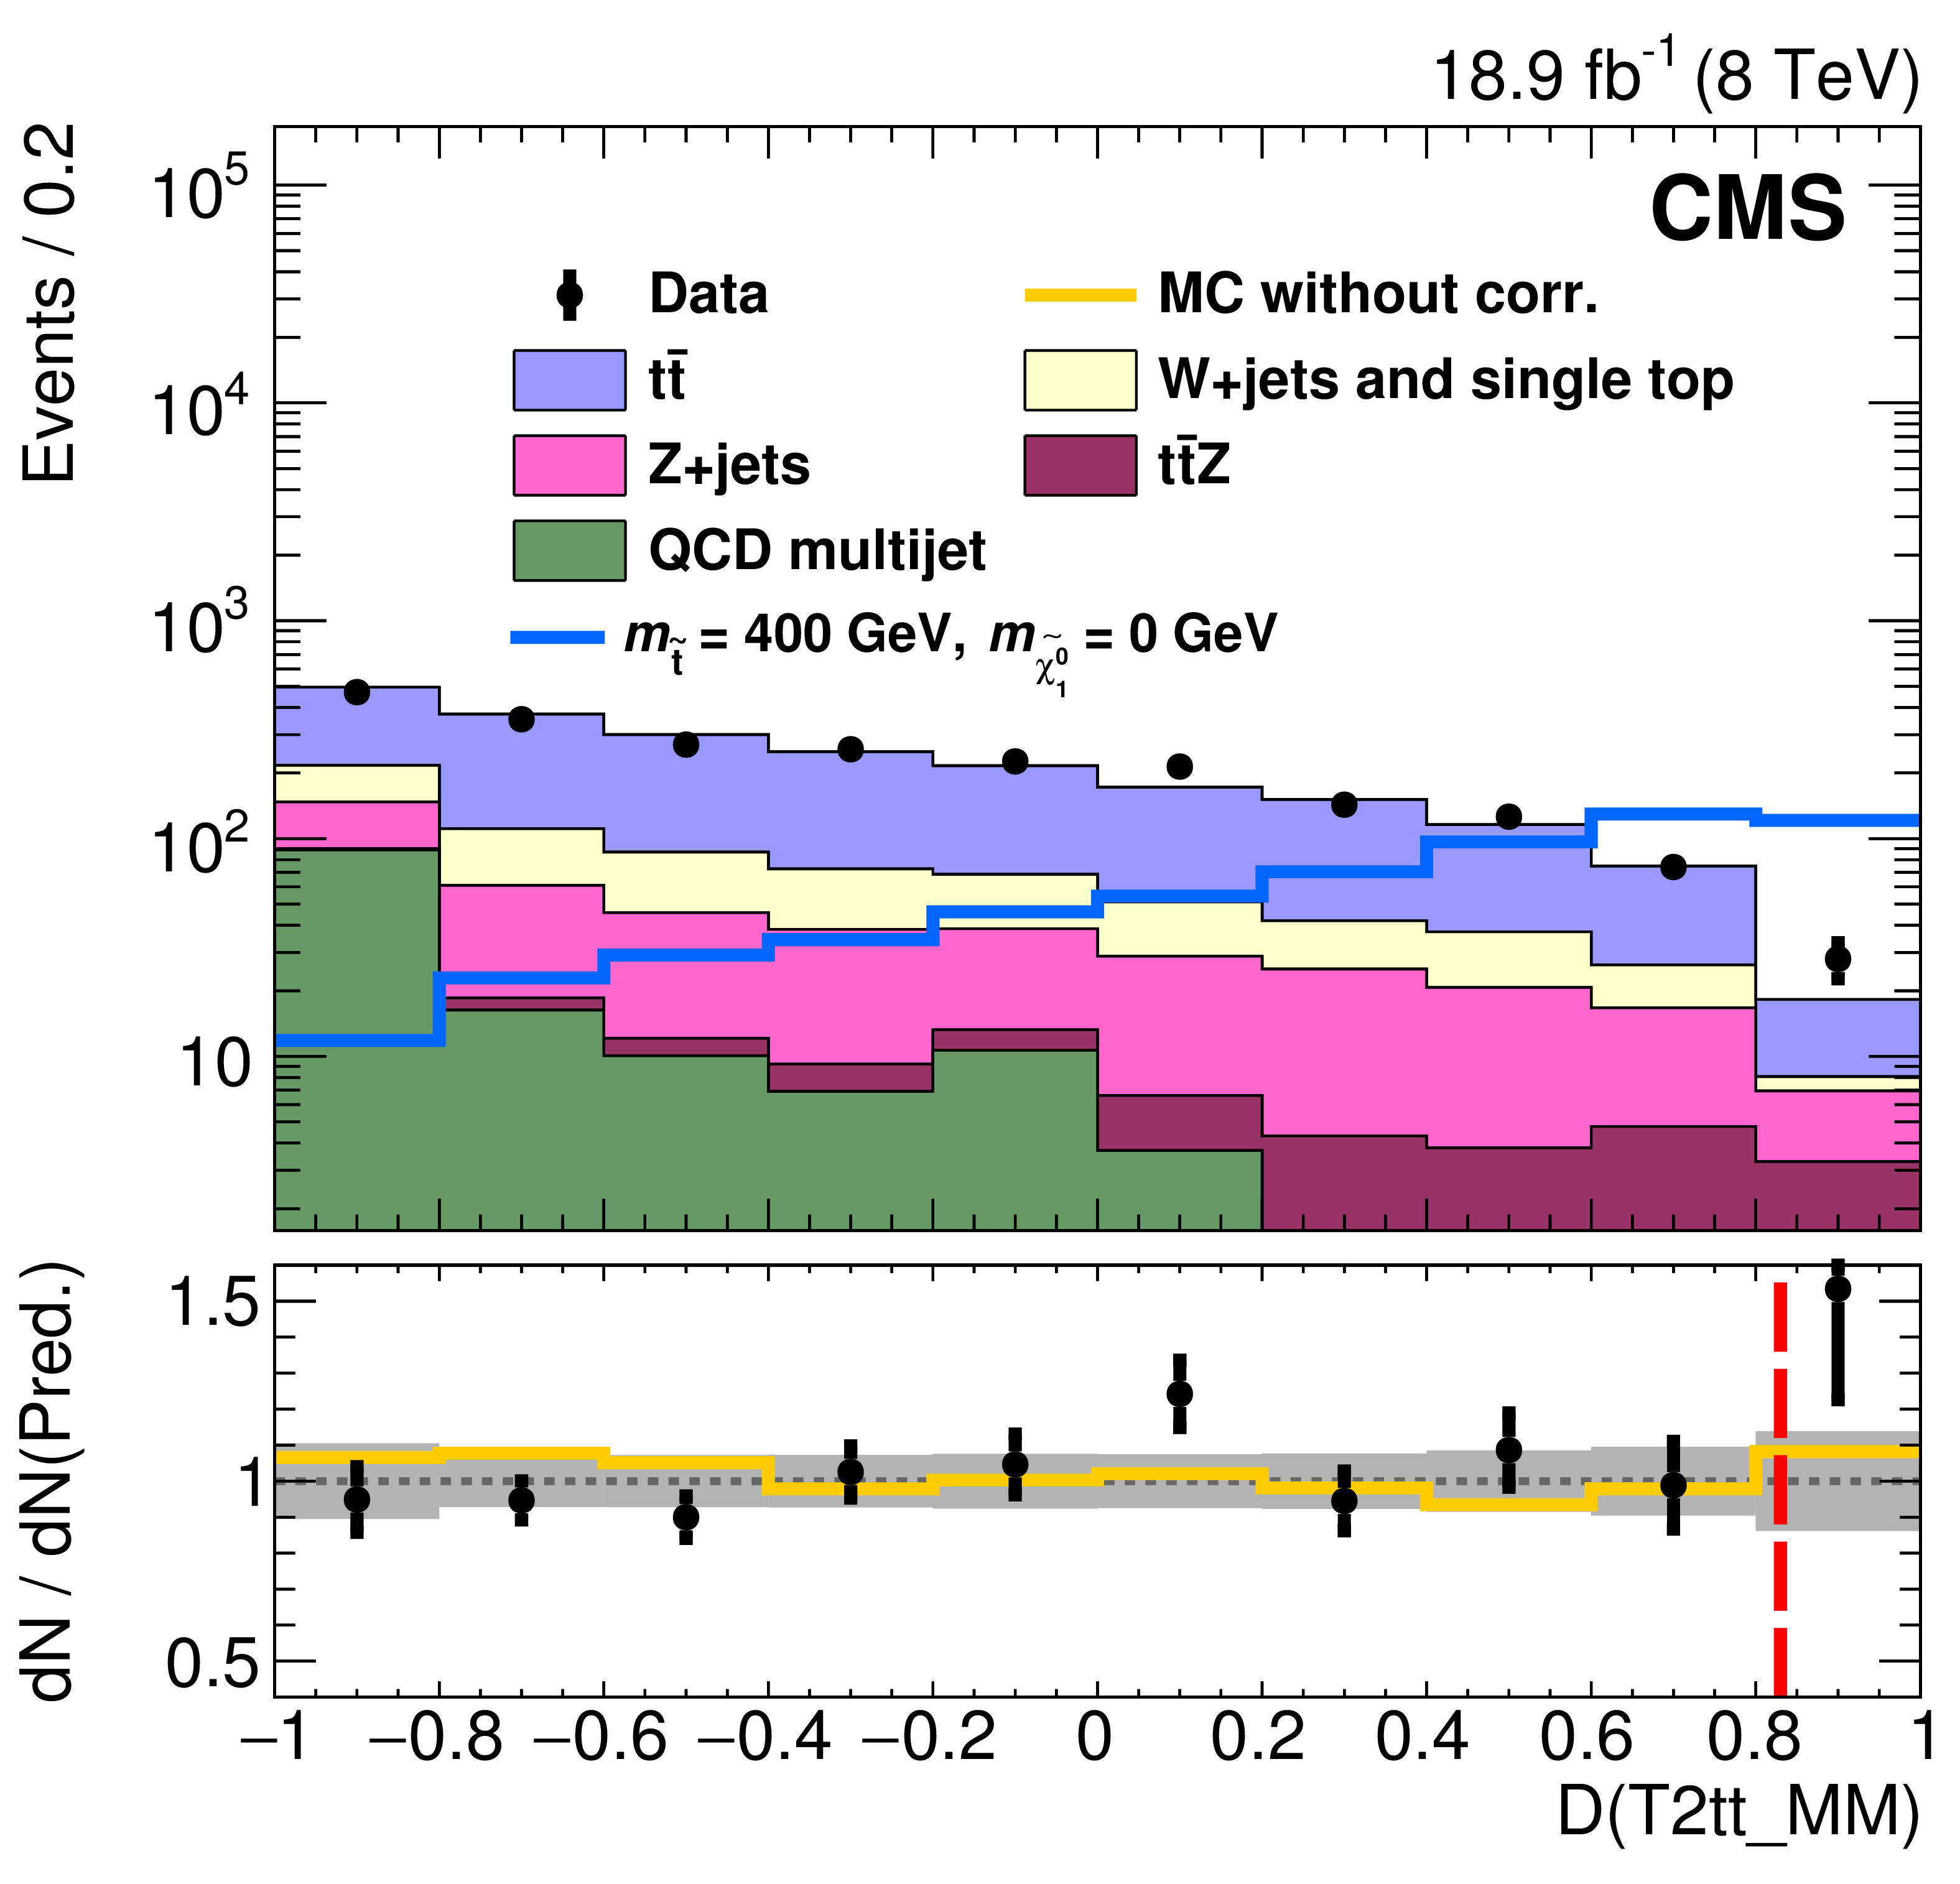
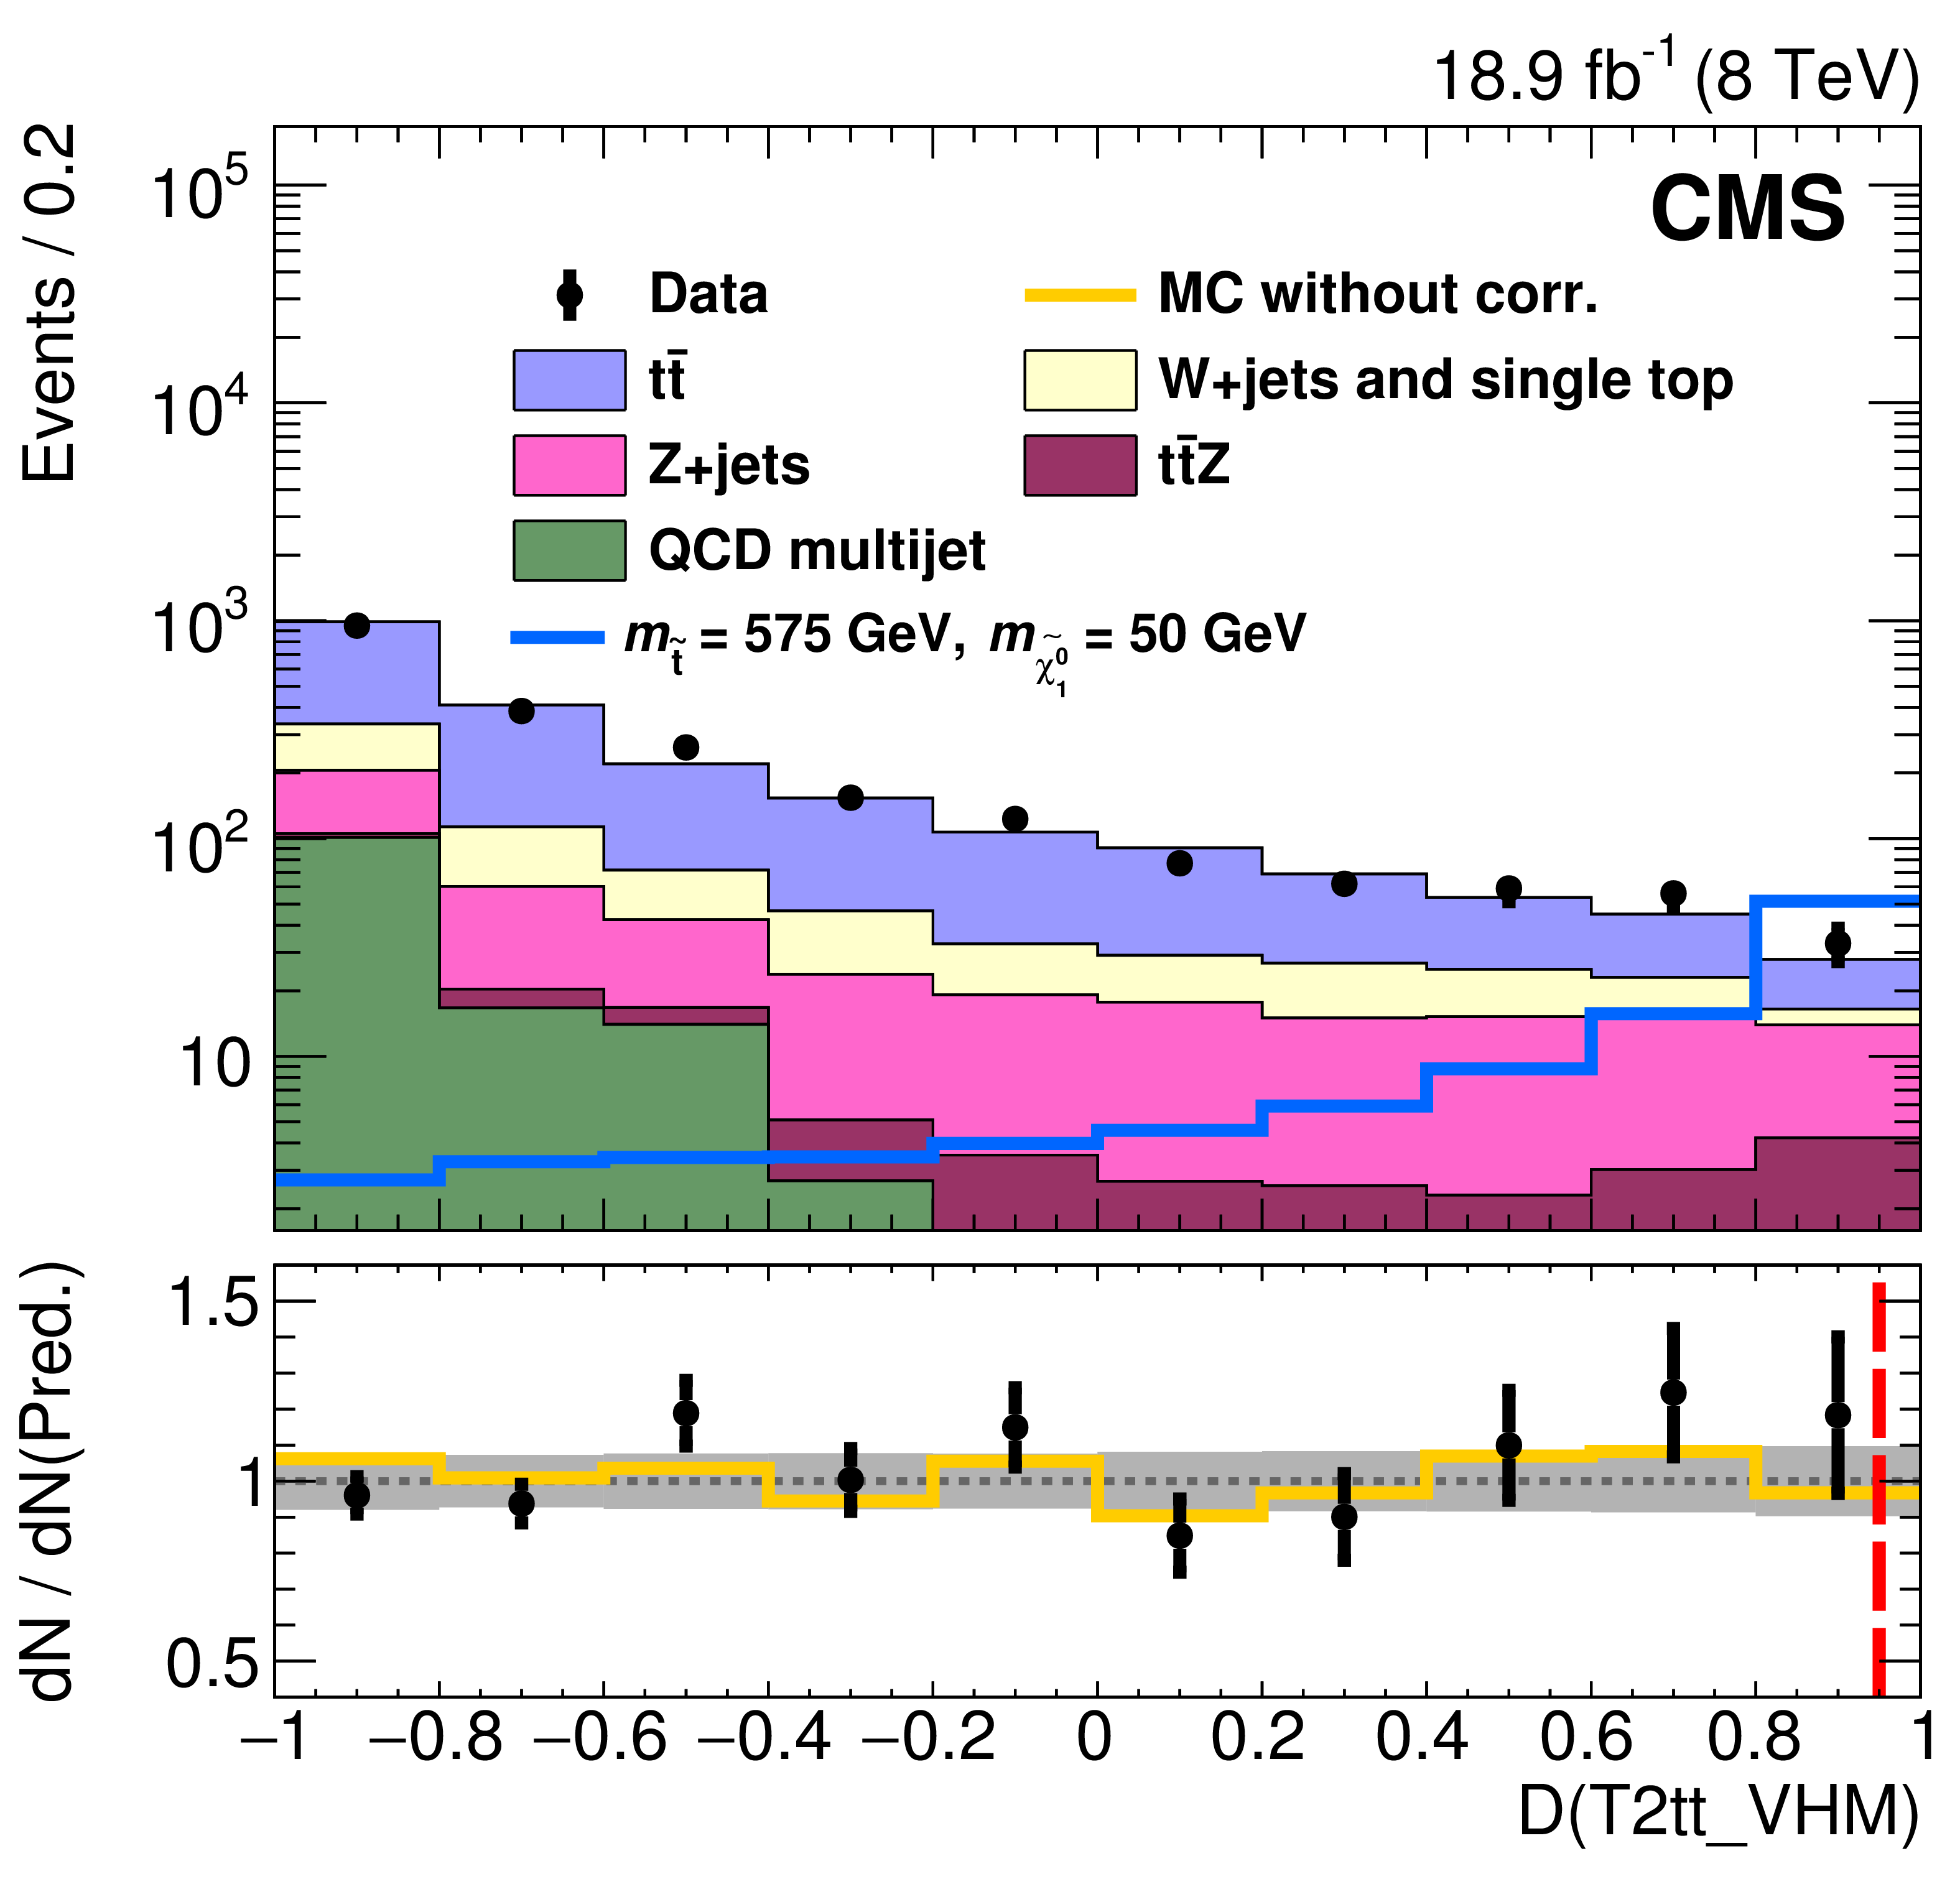
Figure 12-a:
Observed and predicted event yields for each T2tt search region discriminator (D). The bottom pane of each plot shows the ratio of observed to predicted yields where the error bars on data points only include the statistical uncertainties in the data and MC event yields. The filled bands represent the relative systematic uncertainties in the predictions. |
png pdf |
Figure 12-b:
Observed and predicted event yields for each T2tt search region discriminator (D). The bottom pane of each plot shows the ratio of observed to predicted yields where the error bars on data points only include the statistical uncertainties in the data and MC event yields. The filled bands represent the relative systematic uncertainties in the predictions. |

png pdf |
Figure 12-c:
Observed and predicted event yields for each T2tt search region discriminator (D). The bottom pane of each plot shows the ratio of observed to predicted yields where the error bars on data points only include the statistical uncertainties in the data and MC event yields. The filled bands represent the relative systematic uncertainties in the predictions. |
png pdf |
Figure 12-d:
Observed and predicted event yields for each T2tt search region discriminator (D). The bottom pane of each plot shows the ratio of observed to predicted yields where the error bars on data points only include the statistical uncertainties in the data and MC event yields. The filled bands represent the relative systematic uncertainties in the predictions. |
png pdf |
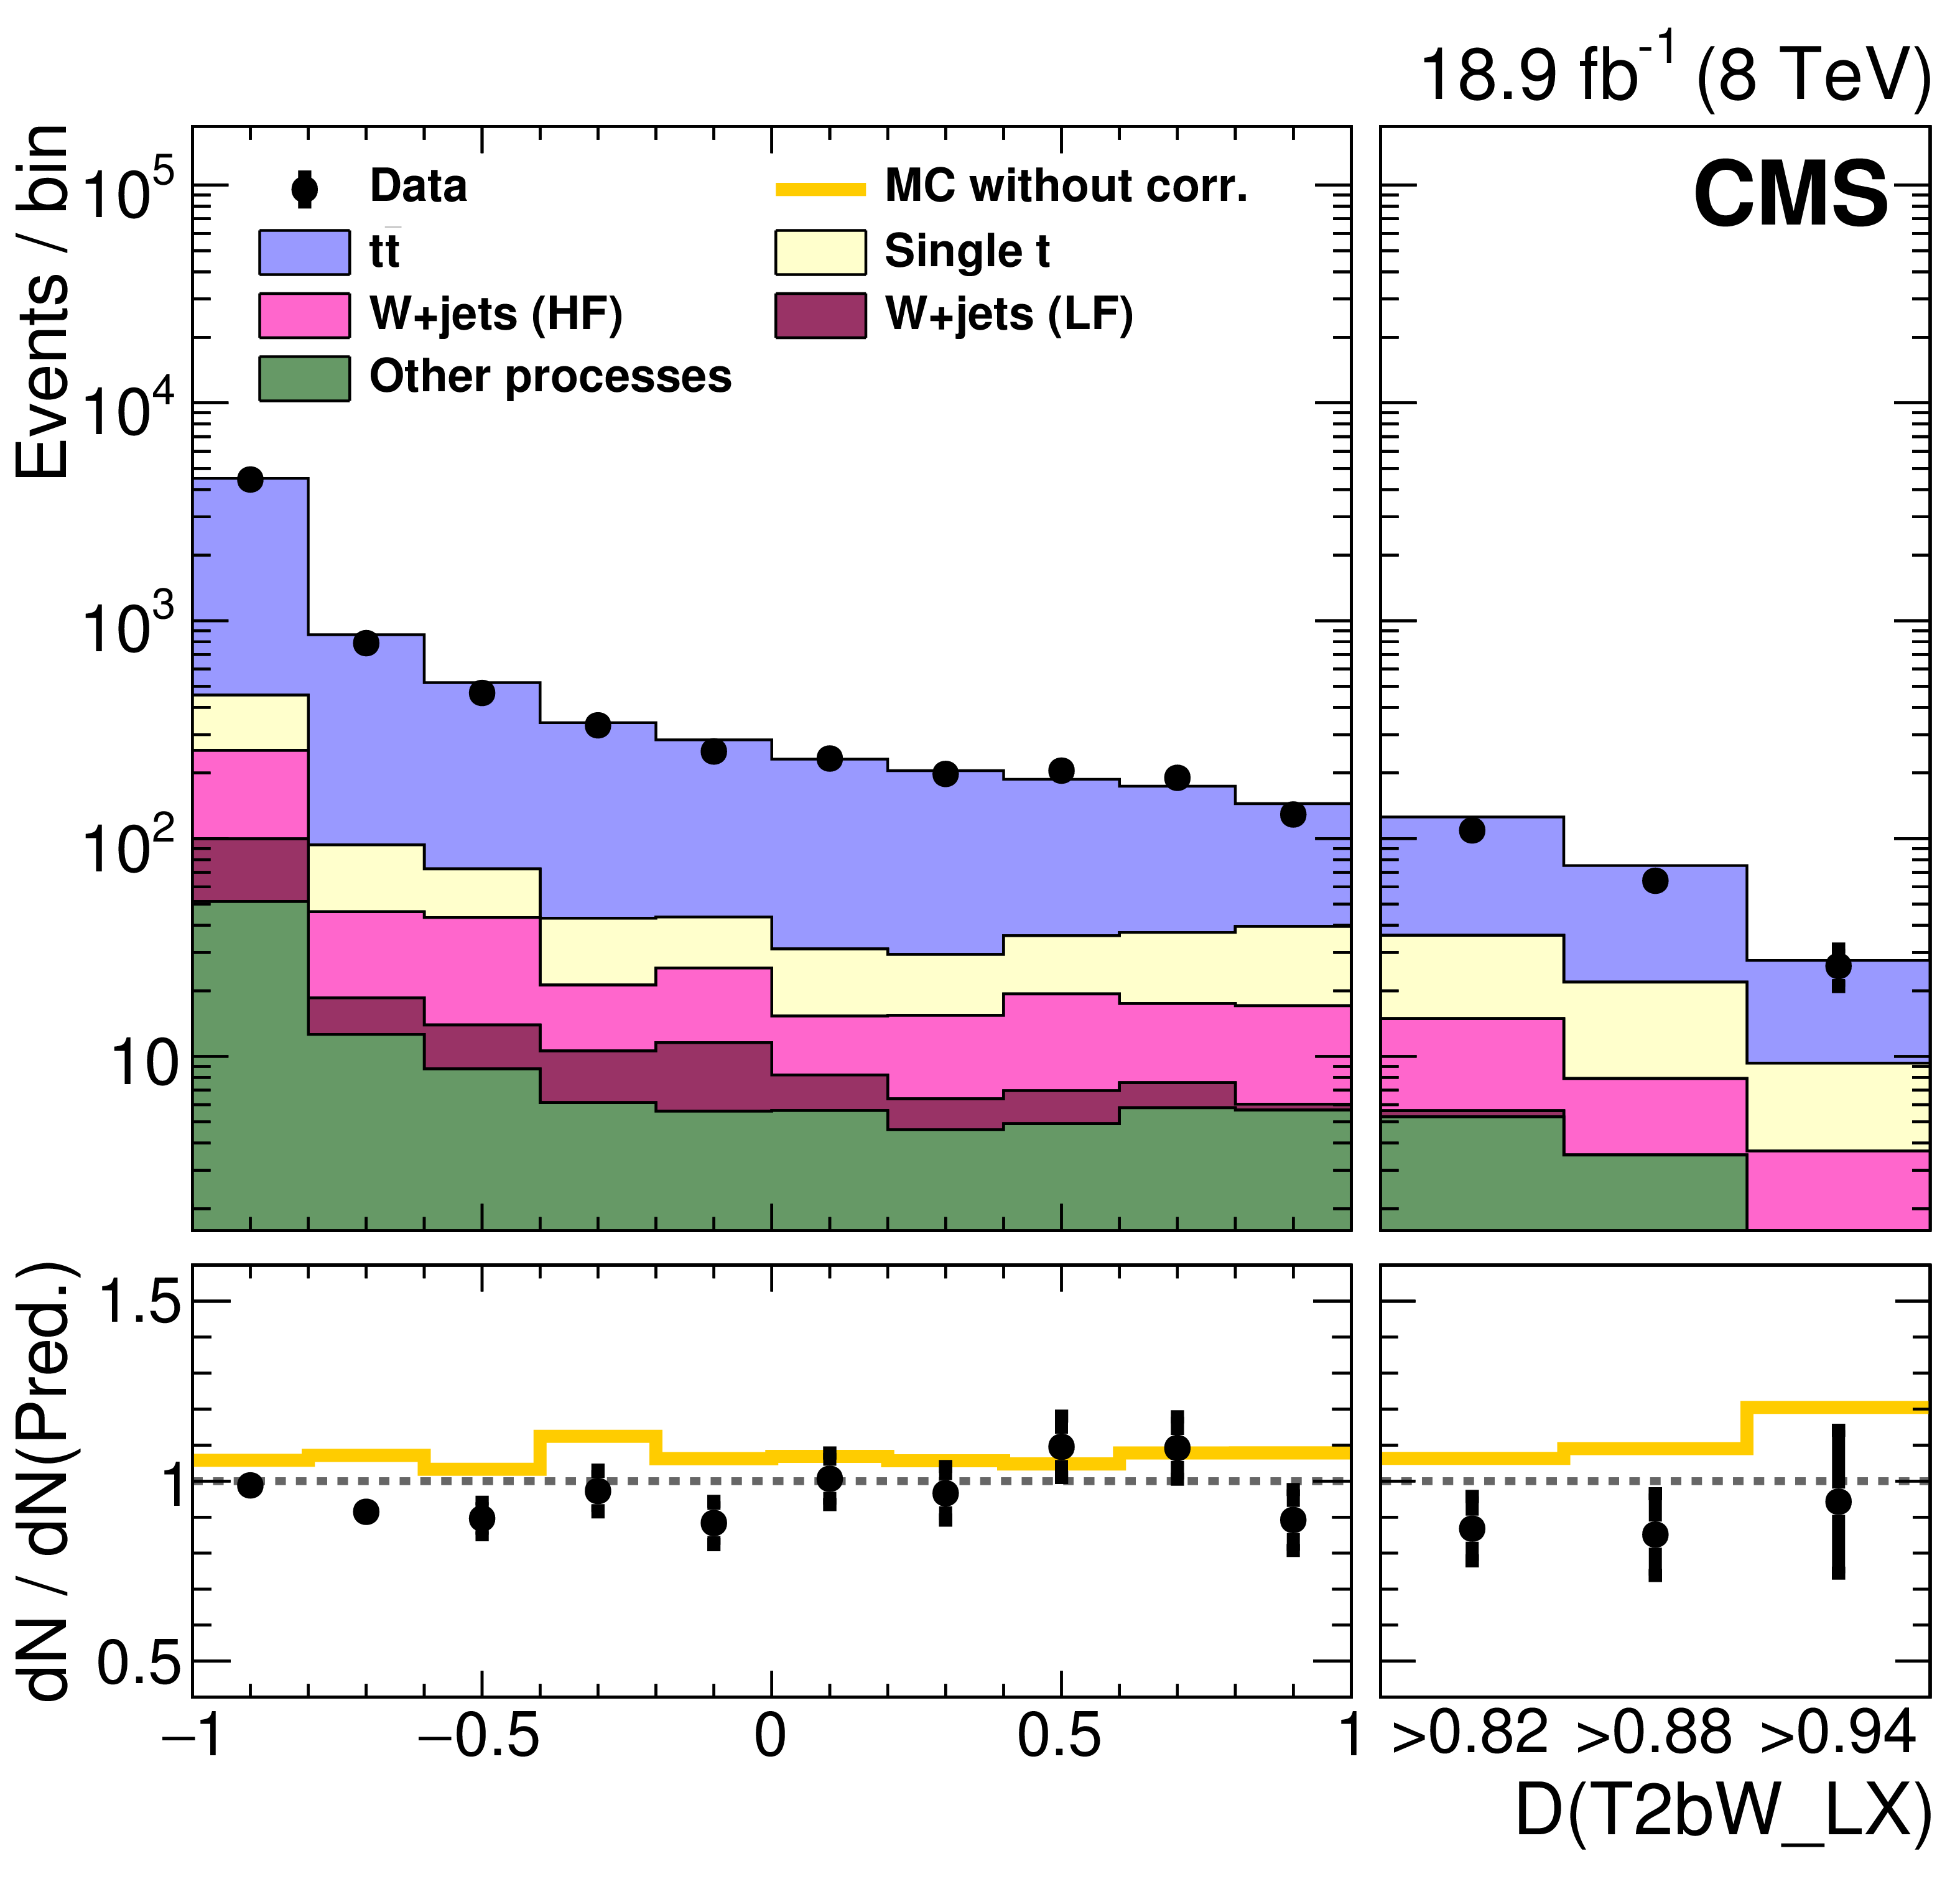
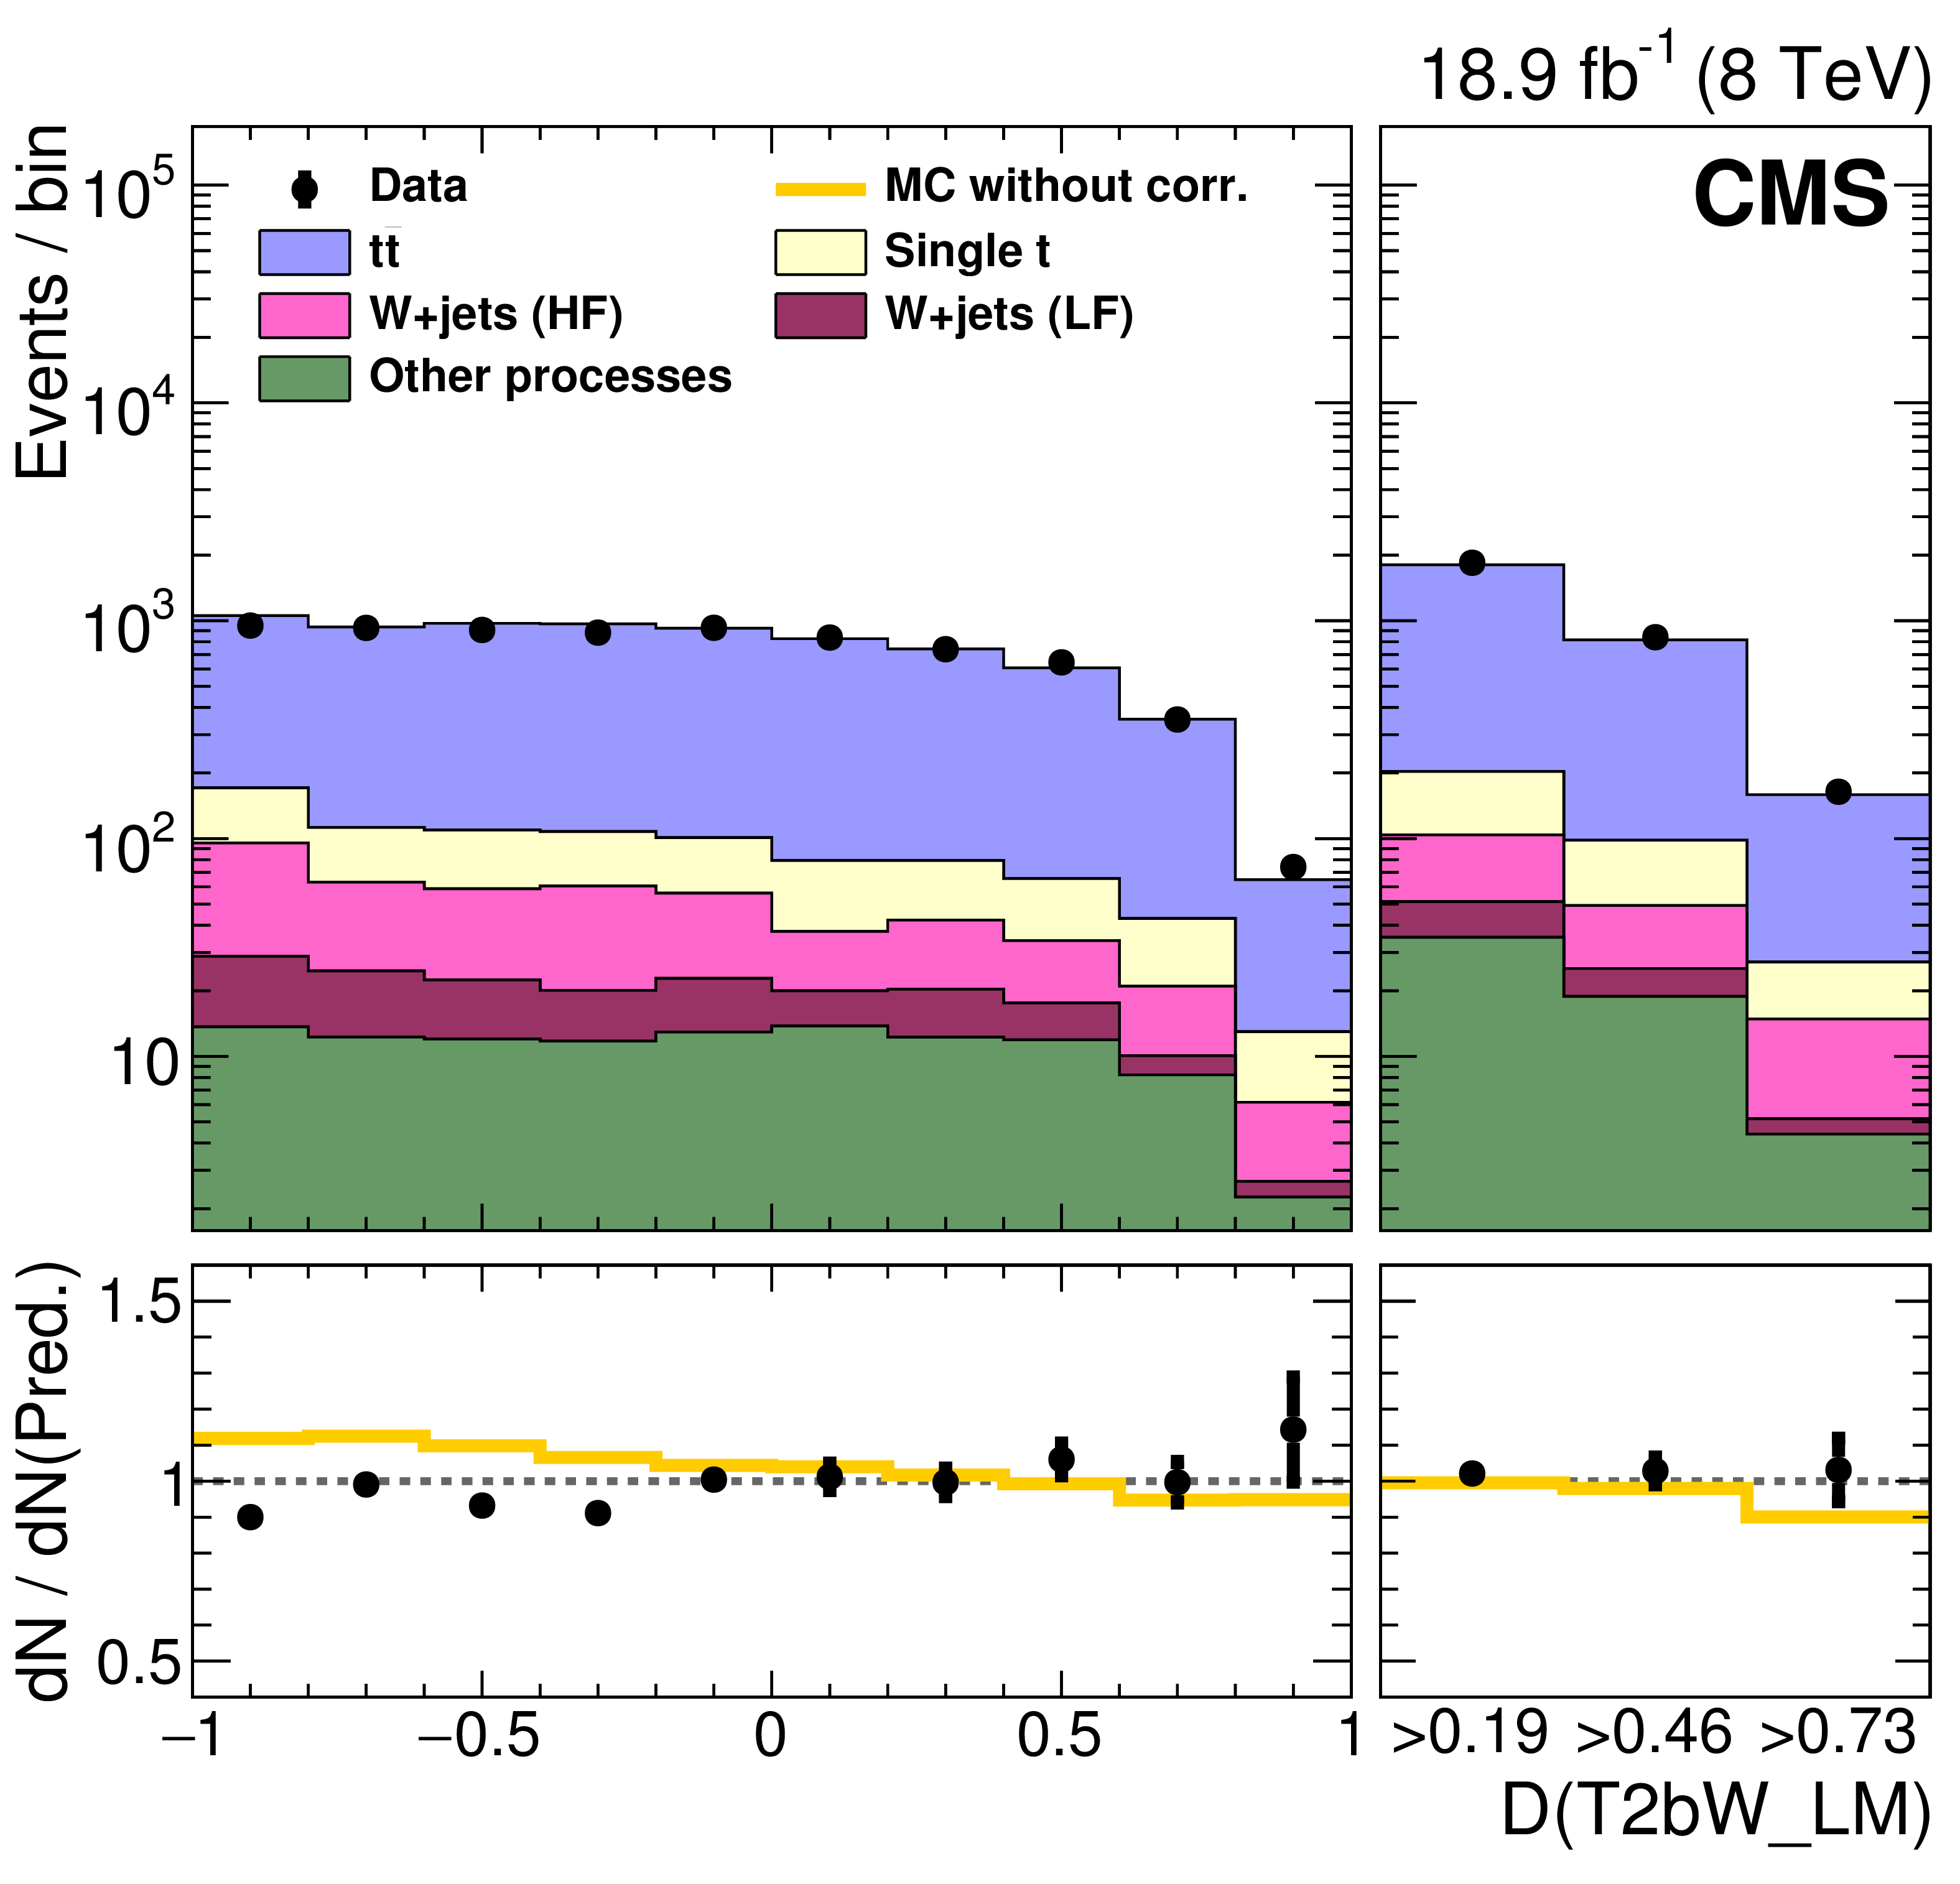
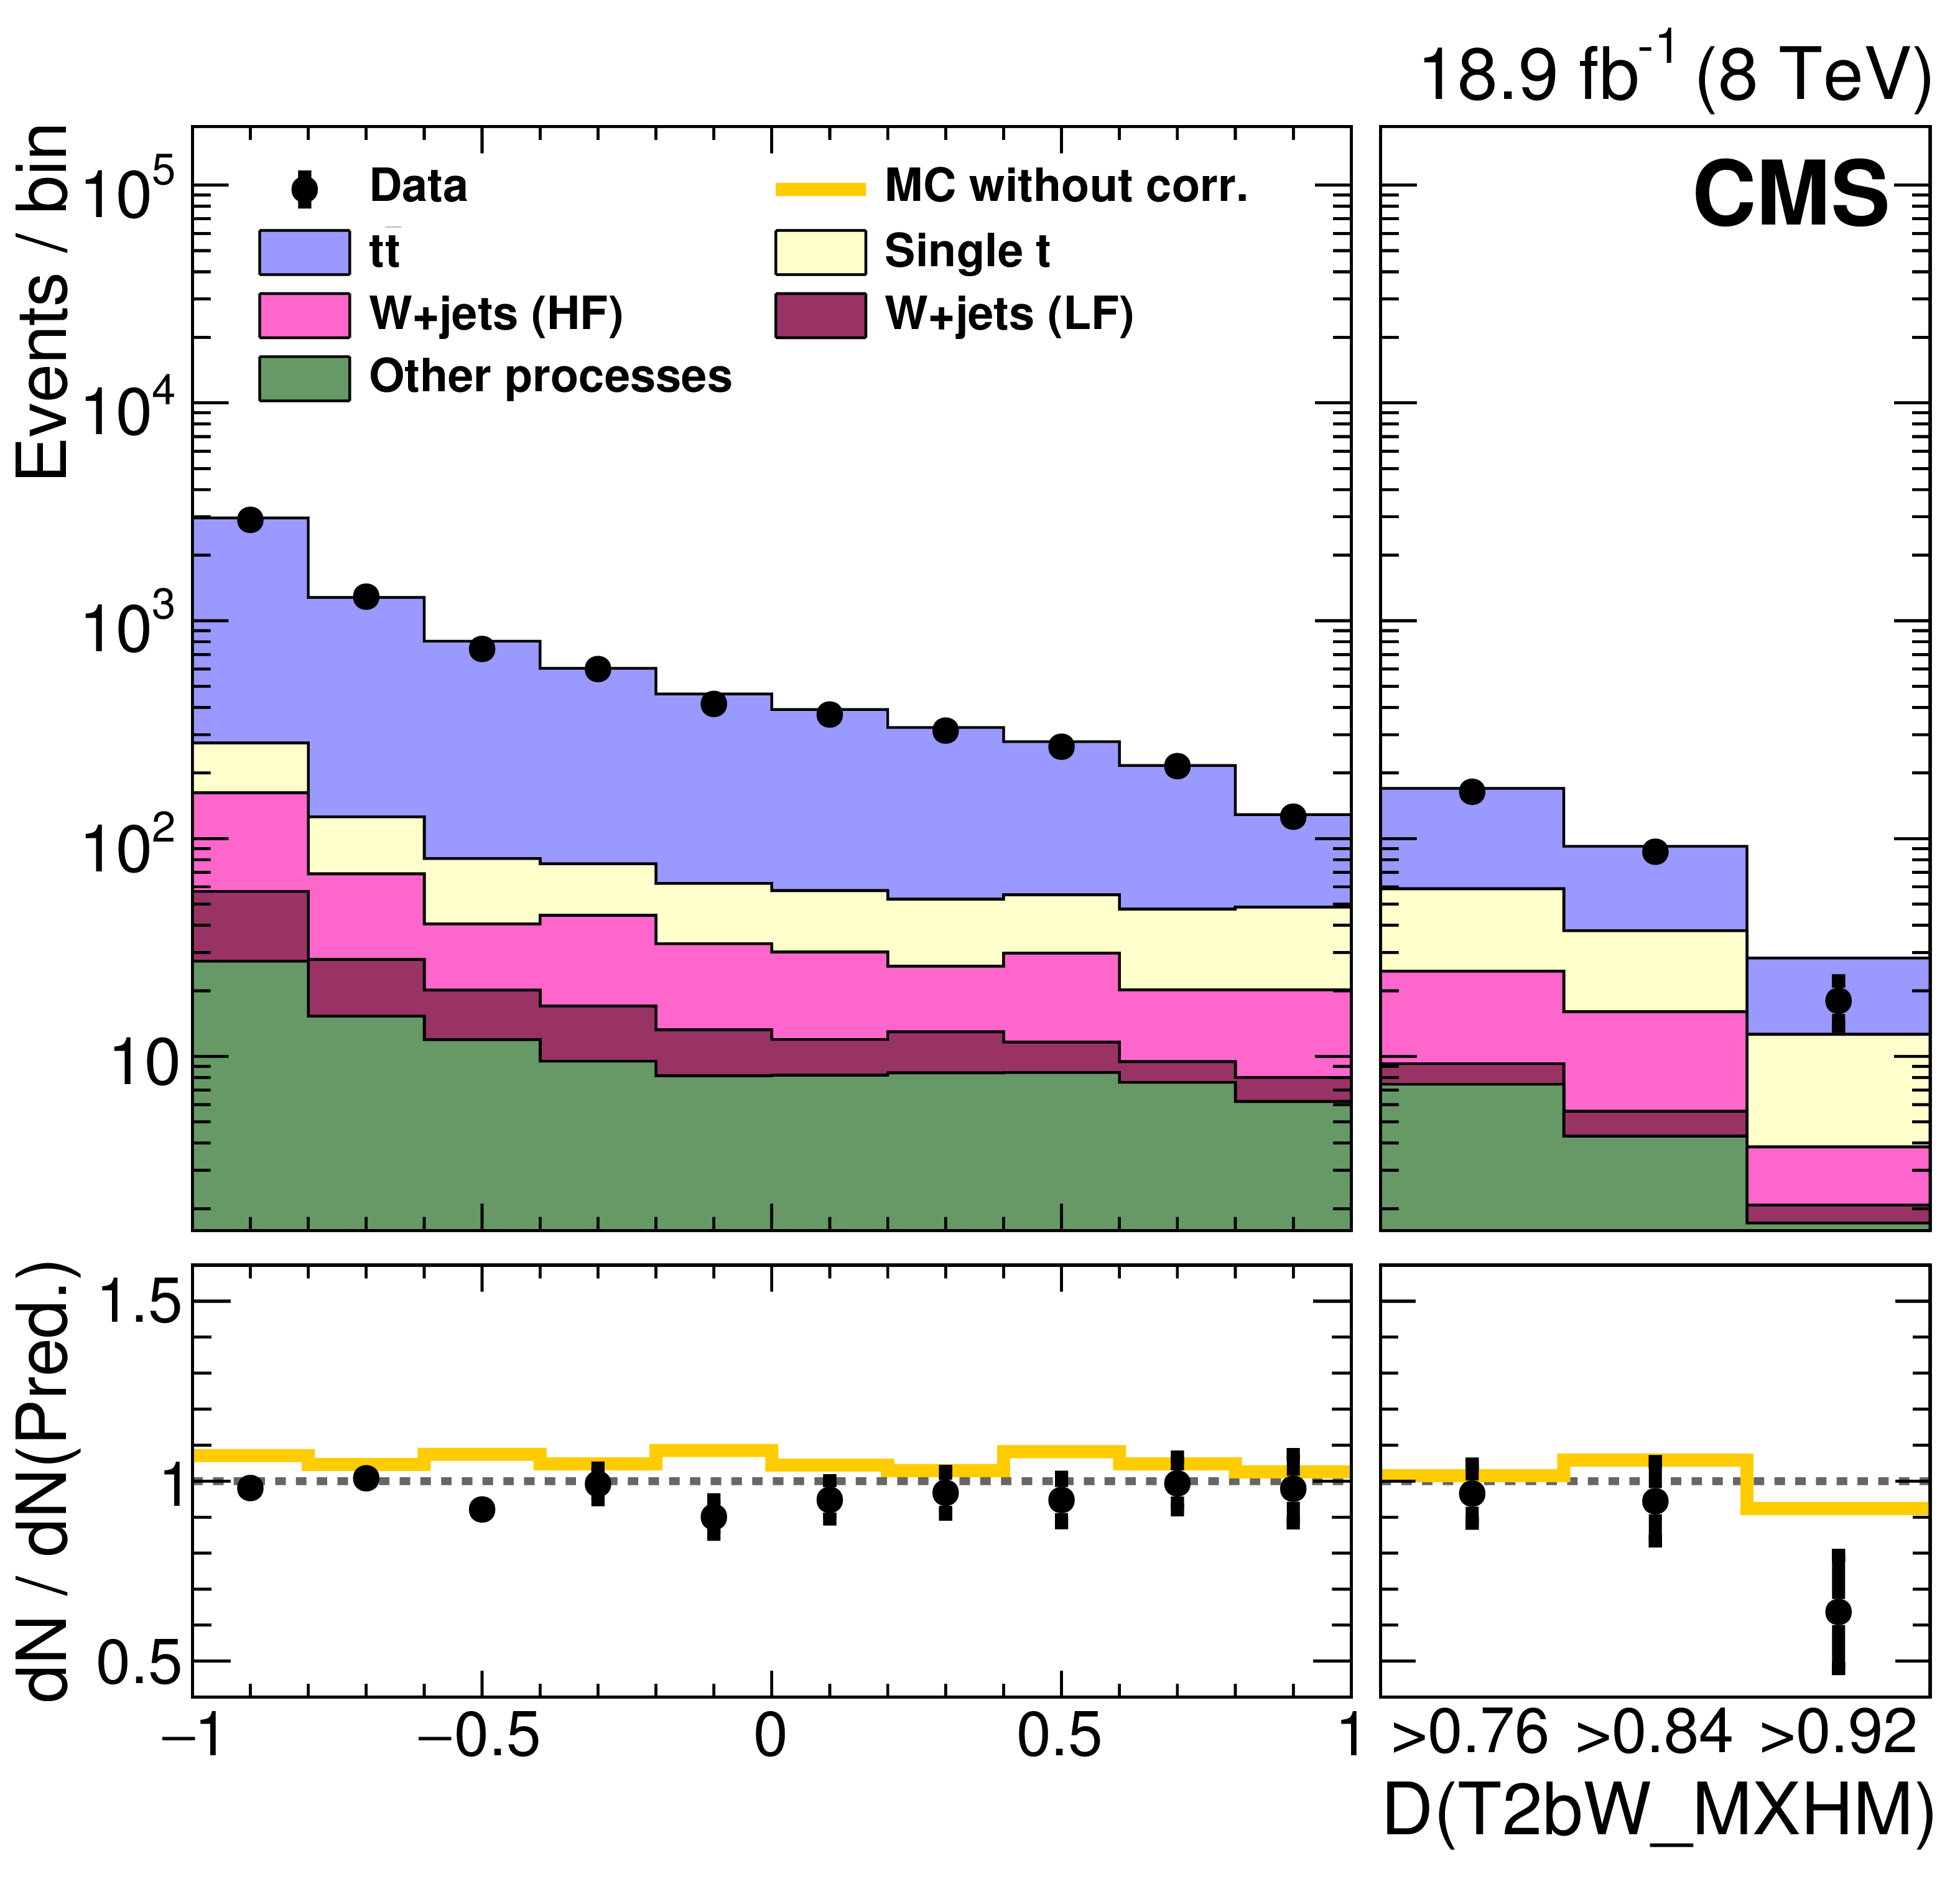
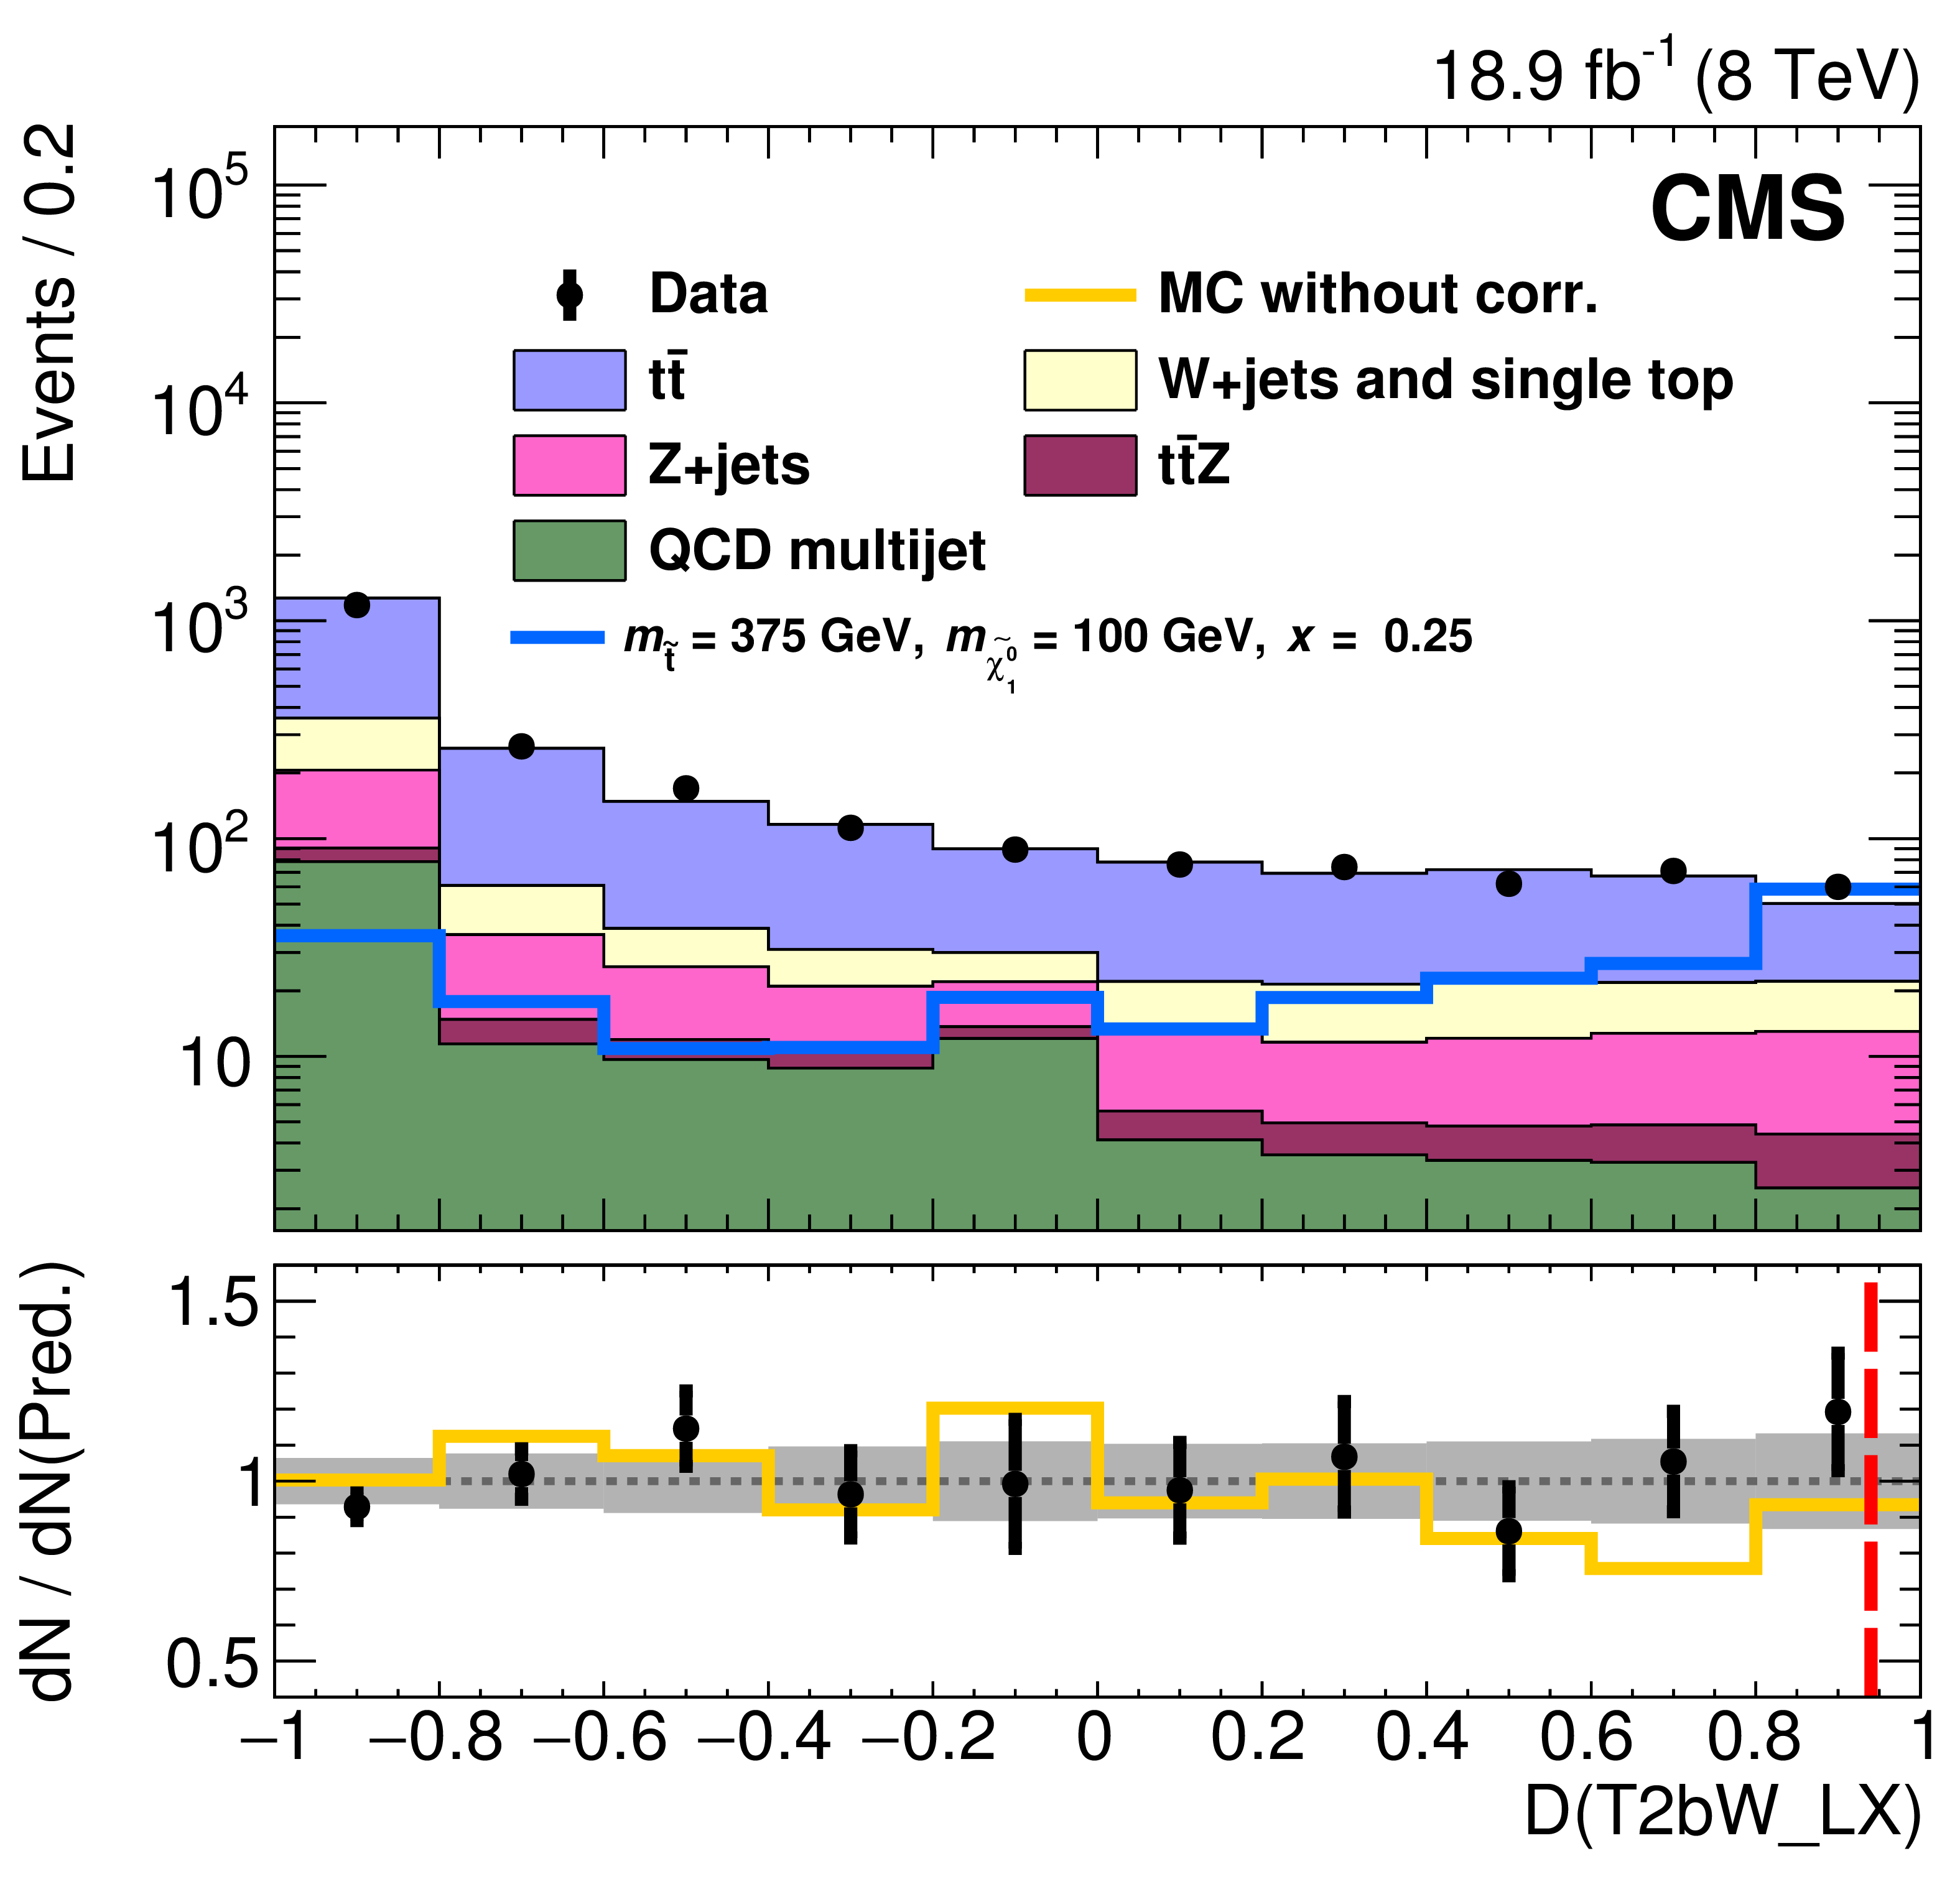
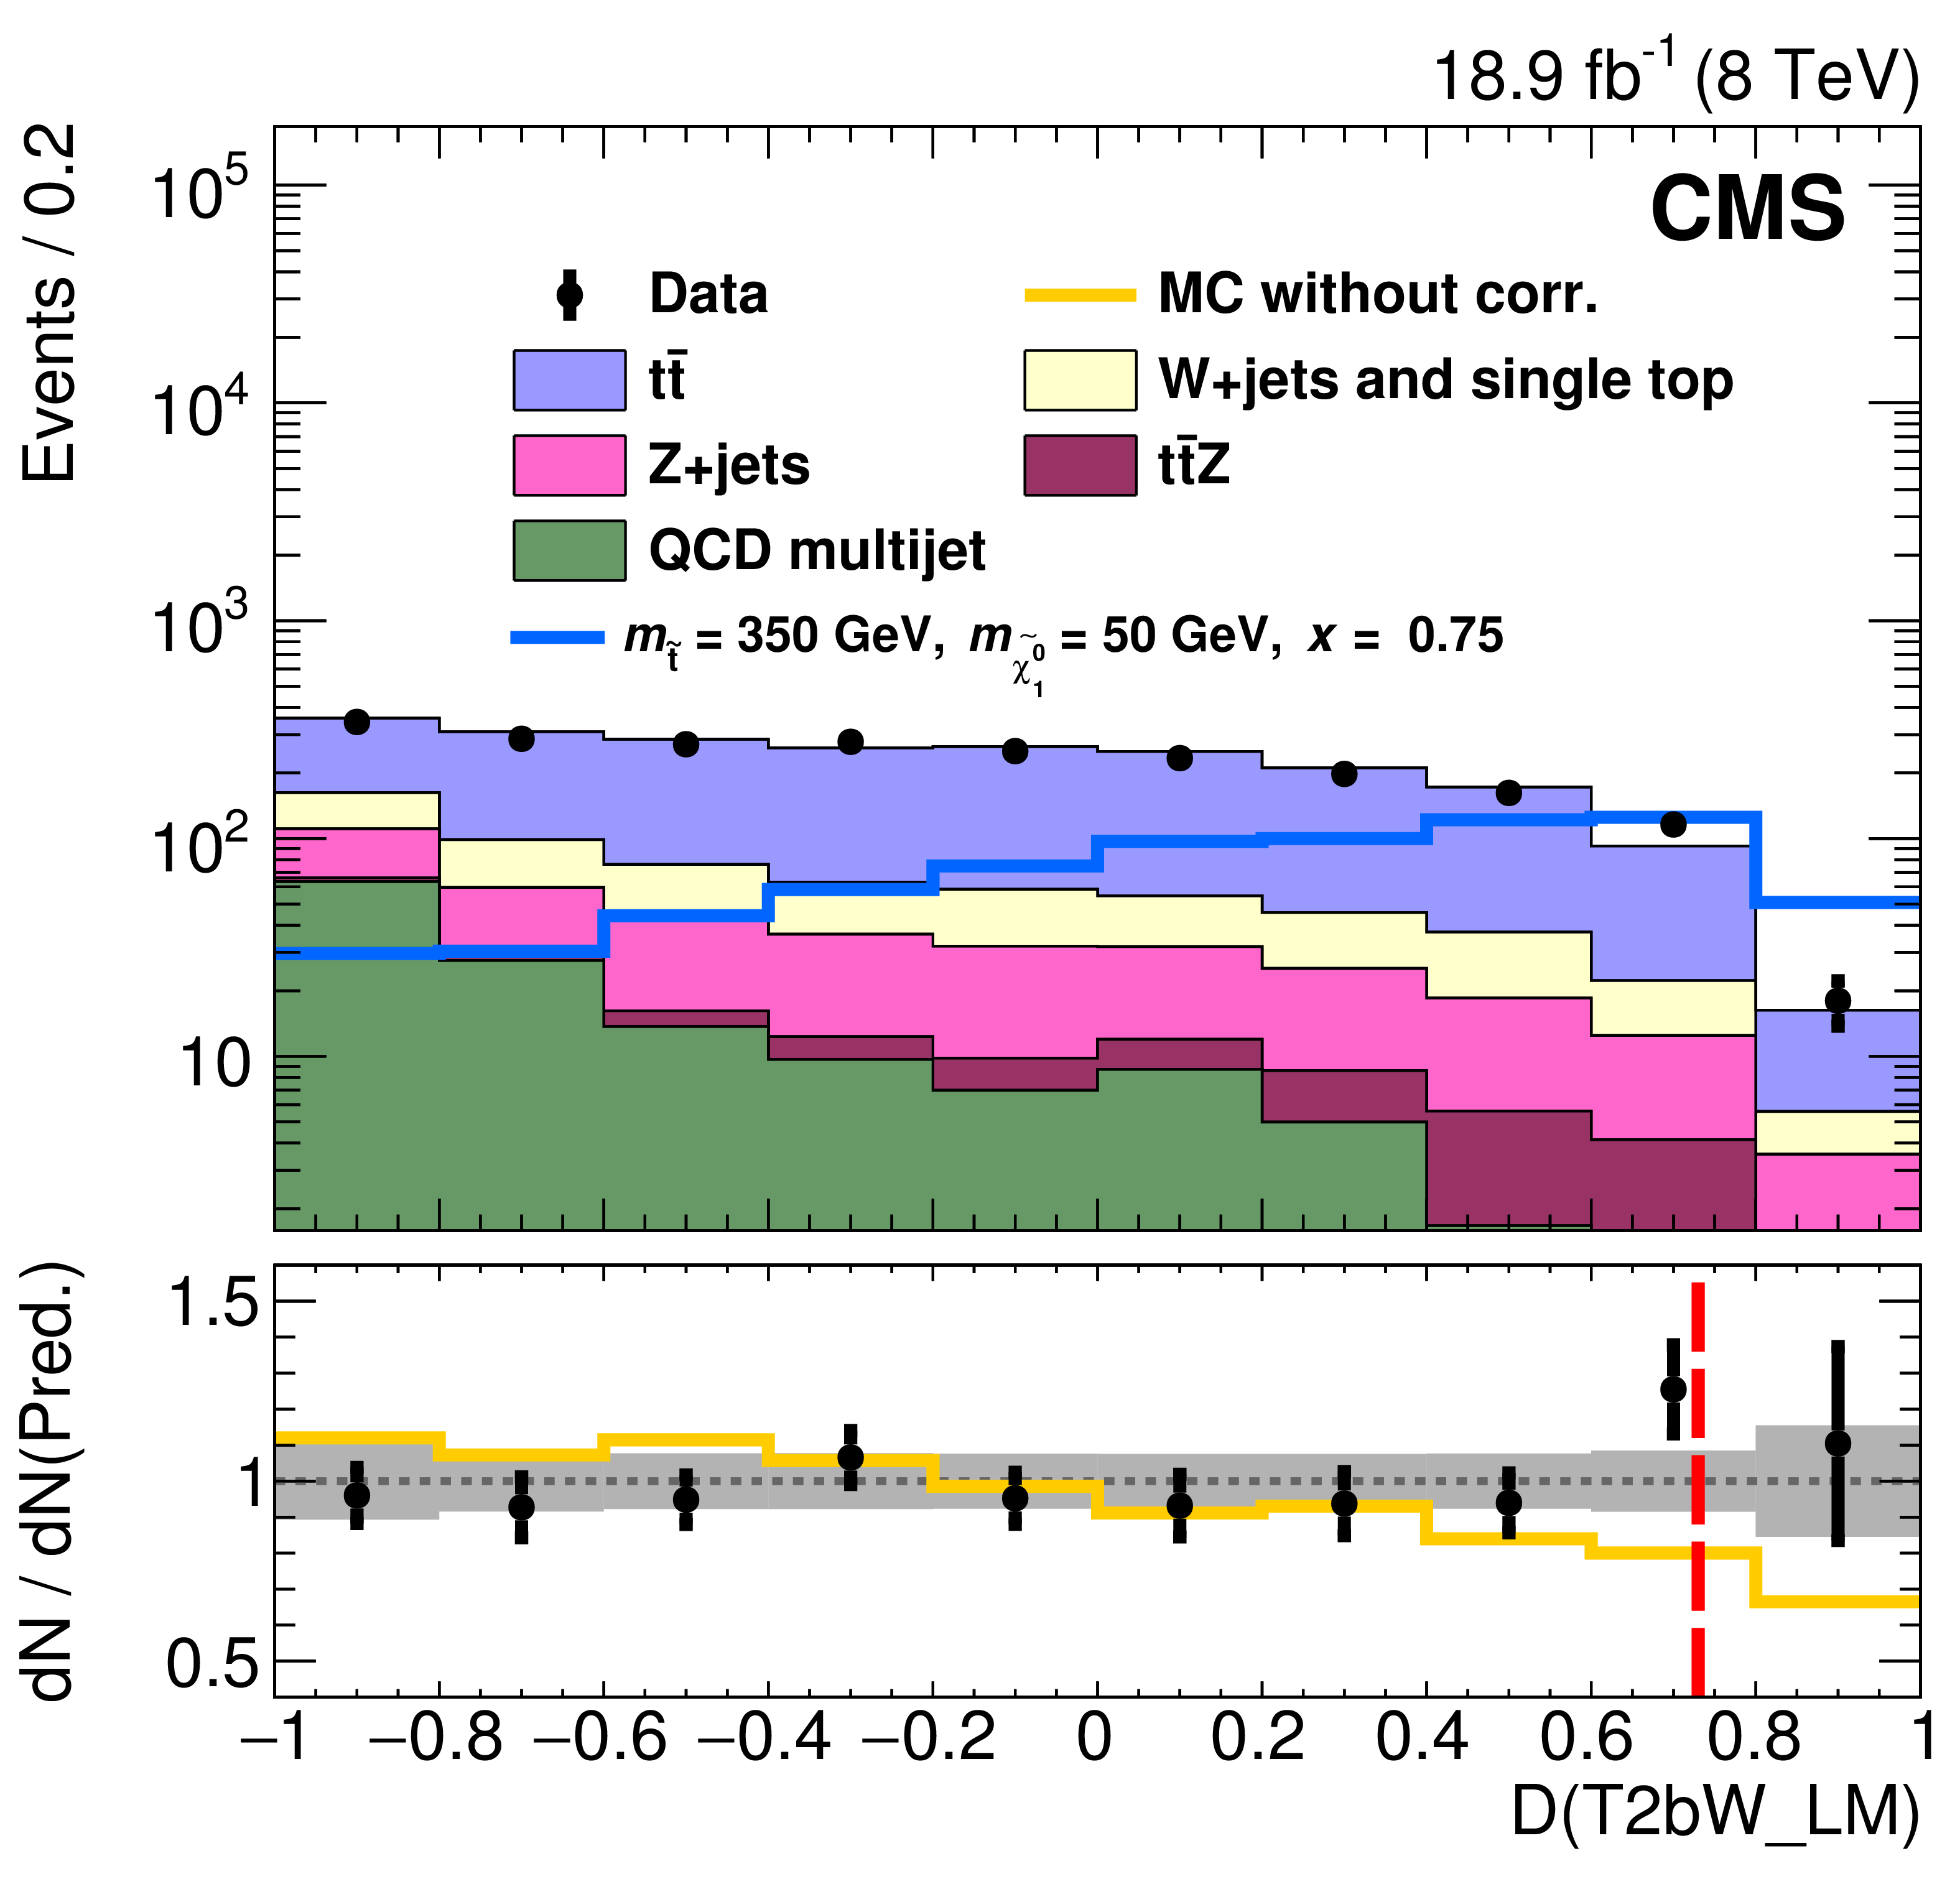
Figure 13-a:
Observed and predicted event yields for each T2bW search region discriminator (D). The bottom pane of each plot shows the ratio of observed to predicted yields where the error bars on data points only include the statistical uncertainties in the data and MC event yields. The filled bands represent the relative systematic uncertainties in the predictions. |
png pdf |
Figure 13-b:
Observed and predicted event yields for each T2bW search region discriminator (D). The bottom pane of each plot shows the ratio of observed to predicted yields where the error bars on data points only include the statistical uncertainties in the data and MC event yields. The filled bands represent the relative systematic uncertainties in the predictions. |

png pdf |
Figure 13-c:
Observed and predicted event yields for each T2bW search region discriminator (D). The bottom pane of each plot shows the ratio of observed to predicted yields where the error bars on data points only include the statistical uncertainties in the data and MC event yields. The filled bands represent the relative systematic uncertainties in the predictions. |
png pdf |
Figure 13-d:
Observed and predicted event yields for each T2bW search region discriminator (D). The bottom pane of each plot shows the ratio of observed to predicted yields where the error bars on data points only include the statistical uncertainties in the data and MC event yields. The filled bands represent the relative systematic uncertainties in the predictions. |

png pdf |
Figure 13-e:
Observed and predicted event yields for each T2bW search region discriminator (D). The bottom pane of each plot shows the ratio of observed to predicted yields where the error bars on data points only include the statistical uncertainties in the data and MC event yields. The filled bands represent the relative systematic uncertainties in the predictions. |
png pdf |
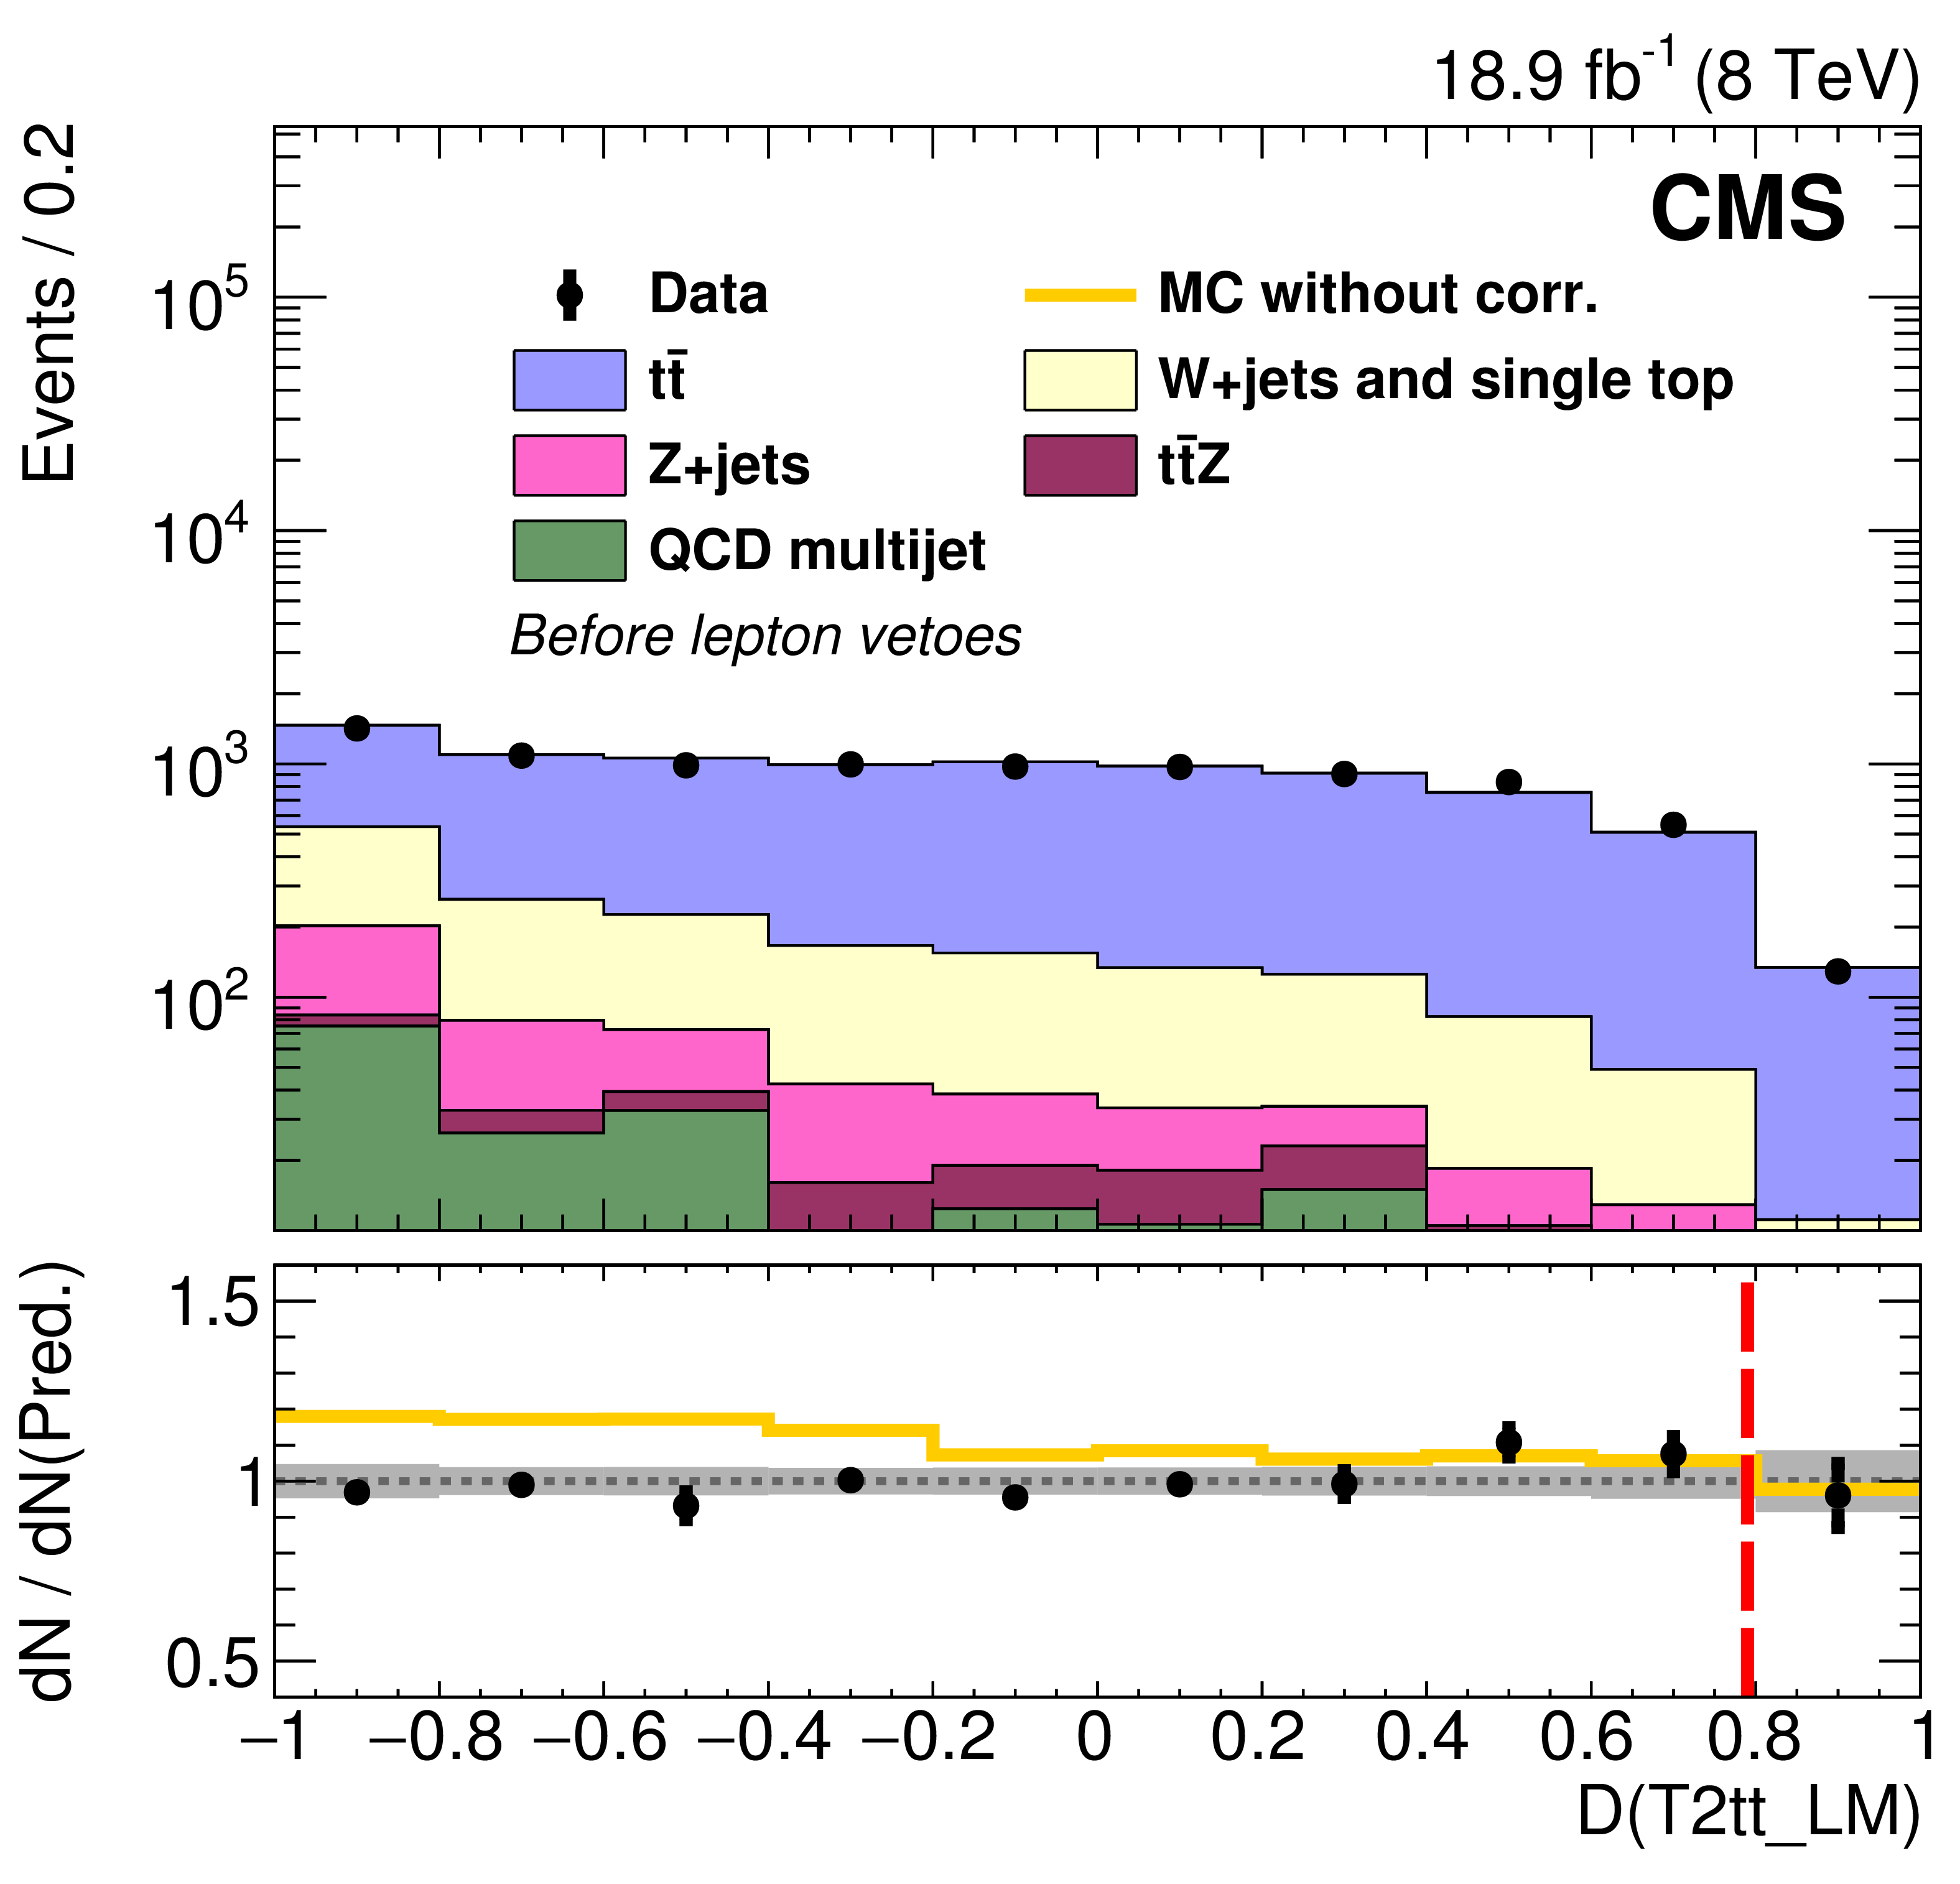
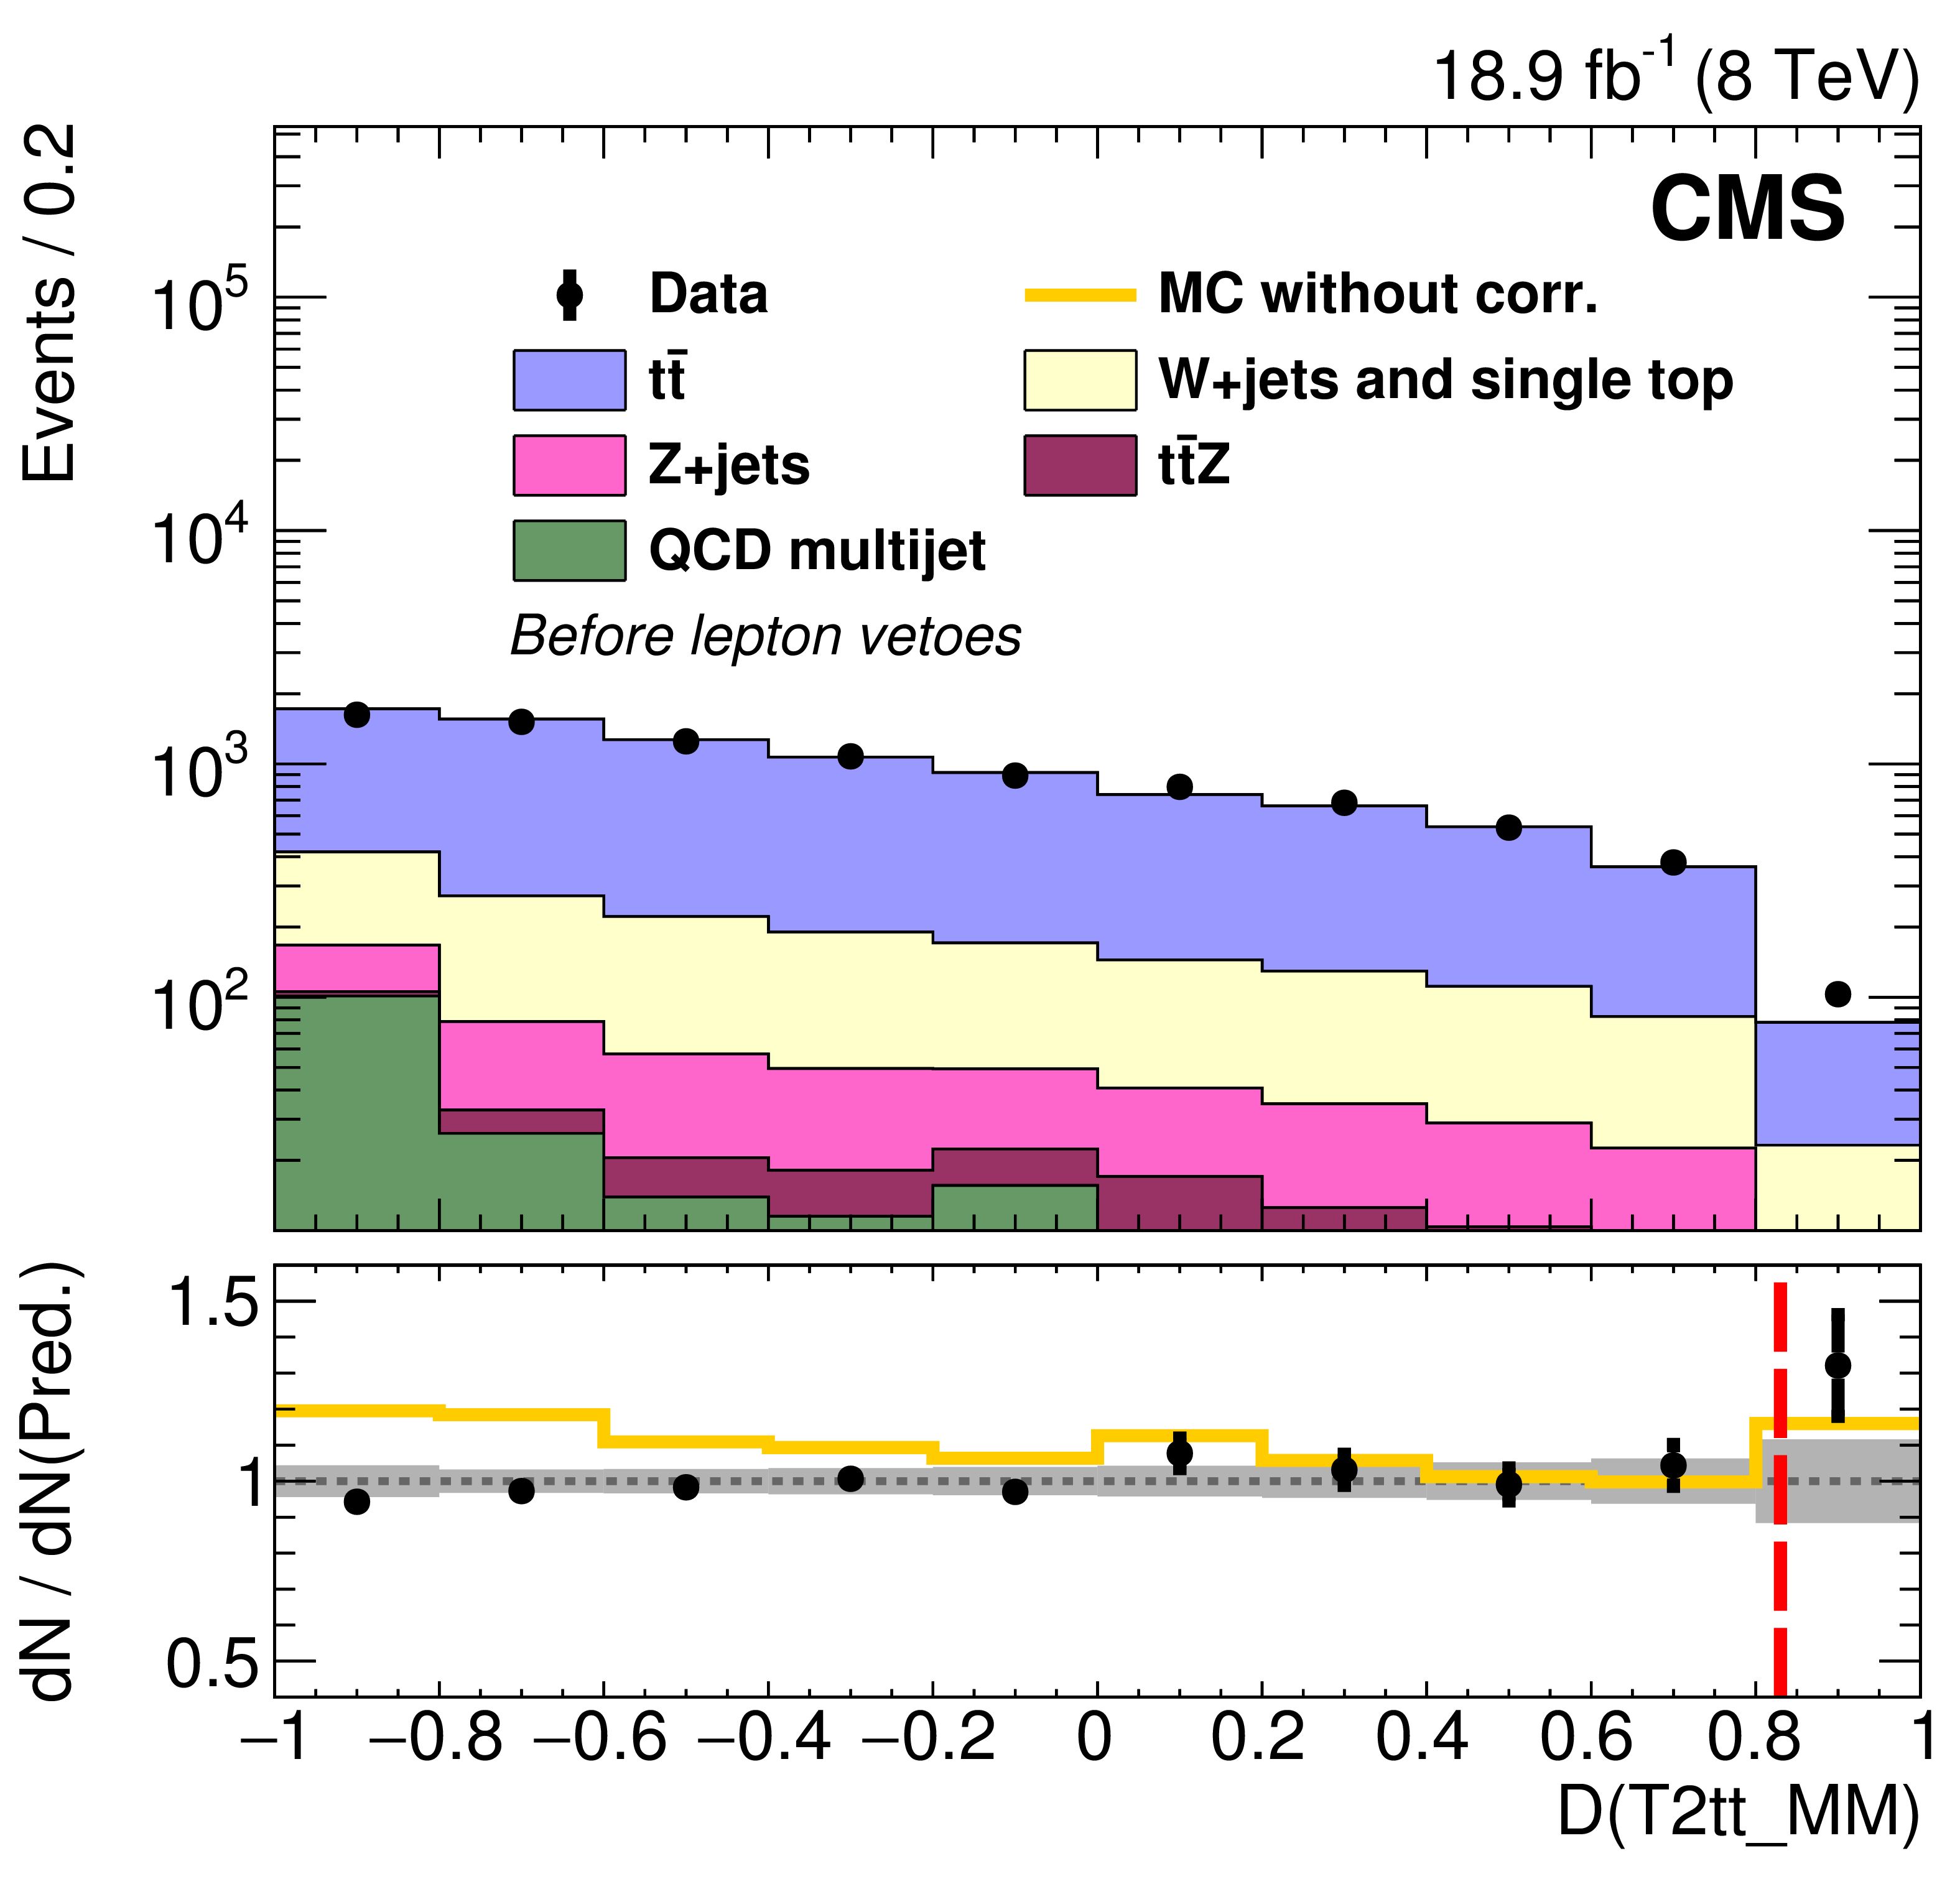
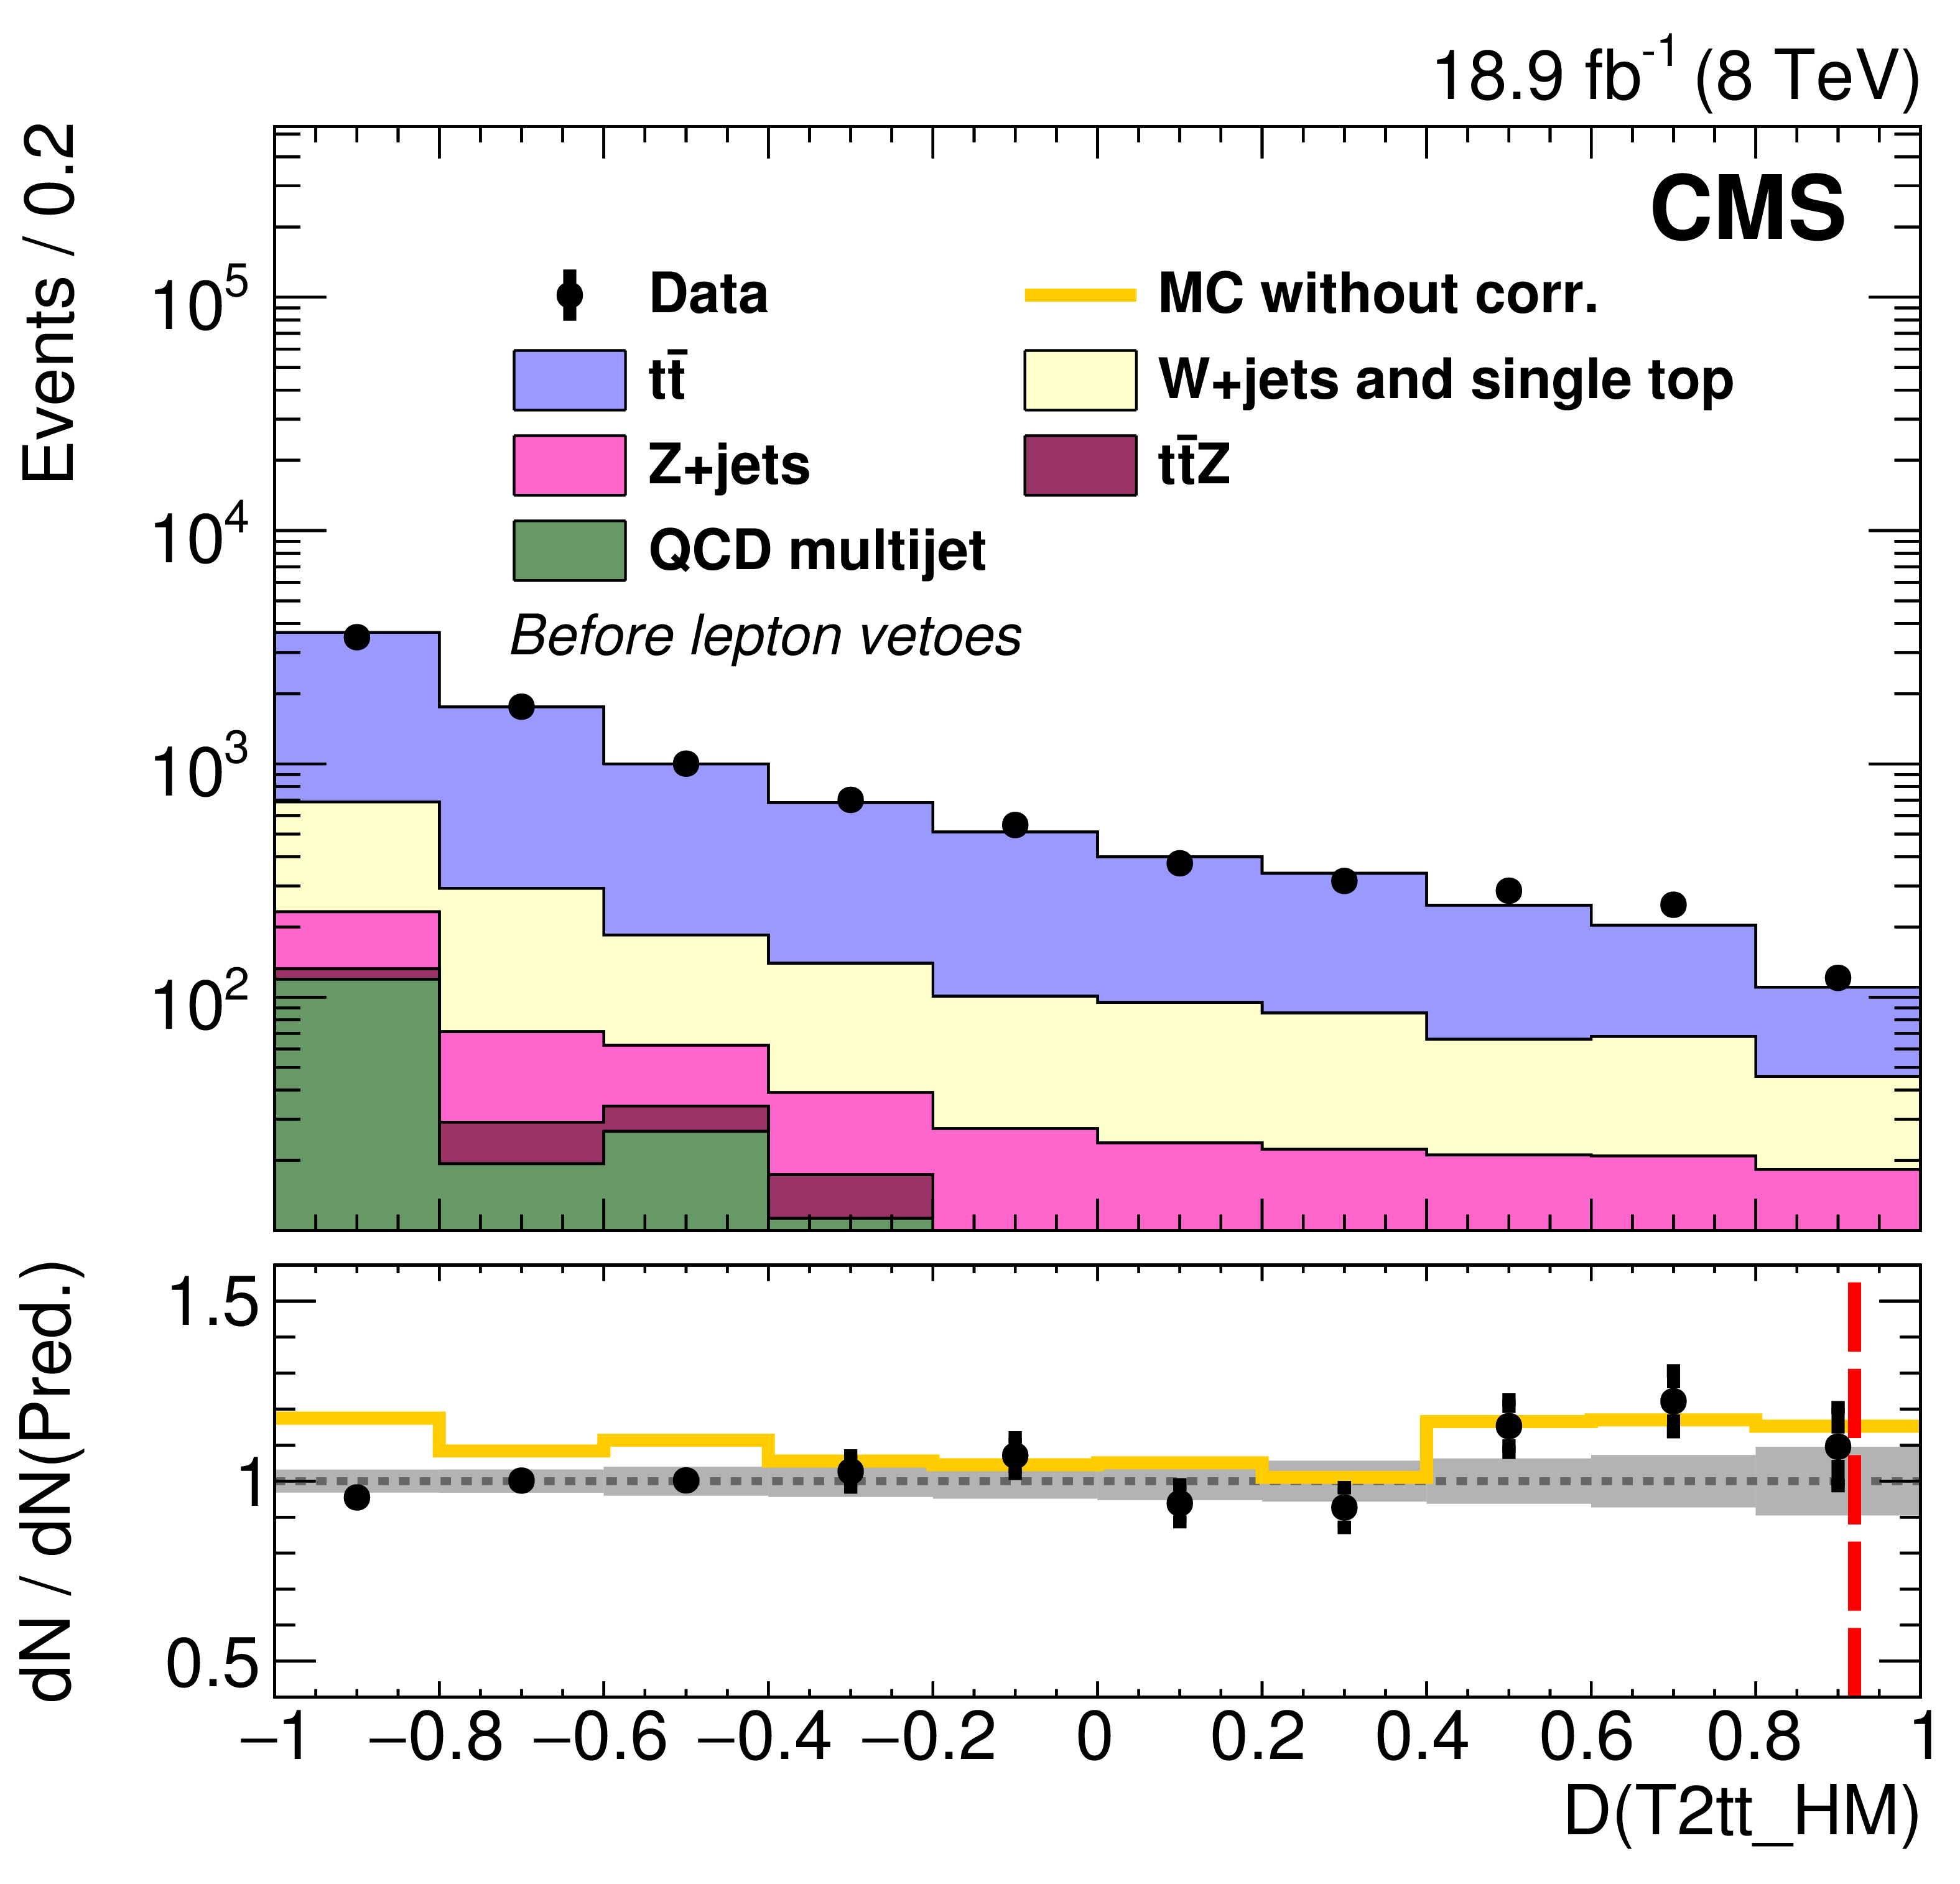
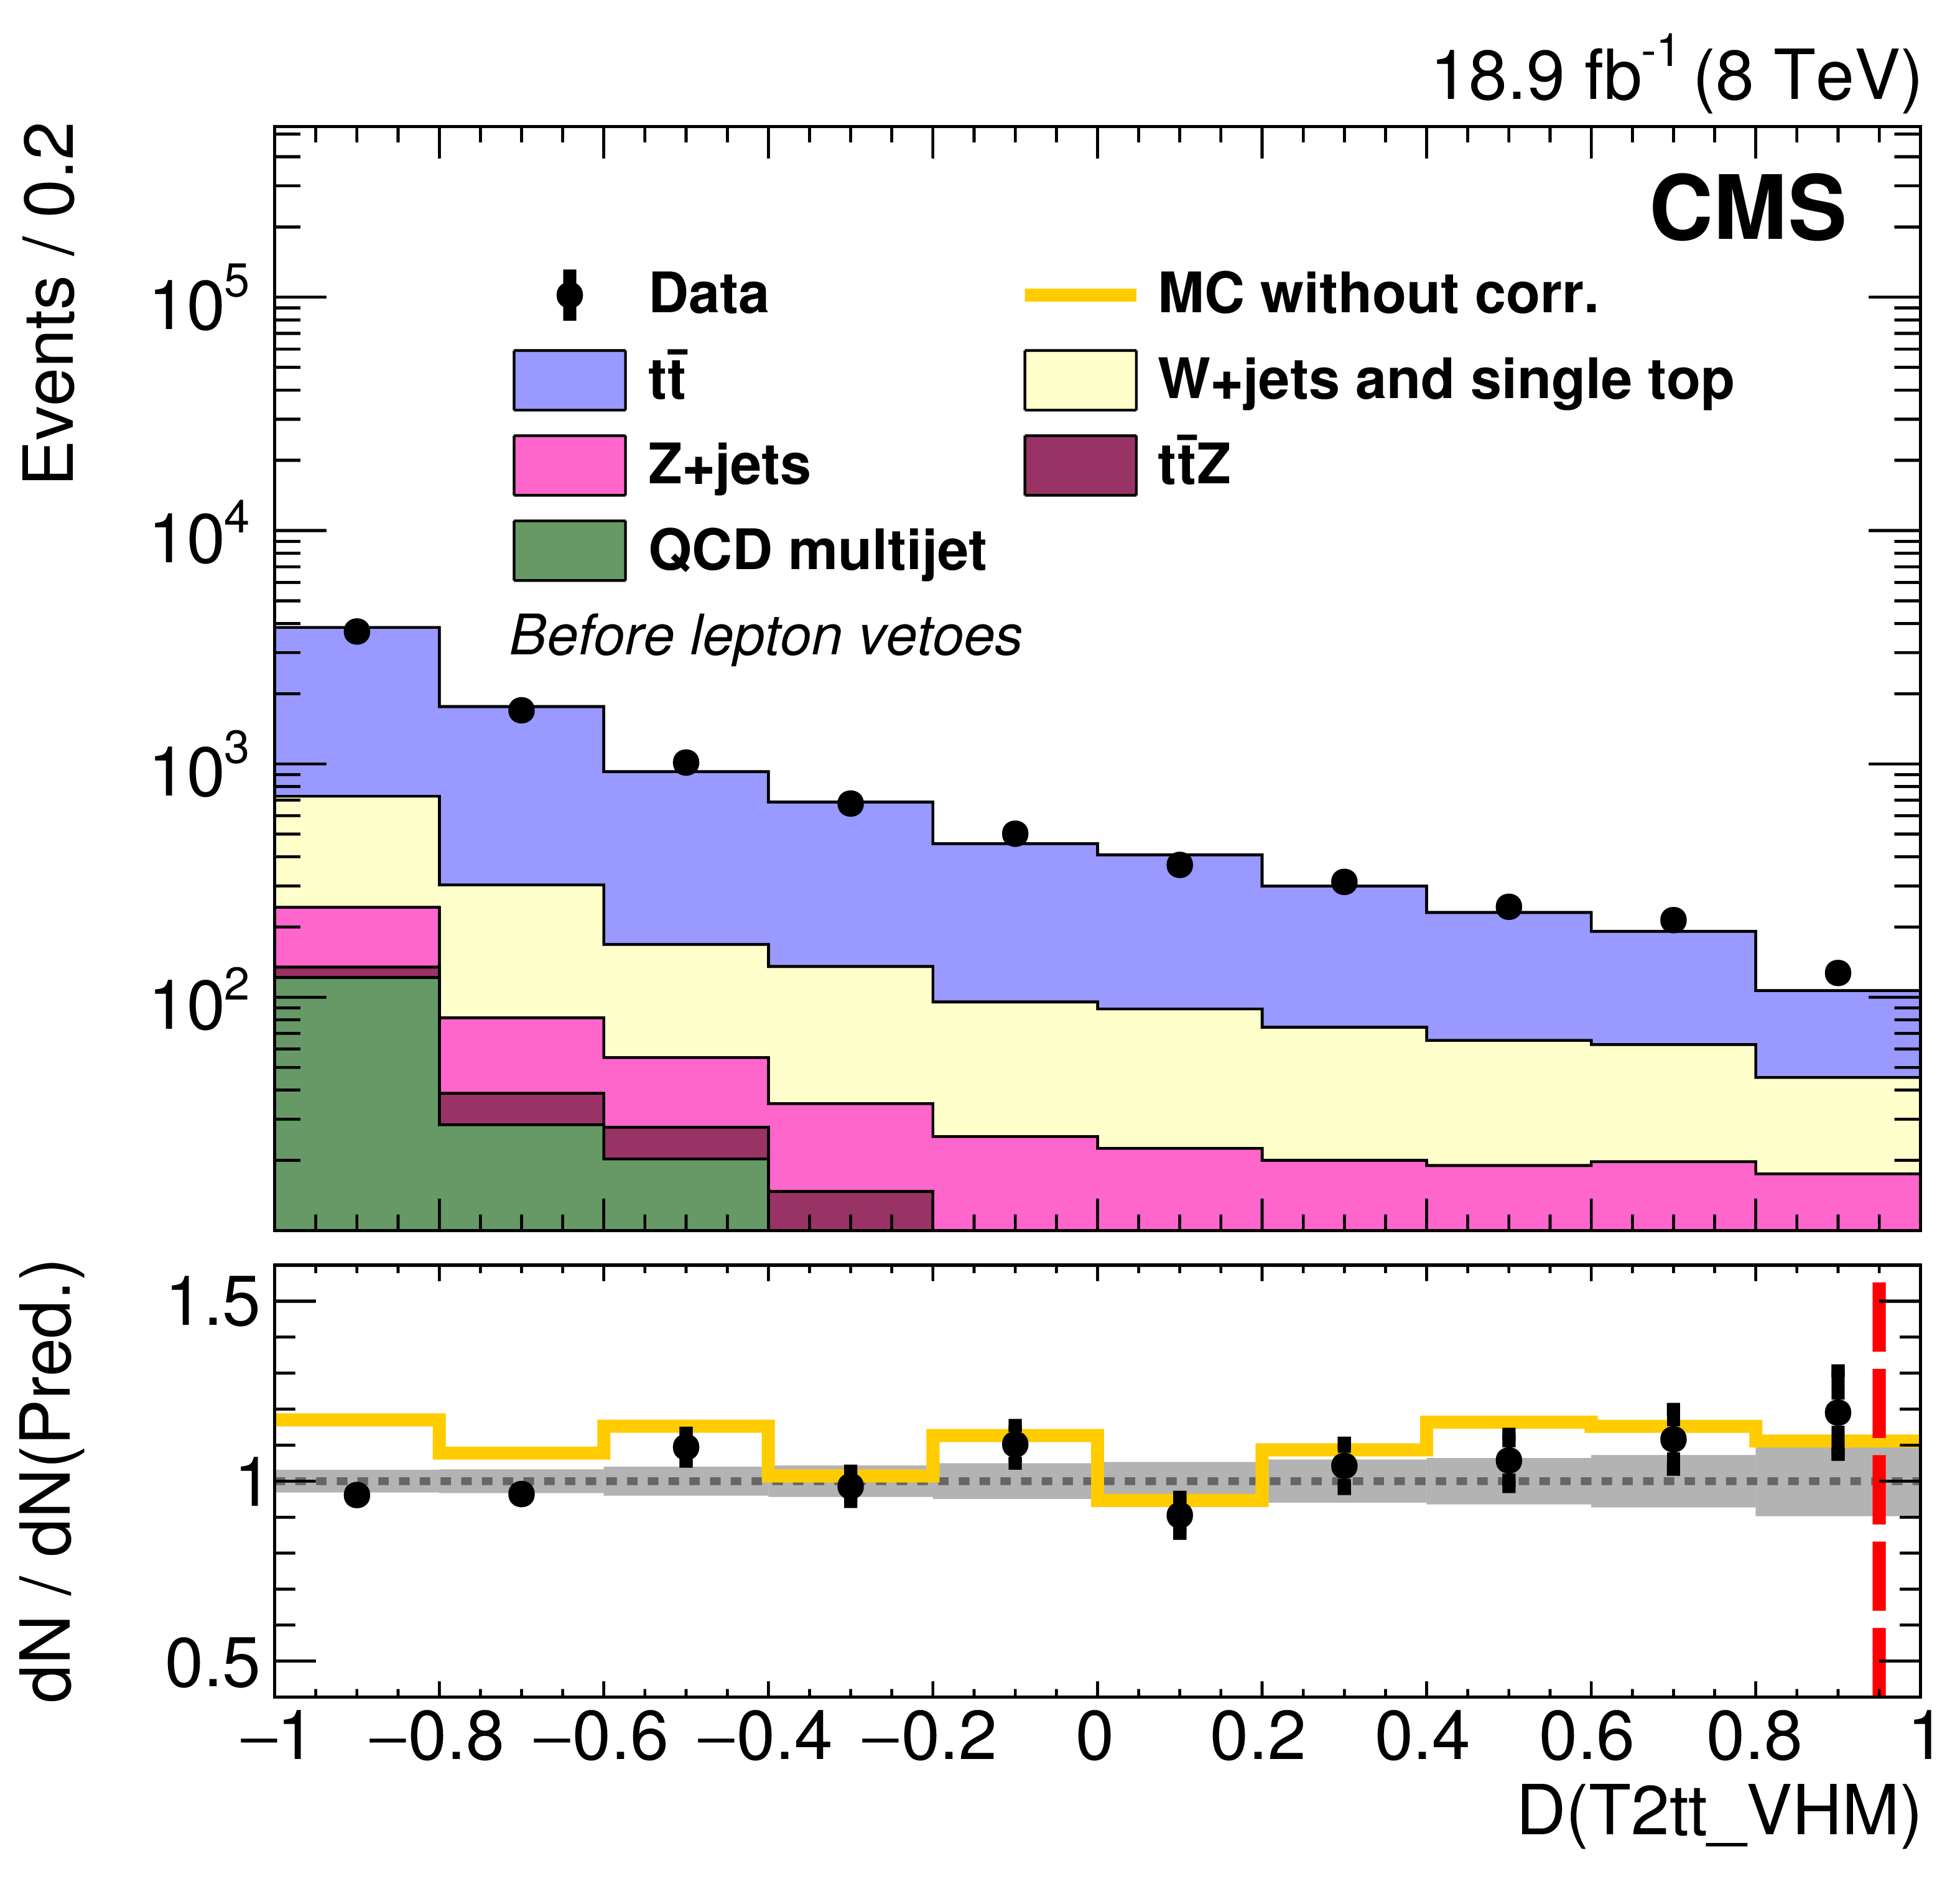
Figure 14-a:
Observed and predicted event yields for each T2tt search region discriminator (D) before lepton vetoes are applied, which are used for the cross-checks discussed in the text. The bottom pane of each plot shows the ratio of observed to predicted yields where the error bars on data points only include the statistical uncertainties in the data and MC event yields. The filled bands represent the relative systematic uncertainties in the predictions. |
png pdf |
Figure 14-b:
Observed and predicted event yields for each T2tt search region discriminator (D) before lepton vetoes are applied, which are used for the cross-checks discussed in the text. The bottom pane of each plot shows the ratio of observed to predicted yields where the error bars on data points only include the statistical uncertainties in the data and MC event yields. The filled bands represent the relative systematic uncertainties in the predictions. |
png pdf |
Figure 14-c:
Observed and predicted event yields for each T2tt search region discriminator (D) before lepton vetoes are applied, which are used for the cross-checks discussed in the text. The bottom pane of each plot shows the ratio of observed to predicted yields where the error bars on data points only include the statistical uncertainties in the data and MC event yields. The filled bands represent the relative systematic uncertainties in the predictions. |
png pdf |
Figure 14-d:
Observed and predicted event yields for each T2tt search region discriminator (D) before lepton vetoes are applied, which are used for the cross-checks discussed in the text. The bottom pane of each plot shows the ratio of observed to predicted yields where the error bars on data points only include the statistical uncertainties in the data and MC event yields. The filled bands represent the relative systematic uncertainties in the predictions. |
png pdf |
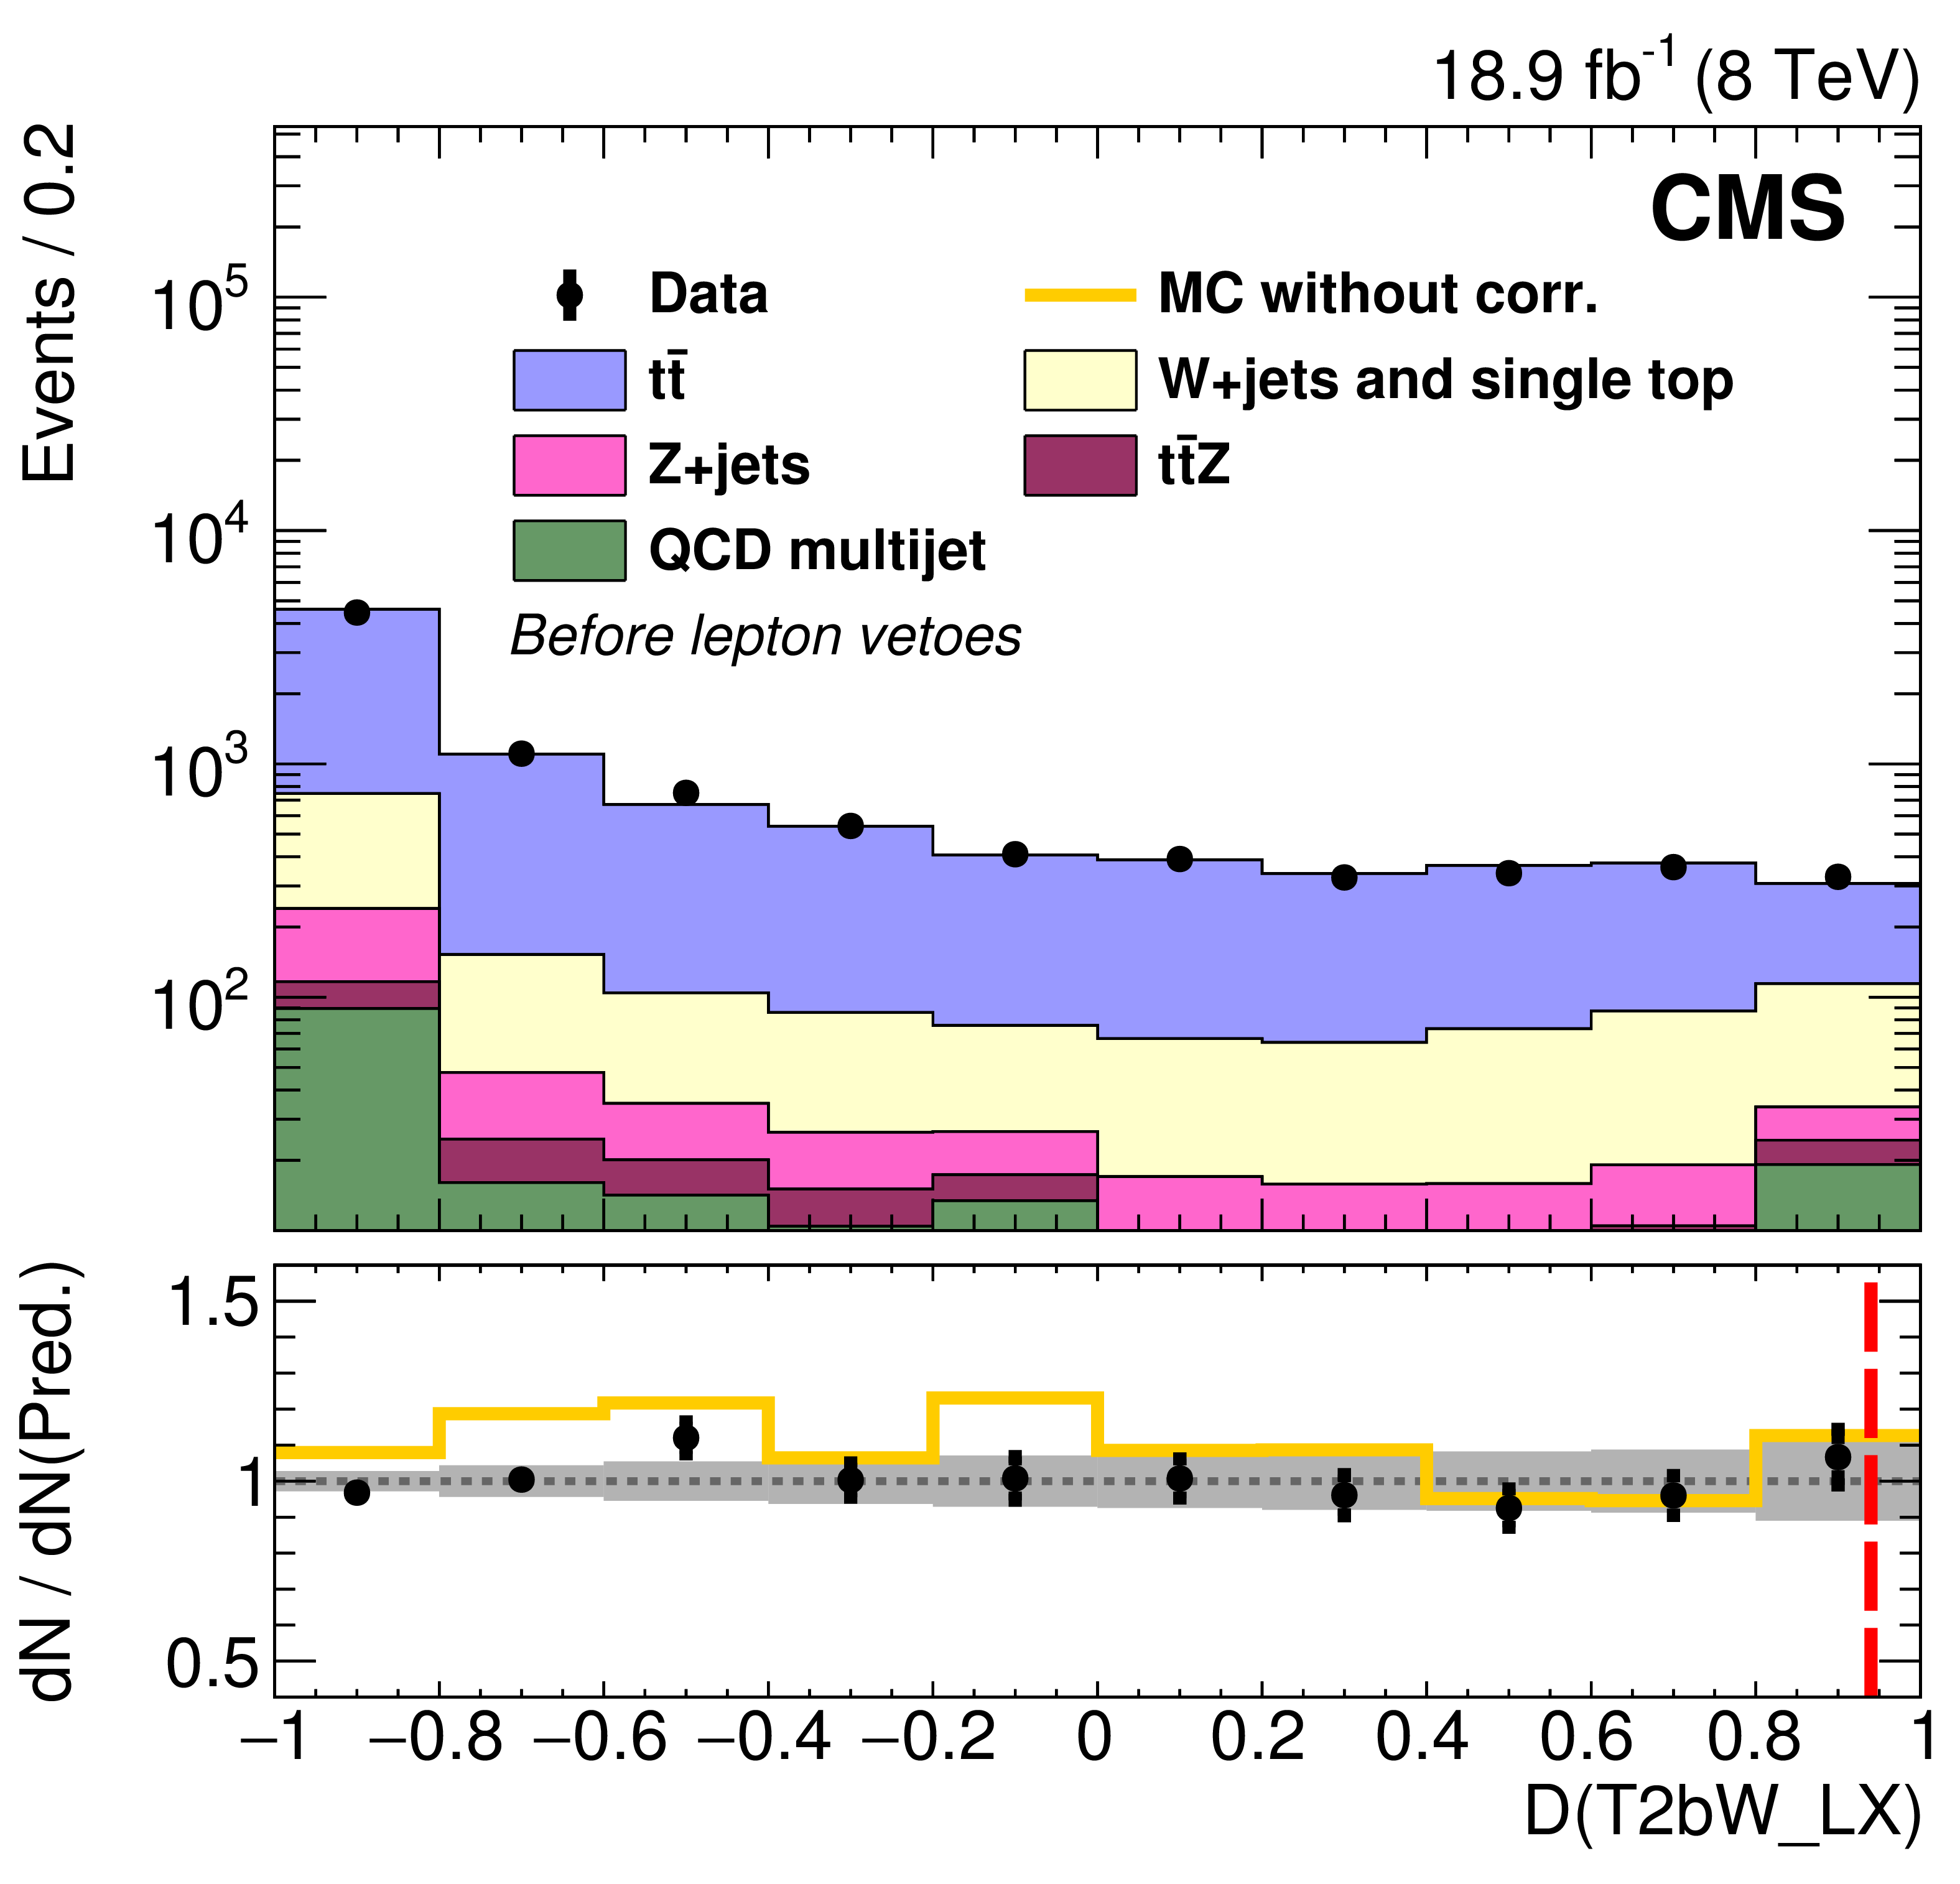
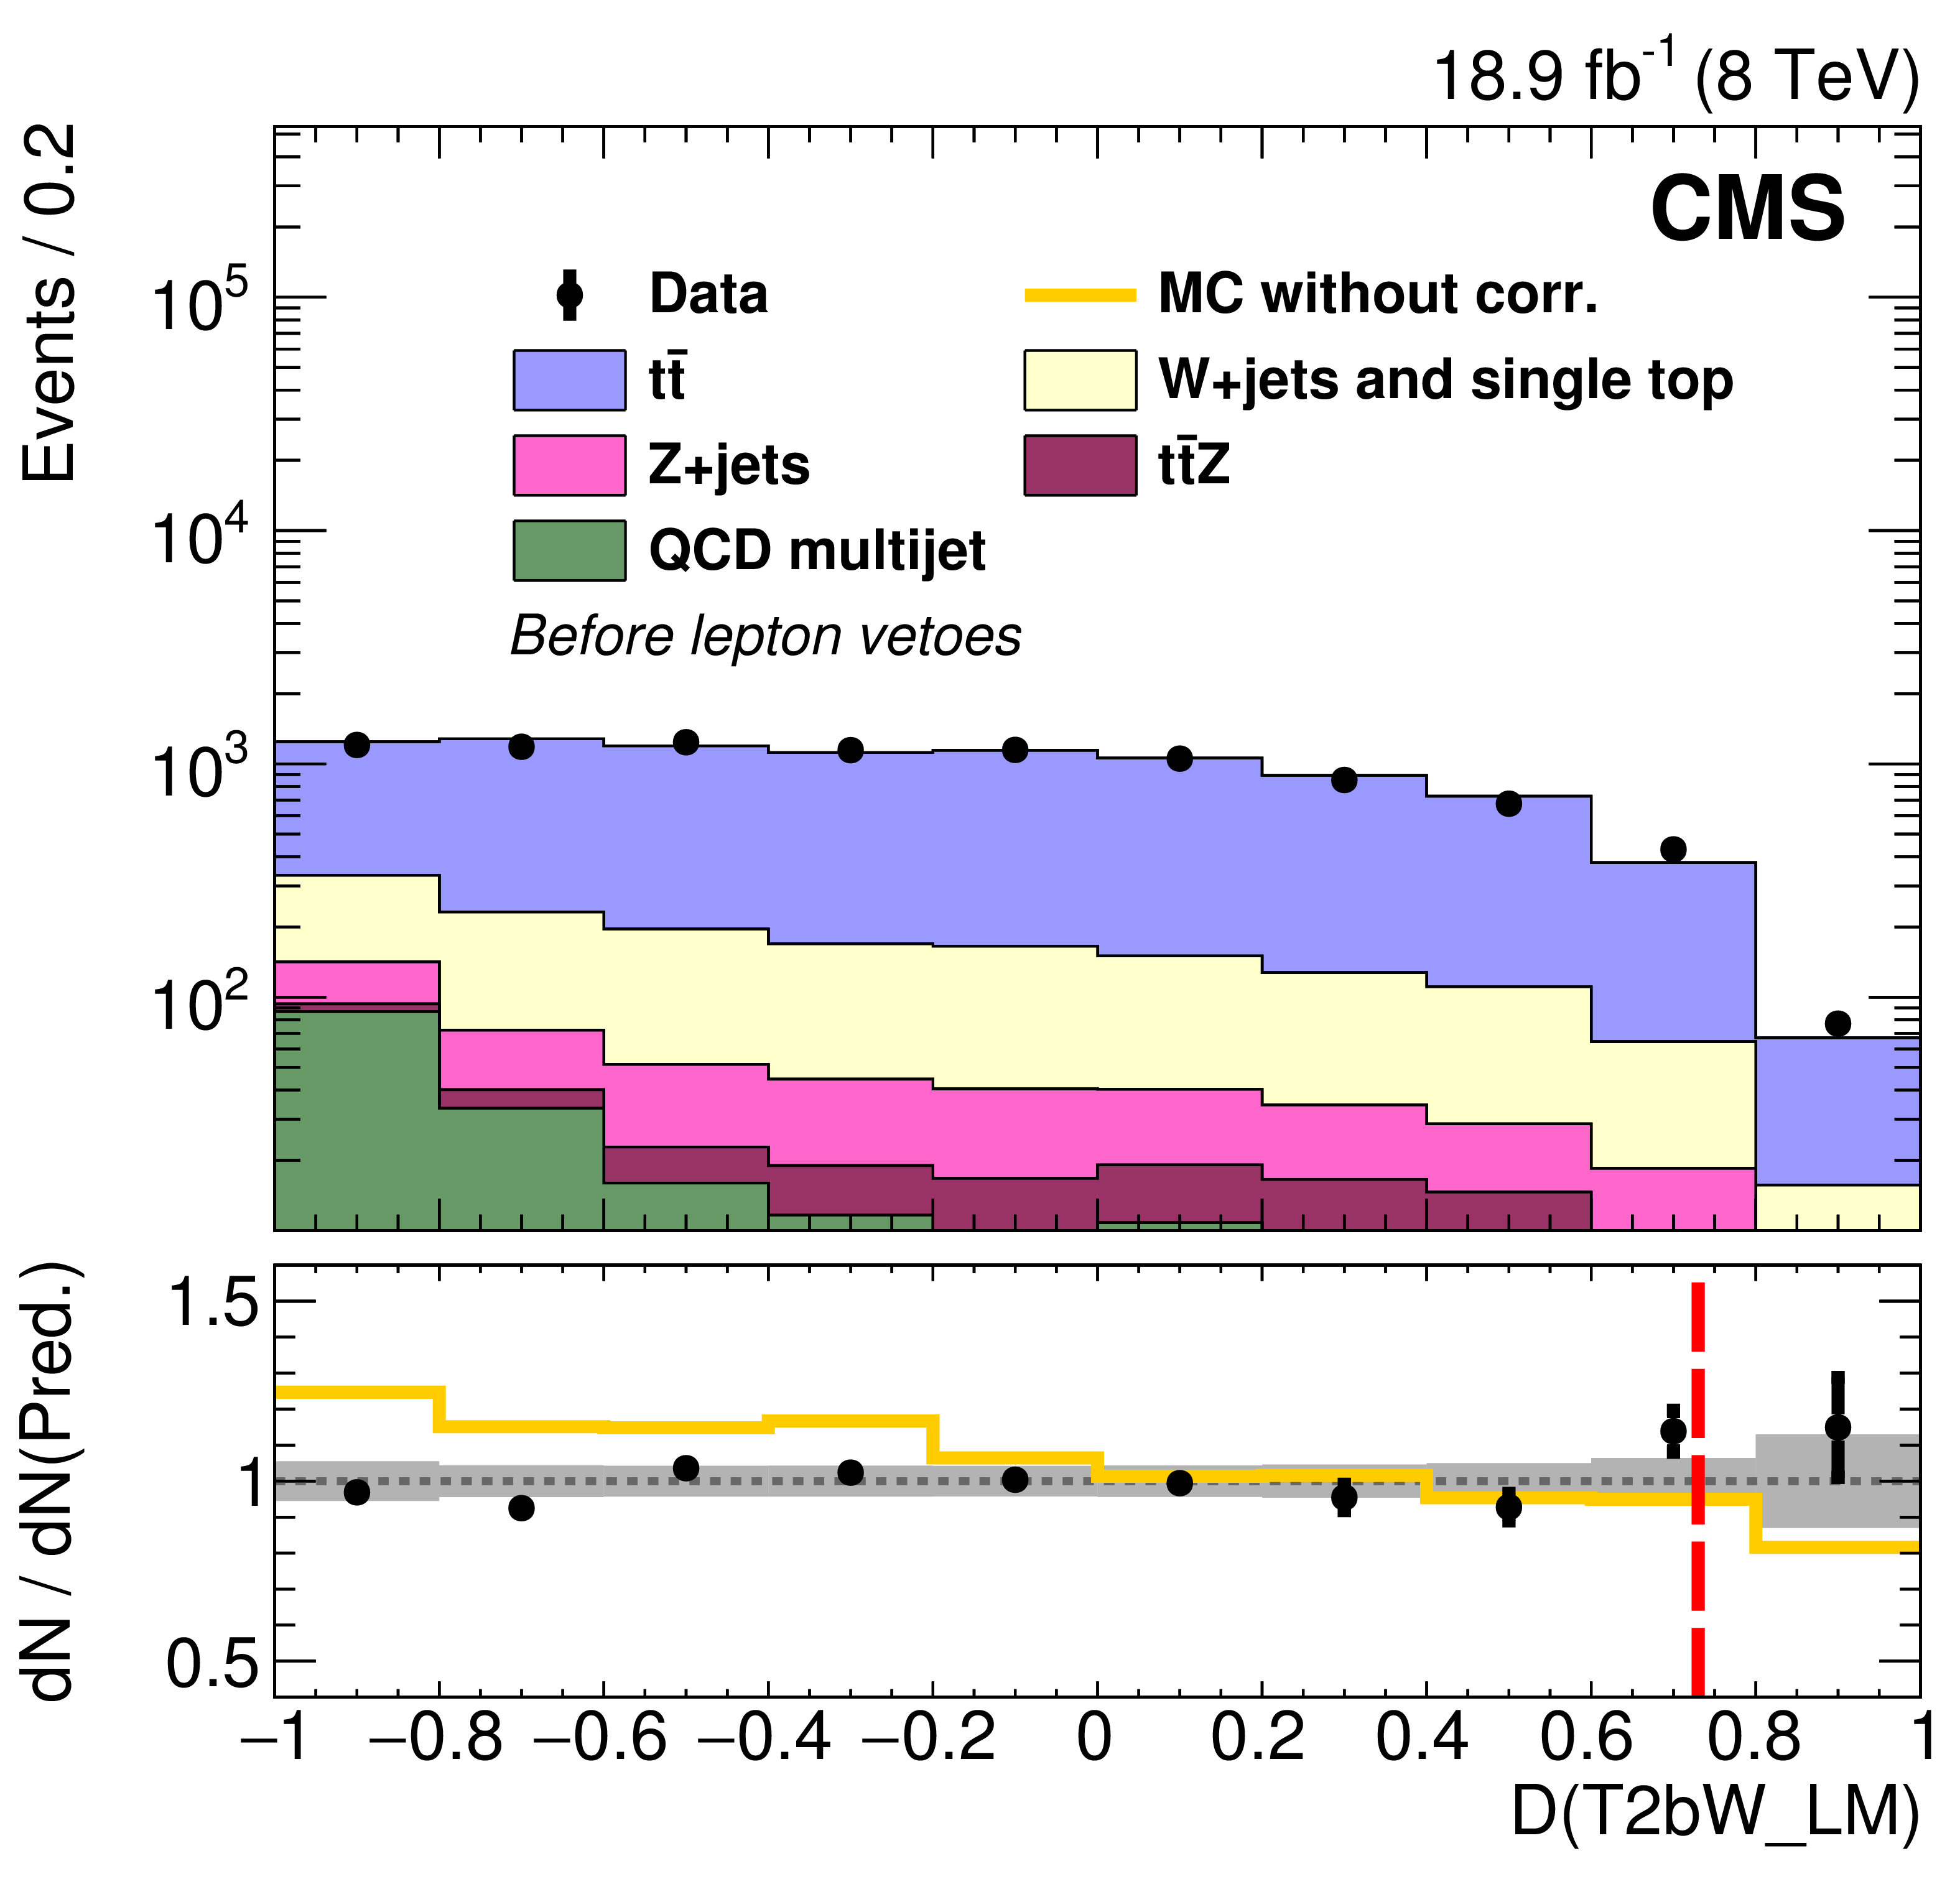
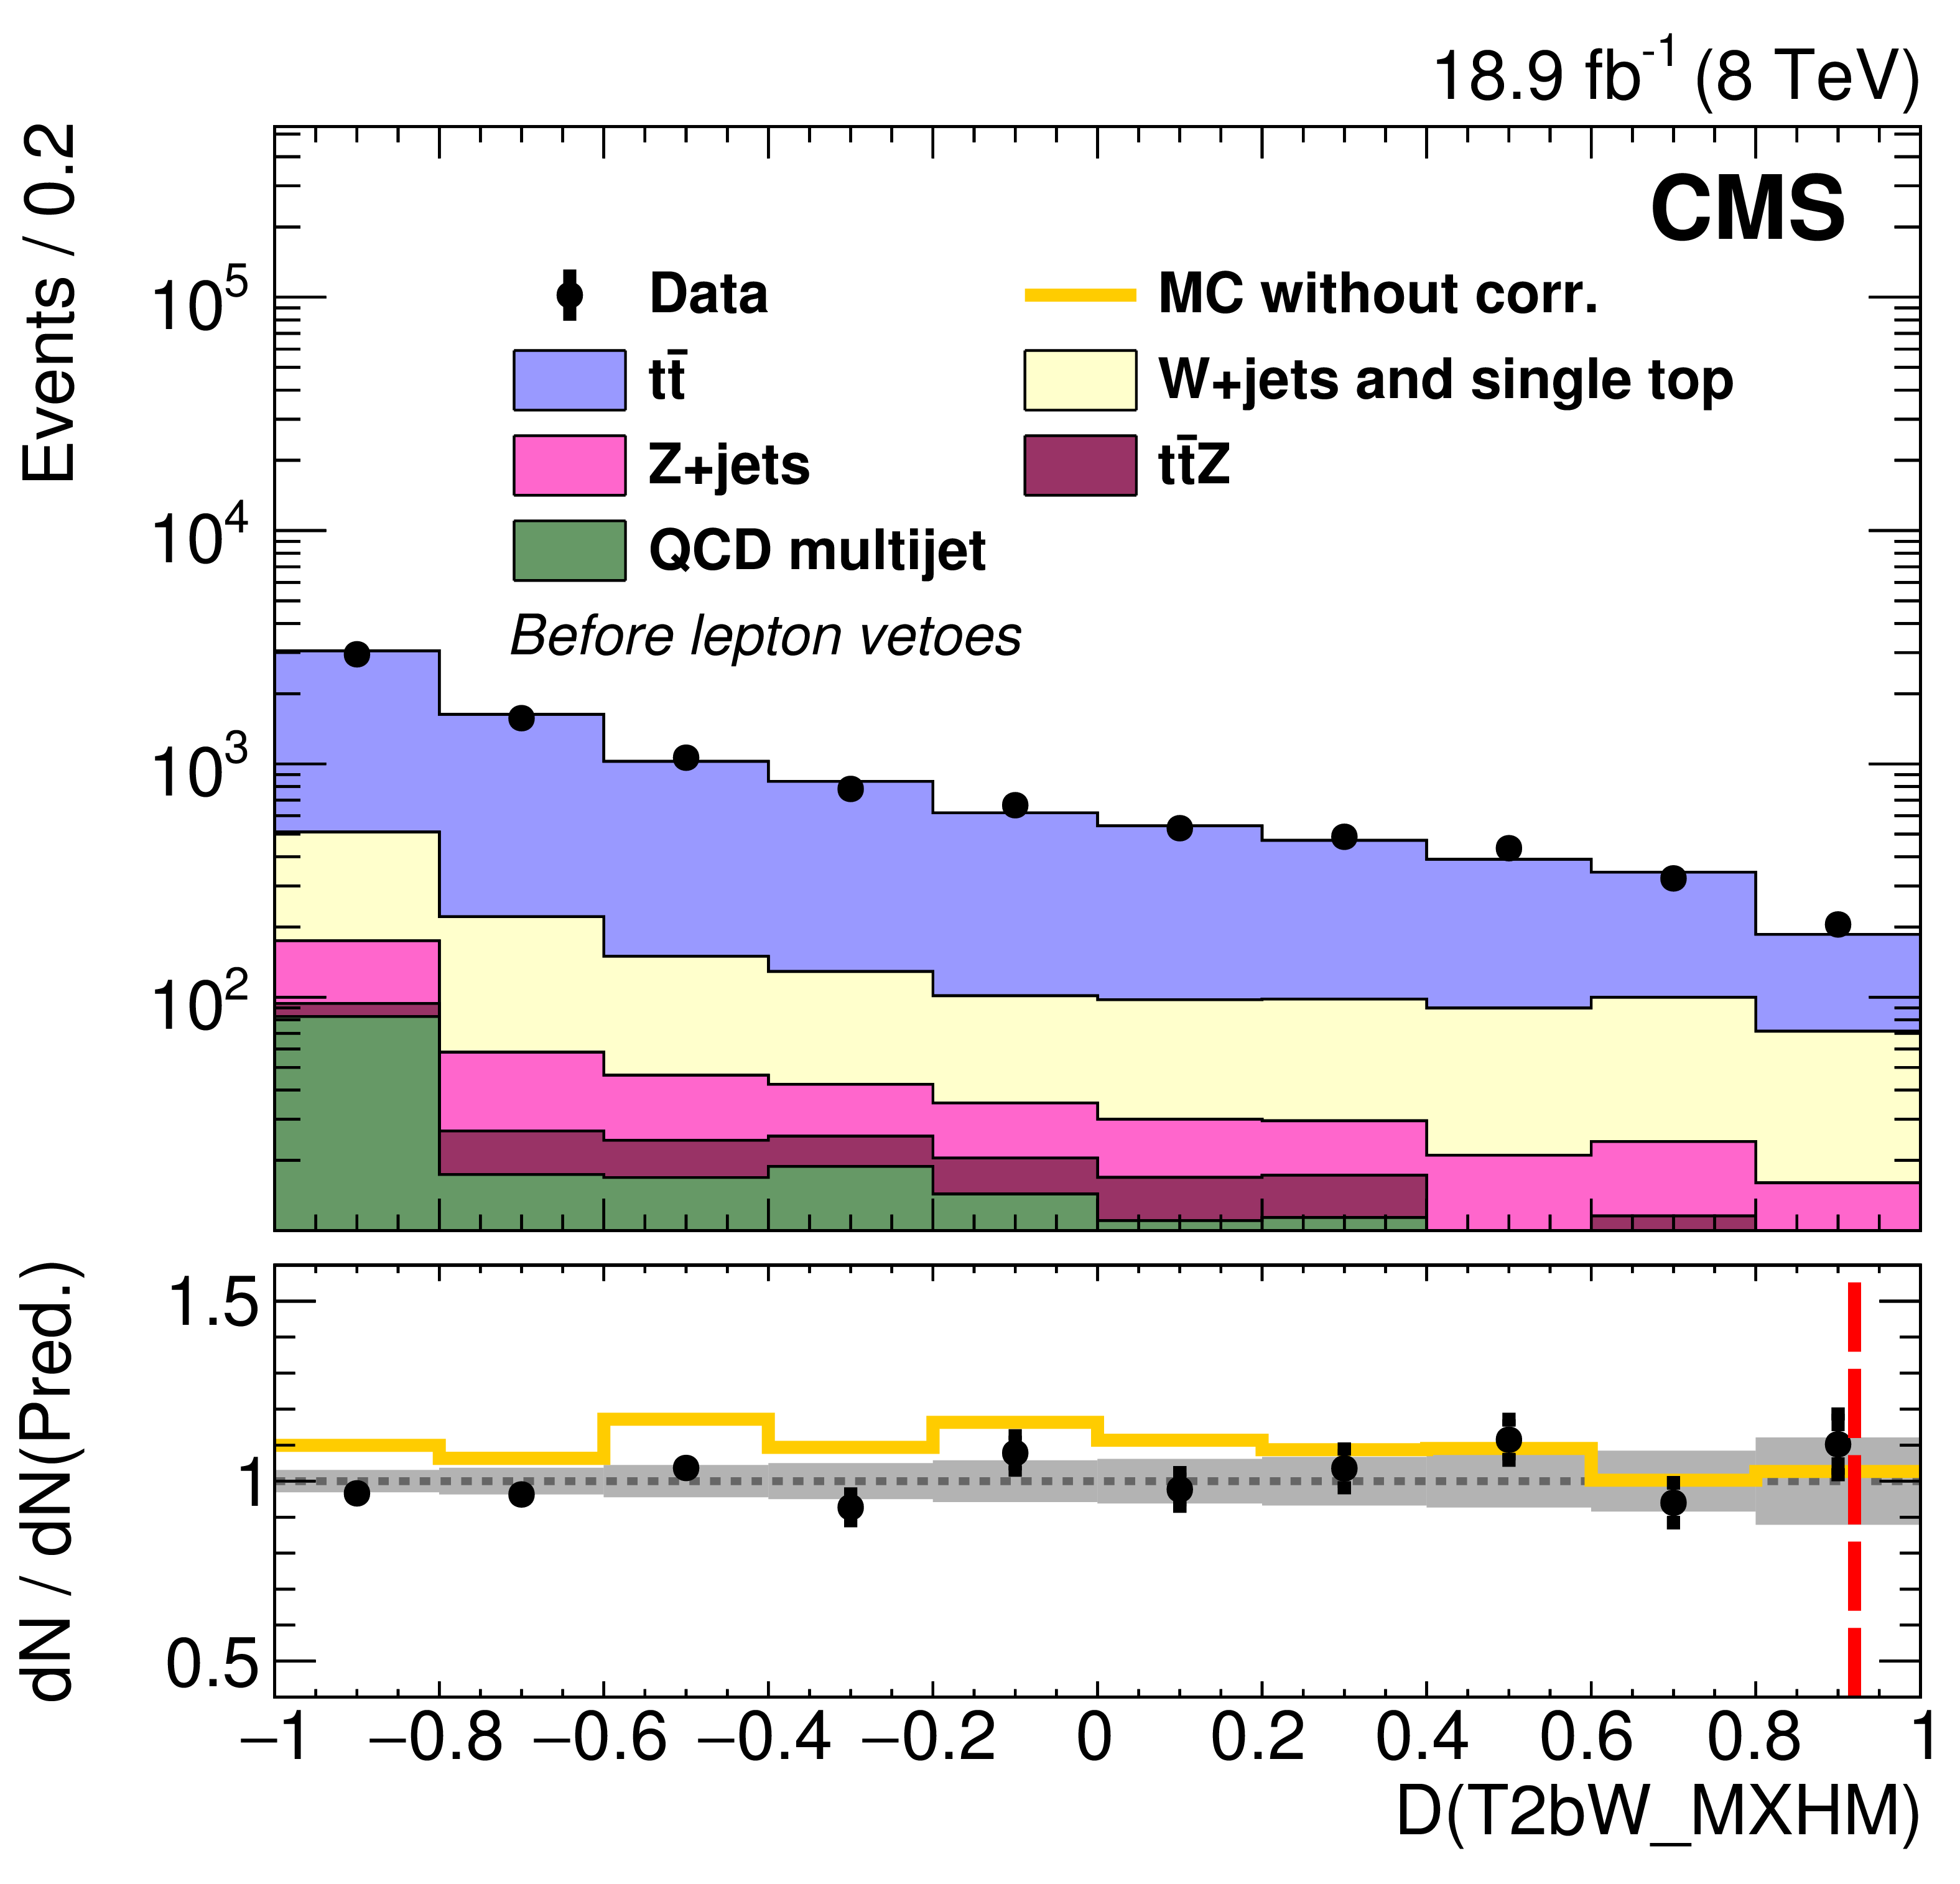
Figure 15-a:
Observed and predicted event yields for each T2bW search region discriminator (D) before lepton vetoes are applied, which are used for the cross-checks discussed in the text. The bottom pane of each plot shows the ratio of observed to predicted yields where the error bars on data points only include the statistical uncertainties in the data and MC event yields. The filled bands represent the relative systematic uncertainties in the predictions. |
png pdf |
Figure 15-b:
Observed and predicted event yields for each T2bW search region discriminator (D) before lepton vetoes are applied, which are used for the cross-checks discussed in the text. The bottom pane of each plot shows the ratio of observed to predicted yields where the error bars on data points only include the statistical uncertainties in the data and MC event yields. The filled bands represent the relative systematic uncertainties in the predictions. |
png pdf |
Figure 15-c:
Observed and predicted event yields for each T2bW search region discriminator (D) before lepton vetoes are applied, which are used for the cross-checks discussed in the text. The bottom pane of each plot shows the ratio of observed to predicted yields where the error bars on data points only include the statistical uncertainties in the data and MC event yields. The filled bands represent the relative systematic uncertainties in the predictions. |

png pdf |
Figure 15-d:
Observed and predicted event yields for each T2bW search region discriminator (D) before lepton vetoes are applied, which are used for the cross-checks discussed in the text. The bottom pane of each plot shows the ratio of observed to predicted yields where the error bars on data points only include the statistical uncertainties in the data and MC event yields. The filled bands represent the relative systematic uncertainties in the predictions. |
png pdf |
Figure 15-e:
Observed and predicted event yields for each T2bW search region discriminator (D) before lepton vetoes are applied, which are used for the cross-checks discussed in the text. The bottom pane of each plot shows the ratio of observed to predicted yields where the error bars on data points only include the statistical uncertainties in the data and MC event yields. The filled bands represent the relative systematic uncertainties in the predictions. |
png pdf |
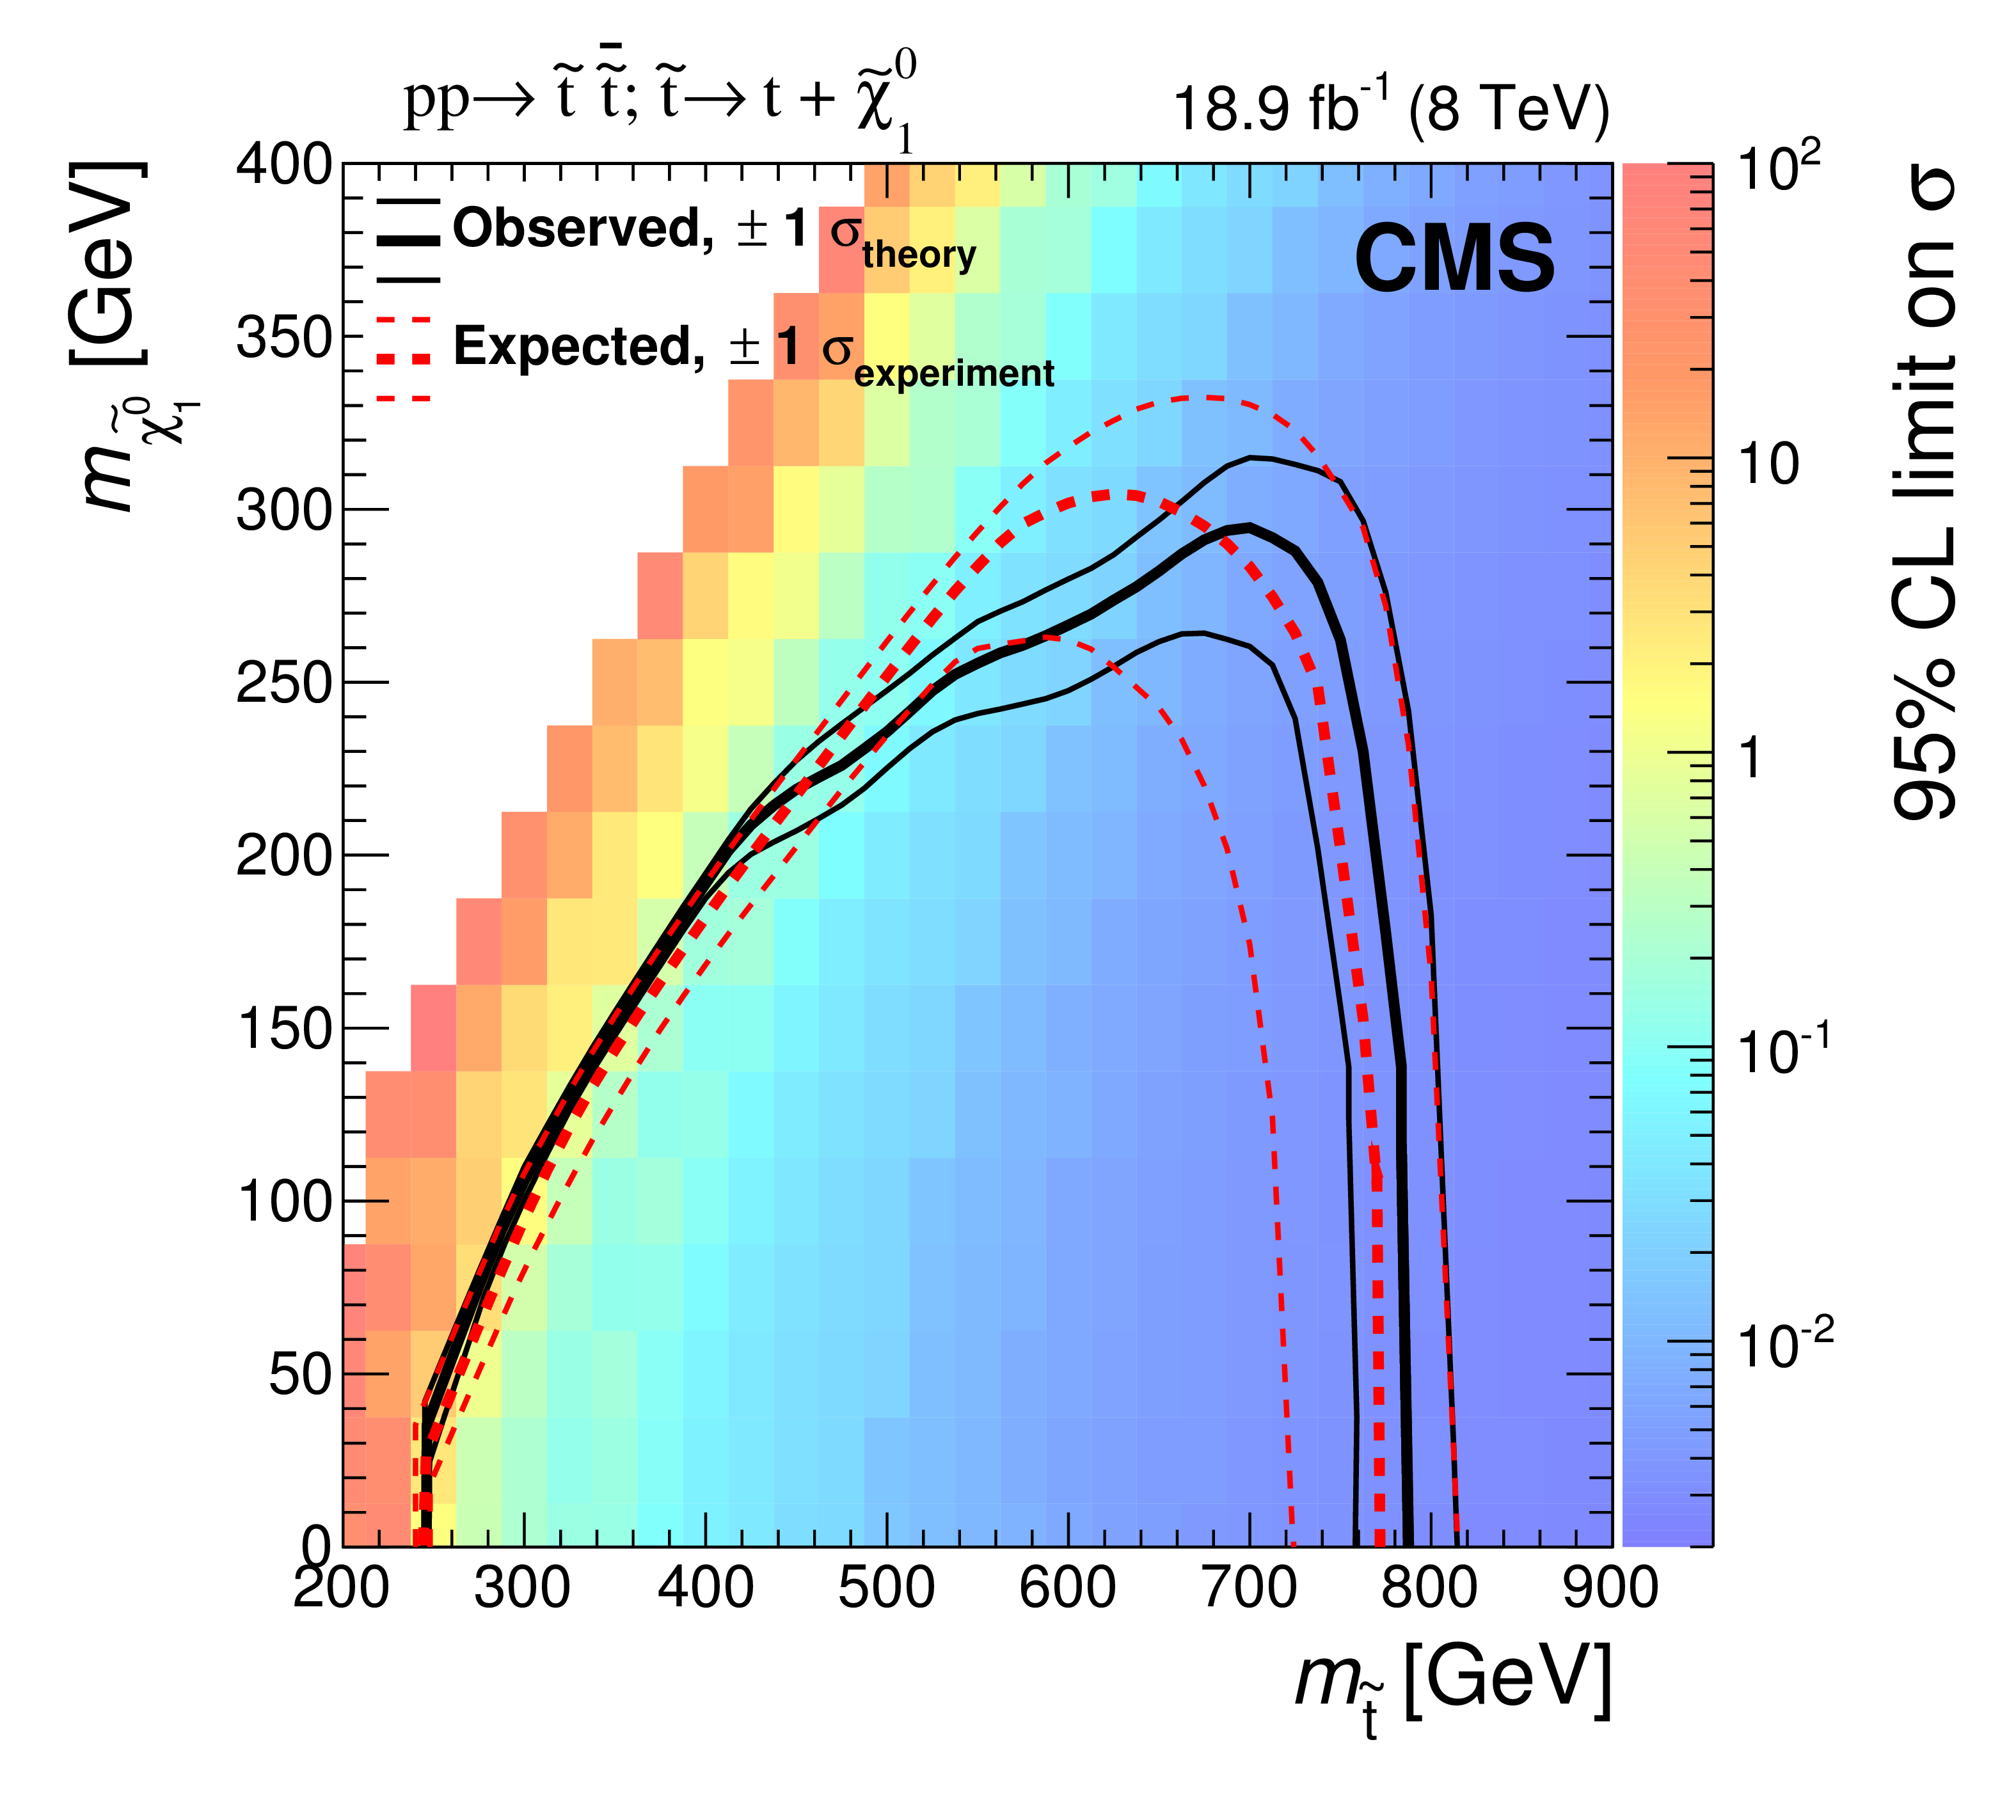
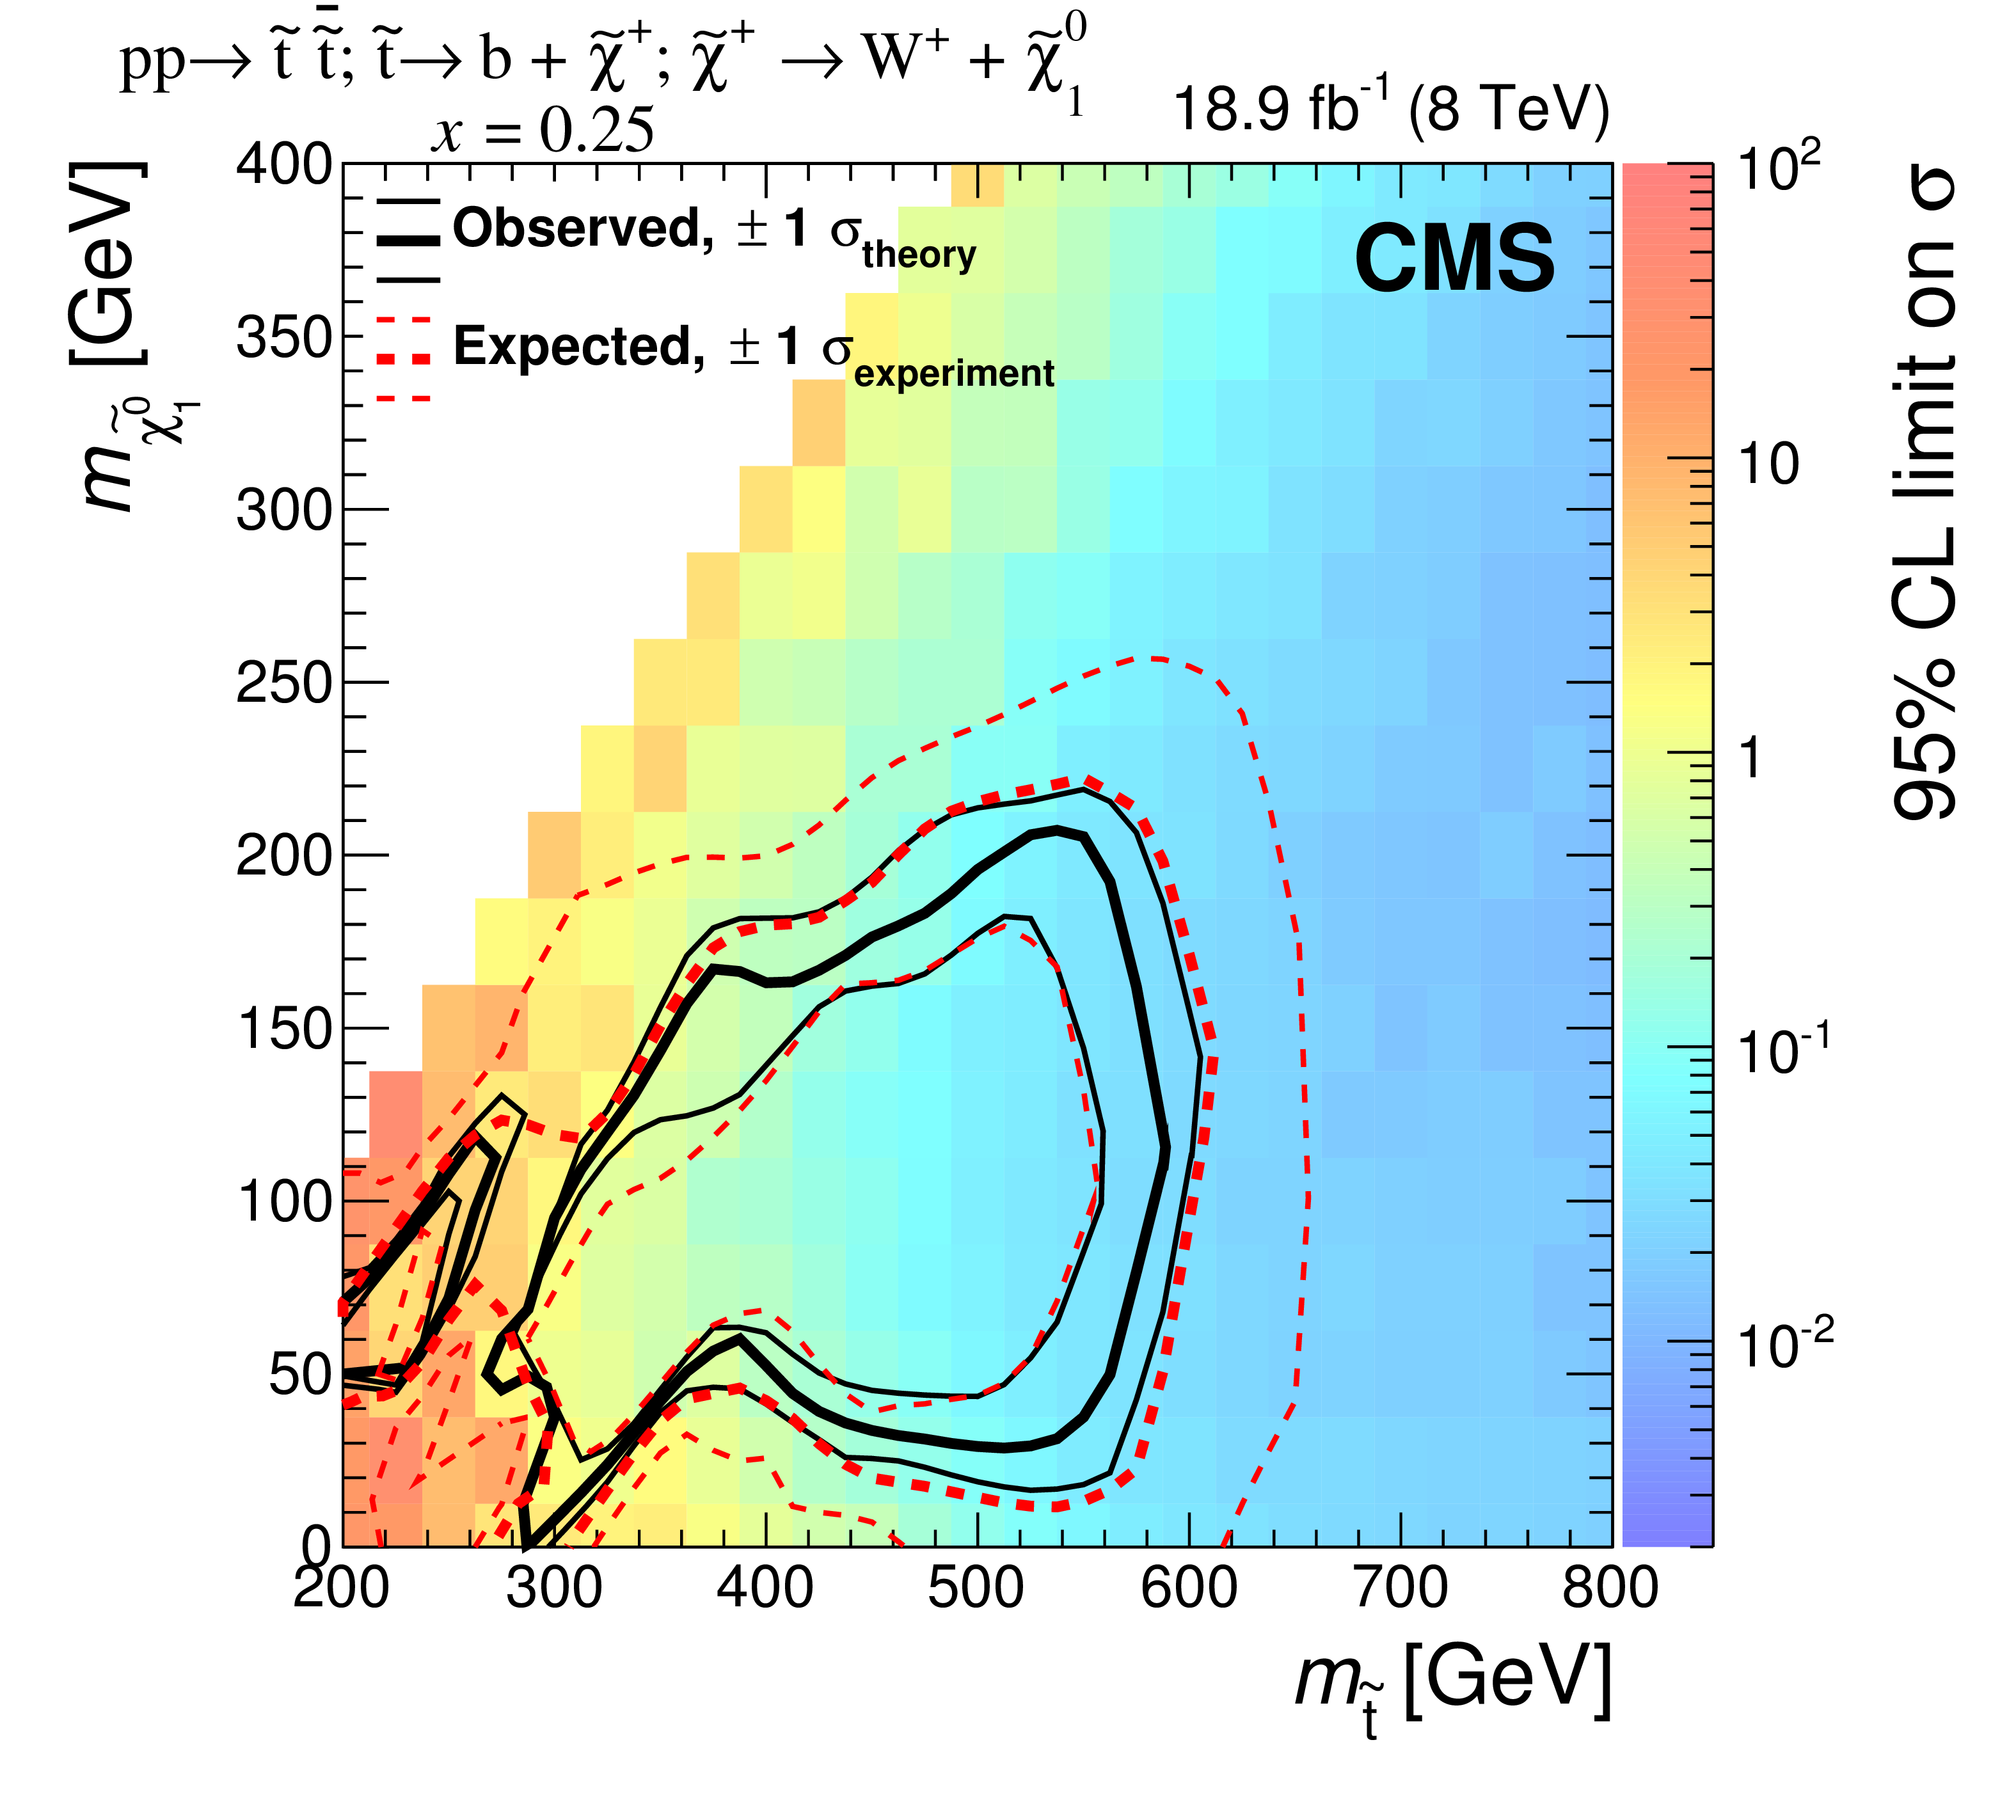
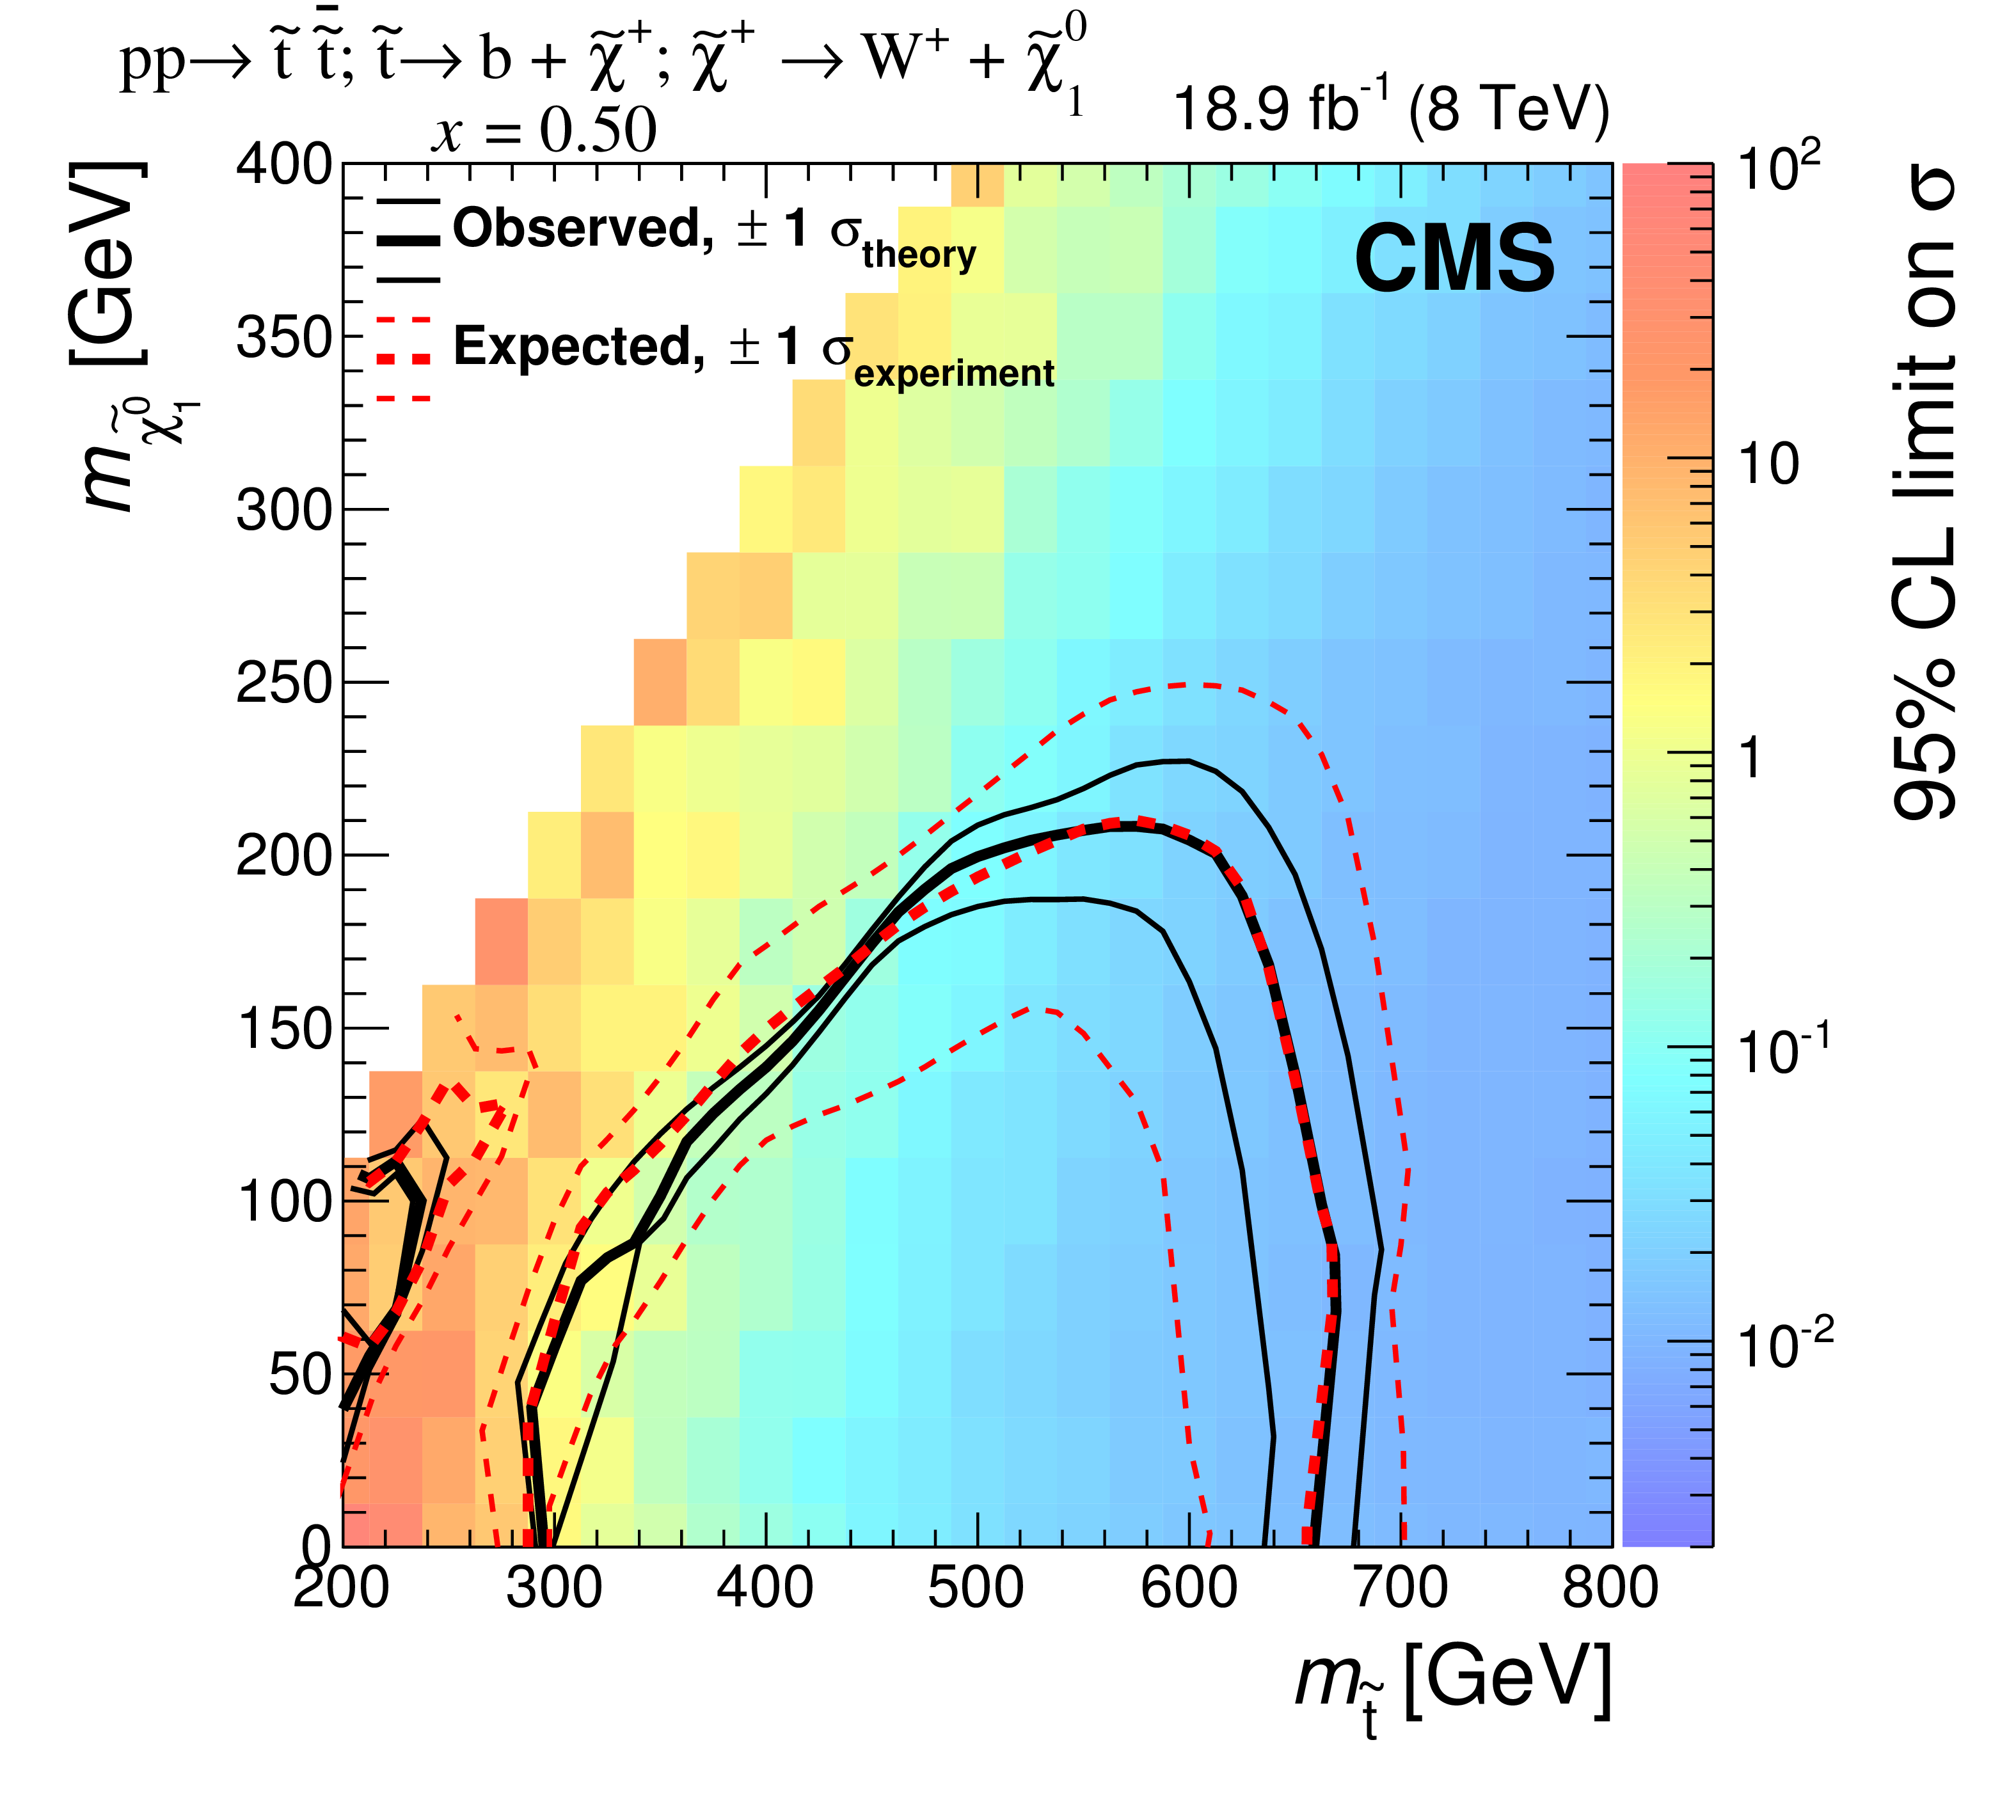
Figure 16-a:
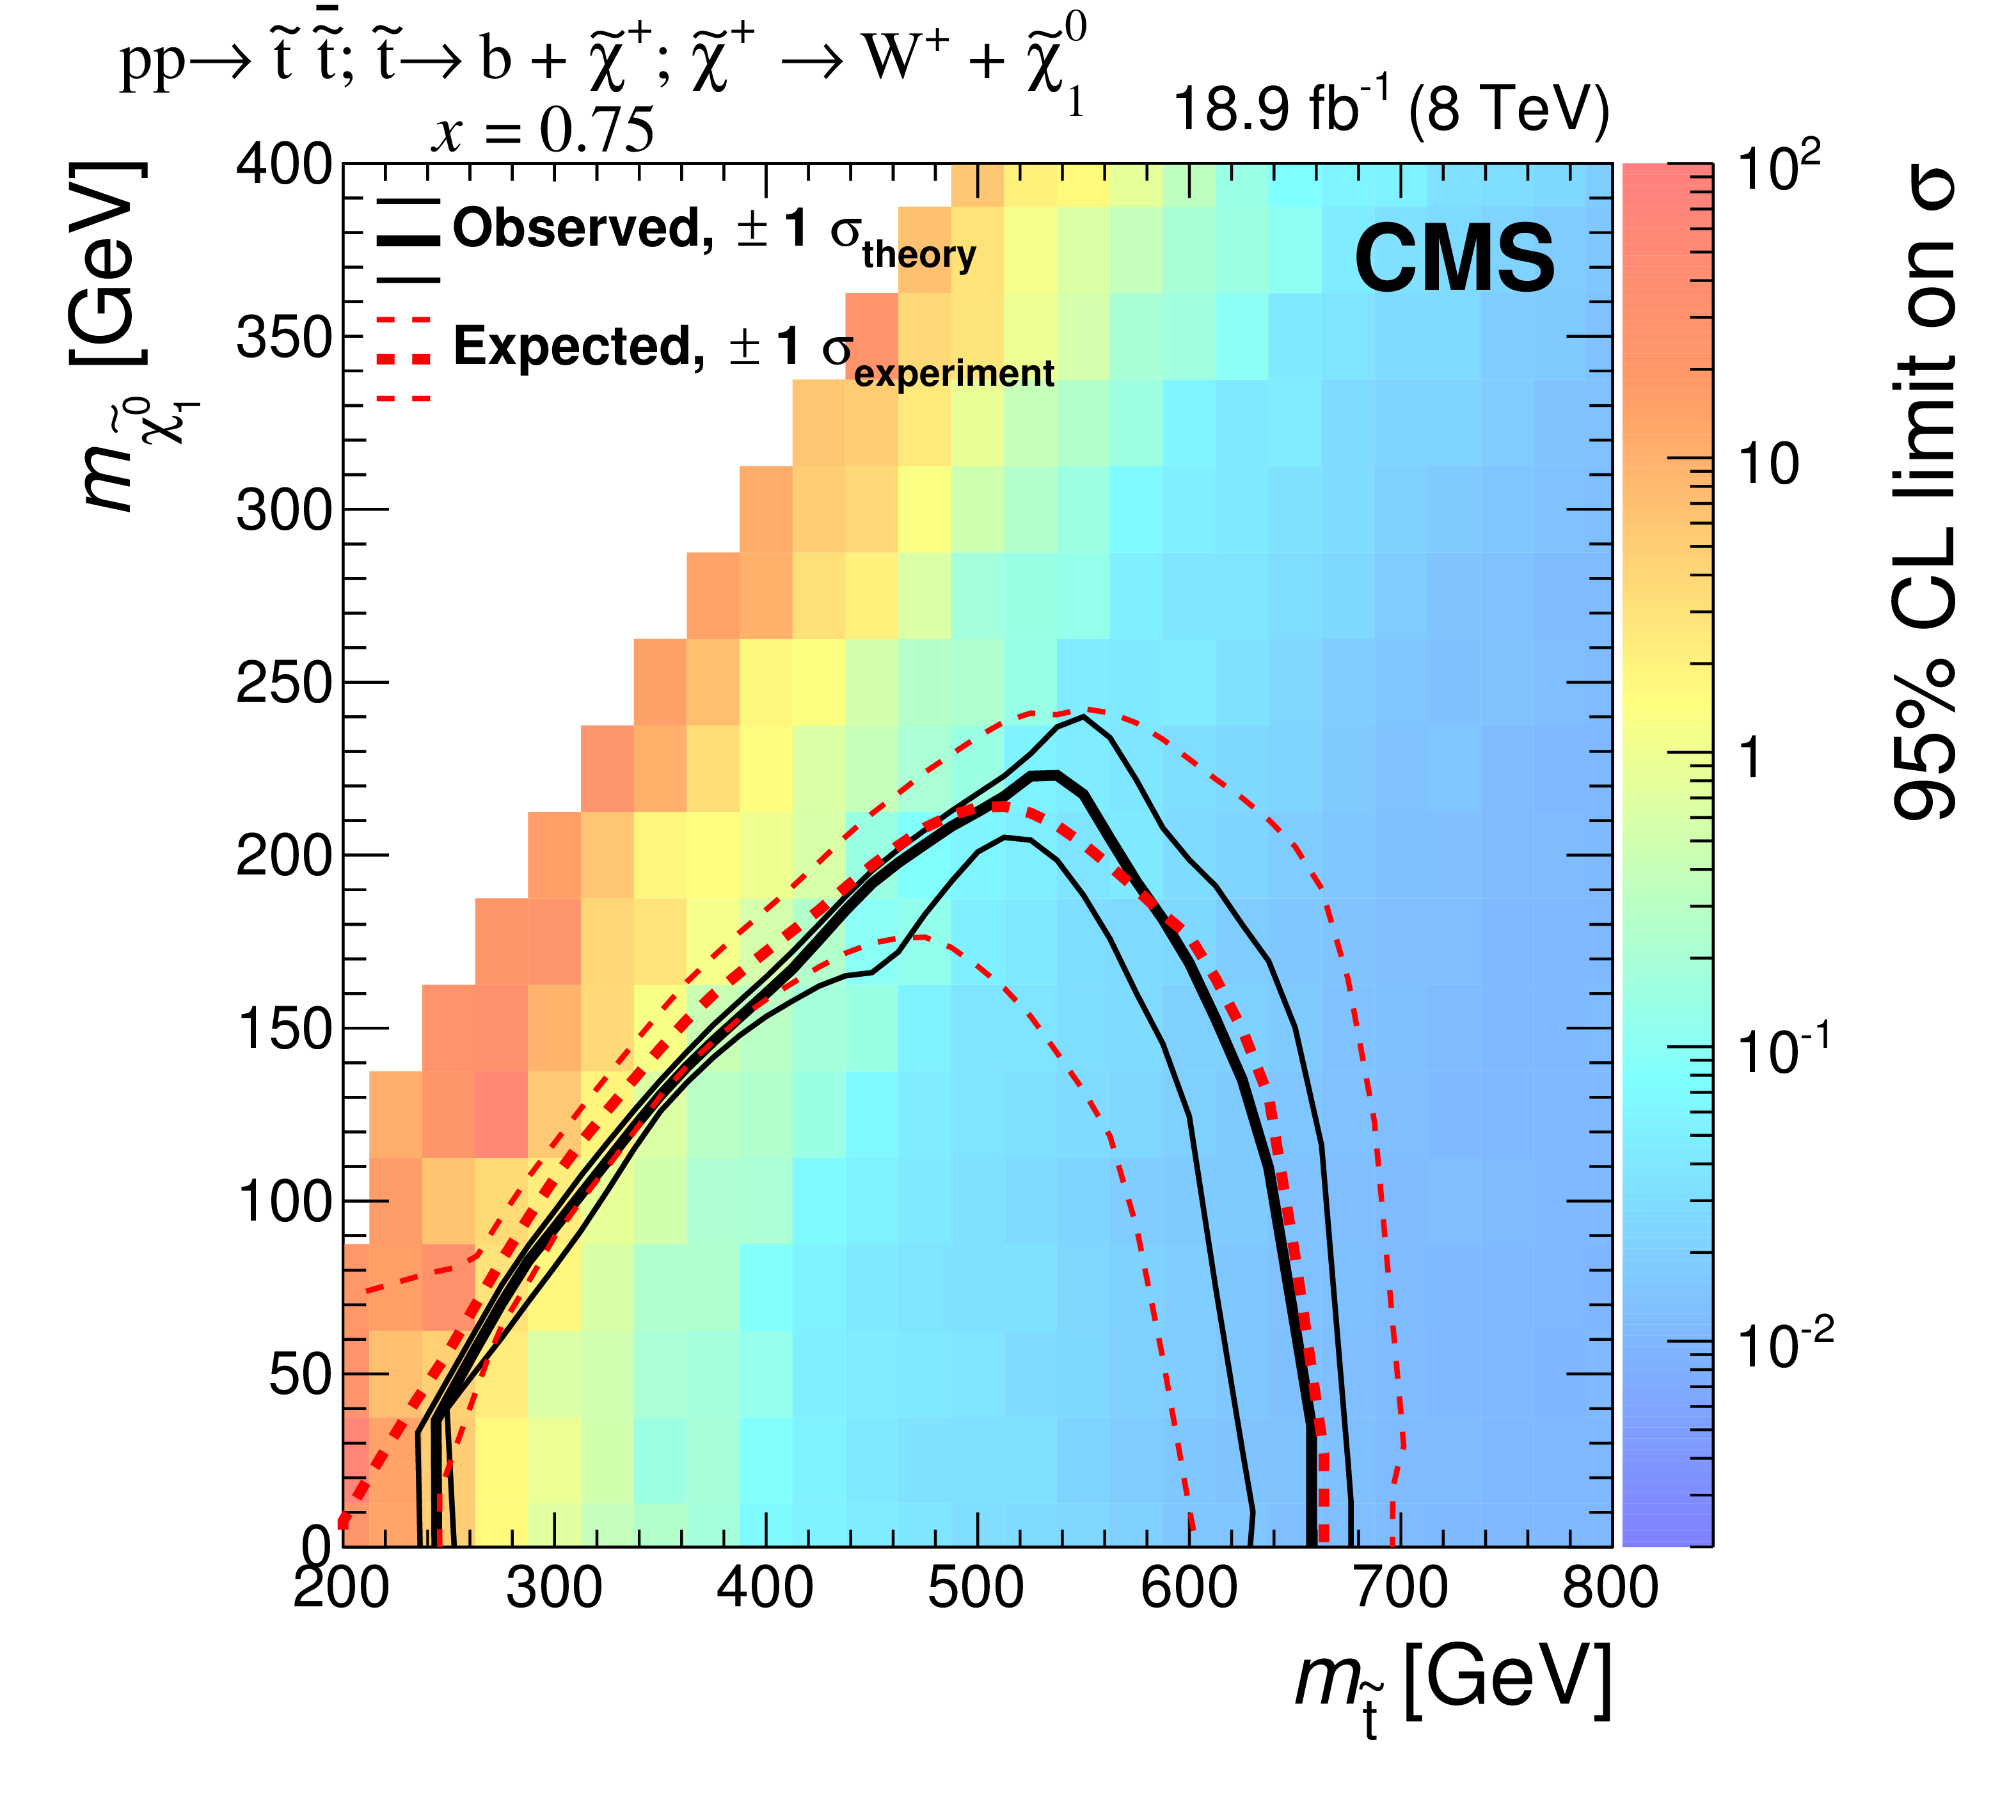
Observed and expected 95% CL limits on the $\tilde{ \mathrm{t} } \tilde{ \bar{ \mathrm{t} } } $ production cross section and exclusion areas in the $ {m_{\tilde{ \mathrm{t} } }} $-$ {m_{\tilde{\chi}^0_1 }} $ plane for the T2tt (a) and T2bW signal topologies (with $x =$ 0.25, 0.50, 0.75). In the rare cases in which a statistical fluctuation leads to zero signal events for a particular set of masses, the limit is taken to be the average of the limits obtained for the neighboring bins. The $\pm$1$\sigma _{\text {theory}}$ lines indicate the variations in the excluded region due to the uncertainty in the theoretical prediction of the signal cross section. |
png pdf |
Figure 16-b:
Observed and expected 95% CL limits on the $\tilde{ \mathrm{t} } \tilde{ \bar{ \mathrm{t} } } $ production cross section and exclusion areas in the $ {m_{\tilde{ \mathrm{t} } }} $-$ {m_{\tilde{\chi}^0_1 }} $ plane for the T2tt (a) and T2bW signal topologies (with $x =$ 0.25, 0.50, 0.75). In the rare cases in which a statistical fluctuation leads to zero signal events for a particular set of masses, the limit is taken to be the average of the limits obtained for the neighboring bins. The $\pm$1$\sigma _{\text {theory}}$ lines indicate the variations in the excluded region due to the uncertainty in the theoretical prediction of the signal cross section. |
png pdf |
Figure 16-c:
Observed and expected 95% CL limits on the $\tilde{ \mathrm{t} } \tilde{ \bar{ \mathrm{t} } } $ production cross section and exclusion areas in the $ {m_{\tilde{ \mathrm{t} } }} $-$ {m_{\tilde{\chi}^0_1 }} $ plane for the T2tt (a) and T2bW signal topologies (with $x =$ 0.25, 0.50, 0.75). In the rare cases in which a statistical fluctuation leads to zero signal events for a particular set of masses, the limit is taken to be the average of the limits obtained for the neighboring bins. The $\pm$1$\sigma _{\text {theory}}$ lines indicate the variations in the excluded region due to the uncertainty in the theoretical prediction of the signal cross section. |
png pdf |
Figure 16-d:
Observed and expected 95% CL limits on the $\tilde{ \mathrm{t} } \tilde{ \bar{ \mathrm{t} } } $ production cross section and exclusion areas in the $ {m_{\tilde{ \mathrm{t} } }} $-$ {m_{\tilde{\chi}^0_1 }} $ plane for the T2tt (a) and T2bW signal topologies (with $x =$ 0.25, 0.50, 0.75). In the rare cases in which a statistical fluctuation leads to zero signal events for a particular set of masses, the limit is taken to be the average of the limits obtained for the neighboring bins. The $\pm$1$\sigma _{\text {theory}}$ lines indicate the variations in the excluded region due to the uncertainty in the theoretical prediction of the signal cross section. |
| Tables | |
png pdf |
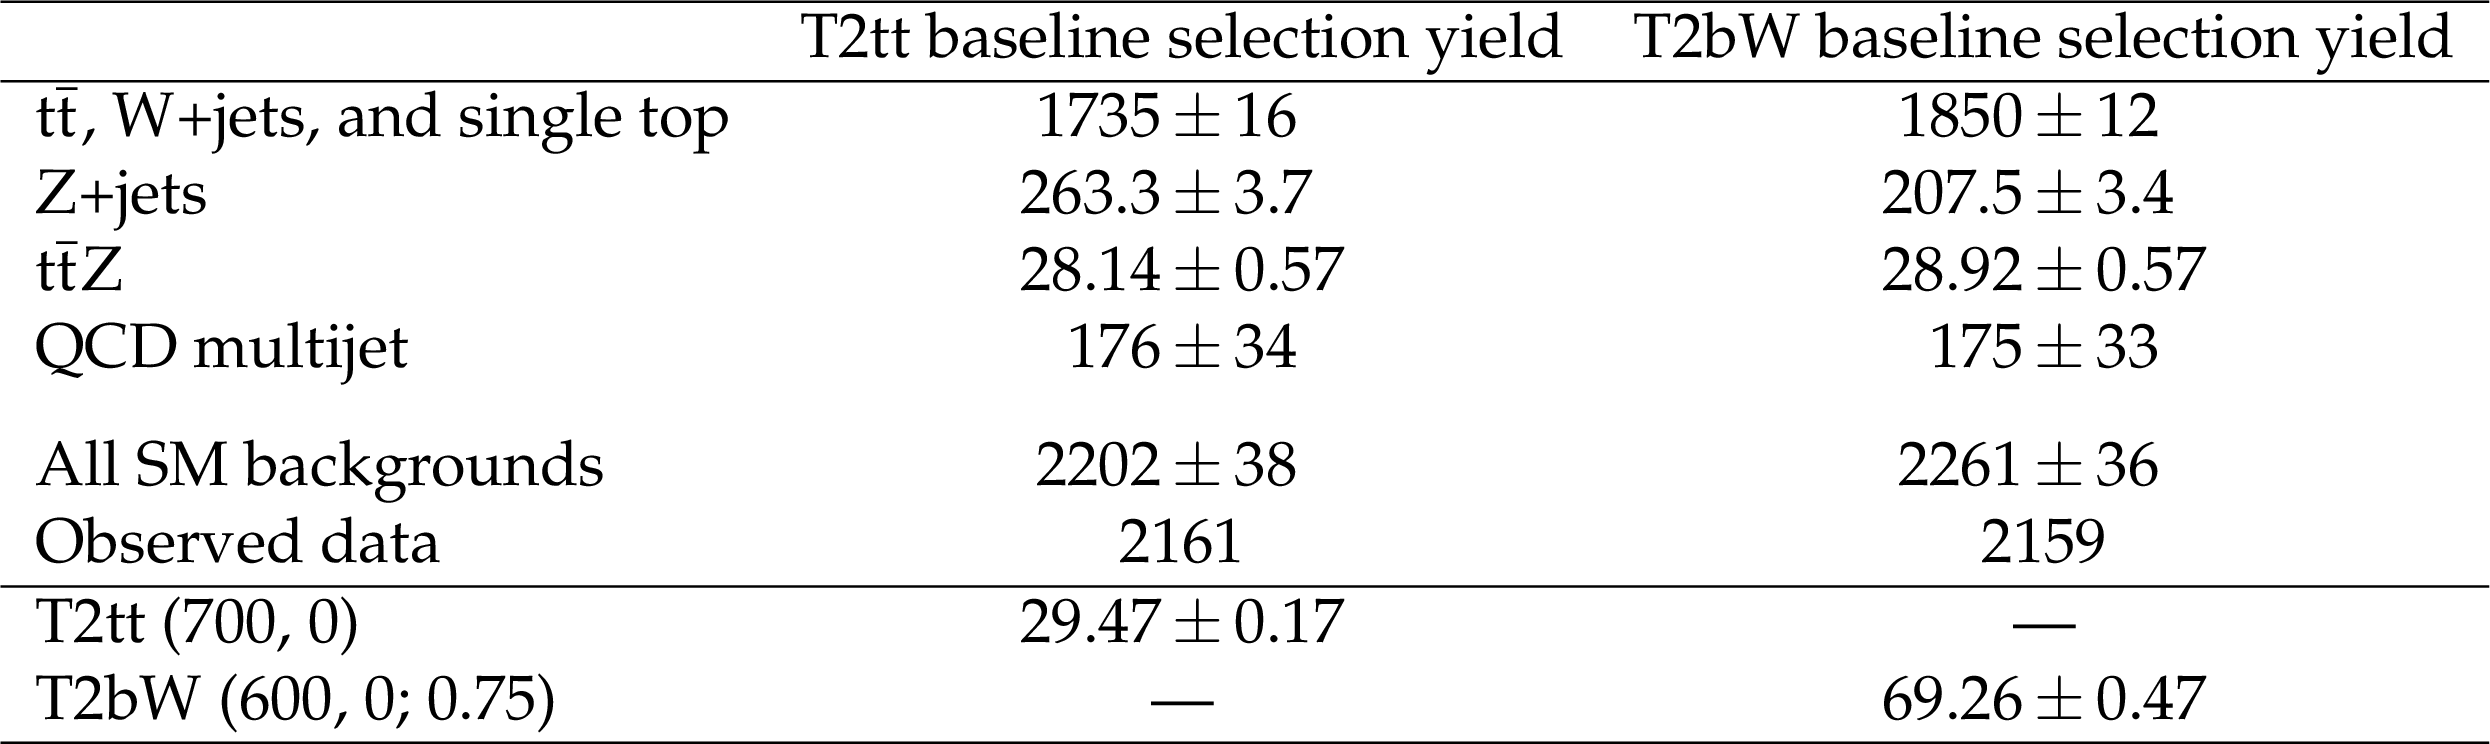
Table 1:
Estimated SM background yields as obtained with the methods described in Section {sec:background}, and the observed data yields for the T2tt and T2bW baseline selections. The T2bW yield corresponds to the simplified model point with $( {m_{\tilde{\mathrm{t}} }},\, {m_{\tilde{\chi}^0_1 }} ; \, x ) = $ (600 GeV, 0 GeV; 0.75), and the T2tt yield is for the simplified model point with $ ( {m_{\tilde{\mathrm{t}} }}, \, {m_{\tilde{\chi}^0_1 }} ) =$ (700 GeV, 0 GeV). The uncertainties listed are statistical only. |
png pdf |
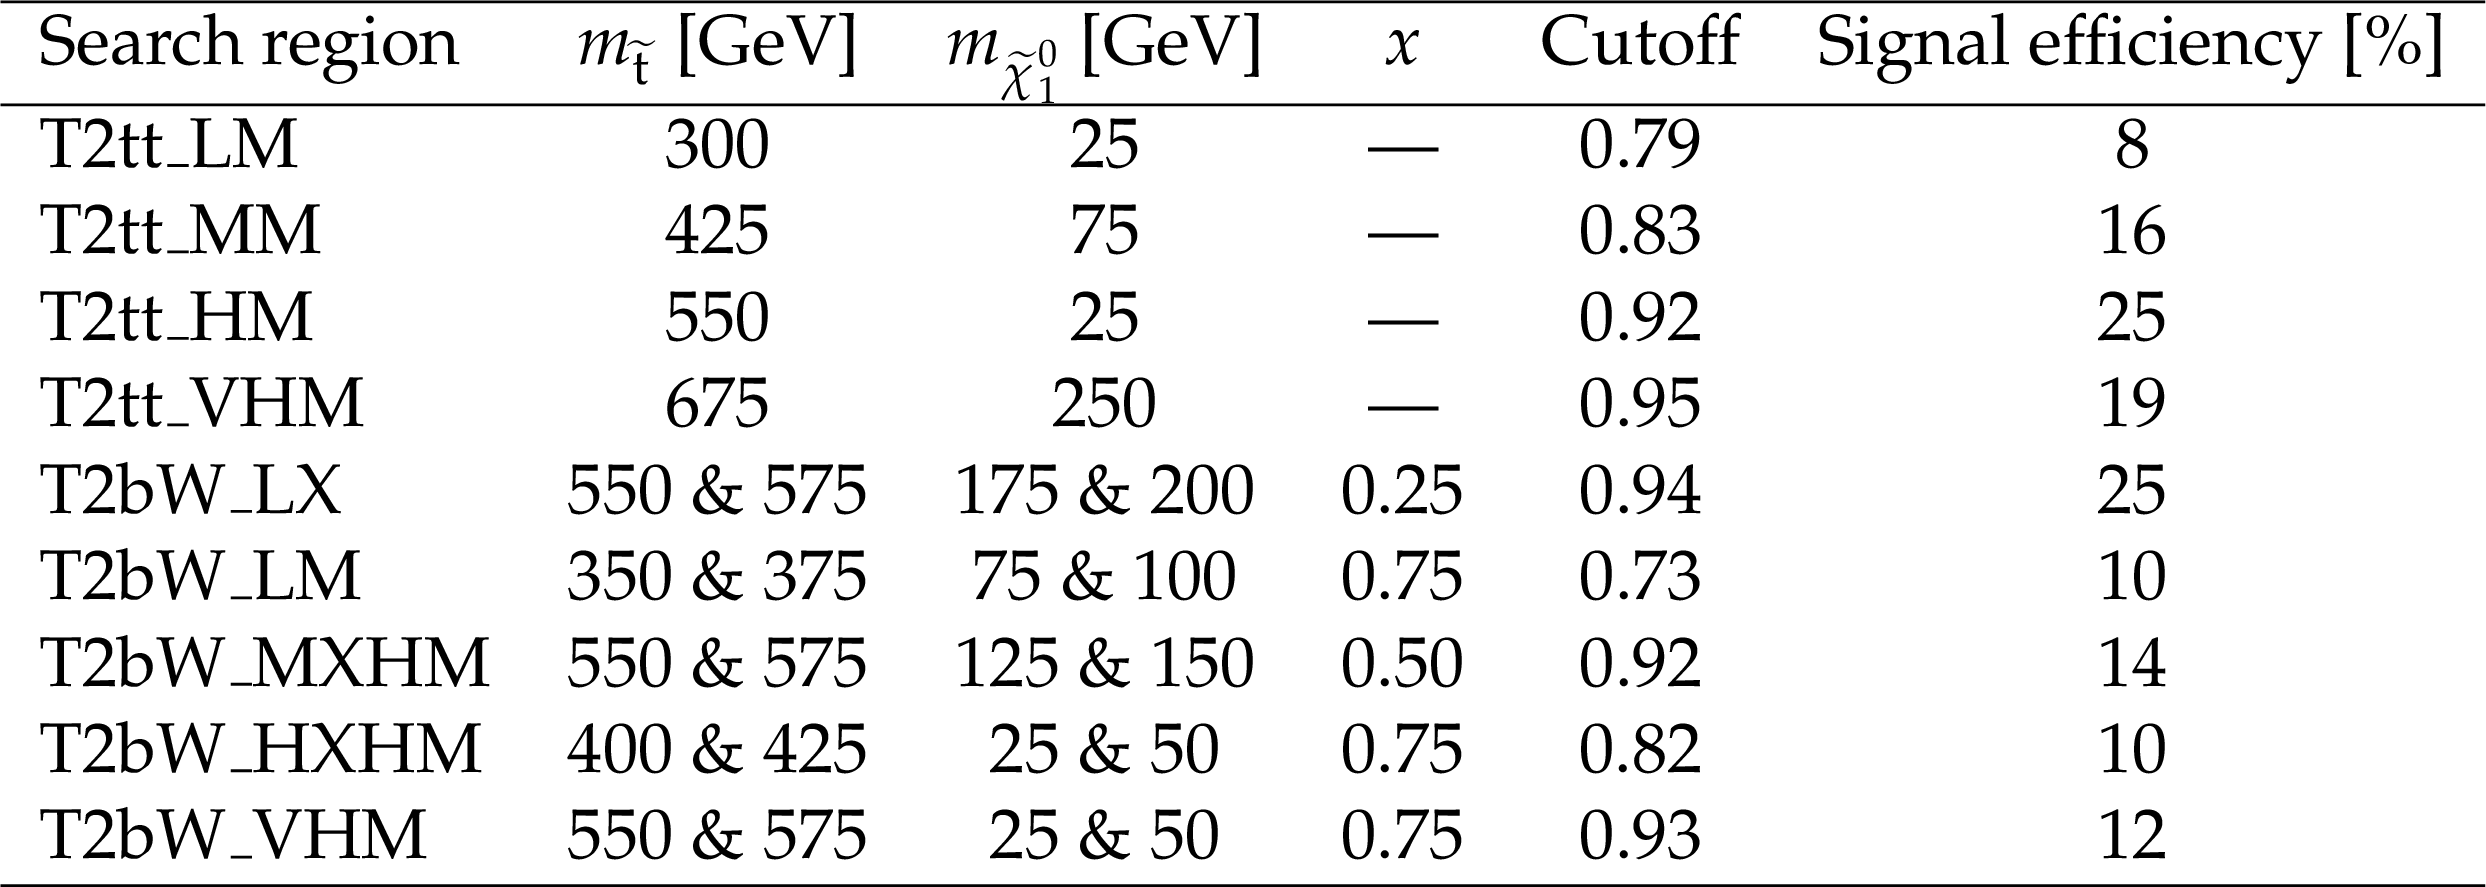
Table 2:
Search regions for the T2tt and T2bW channels. The table lists the SUSY particle masses used for the training of the BDTs, the cutoff on the BDT output, and the efficiency for the signal to pass the BDT selection relative to the baseline selection. The event counts of the T2bW discriminator training samples are limited and so four nearby mass points were used. They are the four combinations of the two $\tilde{\mathrm{t}} $ and two $\tilde{\chi}^0_1 $ masses listed. The signal efficiency in each row of the table is then that of the worst case of the four, which in every case is the point with the largest $ {m_{\tilde{\mathrm{t}} }} $ and smallest $ {m_{\tilde{\chi}^0_1 }} $ values of those indicated. |
png pdf |
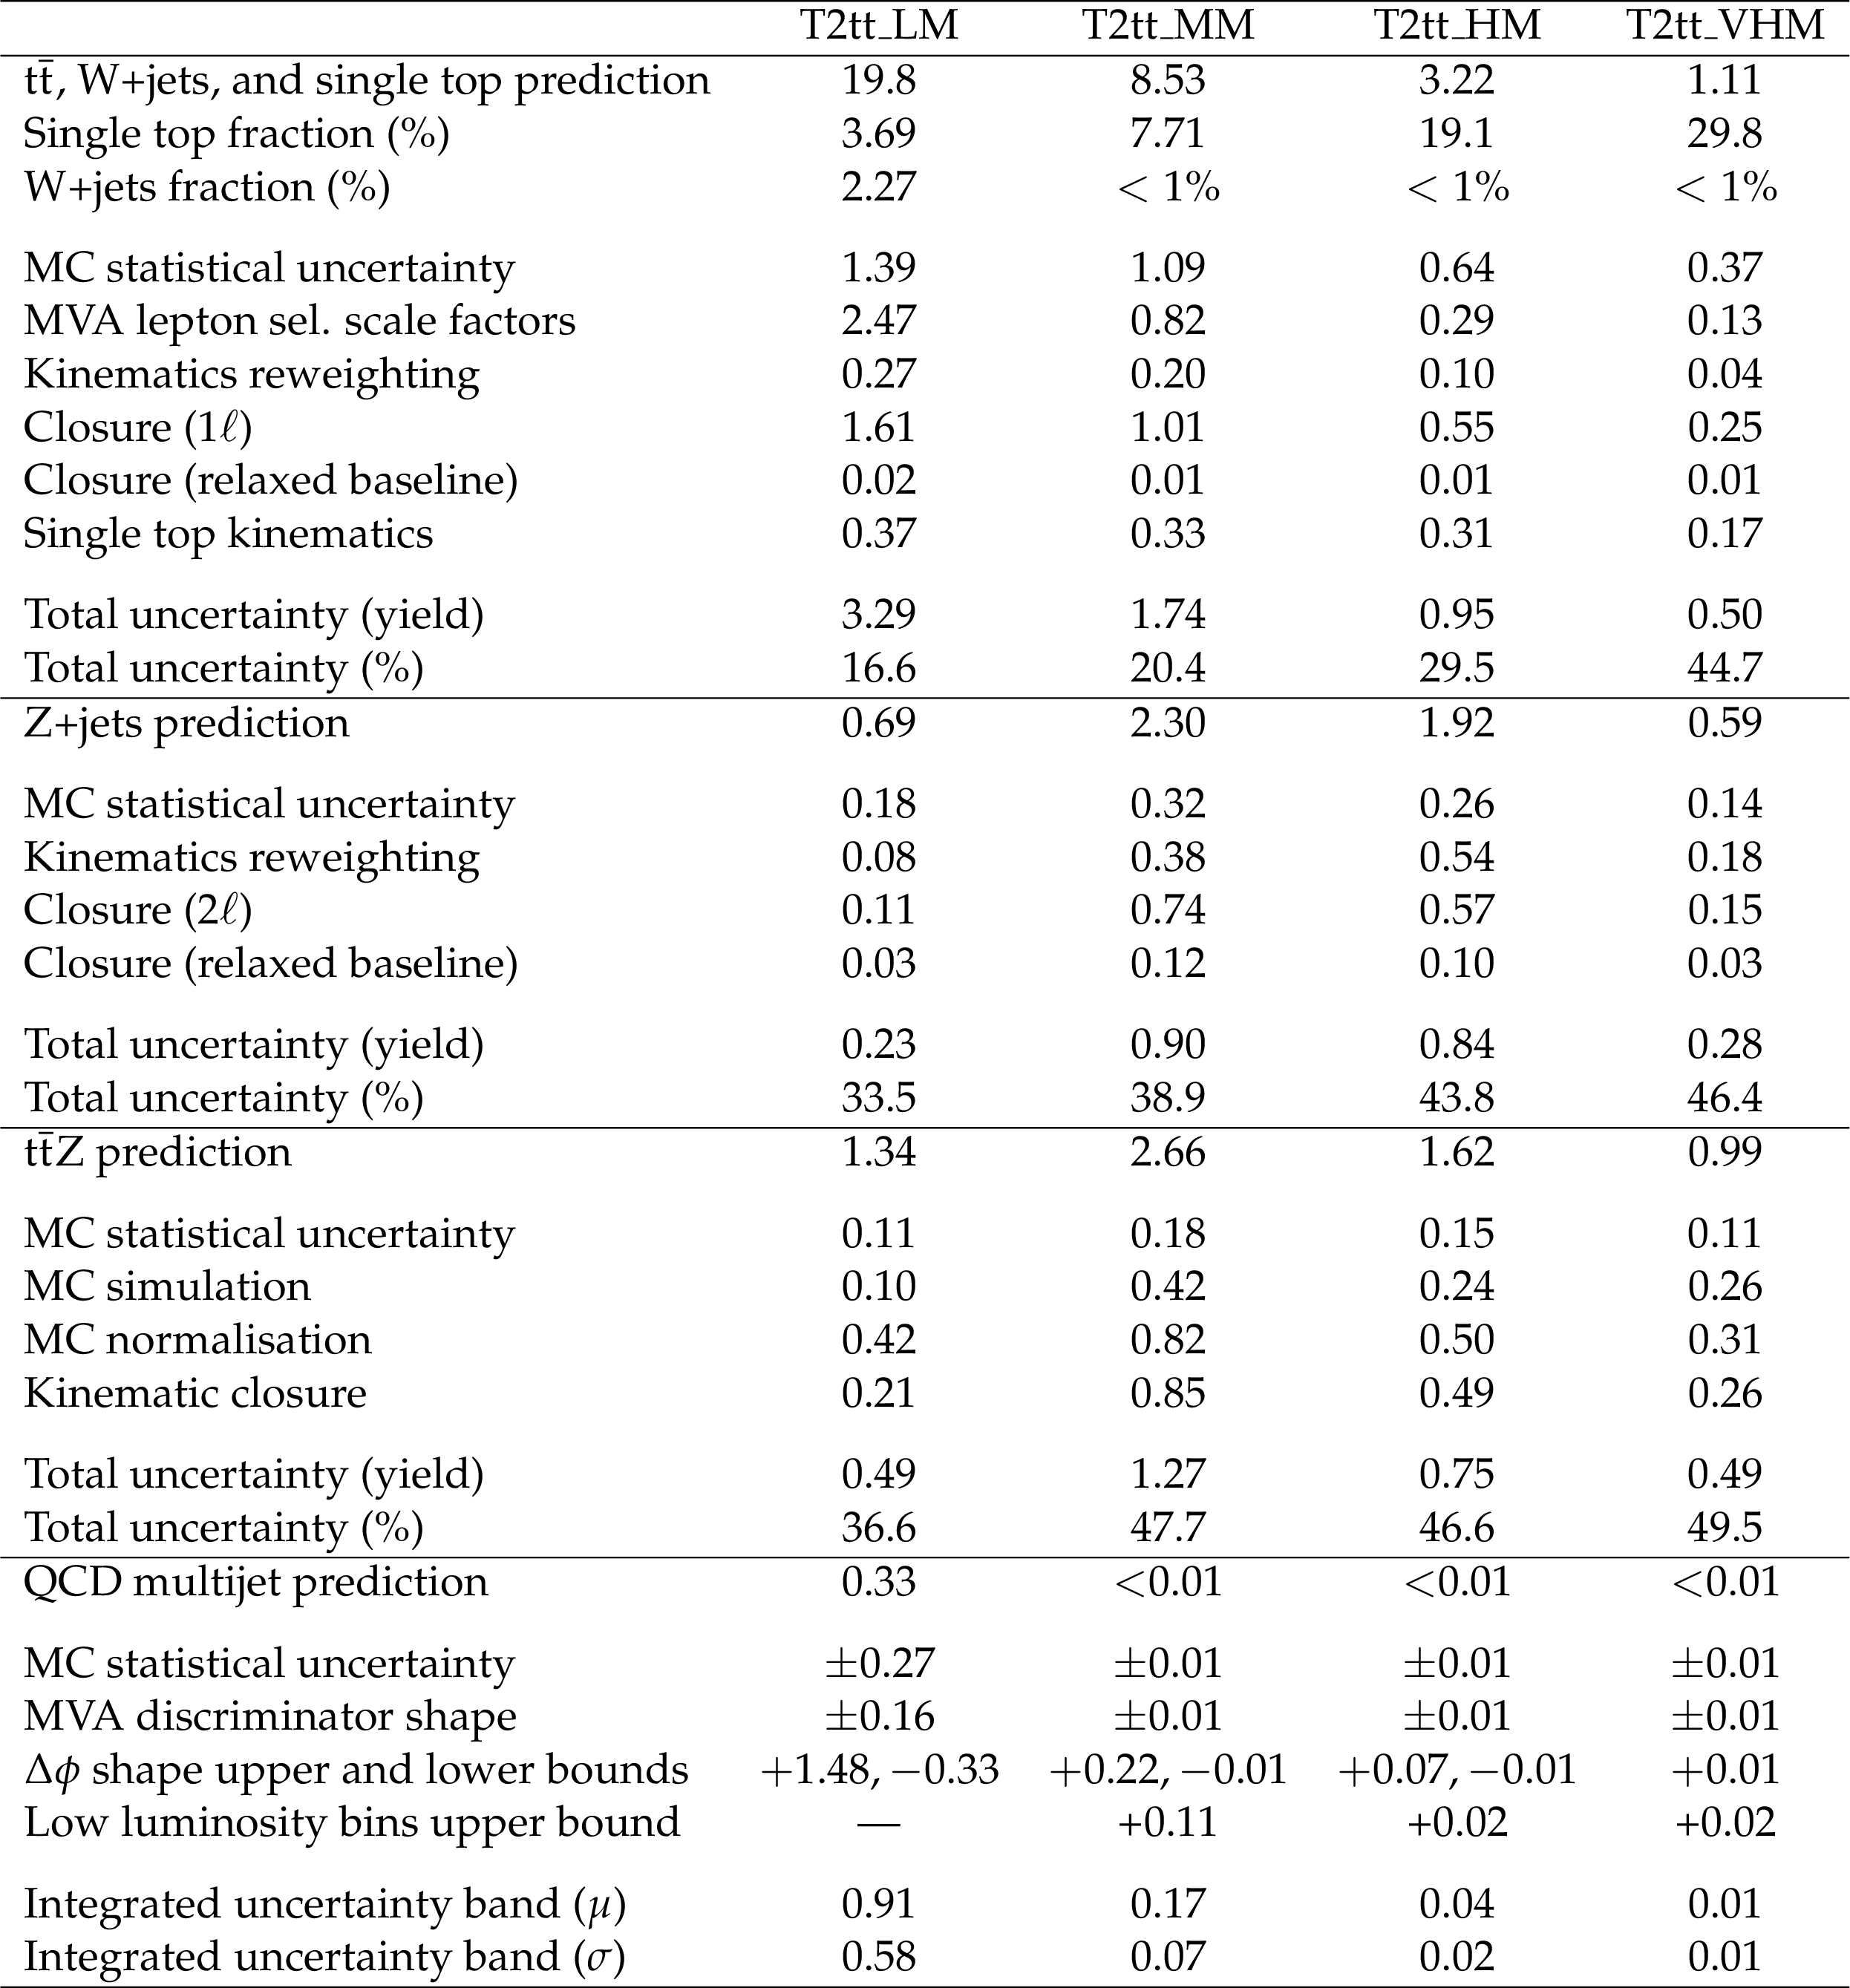
Table 3:
Estimated contributions and uncertainties for the SM backgrounds in the T2tt search regions. The $ \mathrm{ t \bar{t} } $, W+jets, single top, Z+jets, and QCD multijet background estimates make use of MC simulated samples that have been weighted by scale factors obtained from data-MC comparisons as discussed in the text. The $ \mathrm{ t \bar{t} Z } $ background is estimated directly from simulation, with uncertainties assigned for sources of MC mismodelling. |
png pdf |
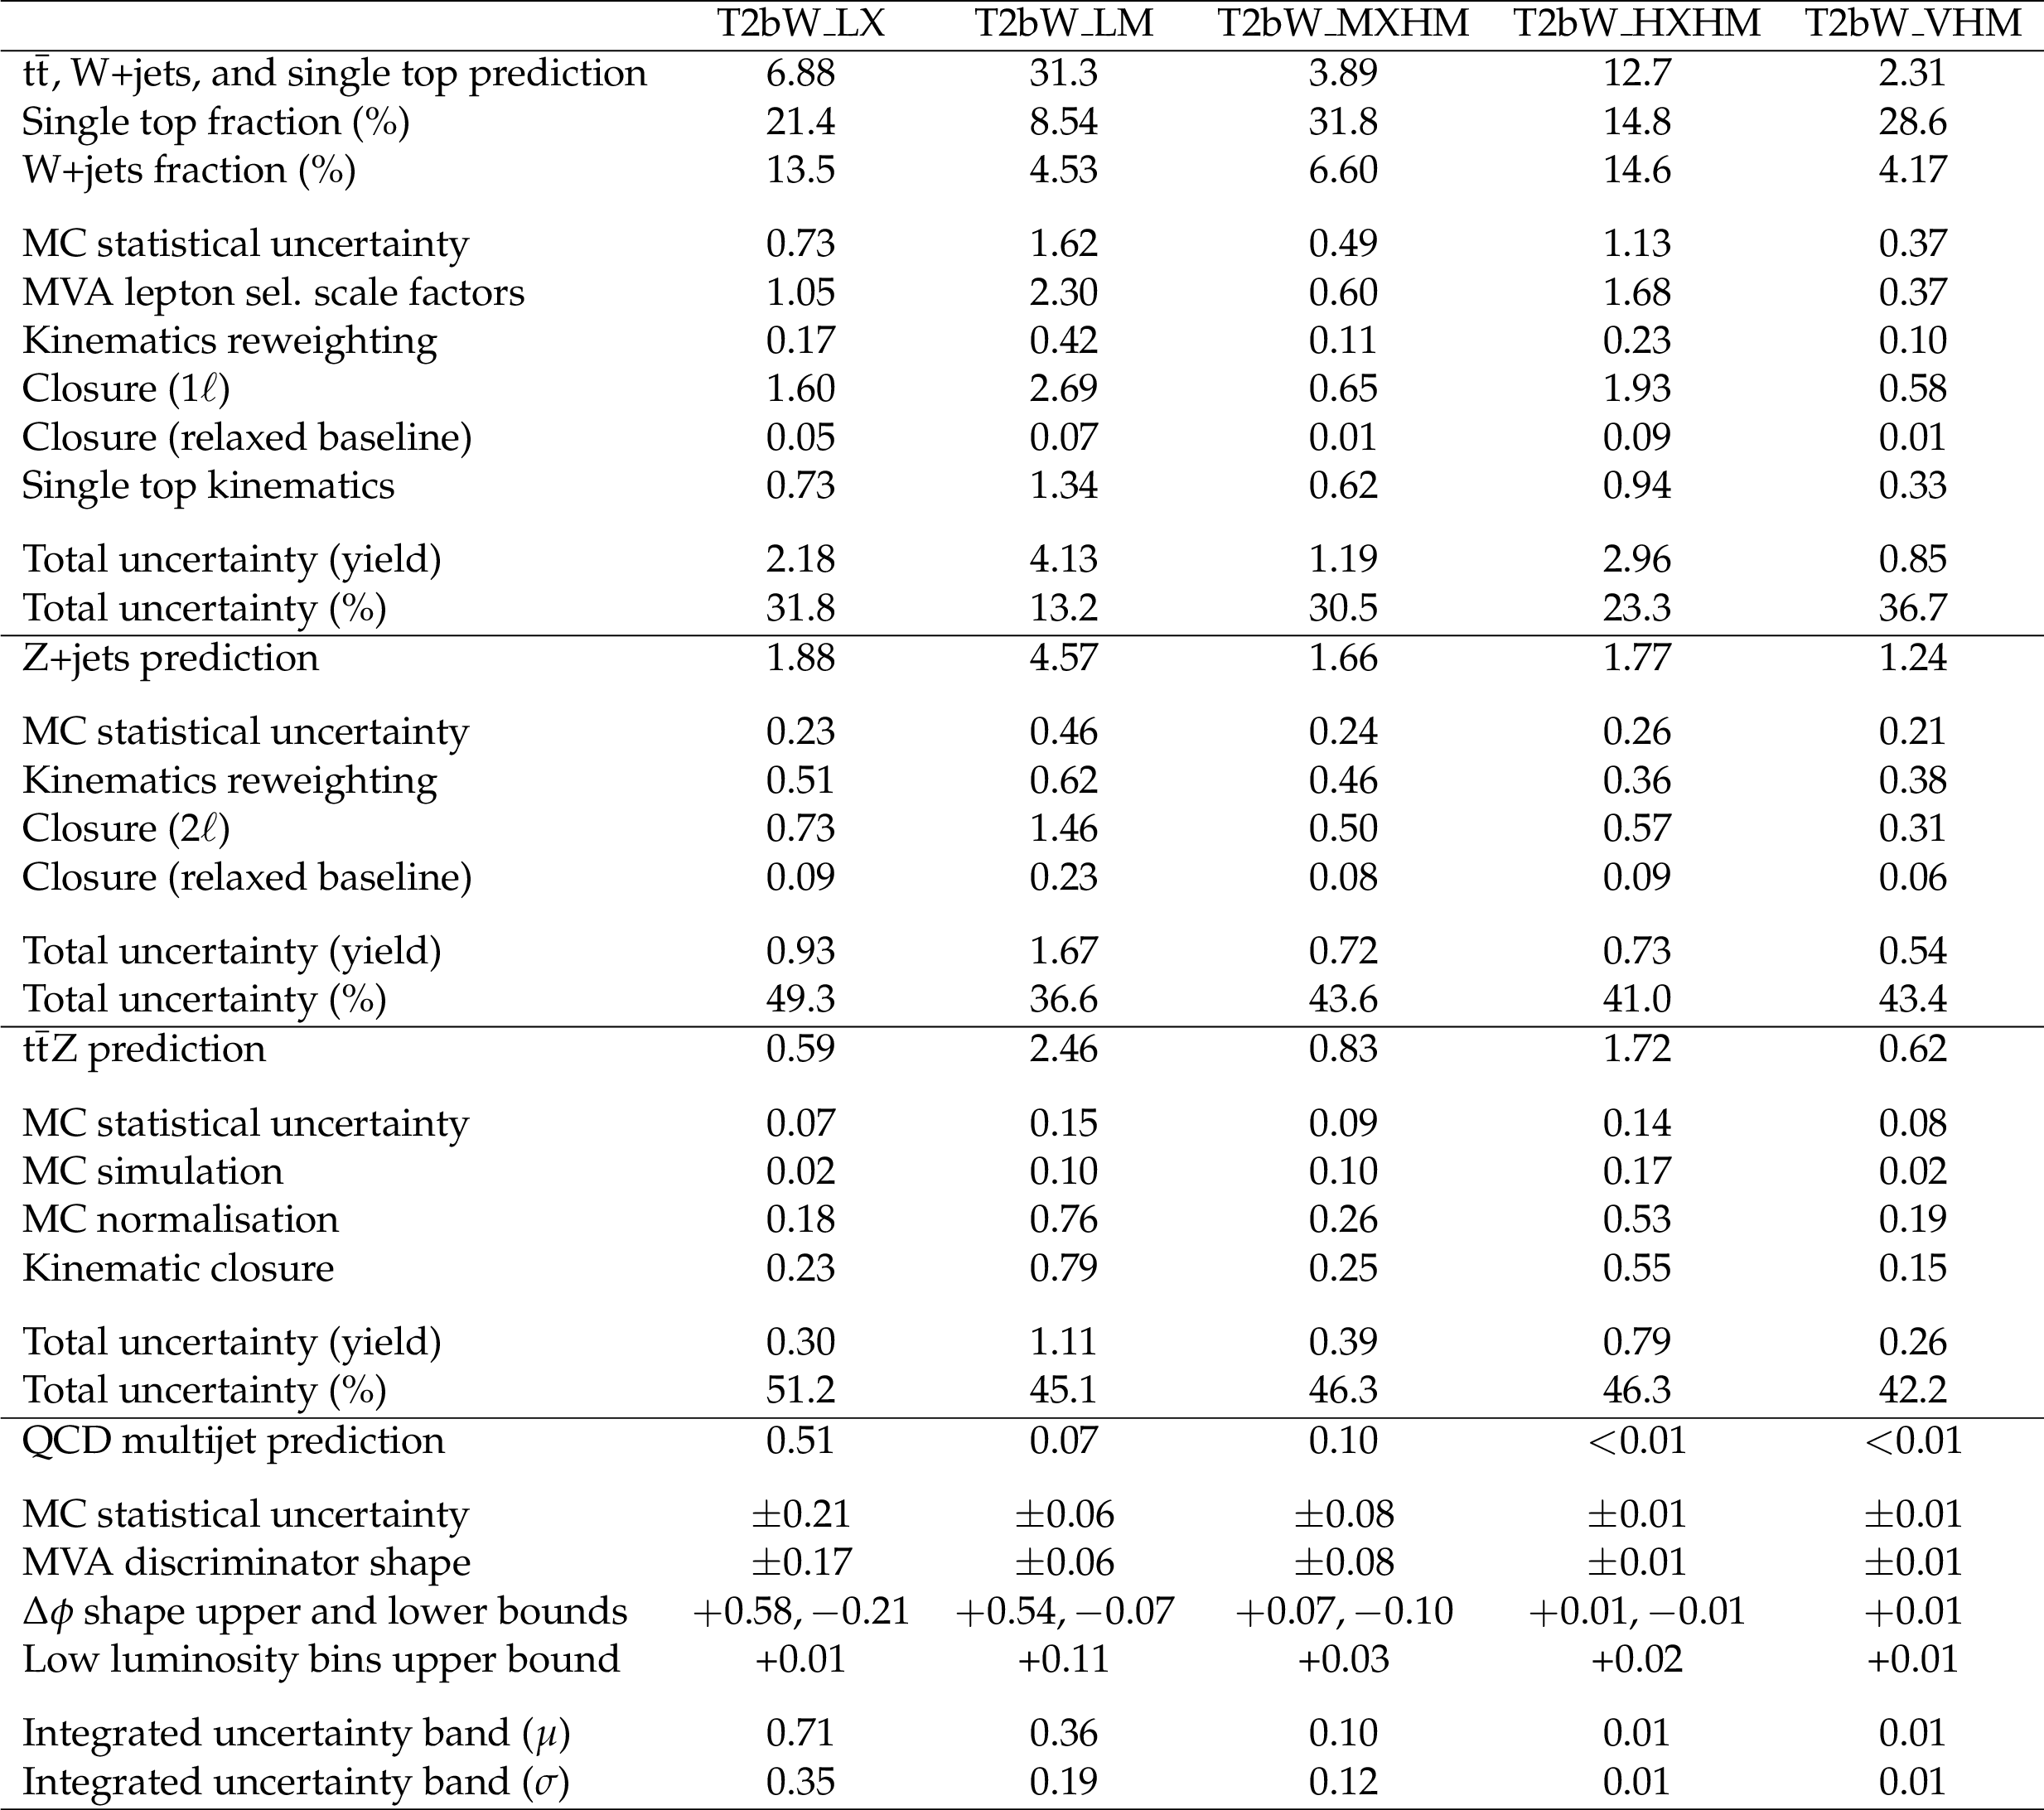
Table 4:
Estimated contributions and uncertainties for the SM backgrounds in the T2bW search regions. The $ \mathrm{ t \bar{t} } $, W+jets, single top, Z+jets, and QCD multijet background estimates make use of MC simulated samples that have been weighted by scale factors obtained from data-MC comparisons as discussed in the text. The $ \mathrm{ t \bar{t} Z } $ background is estimated directly from simulation, with uncertainties assigned for sources of MC mismodelling. |
png pdf |
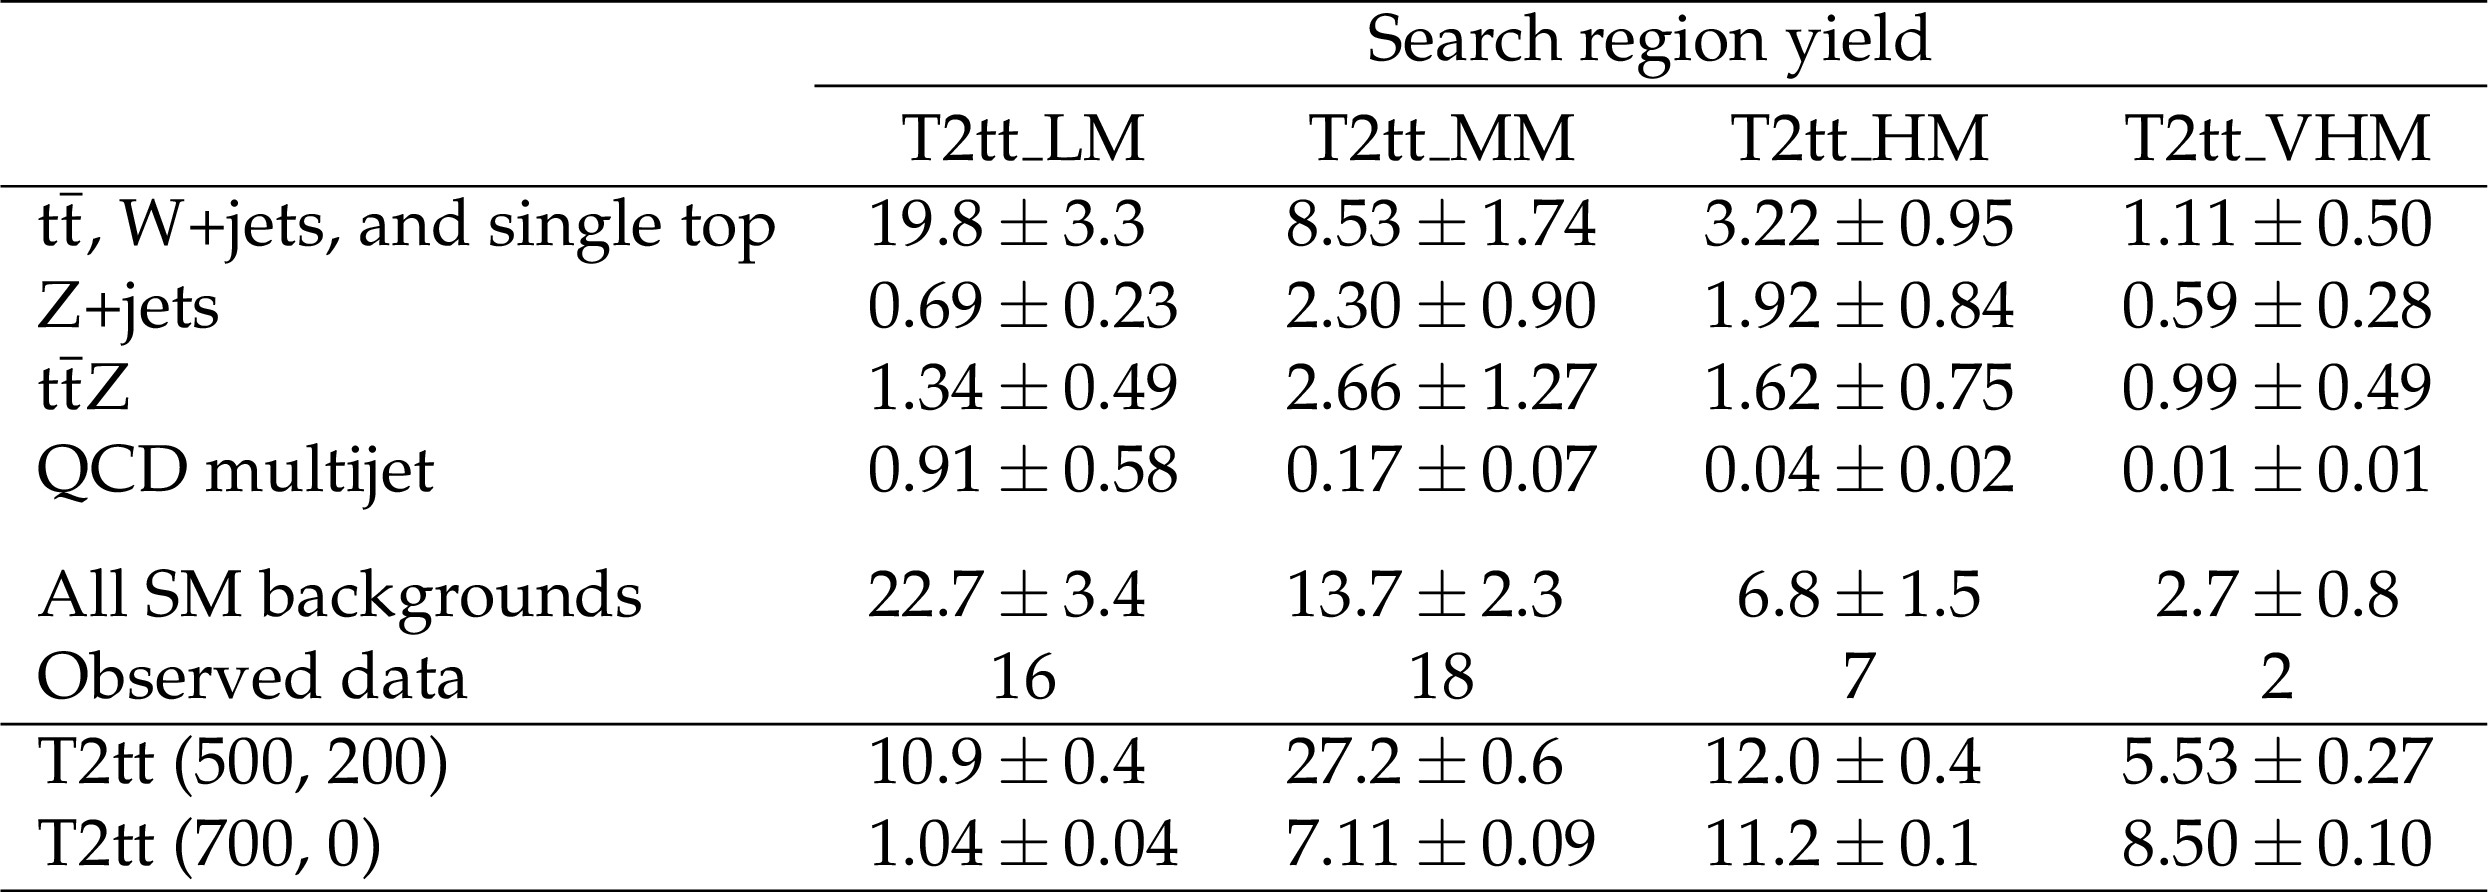
Table 5:
Predicted and observed data yields in the T2tt search regions. The uncertainties in the background predictions are the combined systematic and statistical uncertainties. The T2tt yields correspond to the simplified model points with $( {m_{\tilde{\mathrm{t}} }} , \, {m_{\tilde{\chi}^0_1 }} ) =$ (500 GeV, 200 GeV ) and (700 GeV, 0 GeV ). The uncertainties in the signal yields are statistical only. |
png pdf |
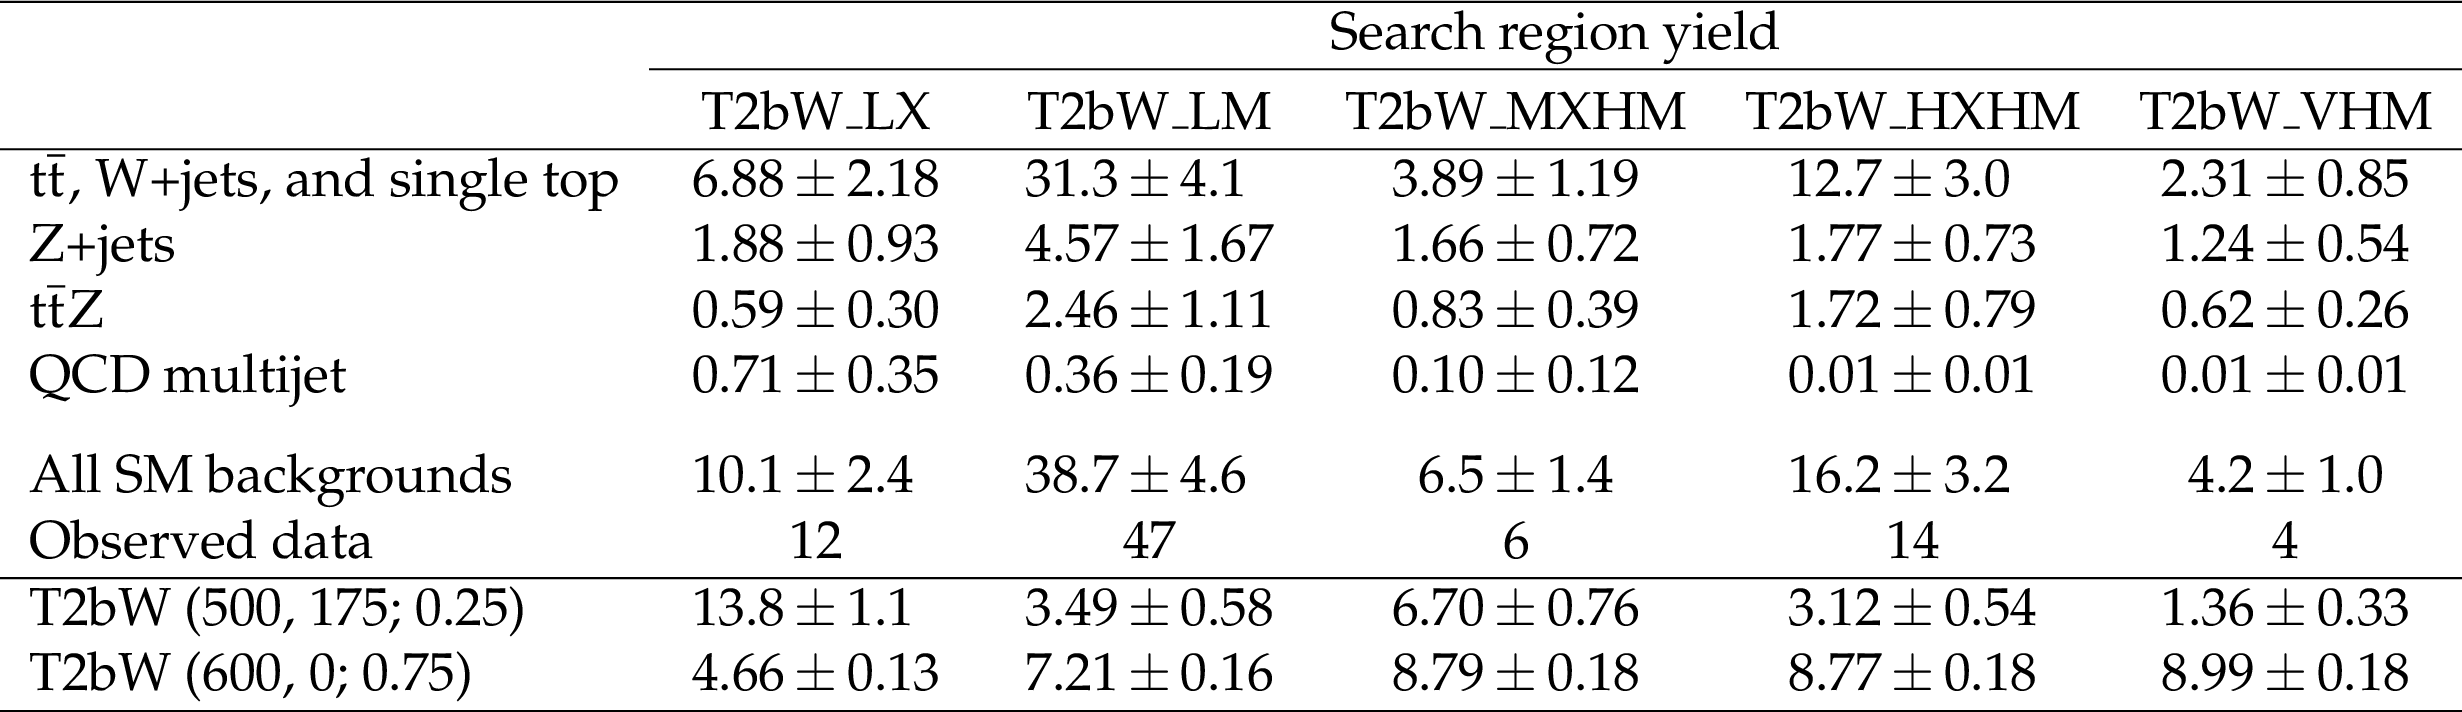
Table 6:
Predicted and observed data yields in the T2bW search regions. The uncertainties in the background predictions are the combined systematic and statistical uncertainties. The T2bW yields correspond to the simplified model points with $( {m_{\tilde{\mathrm{t}} }} ,\, {m_{\tilde{\chi}^0_1 }} ; \, x) =$ (500 GeV, 175 GeV; 0.25) and (600 GeV, 0 GeV; 0.75). The uncertainties in the signal yields are statistical only. |
png pdf |
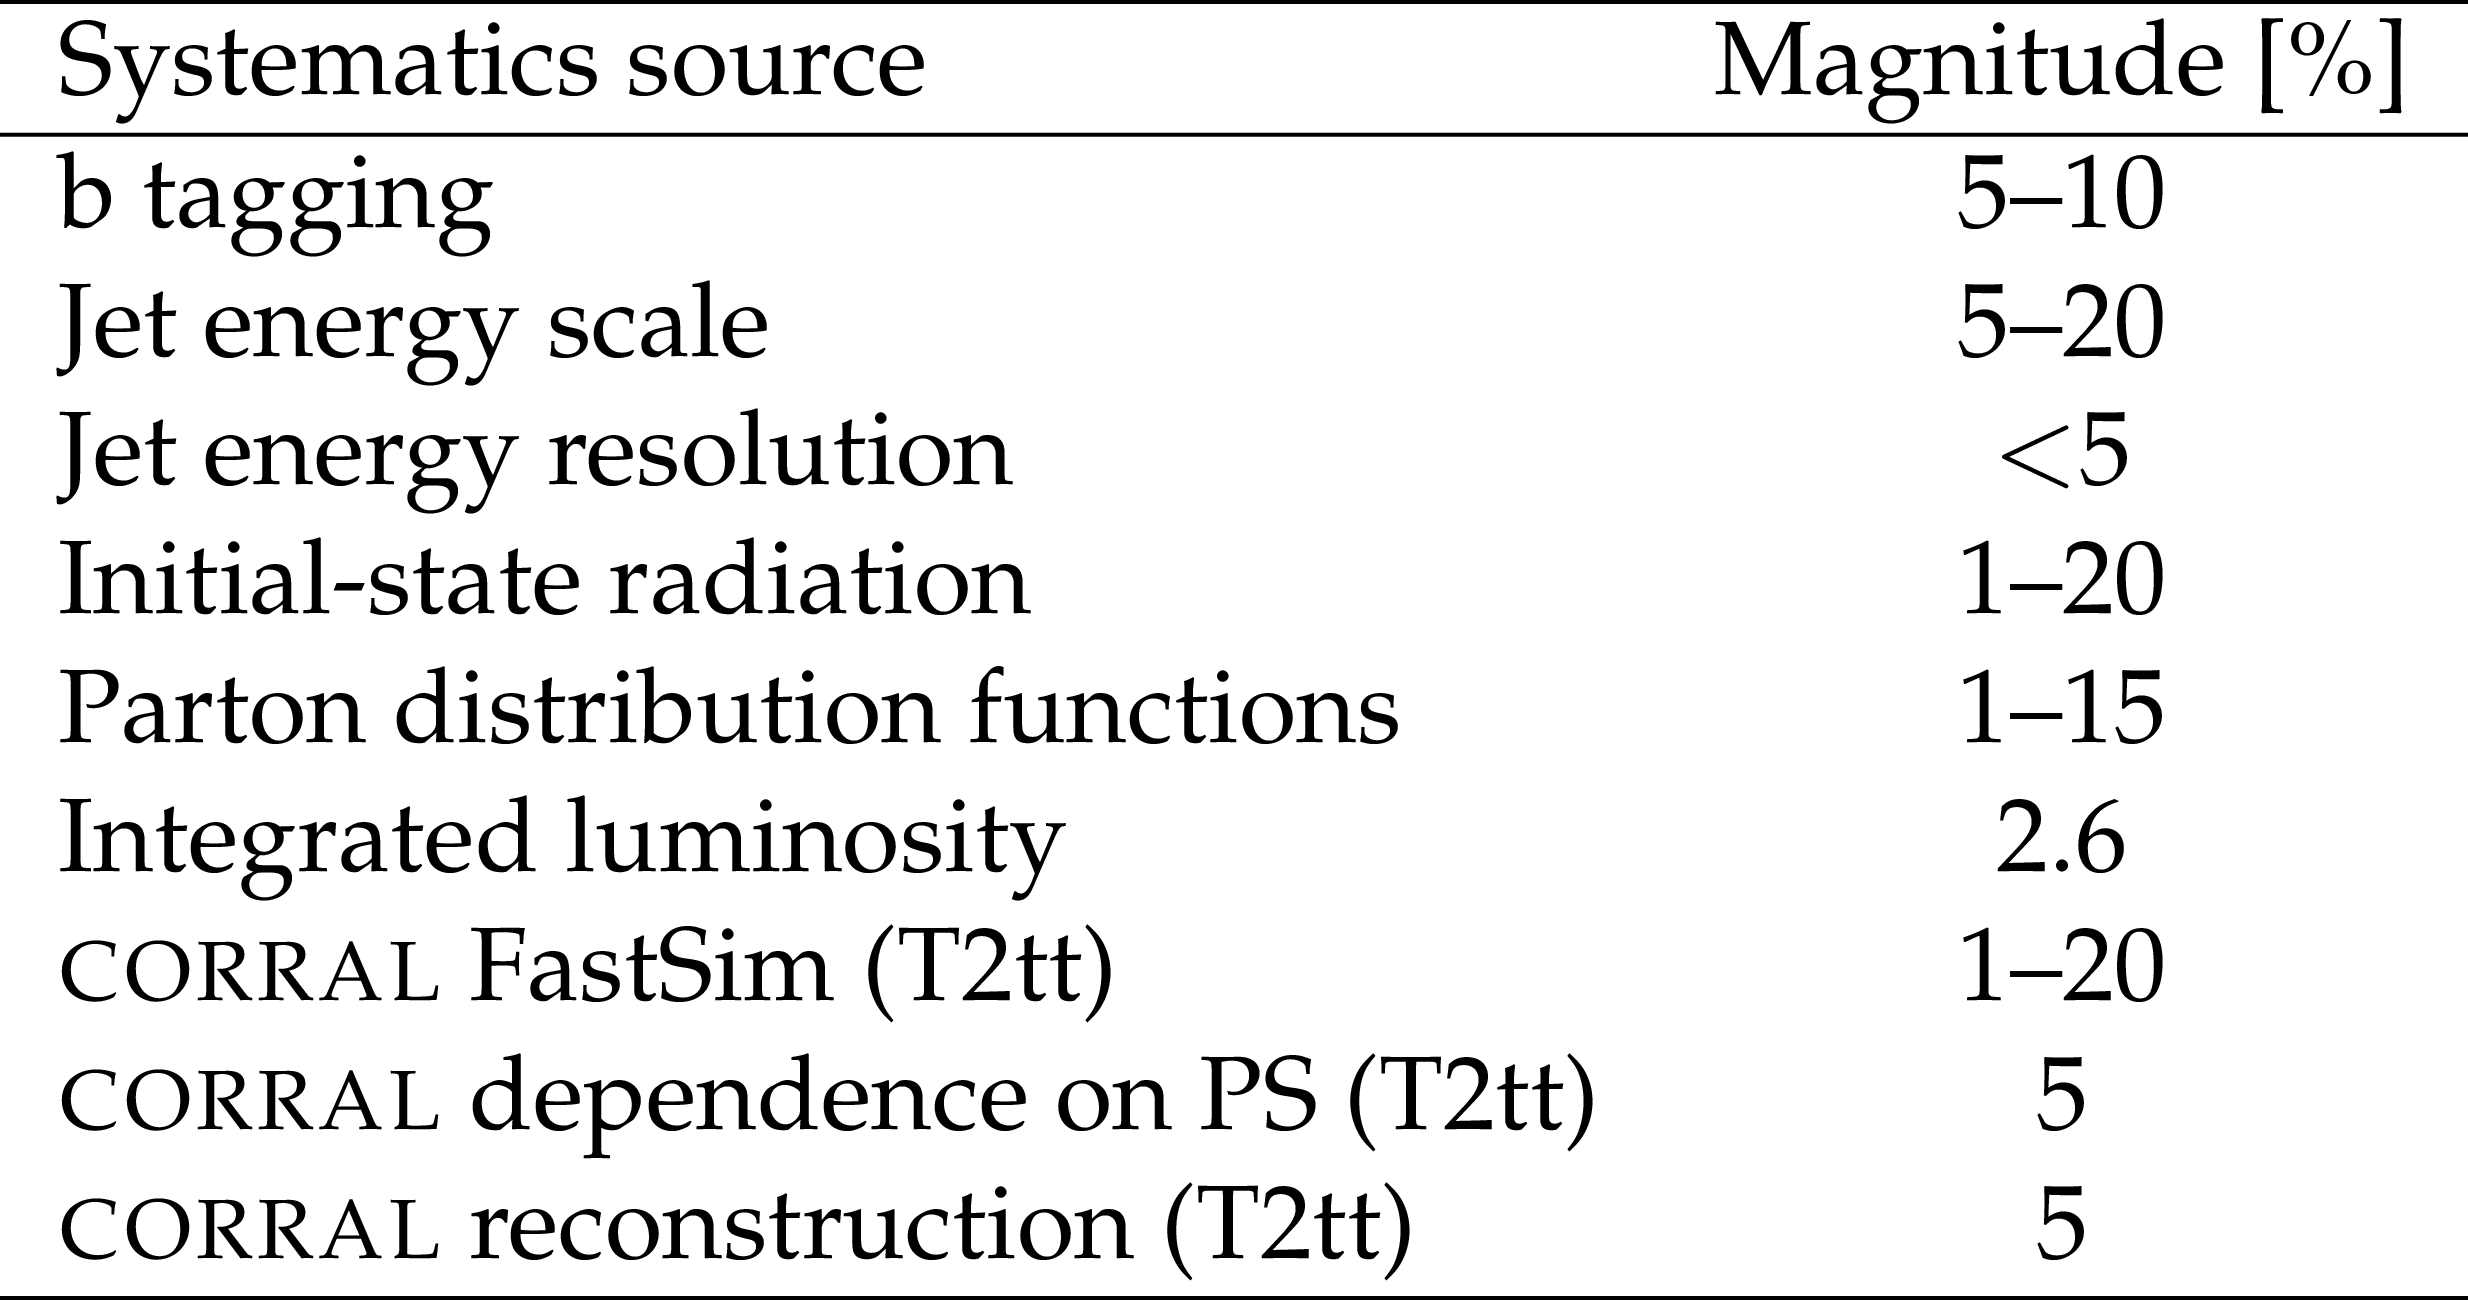
Table 7:
Summary of the systematic uncertainties in the signal selection efficiencies. The uncertainties can depend on signal topology, mass values, and search region. The quoted value ranges capture the variations associated with these dependencies. In all cases, the upper bound corresponds to the region in which $ {m_{\tilde{\chi}^0_1 }} $ is close to $ {m_{\tilde{\mathrm{t}} }} $. |
| Summary |
| We report a search for the direct pair production of top squarks in an all-hadronic final state containing jets and large missing transverse momentum. Two decay channels for the top squarks are considered. In the first channel, each top squark decays to a top quark and a neutralino, whereas in the second channel they each decay to a bottom quark and a chargino, with the chargino subsequently decaying to a W boson and a neutralino. A dedicated top quark pair reconstruction algorithm provides efficient identification of hadronically decaying top quarks. The search is carried out in several search regions based on the output of multivariate discriminators, where the standard model background yield is estimated with corrected simulation samples and validated in data control regions. The observed yields are statistically compatible with the standard model estimates and are used to restrict the allowed parameter space for these two signal topologies. The search is particularly sensitive to the production of top squarks that decay via an on-shell top quark. For models predicting such decays, a 95% CL lower limit of 755 GeV is found for the top squark mass when the neutralino is lighter than 200 GeV, extending the current limits on these models by 50-100 GeV. In models with top squarks that decay via a chargino, scenarios with a top squark mass up to 620 GeV are excluded. |
| References | ||||
| 1 | F. Zwicky | Die Rotverschiebung von extragalaktischen Nebeln | Helv. Phys. Acta 6 (1933) 110 | |
| 2 | V. C. Rubin and J. Ford, W. Kent | Rotation of the Andromeda Nebula from a Spectroscopic Survey of Emission Regions | Astrophys. J. 159 (1970) 379 | |
| 3 | M. Drees and G. Gerbier | Mini-Review of Dark Matter: 2012 | 1204.2373 | |
| 4 | L. Evans and P. Bryant (editors) | LHC Machine | JINST 3 (2008) S08001 | |
| 5 | ATLAS Collaboration | Observation of a new particle in the search for the Standard Model Higgs boson with the ATLAS detector at the LHC | PLB 716 (2012) 1 | 1207.7214 |
| 6 | CMS Collaboration | Observation of a new boson at a mass of 125 GeV with the CMS experiment at the LHC | PLB 716 (2012) 30 | CMS-HIG-12-028 1207.7235 |
| 7 | CMS Collaboration | Observation of a new boson with mass near 125 GeV in pp collisions at $ \sqrt{s} $ = 7 and 8 TeV | JHEP 06 (2013) 081 | CMS-HIG-12-036 1303.4571 |
| 8 | ATLAS Collaboration | Measurement of the Higgs boson mass from the $ \textrm{H}\rightarrow \gamma\gamma $ and $ \textrm{H} \rightarrow \textrm{ZZ}^{*} \rightarrow 4\textrm{l} $ channels with the ATLAS detector using 25 fb$ ^{-1} $ of $ \textrm{pp} $ collision data | PRD 90 (2014) 052004 | 1406.3827 |
| 9 | CMS Collaboration | Precise determination of the mass of the Higgs boson and tests of compatibility of its couplings with the standard model predictions using proton collisions at 7 and 8 $ \,\text {TeV} $ | EPJC 75 (2015) 212 | CMS-HIG-14-009 1412.8662 |
| 10 | ATLAS and CMS Collaborations | Combined Measurement of the Higgs Boson Mass in $ pp $ Collisions at $ \sqrt{s}=7 $ and 8 TeV with the ATLAS and CMS Experiments | PRL 114 (2015) 191803 | 1503.07589 |
| 11 | G. 't Hooft | Naturalness, chiral symmetry, and spontaneous chiral symmetry breaking | in Cargese Summer Institute: Recent Developments in Gauge Theories Cargese, France, August 26-September 8, 1979, p. 135 1980NATO Sci. Ser. B, 59 | |
| 12 | E. Witten | Dynamical breaking of supersymmetry | Nucl. Phys. B 188 (1981) 513 | |
| 13 | M. Dine, W. Fischler, and M. Srednicki | Supersymmetric technicolor | Nucl. Phys. B 189 (1981) 575 | |
| 14 | S. Dimopoulos and S. Raby | Supercolor | Nucl. Phys. B 192 (1981) 353 | |
| 15 | S. Dimopoulos and H. Georgi | Softly broken supersymmetry and SU(5) | Nucl. Phys. B 193 (1981) 150 | |
| 16 | R. K. Kaul and P. Majumdar | Cancellation of quadratically divergent mass corrections in globally supersymmetric spontaneously broken gauge theories | Nucl. Phys. B 199 (1982) 36 | |
| 17 | R. Barbieri, S. Ferrara, and C. A. Savoy | Gauge models with spontaneously broken local supersymmetry | PLB 119 (1982) 343 | |
| 18 | S. Dawson, E. Eichten, and C. Quigg | Search for supersymmetric particles in hadron-hadron collisions | PRD 31 (1985) 1581 | |
| 19 | H. P. Nilles | Supersymmetry, supergravity and particle physics | PR 110 (1984) 1 | |
| 20 | H. E. Haber and G. L. Kane | The search for supersymmetry: Probing physics beyond the standard model | PR 117 (1985) 75 | |
| 21 | D. J. H. Chung et al. | The soft supersymmetry breaking Lagrangian: theory and applications | PR 407 (2005) 1 | hep-ph/0312378 |
| 22 | R. Barbieri and G. F. Giudice | Upper bounds on supersymmetric particle masses | Nucl. Phys. B 306 (1988) 63 | |
| 23 | B. de Carlos and J. A. Casas | One loop analysis of the electroweak breaking in supersymmetric models and the fine tuning problem | PLB 309 (1993) 320 | hep-ph/9303291 |
| 24 | S. Dimopoulos and G. F. Giudice | Naturalness constraints in supersymmetric theories with nonuniversal soft terms | PLB 357 (1995) 573 | hep-ph/9507282 |
| 25 | R. Barbieri, G. R. Dvali, and L. J. Hall | Predictions from a U(2) flavor symmetry in supersymmetric theories | PLB 377 (1996) 76 | hep-ph/9512388 |
| 26 | N. Sakai | Naturalness in supersymmetric GUTS | Z. Phys. C 11 (1981) 153 | |
| 27 | M. Papucci, J. T. Ruderman, and A. Weiler | Natural SUSY endures | JHEP 09 (2012) 035 | 1110.6926 |
| 28 | C. Brust, A. Katz, S. Lawrence, and R. Sundrum | SUSY, the Third Generation and the LHC | JHEP 03 (2012) 103 | 1110.6670 |
| 29 | A. Delgado et al. | The light stop window | EPJC 73 (2013) 2370 | 1212.6847 |
| 30 | J. L. Feng | Naturalness and the Status of Supersymmetry | Ann. Rev. Nucl. Part. Sci. 63 (2013) 351 | 1302.6587 |
| 31 | J. Wess and B. Zumino | Supergauge transformations in four dimensions | Nucl. Phys. B 70 (1974) 39 | |
| 32 | G. R. Farrar and P. Fayet | Phenomenology of the production, decay, and detection of new hadronic states associated with supersymmetry | PLB 76 (1978) 575 | |
| 33 | J. L. Feng | Dark Matter Candidates from Particle Physics and Methods of Detection | Annual Review of Astronomy and Astrophysics 48 (2010) 495 | 1003.0904 |
| 34 | J. Alwall, P. Schuster, and N. Toro | Simplified models for a first characterization of new physics at the LHC | PRD 79 (2009) 075020 | 0810.3921 |
| 35 | J. Alwall, M.-P. Le, M. Lisanti, and J. G. Wacker | Model-independent jets plus missing energy searches | PRD 79 (2009) 015005 | 0809.3264 |
| 36 | LHC New Physics Working Group Collaboration | Simplified models for LHC new physics searches | JPG 39 (2012) 105005 | 1105.2838 |
| 37 | M. Perelstein and A. Weiler | Polarized tops from stop decays at the LHC | JHEP 03 (2009) 141 | 0811.1024 |
| 38 | I. Low | Polarized charginos (and top quarks) in scalar top quark decays | PRD 88 (2013) 095018 | 1304.0491 |
| 39 | W. Beenakker et al. | Stop production at hadron colliders | Nucl. Phys. B 515 (1998) 3 | hep-ph/9710451 |
| 40 | ATLAS Collaboration | Measurement of the $ \mathrm{t}\bar{\mathrm{t}}\mathrm{W} $ and $ \mathrm{t}\bar{\mathrm{t}}\mathrm{Z} $ production cross sections in pp collisions at $ \sqrt{s}=8 $ TeV with the ATLAS detector | JHEP 11 (2015) 172 | 1509.05276 |
| 41 | CMS Collaboration | Observation of top quark pairs produced in association with a vector boson in pp collisions at $ \sqrt{s}=8 $ TeV | JHEP 01 (2016) 096 | CMS-TOP-14-021 1510.01131 |
| 42 | CMS Collaboration | Search for supersymmetry using razor variables in events with b-tagged jets in pp collisions at $ \sqrt{s} = 8 $ TeV | PRD 91 (2015) 052018 | CMS-SUS-13-004 1502.00300 |
| 43 | ATLAS Collaboration | ATLAS Run 1 searches for direct pair production of third-generation squarks at the Large Hadron Collider | EPJC 75 (2015), no. 10, 510 | 1506.08616 |
| 44 | ATLAS Collaboration | Search for a supersymmetric partner to the top quark in final states with jets and missing transverse momentum at $ \sqrt{s}=7 $ TeV with the ATLAS detector | PRL 109 (2012) 211802 | 1208.1447 |
| 45 | ATLAS Collaboration | Search for direct top squark pair production in final states with one isolated lepton, jets, and missing transverse momentum in $ \sqrt{s}=7 $ TeV pp collisions using 4.7 fb$ ^{-1} $ of ATLAS data | PRL 109 (2012) 211803 | 1208.2590 |
| 46 | ATLAS Collaboration | Search for a heavy top-quark partner in final states with two leptons with the ATLAS detector at the LHC | JHEP 11 (2012) 094 | 1209.4186 |
| 47 | ATLAS Collaboration | Search for direct top-squark pair production in final states with two leptons in pp collisions at $ \sqrt{s} = $ 8 TeV with the ATLAS detector | JHEP 06 (2014) 124 | 1403.4853 |
| 48 | ATLAS Collaboration | Search for direct third-generation squark pair production in final states with missing transverse momentum and two b-jets in $ \sqrt{s} = $ 8 TeV pp collisions with the ATLAS detector | JHEP 10 (2013) 189 | 1308.2631 |
| 49 | ATLAS Collaboration | Measurement of Spin Correlation in Top-Antitop Quark Events and Search for Top Squark Pair Production in pp Collisions at $ \sqrt{s}=8 $ TeV Using the ATLAS Detector | PRL 114 (2015) 142001 | 1412.4742 |
| 50 | ATLAS Collaboration | Search for pair-produced third-generation squarks decaying via charm quarks or in compressed supersymmetric scenarios in pp collisions at $ \sqrt{s}=8 $TeV with the ATLAS detector | PRD 90 (2014) 052008 | 1407.0608 |
| 51 | CMS Collaboration | Search for top-squark pair production in the single-lepton final state in pp collisions at $ \sqrt{s} $ = 8 TeV | EPJC 73 (2013) 2677 | CMS-SUS-13-011 1308.1586 |
| 52 | CMS Collaboration | Search for supersymmetry in hadronic final states with missing transverse energy using the variables $ \alpha_T $ and b-quark multiplicity in pp collisions at $ \sqrt s=8 $ TeV | EPJC 73 (2013) 2568 | CMS-SUS-12-028 1303.2985 |
| 53 | CMS Collaboration | Search for new physics in events with same-sign dileptons and b jets in pp collisions at $ \sqrt{s}=8 $ TeV | JHEP 03 (2013) 037, , [Erratum: \DOI10.1007/JHEP07(2013)041] | CMS-SUS-12-017 1212.6194 |
| 54 | CMS Collaboration | Search for top squark and higgsino production using diphoton Higgs boson decays | PRL 112 (2014) 161802 | CMS-SUS-13-014 1312.3310 |
| 55 | CMS Collaboration | Search for top-squark pairs decaying into Higgs or Z bosons in pp collisions at $ \sqrt{s}=8 $ TeV | PLB 736 (2014) 371 | CMS-SUS-13-024 1405.3886 |
| 56 | CMS Collaboration | Searches for supersymmetry based on events with b jets and four W bosons in pp collisions at 8 TeV | PLB 745 (2015) 5 | CMS-SUS-14-010 1412.4109 |
| 57 | CMS Collaboration | Searches for third-generation squark production in fully hadronic final states in proton-proton collisions at $ \sqrt{s} = 8 $ TeV | JHEP 06 (2015) 116 | CMS-SUS-14-001 1503.08037 |
| 58 | ATLAS Collaboration | Search for top squark pair production in final states with one isolated lepton, jets, and missing transverse momentum in $ \sqrt s =8 $ TeV pp collisions with the ATLAS detector | JHEP 11 (2014) 118 | 1407.0583 |
| 59 | ATLAS Collaboration | Search for direct top squark pair production in events with a Z boson, b-jets and missing transverse momentum in $ \sqrt s = $8 TeV pp collisions with the ATLAS detector | EPJC 74 (2014) 2883 | 1403.5222 |
| 60 | ATLAS Collaboration | Search for direct pair production of the top squark in all-hadronic final states in proton-proton collisions at $ \sqrt{s}=8 $ TeV with the ATLAS detector | JHEP 09 (2014) 015 | 1406.1122 |
| 61 | CDF Collaboration | Search for the supersymmetric partner of the top quark in $ p\bar{p} $ collisions at $ \sqrt{s} $ = 1.96 TeV | PRD 82 (2010) 092001 | 1009.0266 |
| 62 | CDF Collaboration | Search for the Production of Scalar Bottom Quarks in $ \textrm{p}\bar{\textrm{p}} $ collisions at $ \sqrt{s} $ = 1.96 TeV | PRL 105 (2010) 081802 | 1005.3600 |
| 63 | CDF Collaboration | Search for scalar top quark production in $ p\bar{p} $ collisions at $ \sqrt{s}=1.96 $ TeV | JHEP 10 (2012) 158 | 1203.4171 |
| 64 | CDF Collaboration | Search for Pair Production of Supersymmetric Top Quarks in Dilepton Events from p anti-p Collisions at $ \sqrt{s}= $ 1.96 TeV | PRL 104 (2010) 251801 | 0912.1308 |
| 65 | D0 Collaboration | Search for pair production of the scalar top quark in the electron+muon final state | PLB 696 (2011) 321 | 1009.5950 |
| 66 | D0 Collaboration | Search for scalar bottom quarks and third-generation leptoquarks in $ \textrm{p}\bar{\textrm{p}} $ collisions at $ \sqrt{s}=1.96 $ TeV | PLB 693 (2010) 95 | 1005.2222 |
| 67 | D0 Collaboration | Search for scalar top quarks in the acoplanar charm jets and missing transverse energy final state in $ p\bar{p} $ collisions at $ \sqrt{s} = 1.96 $ TeV | PLB 665 (2008) 1 | 0803.2263 |
| 68 | D0 Collaboration | Search for pair production of the scalar top quark in muon+tau final states | PLB 710 (2012) 578 | 1202.1978 |
| 69 | CMS Collaboration | Description and performance of track and primary-vertex reconstruction with the CMS tracker | JINST 9 (2014) P10009 | CMS-TRK-11-001 1405.6569 |
| 70 | CMS Collaboration | Determination of jet energy calibration and transverse momentum resolution in CMS | JINST 6 (2011) P11002 | |
| 71 | CMS Collaboration | Performance of CMS muon reconstruction in pp collision events at $ \sqrt{s}=7 $ TeV | JINST 7 (2012) P10002 | CMS-MUO-10-004 1206.4071 |
| 72 | CMS Collaboration | The CMS experiment at the CERN LHC | JINST 3 (2008) S08004 | CMS-00-001 |
| 73 | CMS Collaboration | CMS Luminosity Based on Pixel Cluster Counting - Summer 2013 Update | CMS-PAS-LUM-13-001 | CMS-PAS-LUM-13-001 |
| 74 | CMS Collaboration | Particle-Flow Event Reconstruction in CMS and Performance for Jets, Taus, and MET | CDS | |
| 75 | CMS Collaboration | Commissioning of the Particle-flow Event Reconstruction with the first LHC collisions recorded in the CMS detector | CDS | |
| 76 | CMS Collaboration | Performance of electron reconstruction and selection with the CMS detector in proton-proton collisions at $ \sqrt{s} = $ 8 TeV | JINST 10 (2015) P06005 | CMS-EGM-13-001 1502.02701 |
| 77 | M. Cacciari, G. P. Salam, and G. Soyez | The anti-$ k_t $ jet clustering algorithm | JHEP 04 (2008) 063 | 0802.1189 |
| 78 | M. Cacciari, G. P. Salam, and G. Soyez | FastJet User Manual | EPJC 72 (2012) 1896 | 1111.6097 |
| 79 | CMS Collaboration | Identification and Filtering of Uncharacteristic Noise in the CMS Hadron Calorimeter | JINST 5 (2010) T03014 | CMS-CFT-09-019 0911.4881 |
| 80 | CMS Collaboration | Identification of b-quark jets with the CMS experiment | JINST 8 (2013) P04013 | CMS-BTV-12-001 1211.4462 |
| 81 | CMS Collaboration | Performance of b tagging at $ \sqrt{s}= $ 8 TeV in multijet, ttbar and boosted topology events | CMS-PAS-BTV-13-001 | CMS-PAS-BTV-13-001 |
| 82 | J. Alwall et al. | The automated computation of tree-level and next-to-leading order differential cross sections, and their matching to parton shower simulations | JHEP 07 (2014) 079 | 1405.0301 |
| 83 | J. Pumplin et al. | New generation of parton distributions with uncertainties from global QCD analysis | JHEP 07 (2002) 012 | hep-ph/0201195 |
| 84 | P. Nason | A new method for combining NLO QCD with shower Monte Carlo algorithms | JHEP 11 (2004) 040 | hep-ph/0409146 |
| 85 | S. Frixione, P. Nason, and C. Oleari | Matching NLO QCD computations with Parton Shower simulations: the POWHEG method | JHEP 11 (2007) 070 | 0709.2092 |
| 86 | S. Alioli, P. Nason, C. Oleari, and E. Re | A general framework for implementing NLO calculations in shower Monte Carlo programs: the POWHEG BOX | JHEP 06 (2010) 043 | 1002.2581 |
| 87 | S. Alioli, S.-O. Moch, and P. Uwer | Hadronic top-quark pair-production with one jet and parton showering | JHEP 01 (2012) 137 | 1110.5251 |
| 88 | S. Alioli, P. Nason, C. Oleari, and E. Re | NLO single-top production matched with shower in POWHEG: $ s $- and $ t $-channel contributions | JHEP 09 (2009) 111, , [Erratum: \DOI10.1007/JHEP02(2010)011] | 0907.4076 |
| 89 | T. Sj\"ostrand, S. Mrenna, and P. Skands | PYTHIA 6.4 physics and manual | JHEP 05 (2006) 026 | hep-ph/0603175 |
| 90 | S. Frixione and B. R. Webber | Matching NLO QCD computations and parton shower simulations | JHEP 06 (2002) 029 | hep-ph/0204244 |
| 91 | S. Frixione, P. Nason, and B. R. Webber | Matching NLO QCD and parton showers in heavy flavor production | JHEP 08 (2003) 007 | hep-ph/0305252 |
| 92 | N. Davidson et al. | Universal Interface of TAUOLA Technical and Physics Documentation | CPC 183 (2012) 821 | 1002.0543 |
| 93 | G. Corcella et al. | HERWIG 6: an event generator for hadron emission reactions with interfering gluons (including supersymmetric processes) | JHEP 01 (2001) 010 | hep-ph/0011363 |
| 94 | GEANT4 Collaboration | GEANT4---a simulation toolkit | NIMA 506 (2003) 250 | |
| 95 | CMS Collaboration | The fast simulation of the CMS detector at LHC | J. Phys. Conf. Ser. 331 (2011) 032049 | |
| 96 | Y. L. Dokshitzer, G. D. Leder, S. Moretti, and B. R. Webber | Better jet clustering algorithms | JHEP 08 (1997) 001 | hep-ph/9707323 |
| 97 | M. Wobisch and T. Wengler | Hadronization corrections to jet cross-sections in deep inelastic scattering | in Monte Carlo generators for HERA physics. Proceedings, Workshop, Hamburg, Germany, 1998-1999 1998 | hep-ph/9907280 |
| 98 | J. Thaler and K. Van Tilburg | Identifying boosted objects with N-subjettiness | JHEP 03 (2011) 015 | 1011.2268 |
| 99 | S. Catani, Y. L. Dokshitzer, M. H. Seymour, and B. R. Webber | Longitudinally-invariant k$ _\perp $-clustering algorithms for hadron-hadron collisions | Nucl. Phys. B 406 (1993) 187 | |
| 100 | S. D. Ellis and D. E. Soper | Successive combination jet algorithm for hadron collisions | PRD 48 (1993) 3160 | hep-ph/9305266 |
| 101 | M. Cacciari, G. P. Salam, and G. Soyez | The catchment area of jets | JHEP 04 (2008) 005 | 0802.1188 |
| 102 | D. Krohn, J. Thaler, and L.-T. Wang | Jet trimming | JHEP 02 (2010) 084 | 0912.1342 |
| 103 | G. Soyez et al. | Pileup subtraction for jet shapes | PRL 110 (2013) 162001 | 1211.2811 |
| 104 | CMS Collaboration | Performance of quark/gluon discrimination in 8 TeV pp data | CMS-PAS-JME-13-002 | CMS-PAS-JME-13-002 |
| 105 | M. Rosenblatt | Remarks on Some Nonparametric Estimates of a Density Function | Ann. Math. Statist. 27 (1956) 832 | |
| 106 | E. Parzen | On Estimation of a Probability Density Function and Mode | Ann. Math. Statist. 33 (1962) 1065 | |
| 107 | G. D'Agostini | A Multidimensional unfolding method based on Bayes' theorem | NIMA 362 (1995) 487 | |
| 108 | T. Adye | Unfolding algorithms and tests using RooUnfold | in Proceedings of the PHYSTAT 2011 Workshop, CERN, Geneva, Switzerland, January 2011, CERN-2011-006, p. 313 2011 | 1105.1160 |
| 109 | CMS Collaboration | Measurements of inclusive $ W $ and $ Z $ cross sections in pp collisions at $ \sqrt{s}=7 $ TeV | JHEP 01 (2011) 080 | CMS-EWK-10-002 1012.2466 |
| 110 | CMS Collaboration | MET performance in 8 TeV data | CMS-PAS-JME-12-002 | CMS-PAS-JME-12-002 |
| 111 | B. Efron | The Jackknife, The Bootstrap and Other Resampling Plans | volume 38 of CBMS-NSF Regional Conference Series in Applied Mathematics SIAM, Philadelphia | |
| 112 | CMS Collaboration | Searches for electroweak production of charginos, neutralinos, and sleptons decaying to leptons and W, Z, and Higgs bosons in pp collisions at 8 TeV | EPJC 74 (2014) 3036 | CMS-SUS-13-006 1405.7570 |
| 113 | M. Botje et al. | The PDF4LHC Working Group Interim Recommendations | 1101.0538 | |
| 114 | S. Alekhin et al. | The PDF4LHC Working Group Interim Report | 1101.0536 | |
| 115 | H.-L. Lai et al. | New parton distributions for collider physics | PRD 82 (2010) 074024 | 1007.2241 |
| 116 | A. Martin, W. Stirling, R. Thorne, and G. Watt | Parton distributions for the LHC | EPJC 63 (2009) 189 | 0901.0002 |
| 117 | NNPDF Collaboration | Parton distributions with LHC data | Nucl. Phys. B 867 (2013) 244 | 1207.1303 |
| 118 | T. Junk | Confidence level computation for combining searches with small statistics | NIMA 434 (1999) 435 | hep-ex/9902006 |
| 119 | A. L. Read | Presentation of search results: the $ CL_s $ technique | JPG 28 (2002) 2693 | |
| 120 | ATLAS and CMS Collaborations, The LHC Higgs Combination Group | Procedure for the LHC Higgs boson search combination in Summer 2011 | CMS-NOTE-2011-005 | |
|
|
Compact Muon Solenoid LHC, CERN |
|

|

|

|

|

|