

Compact Muon Solenoid
LHC, CERN
| CMS-SUS-16-046 ; CERN-EP-2017-284 | ||
| Search for gauge-mediated supersymmetry in events with at least one photon and missing transverse momentum in pp collisions at $\sqrt{s} = $ 13 TeV | ||
| CMS Collaboration | ||
| 21 November 2017 | ||
| Phys. Lett. B 780 (2018) 118 | ||
| Abstract: A search for gauge-mediated supersymmetry (SUSY) in final states with photons and large missing transverse momentum is presented. The data sample of pp collisions at $\sqrt{s} = $ 13 TeV was collected with the CMS detector at the CERN LHC and corresponds to an integrated luminosity of 35.9 fb$^{-1}$. Data are compared with models in which the lightest neutralino has bino- or wino-like components, resulting in decays to photons and gravitinos, where the gravitinos escape detection. The event selection is optimized for both electroweak (EWK) and strong production SUSY scenarios. The observed data are consistent with standard model predictions, and limits are set in the context of a general gauge mediation model in which gaugino masses up to 980 GeV are excluded at 95% confidence level. Gaugino masses below 780 and 950 GeV are excluded in two simplified models with EWK production of mass-degenerate charginos and neutralinos. Stringent limits are set on simplified models based on gluino and squark pair production, excluding gluino (squark) masses up to 2100 (1750) GeV depending on the assumptions made for the decay modes and intermediate particle masses. This analysis sets the highest mass limits to date in the studied EWK models, and in the considered strong production models when the mass difference between the gauginos and the squarks or gluinos is small. | ||
| Links: e-print arXiv:1711.08008 [hep-ex] (PDF) ; CDS record ; inSPIRE record ; CADI line (restricted) ; | ||
| Figures & Tables | Summary | Additional Figures & Tables | References | CMS Publications |
|---|
|
Additional information on efficiencies needed for reinterpretation of these results are available here Additional technical material for CMS speakers can be found here |
| Figures | |

png pdf |
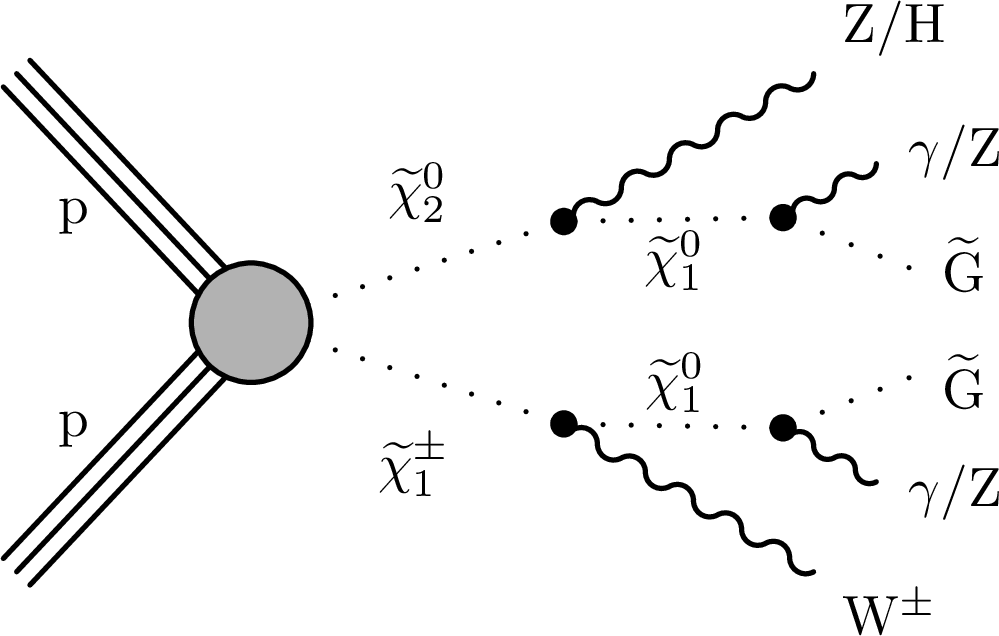
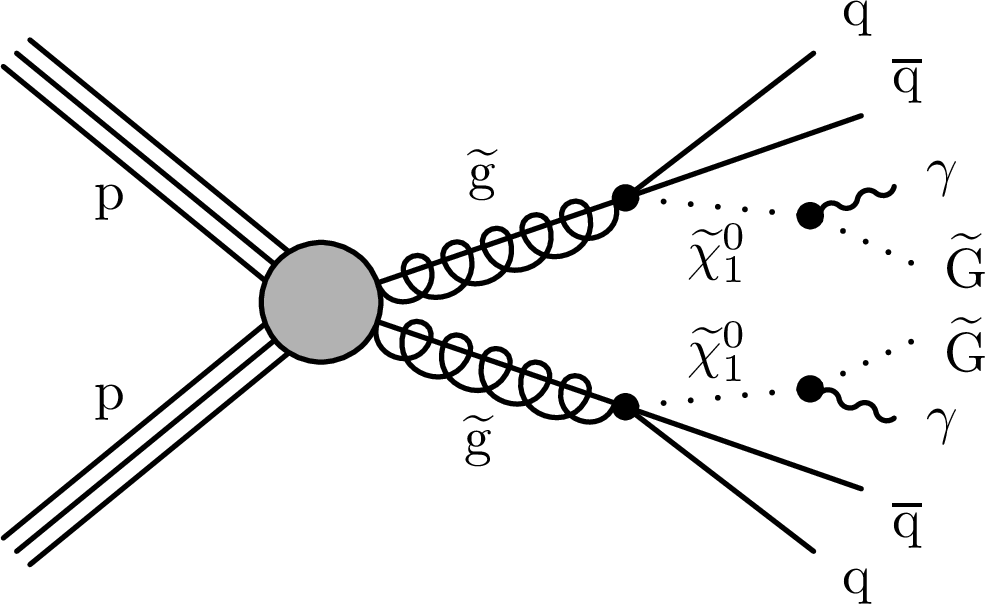
Figure 1:
In the context of GGM, several production and decay channels are possible. The diagram of the dominant process $ \tilde{\chi}^0 _2$-$ \tilde{\chi}^{\pm} _1$ production is shown (upper left), where the gaugino decays depend on the mass configuration under study. In the TChiWg model (upper right), the gauginos are mass degenerate. The TChiNg model comprises $ \tilde{\chi}^{\pm} _1$ pair production (lower left) and $ \tilde{\chi}^{\pm} _1 \tilde{\chi}^0 _1$ production (lower right), where the $ \tilde{\chi}^{\pm} _1$ is only slightly heavier than the $ \tilde{\chi}^0 _1$, so only low-momentum (soft) particles appear in the decay of $ \tilde{\chi}^{\pm} _1$ to $ \tilde{\chi}^0 _1$. |
png pdf |
Figure 1-a:
In the context of GGM, several production and decay channels are possible. The diagram of the dominant process $ \tilde{\chi}^0 _2$-$ \tilde{\chi}^{\pm} _1$ production, where the gaugino decays depend on the mass configuration under study. |
png pdf |
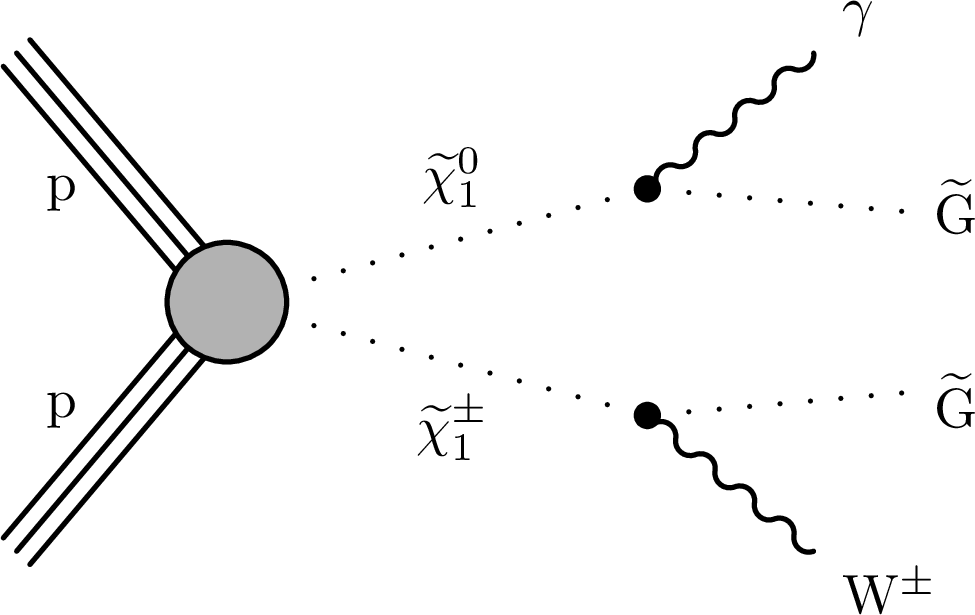
Figure 1-b:
The TChiWg model, where the gauginos are mass degenerate. |
png pdf |
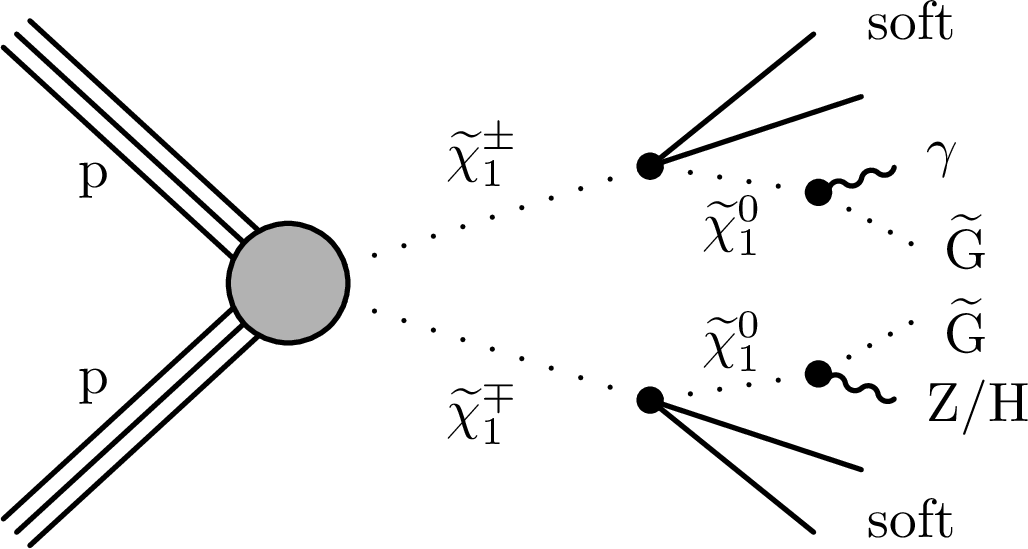
Figure 1-c:
The TChiNg model, which comprises $ \tilde{\chi}^{\pm} _1$ pair production, where the $ \tilde{\chi}^{\pm} _1$ is only slightly heavier than the $ \tilde{\chi}^0 _1$, so only low-momentum (soft) particles appear in the decay of $ \tilde{\chi}^{\pm} _1$ to $ \tilde{\chi}^0 _1$. |

png pdf |
Figure 1-d:
The TChiNg model, which comprises $ \tilde{\chi}^{\pm} _1 \tilde{\chi}^0 _1$ production, where the $ \tilde{\chi}^{\pm} _1$ is only slightly heavier than the $ \tilde{\chi}^0 _1$, so only low-momentum (soft) particles appear in the decay of $ \tilde{\chi}^{\pm} _1$ to $ \tilde{\chi}^0 _1$. |
png pdf |
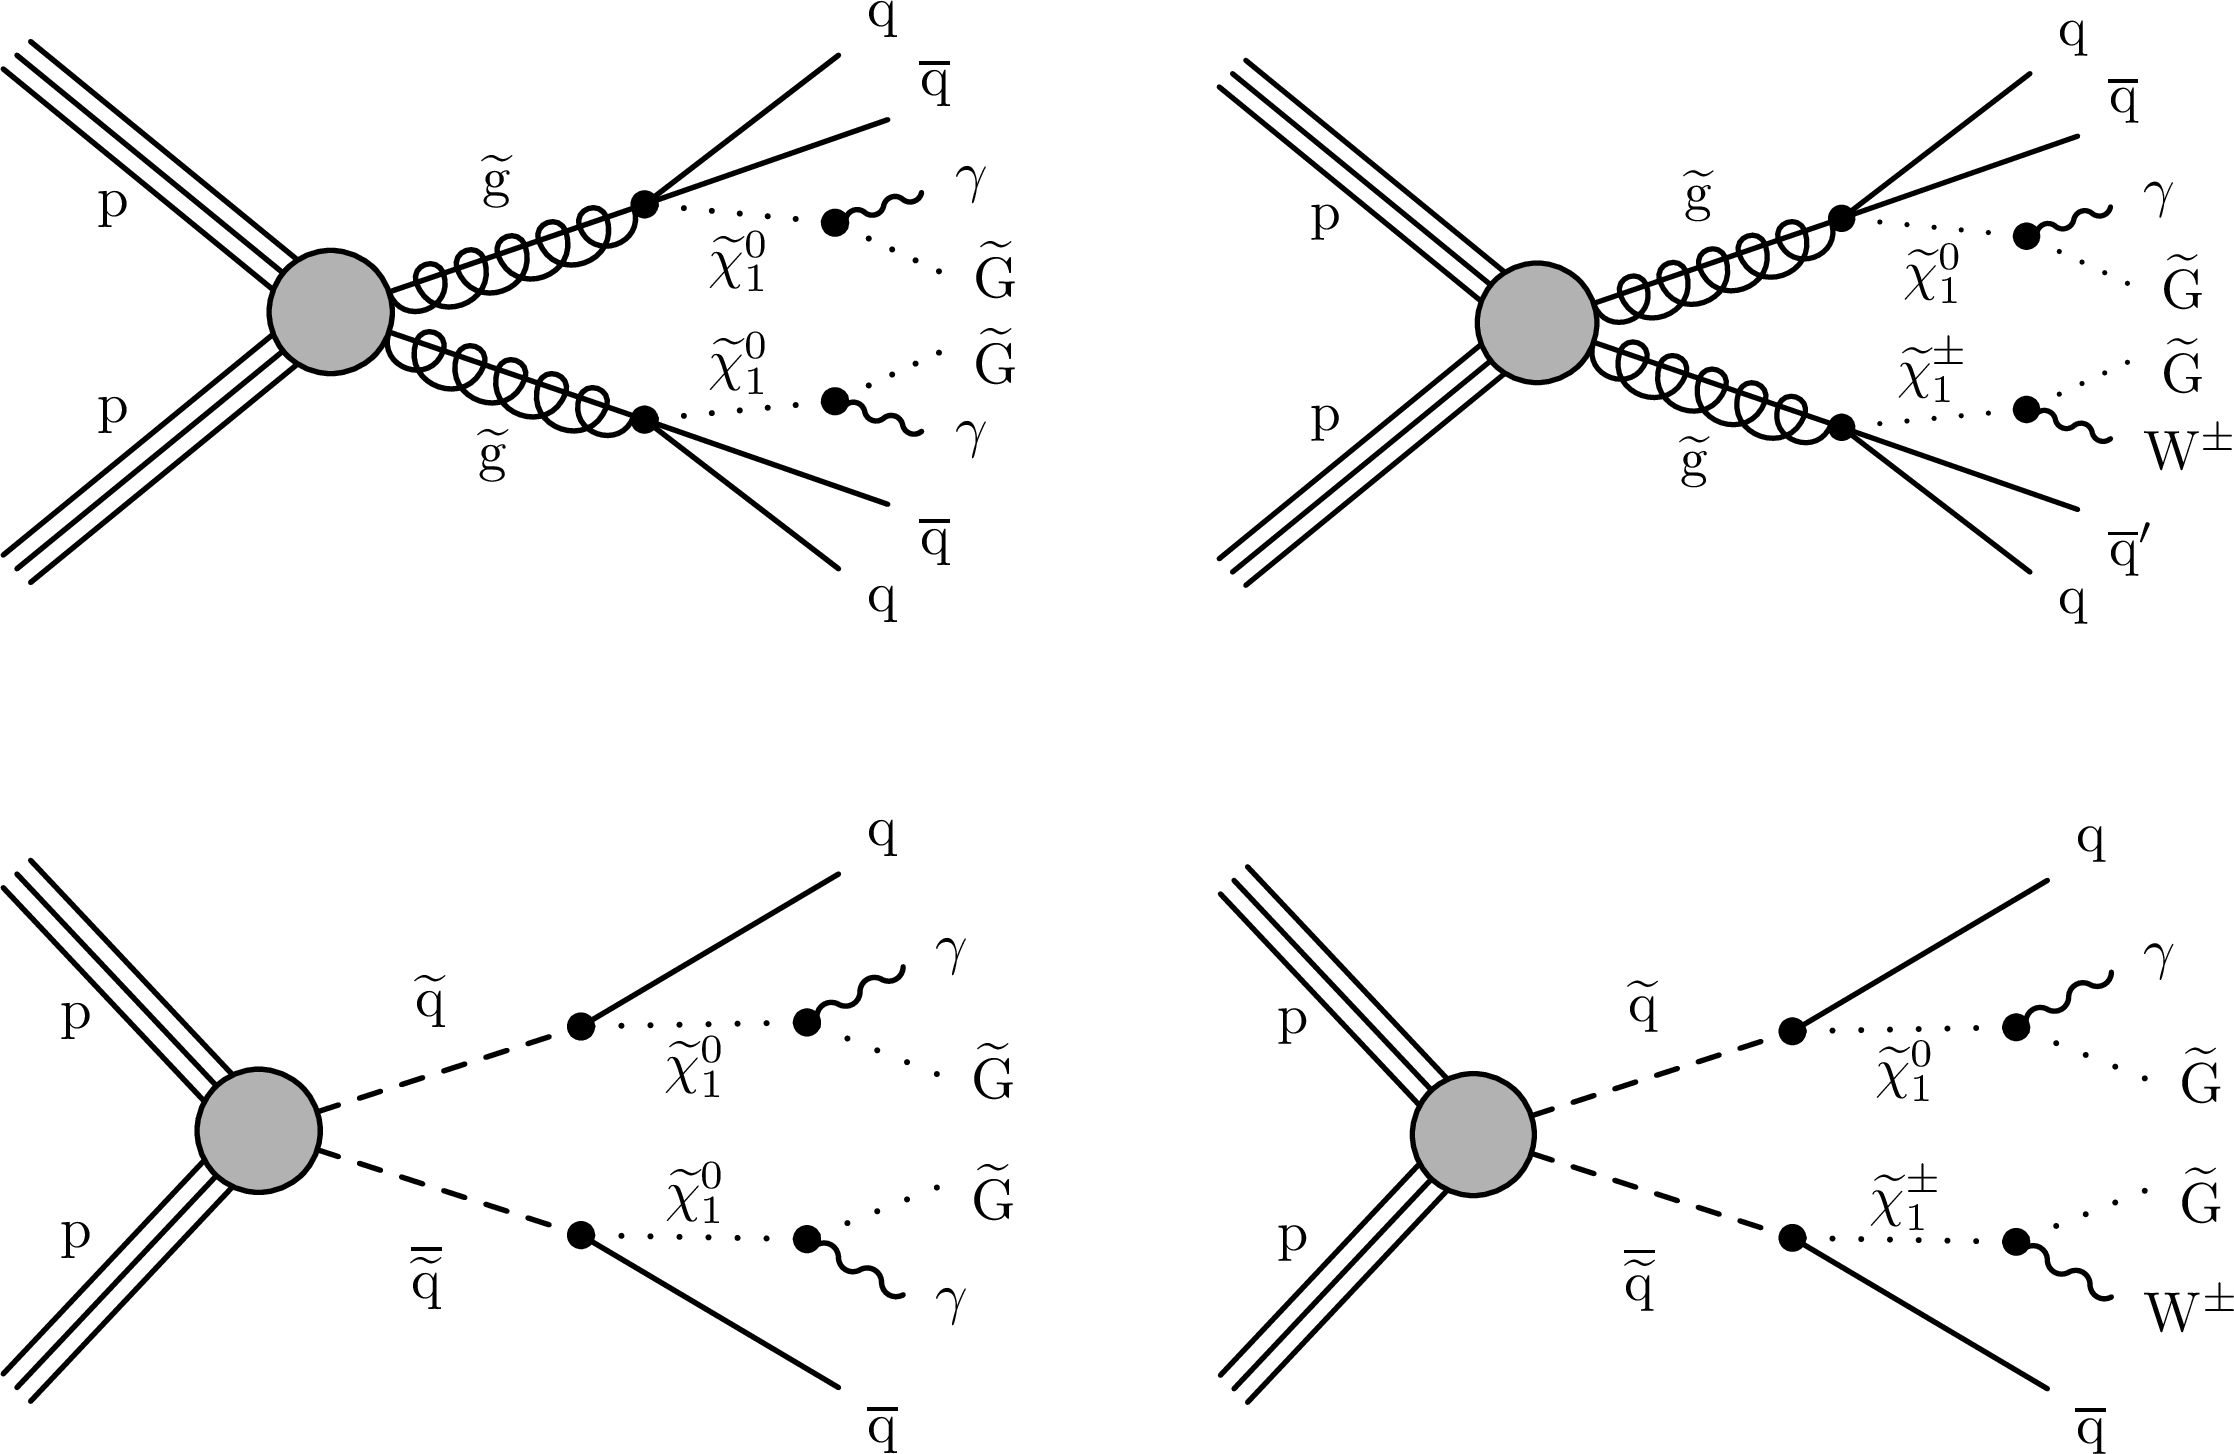
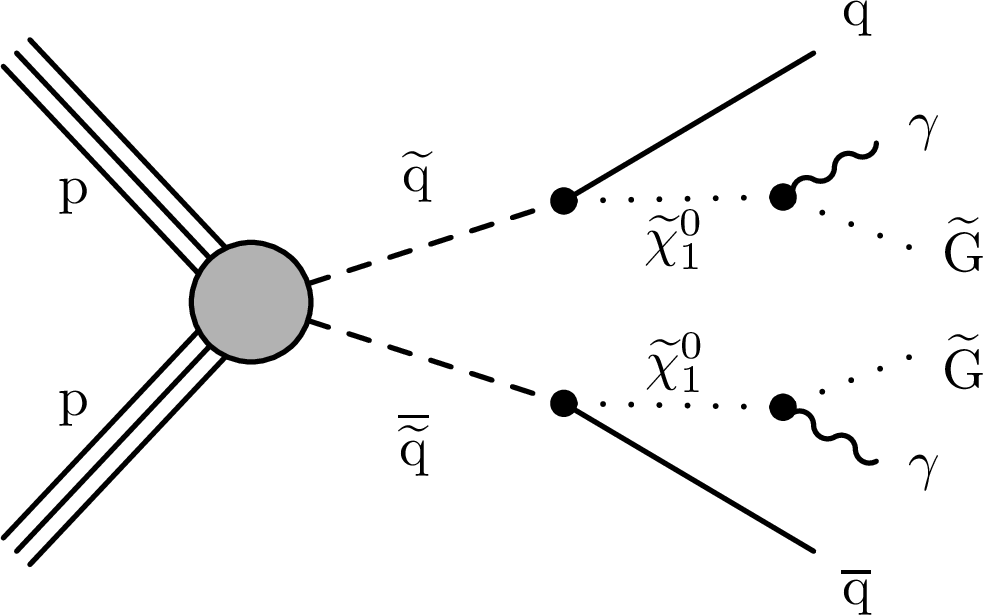
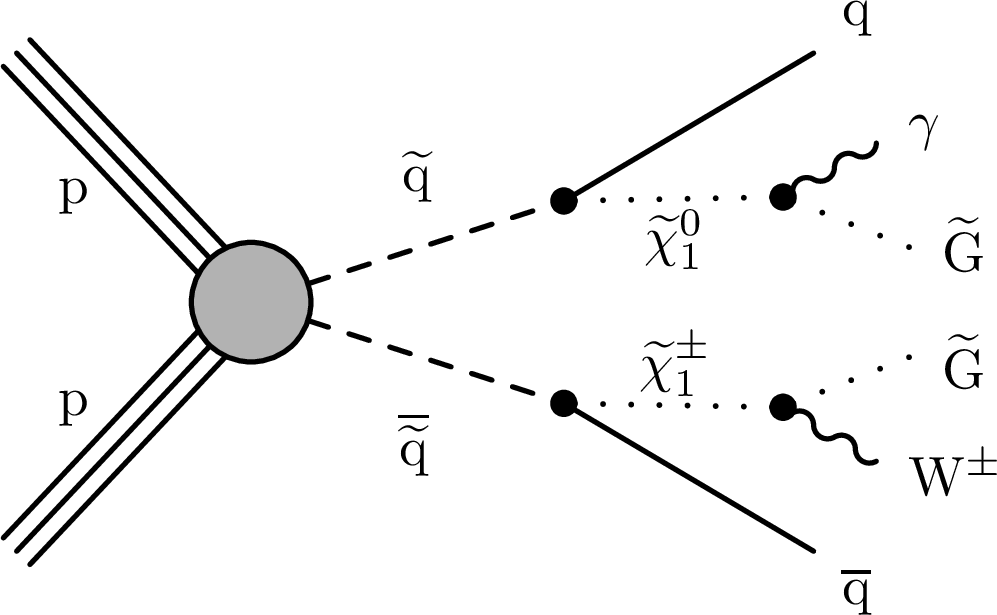
Figure 2:
For strong gluino pair-production the simplified scenarios T5gg (upper left) and T5Wg (upper right) and for squark pair-production the simplified scenarios T6gg (lower left) and T6Wg (lower right) are studied. In the T5Wg (T6Wg) scenario, a branching fraction of 50% is assumed for the decays $\tilde{\mathrm{g}}\rightarrow {\mathrm {q}} {\overline {\mathrm {q}}} \tilde{\chi}^{\pm} _1$ and $\tilde{\mathrm{g}}\rightarrow {\mathrm {q}} {\overline {\mathrm {q}}} \tilde{\chi}^0 _1$ ($\tilde{\mathrm{q}}\rightarrow {\mathrm {q}} \tilde{\chi}^{\pm} _1$ and $\tilde{\mathrm{q}}\rightarrow {\mathrm {q}} \tilde{\chi}^0 _1$), resulting in final states with zero, one, or two photons. |
png pdf |
Figure 2-a:
The strong gluino pair-production simplified scenario T5gg. |

png pdf |
Figure 2-b:
The strong gluino pair-production simplified scenario T5Wg. A branching fraction of 50% is assumed for the decays $\tilde{\mathrm{g}}\rightarrow {\mathrm {q}} {\overline {\mathrm {q}}} \tilde{\chi}^{\pm} _1$ and $\tilde{\mathrm{g}}\rightarrow {\mathrm {q}} {\overline {\mathrm {q}}} \tilde{\chi}^0 _1$ ($\tilde{\mathrm{q}}\rightarrow {\mathrm {q}} \tilde{\chi}^{\pm} _1$ and $\tilde{\mathrm{q}}\rightarrow {\mathrm {q}} \tilde{\chi}^0 _1$), resulting in final states with zero, one, or two photons. |
png pdf |
Figure 2-c:
The quark pair-production simplified scenario T6gg. |
png pdf |
Figure 2-d:
The quark pair-production simplified scenario T6Wg. A branching fraction of 50% is assumed for the decays $\tilde{\mathrm{g}}\rightarrow {\mathrm {q}} {\overline {\mathrm {q}}} \tilde{\chi}^{\pm} _1$ and $\tilde{\mathrm{g}}\rightarrow {\mathrm {q}} {\overline {\mathrm {q}}} \tilde{\chi}^0 _1$ ($\tilde{\mathrm{q}}\rightarrow {\mathrm {q}} \tilde{\chi}^{\pm} _1$ and $\tilde{\mathrm{q}}\rightarrow {\mathrm {q}} \tilde{\chi}^0 _1$), resulting in final states with zero, one, or two photons. |
png pdf |
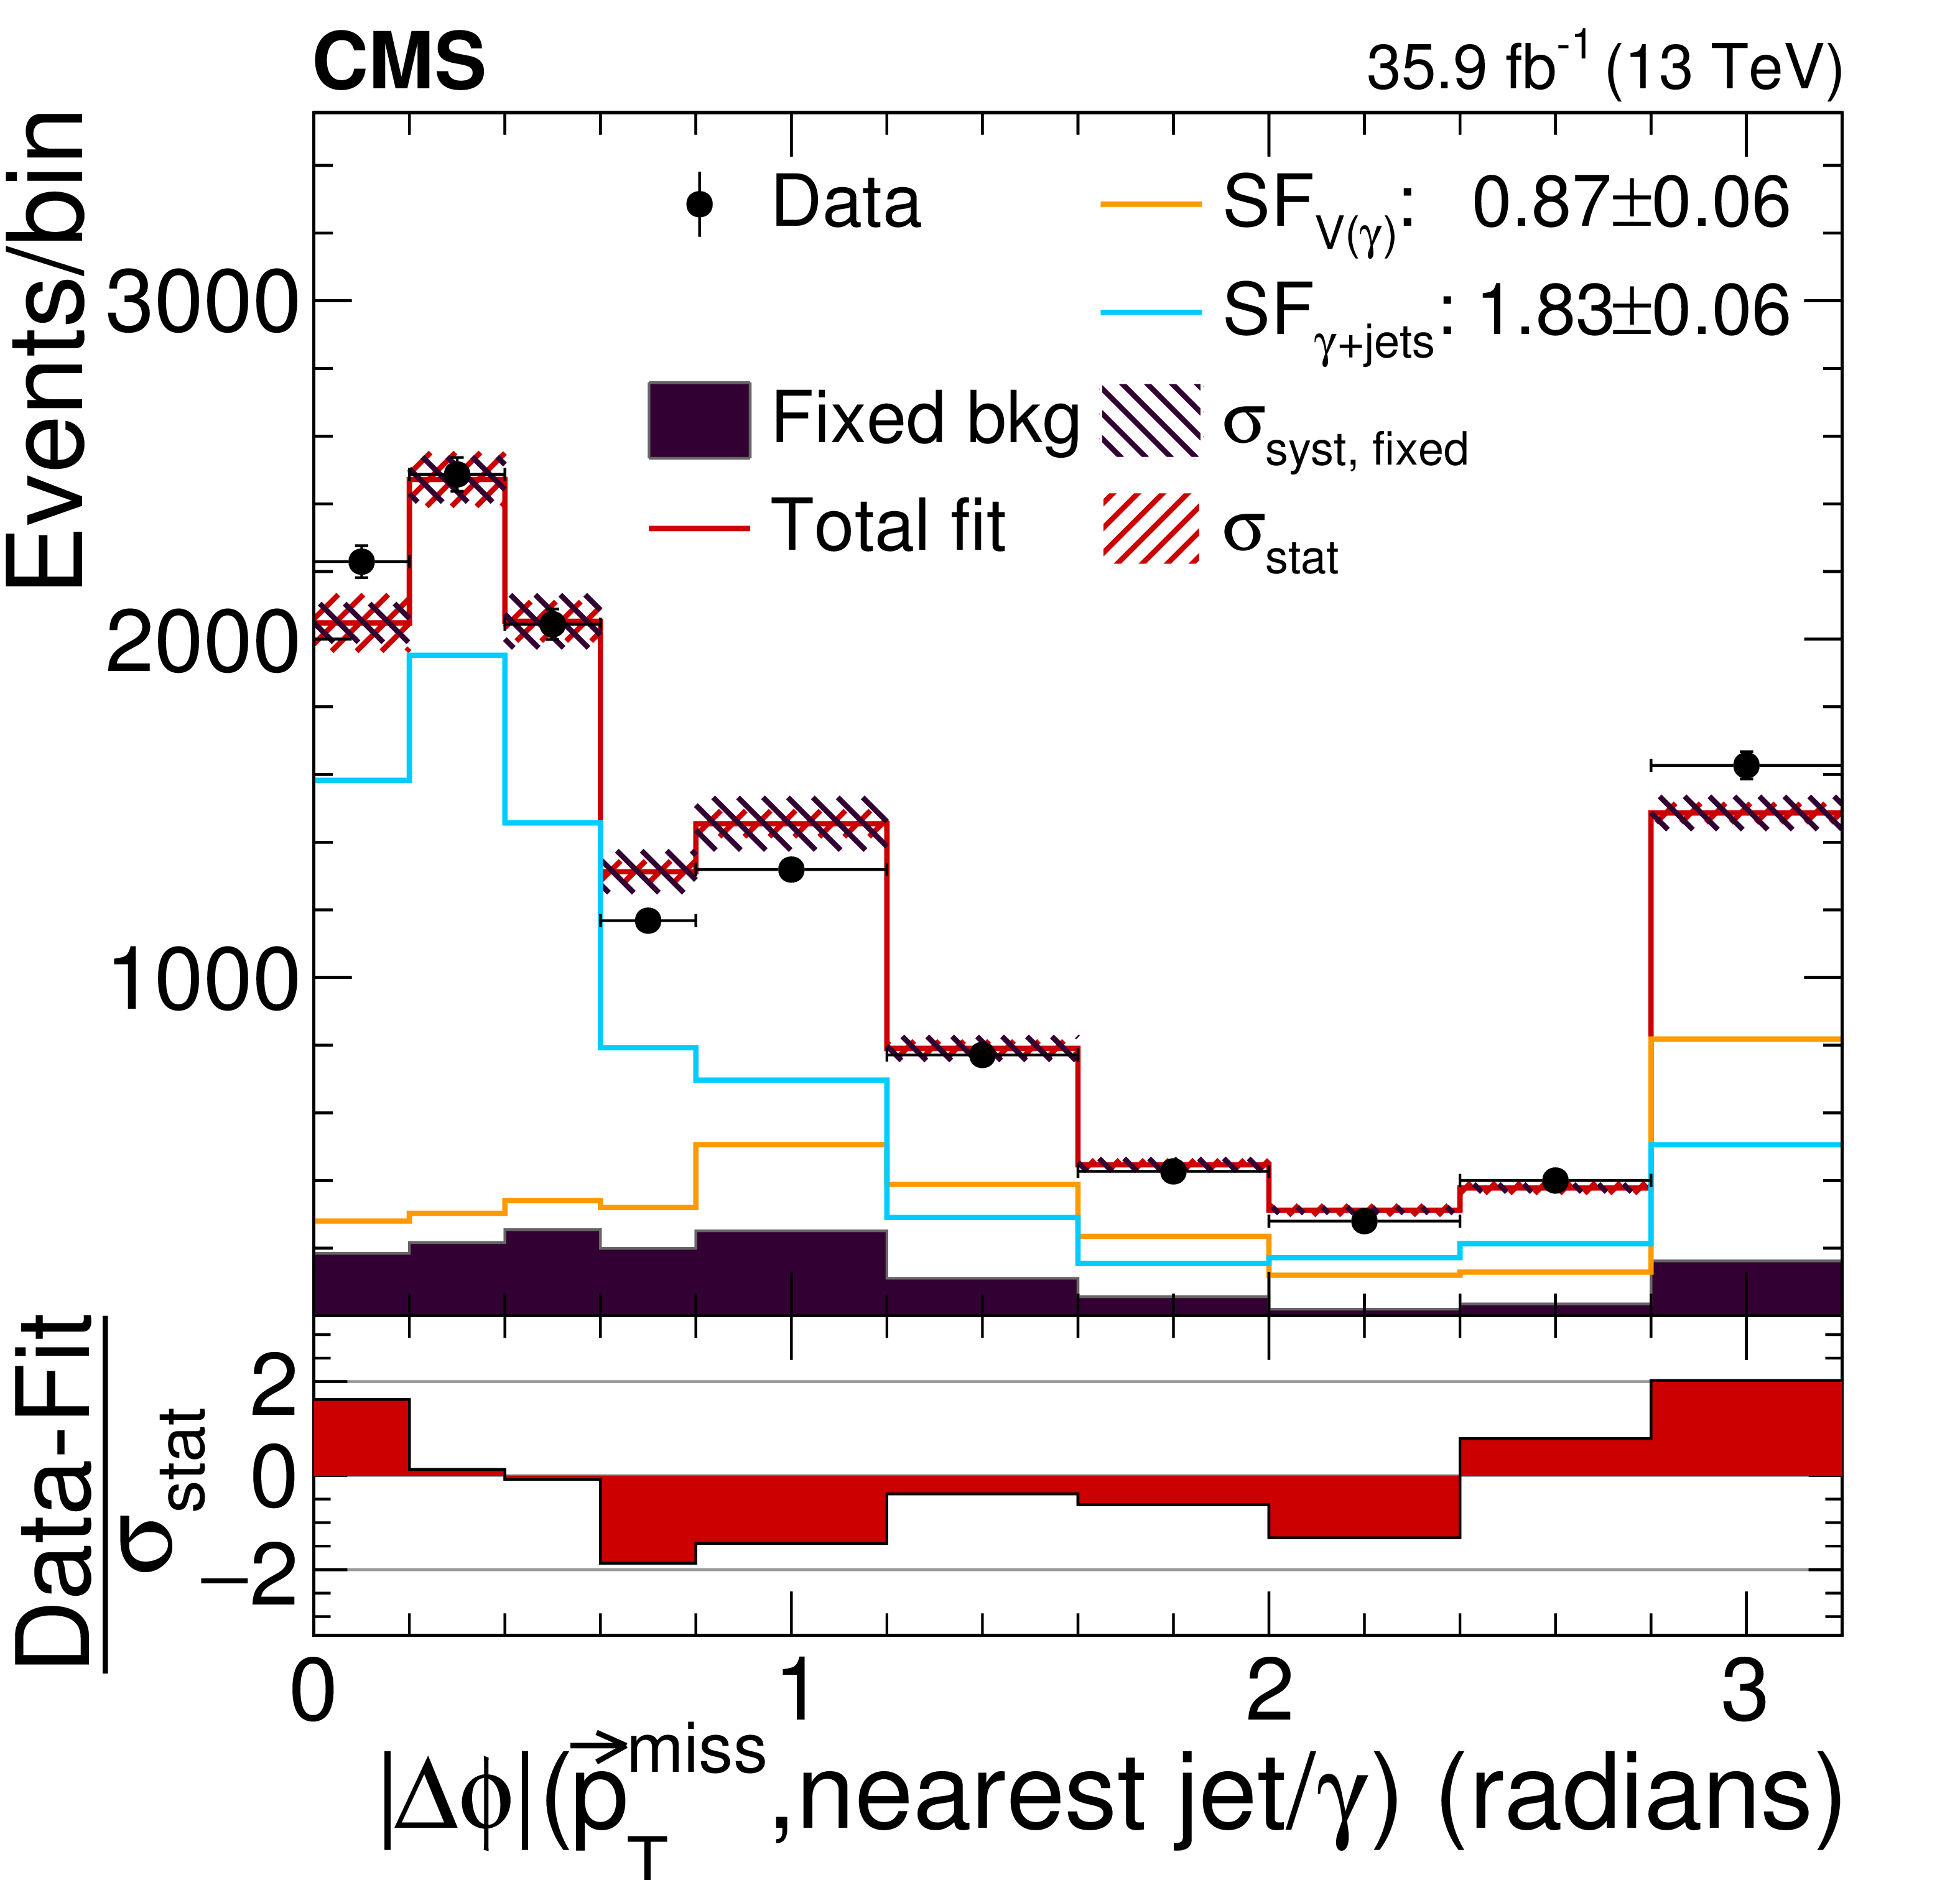
Figure 3:
The post-fit distributions for the $ \gamma $+jets (blue) and V($\gamma $) (orange) background in the control region together with the fixed background (dark magenta) and the total fit distribution stacked onto the fixed backgrounds (red) are shown. The statistical uncertainty ($\sigma _{\text {stat}}$) of the post-fit distribution is shown in the red hatched area and the systematic uncertainty of the fixed background ($\sigma _{\text {syst, fixed}}$) is indicated with the dark magenta hatched area. The values SF$_{{{\rm V}(\gamma)}}$ and SF$_{\gamma{+}{\text{jets}}}$ in the legend are the resulting scale factors. The pull distribution only considers the statistical uncertainty. |

png pdf |
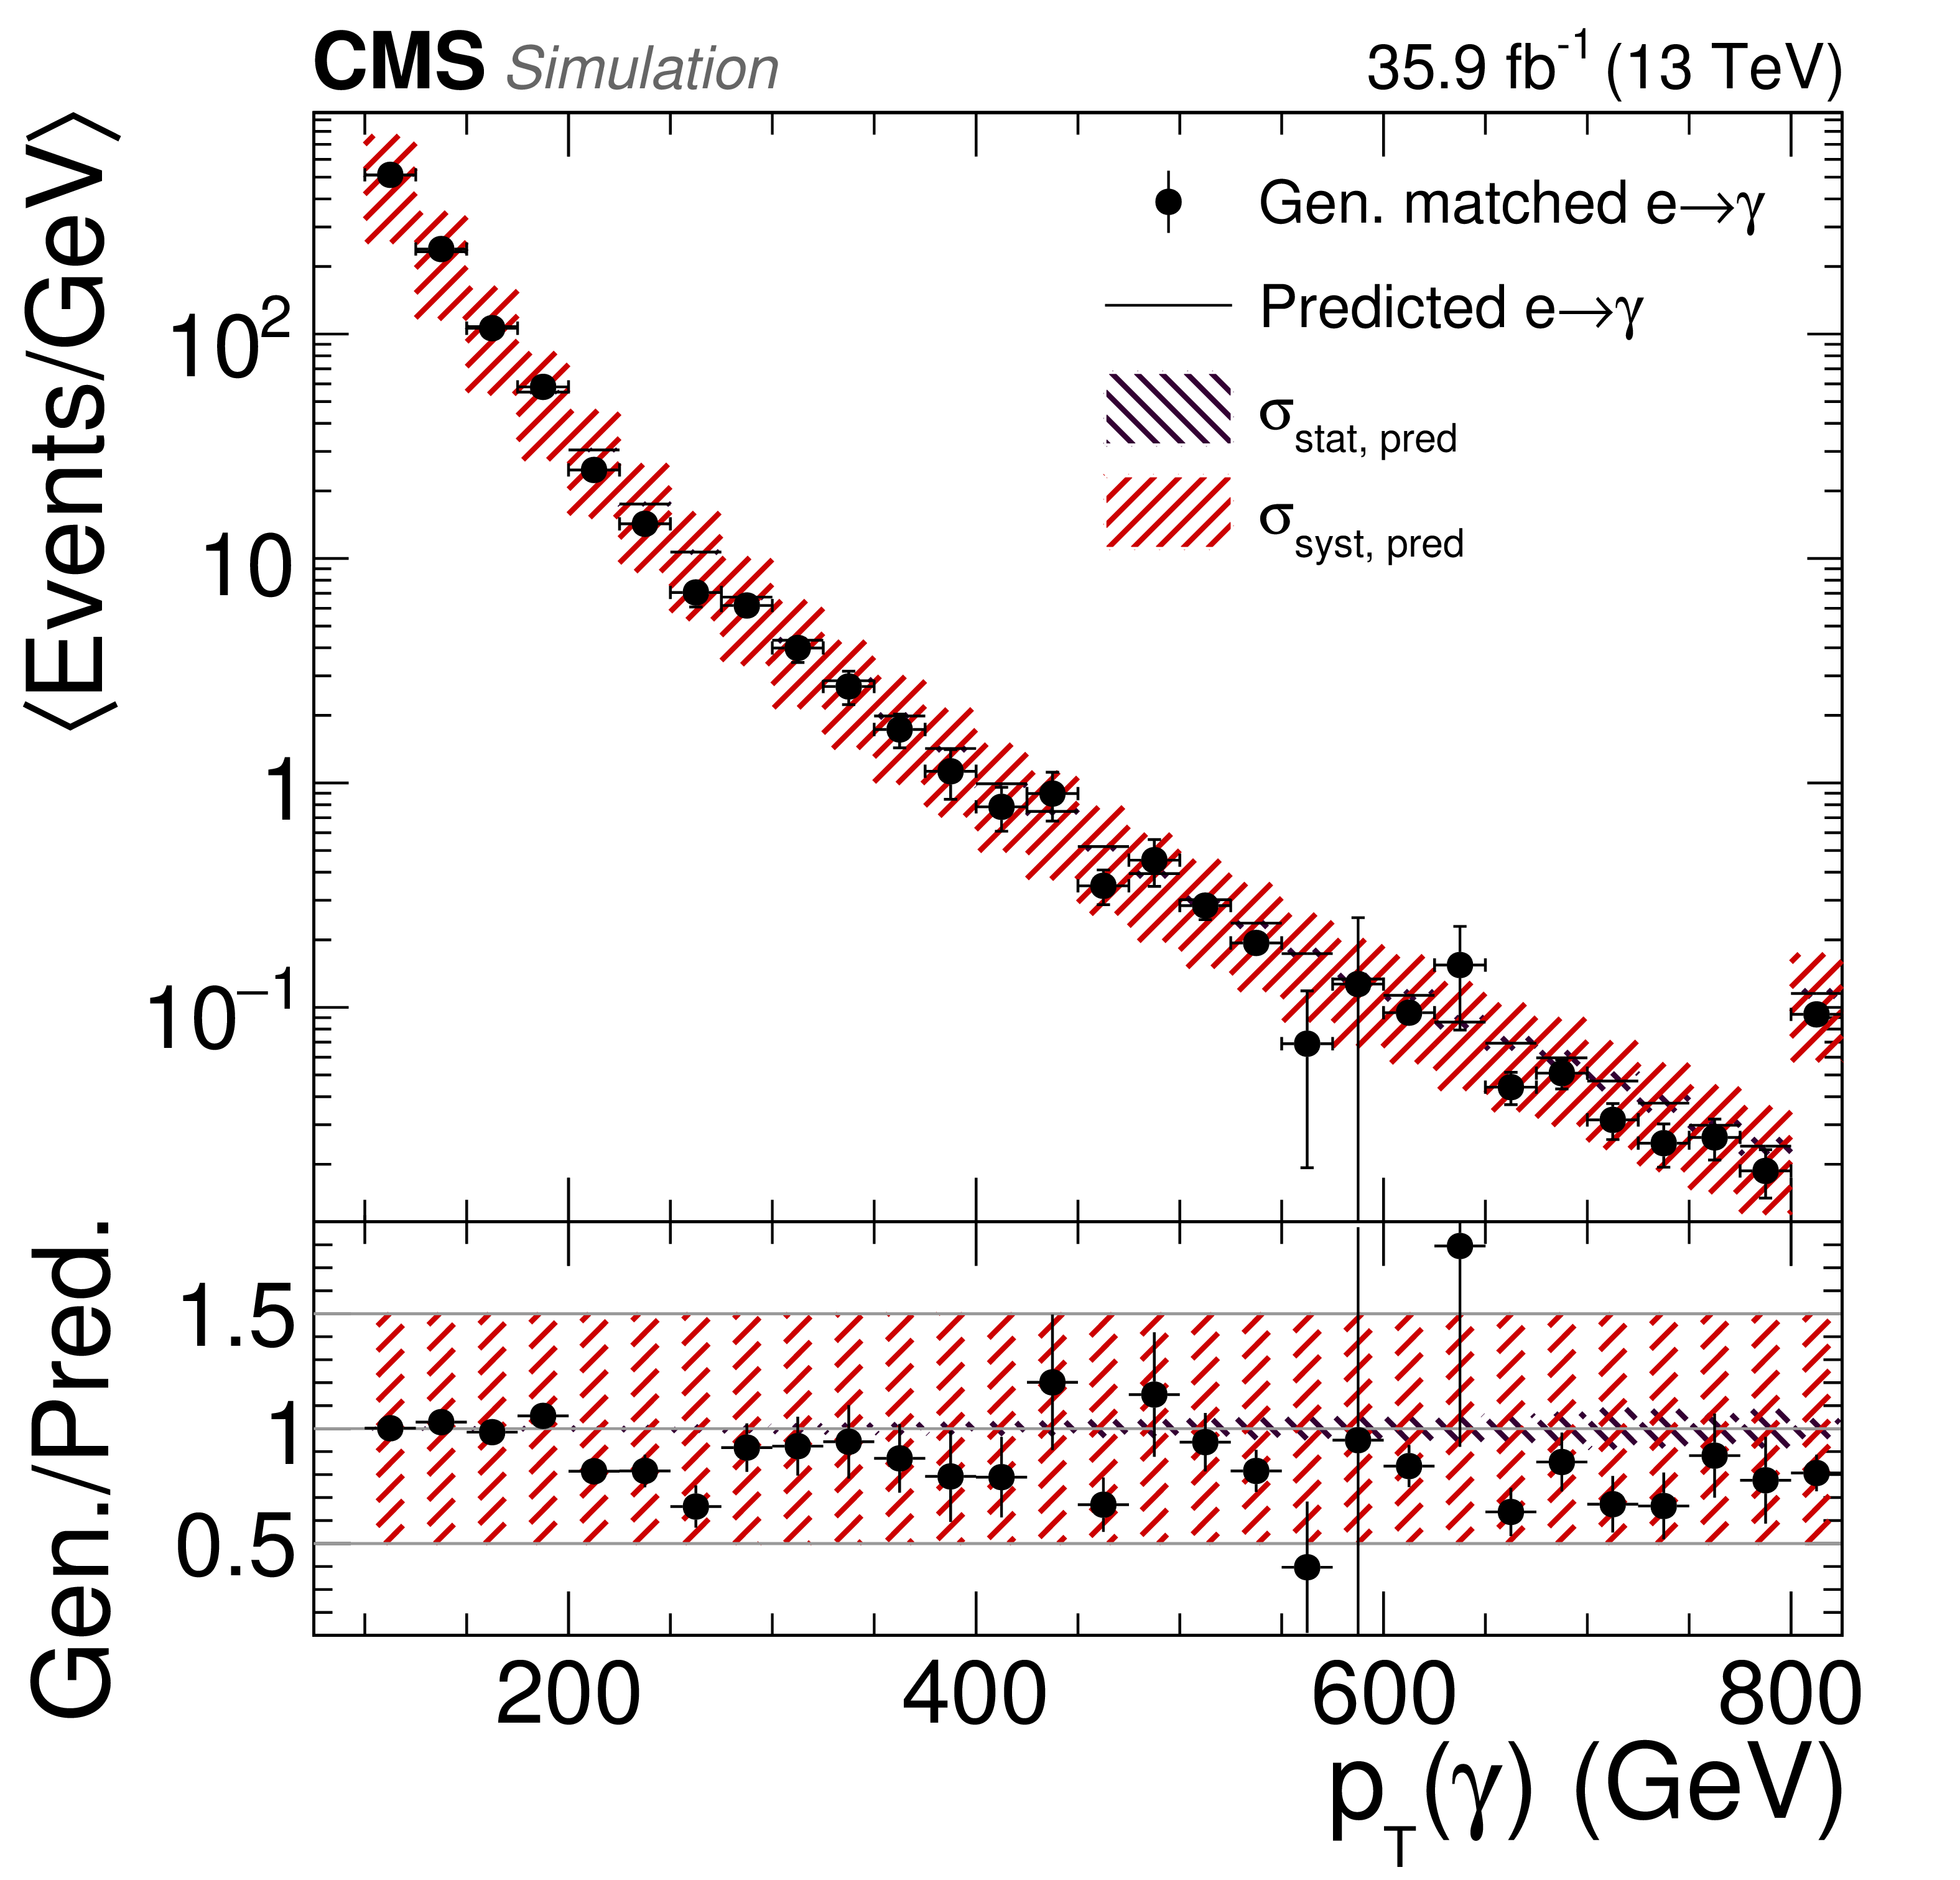
Figure 4:
Validation of the electron misidentification background estimation method using MC simulation. In the selection with at least one photon with $ {p_{\mathrm {T}}} > $ 100 GeV, the prediction of the $ {\mathrm {e}}\to \gamma $ misidentification estimation method is compared to direct simulation in the photon ${p_{\mathrm {T}}}$ (left) and the ${p_{\mathrm {T}}^{\, miss}}$ (right) distributions. The black and red hatched areas represent the statistical ($\sigma _{\text {stat, pred}}$) and the 50% systematic ($\sigma _{\text {syst, pred}}$) uncertainties of the prediction, respectively. Events populating the phase space beyond the shown range are included in the last bin. |
png pdf |
Figure 4-a:
Validation of the electron misidentification background estimation method using MC simulation. In the selection with at least one photon with $ {p_{\mathrm {T}}} > $ 100 GeV, the prediction of the $ {\mathrm {e}}\to \gamma $ misidentification estimation method is compared to direct simulation in the photon ${p_{\mathrm {T}}}$ distribution. The black and red hatched areas represent the statistical ($\sigma _{\text {stat, pred}}$) and the 50% systematic ($\sigma _{\text {syst, pred}}$) uncertainties of the prediction, respectively. Events populating the phase space beyond the shown range are included in the last bin. |
png pdf |
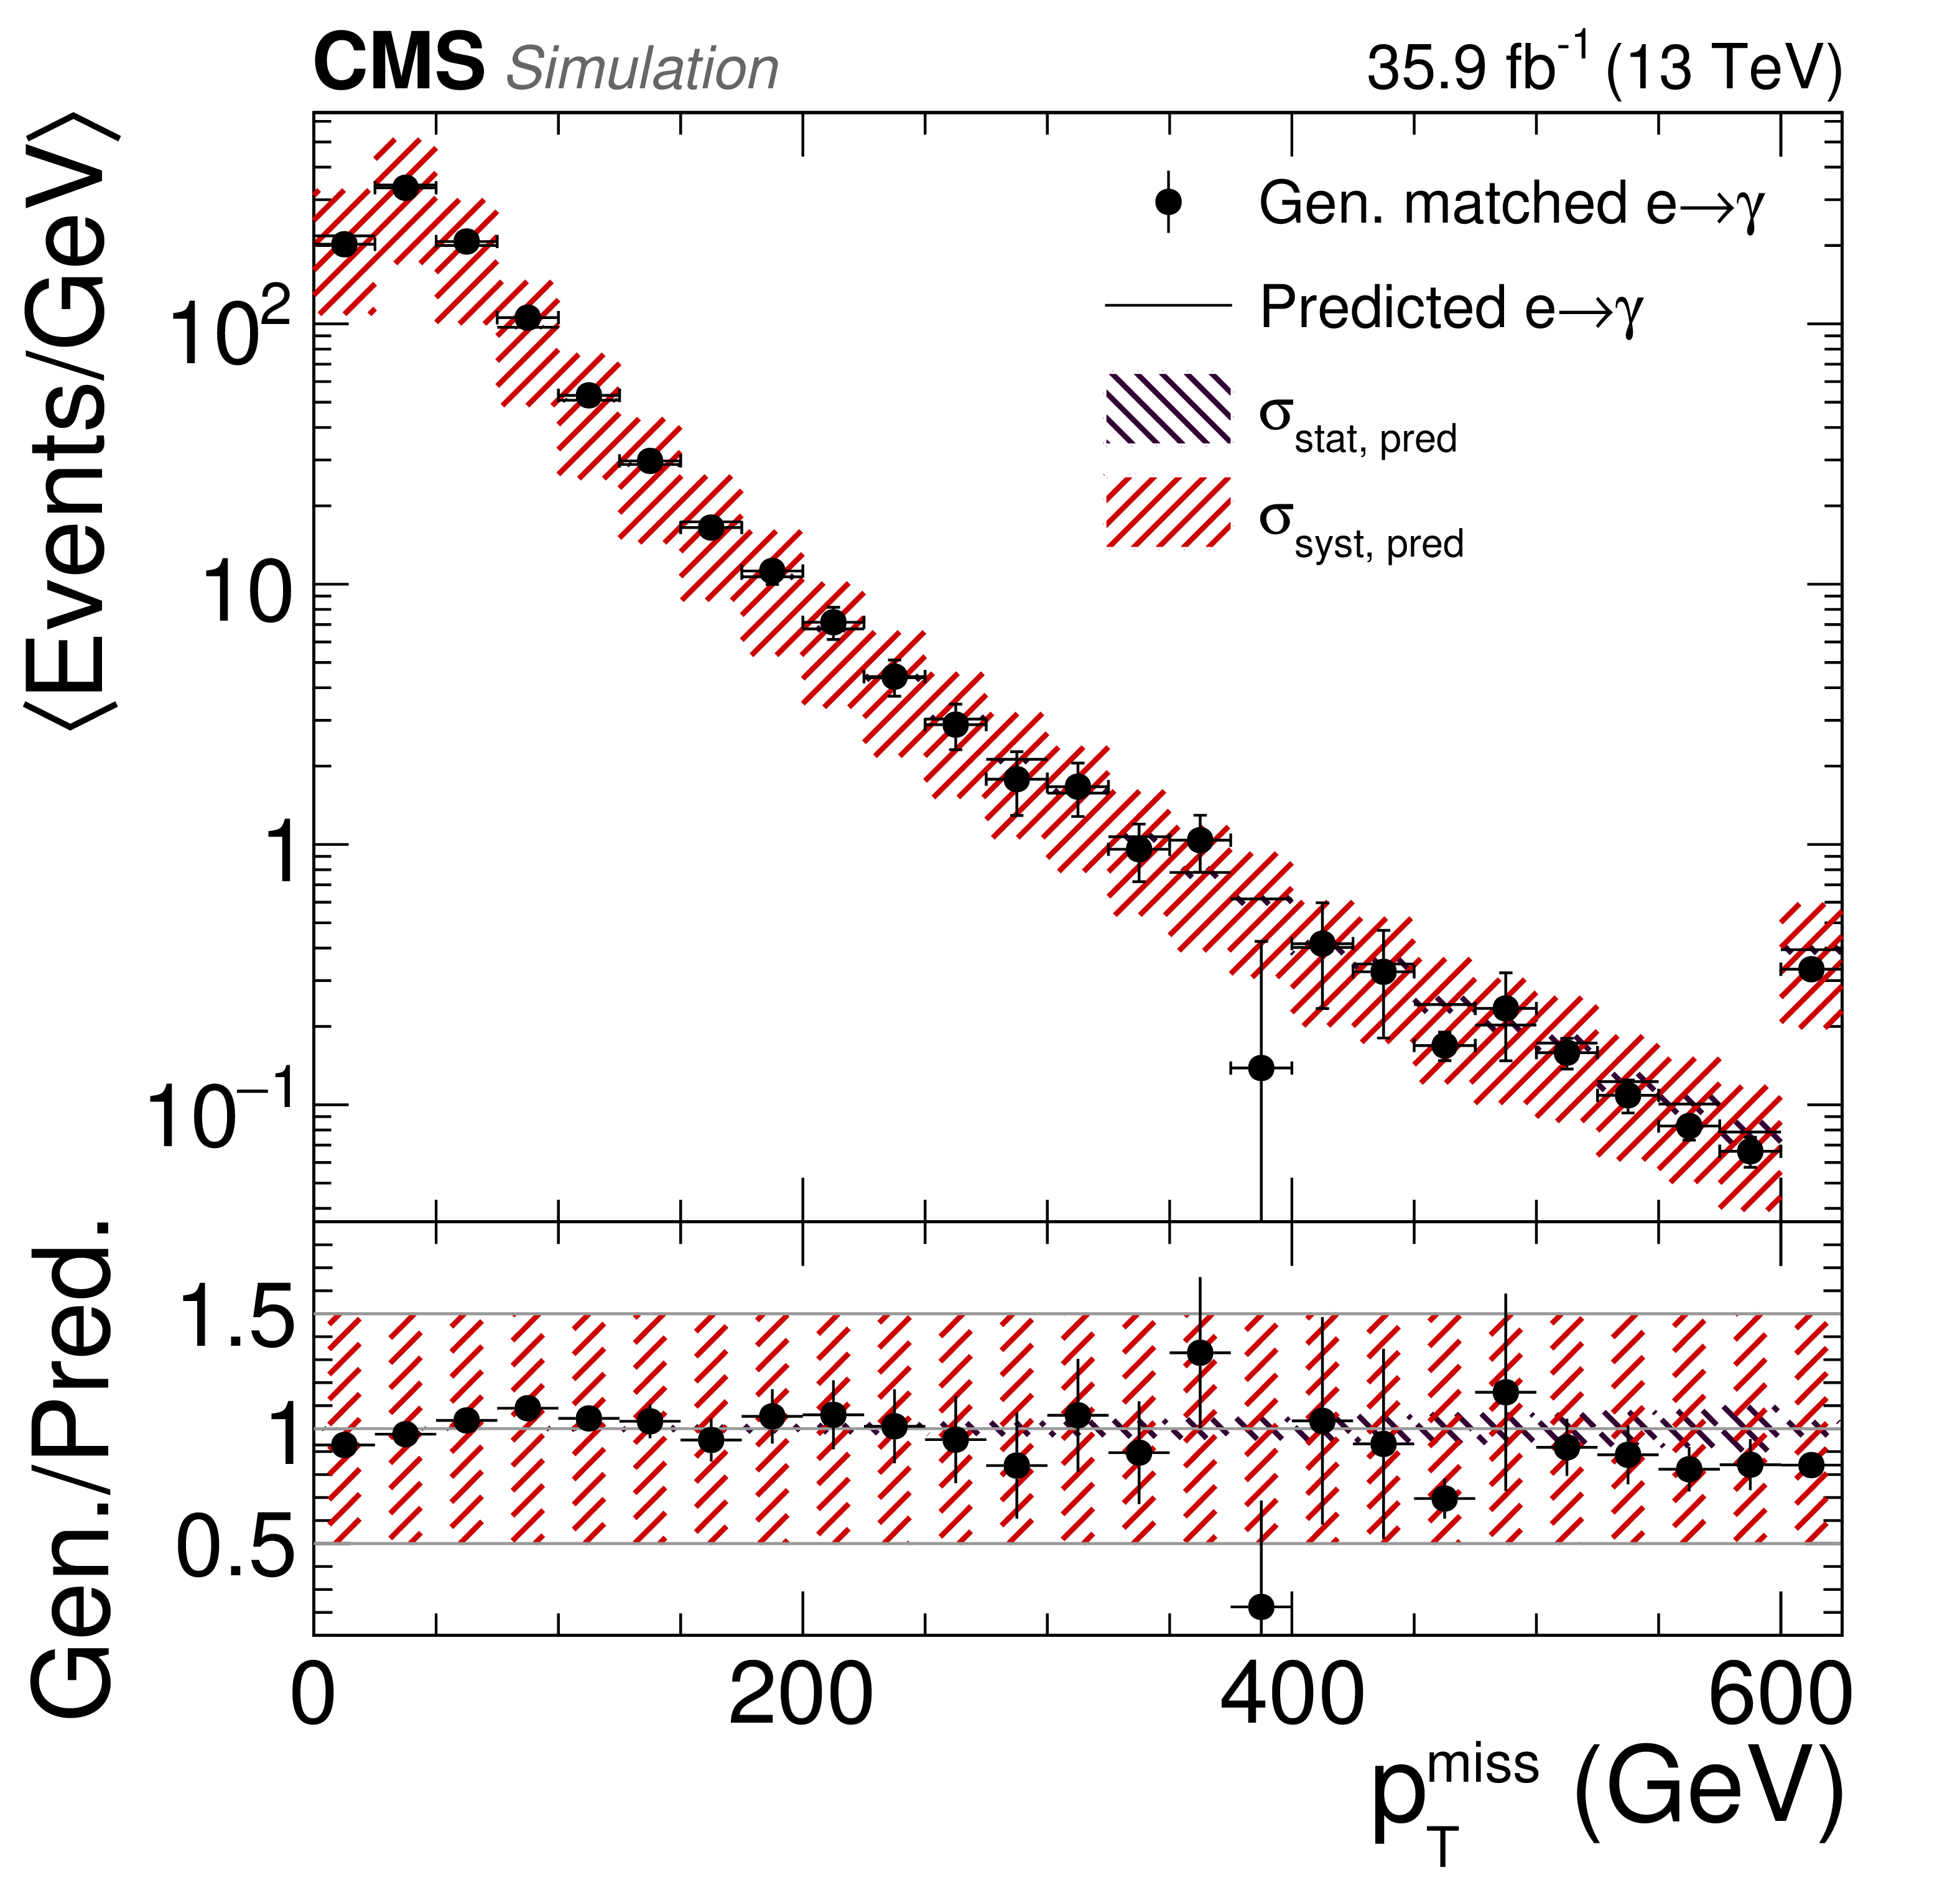
Figure 4-b:
Validation of the electron misidentification background estimation method using MC simulation. In the selection with at least one photon with $ {p_{\mathrm {T}}} > $ 100 GeV, the prediction of the $ {\mathrm {e}}\to \gamma $ misidentification estimation method is compared to direct simulation in the ${p_{\mathrm {T}}^{\, miss}}$ distribution. The black and red hatched areas represent the statistical ($\sigma _{\text {stat, pred}}$) and the 50% systematic ($\sigma _{\text {syst, pred}}$) uncertainties of the prediction, respectively. Events populating the phase space beyond the shown range are included in the last bin. |
png pdf |
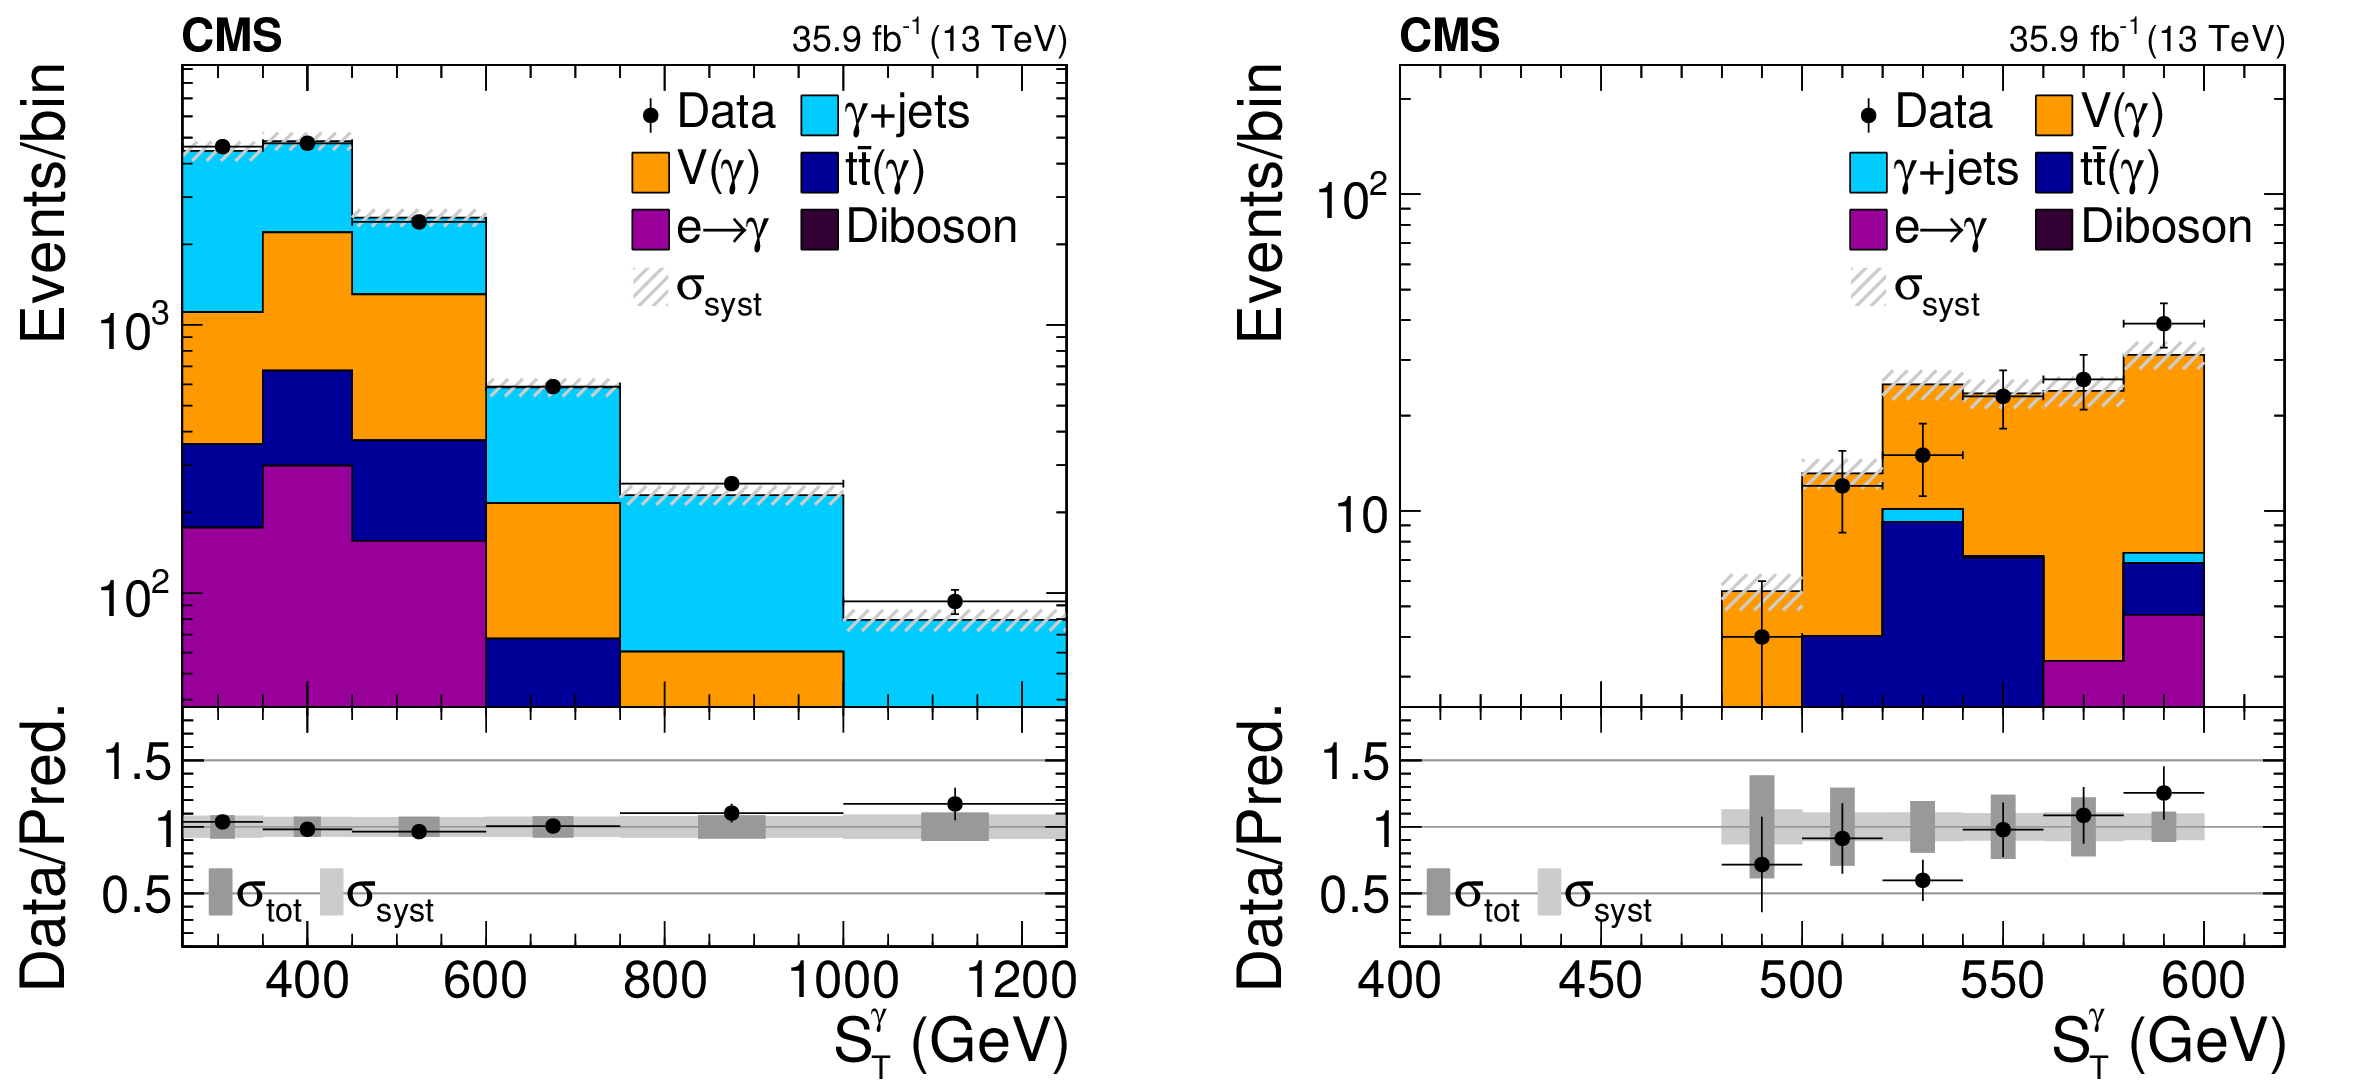
Figure 5:
Data to simulation comparisons in the control region (left) and the validation region (right). Events with ${S_{\mathrm {T}}^{\gamma}}$ beyond the shown range are included in the last bin. The hatched light gray band in the upper panel, as well as the solid light gray band in the lower panel represent the total systematic uncertainty ($\sigma _{\text {syst}}$). The dark gray band in the lower panel indicates the quadratic sum of the statistical and systematic uncertainties ($\sigma _{\text {tot}}$). |

png pdf |
Figure 5-a:
Data to simulation comparisons in the control region. Events with ${S_{\mathrm {T}}^{\gamma}}$ beyond the shown range are included in the last bin. The hatched light gray band in the upper panel, as well as the solid light gray band in the lower panel represent the total systematic uncertainty ($\sigma _{\text {syst}}$). The dark gray band in the lower panel indicates the quadratic sum of the statistical and systematic uncertainties ($\sigma _{\text {tot}}$). |
png pdf |
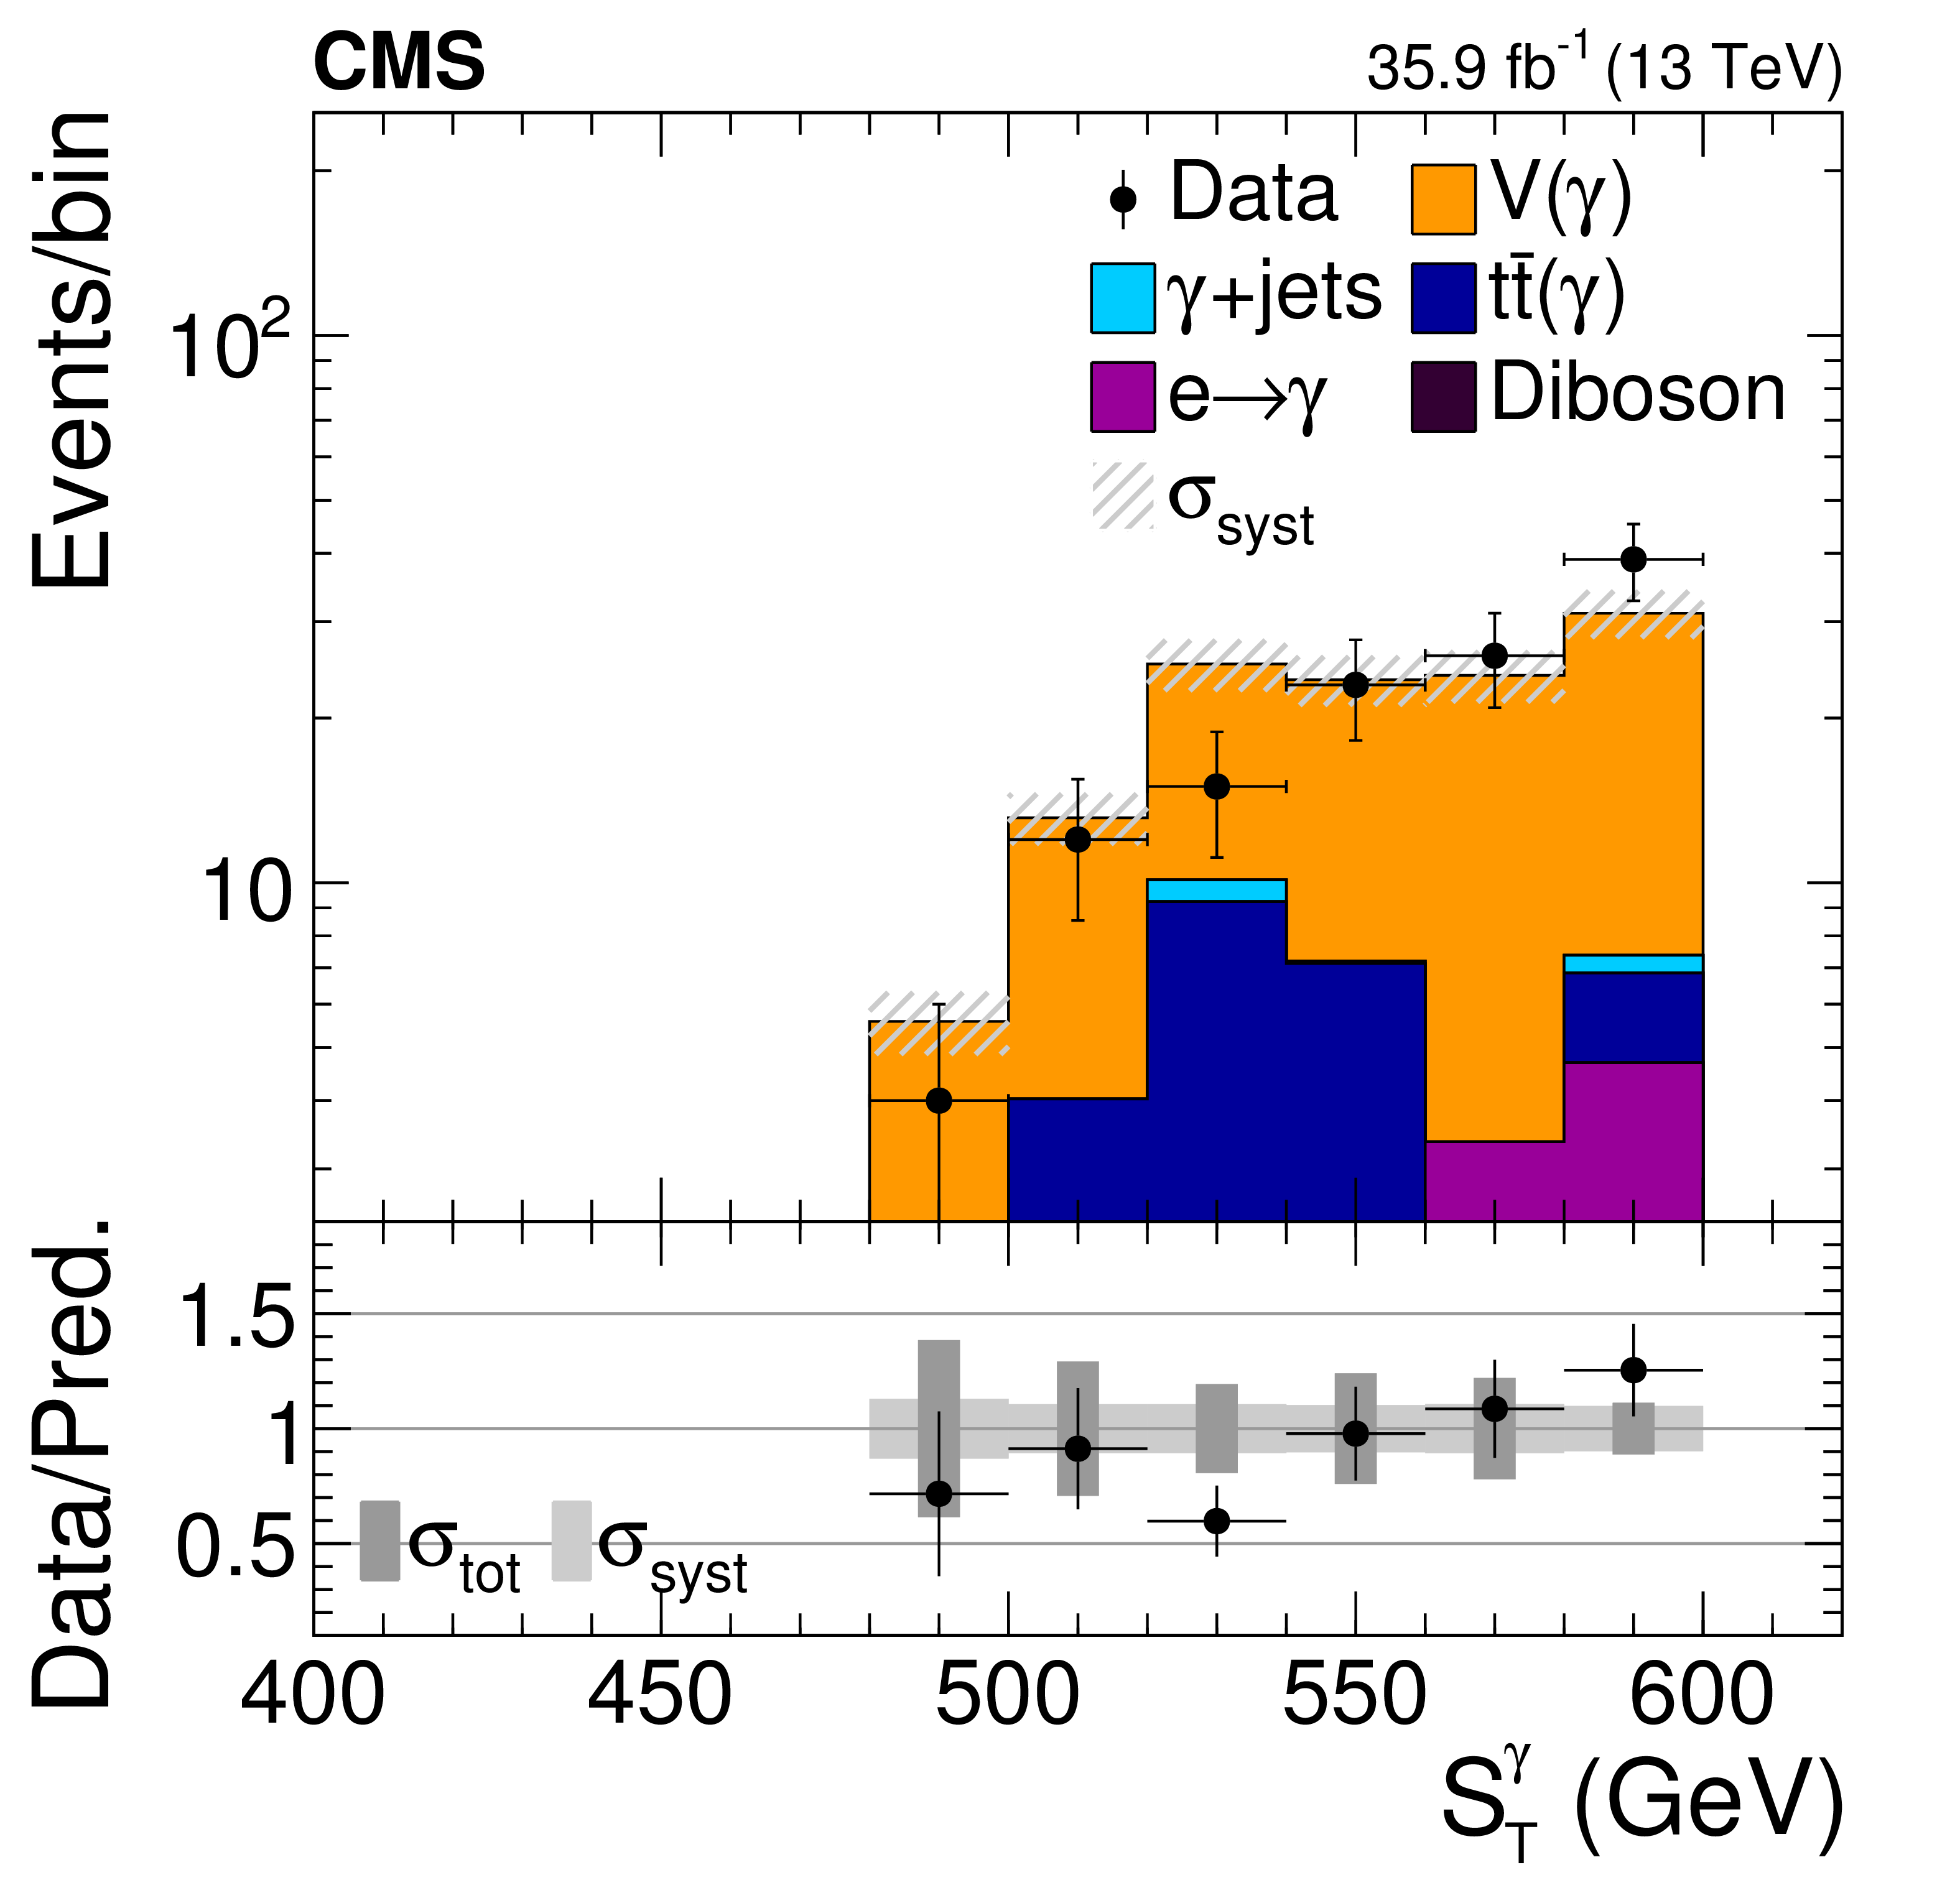
Figure 5-b:
Data to simulation comparisons in the validation region. Events with ${S_{\mathrm {T}}^{\gamma}}$ beyond the shown range are included in the last bin. The hatched light gray band in the upper panel, as well as the solid light gray band in the lower panel represent the total systematic uncertainty ($\sigma _{\text {syst}}$). The dark gray band in the lower panel indicates the quadratic sum of the statistical and systematic uncertainties ($\sigma _{\text {tot}}$). |

png pdf |
Figure 6:
Comparison of the measurement and prediction in the signal region in four exclusive bins of ${S_{\mathrm {T}}^{\gamma}}$. For guidance, two SUSY benchmark signal points are stacked on the SM background prediction, where the TChiWg signal point corresponds to a NLSP mass of 700 GeV and the T5Wg signal point corresponds to a gluino mass of 1750 GeV and a NLSP mass of 1700 GeV. Events with values of ${S_{\mathrm {T}}^{\gamma}}$ beyond the shown range are included in the last bin. The hatched light gray band in the upper panel, as well as the solid light gray band in the lower panel represent the total systematic uncertainty ($\sigma _{\text {syst}}$). The dark gray band in the lower panel indicates the quadratic sum of the statistical and systematic uncertainties ($\sigma _{\text {tot}}$). |

png pdf root |
Figure 7:
Observed upper cross section limit at 95%CL for the EWK GGM signal in the wino-bino mass plane. The thick lines represent the observed (black) and expected (red) exclusion contours, where the phase space closer to the diagonal is excluded by the analysis. The thin dotted red curves indicate the region containing 68% of the distribution of limits expected under the background-only hypothesis. The thin solid black curves show the change in the observed limit due to variation of the signal cross sections within their theoretical uncertainties. |

png pdf |
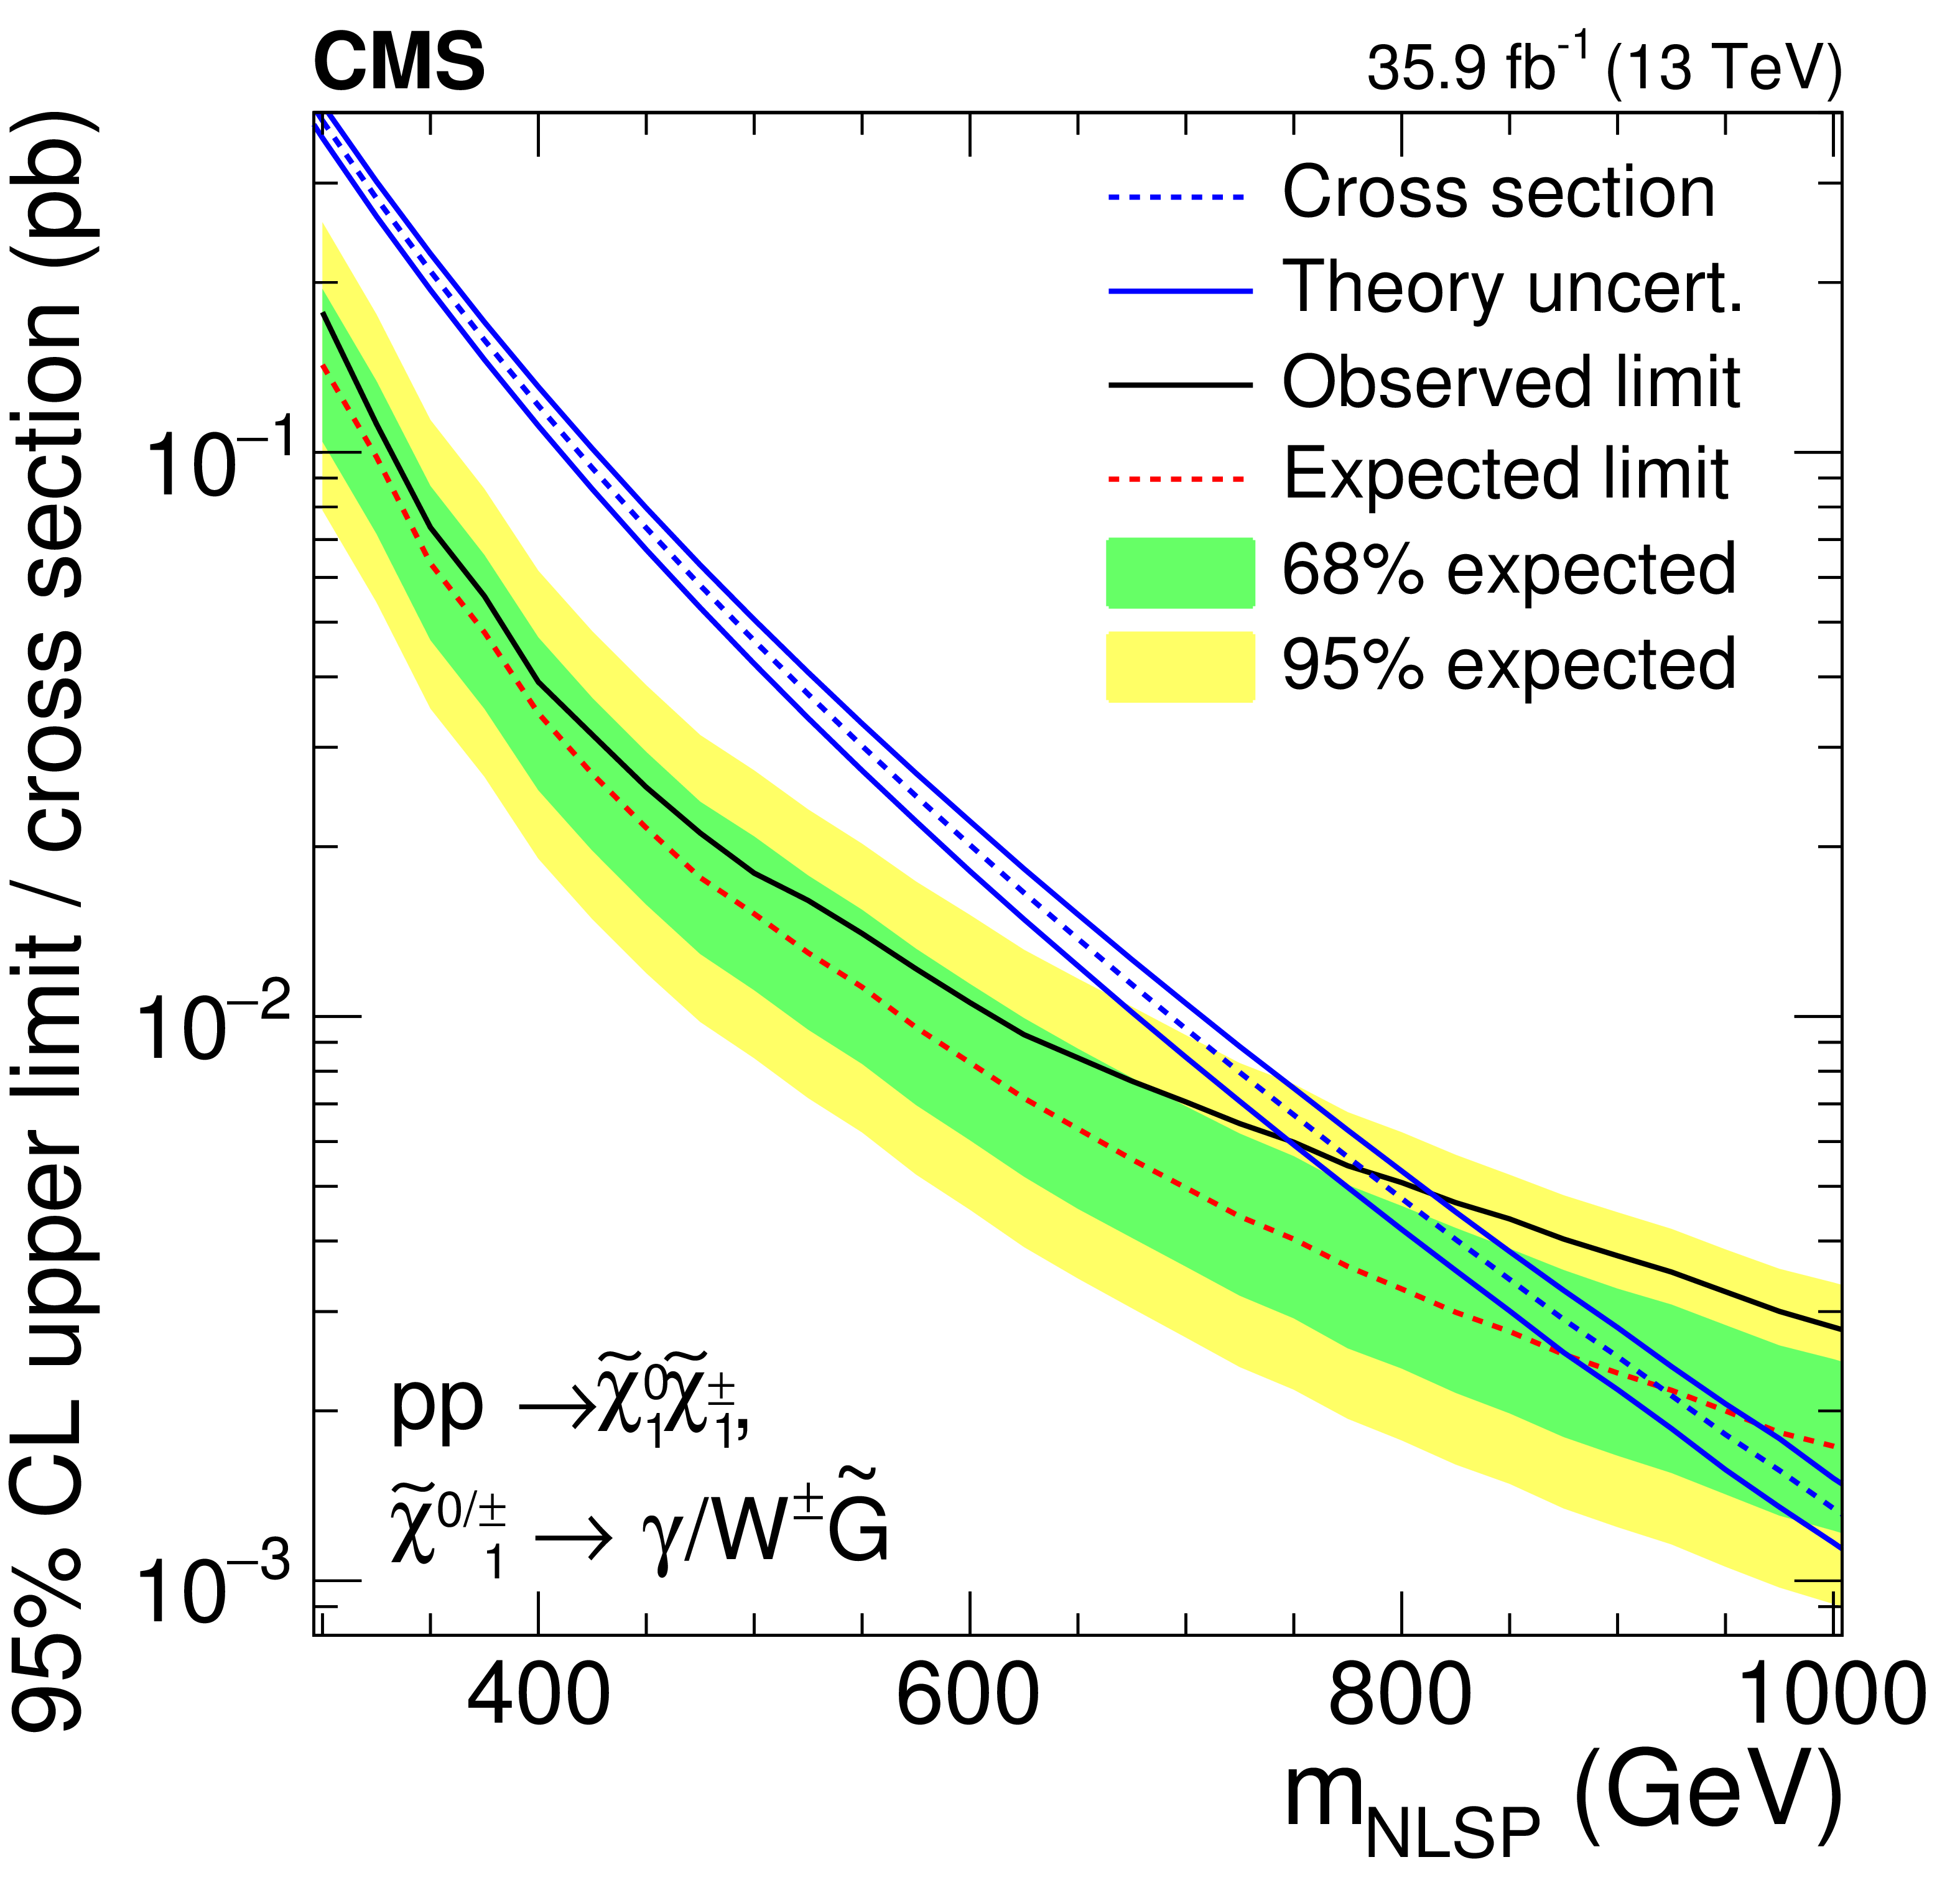
Figure 8:
Observed (black) and expected (red) upper cross section limits as a function of the NLSP mass for the TChiWg (left) and TChiNg (right) model together with the corresponding theoretical cross section (blue). The inner (green) band and the outer (yellow) band indicate the regions containing 68 and 95%, respectively, of the distribution of limits expected under the background-only hypothesis. The solid blue lines represent the theoretical uncertainty in the signal cross section. |
png pdf root |
Figure 8-a:
Observed (black) and expected (red) upper cross section limits as a function of the NLSP mass for the TChiWg model together with the corresponding theoretical cross section (blue). The inner (green) band and the outer (yellow) band indicate the regions containing 68 and 95%, respectively, of the distribution of limits expected under the background-only hypothesis. The solid blue lines represent the theoretical uncertainty in the signal cross section. |

png pdf root |
Figure 8-b:
Observed (black) and expected (red) upper cross section limits as a function of the NLSP mass for the TChiNg model together with the corresponding theoretical cross section (blue). The inner (green) band and the outer (yellow) band indicate the regions containing 68 and 95%, respectively, of the distribution of limits expected under the background-only hypothesis. The solid blue lines represent the theoretical uncertainty in the signal cross section. |

png pdf |
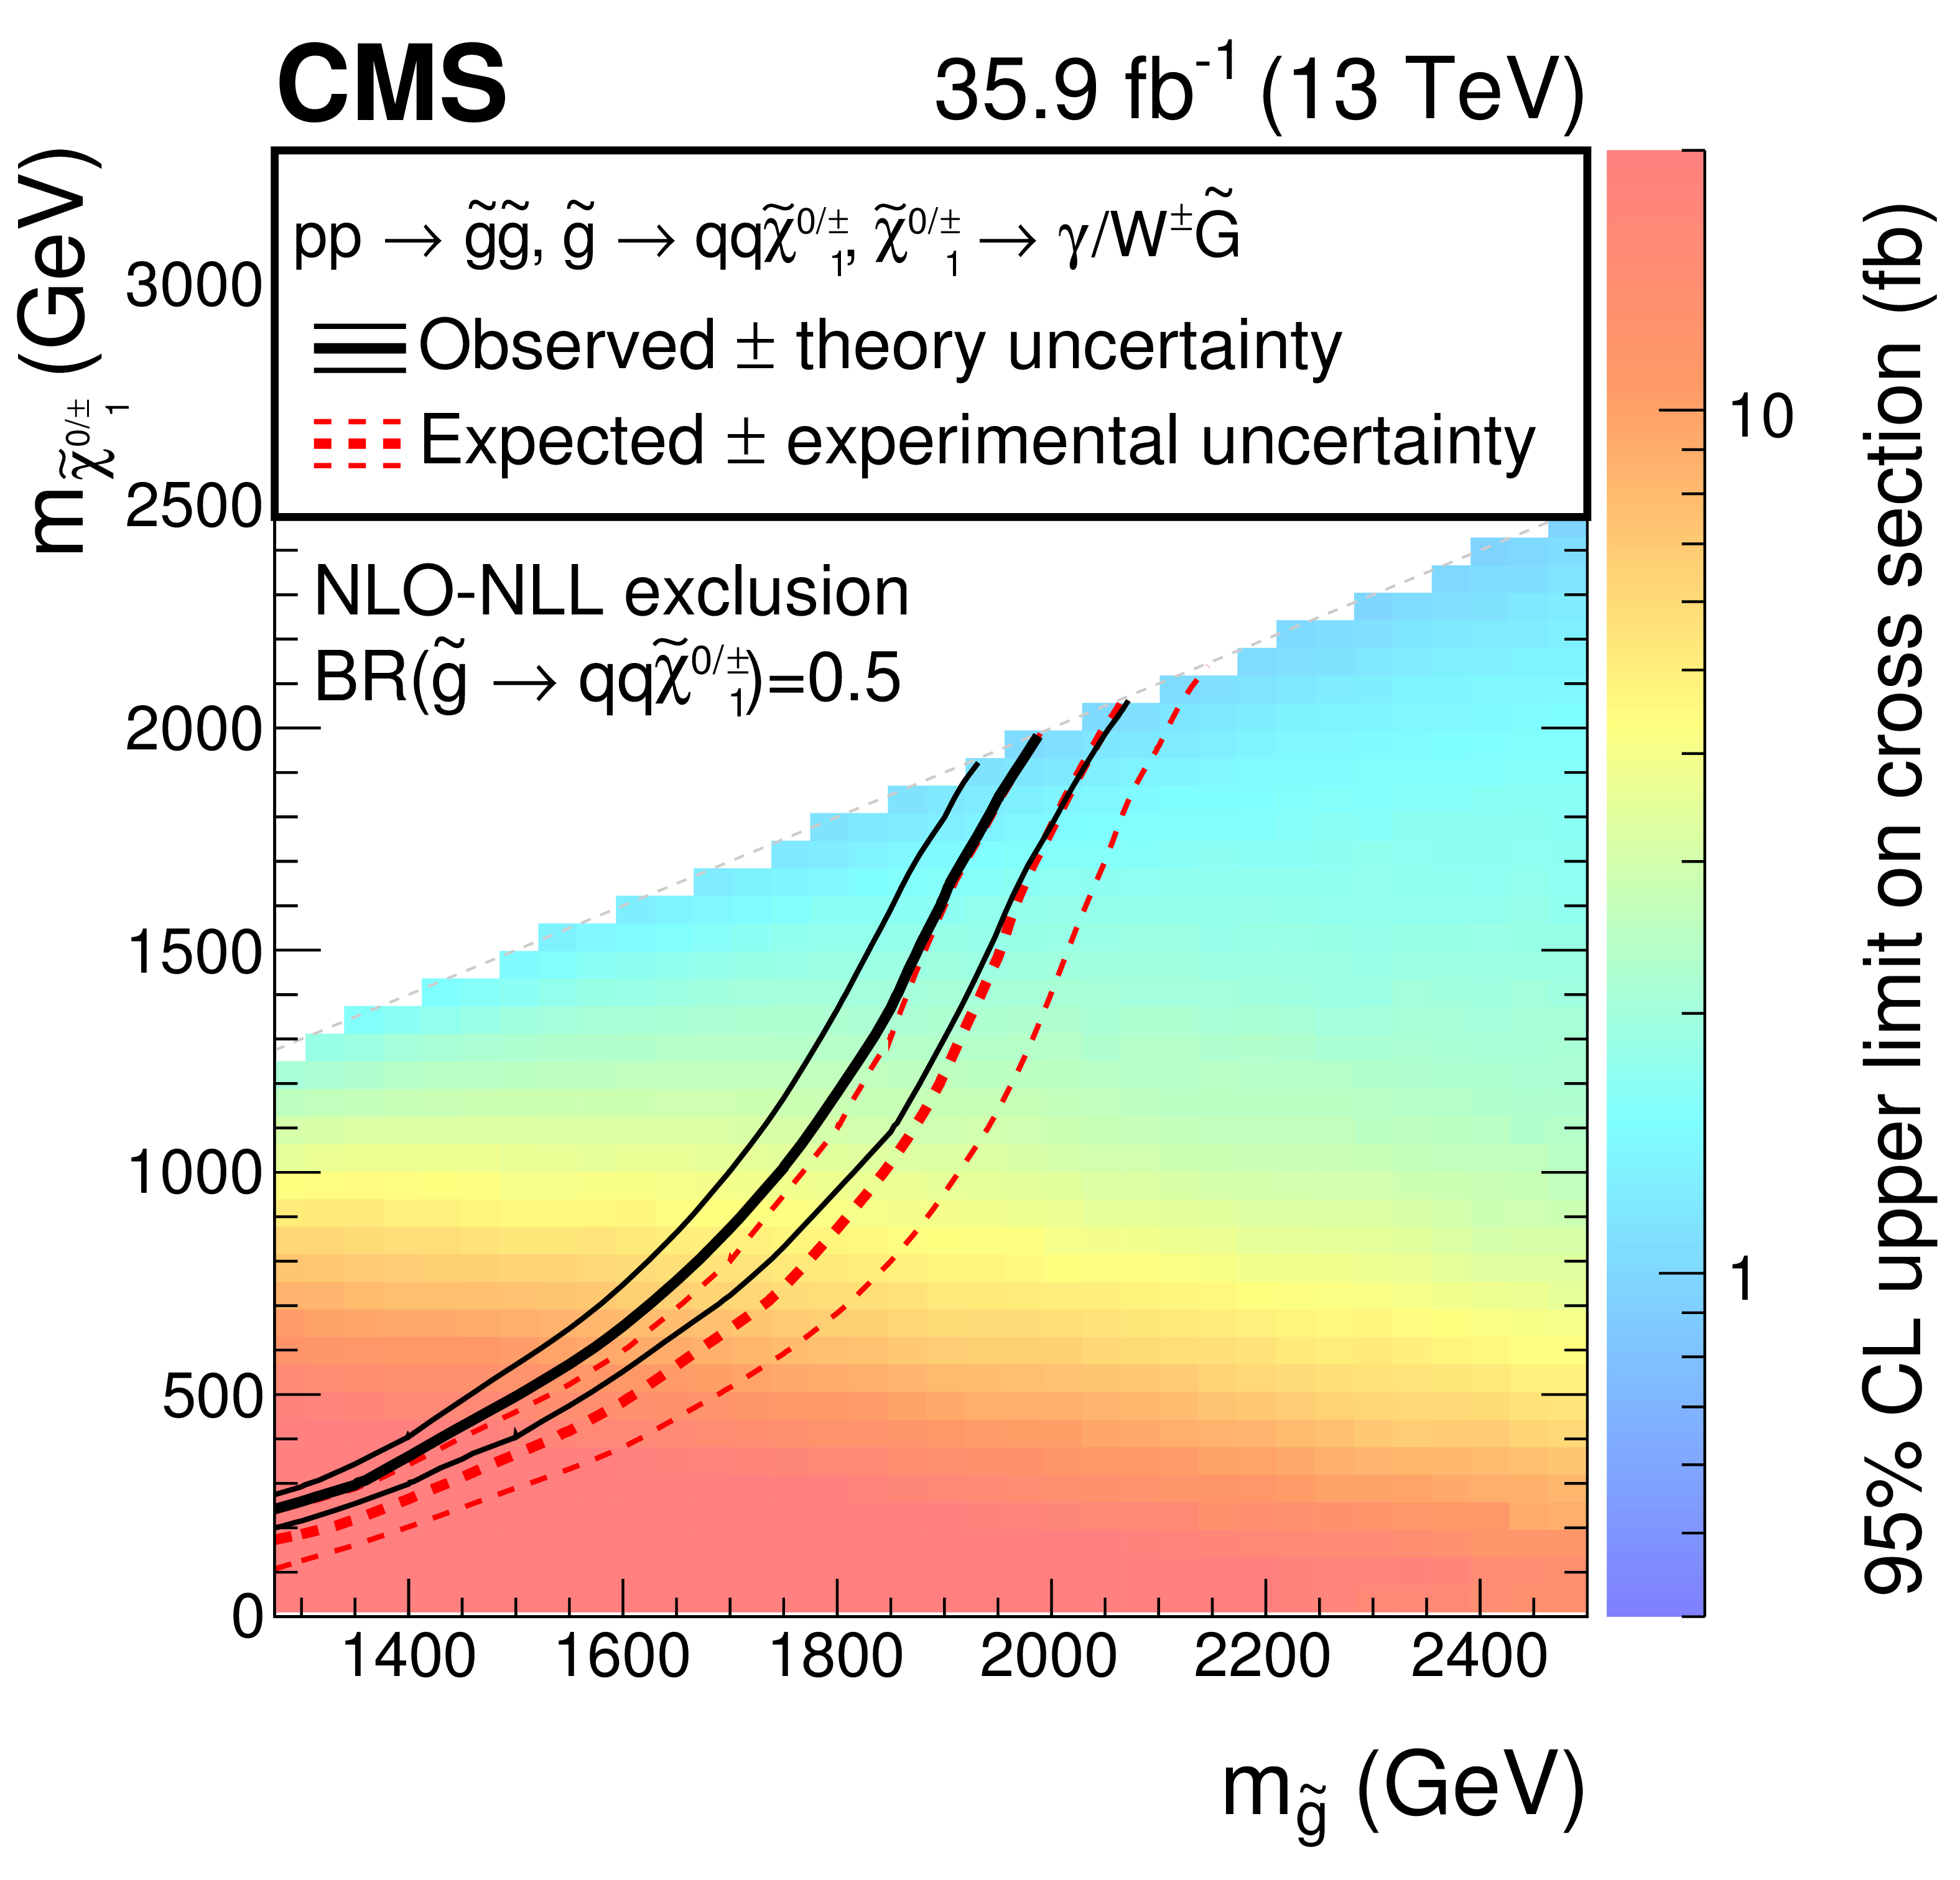
Figure 9:
The 95% CL limits for the T5gg (left) and T5Wg (right) SMS models in the gluino-neutralino/chargino mass plane. The color scale encodes the observed upper cross section limit for each point. The thick lines represent the observed (black) and expected (red) exclusion contours, where the phase space of lower masses is excluded by the analysis. The thin dotted red curves indicate the region containing 68% of the distribution of limits expected under the background-only hypothesis. The thin solid black curves show the change in the observed limit due to variation of the signal cross sections within their theoretical uncertainties. |

png pdf root |
Figure 9-a:
The 95% CL limits for the T5gg SMS model in the gluino-neutralino/chargino mass plane. The color scale encodes the observed upper cross section limit for each point. The thick lines represent the observed (black) and expected (red) exclusion contours, where the phase space of lower masses is excluded by the analysis. The thin dotted red curves indicate the region containing 68% of the distribution of limits expected under the background-only hypothesis. The thin solid black curves show the change in the observed limit due to variation of the signal cross sections within their theoretical uncertainties. |
png pdf root |
Figure 9-b:
The 95% CL limits for the T5Wg SMS model in the gluino-neutralino/chargino mass plane. The color scale encodes the observed upper cross section limit for each point. The thick lines represent the observed (black) and expected (red) exclusion contours, where the phase space of lower masses is excluded by the analysis. The thin dotted red curves indicate the region containing 68% of the distribution of limits expected under the background-only hypothesis. The thin solid black curves show the change in the observed limit due to variation of the signal cross sections within their theoretical uncertainties. |
png pdf |
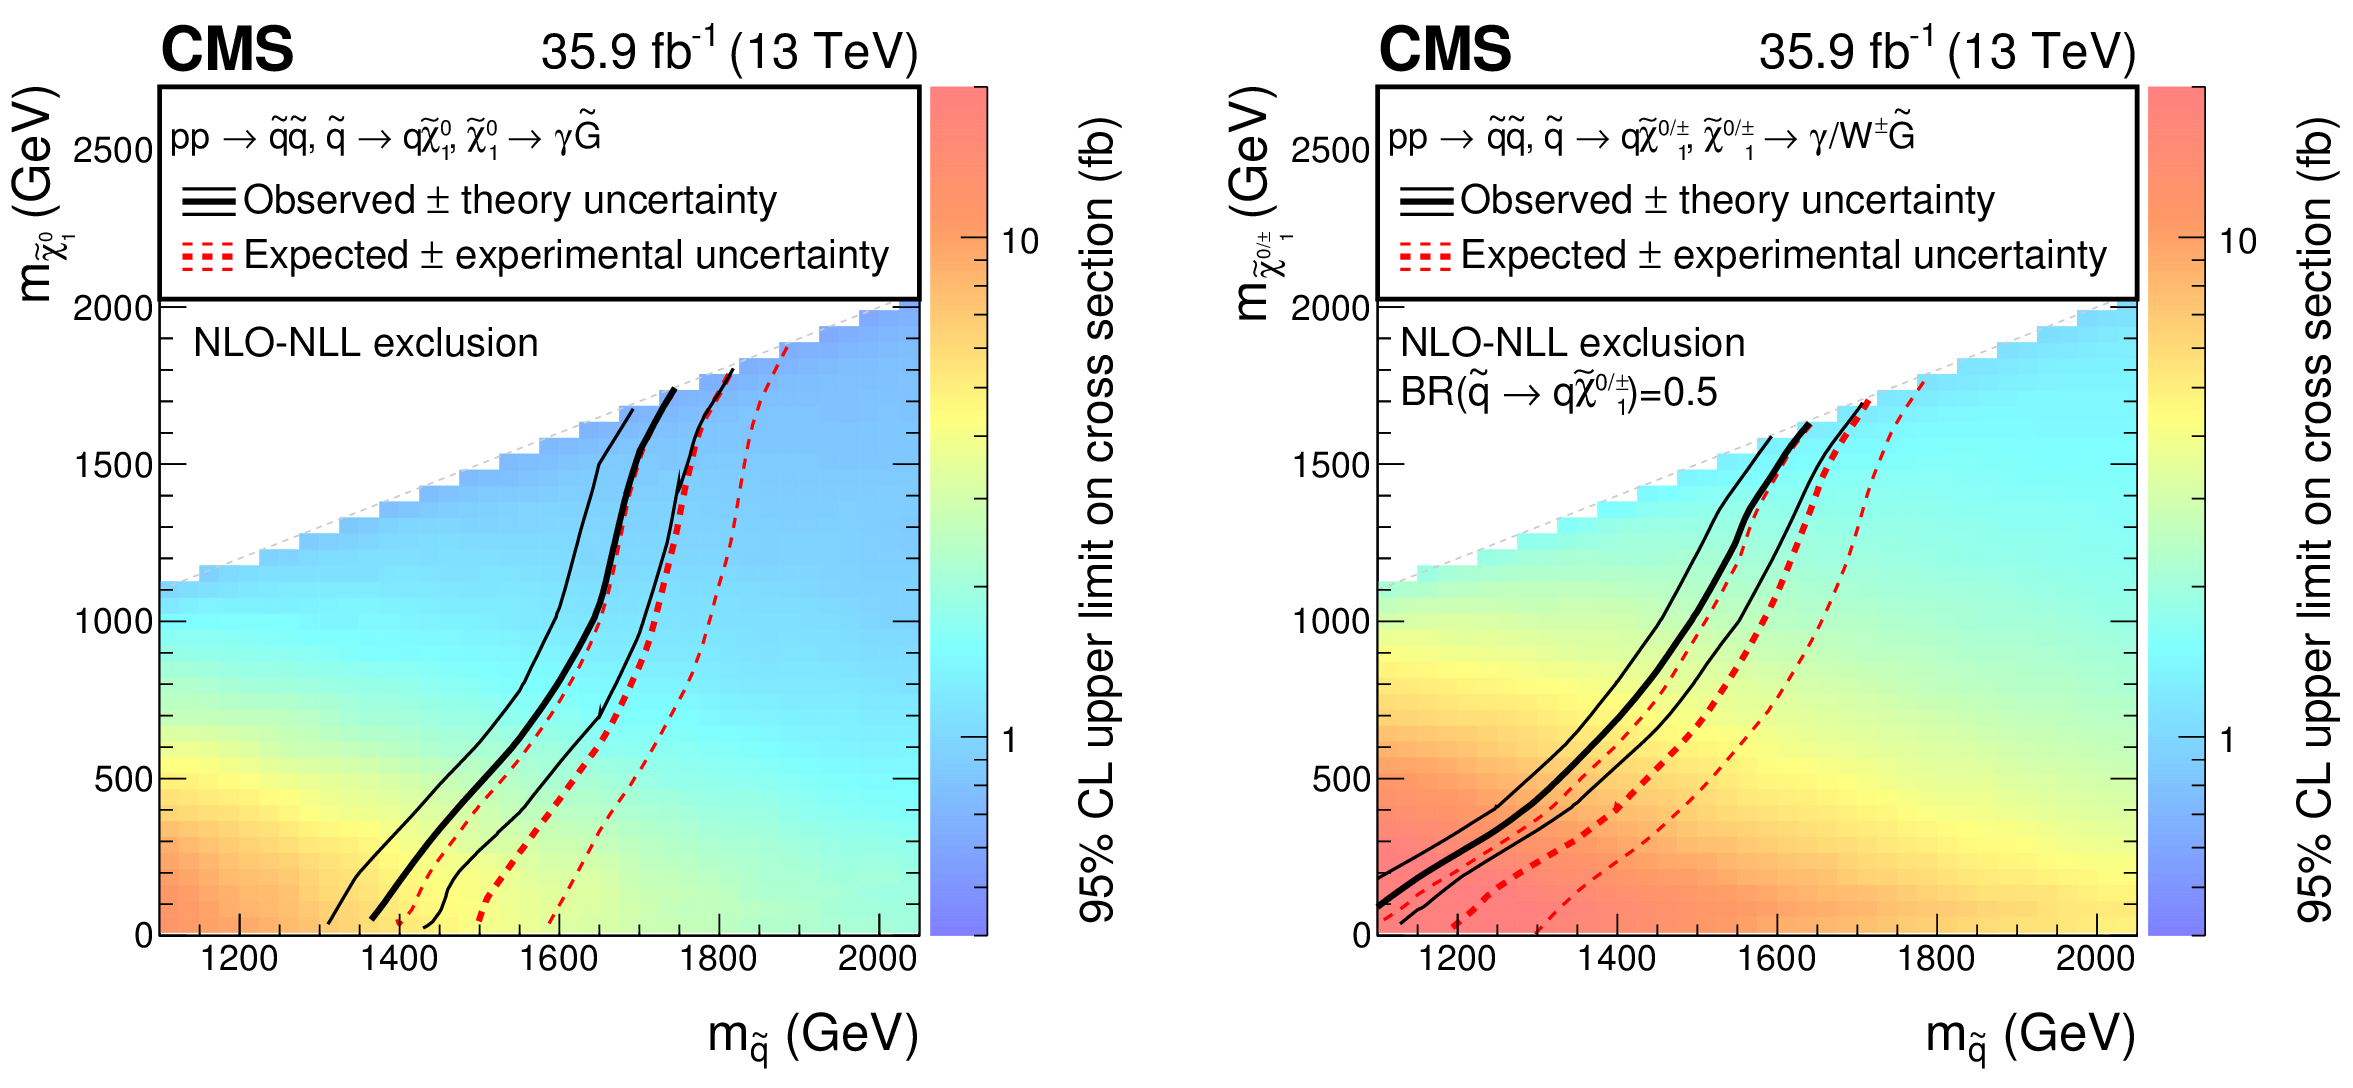
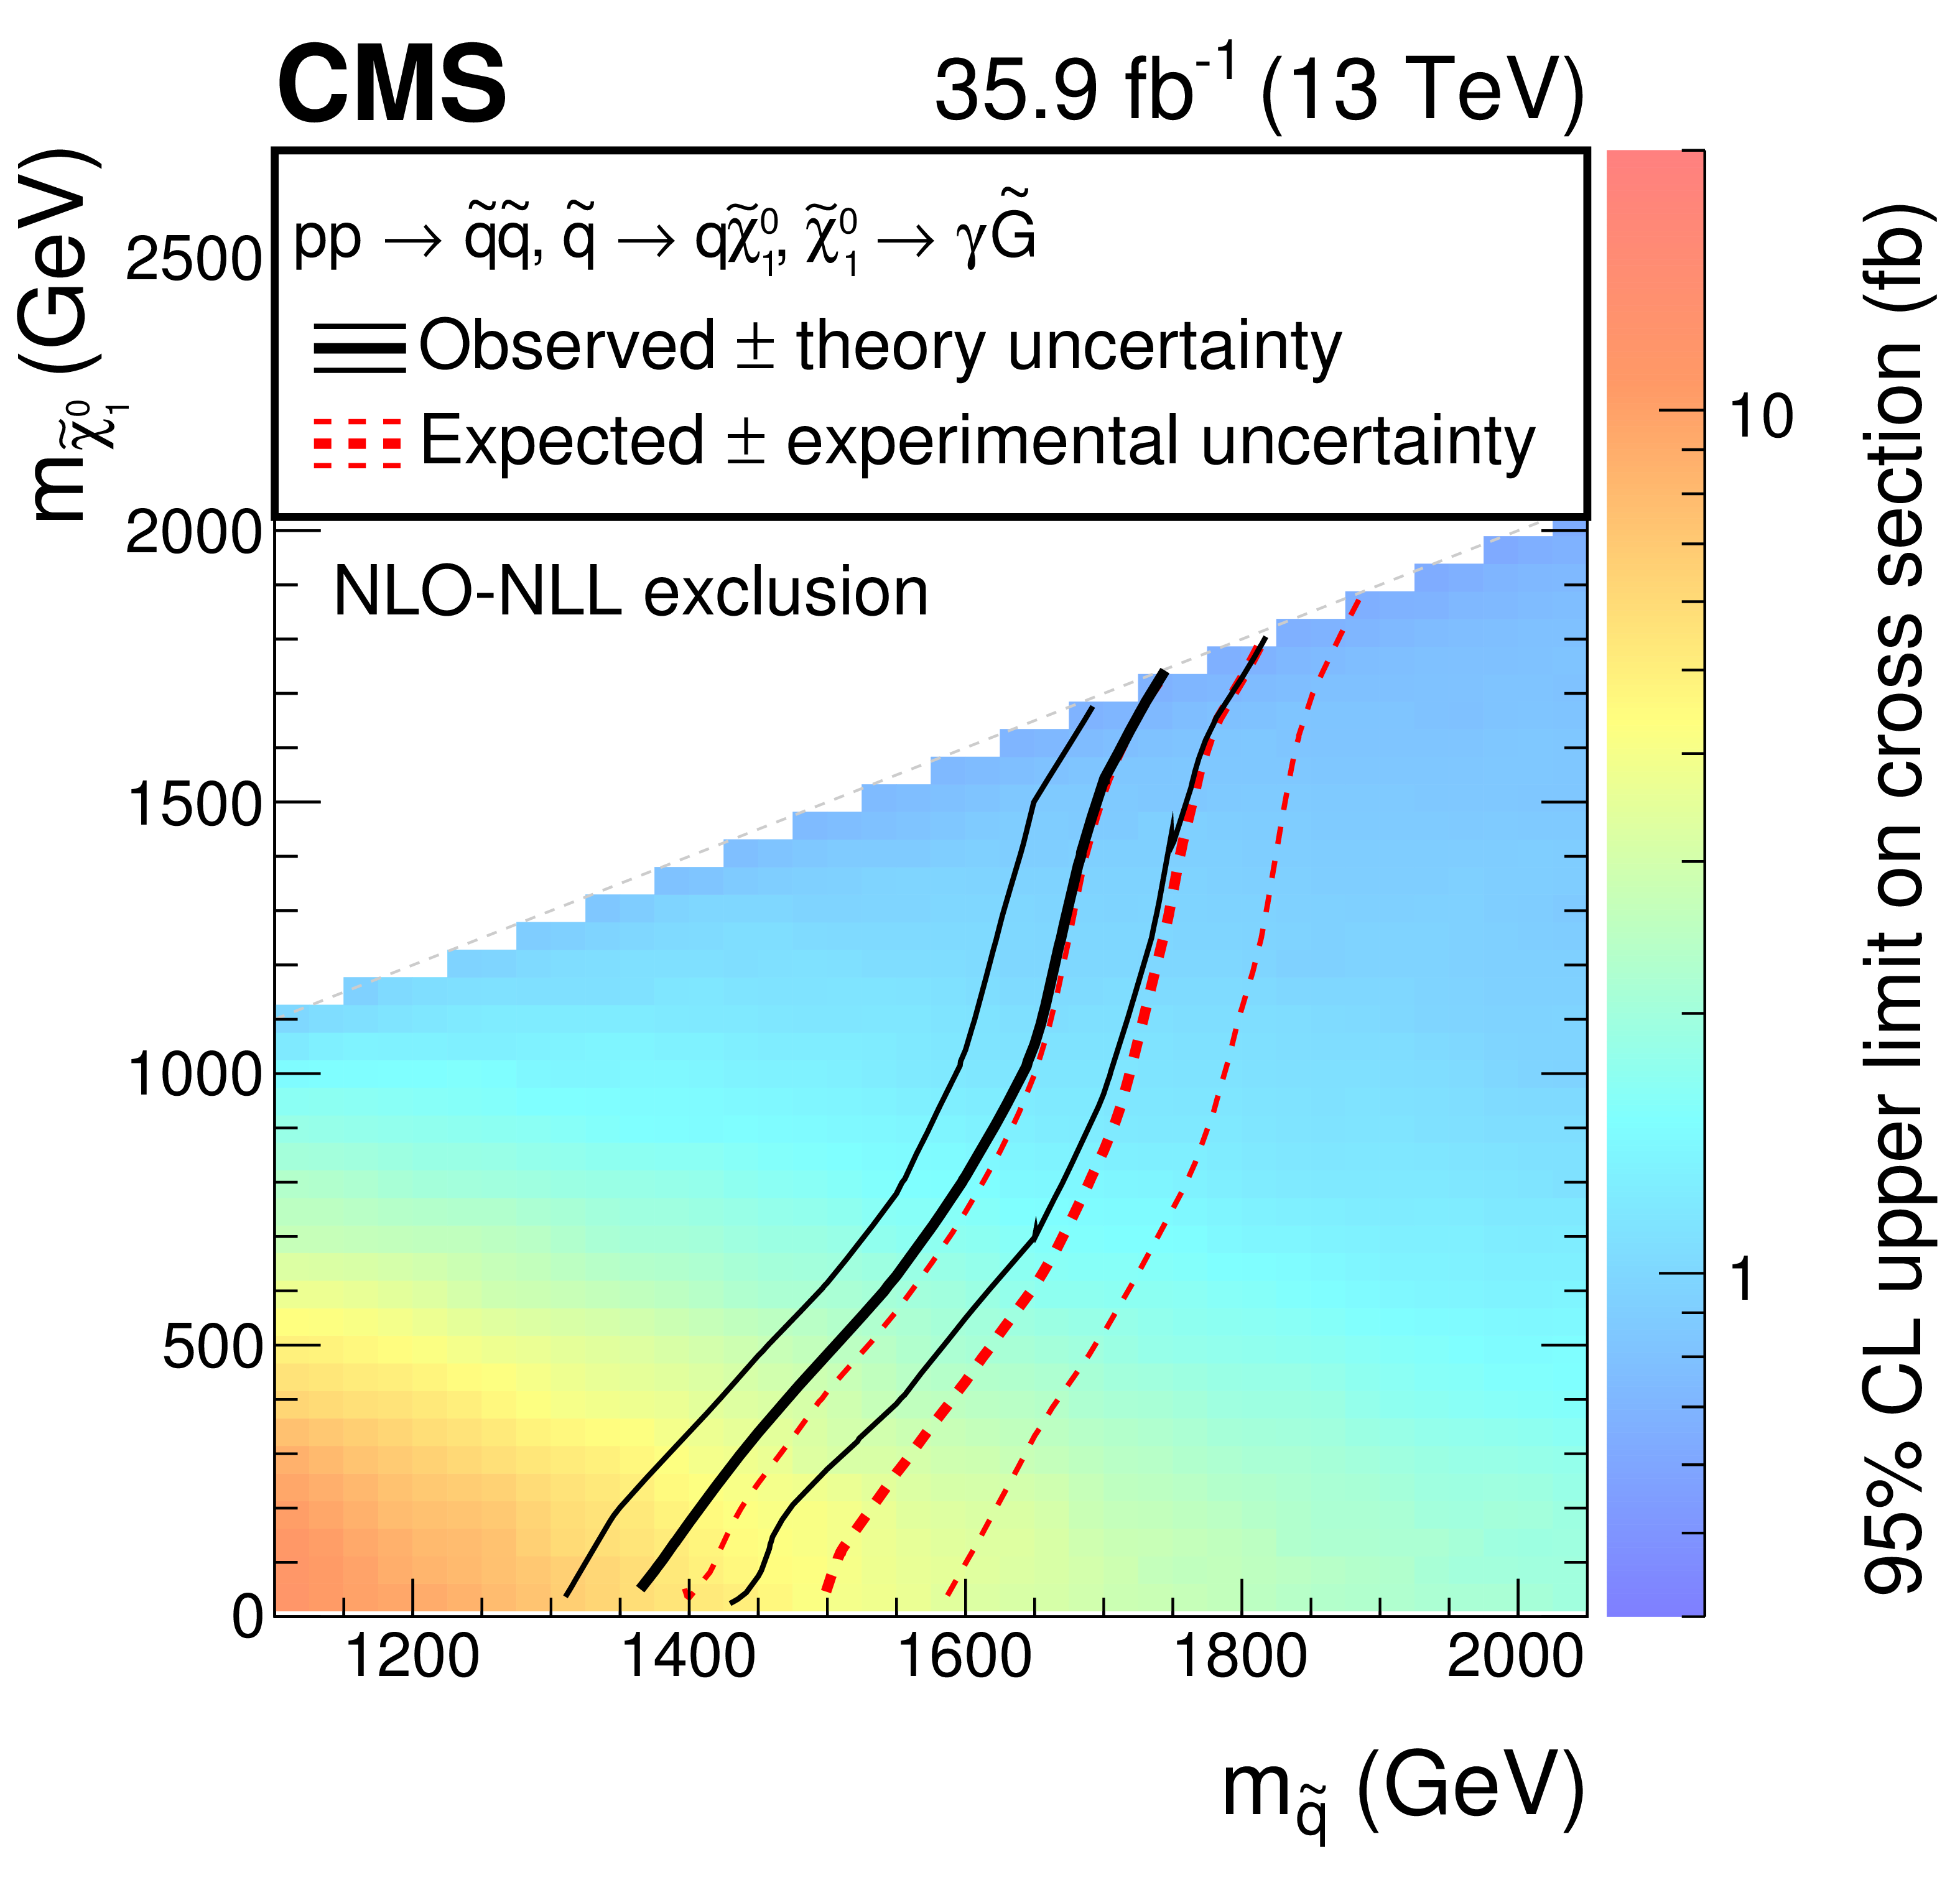
Figure 10:
The 95% CL limits for the T6gg (left) and T6Wg (right) SMS models in the squark-neutralino/chargino mass plane. The color scale encodes the observed upper cross section limit for each point. The thick lines represent the observed (black) and expected (red) exclusion contours, where the phase space of lower masses is excluded by the analysis. The thin dotted red curves indicate the region containing 68% of the distribution of limits expected under the background-only hypothesis. The thin solid black curves show the change in the observed limit due to variation of the signal cross sections within their theoretical uncertainties. For the signal production cross section five accessible mass-degenerate squark flavors for $\tilde{\mathrm{q}}_{\text {L}}$ and $\tilde{\mathrm{q}}_{\text {R}}$ were assumed. |
png pdf root |
Figure 10-a:
The 95% CL limits for the T6gg SMS model in the squark-neutralino/chargino mass plane. The color scale encodes the observed upper cross section limit for each point. The thick lines represent the observed (black) and expected (red) exclusion contours, where the phase space of lower masses is excluded by the analysis. The thin dotted red curves indicate the region containing 68% of the distribution of limits expected under the background-only hypothesis. The thin solid black curves show the change in the observed limit due to variation of the signal cross sections within their theoretical uncertainties. For the signal production cross section five accessible mass-degenerate squark flavors for $\tilde{\mathrm{q}}_{\text {L}}$ and $\tilde{\mathrm{q}}_{\text {R}}$ were assumed. |

png pdf root |
Figure 10-b:
The 95% CL limits for the T6Wg SMS model in the squark-neutralino/chargino mass plane. The color scale encodes the observed upper cross section limit for each point. The thick lines represent the observed (black) and expected (red) exclusion contours, where the phase space of lower masses is excluded by the analysis. The thin dotted red curves indicate the region containing 68% of the distribution of limits expected under the background-only hypothesis. The thin solid black curves show the change in the observed limit due to variation of the signal cross sections within their theoretical uncertainties. For the signal production cross section five accessible mass-degenerate squark flavors for $\tilde{\mathrm{q}}_{\text {L}}$ and $\tilde{\mathrm{q}}_{\text {R}}$ were assumed. |
| Tables | |

png pdf |
Table 1:
Summary of the event selection criteria required for the control, validation, and signal regions. |
png pdf |
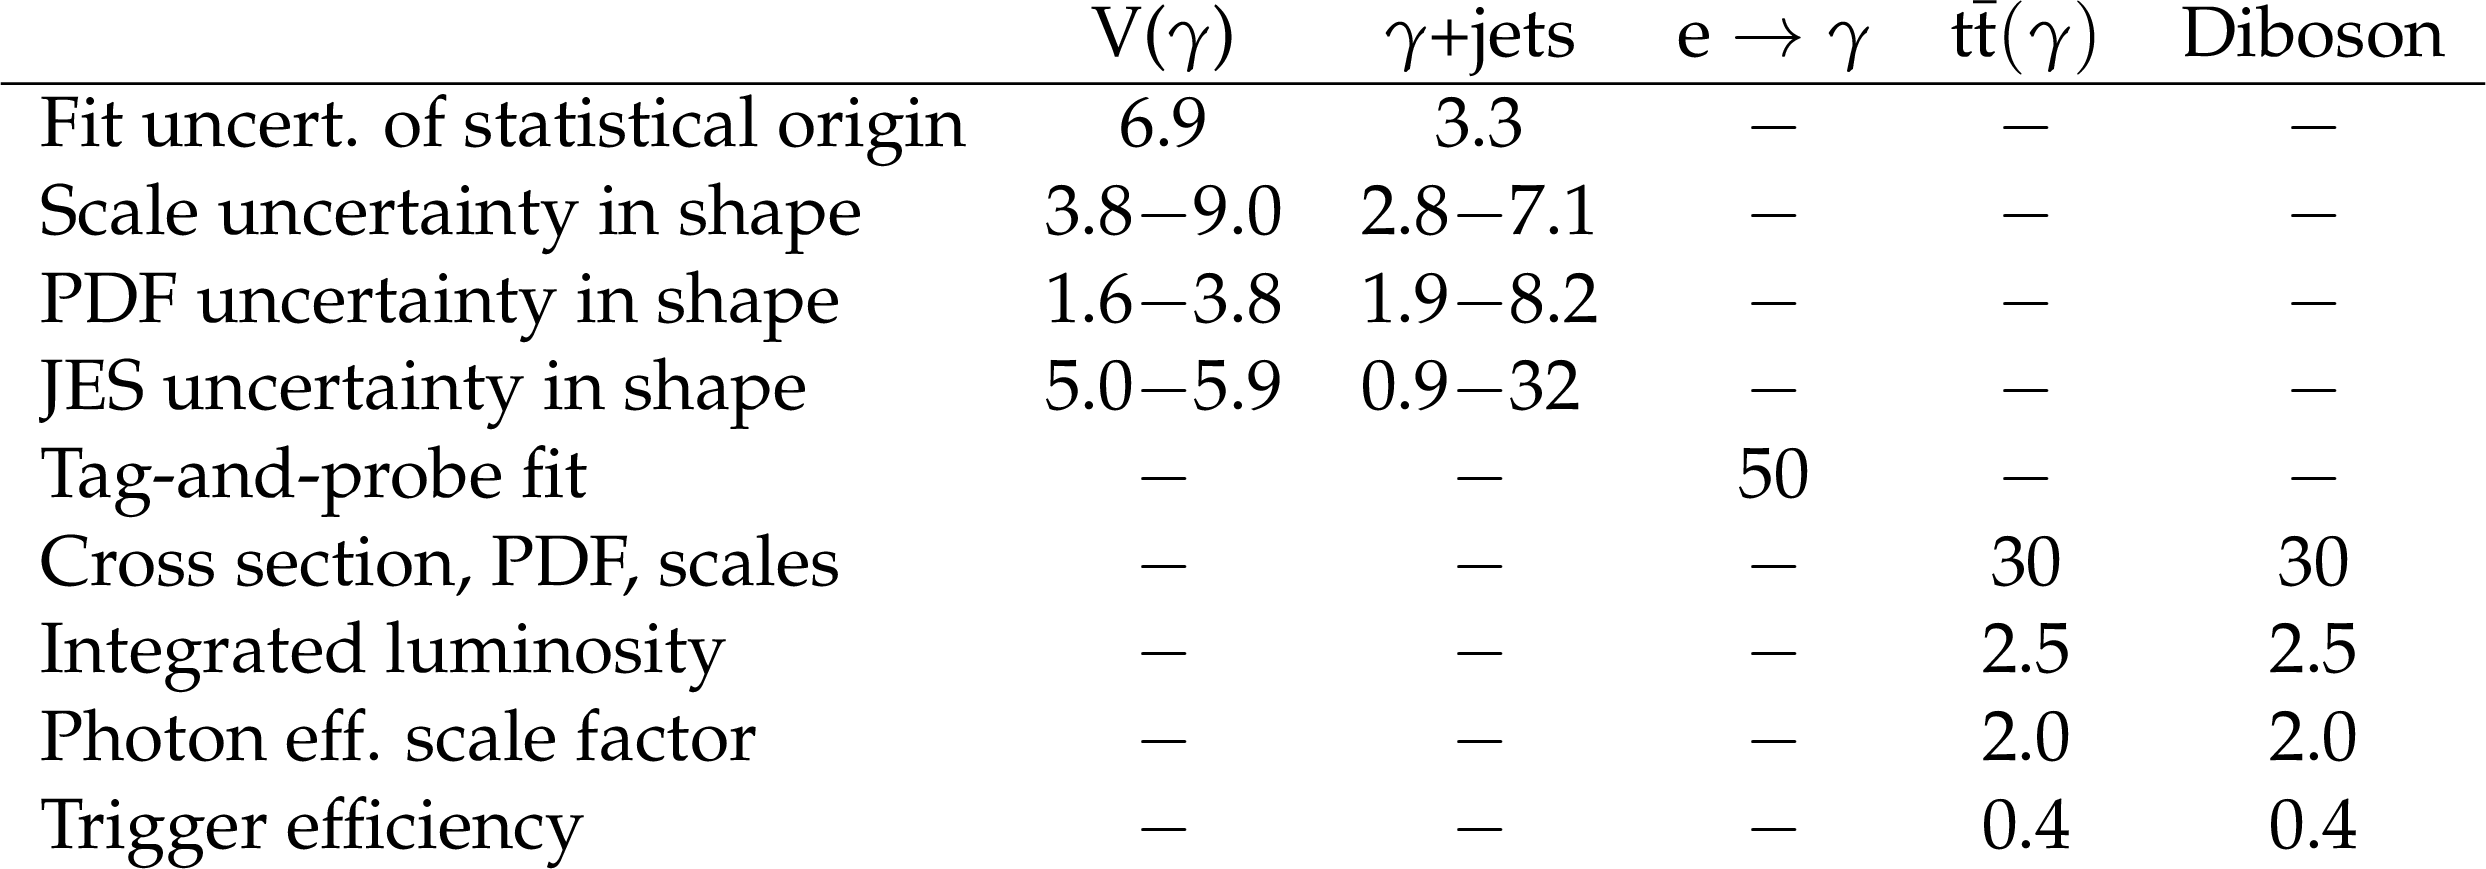
Table 2:
Systematic uncertainties in the background prediction in percent. |
png pdf |
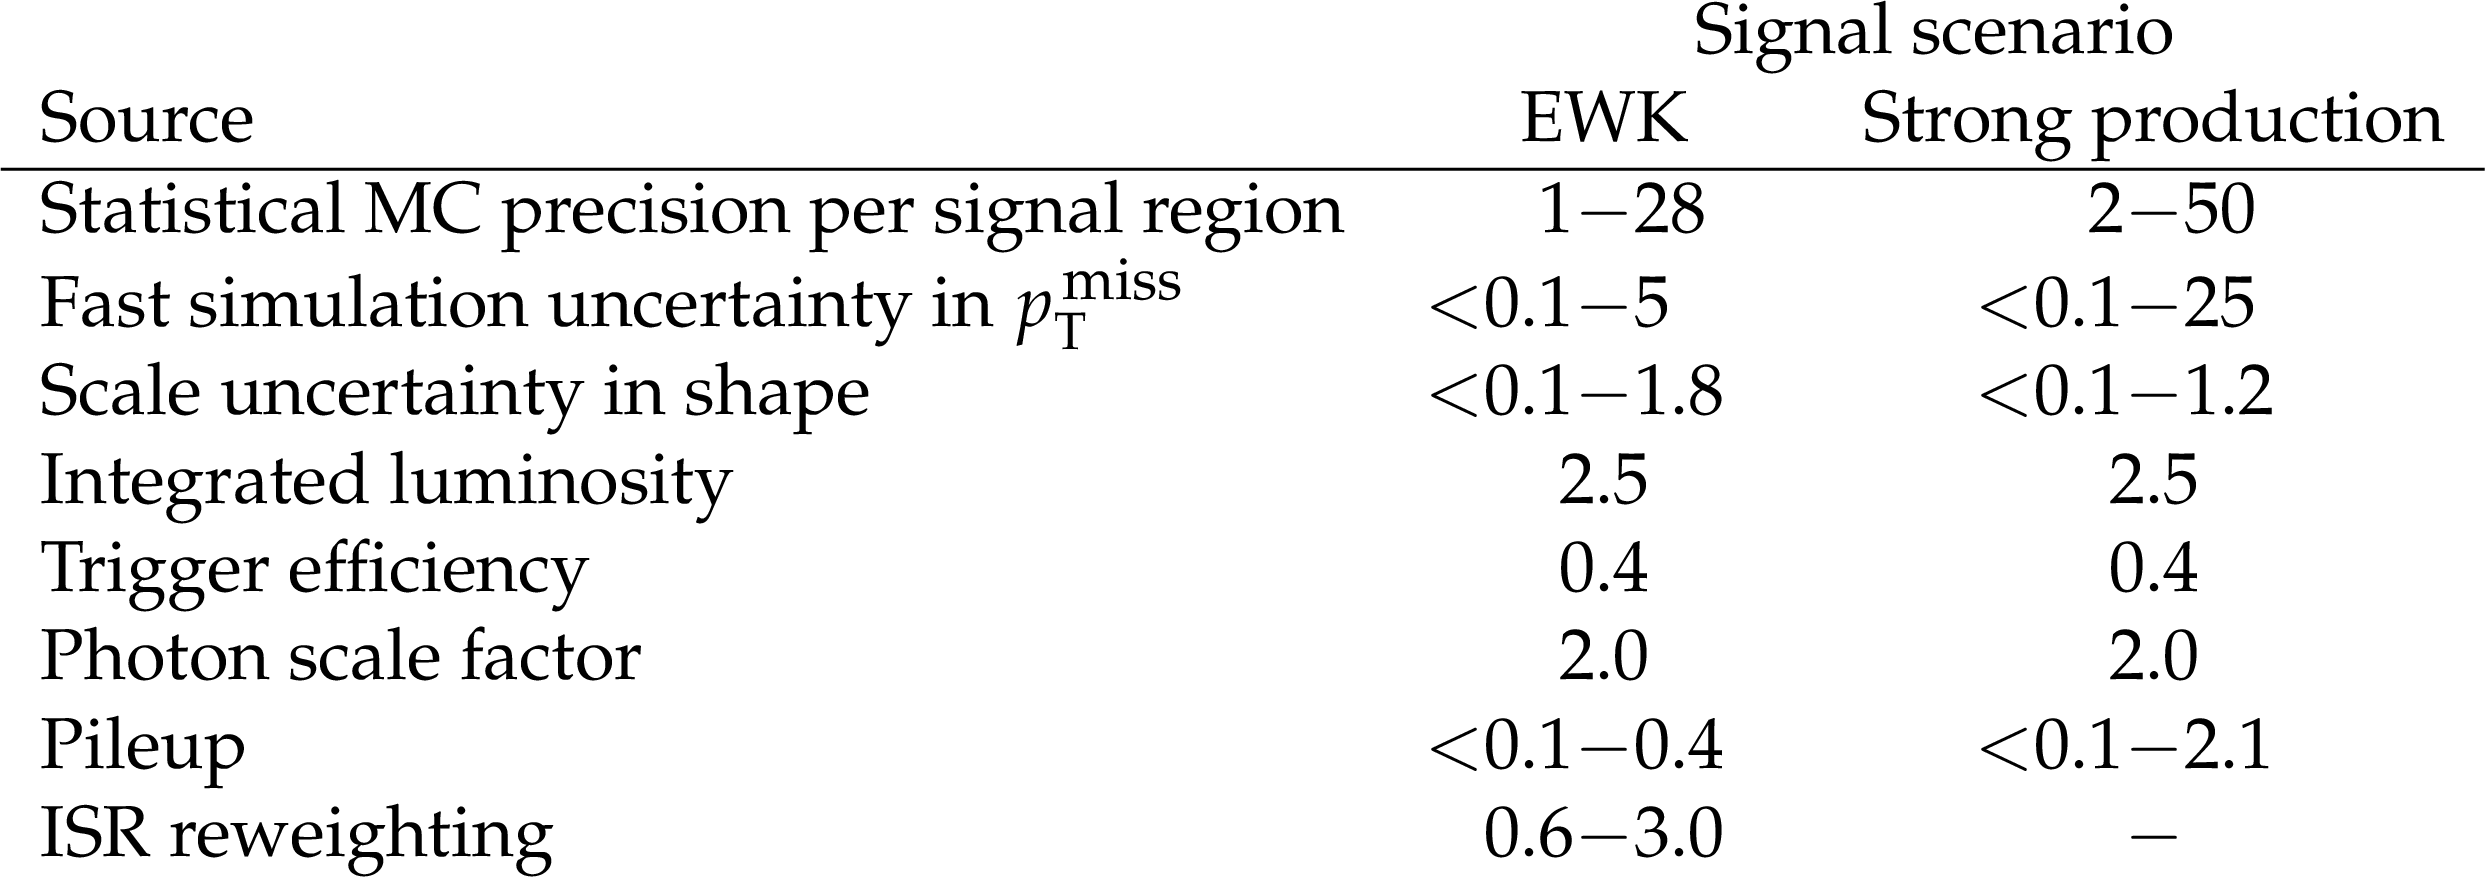
Table 3:
Systematic uncertainties in the signal predictions in percent. |
png pdf |
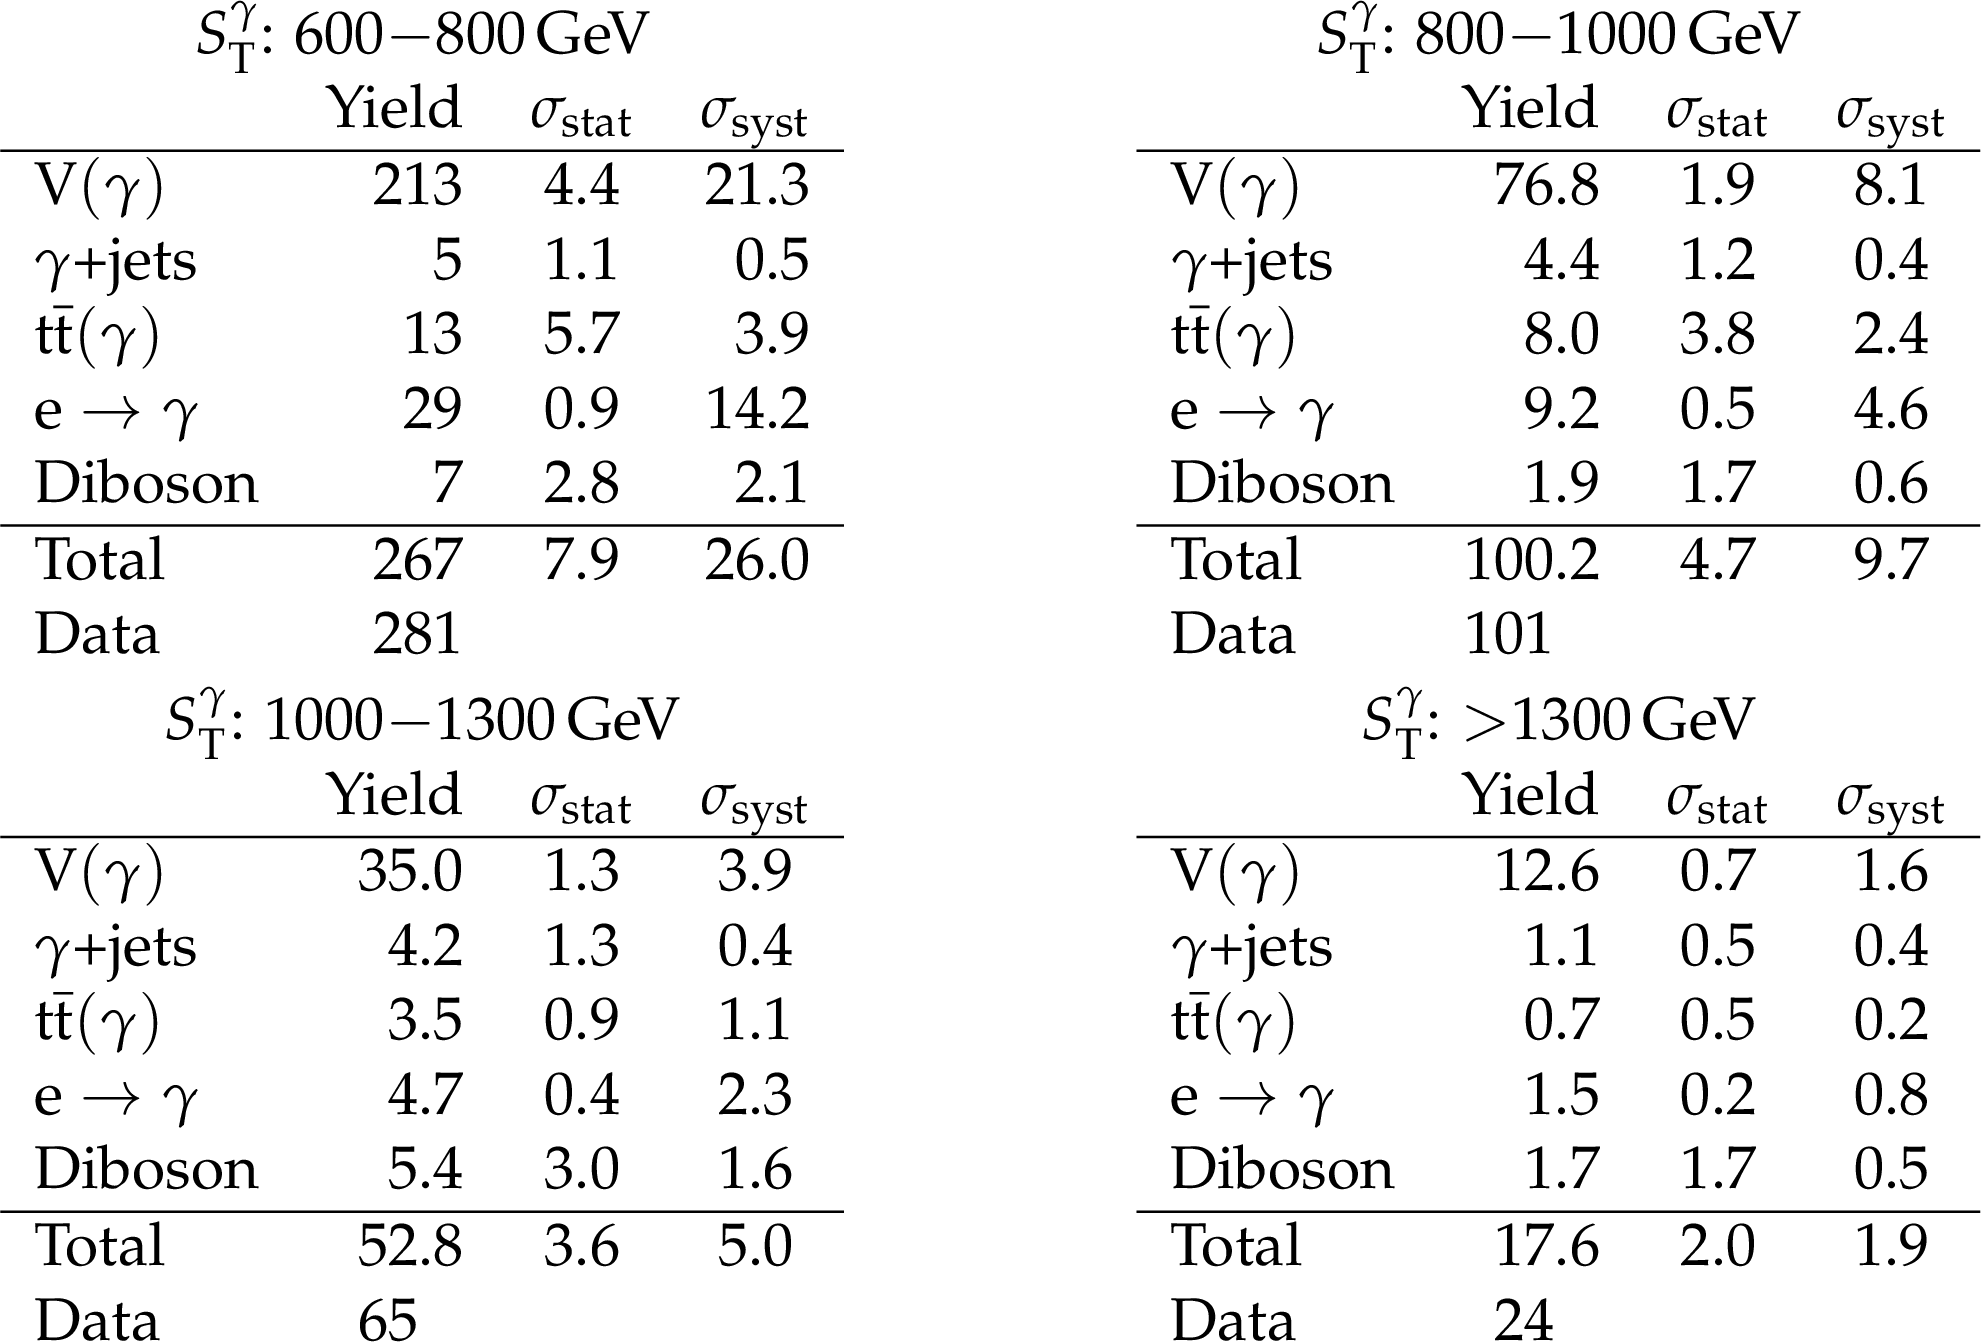
Table 4:
Background and data yields, as well as the statistical and systematic uncertainties for the separate signal region bins. For the total background uncertainty the uncertainties of the individual background components are summed quadratically. |
| Summary |
|
A search for electroweak (EWK) and strong production of gauginos in the framework of gauge mediated supersymmetry breaking in final states with photons and large missing transverse momentum has been performed. A data set recorded by the CMS experiment at a center-of-mass energy of 13 TeV, corresponding to an integrated luminosity of 35.9 fb$^{-1}$, was analyzed. The data were found to agree with the expectation from the standard model, without any indication of new physics. The analysis is sensitive to EWK production of gauginos and to strong production of gluinos and squarks in particular if the mass difference between gauginos and gluinos or squarks is small. A two-dimensional EWK signal scan in the framework of general gauge mediation is used to interpret the results. In the case of similar wino and bino masses, the analysis excludes masses below 980 GeV at 95% confidence level, improving on the current best limit by 270 GeV [26]. Two EWK simplified models are also used for the interpretation. The analysis excludes masses of the next-to-lightest supersymmetric particle $\tilde{\chi}^0_1$ below 780 (950) GeV in the TChiWg (TChiNg) scenario. Additionally, limits are set for strong production simplified models based on gluino (T5gg, T5Wg) and squark (T6gg, T6Wg) pair production, excluding gluino (squark) masses up to 2100 (1750) GeV. This analysis complements searches in the photon+jets, diphoton, and photon+leptons final states, and sets the most stringent limits to date in the EWK production models, and in the strong production models when the gauginos are degenerate in mass with the gluino or squarks. |
| Additional Figures | |
png pdf |
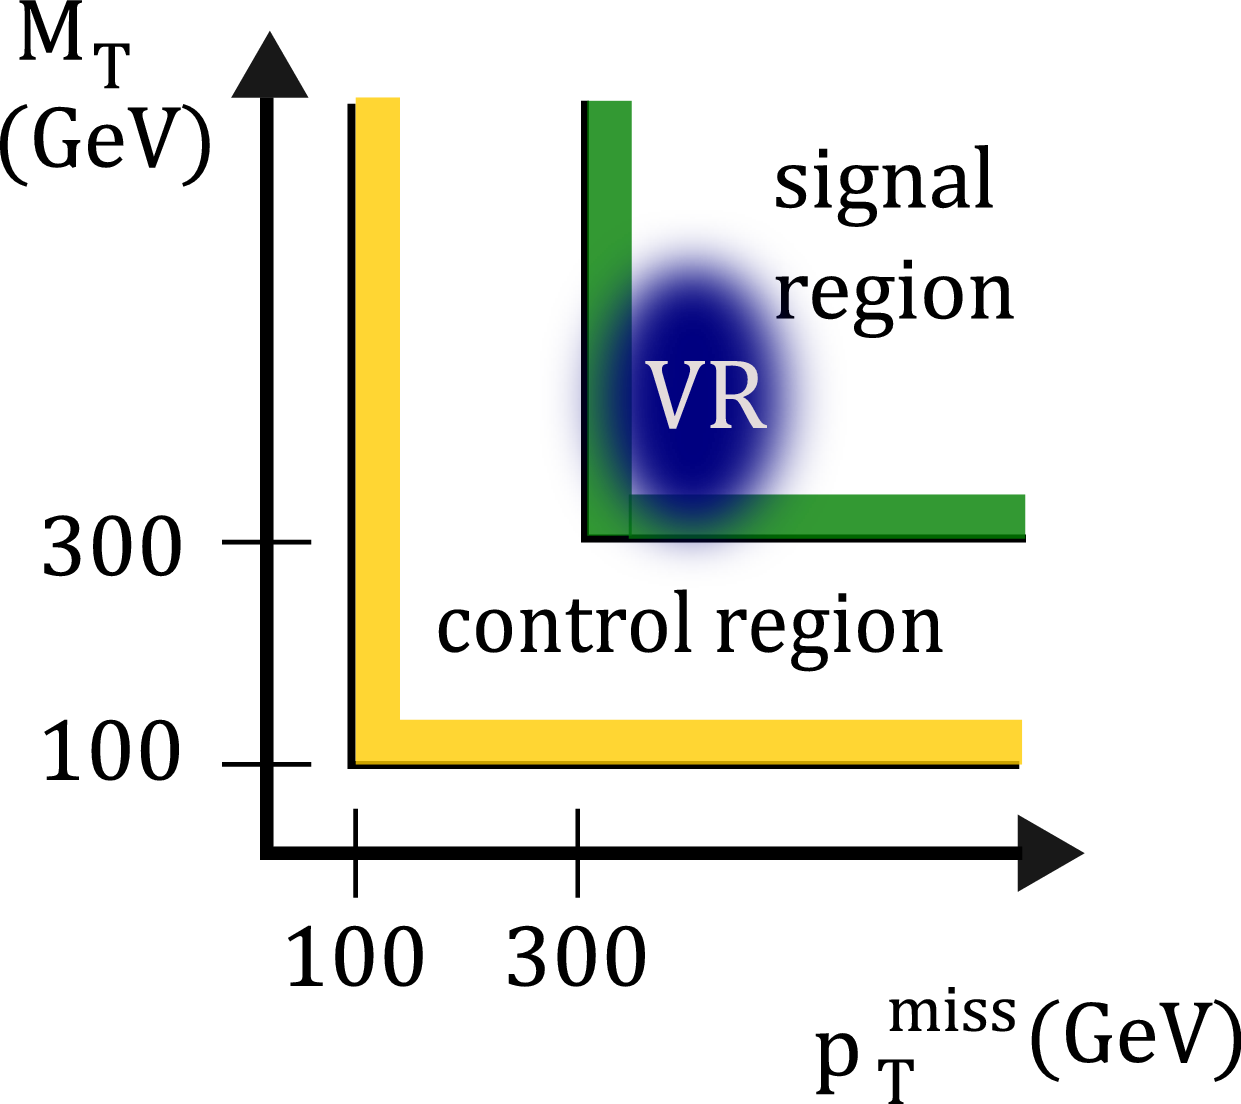
Additional Figure 1:
Sketch of the control region and signal region definition. The blue area indicates the phase space of the validation region. |
| Additional Tables | |
png pdf |
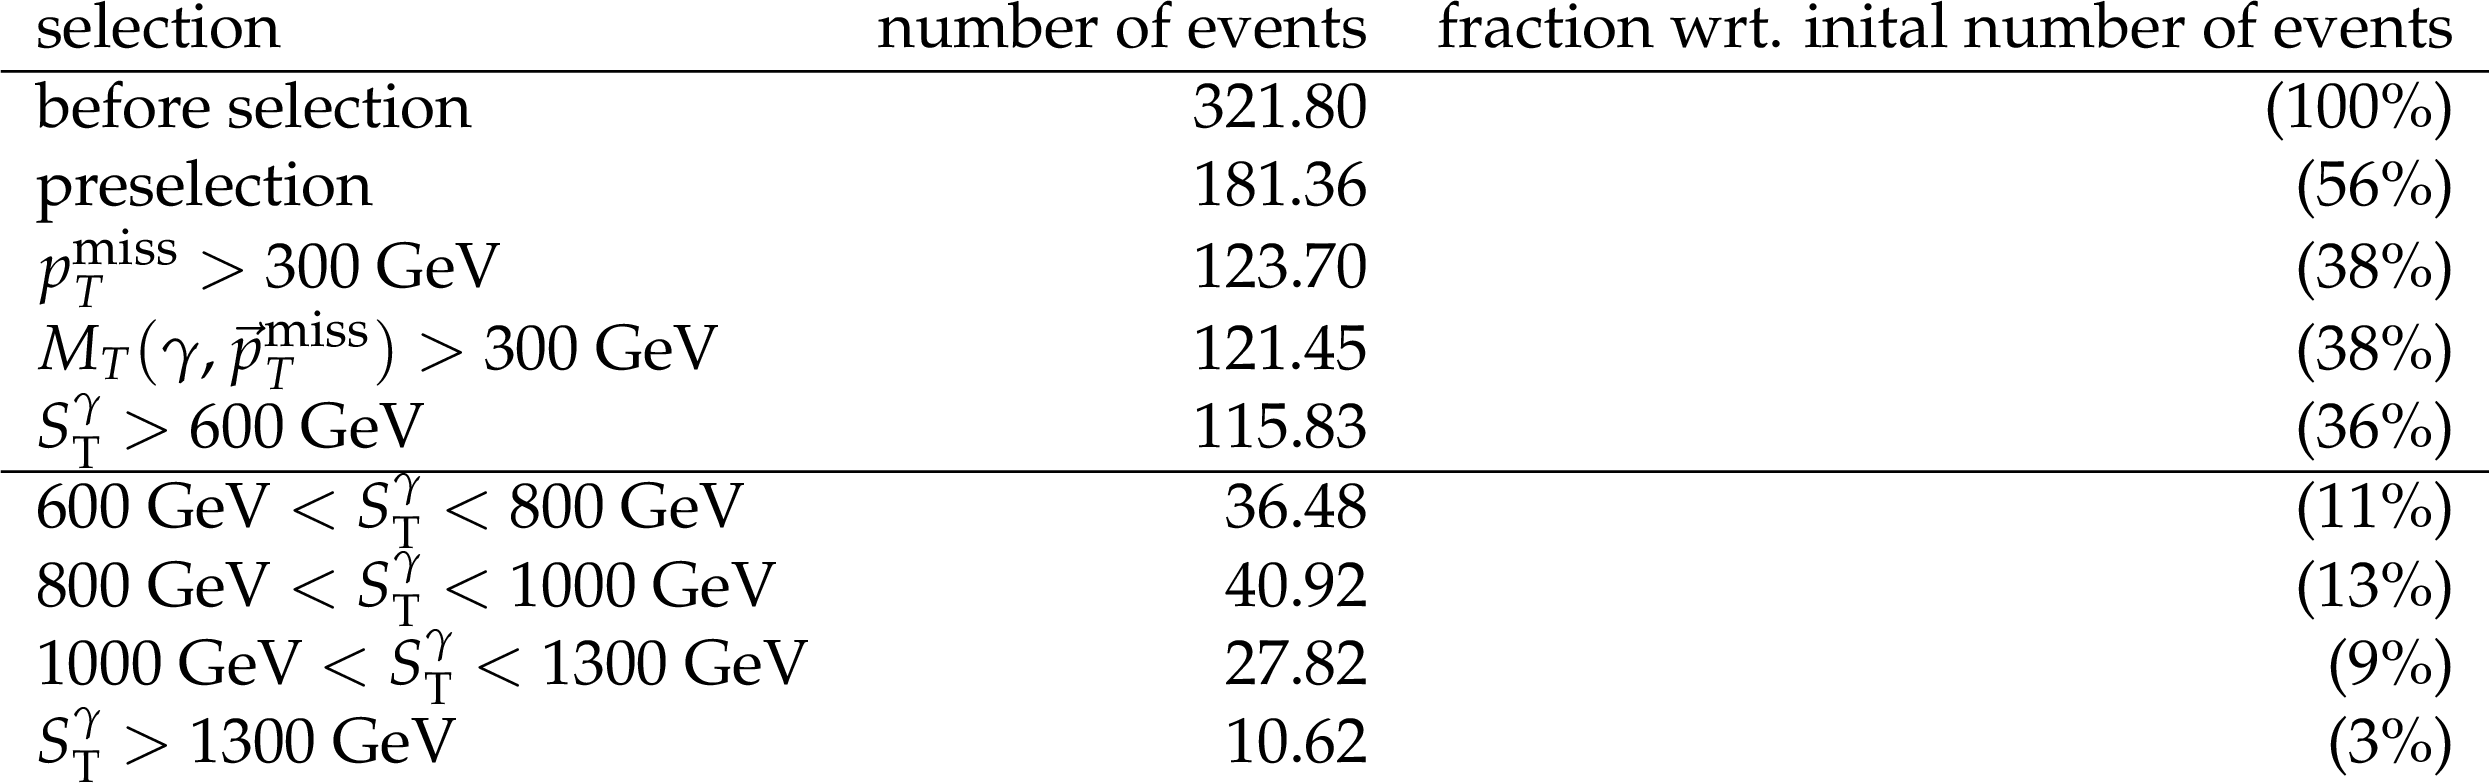
Additional Table 1:
Cutflow of the TChiWg benchmark signal point with a wino NLSP with a mass of 700 GeV. The preselection cut comprises the requirement of at least one loosely isolated photon with ${p_{\mathrm {T}}} > $ 180 GeV and a seed crystal energy fraction of at least 30% wrt. the full corrected photon ${p_{\mathrm {T}}}$, which was accepted by the trigger and was measured in the ECAL barrel. Furthermore, for the photon a minimal distance in $\Delta \mathrm{R}$ of 0.5 is required wrt. to the nearest jet. Also $\Delta \phi (p_{\mathrm{T}}^{\, {\text{miss}}}, \text{jet}) > $ 0.3 is required for all jets with $ {p_{\mathrm {T}}} > $ 100 GeV. The yields correspond to a center-of-mass energy of 13 TeV and an integrated luminosity of 35.9 fb$^{-1}$. |
png pdf |
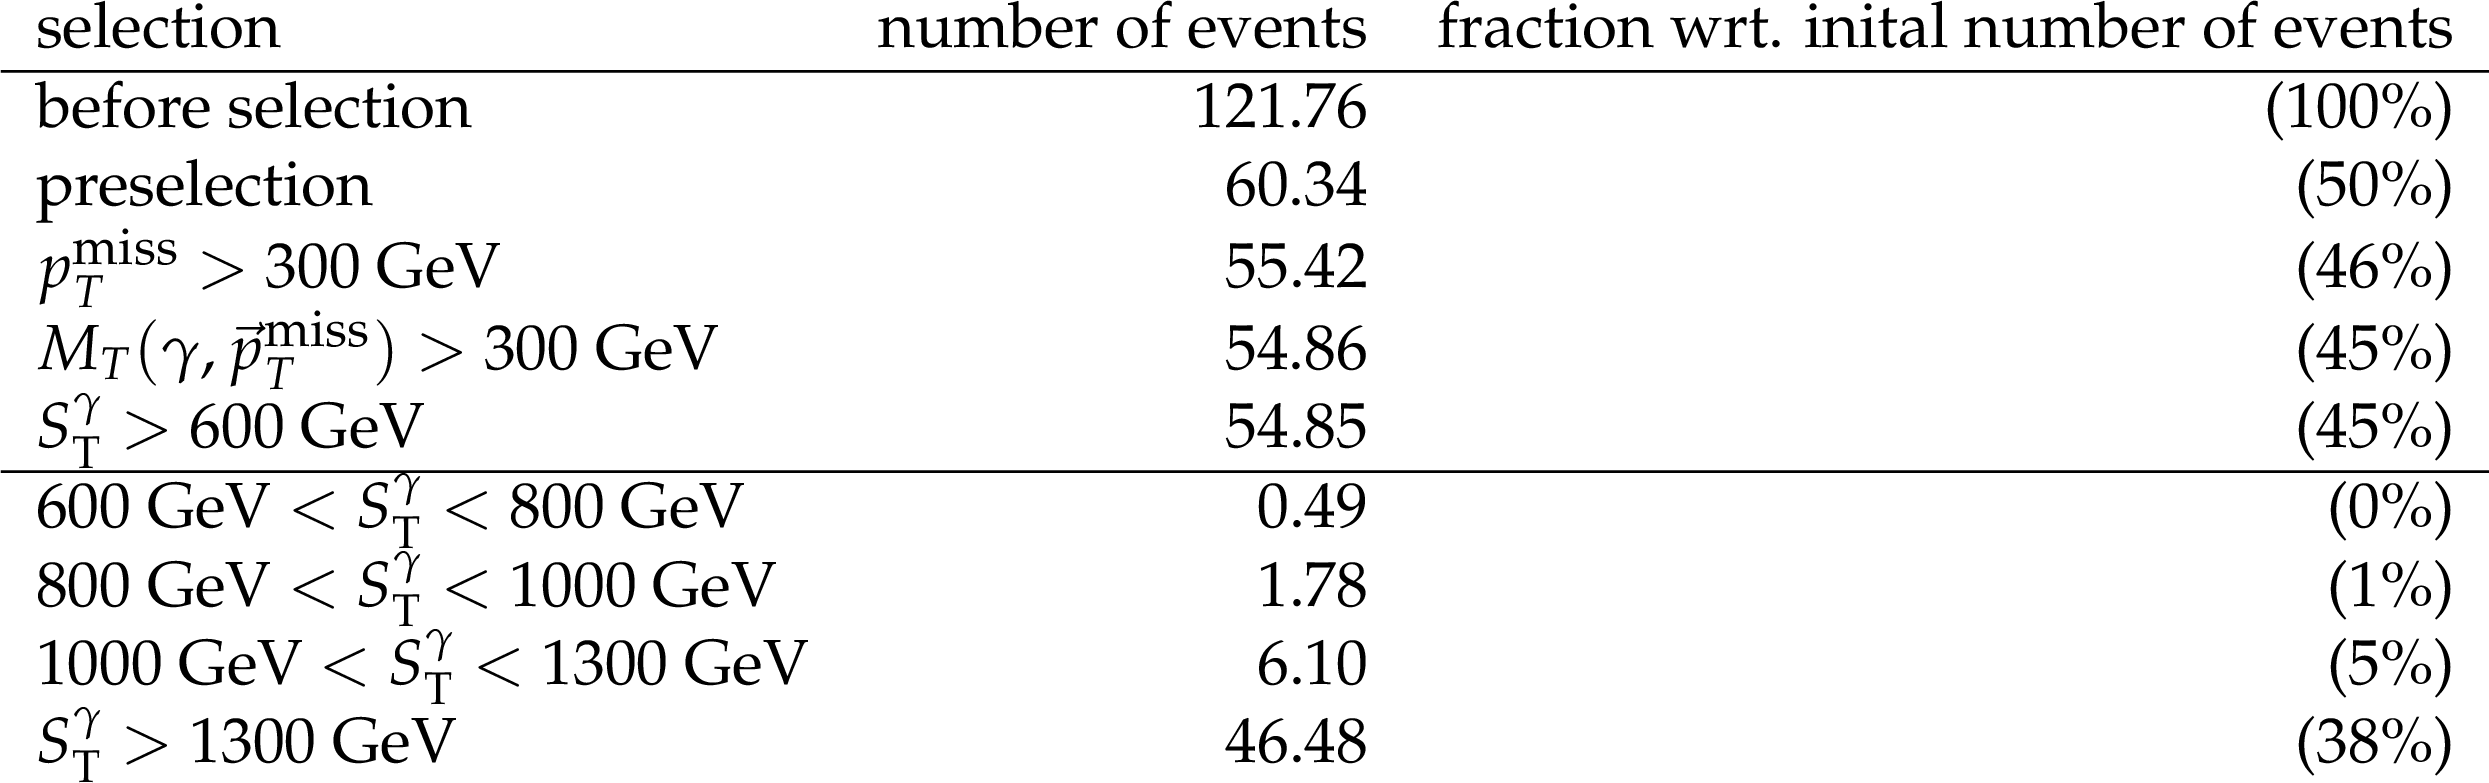
Additional Table 2:
Cutflow of the T5Wg benchmark signal point with a gluino mass of 1750 GeV and a gaugino mass of 1700 GeV. The preselection cut comprises the requirement of at least one loosely isolated photon with ${p_{\mathrm {T}}} > $ 180 GeV and a seed crystal energy fraction of at least 30% wrt. the full corrected photon ${p_{\mathrm {T}}}$, which was accepted by the trigger and was measured in the ECAL barrel. Furthermore, for the photon a minimal distance in $\Delta \mathrm{R}$ of 0.5 is required wrt. to the nearest jet. Also $\Delta \phi (p_{\mathrm{T}}^{\, {\text{miss}}}, \text{jet}) > $ 0.3 is required for all jets with ${p_{\mathrm {T}}} > $ 100 GeV. The yields correspond to a center-of-mass energy of 13 TeV and an integrated luminosity of 35.9 fb$^{-1}$. |
| References | ||||
| 1 | ATLAS Collaboration | Observation of a new particle in the search for the Standard Model Higgs boson with the ATLAS detector at the LHC | PLB 716 (2012) 1 | 1207.7214 |
| 2 | CMS Collaboration | Observation of a new boson at a mass of 125 GeV with the CMS experiment at the LHC | PLB 716 (2012) 30 | CMS-HIG-12-028 1207.7235 |
| 3 | CMS Collaboration | Precise determination of the mass of the Higgs boson and tests of compatibility of its couplings with the standard model predictions using proton collisions at 7 and 8 TeV | EPJC 75 (2015) 212 | CMS-HIG-14-009 1412.8662 |
| 4 | P. Ramond | Dual theory for free fermions | PRD 3 (1971) 2415 | |
| 5 | P. Ramond | An interpretation of dual theories | Nuovo Cim. A 4 (1971) 544 | |
| 6 | Yu. A. Golfand and E. P. Likhtman | Extension of the algebra of Poincare group generators and violation of P invariance | JEPTL 13 (1971) 323 | |
| 7 | D. V. Volkov and V. P. Akulov | Possible universal neutrino interaction | JEPTL 16 (1972) 438 | |
| 8 | J. Wess and B. Zumino | Supergauge transformations in four-dimensions | NPB 70 (1974) 39 | |
| 9 | D. Z. Freedman, P. van Nieuwenhuizen, and S. Ferrara | Progress toward a theory of supergravity | PRD 13 (1976) 3214 | |
| 10 | S. Deser and B. Zumino | Consistent supergravity | PLB 62 (1976) 335 | |
| 11 | D. Z. Freedman and P. van Nieuwenhuizen | Properties of supergravity theory | PRD 14 (1976) 912 | |
| 12 | S. Ferrara and P. van Nieuwenhuizen | Consistent supergravity with complex spin 3/2 gauge fields | PRL 37 (1976) 1669 | |
| 13 | P. Fayet | Supergauge invariant extension of the Higgs mechanism and a model for the electron and its neutrino | NPB 90 (1975) 104 | |
| 14 | A. H. Chamseddine, R. L. Arnowitt, and P. Nath | Locally supersymmetric grand unification | PRL 49 (1982) 970 | |
| 15 | R. Barbieri, S. Ferrara, and C. A. Savoy | Gauge models with spontaneously broken local supersymmetry | PLB 119 (1982) 343 | |
| 16 | L. J. Hall, J. D. Lykken, and S. Weinberg | Supergravity as the messenger of supersymmetry breaking | PRD 27 (1983) 2359 | |
| 17 | G. L. Kane, C. F. Kolda, L. Roszkowski, and J. D. Wells | Study of constrained minimal supersymmetry | PRD 49 (1994) 6173 | hep-ph/9312272 |
| 18 | P. Fayet | Mixing between gravitational and weak interactions through the massive gravitino | PLB 70 (1977) 461 | |
| 19 | H. Baer, M. Brhlik, C. H. Chen, and X. Tata | Signals for the minimal gauge-mediated supersymmetry breaking model at the Fermilab Tevatron collider | PRD 55 (1997) 4463 | hep-ph/9610358 |
| 20 | H. Baer, P. G. Mercadante, X. Tata, and Y. L. Wang | Reach of Tevatron upgrades in gauge-mediated supersymmetry breaking models | PRD 60 (1999) 055001 | hep-ph/9903333 |
| 21 | S. Dimopoulos, S. Thomas, and J. D. Wells | Sparticle spectroscopy and electroweak symmetry breaking with gauge-mediated supersymmetry breaking | NPB 488 (1997) 39 | hep-ph/9609434 |
| 22 | J. R. Ellis, J. L. Lopez, and D. V. Nanopoulos | Analysis of LEP constraints on supersymmetric models with a light gravitino | PLB 394 (1997) 354 | hep-ph/9610470 |
| 23 | M. Dine, A. E. Nelson, Y. Nir, and Y. Shirman | New tools for low energy dynamical supersymmetry breaking | PRD 53 (1996) 2658 | hep-ph/9507378 |
| 24 | G. F. Giudice and R. Rattazzi | Gauge-mediated supersymmetry breaking | in Perspectives on supersymmetry, p. 355 World Scientific, Singapore | |
| 25 | G. R. Farrar and P. Fayet | Phenomenology of the production, decay, and detection of new hadronic states associated with supersymmetry | PLB 76 (1978) 575 | |
| 26 | CMS Collaboration | Search for supersymmetry in electroweak production with photons and large missing transverse energy in pp collisions at $ \sqrt{s} = $ 8 TeV | PLB 759 (2016) 479 | CMS-SUS-14-016 1602.08772 |
| 27 | CMS Collaboration | Data parking and data scouting at the CMS experiment | CDS | |
| 28 | CMS Collaboration | Search for supersymmetry in events with a photon, a lepton, and missing transverse momentum in pp collisions at $ \sqrt{s} = $ 8 TeV | PLB 757 (2016) 6 | CMS-SUS-14-013 1508.01218 |
| 29 | ATLAS Collaboration | Search for photonic signatures of gauge-mediated supersymmetry in 8 TeV pp collisions with the ATLAS detector | PRD 92 (2015) 072001 | 1507.05493 |
| 30 | CMS Collaboration | Search for new physics in events with photons, jets, and missing transverse energy in pp collisions at $ \sqrt{s} = $ 7 TeV | JHEP 03 (2013) 111 | CMS-SUS-12-001 1211.4784 |
| 31 | CMS Collaboration | Search for supersymmetry with photons in pp collisions at $ \sqrt{s} = $ 8 TeV | PRD 92 (2015) 072006 | CMS-SUS-14-004 1507.02898 |
| 32 | P. Meade, N. Seiberg, and D. Shih | General gauge mediation | Prog. Theor. Phys. Suppl. 177 (2009) 143 | 0801.3278 |
| 33 | M. Buican, P. Meade, N. Seiberg, and D. Shih | Exploring general gauge mediation | JHEP 03 (2009) 016 | 0812.3668 |
| 34 | J. T. Ruderman and D. Shih | General neutralino NLSPs at the early LHC | JHEP 08 (2012) 159 | 1103.6083 |
| 35 | Y. Kats, P. Meade, M. Reece, and D. Shih | The status of GMSB after 1 fb$^{-1}$ at the LHC | JHEP 02 (2012) 115 | 1110.6444 |
| 36 | Y. Kats and M. J. Strassler | Probing colored particles with photons, leptons, and jets | JHEP 11 (2012) 097 | 1204.1119 |
| 37 | P. Grajek, A. Mariotti, and D. Redigolo | Phenomenology of general gauge mediation in light of a 125 GeV Higgs | JHEP 07 (2013) 109 | 1303.0870 |
| 38 | CMS Collaboration | Interpretation of searches for supersymmetry with simplified models | PRD 88 (2013) 052017 | CMS-SUS-11-016 1301.2175 |
| 39 | CMS Collaboration | Performance of photon reconstruction and identification with the CMS detector in proton-proton collisions at $ \sqrt{s} = $ 8 TeV | JINST 10 (2015) P08010 | CMS-EGM-14-001 1502.02702 |
| 40 | CMS Collaboration | The CMS experiment at the CERN LHC | JINST 3 (2008) S08004 | CMS-00-001 |
| 41 | CMS Collaboration | Particle-flow reconstruction and global event description with the CMS detector | JINST 12 (2017) P10003 | CMS-PRF-14-001 1706.04965 |
| 42 | CMS Collaboration | Performance of electron reconstruction and selection with the CMS detector in proton-proton collisions at $ \sqrt{s} = $ 8 TeV | JINST 10 (2015) P06005 | CMS-EGM-13-001 1502.02701 |
| 43 | M. Cacciari, G. P. Salam, and G. Soyez | The anti-$ k_t $ jet clustering algorithm | JHEP 04 (2008) 063 | 0802.1189 |
| 44 | M. Cacciari, G. P. Salam, and G. Soyez | FastJet user manual | EPJC 72 (2012) 1896 | 1111.6097 |
| 45 | M. Cacciari and G. P. Salam | Pileup subtraction using jet areas | PLB 659 (2008) 119 | 0707.1378 |
| 46 | CMS Collaboration | Determination of jet energy calibration and transverse momentum resolution in CMS | JINST 6 (2011) 11002 | CMS-JME-10-011 1107.4277 |
| 47 | CMS Collaboration | Performance of the CMS missing transverse momentum reconstruction in pp data at $ \sqrt{s} = $ 8 TeV | JINST 10 (2015) P02006 | CMS-JME-13-003 1411.0511 |
| 48 | J. Alwall et al. | The automated computation of tree-level and next-to-leading order differential cross sections, and their matching to parton shower simulations | JHEP 07 (2014) 079 | 1405.0301 |
| 49 | J. Alwall et al. | Comparative study of various algorithms for the merging of parton showers and matrix elements in hadronic collisions | EPJC 53 (2008) 473 | 0706.2569 |
| 50 | R. Frederix and S. Frixione | Merging meets matching in MC@NLO | JHEP 12 (2012) 061 | 1209.6215 |
| 51 | P. Nason | A new method for combining NLO QCD with shower Monte Carlo algorithms | JHEP 11 (2004) 040 | hep-ph/0409146 |
| 52 | S. Frixione, P. Nason, and C. Oleari | Matching NLO QCD computations with parton shower simulations: the POWHEG method | JHEP 11 (2007) 070 | 0709.2092 |
| 53 | S. Alioli, P. Nason, C. Oleari, and E. Re | A general framework for implementing NLO calculations in shower Monte Carlo programs: the POWHEG BOX | JHEP 06 (2010) 043 | 1002.2581 |
| 54 | T. Melia, P. Nason, R. Rontsch, and G. Zanderighi | W$ ^+ $W$ ^- $, WZ and ZZ production in the POWHEG BOX | JHEP 11 (2011) 078 | 1107.5051 |
| 55 | P. Nason and G. Zanderighi | W$ ^+ $W$ ^- $, WZ and ZZ production in the POWHEG-BOX-V2 | EPJC 74 (2014) 2702 | 1311.1365 |
| 56 | T. Sjostrand, S. Mrenna, and P. Z. Skands | PYTHIA 6.4 physics and manual | JHEP 05 (2006) 026 | hep-ph/0603175 |
| 57 | G. Bozzi et al. | Production of Drell--Yan lepton pairs in hadron collisions: Transverse-momentum resummation at next-to-next-to-leading logarithmic accuracy | PLB 696 (2011) 207 | 1007.2351 |
| 58 | T. Gehrmann et al. | W$ ^+ $W$ ^- $ production at hadron colliders in next-to-next-to leading order QCD | PRL 113 (2014) 212001 | 1408.5243 |
| 59 | W. Beenakker, R. Hopker, M. Spira, and P. M. Zerwas | Squark and gluino production at hadron colliders | NPB 492 (1997) 51 | hep-ph/9610490 |
| 60 | A. Kulesza and L. Motyka | Threshold resummation for squark-antisquark and gluino-pair production at the LHC | PRL 102 (2009) 111802 | 0807.2405 |
| 61 | A. Kulesza and L. Motyka | Soft gluon resummation for the production of gluino-gluino and squark-antisquark pairs at the LHC | PRD 80 (2009) 095004 | 0905.4749 |
| 62 | W. Beenakker et al. | Soft-gluon resummation for squark and gluino hadroproduction | JHEP 12 (2009) 041 | 0909.4418 |
| 63 | W. Beenakker et al. | Squark and gluino hadroproduction | Int. J. Mod. Phys. A 26 (2011) 2637 | 1105.1110 |
| 64 | C. Borschensky et al. | Squark and gluino production cross sections in pp collisions at $ \sqrt{s} = $ 13, 14, 33 and 100 TeV | EPJC 74 (2014) 3174 | 1407.5066 |
| 65 | W. Beenakker et al. | Production of charginos, neutralinos, and sleptons at hadron colliders | PRL 83 (1999) 3780 | hep-ph/9906298 |
| 66 | B. Fuks, M. Klasen, D. R. Lamprea, and M. Rothering | Gaugino production in proton-proton collisions at a center-of-mass energy of 8 TeV | JHEP 10 (2012) 081 | 1207.2159 |
| 67 | B. Fuks, M. Klasen, D. R. Lamprea, and M. Rothering | Precision predictions for electroweak superpartner production at hadron colliders with $ \sc $ Resummino | EPJC 73 (2013) 2480 | 1304.0790 |
| 68 | NNPDF Collaboration | Parton distributions for the LHC Run II | JHEP 04 (2015) 040 | 1410.8849 |
| 69 | CMS Collaboration | Event generator tunes obtained from underlying event and multiparton scattering measurements | EPJC 76 (2016) 155 | CMS-GEN-14-001 1512.00815 |
| 70 | GEANT4 Collaboration | GEANT4---a simulation toolkit | NIMA 506 (2003) 250 | |
| 71 | CMS CollaborationS. Abdullin, et al. | The fast simulation of the CMS detector at LHC | volume 331, p. 032049 2011 | |
| 72 | CMS Collaboration, S. Sekmen | Recent developments in CMS fast simulation | in Proceedings, 38th International Conference on High Energy Physics (ICHEP 2016), p. 181 Chicago, Illinois, USA, August, 2016 [PoS(ICHEP2016)181] | 1701.03850 |
| 73 | CMS Collaboration | The CMS trigger system | JINST 12 (2017) P01020 | |
| 74 | CMS Collaboration | Technical proposal for the Phase-II upgrade of the Compact Muon Solenoid | CMS-PAS-TDR-15-002 | CMS-PAS-TDR-15-002 |
| 75 | CMS Collaboration | Measurement of the inclusive $ w $ and $ z $ production cross sections in pp collisions at $ \sqrt{s} = $ 7 TeV | JHEP 10 (2011) 132 | CMS-EWK-10-005 1107.4789 |
| 76 | J. Butterworth et al. | PDF4LHC recommendations for LHC Run II | JPG 43 (2016) 023001 | 1510.03865 |
| 77 | CMS Collaboration | Measurement of the semileptonic $ \mathrm{t\bar{t}} $+$ \gamma $ production cross section in pp collisions at $ \sqrt{s} = $ 8 TeV | JHEP 10 (2017) 006 | CMS-TOP-14-008 1706.08128 |
| 78 | CMS Collaboration | CMS luminosity measurements for the 2016 data taking period | CMS-PAS-LUM-17-001 | CMS-PAS-LUM-17-001 |
| 79 | CMS Collaboration | Search for top-squark pair production in the single-lepton final state in pp collisions at $ \sqrt{s} = $ 8 TeV | EPJC 73 (2013) 2677 | CMS-SUS-13-011 1308.1586 |
| 80 | T. Junk | Confidence level computation for combining searches with small statistics | NIMA 434 (1999) 435 | hep-ex/9902006 |
| 81 | A. L. Read | Presentation of search results: the CLs technique | JPG 28 (2002) 2693 | |
| 82 | ATLAS, CMS, and LHC Higgs Combination Group collaborations | Procedure for the LHC Higgs boson search combination in Summer 2011 | CMS-NOTE-2011-005 | |
| 83 | G. Cowan, K. Cranmer, E. Gross, and O. Vitells | Asymptotic formulae for likelihood-based tests of new physics | EPJC 71 (2011) 1554 | 1007.1727 |
|
|
Compact Muon Solenoid LHC, CERN |
|

|

|

|

|

|